(unaudited) banking disclosure statement 31 december 2017
TRANSCRIPT
These disclosures are prepared under
the Banking (Disclosure) Rules
(Unaudited)
Banking Disclosure Statement
31 December 2017
BANKING DISCLOSURE STATEMENT (unaudited)
Contents
Page
Introduction
Purpose 4
Basis of preparation 4
The Banking Disclosure Statement 4
Overview of risk management 5
Linkage to the 2017 Annual Report
Basis of consolidation 7
Balance sheet reconciliation 8
Capital and risk-weighted assets
Regulatory capital disclosures 12
Capital ratios and buffer requirements 17
Countercyclical capital buffer ratio 17
Leverage ratio 18
Overview of the minimum capital requirements and RWAs 20
RWA flow statements 21
Credit risk
Credit risk management 22
Credit quality of assets 23
Credit risk under internal ratings-based approach 29
Credit risk under standardised approach 38
Credit risk mitigation 39
Model performance 42
Counterparty credit risk exposures
Counterparty credit risk management 44
Counterparty default risk under internal ratings-based approach 47
Counterparty default risk under standardised approach 48
Market risk
Overview and governance 49
Market risk measures 50
Market risk under standardised approach 52
Analysis of VaR, stressed VaR and incremental risk charge measures 53
Other disclosures
Interest rate exposures in the banking book 54
Mainland activities 55
International claims 55
Foreign exchange exposure 56
Liquidity information 57
Other information
Abbreviations 60
2
BANKING DISCLOSURE STATEMENT (unaudited) (continued)
Tables
Page
Ref Title
1 List of subsidiaries outside the regulatory scope of consolidation 7
2 Reconciliation of balance sheets – accounting to regulatory scope of consolidation 8
3 Detailed reconciliation of balance sheets to transition disclosures template 9
4
10
5 11
6 Transition disclosures template 12
7 Capital instruments 16
8 Capital ratios 17
9 Capital buffers 17
10 Geographical breakdown of RWA in relation to private sector credit exposures 17
11 Leverage ratio 18
12 Leverage ratio common disclosure template 18
13 Summary comparison table 19
14 OV1 – Overview of RWA 20
15 CR8 – RWA flow statements of credit risk exposures under IRB approach 21
16 MR2 – RWA flow statements of market risk exposures under IMM approach 21
17 CR1 – Credit quality of exposures 23
18 CR2 – Changes in defaulted loans and debt securities 23
19 CRB1 – Credit quality of exposures by geography 23
20 CRB2 – Credit quality of exposures by industry 23
21 CRB3 – Credit quality of exposures by residual maturity 24
22 24
23 CRB5 – Impaired exposures and related allowances and write-offs by geographical region 24
24 CRB6 – Aging analysis of past-due exposures but not impaired exposures 25
25 CRB7 – Breakdown of renegotiated loans between impaired and not impaired 25
26 Segmental analysis of loans and advances to customers by geographical area 26
27 Gross loans and advances to customers by industry sector 26
28 Overdue loans and advances to customers 27
29 Off-balance sheet exposures other than derivative transactions 28
30.1 CR6 – Credit risk exposures by portfolio and PD ranges – for IRB approach (Wholesale) 35
30.2 CR6 – Credit risk exposures by portfolio and PD ranges – for IRB approach (Retail) 36
30.3 CR6 – Credit risk exposures by portfolio and PD ranges – for IRB approach (Total) 36
31 CR10 – Specialised lending under supervisory slotting criteria approach – other than HVCRE 37
32 CR10 – Equity exposures under the simple risk-weight method 37
33 CR5 – Credit risk exposures by asset classes and by risk weights – for STC approach 38
34 CR3 – Overview of recognised credit risk mitigation 40
35
40
36 CR4 – Credit risk exposures and effects of recognised credit risk mitigation – for STC approach 41
37.1 CR9 – Back-testing of PD per portfolio – for IRB approach (Wholesale) 42
37.2 CR9 – Back-testing of PD per portfolio – for IRB approach (Retail) 43
38 CCR1 – Analysis of counterparty default risk exposures (other than those to CCPs) by approaches 45
39 CCR2 – CVA capital charge 45
40 CCR8 – Exposures to CCPs 46
41 CCR5 – Composition of collateral for counterparty default risk exposures (including those for contracts or
transactions cleared through CCPs) 46
42
47
43 CCR3 – Counterparty default risk exposures (other than those to CCPs) by asset classes and by risk weights
– for STC approach 48
44 MR1 – Market risk under STM approach 52
45 MR3 – IMM approach values for market risk exposures 53
46 MR4 – Comparison of VaR estimates with gains or losses 53
47 Change in projected net interest income arising from a shift in yield curves 54
48 Mainland activities exposures 55
49 International claims 55
50 Foreign exchange exposure 56
51 Average liquidity coverage ratio 57
52 Total weighted amount of high quality liquid assets 57
53 Liquidity coverage ratio 58
54 Assets pledged and secured liabilities 59
LI1 – Differences between accounting and regulatory scopes of consolidation and mapping of financial statement categories
with regulatory risk categories
LI2 – Main sources of differences between regulatory exposure amounts and carrying values in financial statements
CR7 – Effects on RWA of recognised credit derivative contracts used as recognised credit risk mitigation –
for IRB approach
CCR4 – Counterparty default risk exposures (other than those to CCPs) by portfolio and PD range – for
IRB approach
CRB4 – Impaired exposures and related allowances and write-offs by industry
3
BANKING DISCLOSURE STATEMENT (unaudited) (continued)
Introduction
Purpose
Basis of preparation
The Banking Disclosure Statement
The HKMA has implemented the Basel Committee on Banking Supervision ("BCBS") final standards on revised Pillar 3 disclosures issued in
January 2015. These disclosures are supplemented by specific additional requirements of the HKMA set out in the BDR.
The information contained in this document is for Hang Seng Bank Limited ("the Bank") and its subsidiaries (together "the Group"). It should be
read in conjunction with the Group's 2017 Annual Report. The Group's Annual Report and the Banking Disclosure Statement, taken together,
comply with the Banking (Disclosure) Rules ("BDR") made under section 60A of the Banking Ordinance.
These banking disclosures are governed by the Group's disclosure policy, which has been approved by the Board. The disclosure policy sets out
the governance, control and assurance requirements for publication of the document. While the Banking Disclosure Statement is not required to be
externally audited, the document has been subject to independent review in accordance with the Group's policies on disclosure and its financial
reporting and governance processes.
The Banking Disclosure Statement includes the majority of the information required under the BDR. The remainder of the disclosure requirements
are covered in the Group's 2017 Annual Report which can be found in the Investor Relations – Financial Statements section of our website,
www.hangseng.com.
Disclosure requirements covered in the Group's 2017 Annual Report:
– Section 16J - The Group's definition of "Impaired" and "Renegotiated" and the methods adopted for determining impairments on page 55
– Section 46 - The general disclosure of the major business activities and product lines on pages 165 to 168 (or Note 22) and page 158 (or Note 5)
– Section 52 - Corporate governance on pages 92 to 115
According to the BDR, disclosure of comparative information is not required unless otherwise specified in the standard disclosure templates.
Except where indicated otherwise, the financial information contained in this Banking Disclosure Statement has been prepared on a consolidated
basis. The basis of consolidation for regulatory purposes is different from that for accounting purposes. Information regarding subsidiaries that
are not included in the consolidation for regulatory purposes is set out in the "Basis of consolidation" section in this document.
The information in this document is not audited and does not constitute statutory accounts.
Certain financial information in this document is extracted from the statutory accounts for the year ended 31 December 2017 which will be
delivered to the Registrar of Companies and the Hong Kong Monetary Authority ("HKMA"). The Auditors expressed an unqualified opinion on
those statutory accounts in their report dated 20 February 2018. The Auditor's Report did not include a reference to any matters to which the
auditor drew any attention by way of emphasis without qualifying their report; and did not contain a statement under sections 406(2), 407(2) or (3)
of the Hong Kong Companies Ordinance (Cap.622). The Group's 2017 Annual Report, which include the statutory accounts, can be viewed on
our website: www.hangseng.com.
4
BANKING DISCLOSURE STATEMENT (unaudited) (continued)
Overview of Risk Management
Our risk management framework
Risk culture
Risk appetite
The Group operates a comprehensive stress testing programme that supports our risk management and capital planning. It includes execution of
stress tests mandated by our regulators, as well as internal stress tests. Our stress testing is supported by dedicated teams and infrastructure.
Our testing programme assesses our capital strength through a rigorous examination of our resilience to external shocks. It also helps us
understand and mitigate risks, and informs our decision about capital levels.
Risk appetite is a key component of our management of risk. It sets out the aggregate level and types of risk that we are willing to accept in
achieving our medium to long-term strategic goals. Within the Group, risk appetite is managed through a global risk appetite framework and
articulated in a risk appetite statement ("RAS"), which is approved by the Board on the advice of the Group's Risk Committee.
The RMM regularly reviews the Group's actual risk appetite profile against the limits set out in the Risk Appetite Statement on monthly basis to
enable senior management to monitor the risk profile and guide business activities in order to balance risk and return. The actual risk appetite
profile is also reported to the Risk Committee and Board from Chief Risk Officer including material deviation and related management mitigating
actions.
The Group's risk appetite informs our strategic and financial planning process, defining the desired forward-looking risk profile of the Group. It is
also integrated within other risk management tools, such as the top and emerging risks report and stress testing, to ensure consistency in risk
management. Information on our risk management tools is set out on page 39 of the Group's 2017 Annual Report. Details on the Group's
overarching risk appetite are set out on in the global risk appetite framework.
Stress testing
The Board has ultimate responsibility for the effective management of risk and approves the risk appetite. It is advised by the Risk Committee on
risk appetite and its alignment with strategy, risk governance and internal controls, and high-level risk related matters.
Executive accountability for the ongoing monitoring, assessment and management of the risk environment and the effectiveness of the risk
management framework resides with the Group's Chief Risk Officer, supported by the Risk Management Meeting ("RMM").
Day-to-day responsibility for risk management is delegated to senior managers with individual accountability for decision making. All employees
have a role to play in risk management. These roles are defined using the Three Lines of Defence model, which takes into account the Group’s
business and functional structures.
Our executive risk governance structures ensure appropriate oversight and accountability for risk, which facilitates the reporting and escalation to
the RMM.
We use an enterprise-wide, risk management framework across the organisation and across all risk types. It is underpinned by our risk culture and
is reinforced by HSBC Values and our Global Standards programme.
The framework fosters continuous monitoring of the risk environment, and an integrated evaluation of risks and their interactions. It also ensures
we have a consistent approach to monitoring, managing and mitigating the risks we accept and incur in our activities. Further information on our
risk management framework is set out on page 38 of the Group's 2017 Annual Report. The measurement and management of principal risks facing
the Group is described on pages 40 to 43 of the Group's 2017 Annual Report.
We have long recognised the importance of a strong risk culture, the fostering of which is a key responsibility of senior executives. Our risk
culture is reinforced by HSBC Values and our Global Standards programme. It is instrumental in aligning the behaviours of individuals with our
attitude to assuming and managing risk, which helps to ensure that our risk profile remains in line with our risk appetite.
Our risk culture is further reinforced by our approach to remuneration. Individual awards, including those for senior executives, are based on
compliance with HSBC Values and the achievement of financial and non-financial objectives that are aligned to our risk appetite and strategy.
Risk governance
5
BANKING DISCLOSURE STATEMENT (unaudited) (continued)
Risk measurement and reporting systems
Risk analytics and model governance
Risk measurement and reporting structures deployed at Group level are applied throughout global businesses and major operating subsidiaries
through a common operating model for integrated risk management and control. This model sets out the respective responsibilities of Group,
global business and country level risk functions in respect of such matters as risk governance and oversight, compliance risks, approval authorities
and lending guidelines, global and local scorecards, management information and reporting, and relations with third parties, including regulators,
rating agencies and auditors.
The Group's Risk functions manage a number of analytics disciplines supporting model development and management, including rating, scoring,
economic capital and stress testing models for different risk types and business segments. They formulate technical responses to industry
developments and regulatory policy in the field of risk analytics, supports the development of the HSBC Group's global risk model, develop local
risk model and oversee the use around the Group toward our implementation targets for IRB approaches.
Model governance is under the general oversight of HSBC Group Model Oversight Committee ("MOC"). Local Model Oversight Committees
("Local MOCs") are established for Wholesale Credit and Market Risk ("WCMR") and Retail Banking and Wealth Management ("RBWM") Risk
respectively with comparable terms of reference as HSBC Group MOC.
Our risk measurement and reporting systems are designed to help ensure that risks are comprehensively captured with all the attributes necessary
to support well-founded decisions, that those attributes are accurately assessed, and that information is delivered in a timely manner for those risks
to be successfully managed and mitigated.
Risk measurement and reporting systems are also subject to a governance framework designed to ensure that their build and implementation are fit
for purpose and functioning appropriately. Risk information systems development is a key responsibility of the Risk and IT functions, while the
development and operation of risk rating and management systems and processes are ultimately subject to the oversight of the Board.
We continue to invest significant resources in IT systems and processes in order to maintain and improve our risk management capabilities. A
number of key initiatives and projects to enhance consistent data aggregation, reporting and management, and work towards meeting our BCBS
data obligations are in progress. Group policy promotes the deployment of preferred technology where practicable. Group standards govern the
procurement and operation of systems used in our subsidiaries to process risk information within business lines and risk functions.
The Group's risk functions
The Group's Risk function, headed by the Group's Chief Risk Officer, is responsible for enterprise-wide risk oversight. This includes establishing
and monitoring of risk profiles and forward-looking risk identification and management. The Group's Risk function is made up of sub-functions
covering all risks to our operations and forms part of the second line of defence. They are independent from the sales and trading functions,
ensuring the necessary balance in risk/return decisions.
Risk management and internal control systems
The Directors are responsible for maintaining and reviewing the effectiveness of risk management and internal control systems, and for
determining the aggregate level and risk types they are willing to accept in achieving the Group's business objectives.
On behalf of the Board, the Group's Audit Committee has responsibility for oversight of risk management and internal controls over financial
reporting, and the Group's Risk Committee has responsibility for oversight of risk management and internal controls other than for financial
reporting.
The Directors, through the Group's Risk Committee and the Group's Audit Committee, conduct an annual review of the effectiveness of our
system of risk management and internal control. The Group's Risk Committee and the Group's Audit Committee received confirmation that
executive management has taken or is taking the necessary actions to remedy any failings or weaknesses identified through the operation of our
framework of controls.
6
BANKING DISCLOSURE STATEMENT (unaudited) (continued)
Linkage to the 2017 Annual Report
Basis of consolidation
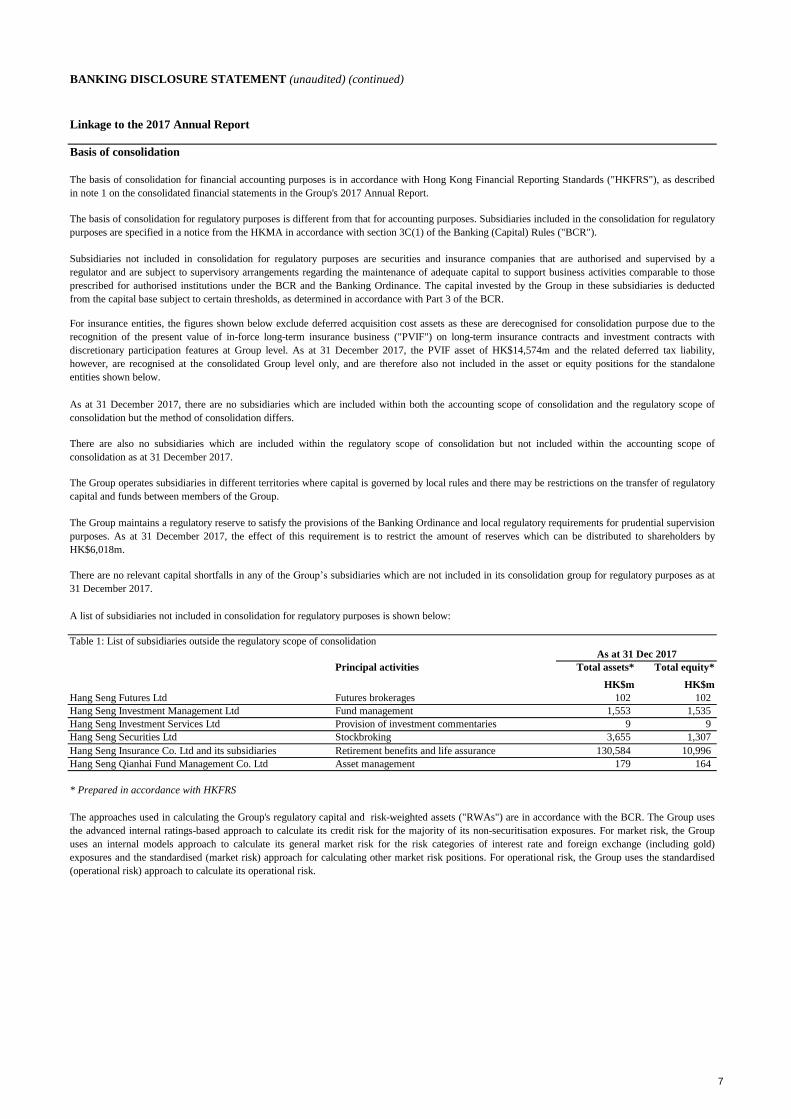
Table 1: List of subsidiaries outside the regulatory scope of consolidation
Principal activities Total assets* Total equity*
HK$m HK$m
Hang Seng Futures Ltd Futures brokerages 102 102
Hang Seng Investment Management Ltd Fund management 1,553 1,535
Hang Seng Investment Services Ltd 9 9
Hang Seng Securities Ltd Stockbroking 3,655 1,307
Hang Seng Insurance Co. Ltd and its subsidiaries 130,584 10,996
Hang Seng Qianhai Fund Management Co. Ltd Asset management 179 164
* Prepared in accordance with HKFRS
The basis of consolidation for financial accounting purposes is in accordance with Hong Kong Financial Reporting Standards ("HKFRS"), as described
in note 1 on the consolidated financial statements in the Group's 2017 Annual Report.
The basis of consolidation for regulatory purposes is different from that for accounting purposes. Subsidiaries included in the consolidation for regulatory
purposes are specified in a notice from the HKMA in accordance with section 3C(1) of the Banking (Capital) Rules ("BCR").
The approaches used in calculating the Group's regulatory capital and risk-weighted assets ("RWAs") are in accordance with the BCR. The Group uses
the advanced internal ratings-based approach to calculate its credit risk for the majority of its non-securitisation exposures. For market risk, the Group
uses an internal models approach to calculate its general market risk for the risk categories of interest rate and foreign exchange (including gold)
exposures and the standardised (market risk) approach for calculating other market risk positions. For operational risk, the Group uses the standardised
(operational risk) approach to calculate its operational risk.
As at 31 December 2017, there are no subsidiaries which are included within both the accounting scope of consolidation and the regulatory scope of
consolidation but the method of consolidation differs.
There are also no subsidiaries which are included within the regulatory scope of consolidation but not included within the accounting scope of
consolidation as at 31 December 2017.
A list of subsidiaries not included in consolidation for regulatory purposes is shown below:
As at 31 Dec 2017
Provision of investment commentaries
Retirement benefits and life assurance
Subsidiaries not included in consolidation for regulatory purposes are securities and insurance companies that are authorised and supervised by a
regulator and are subject to supervisory arrangements regarding the maintenance of adequate capital to support business activities comparable to those
prescribed for authorised institutions under the BCR and the Banking Ordinance. The capital invested by the Group in these subsidiaries is deducted
from the capital base subject to certain thresholds, as determined in accordance with Part 3 of the BCR.
The Group maintains a regulatory reserve to satisfy the provisions of the Banking Ordinance and local regulatory requirements for prudential supervision
purposes. As at 31 December 2017, the effect of this requirement is to restrict the amount of reserves which can be distributed to shareholders by
HK$6,018m.
There are no relevant capital shortfalls in any of the Group’s subsidiaries which are not included in its consolidation group for regulatory purposes as at
31 December 2017.
The Group operates subsidiaries in different territories where capital is governed by local rules and there may be restrictions on the transfer of regulatory
capital and funds between members of the Group.
For insurance entities, the figures shown below exclude deferred acquisition cost assets as these are derecognised for consolidation purpose due to the
recognition of the present value of in-force long-term insurance business ("PVIF") on long-term insurance contracts and investment contracts with
discretionary participation features at Group level. As at 31 December 2017, the PVIF asset of HK$14,574m and the related deferred tax liability,
however, are recognised at the consolidated Group level only, and are therefore also not included in the asset or equity positions for the standalone
entities shown below.
7
BANKING DISCLOSURE STATEMENT (unaudited) (continued)
Balance sheet reconciliation
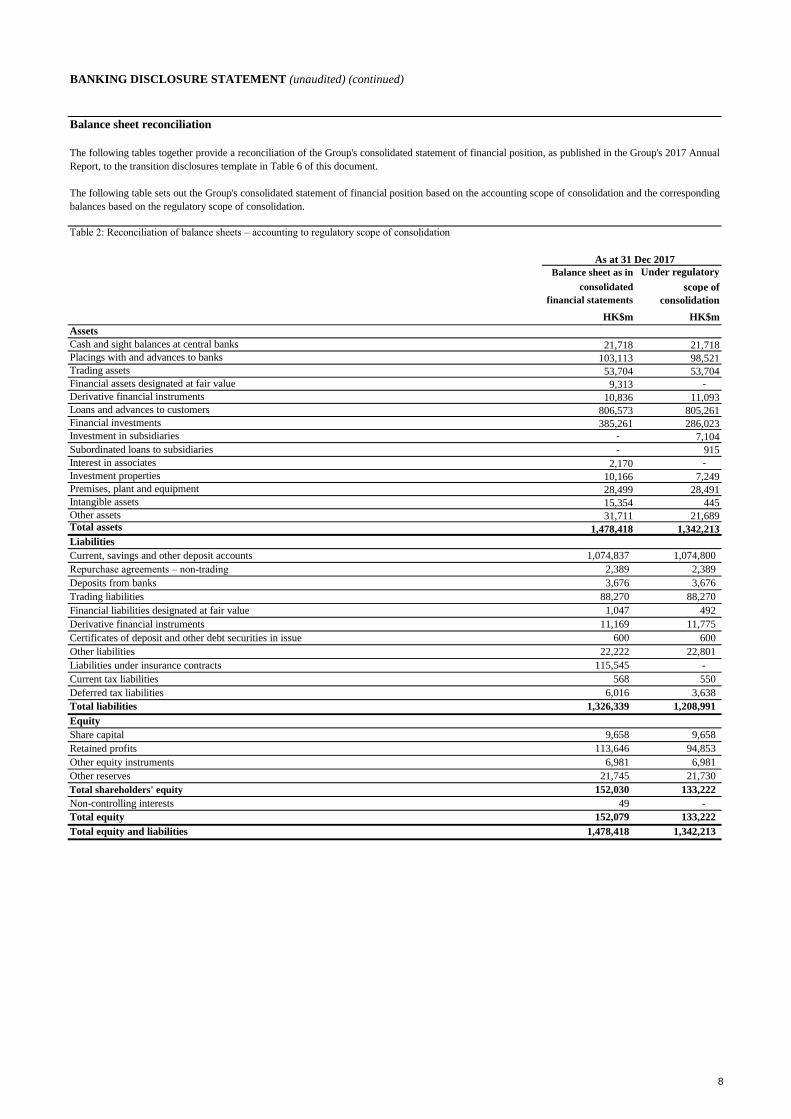
Table 2: Reconciliation of balance sheets – accounting to regulatory scope of consolidation
Under regulatory
scope of
consolidation
HK$m HK$m
Assets
Cash and sight balances at central banks 21,718 21,718
Placings with and advances to banks 103,113 98,521
Trading assets 53,704 53,704
Financial assets designated at fair value 9,313 -
Derivative financial instruments 10,836 11,093
Loans and advances to customers 806,573 805,261
Financial investments 385,261 286,023
Investment in subsidiaries - 7,104
Subordinated loans to subsidiaries - 915
Interest in associates 2,170 -
Investment properties 10,166 7,249
Premises, plant and equipment 28,499 28,491
Intangible assets 15,354 445
Other assets 31,711 21,689 Total assets 1,478,418 1,342,213
Liabilities
Current, savings and other deposit accounts 1,074,837 1,074,800
Repurchase agreements – non-trading 2,389 2,389
Deposits from banks 3,676 3,676
Trading liabilities 88,270 88,270
Financial liabilities designated at fair value 1,047 492
Derivative financial instruments 11,169 11,775
Certificates of deposit and other debt securities in issue 600 600
Other liabilities 22,222 22,801
Liabilities under insurance contracts 115,545 -
Current tax liabilities 568 550
Deferred tax liabilities 6,016 3,638
Total liabilities 1,326,339 1,208,991
Equity
Share capital 9,658 9,658
Retained profits 113,646 94,853
Other equity instruments 6,981 6,981
Other reserves 21,745 21,730
Total shareholders' equity 152,030 133,222
Non-controlling interests 49 -
Total equity 152,079 133,222
Total equity and liabilities 1,478,418 1,342,213
consolidated
financial statements
The following tables together provide a reconciliation of the Group's consolidated statement of financial position, as published in the Group's 2017 Annual
Report, to the transition disclosures template in Table 6 of this document.
The following table sets out the Group's consolidated statement of financial position based on the accounting scope of consolidation and the corresponding
balances based on the regulatory scope of consolidation.
As at 31 Dec 2017
Balance sheet as in
8
BANKING DISCLOSURE STATEMENT (unaudited) (continued)
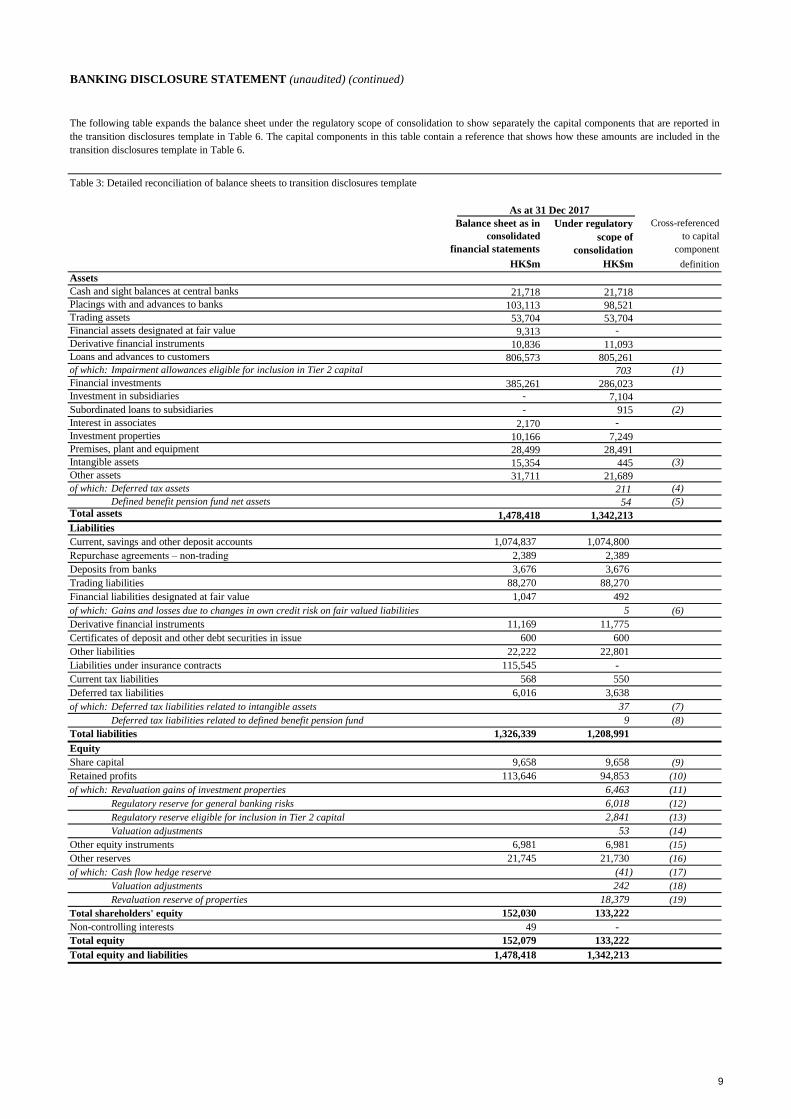
Table 3: Detailed reconciliation of balance sheets to transition disclosures template
Under regulatory Cross-referenced
scope of to capital
consolidation component
HK$m HK$m definition
Assets
Cash and sight balances at central banks 21,718 21,718
Placings with and advances to banks 103,113 98,521
Trading assets 53,704 53,704
Financial assets designated at fair value 9,313 -
Derivative financial instruments 10,836 11,093
Loans and advances to customers 806,573 805,261
of which: Impairment allowances eligible for inclusion in Tier 2 capital 703 (1)
Financial investments 385,261 286,023
Investment in subsidiaries - 7,104
Subordinated loans to subsidiaries - 915 (2)
Interest in associates 2,170 -
Investment properties 10,166 7,249
Premises, plant and equipment 28,499 28,491
Intangible assets 15,354 445 (3)
Other assets 31,711 21,689
of which: Deferred tax assets 211 (4)
Defined benefit pension fund net assets 54 (5)
Total assets 1,478,418 1,342,213
Liabilities
Current, savings and other deposit accounts 1,074,837 1,074,800
Repurchase agreements – non-trading 2,389 2,389
Deposits from banks 3,676 3,676
Trading liabilities 88,270 88,270
Financial liabilities designated at fair value 1,047 492
of which: Gains and losses due to changes in own credit risk on fair valued liabilities 5 (6)
Derivative financial instruments 11,169 11,775
Certificates of deposit and other debt securities in issue 600 600
Other liabilities 22,222 22,801
Liabilities under insurance contracts 115,545 -
Current tax liabilities 568 550
Deferred tax liabilities 6,016 3,638
of which: Deferred tax liabilities related to intangible assets 37 (7)
Deferred tax liabilities related to defined benefit pension fund 9 (8)
Total liabilities 1,326,339 1,208,991
Equity
Share capital 9,658 9,658 (9)
Retained profits 113,646 94,853 (10)
of which: Revaluation gains of investment properties 6,463 (11)
Regulatory reserve for general banking risks 6,018 (12)
Regulatory reserve eligible for inclusion in Tier 2 capital 2,841 (13)
Valuation adjustments 53 (14)
Other equity instruments 6,981 6,981 (15)
Other reserves 21,745 21,730 (16)
of which: Cash flow hedge reserve (41) (17)
Valuation adjustments 242 (18)
Revaluation reserve of properties 18,379 (19)
Total shareholders' equity 152,030 133,222
Non-controlling interests 49 -
Total equity 152,079 133,222
Total equity and liabilities 1,478,418 1,342,213
The following table expands the balance sheet under the regulatory scope of consolidation to show separately the capital components that are reported in
the transition disclosures template in Table 6. The capital components in this table contain a reference that shows how these amounts are included in the
transition disclosures template in Table 6.
As at 31 Dec 2017
Balance sheet as in
consolidated
financial statements
9
BANKING DISCLOSURE STATEMENT (unaudited) (continued)
a b c d e f g
Footnote HK$m HK$m HK$m HK$m HK$m HK$m HK$m
Assets
Cash and sight balances at central banks 21,718 21,718 21,718 - - - -
Placings with and advances to banks 103,113 98,521 97,158 1,363 - - -
Trading assets 53,704 53,704 - - - 51,599 2,105
Financial assets designated at fair value 9,313 - - - - - -
Derivative financial instruments 1 10,836 11,093 - 10,777 - 11,093 316
Loans and advances to customers 806,573 805,261 805,211 50 - - -
Financial investments 385,261 286,023 286,023 - - - -
Investment in subsidiaries - 7,104 7,104 - - - -
Subordinated loans to subsidiaries - 915 - - - - 915
Interest in associates 2,170 - - - - - -
Investment properties 10,166 7,249 7,249 - - - -
Premises, plant and equipment 28,499 28,491 28,491 - - - -
Intangible assets 2 15,354 445 - - - - 408
Other assets 2, 3 31,711 21,689 21,306 118 - - 256 Total assets 1,478,418 1,342,213 1,274,260 12,308 - 62,692 4,000
Liabilities
Current, savings and other deposit accounts 1,074,837 1,074,800 - - - - 1,074,800
Repurchase agreements – non-trading 2,389 2,389 - 2,389 - - -
Deposits from banks 3,676 3,676 - 646 - - 3,030
Trading liabilities 88,270 88,270 - - - 88,270 -
Financial liabilities designated at fair value 1,047 492 - - - - 492
Derivative financial instruments 1 11,169 11,775 - 11,775 - 11,775 -
600 600 - - - - 600
Other liabilities 3 22,222 22,801 - - - - 22,801
Liabilities under insurance contracts 115,545 - - - - - -
Current tax liabilities 568 550 - - - - 550
Deferred tax liabilities 6,016 3,638 - - - - 3,638
Total liabilities 1,326,339 1,208,991 - 14,810 - 100,045 1,105,911
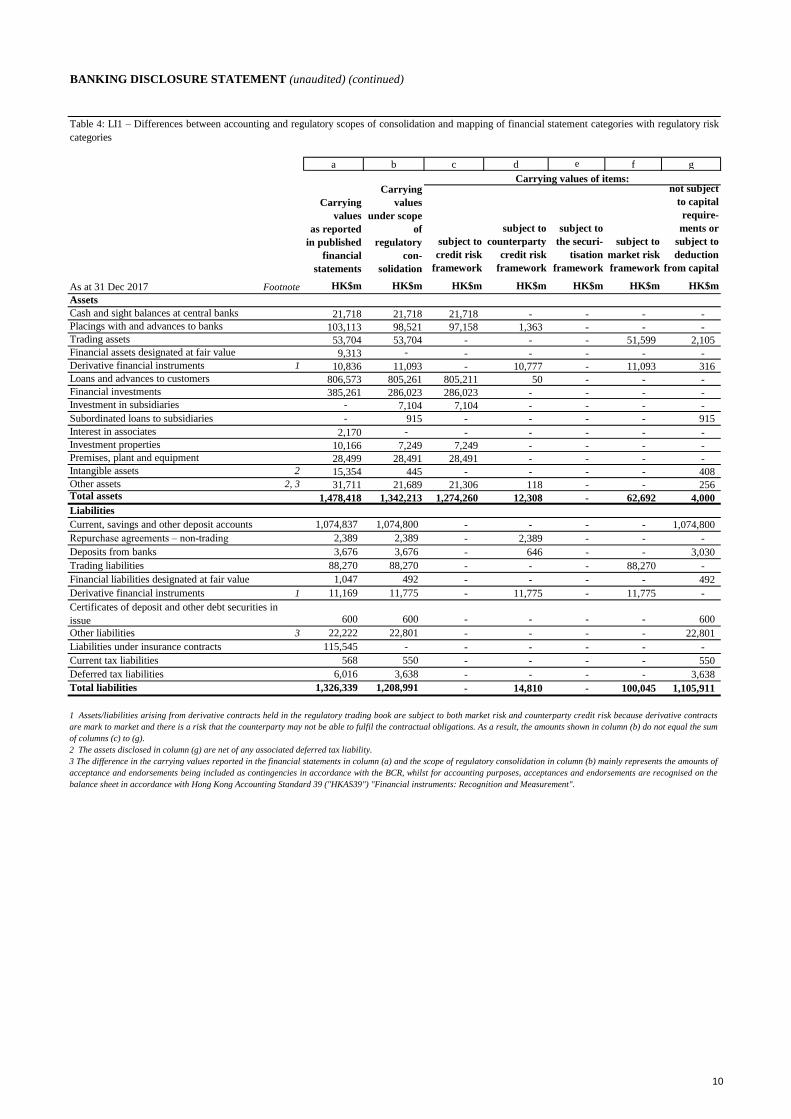
Table 4: LI1 – Differences between accounting and regulatory scopes of consolidation and mapping of financial statement categories with regulatory risk
categories
Carrying
values
as reported
in published
financial
statements
Carrying
values
under scope
of
regulatory
con-
solidation
Carrying values of items:
subject to
credit risk
framework
subject to
counterparty
credit risk
framework
1 Assets/liabilities arising from derivative contracts held in the regulatory trading book are subject to both market risk and counterparty credit risk because derivative contracts
are mark to market and there is a risk that the counterparty may not be able to fulfil the contractual obligations. As a result, the amounts shown in column (b) do not equal the sum
of columns (c) to (g).
2 The assets disclosed in column (g) are net of any associated deferred tax liability.
3 The difference in the carrying values reported in the financial statements in column (a) and the scope of regulatory consolidation in column (b) mainly represents the amounts of
acceptance and endorsements being included as contingencies in accordance with the BCR, whilst for accounting purposes, acceptances and endorsements are recognised on the
balance sheet in accordance with Hong Kong Accounting Standard 39 ("HKAS39") "Financial instruments: Recognition and Measurement".
subject to
the securi-
tisation
framework
subject to
market risk
framework
not subject
to capital
require-
ments or
subject to
deduction
from capital
As at 31 Dec 2017
Certificates of deposit and other debt securities in
issue
10
BANKING DISCLOSURE STATEMENT (unaudited) (continued)
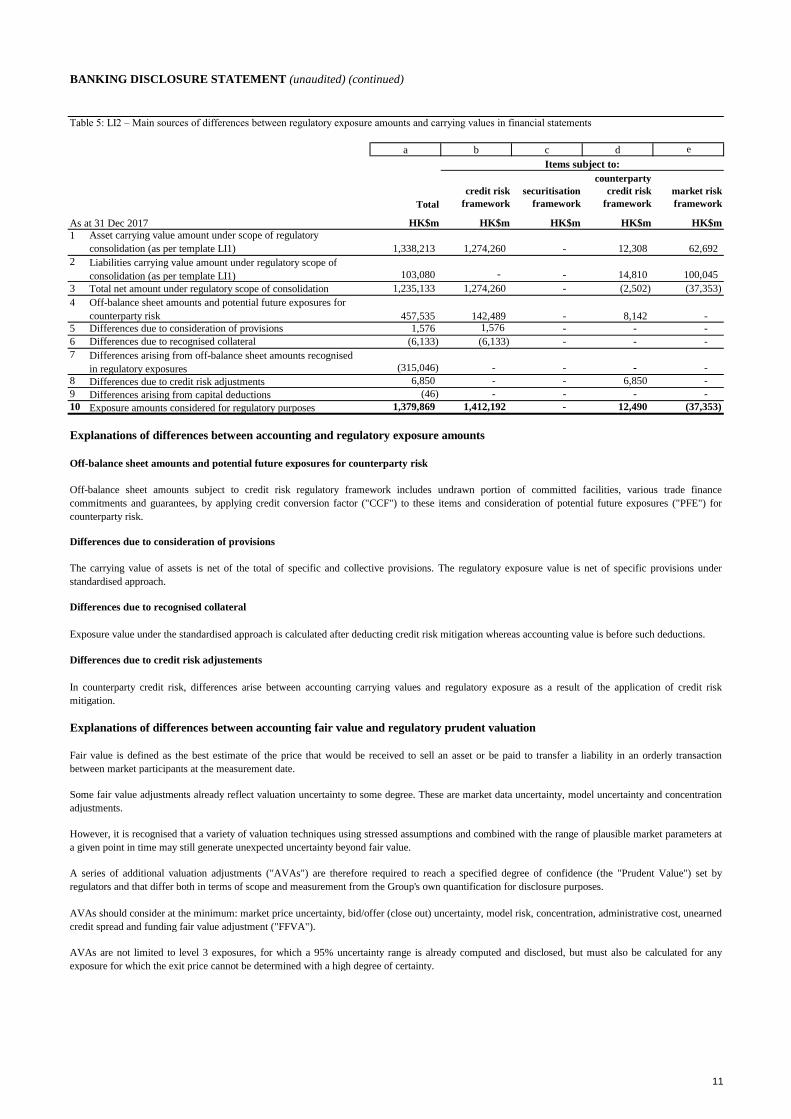
Table 5: LI2 – Main sources of differences between regulatory exposure amounts and carrying values in financial statements
a b c d e
As at 31 Dec 2017 HK$m HK$m HK$m HK$m HK$m
1
1,338,213 1,274,260 - 12,308 62,692
2
103,080 - - 14,810 100,045
3 Total net amount under regulatory scope of consolidation 1,235,133 1,274,260 - (2,502) (37,353)
4
457,535 142,489 - 8,142 -
5 Differences due to consideration of provisions 1,576 1,576 - - -
6 Differences due to recognised collateral (6,133) (6,133) - - -
7
(315,046) - - - -
8 6,850 - - 6,850 -
9 Differences arising from capital deductions (46) - - - -
10 Exposure amounts considered for regulatory purposes 1,379,869 1,412,192 - 12,490 (37,353)
Explanations of differences between accounting and regulatory exposure amounts
Off-balance sheet amounts and potential future exposures for counterparty risk
Differences due to consideration of provisions
Differences due to recognised collateral
Differences due to credit risk adjustements
Explanations of differences between accounting fair value and regulatory prudent valuation
Some fair value adjustments already reflect valuation uncertainty to some degree. These are market data uncertainty, model uncertainty and concentration
adjustments.
However, it is recognised that a variety of valuation techniques using stressed assumptions and combined with the range of plausible market parameters at
a given point in time may still generate unexpected uncertainty beyond fair value.
A series of additional valuation adjustments ("AVAs") are therefore required to reach a specified degree of confidence (the "Prudent Value") set by
regulators and that differ both in terms of scope and measurement from the Group's own quantification for disclosure purposes.
AVAs should consider at the minimum: market price uncertainty, bid/offer (close out) uncertainty, model risk, concentration, administrative cost, unearned
credit spread and funding fair value adjustment ("FFVA").
AVAs are not limited to level 3 exposures, for which a 95% uncertainty range is already computed and disclosed, but must also be calculated for any
exposure for which the exit price cannot be determined with a high degree of certainty.
credit risk
framework
securitisation
framework
counterparty
credit risk
framework
market risk
framework
Fair value is defined as the best estimate of the price that would be received to sell an asset or be paid to transfer a liability in an orderly transaction
between market participants at the measurement date.
In counterparty credit risk, differences arise between accounting carrying values and regulatory exposure as a result of the application of credit risk
mitigation.
Total
Items subject to:
Asset carrying value amount under scope of regulatory
consolidation (as per template LI1)
Liabilities carrying value amount under regulatory scope of
consolidation (as per template LI1)
Off-balance sheet amounts subject to credit risk regulatory framework includes undrawn portion of committed facilities, various trade finance
commitments and guarantees, by applying credit conversion factor ("CCF") to these items and consideration of potential future exposures ("PFE") for
counterparty risk.
Differences arising from off-balance sheet amounts recognised
in regulatory exposures
Exposure value under the standardised approach is calculated after deducting credit risk mitigation whereas accounting value is before such deductions.
The carrying value of assets is net of the total of specific and collective provisions. The regulatory exposure value is net of specific provisions under
standardised approach.
Off-balance sheet amounts and potential future exposures for
counterparty risk
Differences due to credit risk adjustments
11
BANKING DISCLOSURE STATEMENT (unaudited) (continued)
Capital and risk-weighted assets ("RWAs")
Regulatory capital disclosures
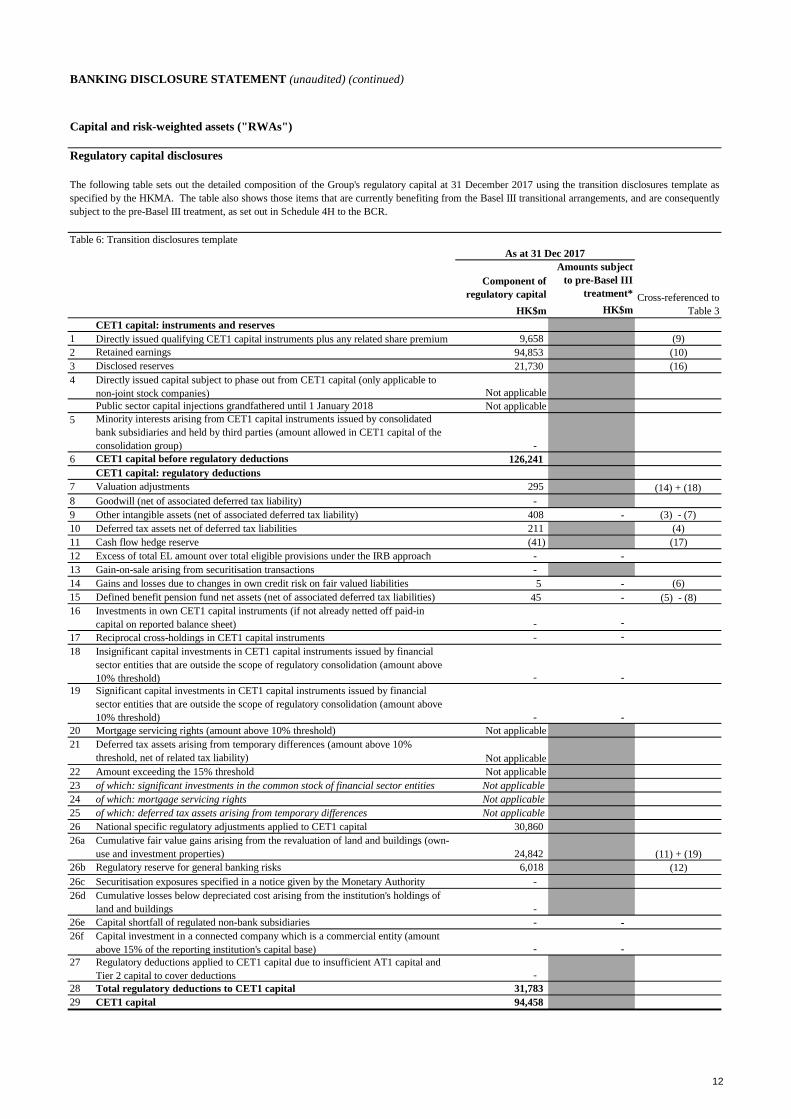
Table 6: Transition disclosures template
Amounts subject
to pre-Basel III
treatment*
HK$m
1 (9)
2 Retained earnings (10)
3 Disclosed reserves (16)
Public sector capital injections grandfathered until 1 January 2018
6 CET1 capital before regulatory deductions
7 (14) + (18)
8
9 - (3) - (7)
10 (4)
11 (17)
12 -
13
14 - (6)
15 - (5) - (8)
16 -
17 -
20
22
23
24
25
26
26a
(11) + (19)
26b (12)
26c
26d
26e -
28
29
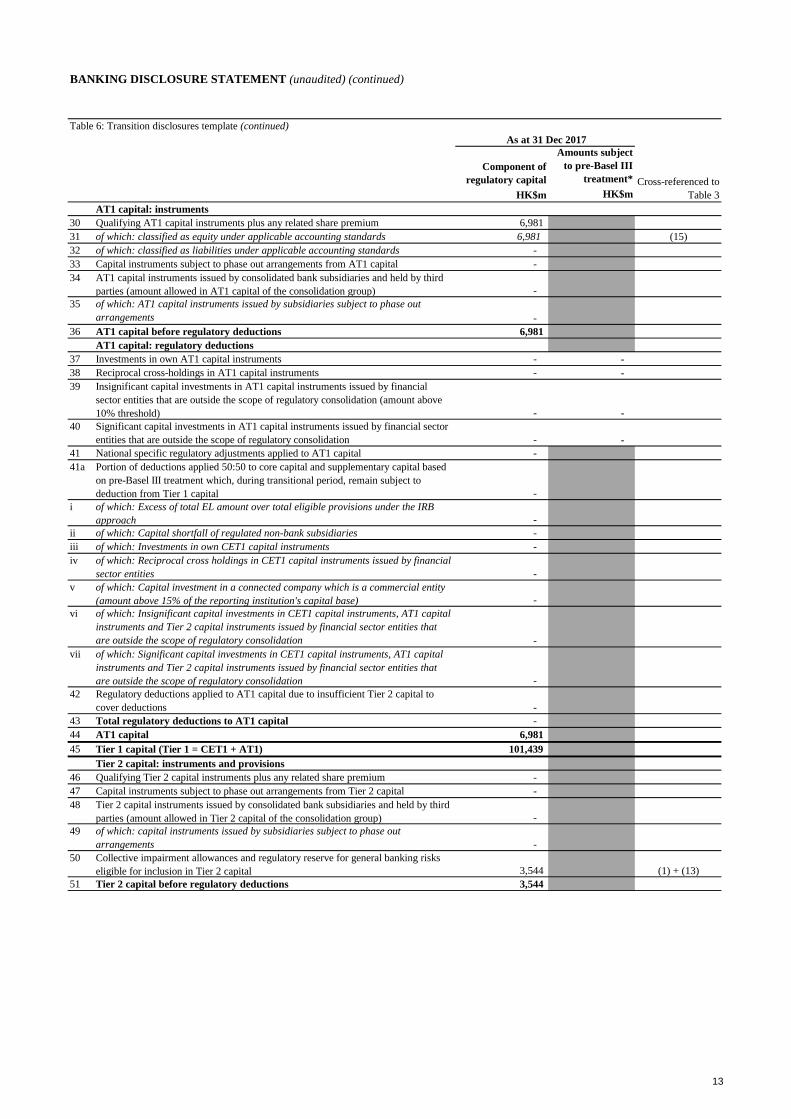
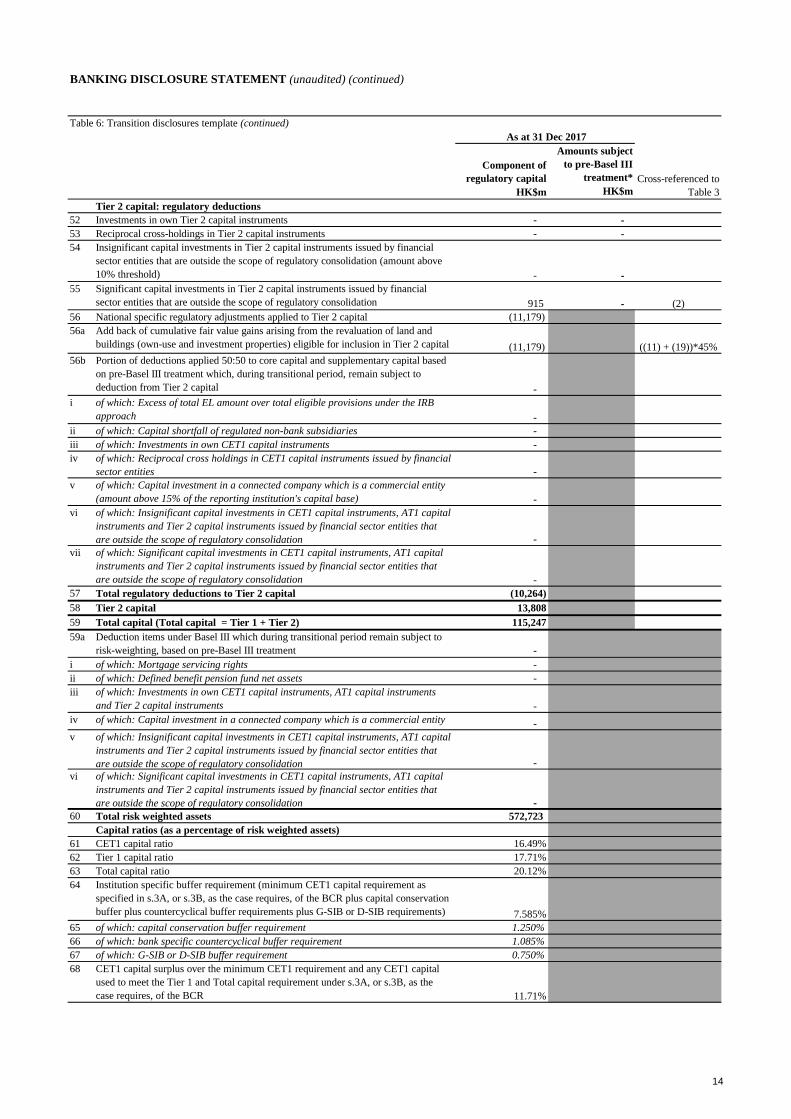
The following table sets out the detailed composition of the Group's regulatory capital at 31 December 2017 using the transition disclosures template as
specified by the HKMA. The table also shows those items that are currently benefiting from the Basel III transitional arrangements, and are consequently
subject to the pre-Basel III treatment, as set out in Schedule 4H to the BCR.
As at 31 Dec 2017
Directly issued qualifying CET1 capital instruments plus any related share premium 9,658
Component of
regulatory capital Cross-referenced to
Table 3HK$m
4 Directly issued capital subject to phase out from CET1 capital (only applicable to
non-joint stock companies) Not applicable
CET1 capital: instruments and reserves
Not applicable
94,853
21,730
126,241
5 Minority interests arising from CET1 capital instruments issued by consolidated
bank subsidiaries and held by third parties (amount allowed in CET1 capital of the
consolidation group) -
Goodwill (net of associated deferred tax liability) -
Other intangible assets (net of associated deferred tax liability) 408
CET1 capital: regulatory deductions
Valuation adjustments 295
Excess of total EL amount over total eligible provisions under the IRB approach -
Gain-on-sale arising from securitisation transactions -
Deferred tax assets net of deferred tax liabilities 211
Cash flow hedge reserve (41)
Investments in own CET1 capital instruments (if not already netted off paid-in
capital on reported balance sheet) -
Reciprocal cross-holdings in CET1 capital instruments -
Gains and losses due to changes in own credit risk on fair valued liabilities 5
Defined benefit pension fund net assets (net of associated deferred tax liabilities) 45
19 Significant capital investments in CET1 capital instruments issued by financial
sector entities that are outside the scope of regulatory consolidation (amount above
10% threshold) - -
18 Insignificant capital investments in CET1 capital instruments issued by financial
sector entities that are outside the scope of regulatory consolidation (amount above
10% threshold) - -
Mortgage servicing rights (amount above 10% threshold) Not applicable
Amount exceeding the 15% threshold Not applicable
of which: significant investments in the common stock of financial sector entities Not applicable
21 Deferred tax assets arising from temporary differences (amount above 10%
threshold, net of related tax liability) Not applicable
National specific regulatory adjustments applied to CET1 capital 30,860
Cumulative fair value gains arising from the revaluation of land and buildings (own-
use and investment properties) 24,842
of which: mortgage servicing rights Not applicable
of which: deferred tax assets arising from temporary differences Not applicable
Cumulative losses below depreciated cost arising from the institution's holdings of
land and buildings -
Capital shortfall of regulated non-bank subsidiaries -
Regulatory reserve for general banking risks 6,018
Securitisation exposures specified in a notice given by the Monetary Authority -
27 Regulatory deductions applied to CET1 capital due to insufficient AT1 capital and
Tier 2 capital to cover deductions -
26f Capital investment in a connected company which is a commercial entity (amount
above 15% of the reporting institution's capital base) - -
Total regulatory deductions to CET1 capital 31,783
CET1 capital 94,458
12
BANKING DISCLOSURE STATEMENT (unaudited) (continued)
Table 6: Transition disclosures template (continued)
Amounts subject
to pre-Basel III
treatment*
HK$m
30
31 (15)
32
33
35
36
37 -
38 -
41
i
ii
iii
iv
42
43
44
45
46
47
49
50
(1) + (13)
51
Cross-referenced to
Table 3
Component of
regulatory capital
HK$m
AT1 capital: instruments
As at 31 Dec 2017
of which: classified as liabilities under applicable accounting standards -
Capital instruments subject to phase out arrangements from AT1 capital -
Qualifying AT1 capital instruments plus any related share premium 6,981
of which: classified as equity under applicable accounting standards 6,981
of which: AT1 capital instruments issued by subsidiaries subject to phase out
arrangements -
34 AT1 capital instruments issued by consolidated bank subsidiaries and held by third
parties (amount allowed in AT1 capital of the consolidation group) -
Investments in own AT1 capital instruments -
Reciprocal cross-holdings in AT1 capital instruments -
AT1 capital before regulatory deductions 6,981
AT1 capital: regulatory deductions
40 Significant capital investments in AT1 capital instruments issued by financial sector
entities that are outside the scope of regulatory consolidation - -
39 Insignificant capital investments in AT1 capital instruments issued by financial
sector entities that are outside the scope of regulatory consolidation (amount above
10% threshold) - -
National specific regulatory adjustments applied to AT1 capital -
of which: Excess of total EL amount over total eligible provisions under the IRB
approach -
41a Portion of deductions applied 50:50 to core capital and supplementary capital based
on pre-Basel III treatment which, during transitional period, remain subject to
deduction from Tier 1 capital -
of which: Capital shortfall of regulated non-bank subsidiaries -
of which: Investments in own CET1 capital instruments -
vi of which: Insignificant capital investments in CET1 capital instruments, AT1 capital
instruments and Tier 2 capital instruments issued by financial sector entities that
are outside the scope of regulatory consolidation -
of which: Reciprocal cross holdings in CET1 capital instruments issued by financial
sector entities -
v of which: Capital investment in a connected company which is a commercial entity
(amount above 15% of the reporting institution's capital base) -
vii of which: Significant capital investments in CET1 capital instruments, AT1 capital
instruments and Tier 2 capital instruments issued by financial sector entities that
are outside the scope of regulatory consolidation -
Regulatory deductions applied to AT1 capital due to insufficient Tier 2 capital to
cover deductions -
Total regulatory deductions to AT1 capital -
AT1 capital 6,981
Qualifying Tier 2 capital instruments plus any related share premium -
Capital instruments subject to phase out arrangements from Tier 2 capital -
Tier 1 capital (Tier 1 = CET1 + AT1) 101,439
Tier 2 capital: instruments and provisions
of which: capital instruments issued by subsidiaries subject to phase out
arrangements -
48 Tier 2 capital instruments issued by consolidated bank subsidiaries and held by third
parties (amount allowed in Tier 2 capital of the consolidation group) -
Collective impairment allowances and regulatory reserve for general banking risks
eligible for inclusion in Tier 2 capital 3,544
Tier 2 capital before regulatory deductions 3,544
13
BANKING DISCLOSURE STATEMENT (unaudited) (continued)
Table 6: Transition disclosures template (continued)
Amounts subject
to pre-Basel III
treatment*
HK$m
52 -
53 -
56
i
ii
iii
iv
57
58
59
59a
i
ii
iii
iv
60
61
62
63
65
66
67
Cross-referenced to
Table 3
As at 31 Dec 2017
Component of
regulatory capital
HK$m
54 Insignificant capital investments in Tier 2 capital instruments issued by financial
sector entities that are outside the scope of regulatory consolidation (amount above
10% threshold) - -
Tier 2 capital: regulatory deductions
Investments in own Tier 2 capital instruments -
55 Significant capital investments in Tier 2 capital instruments issued by financial
sector entities that are outside the scope of regulatory consolidation 915 - (2)
Reciprocal cross-holdings in Tier 2 capital instruments -
National specific regulatory adjustments applied to Tier 2 capital (11,179)
56b Portion of deductions applied 50:50 to core capital and supplementary capital based
on pre-Basel III treatment which, during transitional period, remain subject to
deduction from Tier 2 capital -
56a Add back of cumulative fair value gains arising from the revaluation of land and
buildings (own-use and investment properties) eligible for inclusion in Tier 2 capital (11,179) ((11) + (19))*45%
of which: Excess of total EL amount over total eligible provisions under the IRB
approach -
of which: Capital shortfall of regulated non-bank subsidiaries -
of which: Investments in own CET1 capital instruments -
vi of which: Insignificant capital investments in CET1 capital instruments, AT1 capital
instruments and Tier 2 capital instruments issued by financial sector entities that
are outside the scope of regulatory consolidation -
of which: Reciprocal cross holdings in CET1 capital instruments issued by financial
sector entities -
v of which: Capital investment in a connected company which is a commercial entity
(amount above 15% of the reporting institution's capital base) -
vii of which: Significant capital investments in CET1 capital instruments, AT1 capital
instruments and Tier 2 capital instruments issued by financial sector entities that
are outside the scope of regulatory consolidation -
Total regulatory deductions to Tier 2 capital (10,264)
Deduction items under Basel III which during transitional period remain subject to
risk-weighting, based on pre-Basel III treatment -
of which: Mortgage servicing rights -
Tier 2 capital 13,808
Total capital (Total capital = Tier 1 + Tier 2) 115,247
v of which: Insignificant capital investments in CET1 capital instruments, AT1 capital
instruments and Tier 2 capital instruments issued by financial sector entities that
are outside the scope of regulatory consolidation -
of which: Defined benefit pension fund net assets -
of which: Investments in own CET1 capital instruments, AT1 capital instruments
and Tier 2 capital instruments -
vi of which: Significant capital investments in CET1 capital instruments, AT1 capital
instruments and Tier 2 capital instruments issued by financial sector entities that
are outside the scope of regulatory consolidation -
of which: Capital investment in a connected company which is a commercial entity -
Total risk weighted assets 572,723
Tier 1 capital ratio 17.71%
Total capital ratio 20.12%
Capital ratios (as a percentage of risk weighted assets)
CET1 capital ratio 16.49%
of which: capital conservation buffer requirement 1.250%
64 Institution specific buffer requirement (minimum CET1 capital requirement as
specified in s.3A, or s.3B, as the case requires, of the BCR plus capital conservation
buffer plus countercyclical buffer requirements plus G-SIB or D-SIB requirements) 7.585%
of which: bank specific countercyclical buffer requirement 1.085%
of which: G-SIB or D-SIB buffer requirement 0.750%
68 CET1 capital surplus over the minimum CET1 requirement and any CET1 capital
used to meet the Tier 1 and Total capital requirement under s.3A, or s.3B, as the
case requires, of the BCR 11.71%
14
BANKING DISCLOSURE STATEMENT (unaudited) (continued)
Table 6: Transition disclosures template (continued)
Amounts subject
to pre-Basel III
treatment*
HK$m
69
70
71
74
75
77
78
79
80
81
82
83
84
85
*
Notes to the template:
Elements where a more conservative definition has been applied in the BCR relative to that set out in Basel III capital standards:
Hong Kong
basis
Basel III
basis
HK$m HK$m
10 Deferred tax assets net of deferred tax liabilities 211 96
Explanation
Cross-referenced to
Table 3
National minima (if different from Basel 3 minimum)
National CET1 minimum ratio Not applicable
National Tier 1 minimum ratio Not applicable
73 Significant capital investments in CET1 capital instruments issued by financial
sector entities that are outside the scope of regulatory consolidation 7,848
72 Insignificant capital investments in CET1 capital instruments, AT1 capital
instruments and Tier 2 capital instruments issued by financial sector entities that are
outside the scope of regulatory consolidation 4,093
Mortgage servicing rights (net of related tax liability) Not applicable
Deferred tax assets arising from temporary differences (net of related tax liability) Not applicable
Applicable caps on the inclusion of provisions in Tier 2 capital
As at 31 Dec 2017
Component of
regulatory capital
HK$m
National Total capital minimum ratio Not applicable
Amounts below the thresholds for deduction (before risk weighting)
Cap on inclusion of provisions in Tier 2 under the basic approach and the
standardised (credit risk) approach 763
76 Provisions eligible for inclusion in Tier 2 in respect of exposures subject to the basic
approach and the standardised (credit risk) approach (prior to application of cap) 804
Capital instruments subject to phase-out arrangements
Current cap on CET1 capital instruments subject to phase out arrangements Not applicable
Provisions eligible for inclusion in Tier 2 in respect of exposures subject to the IRB
approach (prior to application of cap) 3,077
Cap for inclusion of provisions in Tier 2 under the IRB approach 2,781
Amount excluded from CET1 due to cap (excess over cap after redemptions and
maturities) Not applicable
Current cap on AT1 capital instruments subject to phase out arrangements -
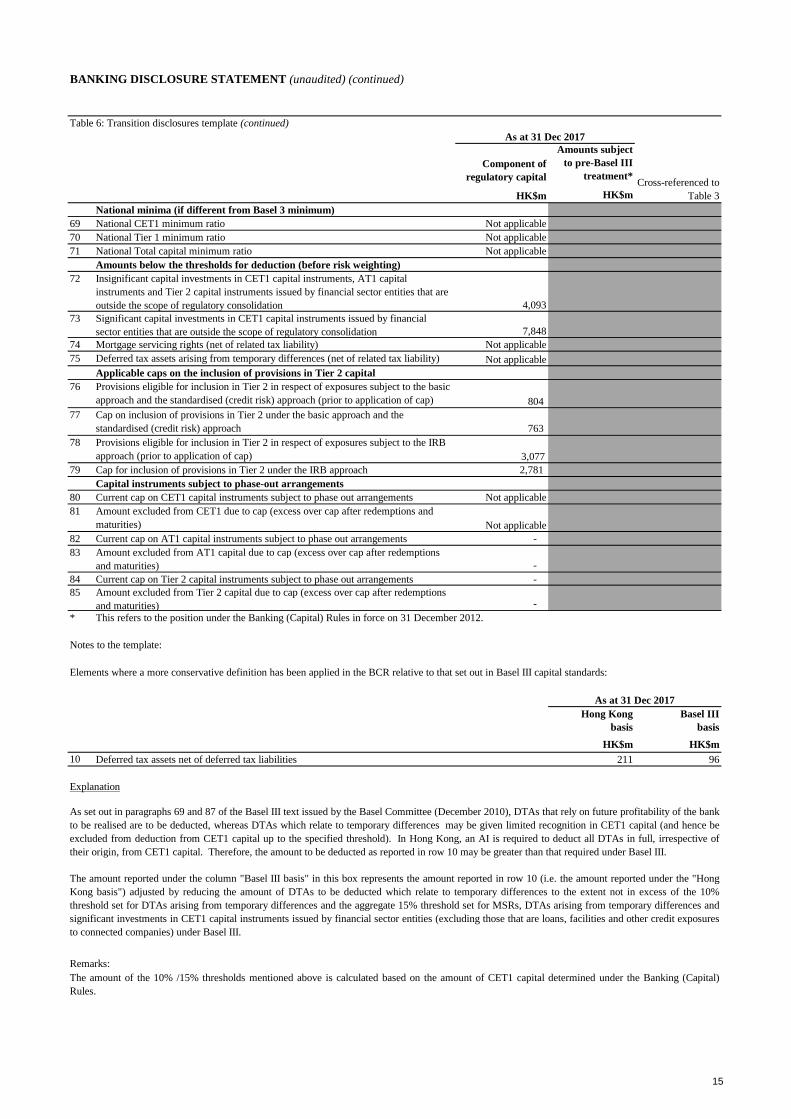
The amount of the 10% /15% thresholds mentioned above is calculated based on the amount of CET1 capital determined under the Banking (Capital)
Rules.
As at 31 Dec 2017
As set out in paragraphs 69 and 87 of the Basel III text issued by the Basel Committee (December 2010), DTAs that rely on future profitability of the bank
to be realised are to be deducted, whereas DTAs which relate to temporary differences may be given limited recognition in CET1 capital (and hence be
excluded from deduction from CET1 capital up to the specified threshold). In Hong Kong, an AI is required to deduct all DTAs in full, irrespective of
their origin, from CET1 capital. Therefore, the amount to be deducted as reported in row 10 may be greater than that required under Basel III.
The amount reported under the column "Basel III basis" in this box represents the amount reported in row 10 (i.e. the amount reported under the "Hong
Kong basis") adjusted by reducing the amount of DTAs to be deducted which relate to temporary differences to the extent not in excess of the 10%
threshold set for DTAs arising from temporary differences and the aggregate 15% threshold set for MSRs, DTAs arising from temporary differences and
significant investments in CET1 capital instruments issued by financial sector entities (excluding those that are loans, facilities and other credit exposures
to connected companies) under Basel III.
Remarks:
Amount excluded from Tier 2 capital due to cap (excess over cap after redemptions
and maturities) -
This refers to the position under the Banking (Capital) Rules in force on 31 December 2012.
Amount excluded from AT1 capital due to cap (excess over cap after redemptions
and maturities) -
Current cap on Tier 2 capital instruments subject to phase out arrangements -
15
BANKING DISCLOSURE STATEMENT (unaudited) (continued)
Capital instruments
Table 7: Capital instruments
As at 31 Dec 2017
1
3
4
5
6
9
10
11
12
13
14
17
18
19
22
23
24
25
26
27
28
30
32
33
36
37
Footnote:
# Regulatory treatment of capital instruments subject to transitional arrangements provided for in Schedule 4H of the Banking (Capital) Rules
+ Regulatory treatment of capital instruments not subject to transitional arrangements provided for in Schedule 4H of the Banking (Capital) Rules
* Include solo-consolidated
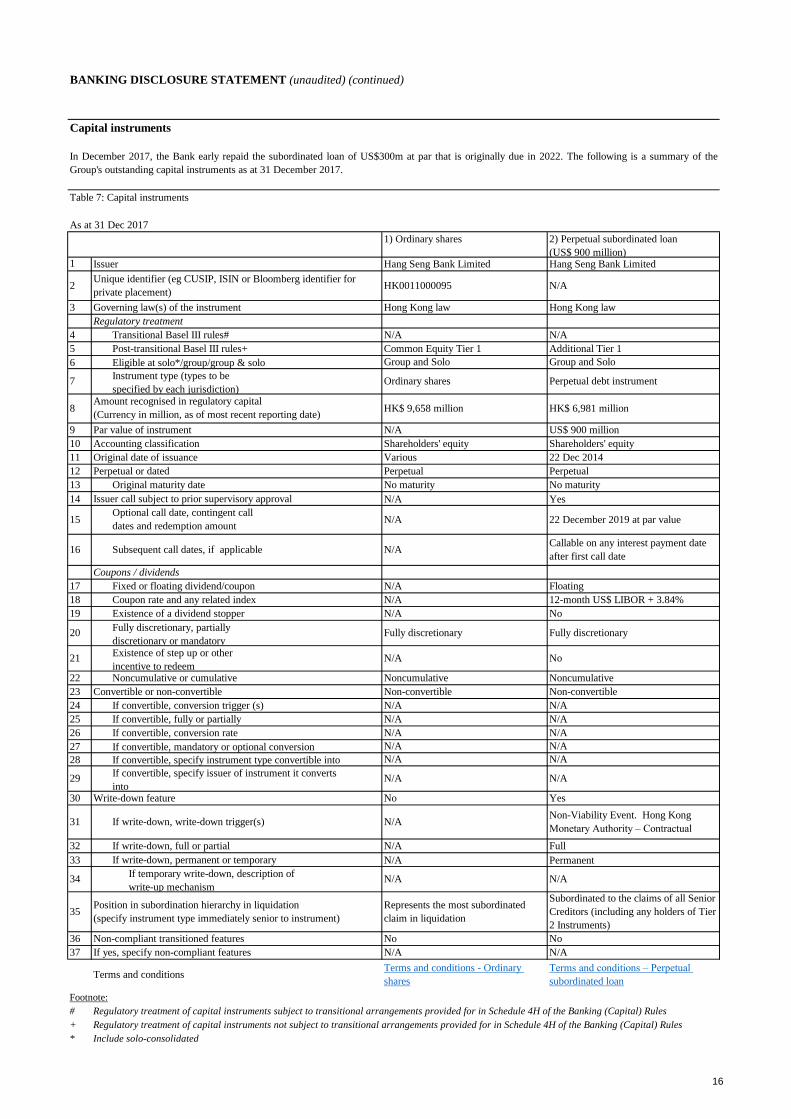
In December 2017, the Bank early repaid the subordinated loan of US$300m at par that is originally due in 2022. The following is a summary of the
Group's outstanding capital instruments as at 31 December 2017.
35Position in subordination hierarchy in liquidation
(specify instrument type immediately senior to instrument)
Represents the most subordinated
claim in liquidation
Subordinated to the claims of all Senior
Creditors (including any holders of Tier
2 Instruments)
If yes, specify non-compliant features N/A N/A
Non-compliant transitioned features No No
34 If temporary write-down, description of
write-up mechanismN/A N/A
If write-down, full or partial N/A Full
If write-down, permanent or temporary N/A Permanent
31 If write-down, write-down trigger(s) N/ANon-Viability Event. Hong Kong
Monetary Authority – Contractual
Write-down feature No Yes
29 If convertible, specify issuer of instrument it converts
intoN/A N/A
If convertible, specify instrument type convertible into N/A N/A
If convertible, mandatory or optional conversion N/A N/A
If convertible, conversion rate N/A N/A
If convertible, fully or partially N/A N/A
If convertible, conversion trigger (s) N/A N/A
Noncumulative or cumulative Noncumulative Noncumulative
Convertible or non-convertible Non-convertible Non-convertible
21 Existence of step up or other
incentive to redeemN/A No
20 Fully discretionary, partially
discretionary or mandatoryFully discretionary Fully discretionary
Existence of a dividend stopper N/A No
Coupon rate and any related index N/A 12-month US$ LIBOR + 3.84%
Fixed or floating dividend/coupon N/A Floating
Coupons / dividends
16 Subsequent call dates, if applicable N/ACallable on any interest payment date
after first call date
15 Optional call date, contingent call
dates and redemption amountN/A 22 December 2019 at par value
Issuer call subject to prior supervisory approval N/A Yes
Original maturity date No maturity No maturity
Perpetual or dated Perpetual Perpetual
Original date of issuance Various 22 Dec 2014
Accounting classification Shareholders' equity Shareholders' equity
Par value of instrument N/A US$ 900 million
8Amount recognised in regulatory capital
(Currency in million, as of most recent reporting date)HK$ 9,658 million HK$ 6,981 million
7 Instrument type (types to be
specified by each jurisdiction)Ordinary shares Perpetual debt instrument
Eligible at solo*/group/group & solo Group and Solo Group and Solo
Post-transitional Basel III rules+ Common Equity Tier 1 Additional Tier 1
Governing law(s) of the instrument Hong Kong law Hong Kong law
Transitional Basel III rules# N/A N/A
Regulatory treatment
1) Ordinary shares 2) Perpetual subordinated loan
(US$ 900 million)
Terms and conditionsTerms and conditions - Ordinary
shares
Terms and conditions – Perpetual
subordinated loan
2Unique identifier (eg CUSIP, ISIN or Bloomberg identifier for
private placement)HK0011000095 N/A
Issuer Hang Seng Bank Limited Hang Seng Bank Limited
16
BANKING DISCLOSURE STATEMENT (unaudited) (continued)
Capital ratios and buffer requirements
Table 8: Capital ratios
31 Dec
2017
Footnote %
CET1 capital ratio 1 16.5
Tier 1 capital ratio 2 17.7
Total capital ratio 3 20.1
HK$m
CET1 captial 94,458
Tier 1 capital 101,439
Total capital 115,247
Total RWAs 4 572,723
1 CET1 capital ratio is equal to CET1 capital divided by total RWAs
2 Tier 1 capital ratio is equal to Tier 1 capital divided by total RWAs
3 Total capital ratio is equal to total capital divided by total RWAs
4 Total RWAs is after the application of the scaling factor of 1.06
Table 9: Capital buffers
31 Dec
2017
%
Capital conservation buffer ratio 1.250
Countercyclical capital buffer ratio 1.085
Higher loss absorbency ratio 0.750
Total 3.085
Countercyclical capital buffer ratio
Table 10: Geographical breakdown of RWA in relation to private sector credit exposures
Jurisdiction
% HK$m % HK$m
1 Hong Kong 1.250 411,244
2 Mainland China - 53,334
3 Macau - 7,782
4 Singapore - 1,626
Total 473,986 1.085 5,142
CCyB ratio of AI
Applicable JCCyB ratio
in effect
Total RWA used in computation of
CCyB ratio of Authorised
Institution ("AI")
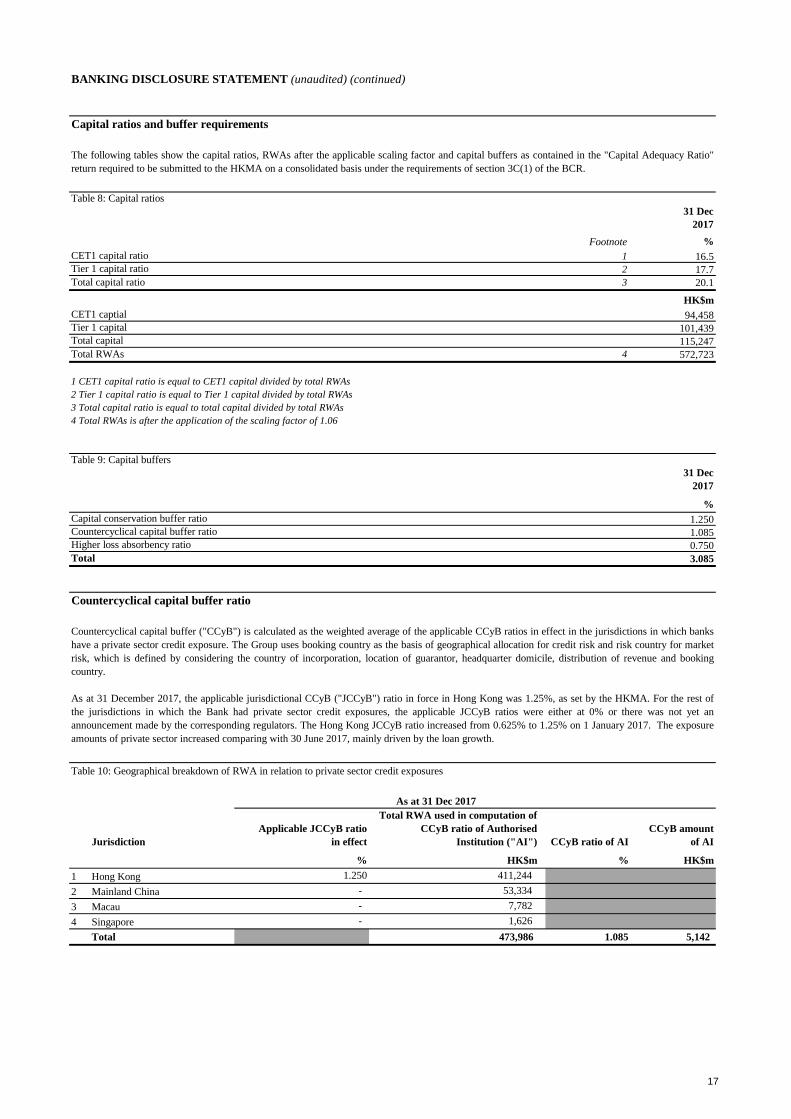
The following tables show the capital ratios, RWAs after the applicable scaling factor and capital buffers as contained in the "Capital Adequacy Ratio"
return required to be submitted to the HKMA on a consolidated basis under the requirements of section 3C(1) of the BCR.
Countercyclical capital buffer ("CCyB") is calculated as the weighted average of the applicable CCyB ratios in effect in the jurisdictions in which banks
have a private sector credit exposure. The Group uses booking country as the basis of geographical allocation for credit risk and risk country for market
risk, which is defined by considering the country of incorporation, location of guarantor, headquarter domicile, distribution of revenue and booking
country.
As at 31 December 2017, the applicable jurisdictional CCyB ("JCCyB") ratio in force in Hong Kong was 1.25%, as set by the HKMA. For the rest of
the jurisdictions in which the Bank had private sector credit exposures, the applicable JCCyB ratios were either at 0% or there was not yet an
announcement made by the corresponding regulators. The Hong Kong JCCyB ratio increased from 0.625% to 1.25% on 1 January 2017. The exposure
amounts of private sector increased comparing with 30 June 2017, mainly driven by the loan growth.
CCyB amount
of AI
As at 31 Dec 2017
17
BANKING DISCLOSURE STATEMENT (unaudited) (continued)
Leverage ratio
Table 11: Leverage ratio
31 Dec
2017
Footnote %
Leverage ratio 1 7.3
Capital and leverage ratio exposure measure HK$m
Tier 1 capital 101,439
Total exposure measure 1,388,288
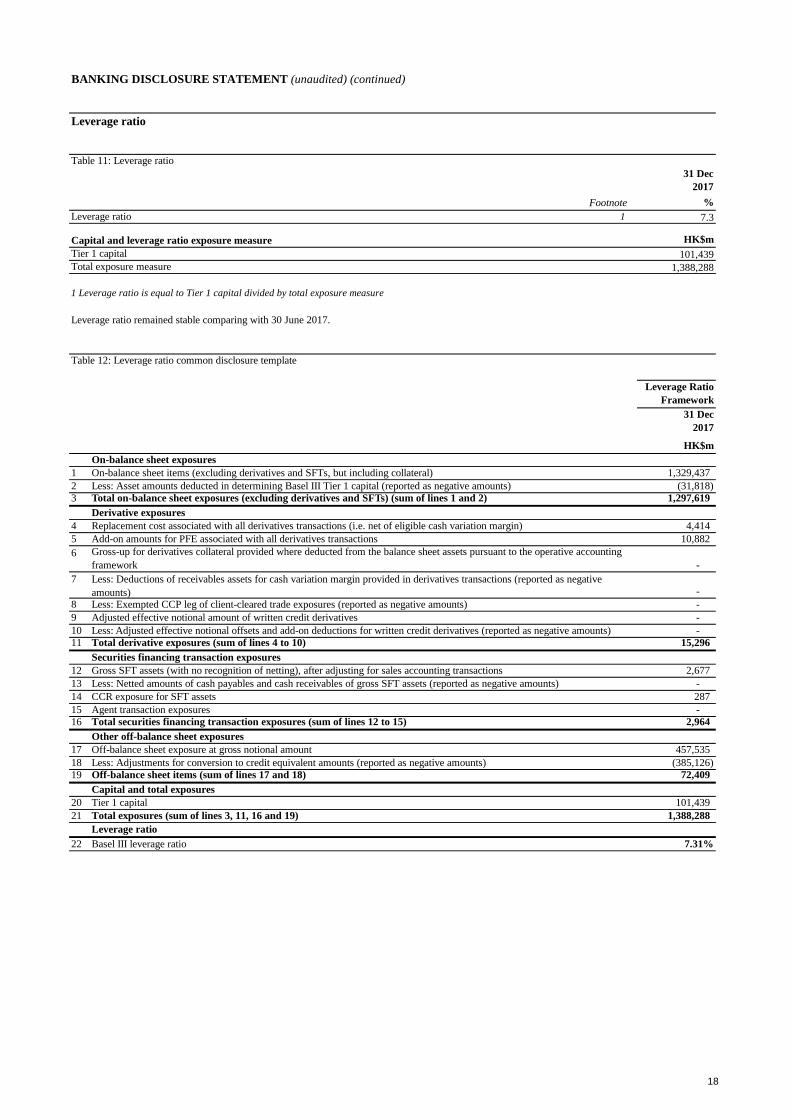
1 Leverage ratio is equal to Tier 1 capital divided by total exposure measure
Table 12: Leverage ratio common disclosure template
Leverage Ratio
Framework
31 Dec
2017
HK$m
On-balance sheet exposures
1 On-balance sheet items (excluding derivatives and SFTs, but including collateral) 1,329,437
2 Less: Asset amounts deducted in determining Basel III Tier 1 capital (reported as negative amounts) (31,818)
3 Total on-balance sheet exposures (excluding derivatives and SFTs) (sum of lines 1 and 2) 1,297,619
Derivative exposures
4 Replacement cost associated with all derivatives transactions (i.e. net of eligible cash variation margin) 4,414
5 Add-on amounts for PFE associated with all derivatives transactions 10,882
8 Less: Exempted CCP leg of client-cleared trade exposures (reported as negative amounts) -
9 Adjusted effective notional amount of written credit derivatives -
10 Less: Adjusted effective notional offsets and add-on deductions for written credit derivatives (reported as negative amounts) -
11 Total derivative exposures (sum of lines 4 to 10) 15,296
Securities financing transaction exposures
12 Gross SFT assets (with no recognition of netting), after adjusting for sales accounting transactions 2,677
13 Less: Netted amounts of cash payables and cash receivables of gross SFT assets (reported as negative amounts) -
14 CCR exposure for SFT assets 287
15 Agent transaction exposures -
16 Total securities financing transaction exposures (sum of lines 12 to 15) 2,964
Other off-balance sheet exposures
17 Off-balance sheet exposure at gross notional amount 457,535
18 Less: Adjustments for conversion to credit equivalent amounts (reported as negative amounts) (385,126)
19 Off-balance sheet items (sum of lines 17 and 18) 72,409
Capital and total exposures
20 Tier 1 capital 101,439
21 Total exposures (sum of lines 3, 11, 16 and 19) 1,388,288
Leverage ratio
22 Basel III leverage ratio 7.31%
Less: Deductions of receivables assets for cash variation margin provided in derivatives transactions (reported as negative
amounts)
7
-
-
Leverage ratio remained stable comparing with 30 June 2017.
6 Gross-up for derivatives collateral provided where deducted from the balance sheet assets pursuant to the operative accounting
framework
18
BANKING DISCLOSURE STATEMENT (unaudited) (continued)
Table 13: Summary comparison table
31 Dec
2017
HK$m
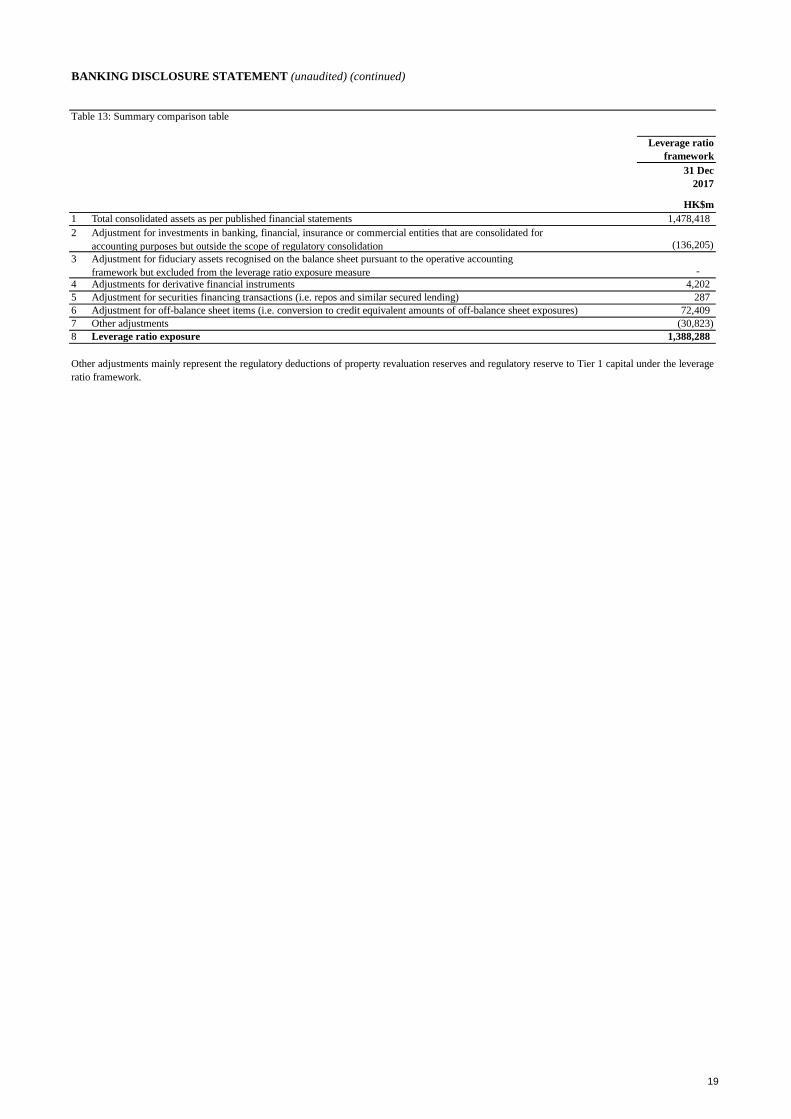
1 Total consolidated assets as per published financial statements 1,478,418
4 Adjustments for derivative financial instruments 4,202
5 Adjustment for securities financing transactions (i.e. repos and similar secured lending) 287
6 Adjustment for off-balance sheet items (i.e. conversion to credit equivalent amounts of off-balance sheet exposures) 72,409
7 Other adjustments (30,823)
8 Leverage ratio exposure 1,388,288
Other adjustments mainly represent the regulatory deductions of property revaluation reserves and regulatory reserve to Tier 1 capital under the leverage
ratio framework.
Leverage ratio
framework
2 Adjustment for investments in banking, financial, insurance or commercial entities that are consolidated for
accounting purposes but outside the scope of regulatory consolidation
3 Adjustment for fiduciary assets recognised on the balance sheet pursuant to the operative accounting
framework but excluded from the leverage ratio exposure measure
(136,205)
-
19
BANKING DISCLOSURE STATEMENT (unaudited) (continued)
Overview of the minimum capital requirements and RWAs
Table 14: OV1 – Overview of RWA
31 Dec 30 Sep 31 Dec
2017 2017 2017
Footnote HK$m HK$m HK$m
1 Credit risk for non-securitisation exposures
2 of which: Standardised (credit risk) ("STC") approach
2a of which: Basic ("BSC") approach
3 of which: Internal ratings-based ("IRB") approach
4 Counterparty credit risk
5 of which: Standardised ("SA-CCR") approach 1
5a of which: Current exposure method ("CEM")
6 of which: Internal models (counterparty credit risk) ("IMM(CCR)") approach
7 Equity exposures in banking book under the market-based approach
8 Collective investment scheme ("CIS") exposures – Look-through approach ("LTA")
9 CIS exposures – Mandate-based approach ("MBA")
10 CIS exposures – Fall-back approach ("FBA")
11 Settlement risk
12 Securitisation ("S") exposures in banking book
13 of which: IRB(S) approach – ratings-based method
14 of which: IRB(S) approach – supervisory formula method
15 of which: STC(S) approach
16 Market risk
17 of which: Standardised (market risk) ("STM") approach
18 of which: Internal models ("IMM") approach
19 Operational risk
20 of which: Basic indicator ("BIA") approach
21 of which: Standardised (operational risk) ("STO") approach
21a of which: Alternative standardised ("ASA") approach
22 of which: Advanced measurement ("AMA") approach
23 Amounts below the thresholds for deduction (subject to 250% RW)
24 Capital floor adjustment
24a Deduction to RWA
24b
24c
25 Total
N/A: Not applicable in the case of Hong Kong
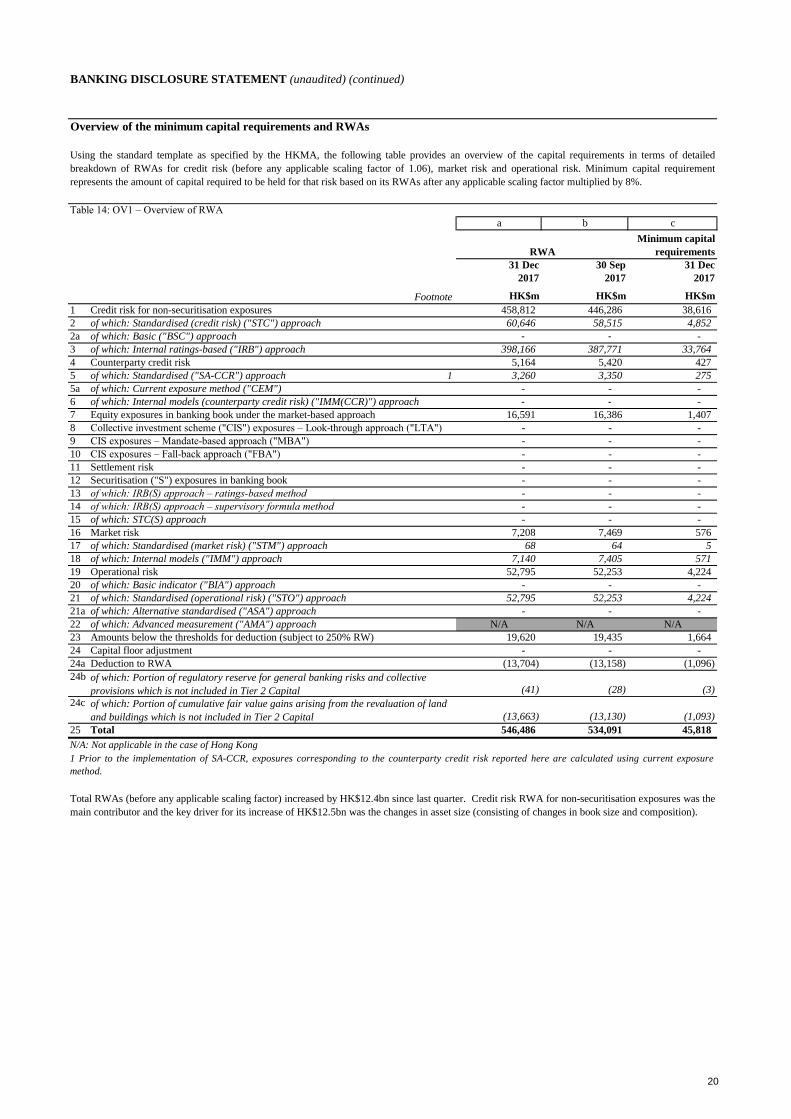
Total RWAs (before any applicable scaling factor) increased by HK$12.4bn since last quarter. Credit risk RWA for non-securitisation exposures was the
main contributor and the key driver for its increase of HK$12.5bn was the changes in asset size (consisting of changes in book size and composition).
546,486 534,091 45,818
1 Prior to the implementation of SA-CCR, exposures corresponding to the counterparty credit risk reported here are calculated using current exposure
method.
of which: Portion of cumulative fair value gains arising from the revaluation of land
and buildings which is not included in Tier 2 Capital (13,663) (13,130) (1,093)
of which: Portion of regulatory reserve for general banking risks and collective
provisions which is not included in Tier 2 Capital (41) (28) (3)
(13,704) (13,158) (1,096)
- - -
19,620 19,435 1,664
N/A N/A N/A
- - -
52,795 52,253 4,224
- - -
52,795 52,253 4,224
7,140 7,405 571
68 64 5
7,208 7,469 576
- - -
- - -
- - -
- - -
- - -
- - -
- - -
- - -
16,591 16,386 1,407
- - -
- - -
a b c
60,646 58,515 4,852
RWA
Minimum capital
requirements
458,812 446,286 38,616
Using the standard template as specified by the HKMA, the following table provides an overview of the capital requirements in terms of detailed
breakdown of RWAs for credit risk (before any applicable scaling factor of 1.06), market risk and operational risk. Minimum capital requirement
represents the amount of capital required to be held for that risk based on its RWAs after any applicable scaling factor multiplied by 8%.
- - -
3,260 3,350 275
5,164 5,420 427
398,166 387,771 33,764
20
BANKING DISCLOSURE STATEMENT (unaudited) (continued)
RWA flow statements
RWA flow statement for credit risk
Table 15: CR8 – RWA flow statements of credit risk exposures under IRB approach
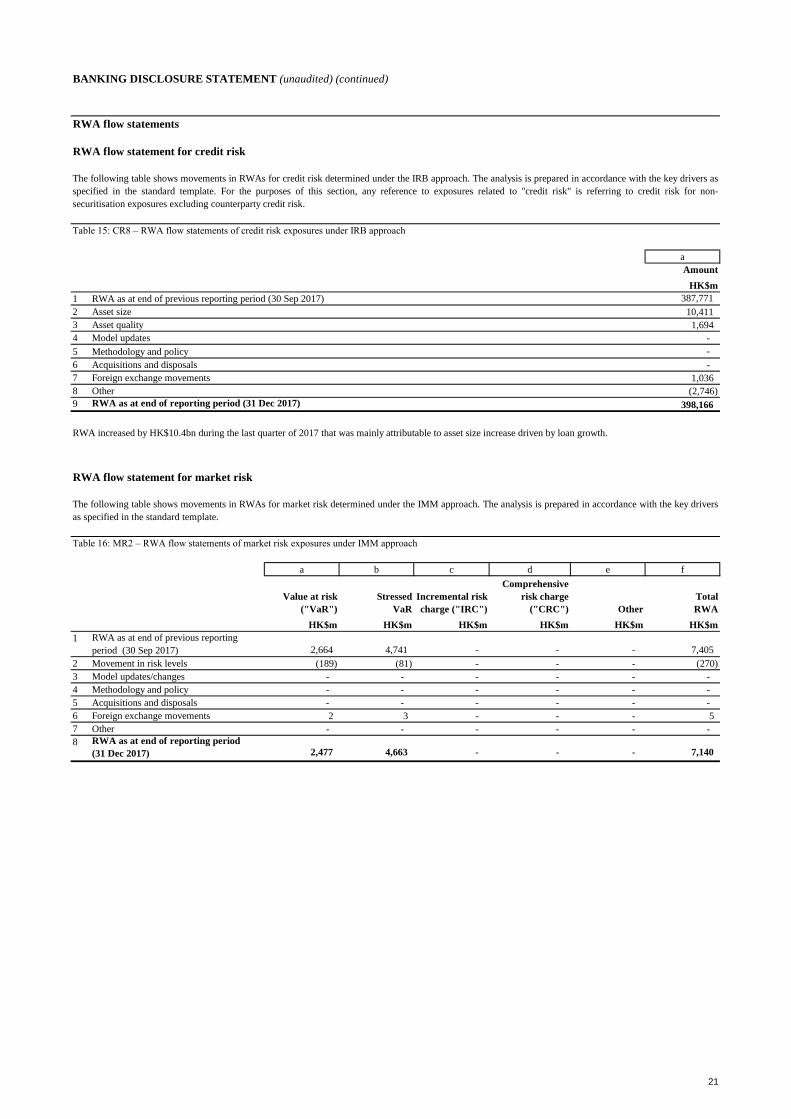
1 387,771
2 Asset size 10,411
3 Asset quality 1,694
4 Model updates -
5 Methodology and policy -
6 Acquisitions and disposals -
7 Foreign exchange movements 1,036
8 Other (2,746)
9 398,166
RWA flow statement for market risk
Table 16: MR2 – RWA flow statements of market risk exposures under IMM approach
1
2,664 4,741 - - - 7,405
2 Movement in risk levels (189) (81) - - - (270)
3 Model updates/changes - - - - - -
4 Methodology and policy - - - - - -
5 Acquisitions and disposals - - - - - -
6 Foreign exchange movements 2 3 - - - 5
7 Other - - - - - -
8 2,477 4,663 - - - 7,140
a
Amount
HK$m
RWA as at end of previous reporting period (30 Sep 2017)
RWA as at end of reporting period (31 Dec 2017)
RWA increased by HK$10.4bn during the last quarter of 2017 that was mainly attributable to asset size increase driven by loan growth.
a b c d e f
Other
Total
RWA
RWA as at end of reporting period
(31 Dec 2017)
HK$m HK$m HK$m HK$m HK$m HK$m
The following table shows movements in RWAs for credit risk determined under the IRB approach. The analysis is prepared in accordance with the key drivers as
specified in the standard template. For the purposes of this section, any reference to exposures related to "credit risk" is referring to credit risk for non-
securitisation exposures excluding counterparty credit risk.
The following table shows movements in RWAs for market risk determined under the IMM approach. The analysis is prepared in accordance with the key drivers
as specified in the standard template.
RWA as at end of previous reporting
period (30 Sep 2017)
Value at risk
("VaR")
Stressed
VaR
Incremental risk
charge ("IRC")
Comprehensive
risk charge
("CRC")
21
BANKING DISCLOSURE STATEMENT (unaudited) (continued)
Credit risk
Credit risk management
For individually assessed customers, the credit process provides for at least annual review of the facility granted. Review may be more frequent,
as required by circumstances.
The Group adopts a set of standards that govern the process through which risk rating systems are initially developed, judged fit for purpose,
approved and implemented, the conditions under which analytical risk model outcomes can be overridden by approvers; and the process of model
performance monitoring and reporting. The framework emphasises on an effective dialogue between business line and risk management, suitable
independence of decision takers and a good understanding and robust reflection on the part of senior management.
Analytical risk rating systems are not static and are subject to review and modification in light of the changing environment and the greater
availability and quality of data. Processes are established to capture the relevant data for continuous model improvement.
Business model/strategy will be reviewed regularly by different business units taking into consideration of current market condition and the
Group's risk appetite. Credit risk policies and limits will also be reviewed to align with the direction of defined risk appetite and business strategy.
Credit Risk Management
The Group's exposure to credit risk arises from a wide range of customers and product types. To measure and manage the risk in these exposures,
both to distinct customer types or product categories, the Group employs diverse risk rating systems and methodologies: judgmental, analytical,
and hybrids of the two.
A fundamental principle of the Group's policy and approach is that analytical risk rating systems and scorecards are decision tools facilitating
management, serving ultimately judgemental decisions for which individual approvers are accountable.
Credit risk is the risk that financial loss arises from the failure of a customer or counterparty to meet its obligations under a contract. It arises
principally from lending, trade finance, and treasury businesses. The Group has dedicated standards, policies and procedures in place to control
and monitor risk from all such activities.
There are dedicated credit risk functions, reported to Chief Risk Officer, responsible for centralised management of credit risk through:
– formulating credit policies on approval process, post disbursement monitoring, recovery process and large exposure;
– issuing guidelines on lending to specified market sectors, industries and products; the acceptability of specific classes of collateral or risk
mitigations and valuation parameters for collateral;
– undertaking an independent review and objective assessment of credit risk for all commercial non-bank credit facilities in excess of designated
amount prior to the facilities being committed to customers;
– controlling exposures to selected industries, counterparties, countries and portfolio types etc by setting limits;
– maintaining and developing credit risk rating/facility grading process to categorise exposures and facilitate focused management;
– reporting to senior executives and various committees on aspects of the Group loan portfolio;
– managing and directing credit-related systems initiatives; and
– providing advice and guidance to business units on various credit-related issues.
These credit risk functions work closely with other functions of the Group.
Credit risk operates through a hierarchy of individual credit approval authority limits. With delegation from the Board, Executive Committee
delegates the credit approval authority limits to Chief Executive and empowers the Chief Executive to further delegate to Chief Risk Officer and
senior management teams on individual basis. Chief Risk Officer is empowered by Chief Executive to further delegate the credit approval
authority limits.
22
BANKING DISCLOSURE STATEMENT (unaudited) (continued)
Credit quality of assets
Table 17: CR1 – Credit quality of exposures
As at 31 Dec 2017
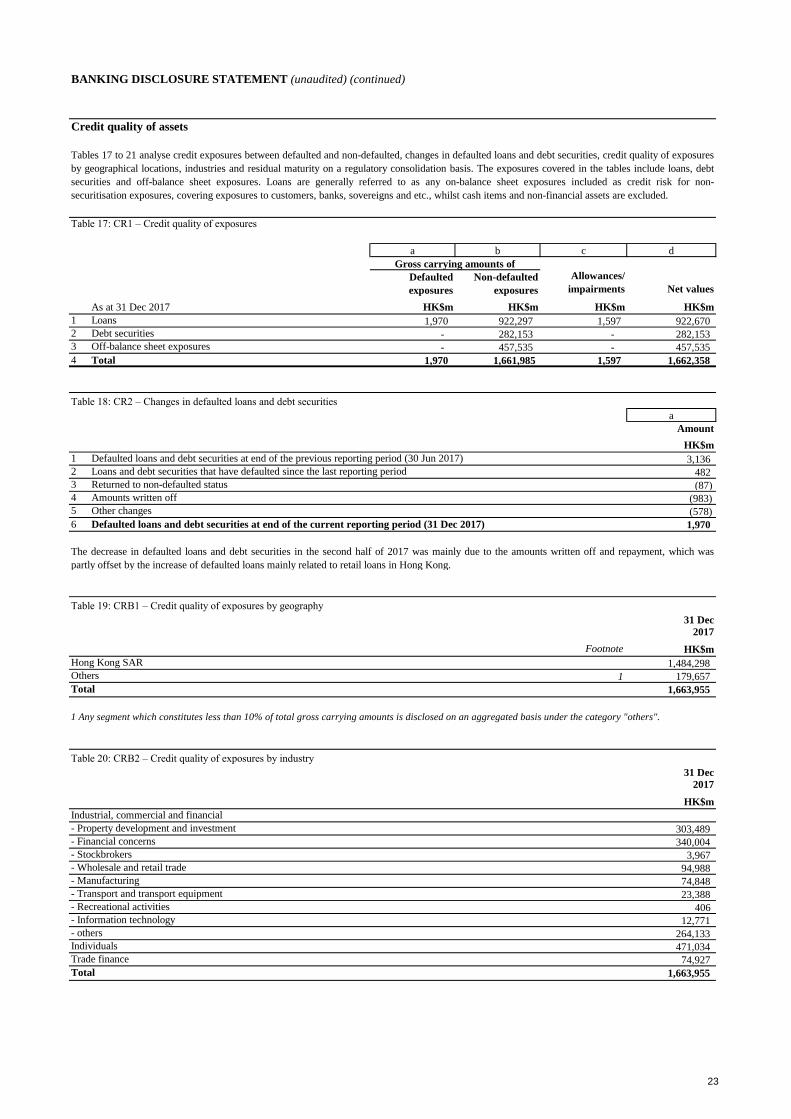
1 Loans 1,970 922,297 1,597 922,670
2 Debt securities - 282,153 - 282,153
3 Off-balance sheet exposures - 457,535 - 457,535
4 Total 1,970 1,661,985 1,597 1,662,358
Table 18: CR2 – Changes in defaulted loans and debt securities
1 Defaulted loans and debt securities at end of the previous reporting period (30 Jun 2017) 3,136
2 Loans and debt securities that have defaulted since the last reporting period 482
3 Returned to non-defaulted status (87)
4 Amounts written off (983)
5 Other changes (578)
6 Defaulted loans and debt securities at end of the current reporting period (31 Dec 2017) 1,970
Table 19: CRB1 – Credit quality of exposures by geography
Footnote
Hong Kong SAR 1,484,298
Others 1 179,657
Total 1,663,955
Table 20: CRB2 – Credit quality of exposures by industry
Industrial, commercial and financial
- Property development and investment 303,489
- Financial concerns 340,004
- Stockbrokers 3,967
- Wholesale and retail trade 94,988
- Manufacturing 74,848
- Transport and transport equipment 23,388
- Recreational activities 406
- Information technology 12,771
- others 264,133
Individuals 471,034
Trade finance 74,927
Total 1,663,955
Tables 17 to 21 analyse credit exposures between defaulted and non-defaulted, changes in defaulted loans and debt securities, credit quality of exposures
by geographical locations, industries and residual maturity on a regulatory consolidation basis. The exposures covered in the tables include loans, debt
securities and off-balance sheet exposures. Loans are generally referred to as any on-balance sheet exposures included as credit risk for non-
securitisation exposures, covering exposures to customers, banks, sovereigns and etc., whilst cash items and non-financial assets are excluded.
HK$m
a
Defaulted
exposures
Non-defaulted
exposures
Gross carrying amounts of
Allowances/
impairments Net values
c da b
HK$m HK$m HK$m HK$m
31 Dec
2017
HK$m
Amount
The decrease in defaulted loans and debt securities in the second half of 2017 was mainly due to the amounts written off and repayment, which was
partly offset by the increase of defaulted loans mainly related to retail loans in Hong Kong.
HK$m
2017
31 Dec
1 Any segment which constitutes less than 10% of total gross carrying amounts is disclosed on an aggregated basis under the category "others".
23
BANKING DISCLOSURE STATEMENT (unaudited) (continued)
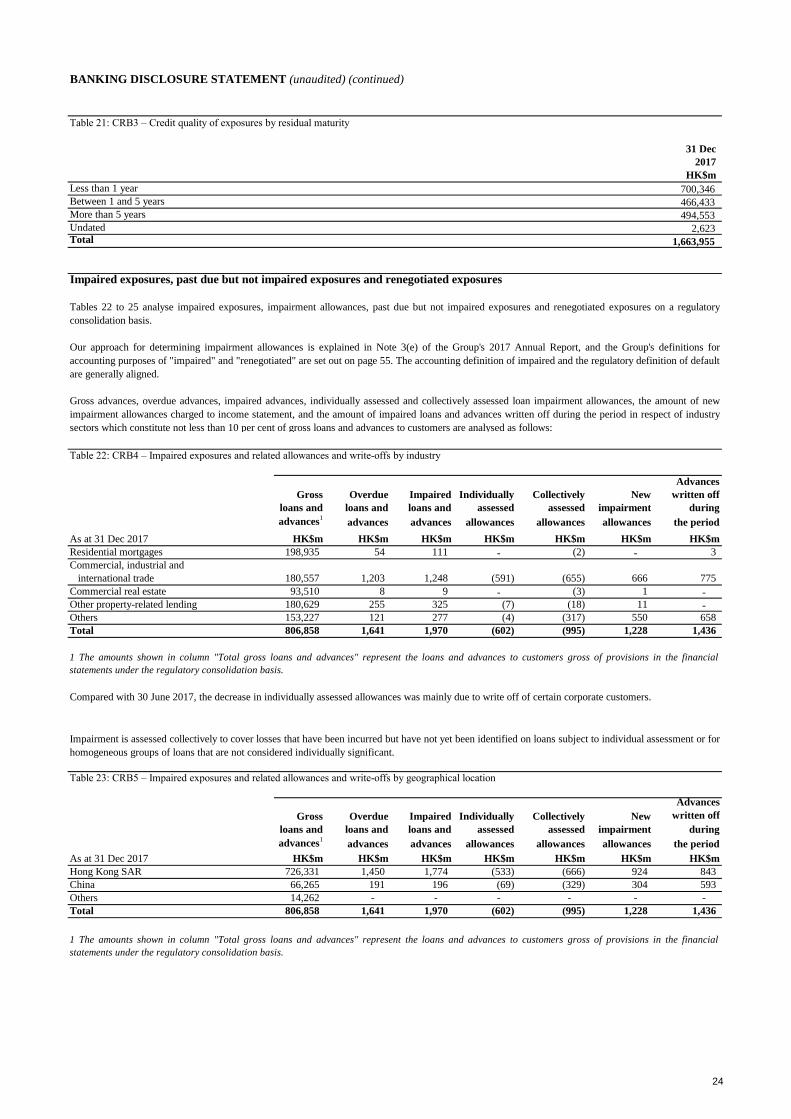
Table 21: CRB3 – Credit quality of exposures by residual maturity
31 Dec
2017
HK$m
Less than 1 year 700,346
Between 1 and 5 years 466,433
More than 5 years 494,553
Undated 2,623 Total 1,663,955
Impaired exposures, past due but not impaired exposures and renegotiated exposures
Table 22: CRB4 – Impaired exposures and related allowances and write-offs by industry
Advances
Gross Overdue Impaired Individually Collectively New written off
loans and loans and loans and assessed assessed impairment during
advances1
advances advances allowances allowances allowances the period
As at 31 Dec 2017 HK$m HK$m HK$m HK$m HK$m HK$m HK$m
Residential mortgages 198,935 54 111 - (2) - 3
Commercial, industrial and
international trade 180,557 1,203 1,248 (591) (655) 666 775
Commercial real estate 93,510 8 9 - (3) 1 -
Other property-related lending 180,629 255 325 (7) (18) 11 -
Others 153,227 121 277 (4) (317) 550 658
Total 806,858 1,641 1,970 (602) (995) 1,228 1,436
Table 23: CRB5 – Impaired exposures and related allowances and write-offs by geographical location
Gross Overdue Impaired Individually Collectively New
Advances
written off
loans and loans and loans and assessed assessed impairment during
advances1
advances advances allowances allowances allowances the period
As at 31 Dec 2017 HK$m HK$m HK$m HK$m HK$m HK$m HK$m
Hong Kong SAR 726,331 1,450 1,774 (533) (666) 924 843
China 66,265 191 196 (69) (329) 304 593
Others 14,262 - - - - - -
Total 806,858 1,641 1,970 (602) (995) 1,228 1,436
Compared with 30 June 2017, the decrease in individually assessed allowances was mainly due to write off of certain corporate customers.
Impairment is assessed collectively to cover losses that have been incurred but have not yet been identified on loans subject to individual assessment or for
homogeneous groups of loans that are not considered individually significant.
1 The amounts shown in column "Total gross loans and advances" represent the loans and advances to customers gross of provisions in the financial
statements under the regulatory consolidation basis.
1 The amounts shown in column "Total gross loans and advances" represent the loans and advances to customers gross of provisions in the financial
statements under the regulatory consolidation basis.
Tables 22 to 25 analyse impaired exposures, impairment allowances, past due but not impaired exposures and renegotiated exposures on a regulatory
consolidation basis.
Our approach for determining impairment allowances is explained in Note 3(e) of the Group's 2017 Annual Report, and the Group's definitions for
accounting purposes of "impaired" and "renegotiated" are set out on page 55. The accounting definition of impaired and the regulatory definition of default
are generally aligned.
Gross advances, overdue advances, impaired advances, individually assessed and collectively assessed loan impairment allowances, the amount of new
impairment allowances charged to income statement, and the amount of impaired loans and advances written off during the period in respect of industry
sectors which constitute not less than 10 per cent of gross loans and advances to customers are analysed as follows:
24
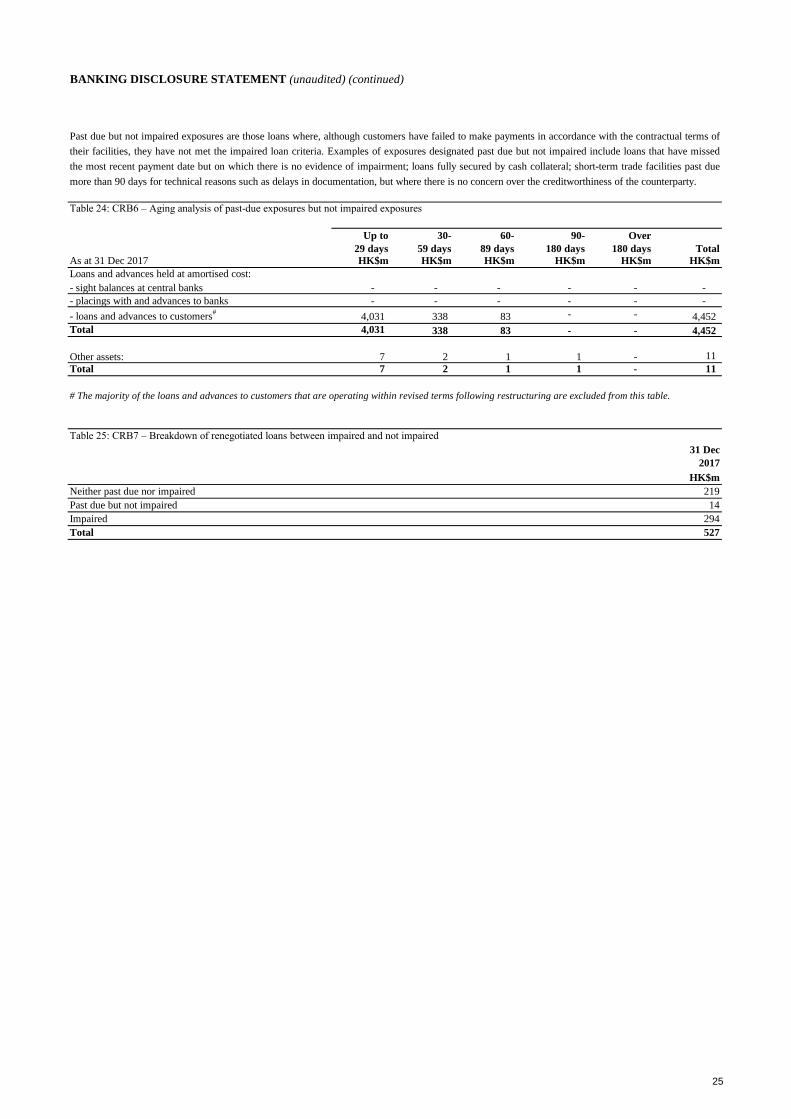
BANKING DISCLOSURE STATEMENT (unaudited) (continued)
Table 24: CRB6 – Aging analysis of past-due exposures but not impaired exposures
Up to 30- 60- 90- Over
29 days 59 days 89 days 180 days 180 days Total
As at 31 Dec 2017 HK$m HK$m HK$m HK$m HK$m HK$m
Loans and advances held at amortised cost:
- sight balances at central banks - - - - - -
- placings with and advances to banks - - - - - -
- loans and advances to customers#
4,031 338 83 - - 4,452
Total 4,031 338 83 - - 4,452
Other assets: 7 2 1 1 - 11
Total 7 2 1 1 - 11
Table 25: CRB7 – Breakdown of renegotiated loans between impaired and not impaired
HK$m
Neither past due nor impaired 219
Past due but not impaired 14
Impaired 294
Total 527
31 Dec
2017
Past due but not impaired exposures are those loans where, although customers have failed to make payments in accordance with the contractual terms of
their facilities, they have not met the impaired loan criteria. Examples of exposures designated past due but not impaired include loans that have missed
the most recent payment date but on which there is no evidence of impairment; loans fully secured by cash collateral; short-term trade facilities past due
more than 90 days for technical reasons such as delays in documentation, but where there is no concern over the creditworthiness of the counterparty.
# The majority of the loans and advances to customers that are operating within revised terms following restructuring are excluded from this table.
25
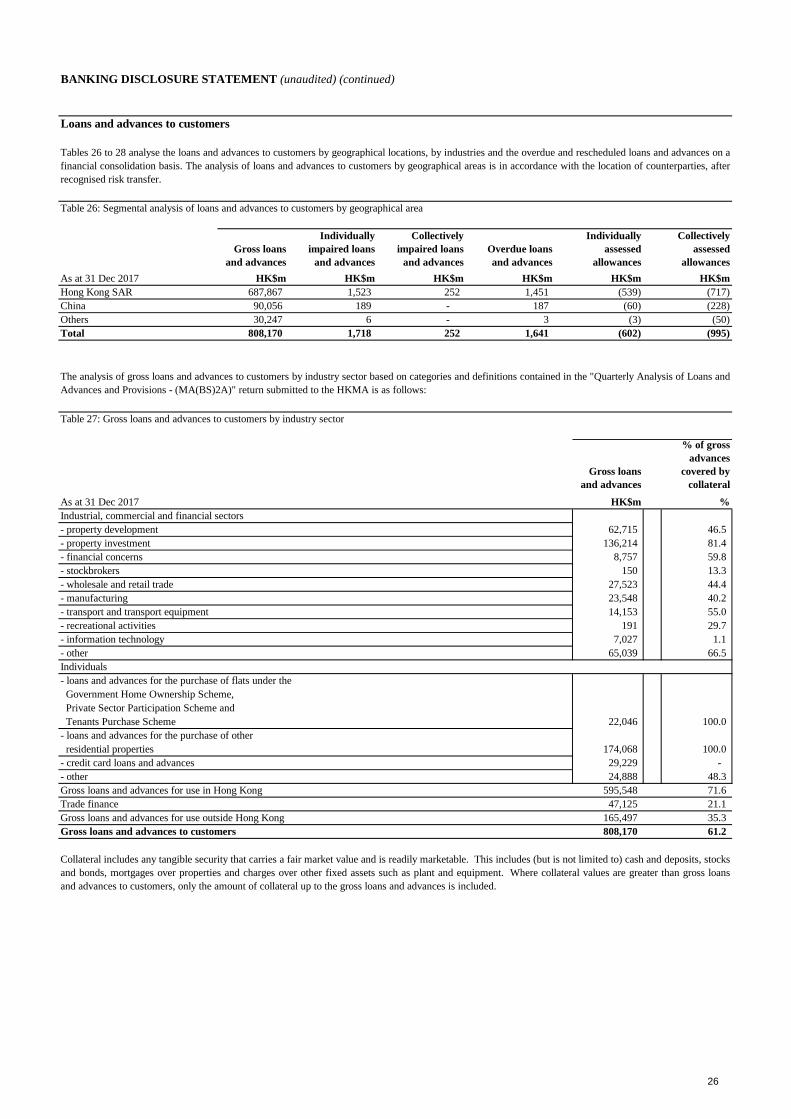
BANKING DISCLOSURE STATEMENT (unaudited) (continued)
Loans and advances to customers
Table 26: Segmental analysis of loans and advances to customers by geographical area
Gross loans
and advances
Individually
impaired loans
and advances
Collectively
impaired loans
and advances
Overdue loans
and advances
Individually
assessed
allowances
Collectively
assessed
allowances
As at 31 Dec 2017 HK$m HK$m HK$m HK$m HK$m HK$m
Hong Kong SAR 687,867 1,523 252 1,451 (539) (717)
China 90,056 189 - 187 (60) (228)
Others 30,247 6 - 3 (3) (50)
Total 808,170 1,718 252 1,641 (602) (995)
Table 27: Gross loans and advances to customers by industry sector
As at 31 Dec 2017 HK$m %
Industrial, commercial and financial sectors
- property development 62,715 46.5
- property investment 136,214 81.4
- financial concerns 8,757 59.8
- stockbrokers 150 13.3
- wholesale and retail trade 27,523 44.4
- manufacturing 23,548 40.2
- transport and transport equipment 14,153 55.0
- recreational activities 191 29.7
- information technology 7,027 1.1
- other 65,039 66.5
Individuals
- loans and advances for the purchase of flats under the
Government Home Ownership Scheme,
Private Sector Participation Scheme and
Tenants Purchase Scheme 22,046 100.0
- loans and advances for the purchase of other
residential properties 174,068 100.0
- credit card loans and advances 29,229 -
- other 24,888 48.3
Gross loans and advances for use in Hong Kong 595,548 71.6
Trade finance 47,125 21.1
Gross loans and advances for use outside Hong Kong 165,497 35.3
Gross loans and advances to customers 808,170 61.2
Gross loans
and advances
% of gross
advances
covered by
collateral
Tables 26 to 28 analyse the loans and advances to customers by geographical locations, by industries and the overdue and rescheduled loans and advances on a
financial consolidation basis. The analysis of loans and advances to customers by geographical areas is in accordance with the location of counterparties, after
recognised risk transfer.
Collateral includes any tangible security that carries a fair market value and is readily marketable. This includes (but is not limited to) cash and deposits, stocks
and bonds, mortgages over properties and charges over other fixed assets such as plant and equipment. Where collateral values are greater than gross loans
and advances to customers, only the amount of collateral up to the gross loans and advances is included.
The analysis of gross loans and advances to customers by industry sector based on categories and definitions contained in the "Quarterly Analysis of Loans and
Advances and Provisions - (MA(BS)2A)" return submitted to the HKMA is as follows:
26
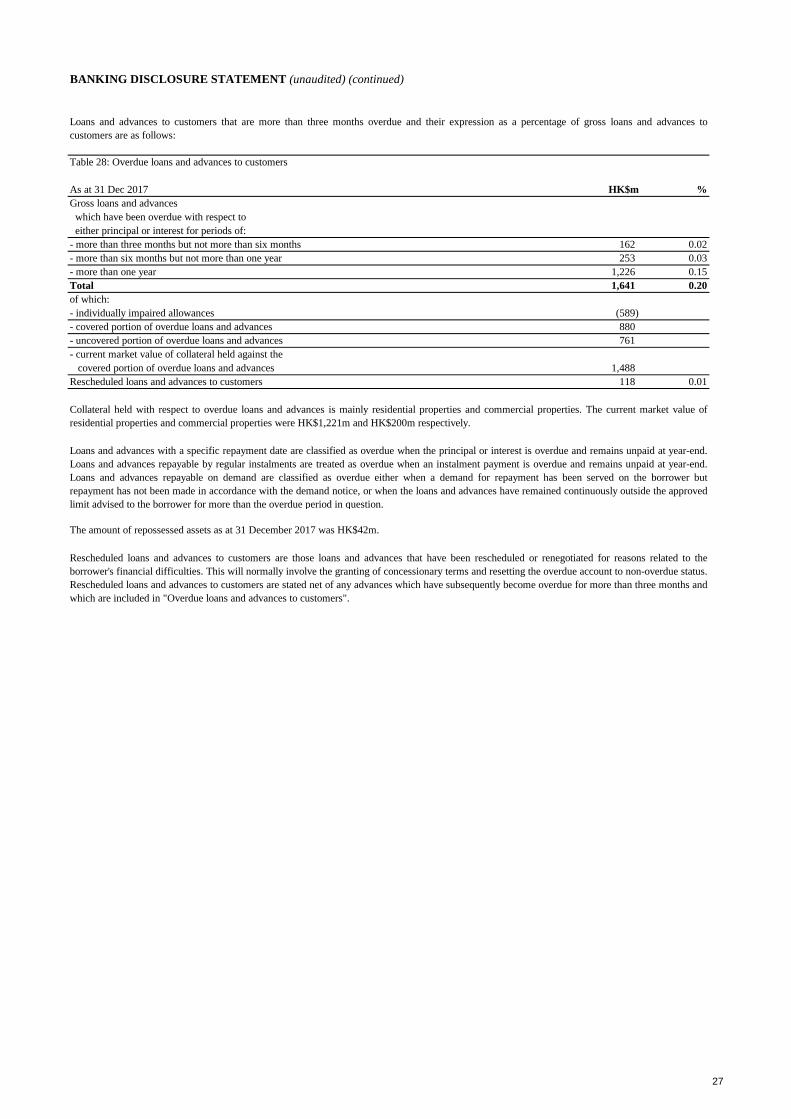
BANKING DISCLOSURE STATEMENT (unaudited) (continued)
Table 28: Overdue loans and advances to customers
As at 31 Dec 2017 HK$m %
Gross loans and advances
which have been overdue with respect to
either principal or interest for periods of:
- more than three months but not more than six months 162 0.02
- more than six months but not more than one year 253 0.03
- more than one year 1,226 0.15
Total 1,641 0.20
of which:
- individually impaired allowances (589)
- covered portion of overdue loans and advances 880
- uncovered portion of overdue loans and advances 761
- current market value of collateral held against the
covered portion of overdue loans and advances 1,488
Rescheduled loans and advances to customers 118 0.01
The amount of repossessed assets as at 31 December 2017 was HK$42m.
Loans and advances to customers that are more than three months overdue and their expression as a percentage of gross loans and advances to
customers are as follows:
Collateral held with respect to overdue loans and advances is mainly residential properties and commercial properties. The current market value of
residential properties and commercial properties were HK$1,221m and HK$200m respectively.
Loans and advances with a specific repayment date are classified as overdue when the principal or interest is overdue and remains unpaid at year-end.
Loans and advances repayable by regular instalments are treated as overdue when an instalment payment is overdue and remains unpaid at year-end.
Loans and advances repayable on demand are classified as overdue either when a demand for repayment has been served on the borrower but
repayment has not been made in accordance with the demand notice, or when the loans and advances have remained continuously outside the approved
limit advised to the borrower for more than the overdue period in question.
Rescheduled loans and advances to customers are those loans and advances that have been rescheduled or renegotiated for reasons related to the
borrower's financial difficulties. This will normally involve the granting of concessionary terms and resetting the overdue account to non-overdue status.
Rescheduled loans and advances to customers are stated net of any advances which have subsequently become overdue for more than three months and
which are included in "Overdue loans and advances to customers".
27
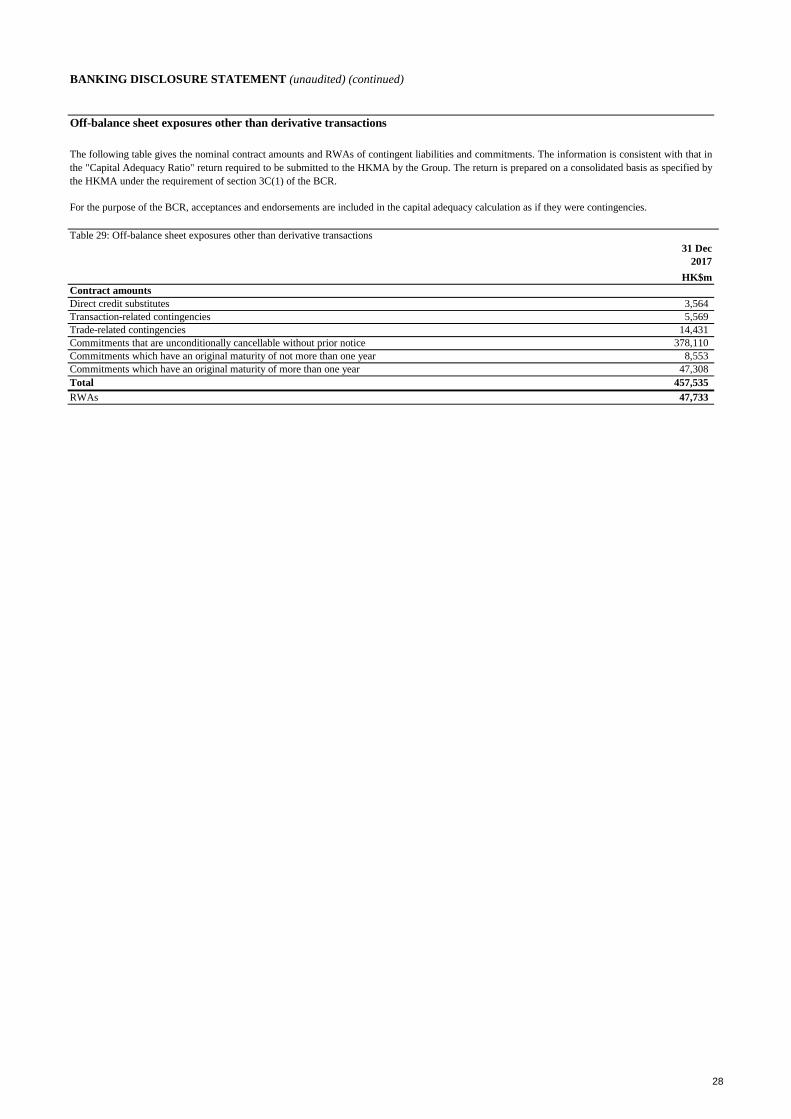
BANKING DISCLOSURE STATEMENT (unaudited) (continued)
Off-balance sheet exposures other than derivative transactions
Table 29: Off-balance sheet exposures other than derivative transactions
31 Dec
2017
HK$m
Contract amounts
Direct credit substitutes 3,564
Transaction-related contingencies 5,569
Trade-related contingencies 14,431
Commitments that are unconditionally cancellable without prior notice 378,110
Commitments which have an original maturity of not more than one year 8,553
Commitments which have an original maturity of more than one year 47,308
Total 457,535
RWAs 47,733
The following table gives the nominal contract amounts and RWAs of contingent liabilities and commitments. The information is consistent with that in
the "Capital Adequacy Ratio" return required to be submitted to the HKMA by the Group. The return is prepared on a consolidated basis as specified by
the HKMA under the requirement of section 3C(1) of the BCR.
For the purpose of the BCR, acceptances and endorsements are included in the capital adequacy calculation as if they were contingencies.
28
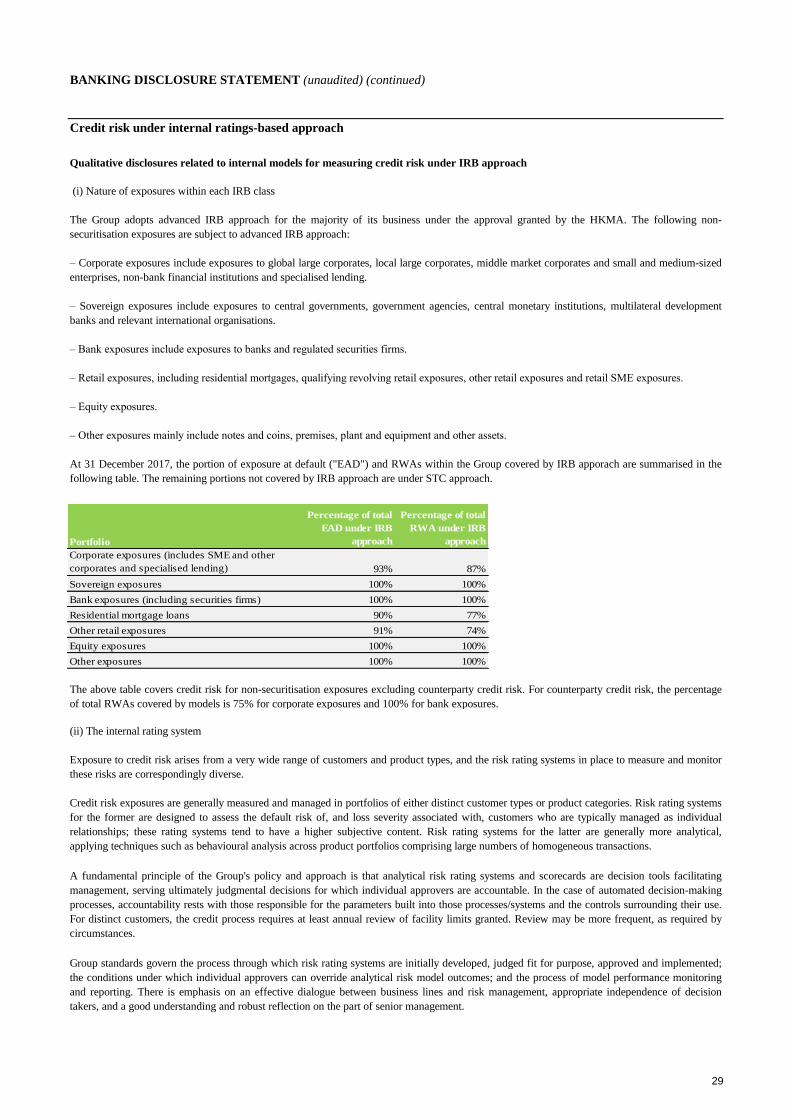
BANKING DISCLOSURE STATEMENT (unaudited) (continued)
Credit risk under internal ratings-based approach
Qualitative disclosures related to internal models for measuring credit risk under IRB approach
Group standards govern the process through which risk rating systems are initially developed, judged fit for purpose, approved and implemented;
the conditions under which individual approvers can override analytical risk model outcomes; and the process of model performance monitoring
and reporting. There is emphasis on an effective dialogue between business lines and risk management, appropriate independence of decision
takers, and a good understanding and robust reflection on the part of senior management.
(i) Nature of exposures within each IRB class
The Group adopts advanced IRB approach for the majority of its business under the approval granted by the HKMA. The following non-
securitisation exposures are subject to advanced IRB approach:
– Corporate exposures include exposures to global large corporates, local large corporates, middle market corporates and small and medium-sized
enterprises, non-bank financial institutions and specialised lending.
– Sovereign exposures include exposures to central governments, government agencies, central monetary institutions, multilateral development
banks and relevant international organisations.
– Bank exposures include exposures to banks and regulated securities firms.
– Retail exposures, including residential mortgages, qualifying revolving retail exposures, other retail exposures and retail SME exposures.
– Equity exposures.
– Other exposures mainly include notes and coins, premises, plant and equipment and other assets.
At 31 December 2017, the portion of exposure at default ("EAD") and RWAs within the Group covered by IRB apporach are summarised in the
following table. The remaining portions not covered by IRB approach are under STC approach.
(ii) The internal rating system
Exposure to credit risk arises from a very wide range of customers and product types, and the risk rating systems in place to measure and monitor
these risks are correspondingly diverse.
Credit risk exposures are generally measured and managed in portfolios of either distinct customer types or product categories. Risk rating systems
for the former are designed to assess the default risk of, and loss severity associated with, customers who are typically managed as individual
relationships; these rating systems tend to have a higher subjective content. Risk rating systems for the latter are generally more analytical,
applying techniques such as behavioural analysis across product portfolios comprising large numbers of homogeneous transactions.
A fundamental principle of the Group's policy and approach is that analytical risk rating systems and scorecards are decision tools facilitating
management, serving ultimately judgmental decisions for which individual approvers are accountable. In the case of automated decision-making
processes, accountability rests with those responsible for the parameters built into those processes/systems and the controls surrounding their use.
For distinct customers, the credit process requires at least annual review of facility limits granted. Review may be more frequent, as required by
circumstances.
The above table covers credit risk for non-securitisation exposures excluding counterparty credit risk. For counterparty credit risk, the percentage
of total RWAs covered by models is 75% for corporate exposures and 100% for bank exposures.
Portfolio
Percentage of total
EAD under IRB
approach
Percentage of total
RWA under IRB
approach
Corporate exposures (includes SME and other
corporates and specialised lending) 93% 87%
Sovereign exposures 100% 100%
Bank exposures (including securities firms) 100% 100%
Residential mortgage loans 90% 77%
Other retail exposures 91% 74%
Equity exposures 100% 100%
Other exposures 100% 100%
29
BANKING DISCLOSURE STATEMENT (unaudited) (continued)
(ii) The internal rating system (continued)
Retail Business
The Group adopts advanced IRB approach for the majority of its business under the approval granted by the HKMA. Retail exposures include
residential mortgages, qualifying revolving retail exposures, small business retail exposures and other retail exposures to individuals. The Group's
exposure to credit risk arises from a wide range of customers and product types. A fundamental principle of the Group's policy and approach is
that analytical risk rating systems and scorecards are decision tools facilitating management. For automated decision making process,
accountability rests with those responsible for the parameters built into those processes/systems and the controls surrounding their use.
Analytical risk rating systems are not static and are subject to review and modification in light of the changing environment and the greater
availability and quality of data. Processes are established to capture the relevant data for continuous model improvement.
Wholesale Business
PD models are developed based on historical loss data, combining both quantitative and qualitative data on financial and various aspects such as
industry environment, economic and political conditions. PD for wholesale customers segments is estimated using a Customer Risk Rating
("CRR") of 23 grades, of which 21 are non-default ratings representing varying degrees of strength of financial condition, and two are default
ratings. The two major drivers of model methodology are the nature of the portfolio and the availability of internal or external data on historical
defaults and risk factors.
Credit score generated by a model and/or a scorecard for individual obligor, mapped to the corresponding Customer Risk Rating, is recommended
to and reviewed by credit approver taking into account all relevant information (including external rating and market data where available) for risk
rating determination. The approved CRR is mapped to a PD value range of which the "mid-point" is used in regulatory capital calculation. PD
models are developed where the risk profile of corporate borrower is specific to a country or a region.
LGD and EAD estimation for wholesale business is subject to Group framework of basic principles. EAD is estimated to a 12-month forward time
horizon and broadly represents the current exposure plus an estimate for future drawdown on undrawn facilities and the crystallisation of
contingent exposures after default. For funded facilities, the actual EAD is equal to the nominal EAD, i.e. 100% CCF. For unfunded facilities, the
actual EAD is equal to the nominal EAD multiplied by CCF. The CCF is a measure of the probability that, contingent on the customer default the
Bank will make actual payments in order to satisfy the obligation, taking into account product types and committed/uncommitted indicator to
calculate EAD using current utilisation and available headroom.
None of the EAD models are calibrated for a downturn, as analysis shows that utilisation decreases during a downturn because credit stress is
accompanied by more intensive limit monitoring and facility reduction.
LGD is based on the facility and collateral structure which takes into account the type of client, priority/seniority of the facility, the type and value
of the collateral, which is expressed as a percentage of EAD. The LGD models are calibrated to a period of credit stress or downturn in economic
conditions to arrive the downturn LGD.
The Group uses supervisory slotting criteria approach in rating its regulatory specialised lending exposure. Under this approach, rating will be
assigned based on the borrower and transaction characteristics.
Like other facets of risk management, analytical risk rating systems are not static and are subject to review and modification in the light of the
changing environment and the greater availability and quality of data. Structured processes and metrics are in place to capture relevant data and
feed it into continuous model improvement.
(iii) Application of IRB parameters
The Group-wide credit risk rating framework incorporates probability of default ("PD", representing the likelihood of a default event in a one-year
horizon) of an obligor and loss severity expressed in terms of exposures at default ("EAD", an estimate of exposures at time of default) and loss
given default ("LGD", the estimates of loss that the Group may incur in the event of default expressed as a percentage of EAD). These measures
are used to calculate expected loss and capital requirements, subject to any floors required by HKMA. They are also used in conjunction with other
inputs to form rating assessments for the purpose of credit approval and for risk management decisions. The narrative explanations that follow
relate to the IRB advanced approaches, that is, IRB advanced for distinct customers and retail IRB for the portfolio-managed retail business.
30

BANKING DISCLOSURE STATEMENT (unaudited) (continued)
(iii) Application of IRB parameters (continued)
PD models are developed using statistical estimation generally based on a minimum of five years of historical data. The models typically
incorporate the characteristics of the products and the borrower's account behaviour. The modelling approach is developed based on a point-in-
time approach, the model outputs become effectively through-the-cycle through the application of long run adjustments. The main driver for the
differences between PD and recent actual default rate is due to applying a long run adjustment which actual default rate is lower in benign period.
EAD models are also generally developed using at least five years of historical observations and typically adopt one of two approaches:
– Closed-end products without the facility for additional drawdowns, EAD is estimated as the outstanding balance of accounts at the time of
observation; or
– EAD for products with the facility for additional drawdowns is estimated as the outstanding balance of accounts at the time of observation plus a
credit conversion factor applied to the undrawn portion of the facility.
LGD estimates have more variation, particularly in respect of the time period that is used to quantify economic downturn assumptions. The LGD
models for retail exposures are developed based on the Group's internal loss and default experience including recovery values for different types of
collaterals for secured retail exposures such as residential mortgage; for unsecured retail exposures such as qualifying revolving retail exposures,
LGD models are developed based on past recovery experiences, account behaviours and repayment ability.
The 3 most material risk rating systems for which we disclose details of modelling methodology and performance data represent RWAs of
approximately 96% of the total retail IRB RWA as of December 2017.
Below tables set out the key characteristics of the significant wholesale credit risk models and retail credit risk models that drive the capital
calculation split by regularly asset class, including the number of models for each component, the model method or approach and the number of
years of loss data used.
31
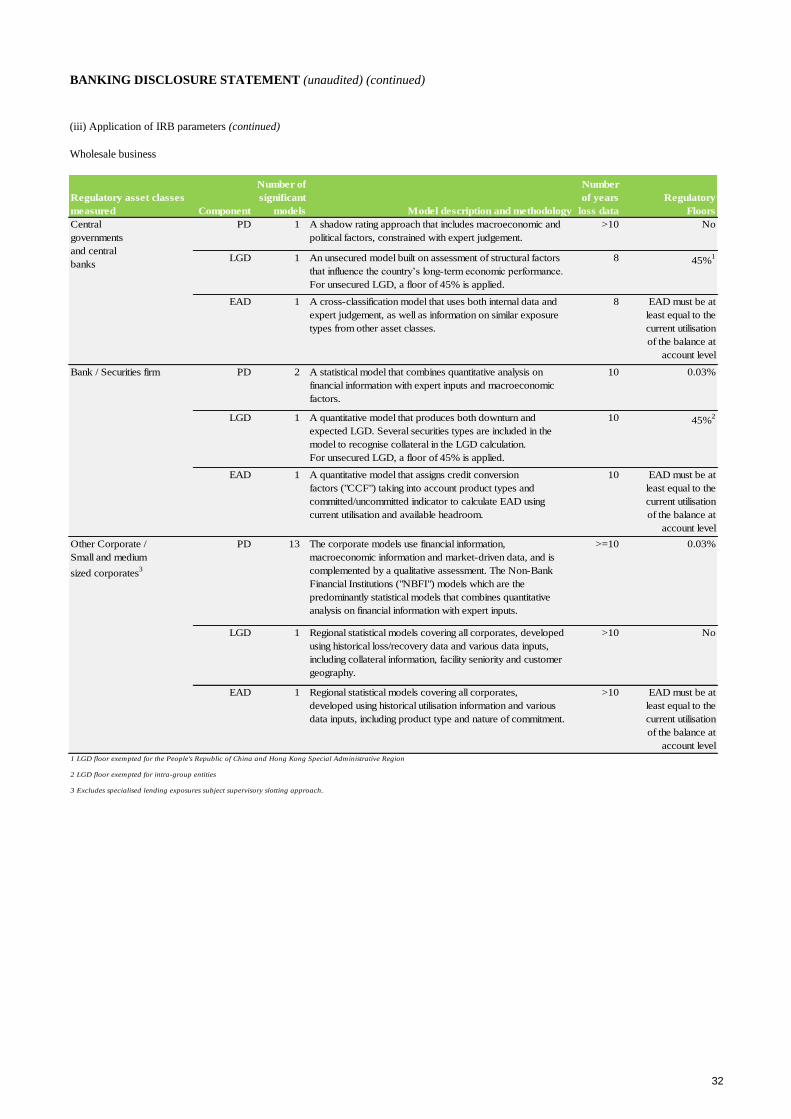
BANKING DISCLOSURE STATEMENT (unaudited) (continued)
(iii) Application of IRB parameters (continued)
Wholesale business
Regulatory asset classes
measured Component
Number of
significant
models Model description and methodology
Number
of years
loss data
Regulatory
Floors
PD 1 A shadow rating approach that includes macroeconomic and
political factors, constrained with expert judgement.
>10 No
LGD 1 An unsecured model built on assessment of structural factors
that influence the country’s long-term economic performance.
For unsecured LGD, a floor of 45% is applied.
8 45%1
EAD 1 A cross-classification model that uses both internal data and
expert judgement, as well as information on similar exposure
types from other asset classes.
8 EAD must be at
least equal to the
current utilisation
of the balance at
account level
PD 2 A statistical model that combines quantitative analysis on
financial information with expert inputs and macroeconomic
factors.
10 0.03%
LGD 1 A quantitative model that produces both downturn and
expected LGD. Several securities types are included in the
model to recognise collateral in the LGD calculation.
For unsecured LGD, a floor of 45% is applied.
10 45%2
EAD 1 A quantitative model that assigns credit conversion
factors ("CCF") taking into account product types and
committed/uncommitted indicator to calculate EAD using
current utilisation and available headroom.
10 EAD must be at
least equal to the
current utilisation
of the balance at
account level
PD 13 The corporate models use financial information,
macroeconomic information and market-driven data, and is
complemented by a qualitative assessment. The Non-Bank
Financial Institutions ("NBFI") models which are the
predominantly statistical models that combines quantitative
analysis on financial information with expert inputs.
>=10 0.03%
LGD 1 Regional statistical models covering all corporates, developed
using historical loss/recovery data and various data inputs,
including collateral information, facility seniority and customer
geography.
>10 No
EAD 1 Regional statistical models covering all corporates,
developed using historical utilisation information and various
data inputs, including product type and nature of commitment.
>10 EAD must be at
least equal to the
current utilisation
of the balance at
account level
1 LGD floor exempted for the People's Republic of China and Hong Kong Special Administrative Region
2 LGD floor exempted for intra-group entities
3 Excludes specialised lending exposures subject supervisory slotting approach.
Central
governments
and central
banks
Bank / Securities firm
Other Corporate /
Small and medium
sized corporates3
32
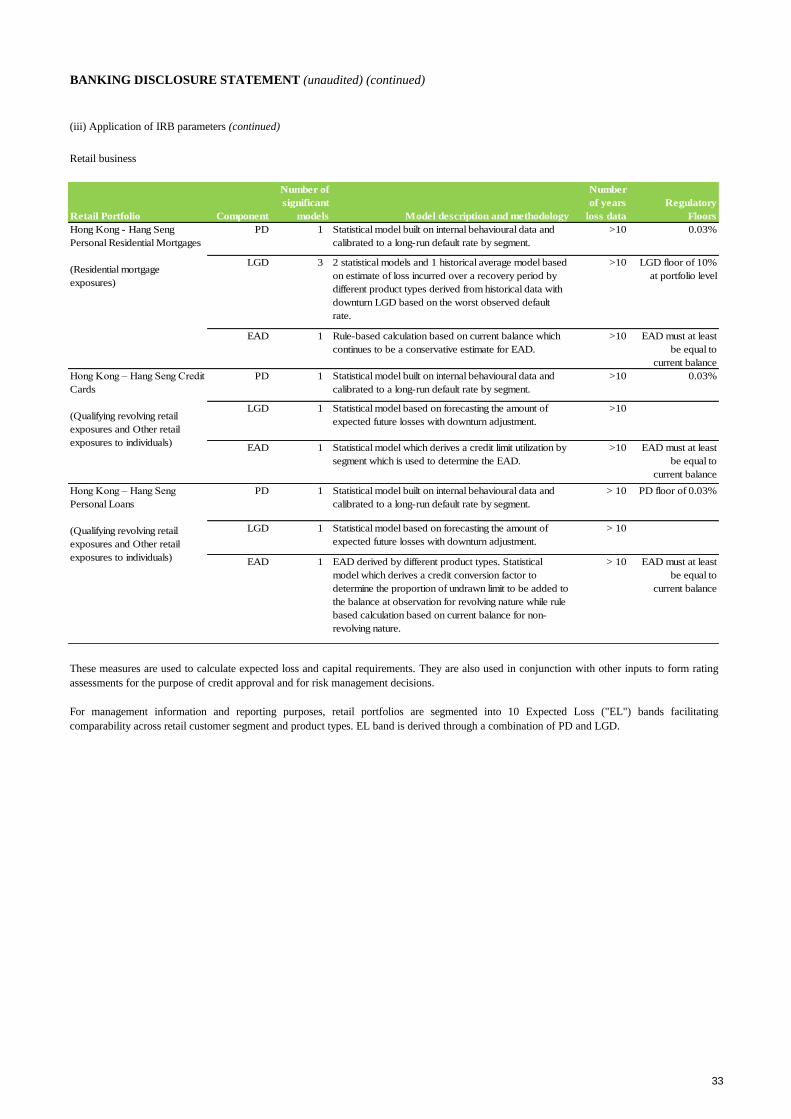
BANKING DISCLOSURE STATEMENT (unaudited) (continued)
(iii) Application of IRB parameters (continued)
Retail business
These measures are used to calculate expected loss and capital requirements. They are also used in conjunction with other inputs to form rating
assessments for the purpose of credit approval and for risk management decisions.
For management information and reporting purposes, retail portfolios are segmented into 10 Expected Loss ("EL") bands facilitating
comparability across retail customer segment and product types. EL band is derived through a combination of PD and LGD.
Number of Number
significant of years
models loss data
PD 1 Statistical model built on internal behavioural data and
calibrated to a long-run default rate by segment.
>10 0.03%
LGD 3 2 statistical models and 1 historical average model based
on estimate of loss incurred over a recovery period by
different product types derived from historical data with
downturn LGD based on the worst observed default
rate.
>10 LGD floor of 10%
at portfolio level
EAD 1 Rule-based calculation based on current balance which
continues to be a conservative estimate for EAD.
>10 EAD must at least
be equal to
current balance
PD 1 Statistical model built on internal behavioural data and
calibrated to a long-run default rate by segment.
>10 0.03%
LGD 1 Statistical model based on forecasting the amount of
expected future losses with downturn adjustment.
>10
EAD 1 Statistical model which derives a credit limit utilization by
segment which is used to determine the EAD.
>10 EAD must at least
be equal to
current balance
LGD 1 Statistical model based on forecasting the amount of
expected future losses with downturn adjustment.
> 10
EAD 1 EAD derived by different product types. Statistical
model which derives a credit conversion factor to
determine the proportion of undrawn limit to be added to
the balance at observation for revolving nature while rule
based calculation based on current balance for non-
revolving nature.
> 10 EAD must at least
be equal to
current balance
Retail Portfolio Component Model description and methodology
Regulatory
Floors
PD 1 Statistical model built on internal behavioural data and
calibrated to a long-run default rate by segment.
> 10 PD floor of 0.03%
Hong Kong - Hang Seng
Personal Residential Mortgages
(Residential mortgage
exposures)
Hong Kong – Hang Seng
Personal Loans
(Qualifying revolving retail
exposures and Other retail
exposures to individuals)
Hong Kong – Hang Seng Credit
Cards
(Qualifying revolving retail
exposures and Other retail
exposures to individuals)
33

BANKING DISCLOSURE STATEMENT (unaudited) (continued)
(iv) Model Governance
Model governance is under the oversight of HSBC Group or Regional Model Oversight Committee ("Group MOC" or "Regional MOC").
Wholesale Credit and Markets MOC and Retail Banking and Wealth Management MOC ("Local MOCs") are established respectively in the Bank
with comparable terms of reference as Group MOC or Regional MOC.
Local MOCs meet regularly and report to RMM. They are chaired by the Risk function, and its membership is drawn from Risk, Finance and
Businesses. Its primary responsibilities are to oversee the framework for the management of model risk, bring a strategic approach to model-
related issues across the Bank, and to oversee the governance of our risk rating models, their consistency, within the regulatory framework. Also,
it identifies emerging risks for all aspects of the risk rating system, ensuring that model risk is managed within our risk appetite statement, and
formally advises RMM / Group MOC / Regional MOC on any material model-related issues.
All new or materially changed IRB capital models require the HKMA and Prudential Regulation Authority's ("PRA") approval and such models
fall directly under the remit of Local MOCs and Group MOC / Regional MOC. Additionally, the Local MOCs are responsible for the approval of
stress testing models used for regulatory stress testing exercises such as those carried out by the HKMA and PRA.
The approval of models/model changes is the responsibility of individual approvers. Model Owner/Technical Expert ensures that the model is
technically sound, has been developed robustly and follows the relevant modelling policies, standards, internal and regulatory requirements.
Whereas the Model User/Steward for the function ensures that the model makes sense to the business or function where it will be used and that
the model satisfies the requirements from the business, function and regulators.
Compliance with the Group and local standards for model development, credit risk models validation and implementation are subject to an
independent model review process led by the HSBC Independent Model Review team which is separated from the Risk Analytics functions that
are responsible for the development, usage and management of models. The Independent Model Review team provides robust challenge to the
modelling approaches used and ensures that the performance of those models is transparent and that their limitations are visible to key
stakeholders.
HSBC Group Audit, local Internal Audit, or a comparable independent model review unit also conducts regular reviews of the risk rating model
application by credit and business groups.
34
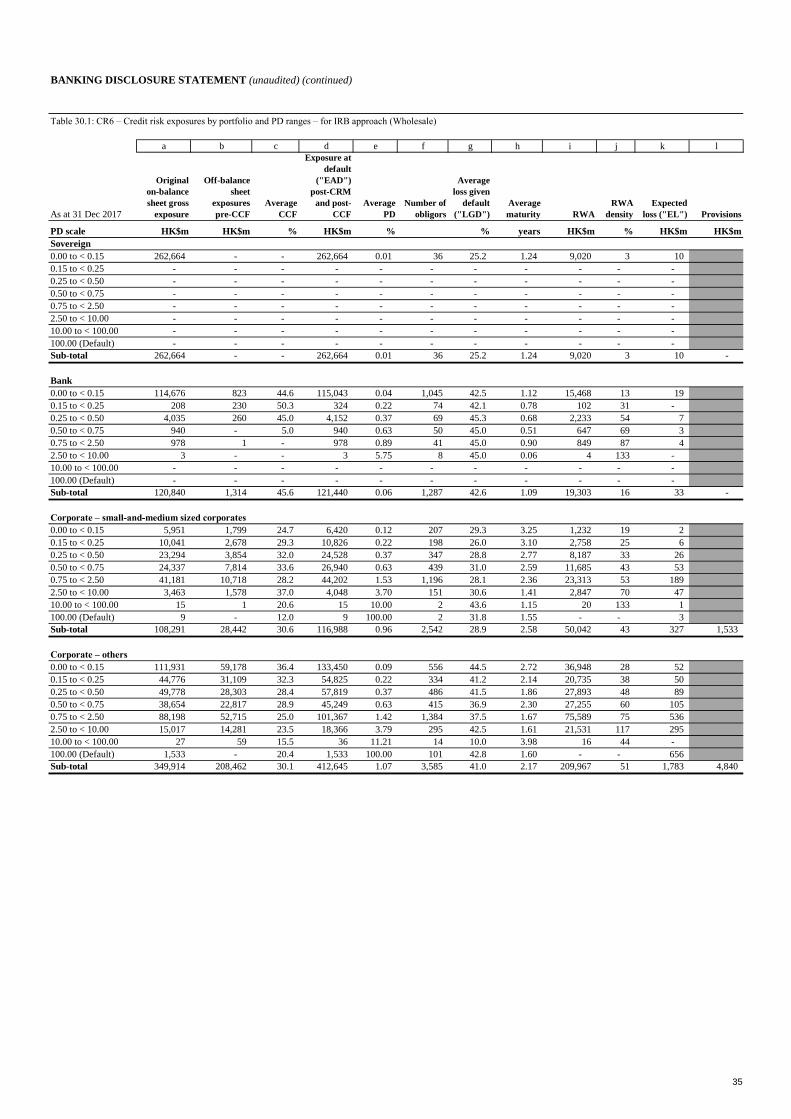
BANKING DISCLOSURE STATEMENT (unaudited) (continued)
Table 30.1: CR6 – Credit risk exposures by portfolio and PD ranges – for IRB approach (Wholesale)
a b c d e f g h i j k l
HK$m HK$m % HK$m % % years HK$m % HK$m HK$m
Sovereign
262,664 - - 262,664 0.01 36 25.2 1.24 9,020 3 10
- - - - - - - - - - -
- - - - - - - - - - -
- - - - - - - - - - -
- - - - - - - - - - -
- - - - - - - - - - -
- - - - - - - - - - -
- - - - - - - - - - -
262,664 - - 262,664 0.01 36 25.2 1.24 9,020 3 10 -
Bank
114,676 823 44.6 115,043 0.04 1,045 42.5 1.12 15,468 13 19
208 230 50.3 324 0.22 74 42.1 0.78 102 31 -
4,035 260 45.0 4,152 0.37 69 45.3 0.68 2,233 54 7
940 - 5.0 940 0.63 50 45.0 0.51 647 69 3
978 1 - 978 0.89 41 45.0 0.90 849 87 4
3 - - 3 5.75 8 45.0 0.06 4 133 -
- - - - - - - - - - -
- - - - - - - - - - -
120,840 1,314 45.6 121,440 0.06 1,287 42.6 1.09 19,303 16 33 -
Corporate – small-and-medium sized corporates
5,951 1,799 24.7 6,420 0.12 207 29.3 3.25 1,232 19 2
10,041 2,678 29.3 10,826 0.22 198 26.0 3.10 2,758 25 6
23,294 3,854 32.0 24,528 0.37 347 28.8 2.77 8,187 33 26
24,337 7,814 33.6 26,940 0.63 439 31.0 2.59 11,685 43 53
41,181 10,718 28.2 44,202 1.53 1,196 28.1 2.36 23,313 53 189
3,463 1,578 37.0 4,048 3.70 151 30.6 1.41 2,847 70 47
15 1 20.6 15 10.00 2 43.6 1.15 20 133 1
9 - 12.0 9 100.00 2 31.8 1.55 - - 3
108,291 28,442 30.6 116,988 0.96 2,542 28.9 2.58 50,042 43 327 1,533
Corporate – others
111,931 59,178 36.4 133,450 0.09 556 44.5 2.72 36,948 28 52
44,776 31,109 32.3 54,825 0.22 334 41.2 2.14 20,735 38 50
49,778 28,303 28.4 57,819 0.37 486 41.5 1.86 27,893 48 89
38,654 22,817 28.9 45,249 0.63 415 36.9 2.30 27,255 60 105
88,198 52,715 25.0 101,367 1.42 1,384 37.5 1.67 75,589 75 536
15,017 14,281 23.5 18,366 3.79 295 42.5 1.61 21,531 117 295
27 59 15.5 36 11.21 14 10.0 3.98 16 44 -
1,533 - 20.4 1,533 100.00 101 42.8 1.60 - - 656
349,914 208,462 30.1 412,645 1.07 3,585 41.0 2.17 209,967 51 1,783 4,840
0.25 to < 0.50
0.50 to < 0.75
0.75 to < 2.50
2.50 to < 10.00
10.00 to < 100.00
100.00 (Default)
0.75 to < 2.50
2.50 to < 10.00
10.00 to < 100.00
0.50 to < 0.75
0.75 to < 2.50
2.50 to < 10.00
10.00 to < 100.00
100.00 (Default)
Sub-total
0.00 to < 0.15
0.15 to < 0.25
0.25 to < 0.50
0.15 to < 0.25
0.25 to < 0.50
0.00 to < 0.15
0.15 to < 0.25
0.25 to < 0.50
0.50 to < 0.75
Original
on-balance
sheet gross
exposure
Off-balance
sheet
exposures
pre-CCF
Average
CCF
Exposure at
default
("EAD")
post-CRM
and post-
CCF
Average
PD
Number of
obligors
Average
loss given
default
("LGD")
Average
maturity
0.75 to < 2.50
2.50 to < 10.00
10.00 to < 100.00
100.00 (Default)
Sub-total
0.00 to < 0.15
Sub-total
PD scale
0.00 to < 0.15
0.15 to < 0.25
RWA
density
Expected
loss ("EL")RWAAs at 31 Dec 2017
0.50 to < 0.75
100.00 (Default)
Sub-total
Provisions
35
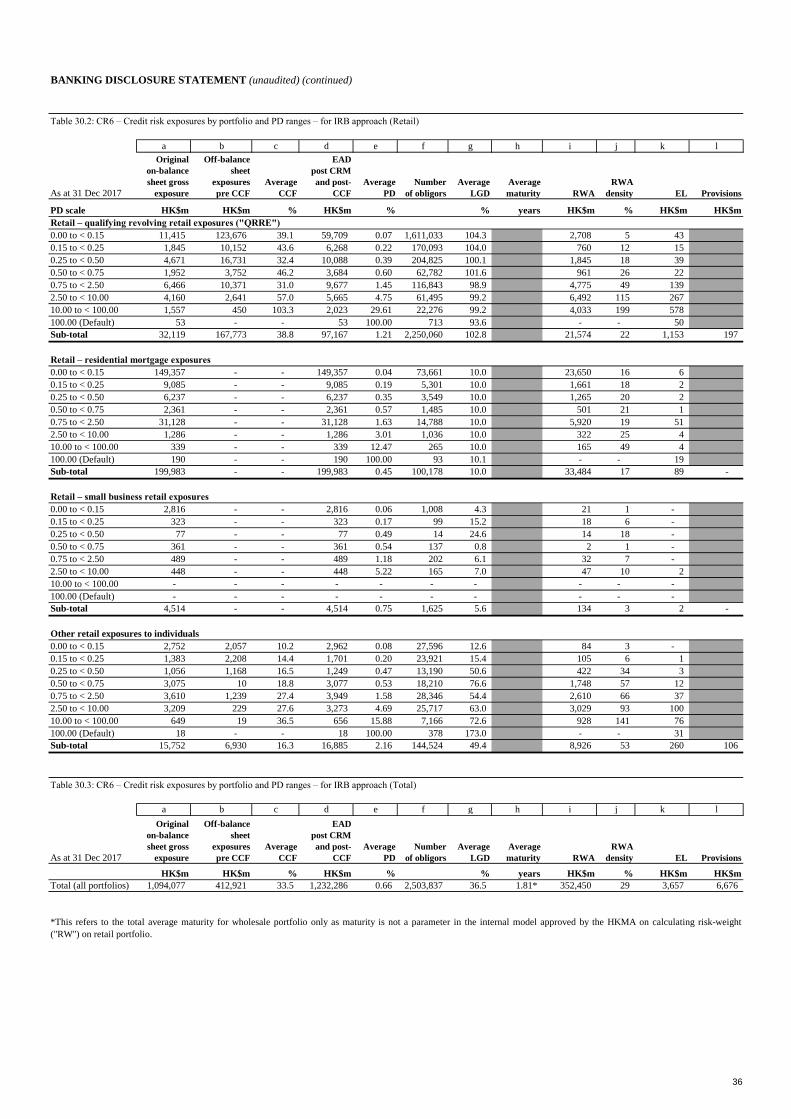
BANKING DISCLOSURE STATEMENT (unaudited) (continued)
Table 30.2: CR6 – Credit risk exposures by portfolio and PD ranges – for IRB approach (Retail)
a b c d e f g h i j k l
HK$m HK$m % HK$m % % years HK$m % HK$m HK$m
Retail – qualifying revolving retail exposures ("QRRE")
11,415 123,676 39.1 59,709 0.07 1,611,033 104.3 2,708 5 43
1,845 10,152 43.6 6,268 0.22 170,093 104.0 760 12 15
4,671 16,731 32.4 10,088 0.39 204,825 100.1 1,845 18 39
1,952 3,752 46.2 3,684 0.60 62,782 101.6 961 26 22
6,466 10,371 31.0 9,677 1.45 116,843 98.9 4,775 49 139
4,160 2,641 57.0 5,665 4.75 61,495 99.2 6,492 115 267
1,557 450 103.3 2,023 29.61 22,276 99.2 4,033 199 578
53 - - 53 100.00 713 93.6 - - 50
32,119 167,773 38.8 97,167 1.21 2,250,060 102.8 21,574 22 1,153 197
Retail – residential mortgage exposures
149,357 - - 149,357 0.04 73,661 10.0 23,650 16 6
9,085 - - 9,085 0.19 5,301 10.0 1,661 18 2
6,237 - - 6,237 0.35 3,549 10.0 1,265 20 2
2,361 - - 2,361 0.57 1,485 10.0 501 21 1
31,128 - - 31,128 1.63 14,788 10.0 5,920 19 51
1,286 - - 1,286 3.01 1,036 10.0 322 25 4
339 - - 339 12.47 265 10.0 165 49 4
190 - - 190 100.00 93 10.1 - - 19
199,983 - - 199,983 0.45 100,178 10.0 33,484 17 89 -
Retail – small business retail exposures
2,816 - - 2,816 0.06 1,008 4.3 21 1 -
323 - - 323 0.17 99 15.2 18 6 -
77 - - 77 0.49 14 24.6 14 18 -
361 - - 361 0.54 137 0.8 2 1 -
489 - - 489 1.18 202 6.1 32 7 -
448 - - 448 5.22 165 7.0 47 10 2
- - - - - - - - - -
- - - - - - - - - -
4,514 - - 4,514 0.75 1,625 5.6 134 3 2 -
Other retail exposures to individuals
2,752 2,057 10.2 2,962 0.08 27,596 12.6 84 3 -
1,383 2,208 14.4 1,701 0.20 23,921 15.4 105 6 1
1,056 1,168 16.5 1,249 0.47 13,190 50.6 422 34 3
3,075 10 18.8 3,077 0.53 18,210 76.6 1,748 57 12
3,610 1,239 27.4 3,949 1.58 28,346 54.4 2,610 66 37
3,209 229 27.6 3,273 4.69 25,717 63.0 3,029 93 100
649 19 36.5 656 15.88 7,166 72.6 928 141 76
18 - - 18 100.00 378 173.0 - - 31
15,752 6,930 16.3 16,885 2.16 144,524 49.4 8,926 53 260 106
Table 30.3: CR6 – Credit risk exposures by portfolio and PD ranges – for IRB approach (Total)
a b c d e f g h i j k l
HK$m HK$m % HK$m % % years HK$m % HK$m HK$m
1,094,077 412,921 33.5 1,232,286 0.66 2,503,837 36.5 1.81* 352,450 29 3,657 6,676
10.00 to < 100.00
100.00 (Default)
Sub-total
As at 31 Dec 2017
0.00 to < 0.15
0.15 to < 0.25
0.25 to < 0.50
0.50 to < 0.75
0.75 to < 2.50
2.50 to < 10.00
10.00 to < 100.00
100.00 (Default)
Sub-total
10.00 to < 100.00
100.00 (Default)
Sub-total
0.00 to < 0.15
0.15 to < 0.25
0.25 to < 0.50
0.50 to < 0.75
0.75 to < 2.50
2.50 to < 10.00
Off-balance
sheet
exposures
pre CCF
Average
CCF
EAD
post CRM
and post-
CCF
Average
PD
Number
of obligors
Average
LGD
Average
maturity
Provisions
RWA
RWA
density
Original
on-balance
sheet gross
exposure
Off-balance
sheet
exposures
pre CCF
Average
CCF
EAD
post CRM
and post-
CCF
Average
PD
Number
of obligors
Average
LGD
Average
maturity
RWA
density EL
0.15 to < 0.25
0.25 to < 0.50
0.50 to < 0.75
PD scale
0.75 to < 2.50
2.50 to < 10.00
10.00 to < 100.00
100.00 (Default)
Sub-total
0.00 to < 0.15
0.00 to < 0.15
0.15 to < 0.25
0.25 to < 0.50
0.50 to < 0.75
0.75 to < 2.50
2.50 to < 10.00
EL
Original
on-balance
sheet gross
exposure
RWA
As at 31 Dec 2017
Total (all portfolios)
*This refers to the total average maturity for wholesale portfolio only as maturity is not a parameter in the internal model approved by the HKMA on calculating risk-weight
("RW") on retail portfolio.
Provisions
36
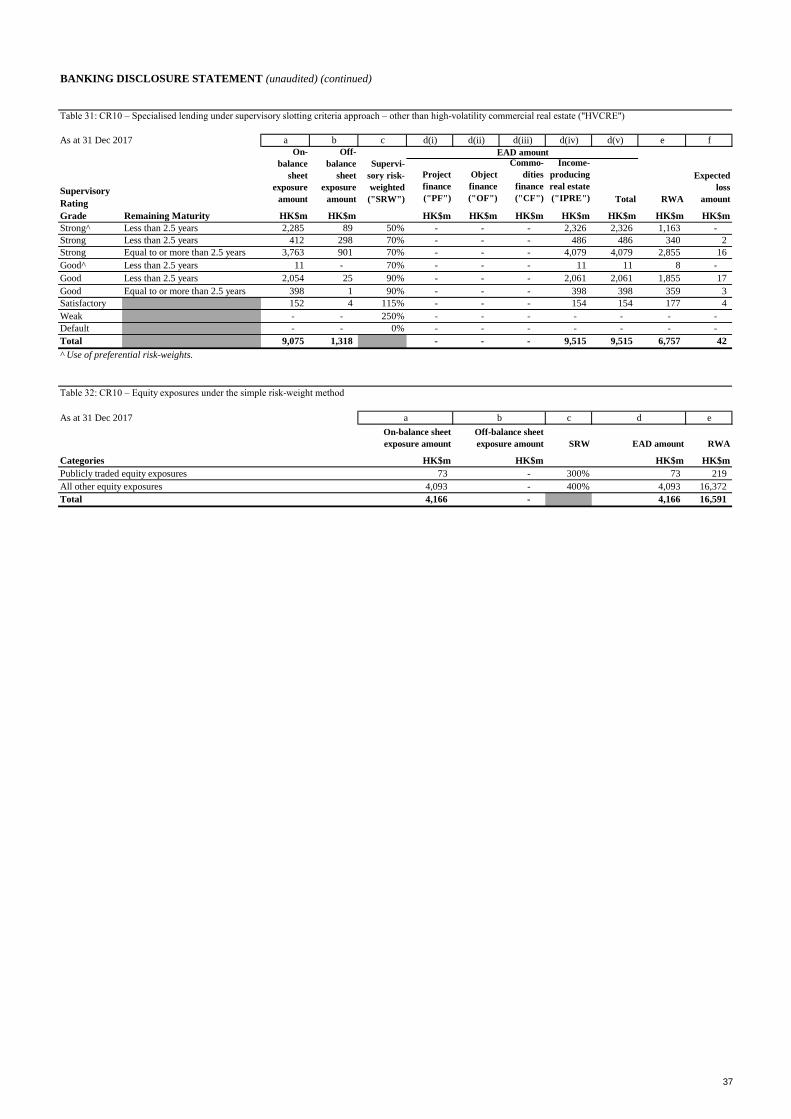
BANKING DISCLOSURE STATEMENT (unaudited) (continued)
Table 31: CR10 – Specialised lending under supervisory slotting criteria approach – other than high-volatility commercial real estate ("HVCRE")
As at 31 Dec 2017 a b c d(i) d(ii) d(iii) d(iv) d(v) e f
Project
finance
("PF")
Object
finance
("OF")
Commo-
dities
finance
("CF")
Income-
producing
real estate
("IPRE") Total
HK$m HK$m HK$m HK$m HK$m HK$m HK$m HK$m HK$m
Less than 2.5 years 2,285 89 50% - - - 2,326 2,326 1,163 -
Less than 2.5 years 412 298 70% - - - 486 486 340 2
Equal to or more than 2.5 years 3,763 901 70% - - - 4,079 4,079 2,855 16
Less than 2.5 years 11 - 70% - - - 11 11 8 -
Less than 2.5 years 2,054 25 90% - - - 2,061 2,061 1,855 17
Equal to or more than 2.5 years 398 1 90% - - - 398 398 359 3
152 4 115% - - - 154 154 177 4
- - 250% - - - - - - -
- - 0% - - - - - - -
9,075 1,318 - - - 9,515 9,515 6,757 42
^ Use of preferential risk-weights.
Table 32: CR10 – Equity exposures under the simple risk-weight method
As at 31 Dec 2017 c e
Categories HK$m
Publicly traded equity exposures 73 - 300% 73 219
All other equity exposures 4,093 - 400% 4,093 16,372
Total 4,166 - 4,166 16,591
HK$m HK$m HK$m
On-balance sheet
exposure amount
Off-balance sheet
exposure amount SRW EAD amount RWA
a b d
Default
Total
Satisfactory
Weak
Good
Good
Strong
Good^
Supervi-
sory risk-
weighted
("SRW")
EAD amount
Strong
RWA
Strong^
Expected
loss
amountSupervisory
Rating
Grade Remaining Maturity
On-
balance
sheet
exposure
amount
Off-
balance
sheet
exposure
amount
37
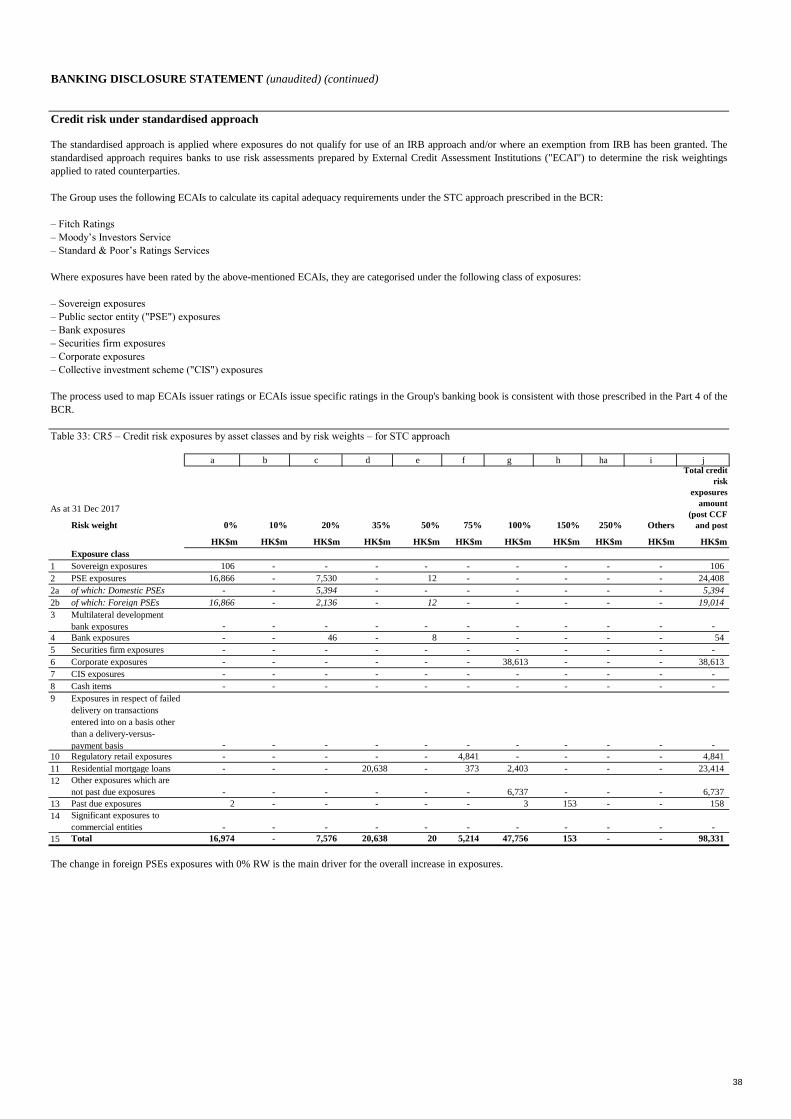
BANKING DISCLOSURE STATEMENT (unaudited) (continued)
Credit risk under standardised approach
Table 33: CR5 – Credit risk exposures by asset classes and by risk weights – for STC approach
a b c d e f g h ha i j
As at 31 Dec 2017
Risk weight 0% 10% 20% 35% 50% 75% 100% 150% 250% Others
HK$m HK$m HK$m HK$m HK$m HK$m HK$m HK$m HK$m HK$m HK$m
Exposure class
1 Sovereign exposures 106 - - - - - - - - - 106
2 PSE exposures 16,866 - 7,530 - 12 - - - - - 24,408
2a of which: Domestic PSEs - - 5,394 - - - - - - - 5,394
2b of which: Foreign PSEs 16,866 - 2,136 - 12 - - - - - 19,014
4 Bank exposures - - 46 - 8 - - - - - 54
5 Securities firm exposures - - - - - - - - - - -
6 Corporate exposures - - - - - - 38,613 - - - 38,613
7 CIS exposures - - - - - - - - - - -
8 Cash items - - - - - - - - - - -
10 Regulatory retail exposures - - - - - 4,841 - - - - 4,841
11 Residential mortgage loans - - - 20,638 - 373 2,403 - - - 23,414
13 Past due exposures 2 - - - - - 3 153 - - 158
15 Total 16,974 - 7,576 20,638 20 5,214 47,756 153 - - 98,331
The change in foreign PSEs exposures with 0% RW is the main driver for the overall increase in exposures.
- - - - -
14 Significant exposures to
commercial entities - - - - - -
6,737 - - 6,737 - - -
12 Other exposures which are
not past due exposures - - - -
- - - - -
9 Exposures in respect of failed
delivery on transactions
entered into on a basis other
than a delivery-versus-
payment basis - - - - - -
-
The standardised approach is applied where exposures do not qualify for use of an IRB approach and/or where an exemption from IRB has been granted. The
standardised approach requires banks to use risk assessments prepared by External Credit Assessment Institutions ("ECAI") to determine the risk weightings
applied to rated counterparties.
The Group uses the following ECAIs to calculate its capital adequacy requirements under the STC approach prescribed in the BCR:
– Fitch Ratings
– Moody’s Investors Service
– Standard & Poor’s Ratings Services
Where exposures have been rated by the above-mentioned ECAIs, they are categorised under the following class of exposures:
– Sovereign exposures
– Public sector entity ("PSE") exposures
– Bank exposures
– Securities firm exposures
– Corporate exposures
– Collective investment scheme ("CIS") exposures
The process used to map ECAIs issuer ratings or ECAIs issue specific ratings in the Group's banking book is consistent with those prescribed in the Part 4 of the
BCR.
Total credit
risk
exposures
amount
(post CCF
and post
3 Multilateral development
bank exposures - - - - - - - - - -
38
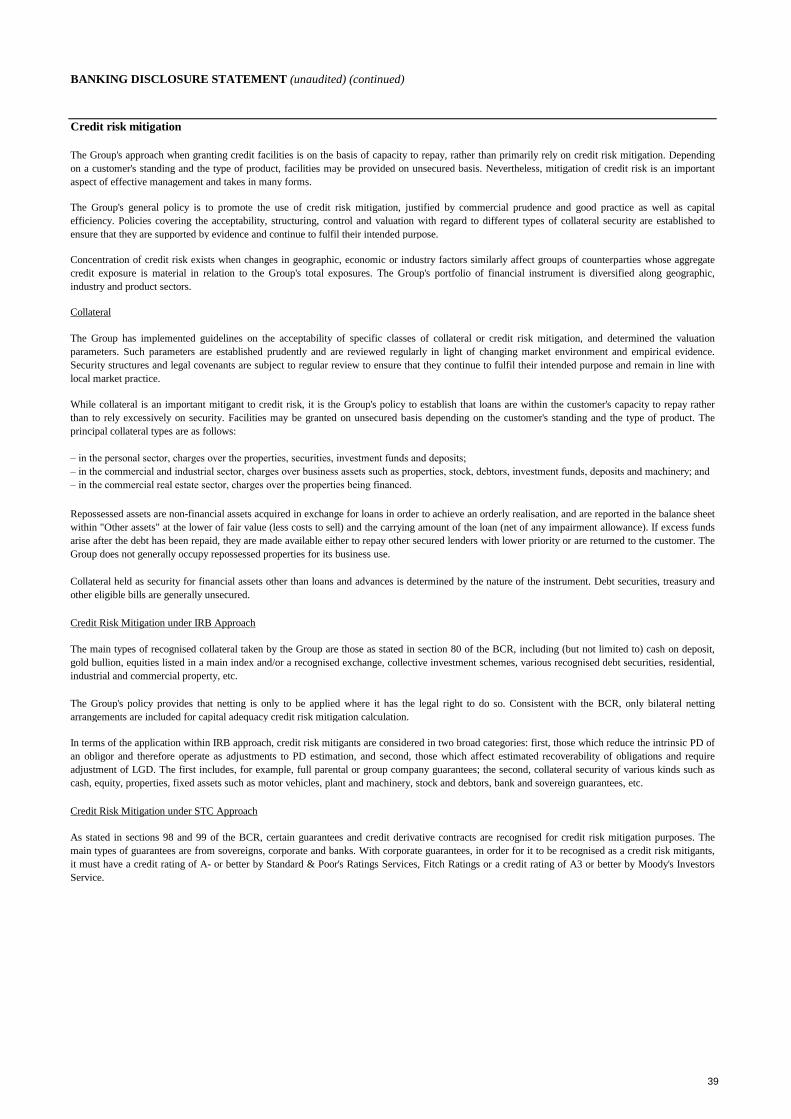
BANKING DISCLOSURE STATEMENT (unaudited) (continued)
Credit risk mitigation
Credit Risk Mitigation under STC Approach
As stated in sections 98 and 99 of the BCR, certain guarantees and credit derivative contracts are recognised for credit risk mitigation purposes. The
main types of guarantees are from sovereigns, corporate and banks. With corporate guarantees, in order for it to be recognised as a credit risk mitigants,
it must have a credit rating of A- or better by Standard & Poor's Ratings Services, Fitch Ratings or a credit rating of A3 or better by Moody's Investors
Service.
Repossessed assets are non-financial assets acquired in exchange for loans in order to achieve an orderly realisation, and are reported in the balance sheet
within "Other assets" at the lower of fair value (less costs to sell) and the carrying amount of the loan (net of any impairment allowance). If excess funds
arise after the debt has been repaid, they are made available either to repay other secured lenders with lower priority or are returned to the customer. The
Group does not generally occupy repossessed properties for its business use.
Collateral held as security for financial assets other than loans and advances is determined by the nature of the instrument. Debt securities, treasury and
other eligible bills are generally unsecured.
Credit Risk Mitigation under IRB Approach
The main types of recognised collateral taken by the Group are those as stated in section 80 of the BCR, including (but not limited to) cash on deposit,
gold bullion, equities listed in a main index and/or a recognised exchange, collective investment schemes, various recognised debt securities, residential,
industrial and commercial property, etc.
The Group's policy provides that netting is only to be applied where it has the legal right to do so. Consistent with the BCR, only bilateral netting
arrangements are included for capital adequacy credit risk mitigation calculation.
In terms of the application within IRB approach, credit risk mitigants are considered in two broad categories: first, those which reduce the intrinsic PD of
an obligor and therefore operate as adjustments to PD estimation, and second, those which affect estimated recoverability of obligations and require
adjustment of LGD. The first includes, for example, full parental or group company guarantees; the second, collateral security of various kinds such as
cash, equity, properties, fixed assets such as motor vehicles, plant and machinery, stock and debtors, bank and sovereign guarantees, etc.
While collateral is an important mitigant to credit risk, it is the Group's policy to establish that loans are within the customer's capacity to repay rather
than to rely excessively on security. Facilities may be granted on unsecured basis depending on the customer's standing and the type of product. The
principal collateral types are as follows:
– in the personal sector, charges over the properties, securities, investment funds and deposits;
– in the commercial and industrial sector, charges over business assets such as properties, stock, debtors, investment funds, deposits and machinery; and
– in the commercial real estate sector, charges over the properties being financed.
The Group's approach when granting credit facilities is on the basis of capacity to repay, rather than primarily rely on credit risk mitigation. Depending
on a customer's standing and the type of product, facilities may be provided on unsecured basis. Nevertheless, mitigation of credit risk is an important
aspect of effective management and takes in many forms.
The Group's general policy is to promote the use of credit risk mitigation, justified by commercial prudence and good practice as well as capital
efficiency. Policies covering the acceptability, structuring, control and valuation with regard to different types of collateral security are established to
ensure that they are supported by evidence and continue to fulfil their intended purpose.
Concentration of credit risk exists when changes in geographic, economic or industry factors similarly affect groups of counterparties whose aggregate
credit exposure is material in relation to the Group's total exposures. The Group's portfolio of financial instrument is diversified along geographic,
industry and product sectors.
Collateral
The Group has implemented guidelines on the acceptability of specific classes of collateral or credit risk mitigation, and determined the valuation
parameters. Such parameters are established prudently and are reviewed regularly in light of changing market environment and empirical evidence.
Security structures and legal covenants are subject to regular review to ensure that they continue to fulfil their intended purpose and remain in line with
local market practice.
39
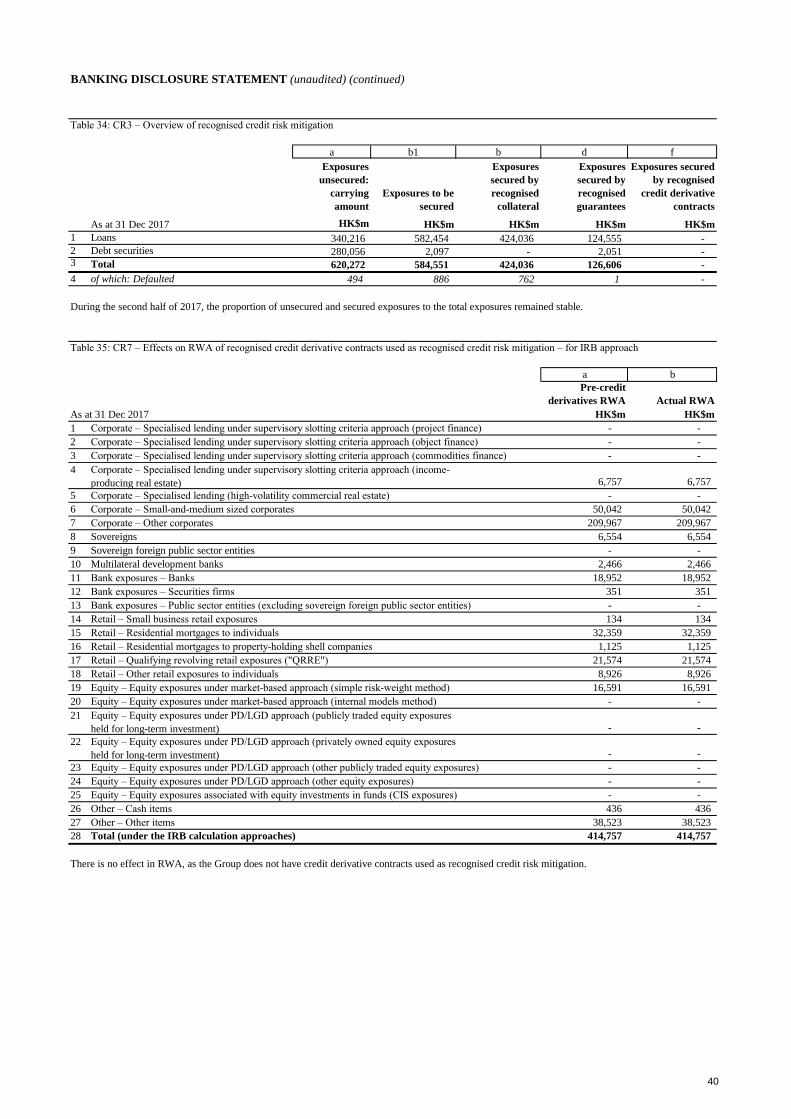
BANKING DISCLOSURE STATEMENT (unaudited) (continued)
Table 34: CR3 – Overview of recognised credit risk mitigation
As at 31 Dec 2017 HK$m
1 Loans 340,216 582,454 424,036 124,555 -
2 Debt securities 280,056 2,097 - 2,051 - 3 Total 620,272 584,551 424,036 126,606 -
4 of which: Defaulted 494 886 762 1 -
Table 35: CR7 – Effects on RWA of recognised credit derivative contracts used as recognised credit risk mitigation – for IRB approach
As at 31 Dec 2017 HK$m HK$m
1 Corporate – Specialised lending under supervisory slotting criteria approach (project finance)
2 Corporate – Specialised lending under supervisory slotting criteria approach (object finance)
3 Corporate – Specialised lending under supervisory slotting criteria approach (commodities finance)
5 Corporate – Specialised lending (high-volatility commercial real estate)
6 Corporate – Small-and-medium sized corporates
7 Corporate – Other corporates
8 Sovereigns
9 Sovereign foreign public sector entities
10 Multilateral development banks
11 Bank exposures – Banks
12 Bank exposures – Securities firms
13 Bank exposures – Public sector entities (excluding sovereign foreign public sector entities)
14 Retail – Small business retail exposures
15 Retail – Residential mortgages to individuals
16 Retail – Residential mortgages to property-holding shell companies
17 Retail – Qualifying revolving retail exposures ("QRRE")
18 Retail – Other retail exposures to individuals
19 Equity – Equity exposures under market-based approach (simple risk-weight method)
20 Equity – Equity exposures under market-based approach (internal models method)
23 Equity – Equity exposures under PD/LGD approach (other publicly traded equity exposures)
24 Equity – Equity exposures under PD/LGD approach (other equity exposures)
25 Equity – Equity exposures associated with equity investments in funds (CIS exposures)
26 Other – Cash items
27 Other – Other items
28 Total (under the IRB calculation approaches)
a b1 b d f
During the second half of 2017, the proportion of unsecured and secured exposures to the total exposures remained stable.
HK$m HK$m HK$m HK$m
Exposures
unsecured:
carrying
amount
Exposures to be
secured
Exposures
secured by
recognised
collateral
Exposures
secured by
recognised
guarantees
Exposures secured
by recognised
credit derivative
contracts
21 Equity – Equity exposures under PD/LGD approach (publicly traded equity exposures
held for long-term investment)
22 Equity – Equity exposures under PD/LGD approach (privately owned equity exposures
held for long-term investment)
a
Pre-credit
derivatives RWA
b
Actual RWA
4 Corporate – Specialised lending under supervisory slotting criteria approach (income-
producing real estate)
2,466
18,952
351
-
134
-
-
-
6,757
-
50,042
209,967
6,554
-
436
-
-
-
-
436
-
-
-
-
-
-
-
-
18,952
351
-
134
32,359
1,125
21,574
8,926
16,591
-
-
6,757
-
50,042
209,967
6,554
-
2,466
There is no effect in RWA, as the Group does not have credit derivative contracts used as recognised credit risk mitigation.
38,523
414,757
32,359
1,125
21,574
8,926
16,591
38,523
414,757
-
40
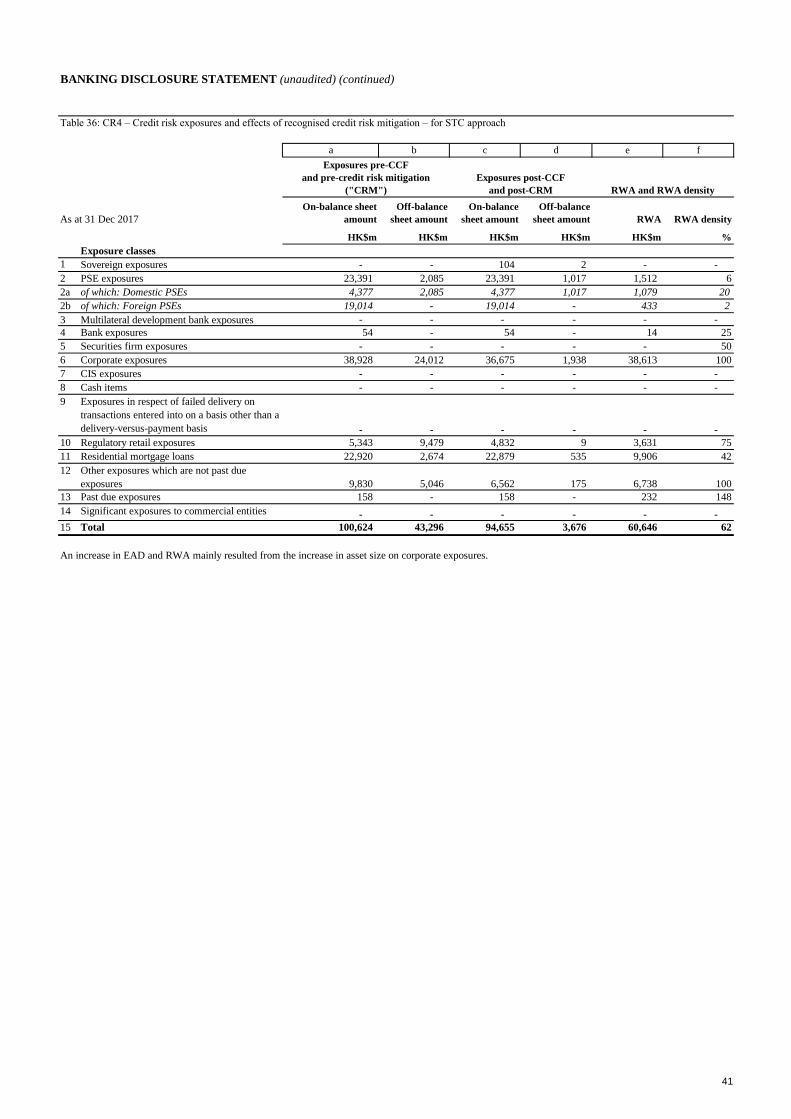
BANKING DISCLOSURE STATEMENT (unaudited) (continued)
Table 36: CR4 – Credit risk exposures and effects of recognised credit risk mitigation – for STC approach
As at 31 Dec 2017
%
Exposure classes
1 Sovereign exposures
2 PSE exposures
2a of which: Domestic PSEs
2b of which: Foreign PSEs
4 Bank exposures
5 Securities firm exposures
6 Corporate exposures
7 CIS exposures
8 Cash items
10 Regulatory retail exposures
11 Residential mortgage loans
13 Past due exposures
15 Total
38,928
-
-
9,906
-
25
50
100
-
-
-
75
42
5,343
22,920
1,938 38,613
-
9,479
24,012 36,675
3,631 9 4,832
54
HK$m
43,296
-
-
54
-
-
-
-
cba fed
On-balance sheet
amount
Off-balance
sheet amount
On-balance
sheet amount
Off-balance
sheet amount RWA densityRWA
Exposures pre-CCF
and pre-credit risk mitigation
("CRM")
Exposures post-CCF
and post-CRM RWA and RWA density
23,391
-
6
14
-
62
Exposures in respect of failed delivery on
transactions entered into on a basis other than a
delivery-versus-payment basis -
100
148
-
- - - -
- 158
5,046 6,562 175 6,738
2,674 22,879 535
- - -
4,377
19,014
104 2
19,014 -
20
2
12
4,377
433
- -
9
-
- - - -
- -
100,624
14
-
94,655 3,676 60,646
- - - -
158 232
Significant exposures to commercial entities
Other exposures which are not past due
exposures
-
9,830
HK$m HK$m HK$m HK$m
3
1,017 1,079
-
-
2,085 23,391 1,017 1,512
Multilateral development bank exposures -
2,085
-
An increase in EAD and RWA mainly resulted from the increase in asset size on corporate exposures.
41
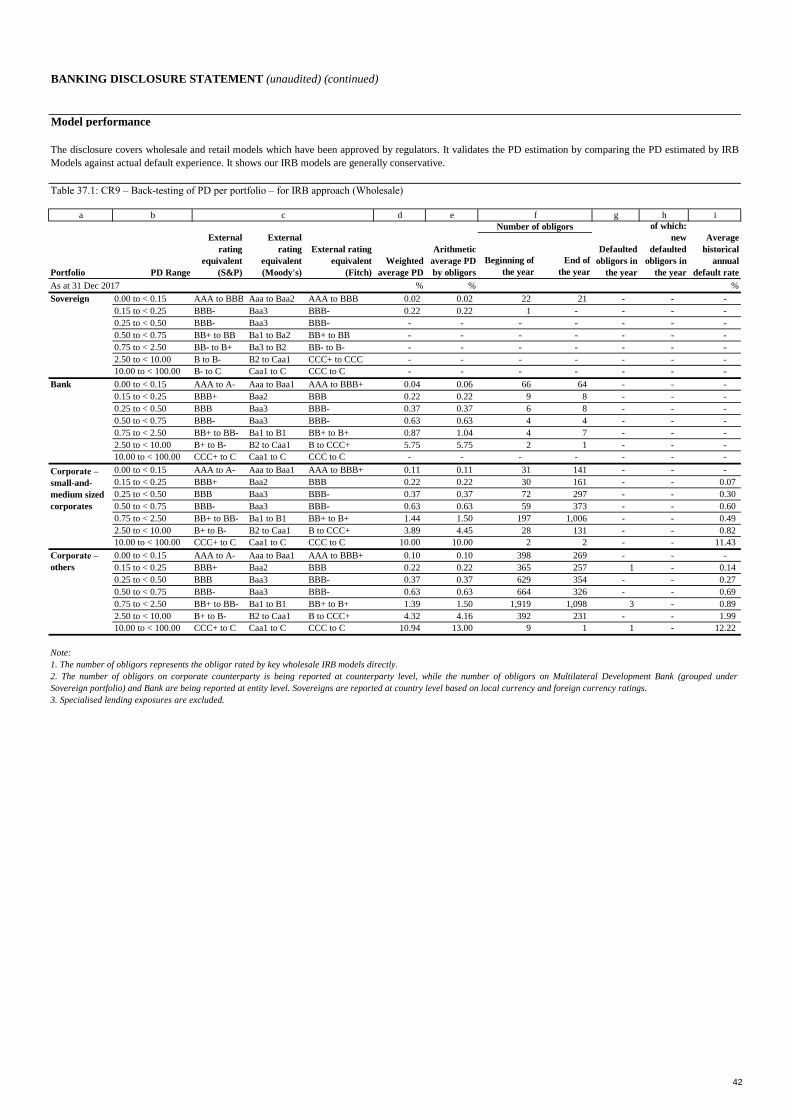
BANKING DISCLOSURE STATEMENT (unaudited) (continued)
Model performance
Table 37.1: CR9 – Back-testing of PD per portfolio – for IRB approach (Wholesale)
b d e g h i
Beginning of
the year
End of
the year
As at 31 Dec 2017 % % %
Sovereign 0.00 to < 0.15 AAA to BBB Aaa to Baa2 AAA to BBB 0.02 0.02 22 21 - - -
0.15 to < 0.25 BBB- Baa3 BBB- 0.22 0.22 1 - - - -
0.25 to < 0.50 BBB- Baa3 BBB- - - - - - - -
0.50 to < 0.75 BB+ to BB Ba1 to Ba2 BB+ to BB - - - - - - -
0.75 to < 2.50 BB- to B+ Ba3 to B2 BB- to B- - - - - - - -
2.50 to < 10.00 B to B- B2 to Caa1 CCC+ to CCC - - - - - - -
10.00 to < 100.00 B- to C Caa1 to C CCC to C - - - - - - -
0.00 to < 0.15 AAA to A- Aaa to Baa1 AAA to BBB+ 0.04 0.06 66 64 - - -
0.15 to < 0.25 BBB+ Baa2 BBB 0.22 0.22 9 8 - - -
0.25 to < 0.50 BBB Baa3 BBB- 0.37 0.37 6 8 - - -
0.50 to < 0.75 BBB- Baa3 BBB- 0.63 0.63 4 4 - - -
0.75 to < 2.50 BB+ to BB- Ba1 to B1 BB+ to B+ 0.87 1.04 4 7 - - -
2.50 to < 10.00 B+ to B- B2 to Caa1 B to CCC+ 5.75 5.75 2 1 - - -
10.00 to < 100.00 CCC+ to C Caa1 to C CCC to C - - - - - - -
0.00 to < 0.15 AAA to A- Aaa to Baa1 AAA to BBB+ 0.11 0.11 31 141 - - -
0.15 to < 0.25 BBB+ Baa2 BBB 0.22 0.22 30 161 - - 0.07
0.25 to < 0.50 BBB Baa3 BBB- 0.37 0.37 72 297 - - 0.30
0.50 to < 0.75 BBB- Baa3 BBB- 0.63 0.63 59 373 - - 0.60
0.75 to < 2.50 BB+ to BB- Ba1 to B1 BB+ to B+ 1.44 1.50 197 1,006 - - 0.49
2.50 to < 10.00 B+ to B- B2 to Caa1 B to CCC+ 3.89 4.45 28 131 - - 0.82
10.00 to < 100.00 CCC+ to C Caa1 to C CCC to C 10.00 10.00 2 2 - - 11.43
0.00 to < 0.15 AAA to A- Aaa to Baa1 AAA to BBB+ 0.10 0.10 398 269 - - -
0.15 to < 0.25 BBB+ Baa2 BBB 0.22 0.22 365 257 1 - 0.14
0.25 to < 0.50 BBB Baa3 BBB- 0.37 0.37 629 354 - - 0.27
0.50 to < 0.75 BBB- Baa3 BBB- 0.63 0.63 664 326 - - 0.69
0.75 to < 2.50 BB+ to BB- Ba1 to B1 BB+ to B+ 1.39 1.50 1,919 1,098 3 - 0.89
2.50 to < 10.00 B+ to B- B2 to Caa1 B to CCC+ 4.32 4.16 392 231 - - 1.99
10.00 to < 100.00 CCC+ to C Caa1 to C CCC to C 10.94 13.00 9 1 1 - 12.22
The disclosure covers wholesale and retail models which have been approved by regulators. It validates the PD estimation by comparing the PD estimated by IRB
Models against actual default experience. It shows our IRB models are generally conservative.
c
External
rating
equivalent
(S&P)
External rating
equivalent
(Fitch)
Note:
1. The number of obligors represents the obligor rated by key wholesale IRB models directly.
2. The number of obligors on corporate counterparty is being reported at counterparty level, while the number of obligors on Multilateral Development Bank (grouped under
Sovereign portfolio) and Bank are being reported at entity level. Sovereigns are reported at country level based on local currency and foreign currency ratings.
3. Specialised lending exposures are excluded.
Corporate –
others
Bank
Corporate –
small-and-
medium sized
corporates
a
Average
historical
annual
default rate
Number of obligors
External
rating
equivalent
(Moody's)PD Range
of which:
new
defaulted
obligors in
the year
Weighted
average PD
Arithmetic
average PD
by obligorsPortfolio
Defaulted
obligors in
the year
f
42
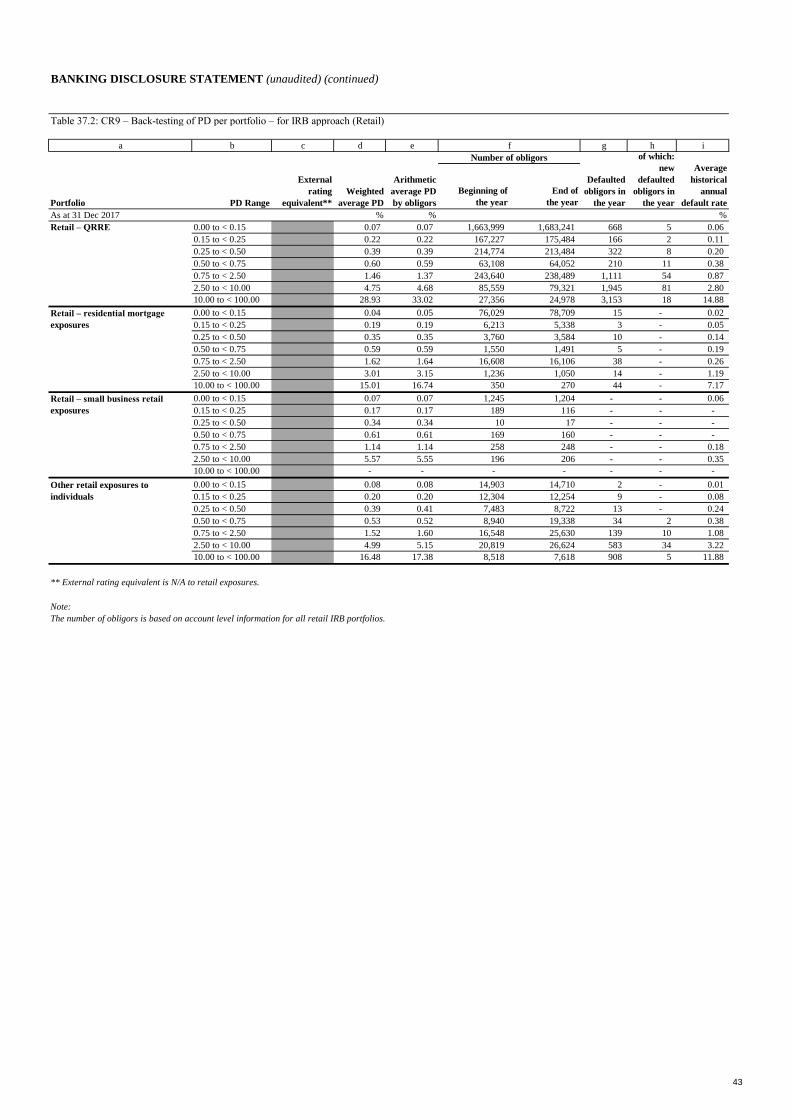
BANKING DISCLOSURE STATEMENT (unaudited) (continued)
Table 37.2: CR9 – Back-testing of PD per portfolio – for IRB approach (Retail)
b c d e g h i
Beginning of
the year
End of
the year
As at 31 Dec 2017 % % %
0.00 to < 0.15 0.07 0.07 1,663,999 1,683,241 668 5 0.06
0.15 to < 0.25 0.22 0.22 167,227 175,484 166 2 0.11
0.25 to < 0.50 0.39 0.39 214,774 213,484 322 8 0.20
0.50 to < 0.75 0.60 0.59 63,108 64,052 210 11 0.38
0.75 to < 2.50 1.46 1.37 243,640 238,489 1,111 54 0.87
2.50 to < 10.00 4.75 4.68 85,559 79,321 1,945 81 2.80
10.00 to < 100.00 28.93 33.02 27,356 24,978 3,153 18 14.88
0.00 to < 0.15 0.04 0.05 76,029 78,709 15 - 0.02
0.15 to < 0.25 0.19 0.19 6,213 5,338 3 - 0.05
0.25 to < 0.50 0.35 0.35 3,760 3,584 10 - 0.14
0.50 to < 0.75 0.59 0.59 1,550 1,491 5 - 0.19
0.75 to < 2.50 1.62 1.64 16,608 16,106 38 - 0.26
2.50 to < 10.00 3.01 3.15 1,236 1,050 14 - 1.19
10.00 to < 100.00 15.01 16.74 350 270 44 - 7.17
0.00 to < 0.15 0.07 0.07 1,245 1,204 - - 0.06
0.15 to < 0.25 0.17 0.17 189 116 - - -
0.25 to < 0.50 0.34 0.34 10 17 - - -
0.50 to < 0.75 0.61 0.61 169 160 - - -
0.75 to < 2.50 1.14 1.14 258 248 - - 0.18
2.50 to < 10.00 5.57 5.55 196 206 - - 0.35
10.00 to < 100.00 - - - - - - -
0.00 to < 0.15 0.08 0.08 14,903 14,710 2 - 0.01
0.15 to < 0.25 0.20 0.20 12,304 12,254 9 - 0.08
0.25 to < 0.50 0.39 0.41 7,483 8,722 13 - 0.24
0.50 to < 0.75 0.53 0.52 8,940 19,338 34 2 0.38
0.75 to < 2.50 1.52 1.60 16,548 25,630 139 10 1.08
2.50 to < 10.00 4.99 5.15 20,819 26,624 583 34 3.22
10.00 to < 100.00 16.48 17.38 8,518 7,618 908 5 11.88
** External rating equivalent is N/A to retail exposures.
Note:
The number of obligors is based on account level information for all retail IRB portfolios.
a f
Retail – QRRE
Retail – residential mortgage
exposures
Portfolio PD Range
External
rating
equivalent**
Weighted
average PD
Arithmetic
average PD
by obligors
Number of obligors
Defaulted
obligors in
the year
of which:
new
defaulted
obligors in
the year
Average
historical
annual
default rate
Retail – small business retail
exposures
Other retail exposures to
individuals
43
BANKING DISCLOSURE STATEMENT (unaudited) (continued)
Counterparty credit risk exposures
Counterparty credit risk management
Credit valuation adjustment
Collateral arrangements
Credit ratings downgrade
Wrong-way risk
Counterparty credit risk ("CCR") arises for derivatives and securities financing transactions ("SFTs"). It is calculated in both the trading and non-trading
books, and is the risk that a counterparty may default before settlement of the transaction. CCR is generated primarily in our wholesale global businesses.
The Bank uses current exposure method to calculate exposure value for CCR RWAs.
The PFE measures used for CCR management are calibrated to the 95th percentile. The measures consider volatility, trade maturity and the counterparty
legal documentation covering netting and collateral.
Limits for CCR exposures are assigned within the overall credit process. The credit risk function assigns a limit against each counterparty to cover
derivatives exposure which may arise as a result of a counterparty default. The magnitude of this limit will depend on the overall risk appetite and type of
derivatives trading undertaken with the counterparty.
Credit valuation adjustment ("CVA") risk is the risk of adverse moves in the credit valuation adjustments taken for expected credit losses on derivative
transactions. The Bank uses the standardised approach to calculate the CVA capital charge.
A credit rating downgrade clause in a Master Agreement or a credit rating downgrade threshold clause in a Credit Support Annex ("CSA") is designed to
trigger an action if the credit rating of the affected party falls below a specified level. These actions may include the requirement to pay or increase
collateral, the termination of transactions by the non-affected party or the assignment of transactions by the affected party.
At 31 December 2017, the potential value of the additional collateral pertaining to International Swaps and Derivatives Association ("ISDA") CSA
downgrade thresholds that we would need to post with counterparties in the event of a one-notch or two-notch downgrade of our rating was nil.
Wrong-way risk occurs when a counterparty's exposures are adversely correlated with its credit quality.
There are two types of wrong-way risk.
– General wrong-way risk occurs when the probability of counterparty default is positively correlated with general risk factors, for example, where a
counterparty is resident and/or incorporated in a higher-risk country and seeks to sell a non-domestic currency in exchange for its home currency.
– Specific wrong-way risk occurs in self-referencing transactions. These are transactions in which exposure is driven by capital or financing instruments
issued by the counterparty and occurs where exposure from the Bank's perspective materially increases as the value of the counterparty's capital or
financing instruments referenced in the contract decreases. It is the HSBC policy that specific wrong-way transactions are approved on a case-by-case
basis.
We use a range of tools to monitor and control wrong-way risk, including requiring the business to obtain prior approval before undertaking wrong-way
risk transactions outside pre-agreed guidelines. The Traded Risk functions are responsible for the control and monitoring process within an overarching
HSBC framework and limit framework.
Our policy is to revalue all traded transactions and associated collateral positions on a daily basis. An independent collateral management function
manages the collateral process including pledging and receiving collateral and investigating disputes and non-receipts.
Eligible collateral types are controlled under a policy to ensure price transparency, price stability, liquidity, enforceability, independence, reusability and
eligibility for regulatory purposes. A valuation "haircut" policy reflects the fact that collateral may fall in value between the date the collateral was called
and the date of liquidation or enforcement.
44
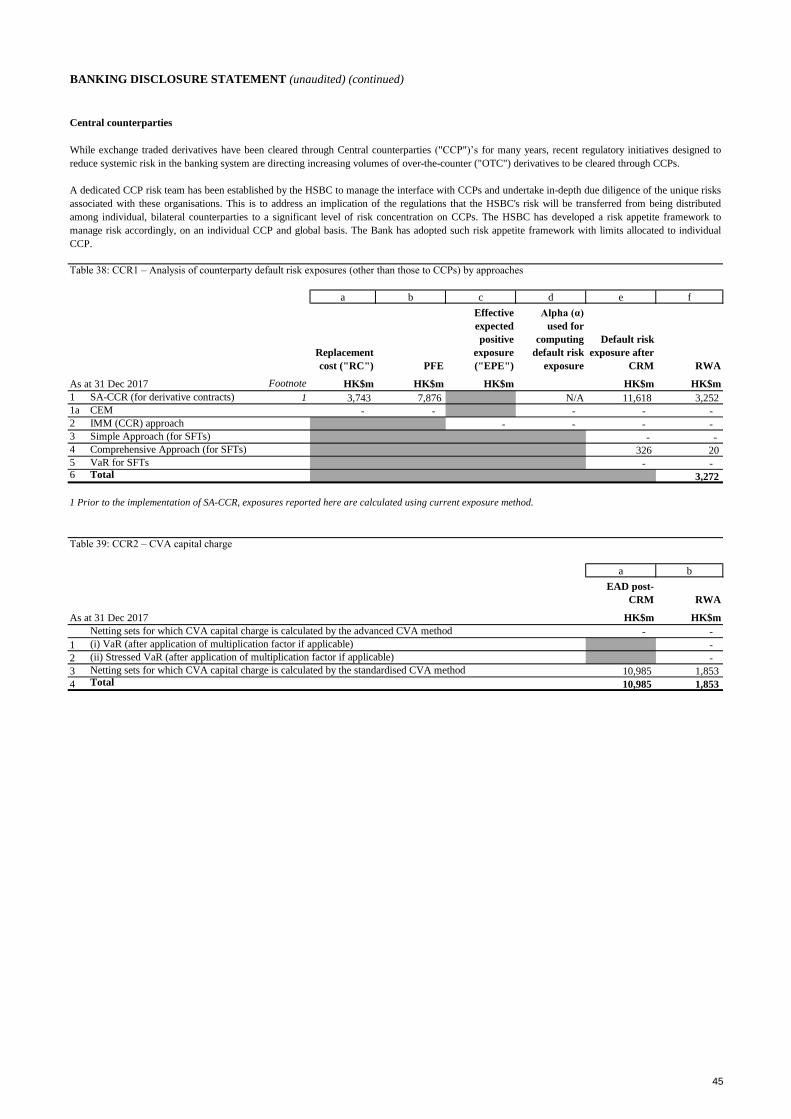
BANKING DISCLOSURE STATEMENT (unaudited) (continued)
Central counterparties
Table 38: CCR1 – Analysis of counterparty default risk exposures (other than those to CCPs) by approaches
As at 31 Dec 2017 Footnote
1 SA-CCR (for derivative contracts) 1
1a CEM
2 IMM (CCR) approach
3 Simple Approach (for SFTs)
4 Comprehensive Approach (for SFTs)
5 VaR for SFTs
6 Total
Table 39: CCR2 – CVA capital charge
As at 31 Dec 2017
Netting sets for which CVA capital charge is calculated by the advanced CVA method
1 (i) VaR (after application of multiplication factor if applicable)
2 (ii) Stressed VaR (after application of multiplication factor if applicable)
3 Netting sets for which CVA capital charge is calculated by the standardised CVA method
4 Total 1,853 10,985
-
1,853 10,985
-
EAD post-
CRM
HK$m
- -
b
RWA
HK$m
- -
3,272
a
1 Prior to the implementation of SA-CCR, exposures reported here are calculated using current exposure method.
326 20
- -
- - - -
- - - - -
3,743 7,876 N/A 11,618 3,252
Replacement
cost ("RC") PFE
Effective
expected
positive
exposure
("EPE")
Alpha (α)
used for
computing
default risk
exposure
Default risk
exposure after
CRM RWA
While exchange traded derivatives have been cleared through Central counterparties ("CCP")’s for many years, recent regulatory initiatives designed to
reduce systemic risk in the banking system are directing increasing volumes of over-the-counter ("OTC") derivatives to be cleared through CCPs.
A dedicated CCP risk team has been established by the HSBC to manage the interface with CCPs and undertake in-depth due diligence of the unique risks
associated with these organisations. This is to address an implication of the regulations that the HSBC's risk will be transferred from being distributed
among individual, bilateral counterparties to a significant level of risk concentration on CCPs. The HSBC has developed a risk appetite framework to
manage risk accordingly, on an individual CCP and global basis. The Bank has adopted such risk appetite framework with limits allocated to individual
CCP.
HK$m HK$m HK$m
c d e f
HK$m HK$m
a b
45
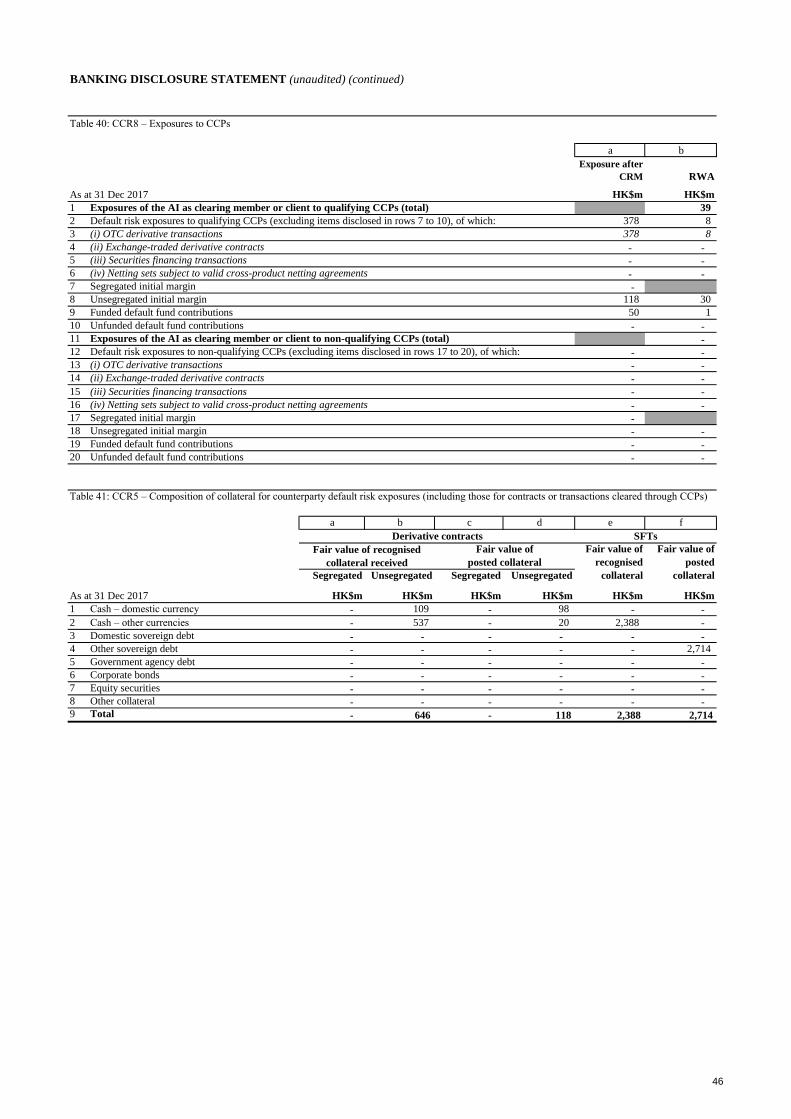
BANKING DISCLOSURE STATEMENT (unaudited) (continued)
Table 40: CCR8 – Exposures to CCPs
As at 31 Dec 2017
1 Exposures of the AI as clearing member or client to qualifying CCPs (total)
2 Default risk exposures to qualifying CCPs (excluding items disclosed in rows 7 to 10), of which:
3 (i) OTC derivative transactions
4 (ii) Exchange-traded derivative contracts
5 (iii) Securities financing transactions
6 (iv) Netting sets subject to valid cross-product netting agreements
7 Segregated initial margin
8 Unsegregated initial margin
9 Funded default fund contributions
10 Unfunded default fund contributions
11 Exposures of the AI as clearing member or client to non-qualifying CCPs (total)
12 Default risk exposures to non-qualifying CCPs (excluding items disclosed in rows 17 to 20), of which:
13 (i) OTC derivative transactions
14 (ii) Exchange-traded derivative contracts
15 (iii) Securities financing transactions
16 (iv) Netting sets subject to valid cross-product netting agreements
17 Segregated initial margin
18 Unsegregated initial margin
19 Funded default fund contributions
20 Unfunded default fund contributions
Table 41: CCR5 – Composition of collateral for counterparty default risk exposures (including those for contracts or transactions cleared through CCPs)
As at 31 Dec 2017
1 Cash – domestic currency
2 Cash – other currencies
3 Domestic sovereign debt
4 Other sovereign debt
5 Government agency debt
6 Corporate bonds
7 Equity securities
8 Other collateral
9 Total
- -
-
- -
- -
- -
- -
- -
- -
- -
-
- -
-
118 30
50 1
- -
- -
- -
39
378 8
378 8
a b
Exposure after
CRM RWA
HK$m HK$m
Derivative contracts SFTs
fa b c d e
HK$m HK$m
Segregated Unsegregated Segregated Unsegregated
Fair value of recognised
collateral received
Fair value of
posted collateral
Fair value of
recognised
collateral
Fair value of
posted
collateral
20 2,388
- 109 - 98 - -
HK$mHK$m HK$m HK$m
- -
- - - - - -
- - 537 -
- -
- - - - - -
2,714 - - -
- -
- - - - - -
- - - -
- 646 - 118 2,388 2,714
- - - -
46
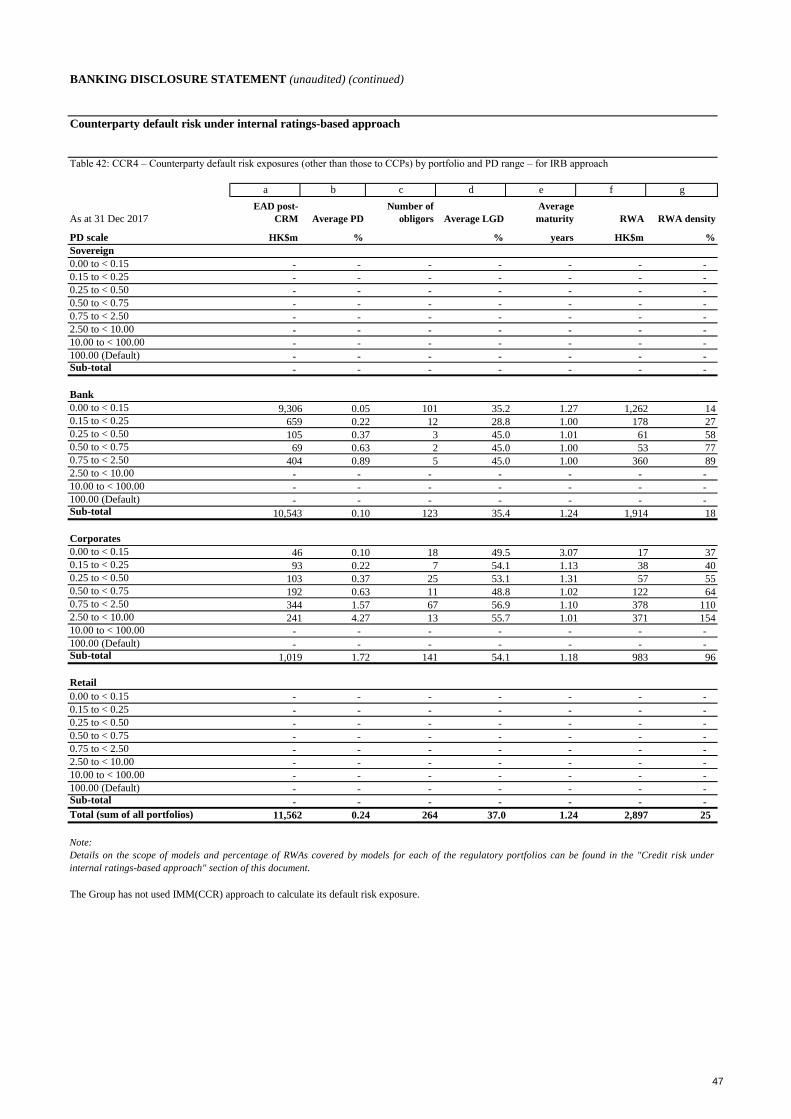
BANKING DISCLOSURE STATEMENT (unaudited) (continued)
Counterparty default risk under internal ratings-based approach
Table 42: CCR4 – Counterparty default risk exposures (other than those to CCPs) by portfolio and PD range – for IRB approach
As at 31 Dec 2017
PD scale
2,897 25
The Group has not used IMM(CCR) approach to calculate its default risk exposure.
Total (sum of all portfolios) 11,562 0.24 264 37.0 1.24
Note:
Details on the scope of models and percentage of RWAs covered by models for each of the regulatory portfolios can be found in the "Credit risk under
internal ratings-based approach" section of this document.
- - Sub-total - - - - - - -
100.00 (Default) - - - - -
- -
10.00 to < 100.00 - - - - - - -
2.50 to < 10.00 - - - - -
0.75 to < 2.50 - - - - - - -
0.50 to < 0.75 - - - - -
0.25 to < 0.50 - - - - - - -
- -
-
0.15 to < 0.25 - - - - - - -
Retail
0.00 to < 0.15 - - - -
- - Sub-total 1,019 1.72 141 54.1 1.18 983 96
100.00 (Default) - - - - -
- -
371 154
10.00 to < 100.00 - - - - - - -
2.50 to < 10.00 241 4.27 13 55.7 1.01
0.75 to < 2.50 344 1.57 67 56.9 1.10 378 110
0.50 to < 0.75 192 0.63 11 48.8 1.02
0.25 to < 0.50 103 0.37 25 53.1 1.31 57 55
122 64
37
0.15 to < 0.25 93 0.22 7 54.1 1.13 38 40
Corporates
0.00 to < 0.15 46 0.10 18 49.5
- - Sub-total 10,543 0.10 123 35.4 1.24 1,914 18
100.00 (Default) - - - - -
3.07 17
- -
10.00 to < 100.00 - - - - - - -
2.50 to < 10.00 - - - - -
0.75 to < 2.50 404 0.89 5 45.0 1.00 360 89
0.50 to < 0.75 69 0.63 2 45.0 1.00
0.25 to < 0.50 105 0.37 3 45.0 1.01 61 58
53 77
14
0.15 to < 0.25 659 0.22 12 28.8 1.00 178 27
Bank
0.00 to < 0.15 9,306 0.05 101 35.2
- - Sub-total - - - - - - -
100.00 (Default) - - - - -
1.27 1,262
- -
10.00 to < 100.00 - - - - - - -
2.50 to < 10.00 - - - - -
- -
0.75 to < 2.50 - - - - - - -
0.50 to < 0.75 - - - - -
- -
0.25 to < 0.50 - - - - - - -
0.15 to < 0.25 - - - - -
years HK$m
0.00 to < 0.15 - - - - - - -
d e f
Sovereign
%HK$m % %
EAD post-
CRM Average PD
Number of
obligors Average LGD
Average
maturity RWA RWA density
ga b c
47
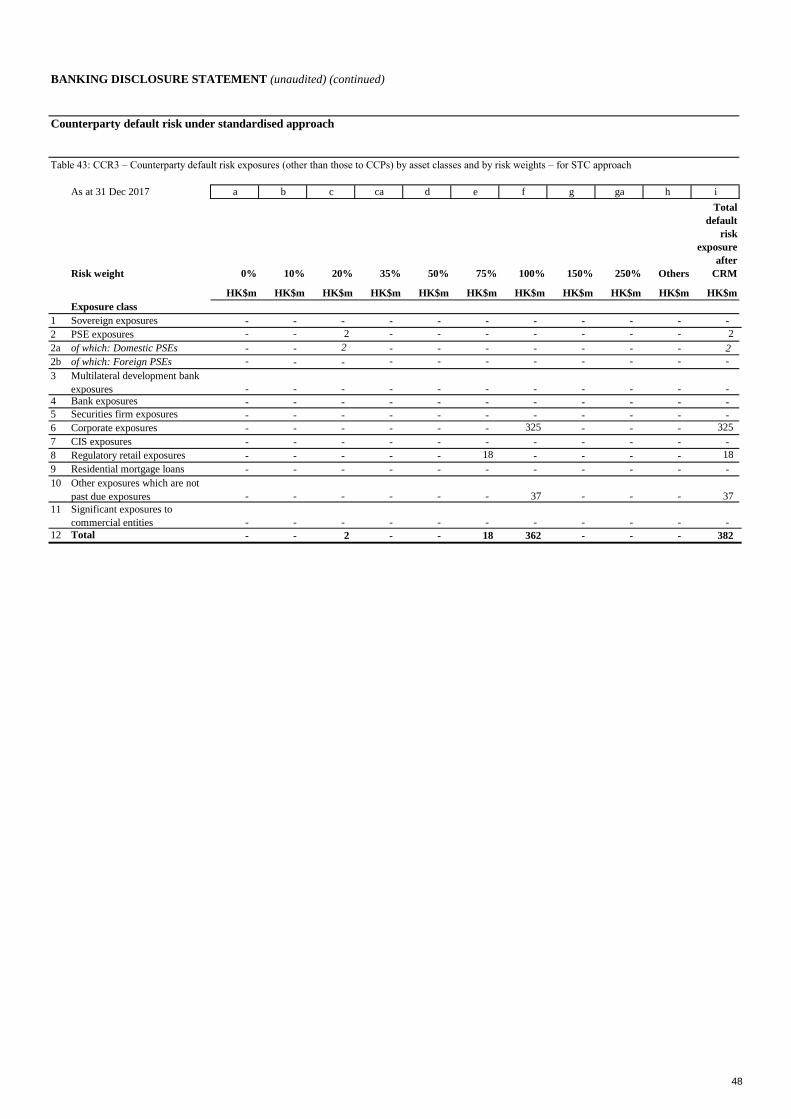
BANKING DISCLOSURE STATEMENT (unaudited) (continued)
Counterparty default risk under standardised approach
Table 43: CCR3 – Counterparty default risk exposures (other than those to CCPs) by asset classes and by risk weights – for STC approach
As at 31 Dec 2017 a b c ca d e f g ga h i
Risk weight
HK$m HK$m HK$m HK$m HK$m HK$m HK$m HK$m HK$m HK$m HK$m
Exposure class
1 Sovereign exposures - - - - - - - - - - -
2 PSE exposures - - 2 - - - - - - - 2
2a of which: Domestic PSEs - - 2 - - - - - - - 2
2b of which: Foreign PSEs - - - - - - - - - - -
- - - - - - - - - - -
4 Bank exposures - - - - - - - - - - -
5 Securities firm exposures - - - - - - - - - - -
6 Corporate exposures - - - - - - 325 - - - 325
7 CIS exposures - - - - - - - - - - -
8 Regulatory retail exposures - - - - - 18 - - - - 18
9 Residential mortgage loans - - - - - - - - - - -
- - - - - - 37 - - - 37
- - - - - - - - - - -
12 Total - - 2 - - 18 362 - - - 382
Others
Total
default
risk
exposure
after
CRM250%
3 Multilateral development bank
exposures
150%10% 20% 35% 50% 75% 100%
11 Significant exposures to
commercial entities
10
0%
Other exposures which are not
past due exposures
48
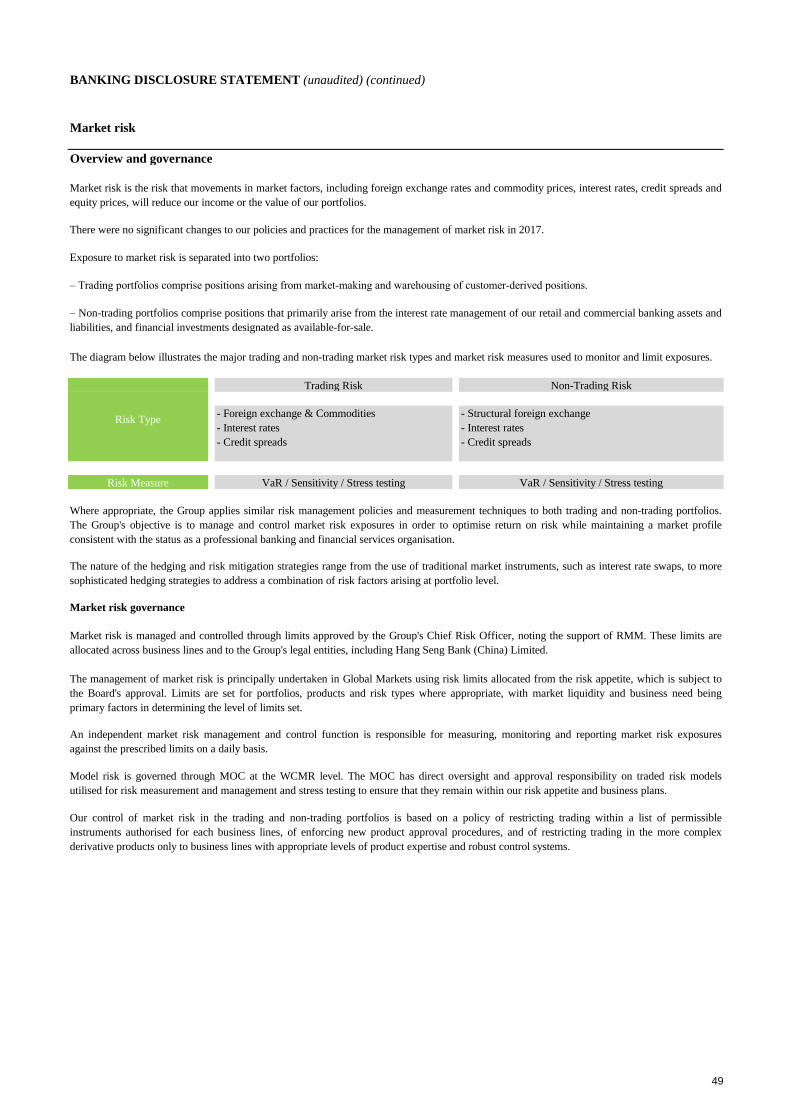
BANKING DISCLOSURE STATEMENT (unaudited) (continued)
Market risk
Overview and governance
Market risk governance
Risk Measure VaR / Sensitivity / Stress testing VaR / Sensitivity / Stress testing
Market risk is the risk that movements in market factors, including foreign exchange rates and commodity prices, interest rates, credit spreads and
equity prices, will reduce our income or the value of our portfolios.
There were no significant changes to our policies and practices for the management of market risk in 2017.
Exposure to market risk is separated into two portfolios:
– Trading portfolios comprise positions arising from market-making and warehousing of customer-derived positions.
– Non-trading portfolios comprise positions that primarily arise from the interest rate management of our retail and commercial banking assets and
liabilities, and financial investments designated as available-for-sale.
The diagram below illustrates the major trading and non-trading market risk types and market risk measures used to monitor and limit exposures.
Risk Type
Trading Risk Non-Trading Risk
- Foreign exchange & Commodities
- Interest rates
- Credit spreads
- Structural foreign exchange
- Interest rates
- Credit spreads
Where appropriate, the Group applies similar risk management policies and measurement techniques to both trading and non-trading portfolios.
The Group's objective is to manage and control market risk exposures in order to optimise return on risk while maintaining a market profile
consistent with the status as a professional banking and financial services organisation.
The nature of the hedging and risk mitigation strategies range from the use of traditional market instruments, such as interest rate swaps, to more
sophisticated hedging strategies to address a combination of risk factors arising at portfolio level.
Market risk is managed and controlled through limits approved by the Group's Chief Risk Officer, noting the support of RMM. These limits are
allocated across business lines and to the Group's legal entities, including Hang Seng Bank (China) Limited.
The management of market risk is principally undertaken in Global Markets using risk limits allocated from the risk appetite, which is subject to
the Board's approval. Limits are set for portfolios, products and risk types where appropriate, with market liquidity and business need being
primary factors in determining the level of limits set.
An independent market risk management and control function is responsible for measuring, monitoring and reporting market risk exposures
against the prescribed limits on a daily basis.
Model risk is governed through MOC at the WCMR level. The MOC has direct oversight and approval responsibility on traded risk models
utilised for risk measurement and management and stress testing to ensure that they remain within our risk appetite and business plans.
Our control of market risk in the trading and non-trading portfolios is based on a policy of restricting trading within a list of permissible
instruments authorised for each business lines, of enforcing new product approval procedures, and of restricting trading in the more complex
derivative products only to business lines with appropriate levels of product expertise and robust control systems.
49
BANKING DISCLOSURE STATEMENT (unaudited) (continued)
Market risk measures
Monitoring and limiting market risk exposures
Sensitivity analysis
VaR
VaR model limitations
Risk not in VaR ("RNIV") framework
Standard VaR is calculated at a 99% confidence level for a one-day holding period while Stressed VaR uses a 10-day holding period and a 99%
confidence interval based on a continuous one-year historical significant stress period. The VaR models used by the Group are predominantly
based on historical simulation which incorporate the following features:
The Group's objective is to manage and control market risk exposures while maintaining a market profile consistent with the Group's risk appetite.
The Group uses a range of tools to monitor and limit market risk exposures including sensitivity analysis, VaR, and stress testing.
The Group uses sensitivity measures to monitor the market risk positions within each risk type. Sensitivity limits are set for portfolios, products
and risk types, with the depth of the market being one of the principal factors in determining the level of limits set.
VaR is a technique that estimates the potential losses on risk positions as a result of movements in market rates and prices over a specified time
horizon and to a given level of confidence. The use of VaR is integrated into market risk management and is calculated for all trading positions
regardless of how the Group capitalises those exposures. Where there is no approved internal model, the Group uses the appropriate local rules to
capitalise exposures.
In addition, the Group calculates VaR for non-trading portfolios in order to have a complete picture of market risk. Where VaR is not calculated
explicitly, alternative tools are used.
Risk factors are reviewed on a regular basis and either incorporated directly in the VaR models, where possible, or quantified through the VaR-
based RNIV approach or a stress test approach within the RNIV framework.
– historical market rates and prices are calculated with reference to foreign exchange rates and commodity prices, interest rates, equity prices and
the associated volatilities;
– potential market movements utilised for Standard VaR are calculated with reference to data from the past two years; and
– Standard VaR is calculated to a 99% confidence level and use a one-day holding period.
The models also incorporate the effect of the option features on the underlying exposures. The nature of the VaR models means that an increase in
observed market volatility will lead to an increase in VaR without any changes in the underlying positions.
Although a valuable guide to risk, VaR should always be viewed in the context of its limitations. For example:
– the use of historical data as a proxy for estimating future events may not encompass all potential events, particularly those which are extreme in
nature;
– the use of a holding period assumes that all positions can be liquidated or the risks offset during that period. This may not fully reflect the market
risk arising at times of severe illiquidity, when the holding period may be insufficient to liquidate or hedge all positions fully;
– the use of a 99% confidence level, by definition does not take into account losses that might occur beyond this level of confidence; and
– VaR is calculated on the basis of exposures outstanding at the close of business and therefore does not necessarily reflect intra-day exposures.
The RNIV framework aims to manage and capitalise material market risks that are not adequately covered in the VaR model. In such instances the
RNIV framework uses stress tests to quantify the capital requirement. On average in 2017, the capital requirement derived from these stress tests
represented 3.7% of the total internal model-based market risk requirement.
RNIV is not viewed as being a material component of the Group's market risk capital requirement. Risks covered by RNIV represent 3.7% of
market risk RWAs for models with regulatory approval.
50
BANKING DISCLOSURE STATEMENT (unaudited) (continued)
Stress testing
Market risk capital models
VaR
Stressed VaR
Stressed VaR is primarily used for regulatory capital purposes and is integrated into the risk management process to ensure prudent capital
management. Stressed VaR complements other risk measures by providing the potential losses under stressed market conditions. Calculations are
based on a continuous one-year period of stress for the trading portfolio, based on the assessment at the Group level.
Stressed VaR modelling follows the same approach as our VaR risk measure, except for the following:
– potential market movements employed for stressed VaR calculations are based on a continuous one-year period of stress for the trading portfolio;
– it is calculated to a 99% confidence using a 10-day holding period;
– it is based on an actual 10-day holding period, whereas Regulatory VaR is based on a one-day holding period scaled to 10 days.
Stress testing is an important tool that is integrated into the Group's market risk management tool to evaluate the potential impact on portfolio
values of more extreme, although plausible, events or movements in a set of financial variables. In such abnormal scenarios, losses can be much
greater than those predicted by VaR modelling.
Stress testing is implemented at the legal entity and the overall Group levels. Scenarios are tailored in order to capture the relevant events or market
movements. A scoring framework is in place for management to effectively assess the severity of the potential stress losses and the likelihood of
occurrence of the stress scenarios. The risk appetite around potential stress losses for the Group is set and monitored against referral limits.
Market Risk Reverse stress tests are undertaken based upon the premise that there is a fixed loss. The stress test process identifies which scenarios
lead to this loss. The rationale behind the reverse stress test is to understand scenarios which are beyond normal business settings that could have
contagion and systemic implications.
Stressed VaR and stress testing, together with reverse stress testing, provide management with insights regarding the "tail risk" beyond VaR for
which the Group appetite is limited.
There are a number of measures that the Group has permission to use in calculating regulatory capital, which are listed below.
The trading books that received approval from the regulator to be covered via an internal model are used to calculate VaR for regulatory purposes.
Regulatory VaR levels contribute to the calculation of market risk RWAs.
51
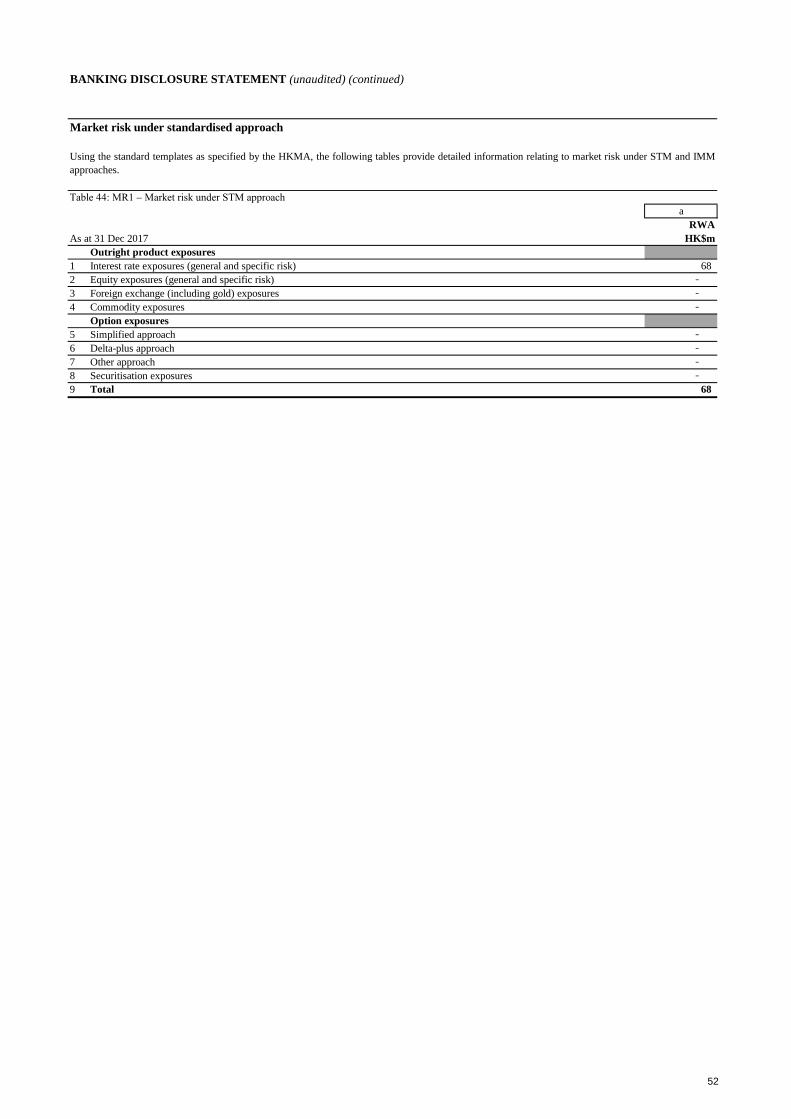
BANKING DISCLOSURE STATEMENT (unaudited) (continued)
Market risk under standardised approach
Table 44: MR1 – Market risk under STM approach
a
RWA
As at 31 Dec 2017 HK$m
Outright product exposures
1 Interest rate exposures (general and specific risk) 68
2 Equity exposures (general and specific risk) -
3 Foreign exchange (including gold) exposures -
4 Commodity exposures -
Option exposures
5 Simplified approach -
6 Delta-plus approach -
7 Other approach -
8 Securitisation exposures -
9 Total 68
Using the standard templates as specified by the HKMA, the following tables provide detailed information relating to market risk under STM and IMM
approaches.
52
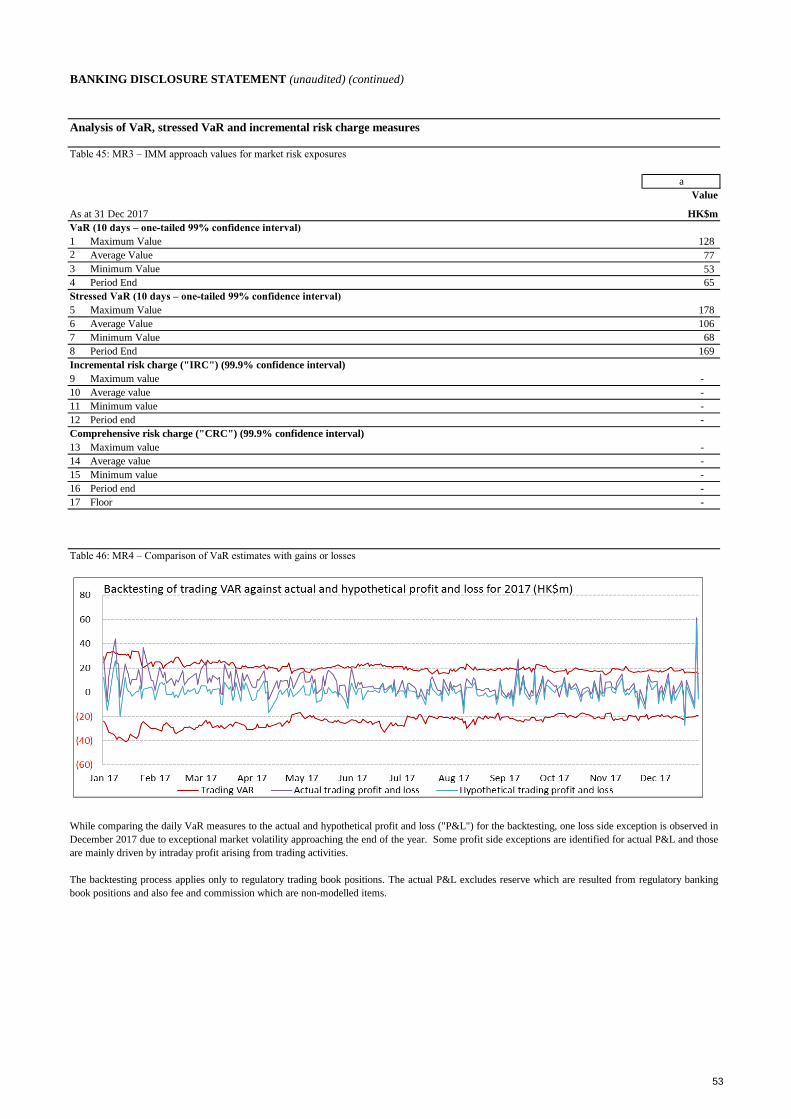
BANKING DISCLOSURE STATEMENT (unaudited) (continued)
Analysis of VaR, stressed VaR and incremental risk charge measures
Table 45: MR3 – IMM approach values for market risk exposures
a
Value
As at 31 Dec 2017 HK$m
VaR (10 days – one-tailed 99% confidence interval)
1 Maximum Value 128
2 Average Value 77
3 Minimum Value 53
4 Period End 65
Stressed VaR (10 days – one-tailed 99% confidence interval)
5 Maximum Value 178
6 Average Value 106
7 Minimum Value 68
8 Period End 169
Incremental risk charge ("IRC") (99.9% confidence interval)
9 Maximum value -
10 Average value -
11 Minimum value -
12 Period end -
Comprehensive risk charge ("CRC") (99.9% confidence interval)
13 Maximum value -
14 Average value -
15 Minimum value -
16 Period end -
17 Floor -
Table 46: MR4 – Comparison of VaR estimates with gains or losses
While comparing the daily VaR measures to the actual and hypothetical profit and loss ("P&L") for the backtesting, one loss side exception is observed in
December 2017 due to exceptional market volatility approaching the end of the year. Some profit side exceptions are identified for actual P&L and those
are mainly driven by intraday profit arising from trading activities.
The backtesting process applies only to regulatory trading book positions. The actual P&L excludes reserve which are resulted from regulatory banking
book positions and also fee and commission which are non-modelled items.
53
BANKING DISCLOSURE STATEMENT (unaudited) (continued)
Other disclosures
Interest rate exposures in the banking book
Table 47: Change in projected net interest income arising from a shift in yield curves
25bp 25bp
increase decrease
at the at the
100bp 100bp beginning beginning
parallel parallel of each of each
increase decrease quarter quarter
HK$m HK$m HK$m HK$m
Change in 2018 projected net interest income
- Hong Kong dollar ("HKD") 2,045 (3,858) 1,496 (2,287)
- US dollar ("USD") 555 (1,154) 374 (670)
- other 716 (601) 420 (362)
Total 3,316 (5,613) 2,290 (3,319)
Change in 2017 projected net interest income
- HKD 1,453 (3,227) 1,051 (1,894)
- USD 679 (1,239) 457 (719)
- other 700 (382) 389 (204)
Total 2,832 (4,848) 1,897 (2,817)
Key assumptions used in the measurement of interest rate sensitivities include business line interest rate pass-on assumptions, re-investment of maturing
assets and liabilities at market rates per shock scenario and prepayment risk. BSM is modelled based on no management actions i.e. the risk profile at the
month end is assumed to remain constant throughout the forecast horizon. The projections make other assumptions, including that contractually fixed
term positions run to maturity, managed rate products and non-interest bearing balances, such as interest-free current accounts, are subject to interest rate
risk behaviouralisation.
Non-traded interest rate risk is the risk of an adverse impact to earnings or capital due to changes in market interest rates. The risk arises from timing
mismatches in the re-pricing of non-traded assets and liabilities and is the potential adverse impact of changes in interest rates on earnings and capital.
A principal part of the Group's management of non-traded interest rate risk is to monitor the sensitivity of projected net interest income at least quarterly
under varying interest rate scenarios (simulation modelling), where all other economic variables are held constant. In its management of the risk, the
Group aims to mitigate the impact of future interest rate movements which could reduce future net interest income, while balancing the cost of hedging
activities to the current revenue stream.
The table below sets out the effect on future net interest income of an incremental 100 basis points ("bp") parallel rise or fall in yield curves at the
beginning of year from 1 January 2018 and an incremental 25bp parallel rise or fall in yield curves at the beginning of each quarter during the 12-month
period from 1 January 2018.
The interest rate sensitivities set out in the table above represent the effect of the pro forma movements in projected yield curves based on a static balance
sheet size and structure assumption. This effect, however, does not incorporate actions which would probably be taken by Balance Sheet Management
("BSM") or in the business units to mitigate the effect of interest rate risk. In reality, BSM proactively seeks to change the interest rate risk profile to
optimise net revenues. The net interest income sensitivity calculations assume that interest rates of all maturities move by the same amount in the "up-
shock" scenario. Rates are not assumed to become negative in the "down-shock" scenario unless the central bank rate is already negative and then not
assumed to go further negative, which may, in certain currencies, effectively result in non-parallel shock. In addition, the net interest income sensitivity
calculations take into account of the effect on net interest income of anticipated differences in changes between interbank interest rates and interest rates
over which the entity has discretion in terms of the timing and extent of rate changes.
54
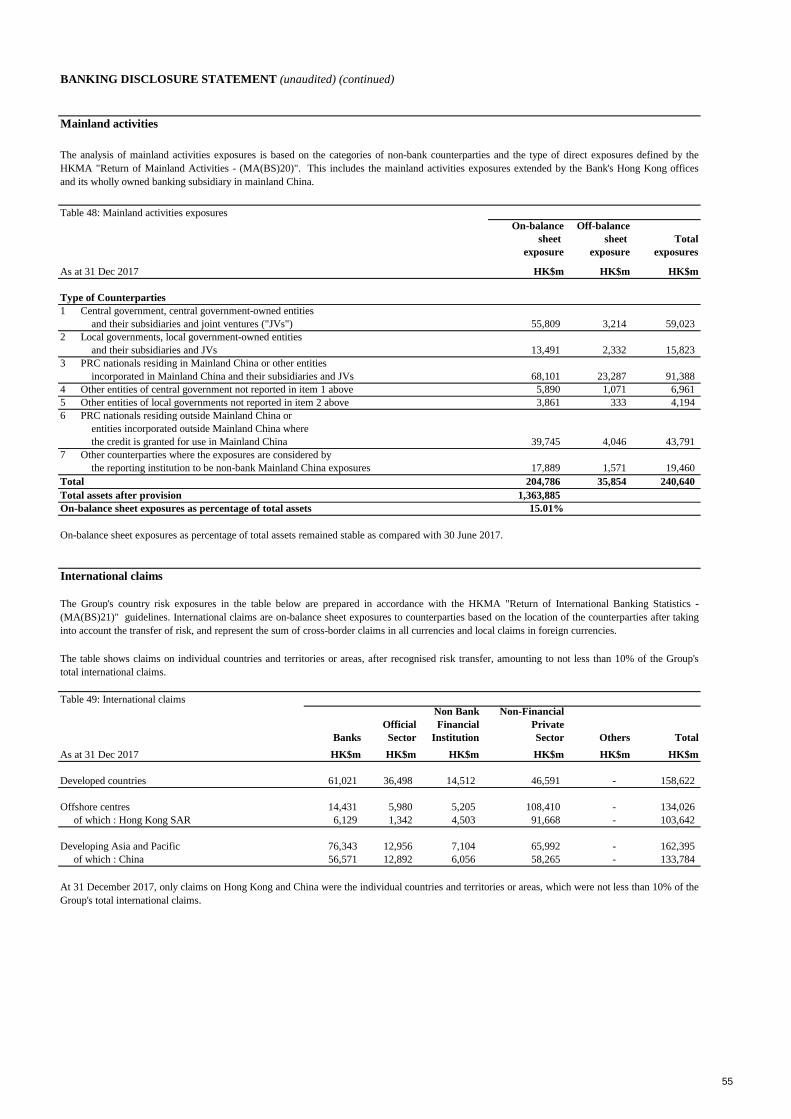
BANKING DISCLOSURE STATEMENT (unaudited) (continued)
Mainland activities
Table 48: Mainland activities exposures
On-balance Off-balance
sheet sheet Total
exposure exposure exposures
As at 31 Dec 2017 HK$m HK$m HK$m
Type of Counterparties
1 Central government, central government-owned entities
and their subsidiaries and joint ventures ("JVs") 55,809 3,214 59,023
2 Local governments, local government-owned entities
and their subsidiaries and JVs 13,491 2,332 15,823
3 PRC nationals residing in Mainland China or other entities
incorporated in Mainland China and their subsidiaries and JVs 68,101 23,287 91,388
4 Other entities of central government not reported in item 1 above 5,890 1,071 6,961
5 Other entities of local governments not reported in item 2 above 3,861 333 4,194
6 PRC nationals residing outside Mainland China or
entities incorporated outside Mainland China where
the credit is granted for use in Mainland China 39,745 4,046 43,791
7 Other counterparties where the exposures are considered by
the reporting institution to be non-bank Mainland China exposures 17,889 1,571 19,460
Total 204,786 35,854 240,640
Total assets after provision 1,363,885
On-balance sheet exposures as percentage of total assets 15.01%
International claims
Table 49: International claims
Non Bank Non-Financial
Official Financial Private
Banks Sector Institution Sector Others Total
As at 31 Dec 2017 HK$m HK$m HK$m HK$m HK$m HK$m
Developed countries 61,021 36,498 14,512 46,591 - 158,622
Offshore centres 14,431 5,980 5,205 108,410 - 134,026
of which : Hong Kong SAR 6,129 1,342 4,503 91,668 - 103,642
Developing Asia and Pacific 76,343 12,956 7,104 65,992 - 162,395
of which : China 56,571 12,892 6,056 58,265 - 133,784
At 31 December 2017, only claims on Hong Kong and China were the individual countries and territories or areas, which were not less than 10% of the
Group's total international claims.
The analysis of mainland activities exposures is based on the categories of non-bank counterparties and the type of direct exposures defined by the
HKMA "Return of Mainland Activities - (MA(BS)20)". This includes the mainland activities exposures extended by the Bank's Hong Kong offices
and its wholly owned banking subsidiary in mainland China.
On-balance sheet exposures as percentage of total assets remained stable as compared with 30 June 2017.
The Group's country risk exposures in the table below are prepared in accordance with the HKMA "Return of International Banking Statistics -
(MA(BS)21)" guidelines. International claims are on-balance sheet exposures to counterparties based on the location of the counterparties after taking
into account the transfer of risk, and represent the sum of cross-border claims in all currencies and local claims in foreign currencies.
The table shows claims on individual countries and territories or areas, after recognised risk transfer, amounting to not less than 10% of the Group's
total international claims.
55
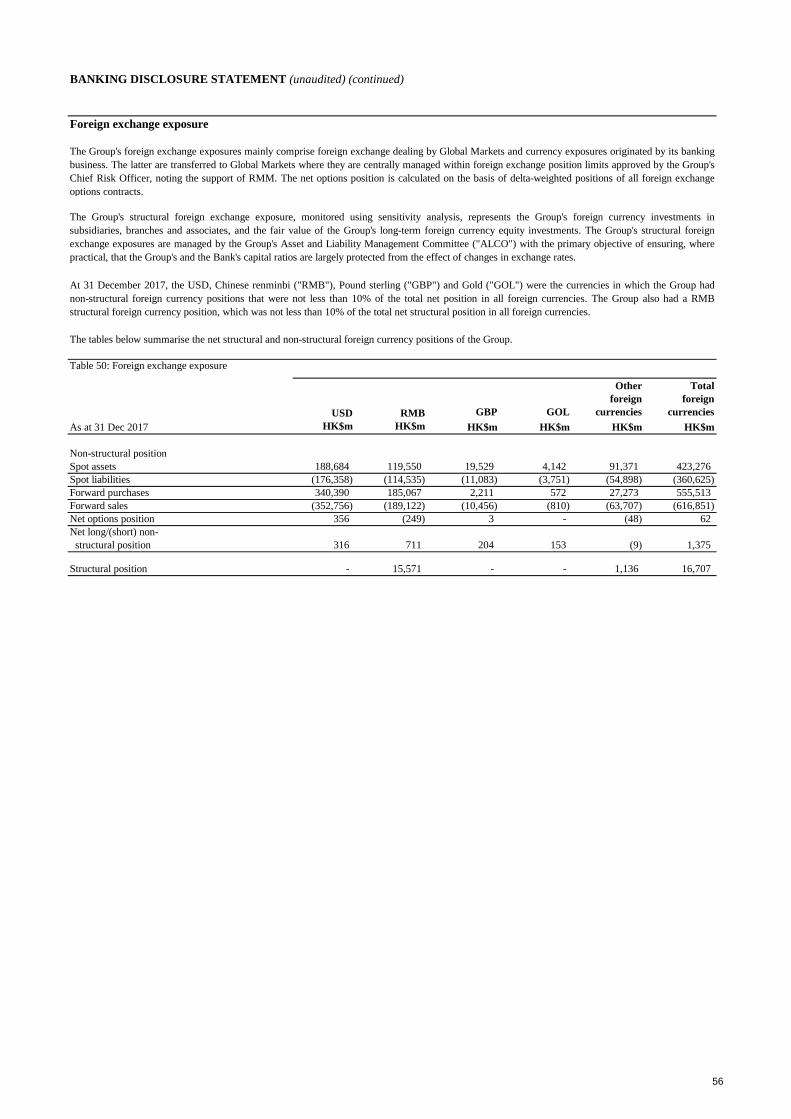
BANKING DISCLOSURE STATEMENT (unaudited) (continued)
Foreign exchange exposure
The tables below summarise the net structural and non-structural foreign currency positions of the Group.
Table 50: Foreign exchange exposure
Other Total
foreign foreign
USD RMB GBP GOL currencies currencies
As at 31 Dec 2017 HK$m HK$m HK$m HK$m HK$m HK$m
Non-structural position
Spot assets 188,684 119,550 19,529 4,142 91,371 423,276
Spot liabilities (176,358) (114,535) (11,083) (3,751) (54,898) (360,625)
Forward purchases 340,390 185,067 2,211 572 27,273 555,513
Forward sales (352,756) (189,122) (10,456) (810) (63,707) (616,851)
Net options position 356 (249) 3 - (48) 62
Net long/(short) non-
structural position 316 711 204 153 (9) 1,375
Structural position - 15,571 - - 1,136 16,707
The Group's foreign exchange exposures mainly comprise foreign exchange dealing by Global Markets and currency exposures originated by its banking
business. The latter are transferred to Global Markets where they are centrally managed within foreign exchange position limits approved by the Group's
Chief Risk Officer, noting the support of RMM. The net options position is calculated on the basis of delta-weighted positions of all foreign exchange
options contracts.
The Group's structural foreign exchange exposure, monitored using sensitivity analysis, represents the Group's foreign currency investments in
subsidiaries, branches and associates, and the fair value of the Group's long-term foreign currency equity investments. The Group's structural foreign
exchange exposures are managed by the Group's Asset and Liability Management Committee ("ALCO") with the primary objective of ensuring, where
practical, that the Group's and the Bank's capital ratios are largely protected from the effect of changes in exchange rates.
At 31 December 2017, the USD, Chinese renminbi ("RMB"), Pound sterling ("GBP") and Gold ("GOL") were the currencies in which the Group had
non-structural foreign currency positions that were not less than 10% of the total net position in all foreign currencies. The Group also had a RMB
structural foreign currency position, which was not less than 10% of the total net structural position in all foreign currencies.
56
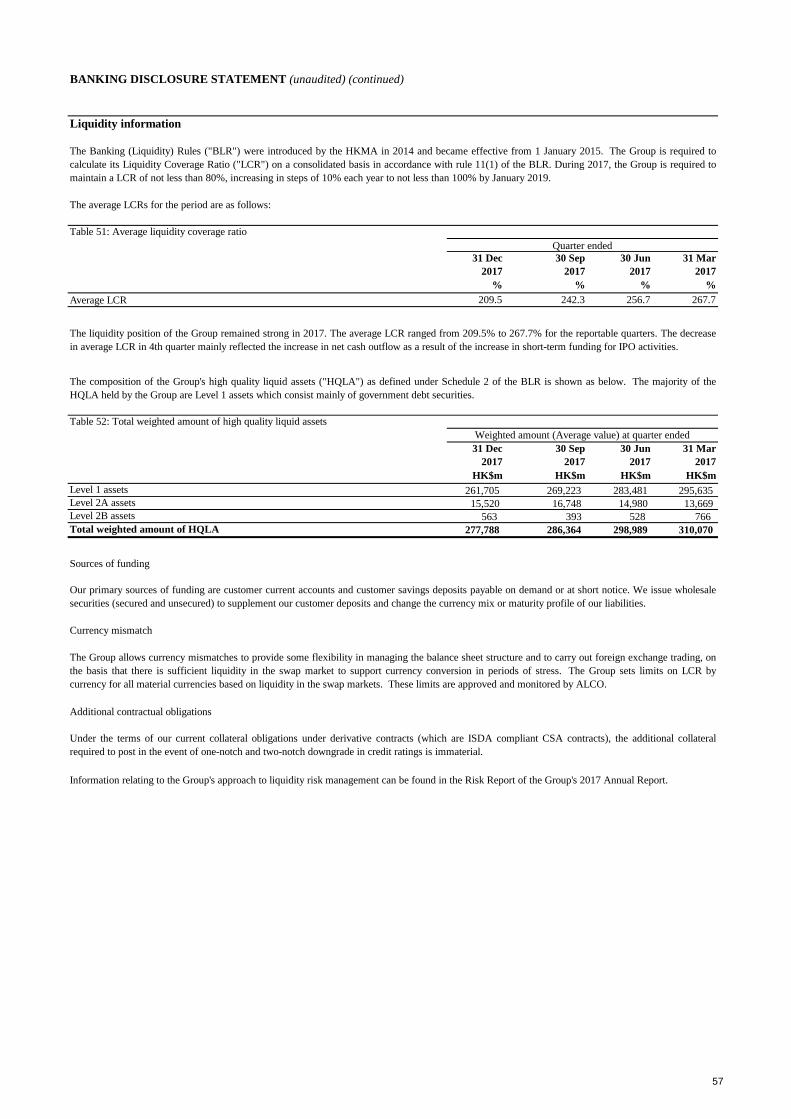
BANKING DISCLOSURE STATEMENT (unaudited) (continued)
Liquidity information
The average LCRs for the period are as follows:
Table 51: Average liquidity coverage ratio
31 Dec
2017
30 Sep
2017
30 Jun
2017
31 Mar
2017
% % % %
Average LCR 209.5 242.3 256.7 267.7
Table 52: Total weighted amount of high quality liquid assets
31 Dec
2017
30 Sep
2017
30 Jun
2017
31 Mar
2017
HK$m HK$m HK$m HK$m
Level 1 assets 261,705 269,223 283,481 295,635
Level 2A assets 15,520 16,748 14,980 13,669
Level 2B assets 563 393 528 766
Total weighted amount of HQLA 277,788 286,364 298,989 310,070
Sources of funding
Currency mismatch
Additional contractual obligations
The liquidity position of the Group remained strong in 2017. The average LCR ranged from 209.5% to 267.7% for the reportable quarters. The decrease
in average LCR in 4th quarter mainly reflected the increase in net cash outflow as a result of the increase in short-term funding for IPO activities.
The Banking (Liquidity) Rules ("BLR") were introduced by the HKMA in 2014 and became effective from 1 January 2015. The Group is required to
calculate its Liquidity Coverage Ratio ("LCR") on a consolidated basis in accordance with rule 11(1) of the BLR. During 2017, the Group is required to
maintain a LCR of not less than 80%, increasing in steps of 10% each year to not less than 100% by January 2019.
Quarter ended
The composition of the Group's high quality liquid assets ("HQLA") as defined under Schedule 2 of the BLR is shown as below. The majority of the
HQLA held by the Group are Level 1 assets which consist mainly of government debt securities.
Weighted amount (Average value) at quarter ended
Our primary sources of funding are customer current accounts and customer savings deposits payable on demand or at short notice. We issue wholesale
securities (secured and unsecured) to supplement our customer deposits and change the currency mix or maturity profile of our liabilities.
The Group allows currency mismatches to provide some flexibility in managing the balance sheet structure and to carry out foreign exchange trading, on
the basis that there is sufficient liquidity in the swap market to support currency conversion in periods of stress. The Group sets limits on LCR by
currency for all material currencies based on liquidity in the swap markets. These limits are approved and monitored by ALCO.
Under the terms of our current collateral obligations under derivative contracts (which are ISDA compliant CSA contracts), the additional collateral
required to post in the event of one-notch and two-notch downgrade in credit ratings is immaterial.
Information relating to the Group's approach to liquidity risk management can be found in the Risk Report of the Group's 2017 Annual Report.
57
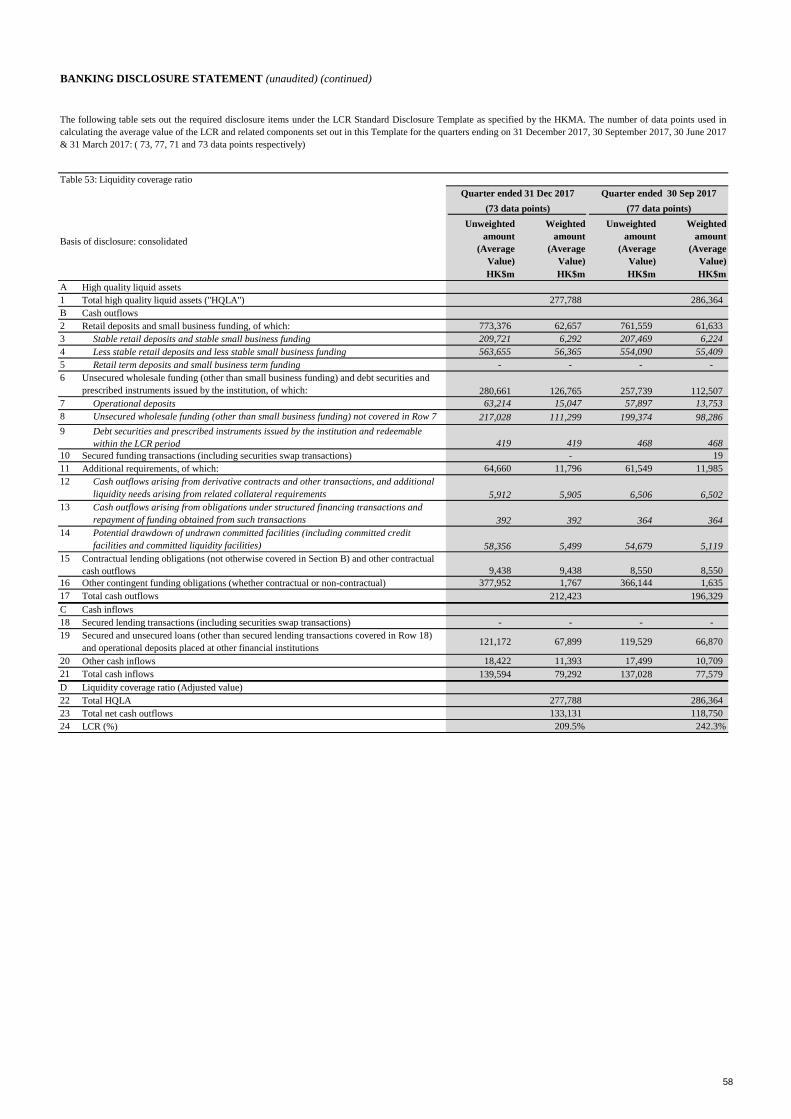
BANKING DISCLOSURE STATEMENT (unaudited) (continued)
Table 53: Liquidity coverage ratio
Unweighted
amount
(Average
Value)
Weighted
amount
(Average
Value)
Unweighted
amount
(Average
Value)
Weighted
amount
(Average
Value)
HK$m HK$m HK$m HK$m
A High quality liquid assets
1 Total high quality liquid assets ("HQLA") 277,788 286,364
B Cash outflows
2 Retail deposits and small business funding, of which: 773,376 62,657 761,559 61,633
3 Stable retail deposits and stable small business funding 209,721 6,292 207,469 6,224
4 Less stable retail deposits and less stable small business funding 563,655 56,365 554,090 55,409
5 Retail term deposits and small business term funding - - - -
6 Unsecured wholesale funding (other than small business funding) and debt securities and
prescribed instruments issued by the institution, of which: 280,661 126,765 257,739 112,507
7 Operational deposits 63,214 15,047 57,897 13,753
8 Unsecured wholesale funding (other than small business funding) not covered in Row 7 217,028 111,299 199,374 98,286
9 Debt securities and prescribed instruments issued by the institution and redeemable
within the LCR period 419 419 468 468
10 Secured funding transactions (including securities swap transactions) - 19
11 Additional requirements, of which: 64,660 11,796 61,549 11,985
12 Cash outflows arising from derivative contracts and other transactions, and additional
liquidity needs arising from related collateral requirements 5,912 5,905 6,506 6,502
13 Cash outflows arising from obligations under structured financing transactions and
repayment of funding obtained from such transactions 392 392 364 364
14 Potential drawdown of undrawn committed facilities (including committed credit
facilities and committed liquidity facilities) 58,356 5,499 54,679 5,119
15 Contractual lending obligations (not otherwise covered in Section B) and other contractual
cash outflows 9,438 9,438 8,550 8,550
16 Other contingent funding obligations (whether contractual or non-contractual) 377,952 1,767 366,144 1,635
17 Total cash outflows 212,423 196,329
C Cash inflows
18 Secured lending transactions (including securities swap transactions) - - - -
19 Secured and unsecured loans (other than secured lending transactions covered in Row 18)
and operational deposits placed at other financial institutions121,172 67,899 119,529 66,870
20 Other cash inflows 18,422 11,393 17,499 10,709
21 Total cash inflows 139,594 79,292 137,028 77,579
D Liquidity coverage ratio (Adjusted value)
22 Total HQLA 277,788 286,364
23 Total net cash outflows 133,131 118,750
24 LCR (%) 209.5% 242.3%
The following table sets out the required disclosure items under the LCR Standard Disclosure Template as specified by the HKMA. The number of data points used in
calculating the average value of the LCR and related components set out in this Template for the quarters ending on 31 December 2017, 30 September 2017, 30 June 2017
& 31 March 2017: ( 73, 77, 71 and 73 data points respectively)
Quarter ended 31 Dec 2017
(73 data points)
Quarter ended 30 Sep 2017
(77 data points)
Basis of disclosure: consolidated
58
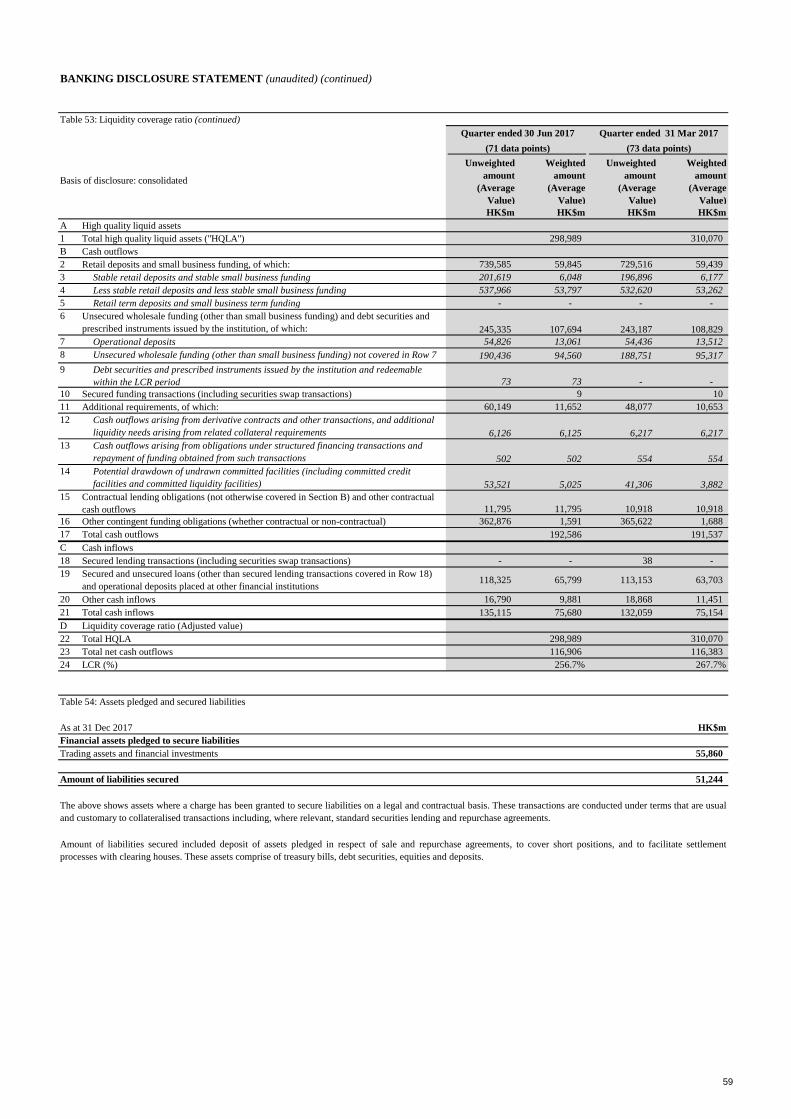
BANKING DISCLOSURE STATEMENT (unaudited) (continued)
Table 53: Liquidity coverage ratio (continued)
Unweighted
amount
(Average
Value)
Weighted
amount
(Average
Value)
Unweighted
amount
(Average
Value)
Weighted
amount
(Average
Value)
HK$m HK$m HK$m HK$m
A High quality liquid assets
1 Total high quality liquid assets ("HQLA") 298,989 310,070
B Cash outflows
2 Retail deposits and small business funding, of which: 739,585 59,845 729,516 59,439
3 Stable retail deposits and stable small business funding 201,619 6,048 196,896 6,177
4 Less stable retail deposits and less stable small business funding 537,966 53,797 532,620 53,262
5 Retail term deposits and small business term funding - - - -
6 Unsecured wholesale funding (other than small business funding) and debt securities and
prescribed instruments issued by the institution, of which: 245,335 107,694 243,187 108,829
7 Operational deposits 54,826 13,061 54,436 13,512
8 Unsecured wholesale funding (other than small business funding) not covered in Row 7 190,436 94,560 188,751 95,317
9 Debt securities and prescribed instruments issued by the institution and redeemable
within the LCR period 73 73 - -
10 Secured funding transactions (including securities swap transactions) 9 10
11 Additional requirements, of which: 60,149 11,652 48,077 10,653
12 Cash outflows arising from derivative contracts and other transactions, and additional
liquidity needs arising from related collateral requirements 6,126 6,125 6,217 6,217
13 Cash outflows arising from obligations under structured financing transactions and
repayment of funding obtained from such transactions 502 502 554 554
14 Potential drawdown of undrawn committed facilities (including committed credit
facilities and committed liquidity facilities) 53,521 5,025 41,306 3,882
15 Contractual lending obligations (not otherwise covered in Section B) and other contractual
cash outflows 11,795 11,795 10,918 10,918
16 Other contingent funding obligations (whether contractual or non-contractual) 362,876 1,591 365,622 1,688
17 Total cash outflows 192,586 191,537
C Cash inflows
18 Secured lending transactions (including securities swap transactions) - - 38 -
19 Secured and unsecured loans (other than secured lending transactions covered in Row 18)
and operational deposits placed at other financial institutions118,325 65,799 113,153 63,703
20 Other cash inflows 16,790 9,881 18,868 11,451
21 Total cash inflows 135,115 75,680 132,059 75,154
D Liquidity coverage ratio (Adjusted value)
22 Total HQLA 298,989 310,070
23 Total net cash outflows 116,906 116,383
24 LCR (%) 256.7% 267.7%
Table 54: Assets pledged and secured liabilities
As at 31 Dec 2017 HK$m
Financial assets pledged to secure liabilities
Trading assets and financial investments 55,860
Amount of liabilities secured 51,244
Quarter ended 30 Jun 2017
(71 data points)
Quarter ended 31 Mar 2017
(73 data points)
The above shows assets where a charge has been granted to secure liabilities on a legal and contractual basis. These transactions are conducted under terms that are usual
and customary to collateralised transactions including, where relevant, standard securities lending and repurchase agreements.
Amount of liabilities secured included deposit of assets pledged in respect of sale and repurchase agreements, to cover short positions, and to facilitate settlement
processes with clearing houses. These assets comprise of treasury bills, debt securities, equities and deposits.
Basis of disclosure: consolidated
59
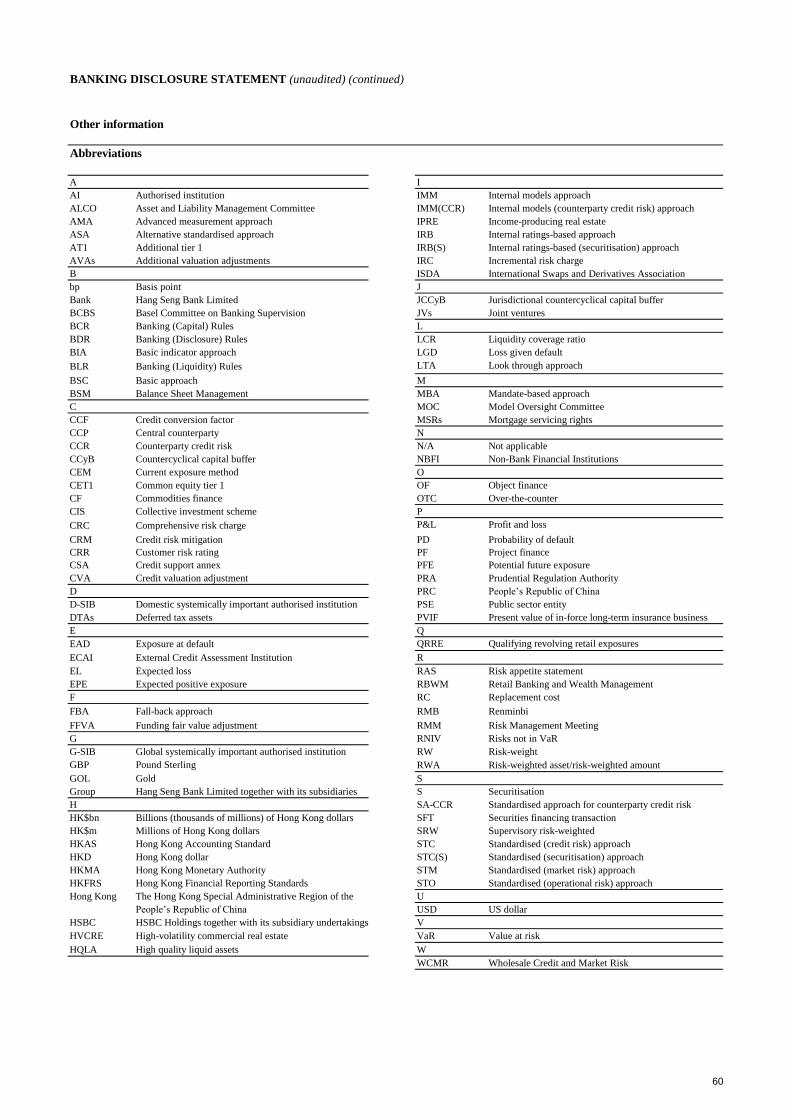
BANKING DISCLOSURE STATEMENT (unaudited) (continued)
Other information
Abbreviations
A I
AI Authorised institution IMM Internal models approach
ALCO Asset and Liability Management Committee IMM(CCR) Internal models (counterparty credit risk) approach
AMA Advanced measurement approach IPRE Income-producing real estate
ASA Alternative standardised approach IRB Internal ratings-based approach
AT1 Additional tier 1 IRB(S) Internal ratings-based (securitisation) approach
AVAs Additional valuation adjustments IRC Incremental risk charge
B ISDA International Swaps and Derivatives Association
bp Basis point J
Bank Hang Seng Bank Limited JCCyB Jurisdictional countercyclical capital buffer
BCBS Basel Committee on Banking Supervision JVs Joint ventures
BCR Banking (Capital) Rules L
BDR Banking (Disclosure) Rules LCR Liquidity coverage ratio
BIA Basic indicator approach LGD Loss given default
BLR Banking (Liquidity) Rules LTA Look through approach
BSC Basic approach M
BSM Balance Sheet Management MBA Mandate-based approach
C MOC Model Oversight Committee
CCF Credit conversion factor MSRs Mortgage servicing rights
CCP Central counterparty N
CCR Counterparty credit risk N/A Not applicable
CCyB Countercyclical capital buffer NBFI Non-Bank Financial Institutions
CEM Current exposure method O
CET1 Common equity tier 1 OF Object finance
CF Commodities finance OTC Over-the-counter
CIS Collective investment scheme P
CRC Comprehensive risk charge P&L Profit and loss
CRM Credit risk mitigation PD Probability of default
CRR Customer risk rating PF Project finance
CSA Credit support annex PFE Potential future exposure
CVA Credit valuation adjustment PRA Prudential Regulation Authority
D PRC People’s Republic of China
D-SIB Domestic systemically important authorised institution PSE Public sector entity
DTAs Deferred tax assets PVIF Present value of in-force long-term insurance business
E Q
EAD Exposure at default QRRE Qualifying revolving retail exposures
ECAI External Credit Assessment Institution R
EL Expected loss RAS Risk appetite statement
EPE Expected positive exposure RBWM Retail Banking and Wealth Management
F RC Replacement cost
FBA Fall-back approach RMB Renminbi
FFVA Funding fair value adjustment RMM Risk Management Meeting
G RNIV Risks not in VaR
G-SIB Global systemically important authorised institution RW Risk-weight
GBP Pound Sterling RWA Risk-weighted asset/risk-weighted amount
GOL Gold S
Group Hang Seng Bank Limited together with its subsidiaries S Securitisation
H SA-CCR Standardised approach for counterparty credit risk
HK$bn Billions (thousands of millions) of Hong Kong dollars SFT Securities financing transaction
HK$m Millions of Hong Kong dollars SRW Supervisory risk-weighted
HKAS Hong Kong Accounting Standard STC Standardised (credit risk) approach
HKD Hong Kong dollar STC(S) Standardised (securitisation) approach
HKMA Hong Kong Monetary Authority STM Standardised (market risk) approach
HKFRS Hong Kong Financial Reporting Standards STO Standardised (operational risk) approach
Hong Kong The Hong Kong Special Administrative Region of the U
People’s Republic of China USD US dollar
HSBC HSBC Holdings together with its subsidiary undertakings V
HVCRE High-volatility commercial real estate VaR Value at risk
HQLA High quality liquid assets W
WCMR Wholesale Credit and Market Risk
60