mathematics guidance: key stage 3 - gov.uk
TRANSCRIPT
Mathematics guidance: Key Stage 3 Non-statutory guidance for the national curriculum in England
September 2021
2
Acknowledgements We would like to thank and acknowledge the following people involved in the production of this publication: Debbie Barker; Frances Carr; Alf Coles; Clare Dawson; Becky Donaldson; Pete Griffin; Jane Hawkins; Alison Hopper; Rachel Houghton; Carol Knights; Steve Lomax; Steve McCormack; Richard Perring; Pete Sides; Dr Mary Stevenson; Charlie Stripp; Dr Nicola Trubridge; Andrew Young and the Maths Hubs Secondary Mastery Specialists. All illustrations by Steve Evans © NCETM unless otherwise stated. Extracts from mathematics past papers from Standards & Testing Agency and other Public sector information licensed under the Open Government Licence v3.0. Extracts from the national curriculum: Department for Education, 2013, National curriculum in England: mathematics programmes of study Graph of world population from www.gapminder.org Reference made to the work of: E. Gray & D. Tall, (1991) Duality, Ambiguity and Flexibility in Successful Mathematical Thinking, (Coventry, University of Warwick); K. M. Hart (ed.), (1981) Children's Understanding of Mathematics: 11–16, (London, John Murray); Küchemann, D. (1978) Children’s Understanding of Numerical Variables, Mathematics in School, 7(4), 23–26; T. Nunes & P. Bryant, (2009) Paper 3: Understanding rational numbers and intensive quantities. In T. Nunes, P. Bryant and A. Watson, Key understandings in mathematics learning: A report to the Nuffield Foundation, https://www.nuffieldfoundation.org/project/key-understandings-in-mathematics-learning; M.C. Mitchelmore & P. White, (2000) Development of angle concepts by progressive abstraction and generalisation, Educational Studies in Mathematics, 41, 209–38; D. Pratt & R. Noss, (2002), The Microevolution of Mathematical Knowledge: The Case of Randomness, Journal of the Learning Sciences, 11(4), 453–488, (Philadelphia, Taylor & Francis).
3
Contents Acknowledgements 2
Contents 3
Summary 5
Who is this publication for? 5
Aims 6
Structure of the document 7
Designing a coherent and connected curriculum 10
Purpose and rationale 10
Guidance 11
Sample Key Stage 3 curriculum framework 16
Year 7 sample curriculum framework 19
Year 8 sample curriculum framework 21
Year 9 sample curriculum framework 23
Split statements of knowledge, skills and understanding 24
Year 7 autumn term 26
Place value 26
Properties of number: factors, multiples, squares and cubes 30
Arithmetic procedures with integers and decimals 41
Expressions and equations 56
Year 7 spring term 67
Plotting coordinates 67
Perimeter and area 73
Arithmetic procedures including fractions 80
Year 7 summer term 98
Understanding multiplicative relationships: fractions and ratio 98
Transformations 112
Year 8 autumn term 121
Estimation and rounding 121
Sequences 129
Graphical representations of linear relationships 137
4
Solving linear equations 147
Year 8 spring term 160
Understanding multiplicative relationships: percentages and proportionality 160
Statistical representations and measures 167
Statistical analysis 175
Year 8 summer term 183
Perimeter, area and volume 183
Geometrical properties: polygons 195
Constructions 204
Year 9 autumn term 212
Geometrical properties: similarity and Pythagoras’ theorem 212
Probability 222
Year 9 spring term 230
Non-linear relationships 230
Expressions and formulae 233
Trigonometry 241
Year 9 summer term 253
Standard form 253
Graphical representations 258
Appendix 1 – key ideas 267
Appendix 2 – language 279

5
Summary This publication provides non-statutory guidance from the Department for Education. It has been produced to help teachers and schools make effective use of the national curriculum to develop secondary school pupils’ mastery of mathematics.
Who is this publication for? This guidance is for:
• local authorities • school leaders, school staff and governing bodies in all maintained schools,
academies and free schools.
6
Aims This publication aims to:
• Bring greater coherence to the national curriculum for mathematics by exemplifying the statutory guidance for Key Stage 3 (DfE, 2013) and giving schools, mathematics departments and teachers further guidance on how learning in mathematics develops across Key Stage 3.
• Highlight the most important knowledge and understanding developed during Key Stage 3, the connections between different mathematical topics, and how they link back to Key Stage 2 and forward to Key Stage 4.
Key considerations concerning how to distribute the national curriculum content across the key stage are discussed. A sample model of a curriculum framework is provided to help mathematics departments structure teaching and learning effectively. Guidance is given on how teachers within a school’s mathematics department might collaborate to plan their long- and medium-term teaching.
Fundamental concepts are highlighted, including how they build on content learnt in Key Stage 2; how they will be developed in Key Stage 4; and which aspects should be prioritised and consolidated within Key Stage 3. For selected key ideas, detailed guidance is provided, including common misconceptions; teaching approaches that lead to a deep and connected understanding; and sample questions.
Teaching and learning are complex, but the intention should always be to develop students’ understanding of mathematical concepts and structures, alongside providing sufficient practice to attain fluency. This combination of developing fluency and mathematical understanding in tandem will enable students to use their learning accurately, efficiently and flexibly to reason mathematically and solve routine and non-routine problems, so meeting the aims of the national curriculum.
The guidance in this document and examples of practice provide teachers with a variety of ways to offer their students opportunities to develop their mathematical understanding and skills. Teachers should also supplement this learning activity with opportunities for students to apply their knowledge to questions where a method for solution is not immediately obvious, but draws upon previously mastered mathematics.
7
Structure of the document The first sections of this document give guidance to departments about long-term planning for cohesive student learning. Later sections are structured termly by year group, according to the order of teaching suggested in the sample curriculum framework offered on pages 16 to 25 in this document.
Each termly section is structured as follows:
Overview This section outlines how the content fits with wider mathematical learning and identifies key considerations and emphases for teaching.
Prior learning Year 7 learning is built upon the mathematical foundations established in Key Stage 2, while some later study in Key Stage 3 is also underpinned by mathematical concepts encountered earlier in the key stage. The sample curriculum framework in this document is used as a basis for an order of teaching and the suggested prior learning elements align with this progression.
Prior learning identified from Key Stage 2 includes the ‘ready-to-progress criteria’ outlined in the Key Stage 2 non-statutory guidance. The ready-to-progress statements are divided into strands as follows:
Ready-to-progress criteria strands Code
Number and place value NPV
Number facts NF
Addition and subtraction AS
Multiplication and division MD
Fractions F
Geometry G
The code 6-AS refers to elements of the addition and subtraction strand that are recommended to be learnt in Year 6. Most of the ready-to-progress criteria referred to are
8
from Year 6, but some areas of mathematical content from Years 4 and 5 are referenced where it is unlikely that there has been further study of these elements in Year 6.
Checking prior learning It is of paramount importance that teaching, at all stages, takes account of prior learning and the depth of understanding already achieved. Pitching teaching appropriately ensures that students are neither bored by repeating content which is already well understood, nor flummoxed by content which they cannot readily assimilate with their existing knowledge. Achieving this balance is arguably one of the most challenging elements of teaching.
Using formative assessment approaches to check prior learning before teaching a particular sequence of lessons can inform effective planning. In this section, sample questions are provided which teachers can use to probe the depth of prior attainment.
Language Using correct mathematical language and terminology gives students the fundamental tools to communicate their reasoning, thinking and ideas accurately and precisely, avoiding ambiguity and potential confusion. Modelling and encouraging the use of correct mathematical language will support students in using it confidently. A selection of key words and phrases that should be encouraged within Key Stage 3 is listed in each section and explained in Appendix 2.
Progression through key ideas In the sample curriculum framework there are between two and four core concepts to be taught in each school term. These are broken down into statements of knowledge, skills and understanding that students should aim to achieve. These statements are further divided into key ideas, which are listed in this section throughout. The broader breakdown will help with medium-term planning, whereas the more detailed breakdown will aid short-term planning.
There is no suggestion that that each key idea represents a lesson. The amount of classroom time required for different key ideas to be mastered will vary. Developing a deep and connected understanding of these key ideas will enable students to make secure progress through the curriculum.
Key ideas with an asterisk * after them are then exemplified.
A full list of key ideas can be found in Appendix 1.
9
Exemplified significant key ideas For a selection of significant key ideas, further teaching guidance is given. Within each exemplification, consideration is given to the common difficulties teachers may encounter and the misconceptions students may hold. Teaching approaches and useful representations are also considered. A few examples of questions which could be used within teaching are then given together with some commentary. The commentary may draw attention to: how the particular example might be used; how it is structured and why this is beneficial to learners; misconceptions that it will help elicit; how the representation used will aid students in deepening their understanding; or some other aspect of pedagogy.
The examples included in this document are drawn from the NCETM’s Key Stage 3 Professional Development materials; further examples and commentary are offered within these materials.
10
Designing a coherent and connected curriculum
Purpose and rationale
High-quality teaching of mathematics in the classroom is, of course, what really makes a difference to students’ learning. For maximum impact, all teachers need to work with an agreed school mathematics curriculum (or scheme of work) which:
• Offers a clear and coherent sequencing of mathematical ideas, concepts, knowledge, and techniques both within each year and across years so that new ideas are built on the firm foundations of existing ones.
• Gives a coherent view of mathematics that highlights important unifying ideas and links between them so that students experience mathematics not as a collection of disparate topics but as a connected whole.
The National Curriculum for mathematics sets out a broad statutory overview and curriculum content entitlement for all students. It is for individual schools to determine their own curriculum to meet these statutory requirements, to be implemented in their own classrooms with their own students.
This document gives guidance about what makes for a rigorous, coherent and connected Key Stage 3 mathematics curriculum and how this might be created. Alongside this is a sample Key Stage 3 curriculum framework, arranged by year group, which includes a detailed termly breakdown of the knowledge, skills and understanding required for Key Stage 3 mathematics. The examples and guidance offered within this document can be used regardless of whether or not a school chooses to teach mathematics in the order suggested in the sample curriculum framework.
This guidance is intended to help schools structure their Key Stage 3 curriculum so that students develop a deep and connected understanding of mathematics. The following principles are particularly important for coherent curriculum design:
• Certain images, techniques and concepts are important precursors to later ideas; sequencing these correctly is an important aspect of planning and teaching.
• When introducing new ideas, it is important to make connections with earlier ideas that are already well understood.
• When something has been deeply understood and mastered, it can and should be used in the next steps of learning.
In the short term, these materials can be used by secondary mathematics departments to review and develop the structure and focus of their curriculum in the context of the severe disruption to education caused by the Covid-19 pandemic. In the longer term, they will help mathematics departments to develop their curriculum to give it greater coherence.
11
Guidance
A fundamental principle of teaching effectively in mathematics is that key ideas need to be understood deeply before moving on. A curriculum which encourages teachers to move on to the next topic too quickly, before key ideas are deeply understood, results in superficial learning. While such an approach to ‘covering’ the curriculum at a rapid pace may seem to work in the short term, in the long term it is an inefficient use of precious curriculum time, because it leads to the same key ideas being retaught year after year.
Without a coherent, connected curriculum there is a danger that students will perceive the mathematics they learn as a bewilderingly large set of separate topics, each one with its own rules and techniques to remember. Students who have this view of mathematics often see it as a hard, impenetrable subject which they find difficult to learn. In contrast, students who experience the subject as a coherent set of connected ideas tend to find learning mathematics achievable, enjoyable, and stimulating.
This is outlined in the national curriculum mathematics programmes of study.
‘Mathematics is an interconnected subject in which students need to be able to move fluently between representations of mathematical ideas. The programme of study for Key Stage 3 is organised into apparently distinct domains, but students should build on Key Stage 2 and connections across mathematical ideas to develop fluency, mathematical reasoning, and competence in solving increasingly sophisticated problems.’
A curriculum compatible with teaching for mastery rejects superficial short-term coverage in favour of developing deep, connected understanding of key ideas. This forms a secure foundation for future learning, so making more efficient use of teaching and learning time.
Discuss and agree the department’s aims and values
The design of a curriculum should be based on a department’s view of what constitutes good mathematics, good learning, and good teaching. If teachers do not already have an agreed view about this across the department, it is important to discuss shared aims and values before beginning to construct a curriculum.
The national curriculum outlines general aims for the teaching of mathematics and the NCETM has published some related themes and key principles. Teachers may find these useful as starting points.
Identify key mathematical ideas which connect topics together
The NCETM secondary PD materials offer an example of a connected view of the Key Stage 3 mathematics curriculum through its structure of themes, core concepts and key ideas. Some examples are given below.
12
• The teaching of algebra is not treated as a separate, stand-alone idea but as a natural generalisation of the structures of number and number operations.
• Multiplicative reasoning is emphasised as a key idea. It is used to connect work in fractions, percentages, ratio, and proportion, and is linked to work on enlargement, scale and many other topics.
The sample Key Stage 3 curriculum framework in this document illustrates how this can be achieved. It offers a clear structure in which over-arching themes provide the framework for a coherent and connected curriculum. Some key points to consider are given below.
Give sufficient time for learning and teaching the first time a new idea or concept is introduced. The sample Key Stage 3 curriculum framework offers an example of appropriate timings and the NCETM secondary assessment materials exemplify the important aspects of deep, embedded and sustainable understanding that are needed at each stage. Being clear about the important prerequisite knowledge from Key Stage 2 and allowing time to consolidate this and then build new Key Stage 3 ideas on these firm foundations is vital.
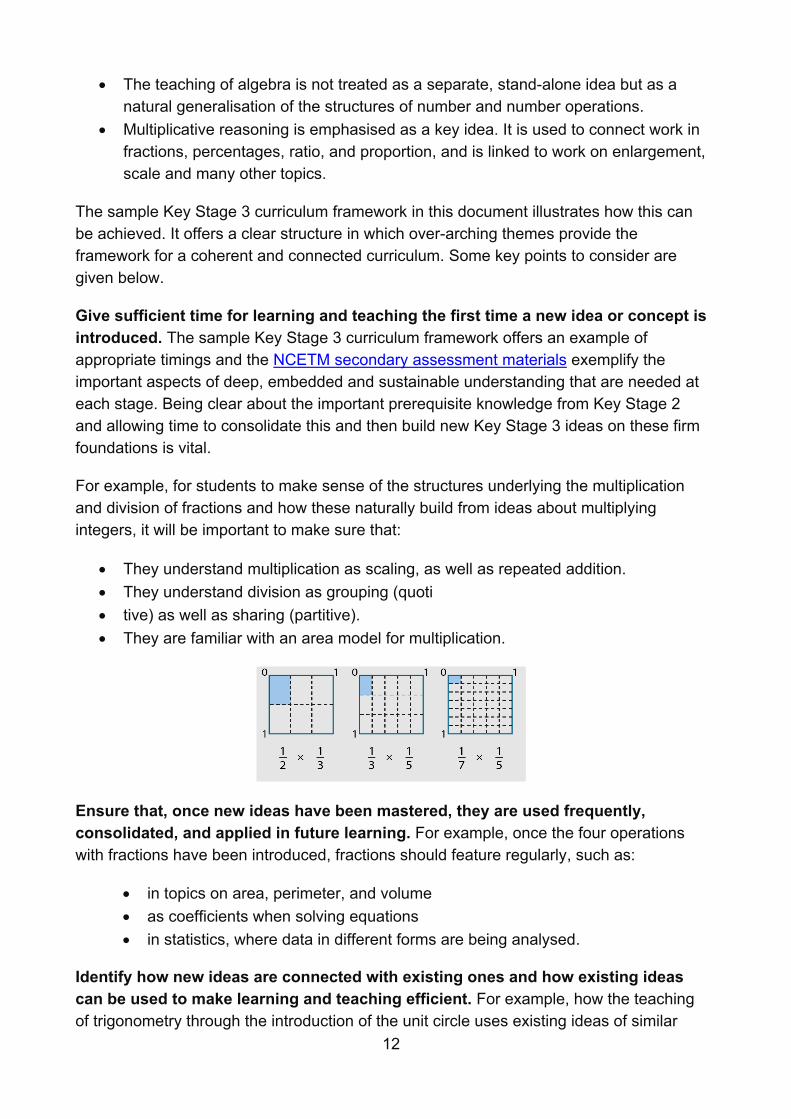
For example, for students to make sense of the structures underlying the multiplication and division of fractions and how these naturally build from ideas about multiplying integers, it will be important to make sure that:
• They understand multiplication as scaling, as well as repeated addition. • They understand division as grouping (quoti • tive) as well as sharing (partitive). • They are familiar with an area model for multiplication.
Ensure that, once new ideas have been mastered, they are used frequently, consolidated, and applied in future learning. For example, once the four operations with fractions have been introduced, fractions should feature regularly, such as:
• in topics on area, perimeter, and volume • as coefficients when solving equations • in statistics, where data in different forms are being analysed.
Identify how new ideas are connected with existing ones and how existing ideas can be used to make learning and teaching efficient. For example, how the teaching of trigonometry through the introduction of the unit circle uses existing ideas of similar
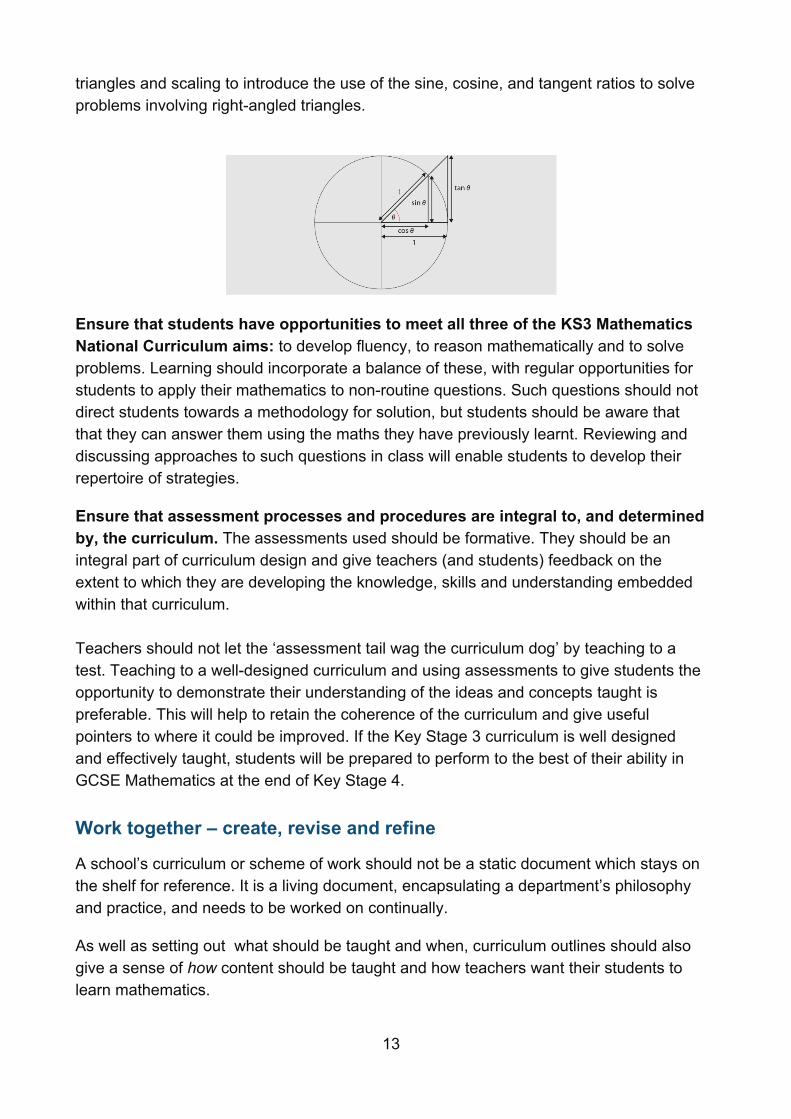
13
triangles and scaling to introduce the use of the sine, cosine, and tangent ratios to solve problems involving right-angled triangles.
Ensure that students have opportunities to meet all three of the KS3 Mathematics National Curriculum aims: to develop fluency, to reason mathematically and to solve problems. Learning should incorporate a balance of these, with regular opportunities for students to apply their mathematics to non-routine questions. Such questions should not direct students towards a methodology for solution, but students should be aware that that they can answer them using the maths they have previously learnt. Reviewing and discussing approaches to such questions in class will enable students to develop their repertoire of strategies.
Ensure that assessment processes and procedures are integral to, and determined by, the curriculum. The assessments used should be formative. They should be an integral part of curriculum design and give teachers (and students) feedback on the extent to which they are developing the knowledge, skills and understanding embedded within that curriculum. Teachers should not let the ‘assessment tail wag the curriculum dog’ by teaching to a test. Teaching to a well-designed curriculum and using assessments to give students the opportunity to demonstrate their understanding of the ideas and concepts taught is preferable. This will help to retain the coherence of the curriculum and give useful pointers to where it could be improved. If the Key Stage 3 curriculum is well designed and effectively taught, students will be prepared to perform to the best of their ability in GCSE Mathematics at the end of Key Stage 4.
Work together – create, revise and refine
A school’s curriculum or scheme of work should not be a static document which stays on the shelf for reference. It is a living document, encapsulating a department’s philosophy and practice, and needs to be worked on continually.
As well as setting out what should be taught and when, curriculum outlines should also give a sense of how content should be taught and how teachers want their students to learn mathematics.
14
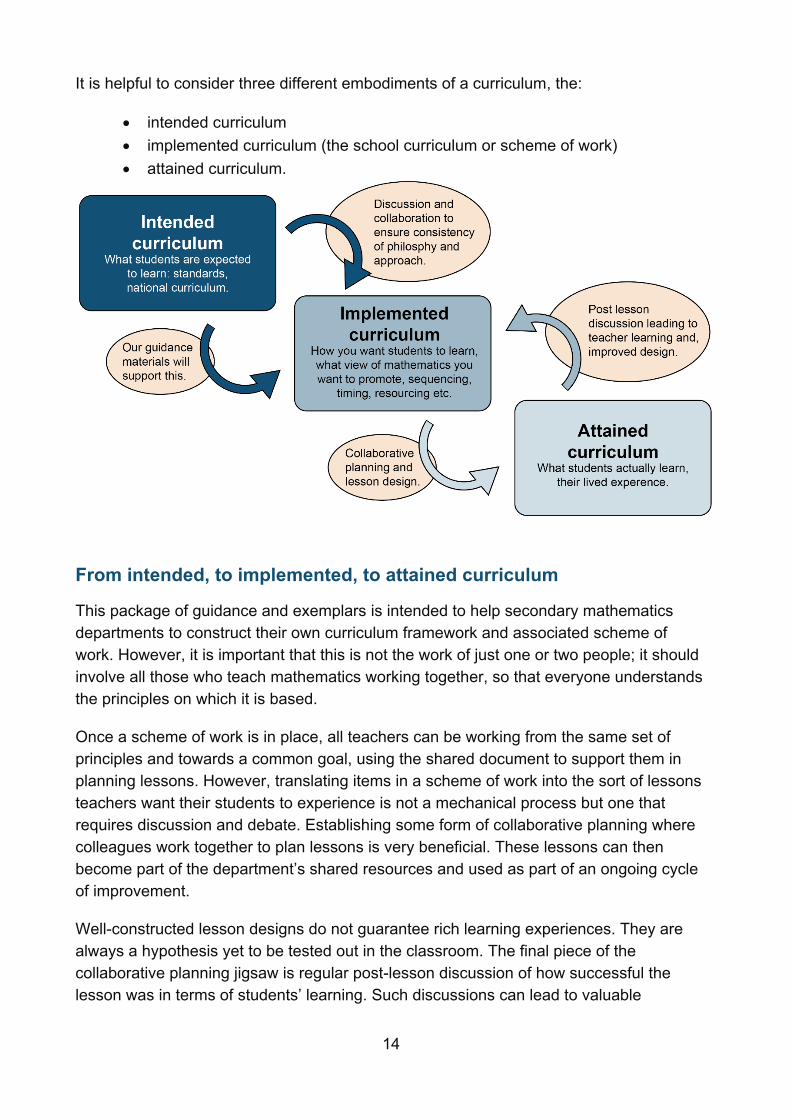
It is helpful to consider three different embodiments of a curriculum, the:
• intended curriculum • implemented curriculum (the school curriculum or scheme of work) • attained curriculum.
From intended, to implemented, to attained curriculum
This package of guidance and exemplars is intended to help secondary mathematics departments to construct their own curriculum framework and associated scheme of work. However, it is important that this is not the work of just one or two people; it should involve all those who teach mathematics working together, so that everyone understands the principles on which it is based.
Once a scheme of work is in place, all teachers can be working from the same set of principles and towards a common goal, using the shared document to support them in planning lessons. However, translating items in a scheme of work into the sort of lessons teachers want their students to experience is not a mechanical process but one that requires discussion and debate. Establishing some form of collaborative planning where colleagues work together to plan lessons is very beneficial. These lessons can then become part of the department’s shared resources and used as part of an ongoing cycle of improvement.
Well-constructed lesson designs do not guarantee rich learning experiences. They are always a hypothesis yet to be tested out in the classroom. The final piece of the collaborative planning jigsaw is regular post-lesson discussion of how successful the lesson was in terms of students’ learning. Such discussions can lead to valuable

15
professional development around subject knowledge, pedagogy and, where necessary, improved lesson design.
16
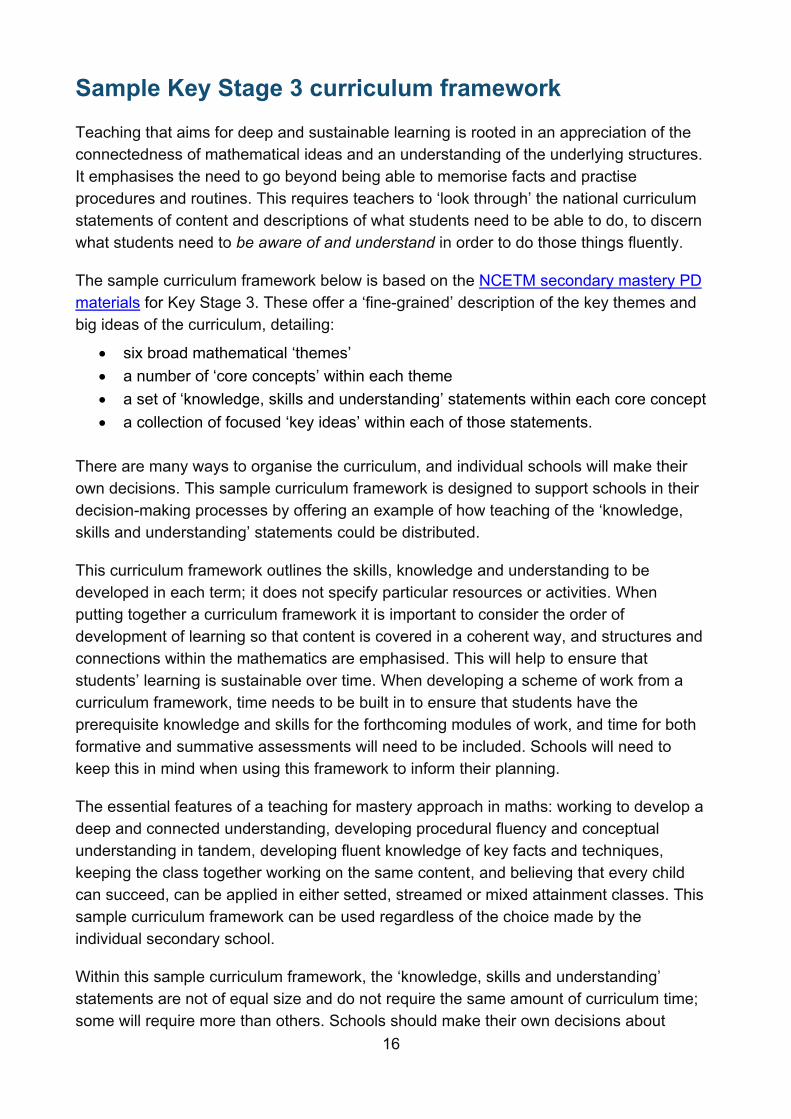
Sample Key Stage 3 curriculum framework Teaching that aims for deep and sustainable learning is rooted in an appreciation of the connectedness of mathematical ideas and an understanding of the underlying structures. It emphasises the need to go beyond being able to memorise facts and practise procedures and routines. This requires teachers to ‘look through’ the national curriculum statements of content and descriptions of what students need to be able to do, to discern what students need to be aware of and understand in order to do those things fluently.
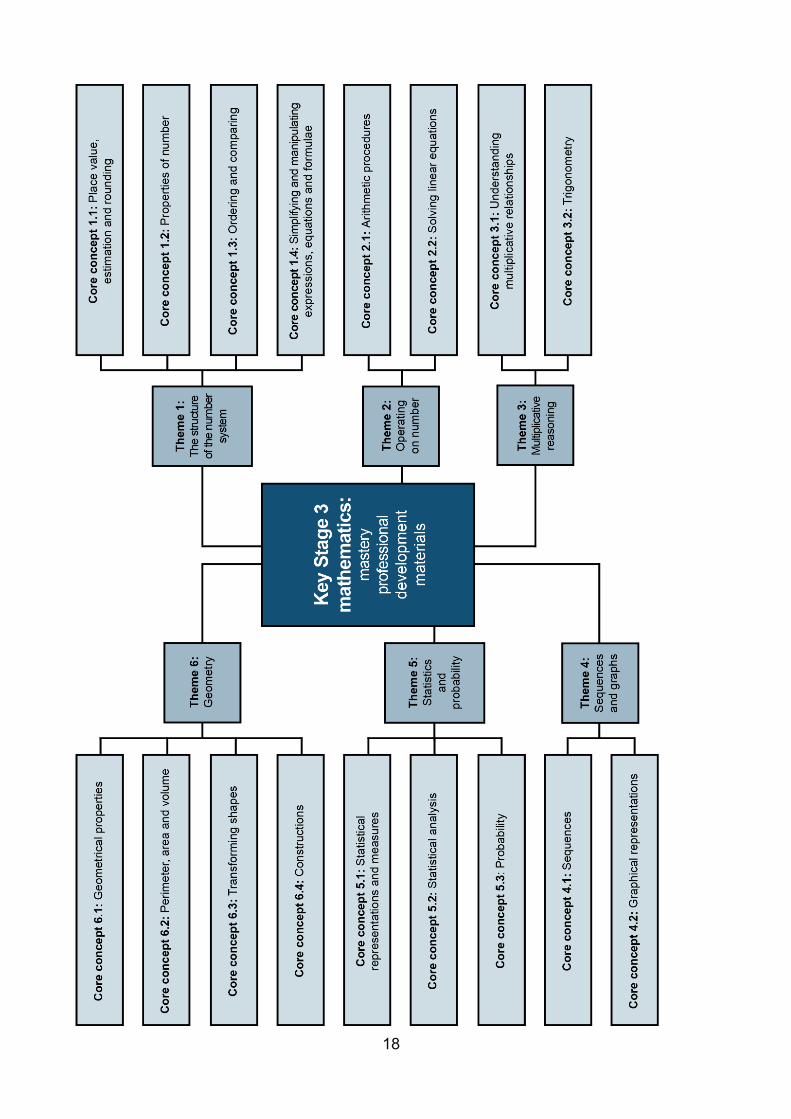
The sample curriculum framework below is based on the NCETM secondary mastery PD materials for Key Stage 3. These offer a ‘fine-grained’ description of the key themes and big ideas of the curriculum, detailing:
• six broad mathematical ‘themes’ • a number of ‘core concepts’ within each theme • a set of ‘knowledge, skills and understanding’ statements within each core concept • a collection of focused ‘key ideas’ within each of those statements.
There are many ways to organise the curriculum, and individual schools will make their own decisions. This sample curriculum framework is designed to support schools in their decision-making processes by offering an example of how teaching of the ‘knowledge, skills and understanding’ statements could be distributed.
This curriculum framework outlines the skills, knowledge and understanding to be developed in each term; it does not specify particular resources or activities. When putting together a curriculum framework it is important to consider the order of development of learning so that content is covered in a coherent way, and structures and connections within the mathematics are emphasised. This will help to ensure that students’ learning is sustainable over time. When developing a scheme of work from a curriculum framework, time needs to be built in to ensure that students have the prerequisite knowledge and skills for the forthcoming modules of work, and time for both formative and summative assessments will need to be included. Schools will need to keep this in mind when using this framework to inform their planning.
The essential features of a teaching for mastery approach in maths: working to develop a deep and connected understanding, developing procedural fluency and conceptual understanding in tandem, developing fluent knowledge of key facts and techniques, keeping the class together working on the same content, and believing that every child can succeed, can be applied in either setted, streamed or mixed attainment classes. This sample curriculum framework can be used regardless of the choice made by the individual secondary school.
Within this sample curriculum framework, the ‘knowledge, skills and understanding’ statements are not of equal size and do not require the same amount of curriculum time; some will require more than others. Schools should make their own decisions about

17
timings based on their knowledge of their students. They will take into consideration that a teaching for mastery approach includes significant time spent developing a deep understanding of the key ideas and concepts that are needed to underpin future learning. The model exemplifies a three-year Key Stage 3; it is not recommended that the content is condensed into two years as the necessary depth of understanding is unlikely to be attained within a shorter time frame.
The diagram on page 18 shows how the Key Stage 3 curriculum has been broken down into the ‘themes’ and ‘core concepts’ which relate to supporting resources in the relevant NCETM website.
18
19
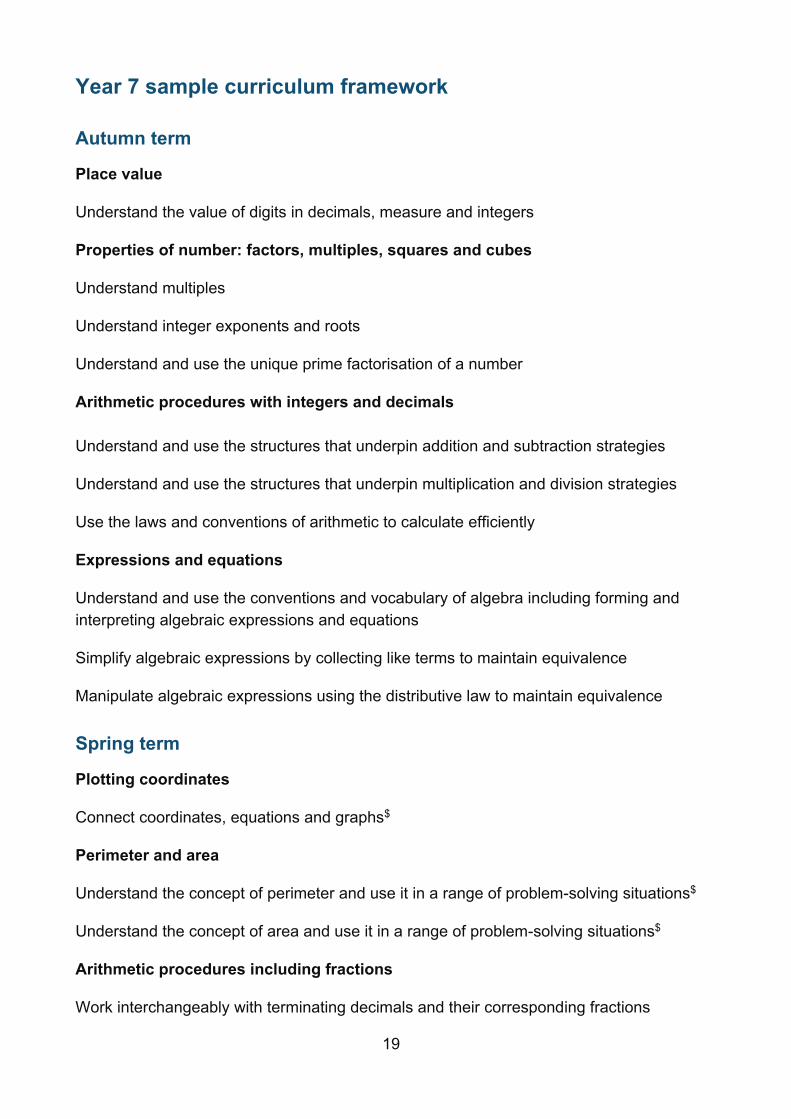
Year 7 sample curriculum framework
Autumn term
Place value
Understand the value of digits in decimals, measure and integers
Properties of number: factors, multiples, squares and cubes
Understand multiples
Understand integer exponents and roots
Understand and use the unique prime factorisation of a number
Arithmetic procedures with integers and decimals Understand and use the structures that underpin addition and subtraction strategies
Understand and use the structures that underpin multiplication and division strategies
Use the laws and conventions of arithmetic to calculate efficiently
Expressions and equations
Understand and use the conventions and vocabulary of algebra including forming and interpreting algebraic expressions and equations
Simplify algebraic expressions by collecting like terms to maintain equivalence
Manipulate algebraic expressions using the distributive law to maintain equivalence
Spring term
Plotting coordinates
Connect coordinates, equations and graphs$
Perimeter and area
Understand the concept of perimeter and use it in a range of problem-solving situations$
Understand the concept of area and use it in a range of problem-solving situations$
Arithmetic procedures including fractions
Work interchangeably with terminating decimals and their corresponding fractions
20
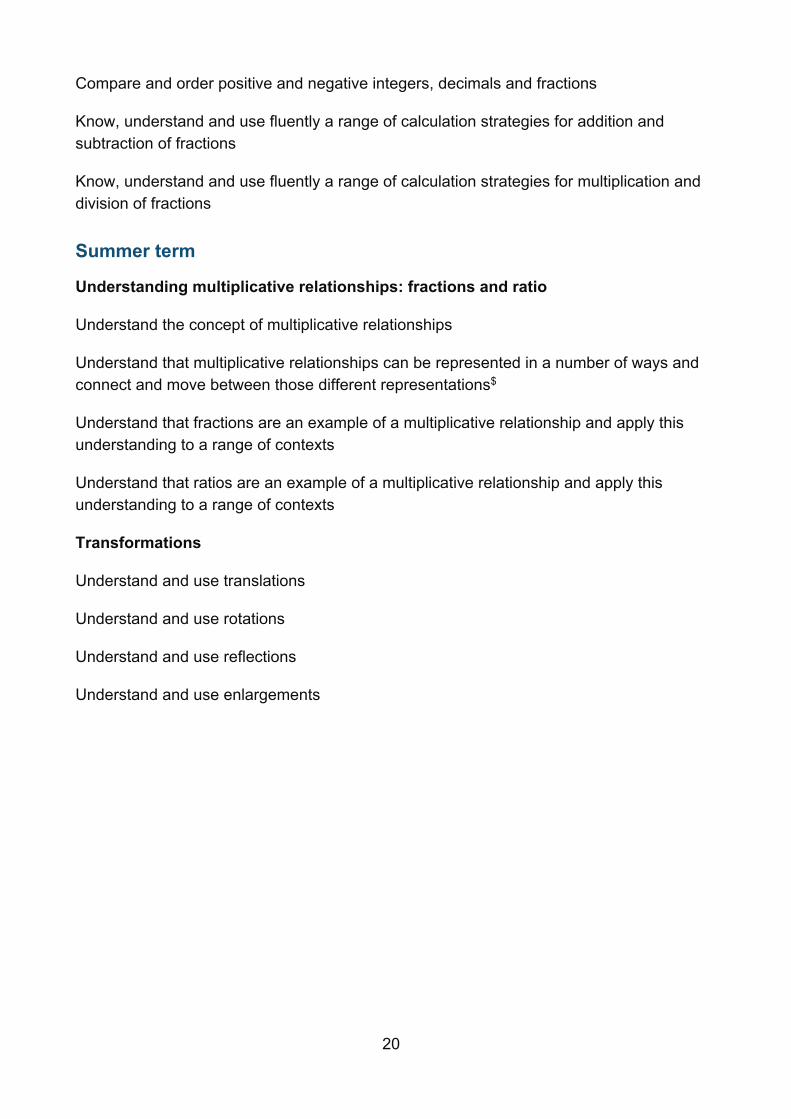
Compare and order positive and negative integers, decimals and fractions
Know, understand and use fluently a range of calculation strategies for addition and subtraction of fractions
Know, understand and use fluently a range of calculation strategies for multiplication and division of fractions
Summer term
Understanding multiplicative relationships: fractions and ratio
Understand the concept of multiplicative relationships
Understand that multiplicative relationships can be represented in a number of ways and connect and move between those different representations$
Understand that fractions are an example of a multiplicative relationship and apply this understanding to a range of contexts
Understand that ratios are an example of a multiplicative relationship and apply this understanding to a range of contexts
Transformations
Understand and use translations
Understand and use rotations
Understand and use reflections
Understand and use enlargements
21
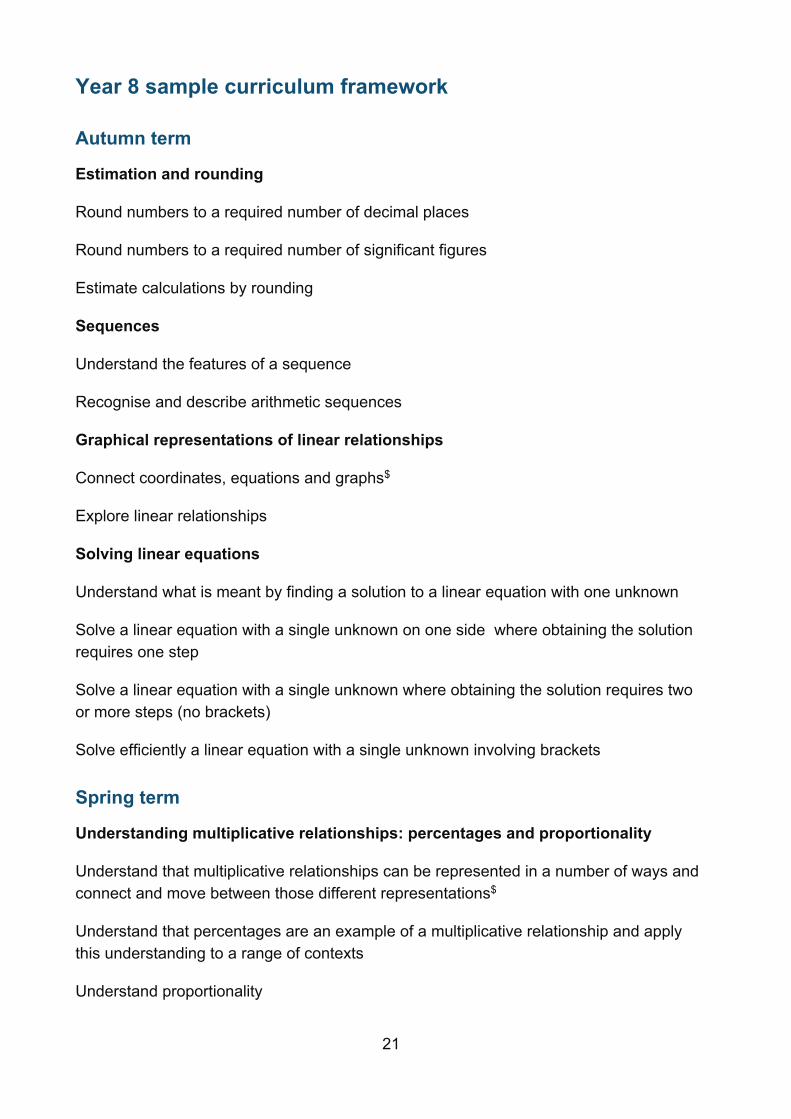
Year 8 sample curriculum framework
Autumn term
Estimation and rounding
Round numbers to a required number of decimal places
Round numbers to a required number of significant figures
Estimate calculations by rounding
Sequences
Understand the features of a sequence
Recognise and describe arithmetic sequences
Graphical representations of linear relationships
Connect coordinates, equations and graphs$
Explore linear relationships
Solving linear equations
Understand what is meant by finding a solution to a linear equation with one unknown
Solve a linear equation with a single unknown on one side where obtaining the solution requires one step
Solve a linear equation with a single unknown where obtaining the solution requires two or more steps (no brackets)
Solve efficiently a linear equation with a single unknown involving brackets
Spring term
Understanding multiplicative relationships: percentages and proportionality
Understand that multiplicative relationships can be represented in a number of ways and connect and move between those different representations$
Understand that percentages are an example of a multiplicative relationship and apply this understanding to a range of contexts
Understand proportionality
22
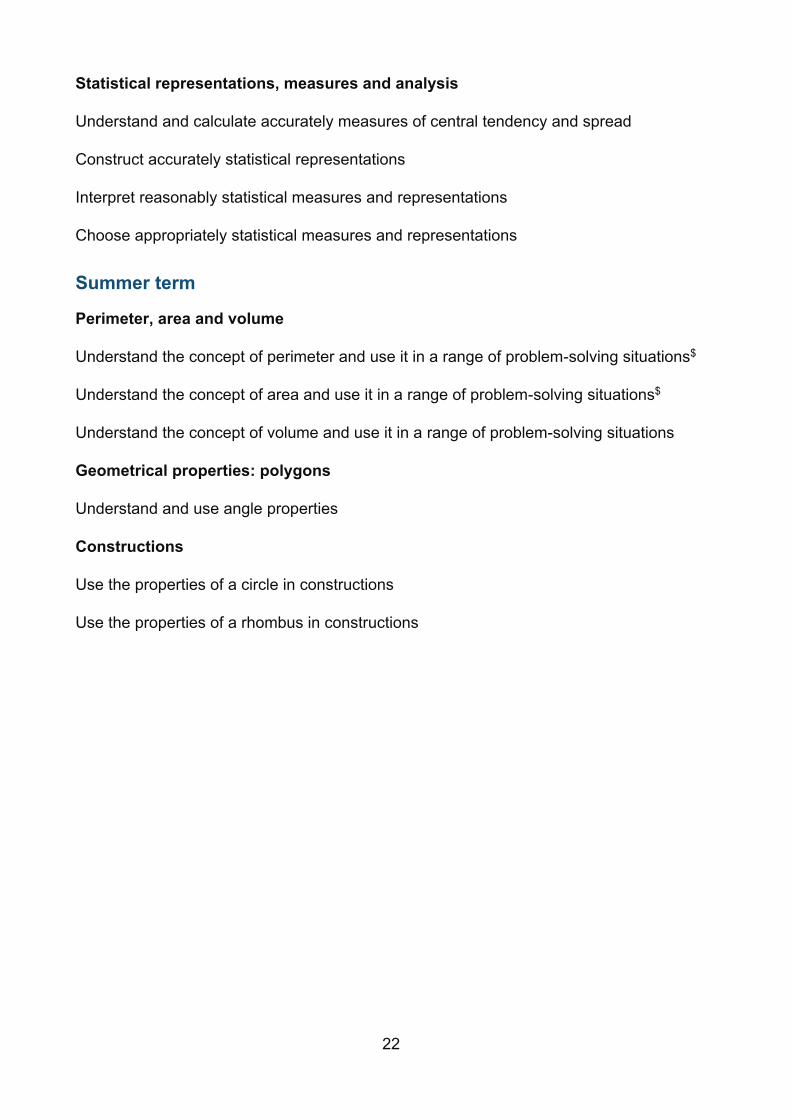
Statistical representations, measures and analysis
Understand and calculate accurately measures of central tendency and spread
Construct accurately statistical representations
Interpret reasonably statistical measures and representations
Choose appropriately statistical measures and representations
Summer term
Perimeter, area and volume
Understand the concept of perimeter and use it in a range of problem-solving situations$
Understand the concept of area and use it in a range of problem-solving situations$
Understand the concept of volume and use it in a range of problem-solving situations
Geometrical properties: polygons
Understand and use angle properties
Constructions
Use the properties of a circle in constructions
Use the properties of a rhombus in constructions
23
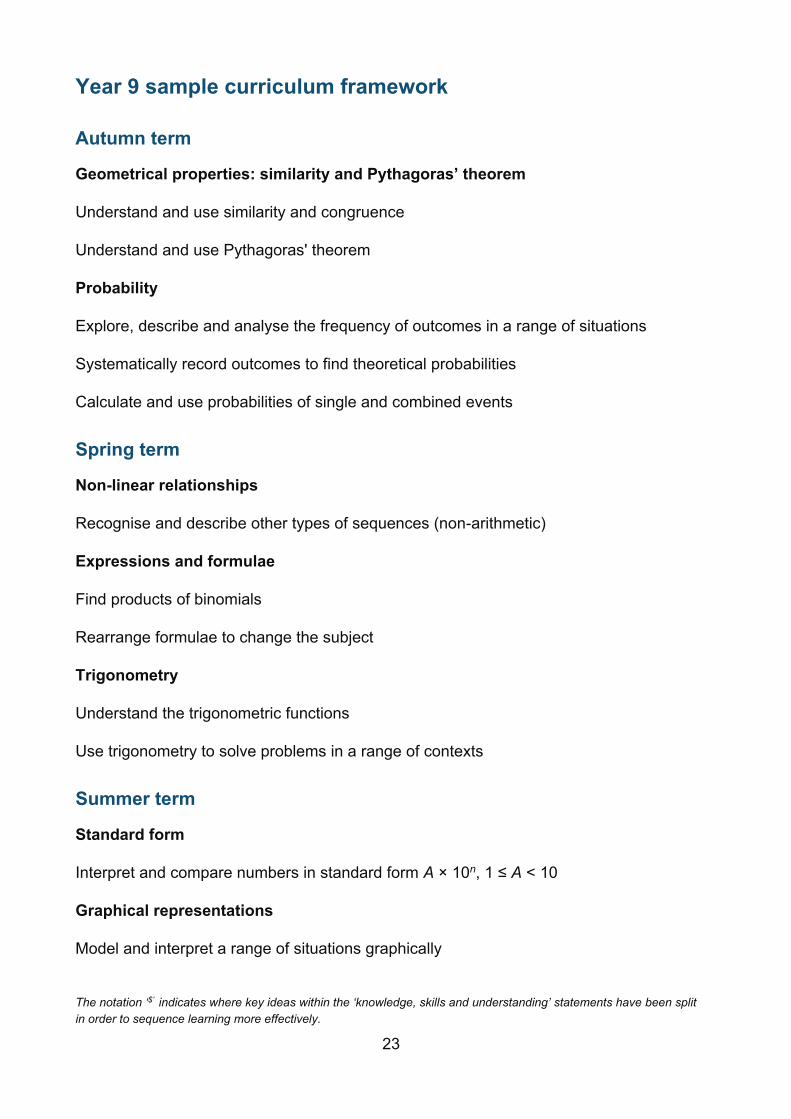
Year 9 sample curriculum framework
Autumn term
Geometrical properties: similarity and Pythagoras’ theorem
Understand and use similarity and congruence
Understand and use Pythagoras' theorem
Probability
Explore, describe and analyse the frequency of outcomes in a range of situations
Systematically record outcomes to find theoretical probabilities
Calculate and use probabilities of single and combined events
Spring term
Non-linear relationships
Recognise and describe other types of sequences (non-arithmetic)
Expressions and formulae
Find products of binomials
Rearrange formulae to change the subject
Trigonometry
Understand the trigonometric functions
Use trigonometry to solve problems in a range of contexts
Summer term
Standard form
Interpret and compare numbers in standard form A × 10n, 1 ≤ A < 10
Graphical representations
Model and interpret a range of situations graphically
The notation ‘$’ indicates where key ideas within the ‘knowledge, skills and understanding’ statements have been split in order to sequence learning more effectively.
24
Split statements of knowledge, skills and understanding In some cases key content has been split between episodes of learning and hence the same, or a very similar, statement will appear in multiple locations. This is indicated by the notation $. It is intended that the following key ideas should be covered in the terms specified.
Understand that multiplicative relationships can be represented in a number of ways and connect and move between those different representations
Use a double number line to represent a multiplicative relationship and connect to other known representations (Year 7 summer term)
Understand the language and notation of ratio and use a ratio table to represent a multiplicative relationship and connect to other known representations (Year 7 summer term)
Use a graph to represent a multiplicative relationship and connect to other known representations (Year 8 spring term)
Use a scaling diagram to represent a multiplicative relationship and connect to other known representations (Year 8 spring term)
Connect coordinates, equations and graphs
Describe and plot coordinates, including non-integer values, in all four quadrants (Year 7 spring term)
Solve a range of problems involving coordinates (Year 7 spring term)
Know that a set of coordinates, constructed according to a mathematical rule, can be represented algebraically and graphically (Year 8 autumn term)
Understand that a graphical representation shows all of the points (within a range) that satisfy a relationship (Year 8 autumn term)
Understand the concept of perimeter and use it in a range of problem-solving situations
Use the properties of a range of polygons to deduce their perimeters (Year 7 spring term)
Recognise that there is constant multiplicative relationship (𝜋) between the diameter and circumference of a circle (Year 8 summer term)
Use the relationship C = 𝜋d to calculate unknown lengths in contexts involving the circumference of circles (Year 8 summer term)
25
Understand the concept of area and use it in a range of problem-solving situations
Derive and use the formula for the area of a trapezium (Year 7 spring term)
Understand that the areas of composite shapes can be found in different ways (Year 7 spring term)
Understand the derivation of, and use the formula for, the area of a circle (Year 8 summer term)
Solve area problems of composite shapes involving whole and/or part circles, including finding the radius or diameter given the area (Year 8 summer term)
Understand the concept of surface area and find the surface area of 3D shapes in an efficient way (Year 8 summer term)
26
Year 7 autumn term
Place value
Overview
Whilst an understanding of our base-ten place-value system for integers and decimals should be well established at Key Stage 2 several important ideas emerge at Key
Stage 3.
It is essential that students are aware of the general structure of the place-value system as based on powers of ten and begin to see how this naturally extends to decimals. Students need to progress beyond recalling place-value column headings when answering questions such as ‘What does the 8 represent in 43 872?’. They need to appreciate that 43 872 has 438 hundreds; and later, that 43 872 is 438.72 hundreds or 438.72 × 100. This learning will support students’ work on significant figures and standard form; students who can express numbers (including very large and very small numbers) in these different ways are more likely to have a feel for the size of such numbers and where they fit in the number system.
It is also important to emphasise the use of measures in real-life contexts. This will support students in understanding that measuring is always to a certain degree of accuracy. This teaching will then support students’ understanding of, and facility with, estimating and rounding – essential skills for working with real-life situations involving contextualised data.
Prior learning
Before beginning place value at Key Stage 3, students should already have a secure understanding of the following learning outcomes from study at upper Key Stage 2:
• Read, write, order and compare numbers up to 10 000 000 and determine the value of each digit.
• Round any whole number to a required degree of accuracy. • Identify the value of each digit in numbers given to three decimal places and
multiply and divide numbers by 10, 100 and 1 000 giving answers up to three decimal places.
NCETM have created the following Key Stage 2 ready-to-progress criteria to support teachers in making judgements about students’ understanding and knowledge.
6NPV-1 Understand the relationship between powers of 10 from 1 hundredth to 10 million, and use this to make a given number 10, 100, 1 000, 1 tenth, 1 hundredth or 1 thousandth times the size (multiply and divide by 10, 100 and 1 000).
27
6NPV-2 Recognise the place value of each digit in numbers up to 10 million, including decimal fractions, and compose and decompose numbers up to 10 million using standard and non-standard partitioning.
6NPV-3 Reason about the location of any number up to 10 million, including decimal fractions, in the linear number system, and round numbers, as appropriate, including in contexts.
6NPV-4 Divide powers of 10, from 1 hundredth to 10 million, into 2, 4, 5 and 10 equal parts, and read scales/number lines with labelled intervals divided into 2, 4, 5 and 10 equal parts.
Checking prior learning
The following activities from the NCETM primary assessment materials offer useful ideas for teachers to use to check whether prior learning is secure.
Reference Activity Year 6 page 9
Think about the number 34 567 800. Say this number aloud. Round this number to the nearest million. What does the digit ‘8’ represent? What does the digit ‘7’ represent? Divide this number by 100 and say your answer aloud. Divide this number by 1 000 and say your answer aloud.
Year 5 page 9
Explore 1 million: • Write 1 million in digits. • Write down the number that is 1 more than 1 million. • Write down the number that is 10 more than 1 million. • Write down the number that is 100 more than 1 million.
Language
decimals, significant figures
Progression through key ideas
Understand the value of digits in decimals, measures and integers
Understanding place value is a fundamental skill and at the heart of a strong sense of number. Students need to be able to correctly say any number and understand where it
28
fits in the number system, i.e. in an ordered list of numbers and on a number line. The focus in this set of key ideas is understanding the structure of the system: that each column value is a power of ten, and that multiplying or dividing by ten shifts digits from one column to the adjacent one.
Key ideas
• Understand place value in integers • Understand place value in decimals, including recognising exponent and fractional
representations of the column headings* • Understand place value in the context of measure • Order and compare numbers and measures using <, >, =
Exemplified significant key ideas
Understand place value in decimals, including recognising exponent and fractional representations of the column headings
Common difficulties and misconceptions: students are likely be familiar with place value charts and the column headings in both words (tens, ones; tenths, hundredths, etc.) and as decimals (10s, 1s, 0.1s, 0.01s, etc.). However they may need to revisit column headings written as fractions and exponents.
Understanding that a mathematical object can have the ‘same value but a different appearance’ is a key understanding in mathematics. Students may find it challenging to recognise that a column headed as tenths, 0.1 or 10-1 will represent digits of equal value.
A focus for this key idea is the structure of the place value system and the connections within it. This builds on the understanding that students developed at KS2 and moves to a more general appreciation of the multiplicative relationships between columns. Examples are given below.
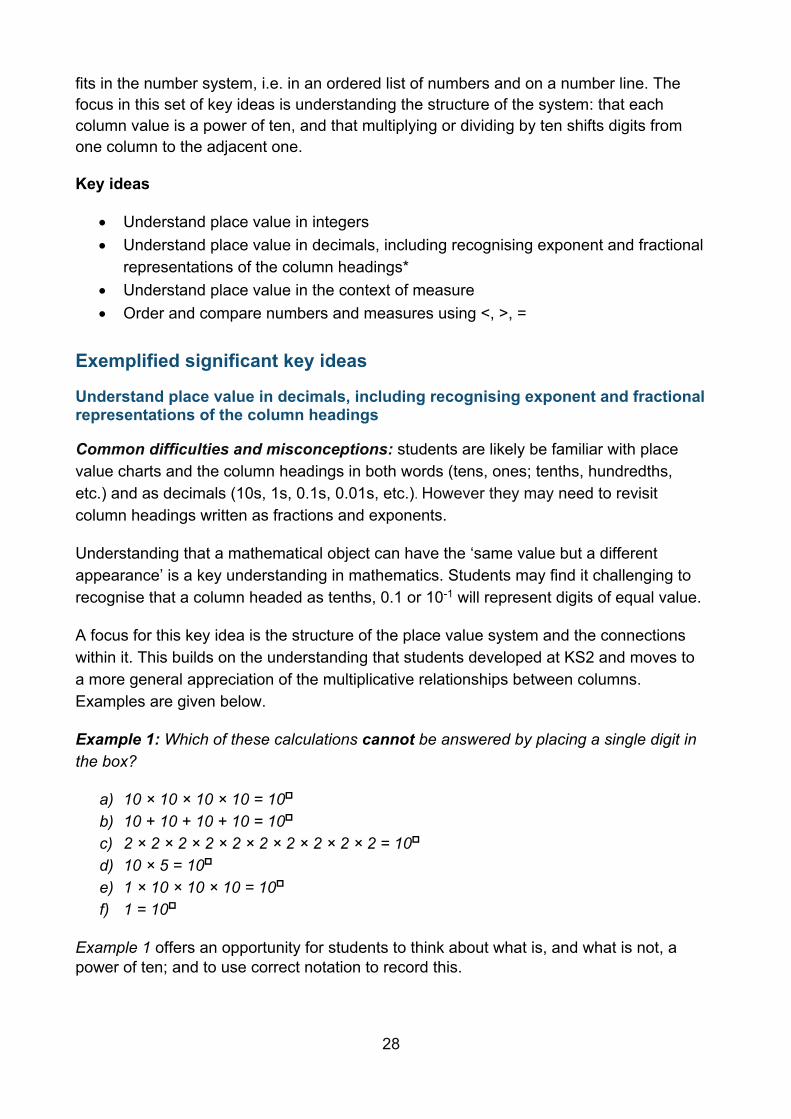
Example 1: Which of these calculations cannot be answered by placing a single digit in the box?
a) 10 × 10 × 10 × 10 = 10 b) 10 + 10 + 10 + 10 = 10 c) 2 × 2 × 2 × 2 × 2 × 2 × 2 × 2 × 2 × 2 = 10 d) 10 × 5 = 10 e) 1 × 10 × 10 × 10 = 10 f) 1 = 10
Example 1 offers an opportunity for students to think about what is, and what is not, a power of ten; and to use correct notation to record this.
29
Part b allows attention to be drawn to the multiplicative nature of exponentiation, and part c offers an opportunity to discuss the role of the base and the exponent in the notation (drawing a distinction between 210 and 102).
Parts e and f introduce a 1 to the beginning of the expansion. The inclusion of the multiplicative identity may help students make sense of the fact that m0 = 1. By describing part e as ‘one multiplied by ten three times’, part a could then be described as ‘one multiplied by ten four times’ and so part f is described as ‘one multiplied by ten zero times’.
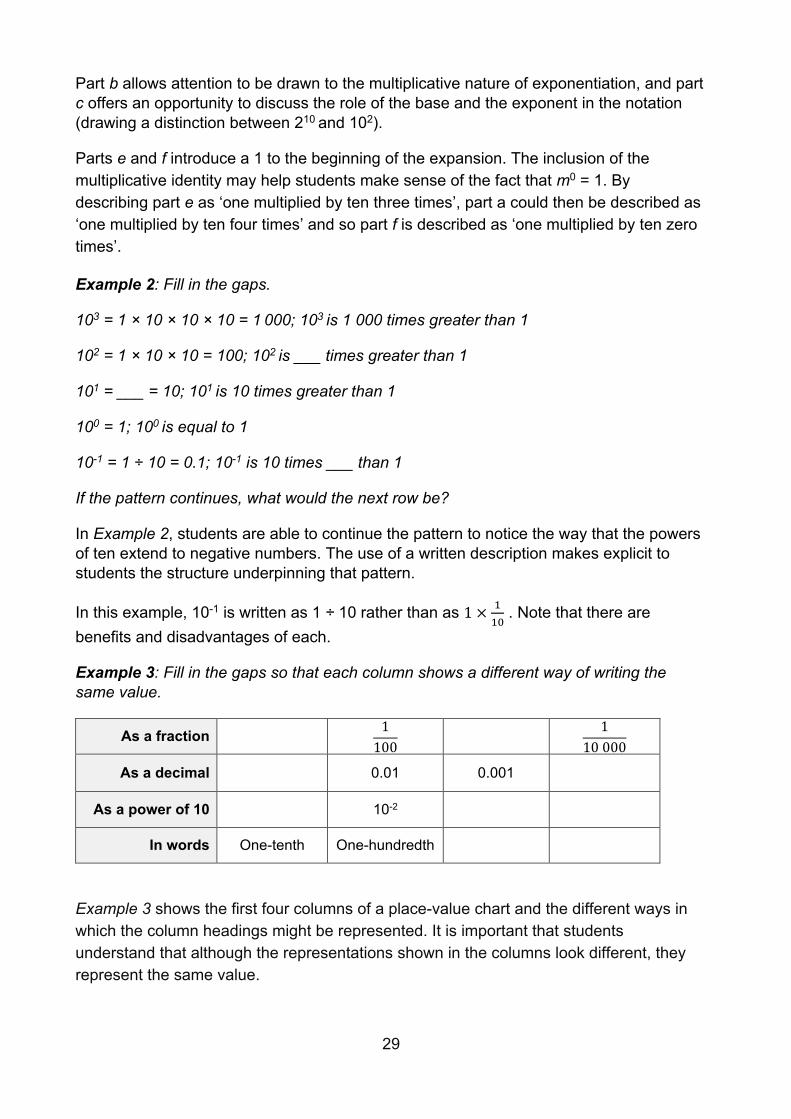
Example 2: Fill in the gaps.
103 = 1 × 10 × 10 × 10 = 1 000; 103 is 1 000 times greater than 1
102 = 1 × 10 × 10 = 100; 102 is ___ times greater than 1
101 = ___ = 10; 101 is 10 times greater than 1
100 = 1; 100 is equal to 1
10-1 = 1 ÷ 10 = 0.1; 10-1 is 10 times ___ than 1
If the pattern continues, what would the next row be?
In Example 2, students are able to continue the pattern to notice the way that the powers of ten extend to negative numbers. The use of a written description makes explicit to students the structure underpinning that pattern.
In this example, 10-1 is written as 1 ÷ 10 rather than as 1 ×1
10 . Note that there are
benefits and disadvantages of each.
Example 3: Fill in the gaps so that each column shows a different way of writing the same value.
As a fraction 1
100 1
10 000
As a decimal 0.01 0.001
As a power of 10 10-2
In words One-tenth One-hundredth
Example 3 shows the first four columns of a place-value chart and the different ways in which the column headings might be represented. It is important that students understand that although the representations shown in the columns look different, they represent the same value.
30
Properties of number: factors, multiples, squares and cubes
Overview
Students will have been introduced to multiples and factors at Key Stage 2 and will have had the opportunity to find factor pairs for a given number. They should know that prime numbers have exactly two factors; and why, therefore, one is not prime. They should also be able to recall prime numbers up to 19 and identify others (possibly using the Sieve of Eratosthenes to find all the prime numbers up to 100). Students will have found common factors and multiples for pairs of numbers, and it is likely that they will have done this by making lists of factors and multiples and looking for common items. The shift at Key Stage 3 is to examine the structure of the numbers involved and explore ways of representing them, for example, by using factor trees and Venn diagrams. In particular, expressing numbers as the product of prime factors will enable students to reason about and identify highest common factors and lowest common multiples, and to appreciate this as a more efficient method than listing in some situations. Students should already be able to recognise square and cube numbers, and use appropriate notation, from their work at Key Stage 2. At Key Stage 3, they will build on this by using other positive integer exponents greater than three, and associated real roots (square, cube and higher). Work on exponents and roots in Key Stage 3 provides the foundation for future learning when exploring negative integer and fractional exponents in Key Stage 4.
Prior learning
Before beginning properties of number at Key Stage 3, students should already have a secure understanding of the following learning outcomes from study at upper Key Stage 2:
• Identify multiples and factors, including finding all factor pairs of a number, and common factors of two numbers.
• Know and use the vocabulary of prime numbers, prime factors and composite numbers (non-prime, greater than one).
• Establish whether a number up to 100 is prime and recall prime numbers up to 19. • Recognise and use square numbers and cube numbers, and the notation for
squared (²) and cubed (³). • Solve problems involving multiplication and division, including using their
knowledge of factors and multiples, squares and cubes. • Identify common factors, common multiples and prime numbers. • Use common factors to simplify fractions; use common multiples to express
fractions in the same denomination.
31
The NCETM has created the following Key Stage 2 ready-to-progress criteria to support teachers in making judgements about students’ understanding and knowledge. 5MD-2 Find factors and multiples of positive whole numbers, including common factors and common multiples, and express a given number as a product of 2 or 3 factors.
Checking prior learning
The following activities from the NCETM primary assessment materials and the Standards & Testing Agency’s past mathematics papers offer useful ideas for teachers to use to check whether prior learning is secure:
Reference Activity Year 5 page 15
8 is a multiple of 4 and a factor of 16 6 is a multiple of 3 and a factor of __ __ is a multiple of 5 and a factor of __ __ is a multiple of __ and a factor of __
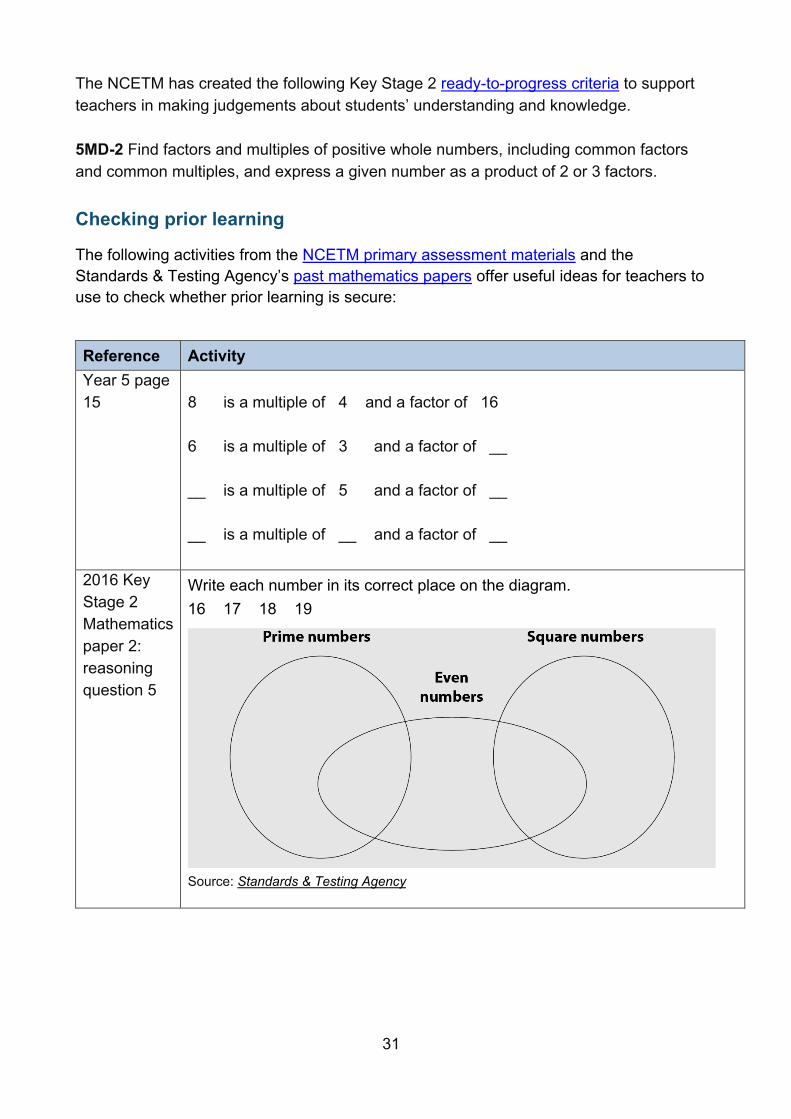
2016 Key Stage 2 Mathematics paper 2: reasoning question 5
Write each number in its correct place on the diagram. 16 17 18 19
Source: Standards & Testing Agency
32
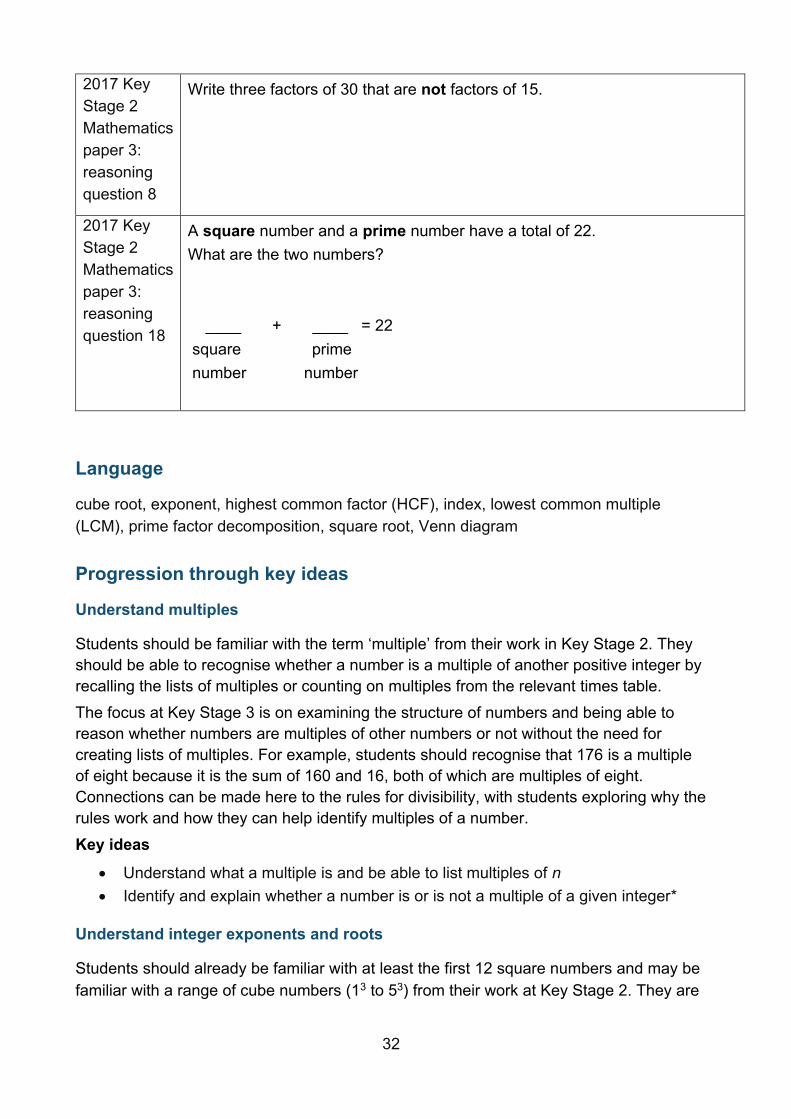
2017 Key Stage 2 Mathematics paper 3: reasoning question 8
Write three factors of 30 that are not factors of 15.
2017 Key Stage 2 Mathematics paper 3: reasoning question 18
A square number and a prime number have a total of 22. What are the two numbers? ____ + ____ = 22 square prime number number
Language
cube root, exponent, highest common factor (HCF), index, lowest common multiple (LCM), prime factor decomposition, square root, Venn diagram
Progression through key ideas
Understand multiples
Students should be familiar with the term ‘multiple’ from their work in Key Stage 2. They should be able to recognise whether a number is a multiple of another positive integer by recalling the lists of multiples or counting on multiples from the relevant times table. The focus at Key Stage 3 is on examining the structure of numbers and being able to reason whether numbers are multiples of other numbers or not without the need for creating lists of multiples. For example, students should recognise that 176 is a multiple of eight because it is the sum of 160 and 16, both of which are multiples of eight. Connections can be made here to the rules for divisibility, with students exploring why the rules work and how they can help identify multiples of a number. Key ideas
• Understand what a multiple is and be able to list multiples of n • Identify and explain whether a number is or is not a multiple of a given integer*
Understand integer exponents and roots
Students should already be familiar with at least the first 12 square numbers and may be familiar with a range of cube numbers (13 to 53) from their work at Key Stage 2. They are
33
likely to have a basic grasp of the notation, including square and cube roots, and know that, e.g. √16 = 4 because 42 = 16 and √8
3 = 2 because 23 = 8.
Students should recognise that the square (or cube) root of any number can be found, but that it is only when they are perfect square (or cube) numbers that this operation will give an integer solution.
In Key Stage 3, students will need to explore positive integer exponents greater than three. This will support other Key Stage 3 work involving writing numbers as the product of prime factors in simplified terms, thus enabling identification of the highest common factor and the lowest common multiple of two or more positive integers.
Key ideas • Understand the concept of square and cube • Understand the concept of square root and cube root • Understand and use correct notation for positive integer exponents • Understand how to use the keys for squares and other powers and square root on
a calculator
Understand and use the unique prime factorisation of a number
Finding factors of a number will be familiar from Key Stage 2. Students should be able to find factor pairs for a given number and know that a number which has exactly two factors is prime. Students are expected to recall prime numbers up to 19 and be able to establish prime numbers up to 100. The focus in this set of key ideas is to be able to identify factors and prime numbers based on a deep understanding of number structure. Where rules for divisibility are used to help these processes, the focus should be on understanding why these rules work.
Students’ experience of highest common factors and multiples at Key Stage 2 is likely to be limited to their work on simplifying fractions and checking to see if they have found the greatest number that is a factor of both the numerator and denominator. Similarly, when expressing fractions in the same denomination in order to compare them, for example, students may have identified the least common multiple of the two denominators even if this formal term has not been used.
In Key Stage 3, students will come across the unique prime factorisation property for the first time. Students will need to recognise that any positive integer greater than one is either a prime number itself or can be expressed as a product of prime numbers, and that there is only one way of writing a number in this way. It is this property that will help students to identify efficiently the highest common factor and lowest common multiple for two or more positive integers.
Key ideas • Understand what a factor is and be able to identify factors of positive integers • Understand what a prime number is and be able to identify prime numbers
34
• Understand that a positive integer can be written uniquely as a product of its prime factors
• Use the prime factorisation of two or more positive integers to efficiently identify the highest common factor*
• Use the prime factorisation of two or more positive integers to efficiently find their lowest common multiple
Exemplified significant key ideas
Identify and explain whether a number is or is not a multiple of a given integer
Common difficulties and misconceptions: students often find multiples of an integer by listing numbers in the specified times table. This strategy is efficient for small numbers of multiples but can lead to misconceptions, such as thinking that numbers have only 12 multiples or that numbers outside of the times tables do not have multiples.
Students need to be able to identify the patterns present in multiples of an integer and explore the structures which generate those patterns. For example, students should understand that adding two different multiples of the same number results in another multiple of that number. Similarly, that if a number is a multiple of 15, for example, it is also a multiple of five and of three. By exploring multiples and reasoning in this way, students can decide whether any number is or is not a multiple of a given integer.
Strategies for identifying multiples usually link to division, especially for larger numbers which are not multiples known from multiplication tables. Students who find it challenging to make the connection between the idea of multiples (numbers in multiplication tables) and division may benefit from revisiting prior work on factora × factorb = product, and variations of this: product ÷ factora = factorb.
The use of partitioning can also be a useful strategy when identifying multiples. For example, 6 132 is not a multiple of eight because 6 132 = 6 000 + 120 + 12 and while 6 000 and 120 are both multiples of eight, 12 is not. Using divisibility rules to test whether a number is a multiple or not may also be helpful. If using these, students should be given time to investigate both why they work and how they can be used.
Students should also understand the connections between multiplication tables. For example, students should know that all multiples of ten are multiples of five but not all multiples of five are multiples of ten. The use of a multiplication grid may support students to see these connections, consider the structures behind them and, consequently, be able to reason fully.
Students may have only experienced multiples as a list of positive integers. Defining multiples by a generalised statement, such as, ‘For any integers a and b, a is a multiple of b if a third integer c exists so that a = bc’ will help students understand that 14, 49, 70 and −21 are all multiples of seven because 14 = 7 × 2, 49 = 7 × 7, 70 = 7 × 10 and −21 = 7 × −3. Examples are given below.
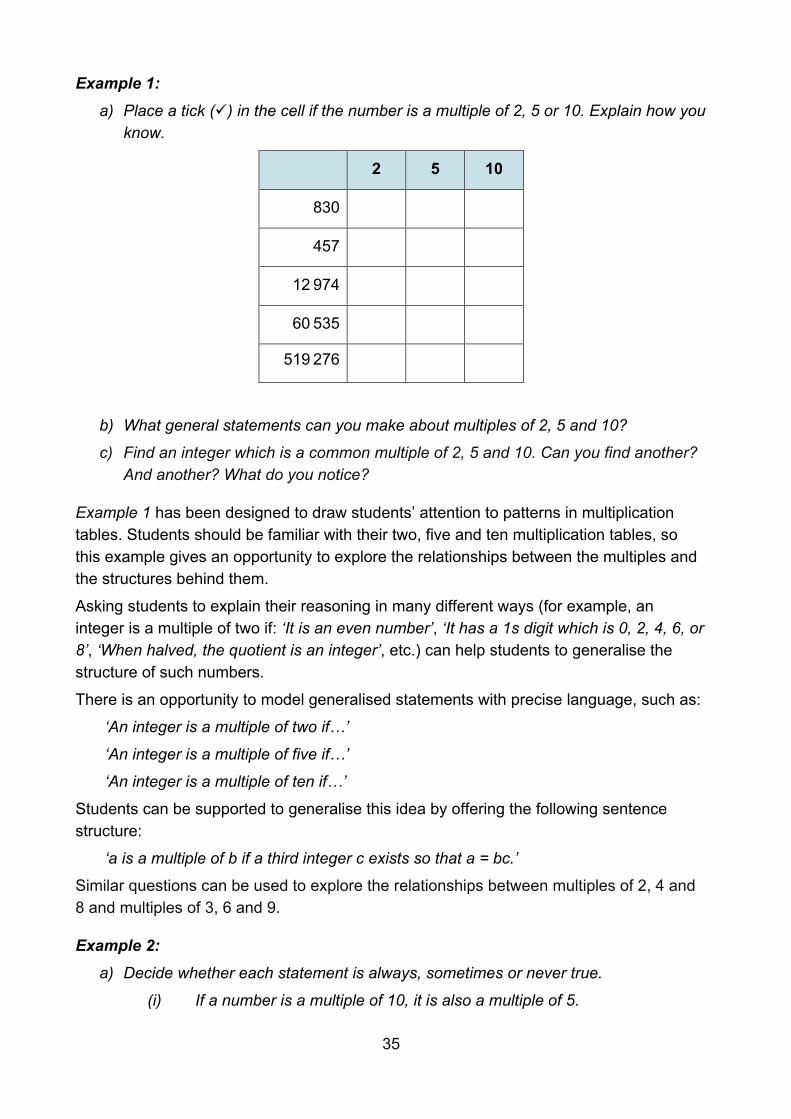
35
Example 1: a) Place a tick (✓) in the cell if the number is a multiple of 2, 5 or 10. Explain how you
know.
2 5 10
830
457
12 974
60 535
519 276
b) What general statements can you make about multiples of 2, 5 and 10?
c) Find an integer which is a common multiple of 2, 5 and 10. Can you find another? And another? What do you notice?
Example 1 has been designed to draw students’ attention to patterns in multiplication tables. Students should be familiar with their two, five and ten multiplication tables, so this example gives an opportunity to explore the relationships between the multiples and the structures behind them.
Asking students to explain their reasoning in many different ways (for example, an integer is a multiple of two if: ‘It is an even number’, ‘It has a 1s digit which is 0, 2, 4, 6, or 8’, ‘When halved, the quotient is an integer’, etc.) can help students to generalise the structure of such numbers.
There is an opportunity to model generalised statements with precise language, such as:
‘An integer is a multiple of two if…’
‘An integer is a multiple of five if…’
‘An integer is a multiple of ten if…’
Students can be supported to generalise this idea by offering the following sentence structure:
‘a is a multiple of b if a third integer c exists so that a = bc.’
Similar questions can be used to explore the relationships between multiples of 2, 4 and 8 and multiples of 3, 6 and 9.
Example 2: a) Decide whether each statement is always, sometimes or never true.
(i) If a number is a multiple of 10, it is also a multiple of 5.
36
(ii) If a number is a multiple of 4, it is also a multiple of 8.
(iii) If a number is a multiple of 9, it is also a multiple of 2.
(iv) Multiples are positive integers.
b) Is it always, sometimes or never true that adding two consecutive multiples of 5 will give a multiple of 10?
c) Is it always, sometimes or never true that adding five consecutive multiples of 2 will give a multiple of 10?
Students who have demonstrated a secure understanding of identifying multiples should be encouraged to go deeper by solving more complex problems, such as exploring all possibilities, creating their own examples and testing conjectures. Students should solve problems where there is more than one answer and there are elements of experimentation, investigation, checking, reasoning, proof, etc.
It is important that students are given opportunities to investigate multiplicative relationships. Example 2 provides a structure for this as well as an opportunity to reason and use examples and counter-examples to demonstrate their mathematical understanding.
Example 3: Two lighthouses flash at different intervals. One flashes every 5 seconds and the other every 8 seconds. At exactly midnight (00:00:00) they flash together. When will they next flash at the same time?
Example 3 provides students with an opportunity to apply their mathematical understanding to unfamiliar problems and to practise their understanding of a concept (i.e. intelligent practice rather than mechanical repetition) through focusing on relationships, rather than the procedure.
Use the prime factorisation of two or more positive integers to efficiently identify the highest common factor
Common difficulties and misconceptions: fundamental to this concept is that students are at ease with the idea that 2 × 3 × 5 is just another way of expressing the number 30 and does not need to be calculated. In fact, by leaving it in this form, it is much easier to discern factors and (when there are two numbers expressed in this way) to discern their common factors. However, students often struggle with this idea. When asked whether 2 × 3 × 5 is a multiple of 10 or not, it is not uncommon for students to multiply the three factors together to obtain 30 before they are able to say that it is a multiple of 10.
An important awareness in this key idea is that when two numbers are written as the product of two or more factors, looking for overlaps between the two products helps to find a common factor. For example, by writing 30 = 5 × 6 and 105 = 5 × 21, it is easily seen that five is a common factor.
37
However, we cannot be sure that five is the highest common factor unless each number is written as the product of prime factors, e.g. 30 = 2 × 3 × 5 and 105 = 3 × 5 × 7. When written in this format, it is clear that 3 × 5 = 15 is the highest common factor.
Students may experience difficulties when the product of repeated prime factors is expressed using index notation (e.g. 450 = 2 × 32 × 52 and 1 500 = 22 × 3 × 53), as it may be harder to detect the common factor of 2 × 3 × 52 in this form. It will be important for students to have experience of discerning highest common factors from both the index and non-index form to help avoid this difficulty.
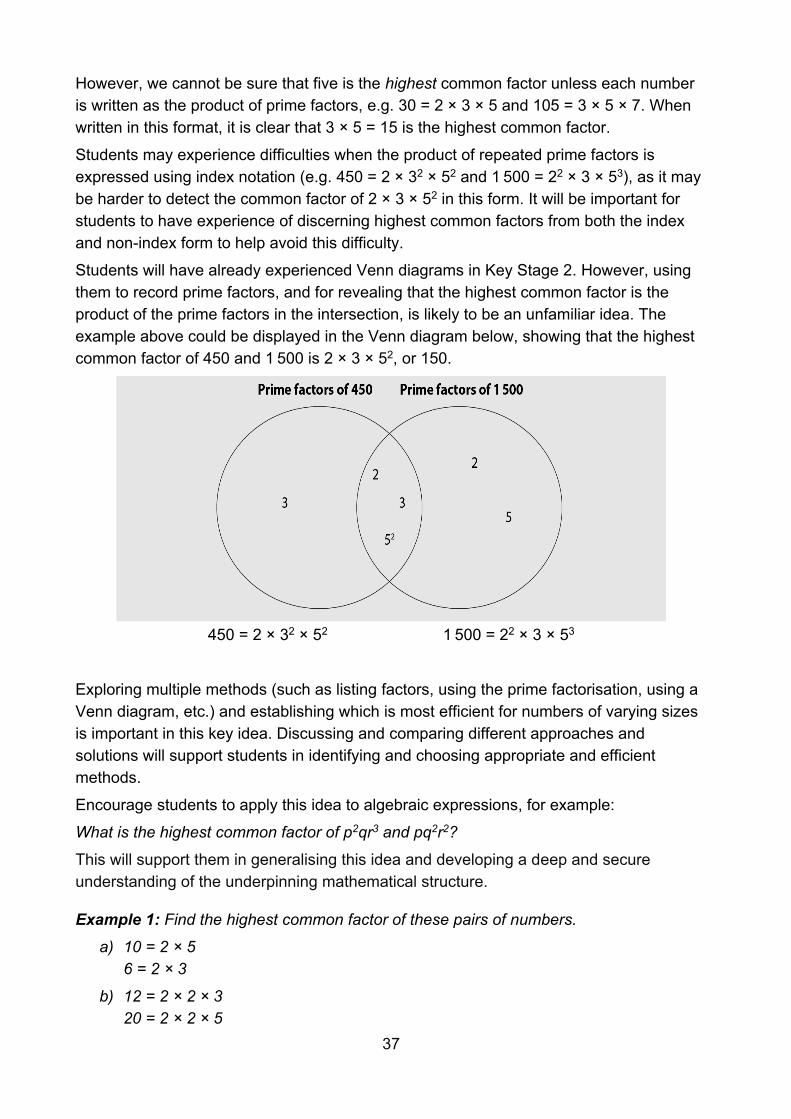
Students will have already experienced Venn diagrams in Key Stage 2. However, using them to record prime factors, and for revealing that the highest common factor is the product of the prime factors in the intersection, is likely to be an unfamiliar idea. The example above could be displayed in the Venn diagram below, showing that the highest common factor of 450 and 1 500 is 2 × 3 × 52, or 150.
450 = 2 × 32 × 52 1 500 = 22 × 3 × 53
Exploring multiple methods (such as listing factors, using the prime factorisation, using a Venn diagram, etc.) and establishing which is most efficient for numbers of varying sizes is important in this key idea. Discussing and comparing different approaches and solutions will support students in identifying and choosing appropriate and efficient methods.
Encourage students to apply this idea to algebraic expressions, for example:
What is the highest common factor of p2qr3 and pq2r2?
This will support them in generalising this idea and developing a deep and secure understanding of the underpinning mathematical structure.
Example 1: Find the highest common factor of these pairs of numbers.
a) 10 = 2 × 5 6 = 2 × 3
b) 12 = 2 × 2 × 3 20 = 2 × 2 × 5
38
c) 30 = 2 × 3 × 5 70 = 2 × 5 × 7
d) 60 = 2 × 2 × 3 × 5 90 = 2 × 3 × 3 × 5
e) 42 = 2 × 3 × 7 210 = 2 × 3 × 5 × 7
f) 29 = 29
16 = 2 × 2 × 2 × 2
Choosing small numbers allows students to find the highest common factor using multiple methods, both by listing factors of each number and by considering prime factors. In Example 1, the numbers have already been written as a product of their prime factors so that students can focus on finding the highest common factor and not on prime factorisation, although they should realise that this is a previous step in this method.
Part of the purpose of an exercise like this is for students to explore the most efficient method and understand why, when numbers are written as product of prime factors, the combination of their common prime factors will generate the highest common factor.
• Part a has been written so that the numbers only share one common prime factor (2).
• Part b is designed to ensure that students can identify and understand that the numbers share two common prime factors. Comparing the repeated common prime factor of two, to the common factors from the lists (2 and 4), is also worthwhile so that students understand that it is the combination of the prime factors that is important.
• In part c, the two common prime factors are different and lead to a highest common factor of 10. Again, comparison with common factors of 2, 5 and 10 from their list of factors is important.
• The numbers in part d have been chosen as they share three common prime factors.
• In part e, the highest common factor is one of the numbers in its entirety. • Part f has been chosen to facilitate discussion about what to do if the highest
common factor is 1, as this is not always apparent when numbers are written as the product of their prime factors.
Example 2:
a) Gosia thinks the highest common factor of 72 and 180 is 6. Her working is below: 72 = 23 × 32 180 = 22 × 32 × 5 HCF = 2 × 3 = 6 Do you agree with Gosia? Justify your answer.
39
b) x = a2 × b × c2 y = a × b3 × c2
where a, b and c are prime. Harrison thinks the highest common factor of x and y is a × b × c2. Do you agree with Harrison? Justify your answer.
In Example 2, in part a the numbers are large enough to encourage students to move away from listing factors and instead compare prime factors to find the highest common factor. Asking students to find all common prime factors by deconstructing the simplified products may support them in finding the highest common factor. In part b, the concept has been applied to algebraic prime factors. Having discussed part a, students then have the opportunity to demonstrate understanding in a more generalised form. Challenge students to think deeply about the concept by asking them to create questions of their own that meet specific criteria. For example:
• Write down two numbers which have a highest common factor of… • Write down two numbers which have a highest common factor of 1 • 72 = 23 × 32
180 = 22 × 32 × 5 o What is the highest common factor of 72 and 180? o Find an additional number so that the highest common factor of the three
numbers (72, 180 and the new number) remains the same. o Write down the prime factorisation of a third number so that all three numbers
have a highest common factor that is less than 12. o Write down a number with a highest common factor of 12 when paired with 72,
but a highest common factor that is greater than 12 when paired with 180.
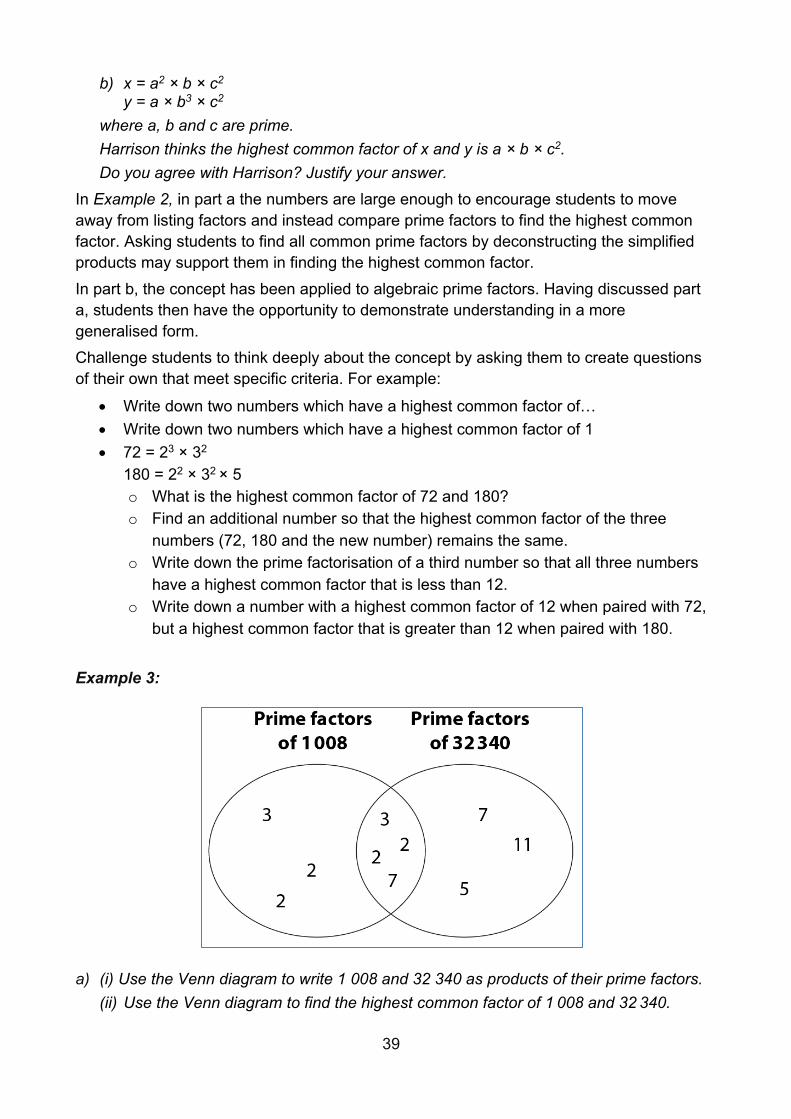
Example 3:
a) (i) Use the Venn diagram to write 1 008 and 32 340 as products of their prime factors. (ii) Use the Venn diagram to find the highest common factor of 1 008 and 32 340.
40
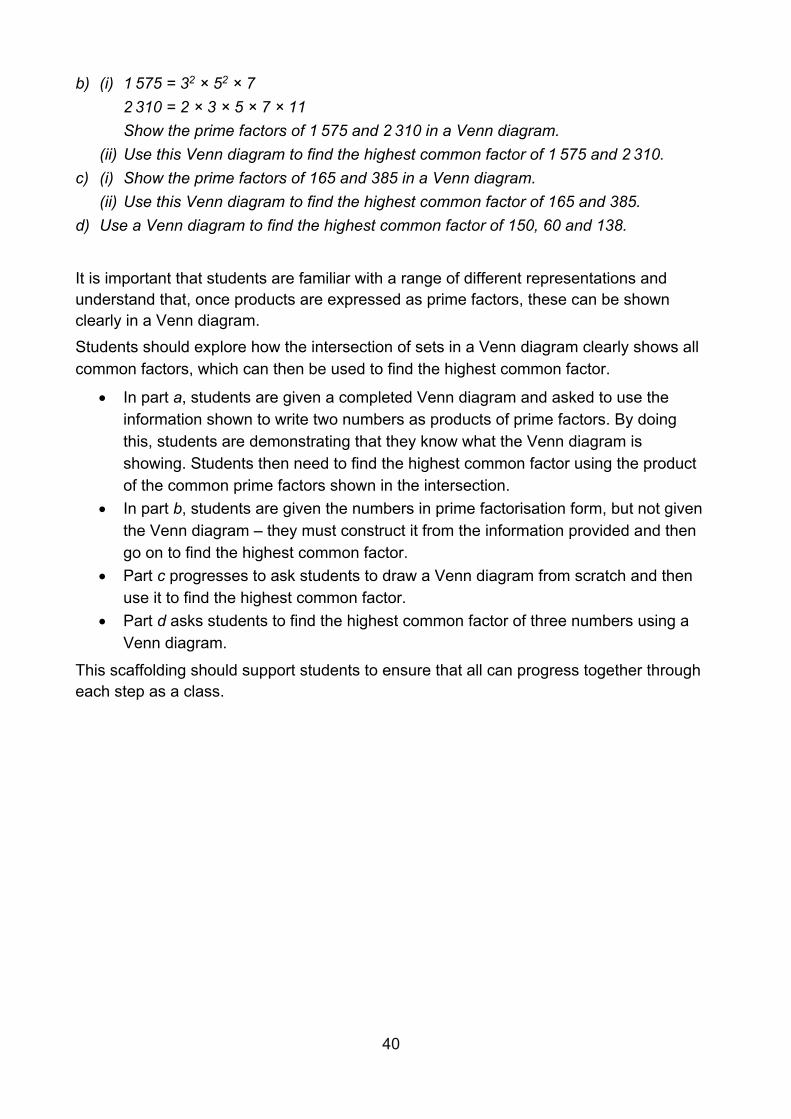
b) (i) 1 575 = 32 × 52 × 7 2 310 = 2 × 3 × 5 × 7 × 11 Show the prime factors of 1 575 and 2 310 in a Venn diagram. (ii) Use this Venn diagram to find the highest common factor of 1 575 and 2 310.
c) (i) Show the prime factors of 165 and 385 in a Venn diagram. (ii) Use this Venn diagram to find the highest common factor of 165 and 385.
d) Use a Venn diagram to find the highest common factor of 150, 60 and 138.
It is important that students are familiar with a range of different representations and understand that, once products are expressed as prime factors, these can be shown clearly in a Venn diagram. Students should explore how the intersection of sets in a Venn diagram clearly shows all common factors, which can then be used to find the highest common factor.
• In part a, students are given a completed Venn diagram and asked to use the information shown to write two numbers as products of prime factors. By doing this, students are demonstrating that they know what the Venn diagram is showing. Students then need to find the highest common factor using the product of the common prime factors shown in the intersection.
• In part b, students are given the numbers in prime factorisation form, but not given the Venn diagram – they must construct it from the information provided and then go on to find the highest common factor.
• Part c progresses to ask students to draw a Venn diagram from scratch and then use it to find the highest common factor.
• Part d asks students to find the highest common factor of three numbers using a Venn diagram.
This scaffolding should support students to ensure that all can progress together through each step as a class.
41
Arithmetic procedures with integers and decimals
Overview
An understanding of and ability to use standard arithmetic procedures for all four operations with integers and decimals, as well as procedures for some calculations with fractions, should be well established at Key Stage 2. Work in Key Stage 3 should develop this both conceptually and procedurally and:
• Ensure students have a strong understanding of the mathematical structures that underpin these standard procedures.
• Ensure students generalise these standard procedures with integers, extend to use with decimals, and appreciate that the structures are the same
• Build on students’ Key Stage 2 experiences of positive and negative numbers to develop a full understanding and fluency with procedures for all four operations with directed numbers.
Students should also develop fluency with a range of calculation approaches and techniques involving combinations of numbers (positive and negative integers, decimals and, later, fractions) and operations. They should develop an ability to exploit number relationships and structures in order to calculate efficiently. For example, students should notice that the calculation 0.43 × 26.2 + 2.62 × 5.7 can be transformed into 0.43 × 26.2 + 26.2 × 0.57 and so simplified to (0.43 + 0.57) × 26.2, which is equal to 26.2.
Key to students’ development in Key Stage 3 is not only a secure proficiency with arithmetic procedures, but also a connected understanding of the underlying concepts and an ability to think and calculate creatively with complex and multi-faceted calculations.
Prior learning
Before beginning arithmetic procedures at Key Stage 3, students should already have a secure understanding of the following learning outcomes from study at upper Key Stage 2:
• Add and subtract whole numbers with more than four digits, including using formal written methods (columnar addition and subtraction).
• Multiply and divide whole numbers and those involving decimals by 10, 100 and 1 000.
• Multiply multi-digit numbers up to four digits by a two-digit whole number using the formal written method of long multiplication.
• Divide numbers up to four digits by a two-digit whole number using the formal written method of long division, and interpret remainders as whole number remainders, fractions, or by rounding, as appropriate for the context.
42
• Divide numbers up to four digits by a two-digit number using the formal written method of short division where appropriate, interpreting remainders according to the context.
• Use their knowledge of the order of operations to carry out calculations involving the four operations.
• Solve addition and subtraction multi-step problems in contexts, deciding which operations and methods to use and why.
• Solve problems involving addition, subtraction, multiplication and division. • Use estimation to check answers to calculations and determine, in the context of a
problem, an appropriate degree of accuracy. • Multiply one-digit numbers with up to two decimal places by whole numbers. • Use written division methods in cases where the answer has up to two decimal
places.
• Use negative numbers in context, and calculate intervals across zero.
The NCETM has created the following Key Stage 2 ready-to-progress criteria to support teachers in making judgements about students’ understanding and knowledge.
6AS/MD-1 Understand that 2 numbers can be related additively or multiplicatively, and quantify additive and multiplicative relationships (multiplicative relationships restricted to multiplication by a whole number).
6AS/MD-2 Use a given additive or multiplicative calculation to derive or complete a related calculation, using arithmetic properties, inverse relationships, and place-value understanding.
5MD-3 Multiply any whole number with up to 4 digits by any one-digit number using a formal written method.
5MD-4 Divide a number with up to 4 digits by a one-digit number using a formal written method, and interpret remainders appropriately for the context.
Checking prior learning
The following activities from the NCETM primary assessment materials and the Standards & Testing Agency’s past mathematics papers offer useful ideas for teachers to use to check whether prior learning is secure:
43
Reference Activity
2018 Key Stage 2 Mathematics paper 3: reasoning question 4
Write the three missing digits to make this addition correct.
2016 Key Stage 2 Mathematics paper 3: reasoning question 11
A toy shop orders 11 boxes of marbles. Each box contains 6 bags of marbles. Each bag contains 45 marbles.
How many marbles does the shop order in total? Show your method.
2016 Key Stage 2 Mathematics paper 3: reasoning question 21
5 542 ÷ 17 = 326
Explain how you can use this fact to find the answer to 18 × 326
2018 Key Stage 2 Mathematics paper 1: arithmetic question 22
645 ÷ 43
Year 6 page 16
Work out:
8.4 × 3 + 8.4 × 7 6.7 × 5 − 0.67 × 50 93 × 0.2 + 0.8 × 93 7.2 × 4 + 3.6 × 8
44
Language
additive identity, associative, commutative, distributive, multiplicative identity
Progression through key ideas
Understand and use the structures that underpin addition and subtraction strategies
Adding and subtracting integers and, to some extent, decimals using the standard columnar format will be familiar to students from Key Stage 2.
The focus in Key Stage 3 is on deeply understanding the structures underpinning the standard columnar format and generalising fully to decimals, i.e. not regarding calculation with decimals as a separate method.
A key idea is that of ‘unitising’ – adding quantities of the same ‘unit’. For example, the standard columnar method with decimal numbers exploits the idea that hundreds can be added to hundreds, tens to tens, ones to ones, tenths to tenths, hundredths to hundredths, etc., and this gives meaning to why decimals need to be aligned as they do in the standard method.
The use of negative numbers extends the domain in which students can explore and deepen their understanding of the additive structure. This can bring to the surface misconceptions based on previous experiences of addition and subtraction with positive numbers – that adding a number always increases and subtracting a number always decreases. Broadening the range of possible examples students explore and work with will deepen their understanding of the underlying additive structures.
Key ideas
• Understand the mathematical structures that underpin addition and subtraction of positive and negative integers*
• Generalise and fluently use written addition and subtraction strategies, including columnar formats, with decimals*
Understand and use the structures that underpin multiplication and division strategies
A key feature of the standard algorithm for the multiplication of integers is that it involves sequences of multiplications of single-digit numbers; place-value considerations and the lining up of columns ensure that the product is of the correct order of magnitude. When using the method with decimals, it is important that the underlying mathematical structure is thoroughly understood. For example, 300 × 7 000 can be considered as 3 × 100 × 7 × 1 000 = 3 × 7 × 100 × 1 000. This awareness supports informal calculation methods and underpins the columnar methods. When multiplying decimals, it is important
45
for students to understand, for example, that 0.3 × 0.007 = 3 × 7 × 0.1 × 0.001 and, therefore, how 3 × 7 and 0.3 × 0.007 are connected. When dividing one decimal by another it will be important for students to understand how multiplying and dividing the dividend and the divisor by 10, 100, etc. changes the quotient, e.g. 74 ÷ 3 = 7.4 ÷ 0.3 = 0.74 ÷ 0.03, etc.; and that, e.g. 7.4 ÷ 3 is ten times smaller than 74 ÷ 3, 74 ÷ 0.3 is ten times bigger than 74 ÷ 3 and 74 ÷ 0.003 is one thousand times bigger than 74 ÷ 3. These various awarenesses come together to give meaning to the idea that a calculation such as 3.14 × 5.6 can be calculated as (314 × 56) ÷ 1 000 and that 25.7 ÷ 0.32 can be calculated as 2 570 ÷ 32. Multiplication and division involving negative integers is introduced in this set of key ideas. It is important to explore why the rules for combining positive and negative numbers work and avoid rote learning of the rules without meaning. For example, use the structure −a × 0 = −a × (+b + −b) together with the application of the distributive law to give meaning to the fact that the product of two negative numbers is a positive number.
Key ideas
• Understand the mathematical structures that underpin multiplication and division of positive and negative integers*
• Factorise multiples of 10n in order to simplify multiplication and division of both integers and decimals, e.g. 300 × 7 000, 0.3 × 0.007, 0.9 ÷ 0.03, etc.
• Generalise and fluently use written multiplication strategies to calculate accurately with decimals*
• Generalise and fluently use written division strategies to calculate accurately with decimals
Use the laws and conventions of arithmetic to calculate efficiently
Previous statements of knowledge, skills and understanding in this core concept have developed students’ awareness and understanding of ideas such as unitising when working additively and scaling when multiplying. The focus has been on broadening the domain of examples that students can draw on when calculating and, through this, deepening their understanding of these operations. This set of key ideas is focused on ways in which these operations fit together and the structures that they have in common.
Students should both know and notice examples of the commutative [ab = ba, a + b = b + a], associative [abc = (ab)c = a(bc); a + b + c = (a + b) + c = a + (b + c)] and distributive laws [a(b + c) = ab + ac] and need to be able to calculate fluently with the full range of different types of numbers in a wide range of contexts and problem-solving situations, exploiting these laws to increase the efficiency of calculation.
46
Key ideas
• Know the commutative law and use it to calculate efficiently • Know the associative law and use it to calculate efficiently • Know the distributive law and use it to calculate efficiently • Calculate using priority of operations, including brackets, powers, exponents and
reciprocals • Use the associative, distributive and commutative laws to flexibly and efficiently
solve problems* • Know how to fluently use certain calculator functions and use a calculator
appropriately
Exemplified significant key ideas
Understand the mathematical structures that underpin addition and subtraction of positive and negative integers
Common difficulties and misconceptions: although students have been introduced to negative numbers at Key Stage 2, their experience is likely to have been set in a context, and it is unlikely that they will have carried out operations with negative numbers.
Students are now working with a new ‘type’ of number and, in doing so, challenging and extending their understanding of additive operations. Until the introduction of negative numbers, their experience will have been that addition makes larger and subtraction makes smaller. Including situations in in which this is not the case can be problematic.
When assessing students’ understanding of operations with negative numbers, Hart (1981) records that, when subtracting a positive integer from either a positive or negative number, many students simply subtract the numerals and then attempt to determine the sign for the answer. When subtracting a negative integer, many students used the rule that ‘two negatives make a positive’. Examining the structure of such calculations (using classroom examples, such as the ones offered below) rather than teaching such rules will help students overcome these difficulties.
Example 1: Fill in the blanks to make the calculations correct. a) 3 + 4 – 4 – ___ = 0
b) 3 – 3 + 1 – ___ = 0
c) 15 + 7 – 15 = ___
d) 10 – 7 – ___ = 0
e) 182 – 82 – ___ = -1
47
Example 1 is designed to draw students’ attention to the way that pairs of numbers can be use so that an answer can be found without the need for calculating. In parts a, b and c, the pairing of numbers is clear. In part d, students need to identify that the calculation can be thought of as (3 + 7) − 7 − ___ = 0. It is awareness of this partitioning that is key.
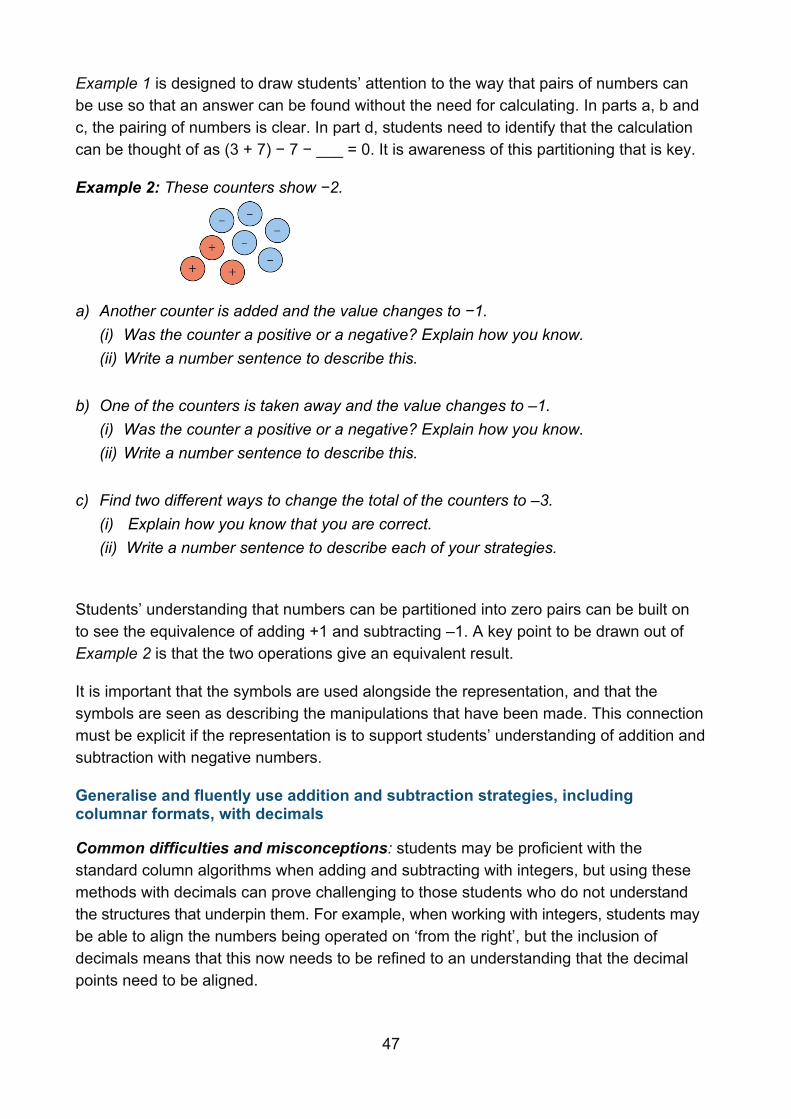
Example 2: These counters show −2.
a) Another counter is added and the value changes to −1.
(i) Was the counter a positive or a negative? Explain how you know. (ii) Write a number sentence to describe this.
b) One of the counters is taken away and the value changes to –1. (i) Was the counter a positive or a negative? Explain how you know. (ii) Write a number sentence to describe this.
c) Find two different ways to change the total of the counters to –3. (i) Explain how you know that you are correct. (ii) Write a number sentence to describe each of your strategies.
Students’ understanding that numbers can be partitioned into zero pairs can be built on to see the equivalence of adding +1 and subtracting –1. A key point to be drawn out of Example 2 is that the two operations give an equivalent result.
It is important that the symbols are used alongside the representation, and that the symbols are seen as describing the manipulations that have been made. This connection must be explicit if the representation is to support students’ understanding of addition and subtraction with negative numbers.
Generalise and fluently use addition and subtraction strategies, including columnar formats, with decimals
Common difficulties and misconceptions: students may be proficient with the standard column algorithms when adding and subtracting with integers, but using these methods with decimals can prove challenging to those students who do not understand the structures that underpin them. For example, when working with integers, students may be able to align the numbers being operated on ‘from the right’, but the inclusion of decimals means that this now needs to be refined to an understanding that the decimal points need to be aligned.
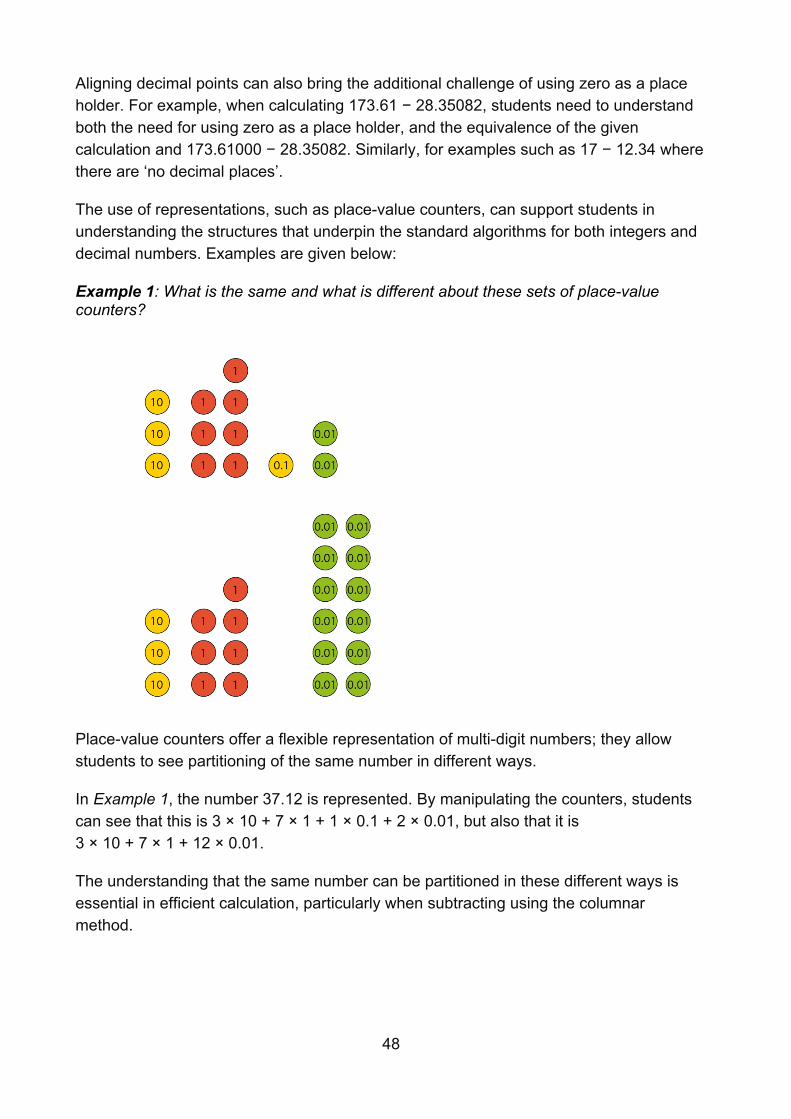
48
Aligning decimal points can also bring the additional challenge of using zero as a place holder. For example, when calculating 173.61 − 28.35082, students need to understand both the need for using zero as a place holder, and the equivalence of the given calculation and 173.61000 − 28.35082. Similarly, for examples such as 17 − 12.34 where there are ‘no decimal places’.
The use of representations, such as place-value counters, can support students in understanding the structures that underpin the standard algorithms for both integers and decimal numbers. Examples are given below:
Example 1: What is the same and what is different about these sets of place-value counters?
Place-value counters offer a flexible representation of multi-digit numbers; they allow students to see partitioning of the same number in different ways.
In Example 1, the number 37.12 is represented. By manipulating the counters, students can see that this is 3 × 10 + 7 × 1 + 1 × 0.1 + 2 × 0.01, but also that it is 3 × 10 + 7 × 1 + 12 × 0.01.
The understanding that the same number can be partitioned in these different ways is essential in efficient calculation, particularly when subtracting using the columnar method.
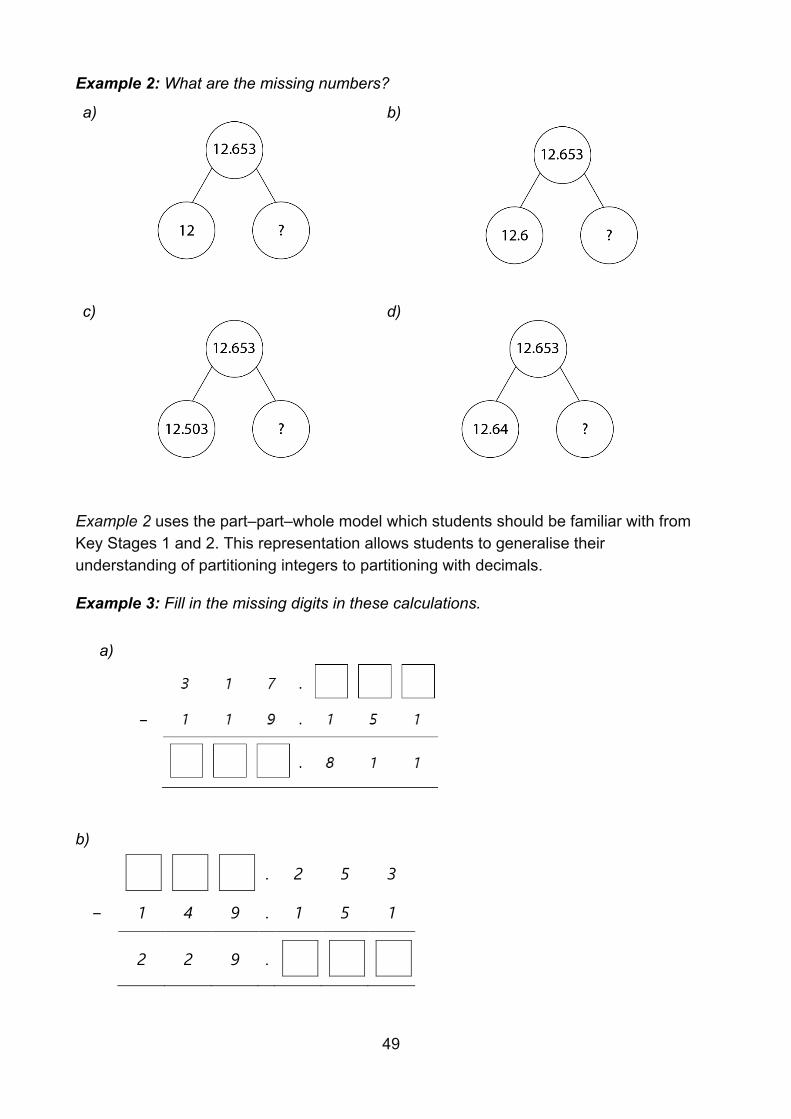
49
Example 2: What are the missing numbers?
a)
b)
c)
d)
Example 2 uses the part–part–whole model which students should be familiar with from Key Stages 1 and 2. This representation allows students to generalise their understanding of partitioning integers to partitioning with decimals.
Example 3: Fill in the missing digits in these calculations.
a)
b)
. 2 5 3
− 1 4 9 . 1 5 1
2 2 9 .
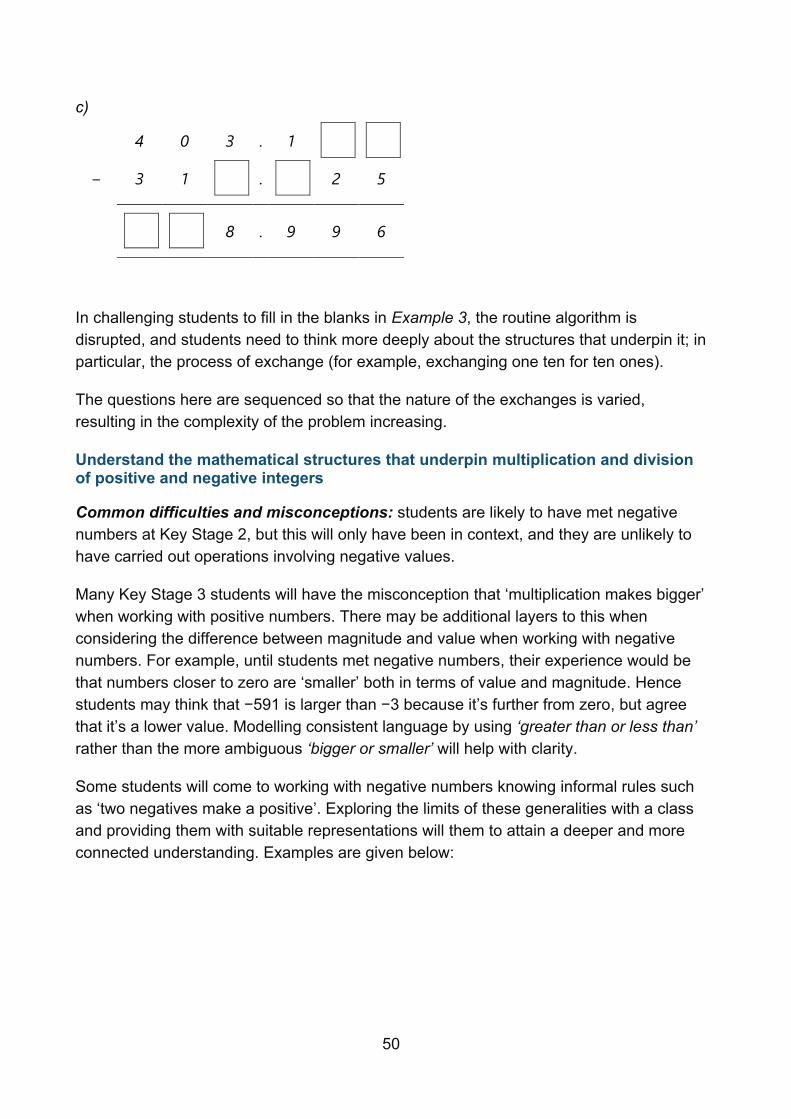
50
c)
In challenging students to fill in the blanks in Example 3, the routine algorithm is disrupted, and students need to think more deeply about the structures that underpin it; in particular, the process of exchange (for example, exchanging one ten for ten ones).
The questions here are sequenced so that the nature of the exchanges is varied, resulting in the complexity of the problem increasing.
Understand the mathematical structures that underpin multiplication and division of positive and negative integers
Common difficulties and misconceptions: students are likely to have met negative numbers at Key Stage 2, but this will only have been in context, and they are unlikely to have carried out operations involving negative values.
Many Key Stage 3 students will have the misconception that ‘multiplication makes bigger’ when working with positive numbers. There may be additional layers to this when considering the difference between magnitude and value when working with negative numbers. For example, until students met negative numbers, their experience would be that numbers closer to zero are ‘smaller’ both in terms of value and magnitude. Hence students may think that −591 is larger than −3 because it’s further from zero, but agree that it’s a lower value. Modelling consistent language by using ‘greater than or less than’ rather than the more ambiguous ‘bigger or smaller’ will help with clarity.
Some students will come to working with negative numbers knowing informal rules such as ‘two negatives make a positive’. Exploring the limits of these generalities with a class and providing them with suitable representations will them to attain a deeper and more connected understanding. Examples are given below:
4 0 3 . 1
− 3 1
.
2 5
8 . 9 9 6
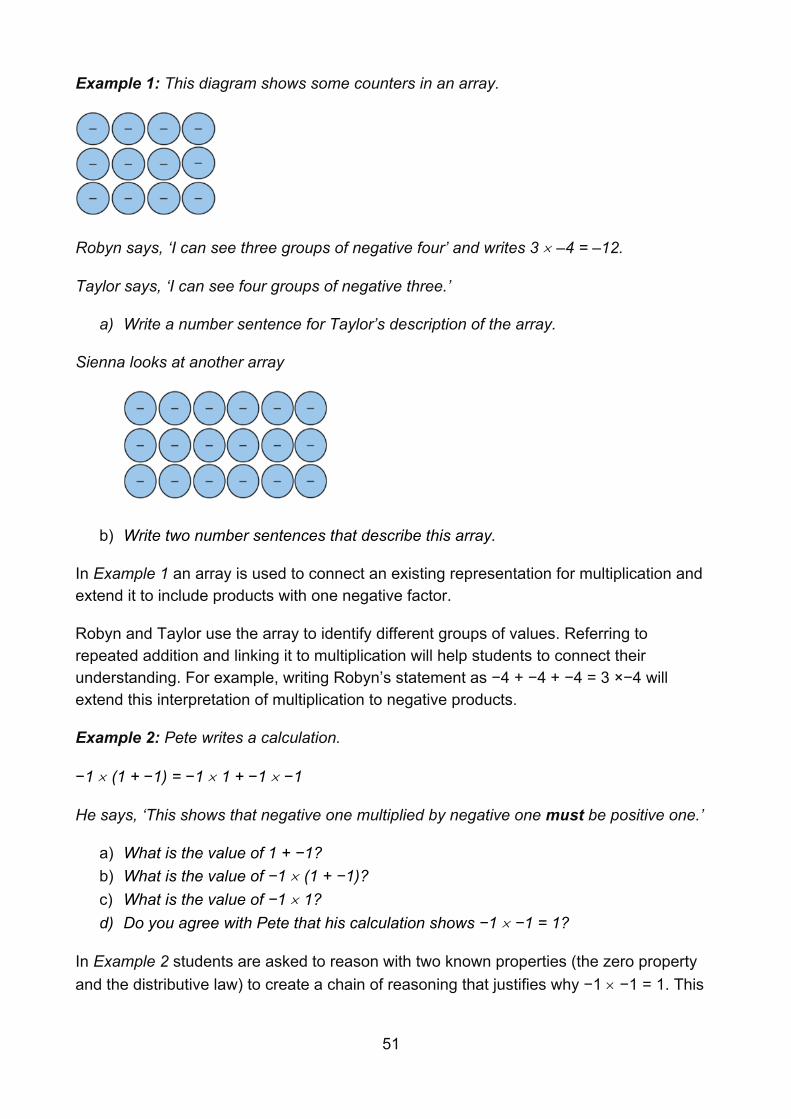
51
Example 1: This diagram shows some counters in an array.
Robyn says, ‘I can see three groups of negative four’ and writes 3 –4 = –12.
Taylor says, ‘I can see four groups of negative three.’
a) Write a number sentence for Taylor’s description of the array.
Sienna looks at another array
b) Write two number sentences that describe this array.
In Example 1 an array is used to connect an existing representation for multiplication and extend it to include products with one negative factor.
Robyn and Taylor use the array to identify different groups of values. Referring to repeated addition and linking it to multiplication will help students to connect their understanding. For example, writing Robyn’s statement as −4 + −4 + −4 = 3 ×−4 will extend this interpretation of multiplication to negative products.
Example 2: Pete writes a calculation.
−1 (1 + −1) = −1 1 + −1 −1
He says, ‘This shows that negative one multiplied by negative one must be positive one.’
a) What is the value of 1 + −1? b) What is the value of −1 (1 + −1)? c) What is the value of −1 1? d) Do you agree with Pete that his calculation shows −1 −1 = 1?
In Example 2 students are asked to reason with two known properties (the zero property and the distributive law) to create a chain of reasoning that justifies why −1 −1 = 1. This
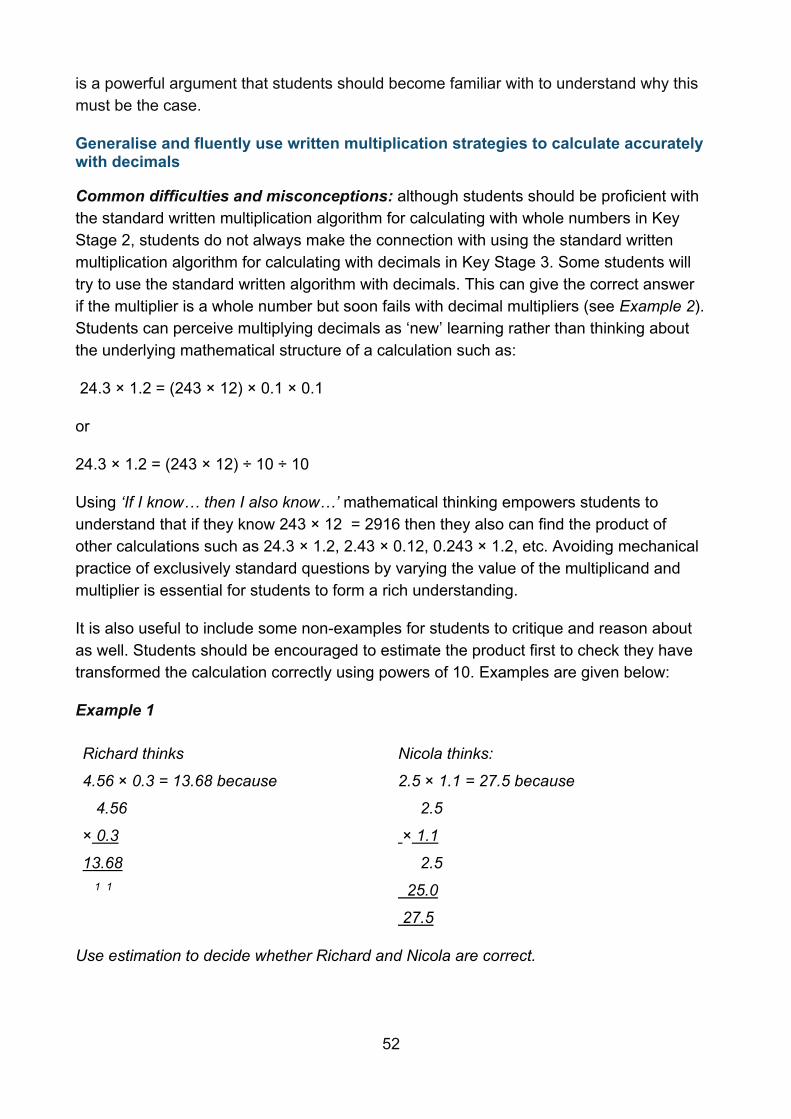
52
is a powerful argument that students should become familiar with to understand why this must be the case.
Generalise and fluently use written multiplication strategies to calculate accurately with decimals
Common difficulties and misconceptions: although students should be proficient with the standard written multiplication algorithm for calculating with whole numbers in Key Stage 2, students do not always make the connection with using the standard written multiplication algorithm for calculating with decimals in Key Stage 3. Some students will try to use the standard written algorithm with decimals. This can give the correct answer if the multiplier is a whole number but soon fails with decimal multipliers (see Example 2). Students can perceive multiplying decimals as ‘new’ learning rather than thinking about the underlying mathematical structure of a calculation such as:
24.3 × 1.2 = (243 × 12) × 0.1 × 0.1
or
24.3 × 1.2 = (243 × 12) ÷ 10 ÷ 10
Using ‘If I know… then I also know…’ mathematical thinking empowers students to understand that if they know 243 × 12 = 2916 then they also can find the product of other calculations such as 24.3 × 1.2, 2.43 × 0.12, 0.243 × 1.2, etc. Avoiding mechanical practice of exclusively standard questions by varying the value of the multiplicand and multiplier is essential for students to form a rich understanding.
It is also useful to include some non-examples for students to critique and reason about as well. Students should be encouraged to estimate the product first to check they have transformed the calculation correctly using powers of 10. Examples are given below:
Example 1
Richard thinks
4.56 × 0.3 = 13.68 because
4.56
× 0.3
13.68 1 1
Nicola thinks:
2.5 × 1.1 = 27.5 because
2.5
× 1.1
2.5
25.0
27.5
Use estimation to decide whether Richard and Nicola are correct.
53
The calculations in Example 1 support students’ awareness that the standard written algorithm for multiplying whole numbers (short/long multiplication) can not be applied to calculations with decimals, in particular when the multiplier is a decimal number.
Students need to be encouraged to recognise that calculations such as 4.56 × 0.3 and 2.5 × 1.1 can be calculated as (456 × 3) ÷ 1000 and (25 × 11) ÷ 100 and to use extimation to check their answers.
Example 2: Given 456 × 12 = 5 472 work out:
a) 45.6 × 12
b) 4.56 × 12
c) 45.6 × 1.2
d) 4.56 × 1.2
e) 4.56 × 0.12
Example 2 draws attention to the digits in a calculation rather than the individual numbers. Asking ‘what is the same and what is different?’ about the five calculations encourages students to notice the connections between the calculations and encourage an ‘if I know… then I also know…’ way of thinking.
Students’ thinking can be deepened by asking more probing questions such as use 456 × 12 = 5 472 to find the products of other pairs of numbers.
Use the associative, distributive and commutative laws to flexibly and efficiently solve problems
Common difficulties and misconceptions: students’ understanding of the laws of arithmetic is crucial if they are to be able to work flexibly to evaluate calculations.
A key idea here is that students are able to identify known facts, connections and relationships and use them to strategically simplify calculations. For some students, whose experience of mathematics may be that there is only one correct process that should be followed, this may prove challenging.
The strategy of inviting students to solve problems ‘in as many different ways as you can’ can help to develop the skill of making sensible choices based on the numbers involved and the relationships between them. It is also helpful to choose examples that draw students’ attention to certain useful connections and ask them, ‘What do you notice?’, for example, 9 999 + 999 + 99 + 9 + 5 or 2.75 × 5.4 + 27.5 × 0.46.
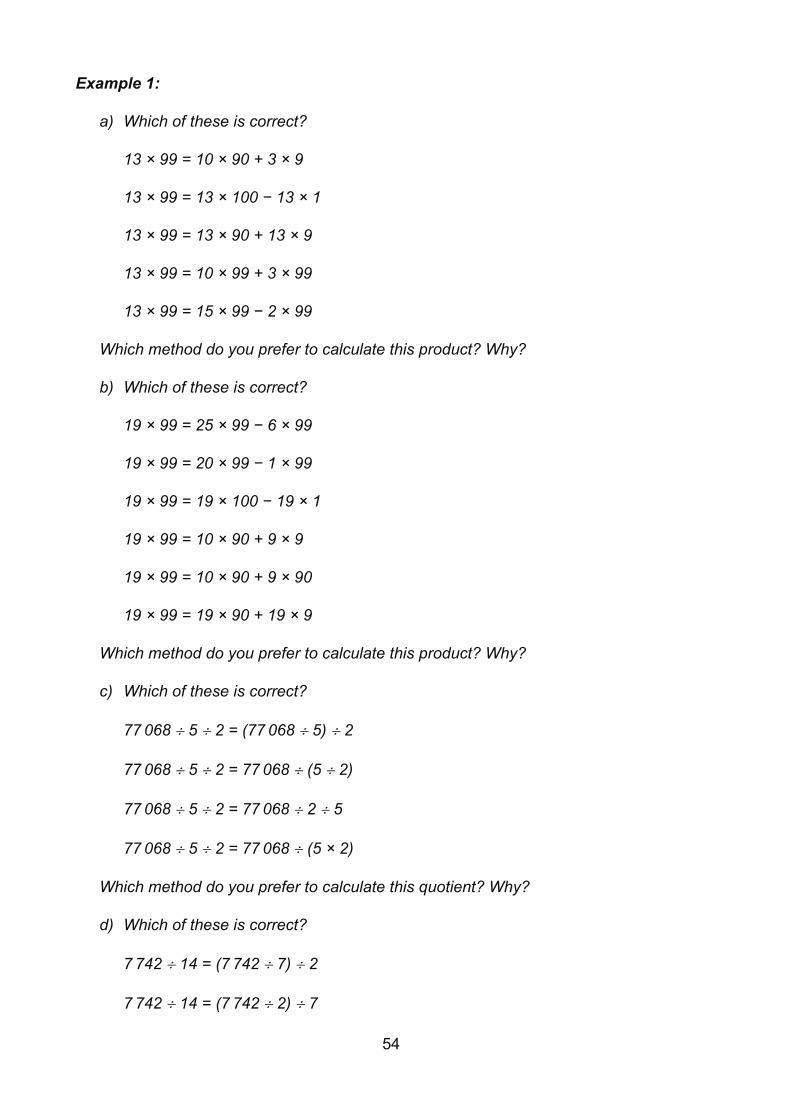
54
Example 1:
a) Which of these is correct?
13 × 99 = 10 × 90 + 3 × 9
13 × 99 = 13 × 100 − 13 × 1
13 × 99 = 13 × 90 + 13 × 9
13 × 99 = 10 × 99 + 3 × 99
13 × 99 = 15 × 99 − 2 × 99
Which method do you prefer to calculate this product? Why?
b) Which of these is correct?
19 × 99 = 25 × 99 − 6 × 99
19 × 99 = 20 × 99 − 1 × 99
19 × 99 = 19 × 100 − 19 × 1
19 × 99 = 10 × 90 + 9 × 9
19 × 99 = 10 × 90 + 9 × 90
19 × 99 = 19 × 90 + 19 × 9
Which method do you prefer to calculate this product? Why?
c) Which of these is correct?
77 068 5 2 = (77 068 5) 2
77 068 5 2 = 77 068 (5 2)
77 068 5 2 = 77 068 2 5
77 068 5 2 = 77 068 (5 × 2)
Which method do you prefer to calculate this quotient? Why?
d) Which of these is correct?
7 742 14 = (7 742 7) 2
7 742 14 = (7 742 2) 7
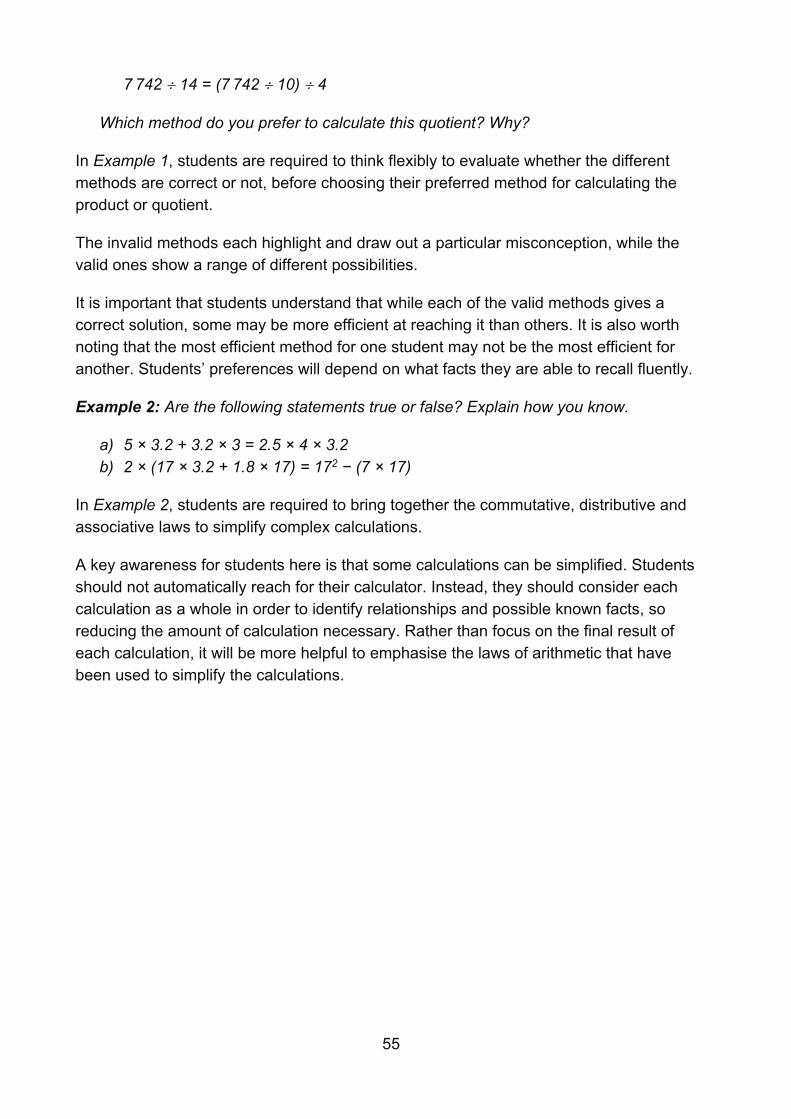
55
7 742 14 = (7 742 10) 4
Which method do you prefer to calculate this quotient? Why?
In Example 1, students are required to think flexibly to evaluate whether the different methods are correct or not, before choosing their preferred method for calculating the product or quotient.
The invalid methods each highlight and draw out a particular misconception, while the valid ones show a range of different possibilities.
It is important that students understand that while each of the valid methods gives a correct solution, some may be more efficient at reaching it than others. It is also worth noting that the most efficient method for one student may not be the most efficient for another. Students’ preferences will depend on what facts they are able to recall fluently.
Example 2: Are the following statements true or false? Explain how you know.
a) 5 × 3.2 + 3.2 × 3 = 2.5 × 4 × 3.2 b) 2 × (17 × 3.2 + 1.8 × 17) = 172 − (7 × 17)
In Example 2, students are required to bring together the commutative, distributive and associative laws to simplify complex calculations.
A key awareness for students here is that some calculations can be simplified. Students should not automatically reach for their calculator. Instead, they should consider each calculation as a whole in order to identify relationships and possible known facts, so reducing the amount of calculation necessary. Rather than focus on the final result of each calculation, it will be more helpful to emphasise the laws of arithmetic that have been used to simplify the calculations.
56
Expressions and equations
Overview
At the heart of algebra and algebraic thinking is the expression of generality. Algebraic notation and techniques for its manipulation, including conventions governing its use, should naturally arise from exploring the structure of the number system and operations on number. For this reason, algebra is not a separate theme in these materials but is linked to the two themes associated with number: ‘The structure of the number system’ and ‘Operating on number’.
Students are presented with situations where the structure of numbers can be generalised. Students are introduced to conventions concerning the writing of algebraic symbols and learn techniques for symbolic manipulation. For example, students who know that equivalent subtractions can be formed by adding or subtracting the same quantity from both the subtrahend and the minuend (for example, 3 476 – 1 998 = 3 478 – 2 000), can be taught to generalise this as (a + n) − (b + n) = a − b = (a − n) − (b − n).
In Year 6, a key focus in relation to algebra is that students ‘should be introduced to the use of symbols and letters to represent variables and unknowns in mathematical situations that they already understand’. This work continues into Key Stage 3, with the important development that students use algebraic notation to examine and analyse number structure, and to deepen their understanding.
Prior learning
Before beginning expressions and equations at Key Stage 3, students should already have a secure understanding of the following learning outcomes from study at upper Key Stage 2:
• Use their knowledge of the order of operations to carry out calculations involving the four operations.
• Use simple formulae. • Express missing number problems algebraically. • Find pairs of numbers that satisfy an equation with two unknowns. • Enumerate possibilities of combinations of two variables. • Be introduced to the use of symbols and letters to represent variables and
unknowns in mathematical situations that they already understand (non-statutory guidance).
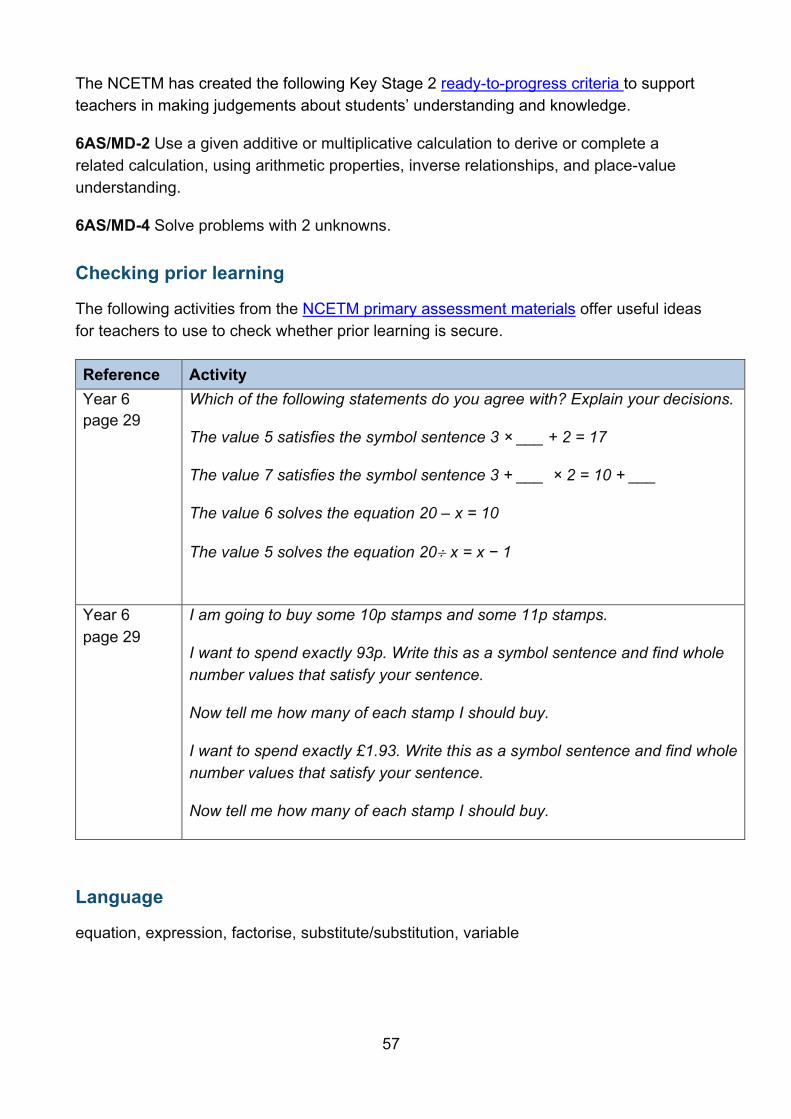
57
The NCETM has created the following Key Stage 2 ready-to-progress criteria to support teachers in making judgements about students’ understanding and knowledge.
6AS/MD-2 Use a given additive or multiplicative calculation to derive or complete a related calculation, using arithmetic properties, inverse relationships, and place-value understanding.
6AS/MD-4 Solve problems with 2 unknowns.
Checking prior learning
The following activities from the NCETM primary assessment materials offer useful ideas for teachers to use to check whether prior learning is secure.
Reference Activity Year 6 page 29
Which of the following statements do you agree with? Explain your decisions.
The value 5 satisfies the symbol sentence 3 × ___ + 2 = 17
The value 7 satisfies the symbol sentence 3 + ___ × 2 = 10 + ___
The value 6 solves the equation 20 – x = 10
The value 5 solves the equation 20 x = x − 1
Year 6 page 29
I am going to buy some 10p stamps and some 11p stamps.
I want to spend exactly 93p. Write this as a symbol sentence and find whole number values that satisfy your sentence.
Now tell me how many of each stamp I should buy.
I want to spend exactly £1.93. Write this as a symbol sentence and find whole number values that satisfy your sentence.
Now tell me how many of each stamp I should buy.
Language
equation, expression, factorise, substitute/substitution, variable
58
Progression through key ideas
Understand and use the conventions and vocabulary of algebra, including forming and interpreting algebraic expressions and equations
The fundamental understanding in this set of key ideas is that a letter can be used to represent a generalised number and that algebraic notation is used to generalise number properties, structures and relationships.
Students will have gained a sense of certain generalities in Key Stage 2 (for example, commutativity of addition and multiplication). They should also have had experience of recording such generalities using symbols (for example, a + b = b + a and ab = ba).
At Key Stage 3, students experience a wide range of examples where generalisations can be made (for example, the sum of three consecutive integers being a multiple of three). Students realise that such generalised statements can become expressions in their own right (for example, 3n represents a generalised multiple of three). They also understand that such statements capture an infinity of cases and hence represent, for example, all the multiples of three ‘in one go’. All these are examples of working from the particular to the general, and students should have a clear understanding of the particular number relationships before generalising using algebra.
One of the ways in which students interpret algebraic expressions and equations is to work from the general to the particular. For example, to interpret the meaning of an algebraic statement, such as 3x + 5 or x2 – 2, it is important that students consider the questions:
• ‘How does the value of the expression change as the value of x changes?’ • ‘When does the expression take a particular value?’
Students should realise that there is a difference between situations where a letter represents a variable which can take any value across a certain domain and where, because of some restriction being imposed (e.g. 3x + 5 = 7, x2 – 2 = 9 or 3x + 5 = x2 – 2), it has a particular value, which may be as yet unknown.
Key ideas
• Understand that a letter can be used to represent a generalised number • Understand that algebraic notation follows particular conventions and that
following these aids clear communication • Know the meaning of and identify: term, coefficient, factor, product, expression,
formula and equation • Understand and recognise that a letter can be used to represent a specific
unknown value or a variable* • Understand that relationships can be generalised using algebraic statements*
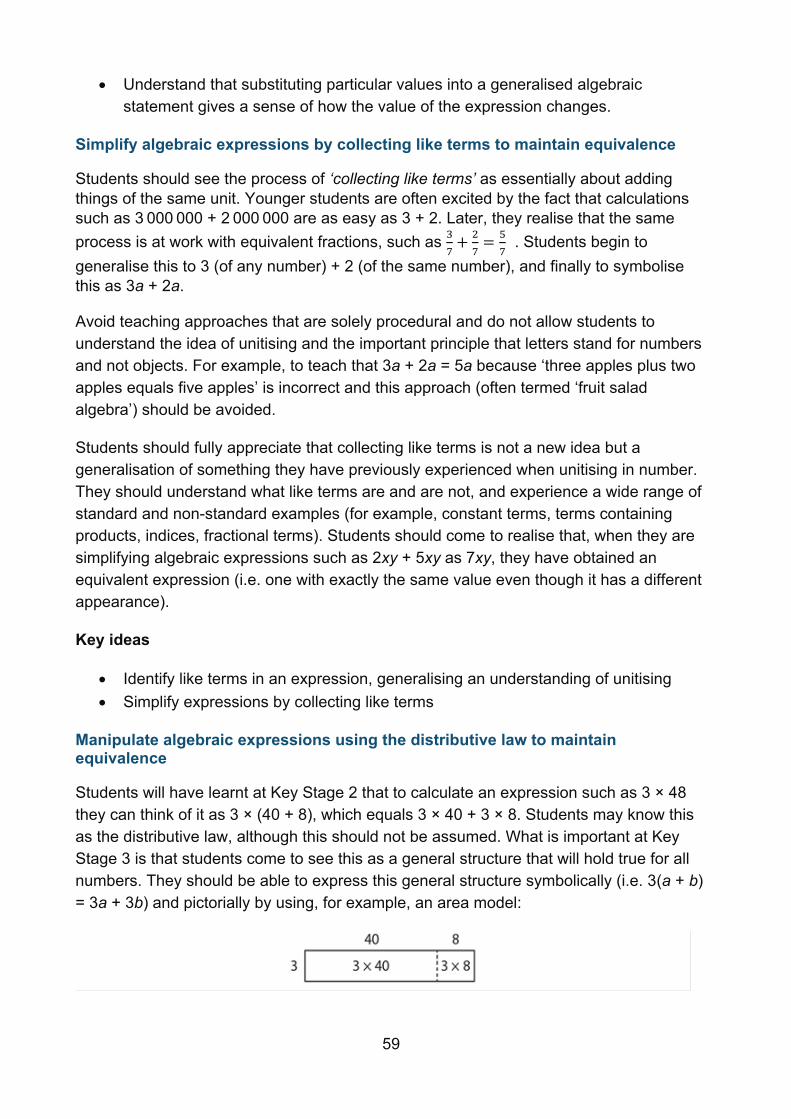
59
• Understand that substituting particular values into a generalised algebraic statement gives a sense of how the value of the expression changes.
Simplify algebraic expressions by collecting like terms to maintain equivalence
Students should see the process of ‘collecting like terms’ as essentially about adding things of the same unit. Younger students are often excited by the fact that calculations such as 3 000 000 + 2 000 000 are as easy as 3 + 2. Later, they realise that the same process is at work with equivalent fractions, such as 3
7+
2
7=
5
7 . Students begin to
generalise this to 3 (of any number) + 2 (of the same number), and finally to symbolise this as 3a + 2a.
Avoid teaching approaches that are solely procedural and do not allow students to understand the idea of unitising and the important principle that letters stand for numbers and not objects. For example, to teach that 3a + 2a = 5a because ‘three apples plus two apples equals five apples’ is incorrect and this approach (often termed ‘fruit salad algebra’) should be avoided.
Students should fully appreciate that collecting like terms is not a new idea but a generalisation of something they have previously experienced when unitising in number. They should understand what like terms are and are not, and experience a wide range of standard and non-standard examples (for example, constant terms, terms containing products, indices, fractional terms). Students should come to realise that, when they are simplifying algebraic expressions such as 2xy + 5xy as 7xy, they have obtained an equivalent expression (i.e. one with exactly the same value even though it has a different appearance).
Key ideas
• Identify like terms in an expression, generalising an understanding of unitising • Simplify expressions by collecting like terms
Manipulate algebraic expressions using the distributive law to maintain equivalence
Students will have learnt at Key Stage 2 that to calculate an expression such as 3 × 48 they can think of it as 3 × (40 + 8), which equals 3 × 40 + 3 × 8. Students may know this as the distributive law, although this should not be assumed. What is important at Key Stage 3 is that students come to see this as a general structure that will hold true for all numbers. They should be able to express this general structure symbolically (i.e. 3(a + b) = 3a + 3b) and pictorially by using, for example, an area model:
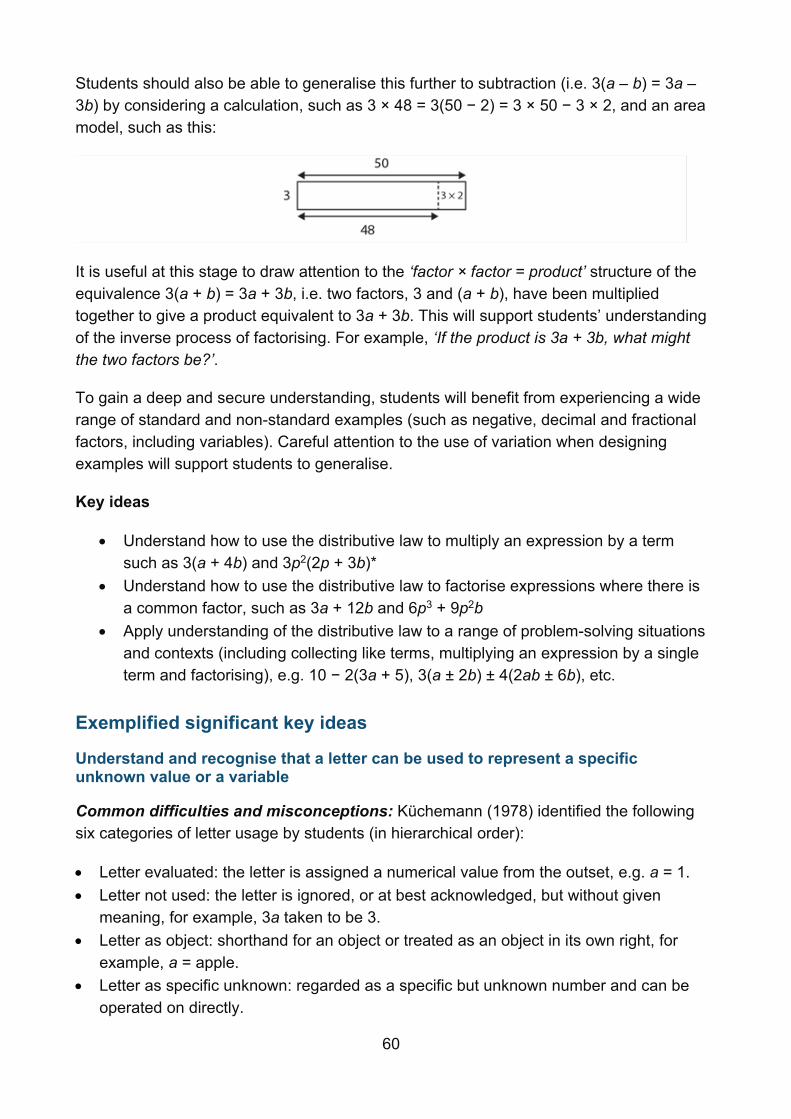
60
Students should also be able to generalise this further to subtraction (i.e. 3(a – b) = 3a – 3b) by considering a calculation, such as 3 × 48 = 3(50 − 2) = 3 × 50 − 3 × 2, and an area model, such as this:
It is useful at this stage to draw attention to the ‘factor × factor = product’ structure of the equivalence 3(a + b) = 3a + 3b, i.e. two factors, 3 and (a + b), have been multiplied together to give a product equivalent to 3a + 3b. This will support students’ understanding of the inverse process of factorising. For example, ‘If the product is 3a + 3b, what might the two factors be?’.
To gain a deep and secure understanding, students will benefit from experiencing a wide range of standard and non-standard examples (such as negative, decimal and fractional factors, including variables). Careful attention to the use of variation when designing examples will support students to generalise.
Key ideas
• Understand how to use the distributive law to multiply an expression by a term such as 3(a + 4b) and 3p2(2p + 3b)*
• Understand how to use the distributive law to factorise expressions where there is a common factor, such as 3a + 12b and 6p3 + 9p2b
• Apply understanding of the distributive law to a range of problem-solving situations and contexts (including collecting like terms, multiplying an expression by a single term and factorising), e.g. 10 − 2(3a + 5), 3(a ± 2b) ± 4(2ab ± 6b), etc.
Exemplified significant key ideas
Understand and recognise that a letter can be used to represent a specific unknown value or a variable
Common difficulties and misconceptions: Küchemann (1978) identified the following six categories of letter usage by students (in hierarchical order):
• Letter evaluated: the letter is assigned a numerical value from the outset, e.g. a = 1. • Letter not used: the letter is ignored, or at best acknowledged, but without given
meaning, for example, 3a taken to be 3. • Letter as object: shorthand for an object or treated as an object in its own right, for
example, a = apple. • Letter as specific unknown: regarded as a specific but unknown number and can be
operated on directly.
61
• Letter as generalised number: seen as being able to take several values rather than just one.
• Letter as variable: representing a range of unspecified values, and a systematic relationship is seen to exist between two sets of values.
The first three offer an indication of the difficulties and misconceptions students might have. The last three outline the progression that students need to make as they develop an increasingly sophisticated view of the way letters are used to represent number.
Example 1: For each of the following statements, use a letter to represent the number Isla is thinking of and write the statement using letters and numbers.
a) ‘I am thinking of a number and I add three.’ b) ‘I am thinking of a number and I multiply by two and add three.’ c) ‘I am thinking of a number and I add three and multiply by two.’ d) ‘I am thinking of a number and I multiply by three and add two.’ e) ‘I am thinking of a number and I add two and multiply by three.’
In Example 1, the numbers are deliberately kept the same in order for students to focus on the order of operations and how algebraic symbolism is used to represent the different order of operations, using brackets where necessary.
A key purpose of variation is to support students’ awareness of what can change, and it can be useful to ask them to make up some examples like these for themselves. For example, through using activities such as: ‘Using the numbers two and three, make up some different “I am thinking of a number” statements and set them for your partner.’
While this example is a useful precursor to solving equations, the central purpose here is to understand that letters can have a range of values and to get a sense of how the value of expressions can change with these different values. Students should be encouraged to offer a number of possible values for x.
This is a good opportunity to introduce the language of ‘variable’ and encourage students to use this term while discussing their answers and their reasoning. For example, ‘In the expression 2x + 3, x is a variable because it can take a range of different values.’
Example 2: For each of the following statements, use a letter to represent the number Isla is thinking of, write the statement using letters and numbers, and find the number she is thinking of.
a) ‘I am thinking of a number; I add four and the answer is 12. What number am I thinking of?’
b) ‘I am thinking of a number; I add four, multiply by three and the answer is 12. What number am I thinking of?’
c) ‘I am thinking of a number; I add four, multiply by three, subtract six and the answer is 12. What number am I thinking of?’
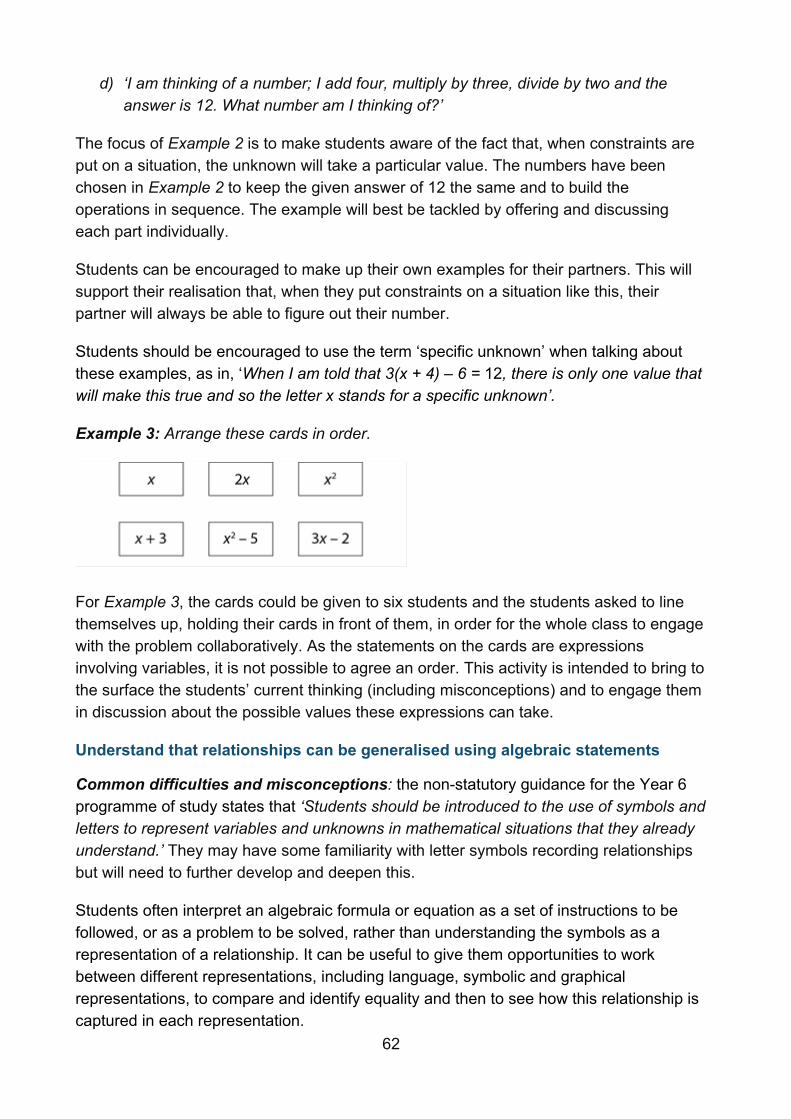
62
d) ‘I am thinking of a number; I add four, multiply by three, divide by two and the answer is 12. What number am I thinking of?’
The focus of Example 2 is to make students aware of the fact that, when constraints are put on a situation, the unknown will take a particular value. The numbers have been chosen in Example 2 to keep the given answer of 12 the same and to build the operations in sequence. The example will best be tackled by offering and discussing each part individually.
Students can be encouraged to make up their own examples for their partners. This will support their realisation that, when they put constraints on a situation like this, their partner will always be able to figure out their number.
Students should be encouraged to use the term ‘specific unknown’ when talking about these examples, as in, ‘When I am told that 3(x + 4) – 6 = 12, there is only one value that will make this true and so the letter x stands for a specific unknown’.
Example 3: Arrange these cards in order.
For Example 3, the cards could be given to six students and the students asked to line themselves up, holding their cards in front of them, in order for the whole class to engage with the problem collaboratively. As the statements on the cards are expressions involving variables, it is not possible to agree an order. This activity is intended to bring to the surface the students’ current thinking (including misconceptions) and to engage them in discussion about the possible values these expressions can take.
Understand that relationships can be generalised using algebraic statements
Common difficulties and misconceptions: the non-statutory guidance for the Year 6 programme of study states that ‘Students should be introduced to the use of symbols and letters to represent variables and unknowns in mathematical situations that they already understand.’ They may have some familiarity with letter symbols recording relationships but will need to further develop and deepen this.
Students often interpret an algebraic formula or equation as a set of instructions to be followed, or as a problem to be solved, rather than understanding the symbols as a representation of a relationship. It can be useful to give them opportunities to work between different representations, including language, symbolic and graphical representations, to compare and identify equality and then to see how this relationship is captured in each representation.
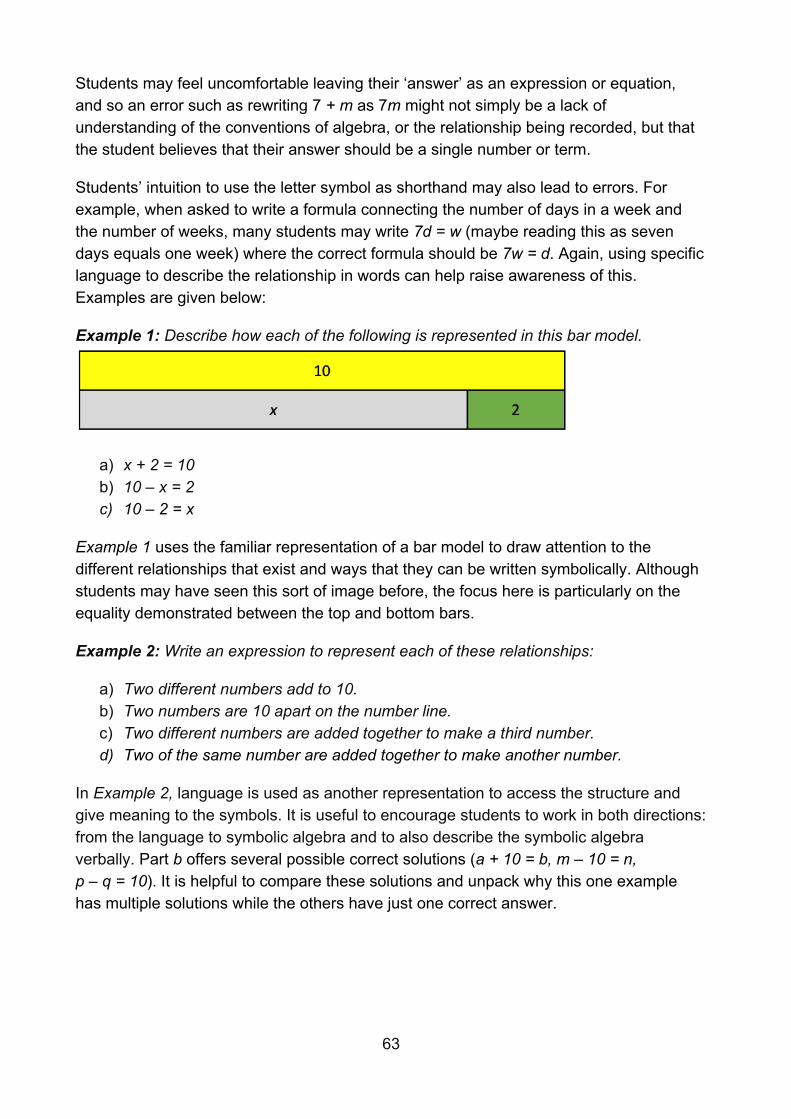
63
Students may feel uncomfortable leaving their ‘answer’ as an expression or equation, and so an error such as rewriting 7 + m as 7m might not simply be a lack of understanding of the conventions of algebra, or the relationship being recorded, but that the student believes that their answer should be a single number or term.
Students’ intuition to use the letter symbol as shorthand may also lead to errors. For example, when asked to write a formula connecting the number of days in a week and the number of weeks, many students may write 7d = w (maybe reading this as seven days equals one week) where the correct formula should be 7w = d. Again, using specific language to describe the relationship in words can help raise awareness of this. Examples are given below:
Example 1: Describe how each of the following is represented in this bar model.
a) x + 2 = 10 b) 10 – x = 2 c) 10 – 2 = x
Example 1 uses the familiar representation of a bar model to draw attention to the different relationships that exist and ways that they can be written symbolically. Although students may have seen this sort of image before, the focus here is particularly on the equality demonstrated between the top and bottom bars.
Example 2: Write an expression to represent each of these relationships:
a) Two different numbers add to 10. b) Two numbers are 10 apart on the number line. c) Two different numbers are added together to make a third number. d) Two of the same number are added together to make another number.
In Example 2, language is used as another representation to access the structure and give meaning to the symbols. It is useful to encourage students to work in both directions: from the language to symbolic algebra and to also describe the symbolic algebra verbally. Part b offers several possible correct solutions (a + 10 = b, m – 10 = n, p – q = 10). It is helpful to compare these solutions and unpack why this one example has multiple solutions while the others have just one correct answer.
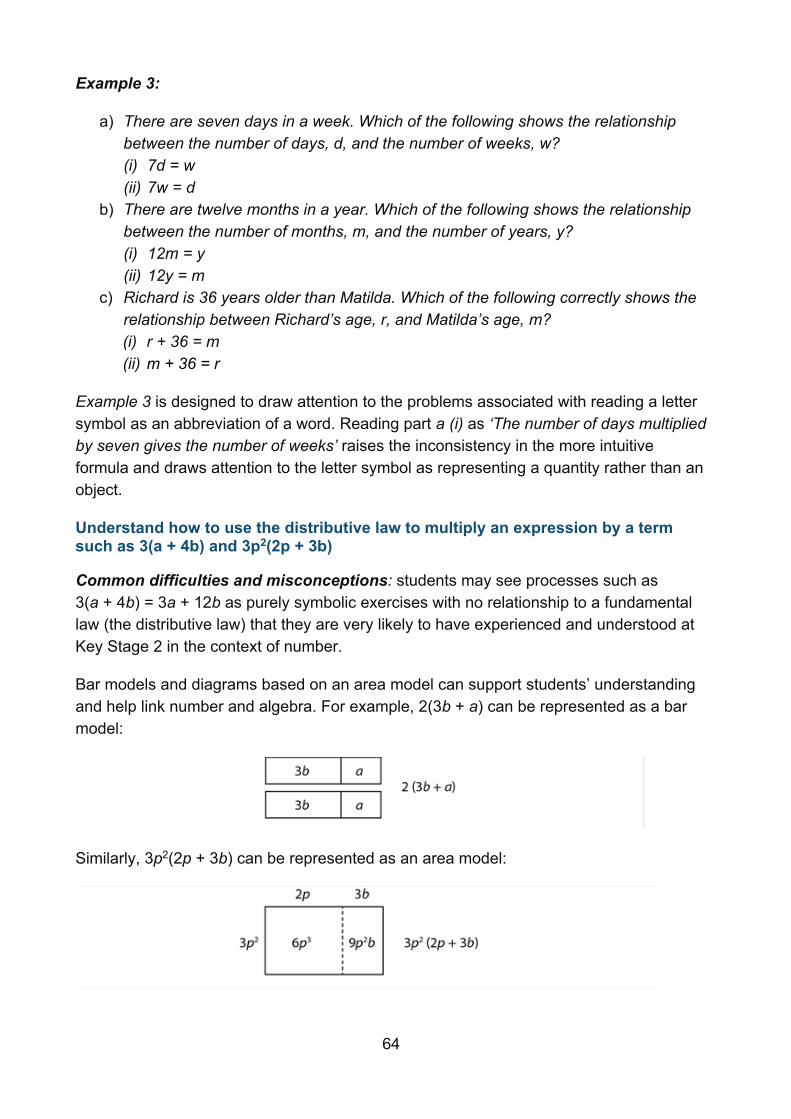
64
Example 3:
a) There are seven days in a week. Which of the following shows the relationship between the number of days, d, and the number of weeks, w? (i) 7d = w (ii) 7w = d
b) There are twelve months in a year. Which of the following shows the relationship between the number of months, m, and the number of years, y? (i) 12m = y (ii) 12y = m
c) Richard is 36 years older than Matilda. Which of the following correctly shows the relationship between Richard’s age, r, and Matilda’s age, m? (i) r + 36 = m (ii) m + 36 = r
Example 3 is designed to draw attention to the problems associated with reading a letter symbol as an abbreviation of a word. Reading part a (i) as ‘The number of days multiplied by seven gives the number of weeks’ raises the inconsistency in the more intuitive formula and draws attention to the letter symbol as representing a quantity rather than an object.
Understand how to use the distributive law to multiply an expression by a term such as 3(a + 4b) and 3p2(2p + 3b)
Common difficulties and misconceptions: students may see processes such as 3(a + 4b) = 3a + 12b as purely symbolic exercises with no relationship to a fundamental law (the distributive law) that they are very likely to have experienced and understood at Key Stage 2 in the context of number.
Bar models and diagrams based on an area model can support students’ understanding and help link number and algebra. For example, 2(3b + a) can be represented as a bar model:
Similarly, 3p2(2p + 3b) can be represented as an area model:
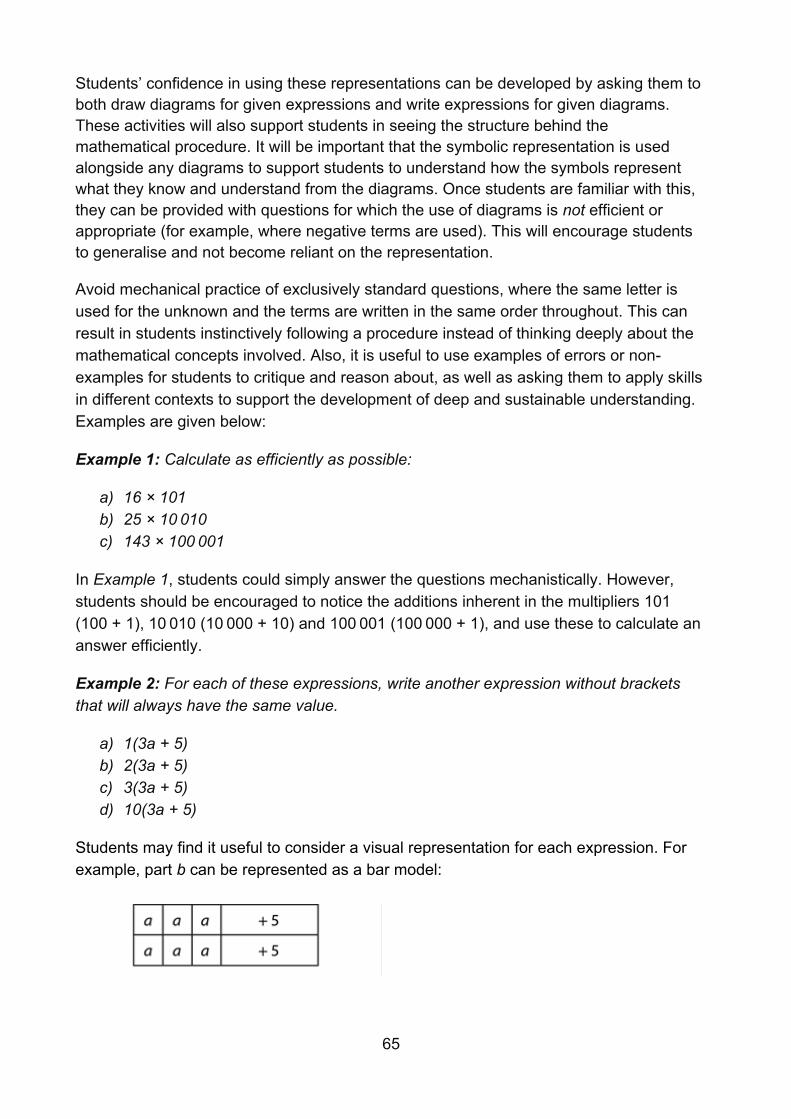
65
Students’ confidence in using these representations can be developed by asking them to both draw diagrams for given expressions and write expressions for given diagrams. These activities will also support students in seeing the structure behind the mathematical procedure. It will be important that the symbolic representation is used alongside any diagrams to support students to understand how the symbols represent what they know and understand from the diagrams. Once students are familiar with this, they can be provided with questions for which the use of diagrams is not efficient or appropriate (for example, where negative terms are used). This will encourage students to generalise and not become reliant on the representation.
Avoid mechanical practice of exclusively standard questions, where the same letter is used for the unknown and the terms are written in the same order throughout. This can result in students instinctively following a procedure instead of thinking deeply about the mathematical concepts involved. Also, it is useful to use examples of errors or non-examples for students to critique and reason about, as well as asking them to apply skills in different contexts to support the development of deep and sustainable understanding. Examples are given below:
Example 1: Calculate as efficiently as possible:
a) 16 × 101 b) 25 × 10 010 c) 143 × 100 001
In Example 1, students could simply answer the questions mechanistically. However, students should be encouraged to notice the additions inherent in the multipliers 101 (100 + 1), 10 010 (10 000 + 10) and 100 001 (100 000 + 1), and use these to calculate an answer efficiently.
Example 2: For each of these expressions, write another expression without brackets that will always have the same value.
a) 1(3a + 5) b) 2(3a + 5) c) 3(3a + 5) d) 10(3a + 5)
Students may find it useful to consider a visual representation for each expression. For example, part b can be represented as a bar model:
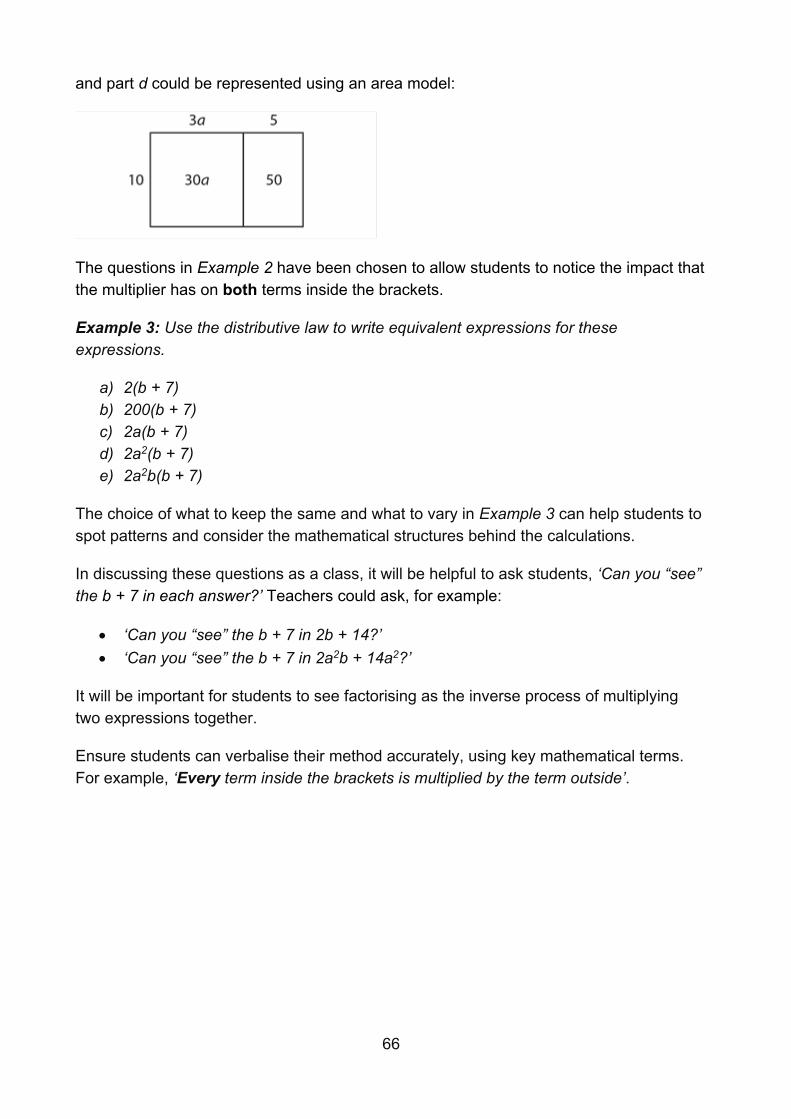
66
and part d could be represented using an area model:
The questions in Example 2 have been chosen to allow students to notice the impact that the multiplier has on both terms inside the brackets.
Example 3: Use the distributive law to write equivalent expressions for these expressions.
a) 2(b + 7) b) 200(b + 7) c) 2a(b + 7) d) 2a2(b + 7) e) 2a2b(b + 7)
The choice of what to keep the same and what to vary in Example 3 can help students to spot patterns and consider the mathematical structures behind the calculations.
In discussing these questions as a class, it will be helpful to ask students, ‘Can you “see” the b + 7 in each answer?’ Teachers could ask, for example:
• ‘Can you “see” the b + 7 in 2b + 14?’ • ‘Can you “see” the b + 7 in 2a2b + 14a2?’
It will be important for students to see factorising as the inverse process of multiplying two expressions together.
Ensure students can verbalise their method accurately, using key mathematical terms. For example, ‘Every term inside the brackets is multiplied by the term outside’.
67
Year 7 spring term
Plotting coordinates
Overview
In Key Stage 2, students should have become familiar with coordinates in all four quadrants. They should have made links with their work in geometry by both plotting points to form common 2D quadrilaterals and ‘predicting missing coordinates using the properties of shapes’ (Department for Education, 2013). These skills are developed further in Key Stage 3. A key focus will be thinking about x- and y-coordinates as the input and output respectively of a function or rule, and appreciating that the set of coordinates generated and the line joining them can be thought of as a graphical representation of that function.
Later in Key Stage 3, significant attention will be given to exploring linear relationships and their representation as straight line graphs. Students should appreciate that all linear relationships have certain key characteristics:
• a specific pair of values or points on the graph; for example, where x = 0 (the intercept)
• a rate of change of one variable in relation to the other variable; for example, how the y-value increases (or decreases) as the x-value increases (the gradient).
Students should be able to recognise these features, both in the written algebraic form of the relationship and in its graphical representation.
Prior learning
Before beginning graphical representations at Key Stage 3, students should already have a secure understanding of the following learning outcomes from study at upper Key Stage 2:
• Describe positions on the full coordinate grid (all four quadrants) • Find pairs of numbers that satisfy an equation with two unknowns • Enumerate possibilities of combinations of two variables
The NCETM has created the following Key Stage 2 ready-to-progress criteria to support teachers in making judgements about students’ understanding and knowledge.
4G-1 Draw polygons, specified by coordinates in the first quadrant, and translate within the first quadrant.
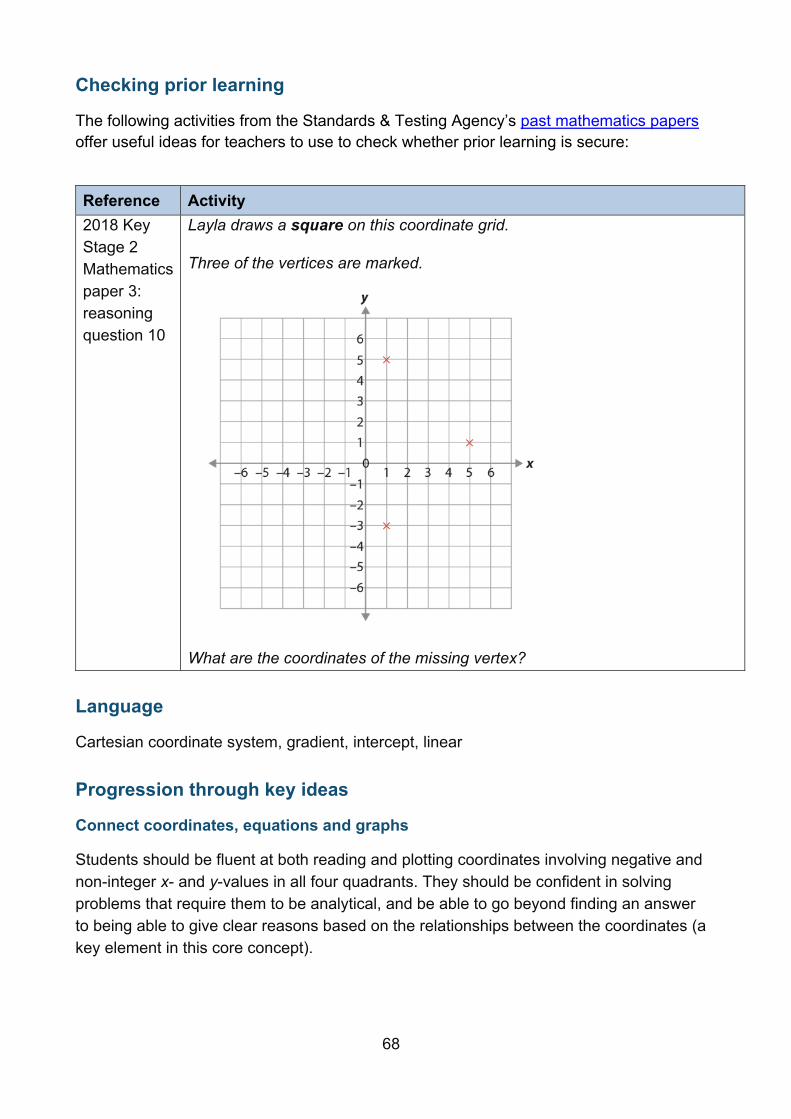
68
Checking prior learning
The following activities from the Standards & Testing Agency’s past mathematics papers offer useful ideas for teachers to use to check whether prior learning is secure:
Reference Activity 2018 Key Stage 2 Mathematics paper 3: reasoning question 10
Layla draws a square on this coordinate grid.
Three of the vertices are marked.
What are the coordinates of the missing vertex?
Language
Cartesian coordinate system, gradient, intercept, linear
Progression through key ideas
Connect coordinates, equations and graphs
Students should be fluent at both reading and plotting coordinates involving negative and non-integer x- and y-values in all four quadrants. They should be confident in solving problems that require them to be analytical, and be able to go beyond finding an answer to being able to give clear reasons based on the relationships between the coordinates (a key element in this core concept).
69
For example, in ‘Checking prior learning’ (above), in order to determine the coordinates of the missing vertex, students could:
• Identify the gradient of one of the sides of the square and infer the gradient of the opposite side.
• Use the fact that the diagonals of the square are perpendicular and of equal length.
A sound understanding of the relationships between the x- and y-values of pairs of coordinates provides the basis for more sophisticated analysis of the features of linear functions and their graphs, which students will need to develop throughout Key Stage 3.
By graphing sets of coordinates where the x- and y-values are connected by a rule, students will become aware of the connection between a rule expressed algebraically and the graph joining the set of points. Students will then also need to think about horizontal and vertical straight line graphs where the functions (x = a and y = b) are of a particular form, and relate the concepts of gradient and intercept to these. This work should lead students to appreciate the important two-way connection, that is:
• If the x- and y-values of the coordinates fit an arithmetic rule, then they will lie on a straight line.
• If the coordinates lie on a straight line, then their x- and y-values will fit an arithmetic rule.
Key ideas
• Describe and plot coordinates, including non-integer values, in all four quadrants • Solve a range of problems involving coordinates • Know that a set of coordinates, constructed according to a mathematical rule, can
be represented algebraically and graphically* • Understand that a graphical representation shows all of the points (within a range)
that satisfy a relationship
Exemplified significant key ideas
Know that a set of coordinates, constructed according to a mathematical rule, can be represented algebraically and graphically
Common difficulties and misconceptions: when working with linear equations and graphs, it is not uncommon for students to accept that integer coordinates fit the rule given by an equation. What students may not appreciate is that the line is representing an infinity of points, all of which fit the rule.
It will be important for students to experiment with coordinates in between integer points they have used to construct the line, and to verify that these coordinates also fit the rule.
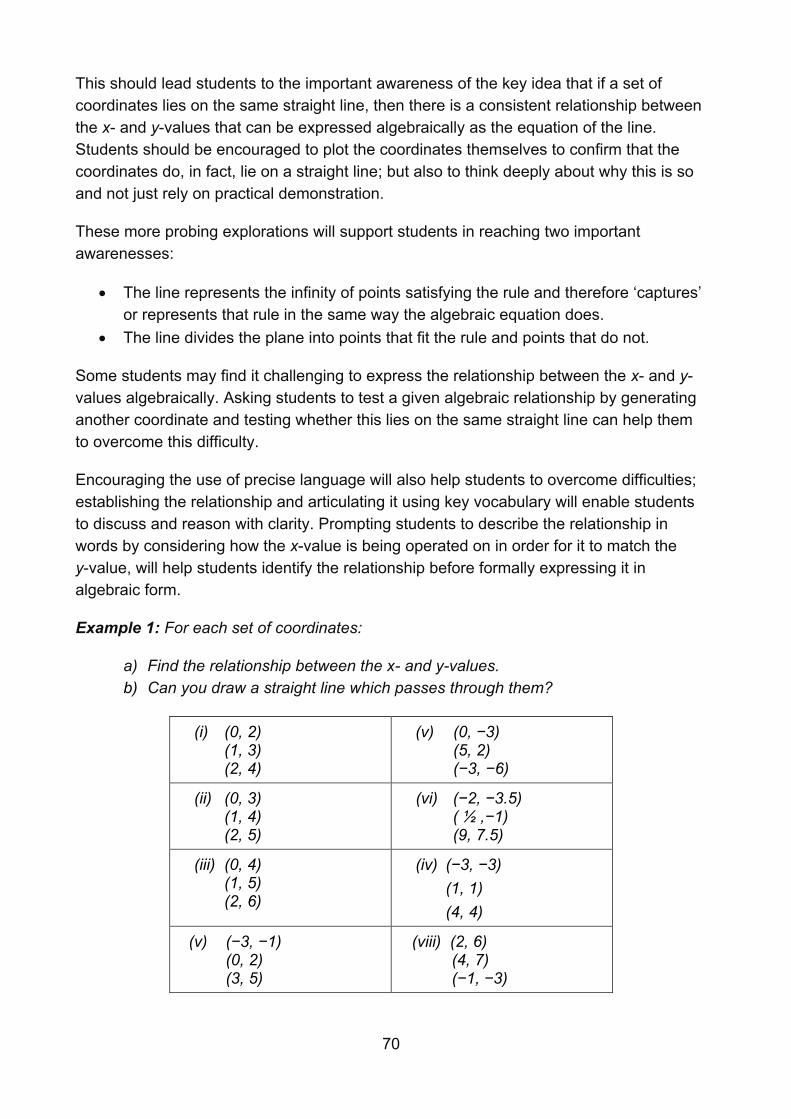
70
This should lead students to the important awareness of the key idea that if a set of coordinates lies on the same straight line, then there is a consistent relationship between the x- and y-values that can be expressed algebraically as the equation of the line. Students should be encouraged to plot the coordinates themselves to confirm that the coordinates do, in fact, lie on a straight line; but also to think deeply about why this is so and not just rely on practical demonstration.
These more probing explorations will support students in reaching two important awarenesses:
• The line represents the infinity of points satisfying the rule and therefore ‘captures’ or represents that rule in the same way the algebraic equation does.
• The line divides the plane into points that fit the rule and points that do not.
Some students may find it challenging to express the relationship between the x- and y-values algebraically. Asking students to test a given algebraic relationship by generating another coordinate and testing whether this lies on the same straight line can help them to overcome this difficulty.
Encouraging the use of precise language will also help students to overcome difficulties; establishing the relationship and articulating it using key vocabulary will enable students to discuss and reason with clarity. Prompting students to describe the relationship in words by considering how the x-value is being operated on in order for it to match the y-value, will help students identify the relationship before formally expressing it in algebraic form.
Example 1: For each set of coordinates:
a) Find the relationship between the x- and y-values. b) Can you draw a straight line which passes through them?
(i) (0, 2) (1, 3) (2, 4)
(v) (0, −3) (5, 2) (−3, −6)
(ii) (0, 3) (1, 4) (2, 5)
(vi) (−2, −3.5) ( ½ ,−1) (9, 7.5)
(iii) (0, 4) (1, 5) (2, 6)
(iv) (−3, −3) (1, 1) (4, 4)
(v) (−3, −1) (0, 2) (3, 5)
(viii) (2, 6) (4, 7) (−1, −3)
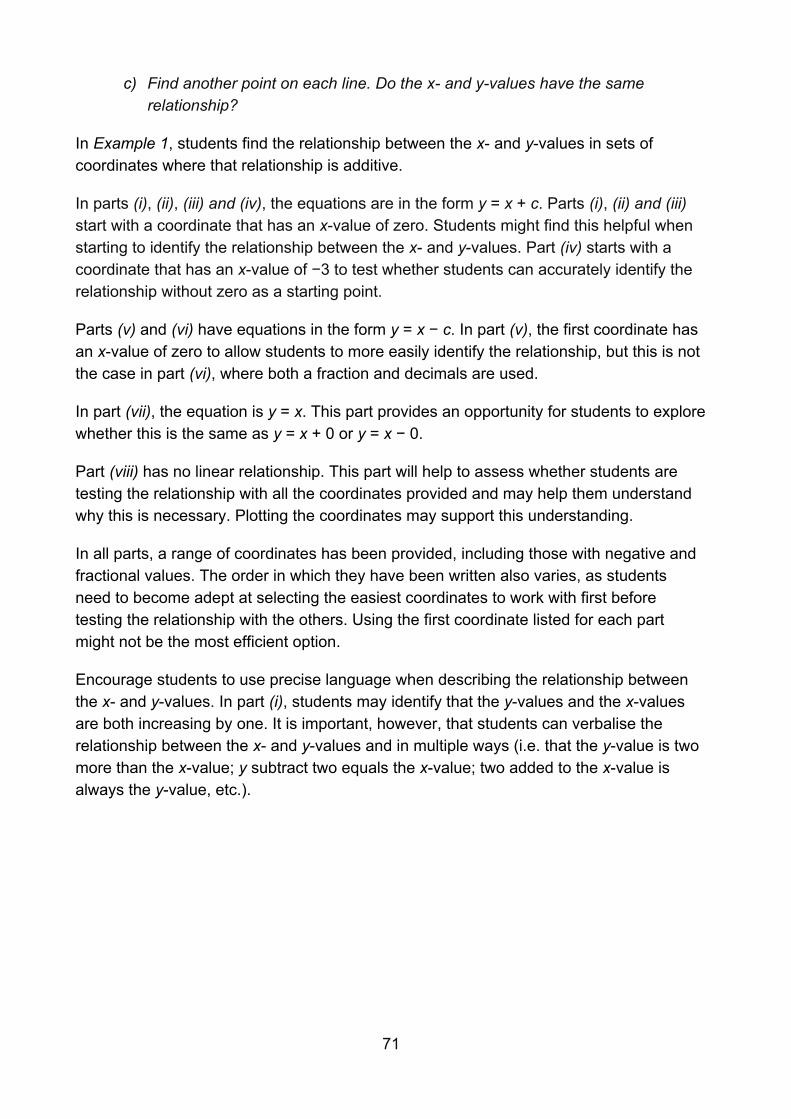
71
c) Find another point on each line. Do the x- and y-values have the same relationship?
In Example 1, students find the relationship between the x- and y-values in sets of coordinates where that relationship is additive.
In parts (i), (ii), (iii) and (iv), the equations are in the form y = x + c. Parts (i), (ii) and (iii) start with a coordinate that has an x-value of zero. Students might find this helpful when starting to identify the relationship between the x- and y-values. Part (iv) starts with a coordinate that has an x-value of −3 to test whether students can accurately identify the relationship without zero as a starting point.
Parts (v) and (vi) have equations in the form y = x − c. In part (v), the first coordinate has an x-value of zero to allow students to more easily identify the relationship, but this is not the case in part (vi), where both a fraction and decimals are used.
In part (vii), the equation is y = x. This part provides an opportunity for students to explore whether this is the same as y = x + 0 or y = x − 0.
Part (viii) has no linear relationship. This part will help to assess whether students are testing the relationship with all the coordinates provided and may help them understand why this is necessary. Plotting the coordinates may support this understanding.
In all parts, a range of coordinates has been provided, including those with negative and fractional values. The order in which they have been written also varies, as students need to become adept at selecting the easiest coordinates to work with first before testing the relationship with the others. Using the first coordinate listed for each part might not be the most efficient option.
Encourage students to use precise language when describing the relationship between the x- and y-values. In part (i), students may identify that the y-values and the x-values are both increasing by one. It is important, however, that students can verbalise the relationship between the x- and y-values and in multiple ways (i.e. that the y-value is two more than the x-value; y subtract two equals the x-value; two added to the x-value is always the y-value, etc.).
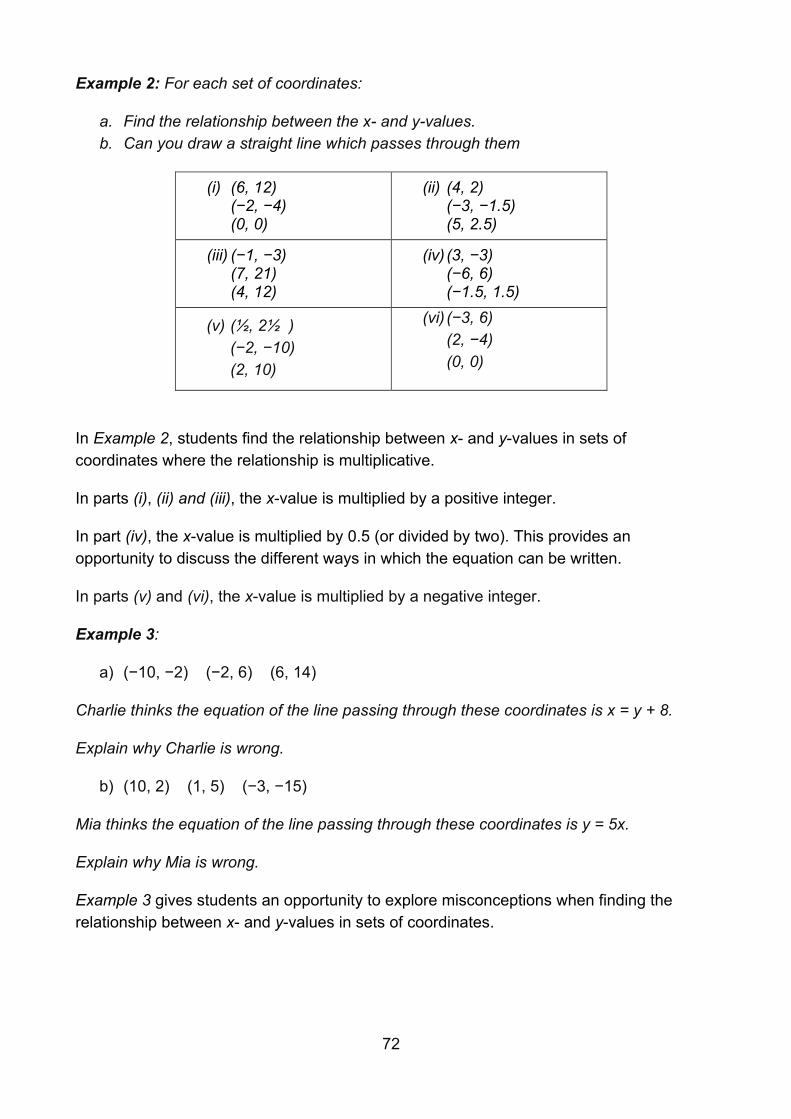
72
Example 2: For each set of coordinates:
a. Find the relationship between the x- and y-values. b. Can you draw a straight line which passes through them
(i) (6, 12) (−2, −4) (0, 0)
(ii) (4, 2) (−3, −1.5) (5, 2.5)
(iii) (−1, −3) (7, 21) (4, 12)
(iv) (3, −3) (−6, 6) (−1.5, 1.5)
(v) (½, 2½ ) (−2, −10) (2, 10)
(vi) (−3, 6) (2, −4) (0, 0)
In Example 2, students find the relationship between x- and y-values in sets of coordinates where the relationship is multiplicative.
In parts (i), (ii) and (iii), the x-value is multiplied by a positive integer.
In part (iv), the x-value is multiplied by 0.5 (or divided by two). This provides an opportunity to discuss the different ways in which the equation can be written.
In parts (v) and (vi), the x-value is multiplied by a negative integer.
Example 3:
a) (−10, −2) (−2, 6) (6, 14)
Charlie thinks the equation of the line passing through these coordinates is x = y + 8.
Explain why Charlie is wrong.
b) (10, 2) (1, 5) (−3, −15)
Mia thinks the equation of the line passing through these coordinates is y = 5x.
Explain why Mia is wrong.
Example 3 gives students an opportunity to explore misconceptions when finding the relationship between x- and y-values in sets of coordinates.
73
Perimeter and area
Overview
At Key Stage 2, students will have had the opportunity to measure the perimeter of simple 2D shapes, find the area by counting squares, and estimate volume by counting blocks. They should have calculated the area of rectangles, triangles and parallelograms. They should also have had opportunities to develop their conceptual understanding by relating the area of rectangles to parallelograms and triangles.
The extent to which students have explored these concepts may vary. There is a danger that the study of this element of the curriculum could be reduced to the mere memorising of formulae and the execution of learnt procedures. It is important that students have a secure and deep understanding of perimeter and area before further developing these ideas in Key Stage 3. Students should fully understand the concepts involved, appreciate how the various formulae are derived and connected, and reason mathematically to solve a wide range of problems, including those in new and unfamiliar situations.
At Key Stage 3, when calculating perimeters, students will use the properties of parallelograms, isosceles triangles and trapezia, as well as non-standard shapes, and reason mathematically to deduce missing information.
Prior learning
Before beginning perimeter and area at Key Stage 3, students should already have a secure understanding of the following learning outcomes from study at upper Key Stage 2:
• Find the area of rectilinear shapes by counting squares. • Measure and calculate the perimeter of composite rectilinear shapes in
centimetres and metres. • Calculate and compare the area of rectangles (including squares), and including
using standard units, square centimetres (cm²) and square metres (m²) and estimate the area of irregular shapes.
• Recognise that shapes with the same areas can have different perimeters and vice versa.
• Recognise when it is possible to use formulae for area of shapes. • Calculate the area of parallelograms and triangles.
The NCETM has created the following Key Stage 2 ready-to-progress criteria to support teachers in making judgements about students’ understanding and knowledge.
4G-2 Find the perimeter of regular and irregular polygons.
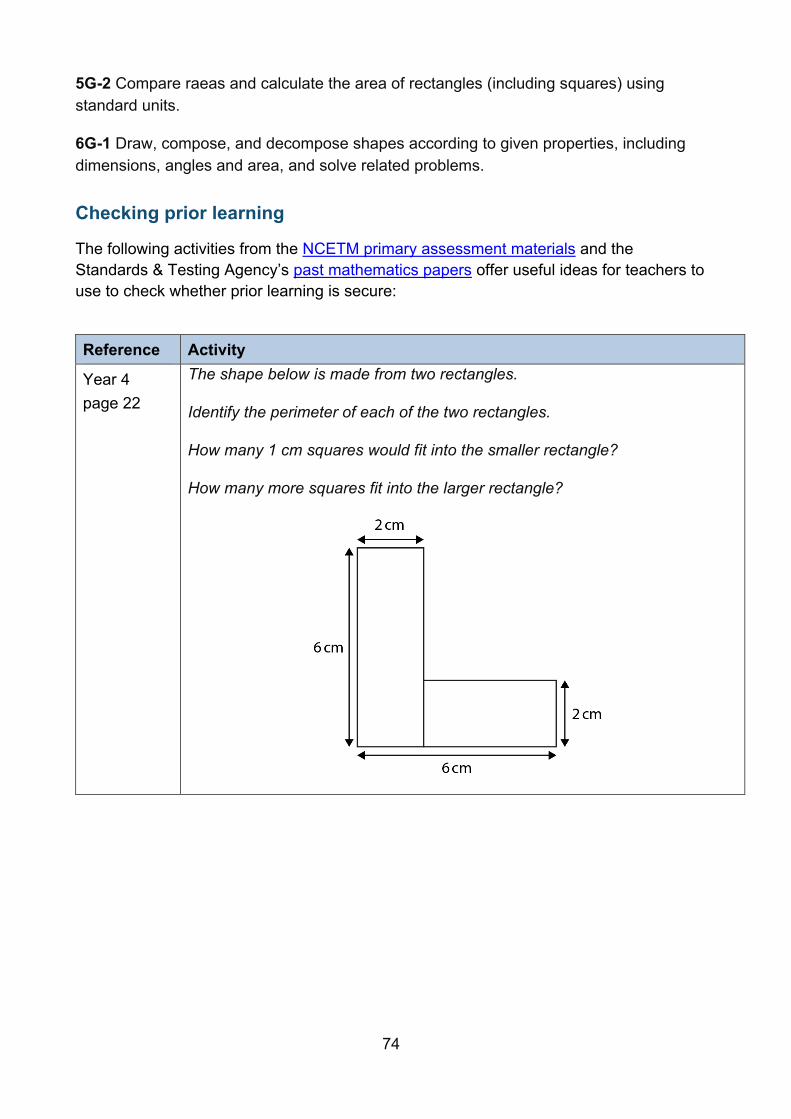
74
5G-2 Compare raeas and calculate the area of rectangles (including squares) using standard units.
6G-1 Draw, compose, and decompose shapes according to given properties, including dimensions, angles and area, and solve related problems.
Checking prior learning
The following activities from the NCETM primary assessment materials and the Standards & Testing Agency’s past mathematics papers offer useful ideas for teachers to use to check whether prior learning is secure:
Reference Activity
Year 4 page 22
The shape below is made from two rectangles.
Identify the perimeter of each of the two rectangles.
How many 1 cm squares would fit into the smaller rectangle?
How many more squares fit into the larger rectangle?
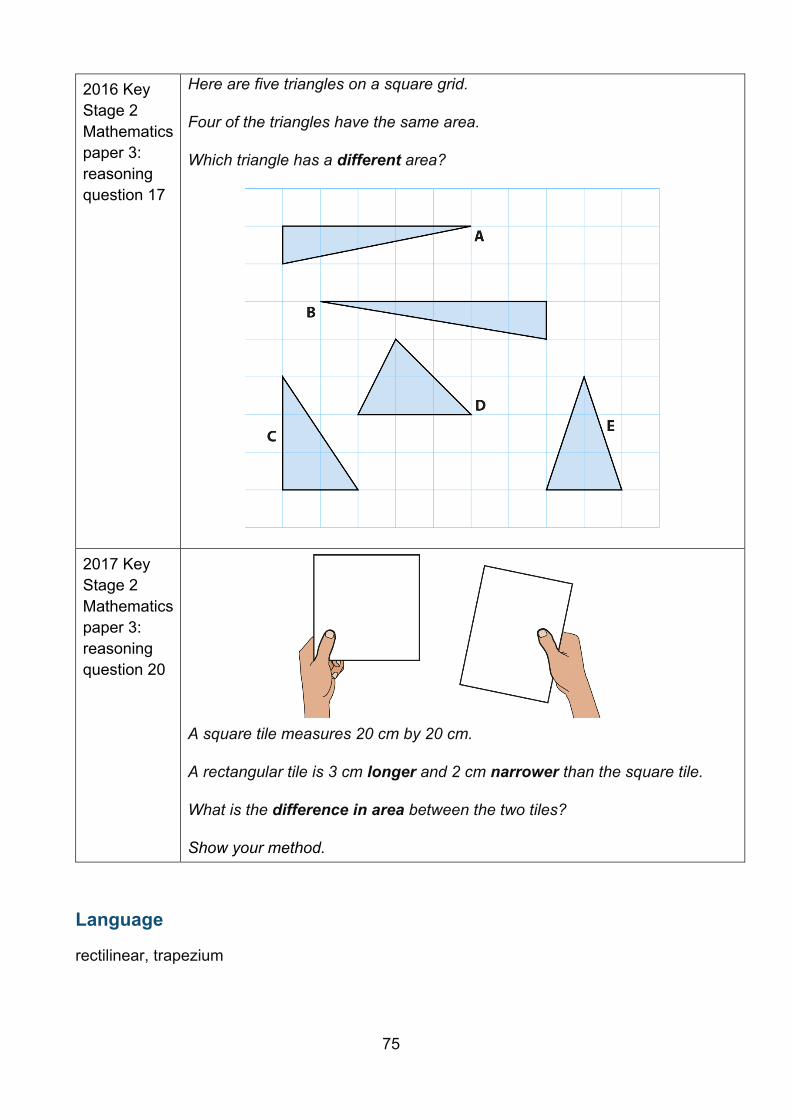
75
2016 Key Stage 2 Mathematics paper 3: reasoning question 17
Here are five triangles on a square grid.
Four of the triangles have the same area.
Which triangle has a different area?
2017 Key Stage 2 Mathematics paper 3: reasoning question 20
A square tile measures 20 cm by 20 cm.
A rectangular tile is 3 cm longer and 2 cm narrower than the square tile.
What is the difference in area between the two tiles?
Show your method.
Language
rectilinear, trapezium
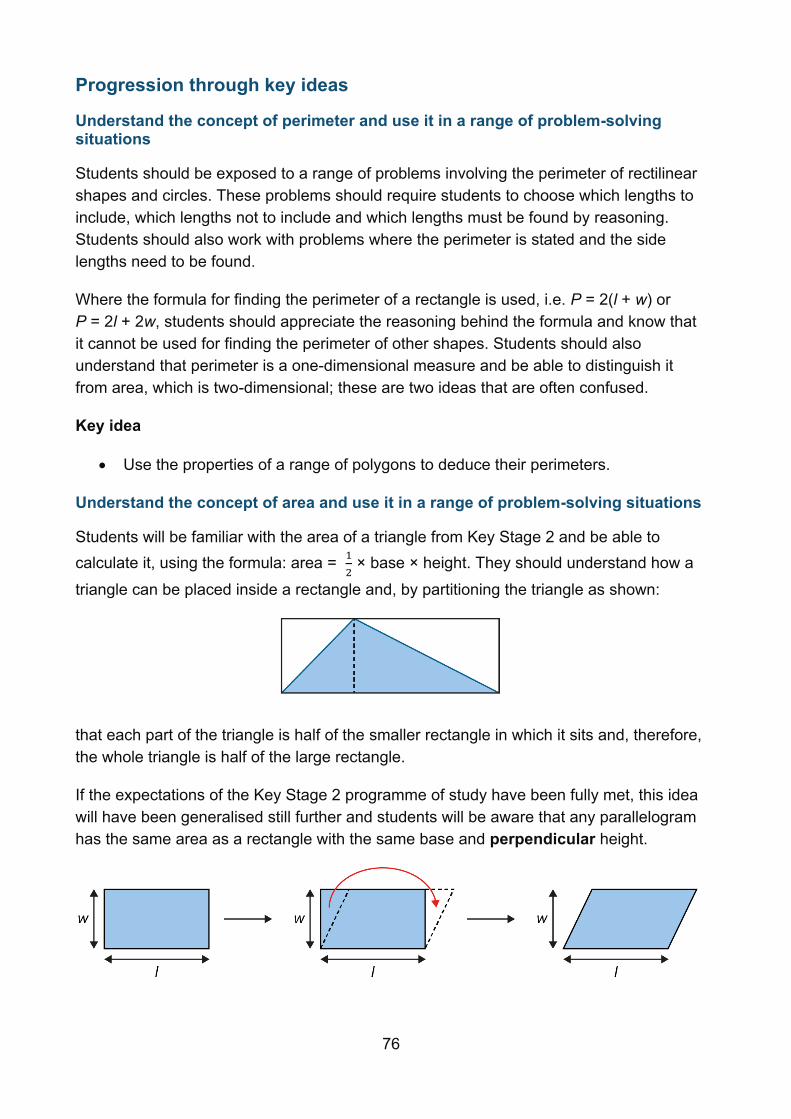
76
Progression through key ideas
Understand the concept of perimeter and use it in a range of problem-solving situations
Students should be exposed to a range of problems involving the perimeter of rectilinear shapes and circles. These problems should require students to choose which lengths to include, which lengths not to include and which lengths must be found by reasoning. Students should also work with problems where the perimeter is stated and the side lengths need to be found.
Where the formula for finding the perimeter of a rectangle is used, i.e. P = 2(l + w) or P = 2l + 2w, students should appreciate the reasoning behind the formula and know that it cannot be used for finding the perimeter of other shapes. Students should also understand that perimeter is a one-dimensional measure and be able to distinguish it from area, which is two-dimensional; these are two ideas that are often confused.
Key idea
• Use the properties of a range of polygons to deduce their perimeters.
Understand the concept of area and use it in a range of problem-solving situations
Students will be familiar with the area of a triangle from Key Stage 2 and be able to calculate it, using the formula: area = 1
2 × base × height. They should understand how a
triangle can be placed inside a rectangle and, by partitioning the triangle as shown:
that each part of the triangle is half of the smaller rectangle in which it sits and, therefore, the whole triangle is half of the large rectangle.
If the expectations of the Key Stage 2 programme of study have been fully met, this idea will have been generalised still further and students will be aware that any parallelogram has the same area as a rectangle with the same base and perpendicular height.
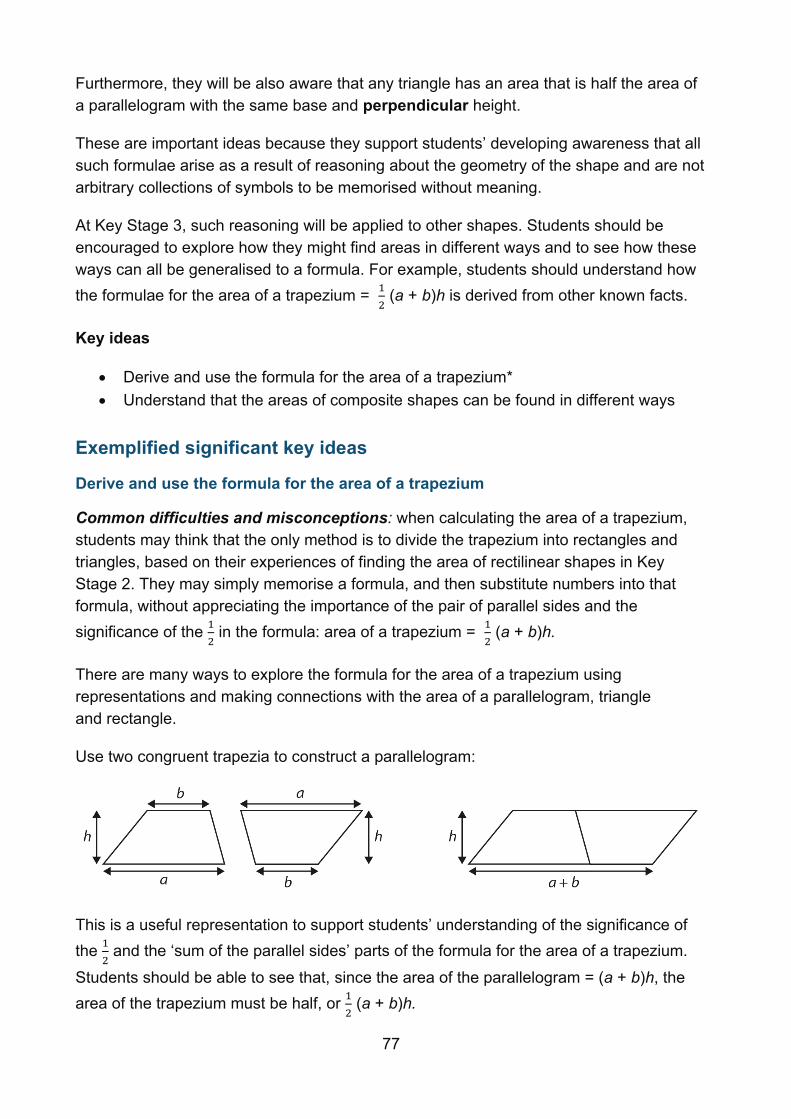
77
Furthermore, they will be also aware that any triangle has an area that is half the area of a parallelogram with the same base and perpendicular height.
These are important ideas because they support students’ developing awareness that all such formulae arise as a result of reasoning about the geometry of the shape and are not arbitrary collections of symbols to be memorised without meaning.
At Key Stage 3, such reasoning will be applied to other shapes. Students should be encouraged to explore how they might find areas in different ways and to see how these ways can all be generalised to a formula. For example, students should understand how the formulae for the area of a trapezium = 1
2 (a + b)h is derived from other known facts.
Key ideas
• Derive and use the formula for the area of a trapezium* • Understand that the areas of composite shapes can be found in different ways
Exemplified significant key ideas
Derive and use the formula for the area of a trapezium
Common difficulties and misconceptions: when calculating the area of a trapezium, students may think that the only method is to divide the trapezium into rectangles and triangles, based on their experiences of finding the area of rectilinear shapes in Key Stage 2. They may simply memorise a formula, and then substitute numbers into that formula, without appreciating the importance of the pair of parallel sides and the significance of the 1
2 in the formula: area of a trapezium = 1
2 (a + b)h.
There are many ways to explore the formula for the area of a trapezium using representations and making connections with the area of a parallelogram, triangle and rectangle.
Use two congruent trapezia to construct a parallelogram:
This is a useful representation to support students’ understanding of the significance of the 1
2 and the ‘sum of the parallel sides’ parts of the formula for the area of a trapezium.
Students should be able to see that, since the area of the parallelogram = (a + b)h, the area of the trapezium must be half, or 1
2 (a + b)h.
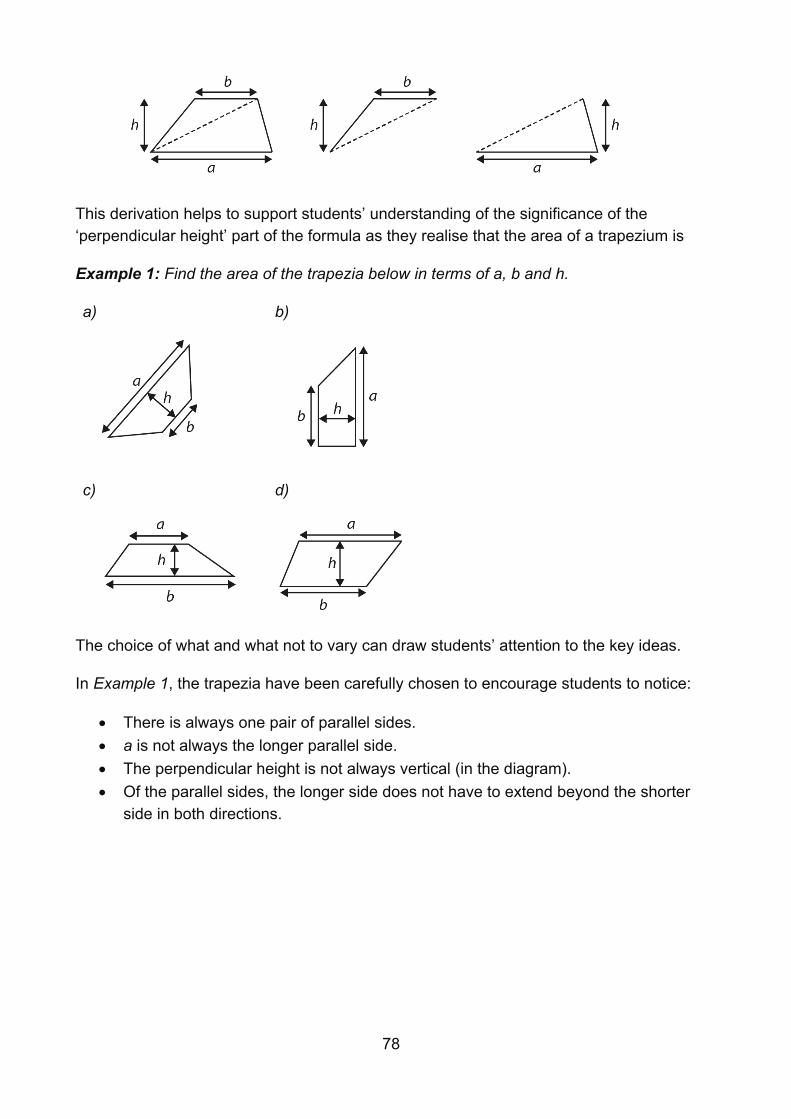
78
This derivation helps to support students’ understanding of the significance of the ‘perpendicular height’ part of the formula as they realise that the area of a trapezium is
Example 1: Find the area of the trapezia below in terms of a, b and h.
a)
b)
c)
d)
The choice of what and what not to vary can draw students’ attention to the key ideas.
In Example 1, the trapezia have been carefully chosen to encourage students to notice:
• There is always one pair of parallel sides. • a is not always the longer parallel side. • The perpendicular height is not always vertical (in the diagram). • Of the parallel sides, the longer side does not have to extend beyond the shorter
side in both directions.
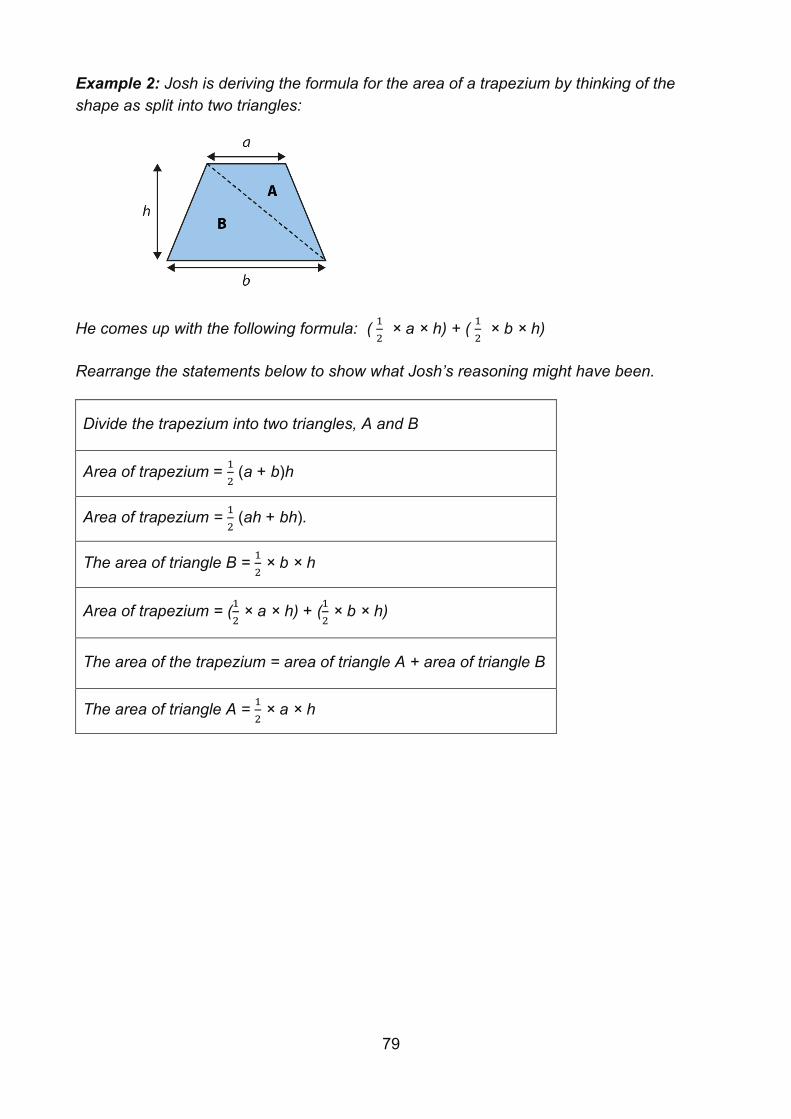
79
Example 2: Josh is deriving the formula for the area of a trapezium by thinking of the shape as split into two triangles:
He comes up with the following formula: ( 1
2 × a × h) + ( 1
2 × b × h)
Rearrange the statements below to show what Josh’s reasoning might have been.
Divide the trapezium into two triangles, A and B
Area of trapezium = 1
2 (a + b)h
Area of trapezium = 1
2 (ah + bh).
The area of triangle B = 1
2 × b × h
Area of trapezium = (1
2 × a × h) + (1
2 × b × h)
The area of the trapezium = area of triangle A + area of triangle B
The area of triangle A = 1
2 × a × h
80
Arithmetic procedures including fractions
Overview
In the autumn term students consolidated and increased their understanding of place value and of arithmetic procedures involving integers and decimals. This now develops to become a more complete understanding through extending this work to fractions. Students should appreciate the interconnected nature of fractions and decimals and be able to order and compare them. Further work with arithmetic procedures should now include the multiplication of any two fractions and the division of any fraction by another.
At Key Stage 2, students worked with numbers represented in a variety of different ways and used a range of representations and manipulatives to explore the base-ten structure of integers. They encountered fractions, decimals and negative numbers, developed ways of comparing and ordering numbers and began to recognise common equivalences. As a result, students should be beginning to form a rich, connected view of the number system.
In their Key Stage 2 work on ordering numbers, students will have appreciated one aspect of the infinity of numbers (sometimes called ‘unbounded infinity’) – namely, that given any number, there will always be a larger or smaller number that can be placed on the number line. An important aspect of infinity that students may not meet until Key Stage 3 is that of ‘bounded infinity’ – namely, that given any two numbers, there will always be another number (i.e. greater than the smaller number and smaller than the larger number) that can be placed between them on a number line.
At Key Stage 3, students will further develop their understanding of the different ways that numbers can be expressed and will become more proficient in changing from one form to another. This will develop their awareness that different representations of the same number can reveal something of its structure and so can be used to compare and order numbers with ease.
Students should develop their understanding of the infinite nature of the number system and work confidently with a wide range of real numbers. For example, they should recognise that for any given pair of numbers, a third that is greater than both, smaller than both or in between the two can always be found. The process of comparing and ordering these numbers becomes easier by considering numbers expressed as decimals and fractions.
Prior learning
Before beginning arithmetic procedures including fractions at Key Stage 3, students should already have a secure understanding of the following learning outcomes from study at upper Key Stage 2:
81
• Multiply and divide whole numbers and those involving decimals by 10, 100 and 1 000.
• Recognise and use thousandths and relate them to tenths, hundredths and decimal equivalents.
• Identify, name and write equivalent fractions of a given fraction, represented visually, including tenths and hundredths.
• Use common factors to simplify fractions; use common multiples to express fractions in the same denomination.
• Recognise mixed numbers and improper fractions and convert from one form to the other, and write mathematical statements > 1 as a mixed number (e.g. 2
5+
4
5=
6
5= 1
1
5 ).
• Read and write decimal numbers as fractions (e.g. 0.71 = 71
100).
• Recognise the per cent symbol (%) and understand that per cent relates to number of parts per hundred, and write percentages as a fraction with denominator 100, and as a decimal.
• Recall and use equivalences between simple fractions, decimals and percentages, including in different contexts.
• Use negative numbers in context and calculate intervals across zero. and earlier in Key Stage 3:
• Understand the value of digits in decimals, measure and integers • Understand integer exponents and roots • Compare and order positive and negative integers, decimals and fractions
The NCETM has created the following Key Stage 2 ready-to-progress criteria to support teachers in making judgements about students’ understanding and knowledge.
5NPV-5 Convert between units of measure, including using common decimals and fractions.
5F-2 Find equivalent fractions and understand that they have the same value and the same position in the linear number system.
5F-3 Recall decimal fraction equivalents for 1
2, 1
4, 1
5, and 1
10, and for multiples of these
proper fractions.
6F-1 Recognise when fractions can be simplified, and use common factors to simplify fractions.
6F-2 Express fractions in a common denomination and use this to compare fractions that are similar in value.
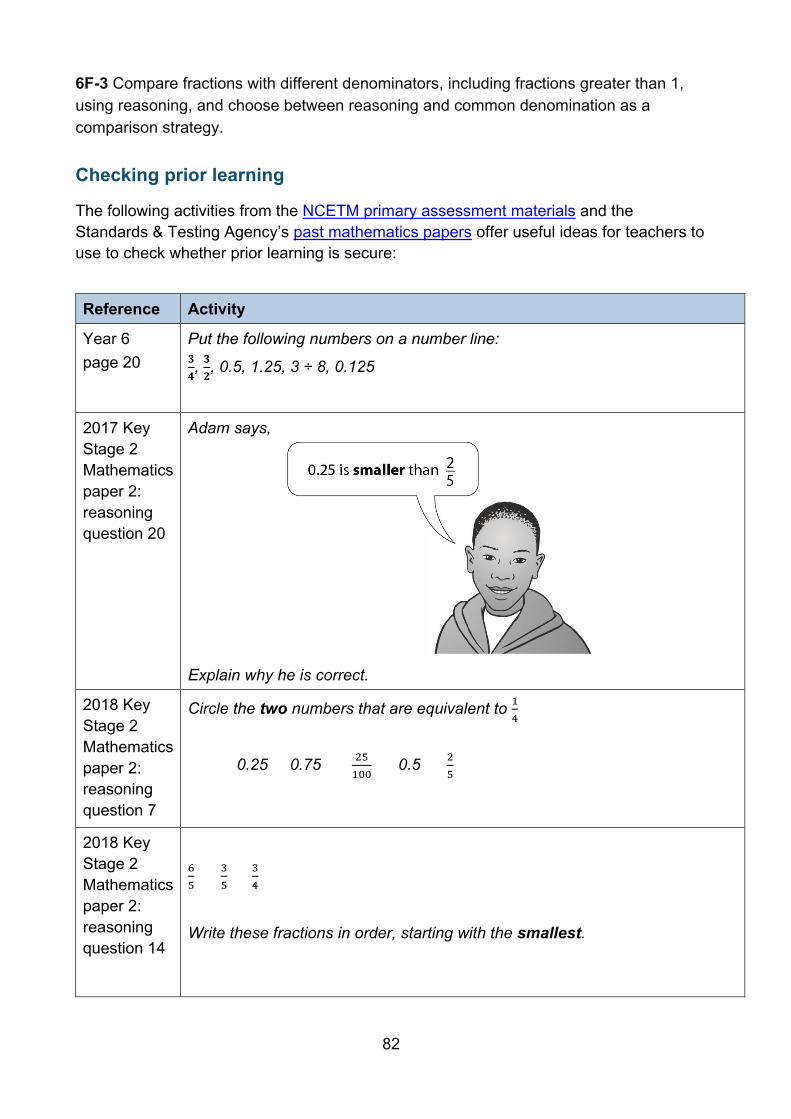
82
6F-3 Compare fractions with different denominators, including fractions greater than 1, using reasoning, and choose between reasoning and common denomination as a comparison strategy.
Checking prior learning
The following activities from the NCETM primary assessment materials and the Standards & Testing Agency’s past mathematics papers offer useful ideas for teachers to use to check whether prior learning is secure:
Reference Activity
Year 6 page 20
Put the following numbers on a number line: 𝟑
𝟒, 𝟑
𝟐, 0.5, 1.25, 3 ÷ 8, 0.125
2017 Key Stage 2 Mathematics paper 2: reasoning question 20
Adam says,
Explain why he is correct.
2018 Key Stage 2 Mathematics paper 2: reasoning question 7
Circle the two numbers that are equivalent to 1
4
0.25 0.75 25
100 0.5 2
5
2018 Key Stage 2 Mathematics paper 2: reasoning question 14
6
5 3
5
3
4
Write these fractions in order, starting with the smallest.
83
Language
infinite, terminating decimal
Progression through key ideas
Work interchangeably with terminating decimals and their corresponding fractions
Students worked with fractions and decimals at Key Stage 2 and should be able to recall and use equivalences between simple fractions, decimals and percentages. They should have a good grasp of decimals up to two decimal places and be able to write decimals as fractions with a denominator of 100.
At Key Stage 2, students should have developed an awareness that any number can be expressed in a variety of ways that reveal the base-ten structure. Students should not simply name the place-value column headings. Rather, they should recognise that, for example, the number 2 437 consists of 24 hundreds or 243 tens.
At Key Stage 3, students begin to recognise decimals such as 0.13 not just as one tenth and three hundredths, but also as 13 hundredths, which leads to its expression as a single fraction. An awareness that a fraction represents a division is crucial at this stage, as this will allow a deep understanding of the process of changing fractions to decimals.
It is important during Key Stage 3 that students become increasingly fluent when converting between fractions and decimals. This will contribute to a strong sense of number, supporting flexibility in calculation and students’ ability to make sensible choices as to when to work mentally, use a written method or use a calculator.
Key ideas
• Understand that 1 can be written in the form 𝑛
𝑛 (where n is any integer) and vice
versa • Understand that fractions of the form 𝑎
𝑏, where a > b, are greater than one and use
this awareness to convert between improper fractions and mixed numbers • Understand that a fraction represents a division and that performing that division
results in an equivalent decimal* • Appreciate that any terminating decimal can be written as a fraction with a
denominator of the form 10n (e.g. 0.56 = 56
100, 560
1000)
• Understand the process of simplifying fractions through dividing both numerator and denominator by common factors*
• Know how to convert from fractions to decimals and back again using the converter key on a calculator
• Know how to enter fractions as divisions on a calculator and understand the limitations of the decimal representation that results
84
Compare and order positive and negative integers, decimals and fractions
At Key Stage 2, students developed ways of solving problems extending beyond positive integers. They encountered negative numbers in simple number problems and real-life contexts. At Key Stage 3, students should continue to develop their understanding of negative numbers and potentially reevaluate their understanding of ‘smaller’ and ‘bigger’ in negative contexts.
Students also worked with fractions and decimals at Key Stage 2, recognising common fractions and putting fractions in order of size. The focus now will be on developing students’ methods for ordering fractions to include converting between equivalent fractions and decimals as appropriate.
Throughout this set of key ideas, students should continue to develop their understanding of how numbers can be represented differently. They should be able to apply different techniques to compare and order numbers in a variety of different contexts and have an appreciation of magnitude. For example, if students know that 0.6 > 1
2 and 3
7 < 1
2, they
should be able to deduce that 0.6 > 3
7 without resorting to converting to a common format.
Such work will support students in being able to find a number in between any other two given numbers (whether two decimals, two fractions or one fraction and one decimal).
Key ideas
• Compare negative integers using < and > • Compare decimals using < and > • Compare and order fractions by converting to decimals • Compare and order fractions by converting to fractions with a common
denominator • Order a variety of positive and negative fractions and decimals using appropriate
methods of conversion and recognising when conversion to a common format is not required
• Appreciate that, for any two numbers there is always another number in between them
Know, understand and use fluently a range of calculation strategies for addition and subtraction of fractions
Students will have been taught strategies for the addition and subtraction of fractions with same and different denominators and mixed numbers during Key Stage 2. The focus in this set of key ideas is to use addition and subtraction of fractions to further expand the range of possible examples that students are able to explore as their understanding of additive structures grows and matures.
Unitising is again a key idea here, and one that is particularly evident when working with fractions. For example, adding halves and thirds is not using the same ‘unit’; however,
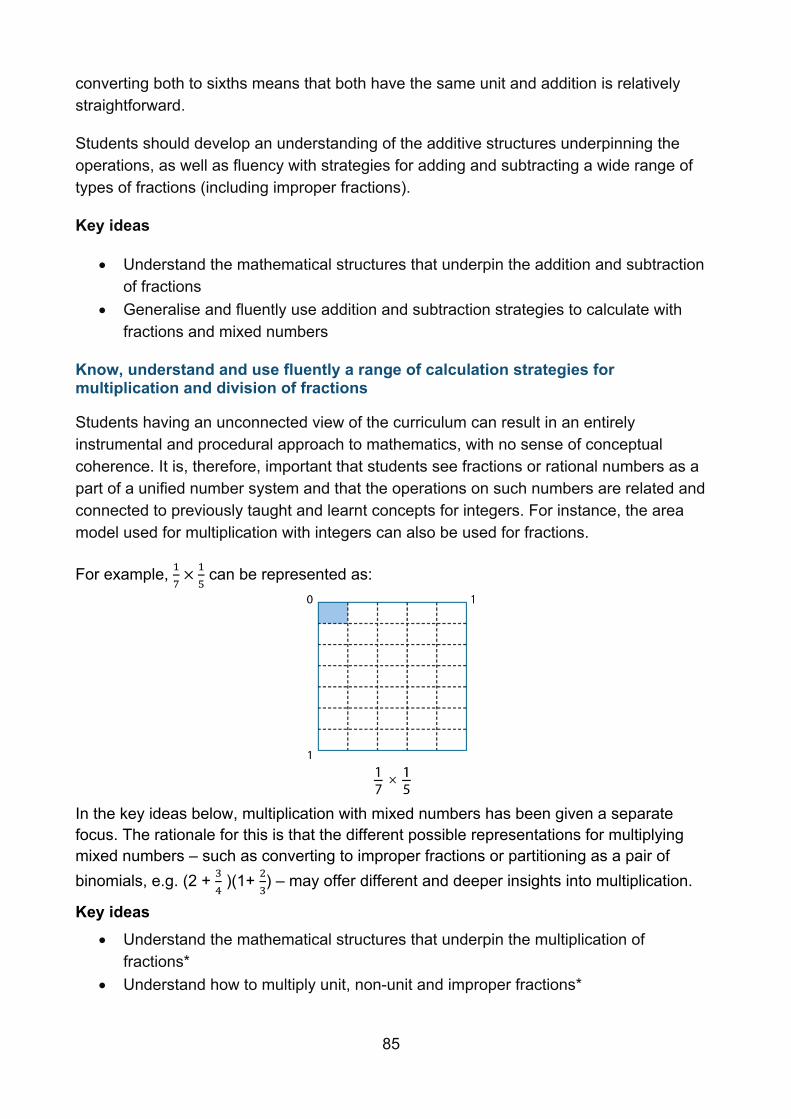
85
converting both to sixths means that both have the same unit and addition is relatively straightforward.
Students should develop an understanding of the additive structures underpinning the operations, as well as fluency with strategies for adding and subtracting a wide range of types of fractions (including improper fractions).
Key ideas
• Understand the mathematical structures that underpin the addition and subtraction of fractions
• Generalise and fluently use addition and subtraction strategies to calculate with fractions and mixed numbers
Know, understand and use fluently a range of calculation strategies for multiplication and division of fractions
Students having an unconnected view of the curriculum can result in an entirely instrumental and procedural approach to mathematics, with no sense of conceptual coherence. It is, therefore, important that students see fractions or rational numbers as a part of a unified number system and that the operations on such numbers are related and connected to previously taught and learnt concepts for integers. For instance, the area model used for multiplication with integers can also be used for fractions.
For example, 1
7×
1
5 can be represented as:
In the key ideas below, multiplication with mixed numbers has been given a separate focus. The rationale for this is that the different possible representations for multiplying mixed numbers – such as converting to improper fractions or partitioning as a pair of binomials, e.g. (2 + 3
4 )(1+ 2
3) – may offer different and deeper insights into multiplication.
Key ideas • Understand the mathematical structures that underpin the multiplication of
fractions* • Understand how to multiply unit, non-unit and improper fractions*
86
• Generalise and fluently use strategies to multiply with mixed numbers (e.g. 2
3
4× 1
2
3)
• Understand the mathematical structures that underpin the division of fractions • Divide a fraction by a whole number • Divide a whole number by a fraction • Divide a fraction by a fraction
Exemplified significant key Ideas
Understand that a fraction represents a division and that performing that division results in an equivalent decimal
Many students, when picturing a fraction such as three-fifths, will imagine a single object split into five equal parts, with three of them selected. This image of a fraction is encouraged by examples such as ‘A cake is cut into five equal parts. Three children each take one part. How much of the cake is eaten?’ In this interpretation both the numerator and denominator of the fraction represent the same ‘unit’ (in this case, slices of a cake).
While this image is accurate, it is incomplete, and a second understanding of fractions (the quotient construct) should also be considered. In this interpretation of the fraction notation, the numerator and denominator represent different units. For example, in the question ‘Three cakes are shared equally between five children. How much cake does each child eat?’, the numerator represents the number of cakes while the denominator represents the number of children.
Nunes and Bryant (2009) state that most children are introduced to fractions through the part–whole model and have less experience of fractions as a quotient. They also suggest that, although the differences between these models are subtle, it is a crucial distinction with at least four implications for students’ understanding of fractions. Here is a summary:
• The understanding of improper fractions may be easier when using the quotient construct: five cakes shared between three children makes is an easier way to understand five-thirds than one child eating five-thirds of a cake.
• Students understand that the way in which a quantity is partitioned doesn’t matter, as long as the sharing is equal. For example, if five cakes are to be shared among three children then each cake doesn’t have to be cut into five equal parts, with each child getting three of them.
• It is suggested that ordering fractions may be easier when using the quotient construct. It is likely to be easier to reason about which is larger, three-fifths or three-sixths, when considered as three cakes shared between five people or three cakes being shared between six people.
• Understanding the equivalence of fractions may also be easier using the quotient construct as students may be able to reason that doubling the number of cakes and the number of children won’t affect the amount of cake any child eats.
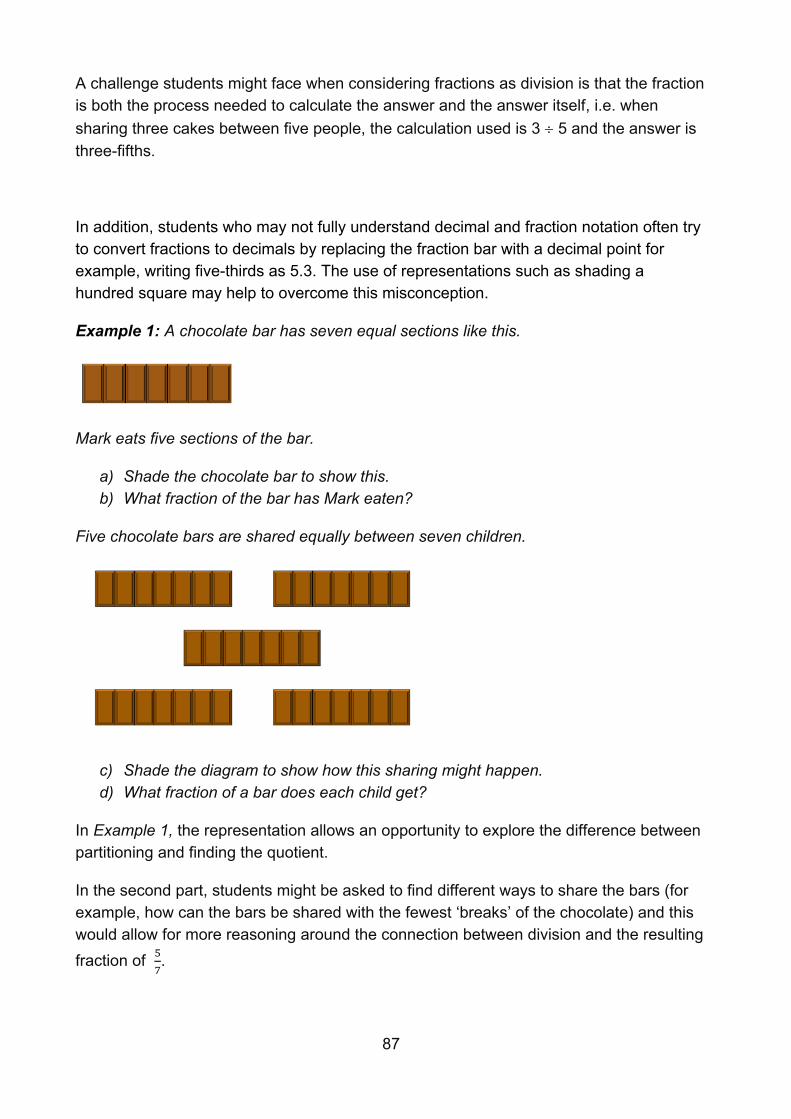
87
A challenge students might face when considering fractions as division is that the fraction is both the process needed to calculate the answer and the answer itself, i.e. when sharing three cakes between five people, the calculation used is 3 5 and the answer is three-fifths.
In addition, students who may not fully understand decimal and fraction notation often try to convert fractions to decimals by replacing the fraction bar with a decimal point for example, writing five-thirds as 5.3. The use of representations such as shading a hundred square may help to overcome this misconception.
Example 1: A chocolate bar has seven equal sections like this.
Mark eats five sections of the bar.
a) Shade the chocolate bar to show this. b) What fraction of the bar has Mark eaten?
Five chocolate bars are shared equally between seven children.
c) Shade the diagram to show how this sharing might happen. d) What fraction of a bar does each child get?
In Example 1, the representation allows an opportunity to explore the difference between partitioning and finding the quotient.
In the second part, students might be asked to find different ways to share the bars (for example, how can the bars be shared with the fewest ‘breaks’ of the chocolate) and this would allow for more reasoning around the connection between division and the resulting fraction of 5
7.
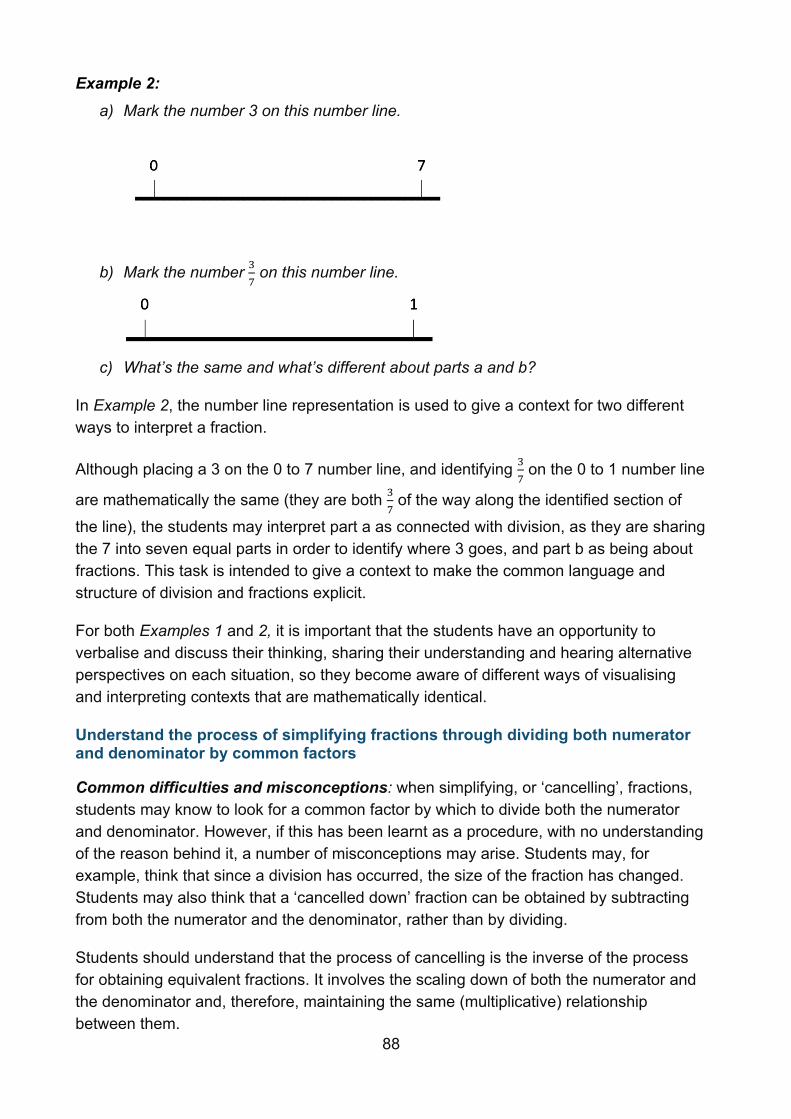
88
Example 2: a) Mark the number 3 on this number line.
b) Mark the number 3
7 on this number line.
c) What’s the same and what’s different about parts a and b?
In Example 2, the number line representation is used to give a context for two different ways to interpret a fraction.
Although placing a 3 on the 0 to 7 number line, and identifying 3
7 on the 0 to 1 number line
are mathematically the same (they are both 3
7 of the way along the identified section of
the line), the students may interpret part a as connected with division, as they are sharing the 7 into seven equal parts in order to identify where 3 goes, and part b as being about fractions. This task is intended to give a context to make the common language and structure of division and fractions explicit.
For both Examples 1 and 2, it is important that the students have an opportunity to verbalise and discuss their thinking, sharing their understanding and hearing alternative perspectives on each situation, so they become aware of different ways of visualising and interpreting contexts that are mathematically identical.
Understand the process of simplifying fractions through dividing both numerator and denominator by common factors
Common difficulties and misconceptions: when simplifying, or ‘cancelling’, fractions, students may know to look for a common factor by which to divide both the numerator and denominator. However, if this has been learnt as a procedure, with no understanding of the reason behind it, a number of misconceptions may arise. Students may, for example, think that since a division has occurred, the size of the fraction has changed. Students may also think that a ‘cancelled down’ fraction can be obtained by subtracting from both the numerator and the denominator, rather than by dividing.
Students should understand that the process of cancelling is the inverse of the process for obtaining equivalent fractions. It involves the scaling down of both the numerator and the denominator and, therefore, maintaining the same (multiplicative) relationship between them.
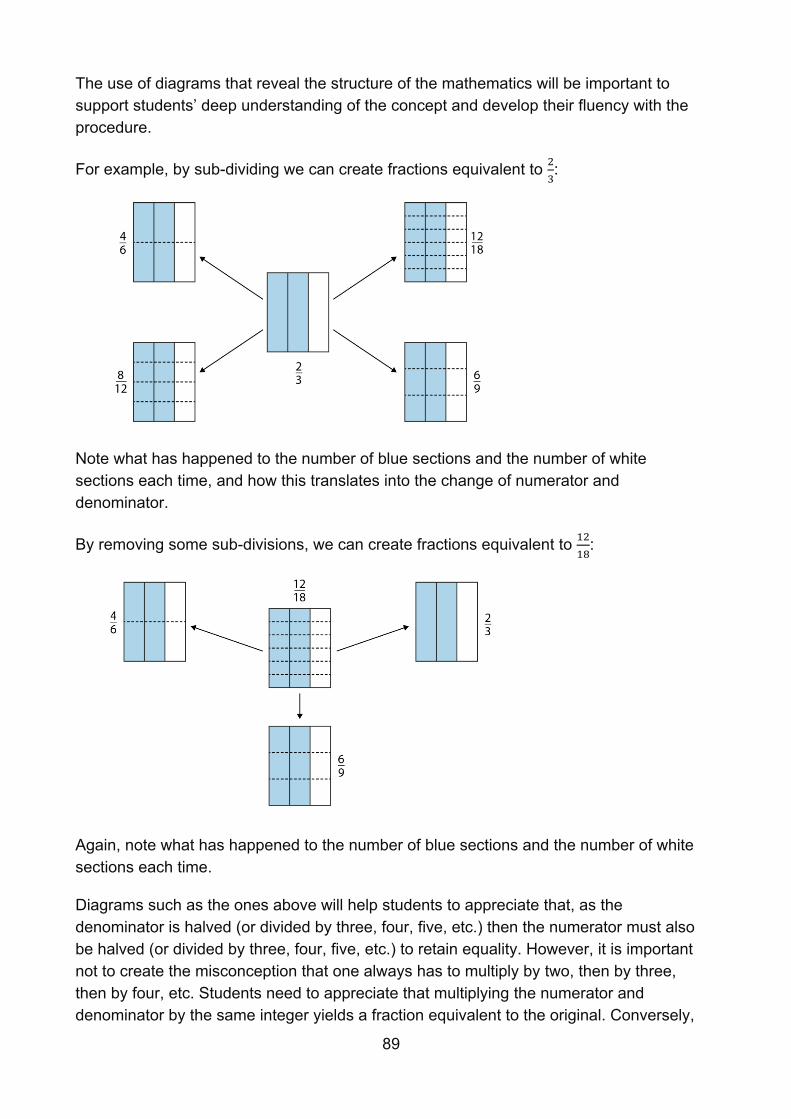
89
The use of diagrams that reveal the structure of the mathematics will be important to support students’ deep understanding of the concept and develop their fluency with the procedure.
For example, by sub-dividing we can create fractions equivalent to 2
3:
Note what has happened to the number of blue sections and the number of white sections each time, and how this translates into the change of numerator and denominator.
By removing some sub-divisions, we can create fractions equivalent to 12
18:
Again, note what has happened to the number of blue sections and the number of white sections each time.
Diagrams such as the ones above will help students to appreciate that, as the denominator is halved (or divided by three, four, five, etc.) then the numerator must also be halved (or divided by three, four, five, etc.) to retain equality. However, it is important not to create the misconception that one always has to multiply by two, then by three, then by four, etc. Students need to appreciate that multiplying the numerator and denominator by the same integer yields a fraction equivalent to the original. Conversely,
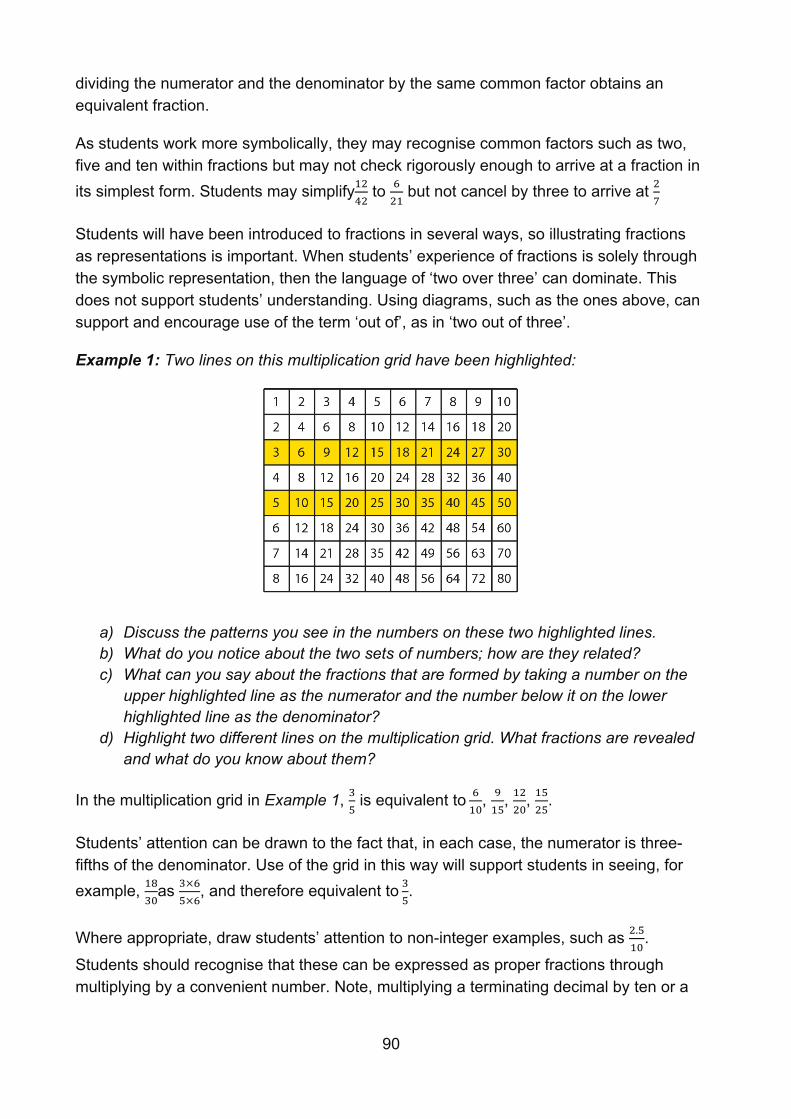
90
dividing the numerator and the denominator by the same common factor obtains an equivalent fraction.
As students work more symbolically, they may recognise common factors such as two, five and ten within fractions but may not check rigorously enough to arrive at a fraction in its simplest form. Students may simplify12
42 to 6
21 but not cancel by three to arrive at 2
7
Students will have been introduced to fractions in several ways, so illustrating fractions as representations is important. When students’ experience of fractions is solely through the symbolic representation, then the language of ‘two over three’ can dominate. This does not support students’ understanding. Using diagrams, such as the ones above, can support and encourage use of the term ‘out of’, as in ‘two out of three’.
Example 1: Two lines on this multiplication grid have been highlighted:
a) Discuss the patterns you see in the numbers on these two highlighted lines. b) What do you notice about the two sets of numbers; how are they related? c) What can you say about the fractions that are formed by taking a number on the
upper highlighted line as the numerator and the number below it on the lower highlighted line as the denominator?
d) Highlight two different lines on the multiplication grid. What fractions are revealed and what do you know about them?
In the multiplication grid in Example 1, 3
5 is equivalent to 6
10, 9
15, 12
20, 15
25.
Students’ attention can be drawn to the fact that, in each case, the numerator is three-fifths of the denominator. Use of the grid in this way will support students in seeing, for example, 18
30as 3×6
5×6, and therefore equivalent to 3
5.
Where appropriate, draw students’ attention to non-integer examples, such as 2.5
10.
Students should recognise that these can be expressed as proper fractions through multiplying by a convenient number. Note, multiplying a terminating decimal by ten or a
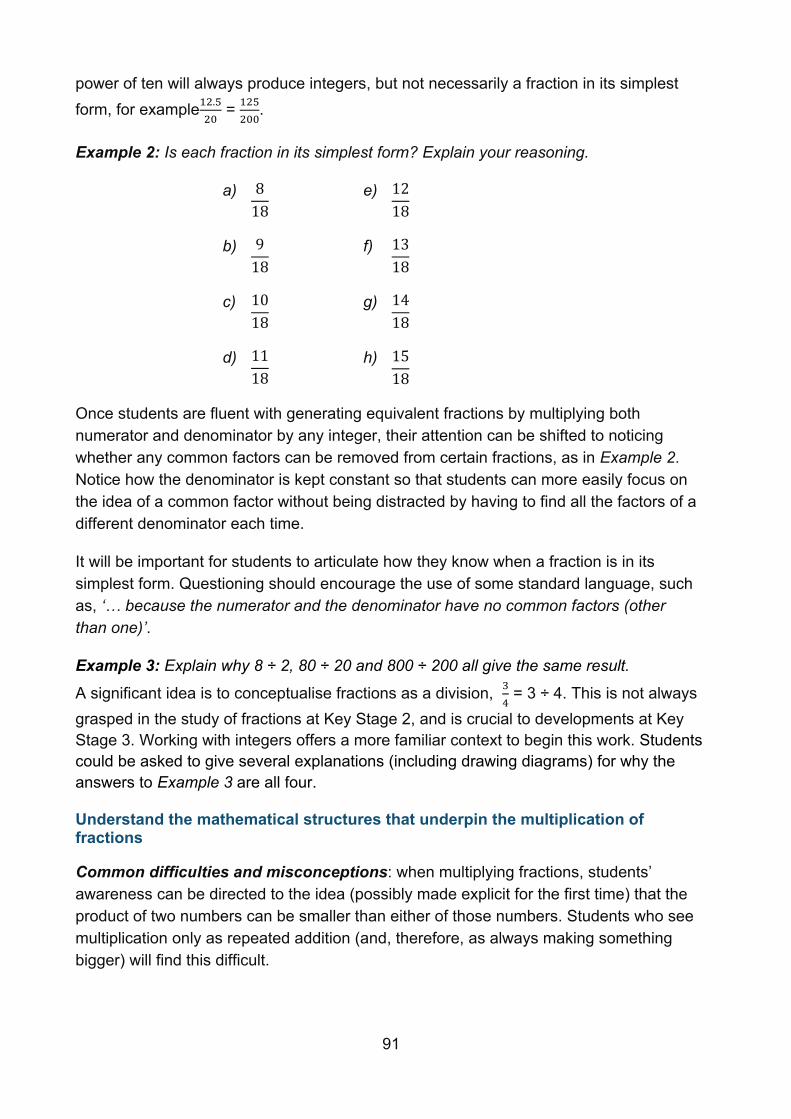
91
power of ten will always produce integers, but not necessarily a fraction in its simplest form, for example12.5
20 = 125
200.
Example 2: Is each fraction in its simplest form? Explain your reasoning.
a) 8
18 e) 12
18
b) 9
18 f) 13
18
c) 10
18 g) 14
18
d) 11
18 h) 15
18
Once students are fluent with generating equivalent fractions by multiplying both numerator and denominator by any integer, their attention can be shifted to noticing whether any common factors can be removed from certain fractions, as in Example 2. Notice how the denominator is kept constant so that students can more easily focus on the idea of a common factor without being distracted by having to find all the factors of a different denominator each time.
It will be important for students to articulate how they know when a fraction is in its simplest form. Questioning should encourage the use of some standard language, such as, ‘… because the numerator and the denominator have no common factors (other than one)’.
Example 3: Explain why 8 ÷ 2, 80 ÷ 20 and 800 ÷ 200 all give the same result.
A significant idea is to conceptualise fractions as a division, 3
4 = 3 ÷ 4. This is not always
grasped in the study of fractions at Key Stage 2, and is crucial to developments at Key Stage 3. Working with integers offers a more familiar context to begin this work. Students could be asked to give several explanations (including drawing diagrams) for why the answers to Example 3 are all four.
Understand the mathematical structures that underpin the multiplication of fractions
Common difficulties and misconceptions: when multiplying fractions, students’ awareness can be directed to the idea (possibly made explicit for the first time) that the product of two numbers can be smaller than either of those numbers. Students who see multiplication only as repeated addition (and, therefore, as always making something bigger) will find this difficult.
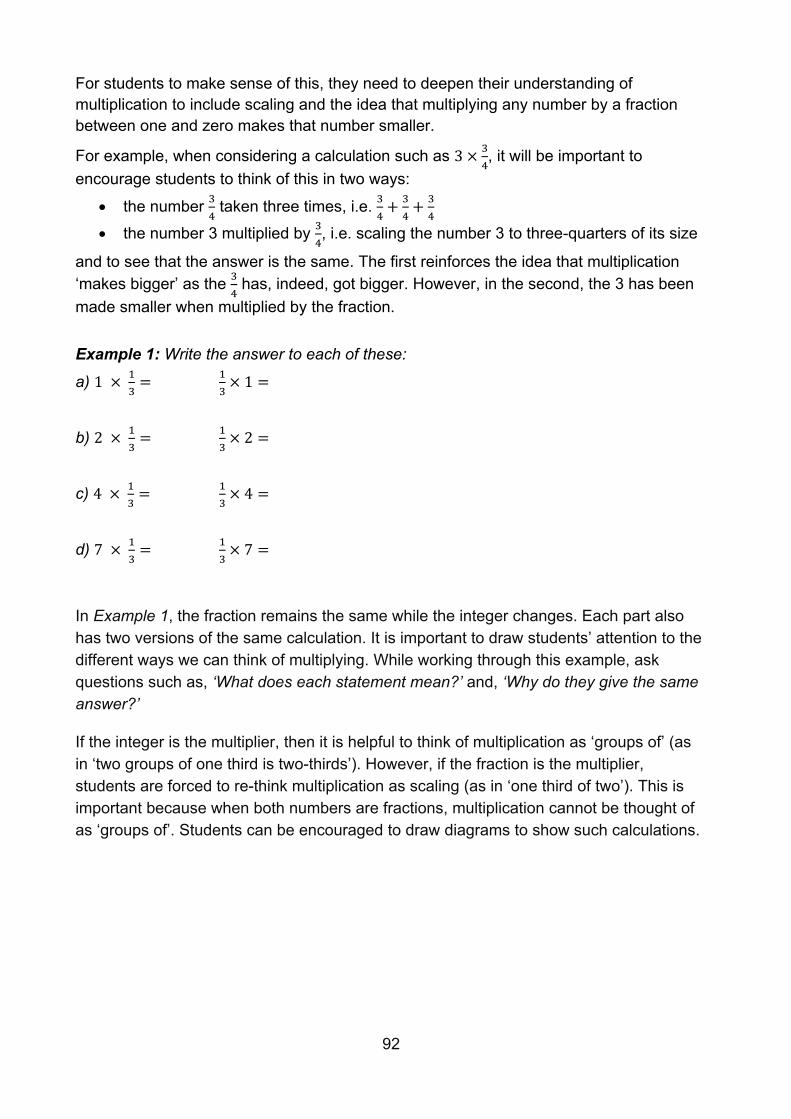
92
For students to make sense of this, they need to deepen their understanding of multiplication to include scaling and the idea that multiplying any number by a fraction between one and zero makes that number smaller.
For example, when considering a calculation such as 3 ×3
4, it will be important to
encourage students to think of this in two ways:
• the number 3
4 taken three times, i.e. 3
4+
3
4+
3
4
• the number 3 multiplied by 3
4, i.e. scaling the number 3 to three-quarters of its size
and to see that the answer is the same. The first reinforces the idea that multiplication ‘makes bigger’ as the 3
4 has, indeed, got bigger. However, in the second, the 3 has been
made smaller when multiplied by the fraction. Example 1: Write the answer to each of these:
a) 1 × 1
3= 1
3× 1 =
b) 2 × 1
3= 1
3× 2 =
c) 4 × 1
3= 1
3× 4 =
d) 7 × 1
3= 1
3× 7 =
In Example 1, the fraction remains the same while the integer changes. Each part also has two versions of the same calculation. It is important to draw students’ attention to the different ways we can think of multiplying. While working through this example, ask questions such as, ‘What does each statement mean?’ and, ‘Why do they give the same answer?’
If the integer is the multiplier, then it is helpful to think of multiplication as ‘groups of’ (as in ‘two groups of one third is two-thirds’). However, if the fraction is the multiplier, students are forced to re-think multiplication as scaling (as in ‘one third of two’). This is important because when both numbers are fractions, multiplication cannot be thought of as ‘groups of’. Students can be encouraged to draw diagrams to show such calculations.
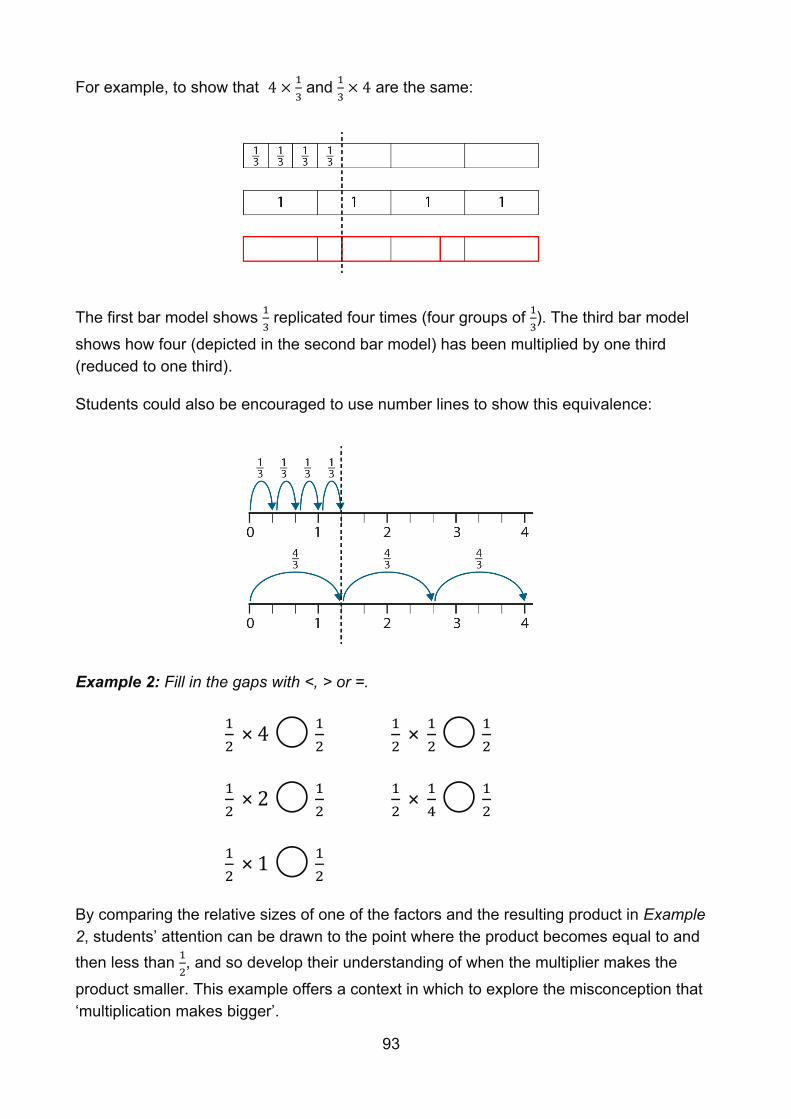
93
For example, to show that 4 ×1
3 and 1
3× 4 are the same:
The first bar model shows 1
3 replicated four times (four groups of 1
3). The third bar model
shows how four (depicted in the second bar model) has been multiplied by one third (reduced to one third).
Students could also be encouraged to use number lines to show this equivalence:
Example 2: Fill in the gaps with <, > or =.
1
2 × 4 ⃝ 1
2
1
2 × 2 ⃝ 1
2
1
2 × 1 ⃝ 1
2
1
2 ×
1
2 ⃝ 1
2
1
2 ×
1
4 ⃝ 1
2
By comparing the relative sizes of one of the factors and the resulting product in Example 2, students’ attention can be drawn to the point where the product becomes equal to and then less than 1
2, and so develop their understanding of when the multiplier makes the
product smaller. This example offers a context in which to explore the misconception that ‘multiplication makes bigger’.
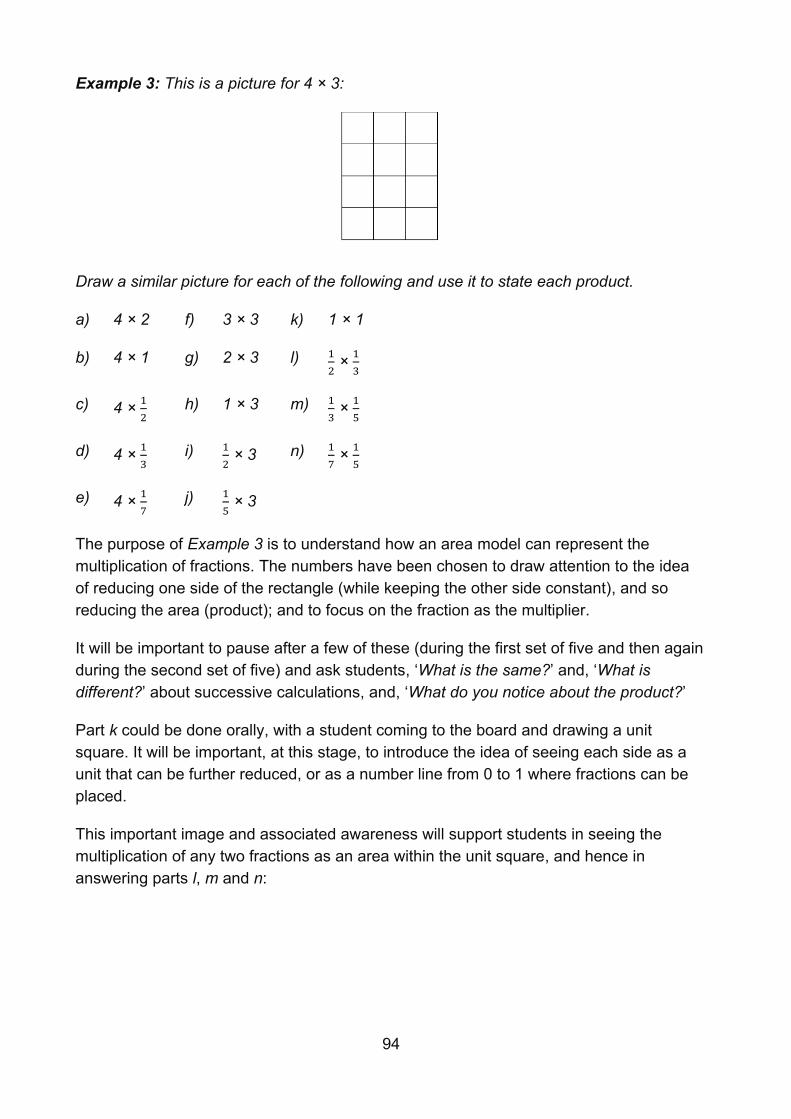
94
Example 3: This is a picture for 4 × 3:
Draw a similar picture for each of the following and use it to state each product.
a) 4 × 2 f) 3 × 3 k) 1 × 1
b) 4 × 1 g) 2 × 3 l) 1
2 × 1
3
c) 4 × 1
2 h) 1 × 3 m) 1
3 × 1
5
d) 4 × 1
3 i) 1
2 × 3 n) 1
7 × 1
5
e) 4 × 1
7 j) 1
5 × 3
The purpose of Example 3 is to understand how an area model can represent the multiplication of fractions. The numbers have been chosen to draw attention to the idea of reducing one side of the rectangle (while keeping the other side constant), and so reducing the area (product); and to focus on the fraction as the multiplier.
It will be important to pause after a few of these (during the first set of five and then again during the second set of five) and ask students, ‘What is the same?’ and, ‘What is different?’ about successive calculations, and, ‘What do you notice about the product?’
Part k could be done orally, with a student coming to the board and drawing a unit square. It will be important, at this stage, to introduce the idea of seeing each side as a unit that can be further reduced, or as a number line from 0 to 1 where fractions can be placed.
This important image and associated awareness will support students in seeing the multiplication of any two fractions as an area within the unit square, and hence in answering parts l, m and n:
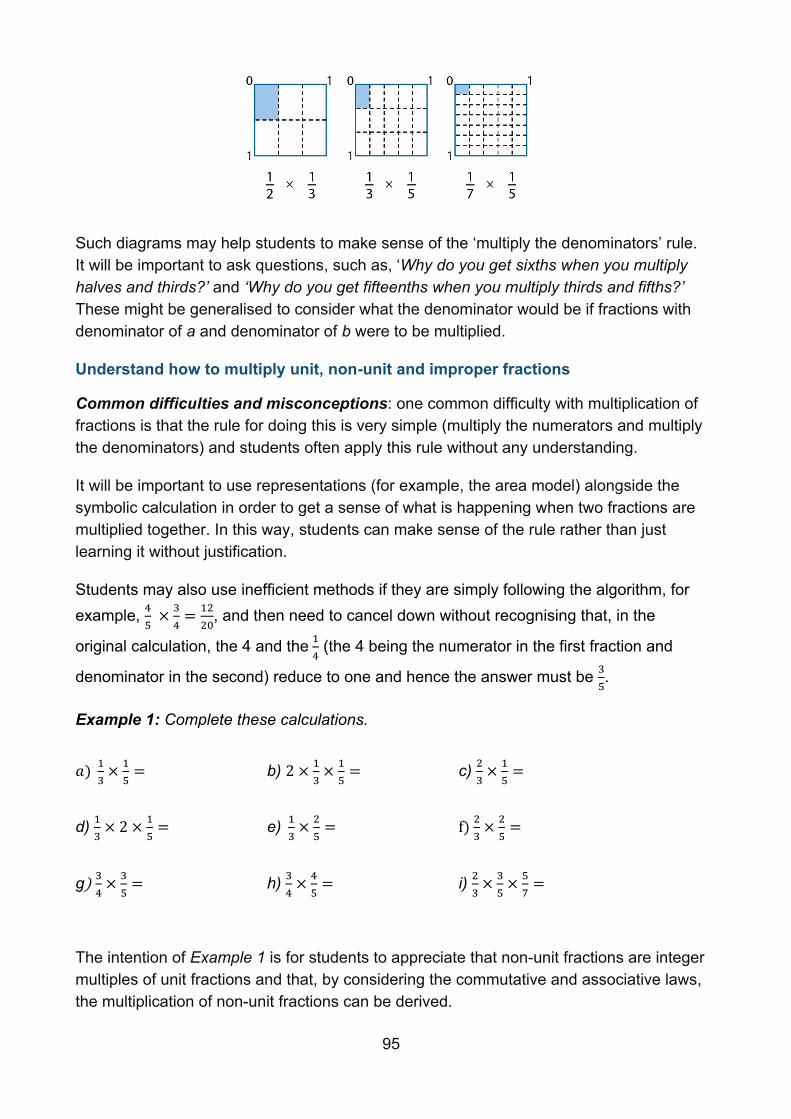
95
Such diagrams may help students to make sense of the ‘multiply the denominators’ rule. It will be important to ask questions, such as, ‘Why do you get sixths when you multiply halves and thirds?’ and ‘Why do you get fifteenths when you multiply thirds and fifths?’ These might be generalised to consider what the denominator would be if fractions with denominator of a and denominator of b were to be multiplied.
Understand how to multiply unit, non-unit and improper fractions
Common difficulties and misconceptions: one common difficulty with multiplication of fractions is that the rule for doing this is very simple (multiply the numerators and multiply the denominators) and students often apply this rule without any understanding.
It will be important to use representations (for example, the area model) alongside the symbolic calculation in order to get a sense of what is happening when two fractions are multiplied together. In this way, students can make sense of the rule rather than just learning it without justification.
Students may also use inefficient methods if they are simply following the algorithm, for example, 4
5 ×
3
4=
12
20, and then need to cancel down without recognising that, in the
original calculation, the 4 and the 1
4 (the 4 being the numerator in the first fraction and
denominator in the second) reduce to one and hence the answer must be 3
5.
Example 1: Complete these calculations.
𝑎) 1
3×
1
5= b) 2 ×
1
3×
1
5= c) 2
3×
1
5=
d) 1
3× 2 ×
1
5= e) 1
3×
2
5= f)
2
3×
2
5=
g) 3
4×
3
5= h) 3
4×
4
5= i) 2
3×
3
5×
5
7=
The intention of Example 1 is for students to appreciate that non-unit fractions are integer multiples of unit fractions and that, by considering the commutative and associative laws, the multiplication of non-unit fractions can be derived.
96
To help enable this for part a, teachers could ask questions such as, ‘Can you draw a picture to show this?’ and ‘Can you see this as 1
3 of 1
5 and as 1
5 of 1
3?’ and ask similar
‘commutativity’ questions for parts c and e.
For parts b and d, it will be important to help students connect the answers to those for parts c and e. Some discussion of part d could include how the calculation might be read:
‘Is it ( 1
3 × 2) × 1
5 ?’ ‘Or is it 1
3 × (2 × 1
5 ) i.e. the same as 1
3×
2
5?’
Students can then realise that these calculations can be seen as equivalent.
Parts f and g can be used as an opportunity to practise these ideas. The prompt ‘In how many ways can you think of this calculation?’ can support students in seeing them in different ways to support fluency: 2
3 of 2
5; 2
5 of 2
3; 2 ×
1
3×
2
5; 2
3× 2 ×
1
5; 2 ×
1
3× 2 ×
1
5; 4 ×
1
3×
1
5, etc.
This sequence of different versions of the same calculation can be used to stimulate discussion and make sense of the ‘multiply the numerators’ rule. It will be important to encourage students to reason why this is true, using examples like the one above. Asking questions, such as the following, will support students’ understanding.
‘What is the same and what is different in these two calculations: 1
3×
1
5 and 2
3×
2
5?’
‘Why is the answer to the second calculation four times bigger than the answer to the first calculation?’
Parts h and i provide opportunities for students to practise these ideas but with some added challenge (i.e. the possibility of cancelling before multiplying in part h and the extension to three fractions in part i).
The strategy of rewriting 2
3×
3
5×
5
7 as 2 ×
1
3× 3 ×
1
5× 5 ×
1
7 and bracketing it as
2 × ( 1
3 × 3) × (1
5 × 5) × 1
7 will help to reveal the structure and support students in
understanding the process of ‘cancelling’ to simplify before calculating. Example 2: Given that 8
15× 465 = 248 find:
4
15 × 465
16
15 × 465
8
3 × 465
In Example 2, students are invited to manipulate a given expression to find the answers to other calculations, further developing their understanding of the use of one fraction (such as a unit fraction) to find the product of two fractions.
97
On completion of the three given calculations, and having discussed their reasoning, students could then be asked to give some other results that they can find using the original product.
Example 3: Which gives the greater result, calculation a or calculation b? Explain how you know.
a) 12
13×
14
15
b) 14
15×
15
16
A key aspect of fluency with calculations of this type is to look for simplifications before multiplying numerators and denominators.
In Example 3, students should be encouraged to reason about the relative size of the answers by looking at the constituent parts of the product rather than calculating the product.
98
Year 7 summer term
Understanding multiplicative relationships: fractions and ratio
Overview
Multiplicative relationships underpin many aspects of mathematics at Key Stage 3, but students often experience them as distinct topics with no obvious connections. Percentages, fractions, proportionality and ratio, for example, can all be considered as contexts in which multiplicative relationships are used and explored. It is, therefore, important that the vocabulary and imagery used in all contexts is consistent, to support students in their understanding that the same mathematical principles are involved. In many cases there will be several different possible representations that could be used to help understand the mathematical structure of a situation. It is important to consider the relative usefulness and efficiency of different representations and approaches. While students will have met these topics in Key Stage 2, a key idea in Key Stage 3 is to connect these contexts through the overarching idea of multiplicative relationships.
Students should have interpreted multiplication as scaling at Key Stage 2, but here it is developed in more depth. Students should recognise that it is possible to go from any number (except the specific case involving zero as one of the factors but not the product) to any other number by multiplying. They should not simply view multiplication as repeated addition, because this could lead to incorrect additive strategies. For example, in the question, ‘If five miles is equivalent to eight kilometres, how many kilometres is seven miles?’ students may respond that two more miles means two more kilometres. Students should experience multiplicative relationships in many different contexts to overcome such errors.
Prior learning
Before beginning multiplicative reasoning at Key Stage 3, students should already have a secure understanding of the following learning outcomes from study at upper Key Stage 2:
• Multiply proper fractions and mixed numbers by whole numbers, supported by materials and diagrams.
• Use all four operations to solve problems involving measure (for example, length, mass, volume, money) using decimal notation, including scaling.
• Solve problems involving the relative sizes of two quantities where missing values can be found by using integer multiplication and division facts.
• Solve problems involving similar shapes where the scale factor is known or can be found.
• Solve problems involving unequal sharing and grouping, using knowledge of fractions and multiples.
99
The NCETM has created the following Key Stage 2 ready-to-progress criteria to support teachers in making judgements about students’ understanding and knowledge.
6AS/MD-1 Understand that 2 numbers can be related additively or multiplicatively and quantify additive and multiplicative relationships (multiplicative relationships restricted to multiplication by a whole number).
6AS/MD-2 Use a given additive or multiplicative calculation to derive or complete a related calculation, using arithmetic properties, inverse relationships, and place-value understanding.
6AS/MD-3 Solve problems involving ratio relationships.
6AS/MD-4 Solve problems with 2 unknowns.
Checking prior learning
The following activities from the NCETM primary assessment materials offer useful ideas for teachers to use to check whether prior learning is secure.
Reference Activity
Year 6 page 24
If I share equally a 3 m ribbon between 5 people, how long will each person’s ribbon be?
Year 6 page 25
Sam and Tom share 45 marbles in the ratio 2:3. How many more marbles does Tom have than Sam?
Language
ratio
Progression through key ideas
Understand the concept of multiplicative relationships
That any two quantities can be linked multiplicatively is a key awareness. It is important for students to see that multiplication is more than simply repeated addition. While students may recognise that, for example, three and six can be connected via a multiplication, it is much less likely that they will see three and five as being linked multiplicatively.
Offering students experiences that encourage them to look for multiplication rather than addition will support them in developing this more sophisticated view of multiplication. It will also lead to the important realisation that any two numbers can be linked in this way.
100
Later, students will appreciate that the multiplier can be expressed as the fraction comprising the two numbers (for example, 3 × 5
3 = 5 and 5 × 3
5 = 3).
Key ideas • Appreciate that any two numbers can be connected via a multiplicative
relationship* • Understand that a multiplicative relationship can be expressed as a ratio and as a
fraction • Be able to calculate the multiplier for any given two numbers • Appreciate that there are an infinite number of pairs of numbers for any given
multiplicative relationship (equivalence)
Understand that multiplicative relationships can be represented in a number of ways and connect and move between those different representations
This collection of key ideas explores some of the images and representations that can be used to build an understanding of the different interpretations of multiplicative structures and so make the connections between seemingly distinct topics explicit. For example, double number track, ratio table, double number line (also known as a stacked number line), scaling diagram, graphs, algebraic symbolism and other notation. Keep in mind that the purpose of these different representations is to reveal the underpinning mathematical structure, rather than to provide a method to achieve an answer.
Key ideas
• Use a double number line to represent a multiplicative relationship and connect to other known representations*
• Understand the language and notation of ratio and use a ratio table to represent a multiplicative relationship and connect to other known representations*
Understand that fractions are an example of a multiplicative relationship and apply this understanding to a range of contexts
This collection of key ideas explores contexts in which fractions are used to describe and explore a given situation. Fraction notation holds within it a multiplicative relationship. In a fraction, such as 2
3, the numerator will be two-thirds of the denominator, and the
denominator will be three-halves of the numerator. However, a particular focus in these key ideas is the use of a fraction as a multiplier. Students should view a relationship of the form ab = c (where a and/or b is a fraction) from different perspectives and in different contexts. Key ideas
• Find a fraction of a given amount • Given a fraction and the result, find the original amount • Express one number as a fraction of another
101
Understand that ratios are an example of a multiplicative relationship and apply this understanding to a range of contexts
Here, ratios are used to describe and explore multiplicative relationships. Students may still view some of these contexts additively, but it is vital that the multiplicative aspect is explored and emphasised. For example, in a question such as, ‘Some money is shared between Alan and Layla in the ratio 2:3. If Alan receives £10, how much does Layla receive?’ students may perceive an entirely additive structure: divide the whole into five parts, take two parts for Alan and three parts for Layla. However, they should also have the awareness that Alan and Layla’s money is linked by multiplicative relationships:
• Layla has 3
2 of Alan’s share.
• Alan has 2
3 of Layla’s share.
• Alan has 2
5 of the total and Layla has 3
5 of the total.
The idea of a rate then becomes an integral part of this multiplicative relationship. The ratio 2:3 can be thought of as, for every £2 Alan has, Layla has £3; or, by considering the multiplier, for every £1 Alan has, Layla has £1.50. The double number line and ratio table representations can be key in supporting students to see a rate as representing different multiplicative relationships. Emphasise that there are two multiplicative relationships evident in each situation: one which scales one value or quantity to the next (for example, if £3 = $4, then £6 = $8, doubling each value); and one which converts one value or quantity to another (for example, if £3 = $4, then £7.50 = $10 since 7.5 is 3
4 of 10).
Key ideas • Be able to divide a quantity into a given ratio • Be able to determine the whole, given one part and the ratio • Be able to determine one part, given the other part and the ratio* • Use ratio to describe rates (for example, exchange rates, conversions, cogs).
Exemplified significant key ideas
Appreciate that any two numbers can be connected via a multiplicative relationship
Common difficulties and misconceptions: students often assume that relationships are additive, including in situations where the actual relationship is multiplicative; for example, in scaling and other proportional situations.
Because students may see multiplication as only repeated addition, as opposed to scaling, their methods often build up to an answer by dealing with small segments of the problem and then adding the answers together. When this is not possible, it is not uncommon for students to consider the difference a − b rather than the ratio a:b.
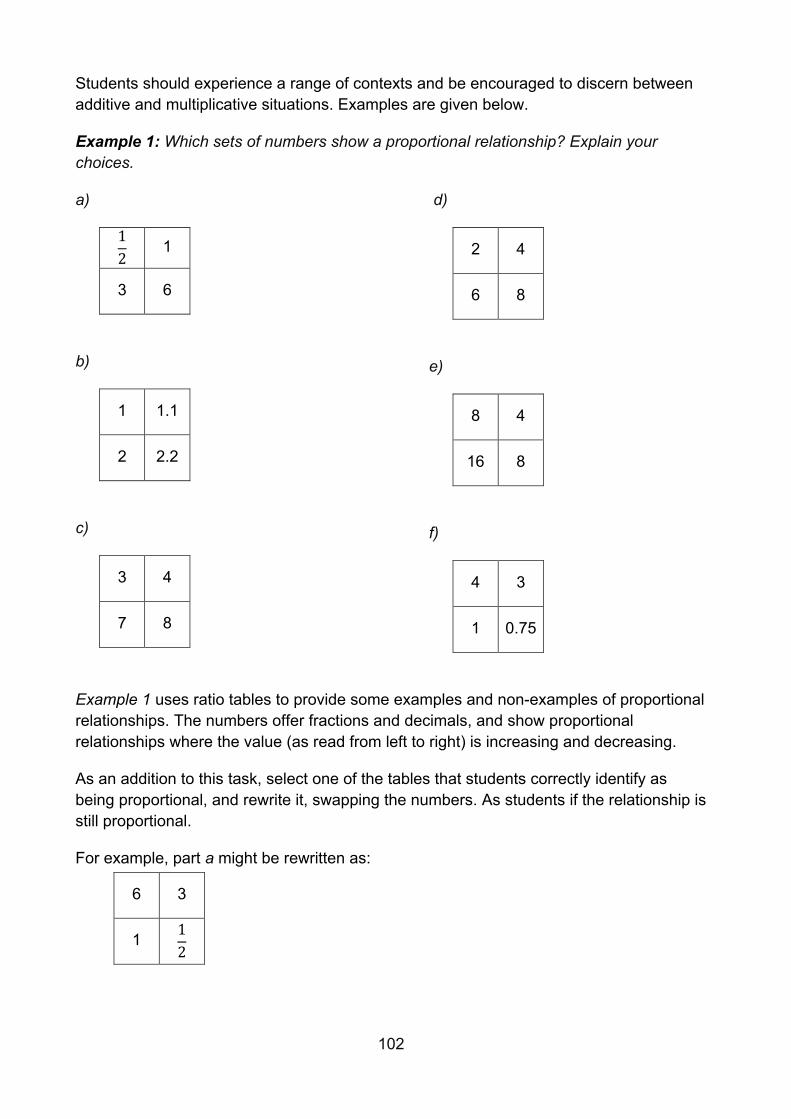
102
Students should experience a range of contexts and be encouraged to discern between additive and multiplicative situations. Examples are given below.
Example 1: Which sets of numbers show a proportional relationship? Explain your choices.
a)
1
2 1
3 6
b)
1 1.1
2 2.2
c)
3 4
7 8
d)
2 4
6 8
e)
8 4
16 8
f)
4 3
1 0.75
Example 1 uses ratio tables to provide some examples and non-examples of proportional relationships. The numbers offer fractions and decimals, and show proportional relationships where the value (as read from left to right) is increasing and decreasing.
As an addition to this task, select one of the tables that students correctly identify as being proportional, and rewrite it, swapping the numbers. As students if the relationship is still proportional.
For example, part a might be rewritten as:
6 3
1 1
2
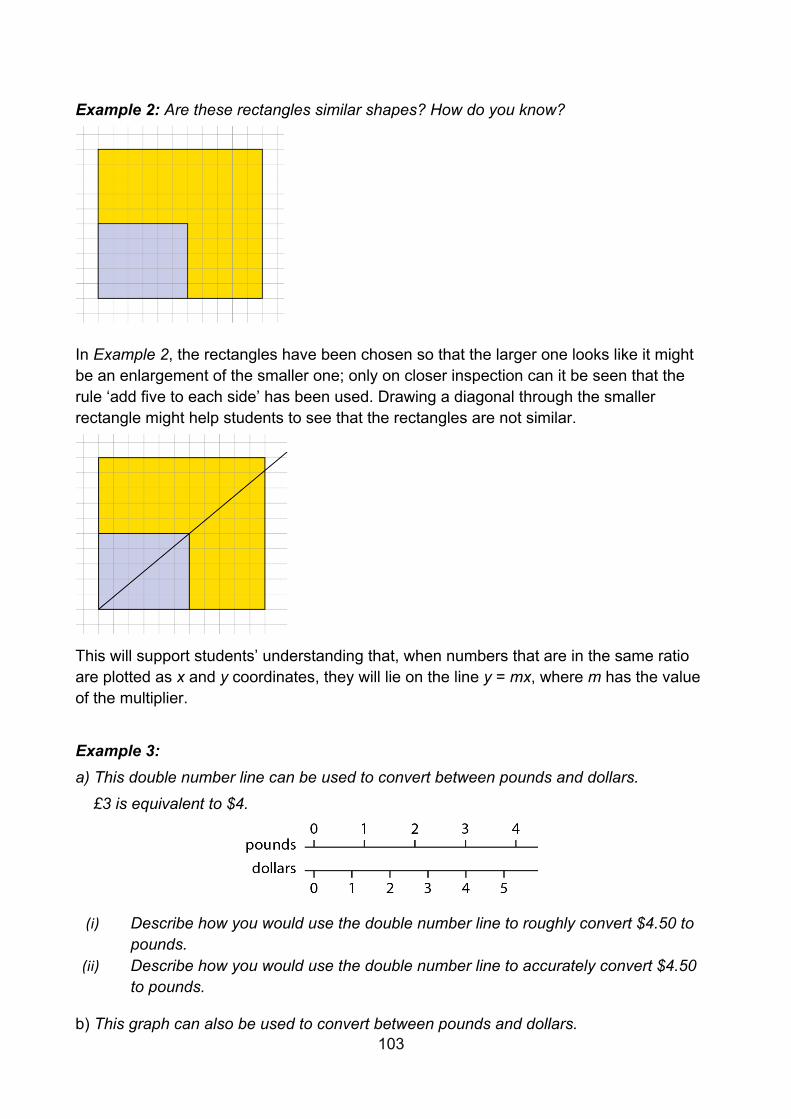
103
Example 2: Are these rectangles similar shapes? How do you know?
In Example 2, the rectangles have been chosen so that the larger one looks like it might be an enlargement of the smaller one; only on closer inspection can it be seen that the rule ‘add five to each side’ has been used. Drawing a diagonal through the smaller rectangle might help students to see that the rectangles are not similar.
This will support students’ understanding that, when numbers that are in the same ratio are plotted as x and y coordinates, they will lie on the line y = mx, where m has the value of the multiplier. Example 3: a) This double number line can be used to convert between pounds and dollars.
£3 is equivalent to $4.
(i) Describe how you would use the double number line to roughly convert $4.50 to
pounds. (ii) Describe how you would use the double number line to accurately convert $4.50
to pounds.
b) This graph can also be used to convert between pounds and dollars.
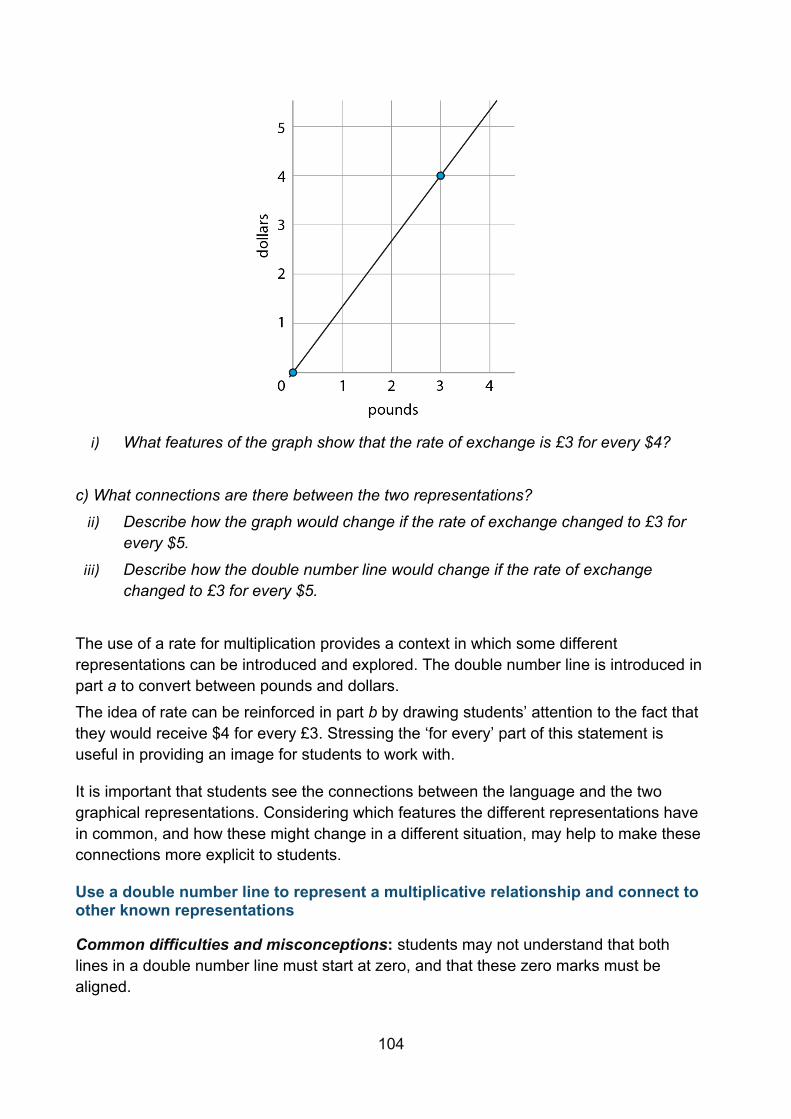
104
i) What features of the graph show that the rate of exchange is £3 for every $4?
c) What connections are there between the two representations?
ii) Describe how the graph would change if the rate of exchange changed to £3 for every $5.
iii) Describe how the double number line would change if the rate of exchange changed to £3 for every $5.
The use of a rate for multiplication provides a context in which some different representations can be introduced and explored. The double number line is introduced in part a to convert between pounds and dollars. The idea of rate can be reinforced in part b by drawing students’ attention to the fact that they would receive $4 for every £3. Stressing the ‘for every’ part of this statement is useful in providing an image for students to work with.
It is important that students see the connections between the language and the two graphical representations. Considering which features the different representations have in common, and how these might change in a different situation, may help to make these connections more explicit to students.
Use a double number line to represent a multiplicative relationship and connect to other known representations
Common difficulties and misconceptions: students may not understand that both lines in a double number line must start at zero, and that these zero marks must be aligned.
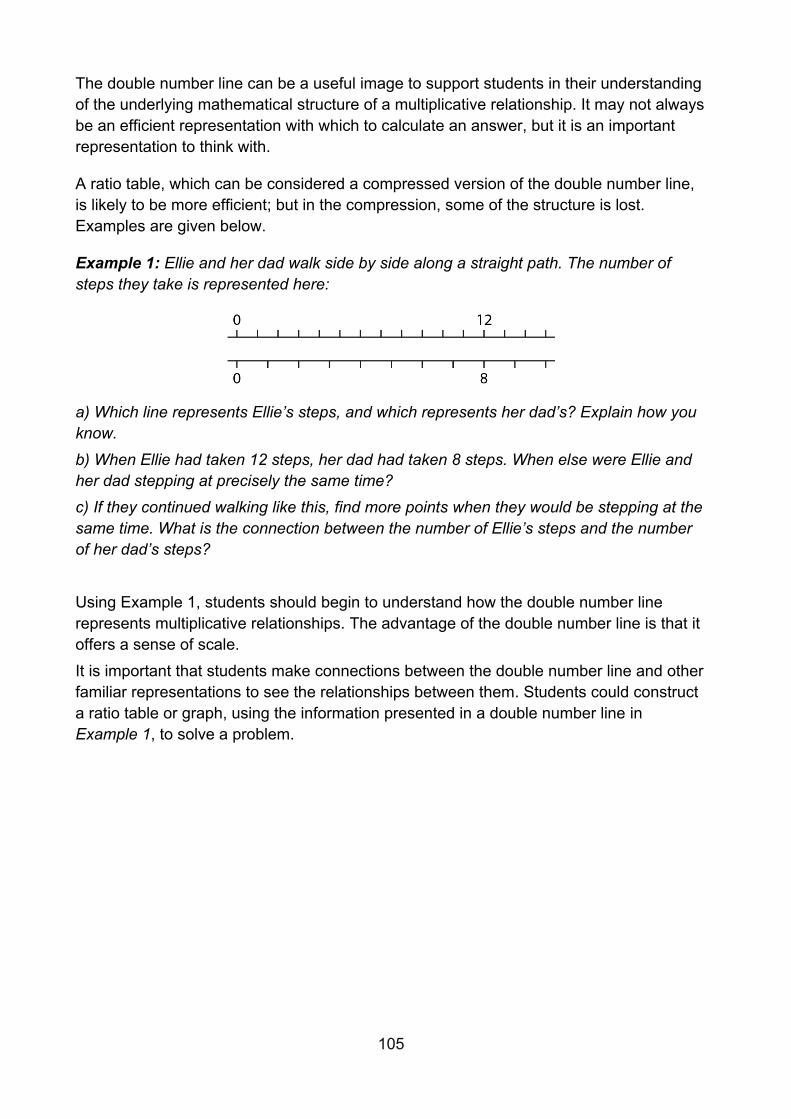
105
The double number line can be a useful image to support students in their understanding of the underlying mathematical structure of a multiplicative relationship. It may not always be an efficient representation with which to calculate an answer, but it is an important representation to think with.
A ratio table, which can be considered a compressed version of the double number line, is likely to be more efficient; but in the compression, some of the structure is lost. Examples are given below.
Example 1: Ellie and her dad walk side by side along a straight path. The number of steps they take is represented here:
a) Which line represents Ellie’s steps, and which represents her dad’s? Explain how you know.
b) When Ellie had taken 12 steps, her dad had taken 8 steps. When else were Ellie and her dad stepping at precisely the same time? c) If they continued walking like this, find more points when they would be stepping at the same time. What is the connection between the number of Ellie’s steps and the number of her dad’s steps? Using Example 1, students should begin to understand how the double number line represents multiplicative relationships. The advantage of the double number line is that it offers a sense of scale. It is important that students make connections between the double number line and other familiar representations to see the relationships between them. Students could construct a ratio table or graph, using the information presented in a double number line in Example 1, to solve a problem.
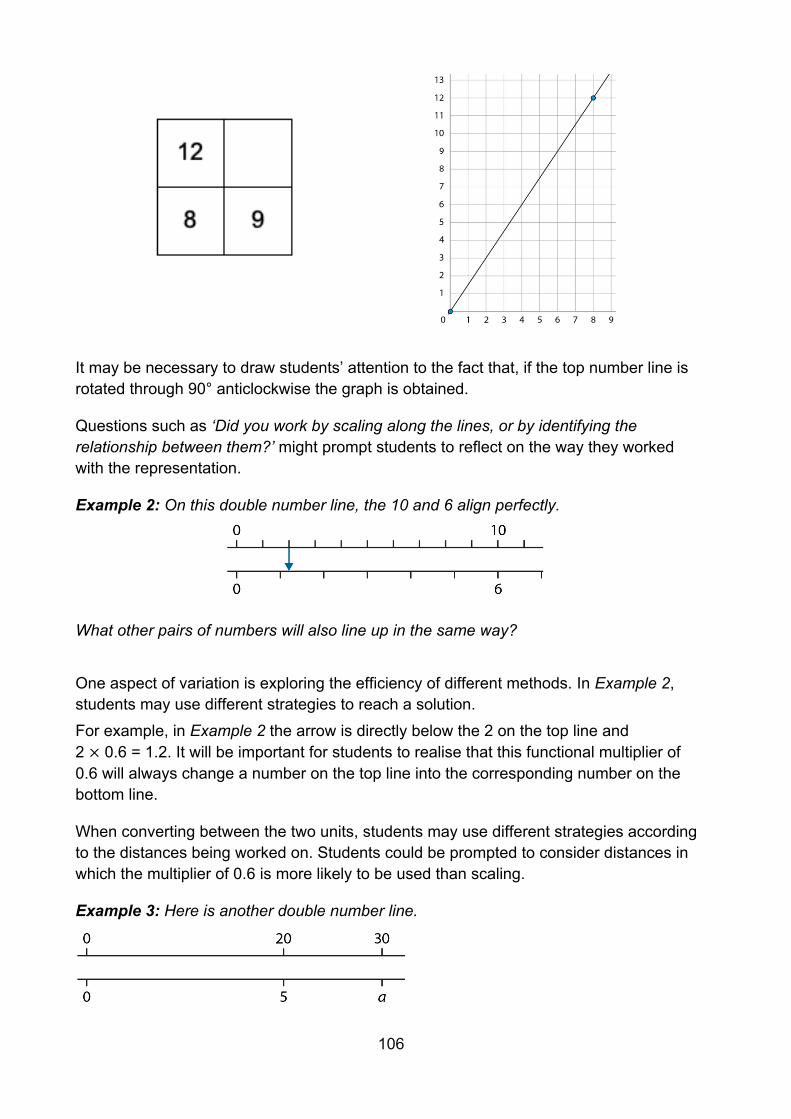
106
It may be necessary to draw students’ attention to the fact that, if the top number line is rotated through 90° anticlockwise the graph is obtained.
Questions such as ‘Did you work by scaling along the lines, or by identifying the relationship between them?’ might prompt students to reflect on the way they worked with the representation.
Example 2: On this double number line, the 10 and 6 align perfectly.
What other pairs of numbers will also line up in the same way?
One aspect of variation is exploring the efficiency of different methods. In Example 2, students may use different strategies to reach a solution. For example, in Example 2 the arrow is directly below the 2 on the top line and 2 × 0.6 = 1.2. It will be important for students to realise that this functional multiplier of 0.6 will always change a number on the top line into the corresponding number on the bottom line.
When converting between the two units, students may use different strategies according to the distances being worked on. Students could be prompted to consider distances in which the multiplier of 0.6 is more likely to be used than scaling.
Example 3: Here is another double number line.
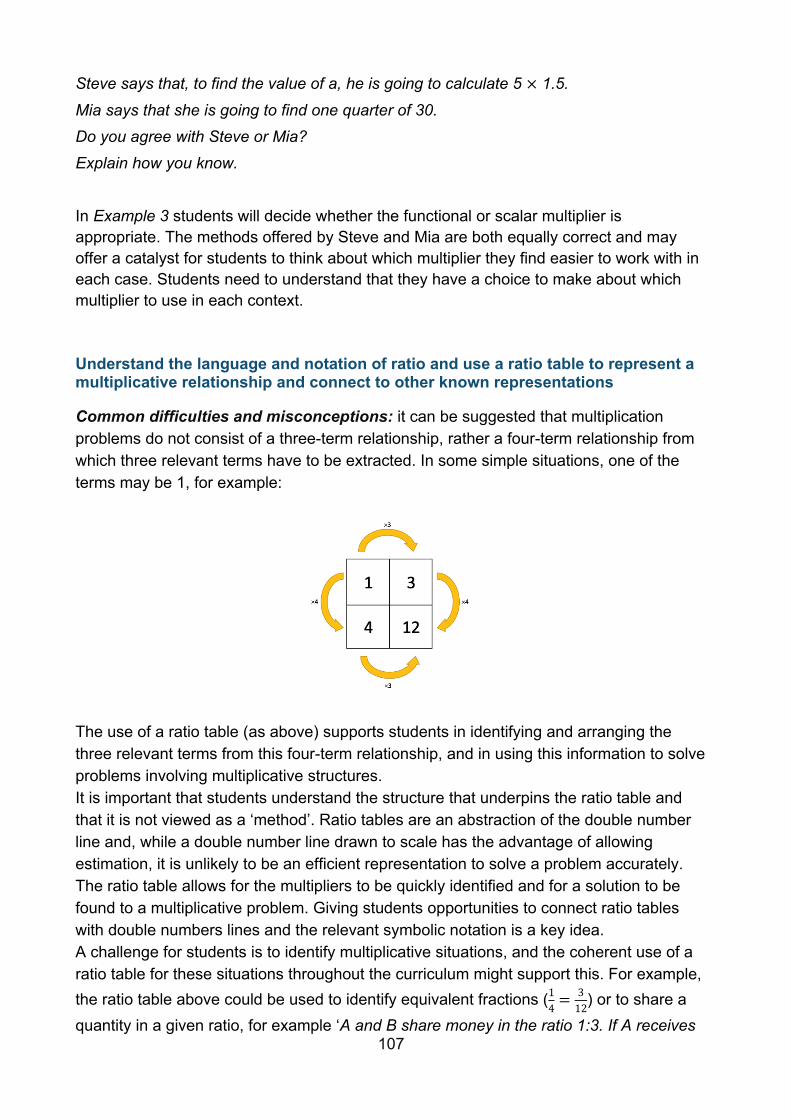
107
Steve says that, to find the value of a, he is going to calculate 5 × 1.5.
Mia says that she is going to find one quarter of 30.
Do you agree with Steve or Mia?
Explain how you know.
In Example 3 students will decide whether the functional or scalar multiplier is appropriate. The methods offered by Steve and Mia are both equally correct and may offer a catalyst for students to think about which multiplier they find easier to work with in each case. Students need to understand that they have a choice to make about which multiplier to use in each context.
Understand the language and notation of ratio and use a ratio table to represent a multiplicative relationship and connect to other known representations
Common difficulties and misconceptions: it can be suggested that multiplication problems do not consist of a three-term relationship, rather a four-term relationship from which three relevant terms have to be extracted. In some simple situations, one of the terms may be 1, for example:
The use of a ratio table (as above) supports students in identifying and arranging the three relevant terms from this four-term relationship, and in using this information to solve problems involving multiplicative structures. It is important that students understand the structure that underpins the ratio table and that it is not viewed as a ‘method’. Ratio tables are an abstraction of the double number line and, while a double number line drawn to scale has the advantage of allowing estimation, it is unlikely to be an efficient representation to solve a problem accurately. The ratio table allows for the multipliers to be quickly identified and for a solution to be found to a multiplicative problem. Giving students opportunities to connect ratio tables with double numbers lines and the relevant symbolic notation is a key idea. A challenge for students is to identify multiplicative situations, and the coherent use of a ratio table for these situations throughout the curriculum might support this. For example, the ratio table above could be used to identify equivalent fractions (1
4=
3
12) or to share a
quantity in a given ratio, for example ‘A and B share money in the ratio 1:3. If A receives
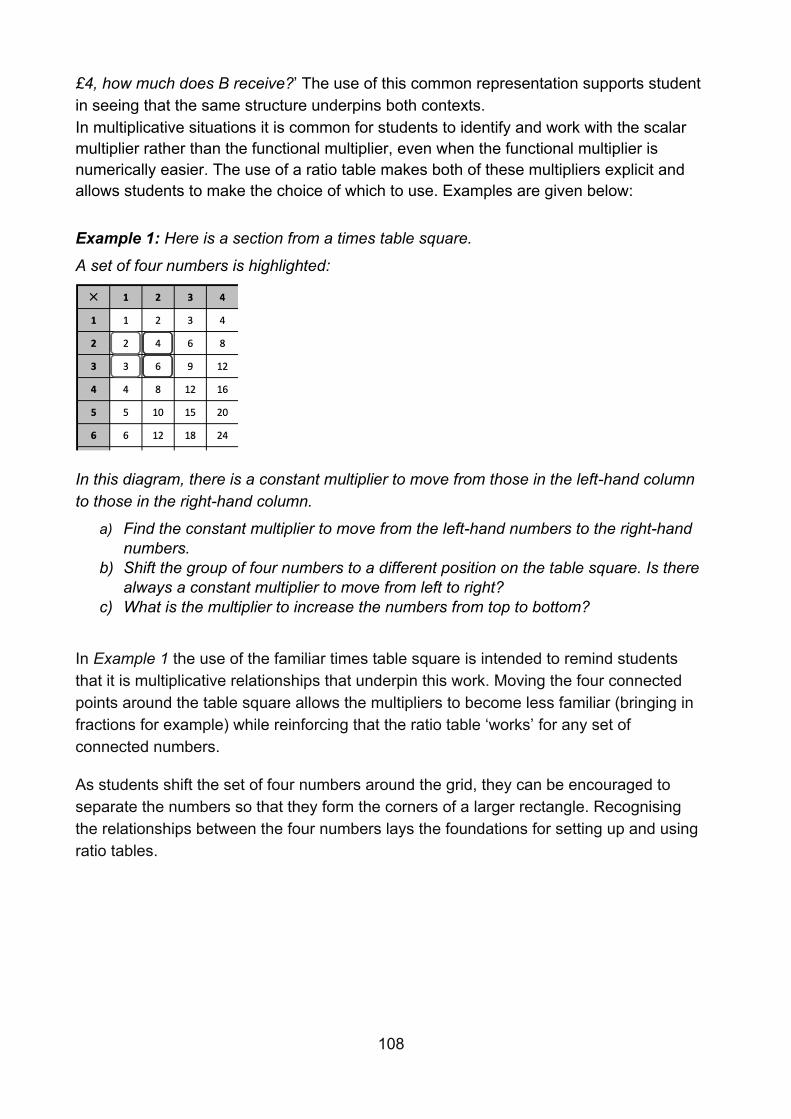
108
£4, how much does B receive?’ The use of this common representation supports student in seeing that the same structure underpins both contexts. In multiplicative situations it is common for students to identify and work with the scalar multiplier rather than the functional multiplier, even when the functional multiplier is numerically easier. The use of a ratio table makes both of these multipliers explicit and allows students to make the choice of which to use. Examples are given below: Example 1: Here is a section from a times table square. A set of four numbers is highlighted:
In this diagram, there is a constant multiplier to move from those in the left-hand column to those in the right-hand column.
a) Find the constant multiplier to move from the left-hand numbers to the right-hand numbers.
b) Shift the group of four numbers to a different position on the table square. Is there always a constant multiplier to move from left to right?
c) What is the multiplier to increase the numbers from top to bottom?
In Example 1 the use of the familiar times table square is intended to remind students that it is multiplicative relationships that underpin this work. Moving the four connected points around the table square allows the multipliers to become less familiar (bringing in fractions for example) while reinforcing that the ratio table ‘works’ for any set of connected numbers.
As students shift the set of four numbers around the grid, they can be encouraged to separate the numbers so that they form the corners of a larger rectangle. Recognising the relationships between the four numbers lays the foundations for setting up and using ratio tables.
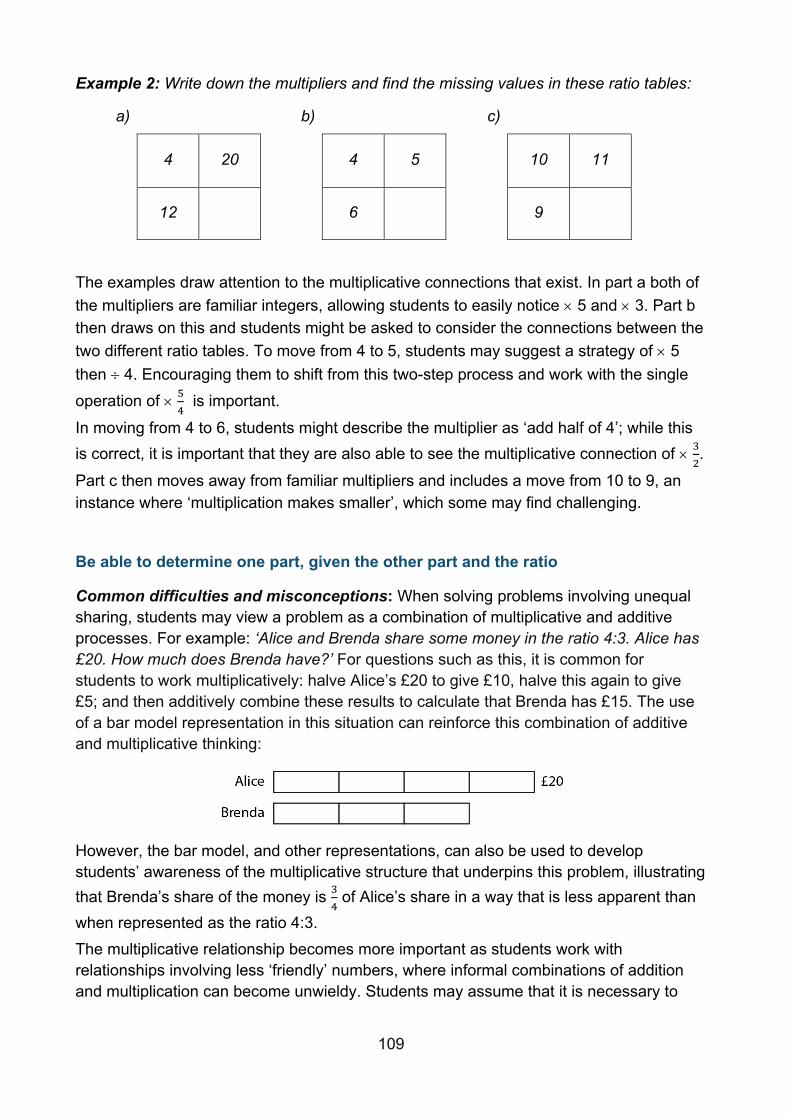
109
Example 2: Write down the multipliers and find the missing values in these ratio tables:
a) b) c)
4 20 4 5 10 11
12 6 9
The examples draw attention to the multiplicative connections that exist. In part a both of the multipliers are familiar integers, allowing students to easily notice 5 and 3. Part b then draws on this and students might be asked to consider the connections between the two different ratio tables. To move from 4 to 5, students may suggest a strategy of 5 then 4. Encouraging them to shift from this two-step process and work with the single operation of 5
4 is important.
In moving from 4 to 6, students might describe the multiplier as ‘add half of 4’; while this is correct, it is important that they are also able to see the multiplicative connection of 3
2.
Part c then moves away from familiar multipliers and includes a move from 10 to 9, an instance where ‘multiplication makes smaller’, which some may find challenging.
Be able to determine one part, given the other part and the ratio
Common difficulties and misconceptions: When solving problems involving unequal sharing, students may view a problem as a combination of multiplicative and additive processes. For example: ‘Alice and Brenda share some money in the ratio 4:3. Alice has £20. How much does Brenda have?’ For questions such as this, it is common for students to work multiplicatively: halve Alice’s £20 to give £10, halve this again to give £5; and then additively combine these results to calculate that Brenda has £15. The use of a bar model representation in this situation can reinforce this combination of additive and multiplicative thinking:
However, the bar model, and other representations, can also be used to develop students’ awareness of the multiplicative structure that underpins this problem, illustrating that Brenda’s share of the money is 3
4 of Alice’s share in a way that is less apparent than
when represented as the ratio 4:3. The multiplicative relationship becomes more important as students work with relationships involving less ‘friendly’ numbers, where informal combinations of addition and multiplication can become unwieldy. Students may assume that it is necessary to
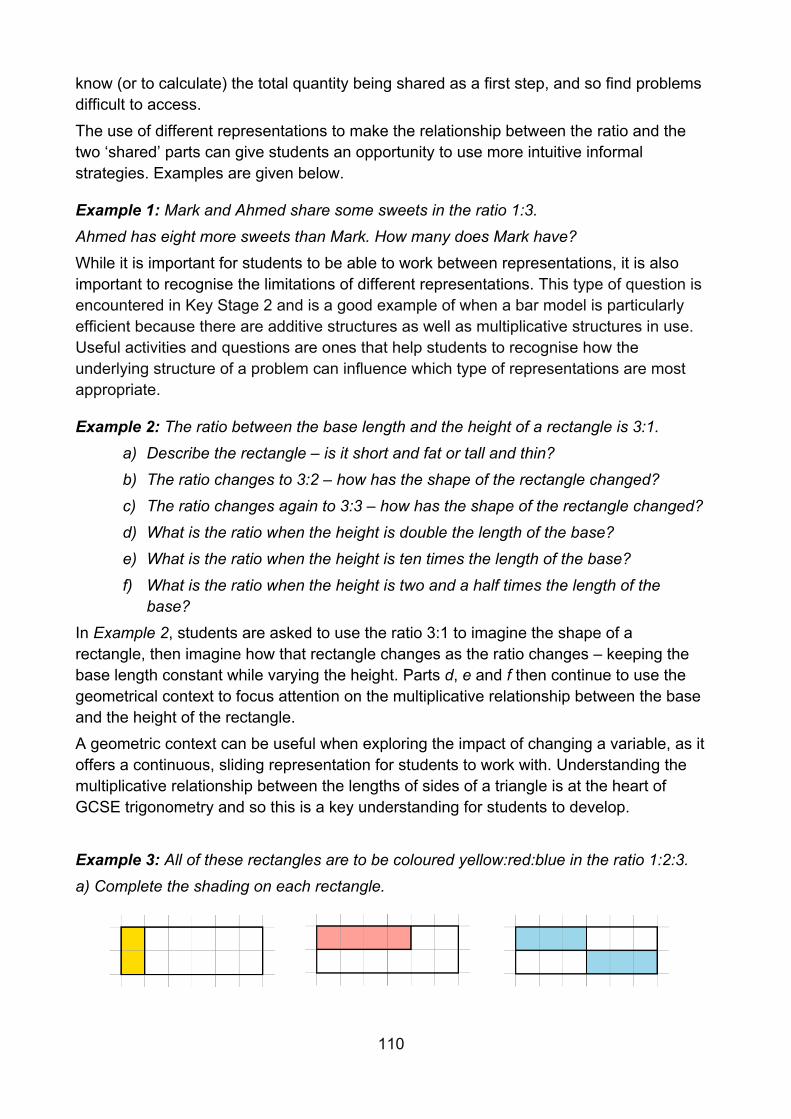
110
know (or to calculate) the total quantity being shared as a first step, and so find problems difficult to access. The use of different representations to make the relationship between the ratio and the two ‘shared’ parts can give students an opportunity to use more intuitive informal strategies. Examples are given below.
Example 1: Mark and Ahmed share some sweets in the ratio 1:3.
Ahmed has eight more sweets than Mark. How many does Mark have?
While it is important for students to be able to work between representations, it is also important to recognise the limitations of different representations. This type of question is encountered in Key Stage 2 and is a good example of when a bar model is particularly efficient because there are additive structures as well as multiplicative structures in use. Useful activities and questions are ones that help students to recognise how the underlying structure of a problem can influence which type of representations are most appropriate.
Example 2: The ratio between the base length and the height of a rectangle is 3:1.
a) Describe the rectangle – is it short and fat or tall and thin?
b) The ratio changes to 3:2 – how has the shape of the rectangle changed?
c) The ratio changes again to 3:3 – how has the shape of the rectangle changed?
d) What is the ratio when the height is double the length of the base?
e) What is the ratio when the height is ten times the length of the base?
f) What is the ratio when the height is two and a half times the length of the base?
In Example 2, students are asked to use the ratio 3:1 to imagine the shape of a rectangle, then imagine how that rectangle changes as the ratio changes – keeping the base length constant while varying the height. Parts d, e and f then continue to use the geometrical context to focus attention on the multiplicative relationship between the base and the height of the rectangle. A geometric context can be useful when exploring the impact of changing a variable, as it offers a continuous, sliding representation for students to work with. Understanding the multiplicative relationship between the lengths of sides of a triangle is at the heart of GCSE trigonometry and so this is a key understanding for students to develop. Example 3: All of these rectangles are to be coloured yellow:red:blue in the ratio 1:2:3.
a) Complete the shading on each rectangle.
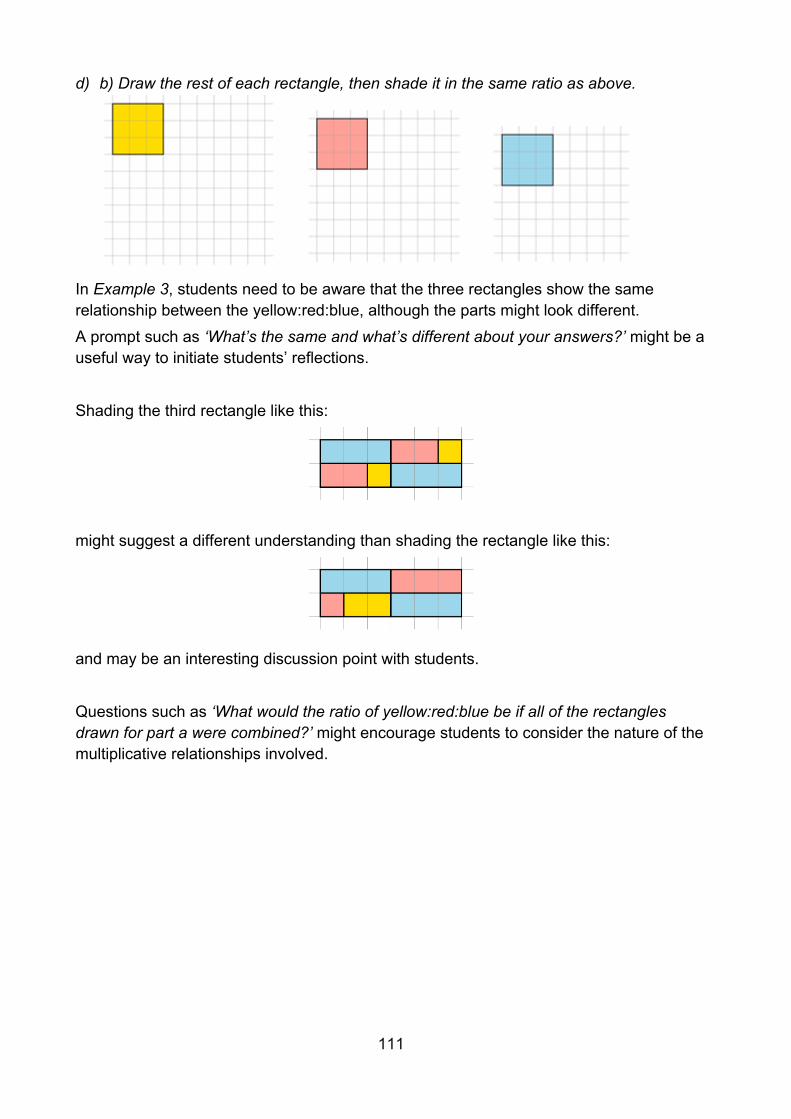
111
d) b) Draw the rest of each rectangle, then shade it in the same ratio as above.
In Example 3, students need to be aware that the three rectangles show the same relationship between the yellow:red:blue, although the parts might look different. A prompt such as ‘What’s the same and what’s different about your answers?’ might be a useful way to initiate students’ reflections. Shading the third rectangle like this:
might suggest a different understanding than shading the rectangle like this:
and may be an interesting discussion point with students. Questions such as ‘What would the ratio of yellow:red:blue be if all of the rectangles drawn for part a were combined?’ might encourage students to consider the nature of the multiplicative relationships involved.
112
Transformations
Overview
Transformations describe different ways of mapping points on a plane to other points on the plane. A way to think about, describe and classify transformations is to consider what changes and what stays the same under different transformations. This also allows for discussion about congruence and similarity. At Key Stage 2, students will have encountered all four transformations – translation, reflection, rotation and enlargement – and learnt to distinguish between them. However, they may not have concentrated on specific features, such as the centre of rotation or the centre of enlargement. In all four transformations, students should recognise that every element of the object, i.e. every point, line or curve, or interior space, etc., undergoes the same transformation and that looking at each of these elements in turn will help them to accurately construct the image. Dynamic geometry software offers an effective tool to support the teaching of transformations. It enables students to see what happens when certain transformations are applied to objects; and to make conjectures, justify and test where, for example, the image of an object under a reflection will be. The order in which transformations have been introduced in this work– translation, rotation, reflection and, finally, enlargement – highlights how the degrees of freedom available, with regards to what can vary, are being increased. Translation maintains congruence and orientation. Rotation produces a change in orientation but maintains the ‘sense’ of the image – a feature which is able to change only under reflection. Translation, rotation and reflection produce congruent shapes in an increasing range of orientations and senses. Enlargement is the only transformation that does not maintain congruence (other than when the scale factor is ±1) but does maintain similarity in any orientation and sense. In this set of key ideas, it will be useful for students to consider what’s the same and what’s different about an object and its image as they work on different transformations.
Prior learning
Before beginning transforming shapes at Key Stage 3, students should already have a secure understanding of the following learning outcomes from study at upper Key Stage 2:
• Identify, describe and represent the position of a shape following a reflection or translation, using the appropriate language, and know that the shape has not changed.
• Draw and translate simple shapes on the coordinate plane and reflect them in the axes.
113
• Solve problems involving similar shapes where the scale factor is known or can be found.
The NCETM has created the following Key Stage 2 ready-to-progress criteria to support teachers in making judgements about students’ understanding and knowledge.
4G-1 Draw polygons, specified by coordinates in the first quadrant, and translate within the first quadrant.
4G-3 Identify line symmetry in 2D shapes presented in different orientations. Reflect shapes in a line of symmetry and complete a symmetric figure or pattern with respect to a specified line of symmetry.
Checking prior learning
The following activities from the NCETM primary assessment materials offer useful ideas for teachers to use to check whether prior learning is secure.
Reference Activity Year 6 page 36
Are these statements always, sometimes or never true?
• If a shape is reflected in an axis, it stays in the same quadrant.
• If a shape is translated to the right and up, it stays in the same quadrant.
• If a shape is translated to the left and down, it stays in the same quadrant.
Explain your decisions.
Language
centre of enlargement, centre of rotation, congruent (figures), enlargement, image, object, scale factor, similar
Progression through key ideas
Understand and use translations
When an object undergoes a translation, the size of its angles and the lengths of its lines are maintained so that the object and image are congruent. This property is shared with both rotation and reflection, but a translation, uniquely, always maintains the orientation of the object in the image. The use of notation to record a translation may follow from a need to describe it accurately and succinctly. Initially, students are likely to use informal language as they develop their understanding of the transformation: describing, for example, a move of ‘three across’ and ‘two down’. While the formal use of vectors is part
114
of the national curriculum Key Stage 4 programme of study, translation offers students a natural opportunity to formalise their intuitive understanding about the distinction between movement and position. Key ideas
• Understand the nature of a translation and appreciate what changes and what is invariant
• Understand the minimum information required to describe a translation (vertical and horizontal displacement)
• Translate objects from information given in a variety of forms
Understand and use rotations
As with translations, rotations maintain congruence but offer a further degree of change between the object and the image, since the orientation of the object is not necessarily maintained. In Key Stage 2, students will have worked with objects rotated through a half, a quarter and three-quarters of a turn. This is generalised to any angle at Key Stage 3, specifying the size and direction of turn. In addition, more attention is paid to the centre of rotation (the one point which does not move under the rotation) and the fact that the position of the image changes with different centres of rotation, even though the orientation may not. In the construction of examples to support students’ understanding, it is important to vary the position of the centre of rotation to include:
• on a vertex of the object • lying within the object • lying outside of the object.
Key ideas
• Understand the nature of rotations and appreciate what changes and what is invariant
• Understand the minimum information required to describe a rotation (centre of rotation, size and direction of rotation)*
• Rotate objects using information about centre, size and direction of rotation
Understand and use reflections
Transforming an object by reflecting it offers the full range of possible congruent shapes, and a context in which congruence may be explored further. Reflection in lines which are neither horizontal nor vertical presents increased challenge and requires students to have a sense of where the image will be. Using a range of tools, such as dynamic geometry software, alongside pencil and paper methods, gives students a greater depth of understanding. Key ideas
• Understand the nature of reflections and appreciate what changes and what is invariant
115
• Understand the minimum information required to describe a reflection (line of reflection)*
• Reflect objects using a range of lines of reflection (including non-vertical and non-horizontal)
Understand and use enlargements
Students are likely to be familiar with enlargements through their work on similar shapes in Key Stage 2. At Key Stage 3, they are introduced to the idea of a centre of enlargement and that the position of this in relation to the object affects the image’s position. In this set of key ideas, students consider the range of possible outcomes with an enlargement. They should come to appreciate that enlargement is the only transformation that does not guarantee a congruent shape. At Key Stage 3, the focus is on enlargements with a scale factor ≥1, but the use of dynamic geometry software offers students an opportunity to reason mathematically about the images that will result if a scale factor outside of this range is used (as it is in Key Stage 4), and to then test and refine their conjectures. Key ideas
• Understand the nature of enlargements and appreciate what changes and what is invariant
• Understand the minimum information required to describe an enlargement (centre of enlargement and scale factor)
• Enlarge objects using information about the centre of enlargement and scale factor
Exemplified significant key ideas
Understand the minimum information required to describe a rotation (centre of rotation, size and direction of rotation)
Common difficulties and misconceptions: a rotation is arguably one of the more challenging transformations for students to visualise. Plenty of opportunity to experiment and become familiar with the behaviour of rotations – for example, through the use of dynamic geometry software and hands-on activities using cut-out shapes or tracing paper – may support students in better understanding rotations. Describing and recording a rotation can prove challenging for students, since it draws on their understanding of angle as a measure of turn. Research suggests that this understanding of angle is not common in students in early Key Stage 3. Rather, an angle is often viewed only as a static measure of the relationship between two lines, i.e. a measure of ‘pointedness’ (Mitchelmore & White, 2000). Rotating several key points or elements of an object to obtain the image may help to establish a better understanding. Examples are given below.
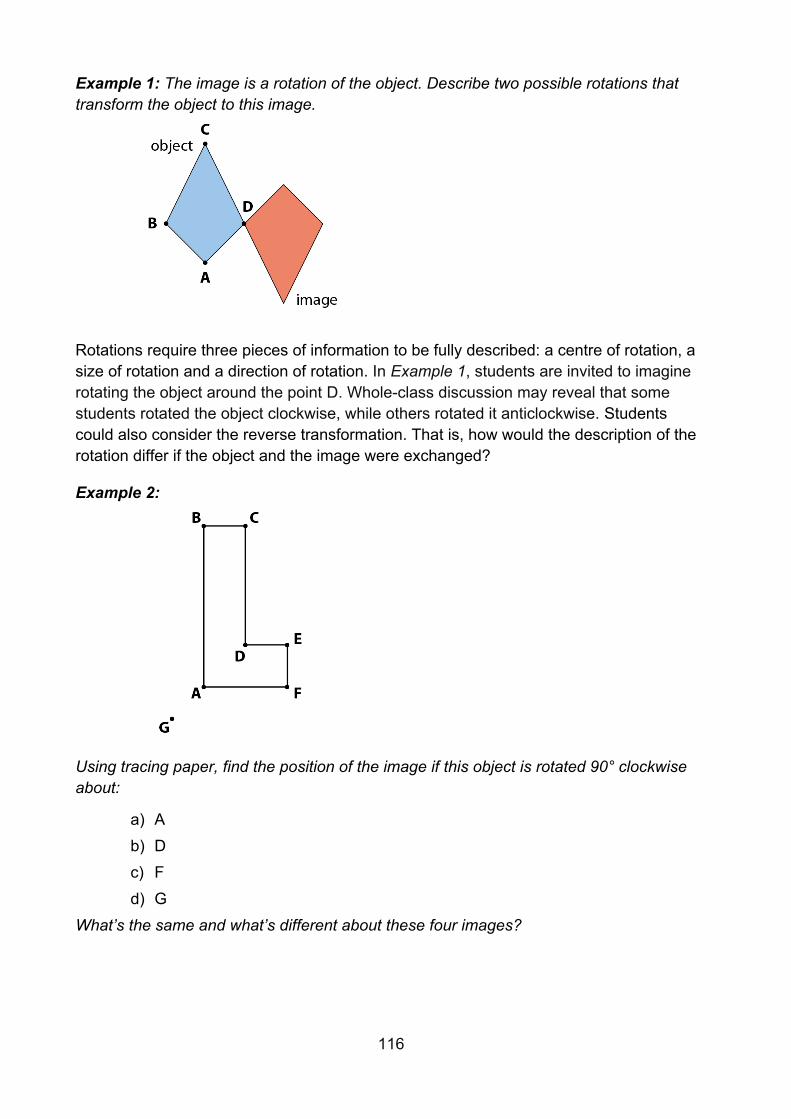
116
Example 1: The image is a rotation of the object. Describe two possible rotations that transform the object to this image.
Rotations require three pieces of information to be fully described: a centre of rotation, a size of rotation and a direction of rotation. In Example 1, students are invited to imagine rotating the object around the point D. Whole-class discussion may reveal that some students rotated the object clockwise, while others rotated it anticlockwise. Students could also consider the reverse transformation. That is, how would the description of the rotation differ if the object and the image were exchanged?
Example 2:
Using tracing paper, find the position of the image if this object is rotated 90° clockwise about:
a) A b) D c) F d) G
What’s the same and what’s different about these four images?
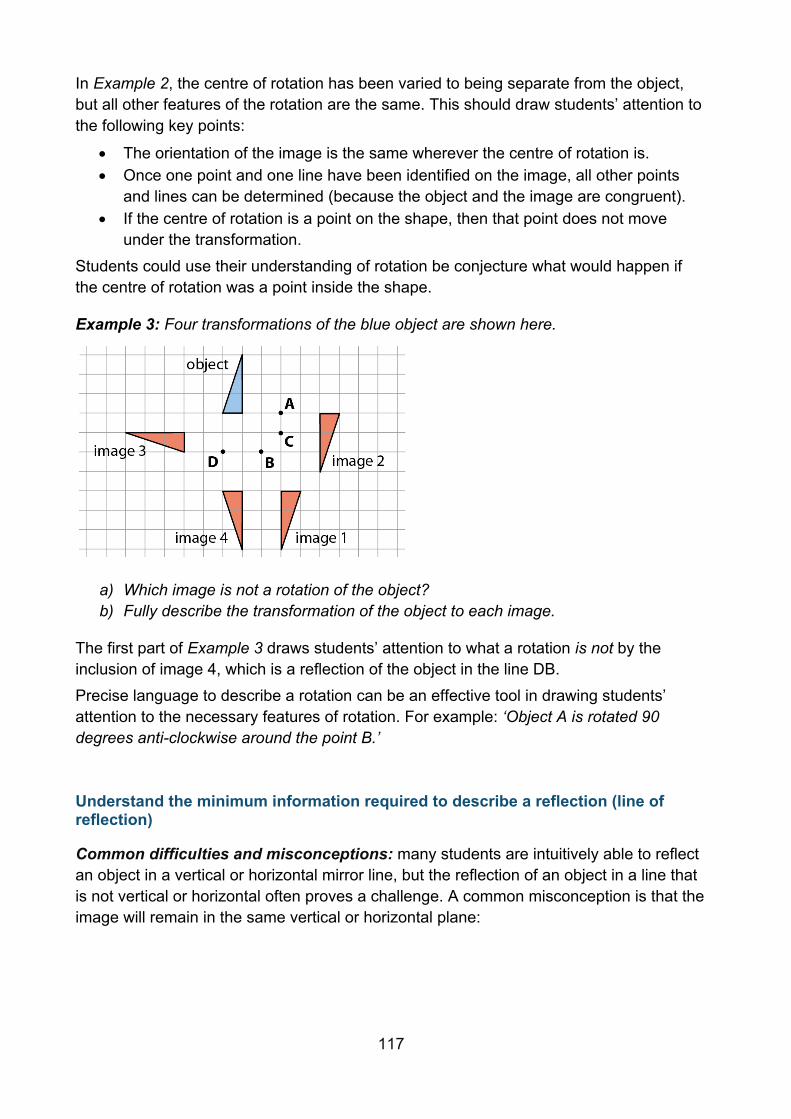
117
In Example 2, the centre of rotation has been varied to being separate from the object, but all other features of the rotation are the same. This should draw students’ attention to the following key points:
• The orientation of the image is the same wherever the centre of rotation is. • Once one point and one line have been identified on the image, all other points
and lines can be determined (because the object and the image are congruent). • If the centre of rotation is a point on the shape, then that point does not move
under the transformation. Students could use their understanding of rotation be conjecture what would happen if the centre of rotation was a point inside the shape.
Example 3: Four transformations of the blue object are shown here.
a) Which image is not a rotation of the object? b) Fully describe the transformation of the object to each image.
The first part of Example 3 draws students’ attention to what a rotation is not by the inclusion of image 4, which is a reflection of the object in the line DB. Precise language to describe a rotation can be an effective tool in drawing students’ attention to the necessary features of rotation. For example: ‘Object A is rotated 90 degrees anti-clockwise around the point B.’
Understand the minimum information required to describe a reflection (line of reflection)
Common difficulties and misconceptions: many students are intuitively able to reflect an object in a vertical or horizontal mirror line, but the reflection of an object in a line that is not vertical or horizontal often proves a challenge. A common misconception is that the image will remain in the same vertical or horizontal plane:
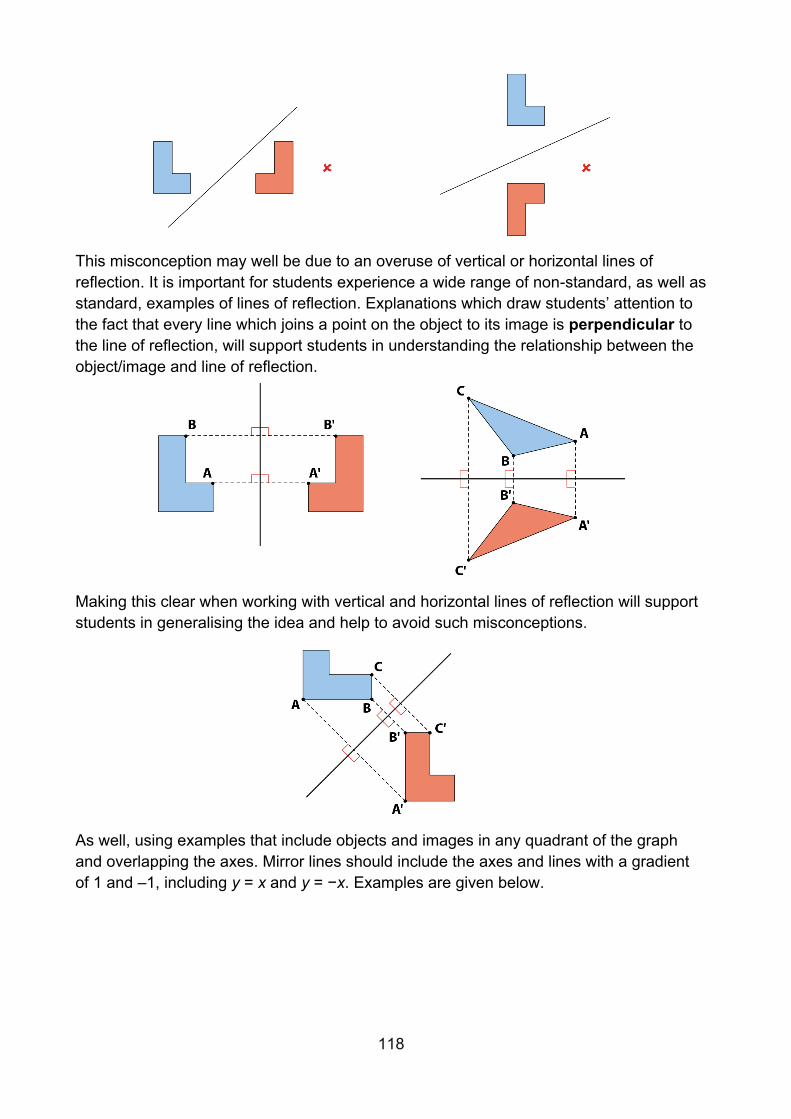
118
This misconception may well be due to an overuse of vertical or horizontal lines of reflection. It is important for students experience a wide range of non-standard, as well as standard, examples of lines of reflection. Explanations which draw students’ attention to the fact that every line which joins a point on the object to its image is perpendicular to the line of reflection, will support students in understanding the relationship between the object/image and line of reflection.
Making this clear when working with vertical and horizontal lines of reflection will support students in generalising the idea and help to avoid such misconceptions.
As well, using examples that include objects and images in any quadrant of the graph and overlapping the axes. Mirror lines should include the axes and lines with a gradient of 1 and –1, including y = x and y = −x. Examples are given below.
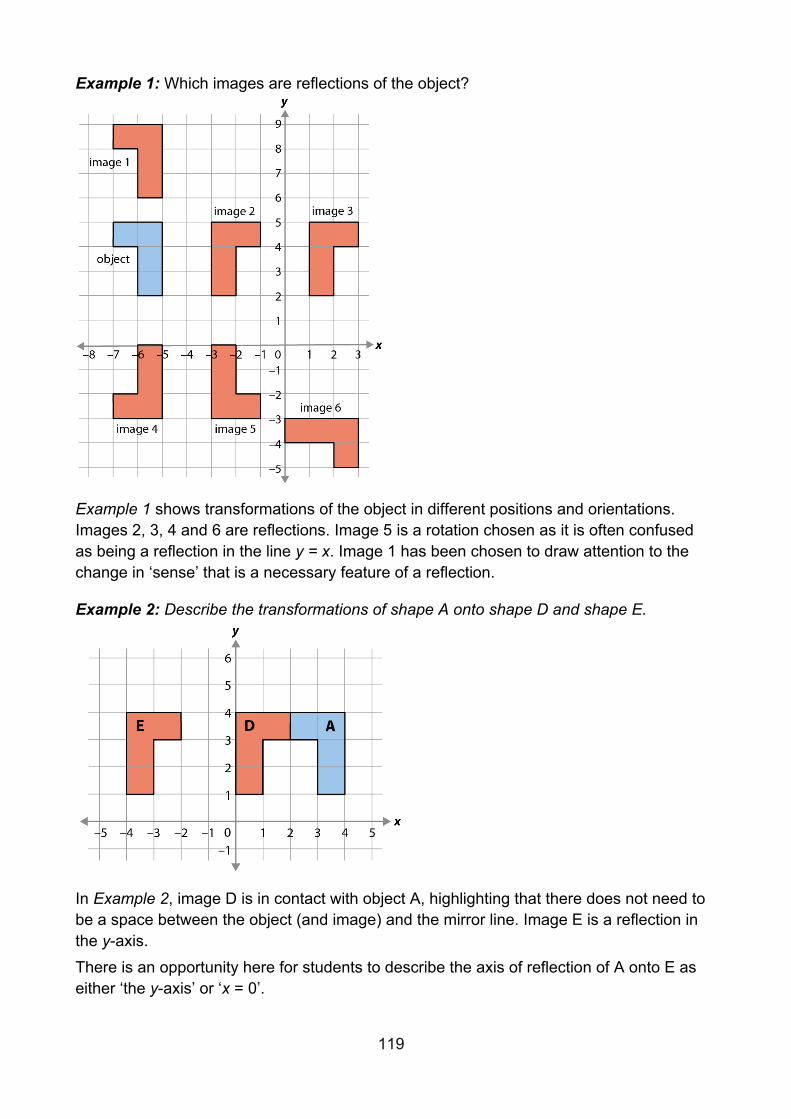
119
Example 1: Which images are reflections of the object?
Example 1 shows transformations of the object in different positions and orientations. Images 2, 3, 4 and 6 are reflections. Image 5 is a rotation chosen as it is often confused as being a reflection in the line y = x. Image 1 has been chosen to draw attention to the change in ‘sense’ that is a necessary feature of a reflection.
Example 2: Describe the transformations of shape A onto shape D and shape E.
In Example 2, image D is in contact with object A, highlighting that there does not need to be a space between the object (and image) and the mirror line. Image E is a reflection in the y-axis. There is an opportunity here for students to describe the axis of reflection of A onto E as either ‘the y-axis’ or ‘x = 0’.
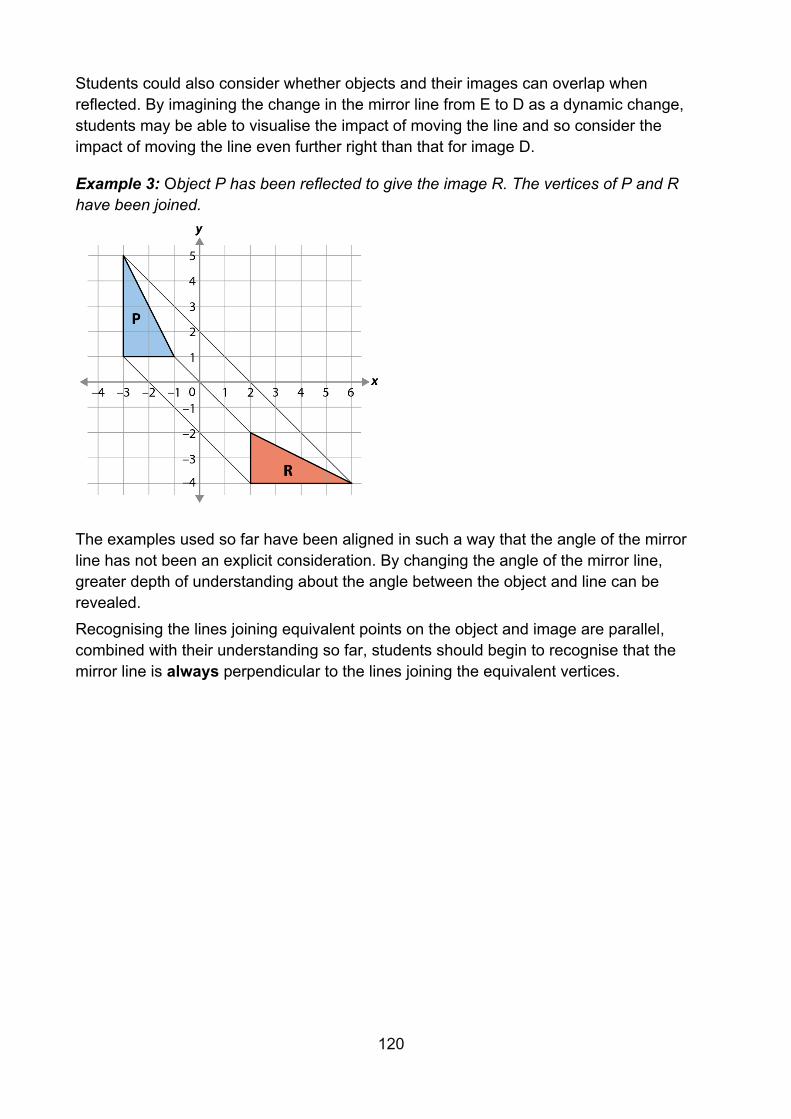
120
Students could also consider whether objects and their images can overlap when reflected. By imagining the change in the mirror line from E to D as a dynamic change, students may be able to visualise the impact of moving the line and so consider the impact of moving the line even further right than that for image D.
Example 3: Object P has been reflected to give the image R. The vertices of P and R have been joined.
The examples used so far have been aligned in such a way that the angle of the mirror line has not been an explicit consideration. By changing the angle of the mirror line, greater depth of understanding about the angle between the object and line can be revealed. Recognising the lines joining equivalent points on the object and image are parallel, combined with their understanding so far, students should begin to recognise that the mirror line is always perpendicular to the lines joining the equivalent vertices.
121
Year 8 autumn term
Estimation and rounding
Overview
The elements here build on the work done in Year 7 autumn term and now include studying estimation and rounding. While an understanding of our base-ten place-value system for integers and decimals should be well established at Key Stage 2, several important ideas emerge at Key Stage 3.
It is essential that students are aware of the general structure of the place-value system as being based on powers of ten and begin to see how this naturally extends to decimals. This learning will support students’ work on significant figures and standard form, as students who can express numbers (including very large and very small numbers) in these different ways are more likely to have a feel for the size of such numbers and where they fit in the number system.
It is also important to emphasise the use of measures in real-life contexts. This will support students in understanding that measuring is always to a certain degree of accuracy. This teaching will then support students’ understanding of and facility with estimating and rounding – essential skills for working with real-life situations involving contextualised data.
Prior learning
Before beginning estimation and rounding at Key Stage 3, students should already have a secure understanding of the following learning outcomes from study at upper Key Stage 2:
• Read, write, order and compare numbers up to 10 000 000 and determine the value of each digit.
• Round any whole number to a required degree of accuracy. • Identify the value of each digit in numbers given to three decimal places and
multiply and divide numbers by 10, 100 and 1 000 giving answers up to three decimal places.
The NCETM has created the following Key Stage 2 ready-to-progress criteria to support teachers in making judgements about students’ understanding and knowledge.
5NPV-3 Reason about the location of any number with up to 2 decimals places in the linear number system, including identifying the previous and next multiple of 1 and 0.1 and rounding to the nearest of each.
122
6NPV-2 Recognise the place value of each digit in numbers up to 10 million, including decimal fractions, and compose and decompose numbers up to 10 million using standard and nonstandard partitioning.
6NPV-3 Reason about the location of any number up to 10 million, including decimal fractions, in the linear number system, and round numbers, as appropriate, including in contexts.
Checking prior learning
The following activities from the NCETM primary assessment materials offer useful ideas for teachers to use to check whether prior learning is secure.
Reference Activity
Year 6 page 10
The population of Shanghai is 21 million, to the nearest million. Each person weighs on average 70 kg. Estimate the total weight of all the people in Shanghai. Do you think your answer is more or less than the actual answer you’d get if you weighed everyone in Shanghai accurately?
Year 6 page 10
Three pupils are asked to estimate the answer to the sum 4243 + 1734. Andrew says, ‘To the nearest 100, the answer will be 5 900.’ Bilal says, ‘To the nearest 50, the answer will be 6000.’ Cheng says, ‘To the nearest 10, the answer will be 5970.’ Do you agree with Andrew, Bilal or Cheng? Can you explain their reasoning?
Language
decimal, significant figures
Progression through key ideas
Round numbers to a required number of decimal places
Students need to understand why rounding is necessary and that it is a valuable tool for estimating number to varying degrees of accuracy. Rounding to a number of decimal places is particularly useful when working with measures in real-life contexts. An important awareness is that rounding to two decimal places (for example) involves choosing between two numbers; one that is just greater than it and one that is just less than it, both of which have two decimal places. Memorising and applying a procedure for rounding a number to a specified number of decimal places without this overall awareness often results in errors.
123
Key ideas
• Round numbers to three decimal places • Round numbers to any number of decimal places
Round numbers to a required number of significant figures
It is important for students to develop a strong sense of the size of numbers and be able to use various methods of rounding, especially when giving answers in context. Rounding large numbers is particularly useful when estimating (for example, crowds at a football match or winnings in a lottery).
Key ideas
• Understand the concept of significant figures • Round integers to a required number of significant figures* • Round decimals to a required number of significant figures
Estimate calculations by rounding
Estimation is a key skill that contributes to students’ fluency in calculation. Fluency demands that students have strategies for checking the validity of their answers. Students who are proficient in carrying out algorithms, but who have no idea whether the answer to a calculation is sensible or not, are not fully fluent.
Key ideas
• Understand what is meant by a sensible degree of accuracy • Estimate numerical calculations* • Estimate and check if solutions to problems are of the correct magnitude • Determine whether calculations using rounding will give an underestimate or
overestimate • Understand the impact of rounding errors when using a calculator, and the way
that these can be compounded to result in large inaccuracies • Calculate possible errors expressed using inequality notation a < x ≤ b
Exemplified significant key ideas
Round integers to a required number of significant figures
Common difficulties and misconceptions: students may see the task of rounding as an algorithm to follow without appreciating the idea that they are trying to find a number (with a specified number of significant figures) to which the chosen number is closer. For example, students may keep on rounding until they achieve a number to one
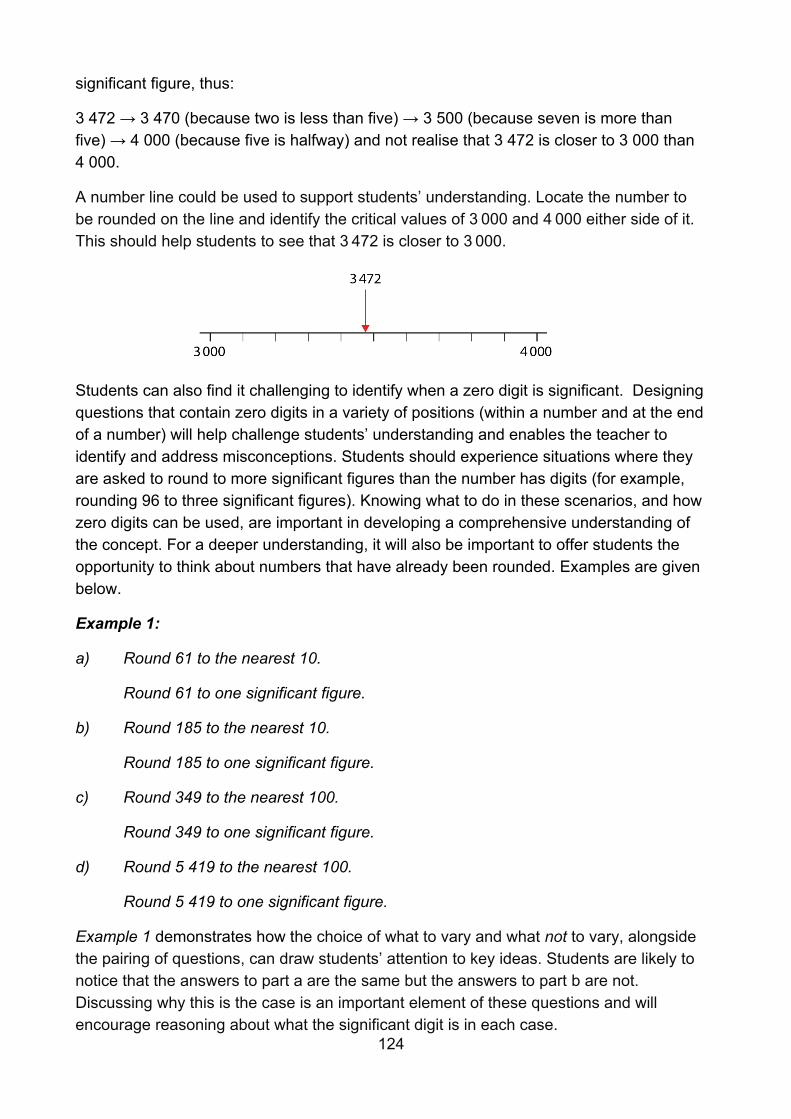
124
significant figure, thus:
3 472 → 3 470 (because two is less than five) → 3 500 (because seven is more than five) → 4 000 (because five is halfway) and not realise that 3 472 is closer to 3 000 than 4 000.
A number line could be used to support students’ understanding. Locate the number to be rounded on the line and identify the critical values of 3 000 and 4 000 either side of it. This should help students to see that 3 472 is closer to 3 000.
Students can also find it challenging to identify when a zero digit is significant. Designing questions that contain zero digits in a variety of positions (within a number and at the end of a number) will help challenge students’ understanding and enables the teacher to identify and address misconceptions. Students should experience situations where they are asked to round to more significant figures than the number has digits (for example, rounding 96 to three significant figures). Knowing what to do in these scenarios, and how zero digits can be used, are important in developing a comprehensive understanding of the concept. For a deeper understanding, it will also be important to offer students the opportunity to think about numbers that have already been rounded. Examples are given below.
Example 1:
a) Round 61 to the nearest 10.
Round 61 to one significant figure.
b) Round 185 to the nearest 10.
Round 185 to one significant figure.
c) Round 349 to the nearest 100.
Round 349 to one significant figure.
d) Round 5 419 to the nearest 100.
Round 5 419 to one significant figure.
Example 1 demonstrates how the choice of what to vary and what not to vary, alongside the pairing of questions, can draw students’ attention to key ideas. Students are likely to notice that the answers to part a are the same but the answers to part b are not. Discussing why this is the case is an important element of these questions and will encourage reasoning about what the significant digit is in each case.
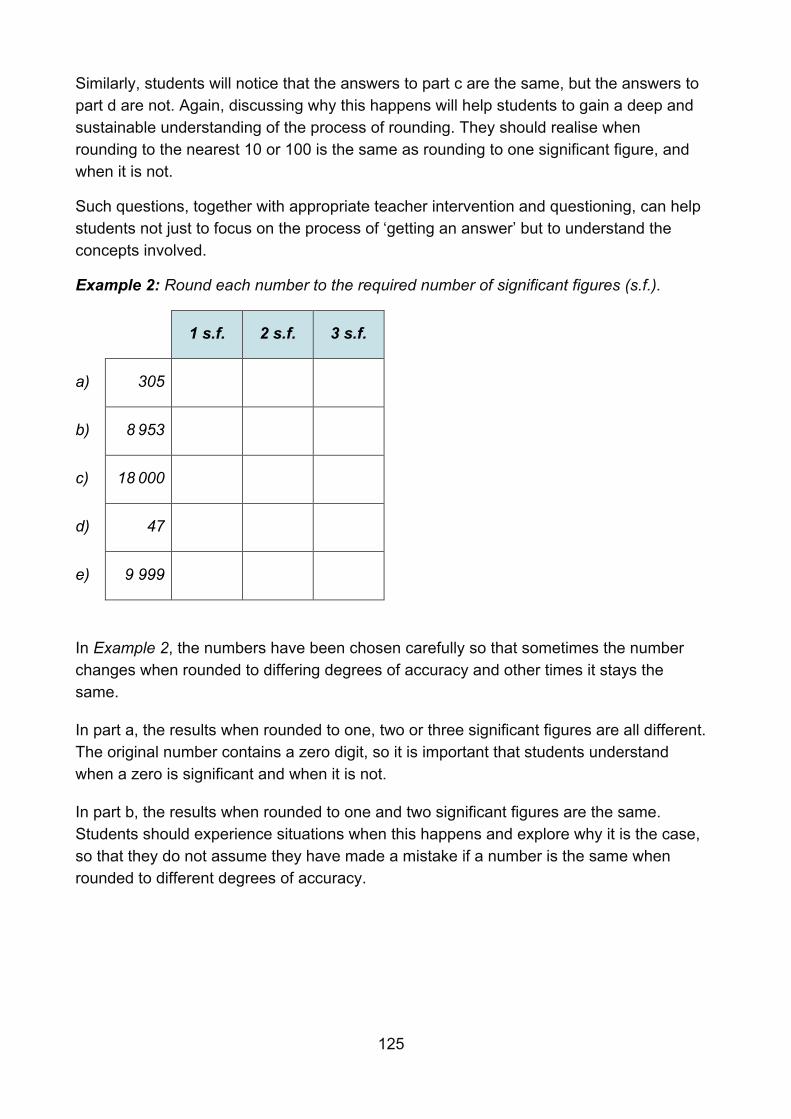
125
Similarly, students will notice that the answers to part c are the same, but the answers to part d are not. Again, discussing why this happens will help students to gain a deep and sustainable understanding of the process of rounding. They should realise when rounding to the nearest 10 or 100 is the same as rounding to one significant figure, and when it is not.
Such questions, together with appropriate teacher intervention and questioning, can help students not just to focus on the process of ‘getting an answer’ but to understand the concepts involved.
Example 2: Round each number to the required number of significant figures (s.f.).
1 s.f. 2 s.f. 3 s.f.
a) 305
b) 8 953
c) 18 000
d) 47
e) 9 999
In Example 2, the numbers have been chosen carefully so that sometimes the number changes when rounded to differing degrees of accuracy and other times it stays the same.
In part a, the results when rounded to one, two or three significant figures are all different. The original number contains a zero digit, so it is important that students understand when a zero is significant and when it is not.
In part b, the results when rounded to one and two significant figures are the same. Students should experience situations when this happens and explore why it is the case, so that they do not assume they have made a mistake if a number is the same when rounded to different degrees of accuracy.
126
Example 3: A number has been rounded to a number of significant figures, with the result of 76 500.
a) Kayla says that it has been rounded to three significant figures. Lakshmi says that it has been rounded to four significant figures.
Who is correct? Why?
b) What might the original number have been before rounding?
Example 3 offers an opportunity for students to experience the reverse procedure to rounding, finding the original number given the rounded number. Students will have previously encountered numbers containing zero digits when being required to round to various numbers of significant figures (as in Example 2). Example 3 allows students to consolidate and deepen this understanding. Students should be given the opportunity to reason fully regarding the zero digits in the answer and which of these may be significant.
Providing an example, such as Example 3, where either statement could be correct, will challenge students’ understanding.
Estimate numerical calculations
Common difficulties and misconceptions: it is important that students acquire a secure conceptual understanding of estimation, what it is and why it is useful, alongside developing procedural fluency. If the focus is purely on the need for rounding, then some students may find it hard to recall at which stage the rounding should take place. This can result in the misconception that estimation involves rounding the final result of a calculation, rather than rounding the numbers involved prior to calculating.
Estimation builds upon prior learning of rounding (usually to one significant figure), so it is imperative that students have a deep and secure understanding of that before approaching this key idea. Some students find rounding decimals (for example, 0.541) problematic and so it is worthwhile addressing this explicitly (as in Example 1). Students can find it especially challenging if the calculation requires a division by a decimal less than one, so it is worth assessing prior understanding of this skill before introducing questions such as those in Example 2.
In Key Stage 3, students should be confident rounding to varying degrees of accuracy. This will prepare them well for Key Stage 4, when there will be more of an emphasis on making a choice of the degree of accuracy depending on the context.
Students might find it easier to make sense of the concepts involved when they are given problems set in familiar contexts (as in Example 3). Questions designed by the teacher to suit the interests of students allow them to see clearly the usefulness of estimation and make connections to other areas of mathematics. It will also lay the foundations for future learning about how estimation can be used to check the relative size of answers and will
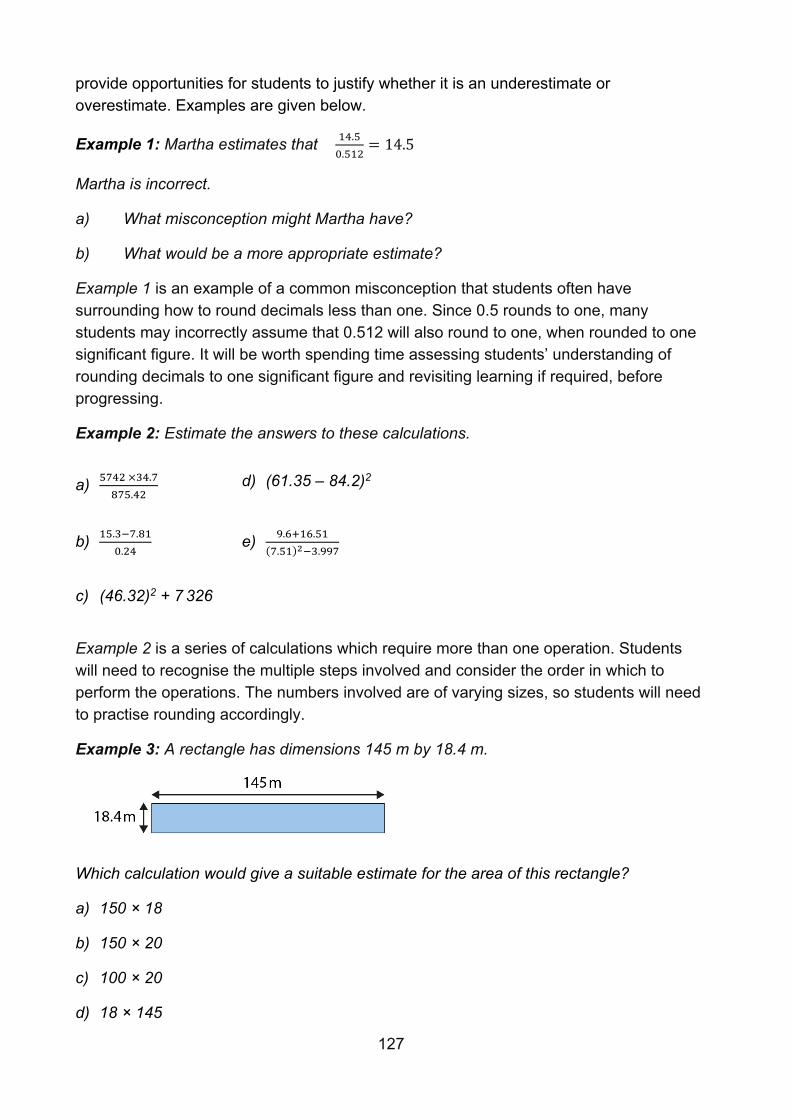
127
provide opportunities for students to justify whether it is an underestimate or overestimate. Examples are given below.
Example 1: Martha estimates that 14.5
0.512= 14.5
Martha is incorrect.
a) What misconception might Martha have?
b) What would be a more appropriate estimate?
Example 1 is an example of a common misconception that students often have surrounding how to round decimals less than one. Since 0.5 rounds to one, many students may incorrectly assume that 0.512 will also round to one, when rounded to one significant figure. It will be worth spending time assessing students’ understanding of rounding decimals to one significant figure and revisiting learning if required, before progressing.
Example 2: Estimate the answers to these calculations.
a) 5742 ×34.7
875.42 d) (61.35 – 84.2)2
b) 15.3−7.81
0.24 e) 9.6+16.51
(7.51)2−3.997
c) (46.32)2 + 7 326
Example 2 is a series of calculations which require more than one operation. Students will need to recognise the multiple steps involved and consider the order in which to perform the operations. The numbers involved are of varying sizes, so students will need to practise rounding accordingly.
Example 3: A rectangle has dimensions 145 m by 18.4 m.
Which calculation would give a suitable estimate for the area of this rectangle?
a) 150 × 18
b) 150 × 20
c) 100 × 20
d) 18 × 145

128
In Example 3, the estimation is for finding the area of a rectangle, a context that students should already be familiar with from Key Stage 2. Students must select an appropriate calculation, with options designed to identify common misconceptions.
In part a, students may have rounded to two significant figures. In part b, they have rounded to the nearest 10. Numbers in part c have been rounded to one significant figure. In part d, they have been rounded to the nearest integer.
It could be argued that all the options are suitable estimations for this question, and so students will need to understand that the nature of estimation means that there is often more than one correct answer.
129
Sequences
Overview
Students began to consider sequences in Key Stage 1, when step counting to learn times tables and when looking at the composition of numbers. In Key Stage 2, they were introduced to the use of symbols and letters to represent variables and unknowns in familiar mathematical situations and began to generalise number patterns.
Students will have explored non-numerical (shape) and numerical sequences, noticed a pattern, described the pattern in words and found the next term in the sequence from the previous term. They will primarily have focused on generating and describing linear number sequences, though they may have also experienced naturally occurring patterns in mathematics, such as square numbers.
The extent to which students have explored these concepts in depth may vary. Therefore, students should consolidate, secure and deepen their understanding of linear sequences and how to find and use term-to-term rules to generate the next term. Then, they can progress to describing any term in the sequence directly in relation to its position in the sequence.
This work extends students’ knowledge of sequences through exploration of the mathematical structure, not just by spotting the patterns that the structure creates. Algebraic notation is used to express the structure, and students should become familiar with finding and using the nth term of a linear sequence. It is important that students have time to develop a full understanding of the connection between the notation and the sequence and come to see the nth term as a way of expressing the structure of every term in the sequence.
This learning has connections to other areas of algebra, particularly solving equations (when checking if a number is a term in a sequence) and straight-line graphs. Work on sequences both here and later in Key Stage 3 provides the foundation for exploring quadratic sequences and simple geometric progressions in Key Stage 4.
Prior learning
Before beginning sequences at Key Stage 3, students should already have a secure understanding of the following learning outcomes from study at upper Key Stage 2:
• Generate and describe linear number sequences • Use simple formulae
and earlier in Key Stage 3:
• Understand multiples
130
• Understand integer exponents and roots • Understand and use the conventions and vocabulary of algebra, including forming
and interpreting algebraic expressions and equations
Checking prior learning
The following activities from the NCETM primary assessment materials offer useful ideas for teachers to use to check whether prior learning is secure.
Reference Activity
Year 6 page 27
Ramesh is exploring two sequence-generating rules.
Rule A is: ‘Start at 2, and then add on 5, and another 5, and another 5, and so on.’
Rule B is: ‘Write out the numbers that are in the five times table, and then subtract 2 from each number.’
What’s the same and what’s different about the sequences generated by these two rules?
Year 6 page 27
On New Year’s Eve, Polly has £3.50 in her money box. On 1 January she puts 30p into her money box. On 2 January she puts another 30p into her money box. She continues putting in 30p every day.
How much money is in the box on 10 January?
How much money is in the box on 10 February?
Write a sequence-generating rule for working out the amount of money in the money box on any day in January.
Language
arithmetic sequence, nth term of a sequence, sequence, term
Progression through key ideas
Understand the features of a sequence
Students should be familiar with finding and using difference patterns in linear sequences to generate the terms of a sequence. This collection of key ideas provides an opportunity
131
to secure and deepen understanding by applying this prior learning to other linear and non-linear sequences, including those containing negative and fractional terms.
Key ideas
• Appreciate that a sequence is a succession of terms formed according to a rule* • Understand that a sequence can be generated and described using term-to-term
approaches • Understand that a sequence can be generated and described by a position-to-
term rule
Recognise and describe arithmetic sequences
Students should realise that generating many terms in a sequence using the term-to-term rule is not an efficient method. By exploring the mathematical structure of a linear sequence, students can instead describe linear sequences using the nth term. Students should then experience a range of ascending and descending sequences, and those containing terms that are decimals and fractions, in order to develop a deep and secure understanding of the nth term and how to use it.
The nth term is new learning to Key Stage 3. It is crucial that students are given time to become fluent at describing linear sequences using the nth term rule, as well as reason with and apply it in order to solve mathematical problems, such as finding the 50th and 100th terms of a linear sequence.
Key ideas
• Understand the features of an arithmetic sequence and be able to recognise one • Understand that any term in an arithmetic sequence can be expressed in terms of
its position in the sequence (nth term)* • Understand that the nth term allows for the calculation of any term • Determine whether a number is a term of a given arithmetic sequence
Exemplified significant key ideas
Appreciate that a sequence is a succession of terms formed according to a rule
Common difficulties and misconceptions: students may have an intuitive sense that the terms in a sequence progress logically according to a rule but may find it difficult to express clearly what that rule is.
They should, through discussion and sharing ideas, be able to clearly articulate a rule and should be encouraged to use mathematical language to describe sequences wherever possible. For example, when describing the sequence 3, 5, 7, 9, 11, … students may often say, ‘It goes up in 2s’. Through discussion, this response can be refined so that students are more explicit regarding the starting number and the amount added each time. For example, ‘The sequence begins with three, and two is added each
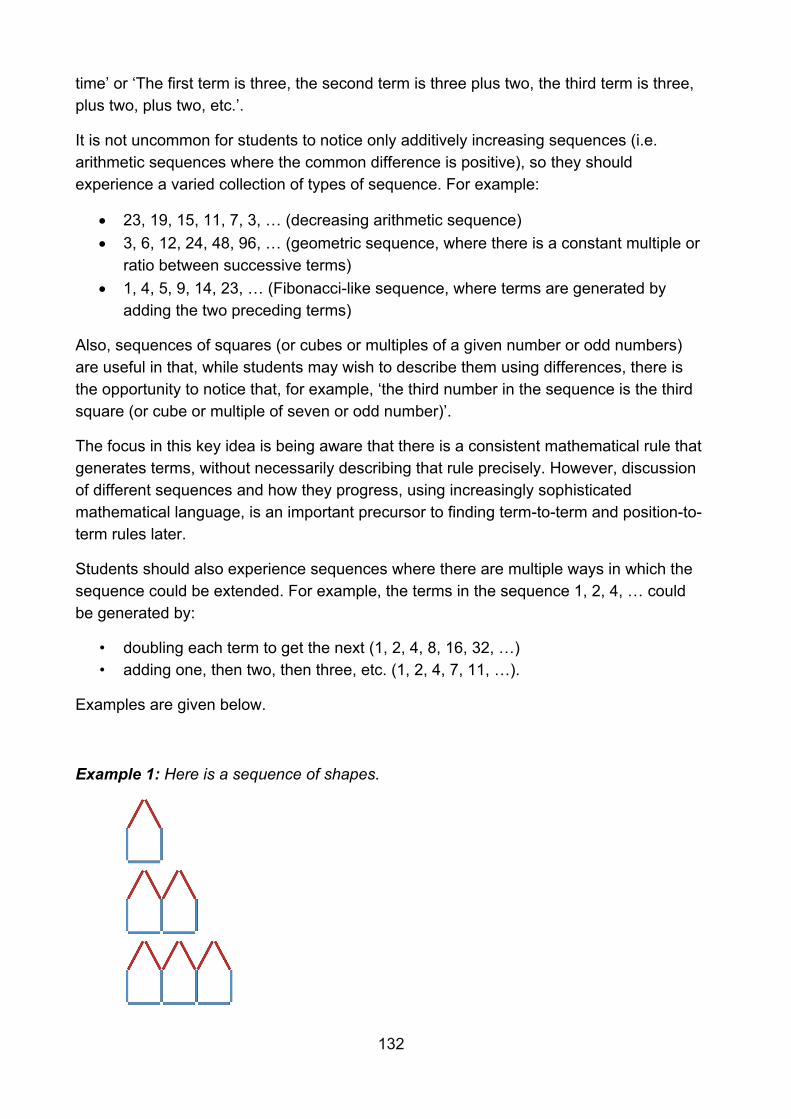
132
time’ or ‘The first term is three, the second term is three plus two, the third term is three, plus two, plus two, etc.’.
It is not uncommon for students to notice only additively increasing sequences (i.e. arithmetic sequences where the common difference is positive), so they should experience a varied collection of types of sequence. For example:
• 23, 19, 15, 11, 7, 3, … (decreasing arithmetic sequence) • 3, 6, 12, 24, 48, 96, … (geometric sequence, where there is a constant multiple or
ratio between successive terms) • 1, 4, 5, 9, 14, 23, … (Fibonacci-like sequence, where terms are generated by
adding the two preceding terms)
Also, sequences of squares (or cubes or multiples of a given number or odd numbers) are useful in that, while students may wish to describe them using differences, there is the opportunity to notice that, for example, ‘the third number in the sequence is the third square (or cube or multiple of seven or odd number)’.
The focus in this key idea is being aware that there is a consistent mathematical rule that generates terms, without necessarily describing that rule precisely. However, discussion of different sequences and how they progress, using increasingly sophisticated mathematical language, is an important precursor to finding term-to-term and position-to-term rules later.
Students should also experience sequences where there are multiple ways in which the sequence could be extended. For example, the terms in the sequence 1, 2, 4, … could be generated by:
• doubling each term to get the next (1, 2, 4, 8, 16, 32, …) • adding one, then two, then three, etc. (1, 2, 4, 7, 11, …).
Examples are given below.
Example 1: Here is a sequence of shapes.
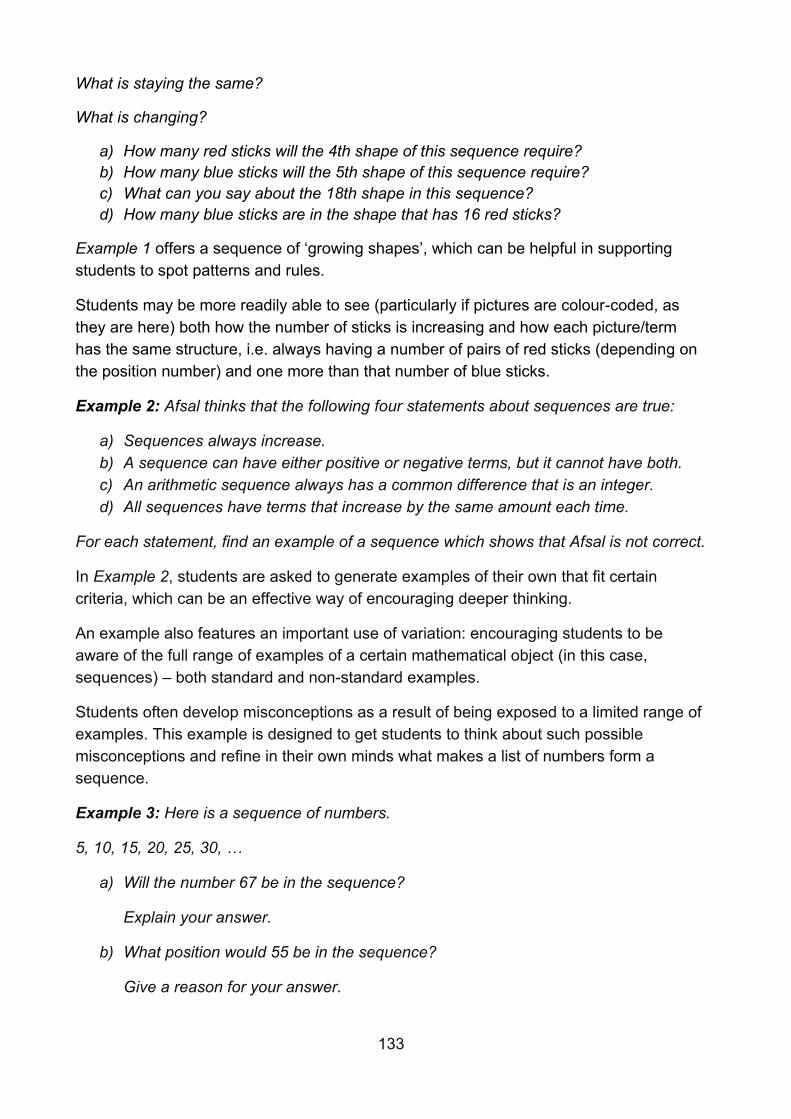
133
What is staying the same?
What is changing?
a) How many red sticks will the 4th shape of this sequence require? b) How many blue sticks will the 5th shape of this sequence require? c) What can you say about the 18th shape in this sequence? d) How many blue sticks are in the shape that has 16 red sticks?
Example 1 offers a sequence of ‘growing shapes’, which can be helpful in supporting students to spot patterns and rules.
Students may be more readily able to see (particularly if pictures are colour-coded, as they are here) both how the number of sticks is increasing and how each picture/term has the same structure, i.e. always having a number of pairs of red sticks (depending on the position number) and one more than that number of blue sticks.
Example 2: Afsal thinks that the following four statements about sequences are true:
a) Sequences always increase. b) A sequence can have either positive or negative terms, but it cannot have both. c) An arithmetic sequence always has a common difference that is an integer. d) All sequences have terms that increase by the same amount each time.
For each statement, find an example of a sequence which shows that Afsal is not correct.
In Example 2, students are asked to generate examples of their own that fit certain criteria, which can be an effective way of encouraging deeper thinking.
An example also features an important use of variation: encouraging students to be aware of the full range of examples of a certain mathematical object (in this case, sequences) – both standard and non-standard examples.
Students often develop misconceptions as a result of being exposed to a limited range of examples. This example is designed to get students to think about such possible misconceptions and refine in their own minds what makes a list of numbers form a sequence.
Example 3: Here is a sequence of numbers.
5, 10, 15, 20, 25, 30, …
a) Will the number 67 be in the sequence?
Explain your answer.
b) What position would 55 be in the sequence?
Give a reason for your answer.
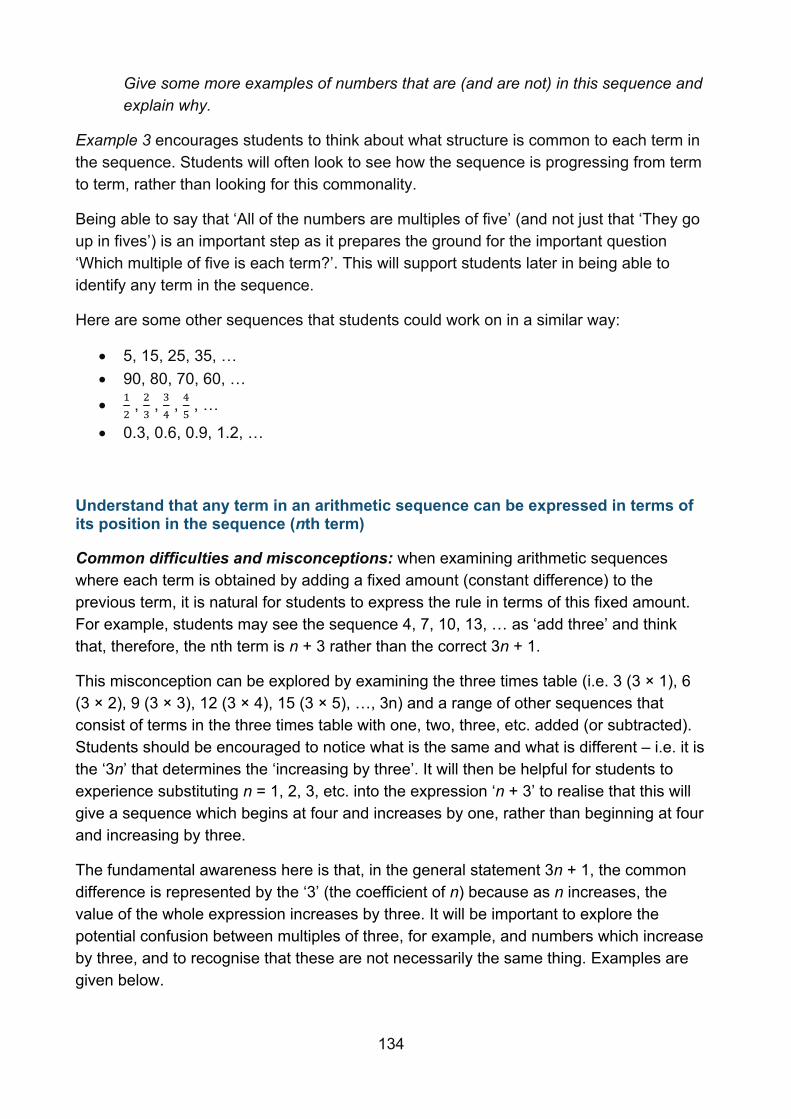
134
Give some more examples of numbers that are (and are not) in this sequence and explain why.
Example 3 encourages students to think about what structure is common to each term in the sequence. Students will often look to see how the sequence is progressing from term to term, rather than looking for this commonality.
Being able to say that ‘All of the numbers are multiples of five’ (and not just that ‘They go up in fives’) is an important step as it prepares the ground for the important question ‘Which multiple of five is each term?’. This will support students later in being able to identify any term in the sequence.
Here are some other sequences that students could work on in a similar way:
• 5, 15, 25, 35, … • 90, 80, 70, 60, … • 1
2 , 2
3 , 3
4 , 4
5 , …
• 0.3, 0.6, 0.9, 1.2, …
Understand that any term in an arithmetic sequence can be expressed in terms of its position in the sequence (nth term)
Common difficulties and misconceptions: when examining arithmetic sequences where each term is obtained by adding a fixed amount (constant difference) to the previous term, it is natural for students to express the rule in terms of this fixed amount. For example, students may see the sequence 4, 7, 10, 13, … as ‘add three’ and think that, therefore, the nth term is n + 3 rather than the correct 3n + 1.
This misconception can be explored by examining the three times table (i.e. 3 (3 × 1), 6 (3 × 2), 9 (3 × 3), 12 (3 × 4), 15 (3 × 5), …, 3n) and a range of other sequences that consist of terms in the three times table with one, two, three, etc. added (or subtracted). Students should be encouraged to notice what is the same and what is different – i.e. it is the ‘3n’ that determines the ‘increasing by three’. It will then be helpful for students to experience substituting n = 1, 2, 3, etc. into the expression ‘n + 3’ to realise that this will give a sequence which begins at four and increases by one, rather than beginning at four and increasing by three.
The fundamental awareness here is that, in the general statement 3n + 1, the common difference is represented by the ‘3’ (the coefficient of n) because as n increases, the value of the whole expression increases by three. It will be important to explore the potential confusion between multiples of three, for example, and numbers which increase by three, and to recognise that these are not necessarily the same thing. Examples are given below.
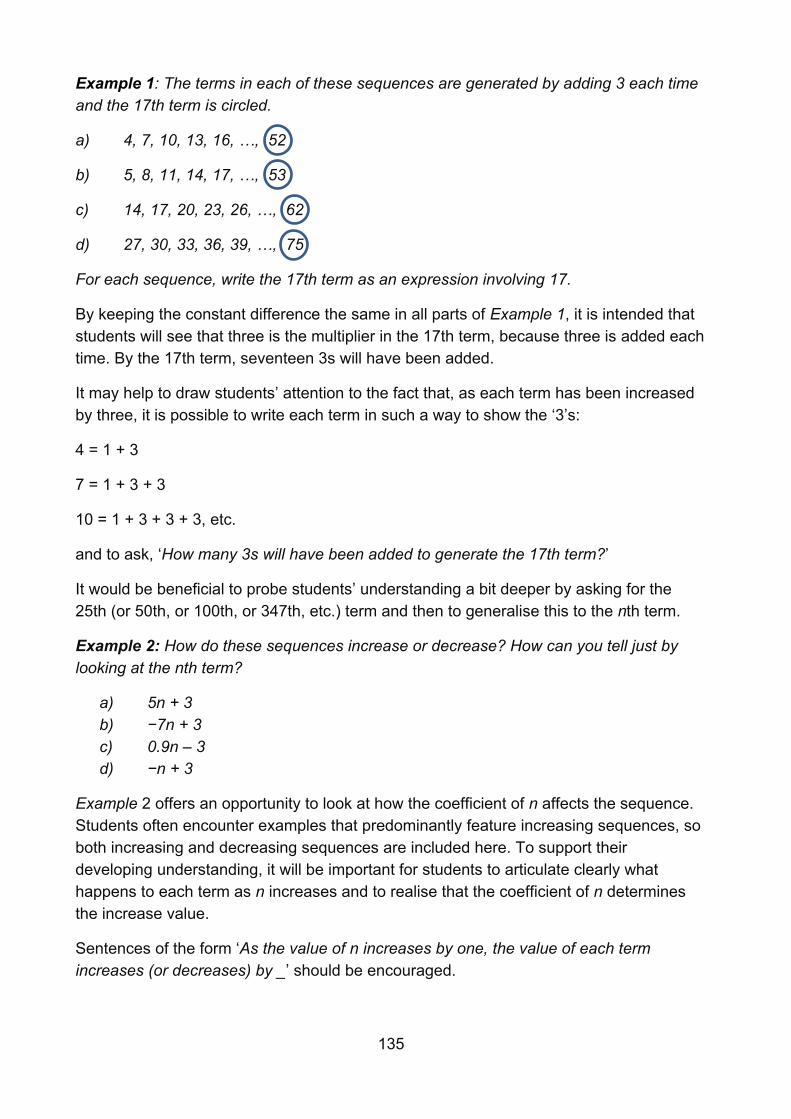
135
Example 1: The terms in each of these sequences are generated by adding 3 each time and the 17th term is circled.
a) 4, 7, 10, 13, 16, …, 52
b) 5, 8, 11, 14, 17, …, 53
c) 14, 17, 20, 23, 26, …, 62
d) 27, 30, 33, 36, 39, …, 75
For each sequence, write the 17th term as an expression involving 17.
By keeping the constant difference the same in all parts of Example 1, it is intended that students will see that three is the multiplier in the 17th term, because three is added each time. By the 17th term, seventeen 3s will have been added.
It may help to draw students’ attention to the fact that, as each term has been increased by three, it is possible to write each term in such a way to show the ‘3’s:
4 = 1 + 3
7 = 1 + 3 + 3
10 = 1 + 3 + 3 + 3, etc.
and to ask, ‘How many 3s will have been added to generate the 17th term?’
It would be beneficial to probe students’ understanding a bit deeper by asking for the 25th (or 50th, or 100th, or 347th, etc.) term and then to generalise this to the nth term.
Example 2: How do these sequences increase or decrease? How can you tell just by looking at the nth term?
a) 5n + 3 b) −7n + 3 c) 0.9n – 3 d) −n + 3
Example 2 offers an opportunity to look at how the coefficient of n affects the sequence. Students often encounter examples that predominantly feature increasing sequences, so both increasing and decreasing sequences are included here. To support their developing understanding, it will be important for students to articulate clearly what happens to each term as n increases and to realise that the coefficient of n determines the increase value.
Sentences of the form ‘As the value of n increases by one, the value of each term increases (or decreases) by _’ should be encouraged.
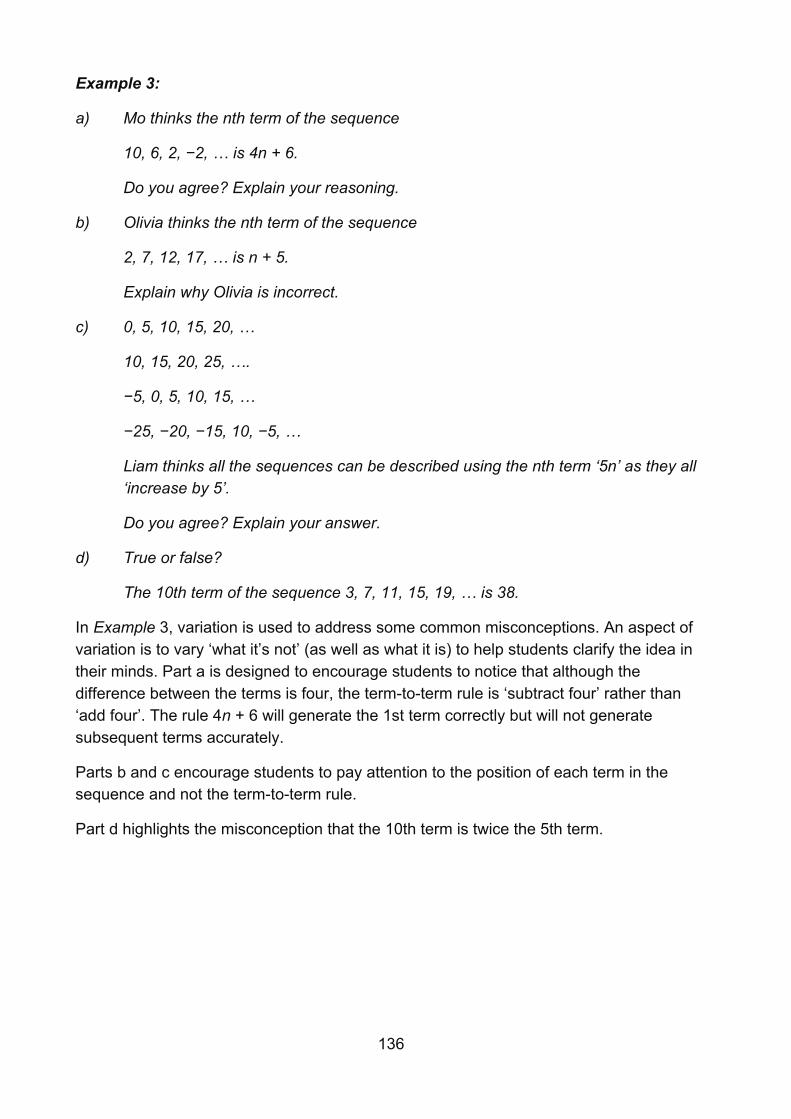
136
Example 3:
a) Mo thinks the nth term of the sequence
10, 6, 2, −2, … is 4n + 6.
Do you agree? Explain your reasoning.
b) Olivia thinks the nth term of the sequence
2, 7, 12, 17, … is n + 5.
Explain why Olivia is incorrect.
c) 0, 5, 10, 15, 20, …
10, 15, 20, 25, ….
−5, 0, 5, 10, 15, …
−25, −20, −15, 10, −5, …
Liam thinks all the sequences can be described using the nth term ‘5n’ as they all ‘increase by 5’.
Do you agree? Explain your answer.
d) True or false?
The 10th term of the sequence 3, 7, 11, 15, 19, … is 38.
In Example 3, variation is used to address some common misconceptions. An aspect of variation is to vary ‘what it’s not’ (as well as what it is) to help students clarify the idea in their minds. Part a is designed to encourage students to notice that although the difference between the terms is four, the term-to-term rule is ‘subtract four’ rather than ‘add four’. The rule 4n + 6 will generate the 1st term correctly but will not generate subsequent terms accurately.
Parts b and c encourage students to pay attention to the position of each term in the sequence and not the term-to-term rule.
Part d highlights the misconception that the 10th term is twice the 5th term.
137
Graphical representations of linear relationships
Overview
In Key Stage 2, students should have become familiar with coordinates in all four quadrants. These skills were developed further earlier in Key Stage 3 when a key focus was thinking about x- and y-coordinates as the input and output respectively of a function or rule and appreciating that the set of coordinates generated and the line joining them can be thought of as a graphical representation of that function.
Significant attention is now given in this work to exploring linear relationships and their representation as straight line graphs. Students should appreciate that all linear relationships have certain key characteristics:
• a specific pair of values or points on the graph; for example, where x = 0 (the intercept)
• a rate of change of one variable in relation to the other variable; for example, how the y-value increases (or decreases) as the x-value increases (the gradient).
Students should be able to recognise these features, both in the written algebraic form of the relationship and in its graphical representation.
Similarities can be drawn with students’ work on arithmetic sequences,where each sequence can be characterised by an initial term and a common difference. When working with linear relationships, it is important that students are aware that, while discrete points can be marked on a set of axes to represent an arithmetic sequence, when a function or equation is represented by a set of points, a continuous line (stretching to infinity in both directions) can be drawn to represent it, and the x- and y-coordinates of every point on the line will satisfy the function.
The Key Stage 3 programme of study states that students should be taught to ‘move freely between different numerical, algebraic, graphical and diagrammatic representations’ and to ‘express relationships between variables algebraically and graphically’. In order to develop a deep understanding and achieve fluency, students should explore the connections between equations of lines and their corresponding graphs, including those presented in a non-standard form, such as ax + by = c, as well as the more standard y = mx + c.
After thoroughly exploring the structure of linear relationships in this way, later in Key Stage 3 students should have experience of other functions and relationships (particularly quadratic ones), be able to use graphs to solve problems in real-life contexts and understand how linear graphs can be used to find solutions to simultaneous equations.
138
Much of this learning is new and is built upon significantly in Key Stage 4. It is therefore essential that students are given time to develop a secure and deep understanding of these ideas, concepts and techniques.
Prior learning
Before beginning graphical representations of linear relationships at Key Stage 3, students should already have a secure understanding of the following learning outcomes from study at upper Key Stage 2:
• Describe positions on the full coordinate grid (all four quadrants) • Find pairs of numbers that satisfy an equation with two unknowns • Enumerate possibilities of combinations of two variables
and earlier in Key Stage 3:
• Understand and use the conventions and vocabulary of algebra, including forming and interpreting algebraic expressions and equations
Checking prior learning
The following activity from the NCETM primary assessment materials offers useful ideas for teachers to use to check whether prior learning is secure.
Reference Activity
Year 6 page 38
Three mobile phone companies each have different monthly pay-as-you-go contracts.
Phil’s Phones: £5 fee every month and 2p for each Mb of data you use.
Manish’s Mobiles: £7 fee every month and 1p for each Mb of data you use.
Harry’s Handsets: £7 fee every month and 200Mb of free data, then 3p for each Mb of data after that.
Amir, Selma and Fred have mobile phones and they have recorded for one month how much data they have used (in Mb) and how much they have paid (in £). They have represented their data on this graph.
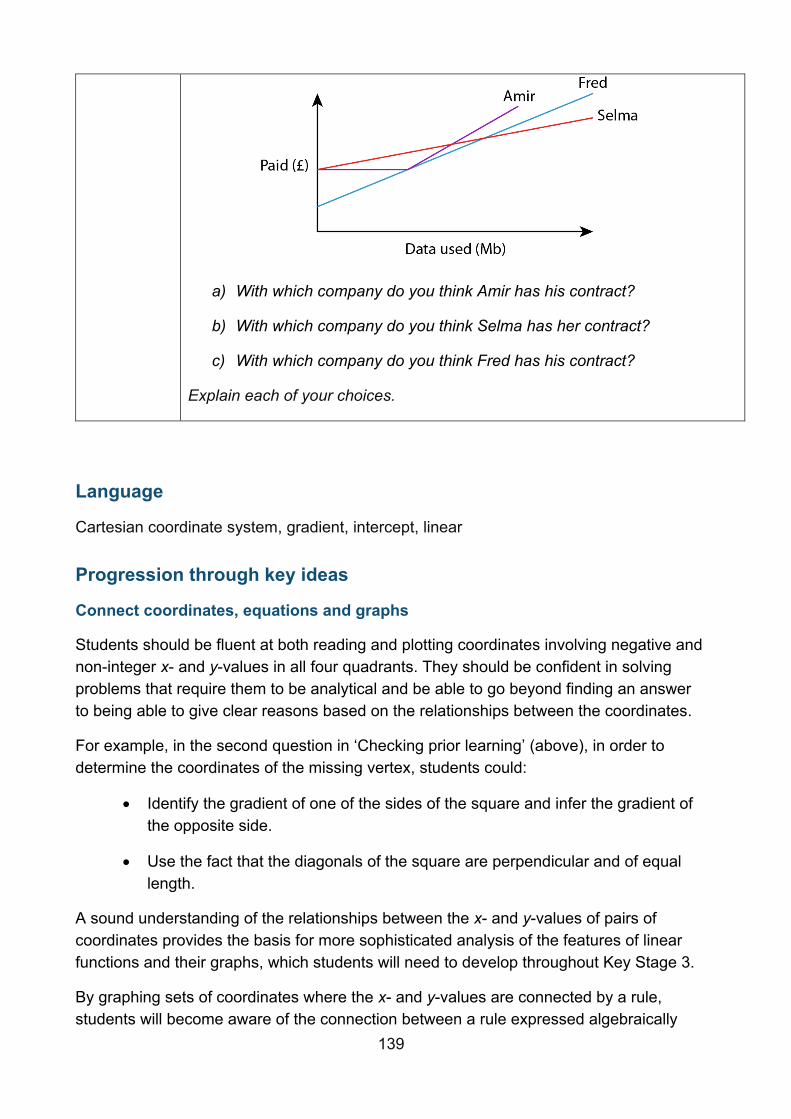
139
a) With which company do you think Amir has his contract?
b) With which company do you think Selma has her contract?
c) With which company do you think Fred has his contract?
Explain each of your choices.
Language
Cartesian coordinate system, gradient, intercept, linear
Progression through key ideas
Connect coordinates, equations and graphs
Students should be fluent at both reading and plotting coordinates involving negative and non-integer x- and y-values in all four quadrants. They should be confident in solving problems that require them to be analytical and be able to go beyond finding an answer to being able to give clear reasons based on the relationships between the coordinates.
For example, in the second question in ‘Checking prior learning’ (above), in order to determine the coordinates of the missing vertex, students could:
• Identify the gradient of one of the sides of the square and infer the gradient of the opposite side.
• Use the fact that the diagonals of the square are perpendicular and of equal length.
A sound understanding of the relationships between the x- and y-values of pairs of coordinates provides the basis for more sophisticated analysis of the features of linear functions and their graphs, which students will need to develop throughout Key Stage 3.
By graphing sets of coordinates where the x- and y-values are connected by a rule, students will become aware of the connection between a rule expressed algebraically
140
and the graph joining the set of points. Students will then also need to think about horizontal and vertical straight-line graphs where the functions (x = a and y = b) are of a particular form, and relate the concepts of gradient and intercept to these. This work should lead students to appreciate the important two-way connection, that is:
• If the x- and y-values of the coordinates fit an arithmetic rule, then they will lie on a straight line.
• If the coordinates lie on a straight line, then their x- and y-values will fit an arithmetic rule.
Key ideas
• Know that a set of coordinates, constructed according to a mathematical rule, can be represented algebraically and graphically*
• Understand that a graphical representation shows all of the points (within a range) that satisfy a relationship
Explore linear relationships
Students will have begun to explore simple algebraic relationships and number patterns in Key Stage 2. This is taken further in Key Stage 3, where students will write the relationship between the x- and y-values in a set of coordinates using algebra and recognise when it is a linear relationship.
They should become fluent at plotting and identifying straight-line graphs and make connections between the equation of the line and the coordinates of points on the corresponding line. To achieve this, students should be given equations presented in a range of forms and opportunities to think about how many points are required to plot a straight line and to choose appropriately scaled axes.
Students should also be given opportunities to explore the connections between the equation of a line, its gradient and its y-intercept. By looking at the features of particular graphs, the corresponding set of points and the equation of the line, certain key features can be identified and discussed. For example, students could be presented with a graph, such as the one below and asked questions, such as:
• ‘How quickly is the graph rising (or falling)?’ • ‘As x increases by one each time, how is y increasing (or decreasing)?’ • ‘How does this relate to its equation?’ • ‘What does the ‘− 2’ in the equation signify? Can you explain why this is so?’
:
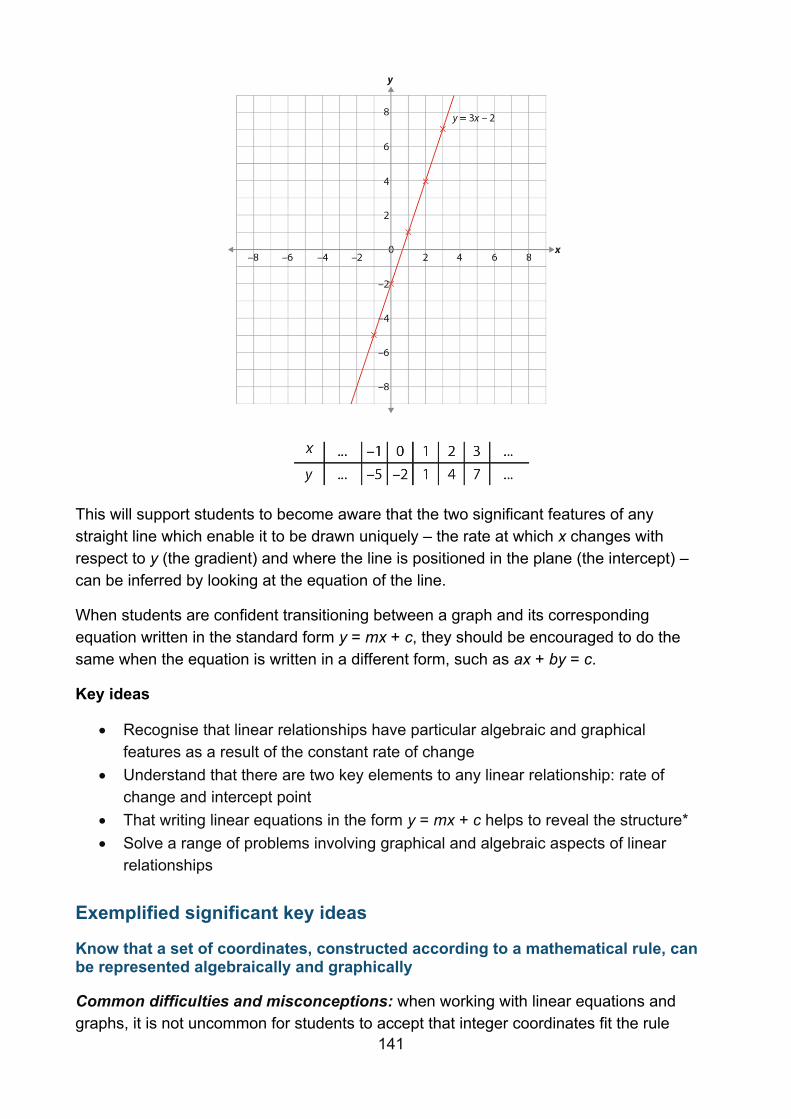
141
This will support students to become aware that the two significant features of any straight line which enable it to be drawn uniquely – the rate at which x changes with respect to y (the gradient) and where the line is positioned in the plane (the intercept) – can be inferred by looking at the equation of the line.
When students are confident transitioning between a graph and its corresponding equation written in the standard form y = mx + c, they should be encouraged to do the same when the equation is written in a different form, such as ax + by = c.
Key ideas
• Recognise that linear relationships have particular algebraic and graphical features as a result of the constant rate of change
• Understand that there are two key elements to any linear relationship: rate of change and intercept point
• That writing linear equations in the form y = mx + c helps to reveal the structure* • Solve a range of problems involving graphical and algebraic aspects of linear
relationships
Exemplified significant key ideas
Know that a set of coordinates, constructed according to a mathematical rule, can be represented algebraically and graphically
Common difficulties and misconceptions: when working with linear equations and graphs, it is not uncommon for students to accept that integer coordinates fit the rule
142
given by an equation. What students may not appreciate is that the line is representing an infinity of points, all of which fit the rule.
It will be important for students to experiment with coordinates in between integer points they have used to construct the line, and to verify that these coordinates also fit the rule. This should lead students to the important awareness of the key idea that if a set of coordinates lies on the same straight line, then there is a consistent relationship between the x- and y-values that can be expressed algebraically as the equation of the line. Students should be encouraged to plot the coordinates themselves to confirm that the coordinates do, in fact, lie on a straight line, but also to think deeply about why this is so and not just rely on practical demonstration.
These more probing explorations will support students in becoming aware of two important features:
• The line represents the infinity of points satisfying the rule and therefore ‘captures’ or represents that rule in the same way the algebraic equation does.
• The line divides the plane into points that fit the rule and points that do not.
Some students may find it challenging to express the relationship between the x- and y-values algebraically. Asking students to test a given algebraic relationship by generating another coordinate and testing whether this lies on the same straight line can help them to overcome this difficulty.
Encouraging the use of precise language will also help students to overcome difficulties; establishing the relationship and articulating it using key vocabulary will enable students to discuss and reason with clarity. Prompting students to describe the relationship in words by considering how the x-value is being operated on in order for it to match the y-value, will help students identify the relationship before formally expressing it in algebraic form. Examples are given below.
Example 1: Here are some coordinates:
(−2, 0) (9, 11) (−4, −2)
• Jamila says that the equation of the line passing through these coordinates is y = x + 2.
• Kuba says the equation is x = y + 2. • Lillie says the equation is x + 2 = y.
Who is correct? Justify your answer.
Example 1 gives students an opportunity to explore and discuss the way in which a verbal relationship is written algebraically. Many students will identify the relationship as + 2 and they should be challenged to explain what they mean by this, using key vocabulary. Questions such as: ‘Does anyone think the relationship is − 2?’, ‘Is there
143
more than one way to write the relationship algebraically?’ and ‘Is one way preferable to another?’ will help to deepen students’ understanding.
Discussing these key ideas is important if students are to become fluent at writing equations in multiple forms and to develop a deep and secure understanding.
Example 2:
a) (−10, −2) (−2, 6) (6, 14)
Charlie thinks the equation of the line passing through these coordinates is
x = y + 8.
Explain why Charlie is wrong.
b) (10, 2) (1, 5) (−3, −15)
Carol thinks the equation of the line passing through these coordinates is
y = 5x.
Explain why Carol is wrong.
Example 2 gives students an opportunity to explore misconceptions when finding the relationship between x- and y-values in sets of coordinates. Students often lose sight of the fact that an equation represents a relationship between two values. Asking students to each write down a coordinate where the y-value is three more than the x-value, and then representing all the coordinates generated on a coordinate grid, can help to reconnect them with this idea.
Example 3: Which of these equations pass through this set of coordinates?
(−2, −2) (5, 12) (0, 2) (4, 10)
a) y = 2x + 2 b) y = 2(x + 1) c) y = 3x − 3 d) y = x
Example 3 is useful in challenging students’ understanding of a concept. Students must check that the equation holds true for all coordinates in the set. Students who consider only one coordinate could select an incorrect equation, as every equation is true for one of the coordinates given.
Students who correctly identify equation a should be asked whether any of the other equations could also be true. Discussing why both equation a and b are correct is useful in exploring the different ways in which equations could be written, making connections to other areas of algebra.
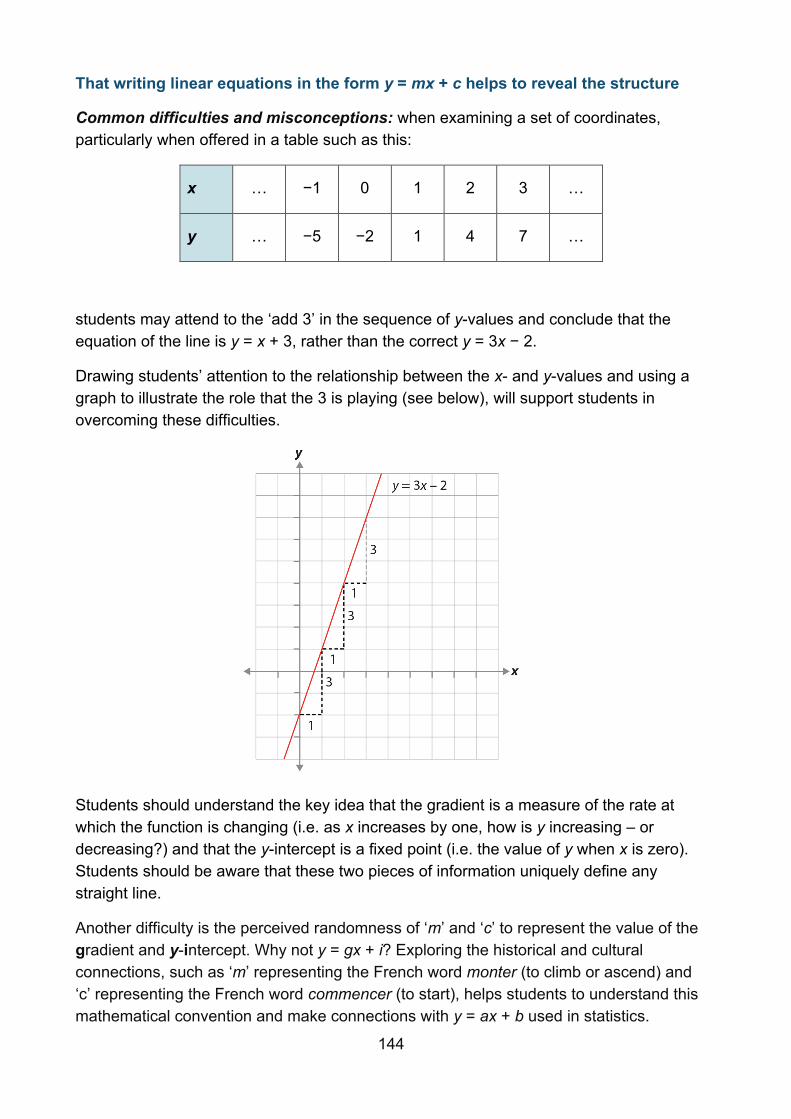
144
That writing linear equations in the form y = mx + c helps to reveal the structure
Common difficulties and misconceptions: when examining a set of coordinates, particularly when offered in a table such as this:
x … −1 0 1 2 3 …
y … −5 −2 1 4 7 …
students may attend to the ‘add 3’ in the sequence of y-values and conclude that the equation of the line is y = x + 3, rather than the correct y = 3x − 2.
Drawing students’ attention to the relationship between the x- and y-values and using a graph to illustrate the role that the 3 is playing (see below), will support students in overcoming these difficulties.
Students should understand the key idea that the gradient is a measure of the rate at which the function is changing (i.e. as x increases by one, how is y increasing – or decreasing?) and that the y-intercept is a fixed point (i.e. the value of y when x is zero). Students should be aware that these two pieces of information uniquely define any straight line.
Another difficulty is the perceived randomness of ‘m’ and ‘c’ to represent the value of the gradient and y-intercept. Why not y = gx + i? Exploring the historical and cultural connections, such as ‘m’ representing the French word monter (to climb or ascend) and ‘c’ representing the French word commencer (to start), helps students to understand this mathematical convention and make connections with y = ax + b used in statistics.
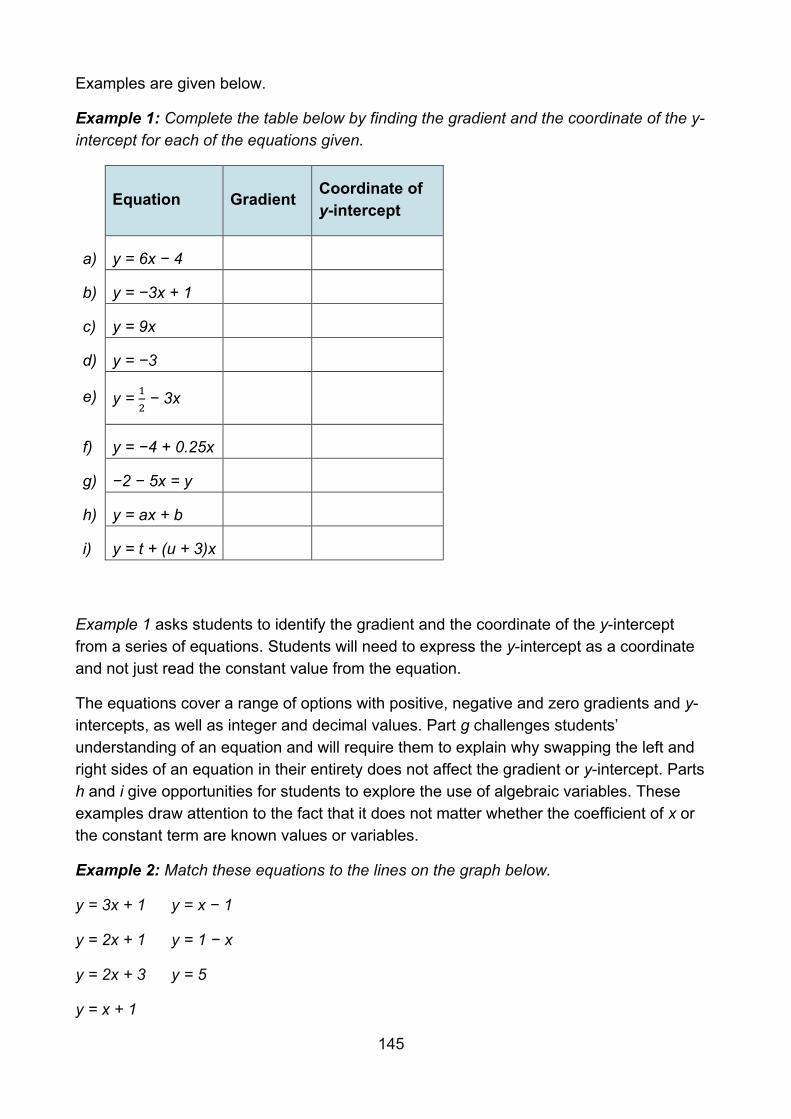
145
Examples are given below.
Example 1: Complete the table below by finding the gradient and the coordinate of the y-intercept for each of the equations given.
Equation Gradient Coordinate of y-intercept
a) y = 6x − 4
b) y = −3x + 1
c) y = 9x
d) y = −3
e) y = 1
2 − 3x
f) y = −4 + 0.25x
g) −2 − 5x = y
h) y = ax + b
i) y = t + (u + 3)x
Example 1 asks students to identify the gradient and the coordinate of the y-intercept from a series of equations. Students will need to express the y-intercept as a coordinate and not just read the constant value from the equation.
The equations cover a range of options with positive, negative and zero gradients and y-intercepts, as well as integer and decimal values. Part g challenges students’ understanding of an equation and will require them to explain why swapping the left and right sides of an equation in their entirety does not affect the gradient or y-intercept. Parts h and i give opportunities for students to explore the use of algebraic variables. These examples draw attention to the fact that it does not matter whether the coefficient of x or the constant term are known values or variables.
Example 2: Match these equations to the lines on the graph below.
y = 3x + 1 y = x − 1
y = 2x + 1 y = 1 − x
y = 2x + 3 y = 5
y = x + 1
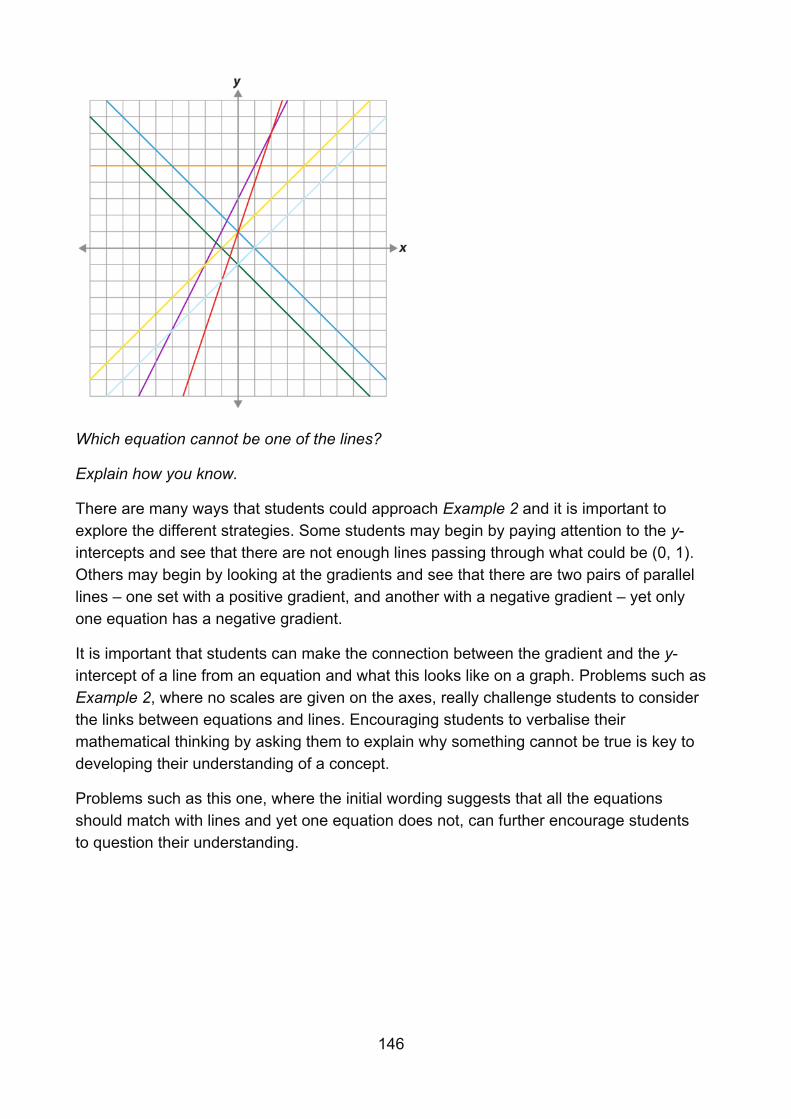
146
Which equation cannot be one of the lines?
Explain how you know.
There are many ways that students could approach Example 2 and it is important to explore the different strategies. Some students may begin by paying attention to the y-intercepts and see that there are not enough lines passing through what could be (0, 1). Others may begin by looking at the gradients and see that there are two pairs of parallel lines – one set with a positive gradient, and another with a negative gradient – yet only one equation has a negative gradient.
It is important that students can make the connection between the gradient and the y-intercept of a line from an equation and what this looks like on a graph. Problems such as Example 2, where no scales are given on the axes, really challenge students to consider the links between equations and lines. Encouraging students to verbalise their mathematical thinking by asking them to explain why something cannot be true is key to developing their understanding of a concept.
Problems such as this one, where the initial wording suggests that all the equations should match with lines and yet one equation does not, can further encourage students to question their understanding.
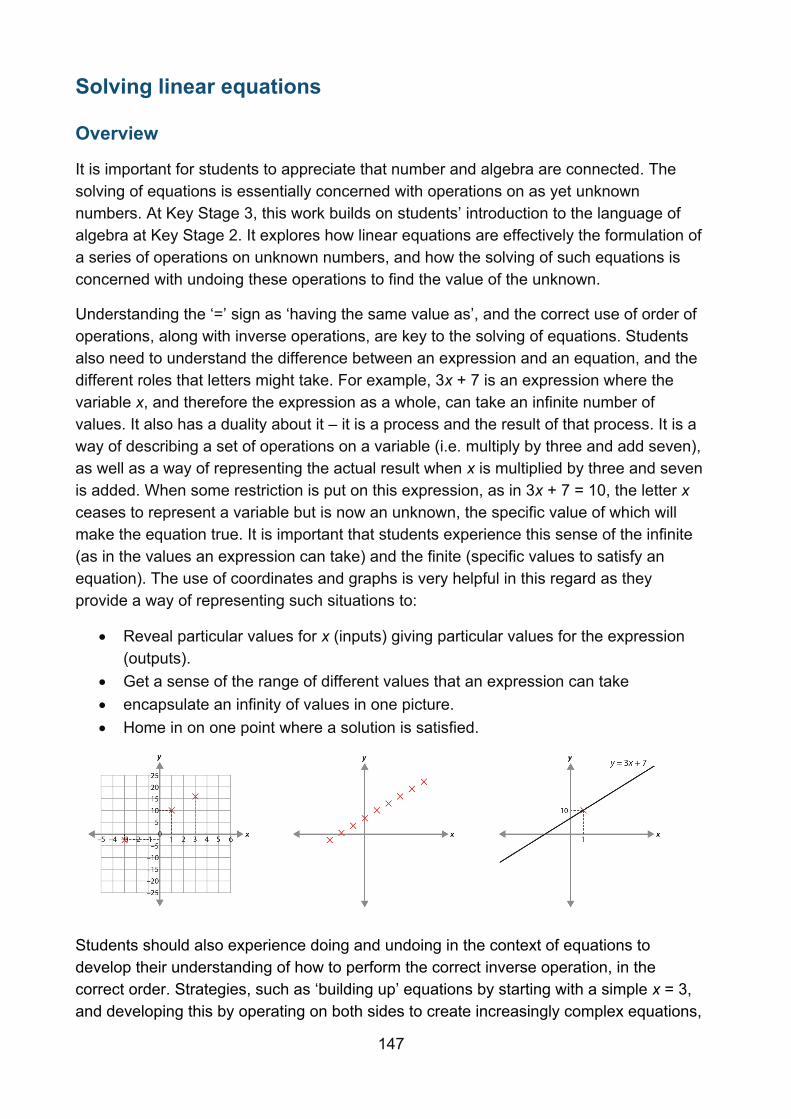
147
Solving linear equations
Overview
It is important for students to appreciate that number and algebra are connected. The solving of equations is essentially concerned with operations on as yet unknown numbers. At Key Stage 3, this work builds on students’ introduction to the language of algebra at Key Stage 2. It explores how linear equations are effectively the formulation of a series of operations on unknown numbers, and how the solving of such equations is concerned with undoing these operations to find the value of the unknown.
Understanding the ‘=’ sign as ‘having the same value as’, and the correct use of order of operations, along with inverse operations, are key to the solving of equations. Students also need to understand the difference between an expression and an equation, and the different roles that letters might take. For example, 3x + 7 is an expression where the variable x, and therefore the expression as a whole, can take an infinite number of values. It also has a duality about it – it is a process and the result of that process. It is a way of describing a set of operations on a variable (i.e. multiply by three and add seven), as well as a way of representing the actual result when x is multiplied by three and seven is added. When some restriction is put on this expression, as in 3x + 7 = 10, the letter x ceases to represent a variable but is now an unknown, the specific value of which will make the equation true. It is important that students experience this sense of the infinite (as in the values an expression can take) and the finite (specific values to satisfy an equation). The use of coordinates and graphs is very helpful in this regard as they provide a way of representing such situations to:
• Reveal particular values for x (inputs) giving particular values for the expression (outputs).
• Get a sense of the range of different values that an expression can take • encapsulate an infinity of values in one picture. • Home in on one point where a solution is satisfied.
Students should also experience doing and undoing in the context of equations to develop their understanding of how to perform the correct inverse operation, in the correct order. Strategies, such as ‘building up’ equations by starting with a simple x = 3, and developing this by operating on both sides to create increasingly complex equations,
148
may support students with this. Students also need opportunities to work on examples that lead to a range of solutions, including positive, negative and fractional.
Prior learning
Before beginning solving linear equations at Key Stage 3, students should already have a secure understanding of the following learning outcomes from study at upper Key Stage 2:
• Express missing number problems algebraically • Find pairs of numbers that satisfy an equation with two unknowns • Enumerate possibilities of combinations of two variables
and earlier in Key Stage 3:
• Understand and use the conventions and vocabulary of algebra including forming and interpreting algebraic expressions and equations
• Simplify algebraic expressions by collecting like terms to maintain equivalence • Manipulate algebraic expressions using the distributive law to maintain
equivalence • Understand and use the structures that underpin addition and subtraction
strategies • Understand and use the structures that underpin multiplication and division
strategies • Know, understand and use fluently a range of calculation strategies for addition
and subtraction of fractions • Know, understand and use fluently a range of calculation strategies for
multiplication and division of fractions • Use the laws and conventions of arithmetic to calculate efficiently
Checking prior learning
The following activities from the NCETM primary assessment materials and the NCETM secondary assessment materials offer useful ideas for teachers to use to check whether prior learning is secure.
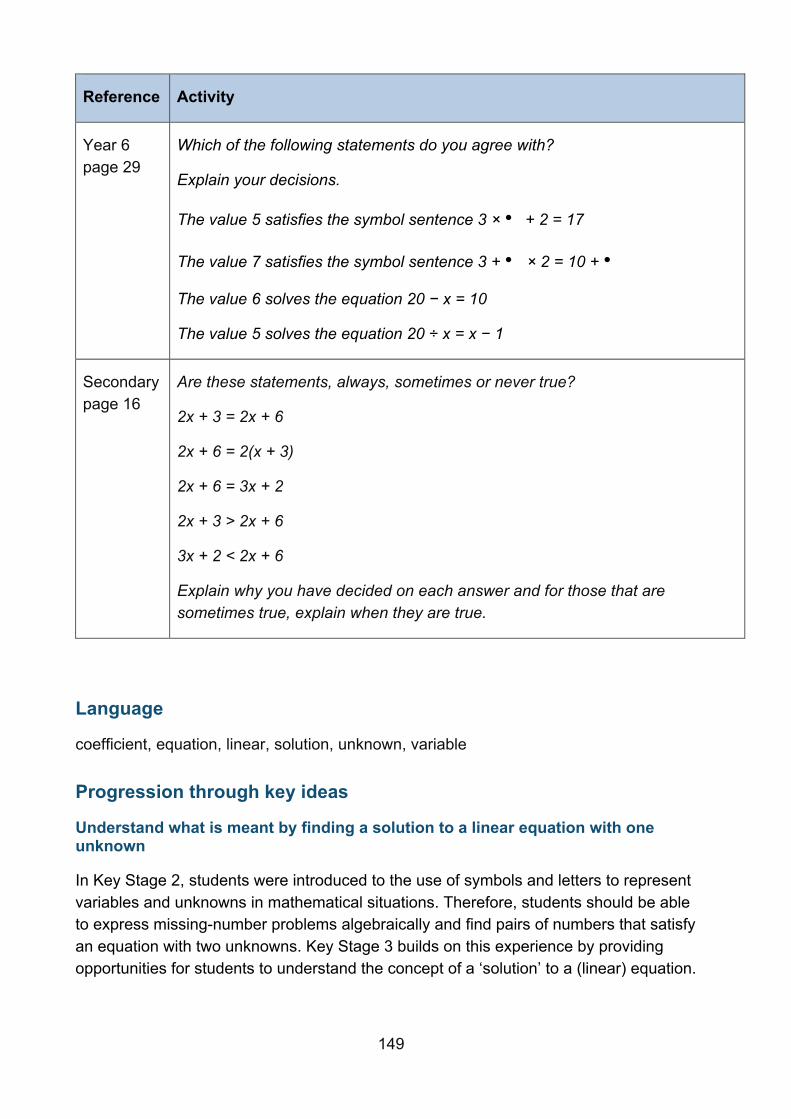
149
Reference Activity
Year 6 page 29
Which of the following statements do you agree with?
Explain your decisions.
The value 5 satisfies the symbol sentence 3 × • + 2 = 17
The value 7 satisfies the symbol sentence 3 + • × 2 = 10 + •
The value 6 solves the equation 20 − x = 10
The value 5 solves the equation 20 ÷ x = x − 1
Secondary page 16
Are these statements, always, sometimes or never true?
2x + 3 = 2x + 6
2x + 6 = 2(x + 3)
2x + 6 = 3x + 2
2x + 3 > 2x + 6
3x + 2 < 2x + 6
Explain why you have decided on each answer and for those that are sometimes true, explain when they are true.
Language
coefficient, equation, linear, solution, unknown, variable
Progression through key ideas
Understand what is meant by finding a solution to a linear equation with one unknown
In Key Stage 2, students were introduced to the use of symbols and letters to represent variables and unknowns in mathematical situations. Therefore, students should be able to express missing-number problems algebraically and find pairs of numbers that satisfy an equation with two unknowns. Key Stage 3 builds on this experience by providing opportunities for students to understand the concept of a ‘solution’ to a (linear) equation.
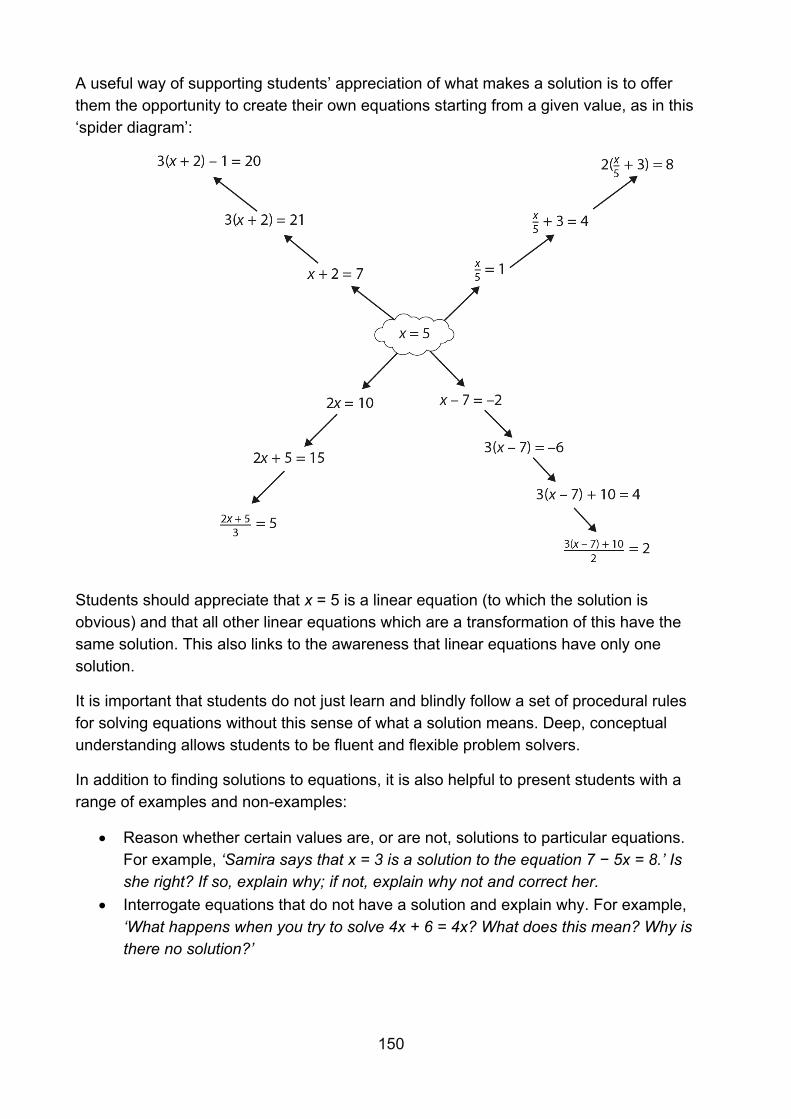
150
A useful way of supporting students’ appreciation of what makes a solution is to offer them the opportunity to create their own equations starting from a given value, as in this ‘spider diagram’:
Students should appreciate that x = 5 is a linear equation (to which the solution is obvious) and that all other linear equations which are a transformation of this have the same solution. This also links to the awareness that linear equations have only one solution.
It is important that students do not just learn and blindly follow a set of procedural rules for solving equations without this sense of what a solution means. Deep, conceptual understanding allows students to be fluent and flexible problem solvers.
In addition to finding solutions to equations, it is also helpful to present students with a range of examples and non-examples:
• Reason whether certain values are, or are not, solutions to particular equations. For example, ‘Samira says that x = 3 is a solution to the equation 7 − 5x = 8.’ Is she right? If so, explain why; if not, explain why not and correct her.
• Interrogate equations that do not have a solution and explain why. For example, ‘What happens when you try to solve 4x + 6 = 4x? What does this mean? Why is there no solution?’
151
Key ideas
• Recognise that there are many different types of equations of which linear is one type
• Understand that in an equation the two sides of the ‘equals’ sign balance • Understand that a solution is a value that makes the two sides of an equation
balance* • Understand that a family of linear equations can all have the same solution
Solve a linear equation with a single unknown on one side where obtaining the solution requires one step
Building on Key Stage 2 experiences, this collection of key ideas explores how simple, one-step linear equations are the formulation of one operation on an unknown number, and how these equations can be solved by undoing the operation to find the value of the unknown. If students have previously mastered additive and multiplicative structures, they should be able to recognise alternative versions of the family of four within that structure, for example 5 + 3 = 8, so 8 − 3 = 5, 8 − 5 = 3 and 3 + 5 = 8. This understanding will enable them to construct all four rearrangements of the equation x + 3 = 10 (3 + x = 10, 10 – 3 = x, 10 – x = 3).
A similar process can be followed for equations of the form x − a = b, ax = b and 𝑥
𝑎 = 𝑏.
In each case, one of the rearrangements will result in a form from which the solution can be calculated.
An important awareness is that, if a = b, then a + c = b + c and a × c = b × c. These ideas could usefully form the basis of separate lessons.
Key ideas
• Solve a linear equation requiring a single additive step • Solve a linear equation requiring a single multiplicative step
Solve a linear equation with a single unknown where obtaining the solution requires two or more steps (no brackets)
Building on solving simple linear equations requiring one step, this section explores how linear equations can also be the formulation of more than one operation on unknown numbers, and how the solving of these equations is concerned with the undoing of these operations in the correct order to find the value of the unknown.
When using the balance method (i.e. operating in the same way on both sides of an equation to maintain equality), it will be useful to explore what constitutes the most efficient solution with students. For example, in the equation 5x − 14 = 6, it is important for students to understand that any operation applied to both sides of the equation will
152
result in equality being maintained and to reason why some operations lead to a solution more quickly than others.
Students who choose to divide both sides by five, giving 5𝑥−14
5=
6
5 , should be
encouraged to do this, to compare it with other possible operations and to reason why (although not incorrect) this is not a wise decision. A revisiting of the type of ‘spider diagram’ that was introduced in 2.2.1 (above) might support this reasoning when considering what order of operations was followed when tracking from the outside of the diagram back to the central solution.
Students will benefit from exploring these ideas with a wide variety of linear equations with unknowns on both sides and, through these experiences, become aware that all equations of the type ax + b = cx + d can be reduced to the form Ax + B = C.
Exploring equations such as 6 − 2x = x + 9 will usefully give rise to a discussion about whether to subtract x from both sides or to add 2x to both sides. Such discussions of efficiency and ease of calculation will support the development of approaches to solving equations of the form a − x = b, which typically students find difficult.
Similarly, consideration of equations of the form 𝑎
𝑥= 𝑏 and 𝑎
𝑥+ 𝑐 = 𝑏 will help students
see that these can be transformed into a = bx and a + cx = bx.
Key ideas
• Understand that an equation needs to be in a format to be ‘ready’ to be solved, through collecting like terms on each side of the equation
• Know that when an additive step and a multiplicative step are required, the order of operations will not affect the solution
• Recognise that equations with unknowns on both sides of the equation can be manipulated so that the unknowns are on one side*
• Solve complex linear equations, including those involving reciprocals
Solve efficiently a linear equation with a single unknown involving brackets
By considering a range of linear equations involving brackets, students should explore the importance of noticing the structure of an equation in order to decide on the most efficient method for solving it. For example, 3(x − 2) = 27 can be simplified directly to x − 2 = 9 rather than multiplying out the brackets first.
Through discussion, students can secure and deepen their understanding of solving linear equations and reflect on the efficiency and elegance of the solutions. Using a range of examples that prompt discussions about method choices will be important. For instance, the following examples could be used to highlight when it is useful to use common factors to simplify, rather than multiplying out the brackets:
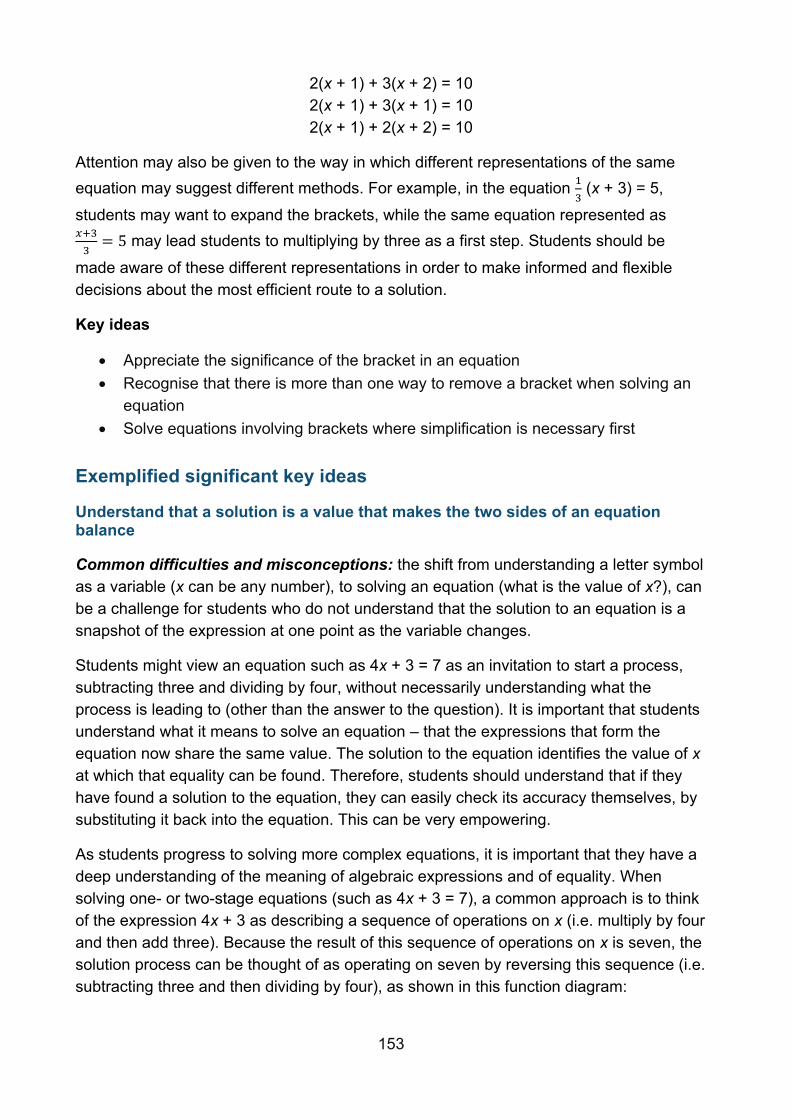
153
2(x + 1) + 3(x + 2) = 10 2(x + 1) + 3(x + 1) = 10 2(x + 1) + 2(x + 2) = 10
Attention may also be given to the way in which different representations of the same equation may suggest different methods. For example, in the equation 1
3 (x + 3) = 5,
students may want to expand the brackets, while the same equation represented as 𝑥+3
3= 5 may lead students to multiplying by three as a first step. Students should be
made aware of these different representations in order to make informed and flexible decisions about the most efficient route to a solution.
Key ideas
• Appreciate the significance of the bracket in an equation • Recognise that there is more than one way to remove a bracket when solving an
equation • Solve equations involving brackets where simplification is necessary first
Exemplified significant key ideas
Understand that a solution is a value that makes the two sides of an equation balance
Common difficulties and misconceptions: the shift from understanding a letter symbol as a variable (x can be any number), to solving an equation (what is the value of x?), can be a challenge for students who do not understand that the solution to an equation is a snapshot of the expression at one point as the variable changes.
Students might view an equation such as 4x + 3 = 7 as an invitation to start a process, subtracting three and dividing by four, without necessarily understanding what the process is leading to (other than the answer to the question). It is important that students understand what it means to solve an equation – that the expressions that form the equation now share the same value. The solution to the equation identifies the value of x at which that equality can be found. Therefore, students should understand that if they have found a solution to the equation, they can easily check its accuracy themselves, by substituting it back into the equation. This can be very empowering.
As students progress to solving more complex equations, it is important that they have a deep understanding of the meaning of algebraic expressions and of equality. When solving one- or two-stage equations (such as 4x + 3 = 7), a common approach is to think of the expression 4x + 3 as describing a sequence of operations on x (i.e. multiply by four and then add three). Because the result of this sequence of operations on x is seven, the solution process can be thought of as operating on seven by reversing this sequence (i.e. subtracting three and then dividing by four), as shown in this function diagram:
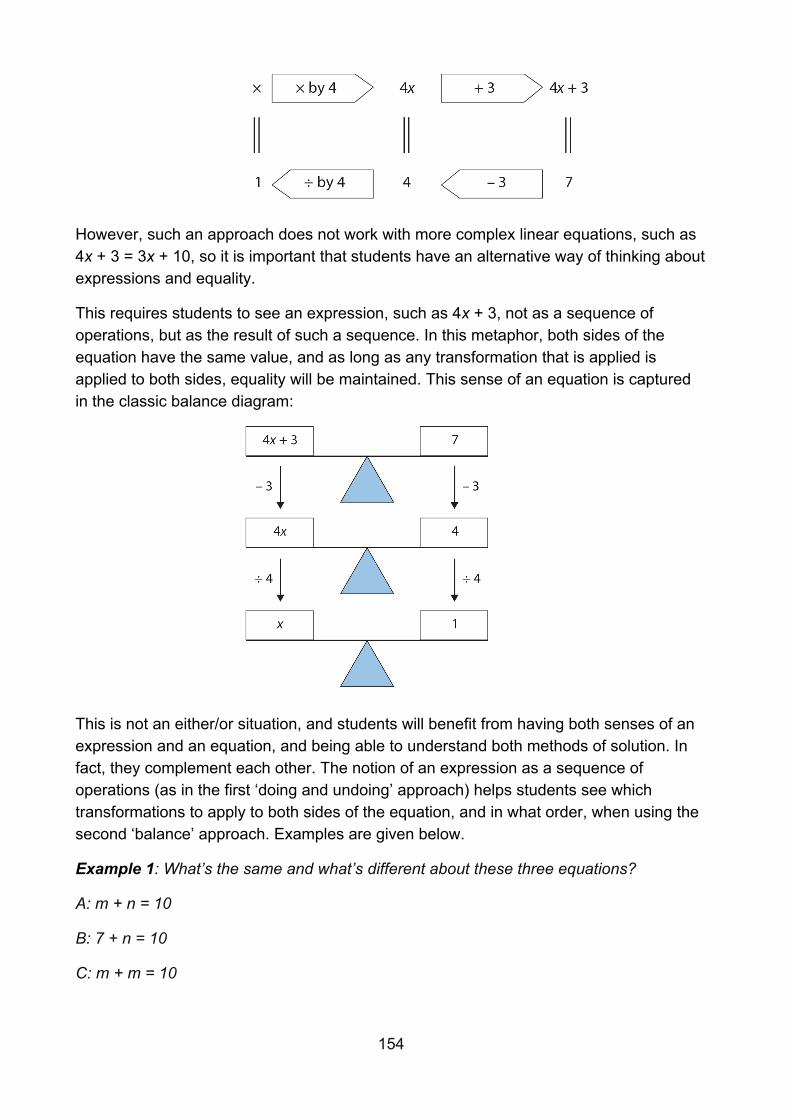
154
However, such an approach does not work with more complex linear equations, such as 4x + 3 = 3x + 10, so it is important that students have an alternative way of thinking about expressions and equality.
This requires students to see an expression, such as 4x + 3, not as a sequence of operations, but as the result of such a sequence. In this metaphor, both sides of the equation have the same value, and as long as any transformation that is applied is applied to both sides, equality will be maintained. This sense of an equation is captured in the classic balance diagram:
This is not an either/or situation, and students will benefit from having both senses of an expression and an equation, and being able to understand both methods of solution. In fact, they complement each other. The notion of an expression as a sequence of operations (as in the first ‘doing and undoing’ approach) helps students see which transformations to apply to both sides of the equation, and in what order, when using the second ‘balance’ approach. Examples are given below.
Example 1: What’s the same and what’s different about these three equations?
A: m + n = 10
B: 7 + n = 10
C: m + m = 10
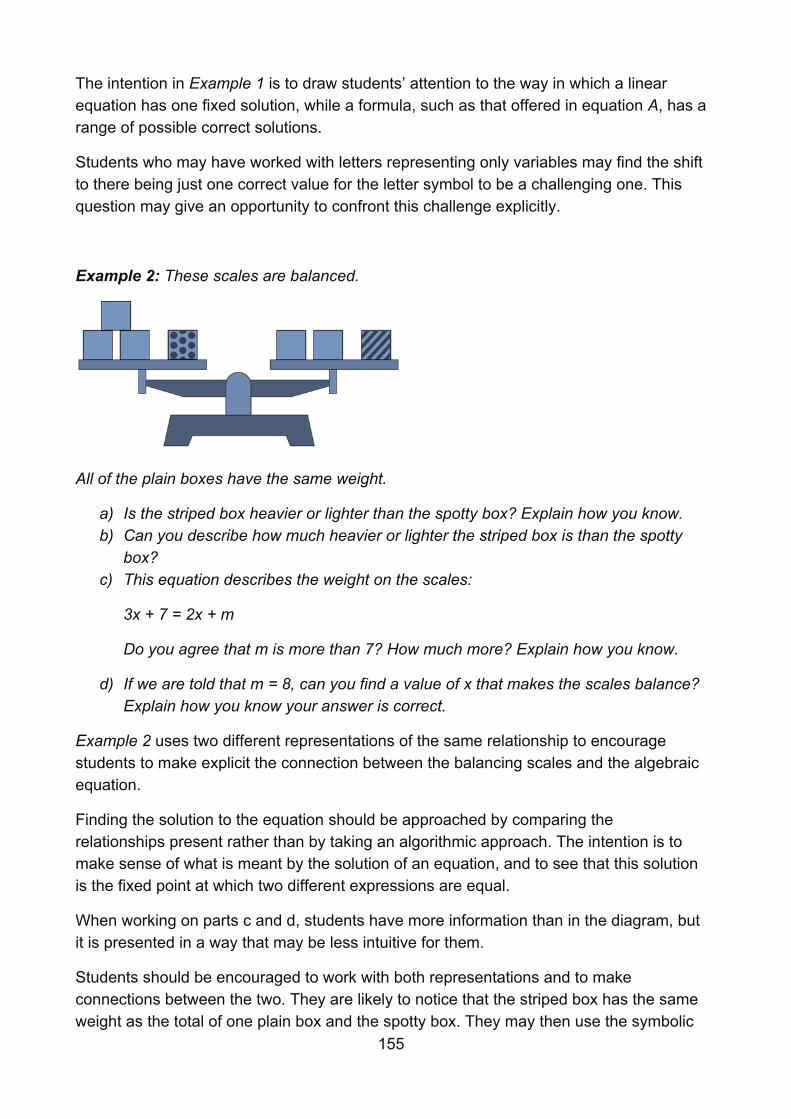
155
The intention in Example 1 is to draw students’ attention to the way in which a linear equation has one fixed solution, while a formula, such as that offered in equation A, has a range of possible correct solutions.
Students who may have worked with letters representing only variables may find the shift to there being just one correct value for the letter symbol to be a challenging one. This question may give an opportunity to confront this challenge explicitly.
Example 2: These scales are balanced.
All of the plain boxes have the same weight.
a) Is the striped box heavier or lighter than the spotty box? Explain how you know. b) Can you describe how much heavier or lighter the striped box is than the spotty
box? c) This equation describes the weight on the scales:
3x + 7 = 2x + m
Do you agree that m is more than 7? How much more? Explain how you know.
d) If we are told that m = 8, can you find a value of x that makes the scales balance? Explain how you know your answer is correct.
Example 2 uses two different representations of the same relationship to encourage students to make explicit the connection between the balancing scales and the algebraic equation.
Finding the solution to the equation should be approached by comparing the relationships present rather than by taking an algorithmic approach. The intention is to make sense of what is meant by the solution of an equation, and to see that this solution is the fixed point at which two different expressions are equal.
When working on parts c and d, students have more information than in the diagram, but it is presented in a way that may be less intuitive for them.
Students should be encouraged to work with both representations and to make connections between the two. They are likely to notice that the striped box has the same weight as the total of one plain box and the spotty box. They may then use the symbolic
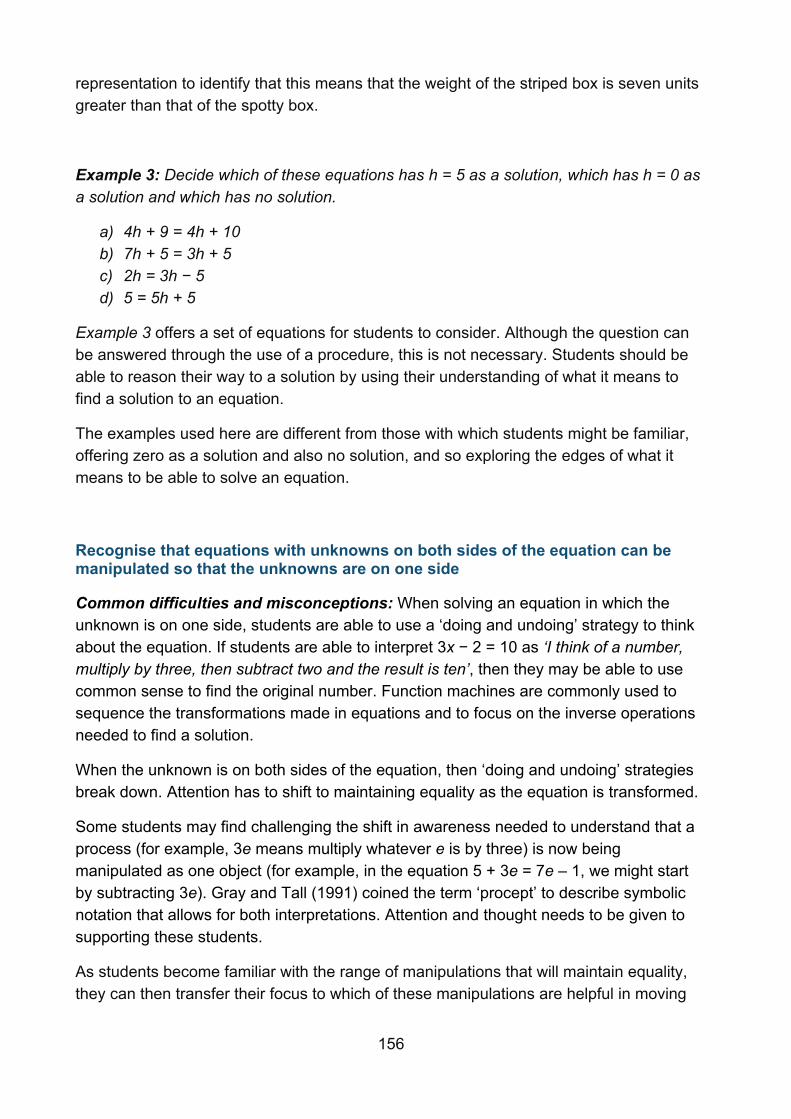
156
representation to identify that this means that the weight of the striped box is seven units greater than that of the spotty box.
Example 3: Decide which of these equations has h = 5 as a solution, which has h = 0 as a solution and which has no solution.
a) 4h + 9 = 4h + 10 b) 7h + 5 = 3h + 5 c) 2h = 3h − 5 d) 5 = 5h + 5
Example 3 offers a set of equations for students to consider. Although the question can be answered through the use of a procedure, this is not necessary. Students should be able to reason their way to a solution by using their understanding of what it means to find a solution to an equation.
The examples used here are different from those with which students might be familiar, offering zero as a solution and also no solution, and so exploring the edges of what it means to be able to solve an equation.
Recognise that equations with unknowns on both sides of the equation can be manipulated so that the unknowns are on one side
Common difficulties and misconceptions: When solving an equation in which the unknown is on one side, students are able to use a ‘doing and undoing’ strategy to think about the equation. If students are able to interpret 3x − 2 = 10 as ‘I think of a number, multiply by three, then subtract two and the result is ten’, then they may be able to use common sense to find the original number. Function machines are commonly used to sequence the transformations made in equations and to focus on the inverse operations needed to find a solution.
When the unknown is on both sides of the equation, then ‘doing and undoing’ strategies break down. Attention has to shift to maintaining equality as the equation is transformed.
Some students may find challenging the shift in awareness needed to understand that a process (for example, 3e means multiply whatever e is by three) is now being manipulated as one object (for example, in the equation 5 + 3e = 7e – 1, we might start by subtracting 3e). Gray and Tall (1991) coined the term ‘procept’ to describe symbolic notation that allows for both interpretations. Attention and thought needs to be given to supporting these students.
As students become familiar with the range of manipulations that will maintain equality, they can then transfer their focus to which of these manipulations are helpful in moving
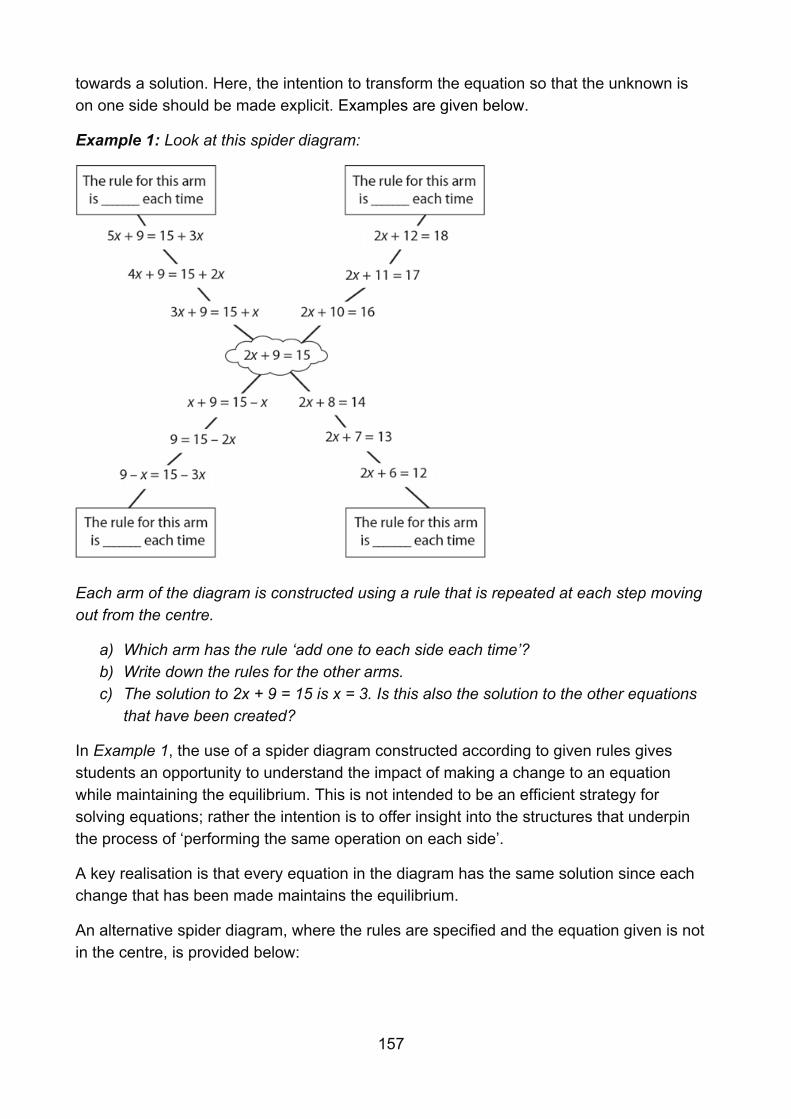
157
towards a solution. Here, the intention to transform the equation so that the unknown is on one side should be made explicit. Examples are given below.
Example 1: Look at this spider diagram:
Each arm of the diagram is constructed using a rule that is repeated at each step moving out from the centre.
a) Which arm has the rule ‘add one to each side each time’? b) Write down the rules for the other arms. c) The solution to 2x + 9 = 15 is x = 3. Is this also the solution to the other equations
that have been created?
In Example 1, the use of a spider diagram constructed according to given rules gives students an opportunity to understand the impact of making a change to an equation while maintaining the equilibrium. This is not intended to be an efficient strategy for solving equations; rather the intention is to offer insight into the structures that underpin the process of ‘performing the same operation on each side’.
A key realisation is that every equation in the diagram has the same solution since each change that has been made maintains the equilibrium.
An alternative spider diagram, where the rules are specified and the equation given is not in the centre, is provided below:
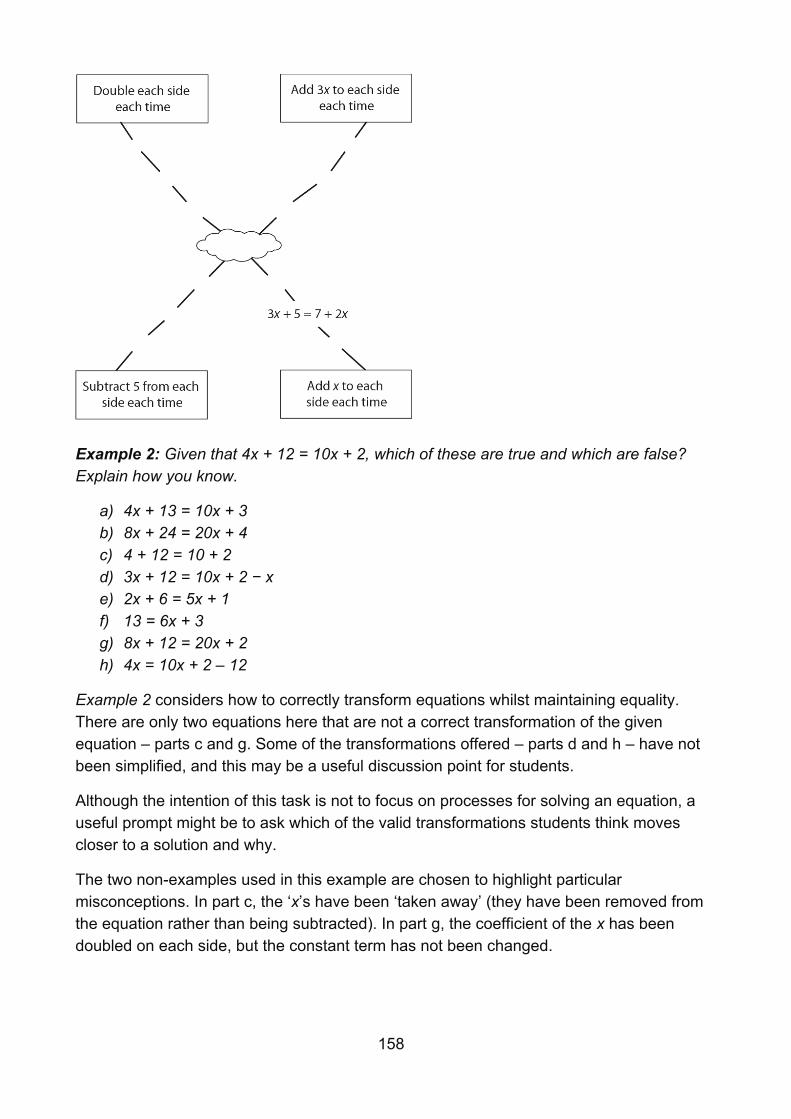
158
Example 2: Given that 4x + 12 = 10x + 2, which of these are true and which are false? Explain how you know.
a) 4x + 13 = 10x + 3 b) 8x + 24 = 20x + 4 c) 4 + 12 = 10 + 2 d) 3x + 12 = 10x + 2 − x e) 2x + 6 = 5x + 1 f) 13 = 6x + 3 g) 8x + 12 = 20x + 2 h) 4x = 10x + 2 – 12
Example 2 considers how to correctly transform equations whilst maintaining equality. There are only two equations here that are not a correct transformation of the given equation – parts c and g. Some of the transformations offered – parts d and h – have not been simplified, and this may be a useful discussion point for students.
Although the intention of this task is not to focus on processes for solving an equation, a useful prompt might be to ask which of the valid transformations students think moves closer to a solution and why.
The two non-examples used in this example are chosen to highlight particular misconceptions. In part c, the ‘x’s have been ‘taken away’ (they have been removed from the equation rather than being subtracted). In part g, the coefficient of the x has been doubled on each side, but the constant term has not been changed.
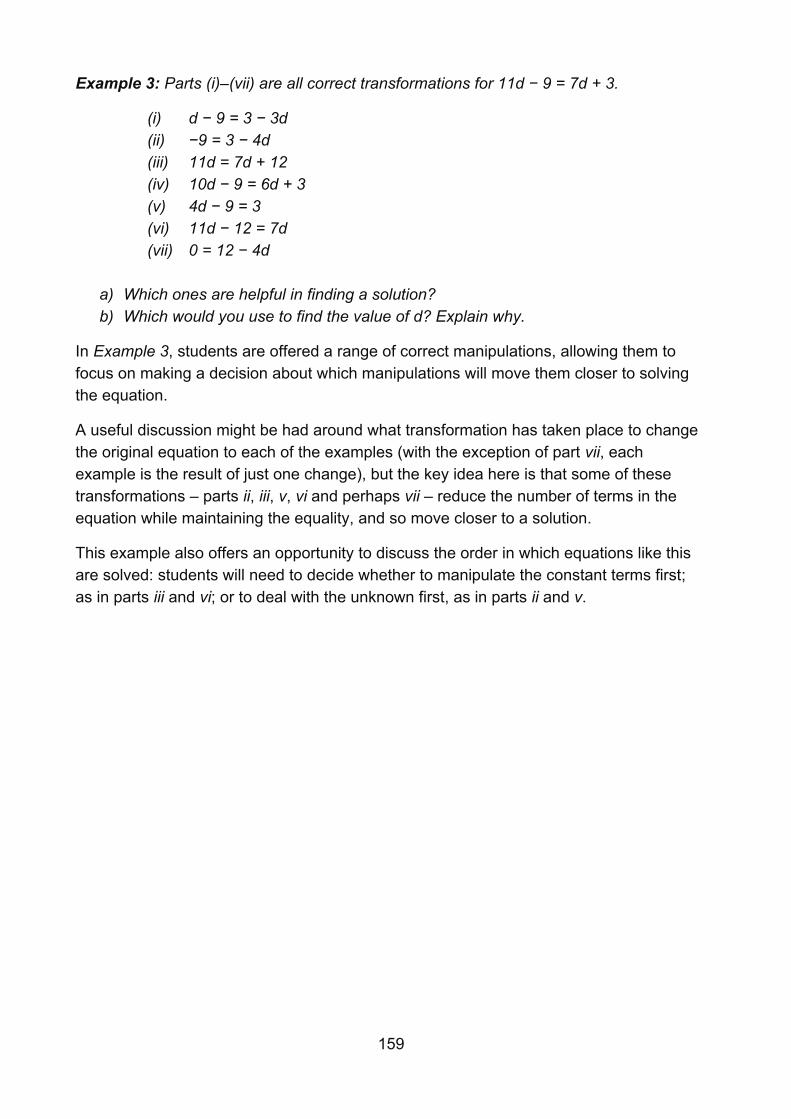
159
Example 3: Parts (i)–(vii) are all correct transformations for 11d − 9 = 7d + 3.
(i) d − 9 = 3 − 3d (ii) −9 = 3 − 4d (iii) 11d = 7d + 12 (iv) 10d − 9 = 6d + 3 (v) 4d − 9 = 3 (vi) 11d − 12 = 7d (vii) 0 = 12 − 4d
a) Which ones are helpful in finding a solution? b) Which would you use to find the value of d? Explain why.
In Example 3, students are offered a range of correct manipulations, allowing them to focus on making a decision about which manipulations will move them closer to solving the equation.
A useful discussion might be had around what transformation has taken place to change the original equation to each of the examples (with the exception of part vii, each example is the result of just one change), but the key idea here is that some of these transformations – parts ii, iii, v, vi and perhaps vii – reduce the number of terms in the equation while maintaining the equality, and so move closer to a solution.
This example also offers an opportunity to discuss the order in which equations like this are solved: students will need to decide whether to manipulate the constant terms first; as in parts iii and vi; or to deal with the unknown first, as in parts ii and v.
160
Year 8 spring term
Understanding multiplicative relationships: percentages and proportionality
Overview
In the summer term of Year 7 students will have explored fractions and ratios and it is important that this is now connected to work focusing on percentages and proportionality so that students do not experience them as distinct topics with no obvious connections. Percentages, fractions, proportionality and ratio can all be considered as contexts in which multiplicative relationships are used and explored. Maintaining consistency with the vocabulary and imagery used in all contexts will support students in their understanding that the same mathematical principles are involved. In many cases, there will be several different possible representations that could be used to help understand the mathematical structure of a situation. An important aspect of work with students will be to consider the relative usefulness and efficiency of different representations and approaches.
Exploring a range of real-life contexts (including use of compound measures) will further support students’ understanding of proportionality. Stressing the notion that, when one measure doubles (or trebles or is multiplied by any scale factor) so too does the other, can usefully highlight the terminology of ‘direct’ proportion and this can be contrasted with inverse proportion, which is a key idea to introduce at Key Stage 3.
Prior learning
Before beginning multiplicative relationships at Key Stage 3, students should already have a secure understanding of the following from previous study:
• Recognise the per cent symbol (%) and understand that per cent relates to ‘number of parts per hundred’, and write percentages as a fraction with denominator 100, and as a decimal.
• Use all four operations to solve problems involving measure (for example, length, mass, volume, money) using decimal notation, including scaling.
• Solve problems involving the relative sizes of two quantities where missing values can be found by using integer multiplication and division facts.
• Solve problems involving the calculation of percentages (for example, of measures, and such as 15% of 360) and the use of percentages for comparison.
• Solve problems involving similar shapes where the scale factor is known or can be found.
• Solve problems involving unequal sharing and grouping, using knowledge of fractions and multiples.
161
The NCETM has created the following Key Stage 2 ready-to-progress criteria to support teachers in making judgements about students’ understanding and knowledge.
6AS/MD-1 Understand that 2 numbers can be related additively or multiplicatively, and quantify additive and multiplicative relationships (multiplicative relationships restricted to multiplication by a whole number).
6AS/MD-2 Use a given additive or multiplicative calculation to derive or complete a related calculation, using arithmetic properties, inverse relationships, and place-value understanding.
6AS/MD-3 Solve problems involving ratio relationships.
Checking prior learning
The following activities from the NCETM primary assessment materials offer useful ideas for teachers to use to check whether prior learning is secure.
Reference Activity Year 6 page 21
Last month Kira saved 3
5 of her £10 pocket money. She also saved 15% of her
£20 birthday money.
How much did she save altogether?
Year 6 page 23
To make a sponge cake, I need six times as much flour as I do when I’m making a fairy cake. If a sponge cake needs 270g of flour, how much does a fairy cake need?
Year 6 page 24
In Year 1 there are 50 pupils, of whom 16 are boys. What percentage of the pupils are girls?
Language
proportion
Progression through key ideas
Understand that multiplicative relationships can be represented in a number of ways and connect and move between those different representations
This collection of key ideas explores some of the images and representations (for example, double number track, ratio table, double number line (also known as a stacked number line), scaling diagram, graphs, algebraic symbolism and other notation) that can be used to build an understanding of the different interpretations of multiplicative
162
structures and so make the connections between seemingly distinct topics explicit. It is important to keep in mind that the purpose of these different representations is to reveal the underpinning mathematical structure, rather than to provide a method to achieve an answer.
Key ideas
• Use a graph to represent a multiplicative relationship and connect to other known representations
• Use a scaling diagram to represent a multiplicative relationship and connect to other known representations
Understand that percentages are an example of a multiplicative relationship and apply this understanding to a range of contexts
In this set of key ideas, the use of percentages to represent multiplicative relationships is explored.
Students may use informal additive methods to calculate percentages. For example, to find 16% of a total they will find 10%, find 5%, find 1% and add these together. While it is important for students to know this, and to be able to work flexibly with percentages, it is also important for efficiency and depth of understanding that they recognise them as multiplicative relationships and understand that there exists a single multiplier linked to any percentage.
As with ratio, the double number line and ratio table representations are useful in supporting students in identifying and working with the multiplier, and consistent use of these representations through ratio, percentages and proportion may make the connections between these apparently different topics more apparent for students.
Throughout, students are again working on the relationship ab = c, where a or b is written as, or interpreted as, a percentage; and exploring this in different contexts and with different representations.
Key ideas
• Describe one number as a percentage of another • Find a percentage of a quantity using a multiplier • Calculate percentage changes (increases and decreases)* • Calculate the original value, given the final value after a stated percentage
increase or decrease • Find the percentage increase or decrease, given start and finish quantities
163
Understand proportionality
As students’ understanding of multiplicative relationships matures, they can work with more complex contexts and use algebraic notation to generalise. An important awareness here is that there is one unifying structure which connects fractions, percentages and ratio, and that this one structure can be described by the algebraic formulae x × k = y or alternatively k = 𝑦
𝑥, where x and y are the quantities in proportion
and k is the constant of proportionality. While exploring a wide range of examples of proportionality (including examples of ‘what it’s not’) it will be important to make the distinction between linear relationships which are not proportional (i.e. of the form y = mx + c rather than y = kx) and also to become aware of situations where the variables are inversely proportional (i.e. y = k × 1
𝑥 or y = 𝑘
𝑥).
In formalising this generalisation, students are able to use the underlying structure to develop an awareness that there are different types of proportionality, particularly inverse proportionality.
Key ideas
• Understand the connection between multiplicative relationships and direct proportion
• Recognise direct proportion and use in a range of contexts, including compound measures
• Recognise and use inverse proportionality in a range of contexts
Exemplified significant key ideas
Calculate percentage changes (increases and decreases)
Common difficulties and misconceptions: students should be confident with using informal additive methods to increase or decrease an amount using a percentage. While it is important for students to be able to work flexibly with percentages, it is important for efficiency and depth of understanding that students understand there exists a single multiplier linked to any percentage change and recognise them as examples of multiplicative relationships.
Some students have difficulties using the additive method as they fail to find the final amount by adding or subtracting the increase/decrease to the original amount. Some students have difficulties with identifying the multiplier for single-digit percentages, such as 5%.
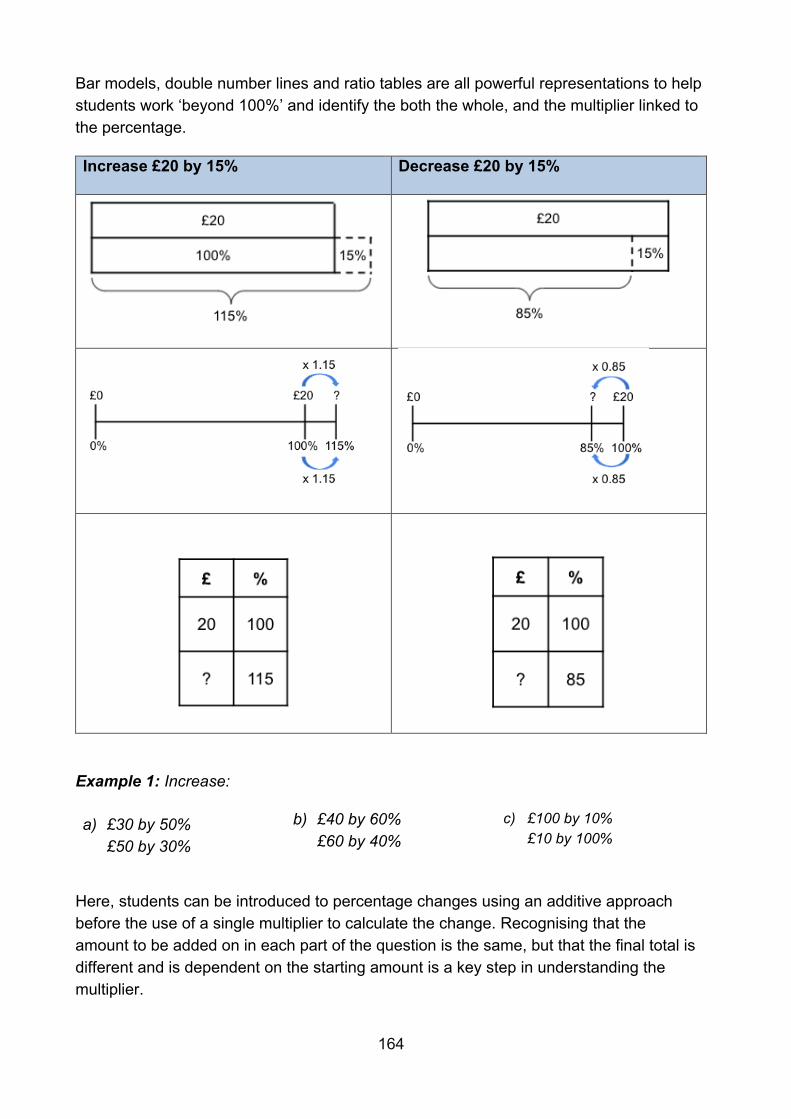
164
Bar models, double number lines and ratio tables are all powerful representations to help students work ‘beyond 100%’ and identify the both the whole, and the multiplier linked to the percentage.
Increase £20 by 15% Decrease £20 by 15%
Example 1: Increase:
a) £30 by 50% £50 by 30%
b) £40 by 60% £60 by 40%
c) £100 by 10% £10 by 100%
Here, students can be introduced to percentage changes using an additive approach before the use of a single multiplier to calculate the change. Recognising that the amount to be added on in each part of the question is the same, but that the final total is different and is dependent on the starting amount is a key step in understanding the multiplier.
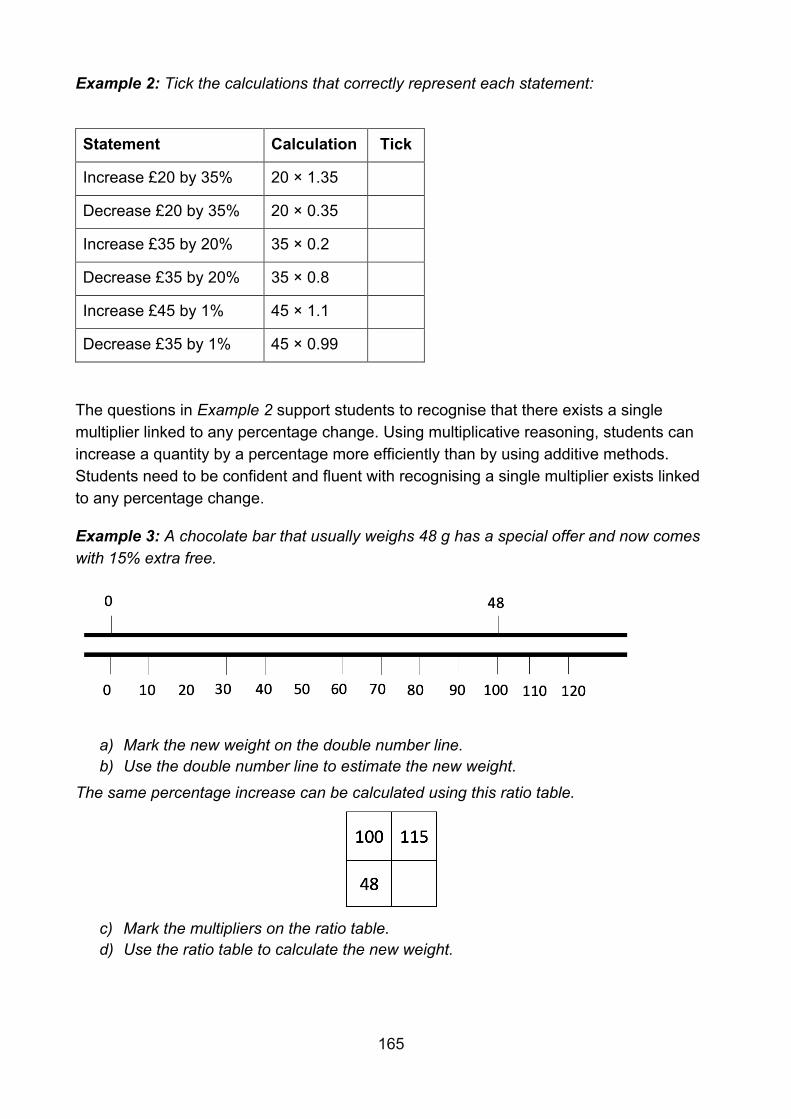
165
Example 2: Tick the calculations that correctly represent each statement:
Statement Calculation Tick
Increase £20 by 35% 20 × 1.35
Decrease £20 by 35% 20 × 0.35
Increase £35 by 20% 35 × 0.2
Decrease £35 by 20% 35 × 0.8
Increase £45 by 1% 45 × 1.1
Decrease £35 by 1% 45 × 0.99
The questions in Example 2 support students to recognise that there exists a single multiplier linked to any percentage change. Using multiplicative reasoning, students can increase a quantity by a percentage more efficiently than by using additive methods. Students need to be confident and fluent with recognising a single multiplier exists linked to any percentage change.
Example 3: A chocolate bar that usually weighs 48 g has a special offer and now comes with 15% extra free.
a) Mark the new weight on the double number line. b) Use the double number line to estimate the new weight.
The same percentage increase can be calculated using this ratio table.
c) Mark the multipliers on the ratio table. d) Use the ratio table to calculate the new weight.
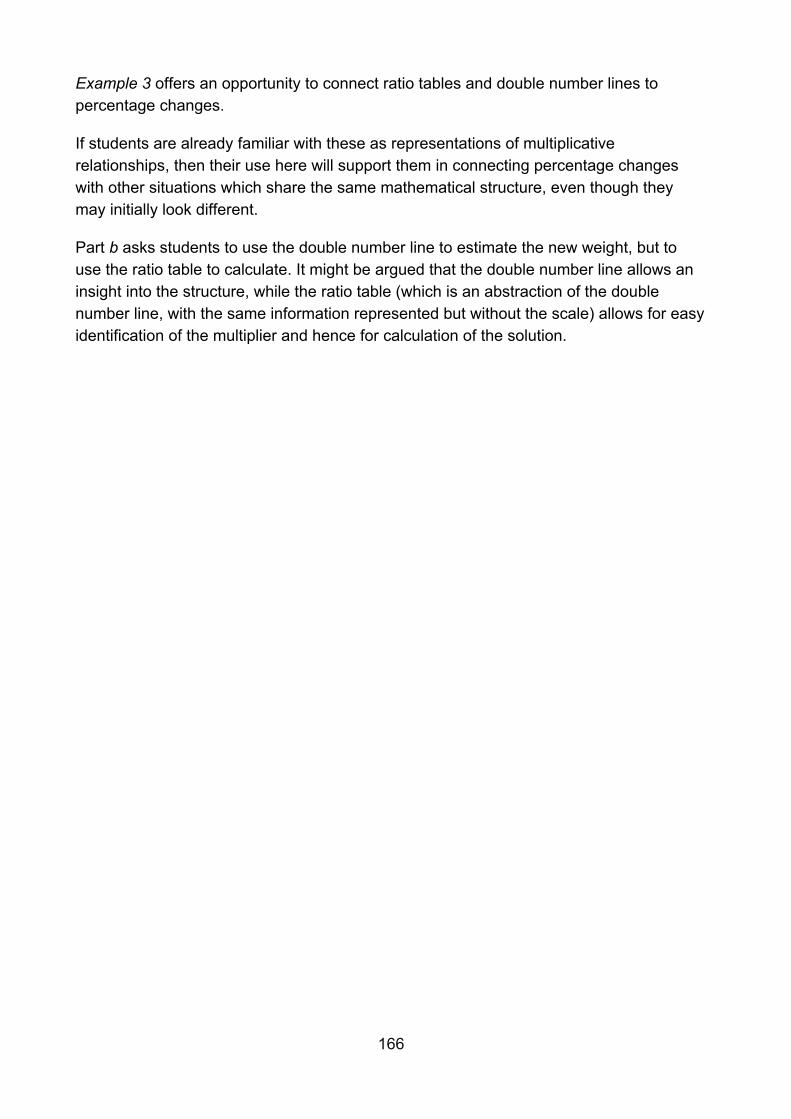
166
Example 3 offers an opportunity to connect ratio tables and double number lines to percentage changes.
If students are already familiar with these as representations of multiplicative relationships, then their use here will support them in connecting percentage changes with other situations which share the same mathematical structure, even though they may initially look different.
Part b asks students to use the double number line to estimate the new weight, but to use the ratio table to calculate. It might be argued that the double number line allows an insight into the structure, while the ratio table (which is an abstraction of the double number line, with the same information represented but without the scale) allows for easy identification of the multiplier and hence for calculation of the solution.
167
Statistical representations and measures
Overview
At Key Stage 2, students encountered the concept of central tendency and learnt how to calculate the (arithmetic) mean. At Key Stage 3, they will develop their knowledge of calculating measures of central tendency to include the mode and median, work with grouped data, and be introduced to a measure of spread in statistics: range. This will enable students to engage in more sophisticated data analysis.
While calculating measures of central tendency accurately and efficiently is important, this should not be the dominant aspect of the learning and teaching in this core concept. It is vital that students have a sense of what the measures of central tendency are actually measuring, and engage in activities which prompt questions, such as:
• How can we use measures of central tendency to compare sets of data? • What do these measures tell us? For example, ‘On average, who has the most
pocket money: class A or class B?’ • How do these measures change when particular data points change? For
example, ‘When considering the average wage in a company, what difference does it make to the various measures when the company director’s salary is added in, or removed?’
Students will construct scatter graphs for the first time, building on the representations covered at Key Stage 2 – bar charts, pie charts and pictograms. Constructing pie charts at Key Stage 3 will involve students making connections with angles, fractions and percentages, and using rulers, protractors and angle measurers. Again, while the accurate construction of such diagrams is important in order to communicate findings clearly, it is also necessary for students to think about when a particular statistical diagram is appropriate and what each type of diagram is communicating about the data. Engagement in a range of real-life, contextual problems that require the collection, analysis and representation of data will be an important part of students’ study in this area.
Prior learning
Before encountering statistical representations and measures at Key Stage 3, students should already have a secure understanding of the following from previous study in Key Stage 2:
• Calculate and interpret the mean as an average. • Draw given angles and measure them in degrees (). • Interpret and construct pie charts and line graphs and use these to solve
problems.
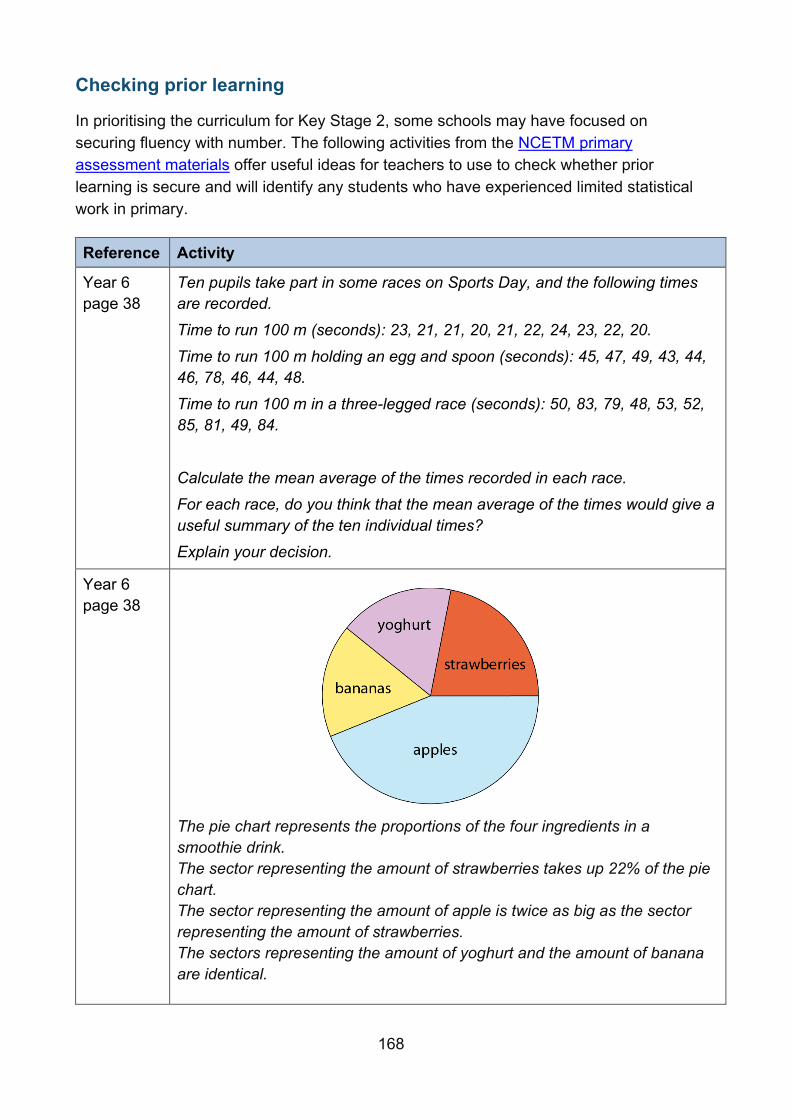
168
Checking prior learning
In prioritising the curriculum for Key Stage 2, some schools may have focused on securing fluency with number. The following activities from the NCETM primary assessment materials offer useful ideas for teachers to use to check whether prior learning is secure and will identify any students who have experienced limited statistical work in primary.
Reference Activity
Year 6 page 38
Ten pupils take part in some races on Sports Day, and the following times are recorded.
Time to run 100 m (seconds): 23, 21, 21, 20, 21, 22, 24, 23, 22, 20.
Time to run 100 m holding an egg and spoon (seconds): 45, 47, 49, 43, 44, 46, 78, 46, 44, 48.
Time to run 100 m in a three-legged race (seconds): 50, 83, 79, 48, 53, 52, 85, 81, 49, 84.
Calculate the mean average of the times recorded in each race.
For each race, do you think that the mean average of the times would give a useful summary of the ten individual times?
Explain your decision.
Year 6 page 38
The pie chart represents the proportions of the four ingredients in a smoothie drink. The sector representing the amount of strawberries takes up 22% of the pie chart. The sector representing the amount of apple is twice as big as the sector representing the amount of strawberries. The sectors representing the amount of yoghurt and the amount of banana are identical.
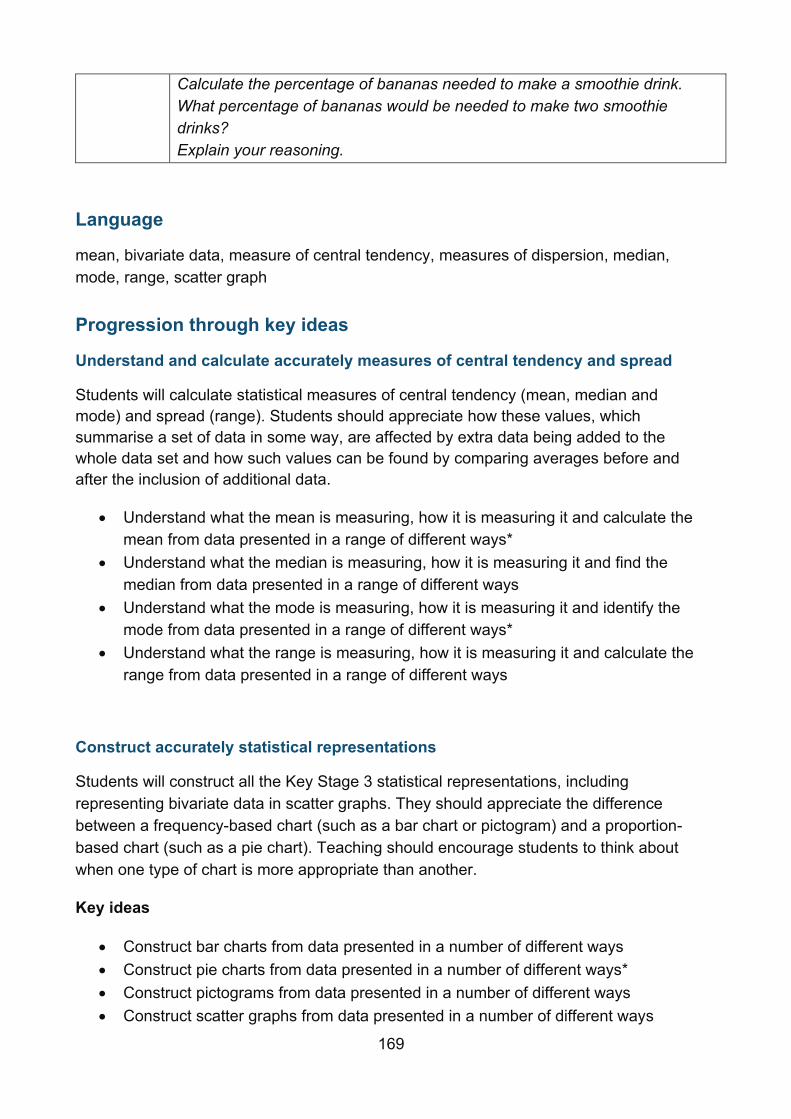
169
Calculate the percentage of bananas needed to make a smoothie drink. What percentage of bananas would be needed to make two smoothie drinks? Explain your reasoning.
Language
mean, bivariate data, measure of central tendency, measures of dispersion, median, mode, range, scatter graph
Progression through key ideas
Understand and calculate accurately measures of central tendency and spread
Students will calculate statistical measures of central tendency (mean, median and mode) and spread (range). Students should appreciate how these values, which summarise a set of data in some way, are affected by extra data being added to the whole data set and how such values can be found by comparing averages before and after the inclusion of additional data.
• Understand what the mean is measuring, how it is measuring it and calculate the mean from data presented in a range of different ways*
• Understand what the median is measuring, how it is measuring it and find the median from data presented in a range of different ways
• Understand what the mode is measuring, how it is measuring it and identify the mode from data presented in a range of different ways*
• Understand what the range is measuring, how it is measuring it and calculate the range from data presented in a range of different ways
Construct accurately statistical representations
Students will construct all the Key Stage 3 statistical representations, including representing bivariate data in scatter graphs. They should appreciate the difference between a frequency-based chart (such as a bar chart or pictogram) and a proportion-based chart (such as a pie chart). Teaching should encourage students to think about when one type of chart is more appropriate than another.
Key ideas
• Construct bar charts from data presented in a number of different ways • Construct pie charts from data presented in a number of different ways* • Construct pictograms from data presented in a number of different ways • Construct scatter graphs from data presented in a number of different ways
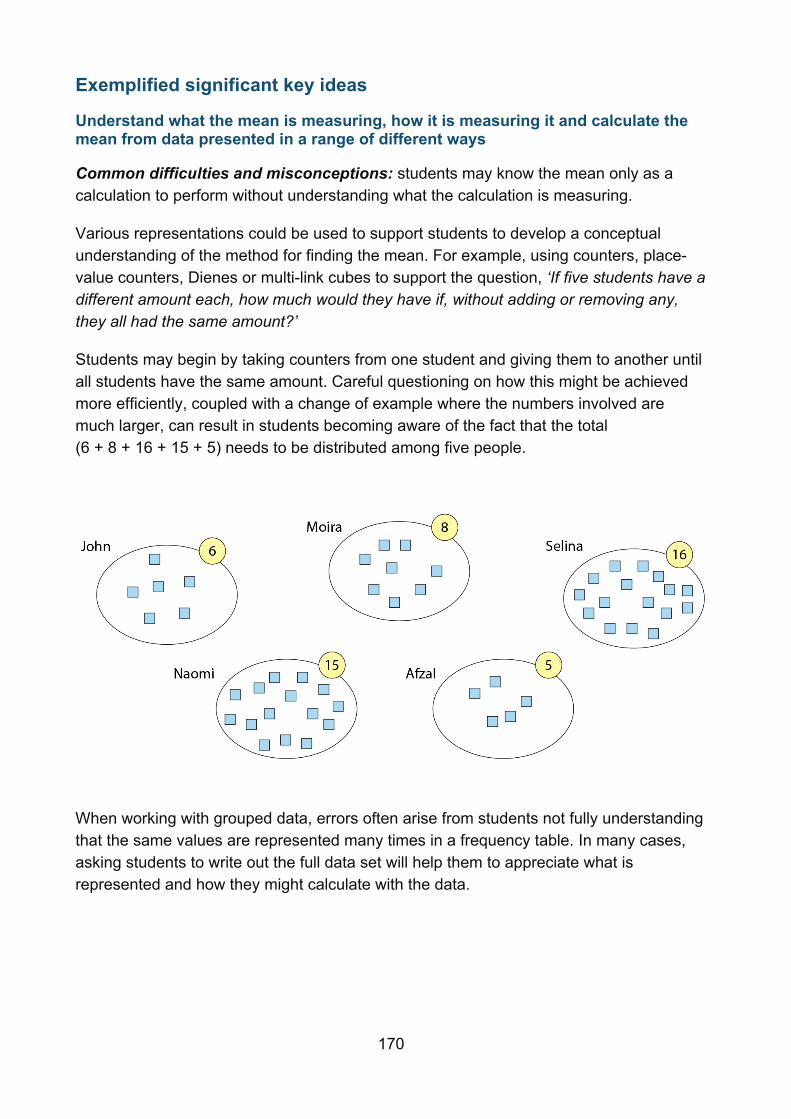
170
Exemplified significant key ideas
Understand what the mean is measuring, how it is measuring it and calculate the mean from data presented in a range of different ways
Common difficulties and misconceptions: students may know the mean only as a calculation to perform without understanding what the calculation is measuring.
Various representations could be used to support students to develop a conceptual understanding of the method for finding the mean. For example, using counters, place-value counters, Dienes or multi-link cubes to support the question, ‘If five students have a different amount each, how much would they have if, without adding or removing any, they all had the same amount?’
Students may begin by taking counters from one student and giving them to another until all students have the same amount. Careful questioning on how this might be achieved more efficiently, coupled with a change of example where the numbers involved are much larger, can result in students becoming aware of the fact that the total (6 + 8 + 16 + 15 + 5) needs to be distributed among five people.
When working with grouped data, errors often arise from students not fully understanding that the same values are represented many times in a frequency table. In many cases, asking students to write out the full data set will help them to appreciate what is represented and how they might calculate with the data.
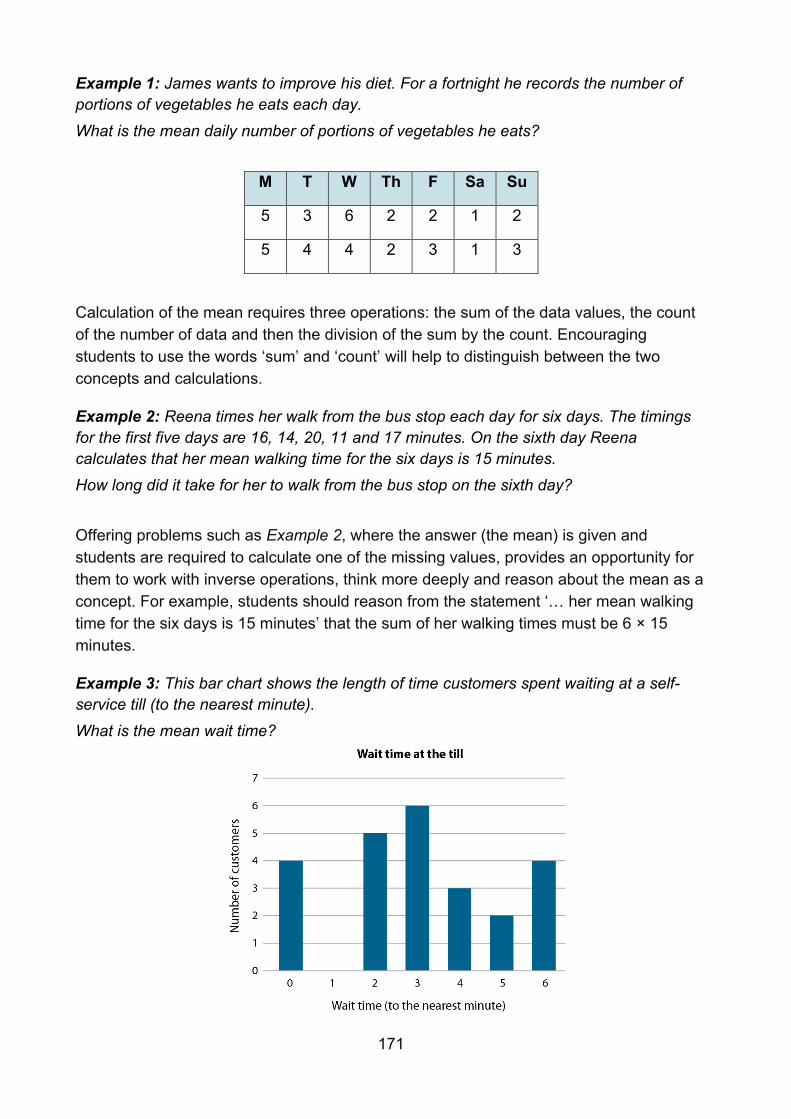
171
Example 1: James wants to improve his diet. For a fortnight he records the number of portions of vegetables he eats each day.
What is the mean daily number of portions of vegetables he eats?
M T W Th F Sa Su
5 3 6 2 2 1 2
5 4 4 2 3 1 3
Calculation of the mean requires three operations: the sum of the data values, the count of the number of data and then the division of the sum by the count. Encouraging students to use the words ‘sum’ and ‘count’ will help to distinguish between the two concepts and calculations.
Example 2: Reena times her walk from the bus stop each day for six days. The timings for the first five days are 16, 14, 20, 11 and 17 minutes. On the sixth day Reena calculates that her mean walking time for the six days is 15 minutes.
How long did it take for her to walk from the bus stop on the sixth day?
Offering problems such as Example 2, where the answer (the mean) is given and students are required to calculate one of the missing values, provides an opportunity for them to work with inverse operations, think more deeply and reason about the mean as a concept. For example, students should reason from the statement ‘… her mean walking time for the six days is 15 minutes’ that the sum of her walking times must be 6 × 15 minutes.
Example 3: This bar chart shows the length of time customers spent waiting at a self-service till (to the nearest minute).
What is the mean wait time?
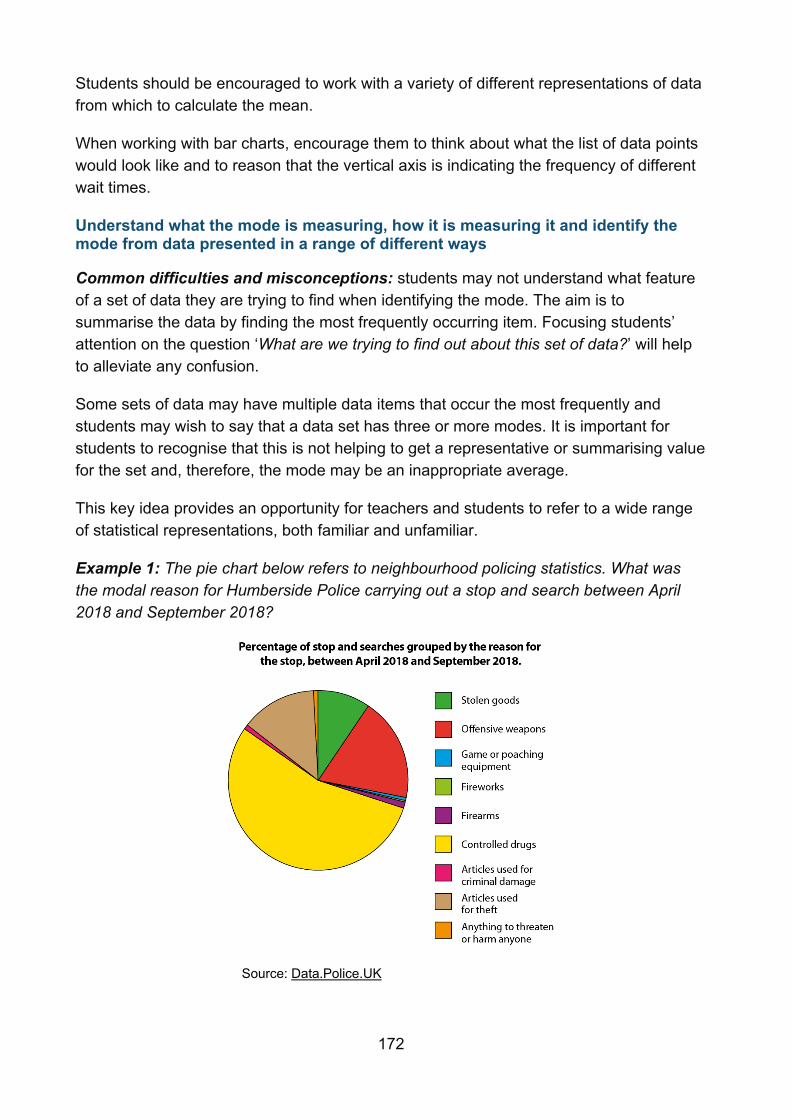
172
Students should be encouraged to work with a variety of different representations of data from which to calculate the mean.
When working with bar charts, encourage them to think about what the list of data points would look like and to reason that the vertical axis is indicating the frequency of different wait times.
Understand what the mode is measuring, how it is measuring it and identify the mode from data presented in a range of different ways
Common difficulties and misconceptions: students may not understand what feature of a set of data they are trying to find when identifying the mode. The aim is to summarise the data by finding the most frequently occurring item. Focusing students’ attention on the question ‘What are we trying to find out about this set of data?’ will help to alleviate any confusion.
Some sets of data may have multiple data items that occur the most frequently and students may wish to say that a data set has three or more modes. It is important for students to recognise that this is not helping to get a representative or summarising value for the set and, therefore, the mode may be an inappropriate average.
This key idea provides an opportunity for teachers and students to refer to a wide range of statistical representations, both familiar and unfamiliar.
Example 1: The pie chart below refers to neighbourhood policing statistics. What was the modal reason for Humberside Police carrying out a stop and search between April 2018 and September 2018?
Source: Data.Police.UK
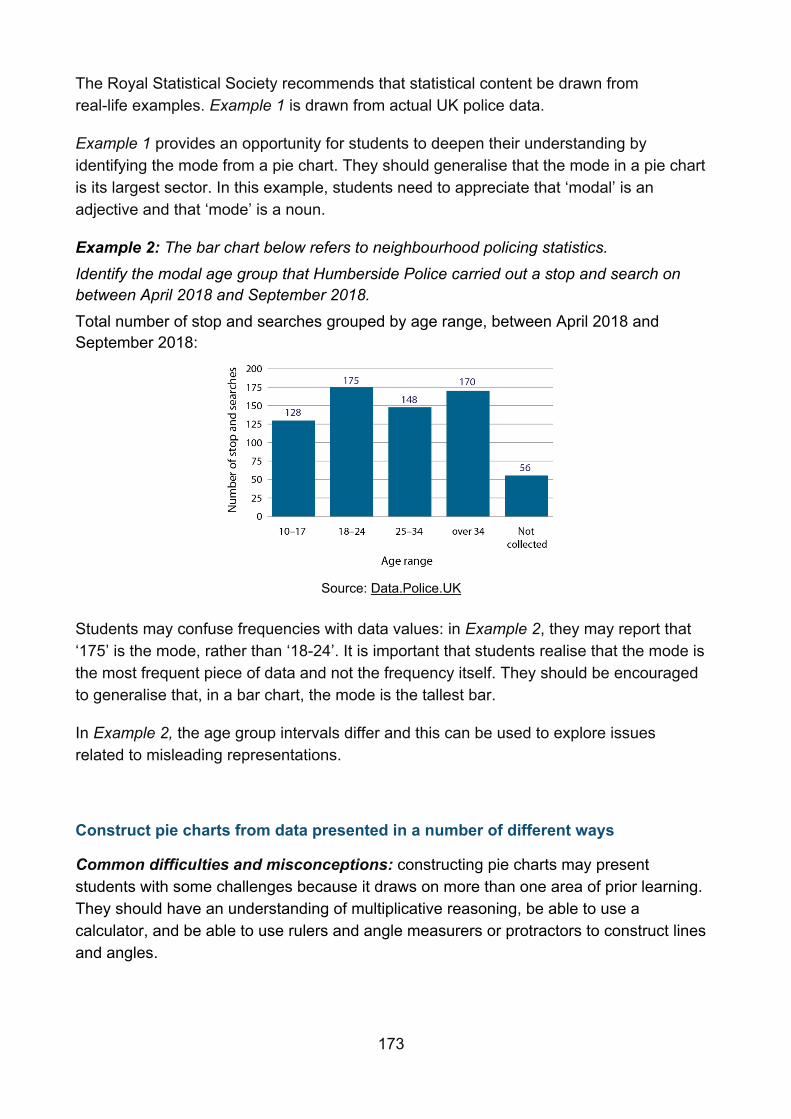
173
The Royal Statistical Society recommends that statistical content be drawn from real-life examples. Example 1 is drawn from actual UK police data.
Example 1 provides an opportunity for students to deepen their understanding by identifying the mode from a pie chart. They should generalise that the mode in a pie chart is its largest sector. In this example, students need to appreciate that ‘modal’ is an adjective and that ‘mode’ is a noun.
Example 2: The bar chart below refers to neighbourhood policing statistics.
Identify the modal age group that Humberside Police carried out a stop and search on between April 2018 and September 2018.
Total number of stop and searches grouped by age range, between April 2018 and September 2018:
Source: Data.Police.UK
Students may confuse frequencies with data values: in Example 2, they may report that ‘175’ is the mode, rather than ‘18-24’. It is important that students realise that the mode is the most frequent piece of data and not the frequency itself. They should be encouraged to generalise that, in a bar chart, the mode is the tallest bar.
In Example 2, the age group intervals differ and this can be used to explore issues related to misleading representations.
Construct pie charts from data presented in a number of different ways
Common difficulties and misconceptions: constructing pie charts may present students with some challenges because it draws on more than one area of prior learning. They should have an understanding of multiplicative reasoning, be able to use a calculator, and be able to use rulers and angle measurers or protractors to construct lines and angles.
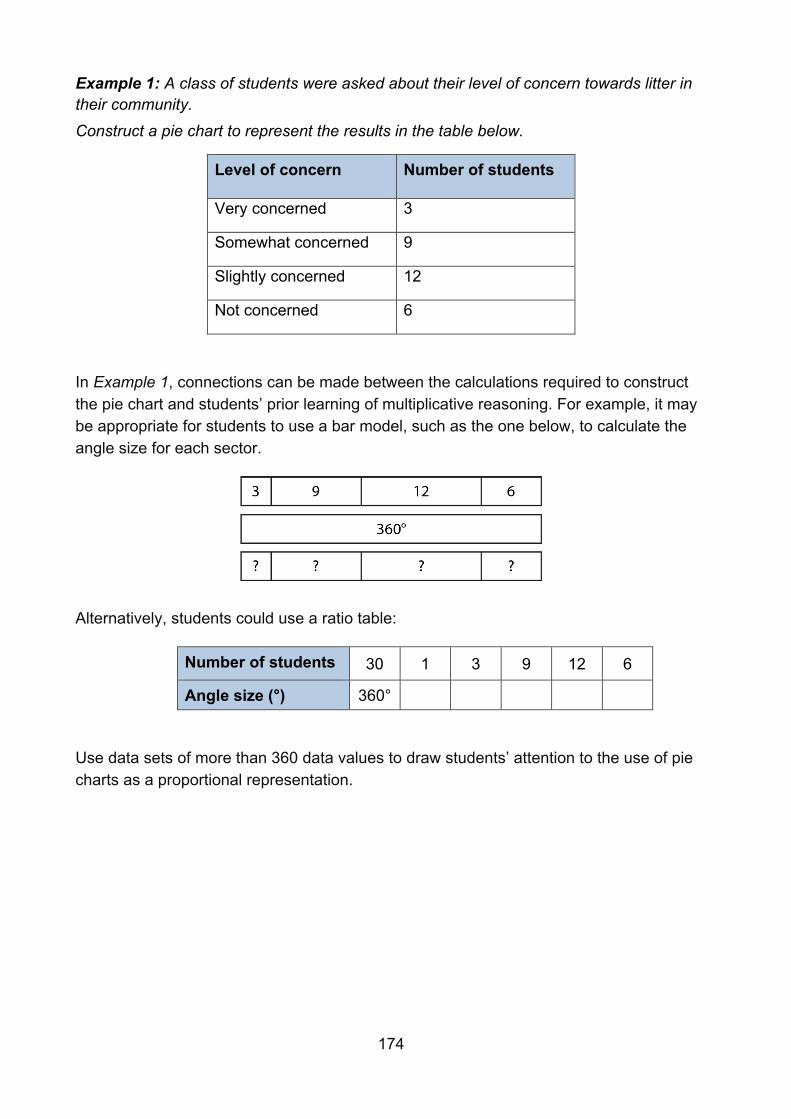
174
Example 1: A class of students were asked about their level of concern towards litter in their community.
Construct a pie chart to represent the results in the table below.
Level of concern Number of students
Very concerned 3
Somewhat concerned 9
Slightly concerned 12
Not concerned 6
In Example 1, connections can be made between the calculations required to construct the pie chart and students’ prior learning of multiplicative reasoning. For example, it may be appropriate for students to use a bar model, such as the one below, to calculate the angle size for each sector.
Alternatively, students could use a ratio table:
Number of students 30 1 3 9 12 6
Angle size (°) 360°
Use data sets of more than 360 data values to draw students’ attention to the use of pie charts as a proportional representation.
175
Statistical analysis
Overview
When students worked with statistics at Key Stage 2, they chose the most appropriate representations for data and explained the reasons for their choice. They interpreted and constructed pie charts and line graphs to solve problems and may have also encountered and drawn graphs relating two variables. They will have had experience of calculating the mean as an average and will know when it is appropriate to find the mean of a data set.
A key skill for students to develop at Key Stage 3 is the ability to make an informed choice of what statistical analysis and representation to use for discrete, continuous and grouped data. Being able to construct representations and calculate values that indicate a measure of central tendency or of spread is important in order to represent and summarise data accurately. Just as important is the need for students to be able to make an informed choice about what statistical tools to use, and understand the effect that these choices have on the interpretation – and misinterpretation – of data, including the potential impact of outliers.
The use of real-life examples will play an important part in developing students’ understanding of the various ways that statistics can be used to represent data sets. Analysis of authentic statistics will also help students to appreciate the meaning and significance of different ways of presenting data.
Students should understand the importance of having both a measure of central tendency (mean, median and mode) and a measure of spread (range, including a consideration of outliers) in order to appreciate the distribution of a set of data. They should be presented with summary data to interrogate, so that they can appreciate the limitations of such information when the raw data is no longer available. Students can use spreadsheets and other technologies in their interrogation of statistics, and analyse large and more complex data sets. Dealing with inaccuracies, outliers and other contextual issues will give students a greater appreciation of the realistic nature of statistical analysis.
Additionally, students should have opportunities to describe simple mathematical relationships between two variables (bivariate data) in observational and experimental contexts, and to illustrate such relationships using scatter graphs. This will be developed further in Key Stage 4, alongside more sophisticated measures of central tendency (including modal class) and spread (including quartiles and inter-quartile range).
Prior learning
Before beginning statistical analysis at Key Stage 3, students may already have a secure understanding of the following from previous study in Key Stage 2:
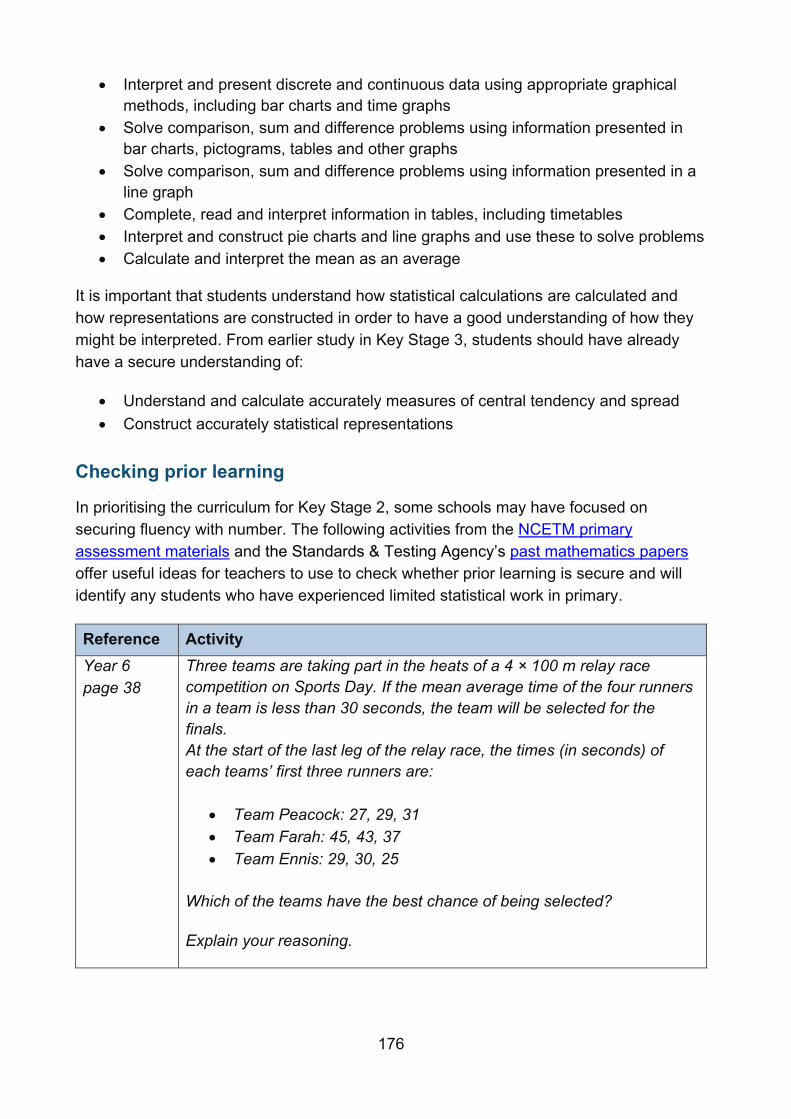
176
• Interpret and present discrete and continuous data using appropriate graphical methods, including bar charts and time graphs
• Solve comparison, sum and difference problems using information presented in bar charts, pictograms, tables and other graphs
• Solve comparison, sum and difference problems using information presented in a line graph
• Complete, read and interpret information in tables, including timetables • Interpret and construct pie charts and line graphs and use these to solve problems • Calculate and interpret the mean as an average
It is important that students understand how statistical calculations are calculated and how representations are constructed in order to have a good understanding of how they might be interpreted. From earlier study in Key Stage 3, students should have already have a secure understanding of:
• Understand and calculate accurately measures of central tendency and spread • Construct accurately statistical representations
Checking prior learning
In prioritising the curriculum for Key Stage 2, some schools may have focused on securing fluency with number. The following activities from the NCETM primary assessment materials and the Standards & Testing Agency’s past mathematics papers offer useful ideas for teachers to use to check whether prior learning is secure and will identify any students who have experienced limited statistical work in primary.
Reference Activity Year 6 page 38
Three teams are taking part in the heats of a 4 × 100 m relay race competition on Sports Day. If the mean average time of the four runners in a team is less than 30 seconds, the team will be selected for the finals. At the start of the last leg of the relay race, the times (in seconds) of each teams’ first three runners are:
• Team Peacock: 27, 29, 31 • Team Farah: 45, 43, 37 • Team Ennis: 29, 30, 25
Which of the teams have the best chance of being selected? Explain your reasoning.
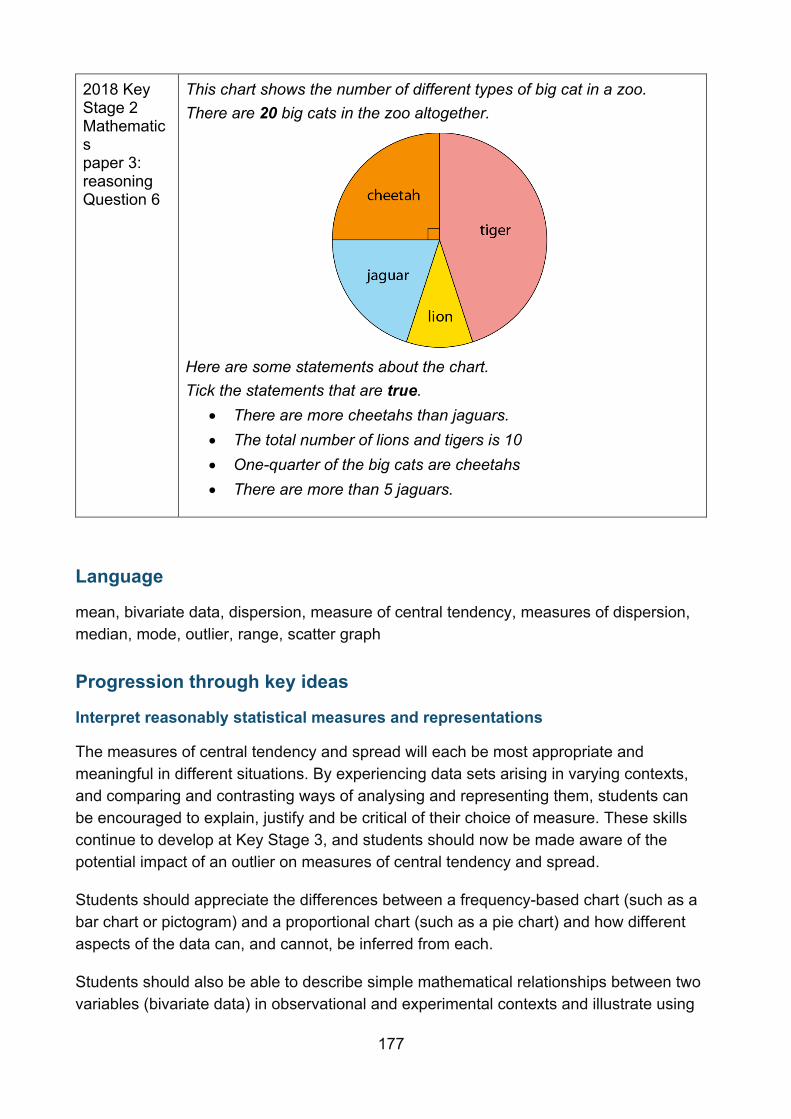
177
2018 Key Stage 2 Mathematics paper 3: reasoning Question 6
This chart shows the number of different types of big cat in a zoo. There are 20 big cats in the zoo altogether.
Here are some statements about the chart. Tick the statements that are true.
• There are more cheetahs than jaguars. • The total number of lions and tigers is 10 • One-quarter of the big cats are cheetahs • There are more than 5 jaguars.
Language
mean, bivariate data, dispersion, measure of central tendency, measures of dispersion, median, mode, outlier, range, scatter graph
Progression through key ideas
Interpret reasonably statistical measures and representations
The measures of central tendency and spread will each be most appropriate and meaningful in different situations. By experiencing data sets arising in varying contexts, and comparing and contrasting ways of analysing and representing them, students can be encouraged to explain, justify and be critical of their choice of measure. These skills continue to develop at Key Stage 3, and students should now be made aware of the potential impact of an outlier on measures of central tendency and spread.
Students should appreciate the differences between a frequency-based chart (such as a bar chart or pictogram) and a proportional chart (such as a pie chart) and how different aspects of the data can, and cannot, be inferred from each.
Students should also be able to describe simple mathematical relationships between two variables (bivariate data) in observational and experimental contexts and illustrate using
178
scatter graphs. In Key Stage 4, students will secure and deepen this understanding by exploring correlation and causation, using estimated lines of best fit to make predictions and interpolating and extrapolating apparent trends while being aware of the risks of doing so.
Key ideas
• Understand that the different measures of central tendency offer a summary of a set of data
• Understand how certain statistical measures may change as a result of changes in data
• Understand range as a measure of spread, including a consideration of outliers • Understand that the different statistical representations offer different insights into
a set of data • Use the different measures of central tendency and spread to compare two sets of
data* • Use the different statistical representations to compare two sets of data • Recognise relationships between bivariate data represented on a scatter graph
Choose appropriately statistical measures and representations
Situations that require statistical techniques to be employed will probably begin with an issue, a question or a problem. For example, ‘Which was the wettest month this year?’ or ‘What different flavours of crisps (and how many packets) should we order for the school tuck shop each month?’. These situations require a number of decisions to be made:
• Which data do I need to collect? • How will I organise this data? • How will I analyse this data in order to address the original
issue/question/problem? • Which representation should I choose in order to address the original
issue/question/problem and communicate clearly my findings?
Students should have the opportunity to consider all of these aspects at different stages of their work on statistics. The use of real-life contexts and issues are important to give statistics meaning.
They should be given opportunities to solve problems that do not necessarily have a correct answer, but be required to justify decisions made and be challenged. As statistical problems often involve prediction of trends and forecasting, probability could be linked with this element of problem solving, so students begin to gain an understanding of confidence and statistical significance. This is more fully developed in Key Stage 4.
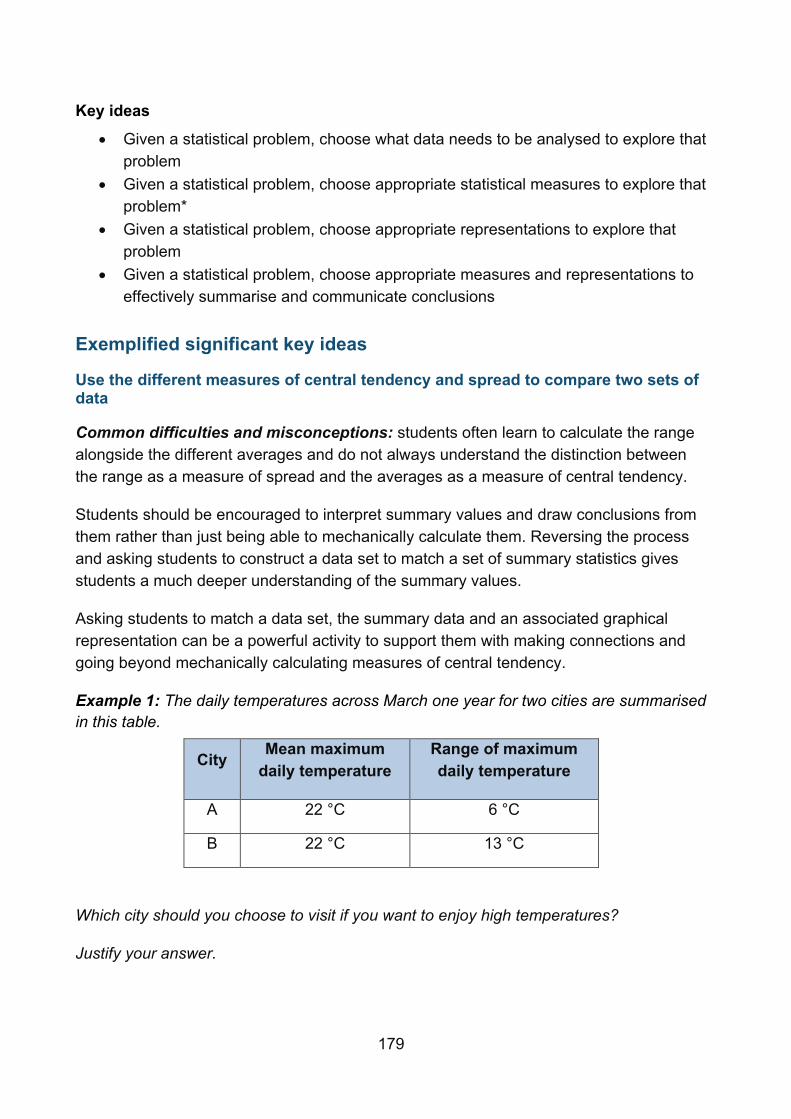
179
Key ideas
• Given a statistical problem, choose what data needs to be analysed to explore that problem
• Given a statistical problem, choose appropriate statistical measures to explore that problem*
• Given a statistical problem, choose appropriate representations to explore that problem
• Given a statistical problem, choose appropriate measures and representations to effectively summarise and communicate conclusions
Exemplified significant key ideas
Use the different measures of central tendency and spread to compare two sets of data
Common difficulties and misconceptions: students often learn to calculate the range alongside the different averages and do not always understand the distinction between the range as a measure of spread and the averages as a measure of central tendency.
Students should be encouraged to interpret summary values and draw conclusions from them rather than just being able to mechanically calculate them. Reversing the process and asking students to construct a data set to match a set of summary statistics gives students a much deeper understanding of the summary values.
Asking students to match a data set, the summary data and an associated graphical representation can be a powerful activity to support them with making connections and going beyond mechanically calculating measures of central tendency.
Example 1: The daily temperatures across March one year for two cities are summarised in this table.
City Mean maximum daily temperature
Range of maximum daily temperature
A 22 °C 6 °C
B 22 °C 13 °C
Which city should you choose to visit if you want to enjoy high temperatures?
Justify your answer.
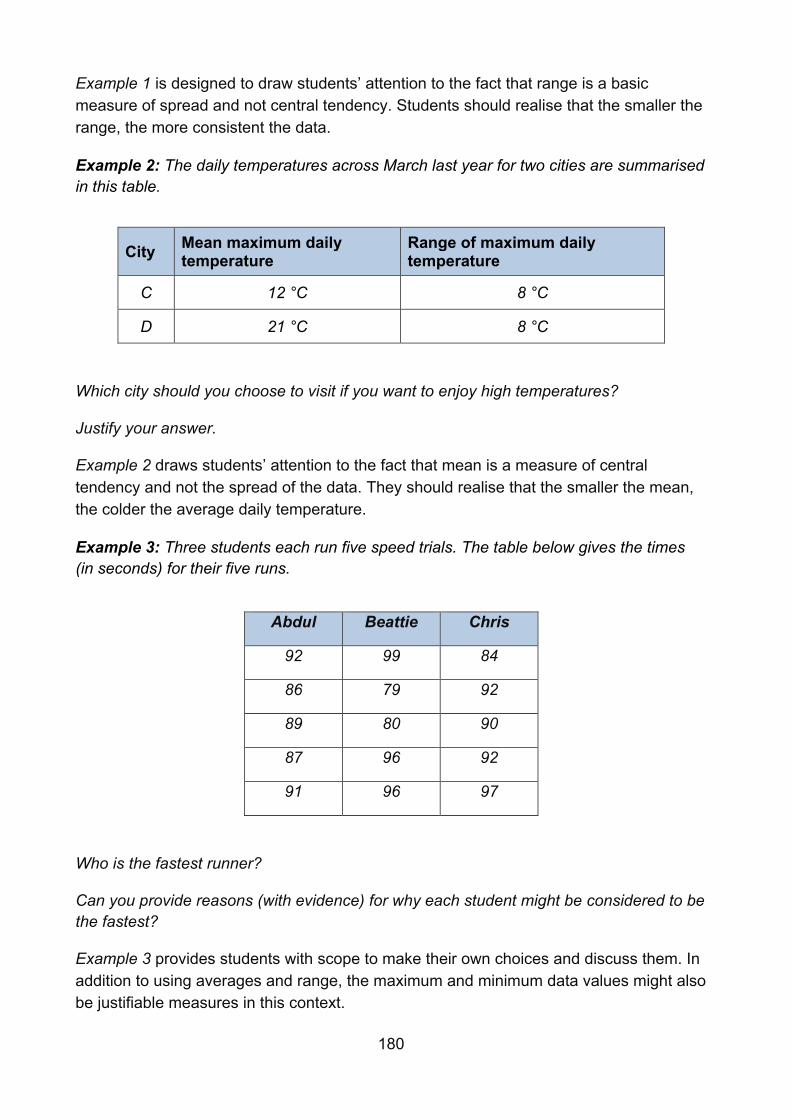
180
Example 1 is designed to draw students’ attention to the fact that range is a basic measure of spread and not central tendency. Students should realise that the smaller the range, the more consistent the data.
Example 2: The daily temperatures across March last year for two cities are summarised in this table.
City Mean maximum daily temperature
Range of maximum daily temperature
C 12 °C 8 °C
D 21 °C 8 °C
Which city should you choose to visit if you want to enjoy high temperatures?
Justify your answer.
Example 2 draws students’ attention to the fact that mean is a measure of central tendency and not the spread of the data. They should realise that the smaller the mean, the colder the average daily temperature.
Example 3: Three students each run five speed trials. The table below gives the times (in seconds) for their five runs.
Abdul Beattie Chris
92 99 84
86 79 92
89 80 90
87 96 92
91 96 97
Who is the fastest runner?
Can you provide reasons (with evidence) for why each student might be considered to be the fastest?
Example 3 provides students with scope to make their own choices and discuss them. In addition to using averages and range, the maximum and minimum data values might also be justifiable measures in this context.
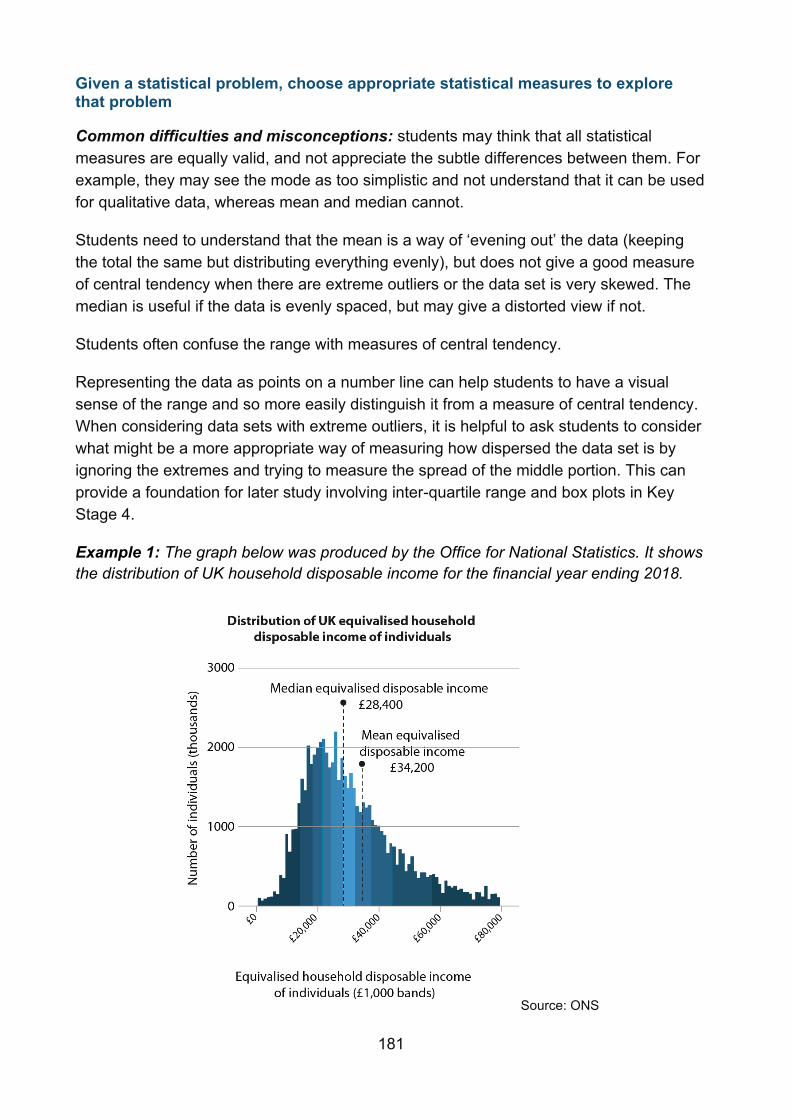
181
Given a statistical problem, choose appropriate statistical measures to explore that problem
Common difficulties and misconceptions: students may think that all statistical measures are equally valid, and not appreciate the subtle differences between them. For example, they may see the mode as too simplistic and not understand that it can be used for qualitative data, whereas mean and median cannot.
Students need to understand that the mean is a way of ‘evening out’ the data (keeping the total the same but distributing everything evenly), but does not give a good measure of central tendency when there are extreme outliers or the data set is very skewed. The median is useful if the data is evenly spaced, but may give a distorted view if not.
Students often confuse the range with measures of central tendency.
Representing the data as points on a number line can help students to have a visual sense of the range and so more easily distinguish it from a measure of central tendency. When considering data sets with extreme outliers, it is helpful to ask students to consider what might be a more appropriate way of measuring how dispersed the data set is by ignoring the extremes and trying to measure the spread of the middle portion. This can provide a foundation for later study involving inter-quartile range and box plots in Key Stage 4.
Example 1: The graph below was produced by the Office for National Statistics. It shows the distribution of UK household disposable income for the financial year ending 2018.
Source: ONS
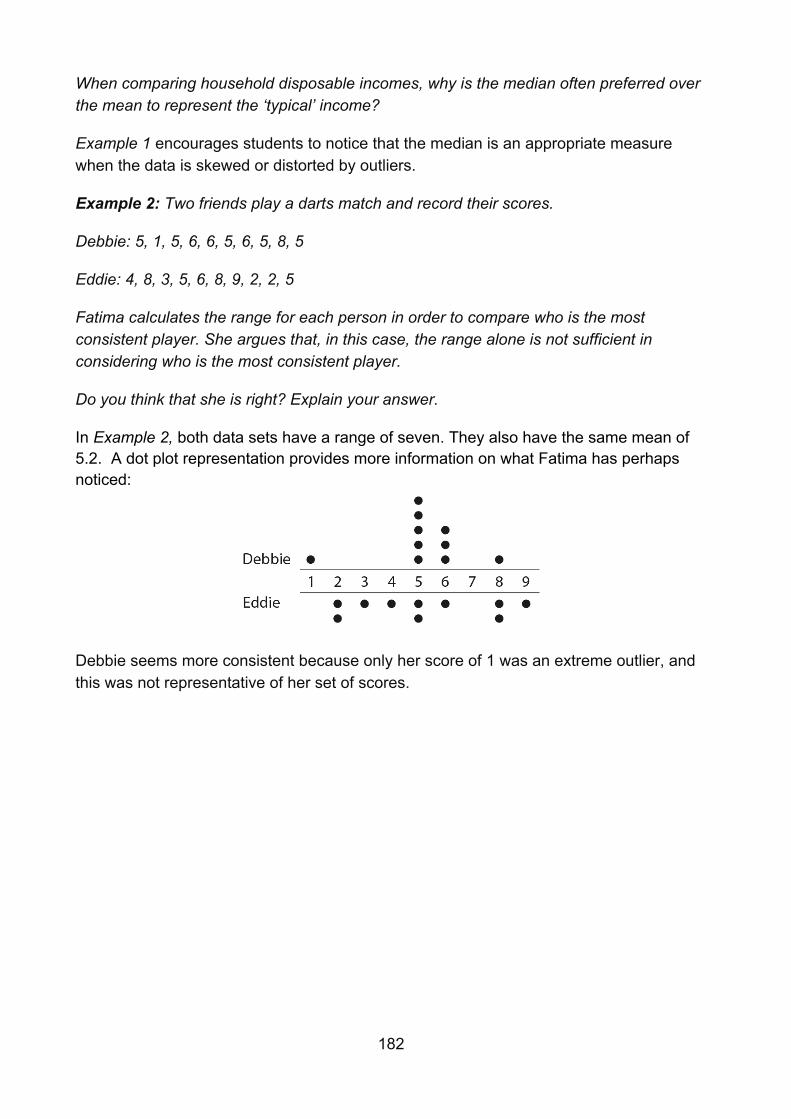
182
When comparing household disposable incomes, why is the median often preferred over the mean to represent the ‘typical’ income?
Example 1 encourages students to notice that the median is an appropriate measure when the data is skewed or distorted by outliers.
Example 2: Two friends play a darts match and record their scores.
Debbie: 5, 1, 5, 6, 6, 5, 6, 5, 8, 5
Eddie: 4, 8, 3, 5, 6, 8, 9, 2, 2, 5
Fatima calculates the range for each person in order to compare who is the most consistent player. She argues that, in this case, the range alone is not sufficient in considering who is the most consistent player.
Do you think that she is right? Explain your answer.
In Example 2, both data sets have a range of seven. They also have the same mean of 5.2. A dot plot representation provides more information on what Fatima has perhaps noticed:
Debbie seems more consistent because only her score of 1 was an extreme outlier, and this was not representative of her set of scores.
183
Year 8 summer term
Perimeter, area and volume
Overview
At Key Stage 2, students will have had the opportunity to measure the perimeter of simple 2D shapes; find the area by counting squares; and estimate volume by counting blocks. They should have calculated the area of rectangles, triangles and parallelograms, and the volume of cubes and cuboids using formulae. They should also have had opportunities to develop their conceptual understanding by relating the area of rectangles to parallelograms and triangles.
The extent to which students have explored these concepts may vary. There is a danger that the study of this element of the curriculum could be reduced to memorising formulae and the execution of learnt procedures. It is important that students have a secure and deep understanding of perimeter, area and volume before further developing these ideas in Key Stage 3. Students should fully understand the concepts involved; appreciate how the various formulae are derived and connected; and reason mathematically to solve a wide range of problems, including those in new and unfamiliar situations.
Earlier in Key Stage 3, when calculating perimeters, students will likely have already used the properties of parallelograms, isosceles triangles and trapezia, as well as non-standard shapes; and reasoned mathematically to deduce missing information. They will now build on this to learn about the perimeter (circumference) of circles and that the ratio between circumference and diameter is the same for all circles. When calculating areas, this will include students using their knowledge of area of circles and the surface area of prisms.
Prior learning
Before beginning perimeter, area and volume at Key Stage 3, students should already have a secure understanding of the following learning outcomes from study at upper Key Stage 2:
• Find the area of rectilinear shapes by counting squares. • Measure and calculate the perimeter of composite rectilinear shapes in
centimetres and metres. • Calculate and compare the area of rectangles (including squares), and including
using standard units, square centimetres (cm²) and square metres (m²) and estimate the area of irregular shapes.
• Estimate volume (for example, using 1 cm³ blocks to build cuboids [including cubes]) and capacity (for example, using water).
184
• Recognise that shapes with the same areas can have different perimeters and vice versa
• Recognise when it is possible to use formulae for area and volume of shapes • Calculate the area of parallelograms and triangles • Calculate, estimate and compare volume of cubes and cuboids using standard
units, including cubic centimetres (cm³) and cubic metres (m³), and extending to other units [for example, mm³ and km³]
and earlier in Key Stage 3:
• Use the properties of a range of polygons to deduce their perimeters • Derive and use the formula for the area of a trapezium • Understand that the areas of composite shapes can be found in different ways.
The NCETM has created the following Key Stage 2 ready-to-progress criteria to support teachers in making judgements about students’ understanding and knowledge.
5G-2 Compare areas and calculate the area of rectangles (including squares) using standard units.
6G-1 Draw, compose, and decompose shapes according to given properties, including dimensions, angles and area, and solve related problems.
Checking prior learning
The following activities from the NCETM primary assessment materials and the NCETM secondary assessment materials offer useful ideas for teachers to use to check whether prior learning is secure.
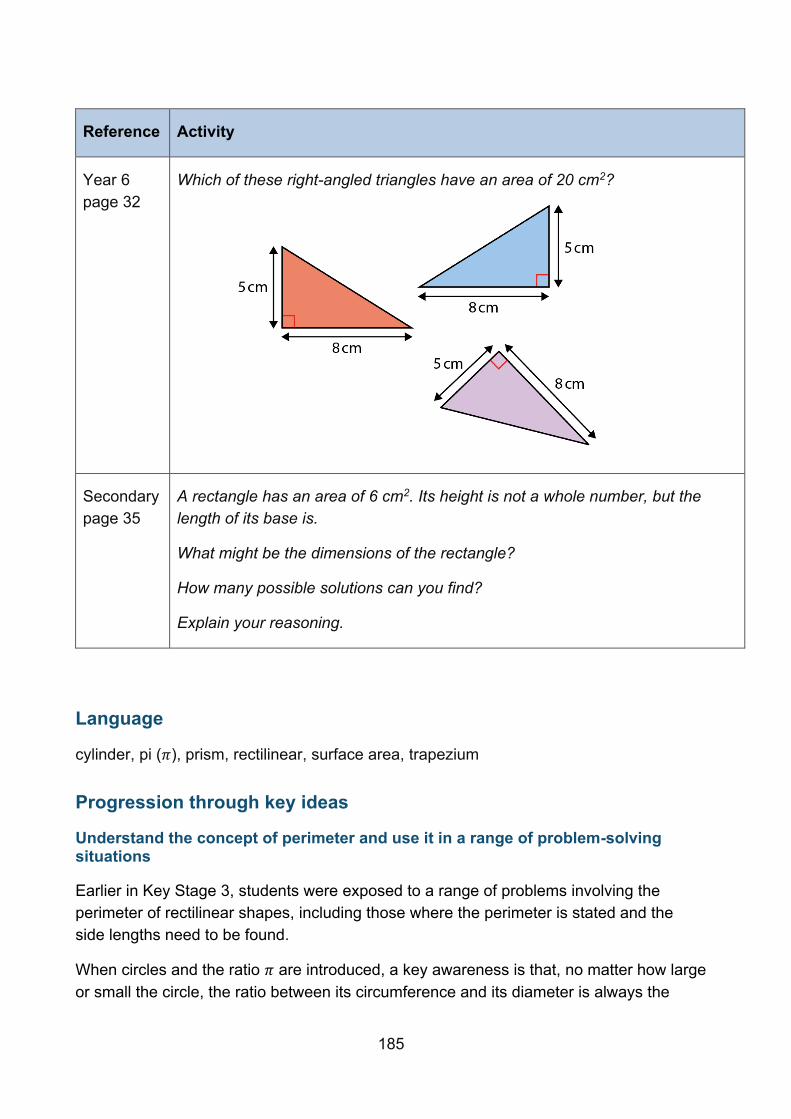
185
Reference Activity
Year 6 page 32
Which of these right-angled triangles have an area of 20 cm2?
Secondary page 35
A rectangle has an area of 6 cm2. Its height is not a whole number, but the length of its base is.
What might be the dimensions of the rectangle?
How many possible solutions can you find?
Explain your reasoning.
Language
cylinder, pi (𝜋), prism, rectilinear, surface area, trapezium
Progression through key ideas
Understand the concept of perimeter and use it in a range of problem-solving situations
Earlier in Key Stage 3, students were exposed to a range of problems involving the perimeter of rectilinear shapes, including those where the perimeter is stated and the side lengths need to be found.
When circles and the ratio 𝜋 are introduced, a key awareness is that, no matter how large or small the circle, the ratio between its circumference and its diameter is always the
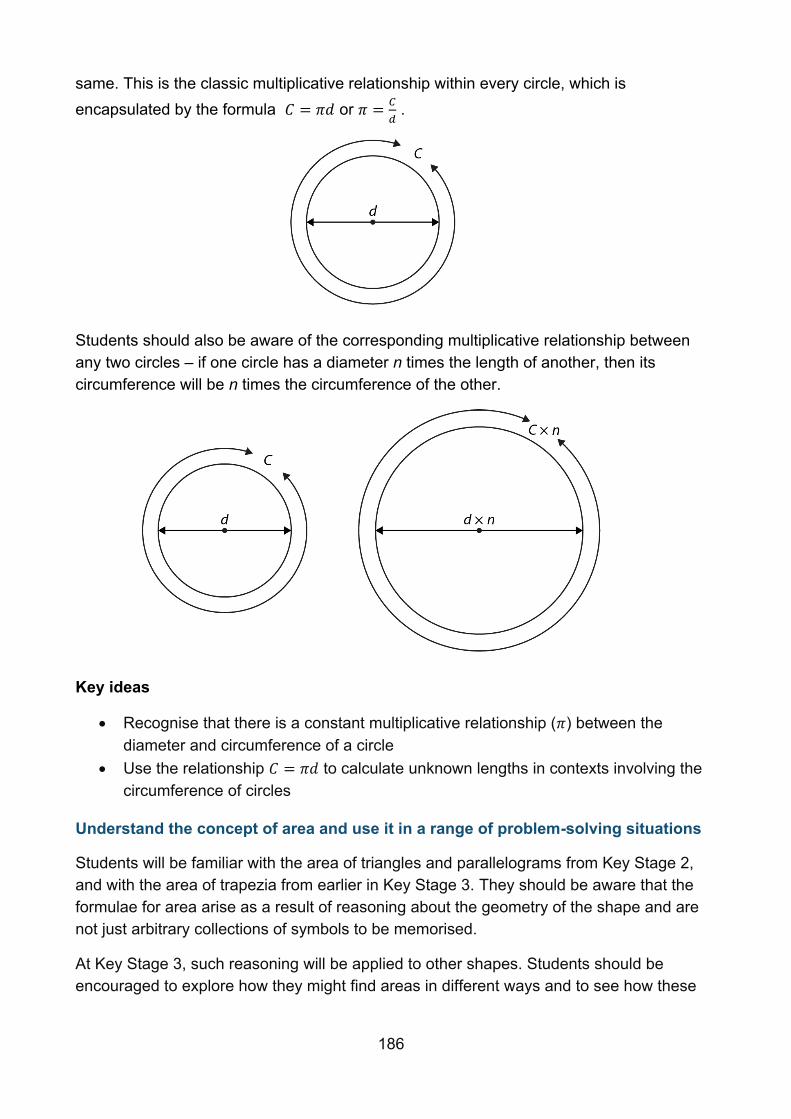
186
same. This is the classic multiplicative relationship within every circle, which is encapsulated by the formula 𝐶 = 𝜋𝑑 or 𝜋 =
𝐶
𝑑 .
Students should also be aware of the corresponding multiplicative relationship between any two circles – if one circle has a diameter n times the length of another, then its circumference will be n times the circumference of the other.
Key ideas
• Recognise that there is a constant multiplicative relationship (𝜋) between the diameter and circumference of a circle
• Use the relationship 𝐶 = 𝜋𝑑 to calculate unknown lengths in contexts involving the circumference of circles
Understand the concept of area and use it in a range of problem-solving situations
Students will be familiar with the area of triangles and parallelograms from Key Stage 2, and with the area of trapezia from earlier in Key Stage 3. They should be aware that the formulae for area arise as a result of reasoning about the geometry of the shape and are not just arbitrary collections of symbols to be memorised.
At Key Stage 3, such reasoning will be applied to other shapes. Students should be encouraged to explore how they might find areas in different ways and to see how these
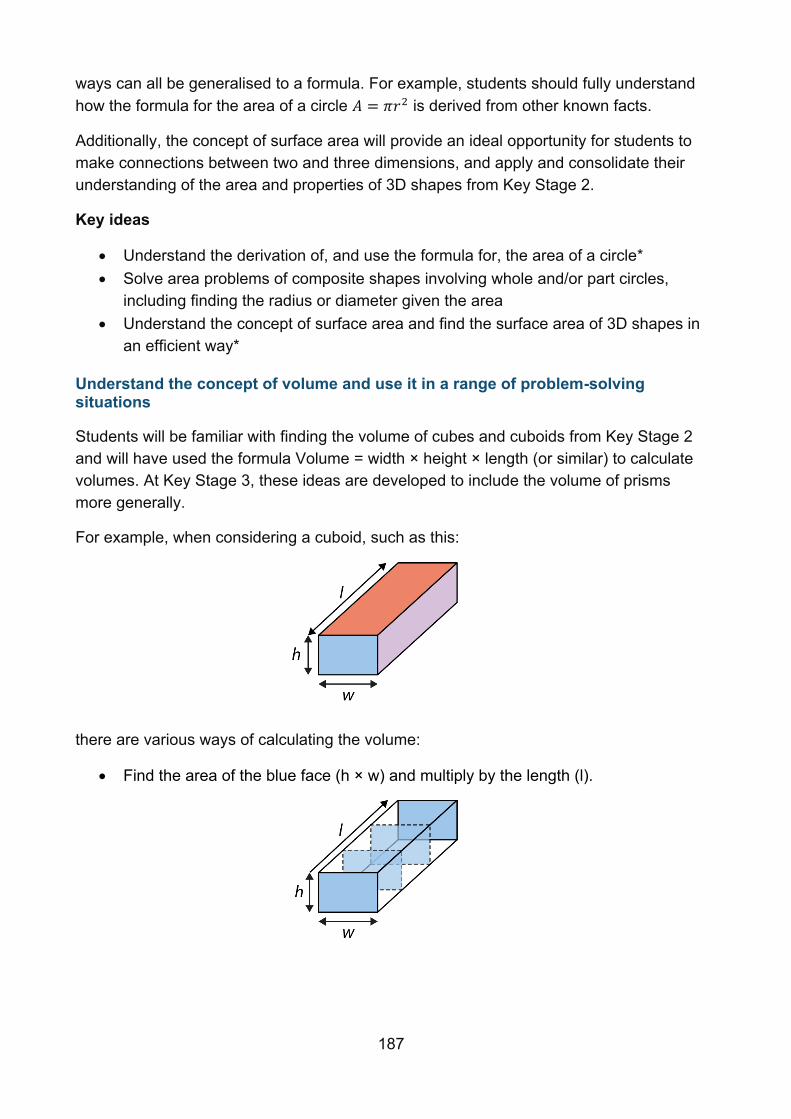
187
ways can all be generalised to a formula. For example, students should fully understand how the formula for the area of a circle 𝐴 = 𝜋𝑟2 is derived from other known facts.
Additionally, the concept of surface area will provide an ideal opportunity for students to make connections between two and three dimensions, and apply and consolidate their understanding of the area and properties of 3D shapes from Key Stage 2.
Key ideas
• Understand the derivation of, and use the formula for, the area of a circle* • Solve area problems of composite shapes involving whole and/or part circles,
including finding the radius or diameter given the area • Understand the concept of surface area and find the surface area of 3D shapes in
an efficient way*
Understand the concept of volume and use it in a range of problem-solving situations
Students will be familiar with finding the volume of cubes and cuboids from Key Stage 2 and will have used the formula Volume = width × height × length (or similar) to calculate volumes. At Key Stage 3, these ideas are developed to include the volume of prisms more generally.
For example, when considering a cuboid, such as this:
there are various ways of calculating the volume:
• Find the area of the blue face (h × w) and multiply by the length (l).
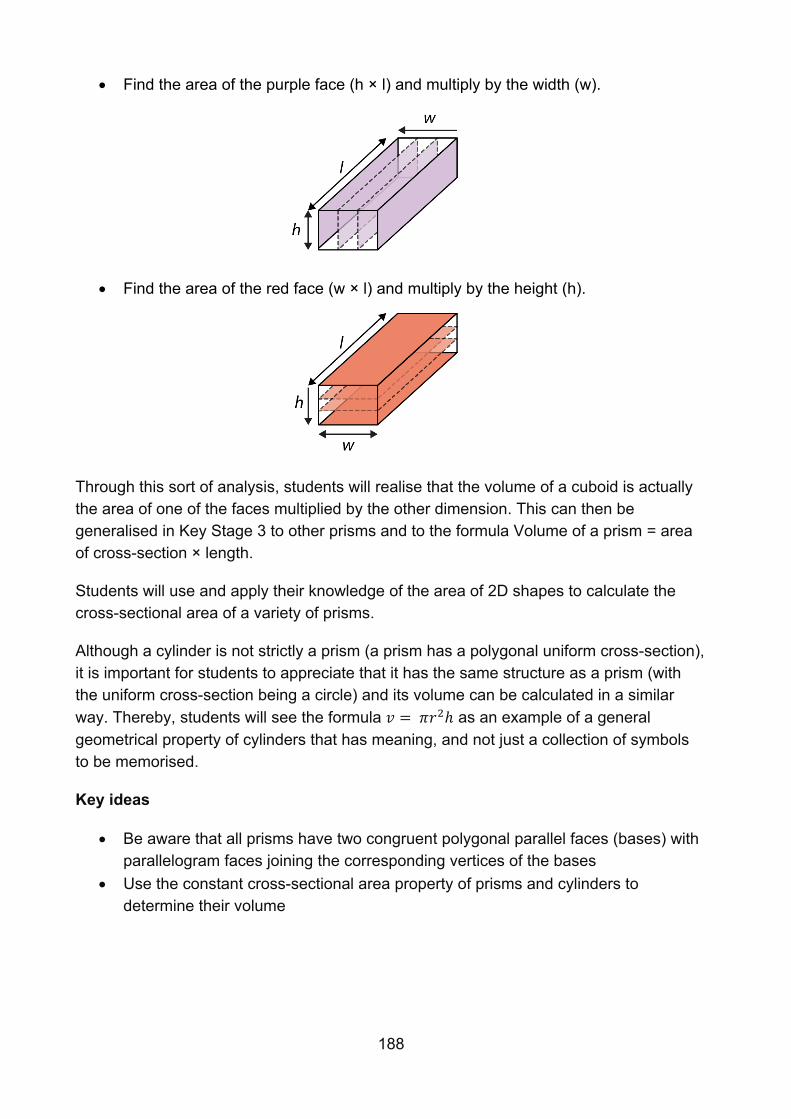
188
• Find the area of the purple face (h × l) and multiply by the width (w).
• Find the area of the red face (w × l) and multiply by the height (h).
Through this sort of analysis, students will realise that the volume of a cuboid is actually the area of one of the faces multiplied by the other dimension. This can then be generalised in Key Stage 3 to other prisms and to the formula Volume of a prism = area of cross-section × length.
Students will use and apply their knowledge of the area of 2D shapes to calculate the cross-sectional area of a variety of prisms.
Although a cylinder is not strictly a prism (a prism has a polygonal uniform cross-section), it is important for students to appreciate that it has the same structure as a prism (with the uniform cross-section being a circle) and its volume can be calculated in a similar way. Thereby, students will see the formula 𝑣 = 𝜋𝑟2ℎ as an example of a general geometrical property of cylinders that has meaning, and not just a collection of symbols to be memorised.
Key ideas
• Be aware that all prisms have two congruent polygonal parallel faces (bases) with parallelogram faces joining the corresponding vertices of the bases
• Use the constant cross-sectional area property of prisms and cylinders to determine their volume
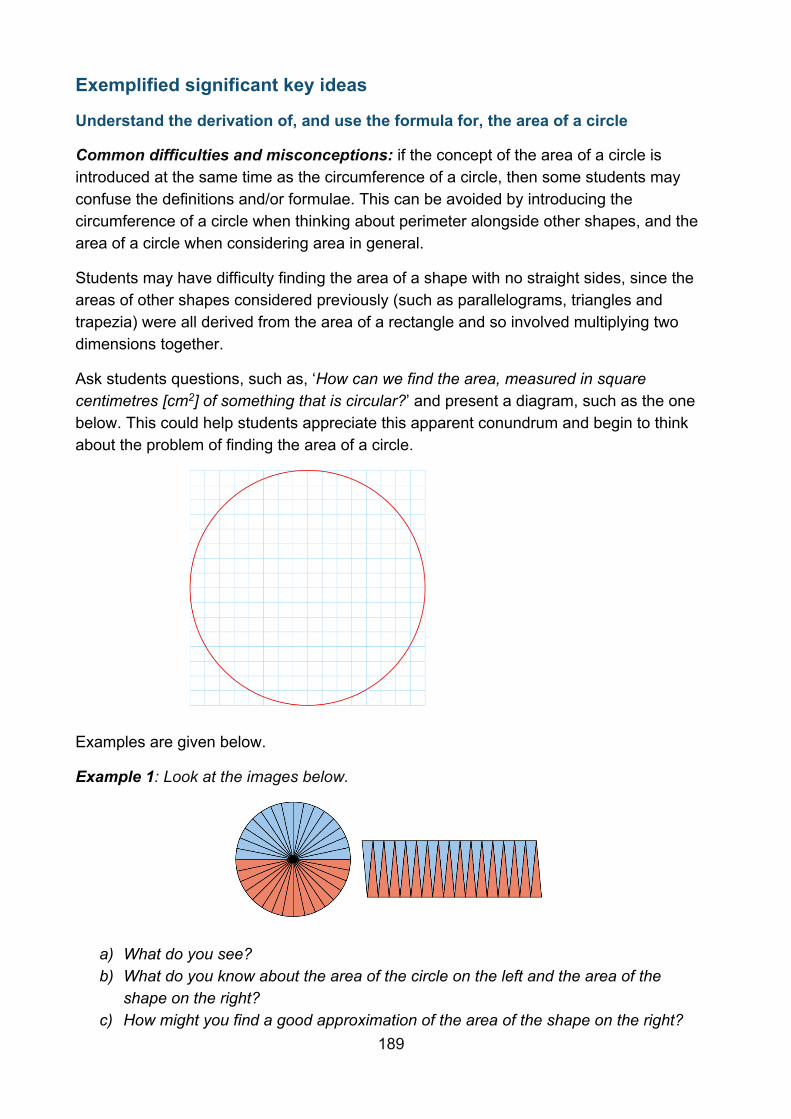
189
Exemplified significant key ideas
Understand the derivation of, and use the formula for, the area of a circle
Common difficulties and misconceptions: if the concept of the area of a circle is introduced at the same time as the circumference of a circle, then some students may confuse the definitions and/or formulae. This can be avoided by introducing the circumference of a circle when thinking about perimeter alongside other shapes, and the area of a circle when considering area in general.
Students may have difficulty finding the area of a shape with no straight sides, since the areas of other shapes considered previously (such as parallelograms, triangles and trapezia) were all derived from the area of a rectangle and so involved multiplying two dimensions together.
Ask students questions, such as, ‘How can we find the area, measured in square centimetres [cm2] of something that is circular?’ and present a diagram, such as the one below. This could help students appreciate this apparent conundrum and begin to think about the problem of finding the area of a circle.
Examples are given below.
Example 1: Look at the images below.
a) What do you see? b) What do you know about the area of the circle on the left and the area of the
shape on the right? c) How might you find a good approximation of the area of the shape on the right?
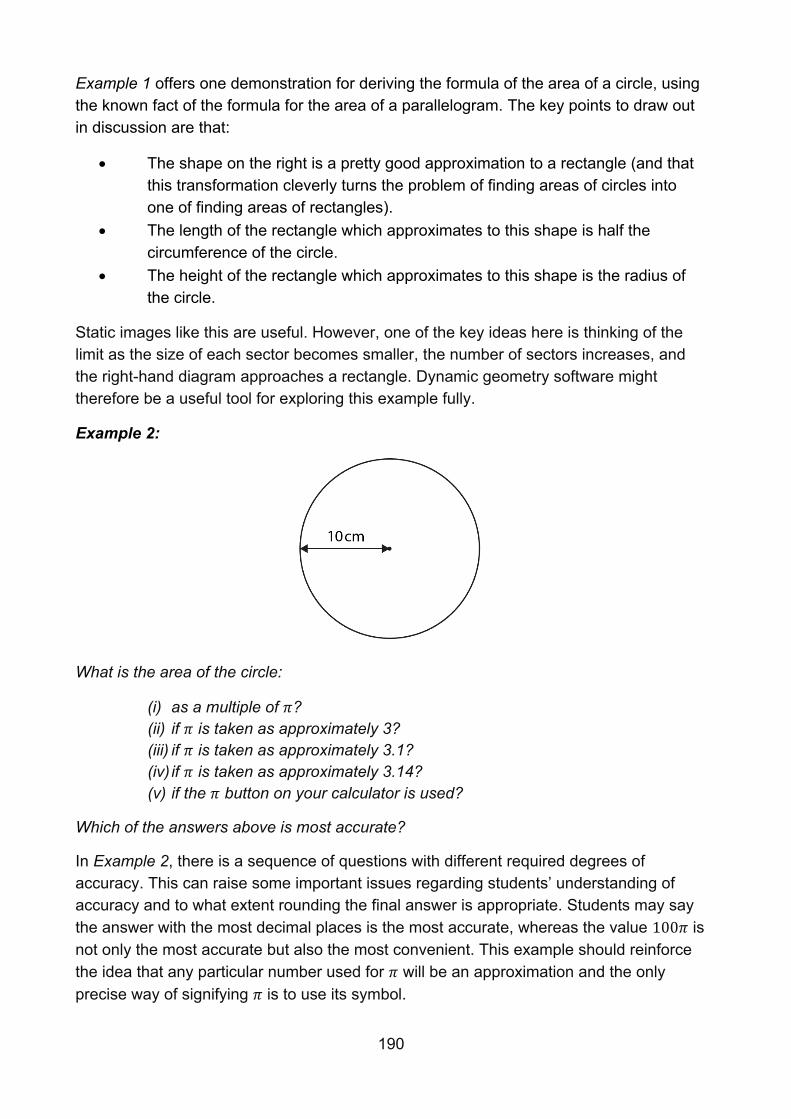
190
Example 1 offers one demonstration for deriving the formula of the area of a circle, using the known fact of the formula for the area of a parallelogram. The key points to draw out in discussion are that:
• The shape on the right is a pretty good approximation to a rectangle (and that this transformation cleverly turns the problem of finding areas of circles into one of finding areas of rectangles).
• The length of the rectangle which approximates to this shape is half the circumference of the circle.
• The height of the rectangle which approximates to this shape is the radius of the circle.
Static images like this are useful. However, one of the key ideas here is thinking of the limit as the size of each sector becomes smaller, the number of sectors increases, and the right-hand diagram approaches a rectangle. Dynamic geometry software might therefore be a useful tool for exploring this example fully.
Example 2:
What is the area of the circle:
(i) as a multiple of 𝜋? (ii) if 𝜋 is taken as approximately 3? (iii) if 𝜋 is taken as approximately 3.1? (iv) if 𝜋 is taken as approximately 3.14? (v) if the 𝜋 button on your calculator is used?
Which of the answers above is most accurate?
In Example 2, there is a sequence of questions with different required degrees of accuracy. This can raise some important issues regarding students’ understanding of accuracy and to what extent rounding the final answer is appropriate. Students may say the answer with the most decimal places is the most accurate, whereas the value 100𝜋 is not only the most accurate but also the most convenient. This example should reinforce the idea that any particular number used for 𝜋 will be an approximation and the only precise way of signifying 𝜋 is to use its symbol.
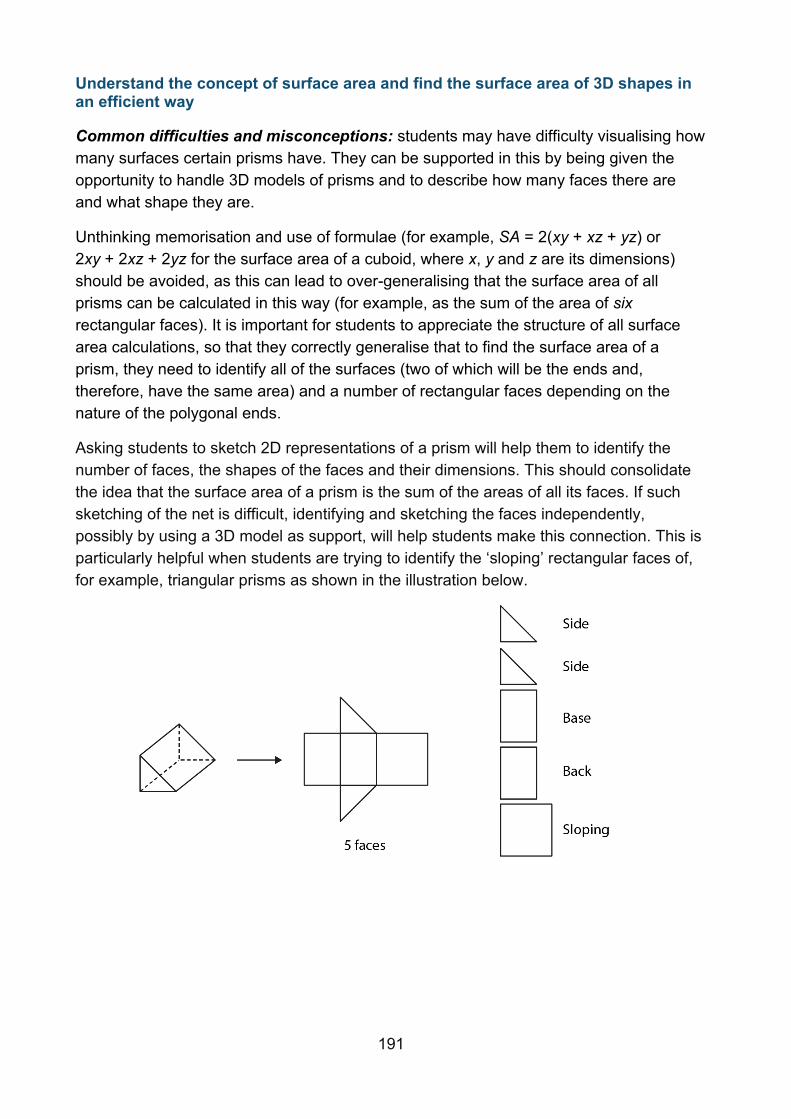
191
Understand the concept of surface area and find the surface area of 3D shapes in an efficient way
Common difficulties and misconceptions: students may have difficulty visualising how many surfaces certain prisms have. They can be supported in this by being given the opportunity to handle 3D models of prisms and to describe how many faces there are and what shape they are.
Unthinking memorisation and use of formulae (for example, SA = 2(xy + xz + yz) or 2xy + 2xz + 2yz for the surface area of a cuboid, where x, y and z are its dimensions) should be avoided, as this can lead to over-generalising that the surface area of all prisms can be calculated in this way (for example, as the sum of the area of six rectangular faces). It is important for students to appreciate the structure of all surface area calculations, so that they correctly generalise that to find the surface area of a prism, they need to identify all of the surfaces (two of which will be the ends and, therefore, have the same area) and a number of rectangular faces depending on the nature of the polygonal ends.
Asking students to sketch 2D representations of a prism will help them to identify the number of faces, the shapes of the faces and their dimensions. This should consolidate the idea that the surface area of a prism is the sum of the areas of all its faces. If such sketching of the net is difficult, identifying and sketching the faces independently, possibly by using a 3D model as support, will help students make this connection. This is particularly helpful when students are trying to identify the ‘sloping’ rectangular faces of, for example, triangular prisms as shown in the illustration below.
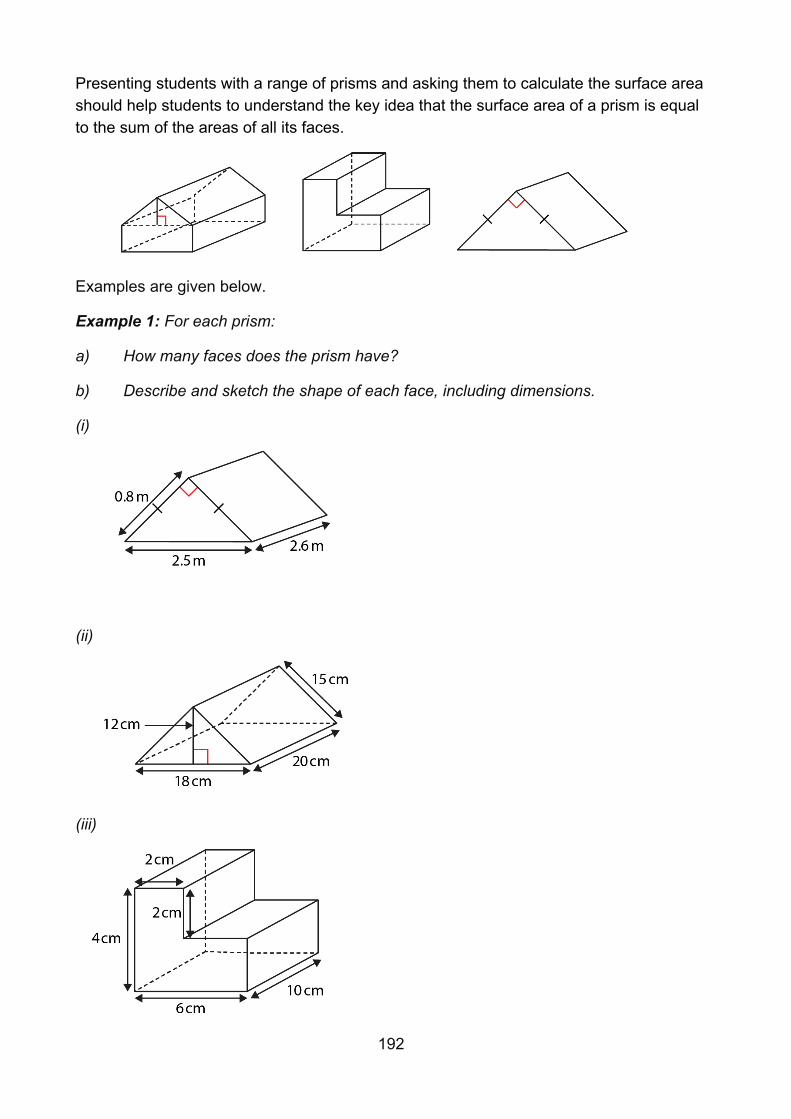
192
Presenting students with a range of prisms and asking them to calculate the surface area should help students to understand the key idea that the surface area of a prism is equal to the sum of the areas of all its faces.
Examples are given below.
Example 1: For each prism:
a) How many faces does the prism have?
b) Describe and sketch the shape of each face, including dimensions.
(i)
(ii)
(iii)
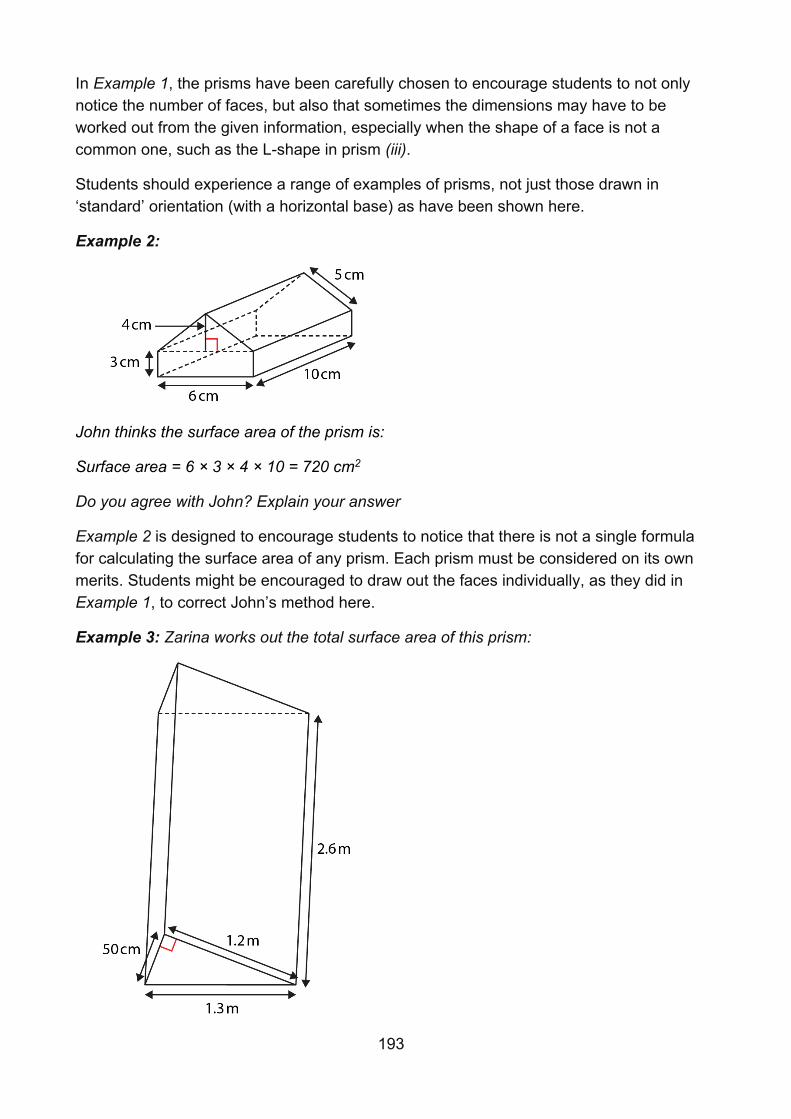
193
In Example 1, the prisms have been carefully chosen to encourage students to not only notice the number of faces, but also that sometimes the dimensions may have to be worked out from the given information, especially when the shape of a face is not a common one, such as the L-shape in prism (iii).
Students should experience a range of examples of prisms, not just those drawn in ‘standard’ orientation (with a horizontal base) as have been shown here.
Example 2:
John thinks the surface area of the prism is:
Surface area = 6 × 3 × 4 × 10 = 720 cm2
Do you agree with John? Explain your answer
Example 2 is designed to encourage students to notice that there is not a single formula for calculating the surface area of any prism. Each prism must be considered on its own merits. Students might be encouraged to draw out the faces individually, as they did in Example 1, to correct John’s method here.
Example 3: Zarina works out the total surface area of this prism:
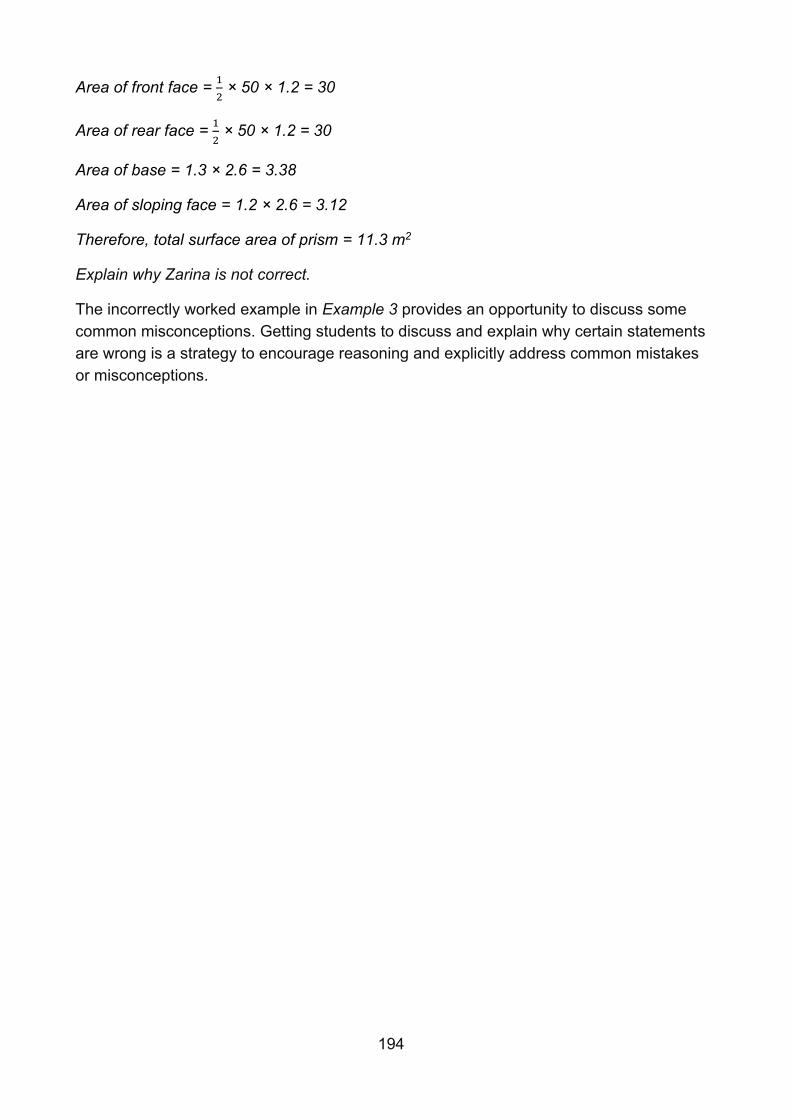
194
Area of front face = 1
2 × 50 × 1.2 = 30
Area of rear face = 1
2 × 50 × 1.2 = 30
Area of base = 1.3 × 2.6 = 3.38
Area of sloping face = 1.2 × 2.6 = 3.12
Therefore, total surface area of prism = 11.3 m2
Explain why Zarina is not correct.
The incorrectly worked example in Example 3 provides an opportunity to discuss some common misconceptions. Getting students to discuss and explain why certain statements are wrong is a strategy to encourage reasoning and explicitly address common mistakes or misconceptions.
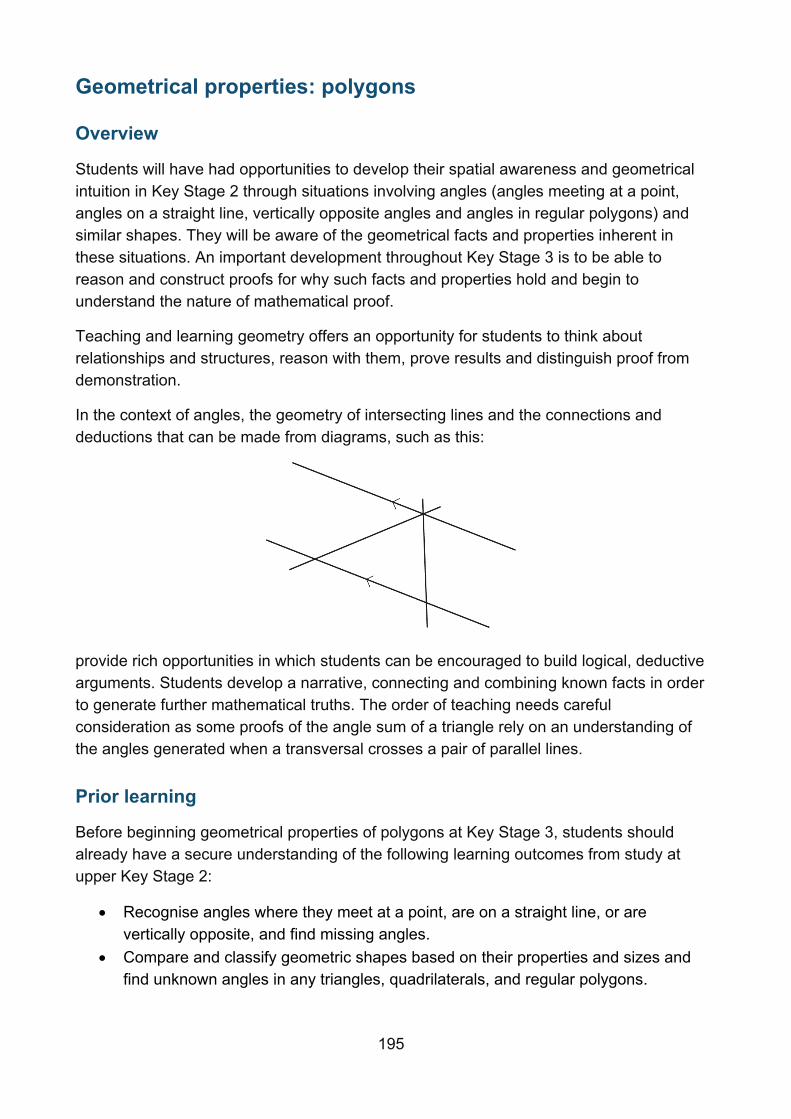
195
Geometrical properties: polygons
Overview
Students will have had opportunities to develop their spatial awareness and geometrical intuition in Key Stage 2 through situations involving angles (angles meeting at a point, angles on a straight line, vertically opposite angles and angles in regular polygons) and similar shapes. They will be aware of the geometrical facts and properties inherent in these situations. An important development throughout Key Stage 3 is to be able to reason and construct proofs for why such facts and properties hold and begin to understand the nature of mathematical proof.
Teaching and learning geometry offers an opportunity for students to think about relationships and structures, reason with them, prove results and distinguish proof from demonstration.
In the context of angles, the geometry of intersecting lines and the connections and deductions that can be made from diagrams, such as this:
provide rich opportunities in which students can be encouraged to build logical, deductive arguments. Students develop a narrative, connecting and combining known facts in order to generate further mathematical truths. The order of teaching needs careful consideration as some proofs of the angle sum of a triangle rely on an understanding of the angles generated when a transversal crosses a pair of parallel lines.
Prior learning
Before beginning geometrical properties of polygons at Key Stage 3, students should already have a secure understanding of the following learning outcomes from study at upper Key Stage 2:
• Recognise angles where they meet at a point, are on a straight line, or are vertically opposite, and find missing angles.
• Compare and classify geometric shapes based on their properties and sizes and find unknown angles in any triangles, quadrilaterals, and regular polygons.
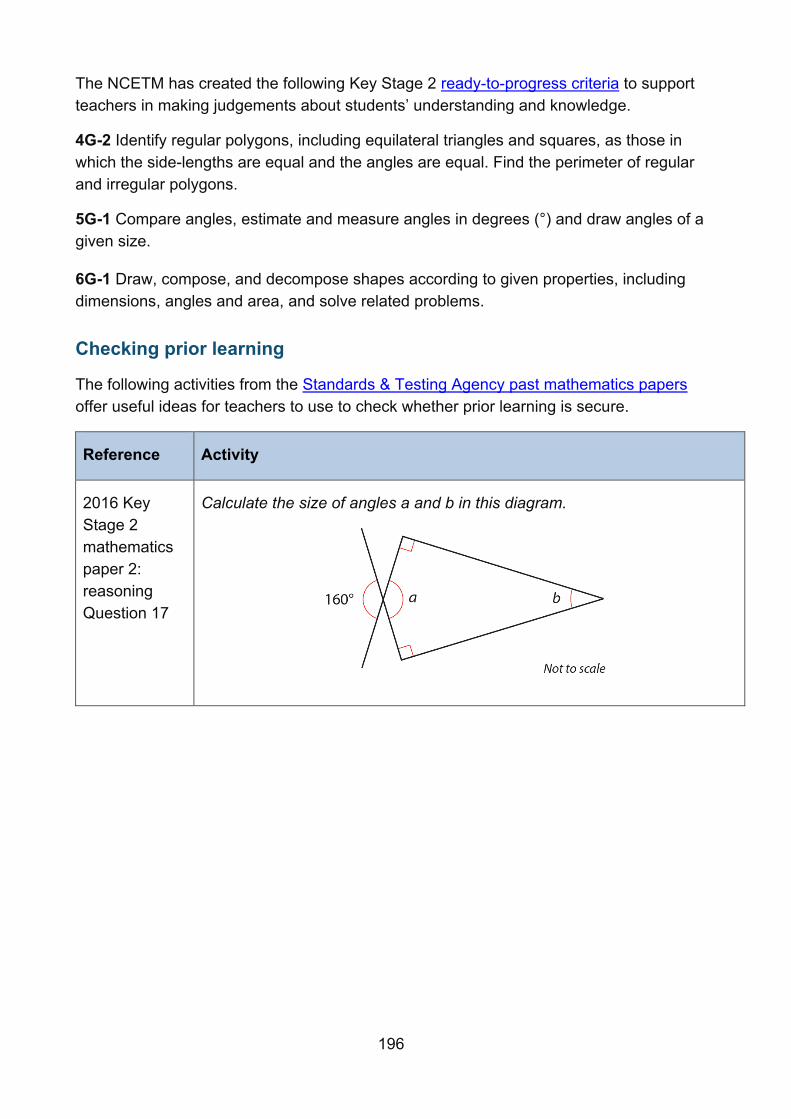
196
The NCETM has created the following Key Stage 2 ready-to-progress criteria to support teachers in making judgements about students’ understanding and knowledge.
4G-2 Identify regular polygons, including equilateral triangles and squares, as those in which the side-lengths are equal and the angles are equal. Find the perimeter of regular and irregular polygons.
5G-1 Compare angles, estimate and measure angles in degrees (°) and draw angles of a given size.
6G-1 Draw, compose, and decompose shapes according to given properties, including dimensions, angles and area, and solve related problems.
Checking prior learning
The following activities from the Standards & Testing Agency past mathematics papers offer useful ideas for teachers to use to check whether prior learning is secure.
Reference Activity
2016 Key Stage 2 mathematics paper 2: reasoning Question 17
Calculate the size of angles a and b in this diagram.
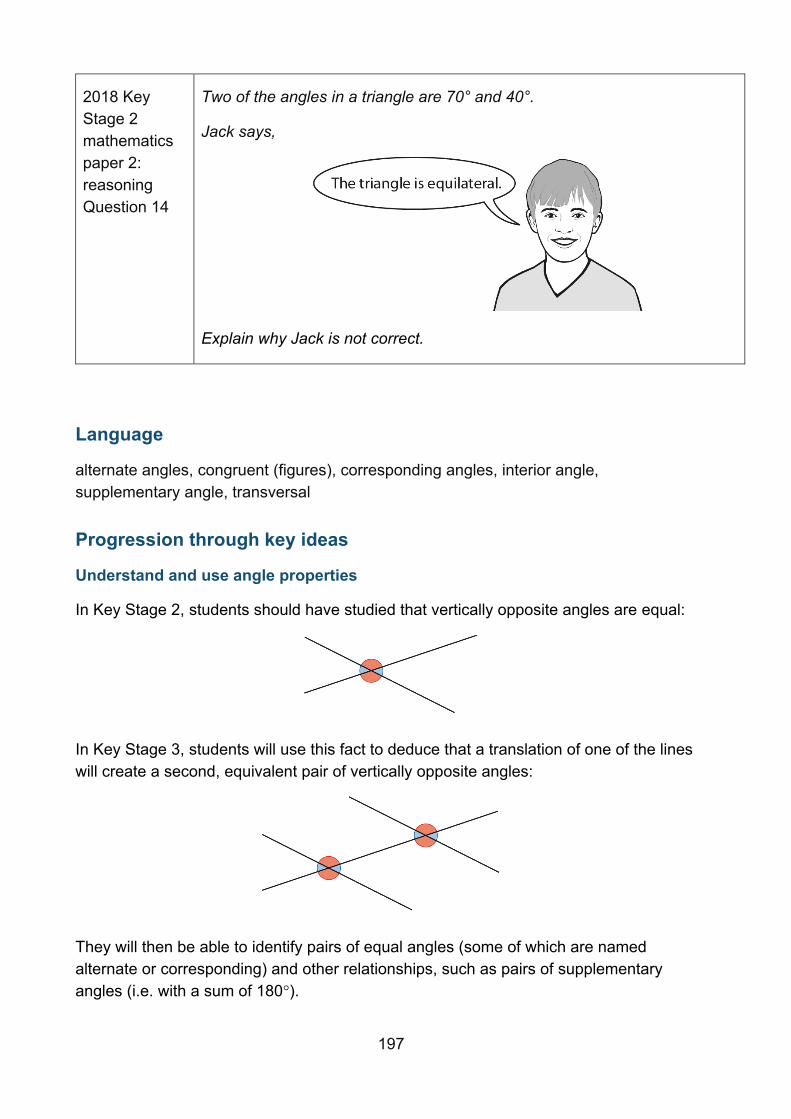
197
2018 Key Stage 2 mathematics paper 2: reasoning Question 14
Two of the angles in a triangle are 70° and 40°.
Jack says,
Explain why Jack is not correct.
Language
alternate angles, congruent (figures), corresponding angles, interior angle, supplementary angle, transversal
Progression through key ideas
Understand and use angle properties
In Key Stage 2, students should have studied that vertically opposite angles are equal:
In Key Stage 3, students will use this fact to deduce that a translation of one of the lines will create a second, equivalent pair of vertically opposite angles:
They will then be able to identify pairs of equal angles (some of which are named alternate or corresponding) and other relationships, such as pairs of supplementary angles (i.e. with a sum of 180°).
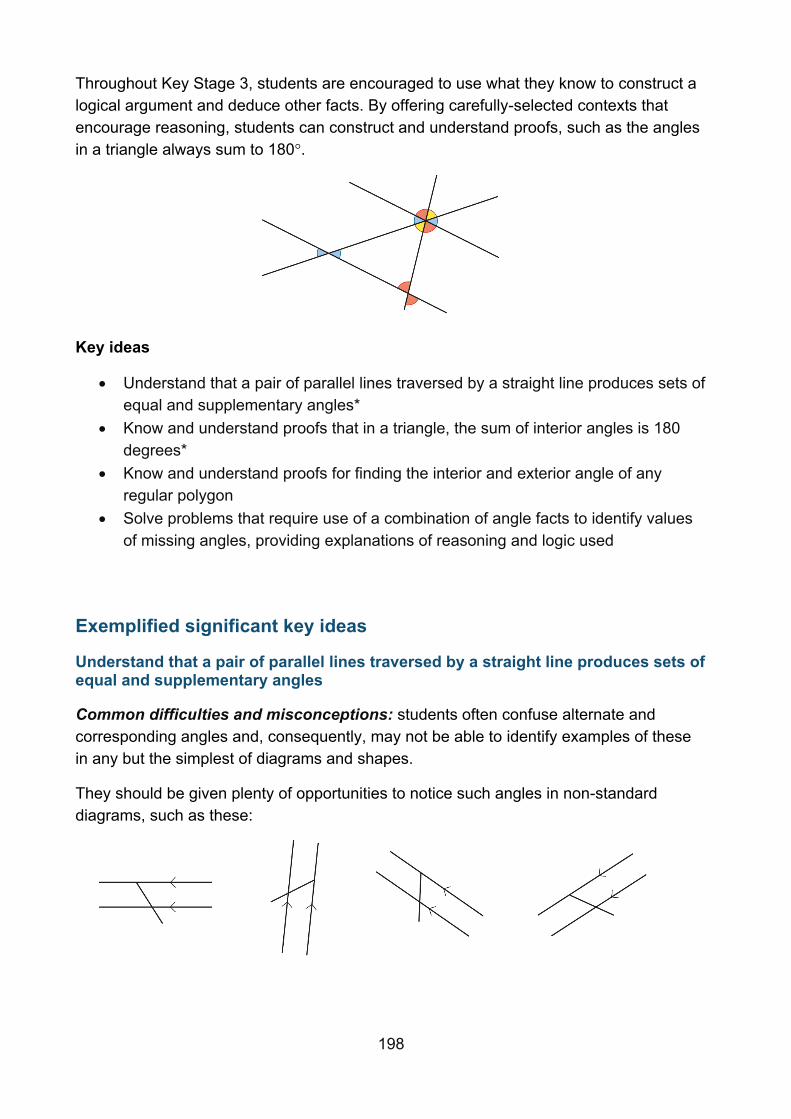
198
Throughout Key Stage 3, students are encouraged to use what they know to construct a logical argument and deduce other facts. By offering carefully-selected contexts that encourage reasoning, students can construct and understand proofs, such as the angles in a triangle always sum to 180°.
Key ideas
• Understand that a pair of parallel lines traversed by a straight line produces sets of equal and supplementary angles*
• Know and understand proofs that in a triangle, the sum of interior angles is 180 degrees*
• Know and understand proofs for finding the interior and exterior angle of any regular polygon
• Solve problems that require use of a combination of angle facts to identify values of missing angles, providing explanations of reasoning and logic used
Exemplified significant key ideas
Understand that a pair of parallel lines traversed by a straight line produces sets of equal and supplementary angles
Common difficulties and misconceptions: students often confuse alternate and corresponding angles and, consequently, may not be able to identify examples of these in any but the simplest of diagrams and shapes.
They should be given plenty of opportunities to notice such angles in non-standard diagrams, such as these:
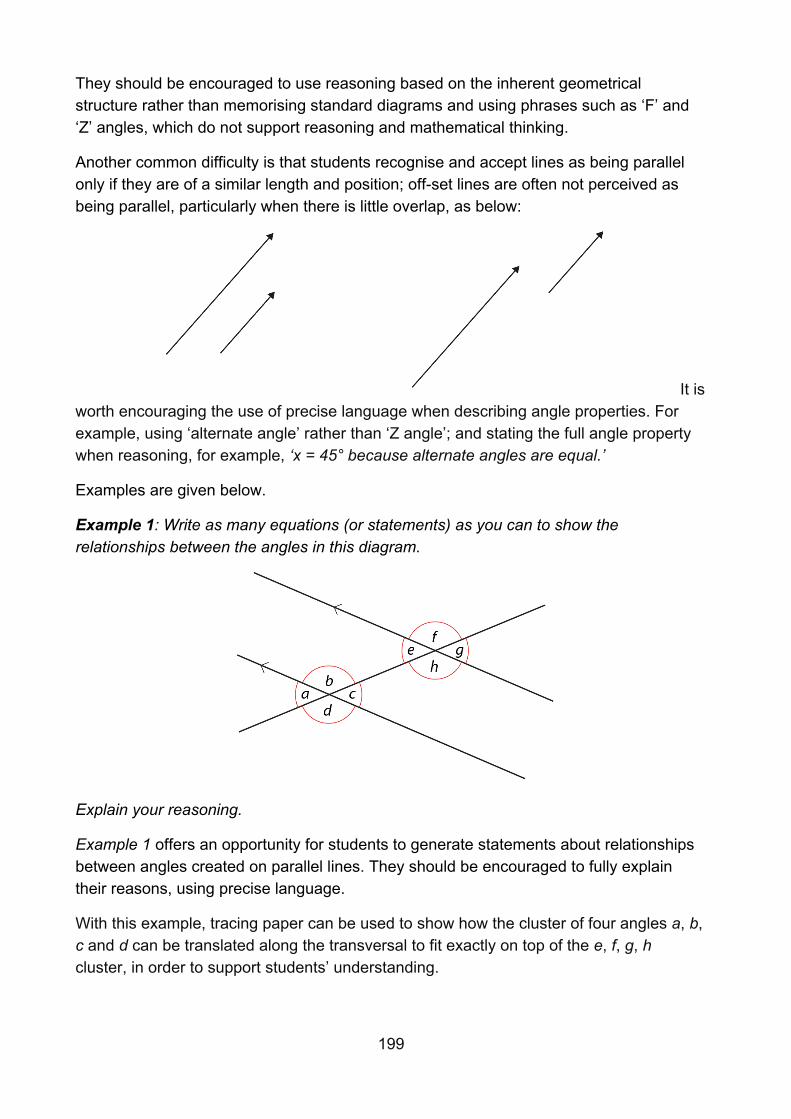
199
They should be encouraged to use reasoning based on the inherent geometrical structure rather than memorising standard diagrams and using phrases such as ‘F’ and ‘Z’ angles, which do not support reasoning and mathematical thinking.
Another common difficulty is that students recognise and accept lines as being parallel only if they are of a similar length and position; off-set lines are often not perceived as being parallel, particularly when there is little overlap, as below:
It is worth encouraging the use of precise language when describing angle properties. For example, using ‘alternate angle’ rather than ‘Z angle’; and stating the full angle property when reasoning, for example, ‘x = 45° because alternate angles are equal.’
Examples are given below.
Example 1: Write as many equations (or statements) as you can to show the relationships between the angles in this diagram.
Explain your reasoning.
Example 1 offers an opportunity for students to generate statements about relationships between angles created on parallel lines. They should be encouraged to fully explain their reasons, using precise language.
With this example, tracing paper can be used to show how the cluster of four angles a, b, c and d can be translated along the transversal to fit exactly on top of the e, f, g, h cluster, in order to support students’ understanding.
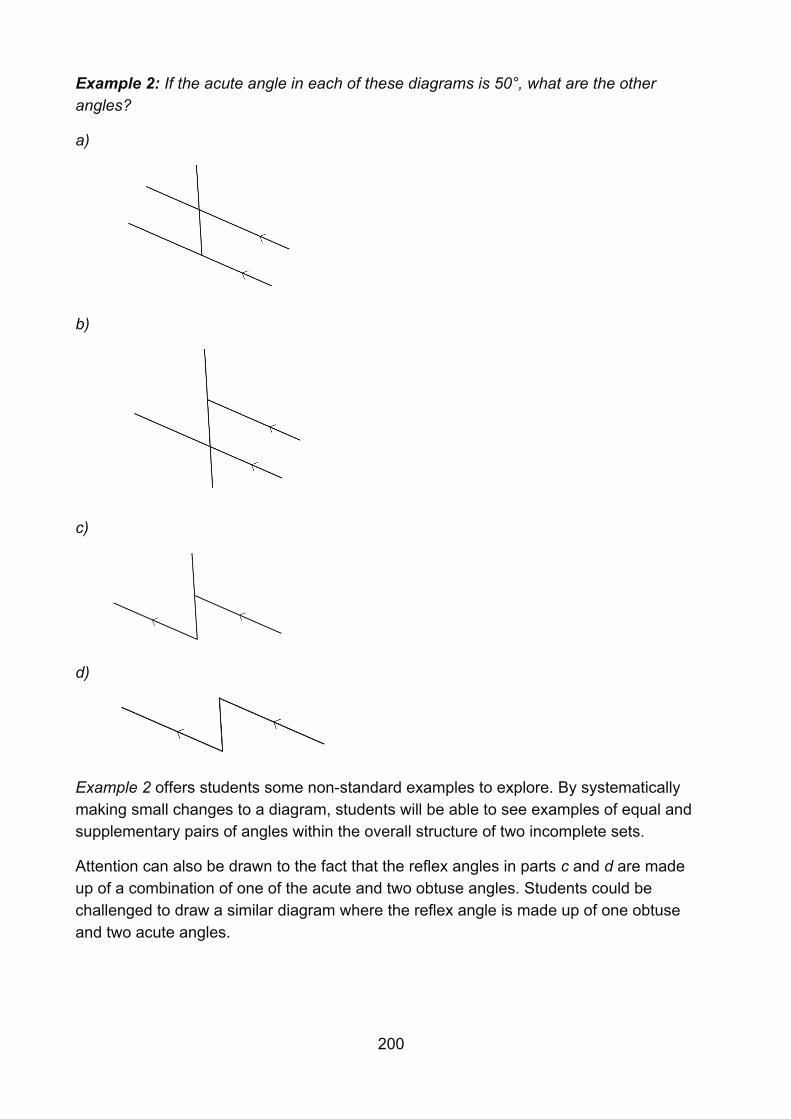
200
Example 2: If the acute angle in each of these diagrams is 50°, what are the other angles?
a)
b)
c)
d)
Example 2 offers students some non-standard examples to explore. By systematically making small changes to a diagram, students will be able to see examples of equal and supplementary pairs of angles within the overall structure of two incomplete sets.
Attention can also be drawn to the fact that the reflex angles in parts c and d are made up of a combination of one of the acute and two obtuse angles. Students could be challenged to draw a similar diagram where the reflex angle is made up of one obtuse and two acute angles.
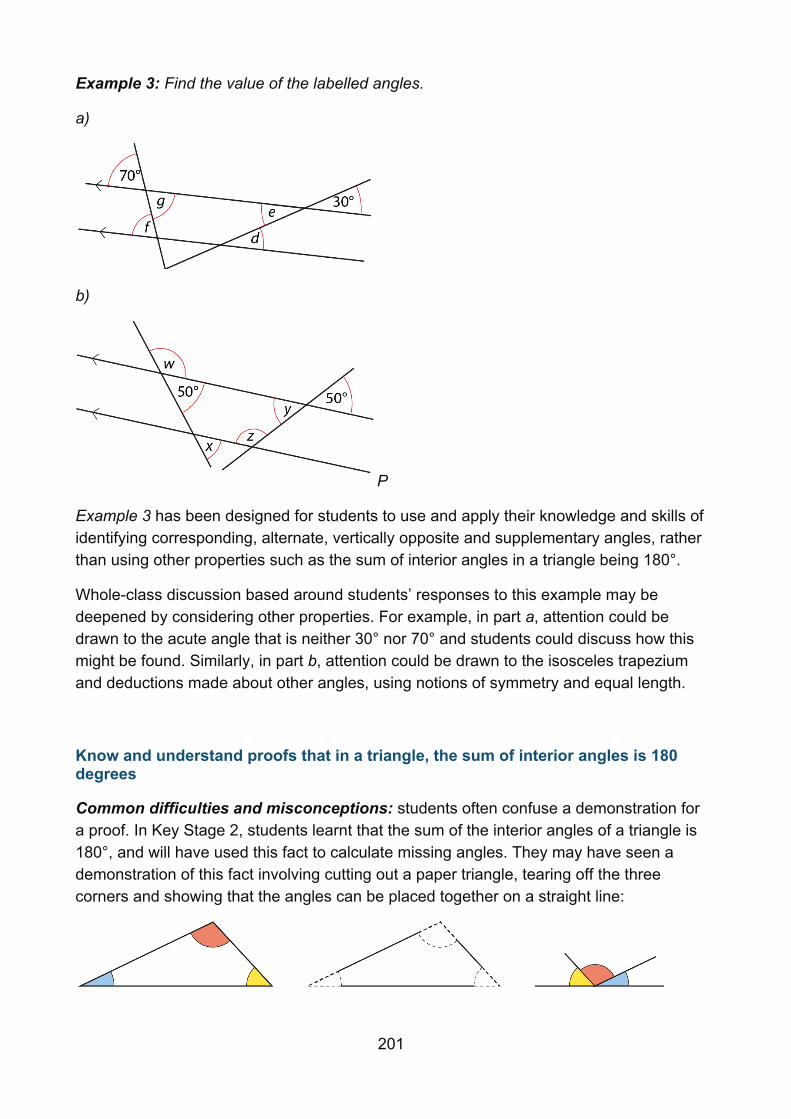
201
Example 3: Find the value of the labelled angles.
a)
b)
P
Example 3 has been designed for students to use and apply their knowledge and skills of identifying corresponding, alternate, vertically opposite and supplementary angles, rather than using other properties such as the sum of interior angles in a triangle being 180°.
Whole-class discussion based around students’ responses to this example may be deepened by considering other properties. For example, in part a, attention could be drawn to the acute angle that is neither 30° nor 70° and students could discuss how this might be found. Similarly, in part b, attention could be drawn to the isosceles trapezium and deductions made about other angles, using notions of symmetry and equal length.
Know and understand proofs that in a triangle, the sum of interior angles is 180 degrees
Common difficulties and misconceptions: students often confuse a demonstration for a proof. In Key Stage 2, students learnt that the sum of the interior angles of a triangle is 180°, and will have used this fact to calculate missing angles. They may have seen a demonstration of this fact involving cutting out a paper triangle, tearing off the three corners and showing that the angles can be placed together on a straight line:
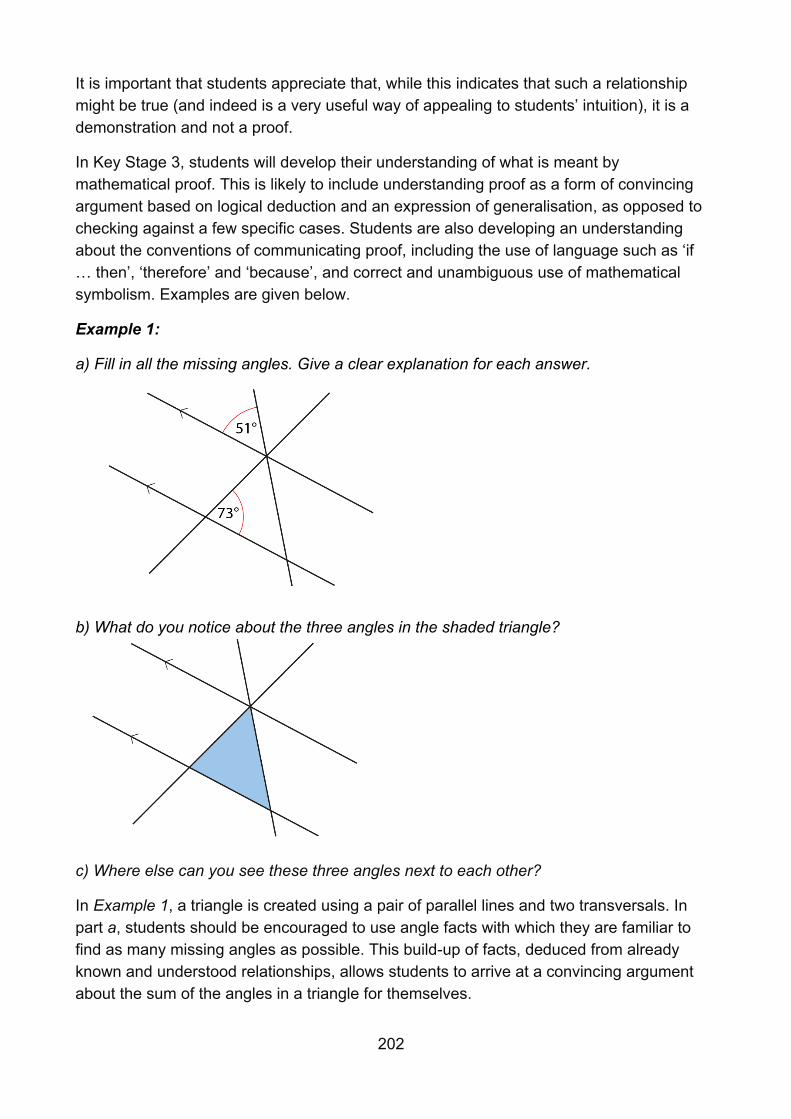
202
It is important that students appreciate that, while this indicates that such a relationship might be true (and indeed is a very useful way of appealing to students’ intuition), it is a demonstration and not a proof.
In Key Stage 3, students will develop their understanding of what is meant by mathematical proof. This is likely to include understanding proof as a form of convincing argument based on logical deduction and an expression of generalisation, as opposed to checking against a few specific cases. Students are also developing an understanding about the conventions of communicating proof, including the use of language such as ‘if … then’, ‘therefore’ and ‘because’, and correct and unambiguous use of mathematical symbolism. Examples are given below.
Example 1:
a) Fill in all the missing angles. Give a clear explanation for each answer.
b) What do you notice about the three angles in the shaded triangle?
c) Where else can you see these three angles next to each other?
In Example 1, a triangle is created using a pair of parallel lines and two transversals. In part a, students should be encouraged to use angle facts with which they are familiar to find as many missing angles as possible. This build-up of facts, deduced from already known and understood relationships, allows students to arrive at a convincing argument about the sum of the angles in a triangle for themselves.
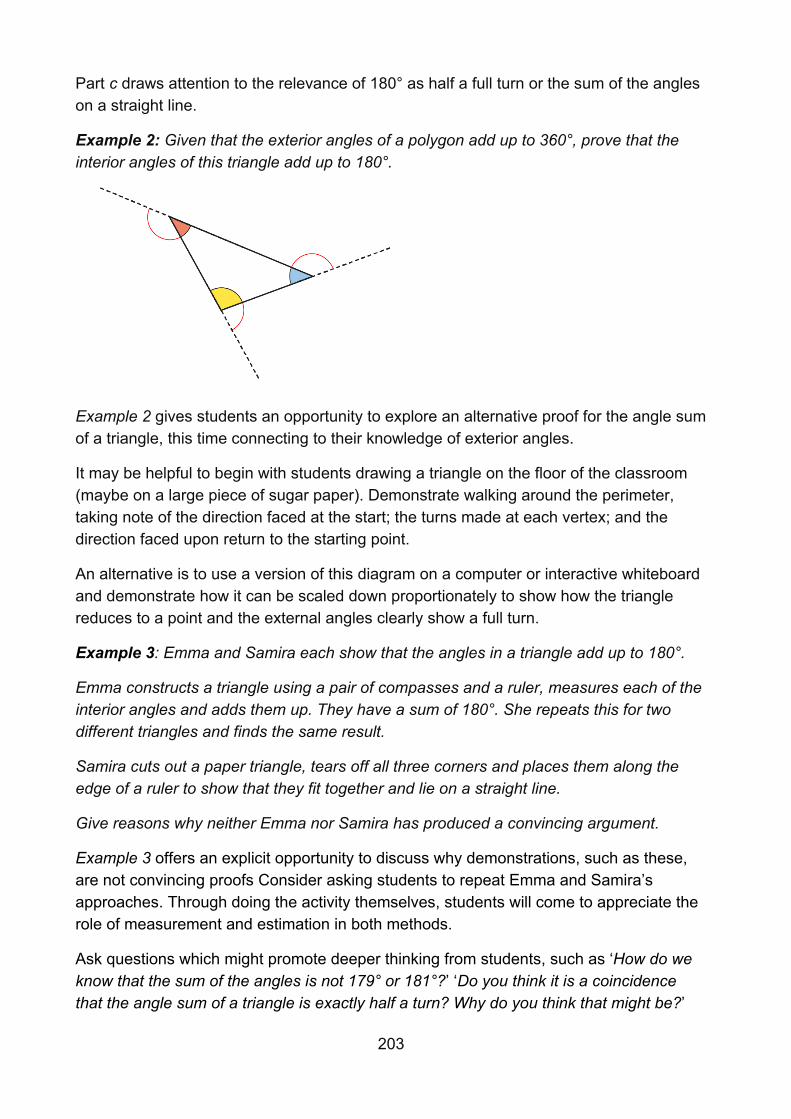
203
Part c draws attention to the relevance of 180° as half a full turn or the sum of the angles on a straight line.
Example 2: Given that the exterior angles of a polygon add up to 360°, prove that the interior angles of this triangle add up to 180°.
Example 2 gives students an opportunity to explore an alternative proof for the angle sum of a triangle, this time connecting to their knowledge of exterior angles.
It may be helpful to begin with students drawing a triangle on the floor of the classroom (maybe on a large piece of sugar paper). Demonstrate walking around the perimeter, taking note of the direction faced at the start; the turns made at each vertex; and the direction faced upon return to the starting point.
An alternative is to use a version of this diagram on a computer or interactive whiteboard and demonstrate how it can be scaled down proportionately to show how the triangle reduces to a point and the external angles clearly show a full turn.
Example 3: Emma and Samira each show that the angles in a triangle add up to 180°.
Emma constructs a triangle using a pair of compasses and a ruler, measures each of the interior angles and adds them up. They have a sum of 180°. She repeats this for two different triangles and finds the same result.
Samira cuts out a paper triangle, tears off all three corners and places them along the edge of a ruler to show that they fit together and lie on a straight line.
Give reasons why neither Emma nor Samira has produced a convincing argument.
Example 3 offers an explicit opportunity to discuss why demonstrations, such as these, are not convincing proofs Consider asking students to repeat Emma and Samira’s approaches. Through doing the activity themselves, students will come to appreciate the role of measurement and estimation in both methods.
Ask questions which might promote deeper thinking from students, such as ‘How do we know that the sum of the angles is not 179° or 181°?’ ‘Do you think it is a coincidence that the angle sum of a triangle is exactly half a turn? Why do you think that might be?’
204
Constructions
Overview
In Key Stage 2, students will have learnt about the properties of certain geometric shapes and used these properties to compare and classify shapes. They will also have had experience of drawing certain shapes using a ruler and angle measurer. Developing this work in Key Stage 3, students will learn the ruler and compass constructions of:
• triangles of given lengths • a perpendicular bisector of a line segment • a perpendicular to a given line through a given point • an angle bisector.
An important awareness is that these constructions are based on the geometrical properties of a few key shapes (a circle, an isosceles triangle and a rhombus). A deep understanding and awareness of these geometrical properties will support students in gaining a conceptual overview of these constructions and guard against constructions being learnt mechanically as a set of procedural steps.
Prior learning
Before beginning constructions at Key Stage 3, students should already have a secure understanding of the following learning outcomes from study at upper Key Stage 2:
• Draw 2D shapes using given dimensions and angles. • Compare and classify geometric shapes based on their properties and sizes and
find unknown angles in any triangles, quadrilaterals, and regular polygons.
The NCETM has created the following Key Stage 2 ready-to-progress criteria to support teachers in making judgements about students’ understanding and knowledge.
5G-1 Compare angles, estimate and measure angles in degrees (°) and draw angles of a given size.
6G-1 Draw, compose, and decompose shapes according to given properties, including dimensions, angles and area, and solve related problems.
Checking prior learning
The following activities from the NCETM primary assessment materials offer useful ideas for teachers to use to check whether prior learning is secure.
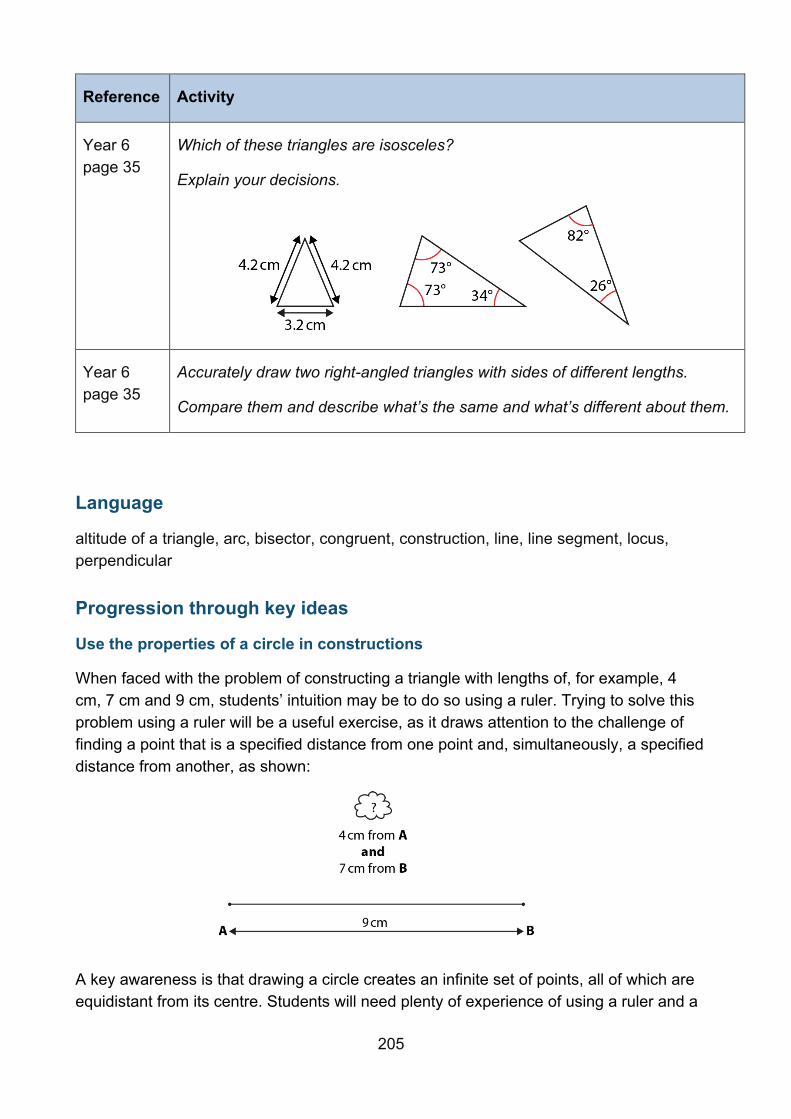
205
Reference Activity
Year 6 page 35
Which of these triangles are isosceles?
Explain your decisions.
Year 6 page 35
Accurately draw two right-angled triangles with sides of different lengths.
Compare them and describe what’s the same and what’s different about them.
Language
altitude of a triangle, arc, bisector, congruent, construction, line, line segment, locus, perpendicular
Progression through key ideas
Use the properties of a circle in constructions
When faced with the problem of constructing a triangle with lengths of, for example, 4 cm, 7 cm and 9 cm, students’ intuition may be to do so using a ruler. Trying to solve this problem using a ruler will be a useful exercise, as it draws attention to the challenge of finding a point that is a specified distance from one point and, simultaneously, a specified distance from another, as shown:
A key awareness is that drawing a circle creates an infinite set of points, all of which are equidistant from its centre. Students will need plenty of experience of using a ruler and a
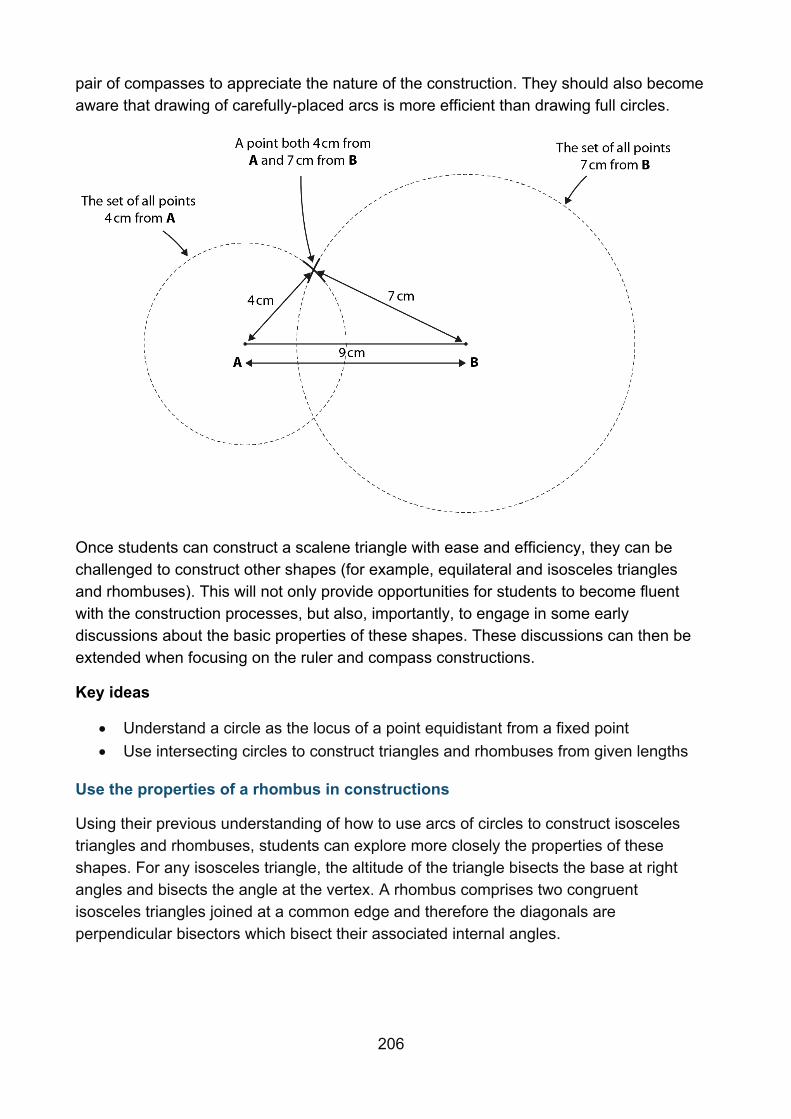
206
pair of compasses to appreciate the nature of the construction. They should also become aware that drawing of carefully-placed arcs is more efficient than drawing full circles.
Once students can construct a scalene triangle with ease and efficiency, they can be challenged to construct other shapes (for example, equilateral and isosceles triangles and rhombuses). This will not only provide opportunities for students to become fluent with the construction processes, but also, importantly, to engage in some early discussions about the basic properties of these shapes. These discussions can then be extended when focusing on the ruler and compass constructions.
Key ideas
• Understand a circle as the locus of a point equidistant from a fixed point • Use intersecting circles to construct triangles and rhombuses from given lengths
Use the properties of a rhombus in constructions
Using their previous understanding of how to use arcs of circles to construct isosceles triangles and rhombuses, students can explore more closely the properties of these shapes. For any isosceles triangle, the altitude of the triangle bisects the base at right angles and bisects the angle at the vertex. A rhombus comprises two congruent isosceles triangles joined at a common edge and therefore the diagonals are perpendicular bisectors which bisect their associated internal angles.
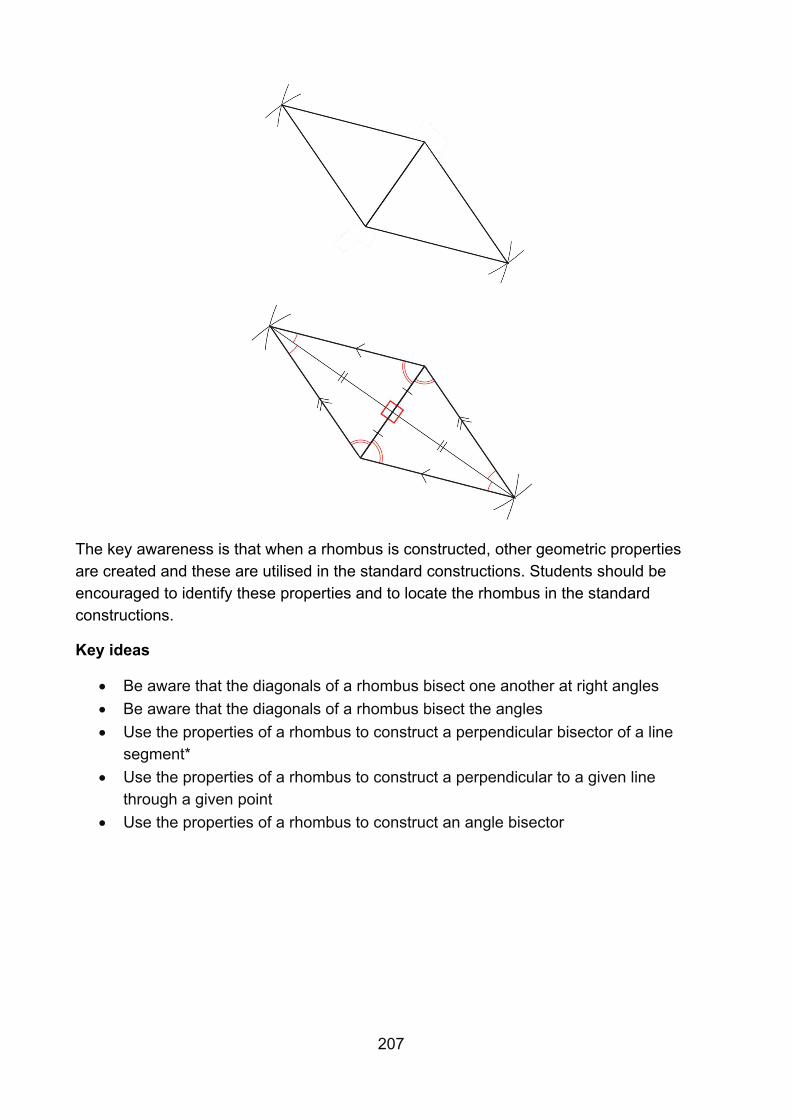
207
The key awareness is that when a rhombus is constructed, other geometric properties are created and these are utilised in the standard constructions. Students should be encouraged to identify these properties and to locate the rhombus in the standard constructions.
Key ideas
• Be aware that the diagonals of a rhombus bisect one another at right angles • Be aware that the diagonals of a rhombus bisect the angles • Use the properties of a rhombus to construct a perpendicular bisector of a line
segment* • Use the properties of a rhombus to construct a perpendicular to a given line
through a given point • Use the properties of a rhombus to construct an angle bisector
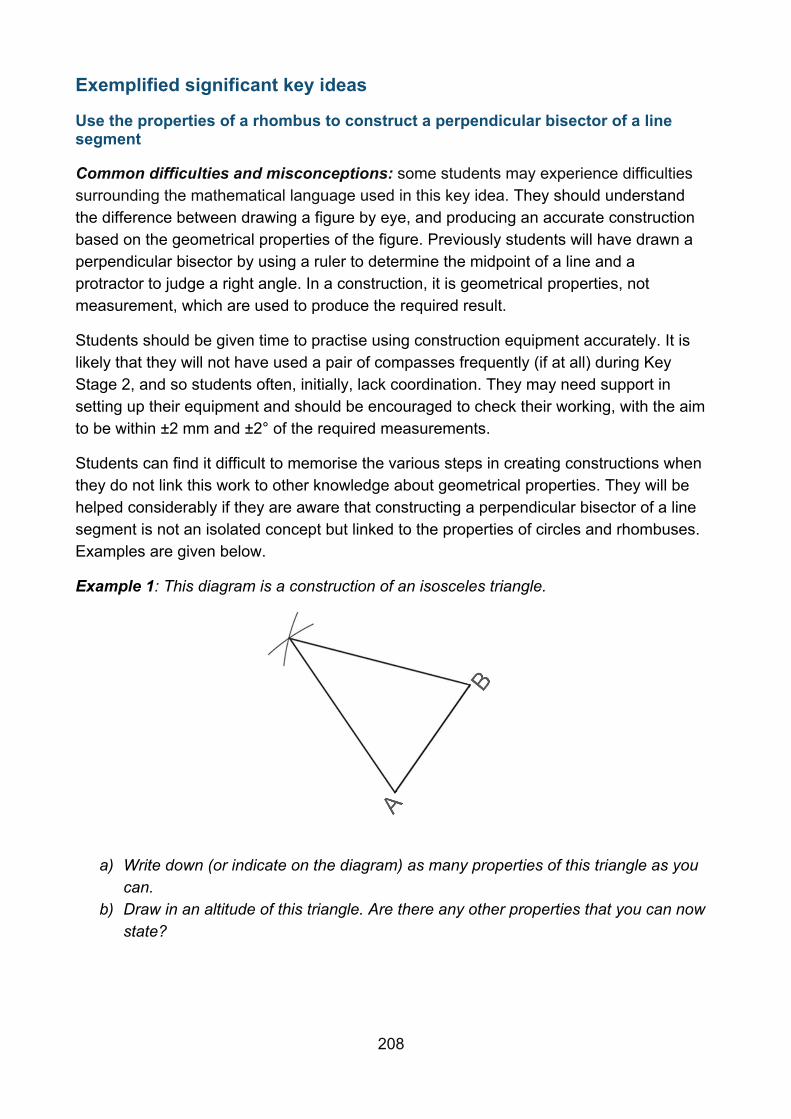
208
Exemplified significant key ideas
Use the properties of a rhombus to construct a perpendicular bisector of a line segment
Common difficulties and misconceptions: some students may experience difficulties surrounding the mathematical language used in this key idea. They should understand the difference between drawing a figure by eye, and producing an accurate construction based on the geometrical properties of the figure. Previously students will have drawn a perpendicular bisector by using a ruler to determine the midpoint of a line and a protractor to judge a right angle. In a construction, it is geometrical properties, not measurement, which are used to produce the required result.
Students should be given time to practise using construction equipment accurately. It is likely that they will not have used a pair of compasses frequently (if at all) during Key Stage 2, and so students often, initially, lack coordination. They may need support in setting up their equipment and should be encouraged to check their working, with the aim to be within ±2 mm and ±2° of the required measurements.
Students can find it difficult to memorise the various steps in creating constructions when they do not link this work to other knowledge about geometrical properties. They will be helped considerably if they are aware that constructing a perpendicular bisector of a line segment is not an isolated concept but linked to the properties of circles and rhombuses. Examples are given below.
Example 1: This diagram is a construction of an isosceles triangle.
a) Write down (or indicate on the diagram) as many properties of this triangle as you can.
b) Draw in an altitude of this triangle. Are there any other properties that you can now state?
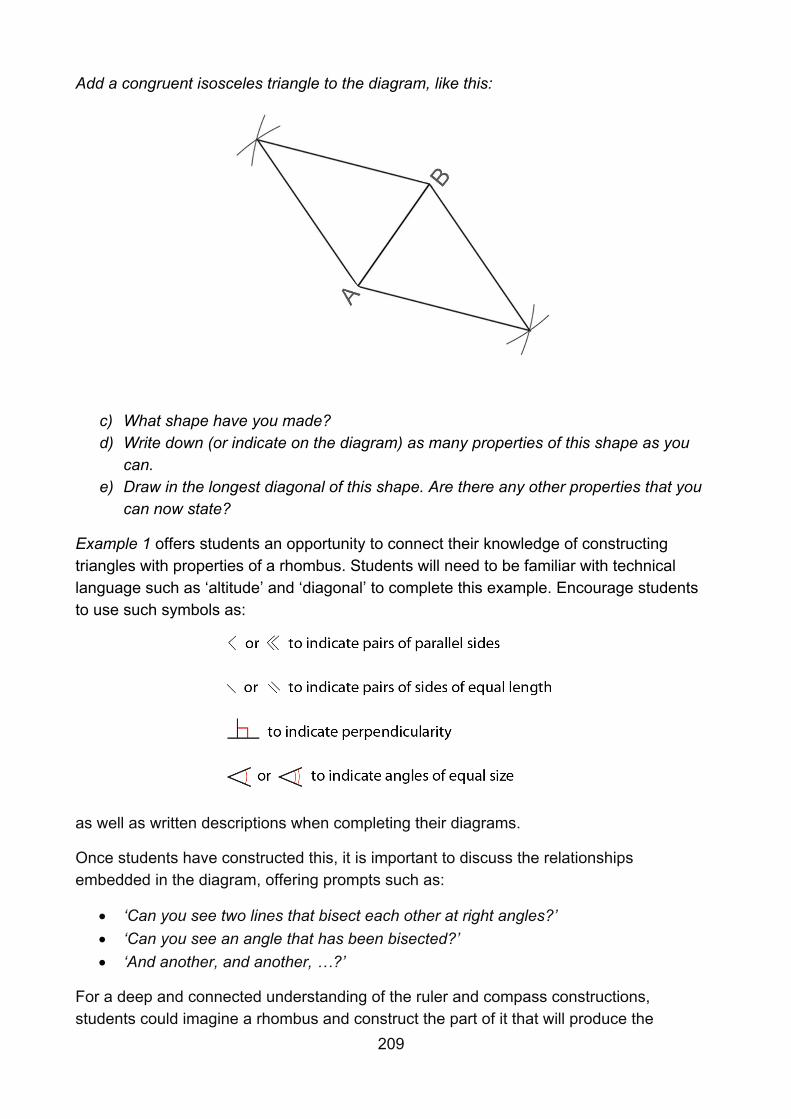
209
Add a congruent isosceles triangle to the diagram, like this:
c) What shape have you made? d) Write down (or indicate on the diagram) as many properties of this shape as you
can. e) Draw in the longest diagonal of this shape. Are there any other properties that you
can now state?
Example 1 offers students an opportunity to connect their knowledge of constructing triangles with properties of a rhombus. Students will need to be familiar with technical language such as ‘altitude’ and ‘diagonal’ to complete this example. Encourage students to use such symbols as:
as well as written descriptions when completing their diagrams.
Once students have constructed this, it is important to discuss the relationships embedded in the diagram, offering prompts such as:
• ‘Can you see two lines that bisect each other at right angles?’ • ‘Can you see an angle that has been bisected?’ • ‘And another, and another, …?’
For a deep and connected understanding of the ruler and compass constructions, students could imagine a rhombus and construct the part of it that will produce the
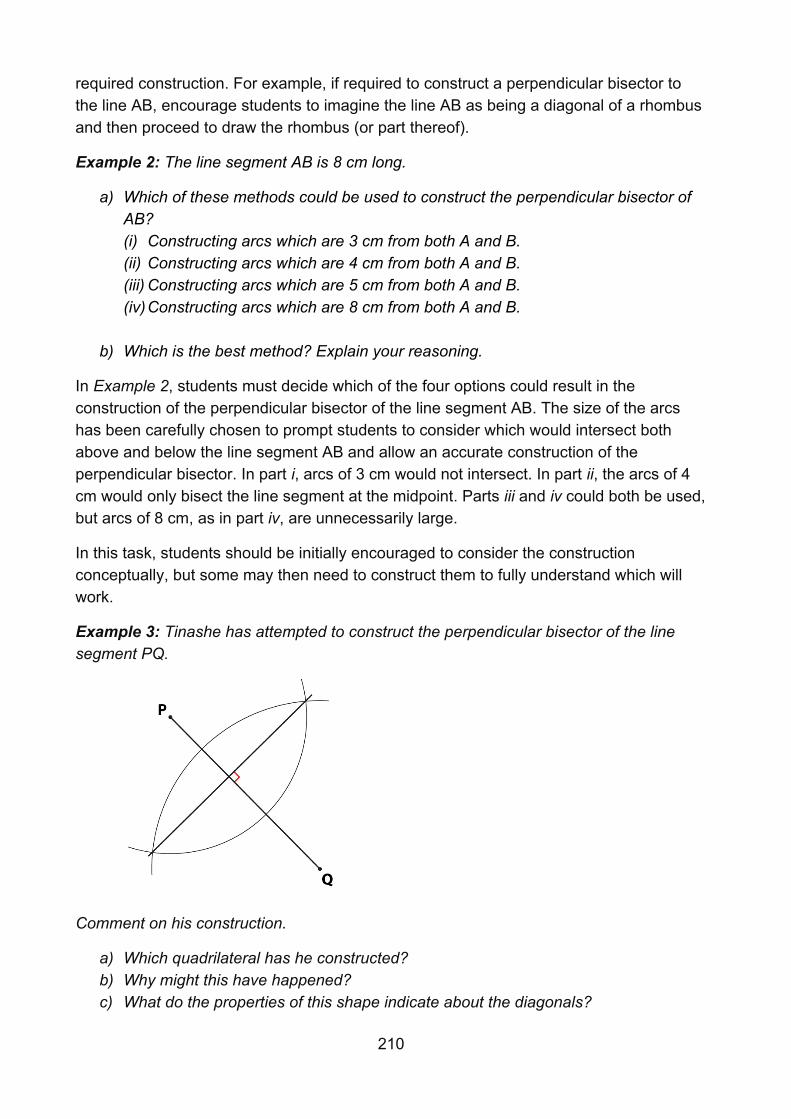
210
required construction. For example, if required to construct a perpendicular bisector to the line AB, encourage students to imagine the line AB as being a diagonal of a rhombus and then proceed to draw the rhombus (or part thereof).
Example 2: The line segment AB is 8 cm long.
a) Which of these methods could be used to construct the perpendicular bisector of AB? (i) Constructing arcs which are 3 cm from both A and B. (ii) Constructing arcs which are 4 cm from both A and B. (iii) Constructing arcs which are 5 cm from both A and B. (iv) Constructing arcs which are 8 cm from both A and B.
b) Which is the best method? Explain your reasoning.
In Example 2, students must decide which of the four options could result in the construction of the perpendicular bisector of the line segment AB. The size of the arcs has been carefully chosen to prompt students to consider which would intersect both above and below the line segment AB and allow an accurate construction of the perpendicular bisector. In part i, arcs of 3 cm would not intersect. In part ii, the arcs of 4 cm would only bisect the line segment at the midpoint. Parts iii and iv could both be used, but arcs of 8 cm, as in part iv, are unnecessarily large.
In this task, students should be initially encouraged to consider the construction conceptually, but some may then need to construct them to fully understand which will work.
Example 3: Tinashe has attempted to construct the perpendicular bisector of the line segment PQ.
Comment on his construction.
a) Which quadrilateral has he constructed? b) Why might this have happened? c) What do the properties of this shape indicate about the diagonals?

211
Example 3 shows an incorrect construction. At first glance it may look like the perpendicular bisector has been constructed, but students should identify that the arcs drawn do not have equal radius and so a kite has been constructed instead of a rhombus. The diagonals of a kite are perpendicular but do not bisect each other, so a perpendicular bisector has not been constructed. This reinforces the need to keep the pair of compasses open to the same length in order to construct a rhombus.
Using non-standard examples of constructions where the line to be bisected is not horizontal or vertical helps students to discern essential and non-essential features.
212
Year 9 autumn term
Geometrical properties: similarity and Pythagoras’ theorem
Overview
The elements in this section of the curriculum build on the work done in Year 8 summer term, and now also include studying similarity and congruence. Students are required to go beyond intuitively recognising when shapes are similar or congruent, and to think about what can change and what has to stay the same for these properties to hold.
While learning about an important theorem in mathematics, such as Pythagoras’ theorem, there is an opportunity to go beyond knowing that it is true to knowing why.
Teaching and learning associated with this core concept offers an opportunity for students to think about relationships and structures, to reason with them and to prove results. Geometrical properties, possibly above all other areas of mathematics, offers students a set of contexts with which to build their understanding of key mathematical concepts and the nature of mathematics itself.
Prior learning
Before beginning geometrical properties at Key Stage 3, students should already have a secure understanding of the following learning outcomes from study at upper Key Stage 2:
• Compare and classify geometric shapes based on their properties and sizes and find unknown angles in any triangles, quadrilaterals, and regular polygons.
• Solve problems involving similar shapes where the scale factor is known or can be found.
and earlier in Key Stage 3:
• Understand and use the conventions and vocabulary of algebra including forming and interpreting algebraic expressions and equations
• Simplify algebraic expressions by collecting like terms to maintain equivalence
• Manipulate algebraic expressions using the distributive law to maintain equivalence
• Find products of binomials
• Rearrange formulae to change the subject
The NCETM has created the following Key Stage 2 ready-to-progress criteria to support teachers in making judgements about students’ understanding and knowledge.
6G-1 Draw, compose, and decompose shapes according to given properties, including dimensions, angles and area, and solve related problems.
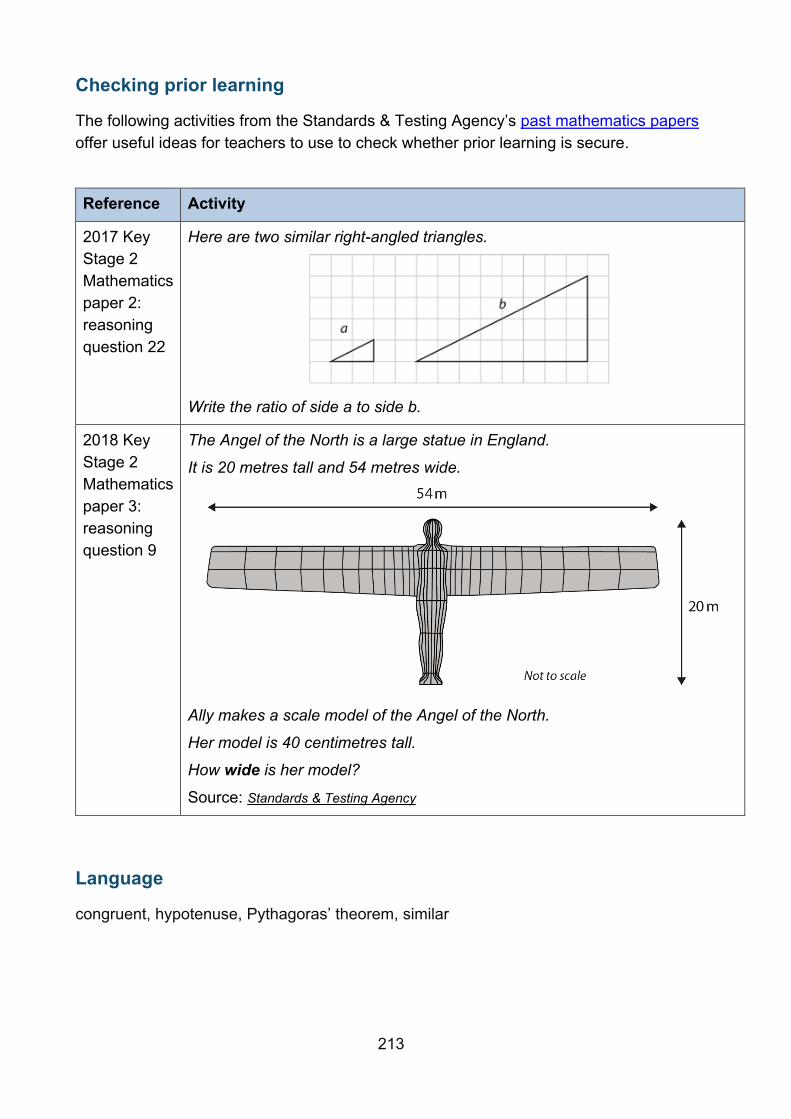
213
Checking prior learning
The following activities from the Standards & Testing Agency’s past mathematics papers offer useful ideas for teachers to use to check whether prior learning is secure.
Reference Activity
2017 Key Stage 2 Mathematics paper 2: reasoning question 22
Here are two similar right-angled triangles.
Write the ratio of side a to side b.
2018 Key Stage 2 Mathematics paper 3: reasoning question 9
The Angel of the North is a large statue in England.
It is 20 metres tall and 54 metres wide.
Ally makes a scale model of the Angel of the North.
Her model is 40 centimetres tall.
How wide is her model?
Source: Standards & Testing Agency
Language
congruent, hypotenuse, Pythagoras’ theorem, similar
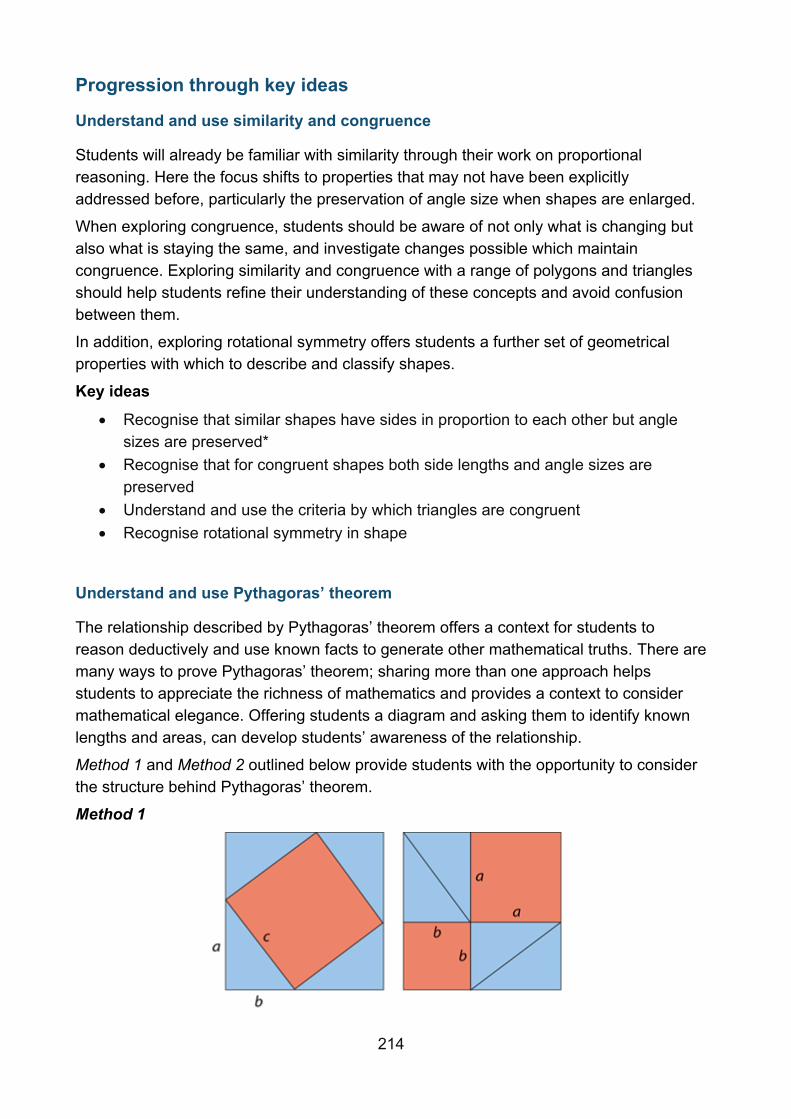
214
Progression through key ideas
Understand and use similarity and congruence
Students will already be familiar with similarity through their work on proportional reasoning. Here the focus shifts to properties that may not have been explicitly addressed before, particularly the preservation of angle size when shapes are enlarged.
When exploring congruence, students should be aware of not only what is changing but also what is staying the same, and investigate changes possible which maintain congruence. Exploring similarity and congruence with a range of polygons and triangles should help students refine their understanding of these concepts and avoid confusion between them.
In addition, exploring rotational symmetry offers students a further set of geometrical properties with which to describe and classify shapes.
Key ideas • Recognise that similar shapes have sides in proportion to each other but angle
sizes are preserved* • Recognise that for congruent shapes both side lengths and angle sizes are
preserved • Understand and use the criteria by which triangles are congruent • Recognise rotational symmetry in shape
Understand and use Pythagoras’ theorem
The relationship described by Pythagoras’ theorem offers a context for students to reason deductively and use known facts to generate other mathematical truths. There are many ways to prove Pythagoras’ theorem; sharing more than one approach helps students to appreciate the richness of mathematics and provides a context to consider mathematical elegance. Offering students a diagram and asking them to identify known lengths and areas, can develop students’ awareness of the relationship.
Method 1 and Method 2 outlined below provide students with the opportunity to consider the structure behind Pythagoras’ theorem.
Method 1
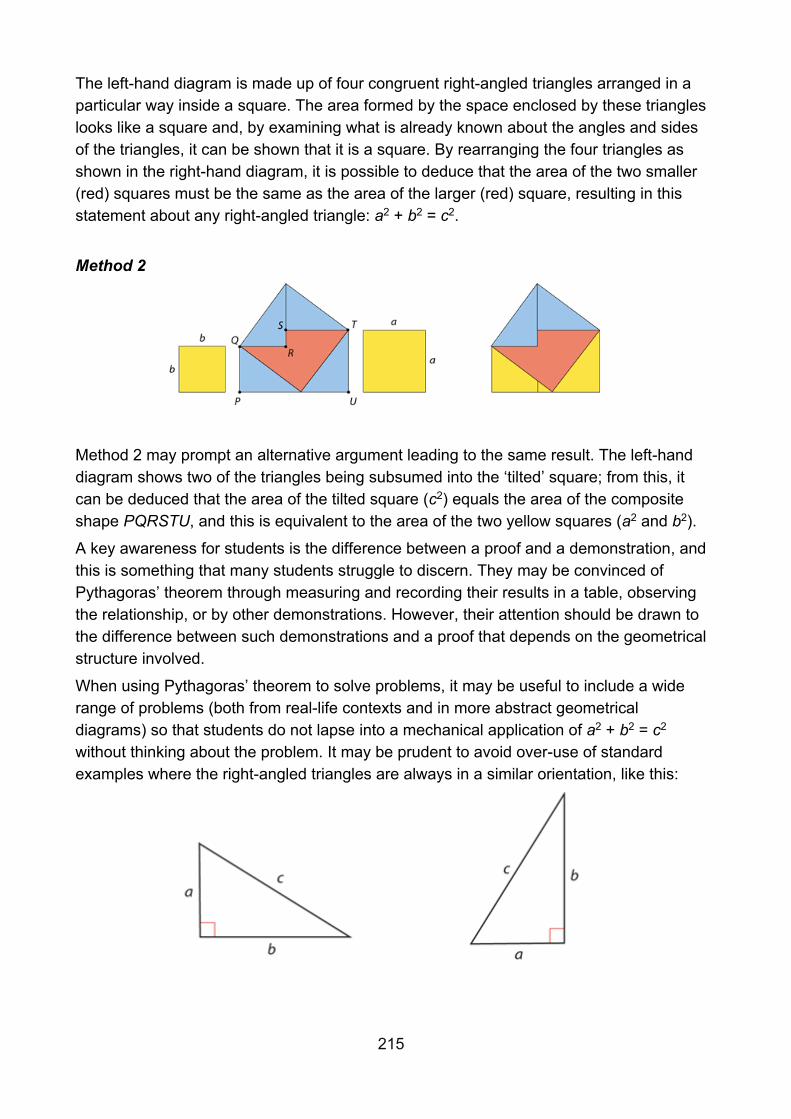
215
The left-hand diagram is made up of four congruent right-angled triangles arranged in a particular way inside a square. The area formed by the space enclosed by these triangles looks like a square and, by examining what is already known about the angles and sides of the triangles, it can be shown that it is a square. By rearranging the four triangles as shown in the right-hand diagram, it is possible to deduce that the area of the two smaller (red) squares must be the same as the area of the larger (red) square, resulting in this statement about any right-angled triangle: a2 + b2 = c2.
Method 2
Method 2 may prompt an alternative argument leading to the same result. The left-hand diagram shows two of the triangles being subsumed into the ‘tilted’ square; from this, it can be deduced that the area of the tilted square (c2) equals the area of the composite shape PQRSTU, and this is equivalent to the area of the two yellow squares (a2 and b2).
A key awareness for students is the difference between a proof and a demonstration, and this is something that many students struggle to discern. They may be convinced of Pythagoras’ theorem through measuring and recording their results in a table, observing the relationship, or by other demonstrations. However, their attention should be drawn to the difference between such demonstrations and a proof that depends on the geometrical structure involved.
When using Pythagoras’ theorem to solve problems, it may be useful to include a wide range of problems (both from real-life contexts and in more abstract geometrical diagrams) so that students do not lapse into a mechanical application of a2 + b2 = c2 without thinking about the problem. It may be prudent to avoid over-use of standard examples where the right-angled triangles are always in a similar orientation, like this:
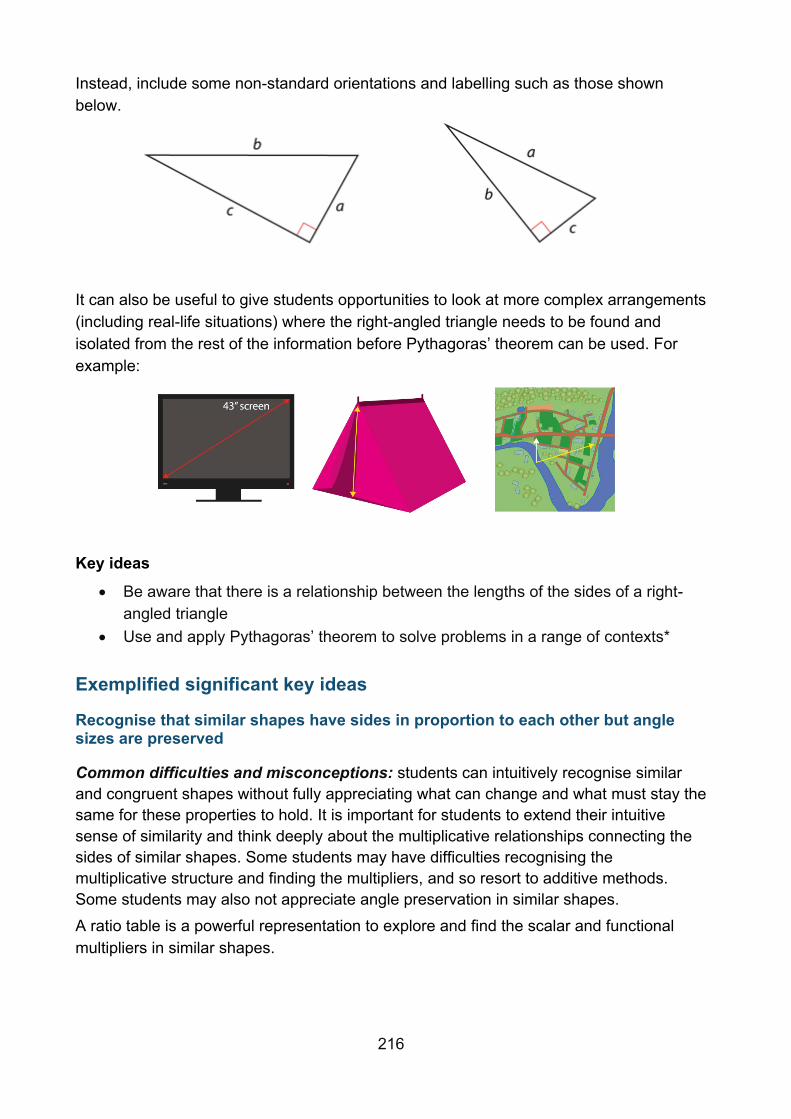
216
Instead, include some non-standard orientations and labelling such as those shown below.
It can also be useful to give students opportunities to look at more complex arrangements (including real-life situations) where the right-angled triangle needs to be found and isolated from the rest of the information before Pythagoras’ theorem can be used. For example:
Key ideas
• Be aware that there is a relationship between the lengths of the sides of a right-angled triangle
• Use and apply Pythagoras’ theorem to solve problems in a range of contexts*
Exemplified significant key ideas
Recognise that similar shapes have sides in proportion to each other but angle sizes are preserved
Common difficulties and misconceptions: students can intuitively recognise similar and congruent shapes without fully appreciating what can change and what must stay the same for these properties to hold. It is important for students to extend their intuitive sense of similarity and think deeply about the multiplicative relationships connecting the sides of similar shapes. Some students may have difficulties recognising the multiplicative structure and finding the multipliers, and so resort to additive methods. Some students may also not appreciate angle preservation in similar shapes. A ratio table is a powerful representation to explore and find the scalar and functional multipliers in similar shapes.
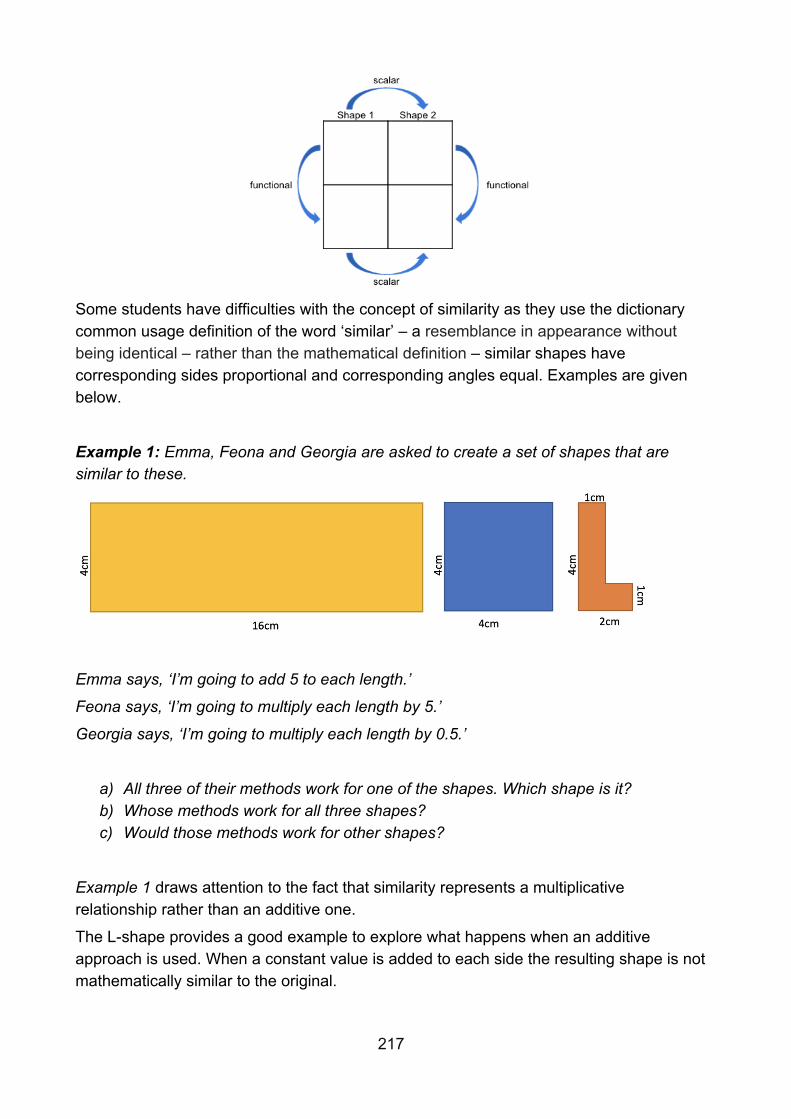
217
Some students have difficulties with the concept of similarity as they use the dictionary common usage definition of the word ‘similar’ – a resemblance in appearance without being identical – rather than the mathematical definition – similar shapes have corresponding sides proportional and corresponding angles equal. Examples are given below.
Example 1: Emma, Feona and Georgia are asked to create a set of shapes that are similar to these.
Emma says, ‘I’m going to add 5 to each length.’
Feona says, ‘I’m going to multiply each length by 5.’
Georgia says, ‘I’m going to multiply each length by 0.5.’
a) All three of their methods work for one of the shapes. Which shape is it? b) Whose methods work for all three shapes? c) Would those methods work for other shapes?
Example 1 draws attention to the fact that similarity represents a multiplicative relationship rather than an additive one.
The L-shape provides a good example to explore what happens when an additive approach is used. When a constant value is added to each side the resulting shape is not mathematically similar to the original.
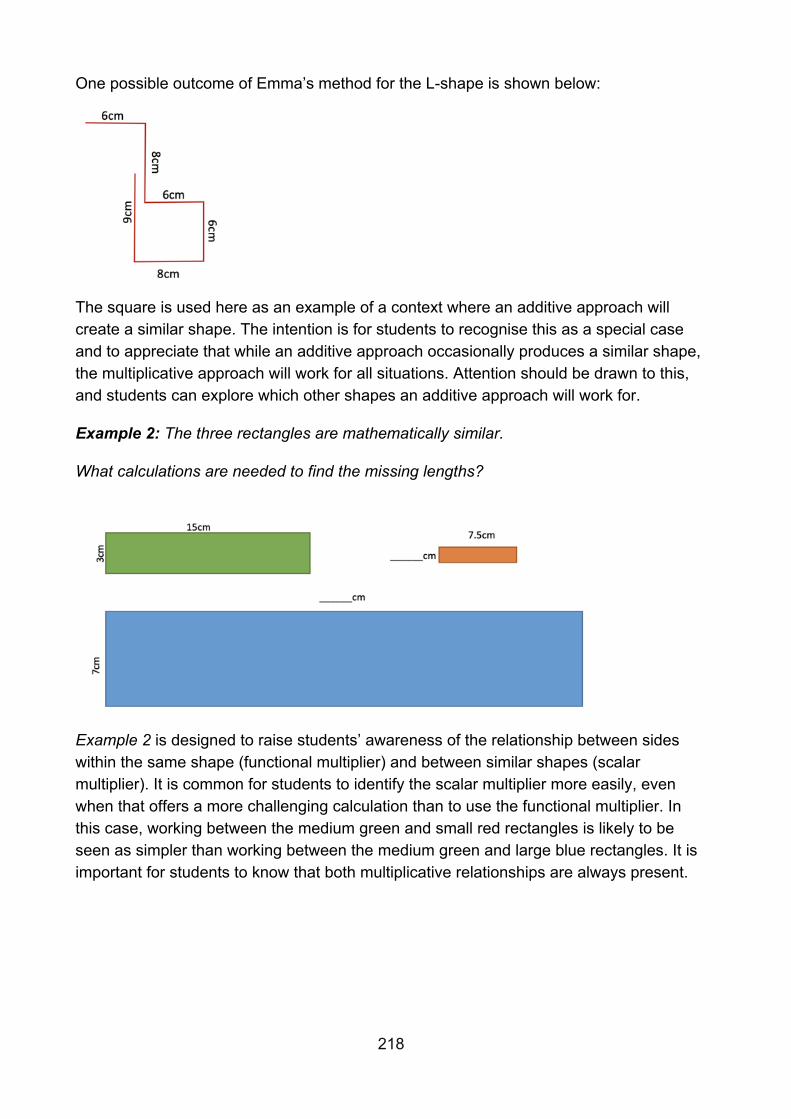
218
One possible outcome of Emma’s method for the L-shape is shown below:
The square is used here as an example of a context where an additive approach will create a similar shape. The intention is for students to recognise this as a special case and to appreciate that while an additive approach occasionally produces a similar shape, the multiplicative approach will work for all situations. Attention should be drawn to this, and students can explore which other shapes an additive approach will work for.
Example 2: The three rectangles are mathematically similar.
What calculations are needed to find the missing lengths?
Example 2 is designed to raise students’ awareness of the relationship between sides within the same shape (functional multiplier) and between similar shapes (scalar multiplier). It is common for students to identify the scalar multiplier more easily, even when that offers a more challenging calculation than to use the functional multiplier. In this case, working between the medium green and small red rectangles is likely to be seen as simpler than working between the medium green and large blue rectangles. It is important for students to know that both multiplicative relationships are always present.
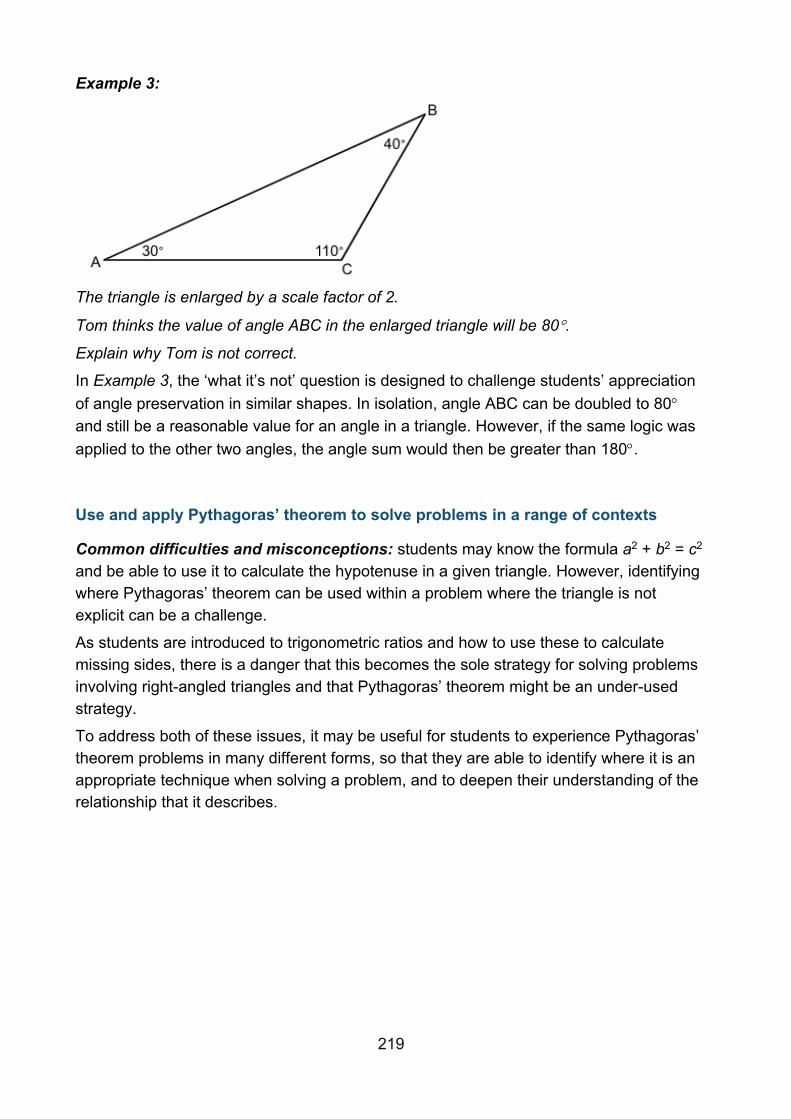
219
Example 3:
The triangle is enlarged by a scale factor of 2.
Tom thinks the value of angle ABC in the enlarged triangle will be 80.
Explain why Tom is not correct.
In Example 3, the ‘what it’s not’ question is designed to challenge students’ appreciation of angle preservation in similar shapes. In isolation, angle ABC can be doubled to 80 and still be a reasonable value for an angle in a triangle. However, if the same logic was applied to the other two angles, the angle sum would then be greater than 180.
Use and apply Pythagoras’ theorem to solve problems in a range of contexts
Common difficulties and misconceptions: students may know the formula a2 + b2 = c2 and be able to use it to calculate the hypotenuse in a given triangle. However, identifying where Pythagoras’ theorem can be used within a problem where the triangle is not explicit can be a challenge.
As students are introduced to trigonometric ratios and how to use these to calculate missing sides, there is a danger that this becomes the sole strategy for solving problems involving right-angled triangles and that Pythagoras’ theorem might be an under-used strategy.
To address both of these issues, it may be useful for students to experience Pythagoras’ theorem problems in many different forms, so that they are able to identify where it is an appropriate technique when solving a problem, and to deepen their understanding of the relationship that it describes.
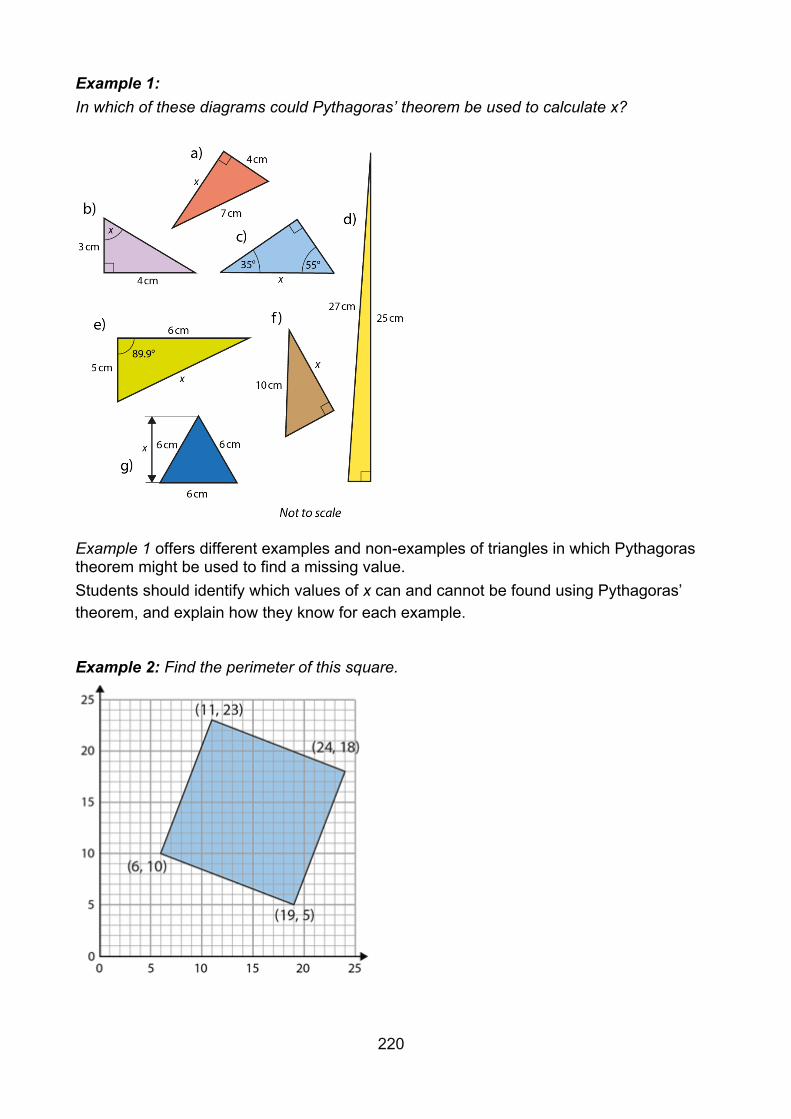
220
Example 1: In which of these diagrams could Pythagoras’ theorem be used to calculate x?
Example 1 offers different examples and non-examples of triangles in which Pythagoras theorem might be used to find a missing value. Students should identify which values of x can and cannot be found using Pythagoras’ theorem, and explain how they know for each example.
Example 2: Find the perimeter of this square.
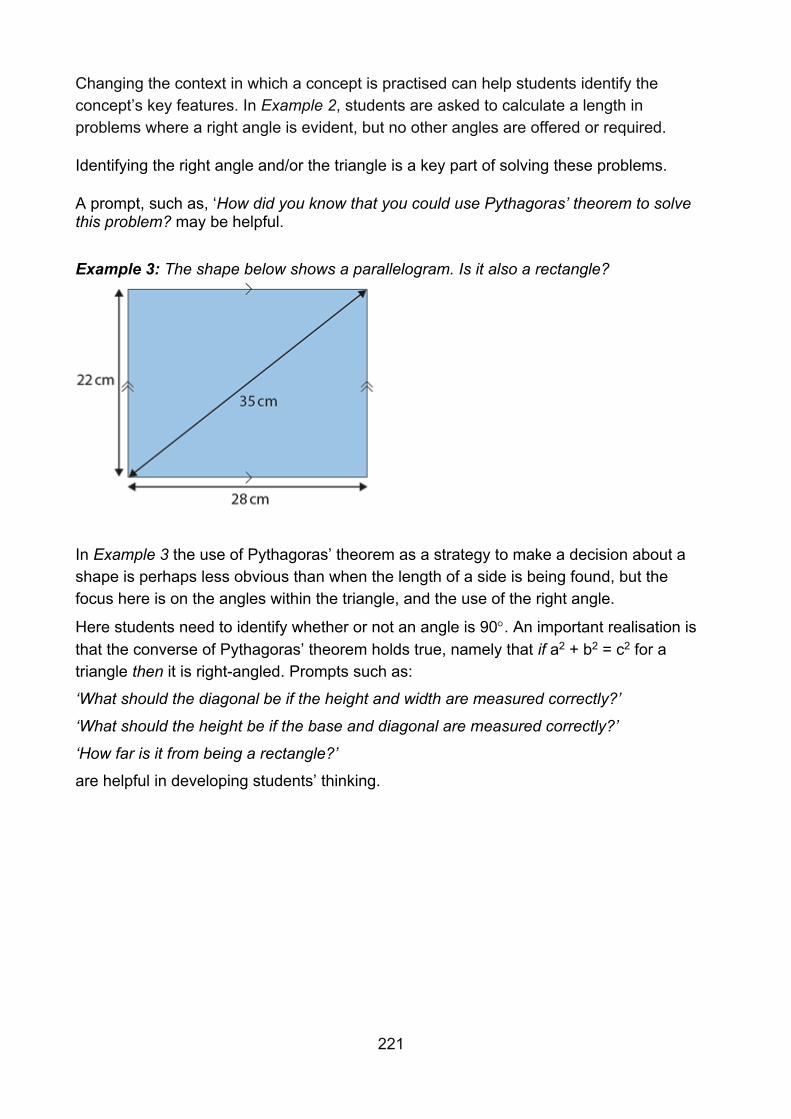
221
Changing the context in which a concept is practised can help students identify the concept’s key features. In Example 2, students are asked to calculate a length in problems where a right angle is evident, but no other angles are offered or required.
Identifying the right angle and/or the triangle is a key part of solving these problems.
A prompt, such as, ‘How did you know that you could use Pythagoras’ theorem to solve this problem? may be helpful. Example 3: The shape below shows a parallelogram. Is it also a rectangle?
In Example 3 the use of Pythagoras’ theorem as a strategy to make a decision about a shape is perhaps less obvious than when the length of a side is being found, but the focus here is on the angles within the triangle, and the use of the right angle.
Here students need to identify whether or not an angle is 90. An important realisation is that the converse of Pythagoras’ theorem holds true, namely that if a2 + b2 = c2 for a triangle then it is right-angled. Prompts such as:
‘What should the diagonal be if the height and width are measured correctly?’
‘What should the height be if the base and diagonal are measured correctly?’
‘How far is it from being a rectangle?’
are helpful in developing students’ thinking.
222
Probability
Overview
Students will encounter probability in many aspects of their daily lives, from sporting events to weather reports. However, students may feel that their lived experiences do not reflect calculated mathematical likelihoods. For example, rolling a six on a die in order to win a board game often ‘feels’ far less likely than any of the other outcomes. The introduction of probability at Key Stage 3 will offer students a way to quantify, explore and explain likelihood and coincidence, and to reason about uncertainty.
Students could engage in experiments and develop a feel for likely, unlikely, even, certain and impossible chances, before starting to quantify probabilities and the likelihood of different outcomes. An understanding of equally likely outcomes is key to this. Often, students mistakenly believe that an event with only two possible outcomes has an ‘even’ chance of happening, or that the probability of one event occurring when there are n possible outcomes is ‘one in n’. Students should be exposed to examples of when this is true and when this is not true (for example, whether it will rain or not rain tomorrow, whether the school football team would beat the Brazil national team if they were to play them, or whether the teacher choosing a student from a class of 30 has a probability of 1 out of 30) and discuss what’s the same and what’s different about the situations.
Furthermore, students need to appreciate that predictions of likelihood do not predict individual events. Rather, experimental data will tend towards this theoretical value. For example, knowing that flipping a head or a tail on a coin has an even chance of occurring does not mean these outcomes will occur an equal number of times.
As they start to quantify outcomes, students should be exposed to different ways to systematically organise and represent possible results, including lists, tables, grids and Venn diagrams.
The use of specific and precise language is key to working with probability. For example, students should understand the distinctions between an event (for example, flipping a coin) and an outcome (for example, a coin landing on heads) or between probability and possibility (for example, it is possible that it will snow in summer, but not probable).
Prior learning
Before beginning to teach probability at Key Stage 3, students should already have a secure understanding of the following learning outcomes from earlier in Key Stage 3:
• Understand that fractions are an example of a multiplicative relationship and apply this understanding to a range of contexts
• Understand that ratios are an example of a multiplicative relationship and apply this understanding to a range of contexts
223
The NCETM has created the following Key Stage 2 ready-to-progress criteria to support teachers in making judgements about students’ understanding and knowledge.
6F-2 Express fractions in a common denomination and use this to compare fractions that are similar in value.
6AS/MD-3 Solve problems involving ratio relationships.
Checking prior learning
The following activities from the NCETM primary assessment materials offer useful ideas for teachers to use to check whether prior learning is secure.
Reference Activity
Year 6 page 20
Put the following numbers on a number line:
3
4, 3
2, 0.5, 1.25, 3 ÷ 8, 0.125
Year 6 page 23
You can buy 3 pots of banana yoghurt for £2.40.
How much will it cost to buy 12 pots of banana yoghurt?
A child’s bus ticket costs £3.70 and an adult’s bus ticket costs twice as much.
How much does an adult bus ticket cost?
To make a sponge cake, I need 6 times as much flour as I do when I’m making a fairy cake.
If a sponge cake needs 270 g of flour, how much does a fairy cake need?
Language
combined event, conditional probability, dependent and independent events, mutually exclusive events, probability, sample space
224
Progression through key ideas
Explore, describe and analyse the frequency of outcomes in a range of situations
Before they quantify probabilities, students need to appreciate that, where an event has different possible outcomes, some of these outcomes may be more or less likely than others for different possible reasons.
One factor that underpins uncertainty is that of randomness. A key awareness for students is to understand that although an individual event might be random, reasoning about uncertain events can be fruitful when they are repeated many times. Given enough time, trends in apparently random behaviour can become predictable by analysing the frequency of outcomes.
Research suggests that students view randomness in a number of different and, sometimes, contradictory ways. Pratt and Noss (2002) identified four ‘naïve’ ways that 10- and 11-year-old students described randomness. These were unpredictability (can the outcome of an event be predicted?), unsteerability (can the outcome of an event be controlled?), irregularity (can a pattern be seen in the outcomes of an event?) and fairness.
To overcome this, students could be exposed to practical experimentation, both engaging in experimentation themselves and collecting collaborative data to enable larger sets of data to be reflected upon.
Key ideas • Understand that some outcomes are equally likely, and some are not • Understand that the likelihood of events happening can be ordered on a scale
from impossible to certain • Understand that the likelihood of outcomes can be determined by designing and
carrying out a probability experiment*
Systematically record outcomes to find theoretical probabilities
Identifying the range of possible outcomes (the sample space) for an event is key for students to be able to reason about the likelihood of one of those outcomes occurring. Students should understand that for situations with equally likely outcomes, the greater the possible number of different outcomes, the less likely each individual outcome becomes.
Students should experience different ways to record and represent outcomes, including lists, tables, grids and Venn diagrams. (Note that ‘tree diagrams’ are introduced in the national curriculum Key Stage 4 programme of study.)
Working systematically to construct and record the outcomes of an event efficiently is not trivial. It is important for students to understand the necessity of systematic listing of outcomes.
225
As the number of equally likely events is increased, consideration of the sample space becomes more crucial. For example, when flipping two coins, many students may say that an outcome of two heads, two tails or a head and a tail are all equally likely. The use of a probability space diagram, where outcomes are assigned probabilities, can help make sense of this misconception.
Key ideas • Systematically find all the possible outcomes for two events using a range of
appropriate diagrams • Systematically identify all possible outcomes for more than two events using
appropriate diagrams, e.g. lists • Find theoretical probabilities from sets of outcomes organised in a systematic way
from a range of appropriate representations
Calculate and use probabilities of single and combined events
Probability is quantified using proportion, and this proportion is usually represented as a fraction, although a decimal or percentage can also be used. Students can find reasoning about proportion challenging, and reasoning about proportion in probability adds an extra layer of complexity.
Probability is also frequently quantified using a ratio, which implies a slightly different perspective on probability. For example, a bag contains two blue counters and three red counters. A counter is repeatedly taken out of the bag and then replaced. The probability that a blue counter is drawn can be quantified as 2
5; that is, for every five counters
selected, two of them can be expected to be blue. When represented as a ratio, this becomes 2:3, with the implicit interpretation that, for every two blue counters drawn out, three red counters remain.
It is important that students are given a range of opportunities to interpret, compare and make decisions on situations based around quantifiable probabilities related to real life.
Students will learn that the total chance of all the outcomes of an event will sum to one and should understand how this can be illustrated on a number line, and subsequently link this knowledge to the relationship: (the chance of an outcome not happening) = 1 – (the chance of it happening)
Key ideas • Understand that probability is a measure of the likelihood of an event happening
and that it can be assigned a numerical value* • Calculate and use theoretical probabilities for single events • Understand that the probabilities of all possible outcomes sum to one • Calculate and use theoretical probabilities for combined events using a variety of
appropriate representations, including Venn diagrams
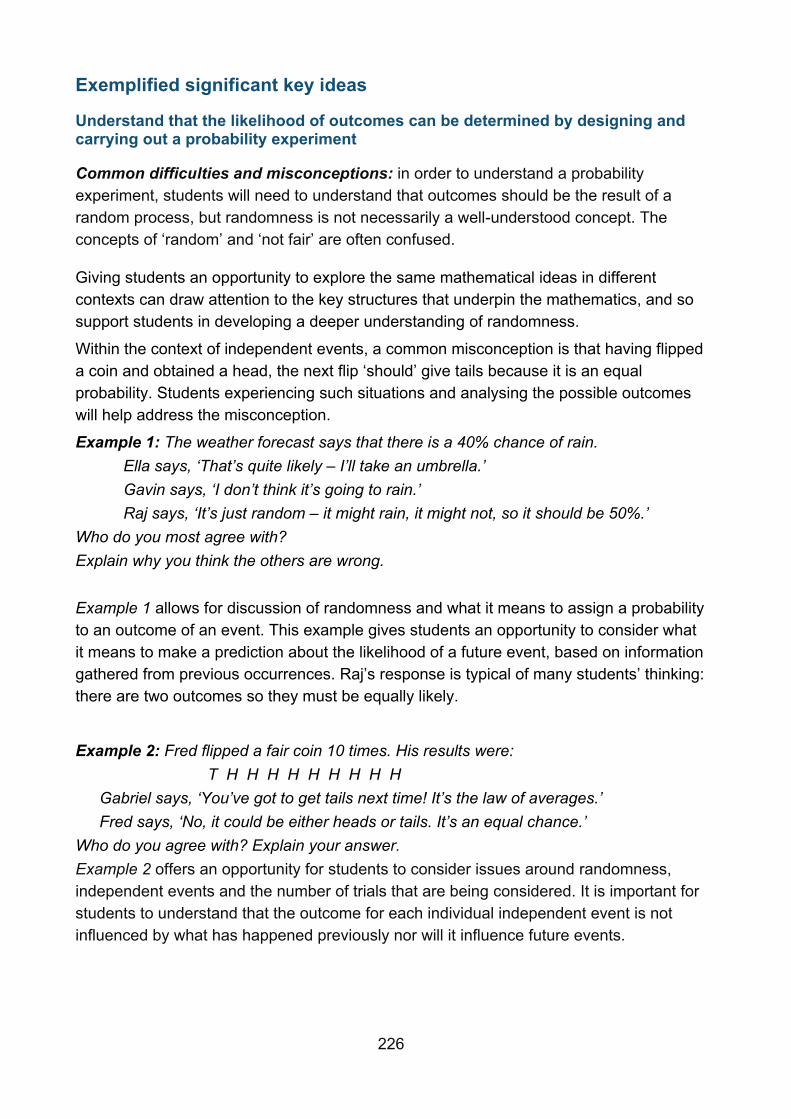
226
Exemplified significant key ideas
Understand that the likelihood of outcomes can be determined by designing and carrying out a probability experiment
Common difficulties and misconceptions: in order to understand a probability experiment, students will need to understand that outcomes should be the result of a random process, but randomness is not necessarily a well-understood concept. The concepts of ‘random’ and ‘not fair’ are often confused.
Giving students an opportunity to explore the same mathematical ideas in different contexts can draw attention to the key structures that underpin the mathematics, and so support students in developing a deeper understanding of randomness.
Within the context of independent events, a common misconception is that having flipped a coin and obtained a head, the next flip ‘should’ give tails because it is an equal probability. Students experiencing such situations and analysing the possible outcomes will help address the misconception.
Example 1: The weather forecast says that there is a 40% chance of rain. Ella says, ‘That’s quite likely – I’ll take an umbrella.’ Gavin says, ‘I don’t think it’s going to rain.’ Raj says, ‘It’s just random – it might rain, it might not, so it should be 50%.’
Who do you most agree with? Explain why you think the others are wrong. Example 1 allows for discussion of randomness and what it means to assign a probability to an outcome of an event. This example gives students an opportunity to consider what it means to make a prediction about the likelihood of a future event, based on information gathered from previous occurrences. Raj’s response is typical of many students’ thinking: there are two outcomes so they must be equally likely.
Example 2: Fred flipped a fair coin 10 times. His results were: T H H H H H H H H H
Gabriel says, ‘You’ve got to get tails next time! It’s the law of averages.’ Fred says, ‘No, it could be either heads or tails. It’s an equal chance.’
Who do you agree with? Explain your answer. Example 2 offers an opportunity for students to consider issues around randomness, independent events and the number of trials that are being considered. It is important for students to understand that the outcome for each individual independent event is not influenced by what has happened previously nor will it influence future events.
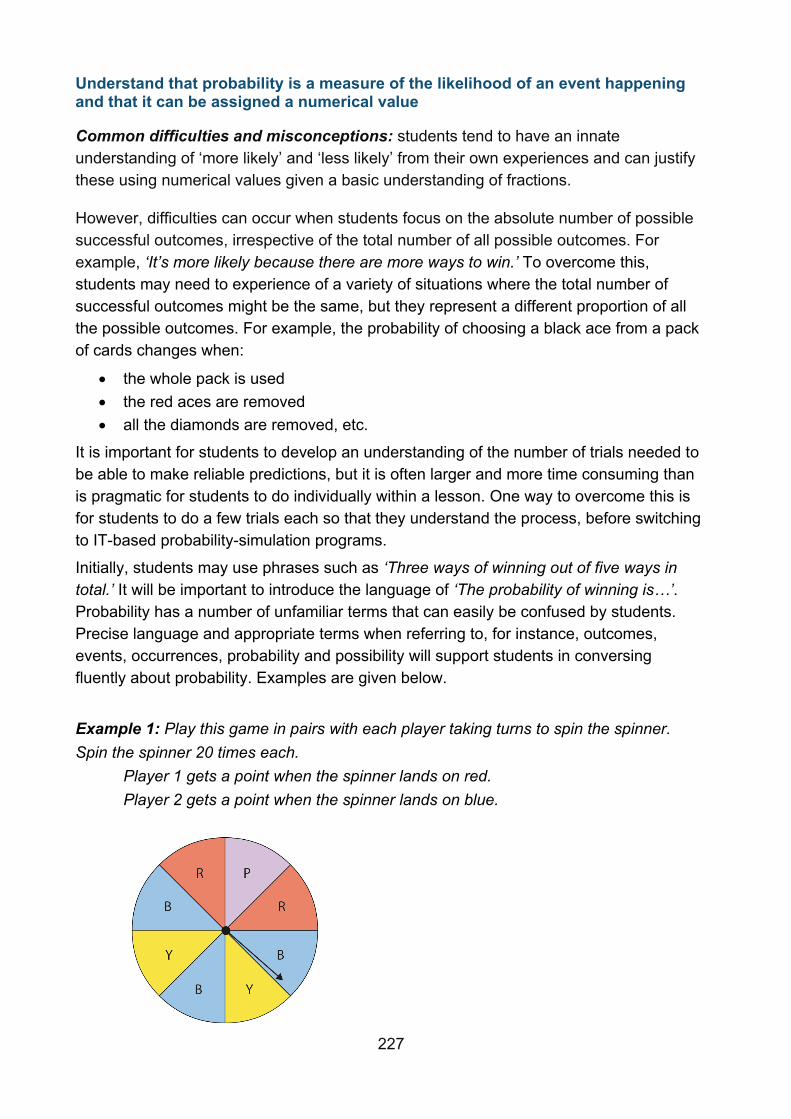
227
Understand that probability is a measure of the likelihood of an event happening and that it can be assigned a numerical value
Common difficulties and misconceptions: students tend to have an innate understanding of ‘more likely’ and ‘less likely’ from their own experiences and can justify these using numerical values given a basic understanding of fractions.
However, difficulties can occur when students focus on the absolute number of possible successful outcomes, irrespective of the total number of all possible outcomes. For example, ‘It’s more likely because there are more ways to win.’ To overcome this, students may need to experience of a variety of situations where the total number of successful outcomes might be the same, but they represent a different proportion of all the possible outcomes. For example, the probability of choosing a black ace from a pack of cards changes when:
• the whole pack is used • the red aces are removed • all the diamonds are removed, etc.
It is important for students to develop an understanding of the number of trials needed to be able to make reliable predictions, but it is often larger and more time consuming than is pragmatic for students to do individually within a lesson. One way to overcome this is for students to do a few trials each so that they understand the process, before switching to IT-based probability-simulation programs.
Initially, students may use phrases such as ‘Three ways of winning out of five ways in total.’ It will be important to introduce the language of ‘The probability of winning is…’. Probability has a number of unfamiliar terms that can easily be confused by students. Precise language and appropriate terms when referring to, for instance, outcomes, events, occurrences, probability and possibility will support students in conversing fluently about probability. Examples are given below.
Example 1: Play this game in pairs with each player taking turns to spin the spinner. Spin the spinner 20 times each.
Player 1 gets a point when the spinner lands on red. Player 2 gets a point when the spinner lands on blue.
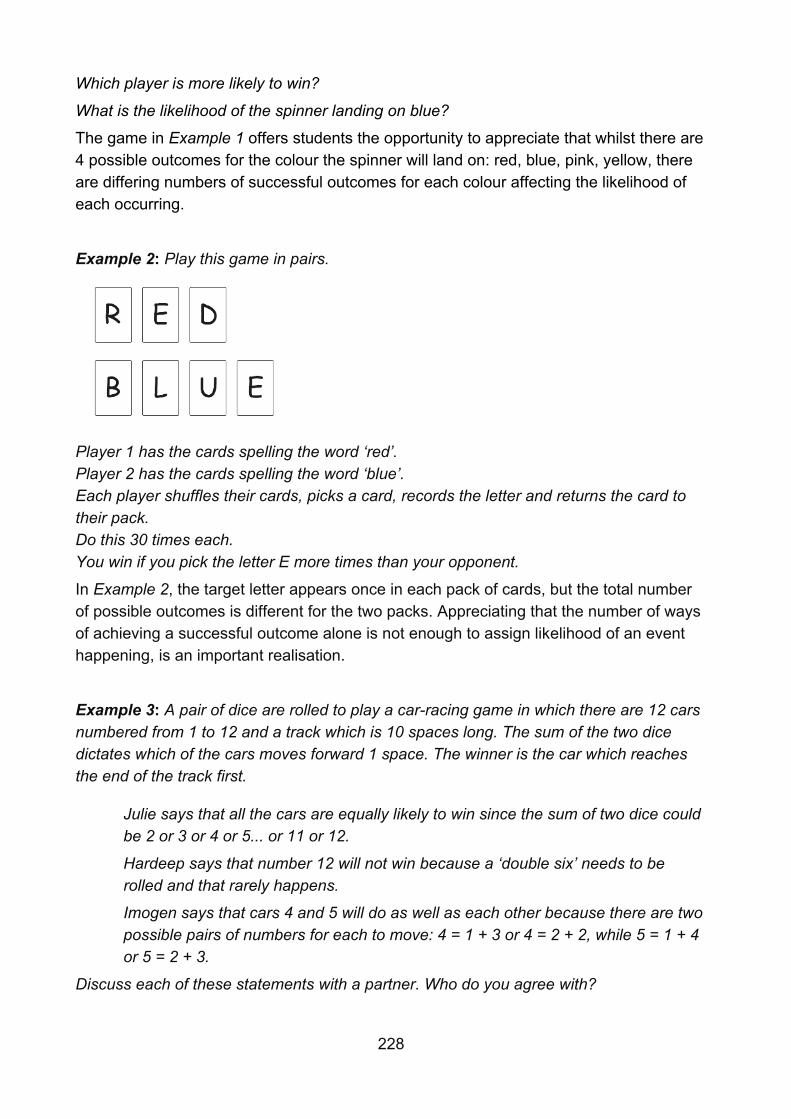
228
Which player is more likely to win?
What is the likelihood of the spinner landing on blue?
The game in Example 1 offers students the opportunity to appreciate that whilst there are 4 possible outcomes for the colour the spinner will land on: red, blue, pink, yellow, there are differing numbers of successful outcomes for each colour affecting the likelihood of each occurring.
Example 2: Play this game in pairs.
Player 1 has the cards spelling the word ‘red’. Player 2 has the cards spelling the word ‘blue’. Each player shuffles their cards, picks a card, records the letter and returns the card to their pack. Do this 30 times each. You win if you pick the letter E more times than your opponent.
In Example 2, the target letter appears once in each pack of cards, but the total number of possible outcomes is different for the two packs. Appreciating that the number of ways of achieving a successful outcome alone is not enough to assign likelihood of an event happening, is an important realisation.
Example 3: A pair of dice are rolled to play a car-racing game in which there are 12 cars numbered from 1 to 12 and a track which is 10 spaces long. The sum of the two dice dictates which of the cars moves forward 1 space. The winner is the car which reaches the end of the track first.
Julie says that all the cars are equally likely to win since the sum of two dice could be 2 or 3 or 4 or 5... or 11 or 12.
Hardeep says that number 12 will not win because a ‘double six’ needs to be rolled and that rarely happens.
Imogen says that cars 4 and 5 will do as well as each other because there are two possible pairs of numbers for each to move: 4 = 1 + 3 or 4 = 2 + 2, while 5 = 1 + 4 or 5 = 2 + 3.
Discuss each of these statements with a partner. Who do you agree with?

229
Combined events are encountered in Example 3 and the use of a sample space diagram will help students to appreciate the difference between obtaining ‘1 and 3’ and obtaining ‘3 and 1’. The use of two different-coloured dice is also helpful in understanding the distinction.
230
Year 9 spring term
Non-linear relationships
Overview
The elements here build on the work done in Year 8 autumn term and now include non-arithmetic sequences. Students will have explored non-numerical (shape) and numerical sequences, noticed a pattern, described the pattern in words and found the next term in the sequence. They may have also experienced naturally occurring patterns in mathematics, such as square numbers.
Students should consolidate, secure and deepen their understanding of sequences so they can progress to describing any term directly in relation to its position in the sequence.
This work extends students’ knowledge of sequences through exploration of the mathematical structure, not just by spotting the patterns that the structure creates.
This learning has connections to other areas of algebra, particularly solving equations (when checking if a number is a term in a sequence) and graphs. Work on sequences in Key Stage 3 provides the foundation for exploring quadratic sequences and simple geometric progressions in Key Stage 4.
Prior learning
Before beginning non-linear relationships in Year 9, students should already have a secure understanding of the following learning outcomes from study earlier in Key Stage 3:
• Understand multiples. • Understand integer exponents and roots. • Understand and use the conventions and vocabulary of algebra, including forming
and interpreting algebraic expressions and equations.
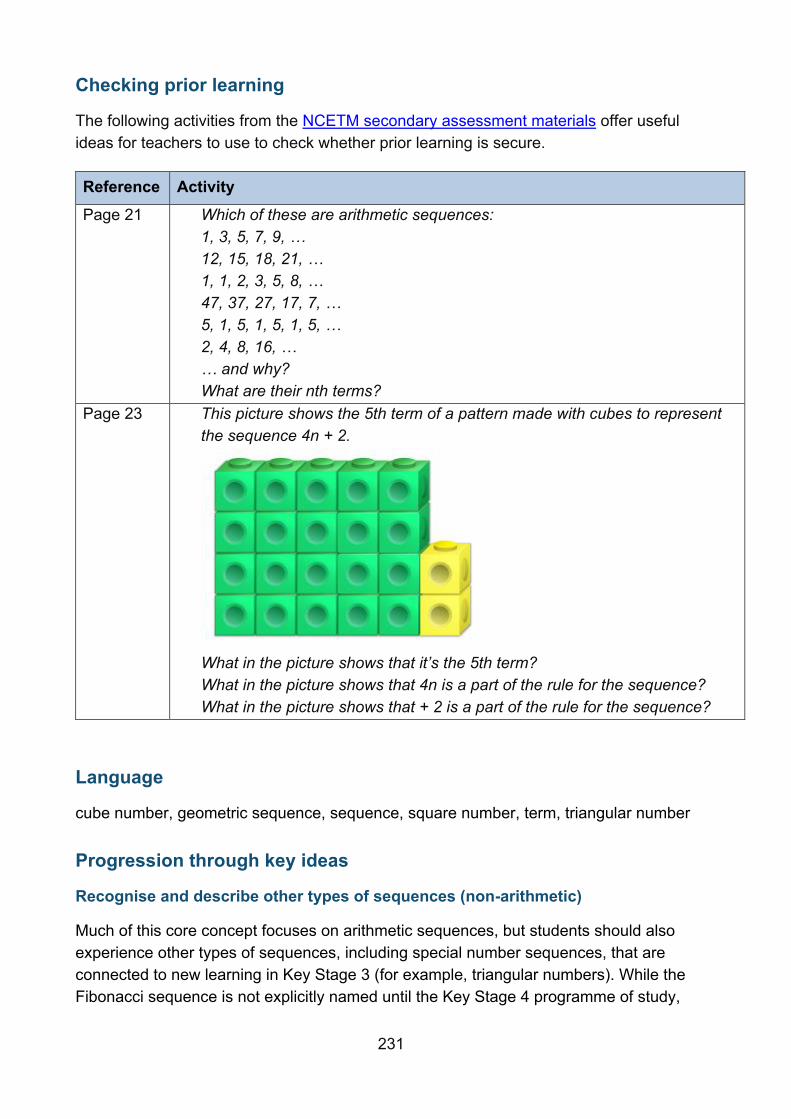
231
Checking prior learning
The following activities from the NCETM secondary assessment materials offer useful ideas for teachers to use to check whether prior learning is secure.
Reference Activity Page 21 Which of these are arithmetic sequences:
1, 3, 5, 7, 9, … 12, 15, 18, 21, … 1, 1, 2, 3, 5, 8, … 47, 37, 27, 17, 7, … 5, 1, 5, 1, 5, 1, 5, … 2, 4, 8, 16, … … and why? What are their nth terms?
Page 23 This picture shows the 5th term of a pattern made with cubes to represent the sequence 4n + 2.
What in the picture shows that it’s the 5th term? What in the picture shows that 4n is a part of the rule for the sequence? What in the picture shows that + 2 is a part of the rule for the sequence?
Language
cube number, geometric sequence, sequence, square number, term, triangular number
Progression through key ideas
Recognise and describe other types of sequences (non-arithmetic)
Much of this core concept focuses on arithmetic sequences, but students should also experience other types of sequences, including special number sequences, that are connected to new learning in Key Stage 3 (for example, triangular numbers). While the Fibonacci sequence is not explicitly named until the Key Stage 4 programme of study,

232
opportunities could be provided in Key Stage 3 to begin exploring other types of number sequences in preparation for this future work.
Key ideas • Understand the features of a geometric sequence and be able to recognise one • Understand the features of special number sequences, such as square, triangle
and cube, and be able to recognise one • Appreciate that there are other number sequences
233
Expressions and formulae
Overview
The elements here build on the work done in Year 7 autumn term and now include manipulating expressions. At the heart of algebra and algebraic thinking is the expression of generality. Algebraic notation and techniques for its manipulation, including conventions governing its use, should naturally arise from exploring the structure of the number system and operations on number. For this reason, algebra is not considered a separate theme but is linked to an understanding of the structure of the number system and operating on number.
Prior learning
Before beginning expressions and formulae in Year 9, students should already have a secure understanding of the following learning outcomes from study at upper Key Stage 2 and from work earlier in Key Stage 3:
• Use their knowledge of the order of operations to carry out calculations involving the four operations.
• Use simple formulae. • Express missing number problems algebraically. • Find pairs of numbers that satisfy an equation with two unknowns. • Enumerate possibilities of combinations of two variables. • Use symbols and letters to represent variables and unknowns in mathematical
situations that they already understand.
The NCETM has created the following Key Stage 2 ready-to-progress criteria to support teachers in making judgements about students’ understanding and knowledge.
4MD-2 Manipulate multiplication and division equations, and understand and apply the commutative property of multiplication.
6AS/MD-2 Use a given additive or multiplicative calculation to derive or complete a related calculation, using arithmetic properties, inverse relationships, and place-value understanding.
6AS/MD-2 Solve problems with two unknowns
Checking prior learning
The following activities, some from the NCETM secondary assessment materials, offer useful ideas for teachers to use to check whether prior learning is secure.
234
Reference Activity Page 15 Match up expressions on the left with their corresponding description
in words on the right.
4 + 2x Four less than x
x – 4 Four times the number that is two more than x
2x – 4 Two less than one-quarter of x
(x + 2) ÷ 4 Four more than twice x
4(x + 2) One quarter of the number which is two more than x
One expression on the left and one description on the right can’t be matched.
Write a description for the expression that isn’t matched.
Write an expression for the description that isn’t matched.
Page 16 Which of these statements are true and which are false?
• 4(b + 2) = 4b + 2 • 3(p – 4) = 3p – 7 • 2(x + 7) + 6 = 2x + 20 • –2(5 – b) = -10 – 2b • 12 – (n – 3) = 15 – n
For those that are true, give a reason and/or draw a picture for why they are true.
For those that are false, explain why they are false and correct them.
Language
binomial, equation, expression, factorise, formula, variable
Progression through key ideas
Find products of binomials
In Year 7 autumn term, students used the distributive law to expand a single term over a binomial. Here they use the same law to work with pairs of binomials. Students should understand that this expansion is a generalisation of the familiar ‘grid method’ for
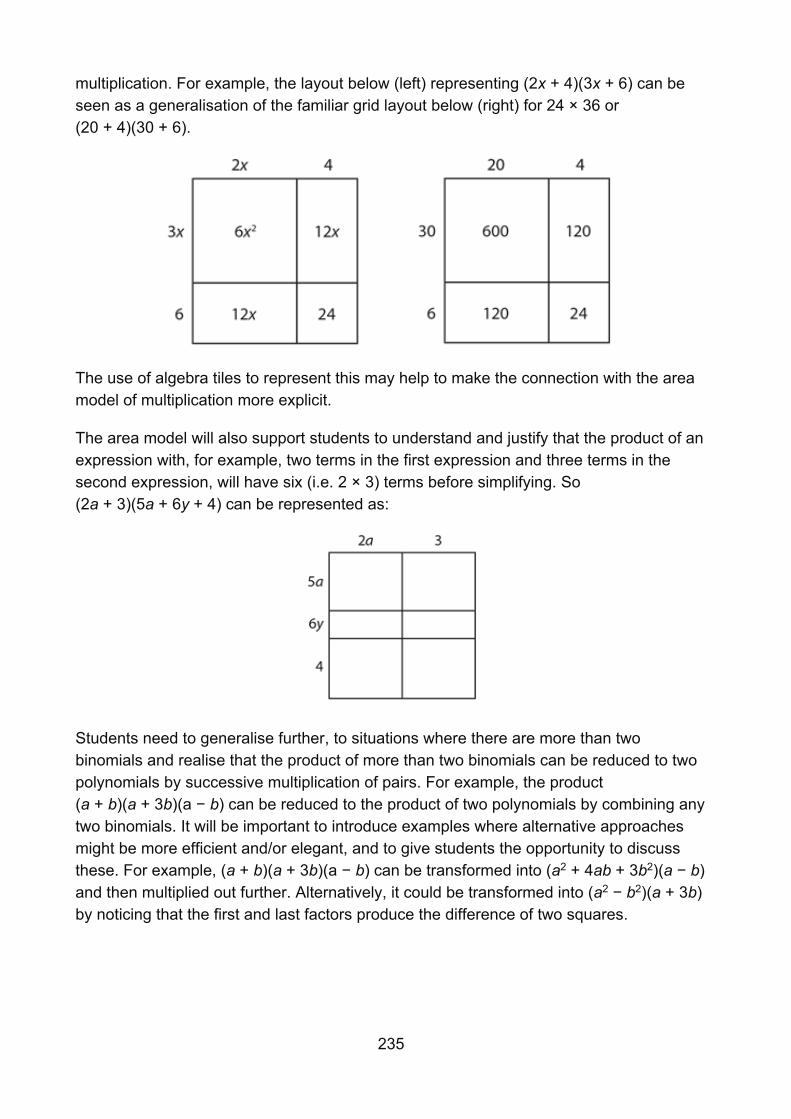
235
multiplication. For example, the layout below (left) representing (2x + 4)(3x + 6) can be seen as a generalisation of the familiar grid layout below (right) for 24 × 36 or (20 + 4)(30 + 6).
The use of algebra tiles to represent this may help to make the connection with the area model of multiplication more explicit.
The area model will also support students to understand and justify that the product of an expression with, for example, two terms in the first expression and three terms in the second expression, will have six (i.e. 2 × 3) terms before simplifying. So (2a + 3)(5a + 6y + 4) can be represented as:
Students need to generalise further, to situations where there are more than two binomials and realise that the product of more than two binomials can be reduced to two polynomials by successive multiplication of pairs. For example, the product (a + b)(a + 3b)(a − b) can be reduced to the product of two polynomials by combining any two binomials. It will be important to introduce examples where alternative approaches might be more efficient and/or elegant, and to give students the opportunity to discuss these. For example, (a + b)(a + 3b)(a − b) can be transformed into (a2 + 4ab + 3b2)(a − b) and then multiplied out further. Alternatively, it could be transformed into (a2 − b2)(a + 3b) by noticing that the first and last factors produce the difference of two squares.
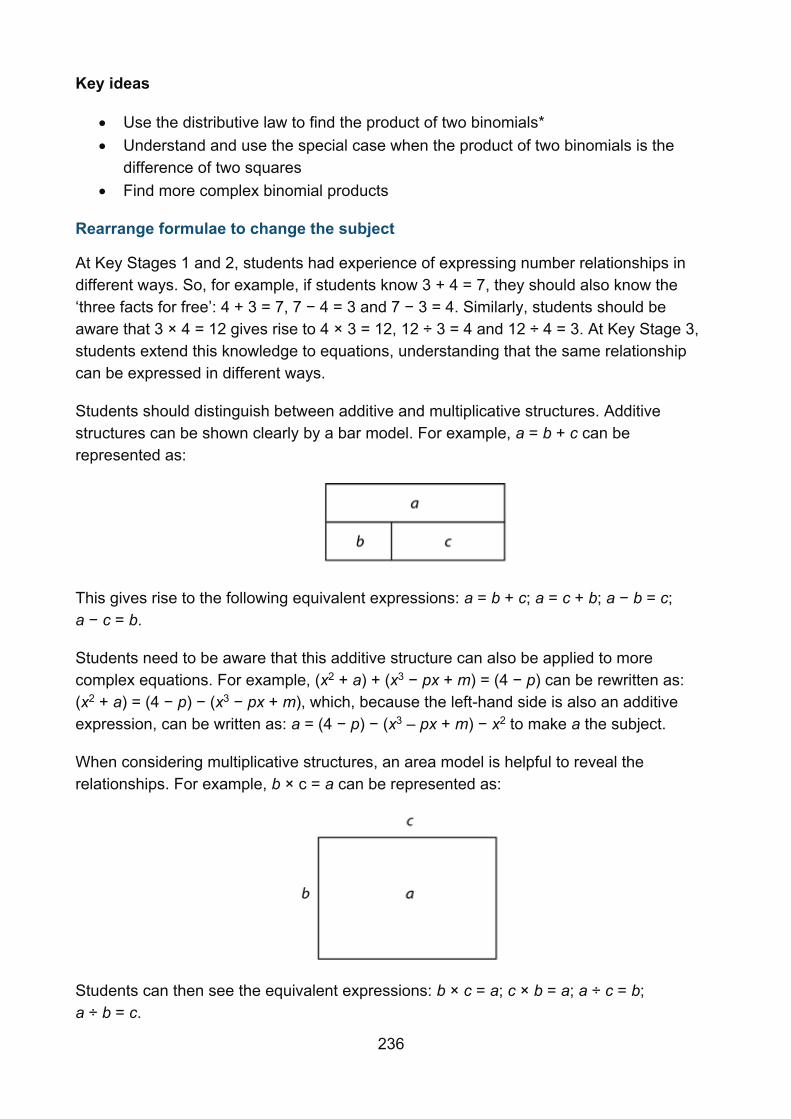
236
Key ideas
• Use the distributive law to find the product of two binomials* • Understand and use the special case when the product of two binomials is the
difference of two squares • Find more complex binomial products
Rearrange formulae to change the subject
At Key Stages 1 and 2, students had experience of expressing number relationships in different ways. So, for example, if students know 3 + 4 = 7, they should also know the ‘three facts for free’: 4 + 3 = 7, 7 − 4 = 3 and 7 − 3 = 4. Similarly, students should be aware that 3 × 4 = 12 gives rise to 4 × 3 = 12, 12 ÷ 3 = 4 and 12 ÷ 4 = 3. At Key Stage 3, students extend this knowledge to equations, understanding that the same relationship can be expressed in different ways.
Students should distinguish between additive and multiplicative structures. Additive structures can be shown clearly by a bar model. For example, a = b + c can be represented as:
This gives rise to the following equivalent expressions: a = b + c; a = c + b; a − b = c; a − c = b.
Students need to be aware that this additive structure can also be applied to more complex equations. For example, (x2 + a) + (x3 − px + m) = (4 − p) can be rewritten as: (x2 + a) = (4 − p) − (x3 − px + m), which, because the left-hand side is also an additive expression, can be written as: a = (4 − p) − (x3 – px + m) − x2 to make a the subject.
When considering multiplicative structures, an area model is helpful to reveal the relationships. For example, b × c = a can be represented as:
Students can then see the equivalent expressions: b × c = a; c × b = a; a ÷ c = b; a ÷ b = c.
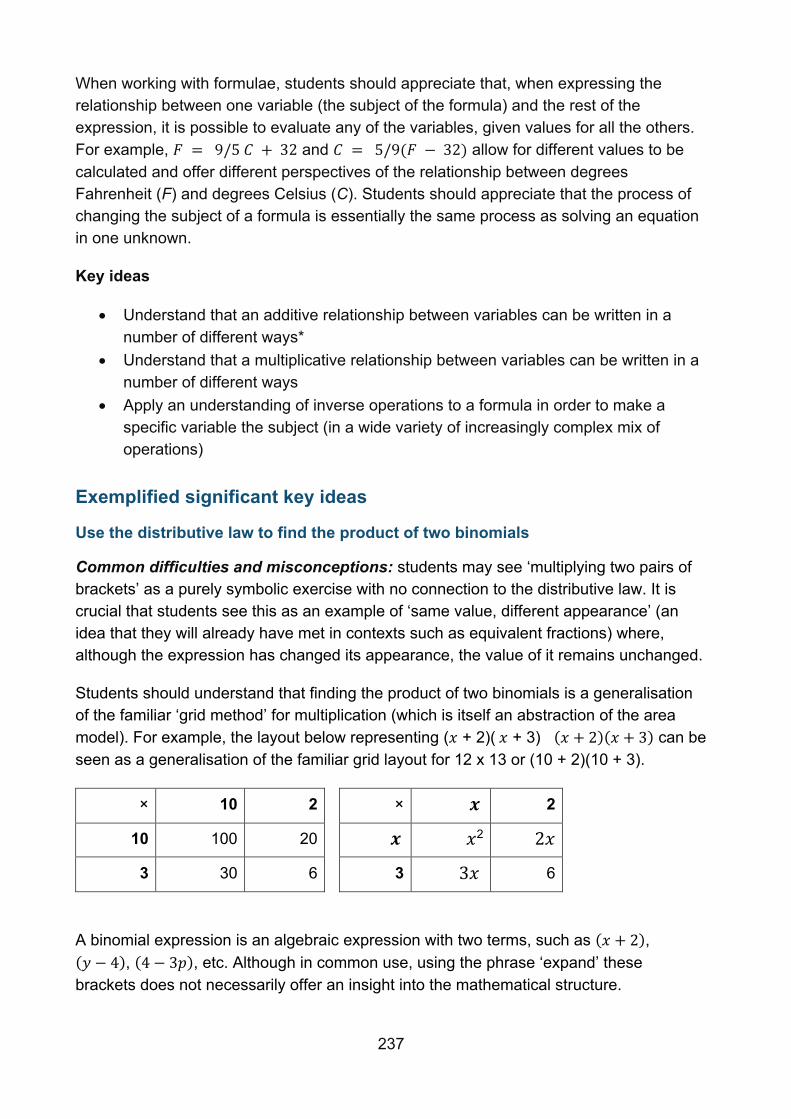
237
When working with formulae, students should appreciate that, when expressing the relationship between one variable (the subject of the formula) and the rest of the expression, it is possible to evaluate any of the variables, given values for all the others. For example, 𝐹 = 9/5 𝐶 + 32 and 𝐶 = 5/9(𝐹 − 32) allow for different values to be calculated and offer different perspectives of the relationship between degrees Fahrenheit (F) and degrees Celsius (C). Students should appreciate that the process of changing the subject of a formula is essentially the same process as solving an equation in one unknown.
Key ideas
• Understand that an additive relationship between variables can be written in a number of different ways*
• Understand that a multiplicative relationship between variables can be written in a number of different ways
• Apply an understanding of inverse operations to a formula in order to make a specific variable the subject (in a wide variety of increasingly complex mix of operations)
Exemplified significant key ideas
Use the distributive law to find the product of two binomials
Common difficulties and misconceptions: students may see ‘multiplying two pairs of brackets’ as a purely symbolic exercise with no connection to the distributive law. It is crucial that students see this as an example of ‘same value, different appearance’ (an idea that they will already have met in contexts such as equivalent fractions) where, although the expression has changed its appearance, the value of it remains unchanged.
Students should understand that finding the product of two binomials is a generalisation of the familiar ‘grid method’ for multiplication (which is itself an abstraction of the area model). For example, the layout below representing (𝑥 + 2)( 𝑥 + 3) (𝑥 + 2)(𝑥 + 3) can be seen as a generalisation of the familiar grid layout for 12 x 13 or (10 + 2)(10 + 3).
× 10 2 • × 𝒙 2
10 100 20 • 𝒙 𝑥2 2𝑥
3 30 6 • 3 3𝑥 6
A binomial expression is an algebraic expression with two terms, such as (𝑥 + 2), (𝑦 − 4), (4 − 3𝑝), etc. Although in common use, using the phrase ‘expand’ these brackets does not necessarily offer an insight into the mathematical structure.
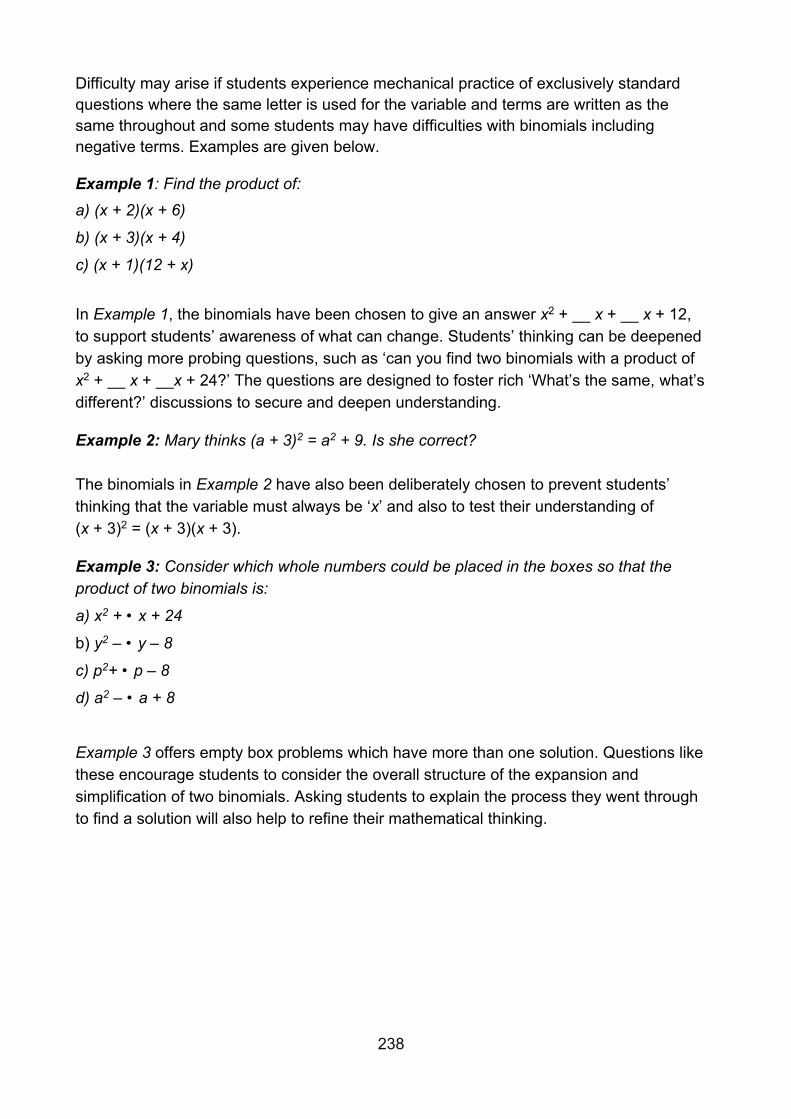
238
Difficulty may arise if students experience mechanical practice of exclusively standard questions where the same letter is used for the variable and terms are written as the same throughout and some students may have difficulties with binomials including negative terms. Examples are given below.
Example 1: Find the product of: a) (x + 2)(x + 6)
b) (x + 3)(x + 4)
c) (x + 1)(12 + x)
In Example 1, the binomials have been chosen to give an answer x2 + __ x + __ x + 12, to support students’ awareness of what can change. Students’ thinking can be deepened by asking more probing questions, such as ‘can you find two binomials with a product of x2 + __ x + __x + 24?’ The questions are designed to foster rich ‘What’s the same, what’s different?’ discussions to secure and deepen understanding.
Example 2: Mary thinks (a + 3)2 = a2 + 9. Is she correct? The binomials in Example 2 have also been deliberately chosen to prevent students’ thinking that the variable must always be ‘x’ and also to test their understanding of (x + 3)2 = (x + 3)(x + 3).
Example 3: Consider which whole numbers could be placed in the boxes so that the product of two binomials is:
a) x2 + • x + 24
b) y2 – • y – 8
c) p2+ • p – 8
d) a2 – • a + 8
Example 3 offers empty box problems which have more than one solution. Questions like these encourage students to consider the overall structure of the expansion and simplification of two binomials. Asking students to explain the process they went through to find a solution will also help to refine their mathematical thinking.
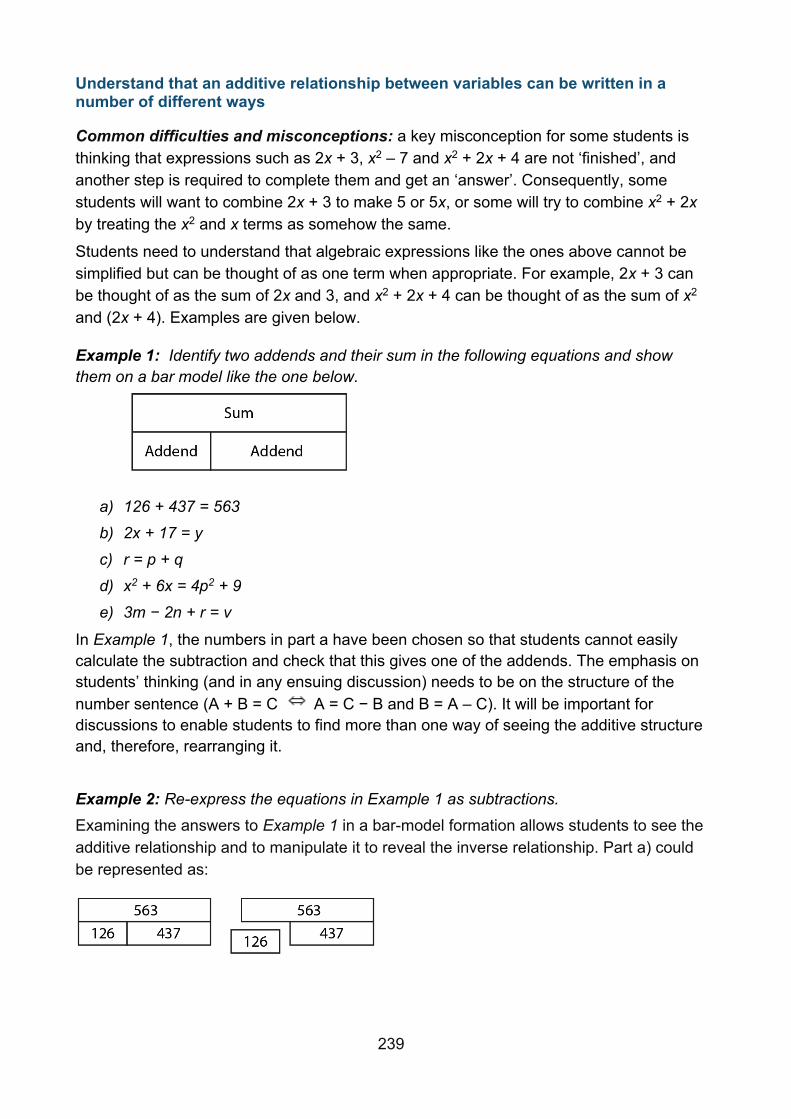
239
Understand that an additive relationship between variables can be written in a number of different ways
Common difficulties and misconceptions: a key misconception for some students is thinking that expressions such as 2x + 3, x2 – 7 and x2 + 2x + 4 are not ‘finished’, and another step is required to complete them and get an ‘answer’. Consequently, some students will want to combine 2x + 3 to make 5 or 5x, or some will try to combine x2 + 2x by treating the x2 and x terms as somehow the same.
Students need to understand that algebraic expressions like the ones above cannot be simplified but can be thought of as one term when appropriate. For example, 2x + 3 can be thought of as the sum of 2x and 3, and x2 + 2x + 4 can be thought of as the sum of x2 and (2x + 4). Examples are given below.
Example 1: Identify two addends and their sum in the following equations and show them on a bar model like the one below.
a) 126 + 437 = 563
b) 2x + 17 = y
c) r = p + q
d) x2 + 6x = 4p2 + 9
e) 3m − 2n + r = v
In Example 1, the numbers in part a have been chosen so that students cannot easily calculate the subtraction and check that this gives one of the addends. The emphasis on students’ thinking (and in any ensuing discussion) needs to be on the structure of the number sentence (A + B = C A = C − B and B = A – C). It will be important for discussions to enable students to find more than one way of seeing the additive structure and, therefore, rearranging it. Example 2: Re-express the equations in Example 1 as subtractions. Examining the answers to Example 1 in a bar-model formation allows students to see the additive relationship and to manipulate it to reveal the inverse relationship. Part a) could be represented as:

240
And part c) as:
The right-hand diagram in each case reveals the inverse additive relationship:
563 – 126 = 437 or 563 – 437 = 126 and r − p = q or r − q = p.
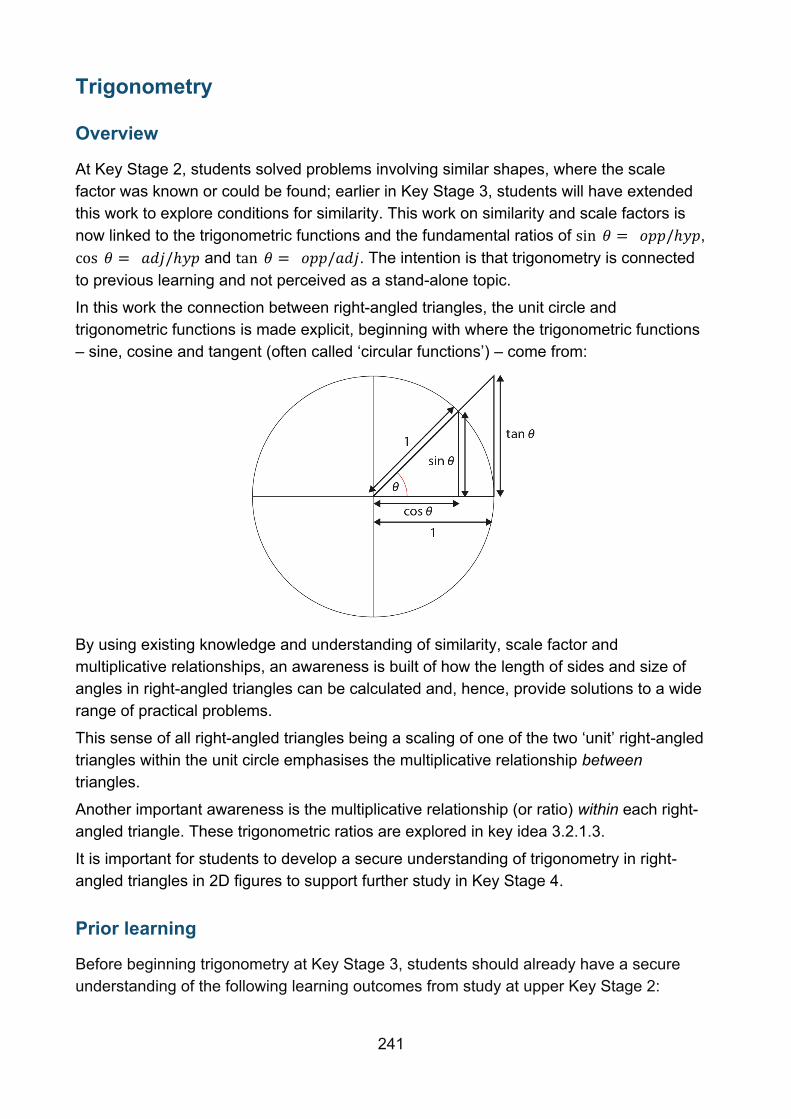
241
Trigonometry
Overview
At Key Stage 2, students solved problems involving similar shapes, where the scale factor was known or could be found; earlier in Key Stage 3, students will have extended this work to explore conditions for similarity. This work on similarity and scale factors is now linked to the trigonometric functions and the fundamental ratios of sin 𝜃 = 𝑜𝑝𝑝/ℎ𝑦𝑝, cos 𝜃 = 𝑎𝑑𝑗/ℎ𝑦𝑝 and tan 𝜃 = 𝑜𝑝𝑝/𝑎𝑑𝑗. The intention is that trigonometry is connected to previous learning and not perceived as a stand-alone topic.
In this work the connection between right-angled triangles, the unit circle and trigonometric functions is made explicit, beginning with where the trigonometric functions – sine, cosine and tangent (often called ‘circular functions’) – come from:
By using existing knowledge and understanding of similarity, scale factor and multiplicative relationships, an awareness is built of how the length of sides and size of angles in right-angled triangles can be calculated and, hence, provide solutions to a wide range of practical problems.
This sense of all right-angled triangles being a scaling of one of the two ‘unit’ right-angled triangles within the unit circle emphasises the multiplicative relationship between triangles.
Another important awareness is the multiplicative relationship (or ratio) within each right-angled triangle. These trigonometric ratios are explored in key idea 3.2.1.3.
It is important for students to develop a secure understanding of trigonometry in right-angled triangles in 2D figures to support further study in Key Stage 4.
Prior learning
Before beginning trigonometry at Key Stage 3, students should already have a secure understanding of the following learning outcomes from study at upper Key Stage 2:
242
• Solve problems involving similar shapes where the scale factor is known or can be found
and earlier in Key Stage 3:
• Understand and use similarity and congruence
The NCETM has created the following Key Stage 2 ready-to-progress criteria to support teachers in making judgements about students’ understanding and knowledge.
6AS/MD-3 Solve problems involving ratio relationships
Checking prior learning
The following activities from the NCETM secondary assessment materials offer useful ideas for teachers to use to check whether prior learning is secure.
Reference Activity
Page 46 Which of the following statements are always true, which are sometimes true and which are never true? Explain your thinking for each statement.
• If a square undergoes an enlargement, the area of the enlargement will be greater than the area of the original square.
• Any square A is similar to any square B. • Any triangle P is similar to any triangle Q. • Adding 2 cm to each side of a square will create an
enlargement of the square. • Adding 2 cm to each side of a rectangle will create an
enlargement of the rectangle. • Adding 2 cm to each side of a triangle will create an
enlargement of the triangle.
Page 44 Which of the following pairs of shapes must be congruent, which might be congruent, and which are definitely not congruent? Explain your reasoning in each case.
• Two triangles, both with angles of 30°, 50° and 100°. • Two triangles, both with sides 3 cm, 4 cm and 5 cm. • A triangle with sides 6 cm, 7 cm and 8 cm, and a second
triangle with sides 7 cm, 8 cm and 9 cm. • A regular hexagon and a regular pentagon.
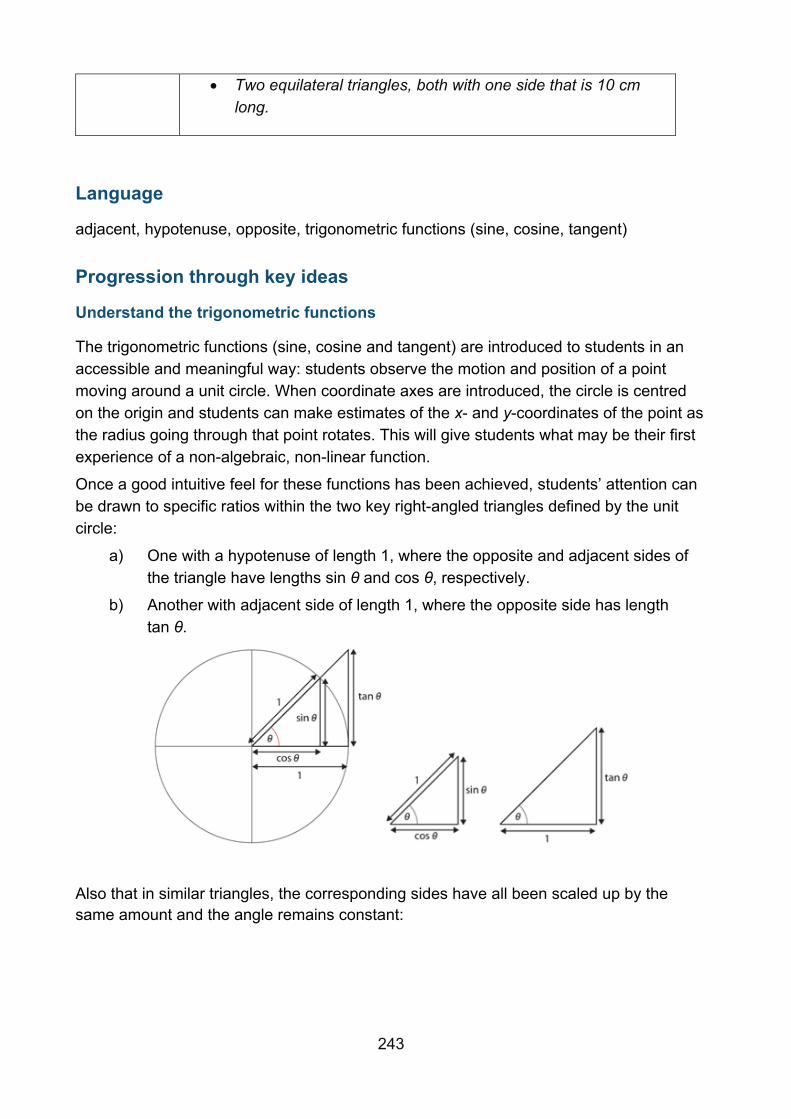
243
• Two equilateral triangles, both with one side that is 10 cm long.
Language
adjacent, hypotenuse, opposite, trigonometric functions (sine, cosine, tangent)
Progression through key ideas
Understand the trigonometric functions
The trigonometric functions (sine, cosine and tangent) are introduced to students in an accessible and meaningful way: students observe the motion and position of a point moving around a unit circle. When coordinate axes are introduced, the circle is centred on the origin and students can make estimates of the x- and y-coordinates of the point as the radius going through that point rotates. This will give students what may be their first experience of a non-algebraic, non-linear function.
Once a good intuitive feel for these functions has been achieved, students’ attention can be drawn to specific ratios within the two key right-angled triangles defined by the unit circle:
a) One with a hypotenuse of length 1, where the opposite and adjacent sides of the triangle have lengths sin θ and cos θ, respectively.
b) Another with adjacent side of length 1, where the opposite side has length tan θ.
Also that in similar triangles, the corresponding sides have all been scaled up by the same amount and the angle remains constant:
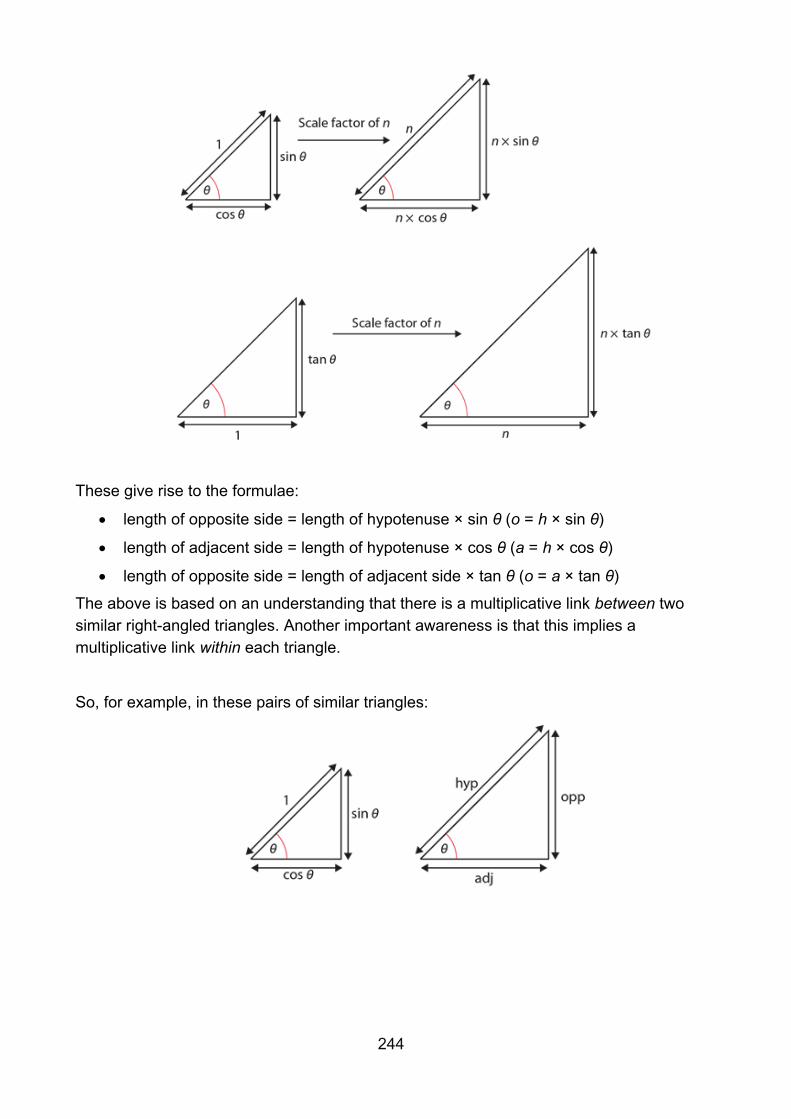
244
These give rise to the formulae:
• length of opposite side = length of hypotenuse × sin θ (o = h × sin θ)
• length of adjacent side = length of hypotenuse × cos θ (a = h × cos θ)
• length of opposite side = length of adjacent side × tan θ (o = a × tan θ)
The above is based on an understanding that there is a multiplicative link between two similar right-angled triangles. Another important awareness is that this implies a multiplicative link within each triangle.
So, for example, in these pairs of similar triangles:
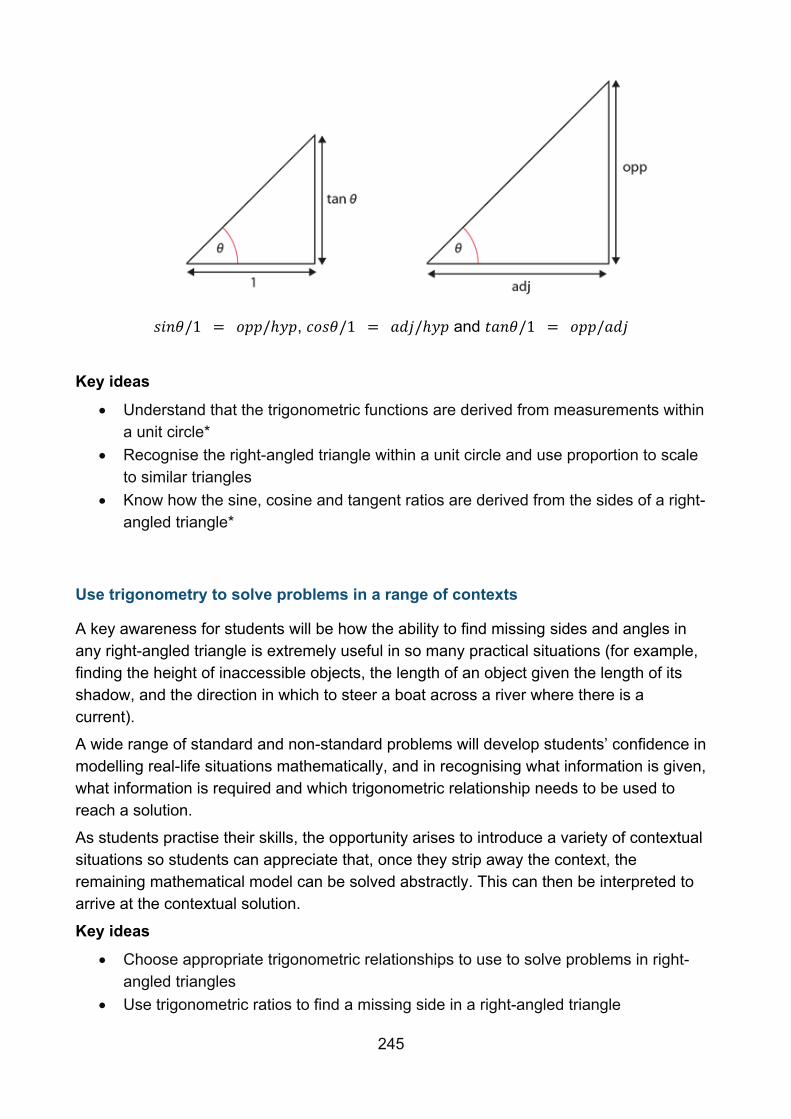
245
𝑠𝑖𝑛𝜃/1 = 𝑜𝑝𝑝/ℎ𝑦𝑝, 𝑐𝑜𝑠𝜃/1 = 𝑎𝑑𝑗/ℎ𝑦𝑝 and 𝑡𝑎𝑛𝜃/1 = 𝑜𝑝𝑝/𝑎𝑑𝑗
Key ideas
• Understand that the trigonometric functions are derived from measurements within a unit circle*
• Recognise the right-angled triangle within a unit circle and use proportion to scale to similar triangles
• Know how the sine, cosine and tangent ratios are derived from the sides of a right-angled triangle*
Use trigonometry to solve problems in a range of contexts
A key awareness for students will be how the ability to find missing sides and angles in any right-angled triangle is extremely useful in so many practical situations (for example, finding the height of inaccessible objects, the length of an object given the length of its shadow, and the direction in which to steer a boat across a river where there is a current).
A wide range of standard and non-standard problems will develop students’ confidence in modelling real-life situations mathematically, and in recognising what information is given, what information is required and which trigonometric relationship needs to be used to reach a solution.
As students practise their skills, the opportunity arises to introduce a variety of contextual situations so students can appreciate that, once they strip away the context, the remaining mathematical model can be solved abstractly. This can then be interpreted to arrive at the contextual solution.
Key ideas • Choose appropriate trigonometric relationships to use to solve problems in right-
angled triangles • Use trigonometric ratios to find a missing side in a right-angled triangle
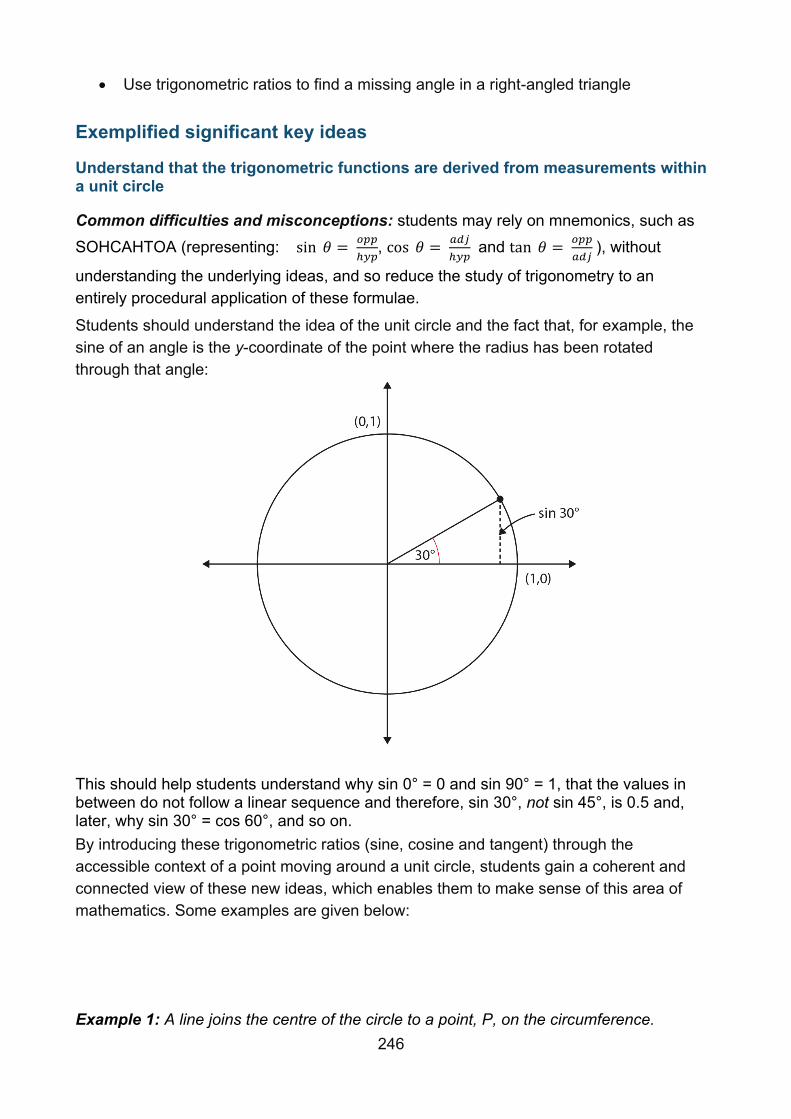
246
• Use trigonometric ratios to find a missing angle in a right-angled triangle
Exemplified significant key ideas
Understand that the trigonometric functions are derived from measurements within a unit circle
Common difficulties and misconceptions: students may rely on mnemonics, such as SOHCAHTOA (representing: sin 𝜃 =
𝑜𝑝𝑝
ℎ𝑦𝑝, cos 𝜃 =
𝑎𝑑𝑗
ℎ𝑦𝑝 and tan 𝜃 =
𝑜𝑝𝑝
𝑎𝑑𝑗 ), without
understanding the underlying ideas, and so reduce the study of trigonometry to an entirely procedural application of these formulae.
Students should understand the idea of the unit circle and the fact that, for example, the sine of an angle is the y-coordinate of the point where the radius has been rotated through that angle:
This should help students understand why sin 0° = 0 and sin 90° = 1, that the values in between do not follow a linear sequence and therefore, sin 30°, not sin 45°, is 0.5 and, later, why sin 30° = cos 60°, and so on. By introducing these trigonometric ratios (sine, cosine and tangent) through the accessible context of a point moving around a unit circle, students gain a coherent and connected view of these new ideas, which enables them to make sense of this area of mathematics. Some examples are given below:
Example 1: A line joins the centre of the circle to a point, P, on the circumference.
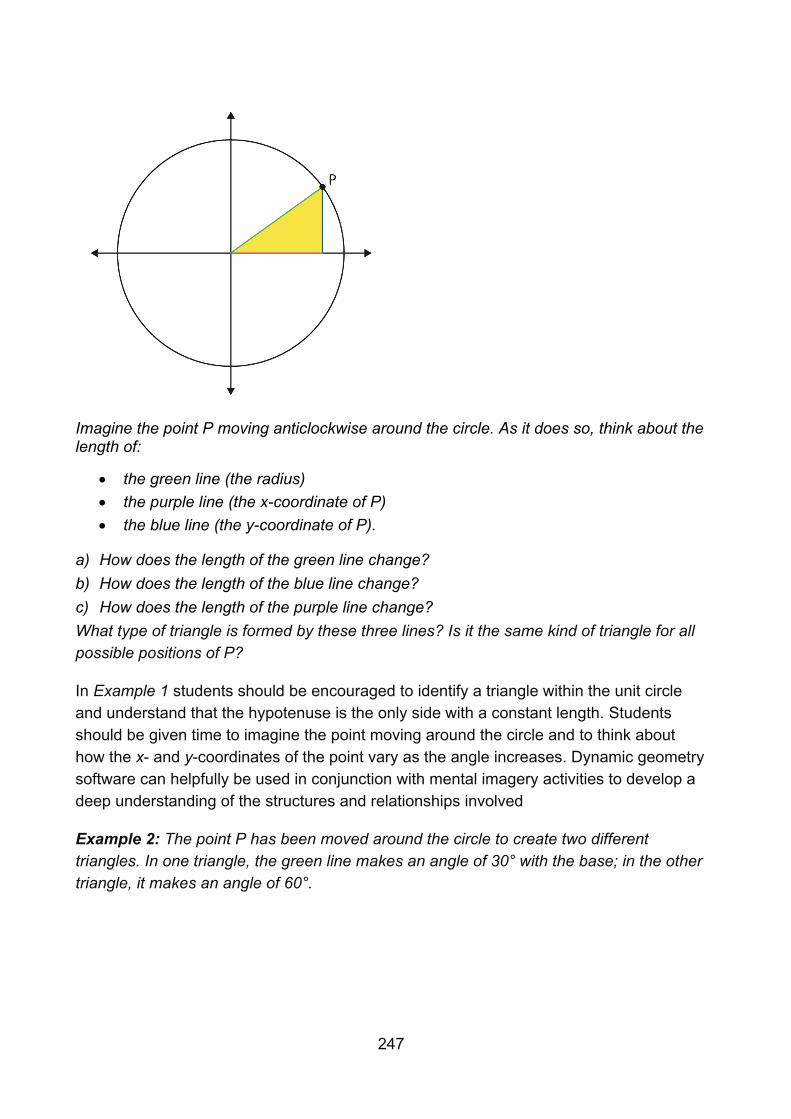
247
Imagine the point P moving anticlockwise around the circle. As it does so, think about the length of:
• the green line (the radius) • the purple line (the x-coordinate of P) • the blue line (the y-coordinate of P).
a) How does the length of the green line change? b) How does the length of the blue line change? c) How does the length of the purple line change? What type of triangle is formed by these three lines? Is it the same kind of triangle for all possible positions of P?
In Example 1 students should be encouraged to identify a triangle within the unit circle and understand that the hypotenuse is the only side with a constant length. Students should be given time to imagine the point moving around the circle and to think about how the x- and y-coordinates of the point vary as the angle increases. Dynamic geometry software can helpfully be used in conjunction with mental imagery activities to develop a deep understanding of the structures and relationships involved
Example 2: The point P has been moved around the circle to create two different triangles. In one triangle, the green line makes an angle of 30° with the base; in the other triangle, it makes an angle of 60°.
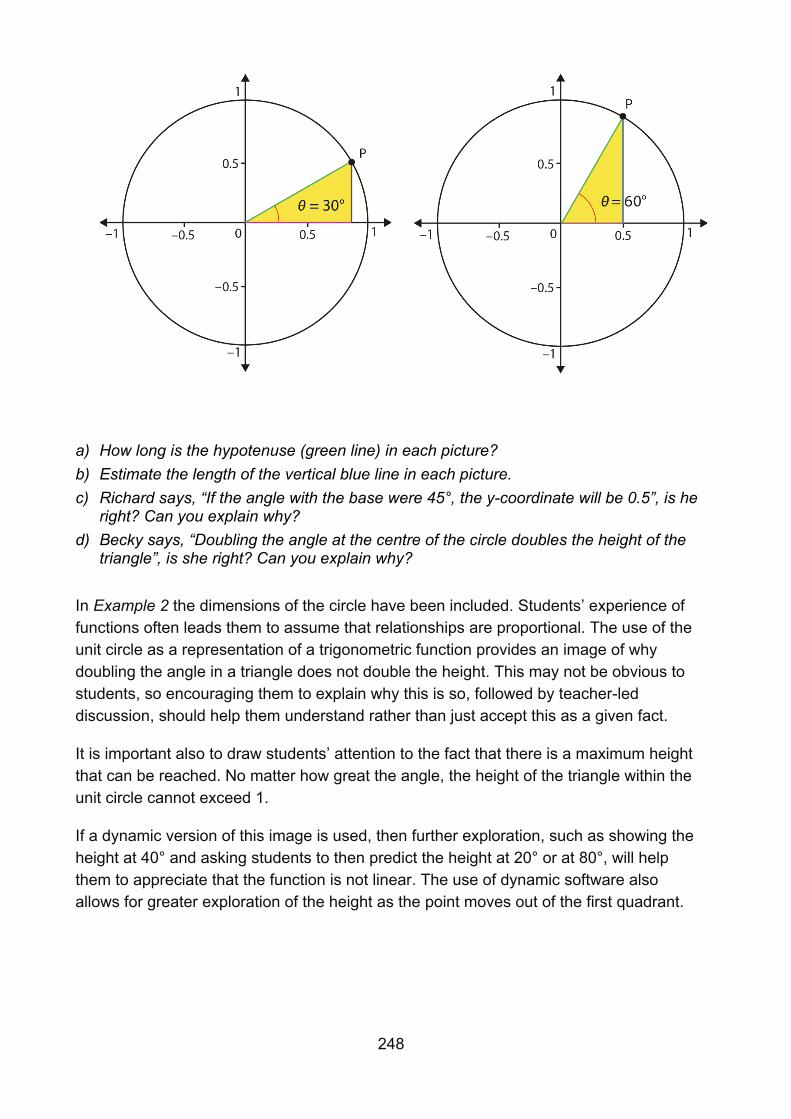
248
a) How long is the hypotenuse (green line) in each picture? b) Estimate the length of the vertical blue line in each picture. c) Richard says, “If the angle with the base were 45°, the y-coordinate will be 0.5”, is he
right? Can you explain why? d) Becky says, “Doubling the angle at the centre of the circle doubles the height of the
triangle”, is she right? Can you explain why?
In Example 2 the dimensions of the circle have been included. Students’ experience of functions often leads them to assume that relationships are proportional. The use of the unit circle as a representation of a trigonometric function provides an image of why doubling the angle in a triangle does not double the height. This may not be obvious to students, so encouraging them to explain why this is so, followed by teacher-led discussion, should help them understand rather than just accept this as a given fact.
It is important also to draw students’ attention to the fact that there is a maximum height that can be reached. No matter how great the angle, the height of the triangle within the unit circle cannot exceed 1.
If a dynamic version of this image is used, then further exploration, such as showing the height at 40° and asking students to then predict the height at 20° or at 80°, will help them to appreciate that the function is not linear. The use of dynamic software also allows for greater exploration of the height as the point moves out of the first quadrant.
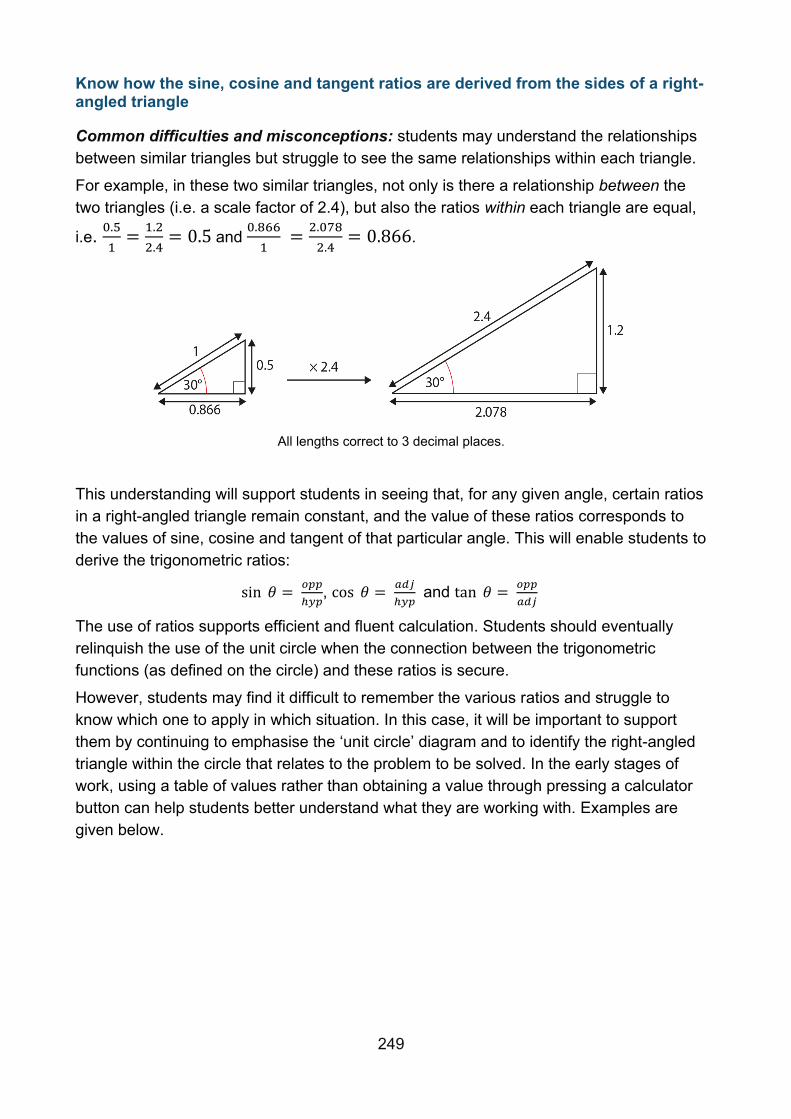
249
Know how the sine, cosine and tangent ratios are derived from the sides of a right-angled triangle
Common difficulties and misconceptions: students may understand the relationships between similar triangles but struggle to see the same relationships within each triangle.
For example, in these two similar triangles, not only is there a relationship between the two triangles (i.e. a scale factor of 2.4), but also the ratios within each triangle are equal,
i.e. 0.5
1=
1.2
2.4= 0.5 and
0.866
1 =
2.078
2.4= 0.866.
All lengths correct to 3 decimal places.
This understanding will support students in seeing that, for any given angle, certain ratios in a right-angled triangle remain constant, and the value of these ratios corresponds to the values of sine, cosine and tangent of that particular angle. This will enable students to derive the trigonometric ratios:
sin 𝜃 = 𝑜𝑝𝑝
ℎ𝑦𝑝, cos 𝜃 =
𝑎𝑑𝑗
ℎ𝑦𝑝 and tan 𝜃 =
𝑜𝑝𝑝
𝑎𝑑𝑗
The use of ratios supports efficient and fluent calculation. Students should eventually relinquish the use of the unit circle when the connection between the trigonometric functions (as defined on the circle) and these ratios is secure.
However, students may find it difficult to remember the various ratios and struggle to know which one to apply in which situation. In this case, it will be important to support them by continuing to emphasise the ‘unit circle’ diagram and to identify the right-angled triangle within the circle that relates to the problem to be solved. In the early stages of work, using a table of values rather than obtaining a value through pressing a calculator button can help students better understand what they are working with. Examples are given below.
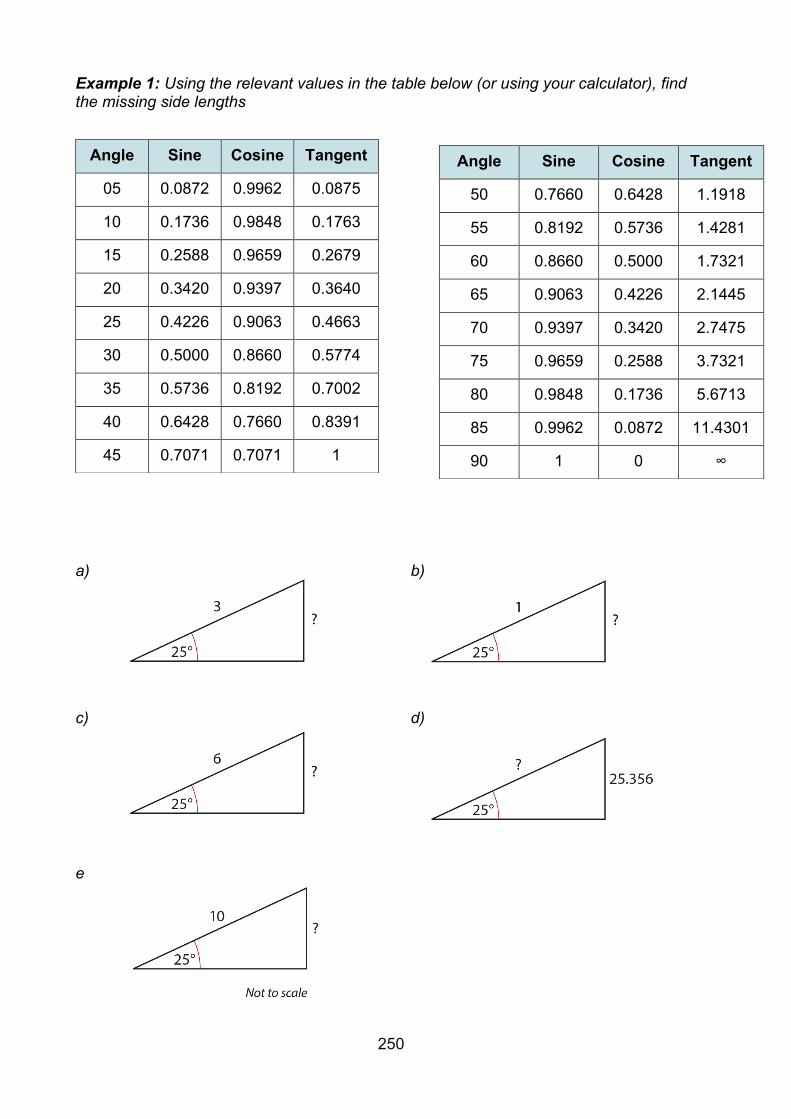
250
Example 1: Using the relevant values in the table below (or using your calculator), find the missing side lengths
a) b)
c) d)
e
Angle Sine Cosine Tangent
50 0.7660 0.6428 1.1918
55 0.8192 0.5736 1.4281
60 0.8660 0.5000 1.7321
65 0.9063 0.4226 2.1445
70 0.9397 0.3420 2.7475
75 0.9659 0.2588 3.7321
80 0.9848 0.1736 5.6713
85 0.9962 0.0872 11.4301
90 1 0 ∞
Angle Sine Cosine Tangent
05 0.0872 0.9962 0.0875
10 0.1736 0.9848 0.1763
15 0.2588 0.9659 0.2679
20 0.3420 0.9397 0.3640
25 0.4226 0.9063 0.4663
30 0.5000 0.8660 0.5774
35 0.5736 0.8192 0.7002
40 0.6428 0.7660 0.8391
45 0.7071 0.7071 1
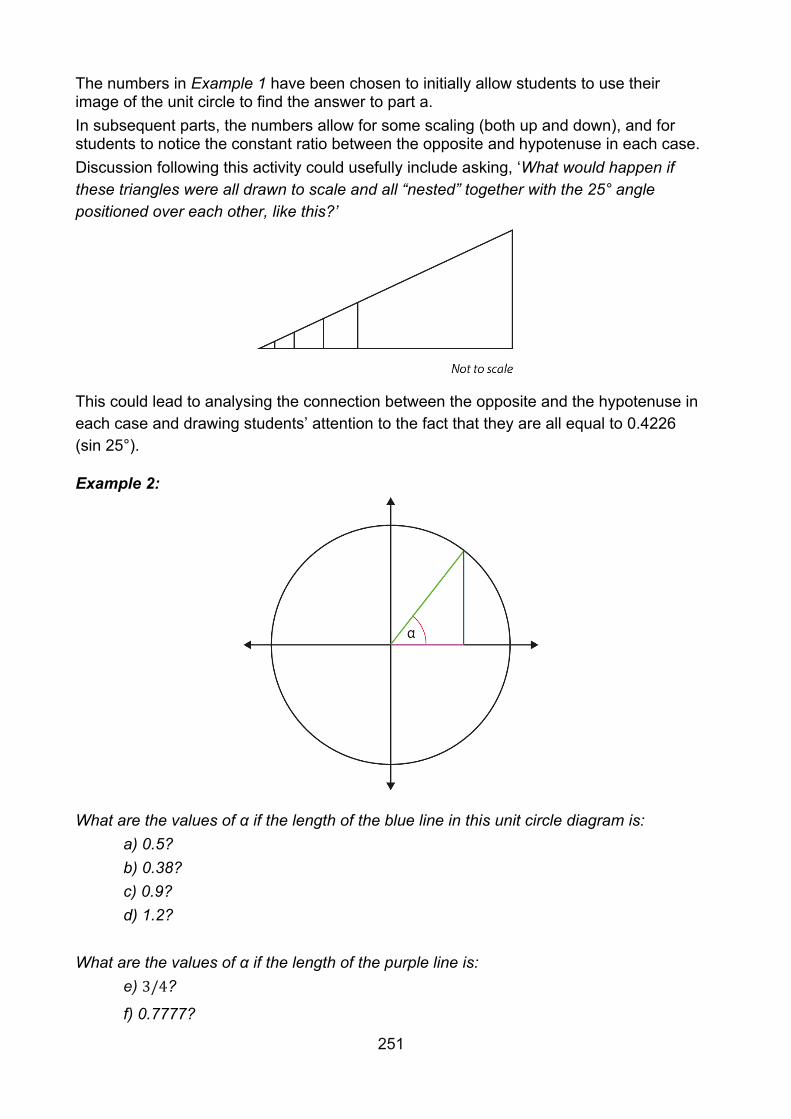
251
The numbers in Example 1 have been chosen to initially allow students to use their image of the unit circle to find the answer to part a. In subsequent parts, the numbers allow for some scaling (both up and down), and for students to notice the constant ratio between the opposite and hypotenuse in each case. Discussion following this activity could usefully include asking, ‘What would happen if these triangles were all drawn to scale and all “nested” together with the 25° angle positioned over each other, like this?’
This could lead to analysing the connection between the opposite and the hypotenuse in each case and drawing students’ attention to the fact that they are all equal to 0.4226 (sin 25°).
Example 2:
What are the values of α if the length of the blue line in this unit circle diagram is:
a) 0.5?
b) 0.38?
c) 0.9?
d) 1.2?
What are the values of α if the length of the purple line is:
e) 3/4?
f) 0.7777?

252
Students could first tackle Example 2 by first using the table from Example 1. They can answer part a and estimate part b as being between 20 and 25 degrees. However, at some stage, students will need to know how they can retrieve this information from a calculator and not only find an angle from a trigonometric value, but also the trigonometric value of any given angle. Part d has been chosen to remind students that the value of sine and cosine does not exist beyond 1. Part e draws students’ attention to the fact that values do not have to be decimals; values given in a fractional format are just as acceptable.
253
Year 9 summer term
Standard form
Overview
The elements here build on the work done in Year 7 spring term, and now include work in standard index form.
In Year 9, students will further develop their understanding of the different ways that numbers can be expressed and will become more proficient in changing from one form to another. This will develop their awareness that different representations of the same number can reveal something of its structure and so can be used to compare and order numbers with ease.
When thinking about very large and very small numbers, working with standard form notation will enable students to develop further their understanding of multiplication and division by powers of ten.
Prior learning
Before beginning standard form in Year 9, students should already have a secure understanding of the following learning outcomes from study at upper Key Stage 2:
• Multiply and divide whole numbers and those involving decimals by 10, 100 and 1 000.
• Recognise and use thousandths and relate them to tenths, hundredths and decimal equivalents.
and earlier in Key Stage 3:
• Understand integer exponents and roots.
The NCETM has created the following Key Stage 2 ready-to-progress criteria to support teachers in making judgements about students’ understanding and knowledge.
6NPV-1 Understand the relationship between powers of 10 from 1 hundredth to 10 million, and use this to make a given number 10, 100, 1 000, 1 tenth, 1 hundredth or 1 thousandth times the size (multiply and divide by 10, 100 and 1 000).
6NPV-2 Recognise the place value of each digit in numbers up to 10 million, including decimal fractions, and compose and decompose numbers up to 10 million using standard and non-standard partitioning.
254
Checking prior learning
The following activities from the NCETM secondary assessment materials offer useful ideas for teachers to use to check whether prior learning is secure.
Reference Activity
Page 8 Put these numbers in order from smallest to largest: 19, 28, 45, 54, 73, 91 Explain how you decided.
Page 8 If 6 miles ≈ 104 metres. Which of these is approximately 600 miles? a) 1010 metres b) 106 metres c) 108 metres. Explain your reasoning.
Language
standard index form (standard form).
Progression through key ideas
Interpret and compare numbers in standard form A × 10n, 1 ≤ A < 10
Students should have had considerable experience at Key Stage 2 of reading, writing and comparing numbers. They should have developed an understanding of place value and the value of digits in both whole and decimal numbers.
At Key Stage 3, students are introduced to standard index form (standard form). A key awareness underpinning a deep understanding of standard index form is that numbers can be written in multiple ways by considering multiplication and division by powers of ten.
For example, students will likely recognise that 2.3456 × 100 = 23.456 × 10 = 234.56 = 2345.6 ÷ 10 = 23 456 ÷ 100, however, the use of a power notation (such as 2.3456 × 10²) to represent this will be new.
As students develop their understanding that index notation represents powers of ten, and later, of negative powers, they should begin to appreciate that such a representation is a way of writing very large or very small numbers in an efficient manner and aids comparison.
Key ideas
• Be able to write any integer in a range of forms, e.g. 53 = 5.3 × 10, 530 × 1
10 ,
5 300 × 0.01*
255
• Understand that very large numbers can be written in the form A × 10n, (where 1 ≤ A < 10) and appreciate the real-life contexts where this format is usefully used
• Understand that very small numbers can be written in the form A × 10−n, (where 1 ≤ A < 10) and appreciate the real-life contexts where this format is usefully used
Exemplified significant key ideas
Be able to write any integer in a range of forms, e.g. 53 = 5.3 × 10, 530 × 𝟏
𝟏𝟎 ,
5 300 × 0.01
Common difficulties and misconceptions: These equivalent forms (for example, 53 = 5.3 × 10, 530 × 1
10 , 5 300 × 0.01) are based on the key idea that when one number
in a product is multiplied (or divided) by n, then, to maintain the same product, the other number must be divided (or multiplied) by n. It is important that students do not learn such manipulations by rote, without any understanding of the mathematical structures involved.
A useful representation to reveal these structures is an area model. This can be used to show how, when one dimension (factor) is reduced by one tenth, the area is maintained by making the other dimension (factor) ten times longer:
This gives rise to equivalent products such as:
53 × 10 = 5.3 × 100 = 0.53 × 1 000 = 530 × 1 = 5 300 × 0.1, etc.
This can be generalised to a multiplication (and corresponding division) by any scale factor, for example, 40 × 2.5 = 10 × 10 (by dividing and multiplying by four). Students should appreciate that this gives rise to other useful calculation strategies.
Example 1: Given that 3.2 × 2.5 = 8, calculate, as efficiently as possible:
a) 1.6 × 2.5
b) 3.2 × 1.25
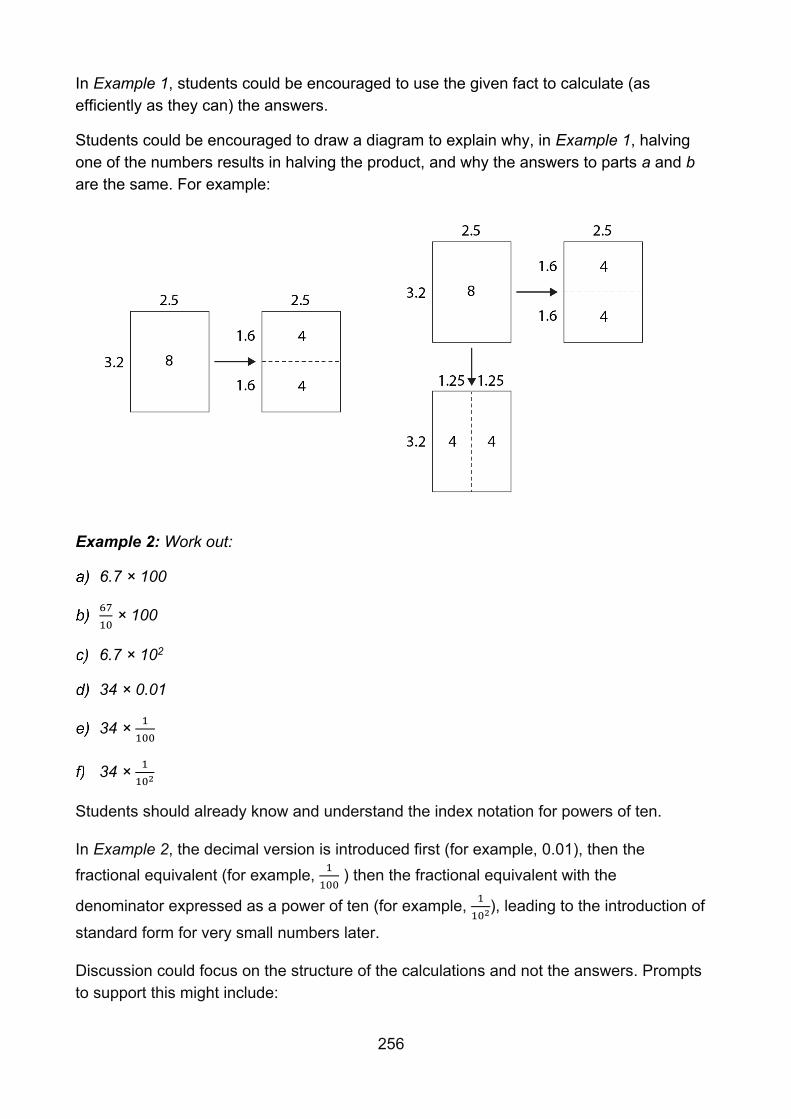
256
In Example 1, students could be encouraged to use the given fact to calculate (as efficiently as they can) the answers.
Students could be encouraged to draw a diagram to explain why, in Example 1, halving one of the numbers results in halving the product, and why the answers to parts a and b are the same. For example:
Example 2: Work out:
6.7 × 100
67
10 × 100
6.7 × 10²
34 × 0.01
34 × 1
100
34 × 1
102
Students should already know and understand the index notation for powers of ten.
In Example 2, the decimal version is introduced first (for example, 0.01), then the fractional equivalent (for example, 1
100 ) then the fractional equivalent with the
denominator expressed as a power of ten (for example, 1
102), leading to the introduction of standard form for very small numbers later.
Discussion could focus on the structure of the calculations and not the answers. Prompts to support this might include:
257
• ‘Why are the answers to parts a, b and c equal? How has each term in the calculation changed?’
• ‘In parts d, e and f, what has changed and what has stayed the same?’
Students should be able to recognise that 0.1 is equivalent to 1
10 and so when using
decimals there are a number of alternative ways the decimal product can be written.
For example, 80 × 1
10 = 80 × 0.1, etc.
Additionally, 100 = 102 and 1 000 = 103, etc.
Furthermore, 1
100 = 1
102 and 1
1000 = 1
103, etc.
Students might find as many ways as they can to write a number, such as 670, using decimals, fractions with denominators that are powers of ten and negative powers of ten.
258
Graphical representations
Overview
The elements here build on the work done in Year 8 autumn, and now include interpreting graphical representations. Significant attention is given in this core concept to exploring linear relationships and their representation as straight line graphs. Students should appreciate that all linear relationships have certain key characteristics:
• A specific pair of values or points on the graph; for example, where x = 0 (the intercept).
• A rate of change of one variable in relation to the other variable; for example, how the y-value increases (or decreases) as the x-value increases (the gradient).
Students should recognise these features, both in the written algebraic form of the relationship and in its graphical representation.
The Key Stage 3 programme of study states that students should be taught to ‘move freely between different numerical, algebraic, graphical and diagrammatic representations’ and to ‘express relationships between variables algebraically and graphically’. To develop a deep understanding and achieve fluency, students should explore the connections between equations of lines and their corresponding graphs, including those presented in a non-standard form, such as ax + by = c, as well as the more standard y = mx + c.
After thoroughly exploring the structure of linear relationships in this way, students should have experience of other functions and relationships (particularly quadratic ones), be able to use graphs to solve problems in real-life contexts and understand how linear graphs can be used to find solutions to simultaneous equations.
Much of this learning is new and is built upon significantly in Key Stages 4. It is therefore essential that students are given time to develop a secure and deep understanding of these ideas, concepts and techniques.
Prior learning
Before beginning graphical representations in Year 9, students should already have a secure understanding of the following learning outcomes from study at upper Key Stage 2:
• Describe positions on the full coordinate grid (all four quadrants). • Find pairs of numbers that satisfy an equation with two unknowns. • Enumerate possibilities of combinations of two variables.
259
and earlier in Key Stage 3: • Understand and use the conventions and vocabulary of algebra, including forming
and interpreting algebraic expressions and equations • Rearrange formulae to change the subject • Know that a set of coordinates, constructed according to a mathematical rule, can
be represented algebraically and graphically • Understand that a graphical representation shows all of the points (within a range)
that satisfy a relationship
Checking prior learning
The following activities from the secondary assessment materials offer useful ideas for teachers to use to check whether prior learning is secure.
Reference Activity
Page 18 Which of the following points lie on the line 2x + y = 7: (1,5) (5,1) (3,1) (4,1) (5,3) (5, –3)? Can you explain why or why not? Can you show this with a calculation as well as a drawing?
Page 20 Which of these equations represent the same straight line? 2x + y = 8 y = 2x + 8 y + 8 = 2x y = 2x – 8 x = 1 2y – 8 y = -2x + 8 Explain your answers using words and calculations as well as graphs.
Language
gradient, intercept, linear, quadratic, simultaneous equations
Progression through key ideas
Model and interpret a range of situations graphically
Students should explore graphs in given contexts, such as distance–time graphs, and be able to match graphs with specific scenarios. They should also not only develop algebraic and graphical fluency when understanding linear functions, but also experience
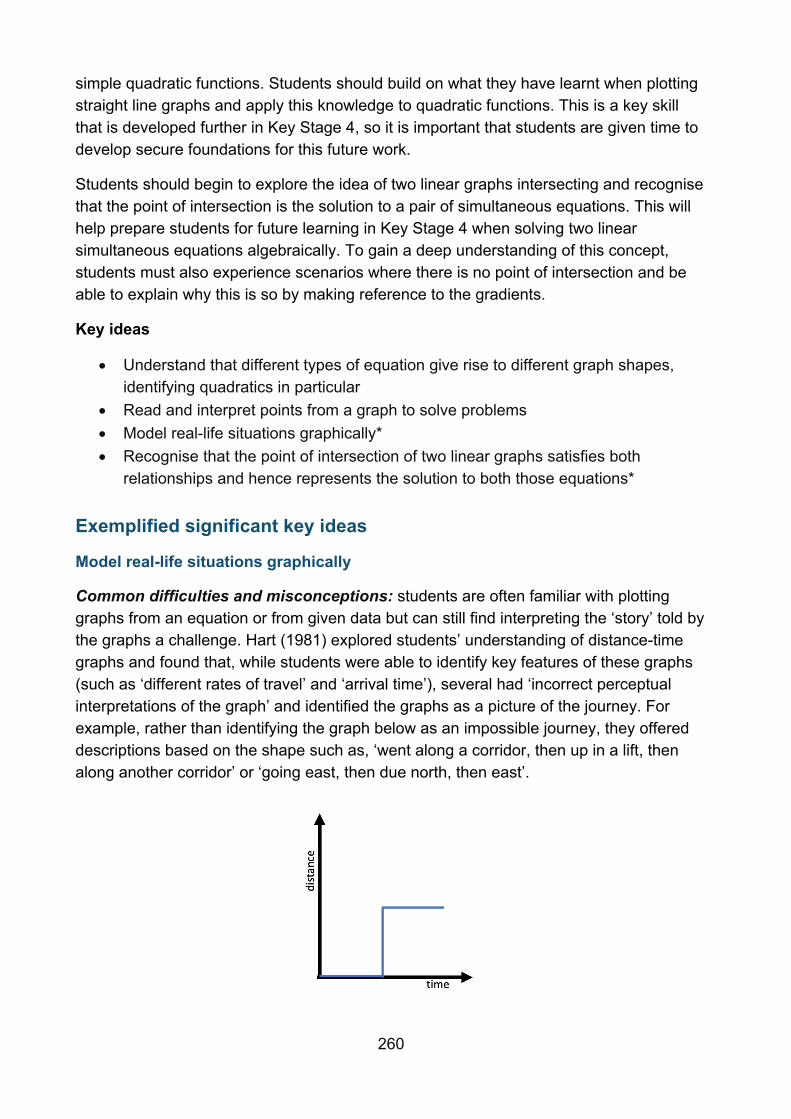
260
simple quadratic functions. Students should build on what they have learnt when plotting straight line graphs and apply this knowledge to quadratic functions. This is a key skill that is developed further in Key Stage 4, so it is important that students are given time to develop secure foundations for this future work.
Students should begin to explore the idea of two linear graphs intersecting and recognise that the point of intersection is the solution to a pair of simultaneous equations. This will help prepare students for future learning in Key Stage 4 when solving two linear simultaneous equations algebraically. To gain a deep understanding of this concept, students must also experience scenarios where there is no point of intersection and be able to explain why this is so by making reference to the gradients.
Key ideas
• Understand that different types of equation give rise to different graph shapes, identifying quadratics in particular
• Read and interpret points from a graph to solve problems • Model real-life situations graphically* • Recognise that the point of intersection of two linear graphs satisfies both
relationships and hence represents the solution to both those equations*
Exemplified significant key ideas
Model real-life situations graphically
Common difficulties and misconceptions: students are often familiar with plotting graphs from an equation or from given data but can still find interpreting the ‘story’ told by the graphs a challenge. Hart (1981) explored students’ understanding of distance-time graphs and found that, while students were able to identify key features of these graphs (such as ‘different rates of travel’ and ‘arrival time’), several had ‘incorrect perceptual interpretations of the graph’ and identified the graphs as a picture of the journey. For example, rather than identifying the graph below as an impossible journey, they offered descriptions based on the shape such as, ‘went along a corridor, then up in a lift, then along another corridor’ or ‘going east, then due north, then east’.
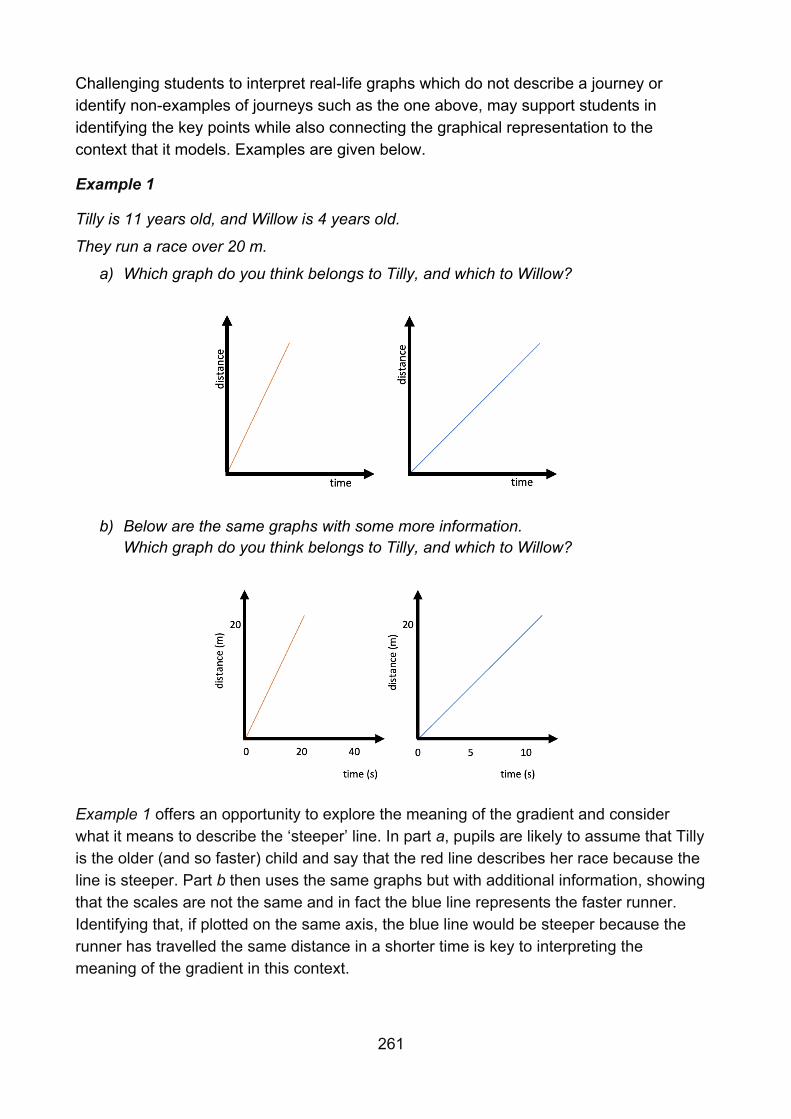
261
Challenging students to interpret real-life graphs which do not describe a journey or identify non-examples of journeys such as the one above, may support students in identifying the key points while also connecting the graphical representation to the context that it models. Examples are given below.
Example 1
Tilly is 11 years old, and Willow is 4 years old.
They run a race over 20 m.
a) Which graph do you think belongs to Tilly, and which to Willow?
b) Below are the same graphs with some more information. Which graph do you think belongs to Tilly, and which to Willow?
Example 1 offers an opportunity to explore the meaning of the gradient and consider what it means to describe the ‘steeper’ line. In part a, pupils are likely to assume that Tilly is the older (and so faster) child and say that the red line describes her race because the line is steeper. Part b then uses the same graphs but with additional information, showing that the scales are not the same and in fact the blue line represents the faster runner. Identifying that, if plotted on the same axis, the blue line would be steeper because the runner has travelled the same distance in a shorter time is key to interpreting the meaning of the gradient in this context.
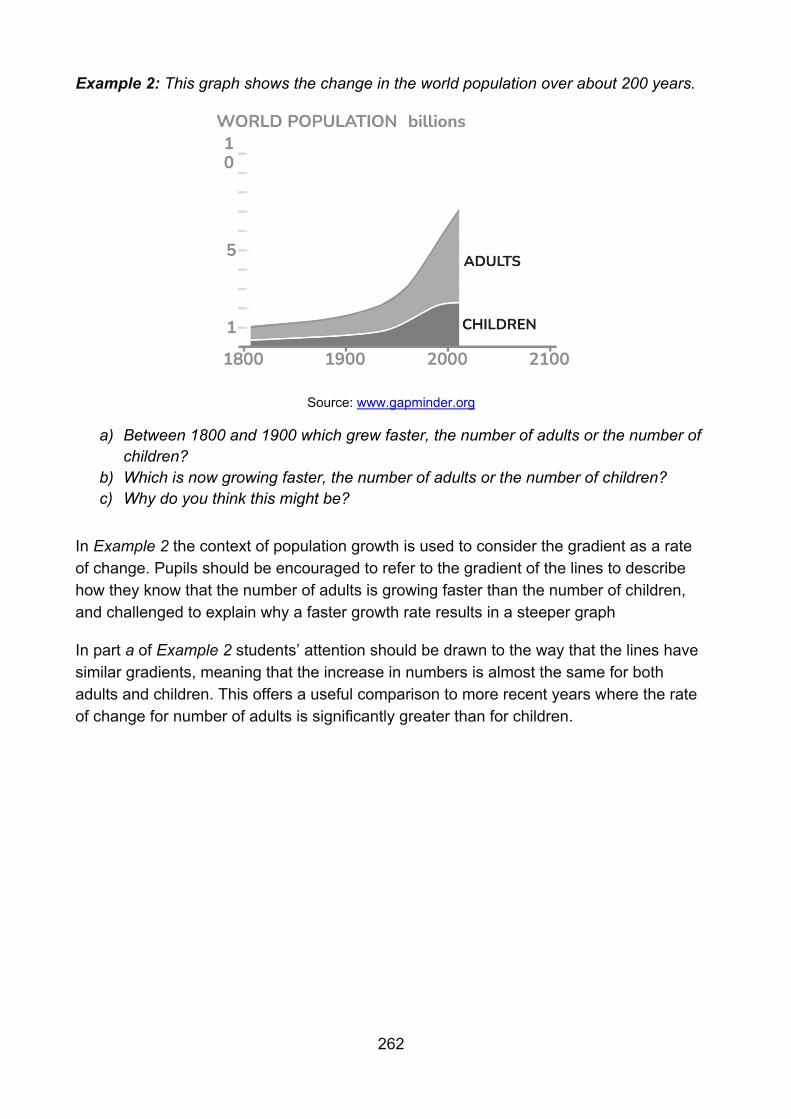
262
Example 2: This graph shows the change in the world population over about 200 years.
Source: www.gapminder.org
a) Between 1800 and 1900 which grew faster, the number of adults or the number of children?
b) Which is now growing faster, the number of adults or the number of children? c) Why do you think this might be?
In Example 2 the context of population growth is used to consider the gradient as a rate of change. Pupils should be encouraged to refer to the gradient of the lines to describe how they know that the number of adults is growing faster than the number of children, and challenged to explain why a faster growth rate results in a steeper graph
In part a of Example 2 students’ attention should be drawn to the way that the lines have similar gradients, meaning that the increase in numbers is almost the same for both adults and children. This offers a useful comparison to more recent years where the rate of change for number of adults is significantly greater than for children.
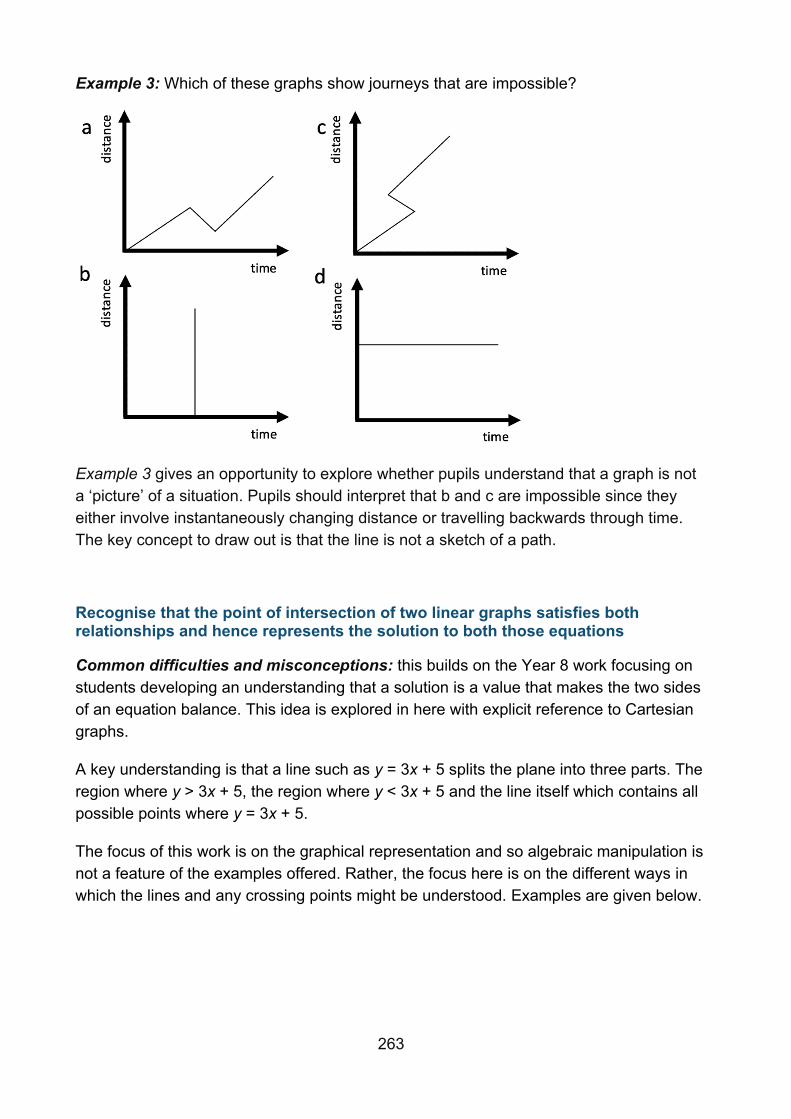
263
Example 3: Which of these graphs show journeys that are impossible?
Example 3 gives an opportunity to explore whether pupils understand that a graph is not a ‘picture’ of a situation. Pupils should interpret that b and c are impossible since they either involve instantaneously changing distance or travelling backwards through time. The key concept to draw out is that the line is not a sketch of a path.
Recognise that the point of intersection of two linear graphs satisfies both relationships and hence represents the solution to both those equations
Common difficulties and misconceptions: this builds on the Year 8 work focusing on students developing an understanding that a solution is a value that makes the two sides of an equation balance. This idea is explored in here with explicit reference to Cartesian graphs.
A key understanding is that a line such as y = 3x + 5 splits the plane into three parts. The region where y > 3x + 5, the region where y < 3x + 5 and the line itself which contains all possible points where y = 3x + 5.
The focus of this work is on the graphical representation and so algebraic manipulation is not a feature of the examples offered. Rather, the focus here is on the different ways in which the lines and any crossing points might be understood. Examples are given below.
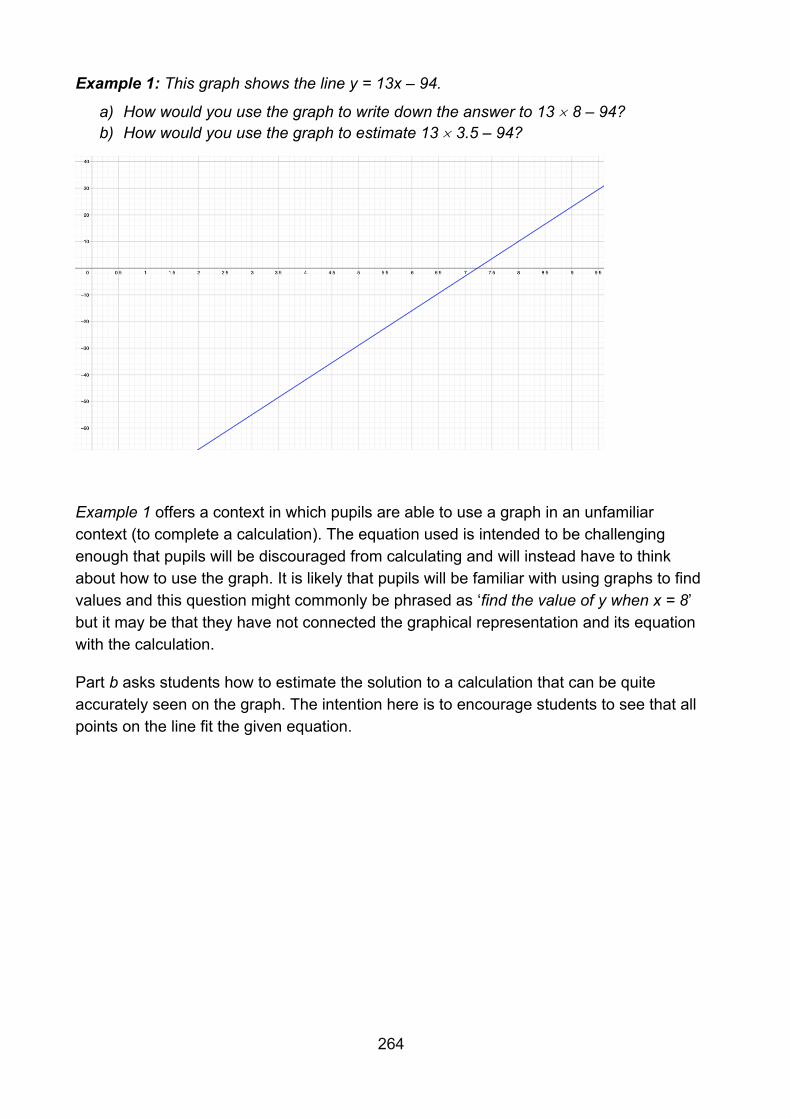
264
Example 1: This graph shows the line y = 13x – 94.
a) How would you use the graph to write down the answer to 13 8 – 94? b) How would you use the graph to estimate 13 3.5 – 94?
Example 1 offers a context in which pupils are able to use a graph in an unfamiliar context (to complete a calculation). The equation used is intended to be challenging enough that pupils will be discouraged from calculating and will instead have to think about how to use the graph. It is likely that pupils will be familiar with using graphs to find values and this question might commonly be phrased as ‘find the value of y when x = 8’ but it may be that they have not connected the graphical representation and its equation with the calculation.
Part b asks students how to estimate the solution to a calculation that can be quite accurately seen on the graph. The intention here is to encourage students to see that all points on the line fit the given equation.
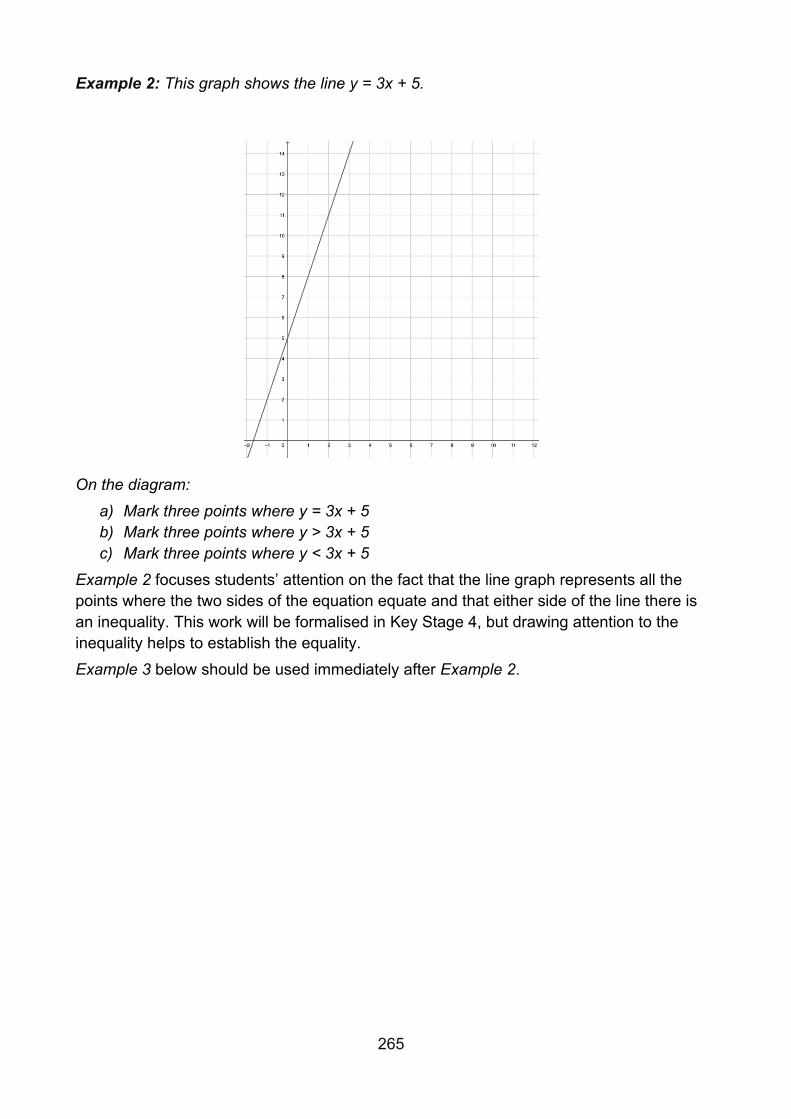
265
Example 2: This graph shows the line y = 3x + 5.
On the diagram:
a) Mark three points where y = 3x + 5 b) Mark three points where y > 3x + 5 c) Mark three points where y < 3x + 5
Example 2 focuses students’ attention on the fact that the line graph represents all the points where the two sides of the equation equate and that either side of the line there is an inequality. This work will be formalised in Key Stage 4, but drawing attention to the inequality helps to establish the equality. Example 3 below should be used immediately after Example 2.
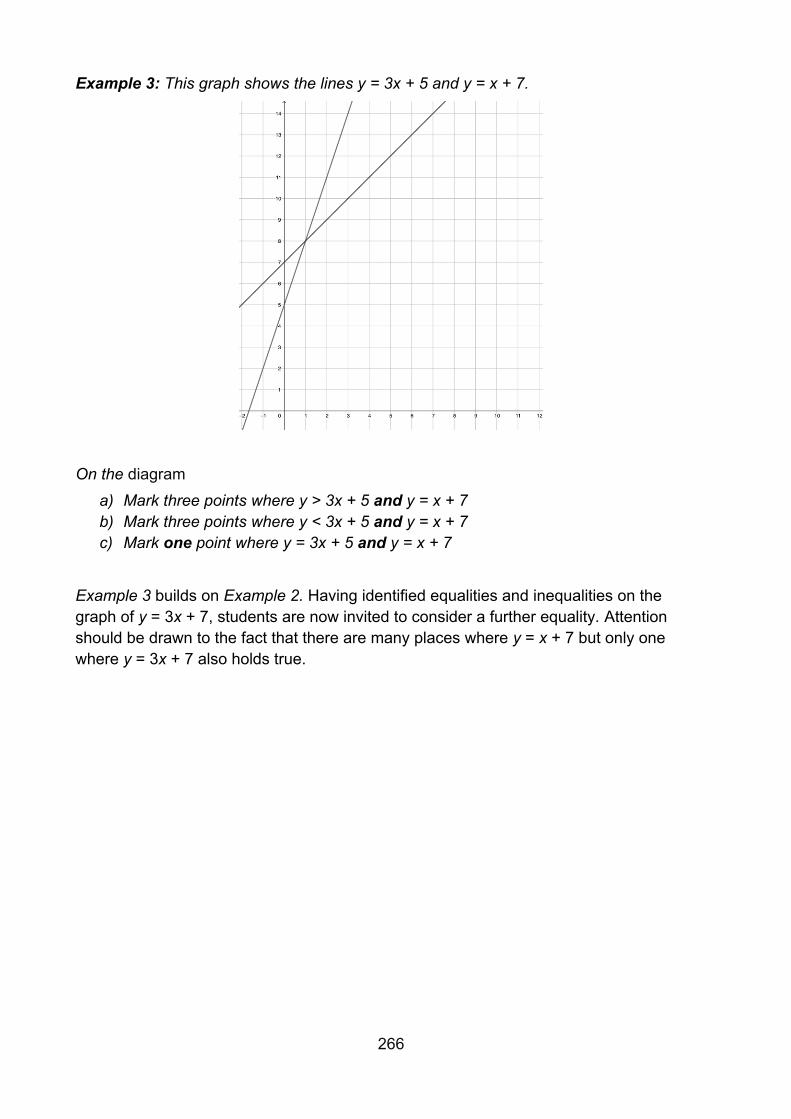
266
Example 3: This graph shows the lines y = 3x + 5 and y = x + 7.
On the diagram
a) Mark three points where y > 3x + 5 and y = x + 7 b) Mark three points where y < 3x + 5 and y = x + 7 c) Mark one point where y = 3x + 5 and y = x + 7
Example 3 builds on Example 2. Having identified equalities and inequalities on the graph of y = 3x + 7, students are now invited to consider a further equality. Attention should be drawn to the fact that there are many places where y = x + 7 but only one where y = 3x + 7 also holds true.
267
Appendix 1 – key ideas * Key ideas marked with an asterisk are exemplified in this document.
NCETM code refers to the code for the key ideas in the NCETM Key Stage 3 PD Materials which contain further exemplification.
Digit 1 refers to the relevant ‘Theme’.
Digit 2 refers to the relevant ‘Core concept’.
Digit 3 refers to the relevant ‘Statement of knowledge, skills and understanding’.
Digit 4 refers to the relevant ‘Key idea’.
For example, breaking down the code 1.2.3.4:
• The ‘1’ denotes that it is part of ‘Theme 1’: ‘The structure of the number system’. • The ‘2’ denotes that the relevant ‘Core concept’ within that theme, 1.2: ‘Properties
of number’ • The ‘3’ denotes that the ‘Statement of knowledge, skills and understanding’ which
is part of that ‘Core concept’, 1.2.3: ‘Understand and use the unique prime factorisation of a number’.
• The 4 denotes the ‘Key idea’ which is a sub-division of the statement, 1.2.3.4: ‘Use the prime factorisation of two or more positive integers to efficiently identify the highest common factor.’
NCETM code
Place value, estimation and rounding
1.1.1.1 Understand place value in integers
1.1.1.2* Understand place value in decimals, including recognising exponent and fractional representations of the column headings
1.1.1.3 Understand place value in the context of measure
1.1.1.4 Order and compare numbers and measures using <, >, =
1.1.2.1 Round numbers to up to three decimal places
1.1.2.2 Round numbers to any number of decimal places
1.1.3.1 Understand the concept of significant figures
1.1.3.2* Round integers to a required number of significant figures
1.1.3.3 Round decimals to a required number of significant figures
1.1.4.1 Understand what is meant by a sensible degree of accuracy
1.1.4.2* Estimate numerical calculations
268
1.1.4.3 Estimate and check if solutions to problems are of the correct magnitude
1.1.4.4 Determine whether calculations using rounding will give an underestimate or overestimate
1.1.4.5 Understand the impact of rounding errors when using a calculator, and the way that these can be compounded to result in large inaccuracies
1.1.4.6 Calculate possible errors expressed using inequality notation a < x ≤ b
NCETM code
Properties of number
1.2.1.1 Understand what a multiple is and be able to list multiples of n
1.2.1.2* Identify and explain whether a number is or is not a multiple of a given integer
1.2.2.1 Understand the concept of square and cube
1.2.2.2 Understand the concept of square root and cube root
1.2.2.3 Understand and use correct notation for positive integer exponents
1.2.2.4 Understand how to use the keys for squares and other powers and square root on a calculator
1.2.3.1 Understand what a factor is and be able to identify factors of positive integers
1.2.3.2 Understand what a prime number is and be able to identify prime numbers
1.2.3.3 Understand that a positive integer can be written uniquely as a product of its prime factors
1.2.3.4* Use the prime factorisation of two or more positive integers to efficiently identify the highest common factor
1.2.3.5 Use the prime factorisation of two or more positive integers to efficiently find their lowest common multiple
NCETM code
Ordering and comparing
1.3.1.1 Understand that 1 can be written in the form 𝑛
𝑛 (where n is any integer)
and vice versa
1.3.1.2 Understand that fractions of the form 𝑎
𝑏 where a > b are greater than 1
and use this awareness to convert between improper fractions and mixed numbers
1.3.1.3* Understand that a fraction represents a division and that performing that division results in an equivalent decimal
1.3.1.4 Appreciate that any terminating decimal can be written as a fraction with a denominator of the form 10n (e.g. 0.56 = 56
100, 560
1000, etc.)
269
1.3.1.5* Understand the process of simplifying fractions through dividing both numerator and denominator by common factors
1.3.1.6 Know how to convert from fractions to decimals and back again using the converter key on a calculator
1.3.1.7 Know how to enter fractions as divisions on a calculator and understand the limitations of the decimal representation that results
1.3.2.1 Compare negative integers using < and >
1.3.2.2 Compare decimals using < and >
1.3.2.3 Compare and order fractions by converting to decimals
1.3.2.4 Compare and order fractions by converting to fractions with a common denominator
1.3.2.5 Order a variety of positive and negative fractions and decimals using appropriate methods of conversion and recognising when conversion to a common format is not required
1.3.2.6 Appreciate that, for any two numbers there is always another number in between them
1.3.3.1* Be able to write any integer in a range of forms, e.g. 53 = 5.3 × 10, 530 × 1
10, 5300 × 0.01, etc.
1.3.3.2 Understand that very large numbers can be written in the form a × 10n, (where 1 < a ≤ 10) and appreciate the real-life contexts where this format is usefully used
1.3.3.3 Understand that very small numbers can be written in the form a × 10−n, (where 1 < a ≤ 10) and appreciate the real-life contexts where this format is usefully used
NCETM code
Simplifying and manipulating expressions, equations and formulae
1.4.1.1 Understand that a letter can be used to represent a generalised number
1.4.1.2 Understand that algebraic notation follows particular conventions and that following these aids clear communication
1.4.1.3 Know the meaning of and identify: term, coefficient, factor, product, expression, formula and equation
1.4.1.4* Understand and recognise that a letter can be used to represent a specific unknown value or a variable
1.4.1.5* Understand that relationships can be generalised using algebraic statements
1.4.1.6 Understand that substituting particular values into a generalised algebraic statement gives a sense of how the value of the expression changes
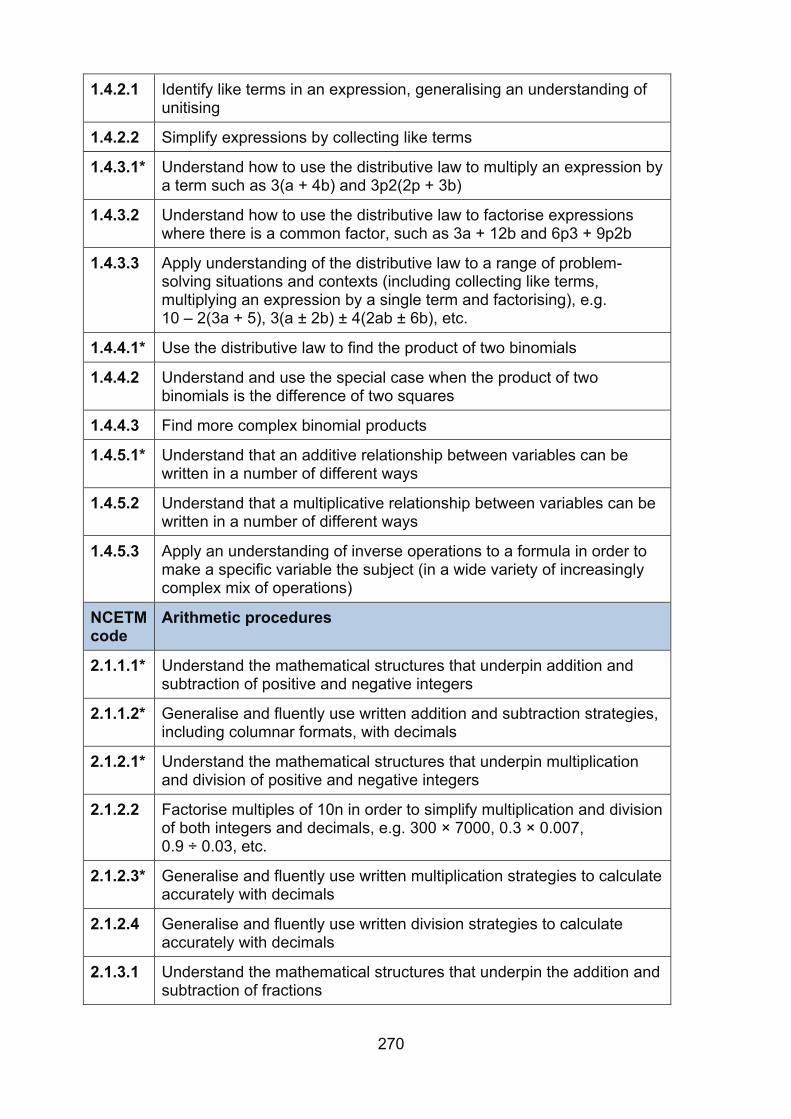
270
1.4.2.1 Identify like terms in an expression, generalising an understanding of unitising
1.4.2.2 Simplify expressions by collecting like terms
1.4.3.1* Understand how to use the distributive law to multiply an expression by a term such as 3(a + 4b) and 3p2(2p + 3b)
1.4.3.2 Understand how to use the distributive law to factorise expressions where there is a common factor, such as 3a + 12b and 6p3 + 9p2b
1.4.3.3 Apply understanding of the distributive law to a range of problem-solving situations and contexts (including collecting like terms, multiplying an expression by a single term and factorising), e.g. 10 – 2(3a + 5), 3(a ± 2b) ± 4(2ab ± 6b), etc.
1.4.4.1* Use the distributive law to find the product of two binomials
1.4.4.2 Understand and use the special case when the product of two binomials is the difference of two squares
1.4.4.3 Find more complex binomial products
1.4.5.1* Understand that an additive relationship between variables can be written in a number of different ways
1.4.5.2 Understand that a multiplicative relationship between variables can be written in a number of different ways
1.4.5.3 Apply an understanding of inverse operations to a formula in order to make a specific variable the subject (in a wide variety of increasingly complex mix of operations)
NCETM code
Arithmetic procedures
2.1.1.1* Understand the mathematical structures that underpin addition and subtraction of positive and negative integers
2.1.1.2* Generalise and fluently use written addition and subtraction strategies, including columnar formats, with decimals
2.1.2.1* Understand the mathematical structures that underpin multiplication and division of positive and negative integers
2.1.2.2 Factorise multiples of 10n in order to simplify multiplication and division of both integers and decimals, e.g. 300 × 7000, 0.3 × 0.007, 0.9 ÷ 0.03, etc.
2.1.2.3* Generalise and fluently use written multiplication strategies to calculate accurately with decimals
2.1.2.4 Generalise and fluently use written division strategies to calculate accurately with decimals
2.1.3.1 Understand the mathematical structures that underpin the addition and subtraction of fractions
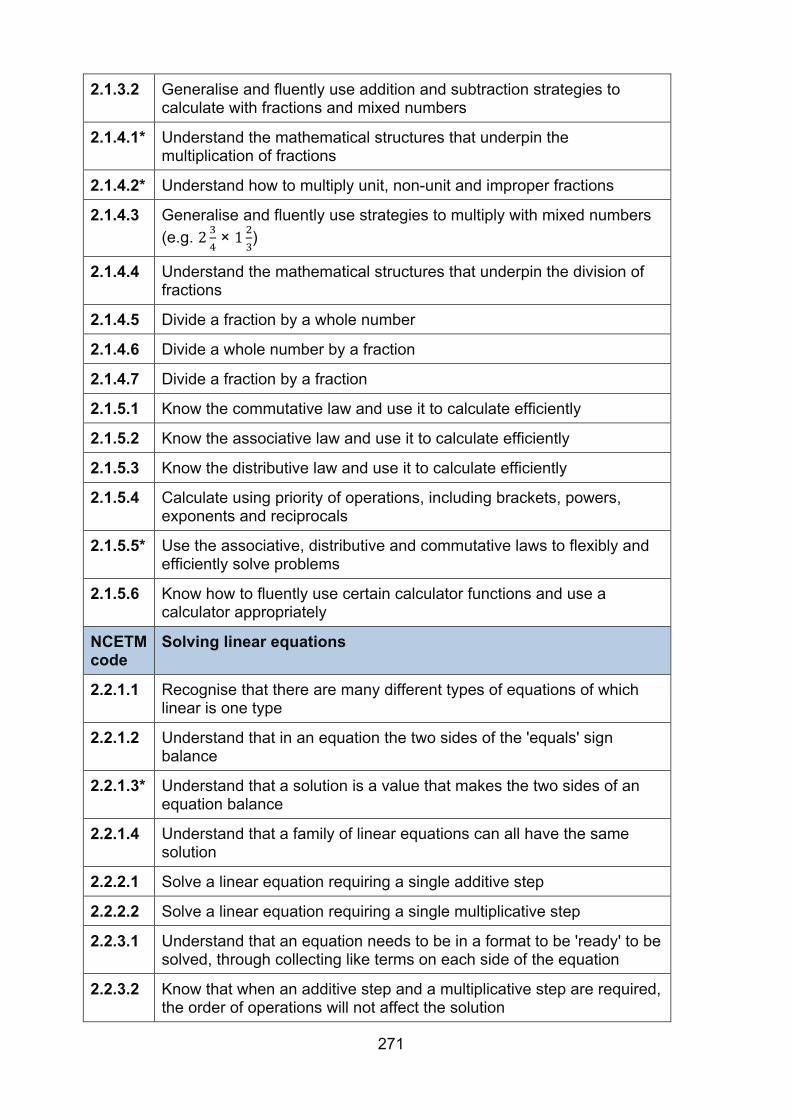
271
2.1.3.2 Generalise and fluently use addition and subtraction strategies to calculate with fractions and mixed numbers
2.1.4.1* Understand the mathematical structures that underpin the multiplication of fractions
2.1.4.2* Understand how to multiply unit, non-unit and improper fractions
2.1.4.3 Generalise and fluently use strategies to multiply with mixed numbers (e.g. 2 3
4 × 1 2
3)
2.1.4.4 Understand the mathematical structures that underpin the division of fractions
2.1.4.5 Divide a fraction by a whole number
2.1.4.6 Divide a whole number by a fraction
2.1.4.7 Divide a fraction by a fraction
2.1.5.1 Know the commutative law and use it to calculate efficiently
2.1.5.2 Know the associative law and use it to calculate efficiently
2.1.5.3 Know the distributive law and use it to calculate efficiently
2.1.5.4 Calculate using priority of operations, including brackets, powers, exponents and reciprocals
2.1.5.5* Use the associative, distributive and commutative laws to flexibly and efficiently solve problems
2.1.5.6 Know how to fluently use certain calculator functions and use a calculator appropriately
NCETM code
Solving linear equations
2.2.1.1 Recognise that there are many different types of equations of which linear is one type
2.2.1.2 Understand that in an equation the two sides of the 'equals' sign balance
2.2.1.3* Understand that a solution is a value that makes the two sides of an equation balance
2.2.1.4 Understand that a family of linear equations can all have the same solution
2.2.2.1 Solve a linear equation requiring a single additive step
2.2.2.2 Solve a linear equation requiring a single multiplicative step
2.2.3.1 Understand that an equation needs to be in a format to be 'ready' to be solved, through collecting like terms on each side of the equation
2.2.3.2 Know that when an additive step and a multiplicative step are required, the order of operations will not affect the solution
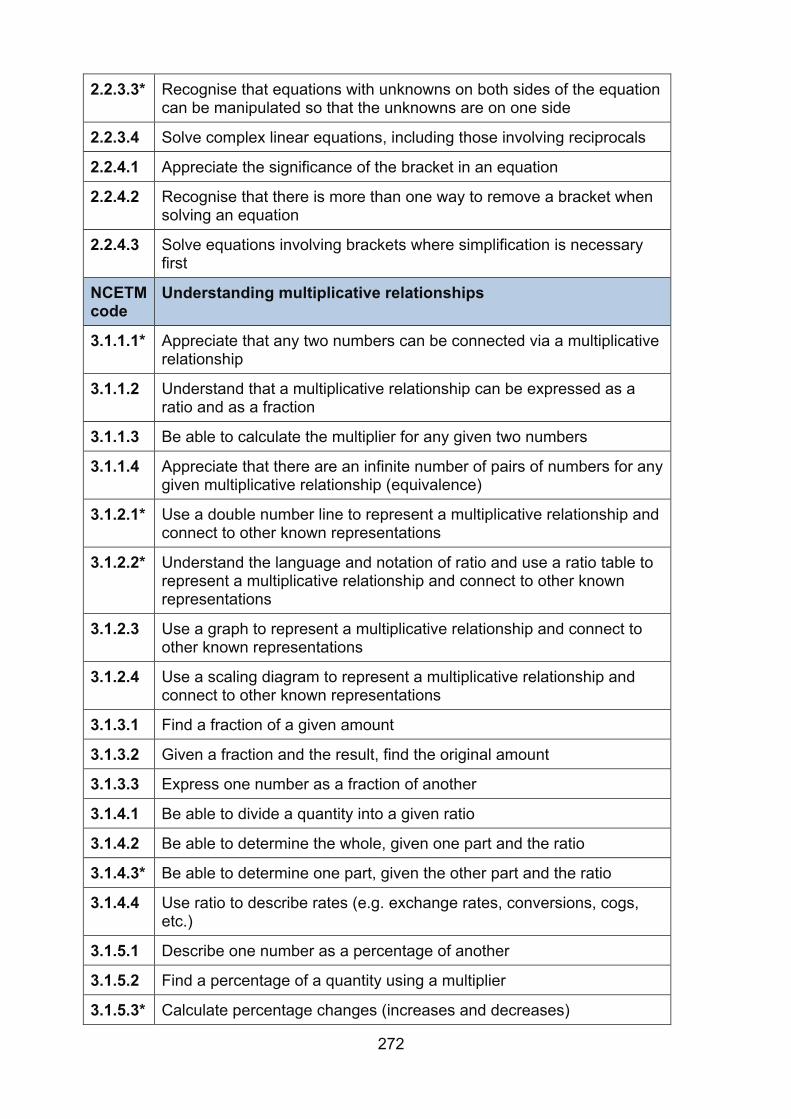
272
2.2.3.3* Recognise that equations with unknowns on both sides of the equation can be manipulated so that the unknowns are on one side
2.2.3.4 Solve complex linear equations, including those involving reciprocals
2.2.4.1 Appreciate the significance of the bracket in an equation
2.2.4.2 Recognise that there is more than one way to remove a bracket when solving an equation
2.2.4.3 Solve equations involving brackets where simplification is necessary first
NCETM code
Understanding multiplicative relationships
3.1.1.1* Appreciate that any two numbers can be connected via a multiplicative relationship
3.1.1.2 Understand that a multiplicative relationship can be expressed as a ratio and as a fraction
3.1.1.3 Be able to calculate the multiplier for any given two numbers
3.1.1.4 Appreciate that there are an infinite number of pairs of numbers for any given multiplicative relationship (equivalence)
3.1.2.1* Use a double number line to represent a multiplicative relationship and connect to other known representations
3.1.2.2* Understand the language and notation of ratio and use a ratio table to represent a multiplicative relationship and connect to other known representations
3.1.2.3 Use a graph to represent a multiplicative relationship and connect to other known representations
3.1.2.4 Use a scaling diagram to represent a multiplicative relationship and connect to other known representations
3.1.3.1 Find a fraction of a given amount
3.1.3.2 Given a fraction and the result, find the original amount
3.1.3.3 Express one number as a fraction of another
3.1.4.1 Be able to divide a quantity into a given ratio
3.1.4.2 Be able to determine the whole, given one part and the ratio
3.1.4.3* Be able to determine one part, given the other part and the ratio
3.1.4.4 Use ratio to describe rates (e.g. exchange rates, conversions, cogs, etc.)
3.1.5.1 Describe one number as a percentage of another
3.1.5.2 Find a percentage of a quantity using a multiplier
3.1.5.3* Calculate percentage changes (increases and decreases)
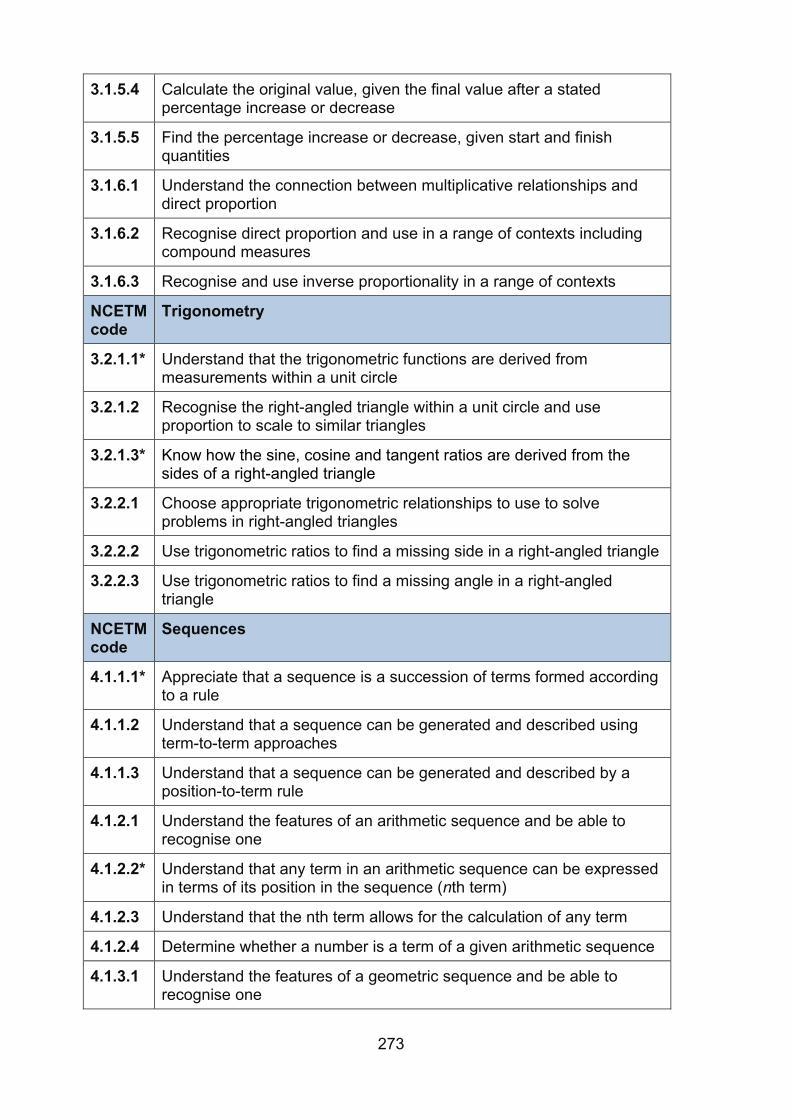
273
3.1.5.4 Calculate the original value, given the final value after a stated percentage increase or decrease
3.1.5.5 Find the percentage increase or decrease, given start and finish quantities
3.1.6.1 Understand the connection between multiplicative relationships and direct proportion
3.1.6.2 Recognise direct proportion and use in a range of contexts including compound measures
3.1.6.3 Recognise and use inverse proportionality in a range of contexts
NCETM code
Trigonometry
3.2.1.1* Understand that the trigonometric functions are derived from measurements within a unit circle
3.2.1.2 Recognise the right-angled triangle within a unit circle and use proportion to scale to similar triangles
3.2.1.3* Know how the sine, cosine and tangent ratios are derived from the sides of a right-angled triangle
3.2.2.1 Choose appropriate trigonometric relationships to use to solve problems in right-angled triangles
3.2.2.2 Use trigonometric ratios to find a missing side in a right-angled triangle
3.2.2.3 Use trigonometric ratios to find a missing angle in a right-angled triangle
NCETM code
Sequences
4.1.1.1* Appreciate that a sequence is a succession of terms formed according to a rule
4.1.1.2 Understand that a sequence can be generated and described using term-to-term approaches
4.1.1.3 Understand that a sequence can be generated and described by a position-to-term rule
4.1.2.1 Understand the features of an arithmetic sequence and be able to recognise one
4.1.2.2* Understand that any term in an arithmetic sequence can be expressed in terms of its position in the sequence (nth term)
4.1.2.3 Understand that the nth term allows for the calculation of any term
4.1.2.4 Determine whether a number is a term of a given arithmetic sequence
4.1.3.1 Understand the features of a geometric sequence and be able to recognise one
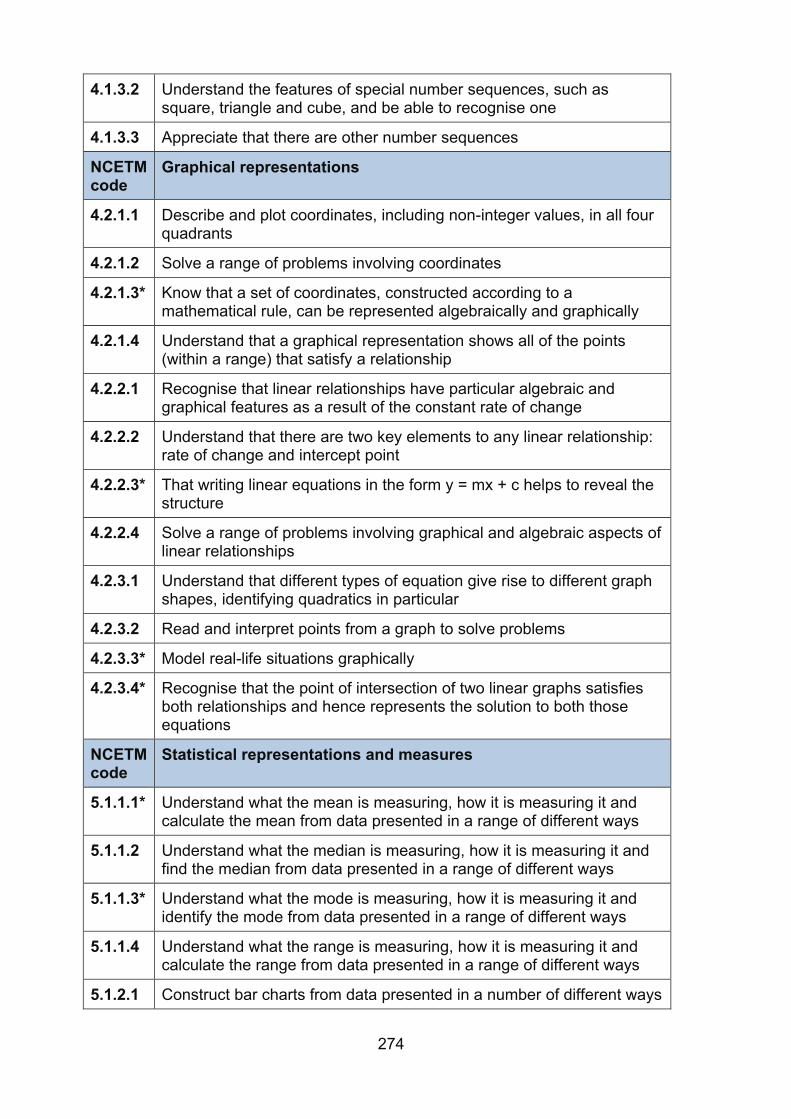
274
4.1.3.2 Understand the features of special number sequences, such as square, triangle and cube, and be able to recognise one
4.1.3.3 Appreciate that there are other number sequences
NCETM code
Graphical representations
4.2.1.1 Describe and plot coordinates, including non-integer values, in all four quadrants
4.2.1.2 Solve a range of problems involving coordinates
4.2.1.3* Know that a set of coordinates, constructed according to a mathematical rule, can be represented algebraically and graphically
4.2.1.4 Understand that a graphical representation shows all of the points (within a range) that satisfy a relationship
4.2.2.1 Recognise that linear relationships have particular algebraic and graphical features as a result of the constant rate of change
4.2.2.2 Understand that there are two key elements to any linear relationship: rate of change and intercept point
4.2.2.3* That writing linear equations in the form y = mx + c helps to reveal the structure
4.2.2.4 Solve a range of problems involving graphical and algebraic aspects of linear relationships
4.2.3.1 Understand that different types of equation give rise to different graph shapes, identifying quadratics in particular
4.2.3.2 Read and interpret points from a graph to solve problems
4.2.3.3* Model real-life situations graphically
4.2.3.4* Recognise that the point of intersection of two linear graphs satisfies both relationships and hence represents the solution to both those equations
NCETM code
Statistical representations and measures
5.1.1.1* Understand what the mean is measuring, how it is measuring it and calculate the mean from data presented in a range of different ways
5.1.1.2 Understand what the median is measuring, how it is measuring it and find the median from data presented in a range of different ways
5.1.1.3* Understand what the mode is measuring, how it is measuring it and identify the mode from data presented in a range of different ways
5.1.1.4 Understand what the range is measuring, how it is measuring it and calculate the range from data presented in a range of different ways
5.1.2.1 Construct bar charts from data presented in a number of different ways
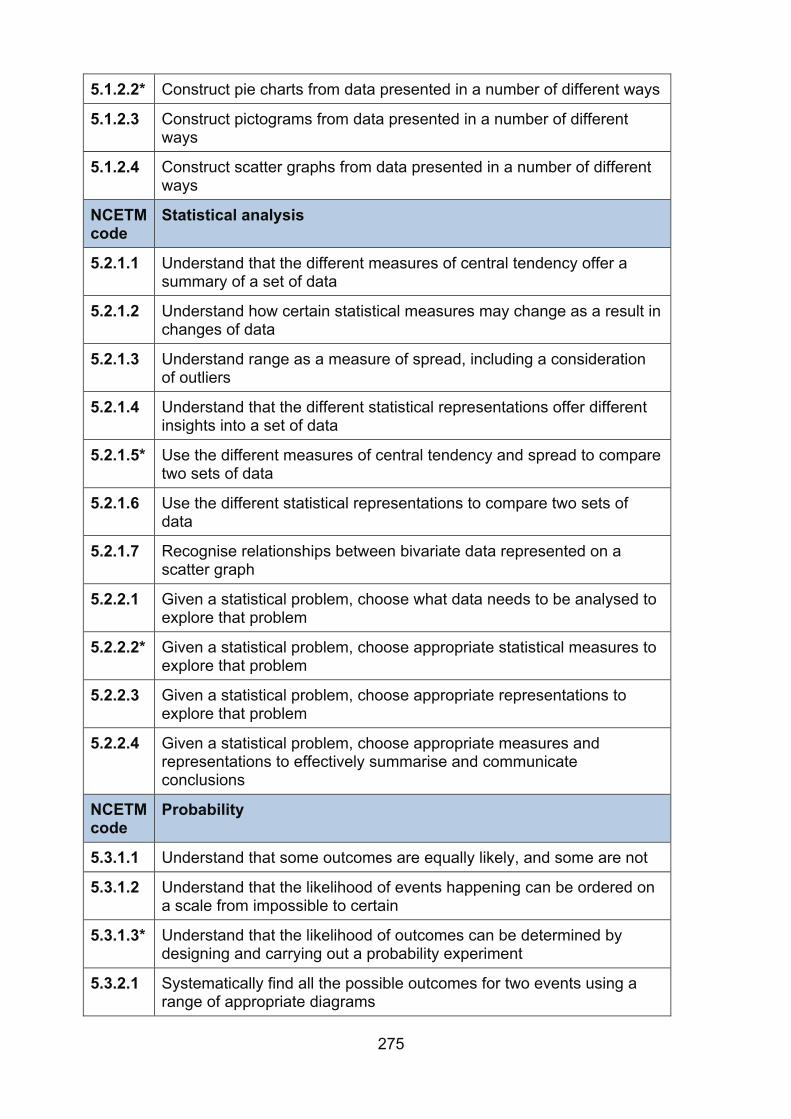
275
5.1.2.2* Construct pie charts from data presented in a number of different ways
5.1.2.3 Construct pictograms from data presented in a number of different ways
5.1.2.4 Construct scatter graphs from data presented in a number of different ways
NCETM code
Statistical analysis
5.2.1.1 Understand that the different measures of central tendency offer a summary of a set of data
5.2.1.2 Understand how certain statistical measures may change as a result in changes of data
5.2.1.3 Understand range as a measure of spread, including a consideration of outliers
5.2.1.4 Understand that the different statistical representations offer different insights into a set of data
5.2.1.5* Use the different measures of central tendency and spread to compare two sets of data
5.2.1.6 Use the different statistical representations to compare two sets of data
5.2.1.7 Recognise relationships between bivariate data represented on a scatter graph
5.2.2.1 Given a statistical problem, choose what data needs to be analysed to explore that problem
5.2.2.2* Given a statistical problem, choose appropriate statistical measures to explore that problem
5.2.2.3 Given a statistical problem, choose appropriate representations to explore that problem
5.2.2.4 Given a statistical problem, choose appropriate measures and representations to effectively summarise and communicate conclusions
NCETM code
Probability
5.3.1.1 Understand that some outcomes are equally likely, and some are not
5.3.1.2 Understand that the likelihood of events happening can be ordered on a scale from impossible to certain
5.3.1.3* Understand that the likelihood of outcomes can be determined by designing and carrying out a probability experiment
5.3.2.1 Systematically find all the possible outcomes for two events using a range of appropriate diagrams
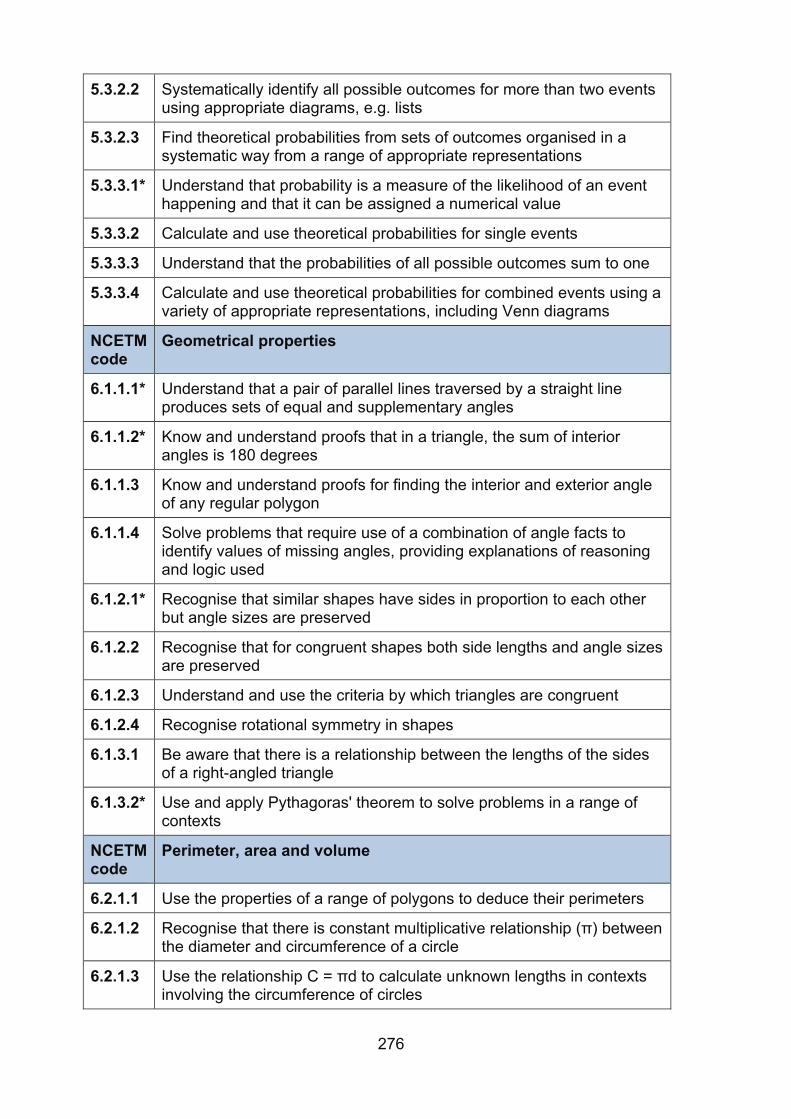
276
5.3.2.2 Systematically identify all possible outcomes for more than two events using appropriate diagrams, e.g. lists
5.3.2.3 Find theoretical probabilities from sets of outcomes organised in a systematic way from a range of appropriate representations
5.3.3.1* Understand that probability is a measure of the likelihood of an event happening and that it can be assigned a numerical value
5.3.3.2 Calculate and use theoretical probabilities for single events
5.3.3.3 Understand that the probabilities of all possible outcomes sum to one
5.3.3.4 Calculate and use theoretical probabilities for combined events using a variety of appropriate representations, including Venn diagrams
NCETM code
Geometrical properties
6.1.1.1* Understand that a pair of parallel lines traversed by a straight line produces sets of equal and supplementary angles
6.1.1.2* Know and understand proofs that in a triangle, the sum of interior angles is 180 degrees
6.1.1.3 Know and understand proofs for finding the interior and exterior angle of any regular polygon
6.1.1.4 Solve problems that require use of a combination of angle facts to identify values of missing angles, providing explanations of reasoning and logic used
6.1.2.1* Recognise that similar shapes have sides in proportion to each other but angle sizes are preserved
6.1.2.2 Recognise that for congruent shapes both side lengths and angle sizes are preserved
6.1.2.3 Understand and use the criteria by which triangles are congruent
6.1.2.4 Recognise rotational symmetry in shapes
6.1.3.1 Be aware that there is a relationship between the lengths of the sides of a right-angled triangle
6.1.3.2* Use and apply Pythagoras' theorem to solve problems in a range of contexts
NCETM code
Perimeter, area and volume
6.2.1.1 Use the properties of a range of polygons to deduce their perimeters
6.2.1.2 Recognise that there is constant multiplicative relationship (π) between the diameter and circumference of a circle
6.2.1.3 Use the relationship C = πd to calculate unknown lengths in contexts involving the circumference of circles
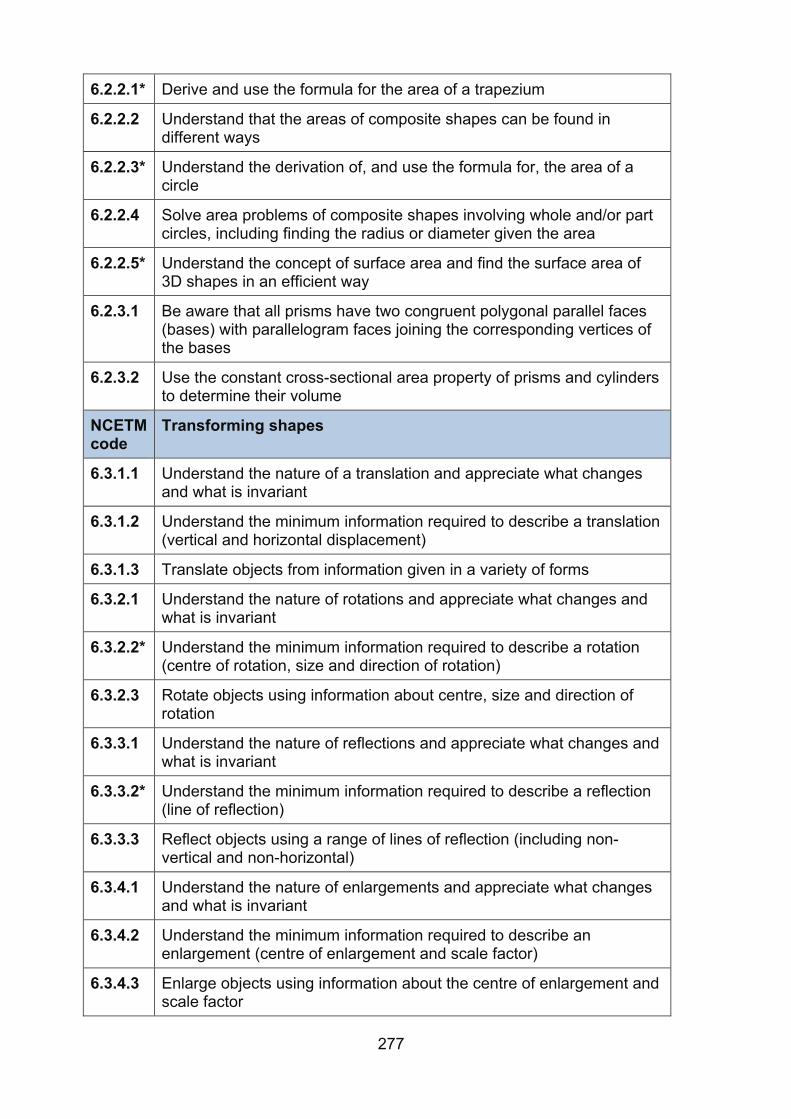
277
6.2.2.1* Derive and use the formula for the area of a trapezium
6.2.2.2 Understand that the areas of composite shapes can be found in different ways
6.2.2.3* Understand the derivation of, and use the formula for, the area of a circle
6.2.2.4 Solve area problems of composite shapes involving whole and/or part circles, including finding the radius or diameter given the area
6.2.2.5* Understand the concept of surface area and find the surface area of 3D shapes in an efficient way
6.2.3.1 Be aware that all prisms have two congruent polygonal parallel faces (bases) with parallelogram faces joining the corresponding vertices of the bases
6.2.3.2 Use the constant cross-sectional area property of prisms and cylinders to determine their volume
NCETM code
Transforming shapes
6.3.1.1 Understand the nature of a translation and appreciate what changes and what is invariant
6.3.1.2 Understand the minimum information required to describe a translation (vertical and horizontal displacement)
6.3.1.3 Translate objects from information given in a variety of forms
6.3.2.1 Understand the nature of rotations and appreciate what changes and what is invariant
6.3.2.2* Understand the minimum information required to describe a rotation (centre of rotation, size and direction of rotation)
6.3.2.3 Rotate objects using information about centre, size and direction of rotation
6.3.3.1 Understand the nature of reflections and appreciate what changes and what is invariant
6.3.3.2* Understand the minimum information required to describe a reflection (line of reflection)
6.3.3.3 Reflect objects using a range of lines of reflection (including non-vertical and non-horizontal)
6.3.4.1 Understand the nature of enlargements and appreciate what changes and what is invariant
6.3.4.2 Understand the minimum information required to describe an enlargement (centre of enlargement and scale factor)
6.3.4.3 Enlarge objects using information about the centre of enlargement and scale factor
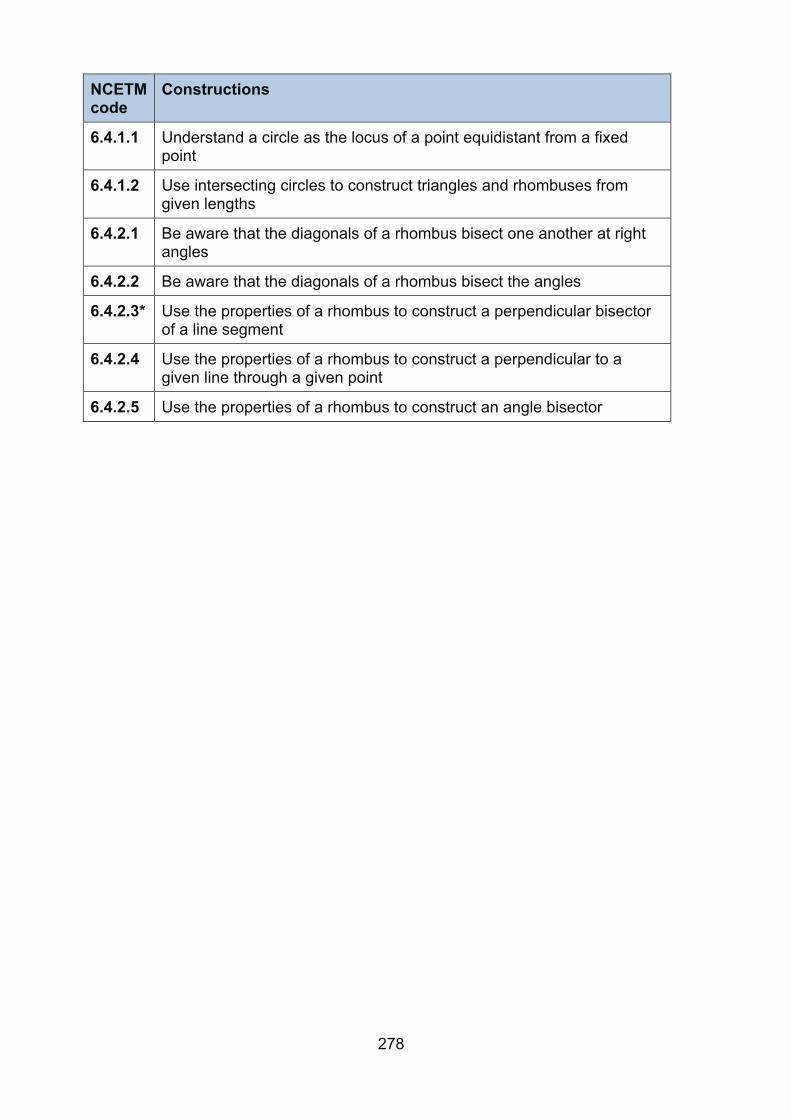
278
NCETM code
Constructions
6.4.1.1 Understand a circle as the locus of a point equidistant from a fixed point
6.4.1.2 Use intersecting circles to construct triangles and rhombuses from given lengths
6.4.2.1 Be aware that the diagonals of a rhombus bisect one another at right angles
6.4.2.2 Be aware that the diagonals of a rhombus bisect the angles
6.4.2.3* Use the properties of a rhombus to construct a perpendicular bisector of a line segment
6.4.2.4 Use the properties of a rhombus to construct a perpendicular to a given line through a given point
6.4.2.5 Use the properties of a rhombus to construct an angle bisector
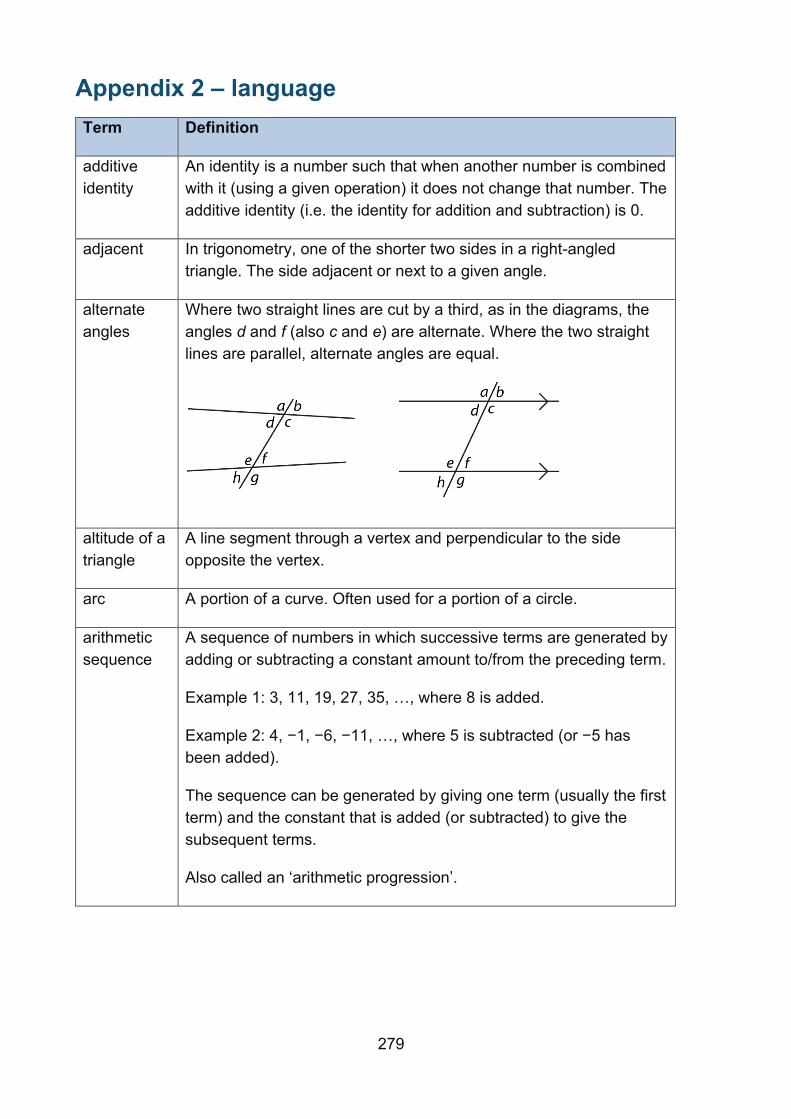
279
Appendix 2 – language Term Definition
additive identity
An identity is a number such that when another number is combined with it (using a given operation) it does not change that number. The additive identity (i.e. the identity for addition and subtraction) is 0.
adjacent In trigonometry, one of the shorter two sides in a right-angled triangle. The side adjacent or next to a given angle.
alternate angles
Where two straight lines are cut by a third, as in the diagrams, the angles d and f (also c and e) are alternate. Where the two straight lines are parallel, alternate angles are equal.
altitude of a triangle
A line segment through a vertex and perpendicular to the side opposite the vertex.
arc A portion of a curve. Often used for a portion of a circle.
arithmetic sequence
A sequence of numbers in which successive terms are generated by adding or subtracting a constant amount to/from the preceding term.
Example 1: 3, 11, 19, 27, 35, …, where 8 is added.
Example 2: 4, −1, −6, −11, …, where 5 is subtracted (or −5 has been added).
The sequence can be generated by giving one term (usually the first term) and the constant that is added (or subtracted) to give the subsequent terms.
Also called an ‘arithmetic progression’.
280
associative A binary operation ∗ on a set S is associative if a ∗ (b ∗ c) = (a ∗ b) ∗ c for all a, b and c in the set S.
Addition of real numbers is associative, which means a + (b + c) = (a + b) + c for all real numbers a, b and c. It follows that, for example, 1 + (2 + 3) = (1 + 2) + 3.
Similarly, multiplication is associative.
Subtraction and division are not associative because 1 − (2 − 3) = 1 − (−1) = 2, whereas (1 − 2) − 3 = (−1) − 3 = −4 and 1 ÷ (2 ÷ 3) = 1 ÷ 2
3 = 3
2, whereas (1 ÷ 2) ÷ 3 = ( 1
2 ) ÷ 3 = 1
6.
binomial An algebraic expression of the sum or difference of two terms.
bisector A point, line or plane that divides a line, an angle or a solid shape into two equal parts.
A perpendicular bisector is a line at right angles to a line-segment that divides it into two equal parts.
bivariate Involving two random variables; used in statistics as a bivariate distribution.
bivariate data
Data that compares the values of two variables by pairing each value of one of the variables with a value of the other.
281
Cartesian coordinate system
A system used to define the position of a point in 2- or 3-dimensional space:
Two axes at right angles to each other are used to define the position of a point in a plane. The usual conventions are to label the horizontal axis as the x-axis and the vertical axis as the y-axis, with the origin at the intersection of the axes. The ordered pair of numbers (x, y) that defines the position of a point is the coordinate pair. The origin is the point (0, 0); positive values of x are to the right of the origin and negative values are to the left of the origin; positive values of y are above the origin and negative values below the origin. Each of the numbers is a coordinate.
The numbers are also known as ‘Cartesian coordinates’, after the French mathematician, René Descartes (1596–1650).
Three mutually-perpendicular axes, conventionally labelled x, y and z, and coordinates (x, y, z) can be used to define the position of a point in space.
centre of enlarge-ment
Mentioned in definition for enlargement: a transformation of the plane in which lengths are multiplied whilst directions and angles are preserved. A centre and a positive scale factor are used to specify an enlargement. The scale factor is the ratio of the distance of any transformed point from the centre to its distance from the centre prior to the transformation. Any figure and its image under enlargement are similar.
centre of rotation
Mentioned in definition for rotation: in 2-dimensions, a transformation of the whole plane, which maps each point to another by rotating it by a specified angle (the angle of rotation) about a fixed point (the centre of rotation).
coefficient Often used for the numerical coefficient. More generally, a factor of an algebraic term.
Example 1: In the term 4xy, 4 is the numerical coefficient of xy but x is also the coefficient of 4y and y is the coefficient of 4x.
Example 2: in the quadratic equation 3x2 + 4x – 2, the coefficients of x2 and x are 3 and 4 respectively.
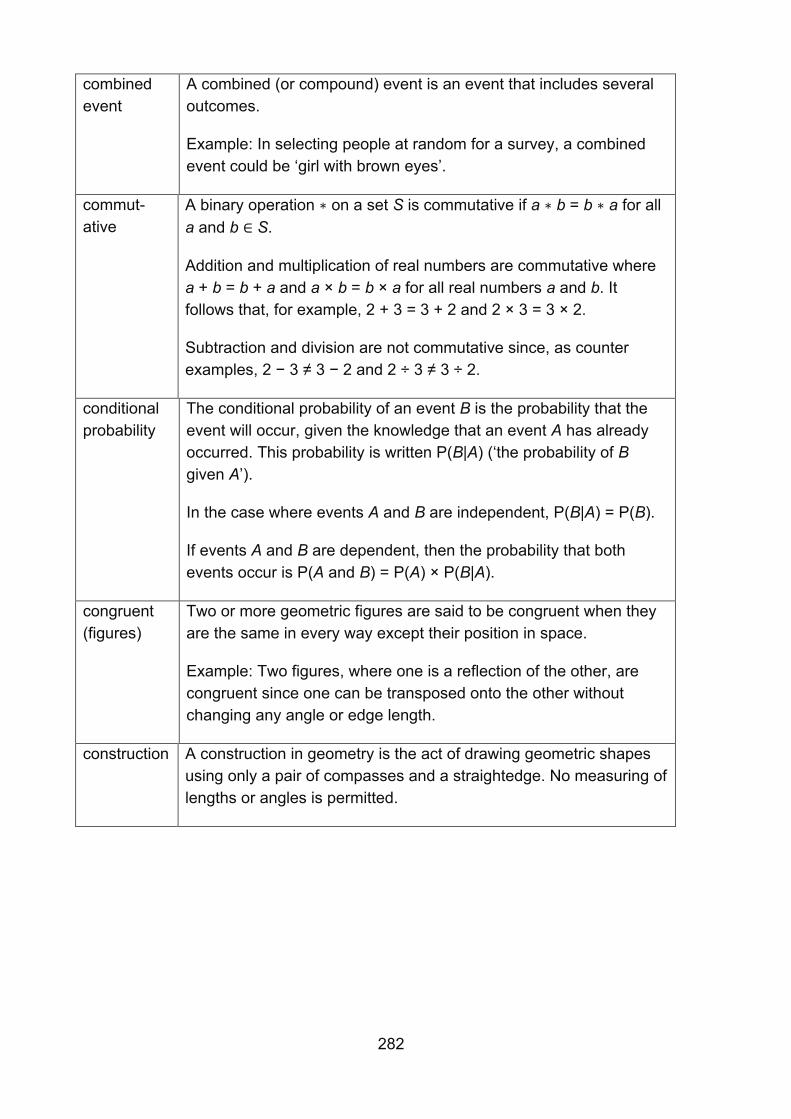
282
combined event
A combined (or compound) event is an event that includes several outcomes.
Example: In selecting people at random for a survey, a combined event could be ‘girl with brown eyes’.
commut-ative
A binary operation ∗ on a set S is commutative if a ∗ b = b ∗ a for all a and b ∈ S.
Addition and multiplication of real numbers are commutative where a + b = b + a and a × b = b × a for all real numbers a and b. It follows that, for example, 2 + 3 = 3 + 2 and 2 × 3 = 3 × 2.
Subtraction and division are not commutative since, as counter examples, 2 − 3 ≠ 3 − 2 and 2 ÷ 3 ≠ 3 ÷ 2.
conditional probability
The conditional probability of an event B is the probability that the event will occur, given the knowledge that an event A has already occurred. This probability is written P(B|A) (‘the probability of B given A’).
In the case where events A and B are independent, P(B|A) = P(B).
If events A and B are dependent, then the probability that both events occur is P(A and B) = P(A) × P(B|A).
congruent (figures)
Two or more geometric figures are said to be congruent when they are the same in every way except their position in space.
Example: Two figures, where one is a reflection of the other, are congruent since one can be transposed onto the other without changing any angle or edge length.
construction A construction in geometry is the act of drawing geometric shapes using only a pair of compasses and a straightedge. No measuring of lengths or angles is permitted.
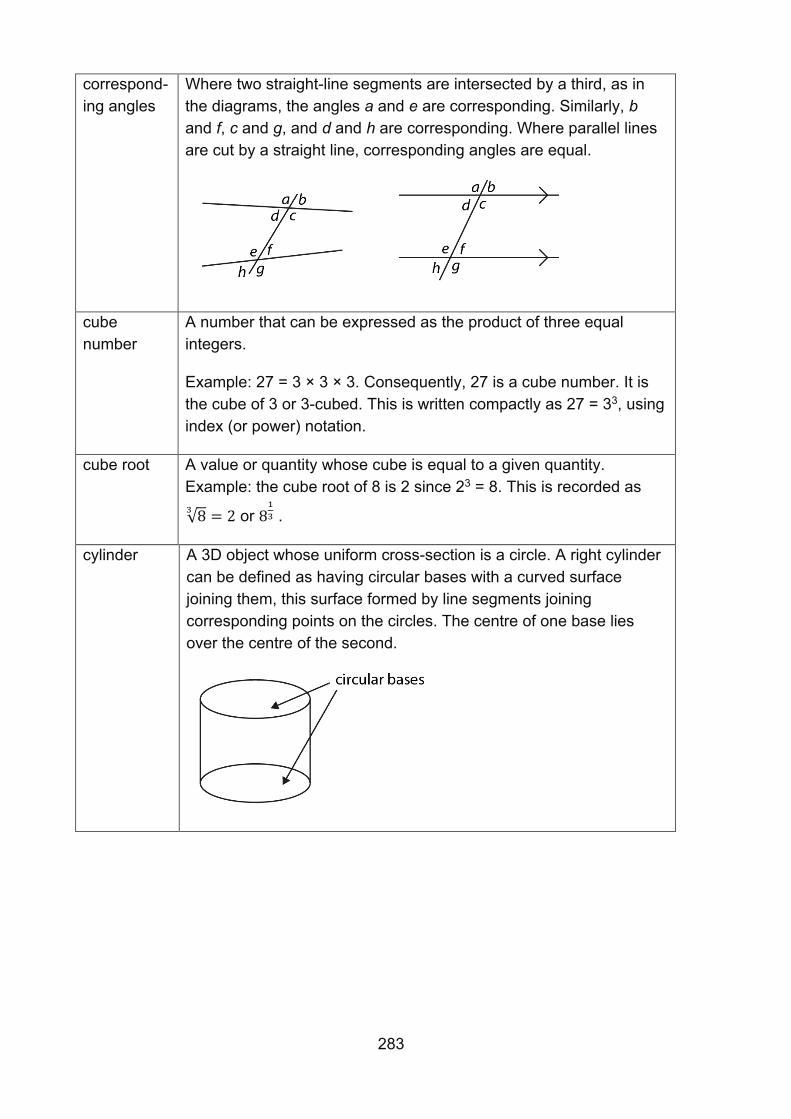
283
correspond-ing angles
Where two straight-line segments are intersected by a third, as in the diagrams, the angles a and e are corresponding. Similarly, b and f, c and g, and d and h are corresponding. Where parallel lines are cut by a straight line, corresponding angles are equal.
cube number
A number that can be expressed as the product of three equal integers.
Example: 27 = 3 × 3 × 3. Consequently, 27 is a cube number. It is the cube of 3 or 3-cubed. This is written compactly as 27 = 33, using index (or power) notation.
cube root A value or quantity whose cube is equal to a given quantity. Example: the cube root of 8 is 2 since 23 = 8. This is recorded as
√83
= 2 or 81
3 .
cylinder A 3D object whose uniform cross-section is a circle. A right cylinder can be defined as having circular bases with a curved surface joining them, this surface formed by line segments joining corresponding points on the circles. The centre of one base lies over the centre of the second.
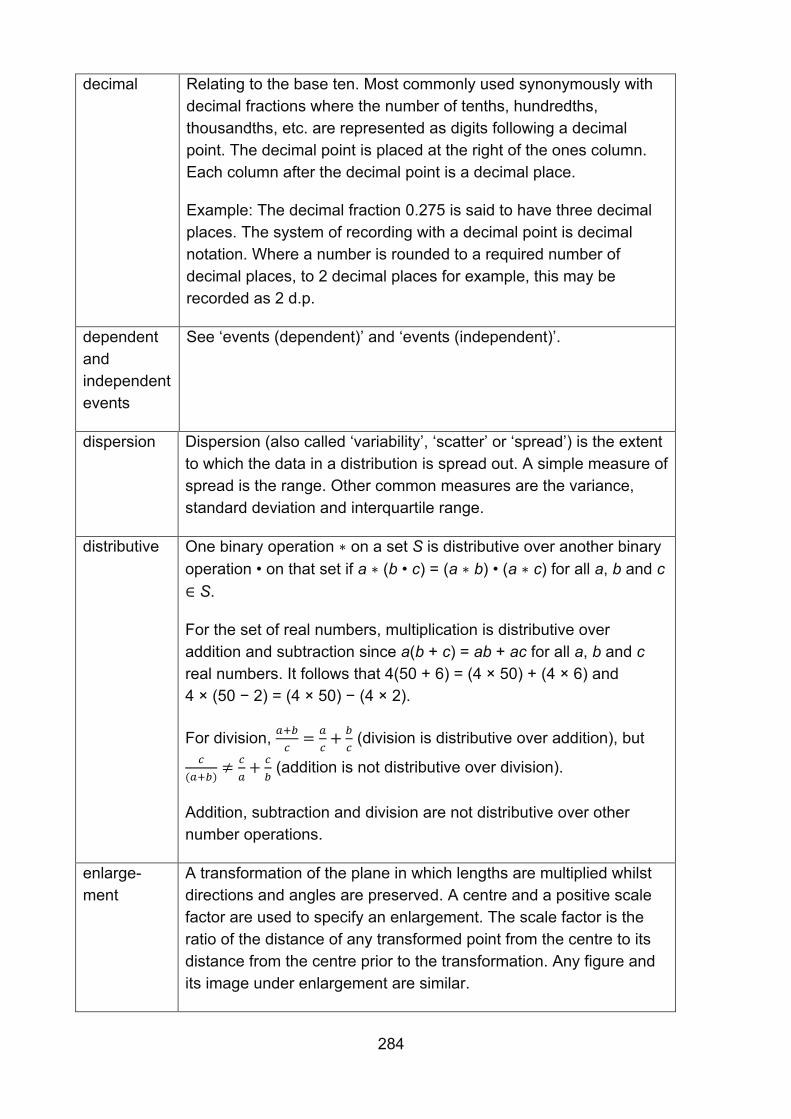
284
decimal Relating to the base ten. Most commonly used synonymously with decimal fractions where the number of tenths, hundredths, thousandths, etc. are represented as digits following a decimal point. The decimal point is placed at the right of the ones column. Each column after the decimal point is a decimal place.
Example: The decimal fraction 0.275 is said to have three decimal places. The system of recording with a decimal point is decimal notation. Where a number is rounded to a required number of decimal places, to 2 decimal places for example, this may be recorded as 2 d.p.
dependent and independent events
See ‘events (dependent)’ and ‘events (independent)’.
dispersion Dispersion (also called ‘variability’, ‘scatter’ or ‘spread’) is the extent to which the data in a distribution is spread out. A simple measure of spread is the range. Other common measures are the variance, standard deviation and interquartile range.
distributive One binary operation ∗ on a set S is distributive over another binary operation • on that set if a ∗ (b • c) = (a ∗ b) • (a ∗ c) for all a, b and c ∈ S.
For the set of real numbers, multiplication is distributive over addition and subtraction since a(b + c) = ab + ac for all a, b and c real numbers. It follows that 4(50 + 6) = (4 × 50) + (4 × 6) and 4 × (50 − 2) = (4 × 50) − (4 × 2).
For division, 𝑎+𝑏
𝑐=
𝑎
𝑐+
𝑏
𝑐 (division is distributive over addition), but
𝑐
(𝑎+𝑏)≠
𝑐
𝑎+
𝑐
𝑏 (addition is not distributive over division).
Addition, subtraction and division are not distributive over other number operations.
enlarge-ment
A transformation of the plane in which lengths are multiplied whilst directions and angles are preserved. A centre and a positive scale factor are used to specify an enlargement. The scale factor is the ratio of the distance of any transformed point from the centre to its distance from the centre prior to the transformation. Any figure and its image under enlargement are similar.
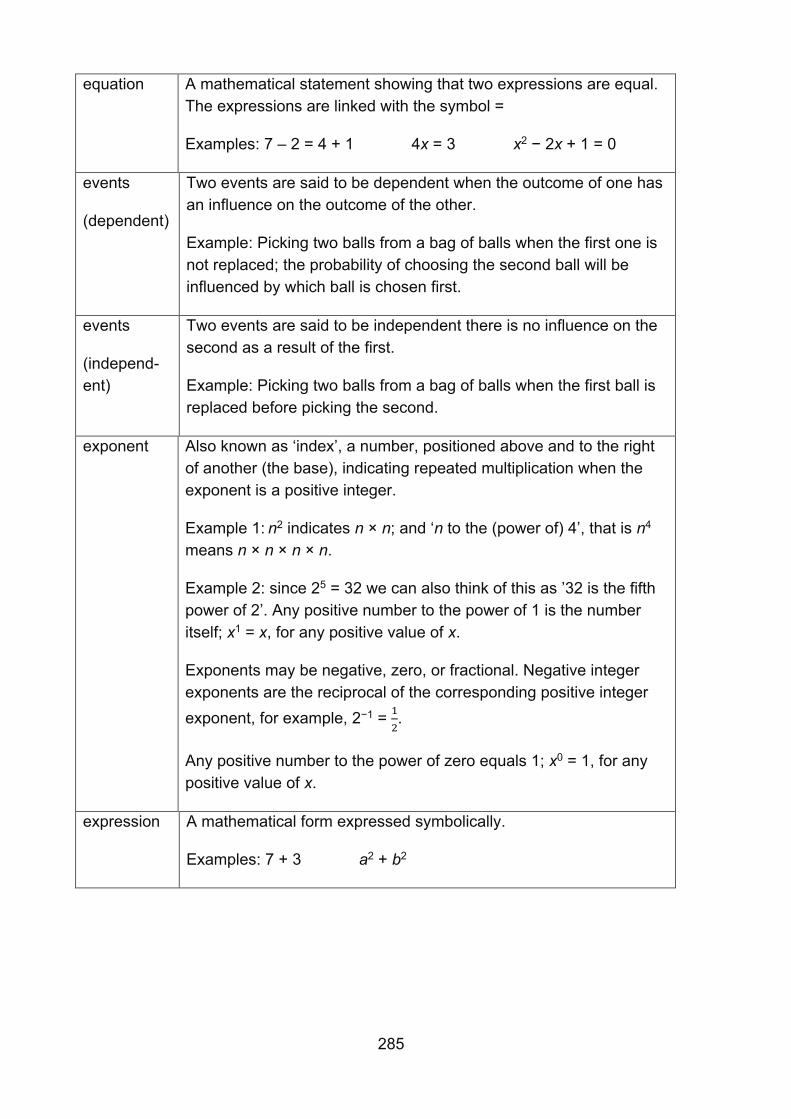
285
equation A mathematical statement showing that two expressions are equal. The expressions are linked with the symbol =
Examples: 7 – 2 = 4 + 1 4x = 3 x2 − 2x + 1 = 0
events
(dependent)
Two events are said to be dependent when the outcome of one has an influence on the outcome of the other.
Example: Picking two balls from a bag of balls when the first one is not replaced; the probability of choosing the second ball will be influenced by which ball is chosen first.
events
(independ-ent)
Two events are said to be independent there is no influence on the second as a result of the first.
Example: Picking two balls from a bag of balls when the first ball is replaced before picking the second.
exponent Also known as ‘index’, a number, positioned above and to the right of another (the base), indicating repeated multiplication when the exponent is a positive integer.
Example 1: n2 indicates n × n; and ‘n to the (power of) 4’, that is n4 means n × n × n × n.
Example 2: since 25 = 32 we can also think of this as ’32 is the fifth power of 2’. Any positive number to the power of 1 is the number itself; x1 = x, for any positive value of x.
Exponents may be negative, zero, or fractional. Negative integer exponents are the reciprocal of the corresponding positive integer exponent, for example, 2−1 = 1
2.
Any positive number to the power of zero equals 1; x0 = 1, for any positive value of x.
expression A mathematical form expressed symbolically.
Examples: 7 + 3 a2 + b2
286
factorise To express a number or a polynomial as the product of its factors.
Example 1: Factorising 12: 12 = 1 × 12 = 2 × 6 = 3 × 4
The factors of 12 are 1, 2, 3, 4, 6 and 12.
12 may be expressed as a product of its prime factors:
12 = 2 × 2 × 3
Example 2: Factorising x2 − 4x − 21: x2 − 4x – 21 = (x + 3)(x − 7) The factors of x2 − 4x – 21 are (x + 3) and (x − 7).
formula An equation linking sets of physical variables.
Example: 𝐴 = 𝜋𝑟2 is the formula for the area of a circle.
Plural: formulae.
geometric sequence
A series of terms in which each term is a constant multiple of the previous term (known as the common ratio) is called a geometric sequence, sometimes also called a ‘geometric progression’.
Example 1: 1, 5, 25, 125, 625, …, where the constant multiplier is 5.
Example 2: 1, −3, 9, −27, 81, …, where the constant multiplier is −3.
A geometric sequence may have a finite number of terms or it may go on forever, in which case it is an infinite geometric sequence. In an infinite geometric sequence with a common ratio strictly between zero and one, all the terms add to a finite sum.
hypotenuse In trigonometry, the longest side of a right-angled triangle. The side opposite the right-angle.
image When a transformation is applied to a shape, the transformed shape is called the ‘image’. The original shape is called the ‘object’.
interior angle
At a vertex of a polygon, the angle that lies within the polygon.
line A set of adjacent points that has length but no width. A straight line is completely determined by two of its points, say A and B. (see ‘line segment’)
287
line segment
The part of a line between any two of its points is a line segment. (See ‘line’.)
linear In algebra, describing an expression or equation of degree one.
Example: 2x + 3y = 7 is a linear equation.
All linear equations can be represented as straight line graphs.
locus A locus of points is the set of points, and only those points, that satisfies given conditions.
Example: The locus of points at a given distance from a given point is a circle.
(arithmetic) mean
The sum of a set of numbers, or quantities, divided by the number of terms in the set.
Example: The arithmetic mean of 5, 6, 14, 15 and 45 is (5 + 6 + 14 + 15 + 45) ÷ 5, i.e. 17.
measure of central tendency
In statistics, a measure of how the values of a particular variable are located in terms of the values collected for a particular sample, or for the relevant population as a whole.
In school mathematics up to Key Stage 4, there are three important measures of central tendency: the arithmetic mean, the median and the mode. These are all statistical averages and often one is more useful than another, depending on the spread of the values under consideration.
median The middle number or value when all values in a set of data are arranged in ascending order.
Example: The median of 5, 6, 14, 15 and 45 is 14.
When there is an even number of values, the arithmetic mean of the two middle values is calculated.
Example: The median of 5, 6, 7, 8, 14 and 45 is (7 + 8) ÷ 2, i.e. 7.5.
The median is one example of an average.
288
mode The most commonly occurring value or class with the largest frequency.
Example: The mode of this set of data: 2, 3, 3, 3, 4, 4, 5, 5, 6, 7, 8 is 3.
Some sets of data may have more than one mode.
multiplicat-ive identity
An identity is a number such that when another number is combined with it (using a given operation) it does not change that number. The multiplicative identity (i.e. the identity for multiplication and division) is 1.
mutually- exclusive events
In probability, events that cannot both occur in one experiment. When the mutually exclusive events cover all possible outcomes, the sum of their probabilities is one.
nth term of a sequence
This is the name for the term that is in the nth position starting the count of terms from the first term.
The nth term is sometimes represented by the symbol un.
object When a transformation is applied to a shape, the original shape is called the ‘object’. The transformed shape is called the ‘image’.
opposite In trigonometry, one of the shorter two sides in a right-angled triangle. The side opposite a given angle.
outlier In statistical samples, an outlier is an exceptional trial result that lies beyond where most of the results are clustered.
Example: Six people have the following salaries: £20 000, £25 600, £2 000, £19 000, £30 000, £160 000. The salary of £160 000 is clearly out of line with the others and is an outlier. At the other end, £2 000 is also well below the central cluster of values and so may also be considered as an outlier.
perpen-dicular
A line or plane that is at right angles to another line or plane.
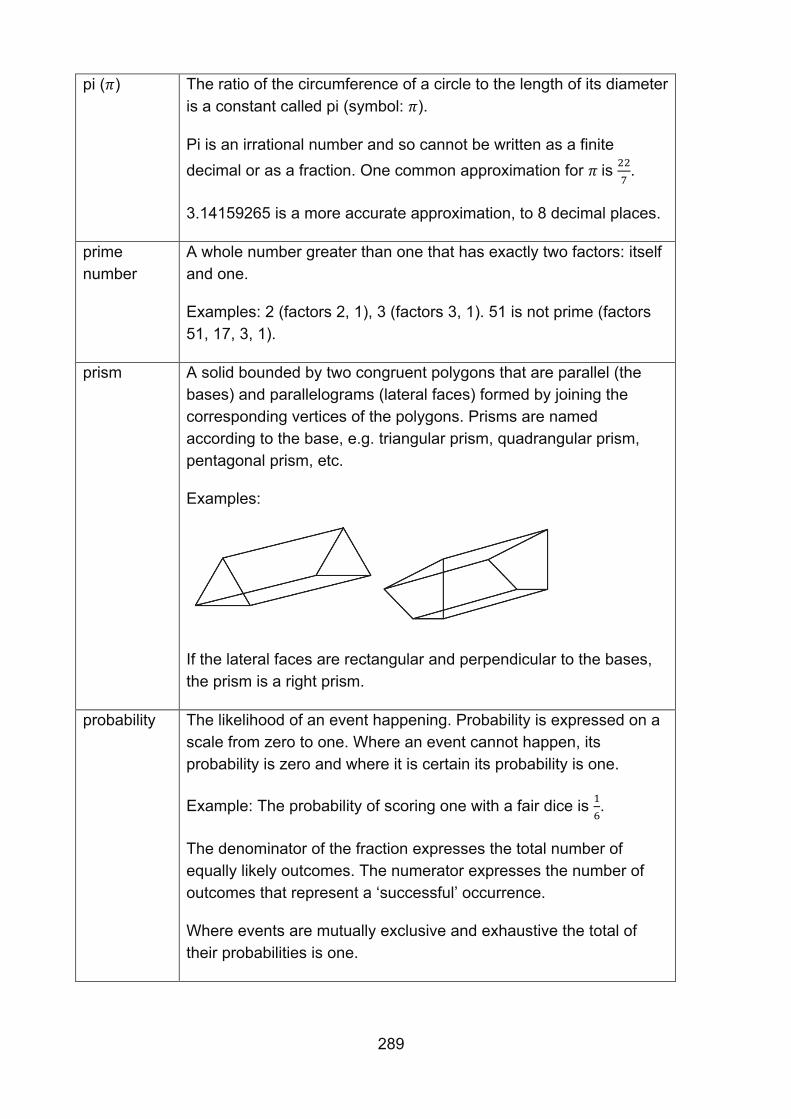
289
pi (𝜋) The ratio of the circumference of a circle to the length of its diameter is a constant called pi (symbol: 𝜋).
Pi is an irrational number and so cannot be written as a finite decimal or as a fraction. One common approximation for 𝜋 is 22
7.
3.14159265 is a more accurate approximation, to 8 decimal places.
prime number
A whole number greater than one that has exactly two factors: itself and one.
Examples: 2 (factors 2, 1), 3 (factors 3, 1). 51 is not prime (factors 51, 17, 3, 1).
prism A solid bounded by two congruent polygons that are parallel (the bases) and parallelograms (lateral faces) formed by joining the corresponding vertices of the polygons. Prisms are named according to the base, e.g. triangular prism, quadrangular prism, pentagonal prism, etc.
Examples:
If the lateral faces are rectangular and perpendicular to the bases, the prism is a right prism.
probability The likelihood of an event happening. Probability is expressed on a scale from zero to one. Where an event cannot happen, its probability is zero and where it is certain its probability is one.
Example: The probability of scoring one with a fair dice is 1
6.
The denominator of the fraction expresses the total number of equally likely outcomes. The numerator expresses the number of outcomes that represent a ‘successful’ occurrence.
Where events are mutually exclusive and exhaustive the total of their probabilities is one.
290
proportion A part-to-whole comparison.
Example: Where £20 is shared between two people in the ratio 3:5, the first receives £7.50, which is 3
8 of the whole £20. This is the first
person’s proportion of the whole.
If two variables x and y are related by an equation of the form y = kx, then y is directly proportional to x; it may also be said that y varies directly as x. When y is plotted against x, this produces a straight-line graph through the origin.
If two variables x and y are related by an equation of the form xy = k, or equivalently 𝑦 =
𝑘
𝑥, where k is a constant and x ≠ 0, y ≠ 0, they
vary in inverse proportion to each other.
Pythagoras’ theorem
In a right-angled triangle, the square of the length of the hypotenuse is equal to the sum of the squares of the lengths of the other sides, i.e. the sides that bound the right angle.
Example:
When ∠DEF is a right angle, a2 + b2 = h2.
range A measure of spread in statistics. The difference between the greatest value and the least value in a set of numerical data.
ratio A part-to-part comparison. The ratio of a to b is usually written a:b.
Example: In a recipe for pastry, fat and flour are mixed in the ratio 1:2, which means that the fat used has half the mass of the flour. That is, 𝑎𝑚𝑜𝑢𝑛𝑡 𝑜𝑓 𝑓𝑎𝑡
𝑎𝑚𝑜𝑢𝑛𝑡 𝑜𝑓 𝑓𝑙𝑜𝑢𝑟=
1
2. Thus, ratios are equivalent to particular
fractional parts.
rectilinear Bounded by straight lines. A closed rectilinear shape is also a polygon. A rectilinear shape can be divided into rectangles and triangles for the purpose of calculating its area.
291
sample space
The sample space is the set of all possible outcomes of a trial. The sum of all the probabilities for all the events in a sample space is one.
scale factor For two similar geometric figures, the ratio of corresponding edge lengths.
sequence A succession of terms formed according to a rule. There is a definite relation between one term and the next and between each term and its position in the sequence.
Example: 1, 4, 9, 16, 25, …
significant figures
The run of digits in a number that are needed to specify the number to a required degree of accuracy. Additional zero digits may also be needed to indicate the number’s magnitude.
Examples: To the nearest thousand, the numbers 125 000, 2 376 000 and 22 000 have 3, 4 and 2 significant figures respectively; to 3 significant figures 98.765 is written 98.8
similar Two shapes are similar if an enlargement of one will produce the other. This may be an enlargement of scale factor 1, although these shapes would then be ‘congruent’. Two similar shapes do not have to share the same orientation nor the same sense.
solution A solution to an equation is a value of the variable that satisfies the equation, i.e. when substituted into the equation, makes it true.
A solution set is the set of values that satisfy a given set of equations or inequalities.
square number
A number that can be expressed as the product of two equal numbers.
Example: 36 = 6 × 6 and so 36 is a square number or ‘6 squared’.
A square number can be represented by dots in a square array.
292
standard index form (standard form)
A form in which numbers are recorded as a number between 1 and 10 multiplied by a power of ten.
Example: 193 in standard index form is recorded as 1.93 × 10² and 0.193 as 1.93 × 10⁻¹.
This form is often used as a succinct notation for very large and very small numbers.
substitute/ substitution
Numbers can be substituted into an algebraic expression in x to get a value for that expression for a given value of x.
Example: When x = −2, the value of the expression 5x2 − 4x + 7 is 5(−2)2 −4(−2) + 7 = 5(4) + 8 + 7 = 35.
surface area The surface area of a 3D figure is a measure of the area covered by all of the surfaces of the figure.
term A term is either a single number or variable, or the product of several numbers or variables. Terms are separated by a + or − sign in an overall expression.
Example: In 3 + 4x + 5yzw; 3, 4x and 5yzw are three separate terms.
terminating decimal
A decimal fraction that has a finite number of digits.
Example: 0.125 is a terminating decimal. In contrast 1
3 is a recurring
decimal fraction.
All terminating decimals can be expressed as fractions in which the denominator is a multiple of 2 or 5.
trapezium A quadrilateral with exactly one pair of sides parallel.
293
trigono-metric functions (sine, cosine, tangent)
Functions of angles. The main trigonometric functions are cosine, sine and tangent. Other functions are reciprocals of these.
Trigonometric functions (also called the ‘circular functions’) are functions of an angle. They relate the angles of a triangle to the lengths of its sides. The most familiar trigonometric functions are the sine, cosine and tangent in the context of the standard unit circle with radius 1 unit, where a triangle is formed by a ray originating at the origin and making some angle with the x-axis; the sine of the angle gives the length of the y-component (rise) of the triangle, the cosine gives the length of the x-component (run), and the tangent function gives the slope (y-component divided by the x-component).
Trigonometric functions are commonly defined as ratios of two sides of a right-angled triangle containing the angle.
cos 𝐴 =𝐴𝑑𝑗𝑎𝑐𝑒𝑛𝑡
𝐻𝑦𝑝𝑜𝑡𝑒𝑛𝑢𝑠𝑒 sin 𝐴 =
𝑂𝑝𝑝𝑜𝑠𝑖𝑡𝑒
𝐻𝑦𝑝𝑜𝑡𝑒𝑛𝑢𝑠𝑒 tan 𝐴 =
sin 𝐴
cos 𝐴=
𝑂𝑝𝑝𝑜𝑠𝑖𝑡𝑒
𝐴𝑑𝑗𝑎𝑐𝑒𝑛𝑡
variable A quantity that can take on a range of values, often denoted by a letter, x, y, z, t, …, etc.
unknown A number that is not known.
Example: In the expression 2x − 5, x represents an unknown.
When presented with more information, such as in the form of an equation (e.g. 2x – 5 = 6), this unknown can be found.

294

295
© Crown copyright 2021
This publication (not including logos) is licensed under the terms of the Open Government Licence v3.0 except where otherwise stated. Where we have identified any third party copyright information you will need to obtain permission from the copyright holders concerned.
To view this licence: visit www.nationalarchives.gov.uk/doc/open-government-licence/version/3 email [email protected] write to Information Policy Team, The National Archives, Kew, London, TW9 4DU
About this publication: enquiries www.education.gov.uk/contactus download www.gov.uk/government/publications
Follow us on Twitter: @educationgovuk
Like us on Facebook: facebook.com/educationgovuk