mathematical literacy - brombacher
TRANSCRIPT
Early Childhood Development
NQFLEVEL
4Unit 1
Budgets
Mathematical Literacy
Mathematical Literacy — Early Childhood Development NQF LEVEL 4
UNIT 1 — BUDGETS 1.2
Activity8
Buyi
ngeq
uipment from
overseas
Activity10
TeTeTlep
hone expenses
Activity1
Read
ing
statements and
budgets
Activity2
Inflatio
n—
things get more
expensive
Activity3
Analy
sing budgets
Activity4 Re
ad
ing your pay slip
Activity5
Infla
tion revisited
Activity6
Deve
lopi
ng
a budget (assessment)
Activity7 Bu
ying
a fridge and astove
Activity9 Fu
ndra
ising selling hot dogs
BUDGETS
Purchases & Sales
Statements, budgets and planning
Inflation
Mathematical Literacy — Early Childhood Development NQF LEVEL 4
UNIT 1 — BUDGETS 1.3
Overview
This unit aims to increase students’ familiarity and understanding of the fi nancial aspects relating to the running of a crèche.
Students should gain an understanding of what income and expenditure statements are. The relationship between budgets on a small scale business level to those on a large scale national level are drawn out.
Infl ation has a signifi cant effect on individuals as well as on all businesses. It is imperative that students gain a clear understanding of what infl ation is and how to run a business whilst making allowances for the effects of infl ation.
Aspects of national economy are also considered. This unit gives the student an understanding of what the sources of government income are and how it uses it’s resources. Government budgeting is also carefully looked at.
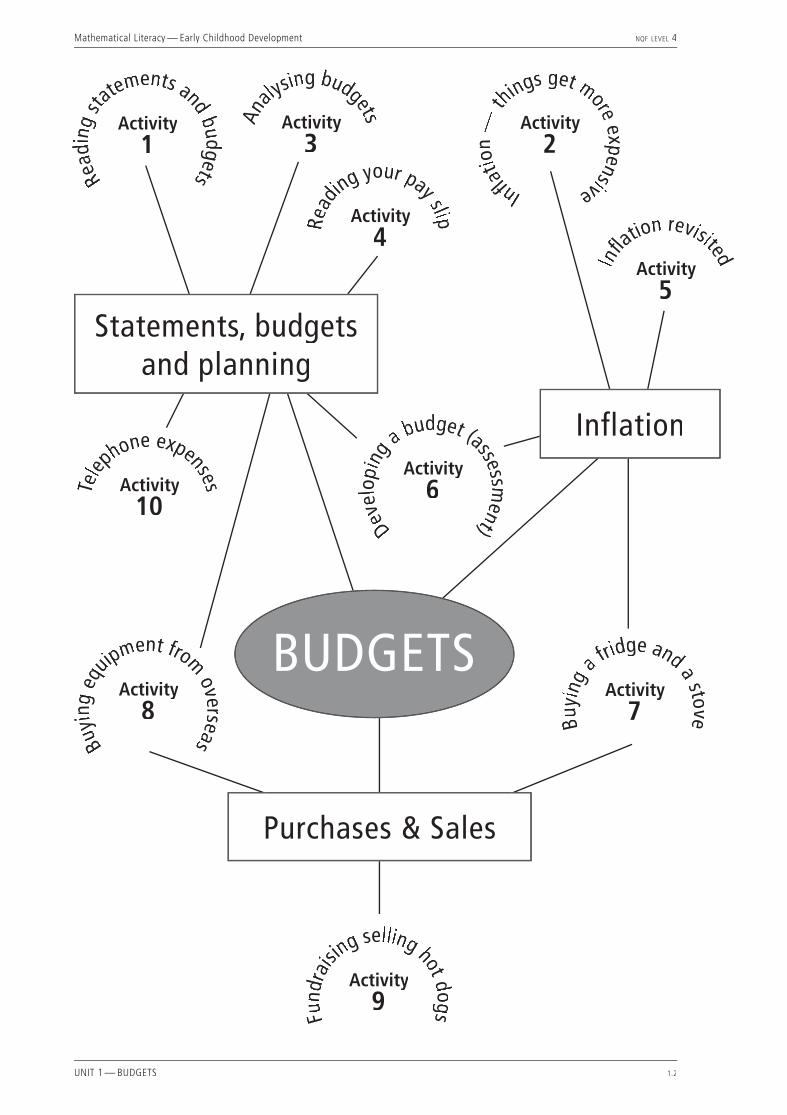
This unit consists of ten activities. Each activity is a stand-alone activity, but they rely on an understanding of the concepts that have been raised preceding each activity. Having worked through this unit, students should have a greater ability to deal with some of the fi nancial aspects of running a successful business. They should also have a greater understanding of the country’s national budget.
Activity 1: Reading statements and budgetsIn this activity we want students to gain an understanding of how to read budget statements. This is because many of the later activities in this unit relate back to budget statements.
We start by asking students to refl ect on their own personal income and expenditure statements. Three budget statements are included with the activity: one is for Sunny Days Crèche and the others are the provincial and national income and expenditure statements. It is important for students to recognize the similarities that exist between all budget statements.
Activity 2: Infl ation – things get more expensiveThis activity introduces the concept of infl ation, and gives students the opportunity to discover for themselves that prices go up over time. It allows students to realise that not all items increase in price by the same amount over a fi xed period of time. The ideas of simple and compound interest are also introduced.
Activity 3: Analysing budgetsIn this activity we will combine the ideas learnt in the fi rst two activities and explore how infl ation plays a signifi cant role in preparing and understanding budgets.
The following Unit Standards, Specifi c Outcomes and Assessment Criteria are addressed by this unit:
Use Mathematics to investigate and monitor the fi nancial aspects of personal, business and national issues (9014)
• Use Mathematics to investigate and analyse regional and/or national budgets and income (SO1).o Regional and/or national budgets from
the media and other sources are accessed, and income and expenditure are described realistically.
o Calculations are carried out effi ciently and correctly using computational tools.
o Solutions obtained are verifi ed in terms of the context.
o Different ways of representing budgets are critically analysed and related.
o Actual income and expenditure is analysed and compared to planned income and expenditure. Variances are identifi ed
• Use compound growth to make sense of infl ationary effects on the national economy (SO2).o Methods of calculation are appropriate to
the problem types. o Computational tools are used effi ciently and
correctly and solutions obtained are verifi ed in terms of the context or problem.
o Solutions to calculations are interpreted in terms of base rates or indices
o Appropriate formulae are understood and used to calculate solutions to problems.
• Use Mathematics to critique and debate aspects of the national economy (SO3).o Values are calculated correctly. o Mathematical tools are used to compare the
effects of changes in different sectors of the national economy.
o Critique and debating points are based on well-reasoned arguments and are supported by mathematical information.
Unit outcomes

Mathematical Literacy — Early Childhood Development NQF LEVEL 4
UNIT 1 — BUDGETS 1.4
Activity 4: Reading your pay slipThis activity looks at pay slips in detail and gives students the opportunity of understanding the information that is provided on a pay slip. In addition, it shows students how tax and UIF is calculated based on income and takings.
Activity 5: Infl ation RevisitedThis activity enables students once again to interact with the important concept of infl ation. We look at a case study of what can happen when infl ation gets out of control. The concepts learned are then applied to the running of a crèche.
Activity 6: Preparing budgetsThis activity is designed to be used as an assessment activity. It is intended to recap principles that have been learnt in the fi rst fi ve activities. There is an opportunity for students to make their own judgments about how a business develops and to draw up a budget accordingly. If time allows it may be worthwhile for students to share their budgets with each other, explaining the reasons behind their decisions.Activity 7: Buying items on hire purchase
In this activity we expose students to the different payment options available when purchasing items on credit. We also consider the various factors at play when deciding which option is most suitable.
Activity 8: Buying items from overseasIn this activity we consider the effect of exchange rates on the cost of purchasing items from foreign countries. We also look at different purchasing options, considering whether to buy in bulk or in smaller quantities as funding allows.
Activity 9: Fundraising selling hot dogsIn this activity we look at an alternative source of income for the crèche through fundraising. The aim of the activity is to allow students to think through the cost of producing the hot dogs for sale. Students should realise that decisions that are made can have far-reaching effects on a business’s profi ts.
Activity 10: Telephone expensesThis activity is completely self-contained. It deals with ways of managing one of the signifi cant budget items: telephone costs.
9014 Use mathematics to investigate & monitor the fi nancial aspects of personal, business and national issues
ACTIVITY 1 2 3 4 5 6 7 8 9 10
SO1 Use mathematics to investigate and analyse regional and/or national budgets and income
AC1 Regional and /or national budgets from the media and other sources are accessed, and income and expenditure are described realistically.
ü ü ü ü
AC2 Calculations are carried out effi ciently and correctly using computational tools.
ü ü ü ü ü ü ü ü
AC3 Solutions obtained are verifi ed in terms of the context. ü ü ü ü ü ü ü ü ü
AC4 Different ways of representing budgets are critically analysed and related.
ü ü ü
AC5 Actual income and expenditure is analysed and and compared to planned income and expenditure. Variances are identifi ed.
ü ü ü
SO2 Use compound growth to make sense of infl ationary effects on the national economy.
AC1 Methods of calculation are appropriate to the problem types. ü ü ü ü ü ü ü ü ü ü
AC2 Computational tools are used effi ciently and correctly and solutions obtained are verifi ed in terms of the context or problem.
ü ü ü ü ü ü ü ü
AC3 Solutions to problems are interpreted in terms of base rates or indices. ü ü ü ü ü ü
AC4 Appropriate formulae are understood and used to calculate solutions to problems.
ü ü ü ü ü ü ü
SO3 Use mathematics to critique and debate aspects of the national economy.
AC1 Values are calculated correctly. ü ü ü ü ü ü ü ü ü
AC2 Mathematics are used to compare the effects of changes in different sectors of the national economy.
ü ü ü
AC3 Critique and debating points are based on well-reasoned arguments and are supported by mathematical information.
ü ü ü ü ü ü ü ü
Mathematical Literacy — Early Childhood Development NQF LEVEL 4
UNIT 1 — BUDGETS 1.5
Activity 1 — Reading statements and budgets
ABOUT THIS ACTIVITYThis activity focuses on income and expenditure. Students will represent and analyse their own personal income and expenditure as well as that of the Sunny Days Crèche. They will also look at a national budget statement and make comparisons and identify links between this and the Sunny Days Crèche budget. Basic budget layout and terminology will be introduced in this activity. Students will be expected to extract appropriate values from the budgets – showing their understanding of the various rows and columns shown on a budget.This activity is aligned with unit standard 9014 and addresses AC 1,3,4,5 of SO1; AC 1 of SO2 and AC 1,3 of SO3.
MANAGING THIS ACTIVITYFor this activity, students will need a set of handouts (5 pages containing Thabita Zola’s pay slip, the Sunny Days Crèche budget, Western Cape budget framework and South African budget framework and additional representations of the Western Cape expenditure).
1.1.1 Sources of income could include any of the following: bursary, loan, pocket money, part-time wages. 1.1.2 The main expenses incurred during the month could include the following: rent, groceries, toiletries,
electricity, telephone and/or cell phone, transport, entertainment, clothes, birthday presents, sundries.
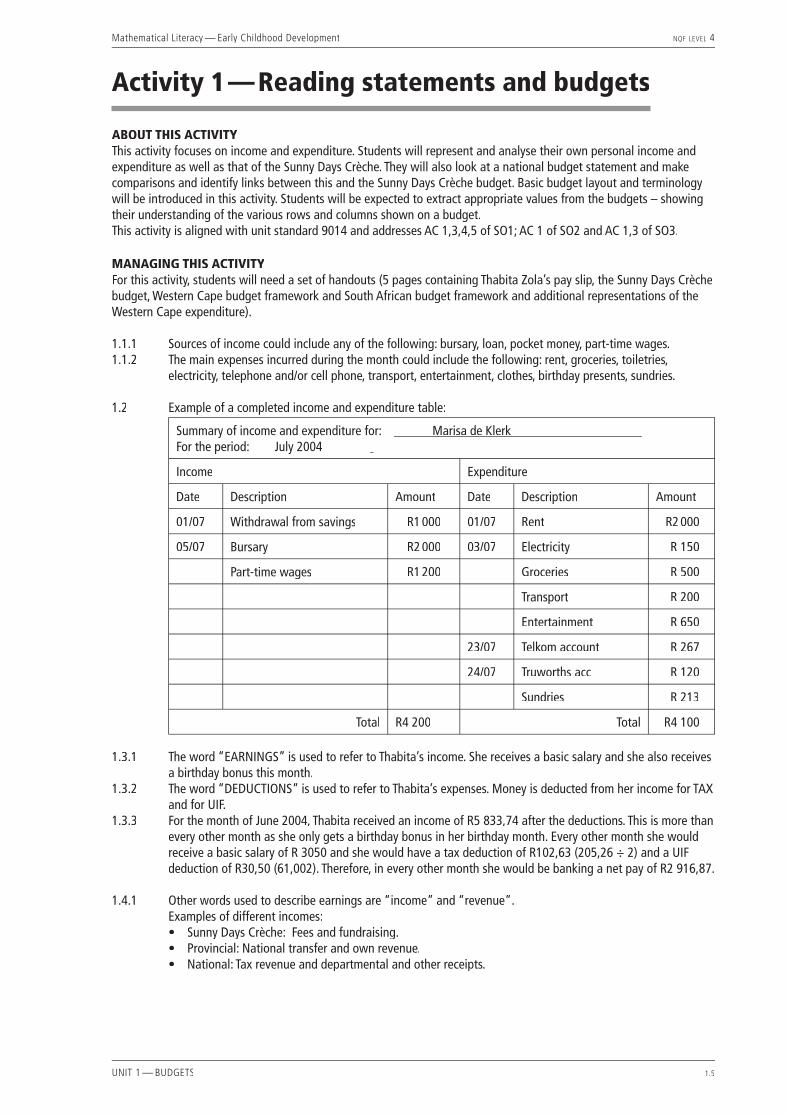
1.2 Example of a completed income and expenditure table:
Summary of income and expenditure for: Marisa de Klerk For the period: July 2004 July 2004
Income Expenditure
Date Description Amount Date Description Amount
01/07 Withdrawal from savings R1 000 01/07 Rent R2 000
05/07 Bursary R2 000 03/07 Electricity R 150
Part-time wages R1 200 Groceries R 500
Transport R 200
Entertainment R 650
23/07 Telkom account R 267
24/07 Truworths acc R 120
Sundries R 213
Total R4 200 Total R4 100
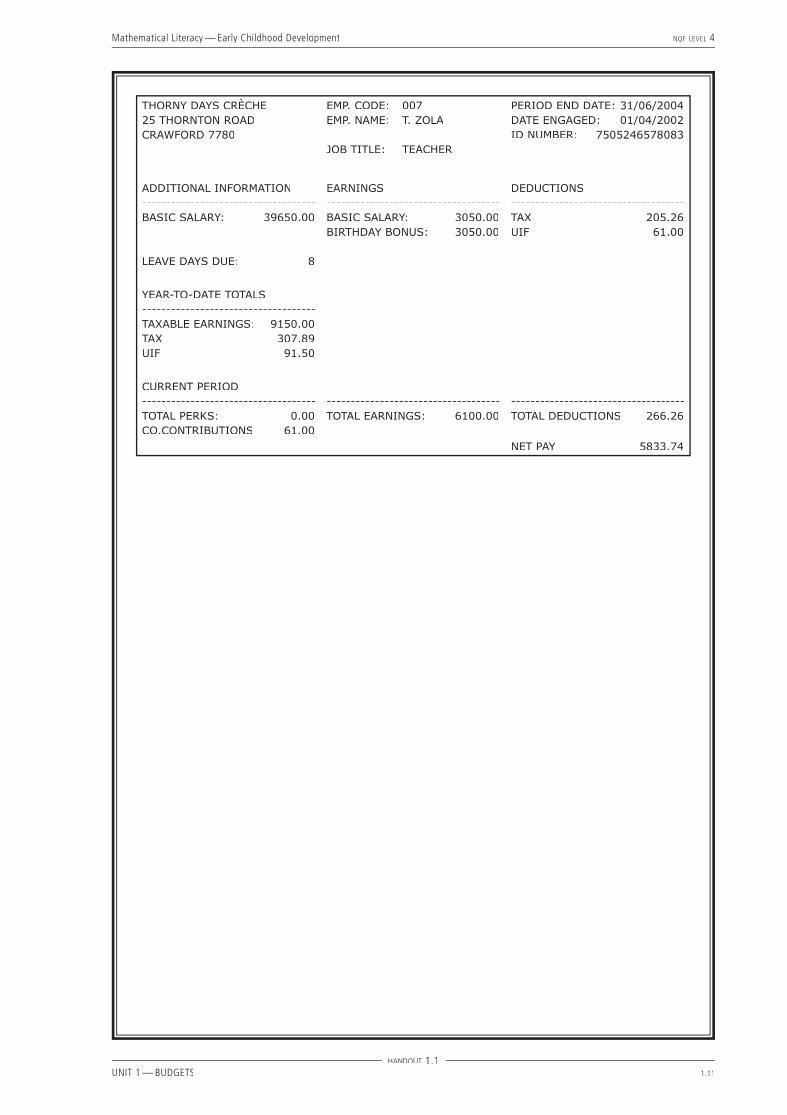
1.3.1 The word “EARNINGS” is used to refer to Thabita’s income. She receives a basic salary and she also receives a birthday bonus this month.
1.3.2 The word “DEDUCTIONS” is used to refer to Thabita’s expenses. Money is deducted from her income for TAX and for UIF.
1.3.3 For the month of June 2004, Thabita received an income of R5 833,74 after the deductions. This is more than every other month as she only gets a birthday bonus in her birthday month. Every other month she would receive a basic salary of R 3050 and she would have a tax deduction of R102,63 (205,26 ÷ 2) and a UIF deduction of R30,50 (61,002). Therefore, in every other month she would be banking a net pay of R2 916,87.
1.4.1 Other words used to describe earnings are “income” and “revenue”. Examples of different incomes:
• Sunny Days Crèche: Fees and fundraising.• Provincial: National transfer and own revenue.• National: Tax revenue and departmental and other receipts.

Mathematical Literacy — Early Childhood Development NQF LEVEL 4
UNIT 1 — BUDGETS 1.6
1.4.2 Other word used to describe deductions are “expenses” and “expenditure”. The 3 largest expenses incurred in 2002:
• Sunny Days Crèche: Salaries, teaching materials and repairs and maintenance. • Provincial: Education, health and social services and poverty alleviation.• National: Provincial equitable share, justice and protection services and State dept cost.
1.4.3 If an organisation plans to spend money on certain things then these things are listed in the column labelled “budget” or “estimate”. The “budget” or “estimate” column contains descriptions of costs that have not yet been incurred. The fi gures in this column are, therefore, merely the expected or estimated fi gures and are determined before payment is actually made. Once an expense is incurred (something is paid for) this expense would then be placed in a column marked “actual” and the fi gure represented next to this item would now be the “actual” (real/correct) amount incurred for this expense. In summary, a budget is prepared before the start of the year in order to guide behaviour during the year while the income/expenditure statement is a refl ection of actual spending and can only be prepared at the end of the fi nancial year.
1.4.4 The fi nancial year for Sunny Days Crèche runs form January – December, therefore simply saying 2002 implies from January 2002 – December 2002. However, the Provincial and National fi nancial year does not run from January – December but runs for a revolving period of 12 months. For example, the tax year runs from the beginning of March in one year till the end of February of the following year.
1.5 Students are expected to identify that the fi gures in the national and provincial budgets are given in million rands, whereas the Sunny Days Crèche budget fi gures are simply the rand values.
1.5.1 National Budget: R326 956 000 000, 00 1.5.2 Western Cape Budget: R17 372 000 000,00 1.5.3 Sunny Days Crèche: R113 400,00
1.6 No. The actual amount in the bank would be refl ected in a statement of assets and liabilities, which is often another element of a fi nancial report. The income and expenditure statements are plans of reports but are not in themselves an indicator of cash-in-hand.
1.7 No. For example, “salary” tells us the total amount spent on salaries but it does not tell us how many teachers are employed or what each employee earns. Similarly, “telephone” does not tell us how many local/long distance/cellular calls are made, only that the total amount spent on telephone calls.
1.8T. ZOLA: PAY SLIP
EARNINGS: DEDUCTIONS:
SALARY: 3 050.00 TAX: 205.26
WESTERN CAPE BUDGET:R million
Revenue National Transfer 12 085
ExpenditureEducation 4 273
SOUTH AFRICAN BUDGET:R million
Revenue Tax Revenue 252 393
ExpenditureProvincial EquitableShare 107 460
SUNNY DAYS CRÈCHEFinancial Statement
INCOMESubsidy 15 092(Education Dept)
EXPENSESSalaries and Wages 72 994
4 273 4 273 4 273 4 273 4 273
Mathematical Literacy — Early Childhood Development NQF LEVEL 4
UNIT 1 — BUDGETS 1.7
1.9 For Thabita to earn a higher salary from Sunny Days Crèche, Sunny Days Crèche would need to receive a larger subsidy from the Education Department, which means that the Western Cape would need to receive more revenue from the national funds, which means that people like Thabita would need to pay more taxes. Of course, this is very simplifi ed.
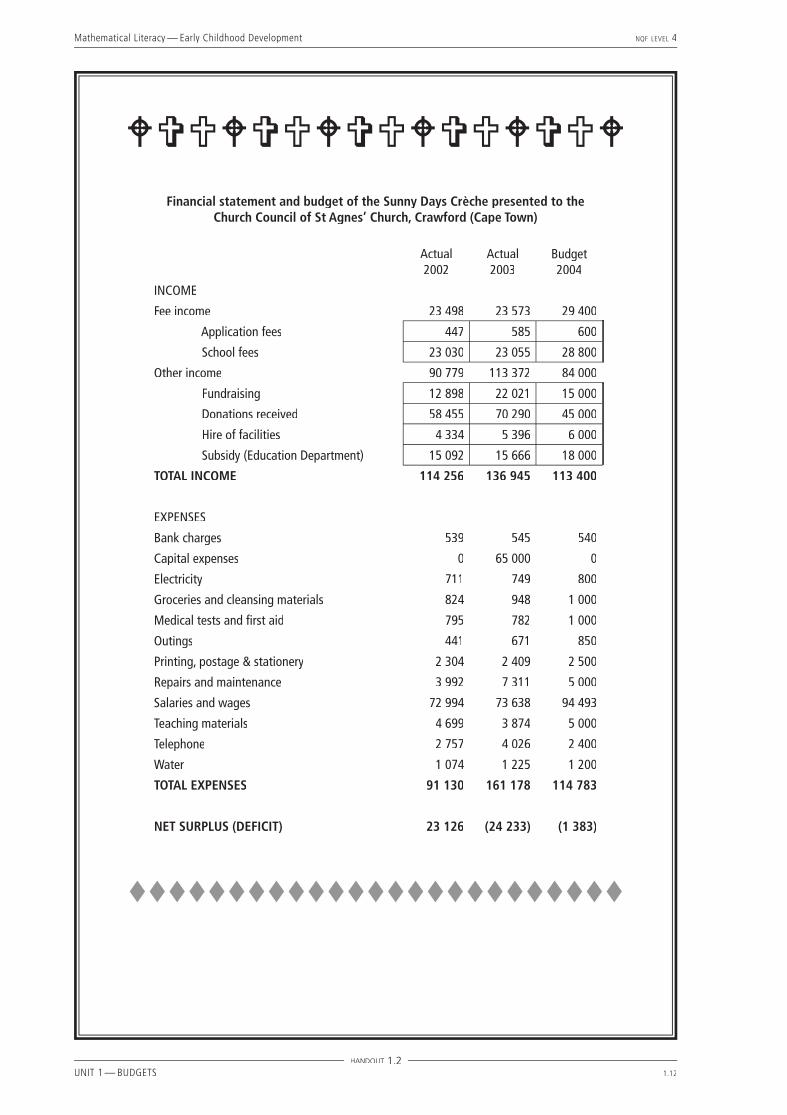
1.10 Above each box is a total. Inside the box is an itemised list of each of the individual entries that make up this total. Not all statements use this layout. Some statements only show a total at the end of each major section (e.g. on the national and provincial budgets). It is not always necessary to use boxes, especially in larger budgets that do not show as much detail and a breakdown of individual fi gures.
1.11 One method of showing a defi cit/loss is to put brackets around a number e.g. the Sunny Days Crèche statement shows a defi cit at the end of the 2003 column as (24 233) meaning –R24 233,00. Another method of showing a defi cit/loss is to use a negative sign before the number e.g. the Western Cape statement shows a defi cit at the end of the 2002/2003 column as –648, meaning –R648 000 000,00.
Mathematical Literacy — Early Childhood Development NQF LEVEL 4
UNIT 1 — BUDGETS 1.8
Mathematical Literacy — Early Childhood Development NQF LEVEL 4
UNIT 1 — BUDGETS 1.9
WORKSHEET 1
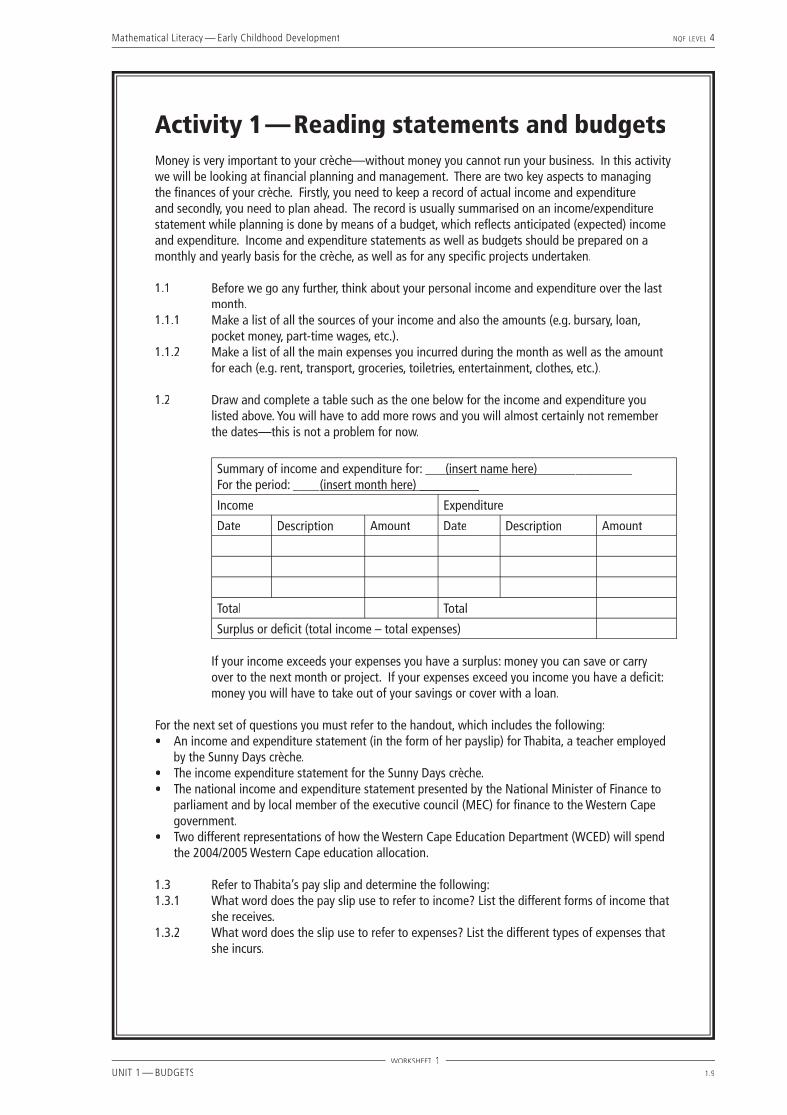
Activity 1 — Reading statements and budgetsMoney is very important to your crèche—without money you cannot run your business. In this activity we will be looking at fi nancial planning and management. There are two key aspects to managing the fi nances of your crèche. Firstly, you need to keep a record of actual income and expenditure and secondly, you need to plan ahead. The record is usually summarised on an income/expenditure statement while planning is done by means of a budget, which refl ects anticipated (expected) income and expenditure. Income and expenditure statements as well as budgets should be prepared on a monthly and yearly basis for the crèche, as well as for any specifi c projects undertaken.
1.1 Before we go any further, think about your personal income and expenditure over the last month.
1.1.1 Make a list of all the sources of your income and also the amounts (e.g. bursary, loan, pocket money, part-time wages, etc.).
1.1.2 Make a list of all the main expenses you incurred during the month as well as the amount for each (e.g. rent, transport, groceries, toiletries, entertainment, clothes, etc.).
1.2 Draw and complete a table such as the one below for the income and expenditure you listed above. You will have to add more rows and you will almost certainly not remember the dates—this is not a problem for now.
Summary of income and expenditure for: ___(insert name here) (insert name here) ________For the period: ____(insert month here) _________(insert month here) _________
Income Expenditure
Date Description Amount Date Description Amount
Total Total
Surplus or defi cit (total income – total expenses)
If your income exceeds your expenses you have a surplus: money you can save or carry over to the next month or project. If your expenses exceed you income you have a defi cit: money you will have to take out of your savings or cover with a loan.
For the next set of questions you must refer to the handout, which includes the following:• An income and expenditure statement (in the form of her payslip) for Thabita, a teacher employed
by the Sunny Days crèche.• The income expenditure statement for the Sunny Days crèche.• The national income and expenditure statement presented by the National Minister of Finance to
parliament and by local member of the executive council (MEC) for fi nance to the Western Cape government.
• Two different representations of how the Western Cape Education Department (WCED) will spend the 2004/2005 Western Cape education allocation.
1.3 Refer to Thabita’s pay slip and determine the following:1.3.1 What word does the pay slip use to refer to income? List the different forms of income that
she receives.1.3.2 What word does the slip use to refer to expenses? List the different types of expenses that
she incurs.
Mathematical Literacy — Early Childhood Development NQF LEVEL 4
UNIT 1 — BUDGETS 1.10
WORKSHEET 1
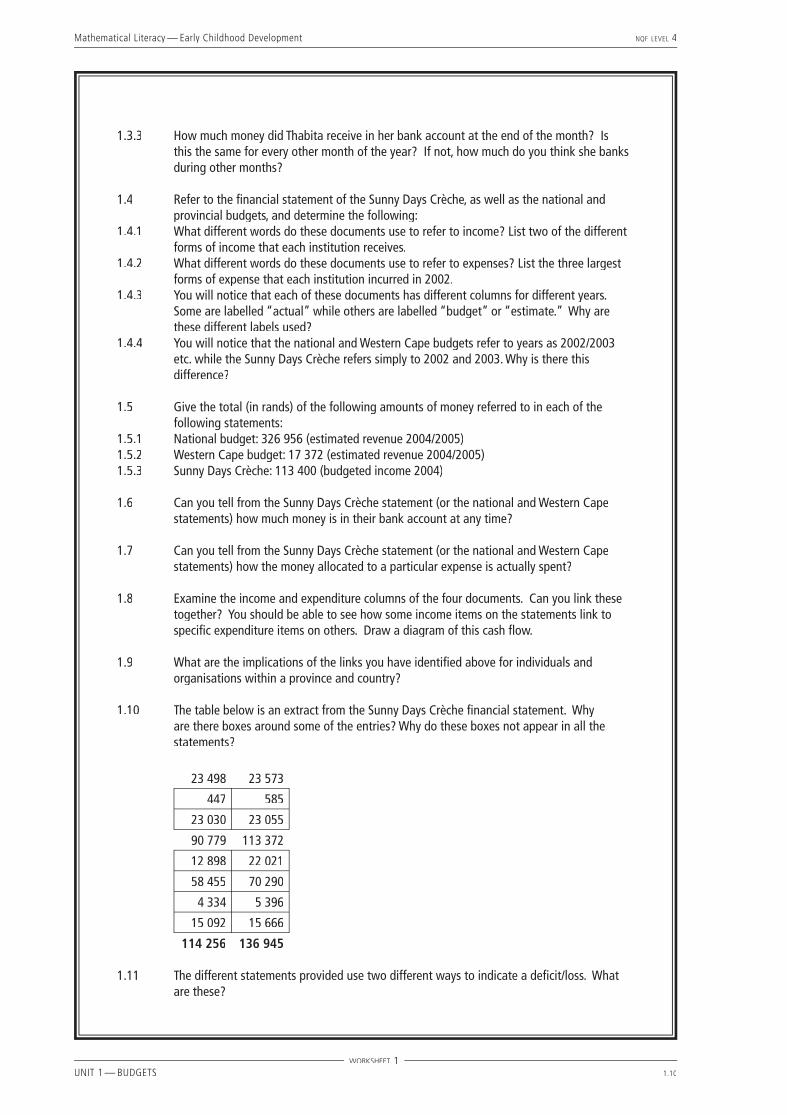
1.3.3 How much money did Thabita receive in her bank account at the end of the month? Is this the same for every other month of the year? If not, how much do you think she banks during other months?
1.4 Refer to the fi nancial statement of the Sunny Days Crèche, as well as the national and provincial budgets, and determine the following:
1.4.1 What different words do these documents use to refer to income? List two of the different forms of income that each institution receives.
1.4.2 What different words do these documents use to refer to expenses? List the three largest forms of expense that each institution incurred in 2002.
1.4.3 You will notice that each of these documents has different columns for different years. Some are labelled “actual” while others are labelled “budget” or “estimate.” Why are these different labels used?
1.4.4 You will notice that the national and Western Cape budgets refer to years as 2002/2003 etc. while the Sunny Days Crèche refers simply to 2002 and 2003. Why is there this difference?
1.5 Give the total (in rands) of the following amounts of money referred to in each of the following statements:
1.5.1 National budget: 326 956 (estimated revenue 2004/2005)1.5.2 Western Cape budget: 17 372 (estimated revenue 2004/2005)1.5.3 Sunny Days Crèche: 113 400 (budgeted income 2004)
1.6 Can you tell from the Sunny Days Crèche statement (or the national and Western Cape statements) how much money is in their bank account at any time?
1.7 Can you tell from the Sunny Days Crèche statement (or the national and Western Cape statements) how the money allocated to a particular expense is actually spent?
1.8 Examine the income and expenditure columns of the four documents. Can you link these together? You should be able to see how some income items on the statements link to specifi c expenditure items on others. Draw a diagram of this cash fl ow.
1.9 What are the implications of the links you have identifi ed above for individuals and organisations within a province and country?
1.10 The table below is an extract from the Sunny Days Crèche fi nancial statement. Why are there boxes around some of the entries? Why do these boxes not appear in all the statements?
23 498 23 573
447 585
23 030 23 055
90 779 113 372
12 898 22 021
58 455 70 290
4 334 5 396
15 092 15 666
114 256 136 945
1.11 The different statements provided use two different ways to indicate a defi cit/loss. What are these?
Mathematical Literacy — Early Childhood Development NQF LEVEL 4
UNIT 1 — BUDGETS 1.11
HANDOUT 1.1
THORNY DAYS CRÈCHE25 THORNTON ROADCRAWFORD 7780
EMP. CODE: 007EMP. NAME: T. ZOLA
JOB TITLE: TEACHER
PERIOD END DATE: 31/06/2004DATE ENGAGED: 01/04/2002ID NUMBER: 7505246578083
ADDITIONAL INFORMATION------------------------------------BASIC SALARY: 39650.00
LEAVE DAYS DUE: 8
EARNINGS------------------------------------BASIC SALARY: 3050.00BIRTHDAY BONUS: 3050.00
DEDUCTIONS------------------------------------TAX 205.26UIF 61.00
YEAR-TO-DATE TOTALS------------------------------------TAXABLE EARNINGS: 9150.00TAX 307.89UIF 91.50
CURRENT PERIOD------------------------------------TOTAL PERKS: 0.00CO.CONTRIBUTIONS 61.00
------------------------------------TOTAL EARNINGS: 6100.00
------------------------------------TOTAL DEDUCTIONS 266.26
NET PAY 5833.74
Mathematical Literacy — Early Childhood Development NQF LEVEL 4
UNIT 1 — BUDGETS 1.12
WVUWVUWVUWVUWVUWFinancial statement and budget of the Sunny Days Crèche presented to the
Church Council of St Agnes’ Church, Crawford (Cape Town)
Actual 2002
Actual 2003
Budget 2004
INCOME
Fee income 23 498 23 573 29 400
Application fees 447 585 600
School fees 23 030 23 055 28 800
Other income 90 779 113 372 84 000
Fundraising 12 898 22 021 15 000
Donations received 58 455 70 290 45 000
Hire of facilities 4 334 5 396 6 000
Subsidy (Education Department) 15 092 15 666 18 000
TOTAL INCOME 114 256 136 945 113 400
EXPENSES
Bank charges 539 545 540
Capital expenses 0 65 000 0
Electricity 711 749 800
Groceries and cleansing materials 824 948 1 000
Medical tests and fi rst aid 795 782 1 000
Outings 441 671 850
Printing, postage & stationery 2 304 2 409 2 500
Repairs and maintenance 3 992 7 311 5 000
Salaries and wages 72 994 73 638 94 493
Teaching materials 4 699 3 874 5 000
Telephone 2 757 4 026 2 400
Water 1 074 1 225 1 200
TOTAL EXPENSES 91 130 161 178 114 783
NET SURPLUS (DEFICIT) 23 126 (24 233) (1 383)
ttttttttttttttttttttttttt
HANDOUT 1.2

Mathematical Literacy — Early Childhood Development NQF LEVEL 4
UNIT 1 — BUDGETS 1.13
HANDOUT 1.3
Western Cape Budget FrameworkBased on the Budget speech of the Provincial Minister of Finance, Economic
Development and Tourism Ebrahim Rasool on 3 March 20041
2001/2002 2002/2003 2003/2004 2004/2005
R million Actual Actual Estimate Estimate
Revenue
National transfer 12 085 13 314 14 963 16 342
Own revenue 954 834 1 015 1 030
Total Revenue 13 039 14 148 15 978 17 372
Expenditure
Provincial administration 280 396 307 312
Provincial parliament 20 24 29 31
Provincial treasury 48 69 200 145
Community safety 97 118 140 147
Education 4 273 4 678 5 030 5 356
Health 3 581 3 871 4 291 4 504
Social services and poverty alleviation 2 384 3 216 3 762 4 324
Housing 382 460 519 547
Environmental affairs 93 121 122 129
Transport and public works 1 060 1 379 1 543 1 641
Agriculture 114 139 169 198
Local government 30 65 63 63
Economic development and tourism 52 152 80 61
Cultural affairs and sport 90 108 137 143
Total expenditure 12 504 14 796 16 392 17 601
Surplus/Defi cit(-) 535 -648 -414 -229
1 Based on details sourced at: http://www.capegateway.gov.za/eng/pubs/budgets/2004/52862 (June 2004)

Mathematical Literacy — Early Childhood Development NQF LEVEL 4
UNIT 1 — BUDGETS 1.14
South African Budget Frameworkbased on the Budget speech of the Minister of Finance, Trevor Manuel, on 18 Feb 20041
2001/2002 2002/2003 2003/2004 2004/2005R million Actual Actual Estimate Estimate
Revenue (National Revenue Fund)
Tax revenue 252 398 282 180 303 318 333 694
Departmental and other receipts 4 169 4 587 6 704 6 590
Less: SACU -8 205 -8 259 -9 723 -13 328
Total Revenue 248 362 278 508 300 299 326 956
Expenditure
Statutory appropriationsStatutory appropriations
State debt cost 47 581 46 808 47 326 50 432
Provincial equitable share 107 460 123 457 144 743 159 971
Skills development funds 2 541 3 259 3 700 4 300
Other 335 350 183 197
Appropriated by voteAppropriated by vote
Central government administration 11 841 14 914 19 032 23 188
Financial and administrative services 9 552 10 791 13 113 14 961
Social services 19 806 19 859 23 655 28 573Arts and cultureEducationHealthLabourScience and technologySocial developmentSports and recreation
4428 6166 2231 396
7012 327
101
5929 3147 0591 283
801639171
92610 584
7 6951 0541 0682 100
228
1 14111 3448 7871 1911 2764 548
286
Justice and protection services 44 051 49 956 53 792 58 269
Economic services and infrastructure 19 427 22 090 25 922 25 283
Standing appropriations 294 30 46 34
Total expenditure 262 888 291 514 331 512 365 208
Surplus/Defi cit(-) -14 526 -13 006 -31 213 -38 252
1 Based on details sourced at: http://www.fi nance.gov.za/ (June 2004)
HANDOUT 1.4
Mathematical Literacy — Early Childhood Development NQF LEVEL 4
UNIT 1 — BUDGETS 1.15
HANDOUT 1.5
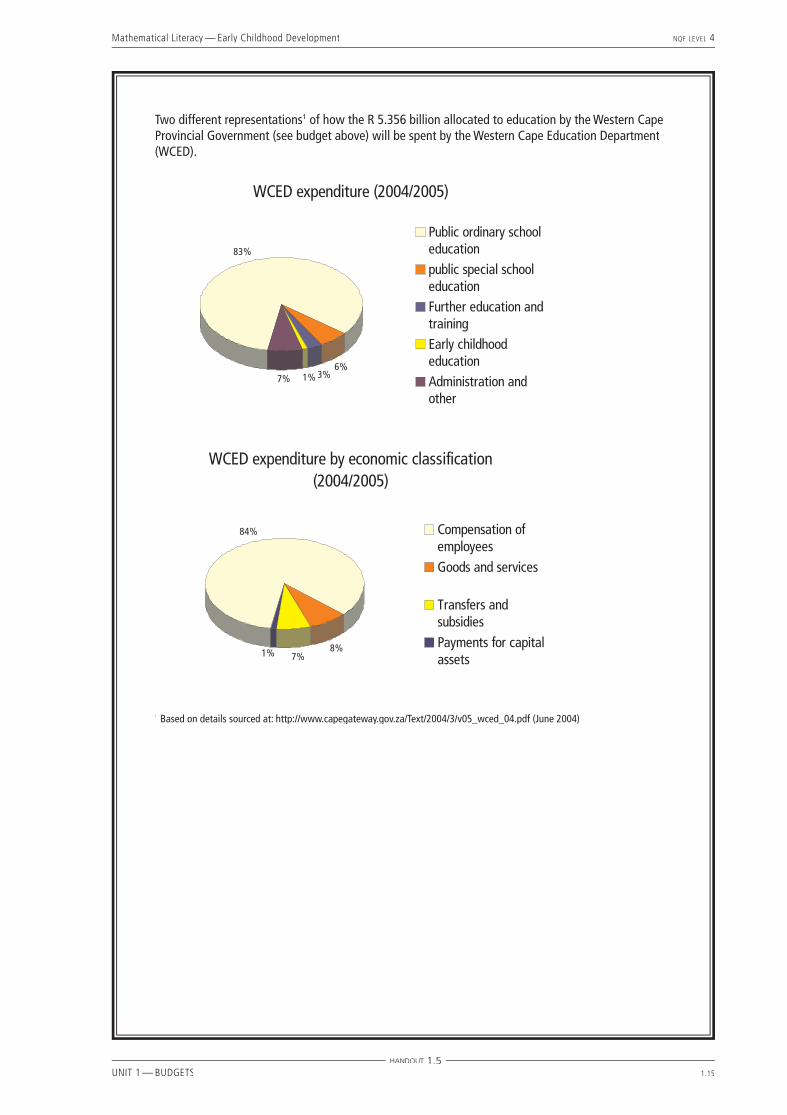
Two different representations1 of how the R 5.356 billion allocated to education by the Western Cape Provincial Government (see budget above) will be spent by the Western Cape Education Department (WCED).
1 Based on details sourced at: http://www.capegateway.gov.za/Text/2004/3/v05_wced_04.pdf (June 2004)

Mathematical Literacy — Early Childhood Development NQF LEVEL 4
UNIT 1 — BUDGETS 1.16
Mathematical Literacy — Early Childhood Development NQF LEVEL 4
UNIT 1 — BUDGETS 1.17
Activity 2 — Infl ation — things get more expensive
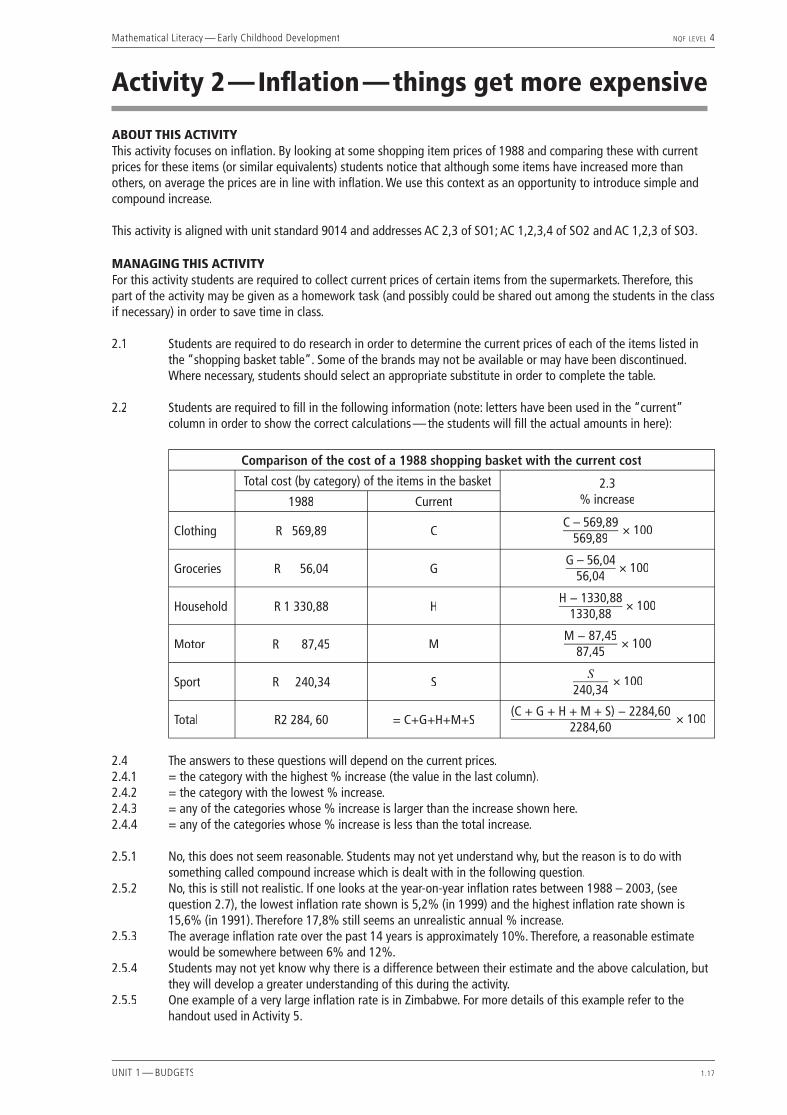
ABOUT THIS ACTIVITYThis activity focuses on infl ation. By looking at some shopping item prices of 1988 and comparing these with current prices for these items (or similar equivalents) students notice that although some items have increased more than others, on average the prices are in line with infl ation. We use this context as an opportunity to introduce simple and compound increase.
This activity is aligned with unit standard 9014 and addresses AC 2,3 of SO1; AC 1,2,3,4 of SO2 and AC 1,2,3 of SO3.
MANAGING THIS ACTIVITYFor this activity students are required to collect current prices of certain items from the supermarkets. Therefore, this part of the activity may be given as a homework task (and possibly could be shared out among the students in the class if necessary) in order to save time in class.
2.1 Students are required to do research in order to determine the current prices of each of the items listed in the “shopping basket table”. Some of the brands may not be available or may have been discontinued. Where necessary, students should select an appropriate substitute in order to complete the table.
2.2 Students are required to fi ll in the following information (note: letters have been used in the “current” column in order to show the correct calculations — the students will fi ll the actual amounts in here):
Comparison of the cost of a 1988 shopping basket with the current cost
Total cost (by category) of the items in the basket 2.3 % increase1988 Current
Clothing R 569,89 CC – 569,89
569,89× 100
Groceries R 56,04 GG – 56,04
56,04× 100
Household R 1 330,88 HH − 1330,88
1330,88× 100
Motor R 87,45 MM − 87,45
87,45× 100
Sport R 240,34 SS
240,34× 100
Total R2 284, 60 = C+G+H+M+S(C + G + H + M + S) − 2284,60
2284,60× 100
2.4 The answers to these questions will depend on the current prices.2.4.1 = the category with the highest % increase (the value in the last column).2.4.2 = the category with the lowest % increase.2.4.3 = any of the categories whose % increase is larger than the increase shown here.2.4.4 = any of the categories whose % increase is less than the total increase.
2.5.1 No, this does not seem reasonable. Students may not yet understand why, but the reason is to do with something called compound increase which is dealt with in the following question.
2.5.2 No, this is still not realistic. If one looks at the year-on-year infl ation rates between 1988 – 2003, (see question 2.7), the lowest infl ation rate shown is 5,2% (in 1999) and the highest infl ation rate shown is 15,6% (in 1991). Therefore 17,8% still seems an unrealistic annual % increase.
2.5.3 The average infl ation rate over the past 14 years is approximately 10%. Therefore, a reasonable estimate would be somewhere between 6% and 12%.
2.5.4 Students may not yet know why there is a difference between their estimate and the above calculation, but they will develop a greater understanding of this during the activity.
2.5.5 One example of a very large infl ation rate is in Zimbabwe. For more details of this example refer to the handout used in Activity 5.
Mathematical Literacy — Early Childhood Development NQF LEVEL 4
UNIT 1 — BUDGETS 1.18
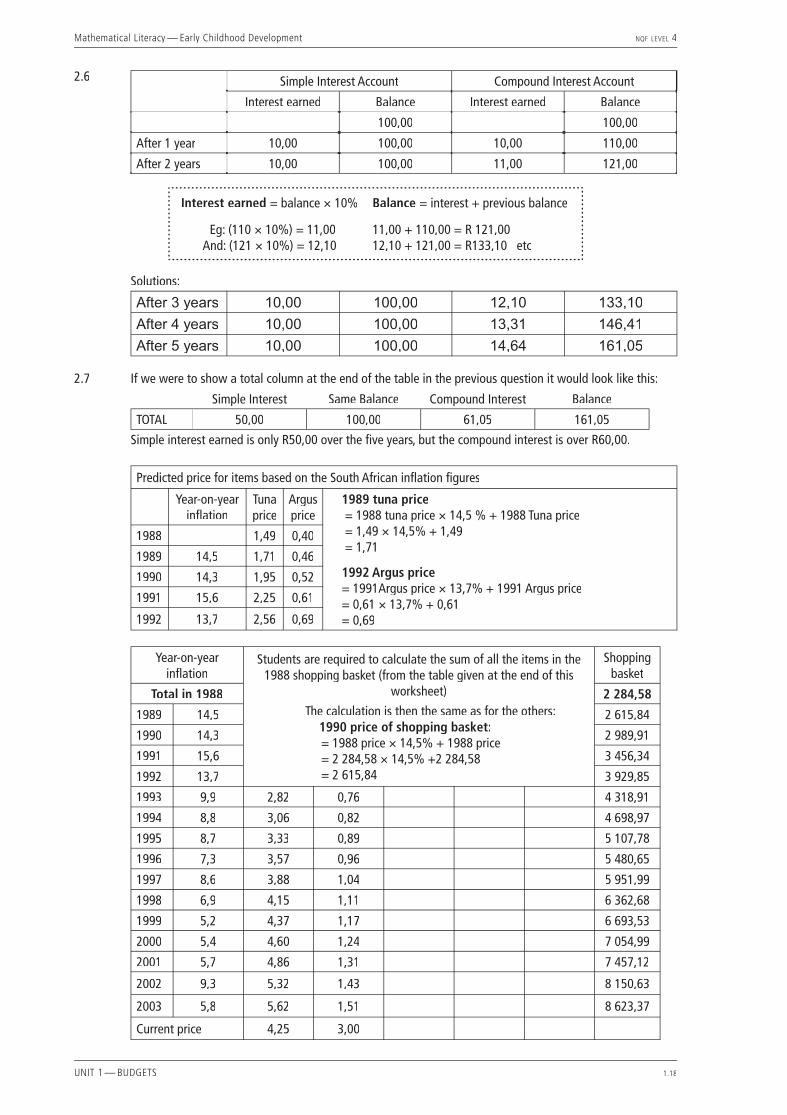
2.6
Simple Interest Account Compound Interest Account
Interest earned Balance Interest earned Balance
100,00 100,00
After 1 year 10,00 100,00 10,00 110,00
After 2 years 10,00 100,00 11,00 121,00
Interest earned = balance × 10% Balance = interest + previous balance
Eg: (110 × 10%) = 11,00 11,00 + 110,00 = R 121,00 And: (121 × 10%) = 12,10 12,10 + 121,00 = R133,10 etc
Solutions:
After 3 years 10,00 100,00 12,10 133,10
After 4 years 10,00 100,00 13,31 146,41
After 5 years 10,00 100,00 14,64 161,05
2.7 If we were to show a total column at the end of the table in the previous question it would look like this:
Simple Interest Same Balance Compound Interest Balance
TOTAL 50,00 100,00 61,05 161,05
Simple interest earned is only R50,00 over the fi ve years, but the compound interest is over R60,00.
Predicted price for items based on the South African infl ation fi gures
Year-on-year infl ation
Tunaprice
Argusprice
1989 tuna price = 1988 tuna price × 14,5 % + 1988 Tuna price = 1,49 × 14,5% + 1,49 = 1,71
1992 Argus price = 1991Argus price × 13,7% + 1991 Argus price= 0,61 × 13,7% + 0,61= 0,69
1988 1,49 0,40
1989 14,5 1,71 0,46
1990 14,3 1,95 0,52
1991 15,6 2,25 0,61
1992 13,7 2,56 0,69
Year-on-year infl ation
Students are required to calculate the sum of all the items in the 1988 shopping basket (from the table given at the end of this
worksheet)
The calculation is then the same as for the others: 1990 price of shopping basket: = 1988 price × 14,5% + 1988 price = 2 284,58 × 14,5% +2 284,58 = 2 615,84
Shopping basket
Total in 1988 2 284,58
1989 14,5 2 615,84
1990 14,3 2 989,91
1991 15,6 3 456,34
1992 13,7 3 929,85
1993 9,9 2,82 0,76 4 318,91
1994 8,8 3,06 0,82 4 698,97
1995 8,7 3,33 0,89 5 107,78
1996 7,3 3,57 0,96 5 480,65
1997 8,6 3,88 1,04 5 951,99
1998 6,9 4,15 1,11 6 362,68
1999 5,2 4,37 1,17 6 693,53
2000 5,4 4,60 1,24 7 054,99
2001 5,7 4,86 1,31 7 457,12
2002 9,3 5,32 1,43 8 150,63
2003 5,8 5,62 1,51 8 623,37
Current price 4,25 3,00
Mathematical Literacy — Early Childhood Development NQF LEVEL 4
UNIT 1 — BUDGETS 1.19
2.8 Infl ation causes the price of commodities to change from year to year (almost always up). Commodities therefore get more expensive from one year to the next. If your income (salary) increases in line with infl ation your spending remains unchanged – that is, you can still buy exactly the same shopping basket. If, however, your income (salary) increases at less than infl ation, your spending power has decreased – you can no longer afford the same shopping basket even though your salary has increased (you are earning more).

Mathematical Literacy — Early Childhood Development NQF LEVEL 4
UNIT 1 — BUDGETS 1.20
Mathematical Literacy — Early Childhood Development NQF LEVEL 4
UNIT 1 — BUDGETS 1.21
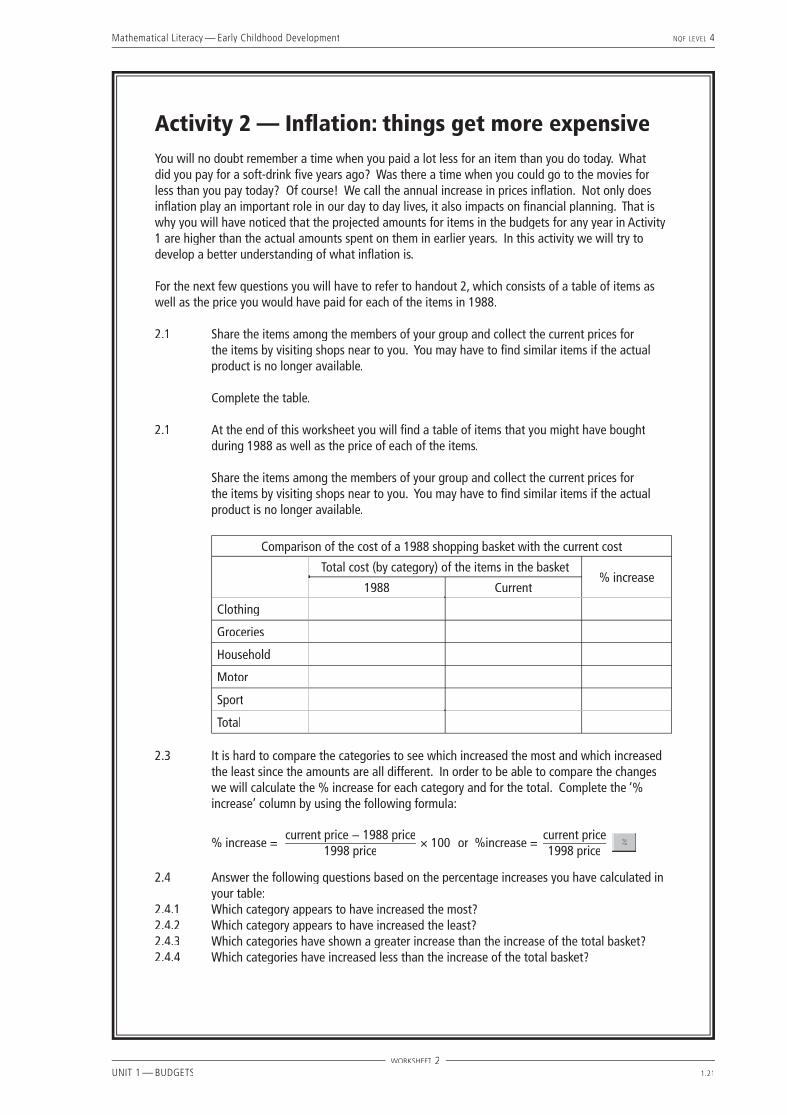
Activity 2 — Infl ation: things get more expensiveYou will no doubt remember a time when you paid a lot less for an item than you do today. What did you pay for a soft-drink fi ve years ago? Was there a time when you could go to the movies for less than you pay today? Of course! We call the annual increase in prices infl ation. Not only does infl ation play an important role in our day to day lives, it also impacts on fi nancial planning. That is why you will have noticed that the projected amounts for items in the budgets for any year in Activity 1 are higher than the actual amounts spent on them in earlier years. In this activity we will try to develop a better understanding of what infl ation is.
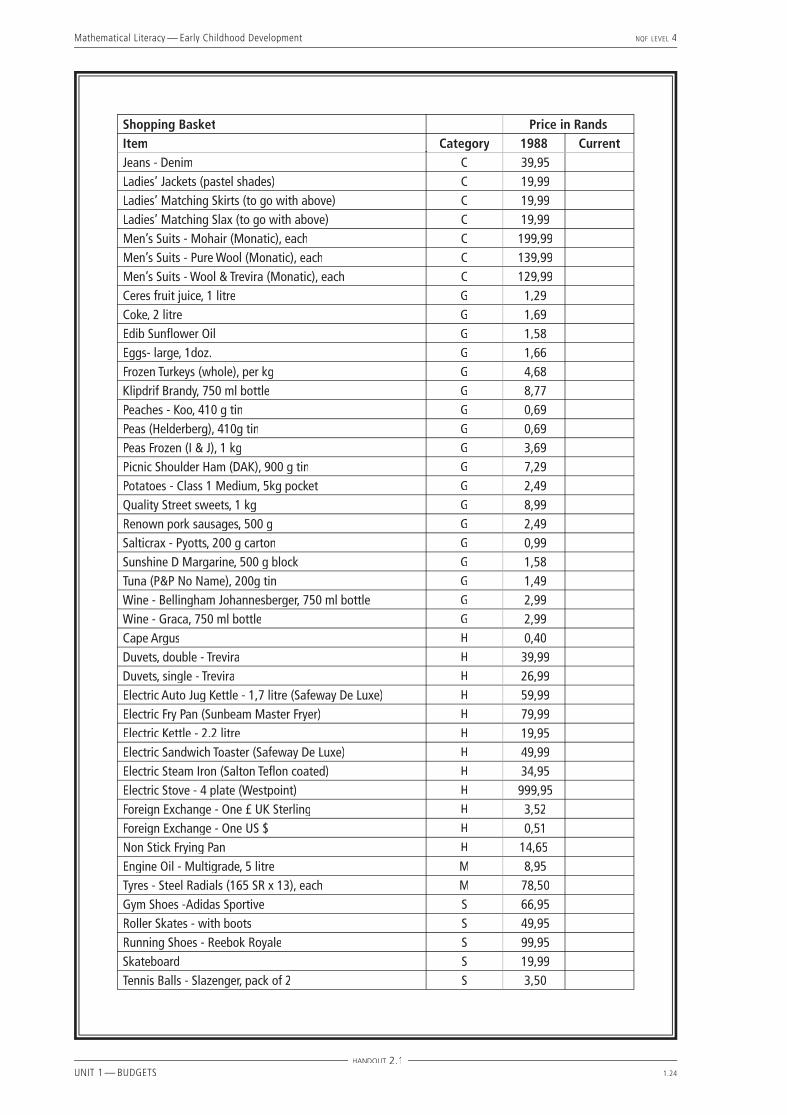
For the next few questions you will have to refer to handout 2, which consists of a table of items as well as the price you would have paid for each of the items in 1988.
2.1 Share the items among the members of your group and collect the current prices for the items by visiting shops near to you. You may have to fi nd similar items if the actual product is no longer available.
Complete the table.
2.1 At the end of this worksheet you will fi nd a table of items that you might have bought during 1988 as well as the price of each of the items.
Share the items among the members of your group and collect the current prices for the items by visiting shops near to you. You may have to fi nd similar items if the actual product is no longer available.
Comparison of the cost of a 1988 shopping basket with the current cost
Total cost (by category) of the items in the basket% increase
1988 Current
Clothing
Groceries
Household
Motor
Sport
Total
2.3 It is hard to compare the categories to see which increased the most and which increased the least since the amounts are all different. In order to be able to compare the changes we will calculate the % increase for each category and for the total. Complete the ‘% increase’ column by using the following formula:
% increase =current price − 1988 price
1998 price× 100 or %increase =
current price1998 price
2.4 Answer the following questions based on the percentage increases you have calculated in your table:
2.4.1 Which category appears to have increased the most?2.4.2 Which category appears to have increased the least?2.4.3 Which categories have shown a greater increase than the increase of the total basket?2.4.4 Which categories have increased less than the increase of the total basket?
WORKSHEET 2
Mathematical Literacy — Early Childhood Development NQF LEVEL 4
UNIT 1 — BUDGETS 1.22
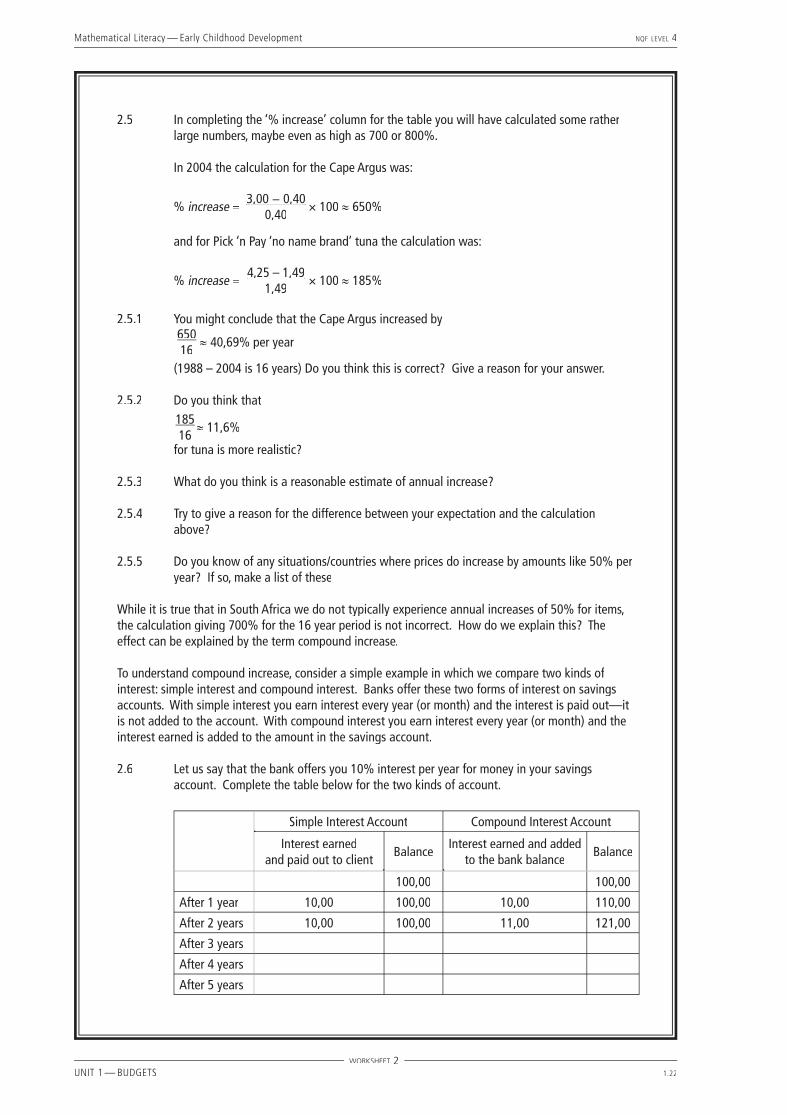
2.5 In completing the ‘% increase’ column for the table you will have calculated some rather large numbers, maybe even as high as 700 or 800%.
In 2004 the calculation for the Cape Argus was:
% increase =3,00 − 0,403,00 − 0,40
0,40× 100 ≈ 650%
and for Pick ‘n Pay ‘no name brand’ tuna the calculation was:
% increase =4,25 – 1,494,25 – 1,49
1,49× 100 ≈ 185%
2.5.1 You might conclude that the Cape Argus increased by65016
≈ 40,69% per year
(1988 – 2004 is 16 years) Do you think this is correct? Give a reason for your answer.
2.5.2 Do you think that18516
≈ 11,6%
for tuna is more realistic?
2.5.3 What do you think is a reasonable estimate of annual increase?
2.5.4 Try to give a reason for the difference between your expectation and the calculation above?
2.5.5 Do you know of any situations/countries where prices do increase by amounts like 50% per year? If so, make a list of these
While it is true that in South Africa we do not typically experience annual increases of 50% for items, the calculation giving 700% for the 16 year period is not incorrect. How do we explain this? The effect can be explained by the term compound increase.
To understand compound increase, consider a simple example in which we compare two kinds of interest: simple interest and compound interest. Banks offer these two forms of interest on savings accounts. With simple interest you earn interest every year (or month) and the interest is paid out—it is not added to the account. With compound interest you earn interest every year (or month) and the interest earned is added to the amount in the savings account.
2.6 Let us say that the bank offers you 10% interest per year for money in your savings account. Complete the table below for the two kinds of account.
Simple Interest Account Compound Interest Account
Interest earnedand paid out to client
BalanceInterest earned and added
to the bank balanceBalance
100,00 100,00
After 1 year 10,00 100,00 10,00 110,00
After 2 years 10,00 100,00 11,00 121,00
After 3 years
After 4 years
After 5 years
WORKSHEET 2
Mathematical Literacy — Early Childhood Development NQF LEVEL 4
UNIT 1 — BUDGETS 1.23
You should notice from the table above that you earned 5 × R 10,00 = R 50,00 interest in the simple interest account over the fi ve year period and the balance remained unchanged. By comparison you earned more than R 60,00 interest in the compound interest account. This is because you earned “interest on interest” in the compound interest account. This principle explains how a much less than 44% increase per year can nonetheless appear to look like 700% over 16 years.
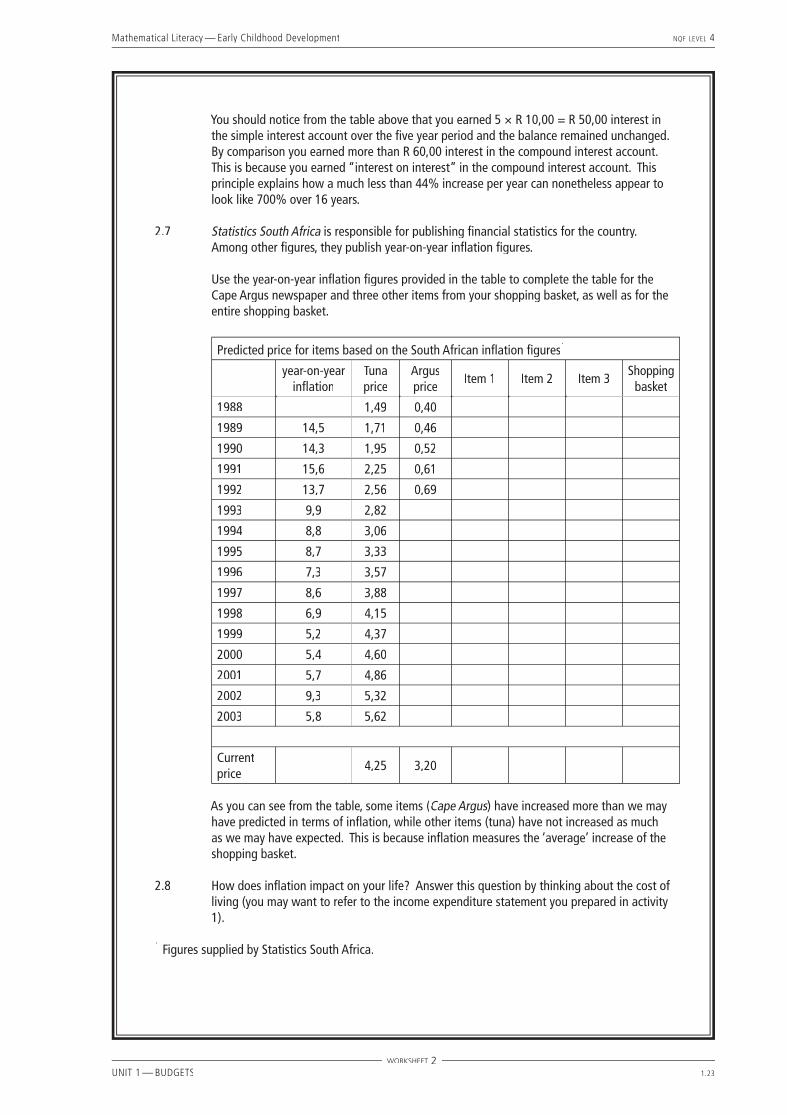
2.7 Statistics South Africa is responsible for publishing fi nancial statistics for the country. Among other fi gures, they publish year-on-year infl ation fi gures.
Use the year-on-year infl ation fi gures provided in the table to complete the table for the Cape Argus newspaper and three other items from your shopping basket, as well as for the entire shopping basket.
Predicted price for items based on the South African infl ation fi gures1
year-on-year infl ation
Tunaprice
Argusprice
Item 1 Item 2 Item 3Shopping
basket
1988 1,49 0,40
1989 14,5 1,71 0,46
1990 14,3 1,95 0,52
1991 15,6 2,25 0,61
1992 13,7 2,56 0,69
1993 9,9 2,82
1994 8,8 3,06
1995 8,7 3,33
1996 7,3 3,57
1997 8,6 3,88
1998 6,9 4,15
1999 5,2 4,37
2000 5,4 4,60
2001 5,7 4,86
2002 9,3 5,32
2003 5,8 5,62
Current price
4,25 3,20
As you can see from the table, some items (Cape Argus) have increased more than we may Cape Argus) have increased more than we may Cape Argushave predicted in terms of infl ation, while other items (tuna) have not increased as much as we may have expected. This is because infl ation measures the ‘average’ increase of the shopping basket.
2.8 How does infl ation impact on your life? Answer this question by thinking about the cost of living (you may want to refer to the income expenditure statement you prepared in activity 1).
1 Figures supplied by Statistics South Africa.
WORKSHEET 2
Mathematical Literacy — Early Childhood Development NQF LEVEL 4
UNIT 1 — BUDGETS 1.24
Shopping Basket Price in RandsItem Category 1988 CurrentJeans - Denim C 39,95Ladies’ Jackets (pastel shades) C 19,99Ladies’ Matching Skirts (to go with above) C 19,99Ladies’ Matching Slax (to go with above) C 19,99Men’s Suits - Mohair (Monatic), each C 199,99Men’s Suits - Pure Wool (Monatic), each C 139,99Men’s Suits - Wool & Trevira (Monatic), each C 129,99Ceres fruit juice, 1 litre G 1,29Coke, 2 litre G 1,69Edib Sunfl ower Oil G 1,58Eggs- large, 1doz. G 1,66Frozen Turkeys (whole), per kg G 4,68Klipdrif Brandy, 750 ml bottle G 8,77Peaches - Koo, 410 g tin G 0,69Peas (Helderberg), 410g tin G 0,69Peas Frozen (I & J), 1 kg G 3,69Picnic Shoulder Ham (DAK), 900 g tin G 7,29Potatoes - Class 1 Medium, 5kg pocket G 2,49Quality Street sweets, 1 kg G 8,99Renown pork sausages, 500 g G 2,49Salticrax - Pyotts, 200 g carton G 0,99Sunshine D Margarine, 500 g block G 1,58Tuna (P&P No Name), 200g tin G 1,49Wine - Bellingham Johannesberger, 750 ml bottle G 2,99Wine - Graca, 750 ml bottle G 2,99Cape Argus H 0,40Duvets, double - Trevira H 39,99Duvets, single - Trevira H 26,99Electric Auto Jug Kettle - 1,7 litre (Safeway De Luxe) H 59,99Electric Fry Pan (Sunbeam Master Fryer) H 79,99Electric Kettle - 2.2 litre H 19,95Electric Sandwich Toaster (Safeway De Luxe) H 49,99Electric Steam Iron (Salton Tefl on coated) H 34,95Electric Stove - 4 plate (Westpoint) H 999,95Foreign Exchange - One £ UK Sterling H 3,52Foreign Exchange - One US $ H 0,51Non Stick Frying Pan H 14,65Engine Oil - Multigrade, 5 litre M 8,95Tyres - Steel Radials (165 SR x 13), each M 78,50Gym Shoes -Adidas Sportive S 66,95Roller Skates - with boots S 49,95Running Shoes - Reebok Royale S 99,95Skateboard S 19,99Tennis Balls - Slazenger, pack of 2 S 3,50
HANDOUT 2.1
Mathematical Literacy — Early Childhood Development NQF LEVEL 4
UNIT 1 — BUDGETS 1.25
Activity 3 — Analysing budgets
ABOUT THIS ACTIVITYBy comparing the national, provincial and crèche budgets the students are introduced to the idea that, generally speaking, the budget items increase with infl ation. Students should notice some anomalies, which can be explained in terms of the other items in the respective budget.
This activity is aligned with unit standard 9014 and addresses AC 1,2,3,4,5 of SO1; AC 1,2,3,4 of SO2 and AC 1,2,3 of SO3.
MANAGING THIS ACTIVITYStudents will need to refer back to the handout pages from activity 1 in order to complete this activity.
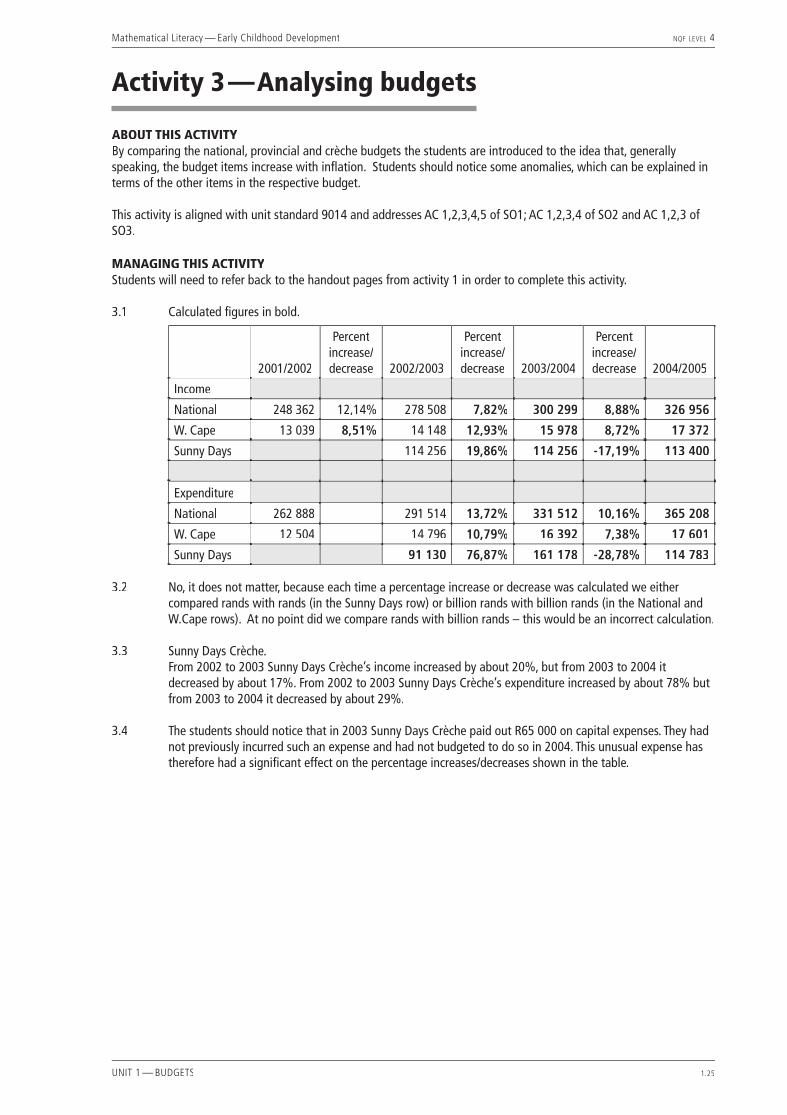
3.1 Calculated fi gures in bold.
2001/2002
Percent increase/ decrease 2002/2003
Percent increase/ decrease 2003/2004
Percent increase/ decrease 2004/2005
Income
National 248 362 12,14% 278 508 7,82% 300 299 8,88% 326 956
W. Cape 13 039 8,51% 14 148 12,93% 15 978 8,72% 17 372
Sunny Days 114 256 19,86% 114 256 -17,19% 113 400
Expenditure
National 262 888 291 514 13,72% 331 512 10,16% 365 208
W. Cape 12 504 14 796 10,79% 16 392 7,38% 17 601
Sunny Days 91 130 76,87% 161 178 -28,78% 114 783
3.2 No, it does not matter, because each time a percentage increase or decrease was calculated we either compared rands with rands (in the Sunny Days row) or billion rands with billion rands (in the National and W.Cape rows). At no point did we compare rands with billion rands – this would be an incorrect calculation.
3.3 Sunny Days Crèche. From 2002 to 2003 Sunny Days Crèche’s income increased by about 20%, but from 2003 to 2004 it
decreased by about 17%. From 2002 to 2003 Sunny Days Crèche’s expenditure increased by about 78% but from 2003 to 2004 it decreased by about 29%.
3.4 The students should notice that in 2003 Sunny Days Crèche paid out R65 000 on capital expenses. They had not previously incurred such an expense and had not budgeted to do so in 2004. This unusual expense has therefore had a signifi cant effect on the percentage increases/decreases shown in the table.

Mathematical Literacy — Early Childhood Development NQF LEVEL 4
UNIT 1 — BUDGETS 1.26
3.5 Altering the 2003 fundraising amount from 22 021 to 13 000 and the donations received from 22 021 to 45 000 brings the total income to a more realistic R102 702,00.
WVUWVUWVUWVUWVUWFinancial statement and budget of the Sunny Days Crèche presented to the
Church Council of St Agnes’ Church, Crawford (Cape Town)
Actual 2002
Actual 2003
Budget 2004
INCOME
Fee income 23 498 23 573 29 400
Application fees 447 585 600
School fees 23 030 23 055 28 800
Other income 90 779 113 372 84 000
Fundraising 12 898 13 000 15 000
Donations received 58 455 45 000 45 000
Hire of facilities 4 334 5 396 6 000
Subsidy (Education Department) 15 092 15 666 18 000
TOTAL INCOME 114 256 102 702 113 400
EXPENSES
Bank charges 539 545 540
Capital expenses 0 0 0
Electricity 711 749 800
Groceries and cleansing materials 824 948 1 000
Medical tests and fi rst aid 795 782 1 000
Outings 441 671 850
Printing, postage & stationery 2 304 2 409 2 500
Repairs and maintenance 3 992 7 311 5 000
Salaries and wages 72 994 73 638 94 493
Teaching materials 4 699 3 874 5 000
Telephone 2 757 4 026 2 400
Water 1 074 1 225 1 200
TOTAL EXPENSES 91 130 96 178 114 783
NET SURPLUS (DEFICIT) 23 126 6 524 (1 383)
ttttttttttttttttttttttttt
By taking out the capital expenses of R65 000 (incurred in 2003) we bring the total expenses down to a more realistic R96 178. This makes the net amount a surplus of R6 526 rather than a defi cit of R24 233.
Altering the 2003 fundraising amount from 22 021 to 13 000 and the donations received from 22 021 to
WVUWVUWVUWVUWVUWFinancial statement and budget of the Sunny Days Crèche presented to the
Church Council of St Agnes’ Church, Crawford (Cape Town)
23 055
113 372
WVUWVUWVUWVUWVUWFinancial statement and budget of the Sunny Days Crèche presented to the
Church Council of St Agnes’ Church, Crawford (Cape Town)
23 030
90 779
441
2 304
3 992
72 994
ttttttttttttttttttttttttt
Mathematical Literacy — Early Childhood Development NQF LEVEL 4
UNIT 1 — BUDGETS 1.27
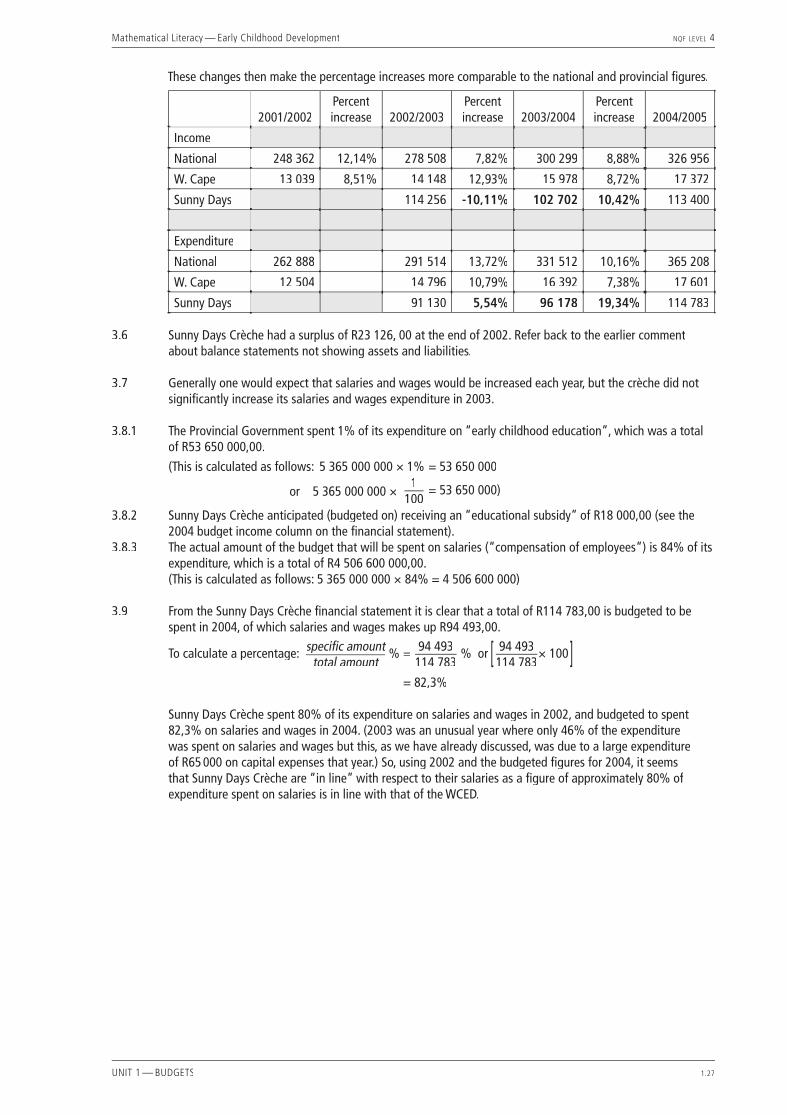
These changes then make the percentage increases more comparable to the national and provincial fi gures.
2001/2002Percent increase 2002/2003
Percent increase 2003/2004
Percent increase 2004/2005
Income
National 248 362 12,14% 278 508 7,82% 300 299 8,88% 326 956
W. Cape 13 039 8,51% 14 148 12,93% 15 978 8,72% 17 372
Sunny Days 114 256 -10,11% 102 702 10,42% 113 400
Expenditure
National 262 888 291 514 13,72% 331 512 10,16% 365 208
W. Cape 12 504 14 796 10,79% 16 392 7,38% 17 601
Sunny Days 91 130 5,54% 96 178 19,34% 114 783
3.6 Sunny Days Crèche had a surplus of R23 126, 00 at the end of 2002. Refer back to the earlier comment about balance statements not showing assets and liabilities.
3.7 Generally one would expect that salaries and wages would be increased each year, but the crèche did not signifi cantly increase its salaries and wages expenditure in 2003.
3.8.1 The Provincial Government spent 1% of its expenditure on “early childhood education”, which was a total of R53 650 000,00.
(This is calculated as follows: 5 365 000 000 × 1% = 53 650 000
or 5 365 000 000 ×
1
100= 53 650 000)
3.8.2 Sunny Days Crèche anticipated (budgeted on) receiving an “educational subsidy” of R18 000,00 (see the 2004 budget income column on the fi nancial statement).
3.8.3 The actual amount of the budget that will be spent on salaries (“compensation of employees”) is 84% of its expenditure, which is a total of R4 506 600 000,00.
(This is calculated as follows: 5 365 000 000 × 84% = 4 506 600 000)
3.9 From the Sunny Days Crèche fi nancial statement it is clear that a total of R114 783,00 is budgeted to be spent in 2004, of which salaries and wages makes up R94 493,00.
To calculate a percentage: specifi c amount
total amount% = 94 493
114 783% or 94 493
114 783× 100
= 82,3%
Sunny Days Crèche spent 80% of its expenditure on salaries and wages in 2002, and budgeted to spent 82,3% on salaries and wages in 2004. (2003 was an unusual year where only 46% of the expenditure was spent on salaries and wages but this, as we have already discussed, was due to a large expenditure of R65 000 on capital expenses that year.) So, using 2002 and the budgeted fi gures for 2004, it seems that Sunny Days Crèche are “in line” with respect to their salaries as a fi gure of approximately 80% of expenditure spent on salaries is in line with that of the WCED.

Mathematical Literacy — Early Childhood Development NQF LEVEL 4
UNIT 1 — BUDGETS 1.28
Mathematical Literacy — Early Childhood Development NQF LEVEL 4
UNIT 1 — BUDGETS 1.29
Activity 3 — Analysing budgets
In activity 1 we looked at different representations of income and expenditure statements and budgets. In activity 2 we looked at infl ation: what it is and the impact it has on the cost of living. In this activity we are going to revisit the income and expenditure statements and budgets of activity 1 in order to analyse them in terms of infl ation.
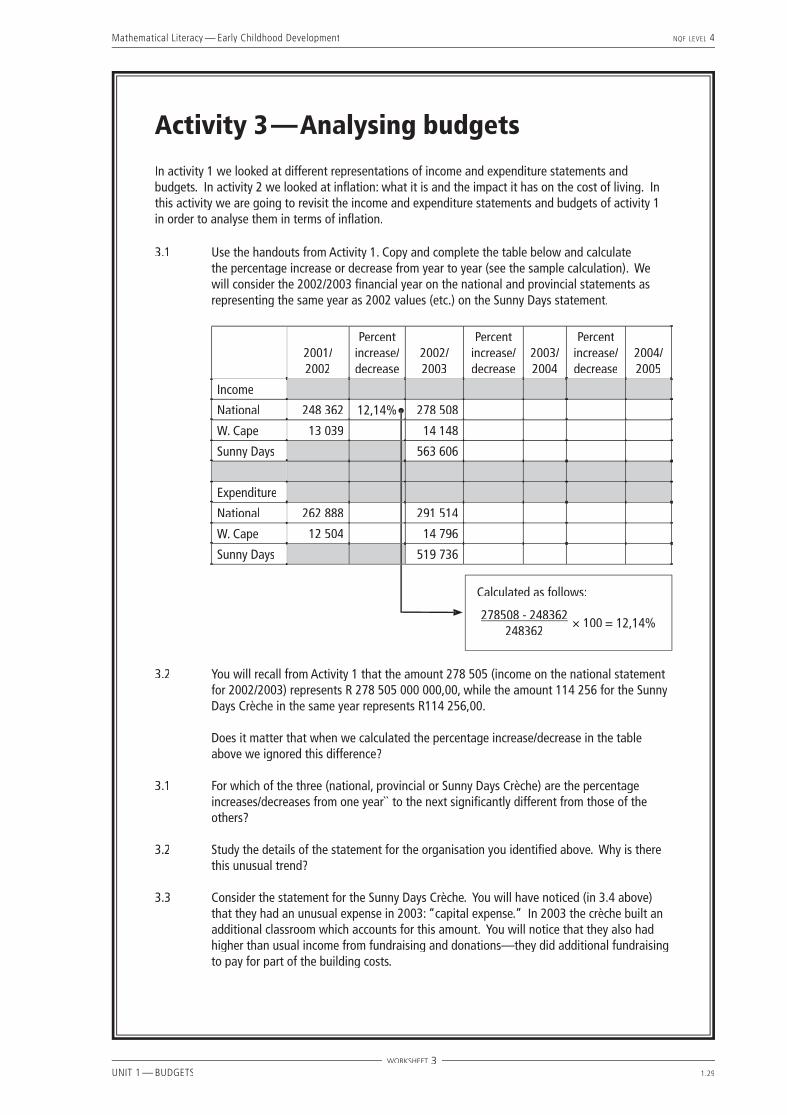
3.1 Use the handouts from Activity 1. Copy and complete the table below and calculate the percentage increase or decrease from year to year (see the sample calculation). We will consider the 2002/2003 fi nancial year on the national and provincial statements as representing the same year as 2002 values (etc.) on the Sunny Days statement.
2001/2002
Percent increase/ decrease
2002/2003
Percent increase/ decrease
2003/2004
Percent increase/ decrease
2004/2005
Income
National 248 362 12,14% 278 508
W. Cape 13 039 14 148
Sunny Days 563 606
Expenditure
National 262 888 291 514
W. Cape 12 504 14 796
Sunny Days 519 736
3.2 You will recall from Activity 1 that the amount 278 505 (income on the national statement for 2002/2003) represents R 278 505 000 000,00, while the amount 114 256 for the Sunny Days Crèche in the same year represents R114 256,00.
Does it matter that when we calculated the percentage increase/decrease in the table above we ignored this difference?
3.1 For which of the three (national, provincial or Sunny Days Crèche) are the percentage increases/decreases from one year`` to the next signifi cantly different from those of the others?
3.2 Study the details of the statement for the organisation you identifi ed above. Why is there this unusual trend?
3.3 Consider the statement for the Sunny Days Crèche. You will have noticed (in 3.4 above) that they had an unusual expense in 2003: “capital expense.” In 2003 the crèche built an additional classroom which accounts for this amount. You will notice that they also had higher than usual income from fundraising and donations—they did additional fundraising to pay for part of the building costs.
WORKSHEET 3
Calculated as follows:
278508 - 248362248362
× 100 = 12,14%
Mathematical Literacy — Early Childhood Development NQF LEVEL 4
UNIT 1 — BUDGETS 1.30
Remove the capital expense cost from the budget and adjust the fundraising and donations income amounts to be in line with the other years on the statement.
Now recalculate the total income and total expenditure for the year 2003 and recalculate the year-on-year percentage increases/decreases in income and expenditure for the crèche.
How do the fi gures for the crèche compare to the national and provincial fi gures now?
3.4 You will notice that the Sunny Days statement suggests that they suffered a great loss in 2003. How do you think they survived this?
3.5 Apart from the fundraising effort and increase in donations during 2003, do you think that the crèche took any other measures to be able to afford the building project?
3.6 Refer to the pie charts in handout 1. These show two different ways of interpreting how the WCED will spend the budget allocation of R 5.365 billion during 2004/2005. Calculate:
3.6.1 The actual amount of the budget that will be spent on early childhood education.3.6.2 How much of this amount the Sunny Days Crèche anticipates receiving. 3.6.3 The actual amount of the budget that will be spent on salaries.
3.7 Calculate the budgeted percentage of expenditure to be spent on salaries by the Sunny Days Crèche in 2004. How does this compare to the WCED expenditure on salaries for 2004/2005?
WORKSHEET 3
Mathematical Literacy — Early Childhood Development NQF LEVEL 4
UNIT 1 — BUDGETS 1.31
Activity 4 — Reading your pay slip
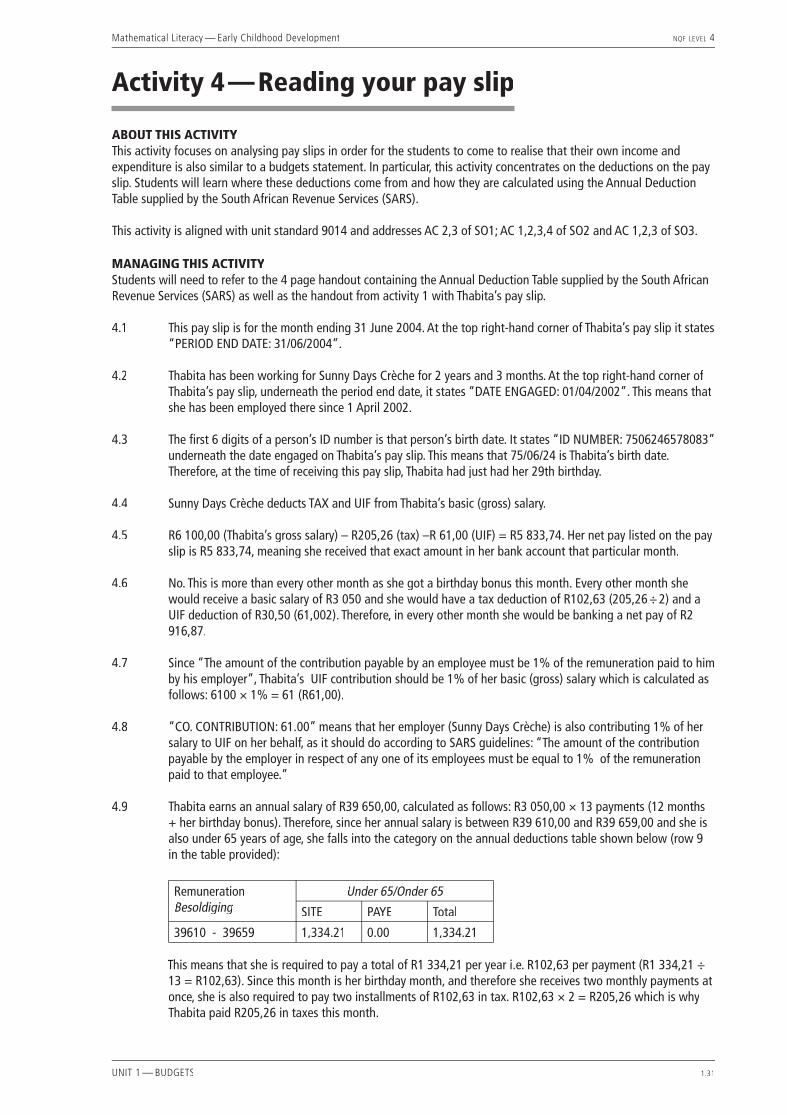
ABOUT THIS ACTIVITYThis activity focuses on analysing pay slips in order for the students to come to realise that their own income and expenditure is also similar to a budgets statement. In particular, this activity concentrates on the deductions on the pay slip. Students will learn where these deductions come from and how they are calculated using the Annual Deduction Table supplied by the South African Revenue Services (SARS).
This activity is aligned with unit standard 9014 and addresses AC 2,3 of SO1; AC 1,2,3,4 of SO2 and AC 1,2,3 of SO3.
MANAGING THIS ACTIVITYStudents will need to refer to the 4 page handout containing the Annual Deduction Table supplied by the South African Revenue Services (SARS) as well as the handout from activity 1 with Thabita’s pay slip.
4.1 This pay slip is for the month ending 31 June 2004. At the top right-hand corner of Thabita’s pay slip it states “PERIOD END DATE: 31/06/2004”.
4.2 Thabita has been working for Sunny Days Crèche for 2 years and 3 months. At the top right-hand corner of Thabita’s pay slip, underneath the period end date, it states “DATE ENGAGED: 01/04/2002”. This means that she has been employed there since 1 April 2002.
4.3 The fi rst 6 digits of a person’s ID number is that person’s birth date. It states “ID NUMBER: 7506246578083” underneath the date engaged on Thabita’s pay slip. This means that 75/06/24 is Thabita’s birth date. Therefore, at the time of receiving this pay slip, Thabita had just had her 29th birthday.
4.4 Sunny Days Crèche deducts TAX and UIF from Thabita’s basic (gross) salary.
4.5 R6 100,00 (Thabita’s gross salary) – R205,26 (tax) –R 61,00 (UIF) = R5 833,74. Her net pay listed on the pay slip is R5 833,74, meaning she received that exact amount in her bank account that particular month.
4.6 No. This is more than every other month as she got a birthday bonus this month. Every other month she would receive a basic salary of R3 050 and she would have a tax deduction of R102,63 (205,26 ÷ 2) and a UIF deduction of R30,50 (61,002). Therefore, in every other month she would be banking a net pay of R2 916,87.
4.7 Since “The amount of the contribution payable by an employee must be 1% of the remuneration paid to him by his employer”, Thabita’s UIF contribution should be 1% of her basic (gross) salary which is calculated as follows: 6100 × 1% = 61 (R61,00).
4.8 “CO. CONTRIBUTION: 61.00” means that her employer (Sunny Days Crèche) is also contributing 1% of her salary to UIF on her behalf, as it should do according to SARS guidelines: “The amount of the contribution payable by the employer in respect of any one of its employees must be equal to 1% of the remuneration paid to that employee.”
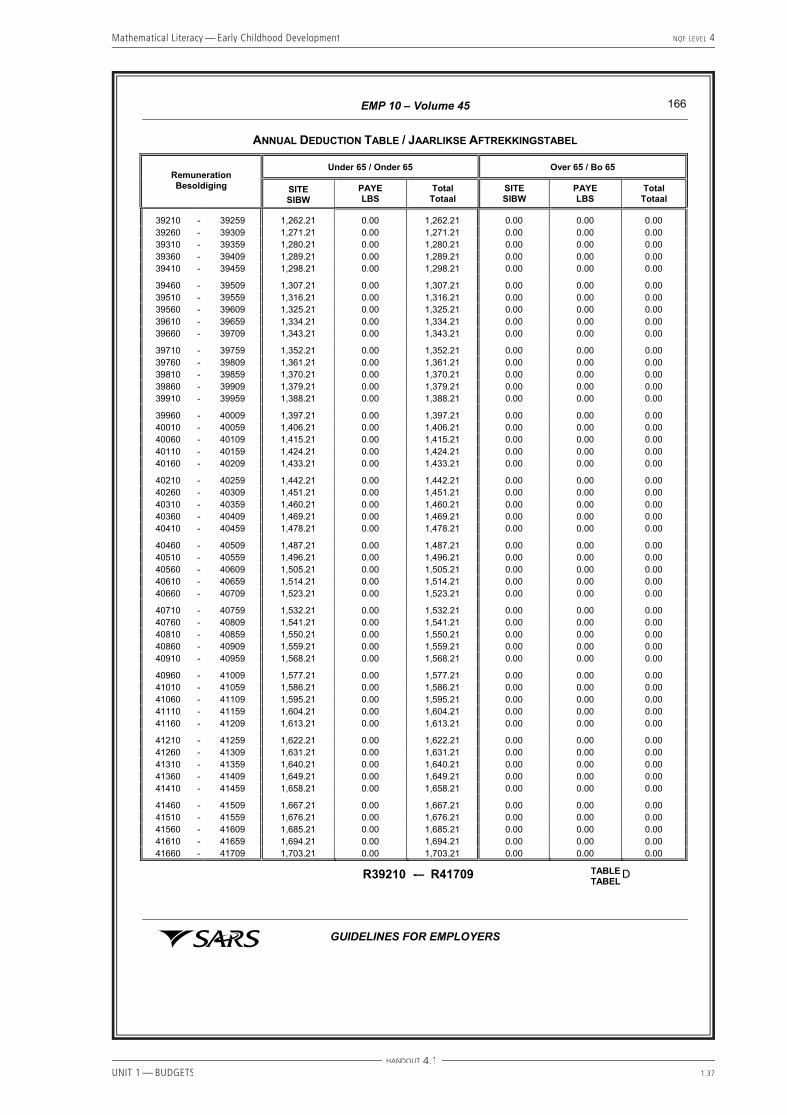
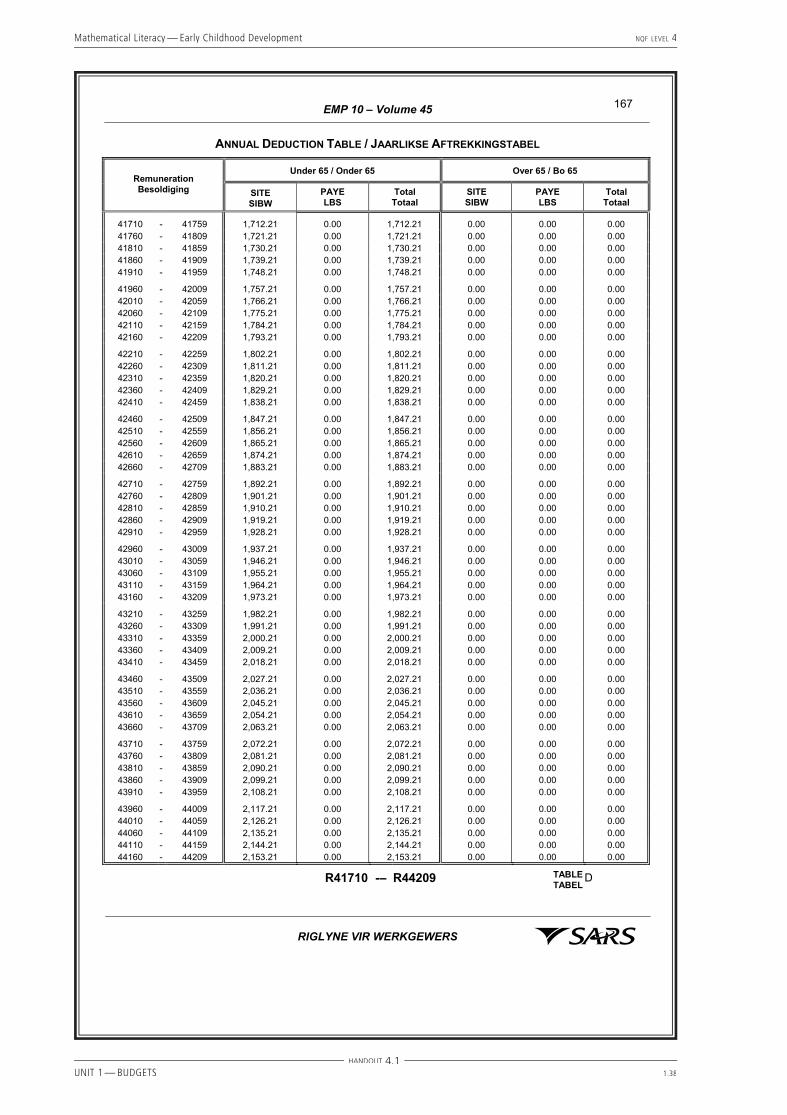
4.9 Thabita earns an annual salary of R39 650,00, calculated as follows: R3 050,00 × 13 payments (12 months + her birthday bonus). Therefore, since her annual salary is between R39 610,00 and R39 659,00 and she is also under 65 years of age, she falls into the category on the annual deductions table shown below (row 9 in the table provided):
RemunerationBesoldiging
Under 65/Onder 65
SITE PAYE Total
39610 - 39659 1,334.21 0.00 1,334.21 This means that she is required to pay a total of R1 334,21 per year i.e. R102,63 per payment (R1 334,21 ÷
13 = R102,63). Since this month is her birthday month, and therefore she receives two monthly payments at once, she is also required to pay two installments of R102,63 in tax. R102,63 × 2 = R205,26 which is why Thabita paid R205,26 in taxes this month.
Mathematical Literacy — Early Childhood Development NQF LEVEL 4
UNIT 1 — BUDGETS 1.32
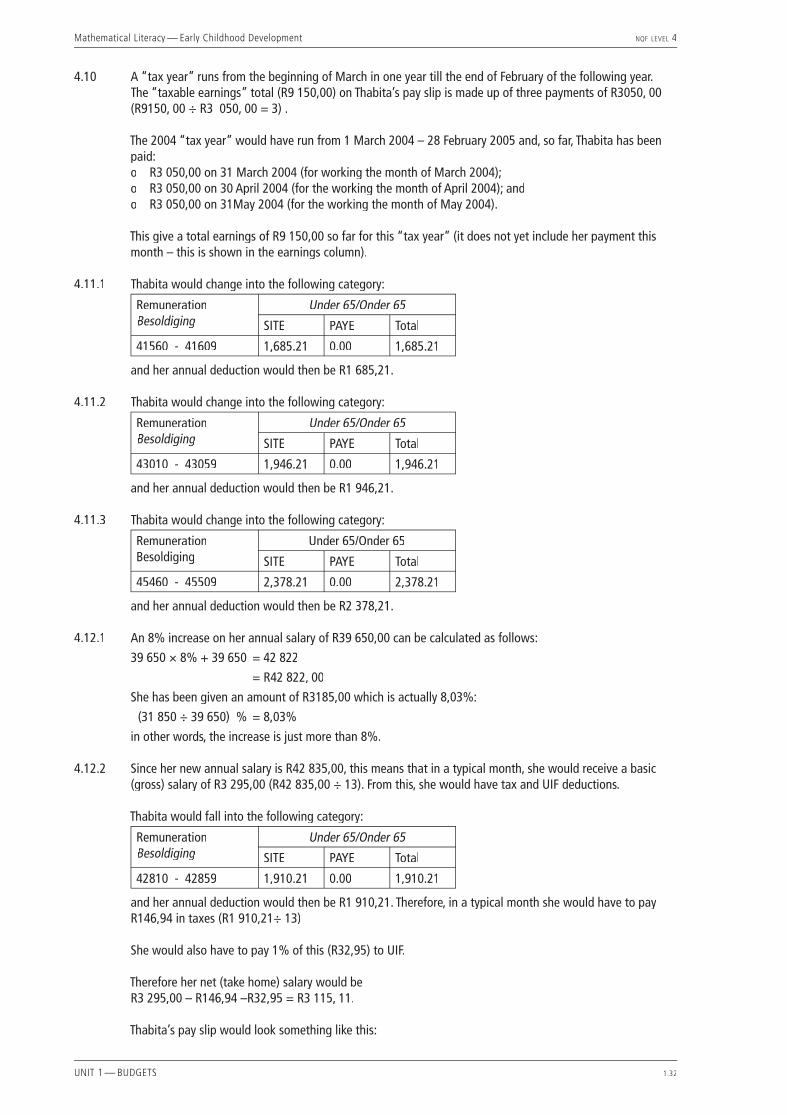
4.10 A “tax year” runs from the beginning of March in one year till the end of February of the following year. The “taxable earnings” total (R9 150,00) on Thabita’s pay slip is made up of three payments of R3050, 00 (R9150, 00 ÷ R3 050, 00 = 3) .
The 2004 “tax year” would have run from 1 March 2004 – 28 February 2005 and, so far, Thabita has been
paid:o R3 050,00 on 31 March 2004 (for working the month of March 2004);o R3 050,00 on 30 April 2004 (for the working the month of April 2004); ando R3 050,00 on 31May 2004 (for the working the month of May 2004).
This give a total earnings of R9 150,00 so far for this “tax year” (it does not yet include her payment this month – this is shown in the earnings column).
4.11.1 Thabita would change into the following category:
RemunerationBesoldiging
Under 65/Onder 65
SITE PAYE Total
41560 - 41609 1,685.21 0.00 1,685.21
and her annual deduction would then be R1 685,21.
4.11.2 Thabita would change into the following category:
RemunerationBesoldiging
Under 65/Onder 65
SITE PAYE Total
43010 - 43059 1,946.21 0.00 1,946.21
and her annual deduction would then be R1 946,21.
4.11.3 Thabita would change into the following category:
RemunerationBesoldiging
Under 65/Onder 65
SITE PAYE Total
45460 - 45509 2,378.21 0.00 2,378.21
and her annual deduction would then be R2 378,21.
4.12.1 An 8% increase on her annual salary of R39 650,00 can be calculated as follows:
39 650 × 8% + 39 650 = 42 822
= R42 822, 00
She has been given an amount of R3185,00 which is actually 8,03%:
(31 850 ÷ 39 650) % = 8,03%
in other words, the increase is just more than 8%.
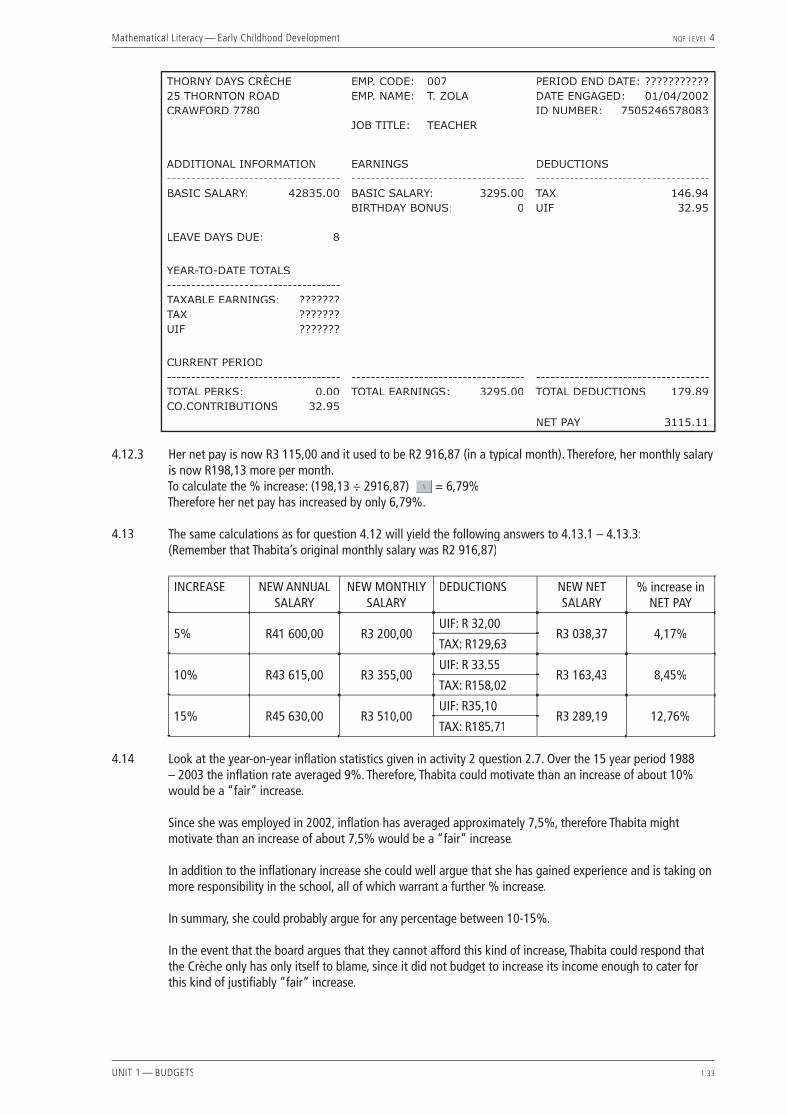
4.12.2 Since her new annual salary is R42 835,00, this means that in a typical month, she would receive a basic (gross) salary of R3 295,00 (R42 835,00 ÷ 13). From this, she would have tax and UIF deductions.
Thabita would fall into the following category:
RemunerationBesoldiging
Under 65/Onder 65
SITE PAYE Total
42810 - 42859 1,910.21 0.00 1,910.21
and her annual deduction would then be R1 910,21. Therefore, in a typical month she would have to pay R146,94 in taxes (R1 910,21÷ 13)
She would also have to pay 1% of this (R32,95) to UIF.
Therefore her net (take home) salary would be R3 295,00 – R146,94 –R32,95 = R3 115, 11.
Thabita’s pay slip would look something like this:
Mathematical Literacy — Early Childhood Development NQF LEVEL 4
UNIT 1 — BUDGETS 1.33
THORNY DAYS CRÈCHE25 THORNTON ROADCRAWFORD 7780
EMP. CODE: 007EMP. NAME: T. ZOLA
JOB TITLE: TEACHER
PERIOD END DATE: ???????????DATE ENGAGED: 01/04/2002ID NUMBER: 7505246578083
ADDITIONAL INFORMATION------------------------------------BASIC SALARY: 42835.00
LEAVE DAYS DUE: 8
EARNINGS------------------------------------BASIC SALARY: 3295.00BIRTHDAY BONUS: 0
DEDUCTIONS------------------------------------TAX 146.94UIF 32.95
YEAR-TO-DATE TOTALS------------------------------------TAXABLE EARNINGS: ???????TAX ???????UIF ???????
CURRENT PERIOD------------------------------------TOTAL PERKS: 0.00CO.CONTRIBUTIONS 32.95
------------------------------------TOTAL EARNINGS: 3295.00
------------------------------------TOTAL DEDUCTIONS 179.89
NET PAY 3115.11
4.12.3 Her net pay is now R3 115,00 and it used to be R2 916,87 (in a typical month). Therefore, her monthly salary is now R198,13 more per month.
To calculate the % increase: (198,13 ÷ 2916,87) = 6,79% Therefore her net pay has increased by only 6,79%.
4.13 The same calculations as for question 4.12 will yield the following answers to 4.13.1 – 4.13.3: (Remember that Thabita’s original monthly salary was R2 916,87)
INCREASE NEW ANNUAL SALARY
NEW MONTHLY SALARY
DEDUCTIONS NEW NET SALARY
% increase in NET PAY
5% R41 600,00 R3 200,00UIF: R 32,00
R3 038,37 4,17%TAX: R129,63
10% R43 615,00 R3 355,00UIF: R 33,55
R3 163,43 8,45%TAX: R158,02
15% R45 630,00 R3 510,00UIF: R35,10
R3 289,19 12,76%TAX: R185,71
4.14 Look at the year-on-year infl ation statistics given in activity 2 question 2.7. Over the 15 year period 1988 – 2003 the infl ation rate averaged 9%. Therefore, Thabita could motivate than an increase of about 10% would be a “fair” increase.
Since she was employed in 2002, infl ation has averaged approximately 7,5%, therefore Thabita might motivate than an increase of about 7,5% would be a “fair” increase.
In addition to the infl ationary increase she could well argue that she has gained experience and is taking on more responsibility in the school, all of which warrant a further % increase.
In summary, she could probably argue for any percentage between 10-15%.
In the event that the board argues that they cannot afford this kind of increase, Thabita could respond that the Crèche only has only itself to blame, since it did not budget to increase its income enough to cater for this kind of justifi ably “fair” increase.

Mathematical Literacy — Early Childhood Development NQF LEVEL 4
UNIT 1 — BUDGETS 1.34
Mathematical Literacy — Early Childhood Development NQF LEVEL 4
UNIT 1 — BUDGETS 1.35
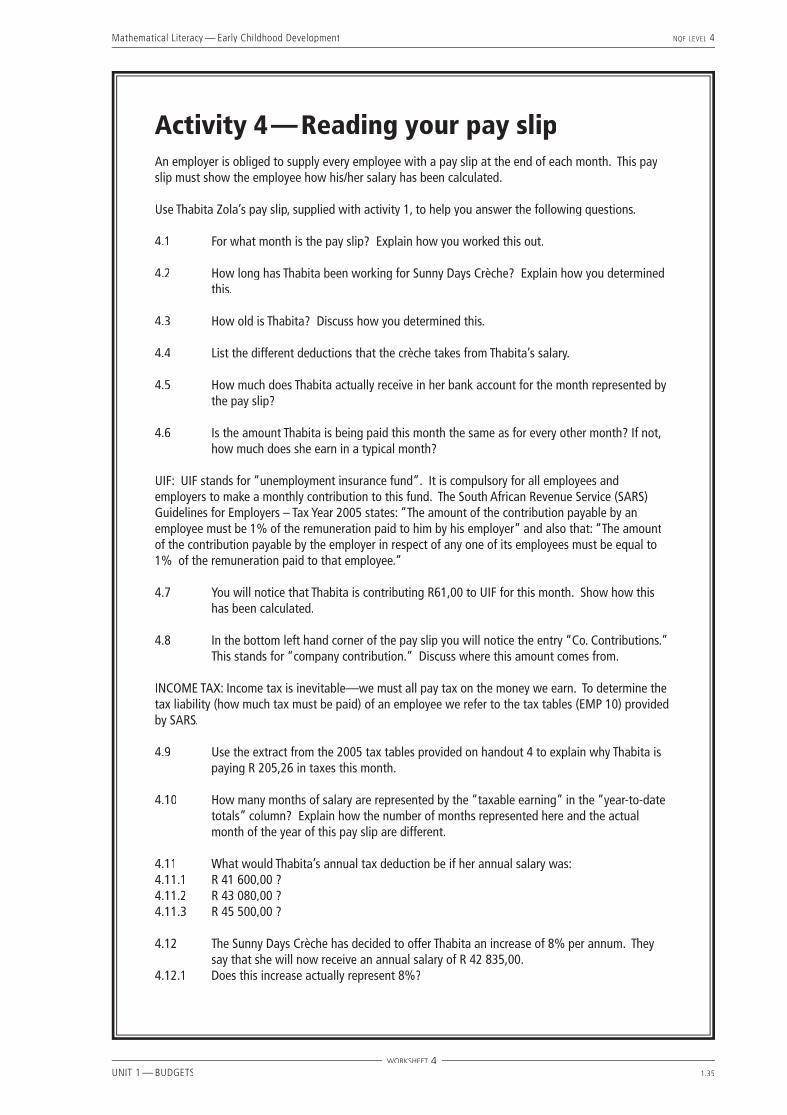
Activity 4 — Reading your pay slipAn employer is obliged to supply every employee with a pay slip at the end of each month. This pay slip must show the employee how his/her salary has been calculated.
Use Thabita Zola’s pay slip, supplied with activity 1, to help you answer the following questions.
4.1 For what month is the pay slip? Explain how you worked this out.
4.2 How long has Thabita been working for Sunny Days Crèche? Explain how you determined this.
4.3 How old is Thabita? Discuss how you determined this.
4.4 List the different deductions that the crèche takes from Thabita’s salary.
4.5 How much does Thabita actually receive in her bank account for the month represented by the pay slip?
4.6 Is the amount Thabita is being paid this month the same as for every other month? If not, how much does she earn in a typical month?
UIF: UIF stands for “unemployment insurance fund”. It is compulsory for all employees and employers to make a monthly contribution to this fund. The South African Revenue Service (SARS) Guidelines for Employers – Tax Year 2005 states: “The amount of the contribution payable by an employee must be 1% of the remuneration paid to him by his employer” and also that: “The amount of the contribution payable by the employer in respect of any one of its employees must be equal to 1% of the remuneration paid to that employee.”
4.7 You will notice that Thabita is contributing R61,00 to UIF for this month. Show how this has been calculated.
4.8 In the bottom left hand corner of the pay slip you will notice the entry “Co. Contributions.” This stands for “company contribution.” Discuss where this amount comes from.
INCOME TAX: Income tax is inevitable—we must all pay tax on the money we earn. To determine the tax liability (how much tax must be paid) of an employee we refer to the tax tables (EMP 10) provided by SARS.
4.9 Use the extract from the 2005 tax tables provided on handout 4 to explain why Thabita is paying R 205,26 in taxes this month.
4.10 How many months of salary are represented by the “taxable earning” in the “year-to-date totals” column? Explain how the number of months represented here and the actual month of the year of this pay slip are different.
4.11 What would Thabita’s annual tax deduction be if her annual salary was:4.11.1 R 41 600,00 ?4.11.2 R 43 080,00 ?4.11.3 R 45 500,00 ?
4.12 The Sunny Days Crèche has decided to offer Thabita an increase of 8% per annum. They say that she will now receive an annual salary of R 42 835,00.
4.12.1 Does this increase actually represent 8%?
WORKSHEET 4
Mathematical Literacy — Early Childhood Development NQF LEVEL 4
UNIT 1 — BUDGETS 1.36
4.12.2 By calculating the deductions (using the tax tables in the handout provided), determine her net pay in a typical month after the increase.
4.12.3 Does her net pay (the amount she takes home) also increase by 8%? Substantiate your answer.
4.13 Repeat the calculations you did in question 4.12 to determine the actual and percentage increases in monthly net pay for each of the following annual increases:
4.13.1 5% increase, new annual salary: R41 600,00.4.13.2 10% increase, new annual salary: R 43 615,00.4.13.3 15% increase, new annual salary: R 45 630,00.
Refer back to the budget and infl ation activities completed so far. Develop an argument that Thabita might present to the church council of St Agnes’ Church in which she motivates what she considers a “fair” increase in salary for 2005.
WORKSHEET 4
Mathematical Literacy — Early Childhood Development NQF LEVEL 4
UNIT 1 — BUDGETS 1.37
HANDOUT 4.1
166
GUIDELINES FOR EMPLOYERS
EMP 10 � Volume 45
ANNUAL DEDUCTION TABLE / JAARLIKSE AFTREKKINGSTABEL
Under 65 / Onder 65 Over 65 / Bo 65Remuneration Besoldiging SITE
SIBW PAYE LBS
Total Totaal
SITE SIBW
PAYE LBS
Total Totaal
39210 - 39259 1,262.21 0.00 1,262.21 0.00 0.00 0.00 39260 - 39309 1,271.21 0.00 1,271.21 0.00 0.00 0.00 39310 - 39359 1,280.21 0.00 1,280.21 0.00 0.00 0.00 39360 - 39409 1,289.21 0.00 1,289.21 0.00 0.00 0.00 39410 - 39459 1,298.21 0.00 1,298.21 0.00 0.00 0.00
39460 - 39509 1,307.21 0.00 1,307.21 0.00 0.00 0.00 39510 - 39559 1,316.21 0.00 1,316.21 0.00 0.00 0.00 39560 - 39609 1,325.21 0.00 1,325.21 0.00 0.00 0.00 39610 - 39659 1,334.21 0.00 1,334.21 0.00 0.00 0.00 39660 - 39709 1,343.21 0.00 1,343.21 0.00 0.00 0.00
39710 - 39759 1,352.21 0.00 1,352.21 0.00 0.00 0.00 39760 - 39809 1,361.21 0.00 1,361.21 0.00 0.00 0.00 39810 - 39859 1,370.21 0.00 1,370.21 0.00 0.00 0.00 39860 - 39909 1,379.21 0.00 1,379.21 0.00 0.00 0.00 39910 - 39959 1,388.21 0.00 1,388.21 0.00 0.00 0.00
39960 - 40009 1,397.21 0.00 1,397.21 0.00 0.00 0.00 40010 - 40059 1,406.21 0.00 1,406.21 0.00 0.00 0.00 40060 - 40109 1,415.21 0.00 1,415.21 0.00 0.00 0.00 40110 - 40159 1,424.21 0.00 1,424.21 0.00 0.00 0.00 40160 - 40209 1,433.21 0.00 1,433.21 0.00 0.00 0.00
40210 - 40259 1,442.21 0.00 1,442.21 0.00 0.00 0.00 40260 - 40309 1,451.21 0.00 1,451.21 0.00 0.00 0.00 40310 - 40359 1,460.21 0.00 1,460.21 0.00 0.00 0.00 40360 - 40409 1,469.21 0.00 1,469.21 0.00 0.00 0.00 40410 - 40459 1,478.21 0.00 1,478.21 0.00 0.00 0.00
40460 - 40509 1,487.21 0.00 1,487.21 0.00 0.00 0.00 40510 - 40559 1,496.21 0.00 1,496.21 0.00 0.00 0.00 40560 - 40609 1,505.21 0.00 1,505.21 0.00 0.00 0.00 40610 - 40659 1,514.21 0.00 1,514.21 0.00 0.00 0.00 40660 - 40709 1,523.21 0.00 1,523.21 0.00 0.00 0.00
40710 - 40759 1,532.21 0.00 1,532.21 0.00 0.00 0.00 40760 - 40809 1,541.21 0.00 1,541.21 0.00 0.00 0.00 40810 - 40859 1,550.21 0.00 1,550.21 0.00 0.00 0.00 40860 - 40909 1,559.21 0.00 1,559.21 0.00 0.00 0.00 40910 - 40959 1,568.21 0.00 1,568.21 0.00 0.00 0.00
40960 - 41009 1,577.21 0.00 1,577.21 0.00 0.00 0.00 41010 - 41059 1,586.21 0.00 1,586.21 0.00 0.00 0.00 41060 - 41109 1,595.21 0.00 1,595.21 0.00 0.00 0.00 41110 - 41159 1,604.21 0.00 1,604.21 0.00 0.00 0.00 41160 - 41209 1,613.21 0.00 1,613.21 0.00 0.00 0.00
41210 - 41259 1,622.21 0.00 1,622.21 0.00 0.00 0.00 41260 - 41309 1,631.21 0.00 1,631.21 0.00 0.00 0.00 41310 - 41359 1,640.21 0.00 1,640.21 0.00 0.00 0.00 41360 - 41409 1,649.21 0.00 1,649.21 0.00 0.00 0.00 41410 - 41459 1,658.21 0.00 1,658.21 0.00 0.00 0.00
41460 - 41509 1,667.21 0.00 1,667.21 0.00 0.00 0.00 41510 - 41559 1,676.21 0.00 1,676.21 0.00 0.00 0.00 41560 - 41609 1,685.21 0.00 1,685.21 0.00 0.00 0.00 41610 - 41659 1,694.21 0.00 1,694.21 0.00 0.00 0.00 41660 - 41709 1,703.21 0.00 1,703.21 0.00 0.00 0.00
R39210 -� R41709 TABLE TABEL
D
Mathematical Literacy — Early Childhood Development NQF LEVEL 4
UNIT 1 — BUDGETS 1.38
HANDOUT 4.1
167
RIGLYNE VIR WERKGEWERS
EMP 10 � Volume 45
ANNUAL DEDUCTION TABLE / JAARLIKSE AFTREKKINGSTABEL
Under 65 / Onder 65 Over 65 / Bo 65Remuneration Besoldiging SITE
SIBW PAYE LBS
Total Totaal
SITE SIBW
PAYE LBS
Total Totaal
41710 - 41759 1,712.21 0.00 1,712.21 0.00 0.00 0.00 41760 - 41809 1,721.21 0.00 1,721.21 0.00 0.00 0.00 41810 - 41859 1,730.21 0.00 1,730.21 0.00 0.00 0.00 41860 - 41909 1,739.21 0.00 1,739.21 0.00 0.00 0.00 41910 - 41959 1,748.21 0.00 1,748.21 0.00 0.00 0.00
41960 - 42009 1,757.21 0.00 1,757.21 0.00 0.00 0.00 42010 - 42059 1,766.21 0.00 1,766.21 0.00 0.00 0.00 42060 - 42109 1,775.21 0.00 1,775.21 0.00 0.00 0.00 42110 - 42159 1,784.21 0.00 1,784.21 0.00 0.00 0.00 42160 - 42209 1,793.21 0.00 1,793.21 0.00 0.00 0.00
42210 - 42259 1,802.21 0.00 1,802.21 0.00 0.00 0.00 42260 - 42309 1,811.21 0.00 1,811.21 0.00 0.00 0.00 42310 - 42359 1,820.21 0.00 1,820.21 0.00 0.00 0.00 42360 - 42409 1,829.21 0.00 1,829.21 0.00 0.00 0.00 42410 - 42459 1,838.21 0.00 1,838.21 0.00 0.00 0.00
42460 - 42509 1,847.21 0.00 1,847.21 0.00 0.00 0.00 42510 - 42559 1,856.21 0.00 1,856.21 0.00 0.00 0.00 42560 - 42609 1,865.21 0.00 1,865.21 0.00 0.00 0.00 42610 - 42659 1,874.21 0.00 1,874.21 0.00 0.00 0.00 42660 - 42709 1,883.21 0.00 1,883.21 0.00 0.00 0.00
42710 - 42759 1,892.21 0.00 1,892.21 0.00 0.00 0.00 42760 - 42809 1,901.21 0.00 1,901.21 0.00 0.00 0.00 42810 - 42859 1,910.21 0.00 1,910.21 0.00 0.00 0.00 42860 - 42909 1,919.21 0.00 1,919.21 0.00 0.00 0.00 42910 - 42959 1,928.21 0.00 1,928.21 0.00 0.00 0.00
42960 - 43009 1,937.21 0.00 1,937.21 0.00 0.00 0.00 43010 - 43059 1,946.21 0.00 1,946.21 0.00 0.00 0.00 43060 - 43109 1,955.21 0.00 1,955.21 0.00 0.00 0.00 43110 - 43159 1,964.21 0.00 1,964.21 0.00 0.00 0.00 43160 - 43209 1,973.21 0.00 1,973.21 0.00 0.00 0.00
43210 - 43259 1,982.21 0.00 1,982.21 0.00 0.00 0.00 43260 - 43309 1,991.21 0.00 1,991.21 0.00 0.00 0.00 43310 - 43359 2,000.21 0.00 2,000.21 0.00 0.00 0.00 43360 - 43409 2,009.21 0.00 2,009.21 0.00 0.00 0.00 43410 - 43459 2,018.21 0.00 2,018.21 0.00 0.00 0.00
43460 - 43509 2,027.21 0.00 2,027.21 0.00 0.00 0.00 43510 - 43559 2,036.21 0.00 2,036.21 0.00 0.00 0.00 43560 - 43609 2,045.21 0.00 2,045.21 0.00 0.00 0.00 43610 - 43659 2,054.21 0.00 2,054.21 0.00 0.00 0.00 43660 - 43709 2,063.21 0.00 2,063.21 0.00 0.00 0.00
43710 - 43759 2,072.21 0.00 2,072.21 0.00 0.00 0.00 43760 - 43809 2,081.21 0.00 2,081.21 0.00 0.00 0.00 43810 - 43859 2,090.21 0.00 2,090.21 0.00 0.00 0.00 43860 - 43909 2,099.21 0.00 2,099.21 0.00 0.00 0.00 43910 - 43959 2,108.21 0.00 2,108.21 0.00 0.00 0.00
43960 - 44009 2,117.21 0.00 2,117.21 0.00 0.00 0.00 44010 - 44059 2,126.21 0.00 2,126.21 0.00 0.00 0.00 44060 - 44109 2,135.21 0.00 2,135.21 0.00 0.00 0.00 44110 - 44159 2,144.21 0.00 2,144.21 0.00 0.00 0.00 44160 - 44209 2,153.21 0.00 2,153.21 0.00 0.00 0.00
R41710 -� R44209 TABLE TABEL
D

Mathematical Literacy — Early Childhood Development NQF LEVEL 4
UNIT 1 — BUDGETS 1.39
HANDOUT 4.1
168
GUIDELINES FOR EMPLOYERS
EMP 10 � Volume 45
ANNUAL DEDUCTION TABLE / JAARLIKSE AFTREKKINGSTABEL
Under 65 / Onder 65 Over 65 / Bo 65Remuneration Besoldiging SITE
SIBW PAYE LBS
Total Totaal
SITE SIBW
PAYE LBS
Total Totaal
44210 - 44259 2,162.21 0.00 2,162.21 0.00 0.00 0.00 44260 - 44309 2,171.21 0.00 2,171.21 0.00 0.00 0.00 44310 - 44359 2,180.21 0.00 2,180.21 0.00 0.00 0.00 44360 - 44409 2,189.21 0.00 2,189.21 0.00 0.00 0.00 44410 - 44459 2,198.21 0.00 2,198.21 0.00 0.00 0.00
44460 - 44509 2,207.21 0.00 2,207.21 0.00 0.00 0.00 44510 - 44559 2,216.21 0.00 2,216.21 0.00 0.00 0.00 44560 - 44609 2,225.21 0.00 2,225.21 0.00 0.00 0.00 44610 - 44659 2,234.21 0.00 2,234.21 0.00 0.00 0.00 44660 - 44709 2,243.21 0.00 2,243.21 0.00 0.00 0.00
44710 - 44759 2,252.21 0.00 2,252.21 0.00 0.00 0.00 44760 - 44809 2,261.21 0.00 2,261.21 0.00 0.00 0.00 44810 - 44859 2,270.21 0.00 2,270.21 0.00 0.00 0.00 44860 - 44909 2,279.21 0.00 2,279.21 0.00 0.00 0.00 44910 - 44959 2,288.21 0.00 2,288.21 0.00 0.00 0.00
44960 - 45009 2,297.21 0.00 2,297.21 0.00 0.00 0.00 45010 - 45059 2,306.21 0.00 2,306.21 0.00 0.00 0.00 45060 - 45109 2,315.21 0.00 2,315.21 0.00 0.00 0.00 45110 - 45159 2,324.21 0.00 2,324.21 0.00 0.00 0.00 45160 - 45209 2,333.21 0.00 2,333.21 0.00 0.00 0.00
45210 - 45259 2,342.21 0.00 2,342.21 0.00 0.00 0.00 45260 - 45309 2,351.21 0.00 2,351.21 0.00 0.00 0.00 45310 - 45359 2,360.21 0.00 2,360.21 0.00 0.00 0.00 45360 - 45409 2,369.21 0.00 2,369.21 0.00 0.00 0.00 45410 - 45459 2,378.21 0.00 2,378.21 0.00 0.00 0.00
45460 - 45509 2,387.21 0.00 2,387.21 0.00 0.00 0.00 45510 - 45559 2,396.21 0.00 2,396.21 0.00 0.00 0.00 45560 - 45609 2,405.21 0.00 2,405.21 0.00 0.00 0.00 45610 - 45659 2,414.21 0.00 2,414.21 0.00 0.00 0.00 45660 - 45709 2,423.21 0.00 2,423.21 0.00 0.00 0.00
45710 - 45759 2,432.21 0.00 2,432.21 0.00 0.00 0.00 45760 - 45809 2,441.21 0.00 2,441.21 0.00 0.00 0.00 45810 - 45859 2,450.21 0.00 2,450.21 0.00 0.00 0.00 45860 - 45909 2,459.21 0.00 2,459.21 0.00 0.00 0.00 45910 - 45959 2,468.21 0.00 2,468.21 0.00 0.00 0.00
45960 - 46009 2,477.21 0.00 2,477.21 0.00 0.00 0.00 46010 - 46059 2,486.21 0.00 2,486.21 0.00 0.00 0.00 46060 - 46109 2,495.21 0.00 2,495.21 0.00 0.00 0.00 46110 - 46159 2,504.21 0.00 2,504.21 0.00 0.00 0.00 46160 - 46209 2,513.21 0.00 2,513.21 0.00 0.00 0.00
46210 - 46259 2,522.21 0.00 2,522.21 0.00 0.00 0.00 46260 - 46309 2,531.21 0.00 2,531.21 0.00 0.00 0.00 46310 - 46359 2,540.21 0.00 2,540.21 0.00 0.00 0.00 46360 - 46409 2,549.21 0.00 2,549.21 0.00 0.00 0.00 46410 - 46459 2,558.21 0.00 2,558.21 0.00 0.00 0.00
46460 - 46509 2,567.21 0.00 2,567.21 0.00 0.00 0.00 46510 - 46559 2,576.21 0.00 2,576.21 0.00 0.00 0.00 46560 - 46609 2,585.21 0.00 2,585.21 0.00 0.00 0.00 46610 - 46659 2,594.21 0.00 2,594.21 0.00 0.00 0.00 46660 - 46709 2,603.21 0.00 2,603.21 0.00 0.00 0.00
R44210 -� R46709 TABLE TABEL
D

Mathematical Literacy — Early Childhood Development NQF LEVEL 4
UNIT 1 — BUDGETS 1.40
Mathematical Literacy — Early Childhood Development NQF LEVEL 4
UNIT 1 — BUDGETS 1.41
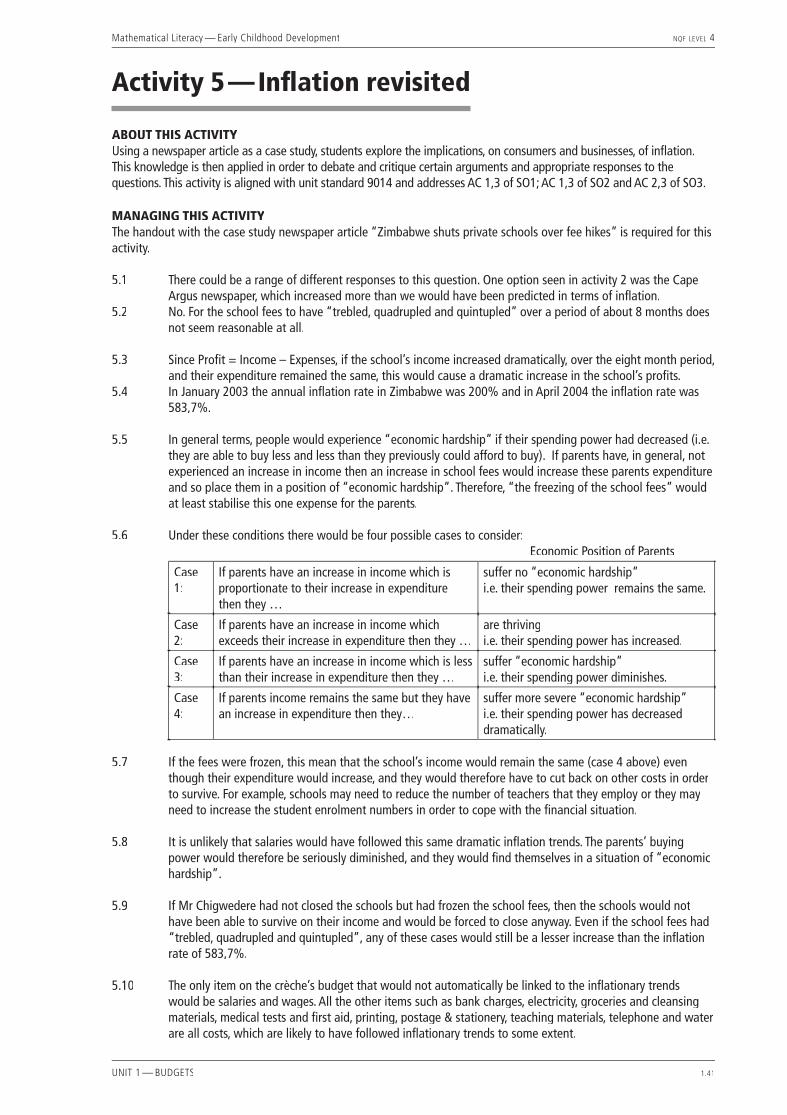
Activity 5 — Infl ation revisited
ABOUT THIS ACTIVITYUsing a newspaper article as a case study, students explore the implications, on consumers and businesses, of infl ation. This knowledge is then applied in order to debate and critique certain arguments and appropriate responses to the questions. This activity is aligned with unit standard 9014 and addresses AC 1,3 of SO1; AC 1,3 of SO2 and AC 2,3 of SO3.
MANAGING THIS ACTIVITYThe handout with the case study newspaper article “Zimbabwe shuts private schools over fee hikes” is required for this activity.
5.1 There could be a range of different responses to this question. One option seen in activity 2 was the Cape Argus newspaper, which increased more than we would have been predicted in terms of infl ation.
5.2 No. For the school fees to have “trebled, quadrupled and quintupled” over a period of about 8 months does not seem reasonable at all.
5.3 Since Profi t = Income – Expenses, if the school’s income increased dramatically, over the eight month period, and their expenditure remained the same, this would cause a dramatic increase in the school’s profi ts.
5.4 In January 2003 the annual infl ation rate in Zimbabwe was 200% and in April 2004 the infl ation rate was 583,7%.
5.5 In general terms, people would experience “economic hardship” if their spending power had decreased (i.e. they are able to buy less and less than they previously could afford to buy). If parents have, in general, not experienced an increase in income then an increase in school fees would increase these parents expenditure and so place them in a position of “economic hardship”. Therefore, “the freezing of the school fees” would at least stabilise this one expense for the parents.
5.6 Under these conditions there would be four possible cases to consider: Economic Position of Parents
Case 1:
If parents have an increase in income which is proportionate to their increase in expenditure then they …
suffer no “economic hardship”i.e. their spending power remains the same.
Case 2:
If parents have an increase in income which exceeds their increase in expenditure then they …
are thrivingi.e. their spending power has increased.
Case 3:
If parents have an increase in income which is less than their increase in expenditure then they …
suffer “economic hardship”i.e. their spending power diminishes.
Case 4:
If parents income remains the same but they have an increase in expenditure then they…
suffer more severe “economic hardship”i.e. their spending power has decreased dramatically.
5.7 If the fees were frozen, this mean that the school’s income would remain the same (case 4 above) even though their expenditure would increase, and they would therefore have to cut back on other costs in order to survive. For example, schools may need to reduce the number of teachers that they employ or they may need to increase the student enrolment numbers in order to cope with the fi nancial situation.
5.8 It is unlikely that salaries would have followed this same dramatic infl ation trends. The parents’ buying power would therefore be seriously diminished, and they would fi nd themselves in a situation of “economic hardship”.
5.9 If Mr Chigwedere had not closed the schools but had frozen the school fees, then the schools would not have been able to survive on their income and would be forced to close anyway. Even if the school fees had “trebled, quadrupled and quintupled”, any of these cases would still be a lesser increase than the infl ation rate of 583,7%.
5.10 The only item on the crèche’s budget that would not automatically be linked to the infl ationary trends would be salaries and wages. All the other items such as bank charges, electricity, groceries and cleansing materials, medical tests and fi rst aid, printing, postage & stationery, teaching materials, telephone and water are all costs, which are likely to have followed infl ationary trends to some extent.
Mathematical Literacy — Early Childhood Development NQF LEVEL 4
UNIT 1 — BUDGETS 1.42
5.11 Provided that parents are earning more (their salaries have increased in line with or more than infl ation), then they would be willing to pay more for school fees – if their income is larger then they have more money to use for their expenses.
5.12 It is not necessarily true that all the items in question 5.10 would increase by the same infl ationary percentage. Remember in the shopping basket exercise some items increased more while others increased by less. On average, though, it is likely that they would follow infl ationary trends.
5.13
ADVANTAGES DISADVANTAGES
• One would expect that, on the whole, the crèche’s expenses are likely to have increased in line with infl ation. Therefore, increasing the school fees in line with infl ation would help to ensure that the crèche’s fi nancial status remains that of Case 1 in question 5.6 where this decision does not place them in a position of economic hardship.
• If we assume that the parents’ income increases in line with infl ation, then increasing the fees in line with infl ation (rather than more than infl ation) might help to ensure that the parents can still afford to send their children to the crèche.
• If the crèche’s school fees are increased in line with infl ation, but parents’ incomes are not, then parents may no longer be able to afford to send their children to that crèche and therefore the crèche’s income may in fact decrease.
• If the crèche’s school fees are increased in line with infl ation, but their expenses have increased more than the infl ationary rate (or they have had additional expenses that year i.e. the crèche’s “capital expenses” in 2003) then they will be running at a loss because (unless they fi nd extra income/funding from elsewhere) their expenses would exceed their income.
5.14 Some of the students responses to this question could overlap with those of question 5.13 .
If fees are increased signifi cantly less than infl ation
If fees are increased signifi cantly more than infl ation
• If the crèche’s school fees are increased signifi cantly less than infl ation, but their expenses have increased in line with or even more than the infl ationary rate, then they will be running at a loss because (unless they fi nd extra income/funding from elsewhere) their expenses would exceed their income.
• If the crèche’s school fees are increased signifi cantly more than infl ation, but parents’ incomes are not, then parents may no longer be able to afford to send their children to that crèche and therefore the crèche’s income may in fact decrease.
• Alternatively, if the crèche’s school fees are increased signifi cantly more than infl ation, and parents’ incomes are also increased signifi cantly more than infl ation the crèche may be able to make a profi t (provided that their expenses remain relatively constant). This is, however, quite unlikely.
5.15
NATIONAL ECONOMY PARENTS’ INCOME
• If the national economy is such that the government can afford to give the crèche a larger educational subsidy, then the crèche may be able to keep the school fees relatively constant due to the extra income generated from the educational subsidy.
• On the contrary, if the national economy is such that the government cannot afford to give the crèche a large enough educational subsidy, then the crèche may be forced to increase the school fees in order to stay open.
• If the crèche’s school fees are increased signifi cantly more than the parents’ incomes, then parents may no longer be able to afford to send their children to that crèche and therefore the crèche’s income may in fact decrease.
• Alternatively, if the crèche’s school fees are increased proportionately to the parents’ incomes then the crèche should be able to maintain its fi nancial position.
5.16 The crèche may have decided to reduce its fees if it receives additional revenue from another source (i.e. donations or fundraising or educational subsidy). Alternatively, if the crèche decided to increase class sizes signifi cantly they would increase the number of parents paying fees and might therefore be able to increase the income generated from school fees, despite fi xing or even reducing the fee per student.

Mathematical Literacy — Early Childhood Development NQF LEVEL 4
UNIT 1 — BUDGETS 1.43
Activity 5 — Infl ation revisitedIn order to understand how infl ation can dramatically affect prices, let us study an example of infl ationary effects in Zimbabwe schools.
Read through the handout headed “Zimbabwe shuts private schools over fee hikes” from the Cape Times (5 May 2004) and answer the following questions.Times (5 May 2004) and answer the following questions.Times
5.1 Education Minister Chigwedere stated that some schools had “trebled, quadrupled and quintupled fees since September” (a period of approximately eight months). What is the most dramatic price rise for an item or service that you can recall? Does this seem normal (recall back to activity 2 to help you decide)?
5.2 Do you think it sounds reasonable for a school to increase its fees by that amount in such a short space of time?
5.3 If the school’s expenses remained the same during the eight month period, what would be the effect on the school’s profi ts?
5.4 What was Zimbabwe’s annual infl ation fi gure in January 2003 and in April 2004 respectively? Note: Annual infl ation is also referred to by the symbols CPIX (consumer price index excluding mortgage rates) or CPI (consumer price index).
5.5 According to the article, in January 2003 the government froze all school fees in order to “ease economic hardship”. Under what personal circumstances will this ruling ease the economic hardship of parents?
5.6 If this ruling had not been introduced, what would be the effect of the school fee hikes on the economic position of parents? You should consider a variety of possibilities, taking into account the possible income changes within families.
5.7 What effect would this ruling have on schools and the quality of the service that they would be able to provide?
5.8 Explain the economic effect on schools and families when infl ation is running at 583,7%.
5.9 What do you think about Mr Chigwedere’s decision to close schools down becuase some schools had “trebled, quadrupled and quintupled fees since September”?
Let us now consider how infl ation affects the running of a crèche.
5.10 In what ways will infl ation affect the running of a crèche? Mention as many budget items as possible that you think will be affected by infl ation.
5.11 Will parents be prepared to pay more for school fees in a year’s time compared to what they are currently paying? Why do you say this?
5.12 Will all of the items mentioned in 5.10 increase by the same infl ationary percentage?
5.13 What are the advantages and disadvantages for the crèche of calculating the new school fees by multiplying the current fees by the annual infl ationary rate?
5.14 What problems could arise for the crèche if the fees are increased by signifi cantly more or signifi cantly less than infl ation?
5.15 In what ways do the national economy and the parents’ personal fi nancial situations affect the fees that a crèche can charge?
5.16 Can you think of any circumstances under which a crèche may decide to reduce its fees?
WORKSHEET 5
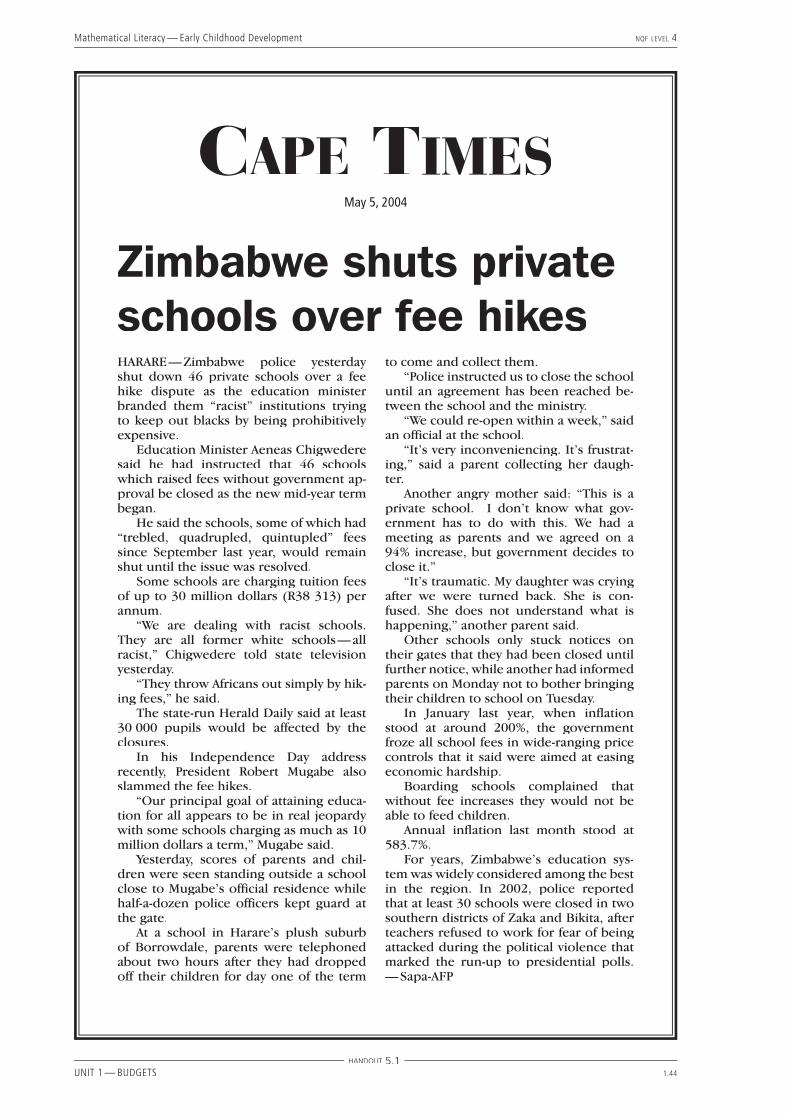
Mathematical Literacy — Early Childhood Development NQF LEVEL 4
UNIT 1 — BUDGETS 1.44
CAPE TIMESMay 5, 2004
Zimbabwe shuts private schools over fee hikesHARARE — Zimbabwe police yesterday shut down 46 private schools over a fee hike dispute as the education minister branded them “racist” institutions trying to keep out blacks by being prohibitively expensive.
Education Minister Aeneas Chigwedere said he had instructed that 46 schools which raised fees without government ap-proval be closed as the new mid-year term began.
He said the schools, some of which had “trebled, quadrupled, quintupled” fees since September last year, would remain shut until the issue was resolved.
Some schools are charging tuition fees of up to 30 million dollars (R38 313) per annum.
“We are dealing with racist schools. They are all former white schools — all racist,” Chigwedere told state television yesterday.
“They throw Africans out simply by hik-ing fees,” he said.
The state-run Herald Daily said at least 30 000 pupils would be affected by the closures.
In his Independence Day address recently, President Robert Mugabe also slammed the fee hikes.
“Our principal goal of attaining educa-tion for all appears to be in real jeopardy with some schools charging as much as 10 million dollars a term,” Mugabe said.
Yesterday, scores of parents and chil-dren were seen standing outside a school close to Mugabe’s official residence while half-a-dozen police officers kept guard at the gate.
At a school in Harare’s plush suburb of Borrowdale, parents were telephoned about two hours after they had dropped off their children for day one of the term
to come and collect them.“Police instructed us to close the school
until an agreement has been reached be-tween the school and the ministry.
“We could re-open within a week,” said an official at the school.
“It’s very inconveniencing. It’s frustrat-ing,” said a parent collecting her daugh-ter.
Another angry mother said: “This is a private school. I don’t know what gov-ernment has to do with this. We had a meeting as parents and we agreed on a 94% increase, but government decides to close it.”
“It’s traumatic. My daughter was crying after we were turned back. She is con-fused. She does not understand what is happening,” another parent said.
Other schools only stuck notices on their gates that they had been closed until further notice, while another had informed parents on Monday not to bother bringing their children to school on Tuesday.
In January last year, when inflation stood at around 200%, the government froze all school fees in wide-ranging price controls that it said were aimed at easing economic hardship.
Boarding schools complained that without fee increases they would not be able to feed children.
Annual inflation last month stood at 583.7%.
For years, Zimbabwe’s education sys-tem was widely considered among the best in the region. In 2002, police reported that at least 30 schools were closed in two southern districts of Zaka and Bikita, after teachers refused to work for fear of being attacked during the political violence that marked the run-up to presidential polls. — Sapa-AFP
HANDOUT 5.1
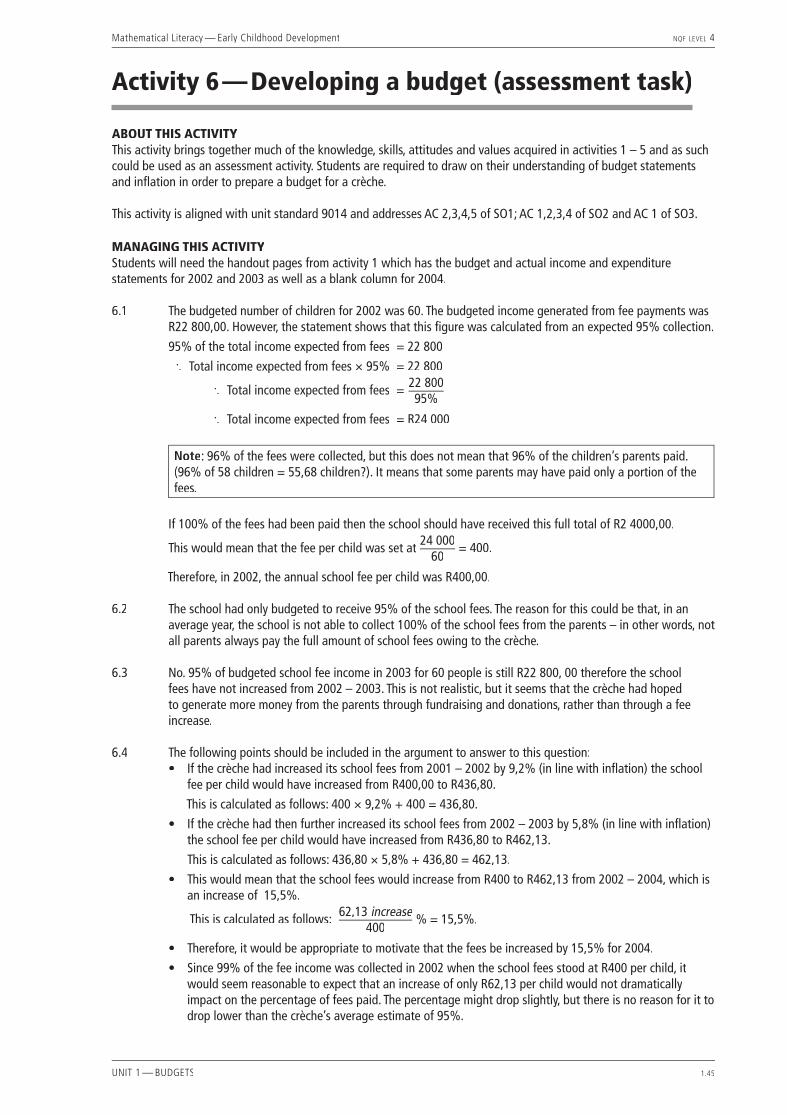
Mathematical Literacy — Early Childhood Development NQF LEVEL 4
UNIT 1 — BUDGETS 1.45
Activity 6 — Developing a budget (assessment task)
ABOUT THIS ACTIVITYThis activity brings together much of the knowledge, skills, attitudes and values acquired in activities 1 – 5 and as such could be used as an assessment activity. Students are required to draw on their understanding of budget statements and infl ation in order to prepare a budget for a crèche.
This activity is aligned with unit standard 9014 and addresses AC 2,3,4,5 of SO1; AC 1,2,3,4 of SO2 and AC 1 of SO3.
MANAGING THIS ACTIVITYStudents will need the handout pages from activity 1 which has the budget and actual income and expenditure statements for 2002 and 2003 as well as a blank column for 2004.
6.1 The budgeted number of children for 2002 was 60. The budgeted income generated from fee payments was R22 800,00. However, the statement shows that this fi gure was calculated from an expected 95% collection.
95% of the total income expected from fees = 22 800
∴ Total income expected from fees × 95% = 22 800
∴ Total income expected from fees = 22 800
95%
∴ Total income expected from fees = R24 000
Note: 96% of the fees were collected, but this does not mean that 96% of the children’s parents paid. (96% of 58 children = 55,68 children?). It means that some parents may have paid only a portion of the fees.
If 100% of the fees had been paid then the school should have received this full total of R2 4000,00.
This would mean that the fee per child was set at 24 000
60= 400.
Therefore, in 2002, the annual school fee per child was R400,00.
6.2 The school had only budgeted to receive 95% of the school fees. The reason for this could be that, in an average year, the school is not able to collect 100% of the school fees from the parents – in other words, not all parents always pay the full amount of school fees owing to the crèche.
6.3 No. 95% of budgeted school fee income in 2003 for 60 people is still R22 800, 00 therefore the school fees have not increased from 2002 – 2003. This is not realistic, but it seems that the crèche had hoped to generate more money from the parents through fundraising and donations, rather than through a fee increase.
6.4 The following points should be included in the argument to answer to this question:• If the crèche had increased its school fees from 2001 – 2002 by 9,2% (in line with infl ation) the school
fee per child would have increased from R400,00 to R436,80.
This is calculated as follows: 400 × 9,2% + 400 = 436,80.
• If the crèche had then further increased its school fees from 2002 – 2003 by 5,8% (in line with infl ation) the school fee per child would have increased from R436,80 to R462,13.
This is calculated as follows: 436,80 × 5,8% + 436,80 = 462,13.
• This would mean that the school fees would increase from R400 to R462,13 from 2002 – 2004, which is an increase of 15,5%.
This is calculated as follows:
62,13 increase400
% = 15,5%.
• Therefore, it would be appropriate to motivate that the fees be increased by 15,5% for 2004.
• Since 99% of the fee income was collected in 2002 when the school fees stood at R400 per child, it would seem reasonable to expect that an increase of only R62,13 per child would not dramatically impact on the percentage of fees paid. The percentage might drop slightly, but there is no reason for it to drop lower than the crèche’s average estimate of 95%.
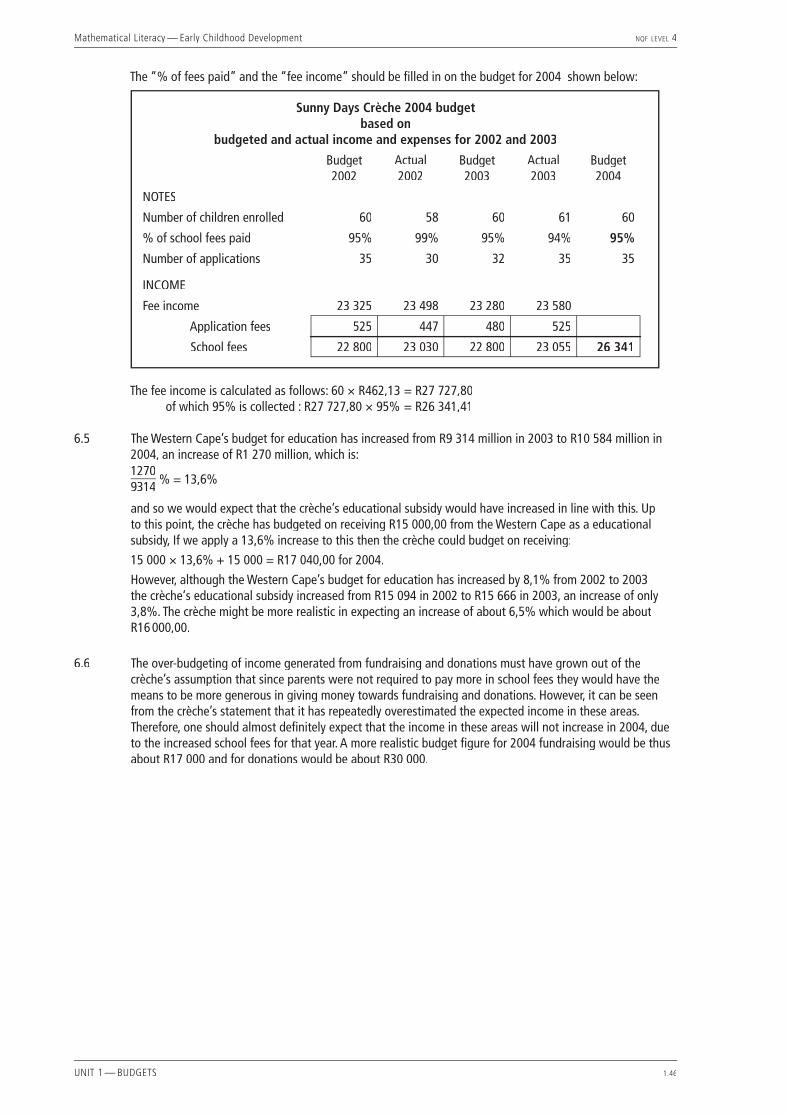
Mathematical Literacy — Early Childhood Development NQF LEVEL 4
UNIT 1 — BUDGETS 1.46
The “% of fees paid” and the “fee income” should be fi lled in on the budget for 2004 shown below:
Sunny Days Crèche 2004 budgetbased on
budgeted and actual income and expenses for 2002 and 2003
Budget2002
Actual 2002
Budget 2003
Actual 2003
Budget 2004
NOTES
Number of children enrolled 60 58 60 61 60
% of school fees paid 95% 99% 95% 94% 95%
Number of applications 35 30 32 35 35
INCOME
Fee income 23 325 23 498 23 280 23 580
Application fees 525 447 480 525
School fees 22 800 23 030 22 800 23 055 26 341
The fee income is calculated as follows: 60 × R462,13 = R27 727,80 of which 95% is collected : R27 727,80 × 95% = R26 341,41
6.5 The Western Cape’s budget for education has increased from R9 314 million in 2003 to R10 584 million in 2004, an increase of R1 270 million, which is:
12709314 % = 13,6%
and so we would expect that the crèche’s educational subsidy would have increased in line with this. Up to this point, the crèche has budgeted on receiving R15 000,00 from the Western Cape as a educational subsidy, If we apply a 13,6% increase to this then the crèche could budget on receiving:
15 000 × 13,6% + 15 000 = R17 040,00 for 2004.
However, although the Western Cape’s budget for education has increased by 8,1% from 2002 to 2003 the crèche‘s educational subsidy increased from R15 094 in 2002 to R15 666 in 2003, an increase of only 3,8%. The crèche might be more realistic in expecting an increase of about 6,5% which would be about R16 000,00.
6.6 The over-budgeting of income generated from fundraising and donations must have grown out of the crèche’s assumption that since parents were not required to pay more in school fees they would have the means to be more generous in giving money towards fundraising and donations. However, it can be seen from the crèche’s statement that it has repeatedly overestimated the expected income in these areas. Therefore, one should almost defi nitely expect that the income in these areas will not increase in 2004, due to the increased school fees for that year. A more realistic budget fi gure for 2004 fundraising would be thus about R17 000 and for donations would be about R30 000.

Mathematical Literacy — Early Childhood Development NQF LEVEL 4
UNIT 1 — BUDGETS 1.47
6.7
Sunny Days Crèche 2004 budgetbased on
budgeted and actual income and expenses for 2002 and 2003
Budget2002
Actual 2002
Budget 2003
Actual 2003
Budget 2004
NOTES
Number of children enrolled 60 58 60 61 60
% of school fees paid 95% 99% 95% 94% 95%
Number of applications 35 30 32 35 35
INCOME
Fee income 23 325 23 498 23 280 23 580 26 866
Application fees 525 447 480 525 525
School fees 22 800 23 030 22 800 23 055 26 341
Other income 64 000 60 779 69 000 67 172 69 000
Fundraising 15 000 12 898 17 000 16 545 17 000
Donations received 30 000 28 455 32 000 29 565 30 000
Hire of facilities 4 000 4 334 5 000 5 396 6 000
Subsidy (Education Department)
15 000 15 092 15 000 15 666 16 000
TOTAL INCOME 87 325 84 277 92 280 90 752 95 866
6.8 Yes, the teacher has a justifi able claim. This teacher is in a similar position to Thabita ( as discussed in activity 4). Looking at the year-on-year infl ation statistics, the teacher would be very justifi ed in claiming that she is poorer in 2002 than in 2003 because her buying power has decreased.
In addition to the infl ationary increase she could well argue that she has gained experience and is taking on more responsibility in the school, all of which warrant a signifi cant % increase in salary.
6.9
2002 2003
% expenditure spent on salaries and wages
72 99491 130 % = approx. 80%
73 63896 178 % = approx. 77%
Rate of infl ation 9,2% 5,8%
Budgeted income for 2004 was R95 866,00. If the crèche attempts to correct its seemingly unfair % of expenditure spent on salaries and wages in 2003 and aims more at an 80% spending in this area for 2004, then this would amount to R76 692,80 (calculated as follows: R95 866,00 × 80% ).
However, we are not sure how many people the crèche employs and we remember from activity 4 that a person given a gross increase of 10% would only bank an increase (net increase) of about 8% . These are all factors for the crèche to take into account.
If we consider the infl ationary effect over the past two years as being approximately 7,5%, then we would hope that the crèche would also try to ensure that its budgeted fi gure for salaries and wages in 2004 was at least 7,5% up on that of 2003. This would be R79 160,85 (calculated as follows: 73 638 × 7,5% +73 638).
With all of this taken into account, a reasonable motivation would be for the crèche to budget to spend between R76 000 – R80 000 on salaries and wages for 2004.
6.10 2002 2003
Expenditure on repairs of fridge and stove
R3 992 × 80% = R3 193,60 R7 311× 80% = R5 848,80
Therefore over the last 2 years they have spent on average about R4000 each year on repairs and maintenance of the fridge and stove.
To avoid having to incur this expense each year, it would be sensible to allocate money in the budget to purchase new fridge and stove.
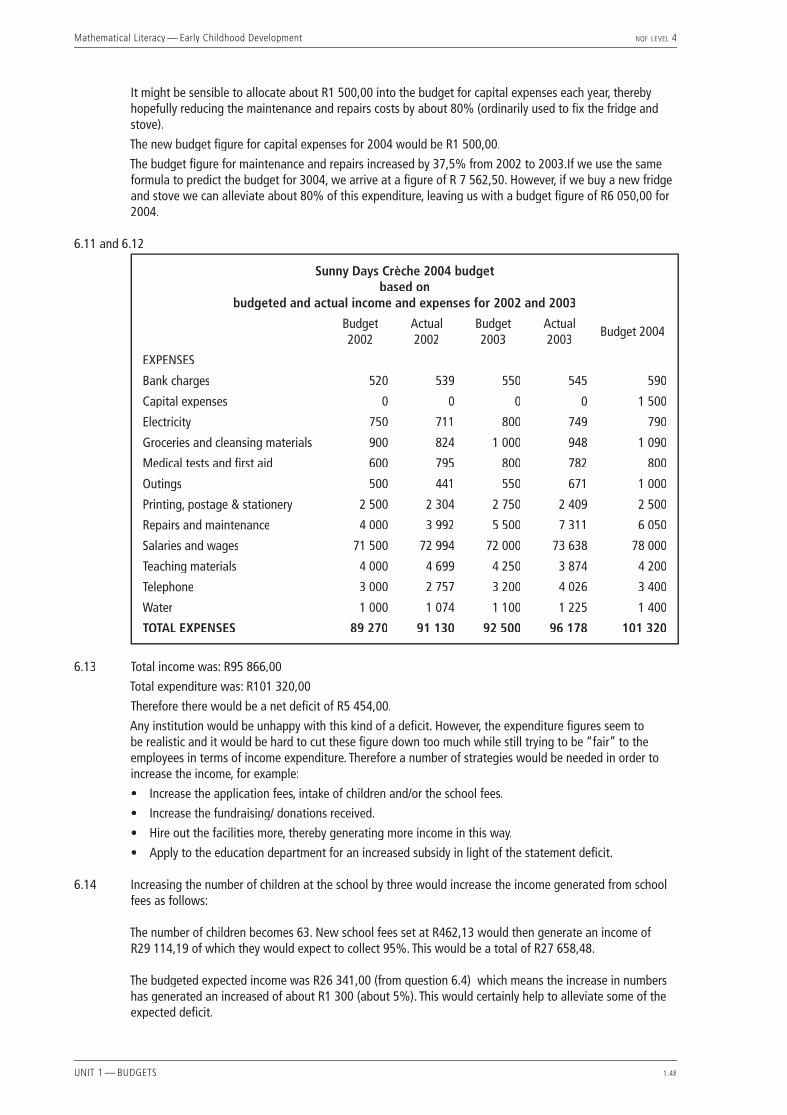
Mathematical Literacy — Early Childhood Development NQF LEVEL 4
UNIT 1 — BUDGETS 1.48
It might be sensible to allocate about R1 500,00 into the budget for capital expenses each year, thereby hopefully reducing the maintenance and repairs costs by about 80% (ordinarily used to fi x the fridge and stove).
The new budget fi gure for capital expenses for 2004 would be R1 500,00.
The budget fi gure for maintenance and repairs increased by 37,5% from 2002 to 2003.If we use the same formula to predict the budget for 3004, we arrive at a fi gure of R 7 562,50. However, if we buy a new fridge and stove we can alleviate about 80% of this expenditure, leaving us with a budget fi gure of R6 050,00 for 2004.
6.11 and 6.12
Sunny Days Crèche 2004 budgetbased on
budgeted and actual income and expenses for 2002 and 2003
Budget2002
Actual 2002
Budget 2003
Actual 2003
Budget 2004
EXPENSES
Bank charges 520 539 550 545 590
Capital expenses 0 0 0 0 1 500
Electricity 750 711 800 749 790
Groceries and cleansing materials 900 824 1 000 948 1 090
Medical tests and fi rst aid 600 795 800 782 800
Outings 500 441 550 671 1 000
Printing, postage & stationery 2 500 2 304 2 750 2 409 2 500
Repairs and maintenance 4 000 3 992 5 500 7 311 6 050
Salaries and wages 71 500 72 994 72 000 73 638 78 000
Teaching materials 4 000 4 699 4 250 3 874 4 200
Telephone 3 000 2 757 3 200 4 026 3 400
Water 1 000 1 074 1 100 1 225 1 400
TOTAL EXPENSES 89 270 91 130 92 500 96 178 101 320
6.13 Total income was: R95 866,00
Total expenditure was: R101 320,00
Therefore there would be a net defi cit of R5 454,00.
Any institution would be unhappy with this kind of a defi cit. However, the expenditure fi gures seem to be realistic and it would be hard to cut these fi gure down too much while still trying to be “fair” to the employees in terms of income expenditure. Therefore a number of strategies would be needed in order to increase the income, for example:
• Increase the application fees, intake of children and/or the school fees.
• Increase the fundraising/ donations received.
• Hire out the facilities more, thereby generating more income in this way.
• Apply to the education department for an increased subsidy in light of the statement defi cit.
6.14 Increasing the number of children at the school by three would increase the income generated from school fees as follows:
The number of children becomes 63. New school fees set at R462,13 would then generate an income of R29 114,19 of which they would expect to collect 95%. This would be a total of R27 658,48.
The budgeted expected income was R26 341,00 (from question 6.4) which means the increase in numbers has generated an increased of about R1 300 (about 5%). This would certainly help to alleviate some of the expected defi cit.
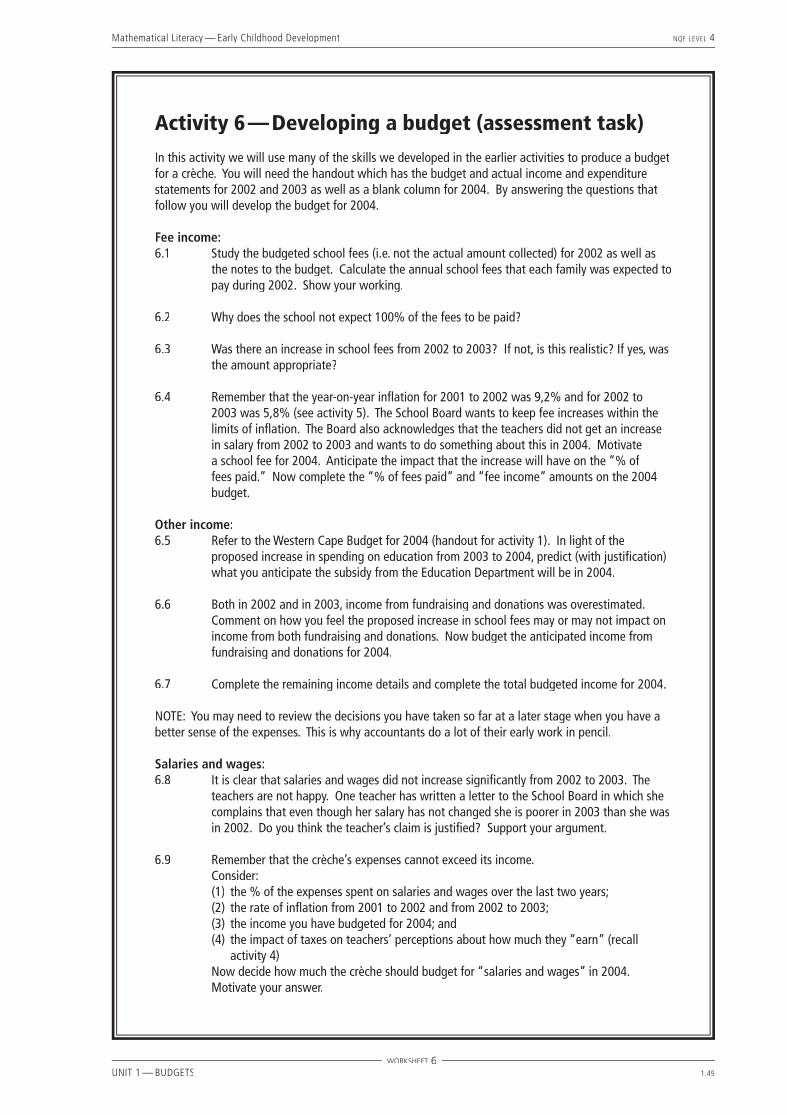
Mathematical Literacy — Early Childhood Development NQF LEVEL 4
UNIT 1 — BUDGETS 1.49
Activity 6 — Developing a budget (assessment task)
In this activity we will use many of the skills we developed in the earlier activities to produce a budget for a crèche. You will need the handout which has the budget and actual income and expenditure statements for 2002 and 2003 as well as a blank column for 2004. By answering the questions that follow you will develop the budget for 2004.
Fee income:6.1 Study the budgeted school fees (i.e. not the actual amount collected) for 2002 as well as
the notes to the budget. Calculate the annual school fees that each family was expected to pay during 2002. Show your working.
6.2 Why does the school not expect 100% of the fees to be paid?
6.3 Was there an increase in school fees from 2002 to 2003? If not, is this realistic? If yes, was the amount appropriate?
6.4 Remember that the year-on-year infl ation for 2001 to 2002 was 9,2% and for 2002 to 2003 was 5,8% (see activity 5). The School Board wants to keep fee increases within the limits of infl ation. The Board also acknowledges that the teachers did not get an increase in salary from 2002 to 2003 and wants to do something about this in 2004. Motivate a school fee for 2004. Anticipate the impact that the increase will have on the “% of fees paid.” Now complete the “% of fees paid” and “fee income” amounts on the 2004 budget.
Other income:6.5 Refer to the Western Cape Budget for 2004 (handout for activity 1). In light of the
proposed increase in spending on education from 2003 to 2004, predict (with justifi cation) what you anticipate the subsidy from the Education Department will be in 2004.
6.6 Both in 2002 and in 2003, income from fundraising and donations was overestimated. Comment on how you feel the proposed increase in school fees may or may not impact on income from both fundraising and donations. Now budget the anticipated income from fundraising and donations for 2004.
6.7 Complete the remaining income details and complete the total budgeted income for 2004.
NOTE: You may need to review the decisions you have taken so far at a later stage when you have a better sense of the expenses. This is why accountants do a lot of their early work in pencil.
Salaries and wages:6.8 It is clear that salaries and wages did not increase signifi cantly from 2002 to 2003. The
teachers are not happy. One teacher has written a letter to the School Board in which she complains that even though her salary has not changed she is poorer in 2003 than she was in 2002. Do you think the teacher’s claim is justifi ed? Support your argument.
6.9 Remember that the crèche’s expenses cannot exceed its income. Consider:
(1) the % of the expenses spent on salaries and wages over the last two years; (2) the rate of infl ation from 2001 to 2002 and from 2002 to 2003; (3) the income you have budgeted for 2004; and (4) the impact of taxes on teachers’ perceptions about how much they “earn” (recall
activity 4) Now decide how much the crèche should budget for “salaries and wages” in 2004. Motivate your answer.
WORKSHEET 6
Mathematical Literacy — Early Childhood Development NQF LEVEL 4
UNIT 1 — BUDGETS 1.50
Other expenses:6.10 You will notice that after salaries, the next largest expense in 2003 was on repairs and
maintenance. Having looked back at the actual invoices posted against repairs and maintenance in 2003, you notice that more than 80% of this amount was spent on repairs to the stove and the fridge. It has been proposed that instead of spending the amount on repairing the stove and fridge again, it might be best to buy new ones. Consider this proposal and budget an amount for each of repairs and maintenance and capital expenses (money to put towards a new stove and fridge—you will revisit this in activity 7).
6.11 The remaining signifi cant expenses for the recent years are: printing, postage and stationery; teaching materials; and telephone. By studying the trend in budgeted and actual expenditure from 2002 to 2003 determine budgeted fi gures for each item for 2004.
6.12 Complete the remaining expenditure details and complete the total budgeted expenditure for 2004.
Balancing the budget:6.13 You need to check that the budgeted expenses do not exceed the budgeted income
for 2004. Determine the net surplus (defi cit) for your budget. Are you happy with the anticipated surplus or defi cit? If yes, argue why. If no, propose changes you can make to the budget to address your concern.
6.14 Would it help the budget to increase the number of children in the school by two or three? Discuss.
WORKSHEET 6
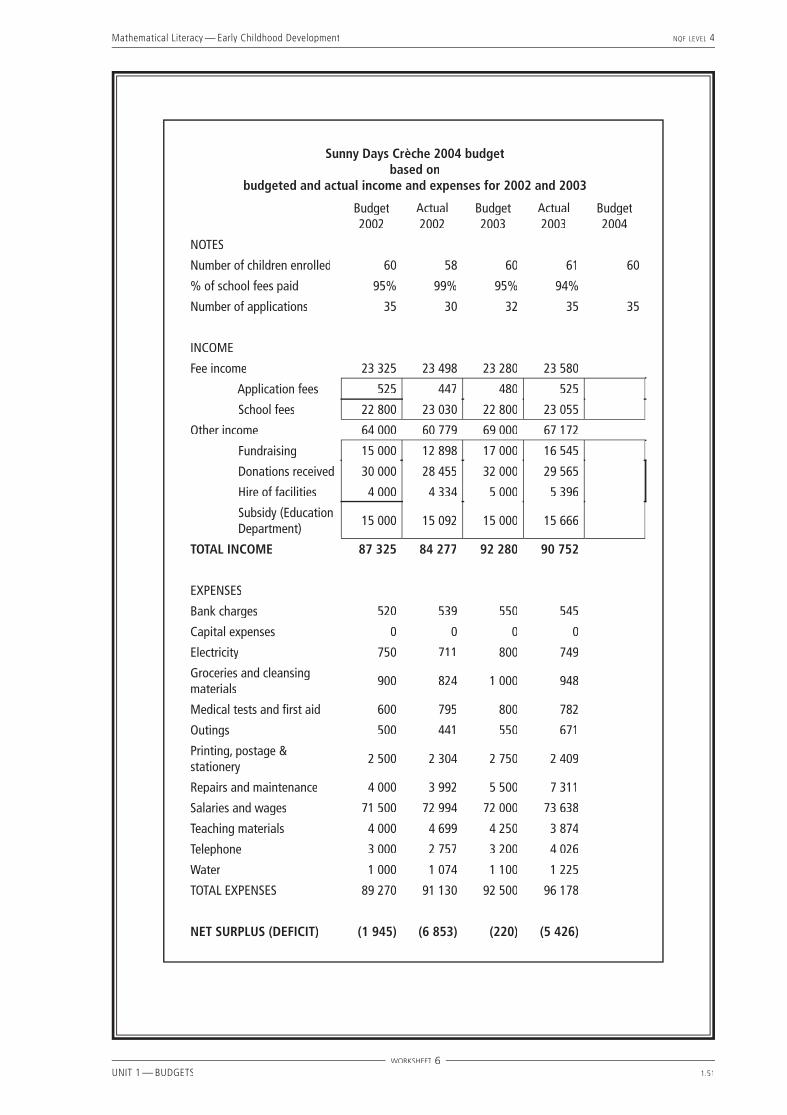
Mathematical Literacy — Early Childhood Development NQF LEVEL 4
UNIT 1 — BUDGETS 1.51
Sunny Days Crèche 2004 budgetbased on
budgeted and actual income and expenses for 2002 and 2003
Budget2002
Actual 2002
Budget 2003
Actual 2003
Budget 2004
NOTES
Number of children enrolled 60 58 60 61 60
% of school fees paid 95% 99% 95% 94%
Number of applications 35 30 32 35 35
INCOME
Fee income 23 325 23 498 23 280 23 580
Application fees 525 447 480 525
School fees 22 800 23 030 22 800 23 055
Other income 64 000 60 779 69 000 67 172
Fundraising 15 000 12 898 17 000 16 545
Donations received 30 000 28 455 32 000 29 565
Hire of facilities 4 000 4 334 5 000 5 396
Subsidy (Education Department)
15 000 15 092 15 000 15 666
TOTAL INCOME 87 325 84 277 92 280 90 752
EXPENSES
Bank charges 520 539 550 545
Capital expenses 0 0 0 0
Electricity 750 711 800 749
Groceries and cleansing materials
900 824 1 000 948
Medical tests and fi rst aid 600 795 800 782
Outings 500 441 550 671
Printing, postage & stationery
2 500 2 304 2 750 2 409
Repairs and maintenance 4 000 3 992 5 500 7 311
Salaries and wages 71 500 72 994 72 000 73 638
Teaching materials 4 000 4 699 4 250 3 874
Telephone 3 000 2 757 3 200 4 026
Water 1 000 1 074 1 100 1 225
TOTAL EXPENSES 89 270 91 130 92 500 96 178
NET SURPLUS (DEFICIT) (1 945) (6 853) (220) (5 426)
WORKSHEET 6

Mathematical Literacy — Early Childhood Development NQF LEVEL 4
UNIT 1 — BUDGETS 1.52
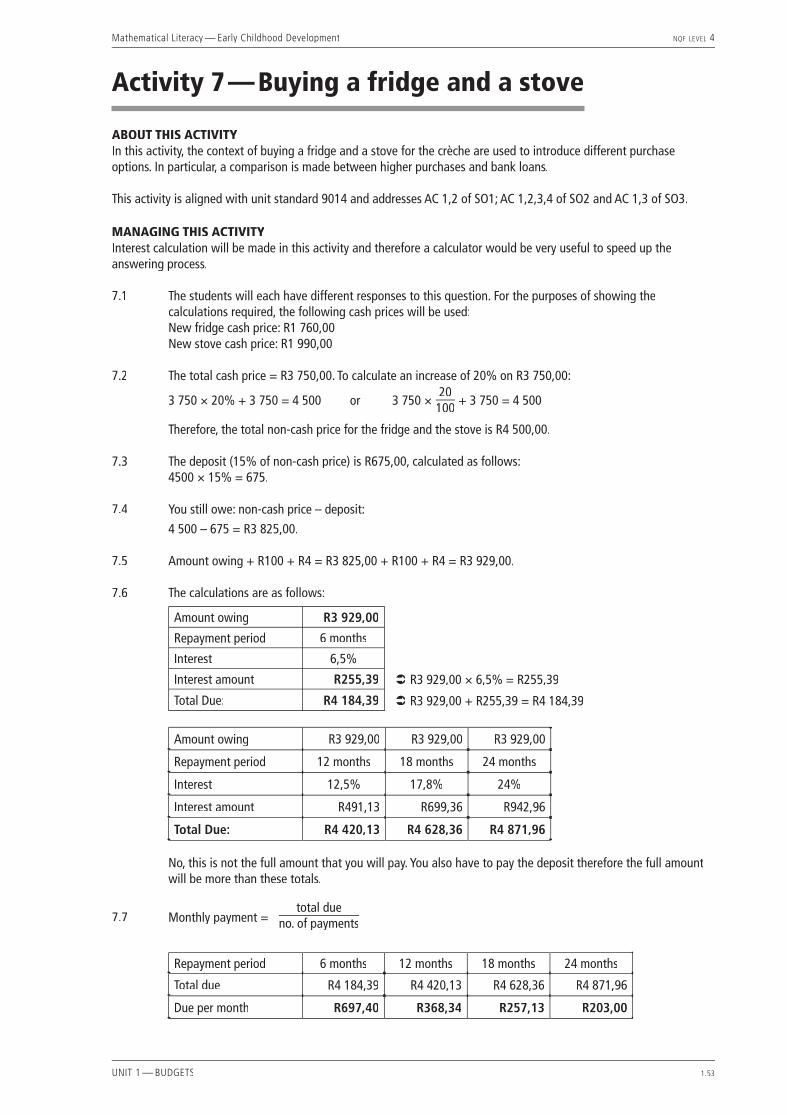
Mathematical Literacy — Early Childhood Development NQF LEVEL 4
UNIT 1 — BUDGETS 1.53
Activity 7 — Buying a fridge and a stove
ABOUT THIS ACTIVITYIn this activity, the context of buying a fridge and a stove for the crèche are used to introduce different purchase options. In particular, a comparison is made between higher purchases and bank loans.
This activity is aligned with unit standard 9014 and addresses AC 1,2 of SO1; AC 1,2,3,4 of SO2 and AC 1,3 of SO3.
MANAGING THIS ACTIVITYInterest calculation will be made in this activity and therefore a calculator would be very useful to speed up the answering process.
7.1 The students will each have different responses to this question. For the purposes of showing the calculations required, the following cash prices will be used:
New fridge cash price: R1 760,00 New stove cash price: R1 990,00
7.2 The total cash price = R3 750,00. To calculate an increase of 20% on R3 750,00:
3 750 × 20% + 3 750 = 4 500 or 3 750 ×
20100 + 3 750 = 4 500
Therefore, the total non-cash price for the fridge and the stove is R4 500,00.
7.3 The deposit (15% of non-cash price) is R675,00, calculated as follows: 4500 × 15% = 675.
7.4 You still owe: non-cash price – deposit:
4 500 – 675 = R3 825,00.
7.5 Amount owing + R100 + R4 = R3 825,00 + R100 + R4 = R3 929,00.
7.6 The calculations are as follows:
Amount owing R3 929,00
Repayment period 6 months
Interest 6,5%
Interest amount R255,39 Ü R3 929,00 × 6,5% = R255,39
Ü R3 929,00 + R255,39 = R4 184,39Total Due: R4 184,39
Amount owing R3 929,00 R3 929,00 R3 929,00
Repayment period 12 months 18 months 24 months
Interest 12,5% 17,8% 24%
Interest amount R491,13 R699,36 R942,96
Total Due: R4 420,13 R4 628,36 R4 871,96 No, this is not the full amount that you will pay. You also have to pay the deposit therefore the full amount
will be more than these totals.
7.7 Monthly payment =
total dueno. of payments
Repayment period 6 months 12 months 18 months 24 months
Total due R4 184,39 R4 420,13 R4 628,36 R4 871,96
Due per month R697,40 R368,34 R257,13 R203,00

Mathematical Literacy — Early Childhood Development NQF LEVEL 4
UNIT 1 — BUDGETS 1.54
7.8
Repayment period 6 months 12 months 18 months 24 months
Total due R4 184,39 R4 420,13 R4 628,36 R4 871,96
+ Deposit R675 R675 R675 R675
Total cost R4 859,39 R5 095,13 R5 303,36 R5 546,96
– original cash price R3 750,00
Extra Paid R1 109,39 R1 345,13 R1 553,36 R1 796,96 Therefore you have to pay this much more for each of the payment plans.
7.9 Students are required to compare the deposit, calculated in question 7.3 and the monthly payment amounts, calculated in question 7.7, with the advertised monthly payment amounts listed in their advertisement.
Any of the following responses could be given:• The deposit in the advert is less/more than 15% (as we calculated it).• The monthly payments we calculated are less/more than those in the advert.• The non-cash price in the advert is less/more than 20% (as we calculated it).
7.10 For the purpose of showing the calculations, assume that the cash price was R 4000,00.
7.11 Minimum monthly repayment =4 000
40 = R100,00.
7.12 This table is drawn up as an example based on a cash price of R 4 000,00 and monthly repayment of
R710,00, and an interest rate of 21% per annum (this amount will change from time to time).
Previously outstanding total + interest:4 000,00 + 70,00 = 4 070,00
Interest on outstanding
balanceOutstanding total Payment
Remaining balance
Start of loan period 0,00 4 000,00 0,00 4 000,00
End of 1st month 70,00 4 070,00 710,00 3360,00
End of 2nd month 58,80 3 418,80 710,00 2 708,80
End of 3rd month 47,40 2 756,20 710,00 2 046,20
End of 4th month 35,81 2 082,01 710,00 1 372,01
End of 5th month 24,01 1 396,02 710,00 686,02
End of 6th month 12,01 698,03 698,03 0.00
Total paid to the bank 4 248,03
Since the interest rate is quoted per annum but the interest is calculated monthly, the monthly interest rate is 21%12 = 1,75% and: 4000 × 1,75% = 70.
or 4000 ×
1,75100
= 70
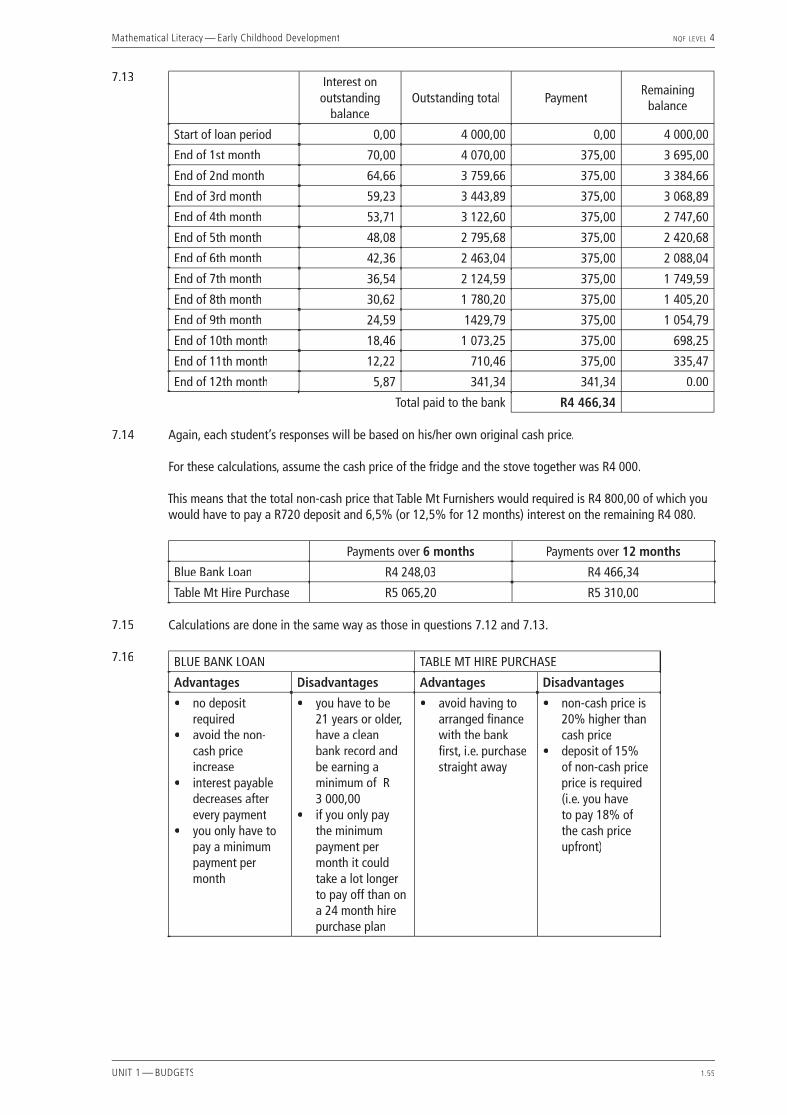
Mathematical Literacy — Early Childhood Development NQF LEVEL 4
UNIT 1 — BUDGETS 1.55
7.13 Interest on outstanding
balanceOutstanding total Payment
Remaining balance
Start of loan period 0,00 4 000,00 0,00 4 000,00
End of 1st month 70,00 4 070,00 375,00 3 695,00
End of 2nd month 64,66 3 759,66 375,00 3 384,66
End of 3rd month 59,23 3 443,89 375,00 3 068,89
End of 4th month 53,71 3 122,60 375,00 2 747,60
End of 5th month 48,08 2 795,68 375,00 2 420,68
End of 6th month 42,36 2 463,04 375,00 2 088,04
End of 7th month 36,54 2 124,59 375,00 1 749,59
End of 8th month 30,62 1 780,20 375,00 1 405,20
End of 9th month 24,59 1429,79 375,00 1 054,79
End of 10th month 18,46 1 073,25 375,00 698,25
End of 11th month 12,22 710,46 375,00 335,47
End of 12th month 5,87 341,34 341,34 0.00
Total paid to the bank R4 466,34
7.14 Again, each student’s responses will be based on his/her own original cash price.
For these calculations, assume the cash price of the fridge and the stove together was R4 000.
This means that the total non-cash price that Table Mt Furnishers would required is R4 800,00 of which you would have to pay a R720 deposit and 6,5% (or 12,5% for 12 months) interest on the remaining R4 080.
Payments over 6 months Payments over 12 months
Blue Bank Loan R4 248,03 R4 466,34
Table Mt Hire Purchase R5 065,20 R5 310,00
7.15 Calculations are done in the same way as those in questions 7.12 and 7.13.
7.16
BLUE BANK LOAN TABLE MT HIRE PURCHASE
Advantages Disadvantages Advantages Disadvantages
• no deposit required
• avoid the non-cash price increase
• interest payable decreases after every payment
• you only have to pay a minimum payment per month
• you have to be 21 years or older, have a clean bank record and be earning a minimum of R 3 000,00
• if you only pay the minimum payment per month it could take a lot longer to pay off than on a 24 month hire purchase plan
• avoid having to arranged fi nance with the bank fi rst, i.e. purchase straight away
• non-cash price is 20% higher than cash price
• deposit of 15% of non-cash price price is required (i.e. you have to pay 18% of the cash price upfront)

Mathematical Literacy — Early Childhood Development NQF LEVEL 4
UNIT 1 — BUDGETS 1.56
Mathematical Literacy — Early Childhood Development NQF LEVEL 4
UNIT 1 — BUDGETS 1.57
Activity 7 — Buying a fridge and a stoveSometimes we are unable to pay for the things we want to buy because we simply do not have the full amount in cash.
When purchasing a house, for example, very few people have suffi cient money to be able to pay the full amount in cash. They need to borrow money from the bank in order to pay the purchase price of the house. An agreement will need to be reached between the purchaser and the bank as to how much money is going to be borrowed, how long the borrower has to pay it back, what the interest rate is going to be and what the monthly payments will be. The agreed repayment period for purchasing a house is usually between 20 and 30 years.
When purchasing items from a furniture or home appliance store the repayment period is likely to be shorter, often no more than 24 months.
Consider the following scenario:The crèche has decided to buy a new fridge and a new stove for the crèche kitchen. If we look at the crèche’s budget for the year it is clear that there is not enough money to pay cash for the fridge and stove. Let us explore two options: (1) you pay the furniture store for the fridge and stove over a period of time, or (2) you take a loan with the bank.
7.1 Look through the newspaper for advertisements for brand-new stoves and fridges. Choose a stove and a fridge that you think you would like to buy for your crèche and determine what the cash price is of the two items.
Buying over 24 months from the furniture storeThe questions that follow are based on actual information supplied by a furniture store in Cape Town—let us call the store Table Mountain Furnishers. To determine what the monthly repayments will be for your purchase you need to do the following:
7.2 Step 1: Determine the non-cash price of the item(s). Because you will not be paying cash, Table Mountain Furnishers adds 20% to the cash price. Calculate the non-cash price for the items you have selected.
7.3 Step 2: Determine the deposit you must pay. Table Mountain Furnishers expects you to pay a deposit of 15% of the non-cash price. How much deposit must you pay?
7.4 Step 3: Calculate the outstanding amount. How much do you still owe for the items once you have paid the deposit?
7.5 Step 4: Add standard costs. Before calculating the monthly repayment, Table Mountain Furnishers adds some standard costs to the amount still owing. They add a R100 delivery charge and R4 for stamp duty (on the contract you are about to enter into) to the amount you still owe. What is the total you now owe?
7.6 Step 5: Calculate the interest. Table Mountain Furnishers now add a percentage to the amount owing. They call this interest. The percentage is dependent on the number of months over which you plan to pay for the items. The table below lists the different percentages (these will change from time to time):
Repayment period 6 months 12 months 18 months 24 months
Interest 6,5% 12,5% 17,8% 24% Calculate the interest amount you owe for each of the different repayment periods and add this to the amount you owe. Is this is the full amount you will pay?
WORKSHEET 7
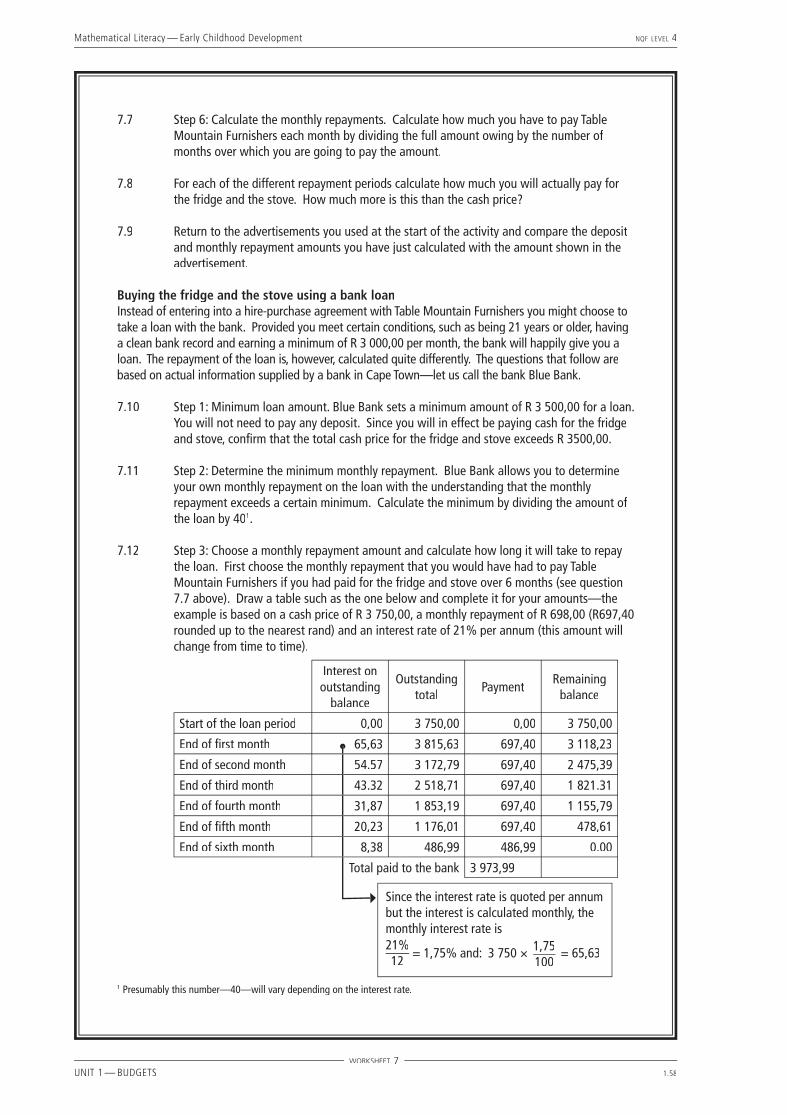
Mathematical Literacy — Early Childhood Development NQF LEVEL 4
UNIT 1 — BUDGETS 1.58
7.7 Step 6: Calculate the monthly repayments. Calculate how much you have to pay Table Mountain Furnishers each month by dividing the full amount owing by the number of months over which you are going to pay the amount.
7.8 For each of the different repayment periods calculate how much you will actually pay for the fridge and the stove. How much more is this than the cash price?
7.9 Return to the advertisements you used at the start of the activity and compare the deposit and monthly repayment amounts you have just calculated with the amount shown in the advertisement.
Buying the fridge and the stove using a bank loanInstead of entering into a hire-purchase agreement with Table Mountain Furnishers you might choose to take a loan with the bank. Provided you meet certain conditions, such as being 21 years or older, having a clean bank record and earning a minimum of R 3 000,00 per month, the bank will happily give you a loan. The repayment of the loan is, however, calculated quite differently. The questions that follow are based on actual information supplied by a bank in Cape Town—let us call the bank Blue Bank.
7.10 Step 1: Minimum loan amount. Blue Bank sets a minimum amount of R 3 500,00 for a loan. You will not need to pay any deposit. Since you will in effect be paying cash for the fridge and stove, confi rm that the total cash price for the fridge and stove exceeds R 3500,00.
7.11 Step 2: Determine the minimum monthly repayment. Blue Bank allows you to determine your own monthly repayment on the loan with the understanding that the monthly repayment exceeds a certain minimum. Calculate the minimum by dividing the amount of the loan by 401.
7.12 Step 3: Choose a monthly repayment amount and calculate how long it will take to repay the loan. First choose the monthly repayment that you would have had to pay Table Mountain Furnishers if you had paid for the fridge and stove over 6 months (see question 7.7 above). Draw a table such as the one below and complete it for your amounts—the example is based on a cash price of R 3 750,00, a monthly repayment of R 698,00 (R697,40 rounded up to the nearest rand) and an interest rate of 21% per annum (this amount will change from time to time).
Interest on outstanding
balance
Outstanding total
PaymentRemaining
balance
Start of the loan period 0,00 3 750,00 0,00 3 750,00
End of fi rst month 65,63 3 815,63 697,40 3 118,23
End of second month 54.57 3 172,79 697,40 2 475,39
End of third month 43.32 2 518,71 697,40 1 821.31
End of fourth month 31,87 1 853,19 697,40 1 155,79
End of fi fth month 20,23 1 176,01 697,40 478,61
End of sixth month 8,38 486,99 486,99 0.00
Total paid to the bank 3 973,99
Since the interest rate is quoted per annum but the interest is calculated monthly, the monthly interest rate is 21%12
= 1,75% and: 3 750 × 1,75100
= 65,63
1 Presumably this number—40—will vary depending on the interest rate.
WORKSHEET 7
Mathematical Literacy — Early Childhood Development NQF LEVEL 4
UNIT 1 — BUDGETS 1.59
7.13 Create a table such as the one above for the cash price of your items but this time using the monthly repayment amount if you had paid for the items over 12 months.
7.14 Compare the total amount you would pay for the fridge and stove if you bought them through Table Mountain Furnishers with the amount if you bought them through a loan from the bank, for both the 6 and 12 month periods.
7.15 You could repeat the calculations above for the 18 and 24 month amounts as well. However, you may fi nd that this takes a lot of calculations and a lot of time. If you can use a spreadsheet, you may want to try to use a spreadsheet for these calculations.
7.16 List the advantages and disadvantages of the two ways of fi nancing the purchase.
WORKSHEET 7

Mathematical Literacy — Early Childhood Development NQF LEVEL 4
UNIT 1 — BUDGETS 1.60
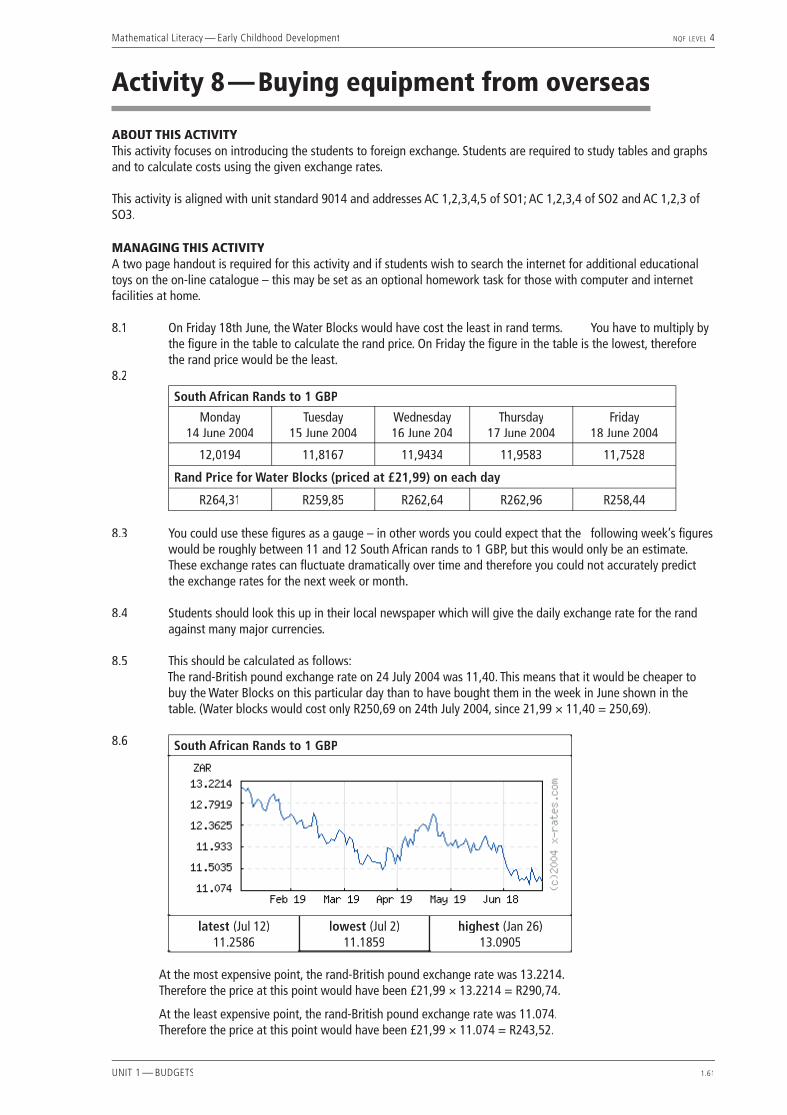
Mathematical Literacy — Early Childhood Development NQF LEVEL 4
UNIT 1 — BUDGETS 1.61
Activity 8 — Buying equipment from overseas
ABOUT THIS ACTIVITYThis activity focuses on introducing the students to foreign exchange. Students are required to study tables and graphs and to calculate costs using the given exchange rates.
This activity is aligned with unit standard 9014 and addresses AC 1,2,3,4,5 of SO1; AC 1,2,3,4 of SO2 and AC 1,2,3 of SO3.
MANAGING THIS ACTIVITYA two page handout is required for this activity and if students wish to search the internet for additional educational toys on the on-line catalogue – this may be set as an optional homework task for those with computer and internet facilities at home.
8.1 On Friday 18th June, the Water Blocks would have cost the least in rand terms. You have to multiply by the fi gure in the table to calculate the rand price. On Friday the fi gure in the table is the lowest, therefore the rand price would be the least.
8.2
South African Rands to 1 GBP
Monday14 June 2004
Tuesday15 June 2004
Wednesday16 June 204
Thursday17 June 2004
Friday18 June 2004
12,0194 11,8167 11,9434 11,9583 11,7528
Rand Price for Water Blocks (priced at £21,99) on each day
R264,31 R259,85 R262,64 R262,96 R258,44
8.3 You could use these fi gures as a gauge – in other words you could expect that the following week’s fi gures would be roughly between 11 and 12 South African rands to 1 GBP, but this would only be an estimate. These exchange rates can fl uctuate dramatically over time and therefore you could not accurately predict the exchange rates for the next week or month.
8.4 Students should look this up in their local newspaper which will give the daily exchange rate for the rand against many major currencies.
8.5 This should be calculated as follows: The rand-British pound exchange rate on 24 July 2004 was 11,40. This means that it would be cheaper to
buy the Water Blocks on this particular day than to have bought them in the week in June shown in the table. (Water blocks would cost only R250,69 on 24th July 2004, since 21,99 × 11,40 = 250,69).
8.6 South African Rands to 1 GBP
latest (Jul 12)11.2586
lowest (Jul 2)11.1859
highest (Jan 26)13.0905
At the most expensive point, the rand-British pound exchange rate was 13.2214. Therefore the price at this point would have been £21,99 × 13.2214 = R290,74.
At the least expensive point, the rand-British pound exchange rate was 11.074.Therefore the price at this point would have been £21,99 × 11.074 = R243,52.

Mathematical Literacy — Early Childhood Development NQF LEVEL 4
UNIT 1 — BUDGETS 1.62
8.7
Item Water blocks Jumbo beads and cards Rainbow sound blocks
Weight (in kg) 1,33kg 1,53kg 1,1kg
Weight (in g) 1330g 1530g 1100g
Mailing cost £5,89 £6,73 £4,84
8.8
Item Water blocks Jumbo beads and Cards
Rainbow sound locks
All
Purchase cost £21,99 £25,99 £19,99 £67,97
Mailing cost £5,89 £6,73 £4,84 £17,46
Total (in £) £27,88 £32,72 £24,83 £85,43
Total (in R) ( × 11.2588) R313,90 R368,39 R279,56 R961,84
1,5% of R total R4,71 R5,53 R4,19 R14,43
Fee R85,00 R85,00 R85,00 R85,00
Bank Charges R89,71 R90,53 R89,19 R99,42
8.8.1 Bank charge for the Water blocks only = R89,71.8.8.2 Bank charge for the Jumbo beads and cards only = R90,53.8.8.3 Bank charge for the Rainbow sound blocks only = R89,19.8.8.4 Bank charge for buying all three of the items at the same time = R99,42.
8.9 Since it would be far more economical to purchase all three items at once this should be the preference.
8.10
If the exchange rate is R11 to the Pound If the exchange rate is R13 to the Pound
Total purchase cost £203,91 Total purchase cost £203,91
Total mailing cost £52,38 Total mailing cost £52,38
Total (in £) £256,29 Total (in £) £256,29
Total (in R) ( × 13) R2819,19 Total (in R) ( × 11) R3331,77
1,5% of R total R42,29 1,5% of R total R49,98
Fee R85,00 Fee R85,00
Bank charges R127,29 Bank charges R134,98
Total expense(Total in R + Bank charge)
R2946,47 Total expense(Total in R + Bank charge)
R3466,75
Provided that the rand-British pound exchange rate stays between R11 and R13 to the pound, then the least they should expect to pay is R2946,47 and the most they should expect to pay is R3466,75. Therefore they should budget for the highest amount (R3466,75), hopefully ensuring that they will be able to afford to make the purchase.

Mathematical Literacy — Early Childhood Development NQF LEVEL 4
UNIT 1 — BUDGETS 1.63
Activity 8 — Buying equipment from overseasOccasionally some specialised equipment for your crèche may not be available in South Africa. It might even be possible to purchase the equipment more economically from overseas. In order to make the purchase from overseas you will have to convert South African rands to the currency of the country from which you are buying in order to pay for the equipment.
Consider the following scenario:Your crèche wants to buy some educational toys for the children with special needs. After searching the internet you fi nd some toys that are ideal on the website of Philip and Tacey a UK-based company (www.philipandtacey.co.uk). Three of the toys, as well as their descriptions and prices, are shown on the handout attached. You may wish to go to the on-line catalogue to look for more or other examples.
We start out by considering the Water Blocks (product number: B12017)
8.1 Refer to the table below which gives the Rand-British Pound exchange rate for each day of the week starting Monday 14 June. On which day would the Water Blocks have cost the least in rand terms?
South African Rands to 1 GBP
Monday14 June 2004
Tuesday15 June 2004
Wednesday16 June 204
Thursday17 June 2004
Friday18 June 2004
12,0194 11,8167 11,9434 11,9583 11,7528
Data sourced at: http://www.x-rates.com (July 2004)
8.2 Calculate the cost, in rands, of the Water Blocks on each of the days of the week. Do your answers support your answer to question 8.1?
8.3 The exchange rates in the table are for a particular week in June. Can you use these rates to predict the exchange rates for each of the days of the next week? Can you use these rates to predict the exchange rates for each of the days of the next month?
8.4 What is the current rand-British pound exchange rate? You should look this up in your local newspaper which will give the daily exchange rate for the rand against many major currencies.
8.5 Is it more or less expensive to purchase the Water Blocks now compared to the week in June?
8.6 South African Rands to 1 GBP
latest (Jul 12)11.2586
lowest (Jul 2)11.1859
highest (Jan 26)13.0905
WORKSHEET 8

Mathematical Literacy — Early Childhood Development NQF LEVEL 4
UNIT 1 — BUDGETS 1.64
8.6 Refer to the graph above (sourced at http://www.x-rates.com) and determine the most and least that you would have paid for a set of Water Blocks during the fi rst half of 2004.
Postage: We now consider what it would cost for Philip and Tacey to send three different products to you by surface mail. In reality, they may use a shipping company but for the purpose of this activity we will assume they use Royal Mail.
The weight of the three items in the handout is: Water Blocks: 1,33kg; Water Blocks: 1,33kg; Water Blocks Jumbo Beads and Cards: 1,53kg; and Rainbow Sound Blocks: 1,1kg.Rainbow Sound Blocks: 1,1kg.Rainbow Sound Blocks
8.7 Refer to the Royal Mail cost table for small packets on the handout and determine what it would cost (in British pounds) to mail each of the items individually.
Bank charges: To make the international payment into the Philip and Tacey’s bank account, your local bank charges R85 plus 1,5% of the value of the amount transferred.
8.8 Assume an exchange rate of R 11,2586 : GBP 1,00. Calculate the bank charges for each of the following:
8.8.1 You only buy the Water Blocks (include postage costs). 8.8.2 You only buy the Jumbo Beads and Cards (include postage costs).8.8.3 You only buy the Rainbow Sound Blocks (include postage costs).8.8.4 You buy all three of the items at the same time (include postage costs—assume each item
is mailed separately).
8.9 In light of the answers above, would you prefer to buy all three of the items at once or would you prefer to buy them individually?
Scenario
8.10 You and two other crèches decide to each buy one of each of the items—i.e. three of each item. You decide to buy these together in order to be able to reduce the bank charges and possibly use a bank loan to pay for the purchase (refer to activity 7). Taking in account fl uctuations in the exchange rate develop a budget for making this purchase. Your budget should show the least you expect to pay and the most you expect to pay for the items.
WORKSHEET 8
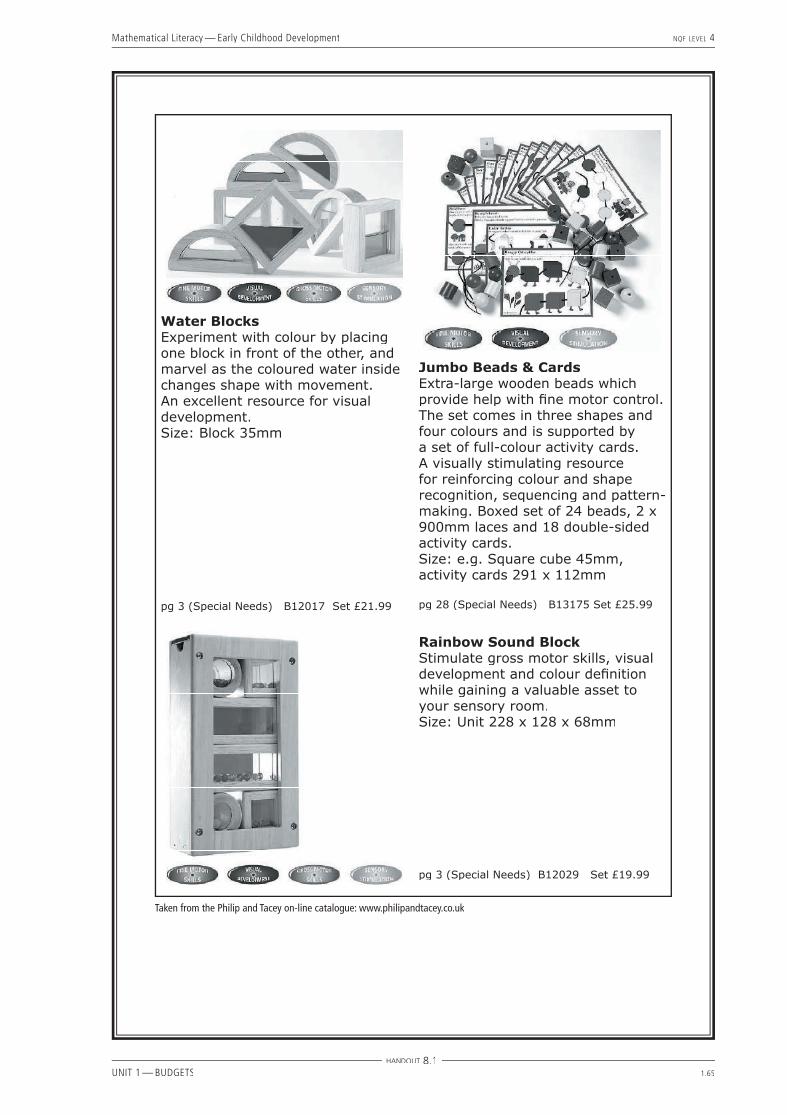
Mathematical Literacy — Early Childhood Development NQF LEVEL 4
UNIT 1 — BUDGETS 1.65
Water Blocks Experiment with colour by placing one block in front of the other, and marvel as the coloured water inside changes shape with movement. An excellent resource for visual development.Size: Block 35mm
pg 3 (Special Needs) B12017 Set £21.99
Jumbo Beads & Cards Extra-large wooden beads which provide help with fi ne motor control. The set comes in three shapes and four colours and is supported by a set of full-colour activity cards. A visually stimulating resource for reinforcing colour and shape recognition, sequencing and pattern-making. Boxed set of 24 beads, 2 x 900mm laces and 18 double-sided activity cards.Size: e.g. Square cube 45mm, activity cards 291 x 112mm
pg 28 (Special Needs) B13175 Set £25.99
Rainbow Sound Block Stimulate gross motor skills, visual development and colour defi nition while gaining a valuable asset to your sensory room.Size: Unit 228 x 128 x 68mm
pg 3 (Special Needs) B12029 Set £19.99
Taken from the Philip and Tacey on-line catalogue: www.philipandtacey.co.uk
HANDOUT 8.1
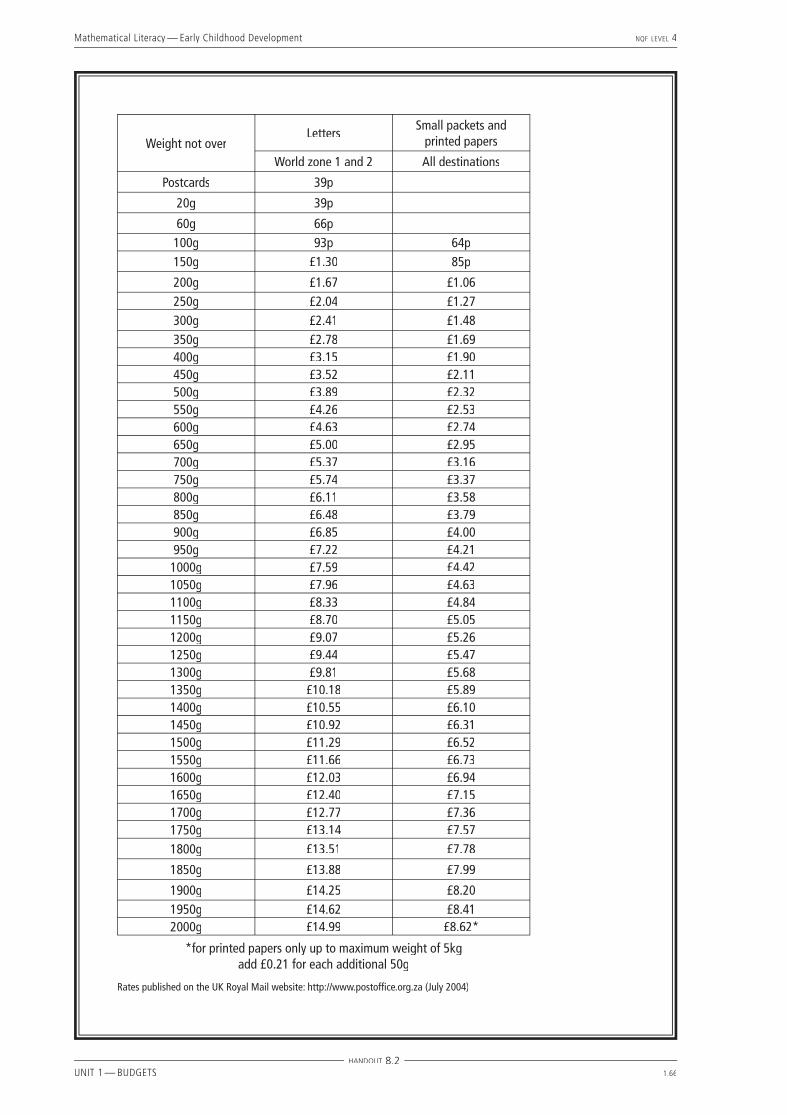
Mathematical Literacy — Early Childhood Development NQF LEVEL 4
UNIT 1 — BUDGETS 1.66
Weight not overLetters
Small packets and printed papers
World zone 1 and 2 All destinations
Postcards 39p
20g 39p
60g 66p100g 93p 64p150g £1.30 85p
200g £1.67 £1.06250g £2.04 £1.27300g £2.41 £1.48350g £2.78 £1.69400g £3.15 £1.90450g £3.52 £2.11500g £3.89 £2.32550g £4.26 £2.53600g £4.63 £2.74650g £5.00 £2.95700g £5.37 £3.16750g £5.74 £3.37800g £6.11 £3.58850g £6.48 £3.79900g £6.85 £4.00950g £7.22 £4.21
1000g £7.59 £4.421050g £7.96 £4.631100g £8.33 £4.841150g £8.70 £5.051200g £9.07 £5.261250g £9.44 £5.471300g £9.81 £5.681350g £10.18 £5.891400g £10.55 £6.101450g £10.92 £6.311500g £11.29 £6.521550g £11.66 £6.731600g £12.03 £6.941650g £12.40 £7.151700g £12.77 £7.361750g £13.14 £7.571800g £13.51 £7.78
1850g £13.88 £7.99
1900g £14.25 £8.201950g £14.62 £8.412000g £14.99 £8.62*
*for printed papers only up to maximum weight of 5kg add £0.21 for each additional 50g
Rates published on the UK Royal Mail website: http://www.postoffi ce.org.za (July 2004)
HANDOUT 8.2
Mathematical Literacy — Early Childhood Development NQF LEVEL 4
UNIT 1 — BUDGETS 1.67
Activity 9 — Fundraising selling hot dogs
ABOUT THIS ACTIVITYThis focus of this activity is on budgets and budgeting. At each stage of the activity choices must be made and the students should be encouraged to refl ect on and explain their choices.This activity is aligned with unit standard 9014 and addresses AC 2 and 3 of SO1; AC 1 and 2 of SO2 and AC 1 and 3 of SO3.
MANAGING THIS ACTIVITYThis activity can be completely self-contained. No data needs to be collected and students should be able to complete the activity in class or even as a homework assignment. You should supply each student with the handout and provide support to the extent that it is needed.
Of course, you may decide to make the activity more interesting by encouraging students to visit their local stores and to collect their own information on the various ingredients. You could even allow students to run a hot dog stand at the college/technikon or local market.
Anticipated responses to questions9.1 This question should provide no challenge, though students may want to pay attention to rounding. Using
a calculator, the students will get R 0,95625 as one of the answers. You may want to discuss at what point to do the rounding and whether or not you always round up or just off. In the end we will almost certainly divide the cost of the bag of groceries by the number of hot dogs rather than adding component values.
Shop brand 1kg (24 sausages) 22,95 ÷ 24 = R 0,96 Shop brand 1⁄2 kg (12 sausages) 12,25 ÷ 12 = R 1,02 Enterprise 1kg (24 sausages) 25,99 ÷ 24 = R 1,08
9.2 Considerations could include the following:• You want to reduce the number of leftover sausages. Rather than being left with 12 unused sausages
(a wastage of 22,95 ÷ 2 = R 11,48), you would rather pay 6c more per sausage and buy the smaller package.
• You may have special needs within your school such as Muslim and/or Jewish children and you may fi nd that only the Enterprise sausages are both Halaal and Kosher.
9.3 All Joy (Family Pack) 2l = 2 000ml and 1Tsp = 15ml
2 000ml ÷ 15ml/serving = 133 servings*
All Joy (600ml) 600ml ÷ 15ml/serving = 40 servings*
Kiddie Squeeze 425ml ÷ 15ml/serving = 28 servings*
*In these problems rounding off should not even be a consideration—fi rstly, you must always round down because we are interested in whole servings and secondly, you will never get the full number of servings anyway because of spillage and other wastage.
9.4 The words “most economical” hint at a rate—we want to know the cost per serving for each option.
All Joy (Family Pack) Cost = R 16,99 + R 11,99 = R 28,98
R 28,98 ÷ 133 servings = R 0,22 per serving*
All Joy (600ml) R 9,69 ÷ 40 servings = R 0,24 per serving*
*The same issue regarding rounding that we encountered in question 9.3 arises here.
9.5 This question requires us fi rst to convert mass to volume—we do this using the ratio provided, namely:
230g of margarine = 250ml of margarine
∴ 250g ≈ 272ml (multiply both sides of the ratio by 250
230)
11⁄2 tsp = 7,5ml
and 272ml ÷ 7,5ml/serving = 36 servings.
Mathematical Literacy — Early Childhood Development NQF LEVEL 4
UNIT 1 — BUDGETS 1.68
9.6 -7 Students will develop different responses to this question as a result of the different choices they make. One possible response could be:
Deciding on how many hot dogs to make:• Since the sausages are by far the most costly part of the hot dog let the number of sausages determine
the number of hot dogs we make. We can either make 36 (24 +12) or 48 (24 × 2) hot dogs. • 1⁄2kg of margarine corresponds to 36 servings and the 600ml bottle of tomato sauce is enough for 40
servings.• It seems that making 36 hot dogs will result in less wastage because you would not have to buy
additional margarine and tomato sauce.
Other choices:• We will use Floro margarine since it comes in a tub that makes for easier use.
Shopping list:
Item Number Unit cost Total cost
Hot dog rolls 36 0,55 19,80
Sausage (Shop brand 1kg) 1 22,95 22,95
Sausage (Shop brand 1⁄2kg) 1 12,25 12,25
Tomato sauce (All Joy 600ml) 1 9,69 9,69
Serviettes (Shop brand 100) 1 11,95 11,95
Margarine (Floro 1⁄2 kg) 1 11,99 11,99
Total R 88,63
Cost per hot dog = 88,36 ÷ 36 = R 2,46.
9.8 In deciding on how much to charge per hot dog we need to weigh up how much profi t we will make per hot dog and how much we expect people to be willing to pay. Furthermore, since we do not want to work with too much change we should decide to charge in whole rand units or at most in half rand units (50c).
Options: 1. R2,50 ⇒ R 0,04 profi t per hot dog and R 1,44 profi t per day. 2. R3,00 ⇒ R 0,54 profi t per hot dog and R 19,44 profi t per day. 3. R3,50 ⇒ R 1,04 profi t per hot dog and R 37,44 profi t per day. 4. R4,00 ⇒ R 1,54 profi t per hot dog and R 55,44 profi t per day. 5. R4.50 ⇒ R 2,04 profi t per hot dog and R 73,44 profi t per day.
Students would at this stage recommend an option.
9.9-10 Again, you need to fi rst make a decision about how many hot dogs to make per week. One possible response could be:
Deciding on how many hot dogs to make:• Based on the success of the fi rst week and the small saving that can be realised by buying the larger
package of sausages we will make 48 per week. • 48 hot dogs per week represents 48 × 4 = 192 hot dogs over the four weeks.
Other choices:• We will use Floro margarine since it comes in a tub that makes for easier use. We will buy two 1kg
tubs and one 1⁄2kg tub. This represents 2 × 72 + 36 = 180 servings. By spreading the margarine a little thinner we should be able to butter all 192 rolls.
• We will buy one Family Pack (2l) of tomato sauce and a set of squeeze bottles (as this is most economical per serving) and one 600ml bottle to reduce wastage. Together with the 4 servings of tomato sauce left over from the trial week, we will now have 133 + 40 + 4 = 177 servings of tomato sauce. This should be enough as we discovered in the trial week that not all of the children want tomato sauce on their hot dog!
• We cannot avoid buying 200 serviettes because we do not have enough left over from the trial week to only buy 100 (100 + (100-36) = 164 and 164 < 192).

Mathematical Literacy — Early Childhood Development NQF LEVEL 4
UNIT 1 — BUDGETS 1.69
Shopping list:
Item Number Unit cost Total cost
Hot dog rolls 192 0,55 105,60
Sausage (Shop brand 1kg) 8 22,95 183.60
Tomato sauce (All Joy 2l) 1 16,99 16,99
Squeeze bottles 1 11,99 11,99
Tomato sauce (All Joy 600ml) 1 9,69 9,69
Serviettes (Diamond 200) 1 22,75 22,75
Margarine (Floro 1 kg) 2 21,95 43,90
Margarine (Floro 1⁄2 kg) 1 11,99 11,99
Total R 406,51
Cost per hot dog = 406,51 ÷ 192 = R 2,12 (a saving of R 0,34 per hot dog!)
9.11 Assuming we went for option 4 i.e. R4,00 per hot dog (in 8 above) and sold all of the hot dogs each week, then we would have a balance sheet something like the one below:
IncomeSales of hot dogs (228 @ R4,00) 912,00
ExpenditurePurchase for the trial week 88,63Purchase for other 4 weeks 406,51 495.14
Profi t R 416.86 It is important that students do not determine the profi t using the following calculation: 36 × (4,00 - 2,46) + 192 × (4,00 - 2,12) = R 416,40
Although the difference in the two calculations is only R0,46, the fi rst approach is correct from an accounting perspective, while the second approach is wrong—the error arising from the rounding we did when calculating the profi t per hot dog.

Mathematical Literacy — Early Childhood Development NQF LEVEL 4
UNIT 1 — BUDGETS 1.70
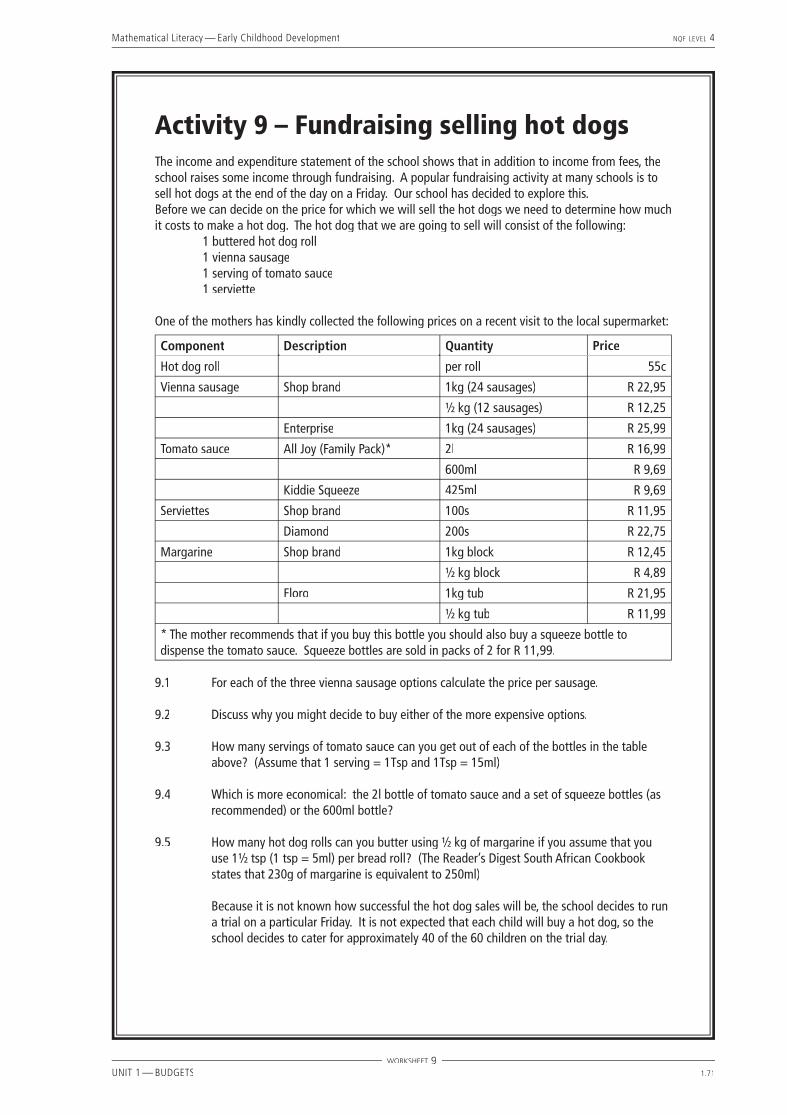
Mathematical Literacy — Early Childhood Development NQF LEVEL 4
UNIT 1 — BUDGETS 1.71
Activity 9 – Fundraising selling hot dogsThe income and expenditure statement of the school shows that in addition to income from fees, the school raises some income through fundraising. A popular fundraising activity at many schools is to sell hot dogs at the end of the day on a Friday. Our school has decided to explore this.Before we can decide on the price for which we will sell the hot dogs we need to determine how much it costs to make a hot dog. The hot dog that we are going to sell will consist of the following:
1 buttered hot dog roll1 vienna sausage1 serving of tomato sauce1 serviette
One of the mothers has kindly collected the following prices on a recent visit to the local supermarket:
Component Description Quantity Price
Hot dog roll per roll 55c
Vienna sausage Shop brand 1kg (24 sausages) R 22,95
1⁄2 kg (12 sausages) R 12,25
Enterprise 1kg (24 sausages) R 25,99
Tomato sauce All Joy (Family Pack)* 2l R 16,99
600ml R 9,69
Kiddie Squeeze 425ml R 9,69
Serviettes Shop brand 100s R 11,95
Diamond 200s R 22,75
Margarine Shop brand 1kg block R 12,45
1⁄2 kg block R 4,89
Floro 1kg tub R 21,95
1⁄2 kg tub R 11,99
* The mother recommends that if you buy this bottle you should also buy a squeeze bottle to dispense the tomato sauce. Squeeze bottles are sold in packs of 2 for R 11,99.
9.1 For each of the three vienna sausage options calculate the price per sausage.
9.2 Discuss why you might decide to buy either of the more expensive options.
9.3 How many servings of tomato sauce can you get out of each of the bottles in the table above? (Assume that 1 serving = 1Tsp and 1Tsp = 15ml)
9.4 Which is more economical: the 2l bottle of tomato sauce and a set of squeeze bottles (as recommended) or the 600ml bottle?
9.5 How many hot dog rolls can you butter using 1⁄2 kg of margarine if you assume that you use 11⁄2 tsp (1 tsp = 5ml) per bread roll? (The Reader’s Digest South African Cookbook states that 230g of margarine is equivalent to 250ml)
Because it is not known how successful the hot dog sales will be, the school decides to run a trial on a particular Friday. It is not expected that each child will buy a hot dog, so the school decides to cater for approximately 40 of the 60 children on the trial day.
WORKSHEET 9
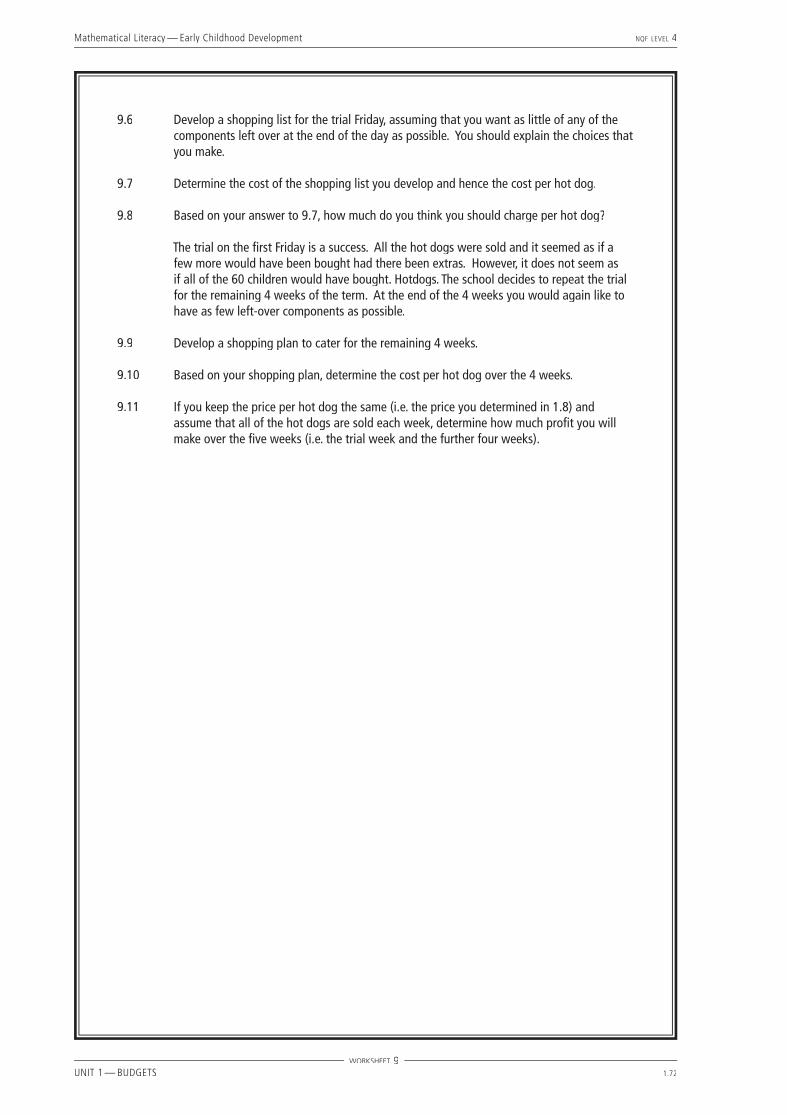
Mathematical Literacy — Early Childhood Development NQF LEVEL 4
UNIT 1 — BUDGETS 1.72
9.6 Develop a shopping list for the trial Friday, assuming that you want as little of any of the components left over at the end of the day as possible. You should explain the choices that you make.
9.7 Determine the cost of the shopping list you develop and hence the cost per hot dog.
9.8 Based on your answer to 9.7, how much do you think you should charge per hot dog?
The trial on the fi rst Friday is a success. All the hot dogs were sold and it seemed as if a few more would have been bought had there been extras. However, it does not seem as if all of the 60 children would have bought. Hotdogs. The school decides to repeat the trial for the remaining 4 weeks of the term. At the end of the 4 weeks you would again like to have as few left-over components as possible.
9.9 Develop a shopping plan to cater for the remaining 4 weeks.
9.10 Based on your shopping plan, determine the cost per hot dog over the 4 weeks.
9.11 If you keep the price per hot dog the same (i.e. the price you determined in 1.8) and assume that all of the hot dogs are sold each week, determine how much profi t you will make over the fi ve weeks (i.e. the trial week and the further four weeks).
WORKSHEET 9
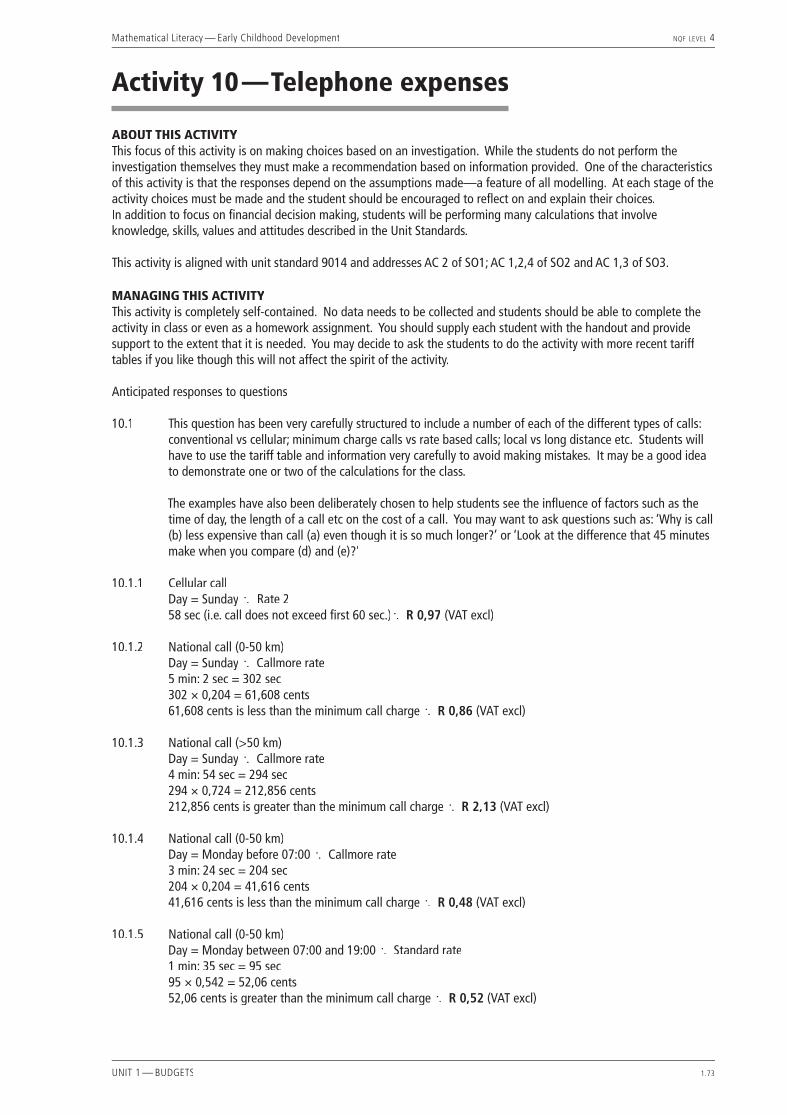
Mathematical Literacy — Early Childhood Development NQF LEVEL 4
UNIT 1 — BUDGETS 1.73
Activity 10 — Telephone expenses
ABOUT THIS ACTIVITYThis focus of this activity is on making choices based on an investigation. While the students do not perform the investigation themselves they must make a recommendation based on information provided. One of the characteristics of this activity is that the responses depend on the assumptions made—a feature of all modelling. At each stage of the activity choices must be made and the student should be encouraged to refl ect on and explain their choices.In addition to focus on fi nancial decision making, students will be performing many calculations that involve knowledge, skills, values and attitudes described in the Unit Standards.
This activity is aligned with unit standard 9014 and addresses AC 2 of SO1; AC 1,2,4 of SO2 and AC 1,3 of SO3.
MANAGING THIS ACTIVITYThis activity is completely self-contained. No data needs to be collected and students should be able to complete the activity in class or even as a homework assignment. You should supply each student with the handout and provide support to the extent that it is needed. You may decide to ask the students to do the activity with more recent tariff tables if you like though this will not affect the spirit of the activity.
Anticipated responses to questions
10.1 This question has been very carefully structured to include a number of each of the different types of calls: conventional vs cellular; minimum charge calls vs rate based calls; local vs long distance etc. Students will have to use the tariff table and information very carefully to avoid making mistakes. It may be a good idea to demonstrate one or two of the calculations for the class.
The examples have also been deliberately chosen to help students see the infl uence of factors such as the time of day, the length of a call etc on the cost of a call. You may want to ask questions such as: ‘Why is call (b) less expensive than call (a) even though it is so much longer?’ or ‘Look at the difference that 45 minutes make when you compare (d) and (e)?’
10.1.1 Cellular call Day = Sunday ∴ Rate 2 58 sec (i.e. call does not exceed fi rst 60 sec.)∴ R 0,97 (VAT excl)
10.1.2 National call (0-50 km) Day = Sunday ∴ Callmore rate
5 min: 2 sec = 302 sec 302 × 0,204 = 61,608 cents 61,608 cents is less than the minimum call charge ∴ R 0,86 (VAT excl)
10.1.3 National call (>50 km) Day = Sunday ∴ Callmore rate 4 min: 54 sec = 294 sec 294 × 0,724 = 212,856 cents 212,856 cents is greater than the minimum call charge ∴ R 2,13 (VAT excl)
10.1.4 National call (0-50 km) Day = Monday before 07:00 ∴ Callmore rate 3 min: 24 sec = 204 sec 204 × 0,204 = 41,616 cents 41,616 cents is less than the minimum call charge ∴ R 0,48 (VAT excl)
10.1.5 National call (0-50 km) Day = Monday between 07:00 and 19:00 ∴ Standard rate 1 min: 35 sec = 95 sec 95 × 0,542 = 52,06 cents 52,06 cents is greater than the minimum call charge ∴ R 0,52 (VAT excl)
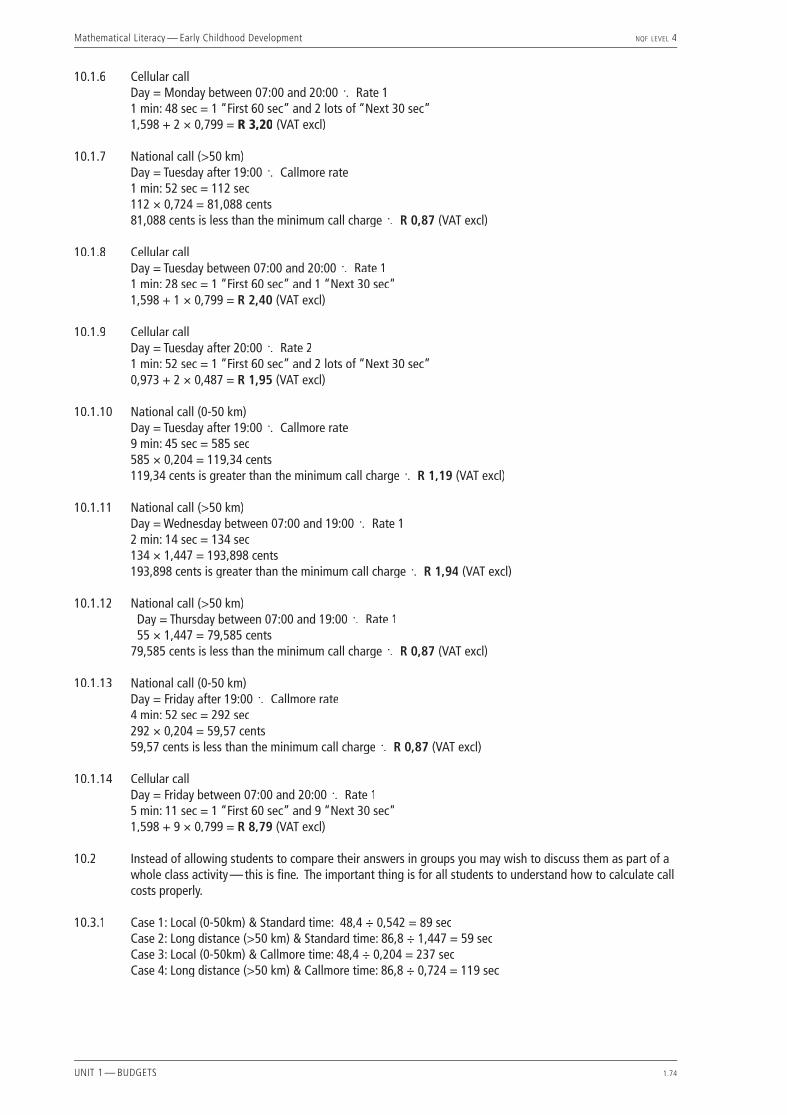
Mathematical Literacy — Early Childhood Development NQF LEVEL 4
UNIT 1 — BUDGETS 1.74
10.1.6 Cellular call Day = Monday between 07:00 and 20:00 ∴ Rate 1 1 min: 48 sec = 1 “First 60 sec” and 2 lots of “Next 30 sec” 1,598 + 2 × 0,799 = R 3,20 (VAT excl)
10.1.7 National call (>50 km) Day = Tuesday after 19:00 ∴ Callmore rate 1 min: 52 sec = 112 sec 112 × 0,724 = 81,088 cents 81,088 cents is less than the minimum call charge ∴ R 0,87 (VAT excl)
10.1.8 Cellular call Day = Tuesday between 07:00 and 20:00 ∴ Rate 1 1 min: 28 sec = 1 “First 60 sec” and 1 “Next 30 sec” 1,598 + 1 × 0,799 = R 2,40 (VAT excl)
10.1.9 Cellular call Day = Tuesday after 20:00 ∴ Rate 2 1 min: 52 sec = 1 “First 60 sec” and 2 lots of “Next 30 sec” 0,973 + 2 × 0,487 = R 1,95 (VAT excl)
10.1.10 National call (0-50 km) Day = Tuesday after 19:00 ∴ Callmore rate 9 min: 45 sec = 585 sec 585 × 0,204 = 119,34 cents 119,34 cents is greater than the minimum call charge ∴ R 1,19 (VAT excl)
10.1.11 National call (>50 km) Day = Wednesday between 07:00 and 19:00 ∴ Rate 1 2 min: 14 sec = 134 sec 134 × 1,447 = 193,898 cents 193,898 cents is greater than the minimum call charge ∴ R 1,94 (VAT excl)
10.1.12 National call (>50 km) Day = Thursday between 07:00 and 19:00 ∴ Rate 1 55 × 1,447 = 79,585 cents 79,585 cents is less than the minimum call charge ∴ R 0,87 (VAT excl)
10.1.13 National call (0-50 km) Day = Friday after 19:00 ∴ Callmore rate 4 min: 52 sec = 292 sec 292 × 0,204 = 59,57 cents 59,57 cents is less than the minimum call charge ∴ R 0,87 (VAT excl)
10.1.14 Cellular call Day = Friday between 07:00 and 20:00 ∴ Rate 1 5 min: 11 sec = 1 “First 60 sec” and 9 “Next 30 sec” 1,598 + 9 × 0,799 = R 8,79 (VAT excl)
10.2 Instead of allowing students to compare their answers in groups you may wish to discuss them as part of a whole class activity — this is fi ne. The important thing is for all students to understand how to calculate call costs properly.
10.3.1 Case 1: Local (0-50km) & Standard time: 48,4 ÷ 0,542 = 89 sec Case 2: Long distance (>50 km) & Standard time: 86,8 ÷ 1,447 = 59 sec Case 3: Local (0-50km) & Callmore time: 48,4 ÷ 0,204 = 237 sec Case 4: Long distance (>50 km) & Callmore time: 86,8 ÷ 0,724 = 119 sec
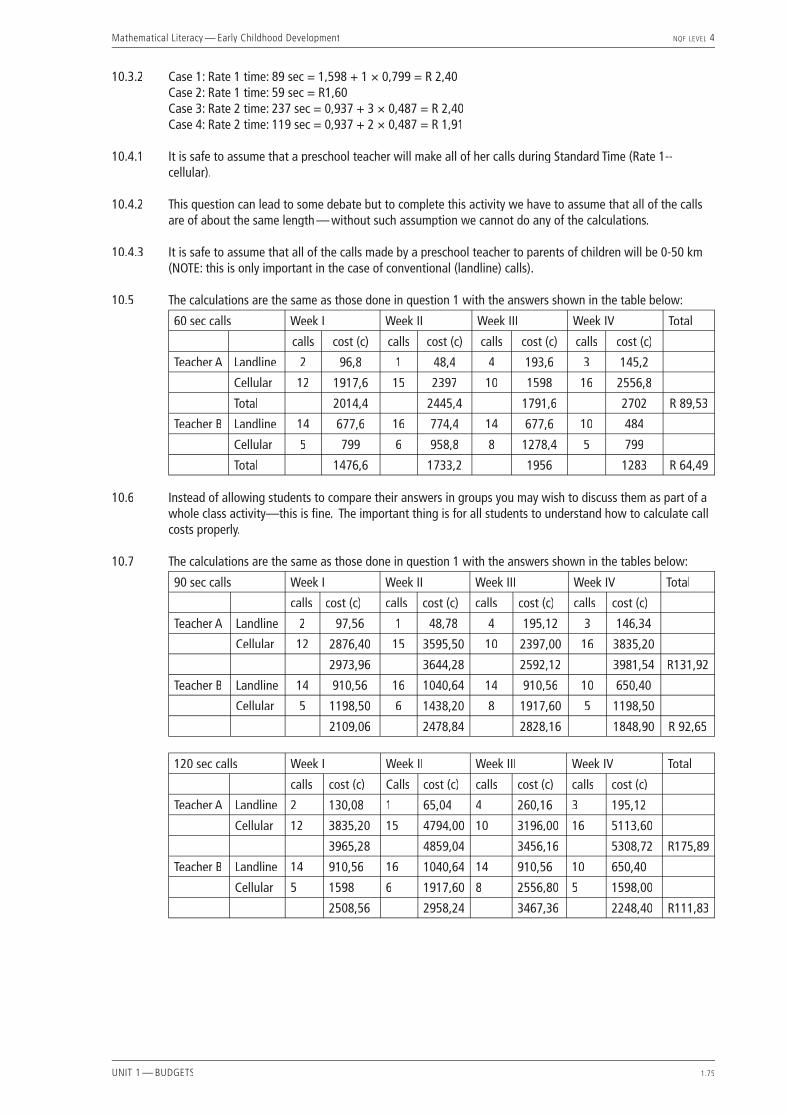
Mathematical Literacy — Early Childhood Development NQF LEVEL 4
UNIT 1 — BUDGETS 1.75
10.3.2 Case 1: Rate 1 time: 89 sec = 1,598 + 1 × 0,799 = R 2,40 Case 2: Rate 1 time: 59 sec = R1,60 Case 3: Rate 2 time: 237 sec = 0,937 + 3 × 0,487 = R 2,40 Case 4: Rate 2 time: 119 sec = 0,937 + 2 × 0,487 = R 1,91
10.4.1 It is safe to assume that a preschool teacher will make all of her calls during Standard Time (Rate 1--cellular).
10.4.2 This question can lead to some debate but to complete this activity we have to assume that all of the calls are of about the same length — without such assumption we cannot do any of the calculations.
10.4.3 It is safe to assume that all of the calls made by a preschool teacher to parents of children will be 0-50 km (NOTE: this is only important in the case of conventional (landline) calls).
10.5 The calculations are the same as those done in question 1 with the answers shown in the table below:
60 sec calls Week I Week II Week III Week IV Total
calls cost (c) calls cost (c) calls cost (c) calls cost (c)
Teacher A Landline 2 96,8 1 48,4 4 193,6 3 145,2
Cellular 12 1917,6 15 2397 10 1598 16 2556,8
Total 2014,4 2445,4 1791,6 2702 R 89,53
Teacher B Landline 14 677,6 16 774,4 14 677,6 10 484
Cellular 5 799 6 958,8 8 1278,4 5 799
Total 1476,6 1733,2 1956 1283 R 64,49
10.6 Instead of allowing students to compare their answers in groups you may wish to discuss them as part of a whole class activity—this is fi ne. The important thing is for all students to understand how to calculate call costs properly.
10.7 The calculations are the same as those done in question 1 with the answers shown in the tables below:
90 sec calls Week I Week II Week III Week IV Total
calls cost (c) calls cost (c) calls cost (c) calls cost (c)
Teacher A Landline 2 97,56 1 48,78 4 195,12 3 146,34
Cellular 12 2876,40 15 3595,50 10 2397,00 16 3835,20
2973,96 3644,28 2592,12 3981,54 R131,92
Teacher B Landline 14 910,56 16 1040,64 14 910,56 10 650,40
Cellular 5 1198,50 6 1438,20 8 1917,60 5 1198,50
2109,06 2478,84 2828,16 1848,90 R 92,65
120 sec calls Week I Week II Week III Week IV Total
calls cost (c) Calls cost (c) calls cost (c) calls cost (c)
Teacher A Landline 2 130,08 1 65,04 4 260,16 3 195,12
Cellular 12 3835,20 15 4794,00 10 3196,00 16 5113,60
3965,28 4859,04 3456,16 5308,72 R175,89
Teacher B Landline 14 910,56 16 1040,64 14 910,56 10 650,40
Cellular 5 1598 6 1917,60 8 2556,80 5 1598,00
2508,56 2958,24 3467,36 2248,40 R111,83
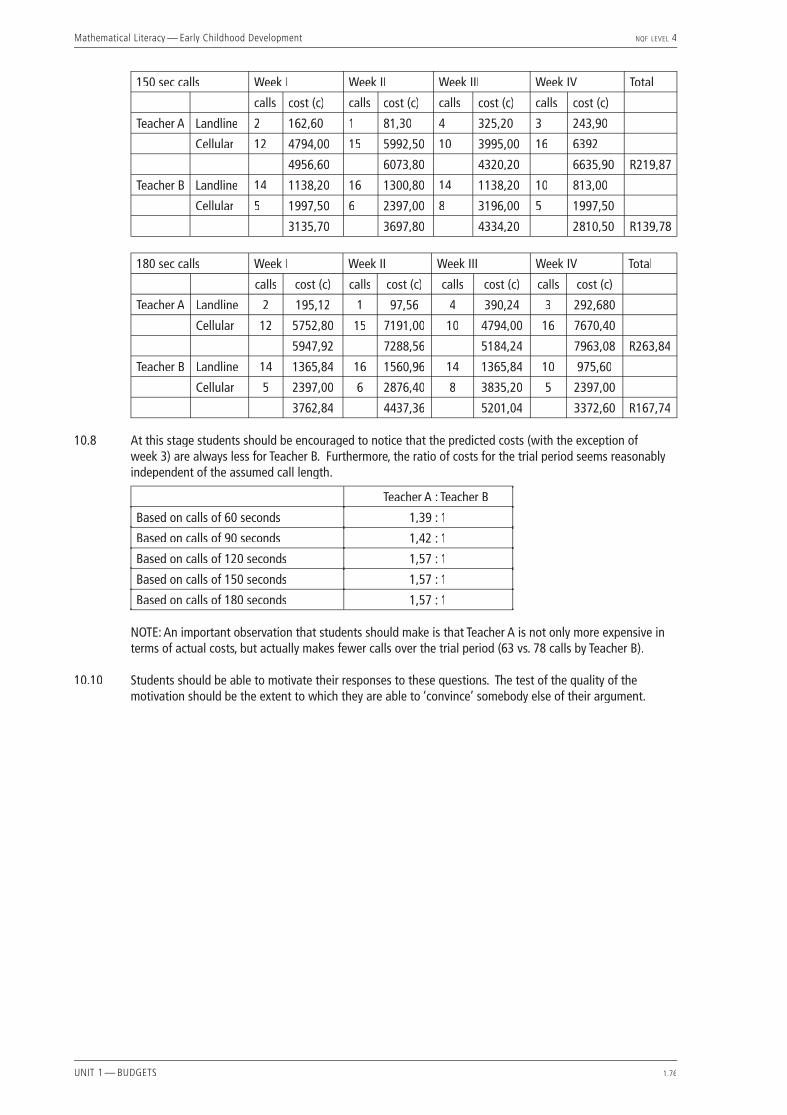
Mathematical Literacy — Early Childhood Development NQF LEVEL 4
UNIT 1 — BUDGETS 1.76
150 sec calls Week I Week II Week III Week IV Total
calls cost (c) calls cost (c) calls cost (c) calls cost (c)
Teacher A Landline 2 162,60 1 81,30 4 325,20 3 243,90
Cellular 12 4794,00 15 5992,50 10 3995,00 16 6392
4956,60 6073,80 4320,20 6635,90 R219,87
Teacher B Landline 14 1138,20 16 1300,80 14 1138,20 10 813,00
Cellular 5 1997,50 6 2397,00 8 3196,00 5 1997,50
3135,70 3697,80 4334,20 2810,50 R139,78
180 sec calls Week I Week II Week III Week IV Total
calls cost (c) calls cost (c) calls cost (c) calls cost (c)
Teacher A Landline 2 195,12 1 97,56 4 390,24 3 292,680
Cellular 12 5752,80 15 7191,00 10 4794,00 16 7670,40
5947,92 7288,56 5184,24 7963,08 R263,84
Teacher B Landline 14 1365,84 16 1560,96 14 1365,84 10 975,60
Cellular 5 2397,00 6 2876,40 8 3835,20 5 2397,00
3762,84 4437,36 5201,04 3372,60 R167,74
10.8 At this stage students should be encouraged to notice that the predicted costs (with the exception of week 3) are always less for Teacher B. Furthermore, the ratio of costs for the trial period seems reasonably independent of the assumed call length.
Teacher A : Teacher B
Based on calls of 60 seconds 1,39 : 1
Based on calls of 90 seconds 1,42 : 1
Based on calls of 120 seconds 1,57 : 1
Based on calls of 150 seconds 1,57 : 1
Based on calls of 180 seconds 1,57 : 1 NOTE: An important observation that students should make is that Teacher A is not only more expensive in
terms of actual costs, but actually makes fewer calls over the trial period (63 vs. 78 calls by Teacher B).
10.10 Students should be able to motivate their responses to these questions. The test of the quality of the motivation should be the extent to which they are able to ‘convince’ somebody else of their argument.
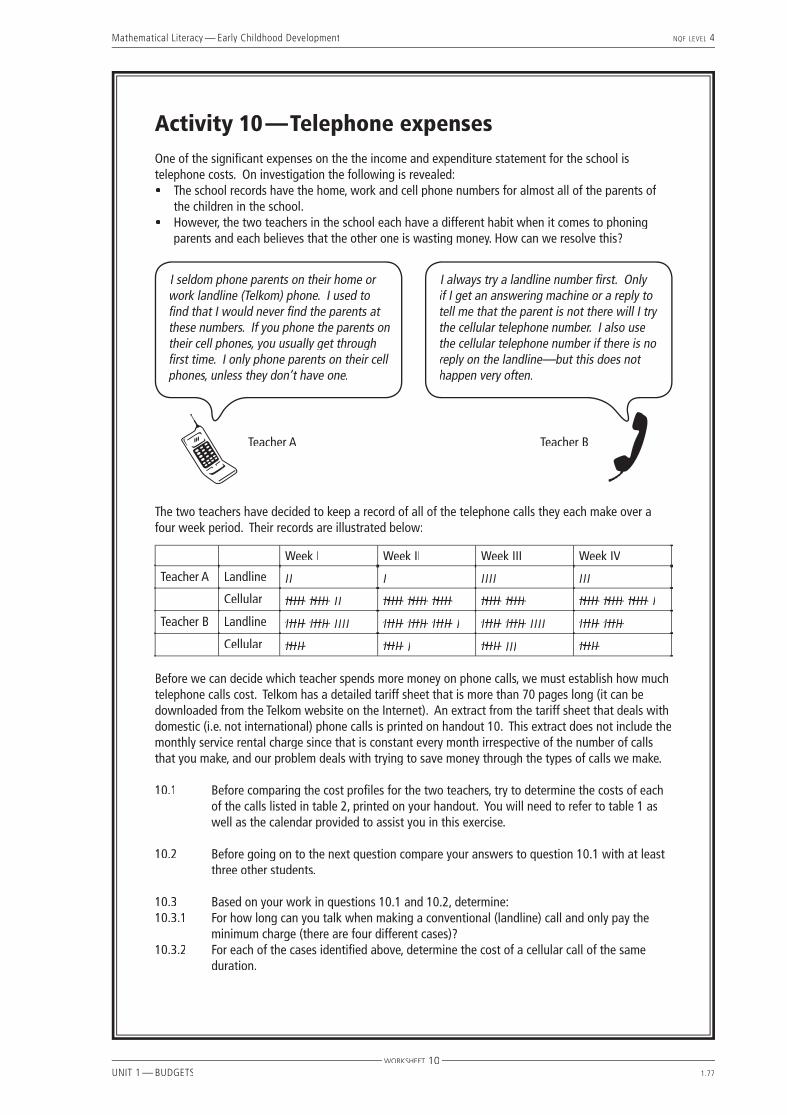
Mathematical Literacy — Early Childhood Development NQF LEVEL 4
UNIT 1 — BUDGETS 1.77
Activity 10 — Telephone expensesOne of the signifi cant expenses on the the income and expenditure statement for the school is telephone costs. On investigation the following is revealed:• The school records have the home, work and cell phone numbers for almost all of the parents of
the children in the school.• However, the two teachers in the school each have a different habit when it comes to phoning
parents and each believes that the other one is wasting money. How can we resolve this?
I seldom phone parents on their home or work landline (Telkom) phone. I used to fi nd that I would never fi nd the parents at these numbers. If you phone the parents on their cell phones, you usually get through fi rst time. I only phone parents on their cell phones, unless they don’t have one.
I always try a landline number fi rst. Only if I get an answering machine or a reply to tell me that the parent is not there will I try the cellular telephone number. I also use the cellular telephone number if there is no reply on the landline—but this does not happen very often.
Teacher A Teacher B
The two teachers have decided to keep a record of all of the telephone calls they each make over a four week period. Their records are illustrated below:
Week I Week II Week III Week IV
Teacher A Landline II I IIII III
Cellular IIIIIIIIII IIIIIIIIII II IIIIIIIIII IIIIIIIIII IIIIIIIIII IIIIIIIIII IIIIIIIIII IIIIIIIIII IIIIIIIIII IIIIIIIIII I
Teacher B Landline IIIIIIIIII IIIIIIIIII IIII IIIIIIIIII IIIIIIIIII IIIIIIIIII I IIIIIIIIII IIIIIIIIII IIII IIIIIIIIII IIIIIIIIII
Cellular IIIIIIIIII IIIIIIIIII I IIIIIIIIII III IIIIIIIIII
Before we can decide which teacher spends more money on phone calls, we must establish how much telephone calls cost. Telkom has a detailed tariff sheet that is more than 70 pages long (it can be downloaded from the Telkom website on the Internet). An extract from the tariff sheet that deals with domestic (i.e. not international) phone calls is printed on handout 10. This extract does not include the monthly service rental charge since that is constant every month irrespective of the number of calls that you make, and our problem deals with trying to save money through the types of calls we make.
10.1 Before comparing the cost profi les for the two teachers, try to determine the costs of each of the calls listed in table 2, printed on your handout. You will need to refer to table 1 as well as the calendar provided to assist you in this exercise.
10.2 Before going on to the next question compare your answers to question 10.1 with at least three other students.
10.3 Based on your work in questions 10.1 and 10.2, determine:10.3.1 For how long can you talk when making a conventional (landline) call and only pay the
minimum charge (there are four different cases)? 10.3.2 For each of the cases identifi ed above, determine the cost of a cellular call of the same
duration.
WORKSHEET 10
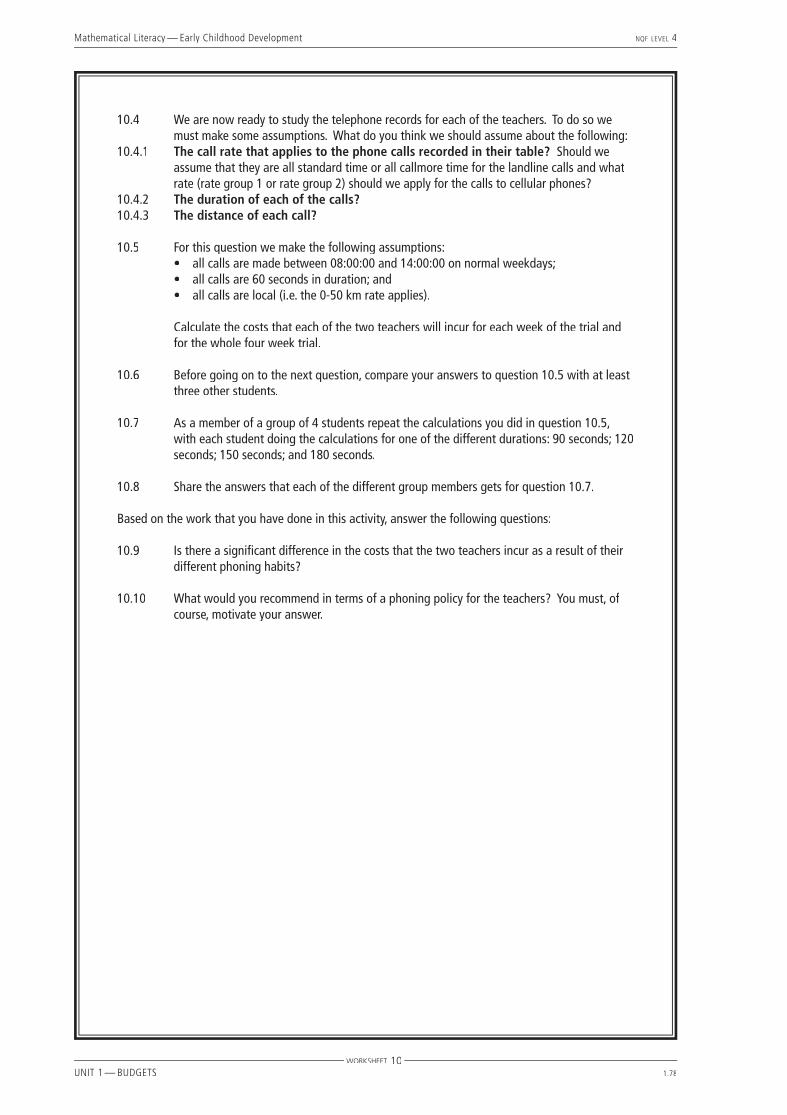
Mathematical Literacy — Early Childhood Development NQF LEVEL 4
UNIT 1 — BUDGETS 1.78
10.4 We are now ready to study the telephone records for each of the teachers. To do so we must make some assumptions. What do you think we should assume about the following:
10.4.1 The call rate that applies to the phone calls recorded in their table? Should we assume that they are all standard time or all callmore time for the landline calls and what rate (rate group 1 or rate group 2) should we apply for the calls to cellular phones?
10.4.2 The duration of each of the calls?10.4.3 The distance of each call?
10.5 For this question we make the following assumptions: • all calls are made between 08:00:00 and 14:00:00 on normal weekdays; • all calls are 60 seconds in duration; and• all calls are local (i.e. the 0-50 km rate applies).
Calculate the costs that each of the two teachers will incur for each week of the trial and for the whole four week trial.
10.6 Before going on to the next question, compare your answers to question 10.5 with at least three other students.
10.7 As a member of a group of 4 students repeat the calculations you did in question 10.5, with each student doing the calculations for one of the different durations: 90 seconds; 120 seconds; 150 seconds; and 180 seconds.
10.8 Share the answers that each of the different group members gets for question 10.7.
Based on the work that you have done in this activity, answer the following questions:
10.9 Is there a signifi cant difference in the costs that the two teachers incur as a result of their different phoning habits?
10.10 What would you recommend in terms of a phoning policy for the teachers? You must, of course, motivate your answer.
WORKSHEET 10
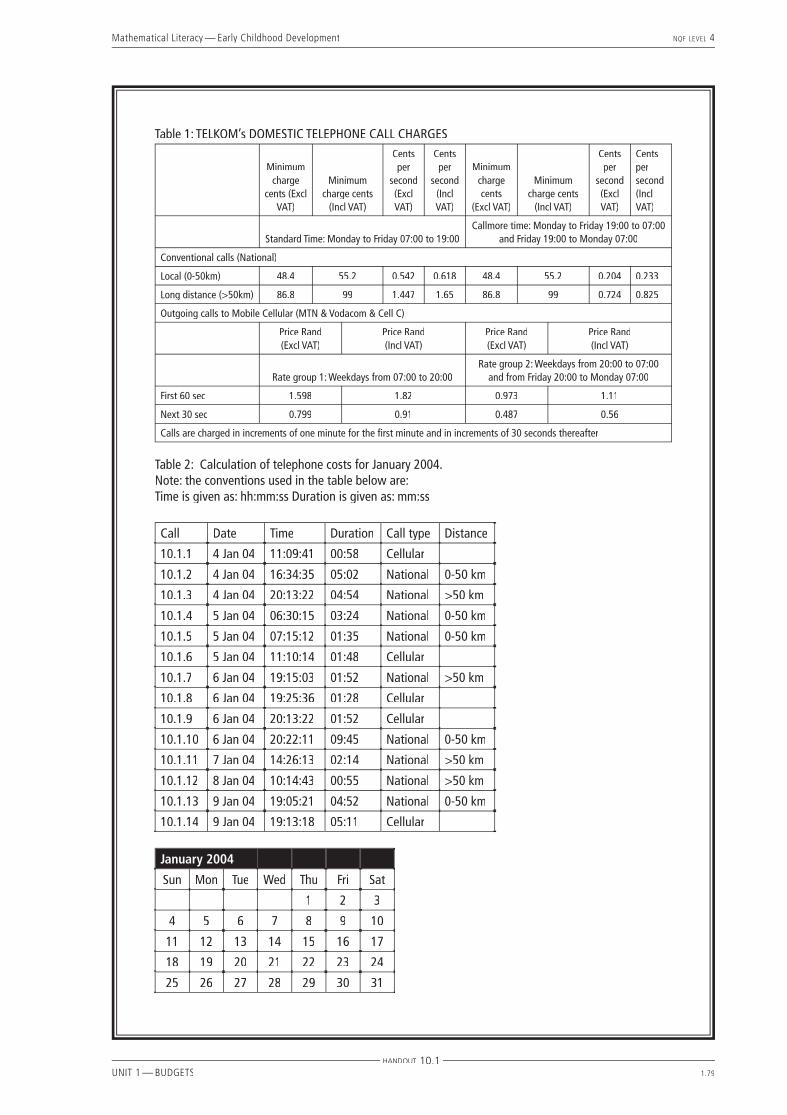
Mathematical Literacy — Early Childhood Development NQF LEVEL 4
UNIT 1 — BUDGETS 1.79
Table 1: TELKOM’s DOMESTIC TELEPHONE CALL CHARGES
Minimum charge
cents (Excl VAT)
Minimum charge cents
(Incl VAT)
Cents per
second (Excl VAT)
Cents per
second (Incl VAT)
Minimum charge cents
(Excl VAT)
Minimum charge cents
(Incl VAT)
Cents per
second (Excl VAT)
Cents per second (Incl VAT)
Standard Time: Monday to Friday 07:00 to 19:00Callmore time: Monday to Friday 19:00 to 07:00
and Friday 19:00 to Monday 07:00
Conventional calls (National)
Local (0-50km) 48.4 55.2 0.542 0.618 48.4 55.2 0.204 0.233
Long distance (>50km) 86.8 99 1.447 1.65 86.8 99 0.724 0.825
Outgoing calls to Mobile Cellular (MTN & Vodacom & Cell C)
Price Rand(Excl VAT)
Price Rand(Incl VAT)
Price Rand(Excl VAT)
Price Rand(Incl VAT)
Rate group 1: Weekdays from 07:00 to 20:00Rate group 2: Weekdays from 20:00 to 07:00
and from Friday 20:00 to Monday 07:00
First 60 sec 1.598 1.82 0.973 1.11
Next 30 sec 0.799 0.91 0.487 0.56
Calls are charged in increments of one minute for the fi rst minute and in increments of 30 seconds thereafter
Table 2: Calculation of telephone costs for January 2004. Note: the conventions used in the table below are:Time is given as: hh:mm:ss Duration is given as: mm:ss
Call Date Time Duration Call type Distance
10.1.1 4 Jan 04 11:09:41 00:58 Cellular
10.1.2 4 Jan 04 16:34:35 05:02 National 0-50 km
10.1.3 4 Jan 04 20:13:22 04:54 National >50 km
10.1.4 5 Jan 04 06:30:15 03:24 National 0-50 km
10.1.5 5 Jan 04 07:15:12 01:35 National 0-50 km
10.1.6 5 Jan 04 11:10:14 01:48 Cellular
10.1.7 6 Jan 04 19:15:03 01:52 National >50 km
10.1.8 6 Jan 04 19:25:36 01:28 Cellular
10.1.9 6 Jan 04 20:13:22 01:52 Cellular
10.1.10 6 Jan 04 20:22:11 09:45 National 0-50 km
10.1.11 7 Jan 04 14:26:13 02:14 National >50 km
10.1.12 8 Jan 04 10:14:43 00:55 National >50 km
10.1.13 9 Jan 04 19:05:21 04:52 National 0-50 km
10.1.14 9 Jan 04 19:13:18 05:11 Cellular
January 2004
Sun Mon Tue Wed Thu Fri Sat
1 2 3
4 5 6 7 8 9 10
11 12 13 14 15 16 17
18 19 20 21 22 23 24
25 26 27 28 29 30 31
HANDOUT 10.1
Early Childhood Development
NQFLEVEL
4Unit 2Data
Mathematical Literacy
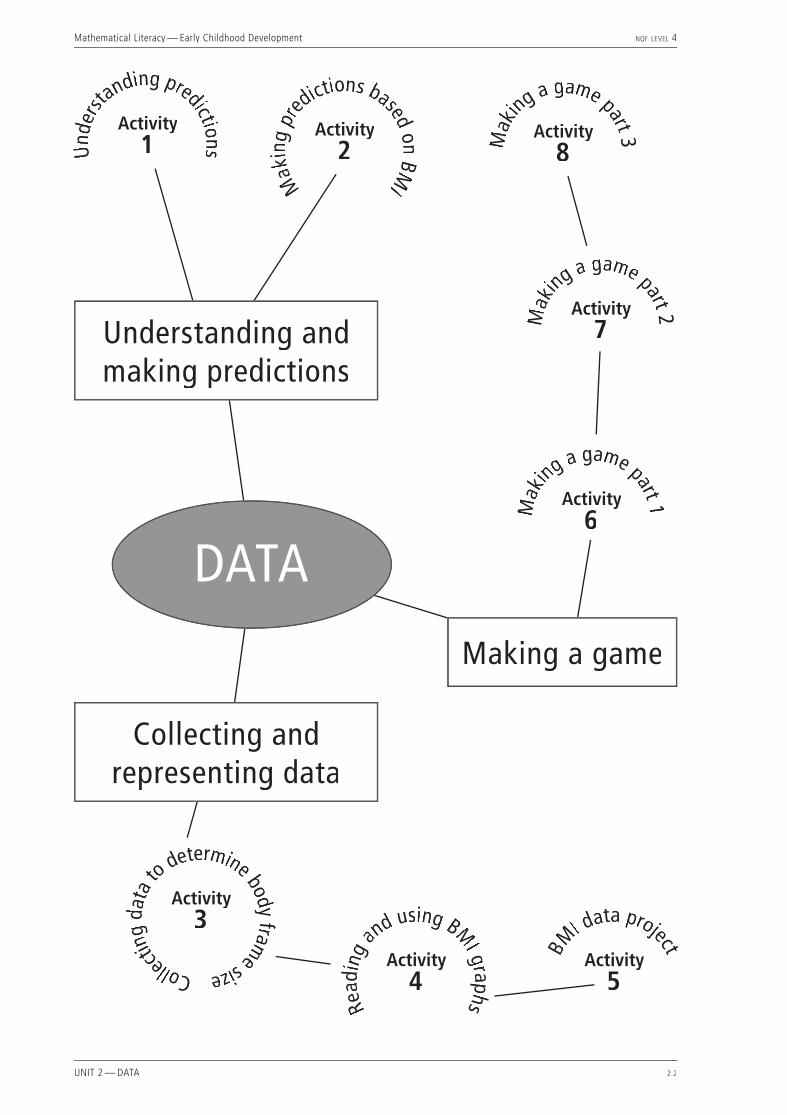
Mathematical Literacy — Early Childhood Development NQF LEVEL 4
UNIT 2 — DATA 2.2
Activity8 M
aking
a game part 3Activity1 U
nder
standing predictions
Activity2
Mak
ing
pred
ictions basedon
BMI
Activity3
Collectin
gda
tato
determine bodyfram
esize Activity4
Read
ing
and using BM
I graphs
Activity5
BM
I data project
Activity6M
aking
a game part 1
Activity7 M
aking
a game part 2
DATA
Understanding and making predictions
Making a game
Collecting and representing data
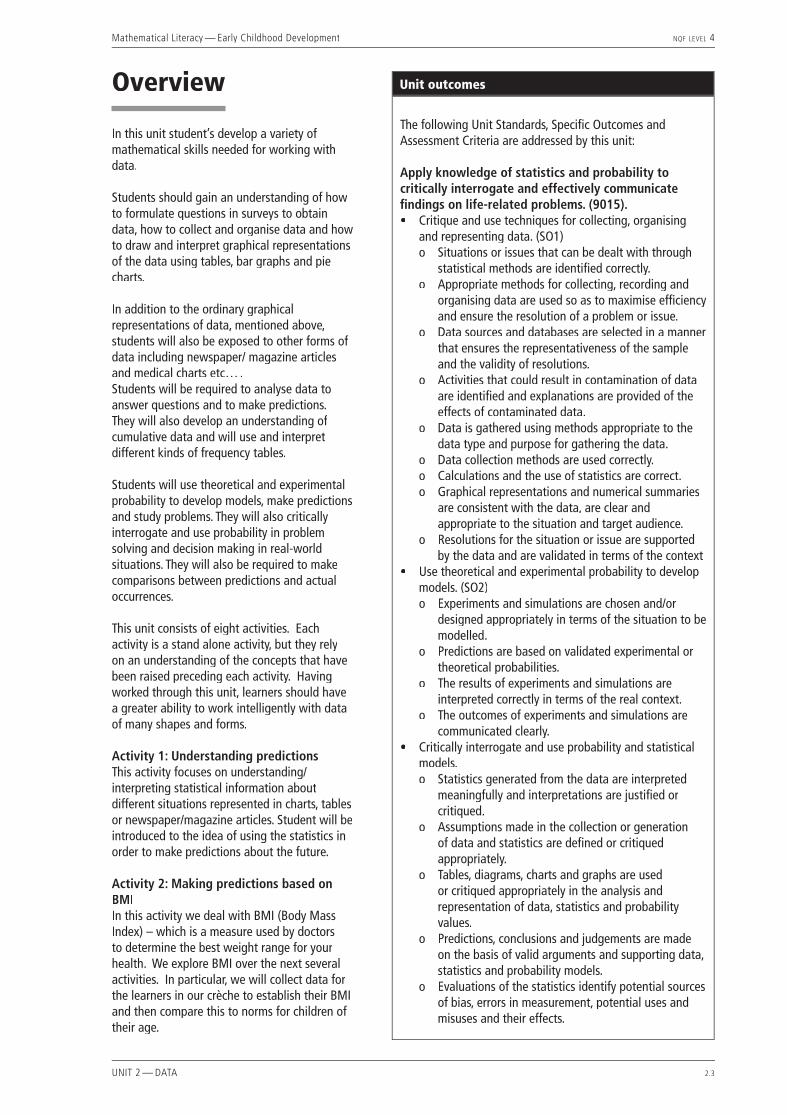
Mathematical Literacy — Early Childhood Development NQF LEVEL 4
UNIT 2 — DATA 2.3
Overview
In this unit student’s develop a variety of mathematical skills needed for working with data.
Students should gain an understanding of how to formulate questions in surveys to obtain data, how to collect and organise data and how to draw and interpret graphical representations of the data using tables, bar graphs and pie charts.
In addition to the ordinary graphical representations of data, mentioned above, students will also be exposed to other forms of data including newspaper/ magazine articles and medical charts etc… .Students will be required to analyse data to answer questions and to make predictions. They will also develop an understanding of cumulative data and will use and interpret different kinds of frequency tables.
Students will use theoretical and experimental probability to develop models, make predictions and study problems. They will also critically interrogate and use probability in problem solving and decision making in real-world situations. They will also be required to make comparisons between predictions and actual occurrences.
This unit consists of eight activities. Each activity is a stand alone activity, but they rely on an understanding of the concepts that have been raised preceding each activity. Having worked through this unit, learners should have a greater ability to work intelligently with data of many shapes and forms.
Activity 1: Understanding predictions This activity focuses on understanding/interpreting statistical information about different situations represented in charts, tables or newspaper/magazine articles. Student will be introduced to the idea of using the statistics in order to make predictions about the future.
Activity 2: Making predictions based on BMIIn this activity we deal with BMI (Body Mass Index) – which is a measure used by doctors to determine the best weight range for your health. We explore BMI over the next several activities. In particular, we will collect data for the learners in our crèche to establish their BMI and then compare this to norms for children of their age.
The following Unit Standards, Specifi c Outcomes and Assessment Criteria are addressed by this unit:
Apply knowledge of statistics and probability to critically interrogate and effectively communicate fi ndings on life-related problems. (9015).• Critique and use techniques for collecting, organising
and representing data. (SO1)o Situations or issues that can be dealt with through
statistical methods are identifi ed correctly. o Appropriate methods for collecting, recording and
organising data are used so as to maximise effi ciency and ensure the resolution of a problem or issue.
o Data sources and databases are selected in a manner that ensures the representativeness of the sample and the validity of resolutions.
o Activities that could result in contamination of data are identifi ed and explanations are provided of the effects of contaminated data.
o Data is gathered using methods appropriate to the data type and purpose for gathering the data.
o Data collection methods are used correctly. o Calculations and the use of statistics are correct. o Graphical representations and numerical summaries
are consistent with the data, are clear and appropriate to the situation and target audience.
o Resolutions for the situation or issue are supported by the data and are validated in terms of the context
• Use theoretical and experimental probability to develop models. (SO2)o Experiments and simulations are chosen and/or
designed appropriately in terms of the situation to be modelled.
o Predictions are based on validated experimental or theoretical probabilities.
o The results of experiments and simulations are interpreted correctly in terms of the real context.
o The outcomes of experiments and simulations are communicated clearly.
• Critically interrogate and use probability and statistical models. o Statistics generated from the data are interpreted
meaningfully and interpretations are justifi ed or critiqued.
o Assumptions made in the collection or generation of data and statistics are defi ned or critiqued appropriately.
o Tables, diagrams, charts and graphs are used or critiqued appropriately in the analysis and representation of data, statistics and probability values.
o Predictions, conclusions and judgements are made on the basis of valid arguments and supporting data, statistics and probability models.
o Evaluations of the statistics identify potential sources of bias, errors in measurement, potential uses and misuses and their effects.
Unit outcomes
Mathematical Literacy — Early Childhood Development NQF LEVEL 4
UNIT 2 — DATA 2.4
Activity 3: Collecting data to determine body frame indexIn this activity we explore body frame size (we return to BMI in the next activity). Students are required to draw up a data sheet in order to collect data for investigating body frame size. Using measurements which the students acquire in a collection process, students must then classify peoples body frame size according to certain specifi ed criteria, calculate the percentage over/underweight and draw pie charts and bar graphs to represent the data.
Activity 4: Reading and using BMI graphsIn this activity we return to Body Mass Index (BMI). Students are required to calculate various children’s BMI from given information, determine what percentile the child’s BMI falls into (using the body mass index-for-age percentiles chart), and classify the child’s health status indicated by this percentile placing. Students are also required to perform calculations which are applications of knowing a child’s BMI or percentile placing.
Activity 5: BMI data projectThis activity is well-suited to be used as an assessment activity (in the form of a project). It is intended to recap principles/skills that have been learnt in the fi rst four activities. There is an opportunity for learners to make their data collection sheet, collect data, analyse this data and summarise the data using tables and graphs in your summary.
Activity 6: Making a game part 1In this activity we begin the process of making a mathematical game. Students fi rst experiment with ordinary dice; calculating the probability and the relative frequency and comparing these. The activity then moves onto using specifi cally designed dice with different colours on each of the faces. Using their knowledge of statistics, students are required to make predictions about how many times they expect the dice to land on the different colours. Following this, students record experiments and collect cumulative frequencies for each of the colours and represent this in table and graphical form.
Activity 7: Making a game part 2In this activity we extend the process of making a mathematical game but experimenting with 2 colour results at the same time. Students are required to complete a tree diagram in order to examine theoretical predictions (probabilities) and compare these to experimental fi ndings.
Activity 8: Making a game part 3In this activity students are given specifi c criteria and, using the skills developed in activity 6 and 7, are required to make the boards for
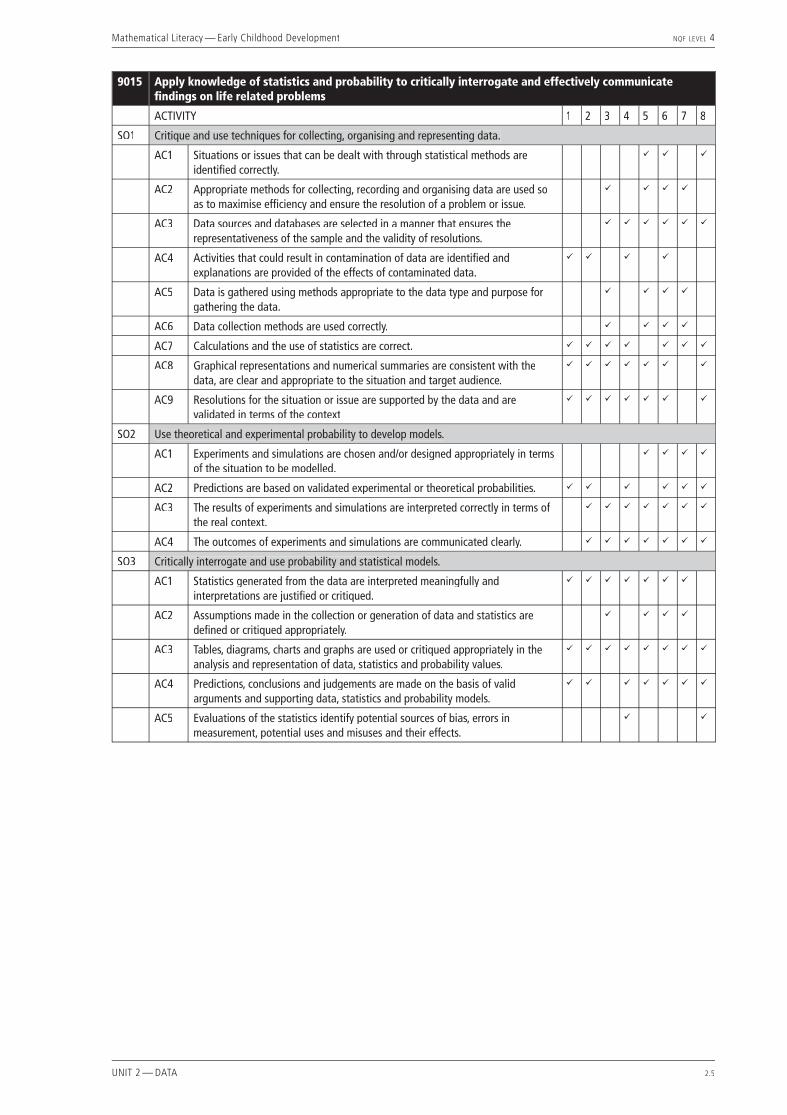
Mathematical Literacy — Early Childhood Development NQF LEVEL 4
UNIT 2 — DATA 2.5
9015 Apply knowledge of statistics and probability to critically interrogate and effectively communicate fi ndings on life related problems
ACTIVITY 1 2 3 4 5 6 7 8
SO1 Critique and use techniques for collecting, organising and representing data.
AC1 Situations or issues that can be dealt with through statistical methods are identifi ed correctly.
ü ü ü
AC2 Appropriate methods for collecting, recording and organising data are used so as to maximise effi ciency and ensure the resolution of a problem or issue.
ü ü ü ü
AC3 Data sources and databases are selected in a manner that ensures the representativeness of the sample and the validity of resolutions.
ü ü ü ü ü ü
AC4 Activities that could result in contamination of data are identifi ed and explanations are provided of the effects of contaminated data.
ü ü ü ü
AC5 Data is gathered using methods appropriate to the data type and purpose for gathering the data.
ü ü ü ü
AC6 Data collection methods are used correctly. ü ü ü ü
AC7 Calculations and the use of statistics are correct. ü ü ü ü ü ü ü
AC8 Graphical representations and numerical summaries are consistent with the data, are clear and appropriate to the situation and target audience.
ü ü ü ü ü ü ü
AC9 Resolutions for the situation or issue are supported by the data and are validated in terms of the context
ü ü ü ü ü ü ü
SO2 Use theoretical and experimental probability to develop models.
AC1 Experiments and simulations are chosen and/or designed appropriately in terms of the situation to be modelled.
ü ü ü ü
AC2 Predictions are based on validated experimental or theoretical probabilities. ü ü ü ü ü ü
AC3 The results of experiments and simulations are interpreted correctly in terms of the real context.
ü ü ü ü ü ü ü
AC4 The outcomes of experiments and simulations are communicated clearly. ü ü ü ü ü ü ü
SO3 Critically interrogate and use probability and statistical models.
AC1 Statistics generated from the data are interpreted meaningfully and interpretations are justifi ed or critiqued.
ü ü ü ü ü ü ü
AC2 Assumptions made in the collection or generation of data and statistics are defi ned or critiqued appropriately.
ü ü ü ü
AC3 Tables, diagrams, charts and graphs are used or critiqued appropriately in the analysis and representation of data, statistics and probability values.
ü ü ü ü ü ü ü ü
AC4 Predictions, conclusions and judgements are made on the basis of valid arguments and supporting data, statistics and probability models.
ü ü ü ü ü ü ü
AC5 Evaluations of the statistics identify potential sources of bias, errors in measurement, potential uses and misuses and their effects.
ü ü

Mathematical Literacy — Early Childhood Development NQF LEVEL 4
UNIT 2 — DATA 2.6

Mathematical Literacy — Early Childhood Development NQF LEVEL 4
UNIT 2 — DATA 2.7
Activity 1 — Understanding predictions
ABOUT THIS ACTIVITYThis activity focuses on understanding/interpreting statistical information about different situations represented in charts, tables or newspaper/magazine articles. Student will be introduced to the idea of using the statistics in order to make predictions about the future.
This activity is aligned with unit standard 9015 and addresses AC 4, 7, 8 and 9 of SO1; AC 2 of SO2 and AC 1, 3 and 4 of SO3.
MANAGING THIS ACTIVITYMany of the questions in this activity will stir up good classroom discussion and it is therefore important to allow time for this to be possible. Encourage the students to think carefully about the situations represented in the different questions in order to interpret the statistics accurately.
1.1 Detailed Forecast: Cape Town
the
wee
k ah
ead
Friday
StormyHi: 13
Low: 11
Saturday
ShowersHi: 16
Low: 07
Sunday
P/cloudyHi: 16
Low: 04
Monday
WindyHi: 16
Low: 13
Tuesday
SunnyHi: 18
Low: 14
1.1.1 The information provided shows us the that the weather predictions for Friday and Saturday are not ideal conditions for outdoor activities (stormy and rainy); that there may be some warmer weather on Sunday; that Monday is not a good day for a picnic but may be a good day to go sailing (windy); and that Tuesday would be the best day of this week to plan an outdoor activity such as a trip to Robben Island. Knowing the weather predictions can infl uence your decisions by helping you to make appropriate plans for the week.
1.1.2 Not very confi dent. It is, after all, only a prediction (“forecast” or “calculated guess”). There is little difference between the high and low predicted temperatures on the Tuesday, therefore I would be fairly confi dent that this day would indeed be sunny.
1.1.3 The weather predictions are merely “calculated guesses”. Whoever predicts these temperatures has no actual control over the weather conditions and therefore cannot know for sure what, in fact, the temperatures will be on these particular days.
1.2.1 No. It is more hygienic to wash your hands, of course, but there are many ways of contracting ‘fl u which will not be eliminated simply by washing your hands.
1.2.2 Essentially, this means that your risk of contracting ‘fl u has been halved.
1.3.1 This means that, on average, an adult is likely to have 2-4 colds a year. In other words, if you asked four different adults, one may have had only one cold, another two adults may have had 3 colds each and the fourth adult 5 colds in the year. Therefore, 4 people had 12 colds altogether. The average is 12÷4=3 colds. Therefore on average an adult may have between 2 and 4 colds per year.
1.3.2 The article suggests that the vaccine is 70%-90% effective in preventing the disease. Therefore if you take the vaccine, you have only a 10%-30% chance of contracting ‘fl u. Your risk has thus been considerably reduced.
1.3.3 Nursing homes generally accommodate a number of elderly people. Elderly people who live in nursing homes are more frail and therefore are unlikely to be outside very often. As it says in the article, if you spend more time indoors and close to other people there is more opportunity for “bugs” to spread.
1.3.4 Yes. If I get the vaccine, then I considerably reduce my risk of infection.
1.4.1 Increased by 40%.
Mathematical Literacy — Early Childhood Development NQF LEVEL 4
UNIT 2 — DATA 2.8
1.4.2 It is expected that there would be 14 twins born out of 1 000 without folate supplements and 19 twins born out of 1 000 pregnancies with folate supplementation – therefore 5 more twins out of a 1 000.
1.4.3 No. If there are 5 more twins expected, then this is an increase of ± 36%. This is calculated as follows:
5
14= 35,7% …and one can check by saying 14 × 35,7% = 5 .
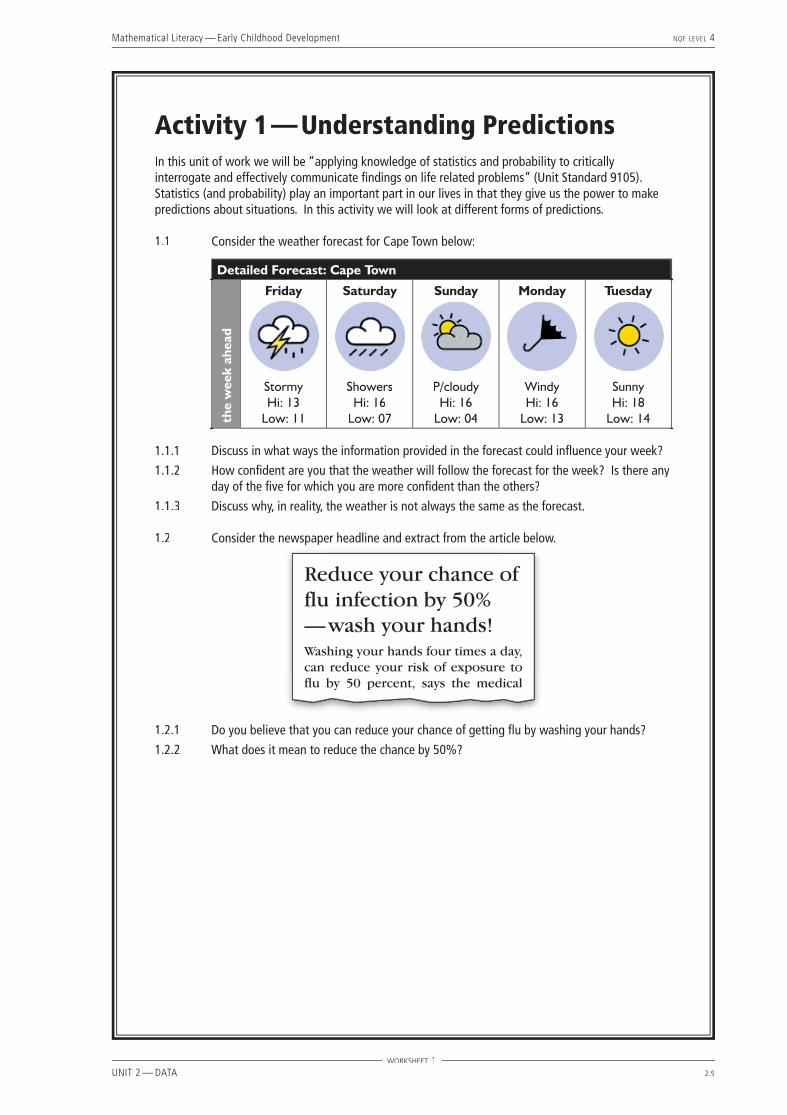
Mathematical Literacy — Early Childhood Development NQF LEVEL 4
UNIT 2 — DATA 2.9
WORKSHEET 1
Activity 1 — Understanding PredictionsIn this unit of work we will be “applying knowledge of statistics and probability to critically interrogate and effectively communicate fi ndings on life related problems” (Unit Standard 9105). Statistics (and probability) play an important part in our lives in that they give us the power to make predictions about situations. In this activity we will look at different forms of predictions.
1.1 Consider the weather forecast for Cape Town below:
Detailed Forecast: Cape Town
the
wee
k ah
ead
Friday
StormyHi: 13
Low: 11
Saturday
ShowersHi: 16
Low: 07
Sunday
P/cloudyHi: 16
Low: 04
Monday
WindyHi: 16
Low: 13
Tuesday
SunnyHi: 18
Low: 14
1.1.1 Discuss in what ways the information provided in the forecast could infl uence your week?
1.1.2 How confi dent are you that the weather will follow the forecast for the week? Is there any day of the fi ve for which you are more confi dent than the others?
1.1.3 Discuss why, in reality, the weather is not always the same as the forecast.
1.2 Consider the newspaper headline and extract from the article below.
Reduce your chance of flu infection by 50% — wash your hands!Washing your hands four times a day, can reduce your risk of exposure to flu by 50 percent, says the medical
1.2.1 Do you believe that you can reduce your chance of getting fl u by washing your hands?
1.2.2 What does it mean to reduce the chance by 50%?
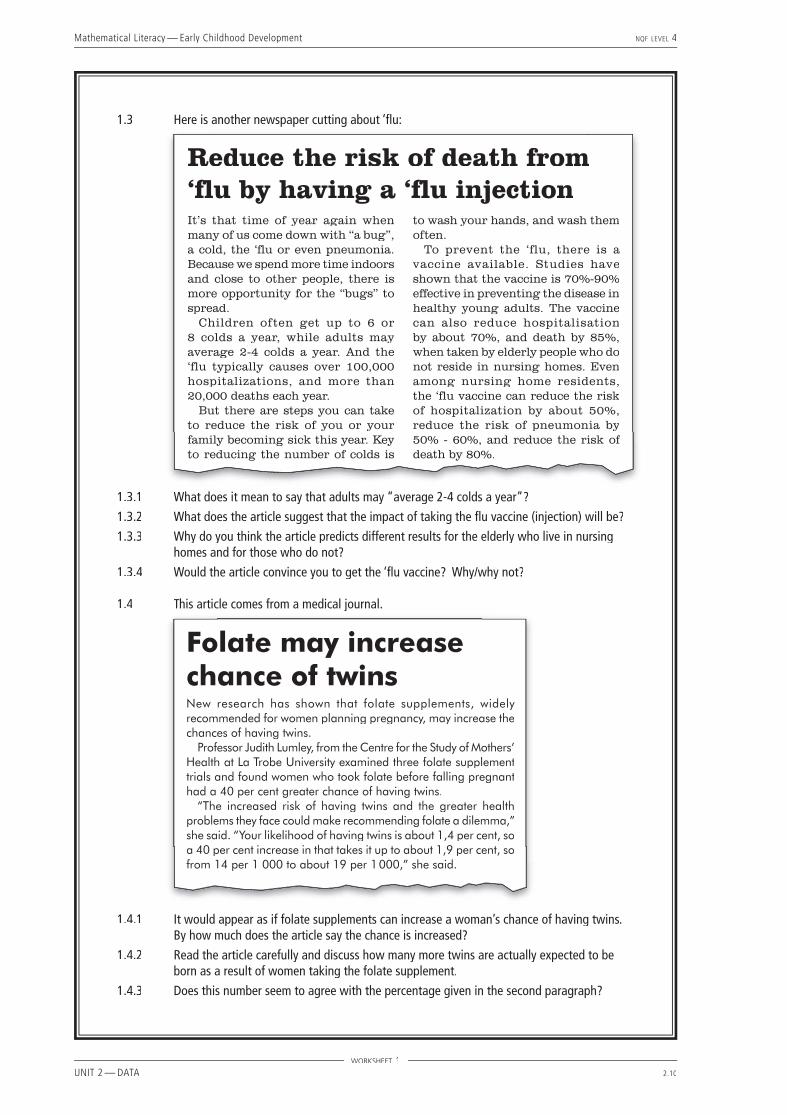
Mathematical Literacy — Early Childhood Development NQF LEVEL 4
UNIT 2 — DATA 2.10
WORKSHEET 1
1.3 Here is another newspaper cutting about ‘fl u:
It’s that time of year again when many of us come down with “a bug”, a cold, the ‘flu or even pneumonia. Because we spend more time indoors and close to other people, there is more opportunity for the “bugs” to spread.
Children often get up to 6 or 8 colds a year, while adults may average 2-4 colds a year. And the ‘flu typically causes over 100,000 hospitalizations, and more than 20,000 deaths each year.
But there are steps you can take to reduce the risk of you or your family becoming sick this year. Key to reducing the number of colds is
to wash your hands, and wash them often.
To prevent the ‘flu, there is a vaccine available. Studies have shown that the vaccine is 70%-90% effective in preventing the disease in healthy young adults. The vaccine can also reduce hospitalisation by about 70%, and death by 85%, when taken by elderly people who do not reside in nursing homes. Even among nursing home residents, the ‘flu vaccine can reduce the risk of hospitalization by about 50%, reduce the risk of pneumonia by 50% - 60%, and reduce the risk of death by 80%.
Reduce the risk of death from ‘flu by having a ‘flu injection
1.3.1 What does it mean to say that adults may “average 2-4 colds a year”?
1.3.2 What does the article suggest that the impact of taking the fl u vaccine (injection) will be?
1.3.3 Why do you think the article predicts different results for the elderly who live in nursing homes and for those who do not?
1.3.4 Would the article convince you to get the ‘fl u vaccine? Why/why not?
1.4 This article comes from a medical journal.
Folate may increase chance of twinsNew research has shown that folate supplements, widely recommended for women planning pregnancy, may increase the chances of having twins.
Professor Judith Lumley, from the Centre for the Study of Mothers’ Health at La Trobe University examined three folate supplement trials and found women who took folate before falling pregnant had a 40 per cent greater chance of having twins.
“The increased risk of having twins and the greater health problems they face could make recommending folate a dilemma,” she said. “Your likelihood of having twins is about 1,4 per cent, so a 40 per cent increase in that takes it up to about 1,9 per cent, so from 14 per 1 000 to about 19 per 1 000,” she said.
1.4.1 It would appear as if folate supplements can increase a woman’s chance of having twins. By how much does the article say the chance is increased?
1.4.2 Read the article carefully and discuss how many more twins are actually expected to be born as a result of women taking the folate supplement.
1.4.3 Does this number seem to agree with the percentage given in the second paragraph?
Mathematical Literacy — Early Childhood Development NQF LEVEL 4
UNIT 2 — DATA 2.11
Activity 2 — Making predictions based on BMI
ABOUT THIS ACTIVITYIn this activity students are introduced to Body Mass Index Measurements. Students begin this activity by studying a BMI-for-Age graph and demonstrate their understanding of what is represented in this graph. They then are introduced to the idea of a percentile and how we can measure predictions about children’s by calculating into which percentile the child falls. The graphs used in this activity were published by The Centre for Disease Control and Prevention (CDC) in the United States (http://www.cdc.gov)
This activity is aligned with unit standard 9015 and addresses AC 7, 8 and 9 of SO1; AC 2, 3 and 4 of SO2 and AC 1, 3 and 4 of SO3.
MANAGING THIS ACTIVITYThis activity is the fi rst of a series of activities which look at Body Mass Index as the context for experimenting with data.
2.1 The horizontal axis represents the children’s ages. The unit used on this axis to measure age is years.
2.2 The vertical axis represents the proportion/fraction of the children who will be obese when they are adults. The unit used on this axis to measure this proportion/fraction is percentage.
2.3 The uncoloured bar represents a Body Mass Index (BMI) of less than the 85th percentile; the grey bar represents a BMI of greater than or equal to the 85th percentile; and the black bar represents a BMI of greater than or equal to the 95th percentile for a particular age category.
2.4 Yes. The 19 above the middle bar for the children in the “1 to 3” age group represents 19% of the children aged 1 to 3, with a BMI of greater than or equal to the 85th percentile, who will be obese as adults.
2.5 If an infant’s head circumference falls within the 90th percentile for his/her age, this means that 10% of the children of the same age will have a head circumference that is larger and 90% will have a head circumference that is smaller than or equal to this infant’s head circumference.
2.6 If a child’s BMI is at the 85th percentile for her age, 15% of children of the same age will have a greater BMI and 85% will have the same or lower BMI.
2.7 No, these children are not considered to be overweight or at risk of being overweight. Their weights are fi ne/normal.
2.8 No, these children are not overweight but they are at risk of becoming overweight.
2.9 Yes, these children are overweight.
2.10 If a child’s BMI is greater than or equal to the 85th percentile but less than the 95th percentile, this means that this child’s BMI is greater than or equal to the BMI of 85%-95% of children. Therefore, this means that 10% (from 5%-15%) of children are at risk of being overweight (or are already \overweight).
2.11 If a child’s BMI is greater than or equal to the 95th percentile, this means that this child’s BMI is greater than or equal to the BMI of 95% of children. Therefore, this means that 5% of children are already overweight.
2.12.1 Children whose weight is acceptable (or possibly underweight, since there is not a separate category/bar on this graph for those whose BMI is the less than the 5th percentile of children).
2.12.2 Children who are at risk of being overweight.
2.12.3 Children who are overweight.
2.13.1 15% of the children in the 1 to 3 year old age group, whose weight is currently acceptable, are likely to be obese when they are 25.
Mathematical Literacy — Early Childhood Development NQF LEVEL 4
UNIT 2 — DATA 2.12
2.13.2 19% of the children in the 1 to 3 year old age group, who are currently at risk of being overweight, are likely to be obese when they are 25.
2.13.3 26% of the children in the 1 to 3 year old age group, who are currently overweight, are likely to be obese when they are 25.
2.14.1 69% of children in the age group 6 to 10, who are overweight, are likely to be obese at age 25.
2.14.2 75% of children in the age group 10 to 15, who are at risk of being overweight, are likely to be obese at age 25.
2.14.3 9% of children in the age group 15 to 18, whoseweight is acceptable or below average, are likely to be obese at age 25.
2.15.1 The CDC most likely studied the trends in BMI and obesity of many generations of children and used this information to predict the most likely outcome for each weight category.
2.15.2 Yes. They can be a clear indicator of whether your body is healthy or whether you should consider trying to reduce your risk of becoming obese by attempting to correct your BMI (by eating better and/or exercising more).
2.16 Basically, the longer you maintain an overweight or at risk-of-being-overweight status as a child, the more likely it is that by the time you are 25 you will be obese. Therefore, the BMI is a clear indicator of your chances of ending up as an obese adult.

Mathematical Literacy — Early Childhood Development NQF LEVEL 4
UNIT 2 — DATA 2.13
Activity 2 — Making predictions based on BMIBMI (Body Mass Index) is a measure used by doctors to determine the best weight range for your health. A person’s BMI relates quite closely to the amount of body fat that he/she has. With the exception of body builders and pregnant women, differences in BMI between people of the same age and sex are usually due to fat.
We are going to explore BMI over the next several activities. In particular, we will collect data for the learners in our crèche to establish their BMI and then compare this to norms for children of their age. Comparing BMI-for-Age for overweight children (from birth to 18 years) with those who are obese at age 25.
The Centre for Disease Control and Prevention (CDC) in the United States (http://www.cdc.gov) has published the graph printed below. We will study the graph in this activity to establish some important ideas about statistics and the use of statistics in making predictions.
By working through the questions that follow you will make sense of this graph.
2.1 What does the horizontal axis represent? What is the unit used on this axis?
2.2 What does the vertical axis represent? What is the unit used on this axis?
2.3 For each of the age ranges on the horizontal axis you will notice three bars (hence this is called a triple bar graph). Look at the legend for the graph and determine what the legend says each bar represents (we will make sense of what that actually means later in this unit).
2.4 On top of each bar in the graph there is a number. Can you see that this number corresponds to the height of the bar measured on the vertical axis? To be sure, what does the 19 above the middle bar for the children in the “1 to 3” age group represent?
Before we can continue you need to understand what percentiles are. Read the explanation below and answer the questions that follow.
WORKSHEET 2
Mathematical Literacy — Early Childhood Development NQF LEVEL 4
UNIT 2 — DATA 2.14
WORKSHEET 2
Percentiles A percentile is a measure that tells us what percentage of the population scored at or below a given value. If a 6-year-old’s weight at a checkup falls within the 20th percentile it means that the child’s weight is greater than or equal to the weight of 20% of the children of the same age in the country. The remaining 80% of children of the same age are heavier than the child.Doctors and nurses at children’s clinics in South Africa often plot the weight of children on a Road to Health Chart distributed by the Department of Health. We will look at these in a later activity. On those charts we see lines representing the weight of children at the 3rd, 50th and 97th percentile. We will also consider the signifi cance of falling outside of these lines.
2.5 If an infant’s head circumference falls within the 90th percentile for his/her age, what percentage of the children of the same age will have a head circumference that is larger and what percentage will have a head circumference that is the same or smaller than this infant?
2.6 If a child’s BMI is at the 85th percentile for her age, what percentage of children of the same age will have a greater BMI and what percentage will have the same or a lower BMI?
The Centre for Disease Control and Prevention (CDC) says the following about children’s BMI:• If their BMI is greater than or equal to the 95th percentile, they are overweight;• If their BMI is greater than or equal to the 85th percentile but less than the 95th percentile then
they are at risk of being overweight; and• If their BMI is less than the 5th percentile they are underweight.
2.7 Refer back to the graph. The uncoloured bar (for each age group) represents children whose BMI is below the 85th percentile. Do these children fi t into the “overweight” category or the “at risk of being overweight” category, or not?
2.8 The grey bar on the graph represents children whose BMI is greater than or equal to () the 85th percentile but below the 95th percentile. Are these children overweight?
2.9 The black bar on the graph represents children whose BMI is greater than or equal to () the 95th percentile. Are these children overweight?
Let’s check that you are keeping up:
2.10 The CDC says that children whose BMI is greater than or equal to the 85th percentile but less than the 95th percentile are at risk of being overweight. What percentage of children at any age are considered to be at risk of being overweight?
2.11 The CDC says that children whose BMI is greater than or equal to the 95th percentile are overweight. What percentage of children at any age are considered to be overweight?
We are now ready to understand the graph.2.12 We begin by referring to the part of the graph printed alongside.
You will notice three bars for the children in the 1 to 3 year old age group.
2.12.1 Which children are represented by the uncoloured bar (on the left)? Are they children whose weight is acceptable, children who are at risk of being overweight or children who are overweight?
2.12.2 Which children are represented by the grey bar (in the middle)? Are they children whose weight is acceptable, children who are at risk of being overweight or children who are overweight?
2.12.3 Which children are represented by the black bar (on the right)?
Mathematical Literacy — Early Childhood Development NQF LEVEL 4
UNIT 2 — DATA 2.15
WORKSHEET 2
2.13 The number on top of each bar corresponds to the value on the vertical axis. The vertical axis tells us what percentage of children will be obese when they are 25.
2.13.1 What percentage of the children in the 1 to 3 year old age group whose weight is currently acceptable will be obese when they are 25?
2.13.2 What percentage of the children in the 1 to 3 year old age group who are currently at risk of being overweight will be obese when they are 25?
2.13.3 What percentage of the children in the 1 to 3 year old age group who are currently overweight will be obese when they are 25?
2.14 Now consider the full graph and answer the following questions:
2.14.1 What percentage of children in the age group 6 to 10 who are overweight will end up being obese at age 25?
2.14.2 What percentage of children in the age group 10 to 15 who are at risk of being overweight will end up being obese at age 25?
2.14.3 What percentage of children in the age group 15 to 18 whose weight is acceptable will end up being obese at age 25?
2.15 In the previous question we looked at the graph to decide what percentage of a group of children will be obese when they are 25. This is only a prediction.
2.15.1 How do you think the CDC has made this prediction?
2.15.2 Since these are all predictions, do you think people should take notice of them?
2.16 Look at the trends in the bars on the graph and write a short paragraph about whether or not being overweight (or at risk of being overweight) at a young age is a good predictor of whether or not you will be obese when you reach 25.
Mathematical Literacy — Early Childhood Development NQF LEVEL 4
UNIT 2 — DATA 2.16
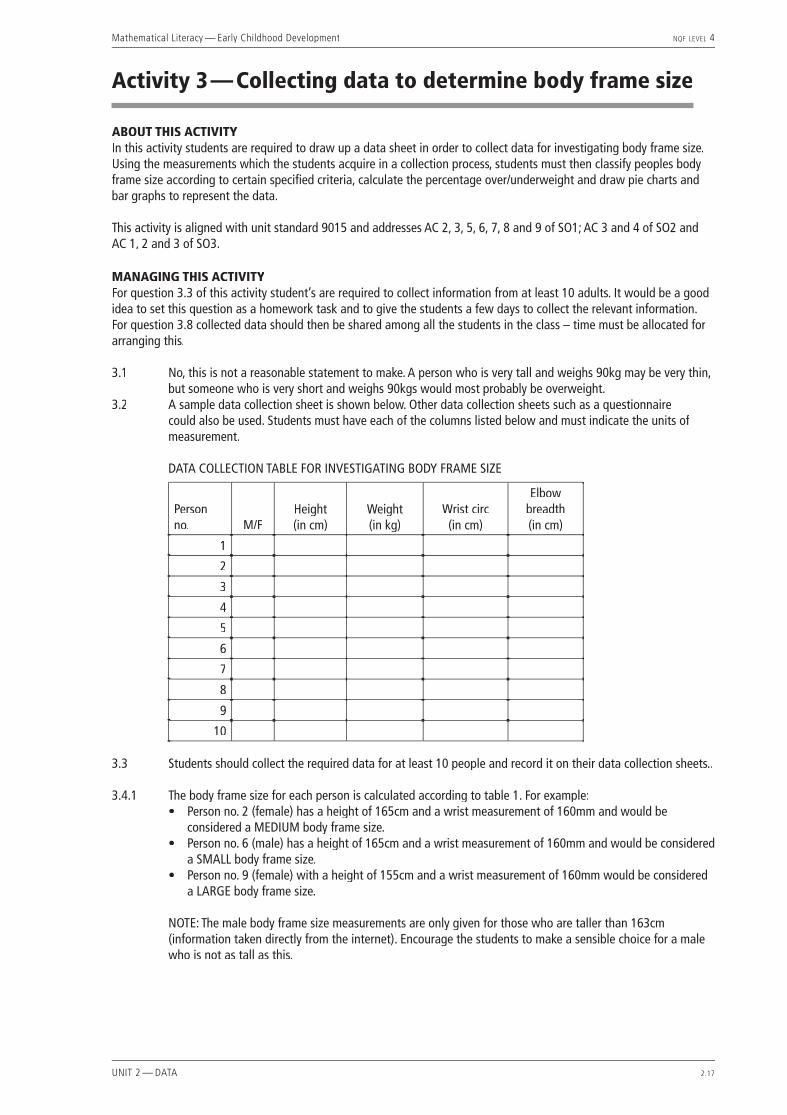
Mathematical Literacy — Early Childhood Development NQF LEVEL 4
UNIT 2 — DATA 2.17
Activity 3 — Collecting data to determine body frame size
ABOUT THIS ACTIVITYIn this activity students are required to draw up a data sheet in order to collect data for investigating body frame size. Using the measurements which the students acquire in a collection process, students must then classify peoples body frame size according to certain specifi ed criteria, calculate the percentage over/underweight and draw pie charts and bar graphs to represent the data.
This activity is aligned with unit standard 9015 and addresses AC 2, 3, 5, 6, 7, 8 and 9 of SO1; AC 3 and 4 of SO2 and AC 1, 2 and 3 of SO3.
MANAGING THIS ACTIVITYFor question 3.3 of this activity student’s are required to collect information from at least 10 adults. It would be a good idea to set this question as a homework task and to give the students a few days to collect the relevant information. For question 3.8 collected data should then be shared among all the students in the class – time must be allocated for arranging this.
3.1 No, this is not a reasonable statement to make. A person who is very tall and weighs 90kg may be very thin, but someone who is very short and weighs 90kgs would most probably be overweight.
3.2 A sample data collection sheet is shown below. Other data collection sheets such as a questionnaire could also be used. Students must have each of the columns listed below and must indicate the units of measurement.
DATA COLLECTION TABLE FOR INVESTIGATING BODY FRAME SIZE
Person no. M/F
Height (in cm)
Weight (in kg)
Wrist circ (in cm)
Elbow breadth (in cm)
1
2
3
4
5
6
7
8
9
10
3.3 Students should collect the required data for at least 10 people and record it on their data collection sheets..
3.4.1 The body frame size for each person is calculated according to table 1. For example:• Person no. 2 (female) has a height of 165cm and a wrist measurement of 160mm and would be
considered a MEDIUM body frame size.• Person no. 6 (male) has a height of 165cm and a wrist measurement of 160mm and would be considered
a SMALL body frame size.• Person no. 9 (female) with a height of 155cm and a wrist measurement of 160mm would be considered
a LARGE body frame size.
NOTE: The male body frame size measurements are only given for those who are taller than 163cm (information taken directly from the internet). Encourage the students to make a sensible choice for a male who is not as tall as this.
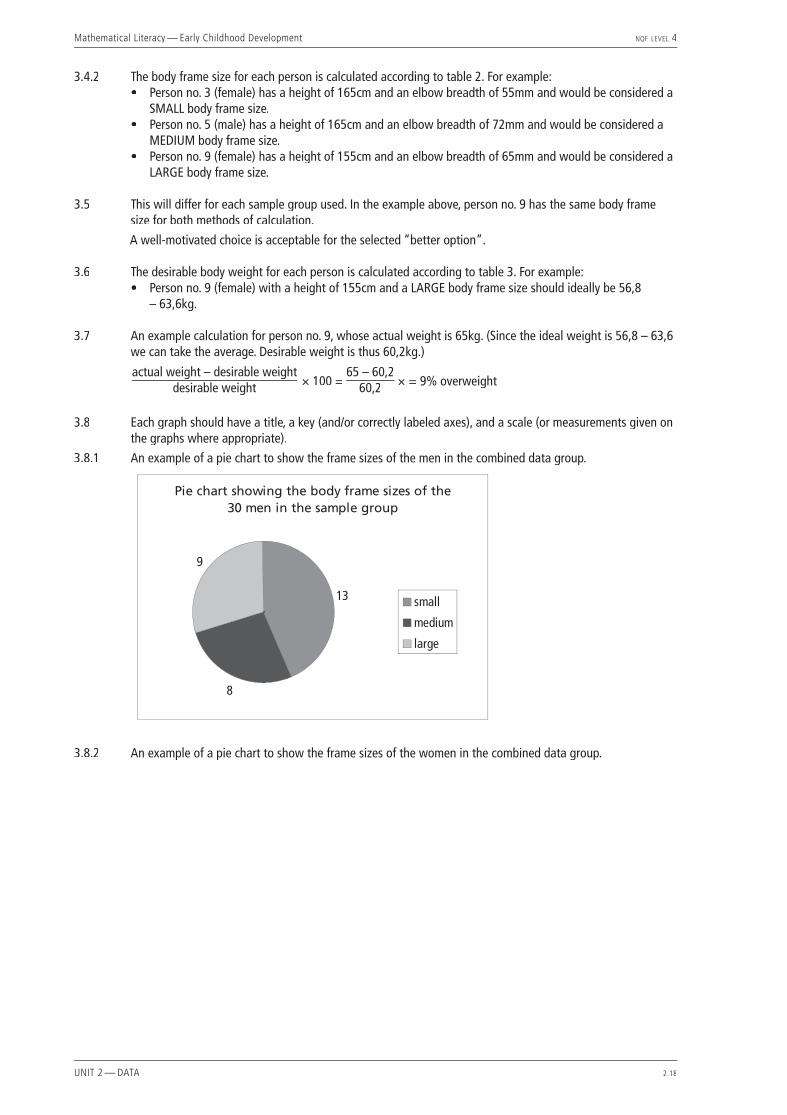
Mathematical Literacy — Early Childhood Development NQF LEVEL 4
UNIT 2 — DATA 2.18
3.4.2 The body frame size for each person is calculated according to table 2. For example:• Person no. 3 (female) has a height of 165cm and an elbow breadth of 55mm and would be considered a
SMALL body frame size.• Person no. 5 (male) has a height of 165cm and an elbow breadth of 72mm and would be considered a
MEDIUM body frame size.• Person no. 9 (female) has a height of 155cm and an elbow breadth of 65mm and would be considered a
LARGE body frame size.
3.5 This will differ for each sample group used. In the example above, person no. 9 has the same body frame size for both methods of calculation.
A well-motivated choice is acceptable for the selected “better option”.
3.6 The desirable body weight for each person is calculated according to table 3. For example:• Person no. 9 (female) with a height of 155cm and a LARGE body frame size should ideally be 56,8
– 63,6kg.
3.7 An example calculation for person no. 9, whose actual weight is 65kg. (Since the ideal weight is 56,8 – 63,6 we can take the average. Desirable weight is thus 60,2kg.)
actual weight – desirable weight
desirable weight × 100 =65 – 60,2
60,2 × = 9% overweight
3.8 Each graph should have a title, a key (and/or correctly labeled axes), and a scale (or measurements given on the graphs where appropriate).
3.8.1 An example of a pie chart to show the frame sizes of the men in the combined data group.
3.8.2 An example of a pie chart to show the frame sizes of the women in the combined data group.

Mathematical Literacy — Early Childhood Development NQF LEVEL 4
UNIT 2 — DATA 2.19
3.8.3 An example of a triple bar graph for the men to show how many of them have a weight that is less than desirable, desirable or more than desirable for their frame size:
3.8.4 An example of a triple bar graph for the women to show how many of them have a weight that is less than desirable, desirable or more than desirable for their frame size:
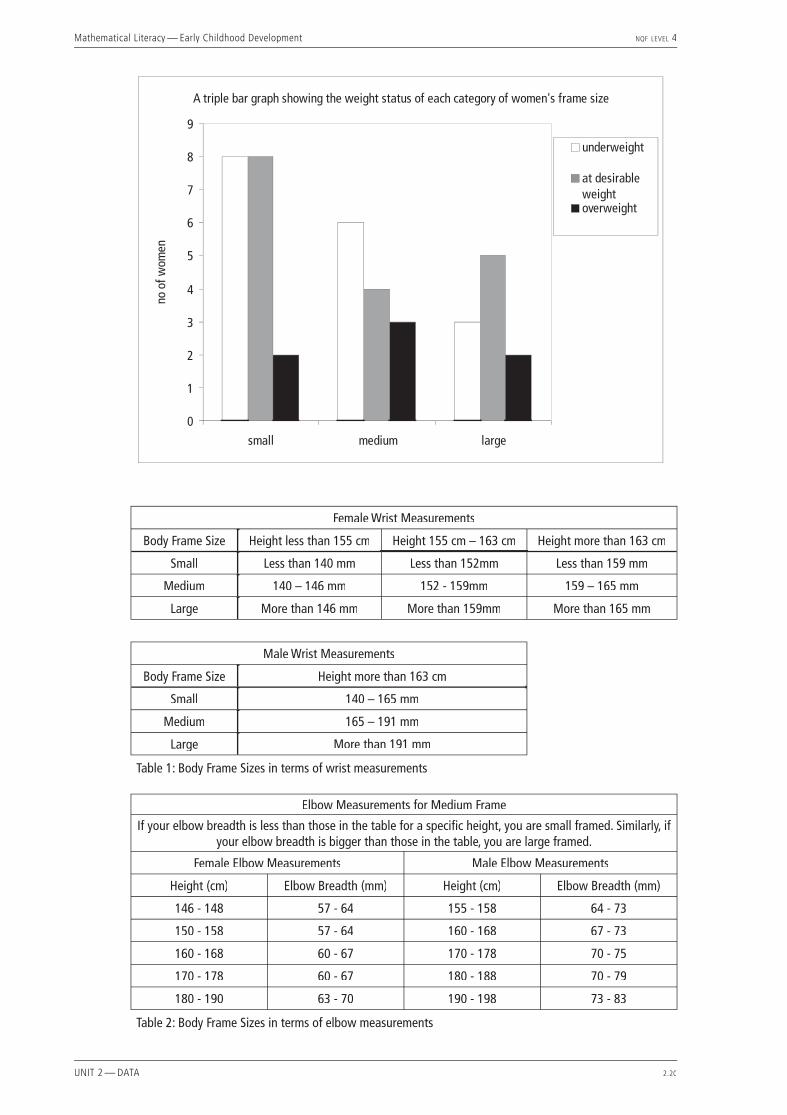
Mathematical Literacy — Early Childhood Development NQF LEVEL 4
UNIT 2 — DATA 2.20
Female Wrist Measurements
Body Frame Size Height less than 155 cm Height 155 cm – 163 cm Height more than 163 cm
Small Less than 140 mm Less than 152mm Less than 159 mm
Medium 140 – 146 mm 152 - 159mm 159 – 165 mm
Large More than 146 mm More than 159mm More than 165 mm
Male Wrist Measurements
Body Frame Size Height more than 163 cm
Small 140 – 165 mm
Medium 165 – 191 mm
Large More than 191 mm
Table 1: Body Frame Sizes in terms of wrist measurements
Elbow Measurements for Medium Frame
If your elbow breadth is less than those in the table for a specifi c height, you are small framed. Similarly, if your elbow breadth is bigger than those in the table, you are large framed.
Female Elbow Measurements Male Elbow Measurements
Height (cm) Elbow Breadth (mm) Height (cm) Elbow Breadth (mm)
146 - 148 57 - 64 155 - 158 64 - 73
150 - 158 57 - 64 160 - 168 67 - 73
160 - 168 60 - 67 170 - 178 70 - 75
170 - 178 60 - 67 180 - 188 70 - 79
180 - 190 63 - 70 190 - 198 73 - 83
Table 2: Body Frame Sizes in terms of elbow measurements
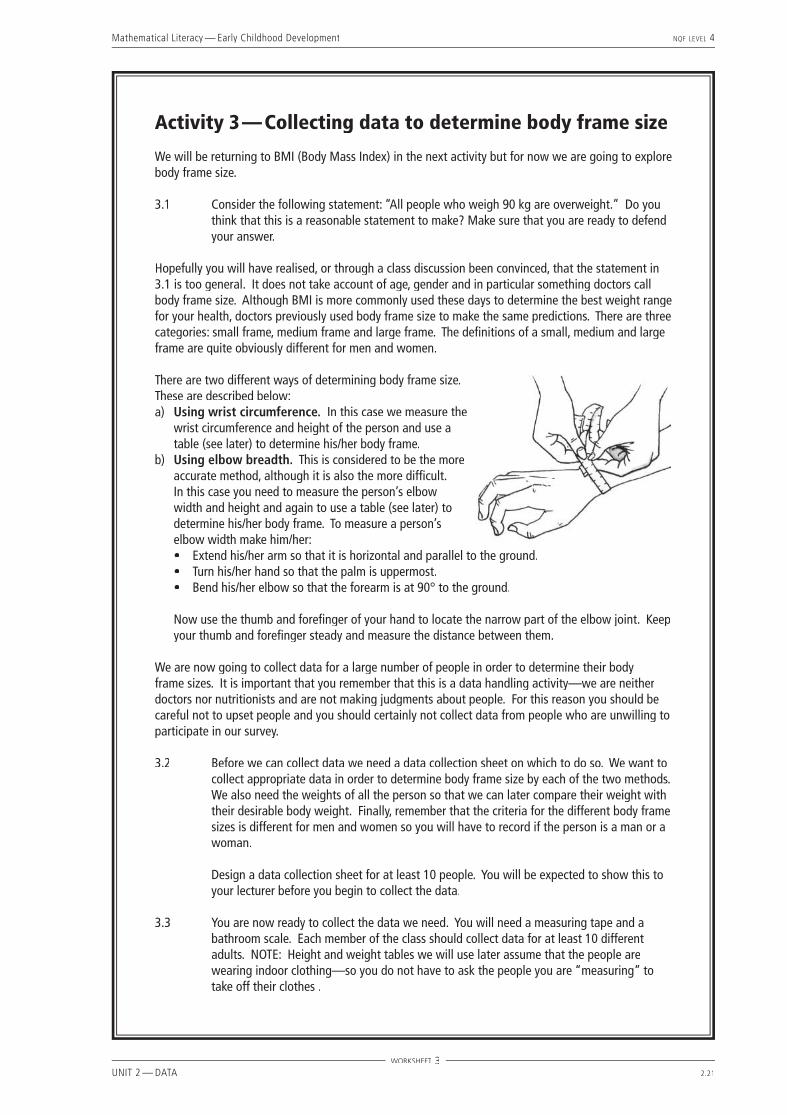
Mathematical Literacy — Early Childhood Development NQF LEVEL 4
UNIT 2 — DATA 2.21
Activity 3 — Collecting data to determine body frame size
We will be returning to BMI (Body Mass Index) in the next activity but for now we are going to explore body frame size.
3.1 Consider the following statement: “All people who weigh 90 kg are overweight.” Do you think that this is a reasonable statement to make? Make sure that you are ready to defend your answer.
Hopefully you will have realised, or through a class discussion been convinced, that the statement in 3.1 is too general. It does not take account of age, gender and in particular something doctors call body frame size. Although BMI is more commonly used these days to determine the best weight range for your health, doctors previously used body frame size to make the same predictions. There are three categories: small frame, medium frame and large frame. The defi nitions of a small, medium and large frame are quite obviously different for men and women.
There are two different ways of determining body frame size. These are described below:a) Using wrist circumference. In this case we measure the
wrist circumference and height of the person and use a table (see later) to determine his/her body frame.
b) Using elbow breadth. This is considered to be the more accurate method, although it is also the more diffi cult. In this case you need to measure the person’s elbow width and height and again to use a table (see later) to determine his/her body frame. To measure a person’s elbow width make him/her:• Extend his/her arm so that it is horizontal and parallel to the ground.• Turn his/her hand so that the palm is uppermost.• Bend his/her elbow so that the forearm is at 90° to the ground.
Now use the thumb and forefi nger of your hand to locate the narrow part of the elbow joint. Keep your thumb and forefi nger steady and measure the distance between them.
We are now going to collect data for a large number of people in order to determine their body frame sizes. It is important that you remember that this is a data handling activity—we are neither doctors nor nutritionists and are not making judgments about people. For this reason you should be careful not to upset people and you should certainly not collect data from people who are unwilling to participate in our survey.
3.2 Before we can collect data we need a data collection sheet on which to do so. We want to collect appropriate data in order to determine body frame size by each of the two methods. We also need the weights of all the person so that we can later compare their weight with their desirable body weight. Finally, remember that the criteria for the different body frame sizes is different for men and women so you will have to record if the person is a man or a woman.
Design a data collection sheet for at least 10 people. You will be expected to show this to your lecturer before you begin to collect the data.
3.3 You are now ready to collect the data we need. You will need a measuring tape and a bathroom scale. Each member of the class should collect data for at least 10 different adults. NOTE: Height and weight tables we will use later assume that the people are wearing indoor clothing—so you do not have to ask the people you are “measuring” to take off their clothes .
WORKSHEET 3
Mathematical Literacy — Early Childhood Development NQF LEVEL 4
UNIT 2 — DATA 2.22
3.4 Having collected the data you should now do the following:3.4.1 Determine the body frame size for each person in your survey based on the wrist
measurement (see table 1).3.4.2 Determine the body frame size for each person in your survey based on the elbow
measurement (see table 2).
3.5 For how many of the people in your study is their frame size the same (i.e. small, medium or large) irrespective of the method you use to determine it? Which method do you think is best? Discuss.
3.6 Using the frame size (based on the method you think is best) determine the desirable body weight for each person by referring to the height and weight data provided in table 3.
3.7 Calculate the percentage that each person is over/underweight for each person in your study as follows:
actual weight – desirable weight
desirable weight × 100
3.8 You should now combine the data for all of the members of the class. You may want to share out the following tasks between the members of the class. Draw the following graphs:
3.8.1 A pie chart to show how many men in the combined data had small, medium and large body frames.
3.8.2 A pie chart to show how many women in the combined data had small, medium and large body frames.
3.8.3 A triple bar graph for the men to show how many of them have a weight that is less than desirable, desirable or more than desirable for their frame size.
3.8.4 A triple bar graph for the women to show how many of them have a weight that is less than desirable, desirable or more than desirable for their frame size.
WORKSHEET 3
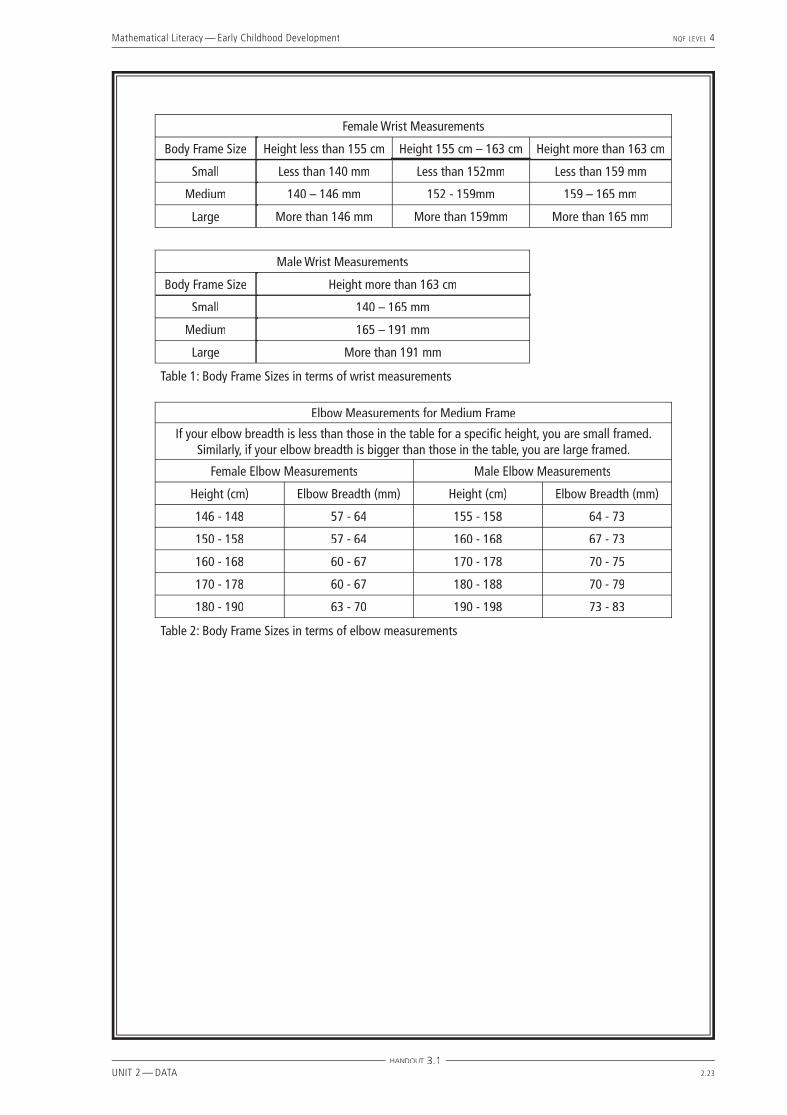
Mathematical Literacy — Early Childhood Development NQF LEVEL 4
UNIT 2 — DATA 2.23
Female Wrist Measurements
Body Frame Size Height less than 155 cm Height 155 cm – 163 cm Height more than 163 cm
Small Less than 140 mm Less than 152mm Less than 159 mm
Medium 140 – 146 mm 152 - 159mm 159 – 165 mm
Large More than 146 mm More than 159mm More than 165 mm
Male Wrist Measurements
Body Frame Size Height more than 163 cm
Small 140 – 165 mm
Medium 165 – 191 mm
Large More than 191 mm
Table 1: Body Frame Sizes in terms of wrist measurements
Elbow Measurements for Medium Frame
If your elbow breadth is less than those in the table for a specifi c height, you are small framed. Similarly, if your elbow breadth is bigger than those in the table, you are large framed.
Female Elbow Measurements Male Elbow Measurements
Height (cm) Elbow Breadth (mm) Height (cm) Elbow Breadth (mm)
146 - 148 57 - 64 155 - 158 64 - 73
150 - 158 57 - 64 160 - 168 67 - 73
160 - 168 60 - 67 170 - 178 70 - 75
170 - 178 60 - 67 180 - 188 70 - 79
180 - 190 63 - 70 190 - 198 73 - 83
Table 2: Body Frame Sizes in terms of elbow measurements
HANDOUT 3.1

Mathematical Literacy — Early Childhood Development NQF LEVEL 4
UNIT 2 — DATA 2.24
1999 Metropolitan Height and Weight (in kg) Tables for Men and Womenaccording to frame, ages 25 - 59
Women Men
Height (cm)
Small FrameMedium Frame
Large FrameHeight (cm)
Small FrameMedium Frame
Large Frame
148 46.4 - 50.5 49.6 - 55.1 53.7 - 59.8 158 58.3 - 61.0 59.6 - 64.2 62.8 - 68.3
149 46.6 - 51.0 50.0 - 55.5 54.1 - 60.3 159 58.6 - 61.3 59.9 - 64.5 63.1 - 68.8
150 46.7 - 51.3 50.3 - 55.9 54.4 - 60.9 160 59.0 - 61.7 60.3 - 64.9 63.5 - 69.4
151 46.9 - 51.7 50.7 - 56.4 54.6 - 61.4 161 59.3 - 62.0 60.6 - 65.2 63.8 - 69.9
152 47.1 - 52.1 51.1 - 57.0 55.2 - 61.9 162 59.7 - 62.4 61.0 - 65.6 64.2 - 70.5
153 47.4 - 52.5 51.5 - 57.5 55.6 - 62.4 163 60.0 - 62.7 61.3 - 66.0 64.5 - 71.1
154 47.8 - 53.0 51.9 - 58.0 56.2 - 63.0 164 60.4 - 63.1 61.7 - 66.5 64.9 - 71.8
155 48.1 - 53.6 52.2 - 58.6 56.8 - 63.6 165 60.8 - 63.5 62.1 - 67.0 65.3 - 72.5
156 48.5 - 54.1 52.7 - 59.1 57.3 - 64.1 166 61.1 - 63.8 62.4 - 67.6 65.6 - 73.2
157 48.8 - 54.6 53.2 - 59.6 57.8 - 64.6 167 61.5 - 64.2 62.8 - 68.2 66.0 - 74.0
158 49.3 - 55.2 53.8 - 60.2 58.4 - 65.3 168 61.8 - 64.6 63.2 - 68.7 66.4 - 74.7
159 49.8 - 55.7 54.3 - 60.7 58.9 - 66.0 169 62.2 - 65.2 63.8 - 69.3 67.0 - 75.4
160 50.3 - 56.2 54.9 - 61.2 59.4 - 66.7 170 62.5 - 65.7 64.3 - 69.8 67.5 - 76.1
161 50.8 - 56.7 55.4 - 61.7 59.9 - 67.4 171 62.9 - 66.2 64.8 - 70.3 68.0 - 76.8
162 51.4 - 57.3 55.9 - 62.3 60.5 - 68.1 172 63.2 - 66.7 65.4 - 70.8 68.5 - 77.5
163 51.9 - 57.8 56.4 - 62.8 61.0 - 68.8 173 63.6 - 67.3 65.9 - 71.4 69.1 - 78.2
164 52.5 - 58.4 57.0 - 63.4 61.5 - 69.5 174 63.9 - 67.8 66.4 - 71.9 69.6 - 78.9
165 53.0 - 58.9 57.5 - 63.9 62.0 - 70.2 175 64.3 - 68.3 66.9 - 72.4 70.1 - 79.6
166 53.6 - 59.5 58.1 - 64.5 62.6 - 70.9 176 64.7 - 68.9 67.5 - 73.0 70.7 - 80.3
167 54.1 - 60.0 58.7 - 65.0 63.2 - 71.7 177 65.0 - 69.5 68.1 - 73.5 71.3 - 81.0
168 54.6 - 60.5 59.2 - 65.5 63.7 - 72.4 178 65.4 - 70.0 68.6 - 74.0 71.8 - 81.8
169 55.2 - 61.1 59.7 - 66.1 64.3 - 73.1 179 65.7 - 70.5 69.2 - 74.6 72.3 - 82.5
170 55.7 - 61.6 60.2 - 66.6 64.8 - 73.8 180 66.1 - 71.0 69.7 - 75.1 72.8 - 83.3
171 56.2 - 62.1 60.7 - 67.1 65.3 - 74.5 181 66.6 - 71.6 70.2 - 75.8 73.4 - 84.0
172 56.8 - 62.6 61.3 - 67.6 65.8 - 75.2 182 67.1 - 72.1 70.7 - 76.5 73.9 - 84.7
173 57.3 - 63.2 61.8 - 68.2 66.4 - 75.9 183 67.7 - 72.7 71.3 - 77.2 74.5 - 85.4
174 57.8 - 63.7 62.3 - 68.7 66.9 - 76.4 184 68.2 - 73.4 71.8 - 77.9 75.2 - 86.1
175 58.3 - 64.2 62.8 - 69.2 67.4 - 76.9 185 68.7 - 74.1 72.4 - 78.6 75.9 - 86.8
176 58.9 - 64.8 63.4 - 69.8 68.0 - 77.5 186 69.2 - 74.8 73.0 - 79.3 76.6 - 87.6
177 59.5 - 65.4 64.0 - 70.4 68.5 - 78.1 187 69.8 - 75.5 73.7 - 80.0 77.3 - 88.5
178 60.0 - 65.9 64.5 - 70.9 69.0 - 78.6 188 70.3 - 76.2 74.4 - 80.7 78.0 - 89.4
179 60.5 - 66.4 65.1 - 71.4 69.6 - 79.1 189 70.9 - 76.9 74.9 - 81.5 78.7 - 90.3
180 61.0 - 66.9 65.6 - 71.9 70.1 - 79.6 190 71.4 - 77.6 75.4 - 82.2 79.4 - 91.2
181 61.6 - 67.5 66.1 - 72.5 70.7 - 80.2 191 72.1 - 78.4 76.1 - 83.0 80.3 - 92.1
182 62.1 - 68.0 66.6 - 73.0 71.2 - 80.7 192 72.8 - 79.1 76.8 - 83.9 81.2 - 93.0
183 62.6 - 68.5 67.1 - 73.5 71.7 - 81.2 193 73.5 - 79.8 77.6 - 84.8 82.1 - 93.9
Table 3: Desirable body weight by height and frame size
HANDOUT 3.2
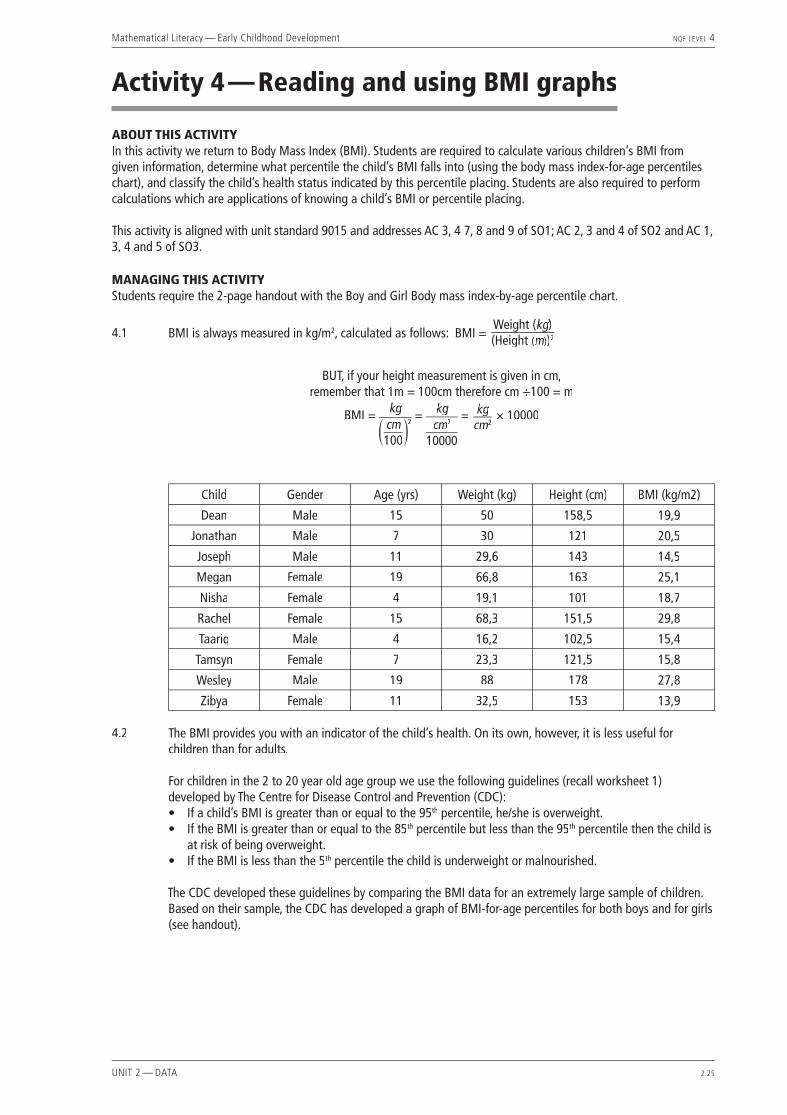
Mathematical Literacy — Early Childhood Development NQF LEVEL 4
UNIT 2 — DATA 2.25
Activity 4 — Reading and using BMI graphs
ABOUT THIS ACTIVITYIn this activity we return to Body Mass Index (BMI). Students are required to calculate various children’s BMI from given information, determine what percentile the child’s BMI falls into (using the body mass index-for-age percentiles chart), and classify the child’s health status indicated by this percentile placing. Students are also required to perform calculations which are applications of knowing a child’s BMI or percentile placing.
This activity is aligned with unit standard 9015 and addresses AC 3, 4 7, 8 and 9 of SO1; AC 2, 3 and 4 of SO2 and AC 1, 3, 4 and 5 of SO3.
MANAGING THIS ACTIVITYStudents require the 2-page handout with the Boy and Girl Body mass index-by-age percentile chart.
4.1 BMI is always measured in kg/m2, calculated as follows: BMI =Weight (kg)kg)kg(Height (m)m)m )2
BUT, if your height measurement is given in cm, remember that 1m = 100cm therefore cm ÷100 = m
BMI = kgcm100
2= kg
cm2cm2cm10000
= kgcm2cm2cm
× 10000
Child Gender Age (yrs) Weight (kg) Height (cm) BMI (kg/m2)
Dean Male 15 50 158,5 19,9
Jonathan Male 7 30 121 20,5
Joseph Male 11 29,6 143 14,5
Megan Female 19 66,8 163 25,1
Nisha Female 4 19,1 101 18,7
Rachel Female 15 68,3 151,5 29,8
Taariq Male 4 16,2 102,5 15,4
Tamsyn Female 7 23,3 121,5 15,8
Wesley Male 19 88 178 27,8
Zibya Female 11 32,5 153 13,9
4.2 The BMI provides you with an indicator of the child’s health. On its own, however, it is less useful for children than for adults.
For children in the 2 to 20 year old age group we use the following guidelines (recall worksheet 1) developed by The Centre for Disease Control and Prevention (CDC):• If a child’s BMI is greater than or equal to the 95th percentile, he/she is overweight.• If the BMI is greater than or equal to the 85th percentile but less than the 95th percentile then the child is
at risk of being overweight.• If the BMI is less than the 5th percentile the child is underweight or malnourished.
The CDC developed these guidelines by comparing the BMI data for an extremely large sample of children. Based on their sample, the CDC has developed a graph of BMI-for-age percentiles for both boys and for girls (see handout).
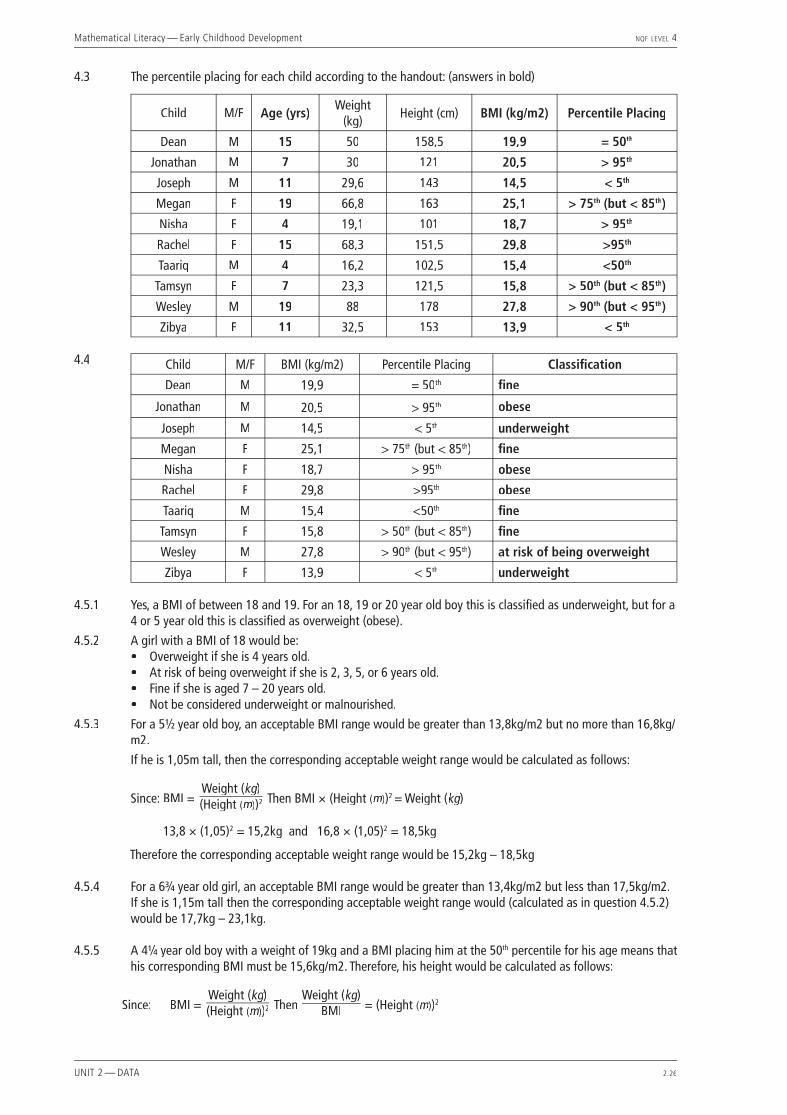
Mathematical Literacy — Early Childhood Development NQF LEVEL 4
UNIT 2 — DATA 2.26
4.3 The percentile placing for each child according to the handout: (answers in bold)
Child M/F Age (yrs)Weight
(kg)Height (cm) BMI (kg/m2) Percentile Placing
Dean M 15 50 158,5 19,9 = 50th
Jonathan M 7 30 121 20,5 > 95th
Joseph M 11 29,6 143 14,5 < 5th
Megan F 19 66,8 163 25,1 > 75th (but < 85th)
Nisha F 4 19,1 101 18,7 > 95th
Rachel F 15 68,3 151,5 29,8 >95th
Taariq M 4 16,2 102,5 15,4 <50th
Tamsyn F 7 23,3 121,5 15,8 > 50th (but < 85th)
Wesley M 19 88 178 27,8 > 90th (but < 95th)
Zibya F 11 32,5 153 13,9 < 5th
4.4
Child M/F BMI (kg/m2) Percentile Placing Classifi cation
Dean M 19,9 = 50th fi ne
Jonathan M 20,5 > 95th obese
Joseph M 14,5 < 5th underweight
Megan F 25,1 > 75th (but < 85th) fi ne
Nisha F 18,7 > 95th obese
Rachel F 29,8 >95th obese
Taariq M 15,4 <50th fi ne
Tamsyn F 15,8 > 50th (but < 85th) fi ne
Wesley M 27,8 > 90th (but < 95th) at risk of being overweight
Zibya F 13,9 < 5th underweight 4.5.1 Yes, a BMI of between 18 and 19. For an 18, 19 or 20 year old boy this is classifi ed as underweight, but for a
4 or 5 year old this is classifi ed as overweight (obese).
4.5.2 A girl with a BMI of 18 would be: • Overweight if she is 4 years old.• At risk of being overweight if she is 2, 3, 5, or 6 years old.• Fine if she is aged 7 – 20 years old.• Not be considered underweight or malnourished.
4.5.3 For a 51⁄2 year old boy, an acceptable BMI range would be greater than 13,8kg/m2 but no more than 16,8kg/m2.
If he is 1,05m tall, then the corresponding acceptable weight range would be calculated as follows:
Since: BMI =
Weight (kg)kg)kg(Height (m)m)m )2 Then BMI × (Height (m)m)m )2 = Weight (kg)kg)kg
13,8 × (1,05)2 = 15,2kg and 16,8 × (1,05)2 = 18,5kg
Therefore the corresponding acceptable weight range would be 15,2kg – 18,5kg
4.5.4 For a 63⁄4 year old girl, an acceptable BMI range would be greater than 13,4kg/m2 but less than 17,5kg/m2. If she is 1,15m tall then the corresponding acceptable weight range would (calculated as in question 4.5.2) would be 17,7kg – 23,1kg.
4.5.5 A 41⁄4 year old boy with a weight of 19kg and a BMI placing him at the 50th percentile for his age means that his corresponding BMI must be 15,6kg/m2. Therefore, his height would be calculated as follows:
Since: BMI =Weight (kg)kg)kg(Height (m)m)m )2 Then
Weight (kg)kg)kgBMI = (Height (m)m)m )2
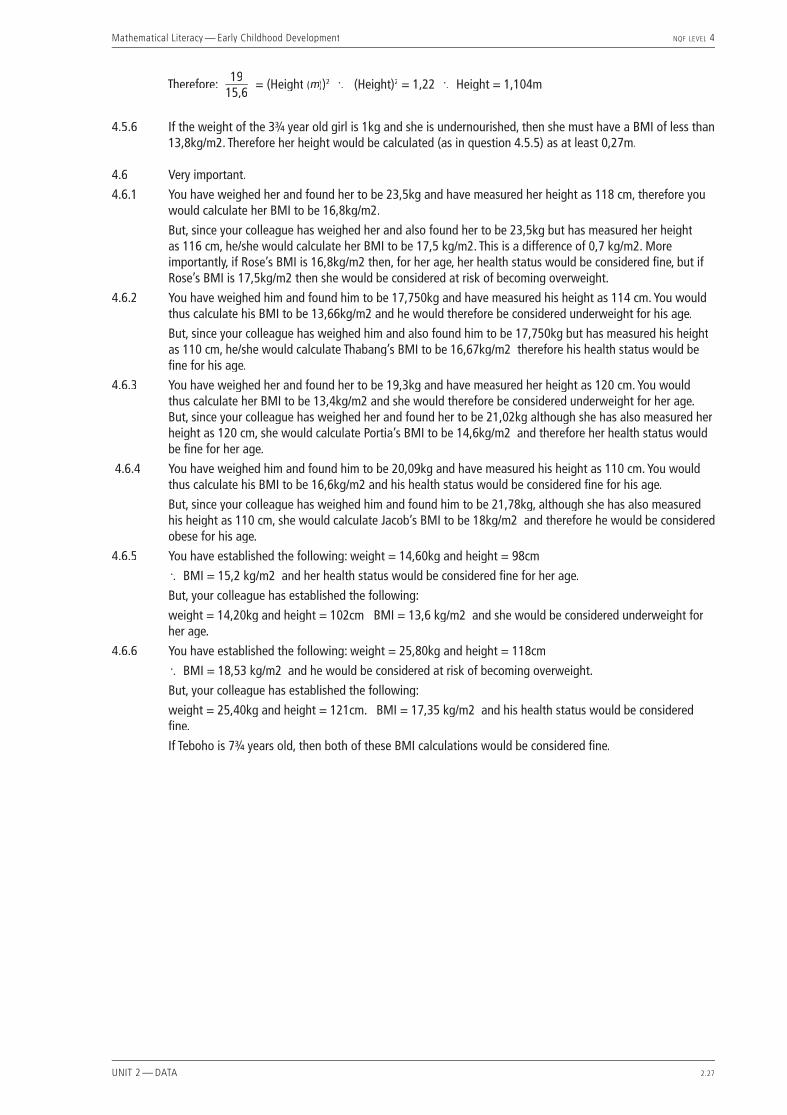
Mathematical Literacy — Early Childhood Development NQF LEVEL 4
UNIT 2 — DATA 2.27
Therefore: 1915,6
= (Height (m)m)m )2 ∴ (Height)2 = 1,22 ∴ Height = 1,104m
4.5.6 If the weight of the 33⁄4 year old girl is 1kg and she is undernourished, then she must have a BMI of less than 13,8kg/m2. Therefore her height would be calculated (as in question 4.5.5) as at least 0,27m.
4.6 Very important.
4.6.1 You have weighed her and found her to be 23,5kg and have measured her height as 118 cm, therefore you would calculate her BMI to be 16,8kg/m2.
But, since your colleague has weighed her and also found her to be 23,5kg but has measured her height as 116 cm, he/she would calculate her BMI to be 17,5 kg/m2. This is a difference of 0,7 kg/m2. More importantly, if Rose’s BMI is 16,8kg/m2 then, for her age, her health status would be considered fi ne, but if Rose’s BMI is 17,5kg/m2 then she would be considered at risk of becoming overweight.
4.6.2 You have weighed him and found him to be 17,750kg and have measured his height as 114 cm. You would thus calculate his BMI to be 13,66kg/m2 and he would therefore be considered underweight for his age.
But, since your colleague has weighed him and also found him to be 17,750kg but has measured his height as 110 cm, he/she would calculate Thabang’s BMI to be 16,67kg/m2 therefore his health status would be fi ne for his age.
4.6.3 You have weighed her and found her to be 19,3kg and have measured her height as 120 cm. You would thus calculate her BMI to be 13,4kg/m2 and she would therefore be considered underweight for her age.
But, since your colleague has weighed her and found her to be 21,02kg although she has also measured her height as 120 cm, she would calculate Portia’s BMI to be 14,6kg/m2 and therefore her health status would be fi ne for her age.
4.6.4 You have weighed him and found him to be 20,09kg and have measured his height as 110 cm. You would thus calculate his BMI to be 16,6kg/m2 and his health status would be considered fi ne for his age.
But, since your colleague has weighed him and found him to be 21,78kg, although she has also measured his height as 110 cm, she would calculate Jacob’s BMI to be 18kg/m2 and therefore he would be considered obese for his age.
4.6.5 You have established the following: weight = 14,60kg and height = 98cm
∴ BMI = 15,2 kg/m2 and her health status would be considered fi ne for her age.
But, your colleague has established the following:
weight = 14,20kg and height = 102cm BMI = 13,6 kg/m2 and she would be considered underweight for her age.
4.6.6 You have established the following: weight = 25,80kg and height = 118cm
∴ BMI = 18,53 kg/m2 and he would be considered at risk of becoming overweight.
But, your colleague has established the following:
weight = 25,40kg and height = 121cm. BMI = 17,35 kg/m2 and his health status would be considered fi ne.
If Teboho is 73⁄4 years old, then both of these BMI calculations would be considered fi ne.

Mathematical Literacy — Early Childhood Development NQF LEVEL 4
UNIT 2 — DATA 2.28
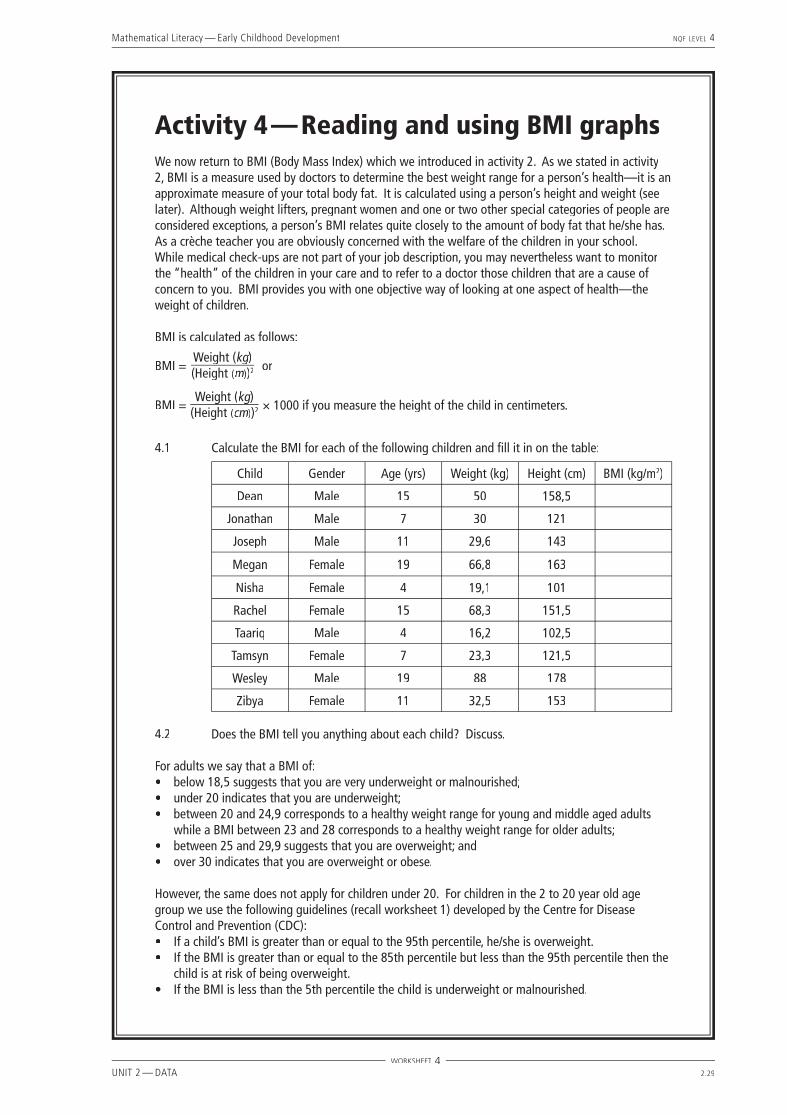
Mathematical Literacy — Early Childhood Development NQF LEVEL 4
UNIT 2 — DATA 2.29
Activity 4 — Reading and using BMI graphsWe now return to BMI (Body Mass Index) which we introduced in activity 2. As we stated in activity 2, BMI is a measure used by doctors to determine the best weight range for a person’s health—it is an approximate measure of your total body fat. It is calculated using a person’s height and weight (see later). Although weight lifters, pregnant women and one or two other special categories of people are considered exceptions, a person’s BMI relates quite closely to the amount of body fat that he/she has.As a crèche teacher you are obviously concerned with the welfare of the children in your school. While medical check-ups are not part of your job description, you may nevertheless want to monitor the “health” of the children in your care and to refer to a doctor those children that are a cause of concern to you. BMI provides you with one objective way of looking at one aspect of health—the weight of children.
BMI is calculated as follows:
BMI =Weight (kg)kg)kg(Height (m)m)m )2 or
BMI =Weight (kg)kg)kg
(Height (cm)cm)cm )2 × 1000 if you measure the height of the child in centimeters.
4.1 Calculate the BMI for each of the following children and fi ll it in on the table:
Child Gender Age (yrs) Weight (kg) Height (cm) BMI (kg/m2)
Dean Male 15 50 158,5
Jonathan Male 7 30 121
Joseph Male 11 29,6 143
Megan Female 19 66,8 163
Nisha Female 4 19,1 101
Rachel Female 15 68,3 151,5
Taariq Male 4 16,2 102,5
Tamsyn Female 7 23,3 121,5
Wesley Male 19 88 178
Zibya Female 11 32,5 153
4.2 Does the BMI tell you anything about each child? Discuss.
For adults we say that a BMI of:• below 18,5 suggests that you are very underweight or malnourished;• under 20 indicates that you are underweight;• between 20 and 24,9 corresponds to a healthy weight range for young and middle aged adults
while a BMI between 23 and 28 corresponds to a healthy weight range for older adults;• between 25 and 29,9 suggests that you are overweight; and• over 30 indicates that you are overweight or obese.
However, the same does not apply for children under 20. For children in the 2 to 20 year old age group we use the following guidelines (recall worksheet 1) developed by the Centre for Disease Control and Prevention (CDC):• If a child’s BMI is greater than or equal to the 95th percentile, he/she is overweight.• If the BMI is greater than or equal to the 85th percentile but less than the 95th percentile then the
child is at risk of being overweight. • If the BMI is less than the 5th percentile the child is underweight or malnourished.
WORKSHEET 4
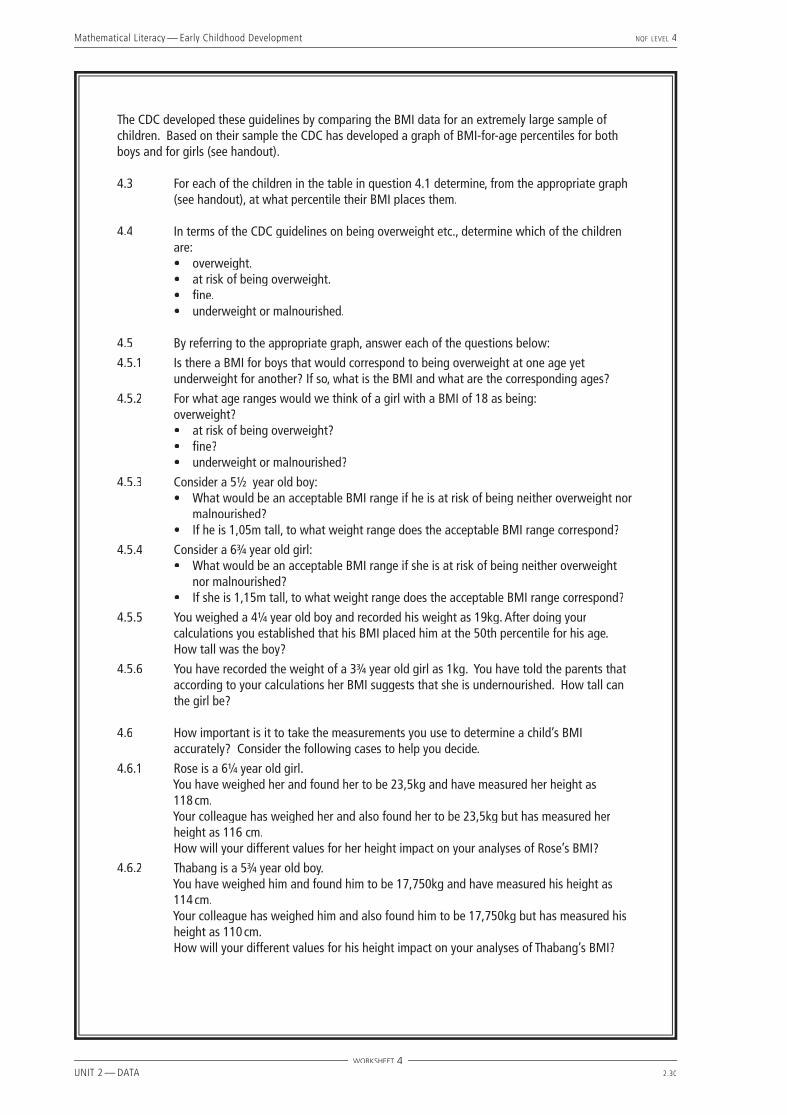
Mathematical Literacy — Early Childhood Development NQF LEVEL 4
UNIT 2 — DATA 2.30
The CDC developed these guidelines by comparing the BMI data for an extremely large sample of children. Based on their sample the CDC has developed a graph of BMI-for-age percentiles for both boys and for girls (see handout).
4.3 For each of the children in the table in question 4.1 determine, from the appropriate graph (see handout), at what percentile their BMI places them.
4.4 In terms of the CDC guidelines on being overweight etc., determine which of the children are:• overweight.• at risk of being overweight.• fi ne.• underweight or malnourished.
4.5 By referring to the appropriate graph, answer each of the questions below:
4.5.1 Is there a BMI for boys that would correspond to being overweight at one age yet underweight for another? If so, what is the BMI and what are the corresponding ages?
4.5.2 For what age ranges would we think of a girl with a BMI of 18 as being: overweight?
• at risk of being overweight?• fi ne?• underweight or malnourished?
4.5.3 Consider a 51⁄2 year old boy: • What would be an acceptable BMI range if he is at risk of being neither overweight nor
malnourished?• If he is 1,05m tall, to what weight range does the acceptable BMI range correspond?
4.5.4 Consider a 63⁄4 year old girl: • What would be an acceptable BMI range if she is at risk of being neither overweight
nor malnourished?• If she is 1,15m tall, to what weight range does the acceptable BMI range correspond?
4.5.5 You weighed a 41⁄4 year old boy and recorded his weight as 19kg. After doing your calculations you established that his BMI placed him at the 50th percentile for his age. How tall was the boy?
4.5.6 You have recorded the weight of a 33⁄4 year old girl as 1kg. You have told the parents that according to your calculations her BMI suggests that she is undernourished. How tall can the girl be?
4.6 How important is it to take the measurements you use to determine a child’s BMI accurately? Consider the following cases to help you decide.
4.6.1 Rose is a 61⁄4 year old girl. You have weighed her and found her to be 23,5kg and have measured her height as
118 cm. Your colleague has weighed her and also found her to be 23,5kg but has measured her
height as 116 cm. How will your different values for her height impact on your analyses of Rose’s BMI?
4.6.2 Thabang is a 53⁄4 year old boy. You have weighed him and found him to be 17,750kg and have measured his height as
114 cm. Your colleague has weighed him and also found him to be 17,750kg but has measured his
height as 110 cm. How will your different values for his height impact on your analyses of Thabang’s BMI?
WORKSHEET 4

Mathematical Literacy — Early Childhood Development NQF LEVEL 4
UNIT 2 — DATA 2.31
4.6.3 Portia is a 71⁄4 year old girl. You have weighed her and found her to be 19,3kg and have measured her height as
120 cm. Your colleague has weighed her and found her to be 21,02kg.She has also measured her
height as 120 cm. How will your different values for her weight impact on your analyses of Portia’s BMI?
4.6.4 Jacob is a 41⁄2 year old boy. You have weighed him and found him to be 20,09kg and have measured his height as
110 cm. Your colleague has weighed him and found him to be 21,78kg. She has also measured his
height as 110 cm. How will your different values for his weight impact on your analyses of Jacob’s BMI?
4.6.5 Jo-Anne is a 4 year old girl. You have established the following: weight = 14,60kg and height = 98cm. Your colleague has established the following: weight = 14,20kg and height = 102cm. How
will your different values impact on your analyses of Jo-Anne’s BMI?
4.6.6 Teboho is a 7 year old boy. You have established the following: weight = 25,80kg and height = 118cm. Your colleague has established the following: weight = 25,40kg and height = 121cm. How
will your different values impact on your analyses of Jo-Anne’s BMI? Would it make a difference if you later establish that Teboho was 7 years and 9 months old
on the day you and your colleague took the measurements?
WORKSHEET 4
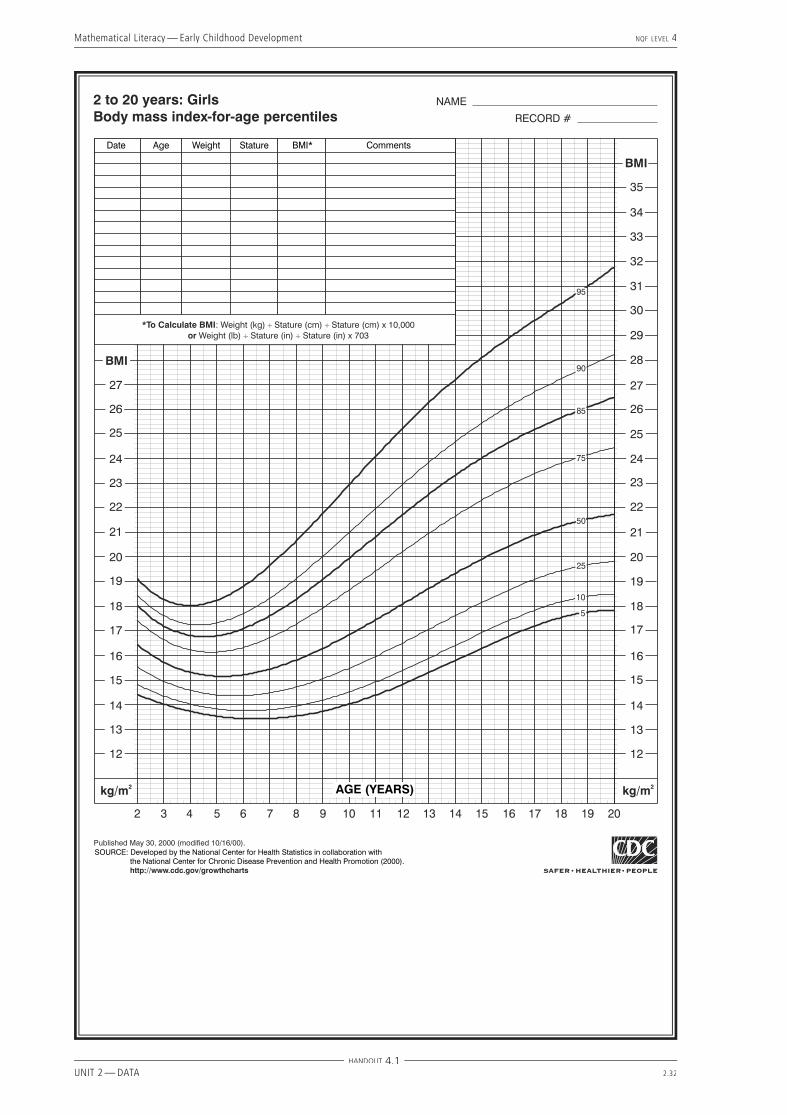
Mathematical Literacy — Early Childhood Development NQF LEVEL 4
UNIT 2 — DATA 2.32
HANDOUT 4.1
� �� �� ������ �����
���� ���� ������������� ���������������
������ �
������� ��������� �
�������
� ��� �������� ������ ��� ������ ���������� �� ������������� ����
��� �������� ������ ��� ������� ������� ���������� ��� ������ ���������
�������������������������������
� ��� � � � � �� �� �� �� �� �� �� �� �� �� ��
��
��
��
��
��
��
��
��
�����
��
��
��
��
��
��
��
��
��
�����
��
��
��
���
���
��� �������
��
��
��
��
��
��
��
��
��
��
��
��
��
��
��
��
��
��
��
��
���� ��� ������ ������� ���� ��������
��
��
��
��
��
��
��
�
��������� ��� ��� ���� ��������� ����������

Mathematical Literacy — Early Childhood Development NQF LEVEL 4
UNIT 2 — DATA 2.33
HANDOUT 4.1
� ��� � � � � �� �� �� �� �� �� �� �� �� �� ��
��
��
��
��
��
��
��
��
�����
��
��
��
��
��
��
��
��
��
�����
��
��
��
���
���
��� �������
��
��
��
��
��
��
��
��
��
��
��
��
��
��
��
��
��
��
��
��
��
��
��
��
��
��
�
��
� �� �� ������ ����
���� ���� ������������� ���������������
������ �
������� ��������� �
�������
� ��� �������� ������ ��� ������ ���������� �� ������������� ����
��� �������� ������ ��� ������� ������� ���������� ��� ������ ���������
�������������������������������
���� ��� ������ ������� ���� ��������
��������� ��� ��� ���� ��������� ����������

Mathematical Literacy — Early Childhood Development NQF LEVEL 4
UNIT 2 — DATA 2.34
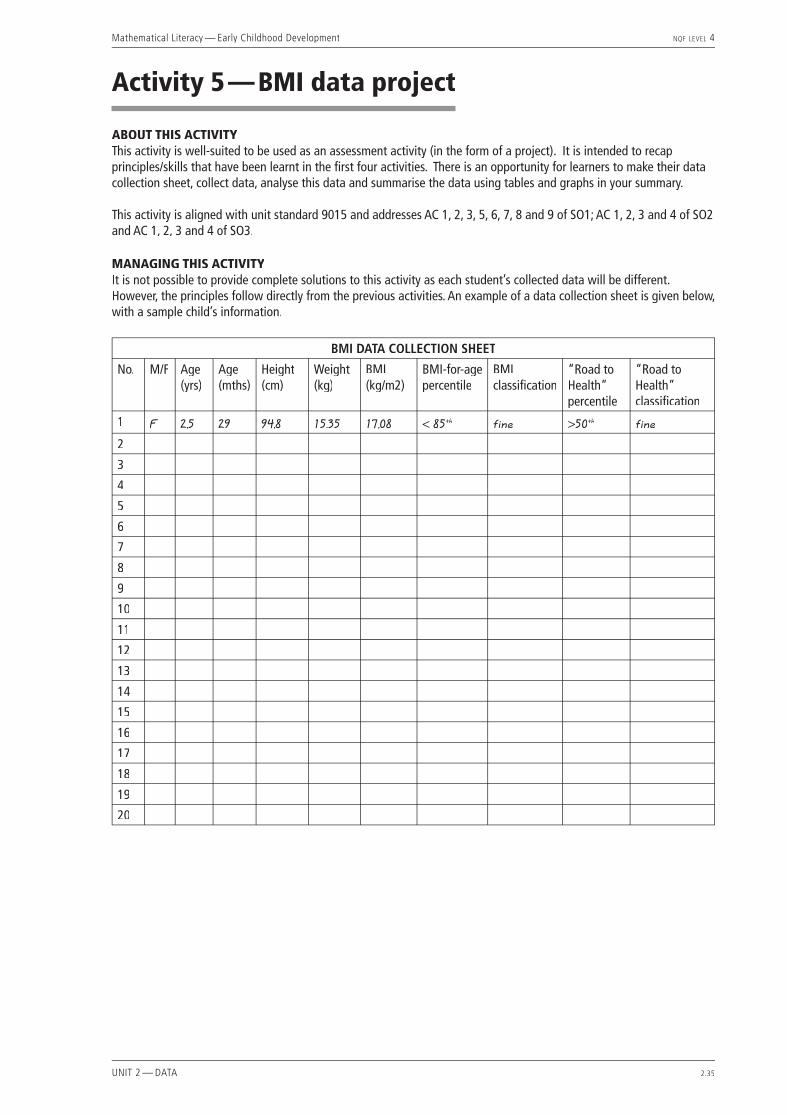
Mathematical Literacy — Early Childhood Development NQF LEVEL 4
UNIT 2 — DATA 2.35
Activity 5 — BMI data project
ABOUT THIS ACTIVITYThis activity is well-suited to be used as an assessment activity (in the form of a project). It is intended to recap principles/skills that have been learnt in the fi rst four activities. There is an opportunity for learners to make their data collection sheet, collect data, analyse this data and summarise the data using tables and graphs in your summary.
This activity is aligned with unit standard 9015 and addresses AC 1, 2, 3, 5, 6, 7, 8 and 9 of SO1; AC 1, 2, 3 and 4 of SO2 and AC 1, 2, 3 and 4 of SO3.
MANAGING THIS ACTIVITYIt is not possible to provide complete solutions to this activity as each student’s collected data will be different. However, the principles follow directly from the previous activities. An example of a data collection sheet is given below, with a sample child’s information.
BMI DATA COLLECTION SHEET
No. M/F Age (yrs)
Age (mths)
Height (cm)
Weight (kg)
BMI (kg/m2)
BMI-for-age percentile
BMI classifi cation
“Road to Health” percentile
“Road to Health” classifi cation
1 F 2,5 29 94,8 15.35 17,08 < 85th fine >50th fine
2
3
4
5
6
7
8
9
10
11
12
13
14
15
16
17
18
19
20

Mathematical Literacy — Early Childhood Development NQF LEVEL 4
UNIT 2 — DATA 2.36
Mathematical Literacy — Early Childhood Development NQF LEVEL 4
UNIT 2 — DATA 2.37
Activity 5 — BMI data projectIt is now time for you to do your own data collection and analysis.
In this activity you must collect data on a large group of children between the ages of 2 and 5 years. You will then analyse the data and draw conclusions and/or make predictions from it. The South African Department of Health (DoH) has developed a “Road to Health Chart.” This chart is given to young mothers by doctors and by the nursing staff at the various children’s clinics around the country. Mothers use this to record their infant’s weight between the ages of 0 and 60 months (fi ve years). This chart has three important lines on it: the 3rd, 50th and 97th percentile lines for infants’ weight.
To complete this project you should:• Get your own copy of the “Road to Health Chart”.• Identify a community, for example the infants at a Sunday school, the children of your friends and
family or even the children in a local crèche. • Complete the following tasks:• Describe the community that you have studied in terms of its BMI profi le with particular reference
to the number of children who seem to be overweight, at risk of being overweight and/or underweight or malnourished.
• Describe the community that you have studied in terms of its weight profi le with particular reference to the number who are below the 3rd percentile, between the 3rd and 50th percentile, between the 50th and 97th percentile and above the 97th percentile.
• Compare the two ways of analysing the wellbeing of infants—namely by means of their BMI or their weight on the “Road to Health Chart”.
NOTE: This is a data handling activity—you are NOT passing judgments on a community and/or its health. You are not qualifi ed to do so! For this reason you should not force anybody to participate against his/her wishes. You should probably also not write down the names of any of the participants.To complete the project you should include the following steps:
5.1 Develop an appropriate data collection sheet. You will be expected to hand this in.
5.2 Collect the data. You will be expected to hand in your completed data collection sheet. In addition you should write a paragraph in which you describe the precautions you took to ensure that the data you collected was as accurate as possible.
5.3 Analyse the data. You should do the necessary calculations to determine the BMI for each infant and then classify each infant according to the BMI-for-age percentile. Based on this you should classify the weight risk (overweight, at risk of being overweight and/or underweight or malnourished etc.) You should also plot his/her weight on the DoH “Road to Health Chart” and classify this weight in terms of the percentile into which it falls.
5.4 Summarise the data. You must describe the community you surveyed based on the data you have collected and your analyses. • Your description should tell the reader/audience about the trends you have identifi ed
in the community and the implications for health programmes. For example, you might want to motivate for a feeding programme at the crèche etc.
• It would be a good idea to include graphs and tables in your summary/presentation.• Your summary/presentation must also be clear about the limitations of your research.
For example, if you only collected data for 10 children out of a community of 1 000, you cannot tell us that much about the whole community. However, if you collected data for each child in a crèche and 90% of the children are at risk of being underweight, you have a stronger case.
WORKSHEET 5

Mathematical Literacy — Early Childhood Development NQF LEVEL 4
UNIT 2 — DATA 2.38
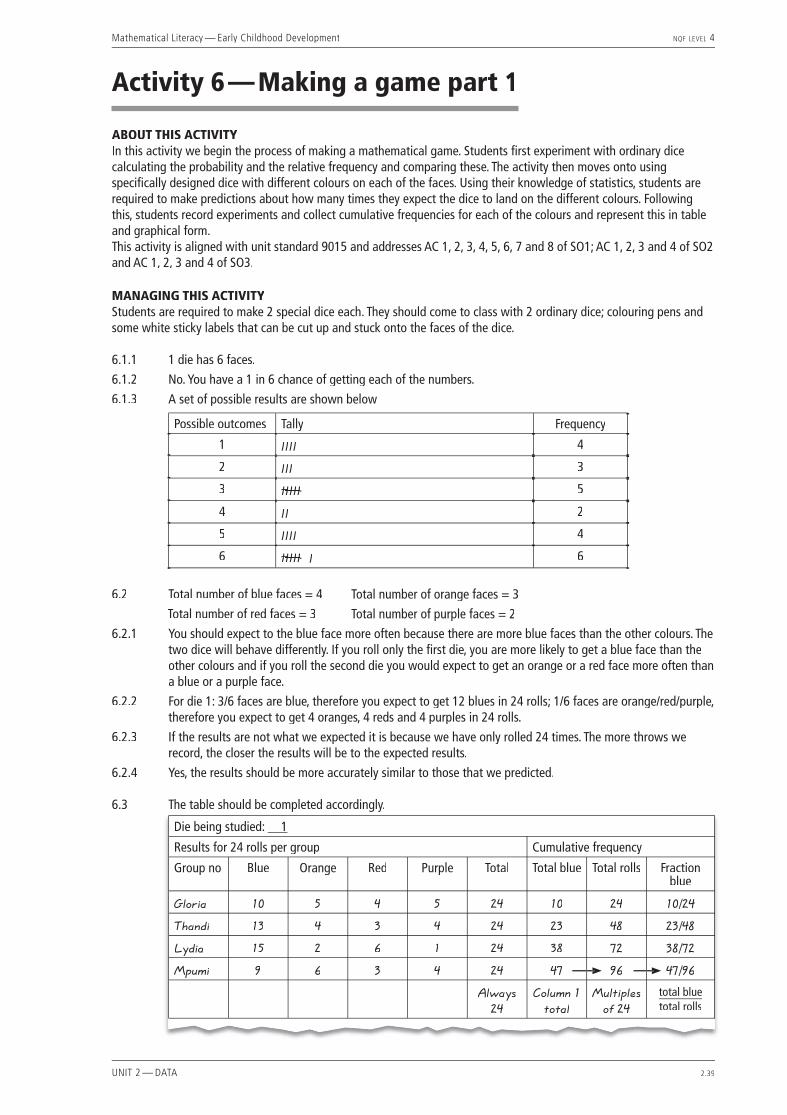
Mathematical Literacy — Early Childhood Development NQF LEVEL 4
UNIT 2 — DATA 2.39
Activity 6 — Making a game part 1
ABOUT THIS ACTIVITYIn this activity we begin the process of making a mathematical game. Students fi rst experiment with ordinary dice calculating the probability and the relative frequency and comparing these. The activity then moves onto using specifi cally designed dice with different colours on each of the faces. Using their knowledge of statistics, students are required to make predictions about how many times they expect the dice to land on the different colours. Following this, students record experiments and collect cumulative frequencies for each of the colours and represent this in table and graphical form. This activity is aligned with unit standard 9015 and addresses AC 1, 2, 3, 4, 5, 6, 7 and 8 of SO1; AC 1, 2, 3 and 4 of SO2 and AC 1, 2, 3 and 4 of SO3.
MANAGING THIS ACTIVITYStudents are required to make 2 special dice each. They should come to class with 2 ordinary dice; colouring pens and some white sticky labels that can be cut up and stuck onto the faces of the dice. 6.1.1 1 die has 6 faces.
6.1.2 No. You have a 1 in 6 chance of getting each of the numbers.
6.1.3 A set of possible results are shown below
Possible outcomes Tally Frequency
1 IIII 4
2 III 3
3 IIIIIIIIII 5
4 II 2
5 IIII 4
6 IIIIIIIIII I 6
6.2 Total number of blue faces = 4 Total number of orange faces = 3
Total number of red faces = 3 Total number of purple faces = 2
6.2.1 You should expect to the blue face more often because there are more blue faces than the other colours. The two dice will behave differently. If you roll only the fi rst die, you are more likely to get a blue face than the other colours and if you roll the second die you would expect to get an orange or a red face more often than a blue or a purple face.
6.2.2 For die 1: 3/6 faces are blue, therefore you expect to get 12 blues in 24 rolls; 1/6 faces are orange/red/purple, therefore you expect to get 4 oranges, 4 reds and 4 purples in 24 rolls.
6.2.3 If the results are not what we expected it is because we have only rolled 24 times. The more throws we record, the closer the results will be to the expected results.
6.2.4 Yes, the results should be more accurately similar to those that we predicted.
6.3 The table should be completed accordingly.
Die being studied: __1__
Results for 24 rolls per group Cumulative frequency
Group no Blue Orange Red Purple Total Total blue Total rolls Fraction blue
Gloria 10 5 4 5 24 10 24 10/24
Thandi 13 4 3 4 24 23 48 23/48
Lydia 15 2 6 1 24 38 72 38/72
Mpumi 9 6 3 4 24 47 96 47/96
Always 24
Column 1 total
Multiples of 24
total bluetotal rolls

Mathematical Literacy — Early Childhood Development NQF LEVEL 4
UNIT 2 — DATA 2.40
6.4 The table should be completed accordingly.
6.5.1 If you roll a die 24 times, the maximum number of outcomes 24. If this is shown as a fraction then the maximum is 24
24=1. This is why the vertical axis only goes up to 1
.
6.5.2 It is likely that the graph might look quite erratic to begin with but it will start to stabilize eventually.
6.5.3 The trend is that if you roll one dice you have “half” (0,5) a chance of getting a blue face.
6.6 Die 1• P(blue) = no. of blue faces
total no. of faces =
total no. of faces =
total no. of faces
36
• P(orange) = no. of orange facesno. of orange facestotal no. of faces =
16
• P(red) = no. of red facestotal no. of faces = total no. of faces = total no. of faces
16
• P(purple) = no. of purple facesno. of purple facestotal no. of faces =
16
Die 2
• P(blue) = no. of blue facestotal no. of faces =
16
• P(orange) = no. of orange facesno. of orange facestotal no. of faces =
26
• P(red) = no. of red facestotal no. of faces = total no. of faces = total no. of faces
16
• P(purple) = no. of purple facesno. of purple facestotal no. of faces =
16

Mathematical Literacy — Early Childhood Development NQF LEVEL 4
UNIT 2 — DATA 2.41
Activity 6 — Making a game part 1Over the next few activities we are going to make a board game. The game is similar to Bingo and is intended for young children aged 3 and up. It can be played by two or three children at a time. It is an educational game intended to help children develop several skills, including matching shapes.Our interest in these activities is, however, limited to the design of the game. We want to design the game in such a way that it is as fair as possible and at the same time exciting. The game is explained briefl y below.
Animal Bingo
The game will consist of:• 3 different playing boards.• Each board is a different
colour.• Each board has 6 places on it
with each place having two animal pictures.
• There are 6 cards for each board with each of the cards matching one of the places on the board.
• 2 dice—each die has the pictures used on the boards and cards on its faces.
The game is played as follows:• Each player is given a board and the cards for the board.• The players take turns to roll the two dice.• After the roll of the dice, each player that is playing looks to see if he/she has a card with the
two pictures that match the two pictures on the die that have come up. If this is the case, the player takes take the card and covers the corresponding space on the board with it. NOTE: more than one player might pick up a card and place it on his/her board.
• The fi rst player to cover all of his/her places wins.
We are going to start by designing the die that we will use for the game.
6.1 You will need one die. Answer the following questions regarding the die:
6.1.1 How many faces does the die have?
6.1.2 When you roll a die do you expect any of the numbers to come up more or less frequently than the others? In other words: do you think that there are some numbers that are “easier to get” than others? Discuss.
6.1.3 Roll the die 24 times and record the results of each roll. Do the results compare with your “predictions” above? If not, why do you think this is?
6.1.4 Combine the results of your 24 rolls with each of the other members in the class. Do the combined results compare more favourably with your predictions? Discuss.
The dice that we are going to use in the game we are developing are different. To make the dice, you should take two ordinary dice and stick stickers onto the faces as follows. When you make your own game later on you can use your own choice of animals, shapes etc. For now we will use colours so that the rest of the worksheet makes sense.
WORKSHEET 6
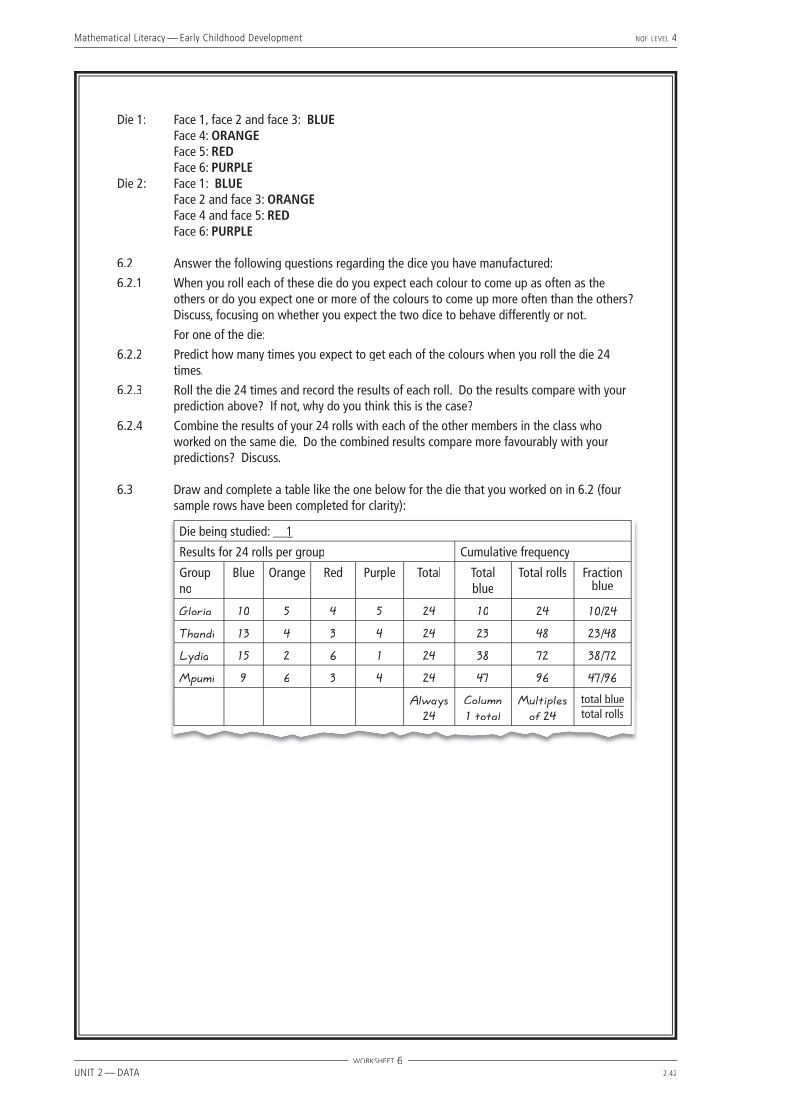
Mathematical Literacy — Early Childhood Development NQF LEVEL 4
UNIT 2 — DATA 2.42
Die 1: Face 1, face 2 and face 3: BLUE Face 4: ORANGE Face 5: RED Face 6: PURPLEDie 2: Face 1: BLUE Face 2 and face 3: ORANGE Face 4 and face 5: RED Face 6: PURPLE
6.2 Answer the following questions regarding the dice you have manufactured:
6.2.1 When you roll each of these die do you expect each colour to come up as often as the others or do you expect one or more of the colours to come up more often than the others? Discuss, focusing on whether you expect the two dice to behave differently or not.
For one of the die:
6.2.2 Predict how many times you expect to get each of the colours when you roll the die 24 times.
6.2.3 Roll the die 24 times and record the results of each roll. Do the results compare with your prediction above? If not, why do you think this is the case?
6.2.4 Combine the results of your 24 rolls with each of the other members in the class who worked on the same die. Do the combined results compare more favourably with your predictions? Discuss.
6.3 Draw and complete a table like the one below for the die that you worked on in 6.2 (four sample rows have been completed for clarity):
Die being studied: __1__
Results for 24 rolls per group Cumulative frequency
Group no
Blue Orange Red Purple Total Total blue
Total rolls Fraction blue
Gloria 10 5 4 5 24 10 24 10/24
Thandi 13 4 3 4 24 23 48 23/48
Lydia 15 2 6 1 24 38 72 38/72
Mpumi 9 6 3 4 24 47 96 47/96
Always 24
Column 1 total
Multiples of 24
total bluetotal rolls
WORKSHEET 6
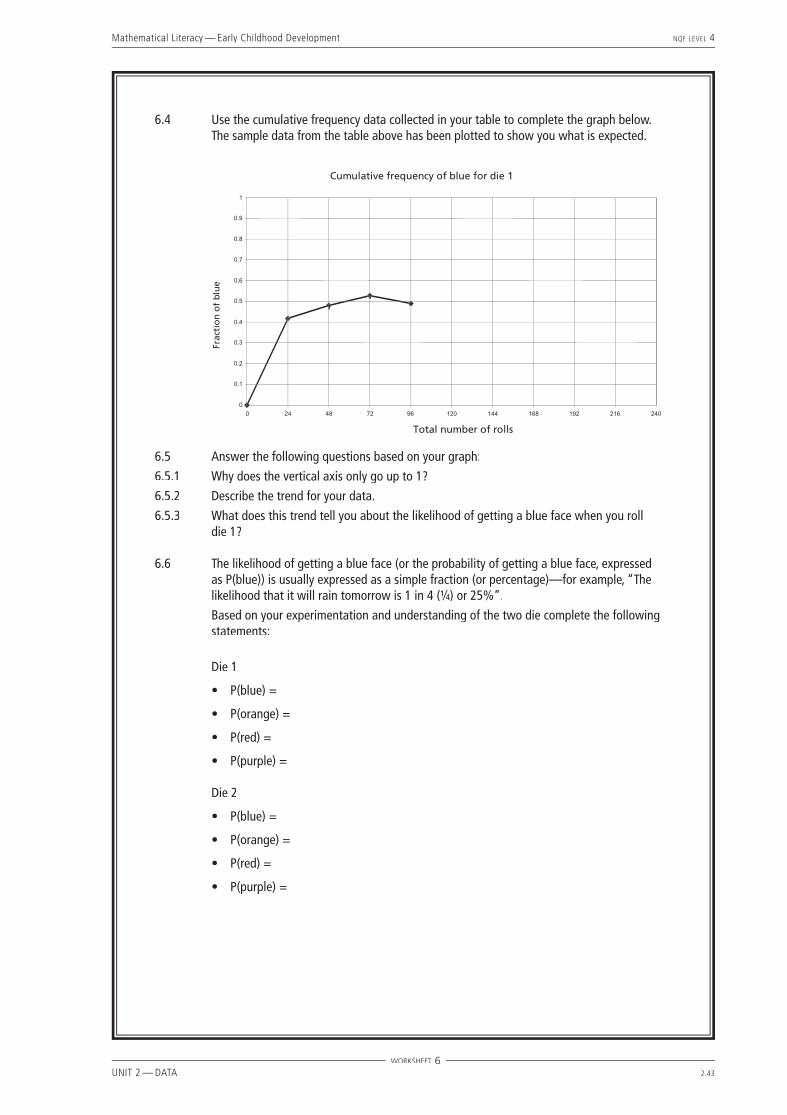
Mathematical Literacy — Early Childhood Development NQF LEVEL 4
UNIT 2 — DATA 2.43
6.4 Use the cumulative frequency data collected in your table to complete the graph below. The sample data from the table above has been plotted to show you what is expected.
6.5 Answer the following questions based on your graph:
6.5.1 Why does the vertical axis only go up to 1?
6.5.2 Describe the trend for your data.
6.5.3 What does this trend tell you about the likelihood of getting a blue face when you roll die 1?
6.6 The likelihood of getting a blue face (or the probability of getting a blue face, expressed as P(blue)) is usually expressed as a simple fraction (or percentage)—for example, “The likelihood that it will rain tomorrow is 1 in 4 (1⁄4) or 25%”.
Based on your experimentation and understanding of the two die complete the following statements:
Die 1
• P(blue) =
• P(orange) =
• P(red) =
• P(purple) =
Die 2
• P(blue) =
• P(orange) =
• P(red) =
• P(purple) =
WORKSHEET 6
Mathematical Literacy — Early Childhood Development NQF LEVEL 4
UNIT 2 — DATA 2.44
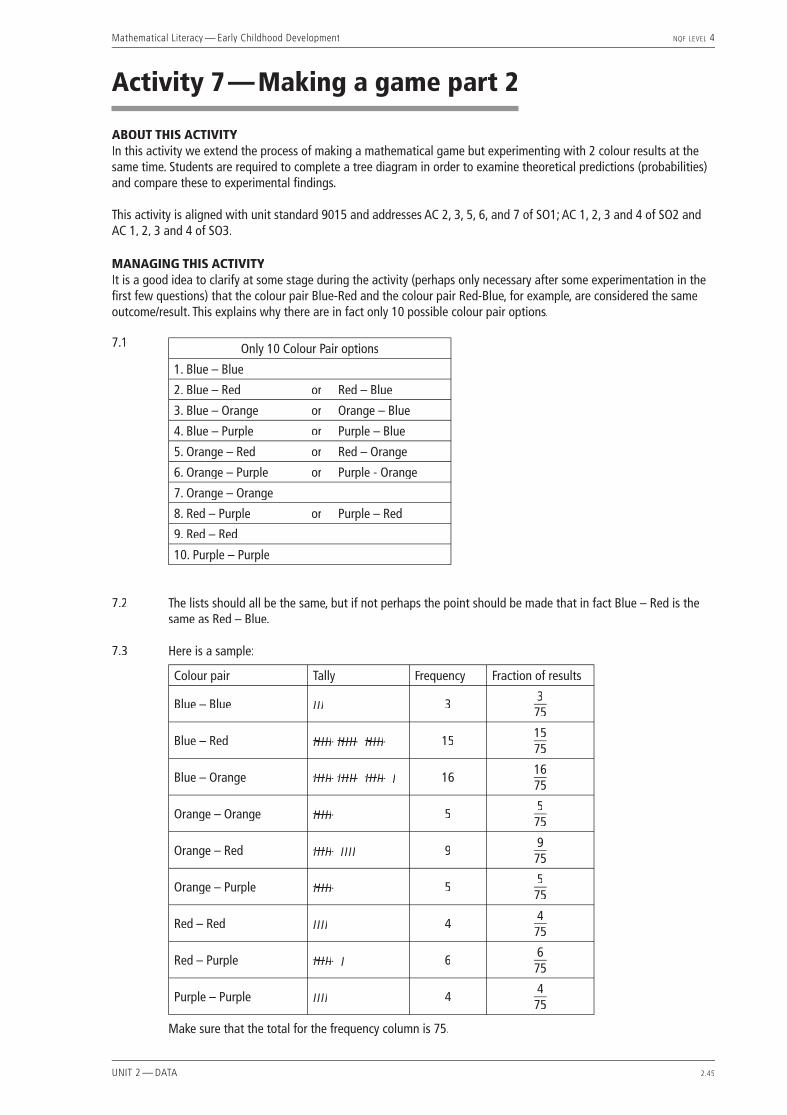
Mathematical Literacy — Early Childhood Development NQF LEVEL 4
UNIT 2 — DATA 2.45
Activity 7 — Making a game part 2
ABOUT THIS ACTIVITYIn this activity we extend the process of making a mathematical game but experimenting with 2 colour results at the same time. Students are required to complete a tree diagram in order to examine theoretical predictions (probabilities) and compare these to experimental fi ndings.
This activity is aligned with unit standard 9015 and addresses AC 2, 3, 5, 6, and 7 of SO1; AC 1, 2, 3 and 4 of SO2 and AC 1, 2, 3 and 4 of SO3.
MANAGING THIS ACTIVITYIt is a good idea to clarify at some stage during the activity (perhaps only necessary after some experimentation in the fi rst few questions) that the colour pair Blue-Red and the colour pair Red-Blue, for example, are considered the same outcome/result. This explains why there are in fact only 10 possible colour pair options.
7.1
Only 10 Colour Pair options
1. Blue – Blue
2. Blue – Red or Red – Blue
3. Blue – Orange or Orange – Blue
4. Blue – Purple or Purple – Blue
5. Orange – Red or Red – Orange
6. Orange – Purple or Purple - Orange
7. Orange – Orange
8. Red – Purple or Purple – Red
9. Red – Red
10. Purple – Purple
7.2 The lists should all be the same, but if not perhaps the point should be made that in fact Blue – Red is the same as Red – Blue.
7.3 Here is a sample:
Colour pair Tally Frequency Fraction of results
Blue – Blue III 33
75
Blue – Red IIIIIIIIII IIIIIIIIII IIIIIIIIII 151575
Blue – Orange IIIIIIIIII IIIIIIIIII IIIIIIIIII I 161675
Orange – Orange IIIIIIIIII 55
75
Orange – Red IIIIIIIIII IIII 99
75
Orange – Purple IIIIIIIIII 55
75
Red – Red IIII 44
75
Red – Purple IIIIIIIIII I 66
75
Purple – Purple IIII 44
75
Make sure that the total for the frequency column is 75.
Mathematical Literacy — Early Childhood Development NQF LEVEL 4
UNIT 2 — DATA 2.46
7.4 Students’ results will vary.
7.5 See the previous table.
7.6.1 Some colour-pairs occur more often than others. Each person’s results are different, but most of the scores are quite similar.
7.6.2 Yes. It is most unlikely that there was a colour-pair that did not occur, unless there is an incorrectly named colour-pair in your list e.g. White – Yellow or something odd.
7.6.3 Yes. Blue – Orange (Orange – Blue) and Blue – Red (Red – Blue) came up more often. Three out of the 6 faces on die 1 are blue, and of the 6 faces on die 2 two are orange and two are red, therefore there is a much greater chance of getting these combinations.
7.7– 7.9 See the table on the following page.
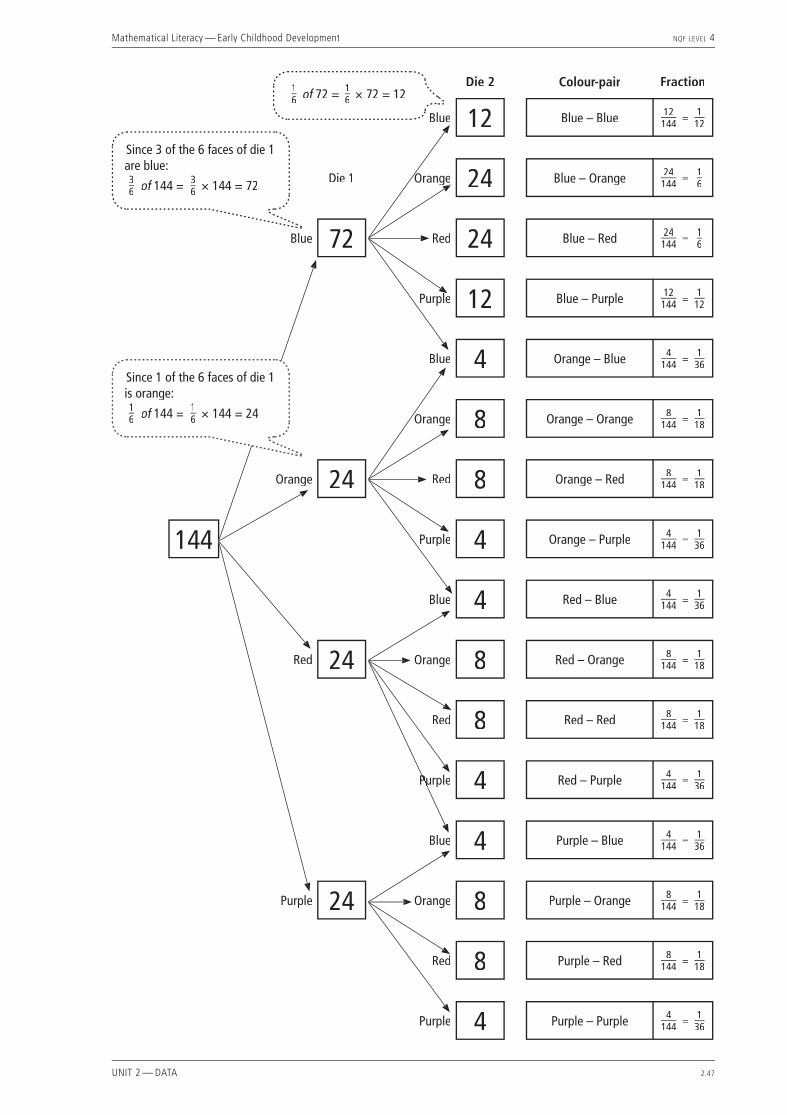
Mathematical Literacy — Early Childhood Development NQF LEVEL 4
UNIT 2 — DATA 2.47
Die 2 Colour-pair Fraction
Blue 12 Blue – Blue 12144 = 1
12
Die 1 Orange 24 Blue – Orange 24144 = 1
6
Blue 72 Red 24 Blue – Red 24144 = 1
6
Purple 12 Blue – Purple 12144 = 1
12
Blue 4 Orange – Blue 4144 = 1
36
Orange 8 Orange – Orange 8144 = 1
18
Orange 24 Red 8 Orange – Red 8144 = 1
18
144 Purple 4 Orange – Purple 4144 = 1
36
Blue 4 Red – Blue 4144 = 1
36
Red 24 Orange 8 Red – Orange 8144 = 1
18
Red 8 Red – Red 8144 = 1
18
Purple 4 Red – Purple 4144 = 1
36
Blue 4 Purple – Blue 4144 = 1
36
Purple 24 Orange 8 Purple – Orange 8144 = 1
18
Red 8 Purple – Red 8144 = 1
18
Purple 4 Purple – Purple 4144 = 1
36
Since 3 of the 6 faces of die 1 are blue: 36 of 144 =of 144 =of 3
6 × 144 = 72 OrangeOrange
Purple
Purple
Since 1 of the 6 faces of die 1 is orange: 16 of 144 =of 144 =of 1
6 × 144 = 24
16 of 72 =of 72 =of 1
6 × 72 = 12
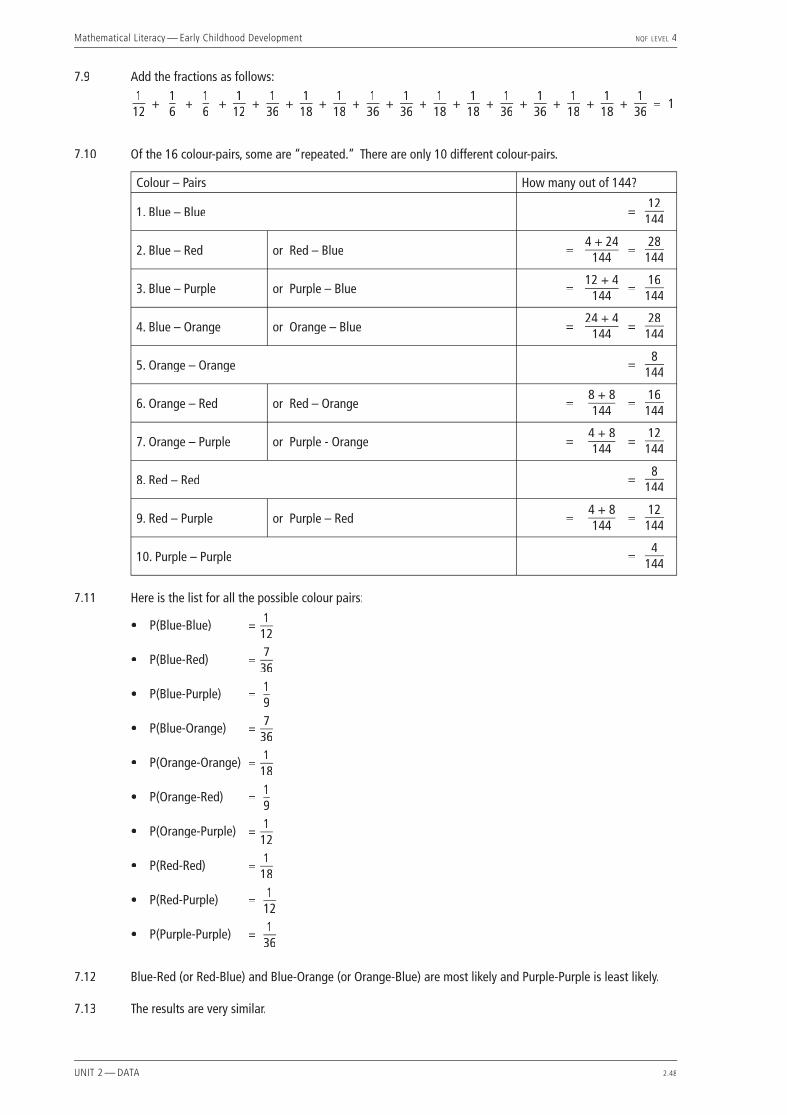
Mathematical Literacy — Early Childhood Development NQF LEVEL 4
UNIT 2 — DATA 2.48
7.9 Add the fractions as follows: 1
12+
16
+16
+1
12+
136
+118
+1
18+
136
+136
+118
+118
+136
+136
+118
+118
+1
36= 1
7.10 Of the 16 colour-pairs, some are “repeated.” There are only 10 different colour-pairs.
Colour – Pairs How many out of 144?
1. Blue – Blue =12144
2. Blue – Red or Red – Blue =4 + 24
144=
28144
3. Blue – Purple or Purple – Blue =12 + 4
144=
16144
4. Blue – Orange or Orange – Blue =24 + 4
144=
28144
5. Orange – Orange =8
144
6. Orange – Red or Red – Orange =8 + 8144
=16144
7. Orange – Purple or Purple - Orange =4 + 8144
=12144
8. Red – Red =8
144
9. Red – Purple or Purple – Red =4 + 8144
=12144
10. Purple – Purple =4
144
7.11 Here is the list for all the possible colour pairs:
• P(Blue-Blue) = 112
• P(Blue-Red) = 736
• P(Blue-Purple) = 19
• P(Blue-Orange) = 736
• P(Orange-Orange) = 118
• P(Orange-Red) = 19
• P(Orange-Purple) = 112
• P(Red-Red) = 118
• P(Red-Purple) =
112
• P(Purple-Purple) =
136
7.12 Blue-Red (or Red-Blue) and Blue-Orange (or Orange-Blue) are most likely and Purple-Purple is least likely.
7.13 The results are very similar.
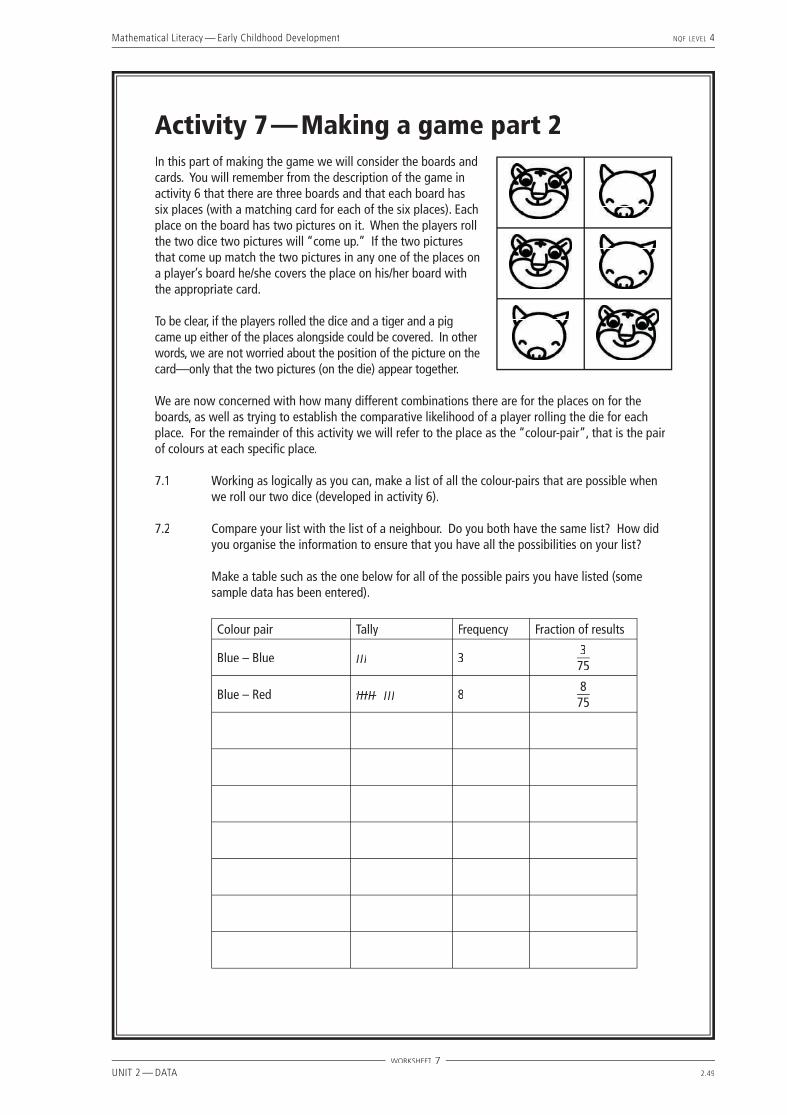
Mathematical Literacy — Early Childhood Development NQF LEVEL 4
UNIT 2 — DATA 2.49
Activity 7 — Making a game part 2In this part of making the game we will consider the boards and cards. You will remember from the description of the game in activity 6 that there are three boards and that each board has six places (with a matching card for each of the six places). Each place on the board has two pictures on it. When the players roll the two dice two pictures will “come up.” If the two pictures that come up match the two pictures in any one of the places on a player’s board he/she covers the place on his/her board with the appropriate card.
To be clear, if the players rolled the dice and a tiger and a pig came up either of the places alongside could be covered. In other words, we are not worried about the position of the picture on the card—only that the two pictures (on the die) appear together.
We are now concerned with how many different combinations there are for the places on for the boards, as well as trying to establish the comparative likelihood of a player rolling the die for each place. For the remainder of this activity we will refer to the place as the “colour-pair”, that is the pair of colours at each specifi c place.
7.1 Working as logically as you can, make a list of all the colour-pairs that are possible when we roll our two dice (developed in activity 6).
7.2 Compare your list with the list of a neighbour. Do you both have the same list? How did you organise the information to ensure that you have all the possibilities on your list?
Make a table such as the one below for all of the possible pairs you have listed (some sample data has been entered).
Colour pair Tally Frequency Fraction of results
Blue – Blue III 3375
Blue – Red IIIIIIIIII III 8875
WORKSHEET 7
Mathematical Literacy — Early Childhood Development NQF LEVEL 4
UNIT 2 — DATA 2.50
7.4 Roll the dice that you made in the previous activity 75 times. Using tally marks, record each time that a particular pair of colours appears. When you have completed the 75 rolls fi ll in the frequency and fraction for each colour-pair on the table.
7.5 Compare your table of values with at least three other members of the class. Answer the following questions:
7.5.1 Do you notice any trend or trends in the data that you have collected?7.5.2 Has each colour-pair on your table come up at least once on your dice? If not, why do you
think this is the case?7.5.3 Are there any colour-pairs that seem to have come up signifi cantly more often than the
other pairs? If yes, which one(s)? Can you explain why this has happened?
Hopefully you have noticed (a) that some colour-pairs come up more often than others do, and (b) that there are more than 6 possible colour-pairs.
You should recall from the description of the game that each of the three game boards has 6 places on it. Obviously we cannot have a game in which all three boards are exactly the same—if we did all the players would fi nish at exactly the same time and there would be no winner (this is why it is important to have more than 6 possible colour-pairs). We are, however, happy that some of the colour-pairs appear on more than one board—this is true of all Bingo-type games (for this reason we can still make the game even though there are not 18 different colour-pairs).
To make the boards involves selecting 6 colour-pairs out of all of the possible colour-pairs in such a way that the boards are: • suffi ciently different to ensure that there will be a winner for most games; and • fair—we do not want one board to have all the colour-pairs that happen more often while another
board has those colour-pairs that happen less often.
By rolling the dice and recording your fi ndings you have performed an experiment (more accurately—a series of experiments). Based on this you have a sense of which colour-pairs come up more than others. By comparing with the other members in the class you have increased the number of experiments and gained confi dence in the trends that you are seeing. The fractions in the table are known as the experimental probability for each of the colour-pairs.
It is possible to design the game based on the experimental probability for the colour pairs but this is not desirable—you will have noticed that all the members of the class had different experimental probabilities for each of the colour-pairs. What we are going to do is to develop the theoretical probability for each colour-pair. To do so we are going to use a tree diagram and rather than actually rolling the dice we will think about what we would expect to happen.
At the end of activity 6 we established the following:Die 1• P(blue) = 3
6
• P(orange) = 16
• P(red) = 16
• P(purple) = 16
Die 2
• P(blue) = 16
• P(orange) = 26
• P(red) = 16
• P(purple) = 16
7.6 In the tree diagram (on the next page) we are going to predict what will happen when we roll our pair of dice 144 times. Use the theoretical probabilities above to fi ll in exactly how many times we will get blue, orange, red and purple from die 1 for 144 rolls of the die. Fill these numbers in under the heading “die 1.”
WORKSHEET 7

Mathematical Literacy — Early Childhood Development NQF LEVEL 4
UNIT 2 — DATA 2.51
7.7 To complete the second column you need to treat the numbers in column 1 as the number of times you are going to roll die 2. You then need to fi ll in exactly how many times we will get blue, orange, red and purple from die 2 for the specifi ed number of rolls. Complete column 2.
7.8 By following the arrows write down the 16 colour-pairs in the third column and calculate what fraction of the 144 rolls will yield each colour-pair (express this as a simple fraction—not a decimal fraction).
7.9 To check that you have done things correctly, add up all of your fractions. Your answer should be 1. Is it? Why should the answer be 1?
7.10 You will notice that while we have 16 colour-pairs, some are “repeated.” After all we agreed earlier that Red-Blue is exactly the same as Blue-Red in our game. Make a list of the different possible colour-pairs and by referring to the tree diagram calculate how many of the 144 rolls of the two die give each pair.
7.11 Simplify the fractions and write down (and complete) the following list for all the possible colour pairs:
P(Blue-Blue) =
P(Blue-Red) =
P(Blue-Purple) = 7.12 Which colour-pairs are most likely and which are least likely?
7.13 How do the theoretical predictions compare with the experimental fi ndings you made earlier?
WORKSHEET 7

Mathematical Literacy — Early Childhood Development NQF LEVEL 4
UNIT 2 — DATA 2.52
WORKSHEET 7
Die 2 Colour-pair Fraction
Blue
Die 1 Orange
Blue Red
Purple
Blue
Orange
Orange Red
Purple
Blue
Red Orange
Red
Purple
Blue
Purple Orange
Red
Purple
Orange
Orange
Purple
Purple
Purple

Mathematical Literacy — Early Childhood Development NQF LEVEL 4
UNIT 2 — DATA 2.53
WORKSHEET 7
Activity 8 — Making a game part 3
ABOUT THIS ACTIVITYIn this activity students are given specifi c criteria and, using the skills developed in activity 6 and 7, are required to make the boards for the game adhering to these criteria.
This activity is aligned with unit standard 9015 and addresses AC 1, 3, 7, 8 and 9 of SO1; AC 1, 2 and 4 of SO2 and AC 3, 4 and 5 of SO3.
MANAGING THIS ACTIVITYStudents are required to make the boards for the game and they will need: paper/cardboard, coloured pens, and the coloured dice that the student’s made in the previous activity.
8.1 Below is an example solution. (B=Blue, O=Orange, R=Red, P=Purple).
B O B B
P O B P
O O P P
O B B B
R P O R
R R O O
B R P O
P R R O
O O R R
The following reasoning is used to come up with an appropriate and “fair” solution:
• Remember that Blue – Orange and Orange – Blue are exactly the same (and there are several pairs like this), therefore placing a Blue – Orange on one card and an Orange – Blue on another card will be completely “fair”.
• Blue – Blue and Orange – Purple are both as likely to occur and therefore placing a Blue – Blue on one card and an Orange – Purple on another card will be completely “fair”.
Since we are only permitted to repeat one of the colour-pairs on all three boards, it would be a pity to use the Purple – Purple colour-pair on all three boards, since this is the least likely to occur and therefore the game might take a long time to complete if the players are all waiting for this outcome.
• In the example solution the Orange – Orange colour-pair is used on all three boards but the other colour-pairs appear on at most two of the boards as instructed.
• To show the how close the “fairness” of each board is, the theoretical probabilities are shown on each board.
8.2 It would be sensible to play the game at least more than 36 times. A multiple of 36, such as 72 or 108 or 144) would be even more helpful.

Mathematical Literacy — Early Childhood Development NQF LEVEL 4
UNIT 2 — DATA 2.54
Mathematical Literacy — Early Childhood Development NQF LEVEL 4
UNIT 2 — DATA 2.55
Activity 8 — Making a game part 3In activities 6 and 7 we did the thinking and ground work. We are now ready to make the boards.Remember:
• We do not want all three boards to be the same otherwise we would not have a game—all three players would fi nish at the same time!
• We want the game to be as fair as possible. In other words, players should not feel that one board favours wining above another.
8.1 Develop the three boards—that is, decide which six colour-pairs to place on each board—taking into account the following constraints:
• You may only use one colour-pair on all three boards. For the rest you may use a colour-pair on at most two boards.
• The combination of colour-pairs you select should result in three boards that are “fair.” One way of thinking about this is that you should be able to show that each board has the same number (as far as it is possible) of colour-pairs that are more likely and the same number of colour-pairs that are less likely to come up as we roll the dice.
• To make certain that the boards “look different” you can swap the order of the colour-pair from one board to the next.
You should be ready to explain how you selected the colour-pairs for each board.
8.2 Having developed the three boards you should play the game a large number of times to see if the boards are indeed fair. How large do you think is large enough for this test? You should record how many times each board wins and based on this decide whether or not you have achieved the objective—a fair game.
WORKSHEET 8
Early Childhood Development
NQFLEVEL
4Unit 3
Measurement
Mathematical Literacy
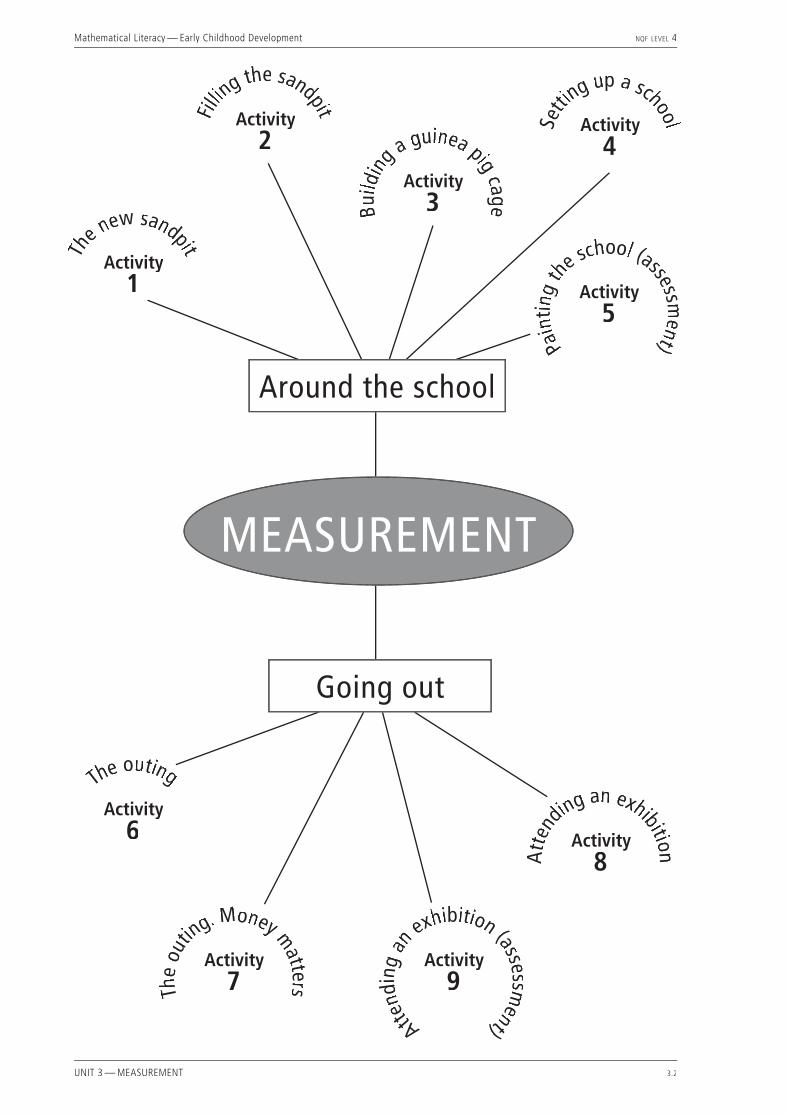
Mathematical Literacy — Early Childhood Development NQF LEVEL 4
UNIT 3 — MEASUREMENT 3.2
Activity8 At
tend
ing an exhibition
Activity1
Th
e new sandpit
Activity2
Fillin
g the sandpit
Activity3 Bu
ildin
g a guinea pigcage
Activity4
Setti
ng up a school
Activity5
Pain
ting
th
e school (assessment)
Activity6
The outing
Activity7 Th
eou
ting. Money matters
MEASUREMENT
Around the school
Activity9
Attend
ing
an
exhibition (assessment)
Going out
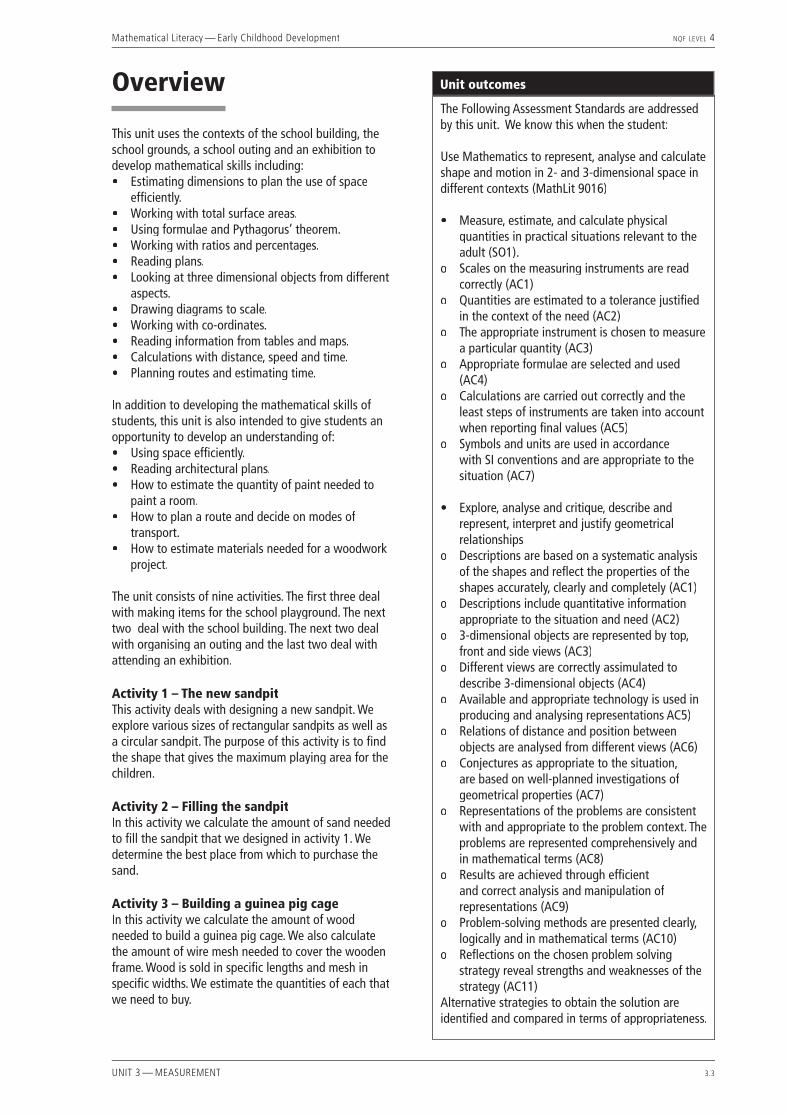
Mathematical Literacy — Early Childhood Development NQF LEVEL 4
UNIT 3 — MEASUREMENT 3.3
Overview
This unit uses the contexts of the school building, the school grounds, a school outing and an exhibition to develop mathematical skills including:• Estimating dimensions to plan the use of space
effi ciently.• Working with total surface areas.• Using formulae and Pythagorus’ theorem.• Working with ratios and percentages.• Reading plans.• Looking at three dimensional objects from different
aspects.• Drawing diagrams to scale.• Working with co-ordinates.• Reading information from tables and maps.• Calculations with distance, speed and time.• Planning routes and estimating time.
In addition to developing the mathematical skills of students, this unit is also intended to give students an opportunity to develop an understanding of:• Using space effi ciently.• Reading architectural plans.• How to estimate the quantity of paint needed to
paint a room.• How to plan a route and decide on modes of
transport.• How to estimate materials needed for a woodwork
project.
The unit consists of nine activities. The fi rst three deal with making items for the school playground. The next two deal with the school building. The next two deal with organising an outing and the last two deal with attending an exhibition.
Activity 1 – The new sandpitThis activity deals with designing a new sandpit. We explore various sizes of rectangular sandpits as well as a circular sandpit. The purpose of this activity is to fi nd the shape that gives the maximum playing area for the children.
Activity 2 – Filling the sandpitIn this activity we calculate the amount of sand needed to fi ll the sandpit that we designed in activity 1. We determine the best place from which to purchase the sand.
Activity 3 – Building a guinea pig cageIn this activity we calculate the amount of wood needed to build a guinea pig cage. We also calculate the amount of wire mesh needed to cover the wooden frame. Wood is sold in specifi c lengths and mesh in specifi c widths. We estimate the quantities of each that we need to buy.
The Following Assessment Standards are addressed by this unit. We know this when the student:
Use Mathematics to represent, analyse and calculate shape and motion in 2- and 3-dimensional space in different contexts (MathLit 9016)
• Measure, estimate, and calculate physical quantities in practical situations relevant to the adult (SO1).
o Scales on the measuring instruments are read correctly (AC1)
o Quantities are estimated to a tolerance justifi ed in the context of the need (AC2)
o The appropriate instrument is chosen to measure a particular quantity (AC3)
o Appropriate formulae are selected and used (AC4)
o Calculations are carried out correctly and the least steps of instruments are taken into account when reporting fi nal values (AC5)
o Symbols and units are used in accordance with SI conventions and are appropriate to the situation (AC7)
• Explore, analyse and critique, describe and represent, interpret and justify geometrical relationships
o Descriptions are based on a systematic analysis of the shapes and refl ect the properties of the shapes accurately, clearly and completely (AC1)
o Descriptions include quantitative information appropriate to the situation and need (AC2)
o 3-dimensional objects are represented by top, front and side views (AC3)
o Different views are correctly assimulated to describe 3-dimensional objects (AC4)
o Available and appropriate technology is used in producing and analysing representations AC5)
o Relations of distance and position between objects are analysed from different views (AC6)
o Conjectures as appropriate to the situation, are based on well-planned investigations of geometrical properties (AC7)
o Representations of the problems are consistent with and appropriate to the problem context. The problems are represented comprehensively and in mathematical terms (AC8)
o Results are achieved through effi cient and correct analysis and manipulation of representations (AC9)
o Problem-solving methods are presented clearly, logically and in mathematical terms (AC10)
o Refl ections on the chosen problem solving strategy reveal strengths and weaknesses of the strategy (AC11)
Alternative strategies to obtain the solution are identifi ed and compared in terms of appropriateness.
Unit outcomes

Mathematical Literacy — Early Childhood Development NQF LEVEL 4
UNIT 3 — MEASUREMENT 3.4
Activity 4 – Setting up a schoolThis activity deals with interpreting architectural plans. We look at various seating arrangements in order to accommodate the maximum number of children.
Activity 5 – Painting the schoolThis activity deals with painting the outside of the school. We estimate the amount of paint needed. We use the fl oor plans from activity 4 to calculate the surface area that is to be painted. We look at different ways of estimating the amount of paint needed for the job. This activity can be used as an assessment.
Activity 6 –The outingIn this activity we organise an outing to the beach. We want to be at the beach at low tide and therefore need to co-ordinate school times, train times and tide times. We read data from different tables in order to sequence the day correctly.
Activity 7 - The outing. Money mattersIn this activity we calculate the cost of the outing for each child. We include transport and food costs.
Activity 8 – Attending an exhibitionThis activity deals with reading maps and train timetables. We determine the best route to get to an exhibition from our school. We then work out the time taken to travel this route by car and train. We also determine the cost of both modes of transport.
Activity 9 – Attending an exhibition (assessment)This activity uses the same context as activity 8 but our school is much further away from the exhibition. This activity can be used for assessment.
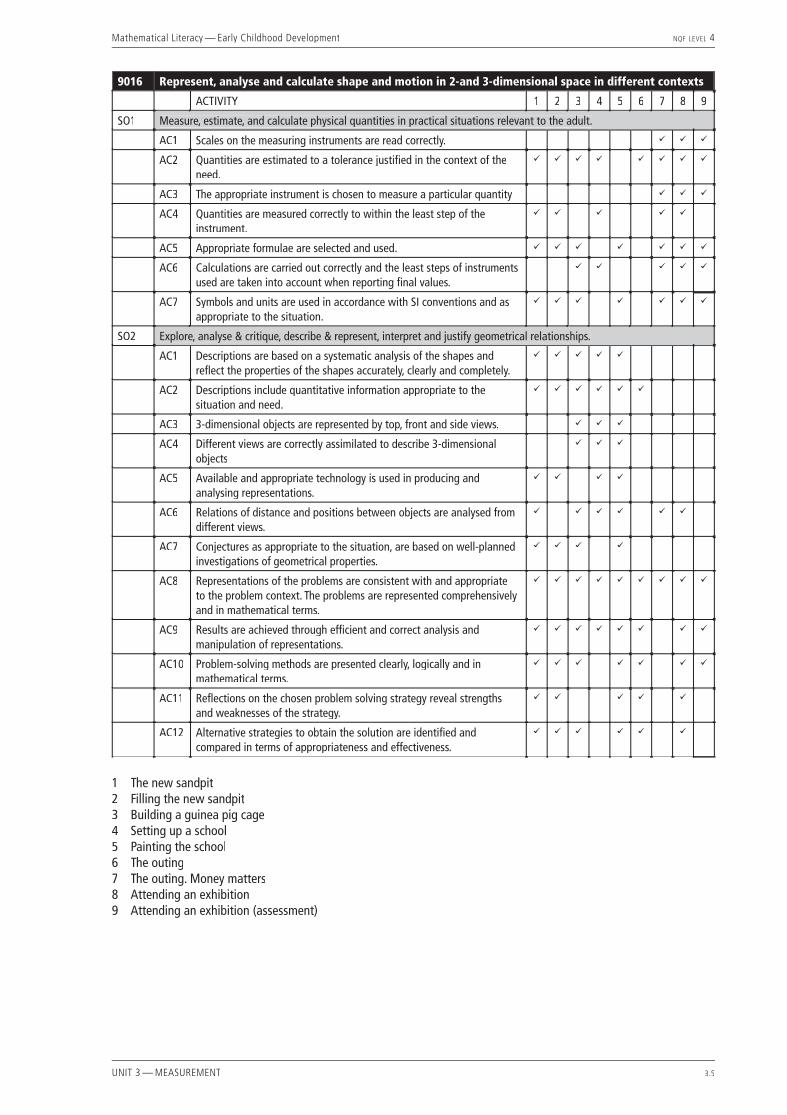
Mathematical Literacy — Early Childhood Development NQF LEVEL 4
UNIT 3 — MEASUREMENT 3.5
9016 Represent, analyse and calculate shape and motion in 2-and 3-dimensional space in different contexts
ACTIVITY 1 2 3 4 5 6 7 8 9
SO1 Measure, estimate, and calculate physical quantities in practical situations relevant to the adult.
AC1 Scales on the measuring instruments are read correctly. ü ü ü
AC2 Quantities are estimated to a tolerance justifi ed in the context of the need.
ü ü ü ü ü ü ü ü
AC3 The appropriate instrument is chosen to measure a particular quantity ü ü ü
AC4 Quantities are measured correctly to within the least step of the instrument.
ü ü ü ü ü
AC5 Appropriate formulae are selected and used. ü ü ü ü ü ü ü
AC6 Calculations are carried out correctly and the least steps of instruments used are taken into account when reporting fi nal values.
ü ü ü ü ü
AC7 Symbols and units are used in accordance with SI conventions and as appropriate to the situation.
ü ü ü ü ü ü ü
SO2 Explore, analyse & critique, describe & represent, interpret and justify geometrical relationships.
AC1 Descriptions are based on a systematic analysis of the shapes and refl ect the properties of the shapes accurately, clearly and completely.
ü ü ü ü ü
AC2 Descriptions include quantitative information appropriate to the situation and need.
ü ü ü ü ü ü
AC3 3-dimensional objects are represented by top, front and side views. ü ü ü
AC4 Different views are correctly assimilated to describe 3-dimensional objects
ü ü ü
AC5 Available and appropriate technology is used in producing and analysing representations.
ü ü ü ü
AC6 Relations of distance and positions between objects are analysed from different views.
ü ü ü ü ü ü
AC7 Conjectures as appropriate to the situation, are based on well-planned investigations of geometrical properties.
ü ü ü ü
AC8 Representations of the problems are consistent with and appropriate to the problem context. The problems are represented comprehensively and in mathematical terms.
ü ü ü ü ü ü ü ü ü
AC9 Results are achieved through effi cient and correct analysis and manipulation of representations.
ü ü ü ü ü ü ü ü
AC10 Problem-solving methods are presented clearly, logically and in mathematical terms.
ü ü ü ü ü ü ü
AC11 Refl ections on the chosen problem solving strategy reveal strengths and weaknesses of the strategy.
ü ü ü ü ü
AC12 Alternative strategies to obtain the solution are identifi ed and compared in terms of appropriateness and effectiveness.
ü ü ü ü ü ü
1 The new sandpit2 Filling the new sandpit3 Building a guinea pig cage4 Setting up a school5 Painting the school6 The outing7 The outing. Money matters8 Attending an exhibition 9 Attending an exhibition (assessment)

Mathematical Literacy — Early Childhood Development NQF LEVEL 4
UNIT 3 — MEASUREMENT 3.6

Mathematical Literacy — Early Childhood Development NQF LEVEL 4
UNIT 3 — MEASUREMENT 3.7
Activity 1 – The new sandpit
We begin this unit by exploring the relationship between the perimeter and the area of different shapes. The context in which this happens is the designing of a new sandpit. The problem set is to fi nd the best shape for maximum area.
ABOUT THIS ACTIVITYIn this activity the students will explore the problem physically using small rectangular blocks and then formalise it mathematically. Area formulae will be used and calculations made. The students then need to decide which design they would chose. This activity is aligned with unit standard 9016 and addresses AC 2, 3, 7 of SO1 and AC 1, 2, 5, 6, 7, 8, 9, 10, 11, 12 of SO2.
MANAGING THIS ACTIVITYThe facilitator needs to supply small rectangular blocks (Lego or other) which the students can use to explore the problem and some tape measures. Students should be given worksheet 1, handout 1 and some squared paper.
The students will need to know how to calculate the areas of rectangles and circles as well as the circumference of circles. Manipulation of the circle formulae is also required. This activity could be extended by allowing shapes other than rectangles and circles to be used.
1.1 6 dozen blocks will be 6 × 12 = 72 blocks. This means that each layer will have 723
= 24 blocks.
1.2 Enough blocks need to be available for the students.
1.3 The perimeter of the shape remains constant but the area will differ for each design. There are 2 main ways in which to arrange the blocks (see diagrams A and B). Within these main divisions there are a further 5 ways to arrange the bricks for method A and 6 ways for method B. So the students should have got a total of 11 options. See options on the squared paper.
1.4 This is an important check.
1.5 This question requires some thought as the blocks overlap at the corners so the number of blocks in the side will be half a brick less in diagram A and needs to be adjusted in diagram B.
The area of the sandpit is calculated by multiplying the length by the breadth of the rectangle. The results are presented in the table below:
Option Number of blocks on the inside of
the breadth
Length in metres
Number of blocks on the inside of the length
Length in metres
Area in m2
A = l × l × l b
A1 1⁄2 0,15 101⁄2 3,15 0,51m2
A2 11⁄2 0,45 91⁄2 2,85 1,28m2
A3 21⁄2 0,75 81⁄2 2,55 1,91m2
A4 31⁄2 1,05 71⁄2 2,25 2,36m2
A5 41⁄2 1,35 61⁄2 1,95 2,63m2
A6 51⁄2 1,65 51⁄2 1,65 2,72m2
B1 1 0,3 10 3 0,9m2
B2 2 0,6 9 2,7 1,62m2
B3 3 0,9 8 2,4 2,16m2
B4 4 1,2 7 2,1 2,52m2
B5 5 1,5 6 1,8 2,7m2
1.6 The students need to choose from the options. The very best option according to the above table is A6.
1.7 This is an important exercise to enable the students to visualise the size of the sandpit.
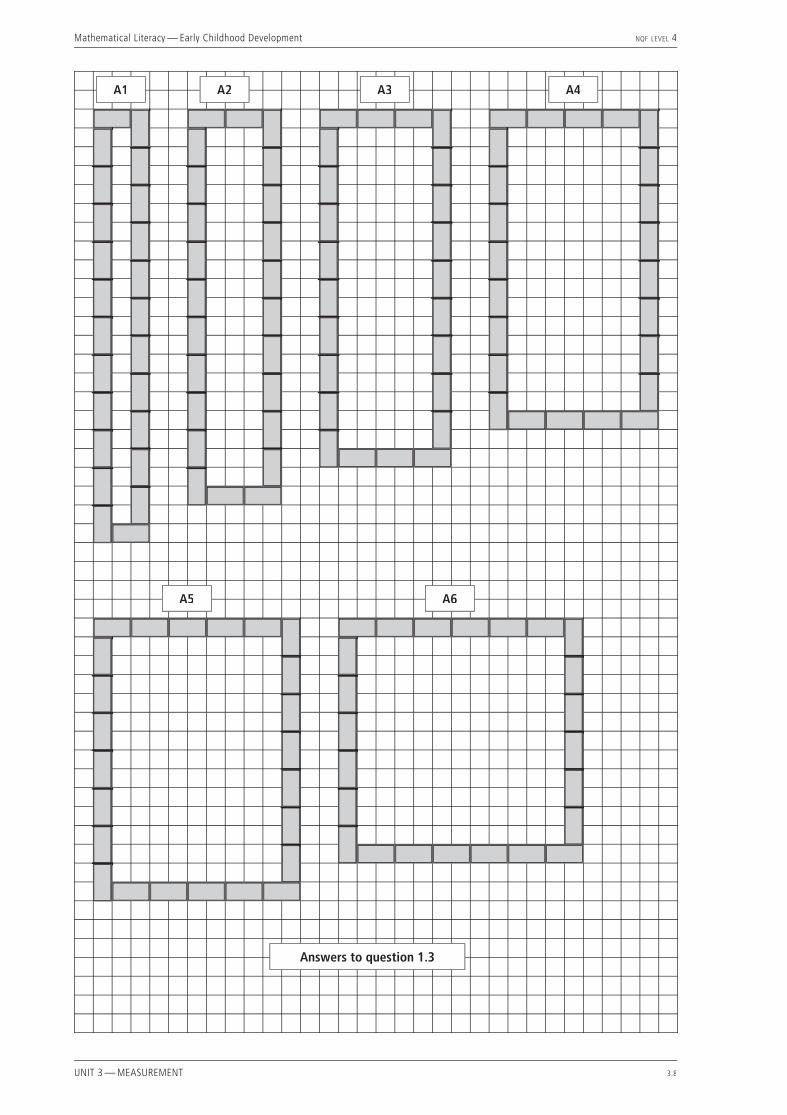
Mathematical Literacy — Early Childhood Development NQF LEVEL 4
UNIT 3 — MEASUREMENT 3.8
A1 A2 A3 A4
A5 A6
Answers to question 1.3
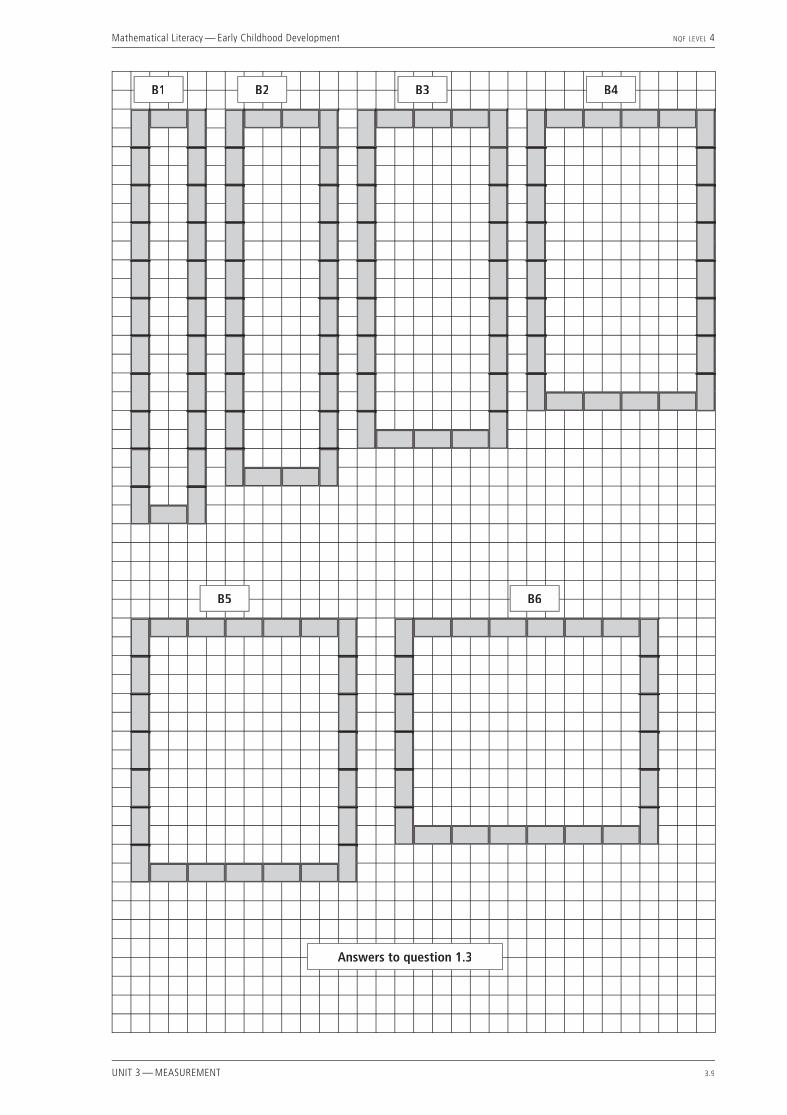
Mathematical Literacy — Early Childhood Development NQF LEVEL 4
UNIT 3 — MEASUREMENT 3.9
B5 B6
Answers to question 1.3
B1 B2 B3 B4
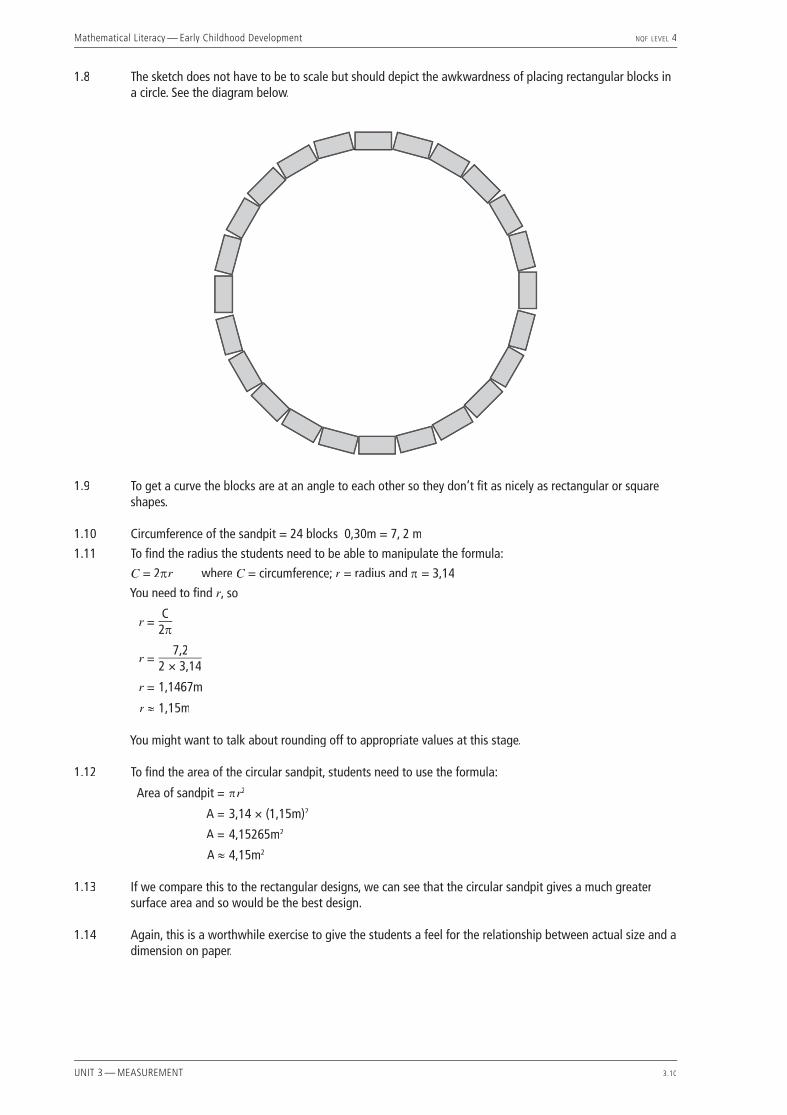
Mathematical Literacy — Early Childhood Development NQF LEVEL 4
UNIT 3 — MEASUREMENT 3.10
1.8 The sketch does not have to be to scale but should depict the awkwardness of placing rectangular blocks in a circle. See the diagram below.
1.9 To get a curve the blocks are at an angle to each other so they don’t fi t as nicely as rectangular or square shapes.
1.10 Circumference of the sandpit = 24 blocks 0,30m = 7, 2 m
1.11 To fi nd the radius the students need to be able to manipulate the formula:
C = 2C = 2C πr where r where r C = circumference; C = circumference; C r = radius and r = radius and r π = 3,14
You need to fi nd r, so
r =r =r C2π
r =r =r7,2
2 × 3,14
r =r =r 1,1467m
r ≈ 1,15m
You might want to talk about rounding off to appropriate values at this stage.
1.12 To fi nd the area of the circular sandpit, students need to use the formula:
Area of sandpit = πr2r2r
A = 3,14 × (1,15m)2
A = 4,15265m2
A ≈ 4,15m2
1.13 If we compare this to the rectangular designs, we can see that the circular sandpit gives a much greater surface area and so would be the best design.
1.14 Again, this is a worthwhile exercise to give the students a feel for the relationship between actual size and a dimension on paper.
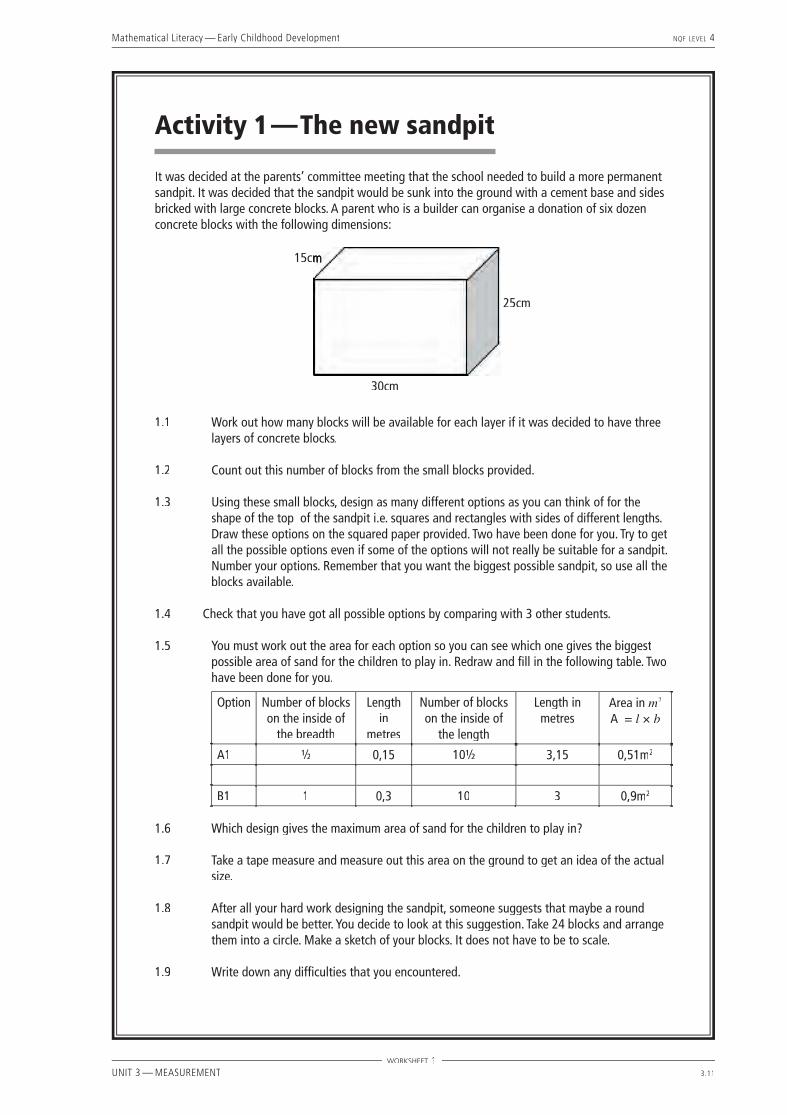
Mathematical Literacy — Early Childhood Development NQF LEVEL 4
UNIT 3 — MEASUREMENT 3.11
Activity 1 — The new sandpit
It was decided at the parents’ committee meeting that the school needed to build a more permanent sandpit. It was decided that the sandpit would be sunk into the ground with a cement base and sides bricked with large concrete blocks. A parent who is a builder can organise a donation of six dozen concrete blocks with the following dimensions:
25cm
30cm
15cm15cm
1.1 Work out how many blocks will be available for each layer if it was decided to have three layers of concrete blocks.
1.2 Count out this number of blocks from the small blocks provided.
1.3 Using these small blocks, design as many different options as you can think of for the shape of the top of the sandpit i.e. squares and rectangles with sides of different lengths. Draw these options on the squared paper provided. Two have been done for you. Try to get all the possible options even if some of the options will not really be suitable for a sandpit. Number your options. Remember that you want the biggest possible sandpit, so use all the blocks available.
1.4 Check that you have got all possible options by comparing with 3 other students.
1.5 You must work out the area for each option so you can see which one gives the biggest possible area of sand for the children to play in. Redraw and fi ll in the following table. Two have been done for you.
Option Number of blocks on the inside of
the breadth
Length in
metres
Number of blocks on the inside of
the length
Length in metres
Area in m2
A = l × l × l b
A1 1⁄2 0,15 101⁄2 3,15 0,51m2
B1 1 0,3 10 3 0,9m2
1.6 Which design gives the maximum area of sand for the children to play in?
1.7 Take a tape measure and measure out this area on the ground to get an idea of the actual size.
1.8 After all your hard work designing the sandpit, someone suggests that maybe a round sandpit would be better. You decide to look at this suggestion. Take 24 blocks and arrange them into a circle. Make a sketch of your blocks. It does not have to be to scale.
1.9 Write down any diffi culties that you encountered.
WORKSHEET 1
Mathematical Literacy — Early Childhood Development NQF LEVEL 4
UNIT 3 — MEASUREMENT 3.12
1.10 Calculate the circumference of the sandpit in metres.
1.11 Now work out the radius of the sandpit. (Circumference = 2πr where r where r r = radius and r = radius and r π = 3,14).
1.12 Work out the area of sand available for the children to play in ( Area = πr2r2r ).
1.13 Compare this to the answers that you got in question 1.6. Which design gives a larger area in which to play?
1.14 Take a tape measure and measure the diameter of the circle to get a feel for the size of the sandpit (Diameter = 2 × radius).
WORKSHEET 1
Mathematical Literacy — Early Childhood Development NQF LEVEL 4
UNIT 3 — MEASUREMENT 3.13
A1
B1
HANDOUT 1
Mathematical Literacy — Early Childhood Development NQF LEVEL 4
UNIT 3 — MEASUREMENT 3.14
HANDOUT 1
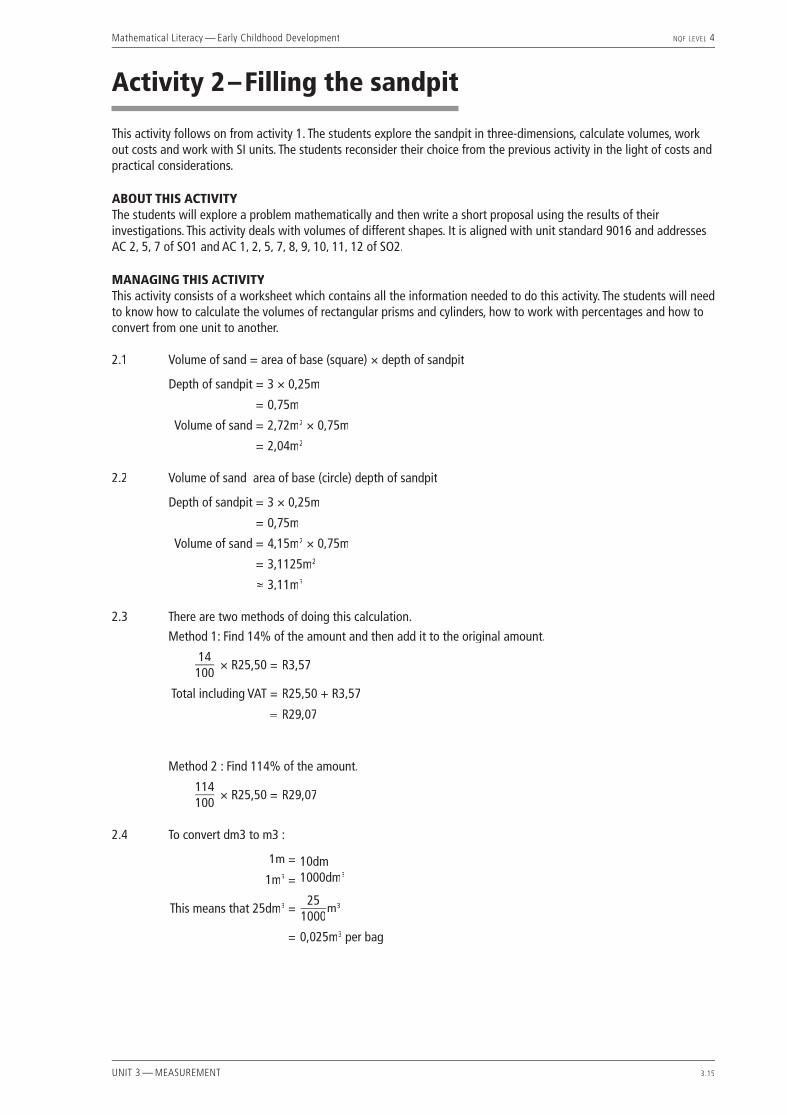
Mathematical Literacy — Early Childhood Development NQF LEVEL 4
UNIT 3 — MEASUREMENT 3.15
Activity 2 – Filling the sandpit
This activity follows on from activity 1. The students explore the sandpit in three-dimensions, calculate volumes, work out costs and work with SI units. The students reconsider their choice from the previous activity in the light of costs and practical considerations.
ABOUT THIS ACTIVITYThe students will explore a problem mathematically and then write a short proposal using the results of their investigations. This activity deals with volumes of different shapes. It is aligned with unit standard 9016 and addresses AC 2, 5, 7 of SO1 and AC 1, 2, 5, 7, 8, 9, 10, 11, 12 of SO2.
MANAGING THIS ACTIVITYThis activity consists of a worksheet which contains all the information needed to do this activity. The students will need to know how to calculate the volumes of rectangular prisms and cylinders, how to work with percentages and how to convert from one unit to another.
2.1 Volume of sand = area of base (square) × depth of sandpit
Depth of sandpit = 3 × 0,25m
= 0,75m
Volume of sand = 2,72m2 × 0,75m
= 2,04m2
2.2 Volume of sand area of base (circle) depth of sandpit
Depth of sandpit = 3 × 0,25m
= 0,75m
Volume of sand = 4,15m2 × 0,75m
= 3,1125m2
≈ 3,11m3
2.3 There are two methods of doing this calculation.
Method 1: Find 14% of the amount and then add it to the original amount.
14100
× R25,50 = R3,57
Total including VAT = R25,50 + R3,57
= R29,07
Method 2 : Find 114% of the amount.
114100
× R25,50 = R29,07
2.4 To convert dm3 to m3 :
1m = 10dm1000dm31m3 =
This means that 25dm3 =25
1000m3
= 0,025m3 per bag
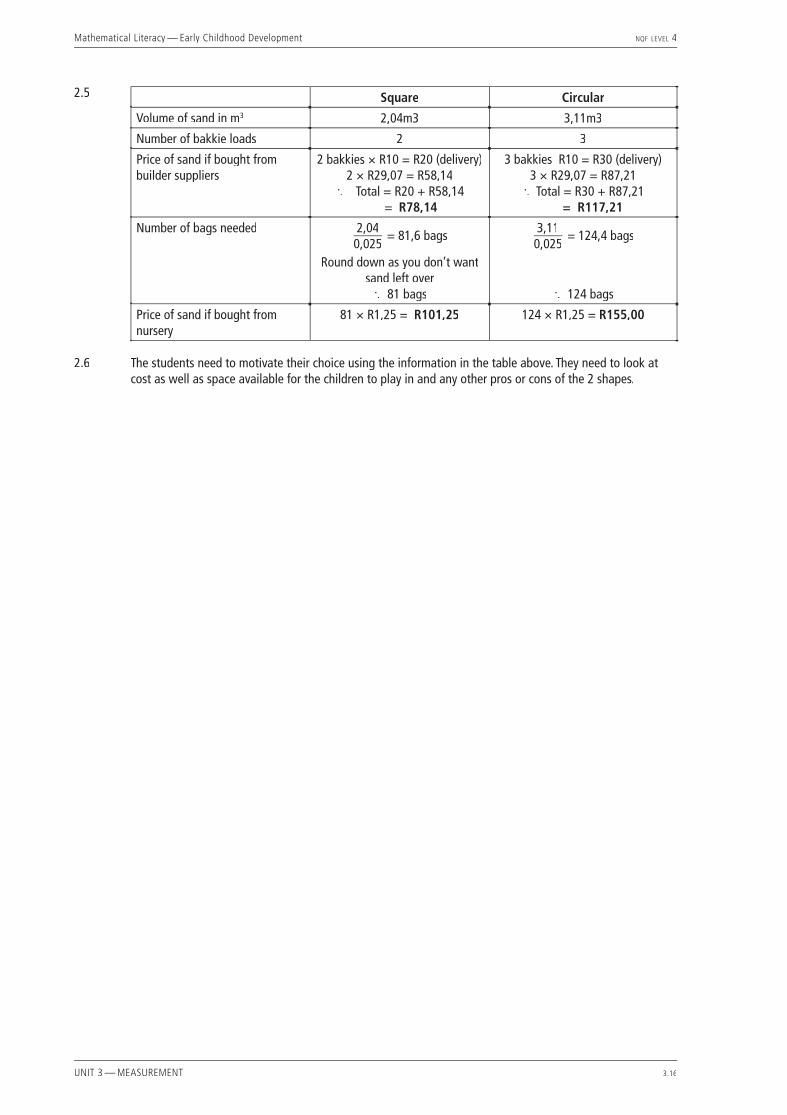
Mathematical Literacy — Early Childhood Development NQF LEVEL 4
UNIT 3 — MEASUREMENT 3.16
2.5
Square Circular
Volume of sand in m3 2,04m3 3,11m3
Number of bakkie loads 2 3
Price of sand if bought from builder suppliers
2 bakkies × R10 = R20 (delivery)2 × R29,07 = R58,14
∴ Total = R20 + R58,14 = R78,14
3 bakkies R10 = R30 (delivery)3 × R29,07 = R87,21
∴ Total = R30 + R87,21 = R117,21
Number of bags needed 2,040,025
= 81,6 bags
Round down as you don’t want sand left over
∴ 81 bags
3,110,025
= 124,4 bags
∴ 124 bags
Price of sand if bought from nursery
81 × R1,25 = R101,25 124 × R1,25 = R155,00
2.6 The students need to motivate their choice using the information in the table above. They need to look at cost as well as space available for the children to play in and any other pros or cons of the 2 shapes.
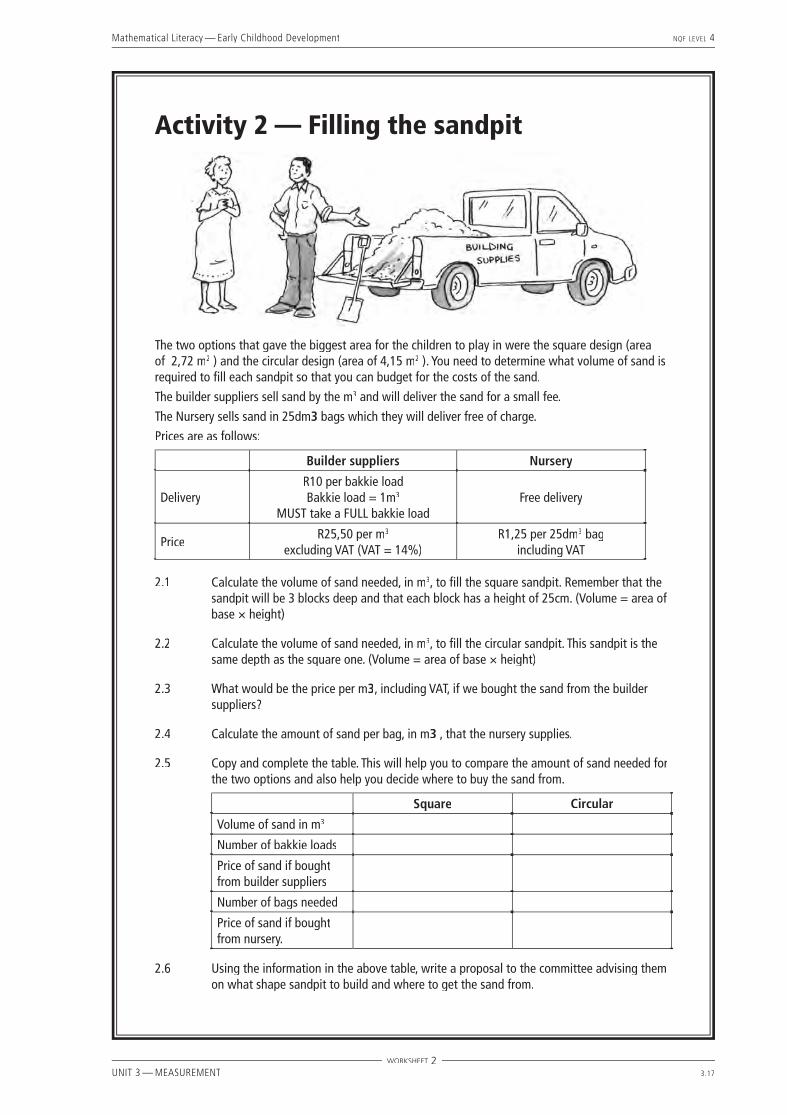
Mathematical Literacy — Early Childhood Development NQF LEVEL 4
UNIT 3 — MEASUREMENT 3.17
Activity 2 — Filling the sandpit
The two options that gave the biggest area for the children to play in were the square design (area of 2,72 m2 ) and the circular design (area of 4,15 m2 ). You need to determine what volume of sand is required to fi ll each sandpit so that you can budget for the costs of the sand.
The builder suppliers sell sand by the m3 and will deliver the sand for a small fee.
The Nursery sells sand in 25dm3 bags which they will deliver free of charge.
Prices are as follows:
Builder suppliers Nursery
DeliveryR10 per bakkie loadBakkie load = 1m3
MUST take a FULL bakkie loadFree delivery
PriceR25,50 per m3
excluding VAT (VAT = 14%)R1,25 per 25dm3 bag
including VAT
2.1 Calculate the volume of sand needed, in m3, to fi ll the square sandpit. Remember that the sandpit will be 3 blocks deep and that each block has a height of 25cm. (Volume = area of base × height)
2.2 Calculate the volume of sand needed, in m3, to fi ll the circular sandpit. This sandpit is the same depth as the square one. (Volume = area of base × height)
2.3 What would be the price per m3, including VAT, if we bought the sand from the builder suppliers?
2.4 Calculate the amount of sand per bag, in m3 , that the nursery supplies.
2.5 Copy and complete the table. This will help you to compare the amount of sand needed for the two options and also help you decide where to buy the sand from.
Square Circular
Volume of sand in m3
Number of bakkie loads
Price of sand if bought from builder suppliers
Number of bags needed
Price of sand if bought from nursery.
2.6 Using the information in the above table, write a proposal to the committee advising them on what shape sandpit to build and where to get the sand from.
WORKSHEET 2
Mathematical Literacy — Early Childhood Development NQF LEVEL 4
UNIT 3 — MEASUREMENT 3.18
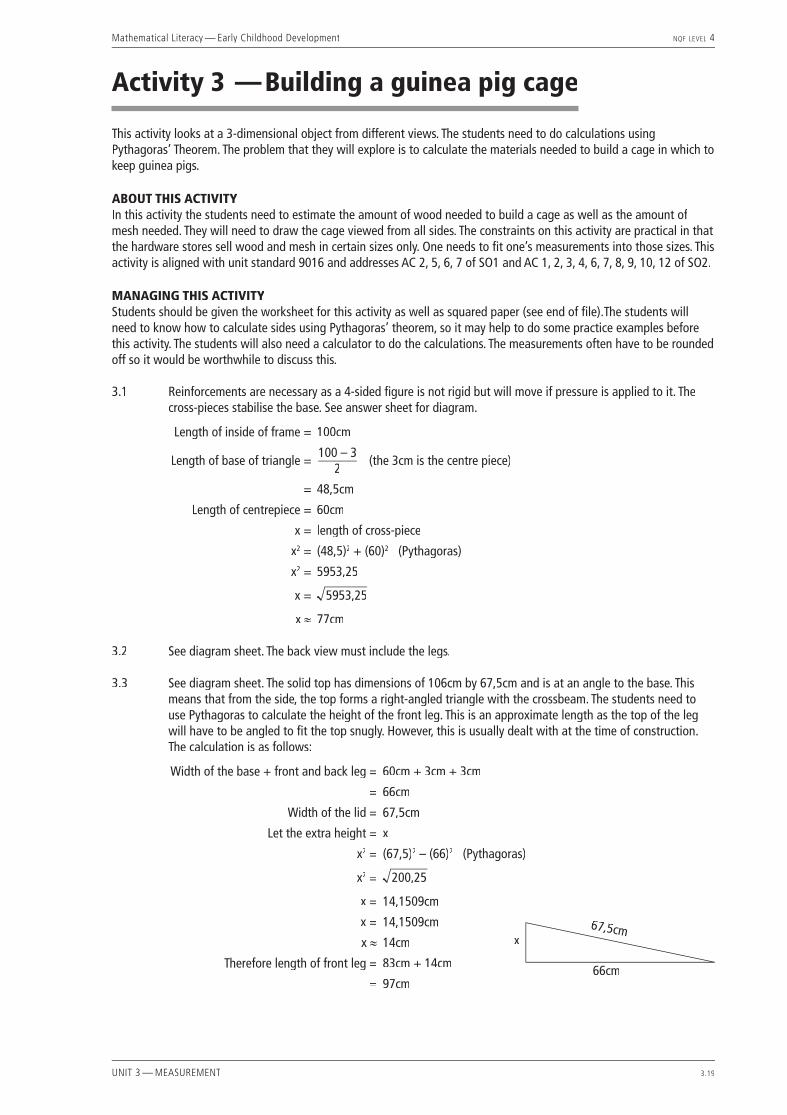
Mathematical Literacy — Early Childhood Development NQF LEVEL 4
UNIT 3 — MEASUREMENT 3.19
Activity 3 — Building a guinea pig cage
This activity looks at a 3-dimensional object from different views. The students need to do calculations using Pythagoras’ Theorem. The problem that they will explore is to calculate the materials needed to build a cage in which to keep guinea pigs.
ABOUT THIS ACTIVITYIn this activity the students need to estimate the amount of wood needed to build a cage as well as the amount of mesh needed. They will need to draw the cage viewed from all sides. The constraints on this activity are practical in that the hardware stores sell wood and mesh in certain sizes only. One needs to fi t one’s measurements into those sizes. This activity is aligned with unit standard 9016 and addresses AC 2, 5, 6, 7 of SO1 and AC 1, 2, 3, 4, 6, 7, 8, 9, 10, 12 of SO2.
MANAGING THIS ACTIVITYStudents should be given the worksheet for this activity as well as squared paper (see end of fi le).The students will need to know how to calculate sides using Pythagoras’ theorem, so it may help to do some practice examples before this activity. The students will also need a calculator to do the calculations. The measurements often have to be rounded off so it would be worthwhile to discuss this.
3.1 Reinforcements are necessary as a 4-sided fi gure is not rigid but will move if pressure is applied to it. The cross-pieces stabilise the base. See answer sheet for diagram.
Length of inside of frame = 100cm
Length of base of triangle =100 – 3
2(the 3cm is the centre piece)
= 48,5cm
Length of centrepiece = 60cm
x = length of cross-piece
x2 = (48,5)2 + (60)2 (Pythagoras)
x2 = 5953,25
x = 5953,25
x ≈ 77cm
3.2 See diagram sheet. The back view must include the legs.
3.3 See diagram sheet. The solid top has dimensions of 106cm by 67,5cm and is at an angle to the base. This means that from the side, the top forms a right-angled triangle with the crossbeam. The students need to use Pythagoras to calculate the height of the front leg. This is an approximate length as the top of the leg will have to be angled to fi t the top snugly. However, this is usually dealt with at the time of construction. The calculation is as follows:
Width of the base + front and back leg = 60cm + 3cm + 3cm
= 66cm
Width of the lid = 67,5cm
Let the extra height = x
x2 = (67,5)2 – (66)2 (Pythagoras)
x2 = 200,25
x = 14,1509cm
x = 14,1509cm
x ≈ 14cm
Therefore length of front leg = 83cm + 14cm
= 97cm
x67,5cm
66cm

Mathematical Literacy — Early Childhood Development NQF LEVEL 4
UNIT 3 — MEASUREMENT 3.20
3.4 The front view is complicated by the gate. Again Pythagoras should be used to calculate the length of the reinforcement beam. This means that the students have to work out the measurement of the inside frame of the gate fi rst.
Width of inside of gate = 40cm – (2 × 3cm)
= 34cm
Length of inside of frame = 97 – (2 × 3cm) – 10cm
= 81cm
Length of inside of frame = 81cm – (2 × 3cm)
= 75cm
Length of inside of gate = 14,1509cm
= 14,1509cm
Length of cross-piece = x
x2 = (34)2 – (75,2)2 (Pythagoras)
x2 = 6781
x = 6781
x ≈ 82cm
3.5 Amount of wood needed (table continues on next page):
VIEW 3cm pieces of wood 1,5cm wood
Front legs 2 × 97cm = 194cm
Back legs 2 × 83cm = 166cm
Bottom 2 × 100cm = 200cm3 60cm = 180cm
2 × 77cm = 154cm
Back 1 × 100cm = 100cm None
Front
Gate
1 × 100cm = 100cm1 × 81cm = 81cm2 × 40cm = 80cm2 × 75cm = 170cm
1 × 82cm = 82cm
TOTAL 1271cm 236cm
3.6 Lengths needed to be bought from shop:
Lengths needed Lengths Available in shop
3cm wood:Two front legs + Two back legs 97cm + 83cm = 180cm 2 1,8m
Four 1m lengths (2 back and 2 front) 1 × 3m and one 1,8m (waste 0,8m)
Three 60cm lengths (3 bottom) 1,8m 1 × 1,8m
One length for front and 2 for gate 81cm + 40cm + 40cm = 161cm 1 × 1,8m (waste 0,19m)
2 lengths for the gate 2 75cm = 170cm 1 × 1,8m (waste 0,10m)
1,5cm wood:2 cross-pieces for bottom 77cm + 77cm = 154cm 1 × 1,8m (waste 0,26m)
1 cross-piece for gate 82cm 1 × 1m (waste 0,18m)
To summarize: 3cm wood needed: 5 × 1,8m and 13m 1,5cm wood needed: 11,8m and 11m
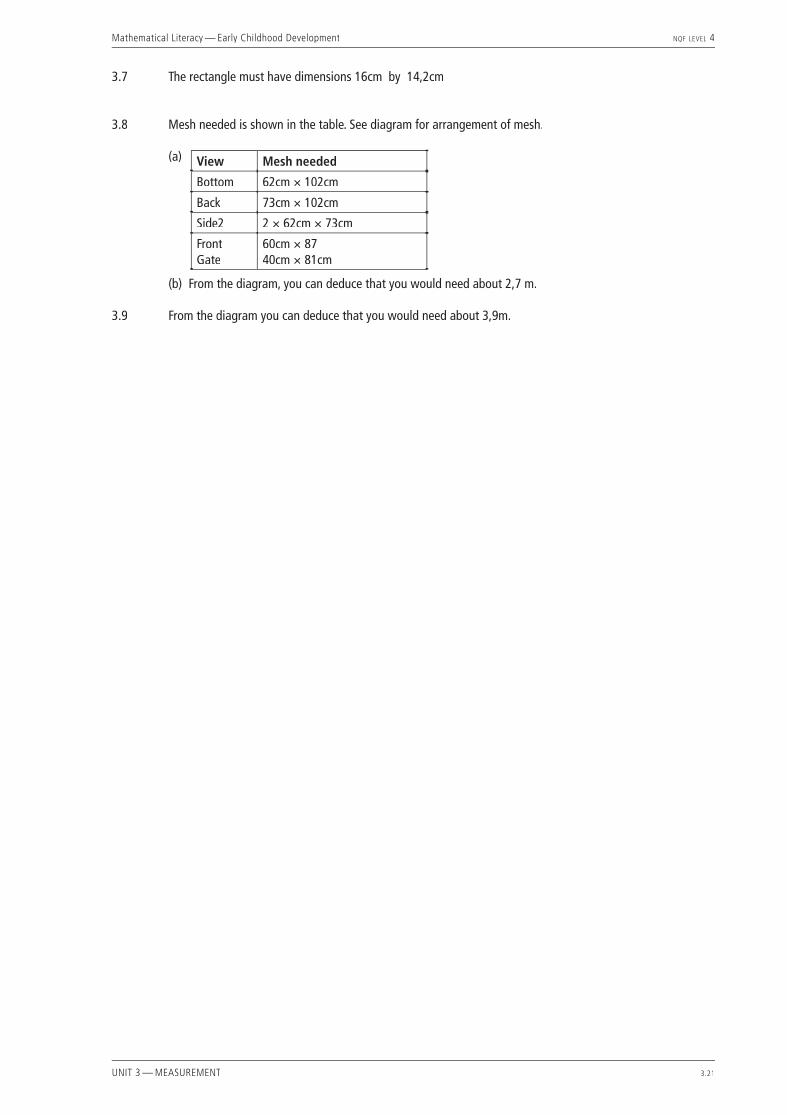
Mathematical Literacy — Early Childhood Development NQF LEVEL 4
UNIT 3 — MEASUREMENT 3.21
3.7 The rectangle must have dimensions 16cm by 14,2cm
3.8 Mesh needed is shown in the table. See diagram for arrangement of mesh.
(a) View Mesh needed
Bottom 62cm × 102cm
Back 73cm × 102cm
Side2 2 × 62cm × 73cm
FrontGate
60cm × 87 40cm × 81cm
(b) From the diagram, you can deduce that you would need about 2,7 m.
3.9 From the diagram you can deduce that you would need about 3,9m.
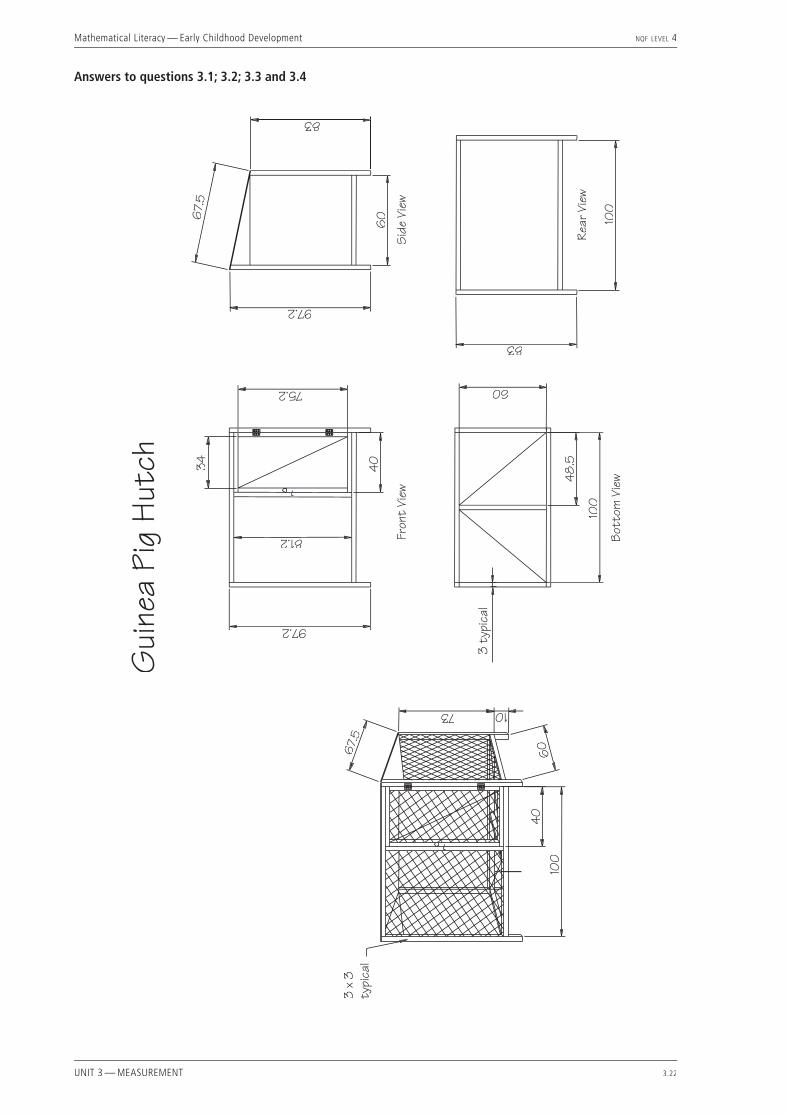
Mathematical Literacy — Early Childhood Development NQF LEVEL 4
UNIT 3 — MEASUREMENT 3.22
Gui
nea
Pig
Hut
ch
3 x
3ty
pica
l
100
406067
.5
73 10
3 ty
pica
l
48.5
100
60
83
100
Bott
om V
iew
Rear
Vie
w
Sid
e Vi
ew6
0
83
97.2
67.
534
81.2
97.2
40
Fron
t Vi
ew
75.2
Answers to questions 3.1; 3.2; 3.3 and 3.4
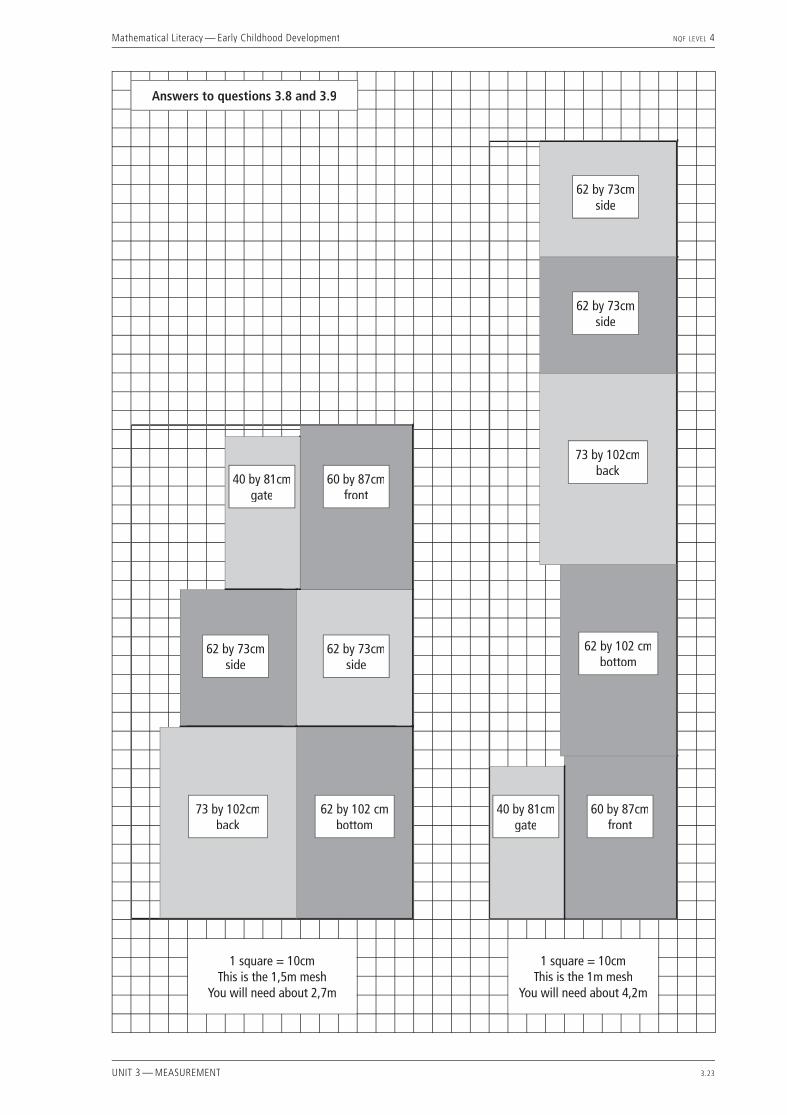
Mathematical Literacy — Early Childhood Development NQF LEVEL 4
UNIT 3 — MEASUREMENT 3.23
Answers to questions 3.8 and 3.9
40 by 81cmgate
60 by 87cmfront
62 by 73cmside
62 by 73cmside
73 by 102cmback
62 by 102 cmbottom
60 by 87cmfront
40 by 81cmgate
62 by 102 cmbottom
73 by 102cmback
62 by 73cmside
62 by 73cmside
1 square = 10cmThis is the 1,5m mesh
You will need about 2,7m
1 square = 10cmThis is the 1m mesh
You will need about 4,2m

Mathematical Literacy — Early Childhood Development NQF LEVEL 4
UNIT 3 — MEASUREMENT 3.24
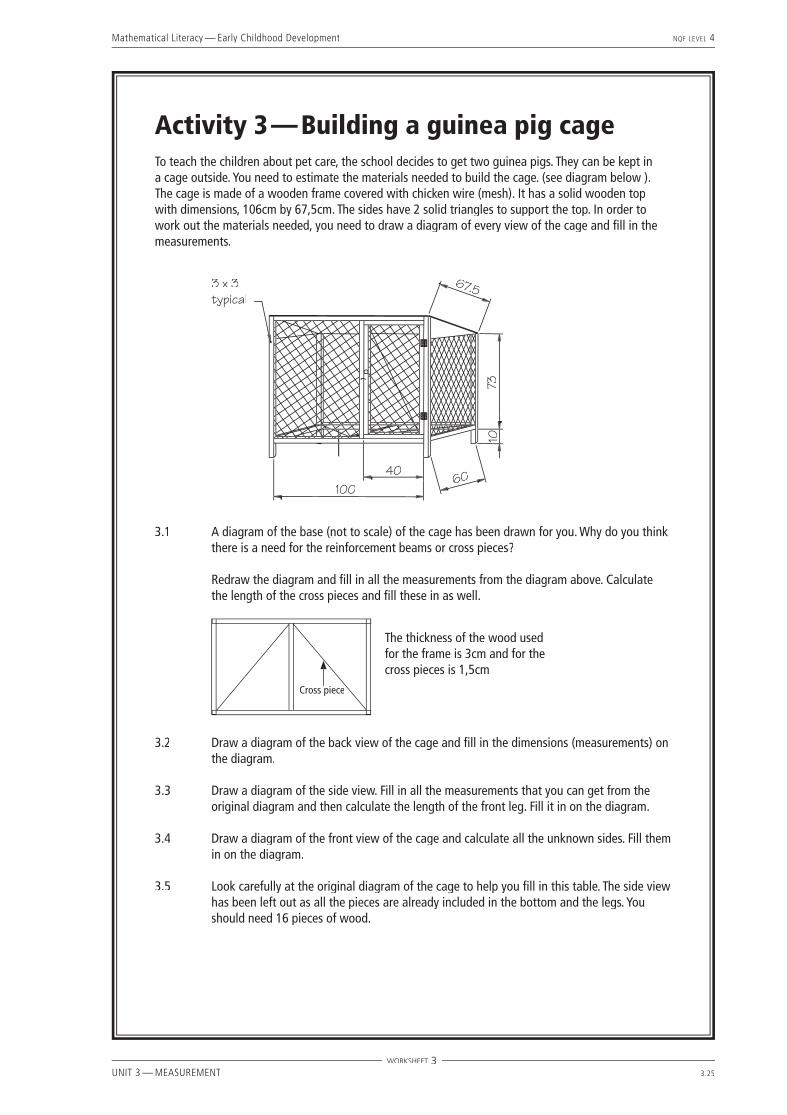
Mathematical Literacy — Early Childhood Development NQF LEVEL 4
UNIT 3 — MEASUREMENT 3.25
Activity 3 — Building a guinea pig cageTo teach the children about pet care, the school decides to get two guinea pigs. They can be kept in a cage outside. You need to estimate the materials needed to build the cage. (see diagram below ). The cage is made of a wooden frame covered with chicken wire (mesh). It has a solid wooden top with dimensions, 106cm by 67,5cm. The sides have 2 solid triangles to support the top. In order to work out the materials needed, you need to draw a diagram of every view of the cage and fi ll in the measurements.
3 x 3typical
10040
60
67.5
7310
3.1 A diagram of the base (not to scale) of the cage has been drawn for you. Why do you think there is a need for the reinforcement beams or cross pieces?
Redraw the diagram and fi ll in all the measurements from the diagram above. Calculate the length of the cross pieces and fi ll these in as well.
Cross pieceCross piece
The thickness of the wood used for the frame is 3cm and for the cross pieces is 1,5cm
3.2 Draw a diagram of the back view of the cage and fi ll in the dimensions (measurements) on the diagram.
3.3 Draw a diagram of the side view. Fill in all the measurements that you can get from the original diagram and then calculate the length of the front leg. Fill it in on the diagram.
3.4 Draw a diagram of the front view of the cage and calculate all the unknown sides. Fill them in on the diagram.
3.5 Look carefully at the original diagram of the cage to help you fi ll in this table. The side view has been left out as all the pieces are already included in the bottom and the legs. You should need 16 pieces of wood.
WORKSHEET 3
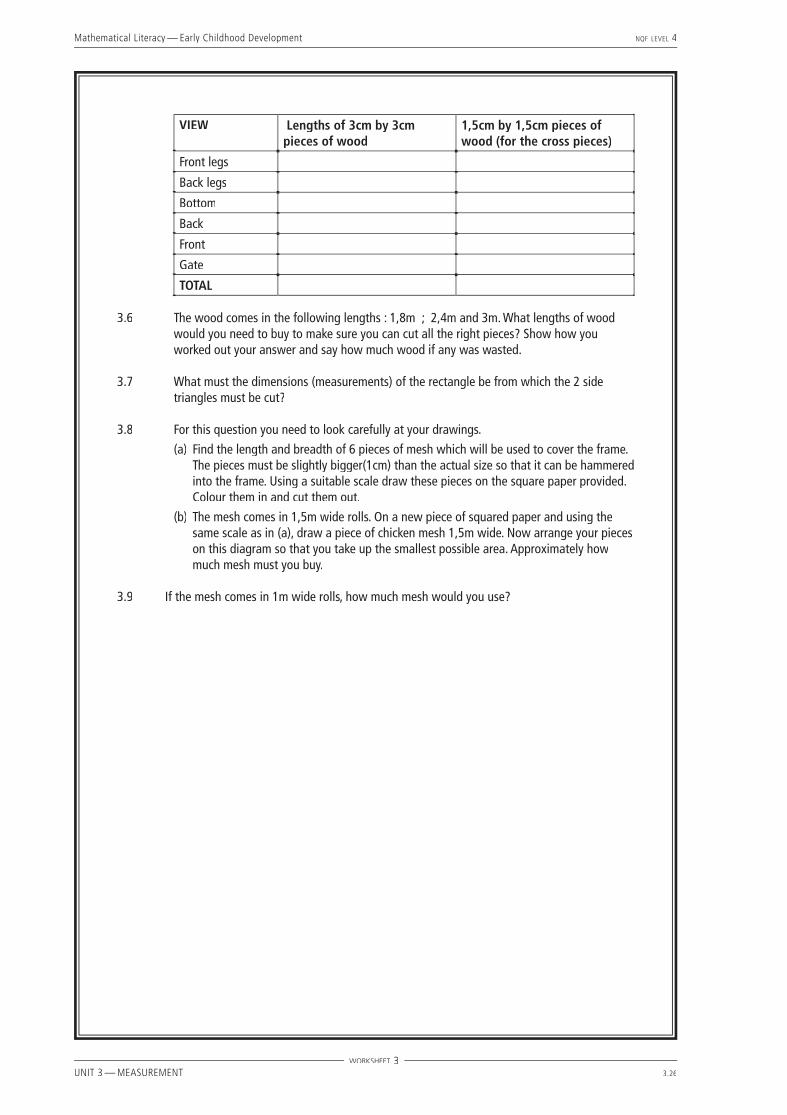
Mathematical Literacy — Early Childhood Development NQF LEVEL 4
UNIT 3 — MEASUREMENT 3.26
VIEW Lengths of 3cm by 3cm pieces of wood
1,5cm by 1,5cm pieces of wood (for the cross pieces)
Front legs
Back legs
Bottom
Back
Front
Gate
TOTAL
3.6 The wood comes in the following lengths : 1,8m ; 2,4m and 3m. What lengths of wood would you need to buy to make sure you can cut all the right pieces? Show how you worked out your answer and say how much wood if any was wasted.
3.7 What must the dimensions (measurements) of the rectangle be from which the 2 side triangles must be cut?
3.8 For this question you need to look carefully at your drawings.
(a) Find the length and breadth of 6 pieces of mesh which will be used to cover the frame. The pieces must be slightly bigger(1cm) than the actual size so that it can be hammered into the frame. Using a suitable scale draw these pieces on the square paper provided. Colour them in and cut them out.
(b) The mesh comes in 1,5m wide rolls. On a new piece of squared paper and using the same scale as in (a), draw a piece of chicken mesh 1,5m wide. Now arrange your pieces on this diagram so that you take up the smallest possible area. Approximately how much mesh must you buy.
3.9 If the mesh comes in 1m wide rolls, how much mesh would you use?
WORKSHEET 3
Mathematical Literacy — Early Childhood Development NQF LEVEL 4
UNIT 3 — MEASUREMENT 3.27
HANDOUT 3

Mathematical Literacy — Early Childhood Development NQF LEVEL 4
UNIT 3 — MEASUREMENT 3.28
HANDOUT 3
Mathematical Literacy — Early Childhood Development NQF LEVEL 4
UNIT 3 — MEASUREMENT 3.29
Activity 4 — Setting up a school
This activity focuses on two dimensional space. The students have to interpret the plans of a community centre and work out how to use the space to run a school. The plan of the community centre is used 2-dimensionally in this activity and 3-dimensionally in the next activity.
ABOUT THIS ACTIVITYThe aim of this activity is for the students to get a feel for the size of rooms. They are asked to pace out the actual size of rooms. The dimensions of the room are read off a plan. They investigate effective use of space using different arrangements of tables and chairs. Three- dimensional objects are viewed from the top. This activity is aligned with unit standard 9016 and addresses AC 2, 3, 4, 7 of SO1 and all of the AC of SO2.
MANAGING THIS ACTIVITYThis activity has one handout on which has the plans of the Community Centre are drawn. The students will need squared paper(see end of fi le), a ruler and a pencil. This activity requires the students to get a feel of the size of rooms so they will need space in which to move. This is an important exercise to help the students to visualise the area in which they are planning their school.
4.1 The students will have their own ideas here but they need to include an offi ce and a space for each year group.
4.2 The ablution area has:(a) 3 toilets(b) 3 basins
4.3 Dimensions are:(a) 7,5m by 4m(b) 6,4m by 4m(c) 4,4m by 4m(d) 25m by 11m(e) 5m by 11m
4.4 This is an important exercise as it gives the students a chance to get a feel for the actual size of the room.
4.5 Answers will vary.
4.6 See diagram on next page.
4.7 See diagram for answers to questions (a), (b), (c) and (d).(e) The 6-children arrangement gives the most seating.

Mathematical Literacy — Early Childhood Development NQF LEVEL 4
UNIT 3 — MEASUREMENT 3.30
Answer to question 4.7(b)The number of children in the room is 8 × 4 = 32
Answer to question 4.7(c)The number of children in the room is 6 × 6 = 36
Answer to question 4.7(d)The number of children in the room is 4 × 8 = 32
Mathematical Literacy — Early Childhood Development NQF LEVEL 4
UNIT 3 — MEASUREMENT 3.31
4.8 The dimensions of the hall are 25m by 11m. The number of children that can fi t into the hall is calculated as follows:
Arrangement 1
No. of groups in length =25
1,75m
= 14
No. of groups in width =11
1,75m
= 6
Therefore no. of groups = 14 × 6
= 84 groups
Therefore number of children = 84 × 4
= 336 children
Arrangement 2
No. of groups in length =25
2,5m
= 10
No. of groups in width =11m
1,75m
= 6
Therefore no. of groups = 10 × 6
= 60 groups
Therefore number of children = 60 × 6
= 360 children
Arrangement 3
No. of groups in length =25
3,25m
= 7
No. of groups in width =11m
1,75m
= 6
Therefore no. of groups = 7 × 6
= 42 groups
Therefore number of children = 42 × 8
= 336 children
Mathematical Literacy — Early Childhood Development NQF LEVEL 4
UNIT 3 — MEASUREMENT 3.32
4.9 Using the 2-table arrangement :
For room 2
No. of groups in length =6,4m2,5m
= 2
No. of groups in width =4m
1,75m
= 2
Therefore no. of groups = 2 × 2
= 4 groups
Therefore number of children = 4 × 6
= 24 children
For stage
No. of groups in length =11m2,5m
= 4
No. of groups in width =4m
1,75m
= 2
Therefore no. of groups = 8 × 2
= 32 groups
Therefore number of children = 32 × 6
= 192 children
Total number of children = 36 + 360 + 24 + 192 = 600 children 4.10 This is far too many children for the available ablutions. There is also a need for fl oor area in which to play
as well as space for equipment, book cases etc.
4.11 This is a chance for the students to use what they have learnt to design what they would do (could be a good discussion point).

Mathematical Literacy — Early Childhood Development NQF LEVEL 4
UNIT 3 — MEASUREMENT 3.33
Activity 4 — Setting up a schoolYou have got permission from the local authorities to use the Community Centre as a venue to set up a new preschool. You have got the plans of the centre from the council and now need to plan how you are going to use the space available (see handout 4). The agreement is that you may use all the smaller rooms. You may also use the stage and hall but only in such a way that they can be easily cleared if there is to be another function in the centre.
Answer the following questions using the plans of the centre on the handout.
4.1 Before you begin to allocate space for various activities, decide what spaces you would need for your school eg offi ce space, space for each year group etc. The number of children will be decided on once you have looked at the plans. Make a list of the spaces you need.
4.2 Find the ablution area on the plan.(a) How many toilets are there?(b) How many basins are there?
4.3 What are the dimensions (length and breadth) of :(a) Room 1?(b) Room 2?(c) Room 3?(d) The hall?(e) The stage?
4.4 Use a tape measure to mark off I metre on the fl oor. Using the marked metre, step out a metre. This should give you a feel as to how long a metre is. Now step out the dimensions of room 1 which is the biggest of the 3 rooms.
4.5 Step out room 3. Does it feel much smaller. What would you use these two rooms for? Give reasons for your answers.
4.6 On the squared paper provided and using a scale of 4 squares to represent 1m, draw the outline of room 1.
4.7 The dimensions of the little square plastic tables that you have available are 75cm by 75cm. The chairs have dimensions 30cm by 30cm. There needs to be an open area of about 50cm around each table so that the children have room to get in and out of the chairs.
WORKSHEET 4
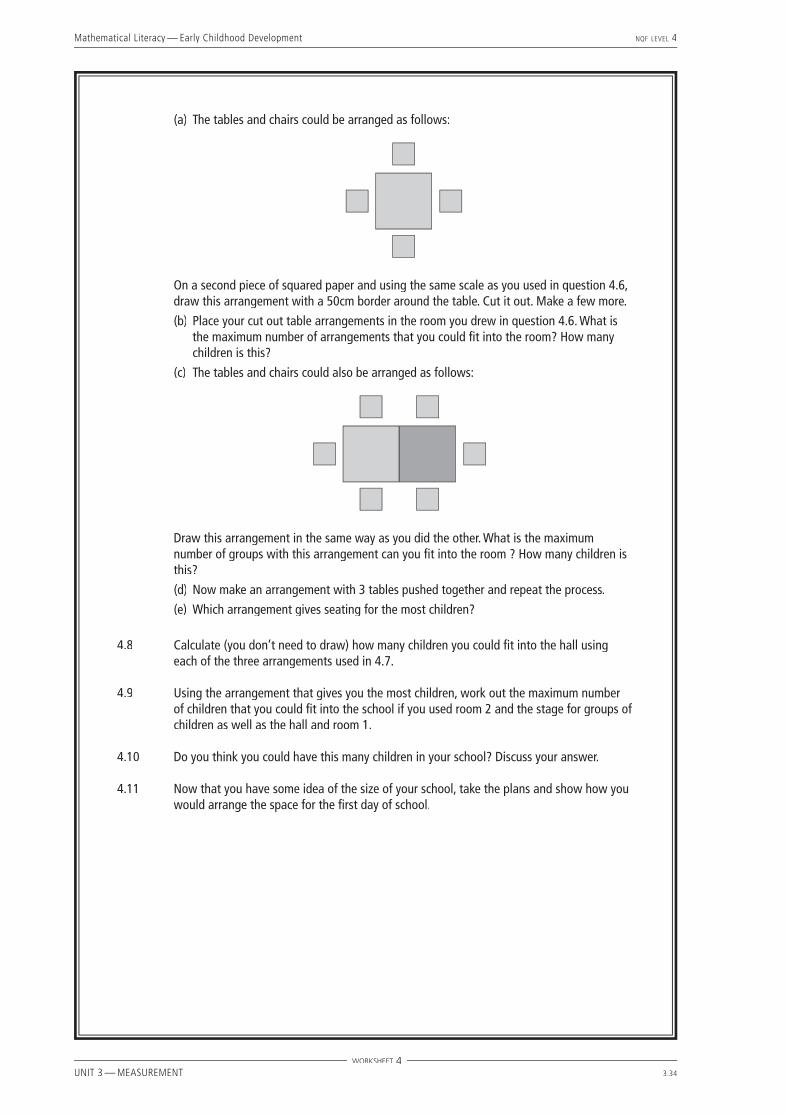
Mathematical Literacy — Early Childhood Development NQF LEVEL 4
UNIT 3 — MEASUREMENT 3.34
WORKSHEET 4
(a) The tables and chairs could be arranged as follows:
On a second piece of squared paper and using the same scale as you used in question 4.6, draw this arrangement with a 50cm border around the table. Cut it out. Make a few more.
(b) Place your cut out table arrangements in the room you drew in question 4.6. What is the maximum number of arrangements that you could fi t into the room? How many children is this?
(c) The tables and chairs could also be arranged as follows:
Draw this arrangement in the same way as you did the other. What is the maximum number of groups with this arrangement can you fi t into the room ? How many children is this?
(d) Now make an arrangement with 3 tables pushed together and repeat the process.
(e) Which arrangement gives seating for the most children?
4.8 Calculate (you don’t need to draw) how many children you could fi t into the hall using each of the three arrangements used in 4.7.
4.9 Using the arrangement that gives you the most children, work out the maximum number of children that you could fi t into the school if you used room 2 and the stage for groups of children as well as the hall and room 1.
4.10 Do you think you could have this many children in your school? Discuss your answer.
4.11 Now that you have some idea of the size of your school, take the plans and show how you would arrange the space for the fi rst day of school.
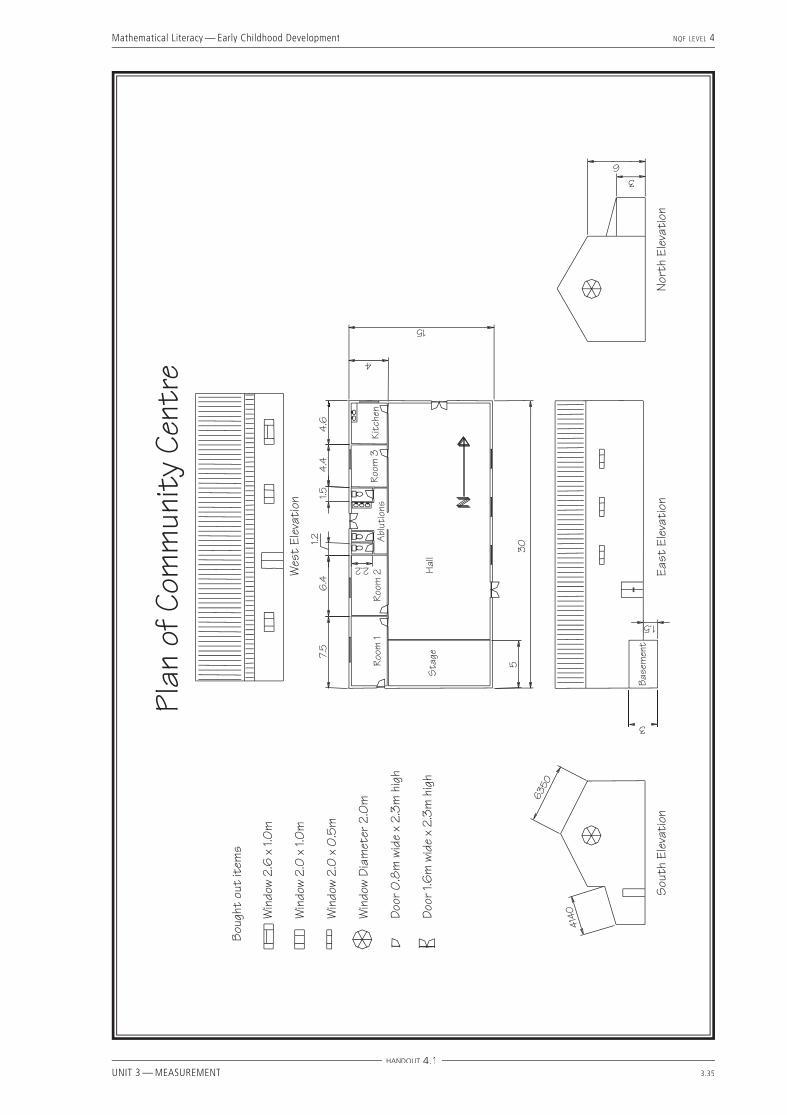
Mathematical Literacy — Early Childhood Development NQF LEVEL 4
UNIT 3 — MEASUREMENT 3.35
HANDOUT 4.1
Mathematical Literacy — Early Childhood Development NQF LEVEL 4
UNIT 3 — MEASUREMENT 3.36
HANDOUT 4.2

Mathematical Literacy — Early Childhood Development NQF LEVEL 4
UNIT 3 — MEASUREMENT 3.37
HANDOUT 4.2

Mathematical Literacy — Early Childhood Development NQF LEVEL 4
UNIT 3 — MEASUREMENT 3.38
HANDOUT 4.2
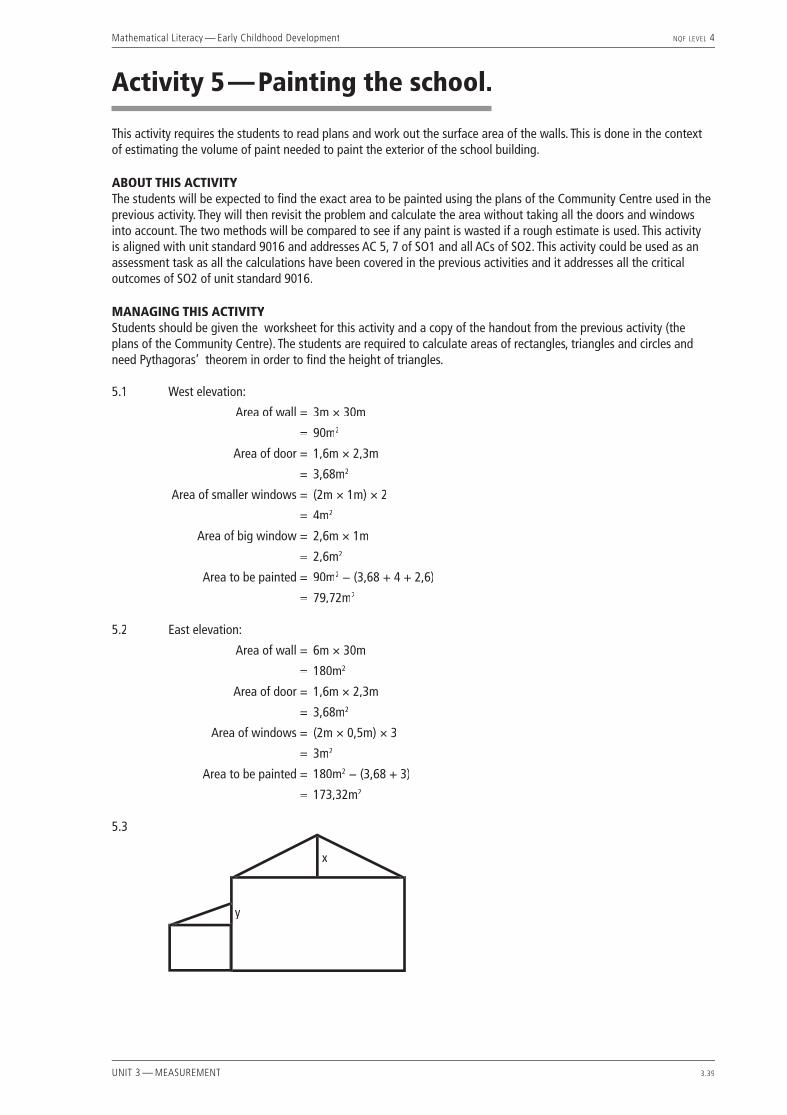
Mathematical Literacy — Early Childhood Development NQF LEVEL 4
UNIT 3 — MEASUREMENT 3.39
Activity 5 — Painting the school.
This activity requires the students to read plans and work out the surface area of the walls. This is done in the context of estimating the volume of paint needed to paint the exterior of the school building.
ABOUT THIS ACTIVITYThe students will be expected to fi nd the exact area to be painted using the plans of the Community Centre used in the previous activity. They will then revisit the problem and calculate the area without taking all the doors and windows into account. The two methods will be compared to see if any paint is wasted if a rough estimate is used. This activity is aligned with unit standard 9016 and addresses AC 5, 7 of SO1 and all ACs of SO2. This activity could be used as an assessment task as all the calculations have been covered in the previous activities and it addresses all the critical outcomes of SO2 of unit standard 9016.
MANAGING THIS ACTIVITYStudents should be given the worksheet for this activity and a copy of the handout from the previous activity (the plans of the Community Centre). The students are required to calculate areas of rectangles, triangles and circles and need Pythagoras’ theorem in order to fi nd the height of triangles.
5.1 West elevation:
Area of wall = 3m × 30m
= 90m2
Area of door = 1,6m × 2,3m
= 3,68m2
Area of smaller windows = (2m × 1m) × 2
= 4m2
Area of big window = 2,6m × 1m
= 2,6m2
Area to be painted = 90m2 − (3,68 + 4 + 2,6)
= 79,72m2
5.2 East elevation:
Area of wall = 6m × 30m
= 180m2
Area of door = 1,6m × 2,3m
= 3,68m2
Area of windows = (2m × 0,5m) × 3
= 3m2
Area to be painted = 180m2 − (3,68 + 3)
= 173,32m2
5.3
x
y

Mathematical Literacy — Early Childhood Development NQF LEVEL 4
UNIT 3 — MEASUREMENT 3.40
Let the height of the main roof = x
x2 = (6,35)2 − (5,5)2 (pythagoras)
x2 = 10,07
x = 10,07
x = 3,17m
Let the height of the side roof = y
y2 = (4,14)2 − (4)2 (pythagoras)
y2 = 1,1396
y = 1,1396
y = 1,07m
5.4 Using the above dimensions:
Area of main rectangle = 6m × 11m
= 66m2
Area of main triangle =11 × 3,17
2
= 17,44m2
Area of smaller rectangle = 3m × 4m
= 12m2
Area of smaller triangle =4 × 1,07
2
= 2,14m2
Total area = 66m2 + 17,44m2 + 12m2 +2,14m2
= 97,582
Area to be subtracted:
Area of circular window = πr2r2r
radius of window =2m2
= 1m
Therefore area = 3.14(1)2
= 3,14m2
Area of door = 0,8m × 2,3m
= 1,84m2
Area to be painted = 97,58m2 − (3,14m2 + 1,84m2)
= 92,6m2
5.5 Area of front of centre to be painted
Total area = 97,58m2
Area of door = 1,6m × 2,3m
= 3,68m2
Area of window = 2m × 1m
= 2m2
Area of round window = 3,14m2
Area to be painted = 97,58m2 − (3,68m2 + 2m2 + 3,14m2)
= 88,76m2
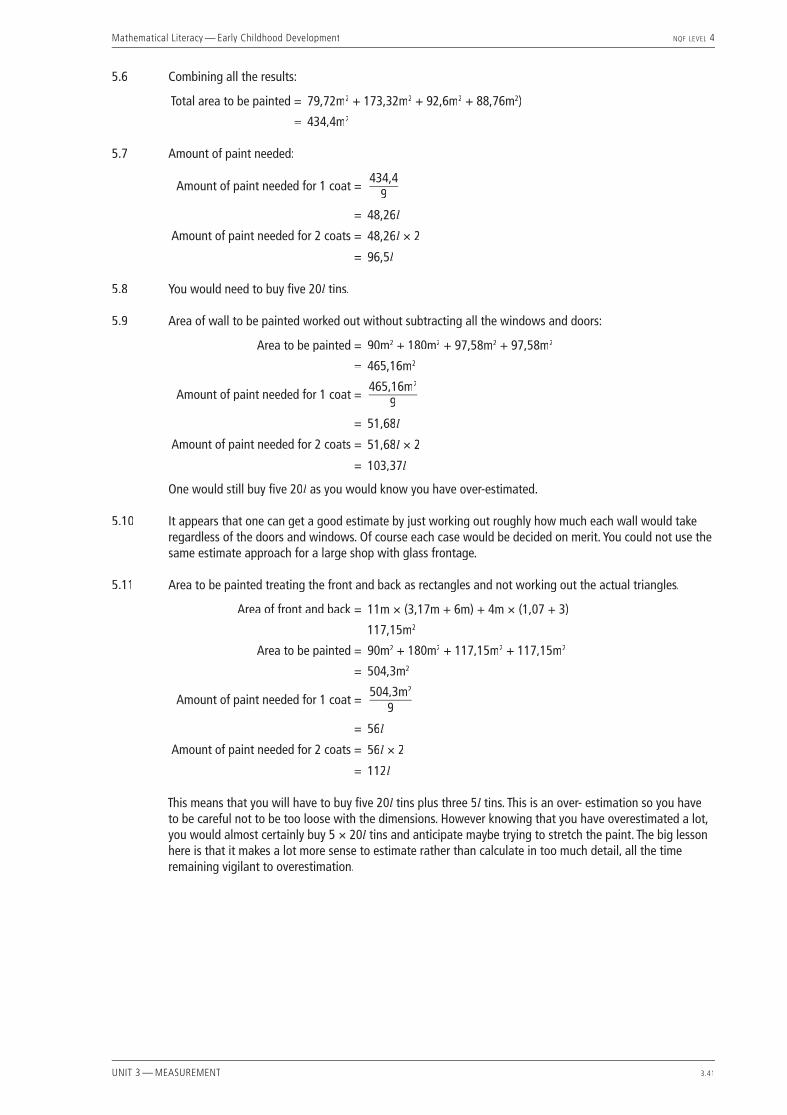
Mathematical Literacy — Early Childhood Development NQF LEVEL 4
UNIT 3 — MEASUREMENT 3.41
5.6 Combining all the results:
Total area to be painted = 79,72m2 + 173,32m2 + 92,6m2 + 88,76m2)
= 434,4m2
5.7 Amount of paint needed:
Amount of paint needed for 1 coat =434,4
9
= 48,26l
Amount of paint needed for 2 coats = 48,26l × 2l × 2l
= 96,5l
5.8 You would need to buy fi ve 20l tins.l tins.l
5.9 Area of wall to be painted worked out without subtracting all the windows and doors:
Area to be painted = 90m2 + 180m2 + 97,58m2 + 97,58m2
= 465,16m2
Amount of paint needed for 1 coat =465,16m2
9
= 51,68l
Amount of paint needed for 2 coats = 51,68l × 2l × 2l
= 103,37l
One would still buy fi ve 20l as you would know you have over-estimated.l as you would know you have over-estimated.l
5.10 It appears that one can get a good estimate by just working out roughly how much each wall would take regardless of the doors and windows. Of course each case would be decided on merit. You could not use the same estimate approach for a large shop with glass frontage.
5.11 Area to be painted treating the front and back as rectangles and not working out the actual triangles.
Area of front and back = 11m × (3,17m + 6m) + 4m × (1,07 + 3)
117,15m2
Area to be painted = 90m2 + 180m2 + 117,15m2 + 117,15m2
= 504,3m2
Amount of paint needed for 1 coat =504,3m2
9
= 56l
Amount of paint needed for 2 coats = 56l × 2l × 2l
= 112l
This means that you will have to buy fi ve 20l tins plus three 5l tins plus three 5l l tins. This is an over- estimation so you have l tins. This is an over- estimation so you have lto be careful not to be too loose with the dimensions. However knowing that you have overestimated a lot, you would almost certainly buy 5 × 20l tins and anticipate maybe trying to stretch the paint. The big lesson l tins and anticipate maybe trying to stretch the paint. The big lesson lhere is that it makes a lot more sense to estimate rather than calculate in too much detail, all the time remaining vigilant to overestimation.

Mathematical Literacy — Early Childhood Development NQF LEVEL 4
UNIT 3 — MEASUREMENT 3.42
Mathematical Literacy — Early Childhood Development NQF LEVEL 4
UNIT 3 — MEASUREMENT 3.43
Activity 5 — Painting the schoolThe parents are happy to help you paint the school. Your job is to estimate the amount of paint needed and to purchase it. You will need to look at the plan of the Community Centre on the handout from the previous activity. It will be easier to consider each elevation separately.
5.1 Work out the area of wall which must be painted on the West elevation (side view). You don’t paint doors and windows with the same paint as the walls.
5.2 Work out the area to be painted on the east elevation (other side view).
5.3 Draw a rough sketch of the south view (back of the hall) and divide it into rectangles and triangles to make calculations easier. Fill in all the dimensions of the walls on your sketch. Calculate the height of the roof of the main hall and then the height of the side roof.
5.4 Using your dimensions determined in 5.3, calculate the area of the south wall that needs to be painted (π = 3,14)
5.5 The north elevation (front of the hall) is the same as the south except it has different windows and doors. Work out the area to be painted.
5.6 Determine the total area to be painted.
5.7 The instructions on the paint tin state that the rate of paint usage is 9m2 per litre. Calculate the number of litres of paint you will need if you plan to do two coats of paint.
5.8 The paint comes in 20l , 5l , 5l l and 1l and 1l l tins. What will you need to purchase for the job?l tins. What will you need to purchase for the job?l
5.9 The above exercise was a lot of hard work. An alternative approach would be to work out the areas of the walls and not worry about the doors and windows. Do this and work out the amount of paint needed.
5.10 Compare your answers for 5.7 and 5.9. How useful is the approach used in 5.9?
What would happen if you regarded the front and the back of the centre as two rectangles and didn’t worry about working out the triangles? Explore this. Is it a good estimation? Give reasons for your answers.
WORKSHEET 5

Mathematical Literacy — Early Childhood Development NQF LEVEL 4
UNIT 3 — MEASUREMENT 3.44
Mathematical Literacy — Early Childhood Development NQF LEVEL 4
UNIT 3 — MEASUREMENT 3.45
Activity 6 — The outing
This activity focuses on measuring time. The problem set is for the students to organise a day at the beach within their school day. The constraints are that they need to catch the train as well as be on the beach at low tide.
ABOUT THIS ACTIVITYThe students are required to read both tide tables and train timetables and then sequence events. Reading these data sheets requires the students to work with 2 co-ordinates. This activity is aligned with unit standard 9016 and addresses AC 2 of SO1 and AC 6, 8, 9, 10, 11, 12 of SO2.
MANAGING THIS ACTIVITYStudents should be given worksheet 6 and 2 handouts. The tide table and calendar are for 2003 but could be updated if so wished. The tide table and train timetable can be found at the following websites respectively: http://www.diveinsa.co.za/tides.htm and http://www.capemetrorail.co.za.
The facilitator can specify the month with which the students must work with. This would narrow the responses of the students.
6.1 Weather obviously plays a big part here so some comment on this is necessary. Other considerations could be that January/February are not good months as the students are still settling in to the routine of the school and educators need to get to know them. They might want to choose a month at the end of the year so as to end the year with a party. We will select March for the purposes of this exercise.
6.2 The train journey is about 40 minutes. Students need to fi nd the difference between the time the train leaves Observatory and the time it leaves St James. This will give them an approximate time for the journey.
6.3 Train no 0151 at 08:49 or 0153 at 09:19 are suitable. The earlier train, no 0147, leaves at 08:24 which is too
early and train no 0155 leaves at 09:44 which is getting late because we want to make the most of the low tide.
Considerations could include the following :• Young children are unpredictable so the later train is better, allowing for a calmer start to the day.• We want to spend as much time as possible on the beach so the sooner we leave the better.
6.4 The tide table gives only high tide times so students will need to know that low tide is 6 hours after high
tide. We will arrive at St James station at about 09:30 or if the later train is taken at about 10:00. We need the tide to be low soon after we arrive so according to the tide table the 4th March (low tide at 10:07), 5th March (low tide at 10.36), 6th March (low tide at 11.04), 20th March (low tide at 10:29) and possibly the 19th March (low tide at 09:53) are options. We need to consult the calendar to make sure that these days are not on the weekend. All these options are fi ne. The students need to choose one day. For this exercise let us choose Wednesday 5th March.
6.5 Students need to give some reasons why this day was chosen. Considerations could include the following :• We will arrive at the beach at about 10h00 and low tide is at 10h40 so that the children will benefi t
from this. The tide will then be coming in which is better than having it going out while the children are swimming.
• We chose Wednesday so that if it rained we could still go on the Thursday.
6.6 In order to work out the time by which we must leave the beach we must consider the following:• The journey takes 40 minutes. • There is a 15 minute walk back to the school from Observatory station.• This is a total of 55 minutes.• We need to be back at the school by 16h00.• The latest we can catch the train is about 15h00.• Look at the train timetable. There are 2 options: either train no. 0208 at 14:36 or train no. 0210 at 14:56.
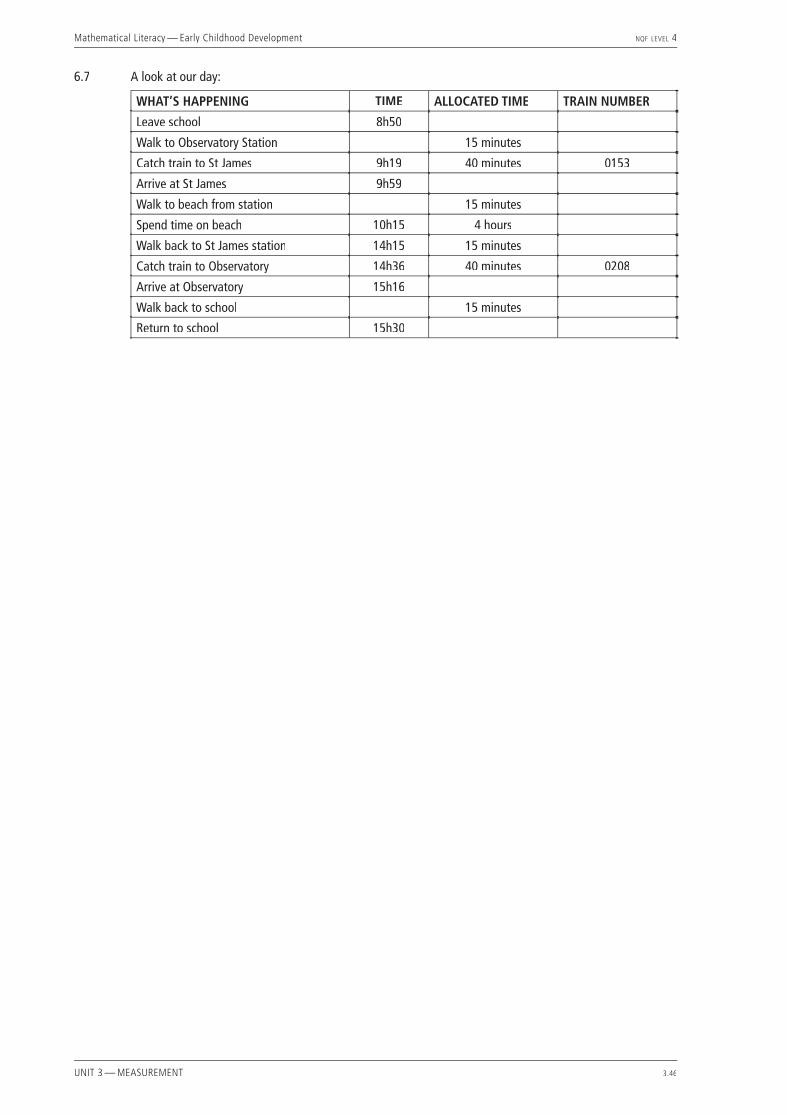
Mathematical Literacy — Early Childhood Development NQF LEVEL 4
UNIT 3 — MEASUREMENT 3.46
6.7 A look at our day:
WHAT’S HAPPENING TIME ALLOCATED TIME TRAIN NUMBER
Leave school 8h50
Walk to Observatory Station 15 minutes
Catch train to St James 9h19 40 minutes 0153
Arrive at St James 9h59
Walk to beach from station 15 minutes
Spend time on beach 10h15 4 hours
Walk back to St James station 14h15 15 minutes
Catch train to Observatory 14h36 40 minutes 0208
Arrive at Observatory 15h16
Walk back to school 15 minutes
Return to school 15h30
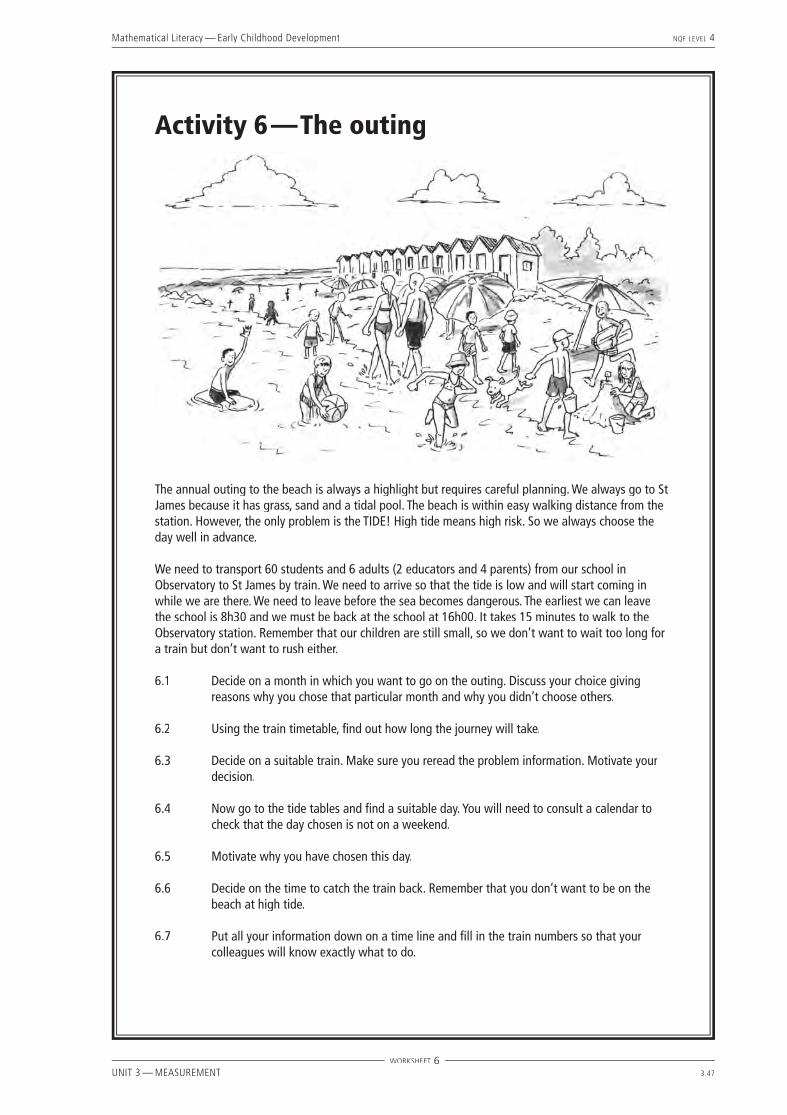
Mathematical Literacy — Early Childhood Development NQF LEVEL 4
UNIT 3 — MEASUREMENT 3.47
Activity 6 — The outing
The annual outing to the beach is always a highlight but requires careful planning. We always go to St James because it has grass, sand and a tidal pool. The beach is within easy walking distance from the station. However, the only problem is the TIDE! High tide means high risk. So we always choose the day well in advance.
We need to transport 60 students and 6 adults (2 educators and 4 parents) from our school in Observatory to St James by train. We need to arrive so that the tide is low and will start coming in while we are there. We need to leave before the sea becomes dangerous. The earliest we can leave the school is 8h30 and we must be back at the school at 16h00. It takes 15 minutes to walk to the Observatory station. Remember that our children are still small, so we don’t want to wait too long for a train but don’t want to rush either.
6.1 Decide on a month in which you want to go on the outing. Discuss your choice giving reasons why you chose that particular month and why you didn’t choose others.
6.2 Using the train timetable, fi nd out how long the journey will take.
6.3 Decide on a suitable train. Make sure you reread the problem information. Motivate your decision.
6.4 Now go to the tide tables and fi nd a suitable day. You will need to consult a calendar to check that the day chosen is not on a weekend.
6.5 Motivate why you have chosen this day.
6.6 Decide on the time to catch the train back. Remember that you don’t want to be on the beach at high tide.
6.7 Put all your information down on a time line and fi ll in the train numbers so that your colleagues will know exactly what to do.
WORKSHEET 6
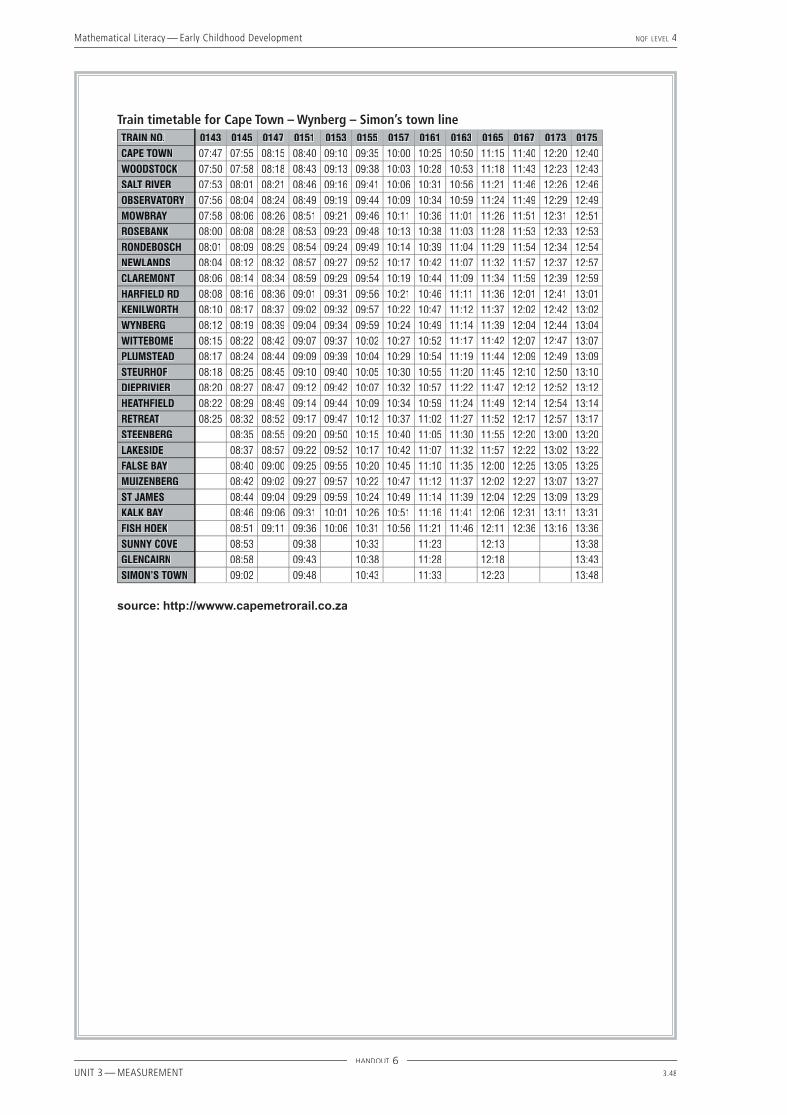
Mathematical Literacy — Early Childhood Development NQF LEVEL 4
UNIT 3 — MEASUREMENT 3.48
HANDOUT 6
Train timetable for Cape Town – Wynberg – Simon’s town lineTRAIN NO. 0143 0145 0147 0151 0153 0155 0157 0161 0163 0165 0167 0173 0175CAPE TOWN 07:47 07:55 08:15 08:40 09:10 09:35 10:00 10:25 10:50 11:15 11:40 12:20 12:40WOODSTOCK 07:50 07:58 08:18 08:43 09:13 09:38 10:03 10:28 10:53 11:18 11:43 12:23 12:43SALT RIVER 07:53 08:01 08:21 08:46 09:16 09:41 10:06 10:31 10:56 11:21 11:46 12:26 12:46OBSERVATORY 07:56 08:04 08:24 08:49 09:19 09:44 10:09 10:34 10:59 11:24 11:49 12:29 12:49MOWBRAY 07:58 08:06 08:26 08:51 09:21 09:46 10:11 10:36 11:01 11:26 11:51 12:31 12:51ROSEBANK 08:00 08:08 08:28 08:53 09:23 09:48 10:13 10:38 11:03 11:28 11:53 12:33 12:53RONDEBOSCH 08:01 08:09 08:29 08:54 09:24 09:49 10:14 10:39 11:04 11:29 11:54 12:34 12:54NEWLANDS 08:04 08:12 08:32 08:57 09:27 09:52 10:17 10:42 11:07 11:32 11:57 12:37 12:57CLAREMONT 08:06 08:14 08:34 08:59 09:29 09:54 10:19 10:44 11:09 11:34 11:59 12:39 12:59HARFIELD RD 08:08 08:16 08:36 09:01 09:31 09:56 10:21 10:46 11:11 11:36 12:01 12:41 13:01KENILWORTH 08:10 08:17 08:37 09:02 09:32 09:57 10:22 10:47 11:12 11:37 12:02 12:42 13:02WYNBERG 08:12 08:19 08:39 09:04 09:34 09:59 10:24 10:49 11:14 11:39 12:04 12:44 13:04WITTEBOME 08:15 08:22 08:42 09:07 09:37 10:02 10:27 10:52 11:17 11:42 12:07 12:47 13:07PLUMSTEAD 08:17 08:24 08:44 09:09 09:39 10:04 10:29 10:54 11:19 11:44 12:09 12:49 13:09STEURHOF 08:18 08:25 08:45 09:10 09:40 10:05 10:30 10:55 11:20 11:45 12:10 12:50 13:10DIEPRIVIER 08:20 08:27 08:47 09:12 09:42 10:07 10:32 10:57 11:22 11:47 12:12 12:52 13:12HEATHFIELD 08:22 08:29 08:49 09:14 09:44 10:09 10:34 10:59 11:24 11:49 12:14 12:54 13:14RETREAT 08:25 08:32 08:52 09:17 09:47 10:12 10:37 11:02 11:27 11:52 12:17 12:57 13:17STEENBERG 08:35 08:55 09:20 09:50 10:15 10:40 11:05 11:30 11:55 12:20 13:00 13:20LAKESIDE 08:37 08:57 09:22 09:52 10:17 10:42 11:07 11:32 11:57 12:22 13:02 13:22FALSE BAY 08:40 09:00 09:25 09:55 10:20 10:45 11:10 11:35 12:00 12:25 13:05 13:25MUIZENBERG 08:42 09:02 09:27 09:57 10:22 10:47 11:12 11:37 12:02 12:27 13:07 13:27ST JAMES 08:44 09:04 09:29 09:59 10:24 10:49 11:14 11:39 12:04 12:29 13:09 13:29KALK BAY 08:46 09:06 09:31 10:01 10:26 10:51 11:16 11:41 12:06 12:31 13:11 13:31FISH HOEK 08:51 09:11 09:36 10:06 10:31 10:56 11:21 11:46 12:11 12:36 13:16 13:36SUNNY COVE 08:53 09:38 10:33 11:23 12:13 13:38GLENCAIRN 08:58 09:43 10:38 11:28 12:18 13:43SIMON’S TOWN 09:02 09:48 10:43 11:33 12:23 13:48
source: http://wwww.capemetrorail.co.za

Mathematical Literacy — Early Childhood Development NQF LEVEL 4
UNIT 3 — MEASUREMENT 3.49
HANDOUT 6
Train timetable for Simon’s Town – Wynberg – Cape Town lineTRAIN NO. 0194 0196 0198 0200 0204 0206 0208 0210 0212 0214 0216 0218 0222 0224 0226SIMON’S TOWN 12:33 13:18 13:58 14:38 15:15 15:55GLENCAIRN 12:38 13:23 14:03 14:43 15:20 16:00SUNNY COVE 12:43 13:28 14:08 14:48 15:25 16:05FISH HOEK 12:20 12:45 13:10 13:30 13:50 14:10 14:30 14:50 15:05 15:27 15:45 16:07KALK BAY 12:24 12:49 13:14 13:34 13:54 14:14 14:34 14:54 15:09 15:31 15:49 16:11ST JAMES 12:26 12:51 13:16 13:36 13:56 14:16 14:36 14:56 15:11 15:33 15:51 16:13MUIZENBERG 12:28 12:53 13:18 13:38 13:58 14:18 14:38 14:58 15:13 15:35 15:53 16:15FALSE BAY 12:30 12:55 13:20 13:40 14:00 14:20 14:40 15:00 15:15 15:37 15:55 16:17LAKESIDE 12:33 12:58 13:23 13:43 14:03 14:23 14:43 15:03 15:18 15:40 15:58 16:20STEENBERG 12:35 13:00 13:25 13:45 14:05 14:25 14:45 15:05 15:20 15:42 16:00 16:22RETREAT 12:38 13:03 13:28 13:48 14:08 14:28 14:48 15:08 15:23 15:35 15:45 15:55 16:03 16:15 16:25HEATHFIELD 12:41 13:06 13:31 13:51 14:11 14:31 14:51 15:11 15:26 15:38 15:48 15:58 16:06 16:18 16:28DIEPRIVIER 12:43 13:08 13:33 13:53 14:13 14:33 14:53 15:13 15:28 15:40 15:50 16:00 16:08 16:20 16:30STEURHOF 12:45 13:10 13:35 13:55 14:15 14:35 14:55 15:15 15:30 15:42 15:52 16:02 16:10 16:22 16:32PLUMSTEAD 12:47 13:12 13:37 13:57 14:17 14:37 14:57 15:17 15:32 15:44 15:54 16:04 16:12 16:24 16:34WITTEBOME 12:48 13:13 13:38 13:58 14:18 14:38 14:58 15:18 15:33 15:45 15:55 16:05 16:13 16:25 16:35WYNBERG 12:50 13:15 13:40 14:00 14:20 14:40 15:00 15:20 15:35 15:47 15:57 16:07 16:15 16:27 16:37KENILWORTH 12:52 13:17 13:42 14:02 14:22 14:42 15:02 15:22 15:37 15:49 15:59 16:09 16:17 16:29 16:39HARFIELD RD 12:54 13:19 13:44 14:04 14:24 14:44 15:04 15:24 15:39 15:51 16:01 16:11 16:19 16:31 16:41CLAREMONT 12:56 13:21 13:46 14:06 14:26 14:46 15:06 15:26 15:41 15:53 16:03 16:13 16:21 16:33 16:43NEWLANDS 12:58 13:23 13:48 14:08 14:28 14:48 15:08 15:28 15:43 15:55 16:05 16:15 16:23 16:35 16:45RONDEBOSCH 13:00 13:25 13:50 14:10 14:30 14:50 15:10 15:30 15:45 15:57 16:07 16:17 16:25 16:37 16:47ROSEBANK 13:02 13:27 13:52 14:12 14:32 14:52 15:12 15:32 15:47 15:59 16:09 16:19 16:27 16:39 16:49MOWBRAY 13:04 13:29 13:54 14:14 14:34 14:54 15:14 15:34 15:49 16:01 16:11 16:21 16:29 16:41 16:51OBSERVATORY 13:06 13:31 13:56 14:16 14:36 14:56 15:16 15:36 15:51 16:03 16:13 16:23 16:31 16:43 16:53SALT RIVER 13:09 13:34 13:59 14:19 14:39 14:59 15:19 15:39 15:54 16:06 16:16 16:26 16:34 16:46 16:56WOODSTOCK 13:12 13:37 14:02 14:22 14:42 15:02 15:22 15:42 15:57 16:09 16:19 16:29 16:37 16:49 16:59CAPE TOWN 13:15 13:40 14:05 14:25 14:45 15:05 15:25 15:45 16:00 16:12 16:22 16:32 16:40 16:52 17:02
source: http://wwww.capemetrorail.co.za
2003January February March April
S M T W T F S S M T W T F S S M T W T F S S M T W T F S1 2 3 4 1 1 1 2 3 4 5
5 6 7 8 9 10 11 2 3 4 5 6 7 8 2 3 4 5 6 7 8 6 7 8 9 10 11 1212 13 14 15 16 17 18 9 10 11 12 13 14 15 9 10 11 12 13 14 15 13 14 15 16 17 18 1919 20 21 22 23 24 25 16 17 18 19 20 21 22 16 17 18 19 20 21 22 20 21 22 23 24 25 2626 27 28 29 30 31 23 24 25 26 27 28 23 24 25 26 27 28 29 27 28 29 30
30 31May June July August
S M T W T F S S M T W T F S S M T W T F S S M T W T F S1 2 3 1 2 3 4 5 6 7 1 2 3 4 5 1 2
4 5 6 7 8 9 10 8 9 10 11 12 13 14 6 7 8 9 10 11 12 3 4 5 6 7 8 911 12 13 14 15 16 17 15 16 17 18 19 20 21 13 14 15 16 17 18 19 10 11 12 13 14 15 16
18 19 20 21 22 23 24 22 23 24 25 26 27 28 20 21 22 23 24 25 26 17 18 19 20 21 22 2325 26 27 28 29 30 31 29 30 27 28 29 30 31 24 25 26 27 28 29 30
31September October November December
S M T W T F S S M T W T F S S M T W T F S S M T W T F S1 2 3 4 5 6 1 2 3 4 1 1 2 3 4 5 6
7 8 9 10 11 12 13 5 6 7 8 9 10 11 2 3 4 5 6 7 8 7 8 9 10 11 12 1314 15 16 17 18 19 20 12 13 14 15 16 17 18 9 10 11 12 13 14 15 14 15 16 17 18 19 2021 22 23 24 25 26 27 19 20 21 22 23 24 25 16 17 18 19 20 21 22 21 22 23 24 25 26 2728 29 30 26 27 28 29 30 31 23 24 25 26 27 28 29 28 29 30 31
30
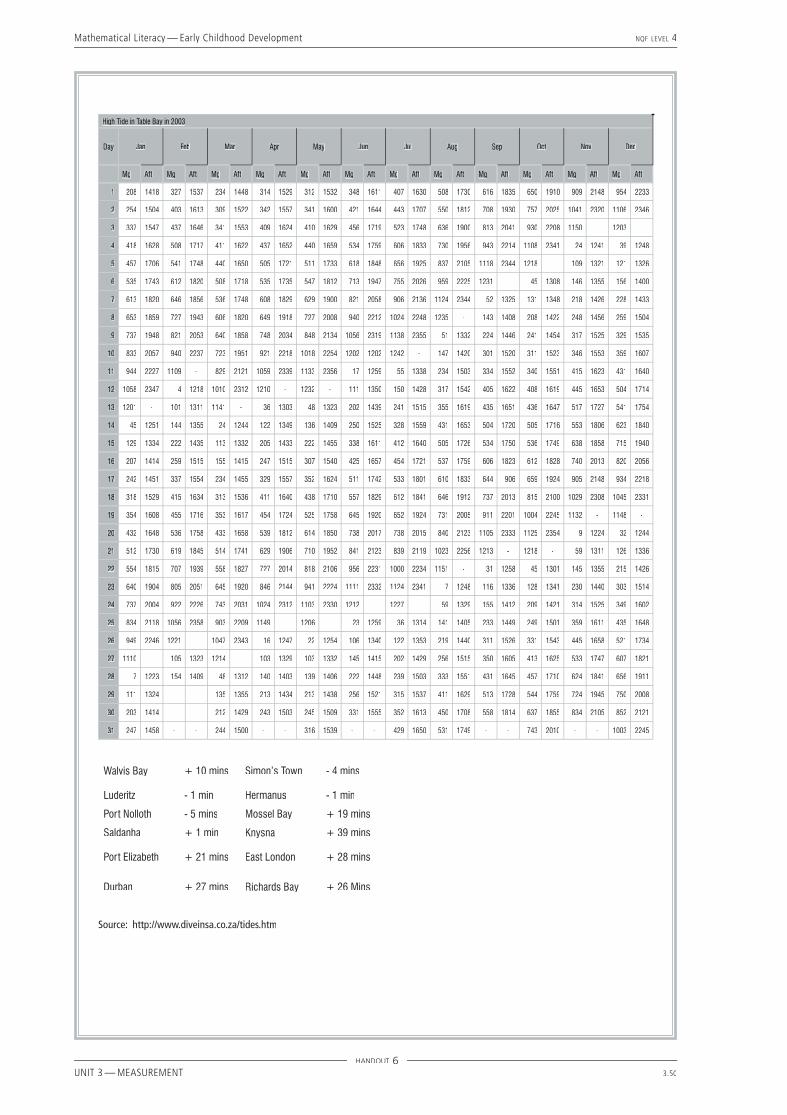
Mathematical Literacy — Early Childhood Development NQF LEVEL 4
UNIT 3 — MEASUREMENT 3.50
High Tide in Table Bay in 2003
Day Jan Feb Mar Apr May Jun Jul Aug Sep Oct Nov Dec
Mg Aft Mg Aft Mg Aft Mg Aft Mg Aft Mg Aft Mg Aft Mg Aft Mg Aft Mg Aft Mg Aft Mg Aft
1 208 1418 327 1537 234 1448 314 1529 312 1532 348 1611 407 1630 508 1730 616 1835 650 1910 909 2148 954 2233
2 254 1504 403 1613 309 1522 342 1557 341 1600 421 1644 443 1707 550 1812 708 1930 757 2025 1041 2320 1106 2346
3 337 1547 437 1646 341 1553 409 1624 410 1629 456 1719 523 1748 636 1900 813 2041 930 2208 1150 - 1203 -
4 418 1628 508 1717 411 1622 437 1652 440 1659 534 1759 606 1833 730 1956 943 2214 1108 2341 24 1241 39 1248
5 457 1706 541 1748 440 1650 505 1721 511 1733 618 1848 656 1925 837 2105 1118 2344 1218 - 109 1321 121 1326
6 535 1743 612 1820 508 1718 535 1735 547 1812 713 1947 755 2026 959 2225 1231 - 45 1308 146 1355 156 1400
7 613 1820 646 1856 536 1748 608 1829 629 1900 821 2058 906 2136 1124 2344 52 1325 131 1348 218 1426 228 1433
8 653 1859 727 1943 606 1820 649 1918 727 2008 940 2212 1024 2248 1235 - 143 1408 208 1422 248 1456 259 1504
9 737 1948 821 2053 640 1858 748 2034 848 2134 1056 2319 1138 2355 51 1332 224 1446 241 1454 317 1525 329 1535
10 833 2057 940 2237 723 1951 921 2218 1018 2254 1202 1202 1242 - 147 1420 301 1520 311 1523 346 1553 359 1607
11 944 2227 1109 - 829 2121 1059 2339 1133 2356 17 1259 55 1338 234 1503 334 1552 340 1551 415 1623 431 1640
12 1058 2347 4 1218 1010 2312 1210 - 1232 - 111 1350 150 1428 317 1542 405 1622 408 1619 445 1653 504 1714
13 1201 - 101 1311 1141 - 36 1303 48 1323 202 1439 241 1515 355 1619 435 1651 436 1647 517 1727 541 1754
14 45 1251 144 1355 24 1244 122 1349 136 1409 250 1525 328 1559 431 1653 504 1720 505 1716 553 1806 623 1840
15 129 1334 222 1435 113 1332 205 1433 222 1455 338 1611 412 1640 505 1726 534 1750 536 1749 638 1858 715 1940
16 207 1414 259 1515 155 1415 247 1515 307 1540 425 1657 454 1721 537 1759 606 1823 612 1828 740 2013 820 2056
17 242 1451 337 1554 234 1455 329 1557 352 1624 511 1742 533 1801 610 1833 644 906 659 1924 905 2148 934 2218
18 318 1529 415 1634 313 1536 411 1640 438 1710 557 1829 612 1841 646 1912 737 2013 815 2100 1029 2308 1045 2331
19 354 1608 455 1716 353 1617 454 1724 525 1758 645 1920 652 1924 731 2005 911 2201 1004 2245 1132 - 1148 -
20 432 1648 536 1758 433 1658 539 1812 614 1850 738 2017 738 2015 840 2123 1105 2333 1125 2354 9 1224 32 1244
21 512 1730 619 1845 514 1741 629 1906 710 1952 841 2123 839 2119 1023 2256 1213 - 1218 - 59 1311 126 1336
22 554 1815 707 1939 558 1827 727 2014 818 2106 956 2231 1000 2234 1151 - 31 1258 45 1301 145 1355 215 1426
23 640 1904 805 2051 645 1920 846 2144 941 2224 1111 2332 1124 2341 7 1248 116 1336 128 1341 230 1440 303 1514
24 737 2004 922 2226 743 2031 1024 2312 1103 2330 1212 - 1227 - 59 1329 155 1412 209 1421 314 1525 349 1602
25 834 2118 1056 2358 903 2209 1149 - 1206 - 23 1259 36 1314 141 1405 233 1449 249 1501 359 1611 435 1648
26 949 2246 1221 - 1047 2343 16 1247 22 1254 106 1340 122 1353 219 1440 311 1526 331 1543 445 1658 521 1734
27 1110 - 105 1323 1214 - 103 1329 103 1332 145 1415 202 1429 256 1515 350 1605 413 1625 533 1747 607 1821
28 7 1223 154 1409 48 1312 140 1403 139 1406 222 1448 239 1503 333 1551 431 1645 457 1710 624 1841 656 1911
29 111 1324 - - 135 1355 213 1434 213 1438 256 1521 315 1537 411 1629 513 1728 544 1759 724 1945 750 2008
30 203 1414 - - 212 1429 243 1503 245 1509 331 1555 352 1613 450 1708 558 1814 637 1855 834 2105 852 2121
31 247 1458 - - 244 1500 - - 316 1539 - - 429 1650 531 1749 - - 743 2010 - - 1003 2245
Walvis Bay + 10 mins Simon’s Town - 4 mins
Luderitz - 1 min Hermanus - 1 min
Port Nolloth - 5 mins Mossel Bay + 19 mins
Saldanha + 1 min Knysna + 39 mins
Port Elizabeth + 21 mins East London + 28 mins
Durban + 27 mins Richards Bay + 26 Mins
Source: http://www.diveinsa.co.za/tides.htm
HANDOUT 6
Mathematical Literacy — Early Childhood Development NQF LEVEL 4
UNIT 3 — MEASUREMENT 3.51
Activity 7 — The outing. Money matters.
This activity follows on from activity 6. The students now measure the volume of juice needed for the day at the beach and calculate the cost of the day per child. The aim of the activity is to plan quantities for a large group of people.
ABOUT THIS ACTIVITYThe students will decide on what quantity of juice is needed for the day by actually measuring volumes using measuring cups. The purpose of this is for the students to get a feel for how much a particular volume actually is. This activity also deals with dilutions so the students will be working with ratios. Although the cost of the outing is calculated the main aim is to work with volumes, ratios, percentages and appropriate rounding off. This activity is aligned with unit standard 9016 and addresses all the assessment criteria of SO1.
MANAGING THIS ACTIVITYStudents should be given the worksheet for this activity. Other items that must be available are children’s juice cups and measuring cups/cylinders. The students will need to be able to work with ratios and percentages.
7.1 The students will need to select the appropriate rate from the information provided.
Cost of children = 60 × R2,80
= R168,00
No. of adults going free =6015
(making use of the special)
= 4 adults
Therefore cost of adults = 2 × R5,50
= R11,00
Total cost = R168 + R11
= R179,00
7.2 This response will vary depending on the type of cups provided for this experiment. The students must decide if it would be wise to fi ll the cup to the top for each drink or to give each child less to avoid spilling and children perhaps not fi nishing a full cup. The amount chosen for the rest of this exercise is 150ml.
7.3 Juice is provided 3 times during the day.
Number of cups of juice needed = 3 × 66
= 198 cups
7.4 Amount of juice needed:
= 198 × 150ml
= 29700ml
To convert to litres =297001000
= 29,7l
7.5 The dilution instructions are 1 part concentrate to 3 parts water, therefore every litre of concentrate will make 4 litres of diluted juice.
Each bottle is 2 liters, therefore each bottle makes 8 liters of juice.
Number of bottles needed =29,7
8
= 3,7125 bottles
Therefore we need at least 4 bottles of concentrate.

Mathematical Literacy — Early Childhood Development NQF LEVEL 4
UNIT 3 — MEASUREMENT 3.52
7.6 Cost of food:
Cost of juice = 4 × R12,49
= R49,96
Number of Niknak strips needed =664
= 16,5 strips
Therefore number of strips = 17 strips
Cost of Niknaks = 17 × R3,49
= R59,33
Number of Fizzers needed = 2 × 66
= 132 Fizzers
Number of packets needed =13224
= 5,5 packets
Therefore number of packets = 6
Cost of Fizzers = 6 × R12,99
= R77,94
Number of apples in packet =1500g120g
= 13 apples
Therefore number of apples per packet = 13 apples
Number of packets needed =6613
= 5,1 packets
Therefore number of packets = 6 packets
Cost of apples = 6 × R8,99
= R53,94
TOTAL FOOD COST = R49,96 + R59,33 + R77,74 + R53,94
= R241,17
7.7 Cost of outing:
Total = R241,17 + R179 = R420,17
Therefore each child pays =420,17
60
= R7,0028
Therefore cost per child = R7,00
7.8 Number of families = 60
12% of 60 =12100
× 60
= R7,2 families
Assume that 8 families will not pay . The amount the committee needs to pay is worked out as follows:
Each child should pay R7,00 but will only pay R2,00. This means the committee needs to pay R5,00 × 8 = R40,00
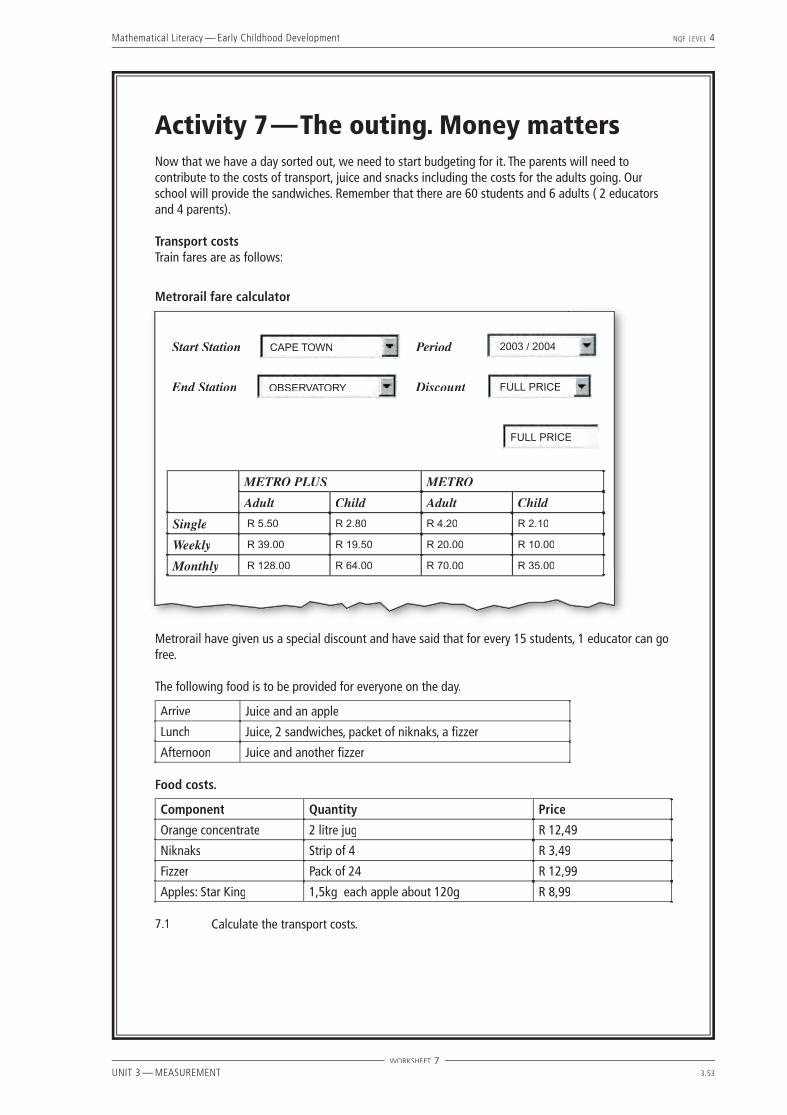
Mathematical Literacy — Early Childhood Development NQF LEVEL 4
UNIT 3 — MEASUREMENT 3.53
Activity 7 — The outing. Money mattersNow that we have a day sorted out, we need to start budgeting for it. The parents will need to contribute to the costs of transport, juice and snacks including the costs for the adults going. Our school will provide the sandwiches. Remember that there are 60 students and 6 adults ( 2 educators and 4 parents).
Transport costsTrain fares are as follows:
Metrorail fare calculator
Start Station Period
End Station Discount
METRO PLUS METRO
Adult Child Adult Child
Single R 5.50 R 2.80 R 4.20 R 2.10
Weekly R 39.00 R 19.50 R 20.00 R 10.00
Monthly R 128.00 R 64.00 R 70.00 R 35.00
CAPE TOWN 2003 / 2004
OBSERVATORY FULL PRICE
FULL PRICE
Metrorail have given us a special discount and have said that for every 15 students, 1 educator can go free.
The following food is to be provided for everyone on the day.
Arrive Juice and an apple
Lunch Juice, 2 sandwiches, packet of niknaks, a fi zzer
Afternoon Juice and another fi zzer
Food costs.
Component Quantity Price
Orange concentrate 2 litre jug R 12,49
Niknaks Strip of 4 R 3,49
Fizzer Pack of 24 R 12,99
Apples: Star King 1,5kg each apple about 120g R 8,99
7.1 Calculate the transport costs.
WORKSHEET 7
Mathematical Literacy — Early Childhood Development NQF LEVEL 4
UNIT 3 — MEASUREMENT 3.54
7.2 We are going to take the school’s plastic cups along with us. Go and fetch a plastic cup that will be provided by the facilitator and determine the volume of juice per cup if the cup is fi lled. Use the measuring equipment provided to do this. Decide if you are going to fi ll the cup or how much juice per cup you are going to give each child. Give a reason for the amount chosen.
7.3 How many cups of juice must we cater for?
7.4 What many litres of juice is this?
7.5 If the dilution instructions on the orange squash are 1:3, determine how many bottles of concentrate are needed.
7.6 Calculate the cost of the food.
7.7 Find the total cost for the outing and then decide what you are going to charge each student.
7.8 We know from our books that about 12% of the families won’t be able to pay the full amount. They will be expected to pay a nominal fee of R2,00 each. The school committee will subsidise these children. Work out how much the school committee must contribute.
WORKSHEET 7
Mathematical Literacy — Early Childhood Development NQF LEVEL 4
UNIT 3 — MEASUREMENT 3.55
Activity 8 — Attending an exhibition
This activity takes the students through an exercise in fi nding their way on a map, working out a sensible route, calculating distances and time as well as costing a trip. The skills learnt here can be applied to the planning of any journey.
ABOUT THIS ACTIVITYThe following two activities use the same context. The fi rst one deals with travel choices in the city and the second with travel from outside the city. The aim of this activity is to expose the students to reading street maps, using grid references (working with co-ordinates) and measuring and working out distances. They should learn from this activity about planning a route and working out the approximate distance using ratios and time of travel. This activity is aligned with unit standard 9016 and addresses all the assessment criteria of SO1 and AC 6, 8, 9, 10, 11 of SO2.
MANAGING THIS ACTIVITYThere are two handouts in this activity which will be needed for both this activity and activity 9.The fi rst handout contains a train timetable. The second handout is a street map of Cape Town city centre and the surrounding suburbs. The students will fi ll in on the map their responses to certain questions. The facilitator needs to explain the difference between highways, roads and railway lines to the students to help them interpret the maps. Each student will need a piece of string and a ruler.
8.1 See map.
8.2 Observatory. 8.3 Cape Town International Convention Centre. CTICC.
8.4 See map.
8.5 See map.
8.6 Using the route shown on the map, distance = 33cm. This may differ from student to student depending on the route chosen. To convert to km :
Must know 100cm = 1m 1000m = 1km The scale is 1:20 000 This means
Distance on map Distance on ground
1 cm 20 000cm
33cm 33 × 20 000cm = 660 000cm
33cm 6 600cm
33cm 6,66km
8.7 To work out time taken :
Time =distancespeed
t =6,6km
40km/h
t = 0,15 hours
Therefore t = 0,15 h × 60 minutes
= 9 minutes
You would need to leave the CTICC about 3:30pm as you need time to pay for parking, fi nd your car and also need a bit of leeway in case of traffi c.
Mathematical Literacy — Early Childhood Development NQF LEVEL 4
UNIT 3 — MEASUREMENT 3.56
8.8 Observatory Station or Salt River Station. See map.
8.9 Distance to Observatory station = 6,2 cm × 0,2 km = 1,24 km Distance to Salt River station = 4,6 cm × 0,2 km = 0,92 km
Salt River Station is closest. Yes, one could walk this distance.
8.10 CA 24
8.11 See the possible route on the map.
8.12 Distance from station to CTICC = 7.3 cm × 0,2 km = 1,46 km
8.13 Using the train timetable one can see that the time taken for the train trip is about 6 minutes.
To walk about 1,5km from the CTICC to the station will take about 20 minutes To walk about 1 km from Salt River Station back to the school will take about 12 minutes. These times are
estimated values. The students should be encouraged to make reasonable estimations.
This makes the total trip about 40 minutes.
The latest train that you could catch would be train no. 197 at 15:38. This means you would arrive at the station at 15:44 and still have time to walk back to the school.
8.14 Cost if travelling by car:
Petrol consumption = 10 litres per 100km
Therefore 1 km needs
10100 l ≈ 0,1 l
6,6 km needs 6,6 km × 0,1 = 0,66 l
Amount needed for return journey = 2 × 0,66
= 1,32 l
cost of petrol = 1,32 l × R4,36l × R4,36l
≈ R5,76
cost of parking 5 – 6 hours = R35
Total cost = R5,76 + R35
= R40, 76
Cost of return journey by train = R5,50 × 2 = R11,00 8.15 If 4 educators were going then it would be more viable to take the car as the train fare is now R44 whereas
the car costs don’t change.
Mathematical Literacy — Early Childhood Development NQF LEVEL 4
UNIT 3 — MEASUREMENT 3.57
Activity 8 — Attending an exhibition
This is an invitation to you to join us in a most innovative and exciting exhibition of books, equipment,
audio-visual aids, computer programmes and ideas! International and local exhibitors.
WHEN: Monday 14th till Saturday 19th May
TIME: 10am – 5pm
WHERE: CAPE TOWN INTERNATIONAL CONFERENCE CENTRE
ENTRANCE: No charge
EARLY CHILDHOOD TEACHERS
The advertisement above was sent to all Early Childhood Development Centres. You are going to attend the exhibition. You decide to get to the exhibition as soon as it opens and to be back at school in time for the late aftercare session at 4 o’clock. You have a choice of taking your own car or going by train. Your school is on the corner of Lower Main and Nelson Street. For this part of the activity you need to use handouts 1 and 2.
Answer the following questions using the information given in the handouts.
8.1 If the grid reading for Nelson Street is CC 29, fi nd it on the map (handout 1) and mark your school with an *.
8.2 In what suburb is the school found?
WORKSHEET 8
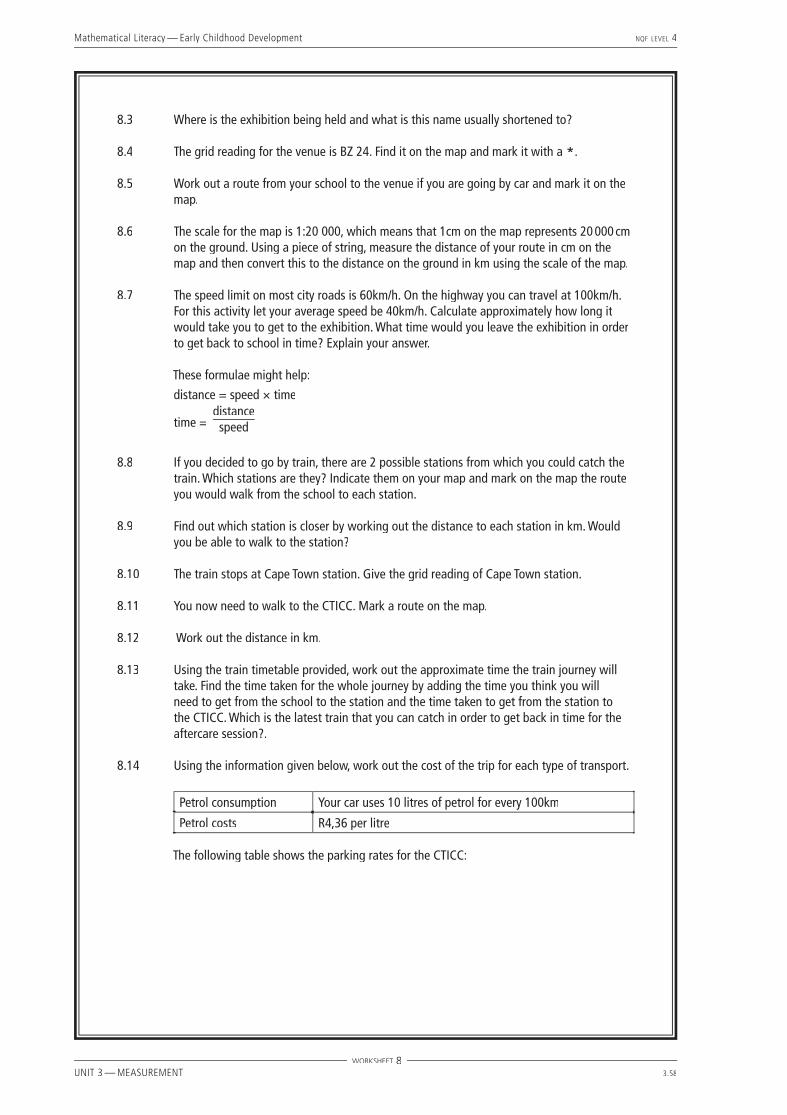
Mathematical Literacy — Early Childhood Development NQF LEVEL 4
UNIT 3 — MEASUREMENT 3.58
8.3 Where is the exhibition being held and what is this name usually shortened to?
8.4 The grid reading for the venue is BZ 24. Find it on the map and mark it with a *.
8.5 Work out a route from your school to the venue if you are going by car and mark it on the map.
8.6 The scale for the map is 1:20 000, which means that 1cm on the map represents 20 000 cm on the ground. Using a piece of string, measure the distance of your route in cm on the map and then convert this to the distance on the ground in km using the scale of the map.
8.7 The speed limit on most city roads is 60km/h. On the highway you can travel at 100km/h. For this activity let your average speed be 40km/h. Calculate approximately how long it would take you to get to the exhibition. What time would you leave the exhibition in order to get back to school in time? Explain your answer.
These formulae might help:
distance = speed × time
time =
distancespeed
8.8 If you decided to go by train, there are 2 possible stations from which you could catch the train. Which stations are they? Indicate them on your map and mark on the map the route you would walk from the school to each station.
8.9 Find out which station is closer by working out the distance to each station in km. Would you be able to walk to the station?
8.10 The train stops at Cape Town station. Give the grid reading of Cape Town station.
8.11 You now need to walk to the CTICC. Mark a route on the map.
8.12 Work out the distance in km.
8.13 Using the train timetable provided, work out the approximate time the train journey will take. Find the time taken for the whole journey by adding the time you think you will need to get from the school to the station and the time taken to get from the station to the CTICC. Which is the latest train that you can catch in order to get back in time for the aftercare session?.
8.14 Using the information given below, work out the cost of the trip for each type of transport.
Petrol consumption Your car uses 10 litres of petrol for every 100km
Petrol costs R4,36 per litre
The following table shows the parking rates for the CTICC:
WORKSHEET 8
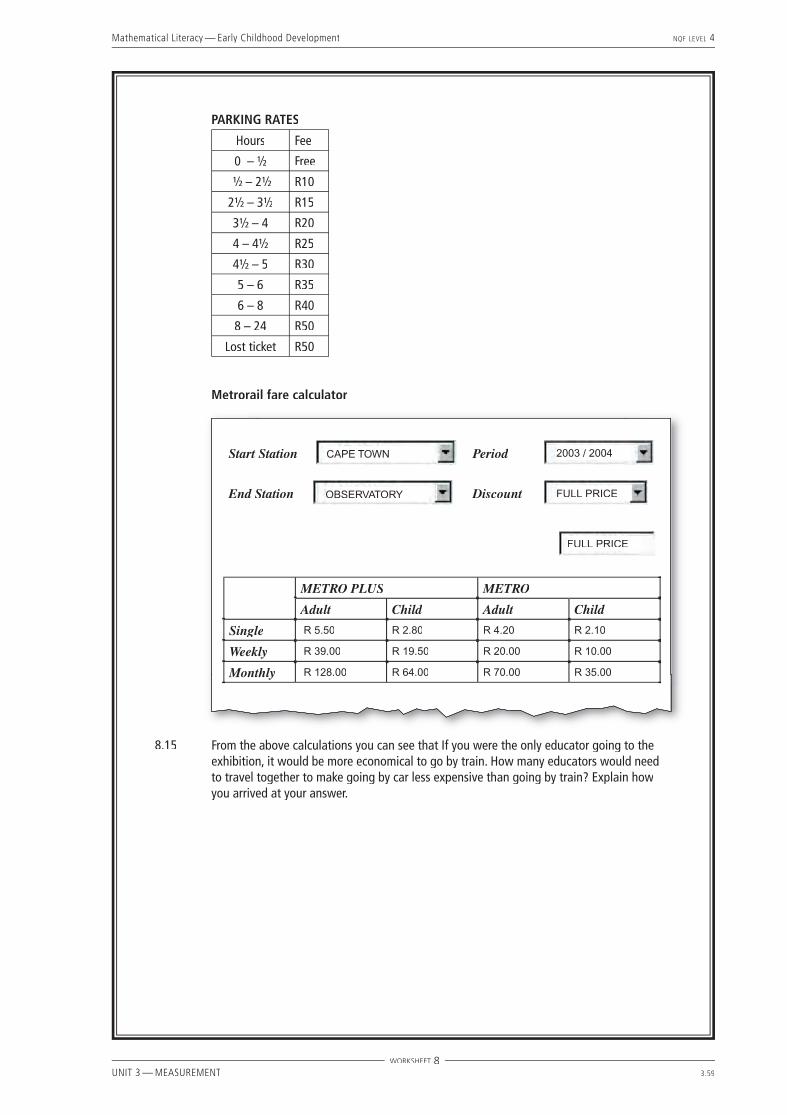
Mathematical Literacy — Early Childhood Development NQF LEVEL 4
UNIT 3 — MEASUREMENT 3.59
PARKING RATES
Hours Fee
0 – 1⁄2 Free
1⁄2 – 21⁄2 R10
21⁄2 – 31⁄2 R15
31⁄2 – 4 R20
4 – 41⁄2 R25
41⁄2 – 5 R30
5 – 6 R35
6 – 8 R40
8 – 24 R50
Lost ticket R50
Metrorail fare calculator
Start Station Period
End Station Discount
METRO PLUS METRO
Adult Child Adult Child
Single R 5.50 R 2.80 R 4.20 R 2.10
Weekly R 39.00 R 19.50 R 20.00 R 10.00
Monthly R 128.00 R 64.00 R 70.00 R 35.00
CAPE TOWN 2003 / 2004
OBSERVATORY FULL PRICE
FULL PRICE
8.15 From the above calculations you can see that If you were the only educator going to the exhibition, it would be more economical to go by train. How many educators would need to travel together to make going by car less expensive than going by train? Explain how you arrived at your answer.
WORKSHEET 8
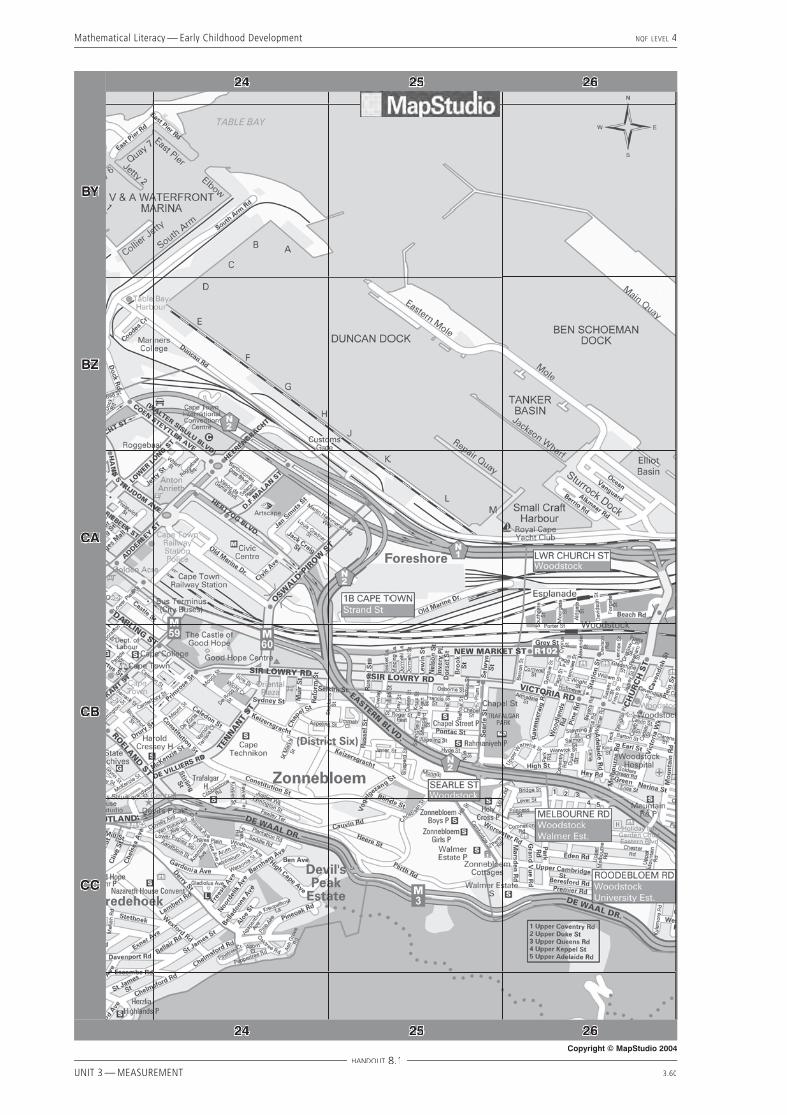
Mathematical Literacy — Early Childhood Development NQF LEVEL 4
UNIT 3 — MEASUREMENT 3.60
HANDOUT 8.1
2424 2525 2626
BYBY
BZBZ
CACA
CBCB
CCCC
2424 2525 2626Copyright © MapStudio 2004

Mathematical Literacy — Early Childhood Development NQF LEVEL 4
UNIT 3 — MEASUREMENT 3.61
HANDOUT 8.1
2727 2828 2929
BYBY
BZBZ
CACA
CBCB
CCCC
2727 2828 2929Copyright © MapStudio 2004

Mathematical Literacy — Early Childhood Development NQF LEVEL 4
UNIT 3 — MEASUREMENT 3.62
HANDOUT 8.2
Train timetable for Cape Town – Simonstown linePLATFORM NO. 1 6 5 4 3 6 2 3 5 4 1 6 3 4TRAIN NO. 169 173 175 177 179 181 183 187 189 191 193 195 197 199CAPE TOWN 12:00 12:20 12:40 13:00 13:20 13:40 14:00 14:20 14:40 14:55 15:10 15:25 15:38 15:50WOODSTOCK 12:03 12:23 12:43 13:03 13:23 13:43 14:03 14:23 14:43 14:58 15:13 15:28 15:41 15:53SALT RIVER 12:06 12:26 12:46 13:06 13:26 13:46 14:06 14:26 14:46 15:01 15:16 15:31 15:44 15:56OBSERVATORY 12:09 12:29 12:49 13:09 13:29 13:49 14:09 14:29 14:49 15:04 15:19 15:34 15:47 15:59MOWBRAY 12:11 12:31 12:51 13:11 13:31 13:51 14:11 14:31 14:51 15:06 15:21 15:36 15:49 16:01ROSEBANK 12:13 12:33 12:53 13:13 13:33 13:53 14:13 14:33 14:53 15:08 15:23 15:38 15:51 16:03RONDEBOSCH 12:14 12:34 12:54 13:14 13:34 13:54 14:14 14:34 14:54 15:09 15:24 15:39 15:52 16:04NEWLANDS 12:17 12:37 12:57 13:17 13:37 13:57 14:17 14:37 14:57 15:12 15:27 15:42 15:55 16:07CLAREMONT 12:19 12:39 12:59 13:19 13:39 13:59 14:19 14:39 14:59 15:14 15:29 15:44 15:57 16:09HARFIELD RD 12:21 12:41 13:01 13:21 13:41 14:01 14:21 14:41 15:01 15:16 15:31 15:46 15:59 16:11KENILWORTH 12:22 12:42 13:02 13:22 13:42 14:02 14:22 14:42 15:02 15:17 15:32 15:47 16:00 16:12WYNBERG 12:24 12:44 13:04 13:24 13:44 14:04 14:24 14:44 15:04 15:19 15:34 15:49 16:02 16:14WITTEBOME 12:27 12:47 13:07 13:27 13:47 14:07 14:27 14:47 15:07 15:22 15:37 15:52 16:05 16:17PLUMSTEAD 12:29 12:49 13:09 13:29 13:49 14:09 14:29 14:49 15:09 15:24 15:39 15:54 16:07 16:19STEURHOF 12:30 12:50 13:10 13:30 13:50 14:10 14:30 14:50 15:10 15:25 15:40 15:55 16:08 16:20DIEPRIVIER 12:32 12:52 13:12 13:32 13:52 14:12 14:32 14:52 15:12 15:27 15:42 15:57 16:10 16:22HEATHFIELD 12:34 12:54 13:14 13:34 13:54 14:14 14:34 14:54 15:14 15:29 15:44 15:59 16:12 16:24RETREAT 12:37 12:57 13:17 13:37 13:57 14:17 14:37 14:57 15:17 15:32 15:47 16:03 16:15 16:27STEENBERG 12:40 13:00 13:20 13:40 14:00 14:20 14:40 15:00 15:20 15:35 15:50 16:18 16:30LAKESIDE 12:42 13:02 13:22 13:42 14:02 14:22 14:42 15:02 15:22 15:37 15:52 16:20 16:32FALSE BAY 12:45 13:05 13:25 13:45 14:05 14:25 14:45 15:05 15:25 15:40 15:55 16:23 16:35MUIZENBERG 12:47 13:07 13:27 13:47 14:07 14:27 14:47 15:07 15:27 15:42 15:57 16:25 16:37ST JAMES 12:49 13:09 13:29 13:49 14:09 14:29 14:49 15:09 15:29 15:44 15:59 16:27 16:39KALK BAY 12:51 13:11 13:31 13:51 14:11 14:31 14:51 15:11 15:31 15:46 16:01 16:29 16:41FISH HOEK 12:56 13:16 13:36 13:56 14:16 14:36 14:56 15:16 15:36 15:51 16:06 16:38 16:46SUNNY COVE 12:58 13:38 14:18 14:58 15:38 16:08 16:40GLENCAIRN 13:03 13:43 14:23 15:03 15:43 16:13 16:45SIMON`S TOWN 13:08 13:48 14:28 15:08 15:48 16:18 16:49
source: http://wwww.capemetrorail.co.za

Mathematical Literacy — Early Childhood Development NQF LEVEL 4
UNIT 3 — MEASUREMENT 3.63
Activity 9 — Attending an exhibition (Assessment)
This activity uses the same context as activity 8 except that the people going to the exhibition are coming from out of town. This activity can therefore be used as an assessment activity as all work has been covered before.
ABOUT THIS ACTIVITYSee notes on activity 8. This activity is aligned with unit standard 9016 and addresses all the assessment criteria of SO1 and AC 6, 8, 9, 10 of SO2.
MANAGING THIS ACTIVITYThe students need to be given the worksheet as well as the maps they worked on in activity 8. They will also need the handout from this activity which is a map of the Western Cape. The students will also need string and a ruler. They will mark some of their answers on the map. The facilitator needs to explain the different types of roads shown on the map.
9.1 See map. AI
9.2 See map. CI
9.3 See map.
9.4 Using the route shown on the map, the approximate distance = 9 cm. This may differ from student to student depending on the route chosen. To convert to km :
Must know 100cm = 1m
1000m = 1km
Therefore 100 × 1000 = 100 000cm
= 1km
The scale is 1:500 000
This means 1cm = 500 000cm
1cm =
500 000100 000
1cm = 5km
Therefore distance to CTICC ≈ 9 cm × 5km
≈ 45 km
9.5 The costs for the day :
Petrol consumption = 10 litres per 100km
Therefore 1km needs
10100l ≈ 0,1l
45 km needs 45km × 0,1 = 4,5
Amount needed for return journey = 9l
cost of petrol = 9l x R4,36l x R4,36l
= R39,24
cost of parking for 6 hours 10 min = R40
Total cost = R39,24 + R40
= R79,24
This means each stylist paid =
R79,242
= R39,62
9.6 “Average speed” is calculated when the distance travelled is divided by the total time taken. This will include stopping times.
9.7 The teachers from Atlantis could travel most of the way by National Road which has a speed limit of
120km/h, whereas the teachers from Observatory had at least half of their journey inside the city.
Mathematical Literacy — Early Childhood Development NQF LEVEL 4
UNIT 3 — MEASUREMENT 3.64
9.8 To work out time taken :
Time =
distancespeed
t =
45km90km/h
t ≈ 0,5 hours
Therefore t = 0,5h × 60 minutes
≈ 30 minutes
9.9 The fi rst 21⁄2 hours are cheapest with each half hour costing only R2. The next hour costs you R5 but then each half hour cost R5 so this means that the parking rate between 31⁄2 and 5 hours is the most expensive. The rate gets cheaper again with each hour costing R5 then 2 hours costing R5 and then 16 hours costs only R10.
Some possible reasons for the different price structure:• It encourages people to deliver goods, drop off or fetch people in less than half an hour. This frees up the
car park.• It encourages people to pop back and buy something if they know that they do not have to pay for
parking.• The management must have decided that 21⁄2 to 5 hours is a popular amount of time to spend at the
exhibition so they can earn more money per half hour.• Making it cheaper to stay longer encourages people to spend the day at the exhibition.

Mathematical Literacy — Early Childhood Development NQF LEVEL 4
UNIT 3 — MEASUREMENT 3.65
Activity 9 — Attending an exhibition. Assessment task
Two teachers from Atlantis also see the advertisement and decide to go to the exhibition. They will travel together and share the costs. Use the handout of the map of Cape Town that you used for the previous for question 7.2
9.1 Find Atlantis on the map in Handout 3 and mark it with a * . Write down the grid reference.
9.2 Using the more detailed map of Cape Town from the previous exercise to help you, decide where the CTICC is on the map of the Western Cape and mark it. Write down the grid reference.
9.3 Fill in on the map the route that the teachers would take to get to the exhibition.
9.4 If the scale of this map is 1:500 000, work out the approximate distance (in km) that the teachers traveled.
9.5 Using the following information, work out how much each teacher must contribute if they are sharing the costs.
Petrol consumption Your car uses 10 litres of petrol for every 100km
Petrol costs R4,36 per litre
Time spent at exhibition 10:30am till 4:40pm 9.6 The teachers’ average speed for the journey is 90km/h. What is meant by the term
“average speed” ?
9.7 Why is it reasonable to say that the teachers’ average speed for the journey was 90km/h when in the previous activity your average speed was only 40km/h?
9.8 Calculate approximately how long it took them to get from Atlantis to the CTICC..
The table below shows the parking rates for the CTICC:
PARKING RATES
Hours Fee
0 – 1⁄2 Free
1⁄2 – 21⁄2 R10
21⁄2 – 31⁄2 R15
31⁄2 – 4 R20
4 – 41⁄2 R25
41⁄2 – 5 R30
5 – 6 R35
6 – 8 R40
8 – 24 R50
Lost ticket R50
9.9 Looking at the parking rates table, what do you notice about the way the price changes for different time periods? Give reasons why you think it is done in this way.
WORKSHEET 9

Mathematical Literacy — Early Childhood Development NQF LEVEL 4
UNIT 3 — MEASUREMENT 3.66
HANDOUT 9.1
A B C D
32
1
Copyright © MapStudio 2004