master software tools user guide
TRANSCRIPT

User Guide
Master Software Tools
Anritsu Company490 Jarvis DriveMorgan Hill, CA 95037-2809USA
Part Number: 10580-00439Revision: A
Published: November 2017Copyright 2017 Anritsu Company

Front-2 PN: 10580-00439 Rev. A Master Software Tools UG

Master Software Tools UG PN: 10580-00439 Rev. A Contents-1
Table of Contents
Chapter 1—General Information
1-1 Introduction. . . . . . . . . . . . . . . . . . . . . . . . . . . . . . . . . . . . . . . . . . . . . . . . . . . . . . . . . . . . . . . . 1-1
1-2 Features . . . . . . . . . . . . . . . . . . . . . . . . . . . . . . . . . . . . . . . . . . . . . . . . . . . . . . . . . . . . . . . . . . 1-1
1-3 System Requirements . . . . . . . . . . . . . . . . . . . . . . . . . . . . . . . . . . . . . . . . . . . . . . . . . . . . . . . 1-2
Chapter 2—Installation
2-1 Introduction. . . . . . . . . . . . . . . . . . . . . . . . . . . . . . . . . . . . . . . . . . . . . . . . . . . . . . . . . . . . . . . . 2-1
2-2 Software Capabilities . . . . . . . . . . . . . . . . . . . . . . . . . . . . . . . . . . . . . . . . . . . . . . . . . . . . . . . . 2-1
Connecting the Instrument . . . . . . . . . . . . . . . . . . . . . . . . . . . . . . . . . . . . . . . . . . . . . . . . . 2-1
Capturing or Retrieving Traces . . . . . . . . . . . . . . . . . . . . . . . . . . . . . . . . . . . . . . . . . . . . . . 2-1
Editing the Graph. . . . . . . . . . . . . . . . . . . . . . . . . . . . . . . . . . . . . . . . . . . . . . . . . . . . . . . . . 2-1
Context Menus . . . . . . . . . . . . . . . . . . . . . . . . . . . . . . . . . . . . . . . . . . . . . . . . . . . . . . . . . . 2-1
Overlaying Traces . . . . . . . . . . . . . . . . . . . . . . . . . . . . . . . . . . . . . . . . . . . . . . . . . . . . . . . . 2-1
Saving, Opening, Creating New, and Printing Files . . . . . . . . . . . . . . . . . . . . . . . . . . . . . . 2-1
Folder Spectrogram. . . . . . . . . . . . . . . . . . . . . . . . . . . . . . . . . . . . . . . . . . . . . . . . . . . . . . . 2-1
Script Master . . . . . . . . . . . . . . . . . . . . . . . . . . . . . . . . . . . . . . . . . . . . . . . . . . . . . . . . . . . . 2-2
2-3 Connection – BTS Master. . . . . . . . . . . . . . . . . . . . . . . . . . . . . . . . . . . . . . . . . . . . . . . . . . . . . 2-2
USB Connection . . . . . . . . . . . . . . . . . . . . . . . . . . . . . . . . . . . . . . . . . . . . . . . . . . . . . . . . . 2-2
Ethernet LAN Connection . . . . . . . . . . . . . . . . . . . . . . . . . . . . . . . . . . . . . . . . . . . . . . . . . . 2-3
Direct Ethernet Connection . . . . . . . . . . . . . . . . . . . . . . . . . . . . . . . . . . . . . . . . . . . . . . . . . 2-7
2-4 Connection – Cell Master, Site Master, & Spectrum Master . . . . . . . . . . . . . . . . . . . . . . . . . 2-11
USB Connection . . . . . . . . . . . . . . . . . . . . . . . . . . . . . . . . . . . . . . . . . . . . . . . . . . . . . . . . 2-11
Serial Connection . . . . . . . . . . . . . . . . . . . . . . . . . . . . . . . . . . . . . . . . . . . . . . . . . . . . . . . 2-12
Serial to USB Connection . . . . . . . . . . . . . . . . . . . . . . . . . . . . . . . . . . . . . . . . . . . . . . . . . 2-12
Configure the PC (Laptop). . . . . . . . . . . . . . . . . . . . . . . . . . . . . . . . . . . . . . . . . . . . . . . . . 2-16
Configure Master Software Tools . . . . . . . . . . . . . . . . . . . . . . . . . . . . . . . . . . . . . . . . . . . 2-19
Test the PC Connection to the Instrument . . . . . . . . . . . . . . . . . . . . . . . . . . . . . . . . . . . . 2-20
Chapter 3—Graphical User Interface (GUI)
3-1 Introduction. . . . . . . . . . . . . . . . . . . . . . . . . . . . . . . . . . . . . . . . . . . . . . . . . . . . . . . . . . . . . . . . 3-1
3-2 Main Screen . . . . . . . . . . . . . . . . . . . . . . . . . . . . . . . . . . . . . . . . . . . . . . . . . . . . . . . . . . . . . . . 3-1
Menu Bar . . . . . . . . . . . . . . . . . . . . . . . . . . . . . . . . . . . . . . . . . . . . . . . . . . . . . . . . . . . . . . . 3-3
File. . . . . . . . . . . . . . . . . . . . . . . . . . . . . . . . . . . . . . . . . . . . . . . . . . . . . . . . . . . . . . . . . . . . 3-3
Edit . . . . . . . . . . . . . . . . . . . . . . . . . . . . . . . . . . . . . . . . . . . . . . . . . . . . . . . . . . . . . . . . . . . 3-7
View. . . . . . . . . . . . . . . . . . . . . . . . . . . . . . . . . . . . . . . . . . . . . . . . . . . . . . . . . . . . . . . . . . . 3-8
Clipboard . . . . . . . . . . . . . . . . . . . . . . . . . . . . . . . . . . . . . . . . . . . . . . . . . . . . . . . . . . . . . . . 3-9
Connection . . . . . . . . . . . . . . . . . . . . . . . . . . . . . . . . . . . . . . . . . . . . . . . . . . . . . . . . . . . . 3-10
Sync. . . . . . . . . . . . . . . . . . . . . . . . . . . . . . . . . . . . . . . . . . . . . . . . . . . . . . . . . . . . . . . . . . 3-11
Tools . . . . . . . . . . . . . . . . . . . . . . . . . . . . . . . . . . . . . . . . . . . . . . . . . . . . . . . . . . . . . . . . . 3-12
Window . . . . . . . . . . . . . . . . . . . . . . . . . . . . . . . . . . . . . . . . . . . . . . . . . . . . . . . . . . . . . . . 3-13
Mode . . . . . . . . . . . . . . . . . . . . . . . . . . . . . . . . . . . . . . . . . . . . . . . . . . . . . . . . . . . . . . . . . 3-14
Help . . . . . . . . . . . . . . . . . . . . . . . . . . . . . . . . . . . . . . . . . . . . . . . . . . . . . . . . . . . . . . . . . 3-14
3-3 Toolbar . . . . . . . . . . . . . . . . . . . . . . . . . . . . . . . . . . . . . . . . . . . . . . . . . . . . . . . . . . . . . . . . . . 3-16
3-4 Graphic Display Edit Toolbar . . . . . . . . . . . . . . . . . . . . . . . . . . . . . . . . . . . . . . . . . . . . . . . . . 3-19

Contents-2 PN: 10580-00439 Rev. A Master Software Tools UG
Table of Contents (Continued)
3-5 Active Measurement Window . . . . . . . . . . . . . . . . . . . . . . . . . . . . . . . . . . . . . . . . . . . . . . . . . 3-21
3-6 File Resource Tabs. . . . . . . . . . . . . . . . . . . . . . . . . . . . . . . . . . . . . . . . . . . . . . . . . . . . . . . . . 3-21
3-7 File Resource Directory Window. . . . . . . . . . . . . . . . . . . . . . . . . . . . . . . . . . . . . . . . . . . . . . . 3-22
3-8 File List Window . . . . . . . . . . . . . . . . . . . . . . . . . . . . . . . . . . . . . . . . . . . . . . . . . . . . . . . . . . . 3-22
3-9 Measurement File Preview/Summary Windows . . . . . . . . . . . . . . . . . . . . . . . . . . . . . . . . . . . 3-22
3-10 Status Bar . . . . . . . . . . . . . . . . . . . . . . . . . . . . . . . . . . . . . . . . . . . . . . . . . . . . . . . . . . . . . . . . 3-23
3-11 Context Menus & Plot Setup. . . . . . . . . . . . . . . . . . . . . . . . . . . . . . . . . . . . . . . . . . . . . . . . . . 3-23
Common Context Menu Command Lines and Plot Setup Configurations – . . . . . . . . . . . 3-23
Spectrum Analyzer . . . . . . . . . . . . . . . . . . . . . . . . . . . . . . . . . . . . . . . . . . . . . . . . . . . . . . 3-29
Vector Network Analyzer . . . . . . . . . . . . . . . . . . . . . . . . . . . . . . . . . . . . . . . . . . . . . . . . . . 3-30
WCDMA. . . . . . . . . . . . . . . . . . . . . . . . . . . . . . . . . . . . . . . . . . . . . . . . . . . . . . . . . . . . . . . 3-31
Interference Analyzer. . . . . . . . . . . . . . . . . . . . . . . . . . . . . . . . . . . . . . . . . . . . . . . . . . . . . 3-32
JPEG File. . . . . . . . . . . . . . . . . . . . . . . . . . . . . . . . . . . . . . . . . . . . . . . . . . . . . . . . . . . . . . 3-34
Limit Line Node . . . . . . . . . . . . . . . . . . . . . . . . . . . . . . . . . . . . . . . . . . . . . . . . . . . . . . . . . 3-34
Power Meter, High Accuracy Power Meter, Fixed WiMAX, Mobile WiMAX, WCDMA . . . 3-35
Signal Standard Editor. . . . . . . . . . . . . . . . . . . . . . . . . . . . . . . . . . . . . . . . . . . . . . . . . . . . 3-36
TD-SCDMA Signal Analyzer . . . . . . . . . . . . . . . . . . . . . . . . . . . . . . . . . . . . . . . . . . . . . . . 3-36
3-12 File Editor, Tools, and Miscellaneous Windows . . . . . . . . . . . . . . . . . . . . . . . . . . . . . . . . . . . 3-37
Print All Measurements . . . . . . . . . . . . . . . . . . . . . . . . . . . . . . . . . . . . . . . . . . . . . . . . . . . 3-37
Antenna File. . . . . . . . . . . . . . . . . . . . . . . . . . . . . . . . . . . . . . . . . . . . . . . . . . . . . . . . . . . . 3-37
Cable File. . . . . . . . . . . . . . . . . . . . . . . . . . . . . . . . . . . . . . . . . . . . . . . . . . . . . . . . . . . . . . 3-38
Signal Standard Editor. . . . . . . . . . . . . . . . . . . . . . . . . . . . . . . . . . . . . . . . . . . . . . . . . . . . 3-38
Language Editor . . . . . . . . . . . . . . . . . . . . . . . . . . . . . . . . . . . . . . . . . . . . . . . . . . . . . . . . 3-39
Pass Fail Editor . . . . . . . . . . . . . . . . . . . . . . . . . . . . . . . . . . . . . . . . . . . . . . . . . . . . . . . . . 3-39
XML Parameter File Editor . . . . . . . . . . . . . . . . . . . . . . . . . . . . . . . . . . . . . . . . . . . . . . . . 3-40
Spectrum Analyzer and VNA Plot Setup . . . . . . . . . . . . . . . . . . . . . . . . . . . . . . . . . . . . . . 3-40
VNA additional Plot Setup . . . . . . . . . . . . . . . . . . . . . . . . . . . . . . . . . . . . . . . . . . . . . . . . . 3-43
Power Meter and High Power Accuracy Meter Plot Setup . . . . . . . . . . . . . . . . . . . . . . . . 3-45
Enter IP Address . . . . . . . . . . . . . . . . . . . . . . . . . . . . . . . . . . . . . . . . . . . . . . . . . . . . . . . . 3-45
Measurement Calculator (VNA). . . . . . . . . . . . . . . . . . . . . . . . . . . . . . . . . . . . . . . . . . . . . 3-46
DAT File Conversion Tool . . . . . . . . . . . . . . . . . . . . . . . . . . . . . . . . . . . . . . . . . . . . . . . . . 3-46
Distance-To-Fault . . . . . . . . . . . . . . . . . . . . . . . . . . . . . . . . . . . . . . . . . . . . . . . . . . . . . . . 3-47
Trace Rename Utility . . . . . . . . . . . . . . . . . . . . . . . . . . . . . . . . . . . . . . . . . . . . . . . . . . . . . 3-48
Product Updates . . . . . . . . . . . . . . . . . . . . . . . . . . . . . . . . . . . . . . . . . . . . . . . . . . . . . . . . 3-49
3-13 Program Options. . . . . . . . . . . . . . . . . . . . . . . . . . . . . . . . . . . . . . . . . . . . . . . . . . . . . . . . . . . 3-49
General Options Tab . . . . . . . . . . . . . . . . . . . . . . . . . . . . . . . . . . . . . . . . . . . . . . . . . . . . . 3-50
Report Generator. . . . . . . . . . . . . . . . . . . . . . . . . . . . . . . . . . . . . . . . . . . . . . . . . . . . . . . . 3-51
Internet Settings. . . . . . . . . . . . . . . . . . . . . . . . . . . . . . . . . . . . . . . . . . . . . . . . . . . . . . . . . 3-52
Serial Port Settings . . . . . . . . . . . . . . . . . . . . . . . . . . . . . . . . . . . . . . . . . . . . . . . . . . . . . . 3-53
Languages . . . . . . . . . . . . . . . . . . . . . . . . . . . . . . . . . . . . . . . . . . . . . . . . . . . . . . . . . . . . . 3-54
MST File Indexing – Trace Catalog . . . . . . . . . . . . . . . . . . . . . . . . . . . . . . . . . . . . . . . . . . 3-55
Archive Options – Trace Catalog. . . . . . . . . . . . . . . . . . . . . . . . . . . . . . . . . . . . . . . . . . . . 3-56
Chapter 4—Using Master Software Tools
4-1 Introduction . . . . . . . . . . . . . . . . . . . . . . . . . . . . . . . . . . . . . . . . . . . . . . . . . . . . . . . . . . . . . . . . 4-1

Master Software Tools UG PN: 10580-00439 Rev. A Contents-3
Table of Contents (Continued)
4-2 General File Management . . . . . . . . . . . . . . . . . . . . . . . . . . . . . . . . . . . . . . . . . . . . . . . . . . . . 4-1
Downloading and Uploading Measurement Files . . . . . . . . . . . . . . . . . . . . . . . . . . . . . . . . 4-1
Open, Save, Save As, Print and Close . . . . . . . . . . . . . . . . . . . . . . . . . . . . . . . . . . . . . . . . 4-2
Export . . . . . . . . . . . . . . . . . . . . . . . . . . . . . . . . . . . . . . . . . . . . . . . . . . . . . . . . . . . . . . . . . 4-2
Exporting S2P-Formatted VNA Files . . . . . . . . . . . . . . . . . . . . . . . . . . . . . . . . . . . . . . . . . . 4-3
Creating Measurement Reports . . . . . . . . . . . . . . . . . . . . . . . . . . . . . . . . . . . . . . . . . . . . . 4-3
Saving JPEG Images from Open Measurements . . . . . . . . . . . . . . . . . . . . . . . . . . . . . . . . 4-3
Saving Folder as DAT . . . . . . . . . . . . . . . . . . . . . . . . . . . . . . . . . . . . . . . . . . . . . . . . . . . . . 4-3
Printing All Open Measurements. . . . . . . . . . . . . . . . . . . . . . . . . . . . . . . . . . . . . . . . . . . . . 4-4
4-3 Editing Measurements . . . . . . . . . . . . . . . . . . . . . . . . . . . . . . . . . . . . . . . . . . . . . . . . . . . . . . . 4-4
Measurement Toolbar . . . . . . . . . . . . . . . . . . . . . . . . . . . . . . . . . . . . . . . . . . . . . . . . . . . . . 4-4
4-4 Overlays . . . . . . . . . . . . . . . . . . . . . . . . . . . . . . . . . . . . . . . . . . . . . . . . . . . . . . . . . . . . . . . . . . 4-4
Drag from Local File List . . . . . . . . . . . . . . . . . . . . . . . . . . . . . . . . . . . . . . . . . . . . . . . . . . . 4-4
Drag from Windows Explorer. . . . . . . . . . . . . . . . . . . . . . . . . . . . . . . . . . . . . . . . . . . . . . . . 4-4
Drag a Similar Measurement. . . . . . . . . . . . . . . . . . . . . . . . . . . . . . . . . . . . . . . . . . . . . . . . 4-4
Edit Graph (The Plot Setup Dialog Box) Using Master Software Tools. . . . . . . . . . . . . . . . 4-5
Overlay Issues. . . . . . . . . . . . . . . . . . . . . . . . . . . . . . . . . . . . . . . . . . . . . . . . . . . . . . . . . . . 4-5
Dragging from the Device File List . . . . . . . . . . . . . . . . . . . . . . . . . . . . . . . . . . . . . . . . . . . 4-5
Dragging Open Measurement Files. . . . . . . . . . . . . . . . . . . . . . . . . . . . . . . . . . . . . . . . . . . 4-5
Frequency Range of Base Measurement File . . . . . . . . . . . . . . . . . . . . . . . . . . . . . . . . . . . 4-5
Overlay File Name at Top of Graph. . . . . . . . . . . . . . . . . . . . . . . . . . . . . . . . . . . . . . . . . . . 4-5
4-5 Edit Graph (Plot Setup Dialog Box) . . . . . . . . . . . . . . . . . . . . . . . . . . . . . . . . . . . . . . . . . . . . . 4-5
4-6 Common Options . . . . . . . . . . . . . . . . . . . . . . . . . . . . . . . . . . . . . . . . . . . . . . . . . . . . . . . . . . . 4-6
Autoscale. . . . . . . . . . . . . . . . . . . . . . . . . . . . . . . . . . . . . . . . . . . . . . . . . . . . . . . . . . . . . . . 4-6
Undo Zoom . . . . . . . . . . . . . . . . . . . . . . . . . . . . . . . . . . . . . . . . . . . . . . . . . . . . . . . . . . . . . 4-6
Marker Table . . . . . . . . . . . . . . . . . . . . . . . . . . . . . . . . . . . . . . . . . . . . . . . . . . . . . . . . . . . . 4-6
Marker Shape . . . . . . . . . . . . . . . . . . . . . . . . . . . . . . . . . . . . . . . . . . . . . . . . . . . . . . . . . . . 4-6
Plot Range. . . . . . . . . . . . . . . . . . . . . . . . . . . . . . . . . . . . . . . . . . . . . . . . . . . . . . . . . . . . . . 4-6
Plot Mode . . . . . . . . . . . . . . . . . . . . . . . . . . . . . . . . . . . . . . . . . . . . . . . . . . . . . . . . . . . . . . 4-6
Measurement Overlays . . . . . . . . . . . . . . . . . . . . . . . . . . . . . . . . . . . . . . . . . . . . . . . . . . . . 4-7
Trace Math . . . . . . . . . . . . . . . . . . . . . . . . . . . . . . . . . . . . . . . . . . . . . . . . . . . . . . . . . . . . . 4-7
Trace Smoothing . . . . . . . . . . . . . . . . . . . . . . . . . . . . . . . . . . . . . . . . . . . . . . . . . . . . . . . . . 4-7
4-7 Working with Limit Lines. . . . . . . . . . . . . . . . . . . . . . . . . . . . . . . . . . . . . . . . . . . . . . . . . . . . . . 4-8
Working in the Active Measurement Window . . . . . . . . . . . . . . . . . . . . . . . . . . . . . . . . . . . 4-8
4-8 Working with Markers . . . . . . . . . . . . . . . . . . . . . . . . . . . . . . . . . . . . . . . . . . . . . . . . . . . . . . . . 4-9
Working in the Active Measurement Window . . . . . . . . . . . . . . . . . . . . . . . . . . . . . . . . . . . 4-9
4-9 Annotating Graphs . . . . . . . . . . . . . . . . . . . . . . . . . . . . . . . . . . . . . . . . . . . . . . . . . . . . . . . . . 4-11
4-10 Remote Access Tool. . . . . . . . . . . . . . . . . . . . . . . . . . . . . . . . . . . . . . . . . . . . . . . . . . . . . . . . 4-13
4-11 3D Spectrogram . . . . . . . . . . . . . . . . . . . . . . . . . . . . . . . . . . . . . . . . . . . . . . . . . . . . . . . . . . . 4-17
Marker Table . . . . . . . . . . . . . . . . . . . . . . . . . . . . . . . . . . . . . . . . . . . . . . . . . . . . . . . . . . . 4-18
Signal ID Table . . . . . . . . . . . . . . . . . . . . . . . . . . . . . . . . . . . . . . . . . . . . . . . . . . . . . . . . . 4-19
3D Spectrogram . . . . . . . . . . . . . . . . . . . . . . . . . . . . . . . . . . . . . . . . . . . . . . . . . . . . . . . . 4-19
4-12 Script Master Editor . . . . . . . . . . . . . . . . . . . . . . . . . . . . . . . . . . . . . . . . . . . . . . . . . . . . . . . . 4-23
GSM/WCDMA Script Master . . . . . . . . . . . . . . . . . . . . . . . . . . . . . . . . . . . . . . . . . . . . . . . 4-24
Channel Scanner Script Master. . . . . . . . . . . . . . . . . . . . . . . . . . . . . . . . . . . . . . . . . . . . . 4-26

Contents-4 PN: 10580-00439 Rev. A Master Software Tools UG
Table of Contents (Continued)
4-13 VNA Master Measurement Window . . . . . . . . . . . . . . . . . . . . . . . . . . . . . . . . . . . . . . . . . . . . 4-31
General Instrument Setting Summary . . . . . . . . . . . . . . . . . . . . . . . . . . . . . . . . . . . . . . . . 4-32
Trace Setting Summary Panel. . . . . . . . . . . . . . . . . . . . . . . . . . . . . . . . . . . . . . . . . . . . . . 4-32
Graph Display Window . . . . . . . . . . . . . . . . . . . . . . . . . . . . . . . . . . . . . . . . . . . . . . . . . . . 4-32
Chapter 5—Support File Management
5-1 Introduction . . . . . . . . . . . . . . . . . . . . . . . . . . . . . . . . . . . . . . . . . . . . . . . . . . . . . . . . . . . . . . . . 5-1
5-2 Antenna Editor (antenna.txt) . . . . . . . . . . . . . . . . . . . . . . . . . . . . . . . . . . . . . . . . . . . . . . . . . . . 5-2
5-3 Signal Standard Editor (SignalStd.sig) . . . . . . . . . . . . . . . . . . . . . . . . . . . . . . . . . . . . . . . . . . . 5-3
5-4 Cable Editor (Cablelist.txt) . . . . . . . . . . . . . . . . . . . . . . . . . . . . . . . . . . . . . . . . . . . . . . . . . . . . 5-3
5-5 Pass/Fail Test Editor (TestModels.txt) . . . . . . . . . . . . . . . . . . . . . . . . . . . . . . . . . . . . . . . . . . . 5-4
5-6 Setup Files (*.stp) . . . . . . . . . . . . . . . . . . . . . . . . . . . . . . . . . . . . . . . . . . . . . . . . . . . . . . . . . . . 5-4
5-7 Calibration Files (Cal*.txt) . . . . . . . . . . . . . . . . . . . . . . . . . . . . . . . . . . . . . . . . . . . . . . . . . . . . . 5-4
5-8 JPEG Files (*.jpg) . . . . . . . . . . . . . . . . . . . . . . . . . . . . . . . . . . . . . . . . . . . . . . . . . . . . . . . . . . . 5-4
5-9 Reports (*.htm, *.pdf) . . . . . . . . . . . . . . . . . . . . . . . . . . . . . . . . . . . . . . . . . . . . . . . . . . . . . . . . 5-5
5-10 Exported Files (*.csv, *.txt) . . . . . . . . . . . . . . . . . . . . . . . . . . . . . . . . . . . . . . . . . . . . . . . . . . . . 5-6
5-11 Folder Spectrogram Files (*.fsg) . . . . . . . . . . . . . . . . . . . . . . . . . . . . . . . . . . . . . . . . . . . . . . . . 5-7
Spectrogram . . . . . . . . . . . . . . . . . . . . . . . . . . . . . . . . . . . . . . . . . . . . . . . . . . . . . . . . . . . . 5-9
Color Selection Configuration Window . . . . . . . . . . . . . . . . . . . . . . . . . . . . . . . . . . . . . . . 5-10
Folder Spectrogram Context Menu . . . . . . . . . . . . . . . . . . . . . . . . . . . . . . . . . . . . . . . . . . 5-11
5-12 Measurement Map Files (*.ptm) . . . . . . . . . . . . . . . . . . . . . . . . . . . . . . . . . . . . . . . . . . . . . . . 5-12
5-13 MapInfo Export Files (*.mif) . . . . . . . . . . . . . . . . . . . . . . . . . . . . . . . . . . . . . . . . . . . . . . . . . . 5-13
5-14 Trace Indexing and the Trace Catalog . . . . . . . . . . . . . . . . . . . . . . . . . . . . . . . . . . . . . . . . . . 5-13
Trace Catalog . . . . . . . . . . . . . . . . . . . . . . . . . . . . . . . . . . . . . . . . . . . . . . . . . . . . . . . . . . 5-13
Trace Catalog-Spectrum Analyzer Toolbar . . . . . . . . . . . . . . . . . . . . . . . . . . . . . . . . . . . . 5-14
5-15 Filter Editor for ISDB-T (*.isdb) . . . . . . . . . . . . . . . . . . . . . . . . . . . . . . . . . . . . . . . . . . . . . . . . 5-18
Chapter 6—Instrument Update
6-1 Introduction . . . . . . . . . . . . . . . . . . . . . . . . . . . . . . . . . . . . . . . . . . . . . . . . . . . . . . . . . . . . . . . . 6-1
6-2 Advanced Tools and Program Options. . . . . . . . . . . . . . . . . . . . . . . . . . . . . . . . . . . . . . . . . . . 6-1
Group Edit . . . . . . . . . . . . . . . . . . . . . . . . . . . . . . . . . . . . . . . . . . . . . . . . . . . . . . . . . . . . . . 6-1
Full Trace Retrieval . . . . . . . . . . . . . . . . . . . . . . . . . . . . . . . . . . . . . . . . . . . . . . . . . . . . . . . 6-1
VNA Measurement Calculator . . . . . . . . . . . . . . . . . . . . . . . . . . . . . . . . . . . . . . . . . . . . . . . 6-1
DAT File Conversion Tool . . . . . . . . . . . . . . . . . . . . . . . . . . . . . . . . . . . . . . . . . . . . . . . . . . 6-1
Procedure . . . . . . . . . . . . . . . . . . . . . . . . . . . . . . . . . . . . . . . . . . . . . . . . . . . . . . . . . . . . . . 6-2
6-3 Trace Rename Utility . . . . . . . . . . . . . . . . . . . . . . . . . . . . . . . . . . . . . . . . . . . . . . . . . . . . . . . . 6-2
Transfer the list of files from your test instrument to the PC . . . . . . . . . . . . . . . . . . . . . . . . 6-2
Rename the Traces That Have Been Retrieved . . . . . . . . . . . . . . . . . . . . . . . . . . . . . . . . . 6-4
6-4 Language Editor . . . . . . . . . . . . . . . . . . . . . . . . . . . . . . . . . . . . . . . . . . . . . . . . . . . . . . . . . . . . 6-7
Modifying or Defining a Language . . . . . . . . . . . . . . . . . . . . . . . . . . . . . . . . . . . . . . . . . . . . 6-7
6-5 Group Edit. . . . . . . . . . . . . . . . . . . . . . . . . . . . . . . . . . . . . . . . . . . . . . . . . . . . . . . . . . . . . . . . . 6-7
Chapter 7—Instrument Files Update
7-1 Introduction . . . . . . . . . . . . . . . . . . . . . . . . . . . . . . . . . . . . . . . . . . . . . . . . . . . . . . . . . . . . . . . . 7-1

Master Software Tools UG PN: 10580-00439 Rev. A Contents-5
Table of Contents (Continued)
7-2 Internet Settings Configuration . . . . . . . . . . . . . . . . . . . . . . . . . . . . . . . . . . . . . . . . . . . . . . . . . 7-1
7-3 Updating Software and Firmware . . . . . . . . . . . . . . . . . . . . . . . . . . . . . . . . . . . . . . . . . . . . . . . 7-5
7-4 Firmware Update . . . . . . . . . . . . . . . . . . . . . . . . . . . . . . . . . . . . . . . . . . . . . . . . . . . . . . . . . . . 7-7
7-5 Emergency Repair Procedure . . . . . . . . . . . . . . . . . . . . . . . . . . . . . . . . . . . . . . . . . . . . . . . . . 7-9
7-6 Generating an Instrument Config File and Installing A New License File. . . . . . . . . . . . . . . . 7-10
Appendix A—Applications and Files
A-1 Supported Anritsu Instruments . . . . . . . . . . . . . . . . . . . . . . . . . . . . . . . . . . . . . . . . . . . . . . . . . A-1
A-2 Supported File Types . . . . . . . . . . . . . . . . . . . . . . . . . . . . . . . . . . . . . . . . . . . . . . . . . . . . . . . . A-2
Measurement & Data Files . . . . . . . . . . . . . . . . . . . . . . . . . . . . . . . . . . . . . . . . . . . . . . . . . A-2
Output Files . . . . . . . . . . . . . . . . . . . . . . . . . . . . . . . . . . . . . . . . . . . . . . . . . . . . . . . . . . . . . A-3
Appendix B—FAQs
B-1 Intermittent Code Loading Problems Associated with Dell Docking Stations . . . . . . . . . . . . . . B-1
Dell Latitude D620 Series Laptops . . . . . . . . . . . . . . . . . . . . . . . . . . . . . . . . . . . . . . . . . . . B-1
Dell Latitude D630 Series Laptops . . . . . . . . . . . . . . . . . . . . . . . . . . . . . . . . . . . . . . . . . . . B-3
B-2 Installing East Asian Language Fonts . . . . . . . . . . . . . . . . . . . . . . . . . . . . . . . . . . . . . . . . . . . B-3
B-3 Instrument Password Protection Feature . . . . . . . . . . . . . . . . . . . . . . . . . . . . . . . . . . . . . . . . . B-5

Contents-6 PN: 10580-00439 Rev. A Master Software Tools UG

Master Software Tools UG PN: 10580-00439 Rev. A 1-1
Chapter 1 — General Information
1-1 IntroductionAnritsu Master Software Tools is a Microsoft Windows 2000, XP, Vista compatible program for transferring and editing saved measurements, markers, and limit lines to a PC. Master Software Tools will not function on earlier versions of the Microsoft Windows operating system.
This guide assumes the user is familiar with the particular test instrument being used, and with the different types of measurements that can be taken with the instrument.
1-2 Features• Download saved measurements in the test instrument memory to a PC for storage and analysis
• Capture live traces to view them and save on a PC
• Upload saved measurements from a PC to the test instrument
• Compare multiple traces using drag, drop, and trace overlay features (Spectrum Analyzer measurements only)
• Add, delete, and modify Limit Lines and Markers
• Use the Cable Editor to modify the instrument’s Cable List
• Use the Antenna Editor to modify the instrument’s Antenna List
• Use the Signal Editor to modify the instrument’s Signal Standard List
• Create, upload, download, or edit Pass/Fail mode lists for WCDMA/HSDPA, GSM/GPRS/EDGE, Fixed & Mobile WiMAX, CDMA, EV-DO, TD-SCDMA, and LTE
• Create, upload, download, or edit Script Master Files for Channel Scanner, WCDMA/HSDPA, and GSM/GPRS/EDGE measurements
• Display power level, calibration status, and GPS information along with a measurement, in one report
• Create and upload custom language files to the instrument to customize soft key labels and messages
• Export measurement data as text files for use in spreadsheets or other documents
• Create reports in HTML format for use in a variety of applications
• Export measurements as graphic files (.jpg format)
• Export measurements as CSV (Comma Separated Value format) files
• Update the instrument with the latest firmware available from: http://www.anritsu.com
• Store an unlimited number of data traces to a PC, easing the task of analyzing and monitoring historical performance
• Establish a connection to a PC using USB, Ethernet LAN, or a Direct Ethernet connection
• Display measurement locations using Microsoft Map Point and GPS location mapping
• Convert DAT files from Anritsu Handheld Software Tools into Anritsu Master Software Tools file formats.

1-3 System Requirements General Information
1-2 PN: 10580-00439 Rev. A Master Software Tools UG
1-3 System RequirementsMinimum requirements and recommendations are:
• Microsoft Windows 2000, XP, Vista-32bit, Vista-64bit (Vista-64bit for USB is incompatible with MST), Windows 7
• Intel Pentium 233 MHz microprocessor minimum (Pentium III 350 MHz or better recommended)
• 128 MB of RAM minimum (256 MB or above recommended)
• Hard disk drive with approximately 80 MB of available space (an additional 80 MB of free space for storage of captured plots is recommended)
• A USB port (USB 1 required, USB 2.0 recommended) or an Ethernet 10/100 Base T connection for communication with the test instrument

Master Software Tools UG PN: 10580-00439 Rev. A 2-1
Chapter 2 — Installation
2-1 IntroductionThis Quick Start Information is intended for advanced users who already have a basic understanding of the software. This chapter defines and describes in detail all of the software features – Menu Bar, Toolbar, context menus, opened windows, and dialog boxes. The use or application of software tools is covered in more depth in the following chapters.
2-2 Software CapabilitiesThe following sections describe some of the available functions and options.
Connecting the Instrument
There are three methods for connecting the test instrument to the computer: Serial, USB and Ethernet. USB is the simplest method. Ethernet is preferred for downloading large batches of data files.
Capturing or Retrieving Traces
Master Software Tools includes a feature to capture the current screen and associated data from the test instrument to the Master Software Tools Graphic Display Editor window. Saved files on the test instrument can also be retrieved and displayed or edited with Master Software Tools.
Editing the Graph
Master Software Tools can be used to change the scale, limit lines, and markers in a measurement through the Edit Graph button in the workspace toolbar, or through the Context Menus.
Context Menus
Context Menus are accessed by right-clicking the mouse on an active measurement screen in the Graphic Display Editor Window. Context Menu functions may include commands that are also available on the pull down menus and toolbar buttons, or functions, commands, and options specific to the active measurement window.
Overlaying Traces
Trace Math and Overlays allow for comparing multiple traces.
Saving, Opening, Creating New, and Printing Files
These standard Windows file commands are included in Master Software Tools.
Folder Spectrogram
Folder Spectrogram is a tool that combines spectrum analyzer traces into one Spectrogram. It does not combine Spectrograms into a “super spectrogram.”
2-3 Connection – BTS Master Installation
2-2 PN: 10580-00439 Rev. A Master Software Tools UG
Script Master
Script Master is an editor to create files that set up measurement parameters and create automated test procedures that aid field techs or FAEs with measurement testing.
2-3 Connection – BTS MasterThere are three ways of connecting an Anritsu test instrument to a PC:
• USB
• Direct Ethernet
• Ethernet LAN
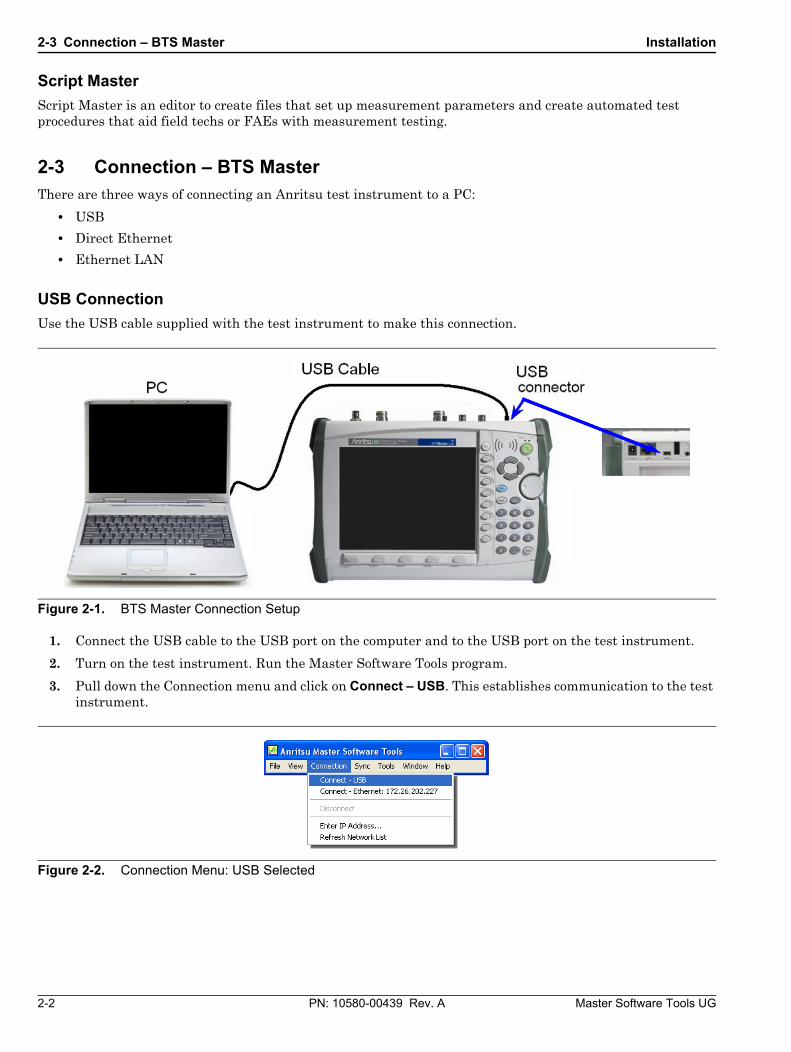
USB Connection
Use the USB cable supplied with the test instrument to make this connection.
1. Connect the USB cable to the USB port on the computer and to the USB port on the test instrument.
2. Turn on the test instrument. Run the Master Software Tools program.
3. Pull down the Connection menu and click on Connect – USB. This establishes communication to the test instrument.
Figure 2-1. BTS Master Connection Setup
Figure 2-2. Connection Menu: USB Selected

Installation 2-3 Connection – BTS Master
Master Software Tools UG PN: 10580-00439 Rev. A 2-3
In the Toolbar, the Connect/Disconnect pull down menu displays USB and the connector icon turns green. Either hardware or software disconnect turns the connector icon red.
If the status bar is turned on (View Status Bar), then a message at the bottom left corner of the application window displays Connected to device using USB when communication is established.
Ethernet LAN Connection
Use standard Ethernet cables to connect between the test instrument, PC and LAN. Attach the cable to the RJ-45 connector port on the test instrument. There are two LEDs integrated to the Ethernet port on the test instrument. The amber LED indicates the presence of LAN voltages—a live LAN connection—and the green LED flashes to show that LAN traffic is present.
To set or view the IP address of the test instrument:
Configure the test instrument’s IP Address manually
1. On the test instrument, press the Shift Key, followed by the System [8] key.
Figure 2-3. USB Connector Displayed in Toolbar
Figure 2-4. USB Connection Displayed in Status Bar
Figure 2-5. Ethernet LAN Setup
NoteThe IP address, Gateway and Subnet mask in the following figure are examples only. Please request from your IT the address information.

2-3 Connection – BTS Master Installation
2-4 PN: 10580-00439 Rev. A Master Software Tools UG
2. Select the System Options soft key and then the Ethernet Config soft key. The Ethernet Editor window opens and displays the IP information. The Ethernet menu is also displayed.
3. Press the Type soft key to select Manual. Manual will be underscored. The cursor moves to the IP address row and the First Octet field.
4. Set the IP address to 192.168.1.100. Use the number keypad, the Up/down arrow keys, or the rotary knob to change the value in the Octet field. Once the value is entered, use the Octet soft keys or the Left/Right arrow keys to move to the next Octet field.
5. Press the Field soft key so that G-Way is underlined. The cursor moves to the Gateway address row and the First Octet field. Set the Gateway address to 192.168.1.1. Use the number keypad, the Up/down arrow keys, or the rotary knob to change the value in the Octet field. Once the value is entered, use the Octet soft keys or the Left/Right arrow keys to move to the next Octet field.
6. Press the Field soft key so that Sub is underlined. The cursor moves to the Subnet address row and the First Octet field. Set the Subnet address to 255.255.255.0.Use the number keypad, the Up/down arrow keys, or the rotary knob to change the value in the Octet field. Once the value is entered, use the Octet soft keys or the Left/Right arrow keys to move to the next Octet field.
7. Press Enter to accept the changes.
Figure 2-6. Ethernet Editor Window

Installation 2-3 Connection – BTS Master
Master Software Tools UG PN: 10580-00439 Rev. A 2-5
Configure the test instrument’s IP Address using DHCP
1. On the test instrument, press the Shift key, then the System [8] key. The test instrument’s System menu is displayed.
2. Press the System Options soft key, and then the Ethernet Config soft key. The Ethernet Editor window opens.
3. Press the Type soft key to select DHCP. DHCP will be underscored.
4. Press the Enter button. The test instrument is ready to obtain an IP address from the DHCP Server.
5. Cycle the test instrument power Off then On.
NoteWhen using DHCP, the LAN Ethernet cable must be connected before the test instrument is turned on in order to set the IP address.
Figure 2-7. Ethernet Hardware Setup
Figure 2-8. Ethernet Editor Window

2-3 Connection – BTS Master Installation
2-6 PN: 10580-00439 Rev. A Master Software Tools UG
6. Immediately after the re-boot the IP Address obtained from the DHCP Server will be flashed on the top left portion of the screen. Write down the IP address.
7. You also can view the IP Address by going into the System menu, press the Shift key followed by the System [8] key, then press the Status soft key. The Status window opens. The IP address is listed first.
• Write down this address
OR
8. Press the System Options soft key followed by Ethernet Config soft key. The Ethernet Editor window displays the IP address, as shown in the picture below.
• Write down the address
Configure Master Software Tools
1. On the PC, open the Master Software Tools connection window and select Enter IP Address.
2. Enter the IP address of the test instrument as shown in the Ethernet Editor Dialog box. Double click on the matching IP address of a test instrument to establish a connection to that test instrument. The Connect: Ethernet icon will change from red to green when communication is established. If the Status Bar is turned on, then a message at the bottom displays connected to Ethernet when communication is established
Figure 2-9. IP Address Display on Instrument
Figure 2-10. IP Address in Instrument Status Display
Figure 2-11. IP Address Display in Ethernet Editor Dialog

Installation 2-3 Connection – BTS Master
Master Software Tools UG PN: 10580-00439 Rev. A 2-7
Direct Ethernet Connection
Use a crossover Ethernet cable to connect directly between PC and the test instrument.
Configure the Test Instrument’s IP Address Manually
1. On the test instrument, press the Shift key, then the System [8] key. The test instrument’s System menu is displayed.
2. Press the System Options soft key, and then the Ethernet Config soft key. The Ethernet Editor window opens and the Ethernet menu is displayed.
3. Press the Type soft key to select Manual. Manual will be underscored. The cursor moves to the IP address row and the First Octet field.
4. Set the IP address to 10.0.0.2. Use the number keypad, the Up/down arrow keys, or the rotary knob to change the value in the Octet field. Once the value is entered, use the Octet soft keys or the Left/Right arrow keys to move to the next Octet field.
Figure 2-12. Direct Ethernet Connection Setup
Figure 2-13. Ethernet Editor Dialog

2-3 Connection – BTS Master Installation
2-8 PN: 10580-00439 Rev. A Master Software Tools UG
5. Press the Field soft key so that G-Way is underlined. The cursor moves to the Gateway address row and the First Octet field. Set the Gateway address to 10.0.0.2. Use the number keypad, the Up/down arrow keys, or the rotary knob to change the value in the Octet field. Once the value is entered, use the Octet soft keys or the Left/Right arrow keys to move to the next Octet field.
6. Press the Field soft key so that Sub is underlined. The cursor moves to the Subnet address row and the First Octet field. Set the Subnet address to 255.255.255.0.Use the number keypad, the Up/down arrow keys, or the rotary knob to change the value in the Octet field. Once the value is entered, use the Octet soft keys or the Left/Right arrow keys to move to the next Octet field.
7. Press Enter to accept the changes.
Configure The PC’s Network TCP/IP
1. On the PC, click Start/Settings
2. Click on Network Connections.
3. Double-click on the Local Area Connection to which the test instrument is connected and click on Properties. The Local Area Connection Properties window opens.
4. In the scroll box, highlight and select Internet Protocol (TCP/IP).
Figure 2-14. Windows Network Connections Selection
Figure 2-15. Local Area Connection Properties Dialog

Installation 2-3 Connection – BTS Master
Master Software Tools UG PN: 10580-00439 Rev. A 2-9
5. Click on the Properties button.
6. Click on the Alternate Configuration tab.
7. Click on the User configured button and enter the IP, Subnet mask, and Default gateway information as shown in the picture below.
8. Set the IP address to 10.0.0.1
9. Set the Subnet mask to 255.255.255.0.
10. Set the Default gateway to 10.0.0.1.
11. Click OK.
12. Close all windows that are open.
13. Reboot both the PC and the test instrument.
Configure Master Software Tools
1. Run the Master Software Tools program on the PC.
Figure 2-16. Internet Protocol (TCP/IP) Properties Dialog
NoteFor quick access, the connection drop-down list in the Master Software Tools toolbar will keep a history of the last ten units that were connected. Clicking on any entry in this list directs the software to attempt to re-establish that connection.

2-3 Connection – BTS Master Installation
2-10 PN: 10580-00439 Rev. A Master Software Tools UG
2. Pull down the Connection menu and select Enter IP Address.
3. Enter the IP address as shown in the window below. Click OK. The Connect – Ethernet: line now displays 10.0.0.2.
In addition, the Toolbar Connect/Disconnect pull down menu displays the new IP address and the connection icon turns green.
For quick access, the connection drop-down list in the Master Software Tools toolbar will keep a history of the last ten units that were connected. Clicking on any entry in this list directs the software to attempt to re-establish that connection.
Figure 2-17. Connection Menu: Enter IP Address Selection
Figure 2-18. Enter IP Address Dialog
Figure 2-19. Ethernet IP Address Displayed in Toolbar

Installation 2-4 Connection – Cell Master, Site Master, & Spectrum Master
Master Software Tools UG PN: 10580-00439 Rev. A 2-11
2-4 Connection – Cell Master, Site Master, & Spectrum Master
USB Connection
Use the USB cable supplied with the test instrument to make this connection.
1. Connect the USB cable between the USB Type-A connector on the computer to the USB Type-B connector on the test instrument.
2. Turn on the test instrument. Run the Master Software Tools program.
3. Pull down the Connection menu and click on Connect - USB. This establishes communication to the test instrument.
4. In the Toolbar, the Connect/Disconnect pull down menu displays USB and the connector icon turns green. Either hardware or software disconnect turns the connector icon red.
5. A message that the instrument is connected is also displayed on the Status bar located at the bottom left corner of the MST application window - Connected to device using USB.
Figure 2-20. USB Connection Setup

2-4 Connection – Cell Master, Site Master, & Spectrum Master Installation
2-12 PN: 10580-00439 Rev. A Master Software Tools UG
Serial Connection
Use the RS232 Serial cable supplied with the test instrument to make this connection.
1. Connect the RS232 Serial cable from the RS232 Serial connector on the computer to the Serial Interface connector on the test instrument.
2. Turn on the test instrument. Run the Master Software Tools program.
3. Go to “Configure the PC (Laptop)” on page 2-16.
Serial to USB Connection
This setup uses an RS232 Serial cable with an RS232 to USB Adapter cable to connect between the test instrument and the USB connector of the PC. This also requires installing the software drivers for the RS232 to USB Adapter first and then configuring the PC.
1. Install the USB to Serial Adapter Software (For this example the USB to Serial Adapter is Tripp-Lite.)
2. Place the USB to Serial Configuration Adapter CD into your PC’s CD/DVD drive.
Figure 2-21. Serial Connection Setup
Figure 2-22. Serial to USB Connection Setup

Installation 2-4 Connection – Cell Master, Site Master, & Spectrum Master
Master Software Tools UG PN: 10580-00439 Rev. A 2-13
3. Connect the USB end of the USB/Serial adapter into the PC.
4. The installation software automatically starts.
5. Click the No, not this time option, then press the Next> button. The content of the window changes to the picture below.
6. Click the Install from a list or specific location (Advanced) option followed by pressing the Next> button.
Figure 2-23. Hardware Wizard Dialog
Figure 2-24. Wizard Selection

2-4 Connection – Cell Master, Site Master, & Spectrum Master Installation
2-14 PN: 10580-00439 Rev. A Master Software Tools UG
7. The window’s messages changes to select the folders that contain the drivers. Press the Browse button to open the Browse For Folder.
8. Click on the drive that contains the installation files.
9. Open the sub-files until the driver file for your PC’s operating system is displayed. Highlight the appropriate OS file and press the OK button.
Figure 2-25. Browse Folder Setup
Figure 2-26. Select Folder per Operating System

Installation 2-4 Connection – Cell Master, Site Master, & Spectrum Master
Master Software Tools UG PN: 10580-00439 Rev. A 2-15
10. Press the Next> button.
11. The USB to Serial Adapter drivers install.
Figure 2-27. Hardware Wizard Selection:
Figure 2-28. Hardware Driver Installation

2-4 Connection – Cell Master, Site Master, & Spectrum Master Installation
2-16 PN: 10580-00439 Rev. A Master Software Tools UG
12. If the warning window on the bottom right of the picture above pops open, press the Continue Anyway button.
13. When the software installation is completed, the window above pops up. Press the Finish button.
Configure the PC (Laptop)
1. Press the Start button. Scroll to Settings and click Control Panel.
Figure 2-29. Completing Hardware Installation
Figure 2-30. PC Setup

Installation 2-4 Connection – Cell Master, Site Master, & Spectrum Master
Master Software Tools UG PN: 10580-00439 Rev. A 2-17
2. Click the System icon to open the System Properties window.
Figure 2-31. PC Setup
Figure 2-32. Hardware Setup
2-4 Connection – Cell Master, Site Master, & Spectrum Master Installation
2-18 PN: 10580-00439 Rev. A Master Software Tools UG
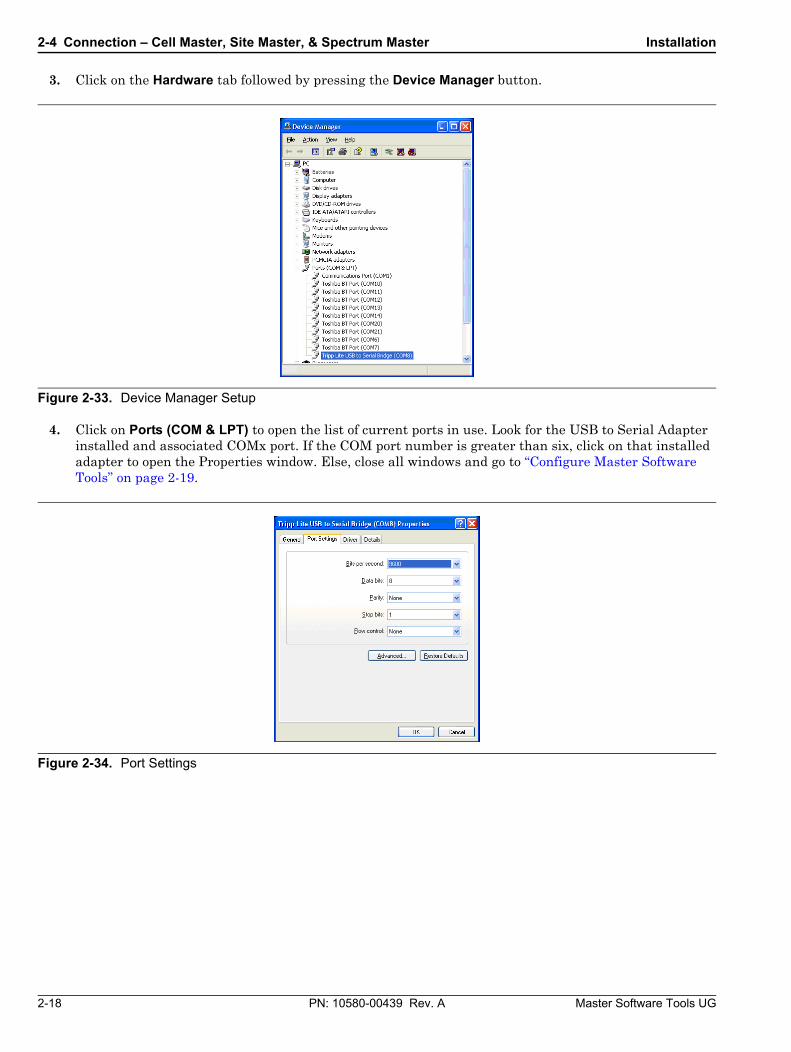
3. Click on the Hardware tab followed by pressing the Device Manager button.
4. Click on Ports (COM & LPT) to open the list of current ports in use. Look for the USB to Serial Adapter installed and associated COMx port. If the COM port number is greater than six, click on that installed adapter to open the Properties window. Else, close all windows and go to “Configure Master Software Tools” on page 2-19.
Figure 2-33. Device Manager Setup
Figure 2-34. Port Settings

Installation 2-4 Connection – Cell Master, Site Master, & Spectrum Master
Master Software Tools UG PN: 10580-00439 Rev. A 2-19
5. Press the Advanced… button to open the Advanced Settings for COMx window.
6. Select an unused COM port between 1 and 6 by pulling down the COM Port Number: list. (In this example, COM4.) Press OK to close all windows.
7. Return to the Device Manager window and highlight Ports (COM & LPT). Press your right mouse button. Click Scan for hardware changes. The Device Manager window updates the new COM port setting.
Configure Master Software Tools
1. Power On the instrument.
2. Connect the serial male connector of the USB Serial Adapter to the female connector of the serial cable attached to the test instrument.
3. Run Master Software Tools (MST)
Figure 2-35. Advanced Port Stings
Figure 2-36. Com Port Setup

2-4 Connection – Cell Master, Site Master, & Spectrum Master Installation
2-20 PN: 10580-00439 Rev. A Master Software Tools UG
4. Click Program Options under the Tools menu. The Program Option window opens.
5. Click on the Serial Port Settings tab.
6. From the Active Port pull down menu, click the COM x port that was set in the Device Manager. Then set the Transfer Baud Rate to 115200. Press the OK button.
Test the PC Connection to the Instrument
1. Click Connect – RS232: COMx in the Connection menu. Note the command line is checked and grayed. The connection list menu displays SERIAL and the connector symbol turns green.
2. Click the Capture Measurement button, on the toolbar. The display screen on the instrument is captured and displayed in MST.
Figure 2-37. Program Options: Serial Port Setting
Figure 2-38. Connection Menu: Serial Connection

Master Software Tools UG PN: 10580-00439 Rev. A 3-1
Chapter 3 — Graphical User Interface (GUI)
3-1 IntroductionThis chapter defines and describes the Master Tools Software (MST) Graphical User Interface to view and operate Master Tools.
3-2 Main ScreenThe main screen displays the MST operational features. Opening the main screen provides the Menu Bar, Toolbar, context menus, edit menus, and measurement panels.
Figure 3-1. Master Software Tools Graphical User Interface

3-2 Main Screen Graphical User Interface (GUI)
3-2 PN: 10580-00439 Rev. A Master Software Tools UG
Window Description
Main Menu Contains the menus - File, View, Sync, Tools, Window, Mode, and Help
ToolbarDisplays tool icons used for file management, instrument connectivity, and trace management.
File Resource Tabs Use to select the source of the measurement file to be displayed
File Resource Directory Window
Displays the directory and folder of the measurement file displayed.
File List Window Displays the content of the folder.
Measurement File Preview and Summary
WindowAllows you to select a thumbnail view of the measurement or file summary.
Status Bar Displays connection and measurement file information.
Active Measurement Edit Toolbar
Tools to edit or manage the measurement files.
Measurement Panels Display of measurement files
Graphical User Interface (GUI) 3-2 Main Screen
Master Software Tools UG PN: 10580-00439 Rev. A 3-3
Menu Bar
File
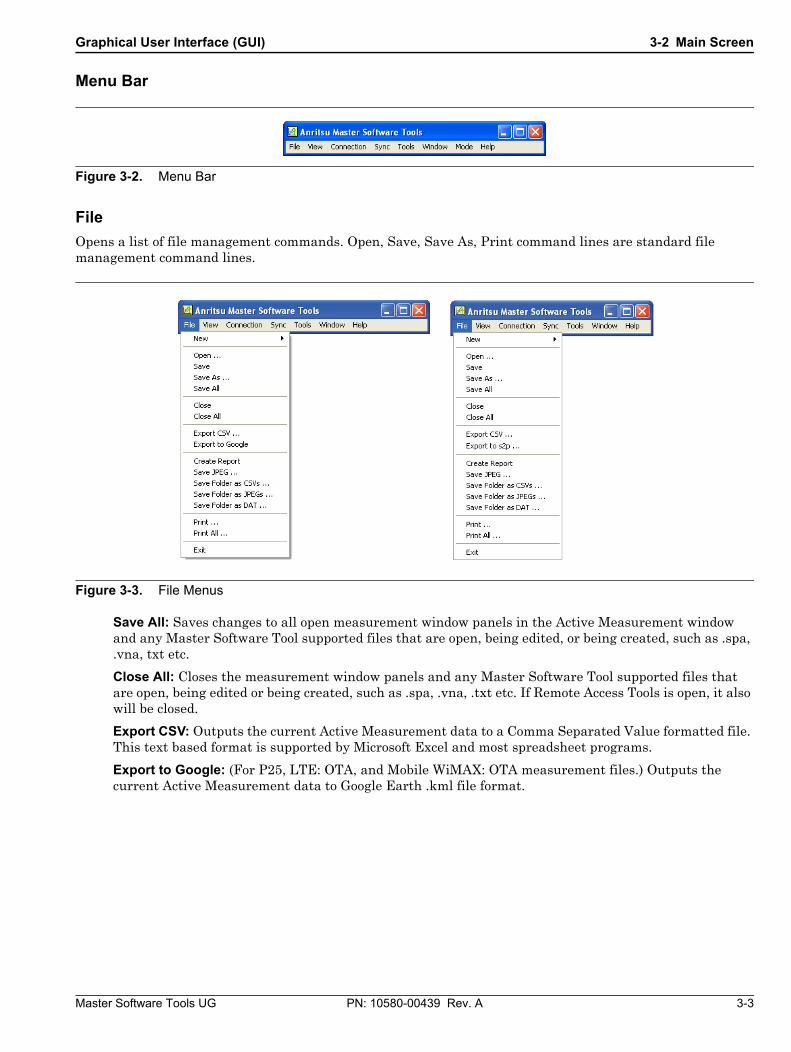
Opens a list of file management commands. Open, Save, Save As, Print command lines are standard file management command lines.
Save All: Saves changes to all open measurement window panels in the Active Measurement window and any Master Software Tool supported files that are open, being edited, or being created, such as .spa, .vna, txt etc.
Close All: Closes the measurement window panels and any Master Software Tool supported files that are open, being edited or being created, such as .spa, .vna, .txt etc. If Remote Access Tools is open, it also will be closed.
Export CSV: Outputs the current Active Measurement data to a Comma Separated Value formatted file. This text based format is supported by Microsoft Excel and most spreadsheet programs.
Export to Google: (For P25, LTE: OTA, and Mobile WiMAX: OTA measurement files.) Outputs the current Active Measurement data to Google Earth .kml file format.
Figure 3-2. Menu Bar
Figure 3-3. File Menus

3-2 Main Screen Graphical User Interface (GUI)
3-4 PN: 10580-00439 Rev. A Master Software Tools UG
Export s2p: (For VNA measurement files only). Exports the current file to S2P file format. S2P files are ASCII text files that can be viewed or edited by any standard text editor.
Create Report: Creates a report from the current Active Measurement displayed.
Save JPEG: Saves the currently displayed Active Measurement as a JPEG file.
Save Folder as CSVs: Creates CSV files from all the measurements in selected folder.
Save Folder as JPEGs: Creates a JPEG image from all measurements in a selected folder.
Save Folder as DAT: Converts selected VNA or SPA files into DAT files and stores them in the selected folder.
Print All: Opens the Print All Measurement window. If Remote Access Tools is open, it will not be printed along with the other measurement window panels.
Exit: Closes all open measurement window panels, disconnects any instrument connected to the Master Software Tools program, and exits Master Software Tools.
The following commands are only available in the File menu when the Language Editor and Signal Standard Editor windows are the active window panel in the Active Measurement Window.
Figure 3-4. Generated Report Sample

Graphical User Interface (GUI) 3-2 Main Screen
Master Software Tools UG PN: 10580-00439 Rev. A 3-5
Load ZNC file for comparison F10: When the Language Editor is open, this command loads ZNC files to compare to an existing ZNC file and add new words into the current file.
Load CSV file for comparison F10: When the Language Editor is open, this command loads CSV files to compare to an existing CSV file and add new words into the current file.
New: Opens a sub-menu for creating or editing Master Software Tools related files.
Antenna File: Opens the Antenna Editor window for creating a new antenna list.
Cable File: Opens the Cable Editor window to create a new cable list.
Signal Standard File: Opens the Signal Standard Editor window.
Figure 3-5. Generated Report Sample
Figure 3-6. Signal Standard Editor

3-2 Main Screen Graphical User Interface (GUI)
3-6 PN: 10580-00439 Rev. A Master Software Tools UG
Pass/Fail Editor: Opens immediately after downloading the file from the test instrument or after dragging a Test Models list file into the Active Measurement Window. This editor is used for editing the three Pass/Fail file types – WCDMA/HSDPA, GSM/EDGE/GPRS, Fixed WiMAX, Mobile WiMAX, CDMA, EV-DO, TD-SCDMA, and LTE.
Click on the type of Pass/Fall file to be created and the Pass/Fail Editor window will open.
Script Master: Lists a submenu to select a measurement file type to be created or edited. File types include GSM/WCDMA files or Channel Scanner files.
Click on the desired file type and the Script Master window will open.
Folder Spectrogram: Creates a Spectrogram from the selected folder of measurement traces.
Measurement Map: Opens the Measurement Map window.
Mobile WiMAX Parameter File: Opens the XML Parameter File Editor.
ISDB-T Filter File: Opens the Filter Editor for editing and creating ISDB-T filters.
Figure 3-7. Pass/Fail File Types
Figure 3-8. Script Master File Types

Graphical User Interface (GUI) 3-2 Main Screen
Master Software Tools UG PN: 10580-00439 Rev. A 3-7
Edit
The Edit menu is available only when the Language Editor and Signal Standard Editor windows are the active window panel in the Active Measurement Window.
Language Editor-Edit Entry: Highlights the foreign language word for editing.
Language Editor-Find Text: Opens an entry widow to search for an English word.
Language Editor-Find Next: Continues the search for the word entered in Find Text.
Language Editor-Copy English Text: Copies the English text from column 2 to column 1.
Language Editor-Copy Comparison Text: Copy Compare string (3rd column) to translation (1st column).
Language Editor-Merge Translation: Merges the new language entries into the current Language file.
Add Signal Standard: Adds a new signal standard at the bottom of the list to be edited.
Delete Signal Standard: Deletes the signal standard currently highlighted.
Add Segment: Adds a segment to the currently highlighted signal standard.
Delete Segment: Deletes the highlighted segment from the current signal standard.
Figure 3-9. Edit Menu for Language Editor of *.znc Files
Figure 3-10. Edit Menu for Signal Standard Editor

3-2 Main Screen Graphical User Interface (GUI)
3-8 PN: 10580-00439 Rev. A Master Software Tools UG
View
Command lines for Trace Catalog, Measurement Preview/Summary Window, Toolbar and Status Bar are toggle switches to display or not to display those items. Additional command lines are listed when specific windows are active in the Active Measurement Window.
Network Unit Summary: Shows a summary of test instrument options when a unit is selected from the Network list. The list of units is available over an active Ethernet connection.
The following Remote Access Tool Display Command is available only when the Remote Access Tool has been enabled and is the current active window panel.
Refresh Rate: Opens a list of refresh rates.
Fast (Low Color): Uses a lower picture resolution that allows for faster communications between the instrument and PC.
Slow (True Color): Uses a higher picture resolution that sacrifices communication speed between the instrument and PC.
Figure 3-11. View Menu
Figure 3-12. Refresh Rate Menu
Figure 3-13. Refresh Rate List

Graphical User Interface (GUI) 3-2 Main Screen
Master Software Tools UG PN: 10580-00439 Rev. A 3-9
Language Editor Commands are listed only when the Language Editor is the current active window panel.
Language Editor-Font Selection: Opens the Font window to change the font style of the highlighted text.
Language Editor-Toggle Color Coding: Toggles the color coding of the Language Editor page on and off.
Language Editor Function Key Summary: Opens a list of Function Key definitions.
Signal Standard Editor Commands are listed only when the Signal Standard Editor is the current active window panel.
Expand All: Expands the list of signal standards and their subsequent segments.
Collapse All: Collapses the signal standards list and segments to only show Signal Standards.
Clipboard
Active only when the Remote Access Tool is enabled and contains the Copy command.
Copy: Copies the current view of the Remote Access Tool window to the clipboard.
Figure 3-14. View Menu with the Language Editor as the Active Window
Figure 3-15. View Menu with the Signal Editor as the Active Window
Figure 3-16. Clipboard Menu

3-2 Main Screen Graphical User Interface (GUI)
3-10 PN: 10580-00439 Rev. A Master Software Tools UG
Connection
This menu is used for setting up communication to a PC via USB or Ethernet.
Connect-USB: Initiates communication between the test instrument and PC via a USB connection. (USB to USB).
Connect-Ethernet: Initiates communication between the test instrument and PC via an Ethernet connection.
Connect-Serial (RS232): Initiates communication between test instruments with serial ports to the PC. (Serial to Serial or USB to Serial)
Disconnect: Disconnects any communication between the test instrument and PC.
Enter IP Address: Opens the input window to enter the IP address of the test instrument.
Refresh Network List: Refreshes the Network Device list. This is a list of Anritsu test instruments visible on the Local Area Network.
Figure 3-17. Connection Menu
Figure 3-18. Address Entry Window

Graphical User Interface (GUI) 3-2 Main Screen
Master Software Tools UG PN: 10580-00439 Rev. A 3-11
Sync
Contains commands to manipulate data files between the test instrument and the PC.
Upload Active Window: Copies the measurement data from the Active Measurement window panel to the internal memory of the test instrument.
File Transfer: Opens the Transfer Files to Handheld Device
Upload Folder: Opens the Upload Files to Handheld Device window.
Capture Current Measurement: Downloads the measurement data and screen display currently on the test instrument to Master Software Tools and creates a measurement screen display panel in the Active Measurement window.
Download File List: (File denotes any one of the commands highlighted in the green box in Figure 3-19.) Downloads associated files from the instrument to be saved on the PC in the Anritsu Master Software Tools folder.
Figure 3-19. Sync Menu
Figure 3-20. Upload Files to Handheld Device Window
NoteE Series instruments Only – When in dual measurement display, measurements are captured as separate data files and placed into individual measurement screen display panels. You must save them as individual files.

3-2 Main Screen Graphical User Interface (GUI)
3-12 PN: 10580-00439 Rev. A Master Software Tools UG
Download All Measurements: Copies all files in the internal memory of the test instrument onto the Anritsu Master Software Tools folder or a folder specified by the user. Note: There is a limit of 1001 files that are allowed to be downloaded at one time.
For very large number of files that need to be copied from the instrument to the PC, a USB memory stick is recommended to transfer files from the instrument to the PC.
Refresh Device Measurement List: Refreshes the list of saved measurements shown for the currently connected test instrument.
Device Status Options: Command lines in this sub menu allow access to the test instrument status data and download the Config and License files.
Tools
Various file management and test instrument controls.
Group Edit: Allows the changing of the measurement title, subtitles, and common features such as plot scaling, markers and limit lines, simultaneously on a large set of similar measurement files.
Trace Rename Utility: Opens the Master Software Tools Rename Utility window to rename measurement traces.
DAT File Conversion Tool: Opens the DAT File Conversion Tool window to convert supported file types from Anritsu Handheld Software Tools format to the file format supported by Master Software Tools.
Distance-To-Fault: Opens the DTF window to convert a VNA Return Loss file to a DTF-Return Loss file.
Figure 3-21. Device Status and Options List
Figure 3-22. Tools Menu
WarningOnce a Handheld Software DAT file is converted using the DAT File Converter to Master Software Tools file format, the new Master Software Tools file cannot be converted back to a Handheld Software Tool DAT file format.

Graphical User Interface (GUI) 3-2 Main Screen
Master Software Tools UG PN: 10580-00439 Rev. A 3-13
Remote Access Tool: Opens a fully functional software emulator that remotely controls the connected test instrument. Note: It is recommended using the most recent remote access software Wireless Remote Access Tool. Go to the Anritsu Website to download this software.
Full Trace Retrieval: Similar to the command line Download All in the Sync menu, this function retrieves all files stored in the internal memory space of the connected instrument. This can be faster, especially on older instruments, than Download All but it requires an Ethernet connection. USB is not supported.
Measurement Calculator: This tool translates certain values into other units. It can show Real and Imaginary values, Magnitude, Phase, Return Loss, Reflection Coefficient, and Transmission Power. Enter a value in any field, and the other fields are adjusted automatically.
Product Updates: Opens the Product Updates window, used to update, repair, or recover files in the internal memory of the test instrument.
Program Options: Opens the Program Options window to set parameters for Program Elements, File Transfer and Confirmations, JPEG Save Options, Measurement Print Options, Report Generator and Internet Settings.
Window
This menu controls the open measurement window panels. Cascade, Tile Vertical and Tile Horizontal organize the measurement panels in the Active Measurement window. Measurement panels in the Active Measurement window are listed under the Close All command. The currently active window panel is checked in this menu.
Cascade: Stacks the window panels diagonally, layered one on top of the other.
Tile Vertical: Places the window panels one above the other.
Tile Horizontal: Places the measurement window panels side by side.
Print All: Opens the Print All Measurements window. If Remote Access Tools is open, it will not be printed along with the other measurement window panels.
Close All: Closes the measurement window panels and any Master Software Tool supported files that are open, being edited or being created, such as .spa, .vna, txt etc. If Remote Access Tools is open, it will also be closed.
Figure 3-23. Window Menu

3-2 Main Screen Graphical User Interface (GUI)
3-14 PN: 10580-00439 Rev. A Master Software Tools UG
Mode
Activated when connected to serial port instruments, S8XXD. Lists the various test modes.
Help
Help Contents: Opens the Master Software Tools User Guide in the Adobe Acrobat Reader (if installed on the PC).
Figure 3-24. Mode Menu
Figure 3-25. Help Menu

Graphical User Interface (GUI) 3-2 Main Screen
Master Software Tools UG PN: 10580-00439 Rev. A 3-15
Contacting Anritsu Customer Support: Opens the Contacting Anritsu window with information on contacting Anritsu Customer Support.
Anritsu on the Web: Click on this web link go to the Anritsu Customer Support Internet site.
App Notes and Instrument Documentation: Lists all of the instrument user’s guides and programming manuals installed during installation. (Will not be listed if no documents were installed.)
About Master Software Tools: Opens the About Master Software Tools window that displays the current version of software and copyright information.
Figure 3-26. Anritsu Contact Window
Figure 3-27. MST Version and Copyright Window

3-3 Toolbar Graphical User Interface (GUI)
3-16 PN: 10580-00439 Rev. A Master Software Tools UG
3-3 Toolbar
Open File: Opens the Open Measurement File window to load a measurement file into Master Software Tools.
Save File: Saves the data from the active measurement window panel to file.
Save All: Saves changes to all open measurement window panels in the Active Measurement window and any Master Software Tools supported files that are open, being edited or being created, such as SPA, VNA, and TXT etc.
Figure 3-28. Main Toolbar
Figure 3-29. Open Measurement File Window
Graphical User Interface (GUI) 3-3 Toolbar
Master Software Tools UG PN: 10580-00439 Rev. A 3-17
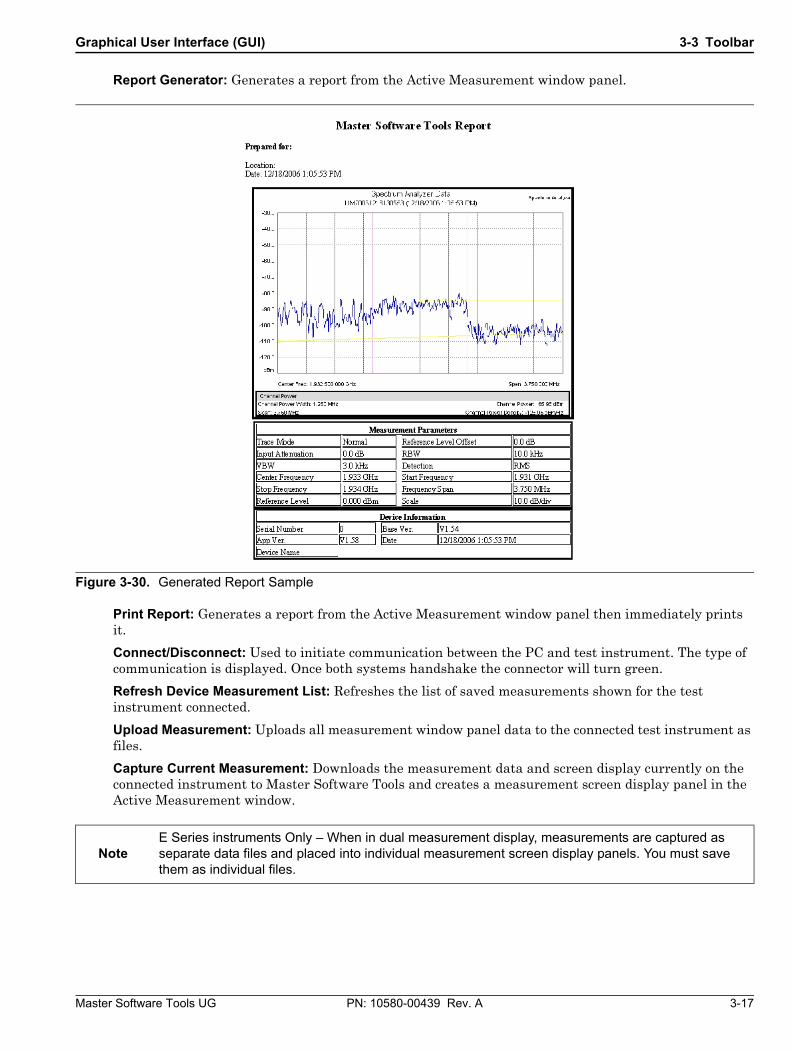
Report Generator: Generates a report from the Active Measurement window panel.
Print Report: Generates a report from the Active Measurement window panel then immediately prints it.
Connect/Disconnect: Used to initiate communication between the PC and test instrument. The type of communication is displayed. Once both systems handshake the connector will turn green.
Refresh Device Measurement List: Refreshes the list of saved measurements shown for the test instrument connected.
Upload Measurement: Uploads all measurement window panel data to the connected test instrument as files.
Capture Current Measurement: Downloads the measurement data and screen display currently on the connected instrument to Master Software Tools and creates a measurement screen display panel in the Active Measurement window.
Figure 3-30. Generated Report Sample
NoteE Series instruments Only – When in dual measurement display, measurements are captured as separate data files and placed into individual measurement screen display panels. You must save them as individual files.

3-3 Toolbar Graphical User Interface (GUI)
3-18 PN: 10580-00439 Rev. A Master Software Tools UG
Launch the DAT File Converter: Opens the DAT File Conversion Tool window. Converts supported file types from Anritsu Handheld Software Tools format to the file format supported by Master Software Tools. The DAT file to MST file conversion is irreversible.
Open the Remote Access Tool Window: Runs the Remote Access Tools program. Note: It is recommended using the most recent remote access software Wireless Remote Access Tool. Go to the Anritsu Website to download this software.
Help: Opens the Master Software Tools User Guide in Adobe Acrobat Reader (if installed).
Figure 3-31. DAT File Conversion Tool Window
Graphical User Interface (GUI) 3-4 Graphic Display Edit Toolbar
Master Software Tools UG PN: 10580-00439 Rev. A 3-19
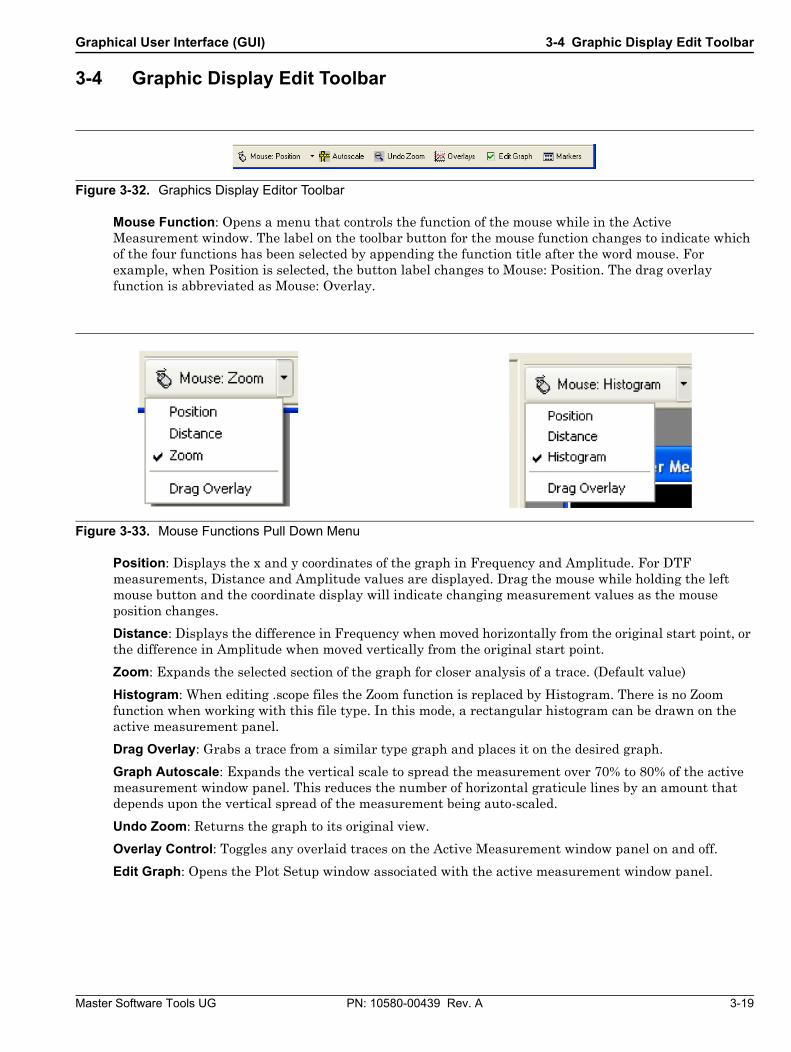
3-4 Graphic Display Edit Toolbar
Mouse Function: Opens a menu that controls the function of the mouse while in the Active Measurement window. The label on the toolbar button for the mouse function changes to indicate which of the four functions has been selected by appending the function title after the word mouse. For example, when Position is selected, the button label changes to Mouse: Position. The drag overlay function is abbreviated as Mouse: Overlay.
Position: Displays the x and y coordinates of the graph in Frequency and Amplitude. For DTF measurements, Distance and Amplitude values are displayed. Drag the mouse while holding the left mouse button and the coordinate display will indicate changing measurement values as the mouse position changes.
Distance: Displays the difference in Frequency when moved horizontally from the original start point, or the difference in Amplitude when moved vertically from the original start point.
Zoom: Expands the selected section of the graph for closer analysis of a trace. (Default value)
Histogram: When editing .scope files the Zoom function is replaced by Histogram. There is no Zoom function when working with this file type. In this mode, a rectangular histogram can be drawn on the active measurement panel.
Drag Overlay: Grabs a trace from a similar type graph and places it on the desired graph.
Graph Autoscale: Expands the vertical scale to spread the measurement over 70% to 80% of the active measurement window panel. This reduces the number of horizontal graticule lines by an amount that depends upon the vertical spread of the measurement being auto-scaled.
Undo Zoom: Returns the graph to its original view.
Overlay Control: Toggles any overlaid traces on the Active Measurement window panel on and off.
Edit Graph: Opens the Plot Setup window associated with the active measurement window panel.
Figure 3-32. Graphics Display Editor Toolbar
Figure 3-33. Mouse Functions Pull Down Menu

3-4 Graphic Display Edit Toolbar Graphical User Interface (GUI)
3-20 PN: 10580-00439 Rev. A Master Software Tools UG
Markers: Lists the marker table under the active measurement graph for selecting and setting up markers. Clicking the pull down menu opens a sub-menu to set a Marker To Peak, set a Marker To Valley, set a marker to Peak Between Markers or set a marker to Valley Between Markers. Highlighting either Marker To Peak or Marker To Valley opens another sub-menu to select a marker. Peak Between Markers and Valley Between Markers lists a sub-menu of markers to position between a maker pair.
Figure 3-34. Sample Plot Setup Window
Figure 3-35. Markers Pull Down Menu

Graphical User Interface (GUI) 3-5 Active Measurement Window
Master Software Tools UG PN: 10580-00439 Rev. A 3-21
3-5 Active Measurement WindowDisplays all measurement windows. The measurement panel whose title bar is highlighted in dark blue is the active measurement window.
3-6 File Resource Tabs
Local: Selects the directory and files on the PC.
Device: List files from the internal memory of the test instrument, a compact flash card, or USB memory.
Open: List files that are currently open in the MST Active Measurement Window.
Network: Selects the directory and files from an available network.
NoteTo maintain a better resolution, the TD-SCDMA Signal Analyzer measurement panel cannot be resized
Figure 3-36. Active Measurement Window
Figure 3-37. File Resource Tab

3-7 File Resource Directory Window Graphical User Interface (GUI)
3-22 PN: 10580-00439 Rev. A Master Software Tools UG
3-7 File Resource Directory WindowWhen the Local button is pressed, the File Resource Directory window and File List window open to display a list of measurement files.
3-8 File List WindowWhen any of the Resource Tab buttons are pressed, the File List window opens to display a list of measurement files.
3-9 Measurement File Preview/Summary WindowsWhen a file in the File List window is highlighted, its data is displayed in graphical format when the Preview tab is pressed or in text when the File Summary tab is pressed.
Figure 3-38. File Resource Directory
Figure 3-39. File List Window
Figure 3-40. Measurement File Preview/Summary Window

Graphical User Interface (GUI) 3-10 Status Bar
Master Software Tools UG PN: 10580-00439 Rev. A 3-23
3-10 Status BarThe Status Bar displays information on the PC connection to the instrument with the type of connection used, the number of measurement files in the instrument, and how long the PC and the instrument have been connected.
3-11 Context Menus & Plot SetupContext Menus are menus that open when the mouse cursor is placed over the active measurement window panel and the right mouse button selected.
There are common command lines and plot setup options in the context menus between several of the analyzers and editors, as highlighted in green below. For specific options not included here, refer to the section of this User Guide specific to the measurement of interest.
Common Context Menu Command Lines and Plot Setup Configurations –
Figure 3-41. Status Bar
Figure 3-42. Example Plot Setup Window
Figure 3-43. Example Context Menu

3-11 Context Menus & Plot Setup Graphical User Interface (GUI)
3-24 PN: 10580-00439 Rev. A Master Software Tools UG
Data Markers: Opens a list of marker commands.
Display Marker Table: Displays a Table of Markers underneath the graphical display.
Compress Marker Table: Compresses the marker table to display only used Markers. Markers not in use or invisible are not shown.
Markers Snap to Data: When enabled, dragging a marker moves from a data point to the next data point. When disabled, dragging the marker allows movement between data points on the line.
Show Marker Numbers: Displays the sequence number of the Marker when initially added.
Marker 1 Reference: Sets Marker 1 as a reference to the six delta markers.
Move Deltas with Reference: Enables the six delta markers to move with Marker 1.
Reset Marker Positions: If moved, resets all markers to their original positions.
Vertical Line: Toggles the Marker to show as a vertical line instead of an inverted triangle.
Inverted Triangle: Toggles the Marker to show as an inverted triangle instead of a vertical line.
View Limit Lines: Opens a list of Limit Line controls. Many measurement types support upper and lower limit lines on data plots. In the Plot Setup dialog box, the limit lines can be turned on or off (upper and lower separately) and can be reset to specified values. When a limit line is reset, it is reduced to two nodes spanning 90% of the x-axis range and is set above or below the vertical data range. A special context menu is associated with each node in a limit line.
Show Upper Limit Line: Toggles the Upper Limit Line on and off.
Show Lower Limit Line: Toggles the Lower Limit Line on and off.
Figure 3-44. Data Markers Pull Down Menu
Figure 3-45. View Limit Line Controls Menu
Graphical User Interface (GUI) 3-11 Context Menus & Plot Setup
Master Software Tools UG PN: 10580-00439 Rev. A 3-25
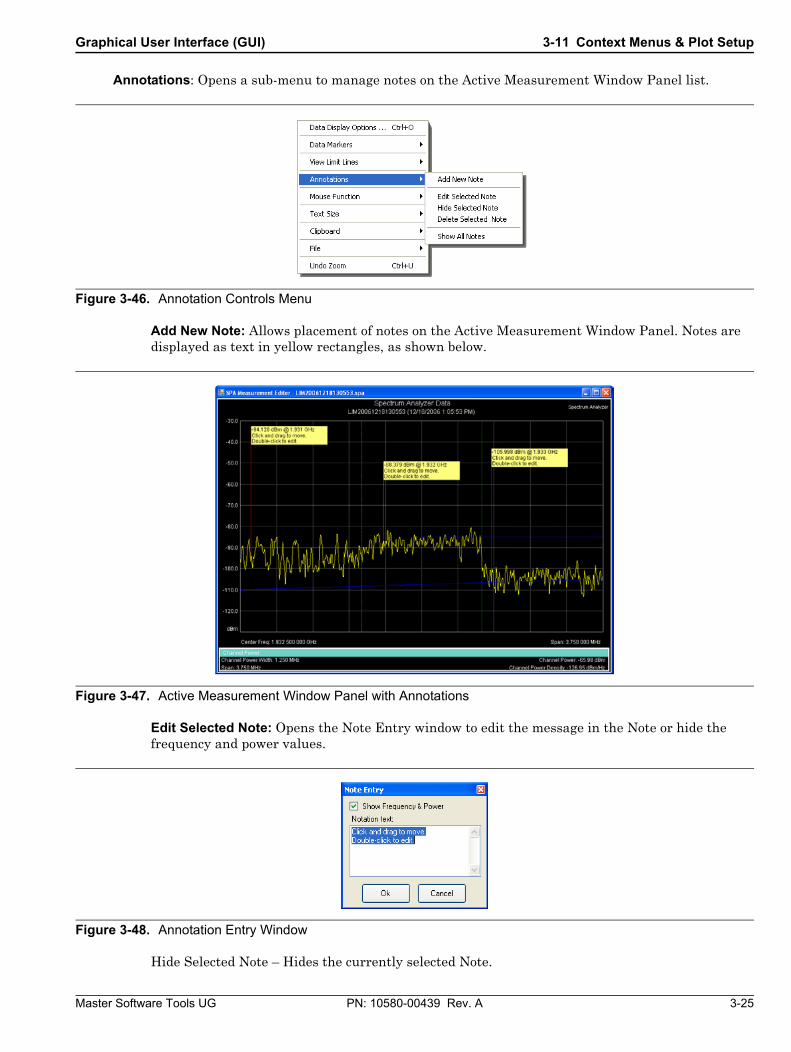
Annotations: Opens a sub-menu to manage notes on the Active Measurement Window Panel list.
Add New Note: Allows placement of notes on the Active Measurement Window Panel. Notes are displayed as text in yellow rectangles, as shown below.
Edit Selected Note: Opens the Note Entry window to edit the message in the Note or hide the frequency and power values.
Hide Selected Note – Hides the currently selected Note.
Figure 3-46. Annotation Controls Menu
Figure 3-47. Active Measurement Window Panel with Annotations
Figure 3-48. Annotation Entry Window

3-11 Context Menus & Plot Setup Graphical User Interface (GUI)
3-26 PN: 10580-00439 Rev. A Master Software Tools UG
Delete Selected Note: Deletes the currently selected Note.
Show All Notes: Displays all hidden Notes.
Mouse Function: Opens a list of mouse functions. These commands are also accessible by clicking on the Mouse menu on the Graphic Toolbar.
The label on the toolbar button for the mouse function changes to indicate which of the four functions has been selected by appending the function title after the word mouse. For example, when position is selected, the button label changes to Mouse: Position. The drag overlay function is abbreviated as Mouse: Overlay.
Position: Displays the x and y coordinates of the graph in Frequency and Amplitude. For DTF measurements, Distance and Amplitude values are displayed. Drag the mouse while holding the left mouse button and the coordinate display will indicate changing measurement values as the mouse position changes.
Distance: Displays the difference in Frequency when moved horizontally from the original start point, or the difference in Amplitude when moved vertically from the original start point.
Zoom: Expands a selected section of the graph. Use this feature for closer analysis of a trace.
Drag Overlay: Grabs a trace from a similar type graph and places it on the desired graph.
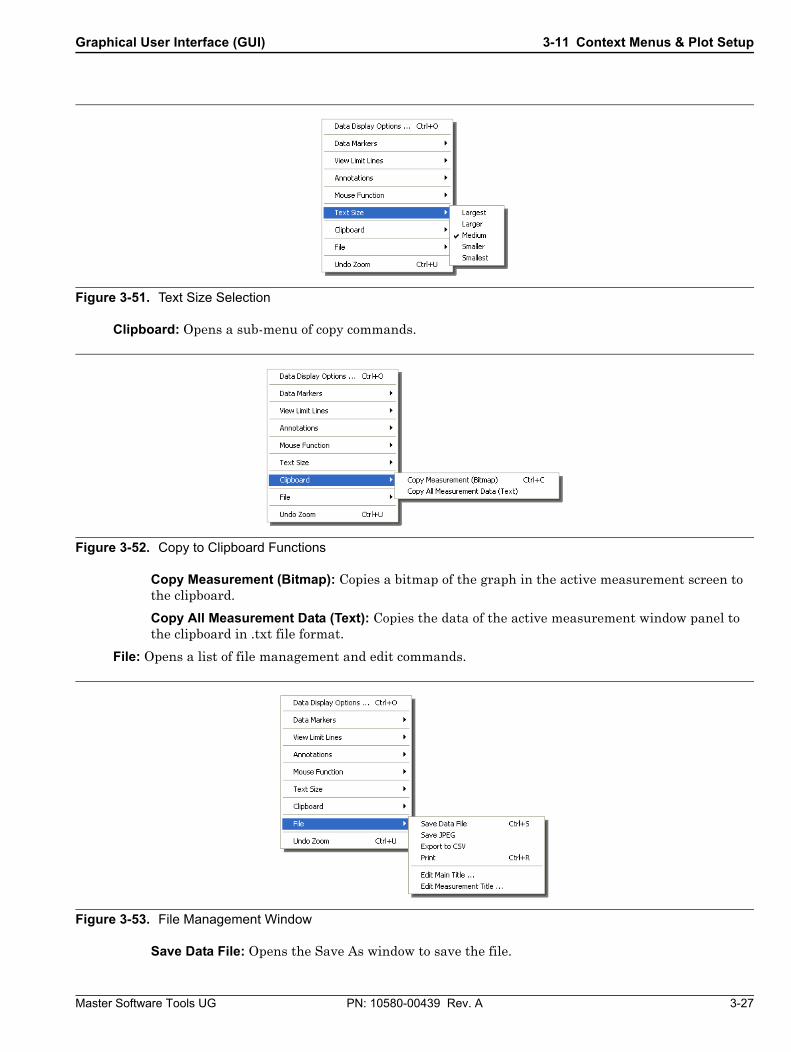
Text Size: Opens a menu to change the text size of the Active Measurement Window. The default text size can be adjusted for all measurement windows. If a window is reduced to a size that is too small for the selected text size, the text size is automatically reduced, but is automatically enlarged again to the selected value if the window is enlarged sufficiently.
Figure 3-49. Mouse Function Menu
Figure 3-50. Mouse Functions Menu
Graphical User Interface (GUI) 3-11 Context Menus & Plot Setup
Master Software Tools UG PN: 10580-00439 Rev. A 3-27
Clipboard: Opens a sub-menu of copy commands.
Copy Measurement (Bitmap): Copies a bitmap of the graph in the active measurement screen to the clipboard.
Copy All Measurement Data (Text): Copies the data of the active measurement window panel to the clipboard in .txt file format.
File: Opens a list of file management and edit commands.
Save Data File: Opens the Save As window to save the file.
Figure 3-51. Text Size Selection
Figure 3-52. Copy to Clipboard Functions
Figure 3-53. File Management Window

3-11 Context Menus & Plot Setup Graphical User Interface (GUI)
3-28 PN: 10580-00439 Rev. A Master Software Tools UG
Save JPEG: Saves the currently displayed Active Measurement as a JPEG file.
Export to CSV: Saves the data file as a CSV (comma separated values) file that can be imported into a spreadsheet application.
Print: Sends the active measurement window graph and data to the printer.
Edit Main Title: Opens the Enter Title entry window to change the main title of the active measurement window.
Edit Measurement Title: Opens the Enter Subtitle entry window to change the sub-title of the active measurement window.
Undo Zoom: Opens a list of file management and edit commands.
Figure 3-54. Enter Title Entry Window
Figure 3-55. Enter Subtitle Entry Window
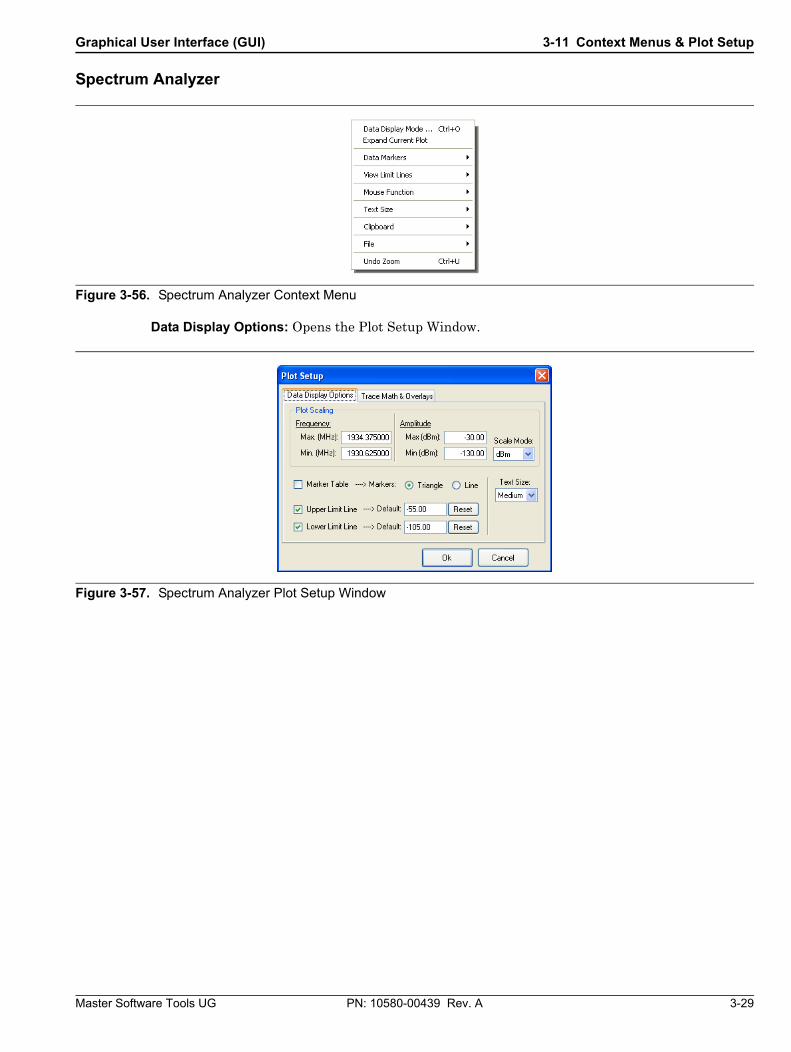
Graphical User Interface (GUI) 3-11 Context Menus & Plot Setup
Master Software Tools UG PN: 10580-00439 Rev. A 3-29
Spectrum Analyzer
Data Display Options: Opens the Plot Setup Window.
Figure 3-56. Spectrum Analyzer Context Menu
Figure 3-57. Spectrum Analyzer Plot Setup Window
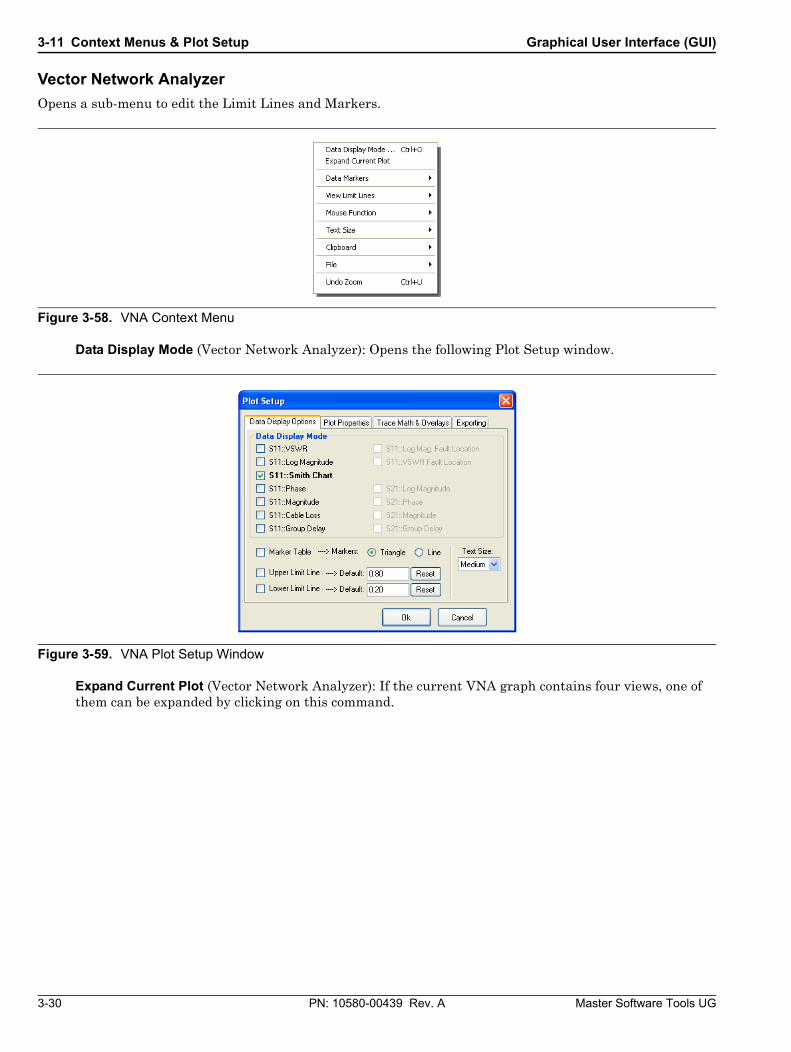
3-11 Context Menus & Plot Setup Graphical User Interface (GUI)
3-30 PN: 10580-00439 Rev. A Master Software Tools UG
Vector Network Analyzer
Opens a sub-menu to edit the Limit Lines and Markers.
Data Display Mode (Vector Network Analyzer): Opens the following Plot Setup window.
Expand Current Plot (Vector Network Analyzer): If the current VNA graph contains four views, one of them can be expanded by clicking on this command.
Figure 3-58. VNA Context Menu
Figure 3-59. VNA Plot Setup Window

Graphical User Interface (GUI) 3-11 Context Menus & Plot Setup
Master Software Tools UG PN: 10580-00439 Rev. A 3-31
WCDMA
Opens a sub-menu to edit the Limit Lines.
Data Display Mode (WCDMA): Opens the Plot Setup window.
Figure 3-60. WCDMA Sub-menu
Figure 3-61. WCDMA Plot Setup Window

3-11 Context Menus & Plot Setup Graphical User Interface (GUI)
3-32 PN: 10580-00439 Rev. A Master Software Tools UG
Interference Analyzer
Opens a sub-menu to save an .IA file in different file formats.The measurement window shows a composite of all traces in a spectrogram. Each data set is shown as a single row of pixels with color variation to indicate amplitude. There is a cursor on the spectrogram that allows selection of a single line from the spectrogram which is then displayed as a normal trace below the spectrogram. In the image shown, the cursor is a red line at the very top of the spectrogram. Between the spectrogram and the individual trace graph is the number of the highlighted trace along with its date and time stamp. GPS and UTC data will be displayed for measurements taken with GPS and UTC data.
Figure 3-62. IA Measurement Editor
Figure 3-63. IA Context Menu

Graphical User Interface (GUI) 3-11 Context Menus & Plot Setup
Master Software Tools UG PN: 10580-00439 Rev. A 3-33
Export to CSV: Opens the Save As window to save the data file as a CSV (comma separated values) file that can be imported into a spreadsheet application.
Save Window as JPEG: Saves both the Spectrogram and the currently selected trace below it in a single JPEG image.
Save Spectrum as JPEG: Saves only the selected trace in a normal x-y plot and does not include the spectrogram. In both cases, a table of measurement parameters is appended below the graph.
Figure 3-64. Active Measurement Window Saved as JPEG Sample
Figure 3-65. Active Measurement Spectrum Only Saved as JPEG Sample
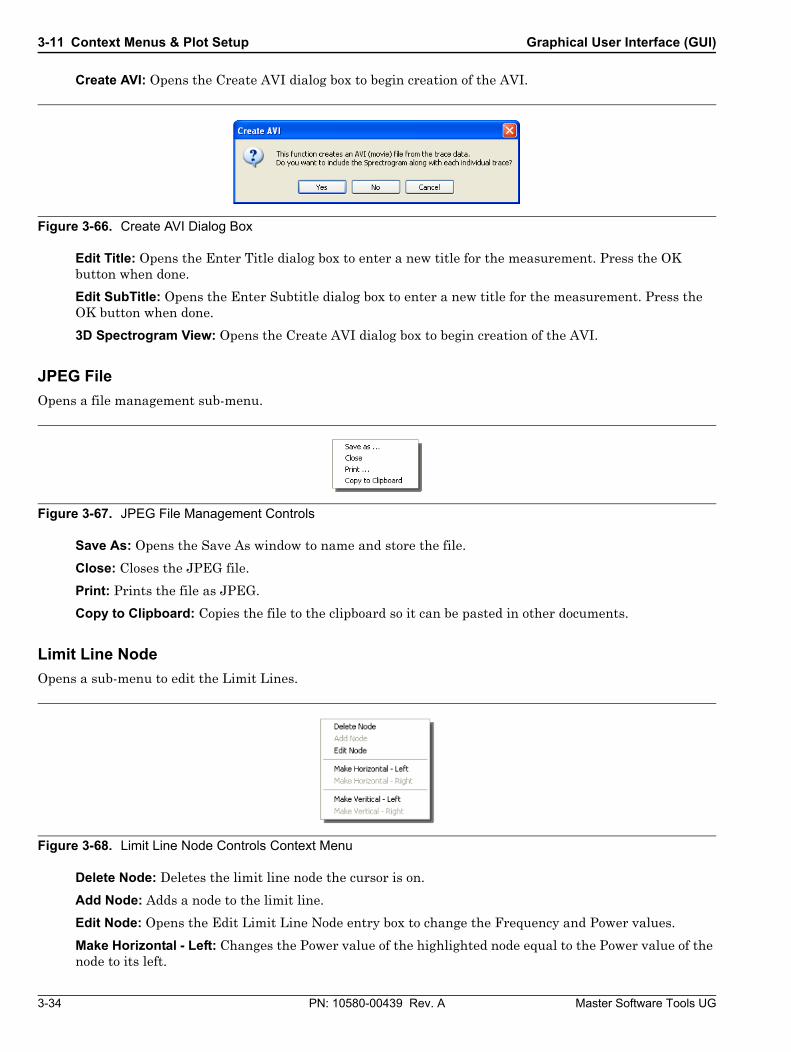
3-11 Context Menus & Plot Setup Graphical User Interface (GUI)
3-34 PN: 10580-00439 Rev. A Master Software Tools UG
Create AVI: Opens the Create AVI dialog box to begin creation of the AVI.
Edit Title: Opens the Enter Title dialog box to enter a new title for the measurement. Press the OK button when done.
Edit SubTitle: Opens the Enter Subtitle dialog box to enter a new title for the measurement. Press the OK button when done.
3D Spectrogram View: Opens the Create AVI dialog box to begin creation of the AVI.
JPEG File
Opens a file management sub-menu.
Save As: Opens the Save As window to name and store the file.
Close: Closes the JPEG file.
Print: Prints the file as JPEG.
Copy to Clipboard: Copies the file to the clipboard so it can be pasted in other documents.
Limit Line Node
Opens a sub-menu to edit the Limit Lines.
Delete Node: Deletes the limit line node the cursor is on.
Add Node: Adds a node to the limit line.
Edit Node: Opens the Edit Limit Line Node entry box to change the Frequency and Power values.
Make Horizontal - Left: Changes the Power value of the highlighted node equal to the Power value of the node to its left.
Figure 3-66. Create AVI Dialog Box
Figure 3-67. JPEG File Management Controls
Figure 3-68. Limit Line Node Controls Context Menu

Graphical User Interface (GUI) 3-11 Context Menus & Plot Setup
Master Software Tools UG PN: 10580-00439 Rev. A 3-35
Make Horizontal - Right: Changes the Power value of the highlighted node equal to the Power value of the node to its right.
Make Vertical - Left: Changes the Frequency value of the highlighted node equal to the Frequency value of the node to its left.
Make Vertical - Right: Changes the Frequency value of the highlighted node equal to the Frequency value of the node to its right.
Power Meter, High Accuracy Power Meter, Fixed WiMAX, Mobile WiMAX, WCDMA
Data Display Options (for both Power Meter and High Accuracy Power Meter): Opens the Plot Setup window.
Data Display Options (Fixed WiMAX, Mobile WiMAX): Opens the dialog window to change the text size of the Fixed WiMAX and Mobile WiMAX Editor window.
Figure 3-69. Context Menu for Power Meter, Hi- Accuracy Power Meter, Fixed WiMAX, Mobile WiMAX, WCDMA
Figure 3-70. Power Meter and High Power Accuracy Meter Plot Setup Window
Figure 3-71. Fixed & Mobile WiMAX Plot Setup Window

3-11 Context Menus & Plot Setup Graphical User Interface (GUI)
3-36 PN: 10580-00439 Rev. A Master Software Tools UG
Signal Standard Editor
Opens a menu to edit the list Signal Standards.
Copy: Copies the highlighted signal or segment to the clipboard.
Cut: Removes the highlighted branch from the list of signal standards.
Paste: Pastes the current signal in the clipboard under the highlighted signal branch. Adds the current segment in the clipboard to the list of segments in the highlighted signal branch.
Add Signal Standard: Adds a signal branch to be edited to the bottom of the list.
Delete Signal Standard: Deletes the highlighted signal standard.
Add Segment: Adds a segment branch under the highlighted signal standard.
Delete Segment: Deletes the highlighted segment standard.
TD-SCDMA Signal Analyzer
The TD-SCDMA Signal Analyzer does not use Limit Line or Marker editing features. Therefore, no context menu opens when clicking the right mouse button.
Figure 3-72. Signal Standard Editor Context Menu

Graphical User Interface (GUI) 3-12 File Editor, Tools, and Miscellaneous Windows
Master Software Tools UG PN: 10580-00439 Rev. A 3-37
3-12 File Editor, Tools, and Miscellaneous Windows
Print All Measurements
Page Layout: Select the number of plots from the Active Measurement Window to be printed per page.
Page Orientation: Places the plot in a Portrait (vertical) or Landscape (horizontal) format.
Dialog Box: States the number files to be printed.
Print Button: Click the Print button to print files.
Antenna File
Opens immediately after downloading and saving a file from the test instrument or after dragging an Antenna List file into the Active Measurement Window. Once an antenna list window is open, use Sync | Upload Active Window to upload the new antenna list to the instrument. The blank box in the Antennas column is for a new antenna entry. When highlighted, a row of blank boxes will appear in the window on the right. Enter the antenna’s Frequency (MHz), Antenna Factor (dB) and Antenna Gain (dbi) in the respective boxes.
Figure 3-73. Print All Measurements Window
Figure 3-74. Antenna Editor Window

3-12 File Editor, Tools, and Miscellaneous Windows Graphical User Interface (GUI)
3-38 PN: 10580-00439 Rev. A Master Software Tools UG
Cable File
Opens immediately after downloading the file from the test instrument or after dragging a Cable List file into the Active Measurement Window. A row of blank boxes are available at the end of the list. Scroll down to these boxes. Enter the new cable name and associated parameters.
Signal Standard Editor
Opens immediately after downloading the file from the test instrument or after dragging a .SIG file into the Active Measurement Window. This editor is used for editing signal standard file types – WCDMA, CDMA, GSM, No Uplink/Downlink, Fixed WiMAX, Mobile WiMAX, TD-SCDMA, and LTE.
Figure 3-75. Cable Editor Window
Figure 3-76. Signal Standard Editor

Graphical User Interface (GUI) 3-12 File Editor, Tools, and Miscellaneous Windows
Master Software Tools UG PN: 10580-00439 Rev. A 3-39
Language Editor
Opens immediately after downloading the file from the test instrument and stores the file xxx.znc locally in C:\Program Files\Anritsu\Anritsu Master Software. The Language Editor allows for modification of the language that is already in the instrument (except English) and also provides the ability to add two custom languages to the instrument.
Pass Fail Editor
Opens immediately after downloading the file from the test instrument or after dragging a Test Models list file into the Active Measurement Window. This editor is used to edit the three Pass/Fail file types – GSM/GPRS/EDGE, WCDMA/HSDPA, Fixed WiMAX, Mobile WiMAX, CDMA, EV-DO, TD-SCDMA, and LTE. The blank box in the Models column at the end of the list is for a new model entry. When highlighted, a row of blank boxes will appear in the window on the right. Enter the associated parameter in each box.
Figure 3-77. Language Editor Window
Figure 3-78. Pass/Fail Editor Window

3-12 File Editor, Tools, and Miscellaneous Windows Graphical User Interface (GUI)
3-40 PN: 10580-00439 Rev. A Master Software Tools UG
XML Parameter File Editor
Simple DL-MAP editor to edit current DL-MAP files or create DL-MAP files in MST. When editing or creating a file is completed, use the Upload button to transfer the file back into the instrument. For more information, please refer to the MX370105A Mobile WiMAX IQ producer documentation.
Spectrum Analyzer and VNA Plot Setup
Used for changing various plot parameters.
• Data Display Options
• Plot Scaling
Frequency: Enter the minimum and maximum frequency plot boundaries.
Amplitude: Enter the minimum and maximum amplitude plot boundaries
Marker Table: Check this box to display the marker table below the graph.
Markers: Toggles the markers to be displayed as inverted triangles or lines.
Figure 3-79. XML Parameter File Editor
Figure 3-80. SPA and VNA Data Display Options

Graphical User Interface (GUI) 3-12 File Editor, Tools, and Miscellaneous Windows
Master Software Tools UG PN: 10580-00439 Rev. A 3-41
Upper Limit Line: Toggles the Upper Limit Line on or off in the active measurement window.
Lower Limit Line: Toggles the Lower Limit Line on or off in the active measurement window.
Reset: If the Limit Lines were moved, the Reset button returns the lines to their original value.
Text Size: Changes the text size in the active measurement window.
Figure 3-81. SPA and VNA Data Display Options

3-12 File Editor, Tools, and Miscellaneous Windows Graphical User Interface (GUI)
3-42 PN: 10580-00439 Rev. A Master Software Tools UG
• Trace Math & Overlays Tab
Trace Math is a tool for comparing two traces. It is possible to upload traces using Master Software Tools, store those traces in memory, and compare the stored traces with a more recent trace.
• Overlay Traces
Add: Opens a .SPA or .VNA File List window to select traces for overlaying.
Remove: Removes a trace from the current Overlay Traces window.
• Trace Math
Trace Math: When a second set of data is overlaid on a measurement trace, normally both data sets are displayed simultaneously, but in different colors. If Trace Math is active, then only a single trace is shown, and that single trace is either the sum or difference, taken point by point, of the original data set and the overlaid data set. There are three options for Trace Math: Trace + Overlay, Trace – Overlay, and Overlay – Trace.
Since up to five overlays can be active at once, trace math is always defined as being the original trace and the first overlay. The arrows in the Overlay dialog box move the overlays up and down in order, to select which of the five to use in trace math.
• Smoothing
Smooth Trace: Allows the user to smooth a trace by a percentage determined by the number in the box. The default is set to 1%.
Show Trace: Smoothing uses a moving average to even out bumps in the data trace. If Show Trace is selected, the original trace is shown in a faint color behind the ‘smoothed’ trace to show the effect of the smoothing.
Weighted: When smoothing a trace, the default is to use a square averaging window, meaning that the new value of a point will be the average value of X number of points to each side. A square window gives each point in the average the same weight, and is considered no weighting. If Weighting is checked, then adjacent data points are given more weight in the average than points further away.

Graphical User Interface (GUI) 3-12 File Editor, Tools, and Miscellaneous Windows
Master Software Tools UG PN: 10580-00439 Rev. A 3-43
VNA additional Plot Setup
• Plot Properties Tab
• Graph Boundaries: The following parameters dictate the boundaries of the plot. Parameters active for the file type are highlighted in black. Inactive parameters are grayed out. Adjust the boundaries by entering the Top and Bottom Limits of the plot.
S11: VSWR
S11: Log Magnitude
S11: Phase
S11: Cable Loss
S11: Log Mag. Fault Location
S11: VSWR Fault Location
S11: Group Delay
S21: Log Magnitude
S21: Phase
S21: Group Delay
• Distance Units:
Meter
Feet
Time (ns)
• Group Delay:
Aperture
Figure 3-82. VNA Plot Properties

3-12 File Editor, Tools, and Miscellaneous Windows Graphical User Interface (GUI)
3-44 PN: 10580-00439 Rev. A Master Software Tools UG
• Exporting Tab:
• Select output options for CSV file export: The following are parameters that can be included in an exported CSV file. Check the desired parameters.
Device Information
VNA Setup Parameters
Data Markers
Limit Lines
Measurement Data
S11 Real & Imaginary
S21 Real & Imaginary
S11 Magnitude and Phase
S21 Magnitude and Phase
• Select output options for s2p file export: The following are parameters that may be included in an exported .s2p file. Check the desired parameters.
Real & Imaginary
Magnitude and Phase
dB & Phase
Figure 3-83. VNA File Exporting Setup

Graphical User Interface (GUI) 3-12 File Editor, Tools, and Miscellaneous Windows
Master Software Tools UG PN: 10580-00439 Rev. A 3-45
Power Meter and High Power Accuracy Meter Plot Setup
Power Limits
Show Limits: Select to show the Limits.
Enter the values of the Lower and Upper Power Limits
Lower (dBm)
Upper (dBm)
Meter Scaling
Enter the values of the Minimum and Maximum Scales of the Meter.
Minimum (dBm)
Maximum (dBm)
Display Units: Select dBm, dBV, dBmV, dBuV, V or mW.
Text Size: Changes the text size in the active measurement window.
Meter Size (Degrees): Changes the arc angle of the meter.
Enter IP Address
Figure 3-84. Power Meter and High Power Accuracy Meter
Figure 3-85. IP Address Entry Box for Setting Up an Ethernet Connection

3-12 File Editor, Tools, and Miscellaneous Windows Graphical User Interface (GUI)
3-46 PN: 10580-00439 Rev. A Master Software Tools UG
Measurement Calculator (VNA)
This tool translates certain values into other units. It can show Real, Imaginary, Magnitude, Phase, Return Loss, Reflection Coefficient, and Transmission Power.
DAT File Conversion Tool
Converts supported file types from Anritsu Handheld Software Tools format to the file format supported by Master Software Tools. Conversion is one way.
Figure 3-86. Measurement Calculator
Figure 3-87. DAT File Conversion Tool Window

Graphical User Interface (GUI) 3-12 File Editor, Tools, and Miscellaneous Windows
Master Software Tools UG PN: 10580-00439 Rev. A 3-47
Distance-To-Fault
Converts RL and VSWR plots to DTF plots.
Transmission Parameters: Select a coax cable, the waveguide, or a cable from the pull down menu. Enter a dielectric constant and insertion loss values for cables not selected from the pull down menu.
Data Format - Meter Scaling: Displays the plot type to be converted to DTF.
Range: Enter the start and stop distances of the measurement.
Units: Select the desired distance unit of measure – Meters or Feet.
Windowing: Select the type of windowing method to be used on the plot.
Figure 3-88. DTF Window

3-12 File Editor, Tools, and Miscellaneous Windows Graphical User Interface (GUI)
3-48 PN: 10580-00439 Rev. A Master Software Tools UG
Trace Rename Utility
Utility window to rename measurement traces.
Figure 3-89. MST Rename Utility Window

Graphical User Interface (GUI) 3-13 Program Options
Master Software Tools UG PN: 10580-00439 Rev. A 3-49
Product Updates
This window is used to update, repair, or recover files in the internal memory of the test instrument.
3-13 Program OptionsThis window sets the parameters for Program Elements, File Transfer & Confirmations, JPEG Save Options, Measurement Print Options, Report Generator and Internet Settings.
Figure 3-90. Product Updates Window
Figure 3-91. Program Options Window with the General Options Tab Selected

3-13 Program Options Graphical User Interface (GUI)
3-50 PN: 10580-00439 Rev. A Master Software Tools UG
General Options Tab
Program Elements
Display Trace Preview/Summary – This window, on the bottom-left of the screen, can be toggled between showing the selected measurement and showing information about the file, such as File type, last saved, size, modified, and location on the network or hard drive.
Display Network Unit Information – When browsing units on the network, this option displays the unit information in the File Summary window under the browser.
Show Toolbar – This option allows displaying the toolbar in the top part of the display.
Display Status Bar – This option allows displaying the status bar located at the very bottom of the Master Software Tools window.
JPEG Save Options
Show Measurement Parameters – This option displays the following information as part of the JPG file: Trace mode, reference level offset, input attenuation, resolution bandwidth (RBW), video bandwidth (VBW), type of detection, start frequency, center frequency, stop frequency, frequency span, reference level, and scale.
Show Device Parameters – This option displays information on the device that collected the data, including the serial number, base version, software version, when the data was taken, and the device name, if applicable.
Invert Colors When Saving – This option inverts all of the colors, so black becomes white or yellow becomes blue, for better visibility and more economical printing.
JPEG Quality – This option allows the user to select the quality level of JPEG images when stored.
File Transfers & Confirmations
Get Remote File List On Connect – When selected, Master Software Tools automatically retrieves the file list when an instrument is selected. Some test instruments may have hundreds (or thousands) of stored traces, so selecting this option can slow access time when connecting and retrieving the device file list. If not selected, Master Software Tools does not automatically retrieve information about the files on the test instrument.
Automatically Save Remote Files – If this option is checked, files that are downloaded from the test instrument are automatically saved to the local hard drive and placed in the currently selected local directory.
Confirm Download From the instrument – This option displays a message when the download has been completed.
Confirm Upload From the Instrument – This option displays a message when the upload has been completed.
Confirm Overwrite When Uploading – This option displays a message when files that are uploaded to the test instrument are being overwritten.
Measurement Print Options
Print Measurement Parameters – When a measurement is displayed, relevant measurement parameters are shown in the File Summary box at the lower left-hand side of the application window. When this option is selected, this same measurement summary information is included in a table below the printed measurement.
Print Device Parameters – When selected, this option includes the following information on the print-out: test instrument serial number, base firmware version, applications firmware version, date and time that the measurement was saved, and the user-defined test instrument name.
Default to Landscape Orientation – Printed measurements default to Landscape Orientation when this option is selected. This option must be changed in the Print Properties dialog box each time that a measurement is printed. This selection affects only the default setting in this dialog box.

Graphical User Interface (GUI) 3-13 Program Options
Master Software Tools UG PN: 10580-00439 Rev. A 3-51
Remember Printer Selection – This option enables Master Software Tools to remember previous printer selections. Otherwise, the system default printer is automatically selected. If a preferred printer is desired for Master Software Tools (other than the system default printer) this option allows the preferred printer to be the default for this application only.
MapPoint Region
Measurements that contain GPS location information can be displayed with Microsoft MapPoint in Master Software Tools. When a map window is initially opened, any measurements that contain GPS data and are currently open are automatically placed on the map. The measurement is placed at the geographic location on the map that is indicated by the GPS data. Microsoft MapPoint must be purchased separately. Choices are: North America or Europe.
Mouse Mode Settings
Apply Mouse Mode to All Windows – When selected, this option applies the current mouse mode to all open windows. When the mouse mode is changed (for instance, from position to distance) in any open measurement window, that change can be applied to any open window with this option. If this option is set to off, then each measurement window can have a different mouse mode setting.
Report Generator
Report Header
The report header displays any of the following on the report:
• Report Title
• Company
• Prepared For
• Location
• Date & Time
• Company Logo: Click the folder button, which engages a file browser, to find the logo file.
• Logo Alignment (left, right, or center aligned)
Figure 3-92. Program Options Window with the Report Generator Tab Selected

3-13 Program Options Graphical User Interface (GUI)
3-52 PN: 10580-00439 Rev. A Master Software Tools UG
Open With
• Default HTML Editor (Microsoft Word, FrontPage, etc.)
• Default Internet Browser (Internet Explorer, etc.)
• Other (User Specified) Click the folder button, which engages a file browser, to find the appropriate application, or enter the full path.
Signature Line
This option appends a signature line with Prepared By and Approved By lines to the report.
Output Format
Select the file type to be generated.
• HTML
Internet Settings
Automatic Update Notification
This option automatically check for updates from the Anritsu Product Support Internet site
Proxy Settings
Use a Proxy Server to access Internet content. If internet access is through a proxy server, then a user-name, password, and domain are required. This information is generally available from the system administrator.
Figure 3-93. Program Options Window with the Internet Settings Tab Selected

Graphical User Interface (GUI) 3-13 Program Options
Master Software Tools UG PN: 10580-00439 Rev. A 3-53
Serial Port Settings
Active Port
Pull down this menu to select the COM port that you set up in the Systems of the Control Panel to communicate with the Anritsu test instrument.
Baud Rate
Set the baud rate to 115200. If you have problems with communications between MST and the test instrument, then lower the baud rate to the next speed.
Figure 3-94. Program Options Window with the Internet Settings Tab Selected

3-13 Program Options Graphical User Interface (GUI)
3-54 PN: 10580-00439 Rev. A Master Software Tools UG
Languages
Language Options
This window allows you to set the language font style in MST for window titles, menu titles, command lines, and options lists. The list of language fonts includes Japanese, Korean, Chinese Traditional, Chinese Simple, French, Italian, German, Spanish, and English. Usually the default font set is to English. To change from the current language font, click the radio button of the desired language font. Fonts will change accordingly. If your computer does not support Asian language fonts, which are the top four languages fonts on the list, the text next to each radio button will display as little rectangles. To install the East Asian language fonts, see Appendix C FAQs – Installing East Asian Language Fonts.
Figure 3-95. Program Options Window with the Languages Tab Selected

Graphical User Interface (GUI) 3-13 Program Options
Master Software Tools UG PN: 10580-00439 Rev. A 3-55
MST File Indexing – Trace Catalog
Trace Index Location
Select either Use Local Trace Index or Use Remote Trace Index to catalog files.
Indexing Schedule
• Select the day or days Trace Indexing should occur.
• Set the time for Trace Indexing to begin.
• Include thumbnails in index – Includes thumbnail pictures of the plot when indexing.
Indexing Root Folder
• Select the directory that contains the files of Traces to be indexed.
Launch Trace Indexing on system startup – Runs the Trace Index program on startup and places the application icon on the Taskbar.
Load thumbnails – Loads thumbnails when displaying the list of indexed traces.
Index Now Button – Begin indexing now, rather than wait for the scheduled indexing set time.
View Log – Opens a .txt file in Notepad to view all the indexing data – start date and time, elapsed time, and file types with the number of files indexed.
Figure 3-96. Master Software Tools File Indexing Setup Window

3-13 Program Options Graphical User Interface (GUI)
3-56 PN: 10580-00439 Rev. A Master Software Tools UG
Archive Options – Trace Catalog
Files to Archive
Archive all selected files: Archives all highlighted files in the Trace Catalog window.
Archive all .XXX files: Archives all files of the type selected. .XXX denotes the different file types supported by Master Software Tools.
Archive All Files in Index: Indexes all files in the Indexing root folder.
Archive by Date
From: Enter the start date for archiving.
Through: Enter the end date for archiving.
Preserve path names in archive: Runs the Trace Index program on startup and places the application icon on the MS Taskbar. This option allows you to choose whether or not to include path names in the archive.
The Trace Indexer finds and lists all supported file types on the selected hard disk. This will give a list, for instance, of all VNA files on the disk regardless of where they are located, and allow sorting and selection based on certain defined measurement parameters. For purposes of backup, or to send a large file set to another location, the selected files can all be compressed (archived) into a ZIP file. A ZIP file can store original relative pathnames, so when it is unzipped the original folder structure is also rebuilt. Alternatively, the path names can be left out of the ZIP file so that when it is unzipped all the files end up in a single folder regardless of their original relative locations on the source disk.
Enter Title
Opens the Enter Title window to change the main title of the active measurement window panel.
Figure 3-97. Archiving Options Setup Window
Figure 3-98. Title Entry Widow

Graphical User Interface (GUI) 3-13 Program Options
Master Software Tools UG PN: 10580-00439 Rev. A 3-57
Edit Measurement Title
Opens the Enter Subtitle entry window to change the subtitle of the active measurement window panel.
Figure 3-99. Subtitle Entry Window

3-13 Program Options Graphical User Interface (GUI)
3-58 PN: 10580-00439 Rev. A Master Software Tools UG

Master Software Tools UG PN: 10580-00439 Rev. A 4-1
Chapter 4 — Using Master Software Tools
4-1 IntroductionThe core function of Master Software Tools is to view and edit measurement files that are collected by supported Anritsu test instruments. The first step in using Master Software Tools is opening a measurement file. Measurement files may come from a variety of sources, but usually are captured as active measurements from a connected test instrument, are downloaded as a stored measurement from a connected test instrument, or are opened as a previous measurement that is already stored on a local hard disk (or accessible network drive). The first step is to establish a connection.
4-2 General File Management
Downloading and Uploading Measurement Files
After a connection has been established, the software is ready to retrieve stored measurements or to capture the current measurement on a connected test instrument. The status of the connection is shown in the application status bar along the bottom edge of the window and also is shown by the color of the icon in the Connection button of the main toolbar. Green indicates connected. Red indicates no connection.
In order to capture the current measurement, press the Capture Current Measurement button in the main toolbar (the icon is an arrow pointing downward). This retrieves the measurement from the unit and displays the measurement. The measurement appearance is very similar to the display on the test instrument. Master Software Tools is designed to closely approximate the look and feel of the test instrument displays so that learning two entirely different displays is not required. In order to upload a measurement to a connected test instrument, press the Upload button (the icon is an arrow pointing upward) on the main toolbar. In the Sync menu, this function is labeled Upload Active Window. This automatically determines the file type and stores it in the appropriate location on the test instrument.
The test instrument has three different memory locations where files can be stored. Select the appropriate location before downloading or uploading. By default, the internal memory in the test instrument is used.
Some instruments provide a Compact Flash slot and a USB slot to add additional memory space for storing traces. An instrument may potentially have stored traces on internal RAM, an inserted compact flash card, and on an inserted USB memory stick. When a connection is established to an instrument with Master Software Tools, a list of measurement files is displayed. This list is for the Internal Memory, a Compact Flash, or a USB stick. The drop-down list in Master Software Tools allows selection of which memory device to view. When files are uploaded or download to/from an instrument, the currently selected memory space is used.
After a connection is established, Master Software Tools searches the test instrument for a file list. This file list is displayed along the left side of the application window under the Device tab. To open any file in this list, double-click with the mouse, or select the file and press Enter on the keyboard.
By default, whenever a file from the test instrument is opened, a local copy is retrieved and stored on the local hard disk. The location where this file is stored is found under the Local tab along the left side of the application window. This tab displays a folder and a file list. Browse to the desired location for file storage. Double-click a file in this Local list to open it in Master Software Tools.
NoteE Series instruments Only – When in dual measurement display, measurements are captured as separate data files and placed into individual measurement screens. You must save them as individual files.

4-2 General File Management Using Master Software Tools
4-2 PN: 10580-00439 Rev. A Master Software Tools UG
At the bottom, left of the application window is a Measurement Preview/File Summary window. Whenever a file is selected, either in the Device or in a Local file list, a preview is generated and displayed. For most measurement modes, this is a picture indicating approximately how the file will appear when opened. For some file types, such as Antenna and Cable lists, no such graphical preview is available. In this case, the File Summary window shows an overview of the file contents. The Measurement Preview/File Summary attempts to track the program focus. When a file is selected either in the Device or in the Local file list, the preview shows that selected file. When an open measurement window is selected, the File Summary is for the measurement in the selected window.
Tabs are located along the left side of the application window with the following labels: Local, Device, Open, and Network. These tabs allow access to local files (on the local PC), available devices (internal memory, compact flash, or USB memory), open files (currently open measurements in the Master Software Tools window), and network devices (test instruments that are connected to the available network).
The Network device list contains a list of all supported devices on the LAN. This list is not automatically generated and must be manually refreshed. Press the Query Network for Instruments button to populate or refresh this list. The Query Network for Instruments button is available only when the Network device list is open. A device that shows up in this list is not necessarily available. Each test instrument can maintain only a single Ethernet connection, so if a device is busy when a connection is initiated, then Master Software Tools fails to connect. Double-clicking a device in this list will initiate a connection request.
A summary of each network device may be selected. The summary will appear in the File Summary area below the list. By default, this feature is turned OFF. Because many devices may already be in use, significant time can be consumed waiting for the Device Summary request to time-out.
To turn on the Network Device Summary feature, use the Program Options screen that is found under the Tools main menu.
Open, Save, Save As, Print and Close
Standard Windows operating system options for handling files are included in the File main menu. Measurement file actions that are available from this menu include: Open, Save, Save As (with a changed name), Print, and Close. These are standard operations and behave in a manner similar to other Windows applications. A few file operations are specific to Master Software Tools and are described in the following sections.
Export
When exporting measurement data from Master Software Tools, the measurement file is saved in a standard text-based file format that can be read by other common applications. This is a CSV (Comma Separated Value) format that is supported by Microsoft Excel and by other spreadsheet and data programs.
Figure 4-1.
Figure 4-2.
Using Master Software Tools 4-2 General File Management
Master Software Tools UG PN: 10580-00439 Rev. A 4-3
The CSV format changes slightly in different countries, depending upon customary use of commas and decimal points when expressing numbers. The Export dialog box has a File Type drop-down list with four options. Select the option that is appropriate for the file destination.
Master Software Tools CSV Format Options:
• CSV (Comma delimited: #.##, #.##)(*.CSV), where a period indicates the decimal, and a comma separates the numbers.
• CSV (Semi-colon delimited: #,##; #,##)(*.CSV), where a comma indicates the decimal, and a semicolon separates the numbers.
• Text (Tab delimited: #.## [Tab] #.##)(*.txt), where a period indicates the decimal, and a tab separates the numbers.
• Text (Tab delimited: #,## [Tab] #,##)[*.txt), where a comma indicates the decimal, and a tab separates the numbers.
The File Type drop-down selection defaults to the file type that is appropriate for the Regional Setting of the PC. If many files are being sent to another area, then the Regional Setting could be changed in order to take advantage of the default test instrument setting. Some measurement types, such as VNA, have a number of additional options for exporting measurement data. These options are available by clicking the Edit Graph button in the Measurement Toolbar, which opens the Plot Setup dialog box.
Exporting S2P-Formatted VNA Files
The Anritsu VNA (Vector Network Analyzer) also has a specific export function for exporting S2P-formatted data files. This option is available under the File main menu only if a VNA file is open and active. Select this function for a standard Save File dialog box. Choose a filename and a destination and then press Ok to export the measurement in *.S2P format. The S2P format is an industry standard that is recognized by many simulation programs. S2P files are ASCII text files and can be viewed or edited by any standard text editor. The data in the files is not case sensitive.
Creating Measurement Reports
Master Software Tools will create a standard report from any open measurement file. Reports are also available for non-measurement files, such as antenna lists, cable lists, language tables, and so forth. Reports are formatted HTML files that are designed to be viewed in an Internet browser. Several options determine what is included in a report, such as company name, company logo, and a signature line. These options are selected from the Program Options dialog box, which is available under the Tools main menu.
Saving JPEG Images from Open Measurements
A picture of a measurement can be captured as a JPEG image. This function is available under the File menu, but it is available only if the active window supports this function. Options are available for the saving of JPEG images, such as image quality and compression level, and whether or not to invert the colors in order to save on printer ink and toner. These options are available from the Program Options dialog box in the Tools main menu. A menu option is also available to create JPEG images from all measurements that are in a specified folder. This is an automatic process. When this option is selected, the test instrument prompts for a folder pathway for the folder that contains the measurement files to be processed. Then, using the JPEG settings that are found under Program Options, Master Software Tools opens each file in the selected folder and creates a JPEG image. The output images are stored in an Image sub-folder under the specified source folder.
Saving Folder as DAT
For HHST users migrating to MST, this command is used to convert the MST measurement file back to a DAT file. Former users of HHST, importing files from their instruments into MST, will have their measurement files automatically converted to the MST format. To export those same files back into the instruments use the DAT File Conversion Tool.

4-3 Editing Measurements Using Master Software Tools
4-4 PN: 10580-00439 Rev. A Master Software Tools UG
Printing All Open Measurements
Select the Print All option under the File menu to print all of the open measurements. A dialog box opens to allow specification of the layout and the number of measurements per page. The number of measurements to be printed on each page is not limited by the software, but needs to be set to an appropriate number for resolution and readability. Unless directed otherwise, Master Software Tools automatically sets the size and format of each measurement for optimal printing. If many measurements are desired on a page, space can be conserved by turning off marker tables.
4-3 Editing MeasurementsEach measurement type has a specific set of parameters that can be edited. Many of these parameters are common across most measurement types, and these parameters are described briefly in the following section. Functions and Edits that are specific to each measurement type are described in later sections that are related to those modes.
Measurement Toolbar
The Measurement toolbar is across the top of the Display Window and contains common functions available to most (but not all) measurement types. When a function is not applicable for the active window, the associated toolbar button is disabled.
4-4 OverlaysClicking on this button toggles any overlaid traces ON or OFF. If no traces have been overlaid, then no action occurs. Overlay files must be of the same file type and should have the same frequency range. The base measurement is used to determine the automatic frequency range. If a measurement that does not overlap in frequency is overlaid, then the overlapping measurement does not show in the plot without manually adjusting the plot range in the Plot Setup dialog box. Overlays may be added to a measurement in several ways.
Drag from Local File List
Click and drag a similar measurement file from the Local File list onto the measurement window where the overlay is desired. The mouse does not need to be in Drag Overlay mode for this operation.
Drag from Windows Explorer
Click and drag a similar measurement file from Windows Explorer or from the Windows Desktop onto the desired measurement window. Master Software Tools does not distinguish the file source, but responds as long as the file is a compatible (same measurement type) file.
Drag a Similar Measurement
To drag an open measurement, the mouse must be in Drag Overlay mode. Otherwise, the mouse function will be to show plot coordinates, distance scale, or zooming. With the mouse in Drag Overlay mode, click anywhere on the source measurement and drag it over the target measurement. If Master Software Tools determines that the files are not compatible, then no change occurs.

Using Master Software Tools 4-5 Edit Graph (Plot Setup Dialog Box)
Master Software Tools UG PN: 10580-00439 Rev. A 4-5
Edit Graph (The Plot Setup Dialog Box) Using Master Software Tools
Browse for overlay measurement files in the Plot Setup dialog box. Overlay files may also be selected by using the file browser in the Plot Setup dialog box. To access this screen, click the Edit Graph button in the Measurement Toolbar and select the Trace Math & Overlays tab page. From this tab, up to 6 files may be selected for overlay. Individual overlay files are listed in the Overlay Traces section of the dialog box and may be turned on and off without disassociating the files. Clicking the Overlays button on the Measurement Toolbar toggles all of the check boxes in this window on and off.
Overlay Issues
Measurement overlays require that specific conditions be met, either to allow the overlay to occur or to allow the overlaid measurement to be displayed.
Dragging from the Device File List
When an overlay is added to a measurement, the overlay filename is stored in the original measurement file. Files can be saved and reloaded while maintaining the file overlay associations, and if the files are moved together, then the overlays are still associated and are shown when the base file is reloaded. In other words, a file cannot be overlaid directly from the device. It must be copied to the local PC disk space first so that a filename exists to be associated with the base file.
Dragging Open Measurement Files
For a similar reason, overlay of files sometimes cannot be achieved by dragging open measurement files inside the Display Window. Depending upon the options that have been selected, opening a device file may or may not automatically save the file in the local disk space. (By default, all files that are opened from a connected test instrument are saved locally.) If this option is turned off, then a remote file can be opened directly without creating a local copy of the measurement file. In this situation, this measurement cannot be overlaid onto another measurement because no local filename is associated with the measurement.
Frequency Range of Base Measurement File
Master Software Tools uses the base measurement file to set the frequency (x-axis) range when displaying data. If the frequency range of the overlaid measurement does not overlap the frequency range of the base measurement, then the overlaid measurement does not show on the plot screen. The x-axis range can be reset in the Plot Setup dialog box.
Overlay File Name at Top of Graph
When a measurement is overlaid, the filename appears across the top of the graph in the measurement window. If no filename appears, then the file did not overlay correctly, either because the file does not exist in the local disk space, or because it is an incompatible file type.
4-5 Edit Graph (Plot Setup Dialog Box)This Measurement Toolbar button opens a Plot Setup dialog box. This dialog box is different for each measurement type. For some measurement types, the dialog box offers more choices than for other measurement types. Each Measurement window also has a context menu (mouse menu) that is accessible by right-clicking the graph with the mouse. Many of the settings on the context menu are duplicated in the Plot Setup dialog box. If a single option is being changed, then the context menu is more convenient to use. When changing more options or changing advanced options that are not available on the context menu, the Plot Setup dialog box is more convenient.
Note A measurement must be saved locally before it can be overlaid.

4-6 Common Options Using Master Software Tools
4-6 PN: 10580-00439 Rev. A Master Software Tools UG
4-6 Common OptionsThese options are common to almost all supported measurement types and are described here in general terms. For specific options not included here, refer to the section of this User Guide specific to the measurement type of interest.
Autoscale
Autoscale expands the vertical scale to spread the measurement over 70% to 80% of the measurement window. When this is done, the number of horizontal graticule lines is reduced by an amount that depends upon the vertical spread of the measurement that is being auto-scaled.
Undo Zoom
Regardless of how many times the user has zoomed in on a measurement, clicking the Undo Zoom button sets the active measurement window to display the entire sweep. Zoom steps are not undone one at a time, but all at once.
Marker Table
Many measurement types support data markers. When monitoring a supported measurement type, the visibility of the marker table can be toggled on and off. The marker table must be visible in order to turn specific markers on and off, but the position of markers can be adjusted without using the marker table.
Marker Shape
Marker shape can be either a line or an inverted triangle. This sets the shape of the data markers that are displayed on the graph.
Plot Range
For measurements that consist of x/y data sets, the x-axis and y-axis ranges can be set in the Plot Setup dialog box. Some measurements have fixed ranges. Generally, if the range can be changed on the test instrument, then the range can also be changed in Master Software Tools. If the range is fixed in the test instrument, then it is fixed in Master Software Tools.
For measurement types with variable plot limits, the display can also be varied using the mouse in Zoom mode. The plot limits that are set in the Plot Setup dialog box are not the visible zoom limits, but are the limits to which a plot is reset when using the undo zoom function (via the Undo Zoom button in the tool bar).
When a measurement is saved in Master Software Tools, the zoom range is not saved. Any changes made to the plot limits in the Plot Setup dialog box are saved and become the default limits if the measurement is recalled, either in Master Software Tools or on a test instrument.
Plot Mode
In several cases, a data set that is stored on a test instrument may contain valid data for more than one view mode. For example, GSM measurements are taken in one of four modes, and the saved measurement file contains valid data for all four views. In this example, the Plot Setup dialog box allows the selection of alternate views from the data. In other cases, data can be translated into alternate views. VNA data sets that are stored as x/y data can be translated into Smith chart data. Similarly, some VNA measurements can be converted to Group Delay measurements even though this is not the view that was originally saved. These alternate views are accessed through the Plot Setup dialog box.

Using Master Software Tools 4-6 Common Options
Master Software Tools UG PN: 10580-00439 Rev. A 4-7
Measurement Overlays
Measurement types that support overlays have a tab in the Plot Setup dialog box for choosing overlay files and for turning on and off specific overlay associations. To add an overlay, click the Add button and browse to the desired file. To remove an overlay, select it in the list and press the Remove button. An overlay can be temporarily hidden by unchecking it in the list.
Overlay files can also be moved up and down in the overlay list. This is useful for measurement types (SPA and VNA, Spectrum Analyzer and Vector Network Analyzer) that allow trace math because the trace math typically is performed between the base trace and the first overlay.
Trace Math
This option is currently available only for SPA and VNA traces. When Trace Math is active, the base trace is added to the first overlay, the base trace is subtracted from the first overlay, or the first overlay is subtracted from the base trace.
Trace Smoothing
This option is available only for SPA and VNA traces, and is normally useful only with VNA data. This option allows for the trace to be smoothed by a simple moving average. The smoothing shape is either rectangular or weighted. A weighted smoothing gives more weight in the averaging of points that are closer (along the x-axis) to the original point.
The smoothing window is set with a percent value. When set to 2% for example, the smoothing window is 2% of the total trace width. If the trace would have 500 points (in this 2% example), then the smoothing window would have 10 points (2% of 500), which means that each point would be averaged with 5 points on each side of it.
The original trace and the smoothed trace can be on screen together, which gives a clear overview of the effect of the smoothing. Smoothing affects trace math. Both can be on simultaneously, and the trace that is a result of the trace math is smoothed.
Note
Saving a file in Master Software Tools does not save every change made to a measurement. Typically, these files exist as an image of a stored measurement on a test instrument. Only parameter changes that could have been changed on the test instrument are saved in the measurement file. For example, a change of text size is not saved in the measurement file, but edits to limit lines are saved.

4-7 Working with Limit Lines Using Master Software Tools
4-8 PN: 10580-00439 Rev. A Master Software Tools UG
4-7 Working with Limit LinesLimit lines are defined by a series of nodes. All limit lines must have at least two nodes, a beginning node and an ending node. Segmented limit lines have more than two nodes and can take on more complex shapes. To edit a limit line, select a node and right-click for the Node context menu. This provides a number of options to quickly set or reset limit lines, and to add, move, and remove nodes. Nodes are sometimes difficult to select. When the mouse pointer is directly over a limit line node, the node changes shape.
Many measurement types support limit lines. To turn on limit lines, use the Plot Setup dialog box (Edit Graph button on the measurement toolbar) or use the Limit Line menu options on the measurement context menu.
Working in the Active Measurement Window
Limit lines can be edited in several ways.
Method 1 (Enter the Value of the Limit Line)1. Right click on the Display Window.
2. Highlight Data Display Mode... and click.
3. Enter the value of the upper limit line, lower limit line, or both. This deletes all but the beginning and ending nodes. A node is an inflection point or end point on a limit line.
4. Click OK when done.
Method 2 (Enter the Value of the Nodes)1. Turn on the limit line.
2. Place the cursor on the start node or end node and click once on the node.
3. Right-Click and select Edit Node.
4. Enter the frequency and the amplitude of the start node.
5. Click OK.
6. Move the cursor to the end node.
7. Right-click and select Edit Node.
8. Enter the frequency and the amplitude of the end node.
9. Click OK.
Method 3 (Drag the Start and End Points)1. Turn on the limit line.
2. Place the cursor on the start node and drag it to the desired position.
3. Place the cursor on the end node and drag it to the desired position.
Editing Segmented Limit LinesSegmented limit lines can be created in Master Software Tools.
1. Right-click on the Display Window and select View Limit Lines.
2. Right-click on the start or stop node and then select Add Node in order to add a node or select Delete Node in order to delete a node.
3. Use the left mouse button and drag the new node to its new location, or select Edit Node and enter the desired amplitude and frequency value of the new node.

Using Master Software Tools 4-8 Working with Markers
Master Software Tools UG PN: 10580-00439 Rev. A 4-9
4-8 Working with MarkersMarkers are supported for many graph types. If a test instrument measurement mode supports markers, then Master Software Tools also supports markers for those measurements. A marker table can be turned on at the bottom of the measurement window through the measurement context menu or by using the Plot Setup dialog box.
Working in the Active Measurement Window
1. Display the Marker Table.
• Using the Toolbar Icon
a. Click the Markers icon on the Graph Edit Toolbar.
• Using the Context Menu
a. Place the mouse cursor over the active measurement display.
b. Press the right mouse button. Scroll down to Data Markers to open the sub-menu for enabling and setting up the markers.
c. Click Display Marker Table.
Figure 4-3. Context Menu: Display Data Marker Table

4-8 Working with Markers Using Master Software Tools
4-10 PN: 10580-00439 Rev. A Master Software Tools UG
2. Click the box in the Reference column of the marker table to place markers on the measurement window. A red marker and red box denotes the active the marker, the marker that can be moved or set to another position of the trace or between multiple traces.
3. There are multiple ways of moving and setting markers. Use the following procedures to -
• Move a Marker
a. To easily grab the marker, place the cursor on the marker label and hold down the left mouse button.
b. Drag the marker to the new position. Release the left mouse button.
• Move a Marker to Peak
a. Press the Markers pull down arrow button.
b. Highlight Marker to Peak and click the desired marker.
• Move a Marker to Valley
a. Press the Markers pull down arrow button.
b. Highlight Marker To Valleys and click the desired marker.
• Activate/Deactivate a Delta Marker
a. Click the Markers tab to display Markers table below trace.
b. Check the desired Delta marker of the corresponding active marker.
Figure 4-4. Trace Display with Data Marker Table Below

Using Master Software Tools 4-9 Annotating Graphs
Master Software Tools UG PN: 10580-00439 Rev. A 4-11
c. Move the delta marker by placing the cursor on the delta marker label and holding down the left mouse button.
d. Drag the delta marker to the new position. Release the left mouse button.
• Place a Marker on a Peak between Selected Markers
a. Press the Markers pull down arrow button.
b. Highlight Peak Between Marker.
c. Select a marker, M1-M6.
d. Click on the desired marker pair where the peak is to be found.
• Place Marker in a Valley between Selected Markers.
a. Press the Markers pull down arrow button.
b. Highlight Valley Between Markers.
c. Select a marker, M1-M6.
d. Click on the desired marker pair where the valley is to be found.
4-9 Annotating GraphsSPA (Spectrum Analyzer) and IA (Interference Analyzer) measurements support Graph annotations. A graph annotation is a note that is added to a graph in a rectangular area, which is connected to a specific point on the measurement curve by a vertical line. Text is added to an annotation by double-clicking the annotation box with the mouse. The annotation can automatically include the frequency and power level at the referenced location. Notes can be edited, hidden and deleted. Any hidden notes can be displayed by clicking on the Show All Notes command line.
To add an annotation:
1. Select Annotations on the measurement context menu (the mouse menu).
Figure 4-5. Annotation Controls Menu

4-9 Annotating Graphs Using Master Software Tools
4-12 PN: 10580-00439 Rev. A Master Software Tools UG
2. Select Add New Note from the Annotations sub-menu. A yellow Note is placed in the top left corner of the graph.
3. Annotations can be added, removed, and hidden. Hidden annotations do not show on the display, but they do not lose their place or their text. To position an annotation box, click and hold with the left mouse button while dragging it to the desired location.
To edit an annotation:
1. Place the cursor over the Note to be edited. Click the right mouse button.
2. Pull down the Annotations menu.
3. Select Edit Selected Note on the context menu (the mouse menu). The Note Entry window pops up.
Figure 4-6. Active Measurement Window Panel with Annotations
Figure 4-7. Annotation Entry Window

Using Master Software Tools 4-10 Remote Access Tool
Master Software Tools UG PN: 10580-00439 Rev. A 4-13
4. Enter new text in the dialog box.
5. To remove the frequency and power values from the Note, uncheck the Show Frequency & Power check box.
6. Click OK. New text is displayed in the Note.
To delete an annotation:
1. Place the cursor over the Note to be deleted and click the right mouse button.
2. Pull down the Annotations menu.
3. Select Delete Selected Note on the context menu (the mouse menu).
4. The Note is deleted from window. Deleted Notes cannot be recovered.
4-10 Remote Access ToolRemote Access Tool is a fully functional software emulator that remotely controls the test instrument connected to the PC. All supported instruments are displayed with their specific front panel. Hard buttons, soft buttons and graphic display emulate the test instrument.
Remote Access Tool only works with an Ethernet connection, LAN or Direct.
1. Open the Tools menu, and click the Remote Access Tool command line. A generic test instrument front panel is displayed in the Active Measurement Window.
Figure 4-8. Tools Menu

4-10 Remote Access Tool Using Master Software Tools
4-14 PN: 10580-00439 Rev. A Master Software Tools UG
2. Click on the dark green ON button in the top right corner. The first sentence in the test instrument screen changes to “The instrument screen should display in a moment” indicating the software emulator is being loaded.
3. The test instrument front panel for the test instrument connected to the PC is displayed. If the test instrument front panel display does not appear, verify that the IP address is selected in the main
Figure 4-9. Initial Generic Test Instrument Panel
Figure 4-10. Text Close Up

Using Master Software Tools 4-10 Remote Access Tool
Master Software Tools UG PN: 10580-00439 Rev. A 4-15
toolbar. If the connection cannot be established, verify that the test instrument firmware has been updated to support the Remote Access Tool.
4. Refer to the specific User’s Guide for the test instrument for more information on setting up and taking measurements.
If the PC mouse has a scroll wheel, place the cursor over the rotary knob and use the scroll wheel to rotate the knob. This feature is useful in changing the graph scale or scrolling through a menu. Clicking the left mouse button on the rotary knob acts as an Enter button.
All hard keys on the test instrument emulator operate like the hard keys on the test instrument. In the case of the soft keys, use the mouse to push the soft-key labels and function hard keys directly. The cursor will change from cross-hairs to a pointer when active.
Remote Access Tools provides the ability to use the test instrument emulator with Master Software Tools in the connected or disconnected mode. See Fig. 4-10.
Figure 4-11. BTS Master MT8222A Emulator Example
Figure 4-12. Ethernet Currently Software Connected

4-10 Remote Access Tool Using Master Software Tools
4-16 PN: 10580-00439 Rev. A Master Software Tools UG
The Ethernet cable is connected in either case. With Master Software Tools connected to the test instrument, that single user is able to manipulate that test instrument via Remote Access Tools. Disconnect the software by clicking on the Disconnect command line in the Connection menu. All of the emulator test instrument’s buttons are disabled. Multiple users are able to monitor the testing and measurements taken by the test instrument. When multiple users are monitoring the test instrument, consider changing the refresh rate for updating information from the test instrument. If too many users are monitoring the test instrument with a short refresh rate, the test instrument’s main function will be updating the users rather than taking measurements. Pull down the View menu and click on the Refresh Rate command line. Select a longer rate that would accommodate the multiple users monitoring the test instrument.
Also, the more users monitoring the test instrument the slower the processing of data takes place. Multiple users consume the test instrument’s resources thereby slowing down the test and measurement process.
Figure 4-13. Refresh Rate Default Set to 2 Seconds

Using Master Software Tools 4-11 3D Spectrogram
Master Software Tools UG PN: 10580-00439 Rev. A 4-17
4-11 3D SpectrogramThe 3D Spectrogram function allows you to view a folder of measurement traces in true 3 dimensions – frequency, time, and amplitude. Use markers to select or point out specific frequencies and amplitudes. With Signal ID, you can view specific types of signals and their SNR.
To access 3D Spectrogram you must have the Folder Spectrogram window open.
1. Right click on the Folder Spectrogram window to list the context menu.
Figure 4-14. Folder Spectrogram Window with the Context Menu Listed
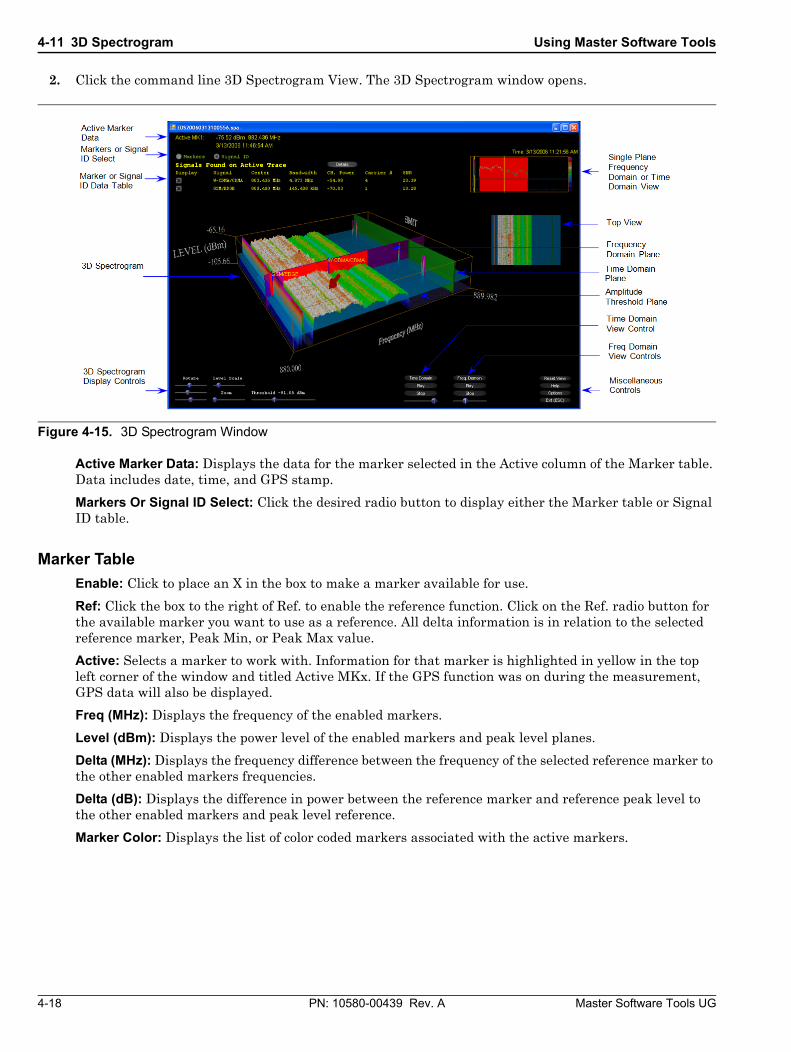
4-11 3D Spectrogram Using Master Software Tools
4-18 PN: 10580-00439 Rev. A Master Software Tools UG
2. Click the command line 3D Spectrogram View. The 3D Spectrogram window opens.
Active Marker Data: Displays the data for the marker selected in the Active column of the Marker table. Data includes date, time, and GPS stamp.
Markers Or Signal ID Select: Click the desired radio button to display either the Marker table or Signal ID table.
Marker Table
Enable: Click to place an X in the box to make a marker available for use.
Ref: Click the box to the right of Ref. to enable the reference function. Click on the Ref. radio button for the available marker you want to use as a reference. All delta information is in relation to the selected reference marker, Peak Min, or Peak Max value.
Active: Selects a marker to work with. Information for that marker is highlighted in yellow in the top left corner of the window and titled Active MKx. If the GPS function was on during the measurement, GPS data will also be displayed.
Freq (MHz): Displays the frequency of the enabled markers.
Level (dBm): Displays the power level of the enabled markers and peak level planes.
Delta (MHz): Displays the frequency difference between the frequency of the selected reference marker to the other enabled markers frequencies.
Delta (dB): Displays the difference in power between the reference marker and reference peak level to the other enabled markers and peak level reference.
Marker Color: Displays the list of color coded markers associated with the active markers.
Figure 4-15. 3D Spectrogram Window
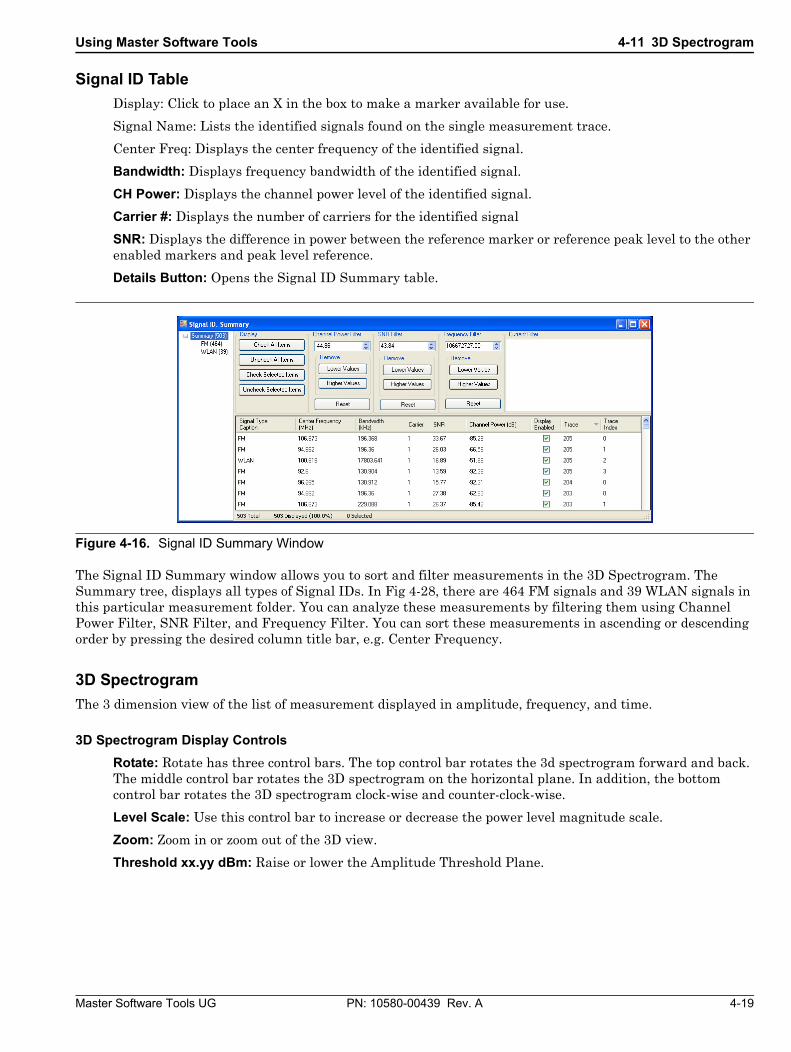
Using Master Software Tools 4-11 3D Spectrogram
Master Software Tools UG PN: 10580-00439 Rev. A 4-19
Signal ID Table
Display: Click to place an X in the box to make a marker available for use.
Signal Name: Lists the identified signals found on the single measurement trace.
Center Freq: Displays the center frequency of the identified signal.
Bandwidth: Displays frequency bandwidth of the identified signal.
CH Power: Displays the channel power level of the identified signal.
Carrier #: Displays the number of carriers for the identified signal
SNR: Displays the difference in power between the reference marker or reference peak level to the other enabled markers and peak level reference.
Details Button: Opens the Signal ID Summary table.
The Signal ID Summary window allows you to sort and filter measurements in the 3D Spectrogram. The Summary tree, displays all types of Signal IDs. In Fig 4-28, there are 464 FM signals and 39 WLAN signals in this particular measurement folder. You can analyze these measurements by filtering them using Channel Power Filter, SNR Filter, and Frequency Filter. You can sort these measurements in ascending or descending order by pressing the desired column title bar, e.g. Center Frequency.
3D Spectrogram
The 3 dimension view of the list of measurement displayed in amplitude, frequency, and time.
3D Spectrogram Display Controls
Rotate: Rotate has three control bars. The top control bar rotates the 3d spectrogram forward and back. The middle control bar rotates the 3D spectrogram on the horizontal plane. In addition, the bottom control bar rotates the 3D spectrogram clock-wise and counter-clock-wise.
Level Scale: Use this control bar to increase or decrease the power level magnitude scale.
Zoom: Zoom in or zoom out of the 3D view.
Threshold xx.yy dBm: Raise or lower the Amplitude Threshold Plane.
Figure 4-16. Signal ID Summary Window

4-11 3D Spectrogram Using Master Software Tools
4-20 PN: 10580-00439 Rev. A Master Software Tools UG
Dialog Options
Select the desired portion of the 3D Spectrogram window to configure – Graph, View 1, View 2, View 3, Markers, and Signal ID. The large middle options panel title and setup parameters change accordingly.
Middle Options Panel
Defines the keyboard keys for additional movement control through the 3D Spectrogram. The setup parameters deal with configuring text, background, dialog, and graph lines annotations. Set these features as desired.
Control Configuration
Edit Controls: Press this button to configure keyboard and mouse key use in the 3D Spectrogram window.
Figure 4-17. Spectrogram Setup Window

Using Master Software Tools 4-11 3D Spectrogram
Master Software Tools UG PN: 10580-00439 Rev. A 4-21
Keyboard: Defines the keyboard keys for addition movement control through the 3D Spectrogram window. To make changes in controls, follow the instructions in the Information panel. Press OK to keep changes, press Cancel to exit and not make any changes.
Mouse: Defines the mouse keys for additional movement control through the 3D Spectrogram window. To make changes in controls, follow the instructions in the Information panel. Press OK to keep changes, press Cancel to exit and not make any changes.
Single Plane Frequency Domain or Time Domain View
Displays a single measurement in Frequency Domain or Time Domain. In the Frequency Domain, the amplitude of a single frequency is displayed. In the Time Domain, the center frequency is highlighted in yellow and the bandwidth in red.
Top View
Allows you to view the 3D Spectrogram from the top. You can see the movement of either Frequency Domain Plane or Time Domain Plane.
Time Domain View Controls
Time Domain: Places the single plane view to Time Domain.
Play: Starts the automatic sweep of the frequencies.
Stop: Stops the automatic sweep of the Time Domain panel.
Manual Control: Use this control to manually move the Time Domain panel left to right, right to left.\
Figure 4-18. Keyboard & Mouse Configuration Window

4-11 3D Spectrogram Using Master Software Tools
4-22 PN: 10580-00439 Rev. A Master Software Tools UG
Frequency Domain View Controls
Frequency Domain: Places the single plane view to Frequency Domain.
Play: Starts the automatic sweep of the signal amplitude.
Stop: Stops the automatic sweep of the Frequency Domain panel.
Manual Control: Use this control to manually move the Frequency Domain panel front to back, back to front.
Miscellaneous Controls
Reset: Resets the 3D Spectrogram to the default view.
Help: Displays the default Keyboard/Mouse controls window.
Options: Displays the configuration window.
Exit (ESC): Exits 3D Spectrogram and returns to Folder Spectrogram.
Figure 4-19. Keyboard & Mouse Configuration Window

Using Master Software Tools 4-12 Script Master Editor
Master Software Tools UG PN: 10580-00439 Rev. A 4-23
4-12 Script Master EditorScript Master Editor provides a means of creating measurement setups, sequences, and processes within a Script File that can be uploaded into an instrument. These Script Files can be setup and measurement test sequence only or they can be interactive with the instrument user. An interactive Script File could prompt the user of real-time measurement parameter or test sequence changes.
Currently, Script Master generates Script Files for the measurement mode types – GSM/GPRS/EDGE, WCDMA/HSDPA, and Channel Scanner. The Script Master function is found in the File menu.
Figure 4-20. Script Master Command Line Listed Under File Menu
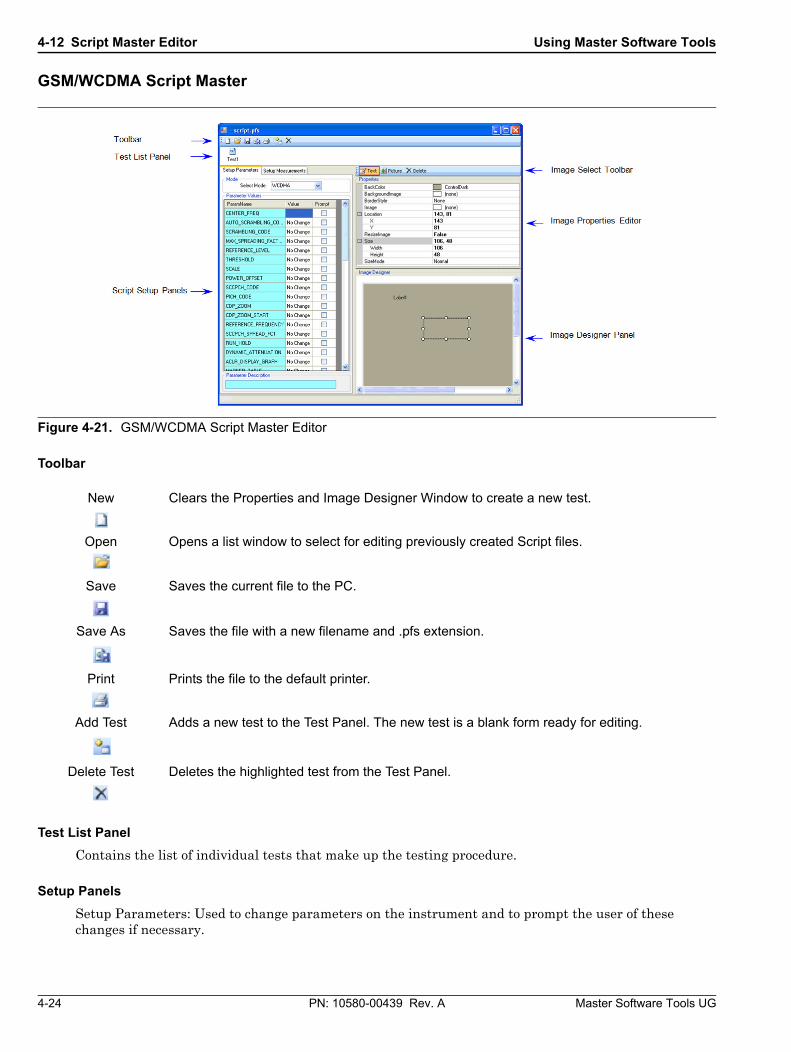
4-12 Script Master Editor Using Master Software Tools
4-24 PN: 10580-00439 Rev. A Master Software Tools UG
GSM/WCDMA Script Master
Toolbar
Test List Panel
Contains the list of individual tests that make up the testing procedure.
Setup Panels
Setup Parameters: Used to change parameters on the instrument and to prompt the user of these changes if necessary.
Figure 4-21. GSM/WCDMA Script Master Editor
New Clears the Properties and Image Designer Window to create a new test.
Open Opens a list window to select for editing previously created Script files.
Save Saves the current file to the PC.
Save As Saves the file with a new filename and .pfs extension.
Print Prints the file to the default printer.
Add Test Adds a new test to the Test Panel. The new test is a blank form ready for editing.
Delete Test Deletes the highlighted test from the Test Panel.

Using Master Software Tools 4-12 Script Master Editor
Master Software Tools UG PN: 10580-00439 Rev. A 4-25
Mode: Press the down arrow of the Select Mode: list box to select either GSM (GSM/GPRS/EDGE) or WCDMA (WCDMA/HSDPA) measurement mode testing.
Parameter Values: These are the test parameters specific to the measurement mode selected in the Select Mode list box.
ParamName: The name of the measurement parameter.
Value: Enter a value to change that parameter value in the instrument. Leaving the value as No Change, defaults to the value in the instrument.
Prompt: A checked box prompts the user of the instrument of the changes taking place with the edited parameter.
Parameter Description: A brief description of the selected parameter is displayed.
Setup Measurements: Used to change measurement settings on the instrument. and to prompt the user of these changes if necessary.
Selected Measurements: text.
Param Name: Press the down arrow to list the measurements of the selected mode. Highlight and click the desired parameter for editing.
Value1 - Value4: Entry boxes for value editing of the selected measurement.
Possible Value: Displays the possible values for the selected measurement.
Description: Displays the limits and units for the selected measurement. Some measurements do not have values such as the Spectral measurement.
Image Select Toolbar
Text: Click to open the text Input window. Enter a label name. Press OK and the labeled text box will be placed on the Image Designer window.
Picture: Click to open the Picture dialogue window to select a picture from the PC. Highlight the desired picture followed by pressing the Open button; the picture will be placed in the Image Designer window.
Delete: Deletes the active text or picture box in the Image Designer window.
Image Properties Editor
The Properties Editor window displays different types of editing fields, depending on the needs of particular property. These edit fields include edit boxes and drop-down lists.
Use this window to define the active text or active picture box in the Image Designer window. When a text or picture box is placed in the Image Designer, properties for that box are listed in the editor. Highlight the desired property to edit.
Image Designer Window
Create visual notes or instructions to be loaded into the test instrument for the field tech or FAE taking measurements. You can resize and position text and picture boxes using the dragging feature.

4-12 Script Master Editor Using Master Software Tools
4-26 PN: 10580-00439 Rev. A Master Software Tools UG
Channel Scanner Script Master
Toolbar
Figure 4-22. Channel Scanner Script Editor
Open Opens a list window to select for editing previously created Script files.
Save Saves the current file to the PC.
Save As Saves the file with a new filename with a .smcs extension.
Open Wizard Dialog Opens the Populate Wizard for creating the Scan List. Select either Scan Channels or Scan Frequency as the desired method of creating the Scan List.
Delete Deletes the highlighted channel from the Scan List.
Clear Channel Scanner Scan List
Clears the Scan List for creating a new Channel Scanner list.
Open Signal Standard File
Opens the Signal Standard file for editing.

Using Master Software Tools 4-12 Script Master Editor
Master Software Tools UG PN: 10580-00439 Rev. A 4-27
Scan Channels
Select Signal Standard: Press the pull down arrow to select a signal standard.
Set Start Channel: Enter the desired start channel for the first channel to be tested.
Channel Increment: Enter a value for incrementing to the next channel.
# channels to populate: Enter the desired number of channels to be tested.
Scan Frequency
Enter the desired frequency: The default unit is MHz if no units are entered.
Select Start Frequency: Enter a desired start frequency.
Set Channel Width: Enter the desired channel width.
Frequency Increment: Enter the number that increments to the next channel frequency.
# channels to populate: Enter the desired number of channels to be tested.
Insert at Cursor
Click this check box to add the new channels or frequencies starting at the highlighted row.
Populate Button
Automatically fills the Scan List based on the parameters entered in the Wizard Type entry dialogue.
Script Setup Panel
Name: Displays the name of an opened Script file.
Record: Sets the parameter for the Record button in the instrument to the On position.
Scan Setup Panel
Click the desired radio button to select setting up the test duration using either Number of Scans or Time Duration. If the Number of Scans is selected for the test duration, then the test will end after the Scan List has been repeated the total number of List scans and Set of 20 scans.
Figure 4-23. Populate Wizard for Scan Channels & Scan Frequency

4-12 Script Master Editor Using Master Software Tools
4-28 PN: 10580-00439 Rev. A Master Software Tools UG
If Time Duration is used, then testing occurs for that time. If the test time of the Scan List is shorter than the Time Duration set, the Scan List will continue and repeat testing until the end of the set Time Duration. If the test time of the Scan List is longer than the Time Duration set, the tests beyond the Time Duration period will not be tested.
Number of Scans
List: Enter the number of repetitions the channels in the Scan List are to be tested. (Maximum 1000 repetitions.)
Set of 20: Enter the number of repetitions a set of 20 channels are to be tested. (Maximum 5 repetitions.)
Time Duration:
Day: Enter the number of days the Scan List is to be tested.
Hour: Enter the number of hours the Scan List is to be tested.
Min: Enter the number of minutes the Scan List is to be tested.
Scan List Editor
Create a Scan List using the Open Wizard Dialog or manually enter individual Signal Standards and corresponding ChannelNumber, Frequency, and ChannelWidth values.
SignalStandard: Press the pull down arrow to select a signal standard. Click Channel Number and its value along with Frequency, and ChannelWidth will be entered automatically.
ChannelNumber: Double-click the entry box and press the down arrow key to open the entry window. Enter a Channel Number within the range of channels listed. Frequency and ChannelWidth will be entered automatically.
Frequency: Automatically entered during SignalStandard set up or ChannelNumber set up.
ChannelWidth: Automatically entered during SignalStandard set up or ChannelNumber set up.
Measurement Log File
After the Channel Scanner measurement is complete, a log file or multiple log files are created. A log file is created for the number of List repetitions set. If List is set to 1, then there is only one log file created. If List is set to the maximum number of 1000, then 1000 log files are created.

Using Master Software Tools 4-12 Script Master Editor
Master Software Tools UG PN: 10580-00439 Rev. A 4-29
The log file name format is SCRIPT_MASTER_LOG followed by a string of numbers that represent year, month, date, hour, minute, and seconds that is expressed as YYYYMMDDHHMMSS - year (YYYY), month (MM), date (DD), hour (HH), minute (MM), and second (SS).
Table Definitions
Figure 4-24. Measurement Log Viewer
Move First Returns to the first measurement in the Scan List and highlighted in dark blue.
Move Previous Moves the counter to the previous measurement.
Select Measurement
Displays the current measurement number. To jump directly to a measurement, enter the number of the desired measurement into the entry window and press Enter on the keyboard.
Move Next Moves to the next measurement.
Move Last Moves the counter and the cursor to the last measurement.
Open Channel Scanner File
Open a file on the PC into the Log Viewer.
Export to CSV Opens the Export file dialog.

4-12 Script Master Editor Using Master Software Tools
4-30 PN: 10580-00439 Rev. A Master Software Tools UG
Row Color
Dark Blue: Highlighted row that corresponds to the measurement number in the Scan List counter.
Yellow: A set of twenty measurements. This list may be less than twenty if it is at the end of the measurement list.
Light Blue: A set of twenty measurements. This list may be less than twenty if it is at the end of the measurement list.
Measurement Graph
Displays the level of power for each Set measurement in a graph. For example, if the Set of 20: parameter is set to 4, four graph bars are displayed.
Powers (dBm)
Displays the numeric value for each Set measurement in a column. For example, if the Set of 20: parameter is set to 4, four values bars are displayed in a column.

Using Master Software Tools 4-13 VNA Master Measurement Window
Master Software Tools UG PN: 10580-00439 Rev. A 4-31
4-13 VNA Master Measurement WindowThe VNA Master Measurement Window in MST replicates the display window on the VNA Master instruments. Both real-time measurements and previously captured and saved measurements will be viewed as though they were on the instrument. The measurement window also allows you to set the number of graph display panels and set the number of traces viewed.
Toolbar
Figure 4-25. VNA Master Trace Window
Open Opens a list window to select for viewing previously saved VNA measurement files.
Save Saves the current file to the PC.
Number of Graph Display Panels Select
Press one of the four boxes to set the number of graphic display panels.
Yellow: Utilizes the full display area for one Display Panel.
Yellow/Purple: Splits the display area vertically for two Display Panels.
Yellow/Purple/Green: Divides the display area into three panels: graph display panel 1 at the top left quadrant, graph display panel 2 in the top right quadrant, and graph display panel 3 utilizing the bottom two quadrants.
Yellow/Purple/Green/White: Divides the display area into four quadrants: graph display panel 1 at the top left quadrant, graph display panel 2 in the top right quadrant, graph display panel 3 in the bottom left quadrant, and graph display panel 4 in the bottom right quadrant.
Set the Number of Traces for
Display
Sets the number of traces to be displayed in the selected number of graph display panels. Traces are color-coded to match its data in the Trace Information section.
NoteThe file downloaded from the instrument can have one to four traces displayed. This setting in MST can only limit the number of traces displayed on the PC. For example, if the instrument only had two traces, then MST can display one or two traces but not more.

4-13 VNA Master Measurement Window Using Master Software Tools
4-32 PN: 10580-00439 Rev. A Master Software Tools UG
General Instrument Setting Summary
Displays the setting information that is common to all traces: Number of Points, IF Bandwidth, Sweep Averaging, Power, Reference Plane Extension for Port 1 and Port 2, and Bias Tee status.
Trace Setting Summary Panel
Displays the information of each of the number of traces set for display. Information included are S-parameter, graph type, smoothing %, and scale settings – resolution/division, and reference value.
Active Trace Indicator: Highlights the active trace with a light blue rectangle.
Graph Display Window
Displays one through four graph display panels depending on the selection made on the Toolbar for the Number of Graph Display Panels.
Example Views – Multiple Combinations of Number of Graphs and Number of Traces
NoteThe current version of MST does not capture the instrument’s calibration status (CAL:ON, CAL:OFF), associated with each of the downloaded traces.
Figure 4-26. Four Graphs with Four Traces
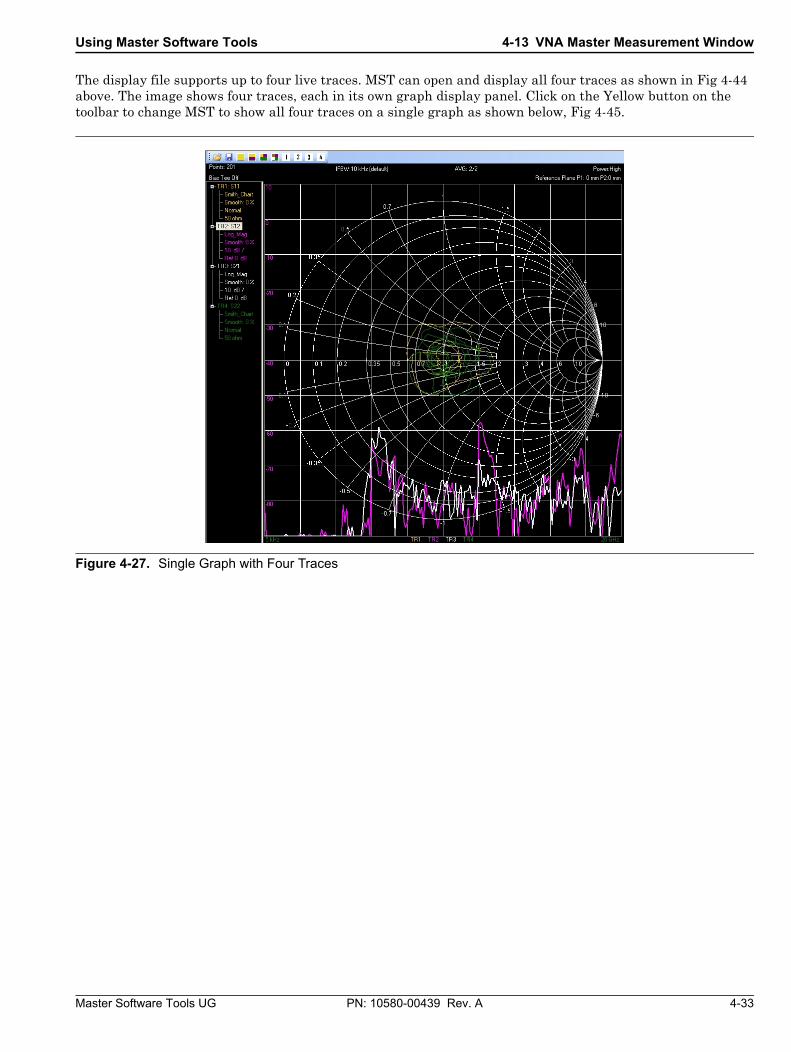
Using Master Software Tools 4-13 VNA Master Measurement Window
Master Software Tools UG PN: 10580-00439 Rev. A 4-33
The display file supports up to four live traces. MST can open and display all four traces as shown in Fig 4-44 above. The image shows four traces, each in its own graph display panel. Click on the Yellow button on the toolbar to change MST to show all four traces on a single graph as shown below, Fig 4-45.
Figure 4-27. Single Graph with Four Traces

4-13 VNA Master Measurement Window Using Master Software Tools
4-34 PN: 10580-00439 Rev. A Master Software Tools UG
Figure 4-28. Two Graphs with Four Traces
Figure 4-29. Three Graphs with Four Traces
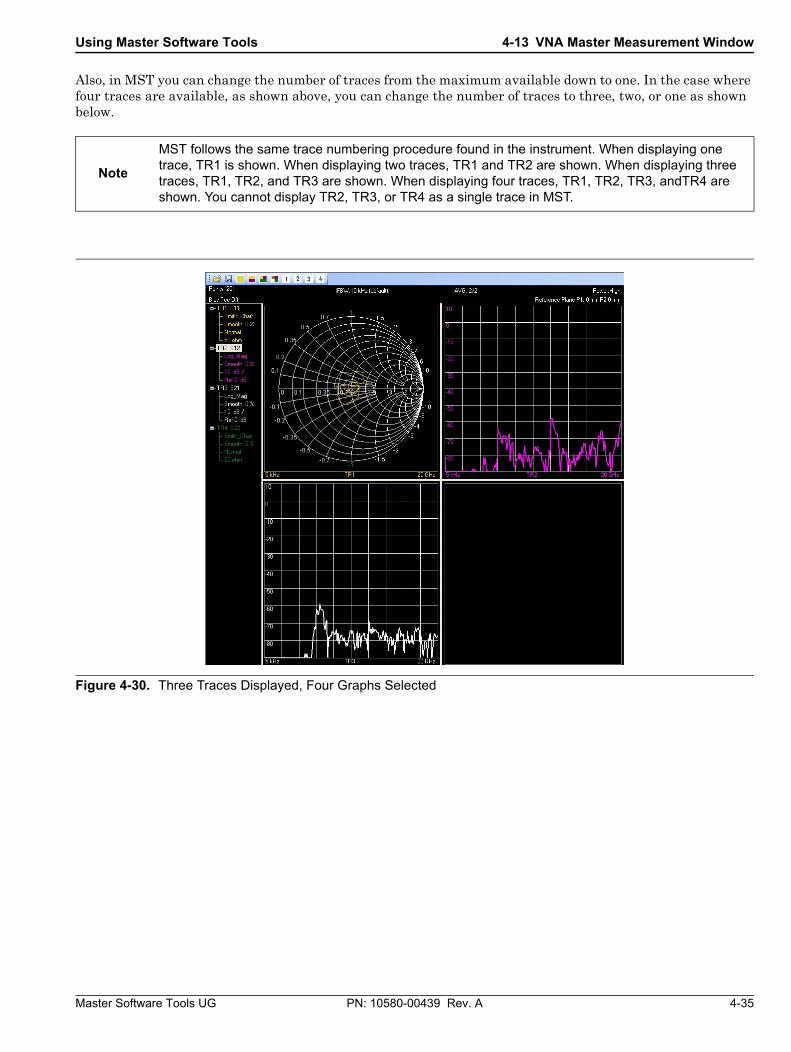
Using Master Software Tools 4-13 VNA Master Measurement Window
Master Software Tools UG PN: 10580-00439 Rev. A 4-35
Also, in MST you can change the number of traces from the maximum available down to one. In the case where four traces are available, as shown above, you can change the number of traces to three, two, or one as shown below.
Note
MST follows the same trace numbering procedure found in the instrument. When displaying one trace, TR1 is shown. When displaying two traces, TR1 and TR2 are shown. When displaying three traces, TR1, TR2, and TR3 are shown. When displaying four traces, TR1, TR2, TR3, andTR4 are shown. You cannot display TR2, TR3, or TR4 as a single trace in MST.
Figure 4-30. Three Traces Displayed, Four Graphs Selected

4-13 VNA Master Measurement Window Using Master Software Tools
4-36 PN: 10580-00439 Rev. A Master Software Tools UG
Figure 4-31. Two Traces Displayed, Four Graphs Selected
Figure 4-32. One Trace Displayed, Four Graphs Selected

Using Master Software Tools 4-13 VNA Master Measurement Window
Master Software Tools UG PN: 10580-00439 Rev. A 4-37
MST also allows you to choose the active trace by clicking on the trace number - TR1, TR2, TR3, or TR4 in the Trace Setting Summary Panel. The selected active trace is highlighted with a light blue rectangle. The reason to choose an active trace is for cases when you have more than one trace overlaid in the same display panel. MST can only display the y-axis scale information for one trace, the Active Trace. In Fig. 4-51 below, TR1 is highlighted in the left hand column, indicating it as the active trace. Therefore, the y-axis scale shown is associated with Trace 1 (yellow). In Fig. 4-52, TR2 is the active trace and the y-axis scale is changed to match the TR2 settings (purple).
Figure 4-33. TR1 Selected as the Active Trace
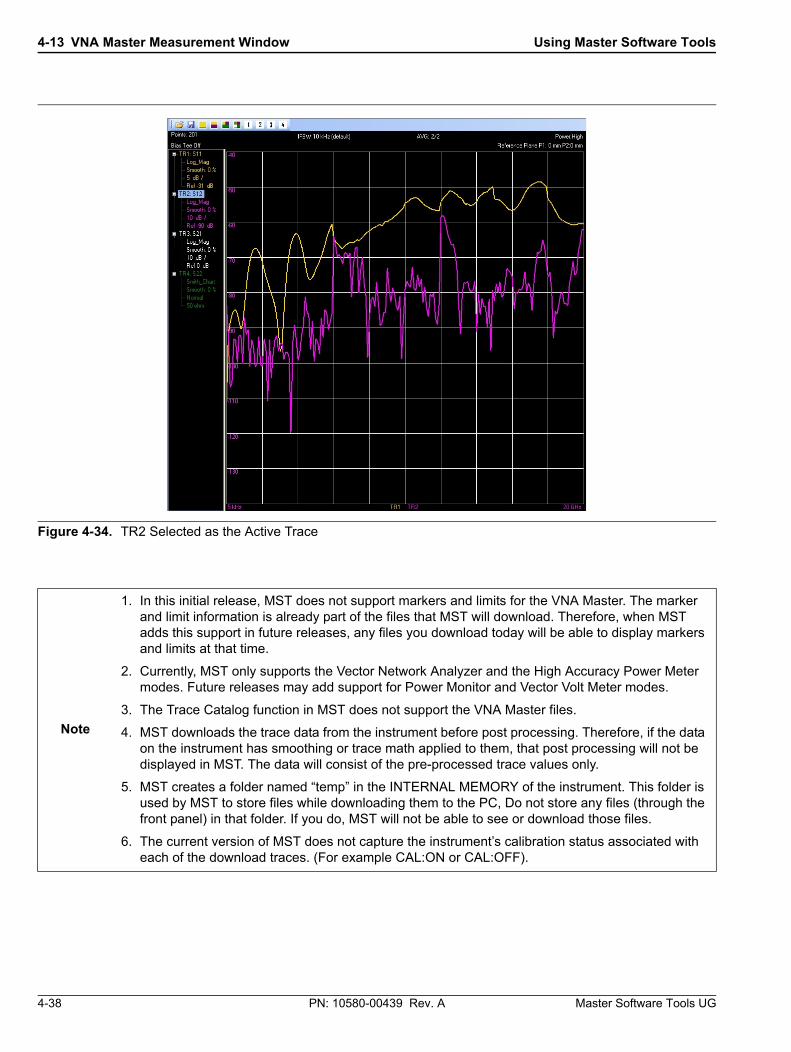
4-13 VNA Master Measurement Window Using Master Software Tools
4-38 PN: 10580-00439 Rev. A Master Software Tools UG
Figure 4-34. TR2 Selected as the Active Trace
Note
1. In this initial release, MST does not support markers and limits for the VNA Master. The marker and limit information is already part of the files that MST will download. Therefore, when MST adds this support in future releases, any files you download today will be able to display markers and limits at that time.
2. Currently, MST only supports the Vector Network Analyzer and the High Accuracy Power Meter modes. Future releases may add support for Power Monitor and Vector Volt Meter modes.
3. The Trace Catalog function in MST does not support the VNA Master files.
4. MST downloads the trace data from the instrument before post processing. Therefore, if the data on the instrument has smoothing or trace math applied to them, that post processing will not be displayed in MST. The data will consist of the pre-processed trace values only.
5. MST creates a folder named “temp” in the INTERNAL MEMORY of the instrument. This folder is used by MST to store files while downloading them to the PC, Do not store any files (through the front panel) in that folder. If you do, MST will not be able to see or download those files.
6. The current version of MST does not capture the instrument’s calibration status associated with each of the download traces. (For example CAL:ON or CAL:OFF).

Master Software Tools UG PN: 10580-00439 Rev. A 5-1
Chapter 5 — Support File Management
5-1 IntroductionSupport files for measurements include:
• Antenna lists
• Signal standard files
• Cable lists
• Pass/Fail test definitions
• Language tables
• Instrument setup files
• Calibration files
• JPEG images
• Reports
• Exported files
• Folder Spectrogram files
• Measurement map files.
Some of these files originate on the test instrument and can be edited in Master Software Tools and uploaded back to the test instrument in order to change test instrument behavior. Other files are created as Master Software Tools files and cannot be uploaded to a test instrument. Each file type has an associated view or editor. These files have characteristics in common, both with each other and with standard measurement files.
In general, any file that can be opened in Master Software Tools can be saved, printed, exported, and turned into a report. In the unusual case where one or more of these options is not available, the option is either not shown or is shown disabled (menu option line grayed out). If a file can be uploaded the Upload button is enabled when the file is active and an active device connection exists.
The following descriptions describe how to edit a file from a connected test instrument, as this is the most common situation. These files can be saved locally and then recalled by using the File | Open... menu function, or by pressing the Open button on the main toolbar. The File | Open... menu function opens the Open Measurement File dialog box. The Open button in the toolbar opens a list of available files.

5-2 Antenna Editor (antenna.txt) Support File Management
5-2 PN: 10580-00439 Rev. A Master Software Tools UG
5-2 Antenna Editor (antenna.txt)The Antenna Editor is used to edit antenna lists. A single antenna file on the Anritsu test instrument is shared among all measurement modes. This Antenna file has multiple antenna definitions, each with a series of frequency and amplitude values that define the antenna response characteristics.
To edit an antenna file, it must be opened. To download the file from a test instrument pull down the Sync Menu and click on the command line Download Antenna List.
The antenna list is retrieved and opened in Master Software Tools. Unless the Auto-save feature under Program Options has been turned off, the file will automatically be saved to a local disk using the path shown in the File Summary preview (under the Local tab on the left side of the application window).
The antenna file on the test instrument is named antenna.txt, and this is the default name that is used by Master Software Tools. The antenna list can be edited and saved on a local PC under any desired filename, but if uploaded to the instrument, it must be named antenna.txt, or it will not be recognized by the test instrument.
Figure 5-1. Antenna Editor Window
Figure 5-2. Sync Pull Down Menu

Support File Management 5-3 Signal Standard Editor (SignalStd.sig)
Master Software Tools UG PN: 10580-00439 Rev. A 5-3
To add a new antenna to the list:
1. Drag the file antenna.txt from the File List Window in the Active Measurement/Edit Window. The Antenna Editor window immediately opens the list of antennas.
2. In the column listed Antennas, scroll down to the bottom of list.
3. Highlight the empty box.
4. Enter the new antenna name in that box.
5. Add frequency and amplitude points to the antenna definition by entering the values in the list. Either Antenna Factor (dB) or Antenna Gain (dBi) values can be added. The editor will calculate the other to match. For faster entry, the Antenna editor automatically advances to the next field in the current amplitude column as you type values and press Enter.
6. Press the Up Arrow button on the toolbar. (Upload active window to instrument.)
7. Power off the instrument, then on.
5-3 Signal Standard Editor (SignalStd.sig)The signal standards editor is organized in a tree structure. When a signal standards file is opened, many standards are shown in a connected list with a + sign at the right. To edit an entry, expand the definition by clicking the + symbol. Standard editing functions are available in a right-click context menu (mouse menu). This feature provides Cut, Copy, and Paste operations, as well as adding new signal standards and deleting unwanted entries.
To edit a value, select it in the list and begin typing. An edit box exists at the top of the window for convenience. Press Enter after editing the value in order to automatically shift focus to the next field.
If a download of the SPA signal standards file is initiated, Master Software Tools first seeks the composite file. If the composite file is not found, then it seeks and downloads the SPA-specific signal standards file. When uploading, Master Software Tools restores what it found: a SPA-specific file or the composite file, depending upon which type of file was downloaded.
Depending upon the version of firmware in the test instrument, both SPA and GSM signal standards may need to be edited in order to effect a change in both places. The file types are distinguished by the filename extensions.
The separate signal standards files have a .txt file extension, and the composite file is named SignalStd.sig. Although a signal standards file can be given any filename in a local disk space, the test instrument recognizes only the original name, SignalStd.sig. Upload composite signal standards files with this name only.
5-4 Cable Editor (Cablelist.txt)The cable editor provides a list of cable definitions. To edit a cable definition, select the field to be modified and enter a new value. New cables can be added by entering the values in the last row, which is empty. To remove a cable, select it and press Delete. The software prompts for confirmation.
As with antennas and signal standards, the cable list file must have the expected filename in order to be recognized and used by the test instrument. The test instrument name for this file is Cablelist.txt. This is the name of any cable list that is downloaded from an Anritsu test instrument. If it is saved locally under a different name, then the original name must be restored (to Cablelist.txt) before uploading the file to a test instrument.

5-5 Pass/Fail Test Editor (TestModels.txt) Support File Management
5-4 PN: 10580-00439 Rev. A Master Software Tools UG
5-5 Pass/Fail Test Editor (TestModels.txt)The GSM/GPRS/EDGE, WCDMA/HSDPA, Fixed WiMAX, Mobile WiMAX, CDMA, EV-DO, TD-SCDMA, and LTE measurement modes support a Pass/Fail measurement mode. In order to edit the Pass/Fail test definition file, connect to the test instrument, select Sync | Download Pass/Fail from the main menu and follow the sub-menus to the desired file type. This opens the Pass/Fail test definition file in the Master Software Tools Pass/Fail Test Editor.
From the toolbar Sync menu, and then from the Download Pass/Fail List sub-menu, choose either GSM/GPRS/EDGE Pass/Fail List, WCDMA/HSDPA Pass/Fail List, Fixed WiMAX Pass/Fail List, Mobile WiMAX Pass/Fail List, CDMA Pass/Fail List, EV-DO Pass/Fail List, TD-SCDMA Pass/Fail List, or LTE Pass/Fail List.
To edit, select the field to be modified and enter a new value. The Pass/Fail editor attempts to present all possible parameters and values in a simple grid. As different rows are selected, the column headings change in order to reflect the values and units of the selected parameter. Some test parameters have fewer constraints than others do, so some field values are blank. The bottom of the Pass/Fail Editor provides information about parameter types and units.
Pass/Fail test definitions need to be named TestModels.txt in order to be recognized by the test instrument.
5-6 Setup Files (*.stp)Setup files, which can be saved and recalled on a test instrument, can also be downloaded into Master Software Tools. Downloaded setup files can be stored and can be used to upload a common setup file to a number of test instruments to ensure that they are all configured in the same manner.
These files cannot be edited, but they can be viewed, saved, printed, exported, and a report can be created from a setup file. When a setup file is opened, only the file header is presented. The window may be resized to show other parameters, but these parameters are not in an easily readable format and cannot be edited.
5-7 Calibration Files (Cal*.txt)As with setup files, calibration files cannot be edited in Master Software Tools. Calibration files also have no facility for printing, exporting, or creating reports. No benefit is derived from uploading a calibration file from one test instrument into another or from recalling a calibration file in Master Software Tools, but these files are stored in the user memory space and have a common syntax and a .txt extension. These files may be viewed. The filename syntax (Cal*.txt) allows quick identification of the file type.
5-8 JPEG Files (*.jpg)The test instruments that are supported by Master Software Tools all provide a function to capture the current screen and save the displayed measurement as a JPEG image file. These files are in the Device File list and can be seen when a test instrument is connected to Master Software Tools. The viewer provides a method to see these stored image files. A JPEG file cannot be edited in Master Software Tools, but can be printed from Master Software Tools. Refer also to JPEG Save Options in the Program Options window for additional information about saving JPEG files.

Support File Management 5-9 Reports (*.htm, *.pdf)
Master Software Tools UG PN: 10580-00439 Rev. A 5-5
5-9 Reports (*.htm, *.pdf)All measurement files and most support files can be saved in a report. There are two formats to choose from, HTML or PDF. The report formatted in HTML can be displayed in an Internet browser. For the PDF generated file you will need Adobe Acrobat Reader. You can obtain this free software by going to http://www.adobe.com/downloads/ and click on Adobe Reader. Follow the instructions for downloading and installing it to your PC.
Reports typically have a header with company name, logo, date and time stamp, and GPS coordinates of the measurement. This header is followed by a picture of the measurement, a table of relevant parameters for the measurement, and the test instrument on which the measurement was captured. A signature line is at the bottom.
All of the items in the header and in the signature line may be eliminated or pre-configured by using the Report tab of the Program Options dialog box.
To configure the report and file type:
1. Pull down the Tools menu and click on the command line Program Options. The Program Option window opens.
Figure 5-3. Tools Pull Down Menu
Figure 5-4. Program Options Window

5-10 Exported Files (*.csv, *.txt) Support File Management
5-6 PN: 10580-00439 Rev. A Master Software Tools UG
2. Click on the Report Generator tab. Configure the report as desired. To store a report, save it to a separate location. The main section of the report contains a JPEG image of the measurement. This image is created in the same location where the active measurement file is located in the local disk space.
a. Report Header
The report header displays any of the following on the report:
• • Report Title
• • Company
• • Prepared For
• • Location
• • Date & Time
• • Company Logo: Click the folder button, which engages a file browser, to find the logo file.
• • Logo Alignment (left, right, or center aligned)
b. Open With
• Default HTML Editor (Microsoft Word, Front Page, etc.)
• Default Internet Browser (Internet Explorer, etc.)
• Other (User Specified) Click the folder button, which engages a file browser, to find the appropriate application, or enter the full path.
c. Signature Line
This option appends a signature line with Prepared By and Approved By lines to the report.
d. Output Format
Select the file type to be generated.
• HTML
Reports provide a useful way to create hard copies of complete measurements, which are more complete than would be achieved by printing the measurements themselves.
5-10 Exported Files (*.csv, *.txt)Exported files may have either a *.csv or *.txt filename format, depending upon the method chosen to create the export file. When exporting a file, select the correct option from the Save as type: drop-down list. The options are designed to assist with differences across cultural and geographic world regions. Choose among the following: comma delimited, semicolon delimited, tab delimited with a period for decimal separator, and tab delimited with a comma for decimal separator.
These file conventions are chosen to work well with Microsoft Excel when using different regional settings. Master Software Tools is designed to default to the most likely option based upon the regional settings of the PC. If the exported file is intended for another part of the world, different settings may be required in order for the files to be opened correctly.

Support File Management 5-11 Folder Spectrogram Files (*.fsg)
Master Software Tools UG PN: 10580-00439 Rev. A 5-7
5-11 Folder Spectrogram Files (*.fsg)A Folder Spectrogram file is a special composite file created from all of the SPA or IA spectrum measurement files contained in a selected folder. All of the files (that are to be used) in the folder are assumed to have the same frequency range, which is the frequency range of the first file.
A Folder Spectrogram file is especially useful to get a composite view of a large number of traces that are stored using Save on Event. This mode of the test instrument allows a spectrum analyzer trace to be stored each time that a set criterion is met, such as peak amplitude above some preset limit, or at the end of each trace sweep. Many thousands of saved traces can quickly accumulate this way, and viewing and evaluating each one is difficult.
Folder Spectrogram files allows a user to quickly review all traces and pick out the specific traces of interest. Several different graphs are provided to review the composite data sets, and post-capture filtering can be done based upon specified criteria.
Figure 5-5. File Menu to Select Folder Spectrogram

5-11 Folder Spectrogram Files (*.fsg) Support File Management
5-8 PN: 10580-00439 Rev. A Master Software Tools UG
To create a Folder Spectrogram file:
1. Pull down the File menu.
2. Highlight New and the click on Folder Spectrogram in the sub-menu. The Browse For Folder dialog window opens. Take note of the message at the top of the dialog window.
3. Read carefully the note at the top of the dialog window.
4. Highlight the folder that contains either the SPA or IA spectrum files and click OK. MST opens each trace file and creates a single composite file containing all of the trace data. The spectrogram window then opens in the Average view.
Figure 5-6. Program Options Window
Figure 5-7. Average View Window - Default Window

Support File Management 5-11 Folder Spectrogram Files (*.fsg)
Master Software Tools UG PN: 10580-00439 Rev. A 5-9
Master Software Tools will open each file and create a single composite file containing all of the data. All of the trace data is sorted according to the measurement time stamp, and a spectrogram display is presented. Depending upon the number of files, creation of the composite spectrogram file may take from approximately 5 seconds to 30 second.
Spectrogram
A spectrogram shows signal versus time in a simulated three-dimensional top view, with the x-axis being frequency, the y-axis being time, and color showing power. Below the spectrogram is a view of the currently selected trace. The selected trace is indicated by a red line on the spectrogram. To select a different trace, use the mouse or cursor keys to move the red line. To the right of the spectrogram is a bar that adjusts the contrast of the spectrogram.
Figure 5-8. Two Pane Spectrogram Window

5-11 Folder Spectrogram Files (*.fsg) Support File Management
5-10 PN: 10580-00439 Rev. A Master Software Tools UG
Color Selection Configuration Window
The Color Selection window allows you to configure the color bar and spectrogram color parameters. Place the mouse on the color bar left of the spectrogram and click the left mouse button. The Color Selection window opens.
Color Bar: You can customize the colors of the color bar. Place the cursor on the desired color to change. Click the left mouse button and the Color window opens. Click on the desired new color and press OK. The previous color is replaced by the new.
RGB Color Adjust: There are three primary color controls – red, green, and blue. They control the overall color tone of the color bars. Use the Up/Down arrow adjacent to the blue control to increase or decrease the tone setup in the RGB controls.
Brightness: Lightens or darkens the colors on the color bar.
Contrast: Defines or blends the lines between colors.
Scale Factor: Use this feature to increase or decrease the dBm scale value and number of dBms per color.
Minimum Threshold: Raises or lowers the minimum threshold value.
Save: Saves the new color bar settings.
Reset: Returns all changes made in the Color Selection configuration window to the default setting.
Cancel: Cancel any changes made and closes the Color Selection configuration window.
Figure 5-9. Color Selection Window

Support File Management 5-11 Folder Spectrogram Files (*.fsg)
Master Software Tools UG PN: 10580-00439 Rev. A 5-11
Folder Spectrogram Context Menu
Select the context menu (mouse menu) by right-clicking the mouse over the Folder Spectrogram Window. This gives access to a menu of advanced options and features.
Data Display Options…
File Filter: Filtered files are displayed in the box to the right of the selections. The filtered file list is sorted based upon the selected column, either filename or frequency of peak or measurement time stamp. Filtered files show up in red in the spectrogram and time chart display modes.
None: No Filtration.
Limit Line from a Measurement: Shows only traces that go above or below the set limit lines.
Deviation from the Average (dB): Filters out files that deviate from the average by more than a specified amount of dB. Upper and lower ranges are set in addition to the filter window width.
JPEG Options: Choose between Small (320x240), Medium (640x480), Large (1024x768), or customized ratio. The Quality may also be selected.
AVI Options: Choose between Small (320x240), Large (640x480, or customized ratio. The frame rate may also be changed as desired. One frame is one trace.
Save Window as JPEG: Saves the current window as a JPEG image file.
Export to csv (Spreadsheet): Saves the Folder Spectrogram composite data file as a CSV (comma separated values) file that can be imported into a spreadsheet application.
Save All to JPEG: Saves all traces in JPEG format. This action creates a sub-folder named Images, where all images are stored.
Create AVI: Creates an AVI video file of the traces. This action creates a file called Folder.avi in the same folder as the trace files. When done creating the file, a message is displayed to ask if the file should be played on the default video player.

5-12 Measurement Map Files (*.ptm) Support File Management
5-12 PN: 10580-00439 Rev. A Master Software Tools UG
3D Spectrogram View: Opens the 3D Spectrogram window to view the list of traces in 3-dimensions – frequency, time, and amplitude. See Chapter 4 section 4-12 3D Spectrogram.
Peak Power: Peak power shows the highest power at each frequency.
Total Power: Total power shows how much power is present over time in that band.
Peak Freq: Peak frequency shows which frequency has delivered the highest power over time.
Time Chart: The time chart shows the number of occurrences per time increment. The number of time increments depends upon the size of the window. The earliest and latest measurements set the start and stop time increments with the intervening increments being uniformly distributed (in time).
Average: Average shows the lowest, highest, and average power levels of all frequencies.
5-12 Measurement Map Files (*.ptm)If Microsoft MapPoint is installed, then a Measurement Map can be created to show the location of all open measurements (as push pins on a map). The Measurement Map display allows the creation of driving instructions to points of interest, such as cell towers. Measurement Maps can be created only from measurement files that contain GPS location information. If GPS is not installed in a test instrument, then this option is not available.
Measurement Map files can be saved as standard MapPoint map files and can be loaded into Microsoft MapPoint independent of Master Software Tools.
Figure 5-10. True 3D Spectrogram Window

Support File Management 5-13 MapInfo Export Files (*.mif)
Master Software Tools UG PN: 10580-00439 Rev. A 5-13
Notice is provided when MapPoint is installed and the active measurement contains GPS coordinate information. The GPS coordinates are displayed in the Measurement Toolbar. In this situation, the GPS coordinates are push buttons to launch a Measurement Map that will display the location of the active measurement file. Additional measurements can be added to an open Measurement Map by dragging and dropping the measurement onto the status bar area of the Measurement Map window.
5-13 MapInfo Export Files (*.mif)When a file containing GPS coordinates is active, an Export to MapInfo option can be found under the File main menu. This option creates a MapInfo .mif file and an accompanying .mid file. These files contain import information for MapInfo with a complete summary of the measurement and its location. A separate copy of MapInfo is required in order to use these files. If this feature is desired, then refer to the MapInfo product documentation about importing .mif files.
5-14 Trace Indexing and the Trace CatalogThe Trace Index is a database containing the location and key parameters of all measurement files that are on the local hard disk. This is a convenient way to organize, locate, and manipulate measurements when many measurement files are spread across a number of folders.
Trace Catalog
With the Trace Catalog, a user can perform the following tasks:
• Index all supported files on the hard disk
• Index measurement files on a network drive
• Store multiple indexes for different clients or regions
• Perform automated indexing on a fixed schedule
• View files in either a detailed list or as thumbnails
• Archive files (Zip) from multiple folders
• Cut and copy measurement files
• Open measurements for editing
• Select just the measurement types that are of interest
• Sort measurements by name, date, or key measurement parameters
• View statistics on number and location of all supported file types
• Locate missing measurements that are hard to find.

5-14 Trace Indexing and the Trace Catalog Support File Management
5-14 PN: 10580-00439 Rev. A Master Software Tools UG
Trace Catalog-Spectrum Analyzer Toolbar
Beneath the Trace Catalog toolbar buttons is the Trace Catalog File List window. This window displays files that have been indexed. Files are listed in the format selected using the Display Format button.
Refresh Index: Immediately refreshes the trace index.
Open Indexing Setup: Opens the MST File Indexing window.
Figure 5-11. Trace Catalog Analyzer Toolbar
Figure 5-12. MST File Indexing Window

Support File Management 5-14 Trace Indexing and the Trace Catalog
Master Software Tools UG PN: 10580-00439 Rev. A 5-15
Archive Index Database: Opens the Archive Options window to create a Zip file archive from the database.
Copy: Copies files to clipboard.
Cut: Removes files from index only.
Delete: Delete file from index and PC (Permanent function)
Display Format Button: Controls how data file is listed
Details: See Fig. 3-36 Trace Catalog Analyzer Toolbar
List: Small Icons: List files as small icons using the graph picture.
Figure 5-13. Archives Options Window
Figure 5-14. List File Display as Small Icons
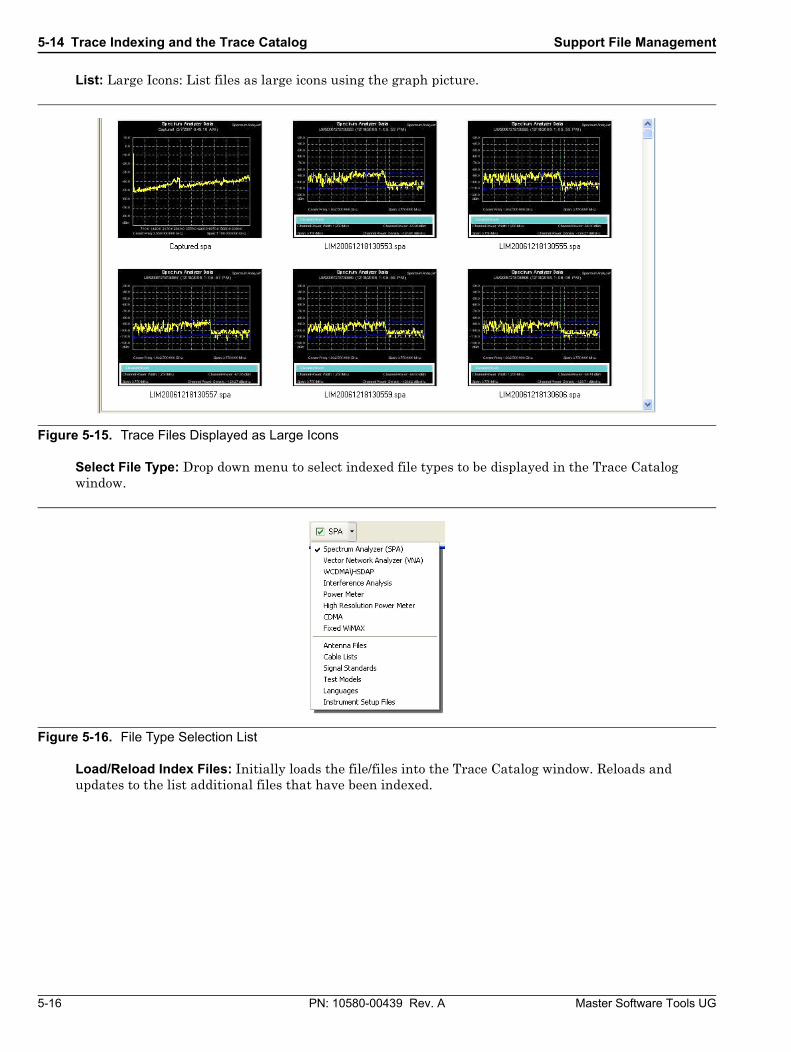
5-14 Trace Indexing and the Trace Catalog Support File Management
5-16 PN: 10580-00439 Rev. A Master Software Tools UG
List: Large Icons: List files as large icons using the graph picture.
Select File Type: Drop down menu to select indexed file types to be displayed in the Trace Catalog window.
Load/Reload Index Files: Initially loads the file/files into the Trace Catalog window. Reloads and updates to the list additional files that have been indexed.
Figure 5-15. Trace Files Displayed as Large Icons
Figure 5-16. File Type Selection List

Support File Management 5-14 Trace Indexing and the Trace Catalog
Master Software Tools UG PN: 10580-00439 Rev. A 5-17
Show Summary: Opens the Catalog Database Summary window.
View Log File: The log file is in .txt format. Therefore, click on this button opens the text file in Notepad.
Clear Log File: Clears the indexing log file.
From the main menu, select Tools | Full Trace Retrieval to open the Trace Retrieval Dialog box.
The window message reads:
“When a unit has many saved traces (more than a few hundred) the response can be very slow. If you have too many traces, you may not be able to retrieve them using normal procedures. This function will retrieve all the saved measurements, but it does require an open Ethernet connection - USB is not supported.”
Two buttons are provided, each followed by a text box for entering a path and filename. The buttons are labeled Destination and Retrieve All.
For saving a measurement, the path and filename can be entered in the destination text box, or select the Destination button, and the Browse For Folder window opens. The window message reads:
“Select a folder to save the remote measurement files to.”
A menu tree of folders and files is provided for the selection.
Figure 5-17.
Figure 5-18. Trace Rename Log File
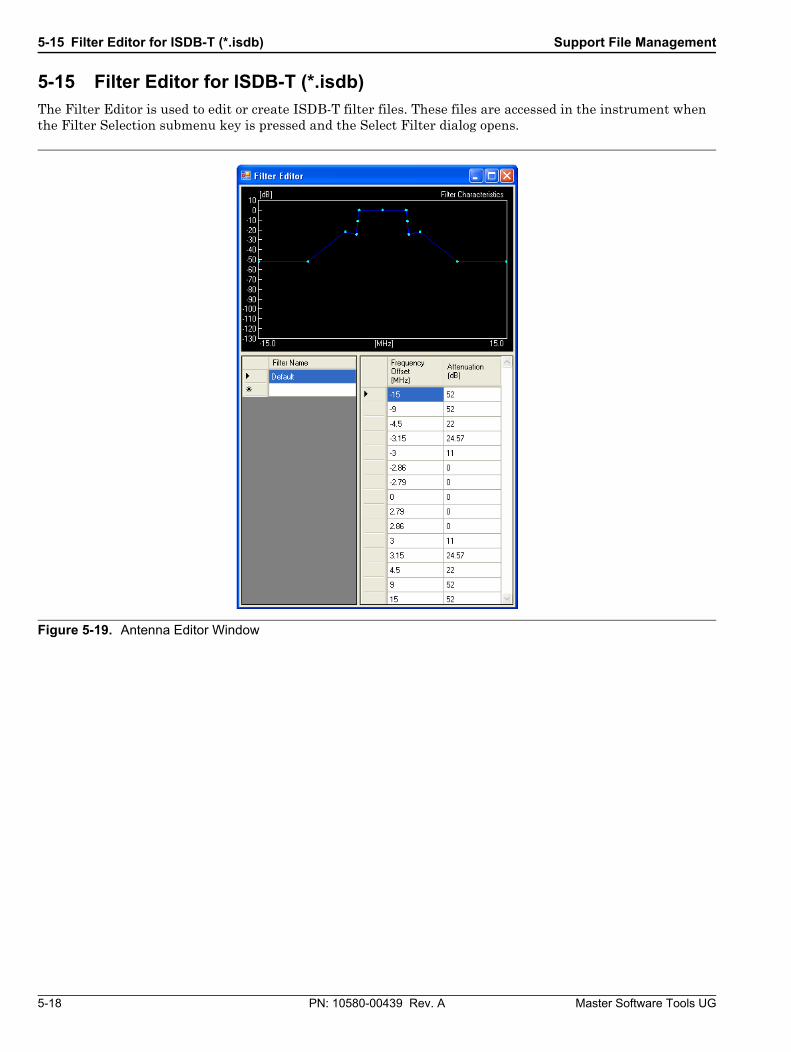
5-15 Filter Editor for ISDB-T (*.isdb) Support File Management
5-18 PN: 10580-00439 Rev. A Master Software Tools UG
5-15 Filter Editor for ISDB-T (*.isdb)The Filter Editor is used to edit or create ISDB-T filter files. These files are accessed in the instrument when the Filter Selection submenu key is pressed and the Select Filter dialog opens.
Figure 5-19. Antenna Editor Window

Support File Management 5-15 Filter Editor for ISDB-T (*.isdb)
Master Software Tools UG PN: 10580-00439 Rev. A 5-19
To create a new file within MST, pull down the File menu click New and then click ISDB-T Filter File.
To edit a filter file on the instrument, download the file into MST by pulling down the Sync Menu and clicking Download ISDB-T Filter List.
Both created or downloaded files will contain a Default filter on the list. Edit either default filters by clicking the desired node value - Frequency Offset or Attenuation. Type in the new value and press the Enter button on the PC keyboard.
The download loaded file contains a Default filter and three user filters – User1, User2, and User3. As with the Default filter, Filter Names, Frequency Offset, and Attenuation values can be changed by clicking on the filter name or desired value. Type in the new value and press the Enter button on the PC keyboard.
Upload the edited filter file by pressing the Upload button on the Toolbar. Closing the edited files automatically saves these files to the default directory in the PC.
Figure 5-20. New Pull Down Menu
Figure 5-21. Sync Pull Down Menu

5-15 Filter Editor for ISDB-T (*.isdb) Support File Management
5-20 PN: 10580-00439 Rev. A Master Software Tools UG

Master Software Tools UG PN: 10580-00439 Rev. A 6-1
Chapter 6 — Instrument Update
6-1 IntroductionThis chapter describes advanced features and program options as well as the built-in report generator.
6-2 Advanced Tools and Program OptionsThe following advanced features and program options are available under the Tools main menu.
Group Edit
This tool allows modification of a large number of measurement files at one time.
All of the following attributes can be reset:
• • Measurement title
• • Measurement subtitles
• • Limit lines
• • Marker positions
• • Plot scaling
Specify a particular file type on which to operate and choose whether to modify files in a specified folder or to modify all currently open measurement files. When modifying open files, changes can be viewed as they occur. The changes are temporary unless the files are saved.
Full Trace Retrieval
This tool simplifies the retrieval of large numbers of traces from a test instrument into a user-specified directory via a USB connection or an Ethernet connection. When a test instrument contains many measurement files, this tool can be used to retrieve all measurements at once. The process can be slow if the number of existing measurements exceeds several hundred.
VNA Measurement Calculator
This tool translates certain values into other units. It can show Real and Imaginary values, Magnitude, Phase, Return Loss, Reflection Coefficient, and Transmission Power. Enter a value in any field, and the other fields are adjusted automatically.
DAT File Conversion Tool
This utility is used to convert saved traces (.dat files) from Handheld Software Tools to the format that is used by Master Software Tools. This conversion is not a reversible process because no equivalent utility exists to convert newer traces to the older format. The trace files in the old format are not deleted, and the new format uses different filename extensions, .spa or .vna instead of .dat. If desired, the old traces remain available for use with the Handheld Software Tools program.
WarningOnce an HHST DAT file is converted to an MST file format, the new MST file cannot be converted to a HHST DAT file.

6-3 Trace Rename Utility Instrument Update
6-2 PN: 10580-00439 Rev. A Master Software Tools UG
Procedure
1. Open the Tools menu in Master Software Tools and select DAT File Conversion Tool.
2. In the Source area at the top area of the window, navigate to the directory that contains the traces that are to be converted.
3. In the Destination area, select the directory into which the converted traces are to be placed.
4. Select the Conflicting Filenames option that is to be used – Keep Existing, Overwrite, Prompt (for a decision), or Skip (skip the conversion of the file for which a conflict exists).
5. Select the measurement or measurements to be converted.
6. Click the Convert button. Note that the new traces appear in the destination window. Before the conversion, select View to preview the file in the new format, if desired. See Fig, 3-21 DAT File Conversion Tool Window
6-3 Trace Rename UtilityThis utility application can be used to quickly rename (filename, measurement title, and/or measurement subtitle) a large set of measurement files in a very systematic way. To use this utility effectively requires some forethought in how the measurements are taken.
Transfer the list of files from your test instrument to the PC
1. Pull down the Sync menu and click on the command line Download All Measurements.
The Browse For Folder window opens.
Figure 6-1. Sync Menu

Instrument Update 6-3 Trace Rename Utility
Master Software Tools UG PN: 10580-00439 Rev. A 6-3
2. Select a folder where the traces will be stored or make a new folder by clicking on the Make New Folder button.
3. Once the destination folder has been selected or created, click on the OK button. The process of downloading the file begins.
4. Click on the Close button when the statement Transfer Complete is displayed.
Figure 6-2. Browse For Folder
Figure 6-3. Download All Measurements Dialog

6-3 Trace Rename Utility Instrument Update
6-4 PN: 10580-00439 Rev. A Master Software Tools UG
Rename the Traces That Have Been Retrieved
1. Pull down the Tools Menu and click on Trace Rename Utility.
2. The MST Rename Utility application opens.
3. Click on the Working Folder button. This is the folder where the traces-to-be-renamed are located and will be stored.
Figure 6-4. Tools Menu
Figure 6-5. Trace Rename Utility

Instrument Update 6-3 Trace Rename Utility
Master Software Tools UG PN: 10580-00439 Rev. A 6-5
4. Place the cursor on the pull down menu and select the type of file to be renamed. Those traces are loaded into the utility.
5. Highlight any traces not to be renamed and click on the Delete button. The selected traces are removed from the list.
6. Activate a rename field by clicking on the box per Field column.
7. Enter names in each active field.
8. If you want to the program to cycle through each parameter, check the Auto-Advance button. The order you click the Auto-Advance check box determines the order the fields will cycle. Turn off Auto-Advance for all fields, and then turn them on in the order of precedence. A number will appear in the Auto-advance label indicating the field’s order. The field marked Auto-Advance (1) will cycle through its values first then when it cycles back to the top value, the Auto-Advance (2) field cycle to its next value and so forth.
9. From the toolbar select the object that you want renamed – Filename, Titles or sub-Titles.
10. Once you’ve activated your fields, names and Auto-Advance selections, you can rename each trace manually or automatically.
11. Rename Traces
a. Rename Manually
To activate Manual Renaming of measurements, select the Manual toolbar button:
• When in Manual mode, double-click a file, or select a file and press enter.
• The change will take place immediately.
• Auto-advance fields will advance each time.
• If you use the Enter key, the file selection will move down automatically.
Figure 6-6. Trace Type Selection Menu
Figure 6-7. Trace Rename Table

6-3 Trace Rename Utility Instrument Update
6-6 PN: 10580-00439 Rev. A Master Software Tools UG
b. Rename Automatically
To process many files at once,
• Select the target files and press the Apply Selected button,
or
• Press the Apply All button, to change all the filenames in the list.
Trace filenames in this example have been renamed. They have been immediately stored with the new names in the working folder file. This procedure can be used to rename the trace’s title and subtitle.
NoteThe change is immediate in the file and cannot be undone, but it can be redone easily to correct any mistakes.
Figure 6-8. Trace Rename Log File
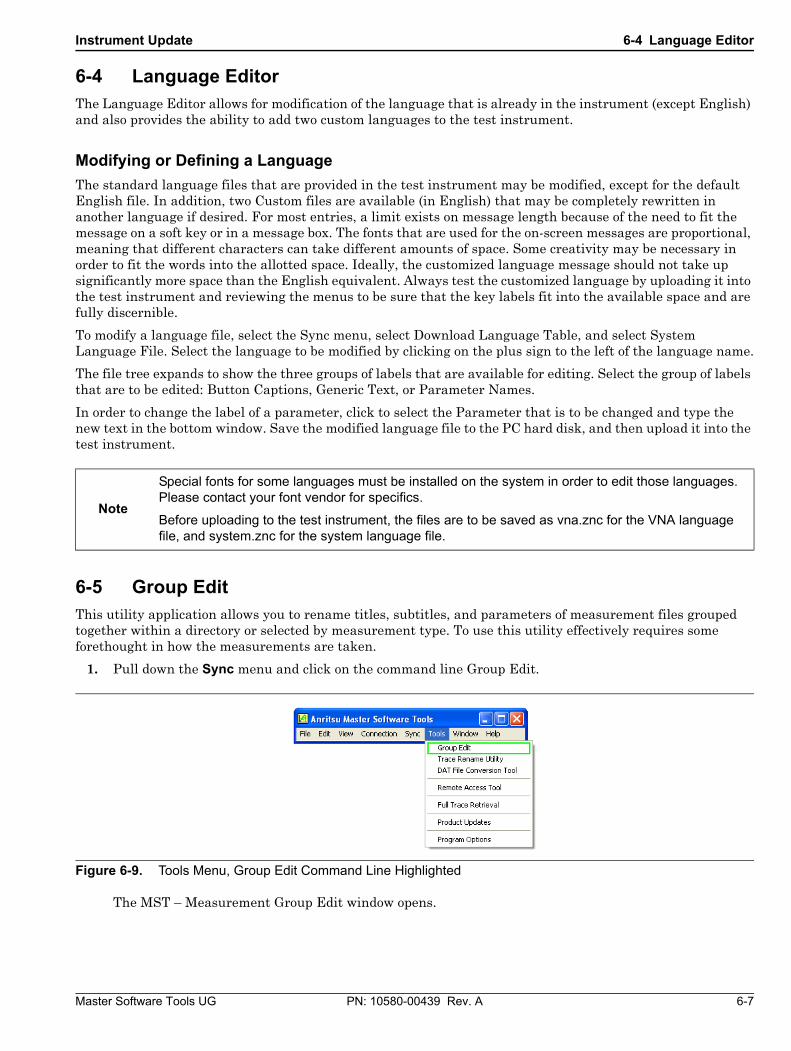
Instrument Update 6-4 Language Editor
Master Software Tools UG PN: 10580-00439 Rev. A 6-7
6-4 Language EditorThe Language Editor allows for modification of the language that is already in the instrument (except English) and also provides the ability to add two custom languages to the test instrument.
Modifying or Defining a Language
The standard language files that are provided in the test instrument may be modified, except for the default English file. In addition, two Custom files are available (in English) that may be completely rewritten in another language if desired. For most entries, a limit exists on message length because of the need to fit the message on a soft key or in a message box. The fonts that are used for the on-screen messages are proportional, meaning that different characters can take different amounts of space. Some creativity may be necessary in order to fit the words into the allotted space. Ideally, the customized language message should not take up significantly more space than the English equivalent. Always test the customized language by uploading it into the test instrument and reviewing the menus to be sure that the key labels fit into the available space and are fully discernible.
To modify a language file, select the Sync menu, select Download Language Table, and select System Language File. Select the language to be modified by clicking on the plus sign to the left of the language name.
The file tree expands to show the three groups of labels that are available for editing. Select the group of labels that are to be edited: Button Captions, Generic Text, or Parameter Names.
In order to change the label of a parameter, click to select the Parameter that is to be changed and type the new text in the bottom window. Save the modified language file to the PC hard disk, and then upload it into the test instrument.
6-5 Group EditThis utility application allows you to rename titles, subtitles, and parameters of measurement files grouped together within a directory or selected by measurement type. To use this utility effectively requires some forethought in how the measurements are taken.
1. Pull down the Sync menu and click on the command line Group Edit.
The MST – Measurement Group Edit window opens.
Note
Special fonts for some languages must be installed on the system in order to edit those languages. Please contact your font vendor for specifics.
Before uploading to the test instrument, the files are to be saved as vna.znc for the VNA language file, and system.znc for the system language file.
Figure 6-9. Tools Menu, Group Edit Command Line Highlighted

6-5 Group Edit Instrument Update
6-8 PN: 10580-00439 Rev. A Master Software Tools UG
2. Selection Scope - Select the location of the files to be edited.
a. Apply to all open files of selected type. This selection edits a group of files, file type determined in Application Type: in the Active Measurement Window. Placing a check in the box, next to Commit Changes to Disk save all changes which cannot be undone.
b. Apply to all files in the specified folder. This selection edits a group of files in the entered folder location.
3. Measurement Titles – Check the box next to the Plot Title or Plot Subtitle that you desire to change. Enter the new title or subtitle into the entry boxes. Use {date}, {time}, {count}, and filename to insert parameter values from each measurement file. You may also use {[VAR]}, where [VAR] is any parameter in the saved measurement. (i.e. {Center_Freq} or {OCC_BW_MEASURED_DB}.
4. Parameter Duplication -
a. Check the desired parameter box that you want to duplicate.
b. Browse the folder for the file with the parameter to be duplicated. Select it and it is displayed in the entry box.
5. Press the Apply button. Titles and parameters are entered as set up in steps 2 through 4.
Figure 6-10. Trace Rename Log File

Master Software Tools UG PN: 10580-00439 Rev. A 7-1
Chapter 7 — Instrument Files Update
7-1 IntroductionOccasionally Anritsu places updated software, firmware, and documentation on their Product Support Web Site. The website can be automatically queued for MST related updates.
7-2 Internet Settings ConfigurationTo automatically queue the Anritsu website for updates, you must configure the MST Internet Settings.
1. On the Tools menu, click Program Options.
The Program Options window opens.
2. Click on the Internet Settings tab.
3. In the Automatic Update Notification box, click on the check box preceding the statement – Automatically check for updates from Anritsu’s Product Support Web Site.
Figure 7-1. Tool Menu: Program Options Command
Figure 7-2. Internet Settings

7-2 Internet Settings Configuration Instrument Files Update
7-2 PN: 10580-00439 Rev. A Master Software Tools UG
4. Then in the Proxy Settings box, click on the check box preceding the statement – Use a Proxy Server to access the Internet content.
5. Enter your Username, Password and network Domain name in the respective entry boxes. You may need to ask you IT team for the Domain name if you don’t know it.
6. Click OK.
7. Close MST and start it up again.
8. On the Tools menu, click Product Updates.
Figure 7-3. Tools Menu: Product Updates Selected

Instrument Files Update 7-2 Internet Settings Configuration
Master Software Tools UG PN: 10580-00439 Rev. A 7-3
9. The Product Updates window opens. Notice at the top right corner of the window a box labeled Internet:. Confirm that the colored box is green. If green, a connection to the Internet has been established. If red, return to the Program Options window and re-enter your correct Username, Password and network Domain information. See button definitions below.
• Go To Website – Becomes active when the instrument connected contains the text Use “Go To Website” Button in the File column. When pressed, it will open the Anritsu firmware page for the family of instruments related to your instrument. Select the correct update method for updating your instrument and follow any subsequent instruction.
• Revision Details – Opens the Customer Service Revision text file for the instrument highlighted. This file contains pertinent information regarding the instrument such as general features, firmware updates, a history of changes, and fixes.
• Retrieve File – If the instrument’s file highlighted Status is Available, use this button to retrieve a file from the web to place on your PC. When the file is on the PC, its status will change to Ready.
• Check for Updates – This button checks for recent versions of firmware placed on the Internet.
• Install to Unit – When the file status for the highlighted firmware is Ready, press this button to load the install the firmware package into the instrument.
Figure 7-4. Program Updates Window

7-2 Internet Settings Configuration Instrument Files Update
7-4 PN: 10580-00439 Rev. A Master Software Tools UG
• Prepare Ext. USB Device – For selected instruments only. Refer to “Firmware Update” on page 7-7 for a more recent firmware update procedure.
a. Place a blank USB memory stick into your PC’s USB slot. Note: Confirm that any preloaded software of files from the memory stick manufacturer has been removed. If necessary, format the memory stick as a FAT 32 drive.
b. Copy a mirror image of the firmware package onto the USB memory stick by pressing the Install to USB button. The Browse For Folder dialogue opens. Highlight the USB Memory stick and click OK.
c. A Code Loading Instructions dialogue opens after the image creation on the USB memory stick is complete.
d. Place the USB Memory stick in the instrument’s USB Port and follow the Code Loading Instructions.
• Emergency Repair – This feature allows you to recover corrupted operating system firmware. By pressing this button, a OS Recovery dialogue opens with a list of instructions. Go to section 7-5 Emergency Repair Procedures for complete procedure instructions.
Figure 7-5. Browse for Folder Dialog
Figure 7-6. Code Loading Instructions Dialog

Instrument Files Update 7-3 Updating Software and Firmware
Master Software Tools UG PN: 10580-00439 Rev. A 7-5
7-3 Updating Software and Firmware1. On the Tools menu, click Program Updates.
The Firmware Update Tip dialog opens. It’s to inform you of an improved method of updating USB enabled handheld instruments (“Firmware Update” on page 7-7). Press the OK button when done.
2. Notice the differences in the two Product Update windows below.
• File: Use “Go To Website” Button
Newer instruments require going to the Anritsu Website for firmware update. If this statement appears in the File column of the Product Updates window, press the Go To Website button. It will open the Anritsu firmware page for the family of instruments related to your instrument. Select the correct update method for updating your instrument and follow any subsequent instruction.
• Status: Ready
In the left window, the highlighted file’s status is Ready and the Install to Unit button is active. Immediately click on Install to Unit button to update the test instrument with the new firmware.
• Status: Available
Figure 7-7. Tools Menu: Program Updates Command
Figure 7-8. Firmware Update Tip Dialog

7-3 Updating Software and Firmware Instrument Files Update
7-6 PN: 10580-00439 Rev. A Master Software Tools UG
The highlighted file’s status, in the window on the right is listed as Available and the Install to Unit button is gray and inactive. This means that the updated file is on the Anritsu’s Product Support Web Site and needs to be for downloaded to your PC. Once the file has been downloaded and placed your PC, the status will change to Ready and the Install to Unit button becomes active. Follow the instructions below.
a. Click on the Retrieve File button.
b. Once the status changes to Ready, click on the now active Install to Unit button. The test instrument is updated with the new firmware.
• File Not Listed
There may be instances after opening the Products Update window; you do not find the file you are looking for. In that case:
a. Click on the Check for Updates button. MST will check for the latest updates in the Anritsu’s Product Support Web Site. New updates found will be listed in the file menu.
b. Click on the Retrieve File button. The file is transferred from the website to PC.
c. Once the status changes to Ready, the Install to Unit button is activated. The test instrument is ready to be updated with the new firmware.
3. At this point you may press Install to Unit or Prepare Ext. USB Device.
Figure 7-9. Program Updates Window: File & Status Column
NoteE-Series instruments firmware can only updated using a USB memory device. Prepare the external USB device. Once USB memory device is updated, review your instruments User Guide for instructions regarding updating the firmware with the USB memory device.

Instrument Files Update 7-4 Firmware Update
Master Software Tools UG PN: 10580-00439 Rev. A 7-7
7-4 Firmware Update To update your Anritsu instrument firmware, use a high quality USB memory device with at least 250 MB of free space and FAT32 file system format. This procedure applies to instruments with USB ports. Legacy instruments may need to use the firmware update procedure found in the instrument’s user guide.
1. Insert the memory device into your PC or laptop.
2. From a browser, go to the following Anritsu Products page:
http://www.anritsu.com/en-US/test-measurement/rf-microwave/base-station-analyzers
3. If the Web page lists more than one product, find your instrument model number and click the link.
4. On the product page, press the Downloads button.
5. Under the Drivers/Firmware/Software tab, you can optionally follow the Firmware Revision/Release History link to download a document detailing current and past firmware changes.
6. Click on the link Firmware Update for your instrument.
7. Click the Download button, then choose Save or Save As. Do not run the executable file directly from the Web page.
8. Go to the Save location designated in Step 7 and double-click the installer file, Model_Ver_USBLoader.exe.
9. In the Firmware Update dialog, click to view, then accept the software license agreement.
10. Click Browse and select the Removable Disk drive where the USB device is inserted.
11. Click Prepare USB Memory Stick to create the firmware update USB device.
12. After the firmware update tool has finished, click through the final steps in the Firmware Update dialog to close the installer program.
13. Eject the memory device from the computer.
14. Turn off the Cell Master and insert the USB memory device into the instrument.
15. Make sure the Cell Master is plugged into an AC power source and not running on battery alone, then turn on the instrument.
16. At bootup, the instrument should detect new firmware on the USB device and ask if you wish to upgrade. Press Yes.
17. The Automatic Firmware Update dialog should open at this time. Skip to Step 19.
18. If there is no error but the instrument does not enter upgrade mode automatically:
a. Press Shift > System (8) > System Options > Reset > Update Firmware.
b. Press Load Firmware at the bottom left of the instrument screen.
c. Press Update Application Firmware.
d. The Firmware Update dialog opens.
NoteThe file structure created on the USB memory device by the installer program is necessary for a successful firmware update and must not be altered in any way.
Note
If the same firmware code as contained on the USB device is already loaded on the instrument, a message indicating that firmware update is skipped will display briefly on the instrument screen.
If the firmware update on the memory device does not match your instrument model, an error message will display briefly, indicating that it is not compatible.
7-4 Firmware Update Instrument Files Update
7-8 PN: 10580-00439 Rev. A Master Software Tools UG
19. Use the Up/Down arrow keys or the rotary knob to select one of the Save modes.
• Save none: No attempt is made to save any user data.
• Save user data: User data is saved to the selected external media device.
• Save & restore user data: User data is saved to the selected external media device. The instrument also attempts to restore the files to the instrument after the update.
20. Press Enter.
21. Press Enter again to confirm your intention to proceed with the firmware upgrade.
To cancel the operation, press Esc. In this case, you need to press Shift > Mode (9) and select an application from the Mode Selector list in order to exit upgrade mode and resume normal instrument operation.
22. After the update is complete, the instrument should reboot automatically.
Warning Some user data may be lost if not enough memory space is available on the selected device.
WarningYou cannot stop the upgrade once it has started. To avoid potential permanent damage, do not turn off the instrument or remove the USB memory device during the firmware update.
Note
If the instrument turns off and does not restart on its own, remove the USB memory device and turn on the instrument by holding down the System (8) key, then pressing the Power button. Keep pressing System (8) until the Anritsu splash screen is displayed.
Be sure to use this key combination in order to perform a Master Reset while turning on the instrument. Pressing the Power button alone may put the instrument in an unrecoverable error state.

Instrument Files Update 7-5 Emergency Repair Procedure
Master Software Tools UG PN: 10580-00439 Rev. A 7-9
7-5 Emergency Repair ProcedureIf you have problems with booting up or updating firmware on the test instrument, use the following steps to resolve the problem.
1. Power off the instrument.
2. Prepare a firmware update USB device as described in the procedure above, “Firmware Update” on page 7-7, and insert it into the instrument. Double check that you have the correct model firmware.
3. Power up the instrument into bootstrap mode:
• On touchscreen instruments, hold Shift, 4, and 0 keys while powering up.
• On non-touchscreen instruments, hold the 1st, 3rd and 5th soft keys, located right of the display directly below the Esc key, while powering up.
• The Bootstrap screen (similar to below) will appear after a few seconds.
4. Press Update OS (USB memory device). The instrument will update the OS firmware and return to the above screen when complete.
5. Press Load applications. The instrument will load the available applications and return to the above screen when complete.
6. Press Load FPGAs. The instrument will load the available FPGA firmware and return to the above screen when complete.
7. Press Load All. The instrument will reload available applications and FPGA firmware and return to the above screen when complete.
8. Reboot and the instrument should start up normally.
WarningIt is vital that the correct instrument model firmware is downloaded during the following step or irreversible damage to the instrument can occur.
Figure 7-10. Option Upgrade Complete Notification Window
Bootstrap version x.xx<keypress>

7-6 Generating an Instrument Config File and Installing A New License File Instrument Files Update
7-10 PN: 10580-00439 Rev. A Master Software Tools UG
7-6 Generating an Instrument Config File and Installing A New License FileTo automatically queue the Anritsu website for updates, you must configure the MST Internet Settings.
1. Run the MST program.
2. Connect to the instrument.
3. Generate a Config File
a. Pull down the Sync menu and highlight Device Status and Options to open the sub-menu.
b. Click Get Options (Config File). The Save Config File window opens.
c. Select the desired folder or create a new folder to save the config file. Use the file name given in the entry box. (The filename format is predetermined: Model-space-serialnumber.config).
Figure 7-11. Get Options Dialog
Figure 7-12. Save Config File Dialog

Instrument Files Update 7-6 Generating an Instrument Config File and Installing A New License File
Master Software Tools UG PN: 10580-00439 Rev. A 7-11
4. Installing a License File
a. Pull down the Sync menu and highlight Device Status and Options to open the sub-menu.
b. Click Set Options (License File). The Open License File window opens.
c. Go to the folder where the license file was previously stored.
d. Highlight the file and press the Open button. The filename format is model-space-serialnumber.license.
Figure 7-13. Set Options Selected
Figure 7-14. Open License File Dialog

7-6 Generating an Instrument Config File and Installing A New License File Instrument Files Update
7-12 PN: 10580-00439 Rev. A Master Software Tools UG
e. MST will install the new license into the instrument. After the installation is complete, the following dialog appears.
f. Follow the instruction.
g. Verify the new option(s) are listed on the boot up screen.
Figure 7-15. Option Upgrade Complete

Master Software Tools UG PN: 10580-00439 Rev. A A-1
Appendix A — Applications and Files
A-1 Supported Anritsu InstrumentsFor the most recent list of supported instruments, go to Master Software Tools in the Anritsu Website - http://www.anritsu.com
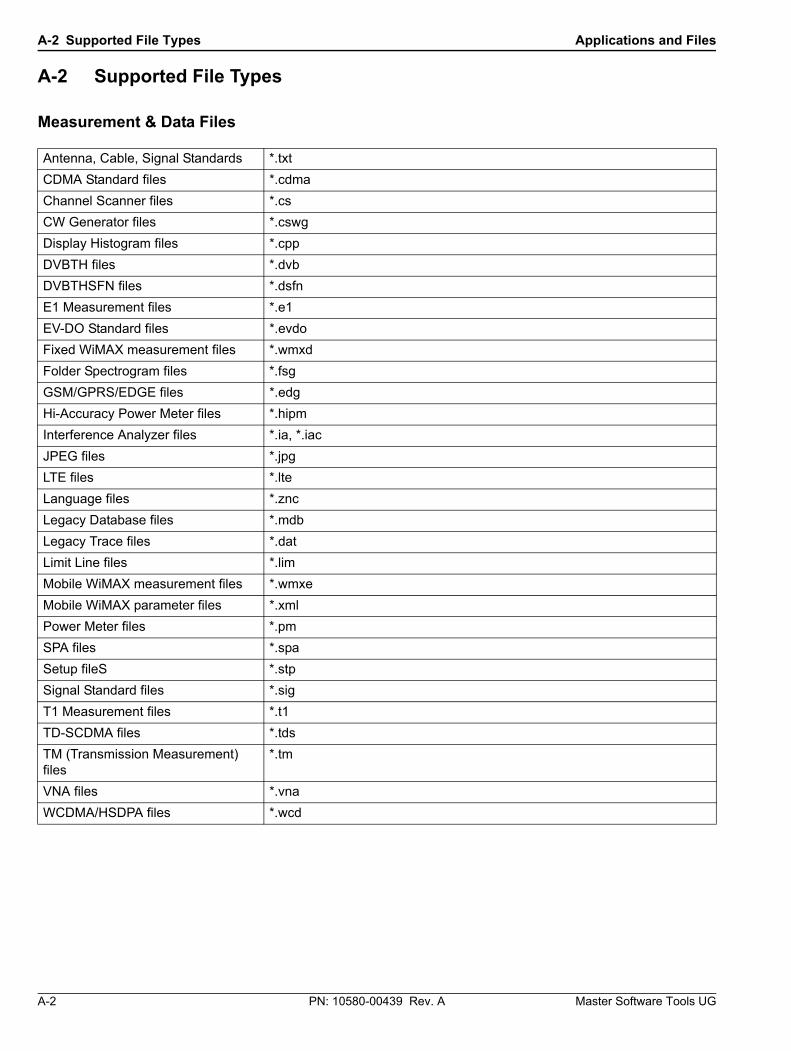
A-2 Supported File Types Applications and Files
A-2 PN: 10580-00439 Rev. A Master Software Tools UG
A-2 Supported File Types
Measurement & Data Files
Antenna, Cable, Signal Standards *.txt
CDMA Standard files *.cdma
Channel Scanner files *.cs
CW Generator files *.cswg
Display Histogram files *.cpp
DVBTH files *.dvb
DVBTHSFN files *.dsfn
E1 Measurement files *.e1
EV-DO Standard files *.evdo
Fixed WiMAX measurement files *.wmxd
Folder Spectrogram files *.fsg
GSM/GPRS/EDGE files *.edg
Hi-Accuracy Power Meter files *.hipm
Interference Analyzer files *.ia, *.iac
JPEG files *.jpg
LTE files *.lte
Language files *.znc
Legacy Database files *.mdb
Legacy Trace files *.dat
Limit Line files *.lim
Mobile WiMAX measurement files *.wmxe
Mobile WiMAX parameter files *.xml
Power Meter files *.pm
SPA files *.spa
Setup fileS *.stp
Signal Standard files *.sig
T1 Measurement files *.t1
TD-SCDMA files *.tds
TM (Transmission Measurement) files
*.tm
VNA files *.vna
WCDMA/HSDPA files *.wcd

Applications and Files A-2 Supported File Types
Master Software Tools UG PN: 10580-00439 Rev. A A-3
Output Files
Comma files *.csv
Export files *.s2p
Google Map Export files *.kml
MapPoint Export files *.dut and *.ptm
Report files *.html
Report files *.pdf
Script Master – Channel Scanner files
*.smcs
Script Master – GSM/WCDMA files * pfs and c
Spectrogram files *.avi
Trace Copy files *.bmp

A-2 Supported File Types Applications and Files
A-4 PN: 10580-00439 Rev. A Master Software Tools UG

Master Software Tools UG PN: 10580-00439 Rev. A B-1
Appendix B — FAQs
B-1 Intermittent Code Loading Problems Associated with Dell Docking Stations
Intermittent boot up problems have occurred with Anritsu instruments after code loading using Master Software Tools on Dell Latitude D620 and D630 laptops. Problems are related to code loading when the laptop is attached to the docking station or with the Integrated USB hub BIOS setting. These problems affect code loading with either USB or Ethernet connections. Please follow the steps for your Dell model laptop below to avoid these problems.
Dell Latitude D620 Series Laptops
1. Power off the laptop and remove it from the docking station.
2. Attach either a USB or an Ethernet cable to your laptop.
3. Turn the laptop power on.
4. During the laptop BIOS boot up process, before the Windows screen, press F2.
a. The BIOS page opens.
b. Scroll down to Onboard Devices using the Down arrow.
1. Press Enter to expand the list.
2. Scroll down to Integrated USB hub
3. Press Enter to modify this setting.
Figure B-1.

B-1 Intermittent Code Loading Problems Associated with Dell Docking Stations FAQs
B-2 PN: 10580-00439 Rev. A Master Software Tools UG
4. Highlight High Speed using the Left/Right arrow.
5. Press Enter when done modifying this field
c. Press Esc to exit the BIOS Setup
d. Press the Left/Right arrow to select Exit.
e. Press Enter.
5. Run Master Software Tools (MST). Follow the instructions for Code Loading in MST. For additional information regarding this topic, go to the MST Help menu and click the Help Contents command line. This opens the Help.pdf file. Go to Chapter 7 Instrument Files Update.
6. After successfully code loading the Anritsu instrument, power down the laptop, detach the communication cable from the laptop, and re-dock the laptop into the docking station.
7. You have the option to return the Integrated USB hub parameter to the factory default setting Compatible or keep the new setting, High Speed.
Figure B-2.
Note
If you are using or suspect to be using known USB 1.1 rev devices e.g. mouse, keyboard, or have intermittent problems with this new setting, follow the instructions in step 4 above to reset Integrated USB hub to Compatible. When in the Integrated USB hub field, use the Left/Right arrow to highlight Compatible.
Leave the Integrated USB hub setting at High Speed if no USB 1.1 rev devices are in use or no USB communication problems occur.

FAQs B-2 Installing East Asian Language Fonts
Master Software Tools UG PN: 10580-00439 Rev. A B-3
Dell Latitude D630 Series Laptops
1. Power off the laptop and remove it from the docking station.
2. Attach either a USB or an Ethernet cable to your laptop.
3. Turn the laptop power on.
4. Run Master Software Tools (MST). Follow the instructions for Code Loading in MST. For additional information regarding this topic, go to the MST Help menu and click the Help Contents command line. This opens the Help.pdf file. Go to Chapter 7 Instrument Files Update.
5. After successfully code loading the Anritsu instrument, power down the laptop, detach the communication cable from the laptop, and re-dock the laptop into the docking station.
B-2 Installing East Asian Language Fonts The following procedure text are for MST users whose PCs are in East Asian countries or users who prefer to work with their PCs in one of the East Asian language fonts – Chinese Simple, Chinese Traditional, Japanese, or Korean.
1. Click the Task Bar.
Figure B-3. Start Menu

B-2 Installing East Asian Language Fonts FAQs
B-4 PN: 10580-00439 Rev. A Master Software Tools UG
2. Move your cursor to Settings and click Control Panel. The Control Panel window opens.
3. Scroll down to and double click Regional and Language Options. The Regional and Language Options dialog opens.
4. Click the Languages tab.
Figure B-4. Control Panel
Figure B-5. Regional and Language Options Dialog

FAQs B-3 Instrument Password Protection Feature
Master Software Tools UG PN: 10580-00439 Rev. A B-5
5. Click the Install files for East Asian Languages. Checking this box opens the following dialog window. Press OK button to install.
6. Click the OK button in the Regional and Language Options window. Installation is complete.
B-3 Instrument Password Protection FeatureSome customers require a secure line when using an Ethernet connection between their instrument and MST. The password feature is implemented on the instrument. If active, the window below will open when attempting to connect to the instrument from MST. Enter the password and press the OK button. (For more information regarding Remote Access Password, please refer to your instrument’s user guide.
Figure B-6. Install Supplemental Language Support Warning
Figure B-7. Instrument Locked Input Dialog

B-3 Instrument Password Protection Feature FAQs
B-6 PN: 10580-00439 Rev. A Master Software Tools UG


Anritsu utilizes recycled paper and environmentally conscious inks and toner.
Anritsu Company490 Jarvis Drive
Morgan Hill, CA 95037-2809USA
http://www.anritsu.com