towards requirements for more adequate software tools that support both: learning and doing...
TRANSCRIPT

TOWARDS REQUIREMENTS FOR MORE ADEQUATE SOFTWARETOOLS THAT SUPPORT BOTH: LEARNING AND DOING STATISTICS
Paper presented at the Fourth International Conference on Teaching Statistics(ICOTS 4)
Marrakech, Morocco, 25-30 July 1994
Rolf BiehlerInstitut für Didaktik der Mathematik (IDM), Universität Bielefeld
Postfach 10 01 31, D-33501 Bielefeld, Germanye-mail: [email protected]
1. Computer support for introductory statistics education
Our notion of introductory statistics education is not restricted to collegeand university levels but also comprises the secondary level. Here the teachingof "stochastics" within mathematics education in schools and the teaching ofdata analysis in other school subjects is included as well.
What kinds of computer software do we need to support introductorystatistics education? If we browse through the literature, we can distinguishvarious types having different educational functions. I should like todistinguish tools, microworlds, resources and tutorial shells.
We need tools or rather computing environments in the sense of Thisted(1986) if we want that students learn to practice statistics similar in style tothat of current statiticians in their computer supported working environments.
We use microworlds as a notion that summarizes interactive experiments,exploratory visualisations and simulations in which students have some con-strained possibility to play with graphs, methods and parameters which mayhelp them with conceptualising statistics. Typical examples are manipulatingthe shape of a distribution and observing how this affects numericalsummaries, manipulating a fitted line and observing how this affects thequality of the fit, changing data and observing how this affects the value of acorrelation coefficient, observing how initial distribution, number ofrepetitions and sample size affect the distribution of the mean (visualising thecentral limit theorem).
The notion resources comprises first of all data and meta-data: Interestingdata sets with background information (stories) and references that help withthe interpretation. Also, a hypertext glossary as a resource for statistical termsand methods could be part of it, as well as interactive movies with applicationsof statistics in multimedia environments (Moore, 1994).
We could consider broader roles of computers in introductory statistics ed-ucation, i.e. taking over parts of roles of teachers and books. For instance,giving expositions and explanations, setting tasks for the students, analysingand evaluating student responses and providing feedback. Authoring systemslike Toolbook or Hypercard are already used by some projects to programsuch tutorial shells that provide an interface with other software and integrate

the use of other tools and microworlds. In many educational programs, thedistinction between tutorial shell and microworld can be made only as aconceptual one: they are in fact amalgamated -- which is a disadvantage ifsomeone would like to use the microworld but not the tutorial approach.
If we assume that teachers have an active role in interpreting and realizinga curriculum or even that teachers want to explore new curriculum content ornew sequences of content, this has consequences with regard to requirementsof software support. Tools, microworlds, resources and tutorial shells shouldbe adaptable -- at least to a certain degree - by teachers for their specificaudience and educational goals. Software has to have a teacher interface, aspecific capability as a meta-tool or meta-medium. We will speek of teachers'meta-tool. We can summarize components as in Figure 1.
Resources
Microworlds
Tools
Meta-tools(for teachers)
Tutorialshell
Fig. 1 Components of educational software
These distiction are partly conceptual and need not correspond to differentsoftware components. For instance, there are programmable data analysis sys-tems that can be used to construct microworlds within the system, for instance,through a limited set of functions and commands in Minitab or Splus. Someprograms even support tutorial shells within the system itself. An example arethe programming of SUCROS in the system Survo 84c, as Puranen (1994) hasshown. Also, the new interface of StatView 4.0 can be used to construct alimited tutorial shell that introduces to using the program for certain statisticalanalyses.
How does a reasonable list of priorities for software support look like?This paper is based on the following rank order (with descending priority):
- student tools whose learning and use can be integrated into anintroductory course
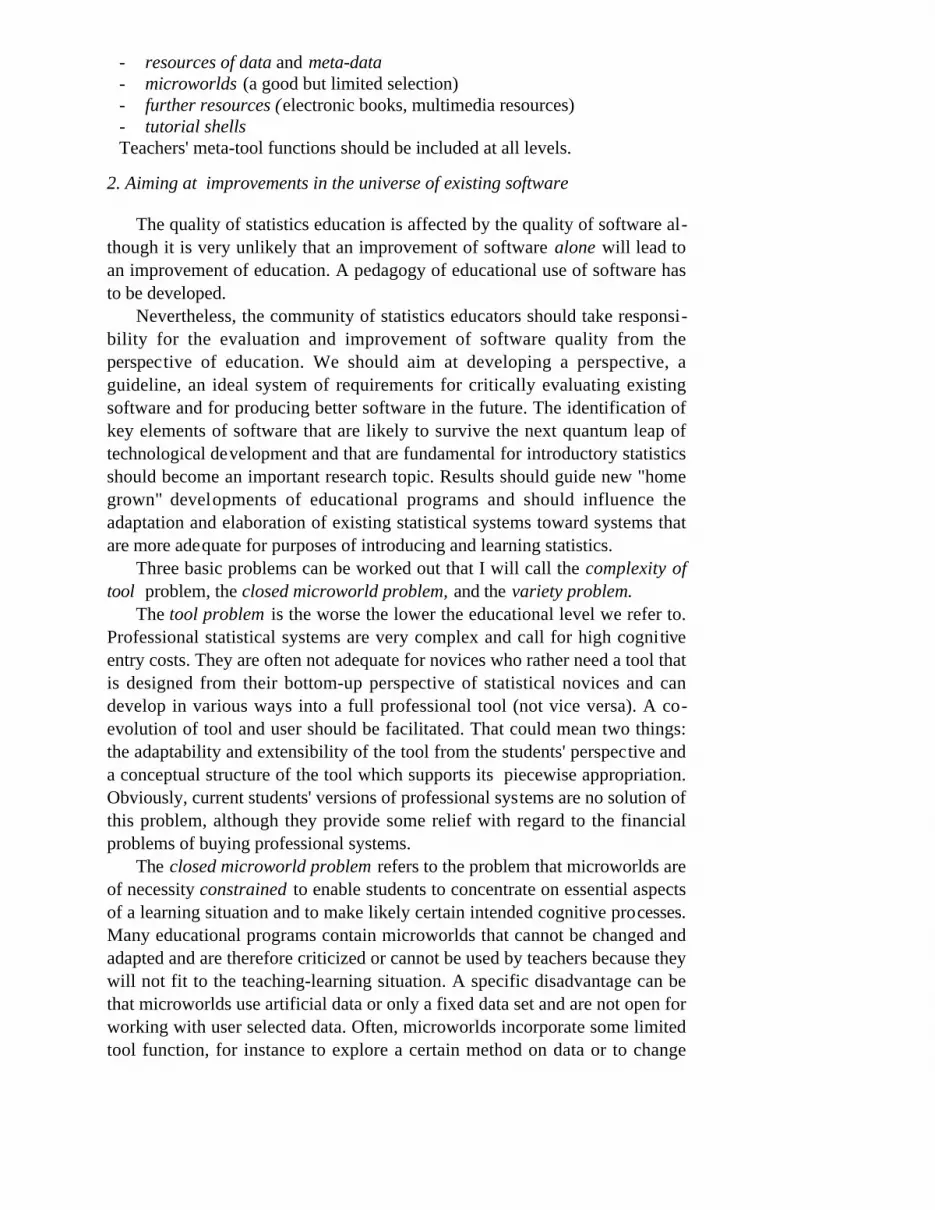
- resources of data and meta-data- microworlds (a good but limited selection)- further resources (electronic books, multimedia resources)- tutorial shellsTeachers' meta-tool functions should be included at all levels.
2. Aiming at improvements in the universe of existing software
The quality of statistics education is affected by the quality of software al-though it is very unlikely that an improvement of software alone will lead toan improvement of education. A pedagogy of educational use of software hasto be developed.
Nevertheless, the community of statistics educators should take responsi-bility for the evaluation and improvement of software quality from theperspective of education. We should aim at developing a perspective, aguideline, an ideal system of requirements for critically evaluating existingsoftware and for producing better software in the future. The identification ofkey elements of software that are likely to survive the next quantum leap oftechnological development and that are fundamental for introductory statisticsshould become an important research topic. Results should guide new "homegrown" developments of educational programs and should influence theadaptation and elaboration of existing statistical systems toward systems thatare more adequate for purposes of introducing and learning statistics.
Three basic problems can be worked out that I will call the complexity oftool problem, the closed microworld problem, and the variety problem.
The tool problem is the worse the lower the educational level we refer to.Professional statistical systems are very complex and call for high cognitiveentry costs. They are often not adequate for novices who rather need a tool thatis designed from their bottom-up perspective of statistical novices and candevelop in various ways into a full professional tool (not vice versa). A co-evolution of tool and user should be facilitated. That could mean two things:the adaptability and extensibility of the tool from the students' perspective anda conceptual structure of the tool which supports its piecewise appropriation.Obviously, current students' versions of professional systems are no solution ofthis problem, although they provide some relief with regard to the financialproblems of buying professional systems.
The closed microworld problem refers to the problem that microworlds areof necessity constrained to enable students to concentrate on essential aspectsof a learning situation and to make likely certain intended cognitive processes.Many educational programs contain microworlds that cannot be changed andadapted and are therefore criticized or cannot be used by teachers because theywill not fit to the teaching-learning situation. A specific disadvantage can bethat microworlds use artificial data or only a fixed data set and are not open forworking with user selected data. Often, microworlds incorporate some limitedtool function, for instance to explore a certain method on data or to change
methods and graphs. However, their support for flexible data analysis islimited, and to satisfy the variety of demands one would need a collection ofthem. A certain solution to this problem is to use embedded microworlds in alarger host system that can be used to modify and enlarge a microworld and tocontinually extend activities from microworlds to working on problems usinga tool. However, embedding often implies that microworlds will share featuresof the host system (for instance formal language), which may not be desirableand come into conflict with the microworlds aim to support a specificcognitive process.
The variety problem is illustrated by the various collections of mi-crowrolds that exist. A more systematic and co-ordinated approach to mi-croworlds is missing. The variety problem exists also with regard to tools. Agood example is an undergraduate course of Snell (1992) where three toolswere used, namely StatView as a data analysis tool, Minitab for doing somesimulation experiments and TrueBasic for designing some more complexmicroworlds and new methods. However, in general, coping with un-coordinated interfaces, notations and ideas and many tools in one coursewould overtax the average teacher and student.
Just as the history of statistical computing has lead us from collections ofspecial purpose programs to integrated and adaptable tools for data analysisthe parallel idea of an integrated tool or an integrated system of co-ordinatedtools for educational purposes seems fascinating. Adaptability (includingextensibility) is a central requirement for data analysis systems to cope withthe variety of needs and users. Current solutions of adaptability are far fromsatisfactory (Steinecker, 1990). We may even hope that adequately adaptabletools for doing statistics can also be co-used as a host system for defining andmodifying microworlds for learning. As learning statistics should involvedoing statistics (with computer support) in any case, a single adaptable toolmay become all we need.
Obviously, there is a tension between solving the variety problem and thecomplexity of tool problem. And, we have to analyse to which extent the vari-ety is just a result of uncoordinated and pragmatic developments and to whichextent it reflects different task domains with different conceptual and opera-tional structure. The model of a coherent system of collaborating (modular)tools with well defined interfaces and minimal functional overlap may be analternative to a supersystem with high complexity. Adequate data transfer andobject linkage facilities between the components will be essential. These newbasic approaches can be already observed with regard to plans of newoperating systems and with regard to plans of splitting up complex wordprocessors and spreadsheets into collections of smaller tools.
In statistics, for instance, it could be advantageous if we had amodelling/simulation tool coordinated with a data analysis tool instead ofusing StatView and Minitab as above with their large functional overlap anddifferent philosophy. If a model is contructed with a modelling tool and
simulated data from the model have been generated, these data should betransferable to a data analysis tool. In addition, a hot linkage of the data to themodel tool may support exploring changes in the results, when the model orthe random seed is changed.
3. Kinds of useful tools
What kind of tools do statisticians need? Thisted (1986) distinguishes"Data analysis environment", "Monte Carlo workbench" and "Theoreticalstatistician's environment". He specified basic requirements for the first fromthe perspective of how to support certain statistical strategies, especially inExploratory Data Analysis. Existing software tools have different profiles ofusefulness with regard to the above three environments (see Biehler & Rach,1990a; Biehler & Rach, 1990b). My basic argument is that we need elementsof the above mentioned three environments for educational purposes, and Iwill re-interpret these environments from an educational point of view.
Requirements of software are dependent on intended educational uses,however, a synthesizing theoretical and empirical analysis of most efficientand promising uses of computers is still lacking. We will start with globallydescribing assumptions concerning the direction in which introductory statis-tics education should move and improve. These have been discussed in moredetail elsewhere (Biehler, 1992; Biehler, 1993; Gordon & Gordon, 1992;Thisted & Vellemann, 1992). The postulates will be used as a background towhich software requirements will refer.
Directions of educational change with distinct functions of computer useinclude:
(1) Students practice data analysis with exploratory working style. Stu-dents should be empowered to do some "small scale" data analysis work thathas the interactive, exploratory and open-end character of real data analysis inpractice. Students should be enabled to combine exploratory and inferentialmethods, graphical and numerical methods as well as integrating data base ac-tivities, data transformations, and documentation of results into their work. Forthese purposes of supporting an exploratory working style, however, an inte-grated student tool is required that is similar to flexible professional tools butincorporates a new quality of balance between flexibility and ease-of-use andease-of-learning. The kind of tool would not be so important if the major usewere just learning to execute some isolated commands of a software packagein order to calculate some examples with applications of methods learned in aprior course.
(2) Students participate in "research in statistics", whose object is to con-struct, analyse and compare statistical methods. Those aspects of research thatcan be performed by computer based simulation studies or experiments on datasets promise to be more accessible to students than mathematical theory. Forinstance, students may explore sampling distributions of t-test statistics underseveral probabilistic assumptions. Students may re-discover and conceptualise
the difference between median and mean as estimators of central tendency etc.Generally, an exploration of alternatives to standard methods may become fea-sible. For instance, students may suggest and explore their own graphs, sum-maries and tests, because custom-designed methods can be explored bysimulation and resampling methods although a mathematical (analytical)theory does not exist. In other words, we consider a guided discovery approachto the methods and concepts of statistics, and not only with regard toapplications of statistics. For that purpose, a software tool is required that haselements of a "Theoretical statistician's environent" and of a Monte Carloworkbench.
(3) Students' construction of models for simple and multistage random ex-periments is an important part of learning elementary probability with manyadvantages over just working with ready made simulations (Biehler, 1991;Konold, 1991). Analysing statistical methods on the basis of one or moreprobability models, simulating experiments for demonstrating, experiencingand coping with situations of uncertainty are additional important pedagogicaluses. From this perspective, a student tool for simulation and modelling, aMonte Carlo workbench for students is required.
(4) Teachers explore new curriculum content. We assume that the contentof current introductory courses has to be questioned. A software tool shouldsupport the educational exploration of various new emphases in the content ofteaching. For instance, bootstrapping and permutation tests promise to providea more "natural" introduction to inference, after students have learned ex-ploratory data analysis. A software tool should be consistent with various al-ternatives or even adaptable to various purposes.
(5) Teachers (and educational researchers) explore new sequences ofcontent. This question is particularly problematical when we start looking fromthe contents of general education in schools to more sophisticated levels, andnot vice versa. The principle of EDA to start an analysis with simple methodsand use more sophisticated methods afterwards, if necessary, could be re-flected in curriculum construction. For instance, eye-fitted lines with residualanalysis should precede the method of least squares. Or, the comparison ofdistributions by box plots precedes t-tests and ANOVA. But even if we wouldnot aim at such shifts, the structure of an adequate tool should reflect the stu-dents' bottom-up perspectives and not only the top-down perspective where auser has to cope with a fully sophisticated system of statistical methods fromthe beginning.
(6) Teachers adapt and modify material and software for their students.Ideally, a software has the character of a meta-tool and meta-medium. i.e.teachers are able to redesign a tool, to make it simpler or better adapted to thespecific curriculum and students' competence.
There can be quite a tension between requirements from the students' andfrom the teachers' perspective if tools are not adaptable.
4. Kinds of useful embedded microworlds
A research program to overcome the closed microworld problem and toidentify relevant microworlds would have to proceed on two levels: Firstly, toanalyze and compare existing microworlds and their educational potential withthe aim to identify some general elements and common building blocks, andsecondly critically analysing available host systems with regard to theircapability of adequately hosting good educational microworlds.
The idea to co-use systems for statistical data analysis for building educa-tional microworlds is not new. Systems with statistically designed interactiveand directly interpreted command languages that can be extended offer goodopportunities. Systems like MINITAB, PC-ISP, SURVO, S-Plus, xlispstat,APL, spreadsheets and general mathematical systems like mathematica andMathcad have been used and extended for these educational purposes. Eachsystem offers its own type of microworld construction, e.g. macro, notebook,template etc. Some also support the writing of electronic books or tutorialshells around the microworlds. We cannot discuss problems with theeducational use of these systems in this paper. Naeve (1991) discusses theeducational advantage of statistical language systems like APL if leadinguniversity students from performing experiments to writing their own is abasic aim.
For secondary education, but also for introductory statistics in higher edu-cation, starting with a command language system is problematical. We areconvinced that a host system with a graphical user interface offers a moreadequate basis. This would be even more so if the limits of menu-basedsystems could be mitigated by allowing formal language input at those placeswhere there is a real need, for instance for defining data transformations ornew procedures.
An essential point is how easy it is to define microworlds, whether pro-gramming expertise is needed or whether we can do "programming by exam-ple". Kaput (1988) has underlined the centrality of this idea for improvingeducational software in general (see also Witten et al., 1992) for the generalbackground. Two trends in software maturation meet these requirements: thegeneral effort of providing easier ways of customisation and the trend ofstatistical tools to support more open explorations.
The notion of programming by example can be explained in the context ofa spreadsheet. Starting from a column of data, we can calculate the mean ofthat data in a new cell, and another cell s the median. We can also open a dia-gram with some visualisation of these data. The fact that all the new cells anddiagrams are dependent on the original data shows up when we change someof the original data. We have not just calculated or plotted data, but written"programs" for calculating mean, median and a specific visualisation. Anotherexample would be to construct a complex statistical graph for a given data setwhere -- hidden from the user -- a code is generated that will produce a similargraph if the original data set is substituted.

Among the existing systems with graphical user interface, the softwareData Desk offers quite interesting possibilities for defining educational mi-croworlds, besides being a tool for data analysis. It supports the definition ofnested "derived variables" by formula, the linking of representations (data,graphs, results, equations of derived variables). A concrete analysis path thathas resulted in a system of linked objects or windows can actually be used as akind of macro or template: there is an easy possibility of changing data andsubstituting variables while maintaining all the defined relations. We considerthis feature of Data Desk a good model for how the "programming by exam-ple" concept should be realised.
The next Fig. 2 offers an example of a microworld for a set of variablesrefering to a sample of cars. In the screendump in Fig. 2, we have made a re-gression of mpg (miles per gallon) vs. weight of the car (window 4). As thegraph has curvature, we would like to try experimentally a transformation ofmpg from the system of transformations x → xm for parameters m∈ℜ − {0} .We define a "slider" with name m (window 1), that is a parameter that can becontinuously varied by moving the vertical line on the screen. We define a"derived variable" f (mpg) = mpgm (window 2). Window 3 shows a regressionline of f(mpg) vs. weight, window 5 and 6 show two displays of residuals ofthat regression. If we change m in window 1, all the dependent windows willupdate. The dependence structure can be summarized as in the right part ofFig. 3.
This microworld can be used for studying the effect of different data trans-formations. One could also use artificial data or data from a certain knownmodel to study these relations. In statistical practice, this microworld could beused for an interactive choice of a linearizing transformation -- instead of usingready-made automatic methods for this purpose. As it is possible to save thisenvironment and to replace the variables chosen by different ones, we have re-ally defined a small new microworld for exploring the effects of data transfor-mation. It would have also been possible to directly edit the formula inwindow 2. We note that formal-mathematical representations have re-enteredat a reasonable location in a limited way. The concept of slider pushes the toola step in the direction of a method construction tool where one operates withgeneral parameters.

12
34
5 6
2
1
3 4
6
Data
5
Fig. 2 An experimental environment in Data Desk 3.0; the linkage structure
I have added the graph with the linkage structure to make the constructiontransparent. It may considered as a weakness of systems like DataDesk that thelinkage structure is not explicitly documented as with explicit programming. Asimilar critique to the program for construction in Euclidean geometry CabriGéomètre has led to the new possibility in the latter software of an automaticgeneration of a self-explanatory description of a construction.
5. Requirements of software tools - experiences from the MEDASS project
5.1 Background of the MEDASS project
The following discussion of requirements for software tools builds on theMEDASS project (Modelling in connection with Exploratory Data Analysisand Stochastic Simulation) that was motivated by the intention to improvestatistics education at the secondary level by providing classroom material forcomputer-supported data analysis in several school subjects and adequatesoftware. Classroom materials for geography by Kohorst (1992), for socialscience and history by Portscheller (1992) and mathematics by Noll andSchmidt (1994) have been developed. Parallel and in coordination to this de-

velopment work, we have elaborated in a detailed specification of a toolintended to support exploratory data analysis and simulation at secondarylevel, and we assume, also beyond that level (Biehler & Rach, 1992). Also ,intended applications and the background of that prototype have beenelaborated (Biehler, 1992).
In fall 1990, the project started from the diagnosis that no adequate soft-ware for introductory statistics education exists for the MS-DOS platform,which is prevalent in German schools. We had some encouraging experiencewith using StatView 512 and Data Desk 2.0 for the Macintosh in teacher edu-cation and in some experimental school classes in 1988-1990 (Biehler, 1990;Biehler & Steinbring, 1991). We intended to use these evaluative experiencestogether with a critical analysis of existing tools in Biehler (1990a) to design anew software for the MS Windows environment, which also incorporates someof the meta-tool and microworld features that have already been described.
When the original plans to program a smaller software component withinthe project frame of MEDASS failed, we concentrated on elaborating and inte-grating our ideas of desired requirements in our design conception. We callthis a "paper-and-pencil prototype" because of its character as a systematicmodel, not being just a list of partly contradictory general requirements. Partsof our specification are being prototyped at the time of writing. Beyond this,we learned a lot during the specification process about the amount and kind ofcomplexity of the projected tool that we would obtain from the variousrequirements. We think that some of the ideas are also valuable as elements ofother tools that may be developed in the future.
In the meantime, many MS-Windows adaptations of existing programshave appeared, and some really new developments for MS Windows are avail-able such as BMDP New System and StatLab (from slp) that seem to offerquite novel possibilities for introductory statistics education. However, thesupply is far from satisfactory, and there is still a need for making the specificdidactical requirements asked of a software more explicit. We see this goalalso supported in a recent paper (Haag, Koch, & Vach, 1993). Theauthors alsoshow a more general concern for developing a "simple statistical computingsystem", although their concrete requirements, their intended constraint-support structure is different from ours that is to give more room forexperimenting and exploration.
In the following, I will describe and explain basic features of our "proto-type", sometimes referring to different and better solutions in other software.Readers could always translate a wording like "the MEDASS system has . . ."into "a more adequate tool should have . . .". Our model is intended to serve asa platform for further discussion. Particularly, our assumptions concerningwhat may be intuitive for novices and what initial complexity can bedemanded from novices will be made explicit. We consider this as a mediumfor specifying justifications for certain requirements.

5.2 System architecture of the MEDASS prototype: Result objects and theirlinkage structure
A fundamental design problem is how to balance flexibility and the result-ing complexity of options against ease-of-use and ease-of-learning. What isbecoming standard in wide-spread text processing systems and other tools hasnot yet reached the realm of professional statistical software.
Configurable menus and tools. A conceptually simple answer that wefavour in the MEDASS system is that menus are configurable. This feature isessential. Otherwise the fully developed MEDASS tool could add to the com-plexity of tool problem. Of course, the design of menu structure has to bear inmind that reasonable reductions and reorganisations are possible. Althoughthis feature is essential, many other solutions have to be found to establish anadequate balance. Some of our constructions and concepts for this purpose,which are based on current trends in statistical software design, will bedescribed in the following.
Main system and satellite tools for more complex or specific problems.Fig. 3 shows components of the MEDASS system. The various window types(objects) are displayed as well as the structure of the commands: a main menu,tool boxes associated with each window type and some multi purpose tools,i.e. tools for defining formulas, for defining models, and for defining subsets.Simple definitions are offered through the menus and by direct manipulation,more complex ones require some formal language input and editing with thetools. The Journal recorder/ player could be used to redisplay and analyseactions of the user: a valuable feature from a didactical point of view, that wehowever did not elaborate in our prototype.

.
Ergebnistabelle 1
1
Sp Var 1
1 Spalte1 Zeile
Index
Result table
Ergebnisformular
Datentabelle 1Name Minimum Maximum Median
Januar 12 33 19Februar 14 35 20März 15 40 25April 20 50 35Mai 40 59 43
Result form
Grafikfenster
Graph window
Arbeitsmappe
Arbeitsmappe window
3 0,19
Datentabelle 1
Sp Var 1
3 Spalten33 Zeilen
Index
2
1 0,23
0,57
Data table window
Formula editor
Prob. Model editor
Subset editor
Journal recorder/ -player
Configurator
Option sheets
Information sheets
Main menue
GraphToolbox
• Formatting• Enhancing• Interacting• Change of variables
Fig.3 Components of the MEDASS system
Workspace. An analysis is performed by selecting commands from themain menu that act on the selected variables of a data table according to theirroles (see below). A result can be a graph, a result table or a result form. Allthese result objects will be saved in a so-called Arbeitsmappe (a metaphor forworkspace) and displayed each in a window of its own on the screen. The re-sult objects are also represented as icons in the Arbeitsmappe, even when thewindows have been closed. They can be re-opened, and as the result objects
are logically linked to their data table, the work on the result object can betaken up again. This supports an incremental, multiple analysis working style.
Linking and experimenting.The linkage with the data table supports aneasy exploration of how changes in the data, method or presentation (view) af-fect the results. Results can be conceptualized as
result =f (data, method, parameters, view) orresult=f (chance, model, parameters, view). Results may have"hot"
(dynamic) links with the "arguments" of the function f.The variables and their roles belong to the data structure of the result ob-
jects. They can be displayed and changed in an associated informationwindow. This feature does not only support a full documentation about thevariables and their roles that went into an analysis. Also, variables and rolescan be easily changed and substituted while keeping the statistical method"constant". In other words, result objects are the core of templates. The userhas done some "programming by example", (s)he has constructed a macro ortemplate whose components are contained in the Arbeitsmappe.
Results are data. Whereas the result form is conceived as more or less justshowing numerical results (with commenting text that could be changed by theteacher), the other result objects are of different character. A result table be-haves more or less like a data table. Variables of the result table can be se-lected for further analysis. By means of this feature, the user may produce asystem of logically linked tables (and graphs). This extends the programmingby example feature to a multi-step program.
Graphs as an interface to data. A result graph does not only reflect allchanges in the data table, but can be also used in the other direction, if individ-ual data points are represented in the graph: subgroups can be selected and thisselection is represented in all other linked representations. We speak of usinggraphs as an interface to data. We assume that this feature simplifies database activities by novices as well as supporting new styles of data analysiswith linked representations.
5.3 Data representation and variable selection: roles and visual data base
The basic object of the MEDASS software is a visually represented case-oriented data table, where columns represent variables (see Fig. 4). We agreewith other software that the table is a fundamental and intuitive data represen-tation for novices. We are aware of its limitations, but we assume that a clev-erly contrived system of possible "variable roles" mitigates this problem. Be-sides the data values that can be text or numbers, the variables have variousattributes that are hidden in the table representation but can be accessed andchanged through the information button. Attritubes include variable typewhere we think that providing the types quantitative, categorical, name is aminimum requirement.

Verkehrsmittel
x
Datentabelle 1
Stefanie
Bettina
Körny
Snezana
Daniel
1
2
3
4
5
6
30
31
50
8
10
Bus
Bus
Bahn
Bahn
Auto
Rad
Schülername Schulwegzeit
3 Spalten
33 Zeilen
Index
keinexyGruppeSelektorzIntervallanfangIntervallende
Fig. 4 MEDASS data table with open button for selecting the role of a variable
Variable based statistical spreadsheet with random variables. With a sec-ond attribute, we distinguish normal variables from derived variables, whichare defined by formula. This is fairly common. We introduce a third type: ran-dom variables are columns of data tables that are defined by probability mod-els. Updating them is equivalent to a new random trial. The random variablesare the elementary building blocks of random experiments in the system. Thefact that a model definition can be hidden from the user can be exploited tohave the user do a statistical analysis on simulated data and compare theresults to the previously hidden "real" model. The possibility of using chainsof derived variables provides some algebraic and numerical capacity for user-defined methods and derived probability models. This concept of a statisticalspreadsheet where the variables with data can be extended by furthervariables, which may be dependent on the data or on a model or formula seemsto be intuitive for novices. Its handling may become a problem with large datasets and many extensions.
Only one rectangular data table is not flexible enough, hence derivednumerical results can also be represented in further linked result tables. We as-sume that further extensions of available data structures are too complex fornovices. However, conceptions like that of DataDesk where systems(relations) of variables and "sliders" (see above) provide more flexibility. Asthey are supported by intuitive visual representations and metaphors, they alsohave advantages for novices.
Visual data base. A major feature for simplifying data base selections arevisual representations of cases which permit graphical selection. We providedata base functions by means of selecting rows "by hand" in the data table andwe use case preserving statistical graphs dynamically linked to the data, such

as scatterplots. The subset editor tool can be used for defining logicalconditions for selecting rows. The representation of cases in a data table mayalready be too abstract for younger students. In the educational software toolTable Top, cases are represented by icons that can be grouped, reordered etc.
Generally, a record based structure from which several table "views" (withdifferent possible definitions of "cases") can be created is more adequate formany complex data. The planned educational software tool by Finzer(1993)aims at providing this more complex structure in a way that is more in-tuitive for novices.
Role concept. In the MEDASS data table, the user can select variables foranalysis by assigning roles to them. The assumption is that the role concept isintuitive for novices and helps very much to reduce complexity. For instance,an x-role and y-role is needed for a scatterplot, several selected x- or y-rolesproduce a juxtaposed or superimposed scatterplot.
Analysis by group as a general feature. The selection of a variable with g-role (group variable) produces a multiple analysis by group. The fact that allanalyses can easily be done normally or "by group" reflects the assumptionthat "analysis by group" should be a fundamental operation of data analysisfrom the beginning. Analysis by group ranges from just calculating sums toproducing multiple graphs.
Excluding cases and subsets. Cases can be excluded from an analysis bysimply clicking in the first column of the respective row in the data table. Asystematic approach is also possible: Selection of a variable with s-role(selective variable) acts as a filter and includes only those cases in which the s-role variable is different from zero. Defined filters can be saved as derived ornormal variables with values 0 or 1 in the data table itself. This may be morepractical than intuitive. An alternative for novices could be that several subsetdefinitions or filters could be "attached" to a data table somehow with the pos-sibility of further editing (like in StatView 4.0).
Dummy roles for additional flexibility. The MEDASS prototype providesthe possibility of assigning further roles like z, ia and ie. This adds flexibilityand helps to overcome the limitations of case-oriented data tables. For instancethe case oriented data table will be interpreted as a contingency table by ade-quately assigning these roles.
We will use one short example to illustrate the use of the role concept. Leta table contain for each day of the year 1986 (i.e. 365 rows) the number ofdeaths in traffic accidents in West Germany. The variables include the day ofthe week, in (inside cities and villages), out (outside villages excluding Auto-bahnen), ab ( Autobahnen) with respective number of deaths. The followingFig. 5 contains the sum of death according to day of the week and according totype of street.

Day of the week in out abMonday 435 619 122Tuesday 434 542 87Wednesday 418 636 104Thursday 452 632 100Friday 536 860 113Saturday 444 901 136Sunday 360 848 93
Fig. 5 Sum of deaths according to traffic accidents in West Germany 1986, :(Source of dataStatistisches Bundesamt, 1987)
How can such a table be produced inthe MEDASS system? We select thevariables in, out, and ab as � variables the day of the week as a grouping g-Variable and select the command sum from the menu numerical summaries.The above result table is automatically generated. The data analysis tool cannow applied to that result table, for instance for constructing a visualisation ofthe table or parts of it. Of course, other summaries instead of sum could havebeen chosen.
5.4 Structure of statistical methods: generic commands and option sheets
Draft results, option sheets, coherent tool boxes. A fundamental designquestion is how to cope with the complexities of statistical methods. Weassume that the following features support a fluent working style and hidecomplexities from the novice. In most cases, the selection of a command fromthe main menu immediately produces a "draft result" with absolutely minimalfurther requests from the user. The "draft result" can be improved andchanged by means of a structured tool box that is "at hand" in any resultwindow. For each window type (graph, table, form) there is only one tool boxfor reasons of coherence, which, however, differs at lower levels according tothe concrete type of graph or analysis. Initial defaults are chosen by thesystem designers. However, an option window can be opened for everymethod, where default method parameters and view parameters can bechanged. The option window could also be used to vary method parameters,while keeping data and view constant: a good facility for exploring effects ofmethod variation on results. However, quick draft results have pedagogicaldisadvantages if students should learn to consciously choose options beforeapplying a method. Therefore, we can select parameters as "to be prompted"in the option window.
Generic command names. A further way of reducing complexity is sum-marising slightly different methods under a common command name, i.e. usinggeneric methods that accept and automatically adapt to different numbers,roles and types of variables

�
Fig. 6 Scatterplot as a generic method for various variable types
Categorical and other axes. For instance, our scatterplot command wouldproduce slightly different plots if both variables are quantitative or if one ofthem is categorical (see Figure 6). Also possible are scatterplots of twocategorical variables or of one name variable and a categorical orquantitative one. We assume that stressing this generalisation of the Cartesianco-ordinate system beyond numerical variables has didactical advantages byunderlining a basic display principle for two variables. Categorical variables
are graphically represented by what we call categorical axes. The tool box hasa tool for changing scales. If it acts on a categorical axis, other optionsbecome available than in the case of a quantitative variable: categories can berearranged "by hand" or according to criteria referring to other variables.With the opportunity of rearranging and permutating the order of the 2categories on each axis "by hand", we might discover new relationships andpossible classifications. In fact this would be a way of implementating thegraphical method of Bertin �(1977)�. We consider these manipulations ofcategorical axes (and similar of name axes) as an elementary but verypowerful operation.
Multiple graphs. Only one command is used for producing multiple graphsby selecting several variables with x or y roles. Our conception of multiplegraphs is threefold: the single graphs can be juxtaposed (all with separateaxes, perhaps in different windows), superimposed (with adaptation of scales)or (not always possible) integrated in a new display format. Examples for inte-grated displays are back to back bar charts, multiple box plot diagrams thatare based on one shared axis and a newly constructed categorical axes for thevariable names. It is easy to switch between these three formats. This designfeature is not only of practical advantage, but we also assume thatunderstanding, decomposing and recomposing graphs is important fornovices.
Raw and aggregated data. Another application of generic command namesis the analysis of raw and aggregated data. A command histogram produces ahistogram with vertical bars for a variable with raw data that has an x-role (y-role would have produced horizontal bars). If we have frequency data, wecould represent them in various ways, for instance by three columns (start ofinterval, end of interval, frequency). If we assign the roles ia,ie,x to this triple,we can use the same command histogram to produce a plot. The tool box formanipulating histograms (for instance, reducing the number of classes) is stillthe same, however, the user not being concerned with how differently theoperations are performed internally. Also, numerical summaries can beadequately calculated for aggregated and raw data by selecting the samecommand.
5.5 Working with graphs: Formatting, interacting, and enhancing
A better structuring of graph modification options. The manipulation ofgraphs is particularly complex, and I will briefly describe our solution for thegraph manipulation tool box (Fig. 7). We assume that it is useful for the noviceto distinguish three general types of manipulation: formatting or changing theview of data, interacting with the graph, and enhancing a graph by further in-formation.
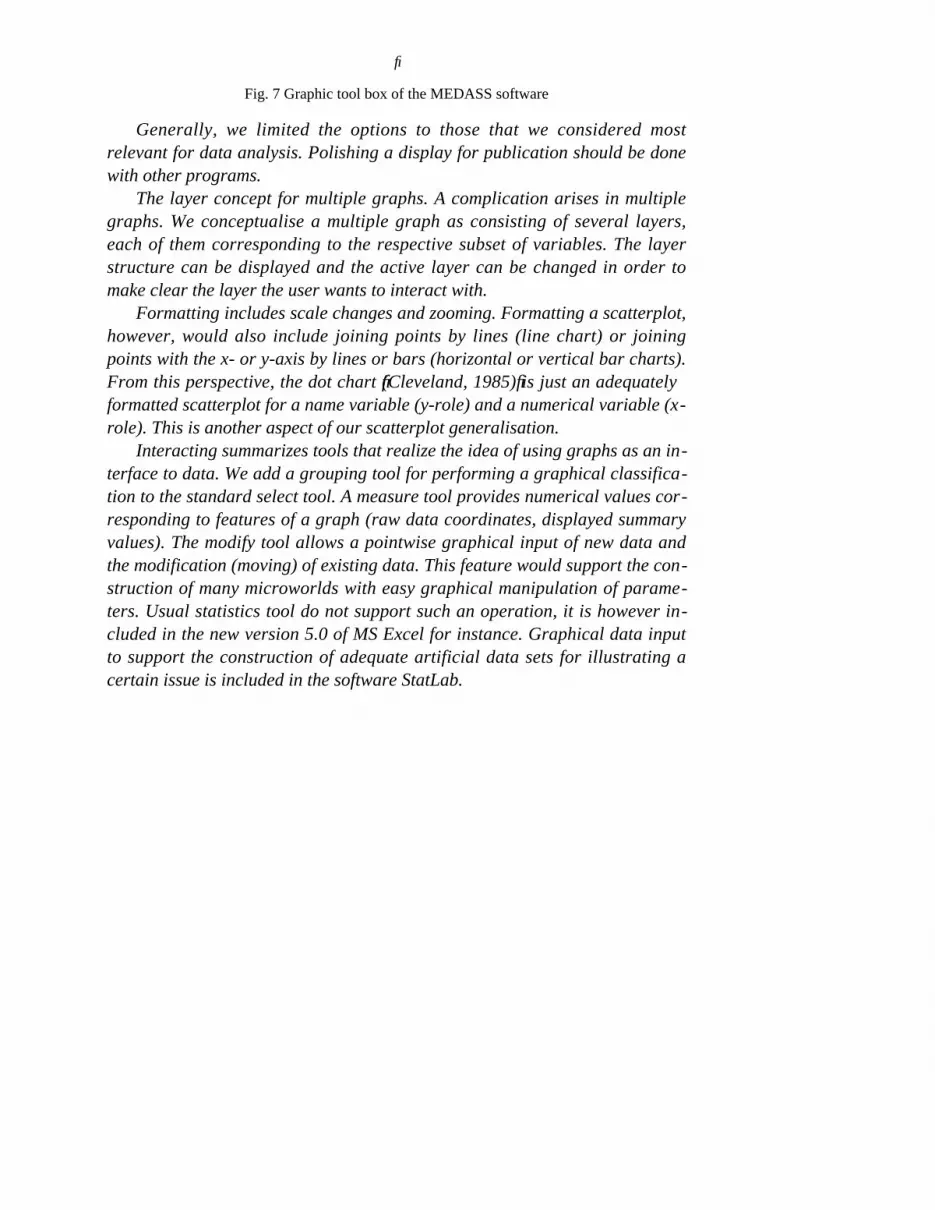
�
Fig. 7 Graphic tool box of the MEDASS software
Generally, we limited the options to those that we considered mostrelevant for data analysis. Polishing a display for publication should be donewith other programs.
The layer concept for multiple graphs. A complication arises in multiplegraphs. We conceptualise a multiple graph as consisting of several layers,each of them corresponding to the respective subset of variables. The layerstructure can be displayed and the active layer can be changed in order tomake clear the layer the user wants to interact with.
Formatting includes scale changes and zooming. Formatting a scatterplot,however, would also include joining points by lines (line chart) or joiningpoints with the x- or y-axis by lines or bars (horizontal or vertical bar charts).From this perspective, the dot chart �(Cleveland, 1985)� is just an adequatelyformatted scatterplot for a name variable (y-role) and a numerical variable (x-role). This is another aspect of our scatterplot generalisation.
Interacting summarizes tools that realize the idea of using graphs as an in-terface to data. We add a grouping tool for performing a graphical classifica-tion to the standard select tool. A measure tool provides numerical values cor-responding to features of a graph (raw data coordinates, displayed summaryvalues). The modify tool allows a pointwise graphical input of new data andthe modification (moving) of existing data. This feature would support the con-struction of many microworlds with easy graphical manipulation of parame-ters. Usual statistics tool do not support such an operation, it is however in-cluded in the new version 5.0 of MS Excel for instance. Graphical data inputto support the construction of adequate artificial data sets for illustrating acertain issue is included in the software StatLab.
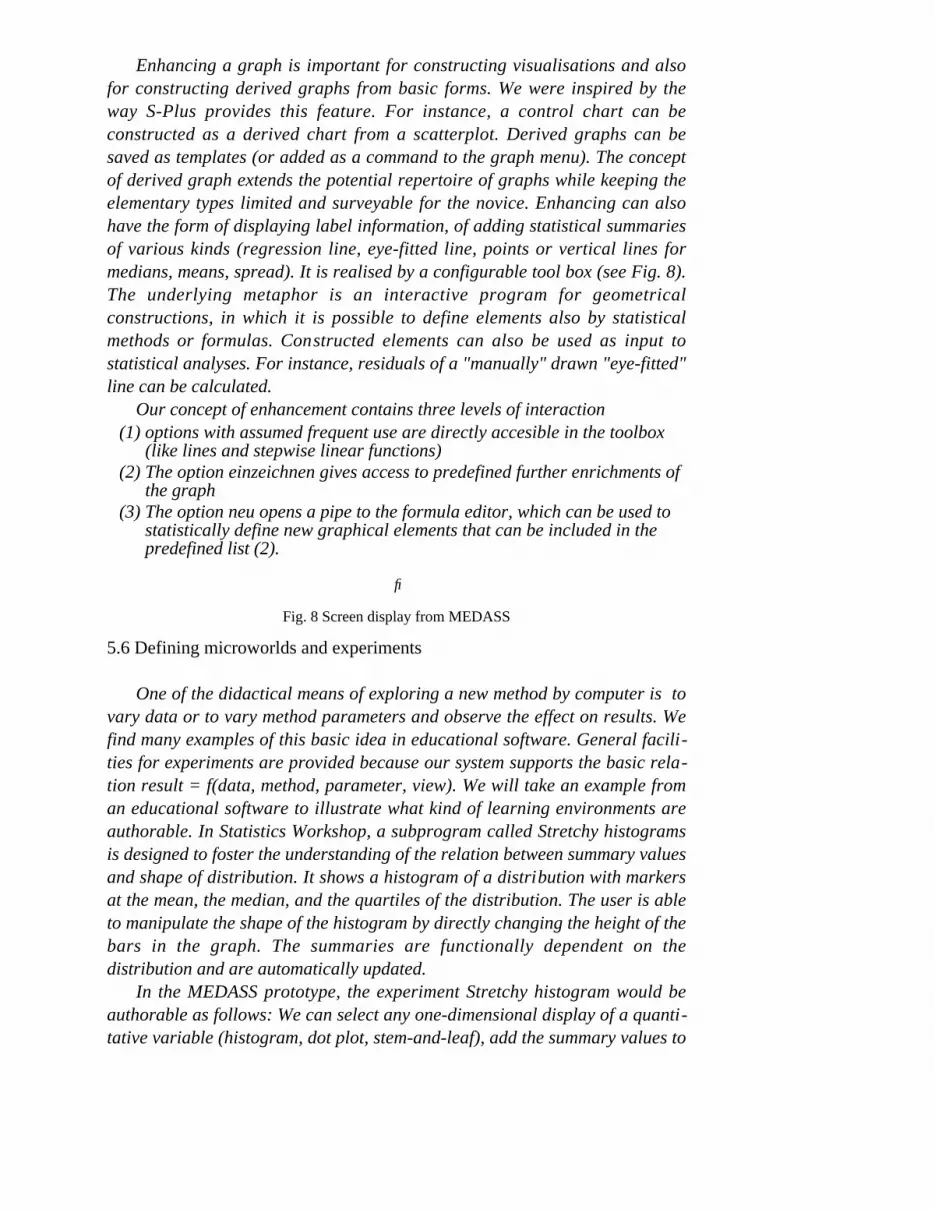
Enhancing a graph is important for constructing visualisations and alsofor constructing derived graphs from basic forms. We were inspired by theway S-Plus provides this feature. For instance, a control chart can beconstructed as a derived chart from a scatterplot. Derived graphs can besaved as templates (or added as a command to the graph menu). The conceptof derived graph extends the potential repertoire of graphs while keeping theelementary types limited and surveyable for the novice. Enhancing can alsohave the form of displaying label information, of adding statistical summariesof various kinds (regression line, eye-fitted line, points or vertical lines formedians, means, spread). It is realised by a configurable tool box (see Fig. 8).The underlying metaphor is an interactive program for geometricalconstructions, in which it is possible to define elements also by statisticalmethods or formulas. Constructed elements can also be used as input tostatistical analyses. For instance, residuals of a "manually" drawn "eye-fitted"line can be calculated.
Our concept of enhancement contains three levels of interaction(1) options with assumed frequent use are directly accesible in the toolbox
(like lines and stepwise linear functions)(2) The option einzeichnen gives access to predefined further enrichments of
the graph(3) The option neu opens a pipe to the formula editor, which can be used to
statistically define new graphical elements that can be included in thepredefined list (2).
�
Fig. 8 Screen display from MEDASS
5.6 Defining microworlds and experiments
One of the didactical means of exploring a new method by computer is tovary data or to vary method parameters and observe the effect on results. Wefind many examples of this basic idea in educational software. General facili-ties for experiments are provided because our system supports the basic rela-tion result = f(data, method, parameter, view). We will take an example froman educational software to illustrate what kind of learning environments areauthorable. In Statistics Workshop, a subprogram called Stretchy histogramsis designed to foster the understanding of the relation between summary valuesand shape of distribution. It shows a histogram of a distribution with markersat the mean, the median, and the quartiles of the distribution. The user is ableto manipulate the shape of the histogram by directly changing the height of thebars in the graph. The summaries are functionally dependent on thedistribution and are automatically updated.
In the MEDASS prototype, the experiment Stretchy histogram would beauthorable as follows: We can select any one-dimensional display of a quanti-tative variable (histogram, dot plot, stem-and-leaf), add the summary values to

the display by the enhancing tool, and then change the data values (not theshape) with the modifying tool.
In the statistics workshop, another experiment Shifty Lines for learningleast squares is possible: the user can change a line in a scatterplot bypushing it with a mouse and observe the numerical effect on the sum ofsquares of the residuals. In MEDASS it would be similarly possible. Howeverthe users can define their own graphical representation or numericalsummaries they want to observe or optimize.
5.6 Modelling and defining random experiments
The software dilemma is especially grave with regard to elementary toolsfor simulation and modelling �(see Biehler, 1991)�. Apart from statisticalprogramming environments, statistical systems for data analysis are weak inthis respect. Models are not separate objects of the systems. It is difficult togenerate the requested random data, especially with simple multistageexperiments, and data analysis is not well adapted to thinking in terms ofevents and random variables whose frequency or distribution has to berecorded during simulation. As basic ways for generating random numbers,MEDASS provides the following spectrum of
(1) urn or box models (number and type of balls), (2) arbitrary discretemodels (elementary events, probabilities), (3) "arbitrary" continuous models(finite domain over which density curves are sketched), (4) standard discreteand continuous models, (5) samples from "populations" (from other data tablecolumns)
Only (4) is standard in most programs, and therefore pedagogical applica-tions of usual programs are limited.
We will look at necessary conceptual components of a modelling simula-tion tool that will also support the definition of relevant microworlds by meansof an example. In an adequate software tool, it should be easily possible to de-fine the standard visualisation of confidence intervals, that is to simulate a se-quence of samples and displaying the (random) sequence of pertinent confi-dence intervals in one display.
We can define an experiment in the following steps(1) Choose a probability model with expected value m.(2) Draw m samples of size n.(3) Calculate the m means.(4) Choose the level (1-a).(5) Calculate the interval lengths according to a method K.(6) Plot the m means vs. 1, ...m in a scatter plot D.(7) Add symmetrical bars to the m points in D that correspond to the confi-
dence intervals.(8) Add a dotted line at y=m. in D.

�
Fig. 9 Visualizing the frequentist conception of confidence interval
Figure 9 displays the structure of the experiment. The steps are executedby selecting commands from the main menu or from the tool boxes. They resultin new objects (data tables or plots) which are dependent of the previousobjects and which can be represented in separate windows. In step (7) and (8),a derived graph is constructed. Now, the user might like to control and changethe parameters model, m, m, n, (1-a), K. It is possible to use another randomseed, that is, repeating the whole random experiment in a simple way, bypressing a "recalculation button". The final plot with the series of confidenceintervals will depend dynamically on these parameters.The basic relation canbe formalised as result = f(chance, model, method). The arguments of thefunction f can be varied for experimental purposes. If we think of a generalsolution with conceptual building blocks that take into account in which termsthe user should think about modelling and constructing random experiments,we can identify components like those displayed in Fig. 6: A model tool forconstructing, modifying, storing and retrieving probability models, asimulation tool for generating data from these models, and a data analysis tool.The latter has to include a tool for enhancing graphs (e.g. additional lines inthis case) and it has to contain possibilities for defining events and randomvariables, depending on the simulated data. In the MEDASS prototype, themodel editor and the simulation tool are integrated and the model is attached toa column of the data table.
It is natural to conceptualize colums as random variables and rows as cor-responding to repetitions. Dependent random variables could be defined by us-ing the derived variable tool. For instance, if we define column (n + 1) as themean of the first n columns we can study the distribution of the mean byanalysing column (n + 1). Statistical methods have to be applied to rows inthis case, which is very unusual.
All numerical statistical functions whose distribution one wants to studyhave therefore to be also accessible in the formula editor, which is uncommonin most available tools. The assignment of repetitions to columns would fit tothe standard way of selecting variables for analyses, but this would not supportnovices thinking in terms of random variables and would not cope with depen-dent variables (there are no "derived rows"!).
The formula editor has to be rich enough to define "events". For instance,if tossing 4 coins with sample space {0,1} is represented by four columns of adata table, an event like 0110 has to be represented as a derived variable
X5 =1
0
if X1 = 0,X2 = 1,X3 = 1,X4 = 0
else
This particular experiment with confidence intervals can be fairly easilyprogrammed in standard spreadsheets with all the above linkages. However, a
macro for calculating confidence limits has to be added, and typically someproblems with the management of the n×m data matrix with arbitrary n and mwill cause some difficulties. With standard statistical systems, the randomnumbers can be generated, but it is often not possible to store the results of themultiple application of the confidence method in a table, because thenumerical results of that procedure are not available to the user but only for thesystem producing prepared output display for each individual interval.
The educational software tool Probability Simulator designed for many re-levant applications in elementary probability education has realized some ofthe above components in environment with multiple linked windows (seeKonold, 1991). The students can use a model tool to define (only) box models,a simulation tool allows to fix sample size and number of repetitions, run andre-run the simulation, raw data are displayed in a spreadsheet format, a eventtool can be used to define one or more events. The results of counting theevents are displayed in a separate window which is dynamically linked to thedata window containing the raw data. The language for defining events is adelicate problem, ProbSim uses wildcards (*) and variables (v1, ...) for thatpurpose and makes a distinction between ordered and unordered events. Forinstance, the event "at least one pair of equal outcomes in an experiment ofsample size 6" is defined by the unordered type of event (v1,v1,*,*,*,*), theordered type would mean that at least one pair occurs in the first two places.As compared to formal programming languages, students can define models interms of urns and define events in a simpler albeit abstract notational system.Also, ProbSim's definition of events may be more intuitive in the beginningthan to think in terms of derived random variables as in the MEDASS system.
However, it is not (yet) possible to define random variables and recordtheir distribution. Also, there is an abundance of simple multi-stage experi-ments in elementary probability with dependent trials that cannot be simulatedbecause ProbSim, as nearly all similar programs, is confined to independentrepetitions. After some experience, one would also appreciate the availabilityof a more general language for defining events to the user. These are some ofthe possibilities to expand a student tool towards wider educational applicati -ons and professional requirements.
Disparate development projects and constrained resources for educationalsoftware development have not yet led to overall satisfying solutions. Thereare some new developments pointing in a promising direction (Finzer, 1993;Finzer, Jackiw, & Erickson, 1993).
6 Concluding remarks
The preceding assumptions about promising directions of introductory sta-tistics education and the features of a software that we suggest some are insome sense informed hypotheses. They are rooted in discussions on design ofstatistical software, and some evidence concerning software use in
introductory statistics education that cannot be elaborated here. Our prototypeshould stimulate discussions on useful features of statistical software from adidactical point of view. A next step would be to conduct more systematicempirical research studies in laboratory and classroom settings, either withexisting systems that have similar features to our prototype, or to integratesuch research studies into the overall process of programming and testing partsof our prototype.
Acknowledgements
The MEDASS project was financially supported by the German Federaland State Ministers of Education as part of a larger project (Modellversuch imBildungswesen) of the FWU Institut für Film und Bild in Wissenschaft undUnterricht in München. I am very indebted to Wolfram Rach, with whom Ijointly developed the MEDASS prototype and with whom I had many dis-cussions on the topic discussed in this paper.
Software
BMDP New System 1.0. BMDP statistical software, 1440 Sepulveda Blvd, Suite 316, LosAngeles, CA 90025, (MS-Windows)
Cabri Géomètre Laborde, J. M., et al., LSDD, B.P. 53 X, F-38041 Grenoble-Cedex(Macintosh, MS-DOS)
Data Desk 4.1. (1993). Velleman, P., Data Description Inc., P.O.Box 4555, Ithaca, NY 14852(Macintosh)
DataScope. (1992) version 1.16. Konold, C. & Miller, C.D., Scientific Reasoning ResearchInstitute, Hasbrouck Lab, Univ of Massachussetts, Amherst, MA 01003, to be publishedby Wings for Learning/Sunburst, 1600 Green Hills Road P.O. Box 660002, Scotts Valley,CA 95067-0002 (Macintosh)
MINITAB. MINITAB Inc., 3081 Enterprise Drive, State College, PA, 16801 USA (MS-DOS,Macintosh and others)
ProbSim - A Probability Simulator. (1992) version 1.3.2, Konold, C. & Miller, C.D., Scienti-fic Reasoning Research Institute, Hasbrouck Lab, Univ of Massachussetts, Amherst, MA01003, to be published by Wings for Learning/Sunburst, 1600 Green Hills Road P.O.Box 660002, Scotts Valley, CA 95067-0002 (Macintosh)
S. and S-Plus (1988). Becker, R. A., Chambers, J. M. & Wilks, A. R., see: Becker, RichardA., Chambers, John M., Wilks, Allan R., The New S Language, Wadsworth & Brooks,Pacific Grove. (Unix, MS-DOS/386 and others)
SPSS. SPSS Inc., 444 North Michigan Avenue, Chicago, IL 60611 (Macintosh, MS-DOS andvarious other systems)
Statistics Workshop(1991) Rubin, A. and Bruce, B. (BBN Inc., Cambridge, MA, USA).Wings for Learning/Sunburst, 1600 Green Hills Road P.O. Box 660002, Scotts Valley,CA 95067-0002 (Macintosh)
StatLab (1987). W. Douglas Stirling. The New Zealand Statistical Association, P.O. Box1731, Wellington, New Zealand (Macintosh)
STATlab by slp (1993). slp Statistiques, 51/59 Rue Ledru-Rollin, F-94853 Ivry Cedex, France(MS-Windows)
StatView SE+Graphics. (1988). Feldman, D. S., jr & Gagnon, J., Abacus Concepts, Inc.,1984 Bonita Ave., Berkeley, CA 94704, USA. (Macintosh)
StatView 4.0 (1992). Feldman, D. S., jr & Gagnon, J., Abacus Concepts, Inc., 1984 BonitaAve., Berkeley, CA 94704, USA. (Macintosh)
Systat 5.0 (1989). SYSTAT Inc., 1800 Sherman Avenue, Evanston, IL 60201-3793(Macintosh, MS-DOS)
TableTop, software in development, Hancock, C.& Kaput, J.J., TERC, 2067 MassachusettsAvenue, Cambridge MA 02140 (Macintosh, MS WINDOWS)
References
Bertin, J. (1977). La Graphique et le Traitement Graphique de l'Information. [Engl. Transl. :Graphics and Graphic Information-Processing, Berlin: de Gruyter 1981]. Paris:Flammarion.
Biehler, R. (1990). Changing conceptions of statistics: A problem area for teacher education.In A. Hawkins (Ed.), Training Teachers to Teach Statistics (pp. 20-38). Voorburg:International Statistical Institute.
Biehler, R. (1991). Computers in probability education. In R. Kapadia & M. Borovcnik (Ed.),Chance Encounters - Probability in Education (pp. 169-211). Dordrecht: Kluwer.
Biehler, R. (1992). Intendierte Anwendungen und didaktische Begründungen zu einemSoftwarewerkzeug zur Explorativen Datenanalyse und stochastischen Simulation fürSchule und Ausbildung. München: Inst. f. Film und Bild in Wissenschaft und Unterricht(FWU).
Biehler, R. (1993). Software tools and mathematics education: the case of statistics. In C.Keitel & K. Ruthven (Ed.), Learning From Computers: Mathematics Education andTechnology (pp. 68-100). Berlin: Springer.
Biehler, R. & Rach, W. (1990a). Softwaretools for statistical data analysis in education andteacher training? An analysis of software conceptions from an educational perspective. InF. Faulbaum, et al. (Ed.), SOFTSTAT '89: Fortschritte der Statistiksoftware 2 (pp. 575-583). Stuttgart: G. Fischer.
Biehler, R. & Rach, W. (1990b). Softwaretools zur Statistik und Datenanalyse: Beispiele,Anwendungen und Konzepte aus didaktischer Sicht. Soest: Soester Verlagskontor.
Biehler, R. & Rach, W. (1992). MEDASS: Explorative Datenanalyse und StochastischeSimulation - Anforderungsbeschreibung zu einem Softwarewerkzeug für Schule undAusbildung. Bielefeld: Universität Bielefeld, Institut für Didaktik der Mathematik.
Biehler, R. & Steinbring, H. (1991). Entdeckende Statistik, Stengel-und-Blätter, Boxplots:Konzepte, Begründungen und Erfahrungen eines Unterrichtsversuches. DerMathematikunterricht, 37(6), 5-32.
Cleveland, W. S. (1985). The Elements of Graphing Data. Monterey: Wadsworth.Finzer, W. F. (1993). StochasticsLab - a Computer Learning environment for Data Analysis
and Statistics in Secondary Schools. A Proposal. Berkeley, CA: Key Curriculum Press.Finzer, W. F., Jackiw, R. N., & Erickson, T. E. (1993). Probability and statistics for
Secondary Schools - A Computer Learning Environment and Curriculum. Final Report.Berkeley, CA: Key Curriculum Press.
Gordon, F. & Gordon, S. (Ed.). (1992). Statistics for the Twenty-First Century. MAA Notes26. Washington: Mathematical Association of America.
Haag, U., Koch, A., & Vach, W. (1993). Why and how to build a simple statistical computingsystem. Computational Statistics & Data Analysis, 16(2), 237-244.
Kaput, J. J. (1988). Looking Back From the Future: A History of Computers in MathematicsEducation, 1978-1998. Unpublished Manuscript, Educational Technology Center,Cambridge (MA).
Kohorst, H. (1992). Bevölkerungsexplosion - MEDASS Materialien. München: FWU Institutfür Film und Bild in Wissenschaft und Unterricht.
Konold, C. (1991). ChancePlus: A Computer Based Currriculum for Probability andStatistics. Second Year Report, Scientific Reasoning Research Institute, University ofMassachusetts, Amherst.
Moore, D. S. (1994). The uses of video in teaching statistics. In L. Brunelli & G. Cicchitelli(Ed.), Proceedings of the First Scientific Meeting of the International Association forStatistical Education (pp. 213-220). Perugia: Università di Perugia.
Naeve, P., Trenkler, D., & Wolf, H. P. (1991). How to make the teaching of statistics roar -Some thoughts on computer based experiments. Computational Statistics Quarterly, 6(4),325-353.
Noll, G. & Schmidt, G. (1994). Trends und statistische Zusammenhänge. Materialien zurExplorativen Datenanalyse und Statistik in der Schule. Soest: Landesinstitut für Schuleund Weiterbildung.
Portscheller, P. (1992). Industrialisierung Deutschlands - MEDASS Materialien. München:FWU Institut für Film und Bild in Wissenschaft und Unterricht.
Puranen, J. (1994). Teaching data analysis with the help of Survo. In L. Brunelli & G.Cicchitelli (Ed.), Proceedings of the First Scientific Meeting of the InternationalAssociation for Statistical Education (pp. 277-284). Perugia: Università di Perugia.
Snell, J. L. & Peterson, W. P. (1992). Does the computer help us understand statistics? In F.Gordon & S. Gordon (Ed.), Statistics for the Twenty-First Century. MAA Notes #26 (pp.167-188). Washington, DC: Mathematical Association of America.
Statistisches Bundesamt (Ed.). (1987). Straßenverkehrsunfälle 1986. Stuttgart/Mainz:Statistisches Bundesamt(??).
Steinecker, J. (1990). Individualisierbarkeit von statistischer Software. Münster: Lit.Thisted, R. A. (1986). Computing environment for data analysis. Statistical Science, 1(2),
259-275.Thisted, R. A. & Vellemann, P. F. (1992). Computers and modern statistics. In D. C. Hoaglin
& D. S. Moore (Ed.), Perspectives on Contemporary Statistics. MAA Notes 21 (pp. 41-54). Washington: Mathematical Association of America.
Witten, I. H., MacDonald, B. A., Maulsby, D. L., & Heise, R. (1992). Programming byexample: The human face of AI. Artificial Intelligence and Society, 6, 166 - 185.