doing psychology experiments
TRANSCRIPT

Seediscussions,stats,andauthorprofilesforthispublicationat:https://www.researchgate.net/publication/283284170
doingpsychologyexperiments
RESEARCH·OCTOBER2015
DOI:10.13140/RG.2.1.1565.0000
READS
46
1AUTHOR:
MohammadKhakshour
FerdowsiUniversityOfMashhad
14PUBLICATIONS0CITATIONS
SEEPROFILE
Availablefrom:MohammadKhakshour
Retrievedon:20January2016


David W. Martin is professor and headof the Department of Psychology atNorth Carolina State University. Previ-ously he was professor and departmenthead at New Mexico State University.He has a bachelor’s degree fromHanover College, where he majored inpsychology and physics. He also has amaster’s degree and Ph.D. from TheOhio State University, where he ma-jored in engineering psychology. Histeaching interests include experimentalmethods, introductory psychology, hu-man performance, and attention. Hehas won teaching awards at both NCState and NMSU.
Dr. Martin has published in a num-ber of research journals in the areas of attention, decision making, and mem-ory. He is a member of the American Psychological Association, AmericanPsychological Society, Human Factors and Ergonomics Society, and Psycho-nomic Society. He has also served as president of the Rocky Mountain Psy-chological Association.
In his leisure hours, Dr. Martin enjoys working out, scuba diving, play-ing the trumpet, singing, and having fun with his two sons. For 12 years heraced dirt-track stockcars and was known as “Dangerous David, the RacingProfessor.”


Publisher: Michele SordiAcquisitions Editor: Erik EvansDevelopment Editor: Kirk BomontAssistant Editor: Gina KesslerEditorial Assistant: Christina GanimAssociate Technology Project Manager:
Lauren KeyesSenior Marketing Manager: Karin SandbergSenior Marketing Communications Manager:
Linda YipContent Project Manager: Karol JuradoCreative Director: Rob Hugel
Thomson Higher Education10 Davis DriveBelmont, CA 94002-3098USA
Senior Art Director: Vernon BoesAssociate Print Buyer: Nora MassudaPermissions Editor: Roberta BroyerProject Coordination/Production Service:
Pre-PressPMGCover Designer: Terri WrightCover Image: Archives of the History of
American Psychology/The University of Akron
Cover Printer: Thomson WestCompositor: Pre-PressPMGPrinter: Thomson West
© 2008, 2004 Thomson Wadsworth, a part ofThe Thomson Corporation. Thomson, theStar logo, and Wadsworth are trademarksused herein under license.
ALL RIGHTS RESERVED. No part of thiswork covered by the copyright hereon maybe reproduced or used in any form or by anymeans—graphic, electronic, or mechanical,including photocopying, recording, taping,Web distribution, information storage andretrieval systems, or in any other manner—without the written permission of thepublisher.
Cover Image: The photograph on the cover shows J. E. W. Wallin testing an unidentified younggirl in the 1920s. He was an early pioneer of school psychology and was using instruments to testher hearing such as tuning forks, a Galton Whistle, and an audiometer constructed by Carl E.Seashore. At this time there were few tests yet available for predicting a child’s success in school.
For more information about our products, contact us at
Thomson Learning Academic Resource Center
1-800-423-0563
For permission to use material from this text or product, submit a request online at
http://www.thomsonrights.com
Any additional questions about permis-sions can be submitted by e-mail to
Doing Psychology Experiments
Seventh EditionDavid W. Martin
Printed in the United States of America
1 2 3 4 5 6 7 11 10 09 08 07
ISBN-13: 978-0-495-11577-9ISBN-10: 0-495-11577-0
Library of Congress Control Number: 2006939529
ExamView® and ExamView Pro® areregistered trademarks of FSCreations, Inc.Windows is a registered trademark of theMicrosoft Corporation used herein underlicense. Macintosh and Power Macintosh areregistered trademarks of Apple Computer,Inc. Used herein under license.


This book is dedicated to:My father, the late Daniel W. Martin,
who taught me logical thinking,My high school teacher, Doris Mitchell,
who showed me that teachers can care,My undergraduate professor, Harve E. Rawson,
who introduced me to psychology,My graduate professor, the late George E. Briggs,
who best demonstrated experimental rigor,And all of my students,
from whom I am continually learning to teach.


vii
PREFACE xi
ONE
How to Make Orderly Observations 1Psychology as a Science 3Quantitative Designs 5Qualitative Designs 14Quantitative versus Qualitative Designs 19Using Methods in Combination 20Summary 24
TWO
How to Do Experiments 25Variables 25Threats to Internal Validity 32Summary of the Experimental Method 38Summary 41
THREE
How to Get an Experimental Idea 42Fearing Experimental Ideas 43Observation 46Vicarious Observation 51Expanding on Your Own Research 53Using Theory to Get Ideas 53Importance of Psychological Research 65Summary 66
FOUR
How to Be Fair with Participants 68Treating Human Participants Fairly 69Treating Animals Fairly 87Summary 93
CONTENTS

FIVE
How to Be Fair with Science 95Dirty Tricks 96Questionable Tricks 104Neat Tricks 108Summary 110
SIX
How to Find Out What Has Been Done 111Why Search the Literature? 111The Timeliness of Sources 113Formal Sources 115Informal Sources 127Summary 129
SEVEN
How to Decide Which Variables to Manipulate andMeasure 131Choosing an Independent Variable 131Choosing a Dependent Variable 136Summary 147
EIGHT
How to Decide on a Between-Subjects versus Within-Subject Design 148Between-Subjects Experiments 150Within-Subject Experiments 151Matching 167Summary 170
NINE
How to Plan Single-Variable, Multiple-Variable, andConverging-Series Experiments 171Single-Variable Experiments 171Factorial Designs 179Converging-Series Designs 185Summary 191
viii Contents

TEN
How to Design Research That Is Not Experimental 193Quasi-Experiments (and Nonexperimental Designs) 193Single-Subject and Small-N Baseline Designs 204Survey Research 212Summary 224
ELEVEN
How to Tell When You Are Ready to Begin 227The Have-a-Nice-Day Society 228Questions before You Begin 229Summary 239
TWELVE
How to Interpret Experimental Results 240Plotting Frequency Distributions 241Statistics for Describing Distributions 244Plotting Relationships between Variables 247Describing the Strength of a Relationship 251Interpreting Results from Factorial Experiments 253Inferential Statistics 257Meta-Analysis 263Using Computers to Help Interpret Results 264Summary 265
THIRTEEN
How to Report Experimental Results 268How APA Style Differs from Other Writing 270Parts of a Report 273Reducing Language Bias 282Writing Style 283Top-Ten List 285A Sample Report 286Presentations at Conferences 300Summary 306
Contents ix

EPILOGUE 308
APPENDIX A
How to Do Basic Statistics 309
APPENDIX B
Statistical Tables 325
APPENDIX C
Table of Random Numbers 337
GLOSSARY 339
REFERENCES 351
INDEX 359
x Contents

Doing Psychology Experiments has now been available for 30 years and it stillseems to be fulfilling its original function: to teach students having little orno background in experimentation how to do simple experiments in psy-chology. Throughout the seven editions of the book I have tried to keep thewriting style informal and friendly. Although scientific results are usuallyreported in an objective, impersonal style, I believe that doing experimenta-tion is a highly personal experience. The experimenter reviews the literatureand forms a view of the body of knowledge. The experimenter creates the the-ories and hypotheses for testing. The experimenter decides which variablesto manipulate and which to measure. The experimenter interprets the resultsand determines how the body of knowledge has been advanced. The experi-menter is personally involved in the process of experimentation, and I believethat the best way to teach new experimenters about this process is through apersonal book.
There has even been some research assessing students’ preferences andlearning when using more personally written books. For example, Paxton(1997) found that students reading a text with a “visible author” (one whowrites in the first person, revealing personal opinions and self) engage inmental conversations with the author, which lead to a closer relationship withthe information contained in the text. Lorin Sheppard (2001), a student atMichigan State University, has even studied the use of humor in texts byusing material from this book and comparing it to material from the book thathad been given, to use her term, a “humorectomy” (personal communication,April 27, 2001). She found that not only did the students report that thehumorous chapters were more interesting and informative, but also thatstudents tended to recall more items from the humorous version during adelayed recall test. I am pleased that these results support my long-held intu-ition that both humor and a personal writing style are pedagogically useful.
Now a few words about what this book does and does not do. It providesenough information so that a student with no experimental background willbe able to design, execute, interpret, and report simple psychological experi-ments. Although the book has most often been used for undergraduatecourses in experimental methods, it has also been used with other books forother purposes. Several colleges use it for the laboratory section of introduc-tory psychology courses. It is sometimes used in conjunction with a statisticsbook or a content book for experimental courses with those orientations. It isfrequently adopted for undergraduate content courses (ranging from deviantbehavior to consumer psychology) when the instructor requires experimentsto be done and the students have little experimental background. I have
PREFACE
xi

talked with many users, both instructors and students. They report that thebook can be used successfully as a stand-alone text and as a supplement. Infact, in my own experimental methods course, I assign chapters before lec-turing on the material, give a little quiz from the test bank available with thebook to encourage the students to read the material before class, and thenspend lecture time clarifying points where necessary, but mostly discussingexperimental proposals and problems. The book does a good job of bringinga diverse set of students up to the same level so that class time can be usedfor more creative interaction.
Although the book is often used as a supplemental text and may appearphysically smaller than some others on the market, it nevertheless does dis-cuss most of the important concepts from experimental methods. I haveattempted to provide comprehensive coverage of the area, and some researchindicates that the attempt has been successful.*
Authors of textbooks representing many areas of psychology were askedto rate the importance of terms and concepts from their subfields. Of the top100 ranked terms in the methods/statistics area, 33 emphasized statistics orpsychometric testing. Of the remaining 67 that emphasized methods, thisbook discusses all but 6. Four of those terms are discussed at a conceptuallevel but using alternative terminology. Only two terms, both ranking in the90s, are not represented in this book. I believe that this evidence confirms theclaim that this book provides comprehensive coverage of experimentalmethods.
What this book does not do is teach students much about the content andcurrent findings in the various areas of experimental psychology. Many of theexamples I use are contrived; they illustrate the methods being discussed, butthey are not real and certainly will not give students a representative cover-age of the content of experimental psychology. However, students shouldbegin to get some exposure to content as they to carry out literature searchesas described in Chapter 6. The book also does not teach students much aboutthe intricacies of complex experimental design and statistical analysis. I havetried to keep it simple. Although I discuss the rationale behind descriptiveand inferential statistics, the actual statistical operations presented in Appen-dix A are admittedly cookbookish.
The seventh edition has a number of changes. Some of these are smallchanges such as new quotes at the beginning of chapters, correcting a fewerrors, and adding a few new cartoons. I changed several contrived examplesthat several adopters had objected to because these examples conflicted withreal data. In Chapter 3, I put in a short discussion of the difference betweentheories that answer proximate question versus ultimate questions. In Chap-ter 4, when discussing the use of the term participants rather than subjects,I added some dissenting points of view. I also updated the section on animalethics. In Chapter 5, I expanded the discussion of plagiarism by discussing
xii Preface
*Boneau, C. A. (1990). Psychological literacy: A first approximation. American Psychologist, 45,891–900.

plagiarism from the Internet and adding some specific examples of violations.I also incorporated the latest version of the APA Ethical Principles of Psycholo-gists and Code of Conduct as it relates to research. In Chapter 6, I updated thesection on doing electronic searches including additional information onPsycINFO and PsycARTICLES. When discussing the logic of inferentialstatistics in Chapter 12, I included more information about null hypothesistesting, Type I and Type II errors, and determination of the power of statisti-cal tests. In this chapter I also added a brief discussion of three-way interac-tions. In Chapter 13, I updated the section on giving conference presentationsbecause nearly all presentations are now computer based. Several reviewerssuggested I include examples of the proper way to format statistical outcomeswithin the text of a manuscript, so I included these after each of the workedexamples in Appendix A.
Additionally, the Test Bank for instructors has been expanded andupdated for the seventh edition. Newly enhanced companion Web sitesfor students and instructors can be found at http://www.thomsonedu.com/psychology/martin.
In making the changes to this edition I have tried very hard to keep thebook as short as possible while covering the necessary topics. In fact, the bookis a few pages shorter than the previous edition. I do not want the book toseem too imposing to students and I want to keep it reasonably priced. Tothose who have used previous editions, I hope you like the changes. To newusers, I hope you like the book.
I would like to thank North Carolina State University for providing mewith the time and resources to write. I would like to thank the followingpeople at Wadsworth: Marcus Boggs, Director; Karol Jurado, Content ProjectManager; Gina Kessler, Assistant Editor; Christina Ganim, Editorial Assistant;Lauren Keyes, Technology Project Manager; Karin Sandberg, MarketingManager; and Natasha Coats, Marketing Assistant. I also thank this edition’smanuscript reviewers for their helpful comments, including: Dr. JenniferBonds-Raacke, Briar Cliff University; Dr. Daniel Cerutti, Duke University;Dr. Joy Drinnon, Milligan College; Dr. Julie Evey, University of SouthernIndiana; and Dr. William Hardy, Sierra College. Finally, I would like to thankthe students in my classes who, by their performance, have told me whereI have succeeded (and failed) and the many students from around the countrywho recognize me at meetings and let me know they like the book.
David W. [email protected]
Preface xiii

This book is meant to teach you how to do experiments in the science ofpsychology. Aside from the fact that learning to do this is required of psy-
chology majors at many colleges, why would you want to know how to dopsychological experimentation? One reason could be that you plan to becomea psychologist, a scientist studying human and, sometimes, animal behavior.The experimental method is one of the major research tools for collecting datato build the scientific body of knowledge in psychology. In this book I willbriefly discuss some of the other tools used in psychology, but my primaryfocus is on how to do experiments.
Even if you do not plan to become a psychologist, learning about the useof experimentation in psychology can help you become a well-educated per-son and can provide you with useful skills that generalize to a number ofother careers. For example, suppose you go into the banking business andwork your way up to being a vice president. Obviously, some of what youlearn in psychology courses can help you succeed because you now knowsomething about human relations. What you know about experimentationcan also help. Your boss calls you in and says: “As you know, we’ve justinstalled all these automatic tellers in our banks. We spent a lot of money onthese newfangled machines, but for some reason the customers don’t liketo use them. I want you to figure out why and make whatever changes arenecessary to get them to use the machines.”
1
1How to Make OrderlyObservations
Direct, intuitive observation, accompanied by questioning,imagination, or creative intervention, is a limited and misleadingprescientific technique.
C. F. MONTE (1975)
The very nature of life is such that when one dissects it, it ceases tobe life. Behavior, being a by-product of life, is even more elusive.
K. Z. LORENZ (1962)
The perversity of animate subjects has, of necessity, whelped a remarkable degree of experimental sophistication in thebehavioral sciences.
S. N. ROSCOE (1980)

You will see as you read this book that carrying out such an assignment,while not a formal experiment, requires most of the skills needed for doing apsychology experiment. First, you must form several hypotheses about whycustomers are not using the automatic tellers. Do they feel depersonalizedinteracting with a machine? Are they intimidated? Do they not know how touse these machines? Do they feel less safe carrying their money to or from anATM without the security of another person present? As a second step, youmust collect some sort of data to narrow down the possible hypotheses, per-haps by doing interviews or using a questionnaire. Then you would probablywant to make a manipulation to see whether you can change the customers’behavior: perhaps offering an educational program, if knowledge is a prob-lem; perhaps giving prizes, if motivation is a problem; perhaps increasing pri-vacy, if security is a problem. Finally, you would want to measure customers’behavior to see whether it changes after your manipulation and to determinewhether any such change is meaningful. Although your boss did not ask youto do a psychology experiment, you have carried out most of the stepsrequired to do one. Most jobs require solving people problems, and the skillsyou learn from this book should make you a better people-problem-solver.
If you do wish to become a psychologist, the reasons for learning aboutresearch and experimentation are probably obvious. Certainly if you want tobe an experimental psychologist, then doing experiments will be your mainactivity and you will repeatedly use the techniques taught in this book. Buteven if you plan on becoming a clinician or a counselor, at the very least youshould know how psychological research is done; ideally, you should be ableto do it. One of the major characteristics that distinguish clinical psycholo-gists from others who do therapy, such as social workers and psychiatrists, ishow closely tied they are to behavioral data. Early in the history of clinicaltraining, some 50 years ago, educators got together and decided that clinicalpsychology students should be trained first as scientists and then as thera-pists, that without the science they would just be guessing about whichtherapeutic techniques work and which do not. That is why most clinicalpsychologists get a Ph.D. (doctor of philosophy), a research degree. Today, itis true that about a quarter of clinical psychologists get a Psy.D. (doctor ofpsychology) rather than a Ph.D., but the curriculum for this degree stillrequires students to be somewhat versed in research methods. Cliniciansmust be able to understand research and experimentation otherwise theywill not be able to determine the effectiveness of various treatments and toevaluate new interventions as they are introduced.
Over and above recognizing these practical reasons for learning to do psy-chology experiments, you will, I hope, want to learn these skills just becauseit’s fun! We are all curious about the world around us. We want to know whythings happen as they do. Humans invented science to better understand theirworld.1 Science is an attempt to approach this discovery process in an orderlyway. Early in life I found out that, for me, experimentation was the most
2 Chapter One
1 And, in the case of astronomy, other worlds as well.

intriguing tool of science because it leads to the discovery of previouslyunknown relationships. Then when I learned about the science of psychology,I further discovered that this powerful tool could be used to understand whatI considered the most interesting subject of all: human behavior.
Most people are curious about their own behavior and the behavior ofothers. That is why we watch soap operas, gossip behind people’s backs, fan-tasize, and read the National Enquirer in the grocery line: to speculate abouthuman behavior. The use of experimentation in psychology allows us tocheck our speculations. What a thrill it was during my first course in experi-mental psychology to find scientific relationships that nobody else had everseen. Even after years of doing experiments, my heart beats a little fasterwhen I take that first look at the results of a new experiment. My colleaguesprobably get tired of my running to their offices to show them the excitingdiscoveries as they unfold in my lab. I hope that you feel the same exhilara-tion when you do your research. Although researchers have more seriousreasons for doing the science of psychology, may you always continue toappreciate the fun of experimentation.
■ Psychology as a SciencePsychologists go about their business much like scientists do in other scien-tific fields. In their search for an understanding of human behavior, psychol-ogists attempt to (1) establish relationships between circumstances andbehaviors and (2) fit these relationships into an orderly body of knowledge. Inthis book we deal primarily with the first activity, although we will touch onthe second activity in Chapters 3 and 13.
What kind of relationship is acceptable to us as scientists? When we candemonstrate that one event is related to a second event in some predictableway, we have made a statement that will fit into the scientific body of knowl-edge. At least one of these events must be a measurable behavior, but thenature of the behavior is what distinguishes one science from another. Thebehavior of major concern to us as psychologists is human behavior (andsometimes animal behavior). And this is where we run into one of our firstproblems—a problem that haunts psychologists but not physical scientists.Humans and animals are variable. We humans often cannot repeat a responseprecisely even if we wish to, and in some cases we may not wish to. In termsof variability, physical scientists typically have it easier than psychologists.
A physicist measuring the coefficient of friction for a wooden block mightmeasure the time it takes the block to slide down an inclined plane. Althoughthe times might vary from trial to trial, such variability would be relativelysmall. The physicist would not be making too great an error if he or she con-sidered the variability a minor nuisance and measured the time for only onetrial. However, a psychologist wanting to measure the time it takes a humanto press a button in response to a light would be making a considerablygreater error by ignoring human variability. While it is unlikely that our
How to Make Orderly Observations 3

physicist’s block will be a little slow on certain trials because it has its mind onother things, isn’t ready, or is blinking or asleep, a human can experiencethese and many other problems.
Psychologists must take into account not only variability among trials butalso variability among humans. Our physicist could construct another blockof the same size, weight, and surface finish as the original and repeat theexperiment. The psychologist, however, cannot recreate humans. Humansseldom have exactly the same genetic background (identical twins being anexception), and they never have exactly the same environmental background.For this reason, in responding to the light, typically one individual’s fastestresponse is considerably slower than another individual’s slowest response.Thus, as psychologists we have to deal not only with one person’s variabil-ity from trial to trial but also with the variability among humans.2
One way to handle variability is to use statistical techniques. Many psy-chology students learn to do this by taking a statistics class early in theircourse work. Because this is not a statistics text, I will not spend much timeconsidering statistical solutions. I briefly mention the topic in Chapter 12, indiscussing the interpretation of experimental results, and in Appendix A,where I demonstrate simple statistical operations. A second way to handlevariability is to control it as much as possible in the design of your research.The goal of this book is to help you do good research, which is a simple wayof saying, “Know where the variability is and be able to account for it.”
4 Chapter One
2 You can see why some psychologists decide to use animals in experiments. Whereaspsychologists can breed animals with similar genetic characteristics and rear them in similarenvironments, they would be criticized if they tried to do the same thing with humans. Yourfriends may say, “All men are animals” or “All women are alike,” but don’t believe them!

Psychologists and other social scientists use a variety of research techniquesto make orderly observations in an attempt to account for variability. In thischapter I give you an overview of the various techniques.
Then in the next chapter and in most of the other chapters I expand onexperimentation because this is the main technique emphasized in thisbook. In Chapter 10 I also go into more detail about several research tech-niques that are not experimental: questionnaires, single-subject designs, andquasi-experimental designs.
The most widely used research techniques are sometimes called quanti-tative designs, in which events can be quantified so that the data end upbeing numbers. These designs include experiments and correlational obser-vations. To give you a complete picture of the research techniques available,in this chapter I also briefly talk about qualitative designs, in which theevents being studied are not easily converted into numbers.
■ Quantitative Designs
THE EXPERIMENTAL METHOD
As scientists, we establish relationships between events, but these events arenot always behaviors. In fact, when we do an experiment, or use the experi-mental method, the relationship of interest is between a set of circumstancesand a behavior. A physicist wants to know the time it takes for a block to slidedown a plane, when the plane is at a particular angle, has a particular sur-face, and has a particular temperature. A psychologist, on the other hand,may want to study students’ behavior in a classroom. Both scientists areattempting to establish relationships between a set of circumstances and abehavior, the behavior of a physical object or a human. These relationshipsare scientific facts, the building blocks with which we build our science.
Unfortunately, designing an experiment to establish such a relationshipis not always easy. Ideally, we would like to specify exhaustively and pre-cisely a particular set of circumstances and then measure all the behaviorsoccurring under these circumstances. We could then say that whenever thisset of circumstances recurred, the same behaviors would result. However, ifwe could list all the circumstances, we would have a unique set. Again, if wewanted to study students in a classroom, what circumstances would interestus? Perhaps we would like to know the effect of the teacher’s gender, or per-haps the type of clothes the teacher wears, or perhaps the class size, or per-haps the use of computers in the classroom, or perhaps the time of day theclass meets. As you can see, there are many circumstances we might like toinvestigate. In fact, there is an infinite number of circumstances and theseform a unique set that would never be repeated.
As is the case with the physicist, the psychologist wants to relate circum-stances to behaviors, and a similar problem arises here. Which behaviors dowe want to investigate? Perhaps how attentive the students are, or perhaps
How to Make Orderly Observations 5

how many notes the students are taking, or perhaps how many questions thestudents ask, or perhaps class attendance, or perhaps even what type of brain-wave activity the students are producing. As with the circumstances, againthere is an infinite number of behaviors that we might choose to measure.
So, scientists potentially have an infinite set of circumstances and behav-iors that they could try to relate to one another. What to do with the behaviorsof less interest is less of a problem than the circumstances of less interest. Oncea particular behavior is chosen, the other behaviors can generally be ignored.However, once a circumstance is chosen, the other circumstances cannot beignored. One possibility would be to hold all the other circumstances constantto make a precise statement about the relationship between the circumstancesand behaviors. However, if we did that, we would end up with an infinitenumber of statements, one for each unique set of circumstances paired witheach of an infinite number of behaviors. Although we would have precisestatements about the relationship between circumstances and behaviors, wewould never be able to predict future behavior from circumstances becausewe would never again find those particular circumstances paired with a par-ticular behavior. How do we get around this problem?
Scientists have had to make a compromise. After they choose one or a fewcircumstances to investigate, they let many of the other circumstances vary,at least within certain constraints. This means that the circumstance (or cir-cumstances) of most interest is precisely specified, whereas most of the othercircumstances form a variable set, not a unique set. In this way any relation-ship found between the circumstance of interest and the behavior can usuallybe generalized to most conditions within that set of circumstances.
In using the experimental method the scientist manipulates at least one cir-cumstance and measures at least one behavior. For example, suppose we wereinterested in finding out whether words or pictures are easier to remember. Wemight make up lists of words like car, tree, house, and hand and then find sim-ple pictures or line drawings of each word. We could then present either theword list or the picture list to people and find out how many trials it takes themto learn each type of list. So we have chosen a circumstance to manipulate andset it at two levels—words versus pictures—and measured the number of trialsa person needs to learn each level. In this way, when we complete our experi-ment, we should be able to make a clear statement about whether presentingmaterial as words or pictures has any effect on the ability to learn the material.We cannot just ignore all the other circumstances. As we will see in the nextchapter, we have to carefully consider how to handle the circumstances we arenot manipulating. However, when an experiment is done correctly, it is possi-ble to make a clear statement that any change in the measured behavior thatoccurs when the circumstance of interest is manipulated is caused by themanipulation. The experimental method is so widely used in science becauseno other method allows us to make such a strong causal statement. As you willsee when we discuss the other scientific methods in this chapter, all the othermethods fall a little short of the ideal: being able to say unequivocally that thechange in the circumstance caused the change in the behavior.
6 Chapter One

CORRELATIONAL OBSERVATION
In establishing relationships that add to our knowledge of human behavior, itis not always possible to conduct an experiment. In such cases, correlationalobservation is often appropriate. In correlational observation we try to deter-mine whether two variables are related without attempting to manipulateeither one experimentally. Suppose, for example, that we were interested infinding the relationship between the population density of the places wherekids live and the rate of juvenile delinquency among these kids. Perhaps ourhypothesis is that the stress of living in high-population-density areas mightincrease the rate of juvenile delinquency. To fit this problem into the experi-mental model, we would have to make population density into a circumstancewe can manipulate and force the parents of a cross section of newborn infantsto live in various communities with different population densities. When thechildren reached age 18, we might count the number of appearances beforejuvenile court for each child. Obviously, not only would few parents agree tosuch an experiment, but our society would also not smile on our sincere effortto do good research. However, rather than give up on what might be an impor-tant question, we could consider using a correlational observation.
In making such an observation, we could randomly choose a number ofchildren from a large number of communities with differing population den-sities. On the basis of these population densities, we could assign a number ona scale from low to high. We could then survey court records to determine thenumber of offenses for each child and determine whether a relationship exists.
Data3 from correlational observations are typically pictured in a scatterplot,in which each variable is represented on an axis and each point represents asingle measurement. For example, hypothetical data from our population-density study are plotted in Figure 1-1. In this case, each point represents apopulation-density score and the number of court appearances for each child.For example, the upper right point in the graph represents a child having fourcourt appearances and living in a very high population-density community,and the lower left point, a child with no court appearances and living in avery low population-density area. This scatterplot shows that there is a mod-erate relationship between population density and court appearances in ourfictitious example. The data points tend to cluster about an imaginary linerunning from the lower left to the upper right of the graph. In this hypothet-ical example, children who live in lower population density communitiestend to have fewer court appearances.
We agreed at the beginning of this chapter that the business of scientistsis establishing relationships between events. Why then is this result not asgood as the result of an experiment? Remember from our discussion of theexperimental method that when we have conducted a good experiment, wecan say that the change in the circumstance we manipulated caused a change
How to Make Orderly Observations 7
3 Every good experimenter must remember that data is a plural word; a datum is, but data are.If you chant to yourself “these data are” three times every morning when you wake up, you’llprobably still forget!

in the behavior we measured. From a correlational observation, however, thebest we can do is to conclude that one variable is related to a second variable.
Why can’t we say that population density causes juvenile delinquency?We can’t make this statement because we have not manipulated any circum-stance; all we have done is measure two behaviors. Only if we had set up anexperiment in which we manipulated population density would we havebeen able to make a causal statement. Instead, what we did was to allow fam-ilies to choose where they live. Thus, choosing to live in a community witha particular population density was a behavior rather than a manipulatedcircumstance, and the strong causal conclusion we could make for experi-mentation no longer applies. Why?
For correlational observation, one of the behaviors might be causing theother, but even if this is the case we do not know which behavior is doing thecausing and which is being caused. This problem is sometimes referred to asthe directionality problem. For instance, in our example it may be that asjuveniles become more delinquent, they convince their parents to move tocommunities with higher population densities. In other words, althoughunlikely, delinquency may cause population-density choices. From a correla-tional study we are unable to know for sure the causal direction even if onebehavior did cause the other.
Another possibility is that neither behavior could be directly causing theother even though there is a relationship. Some third variable may be causingboth behaviors—cleverly known as the third variable problem. In theexample we have been discussing, some third variable such as poverty maybe causing both the choice about where to live and the tendency towardjuvenile delinquency.
8 Chapter One
FIGURE 1-1 Fictitious data showing the relationship between population densityand the number of court appearances for children

Perhaps the following example will illustrate why it is difficult to makecausal statements on the basis of correlational observation. The U.S. Army con-ducted a study of motorcycle accidents, attempting to correlate the number ofaccidents with other variables such as socioeconomic level and age. Theyfound the best predictor to be the number of tattoos the rider had! It would bea ridiculous error to conclude that tattoos cause motorcycle accidents or, forthat matter, that motorcycle accidents cause tattoos. Obviously, a third vari-able is related to both—perhaps preference for risk. A person who is willingto take risks likes to be tattooed and also takes more chances on a motorcycle.
I am sure you are aware of the historical debate between the tobaccoindustry and the government on the health consequences of smoking. Thedilemma faced by the U.S. Surgeon General several decades ago is a goodillustration of the difficulty in making causal statements on of the basis ofcorrelational data. Although it had been known for some time that a positivecorrelation exists between the number of cigarettes smoked and the incidenceof lung cancer and other health problems, the Surgeon General was reluctantto say that smoking caused lung cancer. Some of this reluctance may have beenpolitically motivated. However, much of it was justifiable scientific cautionbecause there could have been a third variable that caused the cancer but alsoinfluenced smoking. For example, people who are nervous might produce achemical that keeps the body in an irritated state, producing irritated cells thatare prone to malignancy. It might also be true that nervous people smoke morecigarettes. Nervousness, then, could have caused the change in both variables.
Thus, someone from the Surgeon General’s office would have had to per-form an experiment to say definitively from one study that smoking causes
How to Make Orderly Observations 9

lung cancer. Such an experiment might require 1000 people to smoke 40 cig-arettes a day, another 1000 people to smoke 30 a day, and so on. In this design,experimenters could determine the probability that an individual in eachgroup would have developed lung cancer during his or her lifetime. Assum-ing that the experimenters did the experiment properly, any real difference inthe incidence of cancer between the groups could be said to be caused by cig-arettes. However, our society requires that a person’s preference be honored,so ethically such an experiment could not be and was not conducted.
How, then, did cigarette packs come to have the following warningprinted on them: “SURGEON GENERAL’S WARNING: Smoking causes lungcancer, heart disease, emphysema, and may complicate pregnancy”?4 In thiscase, experimenters determined correlations for many other variables thatcould have been related to health problems and smoking. As they eliminatedmore and more of these variables, it became increasingly likely that cigarettesmoking was the cause. The Surgeon General apparently felt that the experi-menters had finally eliminated all the logically possible third variables. Thisfact, in combination with animal experiments that did show a causal rela-tionship, convinced him to make such a statement.
The point, then, is that sometimes we must collect correlational data toestablish important psychological relationships. However, we must considerthese data carefully to avoid the common error of interpreting the results of acorrelational observation as a causal relationship.
One of the techniques frequently used to collect data for correlational obser-vations is a survey, which can be in the form of a questionnaire or interview.Because students taking a research course and using this book often do a courseproject that uses a questionnaire, I have discussed the use of questionnaires inmore detail in Chapter 10. Here let me just give a quick overview of surveys.
SURVEYS
Surveys typically ask people about their behavior or their opinions. You haveprobably participated in many surveys yourself, in some cases perhaps with-out realizing it. For example, in my school, graduating seniors are mailed asurvey asking them about their experiences at the university: effectiveness ofprofessors, access to health care, availability of career counseling, tastiness offood service meals, and so on. Or perhaps you have answered the phone andbeen asked questions by a political party regarding your feelings about issuesand candidates. On the Internet when you subscribe to some services youhave to answer questions about who you are and what your preferences are.Even this questionnaire is a type of survey.
Surveys include questionnaires that may be in paper-and-pencil form andare administered in person either individually or to groups of participants(usually called respondents). Questionnaires can also be mailed or even sent
10 Chapter One
4 There are actually several statements that warn of the dire consequences of smoking, but theyall imply that it is smoking that causes health problems.

out over the Internet. Surveys also include interviews that can be done face-to-face or over the telephone. Each method has its advantages and disadvan-tages that I discuss further in Chapter 10.
Doing survey research has several general advantages. One is that youcan directly ask respondents about their opinions, attitudes, and motivationsrather than having to infer these from their behaviors. For example, we mightdo an experiment by changing the way merchandise is displayed at a storeand discover that customers buy more. However, although we knowcustomers are buying more, we really do not know why. Perhaps they feelmore positive toward the store, or perhaps they can find what they are look-ing for more easily. A survey would allow us to determine why they buymore, or at least why they think they buy more. A second advantage is thatcollecting large amounts of data quickly is relatively easy. For instance, I oncewatched the president’s State of the Union address, and a TV network pre-sented the results of a viewer survey just a few minutes after it was over.
Surveys also have some disadvantages. Although you may think that peo-ple are giving you factual information about their behavior or opinions, whatthey say may differ from the truth. For example, the Gallup Organization hasbeen asking people about church attendance for 60 years, and about 40% ofrespondents typically say they attend a worship service once a week. This fig-ure is far higher than that in other Western nations, and many churches havereported a drop in membership in recent years. What is the truth? C. Kirk Had-away and Penny Long Marler (1998) decided to consult pastors and do headcounts. They found the attendance being closer to 20% rather than to 40%.Why are all these good church-going people lying? Perhaps some decide thateven if they didn’t go the week before, they usually do go so it’s okay toanswer yes. Or perhaps they think that good people should go to church andthey want to be identified as good people. Whatever the reason, we know thatin surveys people tend to exaggerate how often they vote or give to charitiesand underestimate how often they use drugs or the office copier for personaltasks. So as a researcher you must remember that the biggest problem withsurveys is that they can tell you only how people say they behave or what theysay they think, not how they actually behave or what they actually think.
Another disadvantage of surveys is the same as one of the advantages—they give you so much data. One problem is that collecting these data requiresa lot of respondents, and in some settings the number of respondents is lim-ited. In my university, for instance, researchers who do large surveys using thepool of introductory psychology students as respondents must sometimeswait until other researchers have completed their research otherwise the wholepool could be exhausted by a few surveys. A more serious disadvantage is thatthe researcher will have difficulty interpreting the large amount of data col-lected. I have read many reports of survey research written by students inwhich they list the results of a survey they have done but then do not knowwhat more to say. Because theory seldom drives survey research, the resultsdo not support or refute some theory, as experiments usually do. In addition,doing a detailed analysis of survey results often requires using complex
How to Make Orderly Observations 11

statistical techniques, such as factor analysis, that are beyond the trainingbeginning researchers receive. I have discussed some of the other advantagesand disadvantages of surveys in Chapter 10, where I go into much greaterdetail about questionnaires.
ARCHIVAL RESEARCH
Another form of correlational observation is archival research. In this caseother people have done you a favor by recording your observations for you.That is, there may be public or private records containing information that isuseful to you. When you examine these records for research purposes andattempt to organize and interpret the information to find relationships, youare doing archival research. I include this type under quantitative researchbecause most of these records can be quantified and turned into numbers.However, when the records consist of interviews, case histories, and the like,this research could be characterized as qualitative research. The records ofinterest to psychologists include census data, court records, newspapers, hos-pital files, accident reports, crime reports, clinical files, government agencyrecords, salary listings of public officials, telephone directories, and corporatesales figures.
As an example of research using archival data, Doug Kenrick and a col-league at Arizona State University examined the marriage listings of a num-ber of newspapers (Kenrick & Keefe, 1992). They were testing an evolutionarytheory of personal attraction. According to this theory, during ancestral timesone of the major reasons that a woman found a man attractive is because ofhis potential to provide resources for his children. A man, on the other hand,found a woman attractive, at least in part, because of her potential to givebirth to many children. If these statements are true, the theory predicts thateven today women should in general be attracted to and marry older men
who have already accumulatedresources, and men shouldmarry younger women whohave many childbearing yearsremaining. To investigate thishypothesis Kenrick and hisresearchers simply read thesection of newspapers thatlists people getting marriedand noted their ages. As thetheory predicts, they did findthat, up to a point, the groomswere older than their brides.Of course, there are other pos-sible explanations for this agedifference, and these reasonshave been discussed at length
12 Chapter One

(Kenrick & Keefe, 1992). Nevertheless, this study clearly illustrates thatarchival data available to all of us, even in our daily newspaper, can form thebasis for significant psychological research.
One of the most extensive examples of archival research formed the basisof Homicide, a book by Martin Daly and Margo Wilson (1988). Theseresearchers were also investigating predictions made by evolutionary theory.In this case the archival data they examined were police reports of homicides.The theory predicts that in general, if people are going to kill other people,they should kill those who contribute least to their probability of reproduc-tive success. The people they should be least likely to kill are their biologicalchildren, who carry their genetic material, and other people who contribute tothe success of those children or future children, such as their faithful mates.So, for example, the theory predicts that parents are more likely to kill theirstepchildren than their biological children and that men are most likely tokill their mates for suspicion of infidelity than for any other reason. Theresearchers carefully reviewed the homicide reports in police files for the cityof Detroit and the country of Canada and discovered that nearly all their pre-dictions were correct. Children were 40 to 100 times more likely to be killed bystepparents than biological parents! And, as predicted, sexual jealousy wasthe motive in most cases in which men murdered their mates.
The data supported even some predictions that seem to run counter tocommon sense. For example, for adult children of a given age, those havingolder parents were more likely to kill them than those having younger parents.Evolutionary theory would predict this finding because the older parents areless likely to have additional children, who would carry the family’s geneticmaterial, but the finding runs counter to several other theories of psychology.In Daly and Wilson’s study, the archival records were so extensive thatthey were able to code most of the data and turn them into numbers so thatthey could do quantitative statistical analysis.
Archival research has several advantages. If you can find appropriateexisting records, you do not have to spend time and effort collecting yourown data. Also, in some cases the records provide data that are much moreextensive than those you would be able to collect. Finally, some data avail-able in the records would be impossible to collect by doing your ownresearch. Psychologists should not provoke people into killing each other oreven encourage people to marry each other for the sake of collecting data!Of course, this approach also has some disadvantages. As is the case withboth correlational observations and naturalistic observations, participantsare not randomly assigned, nor is any variable independently manipulated;therefore, only relationships, not causes, can be found. Additionally, in mostcases those who collect the information contained in the records are nottrained scientists, so its reliability is probably unknown and perhaps suspect.Sometimes the records are also difficult to find or obtain, and even if theyare available, they may be difficult to organize in a systematic way. Finally,in most cases there is simply no available record that will provide the infor-mation you need.
How to Make Orderly Observations 13

■ Qualitative DesignsThe vast majority of researchers in psychology use quantitative designs, such asexperiments or correlational observations, because during the early history ofpsychology the scientific side of psychology fashioned itself in the image of theso-called hard sciences, such as physics and chemistry. The first fleetingattempts by the early introspectionists to use verbal reports as data rather thannumerically measurable behavior were beaten down by the behaviorists, notto appear again for many decades. However, in recent years, some psycholo-gists, particularly those in areas such as educational, clinical, and social psy-chology, have felt too constrained by these strict rules. They have lookedaround for methods that would allow them to use verbal reports as data whilemaintaining some scientific rigor. What they have found and adopted are somemethods from anthropology and, more recently, from sociology called qualita-tive research. Qualitative researchers use descriptive data: written descriptionsof people, including opinions and attitudes, and of events and environments.
ETHNOGRAPHY
Imagine a cultural anthropologist who has traveled to a distant land to inves-tigate an exotic culture. How would the anthropologist proceed? He or shewould know so little about this strange culture that setting up an experimentwould certainly be out of the question. Even developing a questionnaire or aconsistent set of interview questions would be difficult until the anthropolo-gist knew some basic facts about the people. The initial goal would probablybe to talk to the people and describe them and their setting so that the culturewould stop seeming strange and seem familiar. Those who do a type of qual-itative research called ethnography sometimes do the reverse—study famil-iar cultures to make them strange (Erickson, 1973). For example, suppose thatwe were interested in studying the dynamics of a particular type of teachingtechnique in an elementary school. We have all been to elementary school, sowe are familiar with what goes on there. If we wanted to learn something newabout the type of class we are studying, ethnographers would tell us toapproach the task as if we had arrived from outer space and had seen a class-room for the first time, to train ourselves to view everything as strange.
We would probably begin by interviewing the children and the teachers,trying to approach them with a completely open mind without havingformed any hypotheses that might bias us about what happens in the class.We would not conduct these interviews in a haphazard way. Rather than rely-ing on our memory, we would probably record the interviews and transcribethem verbatim into a written text. We might also take extensive notes aboutthe behavior of individuals in the class, the events that took place, and thesetting or context within which the events occurred. Because ethnographersusually try to avoid interpreting their data, we would simply attempt todescribe as accurately as possible what the children and teachers said and didand the classroom environment. Ethnographers also sometimes act as partic-ipant observers. For instance, in the classroom example, a teacher might be
14 Chapter One

doing the research as a participant observer. The participant observer typi-cally would be as unobtrusive as possible to avoid biasing the other partici-pants’ behavior—for example, by writing notes only during breaks.
The classroom example that we have been considering is also a case ofnaturalistic observation—a design we will be examining next. However, notall ethnography or qualitative research has to occur in natural settings.
I have a colleague who is interested in the relationship between mothersand their daughters and in how these relationships have changed from thepast to the present. Her method of collecting data is to conduct extensiveinterviews in her laboratory with both mothers and daughters, record theseinterviews on tape, and then transcribe the tapes into written text. She is alsointerested in interpreting the data, rather than just describing them as a pureethnographer would. Although she has structured the interviews so that sim-ilar topics are discussed in each interview, she does not have a required set ofquestions that her interviewers must ask in a specific order. She has designedthe interview such that it allows some flexibility rather than simply being anoral questionnaire. Qualitative researchers claim that this flexibility is one ofthe strengths of their method: that the interaction with participants mustallow the participants to describe their experiences, feelings, and attitudes intheir own ways. These researchers believe that the experimental method, inwhich an experimenter is testing a limited hypothesis and collecting highlystructured data, is so artificial and constrained that they tap very little of thevast amount of available data. In fact, some qualitative researchers believe ata basic philosophical level that qualitative research is preferable because ithas a humanistic orientation; in qualitative research participants are treated ashuman beings and their humanity is fully tapped, whereas experiments treatparticipants as objects (subjects) on which experiments are conducted.
NATURALISTIC OBSERVATION
As noted in the previous section, some psychologists believe that research isbest done by studying behavior in its natural setting and that the act of fill-ing out a questionnaire or reporting for an experiment could distort thebehavior of a participant. Suppose that we were interested in whether con-sumption of alcohol is related to social aggressiveness. We could set up anexperiment in which groups of research participants drank measuredamounts of alcohol. They would then interact with each other while theexperimenter sat in the room and noted the amount of aggressive activity.How aggressive do you think the drinkers would be in this situation? Theywould probably resemble a church congregation more than a bar crowd.
To get an effective answer to our question, we would probably have to goto a bar and observe its customers. This technique in psychological researchis called naturalistic observation because researchers observe behaviorsunder the conditions in which they naturally occur.5 Naturalistic observations
How to Make Orderly Observations 15
5 Naturalistic observations are also sometimes called field studies because the investigator goesinto the field to collect data. (If I bite my tongue, maybe I can avoid the old saw about thefarmer who was outstanding in his. . . .)
are required when we wish to investigate any behavior that we feel might bedistorted by the artificiality of an experimental situation. Children, forinstance, are typically inhibited by the presence of adults, particularlystrangers. We would expect the behavior of children playing at home withtheir own toys to be far different from that in a psychology lab with unfamil-iar toys and a strange-looking psychologist present.
For a long time, comparative psychologists6 and ethologists wonderedwhether any animal other than humans used tools, and naturalistic observa-tion provided them with the beginnings of an answer. Initially, the data theycollected by observing chimpanzees in zoos supported the general belief thatother animals did not use tools. After a while, however, these researchersbegan to wonder whether zoo chimpanzees were not using tools because notools were available in the zoo. They gave them tools such as pliers and screw-drivers, but the chimps still didn’t use them. Finally, a particularly brightinvestigator named Jane Goodall moved into the forest with the chimps. Shelived with them and constantly observed their behavior for several years. Oneday she noticed that a particular chimp would take a branch, peel off theleaves to make it smooth, trim it to length, and dip it into a termite hill andlick off the termites that were clinging to the stick. Although the stick is not assophisticated as a human’s tools, some investigators consider it an appropri-ate chimpanzee tool, and more recent laboratory work has confirmed the useof tools. Some researchers now contend that other animals such as birds alsohave the capacity to use tools. Without naturalistic observation, researcherswould still be sitting around watching zoo animals not using tools.
Some sciences other than psychology use naturalistic observation astheir primary method because they cannot achieve control over the variables
they are investigating. Astronomers, forexample, must pretty well investigatethe universe as it occurs naturally. Thesame is usually true for archaeologists,paleontologists, ethnologists, and anthro-pologists. This limitation has not pre-vented these scientists from discoveringimportant phenomena such as evolution.Because of problems with control, re-searchers often use naturalistic observationin psychology to suggest hypotheses thatcan later be more carefully investigatedthrough experimentation in the laboratory.Used in this way, naturalistic observationcan be a valuable research tool.
The major problem with naturalistic observation as a research techniquemay be obvious to you. Because investigators have no control over any of the
16 Chapter One
6 A comparative psychologist is not someone who makes television commercials in whichBrand X loses out to Brand Y. A comparative psychologist compares the behavior of animals,including humans, across species. Comparative psychologists contend that the rest of us arefar too egocentric in our research; humans form only a small part of the animal kingdom.
variables they are observing, one variable may be changing systematicallyalong with the primary one being observed. In the bar example, for instance,an investigator might observe that the more alcohol the customers drink, themore aggressive their social interactions become. However, the observer maynot notice that as the evening wears on and more drinks are consumed, thenumber of bar patrons also increases. Maybe aggressiveness is related tocrowding. Or perhaps the bartender is getting tired and brings the drinks ata slower rate. Maybe aggressiveness is related to frustration.
Thus, although naturalistic observation has an advantage in realism, italso has disadvantages in its lack of control. As with correlational observa-tions, experimenters must be aware of potential confounding variables andmust avoid making causal statements.
CASE HISTORY
A final research technique available to psychologists is another qualitativedesign called case history. A case history is a detailed account of the events ina case; the case is usually a person’s life, but it can be an incident such as theshutdown of a nuclear plant. Many of the data in clinical psychology comefrom case studies, dating back to Freud’s reports of clinical cases. As is typi-cal of qualitative designs, data for case histories are usually verbal. Supposethat you were a therapist with a pair of conjoined twins having multiple per-sonalities as patients. You might be interested in exploring why conjoinedtwins develop dual personalities. You would immediately realize that tryingto conduct an experiment to answer the question would be futile. Even if youcould find enough conjoined twins to do an experiment, society considers itunethical to make conjoined twins mentally ill; it is also unethical to makenonconjoined twins mentally ill! You might consider a correlational observa-tion next. Perhaps you could correlate the number of personalities in con-joined twins with the degree of childhood stress. Again, you would need tofind a number of conjoined twins with dual personalities. Because this taskis virtually impossible and a correlational observation based on one datapoint is meaningless,7 you would have to abandon this approach also.
The only option left would seem to be a case history outlining the factorsin the lives of the conjoined twins that have contributed to their develop-ment. First, you would spend many hours interviewing the twins to establisha history of their life from birth to present. In addition, you would talk withtheir relatives and friends and examine any school, medical, and psycholog-ical records that were available. Because all this information would requirefar too much space to report, you would select what you felt were the mostimportant aspects. The case-history technique has built into it all the dangersmentioned for the other methods, including unknown confounding variablesand inability to establish causality. This method also has additional pitfalls.
How to Make Orderly Observations 17
7 Establishing a relationship between two variables with a single point is difficult. However,establishing a relationship with two points is not difficult, because you can draw only onestraight line between them. Reporting a relationship on the basis of two points is a lot likebragging. It’s easy to do but no one pays any attention.

For one thing, the investigator is generally trying to reconstruct past eventsfrom the subjective reports of those who were associated with those events, andresearch has shown that people are terrible at recalling the past. One inves-tigator found that mothers were inaccurate about recalling the details oftheir pregnancy and the birth of their children 6 months to a year after theexperience. You can imagine the problems involved when the memories are20 years old!
A second possible pitfall of the case-history method is the investigator’sbias in selecting events to be reported. In a psychology course, I was oncerequired to support a particular personality theory with the help of eventsfrom the life of the main character in the novel Crime and Punishment. Select-ing events that offered convincing support for my theory was easy. However,I discovered that the other students in the class had used the same book tosupport three other personality theories, also in a convincing way. They hadeither chosen different events or given a different interpretation to the sameevents I had chosen. Even with the limited set of events described in a singlebook, bias was extremely important in determining the relationships weestablished. Is it any wonder that investigators can find support for their ownpet theories from the nearly unlimited set of events in a person’s life?
A number of books have been written that analyze the lives and person-alities of famous historical figures, such as Richard Nixon, John Kennedy, andSigmund Freud. Although they may make interesting speculative reading,these so-called psychohistories are subject to all the dangers inherent in acase history. In addition, most of the events the authors use to support theirtheories are based on secondhand reporting in the public media. Thus, theseauthors are one more step away from the objective truth. (For example, oneauthor concluded that Nixon was psychotic; another concluded that he wasneurotic.)
A case-history approach has also been used in applied experimentalsettings for investigating infrequently occurring events. For example, it isbasically impossible for a psychologist interested in the causes of aircraft acci-dents to set up appropriate experiments. So, these investigators often recon-struct the events preceding an accident in as much detail as possible. Bycollecting enough critical incidents describing accidents and near-accidents,they hope to establish a pattern that will allow them to hypothesize thecauses. These hypotheses can then be more thoroughly investigated undercontrolled experimental conditions.
One of the most defensible uses of the case-study approach is in neu-ropsychology. Neuropsychologists and neuroscientists are interested in deter-mining the function of various structures of the brain. One of the major waysto find out what a part of the brain does is to destroy it and find out howbehavior changes. In humans there are obvious ethical problems withdestroying brain tissue. Because brain tissue does not grow back, any suchprocedure would be permanently debilitating. One solution would be to findsome unfortunate soul whose brain tissue has been destroyed by accident ordisease. From an introductory psychology course you may remember the case
18 Chapter One

of Phineas Gage, a fellow who had a metal rod driven through his brain in amining accident. This case was one of the first that researchers used to under-stand the workings of the brain. Today researchers have extensively docu-mented the behaviors of many patients with various neurological problems.These cases are used along with other data, such as those from animalresearch, to help us understand the functioning of the human brain. How-ever, we should keep in mind that data from even these well-documentedcase studies do not generally come from experiments, so establishing causalrelationships between these circumstances and behaviors should be donewith extreme care.
The obvious advantage of the case-history approach is that it can be usedwhen only one or a few cases can be examined. Some would also argue thatanother advantage is that behavior can be studied in all of its complexity ina natural context, whereas experiments are used to study artificially sim-ple behaviors in artificial settings. However, because this approach hasthe disadvantages mentioned earlier, including, in some cases, relying onpotentially biased subjective reports retrieved from somebody’s long-termmemory, we should remain skeptical of conclusions drawn solely from a sin-gle case history.
■ Quantitative versus Qualitative DesignsUnfortunately, many investigators who have been trained exclusively ineither quantitative research or qualitative research consider those who use theother approach to be misguided. Quantitative researchers argue that unlessdata can be converted into numbers, they can never be organized into thebuilding blocks necessary for the construction of a scientific body of knowl-edge and that science cannot advance unless we can build theories that helpus understand behavior. Such theories require knowledge of the causes ofbehavior, and without experimentation—and to some extent correlationalobservation—no causation can be established. On top of these problems is thequestion of the reliability of the data collected. Without being able to repeatresearch, we will never know whether our data are reliable. Some experi-menters would say that qualitative researchers such as ethnographers donothing but write descriptions of behaviors, a job for historians and novelists,not scientists.
On the other side of the debate are the qualitative researchers, some ofwhom would argue that experimentation deals with only tiny bits of unhu-manlike behavior and does so in artificial settings. They say that quantitativeresearchers will never be able to understand realistic human behavior in aholistic way. In addition, only qualitative research taps into the potential ofthe individuals being studied, using their insights and creativity to help guidethe formation of our scientific body of knowledge. Some would go so far as toassert that there are ethical problems with experimentation in that it treats thepeople it claims to study as objects, rather than as humans. In the mostextreme camp are qualitative researchers who completely reject traditional
How to Make Orderly Observations 19
science and maintain that the quantitative researchers unwilling to acceptqualitative designs are motivated by a desire to maintain political power andsilence those who have traditionally been oppressed.8
A reasonable and moderate position would seem to be that as scientists weshould use whatever type of design is needed to answer our questions. At thevery least, we can use qualitative methods to help us formulate hypotheses thatwe can more rigorously test using quantitative designs. There is also no reasonwhy, in some cases, we cannot use the methods in combination. For example,many surveys have a quantitative section that collects numerical data using arating scale such as a Likert scale and also a qualitative section that asks open-ended questions. In this case we can use the open-ended questions to helpunderstand and interpret the quantitative responses. The following examplealso describes a research question that has benefited by the use of a wide com-bination of methods that we have discussed in this chapter.
■ Using Methods in CombinationTo illustrate how we might use the various research techniques discussed inthis chapter to investigate a research hypothesis, consider the following situ-ation. You are ready to pull your car onto the highway; you quickly look bothways, start to step on the gas, and then pull up and say to yourself: “Whoa!There’s a motorcycle coming. I almost didn’t see it!” Or maybe you have beenthe motorcycle rider and a car pulled out in front of you as if the driver hadnever seen you. Why do you suppose this occurs? As we will discuss in Chap-ter 3, everyday observations and questions like this one can lead to the for-mation of a hypothesis for psychological research. A first step in forming ahypothesis is to examine the situation logically. What is the major differencebetween motorcycles and other vehicles such as cars and trucks?9 Obviously,motorcycles are smaller and so may be less conspicuous than larger vehicles.But we are not the first to have thought of this idea. Once you have readChapter 6, you will know how to find out whether anyone else has investi-gated this issue. You would discover that many people have. Paul Olson ofthe University of Michigan Transportation Research Institute has reviewedsome of this research and called our hypothesis the motorcycle conspicuityhypothesis (Olson, 1989). I will use some of the research he cites to illustratethe research techniques we might use to investigate this hypothesis.
First, although we have seen that the case-history method has many draw-backs, it can be useful in helping us form a hypothesis. To study the motorcy-cle conspicuity hypothesis, although it will be a bit different from the classiccase-study method in which a single case is studied intensively, we can
20 Chapter One
8 The most extreme qualitative researchers are the poststructuralists, who question the possibilityof striving for an objective science. An interesting account of the origins of qualitative researchcan be found in Chapter 1 of Ethnography and Qualitative Design in Educational Research, by Margaret D. LeCompte and Judith Preissle (1993).9 I know, motorcycles are a lot more fun. Wrong answer!

perhaps find people who have almost pulled into the path of a motorcycle andask them what happened to cause their behavior. Is there a way to collect thistype of data in a more systematic manner? Fortunately, somebody has alreadydone some of the work for us, the police. In this case an accident report is a bitlike a short case study. If you collected accident reports for motorcycle–caraccidents and read them, you would find that drivers who violated motorcy-clists’ right of way often claim not to have seen them at all or not to have seenthem in time to avoid the collision. This is the kind of statement we wouldexpect if the conspicuity hypothesis were true. In interpreting these findingswe should keep in mind the limitations of the case-study approach.
Although in this instance we have gained some confidence by havingmany cases, we should remember that the data rely on people’s memory,were collected by people not trained in research, and are self-reports by dri-vers who have just been involved in an accident and for whom the responsesmay have legal ramifications.
Could we use naturalistic observation to investigate our hypothesis? Ifwe had years to waste, we could sit on a street corner and wait for a motor-cycle accident to happen that we could observe. Again, here we are luckybecause accident reports also contain information from people who haveobserved motorcycle accidents and from police officers, who have observedthe consequences of the accidents. We can do archival research and look atthe statistical data from various types of motorcycle–car accidents, compar-ing them with car–car crashes to determine the differences. If we did this wewould find that, in general, cars and motorcycles are involved in the samekinds of collisions with about the same relative frequency, except in the caseof the motorcycle going straight and the car turning left in front of the motor-cycle. We should keep in mind that as is the case with all naturalistic obser-vation, these data are at best correlational observations. An experimenter didnot manipulate anything and then measure a change in behavior. Perhaps wecould interpret the statistics as supporting the conspicuity hypothesis, but itis weak support. Why are motorcycles less conspicuous only under this setof circumstances? Perhaps the automobile drivers would not have seen themotorcycles no matter how conspicuous they were because the drivers werelooking left in the direction they were turning instead of forward at themotorcycle.
How to Make Orderly Observations 21

Would it be possible for us to use the experimental method to investi-gate our hypothesis? As you will see in Chapter 10, quasi-experimentaltechniques can be used in some cases where a full-fledged experiment is notpossible. One example of such a technique would be to look at accidentstatistics for each year prior to an event that had changed motorcycle con-spicuity and then after. Fortunately for us, back in 1967 a number of statesbegan requiring daytime use of headlights on motorcycles. If you measurea particular behavior, such as a motorcycle accident, a number of timesbefore such an event and a number of times after, a quasi-experimentaldesign called an interrupted time-series is created. This design is not as rig-orous as an experiment but is certainly more rigorous than a correlationalobservation. Using such a method, some early investigators estimated thereduction in daytime collisions to range from approximately 4% to 20%.However, more recent investigators have concluded that the effect of day-time headlight operation on motorcycle crashes is minuscule or nonexistent.It is also the case that when an effect of headlight use on motorcycles hasbeen found, headlight use on cars, for which there was never a claim ofconspicuity problems, may be equally effective in reducing crashes. Thus,the headlight data are inconclusive.
We can also possibly conduct formal experiments to investigate car dri-vers’ behavior toward motorcycles. In one such study observers estimatedwhen an approaching vehicle would pass in front of them on the basis of a 2-second observation when the vehicle was about 100 meters away. Nodifferences were found for motorcycles, cars, and trucks. Differences werefound when observers judged the last moment that they could safely pull outin front of a vehicle; they were willing to accept shorter gaps, on average, formotorcycles. However, no experiments have been done to specifically test theconspicuity hypothesis.
The research I have reviewed here, which was cited by Olson (1989),clearly illustrates the various research techniques that can be used to investi-gate a single hypothesis. The research also illustrates some of the advantagesand disadvantages of the various techniques. The case study and naturalisticobservation tend to be more realistic but may be lacking in rigor and preci-sion. In contrast, formal experiments may be highly rigorous but can often becriticized as being unrealistic. Table 1-1 lists some of the advantages and dis-advantages of the designs that we have examined.
I do not want leave you hanging in the air. What does Olson concludefrom his review? He thinks that the conspicuity hypothesis lacks support.The most likely alternative would seem to be that because motorcycles aresmaller, they are more easily blocked out by objects such as other cars,windshield posts, or trees and shrubs. A possibility is that drivers often failto see motorcycles not because they are inconspicuous, but because they arehidden.
22 Chapter One

How to Make Orderly Observations 23
■ TABLE 1-1A Summary of the Advantages and Disadvantages of Using Various Research Designs
Design
Experimentalmethod
Correlationalobservation
Questionnaires
Archivalresearch
Ethnography
Naturalisticobservation
Case history
Advantages
Precise control possibleCausal conclusions possiblePrecise measurement possibleTheory testing possible
Relationships between variablescan be found
Precise measurement usuallypossible
Intrusiveness usually low
Data collection efficientAttitude or opinion can be
measured
No additional data collection required
Rare behaviors can be studiedNonmanipulable events can be
studied
Unfamiliar situations can be described
Complex behaviors can be described
Intrusiveness lowParticipants treated
humanistically
Realistic setting helps generalization
Intrusiveness low
Rare cases can be studiedComplex behavior can be
intensively studied
Disadvantages
Artificial setting is typicalIntrusiveness typically highComplex behaviors difficult
to measureUnstructured exploratory
research difficult
Causal conclusions impossibleControl of variables difficultMany participants required
Causal conclusions impossibleSelf-reports difficult to verifyUnbiased sample selection
difficultResponse rates low when
mailed
Appropriate records often notavailable
Data collected by nonscientistsData usually correlational at
best
Control of variables impossiblePrecise measurement difficultInvestigator bias possibleCausal conclusions impossible
Control of variables impossibleData collection inefficientInvestigator bias possibleCausal conclusions impossible
Control of variables impossibleData often based on fallible
memoriesInvestigator bias highly likelyCausal conclusions impossible

24 Chapter One
■ SummaryAs scientists of human behavior, psychologists have many research designsavailable to them, all of which aim to establish relationships between eventsand to fit these relationships into an orderly body of knowledge. Among thequantitative designs is the experimental method, which is the primary focusof this book. This method requires that a particular circumstance be manipu-lated and some aspect of behavior measured. From an experiment it is possi-ble to say whether the manipulation of the circumstance caused any changefound in the behavior.
Sometimes when an experimental approach cannot be used, it is neces-sary to use correlational observations, in which variables are observed andtheir relationships evaluated. The results of such a study cannot be used toestablish causal relationships, because none of the variables is under thecontrol of the investigator. Correlational observations are often carried outusing a survey in the form of a questionnaire or interview. Correlational datacan also be obtained by doing archival research with data contained in publicor private records, such as census data or court records.
Some investigators are now doing research that employs qualitativedesigns. Qualitative researchers use descriptive data: written descriptions ofpeople, including opinions and attitudes, and of events and environments. Inethnography the investigators use interviews and sometimes participatoryobservations to gather descriptive data. In one form of qualitative researchthey use naturalistic observation, in which data are gathered in realisticsettings. A final qualitative design used when the potential number of obser-vations is limited is the case history, in which detailed accounts of the eventsin a person’s life or in a historical incident are described and analyzed.

25
In the first chapter we briefly discussed the experimental method. You willrecall that the major advantage of doing this type of research is that it allows
you to make causal statements—that a circumstance caused a change inbehavior. Because this type of statement is precise, the rules required to sup-port the statement are quite stringent. Most of these rules involve being ableto account for all the circumstances that could vary.
By way of example, suppose that we were interested in the time it takesa person to press a button in response to a light of a particular intensity.At this point we have chosen a circumstance to manipulate—the intensity ofa light—and a behavior to measure—the time to press a button. These twovariables have formal names.
■ Variables
INDEPENDENT VARIABLES
The circumstance of major interest in an experiment, light intensity in ourexample, is called an independent variable. The best way to remember thisname is to recall that the variable is independent of the participant’s behavior.
As experimenters, we manipulate this variable—that is, choose two ormore levels to present to the participant—and nothing the participant does can
2How to Do Experiments
During its long history down to the middle of the nineteenthcentury, psychology was cultivated by able thinkers who didnot realize their need of carefully observed facts. . . . Finallypsychologists decided that they must follow the lead of physics,chemistry and physiology and transform psychology into anexperimental science.
R. S. WOODWORTH (1940)
We must guard against . . . the drawing of a preconceivedconclusion from experiments or observations which are so vaguelyconditioned that a variety of inferences are as a matter of factpossible.
K. DUNLAP (1920)

26 Chapter Two
change the levels we have chosen. For example, if our independent variable islight intensity, we might select a high-intensity light and a low-intensity lightas our two levels and observe behavior under both circumstances. Without atleast two levels, we are not doing an experiment, but we are free to choosemany more levels or to have more than one independent variable. In the laterchapters I discuss ways of designing these more complex experiments.
DEPENDENT VARIABLES
Once we have chosen the independent variable, we will want to measure aparticipant’s behavior in response to manipulations of that variable. We callthe behavior we choose to measure the dependent variable because it isdependent on what the participant does.1 In the reaction-time experiment,for example, our aim is to find out whether a relationship exists betweenlight intensity and time to respond. Thus, our dependent variable is the timefrom when the light is turned on until the participant presses a button.Making a statement about the expected nature of the relationship is some-times useful; such a statement is called a hypothesis. In the example, we mighthypothesize that the more intense the light, the quicker the response will be.The outcome of the experiment will determine whether the hypothesis issupported and becomes part of the scientific body of knowledge or whetherit is refuted.
I have discussed hypotheses in several different places in this book. In thenext chapter we will consider how hypotheses can be deduced from theoriesand how they must be true if the theory is true. In Chapter 12 we will discussthe concept of a null hypothesis. As we will see, the null hypothesis is just astatistical statement saying that the independent variable has no effect on thedependent variable for a population. However, if you really believed therewould be no effect in your experiment, you would probably not carry out thatexperiment. In actuality, you are usually predicting that the change in levelsof the independent variable will cause a change in the dependent variable.This prediction is your real hypothesis. In fact, experimenters often go beyondthis nondirectional hypothesis of simply predicting some change and state adirectional hypothesis predicting the direction the dependent variable willchange as the independent variable is manipulated.
In some cases hypotheses are not even based on theories, particularlywhen you simply wonder what would happen to a behavior if the indepen-dent variable were manipulated. In this case, the hypothesis is simply theanswer to a question. How does crowding affect aggression? Does markingyour first guess or thinking longer lead to better grades on multiple-choicetests? Are politicians who smile in their campaign posters more or less likelyto win elections than those who don’t? Hypothesized answers to questionssuch as these can also add to the scientific body of knowledge.
1 I believe it is easier to remember the term this way, although the word dependent really refersto the behavior’s being potentially dependent on the levels of independent variable.

CONTROL VARIABLES
So far, we have chosen one circumstance to manipulate—the independentvariable. However, in some way, we will need to account for other circum-stances in an experiment. One possibility is to control the other circumstances,thus making them control variables. We can control such circumstances bymaking sure that they do not vary from a single level. For example, in ourreaction-time experiment, we might require constant lighting conditions inthe room, only right-handed participants, a constant temperature, and so on.Ideally, all circumstances other than the independent variable would stay con-stant throughout an experiment. We would then know that any change in thedependent variable must be due to the changes we had brought about in theindependent variable.
The concept of control is vital for experimentation and makes the exper-imental method distinct from the other forms of research that I discussed inthe previous chapter. In your experiments, many of the variables will be set ascontrol variables. As an experimenter, you will want to be sure that you haveindeed achieved complete command of the control variables in your experi-ment. This is why psychologists go to considerable expense to build specialenvironments in which sound, light, and temperature are controlled and touse special equipment to ensure that stimulus characteristics are consistentand that responses are carefully measured.
However, even though many variables in your experiments will be controlvariables, you should realize that, especially in psychology, not all variableswill be assigned as control variables. First, the experimenter cannot control allthe variables. It is impossible not only to control many genetic and environ-mental conditions but also to force cooperative attitudes, attentional states,metabolic rates, and many other situational factors on human participants.
Second, we really do not want to control all the variables in an experi-ment otherwise we would create a unique set of circumstances. If we couldcontrol all variables while manipulating the independent variable, the rela-tionship established by the experiment would hold in only one case—whenall variables were set at exactly the levels established for control. In otherwords, we could not generalize the experimental result to any other situation.As a rule of thumb, the more highly controlled the experiment, the lessgenerally applicable the results.
Suppose, for example, that General Nosedive from the U.S. Air Forcecame to you and said: “Say, I understand you ran an experiment on reactiontime. Tell me how intense I should make the fire-warning light in my fighterplanes so that my pilots will respond within half a second.” Having conducteda well-controlled experiment, you reply, “Sir, if you can guarantee that thepilot is a 19-year-old college sophomore with an IQ of 115, sitting in an air-conditioned, 10-foot-by-15-foot room, with no distracting sounds and nothingelse to do, and if you always give a warning signal 1 second before the lightcomes on, then I might be able to give you an answer.” You can probablyimagine the general’s reply. The moral of the story: if you want to generalizethe results of your experiment do not control all the variables.
How to Do Experiments 27
28 Chapter Two
The generalizability of an experimental finding is also referred to asexternal validity—how well a causal relationship can be generalized acrosspeople, settings, and times. Cook and Campbell (1979) have defined severaltypes of validity. The way they use this term, validity refers to whether draw-ing experimental conclusions about cause is justifiable. I will introduce otherterms for validity at appropriate places in the book. Threats to external valid-ity might occur if you use a limited sample, such as college sophomores,when you want to generalize to all humans of any age or intelligence (includ-ing, as in our example, Air Force pilots). Or you might have done a highlycontrolled laboratory experiment when you want to generalize to real-worldwork settings where it is noisy, hot, and crowded, and the workers are tiredand unmotivated but have lots of practice. In general, the more tightly con-trolled your experiment—that is, the more circumstances you choose to makeinto control variables—the more likely it is to suffer from threats to externalvalidity.
RANDOM VARIABLES
Having established that we do not want to control all the circumstances, whatcan we do with the remaining circumstances in our experiment? One possi-bility is to let them vary. In what way can we allow the circumstances to varyand still be sure that they will not bias our experiment? One alternative is topermit some of the circumstances to vary randomly. These variables aretermed random variables.
The term random or randomization is used in several different ways in sci-ence. One use of the term is in the context of random selection of items froma population to form a representative sample. In this case, a population ofitems is available and some random process is used that makes the selectionof any one item from that population as likely as the selection of any otheritem. Random selection is used to ensure external validity, that is, to ensurethat the sample of items randomly selected from the population is generaliz-able to that population. So, if you wanted to generalize the results from anexperiment to all people in the United States, ideally you would use a meansof selection that was equivalent to putting the name of everybody in the coun-try into an enormous hat and drawing out a sample of names. You could thensay that you have randomly selected your sample and you could claim goodexternal validity of your findings.
However, in this context the word random in the term random variableusually refers to random assignment of circumstances to the levels of theindependent variable. Many of the circumstances in an experiment concernindividual differences in the participants. Obviously, if we use the same par-ticipants for the various levels of the independent variable, we do not haveto worry about individual differences. However, if we use different partici-pants for each level of the independent variable, then we have to make surethat the characteristics of the participants assigned to each level do not biasour conclusions. For example, suppose that you want to determine the effectsof TV violence on aggression in children. After you have randomly selected

How to Do Experiments 29
two hundred 6-year-old children as a sample from some larger population,you might then randomly assign them to two levels of the independent vari-able: viewing violent TV shows and viewing nonviolent TV shows. Perhapsyou could flip a coin for each child and assign the child to the first group if ahead occurred and to the second group if a tail occurred. Is it possible thatmost of the children in first group attend violent schools or eat lots of sugaror come from abusive homes, while few of those in the second group do? Yes,but if the selection was done in a truly random manner, it is statisticallyunlikely for such large samples to be biased.
Suppose that you let the children watch the violent or nonviolent TVshows at home. Is it possible that most of the children in one group havelarge-screen theater-system TVs at home, while most of those in the secondgroup have small portable TVs? Again, it is possible but not probable; ran-domness makes this possibility highly unlikely.
There is no particular trick to random assignment or random selection.You can use any device that allows each item an equal chance of assignmentor selection. As in the example, if you want to form two groups, you can flipa coin to form them.2 If there are six groups, you can throw a die. If there are33 groups, you can use 33 equal-sized slips of paper. Most mathematicalhandbooks and many statistics texts have random-number tables based on aprocess equivalent to drawing from 10,000 slips of paper. I have included onesuch table in the back of this book as Appendix C. Using any column orcolumns in a table of random numbers, you can assign each of your items anumber and select the item when that number occurs. Just ignore the extracolumns or numbers that are not on your list. If you happen to be a computerbuff, you can use the computer to generate random numbers or events.3
If you have chosen to make a circumstance into a random variable, youmust be sure that it varies in a truly random way, because not all events thatappear random are really so. For instance, if you try to randomize conditionsin an experiment by assigning events yourself, you have not randomized!Humans are notoriously bad at producing random events. If you assume thatparticipants will show up for an experiment throughout the day or through-out the semester in a random order, you are wrong! People who are morningor afternoon volunteers or early-semester or late-semester volunteers havedifferent characteristics. New experimenters commonly make mistakes inrandomization. Don’t you make them!
Perhaps most of the circumstances that become random variables in yourexperiment will be associated with participants and can be randomized byrandomly assigning participants. However, other circumstances that are notassociated with participants can sometimes be treated as random variables.Suppose in our TV violence experiment that the room in which the children
2 Actually, most coins are slightly biased in favor of heads, but, unless your experiment hasover 10,000 trials, don’t worry about it.3 Computers are also less than perfect at generating random events, but they’re much betterthan coins. For assigning events in an experiment, it doesn’t make much difference whichmethod you use.
30 Chapter Two
watch TV is available either in the morning or in the afternoon. If you thinkthere is a reason why watching in the morning versus the afternoon maycause differences in how aggressive children become independent of theamount of violence in the show, then you might want to randomly assign theviolent-TV and the nonviolent-TV groups to morning and afternoon times.You certainly would not want one group to watch exclusively in the morningand the other in the afternoon.
There are other circumstances that also might affect the aggressiveness ofchildren that you may consider as random variables even though you havenot been able to make truly random assignments; for example, how stormythe weather is or how much violence there is in the news on a particular day.If you have multiple sessions of your experiment, you would probably not betoo far off if you assume that these circumstances are randomly distributedacross the levels of your independent variable and that they will not system-atically bias your results.
As mentioned earlier, the major advantage of random selection is thegeneralizability of the results. Every time you choose to make a circumstanceinto a control variable, you can generalize the results to only that level of thevariable. However, if you allow many levels of the circumstance to exist ina population and then randomly choose a sample, you can generalize tothe entire population. The major advantage of random assignment is theelimination of bias from the results. Thus, randomization can be a powerfulexperimental tool.
RANDOMIZATION WITHIN CONSTRAINTS
In some cases you may not want to make a circumstance into either arandom or a control variable. Actually, randomization and control defineopposite ends of a continuum. Falling between these two extremes are vari-ous degrees of randomization within constraints. In this case, you controlone part of the event assignments and randomize the other. Suppose that inour reaction-time experiment we knew that practice could be an importantvariable.
If we presented all the low-intensity trials first, followed by all the high-intensity trials, we could be accused of biasing the experiment; any differencebetween response times to low- versus high-intensity light might, in fact, bedue to short versus long practice. To avoid this problem, we could decide tocontrol the practice variable and give only one trial to each individual. Or wecould assign the low- and high-intensity trials randomly over, say, 12 trialsby flipping a coin and presenting a high-intensity light whenever a headoccurred and a low-intensity light whenever a tail occurred. However, thisalternative might not be the most attractive one, because it could result in aninadequate representation of high and low intensities. (For example, the flip-ping of the coin might result in only three high-intensity trials and nine low-intensity trials.) To avoid this possibility, we could decide to have an equalnumber of high- and low-intensity trials.

How to Do Experiments 31
Thus, as a solution we establish a constraint on the assignment of trials(an equal number of each type of trial) and make a random assignment withinthis constraint. We might write the word high on six slips of paper and theword low on six and draw them out of a hat to determine the order of pre-sentation. This procedure would fulfill the requirement that the conditions berandomly ordered across trials within the constraint that the two intensitiesbe equally represented.
Other constraints, of course, are possible. We might want to avoid thepossibility of too many trials at a particular intensity occurring early in thesequence. We could then randomize within blocks, with the block serving asour constraint. Using this alternative, we could choose three blocks of fourtrials each, ensuring that we randomly selected two high-intensity trials andtwo low-intensity trials within each block. To describe this procedure, wewould say that we randomly assigned conditions to three blocks of four tri-als each, with the constraint of representing each intensity an equal numberof times within each block.
You can legitimately use many such constraints as long as you specifythem. However, the more constraints you specify, the less random your selec-tion process is, and the less generalizable your results are.
CONFOUNDING VARIABLES
If we designed our experiment perfectly so that we have chosen an indepen-dent variable to manipulate and a dependent variable to measure and madethe rest of the circumstances into control variables, random variables, or vari-ables randomized within constraints, then we would not have to worry aboutthe variable I am about to discuss. However, not every experiment isdesigned perfectly, and in many real-world settings, designing a perfectexperiment is impossible. In this case we need to know when a confoundingvariable rears its ugly head. Any circumstance that changes systematically asthe experimenter manipulates the independent variable is a confoundingvariable.
Suppose, for example, that we used three different light intensities in ourreaction-time experiment: a low-intensity light for the first 20 trials, amedium-intensity light for the next 20, and a high-intensity light for the last20. If we reported, “People respond more quickly the more intense the light,”someone else could say, “No, people respond more quickly after practice.” Infact, we could both be correct, or either one of us could be incorrect! The prob-lem is that we have unintentionally confounded the experiment with a variablethat changes systematically with the independent variable.
An experimenter can record the most sophisticated measurements, do thefinest statistical test, and write up the results with the style of Hemingway,yet a confounding variable can make the whole effort worthless. A feudbetween Coca-Cola and PepsiCo illustrates the type of confusion that thisvariable can cause (“Coke-Pepsi Slugfest,” 1976). PepsiCo pitted its colaagainst Coke in a drinkers’ test in which tasters who said they were Coke

32 Chapter Two
drinkers drank Coke from a glass marked Q and Pepsi from a glass markedM. More than half the tasters reportedly chose the glass containing Pepsi astheir favorite. Coca-Cola officials countered by conducting their own prefer-ence test—not of colas but of letters. They claimed that more people choseglass M over glass Q not because they preferred the cola in glass M butbecause they liked the letter M better than they liked Q. This hypothesis wassupported when most people tested still claimed to prefer the drink in the Mglass when both glasses contained Coke.
In this example, the letters were apparently a confounding variable.Because they varied systematically with the colas in the original test, theexperimenters could not distinguish the tasters’ preference for the colas fromtheir preference for the letters.
I mentioned earlier in this chapter that Cook and Campbell (1979) haveidentified several types of validity. Another type is internal validity, whichrefers to whether the manipulated change in the independent variable causedthe change in the dependent variable or whether something else caused thechange. If the independent variable didn’t cause the change, then a con-founding variable must have. So, if we want to avoid confounding variablesin our experiments, we need to understand the various possible threats tointernal validity. There is no more important task for you as an experimenterthan being able to recognize and, if possible, avoid the threats to internalvalidity that may introduce confounding variables into your experiments.
■ Threats to Internal Validity
HISTORY
In laboratory experiments, one can usually collect data at all levels of theindependent variable over a relatively short time span. In this case, any changein the dependent variable is unlikely to have been due to history—some
event that takes place between the testing of the levels of the independentvariables.
For example, suppose that you wanted to find out whether usingcomputer-generated visuals rather than traditional hand-drawn overheadtransparencies in a large introductory psychology class improves grades. Fur-ther suppose that a particular professor teaches this introductory course onlyonce a year. For practical reasons you decide to ask this professor to use thecomputer-generated visuals this year and compare the grades of this class tothose of the previous year’s class. If you find that the overall grades are bet-ter for this year’s class, you might be correct in attributing the improvementto the use of the computer-generated visuals. However, some historical eventcould have caused the change. For example, the school could have tightenedadmission standards, thereby changing the academic quality of students inthe class. Or perhaps the college of engineering decided to require all seniorengineering students to take the class, again changing the class composition.Or perhaps the world has undergone an increase in interest for the subjectmatter being taught, similar to what occurred in computer science coursesafter personal computers appeared. Or perhaps, at a local level, a fraternityhas acquired a copy of last year’s test and has made it available to certainstudents in the class. To have confidence in the conclusion that the change ingrades between the classes was due to the use of computer-generated visu-als, you must rule out these historical events, as well as any others that mightthreaten the internal validity of the conclusion.
MATURATION
Maturation is a threat to internal validity caused by participants’ growingolder or perhaps more experienced. Obviously, maturation is more of a threatwith young children than with adults, such as when evaluating the effects ofpreschool educational programs. However, even for adults, maturation can bea problem in long-term experiments or when participants are undergoingrapid change—for example, when an employee first begins managerial duties.
SELECTION
Selection can be a threat whenever experimenters cannot assign participantsrandomly, particularly when, for practical reasons, participants essentiallyassign themselves to conditions. If, in the previous example, the classes cho-sen for comparison were fall and spring classes, selection could be a problem.My fall introductory psychology class contains many first-year students,many of whom are psychology majors. The spring class has many more engi-neering students who have put off taking this required course until theirsenior year. Do you think there might be differences between these classesbesides the use of computer-generated visuals? Experimenters who use col-lege students as participants are familiar with the potential differences
How to Do Experiments 33

34 Chapter Two
between early-semester volunteers4 and late-semester volunteers. In generalthe early-semester volunteers are more eager and motivated and are probablybetter students or at least better at planning their time. The worst kinds ofselection threats are those that are directly linked to the independent variable.For instance, suppose that you want to evaluate a new industrial training pro-gram. You let workers volunteer to take the new program and then after com-pleting the program you compare the performance of those workers to theperformance of workers who did not volunteer for the program. Do you thinkthere might be a difference in the workers who self-selected to be in the twogroups? What about the difference between the recovery rates of people whochoose a new type of therapy and the rates of those who refuse the therapy?
MORTALITY
Participants dropping out of an experiment, mortality,5 can also be a threatto internal validity. Fortunately, in most experiments, these participants dieonly with respect to their life in the experiment, not with respect to life in gen-eral. Overall mortality is not really a problem; differential mortality is a problem.This occurs when more or different kinds of participants drop out of the groupsassigned to various levels of the independent variable. For example, supposethat a company decides to try a new training program to inoculate newlypromoted middle managers against socially stressful situations.
The company randomly chooses half of its new managers for a 1-hour-per-day exposure to simulated personal confrontation with employees. Theother managers are not exposed to this training program. The number ofstress-related health complaints in the two groups is counted for a period of
4 A volunteer in this case is a little like a volunteer in the military. Although some of thestudents who crowd around experimental sign-up sheets would volunteer even if such service were not a course requirement, most actually volunteer to do this in place of someother requirement, such as writing a paper.5 Mortality is the term used by Cook and Campbell (1979). Some experimenters also refer tothis as attrition.

How to Do Experiments 35
five years after the training. The company finds that the stress-inoculatedgroup has reported fewer such complaints and concludes that the programwas a success. Was it? Among the questions that you should ask is: Howmany managers dropped out of each group during the training program?6
Conversely, the training may have sensitized the managers to be more awareof stress-related health problems. It is likely not only that more managerswould have dropped out of the stress group but also that these managerswould have been the most sensitive to stress. The success of the traininggroup might have little to do with the inoculation procedure but might be dueentirely to the fact that mortality changed the characteristics of the groups.
TESTING
The act of testing can change behavior independently of any other manipula-tion. Testing can be a threat to internal validity when a pretest or multiple-testdesign is used. Suppose that you are interested in whether a new advertisingcampaign would increase the public’s awareness of your company’s brand ofshaving cream. You pick a large random sample of consumers and send thema questionnaire. You ask a number of questions about various brands of shav-ing cream and the commercials associated with the brands. Three months later,after launching a new series of commercials touting your brand, you againsend the questionnaire to the same people and discover that they are nowmuch more familiar with your brand of shaving cream. You declare the adver-tising campaign a success. Are you right?
One problem with the conclusion that the campaign caused a change inawareness is that the pretest itself may have caused the change in awareness.The pretest may have sensitized this particular group of people to noticeshaving cream brands in general. During the following three months, theymay have watched all the shaving cream commercials more closely, and nowthey are able to tell you more about each of the brands regardless of the newadvertising campaign.
In addition to sensitizing participants, testing can also inform the partic-ipants of the experimenter’s topic of interest or even the experimentalhypothesis. A pretest can also provide information, increasing the partici-pants’ knowledge of a topic so that scores on a posttest will be higher, inde-pendent of any experimental manipulation.
STATISTICAL REGRESSION
Perhaps the most subtle threat to internal validity is statistical regression.This term refers to the fact that when experimenters choose participants onthe basis of their having scored very high or very low on a particular test,
6 In addition to the threat to internal validity of mortality, which I am emphasizing here, youshould be able to find other potential threats. For example, the training program might harbor demand characteristics (see Chapter 4) that bias these managers against reportingstress-related health problems.

36 Chapter Two
their scores tend to move toward the mean on a second test. It is not imme-diately obvious why regression toward the mean should occur. Perhaps anexample will help.
Suppose that you have devised a program that you claim will increasethe IQ scores for preschool children who have been classified as having mildretardation (IQ of 53 to 68). You give an IQ test and choose 30 children whoscore within the mild retardation range. After one year in your program, yougive the children the test again. You discover that the mean IQ of the grouphas increased by seven points and that this change is statistically significant.You declare your program to be a success. Is it?7
How could statistical regression have caused or contributed to this result?Imagine that the IQ pretest is composed of two separate components: a “true’’IQ that a perfect test would measure and “error.’’ The perfect test yieldsexactly the same score for a particular child every time you give it. If youcould use such a test, statistical regression would pose no problems. But, alas,the IQ that you measure also has an error component.
This error may be due to a number of unpredictable variables. Forinstance, the child might have been lucky and have guessed the correctanswers to several items on the pretest, or might have been unlucky and haveguessed fewer correct answers than chance would predict. Or perhaps thechild got up on the wrong side of the crib that morning and had a difficulttime concentrating on the pretest. Or perhaps the examiner was feeling par-ticularly grouchy that morning and failed to establish good rapport with the
7 At this point, you should be able to identify a number of potential threats to internal validityother than regression. The problem with maturity over a one-year period for preschool chil-dren is obvious. Testing could be a problem as well. The IQ pretest was probably the first testof any kind that these children had taken. They might have learned something in generalabout taking tests. They might also have remembered specific items from the pretest andlearned the answers over the year.

How to Do Experiments 37
child. Because we cannot predict the size or direction of this error componentfor any particular score,8 we must treat error as if someone were drawing arandom number out of a hat and adding or subtracting it from the true score.
When you chose the group with mild retardation on the basis of a lowpretest score, you probably chose many more children who had error work-ing against them than children who had error artificially inflating their truescore. That is, the true scores of this group were, on the average, not as lowas the ones they received on the pretest. Because you chose only children withlow scores, you biased the group toward those with error working againstthem. However, on the retest one year later, we would expect a less biasederror. We would expect as many errors to increase the true scores as todecrease them. There is still an error component, but now it is not biasing themeasured score away from the true score.
If you are not yet convinced, try a little demonstration. Pick any truescore, say, 100. Write the numbers from –10 to +10 on equal-sized slips ofpaper and put them into a container. Draw a number from the container, addit or subtract it from 100, write down the result, and replace the number. Afterdoing this 30 times, take the lowest five numbers and figure the mean (addthe numbers and divide by 5). Now, follow the same procedure, drawing justfive numbers and figuring the mean. Is the first mean lower than the secondmean? You have just demonstrated statistical regression.
INTERACTIONS WITH SELECTION
Finally, validity threats such as maturation and history may have interactionswith selection. As an example of the possible interaction of selection with his-tory, consider the following study. Stanley Coren and his colleagues studiedarchival records and found that the distributions of right- and left-handers inage-groups ranging from 10-year-olds to 80-year-olds were very different(Coren & Halpern, 1991; Porac & Coren, 1981). From a high of 15% left-handers among the 10-year-olds, the percentage declined until there was 0%in the 80-year-old group. They concluded that left-handers had a “decreasedsurvival fitness” that caused them to die at earlier ages. Obviously, many left-handers, mothers of left-handers, and husbands of left-handers wereconcerned about this conclusion. However, Lauren Harris (1993a) disputedthe conclusions and presented evidence that the interaction of selection andhistory could have caused the change in percentages. Eighty years ago, peopleattached considerable stigma to being left-handed. So parents and teachersstrongly encouraged children to be right-handed, forcing them to eat, write,and do other tasks with their right hands. In other words, selection by meansof social pressure occurred for right-handedness. But this selection changedwith history. Over the years, being left-handed became more acceptable, and
8 If you are using a standardized test, you might be able to get an idea of the general magnitudeof the error component for the test—a number that characterizes the reliability of the test. Thelower this number, the more we must be concerned about the effects of statistical regression.

38 Chapter Two
parents and teachers pressured fewer truly left-handed children to becomeright-handers. So Harris argued that fewer left-handers are in the oldergroups not because most left-handers have died but because there never weremany to begin with. The argument is not yet settled (see Halpern & Coren,1993; Harris, 1993b), but the case of the disappearing left-handers offers aninteresting example of the possible interaction of selection with history.
I hope this discussion of threats to internal validity will help you in yoursearch for confounding variables. Whenever you are planning an experiment,going over each of these threats might be helpful to make sure that none ofthem is a problem for your experiment. In some cases you may have potentialthreats that are difficult or impossible to eliminate, in which case it might bepossible for you to use a quasi-experimental design, many of which I havediscussed in Chapter 10.
■ Summary of the Experimental MethodNow that you are familiar with the use of the experimental method, let’s tryto fit all the terms we have learned into a schematic framework. In Figure 2-1I summarize the experimental model. On the left, I have listed all the cir-cumstances that may affect behavior. On the right, I have listed all the poten-tially measurable behaviors. At the top, on the left, I have chosen one of thecircumstances for manipulation, the independent variable. On the right,I have selected one of the behaviors for measurement, the dependent vari-able. The arrow indicates that we are interested in whether the independentvariable causes a change in the dependent variable. Although we can ignorethe other behaviors, we need to make sure we can account for all the circum-stances. In the figure, I have partitioned these circumstances into controlvariables, random variables, variables randomized within constraints, andconfounding variables. While partitioning the variables, we should keep inmind that a decision to control increases the precision of the results (internalvalidity) but decreases their generality (external validity). On the other endof the continuum, a decision to randomize decreases the precision butincreases the generality.
As a final example to illustrate the types of variables that go into an exper-iment, I will describe an experiment that two colleagues and I conducted(Grobe, Pettibone, & Martin, 1973) and list some of the variables in a figuresimilar to Figure 2-1. We were interested in whether an instructor’s lecturepace makes a difference in how attentive the students are. I was teaching intro-ductory psychology to a class of 200 students at that time, so I had the dubioushonor of trying to lecture to this class at different speeds. As the independentvariable, then, we chose three different lecture paces. I attempted to lecture ateach pace for at least five minutes during each lecture. We tape-recorded thisportion of each lecture and counted the number of syllables per minute tomake sure that my pace was within the allowable range of error. In Figure 2-2you will see lecture pace listed as the independent variable. We could have
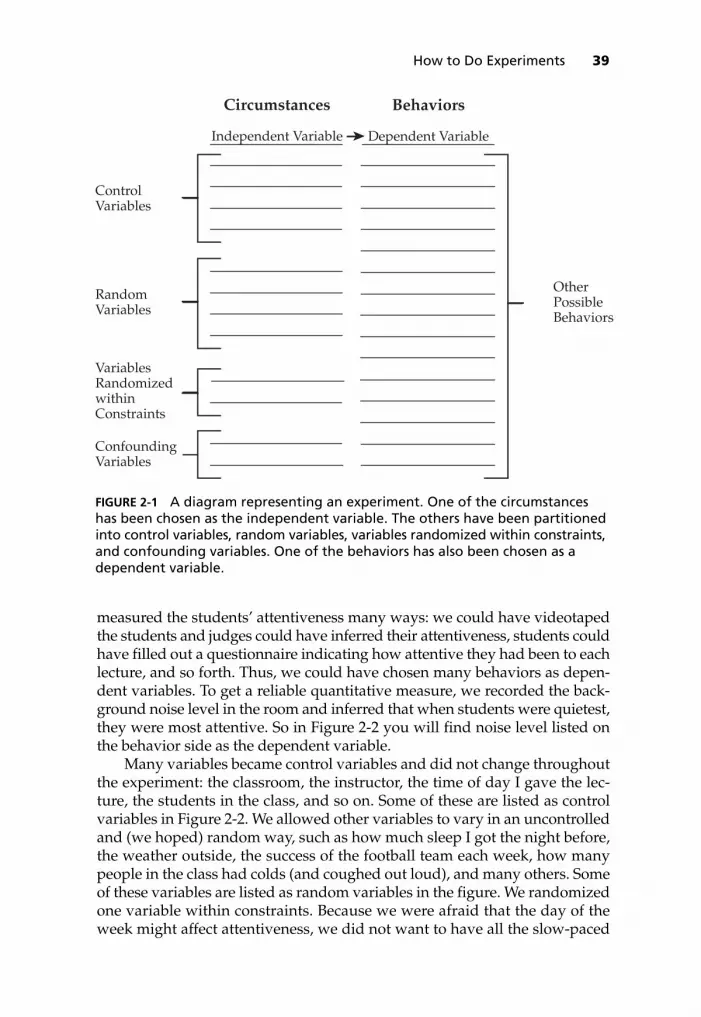
How to Do Experiments 39
measured the students’ attentiveness many ways: we could have videotapedthe students and judges could have inferred their attentiveness, students couldhave filled out a questionnaire indicating how attentive they had been to eachlecture, and so forth. Thus, we could have chosen many behaviors as depen-dent variables. To get a reliable quantitative measure, we recorded the back-ground noise level in the room and inferred that when students were quietest,they were most attentive. So in Figure 2-2 you will find noise level listed onthe behavior side as the dependent variable.
Many variables became control variables and did not change throughoutthe experiment: the classroom, the instructor, the time of day I gave the lec-ture, the students in the class, and so on. Some of these are listed as controlvariables in Figure 2-2. We allowed other variables to vary in an uncontrolledand (we hoped) random way, such as how much sleep I got the night before,the weather outside, the success of the football team each week, how manypeople in the class had colds (and coughed out loud), and many others. Someof these variables are listed as random variables in the figure. We randomizedone variable within constraints. Because we were afraid that the day of theweek might affect attentiveness, we did not want to have all the slow-paced
Control Variables
Random Variables
Variables Randomized within Constraints
Confounding Variables
OtherPossible Behaviors
Circumstances
Independent Variable
Behaviors
Dependent Variable➤
FIGURE 2-1 A diagram representing an experiment. One of the circumstanceshas been chosen as the independent variable. The others have been partitionedinto control variables, random variables, variables randomized within constraints,and confounding variables. One of the behaviors has also been chosen as adependent variable.

40 Chapter Two
lectures on Mondays, the medium ones on Wednesdays, and the fast ones onFridays. Therefore, we randomized the day of the week I would use each pacewithin the constraint that each day I gave each pace the same numberof times.
Finally, although we tried to minimize confounding variables, we knewthat, as in many applied experiments, some would occur. One was, undoubt-edly, the average pitch of my voice. I am not a machine, so—as with mostpeople—the faster I talk, the higher my voice becomes. I am sure that vocalpitch was confounded with lecture pace. In addition, as long as the length ofa lecture remained constant, as I talked faster I could either say more wordsabout a particular topic or say the same number of words and vary the num-ber of topics I covered. I tried to do the former, so the ratio of topics to wordswas necessarily confounded with lecture pace. I have also listed these twoconfounding variables in Figure 2-2. I hope that this example illustrates howvariables can be partitioned into the various types of circumstances andbehaviors.9
FIGURE 2-2 Variables from the lecture-pace experiment partitioned into anindependent variable, control variables, random variables, a variable random-ized within constraint, confounding variables, and a dependent variable
Control Variables
Random Variables
Variables Randomized within Constraints
Confounding Variables
OtherPossible Behaviors
Circumstances Behaviors
➤Lecture Pace
Classroom
Instructor
Time of Day
Students
Instructor ís Sleep
Weather
Football Wins or Losses
Students’ Health
Pace within Day
Vocal Pitch
Ratio of Topics to Words
Noise Level
Judges’ Ratings
Students’ Self-Ratings
of the Week
IndependentVariable
DependentVariable
9 A reader commented that she wanted to know the outcome of this experiment. Briefly, wefound that lecture pace did affect attentiveness. Fortunately, ambient noise levels were lowestfor my medium pace. The noise levels were highest for my fast pace. So, we inferred that amedium pace is best, and it is better to err on the side of going too slow than too fast.
How to Do Experiments 41
■ SummaryThe experimental method allows causal statements to be made—that when acircumstance is manipulated it causes a change in behavior. The circumstancethat is manipulated is called the independent variable and is set by theexperimenter to at least two levels. The behavior that is measured is calledthe dependent variable because it may be dependent on the levels of theindependent variable. The predicted relationship between the independentand dependent variable is call a hypothesis. If the prediction is just thatthe independent variable will cause a change in the dependent variable, it is anondirectional hypothesis, but if the prediction is about the direction ofchange then it is a directional hypothesis. Some of the other circumstancescalled control variables may be set at a particular level and not allowed tovary. Other circumstances called random variables may be allowed to vary ina random manner. Generally, random variables improve the external validityof an experiment, and allow it to be generalized to other people, settings, andtimes. Some circumstances called variables randomized within constraintsmay be allowed to vary randomly but within limits imposed by the experi-menter. Experimenters should attempt to eliminate or minimize confoundingvariables that change systematically with the independent variable anddistort the relationship between the independent and dependent variables.
Confounding variables can cause low internal validity and make itdifficult to say that only the independent variable caused a change in thedependent variable. Threats to internal validity include history, the occur-rence of an uncontrolled event during the experiment; maturation, the changein age or experience of individuals during experimentation; selection, thebiased assignment of individuals to groups; mortality, the nonrandom loss ofindividuals from groups; testing, the change in participants due to the test-ing process; statistical regression, the movement of scores toward the meanfor groups selected on the basis of extreme scores; and interactions withselection, the differential effect of a threat on nonequivalent groups.

42
You can observe a lot by just watching.YOGI BERRA
Perfection is the greatest enemy of a good beginning.ANONYMOUS
As he was testing hypothesis number one by experimentalmethod a flood of other hypotheses would come to mind, and ashe was testing these, some more came to mind, and as he wastesting these, still more came to mind until it became painfullyevident that as he continued testing hypotheses and eliminatingthem or confirming them their number did not decrease. It actually increased as he went along.
R. M. PIRSIG (1975)
The greater the island of knowledge, the longer the shoreline ofthe unknown.
JOHN DONNE
We do not know one millionth of one percent about anything.THOMAS ALVA EDISON
Einstein told me how, since his boyhood, he thought about theman running after the light ray and the man closed in a fallingelevator. The picture of the man running after the light ray led to special relativity theory. The picture of the man in a fallingelevator led to general relativity theory.
L. INFELD (1950)
[Holmes:] I have no data yet. It is a capital mistake to theorizebefore one has data. Insensibly one begins to twist facts to suittheories, instead of theories to suit facts.
A. CONAN DOYLE (1891/1989)
3How to Get an Experimental Idea
Iwas once so bold and foolish as to assign introductory psychology studentsthe task of proposing seven experiments as a course requirement. At first
their reactions to this assignment puzzled me. Above the din of gnashingteeth, the moaning, and the groaning could be heard the plaintive wail of mystupefied students, “How do we get an idea?” Not only did I find it difficult

How to Get an Experimental Idea 43
to understand why getting an idea would pose such a problem, but I alsofound it impossible to answer the question. I have now pondered this perva-sive problem and formed an opinion about why it occurs and what can bedone to solve it.
I don’t believe the problem is that students have no ideas. As small chil-dren, we are curious about everything, including human behavior: “Mommy,why is that man so fat?” “How does Jenny eat with her left hand?” “Whycan’t I spell as good as Betty?” “Why do Tommy’s parents spank him somuch?” I refuse to believe that this curiosity simply fades away. In fact, thesame students who “could not get an idea” seem to have plenty of thoughtsabout human behavior at parties or bull sessions: “What’s the best way tostudy for my bio exam?” “Should I marry him or just move in with him?”“Am I more creative in the morning?”
For this reason I will refuse to believe you if you tell me you don’t haveany ideas for an experiment. It’s not true that you don’t have any ideas, butit may be true that you are afraid something is wrong with the ideas you dohave! This fear can paralyze your natural creativity, and after a while, all yourideas seem inadequate to you.
■ Fearing Experimental IdeasFears about experimental ideas are usually irrational, stemming from amisunderstanding of psychology experiments. Psychologists call irrationalfears phobias. Because I am a psychologist, I cannot resist the temptationto name the phobias behind our inability to get experimental ideas. Thefollowing phobias seem to be the most common.1
GENIEPHOBIA (FEAR OF GENIUSES)
Geniephobia stems from the common belief that anyone doing research mustbe a genius and that your modest brainpower couldn’t possibly measure up.Researchers often do little to counteract this belief, and a few have beenknown to cultivate it. For years, every time I read a journal article I picturedthe author as a wise-looking old man with flowing white locks. I wasshocked to find that many experimenters are young, ordinary-lookingmen and women who make silly mistakes and say stupid things just like therest of us.
My own geniephobia is still being cured. The more experimentalpsychologists I meet, the less I think only geniuses can do this kind of work.2
So relax. Your ideas are probably as good as theirs were when they weregetting started.
1 Any resemblance of these names to accepted psychological terminology is purely coincidental.2 I do not mean to imply that experimental psychologists are dumber than other scientists. Biologists and physicists can be dumb, too.

44 Chapter Three
IMITATOPHOBIA (FEAR OF IMITATING)
People with imitatophobia are afraid to propose any idea unless it isabsolutely original. An imitatophobic who combines this fear with a beliefthat everything worthwhile has already been thought of by someone elseoften reaches a state of total paralysis. Truly original experiments are fewindeed in psychology.
Most experiments use variations of somebody else’s method to test some-body else’s theory. In Chapter 6 you will learn how to find out what otherexperiments have been done in your area of interest, and you will find outexactly how unoriginal you are. However, don’t be afraid to move sciencealong in small steps. That’s what the rest of us do.
PARAPHERNALIOPHOBIA (FEAR OF APPARATUS) AND MANUPHOBIA (FEAR OF DOING THINGS BY HAND)
If the sum total of your mechanical knowledge of the automobile is that theright pedal makes it go and the left pedal makes it stop, you are a prime can-didate for paraphernaliophobia. This malady will scare you away from anyexperimental idea requiring an apparatus more sophisticated than a deck ofcards. On the other hand, if you will not consider doing any experimentunless it requires sophisticated scientific equipment, you are a victim of theopposite affliction—manuphobia. Everyone knows that the more complexthe equipment, the better the research.
Both phobias are unfounded, however. Some of the best research hasused little or no equipment. Jean Piaget developed a major area of childpsychology with no more apparatus than toy blocks, water glasses, andmodeling clay.
Other areas of psychology, such as verbal learning, concept formation,attitude assessment, and personality, require no more than pencil and paper.An apparatus can help you do research, but it isn’t research itself. Also, when

How to Get an Experimental Idea 45
an apparatus is necessary, someone will be available who can teach you howto use it.
PARSIMONIOPHOBIA (FEAR OF SIMPLICITY)
Parsimoniophobics think they must come up with grandiose experiments thatwill change the course of science in one fell swoop. Their motto is: If it’ssimple, it can’t be science. Although doing complex experiments has someadvantages, you should generally aim for the simplest experiment that cananswer your experimental question. People with parsimoniophobia seldomcomplete their majestic experiments; when they do, they usually cannot inter-pret the results. To start with, then, think simple. You can always pursue morecomplex questions later. (In Chapter 9 I discuss what I mean by simple andcomplex experiments.)
CALCULATOPHOBIA (FEAR OF STATISTICS)
Some people dread having to do any calculations tougher than counting ontheir fingers. If you can never remember how to figure out your car’s gasmileage or how to keep your checkbook straight, you are a potentialcalculatophobic. If you will consider only those experiments that require thesimplest statistical tests, remember that such tests are tools that can helpyou interpret your results; they should not cause you to throw out goodexperimental ideas. You can always find someone who enjoys playing withnumbers to help you analyze your data. I am not saying that knowledge ofstatistics is unimportant, but it is, after all, just a tool used in science, notscience itself.
IMPERFECTAPHOBIA (FEAR OF BEING IMPERFECT)
An imperfectaphobic will not tell you about an experimental idea until he orshe has perfectly worked out every tiny detail, and the proposal looks like thefinal report. This attitude often stems from having read too many pristinely

46 Chapter Three
presented journal articles. As we will see in Chapter 5, journal articles are endproducts; they seldom reflect the sloppy thinking and general air of confu-sion that precedes most experiments. Completed experiments are often quitedifferent from the experimenters’ original ideas. The original idea for anexperiment simply forms the kernel; the experimental procedure will evolveas you set up and do the experiment. If you take the plunge and begin talkingabout your experiment in rough form, others may be able to help you mold itinto a perfect experiment. Well, almost perfect.
PSEUDONONPHONOSCIENTIAPHOBIA (FEAR OF NOT SOUNDING SCIENTIFIC)
People with this hideous affliction can recognize a great idea only if it isexpressed in scientific jargonese.3 Scientific jargonese is a pseudolanguage thatsome scientists make up to sound good when they talk with other scientists whodo similar research. It helps obscure the research from the general public—andsometimes from other scientists as well. For example, in jargonese an experi-ment designed to determine whether people remember words better when thewords are in groups is described as an investigation into “the effect of taxonomicand categorical clustering on the retention of verbal material.” Or a notion thatpeople from ethnic groups live in the same neighborhood because of pressurefrom their friends is described as an experiment examining “the effect of demo-graphic distribution by ethnic affiliation as a function of peer-group coercion.”Jargonese can easily be translated into everyday language. If you are interestedin “the effect of affiliative preference on the salience of dimensions in personperception,” you are actually trying to find out whether people who join certainorganizations differ in the way they see other people. Try translating one your-self: “the effects of maternal employment on sibling aggressive tendencies.”4
ERGOPHOBIA (FEAR OF WORK)
Sorry, there is no known cure for this affliction.
Now that we are aware of what fears might block our creativity, let’s tryto get some experimental ideas. What is the best way to start?
■ ObservationSomeone once said that it’s easy to write: Just sit at the computer and stare atthe keyboard until drops of blood appear on your forehead. This alsodescribes the best way to avoid coming up with experimental ideas. Because
3 I am using jargonese to refer to the dictionary definition of jargon, meaning “speech or writingcharacterized by pretensions, complex terminology, and involved syntax,” rather than meaning“the language peculiar to a particular trade, profession, or group.” The line between jargonand jargonese is thin indeed.4 If you came close to “Do working mothers’ kids fight more?” you are catching on. Be sure tobuy my next book: Scientific Jargonese for Fun and Profit.

How to Get an Experimental Idea 47
we are interested in human behavior rather than keyboard behavior, the bestthing to do is observe humans, not keyboards!
Getting experimental ideas is simply a matter of noticing what goes onaround you. Once you become a good observer, your natural curiosity willprovide you with experimentally testable questions. One week of constantobservation should provide you with enough experiments to last threecareers.
Indeed, some of the classic research in experimental psychology startedwith a simple observation. If Eckhard Hess’s wife had not noticed that hispupils got bigger when he was looking at bird pictures, pupillometrics mightnever have been created. If Ivan Pavlov had not noticed that his dogs weresalivating to stimuli other than meat powder, Igor Nosnoranovitch mighthave been the father of classical conditioning instead. If Jean Piaget had notnoticed that his daughter Jacqueline stopped making gurgling noises whenshe could no longer see her bottle, he might have become a famous Swisswatchmaker. Most revolutionary experimental ideas have been generated bysimple observation.
PUBLIC OBSERVATION
After reading the next couple of paragraphs, take a paper and pencil, leavethe room you are in, and walk outside where there are people to observe.As a training exercise in observation, make notes of possible experimentalquestions that occur to you as you stroll around.
First I’ll go on a stroll to show you what I mean: I wander outside, andI see that the sun is shining.
1. Do people get more or less work done when the weather is nice?
I walk past two workmen laying concrete for a bike rack. One is working,while the other is standing and watching.
2. Do workers stand around more when they are unionized?
A couple of joggers run by.
3. Do people who exercise regularly sleep better at night?
A young woman is sitting over there under a tree with a young bearded fel-low. They are looking rather amorous, and I feel like a peeping Tom. Bettermove on.
4. Do women find men with beards more attractive than men withoutbeards?
I see a large group of students filing into a classroom.
5. Do students in large lecture classes make better grades than those insmall classes?
I arrive at a crosswalk. Will that car stop? Yes, it did. Across I go.

48 Chapter Three
6. Are drivers more likely to give the right of way to pedestrians of theopposite sex?
I stop to watch a sports car zooming down the street.
7. Do people drive sports cars faster than regular cars?
I head back past the library.
8. Do students who study in the library retain information better thanthose who study in the dorm?
I pass the bike rack at the front of my office building and see lots of bikes.
9. Are mountain bikes easier to ride than road bikes?
I lope upstairs to my office. I am back.I just got nine potential ideas for experiments. That’s almost one per
minute! Now you try it while I wait.
Welcome back. Did you get plenty of ideas? Think about the ideas youcould get if you were that observant all the time. Now the problem is “Whichidea should I turn into an experiment?” because not all important questionscan be answered through experimentation. All experimental questions mustpass the ROT test: they must be Repeatable, Observable, and Testable. Some ques-tions fail because they are not repeatable. For example, some supporters ofextrasensory perception (ESP) claim that it occurs only under certain condi-tions and that it is impossible to predict when the conditions are right. In otherwords, ESP works only some of the time and fails the repeatability test. As longas this basic tenet governs ESP effects, it is impossible to test for the existenceof this ability. Other questions fail because they are not observable: “Do dogsthink like humans?” “Is my experience of the color red the same as yours?”Finally, some questions fail because they are not testable. For example, sciencecannot answer moral questions, such as “Is abortion wrong?” “Is it proper forwomen to wear short skirts?” “Are drugs evil?” Although we can certainly usethe scientific method to determine people’s opinions about these questions, wecannot devise any test that could answer the questions themselves. We musttherefore eliminate all such questions from any list of experimental ideas.

How to Get an Experimental Idea 49
After reading Chapter 1, you should also recognize that some questionsmust be answered by correlational observation rather than by experimenta-tion. For example, if, as in Question 7, we want to answer the questionwhether people who choose to drive sports cars drive faster than those whodrive other types of cars, we must do a correlational observation. On the otherhand, if we wish to answer the question whether people tend to drive fasterwhen driving a sports car, we could design an experiment. Take another lookat your list of ideas, and label each idea as experimental or correlational.
Our little walks have been interesting, but people in public provide uswith a limited set of behaviors. Whom else can we observe?
OBSERVING YOURSELF
Introspection was one of the earliest techniques in experimental psychology.Introspectionists, however, concentrated on observing their own mentalprocesses rather than their own behavior. Because a controversy developedabout whether a person can know his or her own mental processes, experi-mental psychologists stopped watching themselves altogether. Rather thanfollow the dictum “Know thyself,” they resolved to “Know not thyself.”5 It isstill generally frowned on if you, as a psychologist, do an experiment withyourself as the only participant; nevertheless, you can get some good exper-imental ideas this way. Not only will you be able to collect many samples ofthe behavior you are interested in, but you might also have some idea whyyou did what you did. The former can give you an idea for an experiment,the latter an idea for a theory. We will examine theories later in this chapter.
With a little effort, you can begin to notice your own behavior. It mayseem ridiculous to suggest that you do not notice yourself, but it is probably
Do all the questions in your list of ideas meet the ROT requirements?Take a moment to go through your list and eliminate any that fail to do so.
5 Some experimental psychologists still don’t know who they are.

50 Chapter Three
true. When dressing, which arm do you put into your shirt or blouse first?When you brush your teeth, do you brush the left side first or the right? Doyou put your house key or room key into the lock right side up or upsidedown? When you cross your legs, do you put your left leg or your right leg ontop more often? These are all things you do every day. Do you notice them?Observing yourself can be entertaining,6 as well as a good source of ideas.Write down the ideas as they occur to you.
OBSERVING YOUR FRIENDS
Your friends are also good sources of experimental ideas. It is important,however, to observe their behavior as unobtrusively as possible. Staring isconsidered impolite at best and grounds for a fight at worst. People some-times are not particularly fond of the way they behave and would prefer notto be observed by others. Consequently, to avoid losing friends, keep yourobservations to yourself. Pointing out your insights, no matter how brilliant,will not help you win friends and influence people.
OBSERVING CHILDREN
Observing children is a necessity if you are interested in doing experiments inthe area of developmental psychology, but children can also give you goodideas for other areas of research. If you are not blessed with7 children, youprobably have friends and relatives who would be more than happy to let
6 If you develop this skill, you will have to learn to control yourself in public. You may be considered strange if you break into gales of laughter over your own behavior.7 Or plagued by (depending on your point of view).

How to Get an Experimental Idea 51
you watch theirs for a while. Unlike adults, who have learned that theirbehavior should appear rational, logical, and consistent to an outsideobserver, children generally behave in ways that are uncomplicated bycomplex patterns or social inhibitions. Because most kids couldn’t care lessabout adult standards, you will be able to observe relatively uncontaminatedbehavior patterns in children.
OBSERVING PETS
Animals are interesting to study in their own right, but much of their behav-ior can also be generalized to humans. Furthermore, you will find that petsare even less inhibited than children. Because they are less capable of highlycomplex behavior patterns, their behavior is often easier to interpret. In addi-tion, you can manipulate your pet’s environment without worrying as muchabout the moral implications of possible permanent damage (see Chapter 4for a discussion of the ethics of animal treatment).
■ Vicarious ObservationAlthough you may find it less exciting than direct observation, you can alsoget experimental ideas by reading other people’s research. You might feel thatthis technique of vicarious observation feeds off other people’s creativity, butnonetheless, this approach has certain practical advantages. For one thing,because the broad experimental question you are asking already has a stampof approval from the author and journal reviewers, you know that the ques-tions being posed are considered important. Second, somebody else hasalready fit the experimental result into the existing body of knowledge andhas probably even proposed a theory, thereby structuring the area of researchfor you and saving you time and effort. Finally, earlier researchers havedevised a method of attack that apparently works and that you may be ableto modify and use in your research.
When you search for an idea, you should first identify an area of researchthat interests you. You will then know what types of journals you shouldread. Your topic should be as specific as possible: competition in small groups,play therapy in schools, perception of visual illusions, development ofarithmetic abilities, and so on. For the more general topics, you can simply

52 Chapter Three
scan journals having related articles. For more specific topics, this procedureis rather inefficient, and you will need to do a literature search, as describedin Chapter 6.
As you read these articles, try to discover what important questions theresearch has left unanswered. The author will sometimes help you discoverthese questions by suggesting where future research should go. But after youfinish reading the article, you should also be able to determine where it shouldgo by the questions left unanswered. Usually you wouldn’t want simply toreplicate the research, but it is certainly appropriate to do something similar.
By way of example, suppose that you had read about an experiment ask-ing whether violence on TV causes aggression in children. In the experimentsix-year-old children were exposed to two hours of either violent or nonvio-lent television 30 minutes each day for a month. Their behavior was thenmeasured by observing which toys they played with—aggressive toys suchas guns, knives, and tanks, or nonaggressive toys such as dolls, trucks, andblocks. After reading this article you might decide that you can think of a bet-ter way to manipulate the independent variable. Maybe you do not like theway they defined violence and the TV programs they chose to show the twoviewing groups and you would like to see this defined in a different way. Oryou might wish to add a third group that watches a mixture of violent andnonviolent shows, or a more neutral set of shows, or perhaps no TV at all.
Instead of changing the independent variable, you might wish to changethe dependent variable. Maybe you think that determining how aggressivechildren are by observing what toys they play with is a poor way to measureaggression. Perhaps you think it would be better to have trained judges watchthe children playing together and have them rate each child on aggressive-ness. Or you might want to interview the children’s teachers or their parents.
You might also think that some of the control variables were set atinappropriate levels. Six-year-olds have already been exposed to a lot of TV.Perhaps you think it would be better to use younger children or to use severalgroups of children at various ages. Maybe you think that two hours of TV istoo little given that on average children watch TV closer to four hours per day.Or maybe you think that one month is too short a time to show much effectof TV on behavior.
It may be that you think one of the control variables should have beenrandomized. For example, you think that the investigators were wrong tohave made the children watch TV in groups of six in a laboratory rather thanallowing them to watch it in a family setting in their homes.
An even more interesting reason for doing your own research would be ifyou thought you had discovered a confounding variable that you could elim-inate. For example, it may be that the violent shows were simply louder thanthe nonviolent shows; maybe loud noises rather than violence make childrenmore aggressive. You can probably think up many more ways in which theoriginal experiment could be altered to test the hypothesis in a different way,to elaborate on the hypothesis, or to test a similar but different hypothesis.

So as you read about other people’s research, you might find it helpful togo through a similar set of questions: Are there better or different ways ofmanipulating the independent variable, of measuring the dependent variable,of choosing levels for the control variables, of making control variables intorandom variables or vice versa, or of avoiding confounding variables? Inother words, can you think of ways to improve the internal or external valid-ity of the research? I believe that if you read the articles carefully and askyourself these questions, you will think up many excellent ideas for research.
■ Expanding on Your Own ResearchOnce you have done several experiments, you will find that your ownresearch provides many experimental ideas. Every experiment you do willleave a number of questions unanswered. For example, after using severallevels of an independent variable in an experiment, you may want to see whathappens when you choose other levels. Or you may have controlled a certainvariable at a particular level in one experiment and may wonder what wouldhappen if you set it at a different level. Or you may come up with unexpectedresults and want to find out why the outcome was not as predicted. Eachexperiment usually brings up more unsolved questions than it answers.
This picture of science as a continual growth of new questions is differ-ent from that held by those who think of science as a fixed body of knowl-edge that needs only to be uncovered. This latter outlook views scientificresearch as leaving fewer and fewer questions unanswered as it proceeds. Inreality, however, each experiment actually increases the number of questionsto be answered. Instead of working ourselves out of business, we are workingourselves into more business than we can possibly handle.
This open-ended view of science can be discouraging and exciting. It canbe discouraging because it is sometimes difficult to chart our progressthrough an ever-expanding universe in which we sometimes seem to take fivesteps backward for every step forward. On the other hand, it is excitingbecause we end up asking better and better questions. Perhaps the goal of sci-ence is not to find answers to all possible experimental questions but toanswer ever more promising and important questions. In following up onyour own research, you will find that your main problem is not “How can Iget an experimental idea?” but “Which idea is the most important one towork on?”
■ Using Theory to Get IdeasNow that you have collected a number of observations, how do you put thesetogether into a framework that suggests what kind of experiment you mightdo? This is usually done in science by proposing a theory. In the most typicalcase the purpose of an experiment is to test a theory. So one way of helping
How to Get an Experimental Idea 53

54 Chapter Three
you get an idea for an experiment is to convert some of your observations intoa theory and then test that theory with an experiment. Unfortunately, thosewho do not understand how theory is used in science often have a negativeopinion of it. One mistaken belief is that theories are extremely complex andcan be understood only by geniuses: “Einstein may have understood whate � mc2 means, but I never could.” A second misconception is that a theory issimply somebody’s wild guess: “That’s only a theory.” In fact, a theory canbe quite simple to understand, and as evidence is collected supporting a par-ticular theory, we can become ever more certain that it is true—but, as we willsee, never entirely certain.
Why do we need theories? The outcomes from experiments and othertypes of research are facts. But science is more than a loose collection of facts.It is an organized body of knowledge; it has a structure much as a buildinghas a structure. And just as a randomly arranged pile of bricks is not a build-ing, an unstructured collection of facts is not a science. Theory provides theblueprint that tells us how these facts can be put together into an organizedscientific body of knowledge. From my point of view, one of the reasons thatexperimental psychology is more fun than some of the other sciences is thatexperimental psychologists can be architects and builders as well as brickmakers. Some of the other sciences have imposed a division of labor. Forinstance, most physicists are either theoretical physicists or experimentalphysicists, but not both. Experimental psychologists have traditionally doneboth jobs.
I find it difficult to give a simple understandable definition of theory. Ifforced to do so, I would say that a theory is a statement about the probablerelationships among a set of abstract variables. The theoretical statement isonly probable because it is still subject to testing, and as we will see shortly,theories are easier to disprove by testing than to prove. The relationshipsare among abstract variables because if the variables consisted of directlyobservable events, all we would have would be a statement of fact, a directobservation rather than theory. The abstract variables in a theory are generalcategories of circumstances or behaviors rather than specific circumstancesor behaviors. For example, the theoretical statement that viewing violence

How to Get an Experimental Idea 55
causes aggression is different from an experimental demonstration that afterseeing a war movie, children choose to play with guns.
To help you understand the use of theory a little better, I will show howtheorizing fits into the planning and interpretation of experiments by usingan example. Suppose we have been observing the world around us and havenoticed the following things: Children seem to play rougher after watchingshoot-’em-up shows on TV. In recent years younger kids seem to have beencharged with violent crimes more frequently, and at the same time, violencein the media seems to have increased. Children in war-torn countries take uparms and fight at a very young age. These observations, and perhaps others,might lead us to propose a theory: “The more that children observe violentacts, the more likely they are to display aggressive behavior.”
This theory is pretty easy to understand. Note that it is more abstract, andmore general, than any of the observations that led to it. We may not realizeit, but we came up with this theory through induction. Induction is a logicalprocess in which the conclusion contains more information than the obser-vations on which it is based. That is, we would expect from our theory of vio-lence and aggression that it would hold not only for the three observationsthat led to it but also for all cases of children viewing violence. Of course, wecould be wrong. Perhaps the theory is true only for the instances we haveobserved, in which case our induction is in error. But once the theory is stated,it can at least be further tested through experimentation.
If our theory is any good, it should allow us to make a number ofpredictions. The logical process by which we make these predictions is deduc-tion. When we use deduction, we draw a conclusion from a set of premises,and this conclusion contains no more information than the premises takencollectively. Thus, if the information in the premises is true, the conclusionmust be true. For example, if a horse is a mammal, and all mammals areanimals, then by deductive reasoning a horse must be an animal. In ourexample, if the more that children observe violent acts, the more aggressivethey become, and if watching detective shows on TV involves observingviolent acts, then watching a large number of detective shows on TV mustlead to increased aggressive behavior. So from our theory, through deduction,

56 Chapter Three
we can predict a number of observations such as this one. Each predictedobservation forms a hypothesis for an experiment. To test one hypothesiswe might set up an experiment in which one group of children watchesfour hours per day of TV detective shows containing violence and a secondgroup watches four hours per day of nonviolent TV shows. After a numberof days we observe the children’s play behavior to determine how aggres-sive they are. The hypothesis deduced from our theory is that the groupobserving the detective shows will display more aggressive behavior. Ifthe theory is true, the hypothesis must be true. Figure 3-1 shows thethought process we have gone through so far. At this point we have usedinduction to turn our observations into a theory and used the theory todeduce a predicted observation. We are now ready to do the experiment totest this prediction.
Suppose that the experiment confirms the predicted observation. Havewe proved the theory? No, confirming a hypothesis does not prove the theorythat generated it. It does support the theory, but only through induction, notdeduction. To conclusively prove a theory, we would need to test everyhypothesis that could be deduced from the theory. In our case, we wouldhave to test every possible way that children could observe violence and mea-sure every type of aggressive behavior that they could display. Short of doingthis, all we can say is that the outcome of our experiment supports the the-ory. As additional experiments are done that support the theory, particularlyif they are used for testing a wide range of variables, our confidence in thetheory will continue to increase, but you can see how difficult it would be toever say that the theory has been proved.
Observation
Induction
Theory
Deduction
Predicted Observation
Experimentation
Confirmed Observation
Induction
Theory Supported
Disconfirmed Observation
Deduction
Theory False
➤➤
➤➤
➤
➤➤
➤➤
➤➤
FIGURE 3-1 The role of induction and deduction in linking theory to experimentation

How to Get an Experimental Idea 57
Suppose, on the other hand, that the experimental outcome disconfirmsthe predicted observation. Have we disproved the theory? From a logicalpoint of view, we have (again, see Figure 3-1). Even a single disconfirmed pre-diction disproves at least one of the premises because the prediction wasarrived at through deduction. Remember the example “a horse is a mammal,all mammals are animals, a horse must be an animal”? If we discovered thata horse was not an animal, it would have to be the case that either all mam-mals are not animals or a horse is not a mammal. No other logical possibili-ties exist. Using the same logic, if viewing four hours of violent TV showsrather than nonviolent ones does not cause increased aggressive behavior,then either what we were showing the children was not violent or our theoryas stated is wrong. You can see why Karl Popper, a noted philosopher ofscience, stated that our job as scientists is not to prove theories, but to dis-prove them (Popper, 1968). He reduced this concept to a slogan, “No numberof sightings of white swans can prove the theory that all swans are white. Thesighting of just one black one may disprove it.”
The weakness in the argument that we can logically disprove a theorythrough experimentation is that the statistical calculations we do to reach ourexperimental disconfirmation are not deductive. Although I examine thisissue in more detail in Chapter 12, I make the basic argument here. In ourexample, the way we would disconfirm our experimental hypothesis wouldbe to find no difference in aggressiveness between the two viewing groups—that is, to find no statistically significant difference. The problem is that ourstatistical tests are typically designed to determine whether the levels of theindependent variable cause a difference in behavior, not a sameness.8 Yet,experimentally disconfirming a hypothesis usually involves showing theselevels to be equivalent rather than different, and we do not generally do sta-tistical tests to determine equivalence. So we must be careful in concludingthat a hypothesis, and therefore a theory, is false from such an outcome.
Even if we could have disconfirmed the hypothesis by testing in theproper statistical direction (that is, by determining that the hypothesis is falsebecause an effect is statistically significant), we could still be in error. As wediscuss in Chapter 12, even when used properly, these statistical tests areaccurate at only a probabilistic level. On the basis of the difference on oursample, we can reach only a certain level of confidence that there is a realdifference in the population. For instance, we might conclude that our resultis statistically significant at the .05 level of significance. This conclusion meansthat we might be wrong up to 5% of the time. So, we know that 1 time out of20 we could be in error in believing that we have disconfirmed the hypothe-sis, and thus we would be in error to consider the theory disproved.
There are other reasons, in addition to the statistical ones just mentioned,why the disconfirmation of a hypothesis would not provide as strong a
8 Technically, when we test the null hypothesis we start by assuming that the there is no differ-ence and the statistical test tells us the probability that we are wrong in that assumption. However, the test still does not tell us the probability that they are the same.

58 Chapter Three
disproof of a theory as might be expected by deductive logic. For example,there could be problems with the way the theory was implemented in theexperiment, with the way violence was manipulated or aggression wasmeasured, or with the control or randomization of variables. So a singleexperiment is seldom considered to have disproved a theory until a numberof contrary results have been found.
I have gone into some detail here about the role of theory in helping usget an idea for an experiment and in helping us interpret the results. It isimportant for you to understand, in a general way, how theory and experi-mentation interact. Fortunately, however, you do not have to go through thisformal logical process every time you do an experiment. The steps are thesame for all experiments. In fact, the process I have been describing is quitenatural to humans. In leading our lives we continually make observations,generalize from the observations, and test the generalizations by makingadditional observations. Although we do not call them theories, we live ourlives on the basis of these generalizations. All I have described here is a bitmore formal version of the same natural process.
TYPES OF THEORIES
So far I have given only one example of a theory. But theories can take manyforms. Here I will discuss three types of theories9 and continue to illustratethem using the question “Does violence on television cause aggression?”
Descriptive Theories
A descriptive theory simply attaches names to events without necessarilyexplaining why or how the events have occurred. For example, Freud, as partof psychoanalytic theory, said that repression occurs when we unconsciously
refuse to admit painful or disagreeableideas to conscious thought. Althoughsuch a theory may help clinicians in theirwork, the mere naming does little toexplain the conditions under whichrepression occurs or how it might beexamined experimentally. In a similarway, for many years, psychologists inter-ested in motivation were enrapturedwith naming instincts. At first the con-cept of an instinct seemed to be usefulbecause it appeared that most animalbehaviors could be classified as reflect-ing certain instincts (such as the feeding
9 The three types of theories discussed here are similar to those mentioned by Arnoult (1972) inhis book Fundamentals of Scientific Method in Psychology, although some of the names have beenchanged.

How to Get an Experimental Idea 59
instinct or the mating instinct). However, eventually psychologists began toaccumulate as many names for instincts as there were observable behaviors(such as the “running into a hole when attacked from the front” instinct), andthe concept lost its usefulness.
Descriptive theories can be useful if the names are attached to abstractevents rather than to directly observable events. For example, we mightstate that the observation of violence is related to aggressive behavior. If wecould carefully define “violence” and “aggressive behavior” as generalclasses of events, we might have a useful descriptive theory. But even thiskind of descriptive theory is of limited value because it does not explain howthe relationship works.
Analogical Theories
Analogical theories explain how relationships work by drawing an analogybetween a psychological relationship and a physical model so that the phys-ical analog becomes a psychological model of behavior. For example, manyof the theories that attempt to explain how humans process information usethe computer as a physical analog. Of course, nobody believes that the brainworks exactly like a computer, but enough similarities exist for computermodeling to provide some useful analogical theories.
As an example of an analog-ical theory, let’s take the physi-cal properties of momentum asan analog for the relationshipbetween violence and aggression.As you may know, a physicalobject has momentum in propor-tion to its speed and mass; thefaster it is traveling and the moremassive it is, the more momen-tum it has. This momentum canbe overcome by friction. Thus, wemight state an analogical theoryrelating violence and aggressionas “The amount of aggressionexpressed by an observer is like the force exerted by a moving object, wherethe degree of violence observed is analogous to the mass of the object and thetime of observing is analogous to the speed of the object. After exposure toviolence, the aggressive tendencies will be high but will decrease over timein the same way that friction overcomes momentum.”
This analogical theory is more useful than the descriptive theory pro-posed in the previous section because it explains some of the complexities ofthe relationship. We should also be able to test the theory based on our knowl-edge of how the physical model works. For example, we know that the longera force is exerted on a physical object, the faster its speed and the greater its

60 Chapter Three
momentum. Thus, a longer time is needed for friction to overcome themomentum. By analogy, the longer a person observes violence, the longer itwould take the aggressive tendencies to disappear.
Because of its explanatory power, an analogical theory is certainly moreuseful than a descriptive theory. However, analogical theories are alsodoomed to fail in the end because at some point the properties of the physi-cal analog will no longer correspond to the properties of the human. For thisreason, you can best use analogical theories as first approximations that helpyou identify the major variables and outline in a general way how the vari-ables affect one another. But you will find that analogical theories are seldompowerful enough to help you specify the exact mathematical relationshipsamong the variables.
Quantitative Theories
Quantitative theories do attempt to state relationships in mathematicalterms. They specify not only the direction of relationships among categoriesof variables but also how these categories are quantitatively related. Fewpsychological theories have reached this level of sophistication. Only a fewsubareas in learning, memory, and cognition have attempted to use quanti-tative theories.
Quantitative theories have been limited in psychology because psychol-ogists have more difficulty with variability than do physical scientists. Forexample, in physics the theory of gravity is a quantitative theory expressedin precise mathematical terms. Because gravity affects all physical objects inthe same way, a physicist can assume that any variability in experimentalresults is simply a measurement error. In psychology, however, we cannotpredict the behavior of all individuals on the basis of one individual’s behav-ior, nor can we predict how the same individual will behave at any giventime. Consequently, our quantitative theories must be able to accommodatevariability. The best we can do is to predict how probable it is for a behaviorto occur,10 so we must express mathematical relationships in probabilisticterms. (For example, the probability that a particular individual will learn thislist of words in five trials is .8.)
Psychologists also face the problem of deciding what scale to use inmeasuring behaviors. In the physical sciences, the units for measuring speedor mass are not controversial. In psychology, however, we have to find scalesby which such concepts as violence or aggression can be measured. For exam-ple, consider the following quantitative theory: Humans express a level ofaggressiveness in direct proportion to the average level of violence theyhave observed in the recent past. Because our proposed theory attempts toestablish a mathematical relationship between the scales of violence and
10 In some areas, physical scientists deal with similar problems. The structure of atoms, for example, is expressed probabilistically. In fact, chaos theory, a theory of dynamical systemsbased on nonlinear mathematics, has been developed to deal with probabilistic events in thephysical sciences that do not follow the deterministic rules of classical science.

How to Get an Experimental Idea 61
aggression, we must first determine how to measure them. As you can see,establishing scales for such concepts is no easy task.
There are several areas of psychology in which quantitative theorizinghas grown rapidly in recent years. One of these, structural equation modeling,starts with a theory much like a descriptive theory, in which many conceptsare identified and described. A best guess is then made about how these con-cepts might relate to one another, and links are drawn among concepts toindicate these possible relationships. Then measurements are made for eachof the concepts, and statistics (that are well beyond what you want to knowhere) are calculated; these give weights to the links, indicating which linksare the important ones. In this way the investigator learns how the conceptsare quantitatively linked together.
A second area in which more quantitative theorizing is being done isconnectionism (sometimes called parallel distributed processing). This type of the-orizing begins with an analogical model in which the analog is the humannervous system. At least three levels of units are set up on a computer. Theseare similar to three levels of neurons and can send signals to one another. Asthe units experience the world (for example, they might analyze the curvesand lines of letters) they send signals to the units at deeper levels and makesome of these levels more or less likely to send their own signals, just as neu-rons do. After repeatedly experiencing the world, the units start to establishweightings that reflect how the learning has progressed (for example, thedeeper units begin to recognize some letters). These quantitative weightingscan be considered a theoretical representation of the way a human nervoussystem works, and the behavior of the resulting theoretical representation canbe compared to human behavior in a quantitative way—for example, doesthe system mistake certain letters for others, as humans do? With some ofthese exceptions, most theories in psychology are still descriptive or analog-ical. However, as psychology becomes more sophisticated and we learn tohandle the difficulties caused by variability and scaling, more psychologicaltheories will become quantitative.
PROPERTIES OF A GOOD THEORY
How do you know a good theory when you see one? I have implied thatquantitative theories are better than analogical theories, which in turn arebetter than descriptive theories. Why is this true?
First, a theory must be able to account for most of the data already collected.There is no use proposing a theory if the data do not support it. (You can seewhy a thorough literature search is so important; it will allow you to elimi-nate some of the competing theories before collecting any data.) One or twoitems of disconfirming evidence, however, will usually not destroy a theoryunless an alternative theory can account for all the evidence.
A theory must also be testable. As we saw earlier in this chapter, scienceadvances as research findings eliminate some theories and leave others as stillpossible. To be testable, then, means that the theory can potentially be

62 Chapter Three
disconfirmed. A theory is disconfirmed if the outcome of an experiment is notwhat the theory predicted it would be. If a theory is so universal that itcan account for any experimental result, then disproving it is impossible.11 Onereason a theory might not be testable is that the predicted results are expectedto occur in an unpredictable manner only some of the time. For example,Freud’s theory of repression is virtually untestable as it is usually stated. Howcould you disprove repression experimentally? Perhaps you could provide peo-ple with an experience they would rather forget. For instance, you might temptpeople to cheat and then confront those who succumbed with their dreadfuldeed.12 Sometime later you might have a close friend of each person ask thatindividual whether he or she had ever cheated. If no one reports havingcheated, you have support for the theory because it shows that everyonerepressed the incident (or, perhaps alternatively, they lied). However, ifeveryone reports having cheated, the result doesn’t eliminate the theory,because the theory never claimed that all people repress a particular event, onlythat some people sometimes repress some events. Thus, your experimentwould do little to dislodge the theory. A theory that is so general that no test canbe proposed to discredit it is a worthless theory from a scientific point of view.
Although a theory should not be so general that it can account for anybehavior, it should also not be too restrictive. That is, the fewer directly observ-able events the theory can account for, the less valuable it is. In the mostextreme case, a theory simply restates the relationship between observableevents.13 For example, the statement that “8-year-old children hit a punchingbag more after watching a televised Roadrunner cartoon” is less useful thanthe statement that “watching violence on TV causes aggression in children.”Even more useful is the statement that “observing violence causes people tobe more aggressive.” The more general our statements, the more valuablethey are because they account for a larger set of observable events.
A good theory should also have parsimony, which means that the theoryshould be as simple as possible while still accounting for the data. Theoriesthat are too detailed and complex are not very useful because we often do notknow the status of all the qualifying conditions when we are trying to applythe theory to new situations.
A good theory also predicts the outcome of future experiments. Evendescriptive theories specify the relationship between categories of events.Thus, the relationships between directly observable events that are membersof these categories are predictable from the theory. Analogical and quantita-tive theories also allow you to predict the relationships between events, andthese predictions are even more precise.
Finally, the best theories help answer ultimate questions, not justproximate questions. An ultimate question is a why question. A proximate
11 For this reason, testability is called falsifiability by some. As mentioned earlier in this chapter,Karl Popper (1968) is well known for suggesting that an idea is testable only if it can be falsified.12 For the moment, let’s ignore whether this experiment would be considered ethical.13 Actually, such a statement would not fit our definition of a theory, but some investigatorswould call it a theory.

How to Get an Experimental Idea 63
question is a what or how question. The theory we posed earlier in thischapter, “The more that children observe violent acts, the more likely they areto display aggressive behavior,” answers a what question: what happenswhen children observe violent acts? But it doesn’t answer the ultimate whyquestion: why do children act this way? A theory based on that ultimate ques-tion might say that “Evolution has imbued in humans a tendency to increasetheir level of aggression in response to environmental violence because thatadaptation makes survival more probable.” At this date most theories inpsychology are based on proximate questions. However, the recent increasedemphasis on evolutionary theory in psychology will likely lead to moretheories that answer ultimate questions.
DOES THEORY ALWAYS PRECEDE DATA?
In this somewhat idealized discussion of the relationship between theoriesand experiments I have probably led you to believe that you must alwayshave a theory in mind before you do an experiment. However, there arecertain types of research in which theory is less important. Some investiga-tors prefer to withhold theorizing until after they have collected a lot ofdata. They are like the sleuth Sherlock Holmes: Only after collecting allthe clues (data) will they nail the culprit (theory). They feel that, particularlyearly in a research program, proposing a theory before collecting data is likedeciding on the villain and then looking for clues related only to that person’sguilt: Both procedures are biased. In fact, B. F. Skinner, the late father ofoperant conditioning research, maintained that most theories do more harmthan good (Skinner, 1950).
Skinner believed that our job as scientists is to account for observableevents and that because theories use abstractions rather than events, they donot help us. In addition, because they are abstract, theories also lull us intobelieving that our research is complete when it is not. We are tempted to usethe theories to fill in the holes in our research without really knowing whetherthe answers the theories give us are true. Finally, Skinner worried that when

64 Chapter Three
we let a theory guide our research and then the theory is disproved, we losemuch of the research generated by the theory. Skinner’s rather extremeposition must be understood within the context of behaviorism’s generalrejection of all mental events and intervening variables that are the basis ofmany current theories. Most research psychologists today disagree with theposition he held and feel that theories are vital to most types of research.However, even these researchers know that there are times when theoriesshould play a smaller role in guiding research.
When a particular research topic is still in its infancy, premature theorizingmay cause more problems than it solves. If prior to collecting much data wepropose a tenuous theory, then we have to spend a lot of time and effort testingthat theory when our efforts might be better devoted to collecting additionaldata that might lead us to a better theory. Particularly at the start of a newresearch program, there is certainly nothing wrong with doing many experi-ments whose purpose is simply to answer the question, “I wonder what wouldhappen if . . .” rather than testing a theoretical prediction. After we have madea sufficient number of observations so that theorizing is warranted, collectingdata in this unstructured exploratory way becomes increasingly less efficient.
Another danger is that playing the theory game can be great intellectualfun. In the beginning a researcher finds an important problem, makes initialobservations, and proposes a theory. Others then test this theory, reject it, pro-pose their own, have those rejected, and so on. As theory begets theory, thegame takes on a life of its own, and we sometimes forget what the importantproblem was. We can end up investigating easily testable theories instead oflooking for important problems. But because no science has the resources toinvestigate all problems, we must choose, and we obviously should chooseimportant problems to work on. If, because of theories, we choose to investi-gate easy but rather unimportant problems instead of more difficult but moreimportant ones, we are misusing our resources.14 To counteract this trap,I have threatened at times to teach a course titled Psy 371, “Things PsychologyKnows Nothing About.” The purpose of this course would be to find impor-tant areas of human behavior that nobody is currently investigating and topropose how one might begin research in these areas.
A final type of research in which theory is sometimes less important isapplied research. Applied research is designed to solve a specific problem,as opposed to basic research,15 which is done for the sole purpose ofincreasing the scientific body of knowledge. Most of the research we have
14 Kuhn in his book The Structure of Scientific Revolutions (1970, p. 37) argues, in fact, that once thescientific community has accepted a paradigm (a set of assumptions, widely accepted model, orglobal theory), scientists then work only on problems that can be assumed to have solutionswithin that paradigm: “To a great extent these are the only problems that the community willadmit as scientific. . . . A paradigm can, for that matter, even insulate the community from thosesocially important problems that are not reducible to the puzzle form, because they cannot bestated in terms of the conceptual and instrumental tools the paradigm supplies.”15 Basic research is sometimes also called pure research, perhaps because one is not supposed tohave mixed motives for doing it. Unfortunately, some people who do this kind of researchseem to prefer other dictionary definitions of pure—for example, untainted with evil or guilt. I have never heard pure scientists defend the position that they are physically chaste, eventhough I suspect that this is the subconscious reason behind wearing white lab coats.

How to Get an Experimental Idea 65
been considering up to this point is basic research. Even though basic researchis not designed to solve practical problems, it can help solve such problems.Current behavior modification techniques, which provide some of the mostpowerful procedures for correcting human behavior problems, are based onbasic research done in the rat laboratories of yesteryear. Jack Adams (1972)found that many of the military systems of the 1970s had been designed usinginformation from basic research done more than 20 years earlier.
Applied research, on the other hand, has as its primary purpose thesolution of problems. Perhaps you need to know how humans read hand-written numbers so that you can design a machine to read ZIP codes. Or youmay wish to know whether daily quizzes will improve students’ classroomperformance on major exams. Or you may want to know whether cognitive-behavioral therapy is more effective than psychoanalysis. Many such practi-cal problems need immediate answers that basic researchers might neverfind. Needing an answer to a practical problem is a perfectly legitimate reasonfor doing research, and it can be satisfying, especially if your findings havean immediate impact on the world. In many cases it is even possible to test atheory while doing applied research. When this is possible, the research canmake an immediate practical contribution and also help build the scientificbody of knowledge.
Observation is again the key to getting ideas for applied research. Finding apractical problem is simply a matter of carefully observing human behavior andgiving your curiosity free rein. As with the other procedures we have discussedfor getting experimental ideas, you will find that more practical problems needto be solved than you can possibly do experiments to solve. As before, the ques-tion is not so much “What can I do?” but “What should I do first?”
■ Importance of Psychological ResearchBefore I end this chapter, I want to point out that though I have emphasizedhaving fun with research and doing research to satisfy our curiosity abouthuman behavior, psychological research should also be done because it

66 Chapter Three
provides answers to some of life’s most important problems. If I were to askyou to name the problems that cause our society the most grief and cost usthe most money, which ones would you name? Here are ten I can think of:
1. Our children do not learn enough in school (for example, many can’tread, write, do math, etc.).
2. Too many people abuse drugs.3. People behave in ways that are unhealthy (smoking, sexually trans-
mitting diseases, eating poorly, not exercising, etc.).4. Human conflicts bring about the possibility of wars.5. Domestic violence harms family members.6. Violence causes high crime rates.7. Too many people are on welfare.8. Civility in our society is breaking down, as shown, for example, by
road rage, littering, impoliteness, and frivolous litigation.9. Too many people are killed or injured in accidents.
10. Many workers are poorly trained to do their jobs or need retraining.
How many of these problems are problems with human behavior and there-fore within the scope of psychology? You are right—all of them! Think of theissues politicians talk about: crime, health, education, drugs, and the econ-omy. Problems in these areas come about because of the way people behave.To solve these problems we need to understand human behavior better, andto do that we need research. Thus, the work we do as psychologicalresearchers is not only interesting and fun but also frequently quite impor-tant. Society needs this research, and the answers we find will help peoplelive better lives.
■ SummaryAlthough we all have a natural curiosity about human behavior, many of usdevelop irrational fears that block our ideas. Some of us fear that all otherresearchers are geniuses and that our ideas will not be original. Some peopleare afraid to propose an experiment requiring a complex apparatus, whileothers are afraid of experiments with a simple apparatus. Some others fearthat their idea is too simple, that their experiment will require complicatedstatistics, or that their idea is not perfect when it is proposed. Finally, manypeople do not believe they have good ideas until they translate them intoscientific jargonese.
The major key to getting experimental ideas is to learn to observe theworld about you. You also need to know which ideas are scientifically appro-priate. Ideas must be repeatable, observable, and testable to be experimen-tal ideas. To get ideas, you can observe yourself, friends, children, and evenpets. Although some of the best ideas come from direct observation, you canalso get ideas by reading other people’s research (vicarious observation) andfrom following up your own research.

The typical way in which observations are turned into experiments isthrough a theory, a statement about the probable relationships among a setof abstract variables. Observations lead to theory through a process calledinduction, in which a general statement is derived from specific instances. Aprediction, called a hypothesis, can then be made from the theory through aprocess called deduction. If an experiment testing this hypothesis confirmsit, the theory is supported, not proved. If the hypothesis is disconfirmed,according to the rules of logic, the theory is disproved through deduction.However, because the statistical tests used to disconfirm the hypothesis areprobabilistic, disproof of the theory is not certain.
A descriptive theory attaches names to events and is most useful when thenames are attached to abstract but definable events. Analogical theoriesexplain how relationships work by drawing an analogy between psychologicalrelationships and a physical model. Quantitative theories specify relationshipsin mathematical terms. Psychology has very few quantitative theories becausewe are still learning how to account for variability and how to develop precisescales of measurement. A good theory accounts for most of the data, is testable, isnot too restrictive, has parsimony, and is able to predict the outcome of future exper-iments, and the best theories help answer ultimate questions (why questions)rather than just proximate questions (what questions).
Skinner held that theories are practically useless because they do not helpaccount for observable events, they lull us into believing that unfinishedresearch is complete, and they cause research to become useless when the the-ory is overthrown. Although most investigators disagree with this positionand believe that theories are useful, theories are not always required to dogood research, particularly during the early stages of research, and forapplied research—which is done to solve a problem—as opposed to basicresearch—which is done to contribute to the scientific body of knowledge.
How to Get an Experimental Idea 67

68
Now that you have an idea for an experiment, you are ready to begin plan-ning it in more detail. First, however, we need to consider the issue of
ethics. As experimenters we could be unethical in at least two ways: We couldmistreat the people or animals whose behavior we are measuring. We couldalso mistreat the body of knowledge that we are trying to establish—in otherwords, treat our science unfairly. In this chapter we discuss treating partici-pants fairly; in the next chapter we discuss treating science fairly.
Society as a whole, and the scientific community in particular, has agreedon a set of rules by which we must do our research. Some of these rules areunwritten, such as the basic rules of courtesy. The assumption is that such rulesare so obvious that everybody understands them. Other rules are written, suchas Ethical Principles of Psychologists and Code of Conduct (American PsychologicalAssociation [APA], 2002) and Ethics in Research with Human Participants (Sales &Folkman, 2000). These rules are continually revised as society’s conception of
4How to Be Fair with Participants
Do unto others as you would have them do unto you.MATTHEW 7:12
Our data show that the social structure of competition andreward is one of the sources of permissive behavior in experimen-tation with human subjects; the relatively unsuccessful scientist,striving for recognition, was most likely to be permissive.
B. BARBER (1976)
Oh, what a tangled web we weave,When first we practice to deceive!
SIR WALTER SCOTT
The human mind has no other means of becoming acquaintedwith the laws of the organic world except by experiments andobservation on living animals.
IVAN P. PAVLOV
From an ethical point of view, we all stand on equal footing—whether we stand on two feet, or four, or none at all.
P. SINGER (1985)
How to Be Fair with Participants 69
the role of experimentation and the rights of an individual change. In the firstpart of this chapter, we consider the relationship between the person doing theexperiment and the one being experimented on, including some basic courte-sies in the relationship. Then we examine how this relationship can affect theoutcome of an experiment. We also explore alternative experimenter–participantrelationships. Finally, we consider the ethics of treating animals fairly.
■ Treating Human Participants FairlyBecause the purpose of doing research in psychology is to understand behav-ior, we will usually be interacting with humans (and in some cases animals).Traditionally, psychologists have referred to the people who provide thebehavior as subjects. The early forefathers and foremothers of psychologyprobably liked this term because it sounded scientific and the subjects of theresearch were humans. Unfortunately, the term also may imply that peopleare subject to the experimenter’s will, or even worse, subjected to it! Back inthe 1930s it was suggested that the term experimentee should be used in placeof subject, but the suggestion never caught on (Rosenzweig, 1970).
This discussion may seem pretty trivial to you: What’s in a word? In thiscase, the word subject reflects the nature of the relationship between this indi-vidual and the experimenter and suggests certain ethical considerations. Sub-jects are passive and react to conditions of an experiment much as chemicalspassively react when combined in the laboratory. For these reasons, in 1994the APA recommended that the accepted terminology be changed, and thosewho were formerly called subjects be called participants. The APA felt that thisterm properly acknowledges the help that our participants give us by partic-ipating in our research and gives them a more equivalent status to the exper-imenter. As you will see in Chapter 13, in writing research reports it is best tocall the participants what they are: students, children, women, and so forth,but the appropriate generic term is participants.
The use of the term participants rather than subjects is not universallyaccepted. For instance the Psychonomic Society allows its authors to ignorethis rule. Roddy Roediger, the former president of the American PsychologicalSociety (now the Association for Psychological Sciences), vehemently opposesthe use of the term participants for subjects and claims to have specialdispensation for his articles submitted to APA journals because of a delicatecondition he describes in a letter to a copyeditor of APA, part of which I quote:
I should point out that I am a member (in fact, the founder) of a group ofSufferers of Participant Phobia (SPP). Because I have had to survive the useof the word participant in many APA journals . . . I am also a member ofParticipant Phobia Syndrome Survivors (PPSS). Use of the word participantsin our journals has caused me mental anguish, has produced undue stress,and has caused me to write this letter and seek help from a support group(other experimental psychologists who think the language change anabomination . . .). (Roediger, 2004)

70 Chapter Four
Obviously, this letter overstates the case with a bit of tongue-in-cheek humor,but it does express a legitimate concern some investigators have about thescience of psychology becoming oversensitive to what they feel are certainpressure groups having political rather than scientific agendas.
In the early history of experimental psychology, nobody worried aboutwhat to call the people who were experimented on because the experimenterand the participant were the same person. In those days, most psychologistsreported their own internal experiences as the dependent variable in theirexperiments. Believing that only time and training made it possible to becomeaware of these internal experiences, experimenters considered themselvestheir own best participants.
Later in the history of psychology, many experimenters came to believe thatverbal reports of internal events were inappropriate data for the science of psy-chology. Arguing that being objective and subjective at the same time is notpossible, these experimenters started a revolution in psychology. Some psychol-ogists, overreacting to the revolution, decided that only animals were appropriatefor psychology experiments. If you think verbal reports of a participant are notappropriate subject matter, then pick one who cannot talk!1 During this era, therat became a prime participant for experimentation. Other investigators felt thatalthough experimenters were too experienced to be experimented on, rats wererather unlike most humans. What was needed was a naive human. The naivehuman chosen was the college student. College students are the participants in70% to 85% of published research (Schultz, 1969; Smart, 1966) and in as much as90% of research conducted by university psychology departments (Jung, 1969).
According to the latestview, a participant is supposedto be a naive, well-motivatedobserver who will react toexperimental manipulations inan uncontaminated way. Yet,as we will see, participants arenot uncontaminated observers.They usually have definiteideas about the experimentthey are serving in, and theyattempt to achieve specificgoals that are often differentfrom the experimenter’s.
Humans (even college students) also have certain legal and moral rights.A physicist can take the block of wood from the inclined-plane experimentand drop it, hammer on it, swear at it, kiss it, or do any number of things withit. Although his colleagues may think he is pretty weird, they would not havehim arrested or throw him out of the profession. Psychologists, however,must preserve their participants’ rights at all times.
1 OK, I am taking a bit of liberty with history here. I will discuss some better reasons for usinganimals in research later in this chapter.
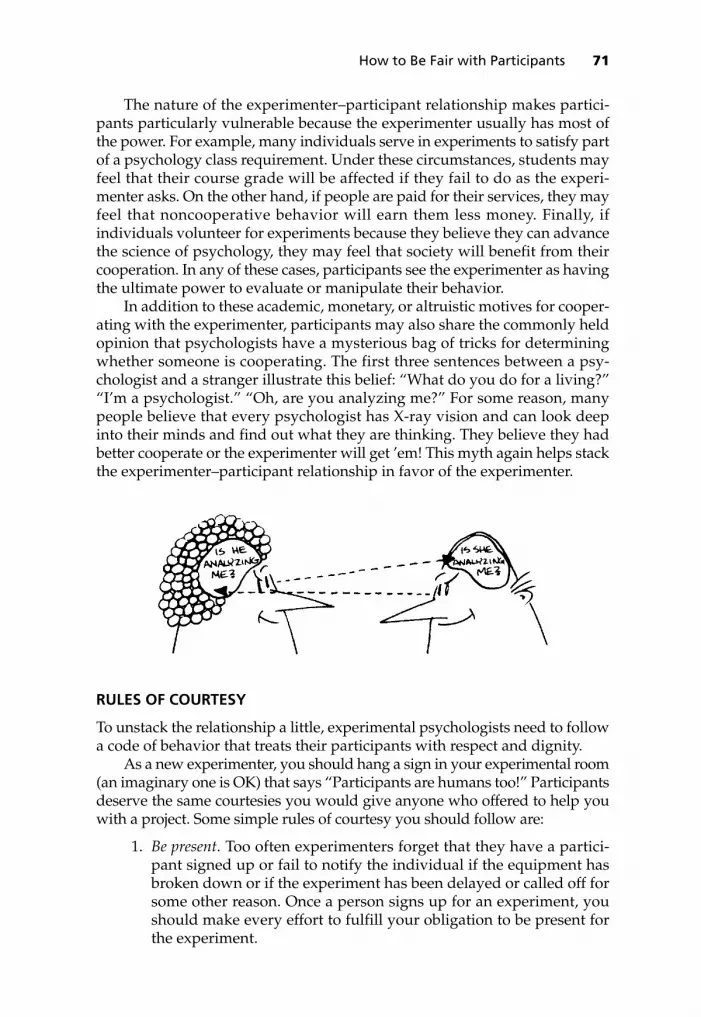
The nature of the experimenter–participant relationship makes partici-pants particularly vulnerable because the experimenter usually has most ofthe power. For example, many individuals serve in experiments to satisfy partof a psychology class requirement. Under these circumstances, students mayfeel that their course grade will be affected if they fail to do as the experi-menter asks. On the other hand, if people are paid for their services, they mayfeel that noncooperative behavior will earn them less money. Finally, ifindividuals volunteer for experiments because they believe they can advancethe science of psychology, they may feel that society will benefit from theircooperation. In any of these cases, participants see the experimenter as havingthe ultimate power to evaluate or manipulate their behavior.
In addition to these academic, monetary, or altruistic motives for cooper-ating with the experimenter, participants may also share the commonly heldopinion that psychologists have a mysterious bag of tricks for determiningwhether someone is cooperating. The first three sentences between a psy-chologist and a stranger illustrate this belief: “What do you do for a living?”“I’m a psychologist.” “Oh, are you analyzing me?” For some reason, manypeople believe that every psychologist has X-ray vision and can look deepinto their minds and find out what they are thinking. They believe they hadbetter cooperate or the experimenter will get ’em! This myth again helps stackthe experimenter–participant relationship in favor of the experimenter.
RULES OF COURTESY
To unstack the relationship a little, experimental psychologists need to followa code of behavior that treats their participants with respect and dignity.
As a new experimenter, you should hang a sign in your experimental room(an imaginary one is OK) that says “Participants are humans too!” Participantsdeserve the same courtesies you would give anyone who offered to help youwith a project. Some simple rules of courtesy you should follow are:
1. Be present. Too often experimenters forget that they have a partici-pant signed up or fail to notify the individual if the equipment hasbroken down or if the experiment has been delayed or called off forsome other reason. Once a person signs up for an experiment, youshould make every effort to fulfill your obligation to be present forthe experiment.
How to Be Fair with Participants 71

72 Chapter Four
2. Be prompt. A participant’s time is valuable too. Don’t waste it.3. Be prepared. You should rehearse all phases of the experiment prior to
meeting any participant. Not only is it discourteous to do otherwise,but also if you stammer over the instructions, tinker with the equip-ment, and generally fumble and mumble your way through theexperiment, participants may become so confused or disgusted thatthey perform poorly.
4. Be polite. Unless the experiment calls for it, ask your participants todo something; don’t order them. Make liberal use of the words“please,” “thank you,” and “you’re welcome.”
5. Be private. Treat all information that a participant gives you within anexperimental context as confidential. Be discreet not only about whatthe individual tells you but also about how he or she performs on theexperimental task. Federally funded grants are specific about whatinformation you may obtain, how you may use that information, andhow you may code and store it. If possible, eliminate participants’names from data sheets, and use a method that will prevent othersfrom discovering the identity of individuals.
6. Be professional. You need not be so sober and stiff that your participantsfeel uncomfortable, but do not be so casual and flippant that you con-vince them that you don’t care much about the experiment. They won’tcare either! Nor is an experiment the proper place to make dates, hus-tle golf partners, sell insurance, or use the experimenter–participantrelationship for any purpose other than research.
These rules seem simple enough, but not all ethical issues concerninghuman participants are so straightforward. More controversial issues, suchas “What constitutes informed consent?” and “Should mental stress be per-mitted?” are discussed at length in Ethical Principles in the Conduct of Researchwith Human Participants (APA, 2002). However, no publication can cover allpossible ethical issues, and many experiments involve “close calls” where anunbiased opinion is required. For these reasons research-oriented institutionshave institutional review boards, often abbreviated as IRBs.2 These IRBs aremade up of experienced researchers and sometimes physicians and othertechnical experts. All research using human participants should be screenedby such a board.3 Typically, the researcher fills out a form that contains a
2 The National Institutes of Health require IRBs for all research funded by them. They publishedthe guideline “Protecting Human Research Subjects: Institutional Review Board Guide” (NIHGuide, Volume 22, Number 29, August 13, 1993) that is designed to assist review board mem-bers, researchers, and institutional administrators in fulfilling their responsibilities. Copies can be obtained from the U.S. Government Printing Office, Superintendent of Documents, P.O. Box 371954, Pittsburgh, PA 15250 (reference GPO Stock No. 017-040-00525-3).3 In some cases, for courses that use a book such as the one you are holding, the instructor canconvince the IRB to let the instructor evaluate classroom experiments for ethical considera-tions. When convincing the IRB, the instructor tends to be conservative about what will beapproved. Although from time to time a course experiment is important enough to publish,the primary purpose of most of the experiments is to train students to do research. In mostcases, the students’ training can be accomplished as well with a low-risk experiment as with ahigh-risk experiment. So if you are planning a classroom experiment in which participants takea handful of drugs and then disclose their kinkiest sexual fantasies to an audience . . . forget it!

number of questions, such as “Will participants be asked to give informedconsent?” and “Will confidentiality of the data be maintained?” This formalso asks the researcher to describe briefly the research being proposed. Themembers of the board pay particular attention to the issue of potential phys-ical or psychological harm to participants. It is unrealistic to expect that therisk of harm can be reduced to zero in any piece of research; a participant maybreak a leg tripping on the carpet. However, the review board’s task is tomake sure that the risk of harm is minimized. And when known risks are anecessary part of the research, the board’s job is to decide whether the bene-fits likely to be derived from the research outweigh these risks.
Such review boards certainly help eliminate or improve many potentiallyunethical investigations. However, IRBs in the biomedical field have them-selves been the subject of research, for it has been found that a significantminority of people who serve on such boards are poor at balancing the risksand benefits of human research (B. Barber, 1976). A large majority of boardmembers surveyed had received no formal training in research ethics.
Some psychologists argue that there is little evidence that IRBs have beeneffective in reducing the risk to human participants (Mueller & Furedy, 2001).Some also feel that IRBs can become so picky that they encroach on intellectualinquiry in the social sciences. Others, such as Tom Puglisi (2001), the formerdirector of the federal government’s office that oversees IRBs, believe that IRBsserve a necessary purpose and that a proper reading of the regulations makesmuch of social and behavioral sciences research exempt from the regulations.In other words, when most psychologists submit their research proposals to anIRB, they should be stating why the research is exempt from regulation ratherthan trying to justify doing the research. Regardless of your opinion about theusefulness of IRBs, you should realize that the ultimate responsibility for doingethical research still lies with you, the experimenter.
INFORMED CONSENT
One of the issues of concern to IRBs and to you is informed consent. Beforethey consent to participate, participants are entitled to be informed about thefactors that might influence this decision. Once they have been so informed,the researcher must document their consent, usually in writing. Althoughinforming participants and obtaining their consent may seem to be prettystraightforward, a number of factors may cloud the issue—for example,documenting that the information given was understandable, ensuring thatparticipants in a subordinate position are not pressured to participate, or, forsome participants, determining whether they are capable of making aninformed decision. Ethical Principles of Psychologists and Code of Conduct (APA,2002) goes into some detail about such issues:
How to Be Fair with Participants 73
Text not available due to copyright restrictions

74 Chapter Four
The “Ethical Principles” also say that there are conditions under whichinformed consent is not required; however, you still usually need to get theapproval of an IRB to ensure that your interpretation is correct:4
8.05 Dispensing With Informed Consent for ResearchPsychologists may dispense with informed consent only
(1) where research would not reasonably be assumed to create distressor harm and involves(a) the study of normal educational practices, curricula, or class-
room management methods conducted in educational settings;
(b) only anonymous questionnaires, naturalistic observations, orarchival research for which disclosure of responses would notplace participants at risk of criminal or civil liability or damagetheir financial standing, employability, or reputation, andconfidentiality is protected; or
(c) the study of factors related to job or organization effective-ness conducted in organizational settings for which there is no risk to participants’ employability, and confidentiality isprotected or
(2) where otherwise permitted by law or federal or institutionalregulations.
Once you are comfortable that you have provided a means for your researchparticipants to give informed consent, you need to consider the nature ofthe experimenter–participant relationship that will be set up in your exper-iment. The nature of this relationship is important because it affects not onlythe participant’s rights but also the experimental outcome. Althoughexperimental psychologists like to pretend that participants in psychologyexperiments are neutral creatures reacting in a sterile, controlled environ-ment, most know that such is not the case. In the next section we considerin more detail how the experimental situation can influence the outcome ofan experiment.
4 IRBs seem to have particular trouble believing that when 1b is true, no harm expected andan anonymous questionnaire, you do not need an informed consent form. I have seen more arguments about this issue at board meetings than any other.
Text not available due to copyright restrictions

DEMAND CHARACTERISTICS
When participants show up for an experiment, they have little idea what theywill be required to do, but they are usually interested in the experiment andwant to know exactly what it is about. Experimenters in turn are often secre-tive about their intention, which prompts the participants to try to determinewhat the experiment is really about from clues the experimenter gives them.The experiment then becomes a problem-solving game.
These clues that influence participants in the experimental situation havebeen called demand characteristics because they demand certain responses(Orne, 1962). While the experimenter provides many such clues, participantsalso bring demand characteristics with them to the experiment. If they havetaken a psychology course, have read about psychology experiments, or haveeven been told about the experiment by a friend, they may bring the follow-ing expectations with them: The experimenter is going to shock me. Theexperimenter is trying to find out how intelligent I am. The experimenter isgoing to trick me into revealing something nasty about myself.
Sometimes these notions are so overpowering that a participant cannotbe swayed from them. A participant in one of my experiments was oncerequired to memorize a set of words presented to him through earphones.Shortly after starting the experiment, he tore off the headset and shouted,“This thing is shocking me!” Thinking he might be right, I carefully measuredfor any current passing through the headset. The headset was well grounded.I tried to continue the experiment, but this fellow still claimed that he wasbeing shocked. He had made up his mind that I was going to shock him andwould not believe otherwise. As a result, his data had to be discarded.
Other demand characteristics come from subtle cues that the participantpicks up during the experiment. To minimize such cues, experimenters attemptto standardize all experimental procedures. An experimenter usually readsinstructions, for example, from a written copy, so that all participants will atleast have the same verbal demand characteristics. In some experiments, how-ever, even the way the experimenter reads the instructions can affect theparticipant’s performance. In one experiment, two sets of tape-recordedinstructions were made by experimenters who were biased toward oppositeexperimental outcomes (Adair & Epstein, 1968). The experimenters foundsignificant differences between the performances of those hearing differenttapes. Although the experimenters read the same instructions, the subtle differ-ences in their voices apparently produced results consistent with their biases.
Even animals seem to be influenced by subtle cues given by the experi-menter. In one of the more famous experiments on experimenter bias, studentexperimenters trained rats to run a maze (Rosenthal & Fode, 1973). Some ofthe experimenters were told that their rats had been specially bred to be bright,fast learners; the others were told that their rats had been bred to be dull, slowlearners. The supposedly bright rats learned to run the maze in fewer trials,even though they were in fact littermates of the supposedly dull rats. Theusual reason given for this result is that the student experimenters must havetreated the rats differently, playing with the “bright” rats more and handling
How to Be Fair with Participants 75

76 Chapter Four
them so that they became less fearful of being manipulated. However, otherinvestigators have claimed that the results might be due to student experi-menters’ cheating with their data (Barber & Silver, 1968). Whatever the reason,experimenter bias was reflected in the outcome of the experiment.
Though my presentation of the concept of demand characteristics makesit sound pretty ominous, it may be less of a problem than I have suggested.Investigators (Weber & Cook, 1972) have reported finding little evidence thatexperimental participants typically try to confirm what they believe is theexperimenter’s hypothesis, which they have deduced from cues in the exper-iment. Instead, these investigators claim that participants try to put their bestfoot forward; that is, they try to appear competent, normal, and likable. Theparticipants’ concern with how they will be judged is far more important thantheir concern about fulfilling the experimenter’s expectancies or confirmingthe hypothesis.
T. X. Barber (1976), in a book dealing with the pitfalls in human research,reports that many experiments claiming to demonstrate demand characteris-tics are themselves seriously weakened by other design flaws. He believesthat much of the research supporting the concept has been poorly done. How-ever, just because the research may be flawed, we cannot necessarily concludethat demand characteristics can be ignored as a potential problem in ourexperiments. Anything that we can do to minimize their potential effectsshould be done to improve our experiments.
Responses of Participants to Demand Characteristics
If participants do detect the demand characteristics in an experiment, howmight they respond?
Cooperative participants. After human participants determine in theirown minds what the demand characteristics of the experiment are, they reactaccording to their attitude toward the experiment (Adair, 1973). Most peopletend to be cooperative and try to fulfill the perceived demands of the experi-menter. Some cooperate to an astounding degree. In one experiment testingcooperativeness, the experimenter gave a participant a stack of 2000 sheets ofpaper and asked him to compute the 224 addition problems on each page.Although this task was obviously impossible, the individual continued to addfor five and one-half hours, at which point the experimenter gave up! In asecond experiment, the experimenter instructed participants to tear up eachsheet into at least 32 pieces after completing the additions. Again, theypersisted in the task for several hours without appearing hostile.
To see how this desire to cooperate might be behind a participant’s responseto demand characteristics, consider the following experiment on group pressure:A person is brought into a room with six other people. The group is given someproblems, asking the group to judge which of two lines is longer. The first fewproblems are easy, and everybody agrees. Then two lines are presented, and ourparticipant is sure that the top line is longer, but everybody else says the

bottom line is longer. After a long pause, the participant finally agrees thatthe bottom line is longer. What happened in this experiment? The experi-menter designed the experiment to find out whether group pressure can causesomeone to make an obviously incorrect response. The other participants inthe room were confederates or stooges trained by the experimenter to lie onthe appropriate trial. Because the real participant gave in to the group pres-sure, the experimenter feels that the hypothesis has been confirmed. But let’sread the mind of our participant5 and see what really happened: “Well, here’sanother pair of lines. The top line is definitely longer. What a dumb experimentthis is! Why waste our time having us do such an obviously easy task? Andwhy are we doing it as a group? The experimenter must be trying to see if wecan influence each other. Sure enough, everybody else is saying the bottom lineis longer. They couldn’t possibly really think that. Let’s see, I could either givein to these shills and agree or hold my ground. I want to do a good job so I canget out of here. Besides, I’m sure that a group of people can get someone tochange his or her mind, so I might as well agree. Besides, the experimenterseems like a nice person and I don’t want to mess up the experiment.”
If our mind reading is correct, our experimenter’s conclusion was wrong.The participant, who is only trying to be cooperative, can cooperate us intodrawing an incorrect conclusion! In fact, by the 1970s it became apparent thatparticipants in conformity studies such as the one just described were oftenhighly suspicious, ranging from 50% to 90% indicating suspiciousness(Glinski, Glinski, & Slatin, 1970). However, the effect of suspiciousness onbehavior appears to be negligible. In other words, there is little differencebetween the behavior of suspicious and naive participants (Kimmel, 1996),and where there are effects, the participants tend toward making themselveslook good rather than reacting negatively toward the experimenter.
Defensive participants. Some participants are less concerned with makingthe experimenter look good than with making themselves look good; let’s callthem defensive participants. These individuals search for demand character-istics in the same way that cooperative participants do, but they use themdifferently. Usually participants trying to perform as well as possible are an assetto an experiment. But, in some experiments, particularly attitude-assessmentexperiments, such persons can cause problems.
Suppose that we are investigating the difference in the way Hispanics andAnglos view gender-role behavior in children. We post one sign-up sheetrequesting volunteers who have Spanish surnames and speak Spanish as a firstlanguage and a second sheet requesting Anglos who meet neither of thesecriteria. Now we show each volunteer pictures of children in traditional genderroles (such as girls playing with dolls) and in nontraditional gender roles (suchas boys playing with dolls). We then ask the participants to rate the acceptabilityof each behavior. Suppose that more Hispanics than Anglos report that they findthe nontraditional behaviors acceptable. We might conclude that Hispanics are
How to Be Fair with Participants 77
5 See, psychologists do have mystical powers.
78 Chapter Four
more liberal than Anglos. On the other hand, another interpretation is possible.The members of each group are aware that they were selected on the basis ofethnic origin. Suppose that the Hispanics were more concerned with upholdingthe pride of their ethnic group than the Anglos were. In this case, they mighthave bent over backward to keep from looking like socially unacceptablechauvinists. In other words, they appropriately perceived the demand charac-teristics of the experiment and attempted to defend their ethnic group.
In an actual experiment that demonstrated the defensive participant’s reac-tion to demand characteristics, experimenters asked participants to tap a keywith their right and then their left index finger (Rosenberg, 1969). Tapping ratesare usually faster for the preferred finger, but one group was told that graduatestudents at Yale and Michigan had been found to tap the key at similar rateswith each finger. A second group was not given this information. The differencebetween tapping rates for the two fingers was significantly smaller for the firstgroup. Again the participants perceived the not-so-subtle demand characteristicsof the experiment and tried to make themselves look as good as possible.
Noncooperative participants. Some participants are neither cooperativenor defensive but downright noncooperative! The result of such behavior hasbeen picturesquely called the “screw-you-effect” (Masling, 1966). The nonco-operative individual attempts to determine the demand characteristics of anexperiment and then behave in such a way as to contradict the experimenter’shypothesis. Such people act out of any number of motives. They may be par-ticipating to fulfill a course requirement and resent being coerced. Or theymay be opposed to the whole idea of studying human behavior scientifically.Or perhaps they simply do not like the experimenter. Whatever the reason,such individuals can be a real nuisance in an experiment. One way to elimi-nate noncooperative participants is to set some minimal standard of perfor-mance so that you may exclude any participant’s data that fall below thisstandard. You should determine this standard before the experiment and noteit when the experiment is reported.
Even this procedure will not eliminate the data of all noncooperativeparticipants, however. Sometimes the best we can do is attempt to give theparticipants a positive impression of our experiment and hope that they willbe cooperative.
How to Minimize Demand Characteristics
Although we cannot completely eliminate demand characteristics from anexperiment, every attempt should be made to minimize those demandcharacteristics that might become confounding variables by differentiallyaffecting the levels of the independent variable. It is important to knowwhether a change in behavior is due to the experimenter’s manipulation ofthe independent variable or to the participant’s perceived demand charac-teristics. Confounding caused by demand characteristics can be minimizedin several ways.

Automation. Demand characteristics can be controlled by automating asmuch of the experiment as possible. We have already discussed the use oftape-recorded instructions as one type of automation. Experimenters are oftenpoor at reading instructions anyway, particularly after reading them aloud20 or 120 times. You can also ask a person who is unaware of the expectedoutcome of the experiment to record the instructions if you want to minimizeexperimenter bias caused by voice inflections.
I have also used videotaped instructions in some of my own experimentsor used computer presentations containing both audio and video. In this caseif experimental trials involve complicated sequences of events, sample trialscan be presented at a slow enough rate for participants to follow, therebyeliminating the need for the experimenter to go back and explain earlierportions of the instructions.
In some laboratories, computers are used to play all or part of the experi-menter’s role in an experiment. Some investigators program the computer sothat the participants never see a human experimenter. The participant showsup at the appointed time. A sign instructs the individual to be seated at the com-puter terminal and to press a button. The computer then displays the instruc-tions. The individual indicates his or her understanding of the instructions, andthe experiment proceeds. The general idea behind this approach is that ifparticipants are not the passive automatons we once thought they were, we canturn experimenters into automatons instead. However, some researchers objectto this procedure on the grounds that the artificiality of the situation not onlycauses participants to feel dehumanized but also decreases the generalizabilityof the results. This procedure also requires that participants be able to read andunderstand the instructions, which makes it unsuitable for some participants,such as children and rats (and college sophomores?).
Blind and double blind. A second way of minimizing demand character-istics transmitted by the experimenter is to keep the experimenter fromknowing the level of the independent variable being presented. Typically,participants are unaware of the level being presented to them. For this reasonsuch experiments are usually called blind experiments. However, it is some-times important that neither the participant nor the experimenter be awareof the manipulations in an experiment. For example, I once did an experi-ment to determine whether it was possible to “feel” colors with the fingers.Participants were blindfolded and given three cards, two red and one blue.On each trial they were required to put the two cards that were alike in onestack and the one that was different in another. I was concerned that I mightunintentionally signal them when they were correct by changing my breath-ing rate, coughing, or grunting when they had the cards correctly arranged.Some of my ESP-believing friends even suggested that I might be sendingESP messages when they were correct! To avoid such signaling, I sat behinda screen so that I could not observe the participants. I was thus “blind” to thecolor they were feeling. In fact, this procedure is sometimes called doubleblind, because neither the participant nor the experimenter is aware of
How to Be Fair with Participants 79

80 Chapter Four
which level of the independent variable the participant is exposed to.6
Psychopharmacologists, who investigate the effects of drugs on behavior,often do research using a double-blind design. Suppose that you, aresearcher, want to know whether a drug called Crowzac, which has justbeen developed, cures people of being depressed whenever they saw crows.You realize that there may be a problem if you just give the drug to onegroup of patients and then try to determine whether their depression hasbeen relieved. The depression might get better solely because of the patients’expectation that the drug will help them. It is also possible that if you areevaluating the patients’ depression, you will see a phantom improvementbecause you expect it. To protect against the effects of patient or experi-menter expectations, you could use a second, no drug level of the indepen-dent variable with another group—a control group. You would have to treatthis control group in exactly the same way you treat the drug group exceptfor actually giving them the drug. You would probably decide to give thecontrol group placebos in place of the drug.
Giving a placebo involves administering a nonactive substance in thesame manner that the active drug is administered. If the drug is taken in pillform, the placebo might be just a sugar pill, or if it is an injection, a saline solu-tion might be the placebo. Even in research on marijuana, placebo cigaretteshave been produced that taste like marijuana but do not contain the activeingredient. The purpose of the placebo is to produce a double-blind design;both the experimenter and the participants are blind to whether any individ-ual is receiving the drug or the placebo.
Sometimes it is difficult or impossible to keep participants and the exper-imenter from knowing the level of the independent variable to which partici-pants are being exposed. If you were an investigator interested in how lightingconditions in an assembly plant affect worker productivity, you might keepone group of workers under existing conditions and put a second group under
6 One of my reviewers points out that this procedure then made me double color blind!

increased illumination. Now, the workers are obviously aware of the lightingconditions as soon as they step into the room, and nothing you do would pre-vent that. I use this example because this was the initial experiment done inthe 1920s from which the term Hawthorne effect came. Hawthorne was thename of the Western Electric Company plant where the experiment was done.The reported outcome was that productivity increased by the same amountfor both groups regardless of the lighting conditions. The Hawthorne effect,then, refers to a change in behavior that is due simply to the experimenter’spaying attention to the participants rather than to the effects of the indepen-dent variable. The overall finding from this research was that over a 5-yearperiod as changes were made in working conditions such as lighting, restpauses, and number of hours worked, productivity kept increasing regardlessof which condition the workers were under (Roethlisberger, 1977).
The original interpretation of this finding was that the workers’ moralekept improving as continuing attention was paid to them during each changein conditions. However, Mac Parsons (1974) reviewed the original research anddiscovered that over the course of the experiment the workers were givenincreased access to feedback about their daily productivity. This feedback, com-bined with changing the way they were paid, could have led to the increasedproductivity. His claim was that the workers had simply increased their outputas a function of increasing reinforcement. So the Hawthorne effect as it is typi-cally interpreted may not have actually caused the results observed at theHawthorne plant. Nevertheless, it is certainly possible for an experimentalmanipulation to cause a change in behavior independent of what that manip-ulation was. So as an experimenter you must attempt to minimize these effectsand the effects of participants’ knowing to which level of the independent vari-able they are exposed. If these effects cannot be completely eliminated, at leastyou should be alert to the possible confounding they might cause.
Multiple experimenters. A third way to deal with experimenter-causeddemand characteristics is to use multiple experimenters. In this case you do notcontrol the experimenter variable but allow it to vary by using random assign-ment of the available experimenters to the various levels of the independent vari-able. Such a procedure increases the generality of your result and decreases thechances that a single, blatantly biased experimenter will influence the outcome.
Are Demand Characteristics a Problem in Your Experiment?
Even when you have attempted to minimize demand characteristics, they cancreep into your experiment. Here are some procedures for detecting them.
Postexperiment questioning. For a number of years after the revolutionagainst subjective verbal reports, experimenters seldom questioned partic-ipants about their impressions after the experiment. Fortunately, manyexperimenters now routinely seek this information. Such information canbe valuable not only for uncovering demand characteristics but also forsuggesting new hypotheses that can later be tested in a formal experiment.
How to Be Fair with Participants 81

82 Chapter Four
Postexperiment questioning can take many forms, from the experimenter’sasking an offhand question to a well-structured written questionnaire. If youwant to be sure of uncovering demand characteristics, you should plan yourquestions ahead of time.
In planning your questions, make sure that they do not have demandcharacteristics built into them. For example, in the group-pressure experimentdiscussed earlier, a biased question would be “You weren’t aware that theother participants weren’t real participants, were you?” The question itselfdemands that the respondent say no. If respondents say yes, they are admit-ting that they were not the naive, cooperative people they had agreed to be.They also put themselves in the position of telling the experimenter that theexperiment was a waste of time because their data cannot be used.
You should also plan your questions so that they go from general,open-ended questions to specific, probing questions. For example, in oneexperiment designed to determine whether humans could be conditionedwithout being aware of it, participants were asked to talk about any topicthey wished and to continue until asked to stop (Krasner, 1958). Wheneverthey said a plural noun, the experimenter nodded, said “Good” or“Uh-huh,” and was generally reinforcing. As participants continued to talk,they used plural nouns more frequently. As evidence that the participantswere unaware of the conditioning, the experimenters asked the postexper-iment question “Did you notice that the experimenter was doing anythingpeculiar as you talked?” Most reported that they had not. Other investiga-tors, not convinced by this experiment, did a similar experiment butfollowed the original question with progressively more specific questions,such as “Did you notice that the experimenter would respond when yousaid certain words?” Although the participants had trouble verbalizing it,most of them were aware that “the experimenter was happier when Italked about certain things, like listing parts to cars.” Those who men-tioned this awareness were the same ones who had shown the effect of con-ditioning. Thus, to determine whether participants are influenced bydemand characteristics, we should ask questions related to specificdemand characteristics and more general questions.
Nonexperiments. Another way to determine whether demand charac-teristics could have affected the experimental outcome is to compare anonexperiment control group with an experimental group (Adair, 1973). Thenonexperiment control group is not exposed to manipulation of the inde-pendent variable at all. Members are simply told about the experiment, giventhe instructions, shown any apparatus, and then asked to describe how theythink they would perform if put into that situation. If their prediction issimilar to the outcome of the experimental group, they may have been ableto detect demand characteristics. These characteristics, rather than the inde-pendent variable, could have caused the outcome of the experiment. If theirprediction is different from the experimental outcome, demand characteris-tics probably did not cause the observed behavior.
For example, Mitchell and Richman (1980) were suspicious of a findingthat supported a “quasi-pictorial” memory representation of mental images.In a typical experiment, participants are asked to memorize a visual stimulus,generate a mental image of it, and then “scan” from one point on the image toanother. The usual finding is that there is a direct linear relationship betweenscan time and physical distance on the stimulus. Mitchell and Richmanthought that demand characteristics were possible with this procedure, so theyconducted a nonexperiment in which participants were simply asked topredict their scan times. These individuals produced scatterplots that wereindistinguishable from those found in the previous experimental work. Theresearchers could not rule out the possibility that the original findings couldalso have been caused by demand characteristics.
Simulation control groups. Although asking participants who have not beenin the actual experiment how they would have behaved may give you someidea of demand characteristics, it really doesn’t tell you how they would actu-ally behave and may mislead you. For example, for a long time people havebeen curious about whether folks who are hypnotized can be made to performantisocial acts or to injure themselves. In 1939, Rowland reported an experi-ment in which hypnotized participants were told that a large diamondbackrattlesnake was a rope and were asked to pick it up. One of the two partici-pants immediately attempted to do this, striking his hand on the invisible glassseparating him from the poisonous snake. However, 41 of 42 nonhypnotizedcontrol participants refused when asked to do the same thing. The originalfinding was again replicated in 1952 by Young (as cited by Kihlstrom, 1995);seven of eight hypnotized participants tried to pick up the snake, which wasbehind an invisible glass, and were also willing to throw a glass of nitric acidat a research assistant, who was also behind glass. Do these results indicatethat hypnotized people are willing to carry out antisocial and harmful actions?
In 1965, Orne and Evans devised a new procedure, the simulation controlgroup, to investigate this topic. A simulation control group is exposed to theexperimental situation but without a critical manipulation of the independentvariable. In this case, an experimental group of highly hypnotizable participantswas hypnotized and asked to pick up a snake called an Australian two-step,because that is as far as you get after it bites you! All participants complied, andthey were also willing to remove a coin from a beaker of nitric acid and eventhrow the acid at one of the experimenters, again protected behind glass.However, both a group of participants not susceptible to hypnosis but asked tosimulate being hypnotized and a group of nonhypnotized participants also com-plied without exception. Were these folks really so insensitive that they werewilling to hurt themselves and the experimenter? Of course not. When inter-viewed after the experiment they said they felt perfectly safe in the experiment.They knew that the experimenter would not allow them to be harmed; safetywas one of the demand characteristics of the experiment and they knew it.The simulation control group in this case was needed to fully understand howthe demand characteristics rather than hypnosis might have dictated behavior.
How to Be Fair with Participants 83

84 Chapter Four
ALTERNATIVE EXPERIMENTER–PARTICIPANT RELATIONSHIPS
In the beginning of this chapter was the naive participant. And the naiveparticipant was pleasing in the sight of the experimenter. But not all naive par-ticipants are good; most are not even naive. So far we have been consideringways of keeping participants as naive as possible, or at least discoveringwhen they cannot be considered naive. We have another alternative, however.We can give in to the fact that participants are not naive and make use of theirproblem-solving ability.
Deception and Role Playing
One way to use this problem-solving ability, is to give participants false cuesso that their interpretation of the demand characteristics is incorrect. This pro-cedure of deception, defined as concealing or camouflaging the real purposeof an experiment, is a controversial topic in psychology, for both moral andpractical reasons.
Deception is widely used in psychology, particularly in some areas ofsocial psychology. Indeed, some areas of social psychology could not be inves-tigated experimentally without deception. For example, suppose that you areinterested in determining the conditions that cause bystanders to give aid tosomeone who is apparently in trouble. It would obviously be quite inefficientto stand around on a street corner until someone is actually in trouble. Insteadyou would probably contrive a situation in which a confederate7 fakes being introuble and you then observe bystander behavior. Of course, then you havedeceived the bystander, but how could you do the experiment otherwise?Deception runs the gamut from the famous and notorious experiment byStanley Milgram (1963), who deceived participants into believing they wereadministering dangerous and perhaps fatal electrical shocks to other partici-pants, to fairly innocuous experiments in cognitive psychology. For example,in an experiment on incidental learning, the participants may be asked to lookat a list of words and rate them on some dimension such as emotionality. Thenat the end of the experiment they are given a memory test and asked to recallthe words from the original list. In some respects they have been deceivedbecause they were never informed that they should memorize the words. Butit would have been impossible to study incidental learning if they had beeninformed; the learning would have been purposeful, not incidental.
Whether the use of deception is increasing or decreasing is debatable.As shown by several surveys, it certainly did increase in the 1970s and intothe 1980s (Gross & Flemming, 1982). However, more recent surveys indicatethat its use has leveled off or even declined (Nicks, Korn, & Mainieri, 1997).It certainly appears to be the case that the kind of deception used has changedin that there are now few studies that blatantly mislead participants and morethat simply withhold relevant information.
7 No, not a rebel soldier! In psychology this is what we call people who are trained to help theexperimenter by acting in a prescribed way during an experiment.

The argument for using deception goes something like this: Although it isgenerally wrong to lie, we are justified in temporarily misleading participantsbecause we are contributing to the advancement of science. And as we havediscussed, in some areas of psychology it would be impossible to answermany of the most important questions without using deception. Besides, wedebrief our participants after the experiment is over and are perfectly honestat that point, thereby wiping out most of the effects of the deception.
The argument against the use of deception goes something like this: You canuse a term like “misleading” if you wish, but it is just a nice way of saying“lying.” There is enough dishonesty in the world without being dishonest in thename of science. How many of these “scientifically justifiable” experiments havecaused great leaps in science? Not many! We can devise alternative ways ofdoing many of the experiments anyway, such as having participants role-play. Itis naive to think that debriefing participants at the end of the experiment wipesout all effects of the deception. As a practical matter there are two additionalproblems: deception increases future participants’ suspiciousness and reducestrust in psychologists, giving the profession a bad name. Deception in psychol-ogy is not worth the costs and should be eliminated (Ortmann & Hertwig, 1997).
Research on these first two points has been done (Kimmel, 1996), and itsuggests that the effects of participant suspiciousness on research performanceare negligible. In addition, this research indicates that deceived participantsdo not become resentful about having been fooled by researchers and decep-tion does not negatively influence their perceptions about psychology or theirattitudes about science in general. For example, Christensen (1988) reviewedstudies that assessed research participants’ reactions to deception experimentsand found that people who participated in deception experiments report thatthey did not mind being deceived, enjoyed the experience more (than thoseparticipating in nondeception experiments), received more educational bene-fit from it, and did not perceive that their privacy was invaded. In addition,surveys have consistently shown that most individuals in the general popula-tion do not have serious objections to deception used in research.
Role playing has been suggested as an alternative procedure to deception.Is it equally effective? Some experimenters have tried to use both deceptionand role playing under the same conditions and then compared the results.In role playing the experimenter asks participants to imagine that they are in aparticular situation and to respond as they think they would in a similar real-world situation. If you are interested in bargaining behavior, for example, youmight ask one individual to imagine that he is a labor leader, another topretend that she is the president of a company, and a third to act like an arbi-trator. You then proceed under the assumption that their responses in someway resemble those of people in the same real-world situation.
Unfortunately, although some experiments do report equivalent resultsfrom deception and role playing (Greenberg, 1967), many others do not(Orne, 1970). It is also difficult to specify the conditions under which similarresults can be expected from the two methods. In many respects role playingexperiments are much like the simulation control mentioned in the previous
How to Be Fair with Participants 85

86 Chapter Four
section. Perhaps role playing simply reflects the demand characteristics of theexperiment, rather than allowing us to predict what behavior would occur ina real-world situation.
The American Psychological Association says the following about decep-tion in its Ethical Principles of Psychologists and Code of Conduct (APA, 2002):
As fledgling psychologists you should take these rules seriously, and if youare considering the use of deception in one of your experiments, you shouldcarefully weigh its costs and benefits.
Naturalistic Observation
I already mentioned this final alternative to the standard experimenter–participant relationship in Chapter 1. Naturalistic observation depends on theexperimenter’s being an unobtrusive observer. Rather than having partici-pants pretend to be in a bargaining role, for example, the experimenter mightgo to an actual bargaining situation and observe behavior. We have alreadydiscussed the problems associated with this method. Experimenters usuallyhave little control over the variables in the situation. They often have to waitfor them to occur naturally, and even then they cannot control potential con-founding variables or draw causal conclusions from the correlational data.
In this section we have examined the problems of treating participants asnaive, uncontaminated observers. At the least, we should be aware of theproblem-solving nature of participants and design our experiments so thatthe effects of their attempts to solve problems can be evaluated. Where pos-sible, these attempts should work for us rather than against us.
I will give the APA the final word (paraphrased) on the investigator’sresponsibilities for treatment of human participants. Here are the principlesthe investigator would do well to follow (APA, 2002):
1. Evaluate the ethical acceptability of the experiment.2. Determine whether participants are at risk.3. Retain responsibility for ethical procedures.4. Disclose risks to participants and obtain informed consent.5. Determine whether deception is justified and necessary.
Text not available due to copyright restrictions

6. Respect the freedom of participants to decline participation.7. Protect participants from discomfort, harm, and danger.8. Give postexperimental debriefings.9. Remove any undesirable consequences of participation.
10. Keep individual research information confidential.
If you follow these basic principles and, when in doubt, seek the adviceof experienced investigators, you will probably never have problems with theethics of human participants. Perhaps the best advice concerns your attitude.The participants are doing us a favor. Without their willingness to participate,the science of human behavior comes to an abrupt halt. Treat your humanparticipants with the proper appreciation.
■ Treating Animals FairlyWhen I ask my introductory psychology students to picture an experimentalpsychologist, most of them come up with an eggheaded, nerdy guy in a whitelab coat running rats in a maze. This picture is a bit deceptive, not onlybecause not all experimental psychologists are eggheaded, or nerdy, or guys,but because only about 7% or 8% of psychology studies involve animals. It istrue that among the experiments using animals, 90% use rats, mice, and birds;very few use dogs, cats, or nonhuman primates. A recent survey indicatedthat among undergraduate psychology programs 62% of experimenters useanimals for teaching purposes (Cunningham, personal communication,August 24, 2001). The most common types of live animals used were rats(81%), birds (27%), mice (19%), and fish (13%).
WHY PSYCHOLOGISTS DO RESEARCH ON ANIMALS
Although the use of animals in psychological research is infrequent, why isit done at all? Why not always use humans?
Continuity of Behaviors
As scientists, we take an evolutionary perspective and assume a continuity inthe animal kingdom not only of biology but also of behavior. Although primatesdo not behave just like humans and rats even less so, human nervous systemsare built from the same building blocks, and there are commonalities. Becausecertain behavioral abilities occurred early in evolutionary history, many of themost basic human behavior patterns are also present in the nonhuman animals.Thus, animal research is based on the assumption that we can investigate cer-tain universal basic behaviors using lower-order animals. We know that duringevolution animals kept basic behaviors but also acquired more complex behav-iors that tended to override the basic behavior patterns. Thus, if we are inter-ested in studying basic behaviors, such as simple learning or motivation, it maybe not only possible but also preferable to use animals that display the basicbehaviors unconfounded by the more sophisticated patterns of behavior shown
How to Be Fair with Participants 87

88 Chapter Four
by higher-order animals. However, we must be careful when we attempt togeneralize the behavior of a lower-order animal to humans. Humans are obvi-ously much more complex than rats, and no reputable investigator suggests thatrat behavior is exactly the same as human behavior. Although some lessreputable interpreters of animal research have been known to overgeneralizefindings out of ignorance or simplemindedness, such occasional misuses ofanimal data do not invalidate the original premise behind using animals.
Control
In addition to theoretical reasons for using animals in research, there are anumber of practical reasons. For one thing, animals are available nearly allthe time. For some reason, college students insist on taking weekends andholidays off. Animals can also be used for experiments that take place over along period. It is also possible and legal to control the conditions under whichanimals exist, both in and out of the experiment. Thus, animal experimenterscan investigate such interesting variables as overcrowding, sensory depriva-tion, wake–sleep cycles, and environmental stressors.
We can control both the heredity and the environment of animals, a taskmade easier by the fast reproduction and multiple births common to loweranimals. In human research, heredity is seldom a controlled or constrainedvariable, whereas in animal research, it often is. It is not true that “anythinggoes” with animals, however. We will consider animal ethics shortly.
Uniqueness
Some animals also have unique characteristics that make them more appropri-ate for certain types of research. For example, fruit flies not only reproducequickly but also have large, simple chromosomes. Squid have much largernerve cells than humans and so lend themselves to investigation of nervous-system structure. Similarly, many animals have a larger portion of the centralnervous system devoted to the sense of smell or the sense of balance than wedo. In such cases, humans are simply not the best participants for research.
Irreversible Effects
Finally, lower animals are often used when the research could have irreversibleeffects on the structure or function of the animal. Ablation research can bedone only with animals because it requires that a portion of the nervous sys-tem be purposely destroyed to observe behavioral consequences. Similarly,humans cannot be used in experiments requiring that electrodes be implantedinto the central nervous system. In many cases this type of research alsorequires that the animal be destroyed and a histology8 performed to locatethe specific structural changes.
8 Histology usually involves examining the tissue of the nervous system to see what has beendestroyed or where the electrodes were placed. The brain is stained and sliced into very thinpieces for microscopic examination.

How to Be Fair with Participants 89
Manipulations such as keeping animals socially isolated can also cause irre-versible effects. One famous example of this procedure was the work in whichinfant monkeys were separated from their mothers shortly after birth and thenpresented with various artificial mothers to determine what the important moth-ering dimensions were (Harlow, 1958). People frown on using human babies forsuch research, and some people likewise frown on using animal babies.
ANIMAL ETHICS
The relationship between humans and animals has been defined in differentways by different cultures throughout history. In the Christian tradition humanshave dominion over animals, and animals have been put on earth for the expressuse of humans. In the Western world this relationship was widely accepted untilthe time of Charles Darwin, the father of evolution. Darwin’s proposition thatthere was a continuity within the animal kingdom was a double-edged sword.On one hand, animals became an important subject matter for the scientific com-munity because of this continuity. On the other hand, this continuity removedthe human from holding a unique place, superior to that of all other animals.Perhaps, then, it is not surprising that about this time, toward the end of the1800s, the first animal rights groups, the antivivisectionists, began having anotable effect on people’s opinions, particularly in England (see Dewsbury,1990). By the turn of the century and for several decades thereafter, the anti-vivisectionists were quite active not only in Europe but also in the United States.They had many run-ins (verbal in nature at that time) with notable psycholo-gists such as William James, Ivan Pavlov, Walter Cannon, and John Watson.
The animal rights movement then waned until it was spurred on by thecivil rights movement and the publication of the book Animal Liberation byPeter Singer (1976). You are probably aware of the modern animal rightsmovement. There are now approximately 7000 animal protection groups inthe United States alone (Justice Department, 1993). The largest of these orga-nizations is People for the Ethical Treatment of Animals (PETA), with approx-imately 350,000 members, a staff of 70, and a budget of $7 million (Meyers,1990). An aspect of the modern movement that was not present with the
90 Chapter Four
antivivisectionists is terrorism. The most militant group is the Animal Liber-ation Front (ALF), an underground organization that has taken credit for 60%of the terrorism on research laboratories and researchers and has beendeemed a terrorist organization by the FBI. Although PETA denies any officialconnection with ALF, it has agreed to publicize ALF’s actions because itbelieves that breaking into a facility is the way to expose the alleged abusivetreatment of animals.
There are those who believe that public interest in animal rights has peaked(Herzog, 1995). The number of articles referenced in a periodical review peakedat about 60 in 1990 but decreased to about 25 by 1994. However, terrorist actscontinue. In 1997 a prize-winning researcher on drug abuse at a major univer-sity was picketed by a student organization, and later several members of thatorganization and an individual wearing a black mask and identifying himselfas an ALF member showed up at her house, harassed the researcher and herfamily, and threatened to burn down her home (APA, 1997). It has beenreported that there have been a total of 313 acts of terrorism by animal-rightsgroups, peaking in 1987–88 and declining somewhat since then (Burd, 1993).These incidents and threats of harassment have cost research institutions mil-lions of dollars and have increasingly involved threats on researchers’ lives(Mangan, 1990). What is going on here? What is the source of this controversy?
Part of the problem is that the most extreme activists believe that therights of animals are the same as the rights of humans and that, therefore, allanimal research should be banned. For example, one advocate says, “Today,animals are by far the most oppressed section of the community: theirexploitation is as great an evil as were Black slavery, child labor and thedegradation of women at the beginning of the last century. It is the greatmoral blind spot of our age” (Ryder, 1979, p. 14). These animal research abo-litionists include the cofounder of PETA, who says she is “working for theday when there will be no animals in cages” (Havemann, 1989). Is this whatthe general public, psychologists, and students of psychology think?
Unfortunately, there has been no survey of the general public’s attitudetoward animal use in psychology. In the medical field there is some evidenceof a decline in public support. Respondents who were asked if they agreedwith the statement “Scientists should be allowed to do research that causespain and injury to animals like dogs and chimpanzees if it produces newinformation about human health problems” fell from 63% in 1985 to 53% in1993 (Pifer, Shimizu, & Pifer, 1994, as cited in Plous, 1996a). Negative opinionis even stronger in Great Britain. On the positive side, however, a poll found88% approval for the use of rats in medical experiments, compared with 55%for dogs (Associated Press, 1985). And several polls have shown that morethan three-quarters of the public believe “the use of animals in medicalresearch is necessary for progress in medicine” (American Medical Associa-tion, 1989, as cited in Plous, 1996a).
To find out what psychologists and psychology students think about ani-mals in psychology experiments, Plous (1996a, 1996b) conducted two excellentsurveys, one using 3982 psychologists and another using 1188 psychology

majors. Perhaps surprisingly, about the same proportion of psychologists andstudents agreed on most issues. When asked their level of support for the useof animals in psychological research, about 80% of psychologists and 72% ofpsychology majors indicated that they either strongly supported it or sup-ported it. And, of those giving an opinion, 84% of psychologists and 81% of themajors believed that the use of animals in psychological research is necessaryfor progress in psychology. However, the fact that surprised me was that 47%of the psychologists and 44% of the majors indicated they were not surewhether animals used in psychological research were treated humanely. Let’slook at the rules regarding treatment.
For many years the U.S. Agriculture Department has been monitoring thefederal-level regulations governing the treatment of most research animals,excluding rats, mice, and birds. Under pressure from the animal-rights groups,amendments were made in 1985 to the Animal Welfare Act—the legislationthat regulates the care of dogs, cats, and nonhuman primates. After manyhearings a set of rules was passed in 1991 and complying with these rules costinstitutions an estimated $537 million (Jaschik, 1991). The rules focus on issuesincluding exercise for dogs, the establishment of institutional animal-researchcommittees, and special care for young animals. Primates in particular areentitled to care that ensures their psychological and physical well-being.9
The 2002 Farm Bill passed by Congress ended a long-standing debateabout whether the laboratory use of rodents and birds should be regulatedby the U.S. Department of Agriculture by ruling that they should not. Con-gress felt that rats, mice, and birds, which are used in about 95% of nonhu-man animal research, were adequately covered by the National Institutes ofHealth, the Association for Assessment and Accreditation of LaboratoryAnimal Care, and local institutional animal care and use committees. All insti-tutions supported by federal funds that do research using animals arerequired to have an animal research committee composed of experts includ-ing a veterinarian and a member from the public. This committee mustapprove all proposed research that uses animals and must ensure that theresearch is done by following the rules that we have already discussed.
I have gone into some detail about this topic to convince you that manypeople, including psychologists, are concerned about the animal-rights issue andare keeping a close watch on it. Because psychologists do use animals forresearch, the American Psychological Association has not been silent on the issue.Ethical Principles of Psychologists and Code of Conduct includes a section on animalresearch, which is given in the following text. There is an extensive statement onanimal ethics on the APA Web site, http://www.apa.org/science/anguide.html
How to Be Fair with Participants 91
9 Ironically, one of the researchers most vilified by the animal-rights radicals, Harry Harlow,did much of the research that forms the basis for these regulations.
Text not available due to copyright restrictions

92 Chapter Four
Why are psychologists so concerned that their right to do research on ani-mals might be taken away? Aside from the fact that most of the psychologistswho work with animals enjoy doing so and consider themselves animal lovers,they also cite the many advances they have made with this type of research thathave improved human welfare (Miller, 1985), and animal welfare as well. Cer-tainly on the medical front, animal research can be cited as having led to thevirtual elimination of polio, rabies, cholera, and diphtheria, as well as the devel-opment of insulin treatment and cataract surgery and the curing of many casesof lymphatic leukemia in children. In psychology, animal research has led tosignificant advances in the treatment of mental disorders, pain control, drugabuse, and recovery from strokes. The highly successful behavior therapies arelargely founded on animal research of 50 years ago. In some cases, particularlywith basic research, it is often difficult to anticipate the exact nature of futurebenefits. Nevertheless, most researchers feel that the costs in terms of possibleanimal suffering are more than offset by the potential benefits.
Even most animal advocates occupy a middle ground between the twoextreme positions and are willing to approach the issue from an informed andreasonable perspective. Most of them certainly condemn the extremists whoterrorize researchers. If you wish to read more on this topic, the APA has pub-lished an expanded set of guidelines: Guidelines for Ethical Conduct in the Careand Use of Animals (1986). Boyce (1989) has a balanced treatment in the Journalof the American Veterinary Medical Association, and Segal (1982) does a good jobof weighing the needs of science against the needs of life. Carroll and Over-mier (2001) have also edited a book Animal Research and Human Health: Advanc-ing Human Welfare Through Behavioral Science that has a thorough discussion ofthese issues. Finally, Dennis Feeney (1987), a psychologist at the University ofNew Mexico with paraplegia, makes a strong case for animal research in anarticle in American Psychologist. He argues that the discussion of animal rights
Text not available due to copyright restrictions

versus human rights has involved individuals from the fields of science andagriculture, and animal-welfare organizations but has virtually ignored thosewho are disabled. He points to basic behavioral research in biofeedback andstroke recovery that has led to unanticipated therapeutic advances.
The following passage captures the essence of his position:
Those of us who have an incurable disease or have permanently cripplinginjuries can only hope for a cure through research. Much of this experimen-tal work will require the use of animals, and accordingly, we must find somecompromise that defends both human rights and animal welfare. In thedetermination of a compromise between the reduction of human sufferingand the violation of animals’ welfare, which at times includes causing pain ordiscomfort, I unequivocally choose to reduce human suffering. (p. 593)
In the end, you will have to decide for yourself about the ethics of usinganimals in research. In making your decision, you will have to go back to thevery foundations of your beliefs about the relationship between humans andanimals. If you are like most people, you will find it difficult to reach anentirely consistent position: Do you eat hamburgers? Would you agree tohave your dog or other pet in a medical experiment? Would you condonethe sacrifice of 100 dogs to find a cure that would save the life of your child?Do you buy ant and roach spray? Are you willing to adopt all the cats at thelocal animal shelter? From your answers to these questions, can you deter-mine where you stand and come up with a consistent philosophy?
The issue is not clear-cut. Like most of us, you may simply have to weigheach case and try to determine whether the benefits exceed the costs. Somepsychological experiments, by their very nature, will subject animals to stressand pain. In such situations, you should be convinced that the potential sci-entific gains are worth the costs before starting your research, and you shouldbe able to defend your decision. Although institutions do have committeescomposed of experts to screen animal research, you should consider thesecommittees as imposing only minimum standards. You must satisfy whatshould be a more stringent standard of ethics—your own.
■ SummaryThe ethical and methodological issues of treating human and animal researchparticipants fairly were considered in this chapter. Because most of the powerin the experimenter–participant relationship lies with the experimenters, it isimportant that they follow certain basic rules of courtesy. They must bepresent, prompt, prepared, polite, private, and professional. Institutionalreview boards have been established to screen research proposals and helpexperimenters make ethical decisions with respect to their treatment ofhuman and animal participants. Among the issues they consider is whetherhuman participants have given informed consent prior to participating.
Although we have assumed in the past that human participants are naiveand passive, they are in reality problem solvers who are sensitive to the
How to Be Fair with Participants 93

94 Chapter Four
demand characteristics, or hidden clues, of the experimental situation. Howthey react to these demand characteristics depends on whether they are coop-erative, defensive, or noncooperative in the experiment. We can minimizedemand characteristics by automating much of the experiment, by usinga blind or double-blind design, so that the participant or both participantand experimenter are unaware of the specific conditions being responded to,or by using multiple experimenters. One form of double-blind design indrug research uses a nonactive placebo for the control condition. When it isimpossible to make participants blind to the experimental manipulation,the experimenter must be aware that the Hawthorne effect may occur: achange in behavior due simply to the attention given to the participants.If unwanted demand characteristics are present in an experiment, we cansometimes detect them through postexperiment questioning or by usingnonexperiment or simulation control groups. An alternative to assumingthat participants are naive is to use their problem-solving natures and givethem false demand characteristics to deceive them about the actual purposeof the experiment. Alternatives to deception are to ask participants to role-play or to observe them in a naturalistic setting.
Psychologists also use animals in experiments because they exhibit con-tinuity, engaging in some of the same basic behavior patterns that humans doin a form unconfounded by more complex behaviors. Animals also providean opportunity for greater environmental and genetic control. Some animalspossess certain unique characteristics that make them superior for certaintypes of research. There is a long history of the animal rights movementworldwide. In the past few decades this movement has gained some advo-cates who have taken extreme positions and even advocated violence. Thepublic, as well as psychologists and psychology students, is more favorabletoward animal research. In recent years the rules and regulations regardinganimal experimentation at the federal, state, and institutional levels have beenupgraded so that the possibility of abuse is minimized. Most researchers whodo this kind of work believe that the benefits usually outweigh the costs andpoint to many advances in human welfare resulting from animal research inpsychology, including treatment of mental disorders and drug abuse, paincontrol, and recovery from strokes.

95
5How to Be Fair with Science
Science is willingness to accept facts even when they are opposedto wishes.
B. F. SKINNER (1953)
To obtain a certain result, one must wish to obtain such a particularresult: If you want a particular result you will obtain it.
T. D. LYSENKO, QUOTED IN I. M. LERNER (1968)
Fraud in science is not just a matter of rotten apples in the barrel. It has something to do with the barrel itself.
NICHOLAS WADE, QUOTED IN K. MCDONALD (1983)
Research is a collegial activity that requires its practitioners to trustthe integrity of their colleagues.
ARNOLD S. RELMAN, QUOTED IN K. MCDONALD (1983)
Dishonesty has always been perceived in our culture, and in allcultures but the most bizarre, as a central human vice. We shouldnote that this perception is consistent with a certain hesitancyabout what constitutes a lie and with the more than sneakingsuspicion that there might be a number of contexts in which lyingis actually justified.
TONY COADY (AUSTRALIAN PHILOSOPHER)
. . . living ethically is much more than not living unethically.MARTIN E. P. SELIGMAN (APA PRESIDENT, 1998)
In this chapter our examination of ethics continues, but here we deal withtreating science fairly. In some respects, science has fewer defenses than a
research participant has. Animals squirm and yell and sometimes die whenmistreated, and the animal-rights groups yell too. Human participants squirmand yell and sometimes sue when mistreated. Science can’t even squirm andyell. If you mistreat it long enough, however, your fellow scientists mighteventually squirm and yell.
You might wonder how you can be unfair to an inanimate thing likescience. In one sense, science can be considered animate in that it is a moving,changing, and, we hope, expanding body of knowledge. New research con-stantly replaces or builds on old findings and theories. Anything you do that

96 Chapter Five
retards the expansion of science or causes it to expand in the wrong directioncan be considered scientifically unethical.
Science has a few safeguards built into it to ensure that the body of knowl-edge continues to expand in a proper direction. For example, before you areallowed to report the outcome of an experiment in the scientific literature, agroup of scientists selected for their research accomplishments reviews it.Through this review, the reviewers establish whether the research follows therules of experimentation, which I have discussed in this book. Furthermore,the reviewers attempt to determine whether your contribution is sufficient towarrant using the limited number of pages available in the journals. In thisway the reviewers and editors of journals attempt to screen research so thatonly competent and relevant findings are added to the body of knowledge.1
Although this reviewing process is not perfect, most psychologists believe thatit accomplishes the important screening function rather well.
Although the review system is designed to exclude research that waspoorly done or that fails to make a large enough contribution, it is notdesigned to determine whether an investigator who may be capable of doinggood research has lied about his or her study. A scientist who knows the rulesand claims to have followed them when in fact he or she has not is cheatingscience. Such behavior is usually geared toward making personal gains ofsome sort: “They weren’t going to promote me unless I had five publications”;“I had to make our product look good”; or “I had to have a positive result onthe experiment to get a passing grade.”
Because unethical behavior can be so harmful to our science and becausewe have very few built-in safeguards to detect it, unethical behavior in sci-ence is not tolerated, and a researcher quickly loses the privilege of practic-ing science when such behavior is detected. I call these clearly unethical andunacceptable behaviors dirty tricks and discuss them in the first section of thischapter. In the next section I discuss some behaviors that are frowned uponand that should be guarded against but are not so egregious that a researcherwould lose scientific privileges; I call these questionable tricks. Finally, there aretimes in science when a researcher tells the truth, but not the whole truth, andour science benefits rather than loses from this behavior. This behavior canmake our science more efficient and easier to understand and is considerednot only acceptable but also necessary. I call these behaviors neat tricks.
■ Dirty Tricks
FABRICATING
One form of blatant cheating is to fabricate results. Some “experimenters”know that the easiest way to run an experiment is not to run it at all. They donot have to bother with such mundane matters as buying equipment, signing
1 Note here that I am using the term relevant differently from the way many people use it. I usethe term to mean relevant to science, not relevant to faddish topics. Sometimes topics that arerelevant in the latter sense are the least relevant in the former sense.

up participants, or learning to do statistics. All they have to do is learn to writeup experiments. (Fabricators better read Chapter 13. They also better learn adifferent profession because they will not be psychologists for long.)
As a student, you may be tempted to fabricate data because an assignmentis due and you have not completed it. Don’t do it! Late assignments cause lowergrades, but contrived results cause class dismissals and terrible letters of rec-ommendation. Professional scientists are totally intolerant of such behavior.
From time to time the American Psychological Association (APA) releasesa document called the Ethical Principles of Psychologists and Code of Conduct inwhich it attempts to specify the ethical standards by which psychologistsshould conduct their business. The latest standards were published in 2002,and some of these speak to the scientific side of psychology (APA, 2002).According to Standard 8.10, “(a) Psychologists do not fabricate data.” and“(b) If psychologists discover significant errors in their published data, theytake reasonable steps to correct such errors in a correction, retraction, erratum,or other appropriate publication means.”
Back in the early 1900s, a biologist named Kammerer attempted to demon-strate that acquired characteristics could be inherited (Ley, 1955), a conceptquite different from Darwinian evolution. He claimed that he had kept gener-ations of fire salamanders on black soil. He reported not only that the sala-manders, which are normally black with yellow spots, had showed increasinglysmaller spots over generations, but also that this reduction in spot size had beenpassed on by inheritance. A second researcher, who doubted these claims,added the time required to bring forth the number of generations thatKammerer had reported and found that the total time was considerably longerthan the time for which Kammerer had been working on this research. Otherscientists also began to demand explanations until, after seven years, two lead-ing scientists examined some specimens. They found injections of India ink inthe specimens. Kammerer admitted that his results “had plainly been‘improved’ postmortem with India ink.” He then promptly committed suicide.
How to Be Fair with Science 97

98 Chapter Five
The most dastardly deed in science is to add noise to the body of knowl-edge. If you do bad research, people can and will ignore it, but if you pretendthat you have done good research when you have not, you will retard theexpansion of the body of knowledge. Others will come along and attempt tobuild their research on yours, only to discover eventually that something iswrong. They must then waste time fixing the foundation and possiblyrebuilding the whole structure. The longer such cheating goes undetected, thegreater the eventual waste of science’s resources.
If undetected, the cheating of science can also lead to the cheating ofsociety. In the late 1930s, for example, a Russian named T. D. Lysenko, whoalso believed that acquired characteristics could be inherited (Lerner, 1968),was so adamant about this theory that he falsified a great deal of data.Lysenkoites claimed that they had brought about miraculous results such astransforming wheat into rye, barley, oats, and even cornflowers; beets intocabbage; pine into fir; and a tree of the hornbeam group into forest walnut(using doctored photographs as evidence), and even the hatching of cuckoosfrom eggs laid by warblers (Lerner, 1968).
Lysenko’s grossly unethical behavior hurt not only science but society aswell. He was personally responsible for the dismissal, exile, and execution ofa number of Russian geneticists. He convinced Stalin and later Khrushchevthat his theories were correct and that they should be applied on a large scalein agricultural programs (Medvedev, 1969). When the devastating agricul-tural failures that followed were eventually attributed in part to Lysenko’smethods, he fell, Khrushchev fell (though not only for this reason), andRussian society suffered.
When I wrote this section for the first edition of this book, I had to lookback into history to find examples of scientific fraud. Unfortunately, findingexamples of fraud is much easier today. I recently found the following head-lines in several professional and local newspapers: “Allegations of Plagiarismof Scientific Manuscript Raise Concerns About ‘Intellectual Theft,’ ” “NobelHonoree Faces Misconduct Charges,” and “U.S. Enters Lawsuit AccusingScientist, Institutions of Fraud.”
Are dirty tricks new, or is there simply more interest today in discover-ing them? Apparently even the old-time scientists were not without guilt. The19th-century geneticist Gregor Mendel has been accused of having beensomewhat less than truthful (Fisher, 1936). Even Sir Isaac Newton apparentlyreported correlations to a degree of precision well beyond his ability tomeasure (Westfall, 1973).
Closer to psychology and more recently, a prominent ESP researcher dis-covered that his laboratory manager had fudged data. A suspicious researchassistant had concealed himself and observed the manager changing the datato support ESP findings.
The most famous case in psychology relates to Sir Cyril Burt, an eminentBritish psychologist who had been knighted by King George VI. His researchwith identical twins was one of the major pillars supporting the argumentthat IQ is largely inherited. After his death, researchers discovered that the

correlations he had reported for identical twins had remained the same tothe third decimal place over many years even as more twins were addedto the study. This seemed a highly unlikely coincidence. Fraud allegationswere made in the London Sunday Times, and the controversy continues todate. On one side are researchers who argue that Burt’s data should be con-sidered fraudulent and were probably fabricated (McAskie, 1978). Othersargue that the case for fraud is weak and that a more probable explanation issimply carelessness (Jensen, 1978). It is also unfortunate that this heateddebate is fueled by the politics of elitism versus egalitarianism.
How can we guard against the possibility of researchers being dishonest?No foolproof system will ever be developed because both the costs and theloss of intellectual freedom would destroy the scientific enterprise. A numberof safeguards are currently in place. The Public Health Service, under whichthe National Institutes of Health operate, already requires universities to haveguidelines for preventing misconduct (Cordes, 1990). The Associationof American Universities recommends that institutions establish explicitpolicies about standards and have administrators to carry out the policies(“AAU Statement,” 1983). When the researcher is federally funded, there iseven a “whistleblower” law dating back to the 1800s that allows citizens tofile lawsuits against researchers and universities and collect a sizablepercentage of any money the government is awarded. Recently, a former tech-nician in a research laboratory filed such a suit against a researcher and hisuniversity, alleging that the researcher had falsified results (Cordes, 1990).
One suggestion for minimizing fraud is to establish data archives for theraw data from research (Bryant & Wortman, 1978).2 Apparently one problemencountered by investigators attempting to validate Burt’s research was hisincredibly sloppy data storage. Theraw test sheets on the twin studieswere stored among papers stuffedinto half a dozen tea chests that werelater destroyed! Using data archives,researchers could either store theirresearch data individually or possiblysend the data to a centralized loca-tion. In this way, research data wouldbe available to the public, which isoften not the case. For instance, agraduate student requesting raw datafrom 37 published authors received only 24% compliance (Wolins, 1962).
The archiving process has the following additional benefits: researcherswould probably be more careful in their original data analysis; they could addto the body of knowledge by examining issues not originally addressed; and
How to Be Fair with Science 99
2 The individual measurements of your dependent variable prior to combining them for statistical analysis are your raw data. Unlike meat, raw data do not spoil—they just take uproom from research.

100 Chapter Five
they could also conduct longitudinal studies in which data are compared overa number of years.
The costs of a formalized central data storage system include the cost ofthe bureaucratic structure to administer it, the time and money required toduplicate the data or conform to a standardized format, and perhaps the costto science of a recognized loss of trust in the integrity of scientists. Some feelthat the costs of this solution are too great when the problem is relativelysmall. They believe that the checks and balances provided by the replicationprocess are sufficient to detect most fraud and make the problem of dirtytricks an anomaly rather than a common practice.
Regardless of the formal requirements, you should keep data for a mini-mum of 5 years. Investigators often request data from one another, and withcomputers, storage and retrieval of raw data are easy. In fact, another ofthe APA’s ethical standards is 8.14, “(a) After research results are published,psychologists do not withhold the data on which their conclusions are basedfrom other competent professionals who seek to verify the substantive claimsthrough reanalysis and who intend to use such data only for that purpose,provided that the confidentiality of the participants can be protected andunless legal rights concerning proprietary data preclude their release.” If youmake a habit of storing raw data, you are helping to protect science, and youare protecting yourself against false accusations as well.
Some data do indicate that scientific fraud is relatively rare. For example,from 1982 to 1988 the National Institutes of Health, which supportsthe research of 50,000 scientists, had handled reports of only 15 to 20 allega-tions of wrongdoing. On the other hand, among scientists at a major researchuniversity who responded to a survey, one third said they had suspecteda colleague of plagiarism or falsifying data, but fewer than half took actionto verify or report their suspicions (Hostetler, 1988). At this time it appearsthat unless scientists take more formal steps to find and eliminate scien-tific misconduct, Congress will impose such steps through legislation.This possibility disturbs the many scientists who believe that regulationby those not trained or experienced in science could lead to undesirableconsequences.
The best and most cost-effective way of preventing fraud in science is toemphasize to new researchers the importance of ethical conduct. This empha-sis, of course, is the purpose of the chapter you are reading. It is only throughan understanding of the way science works that the real motivation for ethicalbehavior can be established. Researchers must understand that science is builton trust. Unless we can trust our colleagues’ research findings, we might aswell discontinue the attempt to build the scientific body of knowledge.
PLAGIARISM
The APA ethical standards state under 8.11 Plagiarism, “Psychologists do notpresent portions of another’s work or data as their own, even if the otherwork or data source is cited occasionally.” Although this statement seems

clear, plagiarism has become such a contentious issue in recent years thatsome elaboration is necessary. Indeed, in just the past couple of years uni-versity presidents have lost their jobs over plagiarized speeches and authorshave been accused of plagiarizing major portions of their books. Such behav-ior does not mean that the criteria for what we call plagiarism have changed;it is just that folks are increasingly ignorant or dismissive of the rules.
Most people realize that the act of directly quoting another person’s pub-lished words is plagiarism. However, apparently some students believe thatmaterial on the Internet is fair game and that they can claim it as their own.Let me be clear: Stealing words off the Internet is as bad as stealing them frommore traditional formally published sources. And be warned that your pro-fessors will use sources such as http://www.turnitin.com to catch studentsplagiarizing from internet sources.
How to Be Fair with Science 101
The worst case of cheating I have personally encountered was a counsel-ing psychologist who copied 90 pages of a 120-page doctoral dissertation fromtwo published books. He did include citations for both books in his referencessection, but nowhere in the manuscript did he formally cite either book eventhough the material came word-for-word from them! Even in this seeminglyclear-cut case, the student argued that he did not consider what he had doneto be plagiarism. One of the student’s former professors even argued that itwasn’t plagiarism because the student did not intend to plagiarize. Again, letme be clear: Intent does not matter; the act defines itself. The psychologist inthis case lost his doctoral degree and his right to practice the profession.
Plagiarism covers more than usurping somebody else’s words; stealingideas is as bad as stealing words. As discussed in Chapter 13, psychologistsoften do less direct quotation in their report writing than do other writers. Weare more likely to paraphrase other researchers; that is, to reword a particularthought or idea using our own words. However, paraphrasing does not let

102 Chapter Five
us off the hook from having to do proper citation. When writing aboutanother researcher’s thoughts, theories, or even speculations, you must citethat researcher and the source from which you learned of the ideas.
To illustrate several of the types of plagiarism we have been discussing,suppose that you have read a paragraph from the following article written byDiener, Lucas, and Scollon and published in the American Psychologist (2006):
The hedonic treadmill theory is built on an automatic habituation model inwhich psychological systems react to deviations from one’s current adapta-tion level (Helson, 1948, 1964). Automatic habituation processes are adaptivebecause they allow constant stimuli to fade into the background. Thus,resources remain available to deal with novel stimuli, which are most likelyto require immediate attention (Fredrick & Lowenstein, 1999).
In your report could you write?
The hedonic treadmill theory is built on an automatic habituation model inwhich psychological systems react to deviations from one’s current adapta-tion level. Automatic habituation processes are adaptive because they allowconstant stimuli to fade into the background.
No, you could not do this because you have used somebody else’s wordsverbatim without citing the source and without placing them within quota-tion marks. Could you say?
An automatic habituation model is the basis for hedonic treadmill theory.There is a deviation from a particular habituated adaptation level so that con-stant stimuli just become background noise allowing resources to be used toprocess new information.
Although you have paraphrased the words in the paragraph, you are stilltalking about somebody else’s ideas, so you would need to cite where thoseideas came from. So, could you say?
An automatic habituation model is the basis for the hedonic treadmill the-ory (Helson, 1948, 1964). There is a deviation from a particular habituatedadaptation level so that constant stimuli just become background noiseallowing resources to be used to process new information (Fredrick &Lowenstein, 1999).
This paragraph is certainly better because it now cites sources. However, inthis case you couldn’t even cite these sources in this way if all you had readwas the Diener, Lucas, and Scollon article. By listing the Helson, and Fredrickand Loewenstein sources, you are implying you have read these articles andare paraphrasing what you read. But, if everything you know about thesesources comes from reading the Diener et al. article, the other two sourcesare called secondary sources and must be cited only in the context of theprimary source that you read, for example, “Helson (1948, 1964), as noted byDiener, Lucus, and Scollon (2006), proposes that an automatic habituationmodel is . . . .” If at all possible, rather than citing a secondary source in thisway you should try to obtain a copy of the original and then cite it as aprimary source.

I have used considerable space discussing plagiarism because it is con-sidered a serious ethical violation. Even minor violations can lead to badgrades. Major violations can lead to loss of reputation, loss of employment,and, in the case of the dissertation cited in the example, loss of a doctoraldegree.
FALSIFYING CREDENTIALS
If you were to walk up to a friend and say, “Would you stand on your headfor me?” the response would probably be “Why?” However, if you were towalk up to another friend and say, “I’m doing an experiment; would youstand on your head for me?” your friend’s response is more likely to be “Howlong?” This difference arises from the fact that our society grants scientists anumber of privileges not given to the average citizen. We allow scientists, par-ticularly behavioral scientists, the freedom to experiment because, as a society,we feel that the gains from such experiments usually outweigh the costs. Wealso grant scientists a certain amount of prestige and generally respond tothem somewhat compliantly.
Scientists not only are allowed to manipulate the lives of those aroundthem in approved ways but also are sometimes supported in this effort by ourtax money. However, we are also capable of taking away these privileges ifwe believe that their advantages to the society no longer outweigh their dis-advantages. Requiring professional credentials of experimenters is one waywe police ourselves. Consequently, to prove to other scientists that you are aqualified investigator, you must present them with your professional record,usually in the form of a vitae or résumé. A résumé is a written record thatshows who you are professionally; it lists your educational degrees, your jobexperience, and your published papers and articles. You use it to get intograduate school, to become professionally certified, or to get a job. Perhaps itshould go without saying that this document must be totally accurate. I willsay it anyway: Falsifying credentials is a blatant dirty trick.
Not surprisingly, the APA ethical standards are clear on this issue.Standard 5.01 Avoidance of False or Deceptive Statements provides thefollowing guidelines:
(b) Psychologists do not make false, deceptive, or fraudulent statements concerning(1) their training, experience, or competence;(2) their academic degrees;(3) their credentials;(4) their institutional or association affiliations;(5) their services;(6) the scientific or clinical basis for, or results or degree of success of,
their services;(7) their fees;(8) their publications or research findings.
Early in my career, I witnessed an incident in which a talented student useda falsified vitae in an attempt to get into graduate school. He had a fine
How to Be Fair with Science 103

104 Chapter Five
record and great letters of recommendation from his professors, but he listedseveral nonexistent papers and articles on his vitae. When his professors dis-covered his deception, the student no longer had either a fine record or let-ters of recommendation, nor is he an experimental psychologist today.Because the agreement between scientists and society is fragile, this type ofdishonesty upsets the delicate balance and cannot be tolerated.
I hope that this discussion of dirty tricks was a waste of your time andthat you would not have considered doing these in the first place. Yet I believethat such topics must be mentioned early in an experimenter’s training.Doing psychology experiments can be fun, but the real purpose of experi-mentation is building science. Those who are not willing to follow the rulesthat make this process orderly do not belong in science.
■ Questionable TricksThe actions that most investigators find unacceptable but lead to frowningand scolding rather than banishment can be considered questionable tricks.These actions can occur during the design of an experiment, during theexperiment itself, during data analysis, or in experimental reporting.
EXPERIMENTAL DESIGN
In the previous chapter, we discussed experimenter bias as communicatedthrough demand characteristics. If you design your experiment so that thedemand characteristics themselves could cause a desired change in thedependent variable and do not attempt to minimize these demand charac-teristics or even discover them, you are, in a sense, being dishonest. You canalso confound an experiment if you claim to have made a particular variableinto a control variable when, in fact, this variable systematically changed withyour independent variable. In some nonlaboratory experiments suchconfounding is difficult to control, but in many cases we can legitimately callthis situation cheating.

For example, remember the experiment mentioned in Chapter 2 in whichI attempted to lecture an introductory psychology class at several differentrates to determine whether lecture pace had an effect on the students’ atten-tiveness? On some days I tried to speak at a slow pace, on other days at amoderate pace, and on others at a fast pace. We measured attentiveness byrecording the level of background noise. Such an experiment would be easyto bias. I could have changed not only my pace but also the degree ofliveliness with which I talked about the topic or perhaps the number of inter-esting examples I used to illustrate my points. These changes in dimensionsother than lecture pace could easily confound the independent variable,whether I intended to or not.
One way to minimize the chance of cheating would be to design theexperiment so that colleagues with little stake in any given outcomewould rate each lecture in terms of the possible confounding variables. Theexperimenter could then collect data only from those lectures with equiva-lent ratings. Of course, moderate cheating in the form of experimenter biaswill not necessarily occur in the first design, but the second design will bemore convincing because such bias is less likely to occur.
COLLECTING DATA
You can also be dishonest when collecting data for your research, especiallyif you must use human judgment to determine what response the participanthas made. In the experiment just discussed, for example, suppose that theexperimenter wants to classify the students’ behavior as attentive or inatten-tive to record the percentage of time spent in attentive versus inattentivelistening. Suppose one student sits scribbling with her pencil on a piece ofpaper. Is she taking notes or doodling? Another student has his eyes closed.Is he concentrating or sleeping? We can classify the behaviors differentlydepending on our bias. If the experimenter who holds the bias is also doingthe classifying, the potential problems are obvious.
How to Be Fair with Science 105

106 Chapter Five
3 Unless you are specifically interested in investigating individual differences.
To avoid this form of trickery, the experimenter might construct a stan-dard checklist of attentive and inattentive behaviors and have several judgesobserve the tapes and independently classify the students’ behaviors. It iseven possible to keep judges blind to the pace the instructor used for the tapebeing observed. Such precautions decrease the possibility of cheating, eitherintentional or unintentional.
Bias can sometimes occur even in experiments in which measurement ofresponses seems straightforward. An experiment was carried out in whichparticipants moved a stick to line up a marker with a moving target.After every 10-second interval, the experimenter quickly read a pointer on avoltmeter dial and reset it. (The farther the marker was from the target, themore quickly the pointer moved across the dial.) This task was difficultbecause the needle seldom fell directly on an index line. The experimentercould easily have made biased judgments about the location of the pointeron the dial. In this experiment, experimenters had to read the dial over15,000 times, giving rise to the possibility that small inconsistencies inreading the instrument would eventually bias experimental results. Thus,whenever biased experimenters must use judgment to interpret a response,they should devise procedures to ensure that the judgment will be madeaccurately.
DATA ANALYSIS
You must also avoid trickery in analyzing your data in a biased way. As dis-cussed in Chapter 12, statistical tests are usually computed to determinewhether a particular result is likely to be a real effect or whether it is due tochance. These statistical tests can be used only when certain assumptions canbe approximated. Using the test when its assumptions are grossly violated isquestionable at best.
For example, the most frequently used statistical tests require that theunderlying distribution be approximately normal, a symmetrical bell shape.Although a small violation of this assumption usually does not totally inval-idate such a test, some investigators continue to use one of these tests whentheir distributions in no way resemble a normal distribution. As an experi-menter, it is up to you to know what assumptions your statistical test requiresand how likely it is for you to make an error if you fail to meet one or more ofthese assumptions.
When analyzing your data, you may discover that although most of theparticipants seem to be showing the predicted experimental effect, several donot show the effect. At this point, you can do nothing about these renegades.3
Obviously, if you could throw out data you obtained from all the participantswho failed to show an expected result, you would never do an experiment thatfailed to support your predictions! For this reason, you must be careful abouteliminating participants from an analysis on the basis of their performance on

How to Be Fair with Science 107
the dependent variable. And you should never eliminate them on the basis oftheir differential responses to the levels of the independent variable.
You can eliminate participants for failing to meet some overallperformance level on the dependent variable only if you determine this per-formance level before collecting the data, if you can logically defend it, andif you specify the performance level in your experimental report. As an illus-tration, suppose you were interested in the effects of noise on people’s abilityto perform a typing task. Before starting the experiment, you might decide toexclude data from all participants who fail to type at least 10 words perminute in the absence of noise. Your logic might be that these individuals aresuch poor typists to begin with that even if noise has a detrimental effect ontyping, they would not show the effect. Or you might argue that you are inter-ested in the effect of noise on experienced typists and that a speed of less than10 words per minute indicates that the person is not an experienced typist.However, if you do not have a logical argument for eliminating participantson the basis of a predetermined dependent-variable performance level, youshould not do it.
You are much safer in eliminating participants on a basis other thanperformance on your dependent variable. Again, however, such criteriashould be set prior to the experiment and should be specified when youreport the results. For example, you might be having participants searchthrough an array of letters to report which letter is printed in red ink. In thiscase, you might exclude individuals who cannot pass an acuity test or a color-blindness test before the experiment.
REPORTING RESULTS
Suppose that you have analyzed your experiment and are now ready to reportthe results. Usually you will want to represent some of your results as a graph.We will discuss some rules to follow in plotting a graph in Chapter 12. Peoplehave written books on how to lie by distorting graphs or statistics (Best, 2001;Campbell, 1974; Huff, 1954; Wainer, 2000). For example, an experimenter

108 Chapter Five
could enlarge one of the graph’s axes to make a tiny effect look like a gigan-tic effect or possibly distort the scale on one axis so that the function beingdisplayed changes shape. If you are a creative person, you can find all sorts ofways to make crummy results look good. Obviously, such behavior doesnothing to advance science and is considered inappropriate.
One other form of questionable trickery is piecemeal reporting of experi-mental results. Although research must progress one experiment at a time,you should not report research in this way. Many decades ago the typicaljournal article in psychology reported the results of a single experiment. Inrecent times, however, the field has grown so much that there has been a lit-erature explosion. So many people are doing so many experiments that theprocess of keeping current with experimental advances is nearly impossible.For this reason, few journals will accept a report of a single experiment unlessit makes an unusually large contribution by itself.
Usually, you should report the results of your experimental research pro-gram as an integrated series of experiments. With this procedure, the growthof knowledge becomes much more efficient and orderly, and readers arespared the task of reorienting themselves to the research, rereading introduc-tion and procedure sections with each experiment, and integrating fragmentedresearch into a coherent structure. In today’s “publish or perish” world, aninvestigator can be tempted to do piecemeal reporting to accumulate publica-tions. However, in the end, such behavior does nothing to improve either theinvestigator’s reputation or the body of scientific knowledge.
■ Neat TricksAlthough it seems counterintuitive, it is sometimes necessary to “lie” to thereader of a research report to communicate efficiently. Research is usually asloppy process, yet when you read an experimental report it sounds as if theinvestigator proceeded in a systematic, orderly manner at all times.4 Don’tbelieve it! Rarely does a researcher’s mind work in the totally logical mannerreflected in the report. Experimenters make many decisions based on hunchesor gut-level intuitions. They make false starts based on bad guesses. They doexperiments the right way for the wrong reasons or the wrong way for theright reasons.
Unfortunately, many students become turned off to experimental psy-chology because they think it is dry and unexciting, when in most cases it isactually an exciting, disorderly, haphazard treasure hunt. You know littleabout experimentation until you try your first experiment.5 The most obvi-ous reason for cleaning up an experimental report is to save time and space.Though it might be fun to read about all your colleague’s mistakes, you donot have the time and journals do not have the space to allow you the luxury.
4 A charmingly written article on the sometimes haphazard process of research is B. F. Skinner’s“A Case History in Scientific Method” (1959).5 It’s kind of like making love: Reading about it is a poor substitute for doing it.

The experimental report is designed to convey information efficiently, notentertain the reader.6
LEAVING THINGS OUT
One way of cleaning up your experimental report is to leave out some exper-iments and analyses.7 Suppose that you had a bad day when you designedthe third experiment in a series, you had a bad intuition, or you were tem-porarily confused. Nobody else is interested in the condition of your life, yourviscera, or your head. So you blew the experiment. I don’t want to read aboutit. You don’t want to write about it. So don’t. Science loses nothing, I losenothing, and you save face. Be sure, however, that you are not tempted toleave out a perfectly good experiment because the results do not support yourfavorite hypothesis. Doing this is not a neat trick!
Not only is it acceptable to leave out whole experiments if they add noth-ing to the report, but at times it is also proper to ignore the details of somedata analyses. Perhaps there were a number of ways to analyze your data,and you did them all. Although you should probably report that you didthe analyses, you need to give details of only those that are most representa-tive and convey the most information.8
REORGANIZING
Especially when doing exploratory research, you may find that the outcomeof an experiment shows that it should not have been the first experiment inthe series. You may find it desirable to back up and do some preliminaryexperiments. In such cases, you need not tell the reader that “owing to mis-judgment and lack of foresight on the experimenter’s part, the followingexperiments are out of order.” You may report them in the most logical order,whether or not this order matches the order in which you did them. Dataare data, and you should report them as efficiently as possible, as long asbending the truth does not bend the science.
REFORMULATING
Finally, it is generally acceptable to reformulate the theory underlying anexperiment. Occasionally, you do an experiment for some reason and laterdiscover a better reason for having done it. Or perhaps you discover thatsomebody else has done an experiment that casts a different light on the oneyou are conducting. In this case, you have to determine how your contributionto the body of knowledge best fits with the new information. Unfortunately,
How to Be Fair with Science 109
6 A lot of textbook writers think this too. They never have any fun!7 Or else put them in a footnote. Nobody reads footnotes.8 Note that I am not endorsing the practice of conducting a multitude of tests and then pickingand choosing only those that yield significant results. In this case, you are distorting the levelof significance (see Chapter 12).

110 Chapter Five
there will be times when your theory does not fit at all, and you will have togo back to the drawing board. Often, however, you will be able to fit yourexperiment into the revised theory by changing your emphasis or reinter-preting your results. In reporting your results, you need not burden thereader with obsolete theory. Again, your major ethical consideration shouldbe whether you are adding to the body of knowledge in an efficient manner.
In this chapter we have by no means exhausted all the ethical questionsthat you will face as an experimenter. In some cases, you will find it difficultto decide whether a particular action is fair to science. When a problem comesup, you may wish to discuss it with colleagues, who may be able to raisepoints and suggest alternatives that you have not considered. In the end,though, the decision is yours. If you apply the principle that ethical actionsare those that aid in the efficient growth of the body of knowledge, you willnever do dirty tricks and seldom do questionable tricks.
■ SummaryBecause science is a growing body of knowledge, any action that retards theefficient expansion of that body of knowledge is unethical. We can be lessthan totally truthful with science in a number of ways. We can engage in dirtytricks by fabricating results, plagiarizing, or by falsifying our credentials. We canalso engage in questionable tricks—by failing to control confounding variablesin the design of an experiment, for example, or by misclassifying responses andmisreading instruments during collection of our data. During data analysis,failing to meet test assumptions and inappropriately eliminating participants arealso unacceptable, as are distorting graphs and reporting a series of experi-ments as piecemeal reports. For the sake of efficiency, it is acceptable to reportexperimental results in a form that does not exactly parallel the experiment.For example, we can leave out experiments and analyses from a report if they donot add any value to the report, or we can reorder experiments and reformulatetheory if these actions increase the efficiency of the experimental report.
111
6How to Find Out What Has Been Done
Perhaps while you were reading Chapter 3, about getting an experimentalidea, a terrific idea came to you in a blinding flash of inspiration. Or, an idea
might have crept in on little cat feet. In any case, I hope that some interestingexperimental idea has begun to form and that you are getting eager to startyour experiment. However, before you begin serious planning, you should real-ize that your terrific idea may have already been somebody else’s terrific idea.
■ Why Search the Literature?Although psychology is a relatively young science, more than 50,000 refer-ences are published in a typical year. Although another investigator probablyhas not done exactly what you are planning to do, it is likely that out of all theresearch accumulated over the short history of psychology, somebody hasdone something quite similar. It would be counterproductive for you to repeatan experiment unless you thought that the published results were not reliable.
You might also find it helpful to study how other investigators haveattacked similar problems. Perhaps they have used experimental techniqueswith which you are unfamiliar. You might also find that other investigatorshave already discovered a number of pitfalls you would rather not wasteyour time rediscovering.
Polonius: What do you read, my lord?Hamlet: Words, words, words.
WILLIAM SHAKESPEARE
But why do we have to endure the academics who insist onmaking verbal mountains out of intellectual molehills?
S. I. HAYAKAWA (1978)
The house of social science research is sadly dilapidated. It isstrewn among the scree of a hundred journals and lies about inthe unsightly rubble of a million dissertations. Even if it cannotbe built into a science, the rubble ought to be sifted and culledfor whatever consistency there is in it.
G. V. GLASS, B. MCGAW, & M. L. SMITH (1981)

112 Chapter Six
Science aims to produce an organized body of knowledge, not a haphaz-ard collection of facts built by scientists doing small, isolated experiments.Thus, the most important reason for determining what research others havedone is that you will be required to fit your findings into this existing bodyof knowledge. When you have completed your research, you have to say notonly “This is how it came out” but also “This is where it fits in.” To knowwhere your work fits in, you obviously have to know what the body ofknowledge was like before your research. This chapter discusses how to findout, through a literature search,1 what is in this body of knowledge.
While you are doing a literature search in the library, be sure to keep arecord of what you find. Each time you find an article or book that might beuseful, make a note of the important points and write down the complete ref-erence. Include the names of the authors,2 title of the work, name of the jour-nal or book, date, volume number, page numbers, and, for a book, thepublisher. You will need all of this information later if you decide to refer tothe article in your research report. Some people find using an index card foreach reference helpful. Automated search is another preferred method. AsI discuss later in this chapter, an automated search can be conducted and a use-ful feature of this type of search is that you will get a full bibliographic recordfor each reference you find. You can simply print this out. Regardless of howyou do your search, the more orderly you are the first time through, the lesstime you will waste later looking for references that you put on the back of a
1 Scientists have traditionally called this process a literature search, although you will probablynot study this type of literature in your college lit courses.2 People who are new to psychology sometimes find it strange that experimental psychologiststalk about experiments by author rather than by subject. If you hear your instructors say suchthings as “The Carothers, Finch, and Finch (1972) findings agree with Peterson, Bergman, andBrill (1971),” they are talking not about law firms but about experimenters.

long-lost gum wrapper. If you find several particularly well-written articles,you should be sure to make full copies and hang on to them. You can use themas good models when you are ready to start writing.
Although a literature search is not particularly difficult to do, it can betime consuming and not particularly inspirational, because it involves lotsof paper shuffling. Knowing the literature, however, is an absolute necessity;it is your scientific body of knowledge! Nothing is more embarrassing whenpresenting the results of your life’s work than to hear someone remark,“You are, of course, familiar with Klip and Klap (2006), who did this sameexperiment last year?”
■ The Timeliness of SourcesIf you are completely unfamiliar with the possible research sources in psy-chology, such as books and articles, you may not know where to begin yourliterature search. First, you need to get a feel for the sources available and howup to date each source is. To do this, let’s follow a typical experiment as it isreported to the scientific community. Figure 6-1 summarizes this process on atimeline in which zero represents the time the researcher starts a project.3
After collecting data, the investigator might present preliminary results to asmall gathering of friends at a local institution. Assuming the researcherisn’t laughed out of the room, he or she may decide to attend a professionalmeeting such as an annual convention and read a paper summarizing theresearch.4 Again, assuming that this somewhat more hostile audience offers alittle support, the investigator might decide to write a manuscript based onthe research and submit it to a journal. If the article is accepted, it will appearin the journal about nine months to a year later. Following journal publica-tion, Psychological Abstracts will publish an abstract of the article. If the articleis important, it may appear later in the Annual Review, be cited in other arti-cles, and perhaps be mentioned in a publication such as Psychological Bulletin.Finally, after several years, a textbook author might mention the research aspart of the accepted body of knowledge.
Figure 6-1 points out the time lag involved in the scientific communica-tion process. If you use the library, your first access to an experimental resultis its appearance as a journal article. As you can see, you have lost consider-able time at this point because the research was probably started at least threeyears before its publication in a journal. If you begin your experiment at thispoint and go through the same process, the other author will have to waitthree more years before your results will be reported in a journal article. (Even
How to Find Out What Has Been Done 113113
3 This figure is based on research that is now a bit old. It is likely that with technological advances in publishing, the timeline has been compressed in recent years. However, I knowof no other recent research that deals with this issue. I believe that the order of events is essentially unchanged today and that the figure still provides a useful way to organize ourthinking about the publication process.4 This is where your professors go when they miss class. And you thought they were on vacationhaving fun.

114 Chapter Six114
Text not available due to copyright restrictions

the U.S. mail has better turnaround time than this!) Because of the need toavoid such delays, fewer than one in seven research efforts originate fromformal sources such as journal articles (Garvey & Griffith, 1971). Most ideasoriginate from more informal communication among scientists in a givenfield, such as presentations at meetings, discussion lists, and Web pages.However, as a new investigator without the contacts necessary for such infor-mal communication, you might have to be content with the formal sourcesfor the time being. If you continue to work in a particular area of research,you will find out who else works in your area and will get to know yourfellow researchers personally. You will then be ahead of the journals and the“new” new investigators.
In the following section we consider the formal sources in more detail,discuss the advantages and disadvantages of each, and determine how tolocate relevant sources. Let’s start with books and work our way to morerecent sources.
■ Formal Sources
BOOKS
Because books include only research that was begun years earlier, you mightthink that they would be the worst possible source. However, this enormoustime lag makes them in some ways the best source. An important processoccurs between the time research is completed and the time it is reported inone of the sources: The research is screened on the basis of importance andquality so that by the time it appears in a book, it has been integrated withother research to form a coherent body of knowledge. Thus, the value of bookresearch lies in the fact that an author includes work in a book because he orshe thinks it is well done and important and that it fits into the growing bodyof knowledge. The author has already done much of your work for you; it’sjust a bit obsolete.
A good place to start your literature search is a recently published bookthat deals with the general research topic you are interested in. If theauthor has done a good job, you can have some confidence that you havea useful summary of the most important research from the start of psy-chology up to about 13 years before the publication date of the text. Yourjob is now considerably easier: to find out what has happened during thelast 13 years or so.
One problem with this approach is that the author would have had to beselective and not been able to include all the research done on a particulartopic since the beginning of psychology. Every author is biased toward sometheoretical or methodological approach and selects research based on thisbias. In addition, most books are not subjected to the same level of peerreview that journal articles are. Peer review means that several highlyrespected researchers have read the material and given it their stamp of
How to Find Out What Has Been Done 115

116 Chapter Six
approval. Most major journals require this review for all articles selected forpublication, but book publishers use this process less frequently. Thus, tobe sure you can trust the author’s scholarship and bias, try to develop aconsensus of several resource books; at the least, try to discover the author’sparticular bias.
I imagine you know how to find books in the library. If you do not, thenasking the reference librarian at your college library how to do a search willbetter serve your purpose, than having me describe it. Libraries have electroniccatalogs of all the available books. You should start there by typing an author’sname, book title, or subject you are interested in. The computer screen will dis-play all the books meeting your requirements. Nowadays, it is even possible touse a computer to search the Internet for books at other libraries, although get-ting those books can be a problem. Interlibrary loans can help here, but be sureyou don’t wait until the last minute after you have collected data and you arewriting up your results. It will be too late to get the books you need. Finally,you can find books using one of the computerized search databases I have dis-cussed later in this chapter. In this case you will certainly not be guaranteedthat any book you find will be in your local library.
Prior to your library visit, you might also look in an introductorypsychology book under your topic. Most basic texts will list some suggestedreadings to get you started. You might also talk to an instructor in yourpsychology department who does research in the area. He or she will proba-bly be happy to give you some book references. Finally, the AmericanPsychological Association’s (APA’s) Library Use: A Handbook for Psychology(Reed & Baxter, 2003) should be helpful to you in learning library skillsspecific to psychology.
REVIEW ARTICLES AND BOOKS
Several other sources make an attempt to summarize and integrate researchwithin particular areas of psychology. These sources are more up to date thantextbooks, and consequently there has been less time for the research to beput into perspective. One such source is a journal published by the APA calledPsychological Bulletin, which publishes “evaluative and integrative reviewsand interpretations of substantive and methodological issues in scientific psy-chology.” Here are some titles from various issues:
“Arousal and the Inverted-U Hypothesis: A Critique of Neiss’s ‘Recon-ceptualizing Arousal’”
“Attributions in Marriage: Review and Critique”“Gender Differences in Mathematics Performance: A Meta-Analysis”“Effects of Alcohol on Human Aggression: An Interactive Research
Review”“Hindsight: Biased Judgments of Past Events after the Outcomes Are
Known”“Ideas about Causation in Philosophy and Psychology”

“Psychotherapy for the Treatment of Depression: A ComprehensiveReview of Controlled Outcome Research”
“Children of Depressed Parents: An Integrative Review”“Science and Morality: The Role of Values in Science and the Scientific
Study of Moral Phenomena”
As you can see, the topics covered in these articles are generally narrowerthan textbook topics. A Bulletin article may also take a previous summary arti-cle as its starting point, rather than the beginning of psychology, and fall shortof a complete survey. Nevertheless, a recent review article can save you agreat deal of search time. And review articles are generally more timely thanbooks, usually within five to eight years of current research.
For those experiments that are similar to the one you are planning,a review article will not provide you with enough details. In this case, theoriginal sources cited at the end of the article will allow you to quickly findwhich references are important and to determine how your experiment willfit in with past research.
Another source of research reviews is the Annual Review of Psychology,published by Annual Reviews, Inc. The topics in this book vary from year toyear depending on the decision of an editorial board. Each chapter is writtenby an author who is a recognized expert in that field and whose job it is tosummarize and integrate the research done since the topic was previouslyincluded in the series. The topics are generally broader than Psychological Bulletin topics:
“Personality”“Developmental Psychology”“Spatial Vision”
However, some topics are a bit narrower:5
“Intervention Techniques: Small Groups”“Social and Cultural Influences on Psychopathology”
In recent years, many edited books have been published. Some of themsummarize the most recent work in a particular area of psychology. Eachchapter is usually written by a researcher who gives an up-to-date review ofan even more narrowly defined research area. These chapters resemblereview articles, and if you can find a chapter that is relevant to your research,you will save search time. For this type of book, in particular, the publicationlag is much shorter than that for more standard textbooks. Many of them, infact, are now produced by “desktop publishing,” in which the lengthyprocess of typesetting, editing, and producing a final copy is considerablyshortened. In this case some of the research reported may be only a year ortwo old. However, again, these books have not been peer reviewed in thesame way as journal articles.
How to Find Out What Has Been Done 117
5 Did you notice the interesting relationship? The broader the topic, the shorter the title.

118 Chapter Six
JOURNAL ARTICLES
Psychological journals form the backbone of our science. They are called pri-mary sources because they present the basic results as interpreted by the exper-imenter or experimenters who did the research rather than by third parties,such as those who compile reviews. To perform a thorough literature search,you must use journal articles. They are the most up to date of the formalsources, following the actual research by only a few years. Thus, although arti-cle authors try to integrate their work with the existing body of knowledge,their effort can be only partly successful because they often cannot know aboutother research being done at the same time. Therefore, you will have to do someintegration yourself to make the research form an orderly body of knowledge.I cannot possibly list all the journals related to psychology here. Many profes-sional organizations publish journals for their members, with a number of pub-lishing companies sponsoring individual journals as well. However, to give youan idea of the kinds of journals available, here is a listing of some journal titles:
American Journal of PsychologyAnimal Learning & BehaviorAudiologyBehavioral and Brain SciencesBehavioral NeuroscienceCognitionCognitive PsychologyCurrent Directions in Psychological ScienceDevelopmental PsychologyJournal of Abnormal PsychologyJournal of Applied PsychologyJournal of Cognitive NeuroscienceJournal of Comparative PsychologyJournal of the Experimental Analysis of BehaviorJournal of Experimental Psychology: Animal Behavior ProcessesJournal of Experimental Psychology: GeneralJournal of Experimental Psychology: Human Perception and PerformanceJournal of Experimental Psychology: Learning, Memory, and CognitionJournal of Memory and LanguageJournal of Personality and Social PsychologyLearning and MotivationMemory & CognitionMotivation and EmotionPerception & PsychophysicsPsychological RecordPsychological ReviewPsychological ScienceQuarterly Journal of Experimental Psychology. A, Human Experimental
PsychologyQuarterly Journal of Experimental Psychology. B, Comparative and Physiological
Psychology

PROCEEDINGS
In some areas of psychology proceedings, reports from scientific meetings areconsidered to be important. For example, the Human Factors and Ergonom-ics Society publishes proceedings, both electronically and in hard copy, thatcontain reports from most of the papers delivered at its annual meetings.While these proceedings articles are shorter than a typical journal article, theyare peer reviewed by a panel of experts and are considered one of the impor-tant sources of information for this area of research. Because of the lengthrestrictions and less rigorous peer review, proceedings articles are usuallyconsidered a little less valuable than journal articles, but they do offer a meansfor getting research results into the scientific literature in a timely manner.
TECHNICAL REPORTS
Technical reports are often ignored as a source of psychological literature, butthey can be helpful in certain areas of research. When the federal governmentsupports research work, particularly Defense Department research, the inves-tigator is usually required to report it in the form of a technical report. Thisreport is similar to a journal article but usually goes into more detail aboutthe procedure and the apparatus, and sometimes it even lists the data.The supporting governmental agency automatically distributes technicalreports to other investigators who are doing similar research supported bythe same agency.
About one author in ten writes these technical reports, and only aboutone third of these reports are later published in a journal (Garvey & Griffith,1971). Most libraries do not routinely order technical reports, because theywould quickly fill up the shelves and are difficult for a library to organize andclassify systematically. Investigators who are working on defense grants orcontracts get a monthly publication listing abstracts of all technical reports.Psychological Abstracts also lists many of these reports. Unfortunately, techni-cal reports are often difficult to obtain. To purchase them, you must send arequest to the Defense Documentation Center in Alexandria, Virginia, andyou must know the document number and the price of the report you want.
Searching through technical reports is a waste of time for some areas ofresearch. However, if you are working in an area supported by a major gov-ernment agency, the technical report is a valuable source of information. Someexamples of government-supported research are automobile driver safety,personnel training and selection, operator control of complex machines, andhuman decision making.
ELECTRONIC PUBLISHING
I am including electronic publishing under formal sources even thoughsome might believe I am giving it too much credit at this time. A wide rangeof electronic publishing is available, from researchers who decide to putthe latest draft of an article on their Web page to electronic journals that
How to Find Out What Has Been Done 119

120 Chapter Six
publish peer-reviewed articles similar in quality to printed journal articles.For this reason, it is sometimes difficult to determine the quality of whatone finds. Some experts have predicted that electronic publishing willbecome the dominant form of scientific communication and will eventuallyeliminate paper publishing entirely, but this has not happened yet. Theadvantages are obvious. The time between completing research and pub-lishing it can be shortened. People can immediately get the article offthe Internet and have a hard copy for only the price of printing it. Theresearcher can post succeeding drafts of the article and revise these on thebasis of comments from readers.
However, electronic publishing also has problems. Who will ensure thequality of articles? Professional associations that publish journals carefullyselect editors, and these editors send research manuscripts, which are sub-mitted to highly respected peer reviewers. In some cases an average of only10% to 20% of the submissions are chosen for publication, and only afterbeing revised and carefully corrected by a copy editor is the paper published.On the Internet anybody with access can create a home page and post aresearch paper. A second problem occurs when different drafts of a postedpaper are available. Which is the final version? Publications, particularly jour-nal articles, form the building blocks of our science, and as scientists we needto have some way of knowing whether a particular article is the sole blockthat will be added to the scientific structure. Finally, there is the matter ofmoney. Professional societies have generally been the keepers of the science.They have provided the infrastructure that has allowed the scientific enter-prise to expand in an orderly fashion. This infrastructure costs money, whichcomes largely from subscription fees paid by libraries and individual scien-tists. If articles are published at no cost on the Internet, where will the moneycome from to provide the scientific infrastructure?
These are just some of the issues yet to be worked out. Therefore, theAPA, the publisher of the largest number of prestigious journals, currentlyhas a policy that it will not consider for publication any manuscript that hasbeen publicly posted on the Internet. It takes the position that if a manuscripthas been posted, it has already been published. This doesn’t mean you cannotsend your manuscript by e-mail to selected people for comments. However,you should keep this policy in mind if you expect to eventually publish yourresearch in a standard scientific journal.
You should also keep some of these issues in mind when you are doingyour literature search. You may find some important articles on the Internet.In particular, articles that are posted on the home pages of well-knownresearchers are probably worth reading and citing in your paper. However, alot of junk is also available on the Internet. You should consider with skepti-cism the information you find using nonscientific search engines. There is nomandatory quality control on the Internet, so you will have to do your ownquality control. Before you cite information found on the Internet, be sure tocheck the credentials of the author and get the opinions of others experiencedin the field about the information being cited.

SEARCHING THE FORMAL LITERATURE
At this point the impossibility of searching through the mass of journals andbooks is probably boggling your mind. I don’t blame you; you could spendthe rest of your life in the library looking through publications as they arepublished and you would still fall farther and farther behind. Fortunately, theAPA has come to your rescue. One of their services is PsycINFO and is dedi-cated to creating products to help researchers locate the literature they need.Since 1927 the APA has published Psychological Abstracts, containing refer-ences and abstracts of articles. Until recent years students doing a literaturesearch would go to the many volumes of this publication in the library andmanually try to find articles related to their topic by using key terms orauthor’s names. It was a tedious but necessary task.
Today the availability of electronic communication has greatly simplifiedthis task. In addition to the Abstracts, APA also produces the PsycINFO elec-tronic database. Many larger libraries buy a site lease for PsycINFO and makeit available both on terminals in the library and, in many cases, remotely. Forinstance, at my university, students and faculty can use their personal com-puters to do a literature search from their dorm rooms or offices. The data-base contains more than 1.5 million abstracts of psychological literature from1887 to today, with about 5500 new references added each month. It includesarticles, dissertations, reports, English-language book chapters and books,and other scholarly documents.
Figure 6-2 shows an example of an entry from the database. The threebasic parts of an entry are a bibliographic citation, a summary, and standard-ized subject indexing. The bibliographic citation includes the title, the author
How to Find Out What Has Been Done 121
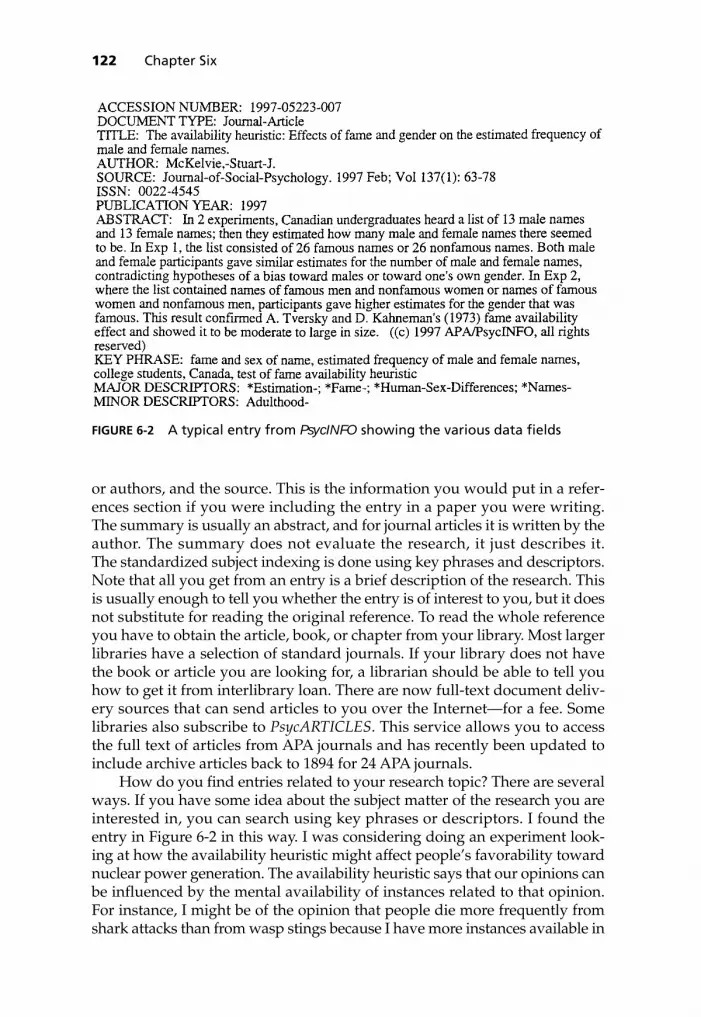
122 Chapter Six
or authors, and the source. This is the information you would put in a refer-ences section if you were including the entry in a paper you were writing.The summary is usually an abstract, and for journal articles it is written by theauthor. The summary does not evaluate the research, it just describes it.The standardized subject indexing is done using key phrases and descriptors.Note that all you get from an entry is a brief description of the research. Thisis usually enough to tell you whether the entry is of interest to you, but it doesnot substitute for reading the original reference. To read the whole referenceyou have to obtain the article, book, or chapter from your library. Most largerlibraries have a selection of standard journals. If your library does not havethe book or article you are looking for, a librarian should be able to tell youhow to get it from interlibrary loan. There are now full-text document deliv-ery sources that can send articles to you over the Internet—for a fee. Somelibraries also subscribe to PsycARTICLES. This service allows you to accessthe full text of articles from APA journals and has recently been updated toinclude archive articles back to 1894 for 24 APA journals.
How do you find entries related to your research topic? There are severalways. If you have some idea about the subject matter of the research you areinterested in, you can search using key phrases or descriptors. I found theentry in Figure 6-2 in this way. I was considering doing an experiment look-ing at how the availability heuristic might affect people’s favorability towardnuclear power generation. The availability heuristic says that our opinions canbe influenced by the mental availability of instances related to that opinion.For instance, I might be of the opinion that people die more frequently fromshark attacks than from wasp stings because I have more instances available in
FIGURE 6-2 A typical entry from PsycINFO showing the various data fields

my memory of shark attacks. In reality, however, mortality from wasp stingsis higher. In our experiment we asked people to give us either advantages ordisadvantages of nuclear power generation and then asked them to rate howfavorable they were toward nuclear power. We expected that just havingrecalled either the advantages or the disadvantages would make the advan-tages or disadvantages more available and thus bias the favorability rating.In this case I was interested in finding references relating to the availabilityheuristic, so that is what I entered into the search.
I got back a message saying that the search had produced about 50 doc-uments. I then began looking through the entries, one of which is shown inFigure 6-2. I read the title and abstract of this particular entry and determinedthat the entry was not close enough to my interests to look at the whole arti-cle. You can see why the search selected this article: Both the title and the keyphrase contain the term availability heuristic. This term could have appearedanywhere in the entry and the entry would have been chosen. I could havelimited the search by specifying which field to search. Each of the capitalizedwords indicates a separate field. So, for instance, I could have searched justthe KEY PHRASE field. Only 11 search fields are shown in Figure 6-2, butthere are actually 89 possible search field values.6 In this way you can limityour search to journal articles, or English-language references, or adult par-ticipants, and so on. With this method you would not have to search throughso many entries.
The exact procedures for conducting a search are too detailed to go intohere, and they change frequently. You can learn these procedures from alibrarian, from one of a number of booklets, and even online from APA(http://www.apa/psycinfo/). However, I will give you a general descrip-tion of the steps you will go through. First you should compose a narrativeof your search question. For example, suppose that you wanted to know,“Do people develop anxieties about using computers?” You should identifythe separate concepts in the question—for example, anxiety and computer.You should then use the electronic Thesaurus available as part of PsycINFOto find appropriate descriptors. The Thesaurus will allow you to explode ornarrow the terms as needed to customize the search for your purposes. Youshould do this step for each of your terms. For example, maybe anxietyshould include fear or phobia. You need to then combine your sets of descrip-tors using the words AND, OR, and NOT. Be careful when you do thisbecause these words have very specific meanings. AND means that youwant the search to be restrictive in that the entry will have to contain all theconcepts—for example, both anxiety and computer. OR gives a much widersearch and means that the entry could have either descriptor. NOT is usedif you are sure that you want to exclude all entries having a particulardescriptor.
How to Find Out What Has Been Done 123
6 You can learn more about these fields by going to the following World Wide Web address:http://www.apa.org/psycinfo/. This address will also go into much more detail about how to conduct an electronic search.

124 Chapter Six
Once the search is complete, the screen will tell you how many entrieswere found. If there are only a few or none, do not automatically assume thatlittle or no research has been done in the area. You should reevaluate the con-cepts in your question or view the few results to create modified descriptors.If the search has produced a few usable references, look at the descriptorslisted in the entries you have found to check whether any would be appro-priate for your search; add them to your search if they are. Try combiningyour descriptors in different ways to see whether this affects the number ofentries found. On the other hand, if your search has identified hundreds ofentries, scan through some of these to check whether there are research areasthat are of no interest to you and try to eliminate these entries by using a NOTor by combining descriptors in some other way.
Another way to search the electronic databases is to use authors ratherthan descriptors. Perhaps you know of an author or several authors who reg-ularly publish in your area of interest, or you have found several such authorswhile doing your descriptor search. You would probably want to enter theseauthors’ names into a search of the author fields of the database to see whatother things they have published. For example, while I was doing my searchon the availability heuristic, I knew that the originators of this term, DanielKahneman and Amos Tversky, had published other articles, chapters, andbooks on this topic, so I searched the database using their names and founda few more relevant references, as well as many more irrelevant ones. Be sureto use all the variants of the names, both with and without initials, becausenames are sometimes listed in a variety of ways.
When you have a reasonable list of entries from your various searches,sort through them on the screen, picking the most appropriate and “mark-ing” them electronically. Later you can print or download all the entries youhave marked or send them to yourself via e-mail. This list will provide youwith the information necessary to find the original articles, books, or chap-ters you want to read in full, and you can later select bibliographic entriesfrom the list to produce the references section of your research report.
I have gone into considerable detail about how to use PsycINFO becauseit is the most widely used database in psychology. However, there are otherscientific literature databases that psychologists find helpful. The library atmy university lists 22 different databases under psychology. For example,particularly for the clinical/medical side of psychology, MEDLINE might begood database to search. Using MEDLINE is quite similar to using PsycINFO.
Suppose that you were interested in bipolar disorder, which is one of themore common mental disorders studied by psychologists. You would enterbipolar on the line that says find. You would then fill in the various lines thatspecify whether the search should include finding the word in the title, in theauthor’s name, in a journal name, or anywhere; the span of time to besearched; how you want the results sorted; and whether you want only thecitation, the abstract, or the full record.
When I entered bipolar and specified that I wanted to do a search of titlesfrom 1995 to 2002, the search listed 250 citations. To make the search more

efficient you would probably want to narrow the search by adding keywords. Suppose that your real interest is in suicides by those diagnosed withbipolar disorders. In this case you could enter bipolar&suicide on the find line.When I made this change, the number of citations found decreased from 250to 15—a much more manageable number.
I would encourage you to visit your library either in person or electronicallyto find out which databases are available there. You may find databases in addi-tion to PsycINFO that will give you the opportunity to broaden your search,particularly if your area of interest overlaps a field in addition to psychology.
“TREEING” BACKWARD THROUGH THE REFERENCES
There is another way to do a literature search that is not as thorough as usingPsycINFO. However, this method is a good way of determining whether youhave missed any key research in your previous search. I refer to this techniqueas treeing backward through the references. The first step is finding the most recentarticle that deals with the topic of interest; this article will form the “trunk” ofyour research tree. Find the references at the end of the article. Many of thesereferences should also be relevant to your topic. (With any luck most of themare already on your list.) Each of these articles will also have a reference listfrom which you can select in the same way. Follow each reference list back-ward through the literature until you have found all the important articles thatform a new set of branches on your tree. This method can be helpful, but donot rely on it as your sole technique because you cannot always assume thatevery author has done a scholarly job of finding the important references.
How to Find Out What Has Been Done 125

126 Chapter Six
“TREEING” FORWARD THROUGH THE REFERENCES
To be thorough in your literature search, you can tree forward through thereferences as well as backward. For example, if you find a key article that isseveral years old and want to find more recent articles that have referencedthat article, you can use the Social Sciences Citation Index (SSCI)—a databasepublished quarterly and cumulated annually by the Institute for ScientificInformation. It covers nearly 1400 journals from virtually every social sciencediscipline. The SSCI now comes in both electronic and paper form. In eithercase you will be using a key article, and you will want to find all the articlespublished since the date of citation of the key article. For a paper search, youwould look through all the yearly volumes published since the key articlecame out. In each volume the key article would be listed, followed by each ofthe other articles that cited it. If you are doing an electronic search, you cansearch all the years at once and, as with other electronic databases, you canelectronically mark the citations you are interested in and have them printedout. Currently, the electronic database also allows you to base your search onthe subject or location of the article.
You can also recycle yourself by finding each article that cited the originalarticle, then treeing backward using the references for each of these new arti-cles. You may wish to take some of these newly acquired references, use themas key references, and go forward again. You can continue this process untilyou feel you have covered all the important references.
REPRINT REQUESTS
A professional courtesy among scientists allows you to get some journal arti-cles free. When authors get articles published, they usually order 100 or soreprints of the article from the journal. As long as these reprints last, the authorwill send one to you if you ask nicely. The usual way is to send a postcard say-ing, “I would very much appreciate receiving a reprint of your article entitled___________ that appeared in ___________.” You might also try sending the

author an e-mail rather than a postcard. If you know where the authorconducts research, you can probably find an e-mail address. For instance, if theauthor is a faculty member, simply go to the one of the search services that listscolleges, find the faculty member’s college Web page, then go to the psychol-ogy department Web page or the university directory, and you will usually findan e-mail address to use. While you are communicating with this author, youmight also ask for other articles dealing with the same subject if you have ageneral interest in the area of research. Be sure to include your address. Theauthor will usually send you a copy as a courtesy. In some cases the author mayhave the article in electronic form and can send it to you as an e-mail attach-ment. Do not be embarrassed to send out these reprint requests. Many youngerinvestigators who are trying to become familiar with research in a particulararea but do not have the resources to buy their own journals send out reprintrequests, and most authors find these requests flattering rather than a nuisance.
CURRENT RESEARCH
The Smithsonian Science Information Exchange provides a way of finding outwhat is going on in current research. Their current file contains records formore than 14,000 projects in all areas of the behavioral sciences. All these pro-jects are being supported by a funding agency such as the National ScienceFoundation. Each listing contains a 200-word description of the work beingperformed. You can order a package containing the listings for general topicareas such as “insomnia” or “behavior therapy with alcoholics.” There is a feefor this service that depends on the number of listings. The disadvantages ofthis system are the cost and the fact that only funded research is listed.However, it is one of the few means of finding out about ongoing research.
■ Informal Sources
PROFESSIONAL MEETINGS
As I mentioned earlier, to be completely up to date on the research in a par-ticular field, you must become familiar with informal sources of communi-cation. About 15 to 18 months prior to journal publication many investigatorspresent their research at a professional meeting by reading a paper. In fact,about one fifth of the articles published in major psychology journals arebased on materials previously presented at an APA convention (Garvey &Griffith, 1971). The APA annually sponsors a national meeting and sixregional conventions. In addition, many other non-APA professional groups,such as the Psychonomic Society, the Psychometric Society, and the Associa-tion for Psychological Science, sponsor meetings.
Of course, you can’t attend every single meeting or convention in yourfield. Thus, as discussed earlier, after some of the meetings, the papers pre-sented at the sessions are published in a bound volume called a proceedings,
How to Find Out What Has Been Done 127

128 Chapter Six
which is available in most libraries. In addition, just before the meetings,members of these organizations receive convention programs. You might beable to find faculty members in your psychology department who belong tothese organizations and get programs before the meetings. Once you knowthat one of these papers is of interest to you, simply send the author a reprintrequest. You will understand the paper better if you read it than if you listento it anyway.
The real reason for attending conventions, aside from engaging in super-fluous hedonistic activities,7 is to talk to other researchers doing work in yourarea of interest. Depending on how defensive they are, you might even find outwhat they are planning to do in the near future. In this way, you can fill in theinformation gap between “starts work” and “convention paper” in Figure 6-1.
By the way, if you learn something in one of these discussions that youmight wish to quote in an article, be sure to write it down, note the date, andget the person’s permission to use it. You can then cite the source in an articleas a personal communication.
RESEARCH GROUPS
Once you learn who does research in a particular area of interest to you, youmay find that they have set up an informal means of keeping one anotherinformed. In some cases this will be a group whose members send oneanother preprints of articles and papers as soon as they are ready or, in somecases, when they are in draft form. Today the Internet also offers a way formembers of these groups to interact. In some cases the purpose may be todistribute papers. In other cases the members of the group may haveresearch-related discussions via an electronic mailing list or a chat room.Sometimes such a group would be willing to have anybody who is interestedjoin in the discussions. Other groups are more restrictive, and you wouldhave to be invited to participate. Once you have established an interest in aparticular area of research, be sure to keep an eye out for such groups.They offer a valuable way of staying informed about the latest researchinformation.
FACULTY MEMBERS
Be sure not to overlook a handy source of informal help with your literaturesearch: the faculty members in your psychology department. Students aresometimes reluctant to approach professors, thinking that they will be toobusy to help them or even thinking that asking the faculty for help is someform of cheating. To the contrary, most are not only willing to help but alsoflattered to be asked. This kind of help is as much a part of teaching as
7 Havin’ fun!

standing in front of a class lecturing. And real researchers use whateversources they can find to help them conduct their research. Science is a teameffort in which the goal is the creation of the body of knowledge, not a strug-gle of researcher against researcher or student against teacher. So give it a try.You may be pleasantly surprised not only at the willingness of your profes-sors to help but also at how knowledgeable they are.
Although the written record of our science is maintained by the formalsources, the informal sources also perform a vital service for science. Theyoffer a forum for saying stupid but creative things. Your informal colleagueswill chuckle quietly and tell you where you are wrong. Your formal col-leagues are forced to guffaw loudly and boisterously tell the world where youhave gone wrong. With only the formal sources, few of us would have thecourage to try to move science by leaps and bounds, and we would stick withsmall, conservative steps. The encouragement and friendly discouragementoffered by informal contacts are important in shaping our thoughts into aform suitable for the formal literature.
I have tried to make this discussion of searching the literature as completeas possible. I hope that in doing so I haven’t made the process sound morecomplex than it really is. Many new investigators believe that a literaturesearch requires some sort of mystical power and many years of experience.However, if you follow the simple steps outlined in this chapter, you will findthat doing a thorough literature search can be a straightforward, satisfyingexperience.
■ SummaryA literature search is necessary to find out whether your experimental ideahas already been investigated, to determine whether similar experimentshave been done, and to see how your experiment will fit into the current bodyof knowledge. To do this search efficiently, you should understand the lines of
How to Find Out What Has Been Done 129

130 Chapter Six
communication within the scientific community and the time lag associatedwith various sources of information. It is usually most efficient to begin yoursearch in books that are relevant to your area of interest. Books describeresearch from the beginning of psychology up to about 13 years prior to cur-rent research. You can then use review articles to bring you within five to eightyears of current research. Journal articles will form the backbone of your liter-ature search. Meeting proceedings and technical reports can be an importantsource of information, particularly in applied fields. You can track downrelevant articles, books, and book chapters using either descriptor terms orauthor names through an electronic search with PsycINFO. You can double-check your search by treeing backward through the references of recentjournal articles. The Social Science Citation Index also allows you to treeforward through the references by determining which articles have cited aparticular earlier article. Informal sources such as papers read at professionalmeetings, personal communications, preprints, and even faculty members are avaluable way to learn about current and future research.

131
7How to Decide WhichVariables to Manipulate and Measure
We learned about various types of research in Chapter 1, discussed ageneral model of an experiment in Chapter 2, learned how to get an
experimental idea in Chapter 3, and considered ethics in Chapters 4 and 5.In Chapter 6 you probably learned more about doing a literature search thanyou wished to know. Now it’s time we got down to work, doing what exper-imental psychologists are supposed to do—experiments.
In this chapter we consider two decisions that have to be made whenplanning any psychology experiment, from the simplest to the most complex:We need to choose the independent and dependent variables.
■ Choosing an Independent VariableRecall from Chapter 2 that the independent variable is the one that the exper-imenter manipulates. Because the purpose of any experiment is to find theeffect of the independent variable on behavior, choosing this variable is aboutthe most important decision you have to make. At first blush it may seem thatthe decision should be rather straightforward—and for some experiments itis. For example, if you want to know whether people press a button inresponse to a light more quickly when a tone is given as a warning signal, theindependent variable is rather obvious: the presence or absence of the tone. If,however, you want to find out whether children are more aggressive afterexposure to violent versus nonviolent television programs, the independentvariable (violence) may be tougher to define. What constitutes violence ontelevision? Is Monday Night Football violent? Are Roadrunner cartoons violent?Are rap videos violent? Not everyone would agree on a particular definitionof violent television programs.
We believe that a concept has no meaning beyond that obtainedfrom the operations on which it is based.
W. R. GARNER, H. W. HAKE, & C. W. ERIKSEN (1956)

DEFINING YOUR INDEPENDENT VARIABLE
The problem here is that there is a difference in precision between what thegeneral public will accept in defining a term and what experimental psychol-ogists will accept. Experimental psychologists should provide operationaldefinitions of the independent and dependent variables, which means thatthey must specify the operations anyone must go through to set up the inde-pendent variable in the same way as they did. So an operational definition isa bit like a recipe, except the procedures and ingredients create a variablerather than a cake.
In the TV-violence experiment discussed in Chapter 2, the operationaldefinition would specify the steps required to determine whether certainshows are violent. For example, you could operationalize the concept of a vio-lent television program by showing each program to a randomly chosengroup of 100 people and requiring that 75% of them indicate a program is vio-lent before you operationally define it as violent. An alternative is to devise achecklist with such items as “Is there physical contact that causes harm toanother person?” “Has an illegal act taken place?” and “Did one person act soas to make another feel inferior?” You might specify that each programshould have at least 2 out of 10 such items checked “yes” for it to beconsidered violent. Again, such a procedure would specify exactly whatoperations any other experimenter must carry out to meet your operationaldefinition of violent television programs.
Psychology researchers have more difficulty agreeing on operationaldefinitions than do physical scientists.1 Galileo did not have to ponder over adefinition for mass before determining whether objects that have differentmasses fall at the same speed in a vacuum. Yet a great many important psy-chological questions require complex operational definitions: Do people
1 A physicist first used the term operational definition. However, in the physical sciences, opera-tional definitions are usually so widely accepted that physical scientists spend considerablyless time agonizing over the definitions than do behavioral scientists.
132 Chapter Seven

whose mothers are affectionate make more successful marriage partners? Dostudents learn more from popular professors? Does a worker’s morale affectwork output? Does anxiety cause depression? Before doing an experiment toanswer any of these questions, you need operational definitions for the termsaffectionate, successful, learn, popular, morale, output, anxiety, and depression. Trymaking up operational definitions for these terms: You will quickly see thepsychology researcher’s challenge.
For most concepts that you want to operationally define, you will findfrom your literature search that other investigators have already been facedwith the challenge of defining most of the concepts. The good news is that ifthey have done a good job, much of your work has been done for you. The badnews is that if you disagree with their definitions, you may have a difficult timegetting a new definition accepted. Science is rather conservative in that it doesnot like rapid changes. You can imagine the chaos if every investigator were toinsist on a different operational definition of each important concept. The sci-entific body of knowledge would resemble the Tower of Babel because every-one would be speaking a different language. So once a concept is operationallydefined, the definition carries some status, and it is sometimes difficult to con-vince others that a new one is needed. As you begin trying to operationallydefine the terms for your experiment, be sure to do a literature search and findout how others have defined the concepts you wish to investigate.
CHOOSING THE RANGE OF YOUR INDEPENDENT VARIABLE
Once you have defined your independent variable, you still have to choosethe range of the variable. The range is the difference between the highest andlowest level of the variable you choose. For example, suppose that we
How to Decide Which Variables to Manipulate and Measure 133

decided to define violent television programs by using our group of 100 peo-ple to classify each program as violent or nonviolent. We could choose to usetwo levels of violence in our experiment: those programs classified as violentby 100% of the people and those that nobody thought were violent. These twolevels of the independent variable would give us the largest possible range.
On the other hand, we might have defined the programs rated violent bymore than 50% of the people as violent and those rated violent by less than50% as nonviolent. These levels would obviously create a much smaller range.
How do we determine what the range should be? Unfortunately, I can’t giveyou any hard-and-fast rule for making this decision, for it is as much an art as ascience. However, following are some guidelines that you might find useful.
Be Realistic
First, you should try to choose a range that is realistic in that it is similar to thelevels found in the situation you will be generalizing to. You should avoid“sledgehammer” effects caused by setting the levels of the independent vari-able at such extremes that you are certain to find a difference in behavior.Some of the early medical research on marijuana was plagued by sledge-hammer effects. In some cases, experimenters gave mice the human equiva-lent of a truckload of marijuana per day! The experimenters got impressivebut impractical results.
Select a Range That Shows Effect
Within realistic limits, you should have a range that is large enough to showan effect of the independent variable on the dependent variable if such aneffect exists. For example, if you were interested in the effect of room tem-perature on manual dexterity in a sorting task and you chose temperaturesof 23°C and 25°C,2 you might conclude falsely that room temperature had noeffect on manual dexterity.
Real-world3 experimental situations require special attention be paid tochoosing a large enough range because the experimenter does not alwayshave complete control over the levels of the independent variable. You canchoose an approximate level, but the actual level may vary from trial to trial.For instance, in the lecture-pace experiment discussed in Chapter 2,I attempted to vary my lecture pace by speaking at a slow, medium, or fastrate. The levels I attempted to achieve were 100, 125, and 150 syllables perminute. But because I am not a machine that can be set at a particular speak-ing rate, I was bound to produce some variability around the desired levels.To determine my actual rate, we recorded the lectures and counted thenumber of syllables per second. Fortunately, the fastest lecture at the slow
134 Chapter Seven
2 For those who refuse to be converted to converting temperature in terms of Celsius, 73°F and77°F, respectively.3 I use the term real world to refer to nonlaboratory experiments designed to find answers to applied problems, not to imply that most people in universities are unreal. People who live in ivory towers shouldn’t throw snipes.

pace was still slower than the slowest lecture at the medium pace, so therewas no overlap of levels. However, if I had chosen a smaller range, I wouldhave had less chance of producing these reliable differences among the lev-els of the independent variable. Thus, in some nonlaboratory experiments,you must remember to make the range large enough that differences in thelevels of the independent variable are not covered up by the uncontrolledvariability of that variable.
Do a Pilot Experiment
Determining the best range for an experiment is, to some extent, guesswork.In some cases, during your literature search you may find experiments thatuse the same independent variable you are planning to use that can give youan idea about an appropriate range. However, if your experiment is originaland nobody else has used an independent variable similar to yours, youmay choose to do a pilot experiment.4
A pilot experiment is a small-scale ver-sion of the experiment you are planning;by performing this experiment you caniron out any problems before you pro-ceed. Because you need not report theresults of this experiment, you maybreak some of the rules of experimenta-tion here. For example, you might cajoleyour friends into participating, and youmight even serve as a participant your-self. You can also change the levels ofyour independent variable halfwaythrough a trial, stop the experiment, ordo only part of the experiment, depending on what you learn as you proceed.
When doing a pilot experiment, you will sometimes find that whatlooked good on paper just does not work. For example, I once discoveredduring a pilot experiment that a supposedly simple experiment I haddesigned required at least three experimenters to operate the equipment. Thepilot experiment may also help you determine whether the levels of yourindependent variable are what you expected. Levels that seem realistic duringthe planning stage of an experiment may seem unrealistic in the laboratory.By having a trial run, you can change an obviously inappropriate rangeof the independent variable before investing a great amount of time and effortin the experiment. The pilot experiment becomes the guide for futureexperiments, leading the experimenter through uncharted waters.
Although searching the literature and doing pilot experiments can giveyou some idea of an appropriate range for your independent variable, in theend you still have to make your best guess. If you turn out to be right, youcan claim good judgment. If you are wrong, you claim bad luck.
How to Decide Which Variables to Manipulate and Measure 135
4 I suppose the term pilot, in this case, is used in the sense of “guiding through unknownplaces,” as when a ship’s pilot comes on board to steer a vessel through unknown waters.

■ Choosing a Dependent VariableAs we know from Chapter 2, the dependent variable is a measure ofbehavior. We saw that we could choose an infinite number of behaviors tomeasure. Thus, in selecting our dependent variable, we must decide whatwe will measure.
OPERATIONAL DEFINITIONS AGAIN
Let’s return to the question “Will violent television shows cause a change ina child’s aggressiveness?” In this experiment, we clearly want to measureaggressiveness, but again we need an operational definition of aggressivenessso that we can determine whether a child’s behavior changes after viewingviolent television shows.
One way to develop an operational definition in this example would beto have a panel of judges watch a movie of each child in a free-play situationand then rate the child’s aggressiveness on a seven-point scale. Or we couldtell each child several stories about other children in frustrating situations andask the child what he or she would do in such situations. We could then usethe number of “direct-attack” responses as a measure of aggressiveness.Another alternative would be to observe children as they played with a selec-tion of toys we had previously classified as aggressive (such as guns, tanks,and knives) or nonaggressive (such as trucks, tools, and dolls). We could thenmeasure the percentage of time each child played with each type of toy. Youcan undoubtedly think of many other behaviors that would be an indicationof a child’s aggressiveness.
136 Chapter Seven

Sometimes, even when a dependent variable seems quite straightfor-ward, there can be problems with operationally defining it. For example,two investigators wanted to determine whether some predictions from atheory of evolutionary psychology would be supported by homicidefigures (Daly & Wilson, 1988). The theory predicts that people are muchless likely to kill blood relatives living with them than to kill geneticallyunrelated people living with them. Now, it would seem to be a pretty sim-ple matter to count homicides within a particular sample. But what exactlyis a homicide? In several countries homicide figures include all “murders,attempted murders, and manslaughters.” Should attempted murders andmanslaughters be counted for this study? For most manslaughters, such asa reckless auto accident, there is no intent to kill. Is intent important?If intent is important, perhaps attempted murders should be treated asmurders.
Should only the cases in which a conviction was obtained be counted asmurder? At first this conclusion might seem appropriate; we would not wantto include a case if the accused were innocent. But counting convictions maybe even more misleading. In a sample of homicides committed in Detroitin one year, 20 men were convicted for killing their wives, and nine womenwere convicted for killing their husbands. One might conclude that menkilled their wives more often. Actually, though, women kill their spousesmore often. But homicidal wives had their cases dismissed without trial 75%of the time, whereas homicidal husbands were spared a trial only 20% of thetime. As the researchers point out, counting only convictions may say moreabout the behavior of prosecutors than about the behavior of offenders!Unfortunately, as this example illustrates, operationally defining dependentvariables is no easier than doing so for independent variables.
With dependent variables, not only do we have to focus on determiningan operational definition, but we also have to know whether the measurementis reliable and valid.
RELIABILITY AND VALIDITY
A measuring instrument is perfectly reliable if we get exactly the same resultwhen we repeat the measurement a number of times under comparable con-ditions. The more variable the results, the less reliable is the measurementinstrument. A rubber ruler, for example, would not be very reliable. It mightmeasure a tabletop at 18 inches one time and 31 inches the next time. To findout how reliable the ruler is, we would have to measure many objects at leasttwo times and see how the results correlate (see Chapter 1). If the result of thefirst measurement is similar to that of the second, correlation is high, and wecan assume that the measurement instrument is reliable. If correlation is low,we know that the instrument is not very reliable.
To use our example of violent television programs, we might show thesame set of videotapes of each child’s behavior to a second panel of judgesand compare the aggressiveness ratings given by the two panels. If the panels
How to Decide Which Variables to Manipulate and Measure 137

gave similar ratings, we could feel more confident that ratings taken fromthese panels of judges were reliable.
Formally determining reliability is particularly important when thedependent variable is the score from a test instrument such as a test ofachievement, aptitude, or personality traits. The reliability of a standardizedtest will already have been tested, and a statistical value indicating thisreliability can be found in the test manual. However, if you use a test orquestionnaire that you constructed, you may have to determine its reliabilityyourself. There are several methods to do this. The most obvious is test–retestreliability, in which the same test is simply repeated on the same group at alater time. The reliability is determined by calculating a correlation coefficientusing two scores from each test taker (see Appendix A). However, the scoreon the second test given to the same person can be contaminated by theprevious testing. The events occurring during the interval between testadministrations can also influence scores. For these reasons, a second way todetermine reliability is the alternative-form method. A second test havingitems similar to the first is constructed and given to the same people. Againthe two scores for each person are correlated. A third way of establishingreliability is to use the split-half technique, in which a single test is statisti-cally split into halves (such as using odd versus even questions) and scoresfor the two halves are correlated. Some of the advantages and disadvantagesof using each technique for establishing reliability are listed in Table 7-1. Ifyour dependent variable is not a test score, you may not have to formallydetermine its reliability. Nevertheless, you should be aware of the necessityof having a reliable measure.
138 Chapter Seven
■ TABLE 7-1Advantages and Disadvantages of Three Methods of Determining Test Reliability
Reliability method
Test–retest
Alternative-form
Split-half
Advantages
It uses the same test items.It is simple to do.
It minimizes repeat-item contamination.
Little time passes beforeretesting.
It is useful for pretest–posttest designs.
It minimizes repeat-item contamination.
No time passes.It is done in one sitting.
Disadvantages
First testing may contaminatethe second.
Respondents may changewith time.
Use of different items lowersreliability.
Use of different items lowersreliability.
It requires a longer test.
Validity5 refers to confirming whether we are measuring what we want tomeasure. Suppose that we have a wooden ruler marked as 12 inches long, butit is really 24 inches long because each inch on the ruler actually measures2 inches. In this case, we could measure a tabletop many times, and the rulerwould indicate 11 inches every time. We have a reliable measuring instru-ment, but, of course, the measurement is wrong because we claim that we aremeasuring in inches when in fact we are not. Thus, we also need to knowwhether our measuring instruments are valid—that is, whether they measurein the same units as does a standard measuring device known to be valid.
In establishing our operational definition of aggressiveness, for example,suppose that we had decided to measure the percentage of time each child spentplaying with aggressive versus nonaggressive toys. If our stopwatch were work-ing correctly, this measurement would probably be reliable because we wouldget about the same reading when we timed the behavior again. However, peoplemight argue that our measure of aggressiveness is not valid. They might claimthat children tend to play with toys that they already know how to use. Becausethey have seen guns and tanks and knives used on violent television programs,they choose these toys to play with. Or they might claim that children can usetrucks and tools and dolls in aggressive ways and in nonaggressive ways. Toconvince them that your measurement is valid, you must compare it with somestandard that you both agree is a valid measure of aggressiveness. If your mea-suring instrument agrees with the standard, you can call it a valid instrument.
When a test score is used as a dependent variable, it is sometimes neces-sary to more formally establish the test’s validity and its reliability. The weak-est form of validity is face validity, which means that, on the surface, it looks asif the test measures what it is supposed to. Obviously, face validity is so sub-jective that it is not of much scientific use; all investigators think that their testshave high face validity. A more formal and defensible validation procedure is toestablish content validity. The subject matter covered by the test is carefullyanalyzed in detail for its content. The test is then designed so that it contains arepresentative sample of questions from each content area identified. For exam-ple, if you were to give a test that claimed to evaluate the reader’s comprehen-sion of this chapter, you would want to have test items that cover each majorconcept introduced in this chapter, such as content validity. A third validationprocedure is to establish predictive validity to determine whether the test suc-cessfully predicts some specific criterion. For example, the tests that high schoolstudents take for entrance to college are valuable in partially predicting the cri-terion of their college grade point average (GPA). A high correlation betweenthe test score and the GPA would indicate high validity. Concurrent validity isalso established by comparing the test score with a criterion, but in this case thetwo measures are taken at the same time. For example, if we were attemptingto construct a questionnaire to be filled out by our TV-watching children’sparents to measure their children’s aggressiveness, we might determine itsconcurrent validity by correlating the questionnaire score for each child with a
How to Decide Which Variables to Manipulate and Measure 139
5 For a more detailed discussion of types of validity, see Chapter 2.

teacher’s numerical rating of aggressiveness. As you can see, measuring adependent variable’s validity is even more difficult than measuring its reliabil-ity. Often the best we can do is to simply argue that our measures are valid froma logically defensible position.
DIRECTLY OBSERVABLE DEPENDENT VARIABLES
The closer you can come to directly observing a behavior, the less controversythere will be over your measure. However, if your interest is in determiningthe workings of the human mind, you should recognize that all dependentmeasures are, in a sense, indirect. For example, suppose you are interested inmemory and want to compare two ways of presenting material to be remem-bered. After a week you wish to measure how much your participantsremember. What should you measure?
That’s easy; just ask them what they remember. But suppose they cannotrecall any of the material presented in either way. Could you then conclude thatthey remember nothing? You might have given them a recognition test insteadand determined their accuracy at distinguishing previously presented mate-rial from new material. Or you could have had them relearn the material andmeasured the percentage of time saved the second time by having learned itbefore. Each of these methods might give you different answers to your ques-tion: How much do people remember? I hope you can see from this examplethat dependent variables, even those that at first appear to be directly observ-able, may be linked only indirectly to the behavior you are interested in.
Single Dependent Variables
Suppose we want to know whether people respond more quickly to a brightlight than to a dim light when signaled to push a button. We would probablystart a clock when a light goes on and stop the clock when each participantpresses a button. We should recognize that only one characteristic of theresponse is being measured. We could have chosen any number of other char-acteristics—how people press the button, for example. Does an individual
140 Chapter Seven

move her finger from the side of the button on one trial and from directly overthe button on the next? On one trial, does she miss the button on the first try?On another trial, does she hit the button lightly at first and then mash itdown? From this diverse set of responses, we chose to measure only one char-acteristic of the response: time from light onset to button depression. In otherwords, we selected a single dependent variable.
Any single dependent variable we choose may or may not be the appro-priate measure to take. For example, suppose that we ask people to use apencil to trace the outline of a star while looking at the star in a mirror.Because the mirror reverses everything, most people find this task verytough on the first few trials. If we want to measure the improvement fromTrial 1 to Trial 10 on this task, what dependent variable would best reflectthis improvement? The standard dependent variable used in these experi-ments is the number of times the participant’s tracing crosses the outline ofthe star. Figure 7-1 shows the tracings from two fictitious individuals whomwe will sagaciously call Participant 1 and Participant 2. On Trial 1, Partici-pant 1 crossed the boundary 20 times and on Trial 10, six times. For thisindividual, the dependent variable reflects the expected improvement in
How to Decide Which Variables to Manipulate and Measure 141
FIGURE 7-1 Star-tracing performance of two participants on Trials 1 and 10

performance. But look at Participant 2—this individual crossed the outline14 times on each of the two trials. Our dependent variable indicates thatParticipant 2 did not improve in mirror-tracing performance. Do youbelieve this conclusion?
The basic problem is that even when using a directly observable dependentvariable such as number of border crossings, we must be concerned with valid-ity. Border-crossing behavior is only one possible measure of mirror-tracing per-formance. Is it a valid measure? Other dependent variables might better reflectoverall mirror-tracing performance. As an alternative, we could have measuredthe total length of the tracing and determined what percentage fell within theborders of the star. Or we could have measured the area between the borderand the tracing for each trial. Or we could have timed the participants to findout whether they were tracing the star more quickly by the 10th trial.
Multiple Dependent Variables
One way of improving the chances that we are choosing appropriate behav-iors to measure in our experiment is by using multiple dependent variables.In fact, in some areas of experimental psychology, it is considered quite inap-propriate to report only one dependent measure. For example, many types ofresearch use choice reaction time as a dependent measure. Choice reactiontime is the time it takes to give one of several responses when one of severalstimuli6 occurs. Naturally, if people want to make as few errors as possible,they must respond rather slowly. If they are willing to be less accurate, theycan respond more quickly. This speed–accuracy trade-off makes it necessarythat both speed and accuracy be reported as dependent variables. If we areinterested in the overall level of performance, one measure is useless withoutthe other. For this reason, the better journals will not accept articles that reportonly speed or only accuracy of a choice-reaction-time response.
Composite Dependent Variables
Although reporting as many aspects of behavior as possible is generally agood idea, this practice can make interpreting the results much more difficult.Suppose we have four dependent variables: One measure shows greatimprovement across conditions, two stay the same, and one decreasesslightly. To say anything about the overall change in behavior, we need a wayof combining our single dependent variables into a composite dependentvariable that will give some indication of overall performance.
A number of areas in experimental psychology, such as intelligence testing,use composite dependent variables. The Wechsler Adult Intelligence Scale, ageneral test of IQ, is an example of a composite dependent variable. The IQ isa composite of two subscales, a verbal scale and a performance scale. The scoreon each of these subscales is a composite made up of subtests. For example, the
142 Chapter Seven
6 Because I haven’t used the term stimuli before, I should point out that stimulus is singularand stimuli is plural. It is time to expand your chant: “This stimulus is, this datum is; thesestimuli are, these data are.” Got that?

verbal score is derived from the scores on the following tests: general informa-tion, digit span, vocabulary, arithmetic, comprehension, and similarities. Theidea behind intelligence testing is that having a single measure that character-izes intelligence in general is useful. Of course, not all psychologists agree thata single number does adequately represent intelligence, but the use of com-posite dependent variables is traditional in the psychology of testing.7
A second type of composite dependent variable combines severalinstances of a single measure. These instances are taken at different times orunder different conditions. Percent savings is one such dependent variableused in memory research. Suppose, for example, that one group of peoplelearned to ride a bicycle when they were young and then did not touch a bikeagain until they were 40 years old. We could have them relearn bike riding,practicing for a number of trials until they could stay on for a minute with-out touching the ground. Suppose they required seven trials to do this. Wecould compare this number to the number of trials it takes a second group of40-year-olds who had never ridden a bike to stay on for a minute. Supposethat it took this group an average of 14 trials. We could then calculate thepercentage of trials saved by having learned to ride at an earlier age:
Number of trials to learn – Number of trials to relearn% saved � × 100
Number of trials to learn
In our example:
14 – 7% saved � × 100 � 50%
14
Through this type of composite dependent variable, you can use a singlenumber to show the effect of a change caused by the independent variable(past bike-riding experience).
It may not be clear to you yet how these composite dependent variablesare derived or why they are appropriate measures, but you will become famil-iar with many others if you do research in certain areas of psychology. Youmay even find yourself making up your own composite variables someday.
INDIRECT DEPENDENT VARIABLES
Sometimes, directly observing the behavior you are interested in is impossi-ble, yet we know that the ROT (repeatable, observable, testable) test of sci-ence requires that the behavior we are studying be publicly observable. How,then, can we do scientific research in such areas as emotion, learning, or intel-ligence? We need an indirect variable that changes along with the internalbehavior we are interested in.
How to Decide Which Variables to Manipulate and Measure 143
7 Stephen Jay Gould (1981) in his book The Mismeasure of Man took the radical position that theuse of a single number such as IQ as a measure of a person’s worth has been a major misuse ofscience in that century. He believed that this composite dependent variable has been largelyused to maintain social ranks and distinctions.

Physiological Measures
Probably the most popular types of indirect variables are physiological mea-sures, which are based on the idea that if the behavior is a private event, suchas an emotion, perhaps the physiology of the body will change along with theprivate event. Because modern technology allows us to observe changes inthe physiology of the body, experimenters use these changes to infer what theprivate event must have been.
Of course, when we use physiological measures to infer internal states,we are assuming that a unique physiological pattern accurately reflects aninternal state. For example, a polygraph, or lie detector, measures four phys-iological processes—respiratory rate, heart rate, blood pressure, and galvanicskin response.8 The operator uses these measures to determine whether a per-son is telling the truth. Some people doubt whether the assumption behindusing physiological measures is correct. For this reason, the results of a lie-detector test are admissible evidence in most courts only if both the plaintiffand the defendant agree to their use. Also, recently, federal law has severelyrestricted the use of polygraph tests in employment screening.
Other physiological measures become popular when researchers claim thatthese measures give an indication of some emotional state. The measures thenlose favor as other investigators show that the same type of physiological changecan occur with a different internal state. For example, an investigator namedHess at one point claimed that the diameter of a person’s pupil increases whenhe or she is thinking pleasant thoughts and decreases when the person is think-ing unpleasant things. For a while, the Madison Avenue advertising tycoonswere so impressed that they used pupillary responses to choose magazineadvertisements. Other investigators have since found that the diameter of thepupil is perhaps a better indication of the amount of information the person isprocessing than of the emotions he or she is feeling (Johnson, 1971). Pupillo-metricians are no longer as welcome on Madison Avenue as they once were.
More recently, some investigators have reported that the characteristicsof a person’s voice can be used for “psychological stress evaluation.” By tape-recording a voice, slowing it down, and measuring certain aspects of vocalfrequencies, these investigators thought they could tell when people are undergreat stress, such as they would be when lying. These claims were not supportedby research, and this measure is now considered worthless by many researchers.
In the past several decades, one of the fastest-growing areas of psychol-ogy is brain imaging, in which the activity of the brain can be measured asvarious tasks are being carried out. The early work often involved measur-ing general brain wave activity in the form of the electroencephalograph(EEG). This general pattern of activity, however, is not useful other than for
144 Chapter Seven
8 In case you are not familiar with the term galvanic skin response, it is not a rash caused by han-dling too many garbage cans. It is a measure of how well the skin will carry a small electriccurrent. Although not technically accurate, the reasoning goes something like this: Because wetskin carries electric current better than dry skin, a person who is “in a sweat” has a differentgalvanic skin response from one who is “cool and calm.”

determining a person’s overall level of arousal. More recently, researcherswere able to present a particular stimulus repeatedly and average the brainwave activity from either the time of stimulus presentation or the time ofresponse. With these event-related potentials (ERPs), small changes in thecharacteristic peaks and valleys of the EEG can be analyzed to determinewhat happens as changes are made in the stimulus presented or in the cog-nitive processing required by the task.
Even more recently, researchers were able to use physiological techniquesto map activity in various locations in the brain as tasks are being carried out.The most widely used technique is functional magnetic resonance imaging(fMRI). Researchers use fMRI to measure blood flow to various areas of thebrain. The general idea is that as a particular area of the brain is processinginformation, this mental activity requires an increased firing of neurons in thearea. As neurons fire they require an increasing blood supply. So if researchersgive participants a task to perform and then find an increasing blood flow toa particular area of their brain, they can infer that this area of the brain mustbe performing this task.
For example, suppose I measure blood flow using fMRI and have youview a particular word. In one condition I might simply have you read theword. In a second condition I might ask you to make a judgment about themeaning of the word. In each condition I can get a picture showing bloodflow to various areas of the brain, and by subtracting the first picture fromthe second, I can infer which areas must be used to process the meaning ofthe word. Researchers have used not only fMRIs to do this kind of work butalso computerized axial tomography (CAT scans), positron emission tomog-raphy (PET scans), and multiple-site EEGs. Great progress has been made inunderstanding the function of the human brain by using these techniques.9
As we learn more about what these measures can tell us, the use of physio-logical measures will undoubtedly increase.
How to Decide Which Variables to Manipulate and Measure 145
9 However, there are researchers who advise caution in the unquestioned acceptance of brainimaging as the royal road to understanding the brain (Van Orden & Paap, 1997).

Behavioral Measures
Some behavioral measures can also be used as indirect dependent variables.As with physiological measures, changes in the way a person performs abehavioral task can reflect the person’s internal state.
Indirect behavioral measures are particularly important in some areas ofcognitive psychology. Cognitive researchers are interested in determiningwhat goes on in the “black box” of the human mind during cognitive taskssuch as reading or problem solving. Because all they really have to work withare the inputs to (stimuli) and outputs from (responses) the box, they havehad to devise clever ways of inferring what must be happening in the box.Suppose, for example, that we want to know how much information isprocessed in completing a particular task. If we assume that limited resourcesare available in the brain for processing cognitive information, one way todetermine how much information is being processed is to measure how longit takes to make a response: The more information processed, the longer theresponse time will be. However, response time would give us only a singlemeasure for the entire task and would tell us little about the processingrequired for subtasks such as encoding or response selection.
Dual-task methodology offers an indirect way of determining the pro-cessing requirements of a task while it is being performed. In this case, whilethe task of primary interest is being performed (the primary task), a secondtask (the secondary task) is also presented. The participants are instructed todo the primary task as well as possible and to use whatever resources are leftover to do the secondary task. We can then measure performance on the sec-ondary task and infer what the processing requirements of the primary taskwere. The better the performance on the secondary task, the fewer resourcesthe primary task must have required. For example, the primary task might beto read a sentence. While the sentence is being read, tones are presented, andparticipants are instructed to press a button as quickly as possible wheneverthey hear a tone. We would infer that the slower the response to the tone, themore processing the sentence must be requiring at that time. With several tri-als, it would be possible to plot response times to the tones at various timeswhile the sentence was being read and thus get a profile of the processingresources required by the sentence (Martin & Kelly, 1974).
As with all indirect behavioral measures, this measure is only as good asthe assumptions that underlie it. In the case of dual-task methodology, the pri-mary assumption is that a single pool of processing resources providesresources for all cognitive tasks. Some researchers have questioned this basicassumption (Navon & Gopher, 1979; Wickens, 1984). Indeed, we now have evi-dence for the existence of multiple pools of resources and for the fact that thetype of pool used depends on whether the task is visual or aural, spatial or ver-bal, and so forth (Wickens, 1984). Even though some of the assumptions ofdual-task methodology have been disputed, the technique still seems to pro-vide a good measure of processing resources in many cases and is widely used.
Other indirect behavioral measures do not necessarily make the sameassumptions as dual-task methodology. However, in general, the more indirect
146 Chapter Seven
the measure, the more elaborate the underlying assumptions have to be, andthe less confident we can be of our inferences. The advantage of indirect mea-sures is that they do offer a way of investigating experimental questions forwhich we have no direct measures. As long as we are aware of the assumptionswe are making when using indirect measures, they can be a valuable tool forhelping us get an idea of the nature of otherwise unobservable events.
■ SummaryIn choosing an independent variable for your experiment, you must firstspecify an operational definition of the variable so that other experimenterswill be able to go through the same operations when they conduct similarexperiments. It is also important to choose the levels of your independentvariable so that the range is large enough to show the experimental effect butsmall enough to be realistic. A trial run, or pilot experiment, will sometimeshelp you in this decision.
The dependent variable must also be operationally defined. In addition,we must be able to show that the dependent variable is reliable and valid. Itis reliable if the same result is obtained every time a measurement is taken.When using test scores as a dependent variable, reliability of the test can bedetermined in several ways: test–retest, alternative-form, and split-half. Thedependent variable is valid if it agrees with a commonly accepted standard.There are several ways of establishing the validity of a test: face validity, con-tent validity, predictive validity, and concurrent validity. Directly observ-able dependent variables are relatively easy to measure, but deciding whichsingle dependent variable to use is sometimes difficult. Some areas ofresearch require that multiple dependent variables be reported or thatdependent variables be combined to form a composite dependent variable.Indirect dependent variables are used when the behavior we are interestedin is not publicly observable. Physiological measures may provide an indi-cation of internal states but are often difficult to interpret. Behavioral mea-sures such as dual-task methodology also offer the possibility of determininga participant’s internal state.
How to Decide Which Variables to Manipulate and Measure 147

148
8How to Decide on aBetween-Subjects versusWithin-Subject Design
Now you have chosen an independent variable to manipulate and adependent variable to measure. If everybody were exactly alike, you
would need to take only a single person and do your experiment on that oneindividual. Fortunately for the sake of having an interesting world, but unfor-tunately for your task as an experimenter, we are not alike. Because we areindividually different, you will have to use a sample of participants and try tominimize the variability by doing statistical tricks such as taking means.However, you have some choice about what to do with the variability causedby differences among participants, depending on how you choose to assignthem to the levels of your independent variable.
There are two basic ways of assigning participants: You can expose eachindividual to only one level of the independent variable, or you can exposeeach individual to all levels. The first method is called a between-subjectsdesign because the variable is manipulated between at least two subjects, orparticipants;1 the second is called a within-subject design because the inde-pendent variable is manipulated within a single subject, or participant.2
Table 8-1 illustrates the two methods of participant assignment for an exper-iment that has two levels of an independent variable. In the top design two
There may be said to be two classes of people in the world: thosewho constantly divide the people of the world into two classes,and those who do not.
ROBERT BENCHLEY
1Up to this point in the book I have been following American Psychological Association (APA)style guidelines by referring to those who participate in experiments as participants ratherthan as subjects. However, in this chapter the terminology gets a little awkward because thenames for commonly used designs and statistical tests have not yet changed to keep up withthe APA’s Publication Manual. So I will still refer to the designs and tests by their acceptednames (for instance, within-subject) but I will continue to refer to those being experimented on as participants. I hope we can all agree on a common terminology in the near future.2 Others have called within-subject designs Treatment × Subject designs or repeated-measures designson the same subjects. Between-subjects designs are sometimes called separate groups or independentgroups designs.

different sets of ten participants are assigned to each level; in the bottomdesign each of the ten participants is assigned to both levels.
Suppose that we want to do an experiment to determine whether takingrest breaks improves studying for students. In one condition we have studentsstudy certain material continuously for two hours. In the other condition thestudents study for a total of two hours but take a five-minute break after everyhalf hour. In either case they take a test at the end of the study period. Now,we could use a between-subjects design and have different groups of ran-domly selected students assigned to each study condition. Or we could use a
How to Decide on a Between-Subjects versus Within-Subject Design 149
■ TABLE 8-1The Assignment of Participants for a Between-SubjectsExperiment and a Within-Subject Experiment
Between-subjects
Within-subject
Independent variable
Level 1 Level 2
Participant 1 Participant 11Participant 2 Participant 12
· ·· ·· ·
Participant 10 Participant 20
Independent variable
Level 1 Level 2
Participant 1 Participant 1Participant 2 Participant 2
· ·· ·· ·
Participant 10 Participant 10

within-subject design, in which case the same group of students would studydifferent materials under each study condition. If we use different people inthe two groups, we have not only individual differences within the groups butalso a possible difference between groups. On the other hand, if we use thesame students, we know that though there are still individual differences instudying ability between students, there should be no overall difference in theability between the groups—they are the same people. However, because wemust use different study materials for the two conditions, there may bedifferences in the difficulty of these materials. Let’s consider some of theadvantages and disadvantages of the two types of designs in more detail.
■ Between-Subjects Experiments
ADVANTAGES
The biggest advantage of between-subjects designs is that exposure to one ofthe levels of the independent variable cannot contaminate the participant’sbehavior under other levels. Because each participant is exposed to only onelevel, you can effectively ignore the other levels for that participant.
Earlier in the book I described an experiment my students and I did inwhich we were testing the availability heuristic by having participants listthree advantages of nuclear power generation, or three disadvantages, orthree advantages and three disadvantages. After listing these, participantsindicated how favorable they were to nuclear power by marking a scale. Thisexperiment used a between-subjects design, so each participant listed threeadvantages or three disadvantages or both. What if we had used a within-subject design? In this case each participant would list three advantages andgive a favorability rating, and then list three disadvantages and give a rating,and finally list three advantages and three disadvantages and give a rating.Would this design accomplish what we wanted? Remember that the reasonwe expected the favorability rating to be affected by listing advantages ordisadvantages is that by making a list, those reasons listed were expected tobecome more available—more easily accessed in the mind of the participant.But once an advantage has become more available, how long does it take tobecome less available? Indeed, in this case if we had used a within-subjectdesign, once participants had been exposed to the first two conditions, list-ing three advantages and then three disadvantages, they would already havebeen exposed to the third condition: listing both.
For many experiments, such as the one just described, it is logically impos-sible to use a within-subject design because we cannot reverse the effects offormer exposure to other levels of the independent variable. In other cases, itmay be logically possible to reverse this exposure, but, as we will discuss laterin this chapter, the design can become much more complicated. In the end,even with sophisticated designs we are sometimes not sure about having com-pletely counteracted the effects of prior exposure. Because between-subjectsdesigns do not have this problem, they are sometimes preferred.
150 Chapter Eight

Doing between-subjects experiments also has some additional practicaladvantages. Because each participant performs under only one level of theindependent variable in a between-subjects experiment, we can collect moredata at this level during a single experimental session. Because participantsare likely to get tired or lose interest in what they are doing, it is easier to keepthe total experimental time short for each participant. You can also avoid bring-ing participants back for more than one experimental session, which is anadvantage because the number of individuals who actually complete an exper-iment tends to decrease dramatically with each additional session required.
DISADVANTAGES
The biggest disadvantage of a between-subjects design is that the groupsassigned to each level of the independent variable might not be equivalent toeach other on some dimension, and this dimension might bias the behaviorbeing measured. Whenever groups are formed with different people, it ispossible that the groups will be quite different. For example, in the experimentasking whether watching violent TV shows causes aggression in children, it ispossible that all the children assigned to the violent TV group might come fromdysfunctional families with a history of abuse, whereas all the children in thenonviolent TV group might come from wonderfully healthy families. But if chil-dren are randomly assigned to groups, it is not probable that this would happen.
When between-subjects designs are used, participants are usuallyassigned to the groups in a random fashion. This assignment can be done in anumber of ways, such as using slips of paper drawn from a hat, tossing coins,or selecting from random-number tables such as the one in Appendix C.People who have little experience with psychological experimentation orstatistics seem to have little confidence in random processes. They often thinkthat randomization is the equivalent of being haphazard or sloppy, and theybelieve that even with large groups there are likely to be sizable differencesin behavior. With experience and an increased understanding of statisticalsampling, researchers come to have considerably more confidence in randomassignment of participants. Additionally, although randomness may seemlike the ultimate in lack of orderliness, it is at least unbiased. It allows you toassign participant variability to the groups in an unbiased way. Especially forlarge groups, the likelihood that the groups are quite different on any behav-ioral dimension is rather small. On top of that, the statistical tests you do inanalyzing your data take potential differences due to random assignment intoaccount. Random assignment of participants for between-subjects experi-ments is actually quite effective in removing potential bias among groups.
■ Within-Subject ExperimentsAlthough within-subject designs are by no means the best choice for all exper-iments, they do offer a number of advantages.
How to Decide on a Between-Subjects versus Within-Subject Design 151
PRACTICAL ADVANTAGES
One practical advantage of a within-subject experiment is immediately obvi-ous from Table 8-1: Fewer participants are required. If N participants3 arerequired to give you an adequate number of data points at any level of awithin-subject experiment, then N × 2 participants are required for a two-level between-subjects experiment, N × 3 for a three-level between-subjectsexperiment, and so on.
In many cases, increasing the number of participants also substan-tially increases the total time required for an experiment. For example, if yourexperiment requires that you pretrain individuals to do a basic task before youexpose them to the experimental manipulation, you will have to pretrain twiceas many in a two-level between-subjects experiment as in a within-subjectexperiment. Suppose that you want to know whether requiring people toremember a certain number of words will interfere with their ability to per-form a complex tracking task, which in itself takes several hours to learn. Ifyou add levels to your independent variable (number of words presented formemory), you add no more pretraining time in a within-subject experiment.But in a between-subjects experiment, you increase the number of participantsand thereby the pretraining time.
It is common to conduct several practice trials at the beginning of anexperiment—a practice that also increases the time to do an experiment asyou include more participants. These practice trials are designed to minimizewarm-up effects—that is, the fast improvement usually found during the firstfew trials as participants get into a state of general readiness.
In addition to the inconvenience of using a large number of participants fora between-subjects experiment, at times the number of participants available toyou will be limited, especially when they must meet certain requirements. Forexample, you may need pilots, race-car drivers, or ballet dancers for certainexperiments. Or you may want participants to be afflicted with some disorderlike psychosis, color blindness, or left-handedness.4 In such cases, you may notbe able to find enough people who meet these requirements to use a between-subjects design, and you will need to rely on a within-subject experiment.
STATISTICAL ADVANTAGES
In addition to their greater efficiency, within-subject designs can be preferablefor statistical reasons. We take a brief look at statistics in Chapter 12, butI mention a few concepts here.
In an inferential statistical test, experimenters attempt to infer whether anydifferences they find among the data samples collected at the various levels ofthe independent variable are due to real differences in the behavior of somelarger population or due to chance. To make this inference, experimenters, in
3 I am using N here to refer to any given number of participants, such as 10 or 20, for a particu-lar experiment.4 Just kidding, lefties. (This was just a sinister joke!)
152 Chapter Eight

most of these tests, compare the differences between the average performancesat the two levels with an estimate of how variable the performance within eachof the levels is. With a statistical test, an experimenter is more likely to call a dif-ference real if the difference between levels is large or if the estimated variabilitywithin levels is small. An example will show you how logical this principle is.
Suppose a track-shoe manufacturer wanted to know whether to sell shoeswith 7-mm spikes or 13-mm spikes to the 100-meter dash runners on a men’strack team. To test these shoes, the manufacturer could randomly choose10 men from a college campus to wear one type of shoe and 10 additionalmen from the same campus to wear the other type. The men in the twogroups would probably be variable in their times to run the dash—from the300-pound, 38-year-old ex-bartender to the 125-pound, 19-year-old halfback.Their scores might look something like those in Table 8-2. If you calculate amean5 for the two groups, you find that those wearing 7-mm spikes average0.5 seconds faster than those wearing 13-mm spikes. Examining the times forthe two groups, would this difference convince you that the shorter spikeswere better for running the 100-meter dash?
Now suppose that the manufacturer decided to do a second experiment,using members of the men’s track team this time, and randomly assigned themto the 7-mm and 13-mm groups. Their scores might look something like thosein Table 8-3. Again there is a 0.5-second average advantage for the runnerswearing the shorter spikes. Would these data convince you that the shorterspikes were better?
Undoubtedly, you would be more likely to accept the difference foundin the second experiment as being a real difference. Because the scores in the
5 As will be discussed in more detail in Chapter 12 and Appendix A, a mean is the sum of theindividual scores divided by the number of scores that were added.
How to Decide on a Between-Subjects versus Within-Subject Design 153
■ TABLE 8-2Individual Times to Run the 100-Meter Dash for Two Groups of Randomly Chosen Men
Men wearing7-mm spikes
MikeBobHomerGeorgeHarryGordonJohnBillRandyTim
Time(in seconds)
11.718.212.215.415.813.213.719.112.916.0
Men wearing13-mm spikes
DonHectorRonTomSteveDalePeteJuanDanPaul
Time(in seconds)
15.713.418.012.813.619.016.211.914.618.0
Mean for 7-mm men = 14.82 seconds. Mean for 13-mm men = 15.32 seconds.Mean difference = 0.5 seconds.

second experiment are less variable, you probably feel that the differencefound there is less likely to be due entirely to chance variation.
Most of the variability in the first experiment’s scores was apparently dueto large individual differences in the men’s ability to run the 100-meter dash,regardless of the shoes. In the second experiment, much of the variability dueto individual differences among the runners was eliminated by choosingrunners who were more alike.
How could we make the participants even more alike in the two groups? Byusing the same participants, some first, some second! You should be able to seewhy a within-subject experiment having only one group gives you a statisticaladvantage here: It is the ultimate way to minimize the individual differencesbetween participants. By using a within-subject design, both you and statisticaltests are more likely to be convinced that any differences in performance foundbetween the levels of the independent variable are real differences.6
DISADVANTAGES
Because there are so many practical and statistical advantages to usingwithin-subject designs, why should we ever use between-subjects designs?Unfortunately, the within-subject design also carries some rather seriousdisadvantages. Although their position is debatable, some experimenterswould go so far as to say these disadvantages make within-subject experi-ments next to worthless: “The day should come then when no reputablepsychologist will use a within-subject design, except for a special purpose,
154 Chapter Eight
6 If you have a bent toward statistical rigor, you may have shuddered and blanched at my attempt to make the logic of inferential statistics intuitively palatable. I’ll be a little more rigorous in Chapter 12. But not much.
■ TABLE 8-3Individual Times to Run the 100-Meter Dash for Two Groups of Randomly Chosen Track-Team Members
Men wearing7-mm spikes
ArtSimonNickDarylRalphWillReubenEdFredWayne
Time(in seconds)
10.610.310.310.210.410.010.210.110.310.4
Men wearing13-mm spikes
RobFrankWaltGaryKenBryanDickStanRichMark
Time(in seconds)
10.811.010.810.610.810.710.610.710.711.1
Mean for 7-mm men = 10.28 seconds. Mean for 13-mm men = 10.78 seconds.Mean difference = 0.5 seconds.

without combining it with a separate groups [between-subjects] design”(Poulton, 1973).
As we discussed under advantages of between-subjects designs the basicproblem is that once participants are exposed to one level of the independentvariable, there is no way to change them back into the individuals they werebefore being exposed. The exposure does something irreversible, so we canno longer treat them as pure, uncontaminated, and naive. Some investigatorsrefer to the way previous exposures have affected participants as carry-overeffects. Because the way participants are changed also depends upon the orderin which they are exposed to the levels of the independent variable, these dif-ferences are sometimes called order effects. An order effect in a within-subjectexperiment occurs when the behavior resulting from a level of the indepen-dent variable depends upon the order in which that level was presented.
One way order can affect behavior is through learning. That is, what par-ticipants have learned during exposure to an earlier level of the independentvariable can affect later behavior. For example, suppose we want to knowwhether it takes someone longer to type on a standard QWERTY7 keyboardor on a newly designed keyboard where the more frequently used letter keysare under the fingers when they are in resting position. We decide thatbecause there are likely to be large individual differences in typing ability, wewill use a within-subject design. We take 10 people and find out how manyhours they have to practice to type 30 words per minute on a standard key-board. We then switch them to the newly designed keyboard and find outhow many hours they have to practice to type 30 words per minute on it. Wefind it takes them an average of 45 hours of practice to reach the criterion onthe QWERTY keyboard but only two hours on the new keyboard. Can weconclude that using the new keyboard is much easier? Obviously not.
During the first part of the experiment, in addition to learning the spe-cific skill of using a QWERTY keyboard, the participants were also learning ageneral typing skill. The general skill is confounded with the specific skill. Bythe time they typed on the new keyboard, their general typing skill wasundoubtedly at a higher level than when they started the experiment. Becausethe QWERTY keyboard always occurred in the first ordered position, the par-ticipants took longer to learn it because both a general skill and a specific skillwere being learned. Because the new keyboard always occurred in the sec-ond ordered position, it took less time to learn because the general skill hadalready been learned for the most part. Learning is one of the most commonorder effects. However, there are others, such as fatigue and maturationaldevelopment. Any time an effect changes systematically during the course ofan experiment, we need to be aware that order effects are possible and becareful to keep our independent variable from being confounded by order.
7 The QWERTY keyboard is named after the first six letters in the upper letter row of thestandard keyboard. Studies have shown that there are more optimal arrangements for the keysthat would make typing a bit faster. However, the effort required to retrain all the typists whoalready know the QWERTY system makes it highly unlikely that any new system would be widely adopted.
How to Decide on a Between-Subjects versus Within-Subject Design 155
Because of this disadvantage of within-subject designs, they are used farless frequently in some areas of psychology than others. For instance, investi-gators who study learning, memory, and some areas of social psychology, suchas attitude formation, expect to make long-lasting changes in their participantsby the very nature of the experiment. You cannot tell someone, “OK, nowforget that list of words I just had you memorize for 10 trials” and expect themto do so, or, “Change your attitude back to where it was before you read thatpersuasive bit of propaganda.” In these research areas, participants are usu-ally irretrievably contaminated by exposure to a particular level of the inde-pendent variable. However, there are other areas of research in which priorexposure has little effect. For instance, if we were studying people’s ability todistinguish between the intensity of two tones, it would be unlikely that expo-sure to a particular intensity difference would affect their ability to distinguisha second difference. In this case, and for many other experiments in areas suchas sensation and perception, within-subject designs are appropriate and areoften used.
COUNTERBALANCING
One way to minimize an order effect like learning is to counterbalance. Essen-tially, when you counterbalance, you admit that a potential confounding ordereffect is present. You also admit that you cannot control it or randomize it outof existence. So you attempt to distribute an equal amount of the confoundingeffect to each level of your independent variable. In this way, you hope, theorder effect will counterbalance itself and not bias any effect caused by theindependent variable.
To illustrate the concept of counterbalancing, I will use scales as shownin Figure 8-1. For a moment, let us pretend that we are omnipotent and knowthe actual size of the effects due to the independent variable and the con-founding variable. If we carried out a perfect experiment presenting two lev-els of our independent variable, A and B, we might find the result illustratedin the graph in panel 1 of Figure 8-1. We are assuming that no variables areaffecting the result other than the independent variable. The size of the effecton the dependent variable is 1 unit for level A and 3 units for level B. Becausethese quantities will be put on the scales, I have converted them to weights.By placing the weights on the scales in panel 2, we see that the pure uncon-founded effect of the independent variable is 2.
Because we are using a within-subject design and cannot present bothlevels of the independent variable at the same time, we obviously must haveseveral trials. Suppose that some confounding effect, like learning, increaseswith each trial, as shown in panel 1 of Figure 8-2. As you can see, on trial 1the effect of the confounding variable is 1 unit on the dependent variable,and by trial 4, it is four units. Again the effect size is converted to weights.What we wish to do is distribute these weights so that the scales are coun-terbalanced. In this way, the scales will show no bias when the independentvariable is added.
156 Chapter Eight
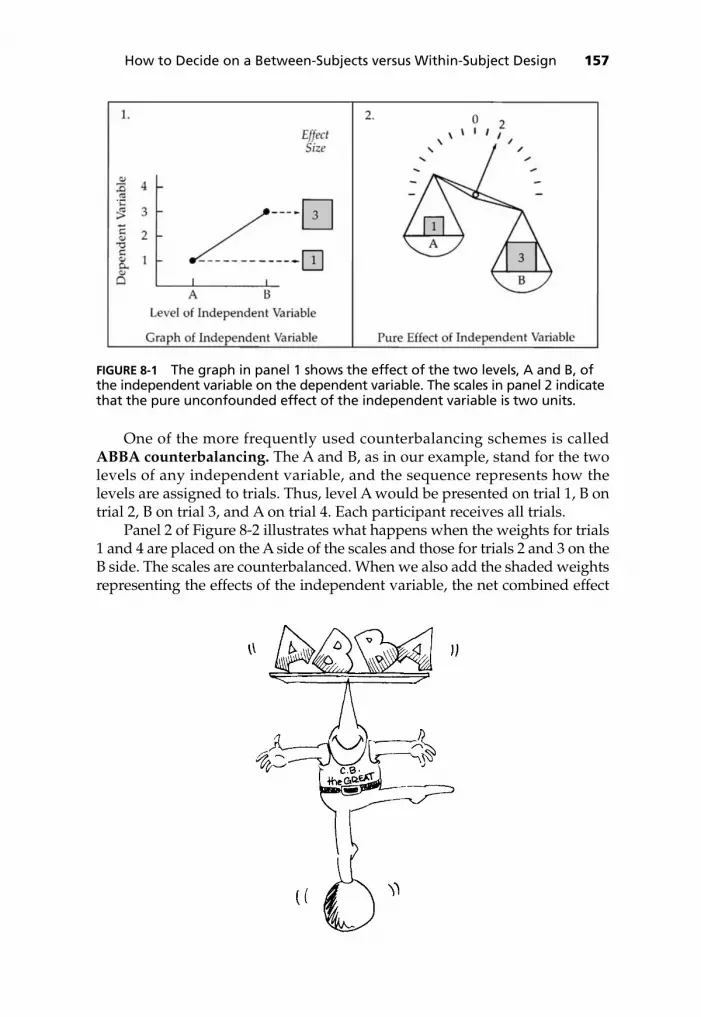
How to Decide on a Between-Subjects versus Within-Subject Design 157
FIGURE 8-1 The graph in panel 1 shows the effect of the two levels, A and B, ofthe independent variable on the dependent variable. The scales in panel 2 indicatethat the pure unconfounded effect of the independent variable is two units.
One of the more frequently used counterbalancing schemes is calledABBA counterbalancing. The A and B, as in our example, stand for the twolevels of any independent variable, and the sequence represents how thelevels are assigned to trials. Thus, level A would be presented on trial 1, B ontrial 2, B on trial 3, and A on trial 4. Each participant receives all trials.
Panel 2 of Figure 8-2 illustrates what happens when the weights for trials1 and 4 are placed on the A side of the scales and those for trials 2 and 3 on theB side. The scales are counterbalanced. When we also add the shaded weightsrepresenting the effects of the independent variable, the net combined effect

158 Chapter Eight
FIGURE 8-2 The graph in panel 1 shows the effect of a linear confounding variable on the dependent variable. The scales in panel 2 indicate that an ABBA ordering of the independent variable has successfully counterbalancedthe confounding variable. When the shaded weights, representing the effectsof the independent variable, are added in panel 3, a correct net effect of twounits is found.
is two, the original pure effect of the independent variable. Basically, this unbi-ased outcome is what we try to achieve with all counterbalancing schemes.
Before you wax too ecstatic over the beauty of counterbalancing, permitme to tell you that counterbalancing schemes are based on certain assump-tions, and when these assumptions are violated, the beauty turns into a beast.
One assumption of ABBA counterbalancing is that the confounding effectis linear—that it forms a straight line. To illustrate what can happen when itis not, let’s return to our weights. Suppose the confounding effect looks likethat shown in panel 1 of Figure 8-3. In fact, learning is the most likely candi-date for confounding, and most learning curves look a lot like this one; aninitial large increase in performance is followed by progressively smallerchanges. Converting to weights and stacking the weights according to an

ABBA design, we can see in panel 2 that the scales are not counterbalanced.They are biased by three units toward the B side. When the weights repre-senting the independent variable are added in panel 3, the net effect is fiveunits rather than the two units we omnipotently know it should be.
Under certain conditions, ABBA counterbalancing not only fails to correctfor a confounding variable but can compound the confounding problem.
An example of this is shown in Figure 8-4. The confounding effect firstimproves performance, then degrades it. Combining the effect of learningwith the effect of fatigue could cause such a function. I will let you work outthe size of the bias caused by the unbalanced confounding variable.
We have seen that ABBA counterbalancing can eliminate the effects ofa confounding variable in within-subject experiments, but only if the
How to Decide on a Between-Subjects versus Within-Subject Design 159
FIGURE 8-3 The graph in panel 1 shows the effects of a learning curve confoundingvariable on the dependent variable. The scales in panel 2 indicate that an ABBAordering has not successfully counterbalanced the confounding variable; the scalesare biased three units toward B. When the weights representing the effectsof the independent variable are added in panel 3, the net effect of five unitsoverestimates the effect of the independent variable by three units.

8 Sometimes it is called nondifferential transfer.
confounding effect is linear. If the effect is nonlinear, we must choose a differ-ent counterbalancing technique or else design a between-subjects experiment.
An ABBA-counterbalancing technique attempts to counterbalance ordereffects in a completely within-subject manner: The same participants get boththe AB order and the BA order. Other counterbalancing techniques treat orderas a between-subjects variable by counterbalancing order across individuals.In the simplest two-level case, one group of participants would receive ABand a second group, BA. The “A” data from groups one and two would beaveraged, as would the “B” data from both groups. If you use this method,the confounding effect does not have to be linear. However, you are still mak-ing the assumption that the effect of having B follow A is just the reverse ofthe effect of having A follow B (Poulton & Freeman, 1966). This assumption issometimes called an assumption of symmetrical transfer.8 When this assump-tion is violated and you get asymmetrical transfer instead, this type of coun-terbalancing is not effective.
Consider an experiment in which asymmetrical transfer was found—theinvestigator was interested in the effect of noise on complex performance(Aldridge, 1978; Poulton, 1979). The participants were first given a consonant-vowel-consonant trigram (for example, DOF) to remember for 16 seconds.While doing this memory task, they also listened to a series of “Bs,” spoken
160 Chapter Eight
FIGURE 8-4 A graph showing the effect of a complex confounding variable on adependent variable. Such a function could be caused by learning and fatigue.
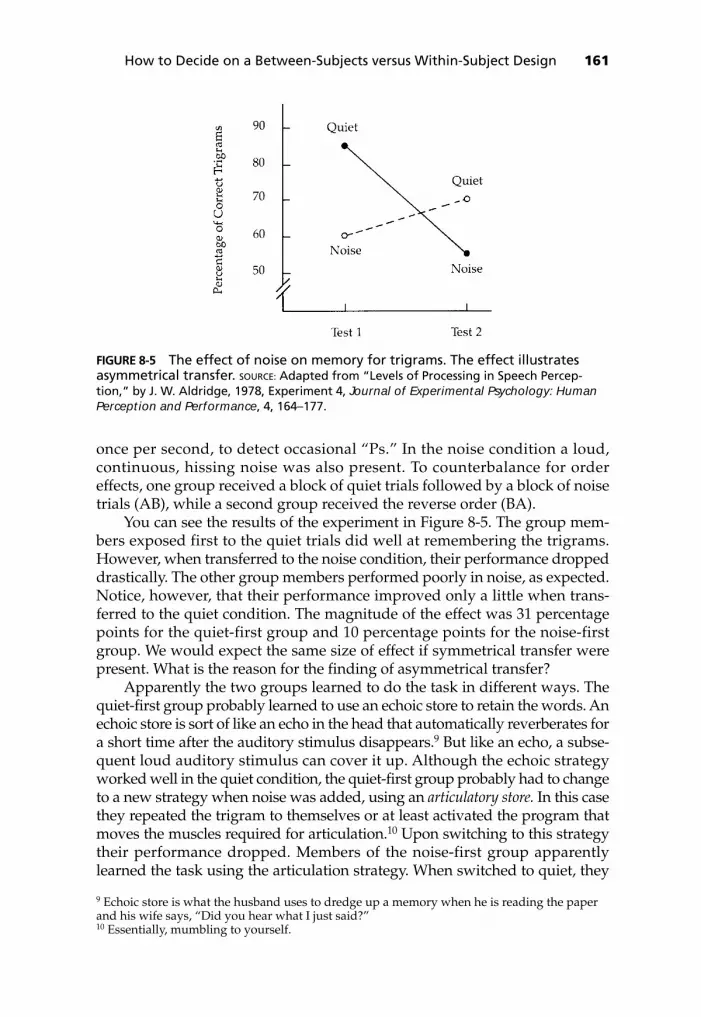
once per second, to detect occasional “Ps.” In the noise condition a loud,continuous, hissing noise was also present. To counterbalance for ordereffects, one group received a block of quiet trials followed by a block of noisetrials (AB), while a second group received the reverse order (BA).
You can see the results of the experiment in Figure 8-5. The group mem-bers exposed first to the quiet trials did well at remembering the trigrams.However, when transferred to the noise condition, their performance droppeddrastically. The other group members performed poorly in noise, as expected.Notice, however, that their performance improved only a little when trans-ferred to the quiet condition. The magnitude of the effect was 31 percentagepoints for the quiet-first group and 10 percentage points for the noise-firstgroup. We would expect the same size of effect if symmetrical transfer werepresent. What is the reason for the finding of asymmetrical transfer?
Apparently the two groups learned to do the task in different ways. Thequiet-first group probably learned to use an echoic store to retain the words. Anechoic store is sort of like an echo in the head that automatically reverberates fora short time after the auditory stimulus disappears.9 But like an echo, a subse-quent loud auditory stimulus can cover it up. Although the echoic strategyworked well in the quiet condition, the quiet-first group probably had to changeto a new strategy when noise was added, using an articulatory store. In this casethey repeated the trigram to themselves or at least activated the program thatmoves the muscles required for articulation.10 Upon switching to this strategytheir performance dropped. Members of the noise-first group apparentlylearned the task using the articulation strategy. When switched to quiet, they
How to Decide on a Between-Subjects versus Within-Subject Design 161
FIGURE 8-5 The effect of noise on memory for trigrams. The effect illustratesasymmetrical transfer. SOURCE: Adapted from “Levels of Processing in Speech Percep-tion,” by J. W. Aldridge, 1978, Experiment 4, Journal of Experimental Psychology: HumanPerception and Performance, 4, 164–177.
9 Echoic store is what the husband uses to dredge up a memory when he is reading the paperand his wife says, “Did you hear what I just said?”10 Essentially, mumbling to yourself.

probably maintained this less efficient strategy, and their performance improveda bit without the noise. Although this explanation is somewhat speculative,some additional data I am not bothering you with support the speculation.
One additional example might help you understand asymmetrical trans-fer. Suppose that you are interested in the effects of drinking alcohol oncomplex motor performance, such as driving a race car in a virtual realityvideo game. You have members of one group consume the equivalent of threedrinks during each of the first three, one-hour sessions that they drive the racecar. They then switch to racing the car sober for the next three sessions. Tocontrol for order, you have a second group do the reverse, going from soberto inebriated condition. You expect that each group will score fewer points onthe video machine when under the influence of alcohol. Depending on thespecific racing conditions, you may be amazed to find that members of thealcohol-first group actually drop in performance initially when switching tothe sober condition and that they never show as large an effect of the alcoholas those in the other group. Such an outcome would be an example of asym-metrical transfer due to state-dependent learning. When we learn a skill in aparticular state (not Idaho, but sober or inebriated) we tend to perform bestwhen put back into that state. Maybe you know someone who shoots poolbetter after a couple of beers; that’s state-dependent learning. In our experi-ment, state-dependent learning could cause asymmetrical transfer effectssimilar to those I have described. When you get such an asymmetrical trans-fer, no form of counterbalancing can save a within-subject design.
As you add more levels to your independent variable, you increase the com-plexity of a complete counterbalancing procedure. In a completely counterbal-anced design, every level has to occur an equal number of times and also followevery other level an equal number of times. Table 8-4 shows completely coun-terbalanced designs for two-, three-, and four-level experiments. As you can see,complete counterbalancing can become a monumental task when you have alarge number of levels or many independent variables. With large experimen-tal designs, it is possible to assign levels randomly or to randomize withinblocks, as described in Chapter 2. You can also sometimes use a technique calledpartial counterbalancing, in which you choose only some of the orders whilemaking sure that each level occurs the same number of times in each position.
A partial counterbalancing scheme often used with independent variableshaving more than two levels is a Latin Square, which ensures that each levelappears at every position in the order equally often. There are many possibleLatin Squares for a given number of levels of the independent variable.Perhaps the most useful of these is a balanced Latin Square, in which not onlydoes each level appear at every position in the order equally often, but eachcondition also precedes and follows each of the other conditions equallyoften. Suppose that we wanted to know how long it took people to read stan-dardized paragraphs presented on a computer screen in four different printfonts: Chicago, Courier, Geneva, and Times, and we were concerned that theorder of presentation might confound the experiment. Figure 8-6 illustrates abalanced Latin Square for this experiment. Note that each of the four print
162 Chapter Eight

How to Decide on a Between-Subjects versus Within-Subject Design 163
■ TABLE 8-4Completely Counterbalanced Design for Two-, Three-, and Four-Level Independent Variables
Two levels of independent variable Three levels of independent variable
Four levels of independent variable
*The letters A, B, C, and D represent the levels.
Number
12
Number
123456789
101112
Order of levels
AB*BA
Order of levels
ABCDABDCACBDACDBADCBADBCBACDBADCBCADBCDABDACBDCA
Number
123456
Number
131415161718192021222324
Order of levels
ABCACBBCABACCABCBA
Order of levels
CABDCADBCBADCBDACDABCDBADABCDACBDBACDBCADCABDCBA
Participant 1
Participant 4
Participant 3
Participant 2
1st 2nd 3rd 4th
Order of Presentation
Chicago Courier Geneva Times
Chicago
Chicago
Chicago
Courier
Courier
Courier
Geneva
Geneva
Geneva
Times
Times
Times
FIGURE 8-6 A balanced Latin Square for ordering the presentation of four printfonts to at least four readers

fonts appears in each position across the four participants. Taking Courier byway of example, also note, moving down the rows, that it is preceded byChicago, nothing, Geneva, and Times, and followed by Geneva, Times,Chicago, and nothing. Thus, we have satisfied the requirements of the design.In order for a Latin Square to work, you must have at least as many partici-pants as levels of the independent variable and, generally, some multiple ofthat number. This form of partial counterbalancing takes care of most of thepotential confounding variables due to order or asymmetrical transfer, but itleaves a few possible subtle confounds caused by possible interactionsbetween order and asymmetrical transfer. A fully counterbalanced design isstill best, but if you have too few participants, a Latin Square does pretty well.
You have seen that a counterbalancing technique is often necessary tominimize the sequential confounding effects found in some within-subjectexperiments. At this point, you should also be aware of the assumptionsunderlying the technique you are using and should try to use a counterbal-ancing technique that allows you to meet the assumptions. However, in someexperiments, such as those having asymmetrical transfer, it may be impos-sible to meet the assumptions, and you will have no choice but to use abetween-subjects design. One other potential disadvantage of within-subjectdesigns cannot be corrected by counterbalancing and may force you to use abetween-subjects design—range effects.
RANGE EFFECTS
Suppose you are the purchasing agent for a widget factory and you are order-ing a new set of working tables for widget assembly. You must choose theheight of the tables, and you want to make sure that the tables are of the rightheight to maximize production. You decide to do an experiment to determinethe correct height. You take one group of workers, Group A, and have themsit at tables of varying heights while you count how many blocks they canturn over during a three-minute period. The table heights you choose are –10,–6, –2, +2, +6, and +10 inches from elbow height. Having read this book,you realize that you could have a problem with sequential-ordering effects,so you carefully counterbalance the order of table heights.
After you have completed the experiment, your boss suggests that shewould like to see you test some tables of even lower height. You design anotherexperiment just like the first, except this time you have Group B use tables ofthe following heights: –18, –14, –10, –6, –2, and +2 inches from elbow height.
Figure 8-7 shows the actual results of this experiment. The startling thingabout the results is that the best table height is different for the two groups.Group A performed best at about elbow height and Group B at six inchesbelow elbow height. Why is this? In learning a task like turning over blocksat a table of a given height, people also learn a skill that is useful for othertasks, like turning over blocks on a table of a different height. The more alikethe two table heights, the better people can transfer the skill from one heightto the other. This is simply a basic principle of learning. So if we consider the
164 Chapter Eight

block-turning experiment to be a learning experiment, we would expect work-ers to perform best at the table height that is most like all the other tableheights used in the experiment. Table 8-5 shows the average difference inheight, in terms of inches, between each table height and the other five heightspresented for each group. For example, the difference between the +10 condi-tion for Group A and the –10 condition is 20, between +10 and –6 is 16, and soon. Adding all difference scores between +10 and each of the other five condi-tions for Group A and dividing by 5 produces a mean of 12. If we expect thehighest rate of work for the task that is most similar to the other conditionspresented in each experiment, we could do a fairly good job of predicting Fig-ure 8-7 from Table 8-5. You can now see why it is called a range effect; peopletend to have the highest level of performance in the middle of the range of lev-els presented because transfer of learning is highest in the middle of the range.Range effects can result from a within-subject experiment whenever stimuli or
How to Decide on a Between-Subjects versus Within-Subject Design 165
■ TABLE 8-5Average Number of Inches of Difference between Each Table Height and the Other Five Heights Presented
Table height
Group AGroup B
–18
12
–14
8.5
–10127.2
–68.57.2
–27.28.5
+27.212
+68.5
+1012
Text not available due to copyright restrictions

responses can be put in a consistent order. Poulton (1973) has noted examplesof range effects throughout most areas of experimental psychology.
Although Poulton and others warn against within-subject experimentsbecause of range effects, other investigators argue that in many cases within-subject experiments are preferable. Greenwald (1976), for instance, haspointed out that a range effect is simply a context effect. The participantcomes to the experiment with a context already established. In the table exam-ple, for instance, people are already experienced at using certain table heights.He suggests that repeatedly presenting an individual with only one level ofthe independent variable, as in a between-subjects experiment, will not elim-inate context. As repeated trials are given at a single level of the independentvariable, a new context develops—the context of the single level. For thesereasons, Greenwald claims that context effects cannot be avoided by usingeither type of design. He suggests that a more important question to ask inchoosing a design is to what situation you plan to generalize your results.
For example, in our violent–TV shows experiment, it could be more arti-ficial to repeatedly expose a child to one level of violence (a between-subjectsdesign) than to expose the child to several different levels. Because we wouldlike to generalize the results to a real-life situation having many levels,perhaps we should choose a within-subject design. That is, the range used inthe experiment should approximate the range found in the situation to whichwe are generalizing. As an experimenter, then, although you should be awarethat range effects could alter the outcome of your experiment, you shouldchoose the design that allows you to generalize your results to the appropri-ate situation.
So which design is preferable—between-subjects design, as claimed byPoulton, or within-subject design, as claimed by Greenwald and some otherresearchers who do only within-subject designs and single-subject designs?A reasonable position would be that it depends upon the particular experi-ment you are planning. As we have seen, in some cases, such as in the studyof attitude formation and some areas of memory, it is virtually impossible touse within-subject designs. There are also areas of research in which the mostsophisticated counterbalancing schemes may not be successful in correctingorder effects such as asymmetrical transfer. In other cases, such as when atherapeutic technique has been found to be successful, it can even be unethi-cal to use within-subject designs that may reverse the beneficial effects of thetherapy. On the other hand, using a participant as his or her own control is apowerful experimental procedure, one that reduces variability to such anextent that we can clearly see small but important effects of experimentalmanipulations. And some areas of research are relatively immune to prob-lems, such as order effects, found in within-subject designs: for example, inmemory research, the study of retention interval or memory loads; in per-ception research, the study of illusions or sound localization; and in attentionresearch, the study of priming. In these cases the most efficient and cleanestexperiments use within-subject designs. So as a researcher the best thing youcan do is to choose a design that best fits the type of research you are doing.
166 Chapter Eight

■ MatchingOne way to take advantage of a between-subjects experiment yet avoid some ofthe problems of individual differences between groups of participants is to usea matched-groups design. This simply means that you have to attempt toassign the same kinds of participants to each level of your independent vari-able. In the typical between-subjects experiment, you hope that the individu-als assigned to each level are pretty much alike, and you have randomizationon your side. Random assignment makes it likely that the groups will be essen-tially equivalent, and this becomes more likely with larger groups. However,because this is a random process, occasionally those assigned to each group willbe quite different, and you may incorrectly attribute differences in their behav-ior to the independent variable. That is, your experiment may be confoundedby group differences. By matching groups, you can minimize this possibility.
On what basis can you match the groups? You must match your groups ona variable that is highly correlated with the dependent variable. In our track-shoe experiment, it would be a waste of time to match the two groups of run-ners on the basis of IQ scores. Fast minds are not related to fast feet. However,we could have each runner run the 100-meter dash in tennis shoes first and thenmake up pairs of subjects: the two fastest, the two next fastest, and so on. Wecould then flip a coin to assign one member of each pair to each of the track-shoeconditions. In this way, we know that the groups are somewhat equivalent inrunning speed before introducing the independent variable. In this experiment,we are assuming a large correlation between tennis-shoe running times andtrack-shoe running times because the lower the correlation between the match-ing variable and the dependent variable, the less we gain by matching.
How to Decide on a Between-Subjects versus Within-Subject Design 167
Through matching, we decrease the probability of being wrong when we saythat the independent variable caused a change in behavior. Matching can alsoprovide a statistical advantage, in that when matched groups are used, a statis-tical test is more likely to say that a given difference in the scores of the dependentvariable is due to the independent variable rather than to chance. That is, the testsare more sensitive to any difference associated with the independent variable.
To illustrate this principle, the column on the left of Table 8-6 again lists therandomly chosen men who ran the dash in track shoes with 7-mm spikes (from

Table 8-2). To match participants, suppose we also had these men run the racein tennis shoes. The tennis-shoe scores are in parentheses. To get a matchinggroup, we now have many more men run the dash in tennis shoes, and wechoose as participants those who have the same times as the men in our origi-nal group. These new participants are listed in the column on the right, alongwith their tennis-shoe times in parentheses. Note that we have been able toeliminate any differences in groups for tennis-shoe scores; the scores are exactlythe same. Now we have the new group run the race in 13-mm spikes and findthat, as in our previous examples, there is an average 0.5-second increase in themean running time. Would you be more likely to believe that the difference inlength of spikes caused the 0.5-second average difference in running times inthe original random-groups experiment or in this matched-groups experiment?Statistical tests make decisions in much the same way you do.11
One disadvantage in doing matched-groups experiments is that it takeslonger to match the groups, so that experiments sometimes require twosessions, one for the pretest and one for the experiment itself. If you are plan-ning to use many participants anyway, the chances of getting large differencesbetween groups using random assignment are small, and the hassle of match-ing might not be worth the effort.
A final consideration is that the matching process itself may cause someproblems. We assumed in the example that the tennis-shoe pretest did not dif-ferentially affect the spiked-shoe test. Suppose, however, that the tennis-shoe
168 Chapter Eight
11 Note, though, that in the statistical tests used for matched-group designs you assume that youhave successfully matched on a variable highly correlated with the dependent variable. For thisreason, these tests are more conservative in calling a given difference statistically significant.So if you have matched on a variable that is not highly correlated with the dependent variableand use one of these tests, you are less likely to find a statistically significant effect than youwould if you had not matched in the first place.
■ TABLE 8-6Individual Times to Run the 100-Meter Dash for Two Matched Groups
Men wearing7-mm spikes
MikeHomerRandyGordonJohnGeorgeHarryTimBobBill
Time(in seconds)
(12.2) 11.7(12.8) 12.2(13.5) 12.9(14.0) 13.2(14.3) 13.7(16.1) 15.4(16.7) 15.8(17.0) 16.0(18.7) 18.2(19.7) 19.1
Men wearing13-mm spikes
VicJackBarryLarryJessStuartHarveySidPatJoe
Time(in seconds)
(12.2) 12.2(12.8) 12.6(13.5) 13.5(14.0) 13.8(14.3) 14.2(16.1) 15.8(16.7) 16.2(17.0) 16.6(18.7) 18.7(19.7) 19.6
Mean for 7-mm men = 14.82 seconds. Mean for 13-mm men = 15.32 seconds.Mean difference = 0.5 seconds.

How to Decide on a Between-Subjects versus Within-Subject Design 169
12 The discussion of whether to manipulate a variable within subject or between subjects is amoot point for some variables: gender, species, personality trait, IQ score, and so on.
■ TABLE 8-7A Summary of the Advantages and Disadvantages of Using Within-Subject and Between-Subjects Designs
Within-subject experiments
Advantages
Fewer participants are required.Experimental time is shorter.Variability between groups is smaller.
Disadvantages
Transfer between conditions is possible.
ABBA counterbalancing assumes linear confounding effect.
All counterbalancing assumes symmetrical transfer.
Range effects can cause problems.
Between-subjects experiments
Advantages
Transfer effects between conditionsare not possible.
Counterbalancing is not required.Matching can reduce variability
between groups.Random assignment of participants
eliminates bias.
Disadvantages
Differences between groups are possible.
More participants are required.More experimental time is required.Matching takes time and effort and
assumes no transfer from matchingoperation.
test taught the runners a smooth-shoe running technique that they couldtransfer to a later test. We might predict that the smoother the shoes on thelater test, the faster the runners will run. Because the shorter spikes are morelike smooth shoes, they will cause faster times. In this case, the pretest woulddifferentially affect the runners’ performance at the two levels of the inde-pendent variable.
Thus, matched-groups designs can be valuable under certain conditions,but they can also cause more problems than they solve. You should weigh thepros and cons of using a matched-groups design for your own experiment.Table 8-7 summarizes the advantages and disadvantages of the designs dis-cussed in this chapter. Obviously, you will want to consider these pros and conswithin the context of any experiment you are considering doing. When we dis-cuss multiple-variable experiments in Chapter 9, you will find that in manycases a single experiment will have both within-subject variables and between-subjects variables. For example, if we were interested in whether the effect ofpresenting a warning light on people’s reaction time to a tone was dependentupon gender, we might vary “warning light/no warning light” as a within-subject variable and “gender” as a between-subjects variable (obviously!).12

So for multiple-variable experiments it makes more sense to use theterms within-subject and between-subjects to refer to variables rather thanexperiments.
■ SummaryThere are two basic ways to assign participants to the levels of the indepen-dent variable: You can assign different individuals to each level or assign thesame ones to all levels. The first method gives you a between-subjects exper-iment and the second, a within-subject experiment. A between-subjectsexperiment offers an advantage in that participants are exposed to only onelevel of the independent variable, so the other levels cannot affect the partic-ipants’ behavior. In addition, experimental sessions can be shorter. The majoradvantage of a within-subject experiment is that variability due to individualdifferences is minimized. Some practical advantages of within-subject designsinclude using fewer participants and minimizing training and instructiontime. A disadvantage of within-subjects designs is the necessity to counter-balance order effects. An ABBA counterbalancing can control for ordereffects within a participant, but you must be able to assume that the ordereffect is linear. Complete counterbalancing of order across participants is alsopossible, but you must still make an assumption of symmetrical transferbetween conditions. In large experiments where complete counterbalancing isnot possible, one can use partial counterbalancing, random assignment, orrandomization within blocks. Even counterbalancing will not overcomerange effects in experiments where the stimuli or responses may be consis-tently ordered. Individual differences among the participants assigned to eachgroup representing a level of the independent variable can be reduced byusing a matched-groups procedure.
170 Chapter Eight

In this chapter we discuss single-variable experiments, which are the types ofexperimental designs making up nearly all the examples used in the book
to this point; in these experiments a single variable is manipulated at two ormore levels. We also discuss multiple-variable or factorial experiments, inwhich several independent variables are included in the same experimentand each of these is manipulated at two or more levels. In the psychologicalliterature, experiments with this design occur more frequently than any otherkind. Finally, we discuss converging-series designs, in which a number ofsingle-variable or multiple-variable experiments are done in sequence to testa hypothesis or theory.
■ Single-Variable Experiments
TWO-LEVEL EXPERIMENTS
In the simplest experiment, there is one independent variable having twolevels. Some investigators call the groups exposed to these levels the experi-mental group and the control group. In some cases it is obvious what the controlcondition should be: no application of a treatment. For example, if you wereinterested in the effects of a particular drug on a behavior, the control group
171
9How to Plan Single-Variable,Multiple-Variable, andConverging-SeriesExperiments
A carefully conceived and executed design is of no avail if thescientific hypothesis that originally led to the experiment iswithout merit.
R. E. KIRK (1968)
I have yet to see any problem, however complicated, which, whenyou looked at it the right way, did not become more complicated.
PAUL ANDERSON

would not receive the drug and the experimental group would. The controlgroup in this case would also be valuable to show that just being in the exper-iment was not causing the observed effect. In other cases, especially whenthere are several levels of the independent variable, it is not clear which oneshould be called the control level.1 For this reason, I will generally stick to theterm level to describe the independent variable. In any case, we must use atleast two levels to have a real experiment. Otherwise, it would be impossibleto say that a change in the independent variable caused a change in behav-ior, because no comparison is possible.
In the early history of experimental psychology the typical experimentreported was a single-variable, two-level experiment. Because our science wasyoung, investigators were more concerned with finding out whether an inde-pendent variable had any effect at all than in determining the exact nature ofthis effect. In addition, they had not yet developed some of the statistical testsrequired to analyze the more complex experimental designs. In some cases,tests existed but were generally not well known by the average investigator.
Nowadays, journal editors usually expect to see more than two levelsmanipulated in an experiment. They sometimes accept very well done two-level experiments, particularly when several experiments are reported, but atypical experiment usually has multiple levels. Nevertheless, as a first projecta two-level experiment is appropriate. New experimenters need to get theirfeet wet without drowning, and in some cases two-level experiments canprovide valuable results.
AdvantagesActually, two-level experiments do have several advantages over morecomplex designs. They offer a way of finding out whether an independentvariable is worth studying. If an independent variable has no effect on a per-son’s behavior, you obviously would be wasting your time doing a morecomplex experiment to determine the exact nature of the effect.
The results of a two-level experiment are also easy to interpret andanalyze. The outcome is simply “Yes, the variable did have an effect; thebehavior changed in this direction” or “No, the variable had no effect.” Todetermine whether any effect is real or due to chance variation, you usuallyhave to do a statistical test, and such tests for two-level experiments are easyto do. They may, for example, involve no more than counting pluses andminuses. Once you know which test to use, it should take you only a fewminutes of hand calculation (or a few seconds of computer calculation) tostatistically analyze your data.
Finally, in some cases you need no more information than a two-levelexperiment will give you. If the purpose of the experiment is to test two
172 Chapter Nine
1 For example, if we decided to vary sex (not how much you get, but which one you are) as the independent variable in an experiment, should we call men or women the control group?Feminists and masculinists could argue for days over this issue, so why not avoid it altogetherand assign the groups to Level 1 and Level 2?

competing theories and one theory predicts a difference in behavior for thetwo levels while the second predicts either no change or an opposite change,then a two-level experiment is adequate to distinguish between the theories.Also, in some types of applied research a two-level experiment can providevaluable information. For instance, if you want to pit two pieces of industrialequipment against each other and only two are available that can do the job,a two-level experiment gives you all the information you need. The sameprinciple holds if you are investigating two therapeutic techniques, two edu-cational systems, two training programs, two drugs, two sexes, or two levelsof any variable when only two levels are important or available.
DisadvantagesAlthough a straight line is the shortest distance between two points, it is notthe only line between two points. In other words, you are at a disadvantagein many two-level experiments because they will tell you nothing aboutthe shape of the relationship between the independent and the dependentvariables.
Suppose that we did an experiment to find out what type size this bookshould be printed in so that you would have to spend as little time as possi-ble struggling with my periphrastic prose. We might decide to use a wordprocessor to print several paragraphs. Some of the paragraphs would beprinted in 12-point type, and the others in a smaller 10-point type. We couldthen measure the time it takes people to read the paragraphs printed in eachtype size. Of course, we would pretest the paragraphs for comprehensibilityand counterbalance order and would do all the other good things we havelearned in this book.
Figure 9-1 shows the fictitious results for this experiment. The arbitrarystraight line drawn through the two data points indicates that the smaller theprint, the longer the reading time. Thus, the experiment has answered our
Single-Variable, Multiple-Variable, and Converging-Series Experiments 173
FIGURE 9-1 Possible results from an experiment measuring the time it takes toread paragraphs printed in 12-point or 10-point type

question: 12-point type makes for speedier reading. However, if we reallywanted to know the best print size out of all possible sizes and we chose thetwo sizes used in the experiment because they were our best guess, then wedon’t have enough information to make a decision. Our results give no indi-cation whether a straight-line relationship between type size and reading timeis true for any size other than 12-point and 10-point.
Figure 9-2 shows a number of other relationships that could also be theactual underlying relationship. You can see that not knowing the shape of therelationship makes interpolation questionable.2 We cannot correctly concludethat a print size halfway between 12-point and 10-point would give a read-ing time halfway between those sizes.
Extrapolating from two points is even more dangerous than interpolating.Most psychological functions have what are called ceiling and floor effects. Aceiling effect occurs when the dependent variable reaches a level that cannot beexceeded. Typical examples of ceiling levels are accuracy of response, 100%;probability of response, 1.0; and confidence in a response, 100%. In each ofthese cases, it is physically impossible for someone to produce a responseexceeding a particular value. (In other words, you can’t be more accurate than100%.) In other cases, although an absolute ceiling does not limit responses, asofter ceiling effectively does. For example, even with practice, the number ofitems we can hold in short-term memory has an effective ceiling—about seven.Likewise, within a finite period humans are effectively limited in the amount
174 Chapter Nine
2 Interpolation is an estimate of intermediate values within a known range; extrapolation is anestimate of values beyond a known range.
FIGURE 9-2 A number of possible relationships between type size and readingtime. All the functions pass through the same two data points.

of information they can process, such as the number of figures they can addup, the number of targets they can find in a display, the number of wordsthey can type, and so forth. The ceiling might not be so hard, but it is stillimpenetrable.
A floor effect is a value below which a response cannot be made. Forexample, no one can respond in fewer than zero seconds or give fewerresponses than none. Again, the floor need not be absolute. There may be asofter effective floor. For instance, the shortest time to detect a stimulus,although theoretically zero, is effectively about 150 milliseconds. If we taketwo data points and extrapolate to values above a ceiling or below a floor, wewon’t be in the attic or basement; we’ll be in hot water! And sometimes it isnot obvious where a ceiling or floor should be. To avoid these problems, youshould make it a rule in a two-level experiment not to interpolate or extrap-olate beyond the levels used in the experiment.
Two-level experiments are also sometimes of limited theoretical value.We agreed in Chapters 1–3 that science is built on relationships and that sci-entists use theories to explain the relationships found in experiments. Each
Single-Variable, Multiple-Variable, and Converging-Series Experiments 175

theory competes with other possible theories until an experiment is done thatsupports one theory, leading to the exclusion of the others. Because manytheories predict that a change in an independent variable will cause thedependent variable to change in a particular direction, the outcome of a two-level experiment will often fail to distinguish among competing theories.Other than when opposing theories predict changes in opposite directions, orone predicts a change while the other does not, theory testing usually requiresmore complex experimental designs.
MULTILEVEL EXPERIMENTS
Multilevel experiments are single-variable experiments presenting three ormore levels of the independent variable. Some investigators also call themfunctional experiments because these experiments allow you to get some ideaof the shape of the function relating the independent variable to the depen-dent variable.
AdvantagesThe major advantage of a multilevel experiment is that its results allow us toinfer the nature of the experimental relationship. Even if an experiment hasonly three levels, it still provides us with a much better idea of the shape ofthe underlying relationship between the independent and dependent vari-ables than a two-level experiment does.
Suppose that we want to know how a student’s anxiety level influencestest scores. We decide to use two introductory psychology classes3 and a two-level, between-subjects design. In Class 1 the instructor spends five minutesbefore each major exam haranguing the students about the importance ofgrades for success in school. She makes it clear that students with the bestgrades get the best jobs, that students with college degrees earn a far largersalary, and that the university is a bit overcrowded at the moment.
In Class 2 she also gives a five-minute talk before each exam. In this talk,she reminds the students that making a good grade is not as important aslearning the material. She tells them that 10 years from now they won’tremember what grade they got on this test anyway. In this experiment, weare careful to control as many potential confounding variables as possible,such as grade level, test difficulty, and class instruction. Thus, we decide thatthe difference in test scores can be attributed to the anxiety produced by thetalk. Assuming that the first speech causes a high level of anxiety in thestudents and the second, a lower level, we might get the results shown inFigure 9-3.
At this point the best guess we could make is that there is no relationshipbetween anxiety level and average test score; a straight line drawn through
176 Chapter Nine
3 Because here we are using two classes that already exist rather than assigning students to the classes in a random manner, this example is not really an experiment but uses a quasi-experimental design that is discussed in Chapter 10. I hope you noticed this difference.

the two points is flat. Suppose, however, that we had decided on a multileveldesign and added a third anxiety level, a neutral level in which the instructorgives a five-minute speech simply reminding the students of some proceduraldetails. Figure 9-4 shows imaginary results for this multilevel experiment.
When we graph the third data point, we see that there is, in fact, animportant relationship between anxiety level and test scores,4 although somedoubt exists about the exact shape of the function. Any of the three shapesshown in Figure 9-4 seem to be good possibilities; and because most psycho-logical functions do not take sharp turns or change directions rapidly, weknow that not many other relationships are possible. As you can see, the thirddata point allows us to get a much better idea of the shape of the experimen-tal relationship. As we add progressively more levels to our experiment, wecan make even better guesses about the true functional relationship betweenthe independent and dependent variables. We can also interpolate andextrapolate from our data points with more confidence. In this example theneutral group that we added could be considered a control group because theteacher was not trying to influence anxiety at all. Another control group, inwhich the teacher said nothing, could have been added to determine whethersaying anything at all affects behavior. Multilevel experiments give this kindof flexibility.
This example also illustrates a second advantage of a multilevel experiment:Generally, the more levels you add, the less critical the range of the indepen-dent variable becomes. As you recall from our discussion in Chapter 7,although the range should be realistic, it should also be large enough to showa relationship if one exists. Obviously, both of these requirements become
Single-Variable, Multiple-Variable, and Converging-Series Experiments 177
FIGURE 9-3 Imaginary results from a two-level experiment varying the anxietylevel of students and measuring their average test score
4 If you have had a course in motivation or attention, you may recognize this function as aform of the Yerkes-Dodson law, in which an inverted U describes the relationship betweenarousal and learning. Good for you!

easier for us to satisfy as more levels of the independent variable are repre-sented in the experiment.
DisadvantagesFrom a practical point of view, the major disadvantage of a multilevel exper-iment is that it requires more time and effort than a two-level experiment.Recall that every time we add a level to a between-subjects experiment, weincrease the number of participants needed. In within-subject experiments,additional levels do not increase the number of participants needed, but theydo increase the total time of the experiment and make counterbalancingschemes more ponderous.
The statistical tests required to analyze multilevel experiments are also abit more difficult to do. They take more time, and it is harder to interpret thedata in light of the statistical test.
In weighing the advantages and disadvantages of two-level versus mul-tilevel designs, these slight additional costs of adding levels to the indepen-dent variable are usually more than offset by the value of the informationgained. This benefit is especially valuable for the first few extra levels addedto the design. At some point, of course, adding more levels will do little toincrease our knowledge of the experimental relationship.
So far we have been pretending that all experiments have only one inde-pendent variable. However, this restriction has been more for the purpose ofdiscussion than it has been a reflection of the real world. Many of the exper-iments that you will want to do will use more than one independent variable.Here I discuss some of the general strategies used in designing progressivelymore complex experiments.
The most frequently used design in experimental psychology is a factorialdesign. To understand the results of most experiments published in psychologyjournals, you must understand the logic of factorial designs.
178 Chapter Nine
FIGURE 9-4 Imaginary results from a three-level experiment varying the anxietylevel of students and measuring their average test score

■ Factorial DesignsThe typical way to combine several variables is in a factorial combination thatpairs each level of one independent variable with each level of the second andthe third, and so on. The independent variables in such a design are alsocalled factors.5
As an example of a factorial experiment, suppose that you want to knowwhether a group with a leader is faster at reaching a consensus than a groupwithout one. You need to decide which circumstances you will control andwhich you will let vary: Should all group members be of the same gender ornot? Should communication be structured or free? Should you give the groupan easy or a hard problem to solve? You may find it unsatisfactory to controlor randomize all these factors. For example, you might feel that the effect ofa leader on a group’s efficiency could depend on the size of the group, inwhich case you might choose to vary both leadership and group size as fac-tors. Suppose that you choose two levels of leadership—with and without—and four levels of size—3, 6, 10, and 20 members.
Figure 9-5 shows the usual way of representing such a factorial experi-ment. As shown in the figure, a matrix is formed with one factor on each side.The boxes within the matrix are called cells. As with the simpler experiments,participants are assigned to the various cells in a random manner. In theexample, the upper left cell would have the participants assigned to groupswith three members, one of whom is made the leader. You can see that anyrow or column by itself forms a simple single-variable experiment. The exam-ple we have chosen is called a 2 � 4 design6 because one factor has two levels,and the other has four.
Only your imagination and the population of the world limit the numberof factors represented in a factorial design. Suppose that we think that
Single-Variable, Multiple-Variable, and Converging-Series Experiments 179
5 Some investigators also call them treatments, which leads to the term treatment combinations.In building our science, we emulate the biblical folk building the Tower of Babel; no one canagree on the language. It’s enough to make a new investigator a babbling idiot!6 The “�’’ in this expression is read “by,’’ not “times.’’ Thus, an English (rather than algebraic)reading of this design would be a two-by-four design.
FIGURE 9-5 A schematic representation of a 2 � 4 factorial design. One factor,leadership, has two levels: with and without. A second factor, group size, hasfour levels: 3, 6, 10, and 20 members.

group–decision-making time differs not only with leadership and size butalso with the gender of the members. We make gender a third factor havingthree levels. Three levels? Right—men, women, and mixed (approximatelyhalf men and half women). Figure 9-6 shows a schematic of this expandeddesign,7 which would be called a 2 � 3 � 4 factorial design.
In Chapter 8 we examined within-subject and between-subjects experi-ments, which was appropriate because we were just considering single-variableexperiments. With factorial experiments, the factors themselves become within-subject and between-subjects, and both kinds of factors can be included in asingle factorial experiment, sometimes called a mixed factorial design. In ourleadership experiment, for example, we could have assigned a different set ofgroup members to each cell, making both factors into between-subjects factors.Or we could have decided to create a mixed design by having the same mem-bers of each group function both with and without a leader. In this case, groupsize would still be a between-subjects factor, but leadership would be a within-subject factor. In deciding whether to make a particular factor within-subjector between-subjects, the advantages and disadvantages of each, as discussedin Chapter 8, would have to be considered. If necessary, appropriate counter-balancing for within-subject factors would also have to be used.
ADVANTAGES
The major advantage of a factorial experiment is that we can study interactions.An interaction occurs when the relationship between one independent variableand the participant’s behavior depends on the level of a second independent
180 Chapter Nine
FIGURE 9-6 A schematic representation of a 2 � 3 � 4 factorial design. Thefactors are leadership (with and without), gender (male, mixed, and female),and group size (3, 6, 10, and 20 members).
7 Schematically representing more than three factors becomes a bit more difficult. Three-dimensional paper is hard to come by. Experimental designs, however, are not limited bythree-dimensional space. They are just difficult to represent in a two-dimensional drawing.

variable. For example, a group of three may make decisions easily with orwithout a leader, but as the group gets larger, we may find that groups with-out leaders take progressively longer to reach a consensus. Thus, the relation-ship between leadership and decision time depends on the size of the group.Figure 9-7 shows a graph of such an interaction. As you can see, the time tosolve a problem is unaffected by whether there is a leader for a group of threepeople. However, as the groups get larger, having a leader becomes importantfor minimizing the time to reach a solution. Two single-variable experimentswould not provide us with information about such interactions; they wouldsimply allow us to see the general effect of either leadership or group size. Onlya factorial experiment allows us to investigate interactions.
Remember in Chapter 2 when we considered the infinite number ofcircumstances that could determine behavior? We decided that to do anexperiment, we would have to pick one of these circumstances to be our inde-pendent variable. The other circumstances would either be controlled or beallowed to vary in a random fashion. Once we determined the effect of thiscircumstance on behavior, we could choose another circumstance to study.The problem with this approach is the naive assumption that once we knowthe effects of each independent variable, we can simply add them togetherand account for the behavior. This assumption totally ignores interactiveeffects among the circumstances. Ignoring interactions when we expect themto exist can lead us into making wrong conclusions.
In designing a single-variable experiment, when you are consideringturning any circumstance into a control variable and thinking that the resultscould be affected by the level you choose to set the variable, you are worriedabout a possible interaction. The words it might depend should tip you off.Does having a leader speed up group problem-solving times? It might dependon the size of the group. Does print size affect reading speed? It might depend
Single-Variable, Multiple-Variable, and Converging-Series Experiments 181
FIGURE 9-7 These hypothetical results show a possible interaction of leadershipwith group size. Note that for the smallest group, problem-solving time isindependent of leadership, but for larger groups, leadership makes for shorter solution times.
With Without
Leadership
20
10
6
3
Group Size
Prob
lem
-Sol
ving
Tim
e

on the age of the reader. Does watching violence on TV affect children’saggressiveness? It might depend on how much they watch. Whenever youthink that the outcome of the experiment you are designing might depend onsome other circumstance, you are in some danger of making an error if youmake that circumstance into a control variable or a random variable. Takingthe experimental results shown in Figure 9-7, we can suppose that rather thandoing a factorial experiment, we had decided that a single-variable experi-ment was good enough. If we had made group size into a control variableand chosen to use only groups of three, we would have concluded that prob-lem-solving time was unrelated to leadership. On the other hand, if we hadchosen groups of 20, we would have concluded that leadership had a largeeffect on problem-solving time.
The situation is not much better if we turn the it might depend circum-stance into a random variable. In a leadership experiment having the outcomeshown in Figure 9-7, if we had randomly chosen group sizes between 3 and20, we would simply have underestimated the potentially large effect of lead-ership. In other words, we would have found a smaller effect of leadershipbecause it would have been averaged across the sizes of our random-sizedgroups. Suppose that the underlying interactions were of a different form,such as the ones shown in either panel of Figure 9-8. In this case, if group sizewere a random variable, we would again be averaging across group sizes andwould incorrectly conclude that leadership had no effect on problem-solvingtime. From this discussion you should begin to appreciate why factorialexperiments are so widely used in psychology. They are the only experimen-tal designs that allow us to investigate interactions between variables.(For more information on how to interpret interactions, see Chapter 12.)
In Chapter 2 we discovered that whenever a circumstance was made intoa random variable, the experimental results increased in generalizability but
182 Chapter Nine
FIGURE 9-8 Two possible interactions of leadership with group size. In eithercase, turning group size into a random variable would probably eliminate theeffect of leadership.
With Without
Leadership
20
10
6
3
Group Size
Prob
lem
-Sol
ving
Tim
e
With Without
Leadership
20
10
6
3
Group Size
Prob
lem
-Sol
ving
Tim
e

decreased in precision. On the other hand, choosing to make the circumstanceinto a control variable increased the precision of the outcome but decreasedthe generalizability. A factorial experiment gives us a third alternative: we canmake the circumstance into another independent variable, thereby increasingthe precision and generalizability of the result. We can generalize the outcometo a larger set of circumstances because in this case more circumstances havebeen made into factors, and we know precisely what the effect is at each levelof these factors. Thus, we have the best of all possible worlds, although everytime we choose to make another circumstance into a factor, the experimentgets progressively more complex.
A third advantage of factorial experiments is a statistical advantage. Recallfrom Chapter 8 that most inferential statistical tests compare the size of anydifference found between the levels of the independent variable with an esti-mate of how variable the data are. A difference is more likely to be declaredsignificant by the test if either that difference is large or the variability is small.In a factorial design, when a circumstance that otherwise would add variabilityto the data is instead made into a factor, the amount of estimated variabilityin the data decreases. Thus, the more circumstances we can make into factors,the smaller the estimate of variability. The smaller this estimate, the more likelyit will be that any difference we find is declared statistically significant.
DISADVANTAGES
With all these good things going for factorial designs, you know that thesedesigns must also have some drawbacks. They do. The major disadvantageof a factorial experiment is that it is time consuming and costly. Supposethat, as in Chapter 2, you are again working for General Nosedive of theAir Force. You are working with a team of engineers designing the cockpit ofa new aircraft. Because you are a psychologist and know all about humans,they expect you to tell them how to design the displays and controls andwhere to place them.
You are aware that some variables might interact with other variables, soyou choose a factorial design. For example, you know that the location of theairspeed indicator might affect the best altimeter location. The first factor youselect is the length of the pointer on the altimeter. You find that four standardlengths are currently in use, so you assign four levels to this factor. You alsohave a choice of five possible places to put the altimeter, so you select altime-ter location as a second factor and assign it five levels. Your third factor is thesize of the airspeed indicator with three levels. Because there are six possiblelocations for this instrument, you have a fourth factor. The fifth factor is thesize of the joystick grip,8 which has four possible diameters and five possiblelengths. We have only started to consider the important variables for cockpitdesign, and we already have a 4 � 5 � 3 � 6 � 4 � 5 factorial experiment.
Single-Variable, Multiple-Variable, and Converging-Series Experiments 183
8 Nonfliers can stop snickering now. A joystick is the steering lever on an aircraft.

So far the design has 7200 cells.9 If we assign ten people to each cell, we willexceed the number of pilots in the Air Force!
As you can see, whenever you add another factor to a factorial experi-ment, you increase the number of cells in the design by a multiple of the num-ber of levels in that factor. At this rate, the size of factorial designs can get outof hand quickly. Because each additional cell calls for more time and effort,you must be careful not to choose an unrealistic number of factors or levelswithin each factor.
184 Chapter Nine
9 Although I earlier told you to interpret the � as by so it is a 4 by 5 by 3 by 6 by 4 by 5 factorialexperiment, for determining the number of cells, the � can be considered a multiplication sign.
If you do not have the resources to do a large factorial experiment, howdo you find an answer for the general? One way is to do several smaller exper-iments. For instance, in the example you could do 4 � 5, 3 � 6, and 4 � 5experiments. The problem with this solution is that you are assuming that theindependent variables appearing in separate experiments (such as altimeterlocation and airspeed indicator size) do not interact. And you have no wayof verifying this assumption without combining all the variables intoone experiment. Nevertheless, this is how most psychologists who have tofind answers to such questions go about finding them in the real world.We examine a strategy for doing a series of smaller experiments later in thischapter.
There is a second, more sophisticated way of dealing with very largefactorial experiments called response-surface methodology (Clark &Williges, 1973; Meyers, 1971). This method allows you to determine theplaces within the factorial design where the dependent variable is likely to beat its maximum or minimum without having to fill each cell of the designwith data points. To do this, one has to assume that some of the most com-plex interactions will not occur—a usually correct assumption. The detailsabout how to use a response-surface methodology are well beyond what thebeginning experimenter needs; you should simply realize that such tech-niques are available should you require them in the future. The references at

the end of this chapter are a good place to start if you need to use suchdesigns.
A second possible difficulty with factorial experiments is interpreting theresults. The statistical procedure used to analyze most factorial experimentsand all factorial experiments having more than two factors is analysis ofvariance. This procedure requires you to make certain assumptions about thetype of variability in your data. One assumption is that the variability is nor-mally distributed in the familiar bell-shaped curve that approximates manyreal-world distributions. If the underlying variability in your data does notapproximate a normal distribution, an analysis-of-variance statistical test isnot appropriate.10 Unfortunately, you often do not know whether you canmeet this assumption until after you have completed your experiment, whichis too bad, because other statistical tests presently available for analyzingcomplex interactions are inadequate. In such cases, you are left with theunpleasant alternative of using a questionable statistical test or doing nostatistical analysis at all. Fortunately, most factorial experiments produce dis-tributions that are fair approximations of a normal distribution, therebyallowing you to use analysis of variance. (We examine analysis of variance inmore detail in Appendix A.)
Even when you can satisfy the assumptions of the statistical analysis,interpreting the results of complex factorial experiments is sometimes diffi-cult. The interactions mentioned so far are two-way interactions, in that therelationship between one factor and the dependent variable depends on thelevel of a second factor. However, as discussed in Chapter 12, you could alsohave three-way interactions in which the type or size of a two-way interac-tion depends on the level of a third factor. For example, perhaps the effec-tiveness of leaders interacts with group size, but only for men. By the timeyou get into four-way and five-way interactions, you will no longer find itobvious how to interpret your results.
We have seen that factorial experiments can offer many advantages oversimple single-variable experiments. They allow you to investigate interactions,give you a statistical advantage by decreasing unwanted variability, and permityou to increase the generality of your results without decreasing the precision.However, you pay for these advantages in the time and effort expended and inthe difficulty of interpreting the results. Is there a way to get some of the advan-tages of multiple-variable experiments without these difficulties? Yes. (Read on.)
■ Converging-Series DesignsMost journal articles report results of a series of experiments because manyexperimenters nowadays choose to do a converging series of experiments.I use this term to refer to any set of experiments that progressively home
Single-Variable, Multiple-Variable, and Converging-Series Experiments 185
10 Bradley (1968), in his book Distribution-Free Statistical Tests, has a good discussion of the errors you can make when you fail to satisfy this assumption.

in on a solution, rather than tackling a problem in one fell swoop. Mostseries of experiments are made up of single-variable or small factorialexperiments.
In one type of series, we may simply have an applied problem thatis too big for a single factorial experiment, such as the cockpit-designexample. In this case, we might decide to do a series of smaller factorialexperiments because higher-order interactions (three- or four-way inter-actions or larger) are of little interest. Once we find an optimal level fora particular factor in one experiment, we make the factor into a controlvariable in subsequent experiments. We can then vary other importantfactors until we have successively manipulated all the independent vari-ables that might reasonably be expected to affect performance. In this way,we can progressively approach the optimal solution to our overall practicalproblem.
CONVERGING OPERATIONS
A form of converging-series design, which is more exciting than those usedfor practical problems, tests psychological theories by converging on a singleexperimental hypothesis that explains an observed behavior. This type ofexperimentation has been called a converging-operations approach (Garner,Hake, & Eriksen, 1956). We start the series with many possible hypothesesthat could explain the behavior we are examining. Each experiment we dohelps eliminate one or more of our initial hypotheses until only one remainsat the end of the series that can account for the data.
To illustrate a converging-operations technique, let’s look at an experi-ment that investigates whether it takes longer for people to perceive vulgarwords than nonvulgar words. Suppose the experimenter presents wordsusing a tachistoscope, an apparatus that exposes visual material for brief con-trolled periods. The experimenter presents four words, two vulgar and twononvulgar, and instructs participants to say the words aloud as soon as theyrecognize them. The experimenter finds that participants require longer expo-sures to report the vulgar words and concludes that this finding supports thehypothesis that people unconsciously suppress the perception of vulgar mate-rial. This perceptual defense hypothesis maintains that longer exposures arerequired to overcome this suppression.
Being an outstanding experimenter, you think of a number of otherhypotheses that could explain this same finding. First, specific characteris-tics of the words may have made the nonvulgar words easier to read withshort exposures. Second, participants might have perceived all four wordsequally well but involuntarily suppressed their response on the vulgarwords until they could no longer avoid it. Third, participants might havebeen aware of the words and known what response to make but voluntar-ily withheld the response until they were positive of being correct. Thus, wehave at least four possible hypotheses that can account for the resultsof the experiment, which are listed in Figure 9-9. We now need to do a series
186 Chapter Nine

Single-Variable, Multiple-Variable, and Converging-Series Experiments 187
FIG
UR
E 9-
9A
sch
emat
ic r
epre
sen
tati
on
of
the
hyp
oth
eses
in c
on
ten
tio
n a
t ea
ch p
oin
t d
uri
ng
th
e th
ree
con
verg
ing
-op
erat
ion
sex
per
imen
ts d
escr
ibed
in t
he
text
of experiments that will converge on one of these hypotheses and excludethe rest.
The first experiment you might do distinguishes between the word-characteristics hypothesis and the other three. You can repeat the originalexperiment using two different vulgar and nonvulgar words. If you againfind that the vulgar words require longer exposures, you are on your way toeliminating the word-characteristics hypothesis.11 If longer exposure timeswere not required to say the vulgar words, your confidence in the word-characteristics hypothesis would increase.12
Assuming that the word-characteristics hypothesis has been eliminated,you still must distinguish among the remaining three. In Experiment 2 wemight try to determine whether participants perceive the vulgar words atshorter exposures than they report them. We remember that a person’sgalvanic skin response (GSR) gives an indication of his or her emotionalresponse to stimuli. Thus, we decide to measure participants’ GSRs duringpresentation of the vulgar words to find out how long the words have to beexposed before they are perceived. The GSR can indicate whether participantsperceive a word, even though they may voluntarily or involuntarily suppresstheir response.
If you find that the GSR doesn’t change until the exposure duration atwhich the participant reports the vulgar words, the perceptual defensehypothesis receives some support. If, however, the GSR shows that theyperceive the vulgar words at the same exposure durations as the nonvulgarwords, one of the two remaining hypotheses must be true.
To distinguish between voluntary and involuntary response suppression,you can use an operation that causes people to voluntarily change the amountof suppression. You might anticipate that when the experimenter is of theopposite sex as the participant, more voluntary suppression occurs than whenboth are of the same sex. Thus, in Experiment 3, you attempt to determine ifthe difference in exposure time for detecting vulgar versus nonvulgar wordsis less when the experimenter and participant are of the same sex. If so, thevoluntary response suppression hypothesis is supported. If not, involuntaryresponse suppression seems likely.
188 Chapter Nine
11 Actually, a single experiment seldom eliminates a hypothesis from further consideration. For example, we might have been unlucky and selected two additional vulgar words that werestill harder to read than the nonvulgar words. Or we might have failed to consider a subset ofthis hypothesis. For example, the effect may be due to vulgar words having a lower frequencyof usage than nonvulgar words. And we recognize higher-frequency words more quickly. Toconclusively exclude a hypothesis, the converging operation must be completely independentof any other possible operation. By changing the specific words, we have not made wordfrequency completely independent of word vulgarity; therefore, we cannot eliminate thishypothesis.12 This sentence was carefully worded because we would not really have provided strongevidence supporting the word-characteristics hypothesis. In experimental psychology wedesign our experiments to show a difference in the dependent variable due to a manipulationof the independent variable. Showing that an independent variable caused no change in thedependent variable is weak evidence for the proposition that it cannot cause a change. Thereare a number of other reasons for finding no change in behavior. For example, participantsmay have failed to follow instructions, fallen asleep, or died.

You can see how the converging operations in this example have allowedus to eliminate all but one hypothesis. The operations we used to zero in onone hypothesis were varied: a stimulus manipulation, a physiological mea-surement, and an interpersonal-relationship manipulation. We could havechosen other operations, but if the assumptions underlying our operationsare correct, all other operations should converge on the same hypothesis.Every time a new operation converges on the hypothesis, we can haveincreased confidence in that hypothesis.
Actually, this discussion has been a bit idealized. You can seldom sitdown before doing a converging series of experiments and detail everypossible hypothesis and every operation that will be carried out to distin-guish among the hypotheses. If you are like most experimenters, you willwork on one experiment at a time. Only after seeing the results of oneexperiment will you decide on a new operation to get you closer to the truehypothesis.
As you complete more experiments in a series, you may also find that thenumber of hypotheses is increasing rather than decreasing. Although you caneliminate some old hypotheses, other new ones become obvious as the exper-imental problem is better understood. At this point it may seem that you aredoing a diverging series of experiments rather than a converging series!In fact, you are still converging, but the set of potential hypotheses is simplymuch larger than you at first imagined it to be.
ADVANTAGES
Most of the advantages of a converging-series approach are rather obviousfrom this discussion. You have a great deal more flexibility than you have ina large factorial experiment. In a large factorial experiment, you must decideon the factors and factor levels before starting the experiment, after whichyou are locked into this predetermined design. One bad choice can destroy alarge investment of time and money. A converging series, however, gives youmany choice points. You can choose new independent variables or levels ateach of these points. You can also be much more efficient because you needn’t
Single-Variable, Multiple-Variable, and Converging-Series Experiments 189

waste time investigating factors and levels that have little effect on thedependent variable. A converging-series design also has built-in replications.Every time you show an experimental result to be repeatable, it gains pres-tige in the scientific community. If you had done all three experiments in ourvulgar-word example, you would have replicated, or repeated, the basicexperimental result of vulgar words requiring longer exposures three times,providing convincing proof of the reliability of this result.
DISADVANTAGES
Converging-series designs also have some minor disadvantages. Determininghow variables interact if they are manipulated between different experiments
190 Chapter Nine
■ TABLE 9-1A Summary of the Advantages and Disadvantages of Two-Level, Multilevel,Factorial, and Converging-Series Experimental Designs
Design
Two-levelexperiment
Multilevelexperiment
Factorialexperiment
Converging-seriesexperiments
Advantages
It is efficient for determiningwhether a variable has anyeffect.
Results are easy to interpret andanalyze.
It is adequate for some theorytesting.
It is useful for applied comparisons.
One can infer shape of functions.Range of independent variable
is less critical.
One can investigate interactions.Adding factors decreases
variability, thus increasingstatistical sensitivity.
It increases generalizabilitywithout decreasing precision.
They offer more flexibility thanlarge factorial experiments.
They have built-in replications.
Disadvantages
One cannot infer shape of functions.
Interpolation and extrapolationare dangerous.
Complex theories are difficultto test.
It requires more participants ortime.
Counterbalancing is moreponderous.
Statistical calculations are moredifficult.
Experiments become large asmore factors are added.
Statistical calculations are moredifficult.
Higher-order interactions aresometimes difficult tointerpret.
Interactions are difficult toassess.
Between-experiment compar-isons are also between-subjects, with associateddifficulties.
One must analyze prior exper-iment before doing the next.

is difficult and sometimes impossible. Under certain circumstances, you cancombine two experiments from a converging series to analyze them as asingle between-subjects factorial experiment. However, if you are primarilyinterested in interactive effects, you should do a factorial experiment.
A second disadvantage is that when comparing the results of separateexperiments in the series, you are always making a between-subjects com-parison with all the accompanying disadvantages of between-subjectsdesigns (see Chapter 8).
Finally, when you use a converging-series design, you must analyze andinterpret the results of one experiment before you can begin the next. It oftentakes several weeks and sometimes months to complete such an analysis. Forthis reason, many investigators work on more than one series at a time so thatthey can do an experiment from one series while analyzing an experimentfrom another series.
Considering the advantages and disadvantages of converging-seriesdesigns, it is easy to see why the approach has become so popular in recentyears. The converging-series approach offers a highly efficient and flexibleway to investigate both applied and basic research problems.
Table 9-1 provides a handy reference summarizing the advantages anddisadvantages of all the experimental designs that we have been examining inthis chapter.
■ SummaryOnce you have decided on a research problem worth investigating, you mustchoose an experimental design. The simplest design you can choose presentsonly two levels of a single independent variable. This design provides a wayto quickly determine whether the independent variable has any effect at allon the participant’s behavior. Such experiments are also easy to interpret andanalyze; for some theoretical and applied problems, they provide all the nec-essary information. However, these simple experiments can tell you nothingabout the shape of the experimental relationship, so both interpolation andextrapolation are risky. Adding more levels to the independent variable willgive you a better idea about the functional relationship between theindependent and the dependent variables. It also makes choosing a range forthe independent variable less critical. A disadvantage of such multilevelexperiments is that they require more time and effort. They are also a bitharder to interpret and analyze.
The most frequently used multiple-variable experimental design is calleda factorial design. In this design the independent variables, sometimes calledfactors, are combined so that the levels of each variable occur in combinationwith the levels of every other variable. If within-subject factors are combinedwith between-subjects factors, the experiment is said to use a mixed factor-ial design. Factorial designs allow you to investigate interactions. Every timeyou add a factor, the generalizability and precision of the results increase,
Single-Variable, Multiple-Variable, and Converging-Series Experiments 191

while the statistical variability decreases. However, large factorial experi-ments can be time consuming and costly. The design can become so large thata series of smaller experiments is required or the use of a response-surfacemethodology is necessary. Interpreting the results can also be a problem,particularly when the statistical assumptions of analysis of variance cannotbe met.
You can use a converging-series design in place of a complex factorialdesign. This design allows you to discover converging operations, whichprogressively eliminate hypotheses until only one remaining hypothesis canaccount for the data. Converging-series designs offer the advantage of flexi-bility and provide built-in replications. However, evaluating interactionsbetween factors varying across experiments is difficult. You must also manip-ulate these factors in a between-subjects manner, and you must analyze oneexperiment before beginning the next.
192 Chapter Nine

Up to this point in the book we have been concentrating on experimentaldesigns. However, it may not always be possible or desirable to design
an experiment to answer a particular research question. In this chapter wediscuss three ways to do research that are not strictly experimental. The first,quasi-experimentation, follows many of the rules of experimentation wehave learned, but because random assignment of participants to levels of theindependent variable is not possible, quasi-experimental designs must beused to minimize possible threats to internal validity that might occur. Single-subject and small-N baseline designs form the second type of nontraditionaldesigns. In this case, because the availability of participants is limited or becauseshowing a clear-cut result of a manipulation on each participant is desired,rules are established that allow effects to be observed without control groupsor within-subject counterbalancing. The third nontraditional research dis-cussed is survey, or questionnaire, research that uses a correlational designrather than an experimental design.
■ Quasi-Experiments (and NonexperimentalDesigns)
Recall from Chapter 2 that one of the options for assignment of circumstancesis to turn them into random variables. In that chapter I also emphasized howimportant it is for true randomization to take place. If we cannot be sure that
193
10How to Design ResearchThat Is Not Experimental
The task confronting persons who try to interpret the results fromquasi-experiments is basically one of separating the effects of atreatment from those due to the initial noncomparability betweenthe average units in each treatment group.
T. D. COOK & D. T. CAMPBELL (1979)
Instead of studying a thousand rats for one hour each, or ahundred rats for ten hours each, the investigator is likely to studyone rat for a thousand hours.
B. F. SKINNER (1966)
a truly random process has been used, a circumstance may vary in a systematicway along with the levels of the independent variable. This is a nice way ofsaying that we have allowed confounding to raise its ugly head. Wheneverwe have the possibility of confounding, we must be aware of all the possiblethreats to internal validity that we discussed in Chapter 2, such as history,maturation, selection, mortality, testing, and statistical regression. Rememberthese? The purpose of quasi-experimental designs is to minimize each ofthese threats even though we are not randomizing our groups. In this waywe hope to avoid confounding variables.
To illustrate this problem, suppose that we wish to determine whetherhanding out “learning evaluations” (short noncredit quizzes) at the end ofeach lecture improves class performance on the major tests in a particular col-lege course. We know from our basic experimental model that we must use atleast two levels of the independent variable—probably “learning evaluations”versus “no learning evaluations.” Some circumstances will become controlvariables. For example, we would probably teach the same course material toparticipants whether they were receiving learning evaluations or not. How-ever, we cannot clone students for a between-subjects design, and using awithin-subject design is not feasible because we cannot undo what the stu-dents have learned from the material the first time through. So we will haveto make the students assigned to each group into a random variable. Ideallywe could put the names of all students in the university who had not takenthe course into a hat and draw out 100 students to assign to each of twoclasses. One class would then be given learning evaluations, and the otherwould not.
Unfortunately, we would probably not be allowed to force these studentsto take a particular class; in the real world, students are allowed to choose theclasses they wish to take. We might have to use two classes that already exist,perhaps a morning class and an afternoon class, and assign them to the lev-els of our independent variable. Do you suppose that there are any differencesbetween the types of students who choose to take morning classes and thosewho take afternoon classes? Can you imagine dimensions in which thesestudents differ that might be related to class performance?
Suppose that the classes were both morning classes, but one met onMonday, Wednesday, and Friday and the other for longer classes on Tuesdayand Thursday. Can you imagine dimensions related to days of the week orlecture duration that might affect performance?
An even more likely problem would develop if the instructor taught onlyone section of this particular course each semester or each year. How manydimensions do you suppose vary between fall and spring students orbetween students from one year to the next? So while we can avoid turningsome circumstances into confounding variables by using control or random-ization, we do not have the option of controlling for participant assignment.
In most applied field settings we do not have the option of making par-ticipant assignment a random variable. When random assignment is not
194 Chapter Ten

possible, we can sometimes use a quasi-experimental design. These quasi-experimental designs allow us to minimize, or in some cases at least assess,the various threats to internal validity we expose ourselves to by violating thestrict laws of experimentation. Each design that we examine next has somestrengths for countering some threats, but none can give us complete assur-ance of having eliminated all threats. In discussing quasi-experimentation, itis useful to characterize the different designs by using a notation systememployed by Cook and Campbell (1979) in their classic book on the topic. Inthis system an “X” stands for a particular level of the independent variable(also called a treatment). An “O” stands for an observation during which thedependent variable is measured. The subscripts “1” through “n” refer to theorder of presenting the treatments (X1 . . . Xn) or measuring the observations(O1 . . . On). A dashed line between experimental groups indicates that theywere not randomly chosen.
NONEXPERIMENTAL DESIGNS
One-Group Posttest-Only Design
If you measure the behavior of a group that has been exposed to only onelevel of an independent variable, you are using a one-group posttest-onlydesign. Using our notation system, this design looks like this:
X O
When you have no other information to supplement the outcome, this designis essentially useless for determining the impact of the treatment.
For example, suppose that a television network airs a program on theHolocaust (X), and you are interested in how the show has affected the pop-ulation’s awareness of the event (O). You send out a questionnaire to a groupof people and discover that 76% are now aware of what happened duringthe Holocaust. What do you know about the impact of the telecast? Did itcause an increase in awareness? A decrease? Without knowing what theawareness level was before the show or what the level is for an equivalentgroup not exposed to the show, your result is useless for answering thesequestions.
This design is similar to the case-study approach discussed in Chapter 1.However, some important differences generally make case studies moreuseful. In a case study, the researcher typically knows a great deal about thecontext in which the behavior is being observed. For this reason, althoughthere may be no direct measure of preobservation behaviors, these can oftenbe inferred. In addition, more than one behavior is usually observed in a casestudy. These behaviors may form a pattern that provides much more infor-mation than is provided by a single dependent variable measured in a moresterile laboratory setting.
How to Design Research That Is Not Experimental 195

Posttest-Only Design with Nonequivalent Groups
If we add a posttest done on a nonequivalent group to the design we havebeen discussing, we get a design that looks like this:
X O
X O
By nonequivalent, I mean that the group was chosen using a selectionmechanism different from that used to choose the group exposed to thetreatment.
In the Holocaust example, suppose we discovered that because a localfootball team was playing, the telecast was not shown in Miami. We mightdecide to use a randomly selected sample from Miami as the nonequivalentgroup and send the chosen participants the questionnaire. If we now find adifference between the groups, can we attribute this difference to the televi-sion show? Miami has a large Jewish population. Do you think that beingJewish could affect your awareness of the Holocaust?
The basic problem with a posttest-only design with nonequivalentgroups is that any observed difference could be due to either the treatmentor selection differences between the groups. The more equivalent the groups,the more convincing the conclusion.
One way of strengthening the conclusion in the absence of a formalpretest is to have informal pretest information by which the two groups canbe compared. This pretest information is more useful, the more highly corre-lated it is with the dependent variable. Thus, we might compare our two sam-ples in terms of age, sex, social class, ethnicity, and religion. This comparisoncould give us an idea of how equivalent the groups are. However, the basicdesign is still weak, and we must take great care in interpreting the results ofany posttest-only nonequivalent-groups design.
One-Group Pretest–Posttest Design
Again taking the basic one-group posttest design, we should consider whatwould happen if we also gave this group a pretest. This one-grouppretest–posttest design looks like this:
O1 X O2
This design has widespread usage in applied field settings and is animprovement over the nonequivalent-groups design in terms of selection. Asis the case for within-subject designs, the same participants are selected forboth observations, thus helping minimize the threat of selection. However,for within-subject designs, procedures such as counterbalancing the order ofpresentation and taking the two observations close together in time minimize
196 Chapter Ten
other threats to internal validity. Unfortunately the one-group pretest-posttestdesign does not minimize these other threats.
Again, using the Holocaust example, what effect do you think giving apretest that asks about awareness of this event would have on a posttestassessing Holocaust awareness? You can see that the threat of testing is a prob-lem in this case. If we decided to minimize the testing problems by giving thepretest well in advance of the treatment—say, one year—we could well run intoother threats. History might conspire against us in that some Holocaust-relatedevent besides the telecast, such as the capture of a war criminal, might changethe group’s awareness. Or, particularly if we were using schoolchildren, matu-rity could have an effect. If we were using the pretest to select a group, regres-sion could also cause problems. Thus, while the pretest design may solvethe selection problem, great care must be taken in interpretation because ofthe other threats to internal validity.
QUASI-EXPERIMENTAL DESIGNS
The three designs discussed in the previous section are called nonexperimen-tal designs because there is no way to assess many of the threats to internalvalidity when these designs are used. The designs discussed in this sectionare called quasi-experimental designs because, although they do not meetthe strict requirements of the basic experimental model, we can assess manyof the threats. It is not within the scope of this book to exhaustively cover allquasi-experimental designs. Instead I mention several that illustrate the twomajor classes of designs. For more detail, refer to Cook and Campbell’s (1979)or Shadish, Cook, and Campbell’s (2002) excellent books.
Nonequivalent Control Group Design with Pretest and Posttest
The first design uses a nonequivalent control group, which is not exposed tothe treatment, in addition to a treatment group. Each group is given both apretest and a posttest. The notation for the design is:
O1 X O2
O1 X O2
This design is probably the most widely used in social science field studiesand allows us to assess most of the simple threats to internal validity.
How much we have to worry about certain threats depends to someextent upon the particular experimental outcome. If the pretest scores of thegroups show essentially no difference, we can have some confidence that thegroups are relatively equivalent, and the possibility of a selection or a regres-sion threat is minimized. If the scores of the control group are the same atpretest and posttest, the threats of history and maturation are minimized.Because both groups receive the same tests, differential effects of testing
How to Design Research That Is Not Experimental 197

should also be minimal. If the number of participants who drop out of thetwo groups between pretest and posttest is different, mortality could be aproblem. However, the design allows this threat to be assessed. The most seri-ous potential problem when using this design is having a threat that interactswith selection. Again, if the two groups score equivalently at pretest, thethreat of a selection interaction is reduced but still possible. For example,while school A is receiving a particular treatment and school B is not, schoolA may also employ a new principal who requires new standards of the teach-ers. This history–selection interaction could threaten our conclusions.
We must be even more concerned about interactions with selection whenthe two groups have very different scores on the pretest. For example, sup-pose that we want to determine whether paying assembly line workers by thepiece increases productivity. We request volunteers who will have their salarylowered but will receive extra money for piecework. At the pretest we dis-cover that the volunteers are more productive, but we figure that we can com-pare the size of this initial difference with the size of the posttest difference.Sure enough, at posttest the difference is even larger. Both groups improvedtheir productivity, but the piecework group improved more. We conclude thatpaying by the piece improves productivity. Are we right?
Because there was a pretest difference in productivity, the volunteers inthe treatment group may have been not only better at that point but alsomaturing (that is, learning, becoming more experienced) at a faster rate.Workers’ skills are seldom stable, and we know that these workers’ skillswere getting better because even the control group improved. When every-one is improving, we should not be surprised that the better workers improvemore rapidly. The basic design does not allow us to determine the size of thispotential maturation–selection interaction. We might subdivide the treatmentgroup by pretest to get some idea of the effect. That is, we would expect theless able workers from the treatment group to improve more slowly than themore able workers. However, we then have a different design. The point isthat even when you use a nonequivalent control group design with bothpretests and posttests, your findings may still be subject to threats such asselection interactions.
Variations. Rather than exhaustively detailing each variant of nonequivalent–control-group designs, I just mention a few possibilities. Sometimes when itis not possible or practical to use the same test for the pretest and posttest, aproxy pretest is used. That is, a pretest measure is taken of some variable orvariables that should correlate with the posttest. For example, if you wishedto evaluate the effects of a new method for teaching algebra, you mightexpose one class to the new method while teaching a second class by the tra-ditional method. Rather than giving a pretest assessing algebra achievementto classes that had yet to learn algebra, you might give them a proxy pretestassessing general mathematical aptitude.
A proxy pretest can be used if it is not possible to give a pretest, such aswhen the treatment consists of some unpredictable historical event affecting
198 Chapter Ten

a portion of a population. Alternatively, even when it is possible to give apretest, testing may be a threat to internal validity, so a proxy test can be usedto avoid exposing the participants to the posttest. In other cases, when novelresponses are called for, using the same test as the pretest and posttest couldbe nonsensical. For example, giving a final exam for an introductory psy-chology course to two classes before they take the course would not makemuch sense.
If testing is a threat, we can use separate pretest and posttest samples. Ratherthan drawing a single sample for each group that will receive both the pretestand the posttest, we draw two samples for each group, one to receive thepretest and the other the posttest. For instance, if an educational program isto be given to one class and not the other, the two classes can be randomlysubdivided, with half of each given the pretest and the other half given theposttest later. The obvious weakness of this design is that it hinges entirelyon the comparability of the pretest and posttest groups. If you believe that thegroups might differ along a dimension related to the treatment, the design isconsiderably weakened.
Another way of strengthening the basic nonequivalent control groupdesign with pretest and posttest is to add pretest observations at more than onetime interval. Adding one or more pretests can help us assess the effects of twopossible threats. Remember when we were discussing how “the able get moreable” and how this might cause a maturation–selection interaction? If we hadgiven an even earlier pretest, we could have determined whether the scoreson that test fell on the trend line for each group. If they did, we would havea strong case for concluding that a maturation–selection interaction ratherthan the treatment caused the posttest difference. That is, the two pretestswould have established a maturation trend, and the posttest would have beeninterpreted as nothing more than a continuation of this trend. An additionalpretest can also help us assess the effects of statistical regression. If the groupswere selected on the basis of the first pretest, regression effects should showup in the scores of the second pretest as well as in the scores of the posttest.
Other variations that are used less frequently include those in which thereis a pretest, exposure to the treatment, a posttest, removal of the treatment,and another posttest. This design can also be expanded by reinstating thetreatment, giving another test, ad infinitum (or possibly ad absurdum). Thesedesigns are much like the baseline designs we discuss later in this chapter.However, unlike quasi-experiments, baseline experiments typically use veryfew participants, and the data are examined for individuals, usually withoutthe aid of statistical analysis.
In some cases one group can be given a treatment that is expected tochange the dependent variable in one direction, and a second group can begiven a treatment expected to have the opposite effect. For example, supposetwo groups of workers are paid partly by the hour and partly by the piece.We might impose a treatment in which one group is paid entirely by the hourand the second group entirely by the piece. If we had predicted that payingby the piece would increase productivity, we would expect a decrease for the
How to Design Research That Is Not Experimental 199
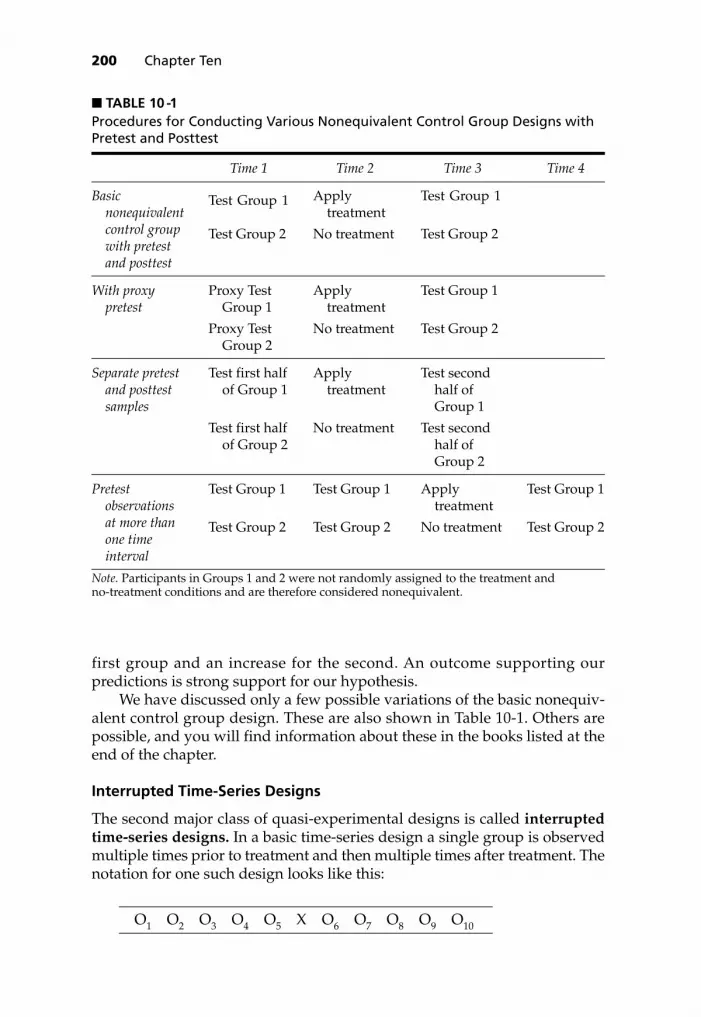
first group and an increase for the second. An outcome supporting ourpredictions is strong support for our hypothesis.
We have discussed only a few possible variations of the basic nonequiv-alent control group design. These are also shown in Table 10-1. Others arepossible, and you will find information about these in the books listed at theend of the chapter.
Interrupted Time-Series Designs
The second major class of quasi-experimental designs is called interruptedtime-series designs. In a basic time-series design a single group is observedmultiple times prior to treatment and then multiple times after treatment. Thenotation for one such design looks like this:
O1 O2 O3 O4 O5 X O6 O7 O8 O9 O10
200 Chapter Ten
■ TABLE 10 -1Procedures for Conducting Various Nonequivalent Control Group Designs withPretest and Posttest
Basic nonequivalentcontrol groupwith pretestand posttest
With proxypretest
Separate pretestand posttestsamples
Pretest observationsat more thanone timeinterval
Time 1
Test Group 1
Test Group 2
Proxy TestGroup 1
Proxy TestGroup 2
Test first halfof Group 1
Test first halfof Group 2
Test Group 1
Test Group 2
Time 2
Apply treatment
No treatment
Apply treatment
No treatment
Apply treatment
No treatment
Test Group 1
Test Group 2
Time 3
Test Group 1
Test Group 2
Test Group 1
Test Group 2
Test secondhalf ofGroup 1
Test secondhalf ofGroup 2
Apply treatment
No treatment
Time 4
Test Group 1
Test Group 2
Note. Participants in Groups 1 and 2 were not randomly assigned to the treatment and no-treatment conditions and are therefore considered nonequivalent.

The outcome easiest to interpret for such a design is an instantaneous, per-manent change in the level of an otherwise flat line. For example, if weemployed a new payoff scheme for workers and found an immediate 10%increase in productivity and if this change was maintained over the course ofthe study, we could have considerable confidence that the new payoff schemehad caused the change. However, even given this ideal outcome, we still needto be wary of possible threats such as history or mortality. Some historicalevent could have coincided with the introduction of the treatment. It is alsopossible, but probably unlikely, that at exactly the time the treatment wasintroduced, some unknown event caused a number of participants to dropout of the study.
Interrupted time-series designs can be used to exclude or assess otherpotential threats to internal validity. For instance, selection and interactionswith selections are not problems, because the same group is used throughoutthe experiment. Any effects of testing or statistical regression should havedisappeared before the treatment is introduced. Generally, we should also beable to exclude maturity as a problem because the effects of maturity aretypically sluggish; hence we would expect to see a trend line rather than adiscontinuous change.
When the change in the dependent variable is delayed, temporary, orreflected in the slope of an increasing or decreasing trend rather than inthe overall level of a flat line, we usually state our conclusion with less
How to Design Research That Is Not Experimental 201
confidence. In this case more sophisticated statistical techniques can some-times help tease out treatment effects.
Variations. As with the first type of design, variations of the simple time-series design are possible. One variation that will add considerable strengthto a conclusion is the addition of a nonequivalent no-treatment controlgroup time series. In this variation, a second nonequivalent group is mea-sured at each of the observation intervals, but no treatment is given duringthe series. The control group allows us to assess the effects of history as athreat because both groups will probably be affected equally by a historicalevent. If the two groups are selected in a different manner, a history–selectioninteraction can occur. However, this threat is a problem only in the unlikelyevent of a unique historical event occurring coincidentally with presentationof the treatment and only for the treatment group.
When treatment effects are expected to be reversible, an interrupted timeseries with removed treatment can be used. After the basic design is com-pleted, the treatment is removed and another series of observations is taken.This design is really an overlapping combination of two basic time-seriesdesigns—one series in which the presence of the treatment is the treatmentand the other in which its absence is the treatment. Actually, you may chooseto add and delete the treatment as many times as you wish so that multiplereplications1 are produced. Each replication increases your confidence in thecausal effect of the treatment. Again, this design is similar to the baselinedesigns discussed later in this chapter.
Another way of building in replications is to use nonequivalent groupsbut to introduce the treatment at different points in the series of observationsfor the two groups. Such a design is called an interrupted time series withswitching replications. This design offers a way to counter or assess most ofthe threats to internal validity, such as history and maturity. Also, by havinga built-in replication on a sample from a different population, the designenhances the external validity of the experimental conclusion. Table 10–2summarizes the interrupted time-series designs discussed in this section.
Statistical Analysis of Quasi-Experiments
Techniques for doing statistical analysis of quasi-experimental data haveimproved greatly over the past few years. Rather sophisticated statisticaltests, which are well beyond the scope of this book, can be found in some ofthe books listed at the end of this chapter. I am sure you will notice thatseveral of the designs presented here are similar to the baseline designs dis-cussed next. However, an important difference between baseline and quasi-experimental designs is that whereas baseline experiments usually have sofew participants that statistical analysis is impossible, quasi-experimentscan typically be analyzed with the same statistical rigor as that used for fully
202 Chapter Ten
1 For ethical reasons if the treatment is found to be beneficial, it may be necessary to end the se-ries with the treatment in effect.

How to Design Research That Is Not Experimental 203
■TA
BLE
10
-2Pr
oce
du
res
for
Co
nd
uct
ing
Var
iou
s In
terr
up
ted
Tim
e-Se
ries
Des
ign
s
Tim
e 1
Tim
e 2
Tim
e 3
Tim
e 4
Tim
e 5
Tim
e 6
Tim
e 7
Bas
ic in
terr
upte
d ti
me-
seri
es d
esig
nTe
st G
roup
1Te
st G
roup
1Te
st G
roup
1A
pply
Test
Gro
up 1
Test
Gro
up 1
Test
Gro
up 1
trea
tmen
t
Wit
h ad
diti
on o
f a n
oneq
uiva
lent
no-
trea
tmen
t con
trol
gro
upTe
st G
roup
1Te
st G
roup
1Te
st G
roup
1A
pply
Test
Gro
up 1
Test
Gro
up 1
Test
Gro
up 1
trea
tmen
tTe
st G
roup
2Te
st G
roup
2Te
st G
roup
2N
o tr
eatm
ent
Test
Gro
up 2
Test
Gro
up 2
Test
Gro
up 2
Wit
h re
mov
ed tr
eatm
ent
Test
Gro
up 1
Test
Gro
up 1
App
lyTe
st G
roup
1Te
st G
roup
1R
emov
eTe
st G
roup
1tr
eatm
ent
trea
tmen
t
Wit
h sw
itch
ing
repl
icat
ions
Test
Gro
up 1
App
lyTe
st G
roup
1Te
st G
roup
1Te
st G
roup
1Te
st G
roup
1Te
st G
roup
1tr
eatm
ent
Test
Gro
up 2
Test
Gro
up 2
Test
Gro
up 2
App
lyTe
st G
roup
2Te
st G
roup
2Te
st G
roup
2tr
eatm
ent
Test
Gro
up 3
Test
Gro
up 3
Test
Gro
up 3
Test
Gro
up 3
Test
Gro
up 3
App
lyTe
st G
roup
3tr
eatm
ent
Not
e.Pa
rtic
ipan
ts in
Gro
ups
1, 2
, and
3 w
ere
not r
and
omly
ass
igne
d to
the
trea
tmen
t con
dit
ions
and
are
ther
efor
e co
nsid
ered
no
nequ
ival
ent.

randomized experimental designs. Certainly, quasi-experimentation shouldno longer be avoided because of difficulties with statistical analysis.
Advantages
The biggest advantage of quasi-experiments is that they allow us to doresearch that was formerly not even possible to do. Quasi-experimentationhas provided a new bagful of tools to psychologists who are interested insocial issues, clinical evaluation, and educational programs and wish to inves-tigate these issues in the real world. And although care must be taken todetermine whether threats to internal validity exist, at least we know whatthese threats might be, and the designs make it possible to evaluate most ofthem to see whether they are a problem.
Disadvantages
Before I wax too ecstatic about quasi-experimentation, let me point out thatthere are some disadvantages too. Even if we try our best we may find threatsto internal validity. Although it is true that we can usually catch these whenthey occur, nevertheless finding such a threat pretty much invalidates ourresults. For example, if we use a basic nonequivalent control group withpretest and posttest design and find a difference in the pretest and posttestfor the control group, interpreting any change in the treatment group is prob-lematic at best. A second problem is that these designs are obviously morecomplex and often require more time and effort to carry out than a more tra-ditional experiment. Measurements have to be taken a number of times ratherthan just once for each condition. And as I mentioned, statistical tests forquasi-experimental designs, though now possible, are more difficult to doand are not routinely taught in basic courses.
Even given these disadvantages, the behavioral sciences have often beencriticized for either doing sound research on simple but unimportant prob-lems or doing unsound research on complex and important problems. Theadvances in quasi-experimental design have made it possible to do researchon complex and important problems. Although we must be careful to limitour interpretations of quasi-experimental research when compared withexperimental research, with these designs it is at least possible to investigatea wider range of problems than was possible using only experimentaldesigns.
■ Single-Subject and Small-N Baseline Designs
INDIVIDUAL VERSUS GROUPED DATA
Some investigators contend that the way most psychologists do experimentsis at best misleading and at worst pointless. The loudest revolutionary inthis group has been Sidman (1960), who claims that the kind of traditionalexperiments we have been learning about tell us little about an individual’s
204 Chapter Ten

behavior. Sidman points out that experiments usually tell us about the behav-ior of some imaginary average participant who does not accurately reflect anyreal individual participant. He claims that most experimenters use groups andpretend that the behavior of individuals in the group resembles the averagebehavior of the group. He argues that there are times the behavior of an indi-vidual in the group may be nothing like the average behavior of the group.
To illustrate this point, consider an experiment designed to find out howquickly a person can learn a simple analogy by being exposed to examples.The first item might be, for example: edit is to tide as recap is to ______. Theanswer is pacer because pacer is recap spelled backward. The next item mightbe something like: pets is to step as tool is to ______. Again, the answer is toolspelled backward, or loot. We give each participant three seconds to solve anitem before we present the next item. We might expect learning to occur in anall-or-nothing fashion. That is, we assume that at some point the participantwill cry “Aha!” or “Eureka!” and from then on get every item correct.
Figure 10-1 shows fictitious individual results for 10 people; Figure 10-2shows a group curve representing the average person. You can see that thegroup curve in Figure 10-2 does not represent any of the individual curves inFigure 10-1. The group curve might cause us to conclude that people learnthe solution gradually; however, every individual actually appears to havegone from solving none of the items to solving all the items on a single trial.
Because of such discrepancies, Sidman believes, group performance sel-dom tells us much about how individuals perform. You may recall fromChapter 8 that Poulton (1973) took a very different position on this issue andwent so far as to argue that all within-subject designs are basically flawed andonly between-subjects manipulations, in which groups are used, can be eas-ily interpreted. Psychologists decided to use groups in the first place becausethe behavior of individuals is so variable and because an individual partici-pant’s variability is likely to be canceled out by others who happen to vary inthe opposite direction. Sidman, however, says that variability is not inherentin the participant but is caused by a failure of the experimenter to control allthe variables affecting that individual. Once experimenters gain adequatebehavioral control, they should no longer find it necessary to use largegroups. By doing a baseline experiment, experimenters can demonstrate thatthey have gained this control.
BASELINE PROCEDURES
To illustrate a Sidmanian baseline experiment, which is often referred to asexperimental analysis of behavior, let’s consider an experiment designed to findout whether punishment can be used to change the behavior of a person withcerebral palsy. Suppose that a therapist is working with a client having cere-bral palsy who wishes to improve his interview skills.2 Individuals with
How to Design Research That Is Not Experimental 205
2 I wish to thank David A. Sachs of Las Cruces, New Mexico, for this particular example. Hedevised the described technique, although the results I report are fictitious.

206 Chapter Ten
FIGURE 10-1 Possible individual results for 10 participants in an analogy experi-ment. Once an individual learns the rule for solving this type of problem, thatperson is correct on all subsequent items.

cerebral palsy often have problems controlling their head movements and sotend to lose eye contact. As an attempt to increase the amount of eye contact,which is one aspect of a successful interview, the therapist decides to devisea procedure in which the client gets a mild electric shock each time his eyecontact is broken. The client, wishing to improve his social skills, agrees tothe shock procedure.3
The first step in this type of experiment is to establish a baseline—thatis, a steady state at which the response rate changes very little. One of thenagging problems in baseline experiments is determining how much “verylittle” is. The methods for determining whether the baseline has reached asteady state vary from a statistical criterion such as “no more than 3% changein the response rate from one session to the next” to a simple visual inspectionof the data for obvious fluctuations or trends. Once a baseline has been estab-lished, the experimenter begins the experimental manipulation.
In our example, the therapist might have the client report every day for ahalf-hour simulated interview. During the interview, the therapist throws ahidden switch whenever the client’s eyes do not maintain contact. The switchis connected to a clock so that the total time of eye contact during each half-hour session can be determined. After a number of sessions, when the thera-pist is satisfied that a stable baseline performance has been reached (that is, afairly consistent time of eye contact per session), the therapist begins theshock procedure. Whenever the client breaks eye contact and the experi-menter throws the switch, the client gets a short electrical shock to the fore-arm. The experimenter then tries to determine whether the amount of eyecontact changes from its baseline rate.
Figure 10-3 shows a possible result for this experiment: The therapistdecided that a stable baseline had been achieved after Session 5 and beganshocks on Session 6. Once the shocks were begun, the client’s eye contact
How to Design Research That Is Not Experimental 207
FIGURE 10-2 The group curve for the people shown in Figure 10-1. Note thatthe group curve is a poor representation of any individual’s behavior.
3 The patient’s agreement is a necessary although not always a sufficient ethical requirement.

increased dramatically. By Session 10, eye contact had reached a stabletransition steady state,4 and the experimenter discontinued the shock. BySessions 12–14, the client had returned to the original baseline behavior.
An experimenter must carry out each of the operations described in theexample to have a true baseline experiment: Establish a stable baseline, applythe experimental manipulation, and establish a stable transition steady state,and then show reversibility by recovering the original baseline when theexperimental manipulation is removed.
208 Chapter Ten
4 The transition steady state is sometimes called the treatment or modification state in clinicalwork.
FIGURE 10-3 Possible results of an experiment in which eye-contact time for aclient with cerebral palsy was measured during 30-minute simulated interviews.The first five sessions provided a baseline. Shock was administered on Sessions6–10, and baseline recovery occurred during Sessions 11–14.

The logic of the method is that once a baseline has been obtained, anuncontrolled confounding variable is unlikely to suddenly begin to affectbehavior on the same trial in which the experimental manipulation is made.Even if this unlikely event happened, the chances that a confounding vari-able then ceases to have an effect on the same trial in which the experimentalmanipulation is discontinued would be extremely small.
To be even more convincing, an experimenter could do an intrasubject repli-cation, repeating the procedure with the same individual one or more times.In the example, the experimenter might again shock the client on Session 15,continue until a stable transition steady state is achieved, discontinue theshock, and recover the original baseline. Each time the effect can be repeated,our confidence that the change in behavior was caused by the experimentalmanipulation rather than an uncontrolled confounding variable increases.Even though this is a single-subject design, doing an intersubject replication—that is, to repeat the experiment with a few additional individuals—wouldalso increase our confidence in the result. We would still evaluate the results bylooking at the data from individuals rather than at those from the group. How-ever, being able to do such intersubject replication strengthens our conclusion.
ADVANTAGES
The major advantage of a baseline experiment is that it gives us a powerfulway of looking at an individual’s behavior. For instance, if the results shownin Figure 10-3 were actual data, they would go a long way toward convinc-ing me that eye contact can be controlled by contingent shock. You would beconvinced too, wouldn’t you?
The results are also easy to interpret. In fact, they are so easy to interpretthat baseline experimenters use no statistical tests. Researchers using baselinedesigns say that if you need a statistical test to convince other investigatorsthat the effect you found is a real effect and not due to chance variation, eitherthe effect is not strong enough to bother with or else you need to refine yourtechniques to get better control over behavior (that is, eliminate unwantedvariability).
In a traditional group experiment, if you use a large number of partici-pants in each group, you may find an effect that is statistically significant butof little practical importance. That is, you may have chosen an independentvariable that has an effect on behavior, but the effect may be small comparedwith other, more important variables. However, a baseline experimental pro-cedure is not sensitive to such unimportant effects. The variability due to themore important independent variables blankets such real but small effects. Abaseline procedure thus guarantees that any effect found is large enough to beof potential importance.
Another advantage of a baseline procedure is the flexibility it allows youin deciding when to impose a level of an independent variable and which levelto use. Prior to doing a standard experiment, the investigator must choose thenumber of trials to present and the levels of the independent variable to use.
How to Design Research That Is Not Experimental 209

Because most statistical tests require it, the investigator then needs to collectan equal number of data points for each level of the independent variable.However, investigators who use baseline designs can decide at any point inthe experiment to collect more data at the present level or to change to a newlevel. For instance, in our example, if the therapist had felt the need for moredata under the shock condition, the flexibility exists to continue that conditionfor more sessions before attempting to recover the baseline.
The therapist also could have decided to use an additional level of theindependent variable after the experiment was under way. Suppose that thechange in behavior was not particularly convincing at the chosen shock inten-sity. After recovering baseline and reaching stable performance, the investiga-tor could choose to try a more intense shock on the next block of trials. Thus,the investigator is not required to use predetermined levels of the independentvariable.
In addition to the advantages of easy interpretation, the elimination ofstatistical tests, the guarantee of finding only fairly large effects, and flexi-bility, baseline experiments can also be used with a single individual. Thera-pists with only one client with cerebral palsy or experimenters with singleparticipants having unusual disorders, training, or talent could not use atraditional experimental design to study them. However, they could use abaseline procedure.
DISADVANTAGES
Although baseline experiments offer so manyadvantages, most experimenters still stick totraditional experimental group designsbecause they cannot meet the assumptions ofbaseline experiments. For example, theassumption that experimental effects can bereversed requires that the individual returnto the original level of behavior at the end ofthe experiment. We saw in the previous chap-ter that many potential sequence and order-ing effects require counterbalancing when awithin-subject design is used. A baselineexperiment is a special kind of within-subjectdesign in which effective counterbalancing isimpossible. Thus, any kind of systematically changing confounding variableprevents us from recovering the original baseline. And unless the behaviorreturns to its former state when the experimental manipulation is removed,we do not know whether to attribute the transition-state behavior to themanipulation or to some confounding variable.
For this reason, many traditional areas of psychology cannot be investi-gated using baseline procedures. Some obviously inappropriate areas are lifespan, memory, and some areas of learning. Most of the changes that take
210 Chapter Ten

place during experiments in these areas cannot be reversed. (“Now forget allthe words you have learned.”)
A second disadvantage is that baseline designs may not allow us todiscover small but important effects. Suppose you work for a telephonecompany and your job is to find out whether the time it takes a directoryassistance operator to find a number is improved by using a computerizedsearch system rather than a standard telephone book. You decide to use abaseline design, and as each request comes in, you record the length of thecall. You have the operator first use the standard telephone book until youachieve a baseline. Then you have the operator switch to a system in whichthe information is keyed into a computer and the computer provides thenumbers. Finally, you have the operator return to the book.
Figure 10-4 shows some possible results. A visual inspection of the fig-ure would probably not convince you or me that there is any differencebetween using the computerized system and using the standard telephonebook. In other words, the transition state does not look any different fromthe baseline. However, the average call under the computerized system isthree seconds shorter than the average call under the book system. If we haddone a standard experiment, a statistical test might show such a difference tobe significant. But would this be an important effect? Yes, it would be, becauseeach second saved on an average directory-assistance call cumulativelysaves telephone companies millions of dollars. That’s certainly importantto them!
Baseline design proponents may argue that variability is the experi-menter’s fault, and they may have a point with respect to rats in a sterilelaboratory environment. However, I have a difficult time conceiving how thetelephone company scientist could have gained better control of the behav-ior being measured. In this case the behavior seems to be driven largely by
How to Design Research That Is Not Experimental 211
FIGURE 10-4 A fictitious baseline experiment measuring the length of each directory-assistance call when the operator was alternately using a standardtelephone book and a computerized system

the customer rather than by the operator. In some situations, variability issimply intrinsic to the setting. In this case, small but important effects can beblanketed by this variability, and baseline designs may not be appropriate.
A final disadvantage of baseline experiments is that it is difficult to deter-mine how general any effect we find may be. Because individuals mayrespond differently to experimental manipulations, our participant may bean oddball. This criticism could be overcome by replicating the results usingadditional participants or with the same or different participants under dif-ferent experimental conditions. However, the tradition in baseline experi-ments is to use only a few individuals.
Baseline experimental designs can be a valuable tool for some areas ofexperimental psychology. While historically these designs were used in thelaboratory for investigating issues such as simple learning, some psycholo-gists believe that these designs can be applied to many other important prob-lems such as managed health care (Blampied, 2000; Morgan & Morgan, 2001).When the assumptions of the design can be met, a baseline experiment offersa way to convincingly show the effects of important experimental manipula-tions. Unfortunately, the assumptions are usually so rigorous that baselinedesigns must be restricted to only a few areas of experimental psychology.
■ Survey Research
WAYS OF DOING SURVEY RESEARCH
Surveys are typically taken to gather information from a sample of peopleand to generalize this information to a larger population. Information aboutbehaviors that might otherwise be directly measured could be included in asurvey. But information that could not be directly measured, such as opin-ions, motivations, and even expected future behaviors, could also beincluded. In these cases there would seem to be no alternative way of col-lecting this type of information other than a survey. That is, surveys allow youto ask not only what people do but also why they do it. For this reason sur-veys are widely used in the social sciences, and when students think of doinga research project, a survey is often one of the first types of research that cometo mind.
There are several ways to collect survey information. Perhaps the mostwidely used method of administration is a mail survey, which is maileddirectly to the participant. (Survey researchers call the participants whorespond to a survey respondents, for obvious reasons.) Mail surveys offer sev-eral advantages. It is possible to sample people at distant locations at rela-tively small cost—a task that would be far more difficult and expensivethrough face-to-face contact. Because anonymity and privacy are easy tomaintain using this method, respondents may be more likely to give honestresponses. It is also possible to send a mail survey to a representative sampleof the population of interest once you have the names and addresses of thatpopulation.
212 Chapter Ten

However, the big problem with a mail survey is that people are free to tossit in the trash along with their other junk mail. So the response rate may below, sometimes as low as 20% to 30%. Well, why not just send out four timesas many surveys as you need and ignore the nonrespondents? The problemwith this solution is that it may produce nonresponse bias. We have alreadydiscussed nonresponse bias in Chapter 2, but there we called it selection as athreat to internal validity. In the case of a survey, you may have carefully cho-sen a sample that is representative of a larger population and to whom youexpect to generalize your findings. But then the composition of this samplechanges as participants fail to become respondents. There would be no prob-lem if they became nonrespondents in a random fashion; the sample wouldstill be representative. However, it is difficult to determine why participantsfail to respond, and the reasons might systematically bias the sample. Maybethose who fail to respond are busier and busy people happen to be richer ormore educated. Or maybe some do not respond because they are uneducatedand have difficulty reading surveys. Or perhaps some do not respond becausethey are politically conservative and believe you are invading their privacy.The problem is that you really do not know how your nonrespondents differfrom your respondents and so you do not know how biased your sample hasbecome. Thus, your ability to generalize your findings to the population hasbecome compromised.
The way to minimize nonresponse bias, of course, is to obtain a highresponse rate. Dillman (1978) suggests a number of ways to improve mail sur-vey response rates. The content of the cover letter included with the surveycan make a difference. You should avoid announcing that this is a survey orquestionnaire, or pleading for help. It is best to list your institutional affilia-tion, the date, name and address of the respondent, a statement about whyparticipation is important, a promise of confidentiality, the usefulness ofthe study, a token reward for participation, where to address questions orcomments, a statement of appreciation, your signature in ink, and your title.The letter should give the appearance of being personal rather than a formletter. The token reward might be as small as a quarter or perhaps a pen therespondent can keep after filling out the survey. Research has shown thatrewards of this size will increase return rates (Pressley & Tullar, 1977).Another effective strategy is to precontact participants by telephone beforethe survey is mailed, politely asking them to fill out the survey when itarrives. Finally, follow-up letters also are effective at increasing response rates.Some investigators send out a postcard a week after the original mailing andthen a follow-up letter and another copy of the survey several weeks later.
Even with all the efforts mentioned, you should not expect a 100%response rate. The very best mail surveys have response rates on the order of80%, and a more realistic figure is probably 60%. With these levels of responseit is important to assess the representativeness of the obtained sample by com-paring it with the population. For instance, you probably know somethingabout the distribution of certain demographic variables across the populationsuch as sex, income level, and education. One reason for asking respondents
How to Design Research That Is Not Experimental 213

to provide such information on the survey form is to make comparisons withthe population. Large deviations of the sample from the population on thesedemographic variables would be a tip-off that the sample obtained is not rep-resentative of the population and so generalization is dangerous.
Another way to collect survey data is by means of a telephone survey, inwhich participants are called on the telephone and asked a standard set ofquestions. At first this option might strike you as both cheaper and easier thana mail survey. It does have the advantage that it is more personal than a let-ter and for this reason might elicit more honest and complete responses.However, this method also has problems. Getting someone to respond overthe phone can be difficult. During the day many families are not home, and inthe evenings many homes are deluged with telemarketers trying to sell prod-ucts and services. Some of these telemarketers now begin their sales pitchesby claiming to be conducting a survey. Lots of folks, understandably, hang upor politely refuse to take any but personal calls, and this reaction is even morelikely now that many states allow those with phones to put their names onlists that prevent telemarketers from calling. On top of this problem, noteveryone has a phone, some have two or more (perhaps hooked up only to acomputer or fax), and many people have unlisted numbers. Even if you geta participant to respond, some questions are more difficult for the respondentto understand over the phone, particularly with the TV set on and the babycrying in the background. Generally, questions have to be shorter and thenumber of response alternatives limited to avoid exceeding the respondent’sattention span. Finally, particularly for some sensitive areas, respondents maynot be sure that confidentiality will be maintained; they are not really sureyou are who you say you are, and there may be other people near the phonewho might overhear their responses.
Sometimes it is possible to save time and effort using group administrationof a survey. In this case the investigator has access to a group of participantsand can distribute and collect a written survey in a short time frame. Forexample, last semester I asked the students in my introductory psychologyclass to answer a one-page survey on attitudes toward nuclear power gener-ation. Total time to distribute, complete, and collect the survey was about 10minutes. My university requires that class time be used exclusively for edu-cational purposes, so after analyzing the results, I spent part of the next classshowing the students the results and using the study to illustrate psycholog-ical research methods. Many students at my university also use the studentresearch pool from introductory psychology classes to collect survey infor-mation, in this case asking 40 or so students to come to a classroom and fillout a questionnaire. In each of these cases, of course, students can refuse toparticipate and can fulfill class requirements in alternative ways. Groupadministration has the advantage of providing large amounts of data rapidly.A disadvantage is that it is hard to ensure complete confidentiality, with otherrespondents sitting close by. It is also often difficult to get a representativesample using such preestablished groups. Do you think students in intro-ductory psychology courses are representative of the general population?
214 Chapter Ten

Most such groups are selected or self-selected for some purpose other thanthe research being conducted and are seldom representative samples ofpopulations of interest.
A time-consuming but effective survey technique is the face-to-face inter-view. The respondent meets individually with an interviewer at a locationsuch as a research lab or at the respondent’s home or workplace. The inter-view can be structured, with the interviewer essentially reading questionsfrom a script, or unstructured, in which case the interviewer has the freedomto explore topics as they come up. The structured interview certainly providesmore control and makes data analysis easier. On the other hand, the unstruc-tured interview may seem more natural to the participant and may be morelikely to elicit deeper and more detailed responses. A strategy used by someinvestigators is to conduct the first part of the survey as structured and thenallow a more unstructured approach toward the end of the session.
We should not overlook the Internet when thinking about survey tech-niques. An Internet survey can be conducted entirely in the electronic format,with respondents providing responses over the net. Or the Internet can beused to contact participants or advertise the availability of a survey thatwould then be mailed to the respondent. For example, a colleague and I justconducted an Internet survey. We belong to a particular professional societyand wanted to collect some survey information from a representative sampleof members. We took a random sample from the organization’s membershipdirectory and, where we could, we used e-mail addresses to send a one-pagesurvey to be filled out electronically and sent back to us. For a few memberswe had no e-mail addresses or ones that did not work, and for these we useda mail survey. I do not know of any research yet that compares response ratesfor Internet surveys with those for mail surveys, but I suspect that for shortsurveys that can be answered electronically, response rates are higher for theInternet. E-mail follow-up reminders are also easy to send. In the future suchsurveys may be considered a violation of the general rule against unsolicitede-mail, but I believe that is not yet the case.
I also have a colleague who maintains a Web page that he uses to collectsurvey data. On this page he has asked people to do such things as rate thebeauty of computer-generated pictures of faces. He then uses these ratings todetermine which facial characteristics are related to beauty. He updates hisWeb site regularly so that after respondents have made their responses theycan find out how their ratings compare with ratings of others. This feedbackapparently provides considerable motivation to do the ratings; he has col-lected thousands of responses in this way. When respondents are self-selectedin this way, there are obvious problems with the representativeness of thesample, but for some kinds of research this issue is not a great problem. Docomputer geeks surfing the Web have different standards of facial beautythan the rest of the population? Perhaps, but probably not. However, whendoing an Internet survey, we should remember that we will always have abiased sample. Not everyone has access to the Internet, and the proportionsof Internet users from different demographic groups vary markedly. It is also
How to Design Research That Is Not Experimental 215
true that you have to know a lot about setting up a Web site or know someonewho does to do this kind of research. However, tutorials are now available onthe Web to help you create surveys. If you think your survey research couldbe conducted this way, you could use a browser or ask your professor for helpin finding such a site.
SELECTING A SAMPLE
As I have emphasized, in selecting your survey sample you want a group thatis representative of the population to whom you want to generalize yourconclusions. How do you pick a representative sample? One possibility is totake a random sample, a task more difficult than you might imagine. If youwanted to generalize to the entire population of the United States, you wouldfirst need a list of all U.S. citizens and then you would randomly pick yoursample from this list. Putting all these names into a hat and drawing a samplewould require an enormous hat! In most cases you would have to be contentto choose from a smaller population, such as the population of a city, a uni-versity, or an introductory psychology class, and hope that the chosen popu-lation was not too different from the one you were really interested in. Eventhen, random selection is often not possible. Most departments of psychol-ogy get their participants from students taking introductory psychologyclasses who volunteer to fulfill a course requirement or for extra credit. Somedepartments pay participants for participation. Either way these people havenot been selected at random. I am sure that you can think of many ways inwhich such a sample might differ from a truly random sample. As an exampleof the impact of nonrandom sampling, in 1993 Ross Perot asked televisionviewers to send responses to questions printed on a postcard in TV Guide andfound that 97% favored bigger cuts in government spending. However, thesame question put to a random sample showed that only 67% favored suchcuts (Tanur, 1994).
When random sampling is not possible, some investigators use a tech-nique called stratified sampling. In this case, subpopulations called strata5 areidentified, and participants are randomly chosen from within these strata. Forexample, if the population to be sampled were all U.S. citizens, even though atruly random sample might be impossible to identify, the investigator mightwant to ensure that economic classes were represented in the proper propor-tion. In this case, the strata might be incomes up to $20,000, from $20,001 to$40,000, from $40,001 to $60,000, and from $60,001 up. Even if the populationwere a university’s student body, an investigator might identify strata toinclude the subpopulations of gender, ethnic group, and class rank to ensurethat each stratum was proportionally represented in the sample.
216 Chapter Ten
5 The everyday meaning of the word strata is not too different from this one: layers, such as thelayers of rock that you would see where the side of a hill has been cut out for construction. It iseasy to picture people of various incomes stacked into such layers. The singular of strata isstratum.

CONSTRUCTING A SURVEY QUESTIONNAIRE
Now that you have chosen a sample, how do you go about making up a surveyquestionnaire? First of all, you should find out whether you need to make oneup at all. If the purpose of your questionnaire is to determine where peoplefall on a particular personality dimension such as being authoritarian, anxious,internally directed, creative, or some other personal characteristic, someonehas probably already designed a questionnaire to do this. It is also likely thatif this questionnaire has been published, it has already been tested for relia-bility and validity (see Chapter 7), so you will know whether it is any good.You may find the existence of such a questionnaire when you do your litera-ture search (see Chapter 6), or one of your professors may be able to help youfind one. If the questionnaire has been published as part of a journal article,you probably will have little difficulty with copyright restrictions. However,if it is available from a commercial publisher, you will likely have to buy copiesof it, and these can be quite expensive. Resist the temptation to plagiarizequestions from such a questionnaire. This practice is not only unethical butalso, in the case of copyrighted material, illegal.
If your topic of interest is more specific or if you cannot find an existingquestionnaire that suits your purpose, you will have to construct one your-self. This seems easy enough. All you have to do is ask questions, right? Forexample, if you are interested in what people think about the issue of abortion,why not just ask, “What is your opinion about abortion?” This is an exampleof an open-ended question because you have left it open for the respondentsto answer any way they wish. Imagine the sentence, paragraph, or book thatyou will get back as a response to this one open-ended question. Even if youcould convince your respondents to take the time to answer this questionthoroughly, how could you possibly analyze the reams of data produced?
How to Design Research That Is Not Experimental 217

As a first step in constructing your questionnaire, you might wish to ask somepeople your potential questions in an interview setting. The types ofresponses people give to such open-ended questions might give you an ideafor constructing more restricted closed-ended questions for your survey.Throughout this process, you should remember that at some point you willhave to analyze the data you collect. Ideally, you should be able to convertmost of the data into numbers, to make them quantitative. Statisticians tellhorror stories about investigators, sometimes students, who walk into theiroffice, plop down a stack of questionnaires, and say: “Here they are. How doI analyze them?”
I do not mean to imply that it is impossible to numerically analyzeanswers to all open-ended questions. Although it requires extra effort, youcan convert answers to well-constructed questions into quantitative data. Forexample, some survey researchers train independent judges to read answersto open-ended questions and code the answers into predetermined responsecategories. The responses of individual judges can then be compared to deter-mine how reliable the coding scheme was. The point is that whatever meansyou use, by the time you finish constructing your questionnaire, you shouldknow exactly what types of data you will end up with and how you willanalyze these data.
One way to turn the respondents’ answers into numbers is to use closed-ended, multiple-alternative questions that restrict the possible responses.Here is an example:
When should a woman be allowed to have an abortion?____ Never____ Only in the case of rape or incest____ Only in the case of rape or incest and with parents’ permission for
minors____ Whenever she decides to do so
The instructions would indicate that the respondent place a check mark nextto only one alternative. With a question item such as this one, we could countup the number of respondents who put check marks next to each alternative.That would give us numbers as data.
Note that although this question will provide quantitative data, even thissimple question could be criticized. Some respondents might wonder whatthe word allowed means: Who is doing the allowing? The state? God? Somerespondents might not find an alternative that perfectly describes their feel-ings. For example, some might believe that the fetus’s father has some rightsor that the age of the fetus is of critical importance. Even the way the ques-tion is framed might make a difference. Do you think that the followingquestions frame the issue in such a way that respondents would be biased toanswer in a particular way?
“Should the right of a woman to terminate her pregnancy be treated likeany other health issue?”
218 Chapter Ten
“When should the government limit a woman’s right to have anabortion?”
“When should a mother be allowed to take the life of her unborn baby?”
Certain words tend to have particular beliefs and emotions associatedwith them. In general, people believe that people’s rights should be protected,that government limitations should be minimized, that women are independentbut that mothers have responsibilities, that fetuses are not human but unbornbabies are, and that to terminate is not to kill but to take the life of is. Most ques-tions would probably not be so blatantly biased as these examples, butsmaller forms of bias can creep in even when we try to avoid it. Recently Iwas writing a questionnaire to find out whether a certain statistics class in myuniversity was adequately preparing our psychology students. I must admitthat I did not think that the class was being well taught. Before I caughtmyself and changed it, the questionnaire I was going to give graduating stu-dents contained an item that said, “If you think that this class was taughtpoorly, which of the following reasons would you give?” I then listed a num-ber of possible problems with the class without listing any possible positiveaspects. I was embarrassed when one of my colleagues pointed out the obvi-ous negative bias I had built into the question.
Even small changes in language can result in large apparent changes inopinion. For example, a telephone poll found that whereas 53% of people saidthat the government was spending too much money “on welfare,” only 23%said the government was spending too much money “on assistance to thepoor.”6 In a similar survey that I mentioned earlier, Ross Perot asked, “Do youbelieve that for every dollar of tax increase, there should be two dollars inspending cuts with the savings earmarked for deficit and debt reduction?”Sixty-seven percent of a random sample responded positively. However,when the question was rewritten to “Would you favor or oppose a proposalto cut spending by two dollars for every dollar in new taxes, with the savingsearmarked for deficit reduction, even if it means cuts in domestic programslike Medicare and education?” only 33% of respondents favored it (Tanur,1994). You can see that subtle wording changes can make large differences inrespondents’ opinions.
You should also examine your questions to make sure that all the lan-guage is understandable to the respondents in your sample. Because mostcollege students and instructors typically interact with people having somecollege education, it is easy to forget that the general population has less well-developed reading skills and vocabulary comprehension. So keep yourvocabulary appropriate for your sample. You should also make sure that thequestions are not so awkwardly stated that they are confusing. For example,questions stated in the negative should typically be avoided: “Does a womannot have the right to an abortion?” The best way to find out whether your
How to Design Research That Is Not Experimental 219
6 From a telephone poll of 600 adult Americans taken for Time and CNN on May 18–19, 1994,by Yankelovich Partners, Inc. Reported in Time, June 27, 1994, p. 26.
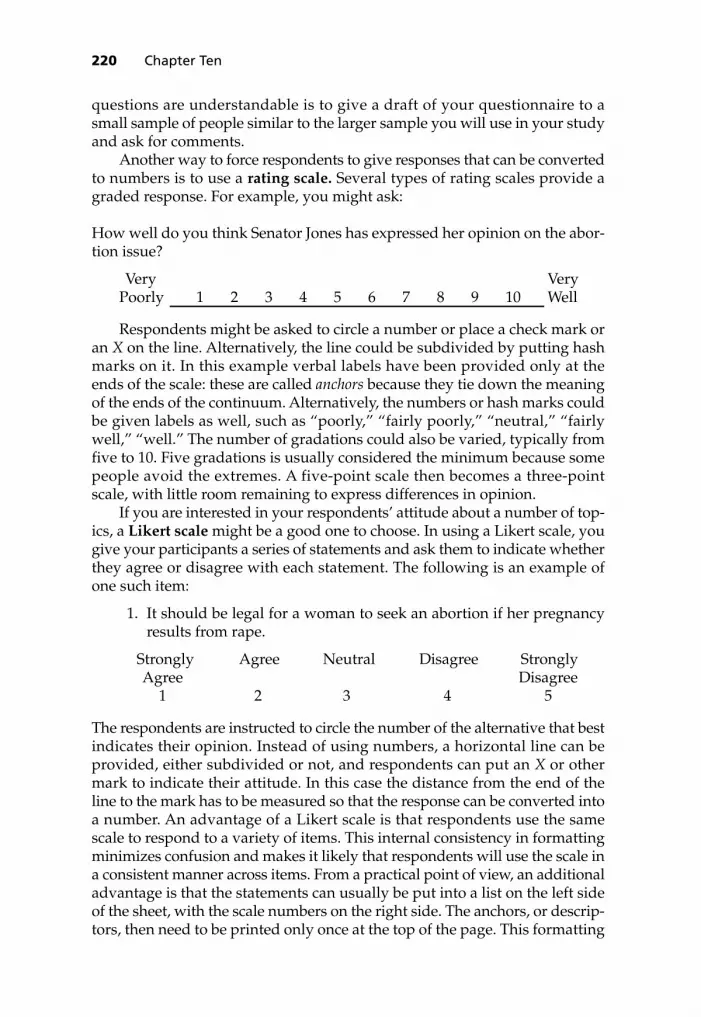
questions are understandable is to give a draft of your questionnaire to asmall sample of people similar to the larger sample you will use in your studyand ask for comments.
Another way to force respondents to give responses that can be convertedto numbers is to use a rating scale. Several types of rating scales provide agraded response. For example, you might ask:
How well do you think Senator Jones has expressed her opinion on the abor-tion issue?
Very VeryPoorly 1 2 3 4 5 6 7 8 9 10 Well
Respondents might be asked to circle a number or place a check mark oran X on the line. Alternatively, the line could be subdivided by putting hashmarks on it. In this example verbal labels have been provided only at theends of the scale: these are called anchors because they tie down the meaningof the ends of the continuum. Alternatively, the numbers or hash marks couldbe given labels as well, such as “poorly,” “fairly poorly,” “neutral,” “fairlywell,” “well.” The number of gradations could also be varied, typically fromfive to 10. Five gradations is usually considered the minimum because somepeople avoid the extremes. A five-point scale then becomes a three-pointscale, with little room remaining to express differences in opinion.
If you are interested in your respondents’ attitude about a number of top-ics, a Likert scale might be a good one to choose. In using a Likert scale, yougive your participants a series of statements and ask them to indicate whetherthey agree or disagree with each statement. The following is an example ofone such item:
1. It should be legal for a woman to seek an abortion if her pregnancyresults from rape.
Strongly Agree Neutral Disagree StronglyAgree Disagree
1 2 3 4 5
The respondents are instructed to circle the number of the alternative that bestindicates their opinion. Instead of using numbers, a horizontal line can beprovided, either subdivided or not, and respondents can put an X or othermark to indicate their attitude. In this case the distance from the end of theline to the mark has to be measured so that the response can be converted intoa number. An advantage of a Likert scale is that respondents use the samescale to respond to a variety of items. This internal consistency in formattingminimizes confusion and makes it likely that respondents will use the scale ina consistent manner across items. From a practical point of view, an additionaladvantage is that the statements can usually be put into a list on the left sideof the sheet, with the scale numbers on the right side. The anchors, or descrip-tors, then need to be printed only once at the top of the page. This formatting
220 Chapter Ten

saves space and is easy for the respondent to understand. An example isshown in Figure 10-5.
Most researchers also collect demographic information in their surveys—information about the respondent’s gender, age, ethnicity, education, income,class rank, religion, grade point average, and so forth. Exactly which infor-mation you wish to ask for will depend on the purpose of the survey. Forexample, if you wanted to determine whether people’s attitudes toward abor-tion were influenced by their religion, you would obviously need to includea question that would allow you to sort the questionnaires according to thisfactor. As you can see, here again it is important for you to determine, whendesigning the questionnaire, how you will analyze your data. Not allresearchers agree about where in the questionnaire to include demographicitems. The most obvious place would be at the beginning, but someresearchers have argued that putting demographic items there might leadparticipants to think the questionnaire is boring, in which case they may beless likely to complete it (Dillman, 1978).
How to Design Research That Is Not Experimental 221
FIGURE 10-5 An example of an opinion survey using a Likert scale for responses
1. Having an abortion is a sin.2. The government should subsidize
abortions for poor women.3. It should be illegal for a woman
under 18 years of age to have an abortion without her parentsí permission.
4. Doctors performing abortions should be required to counsel their patients about alternatives such as adoption.
5. The choice to have an abortion should be left entirely up to the pregnant woman.
6. “Day-after” abortion pills should be legal.
7. People picketing abortion clinics should be arrested.
8. Abortion should be available only in cases of pregnancy due to rape or incest.
Stronglydisagree
1
1
1
1
1
1
1
1
Disagree
2
2
2
2
2
2
2
2
Neutral
3
3
3
3
3
3
3
3
Agree
4
4
4
4
4
4
4
4
Stronglyagree
5
5
5
5
5
5
5
5
Please circle the number on the right that most closely approximates your agreementwith each statement.
Opinions on Abortion Issues

ADVANTAGES
We have already discussed many of the advantages of surveys and question-naires. They offer a way of assessing people’s opinions, attitudes, motivations,and future behaviors that would not be available to us through standardexperimental techniques. In addition, they provide a way of collecting largeamounts of data relatively inexpensively and quickly.
DISADVANTAGES
We have also discussed several of the disadvantages of survey research. Thelarge data sets collected can be difficult to analyze, particularly when dataanalysis has not been planned during the design of the survey. Even whenthe data analysis has been planned, fairly sophisticated statistical techniquesmay be required to analyze large data sets. In addition, when low responserates are a problem, it becomes difficult to generalize to larger populationsbecause of nonresponse bias.
A third disadvantage is that surveys are really correlational observationsrather than experiments. In a survey no independent variable has been manip-ulated to cause a change in behavior. The data from a survey are essentiallymultiple dependent measures. For that reason we have to avoid making causalstatements from the results. For example, we might want to relate attitudestoward abortion to religious affiliation. Perhaps we discover in a survey thatrespondents who indicate more fundamental religious beliefs are also morestrongly opposed to abortion. We might be tempted to say that the religiousbeliefs cause negative attitudes toward abortion, but all we can really say is thatthey are related. I hope you remember the discussions in Chapters 1 and 2 inwhich I pointed out why we have to be careful interpreting correlational data.
A final inherent weakness of surveys and questionnaires, even good ones:They do not measure behavior directly but are self-reports. So respondentscan tell us anything they want, and we have no way of independently veri-fying the information. Why would they lie to us? Actually, there are severalreasons why their responses might not be truthful. One reason is that theywant to protect themselves. Even though the researcher has told them thattheir responses are anonymous and they do not have to put their names onthe form, they may believe that the researcher has somehow coded the formsso that they can be identified. Or if they are filling out the form in a room withother respondents, they may think that somebody else will see their answers.Even if they are convinced that their information will remain confidential, therespondents may have some specific ideas about how the researcher will usethe information and may have some reason for distorting their responses. Forexample, an individual who smokes marijuana and thinks it ought to be legal-ized might state falsely that she has never had a bad experience when underthe influence of drugs. She probably realizes that if a large number of usersreport bad experiences, this information could help prevent legalization.Individuals might even lie because they want to bring attention to their groupor their cause. For example, if a student thinks that something ought to be
222 Chapter Ten

done about guns in his high school, he might claim that he has seen moreguns in his school than he actually has.
In some cases respondents may not be purposely untruthful but may lieto themselves as well as the researcher. In the case of emotion-laden issues,individuals might not wish to admit their own feelings and attitudes, partic-ularly when these differ from what are considered socially acceptable. Forexample, a respondent might strongly deny being a racist while engaging inbehaviors that clearly indicate that he or she is a racist. Because being a racistis not socially acceptable to most members of our society, people have adifficult time admitting to being one even when they are.
Thus, in analyzing survey data, we should always keep in mind that inthe end the data are self-reports. When we discuss the results of surveys, weshould remember to qualify our statements in recognition of this fact. Weshould not say that 27% of high school students have used marijuana if all weknow is that 27% have reported using marijuana. As my grandmother used totell me, “Saying and doing are two different things.”
Table 10-3 provides a handy reference summarizing the advantages anddisadvantages of the various research techniques we have examined in thischapter.
How to Design Research That Is Not Experimental 223
■ TABLE 10-3A Summary of the Advantages and Disadvantages of Doing Quasi-Experiments,Baseline Experiments, and Surveys
Design
Quasi-experiments
Baselineexperiments
Surveys
Advantages
Allows applied research whenexperiments are not possible.
Threats to internal validity canbe assessed.
One individual can provideresults that are easy to interpret without statistics.
Size and timing of independent-variable manipulation are flexible.
Infrequently occurring conditions can be studied.
Internal events (for example, attitudes) can be investigated.
Large amounts of data can becollected quickly.
Disadvantages
Threats to internal validity mayexist.
Designs are more complex thantraditional experiments.
Statistical analysis can bedifficult.
Assumptions are difficult tomeet (for example,reversibility).
Small but important effectscannot be investigated.
Generalizability is limited.
Large data sets are sometimesdifficult to analyze.
Low response rates can causenonresponse bias.
Results are correlational, socausality cannot be inferred.
Self-reports may not betruthful.

■ SummaryIn applied field settings where random assignment of participants to groupsis often not possible, nontraditional designs called quasi-experimentaldesigns can sometimes be used. Nonexperimental designs are difficult tointerpret because of multiple threats to internal validity. These designsinclude a one-group posttest-only design, in which the behavior of only onegroup is tested after exposure to a treatment; a posttest-only design withnonequivalent groups, in which a second group, selected in a different man-ner, is also tested but not exposed to the treatment; and a one-grouppretest–posttest design, in which one group is tested before and after expo-sure to the treatment.
Quasi-experimental designs permit you to eliminate or assess manythreats to internal validity. In a nonequivalent control group design withpretest and posttest, one group is tested before and after the treatment, anda second group, selected in a different manner, is tested at equivalent timesbut without being exposed to the treatment. Variations of this basic designinclude using a proxy pretest to measure a variable correlated with theposttest when the use of a pretest is not possible; using separate pretest andposttest samples by subdividing the nonequivalent groups and testing half ofeach group before and half after exposure to the treatment; and makingpretest observations at more than one time interval, so that each group istested several times before exposure to the treatment.
The second class of quasi-experimental designs is interrupted time-seriesdesigns, in which one group is tested multiple times before and after expo-sure to the treatment. Variations of this design include the addition of a non-equivalent no-treatment control group time series, in which a second group,selected in a different manner, is tested at equivalent times but not exposedto the treatment; using an interrupted time series with removed treatment,in which a third series of tests is given after the treatment is removed;and using an interrupted time-series with switching replications, in whichseveral groups selected in different ways are tested at many points in timebut are exposed to the treatment at different points in the series.
A second type of nontraditional design is a baseline experiment that canshow experimental effects using data from only one individual. Baselineexperiments are often used to evaluate the effects of treatments or therapeu-tic interventions. After establishing a steady-state rate of responding called abaseline, the investigator initiates the experimental manipulation until therate of responding changes to a new transition steady state. The investigatorthen demonstrates reversibility by recovering the original baseline. Anadvantage of baseline designs is that they offer a convincing way to showimportant changes in a single individual’s behavior. The experimenter canalso be flexible in choosing when to manipulate the independent variable andwhich level to change it to. These results are also easy to interpret. However,some assumptions of baseline experiments, such as reversibility, cannot be
224 Chapter Ten

met in many areas of psychology. It is also sometimes difficult to showsmall but important effects and risky to generalize the findings to a largerpopulation.
A third type of nontraditional design is the survey, or questionnaire,which can be used to assess the opinions, attitudes, motivations, or futurebehaviors of a sample of respondents. Mail surveys are relatively inexpen-sive and allow sampling of large geographic areas. However, low responserates can cause problems with nonresponse bias, the disproportionate lossof certain segments of the sample, and affect the generalizability of findingsfrom the sample to the larger population. Response rates can be improvedwith appropriate cover letters, small rewards, precontacts, and follow-up let-ters. Telephone surveys can be done even more quickly and more personally.However, nonresponding is still a problem, as well as is the difficulty in get-ting a representative sample from those with telephones. Group administra-tion of surveys can be quite efficient, but the composition of the group is oftennot representative of the population of interest. Face-to-face interviews, whileless efficient than some of the other procedures, allow a more personal inter-action with the respondent and the possibility of both structured and unstruc-tured interviewing. A developing survey procedure is the Internet survey, inwhich participation can be solicited on the Internet and responding can bedone either electronically or through the mail.
The sample for a survey can be a random sample, in which case all mem-bers of the population have an equal chance of being selected, or a stratifiedsample, in which case various categories or strata are identified and randomsampling occurs within the strata. Survey questionnaires can include open-ended questions, which can be difficult to quantify, or closed-endedquestions, with more restricted response options such as multiple-alterna-tive questions or questions using a rating scale such as a Likert scale.Though surveys offer the opportunity to collect large amounts of data quicklyabout opinions, attitudes, and future behaviors, the large data sets can bedifficult to analyze, low responding can cause nonresponse bias, causalitycannot be inferred from correlational data, and self-reports may not betruthful.
S U G G E S T E D B O O K S O N Q U A S I - E X P E R I M E N TA LS TAT I S T I C S
For the Beginning StudentCook, T. D., & Campbell, D. T. (1979). Quasi-experimentation: Design & analysis issues
for field settings. Chicago: Rand McNally.
For the Advanced StudentBox, G. E. P., & Jenkins, G. M. (1976). Time-series analysis: Forecasting and control. San
Francisco: Holden-Day.Campbell, D. T., & Stanley, J. C. (1966). Experimental and quasi-experimental designs for
research. Chicago: Rand McNally.
How to Design Research That Is Not Experimental 225

Kidder, L. H., & Judd, C. M. (1986). Research methods in social relations (5th ed). NewYork: Holt, Rinehart & Winston.
Shadish, W. R., Cook, T. D., & Campbell, D. T. (2002). Experimental and quasi-experimental designs for generalized causal inference. Boston: Houghton Mifflin.
S U G G E S T E D B O O K S O N B A S E L I N E D E S I G N S
Hersen, M., & Barlow, D. H. (1984). Single-case experimental designs: strategies forstudying behavior change. New York: Pergamon Press.
Robinson, P. W., & Foster, D. F. (1979). Experimental psychology: A small-N approach.New York: Harper & Row.
Todman, J. B., & Dugard, P. (2001). Single-case and small-N experimental designs: Apractical guide to randomization tests. Mahwah, NJ: Lawrence Erlbaum.
S U G G E S T E D B O O K O N S U R V E Y D E S I G N S
Dillman, D. A. (1978). Mail and telephone surveys: The total design method. New York:Wiley.
226 Chapter Ten

You should now have all the tools needed for beginning your experiment.However, you may have to ask yourself some questions to determine
whether you have considered all the important issues before you can begincollecting data.
227
11How to Tell When You AreReady to Begin
An error is a mistake only if repeated.ANONYMOUS
The greatest of faults, I should say, is to be conscious of none.T. CARLYLE (1888)
The way of a fool seems right to him, but a wise man listens toadvice.
PROVERBS 12:15

When I teach experimental methods, my students have to think up,design, and do an original experiment. Before they are allowed to start col-lecting data, they are required to present the proposed experiment to the class.It is the job of the class, and my job, to critique the experiment, trying to findflaws and determining whether the student experimenter has considered allnecessary details before doing the research. This exercise serves severalpurposes. It helps develop a critical sense in the students listening to thepresentation—an ability that all scientists must have. Preparing for the pre-sentation also motivates the student experimenters to try to think aboutthe many assumptions they have made and the small decisions they mayhave avoided up to this point. Finally, this exercise allows all of us to help theexperimenters by suggesting ways of improving the experiment.
■ The Have-a-Nice-Day SocietyBefore discussing some of the commonly unanswered questions that need tobe considered before beginning an experiment, I would like to comment onthe emotional response many of my students have toward presenting theirproposed experiments. Those making the presentations often consider this themost aversive and distressing part of the course. Part of the distress is just theact of making a presentation, any presentation—a skill that is seldom tappedin other college courses. But I suspect that most of the distress is due to havingto defend their experiment before a potentially critical group of peers.
228 Chapter Eleven
The first reaction of the student audience is to keep quiet: “I won’t rockyour boat if you don’t rock mine.” Even with my prodding, some studentsare reluctant to criticize their fellow students’ ideas. We live in a have-a-nice-day society where the rules include extreme tolerance of the behaviors andopinions of others. Some people seem to believe that because we all have theright to express our views, the value of one opinion is equal to the value ofanother. And criticizing other people’s opinions is seen as a personal attackon them or on their right of free speech.

Judging from their comments on the student evaluations filled out at theend of the class, some students certainly do perceive my comments at thestudent presentations as personal and uncalled for. As much as I try to smile,keep my voice down, and project a helpful attitude, these students cannotseem to understand why their nice, friendly teacher has suddenly turned onthem.
I hope that the preceding chapters in this book have, at least on an intel-lectual level, convinced you that within science one opinion is not as good asanother. Opinions must be defendable. If the rules of science are violated, theresults become suspect or useless. The rules of deductive and inductive logic,discussed in Chapter 3, are the basis for arguing that certain results support orrefute a theory. The elimination of potential confounding variables, discussedin Chapter 2, is required to be able to build a case for causality—that is, toclaim that the independent variable caused the change in the dependentvariable. The random selection of an experimental sample of participants,discussed in Chapter 2, is the basis on which results can be generalized to alarger population.
When the class, the instructor, or colleagues criticize a research proposal,they are attempting to help the proposer follow the rules of science so thatafter the research is completed, the results can be defended and added to thescientific body of knowledge. Although criticism at the proposal stage canbe irritating, after the research is completed it is devastating. After-the-factcriticism indicates not only that you made a mistake because you were notthoughtful enough but also that you wasted both your time and the partici-pants’ time, as well as other resources that could have been used to advancethe body of knowledge. The message here is not that science is a deadly seri-ous enterprise in which mistakes bring great guilt but that science has certainrules to which you must adhere as a scientist. And you should use whateverresources are available, including the advice of others, to help you follow therules and do good research.
■ Questions before You BeginThe following questions are the ones I most frequently ask my students whenthey make their research proposals. You may already have answered them.Good for you! If not, be sure that you can before you begin collecting data.
DOES MY EXPERIMENT SATISFY ETHICAL CONCERNS?
As we saw in Chapter 4, the need to treat research participants ethically raisesa number of concerns. Have you considered all these concerns? Will yourparticipants be subjected to any psychological or physical stress? If so, howcan it be minimized? Will your participants give informed consent? If you usesign-up sheets, do these sheets give an adequate description of the experi-ment so that participants can give informed consent? Can you document thisconsent? Are you using deception in your experiment? If so, are you ade-quately debriefing the participants when the experiment is over? Have you
How to Tell When You Are Ready to Begin 229

prepared a debriefing statement? Have you prepared a schedule so that youwill be able to meet all your participants in a timely way? Have you consid-ered what you will do if your equipment breaks down or if you get sick? Doyou know how you are going to ensure that the data you collect remainconfidential? Does your experiment have demand characteristics? Are theselikely to affect the results? You should ask yourself all these questions beforeyou begin your experiment.
In addition, you should do all the paperwork necessary to get permissionfrom your institutional review board to conduct the study. In some cases,these review boards take several weeks to consider a research proposal, andyou cannot begin before they give final approval. So be sure to fill out andsubmit the required paperwork as soon as you have settled on a design.Following this advice is even more important if your experiment is at all eth-ically controversial—that is, if it uses deception, is potentially stressful,involves drugs, and so forth. In this case, the review board will probably takelonger, may come back to you to work out some details, or may not evenapprove the study.
HOW MANY PARTICIPANTS DO I NEED?
It is often hard to figure out how many participants you will need for yourexperiment. One of the most frequent mistakes students make is to use toofew, so that what appears to be a good result is not statistically significant. Ofcourse, there may be some practical considerations, such as a limited pool ofparticipants that restrict the number you are allowed to use. If so, you mayjust have to compromise. Assuming that you may use as many participantsas you wish, there are statistical ways of determining the power of a statisti-cal test and the approximate number of participants needed. We brieflydiscuss statistical power in the next chapter, although actually calculatingthese tests is beyond the scope of this book.
You should also bear in mind that whereas too few participants will notallow you to show statistical significance with a reasonable-sized experi-mental effect, too many can show statistical significance even with an unim-portant effect. In this case, not only is using too many participants inefficient,it may also be misleading.
Perhaps the best way to determine how many participants to use is bystudying the literature. Certainly, if you are replicating someone else’s exper-iment in which a statistically significant effect was reported, you will have apretty good idea of the numbers needed. Even if you are not doing a directreplication, you will probably be able to find similar experiments that haveused the dependent variable you are proposing. The variability found in datagenerated from particular dependent variables such as reaction times orwords recalled from a list tends to be relatively predictable. In the unlikelyevent that you can find no similar experiments, you may have to do a pilotexperiment to get some idea of the number of participants you will need.
230 Chapter Eleven

SHOULD I RUN PARTICIPANTS INDIVIDUALLY OR IN GROUPS?
Most new experimenters think first of doing experiments on participants indi-vidually rather than in groups. Sometimes there’s no choice—for example,only one piece of equipment may be available for recording responses. Inother cases, some individuals might affect the performance of others in thegroup, so they must be run individually. However, if you can run participantsin groups, you can collect data more efficiently.
When considering your options, you should ask yourself questions likethese: Can I give a questionnaire to a group of participants rather than askquestions to individuals? Can I collect the necessary data by using slides or anoverhead projector to display stimuli to a group instead of using flip cards ora computer display with individuals? If you are presenting a consistent seriesof stimuli and recording only the accuracy of responses or the number ofresponses in a particular category, you can most likely use groups. If the orderor timing of stimulus events depends on the responses made to earlier eventsor if precise timing of the responses is necessary, then you will probably needto run participants individually.
HOW LONG WILL MY EXPERIMENT TAKE?
Calculating the length of the experiment poses questions at several levels. Atthe grossest level, how many hours, or days, or weeks will be necessary forcollecting data? At a finer level, how long will a single experimental sessiontake? If you are going to use individual trials, you cannot answer either ques-tion without first determining the length of a trial and the number of trialsnecessary. To figure out trial length, you must know the sequence of eventsthat will occur during a trial and the time required for each event, includingthe intertrial interval (that is, the time between trials). Then, by knowing howmany trials will be presented, you can determine the total time taken tocomplete the trials. In some cases the number of trials may have to beestimated, as, for example, when participants must achieve a performancecriterion, such as two consecutive trials on which they can correctly recall alist of words.
You should also remember to include the time to do other tasks associ-ated with the experiment. Usually the participants will have to be given someinstructions and be allowed to ask questions before starting. A set of practicetrials may be included if some learning is anticipated and a relatively stableperformance is desired. Rest breaks may be needed to avoid fatigue duringlong or tedious experiments. A debriefing session at the end of the experimentmay be required, particularly if students are serving in the experiment as partof a class requirement and are supposed to be learning about experiments.Finally, some “slop time” should be built in because people sometimes arrivelate. Without this time, consecutive sessions will run progressively later andlater. Figure 11-1 shows some of the steps required for determining the timeexpected for an experimental session.
How to Tell When You Are Ready to Begin 231

232 Chapter Eleven
One Trial
Time for Each Event (in Milliseconds)
Total time for one trial = 200 + 200 + 400 + 800 + 400 = 2000 ms, or 2 sec
300 40 40 40 4030 30 30
➤ ➤ ➤
30
➤
300
Time for Each Event (in Seconds)
Total time for experiment = 300 sec + (20 blocks × 40 sec) + (19 rest × 30 sec) + 300 sec = 1970 sec, or 32 min 50 sec
Including some flexibility for late arrivals, time to be seated, and so on, thisexperiment should be scheduled for 40 to 45 minutes.
Res
pons
e In
terv
al
Inte
rtri
al In
terv
al
Stim
ulus
Prim
e
War
ning
Sig
nal
200 200 400 400800
With 20 blocks of 20 trials each, 30-sec rest breaks, 5 minutes for instructions,and 5 minutes for debriefing:
One Session
Inst
ruct
ions
…
Blo
ck 1
Blo
ck 2
Blo
ck 3
Blo
ck 4
Blo
ck 2
0
Deb
rief
ing
40
You will then need to determine how much total participant-data-collection time you will be devoting to this experiment. Again, you shouldanticipate some unplanned time to run extra participants, to replace thosewho failed to show up, those whose data were eliminated for failure to meetsome criterion, or those for whom the equipment malfunctioned. As for the
FIGURE 11-1 An example of the calculations necessary for determining the timerequired for an experimental session. In this experiment each trial consists of a 200-millisecond warning signal, a 200-millisecond prime (prestimulus information), a 400-millisecond stimulus, an 800-millisecond response interval,and a 400-millisecond intertrial interval (time between trials).

total time needed to complete the experiment, remember that data collectionis only part of the job. You will also need time to analyze the data, interpretthem, and produce several drafts of the experimental report. And each ofthese tasks usually takes more time than anticipated.
DO I NEED TO SET PARTICIPANT RESTRICTIONS?
In general, determining whether to set limitations on who may participate inyour experiment depends on the population to which you want to general-ize your findings. The limited pool of participants from which you have todraw will probably have already reduced your ability to generalize. Forexample, if you use college students, you must consider that certain ages aredefinitely overrepresented and certain ones underrepresented. And you musttake into account that compared with the average population of the country,an average group of college students has a higher IQ, is in a higher socio-economic bracket, has greater reading ability, and is less likely to have healthproblems. So you cannot legitimately generalize to the entire population.
However, for practical reasons you might wish to exclude some individ-uals from your experiment even though this further limits the generalizabilityof your results. For example, if you are studying language performance suchas reading ability, identification of words, memory for words, or a number ofrelated language tasks, you might limit your participants to those whose firstlanguage is English. If you are studying visual perception, you might usepeople whose eyesight is corrected to 20/20 or who can pass a test for colorblindness. If you are studying motor ability, such as in sports psychology, youmight exclude individuals who have physical impairments that wouldprevent them from contributing useful data. In some cases, you might useonly men or only women, whereas in other cases, you might have an equalnumber of men and women so that you can evaluate the effect of gender onperformance. These instances are only some of the possible restrictions youmight wish to consider. Depending on the particular task to be performed inyour experiment, other restrictions might be appropriate and should becarefully considered.
SHOULD I SET ANY A PRIORI CRITERIA FOR ELIMINATINGPARTICIPANTS?
As we discussed in Chapter 4, you may wish to set performance criteriabefore collecting data. For example, I often collect reaction-time data in myexperiments. There are sometimes one or two participants whose overallperformance level is not comparable to that of the others. So I often set a cri-terion that data from any individual whose mean reaction time exceeds themean reaction time of all participants in the experiment by 300 millisecondswill be eliminated from the analysis. Such a criterion, along with the numberof participants thus eliminated, should be reported in the results section ofthe experimental report. And as noted in Chapter 4, participants cannot beeliminated or data discarded for failure to support a predicted hypothesis.
How to Tell When You Are Ready to Begin 233

The general purpose of setting a priori criteria is to eliminate participantswho are distinctly different from the others and who therefore add a largeamount of variability to the data. They may be different because of motiva-tional factors, personality factors, or personal limitations. Such differencesmay certainly be of interest to psychologists studying individual differencesor abnormal behavior. But such behavior is usually not of much interest tomost experimental psychologists, whose concern is usually with establishinga science of the behavioral norm.
CAN I OPERATIONALLY DEFINE ALL MY VARIABLES?
In Chapter 7 I discussed the necessity of being able to operationally defineyour independent and dependent variables and to state the required opera-tions that need to be carried out to enable you to repeat your experiment.Although you should determine operational definitions at an early stage ofdesigning your experiment, experimenters sometimes fail to do this.
Because the independent variables are the variables of major interest tothe experimenter, great care must be taken in specifying their definition.Suppose that you propose to do the experiment that sets the record for theone most often proposed by my students1—you want to determine the effectsof listening to music on studying. Some variations of this basic experimentare the effects of rock versus classical music, of TV, of noise, and of loud musicversus soft music. Suppose the comparison is between rock and classicalmusic. What is rock music? Heavy metal, punk rock, new wave, hip-hop, orrock and roll? What is classical music? A Strauss waltz, Dvorák’s New WorldSymphony, a Beethoven sonata, or Tchaikovsky’s 1812 Overture? Even whenyou use classical music, the outcome of the experiment may be quite differentif a quiet string quartet is played rather than a noisy overture complete withrolling timpani and cannons.
Likewise, if the comparison is between loud and soft music, the questionis, how loud? An appropriate answer is not “I’ll turn it up until it soundsloud” or even “I’ll set the volume control of my stereo on 8.” Another exper-imenter would not know what operations to follow to produce the sameloudness. Ideally, you would have someone measure the sound with a meterand tell you the average sound-pressure level in decibels.
For the dependent variable, again an operational definition is required.What are you going to measure to see whether the music has an effect onstudying? There are a number of possibilities. You could find out how manypages participants were able to read within certain time limits. You could findout how many math problems they completed. You might give them a quizon the material studied. Or you could ask the participants to rate how difficultit was to study under a particular condition. Each of these measures has
234 Chapter Eleven
1 This experiment is closely followed in popularity by experiments done to test the effects ofdrug X (for instance, marijuana, alcohol, or cocaine) on the performance of task Y (such as driving, studying, or memorizing). If your instructor requires that you propose an experimentand you want to be impressively original, do not propose either of these experiments!
advantages and drawbacks, but some dependent variable will have to beoperationally defined because no proposal is complete until this is done.
HAVE I ARRANGED FOR ANY EQUIPMENT OR MATERIALS NEEDED?
Many experiments require equipment, and nearly all require some sort ofmaterials to be prepared. Fortunately, computers can be used to present stim-uli with precise timing and to record and store responses. If you have accessto such equipment and know how to use it or can get help from someone whoknows how to use it, you will be able to carry out many experiments withminimum preparation. However, if computers are not readily available, or ifyour experiment cannot benefit from computers, you may have to carry outyour experiment the old-fashioned way, using whatever equipment is onhand or constructing the equipment and materials yourself. In some cases,you may even have to plan your experiment around the available resources.
Among the materials you may have to prepare are a set of instructions,response sheets on which to record data, and a debriefing script. You shouldgenerally write the instructions out ahead of time. Later you may well includethem in an appendix in the experimental report. In any case, these instruc-tions should certainly be available if someone wanting to replicate yourexperiment requests them.
It is usually not a good idea to simply hand instructions to your partici-pants and expect them to read these instructions properly. Some people’sreading ability leaves a bit to be desired, particularly when the experimenteris hovering over them waiting for them to finish. Experimenters often givewritten instructions and then also read them aloud—slowly. (After all, it’s thefirst time the participants have heard the instructions, even though the exper-imenter may have read them many times.) The last sentence of instructionsis usually “Do you have any questions?” Even in experiments in which learn-ing should not be a problem, it is often useful to give participants a few prac-tice trials so that they know what to expect once the experiment starts. Thesepractice trials can also be included toward the end of the instructions.
If your experiment involves recording data about individual responses(as opposed to questionnaires, for example), you will probably have toconstruct data sheets for this purpose. If you are going to present varioustypes of trials that represent different levels of the independent variable, theresponse sheets may also include this information. Particularly, if you haveto randomly present the trial types, you should have determined the randomorders ahead of time by using a random number table or some other ran-dom device. If you attempt to create a random sequence while the experimentis under way, it will not really be random (see Chapter 2).
Finally, you should write a debriefing script so that you can inform theparticipants at the end of the experiment about the purpose of the research.When participants serve in an experiment as part of a class requirement, sucha debriefing is usually necessary. Even if it is not, the debriefing is a good idea.
How to Tell When You Are Ready to Begin 235

DO I KNOW HOW I WILL ANALYZE MY DATA?
Chapter 12 deals with how to interpret your experimental results usingdescriptive and inferential statistics, and Appendix A provides a guide tosome commonly used statistical tests. If your experiment is relatively simpleand small, these may be sufficient for you to determine how to analyze yourdata. If your experiment is more complex, you may need some help fromyour instructor, a statistics book, or a statistical consultant to choose an appro-priate way to analyze the results. Regardless of how you determine what isthe best way, before you do the experiment you must know how the data willbe analyzed. Statistical consultants tell horror stories about people coming tothem with reams of data after an experiment is complete only to discover thatthe data are useless because they are unanalyzable! Don’t become a charac-ter in one of these stories. Know ahead of time in what form your data willneed to be and how they can be analyzed.
HOW WILL I INTERPRET THE POSSIBLE OUTCOMES OF MYEXPERIMENT?
When you decide to do a particular experiment, you probably have some ideaabout what the results will be. Unlike the starting assumption in statistics,called the null hypothesis, that there will be no effect of manipulating theindependent variable, you probably actually expect that the differences in thelevels of your independent variable will cause a difference in the dependentvariable. Scientists are encouraged to be nonpartisan bystanders, not activeparticipants rooting for a particular outcome. In fact, a good deal of the fun ofscience is predicting the outcome of experiments. Being a good predictor is
236 Chapter Eleven
People will leave the experiment feeling more comfortable and not carry awaymisconceptions about what they just went through. In addition, they may beable to learn something about psychology from this experience and, at the veryleast, will feel better about their experience because somebody has taken thetime to explain the purpose of the study and to thank them for their service.

part of the art of being a good scientist.2 But be careful that you do not becomeso enamored of your predictions that you are tempted to lose objectivity andproduce a biased experiment.
So be prepared to interpret the results of your experiment regardless ofthe outcome. Some experiments, because of their design, are considered fail-ures if certain outcomes occur. Scientists sometimes call such outcomes thatsupport the null hypothesis a negative result. For example, suppose that youdid the experiment to determine the effects of rock and classical music on astudent’s ability to study and found that the group listening to rock and thegroup listening to classical music were not statistically different in their per-formance. As discussed in Chapter 12, because our statistical tests aredesigned to test for differences, not samenesses, you cannot really say that theperformances of the groups were the same, you can only say that you failedto show that they were different. Perhaps it would be interesting to know thatrock music affects studying no differently than classical music does, but thefailure to find a difference could have been caused by any number of factorsaside from the lack of an actual difference—for example, using too fewparticipants or not having proper control of variables, which caused thevariability of the data to be high, and so on. In some cases, where a series ofexperiments using similar experimental conditions produces statisticallysignificant effects, you may be a bit more confident that your negative out-come is meaningful. But generally a negative outcome is uninteresting, exceptperhaps as a methodological example of what not to do. Regardless ofwhether the outcome of your experiment is negative or is positive in anunexpected way, you must accept that result and try to explain it. There is acommon tendency to want to pass off the result and simply blame it ondesign or methodological problems. But however strongly you believed inyour hypothesis at the beginning of the experiment, once the experiment isover, you must accept whatever result you get and attempt to explain it.
One way to know whether you will be able to interpret the outcome ofyour experiment is to consider the various possible outcomes and determinewhether you could predict each of them. As discussed in Chapter 3, a theorycan help you predict. Remember that a theory is simply a statement about theprobable relationships among a set of abstract variables—in the case of anexperimental theory, between an independent and a dependent variable. It ismore general than a statement of the specific outcome of any single experi-ment. So you may decide that your experiment fits within the context of aparticular theory; thus, you predict the outcome of your experiment to be thesame as that predicted by the theory. You are in an even better situation if twoor more theories have been proposed that make differing predictions. If oneof these theories supports a positive result and the second a negative result,then interpreting your outcome will still be easier if the positive result occurs,for reasons discussed in the previous paragraph. However, the best of allpossible worlds is when two theories each predict positive results but inopposite directions. In this case, either outcome can be clearly interpreted.
How to Tell When You Are Ready to Begin 237
2 English professors would probably call this statement oxymoronic (but not, I hope, moronic).

A second way that a prediction can be made and supported is from priorresearch. Someone may have done an experiment that is similar to yours insome respects but different in other respects. In this case, you might predictthat you will find a similar outcome. If you do, you have shown that the resultcan be repeated and that it can be generalized to your somewhat differentexperimental situation, and you are on your way to being able to make a moregeneral theoretical statement. If your outcome is different from that reportedin the earlier experiment, you have discovered a limitation of the prior result,and, again, something has been learned.
A third justification for a prediction, particularly when no prior researchor theorizing has been done in a particular area, is simply logical argument.For example, you might argue that it is logical for loud and unpredictablemusic to be distracting because it draws the student’s attention away fromthe studying task. You might also be able to logically predict some othereffects from similar reasoning—for example, that the music might help if itmasks a loud, even more unpredictable noise or that the more familiar thestudent is with the music, the less his or her performance will be degraded.Although these predictions are initially based on logic, they could gain theo-retical status if supported by the outcome of your experiment.
The reason you want to be able to predict the possible outcomes of yourexperiment is, basically, so that you will know ahead of time that when theexperiment is completed, you will have contributed something important toscience. If you cannot defend the various outcomes as supporting anythingimportant, you will have added nothing useful. For example, if the outcomeyou predict would be expected by all the proposed theories and would elimi-nate no alternative theories, your work would contribute nothing to the body ofknowledge. As discussed in Chapter 3, advances in science are generally madeby disconfirming theories, not by confirming theories, and you would not havedisconfirmed any. The basic point is that if you believe a particular result couldbe important for advancing science, you should be able to defend this beliefbefore doing the experiment. Otherwise there is no point in proceeding.
NOW, AM I READY?
If you have answered all the questions posed here, you are probably ready tobegin your experiment. As a final check, you should ask yourself whether youcould, at this point, write all the sections of an experimental report except theresults. In fact, you could save yourself considerable time by doing this beforecollecting data. Graduate students in many experimental psychologyprograms are required to submit a formal prospectus prior to doing a thesisor dissertation. This document is essentially the final experimental report,except that the results section contains various predicted results rather thanactual results and, obviously, contains no statistical analysis. One advantageof doing a prospectus is that most of the writing is completed early. In gradu-ate schools, the procedure also helps protect the student to some extentbecause those on the student’s faculty committee can indicate before the workis done whether they think the design contains any major flaws. For your
238 Chapter Eleven

purposes, the major advantage of trying to write most of the report is that youwould have had to answer the questions in this chapter before writing it. Obvi-ously, you cannot describe an experimental procedure until you have workedout all its details. You cannot write a literature review until you have searchedthe literature. You cannot predict the outcome of the experiment withoutknowing the theories that have been proposed or the results previouslyreported. Writing a prospectus is simply a good way of making sure that youhave thoroughly thought through the experiment you are proposing to do.
At this point you should be ready for the excitement of collecting your owndata. It can be fun, and a good intellectual exercise, to plan an experiment.Searching the literature requires some discipline and can be interesting. Findingthe appropriate statistical tests may thrill some experimenters, but, to be hon-est, I do statistical tests just because they are part of the experimental process.The creative act of collecting data and testing your theories and predictions isworth the hard work of doing some of the steps that you may find less intrin-sically interesting. I do receive satisfaction from moving science along by mak-ing a lasting, and potentially immortal, contribution to the body of knowledge.But for me—and I hope for you too—the most fun of being a scientist is thethrill of discovery, of looking for the first time at data nobody else has seen. Andthat, by itself, is what makes the whole enterprise worth the effort.
■ SummaryBefore you are ready to conduct an experiment, there are many practicaldetails to consider. A useful way to determine whether you have anticipatedthese details is to present your ideas to others—either orally, by means of apresentation, or in writing, through a prospectus. One concern is whether youhave satisfied all possible ethical concerns and whether the experiment has beenapproved by an institutional review board. In determining the number of par-ticipants needed you should find experiments similar to yours that have beenreported in the literature and use similar numbers. In addition, you will decidewhether to run participants individually or in groups. To determine the experi-mental time required to complete the experiment, you will have to determinethe time taken for each trial, the number of trials, the time required for otheractivities, and the number of participants in each condition. In determiningwhether to set participant selection restrictions, you should consider to what pop-ulation you will generalize your results. To avoid including experimental noisein the data, you may also wish to determine criteria for eliminating participantsfrom the experiment. To make adequate operational definitions of variables youshould be able to specify precisely what operations are required to manipu-late the independent variable(s) or measure the dependent variable(s). Arrang-ing for needed equipment or materials often includes preparing instructions,response sheets, and debriefing scripts. Finally, you should know how you willstatistically analyze the data and interpret the results. This interpretation will beaided by existing theories, previously reported findings, or logical argument.If all these issues have been considered before you begin your experiment,completing the experiment and reporting the results should run smoothly.
How to Tell When You Are Ready to Begin 239

240
Now you are ready to collect some data. If you are recording responses byhand, it will be necessary to set up response sheets for each participant.
This sheet should include information such as the participant’s identificationnumber and sex, the condition being presented, and any specific commentsyou might wish to note about the participant or the experimental session.Obviously, there should also be a place to systematically record the responses.These data are then made into a data set arranged according to independentvariables and levels of those variables. If, as is most typical today, the exper-iment was done on a computer, the program will likely arrange data into adata set for you. If you collected the data by hand, you will need to arrangethe data yourself, and if you are using a computer for statistical analysis, youwill need to create a data set on the computer. Now that you have a set ofnumbers, you are still a long way from answering the experimental question:What effect does the independent variable have on the dependent variable?To answer this question, you need to know about several approaches toanalyzing data and how to use them.
This chapter should give you an understanding of the logic underlyingdata analysis. It does not help you do the statistics required to analyze an
12How to InterpretExperimental Results
A well-wrapped statistic is better than Hitler’s “big lie”; it misleads, yet it cannot be pinned on you.
D. HUFF (1954)
There are three kinds of lies: lies, damn lies, and statistics.BENJAMIN DISRAELI
I believe, however, that over the years an overreliance on theimpoverished binary conclusions yielded by the hypothesis-testingprocedure has subtly seduced our discipline into insidious concep-tual cul-de-sacs that have impeded our vision and stymied ourpotential.
G. R. LOFTUS (1993)
In spite of frequent misuse, statistics can be an elegant and powerful tool for making decisions in the face of uncertainty.
ROGER E. KIRK (1990)

How to Interpret Experimental Results 241
experiment. If you need to do such calculations, you should first read thischapter and then look for an appropriate statistical operation in Appendix A.This appendix is not meant to be a substitute for a statistics text, but with yourinstructor’s help, it should allow you to analyze most of the simple experi-mental designs discussed in this book. Neither this chapter nor the appendixwill substitute for taking a statistics course. We discuss only the basics here—enough so that with help in choosing a test, you might be able to analyze asimple experiment. If you wish to do further experimentation, an elementarystatistics course is mandatory.
■ Plotting Frequency DistributionsSuppose that you are interested in whether students who are majoring inpsychology differ in anxiety from those majoring in economics. You find a listof majors in your college, randomly pick 10 students from the two majors, andconvince these students to take a test that has been found to indicate a person’soverall anxiety level. The test scores for the two groups are your raw data.1
Table 12-1 shows some fictitious scores between 0 and 100. The larger thescore, the more anxious the student. Is there a difference between the twogroups? Looking at individual scores in this case is like listening to individ-ual notes from a song—it’s difficult to tell what the melody is. You need someway to rearrange the raw data so that you can interpret them more easily. Youcan draw a frequency distribution, which is simply a plot of how frequentlyeach score appears in the data. You may notice, however, that no score occursmore than one time. Thus, to make the distribution meaningful, you need to
1 You will note that this is not really an experiment but a correlational observation, because youare comparing two behaviors: the behavior of choosing a major and the behavior of answeringquestions on a test. No independent variable has been manipulated in the study.
■ TABLE 12-1Fictitious Anxiety Scores for 10 Economics Majors and 10Psychology Majors
Economics majors Psychology majors
Student no.
12345678910
Score
62566791538751634671
Student no.
11121314151617181920
Score
55426158704762367451

242 Chapter Twelve
put the individual scores into categories. You want several data points in eachof the more frequently occurring categories, so you include 10 scores ineach category (for example, 10 through 19). Figure 12-1 shows such a frequencydistribution for each of your two groups. The vertical axis labeled “Frequency”is simply the number of raw data points that fall into each score category.
Plotting a frequency distribution can be a useful first step in finding outwhether there is a difference between conditions. Sometimes the experimen-tal effect is strong enough that a visual inspection of the distributions willconvince you that there is a difference. In this example, however, the distrib-utions look very much alike.
Statisticians have given names to different types of distributions so thatinvestigators can talk to each other in some common terms without havingto show each other a plot of the entire distribution. We have already men-tioned the properties of a normal distribution, shown in the upper left panelof Figure 12-2. To be normal, a distribution has to fit a complex mathematicalformula. For our purposes, however, we can simply say that a distributionapproximates a normal distribution if it looks something like the bell-shapeddistribution shown in the figure. It is important to know whether yourdistributions are similar to a normal distribution because many statistical testsyou will wish to use require that the data be approximately normal.
Some other types of distributions are also illustrated in Figure 12-2. A dis-tribution that has two most-frequent categories rather than one is a bimodaldistribution. The distribution of heights for a group composed of an equal
FIGURE 12-1 Frequency distributions of the fictitious anxiety scores for psychology majors and economics majors listed in Table 12-1

How to Interpret Experimental Results 243
number of men and women would often be bimodal. A distribution isskewed if it is asymmetrical through having more scores in one of the tails. Adistribution of IQ scores for Ph.D.s would be skewed because, generally, fewhave low IQs. However, if a distribution looks as though one of the tails hasbeen completely chopped off, it is said to be truncated. A plot of reactiontimes would form a truncated distribution because there is a limit to the speedwith which a person can respond.2
FIGURE 12-2 Four types of frequency distributions
2 Remember ceiling and floor effects? They usually cause truncated distributions.

244 Chapter Twelve
Plotting a frequency distribution allows you to describe your data in amore orderly way than simply listing it in raw form, but it is still a rathercumbersome way to represent the results of an experiment. It would be niceto have a single number that represents how the participants in each groupperformed. What we need is a way of calculating a descriptive statistic thatwill describe the data in this manner.
■ Statistics for Describing DistributionsPsychologists use two basic kinds of statistics: descriptive statistics andinferential statistics. A descriptive statistic is simply a number that allows theexperimenter to describe some characteristics of the data rather than having toreport every data point. Inferential statistics are discussed later in the chapter.
CENTRAL TENDENCY
One of the important things we would like to learn from a set of data is thetypical behavior of participants under various conditions. Psychologists calla statistic that describes this typical behavior an indication of central ten-dency. One way of comparing the two groups in our example is to calculatea central tendency for the psychology majors and for the economics majors.
There are three common ways to expressthe central tendency. The mode is the easieststatistic to calculate, but it is usually the worstone to use because it ignores lots of data. Themode is simply the most frequently occurringscore. In our example there is no mode becauseno score occurs more than once. After the datahave been put into categories, a mode can befound. The mode for the psychology majors isthe category 50–59, because it occurs with a fre-quency of three. Although this category seemsto represent the central tendency of this distribution pretty well, note that ifonly one score were moved, the mode could change dramatically. For example,suppose that student 14 scores 71 instead of 58. The category mode would now

How to Interpret Experimental Results 245
be 70–79 because there would be a frequency of three in that category. Do youthink that this category would represent the central tendency of the distribu-tion well?
The problem is that the mode uses only one property of the data—themost frequently occurring score—to describe typical behavior. It ignores allthe other scores. So when you use the mode, you are throwing out lotsof information, such as the ordering and size of each number. With smallsamples, relying on a mode to describe your data can be risky.
The median is literally a middle score; it has an equal number of scoresabove it and below it. To calculate a median, list all the scores in order, andthen pick the middle score. If you have an even number of scores, the medianfalls halfway between the two middle scores. For example, in ordering the10 scores for economics majors, we find that the fifth score is 62 and the sixthis 63, so the median is 62.5. The median for the psychology majors is 56.5. Themedian does not reflect the size of the differences between scores because ituses only order as its defining principle. Thus, we can change any score inthe distribution without changing the median, as long as the position of themiddle score in the list remains the same. Again, we lose some informationwhen we describe our data in terms of a median.
The mean is a weighted average of the scores; that is, it is the sum of allindividual scores divided by the number of scores that were added. Forexample, to find the mean for the economics majors, we add the 10 scores fora sum of 647 and then divide by 10, with the result of 64.7 for the mean.The mean for the psychology majors is 55.6. The mean is the center of gravityfor the distribution. Thus, because the mean is affected by the size of thescores, it changes whenever any score in the distribution changes.
Which measure of central tendency best describes a distribution? As withmost interesting questions, the answer is “It all depends.” First, it dependson the shape of the distribution. If you have a normal distribution or anyother unimodal symmetrical distribution, all three measures give you thesame number. However, as a distribution becomes more skewed, the threemeasures get progressively farther apart. Figure 12-3 shows that the mean ismost influenced by the size of the extreme scores in the right tail of the dis-tribution. The median is influenced only because there are more scores to theright, while the mode is unaffected by these extreme scores.3 You must useyour judgment in deciding which measure to use. If you were to plot theincomes for a large group of people, you would probably get a distributionsimilar to the one in Figure 12-3. In this case a median would probably be thebest average, because it would be influenced less than the mean would be bythe few folks who make outlandish salaries. You can probably think of moreextreme examples in which a few very large or very small scores can distortthe mean. Whenever you must choose a measure to describe an average, you
3 Which measure to use is also influenced by the characteristics of the numbers you are using.See Appendix A for a discussion of number scales and Figure A-1 to see which measure of central tendency is appropriate for each.

246 Chapter Twelve
will simply have to examine the shape of the distribution, determine for whatpurpose the average will be used, and then use your judgment.4
DISPERSION
A measure of central tendency tells you something useful about a distribution,but it describes only one special aspect. A second statistic that helps describea distribution is a measure of dispersion, or how spread out the scores are.
One measure of dispersion is the range, which we can calculate bysubtracting the smallest score from the largest score. In our example, for theeconomics majors, the range is 91� 46 � 45; for the psychology majors,the range is 74 – 36 = 38. Although it gives some indication of dispersion, therange is totally insensitive to the scores in between because it is determinedby only the smallest and largest scores. One extreme score completelychanges the range. For this reason, a different measure of dispersion may bemore useful. As an alternative, we can subtract the mean from each score sothat we have a number indicating the deviation of each score from the mean.To get a mean deviation, we can then add up these deviations and divide bythe number of deviations. However, because the numbers cancel each otherout when added, we will get a sum of zero, which doesn’t help us much. Wecould ignore the sign of the deviations, add up the absolute values, and thusget an average deviation. But statisticians feel that a more useful indicationof dispersion is found by squaring5 each deviation (this also gets rid of theplus or minus sign), adding the squares, and then dividing by the number ofsquared deviations that were added. We then have a measure of dispersioncalled the variance. An even more useful measure is the square root6 of the
4 I am assuming that you have read Chapter 5 and are trying to be fair with science. The booksHow to Lie with Statistics by Huff (1954) and Flaws and Fallacies in Statistical Thinking by Campbell (1974) give many humorous examples of how to make descriptive statistics like the mean into distorting statistics.5 Multiplying it times itself.6 A number that when multiplied times itself gives us the variance.
FIGURE 12-3 The location of the mode, median, and mean for a skewed distribution

How to Interpret Experimental Results 247
variance, a number called the standard deviation. Formulas for calculatingthese measures can be found in Appendix A.
One reason the standard deviation is a useful measure of dispersion is thatit tells us something about the proportion of scores that fall between it and themean. About two thirds of the scores in a normal distribution fall in the inter-val between one standard deviation below the mean and one standard devia-tion above the mean. For example, if we gave writing tests to first year studentsand seniors at a particular college and found that the first year students had astandard deviation of 15, whereas the seniors had a standard deviation of five,we would know that about two thirds of the first year students scored within30 points of each other and two thirds of the seniors scored within 10 pointsof each other. Such a result, along with the finding of an increase in the meanbetween the first year students and the seniors, could be used as supportfor the hypothesis that the college was successful in teaching its students to bebetter writers. Not only did the typical student become a better writer, but thestudent body as a whole also became consistently better at writing.
You may also find it helpful to view the standard deviation as a way ofexpressing the extent of error you are making by using the mean to representthe scores in a distribution. In reality, the mean is simply the best estimateyou could make about any individual score; thus, the standard deviationindicates, on the average, how good an estimate you have made. If all thescores were the same, the standard deviation would be zero, indicating thatthe mean would never be in error. As the differences among scores get larger,the standard deviation increases, as does the error you would make byrepresenting a score with the mean.7
■ Plotting Relationships between VariablesYou do an experiment to find out whether there is a relationship betweenthe independent and dependent variables. Although plotting frequencydistributions is a good first step in analyzing your data, you will often finddrawing a graph to represent the experimental relationship useful. Graphsare not new to you. They have been cropping up from time to time in earlierchapters. To be complete, however, let’s start by looking at basic concepts.
DRAWING GRAPHS
A graph has two axes. The vertical axis (y-axis) is called the ordinate, and thehorizontal axis (x-axis), the abscissa.8 When plotting experimental results, youplot the dependent variable on the ordinate and the independent variable onthe abscissa. In some cases the levels of an independent variable cannot be
7 Which measure of dispersion to use is also influenced by the characteristics of the numbersyou are using. See Appendix A for a discussion of number scales and Figure A-1 to see whichmeasure is appropriate.8 You may find it helpful to remember which term refers to which axis by noticing the shapeyour mouth takes when saying the first part of each word; “ab______” is said with a horizontalmouth, and “or______,” with a vertical mouth. That’s the way I remember them!

248 Chapter Twelve
represented by numbers or if numbers are usedthey have no quantitative meaning. In AppendixA you can see that these levels are said to fall ona nominal scale because they are just names. Inthis case, it is usually appropriate to use a bargraph to represent the data. Figure 12-4 showsa bar graph for the mean anxiety scores of thepsychology and economics majors.
In many cases the independent variable iscontinuous, or, to use the terms from AppendixA, the levels of the variable fall on at least anordinal scale and thus they can be put in order.In this case, you can draw a histogram, as shown in Figure 12-5. A histogrameliminates spaces between the bars of a bar graph. Figure 12-5 shows ficti-tious data relating the length of time patients have been in therapy to theirrating of self-image. Time in therapy is a continuous variable because wecould choose levels anywhere on the continuum of time.
FIGURE 12-4 A bar graph showing the mean anxiety scores for psychology majors and economics majors listed in Table 12-1
FIGURE 12-5 A histogram illustrating the results of a multilevel experiment relating perceived self-image to months spent in therapy (fictitious data)

How to Interpret Experimental Results 249
A more common way of representing data when the independent vari-able is continuous is to use a line graph, or function. Figure 12-6 shows thesame results as those plotted in Figure 12-5 but is a line graph rather than ahistogram. The individual data points are simply plotted and then connectedby straight lines. Notice how this way of representing the data emphasizesthe trends quite effectively. To use this type of graph, you must have data thatlie on a continuum. By way of bad example, suppose that on the abscissa ofthe figure, we had ethnic categories such as Hispanic, African American, andso on, instead of months in therapy. These categories obviously do not lie ona continuum; so the order of listing the categories would be totally arbitrary.Trying to find a trend in such data doesn’t make any sense.
Line graphs are also best used to illustrate the results of a functional(multilevel) experiment rather than those of a two-level experiment. Theproblem with a two-level experiment is that you really do not know whetherthe relationship is linear, and yet you would be using a straight line to repre-sent it. With a functional experiment, more than two levels of the indepen-dent variable are used, and it is possible to get an idea of the shape of thefunction even though the points are connected with straight-line segments.However, some care must be taken when interpreting the shape of graphedfunctions. The shape of the function is meaningful only when the levels ofthe independent variable are equally spaced as they are on the graph. InAppendix A these levels are said to fall on at least an interval scale becauseone interval is equal to any other. If the levels represent only an ordinal scale(can be ordered but have unequal intervals) then general trends can beinferred, but the shape of the function is not interpretable. (For more onconstructing figures for an experimental report, see Chapter 13.)
DESCRIBING FUNCTIONS
Several types of graphed functions are illustrated in Figure 12-7. If changingthe independent variable by one unit always causes the dependent variable to
Low
High
0 3 6 9 12
Months in Therapy
Mea
n Se
lf-I
mag
e R
atin
g
FIGURE 12-6 A line graph illustrating the same data as those plotted in the histogram in Figure 12-5

250 Chapter Twelve
PositiveRelationship
NegativeRelationship
PositivelyAccelerated
NegativelyAcceleratedandAsymptotic
Curvilinear
Linear
Nonmonotonic
Asymptote
➤
➤
FIGURE 12-7 Graphs illustrating some terms used to describe functional relationships
change in a given direction by a constant amount, the function is linear; anyother relationship is curvilinear. If increasing the independent variable causesan increase in the dependent variable, the relationship is positive; if it causesa decrease, the relationship is negative. A function that never reverses direc-tion (that is, portions of the function are either all positive or all negative)is a monotonic function; otherwise, the function is termed nonmonotonic.If changes in the dependent variable become increasingly larger as the

How to Interpret Experimental Results 251
independent variable increases, the function is positively accelerated; if thechanges become smaller, it is negatively accelerated. A negatively acceleratedfunction eventually approaches a particular level and appears to flatten out.The curve at this point is actually getting closer and closer to a straight linecalled an asymptote, although the curve and asymptote never touch. Such afunction is said to be asymptotic or to approach an asymptote.
If you are seeing these terms for the first time, you may feel a bit over-whelmed. However, as you use them to describe psychological relationships,you will find that they become more familiar and allow you to discuss yourresults more efficiently.
■ Describing the Strength of a RelationshipThe functions in the previous section either were idealized or were plots of adescriptive statistic rather than individual data points. Rarely, however, willyou find every data point falling exactly on a smooth function. If you use rawdata to plot an experimental relationship, you will probably find somevariability, or spread, around the functions. As we saw in Chapter 1, such aplot is called a scatterplot.
SCATTERPLOTS
Figure 12-8 shows some examples of scatterplots. These plots could resultfrom an experiment, in which the relationships between independentand dependent variables are plotted, or from a correlational observation(Chapter 1), in which dependent variables are plotted on both axes. If youobserve the spread of the points in a scatterplot, you can get some idea of howstrong the relationship is. However, visual observation is a rather crude wayof estimating this strength. Fortunately, when the relationship is linear,9 adescriptive statistic called a correlation coefficient can be used for this purpose.
9 Actually, one form of correlation uses data that can only be ranked or ordered, in which casethe term linear is meaningless. Such a correlation can be used for any monotonic relationship.

252 Chapter Twelve
CORRELATION COEFFICIENTS
A correlation coefficient is a number between +1.0 and –1.0, with the signindicating whether the relationship is positive or negative and the size of thenumber indicating the strength of the relationship. A correlation of 1.0 (+ or –)indicates a perfect relationship, and 0 indicates no relationship.
Figure 12-8 shows the correlation coefficients for three sets of data. Nocoefficient is shown for the lower right panel because the function isobviously curvilinear and simple linear correlation is not appropriate. (Thereis, however, a way of describing a curvilinear correlation, which is called acorrelation ratio [Kirk, 1990].) You can find out how to calculate a correlationcoefficient by reading Appendix A or by looking in any statistics text.10
Often when a correlation coefficient is reported, a coefficient ofdetermination—or proportion of variation explained—is also reported. Thecoefficient of determination is simply the correlation coefficient squared andrepresents the proportion of the variability shared by the two variables. So ifthe reported correlation is +0.5, the coefficient of determination would be+0.25; 25% of the variability is shared between the two variables. Manyresearchers and manuals, including the Publication Manual of the American Psy-chological Association (American Psychological Association, 2001), recommend
FIGURE 12-8 Four illustrations of scatterplots. Correlation coefficients areshown for three panels. No coefficient is given for the lower right panel because the relationship is curvilinear and a correlation ratio should be used.
10 Several statistics texts are listed at the end of the chapter.

How to Interpret Experimental Results 253
reporting the coefficient of determination whenever a correlation is reported.However, other researchers claim that the correlation coefficient is a betterindication of the effect size for a correlational observation and that the coeffi-cient of determination seriously underestimates the practical importance ofthe results (Rosnow & Rosenthal, 1999). If you use these statistics, you shouldfamiliarize yourself with these arguments and use these numbers in aninformed way.
■ Interpreting Results from Factorial Experiments
The results of factorial experiments are more difficult to interpret than thoseof other types of experiments because they use more than one indepen-dent variable and require you to evaluate interactions. The top graph ofFigure 12-9 shows some fictitious results of our earlier experiment in whichwe measured the time it took students to read paragraphs typed in 12-pointor 10-point print. In this case, however, assume that we used 8-year-olds inone group and 12-year-olds in another. Notice that one independent vari-able (print size) has been plotted on the abscissa, while the other (age) isrepresented by a point and line code. We can no longer just ask whether theindependent variable has had an effect on the dependent variable. We mustask three more specific questions: (1) Is there an effect of print size? (2) Isthere an effect of age? (3) Does the effect of one variable depend on the levelof the other? The first two questions refer to main effects and the third toan interaction.
MAIN EFFECTS
Because we have two independent variables in this experiment, we have twopossible main effects. To discover whether these main effects are significant,we would have to do some statistics. In order to interpret the results of theprint size experiment, let’s assume that any effect that we can see is statisti-cally significant. To determine whether there is a main effect of print size, weneed to ignore any effect of age. Thus, we need to find a point on the graphfor each print size that is halfway between the points for each age-group. Onthe graph in Figure 12-9 under the question “Main effect of print size?” youwill see Xs halfway down from each open circle to the corresponding blackcircle. These Xs represent the effect of print size averaged across the twolevels of age, just as if age had never been manipulated. To find out whetherthere is a difference in reading speed for these two Xs, I have drawn ahorizontal line across to the ordinate. The arrow shows you that a differenceexists between the two Xs that represent the two print sizes. So the answer toour question is yes, there is a main effect of print size. Now follow the sameprocedure to determine whether there is a main effect of age.

254 Chapter Twelve
INTERACTIONS
If you do not remember what an interaction is, you may want to review thediscussion on interactions in Chapter 9, where we considered factorial exper-iments. Remember that an interaction occurs whenever the effect of one vari-able depends on the level of another variable. So in the print size experiment
8-year-olds
12-year-olds
Graph of Results
Main effect of age?
Yes
Yes
Interaction?
Print Size
Print Size
10-point 12-point
Tim
e to
Rea
d P
arag
raph
(in
Seco
nds)
Print Size
40
30
20
10
Main effect of print size?
Yes
Yes
Interaction?
Print Size
Print Size
°°
• •
°°
• •
°°
• •
°°
• •
°°
• •
✕
✕
✕✕➤
➤
➤➤➤
FIGURE 12-9 Main effects and interactions in a 2 � 2 factorial experiment

How to Interpret Experimental Results 255
the question is, does the effect of print size depend on the age of the child or,alternatively, does the effect of age depend on the size of print?
In the bottom left graph of Figure 12-9, I have drawn horizontal lines overto the ordinate to discover the effect of going from 10-point to 12-point printsize for each age-group. Note that for the 8-year-olds there is a decrease inreading time, but for the 12-year-olds there is no change. Thus, the effect ofprint size does depend on age, and the answer to our question is yes, there isan interaction. In the bottom right graph, I have asked the question the otherway: “Does the effect of age on reading time depend on print size?” If youfollow the lines on this graph, you will again see that there is a difference. Ofcourse, there is really only one interaction, so the answers to the twoquestions will always be the same. But checking both ways will give yousome additional practice at interpreting interactions.
Figure 12-10 shows some other possible results for this experiment. Usingthe same procedure we have been discussing, answer the three questions foreach graph.
In attempting to determine whether there are main effects and interac-tions in the graphs you have been viewing, I hope you noticed that whenthere are only main effects, the interpretation is pretty straightforward.However, when there is an interaction, the interpretation of the main effectsis more complex. For example, for the result graphed in Figure 12-9, the maineffect of age on reading time is meaningful even though there is an interac-tion, because the effect exists at both print sizes. However, although there isalso a main effect of print size, the interaction makes its interpretation prob-lematic because the effect exists for only one age-group. The bottom panel ofFigure 12-10 illustrates what is sometimes called a crossover interaction inwhich the lines cross each other.11 When main effects with a crossoverinteraction are present, the main effects are difficult to interpret. In fact, theyare typically meaningless.
This discussion has been limited to the simplest type of factorial experi-ment, when there are only two factors, each of which has only two levels. If anexperiment has factors with additional levels or has additional factors, inter-preting main effects and interactions is even more difficult. In order to giveyou just a small taste of this increased complexity, suppose that we added athird factor to our reading experiment, the difficulty of the reading material:difficult or easy. Figure 12-11 illustrates a possible outcome. In this case youwould have to ask whether each of the three factors has main effects: age,print size, and difficulty. In addition, you would have to ask whetherage interacted with print size, whether age interacted with difficulty, andwhether print size interacted with difficulty. Each of these interactions iscalled a two-way interaction because each is concerned with just two factors.To answer these questions you would find the mean between the two points
11 Rosenthal and Rosnow (1981) call a crossover interaction the only possible interaction because they argue that the main effects should be removed before graphing and interpreting,which then leaves only the crossover interaction.
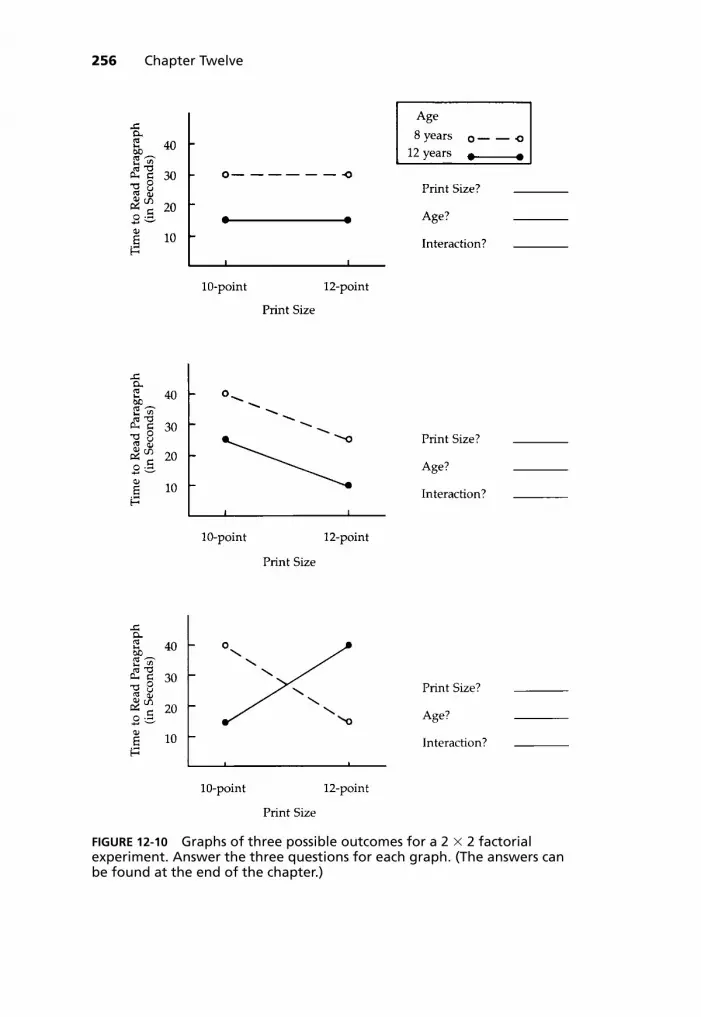
256 Chapter Twelve
FIGURE 12-10 Graphs of three possible outcomes for a 2 � 2 factorial experiment. Answer the three questions for each graph. (The answers can be found at the end of the chapter.)

How to Interpret Experimental Results 257
across the third factor you were ignoring, much like what we did previouslywhen trying to find main effects. Then you would interpret the two-wayinteraction as we did in the previous section.
In this example there is also a possible three-way interaction. A three-wayinteraction is present when the nature of each two-way interaction is depen-dent on the level of the third factor under which it occurs. In the figure, doesthe two-way interaction between age and print size depend upon whetherthe reading material is easy or difficult? It does, so there is a three-wayinteraction. As you can see, when more than two factors are used, interpret-ing interactions becomes more difficult, although the basic procedures forinterpreting your results remain the same.
■ Inferential StatisticsTo discuss the general logic of inferential statistics, let’s return to the anxietytest scores for the psychology and economics majors. To find out whether thetwo groups differed in anxiety level, we plotted frequency distributions andcalculated means for each group. We found that the mean for the economicsmajors was 64.7 and for the psychology majors, 55.6. Is this a real difference?Of course it is, you say: How can a difference not be a difference? And forthese two samples you are absolutely correct; any difference between sam-ples is a real difference between samples. However, what a psychologistmeans by the question is not “Is there a real difference between the scores forthe two samples that you happened to choose for this experiment?” but rather“Is it likely that there is a difference in anxiety level between the entire pop-ulation of all psychology majors and the entire population of all economicsmajors who could have been sampled?” The goal of the experiment is to saysomething about the two populations that could have been chosen, not justthe particular samples that were.
Age
7
60
50
40
Tim
e to
Rea
d P
arag
raph
(in
Seco
nds)
30
20
10
10-point 12-point
EasyMaterial
DifficultMaterial
8 years12 years
FIGURE 12-11 A graph illustrating a three-way interaction for a 2 � 2 � 2 factorial experiment

Pretend that you are a bean farmer. You are not doing very well becauseof bean blight. Bean blight is a mysterious disease that causes many beans towither and shrivel. To find out whether you can get rid of bean blight, youplant a field with a new type of bean that may resist the blight. After har-vesting a blighted field and the new field, you have two bean bins, each con-taining 10 tons of beans. You want to know if both bean bins are blighted.12
You obviously do not wish to examine every bean in the two bins, so youdecide to take a sample of 100 beans from each bin. You find 12 witheredbeans in the sample from the bin you know contains blighted beans andseven in the other sample. Obviously, there is a difference between thesamples, but you want to know whether there is a difference between theentire populations of the two bins. An inferential statistical test can help youanswer this question. The “infer” in “inferential” denotes that the test helpsyou infer whether there is a difference between the populations.
You, as a psychologist, face the same problem that you would face as abean farmer. You have chosen a randomly selected sample of data from twopotentially different populations (the levels of the independent variable), andyou want to know whether the behavior of the populations differs.
NULL HYPOTHESIS SIGNIFICANCE TESTING
Most inferential statistical tests are based upon null hypothesis significancetesting. I briefly introduced the concept of a null hypothesis in the previouschapter, but I expand on it here. The null hypothesis states that the levels ofyour independent variable have no effect. For example, suppose you won-dered whether there was any difference in mathematical ability between menand women. You might test this question by giving the quantitative sectionof the SAT test to a sample of men and a sample of women. The null hypoth-esis in this case would be that there is no difference in mathematical abilitybetween the population of men and the population of women. Even thoughyou may have done the study because you actually think there is a difference,the significance testing procedure you are using requires you to make believethat you think there is no difference. Suppose you then do your research andfind that the mean for the sample of men is different from the mean for thesample of women. When you do an inferential statistical test, the questionyou are asking is how likely it is that this difference in means for the samplescould have arisen by chance variation if indeed the null hypothesis is true—that there is no difference in population means.
Because samples are usually chosen randomly from the populations, it isalways possible that you could find a sizable difference in the samples eventhough there is no difference in the population means. Such an outcomewould be especially true if your sample sizes were small. The statistical testtakes factors such as sample size into effect and tells you how likely it is thatyou would have found your result if the null hypothesis were true.
258 Chapter Twelve
12 Say that quickly three times!

How to Interpret Experimental Results 259
DECISION ERRORS IN SIGNIFICANCE TESTING
Whenever we are forced to make a yes–no decision based on evidence, wecan be right in two ways and wrong in two ways. Suppose for instance thatyou had evidence from a lie detector test and had to decide whether the per-son was lying. You could be right by declaring that she told the truth, whenshe had, or by saying she lied, when she had. However, you could make anerror by saying that she lied, when she had told the truth, or that she told thetruth, when, in fact, she had lied. Table 12-2 illustrates these outcomes for nullhypothesis testing.
As shown in the table, from the probabilistic results of the statistical testyou can conclude either that you should reject the null hypothesis or thatyou should fail to reject it. (Note that as discussed later in this chapter, youcannot say that the null hypothesis should be accepted.) When you come toeither of these conclusions, you can be correct, or you can be wrong. The twoways to be wrong have different names. When you reject the null hypothe-sis when it is true, you make a Type I error, and when you fail to reject thenull hypothesis when it is false, you make a Type II error. The statistical testcan tell you how likely it is to make a Type I error; it is called the level ofsignificance.
■ TABLE 12-2Ways of Being Correct or Making Errors in Null-Hypothesis Testing
Truth
Null hypothesis false Null hypothesis true
Reject Null Correct (Power) Type I ErrorFail to Reject Null Type II Error Correct
LEVELS OF SIGNIFICANCE
Although it is probably unfortunate that we adhere to such a strict standard,most psychologists agree that for a result to be significant, the likelihood of
260 Chapter Twelve
obtaining the observed difference in samples due to chance should be lessthan one in 20. Thus, if the samples really came from the same population dis-tribution, you would expect to get a significant difference in only one out of20 (or five out of 100) experiments. Some psychologists are even more care-ful to avoid saying that there is a difference between populations when thereisn’t. They will not accept any difference as a real one unless the test indicatesthat it could be due to chance only one time in 100. These strategies are calledtesting at the .05 level of significance or at the .01 level of significance, respec-tively. When these probabilities are reached or exceeded, the result is said tobe statistically significant.
When reading a journal article, you will see that these levels of signifi-cance are referred to as p � .05 or p � .01. This term means that the test wasfound to be statistically significant at the .05 or the .01 level, so that you wouldexpect this difference in the levels of the independent variable less than fivetimes out of 100 or one time out of 100, respectively, if they actually came fromthe same population. Be sure to notice which way the sign is pointing; p � .05means that the test was not found to be significant.
Also notice how I have phrased these statements. Some studentsmistakenly think that when you test at a particular level, you can make astatement about how likely it is that you could replicate the result. Forinstance that if you found a statistically significant result at p � .05, youcould conclude if you repeated the experiment you would again reject thenull hypothesis 95% of the time. From the level of statistical significance youcannot draw any conclusion about how likely it is that you could replicateyour result!
STATISTICAL POWER
We have been discussing how likely it is that we might conclude somethingin error, but suppose we are right. Is there any way to know how likely it isthat we are right? You will notice that in Table 12-2, I put the word power inparenthesis next to the correct decision of rejecting the null hypothesis whenit is truly false. Indeed, power refers to the probability that a statistical testwill allow you to correctly reject the null hypothesis. Although it is beyondthe scope of this book, you should know that it is possible to compute thepower of a statistical test to determine how likely it is to miss a real differencein the independent variable when the null hypothesis is false (that is, whenthere is a real difference). For instance, if the power of the test is determinedto be .50, we would know that half the times you do this experiment youwould fail to reject the null hypothesis. The three factors that affect the powerof a test are the level of significance, the size of the underlying effect, and thesample size. Of these, the one the experimenter has most control over isthe sample size. For this reason, researchers often compute the power of anexperiment before conducting it to determine whether they have a largeenough sample.

How to Interpret Experimental Results 261
PARAMETRIC VERSUS NONPARAMETRIC TESTS
Many inferential tests are available that help you make this decision. Yourchoice depends on your experimental design and what test assumptions yourdata can meet. (See Appendix A for worked examples of some inferentialtests.) The most frequently used tests are called parametric tests. In these teststhe assumption is that if frequency distributions were plotted for thepopulations of interest, they would be normal distributions. When thisassumption cannot be met, you must use nonparametric tests.
Inferential tests are obviously an important tool for evaluating the resultsof psychology experiments. In fact, the development of sophisticated statisti-cal tests has been a major influence in making psychology a respectablescience. However, we must realize the limitations of inferential tests.
MISINTERPRETING STATISTICAL TESTS
Some experimenters believe that when a statistical test fails to show a signifi-cant difference in the levels of the independent variable, it has shown that thelevels are significantly the same. This is wrong! To avoid this error, we shouldkeep in mind that inferential tests are designed to say something about the prob-ability of getting a difference if the samples come from the same population;they tell us nothing about getting a sameness if the samples come from different
populations. Consequently, negativeresults (ones that are not statisticallysignificant) are seldom published inpsychology journals. Our statisticaltests are just not designed to tell us theprobability that two samples would bethis equivalent if they came from differ-ent populations; rather, they tell us howprobable it is that samples could comefrom the same population.13
A second mistake some investiga-tors make when using inferential testsis to act as though the .05 and .01 levelsare chiseled in stone; they wouldn’t becaught dead paying any attention to a.06 level. A more realistic approach tosignificance levels is to treat them forwhat they are: a way to help you make
13 Although my contention that our statistical tests do not test for sameness is true of most psychological literature, technically it is not universally true anymore. Formal statistical testsof equivalence, though largely unfamiliar to psychologists, have been evolving over the pastcouple of decades. They are beyond the scope of this book, but I would refer those with an interest to read the article “Using Significance Tests to Evaluate Equivalence between Two Experimental Groups” by Rogers, Howard, and Vessey (1993).

262 Chapter Twelve
a decision. Whenever you make a decision in the face of uncertainty, you haveto consider not only the probability of being right or wrong but also the ben-efits and costs of being right or wrong. In other decisions you do not ignorethese factors. For example, if you are deciding whether to fly an airplane, youprobably require a higher probability of fair weather than if you are simplydeciding whether to carry an umbrella. The benefits and costs are far differ-ent. The .05 and .01 levels ignore such benefits and costs. Thus, you shouldconsider the consequences of being right or wrong when you interpret theresults of your experiments and not blindly test at the .05 level.
There is some controversy in psychology about whether the term signifi-cant should ever be modified—for example, by saying “highly significant.”Some argue that the use of such modifiers is wrong because the tradition inpsychology is to dichotomize results as significant or nonsignificant and, moreimportant, that the use of modifiers mistakenly substitutes the size ofimportance of the effect for the probability of an effect (Harcum, 1989;Levenson, 1990). However, others argue that because probability is a contin-uum, there is nothing wrong with saying that one effect is more significantthan another (Kanekar, 1990). Those on both sides of this argument wouldprobably agree that the key is to avoid mistaking the level of statistical sig-nificance for practical significance—the issue we have just been considering.For this reason, when reporting a positive result it is best to say that it isstatistically significant to emphasize that you are not necessarily claimingpractical significance. And when reporting a negative result, say that it isstatistically nonsignificant rather than insignificant. The term insignificantcertainly does imply unimportant.
When you are trying to avoid confusing statistical significance withpractical significance, remember the fine old saying that a difference is adifference only if it makes a difference. Suppose you are an employer, and theowners of the Fast-Finger Speed-Reading School are trying to convince youthat you should pay them to teach all your employees how to speed-read. Theysay that they have experimental evidence showing that people read signifi-cantly faster after taking their course. Being a skeptic, you ask how muchfaster. They admit that the study shows that their students read an average ofhalf a word per minute faster, but they insist that this difference is statisticallysignificant. They could well be correct. By using enough participants and col-lecting enough data, even tiny differences between populations can be shownto be statistically significant. As an employer, though, you care more aboutpractical significance than statistical significance. As a scientist, you should too.
In an attempt to encourage experimenters to consider whether theirresults are important as well as statistically significant and to get away fromrigid testing at the .05 level, Geoffrey Loftus (1993, 1996), a former editor of amajor psychology journal, says that statistical hypothesis testing is often notreally necessary. He encourages experimenters to plot their data in a graphshowing means with associated measures of dispersion, such as standarddeviations. He believes that, more often than not, inspection of such a figurewill immediately make apparent the significance of the effect without the

necessity of using an inferential statistical test. If this is the case, he discour-ages the use of such tests.
In the end, evaluating practical significance is a matter of judgment. Thetools discussed in this chapter should help you determine when a result isimportant, but these tools do not establish the importance of the result. You,the experimenter, must do this by using logical arguments to convince otherresearchers that your differences make a difference.
■ Meta-AnalysisAlthough you will probably not use it if you are doing a simple experiment,you may run across articles that use a statistical technique called meta-analysis. You should know something about meta-analysis to understandthese articles. In Chapter 6 we discussed how to do a literature search.When you do a search, you will be struck by how many articles there are ona particular subject. Even for relatively narrowly defined areas, hundredsor thousands of articles make up the literature. The typical way in whichresearchers who write review articles evaluate and integrate these studiesis to do a narrative review. The researcher simply reads all the articles, con-siders some studies important and others minor, tries to keep in mind theresults of at least the important ones, and then tries to summarize the majorfindings. The way researchers carry out this process has been studied andfound to be pretty sloppy (Jackson, 1980). In many cases, differentresearchers come up with completely different conclusions from the sameliterature. The problem is that such researchers face an almost impossibletask, much like being forced to look at the data for 100 participants in anexperiment and draw a conclusion without the help of any statistical analy-sis. What meta-analysis does is to provide a statistical way of integratingthe data from many different studies.
You do not have to understand the details of the statistics to understandthe results of a meta-analytic study. If you need more detail, see the books onmeta-analysis listed at the end of this chapter. Basically, meta-analysis allowsyou to take the results of an unlimited number of experiments that investi-gate the same general problem, even if they use different methodologies, andcombine them statistically. For example, Lipsey and Wilson (1993) were inter-ested in whether psychological, educational, and behavioral treatments wereeffective. They examined a decade and a half’s research on this topic—302studies. The basic datum for each study in a meta-analytic review is the meantreatment effect size. It is very easy to compute this statistic; it is the mean ofthe control group, subtracted from the mean of the treatment group and thendivided by the standard deviation of the control group. So in Lipsey andWilson’s review, regardless of how the dependent variable was measured orhow the treatment was administered for each study, the mean for the groupnot undergoing treatment was subtracted from the mean for the group under-going treatment, and this number was divided by the standard deviation of
How to Interpret Experimental Results 263

264 Chapter Twelve
the first group. Using these mean treatment effects as data, the authors didstatistics on them to determine how likely it was that these effects could havebeen due to chance. The data can also be reanalyzed in various ways. Forexample, all the studies using a particular experimental design can beanalyzed separately, or those judged to be of high quality can be analyzedseparately from those judged to be of low quality. These smaller-scale analy-ses allow the researcher to evaluate whether the initial grouping of all thestudies was appropriate.
Some researchers have been critical of meta-analysis (Wilson, 1985),claiming that the technique is sometimes used to combine the results of manyexperiments, each of which has serious flaws. In such cases, the outcome ofthe meta-analysis would be as flawed as the original studies. However, meta-analysis also has its supporters (Mann, 1990) who argue that a sophisticatedapproach including various subanalyses minimizes the possibility ofcombining flawed studies into a super-flawed result. Meta-analysis certainlyseems to be here to stay. When done properly, it can be a valuable tool forintegrating the results of an otherwise unwieldy multitude of research.
■ Using Computers to Help Interpret ResultsComputers are used in many areas of psychological experimentation, such asdoing a literature search, presenting stimuli, and recording responses. How-ever, the most widespread use of computers is for statistical data analysis.Computers are particularly valuable for this task because they can quicklystore and manipulate large sets of numbers. In recent years the availability ofcomputers has increased, and powerful statistical software now allows moststatistical tests to be computed on desktop or laptop machines.
Although the net effect of computers on statistical computation has beenoverwhelmingly positive, there could be problems associated with the use ofcomputers. One problem is that because computers take some of the manualeffort out of doing statistics, people sometimes act as if they need not devotemuch mental effort either. Yet it is especially important to understand howstatistical tests work when you first start using them. Computers allow you tobypass this understanding. If someone shows you the steps necessary forentering data and then the computer gives you back results, it is possible foryou to go through the whole process without ever understanding what youdid. I require my students to calculate each statistical test once by hand beforeusing a computer, so that they will understand what happens inside that littlemagic box.
Computers are also so perfect, hardly ever making a mistake, that theylull us into thinking that whatever they tell us is the truth. But the adageholds: Garbage in, garbage out. You need to remember the lessons aboutinterpreting results that you have learned in this chapter. Also, you need toknow the assumptions and limitations of the various statistics that you mayuse (see Appendix A). Finally, you should not accept the output from a com-puter at face value before making some simple checks. Although it is

How to Interpret Experimental Results 265
unlikely that the computer made a mistake, you might have made a mistakein setting up and entering the data into the computer. A computer is fast andaccurate, but it is exceedingly stupid. The computer does not care in theslightest if you made an error and accidentally told it that you were going toenter the data for condition A before condition B, and then didn’t enter inthat order. The computer will not check to see whether you made such anerror; you will have to check.
One way to make a quick check of your statistical results is to look at thedescriptive statistics that your computer gives you to see whether they makesense. In our print size experiment, for instance, we expect that the 8-year-olds will read more slowly than the 12-year-olds. We would be wary of theanalysis if such logical expectations were not upheld, which could be an indi-cation that we had made a mistake in setting up the data for the computer.We could also calculate some means for a small part of the data by hand tosee whether the result agreed with the computerized output. In the print sizeexample we might decide to compute a mean for one age-group, for oneparagraph, at a particular print size to see whether that mean agreed with theone listed in the output. Several small computations would require only acouple of minutes, but they would greatly increase our confidence that theoutput was correct.
I hope this general discussion has put the role of computers in perspec-tive. Computers and statistical packages are simply tools that can be used tomake data interpretation easier. There is no reason why computers shouldstrike fear in your heart. They are your friends and are getting friendlier allthe time. But as with all complex tools, care should be taken to make sure thatthey are being used correctly. These computer friends are not at all flexibleand require you to compulsively follow their rules. They believe what yousay, even when you are wrong, and they have no common sense for deter-mining when you are wrong. To stay out of trouble, you should understandtheir limitations as well as their capabilities.
■ SummaryOnce you complete an experiment, you must interpret the data listed onthe response sheets. A useful first step is to plot a frequency distributionillustrating the number of data points occurring within categories of thedependent variable. Sometimes these distributions are similar to a symmet-rical bell-shaped distribution called a normal distribution. Others arebimodal, with two most frequent categories; skewed by having more scoresin one tail of the distribution; or truncated by having one tail of the distribu-tion missing. Three commonly used statistics describe the central tendency ofa distribution: The mode is the most frequently occurring category, themedian is the middle score, and the mean is the center of gravity for the dis-tribution. Two statistics are commonly used to describe the dispersion of adistribution: The range is the difference between the highest and lowest

266 Chapter Twelve
scores, and the standard deviation and sometimes the variance describe thedispersion of distributions that are approximately normal.
Graphs illustrate the relationship between the independent anddependent variables. The levels of the independent variable are put on thehorizontal axis, the abscissa, and the values of the dependent variable are puton the vertical axis, the ordinate. A bar graph can be used to illustrate datapoints that represent qualitatively different categories. Either a histogram ora functional line graph can be used to illustrate continuous variables. Indescribing functions, you can indicate whether they are linear or curvilinear,positive or negative, monotonic or nonmonotonic, positively accelerated ornegatively accelerated, or asymptotic. The strength of an experimental rela-tionship can be illustrated in a scatterplot, or if the relationship is linear, youcan calculate a correlation coefficient and a coefficient of determination.
To interpret the results of a factorial experiment, you must determinewhether a main effect is present—an effect of one factor on the dependentvariable at an average value of the other factors. In addition, you must alsodetermine whether the effect of one variable is different depending on thelevels of the other variables. Such differences are called interactions and,particularly with crossover interactions, can make interpretation of maineffects difficult. When there are three or more factors, interpreting interactionscan be even more challenging because there are several two-way interactions,as well as three-way interactions, and with more factors even higher-orderinteractions.
Inferential statistics are used to infer how likely it is that the differencebetween data samples is due to chance rather than due to a real difference inpopulations (levels of the independent variable). So for statistical purposes anull hypothesis is set up stating that levels of the independent variable haveno effect. The statistical test then determines the probability that the differ-ence found in the data samples could be due to chance if the null hypothesisis true. Once a test determines whether the null hypothesis is true, two typesof errors could happen: a Type I error, in which the null hypothesis is rejectedwhen it is true, and a Type II error, in which the null hypothesis is not rejectedwhen it is false. The null hypothesis should be rejected when it is false, andthe probability that an inferential test will do this correctly is called its statis-tical power, which is especially dependent upon the sensitivity of the exper-iment and the number of participants. For an effect to be declared statisticallysignificant—the probability that the difference is due to chance—Type I error,usually must be less than .05 or .01. Parametric tests assume that populationdistributions are normal, whereas nonparametric tests do not. Researcherssometimes misuse statistical tests by equating nonsignificant results withequivalence of conditions, by overemphasizing the .05 and .01 levels of sig-nificance, or by confusing statistical significance with practical significance.
Meta-analysis is a statistical technique for combining the results of manyexperiments. A single statistic called the mean treatment effect size is com-puted for each experiment, and these effect sizes are analyzed to determinehow likely it is that such effects could be due to chance.

How to Interpret Experimental Results 267
Computers can often be used to carry out statistical analyses. However,care must be taken to ensure that the assumptions of the statistical tests are metand that the data have been properly entered into the program. The outputmust be checked for internal consistency and accuracy before it can be accepted.
Answers to the questions in Figure 12-10:
Top graph: Print size? noAge? yesInteraction? no
Middle graph: Print size? yesAge? yesInteraction? no
Bottom graph: Print size? noAge? noInteraction? yes
S U G G E S T E D B O O K S O N S TAT I S T I C S
For the Beginning Student
Hinkle, D. E., Wiersma, W., & Jurs, S. G. (1988). Applied statistics for the behavioralsciences. Boston: Houghton Mifflin.
Kirk, R. E. (1990). Statistics: An introduction. Fort Worth, TX: Holt, Rinehart &Winston.
For the Advanced Student
Keppel, G., & Zeddeck, S. (1989). Data analysis for research designs: Analysis of varianceand multiple regression/correlation approaches. New York: W. H. Freeman.
Maxwell, S. E., & Delaney, H. D. (1990). Designing experiments and analyzing data: Amodel comparison perspective. Belmont, CA: Wadsworth.
Myers, R. H. (1971). Response surface methodology. Boston: Allyn & Bacon.
S U G G E S T E D B O O K S O N M E TA - A N A LY S I S
Cook, T. D., Cooper, H., Cordray, D. S., Hartmann, H., Hedges, L. V., Light, R. J., et al.(Eds.). (1992). Meta-analysis for explanation: A casebook. New York: Russell SageFoundation.
Glass, G. V., McGaw, B., & Smith, M. L. (1981). Meta-analysis in social research.Newbury Park, CA: Sage.
Rosenthal, R. (1991). Meta-analytic procedures for social research (Rev. ed.). NewburyPark, CA: Sage.

268
Self-satisfaction is the enemy of good writing . . . Being able toread one’s own work critically is a skill that is as important asbeing able to construct a beautiful sentence or put together acogent argument.
RACHEL TOOR (2006)
We are all blind seekers after truthConfused by the noisy rabble of wordsWhether we shall ever say what we meanOr mean what we sayWe know not,And only our doingWill teach us in its hour.
B. DECKER (1967)
As we all know, Ten Commandments were accepted and published.What you may not know is that Moses asked that 34 others berevised and resubmitted; 16 more are still in press as a result ofthe lengthy publication lag.
PALLADINO & HANDELSMAN (1995)
What appears in print is a sanitized, rationalized account of theresearch that conforms it to the standard story schema. Althoughexperienced investigators sometimes can guess the probable realstory behind the published report by reading between the lines,the written presentation of the research contains none of this.
MADIGAN, JOHNSON, & LINTON (1995)
13How to Report Experimental Results
Aclassic philosophical debate goes something like this: If a tree falls in theforest and nobody is there to hear it, does it make a sound? The question
is whether a person has to hear a sound for the sound to be a sound. What doyou think? In reporting research, we can ask a similar question: Is researchresearch if nobody hears about it? The metaphysical answer to either ques-tion depends on how you want to define the terms. Because we are concernedwith a practical answer, we can at least say that unreported research might aswell not have been done. The ultimate goal of research is not doing experi-ments but building a scientific body of knowledge. If other scientists do not

How to Report Experimental Results 269
know about your experiments, your results cannot be used as building blocks.An experimental report is the way of making your results public so thatscience can benefit from your research.
Because your experimental report is the product of your research, youshould try to make it a high-quality product. Although an elegantly writtenexperimental report cannot save a bad piece of research, a poorly writtenreport can effectively destroy a good piece of research. I know researcherswho, if one judges from informal discussions of their research, seem to dowell-thought-out experiments on important problems, but their ability tocommunicate on paper is so poor that their work is unknown. Much goodresearch is probably lost this way.
Even instructors in writing courses have a difficult time teaching peoplehow to write orderly thoughts. I do not have enough room in this chapter toteach you much about writing in general.1 William Safire (1979) offers themost concise instructions I have seen for writing:
Remember to never split an infinitive. The passive voice should never beused. Do not put statements in the negative form. Verbs has to agree withtheir subjects. Proofread carefully to see if you any words out. If you rereadyour work, you will find on rereading that a great deal of repetition can beavoided by rereading and editing. A writer must not shift your point of view.And don’t start a sentence with a conjunction. Don’t overuse exclamationmarks!!! Place pronouns as close as possible, especially in long sentences, asof 10 or more words, to their antecedents. Writing carefully, danglingparticiples must be avoided. If any word is improper at the end of a sentence,a linking verb is. Take the bull by the hand and avoid mixed metaphors.Avoid trendy locutions that sound flaky. Everyone should be careful to use asingular pronoun with singular nouns in their writing. Always pick on thecorrect idiom. The adverb always follows the verb. Last but not least, avoidcliches like the plague: seek viable alternatives.
The goal of this chapter is quite limited. I describe the parts of a researchreport, give you some suggestions for determining whether what you write isreadable, and provide an annotated sample report.
Research reports should convey information efficiently by using aconsistent format. With this principle in mind, the American PsychologicalAssociation (APA) (2001) has compiled a set of rules for writing a researchreport: the Publication Manual of the American Psychological Association.2
A well-thumbed copy of this book should sit on every experimental psychol-ogist’s desk. This publication started out in 1929 as a 7-page journal articleand has now become a 439-page book. As you can imagine, it is quite a taskto try mastering all the rules involved in APA-style writing. However, the
1 If you seem to have a difficult time with your writing, you might find Strunk and White’s Elements of Style (1979) helpful.2 Be sure to use the fifth edition of the Publication Manual to write your reports. There weresome changes between the fourth and fifth editions. I have incorporated examples of most ofthese changes into the sample report on pages 287–299, but you will need to refer to the manual to find the many possible variations.

270 Chapter Thirteen
work you put into this effort will be worthwhile. This style manual is astandard reference and is widely used. For instance, the publisher of the bookyou are reading asks its authors to use the manual. Unless your instructors inother courses specify a particular style manual to use, you would probablybe safe in using the rules from this manual. In your psychology classes,even for a class project, you should follow the general guidelines from thePublication Manual. Although I obviously cannot discuss all the topics coveredin this tome, I will mention the most important rules and point out where newinvestigators often make mistakes.3
■ How APA Style Differs from Other WritingBefore I go into many of the rules from the Publication Manual, the rulescollectively called APA style, I want to discuss some of the differences betweenAPA style and the writing style of other disciplines. Some of these traditionsin psychology may not be immediately obvious to you and, in some cases,are only implied in the Publication Manual. Psychology professors sometimesfail to emphasize these differences because the style becomes so ingrainedafter reading hundreds of journal articles. It is important for students to beaware of these subtle traditions because what you learned about writing insome of your other classes might not be acceptable in a psychology class.Much of the information I mention is based on research by Madigan, John-son, and Linton (1995) that compared the language used in two psychologyjournals with that used in the Publication of the Modern Language Associationand the Journal of American History.
LANGUAGE
Research psychologists try to make the language they use transparent. By thisstatement I mean that the language you use should not get in the way of theinformation you are trying to convey. In the humanities, the language andthoughts in written articles are often considered linked in such a way that thewords chosen are as important as the thoughts being presented. In psychol-ogy the language is expected to be as straightforward and unobtrusive aspossible. For example, even though the Publication Manual recommendsagainst it, much of scientific writing has traditionally been done in a passivevoice rather than an active voice—so “the data were analyzed” rather than“I analyzed the data.” Though this may seem to be a subtle distinction, thepassive voice does put the emphasis on the data rather than on the investi-gator. If you try too hard to say things in a creative and unusual way in your
3 For students who want to become real experts on APA style, a book titled Mastering APAStyle: Student’s Workbook and Training Guide (2002) is available from the American PsychologicalAssociation. For instructors another book, Mastering APA Style: Instructor’s Resource Guide(2002), is also available. These and other useful materials, such as Concise Rules of APA Style(2005), can be found at http://www.apastyle.org.

How to Report Experimental Results 271
scientific writing, other researchers will probably not appreciate your literaryefforts, and this writing style may even lead them to question the seriousnessof your work.
CITATIONS
Despite citing other people’s work nearly as much as historians and far morethan literary critics do, psychologists make this citation in a very differentway. Writers in the humanities use many direct quotes; on average, histori-ans use a direct quote once in about every 60 words of text, whereas psy-chologists on average use a direct quote fewer than once in every 3000 words(Madigan et al., 1995). Rather than directly quoting authors, psychologistsparaphrase them. As noted in the previous paragraph, this difference proba-bly reflects a difference in the way language is used. Historians believe thatthe way something is said is as important as what is being said. Psychologistsbelieve that the data, theories, and logical arguments stand on their own,independent of the specific words used. Students sometimes do not under-stand why their literature professor lowers their grade for paraphrasing citedwork, whereas their psychology professor lowers their grade for using toomany direct quotes. Unfortunately, the world is not always fair, and to besuccessful you will have to learn these subtle differences. However, let meemphasize that proper citation is as important when you are paraphrasinganother person’s ideas as it is when you are using a direct quote. If you failto properly cite an author, it is plagiarism in either case. The commonlyaccepted definition of plagiarism is the appropriation (stealing) of thelanguage, ideas, and thoughts of another author. Plagiarism can lead tovery serious consequences whether it occurs in an academic setting or ina professional setting. See Chapter 5 for a more thorough discussion ofplagiarism.
SUBHEADINGS
As is discussed in the next section, APA style requires a specific linearordering of the sections of a report. Even within those sections psychologistsuse a lot of subheadings to announce the introduction of new topics. Thesesubheadings minimize the transitional passages required to introduce newtopics and allow research reports to be concise. Subheadings are far less com-mon in the humanities. All this structure imposed on a research reportemphasizes what is called a story schema, which means that by telling ourresearch stories within a consistent structure we provide a means of commu-nication between the author and the reader, creating specific expectationsabout forthcoming information. Again in keeping with a de-emphasis onlanguage, all this standardized structure may produce a less entertainingliterary piece, but one that consistently and concisely conveys information.

272 Chapter Thirteen
FOOTNOTES
Psychologists rarely use footnotes, especially what are called discursivefootnotes.4 The footnotes psychologists use typically clarify a point being madeor add some information that may not be of interest to many readers.Historians, on the other hand, use about four or five times as many discur-sive footnotes as psychologists do, and literary critics use double that number(Madigan et al., 1995). By using these footnotes historians and literary criticssometimes establish a parallel text that allows a discussion to take place onseveral levels at the same time. Psychologists believe that this type of footnotedistracts the reader from the clear, concise, linear format he or she expects.
DISAGREEMENTS
When historians and literary critics disagree with their colleagues, they aresometimes pretty outspoken about their differences, sometimes to the pointthat the disagreement becomes personal. One author may accuse another ofbeing “naive” or “failing to fully think an issue through” or even of “willfulmisinterpretation.” Psychologists are encouraged to keep personalities out ofdisagreements. They are much more likely to couch their differences in termsof the data, the methodology, or the theories rather than to directly criticizeanother researcher. This tradition of civility to other investigators may comefrom the recognition that in science we are collectively engaged in an effortto build a coherent body of knowledge. Failure to cooperate could cause thebody of knowledge to be poorly constructed or cause delays in its construc-tion. De-emphasizing the individual helps emphasize the data and theoriesthat make up this body of knowledge.
HEDGED CONCLUSIONS
Psychologists are much more likely to use hedge words in their academicwriting; psychologists on average use more than 10 times as many hedgewords as historians and literary critics do (Madigan et al., 1995). Here aresome typical hedge words and phrases: is consistent with, lends support to, maybe considered, may be related to. Psychologists use most of these hedge wordswhen stating their conclusions. In most cases the researcher is hedging notthe data but the theory. As we discussed in Chapter 3, theories are essentiallyimpossible to prove and are difficult, but not impossible, to disprove. So, eventhe strongest data may be only weakly linked to theory. Psychologists recog-nizing the weakness of these linkages properly hedge their conclusions. Whenscientists state their conclusions too dogmatically, their scientific colleaguesmay accuse them of being naive (but in a civil way!).
4 To emphasize this point I’ll use a footnote but not a discursive one. The dictionary says discursive means digressive or rambling. A discursive footnote is one that is a bit off the mainpoint of the discussion.

How to Report Experimental Results 273
I hope this discussion of some less obvious traditions in APA style willhelp you understand why psychologists write in a way that is a bit differentfrom what you have learned in other courses. It will still take some time foryou to fully understand some of the subtle cultural differences in the waydifferent disciplines use language. This understanding will come withexperience in the field, particularly as you read the research literature andbegin your own writing.
■ Parts of a ReportAll experimental reports should contain certain standard sections in properorder. Otherwise we would have to be like the old preacher who said of hissermons: “First I tell ’em what I’m gonna tell ’em, then I tell ’em, then I tell’em what I told ’em.” All experimental reports follow a standard pattern, sowe do not need to use much space “telling ’em what we’re gonna tell ’em.”Not only does the standardized structure improve writing efficiency, but theconsistent organization also allows the reader interested in only one section,such as the method or results, to quickly find the required information. Theparts of a report are listed in the following outline and described in thefollowing sections:
iiiiI. Title pageA. TitleB. Author(s)C. Affiliation(s)D. Running head
iiiII. Abstract pageiiIII. Body of report
A. Introduction1. Background2. Literature review3. Statement of purpose
B. Method1. Participants2. Apparatus/materials3. Procedure
C. Results1. Verbal statement of results2. References to tables and figures3. Descriptive and inferential statistics
D. Discussion1. Relationship between stated purpose and results2. Theoretical or methodological contribution3. Future directions for research

274 Chapter Thirteen
ii IV. Referencesiii V. Author notes (if any)i VI. Footnotes (if any)iVII. TablesVIII. Figure captionsii IX. Figures
TITLE
During the first two months after publication, about half the research reportsin major psychology journals are likely to be read by fewer than 200 psy-chologists (Garvey & Griffith, 1971). The people who do read a report haveprobably selected it because of the title. Most psychologists regularly scan thetitle pages of several journals looking for current research that might interestthem. Most of the key words used in a literature search (Chapter 6) are alsochosen from the title. Thus, in some respects, the title is the most importantpart of your report; if your title conveys little information or the wrong infor-mation, you may lose most readers even before they know what you did.
The two most helpful suggestionsfor creating a title are contradictory:(1) Put in as much information as pos-sible and (2) make it as short as possi-ble. Most titles should mention themajor independent variables of inter-est and the dependent variable. Youshould also identify the general areaof research if it is not obvious from thevariables. The Publication Manual saysthat titles should be no longer than 10to 12 words. Most titles should beconsiderably shorter than this.5
One way to create a title is to start with a long version and then eliminatewords until you are absolutely unwilling to shorten it any further. As anexample, suppose we needed a title for the print size experiment discussedin the earlier chapters. As a first step we might start with this: “An Experi-ment Examining the Effect of the Size of Print on the Time to Read a StandardParagraph for Children of Various Ages.” Now let’s shorten it. We can imme-diately eliminate “An Experiment Examining the Effect of” because thesewords give the reader no new information. We can also eliminate most of theprepositions (of, on, to, for) by rearranging the words. In this case, it isalso more efficient to identify the specific levels of the independent variable(8- and 12-year-olds) than to use a general descriptor (children of various ages).
5 Although I have no evidence to back it up, it seems to me that in general, the better knownthe article, the shorter the title. Perhaps this effect is due to the memory span of the reader, or maybe good writers work at creating short titles. Perhaps I should have called this book Book.

How to Report Experimental Results 275
After a little work, the title might read: “Print Size Effects on Reading Speedof 8- and 12-Year-Olds.” This title contains most of the original informationbut is certainly much shorter.
The use of a colon can often shorten the title and allow elimination ofsome words. If you examine the titles in the references at the end of this book,you will find many examples. For example, there is a title by Johnson, “Pupil-lary Responses during a Short-Term Memory Task: Cognitive Processing,Arousal, or Both?” Without the colon the title would be longer—for example,“Are Pupillary Responses during a Short-Term Memory Task an Indicationof Cognitive Processing, Arousal, or Both?” There is also an article by Green-wald entitled “Within-Subjects Designs: To Use or Not to Use?” He couldhave opted for “Should Within-Subjects Designs Be Used or Not?” In thiscase, the use of a colon does not shorten the title, but it does allow a moreinteresting, Shakespeareanesque version of the question.
AUTHOR AND INSTITUTION
After the title, list the author or authors, followed by the institution where theresearch was done. Listing the institution where the research was done isimportant both because the institution should get credit for providingresources and because it takes responsibility for maintaining proper ethicsand participant care. When there are multiple authors, list only those whohave made substantial scientific contributions to the study. People who havesimply helped collect or analyze some of the data should be acknowledgedin the author note rather than listed as authors. Generally, the person whotook primary responsibility for the research will also write the research reportand should be listed as first author. Other authors’ names should then follow,ordered by the size of their contribution. However, the relative size of aresearcher’s contribution is not always obvious, and disputes can arise,particularly in the case of student–faculty collaborations. It has been sug-gested that the best way to avoid these disputes is to discuss the issues earlyin the research process (Fine & Kurdek, 1993). Among the issues to considerare the nature of professional and nonprofessional contributions required bythe research, the specific abilities of each person, and the duties assigned to

276 Chapter Thirteen
each. Although such agreements may need to be renegotiated as the researchprogresses, having a consensus up front should prevent most seriousdisputes later.
RUNNING HEADS AND PAGE HEADERS
The running head is just a shortened title printed at the top of the title page toidentify the article. It should be no longer than 50 characters including spacesand punctuation. Page headers consist of the first couple of words of the titleand are printed on the upper right-hand corner of each page just to the left ofthe page number. In case the pages of the manuscript become separated, thepage header will allow it to be reassembled.
ABSTRACT
The abstract is the second most important part of the report. Once readerschoose your paper because the title is of interest, they will next read theabstract, in the journal, in Psychological Abstracts, or in PsyINFO. Like a door-to-door salesperson, the title may get your foot in the door, but the abstractcan get you an invitation into the house.
The abstract should be a condensed version of the complete report. Mostinvestigators wait to write the abstract until the rest of the paper is finished,although it appears immediately after the title in the final report. In the abstractyou should introduce the purpose of the research, name the variables, brieflypresent the method, mention the important results, and discuss the implica-tions of the results. To do all this, you are allowed to use a maximum of only120 words. As you can see, you must cover a lot of information in only a fewwords. Again, you may find it useful to write a long first draft and then starteliminating unnecessary information and parts of speech. Make sure that theabstract is still comprehensible and contains complete sentences (unlike a title).If the abstract is too long even after this first editing, you will have to makesome choices about the relative importance of the remaining information,

How to Report Experimental Results 277
eliminating the least important material until your abstract meets the lengthrequirement.
Some investigators treat titles and abstracts as afterthoughts. They dashthem off after having taken great pains with the body of the paper. In this dis-cussion I have tried to convince you that the title and abstract are the twomost important parts of your experimental report. Give them your best effort.
INTRODUCTION
The introduction is used to describe the current state of the body of knowl-edge. Because it is always the first section of the body of the report, it doesn’tneed a heading. You should assume that the reader has some familiarity withyour area of research, so you need to mention only the few experiments mostrelevant to the one you have done. When you cite an experiment, give onlythe author’s name and date of the article in the report body, and give thecomplete citation in the references section.6 Describe these key experimentsin just enough detail to set the stage for your experiment. A good introduc-tion is a miniature literature review that leaves your readers with the feelingthat they know what experiment should be done next—the one you did.
After reviewing the supporting literature, you should state the purpose,or object, of your experiment. This statement should specify the relationshipbetween the independent and dependent variables that you investigated. Forexample: “The purpose of this experiment was to determine whether printsize would have the same effect on reading speed for 8-year-olds as it has for12-year-olds.” If you can predict the outcome of the experiment from theliterature review or from a theoretical argument, state that prediction as ahypothesis. However, you must explain the logic behind your hypothesisbecause the purpose of predicting an outcome is to make the results easier tointerpret later in the report. If your hypothesis is an unsupportable hunch,don’t waste the reader’s time.
METHOD
At this point, your readers should know why you did what you did. Now youmust tell them what you did. The method section should contain enough detailso that the reader could replicate your experiment. However, you must useyour judgment about which details are relevant to the experimental outcome.For example, in the print size experiment, you would not need to specify theexact dimensions of the room in which the paragraphs were read, althoughyou would certainly specify the dimensions of the paper on which each para-graph was typed. Because it is impossible to mention each circumstance from
6 A note about how to cite experiments: For one author, just give the author’s name and thedate of the article: “Jones (1967) found . . .” or “It was found (Jones, 1967). . . .” For two authors,use both last names: “Jones and Smith (1971) found . . . ,” or “It was found (Jones & Smith,1971) that. . . .” For more than two authors, use all the names the first time you cite the researchand the first author’s name followed by “et al.” thereafter: “Johnson et al. (1972) also found. . . .”

the infinite set of circumstances, you should limit yourself to those that couldlogically have been expected to influence the results.
The method section is usually divided into several subsections. A typicalreport has three subsections, although you may wish to use additionalsubsections if your experiment calls for more.
ParticipantsThe participants, or subjects,7 subsection should specify who the participantswere. Were they students, pilots, children? What gender were they? Howmany did you use, and how did you select them? (Were they volunteers?Were they satisfying a class requirement? Were they paid?) Be sure tostate this information in a way that a reader in Samoa could understand.(“Participants were students from PSY 204 . . .” Eh? What’s PSY 204?) For ani-mals, be sure to report their genus, species, supplier, and housing conditions,along with their age and sex. If you eliminated data for any individuals (seeChapter 5), you should indicate the basis for this decision.
Apparatus/MaterialsThe apparatus/materials subsection should describe the equipment or mate-rials you used in your experiment. If you used a standard psychological appa-ratus, you need only give the general name, the manufacturer, and the modelnumber. (“A Scientific Prototype two-channel tachistoscope, Model 800-F, wasused.”) Describe any custom-built apparatus in enough detail so that thereader could construct a similar one. (“The slides were back-projected on aPlexiglas panel 15 cm high and 20 cm wide, mounted vertically 30 cm fromthe participant.”)8 Be sure to make a note of all the measurements at the timeyou do the experiment. Reconstructing these details after the experiment isoften difficult and sometimes impossible.
ProcedureThe procedure subsection should specify exactly what happened to eachparticipant during the experiment. When writing this section, imagine thatyour naive, innocent participant has just walked into the experimental room.What happens from that point on? What instructions did you give? You canusually paraphrase these details unless they were a major part of the experi-mental manipulation. What events happened during a trial, in what order, andwith what timing? How many trials were presented? Were they in blocks orsessions? Were trials randomized or counterbalanced? Exactly what was mea-sured, and how was it measured and recorded? What type of experimentaldesign did you use? Why did you choose to use the procedure described?
278 Chapter Thirteen
7 When reading experimental reports published before 1974, you will see the words subject andexperimenter abbreviated as S and E, respectively. These abbreviations are no longer acceptable.In fact, the term subject should be avoided if possible and replaced with a more specific termsuch as students, children, or rats, or if a generic term is necessary, participants, respondents, or individuals.8 Report all measurements in metric units. If the object was manufactured in nonmetric units,report them as such but insert the metric equivalents in parentheses. (“The panel was 3 ft [0.91 m] in width.”)

The procedure section is one of the most difficult sections to write wellbecause by the time you write the report, you have become intimately famil-iar with each detail, and the procedure now seems so obvious and straight-forward to you. By all means have someone who has no idea what you didread the procedure section and then tell you in his or her own words whatyou did. Then correct any false impressions, and try it with someone else.Eventually the two accounts will correspond, and at that point the proceduresection is complete.
RESULTS
You should typically begin the results section of the report by describing yourdata. Provide raw data only when illustrating a general finding or whenshowing the results of small-N experiments. Descriptive statistics should bereported first.9 When you report a measure of central tendency such as amean or median, you should usually include a measure of dispersion as well,such as a standard deviation. If you have only a few measures to report, youcan include them in the text: “The response times for the 1-, 2-, and 3-s fore-periods were 50, 362, and 391 ms, respectively.” However, use a table or figurewhen you must report more than five or six data points.
Investigators typically use tables to show the results of main effects andto give exact values of the dependent variable when these are important. Youshould type tables on pages separate from the text. The short sample reporttoward the end of this chapter shows how a table should be organized. Forspecific problems, refer to the Publication Manual or to Presenting your findings:A practical guide for creating tables (Nicol & Pexman, 1999).
Use figures sparingly, for they take up journal space and are even morecostly to print than are tables.10 However, as we saw in Chapter 12, figuresare a great way of showing interactions and for illustrating trends in the data.In most cases, figures are preferable to tables because readers can generallyextract and remember information better from figures than from tables. Hereare some general rules to follow in drawing figures:
1. Label the abscissa and ordinate, and specify the units of measurement.11
2. Draw the ordinate two thirds to three fourths as long as the abscissa.3. Make 0 the smallest mark on the ordinate. If you must break the ordi-
nate to save space (for example, if you have no response timesbetween 0 and 0.3 seconds), indicate the break by a double slashedline at that point.
How to Report Experimental Results 279
9 I have seen many student reports in which the first sentence in the results section was something like “The effect of variable A was significant, t (18) = 4.7, p � .01.” Reporting the results of an inferential statistical test before describing the data is a little like reporting the results of a ball game by saying that “one of the teams won.” Who won? By how much? Or inthe experiment: In which direction was the effect? What was the size of the effect?10 A figure is any visual representation of data that cannot be set in standard type. Graphs arethe most common figures in experimental reports.11 New investigators commonly forget this step. To avoid this error, set a rule for yourself thatyou will never put in a data point until you have labeled the axes.

4. Use point and line codes to indicate the independent variables notlisted on the abscissa. Make these codes consistent throughout thereport. Do not rely on different colors to make your distinctions.Colors should be used only in coloring books!
5. Do not put too many curves on a single figure, usually no more thanthree or four.
6. Draw your figures on pages separate from the text.
These rules are designed to help you make your results clear and to minimizethe possibility of distortion. However, you may find that you will need tobend them occasionally to keep from distorting your data.
Usually figures submitted to journals for formal publication can now beproduced using a computer program and a printer. But be sure, if you doyour own figures, that you use a good printer and that the line sizes and lettersizes are appropriate even if the figure must be reduced for publication. Toavoid getting parts of the figure too small during a reduction, letter and num-ber sizes should vary by no more than four points (for example, from 14-pointtype to 10-point type).
Once the data have been described, the results of inferential statisticaltests can be reported. First tell the reader which test or tests you used andhow you mapped your variables onto the test, if this fact is not obvious. Theresults of these tests are reported in a standard way. For example, if the resultof a t-test12 done on two groups of 10 subjects was 4.7, which you found to besignificant at the .01 level, you would report it as follows: “The differencebetween groups was found to be significant, t (18) � 4.7, p � .01.”13 Reportother tests in the same way, first stating the symbol for the test statistic(italicized if not a Greek letter), followed by the degrees of freedom in paren-theses, an equals sign, the result of the test calculation, a comma, a lowercasep italicized, a � sign (or, for nonsignificant results, a � sign), and finally thetesting level.14 Many journals now require the reporting of the effect size, aswell as standard tests of statistical significance. Reporting an effect size letsthe reader determine not only whether any difference you found in yoursample was likely to reflect a difference in the population but also whetherthe difference you found was large enough to be important. You can computean effect size quite easily, typically using the values you obtained from yourinferential test. You should consult a statistics book or your instructor to findthe exact formula to use.
In the results section you should not interpret the results, other thangiving the information needed for clarification. Use the results section for
280 Chapter Thirteen
12 A t-test is an inferential test that indicates whether the means of two samples are signifi-cantly different from each other; its result is a number. By comparing this number with othernumbers listed in a table, you can determine whether the means are statistically different at aparticular probability level (for example, a probability level of .01, p � .01).13 The number in parentheses is the degrees of freedom for the t-test. Most statistical tests havea degrees-of-freedom term, either a single number or two numbers. You will find out how todetermine this number when you learn these tests.14 In Appendix A, at the end of the worked examples for each statistical test, I have shown howto report the test result in the text of the manuscript.

stating what you found; the discussion section is for explaining why you thinkyou found what you found, and in the standard format, never the twainshould meet. In some cases, if the information can be presented more clearlyor efficiently, you may combine the results and discussion sections. If you dothat, be sure to clearly use this heading: Results and Discussion Section.
DISCUSSION
In your introduction you described what the body of knowledge consisted ofand where it needed to be expanded. Your results section then provided anew building block.15 You now have to describe how the new block fits intothe structure and how the new structure differs from the old. Thus, thediscussion section is the place where you update the body of knowledge withyour results.
In most cases, in the introduction section you would have identifiedcompeting theories or stated hypotheses predicting the outcome of the exper-iment. In the discussion section you should briefly review these theories andhypotheses and discuss whether your results support or refute them. If morethan one theory or hypothesis can explain your results, you might suggestways of testing these in future experiments.
This section is also the place for qualifying your results, if necessary, andfor speculating on the reasons for unpredicted findings (as long as you keepyour speculations short and identify them as such). However, you should notwaste the reader’s time by explaining effects that were not statisticallysignificant. Only in rare cases should negative results be interpreted as beingdue to anything other than chance.
Particularly, if you are doing applied work, you should use the discus-sion section to point out the practical value of your results—how and wherethey can be used and how they might change current applied procedures.
Finally, you can use the discussion section to make suggestions about thedirection of future research. Now that you have discussed the new state ofthe body of knowledge, you may be able to suggest where new expansionshould take place.
How to Report Experimental Results 281
15 Or, in some cases, your experiment may have blasted away part of the existing structure.
REFERENCES
Your reference section should list only those references cited in the report andshould be ordered alphabetically by the first author’s name. The referenceslisted at the end of this book and in the sample report follow the proper styleand should provide you with many useful examples. For unusual references,refer to the Publication Manual.
■ Reducing Language BiasWithout realizing it, most of us at times use language that reflects historicalcultural biases. For example, although one of the reasons for the languageconvention of using he, him, and his as generic pronouns rather than having tosay the longer he or she, him or her, and his or hers was probably efficiency,another reason was that, historically, the person being referred to probablywas a man. Men did things worth writing about, and women stayed homeand raised the kids—or at least that is what the people in control of thelanguage (read that, men) thought. I need not point out to you that the worldhas changed. Those of us in psychology should certainly acknowledge thischange; most psychology graduate students and about three fourths of theundergraduate psychology majors are now women. We men in psychologyshould probably consider ourselves lucky that the women are not demandingthe use of generic feminine pronouns for a few centuries to even things up.
Bias also creeps into the language when we refer to ethnicity, age,disability, and sexual orientation. In an attempt to minimize it, the APAhas included a section in the Publication Manual containing guidelines forlanguage usage. Here is my version of these guidelines. I have certainly short-ened them and regrouped them, but I believe that I have not distorted them:
1. Call people what they are. This first guideline has at least two implica-tions. The first is that we should be specific and refer to groupings of peoplein as large or as small a group as is necessary to be accurate. For instance, donot refer to man in a phrase such as man’s search for knowledge if you meanwomen as well. Use men and women or human beings or some other more inclu-sive term. Do not use he, him, or his if a woman could be included; use he orshe, him or her, or his or hers, or change the whole sentence to plural—forexample, changing “Each participant was asked whether he had . . .” to“Participants were asked whether they had. . . .”16 In this way your languagewill be more accurate, and nobody will be excluded. On the other hand, avoidusing language that refers to too large a group. Do not write nonwhite if you
282 Chapter Thirteen
16 Do not mix singular and plural, such as “Each participant was told that they could. . . .” In conversational speech, because it is sometimes difficult to plan sentence structures far enoughin advance to match nouns and pronouns and still avoid using he or him generically, the prac-tice of using a singular noun with a plural pronoun is becoming more common; it is still notcorrect, but people don’t gasp anymore when you do it. However, people will still gasp if you mismatch in a written report. See Foertsch and Gernsbracher (1997) for the practical consequences of such mismatches. Also see Madson and Hessling (2001) to know how peoplerate text that alternates he with she, uses he or she, or uses they.

mean African American. In other words, be as specific as necessary to achieveaccuracy.
A second implication of this guideline is that terms should be used thatrefer to people as people, not objects. I have discussed elsewhere in this bookthe attempt to minimize the use of the term subject because it makes theexperimental participants sound like objects rather than people. Again, thebest terms to use are the most specific: children, students, rats, 8-year-olds,women. If more general terms are needed, participants, respondents, orindividuals are preferable to subjects.
2. Call people what they want to be called. The way we use language changesover time. Included in these changes are terms that refer to subsets of ourpopulation. In some cases the changes occur so rapidly that this book wouldbe out of date in only a couple of years if I tried to give you all of the mostup-to-date terminology. In the past 50 years we have gone from Negro tocolored to Afro-American to black to African American, and there is currentlysome talk of using people of color. As this edition goes to print, Asian Americanis preferred to Oriental, and American Indian or Native American is preferred toIndian. In referring to sexual orientation (note that the neutral orientation ispreferred to choice because we do not know whether choice is involved), thegenerally preferred terms are gay men and lesbians. But in all these cases, youwill have to determine what language is preferred at the time you write yourreport. The best way to do this is to ask your participants what they wouldlike to be called.
3. People are nouns; their attributes are adjectives. This guideline acknowl-edges that people are people, not attributes or conditions. Thus, people withschizophrenia are not schizophrenics; schizophrenia is a condition, not a person.Likewise people with disabilities should not be labeled the disabled, elderly peopleare not the elderly, and gay men are not gays. The same is true for other adjec-tives such as male and female; refer to female participants, not females. The nounsare men and women or, for high school age and younger, girls and boys. By theway, be sure to use parallel terms, particularly when nonparallel terms putone group into a subordinate or stereotyped role, such as men and wives.
These are guidelines, not rigid rules; in some cases wordiness or clumsy prosemight result from following them strictly. They should certainly not be usedas an excuse for lessening the accuracy demanded by science. As a final testof the social implications of the language you use, Maggio (1991) suggestsimagining that you are a member of the group you are discussing. If youwould feel excluded or offended by what you have written, you may need torevise it.
■ Writing StyleExperimental reports are not intended to be literary masterpieces or enter-taining monologues. Thus, your general writing style should not get in theway of smoothly flowing thoughts, nor should it bring more attention to you
How to Report Experimental Results 283
than to your research. To meet these requirements, scientific writing hasevolved a standard style.
Traditionally, scientific writers have used third-person passivevoice rather than first-person active. Instead of writing “I did this experimentto . . . ,” the investigator would write “This experiment was done to. . . .”Although this style did keep the report from reading like a letter home, it alsoforced out much of its life. The prose became dull and monotonous andcaused the reader more pain than pleasure. Today it is considered proper touse the pronoun I to a limited extent—for example, “I thought that . . . ,”rather than “It was thought that. . . .” You should, however, avoid excessiveuse of I to keep from drawing the reader’s attention to you rather than to theresearch. You should also try to use an active verb form rather than a passiveform, especially when there are no pronoun problems—for example, “Aprevious report described a new method” rather than “In a previous report,a new method was described.”17 Again the general rule is to use words thatmake the writing come alive without interrupting the smooth flow ofthoughts.
The context of a sentence will usually tell you which verb tense youshould use. Most sentences in the introduction and method sections referto past actions “Boles (1972) reported . . .” and “The students recalled thewords. . . .” On the other hand, results “are” and theory “is” even after theexperiment is completed. That is, the body of knowledge exists in the presentand so should be discussed using present tense verbs: “These data supportan interference theory of forgetting.”
Finally, scientific writing should be concise. The limited resources of timeand space simply do not allow us the luxury of excess use of verbiage. Forinstance, the style I have used in this book would not be appropriate for sci-entific writing.18 I have purposely used more words than necessary becauseI have tried to do more than transfer information; I have tried to convince,cajole, and convert you as well as communicate with you. In scientific writing,you should assume that the reader has already been convinced, cajoled, andconverted; your only job, then, is to communicate.
The most common problem new investigators have with report writing islaziness. The investigator is not really lazy, of course, because lazy people donot do experiments, but his or her writing style may be lazy. In writing areport, the most important end of your pencil is the one without the point;the most important key is the delete key. Extremely rare is the person whocan write a good, concise report the first time through. Most good scientificwriters have to try a number of alternative words and sentence structuresbefore deciding on the best one. Every word must say precisely what you
284 Chapter Thirteen
17 Some writers may object to this form on the grounds that a report cannot describe—an author describes. I suppose writing is largely a matter of personal preference. In this case, I prefer to trade a little accuracy for a lot livelier style.18 If I had written the book in scientific style, you would have been bored, I would have beenbored, and the publisher would have been bored. My mother would have bought the onlycopy; she loves me even when I’m boring.

want it to say, and every sentence should flow smoothly into the next. Writingthis way is hard work!
When writing a report, most investigators first produce a draft of the bestversion they are capable of writing. Getting the report to this point may taketwo or three attempts because it is often easier to rewrite whole sections thanto make corrections on top of corrections. Once you come up with a final draftyou are satisfied with, you should give it to several people to read. At leastone of these people should be unfamiliar with your experiment because youare probably so familiar with your own research that you cannot judge howwell the report describes it. Because you already know what happened, yourmind conveniently fills in all the gaps you leave in the report. An uninformedreader can be a good gap detector.19
It is also helpful to give the report to a reader who is familiar with whatyou did so that he or she can tell you whether you did what you say you did.This person can serve as your error detector. Finally, you should have a readerwho is familiar with scientific writing style and is a good writer. This readercan tell you how you might improve the way you say what you did.
How to Report Experimental Results 285
19 On the death of one of his scientific colleagues, one of my friends remarked to me: “I’m really going to miss him. He was one of my best enemies. Now I don’t know whom I’ll sendmy reports to.” Often, the best option is to have someone read your report who will be criticalwithout fearing that he or she will break up a social relationship. Friends are often too nice tobe good critics.
After getting comments from these readers, you are ready to write a finalversion of the report. You should neatly type, print, spell-check, and proof-read this copy before you submit it.
Some of you may find that if you follow the procedure described here,your reports will be more readable; others may find that another procedureworks best. Writing is an art; what works for one writer may not work foranother. However, the major point we have been discussing is valid for anyprocedure: the report is the final product of your research and deserves atleast the same effort you give to all other aspects of your research.
■ Top-Ten ListI have graded thousands of research reports written by my students. Evenafter I have tried to pound APA style rules into their heads, they make

mistakes. Some of these mistakes occur much more frequently than others, soI thought it might be helpful to present a top-ten list of commonly mademistakes, à la David Letterman. You will find these listed below. (Okay,I couldn’t resist sneaking in an extra one.)
STUDENTS’ TOP TEN MOST FREQUENT VIOLATIONS OF APA STYLE
10b. Using “since” when not referring to time rather than “because” or “as.”10a. Using “and” within a parenthesis or “&” in the text.
9. In a citation, putting a period after the et in “et al.”8. Calling participants “subjects.”7. Giving the issue number in a reference even when pagination is by
volume.6. When stating statistical outcomes in the text, getting � or � signs
backward.5. Using the wrong level of headings.4. Not including all cited work in the references section.3. Writing “data is.”2. Using “male” and “female” as nouns.1. Not using past tense for what was done or present tense for theory or
results that have continuing applicability.
■ A Sample ReportPlease ignore the contents of the sample report to follow. Not only is itfictitious, but the writing style suffers because I have attempted to illustrate asmany instances of APA style as possible in a short report. The marginal com-ments contain shortened versions of some style rules, with an arrow pointingto an example in the report. The definitive word is still the Publication Manual.
Your instructor may ask you to violate some of these rules. For example,when a report is not actually going to be submitted to a journal for publica-tion, I prefer to have students incorporate figures and tables into the body ofthe report. That way the reader has easy access to them while reading the text.Your instructor may have similar preferences.
For a more detailed coverage of APA style you should, obviously, order acopy of the Publication Manual of the American Psychological Association, fifthedition (2001). There are some additional resources available if you feel youneed more help with writing. Fred Pyrczak and Randal R. Bruce (2000) havewritten a book Writng Empirical Research Reports: A Basic Guide for Students ofthe Social and Behavioral Sciences that is a good general reference. If you needmore help with APA style, the American Psychological Association publishesa book Mastering APA Style: Student’s Workbook and Training Guide (Gelfand,Walker, & APA, 2002). Software products are also available that make APAstyle easier to incorporate in your reports such as APA-Style Helper 5.0downloadable from http://www.apastyle.org and Reference Point Software’sTemplate for APA Style downloadable from ReferencePointSoftware.com.
286 Chapter Thirteen

How to Report Experimental Results 287
Print Size and Reading Speed
of 8- and 12-Year-Olds
William T. Garcia
University of Eastern California
Print Size 1
Running head: PRINT SIZE
Double-space.Abbreviated title, capitalizedand no more than 50 characters. Page header at top
of every page.
Number all pages.
Center title; begin importantwords with capital letters;no more than 10 to 12 words.
Affiliation, centered; whereresearch was done.
Author’s name, centered.

288 Chapter Thirteen
Do not indent abstract.
Double-space.
No more than 120 words.
No right-margin justification or word breaks.
Margins on all pages onall sides should be 1 inch.
Abstract
The time it took 8- and 12-year-old children to
read paragraphs was measured as a function of
print size. Paragraphs were typed in either 12- or
10-point print. Results indicated that the size of
print is an important dimension for the younger
children, with the larger print being read 32%
faster than the smaller print. Print size had no
effect on reading speed for the older children. The
results are interpreted in the context of the
stimulus-impact theory of reading.
Print Size 2

How to Report Experimental Results 289
Print Size 3
Double-space.
Use abbreviations with unitsaccompanied by values.Milliseconds is “ms” withno period.
Cite all authors up to six thefirst time mentioned.
Print Size and Reading Speed
of 8-and 12-Year-Olds
Many researchers have speculated
that younger children require larger objects to
have a given visual impact compared to older
children (Darling, 1990; Millar & Hoaks, 1989;
Williams, Garcia, & Levitz, 1992). In their classic
review article Millar and Hoaks (1989) specified
the dynamics of this statement and called it
stimulus-impact theory.
Williams et al. (1992) later tested the theory
by measuring pupillary response in children at
three different ages. The 3-year-old children
required a 375-ms longer exposure to produce the
same size response as the 7-year-old children.
Cite references by names ofauthors, listed alphabeticallywithin the parentheses.
Use “&” within parentheses.
Use “and” in sentence context.
With three or more authors,use “et al.” after first citation.
For numbers 0–9, write out in words everywherebut in the Abstract.
For time, dates, ages, and numbers preceding units ofmeasurement, use arabicnumerals.
Repeat the full title,centered.
Indent paragraphsfive to seven spaces.

290 Chapter Thirteen
Use arabic numerals fornumbers of 10 or more.Grant (in press) also used pupil size to compare
the effect of 10-cm and 20-cm disks on 48 children
of various ages. Disk size had little effect on
children over 10 years old but had an effect for
younger children.
In the research reported here I attempted to
apply stimulus-impact theory to a reading task.
On the basis of this theory I predicted that print
size would have little effect on reading speed of
12-year-old children but would affect 8-year-olds.
Method
Participants
Thirty 8-year-old children from an
elementary school, 15 girls and 15 boys, served as
Use metrics.
Write out the number if it startsa sentence. Try not to start asentence with a number.
Headings go in this order:1. CENTERED CAPS 2. Centered Mixed3. Centered Mixed Italicized4. Flush Left Mixed Italicized5. Indented, italicized, lowercase paragraph heading ending with a periodIf just two levels of headings are required, as is usually thecase, use No. 2 and No. 4.
Use “in press” for references in process of being published.
Print Size 4

How to Report Experimental Results 291
Print Size 5
Participant informationincludes number, gender,age, how selected, andwhy serving.
participants in one group. Their principal and a
parent had given permission for them to serve.
The 17 boys and 13 girls in the 12-year-old group
were paid $3.50/hr for participation.
Apparatus
A slide projector back-projected the
paragraphs onto a 30-cm x 40-cm frosted-glass
screen. A stopwatch was used to measure reading
time.
Procedure
The children were individually tested in
20-min sessions. After being seated in front of the
screen, they were told that a paragraph would
appear on the screen. They were to read this
paragraph carefully, taking as much time as
Specifications for customapparatus.
Generic description forcommon apparatus.

292 Chapter Thirteen
Print Size 6
Procedure is in past tense.necessary to understand the material. After
reading a paragraph, each child was asked three
questions, having single-word answers, about the
contents of the paragraph. After the questions
were answered, another paragraph was presented
until each child had read three paragraphs.
Each paragraph had been previously tested
for readability and was at or below an 8-year age
level. The questions had been found to be a good
measure of comprehension.
The experimenter manually timed the
reading latency for each trial using a stopwatch.
Scores were obtained for each of the three trials in
Numbers under 10 arewritten as words.
Numbers that represent time,ages, scores, or points on ascale are written as numerals.

How to Report Experimental Results 293
Print Size 7
each session. Thus, the experimental design was a
2 x 2 x 3 factorial design having age at two
levels (8-and 12-year-olds), print size at two levels
(10- and 12-point), and trials at three levels.
Results
Mean reading times for each age group and
print size are shown in Figure 1. An analysis of
variance computed on reading times indicated
that the main effect of age was statistically
significant,F (1,58) = 26.73, p < .01. The main effect
of print size was not significant, F (1,58) = 0.87,
p > .05. However, the Age x Print Size interaction
was significant, F (2,116) = 10.31, p < .01.
Note how the statisticalresults are reported.
Decimals less than 1 arepreceded by a 0 unless they cannot exceed 1 orare a significance level.
Refer to the figure in text.
Capitalize first letter ofinteractions in this form.
Main effects are not capitalized.
There were too few data points here to justify afigure or table in areal report.

294 Chapter Thirteen
Print Size 8
Mean reading times and SDs for each of the
three trials are shown in Table 1. The main effect
of trials failed to reach significance, F (2,24) =
1.53, p > .05.
Discussion
The present data are entirely consistent
with stimulus-impact theory. No difference in
reading time as a function of print size was found
for older children. However, for younger children
a print size difference caused a significant
difference in reading time. An interpretation of
these data within the framework of stimulus-
impact theory is that even the smaller print size
Check the direction of < and > signs;p > for nonsignificant,p < for significant.
Report inferentialstatistics, such as tandF, to two decimals.
This table is included only toillustrate the use of tables. Inan actual report, using both atable and figure to presentequivalent data is redundant.
Data and interpretationscurrently exist, so theyshould be in present tense.
Data is a plural word.
When reporting means, alwaysinclude a measure of dispersion,such as a standard deviation.

How to Report Experimental Results 295
Print Size 9
For quotations under 40 words, use quotation marks; longer quotations shouldbe put in an indented block, without quotation marks.
had maximum visual impact on the older children.
The younger children required a larger-sized print
in order to perform at a high level. As Millar and
Hoaks stated in their 1989 article, “High-impact
stimuli are necessary for maximal performance in
younger children” (p. 346).
The implication of these results is obvious
for publishers of children’s reading material.
However, before recommendations can be
presented to these publishers, additional research
is needed to compare reading times for many
additional print sizes and for children at many age
levels.

296 Chapter Thirteen
Author: Last nameand initials.
Use “&” with multiple authors.
Journal name: Capitalize firstletter of each major word.
Year published.
Title: Capitalizefirst word only.
Pages.
List alphabetically by first author’s last name.
Indent entry linesexcept first.
Each entry should have beencited in the report. All itemscited should be referenced.
Volume number: Italicizejournal name, commas, and volume number.
Print Size 10
You will find examples of the style for books, magazines, and other references by looking at the References at the end of this book.
References
Darling, D. T. (1990). Internal consistency in
stimulus-impact theory. Journal of Child
Behavior, 26, 58-63.
Grant, U. T. (in press). Pupillary response to
disks.Sensation & Perception.
Millar, J. R., & Hoaks, A. R. (1989). Stimulus
impact theory: A developmental theory of
perception.Childhood Perception and
Cognition, 7, 278-295.
Williams, E. T., Garcia, W. T., & Levitz, G. W.
(1992). A review of size effects.Behavioral
Review, 21, 326-354.

How to Report Experimental Results 297
Print Size 11
First paragraph has authorand departmental affiliation.
Author Note
William T. Garcia, Department of
Psychology (now at the Center for Child
Development, Westbrook University).
I would like to thank Nancy Wells for her
help in data collection. This experiment was
reported at the Northwestern Psychological
Society meeting in Madison, Washington,
May 15, 2001.
Correspondence concerning this article
should be sent to William T. Garcia, Center for
Child Development, Box 4546, Westbrook
University, Monroe, Washington 12342, or by
electronic mail to garcia.ccd.wu.edu.
Second paragraph hasacknowledgments offunding agencies andhelpers; also list previous presentations of data.
Third paragraph has pointof contact, includingcurrent address.

298 Chapter Thirteen
Means and Standard Deviations of Paragraph
Reading Times in Seconds as a Function of Age,
Print Size, and Trials
8-year-olds 12-year-olds
Print Size M SD M SD
10-point
Trial 1 84.2 12.9 31.2 8.7
Trial 2 83.4 10.2 27.7 7.8
Trial 3 81.0 10.7 24.7 8.1
12-point
Trial 1 58.2 10.1 32.3 9.2
Trial 2 56.1 8.2 29.1 8.3
Trial 3 55.9 7.7 30.8 8.5
Title in mixed caps andlowercase, leftjustified, and italicized.
Use only horizontal rule lines.
When reporting means,always include a measure of dispersion, such as a standard deviation.
Use indentation where possible rather thantaking a full column.
Table with title should be understandable standing alone. Title should explainabbreviations used in table.
Print Size 12
Table 1

How to Report Experimental Results 299
Figure Caption
Figure 1. Mean reading time in seconds as a
function of print size and age.
Print Size 13
Letters and numbers infigure should be large enough that figure islegible when reduced tojournal-size column.
8-year-olds
12-year-olds
Rea
din
g ti
me
(in
seco
nds)
10-point 12-point
Print size
9075604530150
° °
Place identifying legend near line or in box within the figure.
Figure with caption should beunderstandable standing alone.Caption should explain anyabbreviations used in figure.
Use highly distinguishable plot points, such as opencircles and filled triangles.
Lettering sizes should varyby no more than 4 points.
Caption on separate page.
Ordinate should be2/3 to 3/4 as long as abscissa.
Label axes. Units may be abbreviated.
On back of figure, near the topedge, write lightly “top,” therunning head, and the figurenumber.
■ Presentations at Conferences
ORAL PRESENTATIONS
Although a written report is the primary means of reporting research, mostresearchers, including many students, also report their results by presentingthem at professional conferences. Students have an increasing number ofopportunities to present research results in this way. For example, studentsin my university last year could present their work in a poster session eitherin the psychology department or in a university-wide research conference,both sponsored by student organizations. They could also present a paper atan undergraduate research conference that drew students from several statesor at a conference sponsored by the state psychological association. Someeven presented papers or posters at larger regional or national meetings,either in a student session or as a coauthor in a regular session. Many stu-dents find making presentations exciting, both in telling an audience abouttheir own work and in seeing the broader world of science at work for thefirst time. However, giving a paper or a poster can be a frightening experi-ence, and other than taking a speech course, most students have little training.Here is a crash course in the art of presenting your research orally.
What does the presentation of a conference paper consist of? Althoughthe answer to this question varies depending on the conference, you will gen-erally be expected to stand up in front of a group of 20 to 100 colleagues andpresent your work within 10 to 20 minutes, leaving some time at the end forquestions. Typically, you will have prepared some visual aids, which todayis usually in the form of a computerized presentation such as PowerPoint, orin some cases a paper handout. It is important to realize that presenting yourresearch this way is far different from writing a paper. If you try to read anAPA-style research report to your listeners, you will be lucky if they do notwalk out on you. The written report is too long, goes into far too much detail,and uses a nonconversational style. You might expect a person reading yourwritten report to fully digest it and carry away many details. We know fromresearch on the human memory that the person listening to your presenta-tion will be able to carry away only a few major points. You want to makesure that these points are easy to grasp and remember.
Ideally, the style of your presentation should be conversational. I remem-ber clearly the first paper I ever gave at a conference. In this case I wasspeaking to a national group of researchers in an area of study in which I hadbeen working for only five months. I was terrified. But I worked hard atmemorizing the presentation so I could give it without notes. I got up, kneesshaking, and presented the research without stumbling over very manywords. I was pretty proud of myself. But at a reception later, when my adviserasked the conference coordinator, “Didn’t David do a good job with his pre-sentation today?” the coordinator said, “No. It sounded as if he was readingthe paper, and we don’t do that at this conference.” I was temporarilycrushed, of course, but this was the best advice I could have gotten.Communication researchers know that conversational speech is quite different
300 Chapter Thirteen

How to Report Experimental Results 301
from reading a text. In conversational speech we vary our pace according toour mental activity, pausing to think up the next phrase and then unloadingthe words rather rapidly. The listener uses these pauses and the pacing of thewords to follow the thought pattern of the speaker. In reading text, words arepaced more regularly without long pauses. This sing-song, monotonous styleis a great way of curing a listener’s insomnia but a poor way of conveying theexcitement of the research. As a presenter, you should be thoroughly familiarwith what you want to say, but you should not overrehearse to the point thatyou sound as if you are reading a written report and are bored by it.
Because you want to try to give the presentation as naturally as possible,it will take you longer to present the material than you expect. If you practiceby reading a written version to yourself, even if out loud, you will zoomalong because you do not have to slow down to allow something to sink in;you already understand the content. So, you can expect to take at least 20%longer to present the material to an audience, who are listening to it for thefirst time. Ideally, you should build in some choice points where you can addmaterial or leave it out as you are giving the presentation to control the lengthof time you take. If your presentations are like mine, you will end up havingto take the shorter route at most of these points.
Think about your audience, and try to tailor your presentation to them.Are the listeners students, psychologists, experts in your research field, orscientists from many disciplines? Because we are so familiar with our topic bythe time we present our research, we tend to forget that not everybody is asfamiliar with it, or as interested in it, as we are. Try to transport yourself backin time to where you were when you first got the idea for your research. Thatis probably where your audience will be when you start your presentation.
Many years ago I would have criticized presenters for not using enoughgraphics in their presentations. Graphics were difficult to produce anddisplay, so presenters erred on the side of having too few. Today I believe pre-senters err on the side of having too many. Programs such as PowerPointmake it quite easy to put every point you want to make into a bullet on thescreen. I think doing so is a mistake! While I would not go so far as EdwardTufte, who has written articles and books on the evils of PowerPoint, I dothink that this tool can lead to poor presentation practices.20
I think that the most successful presenters (and teachers) tell compellingstories. Imagine turning a child’s bedtime story into a bulleted PowerPointpresentation. I can think of no better way to wring the mystery and emotionout of the story. In a similar way, once you convert your interesting researchstory into a series of bulleted phrases, many listeners will quickly scan thedisplay and turn off their ears until the next display comes up. My preferenceis to put up just a few major points and not show those until after I have toldthe story that makes each point. I realize that there is security in PowerPointoverkill, particularly for the less experienced presenter; all your notes are up
20 To get a flavor for Tufte’s criticism see http://www.wired.com/wired/archive/11.09/ppt2.html.To see a PowerPoint presentation of the Gettysburg address go to http://www.norvig.com/Gettysburg/.

there on the screen so it is easy to just read them off. However, my advicewould be to avoid that temptation and instead try to tell a story, usingPowerPoint only sparingly to emphasize just the most important points.
Judging from many hours of sitting through presentations, I believethat the biggest error presenters make is to zip through the experimentalprocedure to get on to the important stuff, the results. But unless you makethe procedure clear, the results are not important. I have found that the bestway to help the listeners understand the procedure is, if possible, to turn theminto participants. If in my experiment I showed a series of visual displays tothe participants and then had them make a response, in my presentationI give the listeners a brief set of instructions, show them a series of graphicssimilar to the displays, and have them give the appropriate response. Severalrepresentative trials can often take as little time as explaining the procedurein words, and the audience will remember the procedure so much better.Psychologists know that people learn better by doing than by being told.We should take advantage of that principle.
When presenting your paper, go for the big picture. If people really wantto know the details of your counterbalancing scheme, the levels of statisticalsignificance at which you tested, or other such details, they can ask you lateror ask for a written copy of your paper. Most listeners will never rememberthese details anyway. Usually, the best way to present results is graphically,using computerized displays. If possible you should have a computer moni-tor in front of you showing the same display that is being projected onto thescreen behind you. This arrangement will allow you to continue facing theaudience and the microphone as you are referring to characteristics of the dis-play. If you do use a pointer, such as a laser, to emphasize something on theprojected display, make sure you talk louder when you turn toward thescreen. A better solution is to add the pointer to the display using a computerprogram so you do not have to turn around. Being able to point to somethingon the display is one reason I prefer displays to handouts. You cannot pointto the thing you are talking about on the listener’s handout. Other problemswith handouts include the time it takes to distribute the handouts and the lossof control over the presentation when the listener reads the information fromthe handout before you present it (once I have a handout in hand, I tune outthe speaker and sneak a look at the results)—to say nothing of the cost, theclutter, and the destruction of trees.
In using a projected display, be sure that you are positioned off to the sideso you do not block the audience’s view of the screen. When you show agraph, remember that this is the first time the audience has seen it. Presenterssometimes flash up a graph and immediately launch into a conclusion: “Asyou can clearly see, the results confirmed our hypothesis.” As a member ofthe audience I am saying to myself: “Wait a minute. What’s on each axis? Isbetter performance up or down on the graph? Which condition is representedby the solid line, or the dashed line? What would the figure look like if thehypothesis were not supported? What is it about this figure that supports thehypothesis?” The audience should not have to ask all these questions. Youshould show the figure, pause . . . , explain what is on each axis, explain what
302 Chapter Thirteen

How to Report Experimental Results 303
the lines or bars represent, and indicate where in the figure the audienceshould look to find the important information, pointing as you go. Finally,make sure that the figures are big enough and in bold enough print that theaudience can see them from the back of the room. The figures in your writ-ten report will probably have to be redrawn to meet these requirements.Before you are satisfied with your graphics, you should try projecting themon a screen under conditions similar to what you expect for the room inwhich you will be presenting. For each display, walk to the back of the roomand be sure you can see all the details. Often the colors and contrast that lookgreat on the computer monitor will not translate to the screen and may makethe material difficult to read. Fortunately, with modern word processing,drawing good figures is an easy task technically, yet I still see illegible figuresat many conferences I attend.
At the end of your presentation, you should have a display that lists yourconclusions. This is one final time to give the listener a message to take away. Beconservative. Three to five conclusions are probably all your audience willremember. After giving the conclusions you should be prepared to closedecisively. “Uhm . . . I guess that’s all I have to say” is not an impressive way todo this! Saying “Thank you for your attention” or “If time permits, I’d be happyto answer questions” will signal your audience that you have finished and letthem know that you carefully planned for your presentation to end at this point.
You have just finished your presentation and are ready to sit down, catchyour breath, and relax. What a relief! But the chair of your paper session says,“We have time for a few questions.” You, of course, have not prepared for anyquestions because you have answered all possible questions in your lucid pre-sentation. Then some wag in the audience asks: “I don’t see how you canclaim that your results support Landon’s theory. Doesn’t the theory of reduc-tivity proposed by Wagner last year predict your findings?” You, of course,have never heard of Wagner. How do you respond? I have no pat answers togive you for such a question.21 My point is that you should prepare yourselfas best you can to field questions. After you have exhausted all the potentialquestions you can think up, you should ask others to pose questions for you.In fact, the best way to prepare for presenting a paper is to make a trialpresentation to a group of colleagues, perhaps your classmates or otherstudents and faculty members in your department. Strongly encourage themto ask you hard questions. Try to answer the questions when they are asked,and think about the questions again later when you have time to preparebetter answers. Some of these questions may reappear at the conference.Be prepared.
21 I believe that honesty is the best policy in these situations, but I have heard people try tobluff their way out. There are several categories of retorts: (1) I’m pressed for time—“You maybe right, but the issue is much too complex to discuss here. Why don’t you see me afterward?”“I’ve thought about that, but I rejected it for a number of reasons too detailed to discuss in thetime I have for questions.” “I don’t think that his theory directly applies in this case, but Iwould be happy to discuss it with you later.” (2) Tell me more—“In what way do you thinkthat his theory applies to my findings?” “Could you be more specific?” “I would be interestedin hearing your thoughts on that issue.” (3) It’s not my fault—“My coauthor would be happyto answer that question.”

POSTERS
Most conferences now include poster sessions as well as paper presentations.Picture a large room full of free-standing bulletin boards lined up in rows.People presenting posters stand in front of the bulletin boards, and behindthem the posters are thumbtacked to the cork boards. Crowds are millingabout, some people drifting by the posters reading titles and others talkingwith the presenters. Typically, at such a poster session presenters are givenan hour or so to stand in front of their poster, explain their research, anddiscuss anything the ever-changing audience wants to discuss.
The advantage of giving a poster rather than a paper is that you can havetruly interactive conversations, usually with people who have an interest inwhat you have done. This format works particularly well for simply designedresearch having straightforward results that can be easily captured in a fewgraphs. The disadvantage of a poster is that the first person comes up, asks youwhat you did, and you are two minutes into the explanation when a secondperson asks you the same thing. If you start over, the first person will get bored.If you continue, the second person may have trouble following you. This pat-tern is repeated often throughout the poster session, and when you have fin-ished, you may feel that you never had the opportunity to explain your workfully to anyone. This disadvantage is particularly serious when your researchis complex or uses an unusual complicated methodology or involves testinghighly detailed and unfamiliar theories. In these cases you may simply nothave the time to tell the elaborate story required to do your research justice.
As a general strategy in preparing for a poster session, you should try toput together several minipresentations. One less than a minute should quicklycapsulize your work. This one you might give to the casual member of the audi-ence who wants only a brief overview. You might prepare another “less mini”presentation lasting perhaps several minutes, which you give to someone whoshows considerable interest in your work. You should also be prepared to dis-cuss your work more fully with the few researchers who might come by whoalso work in your area of research. You should also devote a lot of effort to mak-ing the poster self-explanatory. The better job your poster does at explainingwhat you did, the easier it will be for you to spend your time interacting withyour audience rather than rehashing the basics. What should be in this poster?
When your poster is accepted for presentation, you will be sent informa-tion telling you details of the setup. Typically you will be provided with acorkboard measuring four by eight feet and thumbtacks (take your own tacksanyway to be sure). You will mount your materials on this board. Above alldo not simply take a manuscript copy of your paper with you and tack it tothe board! The printing is too small, the detail is too great, and no one willtake the time to read it. Remember that your audience will have only a fewminutes at most to spend trying to understand what you did. You want toconvey as much information as you can in those few minutes. In this case apicture really is worth a thousand words.
Figure 13-1 shows a sample poster arrangement. The information is puton panels about the size of standard sheets of paper. You will notice that much
304 Chapter Thirteen

How to Report Experimental Results 305
of the material is figures. As a general strategy you should present as littletext as possible. Where you do have text, try putting it into figure captions. Asecond general principle is that information flow should start in the upperleft and move to the lower right. However, unlike English text, it should notbe arranged in left-to-right rows. The members of your audience will fall allover one another if you force them to walk back and forth as they follow yourpanels. Instead put the information into columns. Numbering the panels asshown in the figure is helpful, or in some cases it might be appropriate to usearrows to help guide the audience.
At the top of the board should be a title and a list of the authors. The let-tering for these should be at least one inch (72 points) high. Remember thatthe poster will be viewed from a distance of a meter or more. The title shouldbe large enough to be read over the heads of the people talking to the presen-ter. Many people circulating will simply read the title, not be interested, andmove on. Under the names of the authors should be their affiliations, such astheir universities or colleges. This print and all the rest of the lettering can besmaller, but still at least 1/3 of an inch (24 points) high. Figures, drawings,charts, or illustrations should be similar to those used in slides or overheads,with simple heavy lines. One of the organizations I belong to suggests check-ing the readability of your materials using the “Toe Test” (Human Factors andErgonomics Society, 1995). Have a friend or two stand above your poster mate-rials, which have been placed on the floor next to their feet. Can they readthem? If not, have them toe the materials into a trashcan and try again!
The abstract should be simple and concise. Take out all unnecessarydetails. The research methods used should be explained using as few wordsas possible and using pictures for illustration. Depending on your study, the
Abstract
Figure
Figure
Table Table
Conclusions
FigureFigure Figure
1
4 ft
8 ft
4
2 35 6
7
TITLEAuthors & Affiliation
FIGURE 13-1 A sample poster arrangement. The title and author letteringshould be at least 1 inch high, other lettering at least 0.33 inch. Informationshould flow from upper left to lower right in columns. Maximize graphics. Minimize text.
pictures might show stimulus materials for your various conditions, orperhaps sample items from your survey, or perhaps a schematic of yourexperimental design. Results should be graphed with easily readable sym-bols and lettering. If possible, put your statistical results in the figure caption.Generally you should not list raw data or statistical tables. Finally, include aconclusions section in which you briefly summarize your results. List no morethan five or so items. The audience will not be taking notes and will be look-ing at a lot of other posters, so you want to emphasize only a few points thatthey might remember later. Also pitch your materials to your audience. Forexample, if your audience includes scientists from many fields rather thanjust psychologists, you should be particularly careful to avoid psychologicaljargon and to relate the conclusions to real-world applications.
For esthetic reasons some people use colored paper to border their pan-els, but you should not be too fancy. Scientists are more impressed by prettydata than by pretty graphics. If possible, the panels can be dry mounted on astiff board. More typically today, the entire poster is printed onto one or twolarge sheets that can be rolled up in a tube for traveling purposes. That wayyou do not have to worry about getting individual panels straight and evenlyspaced at the start of a session when you are already a little flustered and ner-vous. Finally, proofread the poster! Perhaps because the lettering is so largethat it is more difficult to read normally, posters seem to have a large numberof typos. I have seen world-renowned researchers using professionally pro-duced posters with errors that they have had to correct with a ballpoint pen.These researchers are embarrassed, and you would be too.
As is the case with papers, you should try giving your poster presenta-tion to some colleagues. Have them ask questions. When you are done, askthem how they think the poster or presentation could be improved. Finally, ifpossible, have copies of a complete written report available to hand out.People will be likely to request these.
Regardless of how you present your research, you should take pride inpresenting it and do a quality job. Remember that this is the product of all thework you have done up to this point. All that effort could go to waste if youpresent your work in an unclear or uninteresting way.
■ SummaryBecause research is worthless unless other scientists know about it,experimenters must make their results known by writing a high-qualityexperimental report. This report should follow the guidelines recommendedby the APA in its Publication Manual. Psychological writing differs from thewriting found in other disciplines such as history and literary criticism. Forinstance, the language is more straightforward, few direct-quote citations areused, subheadings are used more liberally, discursive footnotes are infre-quent, intellectual disagreements seldom turn personal, and conclusions areoften hedged. A report has standardized sections. Because many readers willdecide whether to read a report on the basis of its title, your title should beshort but convey enough information to help them make this decision.
306 Chapter Thirteen

The authors and the institution where the research was done follow the title.The abstract, a short (120-word) version of the complete report, ends thepreliminaries.
In the body of the report, the introduction should review enough litera-ture to give the reader an idea of the current body of knowledge and shouldstate the purpose of the experiment. The method section provides the infor-mation necessary to replicate the experiment. It is typically divided into threesubsections: participants, which describes their type and number and howthey were recruited; apparatus/materials, which gives others the informationnecessary to order or build the equipment and materials similar to those used;and procedure, which should give a detailed account of what happened toeach participant. The results section summarizes the findings of the experi-ment. This section contains descriptive statistics, including measures ofcentral tendency and dispersion, either in the text or in tables or figures. Theresults of inferential statistical tests follow, usually including the effect size.This section then relates results back to the body of knowledge in the discus-sion section. The report concludes with an alphabetical list of the referencescited in the paper.
To convey information as efficiently as possible while keeping the generalwriting style lively, it is no longer necessary to write experimental reportsexclusively in third-person passive voice. Active verbs are now consideredpreferable, and occasional use of first person is acceptable. The introductionand method sections are typically written in the past tense, but the presenttense is appropriate for the results and discussion sections. Because the reportshould be as concise as possible, you should avoid lazy writing and shoulduse the comments of other readers to make the report a high-quality product.
Because it is important to avoid language bias and be accurate in researchreports, three guidelines should be followed: Call people what they are; avoidgeneric masculine terms when referring to both genders (man for humanbeings, he for he or she), and use participant rather than subject. Call peoplewhat they want to be called; ask your ethnic participants what the correctterminology is. People are nouns, and their attributes are adjectives. Peoplewith disabilities are not the disabled; female participants are women, not females.
Research can also be reported at professional meetings in the form of aconference paper or poster. A paper is usually presented to a group of 20 to100 colleagues in 10 to 20 minutes. It should be given in a conversationalmanner, leaving out many details from the written report. Visual aids such ascomputerized projections should be carefully prepared so that they can beeasily read. The procedure and results sections, in particular, should beprepared with the level of the listener in mind. Presenters should be ready forquestions. Posters are given in a more interactive way. A poster containing atitle and six to nine panels is prepared, and short presentations are given tocolleagues who circulate through the room asking questions. The postershould be formatted carefully with large print, readable figures, and not toomuch detail. Both papers and posters should be practiced with friendlycolleagues before the conference.
How to Report Experimental Results 307

We shall not cease from explorationAnd the end of all our exploringWill be to arrive where we startedAnd know the place for the first time.
T. S. ELIOT
Congratulations on having wended your way through my thoughts on doingpsychology experiments. May my words and pictures have helped to holdyour interest rather than obstruct your progress. There is a delicate balancebetween informality and precision—a balance that varies from one reader toanother. I hope my prose was not too unbalanced for you.
Obviously, this book has not instantly transformed you into a full-blownexperimental psychologist, but I trust it has given you enough informationso that you can attempt some simple experiments on your own. You willfind that doing experiments is a lot more fun than reading about doingexperiments. So now go have some fun!
Epilogue

If you are a calculatophobic (see Chapter 3), this appendix is written for you.You should be able to use this simplified “cookbook” version of statistics ifyou have learned only basic algebra. This book is certainly not a statisticsbook, and the minor concession I am making in this appendix does notcontradict that statement. Some teachers and students who use this booksometimes feel the need for a brief description of basic descriptive statisticsand inferential statistical tests. Here I tell you how to do a few of these tests.However, I am not telling you why you are doing what you are doing, andgenerally I will tell you only a little bit about the conditions for choosingwhat to do.
It has been my observation that writing words about numbers usuallyconfuses things. Instead, I have attempted to show you what to do with thenumbers by means of worked examples. If you arrange the numbers fromyour data the way the numbers are arranged in the example and follow thesame steps, you should have few problems.
I first mention some characteristics of numbers. Then I give you a shortglossary of statistical symbols. Finally, I provide you with worked examplesof each statistical operation. At the end of each worked example I indicatehow you would report this result within the text of a manuscript.
■ Characteristics of NumbersNumbers can be used in a variety of ways. Some ways convey a lot of infor-mation (“it is 28 miles to the fair”) and some only a little (“the first basemanis number 28”). Some statements and statistical operations are possible withsome numbers (“the theater, which is 14 miles away, is half as far as the fair”).These same statements are ludicrous with others (“the second baseman isnumber 14; for this reason he is only half the first baseman”). So, before youcan do a statistical operation on numbers, you must determine whether theoperation makes sense for the type of numbers you are using.
NOMINAL SCALE
Numbers that are simply used to name something are said to be on a nominalscale. Nominal scale data have no quantitative properties. The only legitimate
309
APPENDIX A
How to Do Basic Statistics

statistical operation you can do with nominal data is to count the number ofinstances that each number occurs: How many players are there with thenumber 28?
ORDINAL SCALE
Numbers that can be ordered, or ranked, are said to lie on an ordinal scale.The race car driver who was champion the previous year is allowed to putthe number 1 on his or her car. The driver who was second in the point stand-ings is number 2, and so on. We know from these ordinal scale numbers thatdriver 1 performed better than driver 2, but we do not know by how much.
310 Appendix A
Nominalscale
Ordinalscale
Intervalor ratioscales
Mode
Mean
Standard deviation
Contingency coefficient
Spearman rank-order correlation coefficient
Pearson product-momentcorrelation coefficient
Mann–Whitney U test
t-test
Chi-square
Range
Variance
Median
Kruskal–Wallis one-way ANOVA by ranks
Wilcoxon matched-pairs signed-ranks
ANOVA
FIGURE A-1 Statistical operations and the number scales they require

Drivers 1 and 2 might have been 500 points apart, whereas drivers 2 and 3might have been only 2 points apart.
INTERVAL SCALE
If the intervals between numbers are meaningful, the numbers lie on aninterval scale. For example, temperature measured on a Fahrenheit scale ison an interval scale. It is 10 °F between 50 °F and 60 °F. It is also 10 °F between60 °F and 70 °F.
RATIO SCALE
If you can make a ratio out of two numbers and if this ratio is meaningful,you have a ratio scale. Thus, although you cannot say that a temperature of20 °F is twice as hot as 10 °F, you can say that 20 miles is twice as far as10 miles. The big difference between an interval and a ratio scale is that thelatter has an absolute zero point. On the Fahrenheit scale, “zero degrees” hasno particular meaning other than the fact it is 32 arbitrary degrees below thefreezing point of water. For quantities such as distance, weight, and volume,zero units is a meaningful concept.
One question you must answer before you perform a statistical operationis “What number scale am I dealing with?” Figure A-1 lists the operations wediscuss in this appendix and the scales they require.
Operations that can be carried out on numbers from lower order scalessuch as nominal can also be used with numbers from higher order scales suchas ratio. For this reason, the shaded area in the figure indicates that all theoperations can legitimately be performed with interval or ratio data, but onlythree of them can be used with nominal data.
■ Symbols Used in Statistical FormulasX � a datum or scoreN � the total number of scores� � sum, or add, the scoresX2 � square X (multiply it by itself)X3 � cube X (multiply it by itself twice)��X � square root of X (What number multiplied by itself equals X?)|x| � absolute value of X (the number disregarding its sign)
■ Descriptive Statistics
MEASURES OF CENTRAL TENDENCY
ModeThe mode is the most frequently occurring score. Count the number of timeseach score occurs and pick the score with the most occurrences. The mode inthe example in the next section is 2 because this number occurs twice.
How to Do Basic Statistics 311

MedianThe median is the middle score. The scores should first be ordered by size. Foran odd number of scores, the median is the middle one. For an even numberof scores, the median lies halfway between the two middle scores. In the fol-lowing example the median is 2.5, because the middle two scores are 2 and 3.
Mean
Mean � M � X– ��XN
Example
X122345
�X � 17N � 6
Reporting in Text. M � 2.8
MEASURES OF DISPERSION
Range
The range is the largest score minus the smallest score. In the previousexample:
Range � 5 � 1 � 4
Variance
Variance � S2 ��(X � X
–)2
N
312 Appendix A
X– � 17
� 2.86
Example
6 scoresso
N � 6
X
123345
�X � 18
X � X–
�2�1
0012
X–*
333333
(X � X–
)2
410014
�(X � X–
)2 � 10
*Mean � X– � 18
� 3.6

�(X � X–)2
�10
� 1.67N 6
Standard Deviation
Standard deviation � SD � � � ��S2 � �����
In the previous example:
SD � ����1.67 � 1.29
Reporting in Text. SD � 1.29
MEASURES OF ASSOCIATION
Contingency Coefficient
The contingency coefficient (C) is a measure of the strength of associationbetween two sets of numbers when nominal scale data are being considered.A chi-square (�2) test must first be done (see p. 315). Suppose that a chi-squaretest has been conducted on a two-variable experiment, and you wish to knowthe strength of association between these two nominal-scale variables. Alsosuppose that �2 was found to be 15, with a total number of observations ofN � 100. Then the contingency coefficient is:
No further testing for the statistical significance of the association is necessarybecause the chi-square test has already been computed to test for significance.
Reporting in Text. C (N � 100) � .36
Spearman Rank-Order Correlation Coefficient
A Spearman rank-order correlation coefficient (rho) is used to measure thestrength of association between two ordinal scale variables. In this case, twoscores, or ranks, are obtained for each participant, and the difference d isdetermined.
���.130 � .36�����15������2
N � �2 100 � 15�C �
�(X � X–)2
N
How to Do Basic Statistics 313
Example
Rank onfirst measure
41523
Rank onsecond measure
42531
Participant
BillJaneBobPeteMary
d
0�1
0�1�2
N � 5
d 2
01014
�d2 � 6

� 1 � .3 � .7
To determine whether the obtained rho is likely to have occurred becauseof chance variation rather than an actual association, we must consult thetable of critical values for rho in Appendix B (Table B-1). We see that with N of5, rho must equal 1 to be significant. It does not. We can also see from the tablethat the larger the number of participants, the better our chances of finding astatistically significant effect, given that there is an association present.
Reporting in Text. � (N � 5) � .70, p � .05
Pearson Product-Moment Correlation Coefficient
A Pearson product-moment correlation coefficient (r) can be used to mea-sure the strength of association between two interval or ratio scale variables.In the following example, X represents the score on one variable, and Y thescore on a second variable.
314 Appendix A
rho � 1 �6�d2
� 1 �6(6)
� 1 �36
N3 � N 125 � 5 120
Example
X
94421375
�X � 35
Y
84643285
�Y � 40
Participant
TomSueJillDaveKenJoJuanAl
X2
811616419
4925
�X2 � 201
Y2
6416361694
6425
�Y2 � 234
XY
721624836
5625
�XY � 210
N � 8
To test whether an r of this size is statistically significant with eight pairsof scores, refer to Table B-2 in Appendix B, listing critical values of r. To usethis table, you must determine a quantity called the degrees of freedom (df).For this test the degrees of freedom is N – 2. So in the example df � 6. Because
r �������N�X2 � (�X)2
N�XY � �X�Y
������N�Y2 � (�Y)2
�������1608 � 1225 ������1872 � 1600
1680 � 1400
� .868�322.7280
���383 ��272
280�
(19.57)(16.49) 280
�������8(201) � 352 ������8(234) � 402
8(210) � (35)(40)

r of .868 exceeds the listed value of .834, it is statistically significant at thep .01 level. That is, we would expect this strength of association to occur ina sample less than 1 time in 100 because of chance selection from a singlepopulation.
Reporting in Text. r (6) � .87, p .01
■ Inferential Statistical Tests
CHI-SQUARE
The chi-square (�2) test is used to determine whether the observed frequencyof occurrence of scores is statistically different from the expected frequency.
How to Do Basic Statistics 315
Example
Number of participantspredicting heads after
a string of tails
6050
�10100
2
Number of participantspredicting tails after
a string of tails
4050
�10100
2
ObservedExpectedO � E(O � E)2
(O � E)2
E
�2 � �(O � E)2
� 2 � 2 � 4E
The expected frequency can be the frequency based either on a set ofprevious observations or on a theoretical prediction. Usually, the theoreticalprediction is that the observed frequency will be that expected by chance. Forinstance, in the example the expectation is that the participants’ predictionswill show no bias (no gambler’s fallacy)—half the time they will predictheads and half the time, tails.
The final step in doing an inferential statistical test is to compare the finalresult of your computation with a table of critical values. You will find a tablefor chi-square values in Appendix B (Table B-3). To find the appropriatenumber in the table, you must first determine the number of degrees offreedom as follows:
df = The number of O – E being considered, minus 1, which in this caseequals 2 – 1 � 1
In the table we find that with df � 1, �2 must exceed 3.84 to be significant atthe p .05 level of significance. Thus, the data in our example are statisticallydifferent from chance at the .05 level. If we had been testing at the p .01

level, �2 � 4 would not have exceeded 6.64, and the test would have failed toreach significance.
Reporting in Text. �2 (1, N � 100) � 4.00, p .05
t-TEST FOR UNCORRELATED MEASURES
There are two forms of the t-test, one for uncorrelated measures and the otherfor correlated measures. The t-test for uncorrelated measures is used to deter-mine the probability that an observed difference between two independentgroups of participants occurred by chance. The underlying distributions areassumed to be normal.
316 Appendix A
Example
Group 1
X1
98774
�X1 � 35
X1 � X–
1
2100
�3
X–
1
77777
(X1 � X–
1)2
41009
�(X1 � X–
1)2 � 14
�1 � �������(X1 � X1)2
��2.8 � 1.67
�
N1 � 5
M1 � X1 � N1
�X1
N1 ��145
� 7
� �
535
Group 2
X2
54321
�X2 � 15
X2 � X–
2
210
�1�2
X–
2
33333
(X2 � X–
2)2
41014
�(X2 � X–
2)2 � 10
N2 � 5

The degrees of freedom for an uncorrelated t-test is:
df � N1 � N2 � 2� 5 � 5 � 2 � 8
Table B-4 in Appendix B indicates that, with 8 df, t must exceed 3.355 forthe difference to be significant at p .01. Thus, our value of 3.67 is significantat that level.
Reporting in Text. t (8) � 3.67, p .01
t-TEST FOR CORRELATED MEASURES
The t-test for correlated measures is used to determine the probability that anobserved difference (D) between two conditions for the same or matchedparticipants occurred by chance.
t �
�����N � 1
�D
XD
s2 5
�����������2s1
��2 5 1.41
5M2 5 X2 5 N2
SX2
��105
5 3
1
5
515
t 5
(�����
M1 2 M2
N1 2 1) (�����N2 2 1)2s2 ���������21.67
1(�����
7 2 3
5 2 1)21.41(�����5 2 1)
5
�������21.67 �������.697 1 .4971(
4 4
2 ) 21.41( 2 )5 5
������S(X2 2 X2)2
N25
�����1.194
45
1.094
5 5 3.67
How to Do Basic Statistics 317
Example
Participant
12345
N � 5
Condition 1
98788
�X1 � 40
Condition 2
65545
�X2 � 25
Difference (D)
33243
�D � 15
X–
D*
33333
XD � X–
D
00
�110
(XD � X–
D)2
00110
�(XD � X–
D)2 � 2
*MD � X–
D ��D
�15
� 3N 5
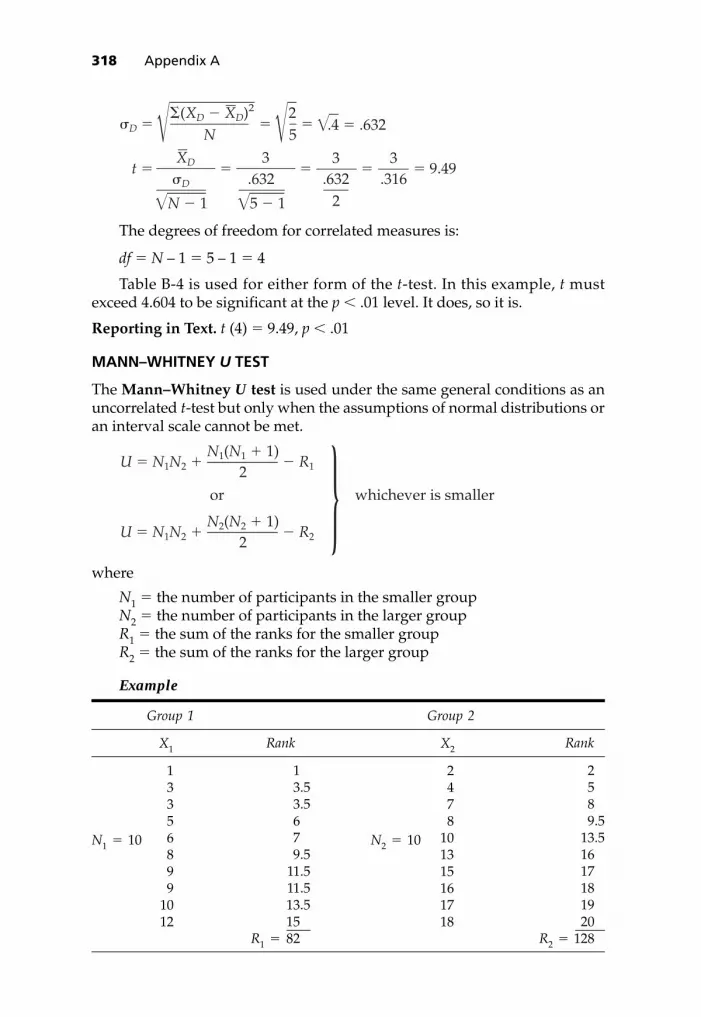
The degrees of freedom for correlated measures is:
df � N – 1 � 5 – 1 � 4
Table B-4 is used for either form of the t-test. In this example, t mustexceed 4.604 to be significant at the p .01 level. It does, so it is.
Reporting in Text. t (4) � 9.49, p .01
MANN–WHITNEY U TEST
The Mann–Whitney U test is used under the same general conditions as anuncorrelated t-test but only when the assumptions of normal distributions oran interval scale cannot be met.
where
N1 � the number of participants in the smaller groupN2 � the number of participants in the larger groupR1 � the sum of the ranks for the smaller groupR2 � the sum of the ranks for the larger group
U � N1N2 �
or whichever is smaller
� R12N1(N1 � 1)
U � N1N2 � � R22N2(N2 � 1) }
�D � ��.4 � .632��25
��������(XD � XD)2
N�
t �
�����N � 1
�D
XD�
�����5 � 1
.6323
�
2.632
3� � 9.49
.3163
318 Appendix A
Example
Group 1 Group 2
N1 � 10
X1
13356899
1012
N2 � 10
X2
2478
101315161718
Rank
2589.5
13.51617181920
R2 � 128
Rank
13.53.5679.5
11.511.513.515
R1 � 82
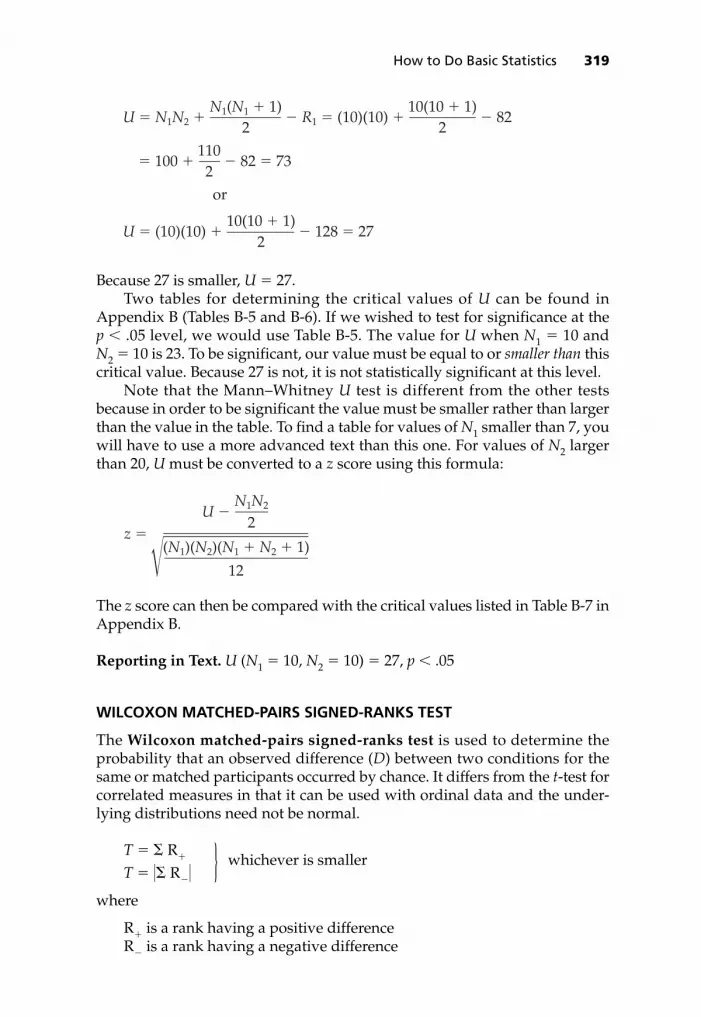
Because 27 is smaller, U � 27.Two tables for determining the critical values of U can be found in
Appendix B (Tables B-5 and B-6). If we wished to test for significance at thep .05 level, we would use Table B-5. The value for U when N1 � 10 andN2 � 10 is 23. To be significant, our value must be equal to or smaller than thiscritical value. Because 27 is not, it is not statistically significant at this level.
Note that the Mann–Whitney U test is different from the other testsbecause in order to be significant the value must be smaller rather than largerthan the value in the table. To find a table for values of N1 smaller than 7, youwill have to use a more advanced text than this one. For values of N2 largerthan 20, U must be converted to a z score using this formula:
The z score can then be compared with the critical values listed in Table B-7 inAppendix B.
Reporting in Text. U (N1 � 10, N2 � 10) � 27, p .05
WILCOXON MATCHED-PAIRS SIGNED-RANKS TEST
The Wilcoxon matched-pairs signed-ranks test is used to determine theprobability that an observed difference (D) between two conditions for thesame or matched participants occurred by chance. It differs from the t-test forcorrelated measures in that it can be used with ordinal data and the under-lying distributions need not be normal.
T � � R�
T � �� R�� } whichever is smaller
where
R� is a rank having a positive differenceR� is a rank having a negative difference
z �
����������(N1)(N2)(N1 � N2 � 1)
U � 2
N1N2
12
U � N1N2 �
or
� R1 � (10)(10) � � 822
N1(N1 � 1)2
10(10 � 1)
� 100 � � 82 � 732
110
U � (10)(10) � � 128 � 272
10(10 � 1)
How to Do Basic Statistics 319

320 Appendix A
Example
Pair
123456789
10
Condition 1
54473942514642544247
50323345383944463933
Condition 2 Difference (D)
4156
�3137
�283
14
Rank of Dignoring sign
3942.575162.58
Rank havinga positive D
394
75
62.58
� R� � 45.5
Rank havinga negative D
�2.5
�1
�� R�� � 3.5
The smaller of 45.5 and 3.5 is 3.5; thus:
T � �� R�� � 3.5
To test for statistical significance, look at Table B-8 in Appendix B. To reachsignificance, T must be equal to or smaller than the number listed. In theexample there are 10 pairs of scores, so n � 10, and assuming that we did notpredict the direction of the difference between conditions, a two-tailed test isappropriate. We see, then, that 3.5 is smaller than 5 but not 3, so p .02.
Reporting in Text. T (n � 10) � 3.50, p .02
ANALYSIS OF VARIANCE
Analysis of variance (ANOVA) can be used for interval or ratio data when theunderlying distributions are approximately normal. ANOVA tests are avail-able for either within-subject (repeated measures) or between-subjects (sepa-rate groups) designs and for designs with multiple independent variables. Inthis appendix, however, we limit our consideration to a between-subjectsdesign with one independent variable. In the following example the inde-pendent variable has three levels. However, the formulas given can also beused for designs having more than three groups.
Although the calculations for ANOVA appear to be complicated, therationale behind the test is really quite simple. Suppose that you conduct anexperiment in which you collect data from three groups. The experimentalquestion is whether the three samples come from the same population anddiffer only by chance variation or whether the samples come from differentpopulations and differ owing to the independent variable, as well as tochance variation. ANOVA allows you to partition the variance found in thedistribution containing all the scores you sampled. Part of the variance in thisdistribution is due to differences between groups, including variance due tothe independent variable. A second part is due to chance variation amongparticipants within groups.

The final number calculated when doing ANOVA is called an F value. It isa ratio of the variance between groups to the variance within groups. If thegroups sampled come from the same population and the independent vari-able has no effect, we would expect the ratio to be close to 1. That is, thebetween-group variance should be about the same size as the within-groupvariance. However, if the independent variable has an effect and the groupscome from different populations, we would expect the between-group vari-ance to be larger than the within-group variance. The F value would then begreater than 1. As the value of F gets larger, we would become increasinglyconfident that the differences among groups were due to the effects of theindependent variable rather than to chance variation.
In the following example, we first calculate a quantity called the total sumof squares (SSTOT) followed by a sum of squares between groups (SSbg) and withingroups (SSwg). We then divide SSbg and SSwg by their appropriate degrees offreedom to get the mean squares between groups (MSbg) and within groups(MSwg). MSbg is then divided by MSwg to find the value of F.
You should be able to follow the example, but if you get into trouble, thefollowing definitions might help:
T � the total sum of all scores for all groupsTj � the total sum of scores in group jN � the number of scores in all groupsnj � the number of scores in group j
j �1
k� means to sum for all groups from 1 to k
k � the number of groups
How to Do Basic Statistics 321
Example
Group 1 Group 3Group 2
X1
3543125231
T1 � 29n1 � 10
X12
92516914
25491
103
X2
9658776487
T2 � 67n2 � 10
X22
81362564494936166449
469
X3
108
11109
101112109
T3 � 100n3 � 10
X32
10064
12110081
10012114410081
1012
N � 10 � 10 � 10 � 30T � 29 � 67 � 100 � 196k � 3

We can now compare this number with the critical values for F listed inTable B-9 in Appendix B. With 2 df in the numerator and 27 df in the denom-inator, F must equal or exceed 3.38 to be significant at p .05 and equal orexceed 5.57 to be significant at p .01. Because 66.7 far exceeds these criticalvalues, the difference between the groups is highly significant. Note that thetest could reach statistical significance owing to a difference between any twogroups. To determine which means are statistically different from one another,further tests would have to be conducted. These tests are beyond the scopeof this book. They can be found in the recommended texts at the end ofChapter 12.
Reporting in Text. F (2, 27) � 66.70, p .05
KRUSKAL–WALLIS ONE-WAY ANOVA BY RANKS
If the assumptions of an interval or ratio scale or normal distributions cannotbe met, a Kruskal–Wallis one-way ANOVA can be used to test for differencesbetween two or more independent groups. Only an ordinal scale is necessary.
In the following example:
K � the number of groupsnj � the number of scores per groupN � the total number of scoresRj � the sum of ranks for group jt � the number of ties for each score
SSTOT � �X2 �
j�1
jk
� 1584 �
� (103 � 469 � 1012) �NT2
30(196)2
30(196)2
SSbg � �
SSwg � SSTOT � SSbg � 303 � 252 � 51dfbg � k � 1 � 3 � 1 � 2dfwg � N � k � 30 � 3 � 27
MSbg �
��nj
T2
NT2
10292
�10672
� �10
1002
� 1584 � 1281 � 30330
38416
� �10841
104489
�
�dfbg
SSbg
2252
� 126
F � �MSwg
MSbg
1.89126
� 66.7
MSwg � �dfwg
SSwg
2751
� 1.89
� 128110
10000
� 84.1 � 448.9 � 1000 � 1281 � 1533 � 1281 � 252
322 Appendix A

K � 3nj � 5N � 15
Rank all the scores to get the ranks for each group.
Now place the ranks from this table next to the individual scores for eachgroup in the previous table, and sum them to get R1, R2, and R3.
j�1
jk
N(N � 1)12
�H � � 3(N � 1)nj
R2
� 15(15 � 1)
125
(55)2
� � 3(15 � 1)� �5(18.5)2
�5
(46.5)2
� 15(16)
125
3025� � 3(16)� �5
342.25�
52162.25
�
� .05(1105.9) � 48 � 55.295 � 48 � 7.29524012
55529.5
� 48� �
Score
122344555567778
Rank
123456789
101112131415
1
2.5
4
5.5
8.5
11
13
15
Average for ties t
2
2
4
3
}
}
}}
Example
Group 1 Group 3
X1
84757
X3
65457
Rank
155.5
138.5
13R1 � 55.0
Rank
118.55.58.5
13R3 � 46.5
Group 2
X2
25231
Rank
2.58.52.541
R2 � 18.5
How to Do Basic Statistics 323

The correction for ties is to divide H by 1 ��(t3 � t)
.N3 � N
According to Table B-10 in Appendix B, for group sizes of 5, 5, and 5, theprobability of having an H as large as 7.51 is less than .049. Thus, the differ-ence between groups is statistically significant at the p .05 level. Becausethis value is smaller than the 7.98 required for the p .01 level, the differenceis not significant at that level.
If the groups contain more than five participants, H is distributed like thechi-square. To determine the critical value in this case, refer to Table B-3 withk – 1 degrees of freedom.
Reporting in Text. H (5, 5, 5) � 7.51, p .05
■ ConclusionThis appendix should allow you to compute some very basic statistical oper-ations. However, if you go much beyond a basic course in experimentation,you will need to do at least three additional things. First, you will need tolearn to use more complex tests for designs having multiple independentvariables and mixtures of within-subject and between-subjects variables.Second, you will need to learn to use packaged computer programs to savetime and effort. Third, and probably most important, you must go beyond acookbook approach to statistics. As a researcher you should understand whyyou do what you do.
An understanding of the concepts underlying statistical operations notonly allows you to choose the most powerful way to analyze your data butalso allows you to design research so that the data can be effectively analyzed.Statistical consultants tell horror stories about inexperienced researchers whodump volumes of data on their desks and ask, “How do I analyze this?” Insome cases the data defy analysis.
The point is that design and statistical analysis are integrally linked. If youplan to design your research, you should also understand the concepts under-lying the statistical operations that should be used to analyze the outcome.
1 � 153 � 15
(23 � 2) � (23 � 2) � (43 � 4) � (33 � 3)
1 � 3375 � 15
(8 � 2) � (8 � 2) � (64 � 4) � (27 � 3)
1 � � 1 � .029 � .9713360
96
H � � 7.51.9717.295
324 Appendix A

325
APPENDIX B
Statistical Tables
TABLE B-1Critical Values of rho (SpearmanRank-Order Correlation Coefficient)
N
56789
1012141618
2022242628
30
p = .0500
1.000.886.786.738.683
.648
.591
.544
.506
.475
.450
.428
.409
.392
.377
.364
p = .0100
—1.000
.929
.881
.833
.794
.777
.715
.665
.625
.591
.562
.537
.515
.496
.478SOURCE: Computed from Olds, E. G., Distribution of the sum of squares of rankdifferences for small numbers of individu-als, Annals of Mathematical Statistics, 1938, 9,133–148, and the 5% significance levels forsums of squares of rank differences and acorrection, Annals of Mathematical Statistics,1949, 20, 117–118. Table B-1 is taken fromElementary Statistics, Underwood et al.,Appleton-Century-Crofts.

326 Appendix B
TABLE B-2Critical Values of r (Pearson Product-Moment Correlation Coefficient)
.10
.988
.900
.805
.729
.669
.622
.582
.549
.521
.497
.476
.458
.441
.426
.412
.400
.389
.378
.369
.360
.323
.296
.275
.257
.243
.231
.211
.195
.183
.173
.164
.05
.997
.950
.878
.811
.754
.707
.666
.632
.602
.576
.553
.532
.514
.497
.482
.468
.456
.444
.433
.423
.381
.349
.325
.304
.288
.273
.250
.232
.217
.205
.195
.01
.9999
.990
.959
.917
.874
.834
.798
.765
.735
.708
.684
.661
.641
.623
.606
.590
.575
.561
.549
.537
.487
.449
.418
.393
.372
.354
.325
.303
.283
.267
.254
SOURCE: Adapted from Fisher, R. A., StatisticalMethods for Research Workers, 14th Edition.Copyright 1973, Hafner Press.
df
12345
6789
10
1112131415
1617181920
2530354045
5060708090
100
Levels of significance fortwo-tailed test

Statistical Tables 327
Text not available due to copyright restrictions

328 Appendix B
Text not available due to copyright restrictions

Statistical Tables 329
TABLE B-5Critical Values of the Mann–Whitney U Test at the p < .05 Level
7
13568
10121416182022242628303234
8
2468
1013151719222426293134363841
9
247
101215172023262831343739424548
10
358
111417202326293336394245485255
11
369
131619232630333740444751555862
12
47
11141822262933374145495357616569
13
48
12162024283337414550545963677276
14
59
13172226313640455055596467747883
15
51014192429343944495459647075808590
16
61115212631374247535964707581869298
17
611172228343945515763677581879399
105
18
7121824303642485561677480869399
106112
19
71319253238455258657278859299
106113119
20
813202734414855626976839098
105112119127
SOURCE: Adapted and abridged from Tables 1, 3, 5, and 7 of Auble, D., Extended tables for the Mann–Whitney statistics, Bulletin of the Institute of Educational Research at IndianaUniversity, 1953, 1(2).
N2
3456789
1011121314151617181920
N1

330 Appendix B
TABLE B-6Critical Values of the Mann–Whitney U Test at the p < .01 Level
7
—0134679
10121315161819212224
8
—124679
1113151718202224262830
9
013579
111316182022242729313336
10
02469
11131618212426293134373942
11
0257
1013161821242730333639424548
12
1369
1215182124273134374144475154
13
137
101317202427313438424549535660
14
147
111518222630343842465054586367
15
258
121620242933374246515560646973
16
259
131822273136414550556065707479
17
26
10151924293439444954606570758186
18
26
11162126313742475358647075818792
19
37
12172228333945515663697481879399
20
38
131824303642485460677379869299
105
SOURCE: Adapted and abridged from Tables 1, 3, 5, and 7 of Auble, D., Extended tables for the Mann–Whitney statistics, Bulletin of the Institute of Educational Research at IndianaUniversity, 1953, 1(2).
N2
3456789
1011121314151617181920
N1

Statistical Tables 331
Text not available due to copyright restrictions

332 Appendix B
Level of significance for aone-tailed test
.05 .025 .01 .005
Level of significance for atwo-tailed test
Level of significance for aone-tailed test
.05 .025 .01 .005
Level of significance for atwo-tailed test
TABLE B-8Critical Values of the Wilcoxon T
n
56789
101112131415161718192021222324252627
.10
02358
101317212530354147536067758391
100110119
.05
—02358
10131721252934404652586573818998
107
.02
——013579
121519232732374349556269768492
.01
———013579
1215192327323742485461687583
n
2829303132333435363738394041424344454647484950
.10
130140151163175187200213227241256271286302319336353371389407426446466
.05
116126137147159170182195208221235249264279294310327343361378396415434
.02
101110120130140151162173185198211224238252266281296312328345362379397
.01
91100109118128138148159171182194207220233247261276291307322339355373
NOTE: The T is the smaller of the sum of ranks having differences that are all of the samesign. For a given number of differences n, the T is significant at a particular level if it isequal to or less than the value shown.SOURCE: From Roger E. Kirk, Elementary Statistics, 2nd Edition. Pacific Grove, CA:Brooks/Cole, 1984.

Statistical Tables 333
TABLE B-9Critical Values of F
1
161.454032.10
18.5198.49
10.1334.12
7.7121.20
6.6116.26
5.9913.74
5.5912.25
5.3211.26
5.1210.56
4.9610.04
4.849.65
4.759.33
4.608.86
4.498.53
4.418.28
4.358.10
4.247.77
4.177.56
2
199.504999.03
19.0099.01
9.5530.81
6.9418.00
5.7913.27
5.1410.92
4.749.55
4.468.65
4.268.02
4.107.56
3.987.20
3.886.93
3.746.51
3.636.23
3.556.01
3.495.85
3.385.57
3.325.39
3
215.725403.49
19.1699.17
9.2829.46
6.5916.69
5.4112.06
4.769.78
4.358.45
4.077.59
3.866.99
3.716.55
3.596.22
3.495.93
3.345.56
3.245.29
3.165.09
3.104.94
2.994.68
2.924.51
4
224.575625.14
19.2599.25
9.1228.71
6.3915.98
5.1911.39
4.539.15
4.127.85
3.847.01
3.636.42
3.485.99
3.365.67
3.265.41
3.115.03
3.014.77
2.934.58
2.874.43
2.764.18
2.694.02
5
230.175764.08
19.3099.30
9.0128.24
6.2615.52
5.0510.97
4.398.75
3.977.46
3.696.63
3.486.06
3.335.64
3.205.32
3.115.06
2.964.69
2.854.44
2.774.25
2.714.10
2.603.86
2.533.70
6
233.975859.39
19.3399.33
8.9427.91
6.1615.21
4.9510.67
4.288.47
3.877.19
3.586.37
3.375.80
3.225.39
3.095.07
3.004.82
2.854.46
2.744.20
2.664.01
2.603.87
2.493.63
2.423.47
8
238.895981.34
19.3799.36
8.8427.49
6.0414.80
4.8210.27
4.158.10
3.736.84
3.446.03
3.235.47
3.075.06
2.954.74
2.854.50
2.704.14
2.593.89
2.513.71
2.453.56
2.343.32
2.273.17
12
243.916105.83
19.4199.42
8.7427.05
5.9114.37
4.689.89
4.007.72
3.576.47
3.285.67
3.075.11
2.914.71
2.794.40
2.694.16
2.533.80
2.423.55
2.343.37
2.283.23
2.162.99
2.092.84
24
249.046234.16
19.4599.46
8.6426.60
5.7713.93
4.539.47
3.847.31
3.416.07
3.125.28
2.904.73
2.744.33
2.614.02
2.503.78
2.353.43
2.243.18
2.153.01
2.082.86
1.962.62
1.892.47
∞
254.326366.48
19.5099.50
8.5326.12
5.6313.46
4.369.02
3.676.88
3.235.65
2.934.86
2.714.31
2.543.91
2.403.60
2.303.36
2.133.00
2.012.75
1.922.57
1.842.42
1.712.17
1.622.01
1
2
3
4
5
6
7
8
9
10
11
12
14
16
18
20
25
30
Degrees of freedom for numerator
Deg
rees
of f
reed
om fo
r de
nom
inat
or
(continued)

334 Appendix B
TABLE B-9 (continued)
1
4.087.31
4.037.17
4.007.08
3.987.01
3.966.98
3.956.92
3.946.90
3.896.97
3.846.64
2
3.235.18
3.185.06
3.154.98
3.134.92
3.114.88
3.104.85
3.094.82
3.044.71
2.994.60
3
2.844.31
2.794.20
2.764.13
2.744.07
2.724.04
2.714.01
2.703.98
2.653.88
2.603.78
4
2.613.83
2.563.72
2.523.65
2.503.60
2.493.56
2.473.53
2.463.51
2.423.41
2.373.32
5
2.453.51
2.403.41
2.373.34
2.353.29
2.333.26
2.323.23
2.303.21
2.263.11
2.213.02
6
2.343.29
2.293.19
2.253.12
2.233.07
2.213.04
2.203.01
2.192.99
2.142.89
2.092.80
8
2.182.99
2.132.89
2.102.82
2.072.78
2.062.74
2.042.72
2.032.69
1.982.60
1.942.51
12
2.002.66
1.952.56
1.922.50
1.892.45
1.882.42
1.862.39
1.852.37
1.802.28
1.752.18
24
1.792.29
1.742.18
1.702.12
1.672.07
1.652.03
1.642.00
1.631.98
1.571.88
1.521.79
∞
1.521.82
1.441.68
1.391.60
1.351.53
1.311.47
1.281.43
1.261.39
1.141.21
40
50
60
70
80
90
100
200
∞
Degrees of freedom for numerator
Deg
rees
of f
reed
om fo
r de
nom
inat
or
NOTE: The top number in each cell is for testing at the .05 level; the bottom number is for testingat the .01 level.SOURCE: Adapted from Table F of Garrett, H. E., Statistics in Psychology and Education, 5th Edition. Copyright 1958, David McKay Co., Inc.

Statistical Tables 335
TABLE B-10Critical Values for H (Kruskal–Wallis One-Way ANOVA by Ranks)
H
2.7000
3.6000
4.57143.7143
3.2000
4.28573.8571
5.35724.71434.50004.4643
5.14294.57144.0000
6.25005.36115.13894.55564.2500
7.20006.48895.68895.60005.06674.6222
3.5714
4.82144.50004.0179
6.00005.33335.12504.45834.1667
5.83335.20835.00004.05563.8889
p
.500
.200
.067
.200
.300
.100
.133
.029
.048
.067
.105
.043
.100
.129
.011
.032
.061
.100
.121
.004
.011
.029
.050
.086
.100
.200
.057
.076
.114
.014
.033
.052
.100
.105
.021
.050
.057
.093
.129
n1
2
2
2
3
3
3
3
3
3
4
4
4
4
n2
1
2
2
1
2
2
3
3
3
1
2
2
3
n3
1
1
2
1
1
2
1
2
3
1
1
2
1
H
6.44446.30005.44445.40004.51114.4444
6.74556.70915.79095.72734.70914.7000
6.66676.16674.96674.86674.16674.0667
7.03646.87275.45455.23644.55454.4455
7.14397.13645.59855.57584.54554.4773
7.65387.53855.69235.65384.65394.5001
3.8571
5.25005.00004.45004.20004.0500
p
.008
.011
.046
.051
.098
.102
.010
.013
.046
.050
.092
.101
.010
.022
.048
.054
.082
.102
.006
.011
.046
.052
.098
.103
.010
.011
.049
.051
.099
.102
.008
.011
.049
.054
.097
.104
.143
.036
.048
.071
.095
.119
n1
4
4
4
4
4
4
5
5
n2
3
3
4
4
4
4
1
2
n3
2
3
1
2
3
4
1
1
Sample sizes Sample sizes
(continued)

TABLE B-10 (continued)
H
6.53336.13335.16005.04004.37334.2933
6.40004.96004.87114.01783.8400
6.90916.82185.25095.10554.65094.4945
7.07886.98185.64855.51524.53334.4121
6.95456.84004.98554.86003.98733.9600
7.20457.11825.27275.26824.54094.5182
7.44497.39495.65645.63084.54874.5231
p
.008
.013
.034
.056
.090
.122
.012
.048
.052
.095
.123
.009
.010
.049
.052
.091
.101
.009
.011
.049
.051
.097
.109
.008
.011
.044
.056
.098
.102
.009
.010
.049
.050
.098
.101
.010
.011
.049
.050
.099
.103
n1
5
5
5
5
5
5
5
n2
2
3
3
3
4
4
4
n3
2
1
2
3
1
2
3
H
7.76047.74405.65715.61764.61874.5527
7.30916.83645.12734.90914.10914.0364
7.33857.26925.33855.24624.62314.5077
7.57807.54295.70555.62644.54514.5363
7.82297.79145.66575.64294.52294.5200
8.00007.98005.78005.66004.56004.5000
p
.009
.011
.049
.050
.100
.102
.009
.011
.046
.053
.086
.105
.010
.010
.047
.051
.097
.100
.010
.010
.046
.051
.100
.102
.010
.010
.049
.050
.099
.101
.009
.010
.049
.051
.100
.102
n1
5
5
5
5
5
5
n2
4
5
5
5
5
5
n3
4
1
2
3
4
5
Sample sizes Sample sizes
SOURCE: Adapted and abridged from Kruskal, W. H., and Wallis, W. A., Use of ranks in one-criterion variance analysis, Journal of American Statistical Association, 1952, 47, 614–617, withthe kind permission of the authors and the publisher. (The corrections to this table given bythe authors in Errata, Journal of the American Statistical Association, 1953, 48, 910, have beenincorporated.)
336 Appendix B

337
Col. (1) (2) (3) (4) (5) (6) (7) (8) (9) (10) (11) (12) (13) (14)
Line
1 10480 15011 01536 02011 81647 91646 69179 14194 62590 36207 20969 99570 91291 90700
2 22368 46573 25595 85393 30995 89198 27982 53402 93965 34095 52666 19174 39615 99505
3 24130 48360 22527 97265 76393 64809 15179 24830 49340 32081 30680 19655 63348 58629
4 42167 93093 06243 61680 07856 16376 39440 53537 71341 57004 00849 74917 97758 16379
5 37570 39975 81837 16656 06121 91782 60468 81305 49684 60672 14110 06927 01263 54613
6 77921 06907 11008 42751 27756 53498 18602 70659 90655 15053 21916 81825 44394 42880
7 99562 72905 56420 69994 98872 31016 71194 18738 44013 48840 63213 21069 10634 12952
8 96301 91977 05463 07972 18876 20922 94595 56869 69014 60045 18425 84903 42508 32307
9 89579 14342 63661 10281 17453 18103 57740 84378 25331 12566 58678 44947 05585 56941
10 85475 36857 43342 53988 53060 59533 38867 62300 08158 17983 16439 11458 18593 64952
11 28918 69578 88231 33276 70997 79936 56865 05859 90106 31595 01547 85590 91610 78188
12 63553 40961 48235 03427 49626 69445 18663 72695 52180 20847 12234 90511 33703 90322
13 09429 93969 52636 92737 88974 33488 36320 17617 30015 08272 84115 27156 30613 74952
14 10365 61129 87529 85689 48237 52267 67689 93394 01511 26358 85104 20285 29975 89868
15 07119 97336 71048 08178 77233 13916 47564 81056 97735 85977 29372 74461 28551 90707
16 51085 12765 51821 51259 77452 16308 60756 92144 49442 53900 70960 63990 75601 40719
17 02368 21382 52404 60268 89368 19885 55322 44819 01188 65255 64835 44919 05944 55157
18 01011 54092 33362 94904 31273 04146 18594 29852 71585 85030 51132 01915 92747 64951
19 52162 53916 46369 58586 23216 14513 83149 98736 23495 64350 94738 17752 35156 35749
20 07056 97628 33787 09998 42698 06691 76988 13602 51851 46104 88916 19509 25625 58104
21 48663 91245 85828 14346 09172 30168 90229 04734 59193 22178 30421 61666 99904 32812
22 54164 58492 22421 74103 47070 25306 76468 26384 58151 06646 21524 15227 96909 44592
23 32639 32363 05597 24200 13363 38005 94342 28728 35806 06912 17012 64161 18296 22851
24 29334 27001 87637 87308 58731 00256 45834 15398 46557 41135 10367 07684 36188 18510
25 02488 33062 28834 07351 19731 92420 60952 61280 50001 67658 32586 86679 50720 94953
26 81525 72295 04839 96423 24878 82651 66566 14778 76797 14780 13300 87074 79666 95725
27 29676 20591 68086 26432 46901 20849 89768 81536 86645 12659 92259 57102 80428 25280
28 00742 57392 39064 66432 84673 40027 32832 61362 98947 96067 64760 64584 96096 98253
29 05366 04213 25669 26422 44407 44048 37937 63904 45766 66134 75470 66520 34693 90449
30 91921 26418 64117 94305 26766 25940 39972 22209 71500 64568 91402 42416 07844 69618
31 00582 04711 87917 77341 42206 35126 74087 99547 81817 42607 43808 76655 62028 76630
32 00725 69884 62797 56170 86324 88072 76222 36086 84637 93161 76038 65855 77919 88006
33 69011 65797 95876 55293 18988 27354 26575 08625 40801 59920 29841 80150 12777 48501
34 25976 57948 29888 88604 67917 48708 18912 82271 65424 69774 33611 54262 85963 03547
35 09763 83473 73577 12908 30883 18317 28290 35797 05998 41688 34952 37888 38917 88050
(continued)
APPENDIX C
Table of Random Numbers

36 91567 42595 27958 30134 04024 86385 29880 99730 55536 84855 29080 09250 79656 73211
37 17955 56349 90999 49127 20044 59931 06115 20542 18059 02008 73708 83317 36103 42791
38 46503 18584 18845 49618 02304 51038 20655 58727 28168 15475 56942 53389 20562 87338
39 92157 89634 94824 78171 84610 82834 09922 25417 44137 48413 25555 21246 35509 20468
40 14577 62765 35605 81263 39667 47358 56873 56307 61607 49518 89656 20103 77490 18062
41 98427 07523 33362 64270 01638 92477 66969 98420 04880 45585 46565 04102 46880 45709
42 34914 63976 88720 82765 34476 17032 87589 40836 32427 70002 70663 88863 77775 69348
43 70060 28277 39475 46473 23219 53416 94970 25832 69975 94884 19661 72828 00102 66794
44 53976 54914 06990 67245 68350 82948 11398 42878 80287 88267 47363 46634 06541 97809
45 76072 29515 40980 07391 58745 25774 22987 80059 39911 96189 41151 14222 60697 59583
46 90725 52210 83974 29992 65831 38857 50490 83765 55657 14361 31720 57375 56228 41546
47 64364 67412 33339 31926 14883 24413 59744 92351 97473 89286 35931 04110 23726 51900
48 08962 00358 31662 25388 61642 34072 81249 35648 56891 69352 48373 45578 78547 81788
49 95012 68379 93526 70765 10593 04542 76463 54328 02349 17247 28865 14777 62730 92277
50 15664 10493 20492 38391 91132 21999 59516 81652 27195 48223 46751 22923 32261 85653
SOURCE: Table of 105,000 Random Decimal Digits, Statement no. 4914, File no. 261-A-1, InterstateCommerce Commission, Washington, DC, May 1949.
Table of Random Numbers (continued)
338 Appendix C

339
ABBA counterbalancing A techniquefor minimizing the effect of a linearconfounding variable in an experi-ment having one independent variable with two levels, A and B.Level A is presented first, followedby two presentations of level B anda final presentation of A.
Abscissa The horizontal axis (see x-axis) of a graph, upon which thelevels of an independent variableare often represented.
Abstract A short (960 characters atmost) summary of a research report.
Alternative-form reliability A meansof determining a test’s reliabilityby giving a second test, havingitems similar to the first, to thesame group and calculating a correlation coefficient on the twosets of scores.
Analogical theory A theory that explains how psychological rela-tionships work by drawing ananalogy to a physical model.
Analysis of variance A parametrictest of statistical inference used foranalyzing data from a factorial ex-periment or a multilevel single-variable experiment.
Applied research Research having asits primary purpose the solution ofa specific problem.
Archival research A type of study inwhich existing public or privaterecords are examined, organized,and interpreted.
Asymptote The imaginary line that anegatively accelerated function approaches as it flattens out.
Bar graph A means of illustrating thefrequency of qualitative data usingspaced vertical bars. Qualitativeclass intervals are plotted on theabscissa, with frequency repre-sented on the ordinate and the fre-quency of each class representedby the height of the bar over thatclass interval.
Baseline experiment A type of single-variable experiment that canshow effects using data from a sin-gle participant. A steady state baseline rate of responding is established, following which an experimental manipulation ismade and a transition state estab-lished. Finally, the manipulation isremoved and the baseline recovered.
Basic research Study aimed at under-standing the basic mechanisms ofscience. Although such researchcan lead to the solution of applied problems, the goal is simply to enhance the body ofknowledge.
Between-subjects design An experi-mental research strategy in whicheach research participant providesdata for only one level of the inde-pendent variable (or variables).
Bimodal distribution A frequencydistribution having two humps,each of which has a maximumvalue.
Blind experiment An experiment inwhich participants are unaware ofthe levels of the independent variable to which they are beingexposed.
GLOSSARY

340 Glossary
Carry-over effect An effect in awithin-subject design, in which achange in behavior is influencedby prior exposure to a differentlevel of the independent variable.
Case history A nonexperimentalmeans of collecting data that con-tains detailed accounts of the be-haviors of a single person or event.
Ceiling effect The truncation of dataat the top of a distribution due to alimit on the highest score possible.
Chi-square test A nonparametric testof statistical inference that is usedto determine whether the observedfrequency of occurrence of scores isstatistically different from the expected frequency.
Choice reaction time The time takento give one of several responses toone of several stimuli.
Closed-ended question A surveyquestion that requires respondentsto answer within an imposedstructure.
Coefficient of determination Astatistic computed by squaring thecorrelation coefficient that specifiesthe proportion of variation explained.
Complete counterbalancing An experimental design in which theorder of the levels of the indepen-dent variable is such that acrossparticipants every level of the inde-pendent variable occurs an equalnumber of times and also followsevery other level an equal numberof times.
Composite dependent variable Ameasure of behavior that combinesthe results of several dependentvariables into one measure of over-all performance.
Concurrent validity A means of establishing a test’s validity by de-termining whether it successfullypredicts some specific criterionwhen the test and the criterionmeasurements are taken at thesame time.
Conference paper An oral presenta-tion of a research project to a groupof researchers who have met toshare research results.
Confounding variable A variablewhose levels are correlated withthe levels of the independent vari-able such that any change in be-havior could be due either to thelevels of the independent variableor those of the confounding variable.
Content validity A means of estab-lishing a test’s validity by carefullyanalyzing the subject matter pur-portedly covered in the test andthen constructing the test so that it contains a representative set of items.
Context effect The influence of par-ticipants’ exposure to the levels ofvariables—the ones that they bringwith them to an experiment andthose that they develop during theexperiment—on their behavior.
Contingency coefficient A measureof the strength of association be-tween two sets of nominal-scalenumbers.
Control group The participants in abetween-subjects design who aretreated in a way comparable tothose in the experimental group (or groups) except for not being exposed to the experimental manipulation.
Control variable A circumstance ofthe experiment that the experi-menter sets at a particular leveland prevents from varying.
Converging-series design Asequence of experiments con-ducted to progressively eliminatecompeting theoretical hypotheses.
Correlation A relationship betweentwo variables that is of a particulardirection and a particular strength.
Correlational observation A researchdesign in which the researcher attempts to determine whether two or more variables are related

Glossary 341
without attempting to manipulatethe variables or draw causal conclusions.
Correlation coefficient A number be-tween +1.0 and –1.0 that expressesthe strength and direction of a rela-tionship between two variables.
Counterbalancing A way of orderingthe presentation of levels of the in-dependent variable to minimize oreliminate the effects of sequentialconfounding variables.
Critical incident In applied research,a single instance that is consideredto be diagnostic of a possible rela-tionship between independent anddependent variables.
Crossover interaction An interactionfrom the results of a factorial ex-periment in which the graphedlines representing the independentvariables cross each other.
Curvilinear function A function thatdeparts from a straight line andcontains components that can be fitby various mathematical formulasfor curved lines.
Deception Concealing or camouflag-ing the real purpose of an experi-ment from the participants.
Deduction A means of reaching a log-ical conclusion from a set ofpremises; this conclusion containsno more information than thepremises taken collectively (for example, A is a B; B is a C;therefore, A is a C).
Demand characteristics Attributes ofan experiment that lead a partici-pant to behave in a certain way,usually in support of the experi-mental hypothesis, independent ofthe levels of the independent variable.
Dependent variable The behaviorthe experimenter chooses to measure; this behavior may be dependent upon the levels of theindependent variable.
Descriptive statistics Ways of reduc-ing data sets so that only certain
properties are described (for exam-ple, central tendency or dispersionof a distribution).
Descriptive theory A theory that sim-ply attaches names to events with-out necessarily explaining why orhow the events have occurred.
Directional hypothesis A tentativeprediction that the levels of an independent variable will cause adependent variable to change in aparticular direction.
Directionality problem Not knowingwhich of the variables was thecause and which the effect from acorrelational observation.
Double-blind experiment An experi-ment in which neither the partici-pant nor the experimenter knowsthe particular level of the indepen-dent variable being presented.
Dual-task methodology A way of indirectly inferring the processingrequirements of a task by measur-ing performance on a second taskperformed simultaneously.
Electronic publishing The publica-tion of information in electronicform, such as on the Internet,rather than in paper form.
Ethnography A qualitative researchdesign that describes a culture indetail.
Experimental group Those participants in a between-subjectsexperiment exposed to the treat-ment condition.
Experimental method A researchtechnique in which an independentvariable is manipulated and a dependent variable is measured.The experimental method allows acausal inference to be made: Anychange in the dependent variablewas caused by the manipulation ofthe independent variable.
External validity The generalizabilityof an experimental result to a par-ticular real-world population, situ-ation, or setting different from thatrepresented in the experiment.

342 Glossary
Fabrication of results A type of sci-entific fraud in which false data areconstructed.
Face validity The weakest form of es-tablishing a test’s validity; the testis simply examined to determinewhether, on the surface, it looks asif the test is measuring what it issupposed to measure.
Factorial design An experimental de-sign containing more than one in-dependent variable in which everylevel of each independent variableis combined with every other level.
Factors The independent variableswhose levels are combined in a factorial experiment.
Floor effect The truncation of data atthe bottom of a distribution due toa limit on the lowest score possible.
Frequency distribution A plot of thenumber of scores occurring foreach score value or for two or morelimited ranges of score values.
Function A line or curve illustratingthe relationship of one variable toanother.
Functional experiment An experi-ment having three or more levelsof an independent variable suchthat a functional relationship be-tween the independent and depen-dent variables can be determined.
Group administration of surveysThe collection of survey datathrough simultaneous administra-tion of the survey to a group of respondents.
Hawthorne effect A change in behav-ior due simply to the experimenter’spaying attention to the participantsrather than to the effects of the independent variable.
Histogram A means of illustrating thefrequency of quantitative data using contiguous vertical bars.Quantitative class intervals areplotted on the abscissa, with fre-quency represented on the ordinateand the frequency of each class
represented by the height of thebar over that class interval.
History as a threat to internal validity A change in the depen-dent variable due to the occurrenceof an event between the testing oflevels of the independent variable.
Hypothesis A statement about a pre-dicted relationship between two ormore variables.
Independent variable A circum-stance having two or more levelsmanipulated by the experimenterso that effects on the dependentvariable can be observed.
Induction A logical process in whichthe conclusion contains more infor-mation than the observations onwhich it is based.
Inferential statistic A statistical testthat allows one to infer the likeli-hood that an observed result is dueto chance alone.
Informed consent A procedure ensur-ing that research participants havebeen given all important informa-tion about the study and have formally agreed to participate.
Institutional review board A com-mittee at a research-oriented insti-tution constituted to ensure that allresearch is conducted in an ethicalmanner.
Interaction in a factorial design Theeffect of the nonadditive combina-tion of multiple independent vari-ables on a dependent variable.
Interactions with selection A threatto internal validity caused by a validity threat such as maturationor history interacting with thethreat of selection.
Internal validity The certainty of the assertion that it was the manipulation of the independentvariable that caused the change inthe dependent variable.
Internet survey A survey adminis-tered electronically over the Internet.

Glossary 343
Interrupted time-series design Aquasi-experimental design in whicha single group is observed multipletimes before an experimental ma-nipulation and then multiple timesafter the manipulation.
Interval scale Measurements in whichthe intervals between numbers area constant unit; 1 = n – (n – 1) (forexample, Fahrenheit temperature).
Interview The structured or unstruc-tured collection of survey data bymeans of direct face-to-face contact of an interviewer with a respondent.
Kruskal–Wallis One-way ANOVA byranks An inferential statisticaltest appropriate for ordinal datathat tests for differences betweentwo or more independent groups.
Latin Square A type of counterbal-ancing that ensures that each levelof the independent variable appears in every ordered positionequally often.
Level of significance The statisticalprobability required by scientists tosay it is unlikely that an observedcharacteristic of a sample is due tochance rather than being true ofthe underlying population. Thisprobability is usually p � .05 or p � .01.
Likert scale A rating scale that allowsa researcher to investigate respon-dents’ attitudes about topics by in-dicating their level of agreementwith a statement.
Linear function A function that formsa straight line.
Line graph A means of illustratingthe relationship of two variablesusing a continuous line or curve.
Literature search The process of ex-amining the formal scientific bodyof knowledge for written materialrelevant to a particular area of research.
Mail survey A survey administeredby sending it through the mail.
Main effect In a factorial design, therelationship between the levels ofone independent variable and a dependent variable averagedacross the levels of other indepen-dent variables.
Mann–Whitney U test A nonpara-metric test of statistical inferenceused for testing the difference between two groups using rank-order information.
Matched-groups design A method ofassigning participants in between-subjects designs in which sets ofparticipants are first formed bymatching them on a variable that ishighly correlated to the dependentvariable; participants from each setare then randomly assigned togroups.
Maturation as a threat to internal validity A change in the depen-dent variable due to participants’aging or becoming more experi-enced between the administrationof levels of the independent variable.
Mean A measure of central tendencyof a distribution that is calculatedby adding all the scores and thendividing the total by the number of scores.
Mean treatment effect size A statis-tic for representing the size of theeffect of an experimental manipu-lation on behavior; it is calculatedby subtracting the mean of the control group from the mean of thetreatment group and dividing bythe standard deviation of the control group.
Median A measure of central tendency of a distribution that is calculated by ordering all scores and selecting the middlescore.
Meta-analysis A technique for esti-mating the cumulative size of anexperimental effect across multipleexperiments.

344 Glossary
Mixed factorial design A factorialdesign having at least one within-subject and one between-subjects independent variable.
Mode A measure of central tendencyof a distribution that is the mostfrequent score.
Monotonic function A function thatincreases throughout its range ordecreases throughout its range.
Mortality as a threat to internal validity A difference in the de-pendent variable due to differen-tial participant attrition fromgroups exposed to different levelsof the independent variable.
Multiple-alternative question Aquestion written such that the possible response alternatives arerestricted.
Naturalistic observation A type ofresearch in which behavior is studied within its natural setting.
Negative function A relationship inwhich increasing values of onevariable are associated with decreasing values of a second variable.
Negatively accelerated function Afunction in which the rate of increase or decrease of one variabledecreases as a second variable in-creases. Such functions are charac-terized by steep initial slopes thatbecome progressively flatter.
Nominal scale A measurement scalewithout quantitative properties inwhich numbers are used as names(for example, a runner with thenumber 342 pinned to her shirt).
Nondifferential transfer (See Symmet-rical transfer.) In an experiment inwhich the two levels of the inde-pendent variable are A and B, theeffect of having B follow A on behavior is the same as having Afollow B.
Nondirectional hypothesis A tenta-tive prediction that the levels of anindependent variable will cause achange in a dependent variable,
but not predicting the direction ofthat change.
Nonequivalent control group designA quasi-experimental design thatuses a control group constituted ina manner different from that of theexperimental group.
Nonexperimental design A researchdesign not having protection fromthe threats to internal validity provided by experimental or quasi-experimental designs. For this reason, the results of such researchare impossible to defend.
Nonexperiment control group Agroup of participants used to as-sess the demand characteristics ofan experiment. Each participant isnot actually exposed to the levelsof the independent variable but istold of the experimental conditionsand asked how he or she would respond.
Nonmonotonic function A functionthat changes from negative to positive slope or positive to nega-tive slope in at least one place.
Nonparametric test A test of statisti-cal inference that does not requireany assumptions about the under-lying population distributions,such as that they are normally distributed.
Nonresponse bias The distortion ofsurvey results due to the differen-tial rate of responding by varioussubgroups.
Normal distribution A frequency dis-tribution, defined by a particularmathematical function that is bellshaped, is unimodal, is symmetri-cal, and has the same mean, median, and mode.
Null hypothesis A statement requiredby null hypothesis statistical testing indicating that there is noeffect in the population due to thelevels of the independent vari-able(s) so that any differencesfound in the samples are due tochance.

Glossary 345
One-group posttest-only design Anonexperimental design in which a single group is exposed to onlyone level of an independent variable.
One-group pretest–posttest designA nonexperimental design inwhich a single group is tested, exposed to only one level of an independent variable, and thenretested.
Open-ended question A surveyquestion that allows respondentsto freely structure their answers.
Operational definition The defini-tion of a concept by specifying theoperations required to manipulateor measure the concept.
Order effect In a within-subject de-sign, the dependence of the behav-ior measured on the presentationorder of the levels of the indepen-dent variable.
Ordinal scale A measurement scale in which the order of the numbersis meaningful but intervals between or ratios of the numbersare not (for example, 9 is greaterthan 8).
Ordinate The vertical axis (see y-axis)of a graph, upon which the levelsof a dependent variable are usuallyrepresented.
Page header The first several wordsof the manuscript title placed inthe upper right of each manuscriptpage.
Parametric test A test of statistical in-ference in which assumptions aremade about the underlying popu-lation distributions, usually thatthey are normally distributed.
Partial counterbalancing A way ofordering the presentation of levelsof the independent variable tominimize some of the effects of sequential confounding variables.
Participants The humans whose behavior the researcher is investigating (formerly called subjects).
Pearson product-moment correlationcoefficient A statistic used tomeasure the strength of associationbetween two interval or ratio scalevariables.
Percent savings A composite depen-dent variable in which the numberof trials to relearn a task is sub-tracted from the number of trialsrequired to originally learn thetask, divided by the number of tri-als needed to originally learn, andmultiplied by 100 to determine thepercentage of trials saved by hav-ing learned the task previously.
Pilot experiment A small-scale experiment that might not satisfyall the requirements of experimen-tation; it is conducted for the purpose of pretesting the levelsand procedures to be used in the final experiment.
Placebo In drug research, a nonactivesubstance administered in thesame manner as the active drug isadministered; sometimes theplacebo can cause a change in behavior even though it is physio-logically nonactive.
Plagiarism The presentation of thewords or ideas of another personwithout proper attribution.
Positive function A relationship inwhich increasing values of onevariable are associated with increasing values of a second variable.
Positively accelerated function Afunction in which the rate of in-crease or decrease of one variableincreases as a second variable in-creases. Such functions are charac-terized by shallow initial slopesthat become progressively steeper.
Poster presentation The presentationof a research project by posting aseries of panels representing the research.
Posttest-only design with nonequiva-lent groups A nonexperimentaldesign in which one group is

346 Glossary
exposed to one level of an indepen-dent variable and a second groupchosen using a different selectionmechanism is exposed to a secondlevel.
Power (statistical) The probability ofrejecting the null hypothesis whenit is false.
Predictive validity A means of establishing a test’s validity by de-termining whether it successfullypredicts some specific criterion.
Proxy pretest A test whose results arecorrelated with the posttest resultsand used in quasi-experimental de-signs having nonequivalent groupsfor the purpose of demonstratingpartial equivalence of the groups.
Proximate questions Questions inscience that ask how a behaviorworks rather than why it works.
Psychohistory Psychobiographies,usually of well-known individuals,that attempt to explain behaviorpatterns by examining criticalevents in their lives.
PsycARTICLES A subscription servicefrom the American PsychologicalAssociation (APA) that allows fullarticles published in APA journalsto be accessed.
PsycINFO A subscription service offered by the American Psycho-logical Association that allows abstracts from psychological research to be searched.
Pure research (See Basic research.)Research aimed at understandingthe basic mechanisms of science.Although such research can lead tothe solution of applied problems,the goal is simply to enhance thebody of knowledge.
Qualitative designs Research designsthat use descriptive data such aswritten descriptions of people, in-cluding opinions and attitudes,and of events and environments.
Quantitative designs Research designs in which events can bequantified so that the final data
are numerical (for example, an experiment).
Quantitative theory A theory thatstates relationships in mathemati-cal terms.
Quasi-experimental designsResearch designs that do not sat-isfy the participant randomizationrequirements of experimentationbut that allow many of the threatsto internal validity to be assessed.
Questionnaire A written survey administered individually or ingroups.
Random assignment The placementof participants selected from a pop-ulation into experimental groupsusing a random process.
Randomization A method of selec-tion that operates by chance suchthat every item has an equalchance of being selected.
Randomization within blocks Amethod of selection in which conditions are randomly assignedto trials within the constraint thateach condition occurs an equalnumber of times within each block of trials.
Randomization within constraints Amethod of selection in which itemsare randomly chosen within thebounds of some selection rule orrules (for example, conditions arerandomly chosen within the con-straint that they be represented anequal number of times).
Random sample A subgroup of apopulation selected by some random process.
Random selection The use of a ran-dom process to choose a sample ofitems or people from a population.
Random variable A circumstance in an experiment whose level is determined by chance rather than being controlled by the experimenter.
Range The difference between thesmallest value of a set of numbersand the largest value.

Glossary 347
Range effect In within-subject designs in which the stimuli or responses can be put into a consis-tent order, the tendency for thebest performance to occur in themiddle positions due to high transfer of learning.
Rating scale A response techniquethat allows a respondent to give a graded response indicating the individual’s rating (for example,from “strongly agree” to “stronglydisagree”).
Ratio scale A measurement scale inwhich the ratios of the numbers aremeaningful (for example, 4 cm istwice as long as 2 cm).
Reliability The degree to which ameasurement can be successfullyrepeated.
Repeated measures design (SeeWithin-subject design.) An experi-mental design in which the samegroup of participants is exposed toall levels of the independent variable (or variables).
Response-surface methodology Atechnique used to estimate the effects of a combination of manyindependent variables withouthaving to conduct a complete fac-torial experiment combining alllevels of all variables.
Reversibility In a baseline experimentthe recovery of the original steadystate response rate following removal of the experimental manipulation.
Scatterplot A means of graphing datapoints in which the position ofeach point is determined by itsvalue corresponding to the vari-ables on each axis.
Secondary source A research publi-cation cited in a manuscript thatwas not read, but the informationwas derived from a primary sourcethat was read.
Selection as a threat to internal validity A difference in the dependent variable due to any
difference in the composition ofparticipant groups exposed to dif-ferent levels of the independentvariable.
Separate groups design (See Between-subjects design.) An experimentaldesign in which each group is exposed to only one level of an independent variable.
Simulation control group Partici-pants who are asked to pretendthat they have been exposed to anexperimental manipulation and tosimulate the expected behavior sothat the demand characteristics ofan experiment can be assessed.
Skewed distribution An asymmetri-cal distribution whose tail extendsfarther in one direction than theother.
Small-N baseline design (See Baselineexperiment.) A type of single-variable experiment that can showeffects using data from a smallnumber of participants. A steadystate baseline rate of responding isestablished, following which an experimental manipulation ismade and a transition state estab-lished. Finally, the manipulation is removed and the baseline recovered.
Spearman rank-order correlation coefficient A statistic used tomeasure the strength of associationbetween two ordinal scale variables.
Split-half reliability A means of determining a test’s reliability bystatistically splitting a single testinto halves and correlating theirscores.
Standard deviation A measure of the dispersion of a frequency distribution in which each score issubtracted from the mean,squared, and summed. The sum isthen divided by the number ofscores, and the square root is taken.
Statistical conclusion validity Thedegree to which a statistically
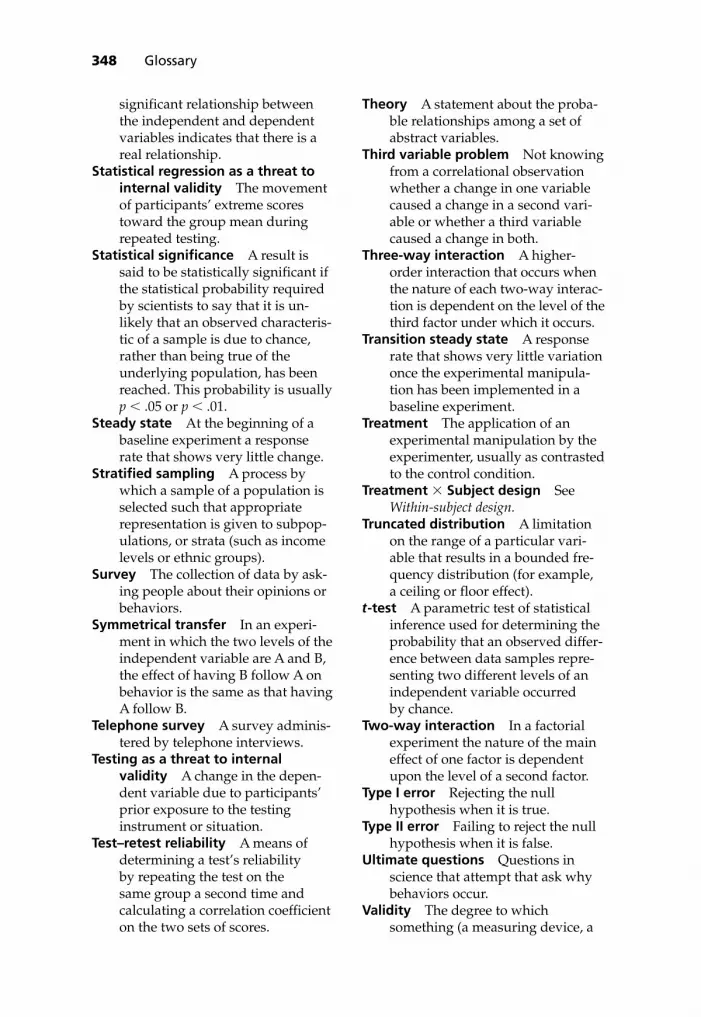
348 Glossary
significant relationship betweenthe independent and dependentvariables indicates that there is areal relationship.
Statistical regression as a threat tointernal validity The movementof participants’ extreme scores toward the group mean during repeated testing.
Statistical significance A result issaid to be statistically significant ifthe statistical probability requiredby scientists to say that it is un-likely that an observed characteris-tic of a sample is due to chance,rather than being true of the underlying population, has beenreached. This probability is usuallyp � .05 or p � .01.
Steady state At the beginning of abaseline experiment a responserate that shows very little change.
Stratified sampling A process bywhich a sample of a population isselected such that appropriate representation is given to subpop-ulations, or strata (such as incomelevels or ethnic groups).
Survey The collection of data by ask-ing people about their opinions orbehaviors.
Symmetrical transfer In an experi-ment in which the two levels of theindependent variable are A and B,the effect of having B follow A onbehavior is the same as that havingA follow B.
Telephone survey A survey adminis-tered by telephone interviews.
Testing as a threat to internal validity A change in the depen-dent variable due to participants’prior exposure to the testing instrument or situation.
Test–retest reliability A means of determining a test’s reliability by repeating the test on the same group a second time and calculating a correlation coefficienton the two sets of scores.
Theory A statement about the proba-ble relationships among a set of abstract variables.
Third variable problem Not knowingfrom a correlational observationwhether a change in one variablecaused a change in a second vari-able or whether a third variablecaused a change in both.
Three-way interaction A higher-order interaction that occurs whenthe nature of each two-way interac-tion is dependent on the level of thethird factor under which it occurs.
Transition steady state A responserate that shows very little variationonce the experimental manipula-tion has been implemented in abaseline experiment.
Treatment The application of an experimental manipulation by theexperimenter, usually as contrastedto the control condition.
Treatment � Subject design SeeWithin-subject design.
Truncated distribution A limitationon the range of a particular vari-able that results in a bounded fre-quency distribution (for example, a ceiling or floor effect).
t-test A parametric test of statisticalinference used for determining theprobability that an observed differ-ence between data samples repre-senting two different levels of anindependent variable occurred by chance.
Two-way interaction In a factorialexperiment the nature of the maineffect of one factor is dependentupon the level of a second factor.
Type I error Rejecting the null hypothesis when it is true.
Type II error Failing to reject the nullhypothesis when it is false.
Ultimate questions Questions in science that attempt that ask whybehaviors occur.
Validity The degree to which something (a measuring device, a

Glossary 349
concept) corresponds to a standard.
Variance A measure of the dispersionof a frequency distribution inwhich each score is subtractedfrom the mean, squared, andsummed. The sum is then dividedby the number of scores.
Wilcoxon matched-pairs signed-rankstest An inferential statistical testappropriate for ordinal data usedto determine the probability thatan observed difference betweenconditions for the same or matchedparticipants occurred by chance.
Within-subject design An experi-mental design in which each participant is exposed to all levelsof the independent variable (orvariables).
x-axis (See Abscissa.) The horizontalaxis of a graph, upon which thelevels of an independent variableare often represented.
y-axis (See Ordinate.) The vertical axisof a graph, upon which the levelsof a dependent variable are usuallyrepresented.


351
AAU statement on preventing andprobing research fraud. (1983).Chronicle of Higher Education, 26, 8.
Adair, J. G. (1973). The human subject.Boston: Little, Brown.
Adair, J. G., & Epstein, J. (1968). Verbalcues in the mediation of experi-menter bias. Psychological Reports,22, 1045–1053.
Adams, J. A. (1972). Research and thefuture of engineering psychology.American Psychologist, 27, 615–622.
Aldridge, J. W. (1978). Levels of process-ing in speech perception. Journalof Experimental Psychology: HumanPerception and Performance, 4,164–177.
American Medical Association. (1989,April). AMA surveys of physician andpublic opinion on health care issues:1989. Chicago: Author.
American Psychological Association.(1997). Animal rights activity in-creases: Threats made against be-havioral scientists. Science Agenda,10, 1, 4.
American Psychological Association.(2001). Publication manual of theAmerican Psychological Association(5th ed.). Washington, D.C.: Author.
American Psychological Association.(2002). Mastering APA style: Instruc-tor’s resource guide. Washington,D.C.: Author.
American Psychological Association.(2002). Mastering APA style: Student’sworkbook and training guide. Washing-ton, D.C.: Author.
American Psychological Association.(2002). Ethical principles of psychol-
ogists and code of conduct. Ameri-can Psychologist, 57, 1060–1073.
American Psychological Association.(2005). Concise rules of APA style.Washington, D.C.: Author.
American Psychological Association.(2007). Guidelines for ethical con-duct in the care and use of animals.Retrieved January 17, 2007, fromhttp://www.apa.org/science/anguide.html.
Arnoult, M. D. (1972). Fundamentalsof scientific method in psychology.Dubuque, IA: William C. Brown.
Associated Press. (1985). [Data availablefrom POLL computer database].Storrs, CT: Roper Center for PublicOpinion.
Barber, B. (1976). The ethics of experi-mentation with human subjects.Scientific American, 234, 25–31.
Barber, T. X., & Silver, J. J. (1968). Fact,fiction, and the experimenter biaseffect. Psychological Bulletin. Mono-graph Supplement, 70, 1–29.
Barber, T. X. (1976). Pitfalls in humanresearch. New York: PergamonPress.
Best, J. (2001). Damned lies and statistics:Untangling numbers from the media,politicians, and activists. Berkley,CA: University of California Press.
Blampied, N. M. (2000). Single-caseresearch designs: A neglectedalternative. American Psychologist,55, 960.
Boyce, J. R. (1989). Use of animals in research: Can we find a middleground? Journal of the VeterinaryMedicine Association, 194, 24–25.
REFERENCES

352 References
Bradley, J. V. (1968). Distribution-free statistical tests. Englewood Cliffs,NJ: Prentice-Hall.
Bryant, F. B., & Wortmen, P. M. (1978).Secondary analysis: The case fordata archives. American Psycholo-gist, 33, 381–387.
Burd, S. (1993). Report finds animalrights activists have stepped up attacks. The Chronicle of Higher Education, 40, A31.
Campbell, S. K. (1974). Flaws and falla-cies in statistical thinking. EnglewoodCliffs, NJ: Prentice-Hall.
Carlyle, T. (1888). On heroes, hero-worship and the heroic in history.New York: Fredrick A. Stokes &Brother. ii. Volume 5-Number 3.Editorial.
Carroll, M. E., & Overmier, J. B. (Eds.).(2001). Animal research and humanhealth: Advancing human welfarethrough behavioral science. Washing-ton, D.C.: American PsychologicalAssociation.
Christensen, L. (1988). Deception inpsychological research: When is itsuse justified? Personality and SocialPsychology Bulletin, 14, 664–675.
Clark, C., & Williges, R. C. (1973).Response surface methodologycentral-composite design modifica-tions for human performance re-search. Human Factors, 15, 295–310.
Coke-Pepsi slugfest. (1976, July 26).Time, pp. 64–65.
Cook, T. D., & Campbell, D. T. (1979).Quasi-experimentation: Design &analysis issues for field settings.Chicago: Rand McNally.
Cordes, C. (1990). U.S. enters lawsuitaccusing scientist, institutions offraud. The Chronicle of Higher Educa-tion, 37, A1, A24, A25.
Coren, S., & Halpern, D. F. (1991).Lefthandedness: A marker for de-creased survival fitness. Psychologi-cal Bulletin, 109, 90–106.
Coren, S., & Porac, C. (1977). Fiftycenturies of right-handedness: The
historical record. Science, 198,631–632.
Daly, M., & Wilson, M. (1988). Homicide.New York: Aldine de Gruyter.
Decker, B. (1967). Words about words: I. Pessimistic. Journal of Creative Behavior, 1, 34.
Dewsbury, D. A. (1990). Early interac-tions between animal psychologistsand animal activists and the found-ing of the APA committee on pre-cautions in animal experimentation.American Psychologist, 45, 315–327.
Diener, E., Lucas, R. E., & Scollon, C. N.(2006). Beyond the hedonic tread-mill: Revising the adaptation theoryof well-being. American Psychologist,61, 305–314.
Dillman, D. A. (1978). Mail and telephonesurveys: The total design method.New York: Wiley.
Doyle, A. C. (1989). A scandal in Bo-hemia. In The adventures of SherlockHolmes. New York: Tom DoughertyAssociates. (Original work pub-lished 1891.)
Dunlap, K. (1920). Mysticism, Freudian-ism, and Scientific Psychology. St.Louis, MO: C. V. Mosby.
Erickson, F. (1973). What makes schoolethnography “ethnographic”? An-thropology & Education Quarterly, 4,10–19.
Estes, W. K. (1993). How to present visual information. APS Observer,6(2), 6–9.
Feeney, D. M. (1987). Human rights andanimal welfare. American Psycholo-gist, 42, 593–599.
Fine, M. A., & Kurdek, L. A. (1993). Reflections on determining author-ship credit and authorship orderon faculty-student collaborations.American Psychologist, 48, 1141–1147.
Fisher, R. A. (1936). Has Mendel’s workbeen rediscovered? Annals of Science,1, 115.
Foertsch, J., & Gernsbacher, M. A. (1997).In search of gender neutrality: Issingular they a cognitively efficient
References 353
substitute for generic he? Psycholog-ical Research, 8, 106–111.
Gallup, G. G., & Suarez, S. D. (1985). Alternatives to the use of animalsin psychological research. AmericanPsychologist, 40, 1104–1111.
Gantt, W. H. (1928). Ivan P. Pavlov: A bi-ographical sketch. In W. H. Gantt(Ed.), I. P. Pavlov’s lectures on condi-tioned reflexes (pp. 11–31). NewYork: Liveright.
Garner, W. R., Hake, H. W., & Eriksen,C. W. (1956). Operationalism andthe concept of perception. Psycho-logical Review, 63, 149–159.
Garvey, W. D., & Griffith, B. C. (1971).Scientific communication: Its rolein the conduct of research and creation of knowledge. AmericanPsychologist, 26, 349–362.
Gelfand, H., Walker, C. J., & AmericanPsychological Association (2002).Mastering APA style: Student’sworkbook and training guide. Wash-ington, D.C.: American Psycho-logical Association.
Glass, G. V., McGaw, B., & Smith, M. L.(1981). Meta-analysis in social re-search. Newbury Park, CA: Sage.
Glinski, R. J., Glinski, B. C., & Slatin,P. T. (1970). Nonnaivety contamina-tion in conformity experiments:Sources, effects, and implicationsfor control. Journal of Personality andSocial Psychology, 16, 478–485.
Gosling, C., Knight, N., & McKenney,L. S. (Eds.). (1989). Search PsycINFO:Student Workbook. Washington, D.C.:American Psychological Association.
Gould, S. J. (1981). The mismeasure ofman. New York: Norton.
Greenberg, M. S. (1967). Role playing:An alternative to deception? Journalof Personality and Social Psychology,7, 152–157.
Greenwald, A. G. (1976). Within-subjectsdesigns: To use or not to use? Psy-chological Bulletin, 83, 314–320.
Grobe, R. P., Pettibone, T. J., & Martin,D. W. (1973). Effectiveness of lec-
ture pace on noise level in a univer-sity classroom. Journal of EducationalResearch, 67, 73–75.
Gross, A. E., & Flemming, I. (1982).Twenty years of deception in socialpsychology. Personality and SocialPsychology Bulletin, 8, 402–408.
Hadaway, C. K., & Marler, P. L. (1998).Did you really go to church thisweek? Behind the poll data. TheChristian Century, 115, 472–476.
Halpern, D. F., & Coren, S. (1993). Left-handedness and life span: A replyto Harris. Psychological Bulletin, 114,235–241.
Harcum, E. R. (1989). The highly inap-propriate calibrations of statisticalsignificance. American Psychologist,44, 964.
Harlow, H. F. (1958). The nature of love.American Psychologist, 13, 673–685.
Harris, L. J. (1993a). Do left-handersdie sooner than right-handers? Com-mentary on Coren and Hal-pern’s(1991) “Left-handedness: A mar-ker for decreased survival fitness.”Psychological Bulletin, 114, 203–234.
Harris, L. J. (1993b). Reply to Halpernand Coren. Psychological Bulletin,114, 242–247.
Havemann, J. (1989, July 13). Proposalson animal research rattle cages. Albuquerque Journal, p. E4.
Hayakawa, S. I. (1978, June–July).Change, 6.
Herzog, H. A. (1995). Has public inter-est in animal rights peaked? Ameri-can Psychologist, 50, 945–947.
Hostetler, A. J. (1988, June). Indictment:Congress sends message on fraud.APA Monitor, p. 5.
Huff, D. (1954). How to lie with statistics.New York: Norton.
Human Factors and Ergonomics Soci-ety. (1995). Instructions and guide-lines for poster presenters: Guidelinesfor preparing and arranging posters.Santa Monica, CA: Author.
Infeld, L. (1950). Albert Einstein. NewYork: Scribner’s.

354 References
Jackson, G. B. (1980). Methods for inte-grative reviews. Review of Educa-tional Research, 50, 438–460.
Jacobson, J. W., Mulick, J. A., &Schwartz, A. A. (1995). A history offacilitated communication: Science,pseudoscience, and antiscience.American Psychologist, 50, 760.
Jaschik, S. (1991). Agriculture Dept. is-sues final rules on care of researchanimals. The Chronicle of HigherEducation, 37, A25–A31.
Jensen, A. R. (1978). Sir Cyril Burt inperspective. American Psychologist,33, 499–503.
Johnson, D. A. (1971). Pupillary responsesduring a short-term memory task:Cognitive processing, arousal, orboth? Journal of Experimental Psychol-ogy, 90, 311–318.
Jung, J. (1969). Current practices andproblems in use of college studentsfor psychological research. Cana-dian Psychologist, 10, 280–290.
Justice Department and Department ofAgriculture release report on ani-mal rights extremism activities.(1993, September). Federation News,p. 6.
Kanekar, S. (1990). Statistical signifi-cance as a continuum. AmericanPsychologist, 45, 296.
Kennedy, J. E., & Landesman, J. (1963).Series effects in motor performancestudies. Journal of Applied Psychol-ogy, 47, 202–205.
Kenrick, D. T., & Keefe, R. C. (1992).Age preferences in mates reflect sexdifferences in reproductive strate-gies. Behavioral and Brain Sciences,15, 75–133.
Kihlstrom, J. F. (1995, June). From thesubject’s point of view: The experi-ment as conversation and collabo-ration between investigator andsubject. Paper presented at theAmerican Psychological SocietyAnnual Convention.
Kimmel, A. J. (1996). Ethical issues inbehavioral research: A survey. Cam-bridge, MA: Blackwell.
Kirk, R. E. (1968). Experimental designs:Procedures for the behavioral sciences.Pacific Grove, CA: Brooks/Cole.
Kirk, R. E. (1990). Statistics: An introduc-tion. Fort Worth, TX: Holt, Rinehart& Winston.
Krasner, L. (1958). Studies of the condi-tioning of verbal behavior. Psycho-logical Bulletin, 55, 148–170.
Kuhn, T. S. (1970). The structure of scien-tific revolutions (2nd ed.). Chicago:University of Chicago Press.
LeCompte, M. D., & Preissle, J. (1993).Ethnography and qualitative design ineducational research. San Diego, CA:Academic Press.
Lerner, I. M. (1968). Heredity, evolution,and society. San Francisco: W. H.Freeman.
Levenson, R. L., Jr. (1990). Comment onHarcum. American Psychologist, 45,295–296.
Ley, W. (1955). Salamanders and otherwonders. New York: Viking Press.
Lipsey, M. W., & Wilson, D. B. (1993).The efficacy of psychological, edu-cational, and behavioral treatment:Confirmation from meta-analysis.American Psychologist, 48, 1181–1209.
Loftus, G. R. (1993). Editorial comment.Memory & Cognition, 21, 1–3.
Loftus, G. R. (1996). Psychology will bea much better science when wechange the way we analyze data.Current Directions in PsychologicalScience, 5, 161–171.
Lorenz, K. Z. (1962). The editors of KingSolomon’s Ring. Chicago: Time-LifeBooks.
Madigan, R. M., Johnson, S., & Linton,P. (1995). The language of psychol-ogy: APA style as epistemology.American Psychologist, 50, 428–436.
Madson, L., & Hessling, R. M. (2001).Reader’s perceptions of four alterna-tives to masculine generic pronouns.The Journal of Social Psychology, 141,156–158.
Maggio, R. (1991). The bias-free wordfinder: A dictionary of nondiscrimina-tory language. Boston: Beacon Press.

References 355
Mangan, K. S. (1990). Universities beefup security at laboratories to protectresearchers threatened by animal-rights activists. The Chronicle ofHigher Education, 37, A16–A19.
Mann, C. (1990). Meta-analysis in thebreech. Science, 249, 476–480.
Martin, D. W., & Kelly, R. T. (1974). Secondary task performance duringdirected forgetting. Journal of Exper-imental Psychology, 103, 1074–1079.
Masling, J. (1966). Role-related behaviorof the subject and psychologist andits effects upon psychological data.In D. Levine (Ed.), Nebraska sympo-sium on motivation. Lincoln: Univer-sity of Nebraska Press.
McAskie, M. (1978). Carelessness orfraud in Sir Cyril Burt’s kinshipdata? A critique of Jensen’s ana-lysis. American Psychologist, 33,496–498.
McDonald, K. (1983). Fraud in scientificresearch: Is it the work of “psy-chopaths”? Chronicle of Higher Education, 26, 7.
Medvedev, Z. A. (1969). The rise and fallof T. D. Lysenko (I. M. Lerner,Trans.). New York: Columbia Uni-versity Press.
Meyers, C. (1990). Association fights restrictions on use of animals in research, drawing praise from sci-entists and anger from its critics.The Chronicle of Higher Education,37, A25–A27.
Meyers, R. H. (1971). Response surfacemethodology. Boston: Allyn & Bacon.
Milgram, S. (1963). Behavioral study ofobedience. Journal of Abnormal andSocial Psychology, 67, 371–378.
Miller, N. E. (1985). The value of behav-ioral research on animals. AmericanPsychologist, 40, 423–440.
Mitchell, D. B., & Richman, C. L. (1980).Confirmed reservations: Mentaltravel. Journal of Experimental Psy-chology. Human Perception and Per-formance, 6, 58–66.
Monte, C. F. (1975). Psychology’s scientificendeavor. New York: Praeger.
Morgan, D. L., & Morgan, R. K.(2001). Single-participant researchdesign. American Psychologist, 56,119–127.
Mueller, J. H., & Furedy, J. J. (2001). Reviewing for risk: What’s the evi-dence that it works? APS Observer,14 (7), 1.
Navon, D., & Gopher, D. (1979). On theeconomy of the human processingsystem. Psychological Review, 86,214–255.
Nelson, N., Rosenthal, R., & Rosnow, R. L. (1986). Interpretation of signif-icance levels and effect sizes bypsychological researchers. Ameri-can Psychologist, 41, 1299–1301.
Nicks, S. D., Korn, J. H., & Mainieri, T.(1997). The rise and fall of decep-tion in social psychology and per-sonality research, 1921 to 1994.Ethics and Behavior, 7, 69–77.
Nicol, A. A. M., & Pexman, P. M. (1999).Presenting your findings: A practicalguide for creating tables. Washing-ton, D.C.: American PsychologicalAssociation.
Olson, P. O. (1989). Motorcycle con-spicuity revisited. Human Factors,31, 141–146.
Orne, M. T. (1962). On the social psy-chology of the psychological exper-iment: With particular reference todemand characteristics and theirimplications. American Psychologist,17, 776–783.
Orne, M. T. (1970). Hypnosis, motiva-tion and the ecological validity ofthe psychological experiment. InW. J. Arnold & M. M. Page (Eds.),Nebraska symposium on motivation.Lincoln: University of NebraskaPress.
Orne, M. T., & Evans, F. J. (1965). Socialcontrol in the psychological ex-periment: Antisocial behavior andhypnosis. Journal of Personality &Social Psychology, 1, 189–200.
Ortmann, A., & Hertwig, R. (1997).Is deception acceptable? AmericanPsychologist, 52, 746–747.

356 References
Palladino, J. J., & Handelsman, M. M.(1995). On the light side: The his-tory of APA format and style. PsyChi Newsletter, 21, 6.
Parsons, H. M. (1974). What happened atHawthorne? Science, 183, 922–932.
Paxton, J. P. (1997). “Someone withlike a life wrote it”: The effects of avisible author on high school his-tory students. Journal of EducationalPsychology, 89, 235–250.
Pifer, L., Shimizu, K., & Pifer, R. (1994).Public attitudes toward animal research: Some international com-parisons. Society & Animals, 2,95–113.
Pirsig, R. M. (1975). Zen and the art ofmotorcycle maintenance. New York:Bantam.
Plous, S. (1996a). Attitudes toward theuse of animals in psychologicalresearch and education: Resultsfrom a national survey of psycholo-gists. American Psychologist, 51,1167–1180.
Plous, S. (1996b). Attitudes toward theuse of animals in psychological research and education: Resultsfrom a national survey of psychol-ogy majors. Psychological Science, 7,352–358.
Popper, K. R. (1968). The logic of scien-tific discovery (Rev. ed.). New York:Basic Books.
Porac, C., & Coren, S. (1981). Lateral pref-erences and human behavior. NewYork: Springer-Verlag.
Position statement on the use of animalsin research. (1993). NIH Guide, 22,2–3.
Poulton, E. C. (1973). Unwanted rangeeffects from using within-subjectexperimental designs. PsychologicalBulletin, 80, 113–121.
Poulton, E. C. (1979). Compositemodel for human performance incontinuous noise. Psychological Re-view, 86, 361–375.
Poulton, E. C., & Freeman, P. R. (1966).Unwanted asymmetrical transfer
effects with balanced experimentaldesigns. Psychological Bulletin, 66,1–8.
Pressley, M. M., & Tullar, W. L. (1977). Afactor interactive investigation ofmall survey response rates froma commercial sample. Journal of Marketing Research, 14, 108–111.
Protecting Human Research Subjects:Institutional Review Board Guide(1993). NIH Guide Grants Contracts,22.
Puglisi, T. (2001). IRB review: It helps toknow the regulatory framework.APS Observer, 14 (5), 1.
Pyrczak, F. & Bruce, R. R. (Eds.). (2000).Writing empirical research reports: Abasic guide for students of the socialand behavioral sciences. Los Angeles:Pyrczak Publishing.
Reed, J. G., & Baxter, P. M. (2003). Library use: A handbook for psychology(3rd ed.). Washington, D.C.: Ameri-can Psychological Association.
Roediger, R. (2004). What should theybe called? APS Observer, 17 (4), 5,46–48.
Roethlisberger, F. J. (1977). The elusivephenomena: An autobiographical ac-count of my work in the field of orga-nized behavior at the Harvard BusinessSchool. Cambridge, MA: Division ofResearch, Graduate School of Busi-ness Administration (distributed byHarvard University Press).
Rogers, J. L., Howard, K. I., & Vessey,J. T. (1993). Using significance testto evaluate equivalence betweentwo experimental groups. Psycho-logical Bulletin, 113, 553–565.
Roscoe, S. M. (1980). Aviation psychology.Ames: Iowa State University Press.
Rosenberg, M. J. (1969). The conditionsand consequences of evaluationapprehension. In T. Rosenthal &T. L. Rosnow (Eds.), Artifact inbehavioral research. New York: Aca-demic Press.
Rosenthal, R., & Fode, K. L. (1973). Theeffect of experimental bias on the

References 357
performance of the albino rat. Behavioral Science, 8, 183–189.
Rosenzweig, S. E. G. (1970). Boring andthe Zeitgeist: Eruditone gesta beavit.Journal of Psychology, 75, 59–71.
Rosnow, R. L., & Rosenthal, R. (1999).Beginning behavioral research: A con-ceptual primer (3rd ed.). UpperSaddle River, NJ: Prentice Hall.
Rowland, L. W. (1939). Will hypnotizedpersons try to harm themselves orothers? Journal of Abnormal and Social Psychology, 34, 114–117.
Ryder, R. D. (1979). The struggle againstspeciesism. In D. Paterson & R. D.Ryder (Eds.), Animal rights—a sym-posium (p. 14). London: CentaurPress.
Safire, W. (1979, November 4). On lan-guage; the fumblerules of grammar.New York Times Magazine, pp. 16–18.
Sales, B. D., & Folkman, S. (2000). Ethicsin research with human participants.Washington, D.C.: American Psy-chological Association.
Schindler, G. E. (1967). Why engineersand scientists write as they do:Twelve characteristics of their prose.IEEE Transactions on EngineeringWriting and Speech, EWS–10, 32.
Schultz, D. P. (1969). The human subjectin psychological research. Psycho-logical Bulletin, 72, 214–228.
Segal, E. (1982). Editorial. Journal of theExperimental Analysis of Behavior,38, 115.
Seligman, M. E. P. (1988). President’scomments. American PsychologicalAssociation Monitor, 29, 2.
Shadish, W. R., Cook, T. D., & Campbell,D. T. (2002). Experimental and quasi-experimental designs for generalizedcausal inference. Boston: HoughtonMifflin.
Sheppard, L. (2001). Examining the effectof humor in text-based instruction on learner’s enjoyment and recall.Unpublished practicum paper.
Sidman, M. (1960). Tactics of scientific research. New York: Basic Books.
Singer, P. (1976). Animal liberation. London: Jonathan Cape.
Singer, P. (1985). In defense of animals.New York: Basil Blackwell.
Skinner, B. F. (1950). Are theories oflearning necessary? PsychologicalReview, 57, 193–216.
Skinner, B. F. (1953). Science and humanbehavior. New York: Free Press.
Skinner, B. F. (1959). A case history inscientific method. In S. Koch (Ed.),Psychology: A study of a science.New York: McGraw-Hill.
Skinner, B. F. (1966). Operant behavior.In W. K. Honig (Ed.), Operant behavior: Areas of research and appli-cation (p. 21). New York: Appleton-Century-Crofts.
Smart, R. (1966). Subject selection biasin psychological research. CanadianPsychologist, 7, 115–121.
Staff (1983). Chronicle of Higher Educa-tion, 29, 7.
Staff. (1994, June 27). Vox pop. Time, p. 26.
Strunk, W., Jr., & White, E. B. (1979). Theelements of style (3rd ed.). New York:Macmillan.
Tanur, J. M. (1994). The trustworthinessof survey research. The Chronicle ofHigher Education, 40, B1–B3.
Todman, J. B., & Dugard, P. (2001).Single-case and small-N experimentaldesigns: A practical guide to random-ization tests. Mahwah, NJ: LawrenceErlbaum.
Toor, R. (2006). What’s to ‘enjoy’? TheChronicle of Higher Education, 52, B5.
Van Orden, G. C., & Paap, K. R. (1997).Functional neural images fail todiscover pieces of mind in parts ofthe brain. Philosophy of Science Jour-nal, 64, 885–994.
Wainer, H. (2000). Visual revelations:Graphical tales of fate and deceptionfrom Napoleon Bonaparte to Ross Perot.Mahwah, NJ: Lawrence Erlbaum.
Weber, S. J., & Cook, T. D. (1972).Subject effects in laboratory re-search: An examination of subject

roles, demand characteristics, andvalid inference. Psychological Bul-letin, 77, 273–295.
Westfall, R. S. (1973). Newton and thefudge factor. Science, 179, 751–758.
Wickens, C. D. (1984). Processing re-sources in attention. In R. Parasura-man & D. R. Davies (Eds.), Varietiesof attention. New York: AcademicPress.
Wilson, G. T. (1985). Limitations ofmeta-analysis in the evaluation ofthe effects of psychological ther-apy. Clinical Psychology Review, 5, 35–47.
Wolins, L. (1962). Responsibility forraw data. American Psychologist, 17,657–658.
Woodworth, R. S. (1940). Psychology(4th ed.). New York: Holt.
358 References

359
ABBA counterbalancing, 157Abscissa, 247 Abstract of a research report, 276, 288 Addition of a nonequivalent
no-treatment control group time series, 202
Analogical theory, 59 Analysis of variance, 185, 320 Animals in research, 89 ANOVA, 324 APA style, 270Apparatus/materials section of a
research report, 278, 291 Applied research, 64 Archival research, 12, 24 Association, measures of, 313 Asymmetrical transfer, 160–164Asymptote, 251 Asymptotic function, 251 Author of a research report, 275, 287 Automation of experiment, 79
Bar graph, 248 Baseline, 207 Baseline designs, 205, 227 Basic research, 64 Between-subjects designs, 148, 150, 172 Bimodal distributions, 242 Blind experiments, 79
Carry-over effects, 155Case history, 17, 24 Causality, 8 Ceiling effect, 174 Central tendency, 244, 311 Chi-square test, 315, 327 Choice reaction time, 142 Citations in report, 271Closed-ended question in a survey, 218 Coefficient of determination, 252
Complete counterbalancing, 162Computers for data analysis, 264 Concurrent validity, 139Conference papers, 128, 300 Confounding variable, 31, 39 Connectionism, 61Content validity, 140 Context effect, 166 Contingency coefficient, 313 Control group, 174 Control variable, 27 Converging operations, 186 Converging-series designs, 185 Correlational observation, 7, 24 Correlation coefficient, 251, 317, 318 Correlation ratio, 252 Counterbalancing, 156
ABBA, 157 complete, 162 partial, 162
Critical incidents, 18Crossover interaction, 255 Curvilinear function, 250
Data storage, 99 Deception, 84Decision errors in significance testing,
259 Deduction, 55Demand characteristics, 75
minimizing, 78 Dependent variable, 26, 39, 137
composite dependent variables, 142 indirect behavioral measures, 146indirect physiological measures, 144 multiple dependent variables, 142 physiological measures, 144single dependent variables, 140
Descriptive statistics, 244, 311 Descriptive theory, 58
INDEX
360 Index
Directional hypothesis, 26Directionality problem, 8 Dirty tricks, 96 Discussion section of a research report,
281, 294 Dispersion, 246, 312 Double blind experiments, 79 Dual-task methodology, 146
Effect size, 236, 280 Electronic publishing, 120 Ethics of science, 95
with animals, 87, 89 with participants, 69, 229
Ethnography, 14 Experimental group, 171 Experimental method, 5, 25 Experimental report, 271 Experimental results interpretation, 240External validity, 28
F, critical values, 333, 334 Fabricating results, 96 Face validity, 140 Factorial designs, 178, 194, 253 Factors, 179 Falsifying professional credentials, 103 Figures in a research report, 279, 299 Floor effect, 175Footnotes in report, 272Frequency distributions, 241 Function, 179, 249 Functional experiments, 176F value, 324
Generalizability, 27 Graphs, 108, 247 Group administration of a survey, 214
H, critical values, 335, 336Hawthorne effect, 81 Histogram, 248History as a threat to internal
validity, 32 Hypothesis, 26, 56
Induction, 55 Independent groups design, 148 Independent variable, 25, 39, 131 Inferential statistics, 57, 257, 315
Informed consent, 73 Institution of author in a report,
275, 287 Institutional review boards, 72 Interactions, 180, 254
with selection as threats to internalvalidity, 37
Internal validity, 32 Internet survey, 215 Interrupted time-series designs, 22, 200 Interrupted time series with removed
treatment, 202 with switching replications, 202
Intersubject replication in a baselineexperiment, 212
Interval scale, 311 Interview as a survey technique, 215 Intrasubject replication in a baseline
experiment, 212 Introduction of a research report,
277, 289IRB, 72
Key phrase in a literature search, 123 Kruskal-Wallis one-way ANOVA by
ranks, 322
Language bias in research reports, 282
Language in psychology reports, 273 Latin Square, 162 Length of experiment, 231 Levels of an independent variable,
26, 175 Levels of statistical significance, 259 Likert scale, 220 Linear function, 250 Line graph, 249 Literature searches, 111
books as sources, 115 computerized searches, 122 databases, 121 electronic publishing as sources, 119 faculty members as sources, 128 formal sources, 121 informal sources, 127 journal articles as sources, 118 personal communications as
sources, 128 proceedings as sources, 119

Index 361
Literature searches (continued)professional meetings as
sources, 127 research groups as sources, 128review articles as sources, 116 technical reports as sources, 119 timeliness of sources, 114
Mail survey, 212 Main effects, 253 Mann-Whitney U test, 318, 329, 330 Matched-groups design, 167 Matching participants, 167 Maturation as a threat to internal
validity, 33 Mean, 245, 312 Mean treatment effect size, 263 Median, 245, 312 MEDLINE, 124Meta-analysis, 263 Method section of a research report,
277, 290 Mixed factorial design, 180 Mode, 244, 311 Modification state, 208 Monotonic function, 250 Mortality as a threat to internal
validity, 34 Multilevel experiments, 176, 194 Multiple-alternative question in a
survey, 218 Multiple experimenters, 81 Multiple replications of interrupted
time series, 205
Naturalistic observation, 15, 24, 86 Neat tricks, 108 Negative function, 250 Negatively accelerated function, 251 Negative result, 237, 281 Nominal scale, 309 Nondifferential transfer, 160 Nondirectional hypothesis, 26Nonequivalent control group design
with pretest and posttest, 197 Nonequivalent no-treatment control
group time series, 202Nonexperimental designs, 193, 195 Nonexperiment control group, 82 Nonmonotonic function, 250
Nonparametric tests, 261Nonresponse bias, 213 Normal distribution, 242 Null hypothesis, 236, 358 Number scales, 309
Observability, 48 Observation to get a research idea, 46One-group posttest-only design, 195 One-group pretest-posttest design,
196 Open-ended question in a survey,
217Operational definitions, 132, 136, 234 Oral presentations at conferences, 300 Order effect, 155 Ordinal scale, 310 Ordinate, 247
Page headers in a report, 276, 287Parallel distributed processing, 61Parametric tests, 261 Partial counterbalancing, 164 Participants, 69
cooperative, 76 defensive, 77 eliminating data of, 107, 233 noncooperative, 78 number needed, 230 rules of courtesy with, 71 setting restrictions on, 233
Participants section of a research report,278, 290
Parts of a research report, 273 Pearson product-moment correlation
coefficient, 314, 326 Percent savings, 143 Physiological measures, 144 Piecemeal reporting, 108 Pilot experiment, 135 Placebo, 80Plagiarism, 100, 271 Positive function, 250 Positively accelerated function, 251 Poster presentations, 304 Postexperiment questioning, 81 Posttest-only designs with
nonequivalent groups, 196 Power, 260Predictive validity, 140

362 Index
Presentations at conferences, 303 Pretest observations at more than one
time interval, 202 Primary sources for literature search,
118 Procedure section of a research report,
278, 291 Professional meetings, 127 Proximate question, 62Proxy pretest, 198 Psychohistory, 18 Psychological Abstracts, 121 PsycARTICLES, 122PsycINFO, 121 Publication Manual of the American
Psychological Association, 269
Qualitative designs, 5, 14, 19 Quantitative designs, 5, 19 Quantitative theory, 61 Quasi-experimental designs, 193,
197, 227 Questionable tricks, 104 Questionnaire, 10, 212, 217
r, critical values of, 326Random assignment, 28Random number table, 337 Random sample, 29, 216Random selection, 28 Random variable, 28 Randomization, 29
within blocks, 31 within constraints, 30, 39
Range, 134, 246, 312 effects of within-subject designs,
164 of independent variable, 133
Rating scale in a survey, 220 Ratio scale, 311 References section of a research report,
282, 296 Reliability, 137
alternative-form, 138 split-half, 138 test-retest, 138
Repeatability, 48 Repeated-measures designs, 148 Reprint requests, 126 Research groups, 129
Research report, parts of, 276 Response-surface methodology,
184 Results section of a research report,
279, 293 Reversibility in a baseline experiment,
208 Rho, critical values of, 325,Role playing, 85 ROT test, 48, 143Running head of a research report,
276, 287
Sample research report, 290 Sample for a survey, 216 Scales of measurement, 309 Scatterplot, 7, 251 Science, 3 Secondary sources, citing from, 102Selection as a threat to internal
validity, 33 Separate-groups designs, 148 Separate pretest and posttest samples,
202 Simulation control group, 83 Single-subject designs, 204 Single-variable experiments, 171 Skewed distributions, 243 Small-N baseline designs, 204 Smithsonian Science Information
Exchange, 127Social Sciences Citation Index, 126 Spearman rank-order correlation
coefficient, 313, 325 Standard deviation, 247, 313 Statistical power, 260Statistical regression as a threat to
internal validity, 365Statistical significance, 261, 280 Statistical tables, 329 Statistics, 244, 262, 313 Steady state in a baseline experiment,
207 Stratified sampling, 216 Structural equation modeling, 61Subheadings in report, 271Subjects, 69 Survey, 10, 212 Symbols used in statistics, 311 Symmetrical transfer, 160

Index 363
t, critical values of, 328Tables in a research report, 279, 298 Telephone survey, 214 Testability, 48, 61 Testing as a threat to internal validity,
35 Threats to internal validity, 33
history, 33 interactions with selection, 38 maturation, 33 mortality, 34 selection, 33, 34statistical regression, 36 testing, 35
Theory, 53 analogical, 59 descriptive, 58 disproof of, 57 properties of, 61 proof of, 56 quantitative, 60reformulating, 109
Third variable problem, 8 Three-way interaction, 257Time lag in scientific communication,
113 Title of a research report, 274, 287, 289 Transition steady state in a baseline
experiment, 208Treatments, 179Treatment state, 208 Treatment � Subject designs, 150 Treeing backward through the
references, 125 Treeing forward through the
references, 126
Truncated distribution, 243t-test for correlated measures, 317 t-test for uncorrelated measures, 316 Two-level experiments, 171Two-way interaction, 255Type I error, 259Type II error, 259
Ultimate question, 62
Validity, 28, 137, 139 concurrent, 139 content, 139 external, 28 face, 139 internal, 32 predictive, 139
Variability, 4 Variable, 26
confounding, 32, 39 control, 27, 39 dependent, 27, 39 independent, 26, 39 random, 29, 39
Variance, 246, 312Vicarious observation, 51 Visual aids for a presentation, 302
Wilcoxon matched-pairs signed-rankstest, 319, 332
Within-subject designs, 148, 151, 172 Writing style in research reports, 283
x-axis, 247 y-axis, 247z-scores, 331

TO THE OWNER OF THIS BOOK:
I hope that you have found Doing Psychology Experiments, 7th edition, useful. So that this book can be improved in a future edition, would you take the time tocomplete this sheet and return it? Thank you.
School and address: __________________________________________________
_______________________________________________________________________________________
Department: ________________________________________________________
Instructor’s name: ____________________________________________________
1. What I like most about this book is:___________________________________
_______________________________________________________________________________________
_______________________________________________________________________________________
2. What I like least about this book is:___________________________________
_______________________________________________________________________________________
_______________________________________________________________________________________
3. My general reaction to this book is:___________________________________
_______________________________________________________________________________________
_______________________________________________________________________________________
4. The name of the course in which I used this book is:_____________________
_______________________________________________________________________________________
5. Were all of the chapters of the book assigned for you to read? ______________
If not, which ones weren’t? __________________________________________
6. In the space below, or on a separate sheet of paper, please write specific suggestions for improving this book and anything else you’d care to share aboutyour experience in using this book.
_______________________________________________________________________________________
_______________________________________________________________________________________