market reactions of return, risk, and liquidity to the creation of restricted voting shares
TRANSCRIPT
M A R K E T R E A C T I O N S OF R E T U R N , R I S K , A N D L I Q U I D I T Y JOG & R I D I N G
Market Reactions of Return, to the Creation of Restricted Vijay M. Jog
Allan 1. Riding
Carleron Universiry
Carleron Universiry
Risk, and Liquidity Voting Shares'
A bstract This study extends previous empiricol findings
r ording the eflecrs on shoreholder weolrh of rhe creorion oFesrricred voting shores. Prior reseorch has documented signficonr and negorive predicrion errors on the dote of listing; in addition, negarive predicrion errors which persisi beyond the dare of listing hove olso been reported. This study extends rhese /indings olong I wo dimensions.
First, evidence rhor the poromerers of the single focror model differ berween restricted voring ond counrerporr superior voting shores is presented. Bosed on ex-post dora, resrricred voting shores were found to exhibit higher esrimares of the coefficienr of sysremoric risk than counrerpori voting shares. One consequence of this difference is thor the esrimores of the poromerers of the morker modelshifi near the dore on which resrricred voting shares arefirst lisied. While rhis shiji may partiolly exploin the findings of negorive prediction errors near rhe dore of lirring, ir is nor likely rhar rhe poromerric shijrs occounr for 011 of the abnormal negarive response on tho1 dore. Such shijrs ore also consisrenr with the findings of persisrenr negarive predicrion errors reported in previous research.
Second, changes in li uidity of shores arrriburoble 10 rhe creation of resrricre 1 voting shores is srudied by the analysis of rroding frequencies for .both classes of shores, before and subsequent 10 the lisring date. Jr is found rhai rroding jrequency is increosed, on increose which is accounied for bj* rhe resiricred voring componenr. Jn addiiion, during rhe course of this reseorch. rhe porenrial impocr of firm- or issue-speci>c voriables on departures of acrual rerurns from those predicted by common models of securiry reruins is investigated, No evidence of firm- or issue-specijk effects on shoreholder weolrh is found.
None of rhese extensions complerely exploin the anomolous findings of negorive prediction errors or rhe dore of lisring. However, these findings do indicore rhor resrricred voriug shores ore subject 10 higher levels of sysremoric risk rhon either counrerporr superior voting shores or the predecessor common shores of the firms involved. Thus, restricred voting shores appeor to be chorocrerized by both o negorive price premium ond higher risk rhon counrerporr voting shores.
&I article prolo e ks conclusions empiriques onre- ruures quanr aux aers de b criotion d'octions a droir de vote restreinr sur b fortune &s actionnoires. kr recherche antdrieure a dimonirk des erreurs de privision ndgorives significorives i la dore d 'cnregisrremeni; d'oilleurs, ces erreurs ont aussi PIP observdes apris eerie dore. to recherche donr il esr foil iror ici diveloppe ces observations selon deux dimensions.
Premiiremenr. on fair lo preuve que les poramirres du modile a un focreur sonr dflkrenrs selon qu'il s'clgii dhctions 6 droir de vote restreint ou de leur conrreportie, Ies ocrions a droir de vote supirkur. Les donnies recueiliies apris coup rhvilenr qu 'oux acrions d droir de vote resrreini correspondenr des devis du coefficienr de risque sysrdmorique qui surpassenr ceux des ocrions a droir de vole superieur. Por conskquenr. Ci Ibpproche du jour d 'enregisrremenr des ocrions a droir de vole resrreint, les devis des poromirres onr rendonce a chonger.
Ces chongements expliquenr parriellemenr, mob pas enriirement. les erreurs de pridicrion nPgarives qu 'on observe en approchonr b dare dknregisrremenr. 11 est improboble, cependonr. que ces chongemenrs expliquenr compliremenr lo deviorion nigorive onormole le jour mime de I knregistremenr. Ces observorions son1 aussi en accord avec lo recherche anririeure en ce domoine.
Lhxiimement, en anolysonr les friquences d 'Pchonge des deux classes d'ocrions avonr el apris lo dore dknre- gisrremenr. on o irudie les chongemenrs dons lo liquidirk d'ocrions dus a lo crkorion dircrions ordinoires a droir de vote resrreinr. II o PIC observt! que lo frkquence de IYchonge augmenie a couse de I'Pliment vote resrreini. Au surplus, on a exomin6 I'cflet potenriel de facreurs spicijques a I 'enrreprise ou b I kdusrrie sur les deviorions enrre les rendemenrs riek er ceux queprddisent les modiles de profirs sur les valeurs mobilieres Ies mieux connus. On n 'o trouvi aucune preuve d'un lien enrre les focreurs spdci/iques b I knrreprise ou d 1 'indutrie er la forrune des acrionnoires.
Aucun de ces prolongements de b rhiorie de base n 'cxplique 6 lui seul les erreurs de prddicrions ngarilrs anormoles ou jour d 'cnregisrremenr. Cependonr, ces dicouverres indiquenr que Ies actions ordinoires a droif de vote resrreinr onr un niveau de risque sysrimoriquc qui surposse celui des actions d droir de vote supirieur ainsi que des actions ordinoires pri-exisranres des enrreprises qui onr foir I'objer IYtude. Ainsi les ocrions o droir de vote resrreinr semblenr &re caracririskes par une prime nkgorive er un niveou de risque qui surpas.'c celui des ocrions ordinoires ti droir de vore.
RCSA / C J A S 62

MARKET REACTIONS OF RETURN. RISK, A N D LIQUIDITY ... JOG & RIDING
INTRODUCTION
Significant attention has recently been accorded to issues associated with some firms' use of classes of common shares with disproportionate voting rights. There has been an identifiable trend away from the "one share, one vote" practice by firms listed on established stock exchanges. In most instances, it is possible to distinguish one class of shares with superior voting rights ("SV" shares henceforth) from another class of shares with relatively more restricted voting rights ("RV" shares). Among the motivations for the use of RV shares is that they provide a means of concentrating control of the firm such that hostile takeovers can be discouraged.* The New York Stock Exchange has recently recommended listing of firms with RV shares, a decision which represents a significant departure from a policy which had endured for almost sixty years. Other stock exchanges have permitted the listing of RV shares; in particular, on the Toronto Stock Exchange (TSE), s h a m with different voting rights have long been listed. The objective of this paper is to extend the results of previous empirical analysis of how issuances of RV shares have affected the market valuations of the firms involved.
Three previous studies of this topic are particularly relevant. Panch (1986), using a sample of 44 NYSE, OTC, and AMEX securities, reports mixed evidence regarding the presence of significant abnormal returns in association with firms' announcement to create RV shares. Partch's sample is dominated by firms which create RV shares by means of a pro-rata distribution of the new shares to existing shareholders. Jog and Riding (1986), using a sample of 33 pairs of securities traded on the Toronto Stock Exchange in which the R V component is created through an exchange offer mechanism, also find no statistically significant price reactions at the announcement. However, they document a significant negative prediction error on the date of listing of the new class of share. They also report a continued decline in the cumulative prediction error during the @day period beyond the date of listing. They note that most of the price decrease is attributable to the R V shares, and that a positive price premium to the SV shares is established as of the date of listing. Other research in this area has also documented the presence of positive price premia for S V shares relative to counterpart RV shares (Levy, 1982; and Lease, McConnell, and Mikkelson, 1983,1984). The third study which relates to this issue is that by Robinson and White (1987) who formulate and test a game-theoretic model of the value of voting power. They conclude from their analysis that the value of the voting provision stems from the ability of controlling shareholders to exprop- riate the wealth of other shareholders. This conclusion is one which is consistent with the findings of both positive price premia and abnormal cumulative losses.
This research extends these previous findings along two dimensions. First, this paper addresses the temporal
stability of the return generating functions used in the CPE methodology. It is found that shifts in the parameters of the return-generating models can be associated with the creation of RV shares, a finding which may partially explain the finding of negative prediction errors on the date of listing reported by Jog and Riding. It is also found that RV shares exhibit significantly higher ex-post estimates of systematic risk than do the S V counterpart shares. The mulrs of the Cumulative Prediction Error methodology (CPE, henceforth) are presented only as a basis for this extension.
Second, the trading frequencies of RV and S V shares subsequent to the listing, and of the original common s h a m prior to the listing, are measured. It is found that the RV shares trade with greater frequency than either the original common shares or the SV shares, a finding consistent with the hypothesis that issuance of RV shares may benefit shareholders by providing enhanced marketability.
Following these introductory remarks, the second section of this paper will set forth a brief description of the RV share creation processes and the sample. The third section describes the methodologies and findings of the CPE analysis including a cross sectional analysis of the potential effects of firm-specific variables. The fourth section describes the methods used to seek event- related shifts in the parameters of the return-generating models, and presents the empirical findings of those techniques. The fifth section describes the analysis of the effects of RV share creation on trading volumes. The paper closes with a brief discussion of the implications of the findings and suggestions for further study in this area.
RV SHARE CREATION AND SAMPLE SELECTION
RV Share Creation There are three methods employed to create R V
shares. The first involves distributing R V shares to holders of the original common shares by means of an exchange offer. This method is similar to a stock split, wherein the firm exchanges a package of R V and SV shares on a pro-rata basis for each of the original common shares. By the second method, RV shares are created and issued as part of an acquisition transaction. The third method, which is rarely used by firms whose voting shares are already listed, is to employ the underwriting process for the creation of RV shares as would be done for initial offerings of other security issuances.'
The RV and S V shares may differ in more respects than voting rights. While the most frequently observed differences relate to differential cash distributions, takeover protection clauses are also common and describe the rights of RV shareholders when a takeover bid is made for the firm's S V shares. Examples include:
M A R S i M A R C H 1989 RCSAICJAS 63

M A R K E T R E A C T I O N S OF R E T U R N , RISK. A N D LIQUIDITY ... JOG & KIDlh<;
clauses which have the effect of requiring offers to be made for equal quantities of R V and S V shares; and clauses which provide R V shareholders with the right to vote on takeover offers by converting RV shares into S V shares. In many instances, however, no takeover protection is afforded. Potentially, these attributes may influence how investors value the R V / S V share package, influences which might be incorporated into the return generating process.
Frequently coincident with the issuance of RV shares are announcements of dividend changes. While dividend rates are commonly equal across the two classes, it is also not unusual for R V shares to have higher indicated dividend rates than (or dividend preferences over) the corresponding SV shares. Accordingly, the issuance of R V shares cannot, a priori, be deemed to be a process of creating shares which simply differ as to voting rights. There may be potentially confounding effects on shareholders' wealth and the valuation of shares caused by such factors as dividend differentials and takeover protection, as well as the considerations involving the value of corporate control which this study investigates.
Previous Findings and Theoretical Considerations The ideas presented in the literature of agency theory
provide ready explanations of why investors might react adversely to the issuance of R V shares. The potential ability of insider-managers to use the R V / S V share distinction to achieve entrenchment may not be in the interests of outside shareholders. Consolidation of control by insider managers not only insulates management from the discipline of the market for corporate control, but it also facilitates additional consumption of perquisites by such a management team. To this effect, works by Lease, McConnell, and Mikkelson (1983 and 1984) and.by Levy (1982) have documented the existence of a positive price premium to S V shares relative to the RV shares. Lease and his co-workers conclude that this positive premium is linked to unidentifiable cash benefits accruing to the S V shareholders. Jensen and Ruback (1984) argue, however, that the premium is related to the value of corporate control.
Moreover, insider-managers may be able to approp- riate disproportionate shares of takeover premia in the event of an external bid for control. DeAngelo and DeAngelo (1985) document instances in which holders of RV shares do not share in the large takeover premia received by insider holders of S V shares. Recent anecdotal evidence to this effect is also available in the Canadian context (for example, prices of RV shares of Canadian Tire Corporation and of Steinberg's Ltd. both declined to an unusual extent in association with possible changes in ownership of the firms).
It should not be surprising. therefore. that investors mag react adversely to issuances of R V shares. Recent work by Jog and Riding( 1986) present empirical findings which suggest that net-of-market returns to both classes of shareholders are negative subsequent to the
announcement date and are negative and statistically significant at the listing, or effective, date. They note that, on average, returns on R V shares are lower than those on counterpart S V shares and that negative returns seem to persist for at least sixty days subsequent to the date of listing. This paper presents an alternative explanation for the apparent persistence of negative abnormal returns.
Partch studied 44 U. S. firms which had issued common shares with limited voting rights (23 of which were traded over-thecounter, 15 of which were listed on the American Stock Exchange, and six of which were listed on on the NYSE). She found that hsiders'average proportionate ownership of votes increased subsequent to the issuance of the new class of shares and concludes that 'managers create limited voting common stock because of a desire to maintain their control position" (page 333). Her findings with respect to share price reactions associated with the creation of RV shares are mixed: she finds some significant and positive stock price reactions associated with the announcement, but a negative and statistically insignificant reaction over the time interval between the announcement date and the shareholder approval date.
In the face of the predictions of agency theory and of the empirical findings described above, it seems surprising that R V shares continue to be issued. There appear to be two explanations of why RV shares are issued: the ability of the insider group to increase its welfare by arranging "non-pecuniary benefits not received by outside shareholders"(Levy, 1982); and that insiders create RV shares to protect themselves from the threat of hostile takeovers and lo expropriate disproportionate takeover premia.'
Partch concludes that managers create RV shares out of a desire 10 retain control. If this "consolidation of control" hypothesis were true, it is reasonable to expect that subsequent to the stock splits by which RV shares are created:
(a) trading volumes in S V shares would be lower than
(b) trading volumes in RV shares would be no less
Findings that trading volumes follow these patterns would by no means be definite support for th is hypothesis, but would be a result which is consistent with this hypothesis. Accordingly, this study reports the results of investigations trading volumes of RV and SV shares following the issuance date and of common shares prior to creation of RV shares.
With the advent of RV common shares, outside RV shareholders may not have the power to influence corporate decisions even though they may be in the majority and may have provided most of the risky capital for the firm. This inability to exert control potentially leaves outside owners relatively less able to control cash payments from the firm to themselves (dividends, for example) and thus, they may be relatively more vulnerable to market-related price fluctuations. Shifts
in counterpart RV shares; and
than in predecessor common shares.
R CSA / CJA S 64 M A R S ; M A R C H 1909

MARKET REACTIONS OF RETURN. RISK. AND LIQUIDITY ... JOG & RIDING
in the levels of the market risk of R V shares could potentially explain the abnormal prediction errors on the date of listing reported in previous research. As noted by Brenner (1977). Larker, Gordon and Pinches (1980). and Brown, Durbin, and Evans (1975) persistently negative prediction CKOS (also known as 'abnormal returns') subsequent to the date of listing may be attributed to shifts in risk parameters. The size and direction of errors in the estimation of abnormal returns can be gauged from the following development of the methodology most commonly employed in the detection of 'abnormal returns'.J
Suppose that during an estimation interval (t subscript), returns are governed by the well-known Single Factor Model (SFM) written here in deviation form:
On the basis of the observed data during this estimation interval, the parameter@) of the SFM may be estimated (supposing the assumptions behind the classical linear model hold) from:
b+ = cov(rl, rm, ) /~ar ( rmt) .
where the denotes an estimated value of the preceding parameter.
Suppose, however, that in the prediction interval (the time pcriod(s) for which 'abnormal returns', or 'prediction errors', are to be estimated, denoted by 7
subscript) the parameter(s) of the model shift according to:
B7 = b + ' d.
and that during the prediction interval ( 7 subscript) returns are generated by the SFM augmented with the sought-after 'abnormal return' (r.) thus:
fr = B7rmT + f a + U 7 (2)
This relatively simple model of non-stationarity supposes that beta values are constant within both the estimation and the prediction intervals, but that a shift occurs, perhaps in conjunction with the event or perhaps in conjunction with decisions made which might be associated with the event. According to this model, the residuals (estimated abnormal returns) during the prediction interval are given by:
u * ~ = r7 - P7
From (3) it is seen that the estimated abnormal returns, or prediction errors, incorporate three components. The first is the well-behaved (according to the assumptions behind the classical linear model) error term which approaches zero on aggregation across the securities in the sample. The second is the sought-for 'abnormal return' associated with the particular event. The third term in the calculated residuals, however, is the contaminating effect of shifts in the model parameter(s). Inspection of this term reveals that it is not always possible, u priori, to specify the manner in which shifts in the parameter might influence the estimation of prediction errors. The bias is seen to be jointly determined by the firm-specific direction of the parametric change and the contemporaneous deviation of the return of the market from its mean. To the extent that parametric shifts are not cross sectionally independent and returns on the market are high or low relative to the mean, abnormal returns are biased and the size and direction of the bias are not opriorispecified. One of the primary purposes of this paper is to identify, empirically, whether or not issuances of RV shares are accompanied by shifts in estimates of the market risk parameter. Such a finding could therefore provide an explanation of the apparent persistence of negative abnormal returns reported in previous studies.
Sample Selection From issues of the Toronto Stock Exchange Review,
130 firms which have dual classes of common shares were initially identified as potential cases for analysis. Two criteria were used to select firms for further analysis from this group.
The first requirement was that eligible firms must have created dual classes of common shares by means of the pro-rata stock split method during the January 1976 to December 1984 period. The application of this criterion resulted in the selection of 62 of the original 130 firms. This particular criterion was chosen for two reasons. First, it was found that firms which had issued R V shares by means other than the stock split process had usually issued them to a small number of individual investors in connection with mergers or acquisitions. Simultaneous mergers or investment activity may mask any effects on shareholders' wealth due solely to the creation of RV shares. Second, in most of these cases, the RV shares tended to be closely held and very little trading was observed in the RV, the SV, or even the original common shares.
The second criterion for inclusion in the sample was that there be sufficient trading in selected securities to permit observation of market values. Shares of many of the 29 firms eliminated in this step typically traded less than once per week. In such instances, no timely price observation is available to reflect the market's valuation of the shares at the various event dates.
The final sample consisted of 33 pairs of securities of firms which had issued R V shares between 1976 and 1984, and which had exhibited a sufficient amount of
1 RCSAICJAS 65 MARSlMARCH 1989
MARKET R E A C T I O N S OF R E T U R N . RISK. A N D LIQUIDITY ... JOG & RIDING
daily trading in each class. In order to test for possible selection biases, characteristics of this sample were compared with those of the 62 firms identified from the first criterion. These comparisons were carried out across a variety of financial measures and ratios. These included size (assets, sales), dividend provisions, control measures, common financial ratios, and industrial sector. Data for this step were collected from financial statements and confirmed by telephone calls with the secretary-treasurer of each company. In no respect, other than thinness of trading, did the 33-firm samgle differ (at the 5% level of statistical significance) from the 62- firm population.6
CPE METHODOLOGY AND FINDINGS
The CPE Methodology In the tradition of information event studies, the
Cumulative Prediction Error (CPE) methodology is employed as the basis of this work. This methodology is a two-step process designed to identify the impact of a particular event on share prices. Accordingly, it is applied to a cross section of securities which share the common event, in this case, the creation of RV shares. The first step of the technique estimates the parameters of a model of the process which is thought to generate security returns.' The second step links departures of actual security returns from those predicted by the estimated return-generating model (prediction errors, or *PE's") to the specific event.8
The interval used in this study to estimate the parameters of the models was from 181 days to 61 days prior to the announcement event. The prediction interval in which PE's were estimated included the period from 60 days before the event to 60 days subsequent to it. For the prediction interval, event time was defined alternately in terms of the announcement date and then in terms of the listing date.
An addition to the standard application of the CPE approach involved adjustments for thin trading. The work of Dimson (1979). Fowler, Rorke, and Jog (1981). and Cohen et al. (1980). provide some examples of proposed adjustments. While the techniques described by Dimson are thought to be inferior to others (Fowler and Rorke, 1983), no consensus about the superiority of any one method has emerged; the impact of the various correction procedures on the parametric estimates also tends to be small. Moreover, Brown and Warner ( 1985) have observed that the results of event analysis techniques are robust to thin trading.
Nonetheless, in addition to requiring a minimum level of trading frequency for inclusion in the sample, an adjustment for thin trading was incorporated in the procedures. These corrections were accomplished by adjusting the variance of the error terms for first order serial correlation in the spirit of Ruback (1983). Asquith el al. (1983; see, in particular, page 127): and Scholes and Williams (1980).
The results of this methodology, based on the use of the Single Factor model of the return generating process, are'reported for each of two event definitions: the announcement date and the effective date, respec- tively. Both models of the return generating process were employed in the course of analysis with results which were virtually identical. Therefore, results presented here, in the interests of brevity, are from only the one model.
For the effective date, returns are computed corres- ponding to each of three simulated investment strategies. The first is for a 'passive" investor. This strategy supposes that the investor who owns pre-split shares receives RV and SV shares at the effective date and continues to hold them in the proportions received. For this strategy, returns are computed on B split-adjusted basis (for some securities, multiple SV and RV shares are issued for each predecessor common share) for the common shares prior to the listing and for the pro-rota package of RV and SV shares subsequent to the listing.
The second strategy corresponds to an investor who, at the opening of trading on the effective date, sells RV shares at the closing price and purchases SV shares (the "SV strategy"). Post-split, returns are calculated based only on the SV shares which would have been purchased from the sale of the RV shares. Finally, the third strategy (the "RV strategy") simulates an investor who, at the opening of trading on the effective date, sells all SV shares at the previous closing prices and purchases RV shares. in both cases, appropriate adjustments are made for changes in the number of shares due to the split.
CPE Findings The results of application of the CPE event analysis
are presented in Tables 1 and 2. The top panel of Table 1 sets forth the findings as they relate to the CPE's in event time, where the event is defined as the announce- ment of the firms'intent to issue RV shares.9 The bottom panel of Table I presents the corresponding results where event time is defined in terms of the effective, or listing, date. Note that both sets of findings are based on the simulated "passive"strategy and on parameter estimates obtained from t=-181 to t=41 in announcement date event time, and are the same results as presented by Jog and Riding (1986).
Table 2 presents the CPE results for the 'SV strategy" and the "RV strategy" in listing date event time, thereby providing a comparative assessment of the performance of these two classes. In each case, the results obtained with and without corrections for thin trading and from alternate return generating-models were not materially different from each other. In the interests of brevity, only one set of results is presented here.
Announcement Date Effects From Table I , it is seen that prior to the announcement
date, abnormal prediction errors are negligible. Subsequent to the announcement, CPE's decrease and
31 SAICJAS 66 MARS,'MARCH 1989

M A R K E T R E A C T I O S S OF R E T U R X . R I S K . A N D L I Q U I D I T Y ... JOG k R I D I N G
TABLE 1 TABLE 2
Prediction Errors: Announcement and Listing Dates
(1) Announcement Date Prediction Errors:
Period From To CPE tCPE &WE PI 1 ~ 1 PI tp2
-60. 60. -0.052 -1.00 -0.65 0.48 -0.17 0.03 4.52 -60. 0. ' O.OO0 0.00 0.70 0.42 -0.87 0.00 -1.32 * 5. 5. 4.016 4.98 4.63 0.63 1.57 0.00 -1.32 - I. 1. -0.010 -1.16 -0.92 0.67 1.91. 0.03 -0.52
0. 0. O.OO0 0.13 0.22 0.58 0.87 0.06 0.28 1. 60. 4.052 -1.42 -1.62 0.58 0.87 0.06 0.28
(2) Listing Date Prediction Errors:
Period From TO CPE ICPE ZCSPE PI tpl PI [PI
do. 60. -0.1691 -3.44** -2.82" 0.67 1.91 0.12 1.88 -60. 0. -0.0588 -1.69 -1.43 0.61 1.22 0.06 0.28 - 5. 5. 4.0226 -1.52 -2.13 0.61 1.22 0.12 1.88 - I . I . 4.0142 -1.83 -1.64 0.58 0.87 0.18 3.47'.
0. 0. -0.0165 -3.70'. -3.86" 0.64 1.67 0.27 5.87" I. 60. -0.1103 -3.19** -2.56.. 0.58 0.87 0.12 1.87
WE ,PI
'IW
', , I
Cumulative prcdiction error for period (cumulative abnormal returns) Student's I t a t (measures statistical significance of CPE) 2 statistic for standardized CPE (alternative measure of significance of CPE) Proportion of firms whose predicllon errors are < 0 Student's I test to measure significance of P, Proponion of firms whose prediction errors are significantly < 0
Relative Performance of RV and SV Shares
(1) RV Strategy Prediction Errors:
Period From TO CPE tcrr LSPE PI t ~ , P? tt2
4. 60. 4.1849 -3.76.. -3.25'. 0.70 2.26.. 0.15 2.68.. -60. 0. 4.0680 -1.95.' -1.74 0.63 1.57 0.06 0.28 - 5. 5. -0.0408 -2.75.. -3.85" 0.73 2.61'. 0.15 2.68.. - I. 1. 0.0297 -3.84.. -3.89.. 0.64 1.57 0.24 5.07**
0. 0. 0.0258 -5.77.. 6.30** 0.76 2.96.. 0.33 7.41'. I . 60. -0.1169 -3.38** -2.86'. 0.61 1.22 0.15 2.68**
(2) SV Strategy Prediction Errors:
Period From TO CPE ~ C P E LSPE PI tr! P2 tr2
-60. 60. -0.1287 -2.62,' -1.85 0.61 1.22 0.09 1.07 -60. 0. 4.0478 -1.37 -1.07 0.58 0.87 0.00 -1.32 - 5. 5. 4.OOO9 -0.06 4.13 0.61 1.22 0.06 0.28 - I . I . 0.0027 0.34 0.80 0.52 0.17 0.09 1.08
0. 0. 4.0056 -1.24 -1.04 0.55 0.52 0.15 2.68'. I . 60. -0.0809 -2.34** -1.55 0.61 1.22 0.12 1.88
tra
**
Note Results presented in this table arc bued on the single Iactor return generating model given by equation ( I ) Findlngs bucd on the aliernative model (2 ) arc not materially different and arc Jvrilablc on request
Student3 t t a t to meuurc significance of P, S t a t i ~ t i ~ ~ l l y significant at 5% kvel Statistically significant at 1% level
it proportion of firms with negative CPE's (PI) exceeds 1 percent; only one finding is statistically significant the5percent level, that ofthe(-1,l)prediction interval, Iring which 67 percent of the firms had negative CPE's. tamination of the data by day prediction errors (not tscnted here for the sake of brevity) revealed only e significant prediction error of -I. I I percent on the y subsequent to the announcement ([=I).
kctivc (Listing) Date Effects In the bottom panel of Table 1, it is seen that the :rease in CPE's associated with R V share creation trongly evident at the listing date. There is both a rp and significant negative prediction error of - I .65 cent at the listing date, as well as a statistically iificant and persistently negative series of prediction trs for the 60day period subsequent to the listing !. Moreover, these results are not attributable to vidual outlier firms. According to the PI and P2
test statistics, a significant fraction of the firms exhibit negative prediction errors in conjunction with the split.
These results reflect the buy and hold strategy. For this strategy, the results following the effective date reflect price changes in both classes of shares. At this point, it is not clear which of these share classes, if only one, accounts for the decreasing CPE's.
Relative Performance of RV and SV Shares Table 2 has very clear implications. An inspection
of these results provides definitive evidence that the decreases in CPE's at the effective date are primarily attributable to the R V shares. The top panel of Table 2 shows the CPE's and associated test statistics for the package of ordinary common shares before the split. and RV shares (exclusively) post-split. The bottom panel of Table 2 presents the same information for the SV strategy.
UCJAS 67 M A R S ; M A R C H 1989

M A R K E T REACTIONS OF R E T l l R X . RISK. AND LIQI!IDIT)
FIGURE 1
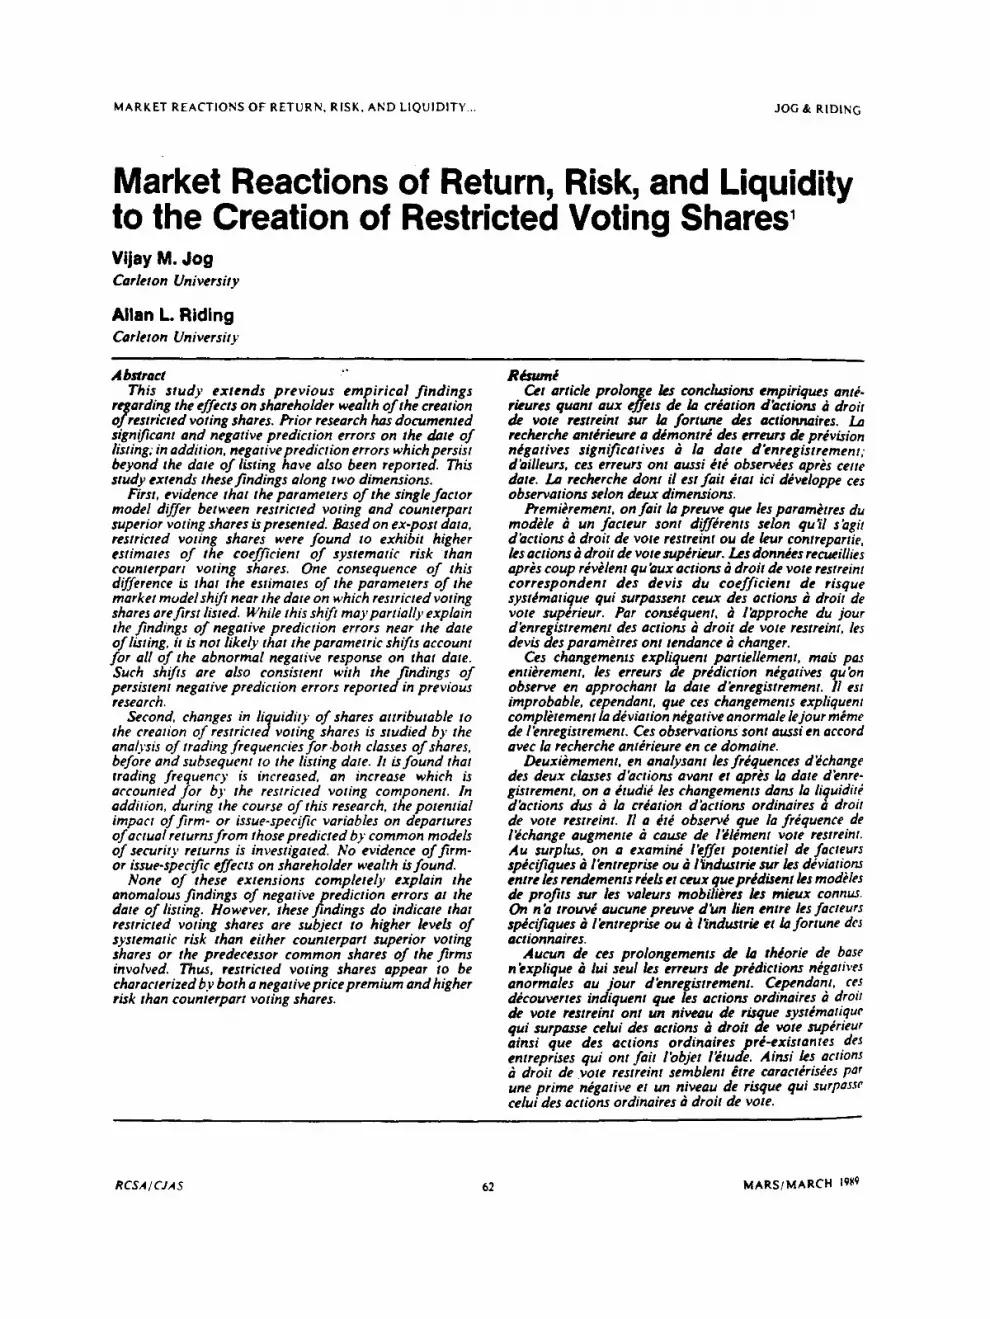
Synthetic Portfolio Moving Beta Estimates
I I I I I
56 60 0. 0 1 -
-1 0 0 10 20 30 40 T I M E PER100 ( D A Y S )
For the RV strategy, the CPE's are uniformly and significantly negative. Moreover, a significant propor- tion of the firms exhibit negative CPE's during most prediction intervals. Conversely, it is seen that, if anything, the values of SV shares appears to temporarily appreciate at the time of listing, even though the CPE's associated with the S V sharc's decrease during the longer prediction intervals. The combination of these effects establishes a premium, relative, to R V shares, for holders of S V shares. The size and direction of this premium is consistent with the earlier results of Lease, McConnell, and Mikkelson (I983,1984), and Levy (1982).
It has already been noted that, in addition to differential voting rights, S V and R V shares may differ, from firm to firm, with respect to dividends, takeover provisions, and other attributes. These issue-specific details may affect the prediction error estimates for a given company. I n order to assess this possibility, cross sectional multiple regression was used to discern correlations between the prediction errors and firm- or issue-specific variables: none of the issue-specific variables investigated here were found to systematically impact the prediction errors."'
ESTIMATION OF PARAMETRIC SHIFTS
Methodology The CPE methodology described above rests on the assumption that the parameters of the return-generaling
function estimated on the basis of pre-event data continue to be appropriate during, and subsequent to, the event. Prediction errors for the RV and SV shares are computed, in the CPE methodology, based on parameter estimates for the original common shares over the -181 to -61 day period in announcement event time. Brenner (l977), and Larker, Gordon, and Pinches (1980) have demonstrated that the violation of the assumption of parametric constancy can result in biased residuals and erroneous conclusions. In particular, residuals estimated on the basis of a mis-stated return-generating model are likely to show a persistent trend away from the fair game assumption. As noted in section 2.2, it follows that the identification of shifts in the estimators of the parameters can provide at least a partial explanation of the persistence of negative prediction errors.
There is little doubt that the assumption of parametric constancy is, in general, a tenuous supposition. Recent evidence (Hays and Upton, 1986) shows that lack of parameter constancy may be the rule rather than the exception. Three models of nonstationarity have been explored. Faboui and Francis (1978) and Alexander and Benson (1982) have explored the random coefficients model of nonstationarity, with mixed findings. Sunder (1980), Jog and Riding (l986), and Alexander, Benson, and Eger (1983) have documented findings which show that a first-order Markov process appears to be appropriate for a significant proportion of securities. Finally, Bey (l983), Riding (1983). and Rosenberg and
RCSAI CJAS 66 M A R S ; M A R C H 1989

M A R K E T R E A C T I O N S OF R E T U R N . R I S K . A S D L I Q U I D I T Y ... JOG & R I D I N G
Guy ( 1976a,b), among others, have investigated discrete shifts in estimates of systematic risk or have attempted to link such shifts to fundamentals of the firm or exogeneous information-related events.
The timing of any shifts which may occur in conjunction with the R V share issue is uncertain. Parametric shifts, reflecting adjustments in systematic risk expectations, could arguably occur at several possible dates, including the dates of announcement and listing. Therefore, several techniques for the investigation of structural change were considered, but ruled out.!'
The "moving regression" approach described by Brown et al., however, was deemed appropriate. It does not require a prion knowledge of the timing of a shift; moreover, it is robust to heteroscedastic disturbance terms. According to the moving regression approach, ordinary least squares estimation of the single factor model is carried out using n of the total of T observations in the time series. Estimation is first carried out using observations 1 through n, then using observations 2 through n+l , and so on.12 In this research, a 36day moving regression interval was selected and applied to the data for t=-181 in announcement event time to t=+60 in listing event time. Associated with the moving regression approach is a variant of the Chow test F- statistic13 for testing the null hypothesis of no parametric shifts.
Parametric Shifts: Findings The aggregated cross sectional beta estimates of the
moving regressions applied to the three strategies (buy and hold, RV, and S V ) are plotted in Figure 1. This graph provides clear visual evidence of parametric shifts and parametric differences between the strategies.
Prior to the split date, the average beta estimate was constant and approximately equal to O.S.14 Subsequent to the split, the average moving beta estimates for the buy and hold strategy increased to approximately 0.7. This was not a statistically significant change in aggregate, nor was the proportion of firms which showed upward shifts in beta significantly different from the proportion expected to shift by chance. Nonetheless, the direction and magnitude of the suggested shift is sufficient to account for some of the long term declines observed in the CPE values.
From Figure I , it is also seen that the cross sectional average of the beta estimates for R V shares is approximately twice that of the S V shares. This difference is statistically significant at the 5 percent level forty days after the date of listing.15 If the beta estimates areequated tosystematic risk, it is seen that the portfolios of investors who hold R V shares are subject to greater rensitivity to market factors than investors who hold otherwise equivalent S V shares.
In order to supplement these results, ordinary least cquares estimation was used to relate returns on the SV shares (RSV,,) to returns on the counterpart R V lares (RRV,,) for each of the jz1.33 securities during he post-split period (tZl.60) according to:
These regressions were found to be statistically significant in 29 of the 33 cases, indicating a high degree of correlation between the returns on the counterpart shares. The estimated values of Bj were significantly greater than 1.0 in 28 cases, a finding consistent with the presence of a higher risk for R V shares than for S V shares.
I t should be noted that while parametric shifts account for the negative CPE values over the long prediction intervals, they fail to explain the finding of a -1.65 percent prediction error for the buy and hold strategy on the day of listing. Nor do changes in the parameters of the return generating models explain the -2.97 percent prediction error for R V shares on the date of listing. These short-term results appear to suggest a trading rule which is inconsistent with the efficient market hypo- thesis.
ANALYSIS OF LlOUlDlTY AND TRADING VOLUME
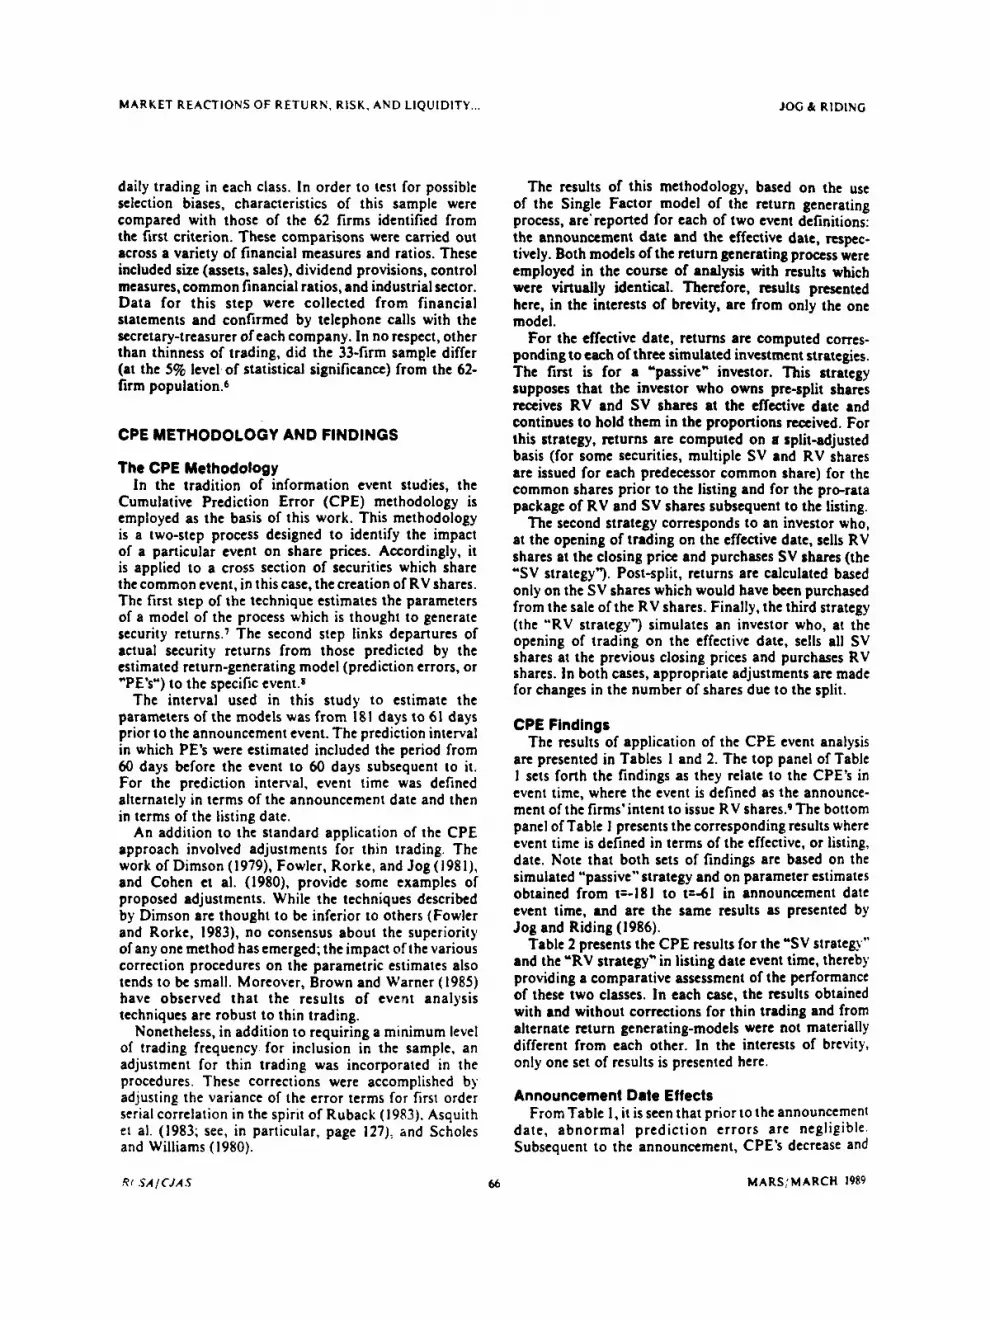
The enhancement of liquidity has been one rationale cited in corporate prospectuses as justification for RV share creation. In order to investigate the effects of RV share creation on liquidity, a trading volume index was constructed using a procedure consisting of two steps.16 Because trading volumes are expressed in terms of the number of "pieces of paper" which trade, the first step consisted of accounting for the split by expressing post- split volumes in terms of the number of pre-split equivalents. In the second step, trading volumes were averaged cross sectionally in event time, where the event was defined as the effective date of the split. Further smoothing of the time series was accomplished by using of a fifteenday moving average longitudinally in event time.
Figure 2 presents the results of the analysis of trading volumes patterns. It is clear that there is a marked increase in trading volume subsequent to the split, most of which is attributable to the R V share component. It is clearly seen that the R V shares enjoy greater trading frequency than do the pre-split shares. In contrast, the S V shares trade at lower volumes than either the R V shares or the pre-split common shares. Further investigation, on a case-by-case basis, revealed that the improvements in trading frequency are most evident for those companies whose original common shares had been among the most thinly traded in the sample.
SUMMARY, DISCUSSION, AND CONCLUSIONS
Two observations summarize the empirical findings presented in the foregoing sections.
69 M A R S I M A R C H 1989 #('!iAl C IA S

MARKET REACTIONS OF RETURN. RISK. A N D LIQUIDITY ... JOG 8: RIDIKG
FIGURE 2
Moving-Average Trading Volume
r 12000
SO00
6000
I000
1
I- c v)
01 I 1 I I 1
Di? R E L R T i v E T O EFFECTIVE b T E -90 60
First, the RV shares were found to exhibit significantly higher average beta estimates than the counterpart SV shares. This finding implies that returns on R V shares are more sensitive to changes in market factors, and therefore can be considered riskier than their SV counterparts. This finding is consistent with the hypothesis that R V shareholders may perceive that they have relatively less control over direct cash payments from the firm and that their returns are relatively more vulnerable to market-related price fluctuations.
Second, an increase in trading frequency is observed, on average, with the issuance of R V shares. In accordance with the "consolidation of control" hypothesis, most of this increased activity is for trading in the R V shares. This finding is also consistent with the presence of an increase in the number of shares in the float. Also in accordancc with the "consolidation of control" hypothesis, the SV shares appear to experience, at most, similar trading volumes to the original common shares.
The findings of significant prediction errors at the effective date remain puzzling. The statistical evidence points to a strong negative price reaction which apparently violates the efficient market hypothesis. However, this type of anomaly does not stand alonc in recent literature. Grinblatt, Masulis. and Titniar: ( 1984), for example. observed significant abnorm:i! positive returns on the ex-dates of stock splits. Thcsc abnormal returns were additional 10 positive abnormai returns associated with the announcement of stock splih.
In addition, Sanger and McConnell (1986) were unable to explain significant negative abnormal returns immediately following the listing of securities on the New York Stock Exchange, even though the securities which they studied had previously been listed on NASDAQ, and even though prior public announcement and approval for listing on the NYSE had been granted.
This same listingdate reaction establishes the positive price premia which R V shares appear to enjoy relative to the counterpart SV shares, a premium which has also been documented in the works of Levy ( 1982), and Lease. McConnell, and Mikkelson (1983, 1984). Most of the reaction at the listing date is attributable to the R V share component. These results are consistent with the findings of Robinson and White (1987) who report that, ceteris paribus, differences in the value of R V and SV shares are attributable to the ability of controlling shareholders to expropriate t he wealth of other shareholders.
Oneexplanation of this effect lies in the trading actions of corporate insiders who seek to consolidate their control by purchasing SV shares. Given a personal wealth constraint, one way in which insiders can finance the purchase of SV shares is through the sale of Rv shares.
A second explanation for the price decline on the effective date could be attributed, to some extent. by the observed upward shift in the aggregate b e ~ a of t h c two classes of shares. A ceteris paribus increase in t h c systematic risk of a firm ought to be accompanied b!

MARKET REACTIONS OF RETUR'c. RISK. AND LIQUIDITY JOG k RIDING
an increase in required return and, hence, a decrease in stock price. The magnitude of the listing day share price reaction, however, to too large to be attributable, in whole, to the observed shifts in the systematic risk parameters. The finding that beta risk estimates appear to have shifted at the time of the RV share listing is consistent with, and may account for, what, in previous research, appeared to be persistent and puzzling cumulative abnormal negative returns.
The findings of higher systematic risk and trading volumes for the RV shares and correspondingly lower trading volumes for the SV shares are consisttnt with successful separation of equity and control. It seems likely that insider-managers retain control by holding the SV shares, but permit the RV shares to enter the float. An expected result of this action is precisely that SV shares would trade less frequently and RV shares more frequently and that RV shares would have higher beta values. The holders of R V shares have no power to discipline a management team. Therefore, it is reasonable to expect that returns on RV shares would be more sensitive to market effects relative to returns on shares whose owners possess voting power.
The implications of the separation of equity and control are considerable. I t is clear that such separation provides insider-managers the power retain control but at the same time reduce their dollar holdings. I t may also allow them to appropriate both additional perquisites and the ability to negotiate disproportionate premia in the event of an attempted takeover. Such managers would be less vulnerable to competing managerial teams. Finally, they may obtain the power to unilaterally re-write the owner-manager covenant.
NOTES
I The authors wish to acknowledge the editorial assistance of Miss Diane Rycrson during the preparation d the manuscript of this paper. The financial support of Carleton University is also acknowledged. The authors are indebted to the time. effort. and interest of three anonymous r e f e m on k h a l f of this work. Errors and omissions which remain are the sok responsibility of the authors.
2 As the m e n t case of Canadian Tire demonstrates, such protection can h a w significant implications for both minority holders of voting shares u well u the holders of restricted voting shares. Note that many of the initial public offerings of common shares under the Quebtc Stock Savings Plan have restricted voting priviledges. DcAngelo and DeAngelo cite four instances in which insiders appear to have benefitted from unusually high takeover premia. In Canada, the recent debates in the press, the Ontario Securities Commission. and the couns also add credence to this idea.
' This development is b u e d on the work of Brenner (1977). ' While this procedure docs not guarantee the absence of a selection bias.
the alternative procedure. namely to use the 62-firm population. was rejected becausc trading in the shares of the 29 firms not included was so thin that price observations would almost certainly contain measurement errors and estimation of parameters of return generating models would be severely contaminated with thin trading effects.
' Two well-known models of the security return generating process uere used. 8s alternates. in the first of the above steps The Single Factor Market (SFM) model. is given by:
R,, = aj + b,R,, + ej, (4) where Rj, and Rm, are wealth relative returns calculated using the standard logarithmic transformation and aj and bj a n paramncrs urumed to k constant a d the error term is rrrumed to obey the assumptions of the classical linear model. The M u n A m y c Return Model (MARA) is spccikd =ording to:
(5) According to tau employed by Brown and W u n r (1980. 1985). and Dodd and Warner( 1983). both models have been found to k appropriate for this methodology. The use of both models and the urociatcd lest statistics have k e n described extensively in sosalled "event uudier" (we. for example, Eckbo. 1983. pp. 252-Uk Jog and Ridin& 1986. and Panch. 1987).
* Price. dividend, and volume data used in the u l cuh t ion of security returns were obtained from FRI Information Services W .nd checked with ihc m o r d s of the Toronto Stock E x c b n p .
* In each uu. announcement dates were confirmed with the ucmary- treasurer of the film.
' 0 Potential explanatory variables examined in this analysis included mcuures of insider holdings. dividend preferences and dividend differemees. a zero-one binary vanable to designate control by majority shareholders. and liquidity (as measured by markcc data on frequency of trading). Ordinary least squares as well as weighted k u t squam estimation vu employed. The weighted least squarer approach w u used to allow lor potential heteroscedasticity by standaradiring each prediction error by theestimated standard deviation of the residuals in the estimation period. The findings of both estimation procedures were consistent: no variable w u found to k statistically significant and the explanatory power of the linear models was nil. T h e n procedures were repeated wing the prediction errors from a vanny of prediction intervals; however, the results proved to k robust. In shon. b u e d on the sample of 33 pairs of securities used here, the observed differences k t m n the prediction errors could not be explained by issue-specific variables.
I i Among these were the so)called Chow test, variabalc parameter regression, and intervention analysis. The recursive midual "cusum- technique dacsribed by Brown Durbin. and Evans (1975) was also dismissed because it lacks power when the goodness of fit of the model is low. To identify the timing of shifts in linear models. Brown and his co-workers describe a variety of techniques which have been applied in a financial context by several researchers. including Hayes and Upton (1986). and Bey (1983). Most techniques. however, either requtre a priori knowledge of the p m i s e timing of parametric shifts or test for purely random shifts. Examples of the former category include variable parameter regression models and the intervention analysis model proposed by Lrkc r . Gordon. and Pinches (1983); examples of thc latter include the random coefficient and random walk models as well as some of the recursive residual-based techniques described by Brown and his colleagues, (such as the cusum of squares test).
While the choice of n is arbitrary. very large values (n>90-100) render the technique less sensitive to parametric variation and very small values (n<12).
RF = QR,] + uj,
IJ Refer to Brown et a1 (1975). 1' Clearly. these firms which have issued RV s h a m arc not representative
of the TSE in terms of systematic risk; however, there is no reason why one would expccl these firms. which have all issued these "unusual" securities 10 be nprercntative.
( 5 When the moving regression ends on the fortieth day. the 36 day moving regression is no longer b u e d on either pn-split data or the unusual listing date effects.
I* Trading volume data W8S obtained from FRI Information Services Ltd.
REFERENCES
G.J. Alexander and P.G. &nron. (1982) "More on &la as a Random Coefficient", Journal of Financial and Quonriraiiw Analjsu. Vol. 17. KO. I . March.
G.J. Alexander. P.G. Benson. and C.E. Egcr. (I983)"Modelling Common Stock &!a Coefficients as First-Order Markov Processes". ProcrrdtnRs of the Amrriron Slarisriral Assoriation.
P. Asquith. R. Bruncr. and D. Mullins Jr.. (1983) 7 h e Gains to Bidding Firms from Merger", Journal of Fmanrial Eronomirs. Vol. I I .
71 M A R S l M A R C H 1989 RCSA I CJAS

MARKET REACTIONS OF RETURN, R I S K , A N D LIQUIDITY ... JOG & RIDIRG
R. Bey. (1983) 'Market Model Stationarity of Individual Public Utilities-. Journolof Finonriolond Quonrirorrrr Anoluis. Vol. 18. No. I . March.
M. Brcnner. (1977) "The Effect of Model Misspccifiution on Tats of the Efficient Market Hypothesis". Journalof Finonrr. Vol. 32. No. I.
R.L. Brown. J. Durbin. and J.M. Evans. (1975) 'Techniques for Testing the Constancy of Regression Relationships Over Time", Journal of rk Row/ Srarisriral Sorirty. Vol. 37. Scm B Methodological.
P.S. Brown and J. Warner. (1980) 'Measuring Security Prim Pcrfomncc', Journal of Finanrial konomics. Vol. 8.
P.S. Brown and J. Warner. (1985) 'Using Daily Stock Returns. The Caw of Event Studies-, Journolof Frnanriol Gonomirs. Vol. 14. No. 1.
KJ.Cohcn.C.H. Hawawini.S.F. Maier. R.A. Schwanr,and D.K. Whitcomb. (1980) 'Estimating and Adjusting for the lntervrling Elf- Bias in Beta". Salmon Brothen Center for the Study of Financial Institutions. Working Paper 205. February.
DcAngclo. H., and L. DcAngclo. (1985) 'Managerial Owmnhip of Voting Rights: A Study of Public Corporations with Dual C h u r of Common Stock-, Journalof Financial konomirs. Vol. 14. No. 1. pp. 33-69,
E. Dimson, (1979) 'Risk Meuurcmnt When Shams arc Subjat to Infrequent Trading". Journol of Finanrial &onomirs. Vol. 7.
P. Dodd and J.B. Warner. (1983) 'On Corporate Governance: A Study of Proxy Contests". Journol of Finamial t5onomrcs. Vol. I I .
B. C. Eckbo. (1983) "Horizontal Mergers. Collusion and Stockholder Wealth'. Journal of Finanrial konomirs. Vol. I I .
F. Faboui and C. Francis. (1978) 'Beta u a Random Cocffeient', Journal of Finonrialand Quonriroriw Anoliris. Vol. 13. No. 1. March. D. Fowler. C.H. Rorkt. and V. Jog. (1981) 'A Bias C o m i n g Procedure for
Beta Estimation in the Presence of Thin Trading". Prorrrdings of rhr Adminisrrariw Srirnrrs Assoriarion of Canoda. Halifax. NOVJ Scotia.
D. Fowler and C. H. Rorke. (1983) " R s k Measurement when Sharer arc Subject to Infrequent Trading- Comment'. Journal of Finonrial Eronomirs. Vol. 12. August.
M Grinblatt. R . Masulis. and S. Titman. (1984) 'The Valuation Effects of Stock Splits and Stock Dividends', lourno/ of Finanrial konomirs. Vol. 13.
V.M. Jog and A.L. Riding.(l986)'Priu Effects of Dual Class Shares". Finonriol Analwr'lournol. Vol. 42. No. I Jan.-Fcb.
D. Lukcr. L Gordon. and C. Pinches. (1980) 'fating for Marta EfCcicnc,. A Comparison of the dumuhtivc Avcrage Residual Methodoloay and lntmention Analysis". Journol of Financial and Quonritotiw Analysis, Vol. 15. No. 2.
R.C. b, J.J. McConnell, and W.H. Mikkelson. (1983) 'The Market Value of Control in Publicly Traded Corporations-. Jownolofhanriol konomirs, VOl. 11.
R.C. Lurc. JJ . McConnll. and W.H. Mikkchon. (1983) T h e M a r k Value d DiITcreacial Voting Rights in C k l y Held Corporations". Journcf of Fiuncial Gvnomirs. Vol. I I. pp. 443467.
H. Lvy, (1983) 'Economic Valuation of the Voting Power of Common Stock" Journalof Finonrr. Vol. 38. No. 1. March. M. Panch. (1987) 'Thc Creation of a C h s of Limited Voting Common Stock
and Shutholder Wulth-, Journal of Financial Eronomics, Vol. 18. No, 2. June.
A.L Riding. (1983) "Stability of the Market Model Beta Coefkient: Effects of lafornution: Unpublished Ph.D. Thais. McGill University.
C. Robinson and A. White, (1987) 'Relative Valution of Voling and Rert&ed Voting Sham'. Yort Uninnity Workiu Paper, January.
8. R a c n b e q and J. Guy. (1976) 'Prediction of Bet& From In*crcment Fundamentrk. Pan One", Finanrial Ano!,rrr'Joumal. Vol. 32, No. 3. May- June.
B. Rormkrg and J. Guy, (1976) 'Prediction of Beta From Inwtrncnt Fundamentals. Pan Two'. Fuonriol Anolysu' Journal. Vol. 32. No. 4,
R. Ruback. (1983) 'Asussing Competition in the Market for Corporate Acquisitions'. Journal of FIMIUUI konomirs. Vol. I I .
C. Sanger and J. McConnell. (1986) 'Stock Exchanp Listings. Firm Value. and Security Market Efkiency: The Impact of NASDAQ" Journal oj Finonrioland Quonriroriw Anolwis. Vol. 21. No. I .
M. Schoks and J. Williams, (1977) 'Estimating Beta From Nonsynchronour Data". Journalof Financial Eronomirs. Vol. 5.
S. Sunder. (1980) 'Stationarity of Market Risk. Random Coefficients Ta t s for Individual Stocks'. Journol of Finonre. Vol. 3% KO. 4. September.
July-Aug .
RC.S.4 1 CJ.4 .'; 72 M A R S i M A R C H 1989