a shares in anatomy - goldman sachs
TRANSCRIPT
A shares in anatomy'A' primer for global investorsWhy China A shares have become more investable for global investors At a time when some investors are questioning the investability of Chinese assets due to significant regulation and growth concerns, we believe China A shares, a US$14tn asset class, have become more investable given the ongoing liberalization and reform measures in the Chinese capital markets. This reinforces our strategic view that China equity is an asset class that is too big, too growthy, and too vibrant to ignore, and will bring profound allocation benefits, thematic appeal, and alpha opportunities to global equity investors. In this 5th edition of our China A primer, we collate +200 most-frequently-asked-for charts to refresh our investment case for A shares, and help investors better navigate and engage in this sizable, under-owned, and to some, underappreciated, market.
Kinger Lau, CFA [email protected] Goldman Sachs (Asia) L.L.C.
Timothy Moe, CFA [email protected] Goldman Sachs (Singapore) Pte
Si Fu, Ph.D. +852-2978-0200 [email protected] Goldman Sachs (Asia) L.L.C.
Kevin Wang, CFA [email protected] Sachs (Asia) L.L.C.
Investors should consider this report as only a single factor in making their investment decision. For Reg AC certification and other important disclosures, see the Disclosure Appendix, or go to www.gs.com/research/hedge.html.
The Goldman Sachs Group, Inc.
PORTFOLIO STRATEGY RESEARCH | 13 February 2022 | 11:45PM HKT
Fifth Edition
Note: The following is a redacted version of the original report published on 13 Feb 2022 [89 pgs].
Executive summary: Why China A has become more “investable” for global investors 4
1. The investment case for A shares for global investors: Why do you need to own A shares? 6
2. Market structure: The uniqueness of A shares 10
3. Accessibility: Many channels to get exposed 15
4. Market regulations: Many changes have been made, and more to come 19
5. Index inclusion: A long-term demand tailwind for A shares 28
6. The Chinese Nasdaqs: STAR, ChiNext, and BJSE 35
7. Fundamentals: A growthy market 40
8. Valuations: Inexpensive vs history, local asset classes, and global equity peers 44
9. Flows/positioning: Structural trends in motion 49
10. ESG: Opportunities, risks, and facts 54
11. GS tools: Your China macro and markets toolkit 61
Disclosure Appendix 74
13 February 2022 2
Goldman Sachs China
Table of Contents
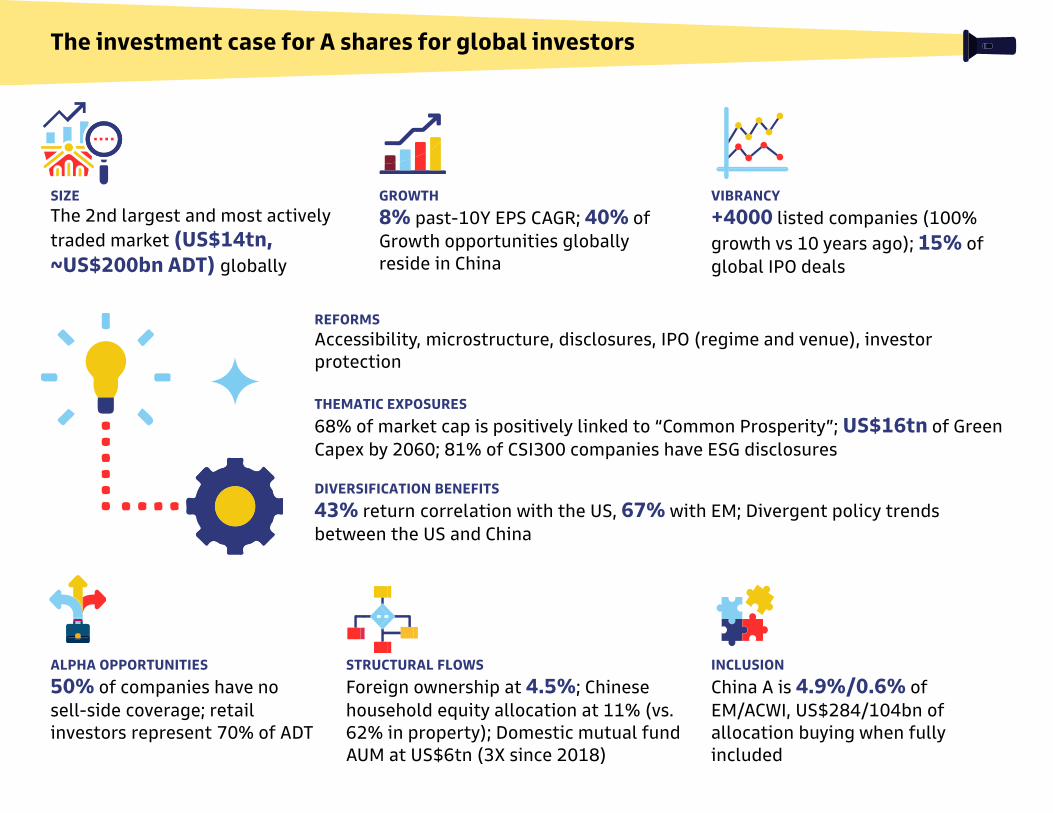
SIZEThe 2nd largest and most actively traded market (US$14tn, ~US$200bn ADT) globally
REFORMSAccessibility, microstructure, disclosures, IPO (regime and venue), investor protection
THEMATIC EXPOSURES
68% of market cap is positively linked to “Common Prosperity”; US$16tn of Green Capex by 2060; 81% of CSI300 companies have ESG disclosures
DIVERSIFICATION BENEFITS
43% return correlation with the US, 67% with EM; Divergent policy trends between the US and China
ALPHA OPPORTUNITIES
50% of companies have no sell-side coverage; retail investors represent 70% of ADT
The investment case for A shares for global investors
GROWTH
8% past-10Y EPS CAGR; 40% of Growth opportunities globally reside in China
VIBRANCY
+4000 listed companies (100%growth vs 10 years ago); 15% ofglobal IPO deals
STRUCTURAL FLOWS
Foreign ownership at 4.5%; Chinese household equity allocation at 11% (vs. 62% in property); Domestic mutual fund AUM at US$6tn (3X since 2018)
INCLUSION
China A is 4.9%/0.6% of EM/ACWI, US$284/104bn of allocation buying when fully included
Executive summary: Why China A has become more “investable” for global investors
2021 was a challenging year for Chinese equities, with regulatory shifts, economic stresses, continued geopolitical tensions and uncertainty around the pandemic inflicting a 33% peak-to-trough correction on MSCI China over the past 12 months, the largest drawdown since 2015. They have also prompted widespread investor questions about the investability of Chinese
assets, the first time this concern has come to the forefront since July 2015 when more than 1400 A shares (31% of market
cap then) were suspended at one point amid a leverage-unwind selloff.
While we recognize the difficult investment landscape for Chinese stocks last year, notably for China ADRs, where forced de-listing remains an ongoing concern, we’d be hard pressed to label China as “uninvestable”. On the contrary, we believe
Chinese A shares have become more investable for international investors considering the ongoing capital market
opening up/reform momentum (QFII reform), accessibility enhancements (expansion of the Connect scheme) and product proliferation (e.g. MSCI China A50 Connect futures), and market structure evolution that we feature extensively in this primer.
These developments add to the strategic investment case for China A that is, at a higher level, predicated on its significant
size and liquidity (the 2nd largest and most actively-traded equity market globally, at US$14tn and US$188bn ADT), promising growth and business potential for investors, and other appeals from both alpha-generation (under-researched, under-owned, inefficiency arbitrage) and asset allocation (rising benchmark weights, positive portfolio effect) perspectives.
“Regulation” currently carries a negative connotation in an equity market context (i.e. after the shocks in 2021). But for A
shares, many regulatory changes concerning the capital markets have been made in recent years, aiming to improve market efficiency (e.g. short selling, registration-based IPOs), governance frameworks, information asymmetry, investor protection, and to better align with international norms.
In previous editions of this primer, index inclusion was a key justification for global investors to incorporate A shares in their
portfolio. Its progress has stalled since Nov 2019 but could regain momentum this year or next as more inclusion conditions are met, warranting renewed attention from investors on index-oriented implications and strategies. Indeed, the market spotlight over the past 2 years has shifted from inclusion to “creation”, with the STAR Board and the Beijing Stock
Exchange making their debut in the span of the past 2.5 years, embodying the overarching macro policy bias of supporting
SMEs and direct financing, reducing leverage, fostering innovation, and promoting fairer competition, especially in the “New China” cohorts.
The new listing regimes/venues onshore should allow growthy companies easier access to the capital market, further boosting the fundamental profile of China A which remains a fertile ground for investors to look for structural/organic
13 February 2022 4
Goldman Sachs China

growth opportunities, with around 40% of them globally residing in China per our classification. Importantly, Chinese
growth looks inexpensively priced in the equity universe, at least compared to its own history, competing asset classes locally, and other equity alternatives globally across absolute and implied valuation metrics.
The compelling growth vs. valuation trade-off has manifested itself in realized portfolio flows, with Northbound net buying
reaching a record-high of US$67bn in 2021 and global mutual fund mandates staying overweight A shares, in stark
contrast to HK and ADRs where investor underweights remain pronounced. Domestically, the long-discussed (and awaited) trend of asset institutionalization appears in motion, as evidenced by the 3-fold surge in equity AUM held by domestic
institutional investors since 2018, perhaps helped by the huge (US$60tn) but struggling property market which still accounts for 62% of household allocation and could drive trillions of dollars of asset reallocation flows to equities over time.
There is no shortage of investment themes in a deep market like A shares. ESG is one of the most consequential initiatives and investment stories globally, and China has a significant role to play as a policy enforcer, standard setter, financier, investor, and a marketplace of ESG investment opportunities, particularly given China’s commitment to achieving carbon
neutrality by 2060 which may entail US$16tn of Green capex in the next 40 years on our global Sustain team’s estimate. Partly related to the “S” in ESG, we believe Common Prosperity will be a guiding principle for China as it strives to become
the largest economy in the world by the end of this decade, and 68% of the A-share market cap is favorably linked to this comprehensive development concept per our sector-mapping analysis.
To present a balanced view, we highlight a number of commonly-cited risks/investor concerns of investing in A shares,
such as corporate governance and accounting irregularities, and present factual evidence on how these issues (and the regulatory oversight of them) have evolved over time. In a similar vein, the Goldman Sachs Macro Research Team has created a wide spectrum of proprietary tools spanning macro growth and industry measures, US-China Relations
Barometer (GSSRUSCN), Equity Risk Barometers (GSSRCERA/H), Retail Sentiment Indicator (GSSRARTL), sector allocation framework, to Regulation Proxy and Regulation Barometer (GSSRCNRG) to better quantify and manage risks and identify opportunities in the stock market from a top-down perspective. Most of these tools are updated in our China Weekly Kickstart for investors who wish to track them on a regular and timely basis.
In sum, while we stay constructive on A shares (Overweight in AeJ) , we acknowledge that the market is still at a nascent stage of its development (32 years of history) and that China A is a high-risk, high-reward market (if defined by returns volatility and dispersion). Precisely for this reason, China A hosts many specific opportunities that offer compelling
risk/reward via a micro lens as well as various thematic and style-based dimensions, including “New Northbound Favorites” and “Common Prosperity portfolio”. We hope this refreshed primer that contains 245 exhibits organized in 12
sections will help investors generate alpha in this exciting market, and better embrace the structural shifts that will likely reshape the global equity investable universe in the years to come.
13 February 2022 5
Goldman Sachs China

1. The investment case for A shares for global investors: Why do you need to own A shares?
Exhibit 1: Size matters: China A is the 2nd largest equity market globally by market cap and cash turnover
01000200030004000500060007000
0102030405060
NYS
E +
NAS
DAQ
SHSE
+ S
ZSE
Japa
n SE
Hon
g Ko
ng S
E
Kore
a SE
Lond
on S
E
Aust
ralia
n SE
Euro
next
Taiw
an
Sing
apor
e
Deu
tsch
eBö
rse
Market cap (US$tn) # of listed companies (RHS)(US$tn)
As of Dec 31, 2021
0.00.51.01.52.02.53.03.5
0
50
100
150
200
250
NYS
E +
NAS
DAQ
SHSE
+ S
ZSE
Japa
n SE
Kore
a SE
Hon
g Ko
ng S
E
Taiw
an
Euro
next
Lond
on S
E
Deu
tsch
eBö
rse
Aust
ralia
n SE
Sing
apor
e
ADVT (2021) Turnover velocity (RHS)(US$bn) (x), 2021
As of Dec 31, 2021
Source: WFE, data compiled by Goldman Sachs Global Investment Research
Exhibit 2: Chinese assets (equities and bonds) look underrepresented in global indexes relative to China’s economic influences
20.4%
14.7% 13.0%10.9%
27.9%
11.2%
4.5% 3.6%0.6%
14.1%
8.0%
3.2%
0%
10%
20%
30%
GDP(2021)
Total trade(2020)
Consumption(2020)
RMB wgt inSDR
(2021)
A-shr turnoveras % of the
world(2H21)
A-shr mkt capas % of the
world(Dec 2021)
Foreignownership in A
shares(Dec 2021)
China % inMSCI AC
World(Dec 2021)
A-shr % inMSCI AC
World(Dec 2021)
China bondsas % of world
(1Q2020)
China % inBloombergBarclays
global bondindex
(Dec 2021)
Foreignownership inChina bonds(Sep 2021)
Equity
Note: China as % of world (Macro Data)
Macro Bond
Source: World Bank, United Nations, WFE, PBoC, MSCI, FactSet, Wind, Bloomberg, Goldman Sachs Global Investment Research
13 February 2022 6
Goldman Sachs China

Exhibit 3: Some unique sectors in A shares which offer investor exposures to “New China” and “Digital Economy”
Exhibit 4: China A appears well positioned for long-term themes and cyclical policy easing
Exhibit 5: China A has shown low return correlations with global equity markets, potentially offering positive portfolio benefits
Cable & Satellite Casinos & GamingCommercial Printing Diversified Capital MarketsDistillers & Vintners Diversified REITs
Drug Retail Insurance BrokersElectric Utilities Reinsurance
Food Distributors SilverFood Retail
Forest ProductsGeneral Merchandise Stores
HomebuildingHomefurnishing Retail
Housewares & SpecialtiesIndustrial Gases
Office Services & SuppliesOil & Gas Refining & Marketing
Precious Metals & MineralsResearch & Consulting Services
Security & Alarm ServicesTechnology Distributors
Trucking
Note: Red color indicates New China sub-industries.
Sectors in A shares,not in H shares
Sectors in H shares,not in A shares
40%
68%
0%
20%
40%
60%
80%
% market cap ofstocks in GS
Common ProsperityUniverse
0.24
0.46
0.0
0.2
0.4
0.6
0.8
Correlation with Chinapolicy proxy^
China Offshore
7
22
0
3
6
9
12
15
18
21
24
South/Northbound flowsin past 3m (US$ bn)
China A shares
^ Based on monthly data since 2012. Cffshore China proxied by MXCN while China A shares proxied by CSI300 index. Higher correlation indicates performance more sensitive to policy stimulus. Connect flows as of Dec 31, 2021.
CN-A CN-H APJ JP US EU EM WD AvgCN-A 75% 69% 36% 43% 43% 67% 50% 55%CN-H 75% 89% 53% 56% 55% 88% 65% 69%APJ 69% 89% 68% 74% 77% 98% 84% 80%AeJ 71% 92% 99% 65% 68% 72% 98% 79% 81%JP 36% 53% 68% 65% 75% 68% 76% 63%US 43% 56% 74% 65% 78% 72% 97% 69%EU 43% 55% 77% 75% 78% 78% 90% 71%EM 67% 88% 98% 68% 72% 78% 83% 79%WD 50% 65% 84% 76% 97% 90% 83% 78%
Weekly MSCI market return (USD) correlation, past 5 years
Source: Wind, FactSet, Goldman Sachs Global Investment Research Source: Bloomberg, Wind, FactSet, Goldman Sachs Global Investment Research Source: FactSet, MSCI, Goldman Sachs Global Investment Research
Exhibit 6: About 40% of growthy companies which are expected by FactSet consensus to generate more than 10% top-line CAGRs over the next 3 years in MSCI AC World reside in China
Exhibit 7: Chinese stocks will likely deliver high earnings growth and look attractively valued relative to other key markets globally in terms of PEG
Exhibit 8: Chinese equities tend to be more volatile, but can also be more “rewarding”
64% 63% 67% 63% 55% 56% 56% 62%
22% 25% 22% 25%31% 30% 30% 26%
13% 12% 11% 12% 14% 14% 14% 13%
0
200
400
600
800
1000
1200
1400
1600
0%10%20%30%40%50%60%70%80%90%
100%
2013
2014
2015
2016
2017
2018
2019
2020
Rest of theWorld
China A
Chinaoffshore
Number ofcompanies
(%)Companies with >10% forward 3Y Sales growth
CAGR in MSCI AC World Index Number of companies
Note: 2020 denotes 2021-2023 Sales growth CAGR
China ADR
India
China ACSI300
China offshoreKorea
South Africa
JapanUS
DM
EMEurope
UK
Mexico
Brazil
0.5
1.0
1.5
2.0
2.5
3.0-5 0 5 10 15 20 25 30 35 40
2021-2023 EPS CAGR of major MSCI DM and EM markets (%)Note: As of Feb 2022; Local currency applies to country names and USD applies to region names. in USD; Country and region names refer to MSCI index.
2022
E PE
G(x
)
0.033654 0.052063 0.0048 0.0007
Note: Calculation based on past 3Y data. CSI300 is used for China A while MSCI indices are used for other EM markets. Realised vol is calculated as: stdev. of 3m rolling return*sqrt(4). 1Q is stocks with highest 25% annual return while 4Q is stocks with lowest 25% annual return
Aus
China
China A
HK India
Indo
Korea
MYNZPHLSG
TW
Thai
JP
MXAPJ
-20%
-10%
0%
10%
20%
30%
40%
50%
60%
15% 20% 25% 30% 35%
Realised volatility (%)
IQR annual return (%) of different markets (1Q-4Q)
Source: MSCI, FactSet, Goldman Sachs Global Investment Research Source: FactSet, MSCI, IBES, Goldman Sachs Global Investment Research Source: MSCI, CSI300, FactSet, Goldman Sachs Global Investment Research
13 February 2022 7
Goldman Sachs China
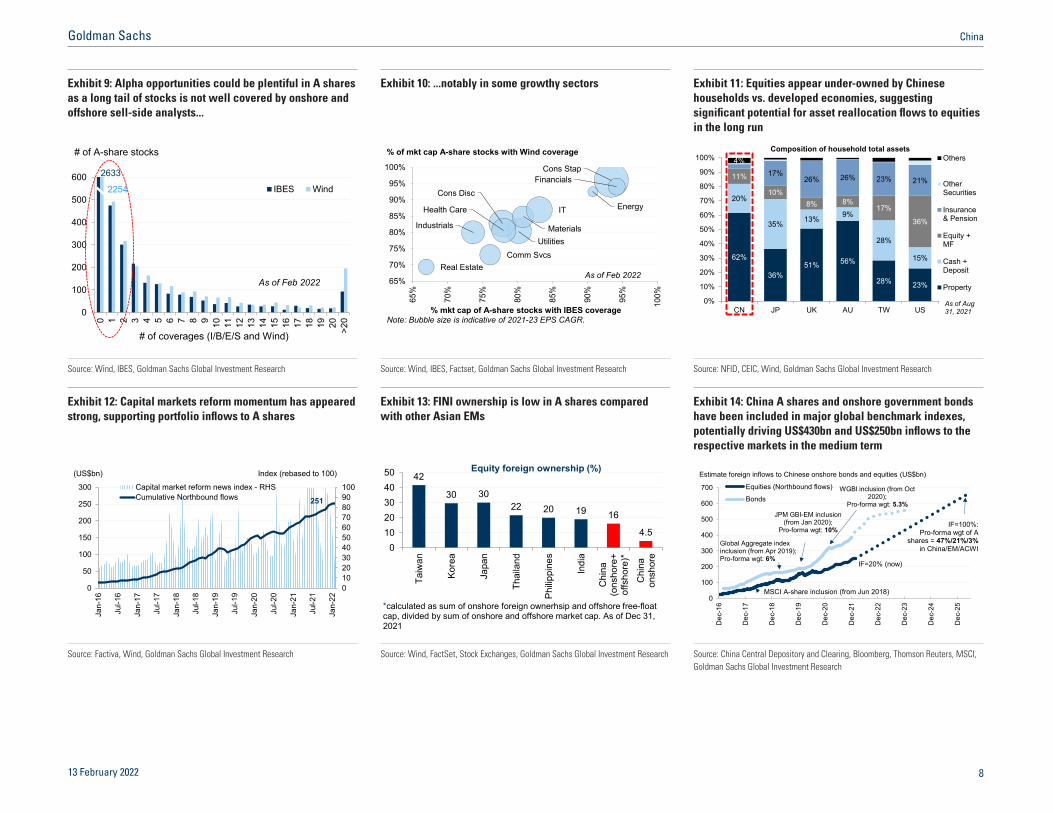
Exhibit 9: Alpha opportunities could be plentiful in A shares as a long tail of stocks is not well covered by onshore and offshore sell-side analysts...
Exhibit 10: ...notably in some growthy sectors Exhibit 11: Equities appear under-owned by Chinese households vs. developed economies, suggesting significant potential for asset reallocation flows to equities in the long run
0
100
200
300
400
500
600
0 1 2 3 4 5 6 7 8 9 10 11 12 13 14 15 16 17 18 19 20 >20
IBES Wind
# of A-share stocks
# of coverages (I/B/E/S and Wind)
As of Feb 2022
2633
2254
Real Estate
Industrials
Utilities
Cons Disc
Comm Svcs
Health Care
Materials
IT Energy
Cons StapFinancials
65%
70%
75%
80%
85%
90%
95%
100%
65%
70%
75%
80%
85%
90%
95%
100%
% of mkt cap A-share stocks with Wind coverage
As of Feb 2022
% mkt cap of A-share stocks with IBES coverageNote: Bubble size is indicative of 2021-23 EPS CAGR.
62%
36%51% 56%
28% 23%
20%
35% 13% 9%
28%
15%
11%
10%8% 8%
17%
36%
17%26% 26% 23% 21%
4%
0%
10%
20%
30%
40%
50%
60%
70%
80%
90%
100%
CN JP UK AU TW US
Others
OtherSecurities
Insurance& Pension
Equity +MF
Cash +Deposit
Property
Composition of household total assets
As of Aug 31, 2021
Source: Wind, IBES, Goldman Sachs Global Investment Research Source: Wind, IBES, Factset, Goldman Sachs Global Investment Research Source: NFID, CEIC, Wind, Goldman Sachs Global Investment Research
Exhibit 12: Capital markets reform momentum has appeared strong, supporting portfolio inflows to A shares
Exhibit 13: FINI ownership is low in A shares compared with other Asian EMs
Exhibit 14: China A shares and onshore government bonds have been included in major global benchmark indexes, potentially driving US$430bn and US$250bn inflows to the respective markets in the medium term
0102030405060708090100
0
50
100
150
200
250
300
Jan-
16
Jul-1
6
Jan-
17
Jul-1
7
Jan-
18
Jul-1
8
Jan-
19
Jul-1
9
Jan-
20
Jul-2
0
Jan-
21
Jul-2
1
Jan-
22
Capital market reform news index - RHSCumulative Northbound flows
(US$bn) Index (rebased to 100)
251
42
30 3022 20 19 16
4.50
1020304050
Taiw
an
Kore
a
Japa
n
Thai
land
Philip
pine
s
Indi
a
Chi
na(o
nsho
re+
offs
hore
)*
Chi
naon
shor
e
Equity foreign ownership (%)
*calculated as sum of onshore foreign ownerhsip and offshore free-float cap, divided by sum of onshore and offshore market cap. As of Dec 31, 2021
0
100
200
300
400
500
600
700
Dec
-16
Dec
-17
Dec
-18
Dec
-19
Dec
-20
Dec
-21
Dec
-22
Dec
-23
Dec
-24
Dec
-25
Equities (Northbound flows)
Bonds
Series3
Estimate foreign inflows to Chinese onshore bonds and equities (US$bn)
JPM GBI-EM inclusion (from Jan 2020);
Pro-forma wgt: 10%
Global Aggregate index inclusion (from Apr 2019);Pro-forma wgt: 6%
MSCI A-share inclusion (from Jun 2018)
IF=100%:Pro-forma wgt of A
shares = 47%/21%/3% in China/EM/ACWI
IF=20% (now)
WGBI inclusion (from Oct 2020);
Pro-forma wgt: 5.3%
Source: Factiva, Wind, Goldman Sachs Global Investment Research Source: Wind, FactSet, Stock Exchanges, Goldman Sachs Global Investment Research Source: China Central Depository and Clearing, Bloomberg, Thomson Reuters, MSCI, Goldman Sachs Global Investment Research
13 February 2022 8
Goldman Sachs China

Exhibit 15: Number of listed companies has doubled since 2010 in China A, while that for the US has only grown 22%
Exhibit 16: China A represented about 15% of IPO transactions globally in the past 2 years
Exhibit 17: Capital raising activities for Chinese companies remained robust in A shares, while those in HK and the US slowed in 2021
0
1000
2000
3000
4000
5000
6000
7000
2003
2004
2005
2006
2007
2008
2009
2010
2011
2012
2013
2014
2015
2016
2017
2018
2019
2020
2021
All A-share US-listed
# Companies # Companies Listed in A-shares vs US
0%
5%
10%
15%
20%
25%
0
500
1000
1500
2000
2500
3000
3500
4000
2010 2011 2012 2013 2014 2015 2016 2017 2018 2019 2020 2021
Number of IPOs in A-share and globally
GlobalA-shareA-share IPOs as % of global market - RHS
Number of deals
^ Based on # of deals 0
20
40
60
80
100
120
140
2010 2011 2012 2013 2014 2015 2016 2017 2018 2019 2020 2021
SZSE SSE ex STAR STAR HK US
IPO amount of Chinese companies listed in Mainland China, HK, and US (US$bn)
Source: FactSet, Wind, Goldman Sachs Global Investment Research Source: Bloomberg, Wind, Goldman Sachs Global Investment Research Source: Bloomberg, Wind, Goldman Sachs Global Investment Research
13 February 2022 9
Goldman Sachs China
2. Market structure: The uniqueness of A shares
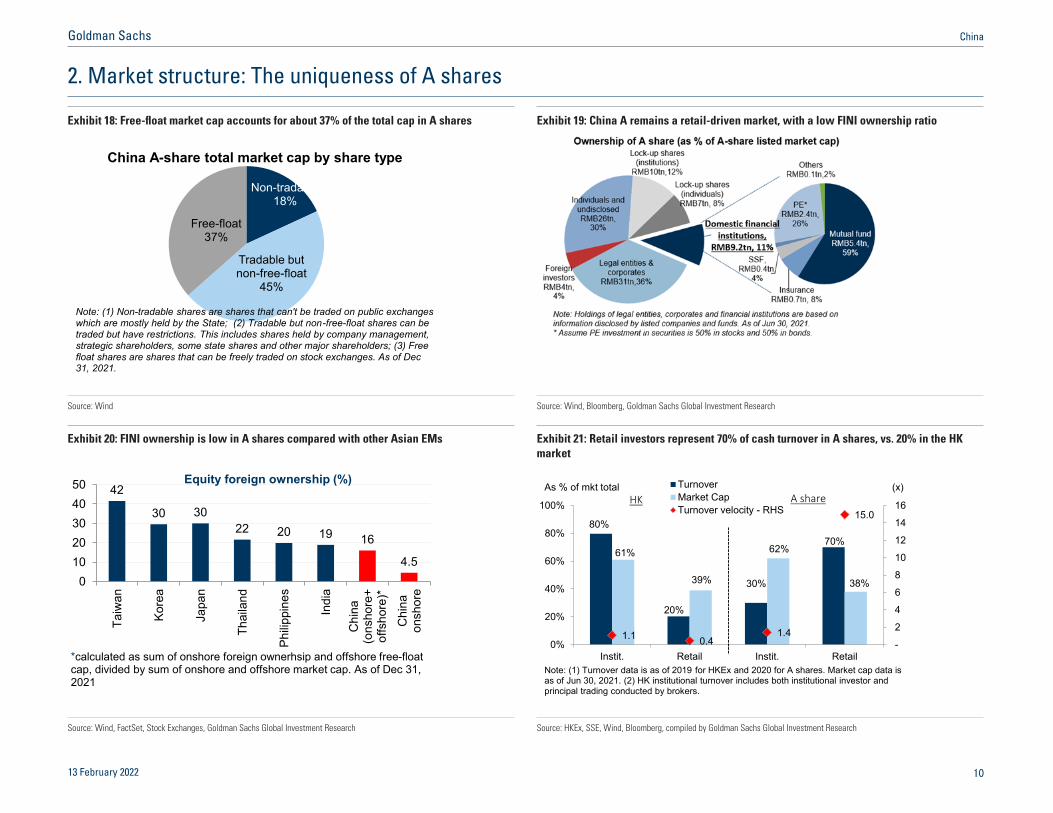
Exhibit 18: Free-float market cap accounts for about 37% of the total cap in A shares Exhibit 19: China A remains a retail-driven market, with a low FINI ownership ratio
Non-tradable18%
Tradable but non-free-float
45%
Free-float37%
China A-share total market cap by share type
Note: (1) Non-tradable shares are shares that can't be traded on public exchanges which are mostly held by the State; (2) Tradable but non-free-float shares can be traded but have restrictions. This includes shares held by company management, strategic shareholders, some state shares and other major shareholders; (3) Free float shares are shares that can be freely traded on stock exchanges. As of Dec 31, 2021.
Source: Wind Source: Wind, Bloomberg, Goldman Sachs Global Investment Research
Exhibit 20: FINI ownership is low in A shares compared with other Asian EMs Exhibit 21: Retail investors represent 70% of cash turnover in A shares, vs. 20% in the HK market
42
30 3022 20 19 16
4.50
1020304050
Taiw
an
Kore
a
Japa
n
Thai
land
Philip
pine
s
Indi
a
Chi
na(o
nsho
re+
offs
hore
)*
Chi
naon
shor
e
Equity foreign ownership (%)
*calculated as sum of onshore foreign ownerhsip and offshore free-floatcap, divided by sum of onshore and offshore market cap. As of Dec 31,2021
80%
20%
30%
70%61%
39%
62%
38%
1.1 0.41.4
15.0
-
2
4
6
8
10
12
14
16
0%
20%
40%
60%
80%
100%
Instit. Retail Instit. Retail
TurnoverMarket CapTurnover velocity - RHS
HK A shareAs % of mkt total (x)
Note: (1) Turnover data is as of 2019 for HKEx and 2020 for A shares. Market cap data is as of Jun 30, 2021. (2) HK institutional turnover includes both institutional investor and principal trading conducted by brokers.
Source: Wind, FactSet, Stock Exchanges, Goldman Sachs Global Investment Research Source: HKEx, SSE, Wind, Bloomberg, compiled by Goldman Sachs Global Investment Research
13 February 2022 <0
Goldman Sachs China

Exhibit 22: Retail investors have a strong bias towards Tech and Consumer stocks in A shares
Exhibit 23: Asset institutionalization in China has significant room to develop, in our view
10% 20% 30% 40% 50% 60% Telecom
Household Products Software
Professional Serv Semiconductors
Health Care Equip Media
IT Hardware Pharma
Materials Food Retaling
Durables Capital Goods
Consumer Services Auto
Div. Fin Utilities
Retailing Real Estate
Food & Beav Transport Insurance
Banks Energy
A-share market retail ownership:
38%
Note: Retail shares are calculated based on intituional shares as disclosed in top 10 shareholder data; as of 3Q 2021
0%
20%
40%
60%
80%
100%
120%
140%
160%
0
5
10
15
20
25
30
35
40
2000
2001
2002
2003
2004
2005
2006
2007
2008
2009
2010
2011
2012
2013
2014
2015
2016
2017
2018
2019
2020
2021
Mutual FundSSFInsuranceChina Total AUM as % of GDP - RHSUS Total AUM as % of GDP - RHS
AUM of Chinese funds and Insurance (RMBtn) Total AUM as % of GDP
Source: Wind Source: CBIRC, CEIC, Wind, Haver Analytics, Goldman Sachs Global Investment Research
Exhibit 24: Capital that could be deployed in the China equity market appears significant Exhibit 25: We estimate that US investors currently hold around US$1tn of Chinese equities currently
Note: The US holdings of HK-listed stocks are estimated based data disclosed by the US Treasury, and the US ownership of China A-share and US-listed Chinese stocks is calculated as the total US holdings divided by the total listed market based on stock-level data from Bloomberg.
14,255
3,064
1,069 1,062115 (1%) 332 (11%) 248 (23%)^ 115 (11%)0
2000
4000
6000
8000
10000
12000
14000
0
2000
4000
6000
8000
10000
12000
14000
16000
A shares H shares US-listedChinese stocks
HK-HK stocks
Listed market cap (US$bn)
US holdings in Chinese equities (US$bn)
Note: Numbers in bold indicate the US holdings in each universe (as % of listed market cap). ^ captures US institutional holdings only. As of Dec 2, 2021.
(US$bn) (US$bn)
Source: PBOC, Wind, CBIRC, SSF, Goldman Sachs Global Investment Research Source: US Department of the Treasury, Wind, Bloomberg, Goldman Sachs Global Investment Research
13 February 2022 <<
Goldman Sachs China

Exhibit 26: Chinese “Alphabet Soup”: Many share classes to navigate
Index Share Class Definition Stock Exchange [Currency]
Total listed market cap of share class
(US$bn)
MSCI Index market cap (US$bn)^
MSCI China A/ MSCI China
A-SharesChina securities incorporated in Mainland China, listed on the Shanghai or Shenzhen Stock Exchange and traded in Renminbi (RMB)
Shanghai [RMB] Shenzhen[RMB] 14255 389
B-SharesChina securities incorporated in Mainland China, listed on the Shanghai Stock Exchange (USD) and Shenzhen Stock Exchange (HKD)
Shanghai [USD] Shenzhen [HKD] 21 4
H-Shares China securities incorporated in Mainland China, listed on the Hong Kong Stock Exchange (HKD) Hong Kong [HKD] 816 520
Red-ChipsChina securities of state-owned companies incorporated outside Mainland China, listed on the Hong Kong Stock Exchange (HKD)
Hong Kong [HKD] 610 134
P-ChipsChina securities of non-government owned companies incorporated outside Mainland China, listed on the Hong Kong Stock Exchange (HKD)
Hong Kong [HKD] 1593 831
N-Shares^^
China securities (ADRs) incorporated outside Greater China (mainland China, Hong Kong, Macao and Taiwan), listed on the NYSE Euronext–New York, NASDAQ, NYSE AMEX traded on USD
New York [USD] 998 543
MSCI China
As of Jan 2022. ^ Index cap calculated based on Foreign Inclusion Factor (FIF). For A-shares, further applied for the Inclusion Factor of 20%. ^^ADRs with secondary / dual primary listings in HK (including Alibaba) are counted as N-shares.
Source: MSCI, FactSet, data compiled by Goldman Sachs Global Investment Research
13 February 2022 <2
Goldman Sachs China

Exhibit 27: Financials and Industrials remain the largest sectors in China A, although the significance of Consumer and Tech is rising
Exhibit 28: Different Chinese equity indexes offer very different sector exposures to investors
0%
10%
20%
30%
40%
50%
60%
70%
80%
90%
100%
2010 2011 2012 2013 2014 2015 2016 2017 2018 2019 2020 2021
Comm Serv
Utilities
Real Estate
Health Care
Cons Stap
IT
Cons Disc
Materials
Energy
Industrials
Financials
Mkt. cap breakdown of all A-shares
0%10%20%30%40%50%60%70%80%90%
100%
A50
CSI
300
SHC
OM
P
SZC
OM
P
Chi
Nex
t
STAR
50*
HSC
EI
HSI
HS
Tech
MXC
N
MXO
CN
Comm Serv
Energy
Utilities
IT
Cons Stap
Materials
Industrials
Cons Disc
Health Care
Real Estate
Financials
Current mkt. cap of sectors as % of China indices Onshore Offshore
Note: As of Jul 2021. *Calculated based on constituents total mkt
Source: FactSet, Wind Source: FactSet, Wind
Exhibit 29: Shenzhen is growthy and more exciting thematically, but Shanghai trades at lower valuation and is arguably less speculative
As of Feb 2022; retail shares are calculated based on institutional ownership disclosed in top 10 shareholder data; annualized turnover velocity=1M avg. turnover/1M avg. free float exchange cap.*252
Growthy & Exciting Higher valuation & risks
25.6
13.1
51015202530
SZ SH
21-23 EPS CAGR (%)
52%36%
0%
20%
40%
60%
SZ SH
'New China' weight
2.2% 1.9%
1%
2%
2%
3%
SZ SH
Margin balance as % of market cap eligible for margin financing
510152025
SZ SH
f-P/E (x)
Agg:18
Agg:11
Median:20Median:21
57%44%
0%
20%
40%
60%
SZ SH
Retail ownership
9.4
6.1
4
6
8
10
SZ SH
Annualized turnover velocity (x)
2.2
3.7
01234
SZ SH
Listed market cap/stock (US$bn)
12%
18%
0%5%
10%15%20%
SZ SH
# of coverage(I/B/E/S)>5 (%)
Source: Wind, IBES, Goldman Sachs Global Investment Research
13 February 2022 <3
Goldman Sachs China
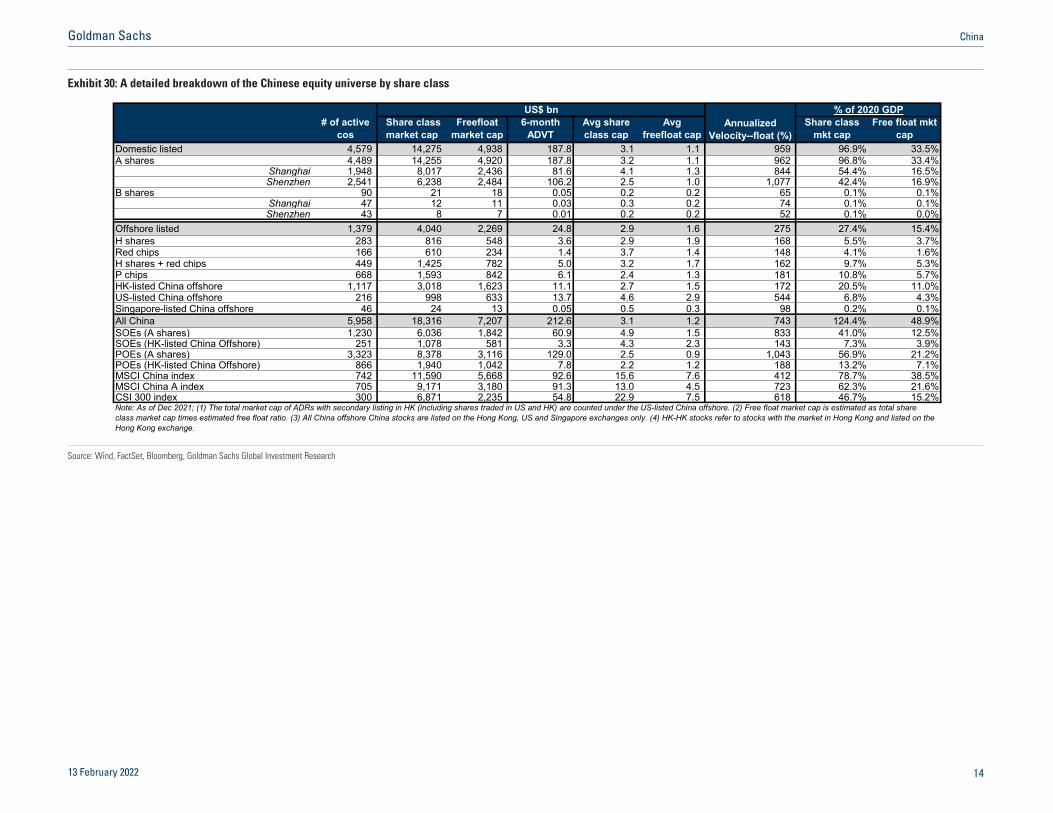
Exhibit 30: A detailed breakdown of the Chinese equity universe by share class
# of active cos
Share class market cap
Freefloat market cap
6-monthADVT
Avg share class cap
Avg freefloat cap
Share class mkt cap
Free float mkt cap
Domestic listed 4,579 14,275 4,938 187.8 3.1 1.1 959 96.9% 33.5%A shares 4,489 14,255 4,920 187.8 3.2 1.1 962 96.8% 33.4%
Shanghai 1,948 8,017 2,436 81.6 4.1 1.3 844 54.4% 16.5%Shenzhen 2,541 6,238 2,484 106.2 2.5 1.0 1,077 42.4% 16.9%
B shares 90 21 18 0.05 0.2 0.2 65 0.1% 0.1%Shanghai 47 12 11 0.03 0.3 0.2 74 0.1% 0.1%Shenzhen 43 8 7 0.01 0.2 0.2 52 0.1% 0.0%
Offshore listed 1,379 4,040 2,269 24.8 2.9 1.6 275 27.4% 15.4%H shares 283 816 548 3.6 2.9 1.9 168 5.5% 3.7%Red chips 166 610 234 1.4 3.7 1.4 148 4.1% 1.6%H shares + red chips 449 1,425 782 5.0 3.2 1.7 162 9.7% 5.3%P chips 668 1,593 842 6.1 2.4 1.3 181 10.8% 5.7%HK-listed China offshore 1,117 3,018 1,623 11.1 2.7 1.5 172 20.5% 11.0%US-listed China offshore 216 998 633 13.7 4.6 2.9 544 6.8% 4.3%Singapore-listed China offshore 46 24 13 0.05 0.5 0.3 98 0.2% 0.1%All China 5,958 18,316 7,207 212.6 3.1 1.2 743 124.4% 48.9%SOEs (A shares) 1,230 6,036 1,842 60.9 4.9 1.5 833 41.0% 12.5%SOEs (HK-listed China Offshore) 251 1,078 581 3.3 4.3 2.3 143 7.3% 3.9%POEs (A shares) 3,323 8,378 3,116 129.0 2.5 0.9 1,043 56.9% 21.2%POEs (HK-listed China Offshore) 866 1,940 1,042 7.8 2.2 1.2 188 13.2% 7.1%MSCI China index 742 11,590 5,668 92.6 15.6 7.6 412 78.7% 38.5%MSCI China A index 705 9,171 3,180 91.3 13.0 4.5 723 62.3% 21.6%CSI 300 index 300 6,871 2,235 54.8 22.9 7.5 618 46.7% 15.2%
US$ bnAnnualized
Velocity--float (%)
% of 2020 GDP
Note: As of Dec 2021; (1) The total market cap of ADRs with secondary listing in HK (including shares traded in US and HK) are counted under the US-listed China offshore. (2) Free float market cap is estimated as total share class market cap times estimated free float ratio. (3) All China offshore China stocks are listed on the Hong Kong, US and Singapore exchanges only. (4) HK-HK stocks refer to stocks with the market in Hong Kong and listed on the Hong Kong exchange.
Source: Wind, FactSet, Bloomberg, Goldman Sachs Global Investment Research
13 February 2022 <4
Goldman Sachs China
3. Accessibility: Many channels to get exposed
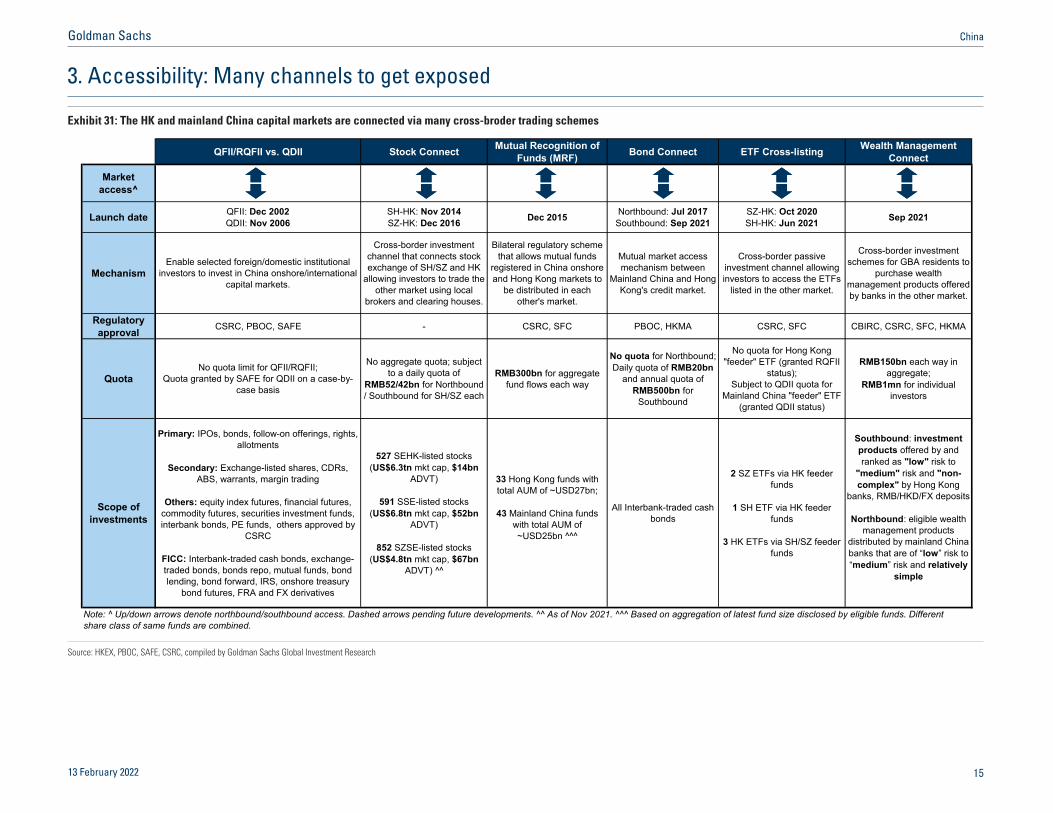
Exhibit 31: The HK and mainland China capital markets are connected via many cross-broder trading schemes
QFII/RQFII vs. QDII Stock Connect Mutual Recognition of Funds (MRF) Bond Connect ETF Cross-listing Wealth Management
Connect
Market access^
Launch date QFII: Dec 2002QDII: Nov 2006
SH-HK: Nov 2014SZ-HK: Dec 2016 Dec 2015 Northbound: Jul 2017
Southbound: Sep 2021SZ-HK: Oct 2020SH-HK: Jun 2021 Sep 2021
MechanismEnable selected foreign/domestic institutional
investors to invest in China onshore/international capital markets.
Cross-border investment channel that connects stock exchange of SH/SZ and HK
allowing investors to trade the other market using local
brokers and clearing houses.
Bilateral regulatory scheme that allows mutual funds
registered in China onshore and Hong Kong markets to
be distributed in each other's market.
Mutual market access mechanism between
Mainland China and Hong Kong's credit market.
Cross-border passive investment channel allowing investors to access the ETFs
listed in the other market.
Cross-border investment schemes for GBA residents to
purchase wealth management products offered by banks in the other market.
Regulatory approval CSRC, PBOC, SAFE - CSRC, SFC PBOC, HKMA CSRC, SFC CBIRC, CSRC, SFC, HKMA
QuotaNo quota limit for QFII/RQFII;
Quota granted by SAFE for QDII on a case-by-case basis
No aggregate quota; subject to a daily quota of
RMB52/42bn for Northbound / Southbound for SH/SZ each
RMB300bn for aggregate fund flows each way
No quota for Northbound; Daily quota of RMB20bn
and annual quota of RMB500bn for
Southbound
No quota for Hong Kong "feeder" ETF (granted RQFII
status); Subject to QDII quota for
Mainland China "feeder" ETF (granted QDII status)
RMB150bn each way in aggregate;
RMB1mn for individual investors
Scope of investments
Primary: IPOs, bonds, follow-on offerings, rights, allotments
Secondary: Exchange-listed shares, CDRs, ABS, warrants, margin trading
Others: equity index futures, financial futures, commodity futures, securities investment funds, interbank bonds, PE funds, others approved by
CSRC
FICC: Interbank-traded cash bonds, exchange-traded bonds, bonds repo, mutual funds, bond lending, bond forward, IRS, onshore treasury
bond futures, FRA and FX derivatives
527 SEHK-listed stocks (US$6.3tn mkt cap, $14bn
ADVT)
591 SSE-listed stocks (US$6.8tn mkt cap, $52bn
ADVT)
852 SZSE-listed stocks (US$4.8tn mkt cap, $67bn
ADVT) ^^
33 Hong Kong funds with total AUM of ~USD27bn;
43 Mainland China funds with total AUM of ~USD25bn ^^^
All Interbank-traded cash bonds
2 SZ ETFs via HK feeder funds
1 SH ETF via HK feeder funds
3 HK ETFs via SH/SZ feeder funds
Southbound: investment products offered by and ranked as "low" risk to
"medium" risk and "non-complex" by Hong Kong
banks, RMB/HKD/FX deposits
Northbound: eligible wealth management products
distributed by mainland China banks that are of “low” risk to “medium” risk and relatively
simple
Note: ^ Up/down arrows denote northbound/southbound access. Dashed arrows pending future developments. ^^ As of Nov 2021. ^^^ Based on aggregation of latest fund size disclosed by eligible funds. Different share class of same funds are combined.
Source: HKEX, PBOC, SAFE, CSRC, compiled by Goldman Sachs Global Investment Research
13 February 2022 <5
Goldman Sachs China
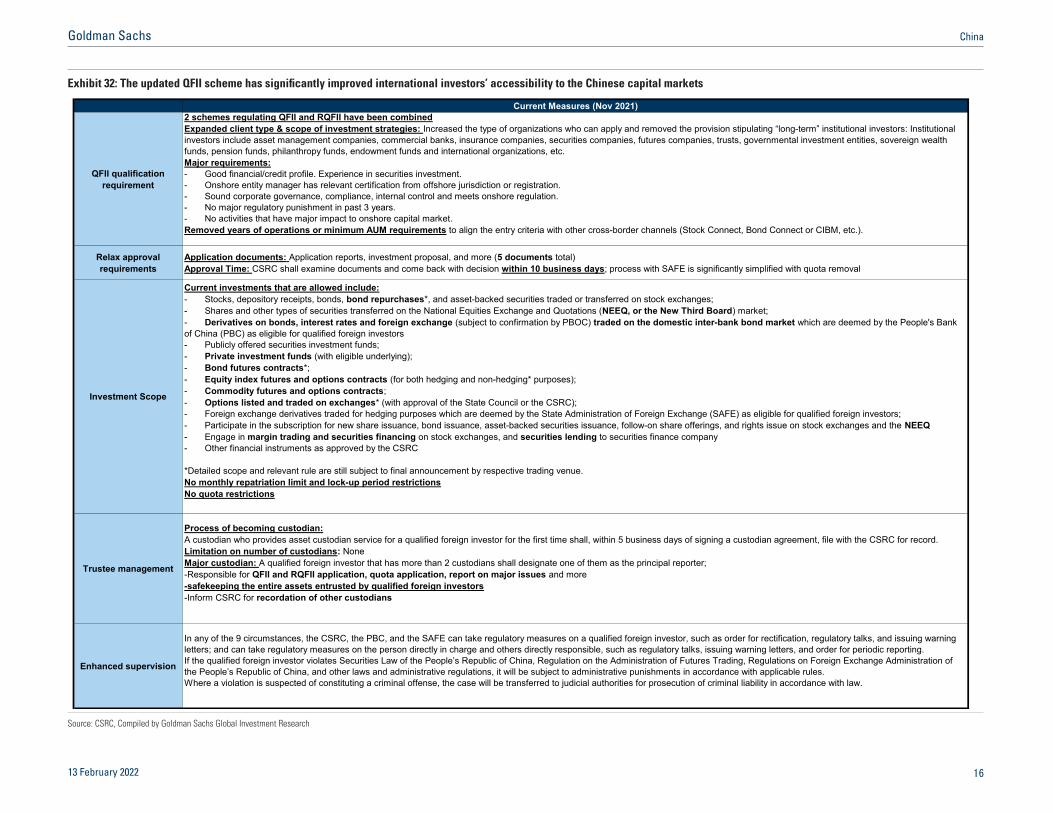
Exhibit 32: The updated QFII scheme has significantly improved international investors’ accessibility to the Chinese capital markets
Current Measures (Nov 2021)
QFII qualification requirement
2 schemes regulating QFII and RQFII have been combinedExpanded client type & scope of investment strategies: Increased the type of organizations who can apply and removed the provision stipulating “long-term” institutional investors: Institutional investors include asset management companies, commercial banks, insurance companies, securities companies, futures companies, trusts, governmental investment entities, sovereign wealth funds, pension funds, philanthropy funds, endowment funds and international organizations, etc.Major requirements:- Good financial/credit profile. Experience in securities investment.- Onshore entity manager has relevant certification from offshore jurisdiction or registration.- Sound corporate governance, compliance, internal control and meets onshore regulation.- No major regulatory punishment in past 3 years.- No activities that have major impact to onshore capital market.Removed years of operations or minimum AUM requirements to align the entry criteria with other cross-border channels (Stock Connect, Bond Connect or CIBM, etc.).
Relax approval requirements
Application documents: Application reports, investment proposal, and more (5 documents total)Approval Time: CSRC shall examine documents and come back with decision within 10 business days; process with SAFE is significantly simplified with quota removal
Investment Scope
Current investments that are allowed include:- Stocks, depository receipts, bonds, bond repurchases*, and asset-backed securities traded or transferred on stock exchanges;- Shares and other types of securities transferred on the National Equities Exchange and Quotations (NEEQ, or the New Third Board) market;- Derivatives on bonds, interest rates and foreign exchange (subject to confirmation by PBOC) traded on the domestic inter-bank bond market which are deemed by the People's Bankof China (PBC) as eligible for qualified foreign investors- Publicly offered securities investment funds;- Private investment funds (with eligible underlying);- Bond futures contracts*;- Equity index futures and options contracts (for both hedging and non-hedging* purposes);- Commodity futures and options contracts;- Options listed and traded on exchanges* (with approval of the State Council or the CSRC);- Foreign exchange derivatives traded for hedging purposes which are deemed by the State Administration of Foreign Exchange (SAFE) as eligible for qualified foreign investors;- Participate in the subscription for new share issuance, bond issuance, asset-backed securities issuance, follow-on share offerings, and rights issue on stock exchanges and the NEEQ- Engage in margin trading and securities financing on stock exchanges, and securities lending to securities finance company- Other financial instruments as approved by the CSRC
*Detailed scope and relevant rule are still subject to final announcement by respective trading venue.No monthly repatriation limit and lock-up period restrictionsNo quota restrictions
Trustee management
Process of becoming custodian:A custodian who provides asset custodian service for a qualified foreign investor for the first time shall, within 5 business days of signing a custodian agreement, file with the CSRC for record.Limitation on number of custodians: NoneMajor custodian: A qualified foreign investor that has more than 2 custodians shall designate one of them as the principal reporter; -Responsible for QFII and RQFII application, quota application, report on major issues and more-safekeeping the entire assets entrusted by qualified foreign investors-Inform CSRC for recordation of other custodians
Enhanced supervision
In any of the 9 circumstances, the CSRC, the PBC, and the SAFE can take regulatory measures on a qualified foreign investor, such as order for rectification, regulatory talks, and issuing warning letters; and can take regulatory measures on the person directly in charge and others directly responsible, such as regulatory talks, issuing warning letters, and order for periodic reporting.If the qualified foreign investor violates Securities Law of the People’s Republic of China, Regulation on the Administration of Futures Trading, Regulations on Foreign Exchange Administration of the People’s Republic of China, and other laws and administrative regulations, it will be subject to administrative punishments in accordance with applicable rules. Where a violation is suspected of constituting a criminal offense, the case will be transferred to judicial authorities for prosecution of criminal liability in accordance with law.
Source: CSRC, Compiled by Goldman Sachs Global Investment Research
13 February 2022 <6
Goldman Sachs China
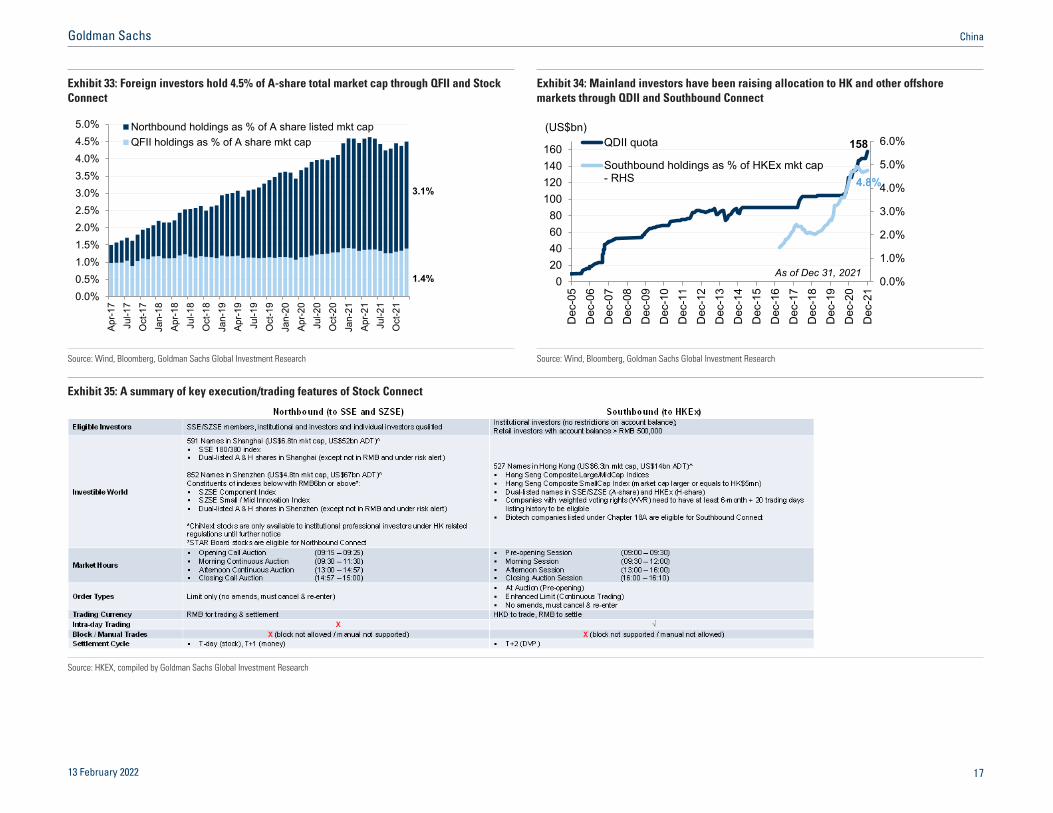
Exhibit 33: Foreign investors hold 4.5% of A-share total market cap through QFII and Stock Connect
Exhibit 34: Mainland investors have been raising allocation to HK and other offshore markets through QDII and Southbound Connect
0.0%0.5%1.0%1.5%2.0%2.5%3.0%3.5%4.0%4.5%5.0%
Apr-1
7Ju
l-17
Oct
-17
Jan-
18Ap
r-18
Jul-1
8O
ct-1
8Ja
n-19
Apr-1
9Ju
l-19
Oct
-19
Jan-
20Ap
r-20
Jul-2
0O
ct-2
0Ja
n-21
Apr-2
1Ju
l-21
Oct
-21
Northbound holdings as % of A share listed mkt capQFII holdings as % of A share mkt cap
1.4%
3.1%
0.0%
1.0%
2.0%
3.0%
4.0%
5.0%
6.0%
020406080
100120140160
Dec
-05
Dec
-06
Dec
-07
Dec
-08
Dec
-09
Dec
-10
Dec
-11
Dec
-12
Dec
-13
Dec
-14
Dec
-15
Dec
-16
Dec
-17
Dec
-18
Dec
-19
Dec
-20
Dec
-21
QDII quota
Southbound holdings as % of HKEx mkt cap- RHS
(US$bn)158
As of Dec 31, 2021
4.8%
Source: Wind, Bloomberg, Goldman Sachs Global Investment Research Source: Wind, Bloomberg, Goldman Sachs Global Investment Research
Exhibit 35: A summary of key execution/trading features of Stock Connect
Source: HKEX, compiled by Goldman Sachs Global Investment Research
13 February 2022 <7
Goldman Sachs China

Exhibit 36: Financials and Consumer are the two largest sectors in the MSCI China A50 Connect Index
Exhibit 37: The sector compostion of MSCI China A50 Connect Index is farily comparable to that of CSI300
Cons. Staples 808bn (17%)
Financials 932bn (21%)
Industrials 349bn (15%)
Cons. Disc. 135bn (7%) I.T. 161bn (13%)
Health Care 222bn (8%)
Real Estate 62bn (2%)
Utilities 106bn (2%)
Materials 140bn (10%)
Comm. Srvcs 29bn (1%)
MSCI China A50 Connect Index Sector Breakdown Total Market Cap in USD (Est. index weights%)
Note: As of Feb 2022 *is estimated based on potential constituents as we screened
Source: MSCI, FactSet, Goldman Sachs Global Investment Research Source: MSCI, FactSet, Goldman Sachs Global Investment Research
Exhibit 38: MSCI China A50 Connect has exhibited high return correlations with key onshore equity benchmarks, notably CSI300
Exhibit 39: Participation of index futures remain subdued for A shares comparing with US and HK
Source: Wind, Bloomberg, FactSet, Goldman Sachs Global Investment Research Source: CME, HKEx, SGX, CFFEX, Goldman Sachs Global Investment Research
13 February 2022 <8
Goldman Sachs China

4. Market regulations: Many changes have been made, and more to come
Exhibit 40: Capital/financial markets liberalization has been an ongoing theme in China
Dec-2002 CSRC first launched QFII to provide foreign institutional investors with the right to trade on stock exchanges in Shanghai and Shenzhen.Dec-2011 CSRC started RQFII with initial quota at RMB 20bn, which allows (initially only 21 HK-based) participants to invest in China with RMB offshore.Dec-2012 RQFII quota rose from RMB 50bn to RMB 270bn by year end.
2013 SAFE clarified that a QFII can remit principal & profits up to 20% of the total onshore assets.Jul-2013 RQFII allowed for inclusion of firms based in Singapore and London.Jul-2014 RQFII was expanded to South Korea and Germany with RMB 80bn quota.
Nov-2014 SH-HK Stock Connect launched, allowing investors in each market to trade shares on the other market using their local brokers and clearing houses.Apr-2015 RQFII was expanded to Luxembourg.Feb-2016 QFII quota ceiling was lifted for single institution and lock-up period was cut from 1 year to 3 months.May-2016 CSRC addressed concerns by QFII/RQFII by clarifying beneficial ownership rules.
Exchanges loosened pre-approval requirements that can restrict the creation of index-linked vehicles.Oct-2016 Foreign asset managers were allowed to set up WOFE funds and engage in private fund management RMB included in SDR.Dec-2016 SZ-HK Stock Connect launched, broadening the range of A-shares international investors can trade.Jul-2017 Bond Connect launched, with Northbound trading link initially and Southbound trading link to be added later.Apr-2018 Daily southbound and northbound quotas quadrupled for SH-HK and SZ-HK Stock Connects to RMB 42bn and RMB 52bn, respectively.
SSE introduced more order types, such as Market on Close (MOC) to encourage broker participation in Closing Auction Session (CAS).Jun-2018 Foreign ownership cap of Chinese JV brokers and mutual funds were lifted from 49% to 51%.
QFII allowed repatriation by foreign investors on daily basis, no longer being capped at 20% of its total domestic assets at last year’s end.Aug-2018 PBoC allowed more foreign institutional investors to invest in inter-bank bond market (not necessarily a QFII or RQFII).Dec-2018 SSE and SZSE further tightened suspension rules to curtail abuse of the practice.Jan-2019 QFII quota was doubled from USD 150bn to 300bn while the RQFII quota was set at RMB1,940 bn.
CSRC launched consultation to harmonize and further relax QFII/RQFII schemes.Shanghai stock exchange established the STAR Board and piloted the registration-based IPO system
Jun-2019 Shanghai-London Stock Connect launched.Oct-2019 NEEQ reform promoted qualified innovative firms to issue stocks to more qualified investors, set up the “select tier” and transfer mechanism to the main board.May-2020 PBoC and SAFE released new regulations to standardize the administrative requirements on inward remittances and significantly simplify outward repatriation of investment income.
QFII/RQFII quota were removed.Jun-2020 Wealth Management Program was announced.Jul-2020 Master SPSA (MSPSA) has been officially launched to facilitate the trading efficiency of Stock Connect as an omnibus function.
Aug-2020 ChiNext board reformed and piloted registration-based IPO system in Shenzhen stock exchangeSep-2020 CSRC, PBoC and SAFE jointly enhanced current QFII/RQFII regime, including unifying QFII/RQFII rules, expanding permissible investment scope, as well as streamlining the application and
review procedures, overall offering a more convenient process for QFII/RQFII.Aug-2021 HKEx announced that its first A-share derivatives product based on the MSCI China A 50 Connect Index will be launched on October 18. The new contract of which will provide international
investors with effective risk management tools.Sep-2021 President Xi announced plans to launch the new Beijing Stock Exchange to serve innovative SMEs; it will initially be formed by a subset (the Select Layer) of National Equity Exchange and
Wealth Management Connect was officially launched, offering more investment options for individual investors in Guangdong–Hong Kong–Macau Greater Bay Area.PBOC and HKMA jointly announced the launch of Southbound Bond Connect.
Oct-2021 CSRC announced to allow QFII to trade commodity futures and options, stock index options from Nov 1st.Beijing Stock Exchange was established. 81 companies debuted trading of which 71 were transferred from the “select tier” of the NEEQ.
Source: MSCI, HKEx, PBoC, CSRC, SAFE, Xinhua, Caixin, Data compiled by Goldman Sachs Global Investment Research
13 February 2022 <9
Goldman Sachs China

Exhibit 41: Notable differences between China A, HK and US in areas such as capital raising, trading, shareholders selling, and financial accounting/reporting framework
HK US
Main Board / SME Board ChiNext STAR board Beijing Stock Exchange (BSE) HKEX Mainboard United States (Nasdaq Select market)
Approval based Registration based Registration based Registration based Registration based Registration based
Large mature companies Growing innovative companies Growing sci-tech innovation companies Small and mid-size innovative companies Large mature companies Large cap
In the last 3 years, no major adverse changes in main business and management
With at least 1 year history on NEEQ Innovative Layer
A track record of >=3 financial years; ownership continuity and control for at least 1 year
With at least 3 years operating history
Cash flow Cumulative 3y net operating cash flow >= rmb50mn No requirements
Intangible assets account for no more than 20% of net assets at the end of the latest period
Net assets no less than rmb20mn at the end of the latest period
There is no undistributed deficit at theend of the latest period There is no undistributed deficit
Issuers should disclose any major risk factors they may face clearly
Issuers should disclose any major risk factors they may face clearly
Issuers should disclose any risk factors they may face clearly
The discussion should be specific andtailored to the risks that the issuer may face
Forward-looking statements not permitted unless the company is under PSLRA safe harbor rules
Required to disclose
Need to disclose the detailed investing plan of proceeds, and lock-up period Need to disclose the use of proceeds Have a separate chapter for future
plans and use of proceeds Not required to disclose
Regulation on major
shareholders
When a substantial shareholder first becomes interested in 5% or more/ drop below 5% of the shares of a listed corporation;When there is an increase or decrease in the percentage level of its holding that results in above 5% (e.g. its interest increases from 6.8% to 7.1% - crossing over 7%)All director and chief executives trading
The disclosure thresholds are triggered when a person acquires beneficial ownership of more than 5% of any class of voting equity securities. Subsequent disclosures required each time there is a material change in the facts that have been disclosed. An acquisition or disposal of 1% or more of the class of securities is deemed material.
Note: ^modifited and effective from Jan 1, 2022
Profit
Aggr 3y net profit >= rmb30mn; each year's profit >= 0;Or the accumulated total operating revenue >= rmb300mn
Satisfy at least 1 of the following requirements:1) Aggr 2y profits>rmb50mn, each year's profit>0;2) MC>rmb1bn, 1y profit>0, 1y revenue>rmb100mn;3) MC>rmb5bn, 1y revenue>rmb300mn
Have a post-offering total capital stock >= rmb30mn;Companies that conform to the orientation of STAR Market, are not yet profitable or have accumulated deficits are allowed to be listed;5 set of differentiated listing standards: Satisfy at least 1 of the following requirements:1) MC>rmb1bn, aggr 2y profits>rmb50mn, each year's profit>0 OR MC>rmb1bn, 1yr profit>0, 1y revenue>rmb100mn;2) MC>rmb1.5bn, 1y revenue>rmb200mn, 3y R&D intensity>15%;3) MC>rmb2bn, 1y revenue>rmb300mn, aggr 3y OCF>rmb100mn; 4) MC>rmb3bn, 1y revenue>rmb300mn;5) MC>rmb4bn for selected companies
Earnings standard:Aggr 3y earnings >= usd11mn; each year>= $0 and each of the two most recent fiscal years >= usd2.2mnCash Flow standard:Aggr 3y earnings >= usd27.5 million; each year >= $0; 1y Avg mkt cap >= usd550mn; 1y revenue >= usd110mnCapitalization with Revenue standard:Avg 1y mkt cap >= usd850mn; 1y Revenue >= usd90mnAssets with Equity standard:Mkt cap >= usd160; Total assets >= usd80mn; Stockholders’ Equity >= usd55mn
Disclosure rules
IPO Requirements
Disclosure & Restriction
Use of Proceeds
Not required to disclose
Allowed to disclose forward-looking statementForward-looking Statement
Inconsistency with former accounting results
More focused on the disclosure structure, but may have less in-depth analysis on the specific risk factors
Reach 5% of a listed company's total issued shares by trading on the exchanges;Report and publish holding reduction plans 15 trading days in advance, and report to the stock exchange within 2 trading days after finish / the end of period if they cannot finish;Eligible VC as a firm major shareholder enjoys less restrictive policy in shares sellingStocks transferred through block trading should not surpass 2% of a company’s total shares in 90 days; buyers are not permitted to sell again within 6 months;Sales of trading-restricted shares should not exceed 50% of their total holdings in a 12-month period after unlocking
The profit test^: Most recent year profit attributable to shareholders >= hkd35mn; in 2 preceding financial years, in aggregate >= hkd45mn. Market cap/revenue/cash flow test: Market cap >= hkd2bn at the time of listing; revenue >= hkd500mn for the most recent audited financial year; cash flow >= hkd100mn in aggregate for the 3 preceding financial years. Market cap/revenue test: Market cap >= hkd4bn at the time of listing; revenue >= hkd500mn for the most recent audited financial year; Exception: Biotech Chapter, WVR Chapter
Mainland China
Satisfy at least 1 of the following requirements:1) MC>rmb200mn, 2y profits ea.>rmb15mn, ROE>8% OR 1y profits>rmb25mn, ROE>8%;2) MC>rmb400mn, 2y avg revenue>rmb100mn with>30% growth, 1y OCF>0;3) MC>rmb800mn, 1y revenue>rmb200mn, aggr 2y R&D intensity>8%;4) MC>rmb1500mn, aggr 2y R&D>rmb50mn
Net assets>rmb50mn
Have a separate chapter for future plans and use of proceeds
Risk Factors
Key Differences
Targeted companies
Main Business integrity
Finance and accounting
Net asset
In the last 2 years, no major adverse changes in the main business and directors, senior managers and core technical personnel
IPO system
Source: CSRC, SSE, SZSE, BSE, HKEX, Compiled by Goldman Sachs Global Investment Research
13 February 2022 20
Goldman Sachs China

Exhibit 42: ChiNext and STAR have more flexible listing options and lower thresholds on listing requirements than competing listing boards, domestically and abroad
USMain Board GEM Main Board SME ChiNext STAR Board BSE Main Board
Pre-revenue √ (with requirements on expected market value)
√ (with requirements on expected market value
and R&D)√
Pre-earnings√ (with requirements on
market value and revenue)
√ (with requirements on expected market value)
√ (with requirements on expected market value
and revenue)√
Non-Mainland incorporated √ √ X √
VIE √ √ X √
WVR √ √ √ √
Listing mechanism Registration
• More internationally exposed
• More internationally exposed • Policy support • More exposure to international
funding sources• Potential access to Mainland investors via Stock Connect
• Potential access to Mainland investors via Stock Connect
• Applicable to companies registered outside of Mainland, with VIE structure or WVR
• Potentially less policy intervention
• Potentially less policy intervention
• Lower financial requirements for listing
• Better access for small/mid-size companies
• Liquidity and valuation tend to be lower than in A shares
• Liquidity and valuation tend to be lower than in A shares
• Strict regulations, with the “class action” feature
• Brand equity/recognition could be lower than A-share listing
• Brand equity/recognition could be lower than A-share listing
• Not yet accessible through Stock Connect
• Brand/equity recognition could be lower for Chinese companies, valuation tend to be lower than in A shares
• Potentially prolonged process
• Potential de-listing risks ifcompanies have limited disclosure to PCAOB
Con
s
• Strict requirements on company structure and financials
• Limited access to foreign investors • Implementation challenges on financial capital movements
Mainland
Registration
• Lower financial requirements for listing
• No IPO queuing
• Lack of established rules and regulations
Pros
• Direct access to Mainland investors • Advantages of the Main Board
• Possibly higher brand recognition/value
• High liquidity and valuation
• "Unicorn" company may enjoy express approval • Applicable to companies registered outside ofMainland, with VIE structure or WVR
√
X √
X √
Registration Approval
√ X (positive earnings for past three quarters)
X
Listing eligibility for companies with features below
HK
√ X
Source: HKEx, CSRC, compiled by Goldman Sachs Global Investment Research
13 February 2022 2<
Goldman Sachs China

Exhibit 43: HKEx recently further relaxed secondary listing rules in support of home-coming ADRs
With WVR structureStock Exchange of
Primary Listing Recognised Stock Exchanges
“Innovative Company”
Requirement Required Not required^^ Not required
Qualifications
- Listing history on a QualifyingExchange^ >=2 years; Marketcap>=hkd 40bn;
OR
- Listing history on a QualifyingExchange^ >=2 years; Marketcap>=hkd 10bn; Revenue >=hkd1bn
- Listing history on a QualifyingExchange >=5 years; Marketcap>=hkd 3bn
OR
- Listing history on a QualifyingExchange >=2 years; Marketcap>=hkd 10bn
- Listing history on a QualifyingExchange >=5 years, MC>=hkd 3bn
Restrictions on Secondary/Dual-primary Listings
Qualifying Exchanges (NYSE, NASDAQ & LSE’s Main Market)
- For Grandfathered (listed on or before Dec 15 2017) Greater China Issuers or Non-Greater China Issuers:can secondary list and dual-primary list with their existing WVR structures and VIE structures intact;- For non-grandfathered (listed on a Qualifying Exchange after Dec 15 2017) Greater China companies: WVRstructures and VIE structures (if they have them) must conform to all primary Listing Rules;- A secondary listed issuer will be regarded as a primary listed issuer in the event of Overseas De-listing, and a dual primary listed issuer in the event of Migration or Primary Conversion;- WVR structure is allowed, but need to satisfy additional requirements such as maximum votes per share,corporate WVR requirements and requirements on WVR beneficiaries.
Note: Key amendments published in Consultation Conclusions Listing Regime for Overseas Issuers (marked in red) are effective since Jan 2022; ^ The previous Joint Policy Statement (JPS) has been either codified into the Listing Rules or consolidated into a new guidance letter for Overseas Issuers; ^^ apply to issuers with centre of gravity in Greater China
HK Secondary/Dual-primary Listing Rules (Chapter 19C)^Without WVR structure
Source: HKEx
13 February 2022 22
Goldman Sachs China
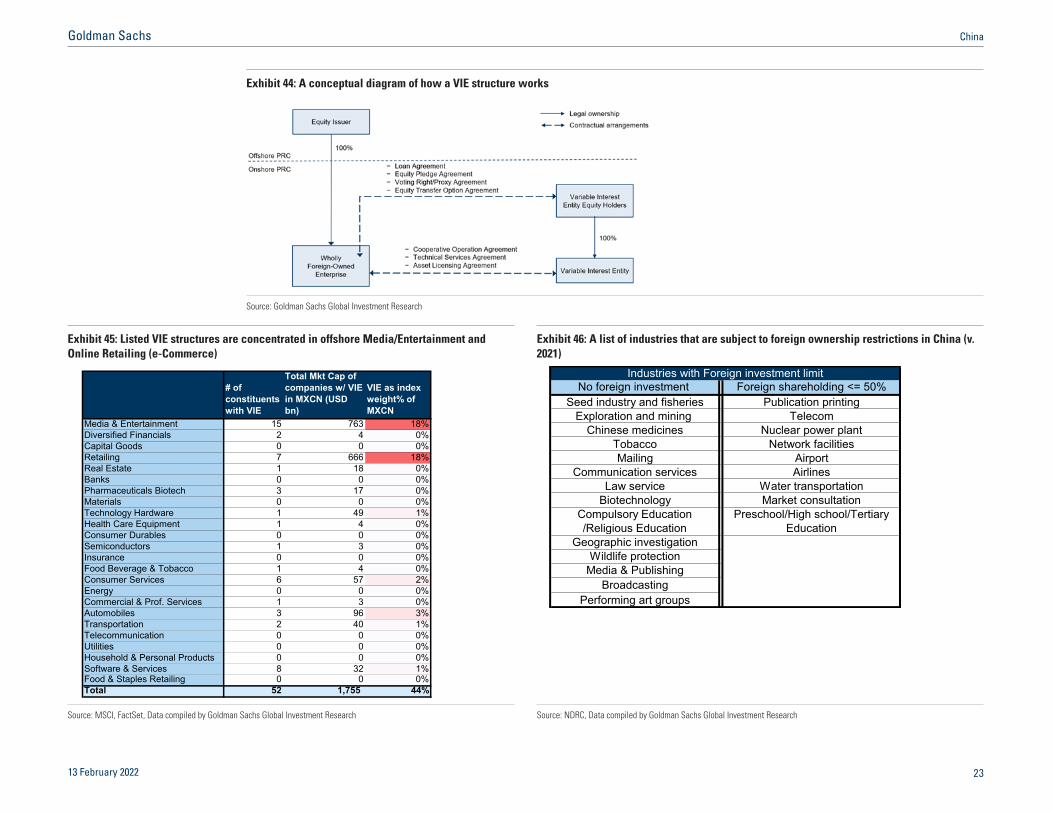
Exhibit 44: A conceptual diagram of how a VIE structure works
Source: Goldman Sachs Global Investment Research
Exhibit 45: Listed VIE structures are concentrated in offshore Media/Entertainment and Online Retailing (e-Commerce)
Exhibit 46: A list of industries that are subject to foreign ownership restrictions in China (v. 2021)
# of constituents with VIE
Total Mkt Cap of companies w/ VIE in MXCN (USD bn)
VIE as index weight% of MXCN
Media & Entertainment 15 763 18%Diversified Financials 2 4 0%Capital Goods 0 0 0%Retailing 7 666 18%Real Estate 1 18 0%Banks 0 0 0%Pharmaceuticals Biotech 3 17 0%Materials 0 0 0%Technology Hardware 1 49 1%Health Care Equipment 1 4 0%Consumer Durables 0 0 0%Semiconductors 1 3 0%Insurance 0 0 0%Food Beverage & Tobacco 1 4 0%Consumer Services 6 57 2%Energy 0 0 0%Commercial & Prof. Services 1 3 0%Automobiles 3 96 3%Transportation 2 40 1%Telecommunication 0 0 0%Utilities 0 0 0%Household & Personal Products 0 0 0%Software & Services 8 32 1%Food & Staples Retailing 0 0 0%Total 52 1,755 44%
No foreign investment Foreign shareholding <= 50%Seed industry and fisheries Publication printing
Exploration and mining TelecomChinese medicines Nuclear power plant
Tobacco Network facilitiesMailing Airport
Communication services AirlinesLaw service Water transportation
Biotechnology Market consultationCompulsory Education /Religious Education
Preschool/High school/Tertiary Education
Geographic investigationWildlife protection
Media & PublishingBroadcasting
Performing art groups
Industries with Foreign investment limit
Source: MSCI, FactSet, Data compiled by Goldman Sachs Global Investment Research Source: NDRC, Data compiled by Goldman Sachs Global Investment Research
13 February 2022 23
Goldman Sachs China

Exhibit 47: The announced regulations so far in this cycle can be broadly grouped under four main categories, in our view
Source: State Council, CPCCC, NDRC, SAMR, CAC, PBoC, CBIRC, Goldman Sachs Global Investment Research
13 February 2022 24
Goldman Sachs China

Exhibit 48: Minor discrepancies exist between Chinese accounting standards and that of global as ASBEs gradually converge with IFRS
Mainland China Hong Kong
Accounting Standards The Accounting Standards for Business Enterprises (ASBEs) Hong Kong Financial Reporting Standards (HKFRSs, virtually identical to IFRSs)
General: Frequency of report
Required: Annual, half-yearly, and quarterly Required: Annual, half-yearly (Mainboard and GEM issuers), and quarterly (only for GEM issuers)
General: Deadline of reporting
Annual: not later than 4 months after year endHalf-yearly: not later than 2 months after half yrQuarterly: not later than 1 month after 1Q/3Q
Main BoardAnnual: not later than 4 monthsHalf-yearly and quarterly: not later than 3 months GEMAnnual: not later than 3 monthsHalf-yearly and quarterly: not later than 45 days
General: Departure from accounting standards (on a requirement)
Not allowed.
Allowed. Extremely rare circumstances: - Management concludes compliance will be misleading and wouldconflict with objectives of financial statements set out.
Fixed Assets (PPE and intangible assets): Valuation method
Only cost model is allowed.
Cost modelCarried at: initial cost - accumulated depreciation/amortization
Both Cost model and revaluation model are allowedRevaluation modelCarried at revalued amount: Fair value at date of revaluation - subsequent accumulated depreciation/amortization- subsequent impairment loss
Assets (Investment Property):Transition from fair value to cost model
Transition is prohibited for investment property using fair value model
Allowed. Situation: Entity determines that fair value of investment property is not reliably determinable on a continuing basis
Assets: Reversing an impairment loss
Not allowed. Allowed (other than good will) .Situation: Change in the estimates used to determine the asset's recoverable amount since last impairment loss was recognized.
Cash Flow Statement: Direct and Indirect methods
Only direct method is allowed.Requires presenting supplementary information notes using indirect method
Either direct or indirect method is allowed
Cash Flow Statement: Classification of cash flows arising from securities
Trading securities, available for sale financial assets, and held-to-maturity investments:Cash flows arising from the purchase and sale of such securities are classified as investing activities.
Trading securitiesCash flows arising from the purchase and sale of such securities are classified as operating activities.Other investment assetsCash flows arising from the purchase and sale of such securities are classified as investing activities.
Others (Employee Benefits):Discount rate used
Discount Rate: Market yields on central government bonds or high-quality corporate bonds of consistent term
Discount rate: Market yields at end of reporting period on high-quality corporate bonds/ market yield of government bonds (if that of corporate is not available) of consistent term and currencies
Others: Related party disclosures
Enterprises under control of state:Not regarded as affiliated parties
Enterprises under control of state*:Regarded as affiliated parties *Entities must disclose the name of its parent and ultimate controllingparty
Source: MOF, IFRS, Goldman Sachs Global Investment Research
13 February 2022 25
Goldman Sachs China

Exhibit 49: Many new regulations focusing on the capital markets have been made in recent years
Dividends Equity Incentive Securities Lending and Borrowing Private Placement Repurchase Other Protections
"Revision of Corporate Governance Code" [2018]
"Revision of Measures for Equity Incentives of Listed Companies"
[2018]
"Rules for the Implementation of Margin Trading" [2019]
"Revision of Measures for the Issuance of Securities by Listed
Companies" [2020]
"Opinions on Listed Companies repurchase"
[2018]
"Guidance on Listed Stocks Suspension and Resumption
Mechanism" [2018]
- Listed companies should activelyrepay shareholders. Dividend policy should be specified in the company’s articles of association - Listed companies should promptly disclose their cash dividend policy and implementation status
- The restriction that the minimum maintenance guarantee ratio must not be lower than 130% has been removed - The number of target stocks for margin financing and securities lending has been expanded from 950 to 1,600
- Private placement can be issued to no more than 35 people- Issue price shall not be lower than 80% of the company's average stock price in the previous 20 tradingdays - Lock-up period varies from 6 months to 18 months
CSRC advocate listed companies to buy back shares
- Guarantee trading opportunities of suspending shares - Compress stock tradingsuspension period - Strengthen information disclosure
"Listed Company Supervision Guidelines No. 3" [2022]
"Notice on Insurance Funds Participating in Securities Lending Business" [2021]
"Guide for listed firms' financing activities" [2020]
"Listed Company Supervision Guidelines
No. 3" [2022]
"Reform of Overseas Listing System" [2019]
- Article 4: Cash dividends should be given priority - Article 5: Specify the minimum cash dividend ratio under different circumstances - Pay special attention to those firms with little or without cash dividends
- Require tbe solvency ratio of insurance company should not be lower than 120% and rating higher than Class B - Net asset threshold for domestic borrowers varies from 6 to 10 billion CHY - Implement strict regulations for overseas borrowers: 1. More than 8-year experience; 2. No less than ¥30 billion cash or cash equivalent; 3. Grade A by rating agencies
Number of issuances shall not exceed 30% of the total share capital
Article 11: Advocate listed companies to repurchase shares when their stock price is lower than net assets per share (except for loss-making companies)
Overseas listed companies are required to uniformly apply the <Company Law of the People's Republic of China> instead of the special provisions
Corporate Governance Market Reforms Investor protection
- Article 8 & 45: Foreign employees can also be included and be allowed to apply for security accounts- Article 13: The validity period of the equity incentive plan shall not exceed 10 years- Article 14: Total number of shares
involved shall not exceed 10% of the total share capital, and each shareholder's position shall not exceed 1%- Article 23: Restricted stock price
should not be less than 50% of the average price- Article 28: Exercise price of stock
options should not be lower than the average price
Source: CSRC, SSE, State Council
13 February 2022 26
Goldman Sachs China

Exhibit 50: HK has recently embraced the concept of SPAC financing, although it has not yet been made available in China A
Hong Kong (HKEX) Singapore (SGX) U.S. (NYSE) U.S. (NGM) U.S. (NCM)Investor Base Professional investor only
Minimum Size Raise at least HK$1bn / ~US$130mn from IPO Minimum market capitalization of SG$150mn / ~US$110mn Minimum market capitalization of US$100mn Minimum market capitalization of US$75mn Minimum market capitalization of US$50mn
Minimum Issue Price HKD 10 SGD 5
Open Market Requirements
- ≥75 professional investors of which at least 20 must be institutional professional investors
holding ≥75% shares to be listed- ≥25% of the SPAC's total number of issued
shares held by the public - ≤ 50% held by top 3 shareholders of SPAC
At least 25% of issued shares to be held by at least 300 public shareholders
At least 1.1 million shares held by at least 300 public shareholders
At least 1.1 million publicly held shares and at least 400 round lot holders
At least 1 million publicly held shares and at least 300 round lot holders
Dual class structure Promoter shares as a separate (unlisted) class in addition to the ordinary listed shares Not allowed
Minimum percentage of IPO proceeds held in trust 100% 90%
SPAC Promoters/Directors
- At least one SPAC Promoter must be licensed for Type 6 and/or Type 9 regulated activities; and
hold ≥10% of the promoter shares- SPAC board must include at least two Type 6 or
Type 9 SFC-Licensed individuals
Appropriate experience and track record but no specific licensing requirements
Shareholders' vote on de-SPAC
Time limit for de-SPAC 24 months for announcement and 36 months for de-SPAC, subject to extension of up to 6 months
2 years from IPO, subject to extension of up to 12 months to be approved by the SGX and 75%
shareholders' vote
Dilution cap Warrant cap: 50%Promoter cap: 20%
Warrant cap: 50%Promoter cap: 20%
Independent PIPE investment
- Staggered thresholds for minimum PIPE size are applied to cater to different De-SPAC values
(from <2bn to >10bn) - At least 50% of the independent PIPE
investment must be contributed by at least three institutional investors with ≥8bn AUM
Share redemption option
SPAC shareholders can redeem shares they hold prior to:
- a de-SPAC transaction- a material change in promoter
- any extension on the time limit for announcing or completing a de-SPAC transaction
Shareholders can redeem their shares and receive a pro rata share of the amount at the time
of the de-SPAC transaction
Lock-up period
Promoters: 12 months from the de-SPAC transaction date
Controlling shareholders of a Successor Company: 6+6 months as standard HK IPOs
- No disposal by founding shareholders from SPAC IPO to the de-SPAC transaction, and 6 months after the de-SPAC transaction- A further 6-month moratorium on 50% of shareholding of the controlling shareholders and other specified persons
de-S
PAC
SPAC
stru
ctur
e
Requires approval by majority of shareholders at a general meeting, excluding promoter and other shareholders with material interest. Subject to other specific articles
Mandatory if the de-SPAC transaction involves share issuances or if the SPAC is directly merging with the target. SPAC promoters are generally allowed to vote
All investors (including retail investors)
No specific licensing requirements
Not specified
Not specified. In practice, a lock-up period of 6-12 months or longer upon the completion of the de-SPAC transaction, subject to certain early release mechanisms
SPACs commonly adopt 2 classes of shares, with the common shares being sold to public and "Class B" or "Class F" shares representing sponsor ownership
USD 4
90%
2 years from IPO, subject to extension of up to 12 months to be approved by public shareholders
Not specified
Shareholders can redeem their shares and receive a pro rata share of the amount held in trust account
Source: HKEx, SGX, NYSE, Nasdaq, Goldman Sachs Global Investment Research
13 February 2022 27
Goldman Sachs China
5. Index inclusion: A long-term demand tailwind for A shares
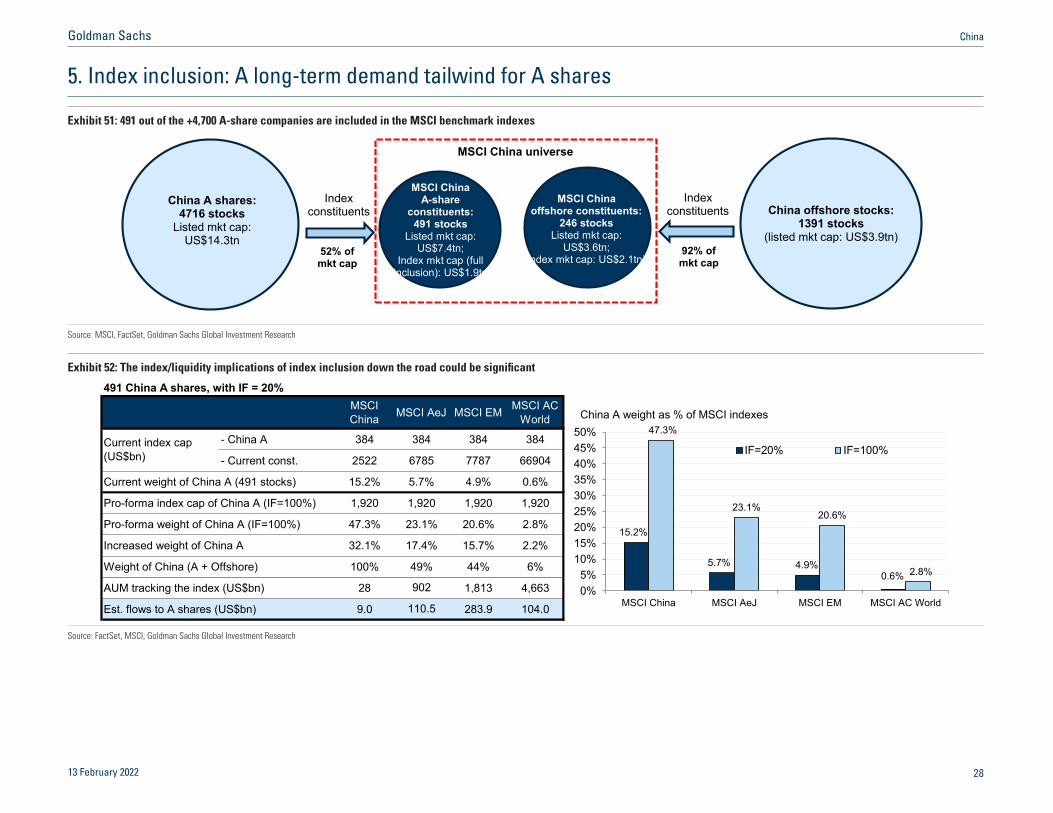
Exhibit 51: 491 out of the +4,700 A-share companies are included in the MSCI benchmark indexes
China A shares: 4716 stocks
Listed mkt cap:US$14.3tn
MSCI ChinaA-share
constituents:491 stocks
Listed mkt cap: US$7.4tn;
Index mkt cap (full inclusion): US$1.9tn
Index constituents China offshore stocks:
1391 stocks (listed mkt cap: US$3.9tn)
Index constituents
MSCI Chinaoffshore constituents:
246 stocksListed mkt cap:
US$3.6tn; Index mkt cap: US$2.1tn)
MSCI China universe
52% of mkt cap
92% of mkt cap
Source: MSCI, FactSet, Goldman Sachs Global Investment Research
Exhibit 52: The index/liquidity implications of index inclusion down the road could be significant
491 China A shares, with IF = 20% MSCI China MSCI AeJ MSCI EM MSCI AC
World
- China A 384 384 384 384
- Current const. 2522 6785 7787 66904
Current weight of China A (491 stocks) 15.2% 5.7% 4.9% 0.6%
Pro-forma index cap of China A (IF=100%) 1,920 1,920 1,920 1,920
Pro-forma weight of China A (IF=100%) 47.3% 23.1% 20.6% 2.8%
Increased weight of China A 32.1% 17.4% 15.7% 2.2%
Weight of China (A + Offshore) 100% 49% 44% 6%
AUM tracking the index (US$bn) 28 1,813 4,663
Est. flows to A shares (US$bn) 9.0 283.9 104.0
Current index cap (US$bn)
902
110.5
15.2%
5.7% 4.9%0.6%
47.3%
23.1%20.6%
2.8%
0%5%
10%15%20%25%30%35%40%45%50%
MSCI China MSCI AeJ MSCI EM MSCI AC World
IF=20% IF=100%
China A weight as % of MSCI indexes
Source: FactSet, MSCI, Goldman Sachs Global Investment Research
13 February 2022 28
Goldman Sachs China

Exhibit 53: China A/All China could represent 21%/44% of EM when A-share inclusion factor reaches 100%
Source: FactSet, MSCI, Goldman Sachs Global Investment Research
Exhibit 54: FINI ownership rose 1.1% per year on average for Korea and Taiwan during their respective inclusion cycle
Exhibit 55: Korea and Taiwan’s experience suggests that the increase in IF could be a gradual process
0%
5%
10%
15%
20%
25%
1991(2016)
1993(2018)
1995(2020)
1997(2022)
1999(2024)
2001(2026)
2003(2028)
2005(2030)
2007(2032)
2009(2034)
Taiwan Korea China AForeign ownership
Note: Years in brackets are for China A
Korea inclusion from 1992(Foreign ownership +0.7pp per year during the next 10 years)
Taiwan inclusion from 1996 (Foreign ownership +1.4pp per year during the next 10 years)China A inclusion since 2018
(Est. foreign ownership +0.5pp per year)
2030E:
0%
20%
40%
60%
80%
100%
Dec-1991
(2016)
Dec-1992
(2017)
Dec-1993
(2018)
Dec-1994
(2019)
Dec-1995
(2020)
Dec-1996
(2021)
Dec-1997
(2022)
Dec-1998
(2023)
Dec-1999
(2024)
Dec-2000
(2025)
Dec-2001
(2026)
Taiwan
Korea
China A (GS Forecast)
China A (Implemented and Proposed by MSCI)
MSCI inclusion factor (in MSCI EM Index)IF increases 12% on average after first inclusion
Note: Years in brackets are for MSCI China A.
20%
Source: CEIC, Wind, Goldman Sachs Global Investment Research Source: MSCI, Goldman Sachs Global Investment Research
13 February 2022 29
Goldman Sachs China

Exhibit 56: The key conditions for further IF increases have not been met by the Chinese regulators
Concerns ahead of further inclusion of China A into MSCI Current Status Potential resolutions
Access to hedging and derivatives
instruments
International institutional investors require liquid on and offshore index futures and options contracts in order to expand their allocation to China and manage their increased exposure
Short settlement cycle
International institutional investors have highlighted that they continue to face significant operational challenges and risks in dealing with the short settlement cycle of China A shares
China currently operates on a T+0/T+1 non-Delivery versus Payment (non-DVP) settlement cycle. Most markets in the MSCI ACWI operate currently on a T+2/T+3 DVP settlement cycle
Revamp the settlement infrastructure in A-share
Trading holidays of Stock Connect
International institutional investors are concerned with the misalignment between onshore China and Stock Connect holidays
The current trading holiday arrangement is yet to be reviewed to minimize unnecessary investment frictions
Open the day before any actual holiday in either market as trading day
Availability of Omnibus trading
mechanism in Stock Connect
The ability to place a single order on behalf of multiple client accounts is critical to facilitate best execution and lower operational risk to international institutional investors
Master SPSA (MSPSA) officially launched in July 2020 to facilitate the trading efficiency of Stock Connect
^Derivatives instruments for onshore indices include: CSI300 futures, SSE50 options, SSE50 futures, CSI500 futures, CSI300 options
Selected onshore index futures and options have become available^. Futures on the new MSCI China A50 Connect Index were launched on October 18 by HKEx. This could provide international investors with an effective risk management tool for their A-share equity exposure.
Source: MSCI, HKEx, Goldman Sachs Global Investment Research
13 February 2022 30
Goldman Sachs China
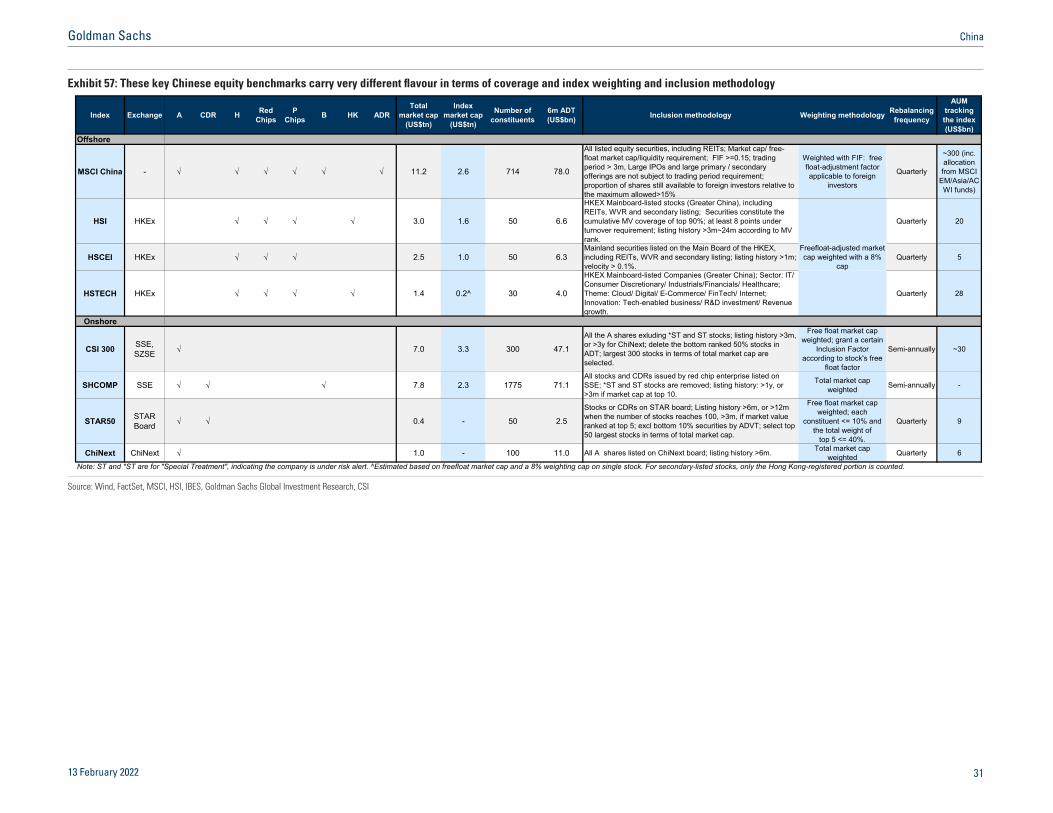
Exhibit 57: These key Chinese equity benchmarks carry very different flavour in terms of coverage and index weighting and inclusion methodology
Index Exchange A CDR H Red Chips
P Chips B HK ADR
Total market cap
(US$tn)
Index market cap
(US$tn)
Number of constituents
6m ADT (US$bn) Inclusion methodology Weighting methodology Rebalancing
frequency
AUM tracking the index (US$bn)
Offshore
MSCI China - 11.2 2.6 714 78.0
All listed equity securities, including REITs; Market cap/ free-float market cap/liquidity requirement; FIF >=0.15; trading period > 3m, Large IPOs and large primary / secondary offerings are not subject to trading period requirement; proportion of shares still available to foreign investors relative to the maximum allowed>15%
Weighted with FIF: free float‐adjustment factor applicable to foreign
investors
Quarterly
~300 (inc. allocation
from MSCI EM/Asia/ACWI funds)
HSI HKEx 3.0 1.6 50 6.6
HKEX Mainboard-listed stocks (Greater China), including REITs, WVR and secondary listing; Securities constitute the cumulative MV coverage of top 90%; at least 8 points under turnover requirement; listing history >3m~24m according to MV rank.
Quarterly 20
HSCEI HKEx 2.5 1.0 50 6.3Mainland securities listed on the Main Board of the HKEX, including REITs, WVR and secondary listing; listing history >1m; velocity > 0.1%.
Quarterly 5
HSTECH HKEx 1.4 0.2^ 30 4.0
HKEX Mainboard-listed Companies (Greater China); Sector: IT/ Consumer Discretionary/ Industrials/Financials/ Healthcare; Theme: Cloud/ Digital/ E-Commerce/ FinTech/ Internet; Innovation: Tech-enabled business/ R&D investment/ Revenue growth.
Quarterly 28
Onshore
CSI 300 SSE, SZSE 7.0 3.3 300 47.1
All the A shares exluding *ST and ST stocks; listing history >3m, or >3y for ChiNext; delete the bottom ranked 50% stocks in ADT; largest 300 stocks in terms of total market cap are selected.
Free float market cap weighted; grant a certain
Inclusion Factor according to stock's free
float factor
Semi-annually ~30
SHCOMP SSE 7.8 2.3 1775 71.1All stocks and CDRs issued by red chip enterprise listed on SSE; *ST and ST stocks are removed; listing history: >1y, or >3m if market cap at top 10.
Total market cap weighted Semi-annually -
STAR50 STAR Board 0.4 - 50 2.5
Stocks or CDRs on STAR board; Listing history >6m, or >12m when the number of stocks reaches 100, >3m, if market value ranked at top 5; excl bottom 10% securities by ADVT; select top 50 largest stocks in terms of total market cap.
Free float market cap weighted; each
constituent <= 10% and the total weight of
top 5 <= 40%.
Quarterly 9
ChiNext ChiNext 1.0 - 100 11.0 All A shares listed on ChiNext board; listing history >6m. Total market cap weighted Quarterly 6
Note: ST and *ST are for "Special Treatment", indicating the company is under risk alert. ^Estimated based on freefloat market cap and a 8% weighting cap on single stock. For secondary-listed stocks, only the Hong Kong-registered portion is counted.
Freefloat-adjusted market cap weighted with a 8%
cap
Source: Wind, FactSet, MSCI, HSI, IBES, Goldman Sachs Global Investment Research, CSI
13 February 2022 3<
Goldman Sachs China
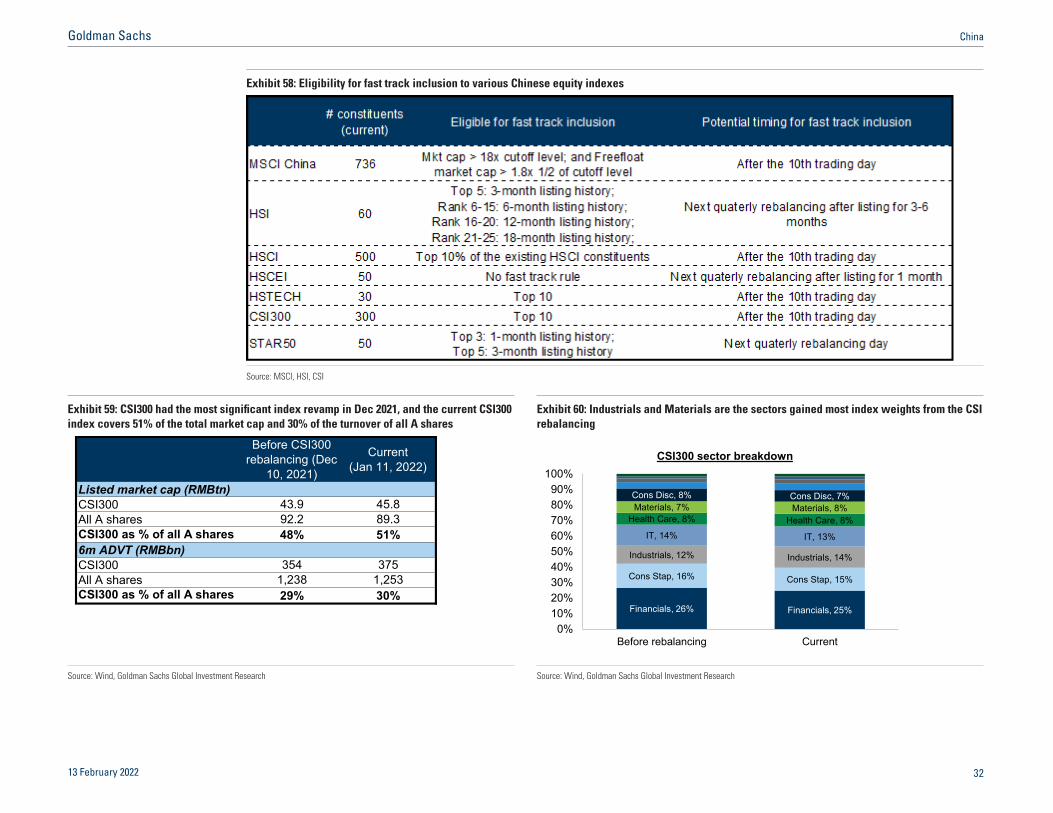
Exhibit 58: Eligibility for fast track inclusion to various Chinese equity indexes
Source: MSCI, HSI, CSI
Exhibit 59: CSI300 had the most significant index revamp in Dec 2021, and the current CSI300 index covers 51% of the total market cap and 30% of the turnover of all A shares
Exhibit 60: Industrials and Materials are the sectors gained most index weights from the CSI rebalancing
Before CSI300 rebalancing (Dec
10, 2021)
Current (Jan 11, 2022)
Listed market cap (RMBtn)
CSI300 43.9 45.8All A shares 92.2 89.3CSI300 as % of all A shares 48% 51%6m ADVT (RMBbn)
CSI300 354 375All A shares 1,238 1,253CSI300 as % of all A shares 29% 30%
Financials, 26% Financials, 25%
Cons Stap, 16% Cons Stap, 15%
Industrials, 12% Industrials, 14%
IT, 14% IT, 13%
Health Care, 8% Health Care, 8%Materials, 7% Materials, 8%Cons Disc, 8% Cons Disc, 7%
0%10%20%30%40%50%60%70%80%90%
100%
Before rebalancing Current
CSI300 sector breakdown
Source: Wind, Goldman Sachs Global Investment Research Source: Wind, Goldman Sachs Global Investment Research
13 February 2022 32
Goldman Sachs China
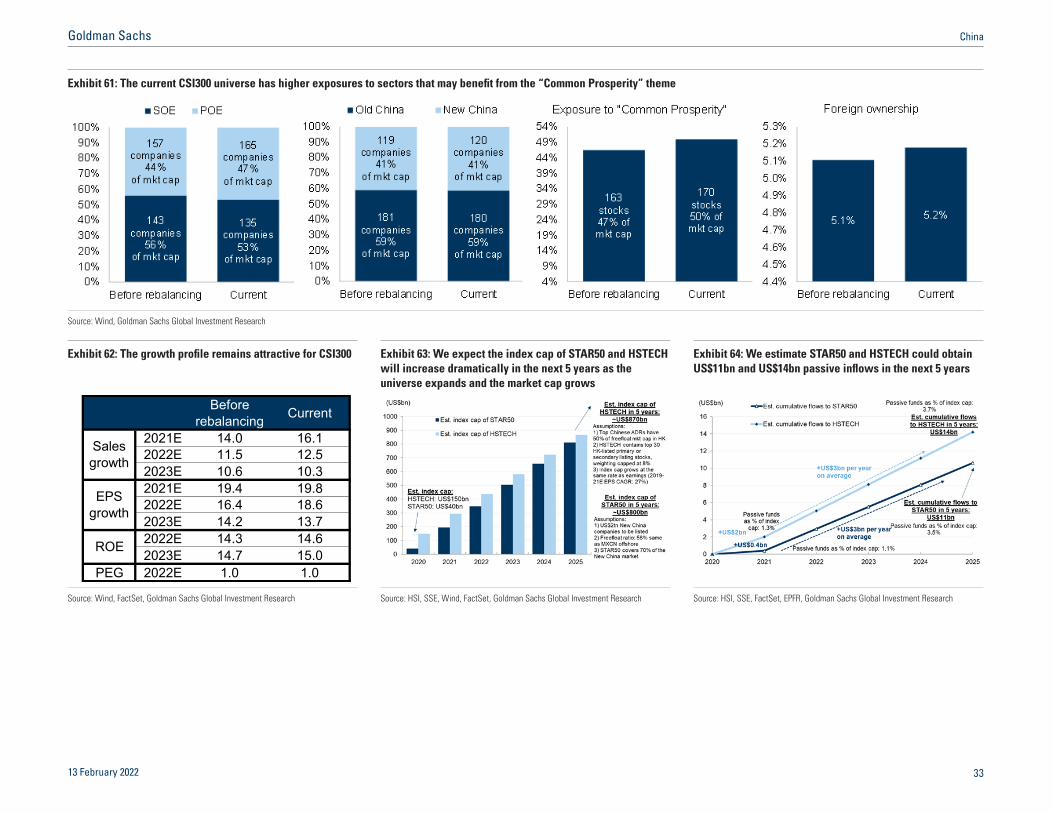
Exhibit 61: The current CSI300 universe has higher exposures to sectors that may benefit from the “Common Prosperity” theme
Source: Wind, Goldman Sachs Global Investment Research
Exhibit 62: The growth profile remains attractive for CSI300 Exhibit 63: We expect the index cap of STAR50 and HSTECH will increase dramatically in the next 5 years as the universe expands and the market cap grows
Exhibit 64: We estimate STAR50 and HSTECH could obtain US$11bn and US$14bn passive inflows in the next 5 years
Before rebalancing Current
2021E 14.0 16.12022E 11.5 12.52023E 10.6 10.32021E 19.4 19.82022E 16.4 18.62023E 14.2 13.72022E 14.3 14.62023E 14.7 15.0
PEG 2022E 1.0 1.0
Sales growth
EPS growth
ROE
Source: Wind, FactSet, Goldman Sachs Global Investment Research Source: HSI, SSE, Wind, FactSet, Goldman Sachs Global Investment Research Source: HSI, SSE, FactSet, EPFR, Goldman Sachs Global Investment Research
13 February 2022 33
Goldman Sachs China
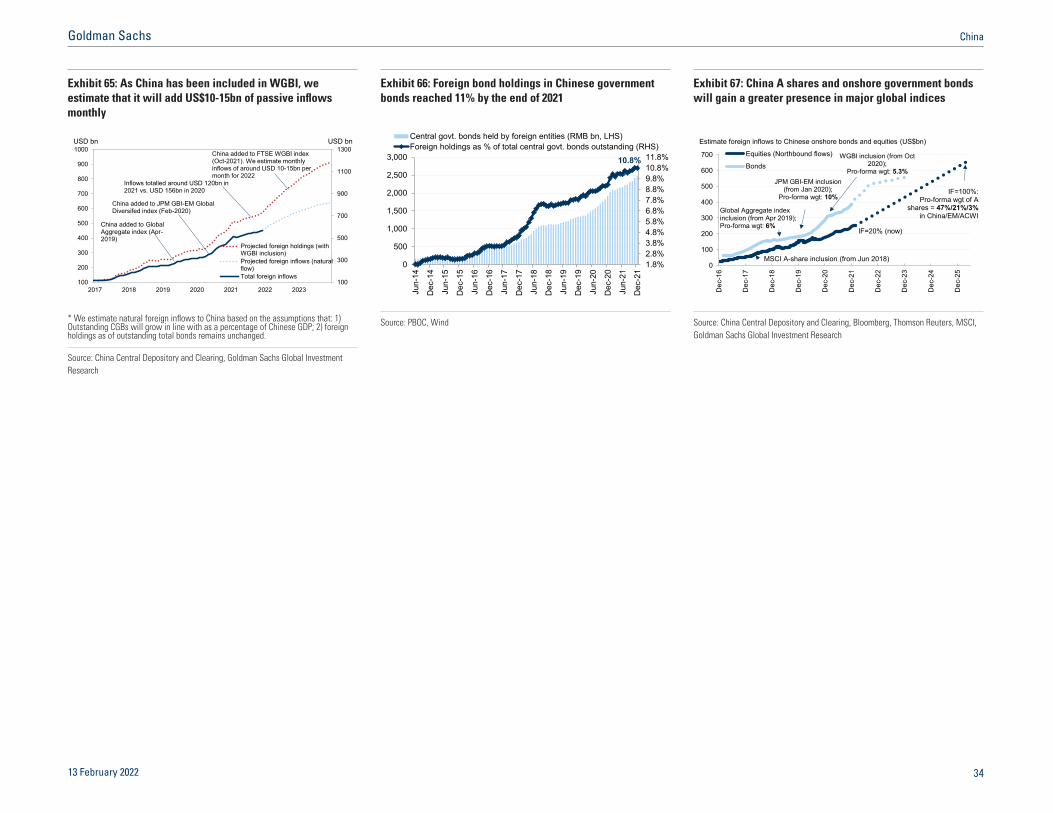
Exhibit 65: As China has been included in WGBI, we estimate that it will add US$10-15bn of passive inflows monthly
Exhibit 66: Foreign bond holdings in Chinese government bonds reached 11% by the end of 2021
Exhibit 67: China A shares and onshore government bonds will gain a greater presence in major global indices
4
5
6
7
8
9
10US
100
300
500
700
900
1100
1300
100
200
300
400
500
600
700
800
900
1000
2017 2018 2019 2020 2021 2022 2023
Projected foreign holdings (withWGBI inclusion)Projected foreign inflows (naturalflow)Total foreign inflows
USD bn USD bn
China added to FTSE WGBI index (Oct-2021). We estimate monthly inflows of around USD 10-15bn per month for 2022
China added to JPM GBI-EM Global Diversifed index (Feb-2020)
China added to Global Aggregate index (Apr-2019)
Inflows totalled around USD 120bn in 2021 vs. USD 156bn in 2020
10.8%
1.8%2.8%3.8%4.8%5.8%6.8%7.8%8.8%9.8%10.8%11.8%
0
500
1,000
1,500
2,000
2,500
3,000
Jun-
14
Dec
-14
Jun-
15
Dec
-15
Jun-
16
Dec
-16
Jun-
17
Dec
-17
Jun-
18
Dec
-18
Jun-
19
Dec
-19
Jun-
20
Dec
-20
Jun-
21
Dec
-21
Central govt. bonds held by foreign entities (RMB bn, LHS)Foreign holdings as % of total central govt. bonds outstanding (RHS)
0
100
200
300
400
500
600
700
Dec
-16
Dec
-17
Dec
-18
Dec
-19
Dec
-20
Dec
-21
Dec
-22
Dec
-23
Dec
-24
Dec
-25
Equities (Northbound flows)
Bonds
Series3
Estimate foreign inflows to Chinese onshore bonds and equities (US$bn)
JPM GBI-EM inclusion (from Jan 2020);
Pro-forma wgt: 10%
Global Aggregate index inclusion (from Apr 2019);Pro-forma wgt: 6%
MSCI A-share inclusion (from Jun 2018)
IF=100%:Pro-forma wgt of A
shares = 47%/21%/3% in China/EM/ACWI
IF=20% (now)
WGBI inclusion (from Oct 2020);
Pro-forma wgt: 5.3%
* We estimate natural foreign inflows to China based on the assumptions that: 1) Outstanding CGBs will grow in line with as a percentage of Chinese GDP; 2) foreign holdings as of outstanding total bonds remains unchanged.
Source: China Central Depository and Clearing, Goldman Sachs Global Investment Research
Source: PBOC, Wind Source: China Central Depository and Clearing, Bloomberg, Thomson Reuters, MSCI, Goldman Sachs Global Investment Research
13 February 2022 34
Goldman Sachs China
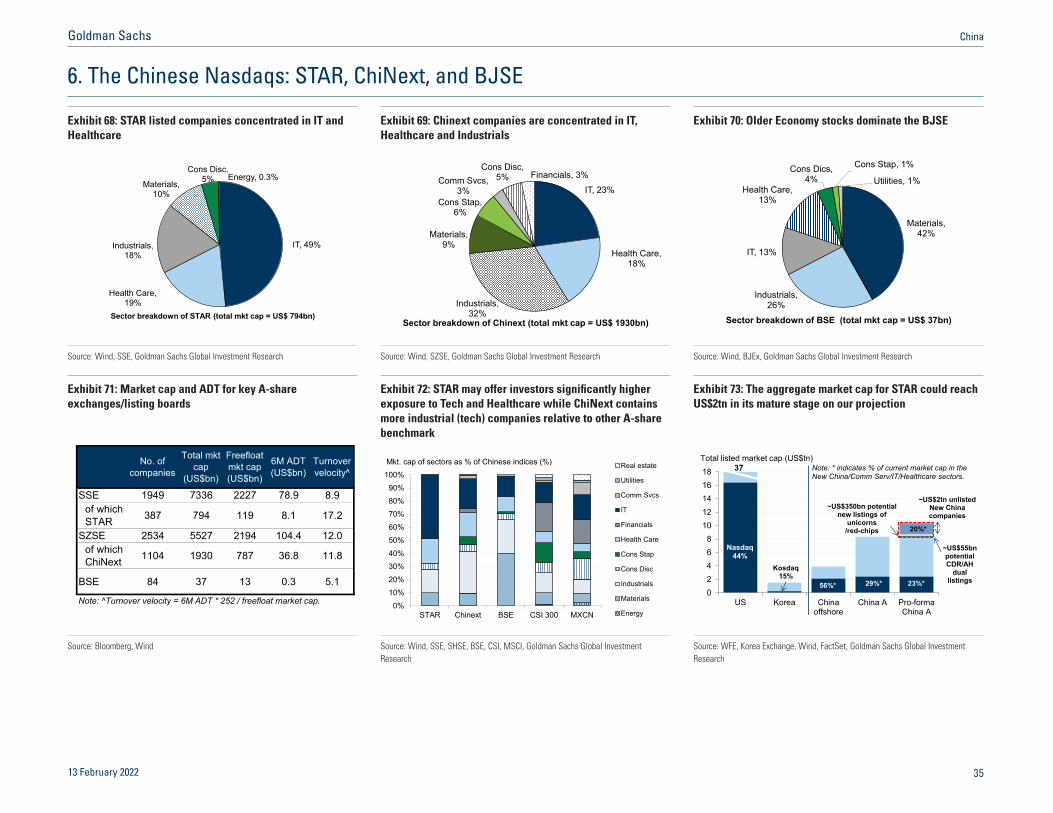
6. The Chinese Nasdaqs: STAR, ChiNext, and BJSE
Exhibit 68: STAR listed companies concentrated in IT and Healthcare
Exhibit 69: Chinext companies are concentrated in IT, Healthcare and Industrials
Exhibit 70: Older Economy stocks dominate the BJSE
IT, 49%
Health Care, 19%
Industrials, 18%
Materials, 10%
Cons Disc, 5% Energy, 0.3%
Sector breakdown of STAR (total mkt cap = US$ 794bn)
IT, 23%
Health Care, 18%
Industrials, 32%
Materials, 9%
Cons Stap, 6%
Comm Svcs, 3%
Cons Disc, 5% Financials, 3%
Sector breakdown of Chinext (total mkt cap = US$ 1930bn)
Materials, 42%
Industrials, 26%
IT, 13%
Health Care, 13%
Cons Dics, 4%
Cons Stap, 1%
Utilities, 1%
Sector breakdown of BSE (total mkt cap = US$ 37bn)
Source: Wind, SSE, Goldman Sachs Global Investment Research Source: Wind, SZSE, Goldman Sachs Global Investment Research Source: Wind, BJEx, Goldman Sachs Global Investment Research
Exhibit 71: Market cap and ADT for key A-share exchanges/listing boards
Exhibit 72: STAR may offer investors significantly higher exposure to Tech and Healthcare while ChiNext contains more industrial (tech) companies relative to other A-share benchmark
Exhibit 73: The aggregate market cap for STAR could reach US$2tn in its mature stage on our projection
No. of companies
Total mkt cap
(US$bn)
Freefloat mkt cap (US$bn)
6M ADT (US$bn)
Turnover velocity^
SSE 1949 7336 2227 78.9 8.9of which STAR 387 794 119 8.1 17.2
SZSE 2534 5527 2194 104.4 12.0of which ChiNext 1104 1930 787 36.8 11.8
BSE 84 37 13 0.3 5.1
Note: ^Turnover velocity = 6M ADT * 252 / freefloat market cap. 0%10%20%30%40%50%60%70%80%90%
100%
STAR Chinext BSE CSI 300 MXCN
Real estate
Utilities
Comm Svcs
IT
Financials
Health Care
Cons Stap
Cons Disc
Industrials
Materials
Energy
Mkt. cap of sectors as % of Chinese indices (%)
02468
1012141618
US Korea Chinaoffshore
China A Pro-formaChina A
Total listed market cap (US$tn)
Nasdaq44%
Kosdaq15%
Note: * indicates % of current market cap in the New China/Comm Serv/IT/Healthcare sectors.
29%*56%*
37
23%*
~US$55bn potentialCDR/AH
dual listings
~US$350bn potentialnew listings of
unicorns /red-chips
~US$2tn unlisted New China companies
20%*
Source: Bloomberg, Wind Source: Wind, SSE, SHSE, BSE, CSI, MSCI, Goldman Sachs Global Investment Research
Source: WFE, Korea Exchange, Wind, FactSet, Goldman Sachs Global Investment Research
13 February 2022 35
Goldman Sachs China
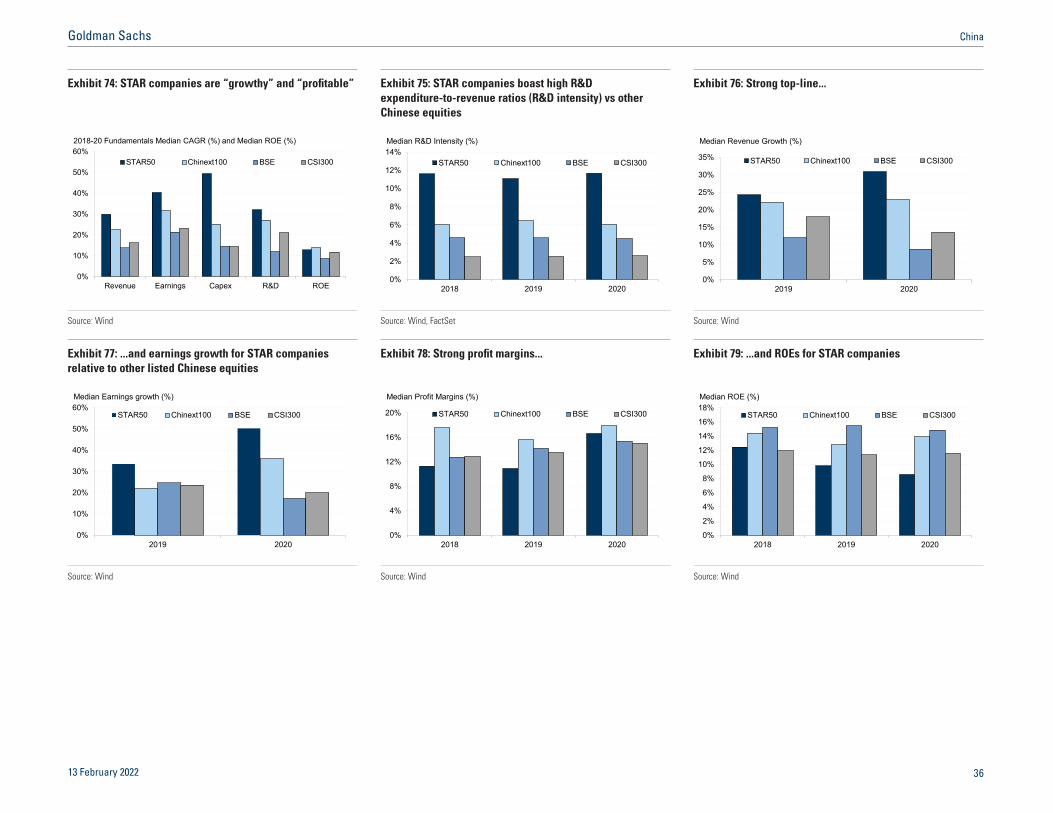
Exhibit 74: STAR companies are “growthy” and “profitable” Exhibit 75: STAR companies boast high R&D expenditure-to-revenue ratios (R&D intensity) vs other Chinese equities
Exhibit 76: Strong top-line...
0%
10%
20%
30%
40%
50%
60%
Revenue Earnings Capex R&D ROE
STAR50 Chinext100 BSE CSI300
2018-20 Fundamentals Median CAGR (%) and Median ROE (%)
0%
2%
4%
6%
8%
10%
12%
14%
2018 2019 2020
STAR50 Chinext100 BSE CSI300
Median R&D Intensity (%)
0%
5%
10%
15%
20%
25%
30%
35%
2019 2020
STAR50 Chinext100 BSE CSI300
Median Revenue Growth (%)
Source: Wind Source: Wind, FactSet Source: Wind
Exhibit 77: ...and earnings growth for STAR companies relative to other listed Chinese equities
Exhibit 78: Strong profit margins... Exhibit 79: ...and ROEs for STAR companies
0%
10%
20%
30%
40%
50%
60%
2019 2020
STAR50 Chinext100 BSE CSI300
Median Earnings growth (%)
0%
4%
8%
12%
16%
20%
2018 2019 2020
STAR50 Chinext100 BSE CSI300
Median Profit Margins (%)
0%
2%
4%
6%
8%
10%
12%
14%
16%
18%
2018 2019 2020
STAR50 Chinext100 BSE CSI300
Median ROE (%)
Source: Wind Source: Wind Source: Wind
13 February 2022 36
Goldman Sachs China

Exhibit 80: STAR and ChiNext are more volatile than CSI300 Exhibit 81: Absolute valuations for STAR look high relative to existing A shares but would look less expensive if their high historical growth rates are taken into consideration, in our view
Exhibit 82: Valuations for STAR are below historical averages
80
90
100
110
120
130
Jan-21 Mar-21 May-21 Jul-21 Sep-21 Nov-21 Jan-22
Rebased performance
Note: volatility calculated based on standard deviation of daily return since Jan-21 or inception; ^cap-weighted perfromance of all stocks listed on BSE
CSI300 (vol = 1.1%)BSE^ (vol = 2.1%)
STAR50 (vol = 1.5%)Chinext100 (vol = 1.7%)
16.3
9.9
3.8
0
5
10
15
20
25
30
35
STAR
50
Chi
next
100
CSI
300
MedianTTM P/S(x)
9.17.5
3.4
0
2
4
6
8
10
12
14
STAR
50
Chi
next
100
CSI
300
Interquartile range2020 P/B(x)
47.8
36.0
21.3
01020304050607080
STAR
50
Chi
next
100
CSI
300
12m fP/E(x)High/low
2030405060708090
100110120
Jul-1
9
Oct
-19
Jan-
20
Apr-2
0
Jul-2
0
Oct
-20
Jan-
21
Apr-2
1
Jul-2
1
Oct
-21
Jan-
22
12m market-cap weighted P/E
Median P/E
STAR 12m fPE (x)
42 (-0.9 s.d.)
33 (-1.9 s.d.)
Source: Bloomberg, Goldman Sachs Global Investment Research Source: Wind Source: Wind, Factset
Exhibit 83: ChiNext stocks are trading close to mid-cycle valuations
Exhibit 84: STAR are trading at higher fPEG level vs ChiNext and CSI300
Exhibit 85: BSE trades on lower valuations than STAR and ChiNext but with better growth than CSI300
0
10
20
30
40
50
60
70
Jan-
10
Jan-
11
Jan-
12
Jan-
13
Jan-
14
Jan-
15
Jan-
16
Jan-
17
Jan-
18
Jan-
19
Jan-
20
Jan-
21
Jan-
22
Median P/E
12m market-cap weighted P/E
ChiNext 12m fPE (x)
30(-0.1 s.d.)24(-0.7 s.d.)
0.5
1
1.5
2
2.5
3
Jan-
15
Jan-
16
Jan-
17
Jan-
18
Jan-
19
Jan-
20
Jan-
21
Jan-
22
ChiNext 12m fPEG
STAR 12m fPEG
CSI300 12m fPEG
12m fPEG (x)
1.21.11.1 0%
10%20%30%40%50%60%70%80%
01020304050607080
BSE STAR50 ChiNext100 CSI300
P/E (TTM) and EPSg ComparisonP/E(TTM)EPSg - RHS
Note: EPSg calculation based on 1H19 - 1H21 earnings CAGR.
(x)
Source: FactSet Source: Factset Source: Wind, Goldman Sachs Global Investment Research
13 February 2022 37
Goldman Sachs China
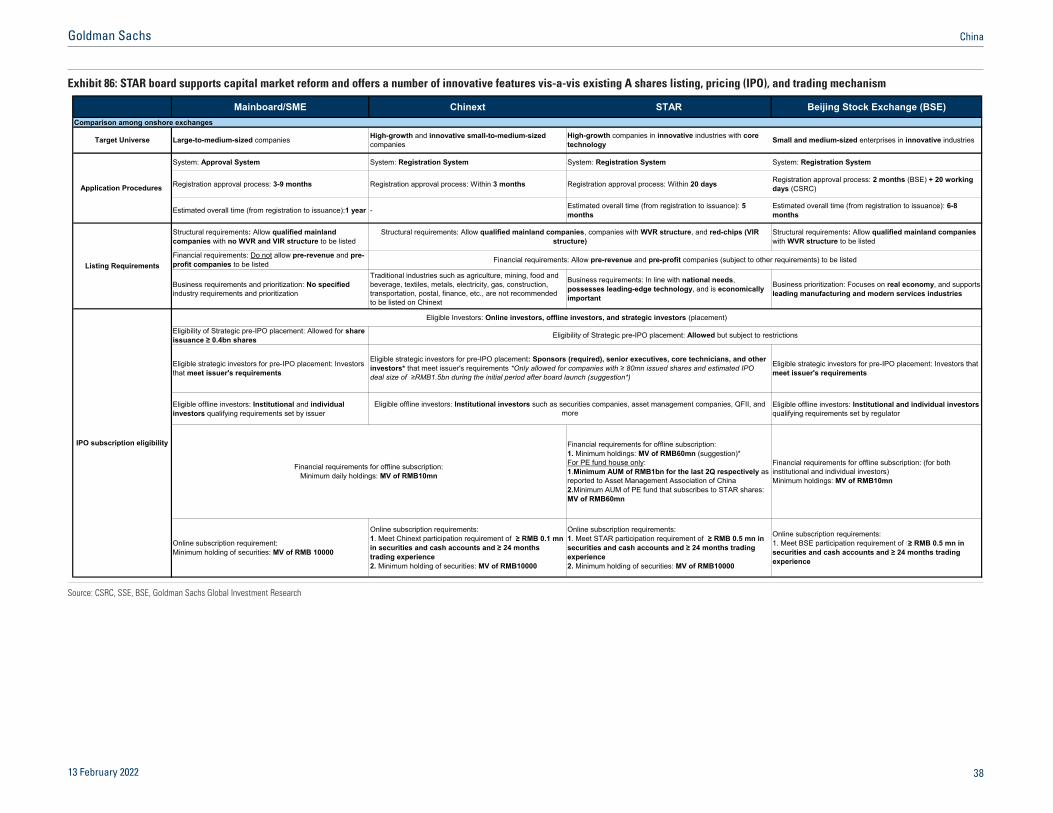
Exhibit 86: STAR board supports capital market reform and offers a number of innovative features vis-a-vis existing A shares listing, pricing (IPO), and trading mechanism
Mainboard/SME Chinext STAR Beijing Stock Exchange (BSE)Comparison among onshore exchanges
System: Approval System System: Registration System System: Registration System System: Registration System
Registration approval process: 3-9 months Registration approval process: Within 3 months Registration approval process: Within 20 days Registration approval process: 2 months (BSE) + 20 working days (CSRC)
Estimated overall time (from registration to issuance):1 year - Estimated overall time (from registration to issuance): 5 months
Estimated overall time (from registration to issuance): 6-8 months
Eligibility of Strategic pre-IPO placement: Allowed for share issuance ≥ 0.4bn shares
Eligible strategic investors for pre-IPO placement: Investors that meet issuer's requirements
Eligible strategic investors for pre-IPO placement: Investors that meet issuer's requirements
Eligible offline investors: Institutional and individual investors qualifying requirements set by issuer
Eligible offline investors: Institutional and individual investors qualifying requirements set by regulator
Financial requirements for offline subscription: 1. Minimum holdings: MV of RMB60mn (suggestion)*For PE fund house only:1.Minimum AUM of RMB1bn for the last 2Q respectively as reported to Asset Management Association of China2.Minimum AUM of PE fund that subscribes to STAR shares: MV of RMB60mn
Financial requirements for offline subscription: (for both institutional and individual investors)Minimum holdings: MV of RMB10mn
Online subscription requirement: Minimum holding of securities: MV of RMB 10000
Online subscription requirements: 1. Meet Chinext participation requirement of ≥ RMB 0.1 mn in securities and cash accounts and ≥ 24 months trading experience2. Minimum holding of securities: MV of RMB10000
Online subscription requirements: 1. Meet STAR participation requirement of ≥ RMB 0.5 mn in securities and cash accounts and ≥ 24 months trading experience2. Minimum holding of securities: MV of RMB10000
Online subscription requirements: 1. Meet BSE participation requirement of ≥ RMB 0.5 mn in securities and cash accounts and ≥ 24 months trading experience
Small and medium-sized enterprises in innovative industries
Structural requirements: Allow qualified mainland companies with WVR structure to be listed
Financial requirements: Allow pre-revenue and pre-profit companies (subject to other requirements) to be listed
Business prioritization: Focuses on real economy, and supports leading manufacturing and modern services industries
Eligible Investors: Online investors, offline investors, and strategic investors (placement)
Structural requirements: Allow qualified mainland companies, companies with WVR structure, and red-chips (VIR structure)
Traditional industries such as agriculture, mining, food and beverage, textiles, metals, electricity, gas, construction, transportation, postal, finance, etc., are not recommended to be listed on Chinext
Business requirements: In line with national needs, possesses leading-edge technology, and is economically important
Listing Requirements
Structural requirements: Allow qualified mainland companies with no WVR and VIR structure to be listed
Financial requirements: Do not allow pre-revenue and pre-profit companies to be listed
Business requirements and prioritization: No specified industry requirements and prioritization
IPO subscription eligibility
Eligible strategic investors for pre-IPO placement: Sponsors (required), senior executives, core technicians, and other investors* that meet issuer's requirements *Only allowed for companies with ≥ 80mn issued shares and estimated IPO deal size of ≥RMB1.5bn during the initial period after board launch (suggestion*)
Eligible offline investors: Institutional investors such as securities companies, asset management companies, QFII, and more
Financial requirements for offline subscription: Minimum daily holdings: MV of RMB10mn
Eligibility of Strategic pre-IPO placement: Allowed but subject to restrictions
Application Procedures
Target Universe Large-to-medium-sized companies High-growth companies in innovative industries with core technology
High-growth and innovative small-to-medium-sized companies
Source: CSRC, SSE, BSE, Goldman Sachs Global Investment Research
13 February 2022 38
Goldman Sachs China
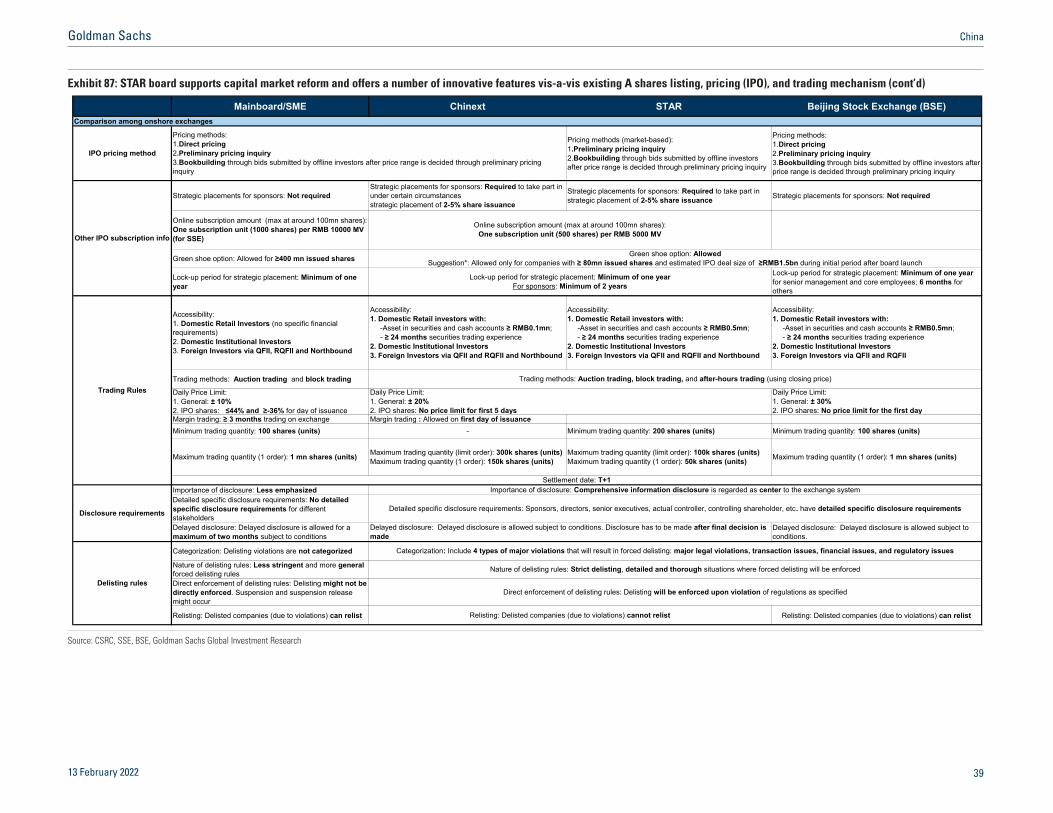
Exhibit 87: STAR board supports capital market reform and offers a number of innovative features vis-a-vis existing A shares listing, pricing (IPO), and trading mechanism (cont’d)
Mainboard/SME Chinext STAR Beijing Stock Exchange (BSE)Comparison among onshore exchanges
Pricing methods (market-based):1.Preliminary pricing inquiry2.Bookbuilding through bids submitted by offline investors after price range is decided through preliminary pricing inquiry
Pricing methods:1.Direct pricing2.Preliminary pricing inquiry3.Bookbuilding through bids submitted by offline investors after price range is decided through preliminary pricing inquiry
Strategic placements for sponsors: Not requiredStrategic placements for sponsors: Required to take part in under certain circumstances strategic placement of 2-5% share issuance
Strategic placements for sponsors: Required to take part in strategic placement of 2-5% share issuance Strategic placements for sponsors: Not required
Green shoe option: Allowed for ≥400 mn issued shares
Lock-up period for strategic placement: Minimum of one year
Lock-up period for strategic placement: Minimum of one year for senior management and core employees; 6 months for others
Accessibility: 1. Domestic Retail Investors (no specific financial requirements)2. Domestic Institutional Investors3. Foreign Investors via QFII, RQFII and Northbound
Accessibility:1. Domestic Retail investors with:
-Asset in securities and cash accounts ≥ RMB0.1mn;- ≥ 24 months securities trading experience
2. Domestic Institutional Investors3. Foreign Investors via QFII and RQFII and Northbound
Accessibility:1. Domestic Retail investors with:
-Asset in securities and cash accounts ≥ RMB0.5mn;- ≥ 24 months securities trading experience
2. Domestic Institutional Investors3. Foreign Investors via QFII and RQFII and Northbound
Accessibility:1. Domestic Retail investors with:
-Asset in securities and cash accounts ≥ RMB0.5mn;- ≥ 24 months securities trading experience
2. Domestic Institutional Investors3. Foreign Investors via QFII and RQFII
Trading methods: Auction trading and block trading
Margin trading: ≥ 3 months trading on exchange Margin trading : Allowed on first day of issuanceMinimum trading quantity: 100 shares (units) - Minimum trading quantity: 200 shares (units) Minimum trading quantity: 100 shares (units)
Maximum trading quantity (1 order): 1 mn shares (units) Maximum trading quantity (limit order): 300k shares (units)Maximum trading quantity (1 order): 150k shares (units)
Maximum trading quantity (limit order): 100k shares (units)Maximum trading quantity (1 order): 50k shares (units) Maximum trading quantity (1 order): 1 mn shares (units)
Importance of disclosure: Less emphasizedDetailed specific disclosure requirements: No detailed specific disclosure requirements for different stakeholdersDelayed disclosure: Delayed disclosure is allowed for a maximum of two months subject to conditions
Delayed disclosure: Delayed disclosure is allowed subject to conditions.
Categorization: Delisting violations are not categorized
Nature of delisting rules: Less stringent and more general forced delisting rulesDirect enforcement of delisting rules: Delisting might not be directly enforced. Suspension and suspension release might occur
Relisting: Delisted companies (due to violations) can relist Relisting: Delisted companies (due to violations) can relist
Green shoe option: AllowedSuggestion*: Allowed only for companies with ≥ 80mn issued shares and estimated IPO deal size of ≥RMB1.5bn during initial period after board launch
Trading methods: Auction trading, block trading, and after-hours trading (using closing price)
Daily Price Limit: 1. General: ± 30%2. IPO shares: No price limit for the first day
Settlement date: T+1
Online subscription amount (max at around 100mn shares): One subscription unit (500 shares) per RMB 5000 MV
Daily Price Limit: 1. General: ± 20%2. IPO shares: No price limit for first 5 days
Online subscription amount (max at around 100mn shares): One subscription unit (1000 shares) per RMB 10000 MV (for SSE)
Lock-up period for strategic placement: Minimum of one yearFor sponsors: Minimum of 2 years
Delisting rules
Relisting: Delisted companies (due to violations) cannot relist
Trading Rules Daily Price Limit: 1. General: ± 10% 2. IPO shares: ≤44% and ≥-36% for day of issuance
Disclosure requirements
Direct enforcement of delisting rules: Delisting will be enforced upon violation of regulations as specified
Delayed disclosure: Delayed disclosure is allowed subject to conditions. Disclosure has to be made after final decision is made
Detailed specific disclosure requirements: Sponsors, directors, senior executives, actual controller, controlling shareholder, etc. have detailed specific disclosure requirements
Importance of disclosure: Comprehensive information disclosure is regarded as center to the exchange system
Categorization: Include 4 types of major violations that will result in forced delisting: major legal violations, transaction issues, financial issues, and regulatory issues
Nature of delisting rules: Strict delisting, detailed and thorough situations where forced delisting will be enforced
Other IPO subscription info
IPO pricing method
Pricing methods:1.Direct pricing2.Preliminary pricing inquiry3.Bookbuilding through bids submitted by offline investors after price range is decided through preliminary pricing inquiry
Source: CSRC, SSE, BSE, Goldman Sachs Global Investment Research
13 February 2022 39
Goldman Sachs China
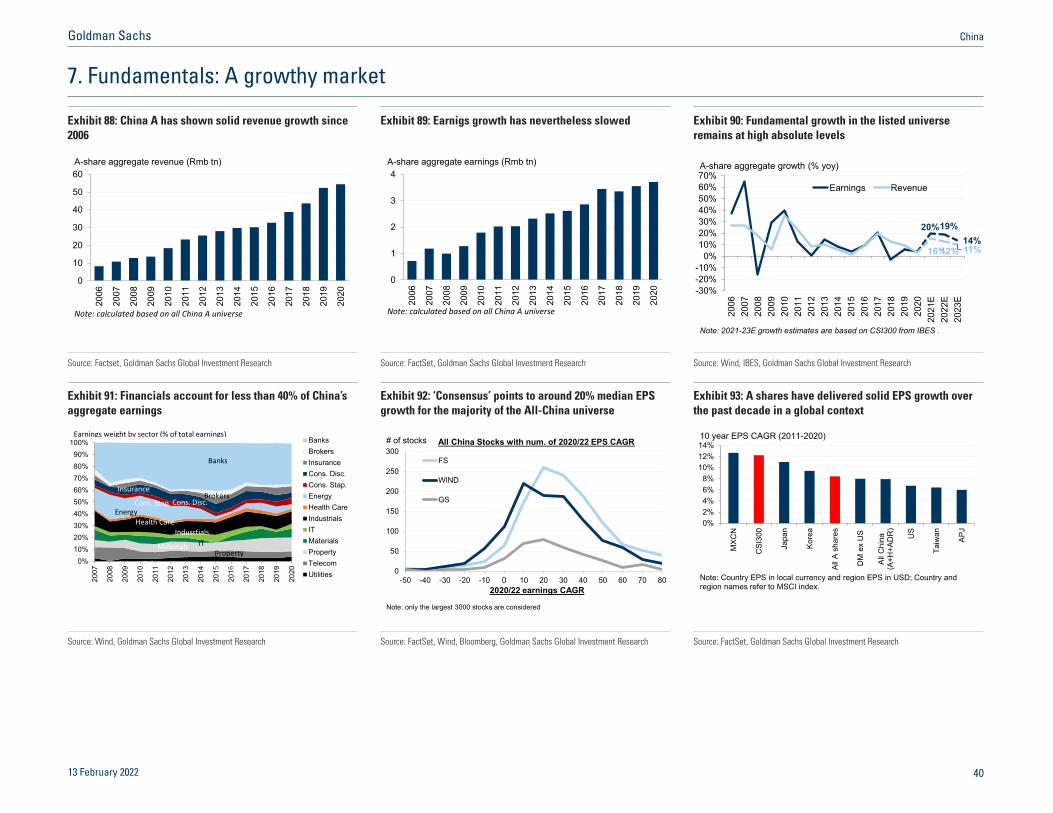
7. Fundamentals: A growthy market
Exhibit 88: China A has shown solid revenue growth since 2006
Exhibit 89: Earnigs growth has nevertheless slowed Exhibit 90: Fundamental growth in the listed universe remains at high absolute levels
0
10
20
30
40
50
60
2006
2007
2008
2009
2010
2011
2012
2013
2014
2015
2016
2017
2018
2019
2020
A-share aggregate revenue (Rmb tn)
Note: calculated based on all China A universe
0
1
2
3
4
2006
2007
2008
2009
2010
2011
2012
2013
2014
2015
2016
2017
2018
2019
2020
A-share aggregate earnings (Rmb tn)
Note: calculated based on all China A universe
19%14%
12% 11%
-30%-20%-10%
0%10%20%30%40%50%60%70%
2006
2007
2008
2009
2010
2011
2012
2013
2014
2015
2016
2017
2018
2019
2020
2021
E20
22E
2023
E
Earnings Revenue
A-share aggregate growth (% yoy)
20%
16%
Note: 2021-23E growth estimates are based on CSI300 from IBES .
Source: Factset, Goldman Sachs Global Investment Research Source: FactSet, Goldman Sachs Global Investment Research Source: Wind, IBES, Goldman Sachs Global Investment Research
Exhibit 91: Financials account for less than 40% of China’s aggregate earnings
Exhibit 92: ‘Consensus’ points to around 20% median EPS growth for the majority of the All-China universe
Exhibit 93: A shares have delivered solid EPS growth over the past decade in a global context
0%10%20%30%40%50%60%70%80%90%
100%
2007
2008
2009
2010
2011
2012
2013
2014
2015
2016
2017
2018
2019
2020
BanksBrokersInsuranceCons. Disc.Cons. Stap.EnergyHealth CareIndustrialsITMaterialsPropertyTelecomUtilities
Earnings weight by sector (% of total earnings)
Banks
BrokersCons. Disc.Cons. Stap.
EnergyHealth Care
Indusrtials
Insurance
ITProperty
Materials
Telecom
Utilities 0
50
100
150
200
250
300
-50 -40 -30 -20 -10 0 10 20 30 40 50 60 70 80
FS
WIND
GS
# of stocks All China Stocks with num. of 2020/22 EPS CAGR
2020/22 earnings CAGR
Note: only the largest 3000 stocks are considered
0%2%4%6%8%
10%12%14%
MXC
N
CSI
300
Japa
n
Kore
a
All A
sha
res
DM
ex
US
All C
hina
(A+H
+AD
R)
US
Taiw
an
APJ
10 year EPS CAGR (2011-2020)
Note: Country EPS in local currency and region EPS in USD; Country and region names refer to MSCI index.
Source: Wind, Goldman Sachs Global Investment Research Source: FactSet, Wind, Bloomberg, Goldman Sachs Global Investment Research Source: FactSet, Goldman Sachs Global Investment Research
13 February 2022 40
Goldman Sachs China

Exhibit 94: Meaningful earnings growth divergence at the sector level
Exhibit 95: There is a strong variance in realized earnings growth across sectors
Exhibit 96: Profit divergence among sectors has been substantial
CSI300 sectors 2021E 2022E 2023ECommunication services 13 21 16Consumer discretionary 22 24 17Consumer staples -29 52 38Energy 78 -3 -1Financials 12 13 13Health care 25 11 20Industrials 53 28 3Information technology 53 22 22Materials 78 21 12Real Estate -4 8 9Utilities -6 21 7CSI300 aggregate 20 18 14
IBES consensus earnings forecast by sector (%)
-10
0
10
20
Hea
lth C
are
Rea
l Est
ate
Con
s. D
isc.
Bank
s
Fina
ncia
ls
Con
s. S
tap.
Insu
ranc
e
Info
. Tec
h.
Indu
stria
ls
Util
ities
Com
m. S
vcs.
Mat
eria
ls
Brok
ers
Ener
gy
2010-20 EPS CAGR %All China 2010-20 EPS Growth CAGR by Sector (%)
-4
050
100150200250300350400450500
2011
2012
2013
2014
2015
2016
2017
2018
2019
2020
BanksInternet/TechDomestic CyclicalsDomestic Cyclicals (ex-Internet/Tech)
All China Sector earnings EPS Index
Source: FactSet, IBES, Goldman Sachs Global Investment Research Source: Wind, FactSet, Goldman Sachs Global Investment Research Source: FactSet, Bloomberg, Goldman Sachs Global Investment Research
Exhibit 97: Earnings growth diverged between POEs and SOEs in 2020
Exhibit 98: Top-line growth to low-single-levels in 2020 as the pandemic slowed economic activities
Exhibit 99: Profitability was under pressure in 2020
-40%
-20%
0%
20%
40%
60%
2006
2007
2008
2009
2010
2011
2012
2013
2014
2015
2016
2017
2018
2019
2020
All China (A+H+ADR)All China ex fin.SOE (ex-fin)POE (ex-fin)
Earnings growth (yoy)
-10%-5%0%5%
10%15%20%25%30%35%40%
2006
2007
2008
2009
2010
2011
2012
2013
2014
2015
2016
2017
2018
2019
2020
All China (A+H+ADR)All China ex fin.SOE (ex-fin)POE (ex-fin)
Revenue growth (yoy)
3%4%5%6%7%8%9%
10%11%12%
2006
2007
2008
2009
2010
2011
2012
2013
2014
2015
2016
2017
2018
2019
2020
All China (A+H+ADR)All China ex fin.SOE (ex-fin)POE (ex-fin)
Net margin (%)
Source: Wind, Bloomberg, Goldman Sachs Global Investment Research Source: Wind, Bloomberg, Goldman Sachs Global Investment Research Source: Wind, Bloomberg, Goldman Sachs Global Investment Research
13 February 2022 4<
Goldman Sachs China

Exhibit 100: ROE has been trending down since mid-2000s Exhibit 101: The cash conversion cycle has been on a rising trend over the past decade
Exhibit 102: Asset turnover has stablized in recent years
4%
6%
8%
10%
12%
14%
16%
18%
20%
2006
2007
2008
2009
2010
2011
2012
2013
2014
2015
2016
2017
2018
2019
2020
All China (A+H+ADR)All China ex fin.SOE ex fin.POE ex fin.
ROE (%)
020406080100120140160180
-150-100-50
050
100150200250300
2007
2008
2009
2010
2011
2012
2013
2014
2015
2016
2017
2018
2019
2020
Payable daysReceivable daysInventory daysCash conversion days - RHS
All China ex fin. cash conversion cycle (days)
Contribution breakdown of changes in ROE for all China ex fin (% yoy)
4.0%
4.5%
5.0%
5.5%
6.0%
6.5%
7.0%
40%
50%
60%
70%
80%
90%
2007
2008
2009
2010
2011
2012
2013
2014
2015
2016
2017
2018
2019
2020
All China ex fin.All China ex fin. & energyAll China financials - RHS
Asset turnover (Revenue / Assets, %)
Source: Wind, Bloomberg, Goldman Sachs Global Investment Research Source: Wind, Bloomberg, Goldman Sachs Global Investment Research Source: Wind, Bloomberg, Goldman Sachs Global Investment Research
Exhibit 103: Capex intensity for SOEs has been falling over the past decade
Exhibit 104: Leverage appears a bigger risk for SOEs than POEs
Exhibit 105: Utilities, Real Estate and Industrials have high leverage and low interest coverage ratio
5%6%7%8%9%
10%11%12%13%14%15%
2007
2008
2009
2010
2011
2012
2013
2014
2015
2016
2017
2018
2019
2020
SOE (ex-fin)POE (ex-fin)All China (A+H+ADR)
Capex / Sales (%)
10%
20%
30%
40%
50%
60%
70%
80%
2007
2008
2009
2010
2011
2012
2013
2014
2015
2016
2017
2018
2019
2020
SOE ex fin.POE ex fin.All China ex fin.
Net debt / equity (%)
Cons. Disc.Cons. Stap.
Energy
Real Estate
Health Care
Industrials
Info. Tech.
Materials
Utilities
All China ex fin.
-20%
0%
20%
40%
60%
80%
100%
120%
140%
0 2 4 6 8 10 12 14
Higher credit risk
Note: Interest expense includes capitalized interests.
Comm. Svcs.
EBITDA / Interest expense (2020, X)
Net
deb
t/ E
quity
(202
0)
Source: Wind, Bloomberg, Goldman Sachs Global Investment Research Source: Wind, Bloomberg, Goldman Sachs Global Investment Research Source: Wind, Bloomberg, Goldman Sachs Global Investment Research
13 February 2022 42
Goldman Sachs China

Exhibit 106: R&D intensity for POEs fell in 2020 likely due to Covid-related disruptions
Exhibit 107: Profit alerts imply softer earnings growth momentum for last quarter
Exhibit 108: Normalizing top- and bottom-line growth post the Covid outbreak in 2020
0.0%
0.5%
1.0%
1.5%
2.0%
2.5%
3.0%
3.5%
2006
2007
2008
2009
2010
2011
2012
2013
2014
2015
2016
2017
2018
2019
2020
All China (A+H+ADR)All China ex fin.POE ex fin.SOE ex fin.
R&D / Revenues (%)
-30%
-20%
-10%
0%
10%
20%
30%
40%
50%
60%
0%10%20%30%40%50%60%70%80%90%
100%
2Q14
4Q14
2Q15
4Q15
2Q16
4Q16
2Q17
4Q17
2Q18
4Q18
2Q19
4Q19
2Q20
4Q20
2Q21
4Q21
Negativealerts
Uncertain
Positivealerts
All Chinaearningsgrowth -RHS
All China (A+H) profit alert by type Earnings growth (yoy)
-40%
-30%
-20%
-10%
0%
10%
20%
30%
40%
Dec
-12
Jun-
13D
ec-1
3Ju
n-14
Dec
-14
Jun-
15D
ec-1
5Ju
n-16
Dec
-16
Jun-
17D
ec-1
7Ju
n-18
Dec
-18
Jun-
19D
ec-1
9Ju
n-20
Dec
-20
Jun-
21
NBS industrial profitsNBS industrial sales
(%yoy, 3MMA)
Source: Wind, Bloomberg, Goldman Sachs Global Investment Research Source: Wind, Goldman Sachs Global Investment Research Source: NBS
Exhibit 109: NBS industrial profits have shown fairly high correlations with listed companies’ earnings in certain sectors
Exhibit 110: Banks, Transportation, and Tech Hardware tend to have high earnings sensitivity to economic growth
Exhibit 111: Tech Hardware, Durables, Semi, and Autos are relatively more reliant on inputs to generate outputs
-1
0
1
2
3Ba
nks
Tran
spor
tatio
n
Tech
Har
dwar
e
Auto
s
Con
s D
urab
les
Cap
ital G
oods
Med
ia
Food
Bev
erag
e
Softw
are
Tele
com
Con
s Se
rvic
es
Rea
l Est
ate
Ener
gy
Util
ities
Phar
ma
Biot
ech
Insu
ranc
e
Div
Fin
anci
als
T-stats - Regressing earnings growth on China CAI (based on all China listed universe and annual data over the past 10Y)
Note: Data as of 2017.
0% 25% 50% 75% 100%
Div FinRetailing
BanksTelecom
Consumer ServSoftware & Services
Media & EntertainTransportation
Real EstateInsurance
Healthcare Eq & ServEnergy
Food & BevComm & Prof Serv
UtilitiesPharma
MaterialsCapital Goods
AutoSemiconductors
Durables & ApparelHardware & Equip
Input
Wage
Tax
Depreciation
Profit
Output value breakdown
Source: FactSet, NBS, Goldman Sachs Global Investment Research Source: Wind, Bloomberg, Goldman Sachs Global Investment Research Source: NBS, Goldman Sachs Global Investment Research
13 February 2022 43
Goldman Sachs China
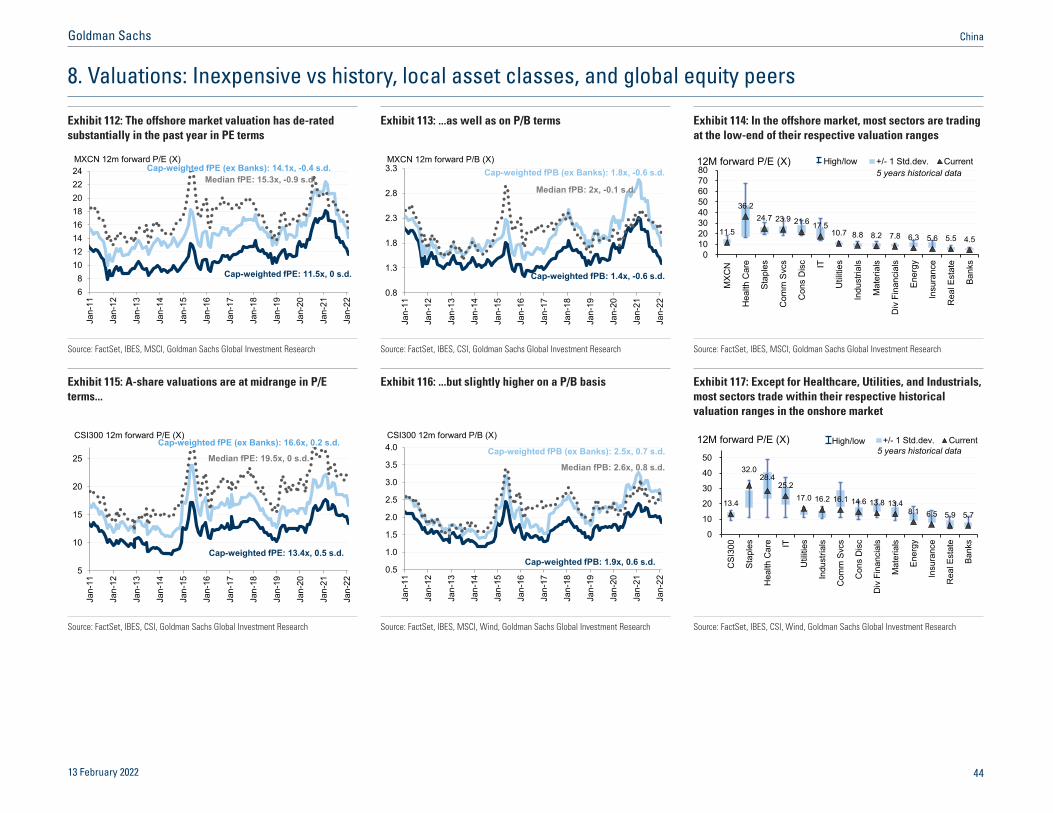
8. Valuations: Inexpensive vs history, local asset classes, and global equity peers
Exhibit 112: The offshore market valuation has de-rated substantially in the past year in PE terms
Exhibit 113: ...as well as on P/B terms Exhibit 114: In the offshore market, most sectors are trading at the low-end of their respective valuation ranges
68
1012141618202224
Jan-
11
Jan-
12
Jan-
13
Jan-
14
Jan-
15
Jan-
16
Jan-
17
Jan-
18
Jan-
19
Jan-
20
Jan-
21
Jan-
22
MXCN 12m forward P/E (X)
Median fPE: 15.3x, -0.9 s.d.Cap-weighted fPE (ex Banks): 14.1x, -0.4 s.d.
Cap-weighted fPE: 11.5x, 0 s.d.
0.8
1.3
1.8
2.3
2.8
3.3
Jan-
11
Jan-
12
Jan-
13
Jan-
14
Jan-
15
Jan-
16
Jan-
17
Jan-
18
Jan-
19
Jan-
20
Jan-
21
Jan-
22
MXCN 12m forward P/B (X)
Median fPB: 2x, -0.1 s.d.
Cap-weighted fPB (ex Banks): 1.8x, -0.6 s.d.
Cap-weighted fPB: 1.4x, -0.6 s.d.
11.5
36.224.7 23.9 21.6 17.5
10.7 8.8 8.2 7.8 6.3 5.6 5.5 4.5
01020304050607080
MXC
N
Hea
lth C
are
Stap
les
Com
m S
vcs
Con
s D
isc IT
Util
ities
Indu
stria
ls
Mat
eria
ls
Div
Fin
anci
als
Ener
gy
Insu
ranc
e
Rea
l Est
ate
Bank
s
12M forward P/E (X) +/- 1 Std.dev. CurrentHigh/low5 years historical data
Source: FactSet, IBES, MSCI, Goldman Sachs Global Investment Research Source: FactSet, IBES, CSI, Goldman Sachs Global Investment Research Source: FactSet, IBES, MSCI, Goldman Sachs Global Investment Research
Exhibit 115: A-share valuations are at midrange in P/E terms...
Exhibit 116: ...but slightly higher on a P/B basis Exhibit 117: Except for Healthcare, Utilities, and Industrials, most sectors trade within their respective historical valuation ranges in the onshore market
5
10
15
20
25
Jan-
11
Jan-
12
Jan-
13
Jan-
14
Jan-
15
Jan-
16
Jan-
17
Jan-
18
Jan-
19
Jan-
20
Jan-
21
Jan-
22
CSI300 12m forward P/E (X)Cap-weighted fPE (ex Banks): 16.6x, 0.2 s.d.
Cap-weighted fPE: 13.4x, 0.5 s.d.
Median fPE: 19.5x, 0 s.d.
0.5
1.0
1.5
2.0
2.5
3.0
3.5
4.0
Jan-
11
Jan-
12
Jan-
13
Jan-
14
Jan-
15
Jan-
16
Jan-
17
Jan-
18
Jan-
19
Jan-
20
Jan-
21
Jan-
22
CSI300 12m forward P/B (X)
Cap-weighted fPB (ex Banks): 2.5x, 0.7 s.d.
Cap-weighted fPB: 1.9x, 0.6 s.d.
Median fPB: 2.6x, 0.8 s.d.
13.4
32.028.4
25.217.0 16.2 16.1 14.6 13.8 13.4
8.1 6.5 5.9 5.7
0
10
20
30
40
50
CSI
300
Stap
les
Hea
lth C
are IT
Util
ities
Indu
stria
ls
Com
m S
vcs
Con
s D
isc
Div
Fin
anci
als
Mat
eria
ls
Ener
gy
Insu
ranc
e
Rea
l Est
ate
Bank
s
12M forward P/E (X) +/- 1 Std.dev. CurrentHigh/low5 years historical data
Source: FactSet, IBES, CSI, Goldman Sachs Global Investment Research Source: FactSet, IBES, MSCI, Wind, Goldman Sachs Global Investment Research Source: FactSet, IBES, CSI, Wind, Goldman Sachs Global Investment Research
13 February 2022 44
Goldman Sachs China

Exhibit 118: Our top-down model points to 15x 2022E PE for CSI300
Exhibit 119: Valuation disparity is significant across markets and indexes
Exhibit 120: The gaps between aggregate and average/median stock valuations remain quite wide in A shares
89
101112131415161718
Dec
-14
Dec
-15
Dec
-16
Dec
-17
Dec
-18
Dec
-19
Dec
-20
Dec
-21
Dec
-22
CSI300 12m fPE (x)
13.2x
CSI30015.0x
(+0.9sd)
2022E GS forecasts
Nominal GDP7D repo
Northbound flows
23.0
11.5 10.7 8.7
35.3
18.6
13.4 13.2 10.8
8.8
0
10
20
30
40
50
ADR
MXC
N
HSI
HSC
EI
Chi
Nex
t100
SZC
OM
P
CSI
300
SHC
OM
P
Chi
na A
Int'l
A50
+/- 1 Stdev. Current High/low12M forward P/E over past 5 yrs(X)
Offshore Onshore
As of Feb 2022
0
10
20
30
40
50
60
70
80
Jan-
05Ja
n-06
Jan-
07Ja
n-08
Jan-
09Ja
n-10
Jan-
11Ja
n-12
Jan-
13Ja
n-14
Jan-
15Ja
n-16
Jan-
17Ja
n-18
Jan-
19Ja
n-20
Jan-
21Ja
n-22
All A shares (aggregate)
All A shares (average)
All A shares (median)
Forward 12M P/E (x)
23.7x(-0.7s.d.)
As of Jan 31, 2022
18.8x(-0.7s.d.)13.3x
(-0.2s.d.)
Source: Wind, Goldman Sachs Global Investment Research Source: FactSet, IBES, Goldman Sachs Global Investment Research Source: FactSet, IBES, Goldman Sachs Global Investment Research
Exhibit 121: Valuation gaps between Growth and Value have reduced
Exhibit 122: Small caps look attractively priced in PE and PEG terms
Exhibit 123: Headline index P/E looks high for Shenzhen listed A shares and ADRs, reflecting their growth potential and thematic exposures
00.1
0.2
0.30.4
0.5
0.60.7
0.8
5
10
15
20
25
30
35
Jan-
10
Jan-
11
Jan-
12
Jan-
13
Jan-
14
Jan-
15
Jan-
16
Jan-
17
Jan-
18
Jan-
19
Jan-
20
Jan-
21
Jan-
22
fPE gap fPEG gap - RHS
MXCN Growth vs. Value valuation gap, since 2010 (x)
Note: As of Jan 2022. Gap is calculated as Growth less Value. Pre-earnings companies are excluded based on available 2021E median consensus estimates.
18.5x(-0.1s.d.)
0.3x(-0.4s.d.)
0.60.81.01.21.41.61.82.02.2
10152025303540455055
Jan-
11
Jan-
12
Jan-
13
Jan-
14
Jan-
15
Jan-
16
Jan-
17
Jan-
18
Jan-
19
Jan-
20
Jan-
21
Jan-
22
CSI1000
12m fPE fPEG- RHS
21.1x(-0.5s.d.)
0.9x(-0.5s.d.)
05
101520253035
Chi
next
Chi
na A
DR
Nas
daq
Indi
aU
SSZ
CO
MP
DM
Aust
ralia
Kosd
aqEu
rope
Chi
na A
Int'l
Chi
na A
Taiw
anM
exic
oJa
pan
CSI
300
EM UK
Chi
na o
ffsho
reSH
CO
MP
Sout
h Af
rica
Kore
a
2022E PE of major MSCI DM and EM markets (X)
Note: As of Feb 2022; Local currency applies to country names and USD applies to region names. in USD; Country and region names refer to MSCI index.
Source: Factset, Goldman Sachs Global Investment Research Source: Wind, FactSet, Goldman Sachs Global Investment Research Source: FactSet, IBES, MSCI, Goldman Sachs Global Investment Research
13 February 2022 45
Goldman Sachs China

Exhibit 124: AH valuation gaps remain significant Exhibit 125: Div. Fin. and IT have the highest AH premiums among other sectors
Exhibit 126: Earnings yields have risen for equities, looking relatively attractive vis-a-vis other competing asset classes
-20%
30%
80%
130%
180%
230%
2006
2007
2008
2009
2010
2011
2012
2013
2014
2015
2016
2017
2018
2019
2020
2021
Equal-weighted A/H premium: 108%Cap-weighted A/H premium: 56%
China A-H Premium - as of 02/10/2022
56%
143% 127%
99%
93%66%62% 60%55%
49%46% 45%
44%19%
0%
50%
100%
150%
200%
All IT
Div
. Fin
Util
ities
Indu
stria
ls
Insu
ranc
e
Ener
gy
Con
s St
ap
Con
s D
isc
Hea
lth C
are
Rea
l Est
ate
Mat
eria
ls
Fina
ncia
ls
Bank
s
+/- 1 Stdev. Current
Cap-weighted AH premium over past 5YHigh/low
0%
2%
4%
6%
8%
10%
12%
14%
Jan-
07Ja
n-08
Jan-
09Ja
n-10
Jan-
11Ja
n-12
Jan-
13Ja
n-14
Jan-
15Ja
n-16
Jan-
17Ja
n-18
Jan-
19Ja
n-20
Jan-
21Ja
n-22
Yield (%)
Earnings (H): 8.5% -0.2 sd
Dividend (H): 1.8% -0.8sd
Govt bond:2.7% -1.7 sd
Rental:1.4% -1.1sd
China cross asset yield
Earnings (A): 7.0% -0.3 sd
Yu'E Bao:2.1% -1.0sd
Source: Wind, Goldman Sachs Global Investment Research Source: Bloomberg, Goldman Sachs Global Investment Research Source: FactSet, Wind, Goldman Sachs Global Investment Research
Exhibit 127: While PE has re-rated substantially, onshore implied cost of equity has moved in a narrow range in the past few years
Exhibit 128: A-share ERP is close to long-term averages Exhibit 129: Offshore implied cost of equity has risen meaningfully in the past year, driving equity valuations lower...
7
8
9
10
11
12
13
14
15
2003
2004
2005
2006
2007
2008
2009
2010
2011
2012
2013
2014
2015
2016
2017
2018
2019
2020
2021
2022
Implied cost of equity(%)CSI 300 average + 1Stdev - 1Stdev
10.7%(-0.6 sd)
3456789
101112
2003
2004
2005
2006
2007
2008
2009
2010
2011
2012
2013
2014
2015
2016
2017
2018
2019
2020
2021
2022
Implied equity risk premium (%)CSI 300 average + 1Stdev - 1Stdev
7.9%(0.0sd)
89
1011121314151617
2001
2002
2003
2004
2005
2006
2007
2008
2009
2010
2011
2012
2013
2014
2015
2016
2017
2018
2019
2020
2021
2022
Implied Cost of Equity(%)MXCN average + 1Stdev - 1Stdev
10.5%(-0.6sd)
Note: Based on current constituents
Source: CSI, FactSet Source: CSI, FactSet Source: MSCI, FactSet
13 February 2022 46
Goldman Sachs China

Exhibit 130: ...with ERP now staying above midcycle Exhibit 131: Equity-bond yield gaps suggest Offshore equities are inexpensively priced vis-a-vis government bonds
Exhibit 132: Equity duration years have significantly shortened in China over the past year
456789
101112
2001
2002
2003
2004
2005
2006
2007
2008
2009
2010
2011
2012
2013
2014
2015
2016
2017
2018
2019
2020
2021
2022
Implied equity risk premium (%)MXCN average + 1Stdev - 1Stdev
7.9%(+0.7sd)
Note: Based on current constituents0
100
200
300
400
500
600
700
Jan-
10
Jan-
11
Jan-
12
Jan-
13
Jan-
14
Jan-
15
Jan-
16
Jan-
17
Jan-
18
Jan-
19
Jan-
20
Jan-
21
Jan-
22
MXCN vs. UST10Y MXCN vs. CGB10YCSI300 vs. UST10Y CSI300 vs. CGB10Y
Yield gap (earnings yield^ vs. 10Y govt bond, bps)
286bps (-0.4 sd)
423bps (0.5sd)
193bps (0.0 sd)
^earnings yield calcuated as 1 divided by median PE of index constituents
329bps (1.1sd)
5 10 15 20
Software & Serv.Cons Staples
Tech H/w & SemisCons Retail & Serv.
Health CareAutos
Internet/Media/Ent.MXCN
Capital GoodsMetals & MiningInsur/other Fins
UtilitiesTelecos
Chem/other Mat.Transportation
EnergyReal Estate
Banks Latest
Feb '21
Implied Equity Duration of Median Stock (Years)Change since Feb '21
MSC
I Chi
na S
ecto
rs
Source: MSCI, FactSet Source: FactSet, Goldman Sachs Global Investment Research Source: FactSet, Goldman Sachs Global Investment Research
Exhibit 133: Chinese equities are positively correlated with US long-end rates (and steepening yield curve) , but negatively vs. Chinese short-end rates
Regression period UST 1M UST 3M UST 2Y UST
10YUST
10Y-3M DR007 SHIBOR 3M
CGB 2YR
CGB 10YR
CGB 10Y-2Y
1Y -1.1 0.2 1.7 2.4 2.4 -2.0 -1.1 -0.3 1.4 1.83Y 1.6 1.4 3.3 3.5 2.4 -1.3 -1.2 1.4 3.3 1.05Y 1.6 1.1 4.4 3.4 2.4 -1.2 0.3 1.8 3.7 1.110Y 1.0 0.6 4.9 4.2 3.9 -2.1 -1.4 1.0 3.2 1.715Y 5.4 5.3 4.9 5.8 1.4 -1.5 -1.4 1.0 4.4 3.1
Average 1.7 1.7 3.9 3.9 2.5 -1.6 -1.0 1.0 3.2 1.71Y -0.8 0.4 1.3 1.7 1.6 -1.9 -1.7 -1.1 0.8 2.33Y 1.0 0.3 2.4 2.0 1.7 -1.8 -1.4 1.2 3.9 1.75Y 0.3 -0.2 3.0 2.4 2.5 -1.3 0.2 1.5 4.1 1.810Y 0.2 -0.6 4.1 2.7 3.0 -2.1 -1.2 0.7 2.9 1.715Y 2.2 1.7 2.4 2.2 0.7 -2.2 -0.7 1.3 4.8 3.2
Average 0.6 0.3 2.6 2.2 1.9 -1.9 -0.9 0.7 3.3 2.1Note: single linear regression t-stat of WoW index returns on WoW interest rate changes
CSI3
00M
XCN
US rates China ratesT-stat of single linear regression (WoW changes)
Source: Federal Reserve, PBoC, Wind, FactSet, Bloomberg, Goldman Sachs Global Investment Research
13 February 2022 47
Goldman Sachs China
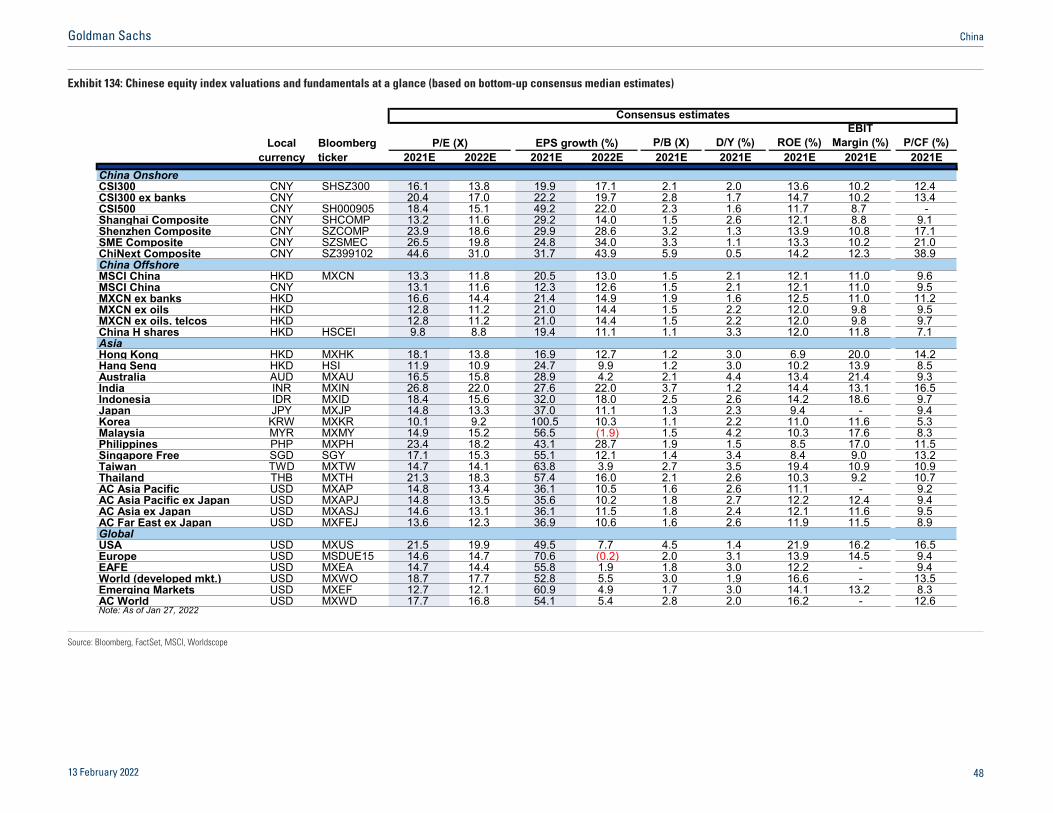
Exhibit 134: Chinese equity index valuations and fundamentals at a glance (based on bottom-up consensus median estimates)
EBITLocal Bloomberg P/B (X) D/Y (%) ROE (%) Margin (%) P/CF (%)
currency ticker 2021E 2022E 2021E 2022E 2021E 2021E 2021E 2021E 2021EChina OnshoreCSI300 CNY SHSZ300 16.1 13.8 19.9 17.1 2.1 2.0 13.6 10.2 12.4CSI300 ex banks CNY 20.4 17.0 22.2 19.7 2.8 1.7 14.7 10.2 13.4CSI500 CNY SH000905 18.4 15.1 49.2 22.0 2.3 1.6 11.7 8.7 -Shanghai Composite CNY SHCOMP 13.2 11.6 29.2 14.0 1.5 2.6 12.1 8.8 9.1Shenzhen Composite CNY SZCOMP 23.9 18.6 29.9 28.6 3.2 1.3 13.9 10.8 17.1SME Composite CNY SZSMEC 26.5 19.8 24.8 34.0 3.3 1.1 13.3 10.2 21.0ChiNext Composite CNY SZ399102 44.6 31.0 31.7 43.9 5.9 0.5 14.2 12.3 38.9China OffshoreMSCI China HKD MXCN 13.3 11.8 20.5 13.0 1.5 2.1 12.1 11.0 9.6MSCI China CNY 13.1 11.6 12.3 12.6 1.5 2.1 12.1 11.0 9.5MXCN ex banks HKD 16.6 14.4 21.4 14.9 1.9 1.6 12.5 11.0 11.2MXCN ex oils HKD 12.8 11.2 21.0 14.4 1.5 2.2 12.0 9.8 9.5MXCN ex oils, telcos HKD 12.8 11.2 21.0 14.4 1.5 2.2 12.0 9.8 9.7China H shares HKD HSCEI 9.8 8.8 19.4 11.1 1.1 3.3 12.0 11.8 7.1AsiaHong Kong HKD MXHK 18.1 13.8 16.9 12.7 1.2 3.0 6.9 20.0 14.2Hang Seng HKD HSI 11.9 10.9 24.7 9.9 1.2 3.0 10.2 13.9 8.5Australia AUD MXAU 16.5 15.8 28.9 4.2 2.1 4.4 13.4 21.4 9.3India INR MXIN 26.8 22.0 27.6 22.0 3.7 1.2 14.4 13.1 16.5Indonesia IDR MXID 18.4 15.6 32.0 18.0 2.5 2.6 14.2 18.6 9.7Japan JPY MXJP 14.8 13.3 37.0 11.1 1.3 2.3 9.4 - 9.4Korea KRW MXKR 10.1 9.2 100.5 10.3 1.1 2.2 11.0 11.6 5.3Malaysia MYR MXMY 14.9 15.2 56.5 (1.9) 1.5 4.2 10.3 17.6 8.3Philippines PHP MXPH 23.4 18.2 43.1 28.7 1.9 1.5 8.5 17.0 11.5Singapore Free SGD SGY 17.1 15.3 55.1 12.1 1.4 3.4 8.4 9.0 13.2Taiwan TWD MXTW 14.7 14.1 63.8 3.9 2.7 3.5 19.4 10.9 10.9Thailand THB MXTH 21.3 18.3 57.4 16.0 2.1 2.6 10.3 9.2 10.7AC Asia Pacific USD MXAP 14.8 13.4 36.1 10.5 1.6 2.6 11.1 - 9.2AC Asia Pacific ex Japan USD MXAPJ 14.8 13.5 35.6 10.2 1.8 2.7 12.2 12.4 9.4AC Asia ex Japan USD MXASJ 14.6 13.1 36.1 11.5 1.8 2.4 12.1 11.6 9.5AC Far East ex Japan USD MXFEJ 13.6 12.3 36.9 10.6 1.6 2.6 11.9 11.5 8.9GlobalUSA USD MXUS 21.5 19.9 49.5 7.7 4.5 1.4 21.9 16.2 16.5Europe USD MSDUE15 14.6 14.7 70.6 (0.2) 2.0 3.1 13.9 14.5 9.4EAFE USD MXEA 14.7 14.4 55.8 1.9 1.8 3.0 12.2 - 9.4World (developed mkt.) USD MXWO 18.7 17.7 52.8 5.5 3.0 1.9 16.6 - 13.5Emerging Markets USD MXEF 12.7 12.1 60.9 4.9 1.7 3.0 14.1 13.2 8.3AC World USD MXWD 17.7 16.8 54.1 5.4 2.8 2.0 16.2 - 12.6Note: As of Jan 27, 2022
Consensus estimates
P/E (X) EPS growth (%)
Source: Bloomberg, FactSet, MSCI, Worldscope
13 February 2022 48
Goldman Sachs China

9. Flows/positioning: Structural trends in motion
Exhibit 135: Notional turnover and turnover velocity have moderated recently
Exhibit 136: New investors trend has remained stable Exhibit 137: Margin selling balance has fallen
02468101214161820
0200400600800
10001200140016001800
Jan-
14
Jul-1
4
Jan-
15
Jul-1
5
Jan-
16
Jul-1
6
Jan-
17
Jul-1
7
Jan-
18
Jul-1
8
Jan-
19
Jul-1
9
Jan-
20
Jul-2
0
Jan-
21
Jul-2
1
Jan-
22
A-share average daily turnover(rolling 1m)
A-share turnover velocity - RHS
*Annualized turnover velocity = 1m avg turnover /1m avg free float exchange cap*252
A-share avg daily turnover (Rmb bn) A-share turnover velocity (X)
RMB 970bn
7.8x
0
1
2
3
4
5
6
Apr-1
5Au
g-15
Dec
-15
Apr-1
6Au
g-16
Dec
-16
Apr-1
7Au
g-17
Dec
-17
Apr-1
8Au
g-18
Dec
-18
Apr-1
9Au
g-19
Dec
-19
Apr-2
0Au
g-20
Dec
-20
Apr-2
1Au
g-21
Dec
-21
# of new investors (mn/month) 6m moving average
Number of new A-share investors (mn / month)
As of Dec 31, 2021
0.00%
0.05%
0.10%
0.15%
0.20%
0.25%
0.000.020.040.060.080.100.120.140.160.180.20
Jan-
14
Jul-1
4
Jan-
15
Jul-1
5
Jan-
16
Jul-1
6
Jan-
17
Jul-1
7
Jan-
18
Jul-1
8
Jan-
19
Jul-1
9
Jan-
20
Jul-2
0
Jan-
21
Jul-2
1
Jan-
22
As % of mkt cap - RHS
Margin Selling Balance
A-share margin selling balance (Rmbtn)
As % of listed market cap
Rmb93bn0.12%
Source: Bloomberg, Wind Source: Wind Source: Wind, Bloomberg
Exhibit 138: Margin balance as % of market cap has almost halved from the peak in 2015
Exhibit 139: The over-subscription ratio remains high for A-share IPOs, although post-IPO performance has droppeddramatically post the IPO reform
Exhibit 140: Retail sentiment is at below average levels in most Asian markets
0.0%
0.5%
1.0%
1.5%
2.0%
2.5%
3.0%
3.5%
4.0%
Jan-
02Ja
n-03
Jan-
04Ja
n-05
Jan-
06Ja
n-07
Jan-
08Ja
n-09
Jan-
10Ja
n-11
Jan-
12Ja
n-13
Jan-
14Ja
n-15
Jan-
16Ja
n-17
Jan-
18Ja
n-19
Jan-
20Ja
n-21
Jan-
22
Mainland China USJapan TaiwanKorea
Margin balance as % of total market cappeak: Rmb 2.3tn
Now: Rmb1.6tn
0%
50%
100%
150%
200%
250%
300%
1000
2000
3000
4000
5000
6000
Jul-1
8
Oct
-18
Jan-
19
Apr-1
9
Jul-1
9
Oct
-19
Jan-
20
Apr-2
0
Jul-2
0
Oct
-20
Jan-
21
Apr-2
1
Jul-2
1
Oct
-21
Jan-
22
Avg online over-subscription ratio of A-share IPOsAvg 1w performance of A-share IPOsAvg 2w performance of A-share IPOs
Over-subscription (x) Performance (%)
0.0-0.7
0.2-1.6
-2.0
-0.5
-3.0
-2.0
-1.0
0.0
1.0
2.0
3.0
China Korea Taiwan Hong Kong India+ASEAN AeJ Region
High-Low range Current 1-Jan-20
Historical range of market retail barometerfirst principal component (since 2014)
As of Jan 27, 2022
Source: Wind, Bloomberg Source: Wind, Goldman Sachs Global Investment Research Source: Goldman Sachs Global Investment Research
13 February 2022 49
Goldman Sachs China
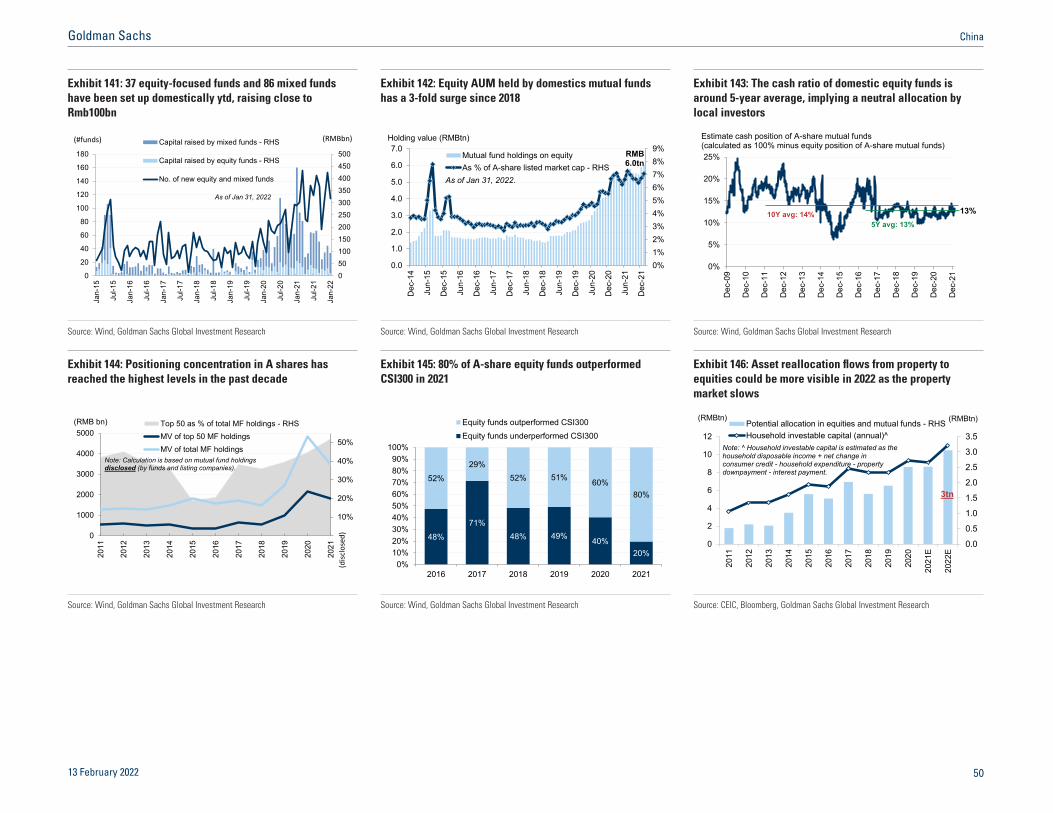
Exhibit 141: 37 equity-focused funds and 86 mixed funds have been set up domestically ytd, raising close to Rmb100bn
Exhibit 142: Equity AUM held by domestics mutual funds has a 3-fold surge since 2018
Exhibit 143: The cash ratio of domestic equity funds is around 5-year average, implying a neutral allocation by local investors
050100150200250300350400450500
0
20
40
60
80
100
120
140
160
180
Jan-
15
Jul-1
5
Jan-
16
Jul-1
6
Jan-
17
Jul-1
7
Jan-
18
Jul-1
8
Jan-
19
Jul-1
9
Jan-
20
Jul-2
0
Jan-
21
Jul-2
1
Jan-
22
Capital raised by mixed funds - RHS
Capital raised by equity funds - RHS
No. of new equity and mixed funds
(#funds) (RMBbn)
As of Jan 31, 2022
0%1%2%3%4%5%6%7%8%9%
0.0
1.0
2.0
3.0
4.0
5.0
6.0
7.0
Dec
-14
Jun-
15
Dec
-15
Jun-
16
Dec
-16
Jun-
17
Dec
-17
Jun-
18
Dec
-18
Jun-
19
Dec
-19
Jun-
20
Dec
-20
Jun-
21
Dec
-21
Mutual fund holdings on equityAs % of A-share listed market cap - RHS
Holding value (RMBtn)
RMB6.0tn
As of Jan 31, 2022.
0%
5%
10%
15%
20%
25%
Dec
-09
Dec
-10
Dec
-11
Dec
-12
Dec
-13
Dec
-14
Dec
-15
Dec
-16
Dec
-17
Dec
-18
Dec
-19
Dec
-20
Dec
-21
Estimate cash position of A-share mutual funds (calculated as 100% minus equity position of A-share mutual funds)
5Y avg: 13%10Y avg: 14% 13%
Source: Wind, Goldman Sachs Global Investment Research Source: Wind, Goldman Sachs Global Investment Research Source: Wind, Goldman Sachs Global Investment Research
Exhibit 144: Positioning concentration in A shares has reached the highest levels in the past decade
Exhibit 145: 80% of A-share equity funds outperformed CSI300 in 2021
Exhibit 146: Asset reallocation flows from property to equities could be more visible in 2022 as the property market slows
0%
10%
20%
30%
40%
50%
0
1000
2000
3000
4000
5000
2011
2012
2013
2014
2015
2016
2017
2018
2019
2020
2021
Top 50 as % of total MF holdings - RHSMV of top 50 MF holdingsMV of total MF holdings
(RMB bn)
(disc
lose
d)
Note: Calculation is based on mutual fund holdings disclosed (by funds and listing companies).
48%71%
48% 49% 40%20%
52%29%
52% 51% 60%80%
0%10%20%30%40%50%60%70%80%90%
100%
2016 2017 2018 2019 2020 2021
Equity funds outperformed CSI300Equity funds underperformed CSI300
0.0
0.5
1.0
1.5
2.0
2.5
3.0
3.5
0
2
4
6
8
10
12
2011
2012
2013
2014
2015
2016
2017
2018
2019
2020
2021
E
2022
E
(RMBtn)Potential allocation in equities and mutual funds - RHSHousehold investable capital (annual)^
(RMBtn)
Note: ^ Household investable capital is estimated as the household disposable income + net change in consumer credit - household expenditure - property downpayment - interest payment.
3tn
Source: Wind, Goldman Sachs Global Investment Research Source: Wind, Goldman Sachs Global Investment Research Source: CEIC, Bloomberg, Goldman Sachs Global Investment Research
13 February 2022 50
Goldman Sachs China
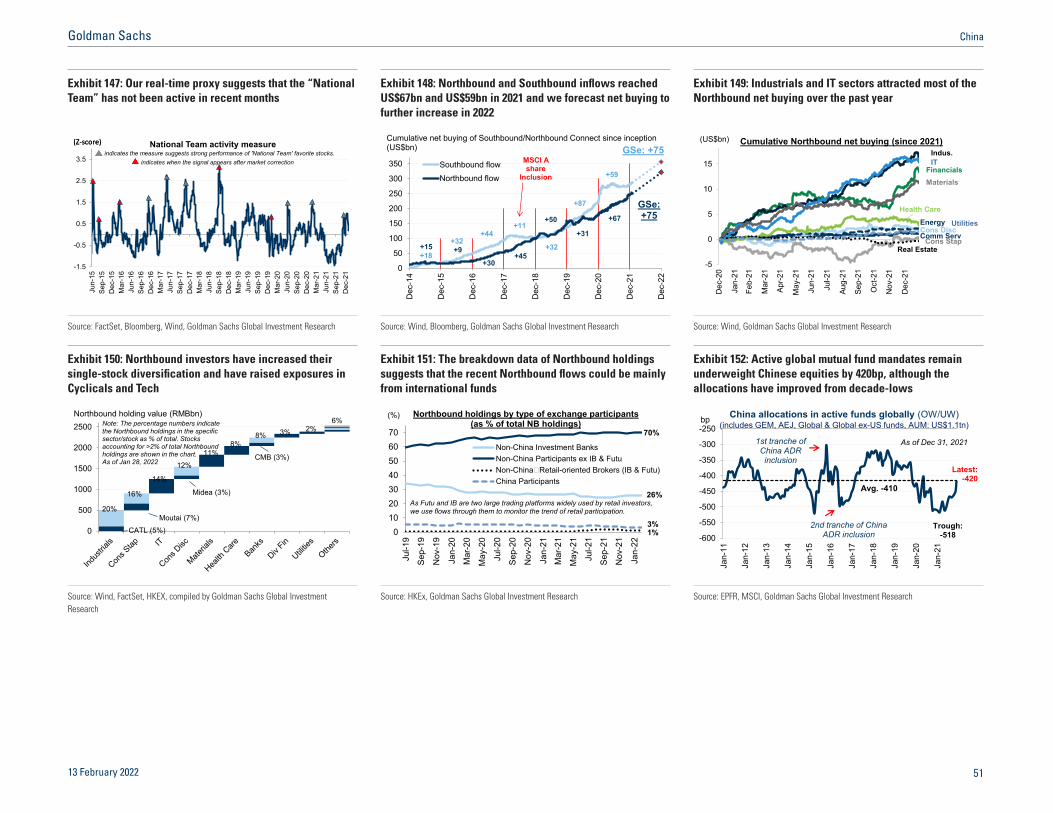
Exhibit 147: Our real-time proxy suggests that the “National Team” has not been active in recent months
Exhibit 148: Northbound and Southbound inflows reached US$67bn and US$59bn in 2021 and we forecast net buying to further increase in 2022
Exhibit 149: Industrials and IT sectors attracted most of the Northbound net buying over the past year
-1.5
-0.5
0.5
1.5
2.5
3.5
Jun-
15Se
p-15
Dec
-15
Mar
-16
Jun-
16Se
p-16
Dec
-16
Mar
-17
Jun-
17Se
p-17
Dec
-17
Mar
-18
Jun-
18Se
p-18
Dec
-18
Mar
-19
Jun-
19Se
p-19
Dec
-19
Mar
-20
Jun-
20Se
p-20
Dec
-20
Mar
-21
Jun-
21Se
p-21
Dec
-21
National Team activity measureindicates the measure suggests strong performance of 'National Team' favorite stocks.
v
(Z-score)
v
(Z-score)
indicates when the signal appears after market correction
0
50
100
150
200
250
300
350
Dec
-14
Dec
-15
Dec
-16
Dec
-17
Dec
-18
Dec
-19
Dec
-20
Dec
-21
Dec
-22
Southbound flowNorthbound flow
Cumulative net buying of Southbound/Northbound Connect since inception(US$bn)
+15
+30 +9
+45+18
+31+32
+44
+32
+87
+50
MSCI A share
Inclusion
GSe: +75
GSe: +75
+11+67
+59
-5
0
5
10
15
Dec
-20
Jan-
21
Feb-
21
Mar
-21
Apr-2
1
May
-21
Jun-
21
Jul-2
1
Aug-
21
Sep-
21
Oct
-21
Nov
-21
Dec
-21
(US$bn) Cumulative Northbound net buying (since 2021)
Comm Serv
Financials
Health Care
Cons DiscEnergy
Materials
IT
Real Estate
Indus.
Cons Stap
Utilities
Source: FactSet, Bloomberg, Wind, Goldman Sachs Global Investment Research Source: Wind, Bloomberg, Goldman Sachs Global Investment Research Source: Wind, Goldman Sachs Global Investment Research
Exhibit 150: Northbound investors have increased their single-stock diversification and have raised exposures in Cyclicals and Tech
Exhibit 151: The breakdown data of Northbound holdings suggests that the recent Northbound flows could be mainly from international funds
Exhibit 152: Active global mutual fund mandates remain underweight Chinese equities by 420bp, although the allocations have improved from decade-lows
0
500
1000
1500
2000
2500 Note: The percentage numbers indicate the Northbound holdings in the specific sector/stock as % of total. Stocks accounting for >2% of total Northbound holdings are shown in the chart. As of Jan 28, 2022
Northbound holding value (RMBbn)
Moutai (7%)
Midea (3%)
20%
16%
14%
12%11%
8%8% 3%
6%2%
CATL (5%)
CMB (3%)
010203040506070
Jul-1
9
Sep-
19
Nov
-19
Jan-
20
Mar
-20
May
-20
Jul-2
0
Sep-
20
Nov
-20
Jan-
21M
ar-2
1
May
-21
Jul-2
1
Sep-
21
Nov
-21
Jan-
22
Non-China Investment BanksNon-China Participants ex IB & FutuNon-China Retail-oriented Brokers (IB & Futu)China Participants
Northbound holdings by type of exchange participants(as % of total NB holdings)
(%)
70%
26%
3%1%
As Futu and IB are two large trading platforms widely used by retail investors, we use flows through them to monitor the trend of retail participation.
-600
-550
-500
-450
-400
-350
-300
-250
Jan-
11
Jan-
12
Jan-
13
Jan-
14
Jan-
15
Jan-
16
Jan-
17
Jan-
18
Jan-
19
Jan-
20
Jan-
21
bp China allocations in active funds globally (OW/UW)
2nd tranche of China ADR inclusion
1st tranche of China ADR inclusion
Avg. -410
As of Dec 31, 2021
(includes GEM, AEJ, Global & Global ex-US funds, AUM: US$1.1tn)
Latest: -420
Trough: -518
Source: Wind, FactSet, HKEX, compiled by Goldman Sachs Global Investment Research
Source: HKEx, Goldman Sachs Global Investment Research Source: EPFR, MSCI, Goldman Sachs Global Investment Research
13 February 2022 5<
Goldman Sachs China
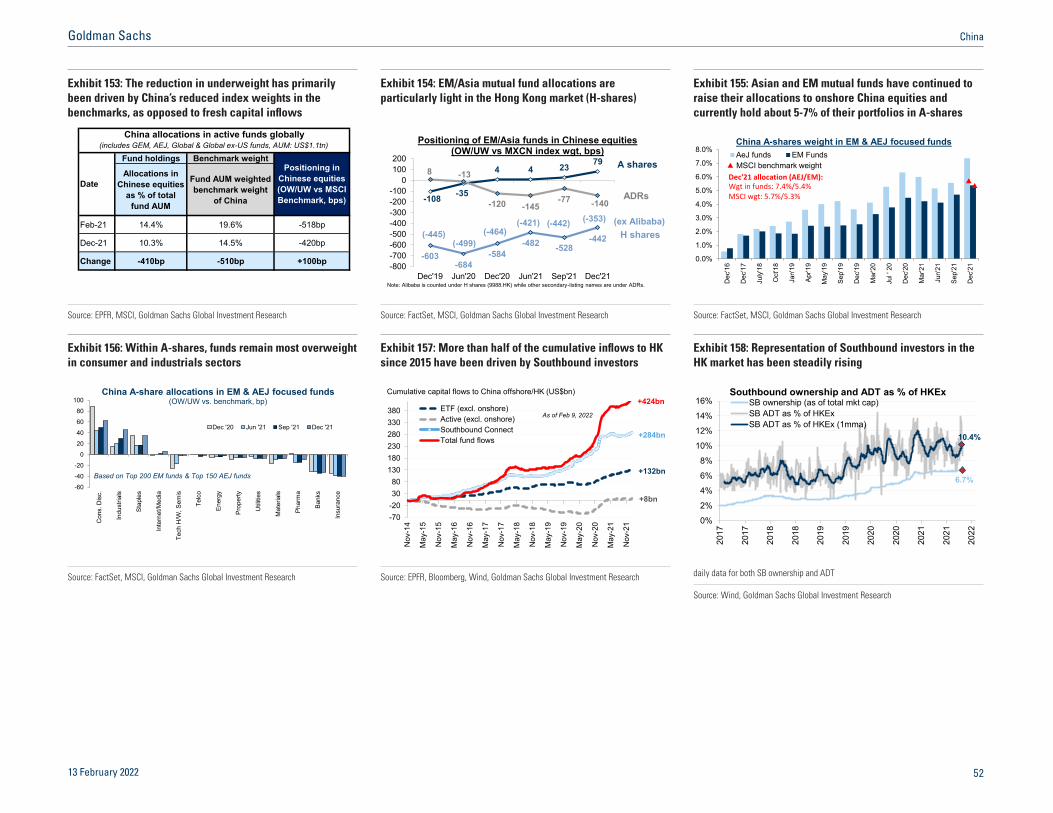
Exhibit 153: The reduction in underweight has primarily been driven by China’s reduced index weights in the benchmarks, as opposed to fresh capital inflows
Exhibit 154: EM/Asia mutual fund allocations are particularly light in the Hong Kong market (H-shares)
Exhibit 155: Asian and EM mutual funds have continued to raise their allocations to onshore China equities and currently hold about 5-7% of their portfolios in A-shares
Fund holdings Benchmark weight
Allocations in Chinese equities
as % of total fund AUM
Fund AUM weighted benchmark weight
of China
Feb-21 14.4% 19.6% -518bp
Dec-21 10.3% 14.5% -420bp
Change -410bp -510bp +100bp
Positioning in Chinese equities (OW/UW vs MSCI Benchmark, bps)
Date
China allocations in active funds globally(includes GEM, AEJ, Global & Global ex-US funds, AUM: US$1.1tn)
-108 -35
4 4 23 79
-603-684
-584-482 -528
-442
8 -13
-120 -145-77 -140
-800-700-600-500-400-300-200-100
0100200
Dec'19 Jun'20 Dec'20 Jun'21 Sep'21 Dec'21
Positioning of EM/Asia funds in Chinese equities(OW/UW vs MXCN index wgt, bps)
A shares
H shares
ADRs
(-445)(-499)
(-464)(-421) (-442) (ex Alibaba)(-353)
Note: Alibaba is counted under H shares (9988.HK) while other secondary-listing names are under ADRs.
0.0%
1.0%
2.0%
3.0%
4.0%
5.0%
6.0%
7.0%
8.0%
Dec
'16
Dec
'17
July
'18
Oct
'18
Jan'
19
Apr'1
9
May
'19
Sep'
19
Dec
'19
Mar
'20
Jul '
20
Dec
'20
Mar
'21
Jun'
21
Sep'
21
Dec
'21
AeJ funds EM FundsChina A-shares weight in EM & AEJ focused funds
Dec'21 allocation (AEJ/EM):Wgt in funds: 7.4%/5.4%MSCI wgt: 5.7%/5.3%
MSCI benchmark weight
Source: EPFR, MSCI, Goldman Sachs Global Investment Research Source: FactSet, MSCI, Goldman Sachs Global Investment Research Source: FactSet, MSCI, Goldman Sachs Global Investment Research
Exhibit 156: Within A-shares, funds remain most overweight in consumer and industrials sectors
Exhibit 157: More than half of the cumulative inflows to HK since 2015 have been driven by Southbound investors
Exhibit 158: Representation of Southbound investors in the HK market has been steadily rising
-60
-40
-20
0
20
40
60
80
100
Con
s. D
isc.
Indu
stria
ls
Stap
les
Inte
rnet
/Med
ia
Tech
H/W
, Sem
is
Telc
o
Ener
gy
Prop
erty
Util
ities
Mat
eria
ls
Phar
ma
Bank
s
Insu
ranc
e
Dec '20 Jun '21 Sep '21 Dec '21
China A-share allocations in EM & AEJ focused funds(OW/UW vs. benchmark, bp)
Based on Top 200 EM funds & Top 150 AEJ funds
-70-203080
130180230280330380
Nov
-14
May
-15
Nov
-15
May
-16
Nov
-16
May
-17
Nov
-17
May
-18
Nov
-18
May
-19
Nov
-19
May
-20
Nov
-20
May
-21
Nov
-21
ETF (excl. onshore)Active (excl. onshore)Southbound ConnectTotal fund flows
Cumulative capital flows to China offshore/HK (US$bn)+424bn
+132bn
+284bn
+8bn
As of Feb 9, 2022
10.4%
6.7%
0%
2%
4%
6%
8%
10%
12%
14%
16%
2017
2017
2018
2018
2019
2019
2020
2020
2021
2021
2022
SB ownership (as of total mkt cap)SB ADT as % of HKExSB ADT as % of HKEx (1mma)
Southbound ownership and ADT as % of HKEx
Source: FactSet, MSCI, Goldman Sachs Global Investment Research Source: EPFR, Bloomberg, Wind, Goldman Sachs Global Investment Research daily data for both SB ownership and ADT
Source: Wind, Goldman Sachs Global Investment Research
13 February 2022 52
Goldman Sachs China

Exhibit 159: Comm. Serv. have regained Southbound inflows in the past months
Exhibit 160: 22% of Energy’s freefloat market cap is now owned by Southbound investors
Exhibit 161: Southbound ownership is largely concentrated in Financials and Tech/Internet
-5
0
5
10
15
20
25
30
Dec
-20
Jan-
21
Feb-
21
Mar
-21
Apr-2
1
May
-21
Jun-
21
Jul-2
1
Aug-
21
Sep-
21
Oct
-21
Nov
-21
Dec
-21
Jan-
22
(US$bn) Cumulative Southbound net buying (since 2021)Comm Serv
Financials
Health CareCons Disc
Energy
MaterialsIT
Real Estate
Indus.Cons Stap
Utilities
0%
5%
10%
15%
20%
25%
Jan-
21Fe
b-21
Mar
-21
Mar
-21
Apr-2
1M
ay-2
1M
ay-2
1Ju
n-21
Jul-2
1Ju
l-21
Aug-
21Se
p-21
Sep-
21O
ct-2
1N
ov-2
1D
ec-2
1D
ec-2
1Ja
n-22
Feb-
22
Southbound ownership (as % of freefloat market cap)
Comm ServFinancialsCons DiscCons StapHealth Care
IT
Energy
IndustrialsUtilitiesReal Estate
Materials
0
500
1000
1500
2000Note: The percentage numbers indicate the Southbound holdings in the specific sector/stock as % of total. Stocks accounting for >2% of total Southbound holdings are shown in the chart. As of Jan 28, 2022
Southbound holding value (HKDbn)
CCB (7%)ICBC (5%)
Meituan (4%)
Tencent (13%)
Xiaomi (2%)
20%
20%
14%8%
6% 5%5%
5%
12%
5%
HSBC (5%)
China Mobile (4%)
CNOOC (2%)
Source: Wind, Goldman Sachs Global Investment Research Source: Wind, Goldman Sachs Global Investment Research Source: Wind, FactSet, HKEX, compiled by Goldman Sachs Global Investment Research
Exhibit 162: Southbound activities are well linked with stocks’ subsequent returns
0.0%
1.0%
2.0%
3.0%
4.0%
5.0%
6.0%
-1W +1W +1M +3M +6M
Average absolute returns of stocksWith the largest weekly Southbound owership increaseWith the largest weekly Southbound net buying
0.0%
0.5%
1.0%
1.5%
2.0%
2.5%
3.0%
-1W +1W +1M +3M +6M
Average relative returns of stocksWith the largest weekly Southbound owership increaseWith the largest weekly Southbound net buying
Source: Wind, FactSet, Goldman Sachs Global Investment Research
13 February 2022 53
Goldman Sachs China

10. ESG: Opportunities, risks, and facts
Exhibit 163: Chinese companies with high ESG scores have moderately outperformed the benchmark per MSCI’s defintion
Exhibit 164: The MSCI ESG leaders are concentrated in the New Economy sectors
Exhibit 165: Companies with relatively high ESG scores by Chindices methodology have performaned better over the past 5 years
50
100
150
200
250
300
Jan-
15
Jan-
16
Jan-
17
Jan-
18
Jan-
19
Jan-
20
Jan-
21
Jan-
22
MSCI China MSCI China ESG Leaders
Index Performance
28%39%
20%
26%16%
12%6%2%
6%4%6%7%6%
3%4%4%
0%10%20%30%40%50%60%70%80%90%
100%
MSCI China MSCI China ESG Leaders
EnergyUtilitiesMaterialsReal EstateCons StapHealth CareIndustrialsITFinancialsComm SvcsCons Disc
Sector weight1Y 3Y 5Y
AAA 181 12% -2% 41%AA 700 13% 21% 71%A 1132 16% 15% 53%BBB 1777 23% 12% 65%BB 438 25% -10% 41%B 194 29% -28% 13%CCC 87 24% -49% -2%CC 16 36% -57% -1%C 2 13% -67% -44%
Chindices ESG ranking
Number of companies
Median returns
Source: MSCI Source: MSCI Source: Wind, Chindices, Goldman Sachs Global Investment Research
Exhibit 166: China’s ETS will cover 5% of global GHG emissions in its initial phase, making it the world’s largest carbon market
Exhibit 167: More A-share companies are embracing ESG, at least in their disclosures
Exhibit 168: Financials tend to have better ESG disclosure among all sectors
0%
5%
10%
15%
20%
25%
2007
2008
2009
2010
2011
2012
2013
2014
2015
2016
2017
2018
2019
2020
E
2021
E
Shar
e of
glo
bal G
HG
em
issi
ons
cove
red
by
carb
on p
ricin
g (%
)
China national ETS EU ETS Japan carbon taxSouth Africa carbon tax Korea ETS Germany ETSMexico carbon tax California CaT Australia ERF Safeguard MechanismMexico pilot ETS Ukraine carbon tax Hubei pilot ETSFujian pilot ETS Kazakhstan ETS France carbon taxNorway carbon tax Finland carbon tax Sweden carbon taxCanada federal fuel charge Others
600
700
800
900
1000
1100
1200
2015 2016 2017 2018 2019 2020
# of A share companies with separate ESG disclosures
0%
10%
20%
30%
40%
50%A shares total E&S Disclosure (Core operations) by sector - Median
Note: calculated by GS Sustain team tomeasure what % of data China A share companies disclosed by GS ESG metrics;only sectors with >20 available data points were included
Source: World Bank Group, Goldman Sachs Global Investment Research Source: Wind, Goldman Sachs Global Investment Research Source: Company reports, Goldman Sachs Global Investment Research
13 February 2022 54
Goldman Sachs China

Exhibit 169: ESG is gaining traction globally, and also in China
Exhibit 170: China has seen strong increases in Green bond issuance
Exhibit 171: Investors are able to increase ESG exposure without sacrificing returns or risks in the credit market
0
5
10
15
20
25
30
35
40
0
50
100
150
200
250
300
2010
2011
2012
2013
2014
2015
2016
2017
2018
2019
2020
2021
ESG China ESG - RHS
Number of news articles related to ESG or China ESG (k)
Source: Factiva, Goldman Sachs Global Investment Research Source: Bloomberg, Goldman Sachs Global Investment Research ESG and non-ESG bonds are matched on an issuer level with same bond rating, seniority and similar maturity (less than one-year difference).
Source: ICE-BAML, Goldman Sachs Global Investment Research
Exhibit 172: AUM of ESG funds has risen rapidly in the past few years...
Exhibit 173: ...driven by strong fund inflows Exhibit 174: Onshore investor interest in ESG themes remains strong
020004000600080001000012000140001600018000
0
200
400
600
800
1000
1200
1400
Dec-14 Dec-15 Dec-16 Dec-17 Dec-18 Dec-19 Dec-20
US$bnUS$bn AUM of ESG and non-ESG fundsESG equity funds globally*Non-ESG equity funds globally [RHS]
*Note: ESG equity funds include SRI/ESG thematic funds defined by EPFR.
-200-100
0100200300400500600
Dec-14 Dec-15 Dec-16 Dec-17 Dec-18 Dec-19 Dec-20
US$bn Cumulative fund flows since 2015ESG equity funds globally*Non-ESG equity funds globally
*Note: ESG equity funds include SRI/ESG thematic funds defined by EPFR.
89
76
0102030405060708090
100Capital raised by China onshore ESG thematic funds(RMBbn)
Source: EPFR, Goldman Sachs Global Investment Research Source: EPFR, Goldman Sachs Global Investment Research Source: Wind, Goldman Sachs Global Investment Research
13 February 2022 55
Goldman Sachs China

Exhibit 175: China has recently made significant regulatory changes to improve transparency and governance of A-shares Recent regulations to improve governance and quality of disclosures for Chinese listed companies
Regulation / Policy Issuer Year Note
Revision of Securities LawChina Securities
Regulatory Commission (CSRC)
Mar-20
- Transition to a market oriented registration-based IPO system, whichreplaces the existing approval-based regulatory framework in order to liberalizecapital markets- Enhanced disclosure standards, requiring information disclosed overseas toalso be disclosed domestically- Stronger shareholder protection by allowing investor protection agencies toraise legal cases on behalf of shareholders, and by stipulating different protectionmeasures for institutional and retail investors
Follow up on State Council's Circular
China Securities Regulatory
Commission (CSRC)Nov-20
- CSRC has announced a campaign to enhance governance of listedcompanies in China, which will include a three-year action plan on SOE reforms- CSRC will strengthen supervision over the exit mechanism of listedcompanies, fine-tune delisting criteria and streamline existing procedures- CSRC will reduce risks associated with stock pledges and reaffirmed zerotolerance over illegal activities in the capital market- CSRC is encouraging listed companies to submit self-assessment surveys toCSRC portal by April 30th, 2021
Circular on improving quality of listed companies State Council Oct-20
- State Council recommends improvements on standardizing managementsystems, and clarifying duties/legal responsibilities of controlling shareholders(including UBOs) and management- Encourages timely disclosure of material information- Recommends simplification of delisting procedures, intensifying supervisionfrom regulators
Revision of Corporate Governance Code
China Securities Regulatory
Commission (CSRC)Sep-18
- Stronger shareholder protection measures, which include minorityshareholders rights, clarification of dividend policies, more stringent restrictions onrelated party transactions- Mandates an audit committee, which is to be led by accounting professionals orindependent directors- Encourages ESG initiatives, especially on environmental protection and povertyalleviation- Encourages shareholder engagement on corporate governance- Encourages board diversity- Prohibits unfair or inconsistent voluntary disclosures that leads to marketmanipulation
Source: CSRC, Data compiled by Goldman Sachs Global Investment Research
13 February 2022 56
Goldman Sachs China

Exhibit 176: Share of clean/renewable energy in total energy consumption has been growing over the past decade
Exhibit 177: GDP carbon intensity has fallen over the 3 past decades, but still comparatively high on a global basis
Exhibit 178: CO2 emission is mainly driven by power usage
0%10%20%30%40%50%60%70%80%90%
100%
2000
2001
2002
2003
2004
2005
2006
2007
2008
2009
2010
2011
2012
2013
2014
2015
2016
2017
2018
2019
2020
Coal Oil Natual Gas Hydro, Nuclear and Wind
China energy consumption by source
0.00
0.20
0.40
0.60
0.80
1.00
1.20
1.40
1.60
1990 1995 2000 2005 2010 2015 2019
ChinaUnited StatesIndiaEU27+UKGlobal avg
Carbon Intensity - CO2/GDP (tCO2/US$'000)
Power36%
Steel17%
Cement10%
Chemicals5%
Pape…
Aluminum4%
Other metals1%
Others26%
Source: NBS Source: European Commission Joint Research Centre (JRC). Emission Database for Global Atmospheric Research (EDGAR) release version 5.0, Goldman Sachs Global Investment Research
Source: GEIDCO, Goldman Sachs Global Investment Research
Exhibit 179: China’s net zero path implies a US$16 tn clean tech infrastructure investment opportunity by 2060...
Exhibit 180: ...creating c.40 mn net new jobs. Exhibit 181: China’s de-carbonization cost curve shows that most of the low cost spectrum is dominated by renewable power generation
1.9
2.0
0.7
0.90.5 2.1
0.51.2 0.3
0.4 2.7
1.4 0.80.5 16.0
0
2
4
6
8
10
12
14
16
18
Renewablepower
Nuclearpower
Powernetworks
Energystorage
(batteries)
TransportEV +FCEV
infrastructure
Biofuels Hydrogenplants(SMR+
electrolyzer)
Industrialprocesses
Hydrogenpipeline
infrastructure
CCUS Naturalsinks
Chinanet zero
2060Total
investments
Cum
ulat
ive
inve
stm
ents
to n
et z
ero
Chi
na b
y 20
60 (U
S$ tn
)
Solar
Onshore wind
Hydro & other RESOffshore wind
17.3
6.9
39.7
(2.5) (2.7) 0.35.1
10.12.1 0.1 2.7 (1.4) 1.7
0
10
20
30
40
50
60R
enew
able
ele
ctric
ityge
nera
tion
(CM
I & O
&M)
Coa
l-fire
d el
ectri
city
gene
ratio
n an
d he
at s
uppl
y
Coa
l min
ing
& d
ress
ing
Nuc
lear
pow
erge
nera
tion
Pow
erne
twor
ks
EV c
harg
ing
infra
. con
stru
ctio
n,in
stal
latio
n, o
pera
tion,
mai
nten
ance
,…
Batte
ries
and
elec
trific
atio
neq
uipm
ent m
anuf
actu
ring
Min
ing
and
proc
essi
ng o
fco
pper
and
oth
er m
etal
s
Biof
uels
and
bio
ener
gypr
oduc
tion
& su
pply
cha
in
Cru
de o
il ex
tract
ion,
proc
essi
ng &
refin
ing
Cle
an h
ydro
gen
man
ufac
turin
gjo
bs (e
lect
roly
zer m
anuf
actu
ring)
Net
job
crea
tion
inC
hina
to 2
060
(mn
jobs
)
Net
job
crea
tion
to 2
060
on th
e pa
th to
C
hina
net
zer
o(m
n)
Construction, installation & manufacturing (CMI)
Operation & maintenance (O&M)
-200-100
0100200300400500600700800900
1,0001,1001,200
0.0 1.0 2.0 3.0 4.0 5.0 6.0 7.0 8.0 9.0 10.0 11.0 12.0 13.0 14.0
Chi
na c
arbo
n ab
atem
ent c
ost
(US$
/tnC
O2e
q)
China GHG emissions abatement potential (Gt CO2eq)Power generation (coal switch to gas & renewables)Transport (road, aviation, shipping)Industry (industrial combustion, process emissions, waste)Buildings (residential & commercial)Agriculture, forestry & other land uses (AFOLU)Non-adaptable at current conservation technologies
Source: Company data, Goldman Sachs Global Investment Research Source: UNEP - ILO - IOE - ITUC, EuropeOn, IRENA, NBSC, Goldman Sachs Global Investment Research
Source: Goldman Sachs Global Investment Research
13 February 2022 57
Goldman Sachs China

Exhibit 182: Corporate donation disclosures have significantly increased for Chinese companies in the past few years
Exhibit 183: Corporate donations per revenue have increased in 2020, although donations are still lower among Chinese companies compared to global peers
Exhibit 184: China does not rank high on Corporate Governance compared to major markets globally
0%
10%
20%
30%
40%
50%
60%
70%
80%
2017 2018 2019 2020 or latest
MSCI ACWI MSCI China
0bps
1bps
2bps
3bps
4bps
5bps
6bps
7bps
8bps
2017 2018 2019 2020 or latest
MSCI ACWI MSCI China
Note: Corporate Governance Score is based on ESG framework by GS SUSTAIN. Ranked base on Independence & Accountability and Board Composition. Data as of 8/17/2020
79%69% 65% 65% 60%
47%37% 36% 33% 30%
24% 23%
0%10%20%30%40%50%60%70%80%90%
Uni
ted
King
dom
Aust
ralia
Uni
ted
Stat
esN
.Am
eric
a
W. E
urop
e
Japa
n
Chi
na A
Taiw
an
Chi
na
Sout
hKo
rea
Hon
gKo
ng
Indi
a
GS SUSTAIN: Corporate Governance Score
Excludes Financials
Source: Refinitiv Eikon, Goldman Sachs Global Investment Research
Excludes Financials
Source: Refinitiv Eikon, Goldman Sachs Global Investment Research
Source: Company Data, Goldman Sachs Global Investment Research, Bloomberg, Thomson Reuters
Exhibit 185: Quantifying governance: a) More than 1/3 of listed A shares have engaged in stock incentive program, concentrating in Tech and Healthcare
Exhibit 186: Stocks with management incentive plan have outperformed
Exhibit 187: Quantifying governance: b) A-share operating cash flow seems strong in a global context
0%10%20%30%40%50%60%70%80%
IT
Hea
lth C
are
Com
m S
ervi
Indu
stria
ls
Con
sDis
c
Mat
eria
ls
Con
sSta
p
Rea
l Est
ate
Ener
gy
Util
ities
Fina
ncia
ls
All A
sha
res
% of A share companies with stock incentive program
As of Feb 2022
50
100
150
200
250
300
350
400
450
Jan- 16
Jul-1
6
Jan- 17
Jul-1
7
Jan- 18
Jul-1
8
Jan- 19
Jul-1
9
Jan- 20
Jul-2
0
Jan- 21
Jul-2
1
Jan- 22
Performance indexNote: Calculation is based on CSI300 constituents. The stocks are included in the basket with management incentive plans since they execute a management incentive plan for the first time.
Stocks with mgt incentive: 159 All: 300
Stocks without mgt incentive: 141
280
231206 199 191 181 180 180 172 159 155 144 136
194 182 180
0
50
100
150
200
250
300
Braz
il
Mex
ico
Kore
a
UK
CSI
300
Euro
pe
MSC
I DM
USA
MSC
I EM
Tota
l
Japa
n
Aust
ralia
Taiw
an
Sout
h…
Indi
a
Rus
sia
2017 - 2019 OCF to Net Income of major MSCI DM and EM markets(3yr avg, ex-financials, %)
Source: Wind Source: Wind, FactSet, Goldman Sachs Global Investment Research Source: FactSet, IBES, Goldman Sachs Global Investment Research
13 February 2022 58
Goldman Sachs China
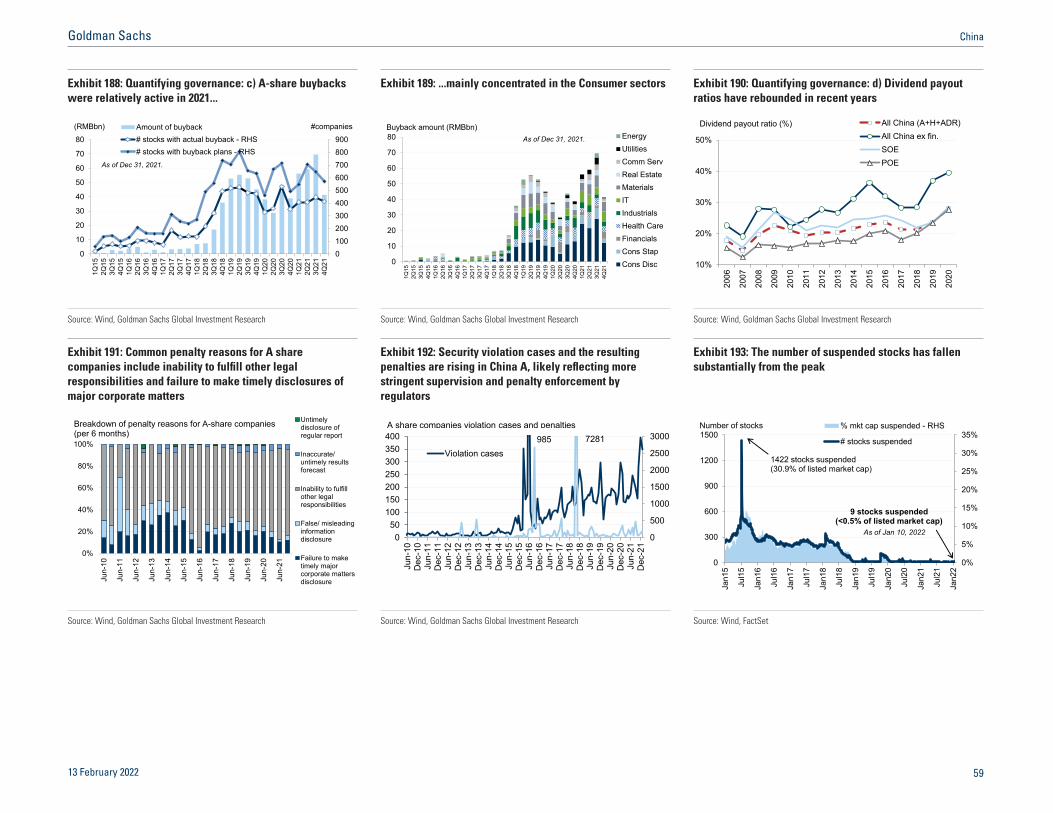
Exhibit 188: Quantifying governance: c) A-share buybacks were relatively active in 2021...
Exhibit 189: ...mainly concentrated in the Consumer sectors Exhibit 190: Quantifying governance: d) Dividend payout ratios have rebounded in recent years
0100200300400500600700800900
0
10
20
30
40
50
60
70
80
1Q15
2Q15
3Q15
4Q15
1Q16
2Q16
3Q16
4Q16
1Q17
2Q17
3Q17
4Q17
1Q18
2Q18
3Q18
4Q18
1Q19
2Q19
3Q19
4Q19
1Q20
2Q20
3Q20
4Q20
1Q21
2Q21
3Q21
4Q21
Amount of buyback# stocks with actual buyback - RHS# stocks with buyback plans - RHS
(RMBbn) #companies
As of Dec 31, 2021.
0
10
20
30
40
50
60
70
80
1Q15
2Q15
3Q15
4Q15
1Q16
2Q16
3Q16
4Q16
1Q17
2Q17
3Q17
4Q17
1Q18
2Q18
3Q18
4Q18
1Q19
2Q19
3Q19
4Q19
1Q20
2Q20
3Q20
4Q20
1Q21
2Q21
3Q21
4Q21
EnergyUtilitiesComm ServReal EstateMaterialsITIndustrialsHealth CareFinancialsCons StapCons Disc
Buyback amount (RMBbn)As of Dec 31, 2021.
10%
20%
30%
40%
50%
2006
2007
2008
2009
2010
2011
2012
2013
2014
2015
2016
2017
2018
2019
2020
All China (A+H+ADR)All China ex fin.SOEPOE
Dividend payout ratio (%)
Source: Wind, Goldman Sachs Global Investment Research Source: Wind, Goldman Sachs Global Investment Research Source: Wind, Goldman Sachs Global Investment Research
Exhibit 191: Common penalty reasons for A share companies include inability to fulfill other legal responsibilities and failure to make timely disclosures of major corporate matters
Exhibit 192: Security violation cases and the resulting penalties are rising in China A, likely reflecting more stringent supervision and penalty enforcement by regulators
Exhibit 193: The number of suspended stocks has fallen substantially from the peak
0%
20%
40%
60%
80%
100%
Jun-
10
Jun-
11
Jun-
12
Jun-
13
Jun-
14
Jun-
15
Jun-
16
Jun-
17
Jun-
18
Jun-
19
Jun-
20
Jun-
21
Untimelydisclosure ofregular report
Inaccurate/untimely resultsforecast
Inability to fulfillother legalresponsibilities
False/ misleadinginformationdisclosure
Failure to maketimely majorcorporate mattersdisclosure
Breakdown of penalty reasons for A-share companies (per 6 months)
0
500
1000
1500
2000
2500
3000
050
100150200250300350400
Jun-
10D
ec-1
0Ju
n-11
Dec
-11
Jun-
12D
ec-1
2Ju
n-13
Dec
-13
Jun-
14D
ec-1
4Ju
n-15
Dec
-15
Jun-
16D
ec-1
6Ju
n-17
Dec
-17
Jun-
18D
ec-1
8Ju
n-19
Dec
-19
Jun-
20D
ec-2
0Ju
n-21
Dec
-21
Violation cases985 7281
A share companies violation cases and penalties
0%
5%
10%
15%
20%
25%
30%
35%
0
300
600
900
1200
1500
Jan1
5
Jul1
5
Jan1
6
Jul1
6
Jan1
7
Jul1
7
Jan1
8
Jul1
8
Jan1
9
Jul1
9
Jan2
0
Jul2
0
Jan2
1
Jul2
1
Jan2
2
% mkt cap suspended - RHS
# stocks suspended
Number of stocks
1422 stocks suspended(30.9% of listed market cap)
9 stocks suspended(<0.5% of listed market cap)
As of Jan 10, 2022
Source: Wind, Goldman Sachs Global Investment Research Source: Wind, Goldman Sachs Global Investment Research Source: Wind, FactSet
13 February 2022 59
Goldman Sachs China
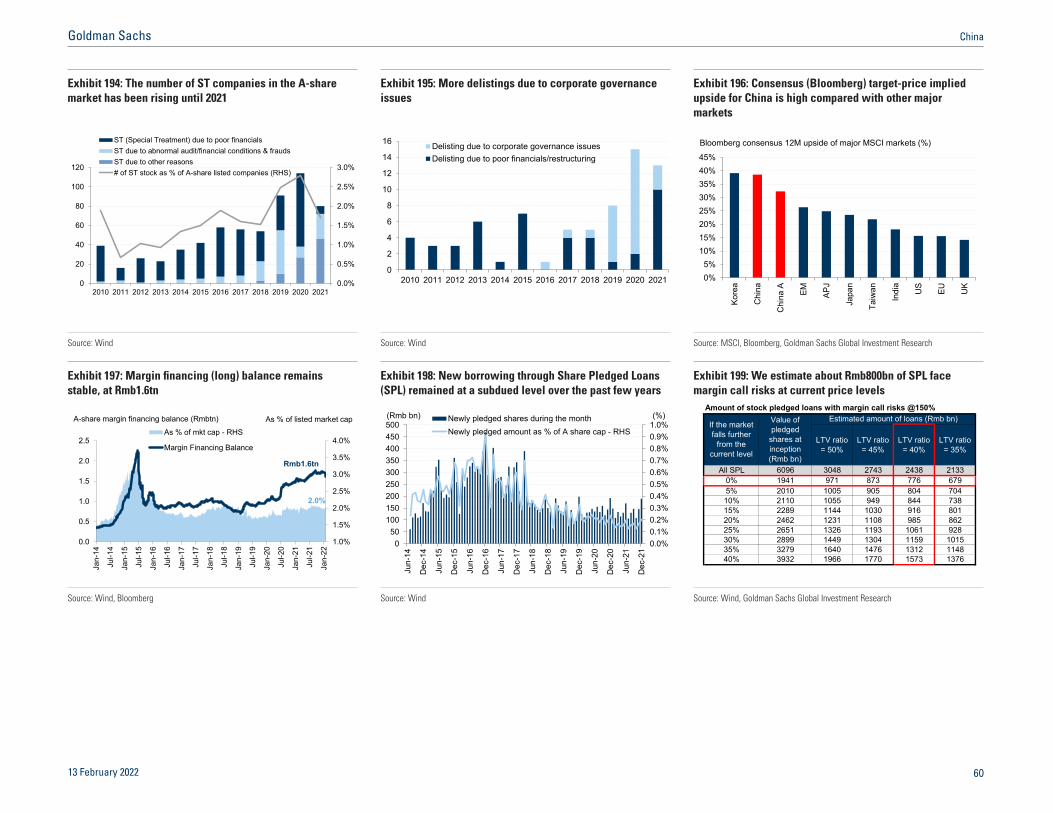
Exhibit 194: The number of ST companies in the A-share market has been rising until 2021
Exhibit 195: More delistings due to corporate governance issues
Exhibit 196: Consensus (Bloomberg) target-price implied upside for China is high compared with other major markets
0.0%
0.5%
1.0%
1.5%
2.0%
2.5%
3.0%
0
20
40
60
80
100
120
2010 2011 2012 2013 2014 2015 2016 2017 2018 2019 2020 2021
ST (Special Treatment) due to poor financialsST due to abnormal audit/financial conditions & fraudsST due to other reasons# of ST stock as % of A-share listed companies (RHS)
0
2
4
6
8
10
12
14
16
2010 2011 2012 2013 2014 2015 2016 2017 2018 2019 2020 2021
Delisting due to corporate governance issuesDelisting due to poor financials/restructuring
0%5%
10%15%20%25%30%35%40%45%
Kore
a
Chi
na
Chi
na A EM APJ
Japa
n
Taiw
an
Indi
a
US
EU UK
Bloomberg consensus 12M upside of major MSCI markets (%)
Source: Wind Source: Wind Source: MSCI, Bloomberg, Goldman Sachs Global Investment Research
Exhibit 197: Margin financing (long) balance remains stable, at Rmb1.6tn
Exhibit 198: New borrowing through Share Pledged Loans (SPL) remained at a subdued level over the past few years
Exhibit 199: We estimate about Rmb800bn of SPL face margin call risks at current price levels
1.0%
1.5%
2.0%
2.5%
3.0%
3.5%
4.0%
0.0
0.5
1.0
1.5
2.0
2.5
Jan-
14
Jul-1
4
Jan-
15
Jul-1
5
Jan-
16
Jul-1
6
Jan-
17
Jul-1
7
Jan-
18
Jul-1
8
Jan-
19
Jul-1
9
Jan-
20
Jul-2
0
Jan-
21
Jul-2
1
Jan-
22
As % of mkt cap - RHS
Margin Financing Balance
A-share margin financing balance (Rmbtn) As % of listed market cap
Rmb1.6tn
2.0%
0.0%0.1%0.2%0.3%0.4%0.5%0.6%0.7%0.8%0.9%1.0%
050
100150200250300350400450500
Jun-
14
Dec
-14
Jun-
15
Dec
-15
Jun-
16
Dec
-16
Jun-
17
Dec
-17
Jun-
18
Dec
-18
Jun-
19
Dec
-19
Jun-
20
Dec
-20
Jun-
21
Dec
-21
Newly pledged shares during the monthNewly pledged amount as % of A share cap - RHS
(Rmb bn) (%)Amount of stock pledged loans with margin call risks @150%
LTV ratio = 50%
LTV ratio = 45%
LTV ratio = 40%
LTV ratio = 35%
All SPL 6096 3048 2743 2438 21330% 1941 971 873 776 6795% 2010 1005 905 804 70410% 2110 1055 949 844 73815% 2289 1144 1030 916 80120% 2462 1231 1108 985 86225% 2651 1326 1193 1061 92830% 2899 1449 1304 1159 101535% 3279 1640 1476 1312 114840% 3932 1966 1770 1573 1376
If the market falls further
from the current level
Value of pledged
shares at inception (Rmb bn)
Estimated amount of loans (Rmb bn)
Source: Wind, Bloomberg Source: Wind Source: Wind, Goldman Sachs Global Investment Research
13 February 2022 60
Goldman Sachs China

11. GS tools: Your China macro and markets toolkit
For details of CERH, please refer to China: Portfolio Strategy Research: Introducing GS China Equity Risk Barometer
For details of CERA, please refer to China Strategy: Introducing GS Equity Risk Barometer for A shares
Exhibit 200: The regulation tightening cycle is showing early signs of moderation per our POE Regulation Proxy
Exhibit 201: Regulation Barometer (GSSRCNRG) remains elevated at 80
Exhibit 202: The regulation concerns over Financial Markets and Data Security remain elevated
-2.5-2.0-1.5-1.0-0.50.00.51.01.52.02.5
Jul-15 Jul-16 Jul-17 Jul-18 Jul-19 Jul-20 Jul-21
POE Regulation Proxy
Tightening policy stance
Note: POE Regulation Proxy reflects the text-mining results of news among POE-heavy sectors. Data points during Mar-Jun 2020 have been removed due to COVID disruptions.
COVID Disruption
(z-score)
Current Episode
2018 Episode
XX XX
XX XX
Feb 11:80
0102030405060708090100
0102030405060708090
100
Jan-
18Ap
r-18
Jul-1
8O
ct-1
8Ja
n-19
Apr-1
9Ju
l-19
Oct
-19
Jan-
20Ap
r-20
Jul-2
0O
ct-2
0Ja
n-21
Apr-2
1Ju
l-21
Oct
-21
Jan-
22Ap
r-22
Jul-2
2
Regulation Barometer by category
Regulatory tightening
Financial Markets (87)
Antitrust (67)
Data Security
(77)
Social Sector
(82)COVID Disruption
Source: Goldman Sachs Global Investment Research Source: Bloomberg, Goldman Sachs Global Investment Research Source: MSCI, FactSet, Wind, Goldman Sachs Global Investment Research
Exhibit 203: US-China Relations Barometer (GSSRUSCN) stays high at 94
Exhibit 204: Except for the Trade barometer, other sub-indices remain elevated
Exhibit 205: GSSRCERA is at -1.7 on Feb 10, suggesting subdued risk appetite onshore
Feb 11:
94
0%
10%
20%
30%
40%
50%
60%
70%
80%
90%
100%
0%
10%
20%
30%
40%
50%
60%
70%
80%
90%
100%
Jan-
18M
ar-1
8M
ay-1
8Ju
l-18
Sep-
18N
ov-1
8Ja
n-19
Mar
-19
May
-19
Jul-1
9Se
p-19
Nov
-19
Jan-
20M
ar-2
0M
ay-2
0Ju
l-20
Sep-
20N
ov-2
0Ja
n-21
Mar
-21
May
-21
Jul-2
1Se
p-21
Nov
-21
Jan-
22
Tension barometers by category Higher tension
Technology: (94%)
Trade: (13%)
Capital Markets: (97%)
Geopolitics: (87%)
0.6
-1.7
-3.0
-2.0
-1.0
0.0
1.0
2.0
3.0
-3.0
-2.0
-1.0
0.0
1.0
2.0
3.0
Mar
-15
Sep-
15
Mar
-16
Sep-
16
Mar
-17
Sep-
17
Mar
-18
Sep-
18
Mar
-19
Sep-
19
Mar
-20
Sep-
20
Mar
-21
Sep-
21
Mar
-22
ERB H ERB AChina ERBs headline index (z-score)
More risk averse
Less risk averse
Source: Bloomberg, Goldman Sachs Global Investment Research Source: Wind, FactSet, Bloomberg, Goldman Sachs Global Investment Research Source: FactSet, MSCI, Bloomberg, Goldman Sachs Global Investment Research
13 February 2022 6<
Goldman Sachs China

Exhibit 206: Our China-A VIP basket (GSCNAVIP) consists of 30 ‘most popular’ A-share stocks based on most OW positions, high Northbound ownership and top ‘consensus Buy’ ratings
Exhibit 207: Our ‘New Infra’ basket (GSSRCNIF) consists of 28 stocks across 14 sub-industries, capturing linkages from both supply (investment) side and demand/product offering/application perspective
Exhibit 208: Our A-shares retail sentiment is around the mid-level of the range
11111111
80100120140160180200220240260
Mar
-20
May
-20
Jul-2
0
Sep-
20
Nov
-20
Jan-
21
Mar
-21
May
-21
Jul-2
1
Sep-
21
Nov
-21
Jan-
22
China-A "VIP"
GSCNAVIP
-1
-0
0
1
2
80
100
120
140
160
180
200
220
240
Mar
-20
May
-20
Jul-2
0
Sep-
20
Nov
-20
Jan-
21
Mar
-21
May
-21
Jul-2
1
Sep-
21
Nov
-21
Jan-
22
New Infra
GSSRCNIFStronger market sentiment
-2.5
-2.0
-1.5
-1.0
-0.5
0.0
0.5
1.0
1.5
2.0
Jan-15 Jan-16 Jan-17 Jan-18 Jan-19 Jan-20 Jan-21 Jan-22
GS China Retail Sentiment BarometerZ-score
Average: -0.2 0.0
Stronger retail market sentiment
Source: FactSet, MSCI, Goldman Sachs Global Investment Research Source: Bloomberg, Goldman Sachs Global Investment Research Source: Goldman Sachs Global Investment Research
Exhibit 209: Risk appetite declined across the Asia Pacific ex-Japan region
Exhibit 210: Our ERLI forecasts further near-term negative earnings revisions
Exhibit 211: Our Asia Bear Market Indicator has risen further to 58% , suggesting moderate chane for an equity bear market for the APxJ region
340380420460500540580620660700740780
-3.0
-2.0
-1.0
0.0
1.0
2.0
3.0
Feb-
18
Aug-
18
Feb-
19
Aug-
19
Feb-
20
Aug-
20
Feb-
21
Aug-
21
Feb-
22
APxJ ERB MXAPJ
APxJ ERB level MXAPJ levelHigh risk appetite
Low risk appetite -20%
-15%
-10%
-5%
0%
5%
10%
Jan-
10
Jan-
11
Jan-
12
Jan-
13
Jan-
14
Jan-
15
Jan-
16
Jan-
17
Jan-
18
Jan-
19
Jan-
20
Jan-
21
Jan-
22
Actual MXAPJNTM EPS 3m Revision
GS ERLIPredicted Values
Mar 22Forecast
Feb 22Forecast
Asia Pacific Earnings Revisions Leading Indicator (ERLI)
Source: Bloomberg, Goldman Sachs Global Investment Research Source: MSCI, FactSet, Goldman Sachs Global Investment Research For details of ABMI, please see Global Strategy Paper: The bear facts: Constructing an Asia bear market risk indicator
Source: Goldman Sachs Global Investment Research
13 February 2022 62
Goldman Sachs China
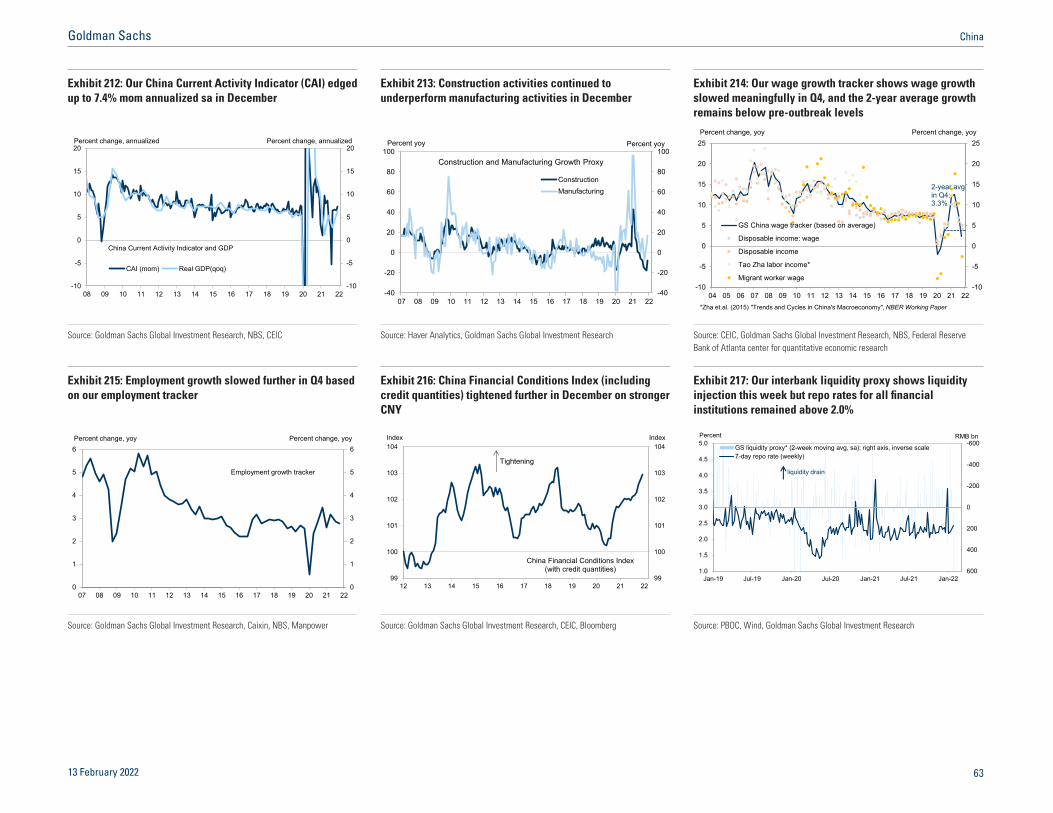
Exhibit 212: Our China Current Activity Indicator (CAI) edged up to 7.4% mom annualized sa in December
Exhibit 213: Construction activities continued to underperform manufacturing activities in December
Exhibit 214: Our wage growth tracker shows wage growth slowed meaningfully in Q4, and the 2-year average growth remains below pre-outbreak levels
-10
-5
0
5
10
15
20
-10
-5
0
5
10
15
20
08 09 10 11 12 13 14 15 16 17 18 19 20 21 22
CAI (mom) Real GDP(qoq)
Percent change, annualized Percent change, annualized
China Current Activity Indicator and GDP
-40
-20
0
20
40
60
80
100
-40
-20
0
20
40
60
80
100
07 08 09 10 11 12 13 14 15 16 17 18 19 20 21 22
Construction and Manufacturing Growth Proxy
ConstructionManufacturing
Percent yoy Percent yoy
-10
-5
0
5
10
15
20
25
-10
-5
0
5
10
15
20
25
04 05 06 07 08 09 10 11 12 13 14 15 16 17 18 19 20 21 22
GS China wage tracker (based on average)
Disposable income: wage
Disposable income
Tao Zha labor income*
Migrant worker wage
Percent change, yoy Percent change, yoy
*Zha et.al. (2015) "Trends and Cycles in China's Macroeconomy", NBER Working Paper
2-year avg in Q4:3.3%
Source: Goldman Sachs Global Investment Research, NBS, CEIC Source: Haver Analytics, Goldman Sachs Global Investment Research Source: CEIC, Goldman Sachs Global Investment Research, NBS, Federal Reserve Bank of Atlanta center for quantitative economic research
Exhibit 215: Employment growth slowed further in Q4 based on our employment tracker
Exhibit 216: China Financial Conditions Index (including credit quantities) tightened further in December on stronger CNY
Exhibit 217: Our interbank liquidity proxy shows liquidity injection this week but repo rates for all financial institutions remained above 2.0%
0
1
2
3
4
5
6
0
1
2
3
4
5
6
07 08 09 10 11 12 13 14 15 16 17 18 19 20 21 22
Percent change, yoy Percent change, yoy
Employment growth tracker
99
100
101
102
103
104
99
100
101
102
103
104
12 13 14 15 16 17 18 19 20 21 22
Tightening
China Financial Conditions Index (with credit quantities)
Index Index-600
-400
-200
0
200
400
6001.0
1.5
2.0
2.5
3.0
3.5
4.0
4.5
5.0
Jan-19 Jul-19 Jan-20 Jul-20 Jan-21 Jul-21 Jan-22
GS liquidity proxy* (2-week moving avg, sa); right axis, inverse scale7-day repo rate (weekly)
liquidity drain
Percent RMB bn
Source: Goldman Sachs Global Investment Research, Caixin, NBS, Manpower Source: Goldman Sachs Global Investment Research, CEIC, Bloomberg Source: PBOC, Wind, Goldman Sachs Global Investment Research
13 February 2022 63
Goldman Sachs China

Exhibit 218: Our preferred gauge of FX flows shows an increase in net inflows in December
Exhibit 219: China domestic macro policy proxy eased slightly in December, mainly driven by easier credit and monetary stance
Exhibit 220: Our measure of augmented fiscal deficit and on-budget deficit narrowed slightly on a 3-month basis in December
-200
-150
-100
-50
0
50
100
150
-200
-150
-100
-50
0
50
100
150
Jan-14 Jan-15 Jan-16 Jan-17 Jan-18 Jan-19 Jan-20 Jan-21
Unusual cross-border RMB flow (since Oct'15)FX flow based on SAFE's onshore FX settlement data
Modified FX flow measure
USD Billion USD Billion
-2.5
-2.0
-1.5
-1.0
-0.5
0.0
0.5
1.0
1.5
2.0
-2.5
-2.0
-1.5
-1.0
-0.5
0.0
0.5
1.0
1.5
2.0
07 08 09 10 11 12 13 14 15 16 17 18 19 20 21 22
Z-score Z-score
More policystimulus
China domestic macro policy proxy
Note: Shaded areas refer to periods when China CAI 3mma growth was below 5.5%. -21
-18
-15
-12
-9
-6
-3
0
3
-21
-18
-15
-12
-9
-6
-3
0
3
09 10 11 12 13 14 15 16 17 18 19 20 21 22
Augmented fiscal deficit-3mmaAugmented fiscal deficit-12mmaEffective fiscal deficit-3mmaEffective fiscal deficit-12mma
Percent of GDP Percent of GDP
Source: Goldman Sachs Global Investment Research, SAFE Source: Goldman Sachs Global Investment Research, Wind, Haver Analytics, CEIC Source: Goldman Sachs Global Investment Research, CEIC, WIND
Exhibit 221: City-level property relative tightness index suggests there have been no new local tightening policies over the past two months
Exhibit 222: 30-city daily property transaction volume recovered marginally slower than the past few years after the Chinese New Year holiday
Exhibit 223: Traffic congestion conditions around Chinese New Year have been close to the levels in 2019
0
20
40
60
80
100
0
20
40
60
80
100
Mar-19 Sep-19 Mar-20 Sep-20 Mar-21 Sep-21
Percent Property policy relative tightness index: relative tightening share Percent
Tighter
0
20
40
60
80
100
0
20
40
60
80
100
Jan Feb Mar Apr May Jun Jul Aug Sep Oct Nov Dec Jan
20192020202120222022 (unsmoothed)
30-city average daily property transaction volume
Feb.9:-81% yoy*
*Percentage change relative to 2021
Thousand sqm, 7-day moving avg Thousand sqm, 7-day moving avg
1.0
1.1
1.2
1.3
1.4
1.5
1.6
1.7
1.8
1.9
1.0
1.1
1.2
1.3
1.4
1.5
1.6
1.7
1.8
1.9
Jan Feb Mar Apr May Jun Jul Aug Sep Oct Nov Dec
20192020202120222022 (unsmoothed)
Traffic congestion index in major cities in China^ (ratio of actual travel time to ‘free flow’ travel time, higher=more congested)
Feb.9:-8% yoy*
*Percentage change relative to 2021
Ratio, 7-day moving avg Ratio, 7-day moving avg
Source: Goldman Sachs Global Investment Research, Sofang.com Source: Wind, Goldman Sachs Global Investment Research ^Population weighted average of 100 cities
Source: Wind, Goldman Sachs Global Investment Research
13 February 2022 64
Goldman Sachs China

Exhibit 224: Our top-down methodology to identify ‘New China’ sub-industries in the listed equity universe
• 46 GICS sub-industries• 2662 companies, US$7.6tn mkt cap
All China universe:• 147 GICS sub-industries
• 6014 companies, US$17tn mkt cap
• 101 GICS sub-industries• 3352 companies, US$8.7tn mkt cap
Growth & Size requirements:
• Past 3Y revenue growth CAGR ≥10%• No less than 5 companies in the sub-industry
New China Old China
Rank > 50%tile based on 5 pillars:
Macro: Low price return correlation with IP, High forward revenue growth
Fundamentals / Returns: High ROE - COE, high EBITDA margin
R&D: High R&D intensity, high R&D growth
Human capital: High wage / revenue ratio, high market cap per employee
Capital structure: Low asset / equity, low fixed assets / total assets
Source: Goldman Sachs Global Investment Research
13 February 2022 65
Goldman Sachs China

Exhibit 225: Methodology diagram of our policy score calculation
Source: Goldman Sachs Global Investment Research
13 February 2022 66
Goldman Sachs China
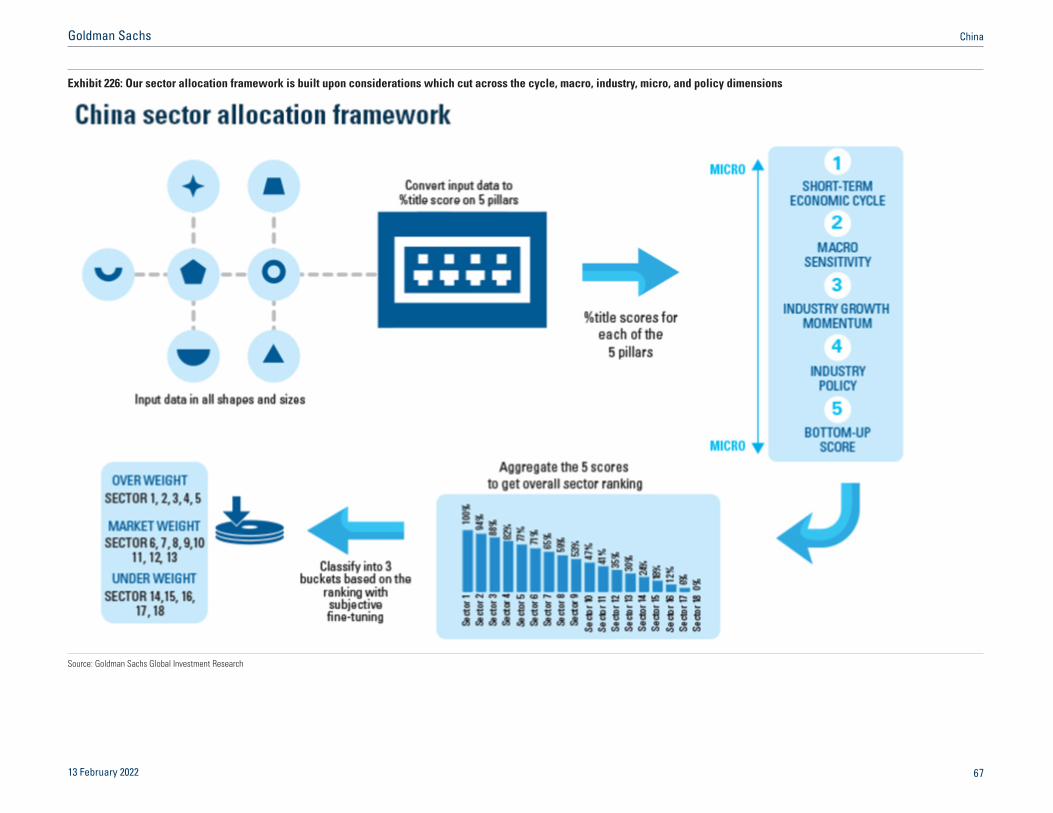
Exhibit 226: Our sector allocation framework is built upon considerations which cut across the cycle, macro, industry, micro, and policy dimensions
Source: Goldman Sachs Global Investment Research
13 February 2022 67
Goldman Sachs China

Exhibit 227: The 7 ‘New Infra’ areas per the government’s definition
Source: IBES, Goldman Sachs Global Investment Research
13 February 2022 68
Goldman Sachs China
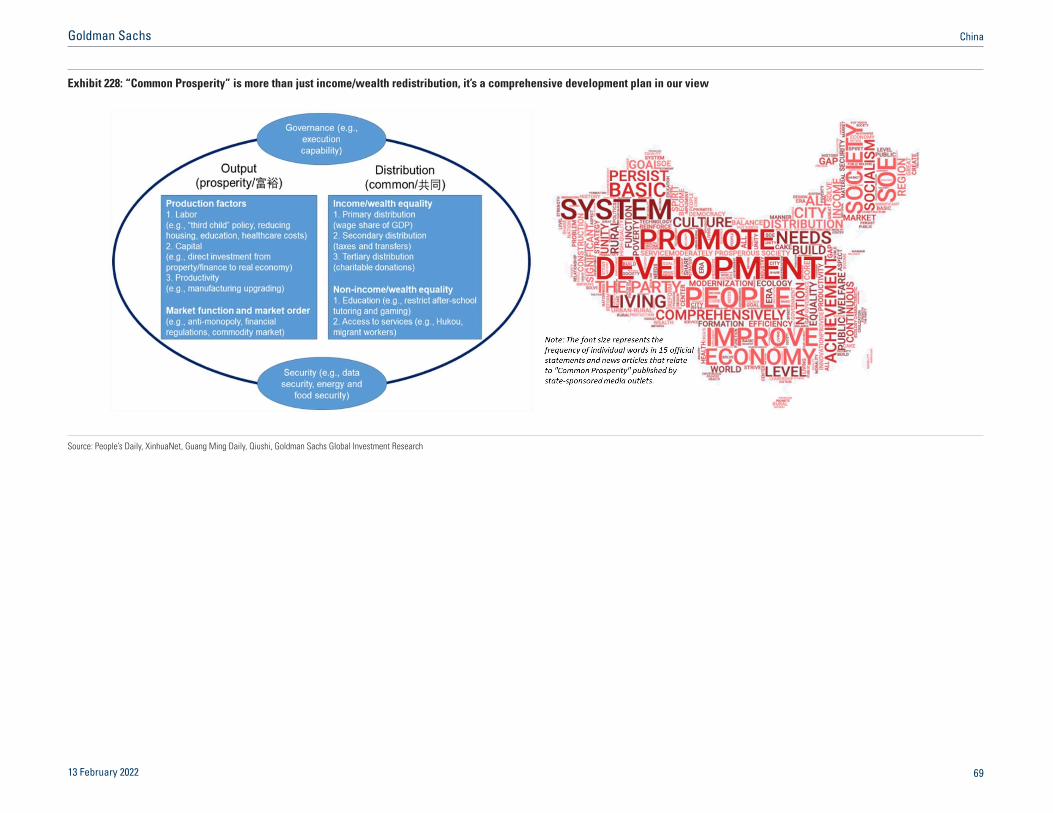
Exhibit 228: “Common Prosperity” is more than just income/wealth redistribution, it’s a comprehensive development plan in our view
Source: People’s Daily, XinhuaNet, Guang Ming Daily, Qiushi, Goldman Sachs Global Investment Research
13 February 2022 69
Goldman Sachs China
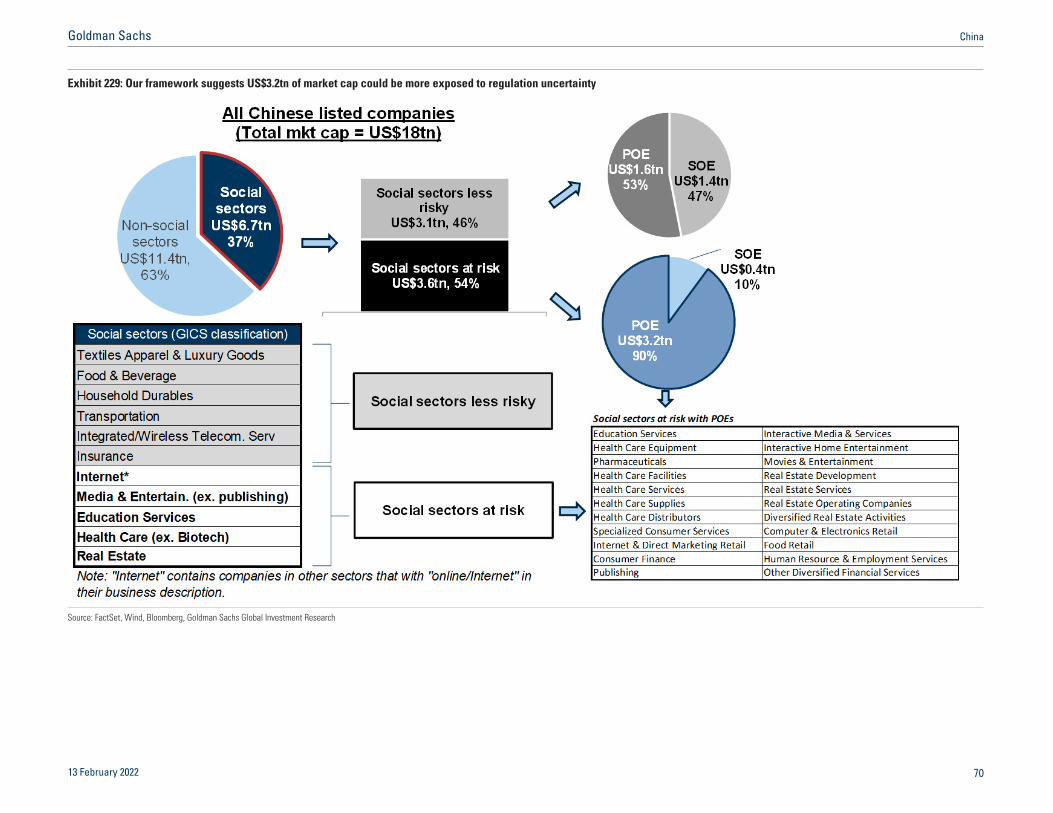
Exhibit 229: Our framework suggests US$3.2tn of market cap could be more exposed to regulation uncertainty
Source: FactSet, Wind, Bloomberg, Goldman Sachs Global Investment Research
13 February 2022 70
Goldman Sachs China

Exhibit 230: The announced regulations so far in this cycle can be broadly grouped under four main categories, in our view
Anti-trust Financial Markets Data Security Social Sector
China policymakers would "strengthen anti-monopoly and be against unfair competition" in 2022, according to the statement issued after the annual Central Economic Work Conference
According to Reuters (Dec 17), citing unidentified persons, Chinese regulators are planning to ban online brokers such as Futu and UP Fintech from offering offshore trading services to mainland clients. The potential ban is driven by concerns over data security and capital outflow, as Reuters reported
MIIT (Dec 9) ordered 106 apps to be removed from app stores following the campaign launched on Nov 3 targeting data violations such as unnecessary collection of users' personal information
The State Tobacco Monopoly Administration (Dec 2) issued draft rules governing e-cigarettes
SAMR announced 13 past merger & acquisition deals failed to report market concentration risks, and imposed a fine of RMB500k for each deal
China's e-commerce livestreaming KOL Viya was fined RMB 1.34bn for tax evasion, according to an announcement published by State Taxation Administration on its website on Dec 20
Reuters reported (Dec 15), citing people with knowledge of the matter, the Chinese government has been expanding the practice of taking minority stakes in private companies - known as "golden share" arrangements. According to Reuters, golden shares have been taken in Truck Alliance
CAC said on Dec 2 that it had summoned and fined social media company Douban RMB1.5mn over "unlawful release of information". According to CAC, Douban has been punished 20 times since Jan
Local taxation bureau in Beijing, Shanghai, Zhejiang, Jiangsu and Guangdong separately issued announcements (Dec 22), asking celebrities and online streamers to "self-check" tax declarations and report business irregularity to local authorities by end of 2021, otherwise they will face more severe actions from the authorities
According to Southern Finance (Dec 22), a state-backed media, MIIT suspended a cooperative partnership with Alibaba Cloud for 6mo on alleged cybersecurity threats. MIIT earlier said that Alibaba Cloud failed to immediately report a security loophole related to Apache Log4j2, a Java-based tool widely used in enterprise systems
Ministry of Education said on Dec 13 that it was suspending new filing of online tutoring apps and withdrawing existing authorisations, including for apps that encourage bad learning habits by simply providing answers to exercises
CSRC (Dec 24) put forward updates on rules regarding overseas listings, requiring companies to register with CSRC before overseas offerings. CSRC clarified that companies with VIE structures are eligible for overseas listing if they meet compliance requirements, but didn't provide further details
4 ministries including CAC, MIIT, MPS and SAMR jointly issued regulations targeting the use of algorithm recommendation technology, which will take effect on Mar 1, 2022. The finalized rules were approved by CAC in Nov 2021 after the public consultation ended in Sept 2021
CAC (Dec 14) imposed RMB3mn fine on Weibo for repeatedly publishing illegal information, which was said to have violated cybersecurity law and minor-protection law. CAC said its Beijing bureau had imposed 44 penalties on Weibo totalling 14.3mn yuan for the year to Nov
NDRC and the Ministry of Commerce (Dec 27) published the 2021 "Negative List" for foreign investments that will take effect on Jan 1, 2022. The updated list was shortened to 31 items compared with 33 items in 2020. Companies that operate in industries where foreign investment is prohibited would need to apply for regulatory approval before overseas listings. Similar to domestic listing companies, foreign ownership in these companies is capped at 30% in aggregate and 10% for a single investor
CAC and 12 other ministries published rules on cybersecurity review which will become effective on Feb 15, 2022. Platform companies with data on more than 1mn users are required to go through a cybersecurity review before they can list abroad. The finalized rules were approved by CAC in Nov 2021
CAC's Beijing bureau said on Dec 20 that CAC had summoned Zhihu for "unlawful release of information" and demanded "immediate rectification" from the company. Some functions would be suspended during the rectification period, as Zhihu announced
CAC announced a 2-month campaign on Dec 23 targeting deceptive behaviors on online platforms, such as faking fans and reviews, boosting engagement statistics, etc.
Dec-21
Source: SAMR, CBIRC, CSRC, MoC, MoE, State Council, CPCCC, NDRC, MIIT, CAC, Goldman Sachs Global Investment Research
13 February 2022 7<
Goldman Sachs China

Exhibit 231: The MIIT has highlighted 3 lists of “Little Giants” for preferential policy treatment
3 Rounds4762 "Little Giants"
Criteria➣SMEs registered in China for more than 3 years➣Recognized by government as “specialized, high-tech and new-style”
➣Providing key components or supporting products for large enterprises and projects
➣Having ability to make R&D investment and innovate continuously
➣Implementing long-term development strategies, with solid corporate governance and strong sense of social responsibility.
➣Average growth rate of major business revenue or net profit in the past two years >= 5%; asset-liability ratio <= 70%
➣Engaged in specific market segments >= 3 years leading products occupying the top 3 market share within the province
➣Possessing valid patents or software copyrights➣Owing brand or obtaining relevant management system certification
Basic Criteria
SpecializedCriteria
Announced by Area Policy Support Period
MoF Fiscal ➣Subsidize >1000 "Little Giants" with RMB 10bn in total 2021-2025
Financing ➣➣Broaden financing channels for SMEs, and prepare high-quality ones for IPOs
Resource Allocation ➣Leverage market mechanism to allocate technology, human capital and data tothese “Little Giants”
Regulation ➣➣Lower barriers to entry by streamlining administrative and regulatory power
Digitalization ➣Implement special action plans to enhance SMEs' ability to use digital and designresources
Public Service ➣Support service agencies to develop service projects for innovative "Little Giant"enterprises, and conduct extensive management consulting and talent training
Note: Extension requires applications and review
MIIT Valid for 3 years^
Source: MIIT, MoF, Data compiled by Goldman Sachs Global Investment Research
13 February 2022 72
Goldman Sachs China

Exhibit 232: We form a “Common Prosperity” equity unvierse by mapping the four key thematic trends onto specific equity sectors
Source: FactSet, Wind, Goldman Sachs Global Investment Research
13 February 2022 73
Goldman Sachs China

Disclosure Appendix
Reg AC We, Kinger Lau, CFA, Timothy Moe, CFA, Si Fu, Ph.D. and Kevin Wang, CFA, hereby certify that all of the views expressed in this report accurately reflect our personal views, which have not been influenced by considerations of the firm’s business or client relationships.
Unless otherwise stated, the individuals listed on the cover page of this report are analysts in Goldman Sachs’ Global Investment Research division.
Disclosures MSCI disclosure All MSCI data used in this report is the exclusive property of MSCI, Inc. (MSCI). Without prior written permission of MSCI, this information and any other MSCI intellectual property may not be reproduced or re-disseminated in any form and may not be used to create any financial instruments or products or any indices. This information is provided on an “as is” basis, and the user of this information assumes the entire risk of any use made of this information. Neither MSCI, any of its affiliates nor any third party involved in, or related to, computing or compiling the data makes any express or implied warranties or representations with respect to this information (or the results to be obtained by the use thereof), and MSCI, its affiliates and any such third party hereby expressly disclaim all warranties of originality, accuracy, completeness, merchantability or fitness for a particular purpose with respect to any of this information. Without limiting any of the foregoing, in no event shall MSCI, any of its affiliates or any third party involved in, or related to, computing or compiling the data have any liability for any direct, indirect, special, punitive, consequential or any other damages (including lost profits) even if notified of the possibility of such damages. MSCI and the MSCI indexes are service marks of MSCI and its affiliates. The Global Industry Classification Standard (GICS) were developed by and is the exclusive property of MSCI and Standard & Poor’s. GICS is a service mark of MSCI and S&P and has been licensed for use by The Goldman Sachs Group, Inc.
Basket disclosure The ability to trade the basket(s) discussed in this research will depend upon market conditions, including liquidity and borrow constraints at the time of trade.
Regulatory disclosures Disclosures required by United States laws and regulations See company-specific regulatory disclosures above for any of the following disclosures required as to companies referred to in this report: manager or co-manager in a pending transaction; 1% or other ownership; compensation for certain services; types of client relationships; managed/co-managed public offerings in prior periods; directorships; for equity securities, market making and/or specialist role. Goldman Sachs trades or may trade as a principal in debt securities (or in related derivatives) of issuers discussed in this report.
The following are additional required disclosures: Ownership and material conflicts of interest: Goldman Sachs policy prohibits its analysts, professionals reporting to analysts and members of their households from owning securities of any company in the analyst’s area of coverage. Analyst compensation: Analysts are paid in part based on the profitability of Goldman Sachs, which includes investment banking revenues. Analyst as officer or director: Goldman Sachs policy generally prohibits its analysts, persons reporting to analysts or members of their households from serving as an officer, director or advisor of any company in the analyst’s area of coverage. Non-U.S. Analysts: Non-U.S. analysts may not be associated persons of Goldman Sachs & Co. LLC and therefore may not be subject to FINRA Rule 2241 or FINRA Rule 2242 restrictions on communications with subject company, public appearances and trading securities held by the analysts.
Additional disclosures required under the laws and regulations of jurisdictions other than the United States The following disclosures are those required by the jurisdiction indicated, except to the extent already made above pursuant to United States laws and regulations. Australia: Goldman Sachs Australia Pty Ltd and its affiliates are not authorised deposit-taking institutions (as that term is defined in the Banking Act 1959 (Cth)) in Australia and do not provide banking services, nor carry on a banking business, in Australia. This research, and any access to it, is intended only for “wholesale clients” within the meaning of the Australian Corporations Act, unless otherwise agreed by Goldman Sachs. In producing research reports, members of the Global Investment Research Division of Goldman Sachs Australia may attend site visits and other meetings hosted by the companies and other entities which are the subject of its research reports. In some instances the costs of such site visits or meetings may be met in part or in whole by the issuers concerned if Goldman Sachs Australia considers it is appropriate and reasonable in the specific circumstances relating to the site visit or meeting. To the extent that the contents of this document contains any financial product advice, it is general advice only and has been prepared by Goldman Sachs without taking into account a client’s objectives, financial situation or needs. A client should, before acting on any such advice, consider the appropriateness of the advice having regard to the client’s own objectives, financial situation and needs. A copy of certain Goldman Sachs Australia and New Zealand disclosure of interests and a copy of Goldman Sachs’ Australian Sell-Side Research Independence Policy Statement are available at: https://www.goldmansachs.com/disclosures/australia-new-zealand/index.html. Brazil: Disclosure information in relation to CVM Resolution n. 20 is available at https://www.gs.com/worldwide/brazil/area/gir/index.html. Where applicable, the Brazil-registered analyst primarily responsible for the content of this research report, as defined in Article 20 of CVM Resolution n. 20, is the first author named at the beginning of this report, unless indicated otherwise at the end of the text. Canada: Goldman Sachs Canada Inc. is an affiliate of The Goldman Sachs Group Inc. and therefore is included in the company specific disclosures relating to Goldman Sachs (as defined above). Goldman Sachs Canada Inc. has approved of, and agreed to take responsibility for, this research report in Canada if and to the extent that Goldman Sachs Canada Inc. disseminates this research report to its clients. Hong Kong: Further information on the securities of covered companies referred to in this research may be obtained on request from Goldman Sachs (Asia) L.L.C. India: Further information on the subject company or companies referred to in this research may be obtained from Goldman Sachs (India) Securities Private Limited, Research Analyst - SEBI Registration Number INH000001493, 951-A, Rational House, Appasaheb Marathe Marg, Prabhadevi, Mumbai 400 025, India, Corporate Identity Number U74140MH2006FTC160634, Phone +91 22 6616 9000, Fax +91 22 6616 9001. Goldman Sachs may beneficially own 1% or more of the securities (as such term is defined in clause 2 (h) the Indian Securities Contracts (Regulation) Act, 1956) of the subject company or companies referred to in this research report. Japan: See below. Korea: This research, and any access to it, is intended only for “professional investors” within the meaning of the Financial Services and Capital Markets Act, unless otherwise agreed by Goldman Sachs. Further
13 February 2022 74
Goldman Sachs China

information on the subject company or companies referred to in this research may be obtained from Goldman Sachs (Asia) L.L.C., Seoul Branch. New Zealand: Goldman Sachs New Zealand Limited and its affiliates are neither “registered banks” nor “deposit takers” (as defined in the Reserve Bank of New Zealand Act 1989) in New Zealand. This research, and any access to it, is intended for “wholesale clients” (as defined in the Financial Advisers Act 2008) unless otherwise agreed by Goldman Sachs. A copy of certain Goldman Sachs Australia and New Zealand disclosure of interests is available at: https://www.goldmansachs.com/disclosures/australia-new-zealand/index.html. Russia: Research reports distributed in the Russian Federation are not advertising as defined in the Russian legislation, but are information and analysis not having product promotion as their main purpose and do not provide appraisal within the meaning of the Russian legislation on appraisal activity. Research reports do not constitute a personalized investment recommendation as defined in Russian laws and regulations, are not addressed to a specific client, and are prepared without analyzing the financial circumstances, investment profiles or risk profiles of clients. Goldman Sachs assumes no responsibility for any investment decisions that may be taken by a client or any other person based on this research report. Singapore: Goldman Sachs (Singapore) Pte. (Company Number: 198602165W), which is regulated by the Monetary Authority of Singapore, accepts legal responsibility for this research, and should be contacted with respect to any matters arising from, or in connection with, this research. Taiwan: This material is for reference only and must not be reprinted without permission. Investors should carefully consider their own investment risk. Investment results are the responsibility of the individual investor. United Kingdom: Persons who would be categorized as retail clients in the United Kingdom, as such term is defined in the rules of the Financial Conduct Authority, should read this research in conjunction with prior Goldman Sachs research on the covered companies referred to herein and should refer to the risk warnings that have been sent to them by Goldman Sachs International. A copy of these risks warnings, and a glossary of certain financial terms used in this report, are available from Goldman Sachs International on request.
European Union and United Kingdom: Disclosure information in relation to Article 6 (2) of the European Commission Delegated Regulation (EU) (2016/958) supplementing Regulation (EU) No 596/2014 of the European Parliament and of the Council (including as that Delegated Regulation is implemented into United Kingdom domestic law and regulation following the United Kingdom’s departure from the European Union and the European Economic Area) with regard to regulatory technical standards for the technical arrangements for objective presentation of investment recommendations or other information recommending or suggesting an investment strategy and for disclosure of particular interests or indications of conflicts of interest is available at https://www.gs.com/disclosures/europeanpolicy.html which states the European Policy for Managing Conflicts of Interest in Connection with Investment Research.
Japan: Goldman Sachs Japan Co., Ltd. is a Financial Instrument Dealer registered with the Kanto Financial Bureau under registration number Kinsho 69, and a member of Japan Securities Dealers Association, Financial Futures Association of Japan and Type II Financial Instruments Firms Association. Sales and purchase of equities are subject to commission pre-determined with clients plus consumption tax. See company-specific disclosures as to any applicable disclosures required by Japanese stock exchanges, the Japanese Securities Dealers Association or the Japanese Securities Finance Company.
Global product; distributing entities The Global Investment Research Division of Goldman Sachs produces and distributes research products for clients of Goldman Sachs on a global basis. Analysts based in Goldman Sachs offices around the world produce research on industries and companies, and research on macroeconomics, currencies, commodities and portfolio strategy. This research is disseminated in Australia by Goldman Sachs Australia Pty Ltd (ABN 21 006 797 897); in Brazil by Goldman Sachs do Brasil Corretora de Títulos e Valores Mobiliários S.A.; Public Communication Channel Goldman Sachs Brazil: 0800 727 5764 and / or [email protected]. Available Weekdays (except holidays), from 9am to 6pm. Canal de Comunicação com o Público Goldman Sachs Brasil: 0800 727 5764 e/ou [email protected]. Horário de funcionamento: segunda-feira à sexta-feira (exceto feriados), das 9h às 18h; in Canada by either Goldman Sachs Canada Inc. or Goldman Sachs & Co. LLC; in Hong Kong by Goldman Sachs (Asia) L.L.C.; in India by Goldman Sachs (India) Securities Private Ltd.; in Japan by Goldman Sachs Japan Co., Ltd.; in the Republic of Korea by Goldman Sachs (Asia) L.L.C., Seoul Branch; in New Zealand by Goldman Sachs New Zealand Limited; in Russia by OOO Goldman Sachs; in Singapore by Goldman Sachs (Singapore) Pte. (Company Number: 198602165W); and in the United States of America by Goldman Sachs & Co. LLC. Goldman Sachs International has approved this research in connection with its distribution in the United Kingdom.
Effective from the date of the United Kingdom’s departure from the European Union and the European Economic Area (“Brexit Day”) the following information with respect to distributing entities will apply:
Goldman Sachs International (“GSI”), authorised by the Prudential Regulation Authority (“PRA”) and regulated by the Financial Conduct Authority (“FCA”) and the PRA, has approved this research in connection with its distribution in the United Kingdom.
European Economic Area: GSI, authorised by the PRA and regulated by the FCA and the PRA, disseminates research in the following jurisdictions within the European Economic Area: the Grand Duchy of Luxembourg, Italy, the Kingdom of Belgium, the Kingdom of Denmark, the Kingdom of Norway, the Republic of Finland, Portugal, the Republic of Cyprus and the Republic of Ireland; GS -Succursale de Paris (Paris branch) which, from Brexit Day, will be authorised by the French Autorité de contrôle prudentiel et de resolution (“ACPR”) and regulated by the Autorité de contrôle prudentiel et de resolution and the Autorité des marches financiers (“AMF”) disseminates research in France; GSI - Sucursal en España (Madrid branch) authorized in Spain by the Comisión Nacional del Mercado de Valores disseminates research in the Kingdom of Spain; GSI - Sweden Bankfilial (Stockholm branch) is authorized by the SFSA as a “third country branch” in accordance with Chapter 4, Section 4 of the Swedish Securities and Market Act (Sw. lag (2007:528) om värdepappersmarknaden) disseminates research in the Kingdom of Sweden; Goldman Sachs Bank Europe SE (“GSBE”) is a credit institution incorporated in Germany and, within the Single Supervisory Mechanism, subject to direct prudential supervision by the European Central Bank and in other respects supervised by German Federal Financial Supervisory Authority (Bundesanstalt für Finanzdienstleistungsaufsicht, BaFin) and Deutsche Bundesbank and disseminates research in the Federal Republic of Germany and those jurisdictions within the European Economic Area where GSI is not authorised to disseminate research and additionally, GSBE, Copenhagen Branch filial af GSBE, Tyskland, supervised by the Danish Financial Authority disseminates research in the Kingdom of Denmark; GSBE - Sucursal en España (Madrid branch) subject (to a limited extent) to local supervision by the Bank of Spain disseminates research in the Kingdom of Spain; GSBE - Succursale Italia (Milan branch) to the relevant applicable extent, subject to local supervision by the Bank of Italy (Banca d’Italia) and the Italian Companies and Exchange Commission (Commissione Nazionale per le Società e la Borsa “Consob”) disseminates research in Italy; GSBE - Succursale de Paris (Paris branch), supervised by the AMF and by the ACPR disseminates research in France; and GSBE - Sweden Bankfilial (Stockholm branch), to a limited extent, subject to local supervision by the Swedish Financial Supervisory Authority (Finansinpektionen) disseminates research in the Kingdom of Sweden.
General disclosures This research is for our clients only. Other than disclosures relating to Goldman Sachs, this research is based on current public information that we consider reliable, but we do not represent it is accurate or complete, and it should not be relied on as such. The information, opinions, estimates and forecasts contained herein are as of the date hereof and are subject to change without prior notification. We seek to update our research as appropriate, but various regulations may prevent us from doing so. Other than certain industry reports published on a periodic basis, the large majority of reports are published at
13 February 2022 75
Goldman Sachs China

irregular intervals as appropriate in the analyst’s judgment.
Goldman Sachs conducts a global full-service, integrated investment banking, investment management, and brokerage business. We have investment banking and other business relationships with a substantial percentage of the companies covered by our Global Investment Research Division. Goldman Sachs & Co. LLC, the United States broker dealer, is a member of SIPC (https://www.sipc.org).
Our salespeople, traders, and other professionals may provide oral or written market commentary or trading strategies to our clients and principal trading desks that reflect opinions that are contrary to the opinions expressed in this research. Our asset management area, principal trading desks and investing businesses may make investment decisions that are inconsistent with the recommendations or views expressed in this research.
We and our affiliates, officers, directors, and employees, will from time to time have long or short positions in, act as principal in, and buy or sell, the securities or derivatives, if any, referred to in this research, unless otherwise prohibited by regulation or Goldman Sachs policy.
The views attributed to third party presenters at Goldman Sachs arranged conferences, including individuals from other parts of Goldman Sachs, do not necessarily reflect those of Global Investment Research and are not an official view of Goldman Sachs.
Any third party referenced herein, including any salespeople, traders and other professionals or members of their household, may have positions in the products mentioned that are inconsistent with the views expressed by analysts named in this report.
This research is focused on investment themes across markets, industries and sectors. It does not attempt to distinguish between the prospects or performance of, or provide analysis of, individual companies within any industry or sector we describe.
Any trading recommendation in this research relating to an equity or credit security or securities within an industry or sector is reflective of the investment theme being discussed and is not a recommendation of any such security in isolation.
This research is not an offer to sell or the solicitation of an offer to buy any security in any jurisdiction where such an offer or solicitation would be illegal. It does not constitute a personal recommendation or take into account the particular investment objectives, financial situations, or needs of individual clients. Clients should consider whether any advice or recommendation in this research is suitable for their particular circumstances and, if appropriate, seek professional advice, including tax advice. The price and value of investments referred to in this research and the income from them may fluctuate. Past performance is not a guide to future performance, future returns are not guaranteed, and a loss of original capital may occur. Fluctuations in exchange rates could have adverse effects on the value or price of, or income derived from, certain investments.
Certain transactions, including those involving futures, options, and other derivatives, give rise to substantial risk and are not suitable for all investors. Investors should review current options and futures disclosure documents which are available from Goldman Sachs sales representatives or at https://www.theocc.com/about/publications/character-risks.jsp and https://www.fiadocumentation.org/fia/regulatory-disclosures_1/fia-uniform-futures-and-options-on-futures-risk-disclosures-booklet-pdf-version-2018. Transaction costs may be significant in option strategies calling for multiple purchase and sales of options such as spreads. Supporting documentation will be supplied upon request.
Differing Levels of Service provided by Global Investment Research: The level and types of services provided to you by the Global Investment Research division of GS may vary as compared to that provided to internal and other external clients of GS, depending on various factors including your individual preferences as to the frequency and manner of receiving communication, your risk profile and investment focus and perspective (e.g., marketwide, sector specific, long term, short term), the size and scope of your overall client relationship with GS, and legal and regulatory constraints. As an example, certain clients may request to receive notifications when research on specific securities is published, and certain clients may request that specific data underlying analysts’ fundamental analysis available on our internal client websites be delivered to them electronically through data feeds or otherwise. No change to an analyst’s fundamental research views (e.g., ratings, price targets, or material changes to earnings estimates for equity securities), will be communicated to any client prior to inclusion of such information in a research report broadly disseminated through electronic publication to our internal client websites or through other means, as necessary, to all clients who are entitled to receive such reports.
All research reports are disseminated and available to all clients simultaneously through electronic publication to our internal client websites. Not all research content is redistributed to our clients or available to third-party aggregators, nor is Goldman Sachs responsible for the redistribution of our research by third party aggregators. For research, models or other data related to one or more securities, markets or asset classes (including related services) that may be available to you, please contact your GS representative or go to https://research.gs.com.
Disclosure information is also available at https://www.gs.com/research/hedge.html or from Research Compliance, 200 West Street, New York, NY 10282.
© 2022 Goldman Sachs.
No part of this material may be (i) copied, photocopied or duplicated in any form by any means or (ii) redistributed without the prior written consent of The Goldman Sachs Group, Inc.
13 February 2022 76
Goldman Sachs China
MINDCRAFT: OUR THEMATIC DEEP DIVES
Top of MindWhat Matters for IPOs
...and more eSports: From Wild West to Mainstream
Music in the Air
EVs: Back to Reality China Consumer
Indian equities Carbonomics
ESG Womenomics
China de-carbonization Age of Automation
Japan Green Consumer China A Shares
China’s Credit Conundrum Top Projects Electrify Now
China VaccineChina Regulation EM ex-ChinaArtificial Intelligence
Cloud Computing
The Post-Pandemic Cycle Gene editing
5G: From Lab to Launchpad
The Genome Revolution Digital Health
Sustainable ESG Investing Future of Work SpaceDrones
Climate ChangeChina Healthcare Technology
Cars: the road ahead
ESG Sector Roadmaps
The Rise of Renewables
EV battery metal recycling
The Green Technology Cycle