multi sector fixed income funds - goldman sachs asset
TRANSCRIPT
Goldman Sachs Funds
Semi-Annual Report September 30, 2021
Multi Sector Fixed Income FundsBondCore Fixed IncomeGlobal Core Fixed IncomeIncomeLong Short Credit StrategiesStrategic Income
Goldman Sachs Multi Sector Fixed Income Funds
� BOND
� CORE FIXED INCOME
� GLOBAL CORE FIXED INCOME
� INCOME
� LONG SHORT CREDIT STRATEGIES
� STRATEGIC INCOME
TABLE OF CONTENTS
Fund Basics 2
Schedules of Investments 15
Financial Statements 128
Financial Highlights 135
Bond 135
Core Fixed Income 143
Global Core Fixed Income 151
Income 158
Long Short Credit Strategies 165
Strategic Income 172
Notes to the Financial Statements 179
Other Information 212
NOT FDIC-INSURED May Lose Value No Bank Guarantee
Goldman Sachs Multi-Sector Fixed Income Funds
The following are highlights both of key factors affecting the fixed income market and of any changes made to the Goldman Sachs
Multi-Sector Fixed Income Funds (the “Funds”) during the six months ended September 30, 2021 (the “Reporting Period”). A
fuller review of the market and these changes will appear in the Funds’ annual shareholder report covering the 12 months ended
March 31, 2022.
Market and Economic Review� The broad U.S. fixed income market, as measured by the Bloomberg U.S. Aggregate Bond Index, posted a return of 1.88%
during the Reporting Period, significantly underperforming the broad U.S. equity market.
� Early in the Reporting Period, global central banks generally remained accommodative, with the U.S. Federal Reserve (“Fed”)
indicating it needed to see “substantial progress” on its employment and inflation goals before altering U.S. monetary policy.
� Remarkably strong U.S. inflation data, deemed “transitory” by the Fed, a disappointing U.S. jobs report released in April 2021
and the spread of the COVID-19 Delta variant suggested pandemic-related dynamics could continue distorting economic data as
the Reporting Period progressed.
� In September 2021, as inflationary trends continued, driven by a sharp rise in energy prices and persistent supply-chain bottlenecks,
developed markets central banks delivered or hinted at sooner than previously consensus expected policy normalization, with the
Fed stating it might start raising interest rates during 2022 and the tapering of its asset purchases “may soon be warranted.”
� Shorter-term U.S. Treasury yields rose modestly during the Reporting Period overall, while intermediate- and longer-term U.S.
Treasury yields fell moderately.
� Corporate bonds, both investment grade and high yield, outperformed U.S. Treasuries during the Reporting Period. So, too, did
Treasury inflation protected securities and emerging markets debt. Securitized assets, including mortgage-backed securities and
asset-backed securities, underperformed U.S. Treasuries during the Reporting Period.
Fund Changes and Highlights
Goldman Sachs Bond Fund
� Effective October 1, 2021, just after the close of the Reporting Period, Michael Swell no longer served as a portfolio manager
for the Fund. Ashish Shah continues to serve as a portfolio manager for the Fund.
Goldman Sachs Core Fixed Income Fund
� Effective October 1, 2021, just after the close of the Reporting Period, Michael Swell no longer served as a portfolio manager
for the Fund. Ashish Shah continues to serve as a portfolio manager for the Fund.
Goldman Sachs Long Short Credit Strategies Fund
� Effective July 29, 2021, the Fund’s benchmark index changed from the ICE Bank of America Merrill Lynch U.S. Dollar Three-
Month LIBOR Constant Maturity Index to the ICE Bank of America Merrill Lynch Three-Month U.S. Treasury Bill Index.
Goldman Sachs Strategic Income Fund
� Effective July 29, 2021, the Fund’s benchmark index changed from the ICE Bank of America Merrill Lynch U.S. Dollar Three-
Month LIBOR Constant Maturity Index to the ICE Bank of America Merrill Lynch Three-Month U.S. Treasury Bill Index.
� Effective October 1, 2021, just after the close of the Reporting Period, Michael Swell no longer served as a portfolio manager
for the Fund. Ashish Shah continues to serve as a portfolio manager for the Fund.
� The Strategic Income Fund is a dynamic fund which may have large fluctuations in sector allocations within a time period.
Goldman Sachs Income Fund
� The Fund outperformed its relative benchmark due to the Fund’s overweight allocations to high yield and investment grade
corporate bonds. Spread Sectors (High yield and investment grade corporate bond) remain generally resilient against rate market
volatility and supply chain pressures.
1
F U N D B A S I C S
Bond Fundas of September 30, 2021
P E R F O R M A N C E R E V I E W
April 1, 2021–September 30, 2021Fund Total Return(based on NAV)1
Bloomberg U.S.Aggregate Bond Index2
30-Day StandardizedSubsidized Yield3
30-Day StandardizedUnsubsidized Yield3
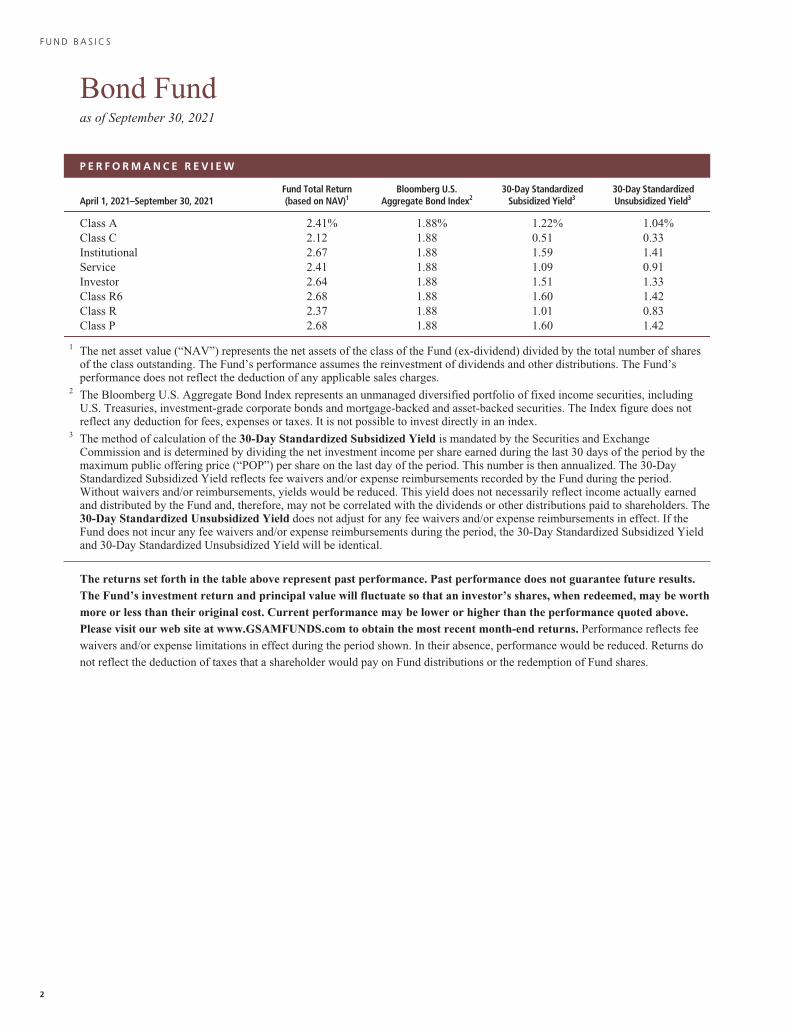
Class A 2.41% 1.88% 1.22% 1.04%Class C 2.12 1.88 0.51 0.33Institutional 2.67 1.88 1.59 1.41Service 2.41 1.88 1.09 0.91Investor 2.64 1.88 1.51 1.33Class R6 2.68 1.88 1.60 1.42Class R 2.37 1.88 1.01 0.83Class P 2.68 1.88 1.60 1.42
1 The net asset value (“NAV”) represents the net assets of the class of the Fund (ex-dividend) divided by the total number of sharesof the class outstanding. The Fund’s performance assumes the reinvestment of dividends and other distributions. The Fund’sperformance does not reflect the deduction of any applicable sales charges.
2 The Bloomberg U.S. Aggregate Bond Index represents an unmanaged diversified portfolio of fixed income securities, includingU.S. Treasuries, investment-grade corporate bonds and mortgage-backed and asset-backed securities. The Index figure does notreflect any deduction for fees, expenses or taxes. It is not possible to invest directly in an index.
3 The method of calculation of the 30-Day Standardized Subsidized Yield is mandated by the Securities and ExchangeCommission and is determined by dividing the net investment income per share earned during the last 30 days of the period by themaximum public offering price (“POP”) per share on the last day of the period. This number is then annualized. The 30-DayStandardized Subsidized Yield reflects fee waivers and/or expense reimbursements recorded by the Fund during the period.Without waivers and/or reimbursements, yields would be reduced. This yield does not necessarily reflect income actually earnedand distributed by the Fund and, therefore, may not be correlated with the dividends or other distributions paid to shareholders. The30-Day Standardized Unsubsidized Yield does not adjust for any fee waivers and/or expense reimbursements in effect. If theFund does not incur any fee waivers and/or expense reimbursements during the period, the 30-Day Standardized Subsidized Yieldand 30-Day Standardized Unsubsidized Yield will be identical.
The returns set forth in the table above represent past performance. Past performance does not guarantee future results.The Fund’s investment return and principal value will fluctuate so that an investor’s shares, when redeemed, may be worthmore or less than their original cost. Current performance may be lower or higher than the performance quoted above.Please visit our web site at www.GSAMFUNDS.com to obtain the most recent month-end returns. Performance reflects fee
waivers and/or expense limitations in effect during the period shown. In their absence, performance would be reduced. Returns do
not reflect the deduction of taxes that a shareholder would pay on Fund distributions or the redemption of Fund shares.
2
F U N D B A S I C S
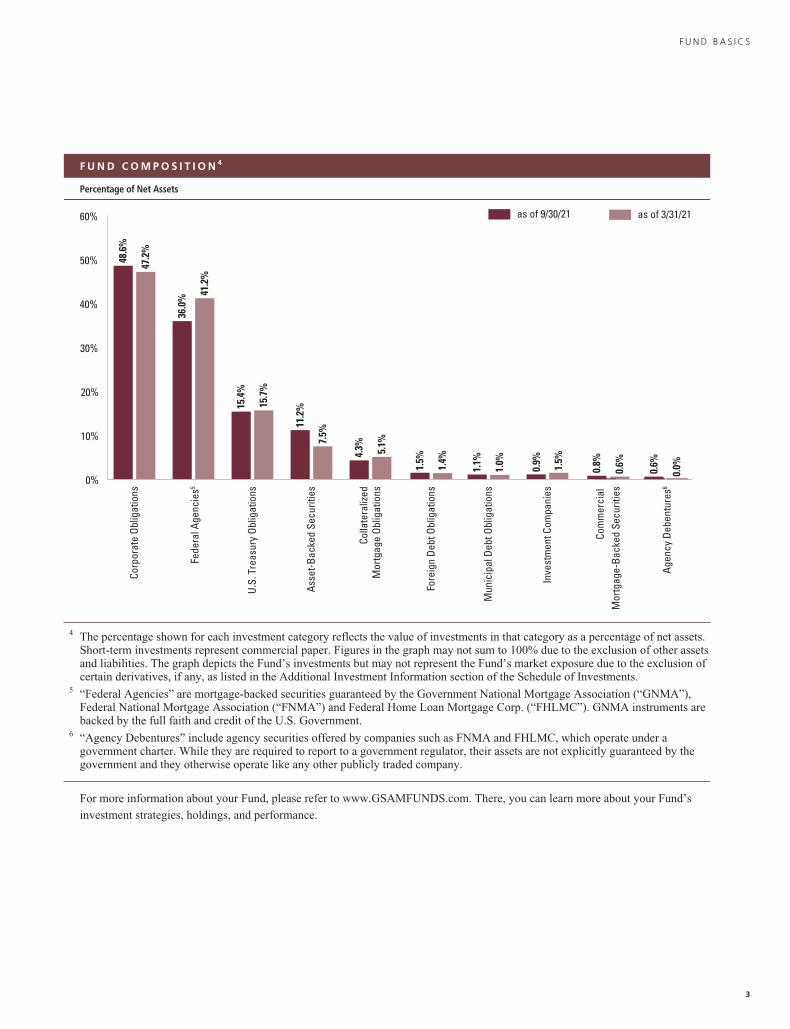
F U N D C O M P O S I T I O N 4
Percentage of Net Assets
as of 9/30/21 as of 3/31/21
Corp
orat
e Ob
ligat
ions
47.2
%
48.6
%
Fede
ral A
genc
ies5
36.0
%
41.2
%
Fore
ign
Debt
Obl
igat
ions
1.4%
1.5%
15.7
%
15.4
%U.
S. T
reas
ury
Oblig
atio
ns
Mun
icip
al D
ebt O
blig
atio
ns1.
1%
1.0%
0.9% 1.5%
Inve
stm
ent C
ompa
nies
Com
mer
cial
M
ortg
age-
Back
ed S
ecur
ities
0.8%
0.6%
0%
10%
20%
60%
50%
40%
30%
0.0%0.6%
Agen
cy D
eben
ture
s6
Asse
t-Bac
ked
Secu
ritie
s7.
5%
11.2
%
4.3% 5.1%
Colla
tera
lized
Mor
tgag
e Ob
ligat
ions
4 The percentage shown for each investment category reflects the value of investments in that category as a percentage of net assets.Short-term investments represent commercial paper. Figures in the graph may not sum to 100% due to the exclusion of other assetsand liabilities. The graph depicts the Fund’s investments but may not represent the Fund’s market exposure due to the exclusion ofcertain derivatives, if any, as listed in the Additional Investment Information section of the Schedule of Investments.
5 “Federal Agencies” are mortgage-backed securities guaranteed by the Government National Mortgage Association (“GNMA”),Federal National Mortgage Association (“FNMA”) and Federal Home Loan Mortgage Corp. (“FHLMC”). GNMA instruments arebacked by the full faith and credit of the U.S. Government.
6 “Agency Debentures” include agency securities offered by companies such as FNMA and FHLMC, which operate under agovernment charter. While they are required to report to a government regulator, their assets are not explicitly guaranteed by thegovernment and they otherwise operate like any other publicly traded company.
For more information about your Fund, please refer to www.GSAMFUNDS.com. There, you can learn more about your Fund’s
investment strategies, holdings, and performance.
3
F U N D B A S I C S
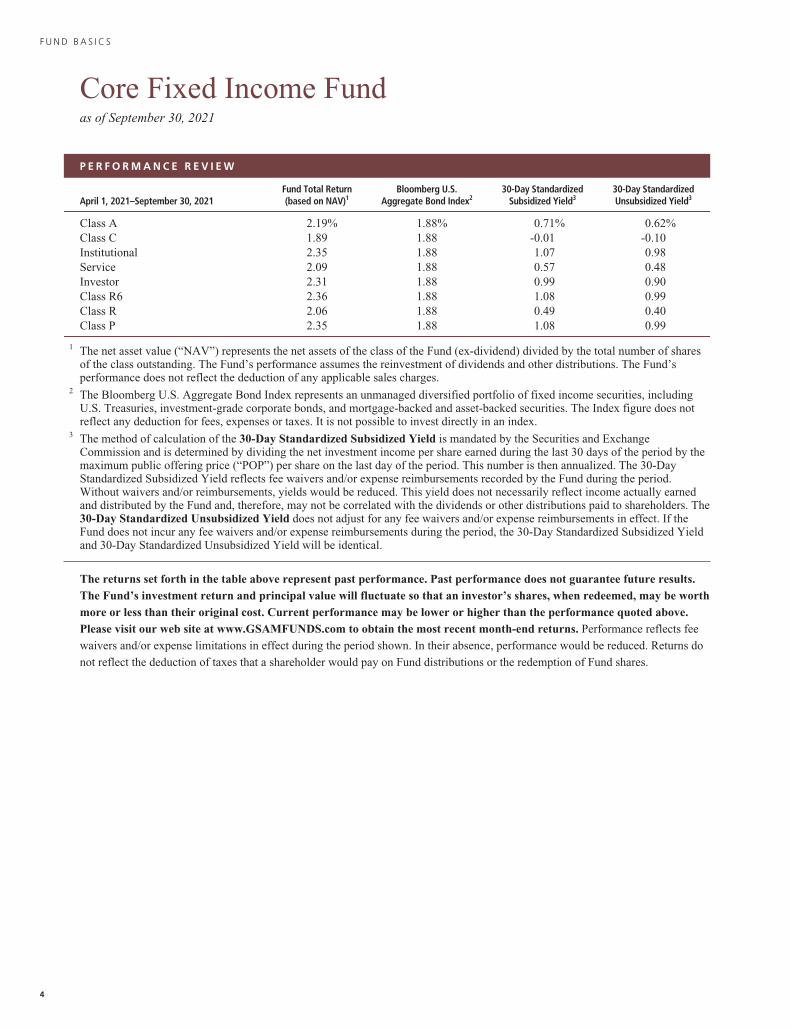
Core Fixed Income Fundas of September 30, 2021
P E R F O R M A N C E R E V I E W
April 1, 2021–September 30, 2021Fund Total Return(based on NAV)1
Bloomberg U.S.Aggregate Bond Index2
30-Day StandardizedSubsidized Yield3
30-Day StandardizedUnsubsidized Yield3
Class A 2.19% 1.88% 0.71% 0.62%Class C 1.89 1.88 -0.01 -0.10Institutional 2.35 1.88 1.07 0.98Service 2.09 1.88 0.57 0.48Investor 2.31 1.88 0.99 0.90Class R6 2.36 1.88 1.08 0.99Class R 2.06 1.88 0.49 0.40Class P 2.35 1.88 1.08 0.99
1 The net asset value (“NAV”) represents the net assets of the class of the Fund (ex-dividend) divided by the total number of sharesof the class outstanding. The Fund’s performance assumes the reinvestment of dividends and other distributions. The Fund’sperformance does not reflect the deduction of any applicable sales charges.
2 The Bloomberg U.S. Aggregate Bond Index represents an unmanaged diversified portfolio of fixed income securities, includingU.S. Treasuries, investment-grade corporate bonds, and mortgage-backed and asset-backed securities. The Index figure does notreflect any deduction for fees, expenses or taxes. It is not possible to invest directly in an index.
3 The method of calculation of the 30-Day Standardized Subsidized Yield is mandated by the Securities and ExchangeCommission and is determined by dividing the net investment income per share earned during the last 30 days of the period by themaximum public offering price (“POP”) per share on the last day of the period. This number is then annualized. The 30-DayStandardized Subsidized Yield reflects fee waivers and/or expense reimbursements recorded by the Fund during the period.Without waivers and/or reimbursements, yields would be reduced. This yield does not necessarily reflect income actually earnedand distributed by the Fund and, therefore, may not be correlated with the dividends or other distributions paid to shareholders. The30-Day Standardized Unsubsidized Yield does not adjust for any fee waivers and/or expense reimbursements in effect. If theFund does not incur any fee waivers and/or expense reimbursements during the period, the 30-Day Standardized Subsidized Yieldand 30-Day Standardized Unsubsidized Yield will be identical.
The returns set forth in the table above represent past performance. Past performance does not guarantee future results.The Fund’s investment return and principal value will fluctuate so that an investor’s shares, when redeemed, may be worthmore or less than their original cost. Current performance may be lower or higher than the performance quoted above.Please visit our web site at www.GSAMFUNDS.com to obtain the most recent month-end returns. Performance reflects fee
waivers and/or expense limitations in effect during the period shown. In their absence, performance would be reduced. Returns do
not reflect the deduction of taxes that a shareholder would pay on Fund distributions or the redemption of Fund shares.
4
F U N D B A S I C S
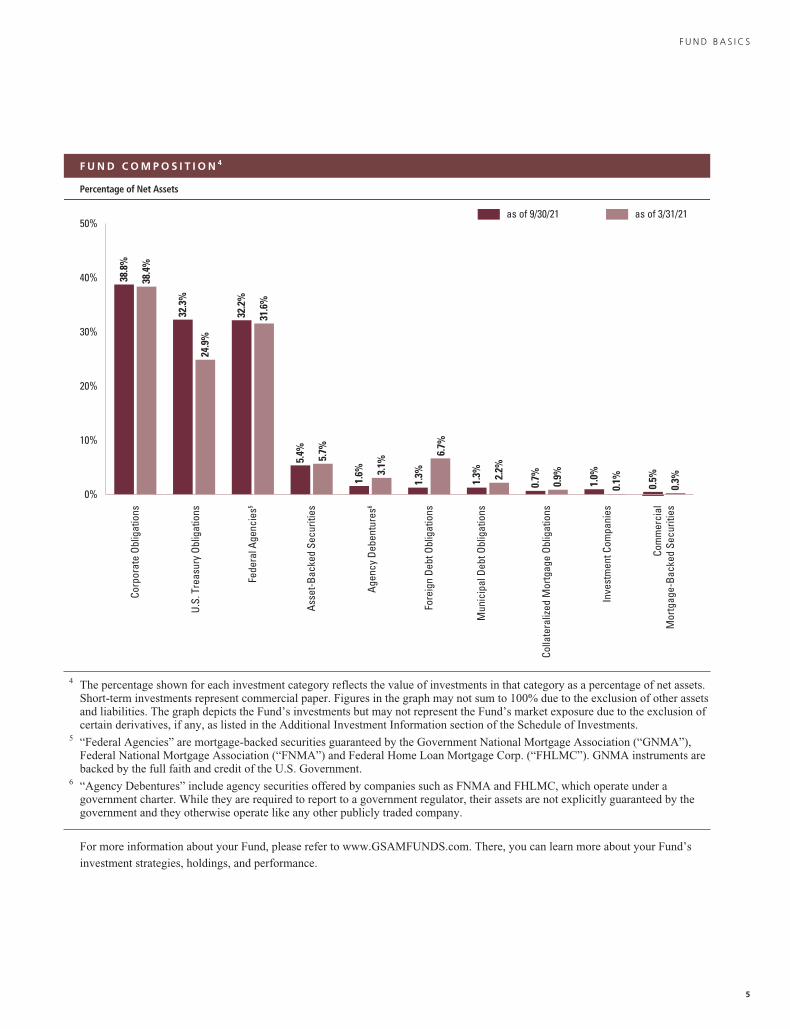
F U N D C O M P O S I T I O N 4
Percentage of Net Assets
as of 3/31/21as of 9/30/21
0%
10%
20%
30%
40%
50%
6.7%
1.3%
Fore
ign
Debt
Obl
igat
ions
0.9%
0.7%
Colla
tera
lized
Mor
tgag
e Ob
ligat
ions
2.2%
1.3%
Mun
icip
al D
ebt O
blig
atio
ns
1.6% 3.
1%Ag
ency
Deb
entu
res6
1.0%
0.1%
Inve
stm
ent C
ompa
nies
5.7%
5.4%
Asse
t-Bac
ked
Secu
ritie
s
32.2
%
31.6
%Fe
dera
l Age
ncie
s5
32.3
%
24.9
%U.
S. T
reas
ury
Oblig
atio
ns
38.4
%
38.8
%Co
rpor
ate
Oblig
atio
ns
Com
mer
cial
Mor
tgag
e-Ba
cked
Sec
uriti
es
0.5%
0.3%
4 The percentage shown for each investment category reflects the value of investments in that category as a percentage of net assets.Short-term investments represent commercial paper. Figures in the graph may not sum to 100% due to the exclusion of other assetsand liabilities. The graph depicts the Fund’s investments but may not represent the Fund’s market exposure due to the exclusion ofcertain derivatives, if any, as listed in the Additional Investment Information section of the Schedule of Investments.
5 “Federal Agencies” are mortgage-backed securities guaranteed by the Government National Mortgage Association (“GNMA”),Federal National Mortgage Association (“FNMA”) and Federal Home Loan Mortgage Corp. (“FHLMC”). GNMA instruments arebacked by the full faith and credit of the U.S. Government.
6 “Agency Debentures” include agency securities offered by companies such as FNMA and FHLMC, which operate under agovernment charter. While they are required to report to a government regulator, their assets are not explicitly guaranteed by thegovernment and they otherwise operate like any other publicly traded company.
For more information about your Fund, please refer to www.GSAMFUNDS.com. There, you can learn more about your Fund’s
investment strategies, holdings, and performance.
5
F U N D B A S I C S
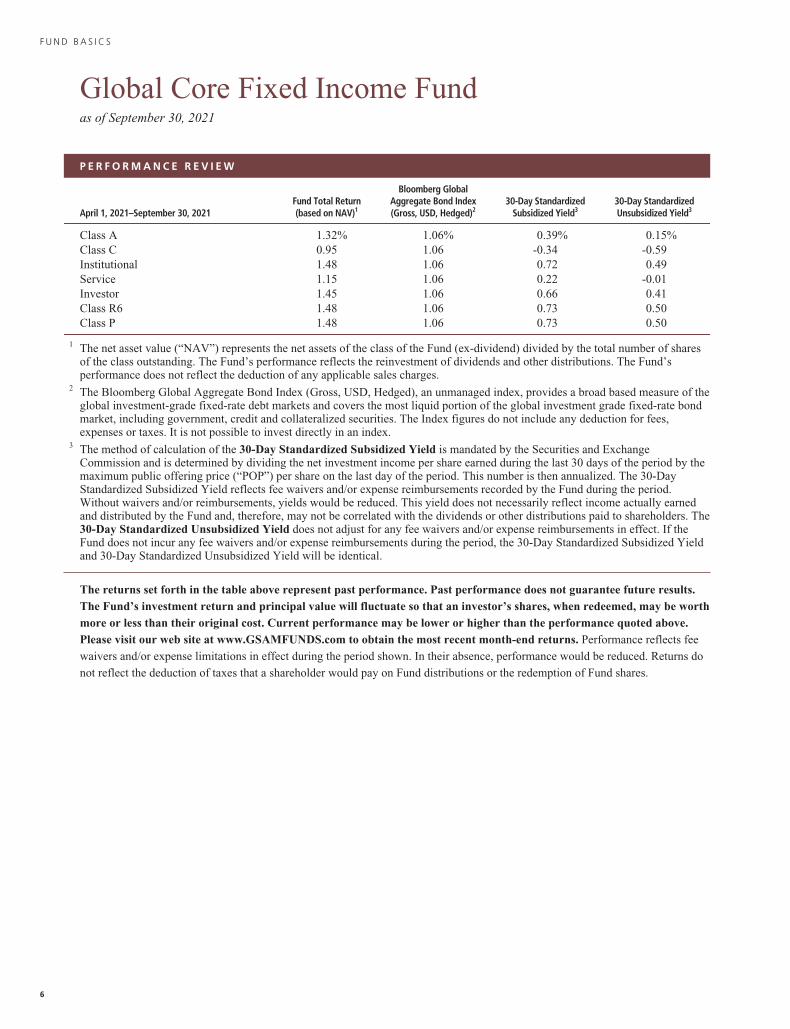
Global Core Fixed Income Fundas of September 30, 2021
P E R F O R M A N C E R E V I E W
April 1, 2021–September 30, 2021Fund Total Return(based on NAV)1
Bloomberg GlobalAggregate Bond Index(Gross, USD, Hedged)2
30-Day StandardizedSubsidized Yield3
30-Day StandardizedUnsubsidized Yield3
Class A 1.32% 1.06% 0.39% 0.15%Class C 0.95 1.06 -0.34 -0.59Institutional 1.48 1.06 0.72 0.49Service 1.15 1.06 0.22 -0.01Investor 1.45 1.06 0.66 0.41Class R6 1.48 1.06 0.73 0.50Class P 1.48 1.06 0.73 0.50
1 The net asset value (“NAV”) represents the net assets of the class of the Fund (ex-dividend) divided by the total number of sharesof the class outstanding. The Fund’s performance reflects the reinvestment of dividends and other distributions. The Fund’sperformance does not reflect the deduction of any applicable sales charges.
2 The Bloomberg Global Aggregate Bond Index (Gross, USD, Hedged), an unmanaged index, provides a broad based measure of theglobal investment-grade fixed-rate debt markets and covers the most liquid portion of the global investment grade fixed-rate bondmarket, including government, credit and collateralized securities. The Index figures do not include any deduction for fees,expenses or taxes. It is not possible to invest directly in an index.
3 The method of calculation of the 30-Day Standardized Subsidized Yield is mandated by the Securities and ExchangeCommission and is determined by dividing the net investment income per share earned during the last 30 days of the period by themaximum public offering price (“POP”) per share on the last day of the period. This number is then annualized. The 30-DayStandardized Subsidized Yield reflects fee waivers and/or expense reimbursements recorded by the Fund during the period.Without waivers and/or reimbursements, yields would be reduced. This yield does not necessarily reflect income actually earnedand distributed by the Fund and, therefore, may not be correlated with the dividends or other distributions paid to shareholders. The30-Day Standardized Unsubsidized Yield does not adjust for any fee waivers and/or expense reimbursements in effect. If theFund does not incur any fee waivers and/or expense reimbursements during the period, the 30-Day Standardized Subsidized Yieldand 30-Day Standardized Unsubsidized Yield will be identical.
The returns set forth in the table above represent past performance. Past performance does not guarantee future results.The Fund’s investment return and principal value will fluctuate so that an investor’s shares, when redeemed, may be worthmore or less than their original cost. Current performance may be lower or higher than the performance quoted above.Please visit our web site at www.GSAMFUNDS.com to obtain the most recent month-end returns. Performance reflects fee
waivers and/or expense limitations in effect during the period shown. In their absence, performance would be reduced. Returns do
not reflect the deduction of taxes that a shareholder would pay on Fund distributions or the redemption of Fund shares.
6
F U N D B A S I C S
C U R R E N C Y A L L O C A T I O N 4
Percentage of Net Assets
as of 9/30/21 as of 3/31/21
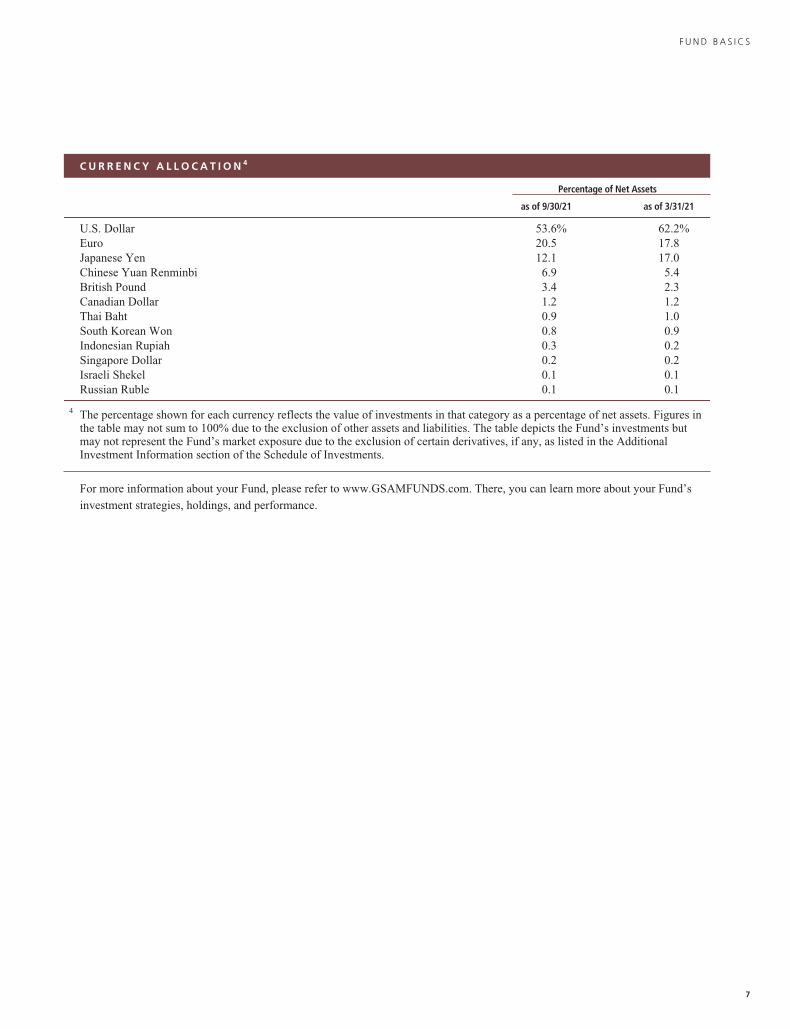
U.S. Dollar 53.6% 62.2%Euro 20.5 17.8Japanese Yen 12.1 17.0Chinese Yuan Renminbi 6.9 5.4British Pound 3.4 2.3Canadian Dollar 1.2 1.2Thai Baht 0.9 1.0South Korean Won 0.8 0.9Indonesian Rupiah 0.3 0.2Singapore Dollar 0.2 0.2Israeli Shekel 0.1 0.1Russian Ruble 0.1 0.1
4 The percentage shown for each currency reflects the value of investments in that category as a percentage of net assets. Figures inthe table may not sum to 100% due to the exclusion of other assets and liabilities. The table depicts the Fund’s investments butmay not represent the Fund’s market exposure due to the exclusion of certain derivatives, if any, as listed in the AdditionalInvestment Information section of the Schedule of Investments.
For more information about your Fund, please refer to www.GSAMFUNDS.com. There, you can learn more about your Fund’s
investment strategies, holdings, and performance.
7
F U N D B A S I C S
Income Fundas of September 30, 2021
P E R F O R M A N C E R E V I E W
April 1, 2021–September 30, 2021Fund Total Return(based on NAV)1
Bloomberg U.S.Aggregate Bond Index2
30-Day StandardizedSubsidized Yield3
30-Day StandardizedUnsubsidized Yield3
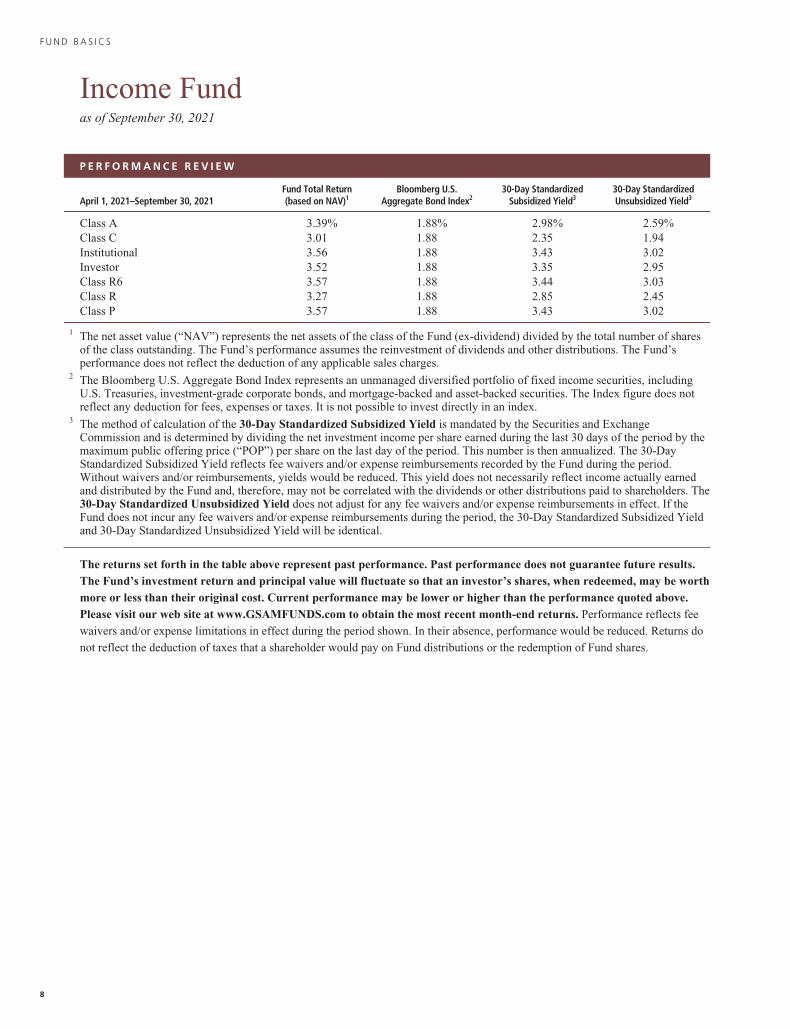
Class A 3.39% 1.88% 2.98% 2.59%Class C 3.01 1.88 2.35 1.94Institutional 3.56 1.88 3.43 3.02Investor 3.52 1.88 3.35 2.95Class R6 3.57 1.88 3.44 3.03Class R 3.27 1.88 2.85 2.45Class P 3.57 1.88 3.43 3.02
1 The net asset value (“NAV”) represents the net assets of the class of the Fund (ex-dividend) divided by the total number of sharesof the class outstanding. The Fund’s performance assumes the reinvestment of dividends and other distributions. The Fund’sperformance does not reflect the deduction of any applicable sales charges.
2 The Bloomberg U.S. Aggregate Bond Index represents an unmanaged diversified portfolio of fixed income securities, includingU.S. Treasuries, investment-grade corporate bonds, and mortgage-backed and asset-backed securities. The Index figure does notreflect any deduction for fees, expenses or taxes. It is not possible to invest directly in an index.
3 The method of calculation of the 30-Day Standardized Subsidized Yield is mandated by the Securities and ExchangeCommission and is determined by dividing the net investment income per share earned during the last 30 days of the period by themaximum public offering price (“POP”) per share on the last day of the period. This number is then annualized. The 30-DayStandardized Subsidized Yield reflects fee waivers and/or expense reimbursements recorded by the Fund during the period.Without waivers and/or reimbursements, yields would be reduced. This yield does not necessarily reflect income actually earnedand distributed by the Fund and, therefore, may not be correlated with the dividends or other distributions paid to shareholders. The30-Day Standardized Unsubsidized Yield does not adjust for any fee waivers and/or expense reimbursements in effect. If theFund does not incur any fee waivers and/or expense reimbursements during the period, the 30-Day Standardized Subsidized Yieldand 30-Day Standardized Unsubsidized Yield will be identical.
The returns set forth in the table above represent past performance. Past performance does not guarantee future results.The Fund’s investment return and principal value will fluctuate so that an investor’s shares, when redeemed, may be worthmore or less than their original cost. Current performance may be lower or higher than the performance quoted above.Please visit our web site at www.GSAMFUNDS.com to obtain the most recent month-end returns. Performance reflects fee
waivers and/or expense limitations in effect during the period shown. In their absence, performance would be reduced. Returns do
not reflect the deduction of taxes that a shareholder would pay on Fund distributions or the redemption of Fund shares.
8
F U N D B A S I C S
F U N D C O M P O S I T I O N 4
Percentage of Net Assets
Inve
stm
ent C
ompa
nies
Bank
Loa
ns
Fore
ign
Debt
Obl
igat
ions
as of 3/31/21as of 9/30/21
0%
20%
40%
60%
100%
80%
U.S.
Tre
asur
y Ob
ligat
ions
Colla
tera
lized
Mor
tgag
eOb
ligat
ions
Asse
t-Bac
ked
Secu
ritie
s
Fede
ral A
genc
ies5
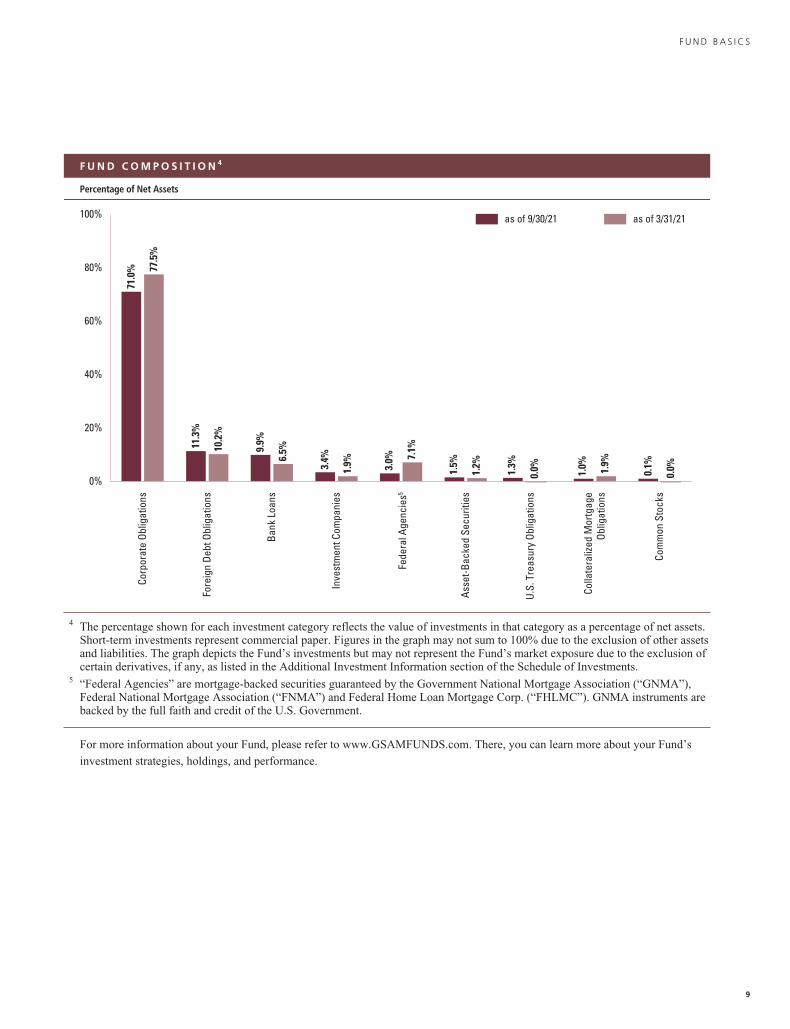
9.9%
6.5%
3.4%
1.9% 3.0%
7.1%
1.5%
1.2%
Corp
orat
e Ob
ligat
ions
71.0
%
77.5
%
11.3
%
10.2
%
1.3%
0.0%
1.0%
1.9%
Com
mon
Sto
cks
0.1%
0.0%
4 The percentage shown for each investment category reflects the value of investments in that category as a percentage of net assets.Short-term investments represent commercial paper. Figures in the graph may not sum to 100% due to the exclusion of other assetsand liabilities. The graph depicts the Fund’s investments but may not represent the Fund’s market exposure due to the exclusion ofcertain derivatives, if any, as listed in the Additional Investment Information section of the Schedule of Investments.
5 “Federal Agencies” are mortgage-backed securities guaranteed by the Government National Mortgage Association (“GNMA”),Federal National Mortgage Association (“FNMA”) and Federal Home Loan Mortgage Corp. (“FHLMC”). GNMA instruments arebacked by the full faith and credit of the U.S. Government.
For more information about your Fund, please refer to www.GSAMFUNDS.com. There, you can learn more about your Fund’s
investment strategies, holdings, and performance.
9
F U N D B A S I C S
Long Short Credit Strategies Fundas of September 30, 2021
P E R F O R M A N C E R E V I E W
April 1, 2021–September 30, 2021Fund Total Return(based on NAV)1
ICE BofAMLThree-MonthU.S. Treasury
Bill Index2
ICE BofAML U.S.Dollar Three-Month
LIBOR ConstantMaturity Index3
30-Day StandardizedSubsidized Yield4
30-Day StandardizedUnsubsidized Yield4
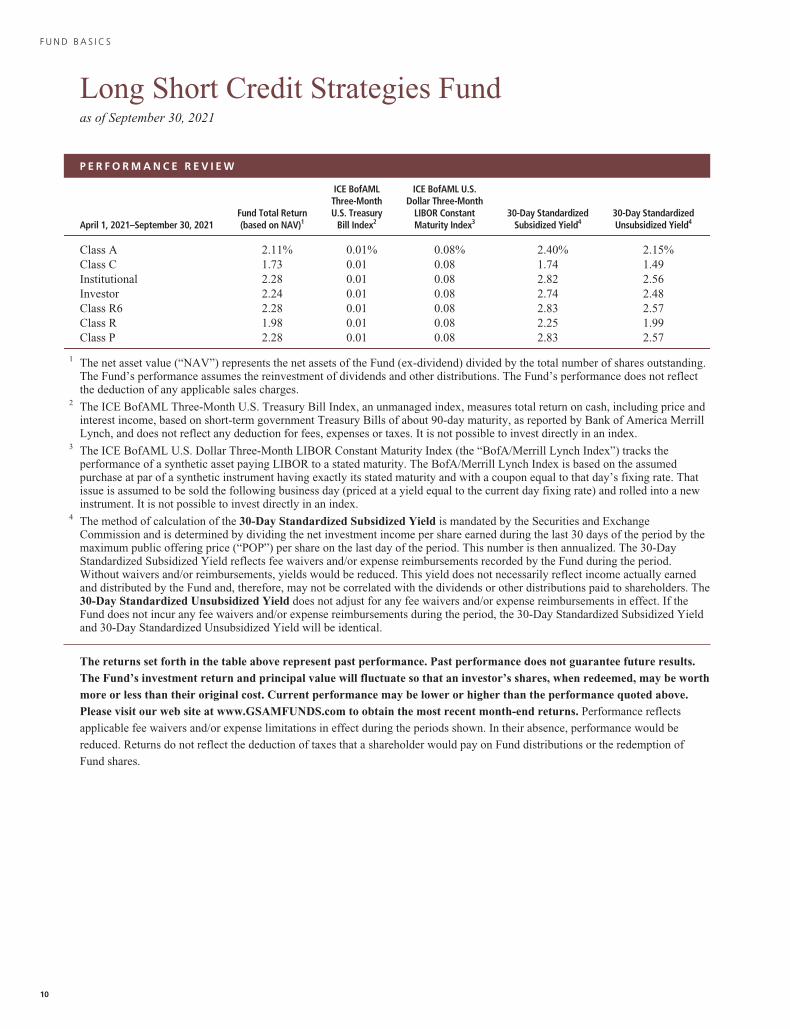
Class A 2.11% 0.01% 0.08% 2.40% 2.15%Class C 1.73 0.01 0.08 1.74 1.49Institutional 2.28 0.01 0.08 2.82 2.56Investor 2.24 0.01 0.08 2.74 2.48Class R6 2.28 0.01 0.08 2.83 2.57Class R 1.98 0.01 0.08 2.25 1.99Class P 2.28 0.01 0.08 2.83 2.57
1 The net asset value (“NAV”) represents the net assets of the Fund (ex-dividend) divided by the total number of shares outstanding.The Fund’s performance assumes the reinvestment of dividends and other distributions. The Fund’s performance does not reflectthe deduction of any applicable sales charges.
2 The ICE BofAML Three-Month U.S. Treasury Bill Index, an unmanaged index, measures total return on cash, including price andinterest income, based on short-term government Treasury Bills of about 90-day maturity, as reported by Bank of America MerrillLynch, and does not reflect any deduction for fees, expenses or taxes. It is not possible to invest directly in an index.
3 The ICE BofAML U.S. Dollar Three-Month LIBOR Constant Maturity Index (the “BofA/Merrill Lynch Index”) tracks theperformance of a synthetic asset paying LIBOR to a stated maturity. The BofA/Merrill Lynch Index is based on the assumedpurchase at par of a synthetic instrument having exactly its stated maturity and with a coupon equal to that day’s fixing rate. Thatissue is assumed to be sold the following business day (priced at a yield equal to the current day fixing rate) and rolled into a newinstrument. It is not possible to invest directly in an index.
4 The method of calculation of the 30-Day Standardized Subsidized Yield is mandated by the Securities and ExchangeCommission and is determined by dividing the net investment income per share earned during the last 30 days of the period by themaximum public offering price (“POP”) per share on the last day of the period. This number is then annualized. The 30-DayStandardized Subsidized Yield reflects fee waivers and/or expense reimbursements recorded by the Fund during the period.Without waivers and/or reimbursements, yields would be reduced. This yield does not necessarily reflect income actually earnedand distributed by the Fund and, therefore, may not be correlated with the dividends or other distributions paid to shareholders. The30-Day Standardized Unsubsidized Yield does not adjust for any fee waivers and/or expense reimbursements in effect. If theFund does not incur any fee waivers and/or expense reimbursements during the period, the 30-Day Standardized Subsidized Yieldand 30-Day Standardized Unsubsidized Yield will be identical.
The returns set forth in the table above represent past performance. Past performance does not guarantee future results.The Fund’s investment return and principal value will fluctuate so that an investor’s shares, when redeemed, may be worthmore or less than their original cost. Current performance may be lower or higher than the performance quoted above.Please visit our web site at www.GSAMFUNDS.com to obtain the most recent month-end returns. Performance reflects
applicable fee waivers and/or expense limitations in effect during the periods shown. In their absence, performance would be
reduced. Returns do not reflect the deduction of taxes that a shareholder would pay on Fund distributions or the redemption of
Fund shares.
10
F U N D B A S I C S
F U N D C O M P O S I T I O N 4
Percentage of Net Assets
as of 3/31/21as of 9/30/21
0%
60%
50%
40%
Othe
r Sec
ured
Debt
Obl
igat
ions
13.1
%
13.0
%
Bank
Loa
ns28
.0%
23.7
%
Inve
stm
ent
Com
pani
es4.
0%
7.3%
U.S.
Tre
asur
yOb
ligat
ions
3.9%
0.0%
Com
mon
Sto
cks
0.4%0.6%
Unse
cure
d De
btOb
ligat
ions
51.4
% 54.4
%
10%
20%
30%
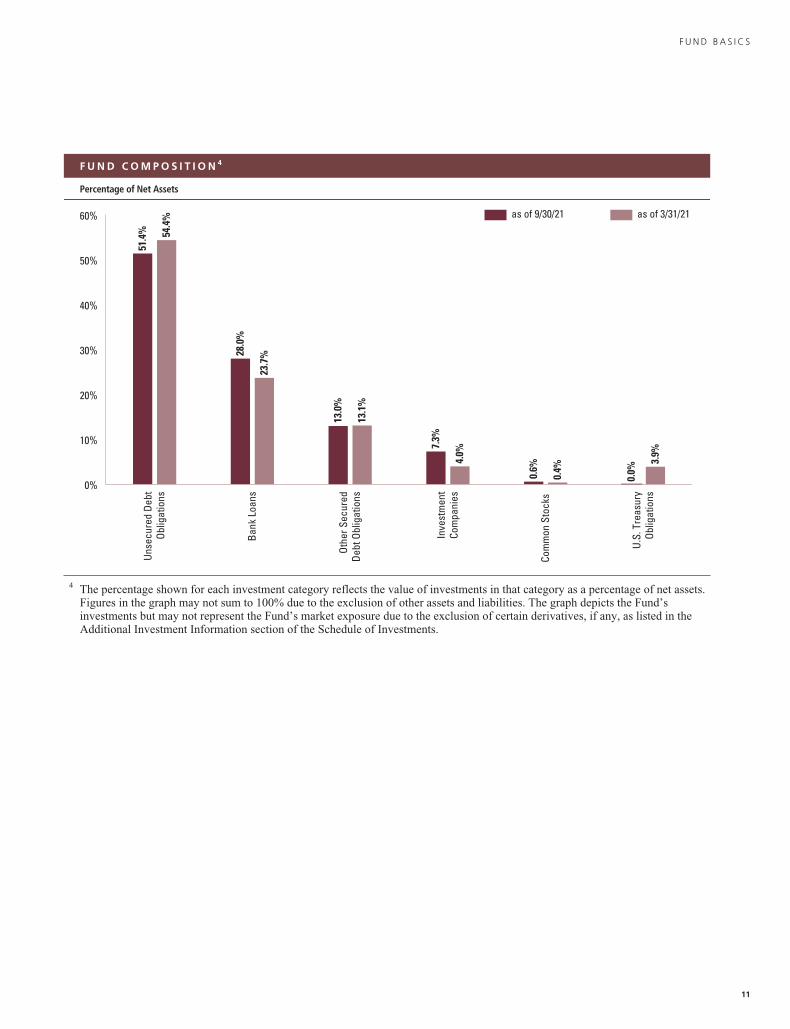
4 The percentage shown for each investment category reflects the value of investments in that category as a percentage of net assets.Figures in the graph may not sum to 100% due to the exclusion of other assets and liabilities. The graph depicts the Fund’sinvestments but may not represent the Fund’s market exposure due to the exclusion of certain derivatives, if any, as listed in theAdditional Investment Information section of the Schedule of Investments.
11
F U N D B A S I C S
T O P T E N I N D U S T R Y A L L O C A T I O N S 5
As of September 30, 2021 Percentage of Net Assets
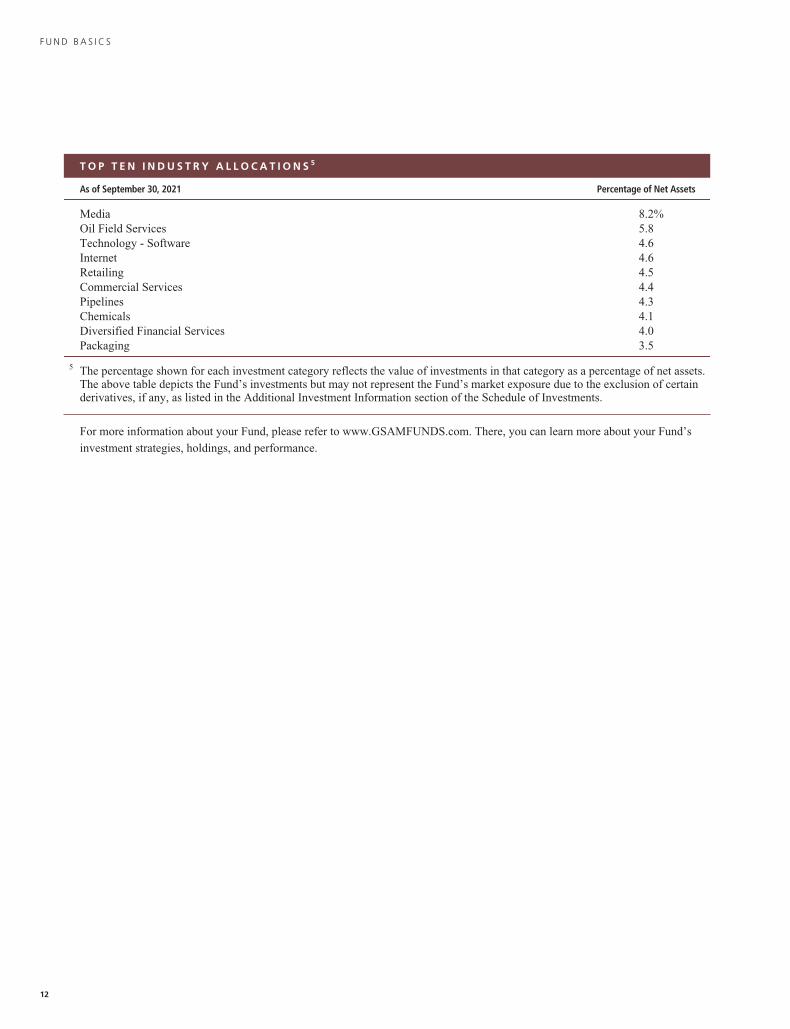
Media 8.2%Oil Field Services 5.8Technology - Software 4.6Internet 4.6Retailing 4.5Commercial Services 4.4Pipelines 4.3Chemicals 4.1Diversified Financial Services 4.0Packaging 3.5
5 The percentage shown for each investment category reflects the value of investments in that category as a percentage of net assets.The above table depicts the Fund’s investments but may not represent the Fund’s market exposure due to the exclusion of certainderivatives, if any, as listed in the Additional Investment Information section of the Schedule of Investments.
For more information about your Fund, please refer to www.GSAMFUNDS.com. There, you can learn more about your Fund’s
investment strategies, holdings, and performance.
12
F U N D B A S I C S
Strategic Income Fundas of September 30, 2021
P E R F O R M A N C E R E V I E W
April 1, 2021–September 30, 2021Fund Total Return(based on NAV)1
ICE BofAMLThree-Month U.S.
Treasury Bill Index2
ICE BofAML U.S.Dollar Three-Month
LIBOR ConstantMaturity Index3
30-Day StandardizedSubsidized Yield4
30-Day StandardizedUnsubsidized Yield4
Class A 2.30% 0.01% 0.08% 1.95% 1.90%Class C 1.90 0.01 0.08 1.30 1.26Institutional 2.44 0.01 0.08 2.35 2.31Investor 2.30 0.01 0.08 2.28 2.24Class R6 2.45 0.01 0.08 2.37 2.32Class R 2.09 0.01 0.08 1.78 1.73Class P 2.45 0.01 0.08 2.37 2.32
1 The net asset value (NAV) represents the net assets of the class of the Fund (ex-dividend) divided by the total number of shares ofthe class outstanding. The Fund’s performance reflects the reinvestment of dividends and other distributions. The Fund’sperformance does not reflect the deduction of any applicable sales charges.
2 The ICE BofAML Three-Month U.S. Treasury Bill Index, an unmanaged index, measures total return on cash, including price andinterest income, based on short-term government Treasury Bills of about 90-day maturity, as reported by Bank of America MerrillLynch, and does not reflect any deduction for fees, expenses or taxes. It is not possible to invest directly in an unmanaged index.
3 The ICE BofAML U.S. Dollar Three-Month LIBOR Constant Maturity Index (the “BofA/Merrill Lynch Index”) tracks theperformance of a synthetic asset paying LIBOR to a stated maturity. The BofA/Merrill Lynch Index is based on the assumedpurchase at par of a synthetic instrument having exactly its stated maturity and with a coupon equal to that day’s fixing rate. Thatissue is assumed to be sold the following business day (priced at a yield equal to the current day fixing rate) and rolled into a newinstrument. It is not possible to invest directly in an index.
4 The method of calculation of the 30-Day Standardized Subsidized Yield is mandated by the Securities and ExchangeCommission and is determined by dividing the net investment income per share earned during the last 30 days of the period by themaximum public offering price (“POP”) per share on the last day of the period. This number is then annualized. The 30-DayStandardized Subsidized Yield reflects fee waivers and/or expense reimbursements recorded by the Fund during the period.Without waivers and/or reimbursements, yields would be reduced. This yield does not necessarily reflect income actually earnedand distributed by the Fund and, therefore, may not be correlated with the dividends or other distributions paid to shareholders. The30-Day Standardized Unsubsidized Yield does not adjust for any fee waivers and/or expense reimbursements in effect. If theFund does not incur any fee waivers and/or expense reimbursements during the period, the 30-Day Standardized Subsidized Yieldand 30-Day Standardized Unsubsidized Yield will be identical.
The returns set forth in the table above represent past performance. Past performance does not guarantee future results.The Fund’s investment return and principal value will fluctuate so that an investor’s shares, when redeemed, may be worthmore or less than their original cost. Current performance may be lower or higher than the performance quoted above.Please visit our web site at www.GSAMFUNDS.com to obtain the most recent month-end returns. Performance reflects
applicable fee waivers and/or expense limitations in effect during the period shown. In their absence, performance would be
reduced. Returns do not reflect the deduction of taxes that a shareholder would pay on Fund distributions or the redemption of
Fund shares.
13
F U N D B A S I C S
F U N D C O M P O S I T I O N 4
Percentage of Net Assets
as of 3/31/21as of 9/30/21
Corp
orat
e Ob
ligat
ions
35.9
%
25.8
%
Mun
icip
al D
ebt
Obl
igat
ions
1.2%
1.1%
Shor
t-ter
m In
vest
men
ts3.
4%
0.0%
U.S.
Tre
asur
y Ob
ligat
ions
19.8
%
0.2%
Colla
tera
lized
Mor
tgag
e O
blig
atio
ns13
.8%
10.5
%
Asse
t-Bac
ked
Secu
ritie
s11
.4%
12.5
%
Inve
stm
ent C
ompa
ny
2.5%3.0%
Com
mer
cial
Mor
tgag
e-Ba
cked
Sec
uriti
es
3.8%
13.0
%
Fede
ral A
genc
ies5
12.8
%
24.2
%
Fore
ign
Debt
Obl
igat
ions
4.0%
2.8%
Exch
ange
Tra
ded
Fund
s
2.1%2.3%
Bank
Loa
ns
2.4%2.5%
0%
10%
20%
30%
40%
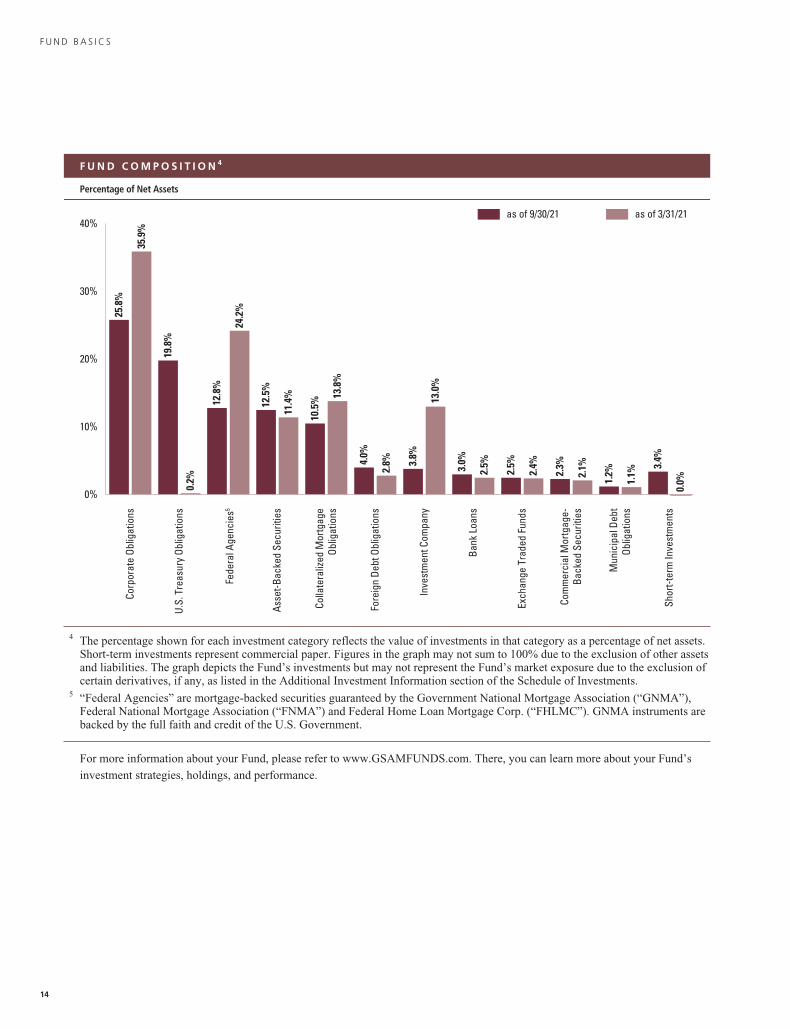
4 The percentage shown for each investment category reflects the value of investments in that category as a percentage of net assets.Short-term investments represent commercial paper. Figures in the graph may not sum to 100% due to the exclusion of other assetsand liabilities. The graph depicts the Fund’s investments but may not represent the Fund’s market exposure due to the exclusion ofcertain derivatives, if any, as listed in the Additional Investment Information section of the Schedule of Investments.
5 “Federal Agencies” are mortgage-backed securities guaranteed by the Government National Mortgage Association (“GNMA”),Federal National Mortgage Association (“FNMA”) and Federal Home Loan Mortgage Corp. (“FHLMC”). GNMA instruments arebacked by the full faith and credit of the U.S. Government.
For more information about your Fund, please refer to www.GSAMFUNDS.com. There, you can learn more about your Fund’s
investment strategies, holdings, and performance.
14
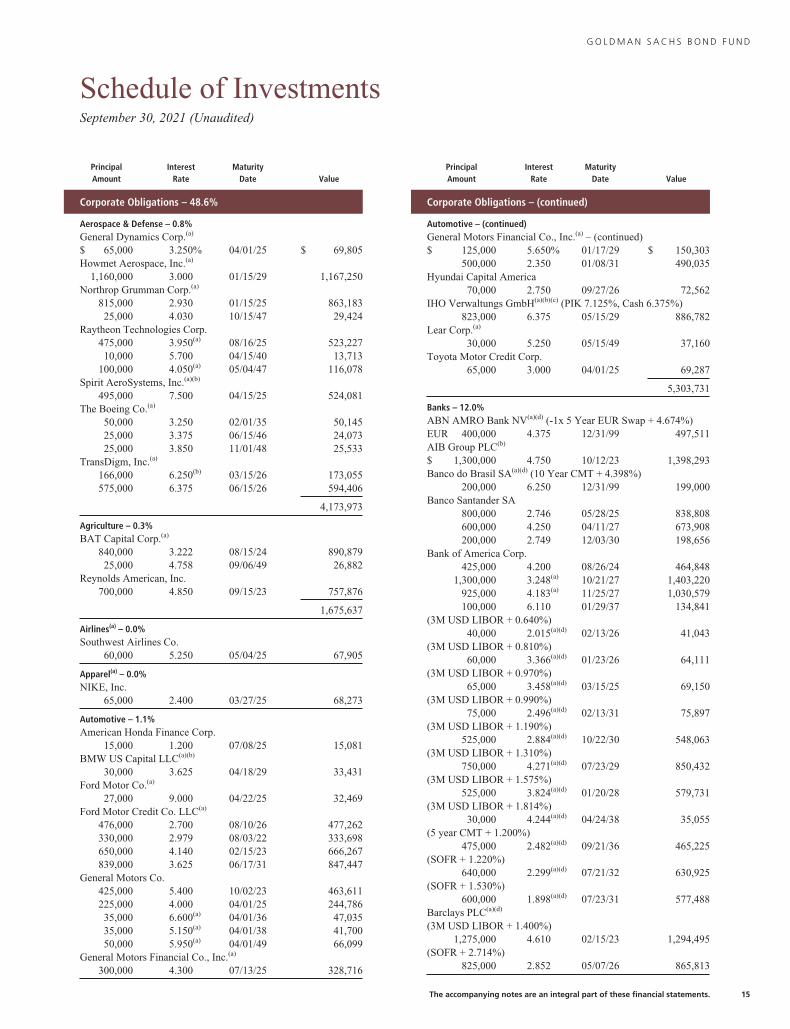
G O L D M A N S A C H S B O N D F U N D
Schedule of InvestmentsSeptember 30, 2021 (Unaudited)
PrincipalAmount
InterestRate
MaturityDate Value
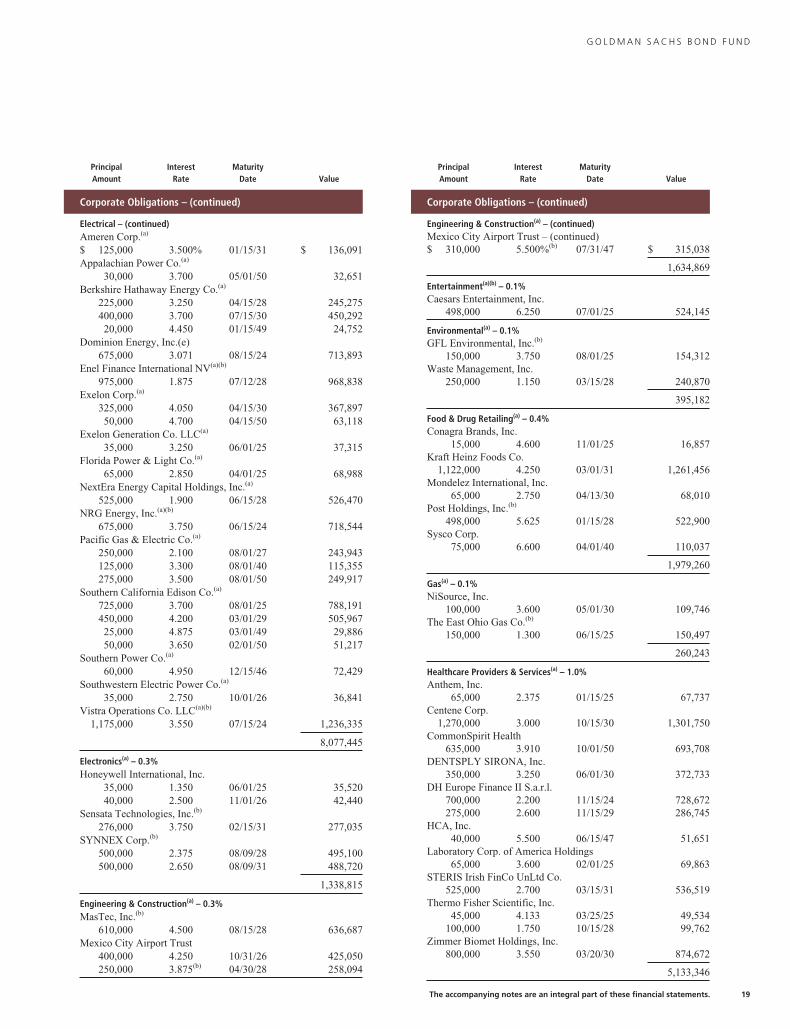
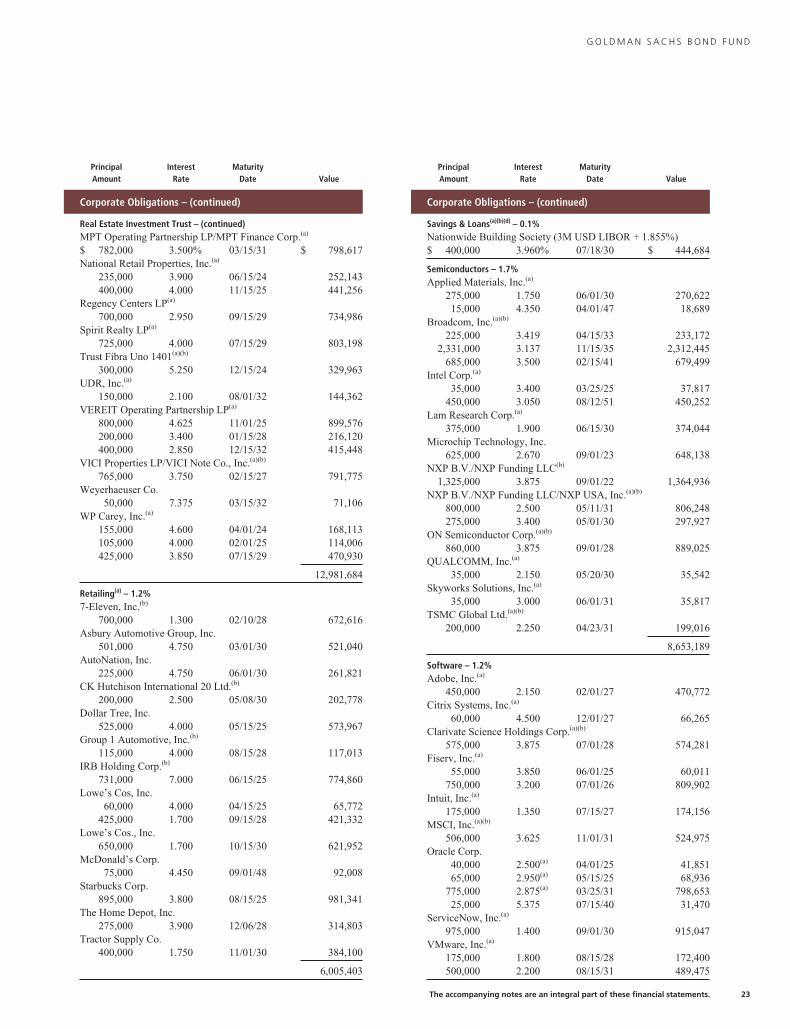
Corporate Obligations – 48.6%
Aerospace & Defense – 0.8%General Dynamics Corp.(a)
$ 65,000 3.250% 04/01/25 $ 69,805Howmet Aerospace, Inc.(a)
1,160,000 3.000 01/15/29 1,167,250Northrop Grumman Corp.(a)
815,000 2.930 01/15/25 863,18325,000 4.030 10/15/47 29,424
Raytheon Technologies Corp.475,000 3.950(a) 08/16/25 523,22710,000 5.700 04/15/40 13,713
100,000 4.050(a) 05/04/47 116,078Spirit AeroSystems, Inc.(a)(b)
495,000 7.500 04/15/25 524,081The Boeing Co.(a)
50,000 3.250 02/01/35 50,14525,000 3.375 06/15/46 24,07325,000 3.850 11/01/48 25,533
TransDigm, Inc.(a)
166,000 6.250(b) 03/15/26 173,055575,000 6.375 06/15/26 594,406
4,173,973
Agriculture – 0.3%BAT Capital Corp.(a)
840,000 3.222 08/15/24 890,87925,000 4.758 09/06/49 26,882
Reynolds American, Inc.700,000 4.850 09/15/23 757,876
1,675,637
Airlines(a) – 0.0%Southwest Airlines Co.
60,000 5.250 05/04/25 67,905
Apparel(a) – 0.0%NIKE, Inc.
65,000 2.400 03/27/25 68,273
Automotive – 1.1%American Honda Finance Corp.
15,000 1.200 07/08/25 15,081BMW US Capital LLC(a)(b)
30,000 3.625 04/18/29 33,431Ford Motor Co.(a)
27,000 9.000 04/22/25 32,469Ford Motor Credit Co. LLC(a)
476,000 2.700 08/10/26 477,262330,000 2.979 08/03/22 333,698650,000 4.140 02/15/23 666,267839,000 3.625 06/17/31 847,447
General Motors Co.425,000 5.400 10/02/23 463,611225,000 4.000 04/01/25 244,78635,000 6.600(a) 04/01/36 47,03535,000 5.150(a) 04/01/38 41,70050,000 5.950(a) 04/01/49 66,099
General Motors Financial Co., Inc.(a)
300,000 4.300 07/13/25 328,716
PrincipalAmount
InterestRate
MaturityDate Value
Corporate Obligations – (continued)
Automotive – (continued)General Motors Financial Co., Inc.(a) – (continued)$ 125,000 5.650% 01/17/29 $ 150,303
500,000 2.350 01/08/31 490,035Hyundai Capital America
70,000 2.750 09/27/26 72,562IHO Verwaltungs GmbH(a)(b)(c) (PIK 7.125%, Cash 6.375%)
823,000 6.375 05/15/29 886,782Lear Corp.(a)
30,000 5.250 05/15/49 37,160Toyota Motor Credit Corp.
65,000 3.000 04/01/25 69,287
5,303,731
Banks – 12.0%ABN AMRO Bank NV(a)(d) (-1x 5 Year EUR Swap + 4.674%)EUR 400,000 4.375 12/31/99 497,511AIB Group PLC(b)
$ 1,300,000 4.750 10/12/23 1,398,293Banco do Brasil SA(a)(d) (10 Year CMT + 4.398%)
200,000 6.250 12/31/99 199,000Banco Santander SA
800,000 2.746 05/28/25 838,808600,000 4.250 04/11/27 673,908200,000 2.749 12/03/30 198,656
Bank of America Corp.425,000 4.200 08/26/24 464,848
1,300,000 3.248(a) 10/21/27 1,403,220925,000 4.183(a) 11/25/27 1,030,579100,000 6.110 01/29/37 134,841
(3M USD LIBOR + 0.640%)40,000 2.015(a)(d) 02/13/26 41,043
(3M USD LIBOR + 0.810%)60,000 3.366(a)(d) 01/23/26 64,111
(3M USD LIBOR + 0.970%)65,000 3.458(a)(d) 03/15/25 69,150
(3M USD LIBOR + 0.990%)75,000 2.496(a)(d) 02/13/31 75,897
(3M USD LIBOR + 1.190%)525,000 2.884(a)(d) 10/22/30 548,063
(3M USD LIBOR + 1.310%)750,000 4.271(a)(d) 07/23/29 850,432
(3M USD LIBOR + 1.575%)525,000 3.824(a)(d) 01/20/28 579,731
(3M USD LIBOR + 1.814%)30,000 4.244(a)(d) 04/24/38 35,055
(5 year CMT + 1.200%)475,000 2.482(a)(d) 09/21/36 465,225
(SOFR + 1.220%)640,000 2.299(a)(d) 07/21/32 630,925
(SOFR + 1.530%)600,000 1.898(a)(d) 07/23/31 577,488
Barclays PLC(a)(d)
(3M USD LIBOR + 1.400%)1,275,000 4.610 02/15/23 1,294,495
(SOFR + 2.714%)825,000 2.852 05/07/26 865,813
The accompanying notes are an integral part of these financial statements. 15
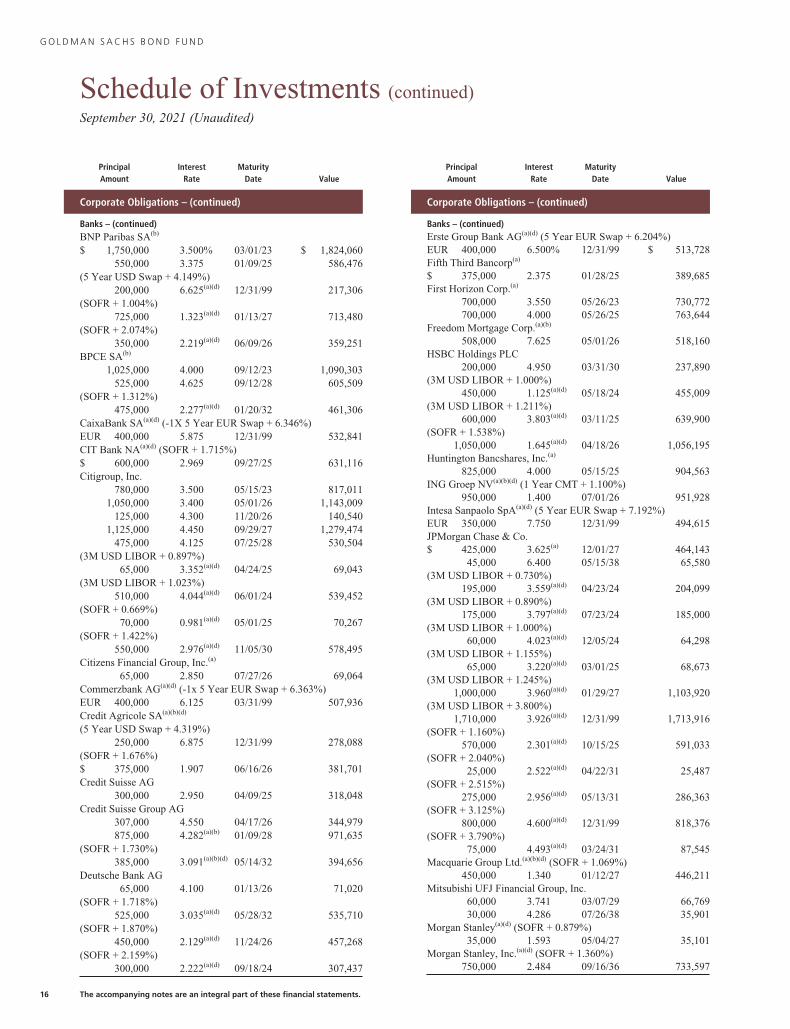
G O L D M A N S A C H S B O N D F U N D
Schedule of Investments (continued)September 30, 2021 (Unaudited)
PrincipalAmount
InterestRate
MaturityDate Value
Corporate Obligations – (continued)
Banks – (continued)BNP Paribas SA(b)
$ 1,750,000 3.500% 03/01/23 $ 1,824,060550,000 3.375 01/09/25 586,476
(5 Year USD Swap + 4.149%)200,000 6.625(a)(d) 12/31/99 217,306
(SOFR + 1.004%)725,000 1.323(a)(d) 01/13/27 713,480
(SOFR + 2.074%)350,000 2.219(a)(d) 06/09/26 359,251
BPCE SA(b)
1,025,000 4.000 09/12/23 1,090,303525,000 4.625 09/12/28 605,509
(SOFR + 1.312%)475,000 2.277(a)(d) 01/20/32 461,306
CaixaBank SA(a)(d) (-1X 5 Year EUR Swap + 6.346%)EUR 400,000 5.875 12/31/99 532,841CIT Bank NA(a)(d) (SOFR + 1.715%)$ 600,000 2.969 09/27/25 631,116Citigroup, Inc.
780,000 3.500 05/15/23 817,0111,050,000 3.400 05/01/26 1,143,009
125,000 4.300 11/20/26 140,5401,125,000 4.450 09/29/27 1,279,474
475,000 4.125 07/25/28 530,504(3M USD LIBOR + 0.897%)
65,000 3.352(a)(d) 04/24/25 69,043(3M USD LIBOR + 1.023%)
510,000 4.044(a)(d) 06/01/24 539,452(SOFR + 0.669%)
70,000 0.981(a)(d) 05/01/25 70,267(SOFR + 1.422%)
550,000 2.976(a)(d) 11/05/30 578,495Citizens Financial Group, Inc.(a)
65,000 2.850 07/27/26 69,064Commerzbank AG(a)(d) (-1x 5 Year EUR Swap + 6.363%)EUR 400,000 6.125 03/31/99 507,936Credit Agricole SA(a)(b)(d)
(5 Year USD Swap + 4.319%)250,000 6.875 12/31/99 278,088
(SOFR + 1.676%)$ 375,000 1.907 06/16/26 381,701Credit Suisse AG
300,000 2.950 04/09/25 318,048Credit Suisse Group AG
307,000 4.550 04/17/26 344,979875,000 4.282(a)(b) 01/09/28 971,635
(SOFR + 1.730%)385,000 3.091(a)(b)(d) 05/14/32 394,656
Deutsche Bank AG65,000 4.100 01/13/26 71,020
(SOFR + 1.718%)525,000 3.035(a)(d) 05/28/32 535,710
(SOFR + 1.870%)450,000 2.129(a)(d) 11/24/26 457,268
(SOFR + 2.159%)300,000 2.222(a)(d) 09/18/24 307,437
PrincipalAmount
InterestRate
MaturityDate Value
Corporate Obligations – (continued)
Banks – (continued)Erste Group Bank AG(a)(d) (5 Year EUR Swap + 6.204%)EUR 400,000 6.500% 12/31/99 $ 513,728Fifth Third Bancorp(a)
$ 375,000 2.375 01/28/25 389,685First Horizon Corp.(a)
700,000 3.550 05/26/23 730,772700,000 4.000 05/26/25 763,644
Freedom Mortgage Corp.(a)(b)
508,000 7.625 05/01/26 518,160HSBC Holdings PLC
200,000 4.950 03/31/30 237,890(3M USD LIBOR + 1.000%)
450,000 1.125(a)(d) 05/18/24 455,009(3M USD LIBOR + 1.211%)
600,000 3.803(a)(d) 03/11/25 639,900(SOFR + 1.538%)
1,050,000 1.645(a)(d) 04/18/26 1,056,195Huntington Bancshares, Inc.(a)
825,000 4.000 05/15/25 904,563ING Groep NV(a)(b)(d) (1 Year CMT + 1.100%)
950,000 1.400 07/01/26 951,928Intesa Sanpaolo SpA(a)(d) (5 Year EUR Swap + 7.192%)EUR 350,000 7.750 12/31/99 494,615JPMorgan Chase & Co.$ 425,000 3.625(a) 12/01/27 464,143
45,000 6.400 05/15/38 65,580(3M USD LIBOR + 0.730%)
195,000 3.559(a)(d) 04/23/24 204,099(3M USD LIBOR + 0.890%)
175,000 3.797(a)(d) 07/23/24 185,000(3M USD LIBOR + 1.000%)
60,000 4.023(a)(d) 12/05/24 64,298(3M USD LIBOR + 1.155%)
65,000 3.220(a)(d) 03/01/25 68,673(3M USD LIBOR + 1.245%)
1,000,000 3.960(a)(d) 01/29/27 1,103,920(3M USD LIBOR + 3.800%)
1,710,000 3.926(a)(d) 12/31/99 1,713,916(SOFR + 1.160%)
570,000 2.301(a)(d) 10/15/25 591,033(SOFR + 2.040%)
25,000 2.522(a)(d) 04/22/31 25,487(SOFR + 2.515%)
275,000 2.956(a)(d) 05/13/31 286,363(SOFR + 3.125%)
800,000 4.600(a)(d) 12/31/99 818,376(SOFR + 3.790%)
75,000 4.493(a)(d) 03/24/31 87,545Macquarie Group Ltd.(a)(b)(d) (SOFR + 1.069%)
450,000 1.340 01/12/27 446,211Mitsubishi UFJ Financial Group, Inc.
60,000 3.741 03/07/29 66,76930,000 4.286 07/26/38 35,901
Morgan Stanley(a)(d) (SOFR + 0.879%)35,000 1.593 05/04/27 35,101
Morgan Stanley, Inc.(a)(d) (SOFR + 1.360%)750,000 2.484 09/16/36 733,597
16 The accompanying notes are an integral part of these financial statements.
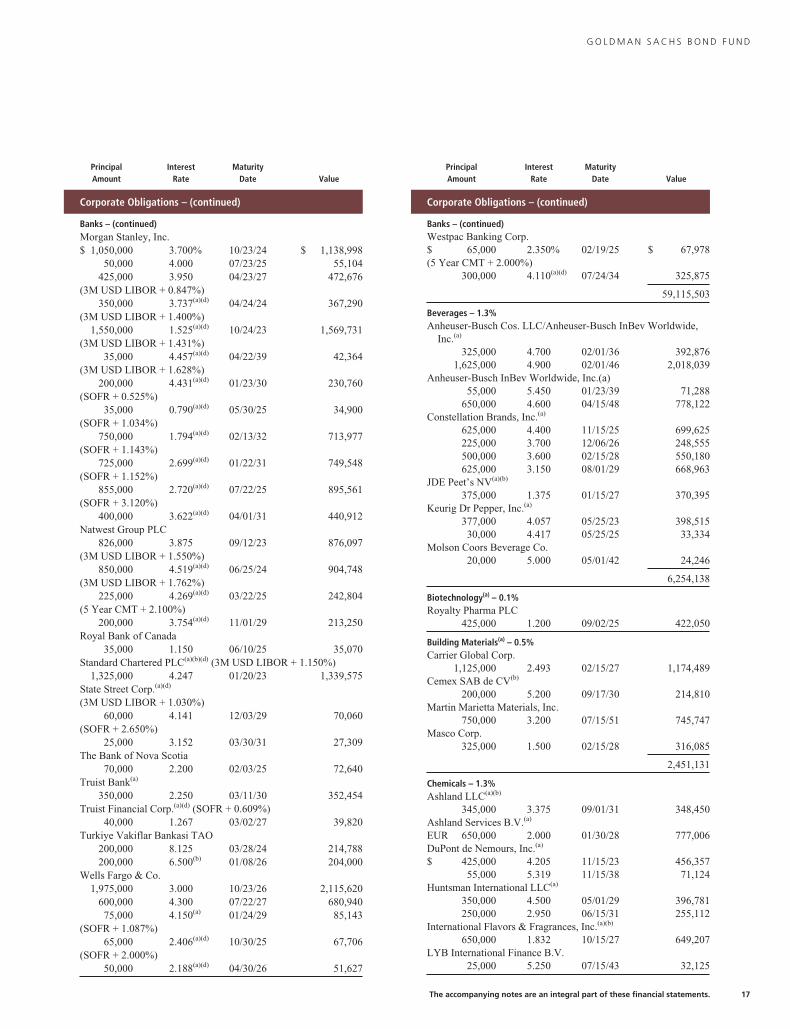
G O L D M A N S A C H S B O N D F U N D
PrincipalAmount
InterestRate
MaturityDate Value
Corporate Obligations – (continued)
Banks – (continued)Morgan Stanley, Inc.$ 1,050,000 3.700% 10/23/24 $ 1,138,998
50,000 4.000 07/23/25 55,104425,000 3.950 04/23/27 472,676
(3M USD LIBOR + 0.847%)350,000 3.737(a)(d) 04/24/24 367,290
(3M USD LIBOR + 1.400%)1,550,000 1.525(a)(d) 10/24/23 1,569,731
(3M USD LIBOR + 1.431%)35,000 4.457(a)(d) 04/22/39 42,364
(3M USD LIBOR + 1.628%)200,000 4.431(a)(d) 01/23/30 230,760
(SOFR + 0.525%)35,000 0.790(a)(d) 05/30/25 34,900
(SOFR + 1.034%)750,000 1.794(a)(d) 02/13/32 713,977
(SOFR + 1.143%)725,000 2.699(a)(d) 01/22/31 749,548
(SOFR + 1.152%)855,000 2.720(a)(d) 07/22/25 895,561
(SOFR + 3.120%)400,000 3.622(a)(d) 04/01/31 440,912
Natwest Group PLC826,000 3.875 09/12/23 876,097
(3M USD LIBOR + 1.550%)850,000 4.519(a)(d) 06/25/24 904,748
(3M USD LIBOR + 1.762%)225,000 4.269(a)(d) 03/22/25 242,804
(5 Year CMT + 2.100%)200,000 3.754(a)(d) 11/01/29 213,250
Royal Bank of Canada35,000 1.150 06/10/25 35,070
Standard Chartered PLC(a)(b)(d) (3M USD LIBOR + 1.150%)1,325,000 4.247 01/20/23 1,339,575
State Street Corp.(a)(d)
(3M USD LIBOR + 1.030%)60,000 4.141 12/03/29 70,060
(SOFR + 2.650%)25,000 3.152 03/30/31 27,309
The Bank of Nova Scotia70,000 2.200 02/03/25 72,640
Truist Bank(a)
350,000 2.250 03/11/30 352,454Truist Financial Corp.(a)(d) (SOFR + 0.609%)
40,000 1.267 03/02/27 39,820Turkiye Vakiflar Bankasi TAO
200,000 8.125 03/28/24 214,788200,000 6.500(b) 01/08/26 204,000
Wells Fargo & Co.1,975,000 3.000 10/23/26 2,115,620
600,000 4.300 07/22/27 680,94075,000 4.150(a) 01/24/29 85,143
(SOFR + 1.087%)65,000 2.406(a)(d) 10/30/25 67,706
(SOFR + 2.000%)50,000 2.188(a)(d) 04/30/26 51,627
PrincipalAmount
InterestRate
MaturityDate Value
Corporate Obligations – (continued)
Banks – (continued)Westpac Banking Corp.$ 65,000 2.350% 02/19/25 $ 67,978(5 Year CMT + 2.000%)
300,000 4.110(a)(d) 07/24/34 325,875
59,115,503
Beverages – 1.3%Anheuser-Busch Cos. LLC/Anheuser-Busch InBev Worldwide,
Inc.(a)
325,000 4.700 02/01/36 392,8761,625,000 4.900 02/01/46 2,018,039
Anheuser-Busch InBev Worldwide, Inc.(a)55,000 5.450 01/23/39 71,288
650,000 4.600 04/15/48 778,122Constellation Brands, Inc.(a)
625,000 4.400 11/15/25 699,625225,000 3.700 12/06/26 248,555500,000 3.600 02/15/28 550,180625,000 3.150 08/01/29 668,963
JDE Peet’s NV(a)(b)
375,000 1.375 01/15/27 370,395Keurig Dr Pepper, Inc.(a)
377,000 4.057 05/25/23 398,51530,000 4.417 05/25/25 33,334
Molson Coors Beverage Co.20,000 5.000 05/01/42 24,246
6,254,138
Biotechnology(a) – 0.1%Royalty Pharma PLC
425,000 1.200 09/02/25 422,050
Building Materials(a) – 0.5%Carrier Global Corp.
1,125,000 2.493 02/15/27 1,174,489Cemex SAB de CV(b)
200,000 5.200 09/17/30 214,810Martin Marietta Materials, Inc.
750,000 3.200 07/15/51 745,747Masco Corp.
325,000 1.500 02/15/28 316,085
2,451,131
Chemicals – 1.3%Ashland LLC(a)(b)
345,000 3.375 09/01/31 348,450Ashland Services B.V.(a)
EUR 650,000 2.000 01/30/28 777,006DuPont de Nemours, Inc.(a)
$ 425,000 4.205 11/15/23 456,35755,000 5.319 11/15/38 71,124
Huntsman International LLC(a)
350,000 4.500 05/01/29 396,781250,000 2.950 06/15/31 255,112
International Flavors & Fragrances, Inc.(a)(b)
650,000 1.832 10/15/27 649,207LYB International Finance B.V.
25,000 5.250 07/15/43 32,125
The accompanying notes are an integral part of these financial statements. 17
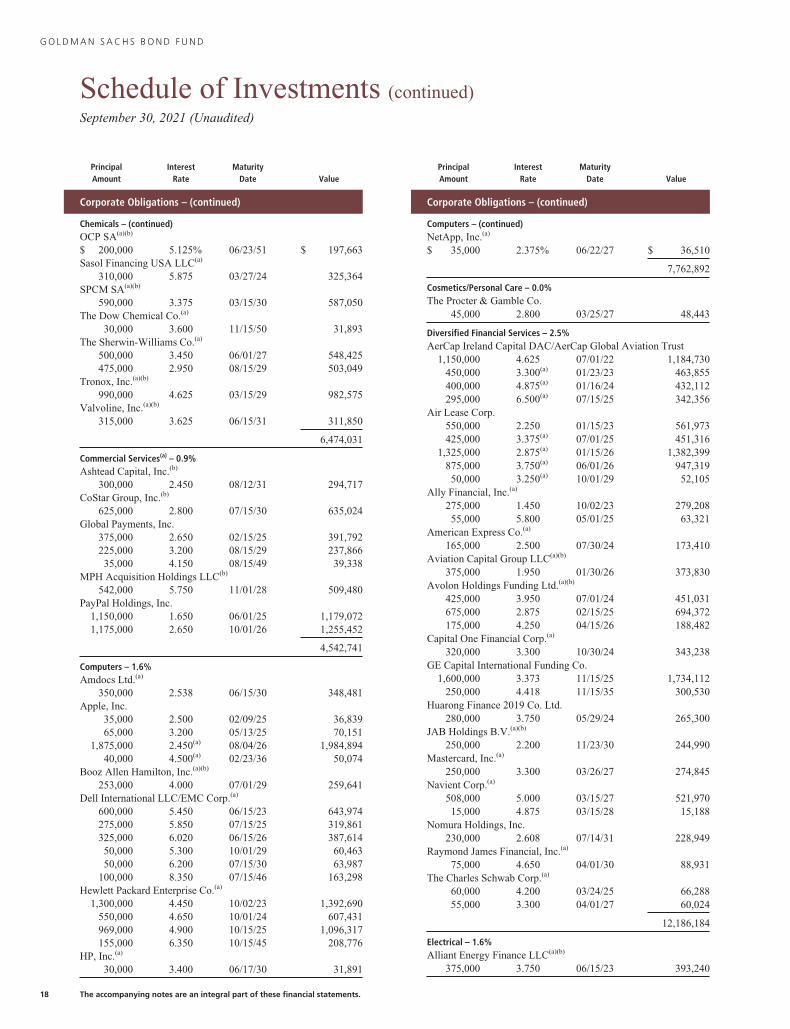
G O L D M A N S A C H S B O N D F U N D
Schedule of Investments (continued)September 30, 2021 (Unaudited)
PrincipalAmount
InterestRate
MaturityDate Value
Corporate Obligations – (continued)
Chemicals – (continued)OCP SA(a)(b)
$ 200,000 5.125% 06/23/51 $ 197,663Sasol Financing USA LLC(a)
310,000 5.875 03/27/24 325,364SPCM SA(a)(b)
590,000 3.375 03/15/30 587,050The Dow Chemical Co.(a)
30,000 3.600 11/15/50 31,893The Sherwin-Williams Co.(a)
500,000 3.450 06/01/27 548,425475,000 2.950 08/15/29 503,049
Tronox, Inc.(a)(b)
990,000 4.625 03/15/29 982,575Valvoline, Inc.(a)(b)
315,000 3.625 06/15/31 311,850
6,474,031
Commercial Services(a) – 0.9%Ashtead Capital, Inc.(b)
300,000 2.450 08/12/31 294,717CoStar Group, Inc.(b)
625,000 2.800 07/15/30 635,024Global Payments, Inc.
375,000 2.650 02/15/25 391,792225,000 3.200 08/15/29 237,86635,000 4.150 08/15/49 39,338
MPH Acquisition Holdings LLC(b)
542,000 5.750 11/01/28 509,480PayPal Holdings, Inc.
1,150,000 1.650 06/01/25 1,179,0721,175,000 2.650 10/01/26 1,255,452
4,542,741
Computers – 1.6%Amdocs Ltd.(a)
350,000 2.538 06/15/30 348,481Apple, Inc.
35,000 2.500 02/09/25 36,83965,000 3.200 05/13/25 70,151
1,875,000 2.450(a) 08/04/26 1,984,89440,000 4.500(a) 02/23/36 50,074
Booz Allen Hamilton, Inc.(a)(b)
253,000 4.000 07/01/29 259,641Dell International LLC/EMC Corp.(a)
600,000 5.450 06/15/23 643,974275,000 5.850 07/15/25 319,861325,000 6.020 06/15/26 387,61450,000 5.300 10/01/29 60,46350,000 6.200 07/15/30 63,987
100,000 8.350 07/15/46 163,298Hewlett Packard Enterprise Co.(a)
1,300,000 4.450 10/02/23 1,392,690550,000 4.650 10/01/24 607,431969,000 4.900 10/15/25 1,096,317155,000 6.350 10/15/45 208,776
HP, Inc.(a)
30,000 3.400 06/17/30 31,891
PrincipalAmount
InterestRate
MaturityDate Value
Corporate Obligations – (continued)
Computers – (continued)NetApp, Inc.(a)
$ 35,000 2.375% 06/22/27 $ 36,510
7,762,892
Cosmetics/Personal Care – 0.0%The Procter & Gamble Co.
45,000 2.800 03/25/27 48,443
Diversified Financial Services – 2.5%AerCap Ireland Capital DAC/AerCap Global Aviation Trust
1,150,000 4.625 07/01/22 1,184,730450,000 3.300(a) 01/23/23 463,855400,000 4.875(a) 01/16/24 432,112295,000 6.500(a) 07/15/25 342,356
Air Lease Corp.550,000 2.250 01/15/23 561,973425,000 3.375(a) 07/01/25 451,316
1,325,000 2.875(a) 01/15/26 1,382,399875,000 3.750(a) 06/01/26 947,31950,000 3.250(a) 10/01/29 52,105
Ally Financial, Inc.(a)
275,000 1.450 10/02/23 279,20855,000 5.800 05/01/25 63,321
American Express Co.(a)
165,000 2.500 07/30/24 173,410Aviation Capital Group LLC(a)(b)
375,000 1.950 01/30/26 373,830Avolon Holdings Funding Ltd.(a)(b)
425,000 3.950 07/01/24 451,031675,000 2.875 02/15/25 694,372175,000 4.250 04/15/26 188,482
Capital One Financial Corp.(a)
320,000 3.300 10/30/24 343,238GE Capital International Funding Co.
1,600,000 3.373 11/15/25 1,734,112250,000 4.418 11/15/35 300,530
Huarong Finance 2019 Co. Ltd.280,000 3.750 05/29/24 265,300
JAB Holdings B.V.(a)(b)
250,000 2.200 11/23/30 244,990Mastercard, Inc.(a)
250,000 3.300 03/26/27 274,845Navient Corp.(a)
508,000 5.000 03/15/27 521,97015,000 4.875 03/15/28 15,188
Nomura Holdings, Inc.230,000 2.608 07/14/31 228,949
Raymond James Financial, Inc.(a)
75,000 4.650 04/01/30 88,931The Charles Schwab Corp.(a)
60,000 4.200 03/24/25 66,28855,000 3.300 04/01/27 60,024
12,186,184
Electrical – 1.6%Alliant Energy Finance LLC(a)(b)
375,000 3.750 06/15/23 393,240
18 The accompanying notes are an integral part of these financial statements.
G O L D M A N S A C H S B O N D F U N D
PrincipalAmount
InterestRate
MaturityDate Value
Corporate Obligations – (continued)
Electrical – (continued)Ameren Corp.(a)
$ 125,000 3.500% 01/15/31 $ 136,091Appalachian Power Co.(a)
30,000 3.700 05/01/50 32,651Berkshire Hathaway Energy Co.(a)
225,000 3.250 04/15/28 245,275400,000 3.700 07/15/30 450,29220,000 4.450 01/15/49 24,752
Dominion Energy, Inc.(e)675,000 3.071 08/15/24 713,893
Enel Finance International NV(a)(b)
975,000 1.875 07/12/28 968,838Exelon Corp.(a)
325,000 4.050 04/15/30 367,89750,000 4.700 04/15/50 63,118
Exelon Generation Co. LLC(a)
35,000 3.250 06/01/25 37,315Florida Power & Light Co.(a)
65,000 2.850 04/01/25 68,988NextEra Energy Capital Holdings, Inc.(a)
525,000 1.900 06/15/28 526,470NRG Energy, Inc.(a)(b)
675,000 3.750 06/15/24 718,544Pacific Gas & Electric Co.(a)
250,000 2.100 08/01/27 243,943125,000 3.300 08/01/40 115,355275,000 3.500 08/01/50 249,917
Southern California Edison Co.(a)
725,000 3.700 08/01/25 788,191450,000 4.200 03/01/29 505,96725,000 4.875 03/01/49 29,88650,000 3.650 02/01/50 51,217
Southern Power Co.(a)
60,000 4.950 12/15/46 72,429Southwestern Electric Power Co.(a)
35,000 2.750 10/01/26 36,841Vistra Operations Co. LLC(a)(b)
1,175,000 3.550 07/15/24 1,236,335
8,077,445
Electronics(a) – 0.3%Honeywell International, Inc.
35,000 1.350 06/01/25 35,52040,000 2.500 11/01/26 42,440
Sensata Technologies, Inc.(b)
276,000 3.750 02/15/31 277,035SYNNEX Corp.(b)
500,000 2.375 08/09/28 495,100500,000 2.650 08/09/31 488,720
1,338,815
Engineering & Construction(a) – 0.3%MasTec, Inc.(b)
610,000 4.500 08/15/28 636,687Mexico City Airport Trust
400,000 4.250 10/31/26 425,050250,000 3.875(b) 04/30/28 258,094
PrincipalAmount
InterestRate
MaturityDate Value
Corporate Obligations – (continued)
Engineering & Construction(a) – (continued)Mexico City Airport Trust – (continued)$ 310,000 5.500%(b) 07/31/47 $ 315,038
1,634,869
Entertainment(a)(b) – 0.1%Caesars Entertainment, Inc.
498,000 6.250 07/01/25 524,145
Environmental(a) – 0.1%GFL Environmental, Inc.(b)
150,000 3.750 08/01/25 154,312Waste Management, Inc.
250,000 1.150 03/15/28 240,870
395,182
Food & Drug Retailing(a) – 0.4%Conagra Brands, Inc.
15,000 4.600 11/01/25 16,857Kraft Heinz Foods Co.
1,122,000 4.250 03/01/31 1,261,456Mondelez International, Inc.
65,000 2.750 04/13/30 68,010Post Holdings, Inc.(b)
498,000 5.625 01/15/28 522,900Sysco Corp.
75,000 6.600 04/01/40 110,037
1,979,260
Gas(a) – 0.1%NiSource, Inc.
100,000 3.600 05/01/30 109,746The East Ohio Gas Co.(b)
150,000 1.300 06/15/25 150,497
260,243
Healthcare Providers & Services(a) – 1.0%Anthem, Inc.
65,000 2.375 01/15/25 67,737Centene Corp.
1,270,000 3.000 10/15/30 1,301,750CommonSpirit Health
635,000 3.910 10/01/50 693,708DENTSPLY SIRONA, Inc.
350,000 3.250 06/01/30 372,733DH Europe Finance II S.a.r.l.
700,000 2.200 11/15/24 728,672275,000 2.600 11/15/29 286,745
HCA, Inc.40,000 5.500 06/15/47 51,651
Laboratory Corp. of America Holdings65,000 3.600 02/01/25 69,863
STERIS Irish FinCo UnLtd Co.525,000 2.700 03/15/31 536,519
Thermo Fisher Scientific, Inc.45,000 4.133 03/25/25 49,534
100,000 1.750 10/15/28 99,762Zimmer Biomet Holdings, Inc.
800,000 3.550 03/20/30 874,672
5,133,346
The accompanying notes are an integral part of these financial statements. 19
G O L D M A N S A C H S B O N D F U N D
Schedule of Investments (continued)September 30, 2021 (Unaudited)
PrincipalAmount
InterestRate
MaturityDate Value
Corporate Obligations – (continued)
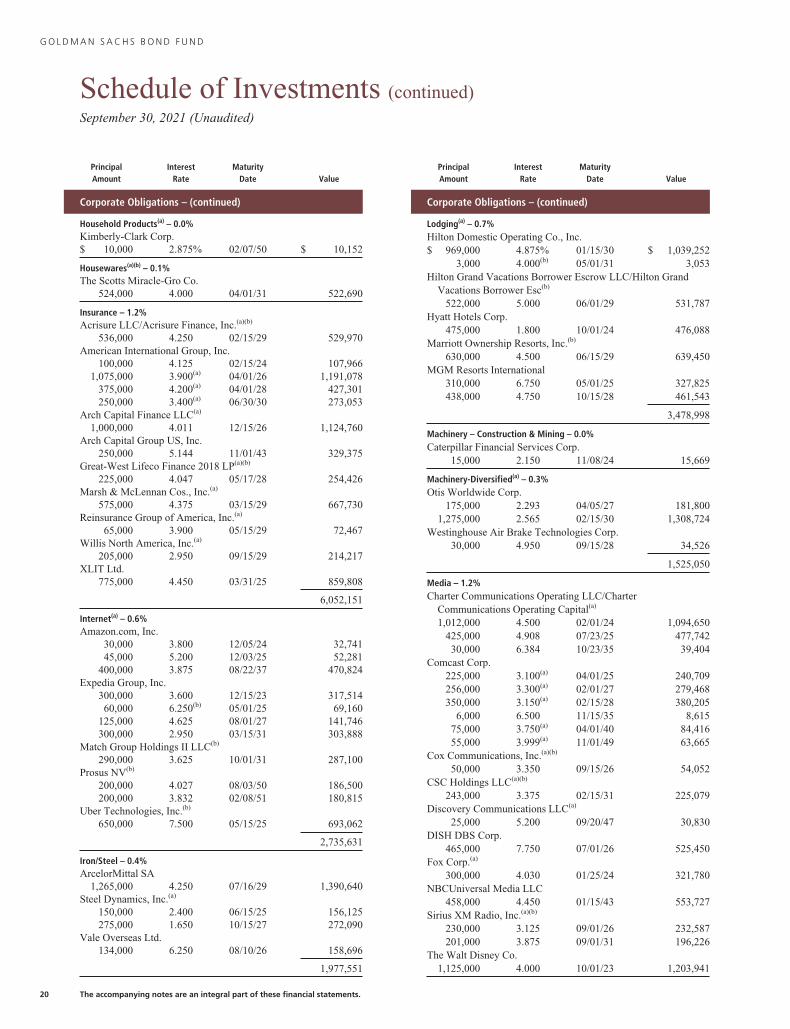
Household Products(a) – 0.0%Kimberly-Clark Corp.$ 10,000 2.875% 02/07/50 $ 10,152
Housewares(a)(b) – 0.1%The Scotts Miracle-Gro Co.
524,000 4.000 04/01/31 522,690
Insurance – 1.2%Acrisure LLC/Acrisure Finance, Inc.(a)(b)
536,000 4.250 02/15/29 529,970American International Group, Inc.
100,000 4.125 02/15/24 107,9661,075,000 3.900(a) 04/01/26 1,191,078
375,000 4.200(a) 04/01/28 427,301250,000 3.400(a) 06/30/30 273,053
Arch Capital Finance LLC(a)
1,000,000 4.011 12/15/26 1,124,760Arch Capital Group US, Inc.
250,000 5.144 11/01/43 329,375Great-West Lifeco Finance 2018 LP(a)(b)
225,000 4.047 05/17/28 254,426Marsh & McLennan Cos., Inc.(a)
575,000 4.375 03/15/29 667,730Reinsurance Group of America, Inc.(a)
65,000 3.900 05/15/29 72,467Willis North America, Inc.(a)
205,000 2.950 09/15/29 214,217XLIT Ltd.
775,000 4.450 03/31/25 859,808
6,052,151
Internet(a) – 0.6%Amazon.com, Inc.
30,000 3.800 12/05/24 32,74145,000 5.200 12/03/25 52,281
400,000 3.875 08/22/37 470,824Expedia Group, Inc.
300,000 3.600 12/15/23 317,51460,000 6.250(b) 05/01/25 69,160
125,000 4.625 08/01/27 141,746300,000 2.950 03/15/31 303,888
Match Group Holdings II LLC(b)
290,000 3.625 10/01/31 287,100Prosus NV(b)
200,000 4.027 08/03/50 186,500200,000 3.832 02/08/51 180,815
Uber Technologies, Inc.(b)
650,000 7.500 05/15/25 693,062
2,735,631
Iron/Steel – 0.4%ArcelorMittal SA
1,265,000 4.250 07/16/29 1,390,640Steel Dynamics, Inc.(a)
150,000 2.400 06/15/25 156,125275,000 1.650 10/15/27 272,090
Vale Overseas Ltd.134,000 6.250 08/10/26 158,696
1,977,551
PrincipalAmount
InterestRate
MaturityDate Value
Corporate Obligations – (continued)
Lodging(a) – 0.7%Hilton Domestic Operating Co., Inc.$ 969,000 4.875% 01/15/30 $ 1,039,252
3,000 4.000(b) 05/01/31 3,053Hilton Grand Vacations Borrower Escrow LLC/Hilton Grand
Vacations Borrower Esc(b)
522,000 5.000 06/01/29 531,787Hyatt Hotels Corp.
475,000 1.800 10/01/24 476,088Marriott Ownership Resorts, Inc.(b)
630,000 4.500 06/15/29 639,450MGM Resorts International
310,000 6.750 05/01/25 327,825438,000 4.750 10/15/28 461,543
3,478,998
Machinery – Construction & Mining – 0.0%Caterpillar Financial Services Corp.
15,000 2.150 11/08/24 15,669
Machinery-Diversified(a) – 0.3%Otis Worldwide Corp.
175,000 2.293 04/05/27 181,8001,275,000 2.565 02/15/30 1,308,724
Westinghouse Air Brake Technologies Corp.30,000 4.950 09/15/28 34,526
1,525,050
Media – 1.2%Charter Communications Operating LLC/Charter
Communications Operating Capital(a)
1,012,000 4.500 02/01/24 1,094,650425,000 4.908 07/23/25 477,74230,000 6.384 10/23/35 39,404
Comcast Corp.225,000 3.100(a) 04/01/25 240,709256,000 3.300(a) 02/01/27 279,468350,000 3.150(a) 02/15/28 380,205
6,000 6.500 11/15/35 8,61575,000 3.750(a) 04/01/40 84,41655,000 3.999(a) 11/01/49 63,665
Cox Communications, Inc.(a)(b)
50,000 3.350 09/15/26 54,052CSC Holdings LLC(a)(b)
243,000 3.375 02/15/31 225,079Discovery Communications LLC(a)
25,000 5.200 09/20/47 30,830DISH DBS Corp.
465,000 7.750 07/01/26 525,450Fox Corp.(a)
300,000 4.030 01/25/24 321,780NBCUniversal Media LLC
458,000 4.450 01/15/43 553,727Sirius XM Radio, Inc.(a)(b)
230,000 3.125 09/01/26 232,587201,000 3.875 09/01/31 196,226
The Walt Disney Co.1,125,000 4.000 10/01/23 1,203,941
20 The accompanying notes are an integral part of these financial statements.
G O L D M A N S A C H S B O N D F U N D
PrincipalAmount
InterestRate
MaturityDate Value
Corporate Obligations – (continued)
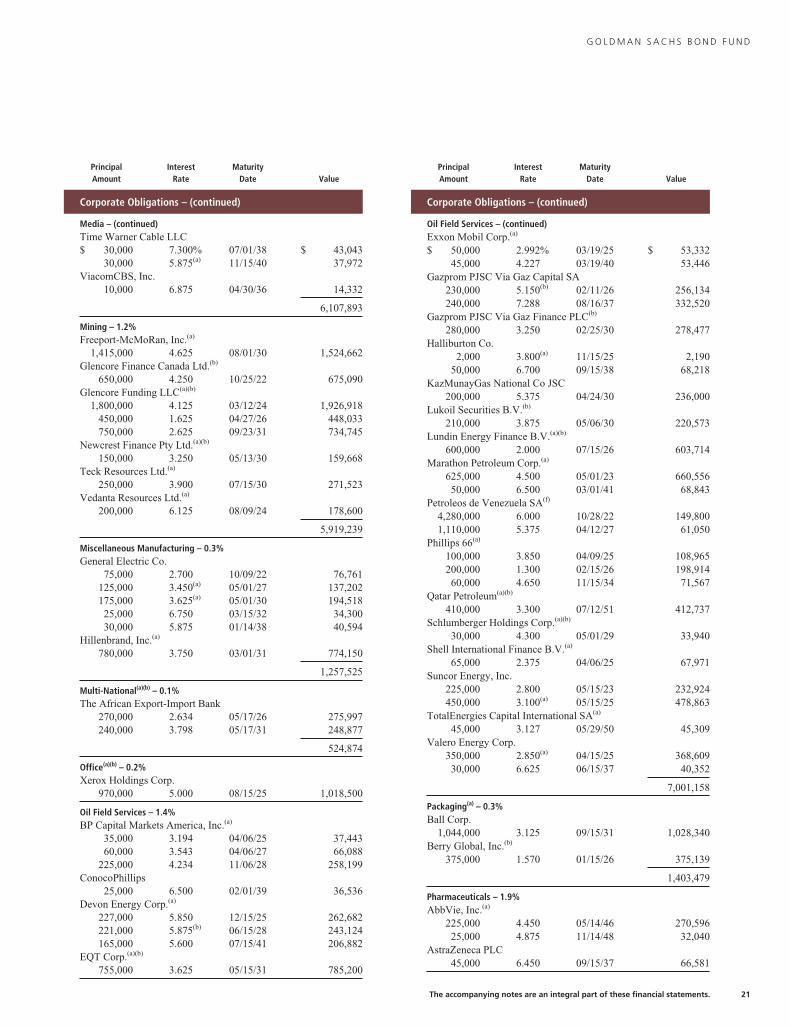
Media – (continued)Time Warner Cable LLC$ 30,000 7.300% 07/01/38 $ 43,043
30,000 5.875(a) 11/15/40 37,972ViacomCBS, Inc.
10,000 6.875 04/30/36 14,332
6,107,893
Mining – 1.2%Freeport-McMoRan, Inc.(a)
1,415,000 4.625 08/01/30 1,524,662Glencore Finance Canada Ltd.(b)
650,000 4.250 10/25/22 675,090Glencore Funding LLC(a)(b)
1,800,000 4.125 03/12/24 1,926,918450,000 1.625 04/27/26 448,033750,000 2.625 09/23/31 734,745
Newcrest Finance Pty Ltd.(a)(b)
150,000 3.250 05/13/30 159,668Teck Resources Ltd.(a)
250,000 3.900 07/15/30 271,523Vedanta Resources Ltd.(a)
200,000 6.125 08/09/24 178,600
5,919,239
Miscellaneous Manufacturing – 0.3%General Electric Co.
75,000 2.700 10/09/22 76,761125,000 3.450(a) 05/01/27 137,202175,000 3.625(a) 05/01/30 194,51825,000 6.750 03/15/32 34,30030,000 5.875 01/14/38 40,594
Hillenbrand, Inc.(a)
780,000 3.750 03/01/31 774,150
1,257,525
Multi-National(a)(b) – 0.1%The African Export-Import Bank
270,000 2.634 05/17/26 275,997240,000 3.798 05/17/31 248,877
524,874
Office(a)(b) – 0.2%Xerox Holdings Corp.
970,000 5.000 08/15/25 1,018,500
Oil Field Services – 1.4%BP Capital Markets America, Inc.(a)
35,000 3.194 04/06/25 37,44360,000 3.543 04/06/27 66,088
225,000 4.234 11/06/28 258,199ConocoPhillips
25,000 6.500 02/01/39 36,536Devon Energy Corp.(a)
227,000 5.850 12/15/25 262,682221,000 5.875(b) 06/15/28 243,124165,000 5.600 07/15/41 206,882
EQT Corp.(a)(b)
755,000 3.625 05/15/31 785,200
PrincipalAmount
InterestRate
MaturityDate Value
Corporate Obligations – (continued)
Oil Field Services – (continued)Exxon Mobil Corp.(a)
$ 50,000 2.992% 03/19/25 $ 53,33245,000 4.227 03/19/40 53,446
Gazprom PJSC Via Gaz Capital SA230,000 5.150(b) 02/11/26 256,134240,000 7.288 08/16/37 332,520
Gazprom PJSC Via Gaz Finance PLC(b)
280,000 3.250 02/25/30 278,477Halliburton Co.
2,000 3.800(a) 11/15/25 2,19050,000 6.700 09/15/38 68,218
KazMunayGas National Co JSC200,000 5.375 04/24/30 236,000
Lukoil Securities B.V.(b)
210,000 3.875 05/06/30 220,573Lundin Energy Finance B.V.(a)(b)
600,000 2.000 07/15/26 603,714Marathon Petroleum Corp.(a)
625,000 4.500 05/01/23 660,55650,000 6.500 03/01/41 68,843
Petroleos de Venezuela SA(f)
4,280,000 6.000 10/28/22 149,8001,110,000 5.375 04/12/27 61,050
Phillips 66(a)
100,000 3.850 04/09/25 108,965200,000 1.300 02/15/26 198,91460,000 4.650 11/15/34 71,567
Qatar Petroleum(a)(b)
410,000 3.300 07/12/51 412,737Schlumberger Holdings Corp.(a)(b)
30,000 4.300 05/01/29 33,940Shell International Finance B.V.(a)
65,000 2.375 04/06/25 67,971Suncor Energy, Inc.
225,000 2.800 05/15/23 232,924450,000 3.100(a) 05/15/25 478,863
TotalEnergies Capital International SA(a)
45,000 3.127 05/29/50 45,309Valero Energy Corp.
350,000 2.850(a) 04/15/25 368,60930,000 6.625 06/15/37 40,352
7,001,158
Packaging(a) – 0.3%Ball Corp.
1,044,000 3.125 09/15/31 1,028,340Berry Global, Inc.(b)
375,000 1.570 01/15/26 375,139
1,403,479
Pharmaceuticals – 1.9%AbbVie, Inc.(a)
225,000 4.450 05/14/46 270,59625,000 4.875 11/14/48 32,040
AstraZeneca PLC45,000 6.450 09/15/37 66,581
The accompanying notes are an integral part of these financial statements. 21
G O L D M A N S A C H S B O N D F U N D
Schedule of Investments (continued)September 30, 2021 (Unaudited)
PrincipalAmount
InterestRate
MaturityDate Value
Corporate Obligations – (continued)
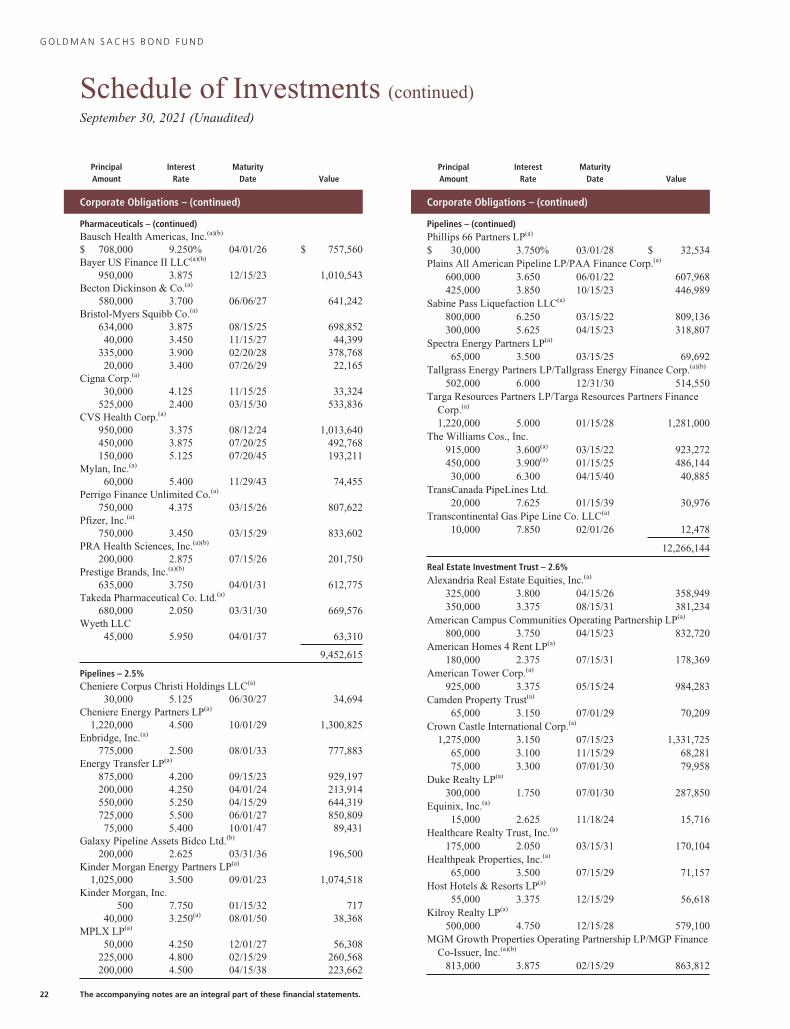
Pharmaceuticals – (continued)Bausch Health Americas, Inc.(a)(b)
$ 708,000 9.250% 04/01/26 $ 757,560Bayer US Finance II LLC(a)(b)
950,000 3.875 12/15/23 1,010,543Becton Dickinson & Co.(a)
580,000 3.700 06/06/27 641,242Bristol-Myers Squibb Co.(a)
634,000 3.875 08/15/25 698,85240,000 3.450 11/15/27 44,399
335,000 3.900 02/20/28 378,76820,000 3.400 07/26/29 22,165
Cigna Corp.(a)
30,000 4.125 11/15/25 33,324525,000 2.400 03/15/30 533,836
CVS Health Corp.(a)
950,000 3.375 08/12/24 1,013,640450,000 3.875 07/20/25 492,768150,000 5.125 07/20/45 193,211
Mylan, Inc.(a)
60,000 5.400 11/29/43 74,455Perrigo Finance Unlimited Co.(a)
750,000 4.375 03/15/26 807,622Pfizer, Inc.(a)
750,000 3.450 03/15/29 833,602PRA Health Sciences, Inc.(a)(b)
200,000 2.875 07/15/26 201,750Prestige Brands, Inc.(a)(b)
635,000 3.750 04/01/31 612,775Takeda Pharmaceutical Co. Ltd.(a)
680,000 2.050 03/31/30 669,576Wyeth LLC
45,000 5.950 04/01/37 63,310
9,452,615
Pipelines – 2.5%Cheniere Corpus Christi Holdings LLC(a)
30,000 5.125 06/30/27 34,694Cheniere Energy Partners LP(a)
1,220,000 4.500 10/01/29 1,300,825Enbridge, Inc.(a)
775,000 2.500 08/01/33 777,883Energy Transfer LP(a)
875,000 4.200 09/15/23 929,197200,000 4.250 04/01/24 213,914550,000 5.250 04/15/29 644,319725,000 5.500 06/01/27 850,80975,000 5.400 10/01/47 89,431
Galaxy Pipeline Assets Bidco Ltd.(b)
200,000 2.625 03/31/36 196,500Kinder Morgan Energy Partners LP(a)
1,025,000 3.500 09/01/23 1,074,518Kinder Morgan, Inc.
500 7.750 01/15/32 71740,000 3.250(a) 08/01/50 38,368
MPLX LP(a)
50,000 4.250 12/01/27 56,308225,000 4.800 02/15/29 260,568200,000 4.500 04/15/38 223,662
PrincipalAmount
InterestRate
MaturityDate Value
Corporate Obligations – (continued)
Pipelines – (continued)Phillips 66 Partners LP(a)
$ 30,000 3.750% 03/01/28 $ 32,534Plains All American Pipeline LP/PAA Finance Corp.(a)
600,000 3.650 06/01/22 607,968425,000 3.850 10/15/23 446,989
Sabine Pass Liquefaction LLC(a)
800,000 6.250 03/15/22 809,136300,000 5.625 04/15/23 318,807
Spectra Energy Partners LP(a)
65,000 3.500 03/15/25 69,692Tallgrass Energy Partners LP/Tallgrass Energy Finance Corp.(a)(b)
502,000 6.000 12/31/30 514,550Targa Resources Partners LP/Targa Resources Partners Finance
Corp.(a)
1,220,000 5.000 01/15/28 1,281,000The Williams Cos., Inc.
915,000 3.600(a) 03/15/22 923,272450,000 3.900(a) 01/15/25 486,14430,000 6.300 04/15/40 40,885
TransCanada PipeLines Ltd.20,000 7.625 01/15/39 30,976
Transcontinental Gas Pipe Line Co. LLC(a)
10,000 7.850 02/01/26 12,478
12,266,144
Real Estate Investment Trust – 2.6%Alexandria Real Estate Equities, Inc.(a)
325,000 3.800 04/15/26 358,949350,000 3.375 08/15/31 381,234
American Campus Communities Operating Partnership LP(a)
800,000 3.750 04/15/23 832,720American Homes 4 Rent LP(a)
180,000 2.375 07/15/31 178,369American Tower Corp.(a)
925,000 3.375 05/15/24 984,283Camden Property Trust(a)
65,000 3.150 07/01/29 70,209Crown Castle International Corp.(a)
1,275,000 3.150 07/15/23 1,331,72565,000 3.100 11/15/29 68,28175,000 3.300 07/01/30 79,958
Duke Realty LP(a)
300,000 1.750 07/01/30 287,850Equinix, Inc.(a)
15,000 2.625 11/18/24 15,716Healthcare Realty Trust, Inc.(a)
175,000 2.050 03/15/31 170,104Healthpeak Properties, Inc.(a)
65,000 3.500 07/15/29 71,157Host Hotels & Resorts LP(a)
55,000 3.375 12/15/29 56,618Kilroy Realty LP(a)
500,000 4.750 12/15/28 579,100MGM Growth Properties Operating Partnership LP/MGP Finance
Co-Issuer, Inc.(a)(b)
813,000 3.875 02/15/29 863,812
22 The accompanying notes are an integral part of these financial statements.
G O L D M A N S A C H S B O N D F U N D
PrincipalAmount
InterestRate
MaturityDate Value
Corporate Obligations – (continued)
Real Estate Investment Trust – (continued)MPT Operating Partnership LP/MPT Finance Corp.(a)
$ 782,000 3.500% 03/15/31 $ 798,617National Retail Properties, Inc.(a)
235,000 3.900 06/15/24 252,143400,000 4.000 11/15/25 441,256
Regency Centers LP(a)
700,000 2.950 09/15/29 734,986Spirit Realty LP(a)
725,000 4.000 07/15/29 803,198Trust Fibra Uno 1401(a)(b)
300,000 5.250 12/15/24 329,963UDR, Inc.(a)
150,000 2.100 08/01/32 144,362VEREIT Operating Partnership LP(a)
800,000 4.625 11/01/25 899,576200,000 3.400 01/15/28 216,120400,000 2.850 12/15/32 415,448
VICI Properties LP/VICI Note Co., Inc.(a)(b)
765,000 3.750 02/15/27 791,775Weyerhaeuser Co.
50,000 7.375 03/15/32 71,106WP Carey, Inc.(a)
155,000 4.600 04/01/24 168,113105,000 4.000 02/01/25 114,006425,000 3.850 07/15/29 470,930
12,981,684
Retailing(a) – 1.2%7-Eleven, Inc.(b)
700,000 1.300 02/10/28 672,616Asbury Automotive Group, Inc.
501,000 4.750 03/01/30 521,040AutoNation, Inc.
225,000 4.750 06/01/30 261,821CK Hutchison International 20 Ltd.(b)
200,000 2.500 05/08/30 202,778Dollar Tree, Inc.
525,000 4.000 05/15/25 573,967Group 1 Automotive, Inc.(b)
115,000 4.000 08/15/28 117,013IRB Holding Corp.(b)
731,000 7.000 06/15/25 774,860Lowe’s Cos, Inc.
60,000 4.000 04/15/25 65,772425,000 1.700 09/15/28 421,332
Lowe’s Cos., Inc.650,000 1.700 10/15/30 621,952
McDonald’s Corp.75,000 4.450 09/01/48 92,008
Starbucks Corp.895,000 3.800 08/15/25 981,341
The Home Depot, Inc.275,000 3.900 12/06/28 314,803
Tractor Supply Co.400,000 1.750 11/01/30 384,100
6,005,403
PrincipalAmount
InterestRate
MaturityDate Value
Corporate Obligations – (continued)
Savings & Loans(a)(b)(d) – 0.1%Nationwide Building Society (3M USD LIBOR + 1.855%)$ 400,000 3.960% 07/18/30 $ 444,684
Semiconductors – 1.7%Applied Materials, Inc.(a)
275,000 1.750 06/01/30 270,62215,000 4.350 04/01/47 18,689
Broadcom, Inc.(a)(b)
225,000 3.419 04/15/33 233,1722,331,000 3.137 11/15/35 2,312,445
685,000 3.500 02/15/41 679,499Intel Corp.(a)
35,000 3.400 03/25/25 37,817450,000 3.050 08/12/51 450,252
Lam Research Corp.(a)
375,000 1.900 06/15/30 374,044Microchip Technology, Inc.
625,000 2.670 09/01/23 648,138NXP B.V./NXP Funding LLC(b)
1,325,000 3.875 09/01/22 1,364,936NXP B.V./NXP Funding LLC/NXP USA, Inc.(a)(b)
800,000 2.500 05/11/31 806,248275,000 3.400 05/01/30 297,927
ON Semiconductor Corp.(a)(b)
860,000 3.875 09/01/28 889,025QUALCOMM, Inc.(a)
35,000 2.150 05/20/30 35,542Skyworks Solutions, Inc.(a)
35,000 3.000 06/01/31 35,817TSMC Global Ltd.(a)(b)
200,000 2.250 04/23/31 199,016
8,653,189
Software – 1.2%Adobe, Inc.(a)
450,000 2.150 02/01/27 470,772Citrix Systems, Inc.(a)
60,000 4.500 12/01/27 66,265Clarivate Science Holdings Corp.(a)(b)
575,000 3.875 07/01/28 574,281Fiserv, Inc.(a)
55,000 3.850 06/01/25 60,011750,000 3.200 07/01/26 809,902
Intuit, Inc.(a)
175,000 1.350 07/15/27 174,156MSCI, Inc.(a)(b)
506,000 3.625 11/01/31 524,975Oracle Corp.
40,000 2.500(a) 04/01/25 41,85165,000 2.950(a) 05/15/25 68,936
775,000 2.875(a) 03/25/31 798,65325,000 5.375 07/15/40 31,470
ServiceNow, Inc.(a)
975,000 1.400 09/01/30 915,047VMware, Inc.(a)
175,000 1.800 08/15/28 172,400500,000 2.200 08/15/31 489,475
The accompanying notes are an integral part of these financial statements. 23
G O L D M A N S A C H S B O N D F U N D
Schedule of Investments (continued)September 30, 2021 (Unaudited)
PrincipalAmount
InterestRate
MaturityDate Value
Corporate Obligations – (continued)
Software – (continued)ZoomInfo Technologies LLC/ZoomInfo Finance Corp.(a)(b)
$ 525,000 3.875% 02/01/29 $ 525,000
5,723,194
Telecommunication Services – 3.0%AT&T, Inc.(a)
400,000 4.450 04/01/24 433,43230,000 4.250 03/01/27 33,957
1,375,000 2.300 06/01/27 1,424,197100,000 1.650 02/01/28 99,081500,000 2.750 06/01/31 513,490694,000 2.550 12/01/33 682,86810,000 5.250 03/01/37 12,381
175,000 4.900 08/15/37 211,893450,000 3.500 06/01/41 462,172100,000 5.150 11/15/46 126,794225,000 5.450 03/01/47 293,58025,000 4.500 03/09/48 28,870
175,000 5.150 02/15/50 220,733300,000 3.650 06/01/51 305,613100,000 3.500 09/15/53 99,016
Level 3 Financing, Inc.(a)(b)
645,000 4.250 07/01/28 653,062Rogers Communications, Inc.(a)
65,000 3.700 11/15/49 67,149T-Mobile USA, Inc.(a)
625,000 3.500 04/15/25 672,819375,000 1.500 02/15/26 376,384
1,050,000 3.750 04/15/27 1,156,848375,000 2.050 02/15/28 378,067550,000 3.875 04/15/30 607,640520,000 2.875 02/15/31 525,409500,000 3.500 04/15/31 526,13460,000 4.375 04/15/40 69,046
250,000 3.000 02/15/41 242,405The Bell Telephone Co. of Canada/Bell Canada(a)
55,000 4.464 04/01/48 66,991Verizon Communications, Inc.
1,265,000 2.100(a) 03/22/28 1,284,241630,000 4.329 09/21/28 724,720575,000 3.150(a) 03/22/30 615,077800,000 2.550(a) 03/21/31 811,608
1,004,000 2.355(a)(b) 03/15/32 994,03050,000 4.125 08/15/46 57,36018,000 5.012 04/15/49 23,57530,000 4.000(a) 03/22/50 33,861
Vodafone Group PLC50,000 4.125 05/30/25 55,32325,000 6.150 02/27/37 34,293
14,924,119
Transportation(a) – 0.1%Canadian Pacific Railway Co.
200,000 2.050 03/05/30 197,426CSX Corp.
65,000 3.250 06/01/27 70,661
PrincipalAmount
InterestRate
MaturityDate Value
Corporate Obligations – (continued)
Transportation(a) – (continued)Union Pacific Corp.$ 35,000 3.799% 10/01/51 $ 40,396United Parcel Service, Inc.
35,000 3.900 04/01/25 38,31625,000 5.300 04/01/50 36,123
382,922
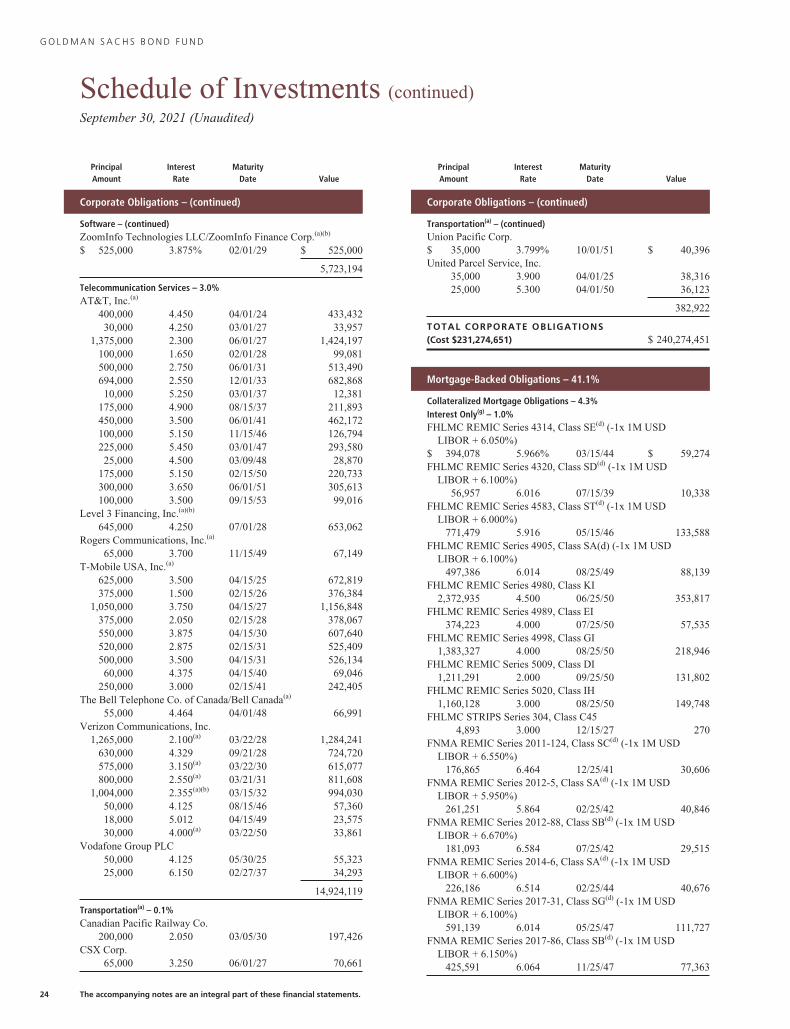
TOTAL CORPORATE OBLIGATIONS(Cost $231,274,651) $ 240,274,451
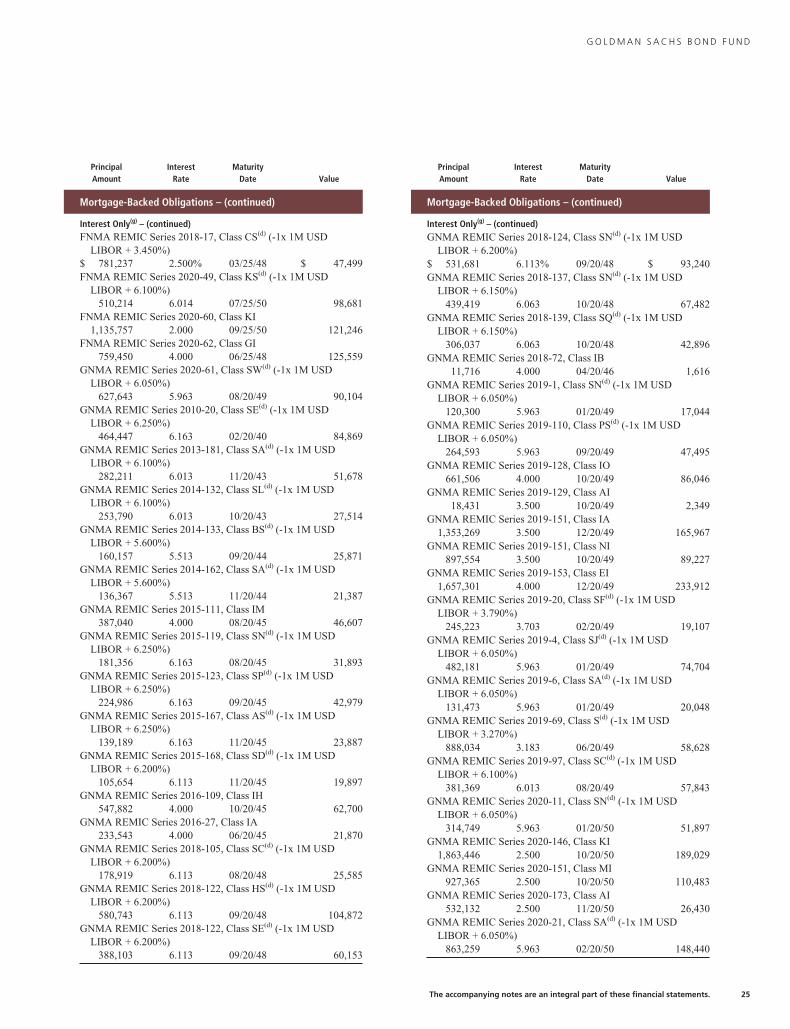
Mortgage-Backed Obligations – 41.1%
Collateralized Mortgage Obligations – 4.3%Interest Only(g) – 1.0%FHLMC REMIC Series 4314, Class SE(d) (-1x 1M USD
LIBOR + 6.050%)$ 394,078 5.966% 03/15/44 $ 59,274FHLMC REMIC Series 4320, Class SD(d) (-1x 1M USD
LIBOR + 6.100%)56,957 6.016 07/15/39 10,338
FHLMC REMIC Series 4583, Class ST(d) (-1x 1M USDLIBOR + 6.000%)
771,479 5.916 05/15/46 133,588FHLMC REMIC Series 4905, Class SA(d) (-1x 1M USD
LIBOR + 6.100%)497,386 6.014 08/25/49 88,139
FHLMC REMIC Series 4980, Class KI2,372,935 4.500 06/25/50 353,817
FHLMC REMIC Series 4989, Class EI374,223 4.000 07/25/50 57,535
FHLMC REMIC Series 4998, Class GI1,383,327 4.000 08/25/50 218,946
FHLMC REMIC Series 5009, Class DI1,211,291 2.000 09/25/50 131,802
FHLMC REMIC Series 5020, Class IH1,160,128 3.000 08/25/50 149,748
FHLMC STRIPS Series 304, Class C454,893 3.000 12/15/27 270
FNMA REMIC Series 2011-124, Class SC(d) (-1x 1M USDLIBOR + 6.550%)
176,865 6.464 12/25/41 30,606FNMA REMIC Series 2012-5, Class SA(d) (-1x 1M USD
LIBOR + 5.950%)261,251 5.864 02/25/42 40,846
FNMA REMIC Series 2012-88, Class SB(d) (-1x 1M USDLIBOR + 6.670%)
181,093 6.584 07/25/42 29,515FNMA REMIC Series 2014-6, Class SA(d) (-1x 1M USD
LIBOR + 6.600%)226,186 6.514 02/25/44 40,676
FNMA REMIC Series 2017-31, Class SG(d) (-1x 1M USDLIBOR + 6.100%)
591,139 6.014 05/25/47 111,727FNMA REMIC Series 2017-86, Class SB(d) (-1x 1M USD
LIBOR + 6.150%)425,591 6.064 11/25/47 77,363
24 The accompanying notes are an integral part of these financial statements.
G O L D M A N S A C H S B O N D F U N D
PrincipalAmount
InterestRate
MaturityDate Value
Mortgage-Backed Obligations – (continued)
Interest Only(g) – (continued)FNMA REMIC Series 2018-17, Class CS(d) (-1x 1M USD
LIBOR + 3.450%)$ 781,237 2.500% 03/25/48 $ 47,499FNMA REMIC Series 2020-49, Class KS(d) (-1x 1M USD
LIBOR + 6.100%)510,214 6.014 07/25/50 98,681
FNMA REMIC Series 2020-60, Class KI1,135,757 2.000 09/25/50 121,246
FNMA REMIC Series 2020-62, Class GI759,450 4.000 06/25/48 125,559
GNMA REMIC Series 2020-61, Class SW(d) (-1x 1M USDLIBOR + 6.050%)
627,643 5.963 08/20/49 90,104GNMA REMIC Series 2010-20, Class SE(d) (-1x 1M USD
LIBOR + 6.250%)464,447 6.163 02/20/40 84,869
GNMA REMIC Series 2013-181, Class SA(d) (-1x 1M USDLIBOR + 6.100%)
282,211 6.013 11/20/43 51,678GNMA REMIC Series 2014-132, Class SL(d) (-1x 1M USD
LIBOR + 6.100%)253,790 6.013 10/20/43 27,514
GNMA REMIC Series 2014-133, Class BS(d) (-1x 1M USDLIBOR + 5.600%)
160,157 5.513 09/20/44 25,871GNMA REMIC Series 2014-162, Class SA(d) (-1x 1M USD
LIBOR + 5.600%)136,367 5.513 11/20/44 21,387
GNMA REMIC Series 2015-111, Class IM387,040 4.000 08/20/45 46,607
GNMA REMIC Series 2015-119, Class SN(d) (-1x 1M USDLIBOR + 6.250%)
181,356 6.163 08/20/45 31,893GNMA REMIC Series 2015-123, Class SP(d) (-1x 1M USD
LIBOR + 6.250%)224,986 6.163 09/20/45 42,979
GNMA REMIC Series 2015-167, Class AS(d) (-1x 1M USDLIBOR + 6.250%)
139,189 6.163 11/20/45 23,887GNMA REMIC Series 2015-168, Class SD(d) (-1x 1M USD
LIBOR + 6.200%)105,654 6.113 11/20/45 19,897
GNMA REMIC Series 2016-109, Class IH547,882 4.000 10/20/45 62,700
GNMA REMIC Series 2016-27, Class IA233,543 4.000 06/20/45 21,870
GNMA REMIC Series 2018-105, Class SC(d) (-1x 1M USDLIBOR + 6.200%)
178,919 6.113 08/20/48 25,585GNMA REMIC Series 2018-122, Class HS(d) (-1x 1M USD
LIBOR + 6.200%)580,743 6.113 09/20/48 104,872
GNMA REMIC Series 2018-122, Class SE(d) (-1x 1M USDLIBOR + 6.200%)
388,103 6.113 09/20/48 60,153
PrincipalAmount
InterestRate
MaturityDate Value
Mortgage-Backed Obligations – (continued)
Interest Only(g) – (continued)GNMA REMIC Series 2018-124, Class SN(d) (-1x 1M USD
LIBOR + 6.200%)$ 531,681 6.113% 09/20/48 $ 93,240GNMA REMIC Series 2018-137, Class SN(d) (-1x 1M USD
LIBOR + 6.150%)439,419 6.063 10/20/48 67,482
GNMA REMIC Series 2018-139, Class SQ(d) (-1x 1M USDLIBOR + 6.150%)
306,037 6.063 10/20/48 42,896GNMA REMIC Series 2018-72, Class IB
11,716 4.000 04/20/46 1,616GNMA REMIC Series 2019-1, Class SN(d) (-1x 1M USD
LIBOR + 6.050%)120,300 5.963 01/20/49 17,044
GNMA REMIC Series 2019-110, Class PS(d) (-1x 1M USDLIBOR + 6.050%)
264,593 5.963 09/20/49 47,495GNMA REMIC Series 2019-128, Class IO
661,506 4.000 10/20/49 86,046GNMA REMIC Series 2019-129, Class AI
18,431 3.500 10/20/49 2,349GNMA REMIC Series 2019-151, Class IA
1,353,269 3.500 12/20/49 165,967GNMA REMIC Series 2019-151, Class NI
897,554 3.500 10/20/49 89,227GNMA REMIC Series 2019-153, Class EI
1,657,301 4.000 12/20/49 233,912GNMA REMIC Series 2019-20, Class SF(d) (-1x 1M USD
LIBOR + 3.790%)245,223 3.703 02/20/49 19,107
GNMA REMIC Series 2019-4, Class SJ(d) (-1x 1M USDLIBOR + 6.050%)
482,181 5.963 01/20/49 74,704GNMA REMIC Series 2019-6, Class SA(d) (-1x 1M USD
LIBOR + 6.050%)131,473 5.963 01/20/49 20,048
GNMA REMIC Series 2019-69, Class S(d) (-1x 1M USDLIBOR + 3.270%)
888,034 3.183 06/20/49 58,628GNMA REMIC Series 2019-97, Class SC(d) (-1x 1M USD
LIBOR + 6.100%)381,369 6.013 08/20/49 57,843
GNMA REMIC Series 2020-11, Class SN(d) (-1x 1M USDLIBOR + 6.050%)
314,749 5.963 01/20/50 51,897GNMA REMIC Series 2020-146, Class KI
1,863,446 2.500 10/20/50 189,029GNMA REMIC Series 2020-151, Class MI
927,365 2.500 10/20/50 110,483GNMA REMIC Series 2020-173, Class AI
532,132 2.500 11/20/50 26,430GNMA REMIC Series 2020-21, Class SA(d) (-1x 1M USD
LIBOR + 6.050%)863,259 5.963 02/20/50 148,440
The accompanying notes are an integral part of these financial statements. 25
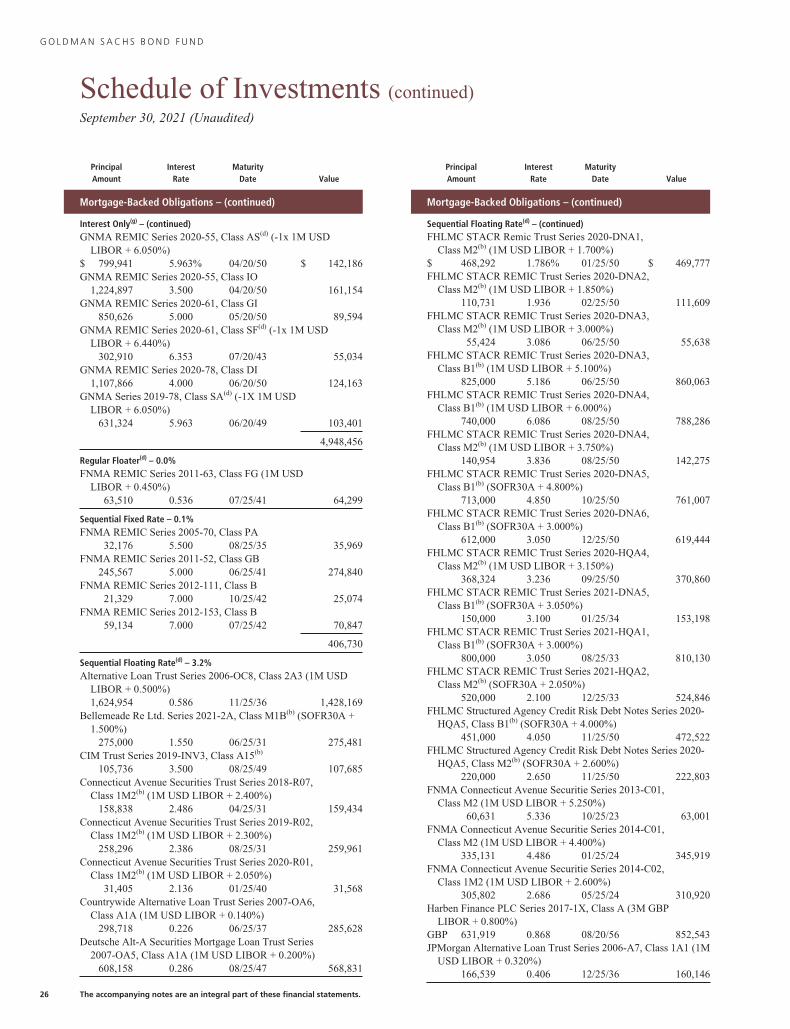
G O L D M A N S A C H S B O N D F U N D
Schedule of Investments (continued)September 30, 2021 (Unaudited)
PrincipalAmount
InterestRate
MaturityDate Value
Mortgage-Backed Obligations – (continued)
Interest Only(g) – (continued)GNMA REMIC Series 2020-55, Class AS(d) (-1x 1M USD
LIBOR + 6.050%)$ 799,941 5.963% 04/20/50 $ 142,186GNMA REMIC Series 2020-55, Class IO
1,224,897 3.500 04/20/50 161,154GNMA REMIC Series 2020-61, Class GI
850,626 5.000 05/20/50 89,594GNMA REMIC Series 2020-61, Class SF(d) (-1x 1M USD
LIBOR + 6.440%)302,910 6.353 07/20/43 55,034
GNMA REMIC Series 2020-78, Class DI1,107,866 4.000 06/20/50 124,163
GNMA Series 2019-78, Class SA(d) (-1X 1M USDLIBOR + 6.050%)
631,324 5.963 06/20/49 103,401
4,948,456
Regular Floater(d) – 0.0%FNMA REMIC Series 2011-63, Class FG (1M USD
LIBOR + 0.450%)63,510 0.536 07/25/41 64,299
Sequential Fixed Rate – 0.1%FNMA REMIC Series 2005-70, Class PA
32,176 5.500 08/25/35 35,969FNMA REMIC Series 2011-52, Class GB
245,567 5.000 06/25/41 274,840FNMA REMIC Series 2012-111, Class B
21,329 7.000 10/25/42 25,074FNMA REMIC Series 2012-153, Class B
59,134 7.000 07/25/42 70,847
406,730
Sequential Floating Rate(d) – 3.2%Alternative Loan Trust Series 2006-OC8, Class 2A3 (1M USD
LIBOR + 0.500%)1,624,954 0.586 11/25/36 1,428,169
Bellemeade Re Ltd. Series 2021-2A, Class M1B(b) (SOFR30A +1.500%)
275,000 1.550 06/25/31 275,481CIM Trust Series 2019-INV3, Class A15(b)
105,736 3.500 08/25/49 107,685Connecticut Avenue Securities Trust Series 2018-R07,
Class 1M2(b) (1M USD LIBOR + 2.400%)158,838 2.486 04/25/31 159,434
Connecticut Avenue Securities Trust Series 2019-R02,Class 1M2(b) (1M USD LIBOR + 2.300%)
258,296 2.386 08/25/31 259,961Connecticut Avenue Securities Trust Series 2020-R01,
Class 1M2(b) (1M USD LIBOR + 2.050%)31,405 2.136 01/25/40 31,568
Countrywide Alternative Loan Trust Series 2007-OA6,Class A1A (1M USD LIBOR + 0.140%)
298,718 0.226 06/25/37 285,628Deutsche Alt-A Securities Mortgage Loan Trust Series
2007-OA5, Class A1A (1M USD LIBOR + 0.200%)608,158 0.286 08/25/47 568,831
PrincipalAmount
InterestRate
MaturityDate Value
Mortgage-Backed Obligations – (continued)
Sequential Floating Rate(d) – (continued)FHLMC STACR Remic Trust Series 2020-DNA1,
Class M2(b) (1M USD LIBOR + 1.700%)$ 468,292 1.786% 01/25/50 $ 469,777FHLMC STACR REMIC Trust Series 2020-DNA2,
Class M2(b) (1M USD LIBOR + 1.850%)110,731 1.936 02/25/50 111,609
FHLMC STACR REMIC Trust Series 2020-DNA3,Class M2(b) (1M USD LIBOR + 3.000%)
55,424 3.086 06/25/50 55,638FHLMC STACR REMIC Trust Series 2020-DNA3,
Class B1(b) (1M USD LIBOR + 5.100%)825,000 5.186 06/25/50 860,063
FHLMC STACR REMIC Trust Series 2020-DNA4,Class B1(b) (1M USD LIBOR + 6.000%)
740,000 6.086 08/25/50 788,286FHLMC STACR REMIC Trust Series 2020-DNA4,
Class M2(b) (1M USD LIBOR + 3.750%)140,954 3.836 08/25/50 142,275
FHLMC STACR REMIC Trust Series 2020-DNA5,Class B1(b) (SOFR30A + 4.800%)
713,000 4.850 10/25/50 761,007FHLMC STACR REMIC Trust Series 2020-DNA6,
Class B1(b) (SOFR30A + 3.000%)612,000 3.050 12/25/50 619,444
FHLMC STACR REMIC Trust Series 2020-HQA4,Class M2(b) (1M USD LIBOR + 3.150%)
368,324 3.236 09/25/50 370,860FHLMC STACR REMIC Trust Series 2021-DNA5,
Class B1(b) (SOFR30A + 3.050%)150,000 3.100 01/25/34 153,198
FHLMC STACR REMIC Trust Series 2021-HQA1,Class B1(b) (SOFR30A + 3.000%)
800,000 3.050 08/25/33 810,130FHLMC STACR REMIC Trust Series 2021-HQA2,
Class M2(b) (SOFR30A + 2.050%)520,000 2.100 12/25/33 524,846
FHLMC Structured Agency Credit Risk Debt Notes Series 2020-HQA5, Class B1(b) (SOFR30A + 4.000%)
451,000 4.050 11/25/50 472,522FHLMC Structured Agency Credit Risk Debt Notes Series 2020-
HQA5, Class M2(b) (SOFR30A + 2.600%)220,000 2.650 11/25/50 222,803
FNMA Connecticut Avenue Securitie Series 2013-C01,Class M2 (1M USD LIBOR + 5.250%)
60,631 5.336 10/25/23 63,001FNMA Connecticut Avenue Securitie Series 2014-C01,
Class M2 (1M USD LIBOR + 4.400%)335,131 4.486 01/25/24 345,919
FNMA Connecticut Avenue Securitie Series 2014-C02,Class 1M2 (1M USD LIBOR + 2.600%)
305,802 2.686 05/25/24 310,920Harben Finance PLC Series 2017-1X, Class A (3M GBP
LIBOR + 0.800%)GBP 631,919 0.868 08/20/56 852,543JPMorgan Alternative Loan Trust Series 2006-A7, Class 1A1 (1M
USD LIBOR + 0.320%)166,539 0.406 12/25/36 160,146
26 The accompanying notes are an integral part of these financial statements.
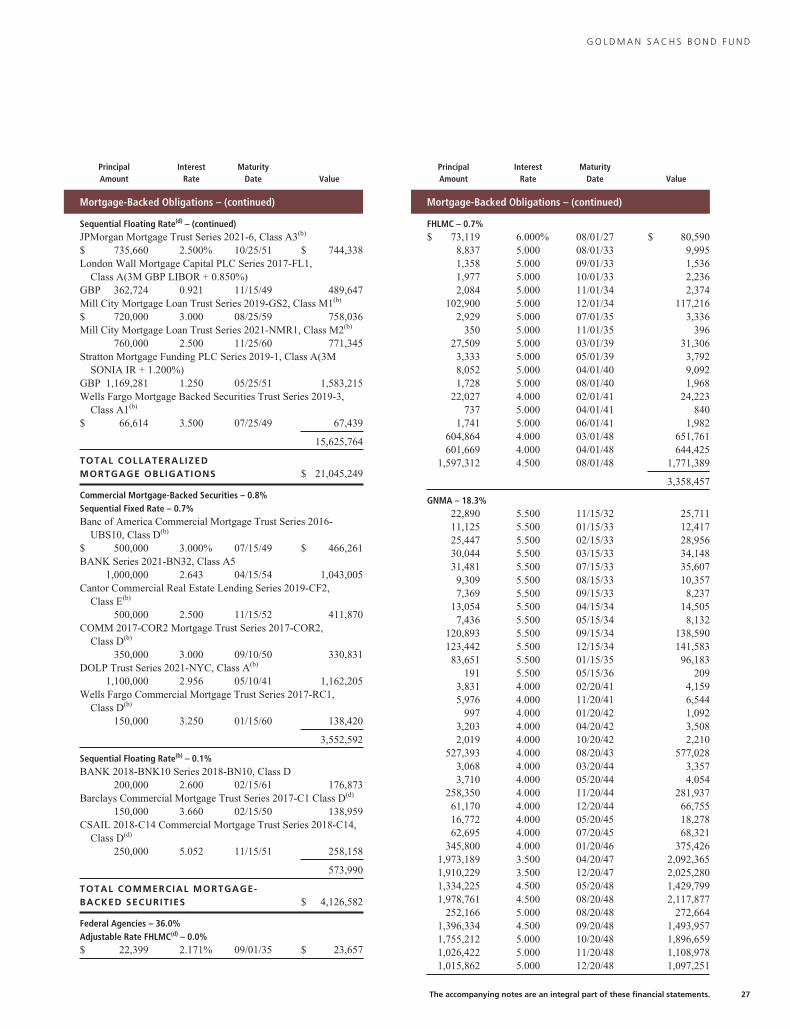
G O L D M A N S A C H S B O N D F U N D
PrincipalAmount
InterestRate
MaturityDate Value
Mortgage-Backed Obligations – (continued)
Sequential Floating Rate(d) – (continued)JPMorgan Mortgage Trust Series 2021-6, Class A3(b)
$ 735,660 2.500% 10/25/51 $ 744,338London Wall Mortgage Capital PLC Series 2017-FL1,
Class A(3M GBP LIBOR + 0.850%)GBP 362,724 0.921 11/15/49 489,647Mill City Mortgage Loan Trust Series 2019-GS2, Class M1(b)
$ 720,000 3.000 08/25/59 758,036Mill City Mortgage Loan Trust Series 2021-NMR1, Class M2(b)
760,000 2.500 11/25/60 771,345Stratton Mortgage Funding PLC Series 2019-1, Class A(3M
SONIA IR + 1.200%)GBP 1,169,281 1.250 05/25/51 1,583,215Wells Fargo Mortgage Backed Securities Trust Series 2019-3,
Class A1(b)
$ 66,614 3.500 07/25/49 67,439
15,625,764
TOTAL COLLATERALIZEDMORTGAGE OBLIGATIONS $ 21,045,249
Commercial Mortgage-Backed Securities – 0.8%Sequential Fixed Rate – 0.7%Banc of America Commercial Mortgage Trust Series 2016-
UBS10, Class D(b)
$ 500,000 3.000% 07/15/49 $ 466,261BANK Series 2021-BN32, Class A5
1,000,000 2.643 04/15/54 1,043,005Cantor Commercial Real Estate Lending Series 2019-CF2,
Class E(b)
500,000 2.500 11/15/52 411,870COMM 2017-COR2 Mortgage Trust Series 2017-COR2,
Class D(b)
350,000 3.000 09/10/50 330,831DOLP Trust Series 2021-NYC, Class A(b)
1,100,000 2.956 05/10/41 1,162,205Wells Fargo Commercial Mortgage Trust Series 2017-RC1,
Class D(b)
150,000 3.250 01/15/60 138,420
3,552,592
Sequential Floating Rate(b) – 0.1%BANK 2018-BNK10 Series 2018-BN10, Class D
200,000 2.600 02/15/61 176,873Barclays Commercial Mortgage Trust Series 2017-C1 Class D(d)
150,000 3.660 02/15/50 138,959CSAIL 2018-C14 Commercial Mortgage Trust Series 2018-C14,
Class D(d)
250,000 5.052 11/15/51 258,158
573,990
TOTAL COMMERCIAL MORTGAGE-BACKED SECURITIES $ 4,126,582
Federal Agencies – 36.0%Adjustable Rate FHLMC(d) – 0.0%$ 22,399 2.171% 09/01/35 $ 23,657
PrincipalAmount
InterestRate
MaturityDate Value
Mortgage-Backed Obligations – (continued)
FHLMC – 0.7%$ 73,119 6.000% 08/01/27 $ 80,590
8,837 5.000 08/01/33 9,9951,358 5.000 09/01/33 1,5361,977 5.000 10/01/33 2,2362,084 5.000 11/01/34 2,374
102,900 5.000 12/01/34 117,2162,929 5.000 07/01/35 3,336
350 5.000 11/01/35 39627,509 5.000 03/01/39 31,3063,333 5.000 05/01/39 3,7928,052 5.000 04/01/40 9,0921,728 5.000 08/01/40 1,968
22,027 4.000 02/01/41 24,223737 5.000 04/01/41 840
1,741 5.000 06/01/41 1,982604,864 4.000 03/01/48 651,761601,669 4.000 04/01/48 644,425
1,597,312 4.500 08/01/48 1,771,389
3,358,457
GNMA – 18.3%22,890 5.500 11/15/32 25,71111,125 5.500 01/15/33 12,41725,447 5.500 02/15/33 28,95630,044 5.500 03/15/33 34,14831,481 5.500 07/15/33 35,6079,309 5.500 08/15/33 10,3577,369 5.500 09/15/33 8,237
13,054 5.500 04/15/34 14,5057,436 5.500 05/15/34 8,132
120,893 5.500 09/15/34 138,590123,442 5.500 12/15/34 141,58383,651 5.500 01/15/35 96,183
191 5.500 05/15/36 2093,831 4.000 02/20/41 4,1595,976 4.000 11/20/41 6,544
997 4.000 01/20/42 1,0923,203 4.000 04/20/42 3,5082,019 4.000 10/20/42 2,210
527,393 4.000 08/20/43 577,0283,068 4.000 03/20/44 3,3573,710 4.000 05/20/44 4,054
258,350 4.000 11/20/44 281,93761,170 4.000 12/20/44 66,75516,772 4.000 05/20/45 18,27862,695 4.000 07/20/45 68,321
345,800 4.000 01/20/46 375,4261,973,189 3.500 04/20/47 2,092,3651,910,229 3.500 12/20/47 2,025,2801,334,225 4.500 05/20/48 1,429,7991,978,761 4.500 08/20/48 2,117,877
252,166 5.000 08/20/48 272,6641,396,334 4.500 09/20/48 1,493,9571,755,212 5.000 10/20/48 1,896,6591,026,422 5.000 11/20/48 1,108,9781,015,862 5.000 12/20/48 1,097,251
The accompanying notes are an integral part of these financial statements. 27
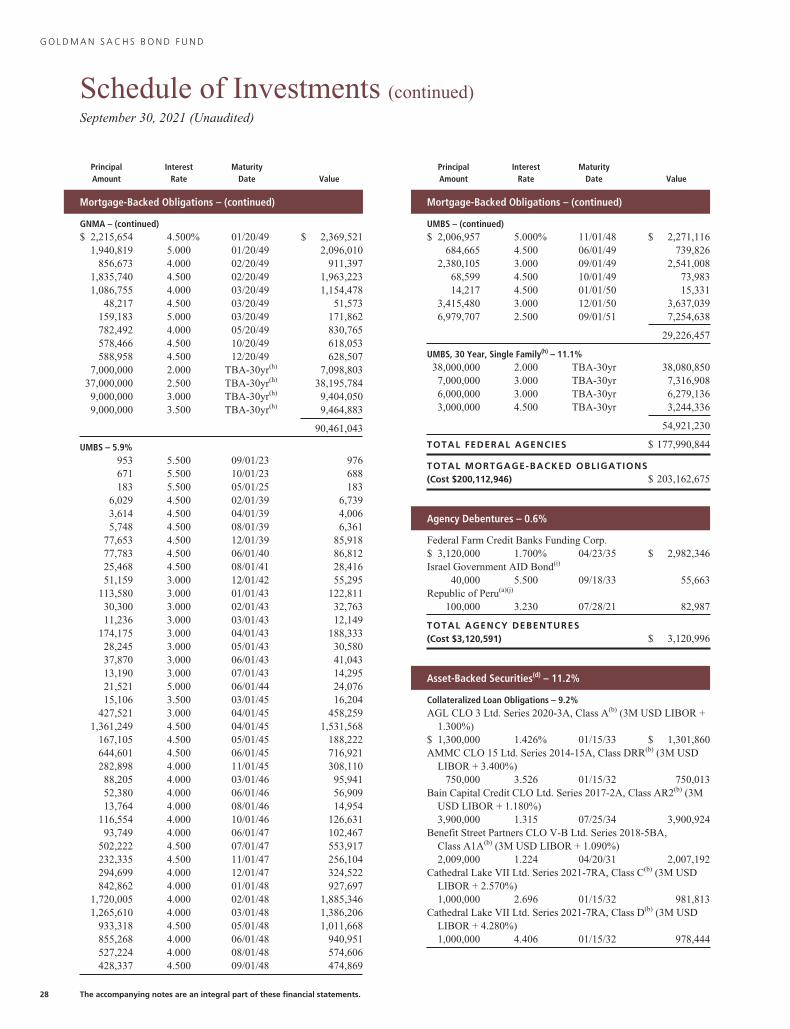
G O L D M A N S A C H S B O N D F U N D
Schedule of Investments (continued)September 30, 2021 (Unaudited)
PrincipalAmount
InterestRate
MaturityDate Value
Mortgage-Backed Obligations – (continued)
GNMA – (continued)$ 2,215,654 4.500% 01/20/49 $ 2,369,521
1,940,819 5.000 01/20/49 2,096,010856,673 4.000 02/20/49 911,397
1,835,740 4.500 02/20/49 1,963,2231,086,755 4.000 03/20/49 1,154,478
48,217 4.500 03/20/49 51,573159,183 5.000 03/20/49 171,862782,492 4.000 05/20/49 830,765578,466 4.500 10/20/49 618,053588,958 4.500 12/20/49 628,507
7,000,000 2.000 TBA-30yr(h) 7,098,80337,000,000 2.500 TBA-30yr(h) 38,195,7849,000,000 3.000 TBA-30yr(h) 9,404,0509,000,000 3.500 TBA-30yr(h) 9,464,883
90,461,043
UMBS – 5.9%953 5.500 09/01/23 976671 5.500 10/01/23 688183 5.500 05/01/25 183
6,029 4.500 02/01/39 6,7393,614 4.500 04/01/39 4,0065,748 4.500 08/01/39 6,361
77,653 4.500 12/01/39 85,91877,783 4.500 06/01/40 86,81225,468 4.500 08/01/41 28,41651,159 3.000 12/01/42 55,295
113,580 3.000 01/01/43 122,81130,300 3.000 02/01/43 32,76311,236 3.000 03/01/43 12,149
174,175 3.000 04/01/43 188,33328,245 3.000 05/01/43 30,58037,870 3.000 06/01/43 41,04313,190 3.000 07/01/43 14,29521,521 5.000 06/01/44 24,07615,106 3.500 03/01/45 16,204
427,521 3.000 04/01/45 458,2591,361,249 4.500 04/01/45 1,531,568
167,105 4.500 05/01/45 188,222644,601 4.500 06/01/45 716,921282,898 4.000 11/01/45 308,11088,205 4.000 03/01/46 95,94152,380 4.000 06/01/46 56,90913,764 4.000 08/01/46 14,954
116,554 4.000 10/01/46 126,63193,749 4.000 06/01/47 102,467
502,222 4.500 07/01/47 553,917232,335 4.500 11/01/47 256,104294,699 4.000 12/01/47 324,522842,862 4.000 01/01/48 927,697
1,720,005 4.000 02/01/48 1,885,3461,265,610 4.000 03/01/48 1,386,206
933,318 4.500 05/01/48 1,011,668855,268 4.000 06/01/48 940,951527,224 4.000 08/01/48 574,606428,337 4.500 09/01/48 474,869
PrincipalAmount
InterestRate
MaturityDate Value
Mortgage-Backed Obligations – (continued)
UMBS – (continued)$ 2,006,957 5.000% 11/01/48 $ 2,271,116
684,665 4.500 06/01/49 739,8262,380,105 3.000 09/01/49 2,541,008
68,599 4.500 10/01/49 73,98314,217 4.500 01/01/50 15,331
3,415,480 3.000 12/01/50 3,637,0396,979,707 2.500 09/01/51 7,254,638
29,226,457
UMBS, 30 Year, Single Family(h) – 11.1%38,000,000 2.000 TBA-30yr 38,080,8507,000,000 3.000 TBA-30yr 7,316,9086,000,000 3.000 TBA-30yr 6,279,1363,000,000 4.500 TBA-30yr 3,244,336
54,921,230
TOTAL FEDERAL AGENCIES $ 177,990,844
TOTAL MORTGAGE-BACKED OBLIGATIONS(Cost $200,112,946) $ 203,162,675
Agency Debentures – 0.6%
Federal Farm Credit Banks Funding Corp.$ 3,120,000 1.700% 04/23/35 $ 2,982,346Israel Government AID Bond(i)
40,000 5.500 09/18/33 55,663Republic of Peru(a)(j)
100,000 3.230 07/28/21 82,987
TOTAL AGENCY DEBENTURES(Cost $3,120,591) $ 3,120,996
Asset-Backed Securities(d) – 11.2%
Collateralized Loan Obligations – 9.2%AGL CLO 3 Ltd. Series 2020-3A, Class A(b) (3M USD LIBOR +
1.300%)$ 1,300,000 1.426% 01/15/33 $ 1,301,860AMMC CLO 15 Ltd. Series 2014-15A, Class DRR(b) (3M USD
LIBOR + 3.400%)750,000 3.526 01/15/32 750,013
Bain Capital Credit CLO Ltd. Series 2017-2A, Class AR2(b) (3MUSD LIBOR + 1.180%)3,900,000 1.315 07/25/34 3,900,924
Benefit Street Partners CLO V-B Ltd. Series 2018-5BA,Class A1A(b) (3M USD LIBOR + 1.090%)2,009,000 1.224 04/20/31 2,007,192
Cathedral Lake VII Ltd. Series 2021-7RA, Class C(b) (3M USDLIBOR + 2.570%)1,000,000 2.696 01/15/32 981,813
Cathedral Lake VII Ltd. Series 2021-7RA, Class D(b) (3M USDLIBOR + 4.280%)1,000,000 4.406 01/15/32 978,444
28 The accompanying notes are an integral part of these financial statements.
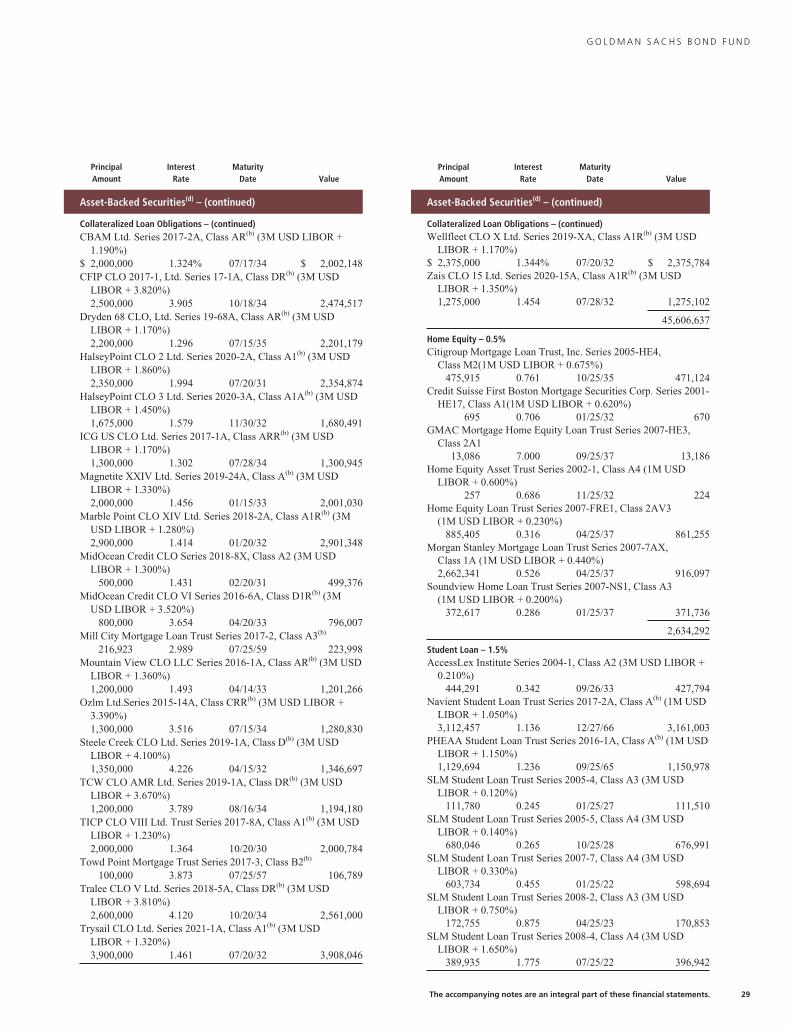
G O L D M A N S A C H S B O N D F U N D
PrincipalAmount
InterestRate
MaturityDate Value
Asset-Backed Securities(d) – (continued)
Collateralized Loan Obligations – (continued)CBAM Ltd. Series 2017-2A, Class AR(b) (3M USD LIBOR +
1.190%)$ 2,000,000 1.324% 07/17/34 $ 2,002,148CFIP CLO 2017-1, Ltd. Series 17-1A, Class DR(b) (3M USD
LIBOR + 3.820%)2,500,000 3.905 10/18/34 2,474,517
Dryden 68 CLO, Ltd. Series 19-68A, Class AR(b) (3M USDLIBOR + 1.170%)2,200,000 1.296 07/15/35 2,201,179
HalseyPoint CLO 2 Ltd. Series 2020-2A, Class A1(b) (3M USDLIBOR + 1.860%)2,350,000 1.994 07/20/31 2,354,874
HalseyPoint CLO 3 Ltd. Series 2020-3A, Class A1A(b) (3M USDLIBOR + 1.450%)1,675,000 1.579 11/30/32 1,680,491
ICG US CLO Ltd. Series 2017-1A, Class ARR(b) (3M USDLIBOR + 1.170%)1,300,000 1.302 07/28/34 1,300,945
Magnetite XXIV Ltd. Series 2019-24A, Class A(b) (3M USDLIBOR + 1.330%)2,000,000 1.456 01/15/33 2,001,030
Marble Point CLO XIV Ltd. Series 2018-2A, Class A1R(b) (3MUSD LIBOR + 1.280%)2,900,000 1.414 01/20/32 2,901,348
MidOcean Credit CLO Series 2018-8X, Class A2 (3M USDLIBOR + 1.300%)
500,000 1.431 02/20/31 499,376MidOcean Credit CLO VI Series 2016-6A, Class D1R(b) (3M
USD LIBOR + 3.520%)800,000 3.654 04/20/33 796,007
Mill City Mortgage Loan Trust Series 2017-2, Class A3(b)
216,923 2.989 07/25/59 223,998Mountain View CLO LLC Series 2016-1A, Class AR(b) (3M USD
LIBOR + 1.360%)1,200,000 1.493 04/14/33 1,201,266
Ozlm Ltd.Series 2015-14A, Class CRR(b) (3M USD LIBOR +3.390%)1,300,000 3.516 07/15/34 1,280,830
Steele Creek CLO Ltd. Series 2019-1A, Class D(b) (3M USDLIBOR + 4.100%)1,350,000 4.226 04/15/32 1,346,697
TCW CLO AMR Ltd. Series 2019-1A, Class DR(b) (3M USDLIBOR + 3.670%)1,200,000 3.789 08/16/34 1,194,180
TICP CLO VIII Ltd. Trust Series 2017-8A, Class A1(b) (3M USDLIBOR + 1.230%)2,000,000 1.364 10/20/30 2,000,784
Towd Point Mortgage Trust Series 2017-3, Class B2(b)
100,000 3.873 07/25/57 106,789Tralee CLO V Ltd. Series 2018-5A, Class DR(b) (3M USD
LIBOR + 3.810%)2,600,000 4.120 10/20/34 2,561,000
Trysail CLO Ltd. Series 2021-1A, Class A1(b) (3M USDLIBOR + 1.320%)3,900,000 1.461 07/20/32 3,908,046
PrincipalAmount
InterestRate
MaturityDate Value
Asset-Backed Securities(d) – (continued)
Collateralized Loan Obligations – (continued)Wellfleet CLO X Ltd. Series 2019-XA, Class A1R(b) (3M USD
LIBOR + 1.170%)$ 2,375,000 1.344% 07/20/32 $ 2,375,784Zais CLO 15 Ltd. Series 2020-15A, Class A1R(b) (3M USD
LIBOR + 1.350%)1,275,000 1.454 07/28/32 1,275,102
45,606,637
Home Equity – 0.5%Citigroup Mortgage Loan Trust, Inc. Series 2005-HE4,
Class M2(1M USD LIBOR + 0.675%)475,915 0.761 10/25/35 471,124
Credit Suisse First Boston Mortgage Securities Corp. Series 2001-HE17, Class A1(1M USD LIBOR + 0.620%)
695 0.706 01/25/32 670GMAC Mortgage Home Equity Loan Trust Series 2007-HE3,
Class 2A113,086 7.000 09/25/37 13,186
Home Equity Asset Trust Series 2002-1, Class A4 (1M USDLIBOR + 0.600%)
257 0.686 11/25/32 224Home Equity Loan Trust Series 2007-FRE1, Class 2AV3
(1M USD LIBOR + 0.230%)885,405 0.316 04/25/37 861,255
Morgan Stanley Mortgage Loan Trust Series 2007-7AX,Class 1A (1M USD LIBOR + 0.440%)2,662,341 0.526 04/25/37 916,097
Soundview Home Loan Trust Series 2007-NS1, Class A3(1M USD LIBOR + 0.200%)
372,617 0.286 01/25/37 371,736
2,634,292
Student Loan – 1.5%AccessLex Institute Series 2004-1, Class A2 (3M USD LIBOR +
0.210%)444,291 0.342 09/26/33 427,794
Navient Student Loan Trust Series 2017-2A, Class A(b) (1M USDLIBOR + 1.050%)3,112,457 1.136 12/27/66 3,161,003
PHEAA Student Loan Trust Series 2016-1A, Class A(b) (1M USDLIBOR + 1.150%)1,129,694 1.236 09/25/65 1,150,978
SLM Student Loan Trust Series 2005-4, Class A3 (3M USDLIBOR + 0.120%)
111,780 0.245 01/25/27 111,510SLM Student Loan Trust Series 2005-5, Class A4 (3M USD
LIBOR + 0.140%)680,046 0.265 10/25/28 676,991
SLM Student Loan Trust Series 2007-7, Class A4 (3M USDLIBOR + 0.330%)
603,734 0.455 01/25/22 598,694SLM Student Loan Trust Series 2008-2, Class A3 (3M USD
LIBOR + 0.750%)172,755 0.875 04/25/23 170,853
SLM Student Loan Trust Series 2008-4, Class A4 (3M USDLIBOR + 1.650%)
389,935 1.775 07/25/22 396,942
The accompanying notes are an integral part of these financial statements. 29
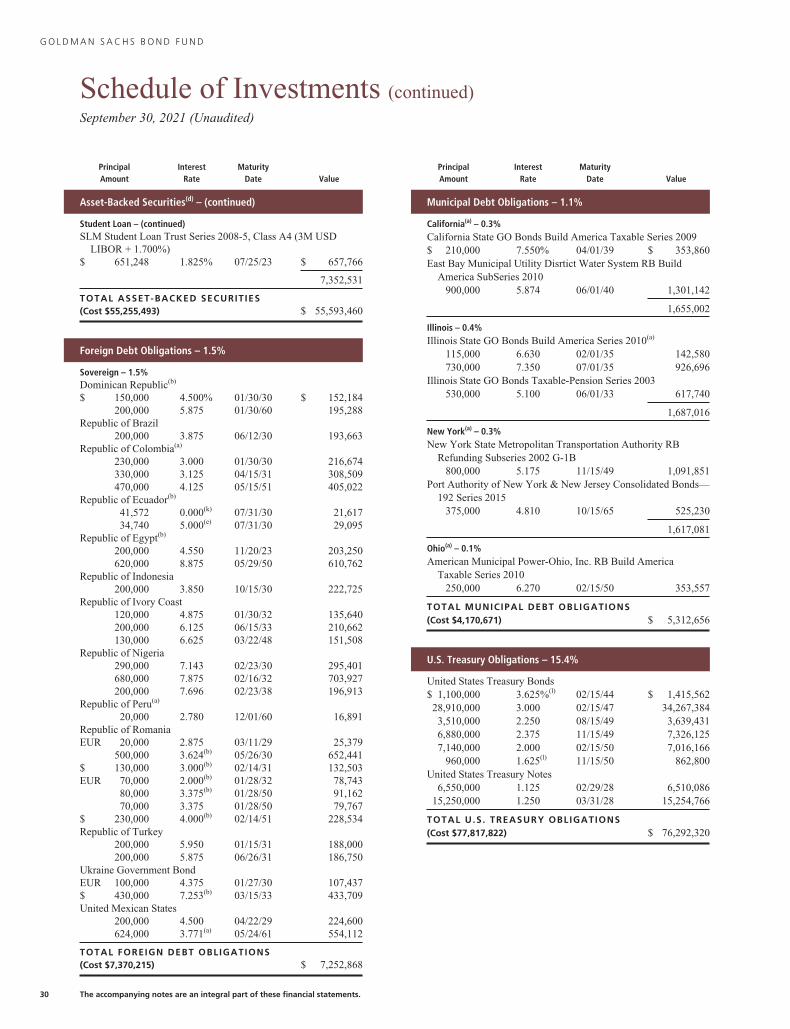
G O L D M A N S A C H S B O N D F U N D
Schedule of Investments (continued)September 30, 2021 (Unaudited)
PrincipalAmount
InterestRate
MaturityDate Value
Asset-Backed Securities(d) – (continued)
Student Loan – (continued)SLM Student Loan Trust Series 2008-5, Class A4 (3M USD
LIBOR + 1.700%)$ 651,248 1.825% 07/25/23 $ 657,766
7,352,531
TOTAL ASSET-BACKED SECURITIES(Cost $55,255,493) $ 55,593,460
Foreign Debt Obligations – 1.5%
Sovereign – 1.5%Dominican Republic(b)
$ 150,000 4.500% 01/30/30 $ 152,184200,000 5.875 01/30/60 195,288
Republic of Brazil200,000 3.875 06/12/30 193,663
Republic of Colombia(a)
230,000 3.000 01/30/30 216,674330,000 3.125 04/15/31 308,509470,000 4.125 05/15/51 405,022
Republic of Ecuador(b)
41,572 0.000(k) 07/31/30 21,61734,740 5.000(e) 07/31/30 29,095
Republic of Egypt(b)
200,000 4.550 11/20/23 203,250620,000 8.875 05/29/50 610,762
Republic of Indonesia200,000 3.850 10/15/30 222,725
Republic of Ivory Coast120,000 4.875 01/30/32 135,640200,000 6.125 06/15/33 210,662130,000 6.625 03/22/48 151,508
Republic of Nigeria290,000 7.143 02/23/30 295,401680,000 7.875 02/16/32 703,927200,000 7.696 02/23/38 196,913
Republic of Peru(a)
20,000 2.780 12/01/60 16,891Republic of RomaniaEUR 20,000 2.875 03/11/29 25,379
500,000 3.624(b) 05/26/30 652,441$ 130,000 3.000(b) 02/14/31 132,503EUR 70,000 2.000(b) 01/28/32 78,743
80,000 3.375(b) 01/28/50 91,16270,000 3.375 01/28/50 79,767
$ 230,000 4.000(b) 02/14/51 228,534Republic of Turkey
200,000 5.950 01/15/31 188,000200,000 5.875 06/26/31 186,750
Ukraine Government BondEUR 100,000 4.375 01/27/30 107,437$ 430,000 7.253(b) 03/15/33 433,709United Mexican States
200,000 4.500 04/22/29 224,600624,000 3.771(a) 05/24/61 554,112
TOTAL FOREIGN DEBT OBLIGATIONS(Cost $7,370,215) $ 7,252,868
PrincipalAmount
InterestRate
MaturityDate Value
Municipal Debt Obligations – 1.1%
California(a) – 0.3%California State GO Bonds Build America Taxable Series 2009$ 210,000 7.550% 04/01/39 $ 353,860East Bay Municipal Utility Disrtict Water System RB Build
America SubSeries 2010900,000 5.874 06/01/40 1,301,142
1,655,002
Illinois – 0.4%Illinois State GO Bonds Build America Series 2010(a)
115,000 6.630 02/01/35 142,580730,000 7.350 07/01/35 926,696
Illinois State GO Bonds Taxable-Pension Series 2003530,000 5.100 06/01/33 617,740
1,687,016
New York(a) – 0.3%New York State Metropolitan Transportation Authority RB
Refunding Subseries 2002 G-1B800,000 5.175 11/15/49 1,091,851
Port Authority of New York & New Jersey Consolidated Bonds—192 Series 2015
375,000 4.810 10/15/65 525,230
1,617,081
Ohio(a) – 0.1%American Municipal Power-Ohio, Inc. RB Build America
Taxable Series 2010250,000 6.270 02/15/50 353,557
TOTAL MUNICIPAL DEBT OBLIGATIONS(Cost $4,170,671) $ 5,312,656
U.S. Treasury Obligations – 15.4%
United States Treasury Bonds$ 1,100,000 3.625%(l) 02/15/44 $ 1,415,56228,910,000 3.000 02/15/47 34,267,3843,510,000 2.250 08/15/49 3,639,4316,880,000 2.375 11/15/49 7,326,1257,140,000 2.000 02/15/50 7,016,166
960,000 1.625(l) 11/15/50 862,800United States Treasury Notes
6,550,000 1.125 02/29/28 6,510,08615,250,000 1.250 03/31/28 15,254,766
TOTAL U.S. TREASURY OBLIGATIONS(Cost $77,817,822) $ 76,292,320
30 The accompanying notes are an integral part of these financial statements.
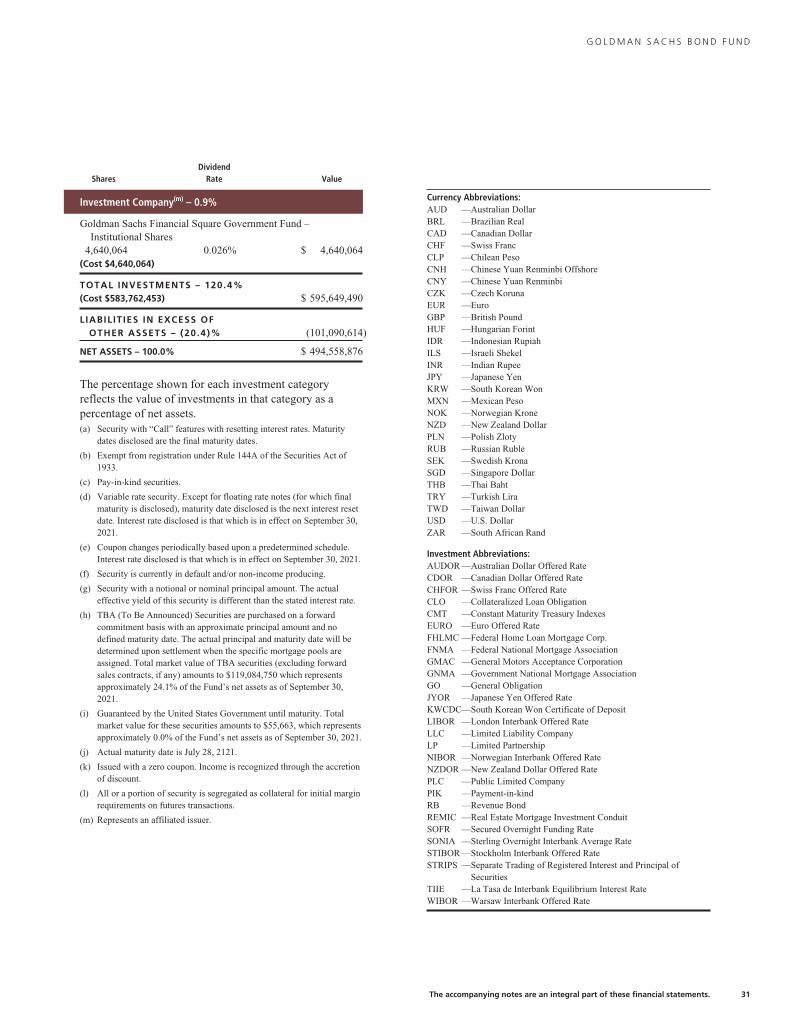
G O L D M A N S A C H S B O N D F U N D
SharesDividend
Rate Value
Investment Company(m) – 0.9%
Goldman Sachs Financial Square Government Fund –Institutional Shares
4,640,064 0.026% $ 4,640,064(Cost $4,640,064)
TOTAL INVESTMENTS – 120.4%(Cost $583,762,453) $ 595,649,490
LIABIL IT IES IN EXCESS OFOTHER ASSETS – (20.4)% (101,090,614)
NET ASSETS – 100.0% $ 494,558,876
The percentage shown for each investment categoryreflects the value of investments in that category as apercentage of net assets.(a) Security with “Call” features with resetting interest rates. Maturity
dates disclosed are the final maturity dates.
(b) Exempt from registration under Rule 144A of the Securities Act of1933.
(c) Pay-in-kind securities.
(d) Variable rate security. Except for floating rate notes (for which finalmaturity is disclosed), maturity date disclosed is the next interest resetdate. Interest rate disclosed is that which is in effect on September 30,2021.
(e) Coupon changes periodically based upon a predetermined schedule.Interest rate disclosed is that which is in effect on September 30, 2021.
(f) Security is currently in default and/or non-income producing.
(g) Security with a notional or nominal principal amount. The actualeffective yield of this security is different than the stated interest rate.
(h) TBA (To Be Announced) Securities are purchased on a forwardcommitment basis with an approximate principal amount and nodefined maturity date. The actual principal and maturity date will bedetermined upon settlement when the specific mortgage pools areassigned. Total market value of TBA securities (excluding forwardsales contracts, if any) amounts to $119,084,750 which representsapproximately 24.1% of the Fund’s net assets as of September 30,2021.
(i) Guaranteed by the United States Government until maturity. Totalmarket value for these securities amounts to $55,663, which representsapproximately 0.0% of the Fund’s net assets as of September 30, 2021.
(j) Actual maturity date is July 28, 2121.
(k) Issued with a zero coupon. Income is recognized through the accretionof discount.
(l) All or a portion of security is segregated as collateral for initial marginrequirements on futures transactions.
(m) Represents an affiliated issuer.
Currency Abbreviations:AUD —Australian DollarBRL —Brazilian RealCAD —Canadian DollarCHF —Swiss FrancCLP —Chilean PesoCNH —Chinese Yuan Renminbi OffshoreCNY —Chinese Yuan RenminbiCZK —Czech KorunaEUR —EuroGBP —British PoundHUF —Hungarian ForintIDR —Indonesian RupiahILS —Israeli ShekelINR —Indian RupeeJPY —Japanese YenKRW —South Korean WonMXN —Mexican PesoNOK —Norwegian KroneNZD —New Zealand DollarPLN —Polish ZlotyRUB —Russian RubleSEK —Swedish KronaSGD —Singapore DollarTHB —Thai BahtTRY —Turkish LiraTWD —Taiwan DollarUSD —U.S. DollarZAR —South African Rand
Investment Abbreviations:AUDOR —Australian Dollar Offered RateCDOR —Canadian Dollar Offered RateCHFOR —Swiss Franc Offered RateCLO —Collateralized Loan ObligationCMT —Constant Maturity Treasury IndexesEURO —Euro Offered RateFHLMC —Federal Home Loan Mortgage Corp.FNMA —Federal National Mortgage AssociationGMAC —General Motors Acceptance CorporationGNMA —Government National Mortgage AssociationGO —General ObligationJYOR —Japanese Yen Offered RateKWCDC—South Korean Won Certificate of DepositLIBOR —London Interbank Offered RateLLC —Limited Liability CompanyLP —Limited PartnershipNIBOR —Norwegian Interbank Offered RateNZDOR —New Zealand Dollar Offered RatePLC —Public Limited CompanyPIK —Payment-in-kindRB —Revenue BondREMIC —Real Estate Mortgage Investment ConduitSOFR —Secured Overnight Funding RateSONIA —Sterling Overnight Interbank Average RateSTIBOR —Stockholm Interbank Offered RateSTRIPS —Separate Trading of Registered Interest and Principal of
SecuritiesTIIE —La Tasa de Interbank Equilibrium Interest RateWIBOR —Warsaw Interbank Offered Rate
The accompanying notes are an integral part of these financial statements. 31
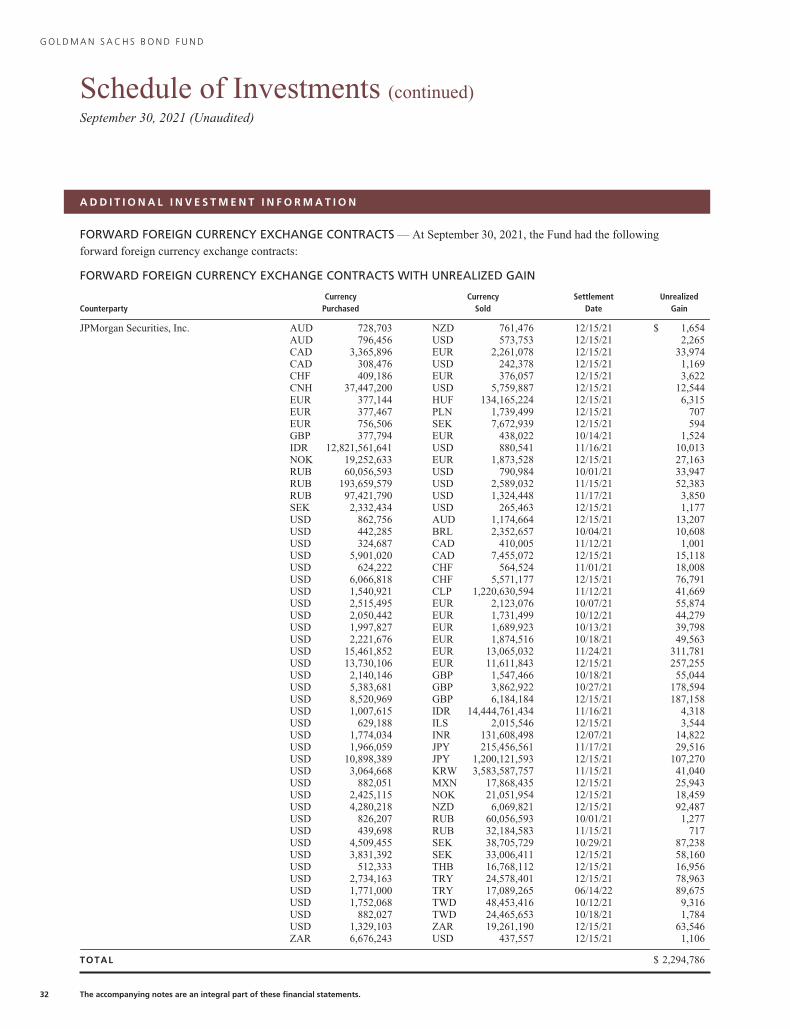
G O L D M A N S A C H S B O N D F U N D
Schedule of Investments (continued)September 30, 2021 (Unaudited)
A D D I T I O N A L I N V E S T M E N T I N F O R M A T I O N
FORWARD FOREIGN CURRENCY EXCHANGE CONTRACTS — At September 30, 2021, the Fund had the following
forward foreign currency exchange contracts:
FORWARD FOREIGN CURRENCY EXCHANGE CONTRACTS WITH UNREALIZED GAIN
CounterpartyCurrency
PurchasedCurrency
SoldSettlement
DateUnrealized
Gain
JPMorgan Securities, Inc. AUD 728,703 NZD 761,476 12/15/21 $ 1,654AUD 796,456 USD 573,753 12/15/21 2,265CAD 3,365,896 EUR 2,261,078 12/15/21 33,974CAD 308,476 USD 242,378 12/15/21 1,169CHF 409,186 EUR 376,057 12/15/21 3,622CNH 37,447,200 USD 5,759,887 12/15/21 12,544EUR 377,144 HUF 134,165,224 12/15/21 6,315EUR 377,467 PLN 1,739,499 12/15/21 707EUR 756,506 SEK 7,672,939 12/15/21 594GBP 377,794 EUR 438,022 10/14/21 1,524IDR 12,821,561,641 USD 880,541 11/16/21 10,013NOK 19,252,633 EUR 1,873,528 12/15/21 27,163RUB 60,056,593 USD 790,984 10/01/21 33,947RUB 193,659,579 USD 2,589,032 11/15/21 52,383RUB 97,421,790 USD 1,324,448 11/17/21 3,850SEK 2,332,434 USD 265,463 12/15/21 1,177USD 862,756 AUD 1,174,664 12/15/21 13,207USD 442,285 BRL 2,352,657 10/04/21 10,608USD 324,687 CAD 410,005 11/12/21 1,001USD 5,901,020 CAD 7,455,072 12/15/21 15,118USD 624,222 CHF 564,524 11/01/21 18,008USD 6,066,818 CHF 5,571,177 12/15/21 76,791USD 1,540,921 CLP 1,220,630,594 11/12/21 41,669USD 2,515,495 EUR 2,123,076 10/07/21 55,874USD 2,050,442 EUR 1,731,499 10/12/21 44,279USD 1,997,827 EUR 1,689,923 10/13/21 39,798USD 2,221,676 EUR 1,874,516 10/18/21 49,563USD 15,461,852 EUR 13,065,032 11/24/21 311,781USD 13,730,106 EUR 11,611,843 12/15/21 257,255USD 2,140,146 GBP 1,547,466 10/18/21 55,044USD 5,383,681 GBP 3,862,922 10/27/21 178,594USD 8,520,969 GBP 6,184,184 12/15/21 187,158USD 1,007,615 IDR 14,444,761,434 11/16/21 4,318USD 629,188 ILS 2,015,546 12/15/21 3,544USD 1,774,034 INR 131,608,498 12/07/21 14,822USD 1,966,059 JPY 215,456,561 11/17/21 29,516USD 10,898,389 JPY 1,200,121,593 12/15/21 107,270USD 3,064,668 KRW 3,583,587,757 11/15/21 41,040USD 882,051 MXN 17,868,435 12/15/21 25,943USD 2,425,115 NOK 21,051,954 12/15/21 18,459USD 4,280,218 NZD 6,069,821 12/15/21 92,487USD 826,207 RUB 60,056,593 10/01/21 1,277USD 439,698 RUB 32,184,583 11/15/21 717USD 4,509,455 SEK 38,705,729 10/29/21 87,238USD 3,831,392 SEK 33,006,411 12/15/21 58,160USD 512,333 THB 16,768,112 12/15/21 16,956USD 2,734,163 TRY 24,578,401 12/15/21 78,963USD 1,771,000 TRY 17,089,265 06/14/22 89,675USD 1,752,068 TWD 48,453,416 10/12/21 9,316USD 882,027 TWD 24,465,653 10/18/21 1,784USD 1,329,103 ZAR 19,261,190 12/15/21 63,546ZAR 6,676,243 USD 437,557 12/15/21 1,106
TOTAL $ 2,294,786
32 The accompanying notes are an integral part of these financial statements.
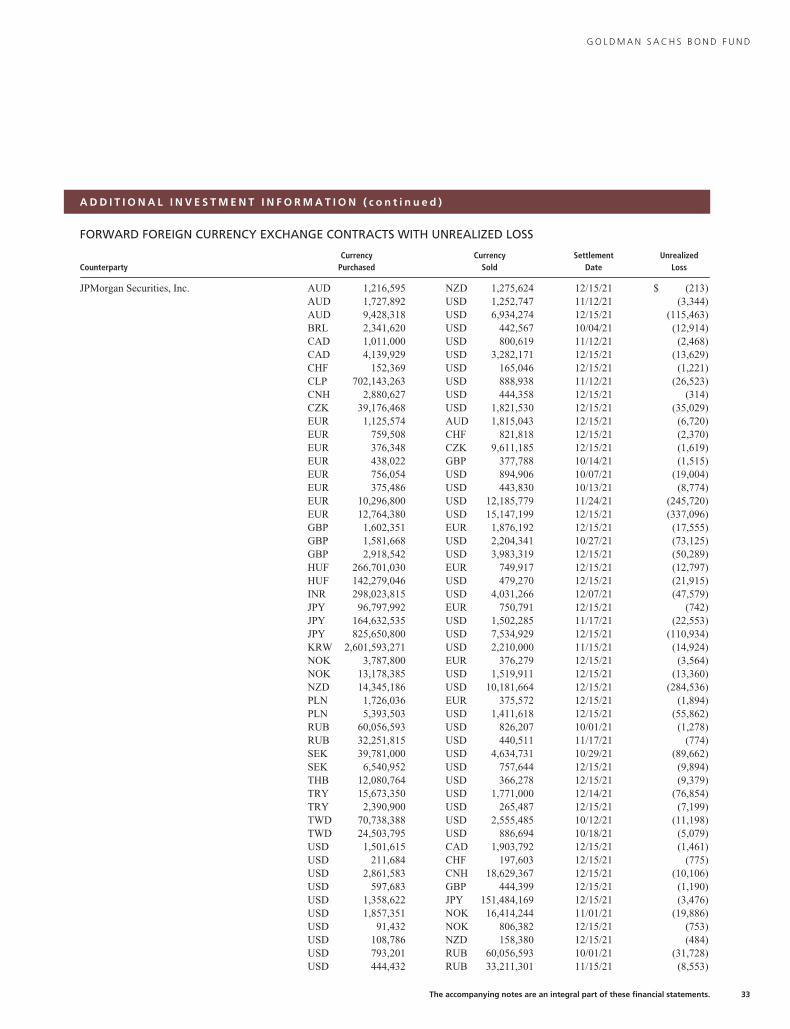
G O L D M A N S A C H S B O N D F U N D
A D D I T I O N A L I N V E S T M E N T I N F O R M A T I O N ( c o n t i n u e d )
FORWARD FOREIGN CURRENCY EXCHANGE CONTRACTS WITH UNREALIZED LOSS
CounterpartyCurrency
PurchasedCurrency
SoldSettlement
DateUnrealized
Loss
JPMorgan Securities, Inc. AUD 1,216,595 NZD 1,275,624 12/15/21 $ (213)AUD 1,727,892 USD 1,252,747 11/12/21 (3,344)AUD 9,428,318 USD 6,934,274 12/15/21 (115,463)BRL 2,341,620 USD 442,567 10/04/21 (12,914)CAD 1,011,000 USD 800,619 11/12/21 (2,468)CAD 4,139,929 USD 3,282,171 12/15/21 (13,629)CHF 152,369 USD 165,046 12/15/21 (1,221)CLP 702,143,263 USD 888,938 11/12/21 (26,523)CNH 2,880,627 USD 444,358 12/15/21 (314)CZK 39,176,468 USD 1,821,530 12/15/21 (35,029)EUR 1,125,574 AUD 1,815,043 12/15/21 (6,720)EUR 759,508 CHF 821,818 12/15/21 (2,370)EUR 376,348 CZK 9,611,185 12/15/21 (1,619)EUR 438,022 GBP 377,788 10/14/21 (1,515)EUR 756,054 USD 894,906 10/07/21 (19,004)EUR 375,486 USD 443,830 10/13/21 (8,774)EUR 10,296,800 USD 12,185,779 11/24/21 (245,720)EUR 12,764,380 USD 15,147,199 12/15/21 (337,096)GBP 1,602,351 EUR 1,876,192 12/15/21 (17,555)GBP 1,581,668 USD 2,204,341 10/27/21 (73,125)GBP 2,918,542 USD 3,983,319 12/15/21 (50,289)HUF 266,701,030 EUR 749,917 12/15/21 (12,797)HUF 142,279,046 USD 479,270 12/15/21 (21,915)INR 298,023,815 USD 4,031,266 12/07/21 (47,579)JPY 96,797,992 EUR 750,791 12/15/21 (742)JPY 164,632,535 USD 1,502,285 11/17/21 (22,553)JPY 825,650,800 USD 7,534,929 12/15/21 (110,934)KRW 2,601,593,271 USD 2,210,000 11/15/21 (14,924)NOK 3,787,800 EUR 376,279 12/15/21 (3,564)NOK 13,178,385 USD 1,519,911 12/15/21 (13,360)NZD 14,345,186 USD 10,181,664 12/15/21 (284,536)PLN 1,726,036 EUR 375,572 12/15/21 (1,894)PLN 5,393,503 USD 1,411,618 12/15/21 (55,862)RUB 60,056,593 USD 826,207 10/01/21 (1,278)RUB 32,251,815 USD 440,511 11/17/21 (774)SEK 39,781,000 USD 4,634,731 10/29/21 (89,662)SEK 6,540,952 USD 757,644 12/15/21 (9,894)THB 12,080,764 USD 366,278 12/15/21 (9,379)TRY 15,673,350 USD 1,771,000 12/14/21 (76,854)TRY 2,390,900 USD 265,487 12/15/21 (7,199)TWD 70,738,388 USD 2,555,485 10/12/21 (11,198)TWD 24,503,795 USD 886,694 10/18/21 (5,079)USD 1,501,615 CAD 1,903,792 12/15/21 (1,461)USD 211,684 CHF 197,603 12/15/21 (775)USD 2,861,583 CNH 18,629,367 12/15/21 (10,106)USD 597,683 GBP 444,399 12/15/21 (1,190)USD 1,358,622 JPY 151,484,169 12/15/21 (3,476)USD 1,857,351 NOK 16,414,244 11/01/21 (19,886)USD 91,432 NOK 806,382 12/15/21 (753)USD 108,786 NZD 158,380 12/15/21 (484)USD 793,201 RUB 60,056,593 10/01/21 (31,728)USD 444,432 RUB 33,211,301 11/15/21 (8,553)
The accompanying notes are an integral part of these financial statements. 33
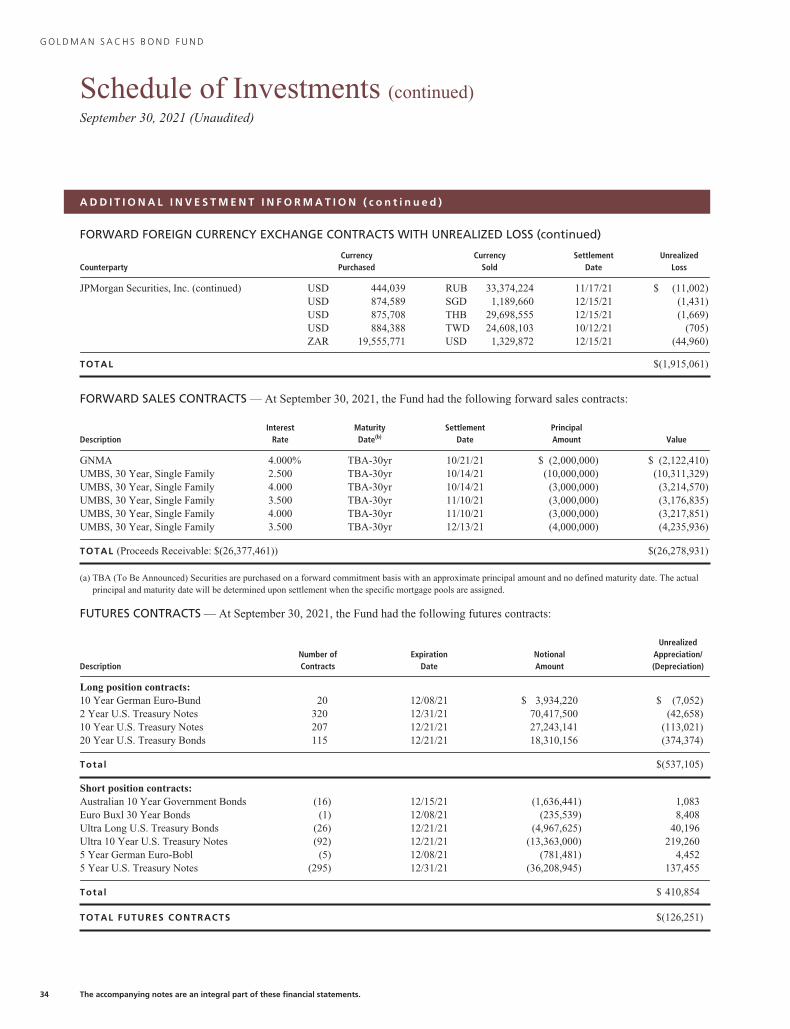
G O L D M A N S A C H S B O N D F U N D
Schedule of Investments (continued)September 30, 2021 (Unaudited)
A D D I T I O N A L I N V E S T M E N T I N F O R M A T I O N ( c o n t i n u e d )
FORWARD FOREIGN CURRENCY EXCHANGE CONTRACTS WITH UNREALIZED LOSS (continued)
CounterpartyCurrency
PurchasedCurrency
SoldSettlement
DateUnrealized
Loss
JPMorgan Securities, Inc. (continued) USD 444,039 RUB 33,374,224 11/17/21 $ (11,002)USD 874,589 SGD 1,189,660 12/15/21 (1,431)USD 875,708 THB 29,698,555 12/15/21 (1,669)USD 884,388 TWD 24,608,103 10/12/21 (705)ZAR 19,555,771 USD 1,329,872 12/15/21 (44,960)
TOTAL $(1,915,061)
FORWARD SALES CONTRACTS — At September 30, 2021, the Fund had the following forward sales contracts:
DescriptionInterest
RateMaturityDate(b)
SettlementDate
PrincipalAmount Value
GNMA 4.000% TBA-30yr 10/21/21 $ (2,000,000) $ (2,122,410)UMBS, 30 Year, Single Family 2.500 TBA-30yr 10/14/21 (10,000,000) (10,311,329)UMBS, 30 Year, Single Family 4.000 TBA-30yr 10/14/21 (3,000,000) (3,214,570)UMBS, 30 Year, Single Family 3.500 TBA-30yr 11/10/21 (3,000,000) (3,176,835)UMBS, 30 Year, Single Family 4.000 TBA-30yr 11/10/21 (3,000,000) (3,217,851)UMBS, 30 Year, Single Family 3.500 TBA-30yr 12/13/21 (4,000,000) (4,235,936)
TOTAL (Proceeds Receivable: $(26,377,461)) $(26,278,931)
(a) TBA (To Be Announced) Securities are purchased on a forward commitment basis with an approximate principal amount and no defined maturity date. The actualprincipal and maturity date will be determined upon settlement when the specific mortgage pools are assigned.
FUTURES CONTRACTS — At September 30, 2021, the Fund had the following futures contracts:
DescriptionNumber ofContracts
ExpirationDate
NotionalAmount
UnrealizedAppreciation/(Depreciation)
Long position contracts:10 Year German Euro-Bund 20 12/08/21 $ 3,934,220 $ (7,052)2 Year U.S. Treasury Notes 320 12/31/21 70,417,500 (42,658)10 Year U.S. Treasury Notes 207 12/21/21 27,243,141 (113,021)20 Year U.S. Treasury Bonds 115 12/21/21 18,310,156 (374,374)
Total $(537,105)
Short position contracts:Australian 10 Year Government Bonds (16) 12/15/21 (1,636,441) 1,083Euro Buxl 30 Year Bonds (1) 12/08/21 (235,539) 8,408Ultra Long U.S. Treasury Bonds (26) 12/21/21 (4,967,625) 40,196Ultra 10 Year U.S. Treasury Notes (92) 12/21/21 (13,363,000) 219,2605 Year German Euro-Bobl (5) 12/08/21 (781,481) 4,4525 Year U.S. Treasury Notes (295) 12/31/21 (36,208,945) 137,455
Total $ 410,854
TOTAL FUTURES CONTRACTS $(126,251)
34 The accompanying notes are an integral part of these financial statements.
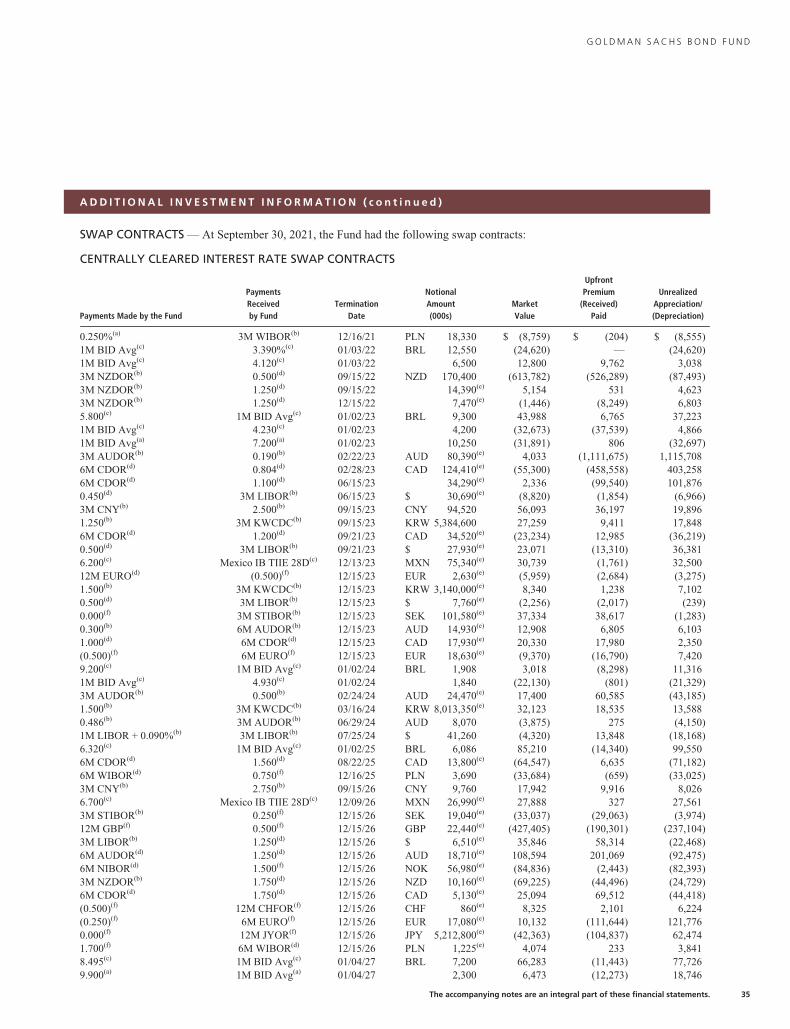
G O L D M A N S A C H S B O N D F U N D
A D D I T I O N A L I N V E S T M E N T I N F O R M A T I O N ( c o n t i n u e d )
SWAP CONTRACTS — At September 30, 2021, the Fund had the following swap contracts:
CENTRALLY CLEARED INTEREST RATE SWAP CONTRACTS
Payments Made by the Fund
PaymentsReceivedby Fund
TerminationDate
NotionalAmount(000s)
MarketValue
UpfrontPremium
(Received)Paid
UnrealizedAppreciation/(Depreciation)
0.250%(a) 3M WIBOR(b) 12/16/21 PLN 18,330 $ (8,759) $ (204) $ (8,555)1M BID Avg(c) 3.390%(c) 01/03/22 BRL 12,550 (24,620) — (24,620)1M BID Avg(c) 4.120(c) 01/03/22 6,500 12,800 9,762 3,0383M NZDOR(b) 0.500(d) 09/15/22 NZD 170,400 (613,782) (526,289) (87,493)3M NZDOR(b) 1.250(d) 09/15/22 14,390(e) 5,154 531 4,6233M NZDOR(b) 1.250(d) 12/15/22 7,470(e) (1,446) (8,249) 6,8035.800(c) 1M BID Avg(c) 01/02/23 BRL 9,300 43,988 6,765 37,2231M BID Avg(c) 4.230(c) 01/02/23 4,200 (32,673) (37,539) 4,8661M BID Avg(a) 7.200(a) 01/02/23 10,250 (31,891) 806 (32,697)3M AUDOR(b) 0.190(b) 02/22/23 AUD 80,390(e) 4,033 (1,111,675) 1,115,7086M CDOR(d) 0.804(d) 02/28/23 CAD 124,410(e) (55,300) (458,558) 403,2586M CDOR(d) 1.100(d) 06/15/23 34,290(e) 2,336 (99,540) 101,8760.450(d) 3M LIBOR(b) 06/15/23 $ 30,690(e) (8,820) (1,854) (6,966)3M CNY(b) 2.500(b) 09/15/23 CNY 94,520 56,093 36,197 19,8961.250(b) 3M KWCDC(b) 09/15/23 KRW 5,384,600 27,259 9,411 17,8486M CDOR(d) 1.200(d) 09/21/23 CAD 34,520(e) (23,234) 12,985 (36,219)0.500(d) 3M LIBOR(b) 09/21/23 $ 27,930(e) 23,071 (13,310) 36,3816.200(c) Mexico IB TIIE 28D(c) 12/13/23 MXN 75,340(e) 30,739 (1,761) 32,50012M EURO(d) (0.500)(f) 12/15/23 EUR 2,630(e) (5,959) (2,684) (3,275)1.500(b) 3M KWCDC(b) 12/15/23 KRW 3,140,000(e) 8,340 1,238 7,1020.500(d) 3M LIBOR(b) 12/15/23 $ 7,760(e) (2,256) (2,017) (239)0.000(f) 3M STIBOR(b) 12/15/23 SEK 101,580(e) 37,334 38,617 (1,283)0.300(b) 6M AUDOR(b) 12/15/23 AUD 14,930(e) 12,908 6,805 6,1031.000(d) 6M CDOR(d) 12/15/23 CAD 17,930(e) 20,330 17,980 2,350(0.500)(f) 6M EURO(f) 12/15/23 EUR 18,630(e) (9,370) (16,790) 7,4209.200(c) 1M BID Avg(c) 01/02/24 BRL 1,908 3,018 (8,298) 11,3161M BID Avg(c) 4.930(c) 01/02/24 1,840 (22,130) (801) (21,329)3M AUDOR(b) 0.500(b) 02/24/24 AUD 24,470(e) 17,400 60,585 (43,185)1.500(b) 3M KWCDC(b) 03/16/24 KRW 8,013,350(e) 32,123 18,535 13,5880.486(b) 3M AUDOR(b) 06/29/24 AUD 8,070 (3,875) 275 (4,150)1M LIBOR + 0.090%(b) 3M LIBOR(b) 07/25/24 $ 41,260 (4,320) 13,848 (18,168)6.320(c) 1M BID Avg(c) 01/02/25 BRL 6,086 85,210 (14,340) 99,5506M CDOR(d) 1.560(d) 08/22/25 CAD 13,800(e) (64,547) 6,635 (71,182)6M WIBOR(d) 0.750(f) 12/16/25 PLN 3,690 (33,684) (659) (33,025)3M CNY(b) 2.750(b) 09/15/26 CNY 9,760 17,942 9,916 8,0266.700(c) Mexico IB TIIE 28D(c) 12/09/26 MXN 26,990(e) 27,888 327 27,5613M STIBOR(b) 0.250(f) 12/15/26 SEK 19,040(e) (33,037) (29,063) (3,974)12M GBP(f) 0.500(f) 12/15/26 GBP 22,440(e) (427,405) (190,301) (237,104)3M LIBOR(b) 1.250(d) 12/15/26 $ 6,510(e) 35,846 58,314 (22,468)6M AUDOR(d) 1.250(d) 12/15/26 AUD 18,710(e) 108,594 201,069 (92,475)6M NIBOR(d) 1.500(f) 12/15/26 NOK 56,980(e) (84,836) (2,443) (82,393)3M NZDOR(b) 1.750(d) 12/15/26 NZD 10,160(e) (69,225) (44,496) (24,729)6M CDOR(d) 1.750(d) 12/15/26 CAD 5,130(e) 25,094 69,512 (44,418)(0.500)(f) 12M CHFOR(f) 12/15/26 CHF 860(e) 8,325 2,101 6,224(0.250)(f) 6M EURO(f) 12/15/26 EUR 17,080(e) 10,132 (111,644) 121,7760.000(f) 12M JYOR(f) 12/15/26 JPY 5,212,800(e) (42,363) (104,837) 62,4741.700(f) 6M WIBOR(d) 12/15/26 PLN 1,225(e) 4,074 233 3,8418.495(c) 1M BID Avg(c) 01/04/27 BRL 7,200 66,283 (11,443) 77,7269.900(a) 1M BID Avg(a) 01/04/27 2,300 6,473 (12,273) 18,746
The accompanying notes are an integral part of these financial statements. 35
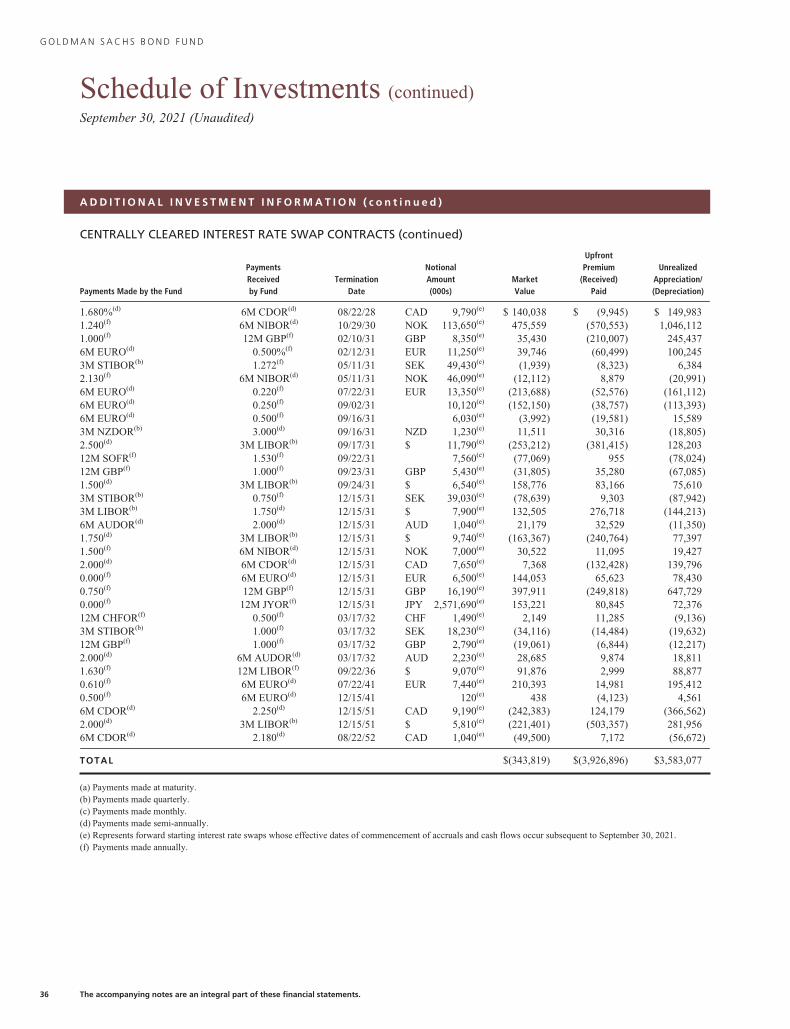
G O L D M A N S A C H S B O N D F U N D
Schedule of Investments (continued)September 30, 2021 (Unaudited)
A D D I T I O N A L I N V E S T M E N T I N F O R M A T I O N ( c o n t i n u e d )
CENTRALLY CLEARED INTEREST RATE SWAP CONTRACTS (continued)
Payments Made by the Fund
PaymentsReceivedby Fund
TerminationDate
NotionalAmount(000s)
MarketValue
UpfrontPremium
(Received)Paid
UnrealizedAppreciation/(Depreciation)
1.680%(d) 6M CDOR(d) 08/22/28 CAD 9,790(e) $ 140,038 $ (9,945) $ 149,9831.240(f) 6M NIBOR(d) 10/29/30 NOK 113,650(e) 475,559 (570,553) 1,046,1121.000(f) 12M GBP(f) 02/10/31 GBP 8,350(e) 35,430 (210,007) 245,4376M EURO(d) 0.500%(f) 02/12/31 EUR 11,250(e) 39,746 (60,499) 100,2453M STIBOR(b) 1.272(f) 05/11/31 SEK 49,430(e) (1,939) (8,323) 6,3842.130(f) 6M NIBOR(d) 05/11/31 NOK 46,090(e) (12,112) 8,879 (20,991)6M EURO(d) 0.220(f) 07/22/31 EUR 13,350(e) (213,688) (52,576) (161,112)6M EURO(d) 0.250(f) 09/02/31 10,120(e) (152,150) (38,757) (113,393)6M EURO(d) 0.500(f) 09/16/31 6,030(e) (3,992) (19,581) 15,5893M NZDOR(b) 3.000(d) 09/16/31 NZD 1,230(e) 11,511 30,316 (18,805)2.500(d) 3M LIBOR(b) 09/17/31 $ 11,790(e) (253,212) (381,415) 128,20312M SOFR(f) 1.530(f) 09/22/31 7,560(e) (77,069) 955 (78,024)12M GBP(f) 1.000(f) 09/23/31 GBP 5,430(e) (31,805) 35,280 (67,085)1.500(d) 3M LIBOR(b) 09/24/31 $ 6,540(e) 158,776 83,166 75,6103M STIBOR(b) 0.750(f) 12/15/31 SEK 39,030(e) (78,639) 9,303 (87,942)3M LIBOR(b) 1.750(d) 12/15/31 $ 7,900(e) 132,505 276,718 (144,213)6M AUDOR(d) 2.000(d) 12/15/31 AUD 1,040(e) 21,179 32,529 (11,350)1.750(d) 3M LIBOR(b) 12/15/31 $ 9,740(e) (163,367) (240,764) 77,3971.500(f) 6M NIBOR(d) 12/15/31 NOK 7,000(e) 30,522 11,095 19,4272.000(d) 6M CDOR(d) 12/15/31 CAD 7,650(e) 7,368 (132,428) 139,7960.000(f) 6M EURO(d) 12/15/31 EUR 6,500(e) 144,053 65,623 78,4300.750(f) 12M GBP(f) 12/15/31 GBP 16,190(e) 397,911 (249,818) 647,7290.000(f) 12M JYOR(f) 12/15/31 JPY 2,571,690(e) 153,221 80,845 72,37612M CHFOR(f) 0.500(f) 03/17/32 CHF 1,490(e) 2,149 11,285 (9,136)3M STIBOR(b) 1.000(f) 03/17/32 SEK 18,230(e) (34,116) (14,484) (19,632)12M GBP(f) 1.000(f) 03/17/32 GBP 2,790(e) (19,061) (6,844) (12,217)2.000(d) 6M AUDOR(d) 03/17/32 AUD 2,230(e) 28,685 9,874 18,8111.630(f) 12M LIBOR(f) 09/22/36 $ 9,070(e) 91,876 2,999 88,8770.610(f) 6M EURO(d) 07/22/41 EUR 7,440(e) 210,393 14,981 195,4120.500(f) 6M EURO(d) 12/15/41 120(e) 438 (4,123) 4,5616M CDOR(d) 2.250(d) 12/15/51 CAD 9,190(e) (242,383) 124,179 (366,562)2.000(d) 3M LIBOR(b) 12/15/51 $ 5,810(e) (221,401) (503,357) 281,9566M CDOR(d) 2.180(d) 08/22/52 CAD 1,040(e) (49,500) 7,172 (56,672)
TOTAL $(343,819) $(3,926,896) $3,583,077
(a) Payments made at maturity.(b) Payments made quarterly.(c) Payments made monthly.(d) Payments made semi-annually.(e) Represents forward starting interest rate swaps whose effective dates of commencement of accruals and cash flows occur subsequent to September 30, 2021.(f) Payments made annually.
36 The accompanying notes are an integral part of these financial statements.
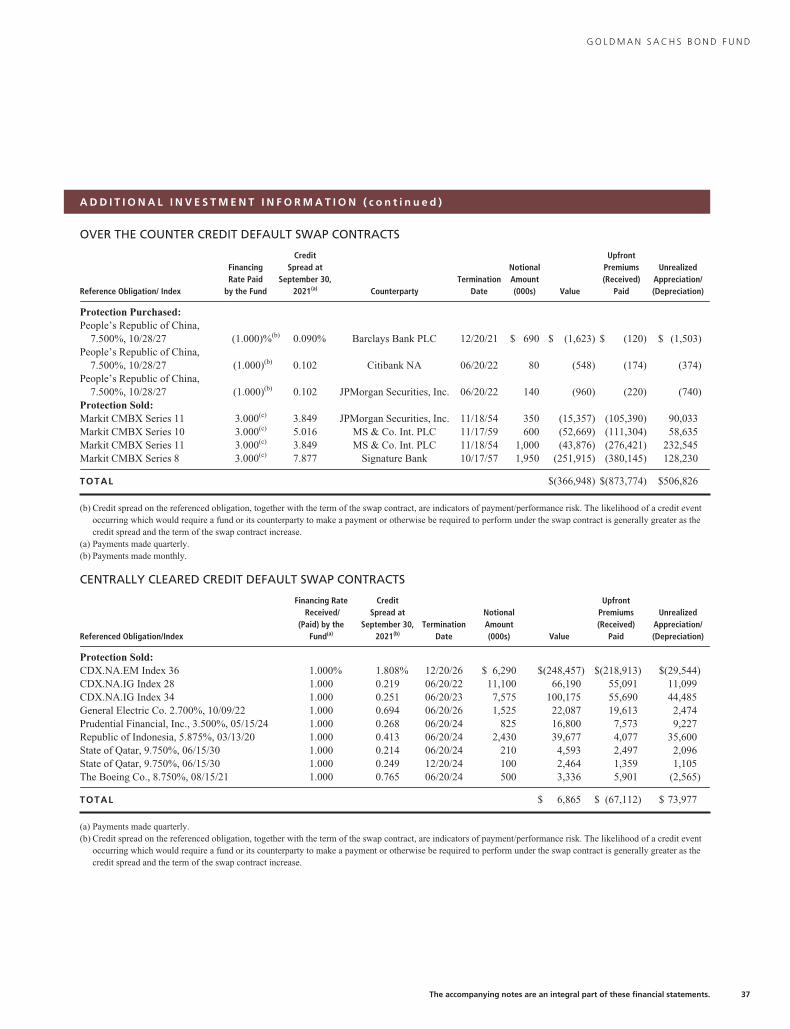
G O L D M A N S A C H S B O N D F U N D
A D D I T I O N A L I N V E S T M E N T I N F O R M A T I O N ( c o n t i n u e d )
OVER THE COUNTER CREDIT DEFAULT SWAP CONTRACTS
Reference Obligation/ Index
FinancingRate Paid
by the Fund
CreditSpread at
September 30,2021(a) Counterparty
TerminationDate
NotionalAmount(000s) Value
UpfrontPremiums(Received)
Paid
UnrealizedAppreciation/(Depreciation)
Protection Purchased:People’s Republic of China,
7.500%, 10/28/27 (1.000)%(b) 0.090% Barclays Bank PLC 12/20/21 $ 690 $ (1,623) $ (120) $ (1,503)People’s Republic of China,
7.500%, 10/28/27 (1.000)(b) 0.102 Citibank NA 06/20/22 80 (548) (174) (374)People’s Republic of China,
7.500%, 10/28/27 (1.000)(b) 0.102 JPMorgan Securities, Inc. 06/20/22 140 (960) (220) (740)Protection Sold:Markit CMBX Series 11 3.000(c) 3.849 JPMorgan Securities, Inc. 11/18/54 350 (15,357) (105,390) 90,033Markit CMBX Series 10 3.000(c) 5.016 MS & Co. Int. PLC 11/17/59 600 (52,669) (111,304) 58,635Markit CMBX Series 11 3.000(c) 3.849 MS & Co. Int. PLC 11/18/54 1,000 (43,876) (276,421) 232,545Markit CMBX Series 8 3.000(c) 7.877 Signature Bank 10/17/57 1,950 (251,915) (380,145) 128,230
TOTAL $(366,948) $(873,774) $506,826
(b) Credit spread on the referenced obligation, together with the term of the swap contract, are indicators of payment/performance risk. The likelihood of a credit eventoccurring which would require a fund or its counterparty to make a payment or otherwise be required to perform under the swap contract is generally greater as thecredit spread and the term of the swap contract increase.
(a) Payments made quarterly.(b) Payments made monthly.
CENTRALLY CLEARED CREDIT DEFAULT SWAP CONTRACTS
Referenced Obligation/Index
Financing RateReceived/
(Paid) by theFund(a)
CreditSpread at
September 30,2021(b)
TerminationDate
NotionalAmount(000s) Value
UpfrontPremiums(Received)
Paid
UnrealizedAppreciation/(Depreciation)
Protection Sold:CDX.NA.EM Index 36 1.000% 1.808% 12/20/26 $ 6,290 $(248,457) $(218,913) $(29,544)CDX.NA.IG Index 28 1.000 0.219 06/20/22 11,100 66,190 55,091 11,099CDX.NA.IG Index 34 1.000 0.251 06/20/23 7,575 100,175 55,690 44,485General Electric Co. 2.700%, 10/09/22 1.000 0.694 06/20/26 1,525 22,087 19,613 2,474Prudential Financial, Inc., 3.500%, 05/15/24 1.000 0.268 06/20/24 825 16,800 7,573 9,227Republic of Indonesia, 5.875%, 03/13/20 1.000 0.413 06/20/24 2,430 39,677 4,077 35,600State of Qatar, 9.750%, 06/15/30 1.000 0.214 06/20/24 210 4,593 2,497 2,096State of Qatar, 9.750%, 06/15/30 1.000 0.249 12/20/24 100 2,464 1,359 1,105The Boeing Co., 8.750%, 08/15/21 1.000 0.765 06/20/24 500 3,336 5,901 (2,565)
TOTAL $ 6,865 $ (67,112) $ 73,977
(a) Payments made quarterly.(b) Credit spread on the referenced obligation, together with the term of the swap contract, are indicators of payment/performance risk. The likelihood of a credit event
occurring which would require a fund or its counterparty to make a payment or otherwise be required to perform under the swap contract is generally greater as thecredit spread and the term of the swap contract increase.
The accompanying notes are an integral part of these financial statements. 37
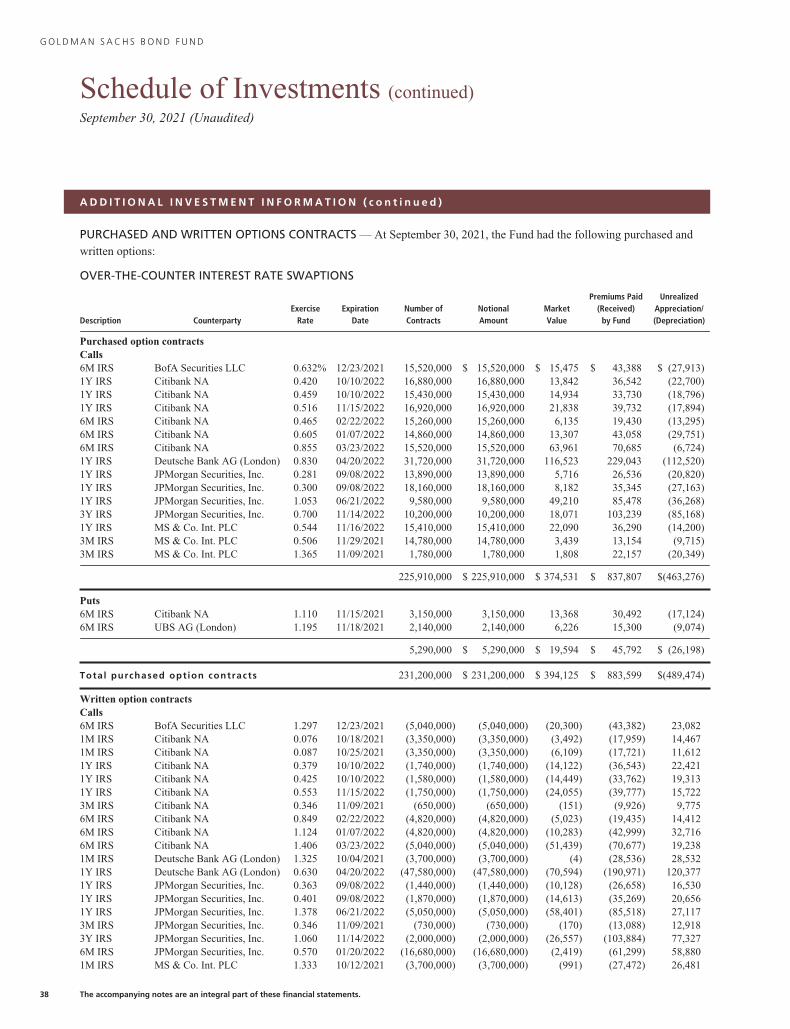
G O L D M A N S A C H S B O N D F U N D
Schedule of Investments (continued)September 30, 2021 (Unaudited)
A D D I T I O N A L I N V E S T M E N T I N F O R M A T I O N ( c o n t i n u e d )
PURCHASED AND WRITTEN OPTIONS CONTRACTS — At September 30, 2021, the Fund had the following purchased and
written options:
OVER-THE-COUNTER INTEREST RATE SWAPTIONS
Description CounterpartyExercise
RateExpiration
DateNumber ofContracts
NotionalAmount
MarketValue
Premiums Paid(Received)
by Fund
UnrealizedAppreciation/(Depreciation)
Purchased option contractsCalls6M IRS BofA Securities LLC 0.632% 12/23/2021 15,520,000 $ 15,520,000 $ 15,475 $ 43,388 $ (27,913)1Y IRS Citibank NA 0.420 10/10/2022 16,880,000 16,880,000 13,842 36,542 (22,700)1Y IRS Citibank NA 0.459 10/10/2022 15,430,000 15,430,000 14,934 33,730 (18,796)1Y IRS Citibank NA 0.516 11/15/2022 16,920,000 16,920,000 21,838 39,732 (17,894)6M IRS Citibank NA 0.465 02/22/2022 15,260,000 15,260,000 6,135 19,430 (13,295)6M IRS Citibank NA 0.605 01/07/2022 14,860,000 14,860,000 13,307 43,058 (29,751)6M IRS Citibank NA 0.855 03/23/2022 15,520,000 15,520,000 63,961 70,685 (6,724)1Y IRS Deutsche Bank AG (London) 0.830 04/20/2022 31,720,000 31,720,000 116,523 229,043 (112,520)1Y IRS JPMorgan Securities, Inc. 0.281 09/08/2022 13,890,000 13,890,000 5,716 26,536 (20,820)1Y IRS JPMorgan Securities, Inc. 0.300 09/08/2022 18,160,000 18,160,000 8,182 35,345 (27,163)1Y IRS JPMorgan Securities, Inc. 1.053 06/21/2022 9,580,000 9,580,000 49,210 85,478 (36,268)3Y IRS JPMorgan Securities, Inc. 0.700 11/14/2022 10,200,000 10,200,000 18,071 103,239 (85,168)1Y IRS MS & Co. Int. PLC 0.544 11/16/2022 15,410,000 15,410,000 22,090 36,290 (14,200)3M IRS MS & Co. Int. PLC 0.506 11/29/2021 14,780,000 14,780,000 3,439 13,154 (9,715)3M IRS MS & Co. Int. PLC 1.365 11/09/2021 1,780,000 1,780,000 1,808 22,157 (20,349)
225,910,000 $ 225,910,000 $ 374,531 $ 837,807 $(463,276)
Puts6M IRS Citibank NA 1.110 11/15/2021 3,150,000 3,150,000 13,368 30,492 (17,124)6M IRS UBS AG (London) 1.195 11/18/2021 2,140,000 2,140,000 6,226 15,300 (9,074)
5,290,000 $ 5,290,000 $ 19,594 $ 45,792 $ (26,198)
Total purchased option contracts 231,200,000 $ 231,200,000 $ 394,125 $ 883,599 $(489,474)
Written option contractsCalls6M IRS BofA Securities LLC 1.297 12/23/2021 (5,040,000) (5,040,000) (20,300) (43,382) 23,0821M IRS Citibank NA 0.076 10/18/2021 (3,350,000) (3,350,000) (3,492) (17,959) 14,4671M IRS Citibank NA 0.087 10/25/2021 (3,350,000) (3,350,000) (6,109) (17,721) 11,6121Y IRS Citibank NA 0.379 10/10/2022 (1,740,000) (1,740,000) (14,122) (36,543) 22,4211Y IRS Citibank NA 0.425 10/10/2022 (1,580,000) (1,580,000) (14,449) (33,762) 19,3131Y IRS Citibank NA 0.553 11/15/2022 (1,750,000) (1,750,000) (24,055) (39,777) 15,7223M IRS Citibank NA 0.346 11/09/2021 (650,000) (650,000) (151) (9,926) 9,7756M IRS Citibank NA 0.849 02/22/2022 (4,820,000) (4,820,000) (5,023) (19,435) 14,4126M IRS Citibank NA 1.124 01/07/2022 (4,820,000) (4,820,000) (10,283) (42,999) 32,7166M IRS Citibank NA 1.406 03/23/2022 (5,040,000) (5,040,000) (51,439) (70,677) 19,2381M IRS Deutsche Bank AG (London) 1.325 10/04/2021 (3,700,000) (3,700,000) (4) (28,536) 28,5321Y IRS Deutsche Bank AG (London) 0.630 04/20/2022 (47,580,000) (47,580,000) (70,594) (190,971) 120,3771Y IRS JPMorgan Securities, Inc. 0.363 09/08/2022 (1,440,000) (1,440,000) (10,128) (26,658) 16,5301Y IRS JPMorgan Securities, Inc. 0.401 09/08/2022 (1,870,000) (1,870,000) (14,613) (35,269) 20,6561Y IRS JPMorgan Securities, Inc. 1.378 06/21/2022 (5,050,000) (5,050,000) (58,401) (85,518) 27,1173M IRS JPMorgan Securities, Inc. 0.346 11/09/2021 (730,000) (730,000) (170) (13,088) 12,9183Y IRS JPMorgan Securities, Inc. 1.060 11/14/2022 (2,000,000) (2,000,000) (26,557) (103,884) 77,3276M IRS JPMorgan Securities, Inc. 0.570 01/20/2022 (16,680,000) (16,680,000) (2,419) (61,299) 58,8801M IRS MS & Co. Int. PLC 1.333 10/12/2021 (3,700,000) (3,700,000) (991) (27,472) 26,481
38 The accompanying notes are an integral part of these financial statements.
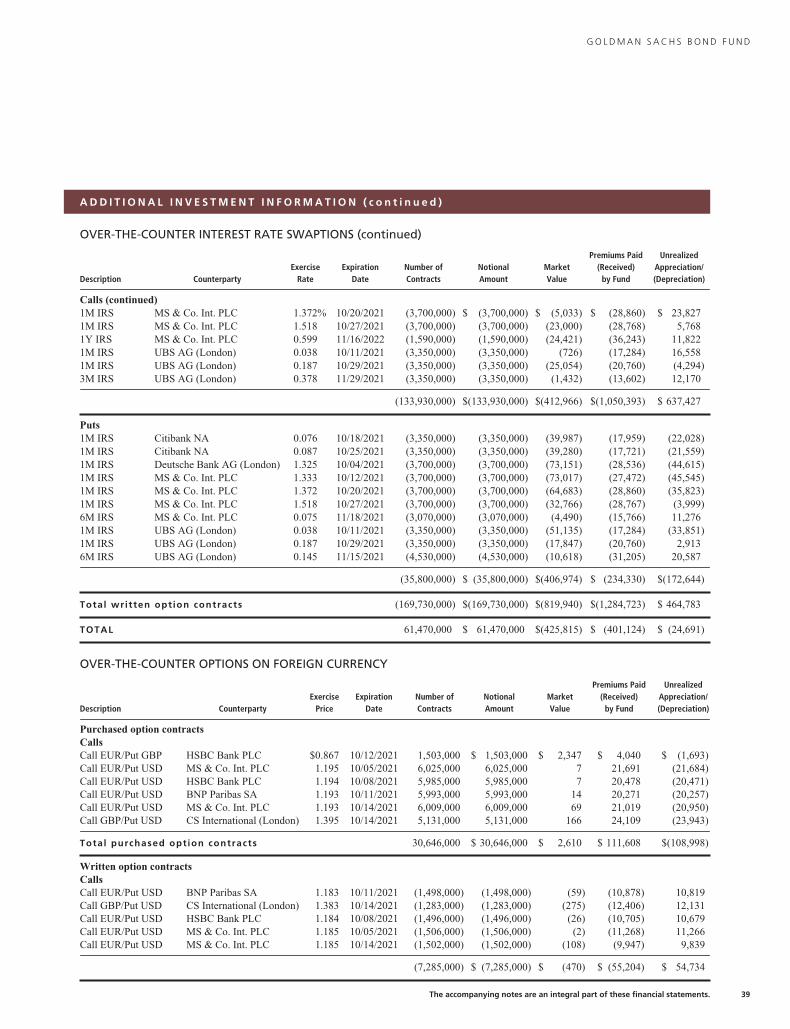
G O L D M A N S A C H S B O N D F U N D
A D D I T I O N A L I N V E S T M E N T I N F O R M A T I O N ( c o n t i n u e d )
OVER-THE-COUNTER INTEREST RATE SWAPTIONS (continued)
Description CounterpartyExercise
RateExpiration
DateNumber ofContracts
NotionalAmount
MarketValue
Premiums Paid(Received)
by Fund
UnrealizedAppreciation/(Depreciation)
Calls (continued)1M IRS MS & Co. Int. PLC 1.372% 10/20/2021 (3,700,000) $ (3,700,000) $ (5,033) $ (28,860) $ 23,8271M IRS MS & Co. Int. PLC 1.518 10/27/2021 (3,700,000) (3,700,000) (23,000) (28,768) 5,7681Y IRS MS & Co. Int. PLC 0.599 11/16/2022 (1,590,000) (1,590,000) (24,421) (36,243) 11,8221M IRS UBS AG (London) 0.038 10/11/2021 (3,350,000) (3,350,000) (726) (17,284) 16,5581M IRS UBS AG (London) 0.187 10/29/2021 (3,350,000) (3,350,000) (25,054) (20,760) (4,294)3M IRS UBS AG (London) 0.378 11/29/2021 (3,350,000) (3,350,000) (1,432) (13,602) 12,170
(133,930,000) $(133,930,000) $(412,966) $(1,050,393) $ 637,427
Puts1M IRS Citibank NA 0.076 10/18/2021 (3,350,000) (3,350,000) (39,987) (17,959) (22,028)1M IRS Citibank NA 0.087 10/25/2021 (3,350,000) (3,350,000) (39,280) (17,721) (21,559)1M IRS Deutsche Bank AG (London) 1.325 10/04/2021 (3,700,000) (3,700,000) (73,151) (28,536) (44,615)1M IRS MS & Co. Int. PLC 1.333 10/12/2021 (3,700,000) (3,700,000) (73,017) (27,472) (45,545)1M IRS MS & Co. Int. PLC 1.372 10/20/2021 (3,700,000) (3,700,000) (64,683) (28,860) (35,823)1M IRS MS & Co. Int. PLC 1.518 10/27/2021 (3,700,000) (3,700,000) (32,766) (28,767) (3,999)6M IRS MS & Co. Int. PLC 0.075 11/18/2021 (3,070,000) (3,070,000) (4,490) (15,766) 11,2761M IRS UBS AG (London) 0.038 10/11/2021 (3,350,000) (3,350,000) (51,135) (17,284) (33,851)1M IRS UBS AG (London) 0.187 10/29/2021 (3,350,000) (3,350,000) (17,847) (20,760) 2,9136M IRS UBS AG (London) 0.145 11/15/2021 (4,530,000) (4,530,000) (10,618) (31,205) 20,587
(35,800,000) $ (35,800,000) $(406,974) $ (234,330) $(172,644)
Total written option contracts (169,730,000) $(169,730,000) $(819,940) $(1,284,723) $ 464,783
TOTAL 61,470,000 $ 61,470,000 $(425,815) $ (401,124) $ (24,691)
OVER-THE-COUNTER OPTIONS ON FOREIGN CURRENCY
Description CounterpartyExercise
PriceExpiration
DateNumber ofContracts
NotionalAmount
MarketValue
Premiums Paid(Received)
by Fund
UnrealizedAppreciation/(Depreciation)
Purchased option contractsCallsCall EUR/Put GBP HSBC Bank PLC $0.867 10/12/2021 1,503,000 $ 1,503,000 $ 2,347 $ 4,040 $ (1,693)Call EUR/Put USD MS & Co. Int. PLC 1.195 10/05/2021 6,025,000 6,025,000 7 21,691 (21,684)Call EUR/Put USD HSBC Bank PLC 1.194 10/08/2021 5,985,000 5,985,000 7 20,478 (20,471)Call EUR/Put USD BNP Paribas SA 1.193 10/11/2021 5,993,000 5,993,000 14 20,271 (20,257)Call EUR/Put USD MS & Co. Int. PLC 1.193 10/14/2021 6,009,000 6,009,000 69 21,019 (20,950)Call GBP/Put USD CS International (London) 1.395 10/14/2021 5,131,000 5,131,000 166 24,109 (23,943)
Total purchased option contracts 30,646,000 $ 30,646,000 $ 2,610 $ 111,608 $(108,998)
Written option contractsCallsCall EUR/Put USD BNP Paribas SA 1.183 10/11/2021 (1,498,000) (1,498,000) (59) (10,878) 10,819Call GBP/Put USD CS International (London) 1.383 10/14/2021 (1,283,000) (1,283,000) (275) (12,406) 12,131Call EUR/Put USD HSBC Bank PLC 1.184 10/08/2021 (1,496,000) (1,496,000) (26) (10,705) 10,679Call EUR/Put USD MS & Co. Int. PLC 1.185 10/05/2021 (1,506,000) (1,506,000) (2) (11,268) 11,266Call EUR/Put USD MS & Co. Int. PLC 1.185 10/14/2021 (1,502,000) (1,502,000) (108) (9,947) 9,839
(7,285,000) $ (7,285,000) $ (470) $ (55,204) $ 54,734
The accompanying notes are an integral part of these financial statements. 39
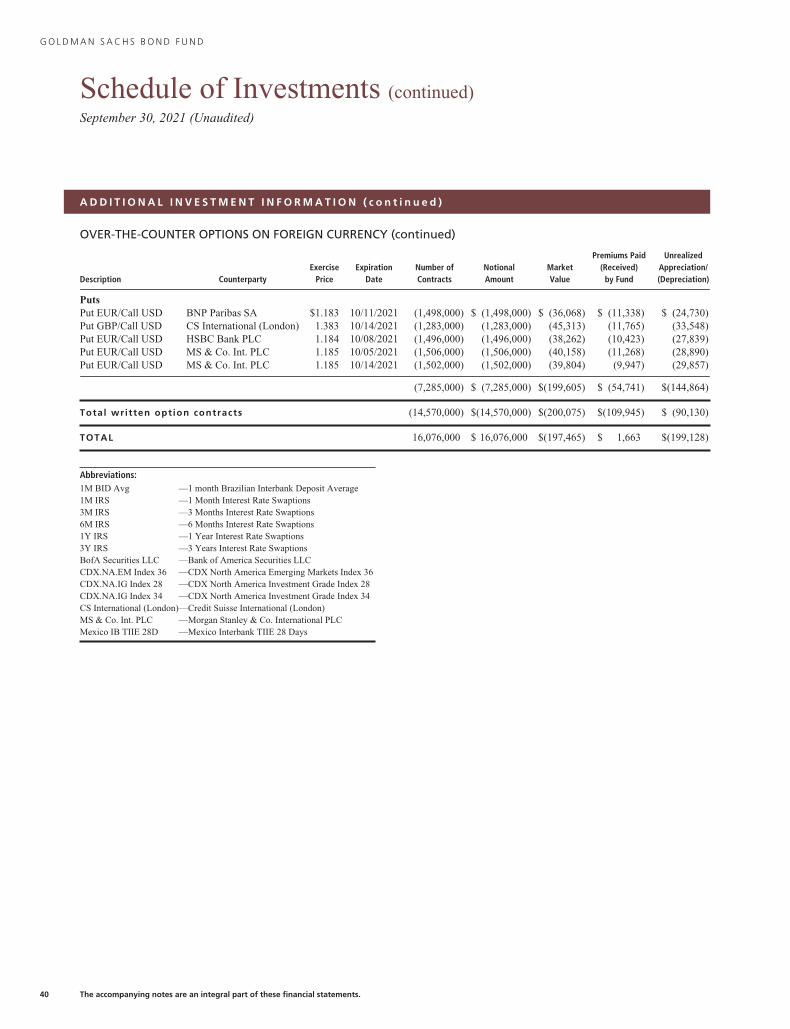
G O L D M A N S A C H S B O N D F U N D
Schedule of Investments (continued)September 30, 2021 (Unaudited)
A D D I T I O N A L I N V E S T M E N T I N F O R M A T I O N ( c o n t i n u e d )
OVER-THE-COUNTER OPTIONS ON FOREIGN CURRENCY (continued)
Description CounterpartyExercise
PriceExpiration
DateNumber ofContracts
NotionalAmount
MarketValue
Premiums Paid(Received)
by Fund
UnrealizedAppreciation/(Depreciation)
PutsPut EUR/Call USD BNP Paribas SA $1.183 10/11/2021 (1,498,000) $ (1,498,000) $ (36,068) $ (11,338) $ (24,730)Put GBP/Call USD CS International (London) 1.383 10/14/2021 (1,283,000) (1,283,000) (45,313) (11,765) (33,548)Put EUR/Call USD HSBC Bank PLC 1.184 10/08/2021 (1,496,000) (1,496,000) (38,262) (10,423) (27,839)Put EUR/Call USD MS & Co. Int. PLC 1.185 10/05/2021 (1,506,000) (1,506,000) (40,158) (11,268) (28,890)Put EUR/Call USD MS & Co. Int. PLC 1.185 10/14/2021 (1,502,000) (1,502,000) (39,804) (9,947) (29,857)
(7,285,000) $ (7,285,000) $(199,605) $ (54,741) $(144,864)
Total written option contracts (14,570,000) $(14,570,000) $(200,075) $(109,945) $ (90,130)
TOTAL 16,076,000 $ 16,076,000 $(197,465) $ 1,663 $(199,128)
Abbreviations:1M BID Avg —1 month Brazilian Interbank Deposit Average1M IRS —1 Month Interest Rate Swaptions3M IRS —3 Months Interest Rate Swaptions6M IRS —6 Months Interest Rate Swaptions1Y IRS —1 Year Interest Rate Swaptions3Y IRS —3 Years Interest Rate SwaptionsBofA Securities LLC —Bank of America Securities LLCCDX.NA.EM Index 36 —CDX North America Emerging Markets Index 36CDX.NA.IG Index 28 —CDX North America Investment Grade Index 28CDX.NA.IG Index 34 —CDX North America Investment Grade Index 34CS International (London)—Credit Suisse International (London)MS & Co. Int. PLC —Morgan Stanley & Co. International PLCMexico IB TIIE 28D —Mexico Interbank TIIE 28 Days
40 The accompanying notes are an integral part of these financial statements.
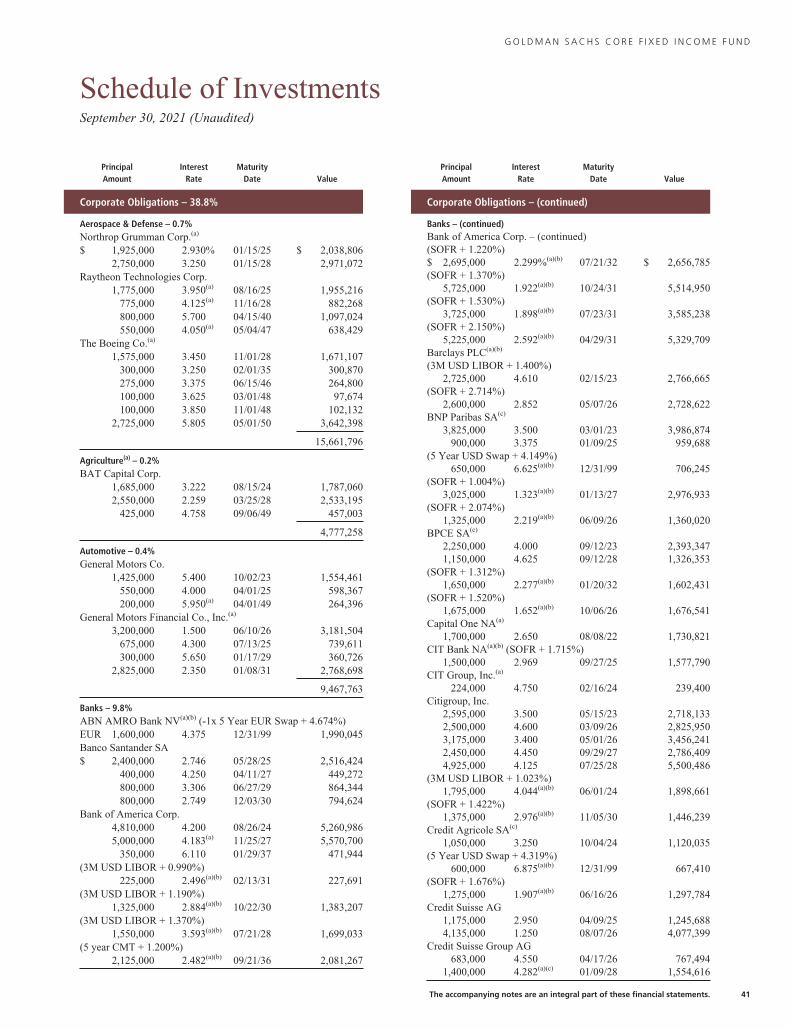
G O L D M A N S A C H S C O R E F I X E D I N C O M E F U N D
Schedule of InvestmentsSeptember 30, 2021 (Unaudited)
PrincipalAmount
InterestRate
MaturityDate Value
Corporate Obligations – 38.8%
Aerospace & Defense – 0.7%Northrop Grumman Corp.(a)
$ 1,925,000 2.930% 01/15/25 $ 2,038,8062,750,000 3.250 01/15/28 2,971,072
Raytheon Technologies Corp.1,775,000 3.950(a) 08/16/25 1,955,216
775,000 4.125(a) 11/16/28 882,268800,000 5.700 04/15/40 1,097,024550,000 4.050(a) 05/04/47 638,429
The Boeing Co.(a)
1,575,000 3.450 11/01/28 1,671,107300,000 3.250 02/01/35 300,870275,000 3.375 06/15/46 264,800100,000 3.625 03/01/48 97,674100,000 3.850 11/01/48 102,132
2,725,000 5.805 05/01/50 3,642,398
15,661,796
Agriculture(a) – 0.2%BAT Capital Corp.
1,685,000 3.222 08/15/24 1,787,0602,550,000 2.259 03/25/28 2,533,195
425,000 4.758 09/06/49 457,003
4,777,258
Automotive – 0.4%General Motors Co.
1,425,000 5.400 10/02/23 1,554,461550,000 4.000 04/01/25 598,367200,000 5.950(a) 04/01/49 264,396
General Motors Financial Co., Inc.(a)
3,200,000 1.500 06/10/26 3,181,504675,000 4.300 07/13/25 739,611300,000 5.650 01/17/29 360,726
2,825,000 2.350 01/08/31 2,768,698
9,467,763
Banks – 9.8%ABN AMRO Bank NV(a)(b) (-1x 5 Year EUR Swap + 4.674%)EUR 1,600,000 4.375 12/31/99 1,990,045Banco Santander SA$ 2,400,000 2.746 05/28/25 2,516,424
400,000 4.250 04/11/27 449,272800,000 3.306 06/27/29 864,344800,000 2.749 12/03/30 794,624
Bank of America Corp.4,810,000 4.200 08/26/24 5,260,9865,000,000 4.183(a) 11/25/27 5,570,700
350,000 6.110 01/29/37 471,944(3M USD LIBOR + 0.990%)
225,000 2.496(a)(b) 02/13/31 227,691(3M USD LIBOR + 1.190%)
1,325,000 2.884(a)(b) 10/22/30 1,383,207(3M USD LIBOR + 1.370%)
1,550,000 3.593(a)(b) 07/21/28 1,699,033(5 year CMT + 1.200%)
2,125,000 2.482(a)(b) 09/21/36 2,081,267
PrincipalAmount
InterestRate
MaturityDate Value
Corporate Obligations – (continued)
Banks – (continued)Bank of America Corp. – (continued)(SOFR + 1.220%)$ 2,695,000 2.299%(a)(b) 07/21/32 $ 2,656,785(SOFR + 1.370%)
5,725,000 1.922(a)(b) 10/24/31 5,514,950(SOFR + 1.530%)
3,725,000 1.898(a)(b) 07/23/31 3,585,238(SOFR + 2.150%)
5,225,000 2.592(a)(b) 04/29/31 5,329,709Barclays PLC(a)(b)
(3M USD LIBOR + 1.400%)2,725,000 4.610 02/15/23 2,766,665
(SOFR + 2.714%)2,600,000 2.852 05/07/26 2,728,622
BNP Paribas SA(c)
3,825,000 3.500 03/01/23 3,986,874900,000 3.375 01/09/25 959,688
(5 Year USD Swap + 4.149%)650,000 6.625(a)(b) 12/31/99 706,245
(SOFR + 1.004%)3,025,000 1.323(a)(b) 01/13/27 2,976,933
(SOFR + 2.074%)1,325,000 2.219(a)(b) 06/09/26 1,360,020
BPCE SA(c)
2,250,000 4.000 09/12/23 2,393,3471,150,000 4.625 09/12/28 1,326,353
(SOFR + 1.312%)1,650,000 2.277(a)(b) 01/20/32 1,602,431
(SOFR + 1.520%)1,675,000 1.652(a)(b) 10/06/26 1,676,541
Capital One NA(a)
1,700,000 2.650 08/08/22 1,730,821CIT Bank NA(a)(b) (SOFR + 1.715%)
1,500,000 2.969 09/27/25 1,577,790CIT Group, Inc.(a)
224,000 4.750 02/16/24 239,400Citigroup, Inc.
2,595,000 3.500 05/15/23 2,718,1332,500,000 4.600 03/09/26 2,825,9503,175,000 3.400 05/01/26 3,456,2412,450,000 4.450 09/29/27 2,786,4094,925,000 4.125 07/25/28 5,500,486
(3M USD LIBOR + 1.023%)1,795,000 4.044(a)(b) 06/01/24 1,898,661
(SOFR + 1.422%)1,375,000 2.976(a)(b) 11/05/30 1,446,239
Credit Agricole SA(c)
1,050,000 3.250 10/04/24 1,120,035(5 Year USD Swap + 4.319%)
600,000 6.875(a)(b) 12/31/99 667,410(SOFR + 1.676%)
1,275,000 1.907(a)(b) 06/16/26 1,297,784Credit Suisse AG
1,175,000 2.950 04/09/25 1,245,6884,135,000 1.250 08/07/26 4,077,399
Credit Suisse Group AG683,000 4.550 04/17/26 767,494
1,400,000 4.282(a)(c) 01/09/28 1,554,616
The accompanying notes are an integral part of these financial statements. 41
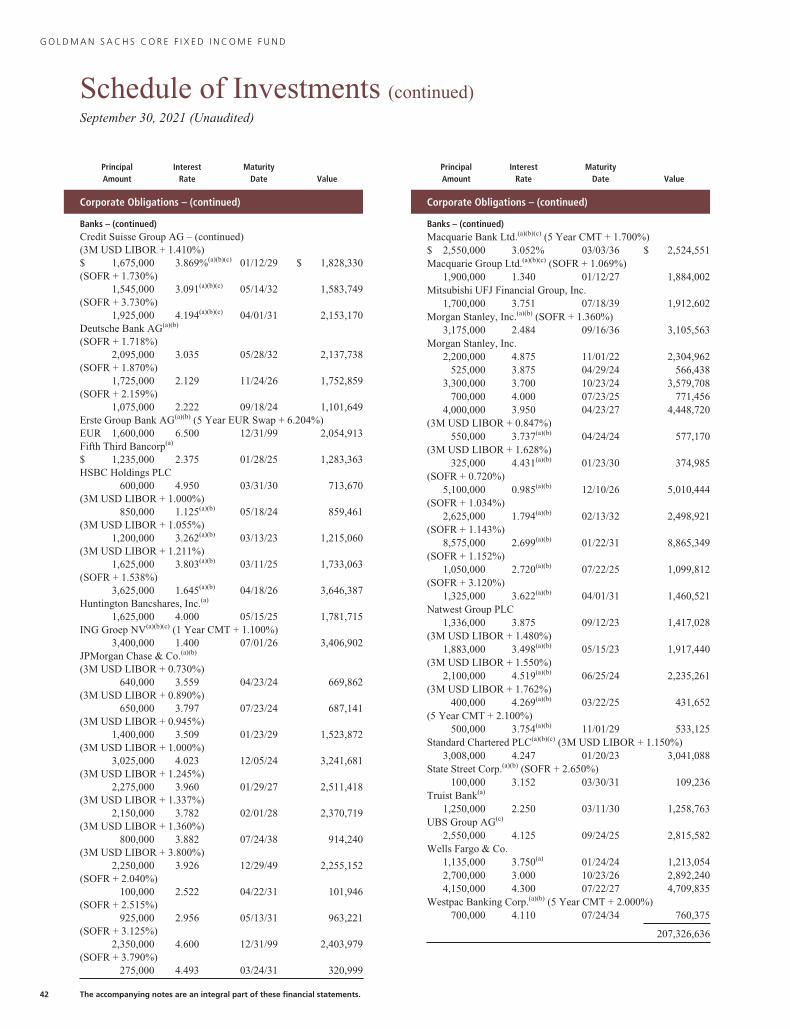
G O L D M A N S A C H S C O R E F I X E D I N C O M E F U N D
Schedule of Investments (continued)September 30, 2021 (Unaudited)
PrincipalAmount
InterestRate
MaturityDate Value
Corporate Obligations – (continued)
Banks – (continued)Credit Suisse Group AG – (continued)(3M USD LIBOR + 1.410%)$ 1,675,000 3.869%(a)(b)(c) 01/12/29 $ 1,828,330(SOFR + 1.730%)
1,545,000 3.091(a)(b)(c) 05/14/32 1,583,749(SOFR + 3.730%)
1,925,000 4.194(a)(b)(c) 04/01/31 2,153,170Deutsche Bank AG(a)(b)
(SOFR + 1.718%)2,095,000 3.035 05/28/32 2,137,738
(SOFR + 1.870%)1,725,000 2.129 11/24/26 1,752,859
(SOFR + 2.159%)1,075,000 2.222 09/18/24 1,101,649
Erste Group Bank AG(a)(b) (5 Year EUR Swap + 6.204%)EUR 1,600,000 6.500 12/31/99 2,054,913Fifth Third Bancorp(a)
$ 1,235,000 2.375 01/28/25 1,283,363HSBC Holdings PLC
600,000 4.950 03/31/30 713,670(3M USD LIBOR + 1.000%)
850,000 1.125(a)(b) 05/18/24 859,461(3M USD LIBOR + 1.055%)
1,200,000 3.262(a)(b) 03/13/23 1,215,060(3M USD LIBOR + 1.211%)
1,625,000 3.803(a)(b) 03/11/25 1,733,063(SOFR + 1.538%)
3,625,000 1.645(a)(b) 04/18/26 3,646,387Huntington Bancshares, Inc.(a)
1,625,000 4.000 05/15/25 1,781,715ING Groep NV(a)(b)(c) (1 Year CMT + 1.100%)
3,400,000 1.400 07/01/26 3,406,902JPMorgan Chase & Co.(a)(b)
(3M USD LIBOR + 0.730%)640,000 3.559 04/23/24 669,862
(3M USD LIBOR + 0.890%)650,000 3.797 07/23/24 687,141
(3M USD LIBOR + 0.945%)1,400,000 3.509 01/23/29 1,523,872
(3M USD LIBOR + 1.000%)3,025,000 4.023 12/05/24 3,241,681
(3M USD LIBOR + 1.245%)2,275,000 3.960 01/29/27 2,511,418
(3M USD LIBOR + 1.337%)2,150,000 3.782 02/01/28 2,370,719
(3M USD LIBOR + 1.360%)800,000 3.882 07/24/38 914,240
(3M USD LIBOR + 3.800%)2,250,000 3.926 12/29/49 2,255,152
(SOFR + 2.040%)100,000 2.522 04/22/31 101,946
(SOFR + 2.515%)925,000 2.956 05/13/31 963,221
(SOFR + 3.125%)2,350,000 4.600 12/31/99 2,403,979
(SOFR + 3.790%)275,000 4.493 03/24/31 320,999
PrincipalAmount
InterestRate
MaturityDate Value
Corporate Obligations – (continued)
Banks – (continued)Macquarie Bank Ltd.(a)(b)(c) (5 Year CMT + 1.700%)$ 2,550,000 3.052% 03/03/36 $ 2,524,551Macquarie Group Ltd.(a)(b)(c) (SOFR + 1.069%)
1,900,000 1.340 01/12/27 1,884,002Mitsubishi UFJ Financial Group, Inc.
1,700,000 3.751 07/18/39 1,912,602Morgan Stanley, Inc.(a)(b) (SOFR + 1.360%)
3,175,000 2.484 09/16/36 3,105,563Morgan Stanley, Inc.
2,200,000 4.875 11/01/22 2,304,962525,000 3.875 04/29/24 566,438
3,300,000 3.700 10/23/24 3,579,708700,000 4.000 07/23/25 771,456
4,000,000 3.950 04/23/27 4,448,720(3M USD LIBOR + 0.847%)
550,000 3.737(a)(b) 04/24/24 577,170(3M USD LIBOR + 1.628%)
325,000 4.431(a)(b) 01/23/30 374,985(SOFR + 0.720%)
5,100,000 0.985(a)(b) 12/10/26 5,010,444(SOFR + 1.034%)
2,625,000 1.794(a)(b) 02/13/32 2,498,921(SOFR + 1.143%)
8,575,000 2.699(a)(b) 01/22/31 8,865,349(SOFR + 1.152%)
1,050,000 2.720(a)(b) 07/22/25 1,099,812(SOFR + 3.120%)
1,325,000 3.622(a)(b) 04/01/31 1,460,521Natwest Group PLC
1,336,000 3.875 09/12/23 1,417,028(3M USD LIBOR + 1.480%)
1,883,000 3.498(a)(b) 05/15/23 1,917,440(3M USD LIBOR + 1.550%)
2,100,000 4.519(a)(b) 06/25/24 2,235,261(3M USD LIBOR + 1.762%)
400,000 4.269(a)(b) 03/22/25 431,652(5 Year CMT + 2.100%)
500,000 3.754(a)(b) 11/01/29 533,125Standard Chartered PLC(a)(b)(c) (3M USD LIBOR + 1.150%)
3,008,000 4.247 01/20/23 3,041,088State Street Corp.(a)(b) (SOFR + 2.650%)
100,000 3.152 03/30/31 109,236Truist Bank(a)
1,250,000 2.250 03/11/30 1,258,763UBS Group AG(c)
2,550,000 4.125 09/24/25 2,815,582Wells Fargo & Co.
1,135,000 3.750(a) 01/24/24 1,213,0542,700,000 3.000 10/23/26 2,892,2404,150,000 4.300 07/22/27 4,709,835
Westpac Banking Corp.(a)(b) (5 Year CMT + 2.000%)700,000 4.110 07/24/34 760,375
207,326,636
42 The accompanying notes are an integral part of these financial statements.
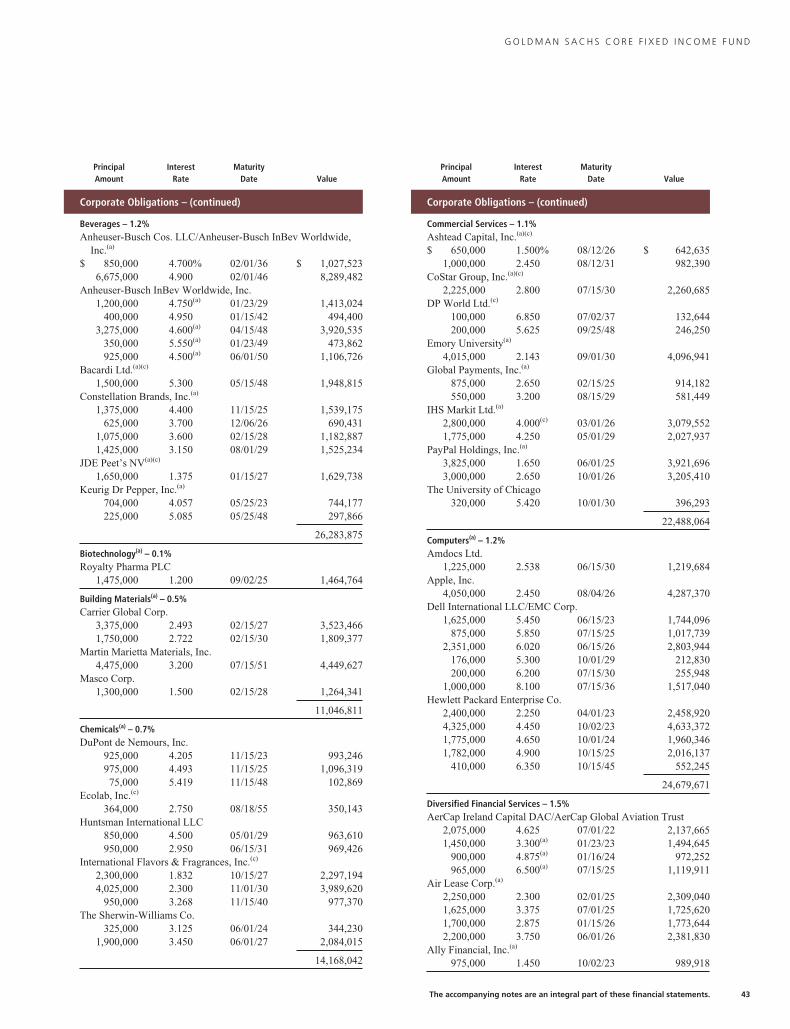
G O L D M A N S A C H S C O R E F I X E D I N C O M E F U N D
PrincipalAmount
InterestRate
MaturityDate Value
Corporate Obligations – (continued)
Beverages – 1.2%Anheuser-Busch Cos. LLC/Anheuser-Busch InBev Worldwide,
Inc.(a)
$ 850,000 4.700% 02/01/36 $ 1,027,5236,675,000 4.900 02/01/46 8,289,482
Anheuser-Busch InBev Worldwide, Inc.1,200,000 4.750(a) 01/23/29 1,413,024
400,000 4.950 01/15/42 494,4003,275,000 4.600(a) 04/15/48 3,920,535
350,000 5.550(a) 01/23/49 473,862925,000 4.500(a) 06/01/50 1,106,726
Bacardi Ltd.(a)(c)
1,500,000 5.300 05/15/48 1,948,815Constellation Brands, Inc.(a)
1,375,000 4.400 11/15/25 1,539,175625,000 3.700 12/06/26 690,431
1,075,000 3.600 02/15/28 1,182,8871,425,000 3.150 08/01/29 1,525,234
JDE Peet’s NV(a)(c)
1,650,000 1.375 01/15/27 1,629,738Keurig Dr Pepper, Inc.(a)
704,000 4.057 05/25/23 744,177225,000 5.085 05/25/48 297,866
26,283,875
Biotechnology(a) – 0.1%Royalty Pharma PLC
1,475,000 1.200 09/02/25 1,464,764
Building Materials(a) – 0.5%Carrier Global Corp.
3,375,000 2.493 02/15/27 3,523,4661,750,000 2.722 02/15/30 1,809,377
Martin Marietta Materials, Inc.4,475,000 3.200 07/15/51 4,449,627
Masco Corp.1,300,000 1.500 02/15/28 1,264,341
11,046,811
Chemicals(a) – 0.7%DuPont de Nemours, Inc.
925,000 4.205 11/15/23 993,246975,000 4.493 11/15/25 1,096,31975,000 5.419 11/15/48 102,869
Ecolab, Inc.(c)
364,000 2.750 08/18/55 350,143Huntsman International LLC
850,000 4.500 05/01/29 963,610950,000 2.950 06/15/31 969,426
International Flavors & Fragrances, Inc.(c)
2,300,000 1.832 10/15/27 2,297,1944,025,000 2.300 11/01/30 3,989,620
950,000 3.268 11/15/40 977,370The Sherwin-Williams Co.
325,000 3.125 06/01/24 344,2301,900,000 3.450 06/01/27 2,084,015
14,168,042
PrincipalAmount
InterestRate
MaturityDate Value
Corporate Obligations – (continued)
Commercial Services – 1.1%Ashtead Capital, Inc.(a)(c)
$ 650,000 1.500% 08/12/26 $ 642,6351,000,000 2.450 08/12/31 982,390
CoStar Group, Inc.(a)(c)
2,225,000 2.800 07/15/30 2,260,685DP World Ltd.(c)
100,000 6.850 07/02/37 132,644200,000 5.625 09/25/48 246,250
Emory University(a)
4,015,000 2.143 09/01/30 4,096,941Global Payments, Inc.(a)
875,000 2.650 02/15/25 914,182550,000 3.200 08/15/29 581,449
IHS Markit Ltd.(a)
2,800,000 4.000(c) 03/01/26 3,079,5521,775,000 4.250 05/01/29 2,027,937
PayPal Holdings, Inc.(a)
3,825,000 1.650 06/01/25 3,921,6963,000,000 2.650 10/01/26 3,205,410
The University of Chicago320,000 5.420 10/01/30 396,293
22,488,064
Computers(a) – 1.2%Amdocs Ltd.
1,225,000 2.538 06/15/30 1,219,684Apple, Inc.
4,050,000 2.450 08/04/26 4,287,370Dell International LLC/EMC Corp.
1,625,000 5.450 06/15/23 1,744,096875,000 5.850 07/15/25 1,017,739
2,351,000 6.020 06/15/26 2,803,944176,000 5.300 10/01/29 212,830200,000 6.200 07/15/30 255,948
1,000,000 8.100 07/15/36 1,517,040Hewlett Packard Enterprise Co.
2,400,000 2.250 04/01/23 2,458,9204,325,000 4.450 10/02/23 4,633,3721,775,000 4.650 10/01/24 1,960,3461,782,000 4.900 10/15/25 2,016,137
410,000 6.350 10/15/45 552,245
24,679,671
Diversified Financial Services – 1.5%AerCap Ireland Capital DAC/AerCap Global Aviation Trust
2,075,000 4.625 07/01/22 2,137,6651,450,000 3.300(a) 01/23/23 1,494,645
900,000 4.875(a) 01/16/24 972,252965,000 6.500(a) 07/15/25 1,119,911
Air Lease Corp.(a)
2,250,000 2.300 02/01/25 2,309,0401,625,000 3.375 07/01/25 1,725,6201,700,000 2.875 01/15/26 1,773,6442,200,000 3.750 06/01/26 2,381,830
Ally Financial, Inc.(a)
975,000 1.450 10/02/23 989,918
The accompanying notes are an integral part of these financial statements. 43
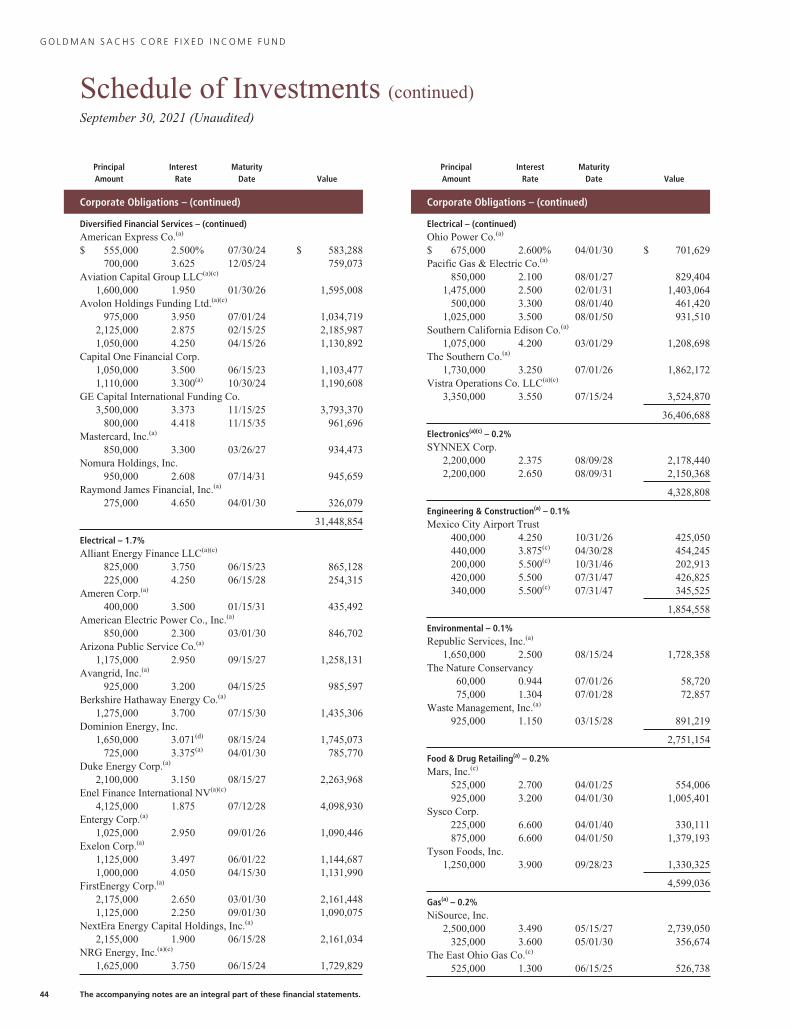
G O L D M A N S A C H S C O R E F I X E D I N C O M E F U N D
Schedule of Investments (continued)September 30, 2021 (Unaudited)
PrincipalAmount
InterestRate
MaturityDate Value
Corporate Obligations – (continued)
Diversified Financial Services – (continued)American Express Co.(a)
$ 555,000 2.500% 07/30/24 $ 583,288700,000 3.625 12/05/24 759,073
Aviation Capital Group LLC(a)(c)
1,600,000 1.950 01/30/26 1,595,008Avolon Holdings Funding Ltd.(a)(c)
975,000 3.950 07/01/24 1,034,7192,125,000 2.875 02/15/25 2,185,9871,050,000 4.250 04/15/26 1,130,892
Capital One Financial Corp.1,050,000 3.500 06/15/23 1,103,4771,110,000 3.300(a) 10/30/24 1,190,608
GE Capital International Funding Co.3,500,000 3.373 11/15/25 3,793,370
800,000 4.418 11/15/35 961,696Mastercard, Inc.(a)
850,000 3.300 03/26/27 934,473Nomura Holdings, Inc.
950,000 2.608 07/14/31 945,659Raymond James Financial, Inc.(a)
275,000 4.650 04/01/30 326,079
31,448,854
Electrical – 1.7%Alliant Energy Finance LLC(a)(c)
825,000 3.750 06/15/23 865,128225,000 4.250 06/15/28 254,315
Ameren Corp.(a)
400,000 3.500 01/15/31 435,492American Electric Power Co., Inc.(a)
850,000 2.300 03/01/30 846,702Arizona Public Service Co.(a)
1,175,000 2.950 09/15/27 1,258,131Avangrid, Inc.(a)
925,000 3.200 04/15/25 985,597Berkshire Hathaway Energy Co.(a)
1,275,000 3.700 07/15/30 1,435,306Dominion Energy, Inc.
1,650,000 3.071(d) 08/15/24 1,745,073725,000 3.375(a) 04/01/30 785,770
Duke Energy Corp.(a)
2,100,000 3.150 08/15/27 2,263,968Enel Finance International NV(a)(c)
4,125,000 1.875 07/12/28 4,098,930Entergy Corp.(a)
1,025,000 2.950 09/01/26 1,090,446Exelon Corp.(a)
1,125,000 3.497 06/01/22 1,144,6871,000,000 4.050 04/15/30 1,131,990
FirstEnergy Corp.(a)
2,175,000 2.650 03/01/30 2,161,4481,125,000 2.250 09/01/30 1,090,075
NextEra Energy Capital Holdings, Inc.(a)
2,155,000 1.900 06/15/28 2,161,034NRG Energy, Inc.(a)(c)
1,625,000 3.750 06/15/24 1,729,829
PrincipalAmount
InterestRate
MaturityDate Value
Corporate Obligations – (continued)
Electrical – (continued)Ohio Power Co.(a)
$ 675,000 2.600% 04/01/30 $ 701,629Pacific Gas & Electric Co.(a)
850,000 2.100 08/01/27 829,4041,475,000 2.500 02/01/31 1,403,064
500,000 3.300 08/01/40 461,4201,025,000 3.500 08/01/50 931,510
Southern California Edison Co.(a)
1,075,000 4.200 03/01/29 1,208,698The Southern Co.(a)
1,730,000 3.250 07/01/26 1,862,172Vistra Operations Co. LLC(a)(c)
3,350,000 3.550 07/15/24 3,524,870
36,406,688
Electronics(a)(c) – 0.2%SYNNEX Corp.
2,200,000 2.375 08/09/28 2,178,4402,200,000 2.650 08/09/31 2,150,368
4,328,808
Engineering & Construction(a) – 0.1%Mexico City Airport Trust
400,000 4.250 10/31/26 425,050440,000 3.875(c) 04/30/28 454,245200,000 5.500(c) 10/31/46 202,913420,000 5.500 07/31/47 426,825340,000 5.500(c) 07/31/47 345,525
1,854,558
Environmental – 0.1%Republic Services, Inc.(a)
1,650,000 2.500 08/15/24 1,728,358The Nature Conservancy
60,000 0.944 07/01/26 58,72075,000 1.304 07/01/28 72,857
Waste Management, Inc.(a)
925,000 1.150 03/15/28 891,219
2,751,154
Food & Drug Retailing(a) – 0.2%Mars, Inc.(c)
525,000 2.700 04/01/25 554,006925,000 3.200 04/01/30 1,005,401
Sysco Corp.225,000 6.600 04/01/40 330,111875,000 6.600 04/01/50 1,379,193
Tyson Foods, Inc.1,250,000 3.900 09/28/23 1,330,325
4,599,036
Gas(a) – 0.2%NiSource, Inc.
2,500,000 3.490 05/15/27 2,739,050325,000 3.600 05/01/30 356,674
The East Ohio Gas Co.(c)
525,000 1.300 06/15/25 526,738
44 The accompanying notes are an integral part of these financial statements.
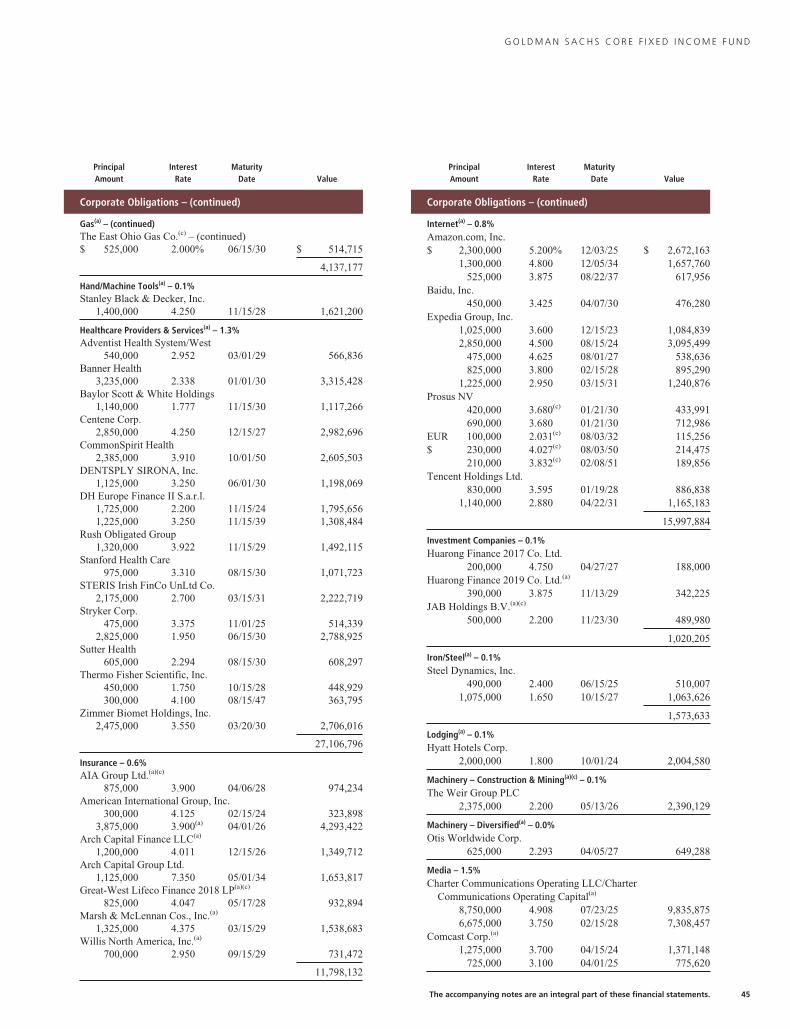
G O L D M A N S A C H S C O R E F I X E D I N C O M E F U N D
PrincipalAmount
InterestRate
MaturityDate Value
Corporate Obligations – (continued)
Gas(a) – (continued)The East Ohio Gas Co.(c) – (continued)$ 525,000 2.000% 06/15/30 $ 514,715
4,137,177
Hand/Machine Tools(a) – 0.1%Stanley Black & Decker, Inc.
1,400,000 4.250 11/15/28 1,621,200
Healthcare Providers & Services(a) – 1.3%Adventist Health System/West
540,000 2.952 03/01/29 566,836Banner Health
3,235,000 2.338 01/01/30 3,315,428Baylor Scott & White Holdings
1,140,000 1.777 11/15/30 1,117,266Centene Corp.
2,850,000 4.250 12/15/27 2,982,696CommonSpirit Health
2,385,000 3.910 10/01/50 2,605,503DENTSPLY SIRONA, Inc.
1,125,000 3.250 06/01/30 1,198,069DH Europe Finance II S.a.r.l.
1,725,000 2.200 11/15/24 1,795,6561,225,000 3.250 11/15/39 1,308,484
Rush Obligated Group1,320,000 3.922 11/15/29 1,492,115
Stanford Health Care975,000 3.310 08/15/30 1,071,723
STERIS Irish FinCo UnLtd Co.2,175,000 2.700 03/15/31 2,222,719
Stryker Corp.475,000 3.375 11/01/25 514,339
2,825,000 1.950 06/15/30 2,788,925Sutter Health
605,000 2.294 08/15/30 608,297Thermo Fisher Scientific, Inc.
450,000 1.750 10/15/28 448,929300,000 4.100 08/15/47 363,795
Zimmer Biomet Holdings, Inc.2,475,000 3.550 03/20/30 2,706,016
27,106,796
Insurance – 0.6%AIA Group Ltd.(a)(c)
875,000 3.900 04/06/28 974,234American International Group, Inc.
300,000 4.125 02/15/24 323,8983,875,000 3.900(a) 04/01/26 4,293,422
Arch Capital Finance LLC(a)
1,200,000 4.011 12/15/26 1,349,712Arch Capital Group Ltd.
1,125,000 7.350 05/01/34 1,653,817Great-West Lifeco Finance 2018 LP(a)(c)
825,000 4.047 05/17/28 932,894Marsh & McLennan Cos., Inc.(a)
1,325,000 4.375 03/15/29 1,538,683Willis North America, Inc.(a)
700,000 2.950 09/15/29 731,472
11,798,132
PrincipalAmount
InterestRate
MaturityDate Value
Corporate Obligations – (continued)
Internet(a) – 0.8%Amazon.com, Inc.$ 2,300,000 5.200% 12/03/25 $ 2,672,163
1,300,000 4.800 12/05/34 1,657,760525,000 3.875 08/22/37 617,956
Baidu, Inc.450,000 3.425 04/07/30 476,280
Expedia Group, Inc.1,025,000 3.600 12/15/23 1,084,8392,850,000 4.500 08/15/24 3,095,499
475,000 4.625 08/01/27 538,636825,000 3.800 02/15/28 895,290
1,225,000 2.950 03/15/31 1,240,876Prosus NV
420,000 3.680(c) 01/21/30 433,991690,000 3.680 01/21/30 712,986
EUR 100,000 2.031(c) 08/03/32 115,256$ 230,000 4.027(c) 08/03/50 214,475
210,000 3.832(c) 02/08/51 189,856Tencent Holdings Ltd.
830,000 3.595 01/19/28 886,8381,140,000 2.880 04/22/31 1,165,183
15,997,884
Investment Companies – 0.1%Huarong Finance 2017 Co. Ltd.
200,000 4.750 04/27/27 188,000Huarong Finance 2019 Co. Ltd.(a)
390,000 3.875 11/13/29 342,225JAB Holdings B.V.(a)(c)
500,000 2.200 11/23/30 489,980
1,020,205
Iron/Steel(a) – 0.1%Steel Dynamics, Inc.
490,000 2.400 06/15/25 510,0071,075,000 1.650 10/15/27 1,063,626
1,573,633
Lodging(a) – 0.1%Hyatt Hotels Corp.
2,000,000 1.800 10/01/24 2,004,580
Machinery – Construction & Mining(a)(c) – 0.1%The Weir Group PLC
2,375,000 2.200 05/13/26 2,390,129
Machinery – Diversified(a) – 0.0%Otis Worldwide Corp.
625,000 2.293 04/05/27 649,288
Media – 1.5%Charter Communications Operating LLC/Charter
Communications Operating Capital(a)
8,750,000 4.908 07/23/25 9,835,8756,675,000 3.750 02/15/28 7,308,457
Comcast Corp.(a)
1,275,000 3.700 04/15/24 1,371,148725,000 3.100 04/01/25 775,620
The accompanying notes are an integral part of these financial statements. 45
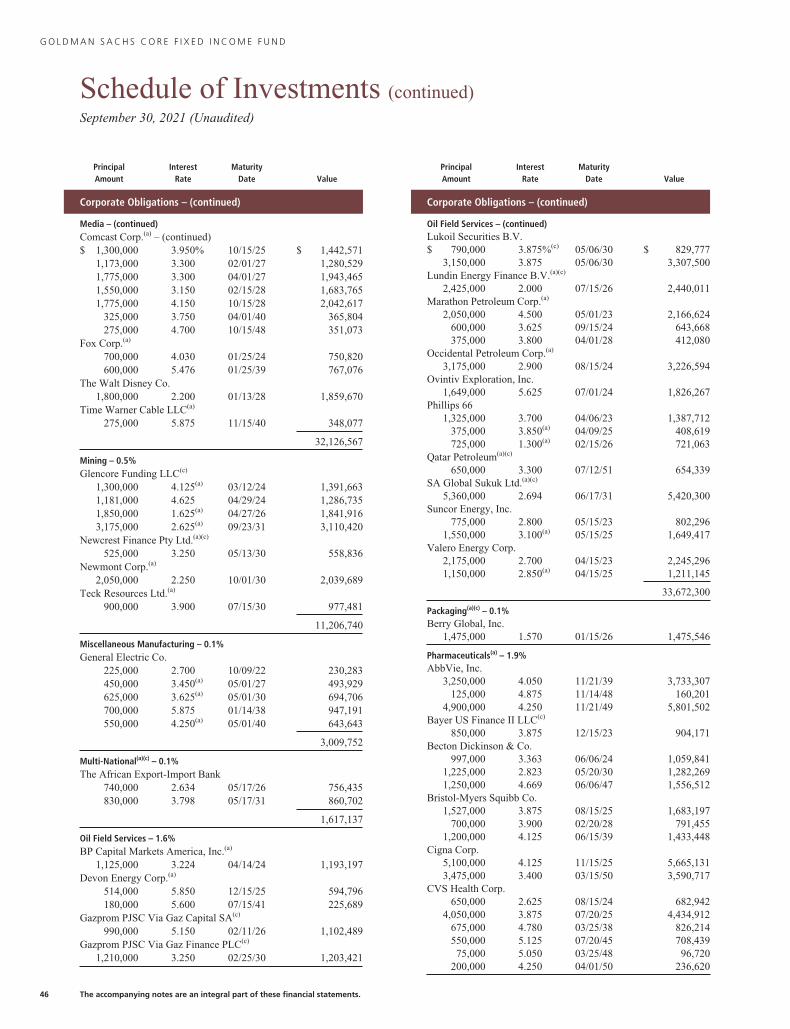
G O L D M A N S A C H S C O R E F I X E D I N C O M E F U N D
Schedule of Investments (continued)September 30, 2021 (Unaudited)
PrincipalAmount
InterestRate
MaturityDate Value
Corporate Obligations – (continued)
Media – (continued)Comcast Corp.(a) – (continued)$ 1,300,000 3.950% 10/15/25 $ 1,442,571
1,173,000 3.300 02/01/27 1,280,5291,775,000 3.300 04/01/27 1,943,4651,550,000 3.150 02/15/28 1,683,7651,775,000 4.150 10/15/28 2,042,617
325,000 3.750 04/01/40 365,804275,000 4.700 10/15/48 351,073
Fox Corp.(a)
700,000 4.030 01/25/24 750,820600,000 5.476 01/25/39 767,076
The Walt Disney Co.1,800,000 2.200 01/13/28 1,859,670
Time Warner Cable LLC(a)
275,000 5.875 11/15/40 348,077
32,126,567
Mining – 0.5%Glencore Funding LLC(c)
1,300,000 4.125(a) 03/12/24 1,391,6631,181,000 4.625 04/29/24 1,286,7351,850,000 1.625(a) 04/27/26 1,841,9163,175,000 2.625(a) 09/23/31 3,110,420
Newcrest Finance Pty Ltd.(a)(c)
525,000 3.250 05/13/30 558,836Newmont Corp.(a)
2,050,000 2.250 10/01/30 2,039,689Teck Resources Ltd.(a)
900,000 3.900 07/15/30 977,481
11,206,740
Miscellaneous Manufacturing – 0.1%General Electric Co.
225,000 2.700 10/09/22 230,283450,000 3.450(a) 05/01/27 493,929625,000 3.625(a) 05/01/30 694,706700,000 5.875 01/14/38 947,191550,000 4.250(a) 05/01/40 643,643
3,009,752
Multi-National(a)(c) – 0.1%The African Export-Import Bank
740,000 2.634 05/17/26 756,435830,000 3.798 05/17/31 860,702
1,617,137
Oil Field Services – 1.6%BP Capital Markets America, Inc.(a)
1,125,000 3.224 04/14/24 1,193,197Devon Energy Corp.(a)
514,000 5.850 12/15/25 594,796180,000 5.600 07/15/41 225,689
Gazprom PJSC Via Gaz Capital SA(c)
990,000 5.150 02/11/26 1,102,489Gazprom PJSC Via Gaz Finance PLC(c)
1,210,000 3.250 02/25/30 1,203,421
PrincipalAmount
InterestRate
MaturityDate Value
Corporate Obligations – (continued)
Oil Field Services – (continued)Lukoil Securities B.V.$ 790,000 3.875%(c) 05/06/30 $ 829,777
3,150,000 3.875 05/06/30 3,307,500Lundin Energy Finance B.V.(a)(c)
2,425,000 2.000 07/15/26 2,440,011Marathon Petroleum Corp.(a)
2,050,000 4.500 05/01/23 2,166,624600,000 3.625 09/15/24 643,668375,000 3.800 04/01/28 412,080
Occidental Petroleum Corp.(a)
3,175,000 2.900 08/15/24 3,226,594Ovintiv Exploration, Inc.
1,649,000 5.625 07/01/24 1,826,267Phillips 66
1,325,000 3.700 04/06/23 1,387,712375,000 3.850(a) 04/09/25 408,619725,000 1.300(a) 02/15/26 721,063
Qatar Petroleum(a)(c)
650,000 3.300 07/12/51 654,339SA Global Sukuk Ltd.(a)(c)
5,360,000 2.694 06/17/31 5,420,300Suncor Energy, Inc.
775,000 2.800 05/15/23 802,2961,550,000 3.100(a) 05/15/25 1,649,417
Valero Energy Corp.2,175,000 2.700 04/15/23 2,245,2961,150,000 2.850(a) 04/15/25 1,211,145
33,672,300
Packaging(a)(c) – 0.1%Berry Global, Inc.
1,475,000 1.570 01/15/26 1,475,546
Pharmaceuticals(a) – 1.9%AbbVie, Inc.
3,250,000 4.050 11/21/39 3,733,307125,000 4.875 11/14/48 160,201
4,900,000 4.250 11/21/49 5,801,502Bayer US Finance II LLC(c)
850,000 3.875 12/15/23 904,171Becton Dickinson & Co.
997,000 3.363 06/06/24 1,059,8411,225,000 2.823 05/20/30 1,282,2691,250,000 4.669 06/06/47 1,556,512
Bristol-Myers Squibb Co.1,527,000 3.875 08/15/25 1,683,197
700,000 3.900 02/20/28 791,4551,200,000 4.125 06/15/39 1,433,448
Cigna Corp.5,100,000 4.125 11/15/25 5,665,1313,475,000 3.400 03/15/50 3,590,717
CVS Health Corp.650,000 2.625 08/15/24 682,942
4,050,000 3.875 07/20/25 4,434,912675,000 4.780 03/25/38 826,214550,000 5.125 07/20/45 708,43975,000 5.050 03/25/48 96,720
200,000 4.250 04/01/50 236,620
46 The accompanying notes are an integral part of these financial statements.
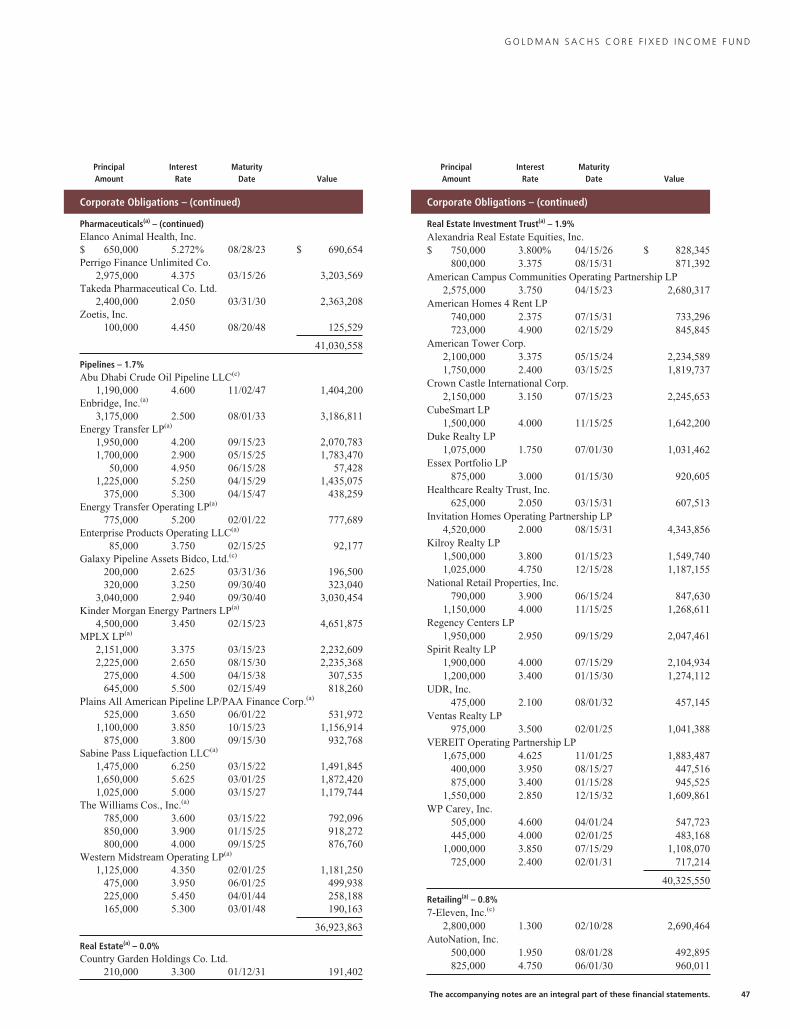
G O L D M A N S A C H S C O R E F I X E D I N C O M E F U N D
PrincipalAmount
InterestRate
MaturityDate Value
Corporate Obligations – (continued)
Pharmaceuticals(a) – (continued)Elanco Animal Health, Inc.$ 650,000 5.272% 08/28/23 $ 690,654Perrigo Finance Unlimited Co.
2,975,000 4.375 03/15/26 3,203,569Takeda Pharmaceutical Co. Ltd.
2,400,000 2.050 03/31/30 2,363,208Zoetis, Inc.
100,000 4.450 08/20/48 125,529
41,030,558
Pipelines – 1.7%Abu Dhabi Crude Oil Pipeline LLC(c)
1,190,000 4.600 11/02/47 1,404,200Enbridge, Inc.(a)
3,175,000 2.500 08/01/33 3,186,811Energy Transfer LP(a)
1,950,000 4.200 09/15/23 2,070,7831,700,000 2.900 05/15/25 1,783,470
50,000 4.950 06/15/28 57,4281,225,000 5.250 04/15/29 1,435,075
375,000 5.300 04/15/47 438,259Energy Transfer Operating LP(a)
775,000 5.200 02/01/22 777,689Enterprise Products Operating LLC(a)
85,000 3.750 02/15/25 92,177Galaxy Pipeline Assets Bidco, Ltd.(c)
200,000 2.625 03/31/36 196,500320,000 3.250 09/30/40 323,040
3,040,000 2.940 09/30/40 3,030,454Kinder Morgan Energy Partners LP(a)
4,500,000 3.450 02/15/23 4,651,875MPLX LP(a)
2,151,000 3.375 03/15/23 2,232,6092,225,000 2.650 08/15/30 2,235,368
275,000 4.500 04/15/38 307,535645,000 5.500 02/15/49 818,260
Plains All American Pipeline LP/PAA Finance Corp.(a)
525,000 3.650 06/01/22 531,9721,100,000 3.850 10/15/23 1,156,914
875,000 3.800 09/15/30 932,768Sabine Pass Liquefaction LLC(a)
1,475,000 6.250 03/15/22 1,491,8451,650,000 5.625 03/01/25 1,872,4201,025,000 5.000 03/15/27 1,179,744
The Williams Cos., Inc.(a)
785,000 3.600 03/15/22 792,096850,000 3.900 01/15/25 918,272800,000 4.000 09/15/25 876,760
Western Midstream Operating LP(a)
1,125,000 4.350 02/01/25 1,181,250475,000 3.950 06/01/25 499,938225,000 5.450 04/01/44 258,188165,000 5.300 03/01/48 190,163
36,923,863
Real Estate(a) – 0.0%Country Garden Holdings Co. Ltd.
210,000 3.300 01/12/31 191,402
PrincipalAmount
InterestRate
MaturityDate Value
Corporate Obligations – (continued)
Real Estate Investment Trust(a) – 1.9%Alexandria Real Estate Equities, Inc.$ 750,000 3.800% 04/15/26 $ 828,345
800,000 3.375 08/15/31 871,392American Campus Communities Operating Partnership LP
2,575,000 3.750 04/15/23 2,680,317American Homes 4 Rent LP
740,000 2.375 07/15/31 733,296723,000 4.900 02/15/29 845,845
American Tower Corp.2,100,000 3.375 05/15/24 2,234,5891,750,000 2.400 03/15/25 1,819,737
Crown Castle International Corp.2,150,000 3.150 07/15/23 2,245,653
CubeSmart LP1,500,000 4.000 11/15/25 1,642,200
Duke Realty LP1,075,000 1.750 07/01/30 1,031,462
Essex Portfolio LP875,000 3.000 01/15/30 920,605
Healthcare Realty Trust, Inc.625,000 2.050 03/15/31 607,513
Invitation Homes Operating Partnership LP4,520,000 2.000 08/15/31 4,343,856
Kilroy Realty LP1,500,000 3.800 01/15/23 1,549,7401,025,000 4.750 12/15/28 1,187,155
National Retail Properties, Inc.790,000 3.900 06/15/24 847,630
1,150,000 4.000 11/15/25 1,268,611Regency Centers LP
1,950,000 2.950 09/15/29 2,047,461Spirit Realty LP
1,900,000 4.000 07/15/29 2,104,9341,200,000 3.400 01/15/30 1,274,112
UDR, Inc.475,000 2.100 08/01/32 457,145
Ventas Realty LP975,000 3.500 02/01/25 1,041,388
VEREIT Operating Partnership LP1,675,000 4.625 11/01/25 1,883,487
400,000 3.950 08/15/27 447,516875,000 3.400 01/15/28 945,525
1,550,000 2.850 12/15/32 1,609,861WP Carey, Inc.
505,000 4.600 04/01/24 547,723445,000 4.000 02/01/25 483,168
1,000,000 3.850 07/15/29 1,108,070725,000 2.400 02/01/31 717,214
40,325,550
Retailing(a) – 0.8%7-Eleven, Inc.(c)
2,800,000 1.300 02/10/28 2,690,464AutoNation, Inc.
500,000 1.950 08/01/28 492,895825,000 4.750 06/01/30 960,011
The accompanying notes are an integral part of these financial statements. 47
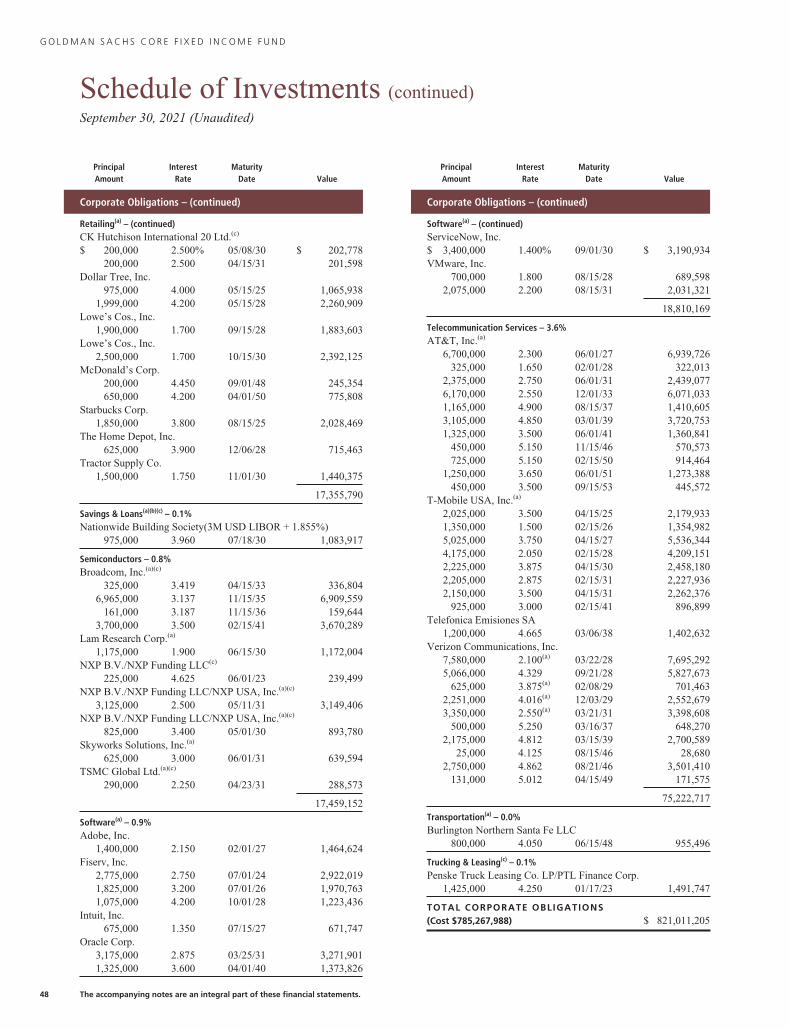
G O L D M A N S A C H S C O R E F I X E D I N C O M E F U N D
Schedule of Investments (continued)September 30, 2021 (Unaudited)
PrincipalAmount
InterestRate
MaturityDate Value
Corporate Obligations – (continued)
Retailing(a) – (continued)CK Hutchison International 20 Ltd.(c)
$ 200,000 2.500% 05/08/30 $ 202,778200,000 2.500 04/15/31 201,598
Dollar Tree, Inc.975,000 4.000 05/15/25 1,065,938
1,999,000 4.200 05/15/28 2,260,909Lowe’s Cos., Inc.
1,900,000 1.700 09/15/28 1,883,603Lowe’s Cos., Inc.
2,500,000 1.700 10/15/30 2,392,125McDonald’s Corp.
200,000 4.450 09/01/48 245,354650,000 4.200 04/01/50 775,808
Starbucks Corp.1,850,000 3.800 08/15/25 2,028,469
The Home Depot, Inc.625,000 3.900 12/06/28 715,463
Tractor Supply Co.1,500,000 1.750 11/01/30 1,440,375
17,355,790
Savings & Loans(a)(b)(c) – 0.1%Nationwide Building Society(3M USD LIBOR + 1.855%)
975,000 3.960 07/18/30 1,083,917
Semiconductors – 0.8%Broadcom, Inc.(a)(c)
325,000 3.419 04/15/33 336,8046,965,000 3.137 11/15/35 6,909,559
161,000 3.187 11/15/36 159,6443,700,000 3.500 02/15/41 3,670,289
Lam Research Corp.(a)
1,175,000 1.900 06/15/30 1,172,004NXP B.V./NXP Funding LLC(c)
225,000 4.625 06/01/23 239,499NXP B.V./NXP Funding LLC/NXP USA, Inc.(a)(c)
3,125,000 2.500 05/11/31 3,149,406NXP B.V./NXP Funding LLC/NXP USA, Inc.(a)(c)
825,000 3.400 05/01/30 893,780Skyworks Solutions, Inc.(a)
625,000 3.000 06/01/31 639,594TSMC Global Ltd.(a)(c)
290,000 2.250 04/23/31 288,573
17,459,152
Software(a) – 0.9%Adobe, Inc.
1,400,000 2.150 02/01/27 1,464,624Fiserv, Inc.
2,775,000 2.750 07/01/24 2,922,0191,825,000 3.200 07/01/26 1,970,7631,075,000 4.200 10/01/28 1,223,436
Intuit, Inc.675,000 1.350 07/15/27 671,747
Oracle Corp.3,175,000 2.875 03/25/31 3,271,9011,325,000 3.600 04/01/40 1,373,826
PrincipalAmount
InterestRate
MaturityDate Value
Corporate Obligations – (continued)
Software(a) – (continued)ServiceNow, Inc.$ 3,400,000 1.400% 09/01/30 $ 3,190,934VMware, Inc.
700,000 1.800 08/15/28 689,5982,075,000 2.200 08/15/31 2,031,321
18,810,169
Telecommunication Services – 3.6%AT&T, Inc.(a)
6,700,000 2.300 06/01/27 6,939,726325,000 1.650 02/01/28 322,013
2,375,000 2.750 06/01/31 2,439,0776,170,000 2.550 12/01/33 6,071,0331,165,000 4.900 08/15/37 1,410,6053,105,000 4.850 03/01/39 3,720,7531,325,000 3.500 06/01/41 1,360,841
450,000 5.150 11/15/46 570,573725,000 5.150 02/15/50 914,464
1,250,000 3.650 06/01/51 1,273,388450,000 3.500 09/15/53 445,572
T-Mobile USA, Inc.(a)
2,025,000 3.500 04/15/25 2,179,9331,350,000 1.500 02/15/26 1,354,9825,025,000 3.750 04/15/27 5,536,3444,175,000 2.050 02/15/28 4,209,1512,225,000 3.875 04/15/30 2,458,1802,205,000 2.875 02/15/31 2,227,9362,150,000 3.500 04/15/31 2,262,376
925,000 3.000 02/15/41 896,899Telefonica Emisiones SA
1,200,000 4.665 03/06/38 1,402,632Verizon Communications, Inc.
7,580,000 2.100(a) 03/22/28 7,695,2925,066,000 4.329 09/21/28 5,827,673
625,000 3.875(a) 02/08/29 701,4632,251,000 4.016(a) 12/03/29 2,552,6793,350,000 2.550(a) 03/21/31 3,398,608
500,000 5.250 03/16/37 648,2702,175,000 4.812 03/15/39 2,700,589
25,000 4.125 08/15/46 28,6802,750,000 4.862 08/21/46 3,501,410
131,000 5.012 04/15/49 171,575
75,222,717
Transportation(a) – 0.0%Burlington Northern Santa Fe LLC
800,000 4.050 06/15/48 955,496
Trucking & Leasing(c) – 0.1%Penske Truck Leasing Co. LP/PTL Finance Corp.
1,425,000 4.250 01/17/23 1,491,747
TOTAL CORPORATE OBLIGATIONS(Cost $785,267,988) $ 821,011,205
48 The accompanying notes are an integral part of these financial statements.
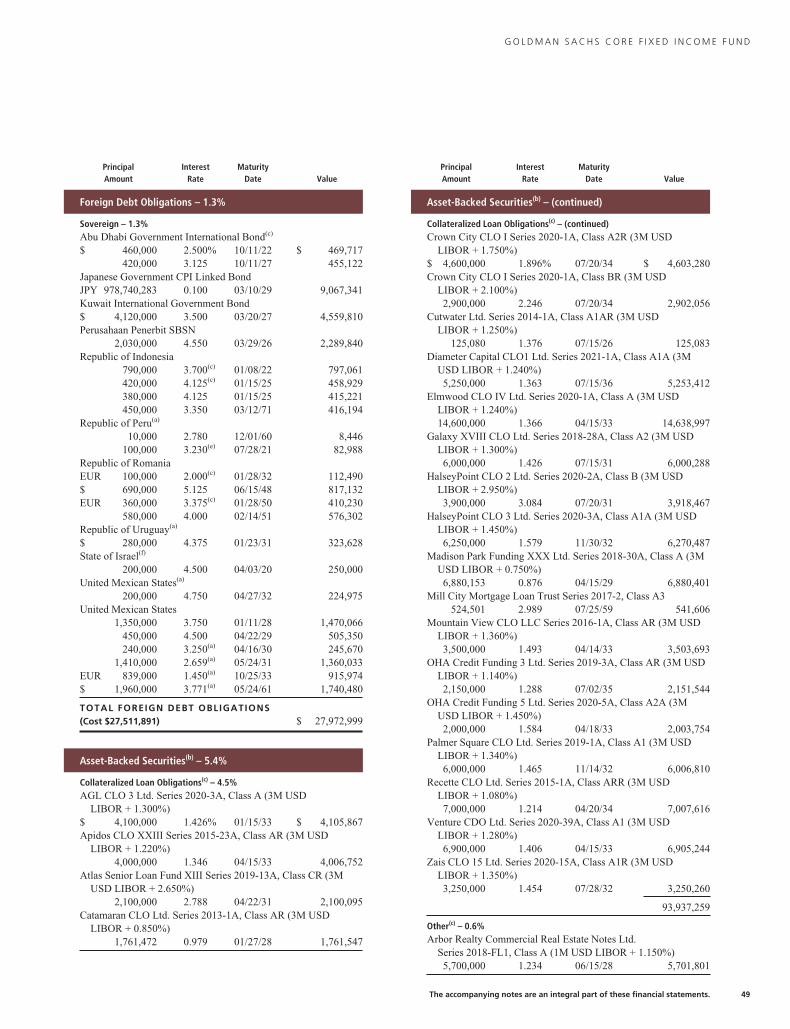
G O L D M A N S A C H S C O R E F I X E D I N C O M E F U N D
PrincipalAmount
InterestRate
MaturityDate Value
Foreign Debt Obligations – 1.3%
Sovereign – 1.3%Abu Dhabi Government International Bond(c)
$ 460,000 2.500% 10/11/22 $ 469,717420,000 3.125 10/11/27 455,122
Japanese Government CPI Linked BondJPY 978,740,283 0.100 03/10/29 9,067,341Kuwait International Government Bond$ 4,120,000 3.500 03/20/27 4,559,810Perusahaan Penerbit SBSN
2,030,000 4.550 03/29/26 2,289,840Republic of Indonesia
790,000 3.700(c) 01/08/22 797,061420,000 4.125(c) 01/15/25 458,929380,000 4.125 01/15/25 415,221450,000 3.350 03/12/71 416,194
Republic of Peru(a)
10,000 2.780 12/01/60 8,446100,000 3.230(e) 07/28/21 82,988
Republic of RomaniaEUR 100,000 2.000(c) 01/28/32 112,490$ 690,000 5.125 06/15/48 817,132EUR 360,000 3.375(c) 01/28/50 410,230
580,000 4.000 02/14/51 576,302Republic of Uruguay(a)
$ 280,000 4.375 01/23/31 323,628State of Israel(f)
200,000 4.500 04/03/20 250,000United Mexican States(a)
200,000 4.750 04/27/32 224,975United Mexican States
1,350,000 3.750 01/11/28 1,470,066450,000 4.500 04/22/29 505,350240,000 3.250(a) 04/16/30 245,670
1,410,000 2.659(a) 05/24/31 1,360,033EUR 839,000 1.450(a) 10/25/33 915,974$ 1,960,000 3.771(a) 05/24/61 1,740,480
TOTAL FOREIGN DEBT OBLIGATIONS(Cost $27,511,891) $ 27,972,999
Asset-Backed Securities(b) – 5.4%
Collateralized Loan Obligations(c) – 4.5%AGL CLO 3 Ltd. Series 2020-3A, Class A (3M USD
LIBOR + 1.300%)$ 4,100,000 1.426% 01/15/33 $ 4,105,867Apidos CLO XXIII Series 2015-23A, Class AR (3M USD
LIBOR + 1.220%)4,000,000 1.346 04/15/33 4,006,752
Atlas Senior Loan Fund XIII Series 2019-13A, Class CR (3MUSD LIBOR + 2.650%)
2,100,000 2.788 04/22/31 2,100,095Catamaran CLO Ltd. Series 2013-1A, Class AR (3M USD
LIBOR + 0.850%)1,761,472 0.979 01/27/28 1,761,547
PrincipalAmount
InterestRate
MaturityDate Value
Asset-Backed Securities(b) – (continued)
Collateralized Loan Obligations(c) – (continued)Crown City CLO I Series 2020-1A, Class A2R (3M USD
LIBOR + 1.750%)$ 4,600,000 1.896% 07/20/34 $ 4,603,280Crown City CLO I Series 2020-1A, Class BR (3M USD
LIBOR + 2.100%)2,900,000 2.246 07/20/34 2,902,056
Cutwater Ltd. Series 2014-1A, Class A1AR (3M USDLIBOR + 1.250%)
125,080 1.376 07/15/26 125,083Diameter Capital CLO1 Ltd. Series 2021-1A, Class A1A (3M
USD LIBOR + 1.240%)5,250,000 1.363 07/15/36 5,253,412
Elmwood CLO IV Ltd. Series 2020-1A, Class A (3M USDLIBOR + 1.240%)14,600,000 1.366 04/15/33 14,638,997
Galaxy XVIII CLO Ltd. Series 2018-28A, Class A2 (3M USDLIBOR + 1.300%)6,000,000 1.426 07/15/31 6,000,288
HalseyPoint CLO 2 Ltd. Series 2020-2A, Class B (3M USDLIBOR + 2.950%)3,900,000 3.084 07/20/31 3,918,467
HalseyPoint CLO 3 Ltd. Series 2020-3A, Class A1A (3M USDLIBOR + 1.450%)6,250,000 1.579 11/30/32 6,270,487
Madison Park Funding XXX Ltd. Series 2018-30A, Class A (3MUSD LIBOR + 0.750%)6,880,153 0.876 04/15/29 6,880,401
Mill City Mortgage Loan Trust Series 2017-2, Class A3524,501 2.989 07/25/59 541,606
Mountain View CLO LLC Series 2016-1A, Class AR (3M USDLIBOR + 1.360%)3,500,000 1.493 04/14/33 3,503,693
OHA Credit Funding 3 Ltd. Series 2019-3A, Class AR (3M USDLIBOR + 1.140%)2,150,000 1.288 07/02/35 2,151,544
OHA Credit Funding 5 Ltd. Series 2020-5A, Class A2A (3MUSD LIBOR + 1.450%)2,000,000 1.584 04/18/33 2,003,754
Palmer Square CLO Ltd. Series 2019-1A, Class A1 (3M USDLIBOR + 1.340%)6,000,000 1.465 11/14/32 6,006,810
Recette CLO Ltd. Series 2015-1A, Class ARR (3M USDLIBOR + 1.080%)7,000,000 1.214 04/20/34 7,007,616
Venture CDO Ltd. Series 2020-39A, Class A1 (3M USDLIBOR + 1.280%)6,900,000 1.406 04/15/33 6,905,244
Zais CLO 15 Ltd. Series 2020-15A, Class A1R (3M USDLIBOR + 1.350%)3,250,000 1.454 07/28/32 3,250,260
93,937,259
Other(c) – 0.6%Arbor Realty Commercial Real Estate Notes Ltd.
Series 2018-FL1, Class A (1M USD LIBOR + 1.150%)5,700,000 1.234 06/15/28 5,701,801
The accompanying notes are an integral part of these financial statements. 49
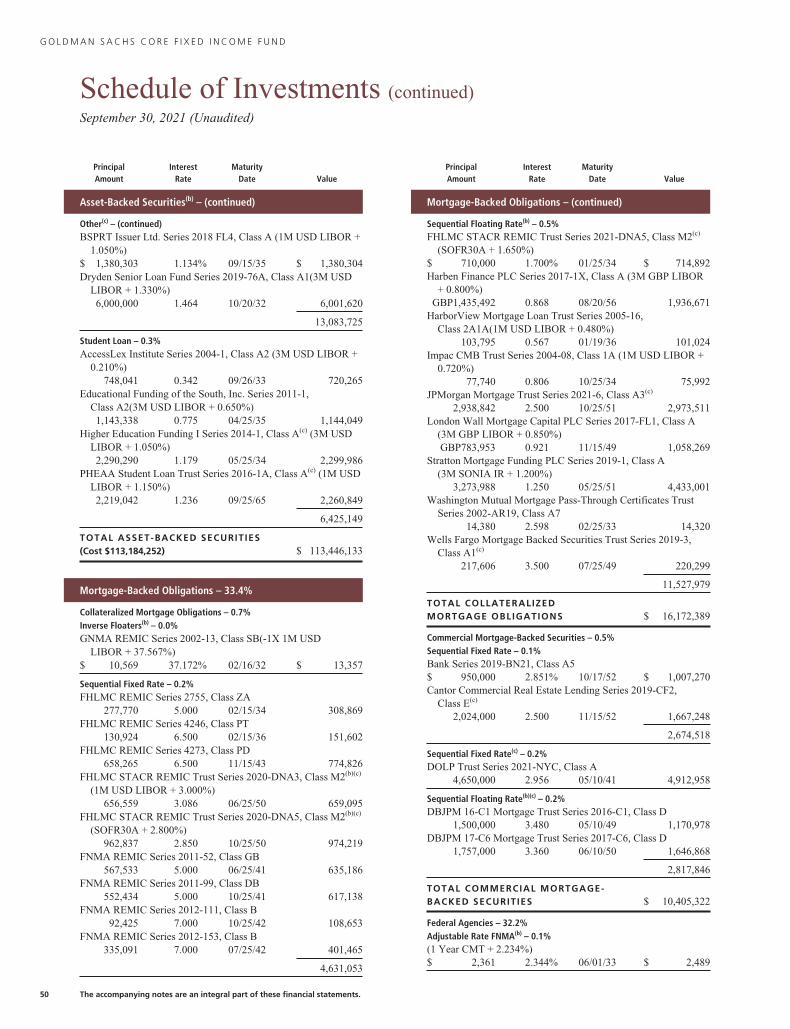
G O L D M A N S A C H S C O R E F I X E D I N C O M E F U N D
Schedule of Investments (continued)September 30, 2021 (Unaudited)
PrincipalAmount
InterestRate
MaturityDate Value
Asset-Backed Securities(b) – (continued)
Other(c) – (continued)BSPRT Issuer Ltd. Series 2018 FL4, Class A (1M USD LIBOR +
1.050%)$ 1,380,303 1.134% 09/15/35 $ 1,380,304Dryden Senior Loan Fund Series 2019-76A, Class A1(3M USD
LIBOR + 1.330%)6,000,000 1.464 10/20/32 6,001,620
13,083,725
Student Loan – 0.3%AccessLex Institute Series 2004-1, Class A2 (3M USD LIBOR +
0.210%)748,041 0.342 09/26/33 720,265
Educational Funding of the South, Inc. Series 2011-1,Class A2(3M USD LIBOR + 0.650%)1,143,338 0.775 04/25/35 1,144,049
Higher Education Funding I Series 2014-1, Class A(c) (3M USDLIBOR + 1.050%)2,290,290 1.179 05/25/34 2,299,986
PHEAA Student Loan Trust Series 2016-1A, Class A(c) (1M USDLIBOR + 1.150%)2,219,042 1.236 09/25/65 2,260,849
6,425,149
TOTAL ASSET-BACKED SECURITIES(Cost $113,184,252) $ 113,446,133
Mortgage-Backed Obligations – 33.4%
Collateralized Mortgage Obligations – 0.7%Inverse Floaters(b) – 0.0%GNMA REMIC Series 2002-13, Class SB(-1X 1M USD
LIBOR + 37.567%)$ 10,569 37.172% 02/16/32 $ 13,357
Sequential Fixed Rate – 0.2%FHLMC REMIC Series 2755, Class ZA
277,770 5.000 02/15/34 308,869FHLMC REMIC Series 4246, Class PT
130,924 6.500 02/15/36 151,602FHLMC REMIC Series 4273, Class PD
658,265 6.500 11/15/43 774,826FHLMC STACR REMIC Trust Series 2020-DNA3, Class M2(b)(c)
(1M USD LIBOR + 3.000%)656,559 3.086 06/25/50 659,095
FHLMC STACR REMIC Trust Series 2020-DNA5, Class M2(b)(c)
(SOFR30A + 2.800%)962,837 2.850 10/25/50 974,219
FNMA REMIC Series 2011-52, Class GB567,533 5.000 06/25/41 635,186
FNMA REMIC Series 2011-99, Class DB552,434 5.000 10/25/41 617,138
FNMA REMIC Series 2012-111, Class B92,425 7.000 10/25/42 108,653
FNMA REMIC Series 2012-153, Class B335,091 7.000 07/25/42 401,465
4,631,053
PrincipalAmount
InterestRate
MaturityDate Value
Mortgage-Backed Obligations – (continued)
Sequential Floating Rate(b) – 0.5%FHLMC STACR REMIC Trust Series 2021-DNA5, Class M2(c)
(SOFR30A + 1.650%)$ 710,000 1.700% 01/25/34 $ 714,892Harben Finance PLC Series 2017-1X, Class A (3M GBP LIBOR
+ 0.800%)GBP1,435,492 0.868 08/20/56 1,936,671
HarborView Mortgage Loan Trust Series 2005-16,Class 2A1A(1M USD LIBOR + 0.480%)
103,795 0.567 01/19/36 101,024Impac CMB Trust Series 2004-08, Class 1A (1M USD LIBOR +
0.720%)77,740 0.806 10/25/34 75,992
JPMorgan Mortgage Trust Series 2021-6, Class A3(c)
2,938,842 2.500 10/25/51 2,973,511London Wall Mortgage Capital PLC Series 2017-FL1, Class A
(3M GBP LIBOR + 0.850%)GBP783,953 0.921 11/15/49 1,058,269
Stratton Mortgage Funding PLC Series 2019-1, Class A(3M SONIA IR + 1.200%)
3,273,988 1.250 05/25/51 4,433,001Washington Mutual Mortgage Pass-Through Certificates Trust
Series 2002-AR19, Class A714,380 2.598 02/25/33 14,320
Wells Fargo Mortgage Backed Securities Trust Series 2019-3,Class A1(c)
217,606 3.500 07/25/49 220,299
11,527,979
TOTAL COLLATERALIZEDMORTGAGE OBLIGATIONS $ 16,172,389
Commercial Mortgage-Backed Securities – 0.5%Sequential Fixed Rate – 0.1%Bank Series 2019-BN21, Class A5$ 950,000 2.851% 10/17/52 $ 1,007,270Cantor Commercial Real Estate Lending Series 2019-CF2,
Class E(c)
2,024,000 2.500 11/15/52 1,667,248
2,674,518
Sequential Fixed Rate(c) – 0.2%DOLP Trust Series 2021-NYC, Class A
4,650,000 2.956 05/10/41 4,912,958
Sequential Floating Rate(b)(c) – 0.2%DBJPM 16-C1 Mortgage Trust Series 2016-C1, Class D
1,500,000 3.480 05/10/49 1,170,978DBJPM 17-C6 Mortgage Trust Series 2017-C6, Class D
1,757,000 3.360 06/10/50 1,646,868
2,817,846
TOTAL COMMERCIAL MORTGAGE-BACKED SECURITIES $ 10,405,322
Federal Agencies – 32.2%Adjustable Rate FNMA(b) – 0.1%(1 Year CMT + 2.234%)$ 2,361 2.344% 06/01/33 $ 2,489
50 The accompanying notes are an integral part of these financial statements.
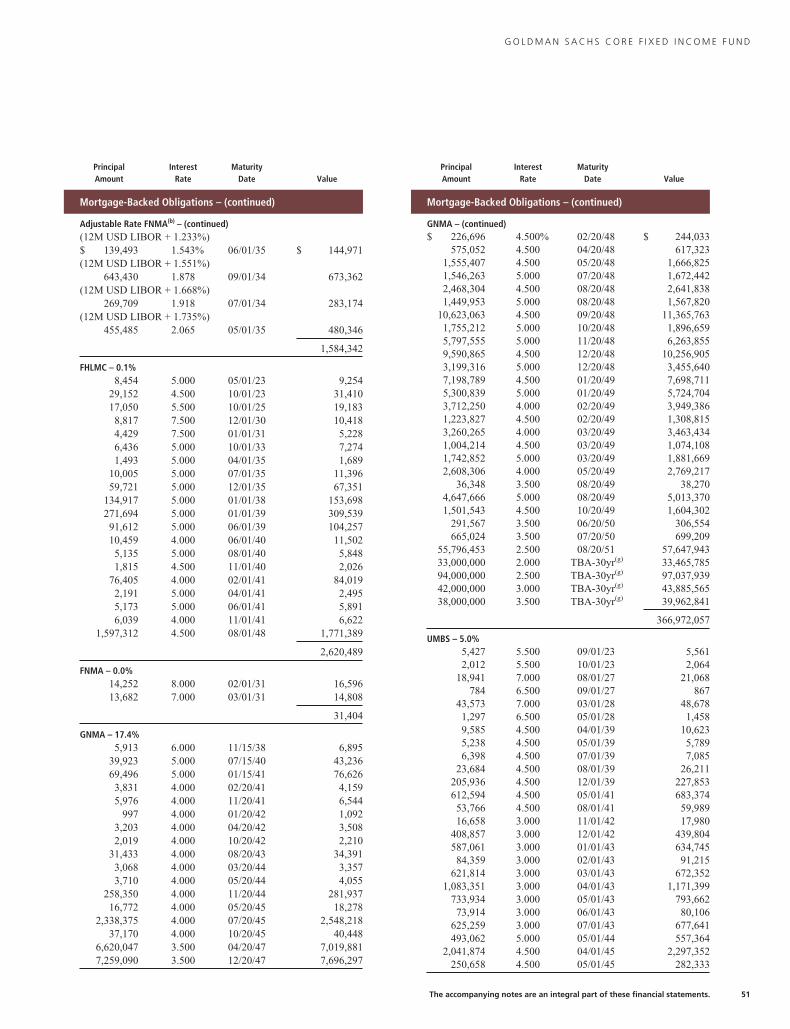
G O L D M A N S A C H S C O R E F I X E D I N C O M E F U N D
PrincipalAmount
InterestRate
MaturityDate Value
Mortgage-Backed Obligations – (continued)
Adjustable Rate FNMA(b) – (continued)(12M USD LIBOR + 1.233%)$ 139,493 1.543% 06/01/35 $ 144,971(12M USD LIBOR + 1.551%)
643,430 1.878 09/01/34 673,362(12M USD LIBOR + 1.668%)
269,709 1.918 07/01/34 283,174(12M USD LIBOR + 1.735%)
455,485 2.065 05/01/35 480,346
1,584,342
FHLMC – 0.1%8,454 5.000 05/01/23 9,254
29,152 4.500 10/01/23 31,41017,050 5.500 10/01/25 19,1838,817 7.500 12/01/30 10,4184,429 7.500 01/01/31 5,2286,436 5.000 10/01/33 7,2741,493 5.000 04/01/35 1,689
10,005 5.000 07/01/35 11,39659,721 5.000 12/01/35 67,351
134,917 5.000 01/01/38 153,698271,694 5.000 01/01/39 309,53991,612 5.000 06/01/39 104,25710,459 4.000 06/01/40 11,5025,135 5.000 08/01/40 5,8481,815 4.500 11/01/40 2,026
76,405 4.000 02/01/41 84,0192,191 5.000 04/01/41 2,4955,173 5.000 06/01/41 5,8916,039 4.000 11/01/41 6,622
1,597,312 4.500 08/01/48 1,771,389
2,620,489
FNMA – 0.0%14,252 8.000 02/01/31 16,59613,682 7.000 03/01/31 14,808
31,404
GNMA – 17.4%5,913 6.000 11/15/38 6,895
39,923 5.000 07/15/40 43,23669,496 5.000 01/15/41 76,6263,831 4.000 02/20/41 4,1595,976 4.000 11/20/41 6,544
997 4.000 01/20/42 1,0923,203 4.000 04/20/42 3,5082,019 4.000 10/20/42 2,210
31,433 4.000 08/20/43 34,3913,068 4.000 03/20/44 3,3573,710 4.000 05/20/44 4,055
258,350 4.000 11/20/44 281,93716,772 4.000 05/20/45 18,278
2,338,375 4.000 07/20/45 2,548,21837,170 4.000 10/20/45 40,448
6,620,047 3.500 04/20/47 7,019,8817,259,090 3.500 12/20/47 7,696,297
PrincipalAmount
InterestRate
MaturityDate Value
Mortgage-Backed Obligations – (continued)
GNMA – (continued)$ 226,696 4.500% 02/20/48 $ 244,033
575,052 4.500 04/20/48 617,3231,555,407 4.500 05/20/48 1,666,8251,546,263 5.000 07/20/48 1,672,4422,468,304 4.500 08/20/48 2,641,8381,449,953 5.000 08/20/48 1,567,820
10,623,063 4.500 09/20/48 11,365,7631,755,212 5.000 10/20/48 1,896,6595,797,555 5.000 11/20/48 6,263,8559,590,865 4.500 12/20/48 10,256,9053,199,316 5.000 12/20/48 3,455,6407,198,789 4.500 01/20/49 7,698,7115,300,839 5.000 01/20/49 5,724,7043,712,250 4.000 02/20/49 3,949,3861,223,827 4.500 02/20/49 1,308,8153,260,265 4.000 03/20/49 3,463,4341,004,214 4.500 03/20/49 1,074,1081,742,852 5.000 03/20/49 1,881,6692,608,306 4.000 05/20/49 2,769,217
36,348 3.500 08/20/49 38,2704,647,666 5.000 08/20/49 5,013,3701,501,543 4.500 10/20/49 1,604,302
291,567 3.500 06/20/50 306,554665,024 3.500 07/20/50 699,209
55,796,453 2.500 08/20/51 57,647,94333,000,000 2.000 TBA-30yr(g) 33,465,78594,000,000 2.500 TBA-30yr(g) 97,037,93942,000,000 3.000 TBA-30yr(g) 43,885,56538,000,000 3.500 TBA-30yr(g) 39,962,841
366,972,057
UMBS – 5.0%5,427 5.500 09/01/23 5,5612,012 5.500 10/01/23 2,064
18,941 7.000 08/01/27 21,068784 6.500 09/01/27 867
43,573 7.000 03/01/28 48,6781,297 6.500 05/01/28 1,4589,585 4.500 04/01/39 10,6235,238 4.500 05/01/39 5,7896,398 4.500 07/01/39 7,085
23,684 4.500 08/01/39 26,211205,936 4.500 12/01/39 227,853612,594 4.500 05/01/41 683,37453,766 4.500 08/01/41 59,98916,658 3.000 11/01/42 17,980
408,857 3.000 12/01/42 439,804587,061 3.000 01/01/43 634,74584,359 3.000 02/01/43 91,215
621,814 3.000 03/01/43 672,3521,083,351 3.000 04/01/43 1,171,399
733,934 3.000 05/01/43 793,66273,914 3.000 06/01/43 80,106
625,259 3.000 07/01/43 677,641493,062 5.000 05/01/44 557,364
2,041,874 4.500 04/01/45 2,297,352250,658 4.500 05/01/45 282,333
The accompanying notes are an integral part of these financial statements. 51
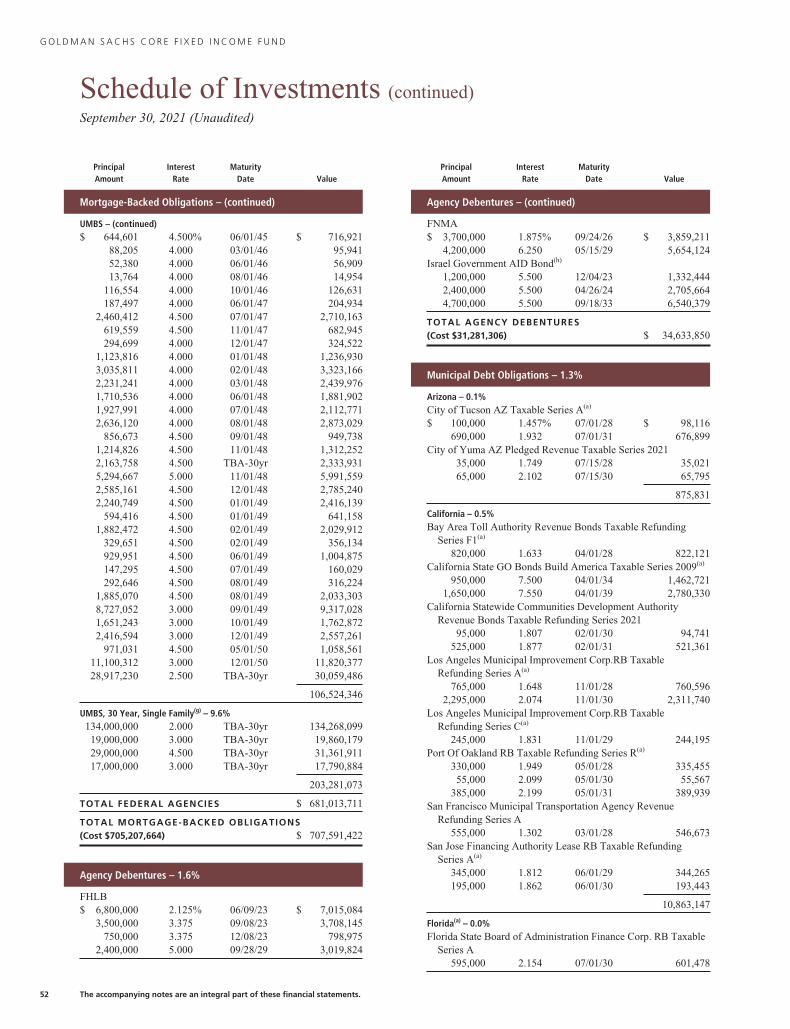
G O L D M A N S A C H S C O R E F I X E D I N C O M E F U N D
Schedule of Investments (continued)September 30, 2021 (Unaudited)
PrincipalAmount
InterestRate
MaturityDate Value
Mortgage-Backed Obligations – (continued)
UMBS – (continued)$ 644,601 4.500% 06/01/45 $ 716,921
88,205 4.000 03/01/46 95,94152,380 4.000 06/01/46 56,90913,764 4.000 08/01/46 14,954
116,554 4.000 10/01/46 126,631187,497 4.000 06/01/47 204,934
2,460,412 4.500 07/01/47 2,710,163619,559 4.500 11/01/47 682,945294,699 4.000 12/01/47 324,522
1,123,816 4.000 01/01/48 1,236,9303,035,811 4.000 02/01/48 3,323,1662,231,241 4.000 03/01/48 2,439,9761,710,536 4.000 06/01/48 1,881,9021,927,991 4.000 07/01/48 2,112,7712,636,120 4.000 08/01/48 2,873,029
856,673 4.500 09/01/48 949,7381,214,826 4.500 11/01/48 1,312,2522,163,758 4.500 TBA-30yr 2,333,9315,294,667 5.000 11/01/48 5,991,5592,585,161 4.500 12/01/48 2,785,2402,240,749 4.500 01/01/49 2,416,139
594,416 4.500 01/01/49 641,1581,882,472 4.500 02/01/49 2,029,912
329,651 4.500 02/01/49 356,134929,951 4.500 06/01/49 1,004,875147,295 4.500 07/01/49 160,029292,646 4.500 08/01/49 316,224
1,885,070 4.500 08/01/49 2,033,3038,727,052 3.000 09/01/49 9,317,0281,651,243 3.000 10/01/49 1,762,8722,416,594 3.000 12/01/49 2,557,261
971,031 4.500 05/01/50 1,058,56111,100,312 3.000 12/01/50 11,820,37728,917,230 2.500 TBA-30yr 30,059,486
106,524,346
UMBS, 30 Year, Single Family(g) – 9.6%134,000,000 2.000 TBA-30yr 134,268,09919,000,000 3.000 TBA-30yr 19,860,17929,000,000 4.500 TBA-30yr 31,361,91117,000,000 3.000 TBA-30yr 17,790,884
203,281,073
TOTAL FEDERAL AGENCIES $ 681,013,711
TOTAL MORTGAGE-BACKED OBLIGATIONS(Cost $705,207,664) $ 707,591,422
Agency Debentures – 1.6%
FHLB$ 6,800,000 2.125% 06/09/23 $ 7,015,084
3,500,000 3.375 09/08/23 3,708,145750,000 3.375 12/08/23 798,975
2,400,000 5.000 09/28/29 3,019,824
PrincipalAmount
InterestRate
MaturityDate Value
Agency Debentures – (continued)
FNMA$ 3,700,000 1.875% 09/24/26 $ 3,859,211
4,200,000 6.250 05/15/29 5,654,124Israel Government AID Bond(h)
1,200,000 5.500 12/04/23 1,332,4442,400,000 5.500 04/26/24 2,705,6644,700,000 5.500 09/18/33 6,540,379
TOTAL AGENCY DEBENTURES(Cost $31,281,306) $ 34,633,850
Municipal Debt Obligations – 1.3%
Arizona – 0.1%City of Tucson AZ Taxable Series A(a)
$ 100,000 1.457% 07/01/28 $ 98,116690,000 1.932 07/01/31 676,899
City of Yuma AZ Pledged Revenue Taxable Series 202135,000 1.749 07/15/28 35,02165,000 2.102 07/15/30 65,795
875,831
California – 0.5%Bay Area Toll Authority Revenue Bonds Taxable Refunding
Series F1(a)
820,000 1.633 04/01/28 822,121California State GO Bonds Build America Taxable Series 2009(a)
950,000 7.500 04/01/34 1,462,7211,650,000 7.550 04/01/39 2,780,330
California Statewide Communities Development AuthorityRevenue Bonds Taxable Refunding Series 2021
95,000 1.807 02/01/30 94,741525,000 1.877 02/01/31 521,361
Los Angeles Municipal Improvement Corp.RB TaxableRefunding Series A(a)
765,000 1.648 11/01/28 760,5962,295,000 2.074 11/01/30 2,311,740
Los Angeles Municipal Improvement Corp.RB TaxableRefunding Series C(a)
245,000 1.831 11/01/29 244,195Port Of Oakland RB Taxable Refunding Series R(a)
330,000 1.949 05/01/28 335,45555,000 2.099 05/01/30 55,567
385,000 2.199 05/01/31 389,939San Francisco Municipal Transportation Agency Revenue
Refunding Series A555,000 1.302 03/01/28 546,673
San Jose Financing Authority Lease RB Taxable RefundingSeries A(a)
345,000 1.812 06/01/29 344,265195,000 1.862 06/01/30 193,443
10,863,147
Florida(a) – 0.0%Florida State Board of Administration Finance Corp. RB Taxable
Series A595,000 2.154 07/01/30 601,478
52 The accompanying notes are an integral part of these financial statements.
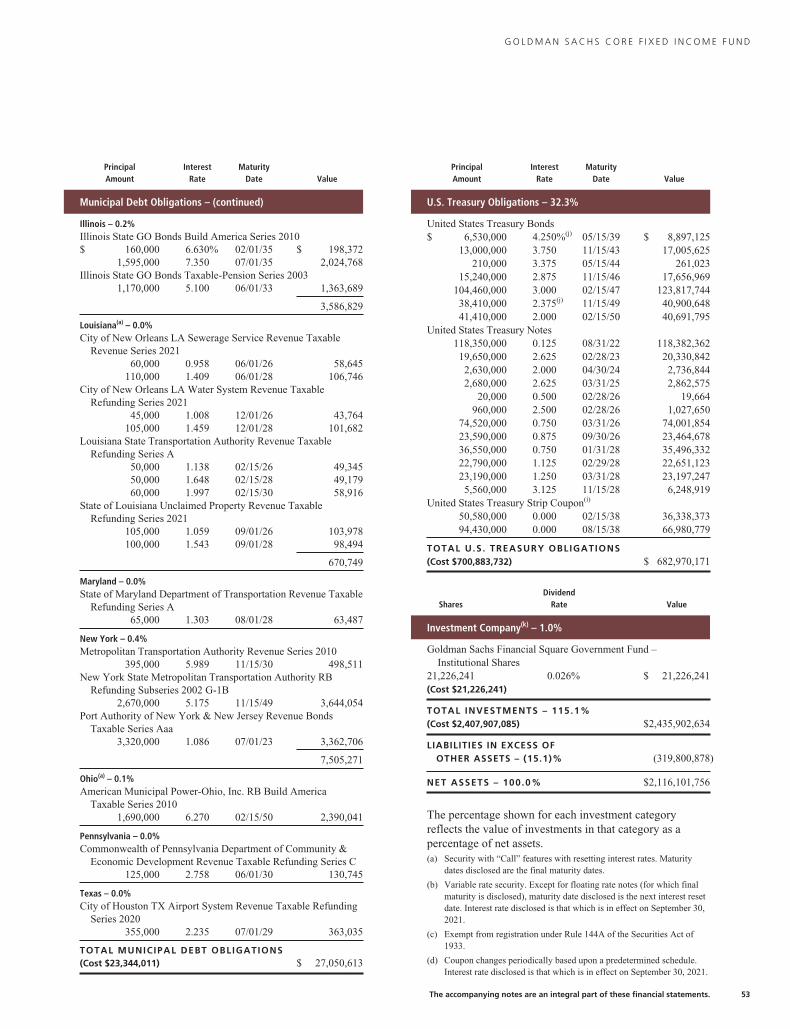
G O L D M A N S A C H S C O R E F I X E D I N C O M E F U N D
PrincipalAmount
InterestRate
MaturityDate Value
Municipal Debt Obligations – (continued)
Illinois – 0.2%Illinois State GO Bonds Build America Series 2010$ 160,000 6.630% 02/01/35 $ 198,372
1,595,000 7.350 07/01/35 2,024,768Illinois State GO Bonds Taxable-Pension Series 2003
1,170,000 5.100 06/01/33 1,363,689
3,586,829
Louisiana(a) – 0.0%City of New Orleans LA Sewerage Service Revenue Taxable
Revenue Series 202160,000 0.958 06/01/26 58,645
110,000 1.409 06/01/28 106,746City of New Orleans LA Water System Revenue Taxable
Refunding Series 202145,000 1.008 12/01/26 43,764
105,000 1.459 12/01/28 101,682Louisiana State Transportation Authority Revenue Taxable
Refunding Series A50,000 1.138 02/15/26 49,34550,000 1.648 02/15/28 49,17960,000 1.997 02/15/30 58,916
State of Louisiana Unclaimed Property Revenue TaxableRefunding Series 2021
105,000 1.059 09/01/26 103,978100,000 1.543 09/01/28 98,494
670,749
Maryland – 0.0%State of Maryland Department of Transportation Revenue Taxable
Refunding Series A65,000 1.303 08/01/28 63,487
New York – 0.4%Metropolitan Transportation Authority Revenue Series 2010
395,000 5.989 11/15/30 498,511New York State Metropolitan Transportation Authority RB
Refunding Subseries 2002 G-1B2,670,000 5.175 11/15/49 3,644,054
Port Authority of New York & New Jersey Revenue BondsTaxable Series Aaa
3,320,000 1.086 07/01/23 3,362,706
7,505,271
Ohio(a) – 0.1%American Municipal Power-Ohio, Inc. RB Build America
Taxable Series 20101,690,000 6.270 02/15/50 2,390,041
Pennsylvania – 0.0%Commonwealth of Pennsylvania Department of Community &
Economic Development Revenue Taxable Refunding Series C125,000 2.758 06/01/30 130,745
Texas – 0.0%City of Houston TX Airport System Revenue Taxable Refunding
Series 2020355,000 2.235 07/01/29 363,035
TOTAL MUNICIPAL DEBT OBLIGATIONS(Cost $23,344,011) $ 27,050,613
PrincipalAmount
InterestRate
MaturityDate Value
U.S. Treasury Obligations – 32.3%
United States Treasury Bonds$ 6,530,000 4.250%(j) 05/15/39 $ 8,897,125
13,000,000 3.750 11/15/43 17,005,625210,000 3.375 05/15/44 261,023
15,240,000 2.875 11/15/46 17,656,969104,460,000 3.000 02/15/47 123,817,74438,410,000 2.375(j) 11/15/49 40,900,64841,410,000 2.000 02/15/50 40,691,795
United States Treasury Notes118,350,000 0.125 08/31/22 118,382,36219,650,000 2.625 02/28/23 20,330,8422,630,000 2.000 04/30/24 2,736,8442,680,000 2.625 03/31/25 2,862,575
20,000 0.500 02/28/26 19,664960,000 2.500 02/28/26 1,027,650
74,520,000 0.750 03/31/26 74,001,85423,590,000 0.875 09/30/26 23,464,67836,550,000 0.750 01/31/28 35,496,33222,790,000 1.125 02/29/28 22,651,12323,190,000 1.250 03/31/28 23,197,2475,560,000 3.125 11/15/28 6,248,919
United States Treasury Strip Coupon(i)
50,580,000 0.000 02/15/38 36,338,37394,430,000 0.000 08/15/38 66,980,779
TOTAL U.S. TREASURY OBLIGATIONS(Cost $700,883,732) $ 682,970,171
SharesDividend
Rate Value
Investment Company(k) – 1.0%
Goldman Sachs Financial Square Government Fund –Institutional Shares
21,226,241 0.026% $ 21,226,241(Cost $21,226,241)
TOTAL INVESTMENTS – 115.1%(Cost $2,407,907,085) $2,435,902,634
LIABILITIES IN EXCESS OFOTHER ASSETS – (15.1)% (319,800,878)
NET ASSETS – 100.0% $2,116,101,756
The percentage shown for each investment categoryreflects the value of investments in that category as apercentage of net assets.(a) Security with “Call” features with resetting interest rates. Maturity
dates disclosed are the final maturity dates.
(b) Variable rate security. Except for floating rate notes (for which finalmaturity is disclosed), maturity date disclosed is the next interest resetdate. Interest rate disclosed is that which is in effect on September 30,2021.
(c) Exempt from registration under Rule 144A of the Securities Act of1933.
(d) Coupon changes periodically based upon a predetermined schedule.Interest rate disclosed is that which is in effect on September 30, 2021.
The accompanying notes are an integral part of these financial statements. 53
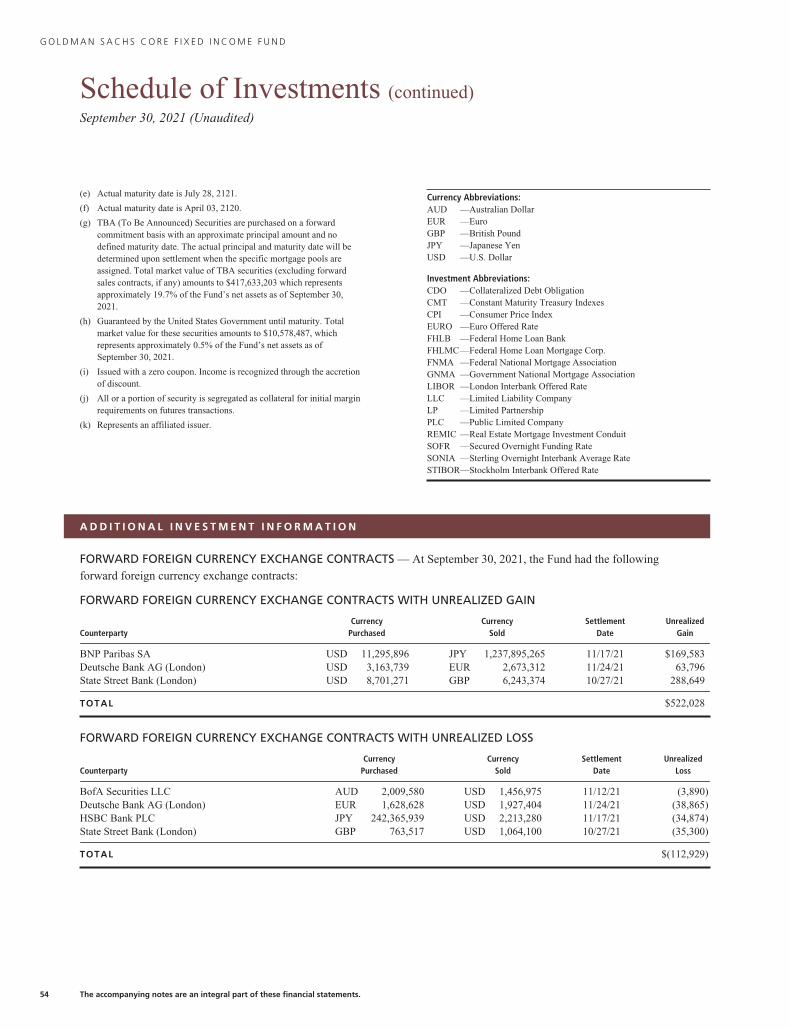
G O L D M A N S A C H S C O R E F I X E D I N C O M E F U N D
Schedule of Investments (continued)September 30, 2021 (Unaudited)
(e) Actual maturity date is July 28, 2121.
(f) Actual maturity date is April 03, 2120.
(g) TBA (To Be Announced) Securities are purchased on a forwardcommitment basis with an approximate principal amount and nodefined maturity date. The actual principal and maturity date will bedetermined upon settlement when the specific mortgage pools areassigned. Total market value of TBA securities (excluding forwardsales contracts, if any) amounts to $417,633,203 which representsapproximately 19.7% of the Fund’s net assets as of September 30,2021.
(h) Guaranteed by the United States Government until maturity. Totalmarket value for these securities amounts to $10,578,487, whichrepresents approximately 0.5% of the Fund’s net assets as ofSeptember 30, 2021.
(i) Issued with a zero coupon. Income is recognized through the accretionof discount.
(j) All or a portion of security is segregated as collateral for initial marginrequirements on futures transactions.
(k) Represents an affiliated issuer.
Currency Abbreviations:AUD —Australian DollarEUR —EuroGBP —British PoundJPY —Japanese YenUSD —U.S. Dollar
Investment Abbreviations:CDO —Collateralized Debt ObligationCMT —Constant Maturity Treasury IndexesCPI —Consumer Price IndexEURO —Euro Offered RateFHLB —Federal Home Loan BankFHLMC—Federal Home Loan Mortgage Corp.FNMA —Federal National Mortgage AssociationGNMA —Government National Mortgage AssociationLIBOR —London Interbank Offered RateLLC —Limited Liability CompanyLP —Limited PartnershipPLC —Public Limited CompanyREMIC —Real Estate Mortgage Investment ConduitSOFR —Secured Overnight Funding RateSONIA —Sterling Overnight Interbank Average RateSTIBOR—Stockholm Interbank Offered Rate
A D D I T I O N A L I N V E S T M E N T I N F O R M A T I O N
FORWARD FOREIGN CURRENCY EXCHANGE CONTRACTS — At September 30, 2021, the Fund had the following
forward foreign currency exchange contracts:
FORWARD FOREIGN CURRENCY EXCHANGE CONTRACTS WITH UNREALIZED GAIN
CounterpartyCurrency
PurchasedCurrency
SoldSettlement
DateUnrealized
Gain
BNP Paribas SA USD 11,295,896 JPY 1,237,895,265 11/17/21 $169,583Deutsche Bank AG (London) USD 3,163,739 EUR 2,673,312 11/24/21 63,796State Street Bank (London) USD 8,701,271 GBP 6,243,374 10/27/21 288,649
TOTAL $522,028
FORWARD FOREIGN CURRENCY EXCHANGE CONTRACTS WITH UNREALIZED LOSS
CounterpartyCurrency
PurchasedCurrency
SoldSettlement
DateUnrealized
Loss
BofA Securities LLC AUD 2,009,580 USD 1,456,975 11/12/21 (3,890)Deutsche Bank AG (London) EUR 1,628,628 USD 1,927,404 11/24/21 (38,865)HSBC Bank PLC JPY 242,365,939 USD 2,213,280 11/17/21 (34,874)State Street Bank (London) GBP 763,517 USD 1,064,100 10/27/21 (35,300)
TOTAL $(112,929)
54 The accompanying notes are an integral part of these financial statements.
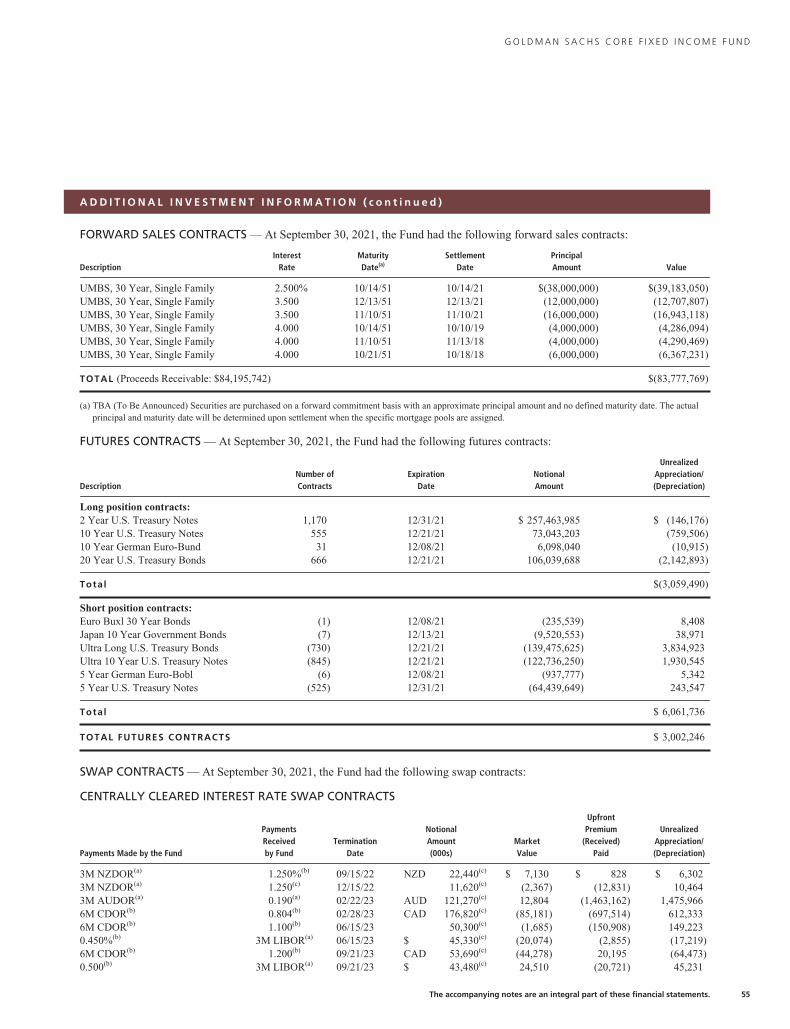
G O L D M A N S A C H S C O R E F I X E D I N C O M E F U N D
A D D I T I O N A L I N V E S T M E N T I N F O R M A T I O N ( c o n t i n u e d )
FORWARD SALES CONTRACTS — At September 30, 2021, the Fund had the following forward sales contracts:
DescriptionInterest
RateMaturityDate(a)
SettlementDate
PrincipalAmount Value
UMBS, 30 Year, Single Family 2.500% 10/14/51 10/14/21 $(38,000,000) $(39,183,050)UMBS, 30 Year, Single Family 3.500 12/13/51 12/13/21 (12,000,000) (12,707,807)UMBS, 30 Year, Single Family 3.500 11/10/51 11/10/21 (16,000,000) (16,943,118)UMBS, 30 Year, Single Family 4.000 10/14/51 10/10/19 (4,000,000) (4,286,094)UMBS, 30 Year, Single Family 4.000 11/10/51 11/13/18 (4,000,000) (4,290,469)UMBS, 30 Year, Single Family 4.000 10/21/51 10/18/18 (6,000,000) (6,367,231)
TOTAL (Proceeds Receivable: $84,195,742) $(83,777,769)
(a) TBA (To Be Announced) Securities are purchased on a forward commitment basis with an approximate principal amount and no defined maturity date. The actualprincipal and maturity date will be determined upon settlement when the specific mortgage pools are assigned.
FUTURES CONTRACTS — At September 30, 2021, the Fund had the following futures contracts:
DescriptionNumber ofContracts
ExpirationDate
NotionalAmount
UnrealizedAppreciation/(Depreciation)
Long position contracts:2 Year U.S. Treasury Notes 1,170 12/31/21 $ 257,463,985 $ (146,176)10 Year U.S. Treasury Notes 555 12/21/21 73,043,203 (759,506)10 Year German Euro-Bund 31 12/08/21 6,098,040 (10,915)20 Year U.S. Treasury Bonds 666 12/21/21 106,039,688 (2,142,893)
Total $(3,059,490)
Short position contracts:Euro Buxl 30 Year Bonds (1) 12/08/21 (235,539) 8,408Japan 10 Year Government Bonds (7) 12/13/21 (9,520,553) 38,971Ultra Long U.S. Treasury Bonds (730) 12/21/21 (139,475,625) 3,834,923Ultra 10 Year U.S. Treasury Notes (845) 12/21/21 (122,736,250) 1,930,5455 Year German Euro-Bobl (6) 12/08/21 (937,777) 5,3425 Year U.S. Treasury Notes (525) 12/31/21 (64,439,649) 243,547
Total $ 6,061,736
TOTAL FUTURES CONTRACTS $ 3,002,246
SWAP CONTRACTS — At September 30, 2021, the Fund had the following swap contracts:
CENTRALLY CLEARED INTEREST RATE SWAP CONTRACTS
Payments Made by the Fund
PaymentsReceivedby Fund
TerminationDate
NotionalAmount(000s)
MarketValue
UpfrontPremium
(Received)Paid
UnrealizedAppreciation/(Depreciation)
3M NZDOR(a) 1.250%(b) 09/15/22 NZD 22,440(c) $ 7,130 $ 828 $ 6,3023M NZDOR(a) 1.250(c) 12/15/22 11,620(c) (2,367) (12,831) 10,4643M AUDOR(a) 0.190(a) 02/22/23 AUD 121,270(c) 12,804 (1,463,162) 1,475,9666M CDOR(b) 0.804(b) 02/28/23 CAD 176,820(c) (85,181) (697,514) 612,3336M CDOR(b) 1.100(b) 06/15/23 50,300(c) (1,685) (150,908) 149,2230.450%(b) 3M LIBOR(a) 06/15/23 $ 45,330(c) (20,074) (2,855) (17,219)6M CDOR(b) 1.200(b) 09/21/23 CAD 53,690(c) (44,278) 20,195 (64,473)0.500(b) 3M LIBOR(a) 09/21/23 $ 43,480(c) 24,510 (20,721) 45,231
The accompanying notes are an integral part of these financial statements. 55
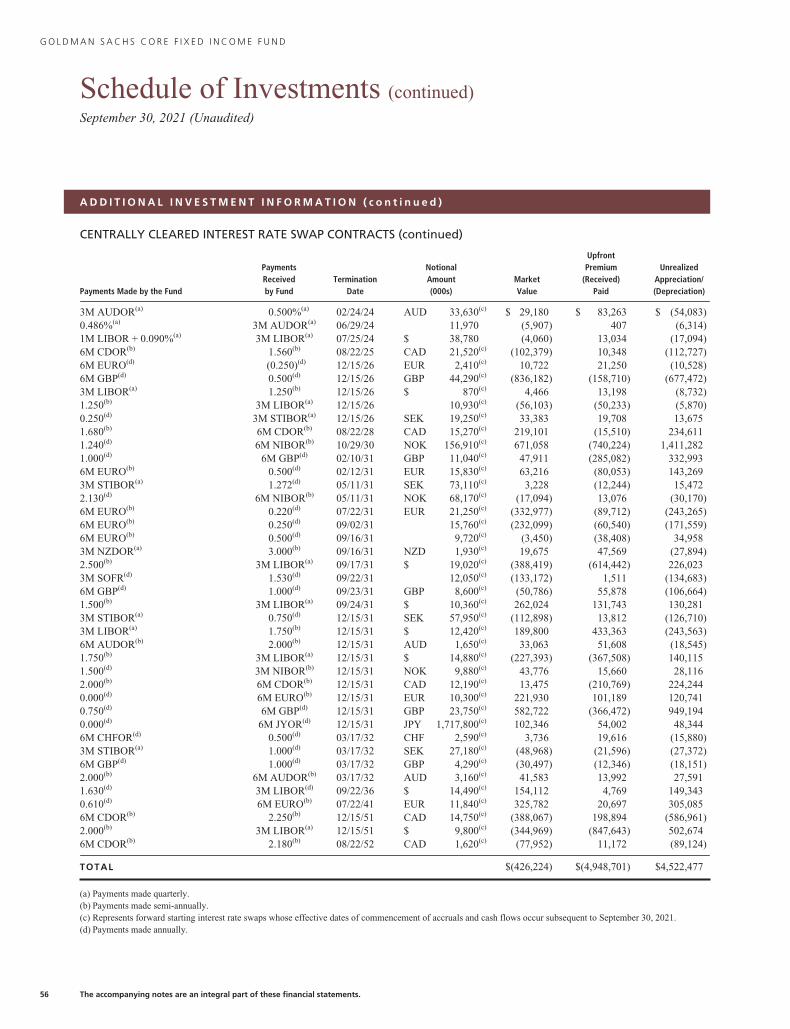
G O L D M A N S A C H S C O R E F I X E D I N C O M E F U N D
Schedule of Investments (continued)September 30, 2021 (Unaudited)
A D D I T I O N A L I N V E S T M E N T I N F O R M A T I O N ( c o n t i n u e d )
CENTRALLY CLEARED INTEREST RATE SWAP CONTRACTS (continued)
Payments Made by the Fund
PaymentsReceivedby Fund
TerminationDate
NotionalAmount(000s)
MarketValue
UpfrontPremium
(Received)Paid
UnrealizedAppreciation/(Depreciation)
3M AUDOR(a) 0.500%(a) 02/24/24 AUD 33,630(c) $ 29,180 $ 83,263 $ (54,083)0.486%(a) 3M AUDOR(a) 06/29/24 11,970 (5,907) 407 (6,314)1M LIBOR + 0.090%(a) 3M LIBOR(a) 07/25/24 $ 38,780 (4,060) 13,034 (17,094)6M CDOR(b) 1.560(b) 08/22/25 CAD 21,520(c) (102,379) 10,348 (112,727)6M EURO(d) (0.250)(d) 12/15/26 EUR 2,410(c) 10,722 21,250 (10,528)6M GBP(d) 0.500(d) 12/15/26 GBP 44,290(c) (836,182) (158,710) (677,472)3M LIBOR(a) 1.250(b) 12/15/26 $ 870(c) 4,466 13,198 (8,732)1.250(b) 3M LIBOR(a) 12/15/26 10,930(c) (56,103) (50,233) (5,870)0.250(d) 3M STIBOR(a) 12/15/26 SEK 19,250(c) 33,383 19,708 13,6751.680(b) 6M CDOR(b) 08/22/28 CAD 15,270(c) 219,101 (15,510) 234,6111.240(d) 6M NIBOR(b) 10/29/30 NOK 156,910(c) 671,058 (740,224) 1,411,2821.000(d) 6M GBP(d) 02/10/31 GBP 11,040(c) 47,911 (285,082) 332,9936M EURO(b) 0.500(d) 02/12/31 EUR 15,830(c) 63,216 (80,053) 143,2693M STIBOR(a) 1.272(d) 05/11/31 SEK 73,110(c) 3,228 (12,244) 15,4722.130(d) 6M NIBOR(b) 05/11/31 NOK 68,170(c) (17,094) 13,076 (30,170)6M EURO(b) 0.220(d) 07/22/31 EUR 21,250(c) (332,977) (89,712) (243,265)6M EURO(b) 0.250(d) 09/02/31 15,760(c) (232,099) (60,540) (171,559)6M EURO(b) 0.500(d) 09/16/31 9,720(c) (3,450) (38,408) 34,9583M NZDOR(a) 3.000(b) 09/16/31 NZD 1,930(c) 19,675 47,569 (27,894)2.500(b) 3M LIBOR(a) 09/17/31 $ 19,020(c) (388,419) (614,442) 226,0233M SOFR(d) 1.530(d) 09/22/31 12,050(c) (133,172) 1,511 (134,683)6M GBP(d) 1.000(d) 09/23/31 GBP 8,600(c) (50,786) 55,878 (106,664)1.500(b) 3M LIBOR(a) 09/24/31 $ 10,360(c) 262,024 131,743 130,2813M STIBOR(a) 0.750(d) 12/15/31 SEK 57,950(c) (112,898) 13,812 (126,710)3M LIBOR(a) 1.750(b) 12/15/31 $ 12,420(c) 189,800 433,363 (243,563)6M AUDOR(b) 2.000(b) 12/15/31 AUD 1,650(c) 33,063 51,608 (18,545)1.750(b) 3M LIBOR(a) 12/15/31 $ 14,880(c) (227,393) (367,508) 140,1151.500(d) 3M NIBOR(b) 12/15/31 NOK 9,880(c) 43,776 15,660 28,1162.000(b) 6M CDOR(b) 12/15/31 CAD 12,190(c) 13,475 (210,769) 224,2440.000(d) 6M EURO(b) 12/15/31 EUR 10,300(c) 221,930 101,189 120,7410.750(d) 6M GBP(d) 12/15/31 GBP 23,750(c) 582,722 (366,472) 949,1940.000(d) 6M JYOR(d) 12/15/31 JPY 1,717,800(c) 102,346 54,002 48,3446M CHFOR(d) 0.500(d) 03/17/32 CHF 2,590(c) 3,736 19,616 (15,880)3M STIBOR(a) 1.000(d) 03/17/32 SEK 27,180(c) (48,968) (21,596) (27,372)6M GBP(d) 1.000(d) 03/17/32 GBP 4,290(c) (30,497) (12,346) (18,151)2.000(b) 6M AUDOR(b) 03/17/32 AUD 3,160(c) 41,583 13,992 27,5911.630(d) 3M LIBOR(d) 09/22/36 $ 14,490(c) 154,112 4,769 149,3430.610(d) 6M EURO(b) 07/22/41 EUR 11,840(c) 325,782 20,697 305,0856M CDOR(b) 2.250(b) 12/15/51 CAD 14,750(c) (388,067) 198,894 (586,961)2.000(b) 3M LIBOR(a) 12/15/51 $ 9,800(c) (344,969) (847,643) 502,6746M CDOR(b) 2.180(b) 08/22/52 CAD 1,620(c) (77,952) 11,172 (89,124)
TOTAL $(426,224) $(4,948,701) $4,522,477
(a) Payments made quarterly.(b) Payments made semi-annually.(c) Represents forward starting interest rate swaps whose effective dates of commencement of accruals and cash flows occur subsequent to September 30, 2021.(d) Payments made annually.
56 The accompanying notes are an integral part of these financial statements.
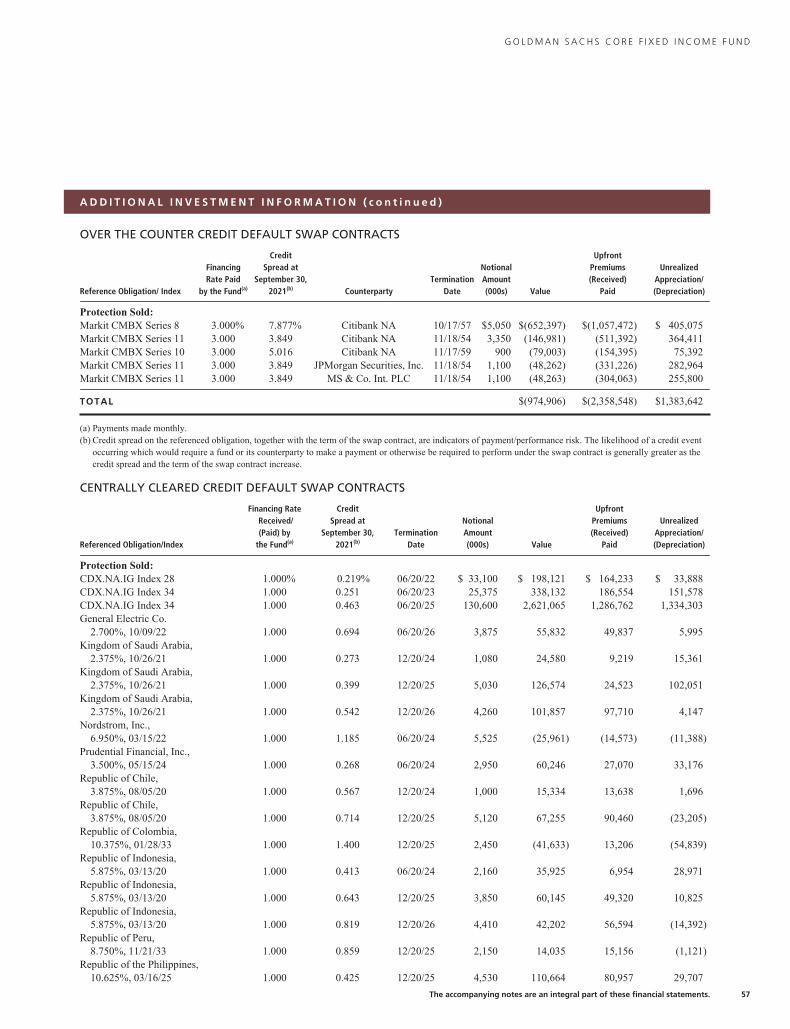
G O L D M A N S A C H S C O R E F I X E D I N C O M E F U N D
A D D I T I O N A L I N V E S T M E N T I N F O R M A T I O N ( c o n t i n u e d )
OVER THE COUNTER CREDIT DEFAULT SWAP CONTRACTS
Reference Obligation/ Index
FinancingRate Paid
by the Fund(a)
CreditSpread at
September 30,2021(b) Counterparty
TerminationDate
NotionalAmount(000s) Value
UpfrontPremiums(Received)
Paid
UnrealizedAppreciation/(Depreciation)
Protection Sold:Markit CMBX Series 8 3.000% 7.877% Citibank NA 10/17/57 $5,050 $(652,397) $(1,057,472) $ 405,075Markit CMBX Series 11 3.000 3.849 Citibank NA 11/18/54 3,350 (146,981) (511,392) 364,411Markit CMBX Series 10 3.000 5.016 Citibank NA 11/17/59 900 (79,003) (154,395) 75,392Markit CMBX Series 11 3.000 3.849 JPMorgan Securities, Inc. 11/18/54 1,100 (48,262) (331,226) 282,964Markit CMBX Series 11 3.000 3.849 MS & Co. Int. PLC 11/18/54 1,100 (48,263) (304,063) 255,800
TOTAL $(974,906) $(2,358,548) $1,383,642
(a) Payments made monthly.(b) Credit spread on the referenced obligation, together with the term of the swap contract, are indicators of payment/performance risk. The likelihood of a credit event
occurring which would require a fund or its counterparty to make a payment or otherwise be required to perform under the swap contract is generally greater as thecredit spread and the term of the swap contract increase.
CENTRALLY CLEARED CREDIT DEFAULT SWAP CONTRACTS
Referenced Obligation/Index
Financing RateReceived/(Paid) by
the Fund(a)
CreditSpread at
September 30,2021(b)
TerminationDate
NotionalAmount(000s) Value
UpfrontPremiums(Received)
Paid
UnrealizedAppreciation/(Depreciation)
Protection Sold:CDX.NA.IG Index 28 1.000% 0.219% 06/20/22 $ 33,100 $ 198,121 $ 164,233 $ 33,888CDX.NA.IG Index 34 1.000 0.251 06/20/23 25,375 338,132 186,554 151,578CDX.NA.IG Index 34 1.000 0.463 06/20/25 130,600 2,621,065 1,286,762 1,334,303General Electric Co.
2.700%, 10/09/22 1.000 0.694 06/20/26 3,875 55,832 49,837 5,995Kingdom of Saudi Arabia,
2.375%, 10/26/21 1.000 0.273 12/20/24 1,080 24,580 9,219 15,361Kingdom of Saudi Arabia,
2.375%, 10/26/21 1.000 0.399 12/20/25 5,030 126,574 24,523 102,051Kingdom of Saudi Arabia,
2.375%, 10/26/21 1.000 0.542 12/20/26 4,260 101,857 97,710 4,147Nordstrom, Inc.,
6.950%, 03/15/22 1.000 1.185 06/20/24 5,525 (25,961) (14,573) (11,388)Prudential Financial, Inc.,
3.500%, 05/15/24 1.000 0.268 06/20/24 2,950 60,246 27,070 33,176Republic of Chile,
3.875%, 08/05/20 1.000 0.567 12/20/24 1,000 15,334 13,638 1,696Republic of Chile,
3.875%, 08/05/20 1.000 0.714 12/20/25 5,120 67,255 90,460 (23,205)Republic of Colombia,
10.375%, 01/28/33 1.000 1.400 12/20/25 2,450 (41,633) 13,206 (54,839)Republic of Indonesia,
5.875%, 03/13/20 1.000 0.413 06/20/24 2,160 35,925 6,954 28,971Republic of Indonesia,
5.875%, 03/13/20 1.000 0.643 12/20/25 3,850 60,145 49,320 10,825Republic of Indonesia,
5.875%, 03/13/20 1.000 0.819 12/20/26 4,410 42,202 56,594 (14,392)Republic of Peru,
8.750%, 11/21/33 1.000 0.859 12/20/25 2,150 14,035 15,156 (1,121)Republic of the Philippines,
10.625%, 03/16/25 1.000 0.425 12/20/25 4,530 110,664 80,957 29,707
The accompanying notes are an integral part of these financial statements. 57
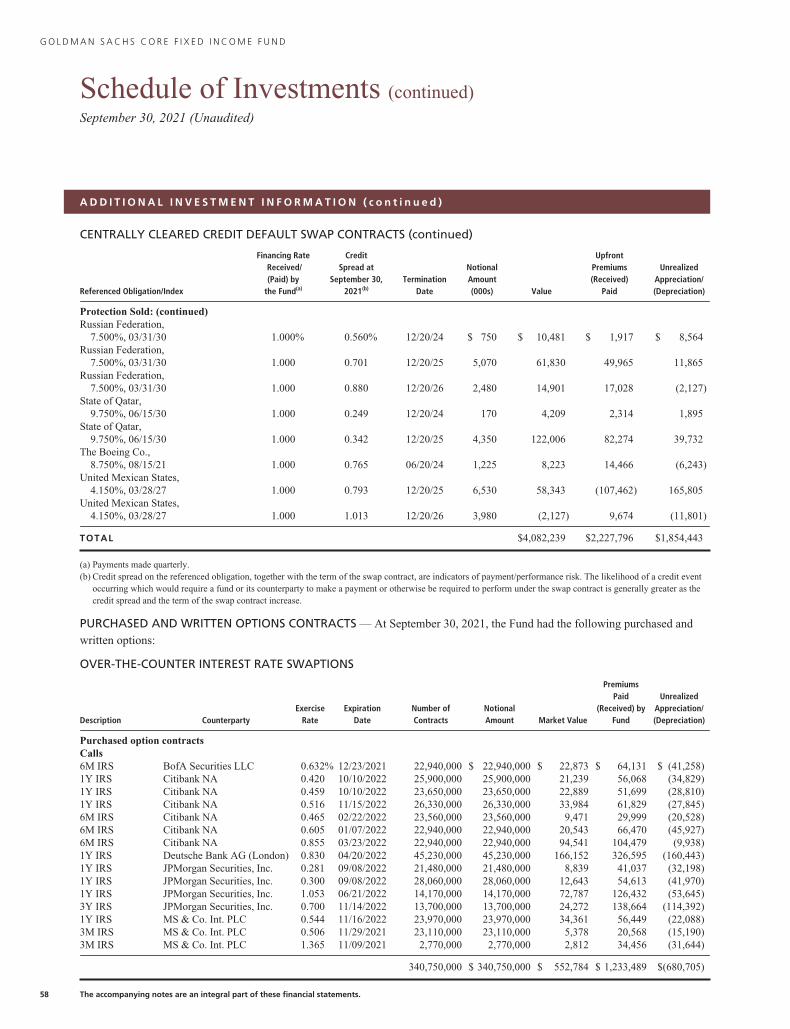
G O L D M A N S A C H S C O R E F I X E D I N C O M E F U N D
Schedule of Investments (continued)September 30, 2021 (Unaudited)
A D D I T I O N A L I N V E S T M E N T I N F O R M A T I O N ( c o n t i n u e d )
CENTRALLY CLEARED CREDIT DEFAULT SWAP CONTRACTS (continued)
Referenced Obligation/Index
Financing RateReceived/(Paid) by
the Fund(a)
CreditSpread at
September 30,2021(b)
TerminationDate
NotionalAmount(000s) Value
UpfrontPremiums(Received)
Paid
UnrealizedAppreciation/(Depreciation)
Protection Sold: (continued)Russian Federation,
7.500%, 03/31/30 1.000% 0.560% 12/20/24 $ 750 $ 10,481 $ 1,917 $ 8,564Russian Federation,
7.500%, 03/31/30 1.000 0.701 12/20/25 5,070 61,830 49,965 11,865Russian Federation,
7.500%, 03/31/30 1.000 0.880 12/20/26 2,480 14,901 17,028 (2,127)State of Qatar,
9.750%, 06/15/30 1.000 0.249 12/20/24 170 4,209 2,314 1,895State of Qatar,
9.750%, 06/15/30 1.000 0.342 12/20/25 4,350 122,006 82,274 39,732The Boeing Co.,
8.750%, 08/15/21 1.000 0.765 06/20/24 1,225 8,223 14,466 (6,243)United Mexican States,
4.150%, 03/28/27 1.000 0.793 12/20/25 6,530 58,343 (107,462) 165,805United Mexican States,
4.150%, 03/28/27 1.000 1.013 12/20/26 3,980 (2,127) 9,674 (11,801)
TOTAL $4,082,239 $2,227,796 $1,854,443
(a) Payments made quarterly.(b) Credit spread on the referenced obligation, together with the term of the swap contract, are indicators of payment/performance risk. The likelihood of a credit event
occurring which would require a fund or its counterparty to make a payment or otherwise be required to perform under the swap contract is generally greater as thecredit spread and the term of the swap contract increase.
PURCHASED AND WRITTEN OPTIONS CONTRACTS — At September 30, 2021, the Fund had the following purchased and
written options:
OVER-THE-COUNTER INTEREST RATE SWAPTIONS
Description CounterpartyExercise
RateExpiration
DateNumber ofContracts
NotionalAmount Market Value
PremiumsPaid
(Received) byFund
UnrealizedAppreciation/(Depreciation)
Purchased option contractsCalls6M IRS BofA Securities LLC 0.632% 12/23/2021 22,940,000 $ 22,940,000 $ 22,873 $ 64,131 $ (41,258)1Y IRS Citibank NA 0.420 10/10/2022 25,900,000 25,900,000 21,239 56,068 (34,829)1Y IRS Citibank NA 0.459 10/10/2022 23,650,000 23,650,000 22,889 51,699 (28,810)1Y IRS Citibank NA 0.516 11/15/2022 26,330,000 26,330,000 33,984 61,829 (27,845)6M IRS Citibank NA 0.465 02/22/2022 23,560,000 23,560,000 9,471 29,999 (20,528)6M IRS Citibank NA 0.605 01/07/2022 22,940,000 22,940,000 20,543 66,470 (45,927)6M IRS Citibank NA 0.855 03/23/2022 22,940,000 22,940,000 94,541 104,479 (9,938)1Y IRS Deutsche Bank AG (London) 0.830 04/20/2022 45,230,000 45,230,000 166,152 326,595 (160,443)1Y IRS JPMorgan Securities, Inc. 0.281 09/08/2022 21,480,000 21,480,000 8,839 41,037 (32,198)1Y IRS JPMorgan Securities, Inc. 0.300 09/08/2022 28,060,000 28,060,000 12,643 54,613 (41,970)1Y IRS JPMorgan Securities, Inc. 1.053 06/21/2022 14,170,000 14,170,000 72,787 126,432 (53,645)3Y IRS JPMorgan Securities, Inc. 0.700 11/14/2022 13,700,000 13,700,000 24,272 138,664 (114,392)1Y IRS MS & Co. Int. PLC 0.544 11/16/2022 23,970,000 23,970,000 34,361 56,449 (22,088)3M IRS MS & Co. Int. PLC 0.506 11/29/2021 23,110,000 23,110,000 5,378 20,568 (15,190)3M IRS MS & Co. Int. PLC 1.365 11/09/2021 2,770,000 2,770,000 2,812 34,456 (31,644)
340,750,000 $ 340,750,000 $ 552,784 $ 1,233,489 $(680,705)
58 The accompanying notes are an integral part of these financial statements.
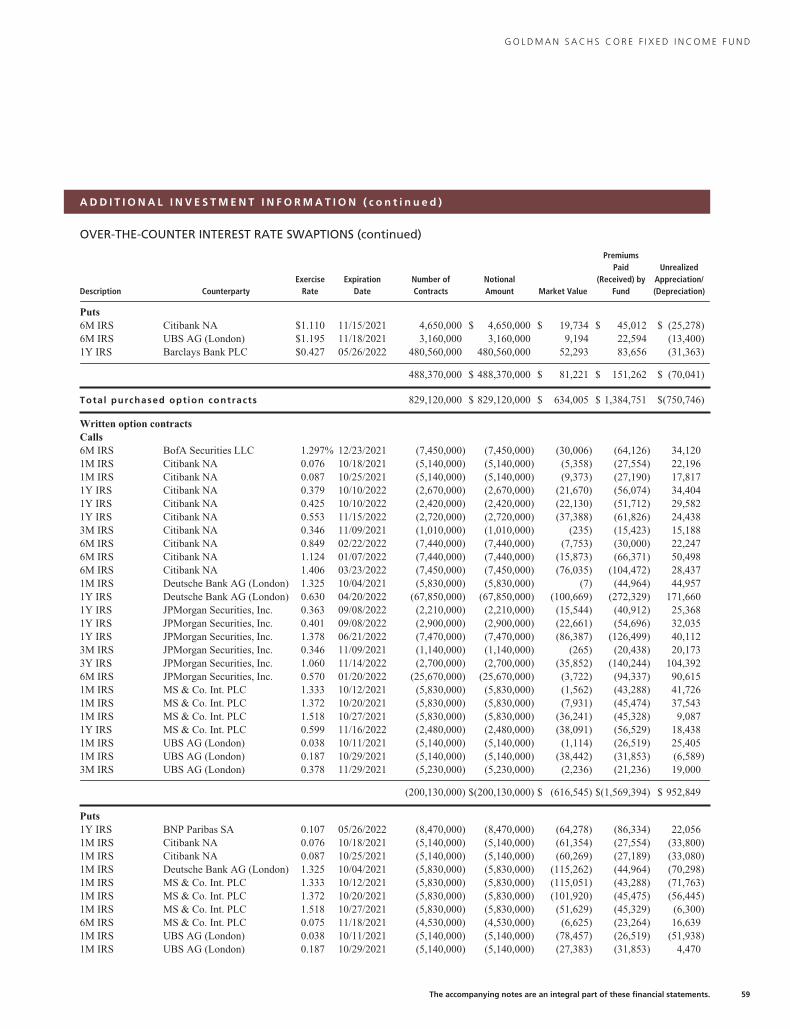
G O L D M A N S A C H S C O R E F I X E D I N C O M E F U N D
A D D I T I O N A L I N V E S T M E N T I N F O R M A T I O N ( c o n t i n u e d )
OVER-THE-COUNTER INTEREST RATE SWAPTIONS (continued)
Description CounterpartyExercise
RateExpiration
DateNumber ofContracts
NotionalAmount Market Value
PremiumsPaid
(Received) byFund
UnrealizedAppreciation/(Depreciation)
Puts6M IRS Citibank NA $1.110 11/15/2021 4,650,000 $ 4,650,000 $ 19,734 $ 45,012 $ (25,278)6M IRS UBS AG (London) $1.195 11/18/2021 3,160,000 3,160,000 9,194 22,594 (13,400)1Y IRS Barclays Bank PLC $0.427 05/26/2022 480,560,000 480,560,000 52,293 83,656 (31,363)
488,370,000 $ 488,370,000 $ 81,221 $ 151,262 $ (70,041)
Total purchased option contracts 829,120,000 $ 829,120,000 $ 634,005 $ 1,384,751 $(750,746)
Written option contractsCalls6M IRS BofA Securities LLC 1.297% 12/23/2021 (7,450,000) (7,450,000) (30,006) (64,126) 34,1201M IRS Citibank NA 0.076 10/18/2021 (5,140,000) (5,140,000) (5,358) (27,554) 22,1961M IRS Citibank NA 0.087 10/25/2021 (5,140,000) (5,140,000) (9,373) (27,190) 17,8171Y IRS Citibank NA 0.379 10/10/2022 (2,670,000) (2,670,000) (21,670) (56,074) 34,4041Y IRS Citibank NA 0.425 10/10/2022 (2,420,000) (2,420,000) (22,130) (51,712) 29,5821Y IRS Citibank NA 0.553 11/15/2022 (2,720,000) (2,720,000) (37,388) (61,826) 24,4383M IRS Citibank NA 0.346 11/09/2021 (1,010,000) (1,010,000) (235) (15,423) 15,1886M IRS Citibank NA 0.849 02/22/2022 (7,440,000) (7,440,000) (7,753) (30,000) 22,2476M IRS Citibank NA 1.124 01/07/2022 (7,440,000) (7,440,000) (15,873) (66,371) 50,4986M IRS Citibank NA 1.406 03/23/2022 (7,450,000) (7,450,000) (76,035) (104,472) 28,4371M IRS Deutsche Bank AG (London) 1.325 10/04/2021 (5,830,000) (5,830,000) (7) (44,964) 44,9571Y IRS Deutsche Bank AG (London) 0.630 04/20/2022 (67,850,000) (67,850,000) (100,669) (272,329) 171,6601Y IRS JPMorgan Securities, Inc. 0.363 09/08/2022 (2,210,000) (2,210,000) (15,544) (40,912) 25,3681Y IRS JPMorgan Securities, Inc. 0.401 09/08/2022 (2,900,000) (2,900,000) (22,661) (54,696) 32,0351Y IRS JPMorgan Securities, Inc. 1.378 06/21/2022 (7,470,000) (7,470,000) (86,387) (126,499) 40,1123M IRS JPMorgan Securities, Inc. 0.346 11/09/2021 (1,140,000) (1,140,000) (265) (20,438) 20,1733Y IRS JPMorgan Securities, Inc. 1.060 11/14/2022 (2,700,000) (2,700,000) (35,852) (140,244) 104,3926M IRS JPMorgan Securities, Inc. 0.570 01/20/2022 (25,670,000) (25,670,000) (3,722) (94,337) 90,6151M IRS MS & Co. Int. PLC 1.333 10/12/2021 (5,830,000) (5,830,000) (1,562) (43,288) 41,7261M IRS MS & Co. Int. PLC 1.372 10/20/2021 (5,830,000) (5,830,000) (7,931) (45,474) 37,5431M IRS MS & Co. Int. PLC 1.518 10/27/2021 (5,830,000) (5,830,000) (36,241) (45,328) 9,0871Y IRS MS & Co. Int. PLC 0.599 11/16/2022 (2,480,000) (2,480,000) (38,091) (56,529) 18,4381M IRS UBS AG (London) 0.038 10/11/2021 (5,140,000) (5,140,000) (1,114) (26,519) 25,4051M IRS UBS AG (London) 0.187 10/29/2021 (5,140,000) (5,140,000) (38,442) (31,853) (6,589)3M IRS UBS AG (London) 0.378 11/29/2021 (5,230,000) (5,230,000) (2,236) (21,236) 19,000
(200,130,000) $(200,130,000) $ (616,545) $(1,569,394) $ 952,849
Puts1Y IRS BNP Paribas SA 0.107 05/26/2022 (8,470,000) (8,470,000) (64,278) (86,334) 22,0561M IRS Citibank NA 0.076 10/18/2021 (5,140,000) (5,140,000) (61,354) (27,554) (33,800)1M IRS Citibank NA 0.087 10/25/2021 (5,140,000) (5,140,000) (60,269) (27,189) (33,080)1M IRS Deutsche Bank AG (London) 1.325 10/04/2021 (5,830,000) (5,830,000) (115,262) (44,964) (70,298)1M IRS MS & Co. Int. PLC 1.333 10/12/2021 (5,830,000) (5,830,000) (115,051) (43,288) (71,763)1M IRS MS & Co. Int. PLC 1.372 10/20/2021 (5,830,000) (5,830,000) (101,920) (45,475) (56,445)1M IRS MS & Co. Int. PLC 1.518 10/27/2021 (5,830,000) (5,830,000) (51,629) (45,329) (6,300)6M IRS MS & Co. Int. PLC 0.075 11/18/2021 (4,530,000) (4,530,000) (6,625) (23,264) 16,6391M IRS UBS AG (London) 0.038 10/11/2021 (5,140,000) (5,140,000) (78,457) (26,519) (51,938)1M IRS UBS AG (London) 0.187 10/29/2021 (5,140,000) (5,140,000) (27,383) (31,853) 4,470
The accompanying notes are an integral part of these financial statements. 59
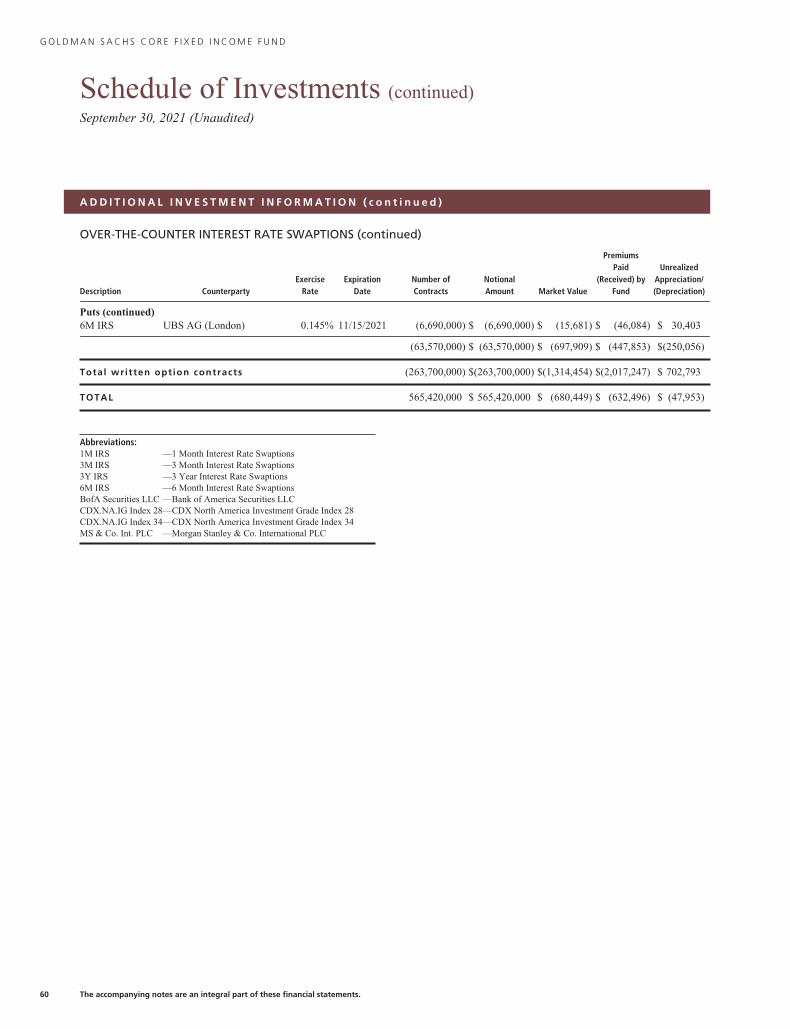
G O L D M A N S A C H S C O R E F I X E D I N C O M E F U N D
Schedule of Investments (continued)September 30, 2021 (Unaudited)
A D D I T I O N A L I N V E S T M E N T I N F O R M A T I O N ( c o n t i n u e d )
OVER-THE-COUNTER INTEREST RATE SWAPTIONS (continued)
Description CounterpartyExercise
RateExpiration
DateNumber ofContracts
NotionalAmount Market Value
PremiumsPaid
(Received) byFund
UnrealizedAppreciation/(Depreciation)
Puts (continued)6M IRS UBS AG (London) 0.145% 11/15/2021 (6,690,000) $ (6,690,000) $ (15,681) $ (46,084) $ 30,403
(63,570,000) $ (63,570,000) $ (697,909) $ (447,853) $(250,056)
Total written option contracts (263,700,000) $(263,700,000) $(1,314,454) $(2,017,247) $ 702,793
TOTAL 565,420,000 $ 565,420,000 $ (680,449) $ (632,496) $ (47,953)
Abbreviations:1M IRS —1 Month Interest Rate Swaptions3M IRS —3 Month Interest Rate Swaptions3Y IRS —3 Year Interest Rate Swaptions6M IRS —6 Month Interest Rate SwaptionsBofA Securities LLC —Bank of America Securities LLCCDX.NA.IG Index 28—CDX North America Investment Grade Index 28CDX.NA.IG Index 34—CDX North America Investment Grade Index 34MS & Co. Int. PLC —Morgan Stanley & Co. International PLC
60 The accompanying notes are an integral part of these financial statements.
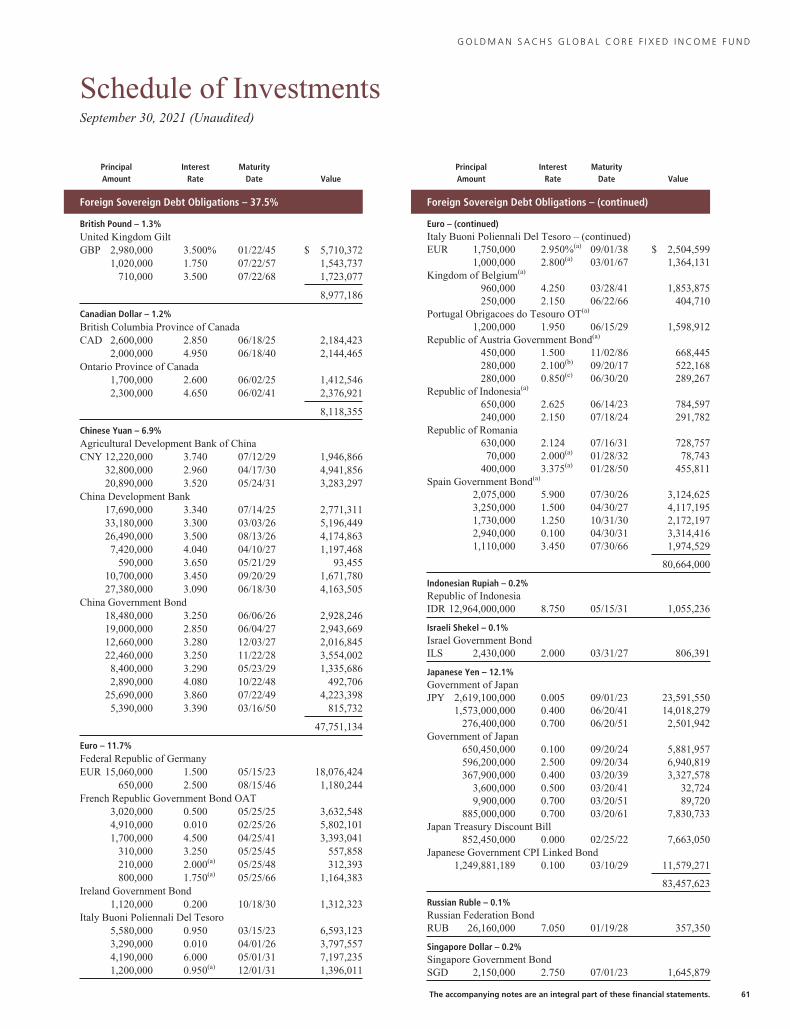
G O L D M A N S A C H S G L O B A L C O R E F I X E D I N C O M E F U N D
Schedule of InvestmentsSeptember 30, 2021 (Unaudited)
PrincipalAmount
InterestRate
MaturityDate Value
Foreign Sovereign Debt Obligations – 37.5%
British Pound – 1.3%United Kingdom GiltGBP 2,980,000 3.500% 01/22/45 $ 5,710,372
1,020,000 1.750 07/22/57 1,543,737710,000 3.500 07/22/68 1,723,077
8,977,186
Canadian Dollar – 1.2%British Columbia Province of CanadaCAD 2,600,000 2.850 06/18/25 2,184,423
2,000,000 4.950 06/18/40 2,144,465Ontario Province of Canada
1,700,000 2.600 06/02/25 1,412,5462,300,000 4.650 06/02/41 2,376,921
8,118,355
Chinese Yuan – 6.9%Agricultural Development Bank of ChinaCNY 12,220,000 3.740 07/12/29 1,946,866
32,800,000 2.960 04/17/30 4,941,85620,890,000 3.520 05/24/31 3,283,297
China Development Bank17,690,000 3.340 07/14/25 2,771,31133,180,000 3.300 03/03/26 5,196,44926,490,000 3.500 08/13/26 4,174,8637,420,000 4.040 04/10/27 1,197,468
590,000 3.650 05/21/29 93,45510,700,000 3.450 09/20/29 1,671,78027,380,000 3.090 06/18/30 4,163,505
China Government Bond18,480,000 3.250 06/06/26 2,928,24619,000,000 2.850 06/04/27 2,943,66912,660,000 3.280 12/03/27 2,016,84522,460,000 3.250 11/22/28 3,554,0028,400,000 3.290 05/23/29 1,335,6862,890,000 4.080 10/22/48 492,706
25,690,000 3.860 07/22/49 4,223,3985,390,000 3.390 03/16/50 815,732
47,751,134
Euro – 11.7%Federal Republic of GermanyEUR 15,060,000 1.500 05/15/23 18,076,424
650,000 2.500 08/15/46 1,180,244French Republic Government Bond OAT
3,020,000 0.500 05/25/25 3,632,5484,910,000 0.010 02/25/26 5,802,1011,700,000 4.500 04/25/41 3,393,041
310,000 3.250 05/25/45 557,858210,000 2.000(a) 05/25/48 312,393800,000 1.750(a) 05/25/66 1,164,383
Ireland Government Bond1,120,000 0.200 10/18/30 1,312,323
Italy Buoni Poliennali Del Tesoro5,580,000 0.950 03/15/23 6,593,1233,290,000 0.010 04/01/26 3,797,5574,190,000 6.000 05/01/31 7,197,2351,200,000 0.950(a) 12/01/31 1,396,011
PrincipalAmount
InterestRate
MaturityDate Value
Foreign Sovereign Debt Obligations – (continued)
Euro – (continued)Italy Buoni Poliennali Del Tesoro – (continued)EUR 1,750,000 2.950%(a) 09/01/38 $ 2,504,599
1,000,000 2.800(a) 03/01/67 1,364,131Kingdom of Belgium(a)
960,000 4.250 03/28/41 1,853,875250,000 2.150 06/22/66 404,710
Portugal Obrigacoes do Tesouro OT(a)
1,200,000 1.950 06/15/29 1,598,912Republic of Austria Government Bond(a)
450,000 1.500 11/02/86 668,445280,000 2.100(b) 09/20/17 522,168280,000 0.850(c) 06/30/20 289,267
Republic of Indonesia(a)
650,000 2.625 06/14/23 784,597240,000 2.150 07/18/24 291,782
Republic of Romania630,000 2.124 07/16/31 728,75770,000 2.000(a) 01/28/32 78,743
400,000 3.375(a) 01/28/50 455,811Spain Government Bond(a)
2,075,000 5.900 07/30/26 3,124,6253,250,000 1.500 04/30/27 4,117,1951,730,000 1.250 10/31/30 2,172,1972,940,000 0.100 04/30/31 3,314,4161,110,000 3.450 07/30/66 1,974,529
80,664,000
Indonesian Rupiah – 0.2%Republic of IndonesiaIDR 12,964,000,000 8.750 05/15/31 1,055,236
Israeli Shekel – 0.1%Israel Government BondILS 2,430,000 2.000 03/31/27 806,391
Japanese Yen – 12.1%Government of JapanJPY 2,619,100,000 0.005 09/01/23 23,591,550
1,573,000,000 0.400 06/20/41 14,018,279276,400,000 0.700 06/20/51 2,501,942
Government of Japan650,450,000 0.100 09/20/24 5,881,957596,200,000 2.500 09/20/34 6,940,819367,900,000 0.400 03/20/39 3,327,578
3,600,000 0.500 03/20/41 32,7249,900,000 0.700 03/20/51 89,720
885,000,000 0.700 03/20/61 7,830,733Japan Treasury Discount Bill
852,450,000 0.000 02/25/22 7,663,050Japanese Government CPI Linked Bond
1,249,881,189 0.100 03/10/29 11,579,271
83,457,623
Russian Ruble – 0.1%Russian Federation BondRUB 26,160,000 7.050 01/19/28 357,350
Singapore Dollar – 0.2%Singapore Government BondSGD 2,150,000 2.750 07/01/23 1,645,879
The accompanying notes are an integral part of these financial statements. 61
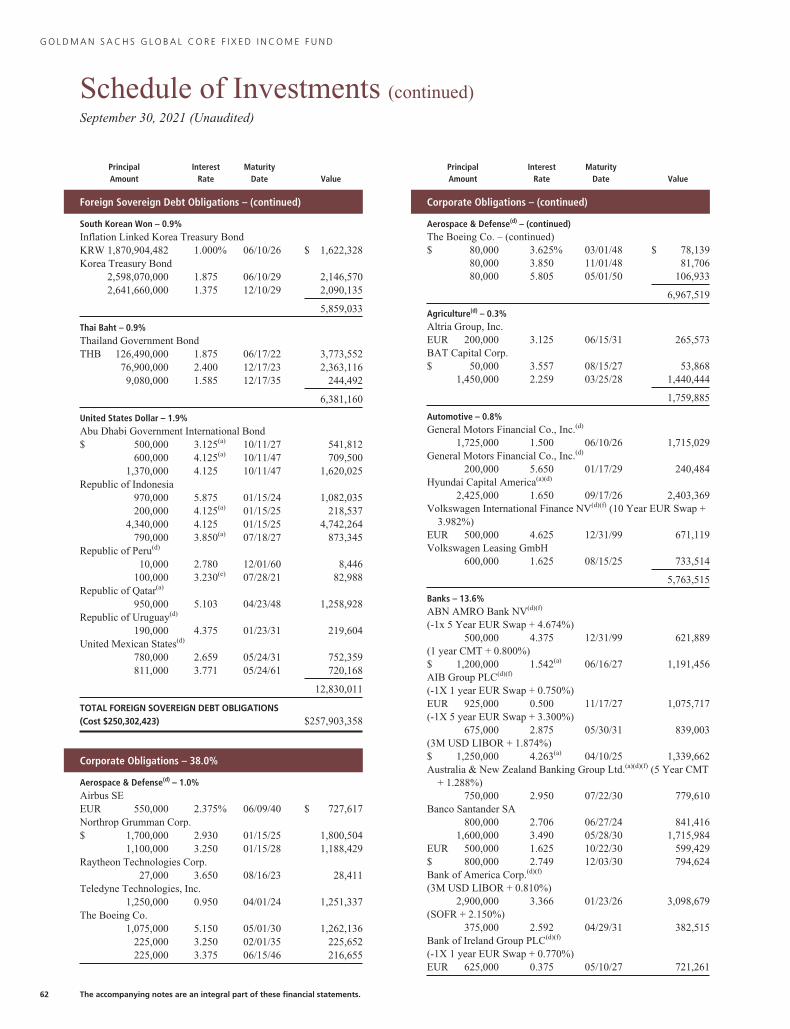
G O L D M A N S A C H S G L O B A L C O R E F I X E D I N C O M E F U N D
Schedule of Investments (continued)September 30, 2021 (Unaudited)
PrincipalAmount
InterestRate
MaturityDate Value
Foreign Sovereign Debt Obligations – (continued)
South Korean Won – 0.9%Inflation Linked Korea Treasury BondKRW 1,870,904,482 1.000% 06/10/26 $ 1,622,328Korea Treasury Bond
2,598,070,000 1.875 06/10/29 2,146,5702,641,660,000 1.375 12/10/29 2,090,135
5,859,033
Thai Baht – 0.9%Thailand Government BondTHB 126,490,000 1.875 06/17/22 3,773,552
76,900,000 2.400 12/17/23 2,363,1169,080,000 1.585 12/17/35 244,492
6,381,160
United States Dollar – 1.9%Abu Dhabi Government International Bond$ 500,000 3.125(a) 10/11/27 541,812
600,000 4.125(a) 10/11/47 709,5001,370,000 4.125 10/11/47 1,620,025
Republic of Indonesia970,000 5.875 01/15/24 1,082,035200,000 4.125(a) 01/15/25 218,537
4,340,000 4.125 01/15/25 4,742,264790,000 3.850(a) 07/18/27 873,345
Republic of Peru(d)
10,000 2.780 12/01/60 8,446100,000 3.230(e) 07/28/21 82,988
Republic of Qatar(a)
950,000 5.103 04/23/48 1,258,928Republic of Uruguay(d)
190,000 4.375 01/23/31 219,604United Mexican States(d)
780,000 2.659 05/24/31 752,359811,000 3.771 05/24/61 720,168
12,830,011
TOTAL FOREIGN SOVEREIGN DEBT OBLIGATIONS(Cost $250,302,423) $257,903,358
Corporate Obligations – 38.0%
Aerospace & Defense(d) – 1.0%Airbus SEEUR 550,000 2.375% 06/09/40 $ 727,617Northrop Grumman Corp.$ 1,700,000 2.930 01/15/25 1,800,504
1,100,000 3.250 01/15/28 1,188,429Raytheon Technologies Corp.
27,000 3.650 08/16/23 28,411Teledyne Technologies, Inc.
1,250,000 0.950 04/01/24 1,251,337The Boeing Co.
1,075,000 5.150 05/01/30 1,262,136225,000 3.250 02/01/35 225,652225,000 3.375 06/15/46 216,655
PrincipalAmount
InterestRate
MaturityDate Value
Corporate Obligations – (continued)
Aerospace & Defense(d) – (continued)The Boeing Co. – (continued)$ 80,000 3.625% 03/01/48 $ 78,139
80,000 3.850 11/01/48 81,70680,000 5.805 05/01/50 106,933
6,967,519
Agriculture(d) – 0.3%Altria Group, Inc.EUR 200,000 3.125 06/15/31 265,573BAT Capital Corp.$ 50,000 3.557 08/15/27 53,868
1,450,000 2.259 03/25/28 1,440,444
1,759,885
Automotive – 0.8%General Motors Financial Co., Inc.(d)
1,725,000 1.500 06/10/26 1,715,029General Motors Financial Co., Inc.(d)
200,000 5.650 01/17/29 240,484Hyundai Capital America(a)(d)
2,425,000 1.650 09/17/26 2,403,369Volkswagen International Finance NV(d)(f) (10 Year EUR Swap +
3.982%)EUR 500,000 4.625 12/31/99 671,119Volkswagen Leasing GmbH
600,000 1.625 08/15/25 733,514
5,763,515
Banks – 13.6%ABN AMRO Bank NV(d)(f)
(-1x 5 Year EUR Swap + 4.674%)500,000 4.375 12/31/99 621,889
(1 year CMT + 0.800%)$ 1,200,000 1.542(a) 06/16/27 1,191,456AIB Group PLC(d)(f)
(-1X 1 year EUR Swap + 0.750%)EUR 925,000 0.500 11/17/27 1,075,717(-1X 5 year EUR Swap + 3.300%)
675,000 2.875 05/30/31 839,003(3M USD LIBOR + 1.874%)$ 1,250,000 4.263(a) 04/10/25 1,339,662Australia & New Zealand Banking Group Ltd.(a)(d)(f) (5 Year CMT
+ 1.288%)750,000 2.950 07/22/30 779,610
Banco Santander SA800,000 2.706 06/27/24 841,416
1,600,000 3.490 05/28/30 1,715,984EUR 500,000 1.625 10/22/30 599,429$ 800,000 2.749 12/03/30 794,624Bank of America Corp.(d)(f)
(3M USD LIBOR + 0.810%)2,900,000 3.366 01/23/26 3,098,679
(SOFR + 2.150%)375,000 2.592 04/29/31 382,515
Bank of Ireland Group PLC(d)(f)
(-1X 1 year EUR Swap + 0.770%)EUR 625,000 0.375 05/10/27 721,261
62 The accompanying notes are an integral part of these financial statements.
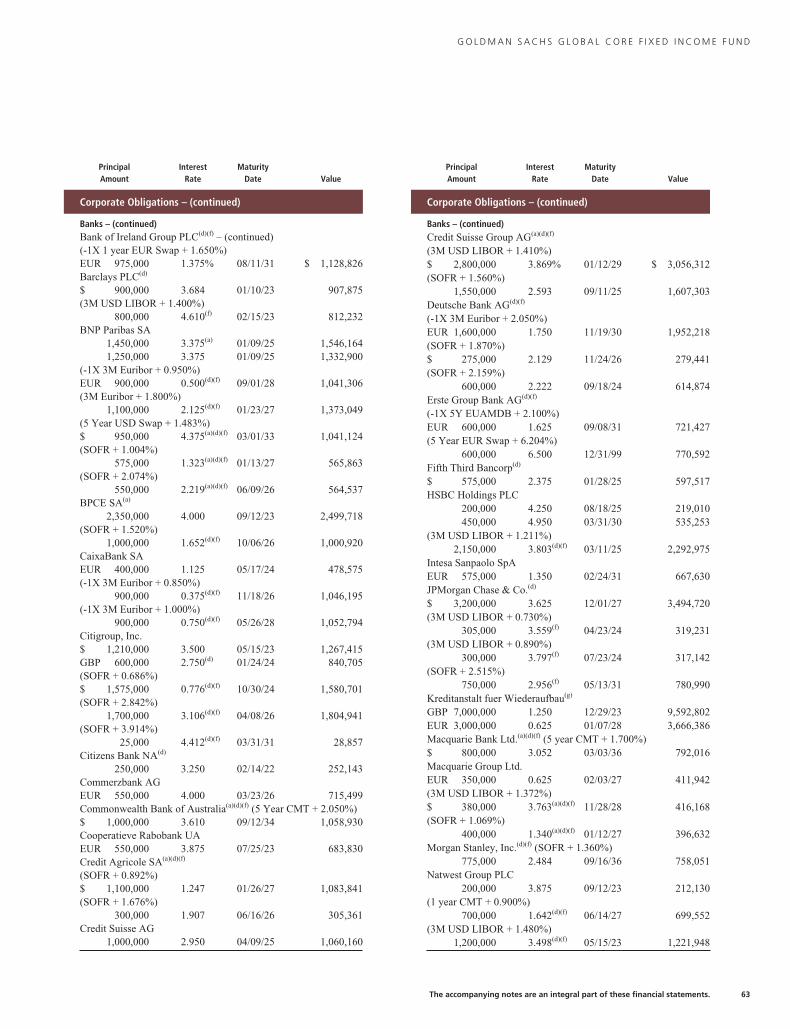
G O L D M A N S A C H S G L O B A L C O R E F I X E D I N C O M E F U N D
PrincipalAmount
InterestRate
MaturityDate Value
Corporate Obligations – (continued)
Banks – (continued)Bank of Ireland Group PLC(d)(f) – (continued)(-1X 1 year EUR Swap + 1.650%)EUR 975,000 1.375% 08/11/31 $ 1,128,826Barclays PLC(d)
$ 900,000 3.684 01/10/23 907,875(3M USD LIBOR + 1.400%)
800,000 4.610(f) 02/15/23 812,232BNP Paribas SA
1,450,000 3.375(a) 01/09/25 1,546,1641,250,000 3.375 01/09/25 1,332,900
(-1X 3M Euribor + 0.950%)EUR 900,000 0.500(d)(f) 09/01/28 1,041,306(3M Euribor + 1.800%)
1,100,000 2.125(d)(f) 01/23/27 1,373,049(5 Year USD Swap + 1.483%)$ 950,000 4.375(a)(d)(f) 03/01/33 1,041,124(SOFR + 1.004%)
575,000 1.323(a)(d)(f) 01/13/27 565,863(SOFR + 2.074%)
550,000 2.219(a)(d)(f) 06/09/26 564,537BPCE SA(a)
2,350,000 4.000 09/12/23 2,499,718(SOFR + 1.520%)
1,000,000 1.652(d)(f) 10/06/26 1,000,920CaixaBank SAEUR 400,000 1.125 05/17/24 478,575(-1X 3M Euribor + 0.850%)
900,000 0.375(d)(f) 11/18/26 1,046,195(-1X 3M Euribor + 1.000%)
900,000 0.750(d)(f) 05/26/28 1,052,794Citigroup, Inc.$ 1,210,000 3.500 05/15/23 1,267,415GBP 600,000 2.750(d) 01/24/24 840,705(SOFR + 0.686%)$ 1,575,000 0.776(d)(f) 10/30/24 1,580,701(SOFR + 2.842%)
1,700,000 3.106(d)(f) 04/08/26 1,804,941(SOFR + 3.914%)
25,000 4.412(d)(f) 03/31/31 28,857Citizens Bank NA(d)
250,000 3.250 02/14/22 252,143Commerzbank AGEUR 550,000 4.000 03/23/26 715,499Commonwealth Bank of Australia(a)(d)(f) (5 Year CMT + 2.050%)$ 1,000,000 3.610 09/12/34 1,058,930Cooperatieve Rabobank UAEUR 550,000 3.875 07/25/23 683,830Credit Agricole SA(a)(d)(f)
(SOFR + 0.892%)$ 1,100,000 1.247 01/26/27 1,083,841(SOFR + 1.676%)
300,000 1.907 06/16/26 305,361Credit Suisse AG
1,000,000 2.950 04/09/25 1,060,160
PrincipalAmount
InterestRate
MaturityDate Value
Corporate Obligations – (continued)
Banks – (continued)Credit Suisse Group AG(a)(d)(f)
(3M USD LIBOR + 1.410%)$ 2,800,000 3.869% 01/12/29 $ 3,056,312(SOFR + 1.560%)
1,550,000 2.593 09/11/25 1,607,303Deutsche Bank AG(d)(f)
(-1X 3M Euribor + 2.050%)EUR 1,600,000 1.750 11/19/30 1,952,218(SOFR + 1.870%)$ 275,000 2.129 11/24/26 279,441(SOFR + 2.159%)
600,000 2.222 09/18/24 614,874Erste Group Bank AG(d)(f)
(-1X 5Y EUAMDB + 2.100%)EUR 600,000 1.625 09/08/31 721,427(5 Year EUR Swap + 6.204%)
600,000 6.500 12/31/99 770,592Fifth Third Bancorp(d)
$ 575,000 2.375 01/28/25 597,517HSBC Holdings PLC
200,000 4.250 08/18/25 219,010450,000 4.950 03/31/30 535,253
(3M USD LIBOR + 1.211%)2,150,000 3.803(d)(f) 03/11/25 2,292,975
Intesa Sanpaolo SpAEUR 575,000 1.350 02/24/31 667,630JPMorgan Chase & Co.(d)
$ 3,200,000 3.625 12/01/27 3,494,720(3M USD LIBOR + 0.730%)
305,000 3.559(f) 04/23/24 319,231(3M USD LIBOR + 0.890%)
300,000 3.797(f) 07/23/24 317,142(SOFR + 2.515%)
750,000 2.956(f) 05/13/31 780,990Kreditanstalt fuer Wiederaufbau(g)
GBP 7,000,000 1.250 12/29/23 9,592,802EUR 3,000,000 0.625 01/07/28 3,666,386Macquarie Bank Ltd.(a)(d)(f) (5 year CMT + 1.700%)$ 800,000 3.052 03/03/36 792,016Macquarie Group Ltd.EUR 350,000 0.625 02/03/27 411,942(3M USD LIBOR + 1.372%)$ 380,000 3.763(a)(d)(f) 11/28/28 416,168(SOFR + 1.069%)
400,000 1.340(a)(d)(f) 01/12/27 396,632Morgan Stanley, Inc.(d)(f) (SOFR + 1.360%)
775,000 2.484 09/16/36 758,051Natwest Group PLC
200,000 3.875 09/12/23 212,130(1 year CMT + 0.900%)
700,000 1.642(d)(f) 06/14/27 699,552(3M USD LIBOR + 1.480%)
1,200,000 3.498(d)(f) 05/15/23 1,221,948
The accompanying notes are an integral part of these financial statements. 63
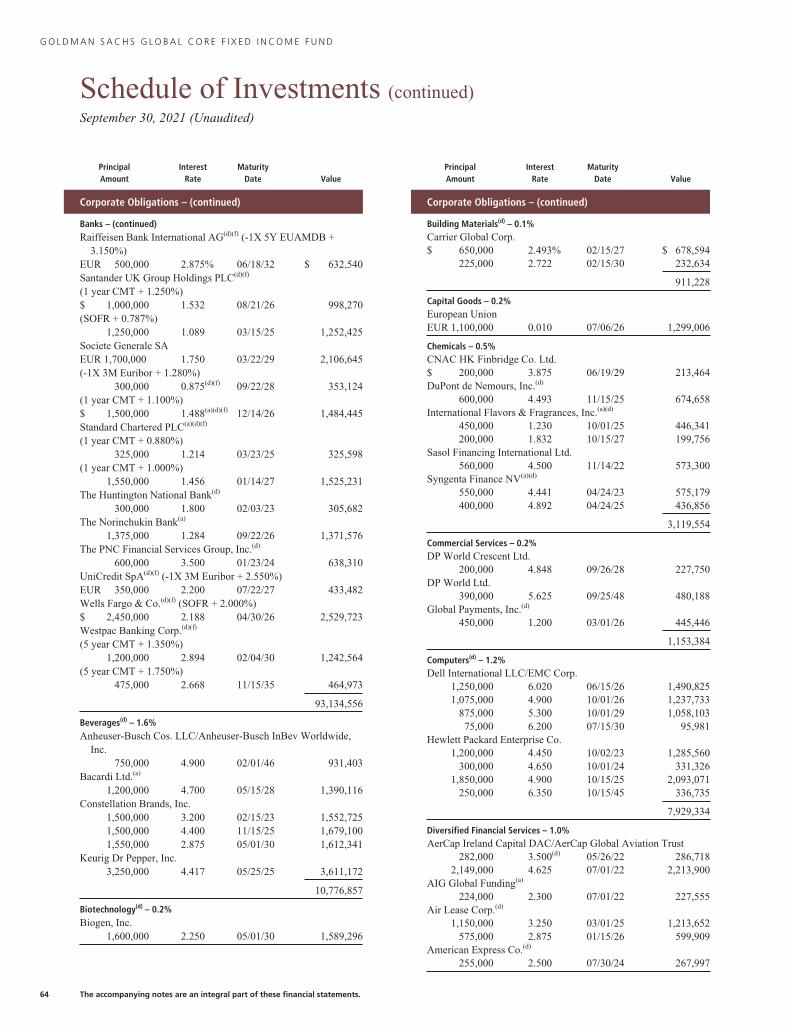
G O L D M A N S A C H S G L O B A L C O R E F I X E D I N C O M E F U N D
Schedule of Investments (continued)September 30, 2021 (Unaudited)
PrincipalAmount
InterestRate
MaturityDate Value
Corporate Obligations – (continued)
Banks – (continued)Raiffeisen Bank International AG(d)(f) (-1X 5Y EUAMDB +
3.150%)EUR 500,000 2.875% 06/18/32 $ 632,540Santander UK Group Holdings PLC(d)(f)
(1 year CMT + 1.250%)$ 1,000,000 1.532 08/21/26 998,270(SOFR + 0.787%)
1,250,000 1.089 03/15/25 1,252,425Societe Generale SAEUR 1,700,000 1.750 03/22/29 2,106,645(-1X 3M Euribor + 1.280%)
300,000 0.875(d)(f) 09/22/28 353,124(1 year CMT + 1.100%)$ 1,500,000 1.488(a)(d)(f) 12/14/26 1,484,445Standard Chartered PLC(a)(d)(f)
(1 year CMT + 0.880%)325,000 1.214 03/23/25 325,598
(1 year CMT + 1.000%)1,550,000 1.456 01/14/27 1,525,231
The Huntington National Bank(d)
300,000 1.800 02/03/23 305,682The Norinchukin Bank(a)
1,375,000 1.284 09/22/26 1,371,576The PNC Financial Services Group, Inc.(d)
600,000 3.500 01/23/24 638,310UniCredit SpA(d)(f) (-1X 3M Euribor + 2.550%)EUR 350,000 2.200 07/22/27 433,482Wells Fargo & Co.(d)(f) (SOFR + 2.000%)$ 2,450,000 2.188 04/30/26 2,529,723Westpac Banking Corp.(d)(f)
(5 year CMT + 1.350%)1,200,000 2.894 02/04/30 1,242,564
(5 year CMT + 1.750%)475,000 2.668 11/15/35 464,973
93,134,556
Beverages(d) – 1.6%Anheuser-Busch Cos. LLC/Anheuser-Busch InBev Worldwide,
Inc.750,000 4.900 02/01/46 931,403
Bacardi Ltd.(a)
1,200,000 4.700 05/15/28 1,390,116Constellation Brands, Inc.
1,500,000 3.200 02/15/23 1,552,7251,500,000 4.400 11/15/25 1,679,1001,550,000 2.875 05/01/30 1,612,341
Keurig Dr Pepper, Inc.3,250,000 4.417 05/25/25 3,611,172
10,776,857
Biotechnology(d) – 0.2%Biogen, Inc.
1,600,000 2.250 05/01/30 1,589,296
PrincipalAmount
InterestRate
MaturityDate Value
Corporate Obligations – (continued)
Building Materials(d) – 0.1%Carrier Global Corp.$ 650,000 2.493% 02/15/27 $ 678,594
225,000 2.722 02/15/30 232,634
911,228
Capital Goods – 0.2%European UnionEUR 1,100,000 0.010 07/06/26 1,299,006
Chemicals – 0.5%CNAC HK Finbridge Co. Ltd.$ 200,000 3.875 06/19/29 213,464DuPont de Nemours, Inc.(d)
600,000 4.493 11/15/25 674,658International Flavors & Fragrances, Inc.(a)(d)
450,000 1.230 10/01/25 446,341200,000 1.832 10/15/27 199,756
Sasol Financing International Ltd.560,000 4.500 11/14/22 573,300
Syngenta Finance NV(a)(d)
550,000 4.441 04/24/23 575,179400,000 4.892 04/24/25 436,856
3,119,554
Commercial Services – 0.2%DP World Crescent Ltd.
200,000 4.848 09/26/28 227,750DP World Ltd.
390,000 5.625 09/25/48 480,188Global Payments, Inc.(d)
450,000 1.200 03/01/26 445,446
1,153,384
Computers(d) – 1.2%Dell International LLC/EMC Corp.
1,250,000 6.020 06/15/26 1,490,8251,075,000 4.900 10/01/26 1,237,733
875,000 5.300 10/01/29 1,058,10375,000 6.200 07/15/30 95,981
Hewlett Packard Enterprise Co.1,200,000 4.450 10/02/23 1,285,560
300,000 4.650 10/01/24 331,3261,850,000 4.900 10/15/25 2,093,071
250,000 6.350 10/15/45 336,735
7,929,334
Diversified Financial Services – 1.0%AerCap Ireland Capital DAC/AerCap Global Aviation Trust
282,000 3.500(d) 05/26/22 286,7182,149,000 4.625 07/01/22 2,213,900
AIG Global Funding(a)
224,000 2.300 07/01/22 227,555Air Lease Corp.(d)
1,150,000 3.250 03/01/25 1,213,652575,000 2.875 01/15/26 599,909
American Express Co.(d)
255,000 2.500 07/30/24 267,997
64 The accompanying notes are an integral part of these financial statements.
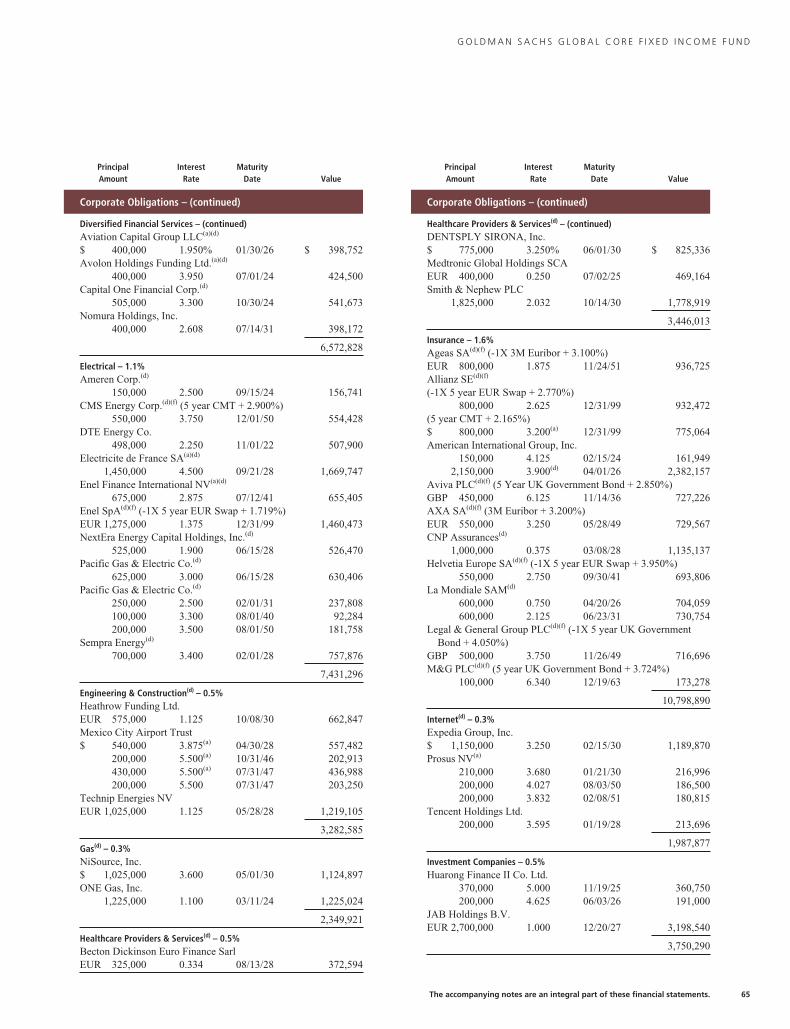
G O L D M A N S A C H S G L O B A L C O R E F I X E D I N C O M E F U N D
PrincipalAmount
InterestRate
MaturityDate Value
Corporate Obligations – (continued)
Diversified Financial Services – (continued)Aviation Capital Group LLC(a)(d)
$ 400,000 1.950% 01/30/26 $ 398,752Avolon Holdings Funding Ltd.(a)(d)
400,000 3.950 07/01/24 424,500Capital One Financial Corp.(d)
505,000 3.300 10/30/24 541,673Nomura Holdings, Inc.
400,000 2.608 07/14/31 398,172
6,572,828
Electrical – 1.1%Ameren Corp.(d)
150,000 2.500 09/15/24 156,741CMS Energy Corp.(d)(f) (5 year CMT + 2.900%)
550,000 3.750 12/01/50 554,428DTE Energy Co.
498,000 2.250 11/01/22 507,900Electricite de France SA(a)(d)
1,450,000 4.500 09/21/28 1,669,747Enel Finance International NV(a)(d)
675,000 2.875 07/12/41 655,405Enel SpA(d)(f) (-1X 5 year EUR Swap + 1.719%)EUR 1,275,000 1.375 12/31/99 1,460,473NextEra Energy Capital Holdings, Inc.(d)
525,000 1.900 06/15/28 526,470Pacific Gas & Electric Co.(d)
625,000 3.000 06/15/28 630,406Pacific Gas & Electric Co.(d)
250,000 2.500 02/01/31 237,808100,000 3.300 08/01/40 92,284200,000 3.500 08/01/50 181,758
Sempra Energy(d)
700,000 3.400 02/01/28 757,876
7,431,296
Engineering & Construction(d) – 0.5%Heathrow Funding Ltd.EUR 575,000 1.125 10/08/30 662,847Mexico City Airport Trust$ 540,000 3.875(a) 04/30/28 557,482
200,000 5.500(a) 10/31/46 202,913430,000 5.500(a) 07/31/47 436,988200,000 5.500 07/31/47 203,250
Technip Energies NVEUR 1,025,000 1.125 05/28/28 1,219,105
3,282,585
Gas(d) – 0.3%NiSource, Inc.$ 1,025,000 3.600 05/01/30 1,124,897ONE Gas, Inc.
1,225,000 1.100 03/11/24 1,225,024
2,349,921
Healthcare Providers & Services(d) – 0.5%Becton Dickinson Euro Finance SarlEUR 325,000 0.334 08/13/28 372,594
PrincipalAmount
InterestRate
MaturityDate Value
Corporate Obligations – (continued)
Healthcare Providers & Services(d) – (continued)DENTSPLY SIRONA, Inc.$ 775,000 3.250% 06/01/30 $ 825,336Medtronic Global Holdings SCAEUR 400,000 0.250 07/02/25 469,164Smith & Nephew PLC
1,825,000 2.032 10/14/30 1,778,919
3,446,013
Insurance – 1.6%Ageas SA(d)(f) (-1X 3M Euribor + 3.100%)EUR 800,000 1.875 11/24/51 936,725Allianz SE(d)(f)
(-1X 5 year EUR Swap + 2.770%)800,000 2.625 12/31/99 932,472
(5 year CMT + 2.165%)$ 800,000 3.200(a) 12/31/99 775,064American International Group, Inc.
150,000 4.125 02/15/24 161,9492,150,000 3.900(d) 04/01/26 2,382,157
Aviva PLC(d)(f) (5 Year UK Government Bond + 2.850%)GBP 450,000 6.125 11/14/36 727,226AXA SA(d)(f) (3M Euribor + 3.200%)EUR 550,000 3.250 05/28/49 729,567CNP Assurances(d)
1,000,000 0.375 03/08/28 1,135,137Helvetia Europe SA(d)(f) (-1X 5 year EUR Swap + 3.950%)
550,000 2.750 09/30/41 693,806La Mondiale SAM(d)
600,000 0.750 04/20/26 704,059600,000 2.125 06/23/31 730,754
Legal & General Group PLC(d)(f) (-1X 5 year UK GovernmentBond + 4.050%)
GBP 500,000 3.750 11/26/49 716,696M&G PLC(d)(f) (5 year UK Government Bond + 3.724%)
100,000 6.340 12/19/63 173,278
10,798,890
Internet(d) – 0.3%Expedia Group, Inc.$ 1,150,000 3.250 02/15/30 1,189,870Prosus NV(a)
210,000 3.680 01/21/30 216,996200,000 4.027 08/03/50 186,500200,000 3.832 02/08/51 180,815
Tencent Holdings Ltd.200,000 3.595 01/19/28 213,696
1,987,877
Investment Companies – 0.5%Huarong Finance II Co. Ltd.
370,000 5.000 11/19/25 360,750200,000 4.625 06/03/26 191,000
JAB Holdings B.V.EUR 2,700,000 1.000 12/20/27 3,198,540
3,750,290
The accompanying notes are an integral part of these financial statements. 65
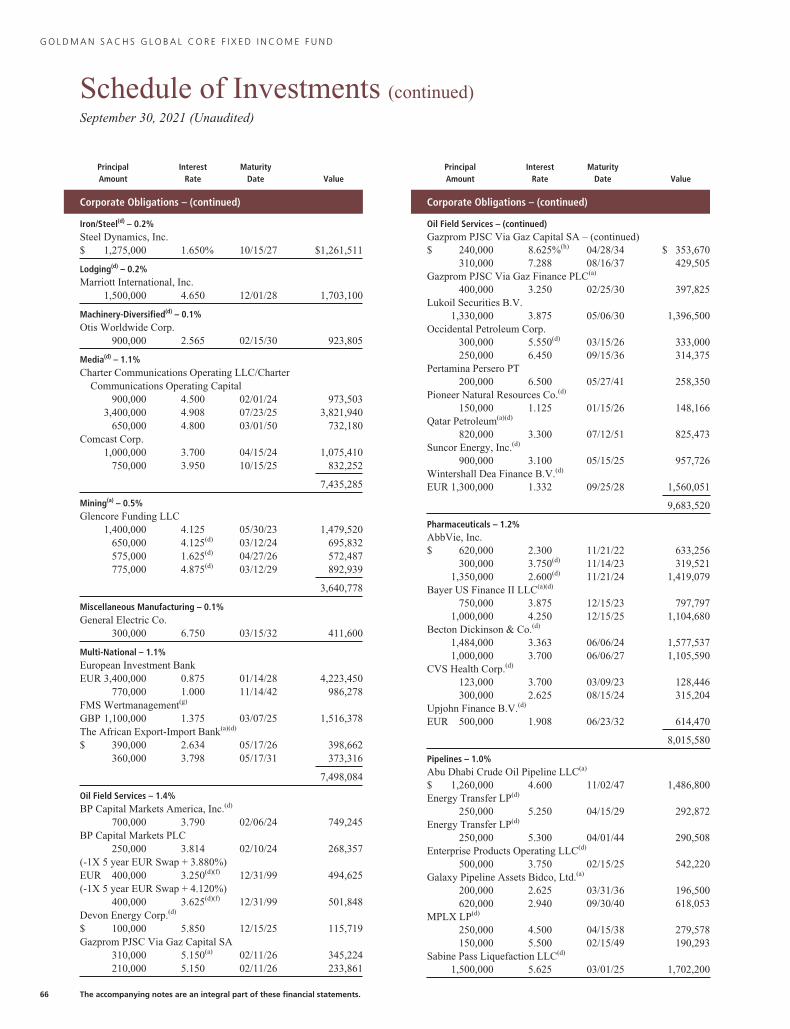
G O L D M A N S A C H S G L O B A L C O R E F I X E D I N C O M E F U N D
Schedule of Investments (continued)September 30, 2021 (Unaudited)
PrincipalAmount
InterestRate
MaturityDate Value
Corporate Obligations – (continued)
Iron/Steel(d) – 0.2%Steel Dynamics, Inc.$ 1,275,000 1.650% 10/15/27 $1,261,511
Lodging(d) – 0.2%Marriott International, Inc.
1,500,000 4.650 12/01/28 1,703,100
Machinery-Diversified(d) – 0.1%Otis Worldwide Corp.
900,000 2.565 02/15/30 923,805
Media(d) – 1.1%Charter Communications Operating LLC/Charter
Communications Operating Capital900,000 4.500 02/01/24 973,503
3,400,000 4.908 07/23/25 3,821,940650,000 4.800 03/01/50 732,180
Comcast Corp.1,000,000 3.700 04/15/24 1,075,410
750,000 3.950 10/15/25 832,252
7,435,285
Mining(a) – 0.5%Glencore Funding LLC
1,400,000 4.125 05/30/23 1,479,520650,000 4.125(d) 03/12/24 695,832575,000 1.625(d) 04/27/26 572,487775,000 4.875(d) 03/12/29 892,939
3,640,778
Miscellaneous Manufacturing – 0.1%General Electric Co.
300,000 6.750 03/15/32 411,600
Multi-National – 1.1%European Investment BankEUR 3,400,000 0.875 01/14/28 4,223,450
770,000 1.000 11/14/42 986,278FMS Wertmanagement(g)
GBP 1,100,000 1.375 03/07/25 1,516,378The African Export-Import Bank(a)(d)
$ 390,000 2.634 05/17/26 398,662360,000 3.798 05/17/31 373,316
7,498,084
Oil Field Services – 1.4%BP Capital Markets America, Inc.(d)
700,000 3.790 02/06/24 749,245BP Capital Markets PLC
250,000 3.814 02/10/24 268,357(-1X 5 year EUR Swap + 3.880%)EUR 400,000 3.250(d)(f) 12/31/99 494,625(-1X 5 year EUR Swap + 4.120%)
400,000 3.625(d)(f) 12/31/99 501,848Devon Energy Corp.(d)
$ 100,000 5.850 12/15/25 115,719Gazprom PJSC Via Gaz Capital SA
310,000 5.150(a) 02/11/26 345,224210,000 5.150 02/11/26 233,861
PrincipalAmount
InterestRate
MaturityDate Value
Corporate Obligations – (continued)
Oil Field Services – (continued)Gazprom PJSC Via Gaz Capital SA – (continued)$ 240,000 8.625%(h) 04/28/34 $ 353,670
310,000 7.288 08/16/37 429,505Gazprom PJSC Via Gaz Finance PLC(a)
400,000 3.250 02/25/30 397,825Lukoil Securities B.V.
1,330,000 3.875 05/06/30 1,396,500Occidental Petroleum Corp.
300,000 5.550(d) 03/15/26 333,000250,000 6.450 09/15/36 314,375
Pertamina Persero PT200,000 6.500 05/27/41 258,350
Pioneer Natural Resources Co.(d)
150,000 1.125 01/15/26 148,166Qatar Petroleum(a)(d)
820,000 3.300 07/12/51 825,473Suncor Energy, Inc.(d)
900,000 3.100 05/15/25 957,726Wintershall Dea Finance B.V.(d)
EUR 1,300,000 1.332 09/25/28 1,560,051
9,683,520
Pharmaceuticals – 1.2%AbbVie, Inc.$ 620,000 2.300 11/21/22 633,256
300,000 3.750(d) 11/14/23 319,5211,350,000 2.600(d) 11/21/24 1,419,079
Bayer US Finance II LLC(a)(d)
750,000 3.875 12/15/23 797,7971,000,000 4.250 12/15/25 1,104,680
Becton Dickinson & Co.(d)
1,484,000 3.363 06/06/24 1,577,5371,000,000 3.700 06/06/27 1,105,590
CVS Health Corp.(d)
123,000 3.700 03/09/23 128,446300,000 2.625 08/15/24 315,204
Upjohn Finance B.V.(d)
EUR 500,000 1.908 06/23/32 614,470
8,015,580
Pipelines – 1.0%Abu Dhabi Crude Oil Pipeline LLC(a)
$ 1,260,000 4.600 11/02/47 1,486,800Energy Transfer LP(d)
250,000 5.250 04/15/29 292,872Energy Transfer LP(d)
250,000 5.300 04/01/44 290,508Enterprise Products Operating LLC(d)
500,000 3.750 02/15/25 542,220Galaxy Pipeline Assets Bidco, Ltd.(a)
200,000 2.625 03/31/36 196,500620,000 2.940 09/30/40 618,053
MPLX LP(d)
250,000 4.500 04/15/38 279,578150,000 5.500 02/15/49 190,293
Sabine Pass Liquefaction LLC(d)
1,500,000 5.625 03/01/25 1,702,200
66 The accompanying notes are an integral part of these financial statements.
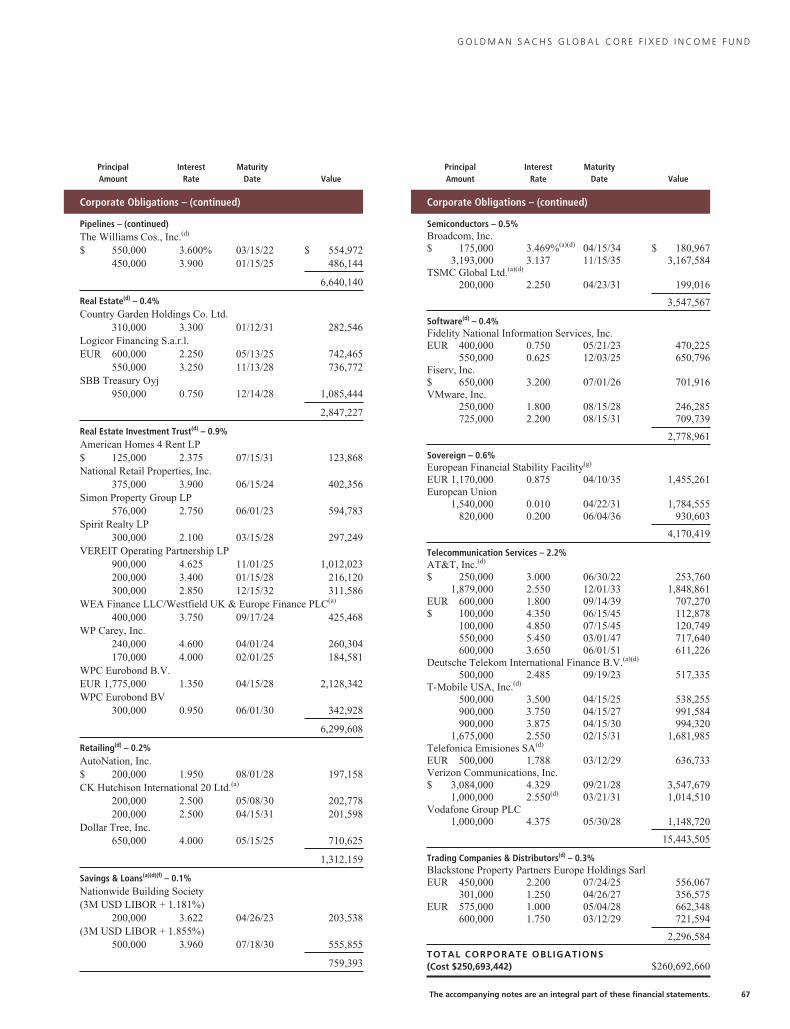
G O L D M A N S A C H S G L O B A L C O R E F I X E D I N C O M E F U N D
PrincipalAmount
InterestRate
MaturityDate Value
Corporate Obligations – (continued)
Pipelines – (continued)The Williams Cos., Inc.(d)
$ 550,000 3.600% 03/15/22 $ 554,972450,000 3.900 01/15/25 486,144
6,640,140
Real Estate(d) – 0.4%Country Garden Holdings Co. Ltd.
310,000 3.300 01/12/31 282,546Logicor Financing S.a.r.l.EUR 600,000 2.250 05/13/25 742,465
550,000 3.250 11/13/28 736,772SBB Treasury Oyj
950,000 0.750 12/14/28 1,085,444
2,847,227
Real Estate Investment Trust(d) – 0.9%American Homes 4 Rent LP$ 125,000 2.375 07/15/31 123,868National Retail Properties, Inc.
375,000 3.900 06/15/24 402,356Simon Property Group LP
576,000 2.750 06/01/23 594,783Spirit Realty LP
300,000 2.100 03/15/28 297,249VEREIT Operating Partnership LP
900,000 4.625 11/01/25 1,012,023200,000 3.400 01/15/28 216,120300,000 2.850 12/15/32 311,586
WEA Finance LLC/Westfield UK & Europe Finance PLC(a)
400,000 3.750 09/17/24 425,468WP Carey, Inc.
240,000 4.600 04/01/24 260,304170,000 4.000 02/01/25 184,581
WPC Eurobond B.V.EUR 1,775,000 1.350 04/15/28 2,128,342WPC Eurobond BV
300,000 0.950 06/01/30 342,928
6,299,608
Retailing(d) – 0.2%AutoNation, Inc.$ 200,000 1.950 08/01/28 197,158CK Hutchison International 20 Ltd.(a)
200,000 2.500 05/08/30 202,778200,000 2.500 04/15/31 201,598
Dollar Tree, Inc.650,000 4.000 05/15/25 710,625
1,312,159
Savings & Loans(a)(d)(f) – 0.1%Nationwide Building Society(3M USD LIBOR + 1.181%)
200,000 3.622 04/26/23 203,538(3M USD LIBOR + 1.855%)
500,000 3.960 07/18/30 555,855
759,393
PrincipalAmount
InterestRate
MaturityDate Value
Corporate Obligations – (continued)
Semiconductors – 0.5%Broadcom, Inc.$ 175,000 3.469%(a)(d) 04/15/34 $ 180,967
3,193,000 3.137 11/15/35 3,167,584TSMC Global Ltd.(a)(d)
200,000 2.250 04/23/31 199,016
3,547,567
Software(d) – 0.4%Fidelity National Information Services, Inc.EUR 400,000 0.750 05/21/23 470,225
550,000 0.625 12/03/25 650,796Fiserv, Inc.$ 650,000 3.200 07/01/26 701,916VMware, Inc.
250,000 1.800 08/15/28 246,285725,000 2.200 08/15/31 709,739
2,778,961
Sovereign – 0.6%European Financial Stability Facility(g)
EUR 1,170,000 0.875 04/10/35 1,455,261European Union
1,540,000 0.010 04/22/31 1,784,555820,000 0.200 06/04/36 930,603
4,170,419
Telecommunication Services – 2.2%AT&T, Inc.(d)
$ 250,000 3.000 06/30/22 253,7601,879,000 2.550 12/01/33 1,848,861
EUR 600,000 1.800 09/14/39 707,270$ 100,000 4.350 06/15/45 112,878
100,000 4.850 07/15/45 120,749550,000 5.450 03/01/47 717,640600,000 3.650 06/01/51 611,226
Deutsche Telekom International Finance B.V.(a)(d)
500,000 2.485 09/19/23 517,335T-Mobile USA, Inc.(d)
500,000 3.500 04/15/25 538,255900,000 3.750 04/15/27 991,584900,000 3.875 04/15/30 994,320
1,675,000 2.550 02/15/31 1,681,985Telefonica Emisiones SA(d)
EUR 500,000 1.788 03/12/29 636,733Verizon Communications, Inc.$ 3,084,000 4.329 09/21/28 3,547,679
1,000,000 2.550(d) 03/21/31 1,014,510Vodafone Group PLC
1,000,000 4.375 05/30/28 1,148,720
15,443,505
Trading Companies & Distributors(d) – 0.3%Blackstone Property Partners Europe Holdings SarlEUR 450,000 2.200 07/24/25 556,067
301,000 1.250 04/26/27 356,575EUR 575,000 1.000 05/04/28 662,348
600,000 1.750 03/12/29 721,594
2,296,584
TOTAL CORPORATE OBLIGATIONS(Cost $250,693,442) $260,692,660
The accompanying notes are an integral part of these financial statements. 67
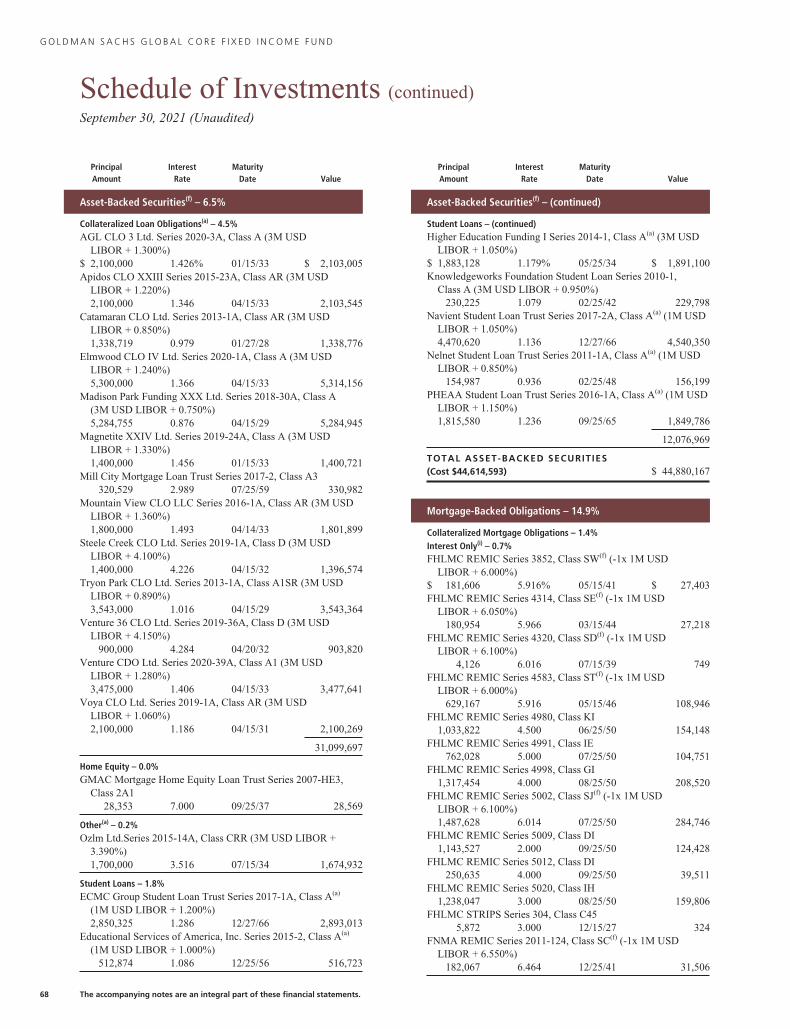
G O L D M A N S A C H S G L O B A L C O R E F I X E D I N C O M E F U N D
Schedule of Investments (continued)September 30, 2021 (Unaudited)
PrincipalAmount
InterestRate
MaturityDate Value
Asset-Backed Securities(f) – 6.5%
Collateralized Loan Obligations(a) – 4.5%AGL CLO 3 Ltd. Series 2020-3A, Class A (3M USD
LIBOR + 1.300%)$ 2,100,000 1.426% 01/15/33 $ 2,103,005Apidos CLO XXIII Series 2015-23A, Class AR (3M USD
LIBOR + 1.220%)2,100,000 1.346 04/15/33 2,103,545
Catamaran CLO Ltd. Series 2013-1A, Class AR (3M USDLIBOR + 0.850%)1,338,719 0.979 01/27/28 1,338,776
Elmwood CLO IV Ltd. Series 2020-1A, Class A (3M USDLIBOR + 1.240%)5,300,000 1.366 04/15/33 5,314,156
Madison Park Funding XXX Ltd. Series 2018-30A, Class A(3M USD LIBOR + 0.750%)5,284,755 0.876 04/15/29 5,284,945
Magnetite XXIV Ltd. Series 2019-24A, Class A (3M USDLIBOR + 1.330%)1,400,000 1.456 01/15/33 1,400,721
Mill City Mortgage Loan Trust Series 2017-2, Class A3320,529 2.989 07/25/59 330,982
Mountain View CLO LLC Series 2016-1A, Class AR (3M USDLIBOR + 1.360%)1,800,000 1.493 04/14/33 1,801,899
Steele Creek CLO Ltd. Series 2019-1A, Class D (3M USDLIBOR + 4.100%)1,400,000 4.226 04/15/32 1,396,574
Tryon Park CLO Ltd. Series 2013-1A, Class A1SR (3M USDLIBOR + 0.890%)3,543,000 1.016 04/15/29 3,543,364
Venture 36 CLO Ltd. Series 2019-36A, Class D (3M USDLIBOR + 4.150%)
900,000 4.284 04/20/32 903,820Venture CDO Ltd. Series 2020-39A, Class A1 (3M USD
LIBOR + 1.280%)3,475,000 1.406 04/15/33 3,477,641
Voya CLO Ltd. Series 2019-1A, Class AR (3M USDLIBOR + 1.060%)2,100,000 1.186 04/15/31 2,100,269
31,099,697
Home Equity – 0.0%GMAC Mortgage Home Equity Loan Trust Series 2007-HE3,
Class 2A128,353 7.000 09/25/37 28,569
Other(a) – 0.2%Ozlm Ltd.Series 2015-14A, Class CRR (3M USD LIBOR +
3.390%)1,700,000 3.516 07/15/34 1,674,932
Student Loans – 1.8%ECMC Group Student Loan Trust Series 2017-1A, Class A(a)
(1M USD LIBOR + 1.200%)2,850,325 1.286 12/27/66 2,893,013
Educational Services of America, Inc. Series 2015-2, Class A(a)
(1M USD LIBOR + 1.000%)512,874 1.086 12/25/56 516,723
PrincipalAmount
InterestRate
MaturityDate Value
Asset-Backed Securities(f) – (continued)
Student Loans – (continued)Higher Education Funding I Series 2014-1, Class A(a) (3M USD
LIBOR + 1.050%)$ 1,883,128 1.179% 05/25/34 $ 1,891,100Knowledgeworks Foundation Student Loan Series 2010-1,
Class A (3M USD LIBOR + 0.950%)230,225 1.079 02/25/42 229,798
Navient Student Loan Trust Series 2017-2A, Class A(a) (1M USDLIBOR + 1.050%)4,470,620 1.136 12/27/66 4,540,350
Nelnet Student Loan Trust Series 2011-1A, Class A(a) (1M USDLIBOR + 0.850%)
154,987 0.936 02/25/48 156,199PHEAA Student Loan Trust Series 2016-1A, Class A(a) (1M USD
LIBOR + 1.150%)1,815,580 1.236 09/25/65 1,849,786
12,076,969
TOTAL ASSET-BACKED SECURITIES(Cost $44,614,593) $ 44,880,167
Mortgage-Backed Obligations – 14.9%
Collateralized Mortgage Obligations – 1.4%Interest Only(i) – 0.7%FHLMC REMIC Series 3852, Class SW(f) (-1x 1M USD
LIBOR + 6.000%)$ 181,606 5.916% 05/15/41 $ 27,403FHLMC REMIC Series 4314, Class SE(f) (-1x 1M USD
LIBOR + 6.050%)180,954 5.966 03/15/44 27,218
FHLMC REMIC Series 4320, Class SD(f) (-1x 1M USDLIBOR + 6.100%)
4,126 6.016 07/15/39 749FHLMC REMIC Series 4583, Class ST(f) (-1x 1M USD
LIBOR + 6.000%)629,167 5.916 05/15/46 108,946
FHLMC REMIC Series 4980, Class KI1,033,822 4.500 06/25/50 154,148
FHLMC REMIC Series 4991, Class IE762,028 5.000 07/25/50 104,751
FHLMC REMIC Series 4998, Class GI1,317,454 4.000 08/25/50 208,520
FHLMC REMIC Series 5002, Class SJ(f) (-1x 1M USDLIBOR + 6.100%)1,487,628 6.014 07/25/50 284,746
FHLMC REMIC Series 5009, Class DI1,143,527 2.000 09/25/50 124,428
FHLMC REMIC Series 5012, Class DI250,635 4.000 09/25/50 39,511
FHLMC REMIC Series 5020, Class IH1,238,047 3.000 08/25/50 159,806
FHLMC STRIPS Series 304, Class C455,872 3.000 12/15/27 324
FNMA REMIC Series 2011-124, Class SC(f) (-1x 1M USDLIBOR + 6.550%)
182,067 6.464 12/25/41 31,506
68 The accompanying notes are an integral part of these financial statements.
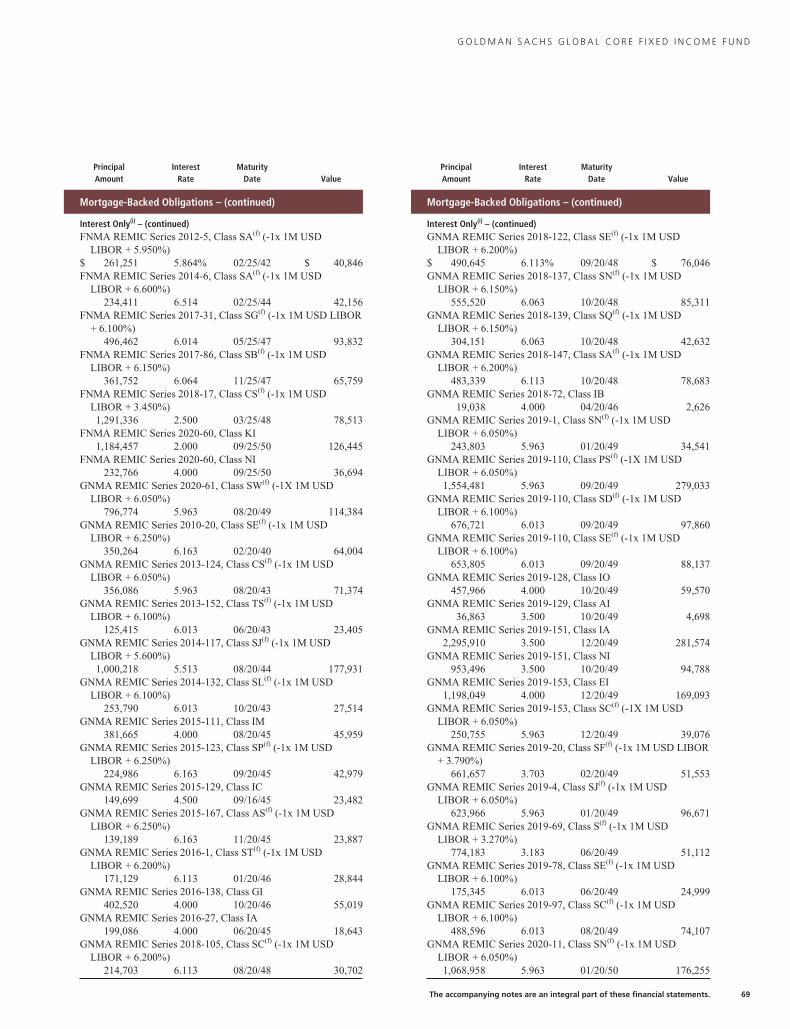
G O L D M A N S A C H S G L O B A L C O R E F I X E D I N C O M E F U N D
PrincipalAmount
InterestRate
MaturityDate Value
Mortgage-Backed Obligations – (continued)
Interest Only(i) – (continued)FNMA REMIC Series 2012-5, Class SA(f) (-1x 1M USD
LIBOR + 5.950%)$ 261,251 5.864% 02/25/42 $ 40,846FNMA REMIC Series 2014-6, Class SA(f) (-1x 1M USD
LIBOR + 6.600%)234,411 6.514 02/25/44 42,156
FNMA REMIC Series 2017-31, Class SG(f) (-1x 1M USD LIBOR+ 6.100%)
496,462 6.014 05/25/47 93,832FNMA REMIC Series 2017-86, Class SB(f) (-1x 1M USD
LIBOR + 6.150%)361,752 6.064 11/25/47 65,759
FNMA REMIC Series 2018-17, Class CS(f) (-1x 1M USDLIBOR + 3.450%)1,291,336 2.500 03/25/48 78,513
FNMA REMIC Series 2020-60, Class KI1,184,457 2.000 09/25/50 126,445
FNMA REMIC Series 2020-60, Class NI232,766 4.000 09/25/50 36,694
GNMA REMIC Series 2020-61, Class SW(f) (-1X 1M USDLIBOR + 6.050%)
796,774 5.963 08/20/49 114,384GNMA REMIC Series 2010-20, Class SE(f) (-1x 1M USD
LIBOR + 6.250%)350,264 6.163 02/20/40 64,004
GNMA REMIC Series 2013-124, Class CS(f) (-1x 1M USDLIBOR + 6.050%)
356,086 5.963 08/20/43 71,374GNMA REMIC Series 2013-152, Class TS(f) (-1x 1M USD
LIBOR + 6.100%)125,415 6.013 06/20/43 23,405
GNMA REMIC Series 2014-117, Class SJ(f) (-1x 1M USDLIBOR + 5.600%)1,000,218 5.513 08/20/44 177,931
GNMA REMIC Series 2014-132, Class SL(f) (-1x 1M USDLIBOR + 6.100%)
253,790 6.013 10/20/43 27,514GNMA REMIC Series 2015-111, Class IM
381,665 4.000 08/20/45 45,959GNMA REMIC Series 2015-123, Class SP(f) (-1x 1M USD
LIBOR + 6.250%)224,986 6.163 09/20/45 42,979
GNMA REMIC Series 2015-129, Class IC149,699 4.500 09/16/45 23,482
GNMA REMIC Series 2015-167, Class AS(f) (-1x 1M USDLIBOR + 6.250%)
139,189 6.163 11/20/45 23,887GNMA REMIC Series 2016-1, Class ST(f) (-1x 1M USD
LIBOR + 6.200%)171,129 6.113 01/20/46 28,844
GNMA REMIC Series 2016-138, Class GI402,520 4.000 10/20/46 55,019
GNMA REMIC Series 2016-27, Class IA199,086 4.000 06/20/45 18,643
GNMA REMIC Series 2018-105, Class SC(f) (-1x 1M USDLIBOR + 6.200%)
214,703 6.113 08/20/48 30,702
PrincipalAmount
InterestRate
MaturityDate Value
Mortgage-Backed Obligations – (continued)
Interest Only(i) – (continued)GNMA REMIC Series 2018-122, Class SE(f) (-1x 1M USD
LIBOR + 6.200%)$ 490,645 6.113% 09/20/48 $ 76,046GNMA REMIC Series 2018-137, Class SN(f) (-1x 1M USD
LIBOR + 6.150%)555,520 6.063 10/20/48 85,311
GNMA REMIC Series 2018-139, Class SQ(f) (-1x 1M USDLIBOR + 6.150%)
304,151 6.063 10/20/48 42,632GNMA REMIC Series 2018-147, Class SA(f) (-1x 1M USD
LIBOR + 6.200%)483,339 6.113 10/20/48 78,683
GNMA REMIC Series 2018-72, Class IB19,038 4.000 04/20/46 2,626
GNMA REMIC Series 2019-1, Class SN(f) (-1x 1M USDLIBOR + 6.050%)
243,803 5.963 01/20/49 34,541GNMA REMIC Series 2019-110, Class PS(f) (-1X 1M USD
LIBOR + 6.050%)1,554,481 5.963 09/20/49 279,033
GNMA REMIC Series 2019-110, Class SD(f) (-1x 1M USDLIBOR + 6.100%)
676,721 6.013 09/20/49 97,860GNMA REMIC Series 2019-110, Class SE(f) (-1x 1M USD
LIBOR + 6.100%)653,805 6.013 09/20/49 88,137
GNMA REMIC Series 2019-128, Class IO457,966 4.000 10/20/49 59,570
GNMA REMIC Series 2019-129, Class AI36,863 3.500 10/20/49 4,698
GNMA REMIC Series 2019-151, Class IA2,295,910 3.500 12/20/49 281,574
GNMA REMIC Series 2019-151, Class NI953,496 3.500 10/20/49 94,788
GNMA REMIC Series 2019-153, Class EI1,198,049 4.000 12/20/49 169,093
GNMA REMIC Series 2019-153, Class SC(f) (-1X 1M USDLIBOR + 6.050%)
250,755 5.963 12/20/49 39,076GNMA REMIC Series 2019-20, Class SF(f) (-1x 1M USD LIBOR
+ 3.790%)661,657 3.703 02/20/49 51,553
GNMA REMIC Series 2019-4, Class SJ(f) (-1x 1M USDLIBOR + 6.050%)
623,966 5.963 01/20/49 96,671GNMA REMIC Series 2019-69, Class S(f) (-1x 1M USD
LIBOR + 3.270%)774,183 3.183 06/20/49 51,112
GNMA REMIC Series 2019-78, Class SE(f) (-1x 1M USDLIBOR + 6.100%)
175,345 6.013 06/20/49 24,999GNMA REMIC Series 2019-97, Class SC(f) (-1x 1M USD
LIBOR + 6.100%)488,596 6.013 08/20/49 74,107
GNMA REMIC Series 2020-11, Class SN(f) (-1x 1M USDLIBOR + 6.050%)1,068,958 5.963 01/20/50 176,255
The accompanying notes are an integral part of these financial statements. 69
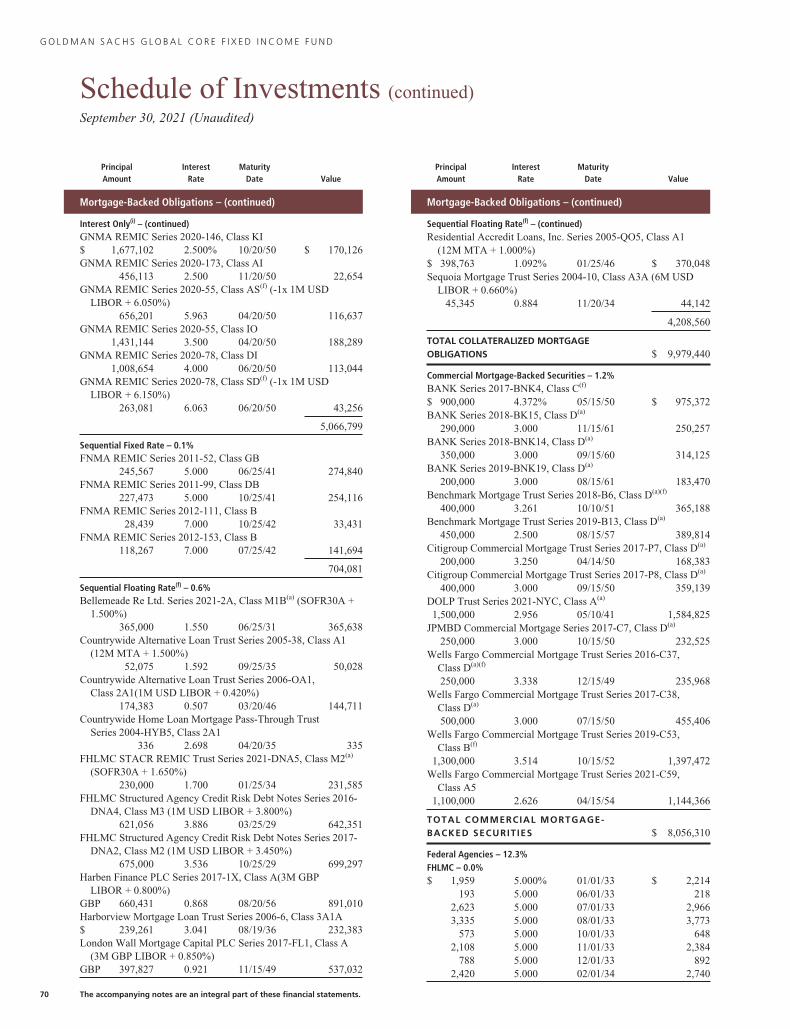
G O L D M A N S A C H S G L O B A L C O R E F I X E D I N C O M E F U N D
Schedule of Investments (continued)September 30, 2021 (Unaudited)
PrincipalAmount
InterestRate
MaturityDate Value
Mortgage-Backed Obligations – (continued)
Interest Only(i) – (continued)GNMA REMIC Series 2020-146, Class KI$ 1,677,102 2.500% 10/20/50 $ 170,126GNMA REMIC Series 2020-173, Class AI
456,113 2.500 11/20/50 22,654GNMA REMIC Series 2020-55, Class AS(f) (-1x 1M USD
LIBOR + 6.050%)656,201 5.963 04/20/50 116,637
GNMA REMIC Series 2020-55, Class IO1,431,144 3.500 04/20/50 188,289
GNMA REMIC Series 2020-78, Class DI1,008,654 4.000 06/20/50 113,044
GNMA REMIC Series 2020-78, Class SD(f) (-1x 1M USDLIBOR + 6.150%)
263,081 6.063 06/20/50 43,256
5,066,799
Sequential Fixed Rate – 0.1%FNMA REMIC Series 2011-52, Class GB
245,567 5.000 06/25/41 274,840FNMA REMIC Series 2011-99, Class DB
227,473 5.000 10/25/41 254,116FNMA REMIC Series 2012-111, Class B
28,439 7.000 10/25/42 33,431FNMA REMIC Series 2012-153, Class B
118,267 7.000 07/25/42 141,694
704,081
Sequential Floating Rate(f) – 0.6%Bellemeade Re Ltd. Series 2021-2A, Class M1B(a) (SOFR30A +
1.500%)365,000 1.550 06/25/31 365,638
Countrywide Alternative Loan Trust Series 2005-38, Class A1(12M MTA + 1.500%)
52,075 1.592 09/25/35 50,028Countrywide Alternative Loan Trust Series 2006-OA1,
Class 2A1(1M USD LIBOR + 0.420%)174,383 0.507 03/20/46 144,711
Countrywide Home Loan Mortgage Pass-Through TrustSeries 2004-HYB5, Class 2A1
336 2.698 04/20/35 335FHLMC STACR REMIC Trust Series 2021-DNA5, Class M2(a)
(SOFR30A + 1.650%)230,000 1.700 01/25/34 231,585
FHLMC Structured Agency Credit Risk Debt Notes Series 2016-DNA4, Class M3 (1M USD LIBOR + 3.800%)
621,056 3.886 03/25/29 642,351FHLMC Structured Agency Credit Risk Debt Notes Series 2017-
DNA2, Class M2 (1M USD LIBOR + 3.450%)675,000 3.536 10/25/29 699,297
Harben Finance PLC Series 2017-1X, Class A(3M GBPLIBOR + 0.800%)
GBP 660,431 0.868 08/20/56 891,010Harborview Mortgage Loan Trust Series 2006-6, Class 3A1A$ 239,261 3.041 08/19/36 232,383London Wall Mortgage Capital PLC Series 2017-FL1, Class A
(3M GBP LIBOR + 0.850%)GBP 397,827 0.921 11/15/49 537,032
PrincipalAmount
InterestRate
MaturityDate Value
Mortgage-Backed Obligations – (continued)
Sequential Floating Rate(f) – (continued)Residential Accredit Loans, Inc. Series 2005-QO5, Class A1
(12M MTA + 1.000%)$ 398,763 1.092% 01/25/46 $ 370,048Sequoia Mortgage Trust Series 2004-10, Class A3A (6M USD
LIBOR + 0.660%)45,345 0.884 11/20/34 44,142
4,208,560
TOTAL COLLATERALIZED MORTGAGEOBLIGATIONS $ 9,979,440
Commercial Mortgage-Backed Securities – 1.2%BANK Series 2017-BNK4, Class C(f)
$ 900,000 4.372% 05/15/50 $ 975,372BANK Series 2018-BK15, Class D(a)
290,000 3.000 11/15/61 250,257BANK Series 2018-BNK14, Class D(a)
350,000 3.000 09/15/60 314,125BANK Series 2019-BNK19, Class D(a)
200,000 3.000 08/15/61 183,470Benchmark Mortgage Trust Series 2018-B6, Class D(a)(f)
400,000 3.261 10/10/51 365,188Benchmark Mortgage Trust Series 2019-B13, Class D(a)
450,000 2.500 08/15/57 389,814Citigroup Commercial Mortgage Trust Series 2017-P7, Class D(a)
200,000 3.250 04/14/50 168,383Citigroup Commercial Mortgage Trust Series 2017-P8, Class D(a)
400,000 3.000 09/15/50 359,139DOLP Trust Series 2021-NYC, Class A(a)
1,500,000 2.956 05/10/41 1,584,825JPMBD Commercial Mortgage Series 2017-C7, Class D(a)
250,000 3.000 10/15/50 232,525Wells Fargo Commercial Mortgage Trust Series 2016-C37,
Class D(a)(f)
250,000 3.338 12/15/49 235,968Wells Fargo Commercial Mortgage Trust Series 2017-C38,
Class D(a)
500,000 3.000 07/15/50 455,406Wells Fargo Commercial Mortgage Trust Series 2019-C53,
Class B(f)
1,300,000 3.514 10/15/52 1,397,472Wells Fargo Commercial Mortgage Trust Series 2021-C59,
Class A51,100,000 2.626 04/15/54 1,144,366
TOTAL COMMERCIAL MORTGAGE-BACKED SECURITIES $ 8,056,310
Federal Agencies – 12.3%FHLMC – 0.0%$ 1,959 5.000% 01/01/33 $ 2,214
193 5.000 06/01/33 2182,623 5.000 07/01/33 2,9663,335 5.000 08/01/33 3,773
573 5.000 10/01/33 6482,108 5.000 11/01/33 2,384
788 5.000 12/01/33 8922,420 5.000 02/01/34 2,740
70 The accompanying notes are an integral part of these financial statements.
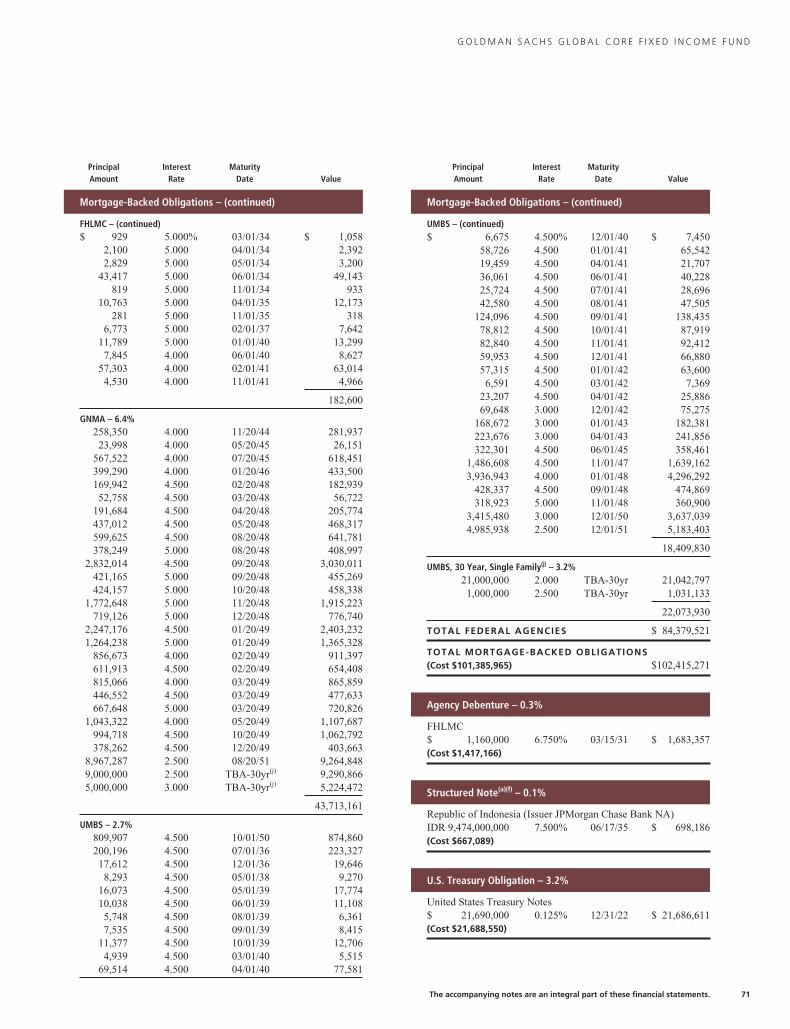
G O L D M A N S A C H S G L O B A L C O R E F I X E D I N C O M E F U N D
PrincipalAmount
InterestRate
MaturityDate Value
Mortgage-Backed Obligations – (continued)
FHLMC – (continued)$ 929 5.000% 03/01/34 $ 1,058
2,100 5.000 04/01/34 2,3922,829 5.000 05/01/34 3,200
43,417 5.000 06/01/34 49,143819 5.000 11/01/34 933
10,763 5.000 04/01/35 12,173281 5.000 11/01/35 318
6,773 5.000 02/01/37 7,64211,789 5.000 01/01/40 13,2997,845 4.000 06/01/40 8,627
57,303 4.000 02/01/41 63,0144,530 4.000 11/01/41 4,966
182,600
GNMA – 6.4%258,350 4.000 11/20/44 281,93723,998 4.000 05/20/45 26,151
567,522 4.000 07/20/45 618,451399,290 4.000 01/20/46 433,500169,942 4.500 02/20/48 182,93952,758 4.500 03/20/48 56,722
191,684 4.500 04/20/48 205,774437,012 4.500 05/20/48 468,317599,625 4.500 08/20/48 641,781378,249 5.000 08/20/48 408,997
2,832,014 4.500 09/20/48 3,030,011421,165 5.000 09/20/48 455,269424,157 5.000 10/20/48 458,338
1,772,648 5.000 11/20/48 1,915,223719,126 5.000 12/20/48 776,740
2,247,176 4.500 01/20/49 2,403,2321,264,238 5.000 01/20/49 1,365,328
856,673 4.000 02/20/49 911,397611,913 4.500 02/20/49 654,408815,066 4.000 03/20/49 865,859446,552 4.500 03/20/49 477,633667,648 5.000 03/20/49 720,826
1,043,322 4.000 05/20/49 1,107,687994,718 4.500 10/20/49 1,062,792378,262 4.500 12/20/49 403,663
8,967,287 2.500 08/20/51 9,264,8489,000,000 2.500 TBA-30yr(j) 9,290,8665,000,000 3.000 TBA-30yr(j) 5,224,472
43,713,161
UMBS – 2.7%809,907 4.500 10/01/50 874,860200,196 4.500 07/01/36 223,32717,612 4.500 12/01/36 19,6468,293 4.500 05/01/38 9,270
16,073 4.500 05/01/39 17,77410,038 4.500 06/01/39 11,1085,748 4.500 08/01/39 6,3617,535 4.500 09/01/39 8,415
11,377 4.500 10/01/39 12,7064,939 4.500 03/01/40 5,515
69,514 4.500 04/01/40 77,581
PrincipalAmount
InterestRate
MaturityDate Value
Mortgage-Backed Obligations – (continued)
UMBS – (continued)$ 6,675 4.500% 12/01/40 $ 7,450
58,726 4.500 01/01/41 65,54219,459 4.500 04/01/41 21,70736,061 4.500 06/01/41 40,22825,724 4.500 07/01/41 28,69642,580 4.500 08/01/41 47,505
124,096 4.500 09/01/41 138,43578,812 4.500 10/01/41 87,91982,840 4.500 11/01/41 92,41259,953 4.500 12/01/41 66,88057,315 4.500 01/01/42 63,6006,591 4.500 03/01/42 7,369
23,207 4.500 04/01/42 25,88669,648 3.000 12/01/42 75,275
168,672 3.000 01/01/43 182,381223,676 3.000 04/01/43 241,856322,301 4.500 06/01/45 358,461
1,486,608 4.500 11/01/47 1,639,1623,936,943 4.000 01/01/48 4,296,292
428,337 4.500 09/01/48 474,869318,923 5.000 11/01/48 360,900
3,415,480 3.000 12/01/50 3,637,0394,985,938 2.500 12/01/51 5,183,403
18,409,830
UMBS, 30 Year, Single Family(j) – 3.2%21,000,000 2.000 TBA-30yr 21,042,7971,000,000 2.500 TBA-30yr 1,031,133
22,073,930
TOTAL FEDERAL AGENCIES $ 84,379,521
TOTAL MORTGAGE-BACKED OBLIGATIONS(Cost $101,385,965) $102,415,271
Agency Debenture – 0.3%
FHLMC$ 1,160,000 6.750% 03/15/31 $ 1,683,357(Cost $1,417,166)
Structured Note(a)(f) – 0.1%
Republic of Indonesia (Issuer JPMorgan Chase Bank NA)IDR 9,474,000,000 7.500% 06/17/35 $ 698,186(Cost $667,089)
U.S. Treasury Obligation – 3.2%
United States Treasury Notes$ 21,690,000 0.125% 12/31/22 $ 21,686,611(Cost $21,688,550)
The accompanying notes are an integral part of these financial statements. 71
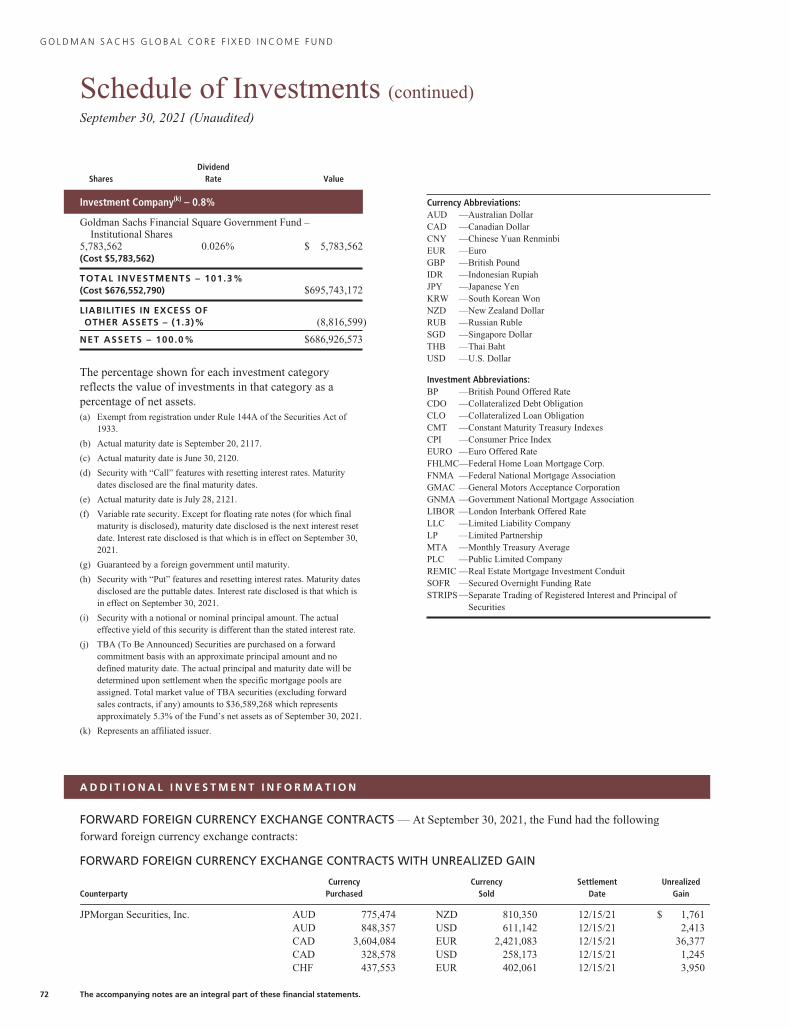
G O L D M A N S A C H S G L O B A L C O R E F I X E D I N C O M E F U N D
Schedule of Investments (continued)September 30, 2021 (Unaudited)
SharesDividend
Rate Value
Investment Company(k) – 0.8%
Goldman Sachs Financial Square Government Fund –Institutional Shares
5,783,562 0.026% $ 5,783,562(Cost $5,783,562)
TOTAL INVESTMENTS – 101.3%(Cost $676,552,790) $695,743,172
LIABILITIES IN EXCESS OFOTHER ASSETS – (1.3)% (8,816,599)
NET ASSETS – 100.0% $686,926,573
The percentage shown for each investment categoryreflects the value of investments in that category as apercentage of net assets.(a) Exempt from registration under Rule 144A of the Securities Act of
1933.
(b) Actual maturity date is September 20, 2117.
(c) Actual maturity date is June 30, 2120.
(d) Security with “Call” features with resetting interest rates. Maturitydates disclosed are the final maturity dates.
(e) Actual maturity date is July 28, 2121.
(f) Variable rate security. Except for floating rate notes (for which finalmaturity is disclosed), maturity date disclosed is the next interest resetdate. Interest rate disclosed is that which is in effect on September 30,2021.
(g) Guaranteed by a foreign government until maturity.
(h) Security with “Put” features and resetting interest rates. Maturity datesdisclosed are the puttable dates. Interest rate disclosed is that which isin effect on September 30, 2021.
(i) Security with a notional or nominal principal amount. The actualeffective yield of this security is different than the stated interest rate.
(j) TBA (To Be Announced) Securities are purchased on a forwardcommitment basis with an approximate principal amount and nodefined maturity date. The actual principal and maturity date will bedetermined upon settlement when the specific mortgage pools areassigned. Total market value of TBA securities (excluding forwardsales contracts, if any) amounts to $36,589,268 which representsapproximately 5.3% of the Fund’s net assets as of September 30, 2021.
(k) Represents an affiliated issuer.
Currency Abbreviations:AUD —Australian DollarCAD —Canadian DollarCNY —Chinese Yuan RenminbiEUR —EuroGBP —British PoundIDR —Indonesian RupiahJPY —Japanese YenKRW —South Korean WonNZD —New Zealand DollarRUB —Russian RubleSGD —Singapore DollarTHB —Thai BahtUSD —U.S. Dollar
Investment Abbreviations:BP —British Pound Offered RateCDO —Collateralized Debt ObligationCLO —Collateralized Loan ObligationCMT —Constant Maturity Treasury IndexesCPI —Consumer Price IndexEURO —Euro Offered RateFHLMC—Federal Home Loan Mortgage Corp.FNMA —Federal National Mortgage AssociationGMAC —General Motors Acceptance CorporationGNMA —Government National Mortgage AssociationLIBOR —London Interbank Offered RateLLC —Limited Liability CompanyLP —Limited PartnershipMTA —Monthly Treasury AveragePLC —Public Limited CompanyREMIC —Real Estate Mortgage Investment ConduitSOFR —Secured Overnight Funding RateSTRIPS —Separate Trading of Registered Interest and Principal of
Securities
A D D I T I O N A L I N V E S T M E N T I N F O R M A T I O N
FORWARD FOREIGN CURRENCY EXCHANGE CONTRACTS — At September 30, 2021, the Fund had the following
forward foreign currency exchange contracts:
FORWARD FOREIGN CURRENCY EXCHANGE CONTRACTS WITH UNREALIZED GAIN
CounterpartyCurrency
PurchasedCurrency
SoldSettlement
DateUnrealized
Gain
JPMorgan Securities, Inc. AUD 775,474 NZD 810,350 12/15/21 $ 1,761AUD 848,357 USD 611,142 12/15/21 2,413CAD 3,604,084 EUR 2,421,083 12/15/21 36,377CAD 328,578 USD 258,173 12/15/21 1,245CHF 437,553 EUR 402,061 12/15/21 3,950
72 The accompanying notes are an integral part of these financial statements.
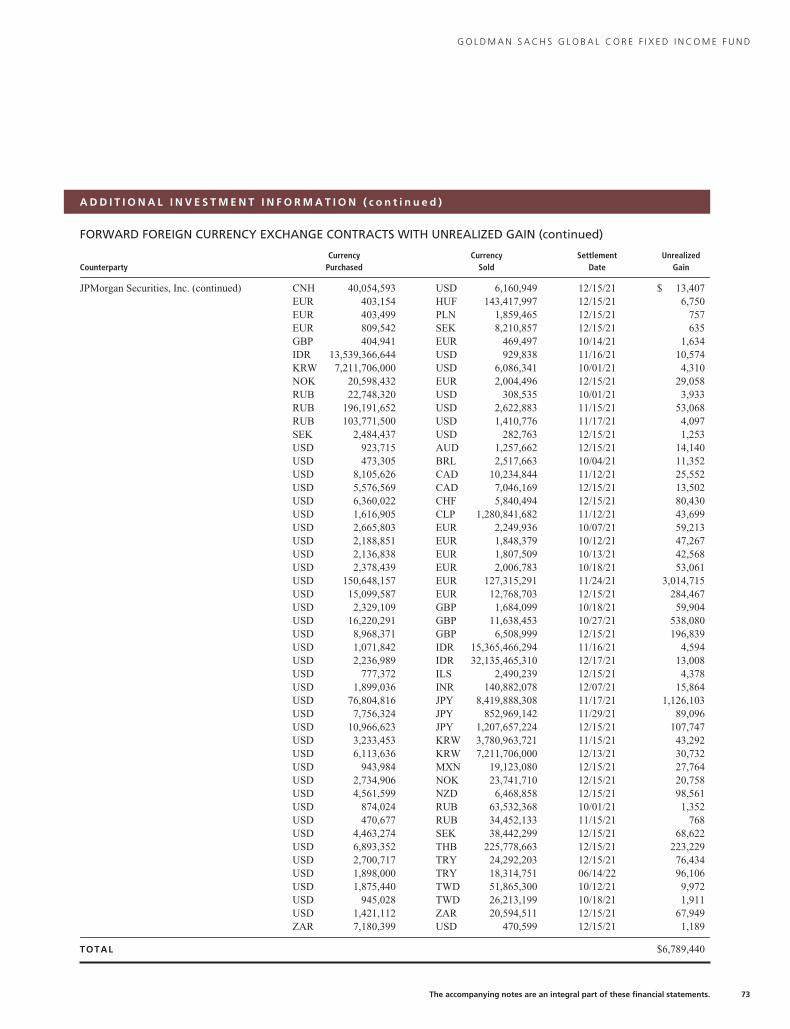
G O L D M A N S A C H S G L O B A L C O R E F I X E D I N C O M E F U N D
A D D I T I O N A L I N V E S T M E N T I N F O R M A T I O N ( c o n t i n u e d )
FORWARD FOREIGN CURRENCY EXCHANGE CONTRACTS WITH UNREALIZED GAIN (continued)
CounterpartyCurrency
PurchasedCurrency
SoldSettlement
DateUnrealized
Gain
JPMorgan Securities, Inc. (continued) CNH 40,054,593 USD 6,160,949 12/15/21 $ 13,407EUR 403,154 HUF 143,417,997 12/15/21 6,750EUR 403,499 PLN 1,859,465 12/15/21 757EUR 809,542 SEK 8,210,857 12/15/21 635GBP 404,941 EUR 469,497 10/14/21 1,634IDR 13,539,366,644 USD 929,838 11/16/21 10,574KRW 7,211,706,000 USD 6,086,341 10/01/21 4,310NOK 20,598,432 EUR 2,004,496 12/15/21 29,058RUB 22,748,320 USD 308,535 10/01/21 3,933RUB 196,191,652 USD 2,622,883 11/15/21 53,068RUB 103,771,500 USD 1,410,776 11/17/21 4,097SEK 2,484,437 USD 282,763 12/15/21 1,253USD 923,715 AUD 1,257,662 12/15/21 14,140USD 473,305 BRL 2,517,663 10/04/21 11,352USD 8,105,626 CAD 10,234,844 11/12/21 25,552USD 5,576,569 CAD 7,046,169 12/15/21 13,502USD 6,360,022 CHF 5,840,494 12/15/21 80,430USD 1,616,905 CLP 1,280,841,682 11/12/21 43,699USD 2,665,803 EUR 2,249,936 10/07/21 59,213USD 2,188,851 EUR 1,848,379 10/12/21 47,267USD 2,136,838 EUR 1,807,509 10/13/21 42,568USD 2,378,439 EUR 2,006,783 10/18/21 53,061USD 150,648,157 EUR 127,315,291 11/24/21 3,014,715USD 15,099,587 EUR 12,768,703 12/15/21 284,467USD 2,329,109 GBP 1,684,099 10/18/21 59,904USD 16,220,291 GBP 11,638,453 10/27/21 538,080USD 8,968,371 GBP 6,508,999 12/15/21 196,839USD 1,071,842 IDR 15,365,466,294 11/16/21 4,594USD 2,236,989 IDR 32,135,465,310 12/17/21 13,008USD 777,372 ILS 2,490,239 12/15/21 4,378USD 1,899,036 INR 140,882,078 12/07/21 15,864USD 76,804,816 JPY 8,419,888,308 11/17/21 1,126,103USD 7,756,324 JPY 852,969,142 11/29/21 89,096USD 10,966,623 JPY 1,207,657,224 12/15/21 107,747USD 3,233,453 KRW 3,780,963,721 11/15/21 43,292USD 6,113,636 KRW 7,211,706,000 12/13/21 30,732USD 943,984 MXN 19,123,080 12/15/21 27,764USD 2,734,906 NOK 23,741,710 12/15/21 20,758USD 4,561,599 NZD 6,468,858 12/15/21 98,561USD 874,024 RUB 63,532,368 10/01/21 1,352USD 470,677 RUB 34,452,133 11/15/21 768USD 4,463,274 SEK 38,442,299 12/15/21 68,622USD 6,893,352 THB 225,778,663 12/15/21 223,229USD 2,700,717 TRY 24,292,203 12/15/21 76,434USD 1,898,000 TRY 18,314,751 06/14/22 96,106USD 1,875,440 TWD 51,865,300 10/12/21 9,972USD 945,028 TWD 26,213,199 10/18/21 1,911USD 1,421,112 ZAR 20,594,511 12/15/21 67,949ZAR 7,180,399 USD 470,599 12/15/21 1,189
TOTAL $6,789,440
The accompanying notes are an integral part of these financial statements. 73
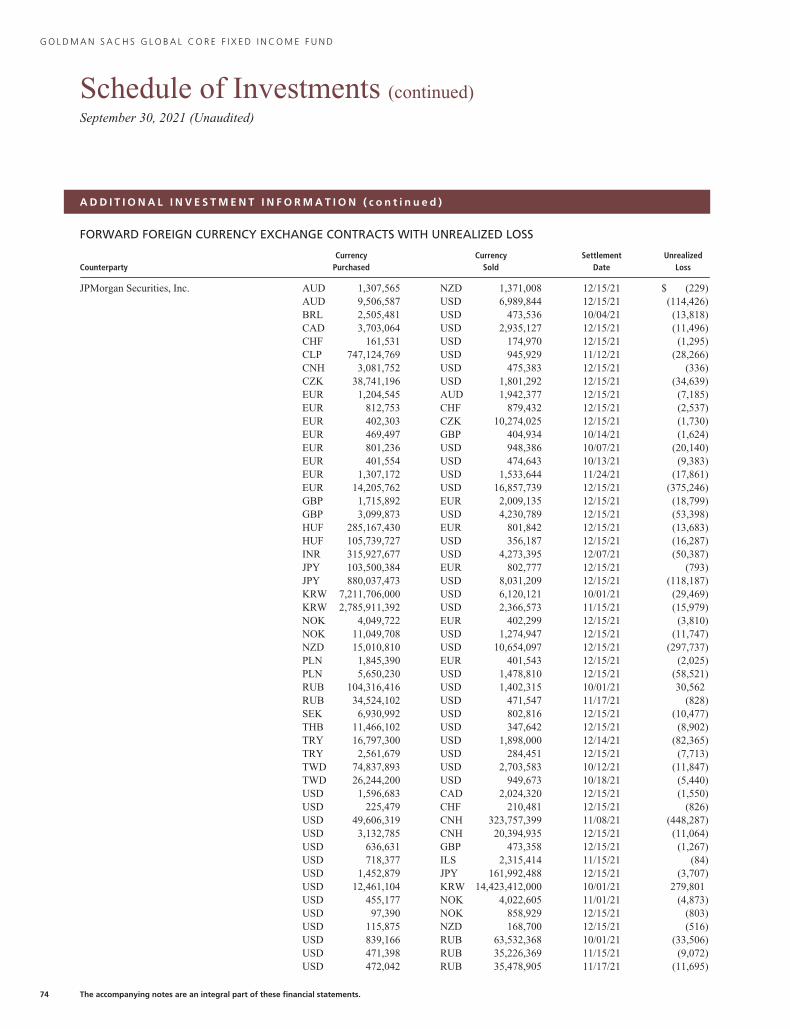
G O L D M A N S A C H S G L O B A L C O R E F I X E D I N C O M E F U N D
Schedule of Investments (continued)September 30, 2021 (Unaudited)
A D D I T I O N A L I N V E S T M E N T I N F O R M A T I O N ( c o n t i n u e d )
FORWARD FOREIGN CURRENCY EXCHANGE CONTRACTS WITH UNREALIZED LOSS
CounterpartyCurrency
PurchasedCurrency
SoldSettlement
DateUnrealized
Loss
JPMorgan Securities, Inc. AUD 1,307,565 NZD 1,371,008 12/15/21 $ (229)AUD 9,506,587 USD 6,989,844 12/15/21 (114,426)BRL 2,505,481 USD 473,536 10/04/21 (13,818)CAD 3,703,064 USD 2,935,127 12/15/21 (11,496)CHF 161,531 USD 174,970 12/15/21 (1,295)CLP 747,124,769 USD 945,929 11/12/21 (28,266)CNH 3,081,752 USD 475,383 12/15/21 (336)CZK 38,741,196 USD 1,801,292 12/15/21 (34,639)EUR 1,204,545 AUD 1,942,377 12/15/21 (7,185)EUR 812,753 CHF 879,432 12/15/21 (2,537)EUR 402,303 CZK 10,274,025 12/15/21 (1,730)EUR 469,497 GBP 404,934 10/14/21 (1,624)EUR 801,236 USD 948,386 10/07/21 (20,140)EUR 401,554 USD 474,643 10/13/21 (9,383)EUR 1,307,172 USD 1,533,644 11/24/21 (17,861)EUR 14,205,762 USD 16,857,739 12/15/21 (375,246)GBP 1,715,892 EUR 2,009,135 12/15/21 (18,799)GBP 3,099,873 USD 4,230,789 12/15/21 (53,398)HUF 285,167,430 EUR 801,842 12/15/21 (13,683)HUF 105,739,727 USD 356,187 12/15/21 (16,287)INR 315,927,677 USD 4,273,395 12/07/21 (50,387)JPY 103,500,384 EUR 802,777 12/15/21 (793)JPY 880,037,473 USD 8,031,209 12/15/21 (118,187)KRW 7,211,706,000 USD 6,120,121 10/01/21 (29,469)KRW 2,785,911,392 USD 2,366,573 11/15/21 (15,979)NOK 4,049,722 EUR 402,299 12/15/21 (3,810)NOK 11,049,708 USD 1,274,947 12/15/21 (11,747)NZD 15,010,810 USD 10,654,097 12/15/21 (297,737)PLN 1,845,390 EUR 401,543 12/15/21 (2,025)PLN 5,650,230 USD 1,478,810 12/15/21 (58,521)RUB 104,316,416 USD 1,402,315 10/01/21 30,562RUB 34,524,102 USD 471,547 11/17/21 (828)SEK 6,930,992 USD 802,816 12/15/21 (10,477)THB 11,466,102 USD 347,642 12/15/21 (8,902)TRY 16,797,300 USD 1,898,000 12/14/21 (82,365)TRY 2,561,679 USD 284,451 12/15/21 (7,713)TWD 74,837,893 USD 2,703,583 10/12/21 (11,847)TWD 26,244,200 USD 949,673 10/18/21 (5,440)USD 1,596,683 CAD 2,024,320 12/15/21 (1,550)USD 225,479 CHF 210,481 12/15/21 (826)USD 49,606,319 CNH 323,757,399 11/08/21 (448,287)USD 3,132,785 CNH 20,394,935 12/15/21 (11,064)USD 636,631 GBP 473,358 12/15/21 (1,267)USD 718,377 ILS 2,315,414 11/15/21 (84)USD 1,452,879 JPY 161,992,488 12/15/21 (3,707)USD 12,461,104 KRW 14,423,412,000 10/01/21 279,801USD 455,177 NOK 4,022,605 11/01/21 (4,873)USD 97,390 NOK 858,929 12/15/21 (803)USD 115,875 NZD 168,700 12/15/21 (516)USD 839,166 RUB 63,532,368 10/01/21 (33,506)USD 471,398 RUB 35,226,369 11/15/21 (9,072)USD 472,042 RUB 35,478,905 11/17/21 (11,695)
74 The accompanying notes are an integral part of these financial statements.
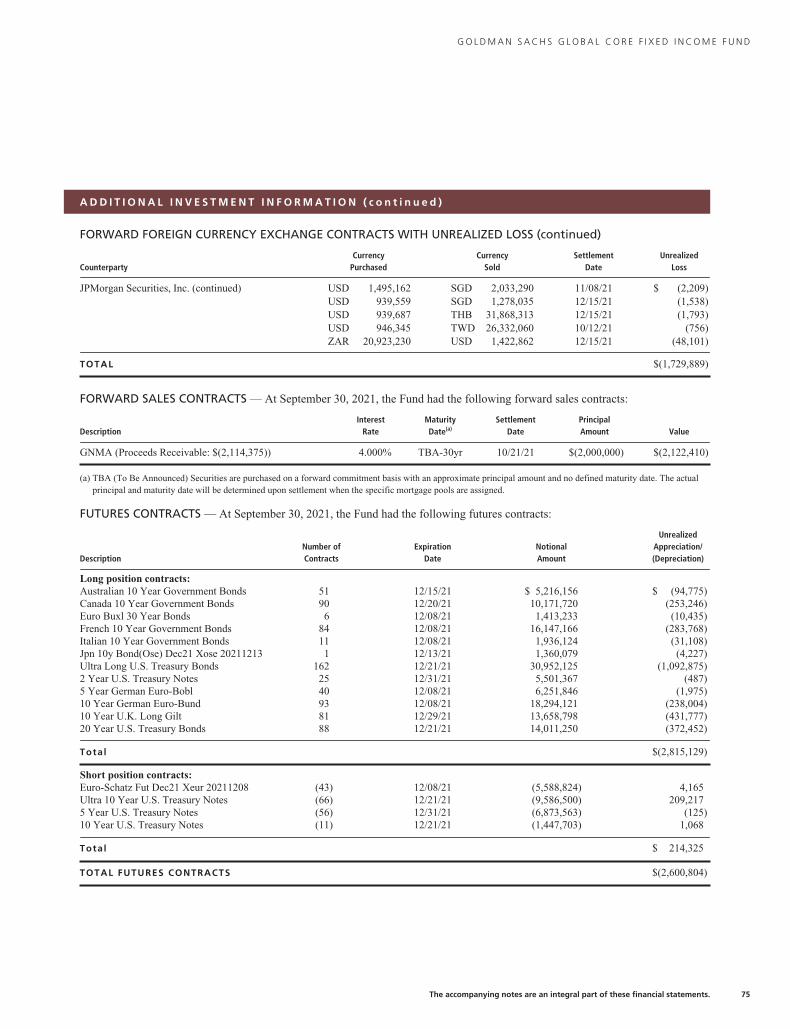
G O L D M A N S A C H S G L O B A L C O R E F I X E D I N C O M E F U N D
A D D I T I O N A L I N V E S T M E N T I N F O R M A T I O N ( c o n t i n u e d )
FORWARD FOREIGN CURRENCY EXCHANGE CONTRACTS WITH UNREALIZED LOSS (continued)
CounterpartyCurrency
PurchasedCurrency
SoldSettlement
DateUnrealized
Loss
JPMorgan Securities, Inc. (continued) USD 1,495,162 SGD 2,033,290 11/08/21 $ (2,209)USD 939,559 SGD 1,278,035 12/15/21 (1,538)USD 939,687 THB 31,868,313 12/15/21 (1,793)USD 946,345 TWD 26,332,060 10/12/21 (756)ZAR 20,923,230 USD 1,422,862 12/15/21 (48,101)
TOTAL $(1,729,889)
FORWARD SALES CONTRACTS — At September 30, 2021, the Fund had the following forward sales contracts:
DescriptionInterest
RateMaturityDate(a)
SettlementDate
PrincipalAmount Value
GNMA (Proceeds Receivable: $(2,114,375)) 4.000% TBA-30yr 10/21/21 $(2,000,000) $(2,122,410)
(a) TBA (To Be Announced) Securities are purchased on a forward commitment basis with an approximate principal amount and no defined maturity date. The actualprincipal and maturity date will be determined upon settlement when the specific mortgage pools are assigned.
FUTURES CONTRACTS — At September 30, 2021, the Fund had the following futures contracts:
DescriptionNumber ofContracts
ExpirationDate
NotionalAmount
UnrealizedAppreciation/(Depreciation)
Long position contracts:Australian 10 Year Government Bonds 51 12/15/21 $ 5,216,156 $ (94,775)Canada 10 Year Government Bonds 90 12/20/21 10,171,720 (253,246)Euro Buxl 30 Year Bonds 6 12/08/21 1,413,233 (10,435)French 10 Year Government Bonds 84 12/08/21 16,147,166 (283,768)Italian 10 Year Government Bonds 11 12/08/21 1,936,124 (31,108)Jpn 10y Bond(Ose) Dec21 Xose 20211213 1 12/13/21 1,360,079 (4,227)Ultra Long U.S. Treasury Bonds 162 12/21/21 30,952,125 (1,092,875)2 Year U.S. Treasury Notes 25 12/31/21 5,501,367 (487)5 Year German Euro-Bobl 40 12/08/21 6,251,846 (1,975)10 Year German Euro-Bund 93 12/08/21 18,294,121 (238,004)10 Year U.K. Long Gilt 81 12/29/21 13,658,798 (431,777)20 Year U.S. Treasury Bonds 88 12/21/21 14,011,250 (372,452)
Total $(2,815,129)
Short position contracts:Euro-Schatz Fut Dec21 Xeur 20211208 (43) 12/08/21 (5,588,824) 4,165Ultra 10 Year U.S. Treasury Notes (66) 12/21/21 (9,586,500) 209,2175 Year U.S. Treasury Notes (56) 12/31/21 (6,873,563) (125)10 Year U.S. Treasury Notes (11) 12/21/21 (1,447,703) 1,068
Total $ 214,325
TOTAL FUTURES CONTRACTS $(2,600,804)
The accompanying notes are an integral part of these financial statements. 75
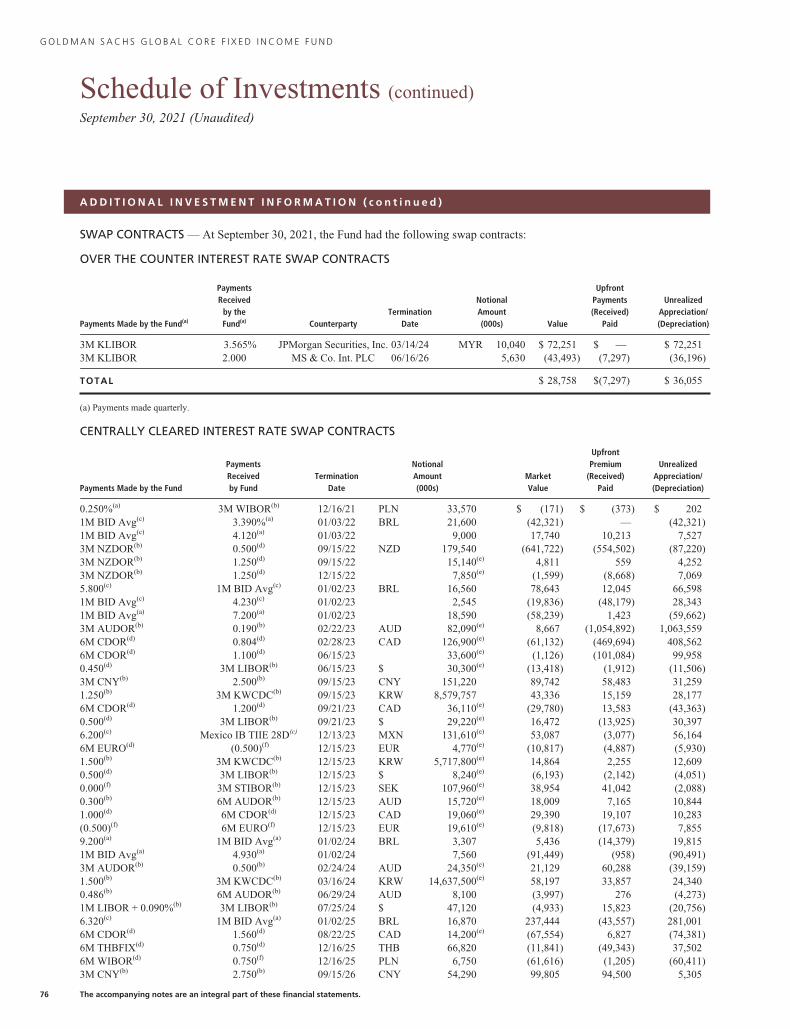
G O L D M A N S A C H S G L O B A L C O R E F I X E D I N C O M E F U N D
Schedule of Investments (continued)September 30, 2021 (Unaudited)
A D D I T I O N A L I N V E S T M E N T I N F O R M A T I O N ( c o n t i n u e d )
SWAP CONTRACTS — At September 30, 2021, the Fund had the following swap contracts:
OVER THE COUNTER INTEREST RATE SWAP CONTRACTS
Payments Made by the Fund(a)
PaymentsReceived
by theFund(a) Counterparty
TerminationDate
NotionalAmount(000s) Value
UpfrontPayments(Received)
Paid
UnrealizedAppreciation/(Depreciation)
3M KLIBOR 3.565% JPMorgan Securities, Inc. 03/14/24 MYR 10,040 $ 72,251 $ — $ 72,2513M KLIBOR 2.000 MS & Co. Int. PLC 06/16/26 5,630 (43,493) (7,297) (36,196)
TOTAL $ 28,758 $(7,297) $ 36,055
(a) Payments made quarterly.
CENTRALLY CLEARED INTEREST RATE SWAP CONTRACTS
Payments Made by the Fund
PaymentsReceivedby Fund
TerminationDate
NotionalAmount(000s)
MarketValue
UpfrontPremium
(Received)Paid
UnrealizedAppreciation/(Depreciation)
0.250%(a) 3M WIBOR(b) 12/16/21 PLN 33,570 $ (171) $ (373) $ 2021M BID Avg(c) 3.390%(a) 01/03/22 BRL 21,600 (42,321) — (42,321)1M BID Avg(c) 4.120(a) 01/03/22 9,000 17,740 10,213 7,5273M NZDOR(b) 0.500(d) 09/15/22 NZD 179,540 (641,722) (554,502) (87,220)3M NZDOR(b) 1.250(d) 09/15/22 15,140(e) 4,811 559 4,2523M NZDOR(b) 1.250(d) 12/15/22 7,850(e) (1,599) (8,668) 7,0695.800(c) 1M BID Avg(c) 01/02/23 BRL 16,560 78,643 12,045 66,5981M BID Avg(c) 4.230(c) 01/02/23 2,545 (19,836) (48,179) 28,3431M BID Avg(a) 7.200(a) 01/02/23 18,590 (58,239) 1,423 (59,662)3M AUDOR(b) 0.190(b) 02/22/23 AUD 82,090(e) 8,667 (1,054,892) 1,063,5596M CDOR(d) 0.804(d) 02/28/23 CAD 126,900(e) (61,132) (469,694) 408,5626M CDOR(d) 1.100(d) 06/15/23 33,600(e) (1,126) (101,084) 99,9580.450(d) 3M LIBOR(b) 06/15/23 $ 30,300(e) (13,418) (1,912) (11,506)3M CNY(b) 2.500(b) 09/15/23 CNY 151,220 89,742 58,483 31,2591.250(b) 3M KWCDC(b) 09/15/23 KRW 8,579,757 43,336 15,159 28,1776M CDOR(d) 1.200(d) 09/21/23 CAD 36,110(e) (29,780) 13,583 (43,363)0.500(d) 3M LIBOR(b) 09/21/23 $ 29,220(e) 16,472 (13,925) 30,3976.200(c) Mexico IB TIIE 28D(c) 12/13/23 MXN 131,610(e) 53,087 (3,077) 56,1646M EURO(d) (0.500)(f) 12/15/23 EUR 4,770(e) (10,817) (4,887) (5,930)1.500(b) 3M KWCDC(b) 12/15/23 KRW 5,717,800(e) 14,864 2,255 12,6090.500(d) 3M LIBOR(b) 12/15/23 $ 8,240(e) (6,193) (2,142) (4,051)0.000(f) 3M STIBOR(b) 12/15/23 SEK 107,960(e) 38,954 41,042 (2,088)0.300(b) 6M AUDOR(b) 12/15/23 AUD 15,720(e) 18,009 7,165 10,8441.000(d) 6M CDOR(d) 12/15/23 CAD 19,060(e) 29,390 19,107 10,283(0.500)(f) 6M EURO(f) 12/15/23 EUR 19,610(e) (9,818) (17,673) 7,8559.200(a) 1M BID Avg(a) 01/02/24 BRL 3,307 5,436 (14,379) 19,8151M BID Avg(a) 4.930(a) 01/02/24 7,560 (91,449) (958) (90,491)3M AUDOR(b) 0.500(b) 02/24/24 AUD 24,350(e) 21,129 60,288 (39,159)1.500(b) 3M KWCDC(b) 03/16/24 KRW 14,637,500(e) 58,197 33,857 24,3400.486(b) 6M AUDOR(b) 06/29/24 AUD 8,100 (3,997) 276 (4,273)1M LIBOR + 0.090%(b) 3M LIBOR(b) 07/25/24 $ 47,120 (4,933) 15,823 (20,756)6.320(c) 1M BID Avg(a) 01/02/25 BRL 16,870 237,444 (43,557) 281,0016M CDOR(d) 1.560(d) 08/22/25 CAD 14,200(e) (67,554) 6,827 (74,381)6M THBFIX(d) 0.750(d) 12/16/25 THB 66,820 (11,841) (49,343) 37,5026M WIBOR(d) 0.750(f) 12/16/25 PLN 6,750 (61,616) (1,205) (60,411)3M CNY(b) 2.750(b) 09/15/26 CNY 54,290 99,805 94,500 5,305
76 The accompanying notes are an integral part of these financial statements.
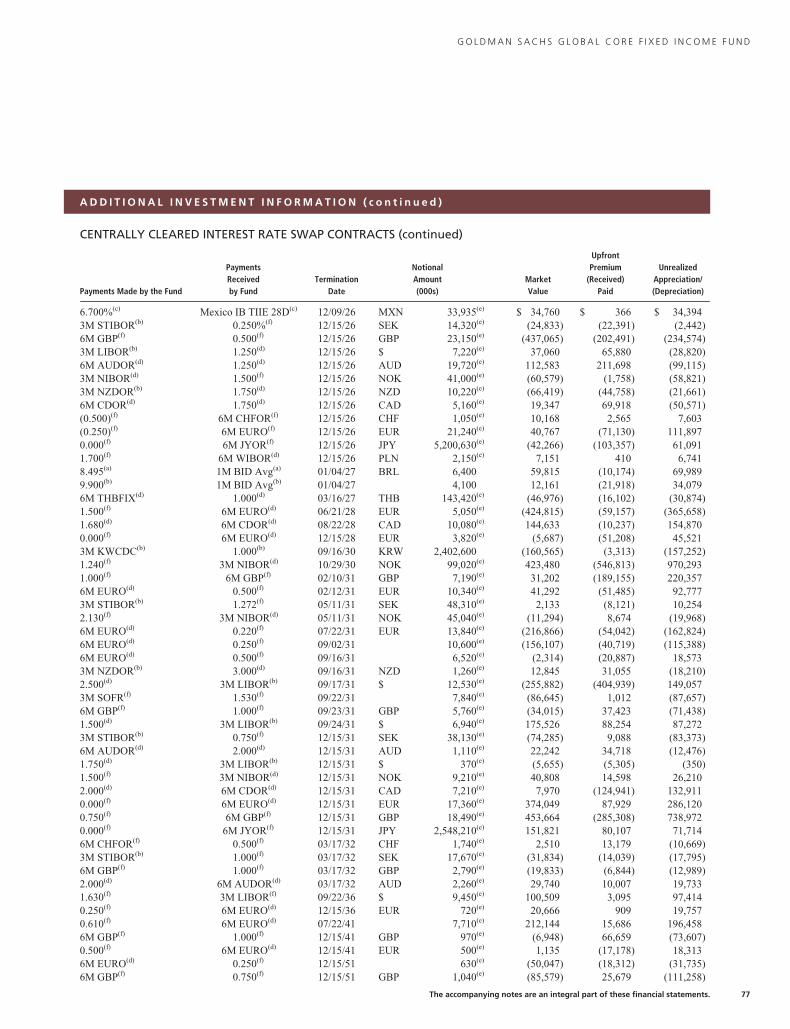
G O L D M A N S A C H S G L O B A L C O R E F I X E D I N C O M E F U N D
A D D I T I O N A L I N V E S T M E N T I N F O R M A T I O N ( c o n t i n u e d )
CENTRALLY CLEARED INTEREST RATE SWAP CONTRACTS (continued)
Payments Made by the Fund
PaymentsReceivedby Fund
TerminationDate
NotionalAmount(000s)
MarketValue
UpfrontPremium
(Received)Paid
UnrealizedAppreciation/(Depreciation)
6.700%(c) Mexico IB TIIE 28D(c) 12/09/26 MXN 33,935(e) $ 34,760 $ 366 $ 34,3943M STIBOR(b) 0.250%(f) 12/15/26 SEK 14,320(e) (24,833) (22,391) (2,442)6M GBP(f) 0.500(f) 12/15/26 GBP 23,150(e) (437,065) (202,491) (234,574)3M LIBOR(b) 1.250(d) 12/15/26 $ 7,220(e) 37,060 65,880 (28,820)6M AUDOR(d) 1.250(d) 12/15/26 AUD 19,720(e) 112,583 211,698 (99,115)3M NIBOR(d) 1.500(f) 12/15/26 NOK 41,000(e) (60,579) (1,758) (58,821)3M NZDOR(b) 1.750(d) 12/15/26 NZD 10,220(e) (66,419) (44,758) (21,661)6M CDOR(d) 1.750(d) 12/15/26 CAD 5,160(e) 19,347 69,918 (50,571)(0.500)(f) 6M CHFOR(f) 12/15/26 CHF 1,050(e) 10,168 2,565 7,603(0.250)(f) 6M EURO(f) 12/15/26 EUR 21,240(e) 40,767 (71,130) 111,8970.000(f) 6M JYOR(f) 12/15/26 JPY 5,200,630(e) (42,266) (103,357) 61,0911.700(f) 6M WIBOR(d) 12/15/26 PLN 2,150(e) 7,151 410 6,7418.495(a) 1M BID Avg(a) 01/04/27 BRL 6,400 59,815 (10,174) 69,9899.900(b) 1M BID Avg(b) 01/04/27 4,100 12,161 (21,918) 34,0796M THBFIX(d) 1.000(d) 03/16/27 THB 143,420(e) (46,976) (16,102) (30,874)1.500(f) 6M EURO(d) 06/21/28 EUR 5,050(e) (424,815) (59,157) (365,658)1.680(d) 6M CDOR(d) 08/22/28 CAD 10,080(e) 144,633 (10,237) 154,8700.000(f) 6M EURO(d) 12/15/28 EUR 3,820(e) (5,687) (51,208) 45,5213M KWCDC(b) 1.000(b) 09/16/30 KRW 2,402,600 (160,565) (3,313) (157,252)1.240(f) 3M NIBOR(d) 10/29/30 NOK 99,020(e) 423,480 (546,813) 970,2931.000(f) 6M GBP(f) 02/10/31 GBP 7,190(e) 31,202 (189,155) 220,3576M EURO(d) 0.500(f) 02/12/31 EUR 10,340(e) 41,292 (51,485) 92,7773M STIBOR(b) 1.272(f) 05/11/31 SEK 48,310(e) 2,133 (8,121) 10,2542.130(f) 3M NIBOR(d) 05/11/31 NOK 45,040(e) (11,294) 8,674 (19,968)6M EURO(d) 0.220(f) 07/22/31 EUR 13,840(e) (216,866) (54,042) (162,824)6M EURO(d) 0.250(f) 09/02/31 10,600(e) (156,107) (40,719) (115,388)6M EURO(d) 0.500(f) 09/16/31 6,520(e) (2,314) (20,887) 18,5733M NZDOR(b) 3.000(d) 09/16/31 NZD 1,260(e) 12,845 31,055 (18,210)2.500(d) 3M LIBOR(b) 09/17/31 $ 12,530(e) (255,882) (404,939) 149,0573M SOFR(f) 1.530(f) 09/22/31 7,840(e) (86,645) 1,012 (87,657)6M GBP(f) 1.000(f) 09/23/31 GBP 5,760(e) (34,015) 37,423 (71,438)1.500(d) 3M LIBOR(b) 09/24/31 $ 6,940(e) 175,526 88,254 87,2723M STIBOR(b) 0.750(f) 12/15/31 SEK 38,130(e) (74,285) 9,088 (83,373)6M AUDOR(d) 2.000(d) 12/15/31 AUD 1,110(e) 22,242 34,718 (12,476)1.750(d) 3M LIBOR(b) 12/15/31 $ 370(e) (5,655) (5,305) (350)1.500(f) 3M NIBOR(d) 12/15/31 NOK 9,210(e) 40,808 14,598 26,2102.000(d) 6M CDOR(d) 12/15/31 CAD 7,210(e) 7,970 (124,941) 132,9110.000(f) 6M EURO(d) 12/15/31 EUR 17,360(e) 374,049 87,929 286,1200.750(f) 6M GBP(f) 12/15/31 GBP 18,490(e) 453,664 (285,308) 738,9720.000(f) 6M JYOR(f) 12/15/31 JPY 2,548,210(e) 151,821 80,107 71,7146M CHFOR(f) 0.500(f) 03/17/32 CHF 1,740(e) 2,510 13,179 (10,669)3M STIBOR(b) 1.000(f) 03/17/32 SEK 17,670(e) (31,834) (14,039) (17,795)6M GBP(f) 1.000(f) 03/17/32 GBP 2,790(e) (19,833) (6,844) (12,989)2.000(d) 6M AUDOR(d) 03/17/32 AUD 2,260(e) 29,740 10,007 19,7331.630(f) 3M LIBOR(f) 09/22/36 $ 9,450(e) 100,509 3,095 97,4140.250(f) 6M EURO(d) 12/15/36 EUR 720(e) 20,666 909 19,7570.610(f) 6M EURO(d) 07/22/41 7,710(e) 212,144 15,686 196,4586M GBP(f) 1.000(f) 12/15/41 GBP 970(e) (6,948) 66,659 (73,607)0.500(f) 6M EURO(d) 12/15/41 EUR 500(e) 1,135 (17,178) 18,3136M EURO(d) 0.250(f) 12/15/51 630(e) (50,047) (18,312) (31,735)6M GBP(f) 0.750(f) 12/15/51 GBP 1,040(e) (85,579) 25,679 (111,258)
The accompanying notes are an integral part of these financial statements. 77
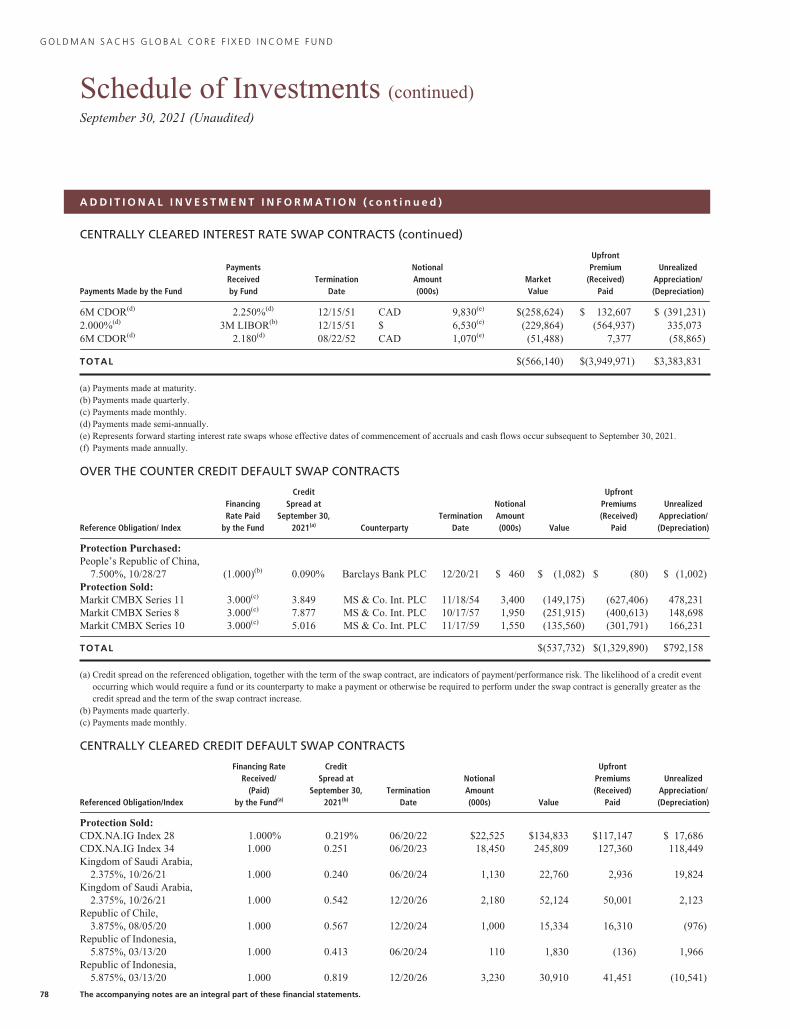
G O L D M A N S A C H S G L O B A L C O R E F I X E D I N C O M E F U N D
Schedule of Investments (continued)September 30, 2021 (Unaudited)
A D D I T I O N A L I N V E S T M E N T I N F O R M A T I O N ( c o n t i n u e d )
CENTRALLY CLEARED INTEREST RATE SWAP CONTRACTS (continued)
Payments Made by the Fund
PaymentsReceivedby Fund
TerminationDate
NotionalAmount(000s)
MarketValue
UpfrontPremium
(Received)Paid
UnrealizedAppreciation/(Depreciation)
6M CDOR(d) 2.250%(d) 12/15/51 CAD 9,830(e) $(258,624) $ 132,607 $ (391,231)2.000%(d) 3M LIBOR(b) 12/15/51 $ 6,530(e) (229,864) (564,937) 335,0736M CDOR(d) 2.180(d) 08/22/52 CAD 1,070(e) (51,488) 7,377 (58,865)
TOTAL $(566,140) $(3,949,971) $3,383,831
(a) Payments made at maturity.(b) Payments made quarterly.(c) Payments made monthly.(d) Payments made semi-annually.(e) Represents forward starting interest rate swaps whose effective dates of commencement of accruals and cash flows occur subsequent to September 30, 2021.(f) Payments made annually.
OVER THE COUNTER CREDIT DEFAULT SWAP CONTRACTS
Reference Obligation/ Index
FinancingRate Paid
by the Fund
CreditSpread at
September 30,2021(a) Counterparty
TerminationDate
NotionalAmount(000s) Value
UpfrontPremiums(Received)
Paid
UnrealizedAppreciation/(Depreciation)
Protection Purchased:People’s Republic of China,
7.500%, 10/28/27 (1.000)(b) 0.090% Barclays Bank PLC 12/20/21 $ 460 $ (1,082) $ (80) $ (1,002)Protection Sold:Markit CMBX Series 11 3.000(c) 3.849 MS & Co. Int. PLC 11/18/54 3,400 (149,175) (627,406) 478,231Markit CMBX Series 8 3.000(c) 7.877 MS & Co. Int. PLC 10/17/57 1,950 (251,915) (400,613) 148,698Markit CMBX Series 10 3.000(c) 5.016 MS & Co. Int. PLC 11/17/59 1,550 (135,560) (301,791) 166,231
TOTAL $(537,732) $(1,329,890) $792,158
(a) Credit spread on the referenced obligation, together with the term of the swap contract, are indicators of payment/performance risk. The likelihood of a credit eventoccurring which would require a fund or its counterparty to make a payment or otherwise be required to perform under the swap contract is generally greater as thecredit spread and the term of the swap contract increase.
(b) Payments made quarterly.(c) Payments made monthly.
CENTRALLY CLEARED CREDIT DEFAULT SWAP CONTRACTS
Referenced Obligation/Index
Financing RateReceived/
(Paid)by the Fund(a)
CreditSpread at
September 30,2021(b)
TerminationDate
NotionalAmount(000s) Value
UpfrontPremiums(Received)
Paid
UnrealizedAppreciation/(Depreciation)
Protection Sold:CDX.NA.IG Index 28 1.000% 0.219% 06/20/22 $22,525 $134,833 $117,147 $ 17,686CDX.NA.IG Index 34 1.000 0.251 06/20/23 18,450 245,809 127,360 118,449Kingdom of Saudi Arabia,
2.375%, 10/26/21 1.000 0.240 06/20/24 1,130 22,760 2,936 19,824Kingdom of Saudi Arabia,
2.375%, 10/26/21 1.000 0.542 12/20/26 2,180 52,124 50,001 2,123Republic of Chile,
3.875%, 08/05/20 1.000 0.567 12/20/24 1,000 15,334 16,310 (976)Republic of Indonesia,
5.875%, 03/13/20 1.000 0.413 06/20/24 110 1,830 (136) 1,966Republic of Indonesia,
5.875%, 03/13/20 1.000 0.819 12/20/26 3,230 30,910 41,451 (10,541)
78 The accompanying notes are an integral part of these financial statements.
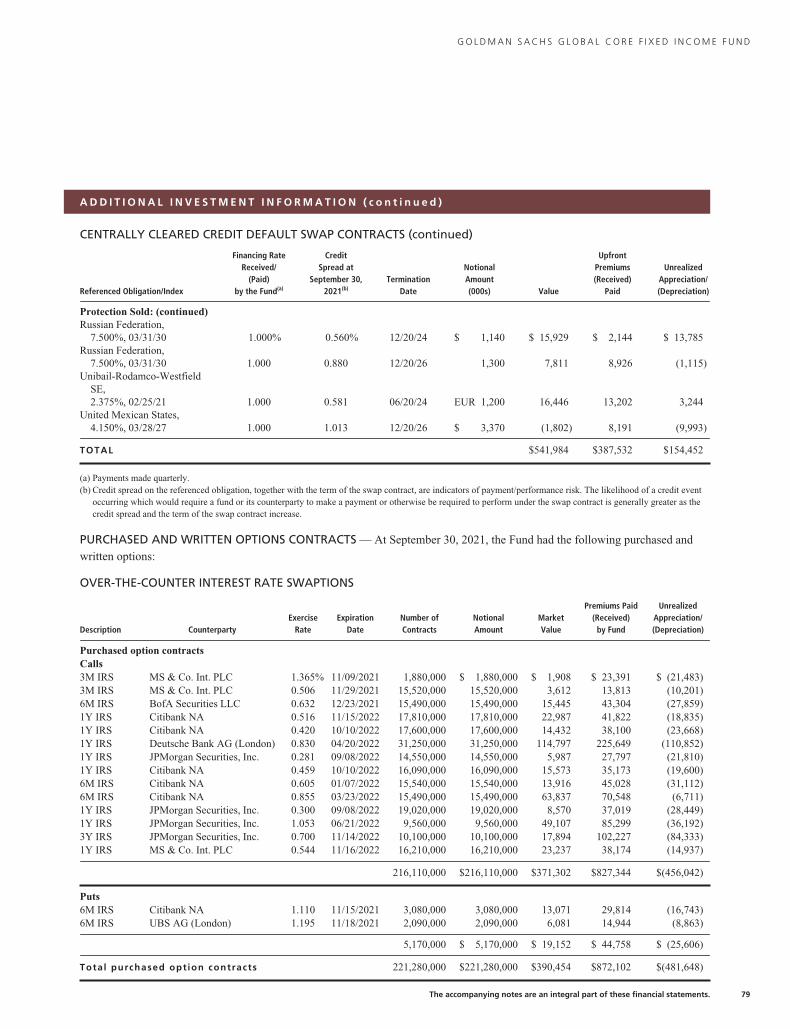
G O L D M A N S A C H S G L O B A L C O R E F I X E D I N C O M E F U N D
A D D I T I O N A L I N V E S T M E N T I N F O R M A T I O N ( c o n t i n u e d )
CENTRALLY CLEARED CREDIT DEFAULT SWAP CONTRACTS (continued)
Referenced Obligation/Index
Financing RateReceived/
(Paid)by the Fund(a)
CreditSpread at
September 30,2021(b)
TerminationDate
NotionalAmount(000s) Value
UpfrontPremiums(Received)
Paid
UnrealizedAppreciation/(Depreciation)
Protection Sold: (continued)Russian Federation,
7.500%, 03/31/30 1.000% 0.560% 12/20/24 $ 1,140 $ 15,929 $ 2,144 $ 13,785Russian Federation,
7.500%, 03/31/30 1.000 0.880 12/20/26 1,300 7,811 8,926 (1,115)Unibail-Rodamco-Westfield
SE,2.375%, 02/25/21 1.000 0.581 06/20/24 EUR 1,200 16,446 13,202 3,244
United Mexican States,4.150%, 03/28/27 1.000 1.013 12/20/26 $ 3,370 (1,802) 8,191 (9,993)
TOTAL $541,984 $387,532 $154,452
(a) Payments made quarterly.(b) Credit spread on the referenced obligation, together with the term of the swap contract, are indicators of payment/performance risk. The likelihood of a credit event
occurring which would require a fund or its counterparty to make a payment or otherwise be required to perform under the swap contract is generally greater as thecredit spread and the term of the swap contract increase.
PURCHASED AND WRITTEN OPTIONS CONTRACTS — At September 30, 2021, the Fund had the following purchased and
written options:
OVER-THE-COUNTER INTEREST RATE SWAPTIONS
Description CounterpartyExercise
RateExpiration
DateNumber ofContracts
NotionalAmount
MarketValue
Premiums Paid(Received)
by Fund
UnrealizedAppreciation/(Depreciation)
Purchased option contractsCalls3M IRS MS & Co. Int. PLC 1.365% 11/09/2021 1,880,000 $ 1,880,000 $ 1,908 $ 23,391 $ (21,483)3M IRS MS & Co. Int. PLC 0.506 11/29/2021 15,520,000 15,520,000 3,612 13,813 (10,201)6M IRS BofA Securities LLC 0.632 12/23/2021 15,490,000 15,490,000 15,445 43,304 (27,859)1Y IRS Citibank NA 0.516 11/15/2022 17,810,000 17,810,000 22,987 41,822 (18,835)1Y IRS Citibank NA 0.420 10/10/2022 17,600,000 17,600,000 14,432 38,100 (23,668)1Y IRS Deutsche Bank AG (London) 0.830 04/20/2022 31,250,000 31,250,000 114,797 225,649 (110,852)1Y IRS JPMorgan Securities, Inc. 0.281 09/08/2022 14,550,000 14,550,000 5,987 27,797 (21,810)1Y IRS Citibank NA 0.459 10/10/2022 16,090,000 16,090,000 15,573 35,173 (19,600)6M IRS Citibank NA 0.605 01/07/2022 15,540,000 15,540,000 13,916 45,028 (31,112)6M IRS Citibank NA 0.855 03/23/2022 15,490,000 15,490,000 63,837 70,548 (6,711)1Y IRS JPMorgan Securities, Inc. 0.300 09/08/2022 19,020,000 19,020,000 8,570 37,019 (28,449)1Y IRS JPMorgan Securities, Inc. 1.053 06/21/2022 9,560,000 9,560,000 49,107 85,299 (36,192)3Y IRS JPMorgan Securities, Inc. 0.700 11/14/2022 10,100,000 10,100,000 17,894 102,227 (84,333)1Y IRS MS & Co. Int. PLC 0.544 11/16/2022 16,210,000 16,210,000 23,237 38,174 (14,937)
216,110,000 $216,110,000 $371,302 $827,344 $(456,042)
Puts6M IRS Citibank NA 1.110 11/15/2021 3,080,000 3,080,000 13,071 29,814 (16,743)6M IRS UBS AG (London) 1.195 11/18/2021 2,090,000 2,090,000 6,081 14,944 (8,863)
5,170,000 $ 5,170,000 $ 19,152 $ 44,758 $ (25,606)
Total purchased option contracts 221,280,000 $221,280,000 $390,454 $872,102 $(481,648)
The accompanying notes are an integral part of these financial statements. 79
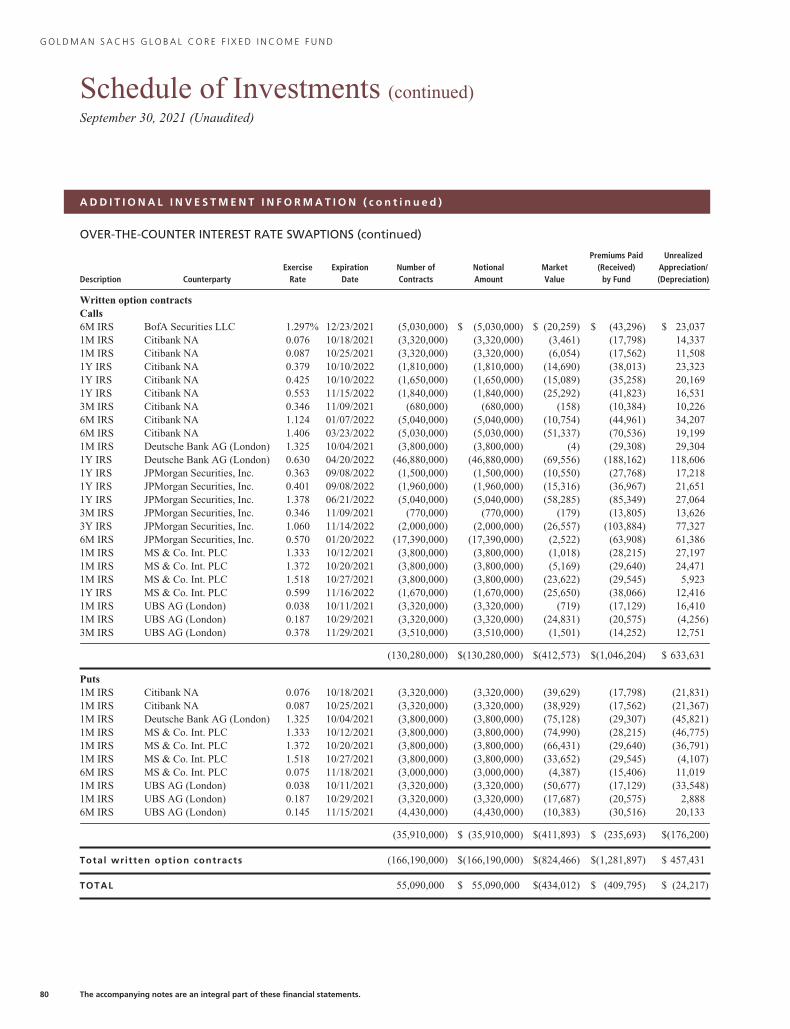
G O L D M A N S A C H S G L O B A L C O R E F I X E D I N C O M E F U N D
Schedule of Investments (continued)September 30, 2021 (Unaudited)
A D D I T I O N A L I N V E S T M E N T I N F O R M A T I O N ( c o n t i n u e d )
OVER-THE-COUNTER INTEREST RATE SWAPTIONS (continued)
Description CounterpartyExercise
RateExpiration
DateNumber ofContracts
NotionalAmount
MarketValue
Premiums Paid(Received)
by Fund
UnrealizedAppreciation/(Depreciation)
Written option contractsCalls6M IRS BofA Securities LLC 1.297% 12/23/2021 (5,030,000) $ (5,030,000) $ (20,259) $ (43,296) $ 23,0371M IRS Citibank NA 0.076 10/18/2021 (3,320,000) (3,320,000) (3,461) (17,798) 14,3371M IRS Citibank NA 0.087 10/25/2021 (3,320,000) (3,320,000) (6,054) (17,562) 11,5081Y IRS Citibank NA 0.379 10/10/2022 (1,810,000) (1,810,000) (14,690) (38,013) 23,3231Y IRS Citibank NA 0.425 10/10/2022 (1,650,000) (1,650,000) (15,089) (35,258) 20,1691Y IRS Citibank NA 0.553 11/15/2022 (1,840,000) (1,840,000) (25,292) (41,823) 16,5313M IRS Citibank NA 0.346 11/09/2021 (680,000) (680,000) (158) (10,384) 10,2266M IRS Citibank NA 1.124 01/07/2022 (5,040,000) (5,040,000) (10,754) (44,961) 34,2076M IRS Citibank NA 1.406 03/23/2022 (5,030,000) (5,030,000) (51,337) (70,536) 19,1991M IRS Deutsche Bank AG (London) 1.325 10/04/2021 (3,800,000) (3,800,000) (4) (29,308) 29,3041Y IRS Deutsche Bank AG (London) 0.630 04/20/2022 (46,880,000) (46,880,000) (69,556) (188,162) 118,6061Y IRS JPMorgan Securities, Inc. 0.363 09/08/2022 (1,500,000) (1,500,000) (10,550) (27,768) 17,2181Y IRS JPMorgan Securities, Inc. 0.401 09/08/2022 (1,960,000) (1,960,000) (15,316) (36,967) 21,6511Y IRS JPMorgan Securities, Inc. 1.378 06/21/2022 (5,040,000) (5,040,000) (58,285) (85,349) 27,0643M IRS JPMorgan Securities, Inc. 0.346 11/09/2021 (770,000) (770,000) (179) (13,805) 13,6263Y IRS JPMorgan Securities, Inc. 1.060 11/14/2022 (2,000,000) (2,000,000) (26,557) (103,884) 77,3276M IRS JPMorgan Securities, Inc. 0.570 01/20/2022 (17,390,000) (17,390,000) (2,522) (63,908) 61,3861M IRS MS & Co. Int. PLC 1.333 10/12/2021 (3,800,000) (3,800,000) (1,018) (28,215) 27,1971M IRS MS & Co. Int. PLC 1.372 10/20/2021 (3,800,000) (3,800,000) (5,169) (29,640) 24,4711M IRS MS & Co. Int. PLC 1.518 10/27/2021 (3,800,000) (3,800,000) (23,622) (29,545) 5,9231Y IRS MS & Co. Int. PLC 0.599 11/16/2022 (1,670,000) (1,670,000) (25,650) (38,066) 12,4161M IRS UBS AG (London) 0.038 10/11/2021 (3,320,000) (3,320,000) (719) (17,129) 16,4101M IRS UBS AG (London) 0.187 10/29/2021 (3,320,000) (3,320,000) (24,831) (20,575) (4,256)3M IRS UBS AG (London) 0.378 11/29/2021 (3,510,000) (3,510,000) (1,501) (14,252) 12,751
(130,280,000) $(130,280,000) $(412,573) $(1,046,204) $ 633,631
Puts1M IRS Citibank NA 0.076 10/18/2021 (3,320,000) (3,320,000) (39,629) (17,798) (21,831)1M IRS Citibank NA 0.087 10/25/2021 (3,320,000) (3,320,000) (38,929) (17,562) (21,367)1M IRS Deutsche Bank AG (London) 1.325 10/04/2021 (3,800,000) (3,800,000) (75,128) (29,307) (45,821)1M IRS MS & Co. Int. PLC 1.333 10/12/2021 (3,800,000) (3,800,000) (74,990) (28,215) (46,775)1M IRS MS & Co. Int. PLC 1.372 10/20/2021 (3,800,000) (3,800,000) (66,431) (29,640) (36,791)1M IRS MS & Co. Int. PLC 1.518 10/27/2021 (3,800,000) (3,800,000) (33,652) (29,545) (4,107)6M IRS MS & Co. Int. PLC 0.075 11/18/2021 (3,000,000) (3,000,000) (4,387) (15,406) 11,0191M IRS UBS AG (London) 0.038 10/11/2021 (3,320,000) (3,320,000) (50,677) (17,129) (33,548)1M IRS UBS AG (London) 0.187 10/29/2021 (3,320,000) (3,320,000) (17,687) (20,575) 2,8886M IRS UBS AG (London) 0.145 11/15/2021 (4,430,000) (4,430,000) (10,383) (30,516) 20,133
(35,910,000) $ (35,910,000) $(411,893) $ (235,693) $(176,200)
Total written option contracts (166,190,000) $(166,190,000) $(824,466) $(1,281,897) $ 457,431
TOTAL 55,090,000 $ 55,090,000 $(434,012) $ (409,795) $ (24,217)
80 The accompanying notes are an integral part of these financial statements.
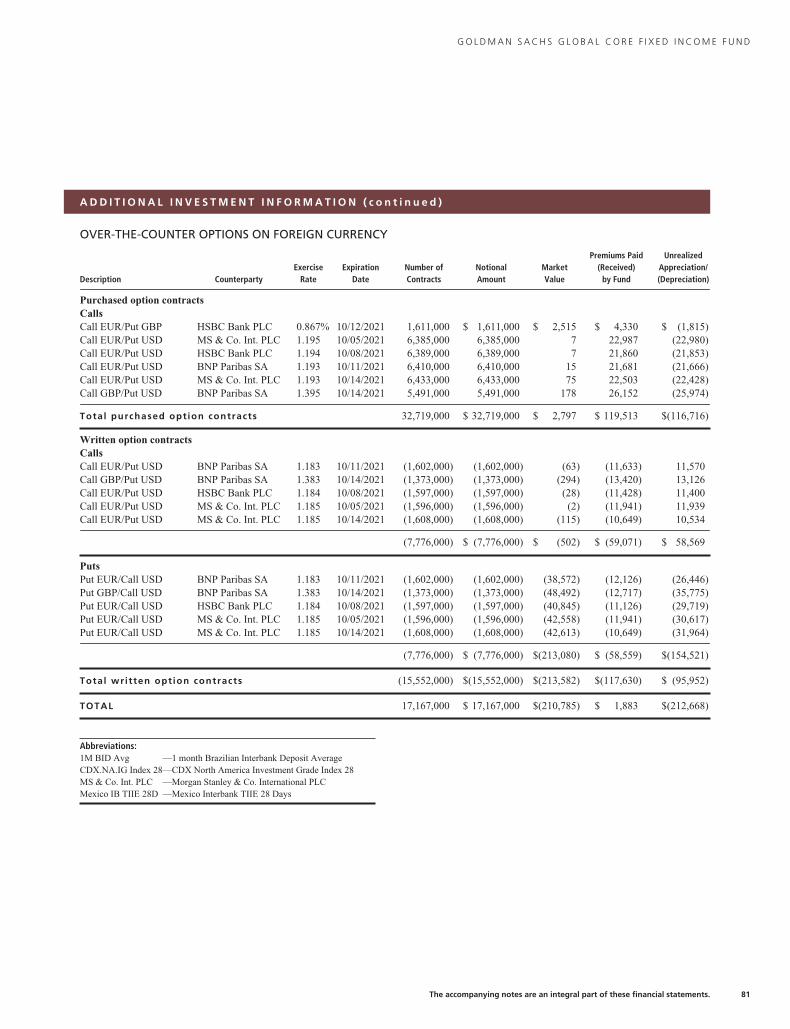
G O L D M A N S A C H S G L O B A L C O R E F I X E D I N C O M E F U N D
A D D I T I O N A L I N V E S T M E N T I N F O R M A T I O N ( c o n t i n u e d )
OVER-THE-COUNTER OPTIONS ON FOREIGN CURRENCY
Description CounterpartyExercise
RateExpiration
DateNumber ofContracts
NotionalAmount
MarketValue
Premiums Paid(Received)
by Fund
UnrealizedAppreciation/(Depreciation)
Purchased option contractsCallsCall EUR/Put GBP HSBC Bank PLC 0.867% 10/12/2021 1,611,000 $ 1,611,000 $ 2,515 $ 4,330 $ (1,815)Call EUR/Put USD MS & Co. Int. PLC 1.195 10/05/2021 6,385,000 6,385,000 7 22,987 (22,980)Call EUR/Put USD HSBC Bank PLC 1.194 10/08/2021 6,389,000 6,389,000 7 21,860 (21,853)Call EUR/Put USD BNP Paribas SA 1.193 10/11/2021 6,410,000 6,410,000 15 21,681 (21,666)Call EUR/Put USD MS & Co. Int. PLC 1.193 10/14/2021 6,433,000 6,433,000 75 22,503 (22,428)Call GBP/Put USD BNP Paribas SA 1.395 10/14/2021 5,491,000 5,491,000 178 26,152 (25,974)
Total purchased option contracts 32,719,000 $ 32,719,000 $ 2,797 $ 119,513 $(116,716)
Written option contractsCallsCall EUR/Put USD BNP Paribas SA 1.183 10/11/2021 (1,602,000) (1,602,000) (63) (11,633) 11,570Call GBP/Put USD BNP Paribas SA 1.383 10/14/2021 (1,373,000) (1,373,000) (294) (13,420) 13,126Call EUR/Put USD HSBC Bank PLC 1.184 10/08/2021 (1,597,000) (1,597,000) (28) (11,428) 11,400Call EUR/Put USD MS & Co. Int. PLC 1.185 10/05/2021 (1,596,000) (1,596,000) (2) (11,941) 11,939Call EUR/Put USD MS & Co. Int. PLC 1.185 10/14/2021 (1,608,000) (1,608,000) (115) (10,649) 10,534
(7,776,000) $ (7,776,000) $ (502) $ (59,071) $ 58,569
PutsPut EUR/Call USD BNP Paribas SA 1.183 10/11/2021 (1,602,000) (1,602,000) (38,572) (12,126) (26,446)Put GBP/Call USD BNP Paribas SA 1.383 10/14/2021 (1,373,000) (1,373,000) (48,492) (12,717) (35,775)Put EUR/Call USD HSBC Bank PLC 1.184 10/08/2021 (1,597,000) (1,597,000) (40,845) (11,126) (29,719)Put EUR/Call USD MS & Co. Int. PLC 1.185 10/05/2021 (1,596,000) (1,596,000) (42,558) (11,941) (30,617)Put EUR/Call USD MS & Co. Int. PLC 1.185 10/14/2021 (1,608,000) (1,608,000) (42,613) (10,649) (31,964)
(7,776,000) $ (7,776,000) $(213,080) $ (58,559) $(154,521)
Total written option contracts (15,552,000) $(15,552,000) $(213,582) $(117,630) $ (95,952)
TOTAL 17,167,000 $ 17,167,000 $(210,785) $ 1,883 $(212,668)
Abbreviations:1M BID Avg —1 month Brazilian Interbank Deposit AverageCDX.NA.IG Index 28—CDX North America Investment Grade Index 28MS & Co. Int. PLC —Morgan Stanley & Co. International PLCMexico IB TIIE 28D —Mexico Interbank TIIE 28 Days
The accompanying notes are an integral part of these financial statements. 81
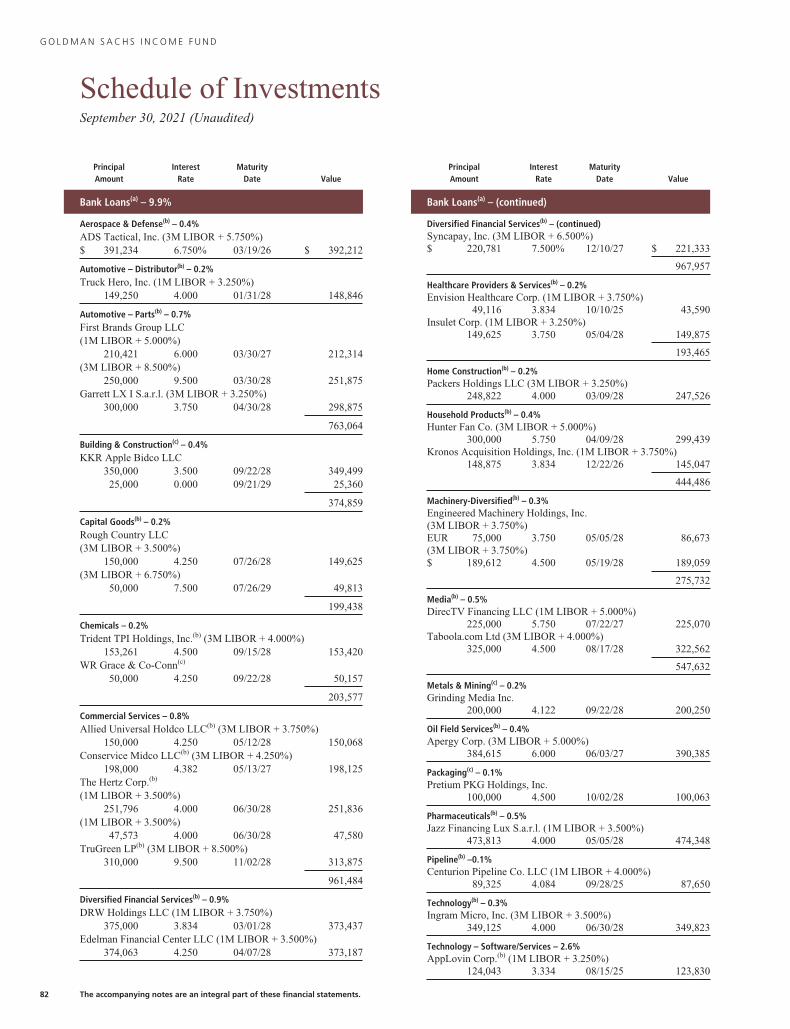
G O L D M A N S A C H S I N C O M E F U N D
Schedule of InvestmentsSeptember 30, 2021 (Unaudited)
PrincipalAmount
InterestRate
MaturityDate Value
Bank Loans(a) – 9.9%
Aerospace & Defense(b) – 0.4%ADS Tactical, Inc. (3M LIBOR + 5.750%)$ 391,234 6.750% 03/19/26 $ 392,212
Automotive – Distributor(b) – 0.2%Truck Hero, Inc. (1M LIBOR + 3.250%)
149,250 4.000 01/31/28 148,846
Automotive – Parts(b) – 0.7%First Brands Group LLC(1M LIBOR + 5.000%)
210,421 6.000 03/30/27 212,314(3M LIBOR + 8.500%)
250,000 9.500 03/30/28 251,875Garrett LX I S.a.r.l. (3M LIBOR + 3.250%)
300,000 3.750 04/30/28 298,875
763,064
Building & Construction(c) – 0.4%KKR Apple Bidco LLC
350,000 3.500 09/22/28 349,49925,000 0.000 09/21/29 25,360
374,859
Capital Goods(b) – 0.2%Rough Country LLC(3M LIBOR + 3.500%)
150,000 4.250 07/26/28 149,625(3M LIBOR + 6.750%)
50,000 7.500 07/26/29 49,813
199,438
Chemicals – 0.2%Trident TPI Holdings, Inc.(b) (3M LIBOR + 4.000%)
153,261 4.500 09/15/28 153,420WR Grace & Co-Conn(c)
50,000 4.250 09/22/28 50,157
203,577
Commercial Services – 0.8%Allied Universal Holdco LLC(b) (3M LIBOR + 3.750%)
150,000 4.250 05/12/28 150,068Conservice Midco LLC(b) (3M LIBOR + 4.250%)
198,000 4.382 05/13/27 198,125The Hertz Corp.(b)
(1M LIBOR + 3.500%)251,796 4.000 06/30/28 251,836
(1M LIBOR + 3.500%)47,573 4.000 06/30/28 47,580
TruGreen LP(b) (3M LIBOR + 8.500%)310,000 9.500 11/02/28 313,875
961,484
Diversified Financial Services(b) – 0.9%DRW Holdings LLC (1M LIBOR + 3.750%)
375,000 3.834 03/01/28 373,437Edelman Financial Center LLC (1M LIBOR + 3.500%)
374,063 4.250 04/07/28 373,187
PrincipalAmount
InterestRate
MaturityDate Value
Bank Loans(a) – (continued)
Diversified Financial Services(b) – (continued)Syncapay, Inc. (3M LIBOR + 6.500%)$ 220,781 7.500% 12/10/27 $ 221,333
967,957
Healthcare Providers & Services(b) – 0.2%Envision Healthcare Corp. (1M LIBOR + 3.750%)
49,116 3.834 10/10/25 43,590Insulet Corp. (1M LIBOR + 3.250%)
149,625 3.750 05/04/28 149,875
193,465
Home Construction(b) – 0.2%Packers Holdings LLC (3M LIBOR + 3.250%)
248,822 4.000 03/09/28 247,526
Household Products(b) – 0.4%Hunter Fan Co. (3M LIBOR + 5.000%)
300,000 5.750 04/09/28 299,439Kronos Acquisition Holdings, Inc. (1M LIBOR + 3.750%)
148,875 3.834 12/22/26 145,047
444,486
Machinery-Diversified(b) – 0.3%Engineered Machinery Holdings, Inc.(3M LIBOR + 3.750%)EUR 75,000 3.750 05/05/28 86,673(3M LIBOR + 3.750%)$ 189,612 4.500 05/19/28 189,059
275,732
Media(b) – 0.5%DirecTV Financing LLC (1M LIBOR + 5.000%)
225,000 5.750 07/22/27 225,070Taboola.com Ltd (3M LIBOR + 4.000%)
325,000 4.500 08/17/28 322,562
547,632
Metals & Mining(c) – 0.2%Grinding Media Inc.
200,000 4.122 09/22/28 200,250
Oil Field Services(b) – 0.4%Apergy Corp. (3M LIBOR + 5.000%)
384,615 6.000 06/03/27 390,385
Packaging(c) – 0.1%Pretium PKG Holdings, Inc.
100,000 4.500 10/02/28 100,063
Pharmaceuticals(b) – 0.5%Jazz Financing Lux S.a.r.l. (1M LIBOR + 3.500%)
473,813 4.000 05/05/28 474,348
Pipeline(b) –0.1%Centurion Pipeline Co. LLC (1M LIBOR + 4.000%)
89,325 4.084 09/28/25 87,650
Technology(b) – 0.3%Ingram Micro, Inc. (3M LIBOR + 3.500%)
349,125 4.000 06/30/28 349,823
Technology – Software/Services – 2.6%AppLovin Corp.(b) (1M LIBOR + 3.250%)
124,043 3.334 08/15/25 123,830
82 The accompanying notes are an integral part of these financial statements.
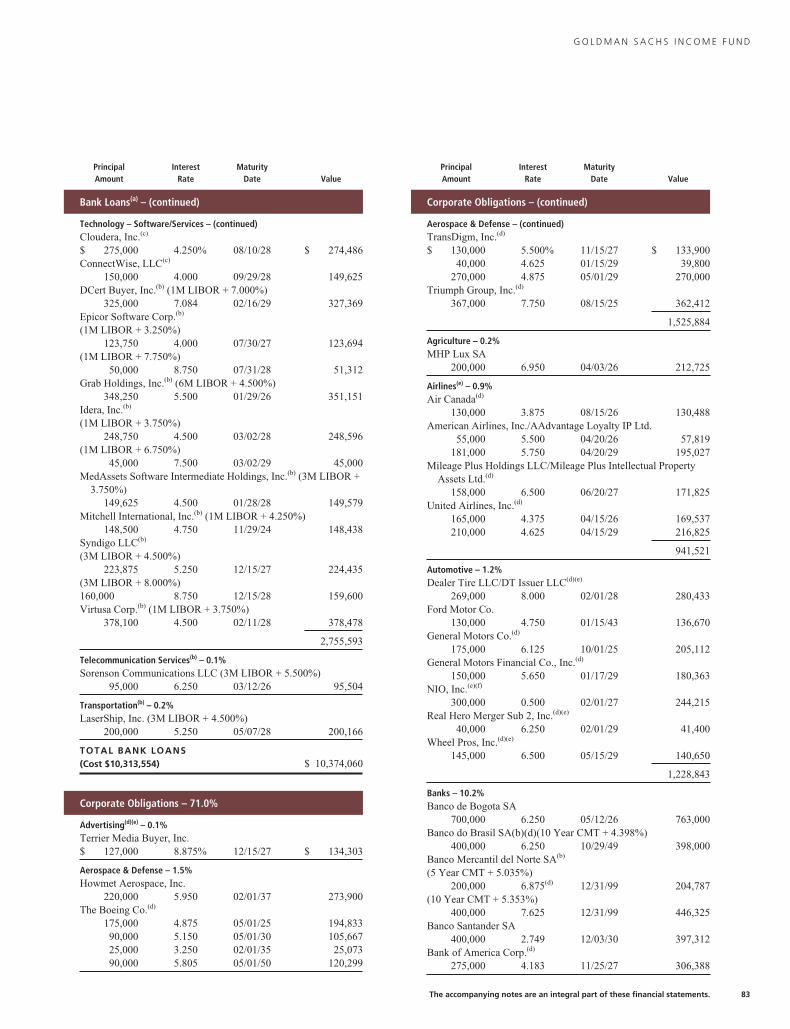
G O L D M A N S A C H S I N C O M E F U N D
PrincipalAmount
InterestRate
MaturityDate Value
Bank Loans(a) – (continued)
Technology – Software/Services – (continued)Cloudera, Inc.(c)
$ 275,000 4.250% 08/10/28 $ 274,486ConnectWise, LLC(c)
150,000 4.000 09/29/28 149,625DCert Buyer, Inc.(b) (1M LIBOR + 7.000%)
325,000 7.084 02/16/29 327,369Epicor Software Corp.(b)
(1M LIBOR + 3.250%)123,750 4.000 07/30/27 123,694
(1M LIBOR + 7.750%)50,000 8.750 07/31/28 51,312
Grab Holdings, Inc.(b) (6M LIBOR + 4.500%)348,250 5.500 01/29/26 351,151
Idera, Inc.(b)
(1M LIBOR + 3.750%)248,750 4.500 03/02/28 248,596
(1M LIBOR + 6.750%)45,000 7.500 03/02/29 45,000
MedAssets Software Intermediate Holdings, Inc.(b) (3M LIBOR +3.750%)
149,625 4.500 01/28/28 149,579Mitchell International, Inc.(b) (1M LIBOR + 4.250%)
148,500 4.750 11/29/24 148,438Syndigo LLC(b)
(3M LIBOR + 4.500%)223,875 5.250 12/15/27 224,435
(3M LIBOR + 8.000%)160,000 8.750 12/15/28 159,600Virtusa Corp.(b) (1M LIBOR + 3.750%)
378,100 4.500 02/11/28 378,478
2,755,593
Telecommunication Services(b) – 0.1%Sorenson Communications LLC (3M LIBOR + 5.500%)
95,000 6.250 03/12/26 95,504
Transportation(b) – 0.2%LaserShip, Inc. (3M LIBOR + 4.500%)
200,000 5.250 05/07/28 200,166
TOTAL BANK LOANS(Cost $10,313,554) $ 10,374,060
Corporate Obligations – 71.0%
Advertising(d)(e) – 0.1%Terrier Media Buyer, Inc.$ 127,000 8.875% 12/15/27 $ 134,303
Aerospace & Defense – 1.5%Howmet Aerospace, Inc.
220,000 5.950 02/01/37 273,900The Boeing Co.(d)
175,000 4.875 05/01/25 194,83390,000 5.150 05/01/30 105,66725,000 3.250 02/01/35 25,07390,000 5.805 05/01/50 120,299
PrincipalAmount
InterestRate
MaturityDate Value
Corporate Obligations – (continued)
Aerospace & Defense – (continued)TransDigm, Inc.(d)
$ 130,000 5.500% 11/15/27 $ 133,90040,000 4.625 01/15/29 39,800
270,000 4.875 05/01/29 270,000Triumph Group, Inc.(d)
367,000 7.750 08/15/25 362,412
1,525,884
Agriculture – 0.2%MHP Lux SA
200,000 6.950 04/03/26 212,725
Airlines(e) – 0.9%Air Canada(d)
130,000 3.875 08/15/26 130,488American Airlines, Inc./AAdvantage Loyalty IP Ltd.
55,000 5.500 04/20/26 57,819181,000 5.750 04/20/29 195,027
Mileage Plus Holdings LLC/Mileage Plus Intellectual PropertyAssets Ltd.(d)
158,000 6.500 06/20/27 171,825United Airlines, Inc.(d)
165,000 4.375 04/15/26 169,537210,000 4.625 04/15/29 216,825
941,521
Automotive – 1.2%Dealer Tire LLC/DT Issuer LLC(d)(e)
269,000 8.000 02/01/28 280,433Ford Motor Co.
130,000 4.750 01/15/43 136,670General Motors Co.(d)
175,000 6.125 10/01/25 205,112General Motors Financial Co., Inc.(d)
150,000 5.650 01/17/29 180,363NIO, Inc.(e)(f)
300,000 0.500 02/01/27 244,215Real Hero Merger Sub 2, Inc.(d)(e)
40,000 6.250 02/01/29 41,400Wheel Pros, Inc.(d)(e)
145,000 6.500 05/15/29 140,650
1,228,843
Banks – 10.2%Banco de Bogota SA
700,000 6.250 05/12/26 763,000Banco do Brasil SA(b)(d)(10 Year CMT + 4.398%)
400,000 6.250 10/29/49 398,000Banco Mercantil del Norte SA(b)
(5 Year CMT + 5.035%)200,000 6.875(d) 12/31/99 204,787
(10 Year CMT + 5.353%)400,000 7.625 12/31/99 446,325
Banco Santander SA400,000 2.749 12/03/30 397,312
Bank of America Corp.(d)
275,000 4.183 11/25/27 306,388
The accompanying notes are an integral part of these financial statements. 83
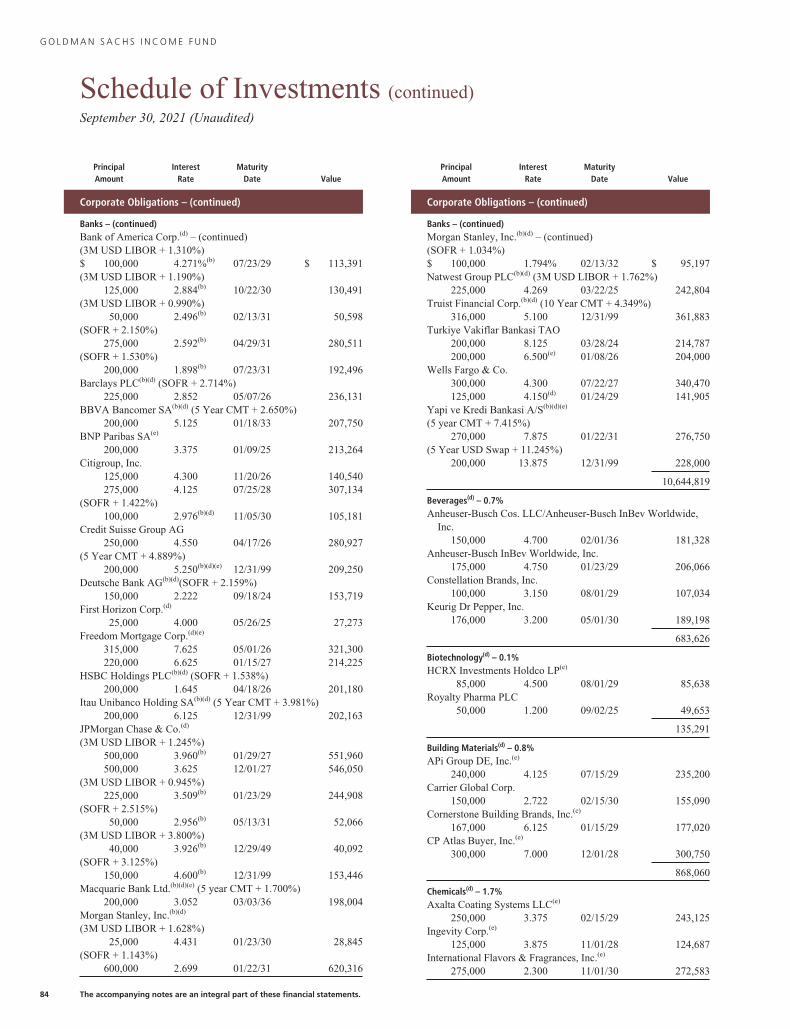
G O L D M A N S A C H S I N C O M E F U N D
Schedule of Investments (continued)September 30, 2021 (Unaudited)
PrincipalAmount
InterestRate
MaturityDate Value
Corporate Obligations – (continued)
Banks – (continued)Bank of America Corp.(d) – (continued)(3M USD LIBOR + 1.310%)$ 100,000 4.271%(b) 07/23/29 $ 113,391(3M USD LIBOR + 1.190%)
125,000 2.884(b) 10/22/30 130,491(3M USD LIBOR + 0.990%)
50,000 2.496(b) 02/13/31 50,598(SOFR + 2.150%)
275,000 2.592(b) 04/29/31 280,511(SOFR + 1.530%)
200,000 1.898(b) 07/23/31 192,496Barclays PLC(b)(d) (SOFR + 2.714%)
225,000 2.852 05/07/26 236,131BBVA Bancomer SA(b)(d) (5 Year CMT + 2.650%)
200,000 5.125 01/18/33 207,750BNP Paribas SA(e)
200,000 3.375 01/09/25 213,264Citigroup, Inc.
125,000 4.300 11/20/26 140,540275,000 4.125 07/25/28 307,134
(SOFR + 1.422%)100,000 2.976(b)(d) 11/05/30 105,181
Credit Suisse Group AG250,000 4.550 04/17/26 280,927
(5 Year CMT + 4.889%)200,000 5.250(b)(d)(e) 12/31/99 209,250
Deutsche Bank AG(b)(d)(SOFR + 2.159%)150,000 2.222 09/18/24 153,719
First Horizon Corp.(d)
25,000 4.000 05/26/25 27,273Freedom Mortgage Corp.(d)(e)
315,000 7.625 05/01/26 321,300220,000 6.625 01/15/27 214,225
HSBC Holdings PLC(b)(d) (SOFR + 1.538%)200,000 1.645 04/18/26 201,180
Itau Unibanco Holding SA(b)(d) (5 Year CMT + 3.981%)200,000 6.125 12/31/99 202,163
JPMorgan Chase & Co.(d)
(3M USD LIBOR + 1.245%)500,000 3.960(b) 01/29/27 551,960500,000 3.625 12/01/27 546,050
(3M USD LIBOR + 0.945%)225,000 3.509(b) 01/23/29 244,908
(SOFR + 2.515%)50,000 2.956(b) 05/13/31 52,066
(3M USD LIBOR + 3.800%)40,000 3.926(b) 12/29/49 40,092
(SOFR + 3.125%)150,000 4.600(b) 12/31/99 153,446
Macquarie Bank Ltd.(b)(d)(e) (5 year CMT + 1.700%)200,000 3.052 03/03/36 198,004
Morgan Stanley, Inc.(b)(d)
(3M USD LIBOR + 1.628%)25,000 4.431 01/23/30 28,845
(SOFR + 1.143%)600,000 2.699 01/22/31 620,316
PrincipalAmount
InterestRate
MaturityDate Value
Corporate Obligations – (continued)
Banks – (continued)Morgan Stanley, Inc.(b)(d) – (continued)(SOFR + 1.034%)$ 100,000 1.794% 02/13/32 $ 95,197Natwest Group PLC(b)(d) (3M USD LIBOR + 1.762%)
225,000 4.269 03/22/25 242,804Truist Financial Corp.(b)(d) (10 Year CMT + 4.349%)
316,000 5.100 12/31/99 361,883Turkiye Vakiflar Bankasi TAO
200,000 8.125 03/28/24 214,787200,000 6.500(e) 01/08/26 204,000
Wells Fargo & Co.300,000 4.300 07/22/27 340,470125,000 4.150(d) 01/24/29 141,905
Yapi ve Kredi Bankasi A/S(b)(d)(e)
(5 year CMT + 7.415%)270,000 7.875 01/22/31 276,750
(5 Year USD Swap + 11.245%)200,000 13.875 12/31/99 228,000
10,644,819
Beverages(d) – 0.7%Anheuser-Busch Cos. LLC/Anheuser-Busch InBev Worldwide,
Inc.150,000 4.700 02/01/36 181,328
Anheuser-Busch InBev Worldwide, Inc.175,000 4.750 01/23/29 206,066
Constellation Brands, Inc.100,000 3.150 08/01/29 107,034
Keurig Dr Pepper, Inc.176,000 3.200 05/01/30 189,198
683,626
Biotechnology(d) – 0.1%HCRX Investments Holdco LP(e)
85,000 4.500 08/01/29 85,638Royalty Pharma PLC
50,000 1.200 09/02/25 49,653
135,291
Building Materials(d) – 0.8%APi Group DE, Inc.(e)
240,000 4.125 07/15/29 235,200Carrier Global Corp.
150,000 2.722 02/15/30 155,090Cornerstone Building Brands, Inc.(e)
167,000 6.125 01/15/29 177,020CP Atlas Buyer, Inc.(e)
300,000 7.000 12/01/28 300,750
868,060
Chemicals(d) – 1.7%Axalta Coating Systems LLC(e)
250,000 3.375 02/15/29 243,125Ingevity Corp.(e)
125,000 3.875 11/01/28 124,687International Flavors & Fragrances, Inc.(e)
275,000 2.300 11/01/30 272,583
84 The accompanying notes are an integral part of these financial statements.
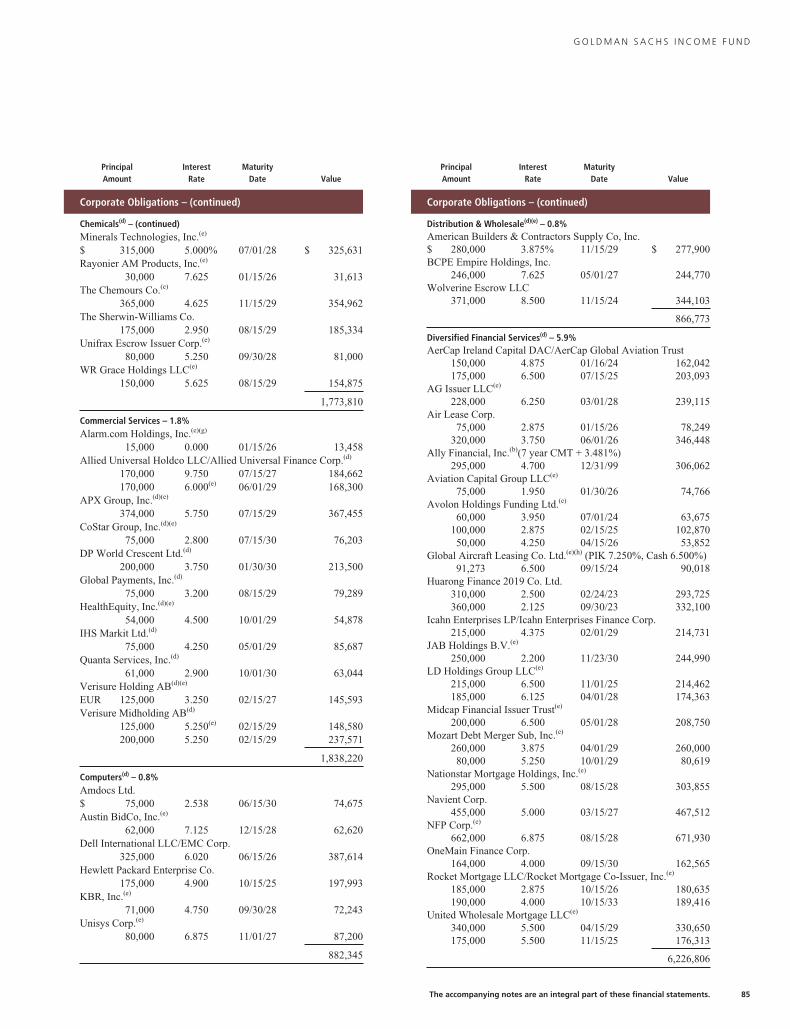
G O L D M A N S A C H S I N C O M E F U N D
PrincipalAmount
InterestRate
MaturityDate Value
Corporate Obligations – (continued)
Chemicals(d) – (continued)Minerals Technologies, Inc.(e)
$ 315,000 5.000% 07/01/28 $ 325,631Rayonier AM Products, Inc.(e)
30,000 7.625 01/15/26 31,613The Chemours Co.(e)
365,000 4.625 11/15/29 354,962The Sherwin-Williams Co.
175,000 2.950 08/15/29 185,334Unifrax Escrow Issuer Corp.(e)
80,000 5.250 09/30/28 81,000WR Grace Holdings LLC(e)
150,000 5.625 08/15/29 154,875
1,773,810
Commercial Services – 1.8%Alarm.com Holdings, Inc.(e)(g)
15,000 0.000 01/15/26 13,458Allied Universal Holdco LLC/Allied Universal Finance Corp.(d)
170,000 9.750 07/15/27 184,662170,000 6.000(e) 06/01/29 168,300
APX Group, Inc.(d)(e)
374,000 5.750 07/15/29 367,455CoStar Group, Inc.(d)(e)
75,000 2.800 07/15/30 76,203DP World Crescent Ltd.(d)
200,000 3.750 01/30/30 213,500Global Payments, Inc.(d)
75,000 3.200 08/15/29 79,289HealthEquity, Inc.(d)(e)
54,000 4.500 10/01/29 54,878IHS Markit Ltd.(d)
75,000 4.250 05/01/29 85,687Quanta Services, Inc.(d)
61,000 2.900 10/01/30 63,044Verisure Holding AB(d)(e)
EUR 125,000 3.250 02/15/27 145,593Verisure Midholding AB(d)
125,000 5.250(e) 02/15/29 148,580200,000 5.250 02/15/29 237,571
1,838,220
Computers(d) – 0.8%Amdocs Ltd.$ 75,000 2.538 06/15/30 74,675Austin BidCo, Inc.(e)
62,000 7.125 12/15/28 62,620Dell International LLC/EMC Corp.
325,000 6.020 06/15/26 387,614Hewlett Packard Enterprise Co.
175,000 4.900 10/15/25 197,993KBR, Inc.(e)
71,000 4.750 09/30/28 72,243Unisys Corp.(e)
80,000 6.875 11/01/27 87,200
882,345
PrincipalAmount
InterestRate
MaturityDate Value
Corporate Obligations – (continued)
Distribution & Wholesale(d)(e) – 0.8%American Builders & Contractors Supply Co, Inc.$ 280,000 3.875% 11/15/29 $ 277,900BCPE Empire Holdings, Inc.
246,000 7.625 05/01/27 244,770Wolverine Escrow LLC
371,000 8.500 11/15/24 344,103
866,773
Diversified Financial Services(d) – 5.9%AerCap Ireland Capital DAC/AerCap Global Aviation Trust
150,000 4.875 01/16/24 162,042175,000 6.500 07/15/25 203,093
AG Issuer LLC(e)
228,000 6.250 03/01/28 239,115Air Lease Corp.
75,000 2.875 01/15/26 78,249320,000 3.750 06/01/26 346,448
Ally Financial, Inc.(b)(7 year CMT + 3.481%)295,000 4.700 12/31/99 306,062
Aviation Capital Group LLC(e)
75,000 1.950 01/30/26 74,766Avolon Holdings Funding Ltd.(e)
60,000 3.950 07/01/24 63,675100,000 2.875 02/15/25 102,87050,000 4.250 04/15/26 53,852
Global Aircraft Leasing Co. Ltd.(e)(h) (PIK 7.250%, Cash 6.500%)91,273 6.500 09/15/24 90,018
Huarong Finance 2019 Co. Ltd.310,000 2.500 02/24/23 293,725360,000 2.125 09/30/23 332,100
Icahn Enterprises LP/Icahn Enterprises Finance Corp.215,000 4.375 02/01/29 214,731
JAB Holdings B.V.(e)
250,000 2.200 11/23/30 244,990LD Holdings Group LLC(e)
215,000 6.500 11/01/25 214,462185,000 6.125 04/01/28 174,363
Midcap Financial Issuer Trust(e)
200,000 6.500 05/01/28 208,750Mozart Debt Merger Sub, Inc.(e)
260,000 3.875 04/01/29 260,00080,000 5.250 10/01/29 80,619
Nationstar Mortgage Holdings, Inc.(e)
295,000 5.500 08/15/28 303,855Navient Corp.
455,000 5.000 03/15/27 467,512NFP Corp.(e)
662,000 6.875 08/15/28 671,930OneMain Finance Corp.
164,000 4.000 09/15/30 162,565Rocket Mortgage LLC/Rocket Mortgage Co-Issuer, Inc.(e)
185,000 2.875 10/15/26 180,635190,000 4.000 10/15/33 189,416
United Wholesale Mortgage LLC(e)
340,000 5.500 04/15/29 330,650175,000 5.500 11/15/25 176,313
6,226,806
The accompanying notes are an integral part of these financial statements. 85
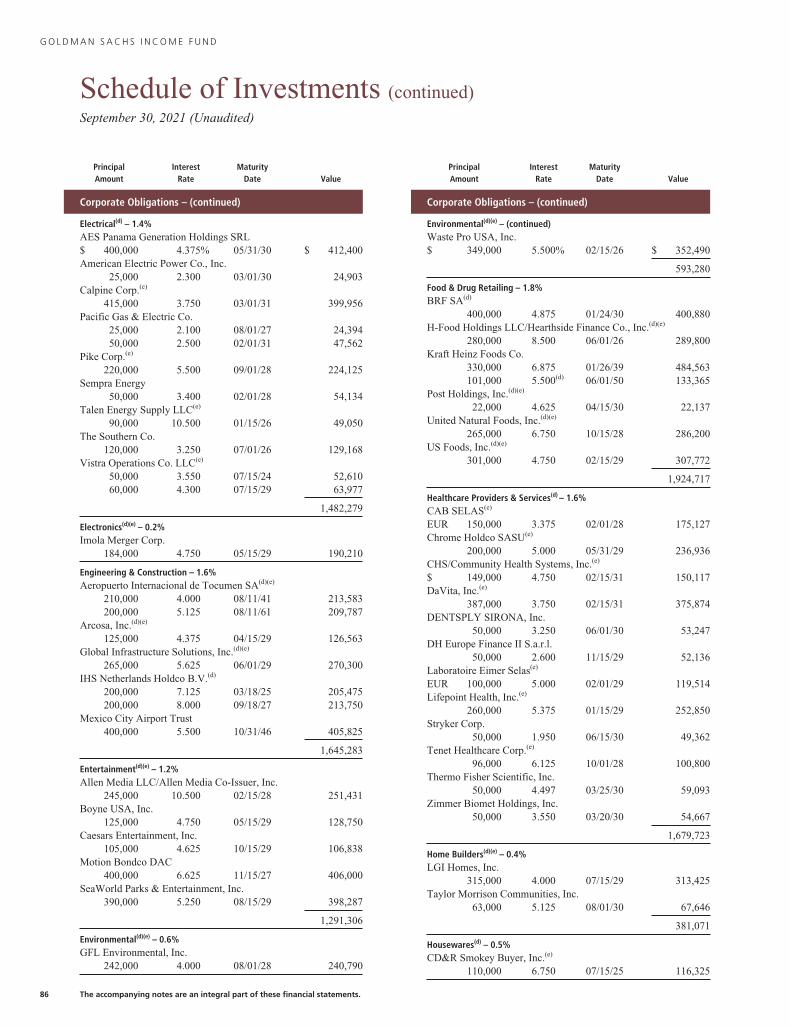
G O L D M A N S A C H S I N C O M E F U N D
Schedule of Investments (continued)September 30, 2021 (Unaudited)
PrincipalAmount
InterestRate
MaturityDate Value
Corporate Obligations – (continued)
Electrical(d) – 1.4%AES Panama Generation Holdings SRL$ 400,000 4.375% 05/31/30 $ 412,400American Electric Power Co., Inc.
25,000 2.300 03/01/30 24,903Calpine Corp.(e)
415,000 3.750 03/01/31 399,956Pacific Gas & Electric Co.
25,000 2.100 08/01/27 24,39450,000 2.500 02/01/31 47,562
Pike Corp.(e)
220,000 5.500 09/01/28 224,125Sempra Energy
50,000 3.400 02/01/28 54,134Talen Energy Supply LLC(e)
90,000 10.500 01/15/26 49,050The Southern Co.
120,000 3.250 07/01/26 129,168Vistra Operations Co. LLC(e)
50,000 3.550 07/15/24 52,61060,000 4.300 07/15/29 63,977
1,482,279
Electronics(d)(e) – 0.2%Imola Merger Corp.
184,000 4.750 05/15/29 190,210
Engineering & Construction – 1.6%Aeropuerto Internacional de Tocumen SA(d)(e)
210,000 4.000 08/11/41 213,583200,000 5.125 08/11/61 209,787
Arcosa, Inc.(d)(e)
125,000 4.375 04/15/29 126,563Global Infrastructure Solutions, Inc.(d)(e)
265,000 5.625 06/01/29 270,300IHS Netherlands Holdco B.V.(d)
200,000 7.125 03/18/25 205,475200,000 8.000 09/18/27 213,750
Mexico City Airport Trust400,000 5.500 10/31/46 405,825
1,645,283
Entertainment(d)(e) – 1.2%Allen Media LLC/Allen Media Co-Issuer, Inc.
245,000 10.500 02/15/28 251,431Boyne USA, Inc.
125,000 4.750 05/15/29 128,750Caesars Entertainment, Inc.
105,000 4.625 10/15/29 106,838Motion Bondco DAC
400,000 6.625 11/15/27 406,000SeaWorld Parks & Entertainment, Inc.
390,000 5.250 08/15/29 398,287
1,291,306
Environmental(d)(e) – 0.6%GFL Environmental, Inc.
242,000 4.000 08/01/28 240,790
PrincipalAmount
InterestRate
MaturityDate Value
Corporate Obligations – (continued)
Environmental(d)(e) – (continued)Waste Pro USA, Inc.$ 349,000 5.500% 02/15/26 $ 352,490
593,280
Food & Drug Retailing – 1.8%BRF SA(d)
400,000 4.875 01/24/30 400,880H-Food Holdings LLC/Hearthside Finance Co., Inc.(d)(e)
280,000 8.500 06/01/26 289,800Kraft Heinz Foods Co.
330,000 6.875 01/26/39 484,563101,000 5.500(d) 06/01/50 133,365
Post Holdings, Inc.(d)(e)
22,000 4.625 04/15/30 22,137United Natural Foods, Inc.(d)(e)
265,000 6.750 10/15/28 286,200US Foods, Inc.(d)(e)
301,000 4.750 02/15/29 307,772
1,924,717
Healthcare Providers & Services(d) – 1.6%CAB SELAS(e)
EUR 150,000 3.375 02/01/28 175,127Chrome Holdco SASU(e)
200,000 5.000 05/31/29 236,936CHS/Community Health Systems, Inc.(e)
$ 149,000 4.750 02/15/31 150,117DaVita, Inc.(e)
387,000 3.750 02/15/31 375,874DENTSPLY SIRONA, Inc.
50,000 3.250 06/01/30 53,247DH Europe Finance II S.a.r.l.
50,000 2.600 11/15/29 52,136Laboratoire Eimer Selas(e)
EUR 100,000 5.000 02/01/29 119,514Lifepoint Health, Inc.(e)
260,000 5.375 01/15/29 252,850Stryker Corp.
50,000 1.950 06/15/30 49,362Tenet Healthcare Corp.(e)
96,000 6.125 10/01/28 100,800Thermo Fisher Scientific, Inc.
50,000 4.497 03/25/30 59,093Zimmer Biomet Holdings, Inc.
50,000 3.550 03/20/30 54,667
1,679,723
Home Builders(d)(e) – 0.4%LGI Homes, Inc.
315,000 4.000 07/15/29 313,425Taylor Morrison Communities, Inc.
63,000 5.125 08/01/30 67,646
381,071
Housewares(d) – 0.5%CD&R Smokey Buyer, Inc.(e)
110,000 6.750 07/15/25 116,325
86 The accompanying notes are an integral part of these financial statements.
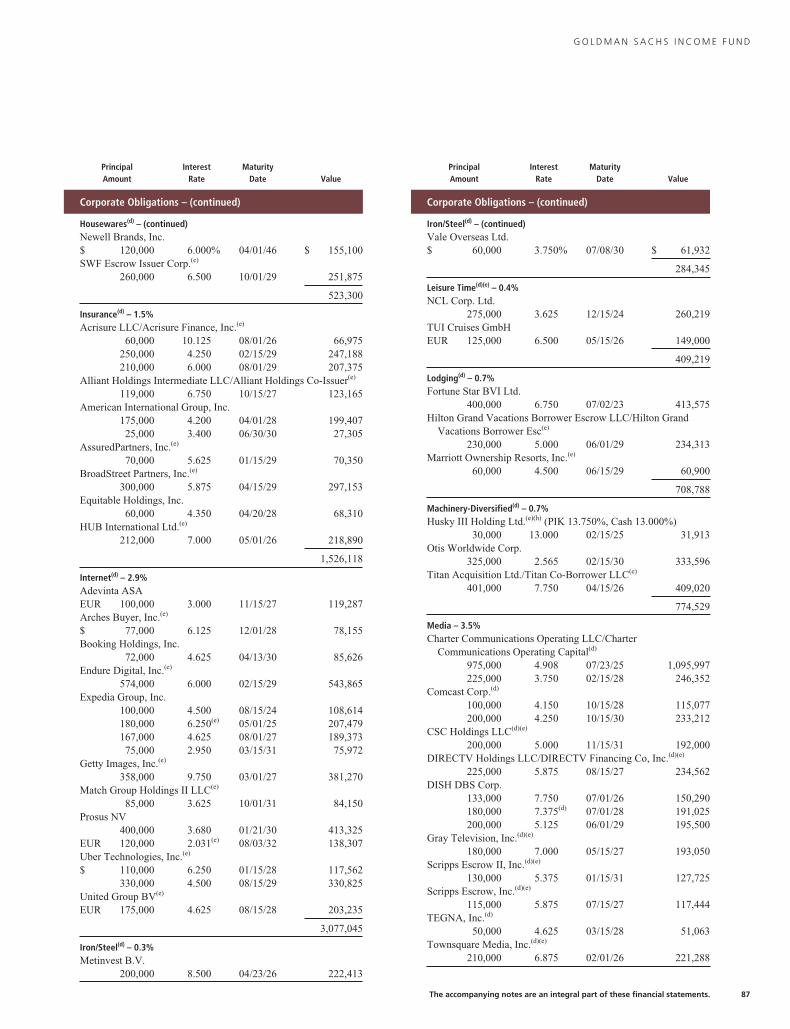
G O L D M A N S A C H S I N C O M E F U N D
PrincipalAmount
InterestRate
MaturityDate Value
Corporate Obligations – (continued)
Housewares(d) – (continued)Newell Brands, Inc.$ 120,000 6.000% 04/01/46 $ 155,100SWF Escrow Issuer Corp.(e)
260,000 6.500 10/01/29 251,875
523,300
Insurance(d) – 1.5%Acrisure LLC/Acrisure Finance, Inc.(e)
60,000 10.125 08/01/26 66,975250,000 4.250 02/15/29 247,188210,000 6.000 08/01/29 207,375
Alliant Holdings Intermediate LLC/Alliant Holdings Co-Issuer(e)
119,000 6.750 10/15/27 123,165American International Group, Inc.
175,000 4.200 04/01/28 199,40725,000 3.400 06/30/30 27,305
AssuredPartners, Inc.(e)
70,000 5.625 01/15/29 70,350BroadStreet Partners, Inc.(e)
300,000 5.875 04/15/29 297,153Equitable Holdings, Inc.
60,000 4.350 04/20/28 68,310HUB International Ltd.(e)
212,000 7.000 05/01/26 218,890
1,526,118
Internet(d) – 2.9%Adevinta ASAEUR 100,000 3.000 11/15/27 119,287Arches Buyer, Inc.(e)
$ 77,000 6.125 12/01/28 78,155Booking Holdings, Inc.
72,000 4.625 04/13/30 85,626Endure Digital, Inc.(e)
574,000 6.000 02/15/29 543,865Expedia Group, Inc.
100,000 4.500 08/15/24 108,614180,000 6.250(e) 05/01/25 207,479167,000 4.625 08/01/27 189,37375,000 2.950 03/15/31 75,972
Getty Images, Inc.(e)
358,000 9.750 03/01/27 381,270Match Group Holdings II LLC(e)
85,000 3.625 10/01/31 84,150Prosus NV
400,000 3.680 01/21/30 413,325EUR 120,000 2.031(e) 08/03/32 138,307Uber Technologies, Inc.(e)
$ 110,000 6.250 01/15/28 117,562330,000 4.500 08/15/29 330,825
United Group BV(e)
EUR 175,000 4.625 08/15/28 203,235
3,077,045
Iron/Steel(d) – 0.3%Metinvest B.V.
200,000 8.500 04/23/26 222,413
PrincipalAmount
InterestRate
MaturityDate Value
Corporate Obligations – (continued)
Iron/Steel(d) – (continued)Vale Overseas Ltd.$ 60,000 3.750% 07/08/30 $ 61,932
284,345
Leisure Time(d)(e) – 0.4%NCL Corp. Ltd.
275,000 3.625 12/15/24 260,219TUI Cruises GmbHEUR 125,000 6.500 05/15/26 149,000
409,219
Lodging(d) – 0.7%Fortune Star BVI Ltd.
400,000 6.750 07/02/23 413,575Hilton Grand Vacations Borrower Escrow LLC/Hilton Grand
Vacations Borrower Esc(e)
230,000 5.000 06/01/29 234,313Marriott Ownership Resorts, Inc.(e)
60,000 4.500 06/15/29 60,900
708,788
Machinery-Diversified(d) – 0.7%Husky III Holding Ltd.(e)(h) (PIK 13.750%, Cash 13.000%)
30,000 13.000 02/15/25 31,913Otis Worldwide Corp.
325,000 2.565 02/15/30 333,596Titan Acquisition Ltd./Titan Co-Borrower LLC(e)
401,000 7.750 04/15/26 409,020
774,529
Media – 3.5%Charter Communications Operating LLC/Charter
Communications Operating Capital(d)
975,000 4.908 07/23/25 1,095,997225,000 3.750 02/15/28 246,352
Comcast Corp.(d)
100,000 4.150 10/15/28 115,077200,000 4.250 10/15/30 233,212
CSC Holdings LLC(d)(e)
200,000 5.000 11/15/31 192,000DIRECTV Holdings LLC/DIRECTV Financing Co, Inc.(d)(e)
225,000 5.875 08/15/27 234,562DISH DBS Corp.
133,000 7.750 07/01/26 150,290180,000 7.375(d) 07/01/28 191,025200,000 5.125 06/01/29 195,500
Gray Television, Inc.(d)(e)
180,000 7.000 05/15/27 193,050Scripps Escrow II, Inc.(d)(e)
130,000 5.375 01/15/31 127,725Scripps Escrow, Inc.(d)(e)
115,000 5.875 07/15/27 117,444TEGNA, Inc.(d)
50,000 4.625 03/15/28 51,063Townsquare Media, Inc.(d)(e)
210,000 6.875 02/01/26 221,288
The accompanying notes are an integral part of these financial statements. 87
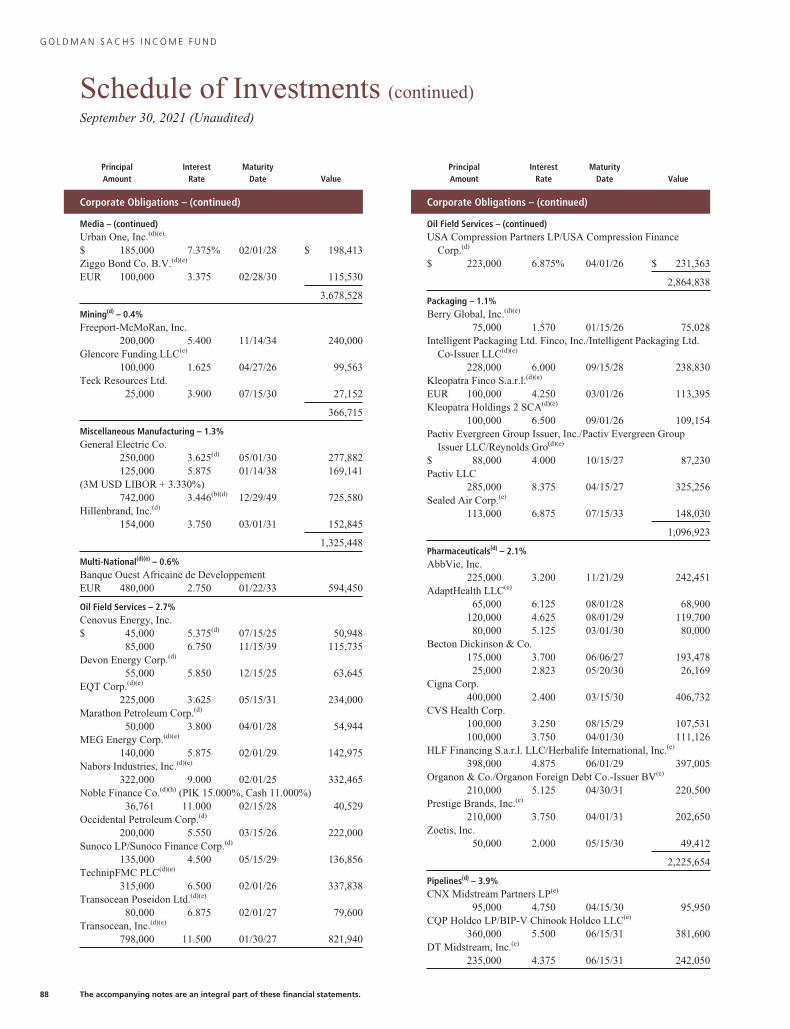
G O L D M A N S A C H S I N C O M E F U N D
Schedule of Investments (continued)September 30, 2021 (Unaudited)
PrincipalAmount
InterestRate
MaturityDate Value
Corporate Obligations – (continued)
Media – (continued)Urban One, Inc.(d)(e)
$ 185,000 7.375% 02/01/28 $ 198,413Ziggo Bond Co. B.V.(d)(e)
EUR 100,000 3.375 02/28/30 115,530
3,678,528
Mining(d) – 0.4%Freeport-McMoRan, Inc.
200,000 5.400 11/14/34 240,000Glencore Funding LLC(e)
100,000 1.625 04/27/26 99,563Teck Resources Ltd.
25,000 3.900 07/15/30 27,152
366,715
Miscellaneous Manufacturing – 1.3%General Electric Co.
250,000 3.625(d) 05/01/30 277,882125,000 5.875 01/14/38 169,141
(3M USD LIBOR + 3.330%)742,000 3.446(b)(d) 12/29/49 725,580
Hillenbrand, Inc.(d)
154,000 3.750 03/01/31 152,845
1,325,448
Multi-National(d)(e) – 0.6%Banque Ouest Africaine de DeveloppementEUR 480,000 2.750 01/22/33 594,450
Oil Field Services – 2.7%Cenovus Energy, Inc.$ 45,000 5.375(d) 07/15/25 50,948
85,000 6.750 11/15/39 115,735Devon Energy Corp.(d)
55,000 5.850 12/15/25 63,645EQT Corp.(d)(e)
225,000 3.625 05/15/31 234,000Marathon Petroleum Corp.(d)
50,000 3.800 04/01/28 54,944MEG Energy Corp.(d)(e)
140,000 5.875 02/01/29 142,975Nabors Industries, Inc.(d)(e)
322,000 9.000 02/01/25 332,465Noble Finance Co.(d)(h) (PIK 15.000%, Cash 11.000%)
36,761 11.000 02/15/28 40,529Occidental Petroleum Corp.(d)
200,000 5.550 03/15/26 222,000Sunoco LP/Sunoco Finance Corp.(d)
135,000 4.500 05/15/29 136,856TechnipFMC PLC(d)(e)
315,000 6.500 02/01/26 337,838Transocean Poseidon Ltd.(d)(e)
80,000 6.875 02/01/27 79,600Transocean, Inc.(d)(e)
798,000 11.500 01/30/27 821,940
PrincipalAmount
InterestRate
MaturityDate Value
Corporate Obligations – (continued)
Oil Field Services – (continued)USA Compression Partners LP/USA Compression Finance
Corp.(d)
$ 223,000 6.875% 04/01/26 $ 231,363
2,864,838
Packaging – 1.1%Berry Global, Inc.(d)(e)
75,000 1.570 01/15/26 75,028Intelligent Packaging Ltd. Finco, Inc./Intelligent Packaging Ltd.
Co-Issuer LLC(d)(e)
228,000 6.000 09/15/28 238,830Kleopatra Finco S.a.r.l.(d)(e)
EUR 100,000 4.250 03/01/26 113,395Kleopatra Holdings 2 SCA(d)(e)
100,000 6.500 09/01/26 109,154Pactiv Evergreen Group Issuer, Inc./Pactiv Evergreen Group
Issuer LLC/Reynolds Gro(d)(e)
$ 88,000 4.000 10/15/27 87,230Pactiv LLC
285,000 8.375 04/15/27 325,256Sealed Air Corp.(e)
113,000 6.875 07/15/33 148,030
1,096,923
Pharmaceuticals(d) – 2.1%AbbVie, Inc.
225,000 3.200 11/21/29 242,451AdaptHealth LLC(e)
65,000 6.125 08/01/28 68,900120,000 4.625 08/01/29 119,70080,000 5.125 03/01/30 80,000
Becton Dickinson & Co.175,000 3.700 06/06/27 193,47825,000 2.823 05/20/30 26,169
Cigna Corp.400,000 2.400 03/15/30 406,732
CVS Health Corp.100,000 3.250 08/15/29 107,531100,000 3.750 04/01/30 111,126
HLF Financing S.a.r.l. LLC/Herbalife International, Inc.(e)
398,000 4.875 06/01/29 397,005Organon & Co./Organon Foreign Debt Co.-Issuer BV(e)
210,000 5.125 04/30/31 220,500Prestige Brands, Inc.(e)
210,000 3.750 04/01/31 202,650Zoetis, Inc.
50,000 2.000 05/15/30 49,412
2,225,654
Pipelines(d) – 3.9%CNX Midstream Partners LP(e)
95,000 4.750 04/15/30 95,950CQP Holdco LP/BIP-V Chinook Holdco LLC(e)
360,000 5.500 06/15/31 381,600DT Midstream, Inc.(e)
235,000 4.375 06/15/31 242,050
88 The accompanying notes are an integral part of these financial statements.
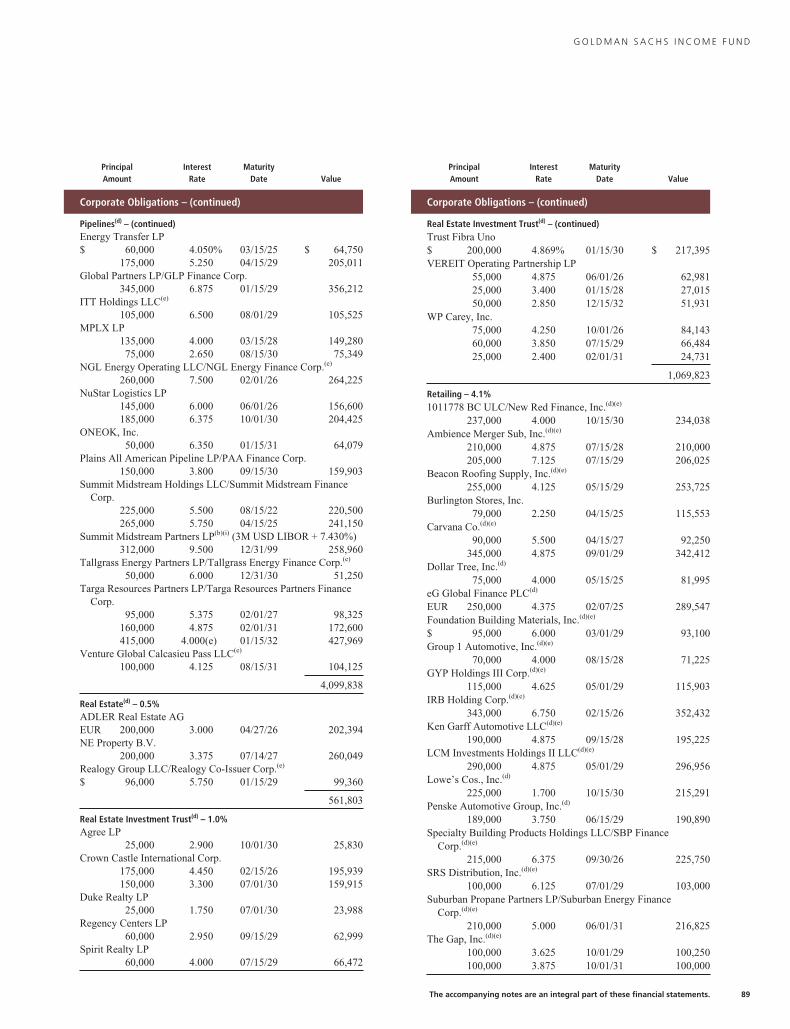
G O L D M A N S A C H S I N C O M E F U N D
PrincipalAmount
InterestRate
MaturityDate Value
Corporate Obligations – (continued)
Pipelines(d) – (continued)Energy Transfer LP$ 60,000 4.050% 03/15/25 $ 64,750
175,000 5.250 04/15/29 205,011Global Partners LP/GLP Finance Corp.
345,000 6.875 01/15/29 356,212ITT Holdings LLC(e)
105,000 6.500 08/01/29 105,525MPLX LP
135,000 4.000 03/15/28 149,28075,000 2.650 08/15/30 75,349
NGL Energy Operating LLC/NGL Energy Finance Corp.(e)
260,000 7.500 02/01/26 264,225NuStar Logistics LP
145,000 6.000 06/01/26 156,600185,000 6.375 10/01/30 204,425
ONEOK, Inc.50,000 6.350 01/15/31 64,079
Plains All American Pipeline LP/PAA Finance Corp.150,000 3.800 09/15/30 159,903
Summit Midstream Holdings LLC/Summit Midstream FinanceCorp.
225,000 5.500 08/15/22 220,500265,000 5.750 04/15/25 241,150
Summit Midstream Partners LP(b)(i) (3M USD LIBOR + 7.430%)312,000 9.500 12/31/99 258,960
Tallgrass Energy Partners LP/Tallgrass Energy Finance Corp.(e)
50,000 6.000 12/31/30 51,250Targa Resources Partners LP/Targa Resources Partners Finance
Corp.95,000 5.375 02/01/27 98,325
160,000 4.875 02/01/31 172,600415,000 4.000(e) 01/15/32 427,969
Venture Global Calcasieu Pass LLC(e)
100,000 4.125 08/15/31 104,125
4,099,838
Real Estate(d) – 0.5%ADLER Real Estate AGEUR 200,000 3.000 04/27/26 202,394NE Property B.V.
200,000 3.375 07/14/27 260,049Realogy Group LLC/Realogy Co-Issuer Corp.(e)
$ 96,000 5.750 01/15/29 99,360
561,803
Real Estate Investment Trust(d) – 1.0%Agree LP
25,000 2.900 10/01/30 25,830Crown Castle International Corp.
175,000 4.450 02/15/26 195,939150,000 3.300 07/01/30 159,915
Duke Realty LP25,000 1.750 07/01/30 23,988
Regency Centers LP60,000 2.950 09/15/29 62,999
Spirit Realty LP60,000 4.000 07/15/29 66,472
PrincipalAmount
InterestRate
MaturityDate Value
Corporate Obligations – (continued)
Real Estate Investment Trust(d) – (continued)Trust Fibra Uno$ 200,000 4.869% 01/15/30 $ 217,395VEREIT Operating Partnership LP
55,000 4.875 06/01/26 62,98125,000 3.400 01/15/28 27,01550,000 2.850 12/15/32 51,931
WP Carey, Inc.75,000 4.250 10/01/26 84,14360,000 3.850 07/15/29 66,48425,000 2.400 02/01/31 24,731
1,069,823
Retailing – 4.1%1011778 BC ULC/New Red Finance, Inc.(d)(e)
237,000 4.000 10/15/30 234,038Ambience Merger Sub, Inc.(d)(e)
210,000 4.875 07/15/28 210,000205,000 7.125 07/15/29 206,025
Beacon Roofing Supply, Inc.(d)(e)
255,000 4.125 05/15/29 253,725Burlington Stores, Inc.
79,000 2.250 04/15/25 115,553Carvana Co.(d)(e)
90,000 5.500 04/15/27 92,250345,000 4.875 09/01/29 342,412
Dollar Tree, Inc.(d)
75,000 4.000 05/15/25 81,995eG Global Finance PLC(d)
EUR 250,000 4.375 02/07/25 289,547Foundation Building Materials, Inc.(d)(e)
$ 95,000 6.000 03/01/29 93,100Group 1 Automotive, Inc.(d)(e)
70,000 4.000 08/15/28 71,225GYP Holdings III Corp.(d)(e)
115,000 4.625 05/01/29 115,903IRB Holding Corp.(d)(e)
343,000 6.750 02/15/26 352,432Ken Garff Automotive LLC(d)(e)
190,000 4.875 09/15/28 195,225LCM Investments Holdings II LLC(d)(e)
290,000 4.875 05/01/29 296,956Lowe’s Cos., Inc.(d)
225,000 1.700 10/15/30 215,291Penske Automotive Group, Inc.(d)
189,000 3.750 06/15/29 190,890Specialty Building Products Holdings LLC/SBP Finance
Corp.(d)(e)
215,000 6.375 09/30/26 225,750SRS Distribution, Inc.(d)(e)
100,000 6.125 07/01/29 103,000Suburban Propane Partners LP/Suburban Energy Finance
Corp.(d)(e)
210,000 5.000 06/01/31 216,825The Gap, Inc.(d)(e)
100,000 3.625 10/01/29 100,250100,000 3.875 10/01/31 100,000
The accompanying notes are an integral part of these financial statements. 89
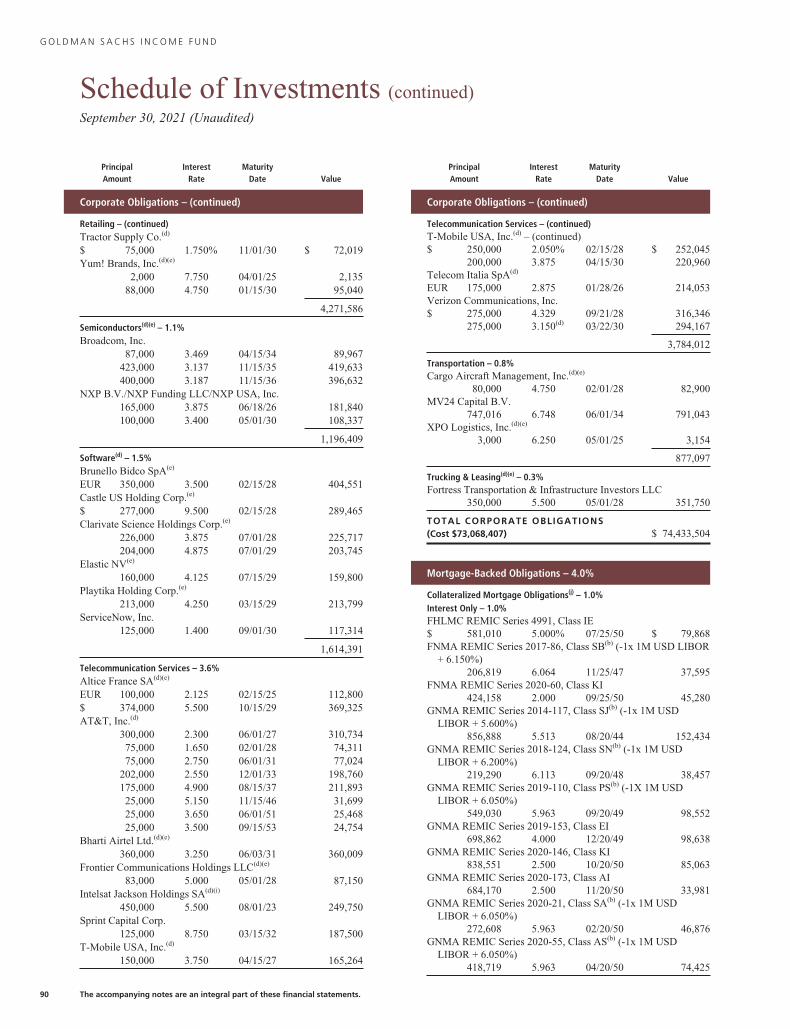
G O L D M A N S A C H S I N C O M E F U N D
Schedule of Investments (continued)September 30, 2021 (Unaudited)
PrincipalAmount
InterestRate
MaturityDate Value
Corporate Obligations – (continued)
Retailing – (continued)Tractor Supply Co.(d)
$ 75,000 1.750% 11/01/30 $ 72,019Yum! Brands, Inc.(d)(e)
2,000 7.750 04/01/25 2,13588,000 4.750 01/15/30 95,040
4,271,586
Semiconductors(d)(e) – 1.1%Broadcom, Inc.
87,000 3.469 04/15/34 89,967423,000 3.137 11/15/35 419,633400,000 3.187 11/15/36 396,632
NXP B.V./NXP Funding LLC/NXP USA, Inc.165,000 3.875 06/18/26 181,840100,000 3.400 05/01/30 108,337
1,196,409
Software(d) – 1.5%Brunello Bidco SpA(e)
EUR 350,000 3.500 02/15/28 404,551Castle US Holding Corp.(e)
$ 277,000 9.500 02/15/28 289,465Clarivate Science Holdings Corp.(e)
226,000 3.875 07/01/28 225,717204,000 4.875 07/01/29 203,745
Elastic NV(e)
160,000 4.125 07/15/29 159,800Playtika Holding Corp.(e)
213,000 4.250 03/15/29 213,799ServiceNow, Inc.
125,000 1.400 09/01/30 117,314
1,614,391
Telecommunication Services – 3.6%Altice France SA(d)(e)
EUR 100,000 2.125 02/15/25 112,800$ 374,000 5.500 10/15/29 369,325AT&T, Inc.(d)
300,000 2.300 06/01/27 310,73475,000 1.650 02/01/28 74,31175,000 2.750 06/01/31 77,024
202,000 2.550 12/01/33 198,760175,000 4.900 08/15/37 211,89325,000 5.150 11/15/46 31,69925,000 3.650 06/01/51 25,46825,000 3.500 09/15/53 24,754
Bharti Airtel Ltd.(d)(e)
360,000 3.250 06/03/31 360,009Frontier Communications Holdings LLC(d)(e)
83,000 5.000 05/01/28 87,150Intelsat Jackson Holdings SA(d)(i)
450,000 5.500 08/01/23 249,750Sprint Capital Corp.
125,000 8.750 03/15/32 187,500T-Mobile USA, Inc.(d)
150,000 3.750 04/15/27 165,264
PrincipalAmount
InterestRate
MaturityDate Value
Corporate Obligations – (continued)
Telecommunication Services – (continued)T-Mobile USA, Inc.(d) – (continued)$ 250,000 2.050% 02/15/28 $ 252,045
200,000 3.875 04/15/30 220,960Telecom Italia SpA(d)
EUR 175,000 2.875 01/28/26 214,053Verizon Communications, Inc.$ 275,000 4.329 09/21/28 316,346
275,000 3.150(d) 03/22/30 294,167
3,784,012
Transportation – 0.8%Cargo Aircraft Management, Inc.(d)(e)
80,000 4.750 02/01/28 82,900MV24 Capital B.V.
747,016 6.748 06/01/34 791,043XPO Logistics, Inc.(d)(e)
3,000 6.250 05/01/25 3,154
877,097
Trucking & Leasing(d)(e) – 0.3%Fortress Transportation & Infrastructure Investors LLC
350,000 5.500 05/01/28 351,750
TOTAL CORPORATE OBLIGATIONS(Cost $73,068,407) $ 74,433,504
Mortgage-Backed Obligations – 4.0%
Collateralized Mortgage Obligations(j) – 1.0%Interest Only – 1.0%FHLMC REMIC Series 4991, Class IE$ 581,010 5.000% 07/25/50 $ 79,868FNMA REMIC Series 2017-86, Class SB(b) (-1x 1M USD LIBOR
+ 6.150%)206,819 6.064 11/25/47 37,595
FNMA REMIC Series 2020-60, Class KI424,158 2.000 09/25/50 45,280
GNMA REMIC Series 2014-117, Class SJ(b) (-1x 1M USDLIBOR + 5.600%)
856,888 5.513 08/20/44 152,434GNMA REMIC Series 2018-124, Class SN(b) (-1x 1M USD
LIBOR + 6.200%)219,290 6.113 09/20/48 38,457
GNMA REMIC Series 2019-110, Class PS(b) (-1X 1M USDLIBOR + 6.050%)
549,030 5.963 09/20/49 98,552GNMA REMIC Series 2019-153, Class EI
698,862 4.000 12/20/49 98,638GNMA REMIC Series 2020-146, Class KI
838,551 2.500 10/20/50 85,063GNMA REMIC Series 2020-173, Class AI
684,170 2.500 11/20/50 33,981GNMA REMIC Series 2020-21, Class SA(b) (-1x 1M USD
LIBOR + 6.050%)272,608 5.963 02/20/50 46,876
GNMA REMIC Series 2020-55, Class AS(b) (-1x 1M USDLIBOR + 6.050%)
418,719 5.963 04/20/50 74,425
90 The accompanying notes are an integral part of these financial statements.
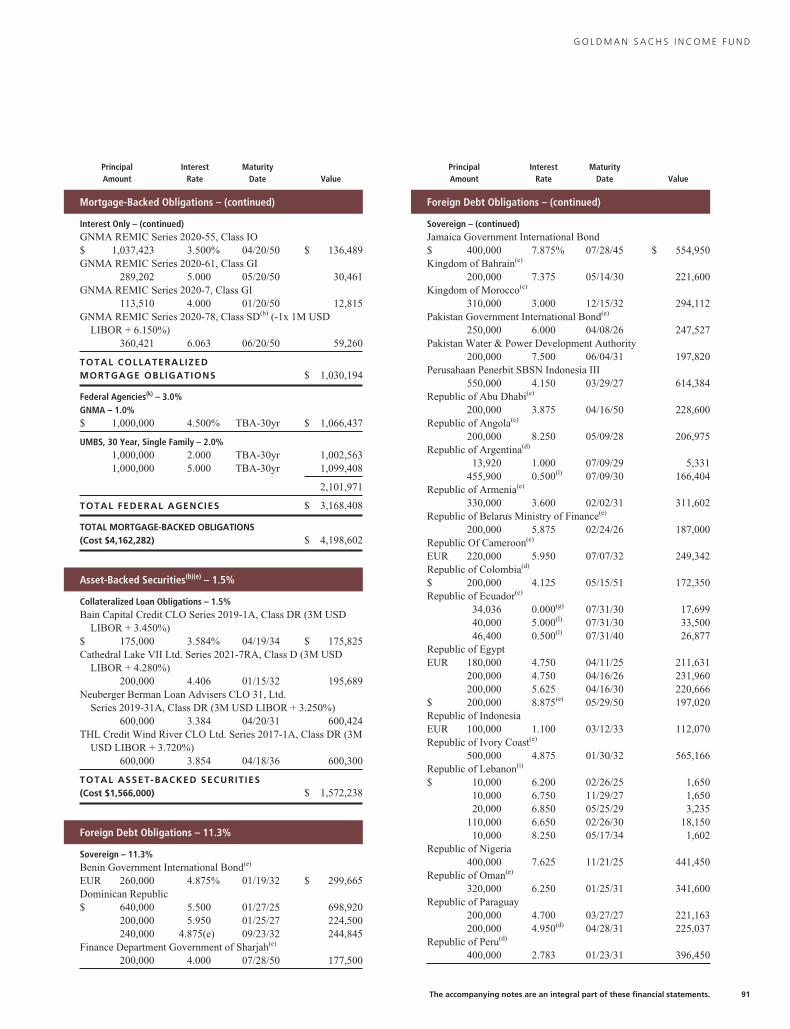
G O L D M A N S A C H S I N C O M E F U N D
PrincipalAmount
InterestRate
MaturityDate Value
Mortgage-Backed Obligations – (continued)
Interest Only – (continued)GNMA REMIC Series 2020-55, Class IO$ 1,037,423 3.500% 04/20/50 $ 136,489GNMA REMIC Series 2020-61, Class GI
289,202 5.000 05/20/50 30,461GNMA REMIC Series 2020-7, Class GI
113,510 4.000 01/20/50 12,815GNMA REMIC Series 2020-78, Class SD(b) (-1x 1M USD
LIBOR + 6.150%)360,421 6.063 06/20/50 59,260
TOTAL COLLATERALIZEDMORTGAGE OBLIGATIONS $ 1,030,194
Federal Agencies(k) – 3.0%GNMA – 1.0%$ 1,000,000 4.500% TBA-30yr $ 1,066,437
UMBS, 30 Year, Single Family – 2.0%1,000,000 2.000 TBA-30yr 1,002,5631,000,000 5.000 TBA-30yr 1,099,408
2,101,971
TOTAL FEDERAL AGENCIES $ 3,168,408
TOTAL MORTGAGE-BACKED OBLIGATIONS(Cost $4,162,282) $ 4,198,602
Asset-Backed Securities(b)(e) – 1.5%
Collateralized Loan Obligations – 1.5%Bain Capital Credit CLO Series 2019-1A, Class DR (3M USD
LIBOR + 3.450%)$ 175,000 3.584% 04/19/34 $ 175,825Cathedral Lake VII Ltd. Series 2021-7RA, Class D (3M USD
LIBOR + 4.280%)200,000 4.406 01/15/32 195,689
Neuberger Berman Loan Advisers CLO 31, Ltd.Series 2019-31A, Class DR (3M USD LIBOR + 3.250%)
600,000 3.384 04/20/31 600,424THL Credit Wind River CLO Ltd. Series 2017-1A, Class DR (3M
USD LIBOR + 3.720%)600,000 3.854 04/18/36 600,300
TOTAL ASSET-BACKED SECURITIES(Cost $1,566,000) $ 1,572,238
Foreign Debt Obligations – 11.3%
Sovereign – 11.3%Benin Government International Bond(e)
EUR 260,000 4.875% 01/19/32 $ 299,665Dominican Republic$ 640,000 5.500 01/27/25 698,920
200,000 5.950 01/25/27 224,500240,000 4.875(e) 09/23/32 244,845
Finance Department Government of Sharjah(e)
200,000 4.000 07/28/50 177,500
PrincipalAmount
InterestRate
MaturityDate Value
Foreign Debt Obligations – (continued)
Sovereign – (continued)Jamaica Government International Bond$ 400,000 7.875% 07/28/45 $ 554,950Kingdom of Bahrain(e)
200,000 7.375 05/14/30 221,600Kingdom of Morocco(e)
310,000 3.000 12/15/32 294,112Pakistan Government International Bond(e)
250,000 6.000 04/08/26 247,527Pakistan Water & Power Development Authority
200,000 7.500 06/04/31 197,820Perusahaan Penerbit SBSN Indonesia III
550,000 4.150 03/29/27 614,384Republic of Abu Dhabi(e)
200,000 3.875 04/16/50 228,600Republic of Angola(e)
200,000 8.250 05/09/28 206,975Republic of Argentina(d)
13,920 1.000 07/09/29 5,331455,900 0.500(l) 07/09/30 166,404
Republic of Armenia(e)
330,000 3.600 02/02/31 311,602Republic of Belarus Ministry of Finance(e)
200,000 5.875 02/24/26 187,000Republic Of Cameroon(e)
EUR 220,000 5.950 07/07/32 249,342Republic of Colombia(d)
$ 200,000 4.125 05/15/51 172,350Republic of Ecuador(e)
34,036 0.000(g) 07/31/30 17,69940,000 5.000(l) 07/31/30 33,50046,400 0.500(l) 07/31/40 26,877
Republic of EgyptEUR 180,000 4.750 04/11/25 211,631
200,000 4.750 04/16/26 231,960200,000 5.625 04/16/30 220,666
$ 200,000 8.875(e) 05/29/50 197,020Republic of IndonesiaEUR 100,000 1.100 03/12/33 112,070Republic of Ivory Coast(e)
500,000 4.875 01/30/32 565,166Republic of Lebanon(i)
$ 10,000 6.200 02/26/25 1,65010,000 6.750 11/29/27 1,65020,000 6.850 05/25/29 3,235
110,000 6.650 02/26/30 18,15010,000 8.250 05/17/34 1,602
Republic of Nigeria400,000 7.625 11/21/25 441,450
Republic of Oman(e)
320,000 6.250 01/25/31 341,600Republic of Paraguay
200,000 4.700 03/27/27 221,163200,000 4.950(d) 04/28/31 225,037
Republic of Peru(d)
400,000 2.783 01/23/31 396,450
The accompanying notes are an integral part of these financial statements. 91
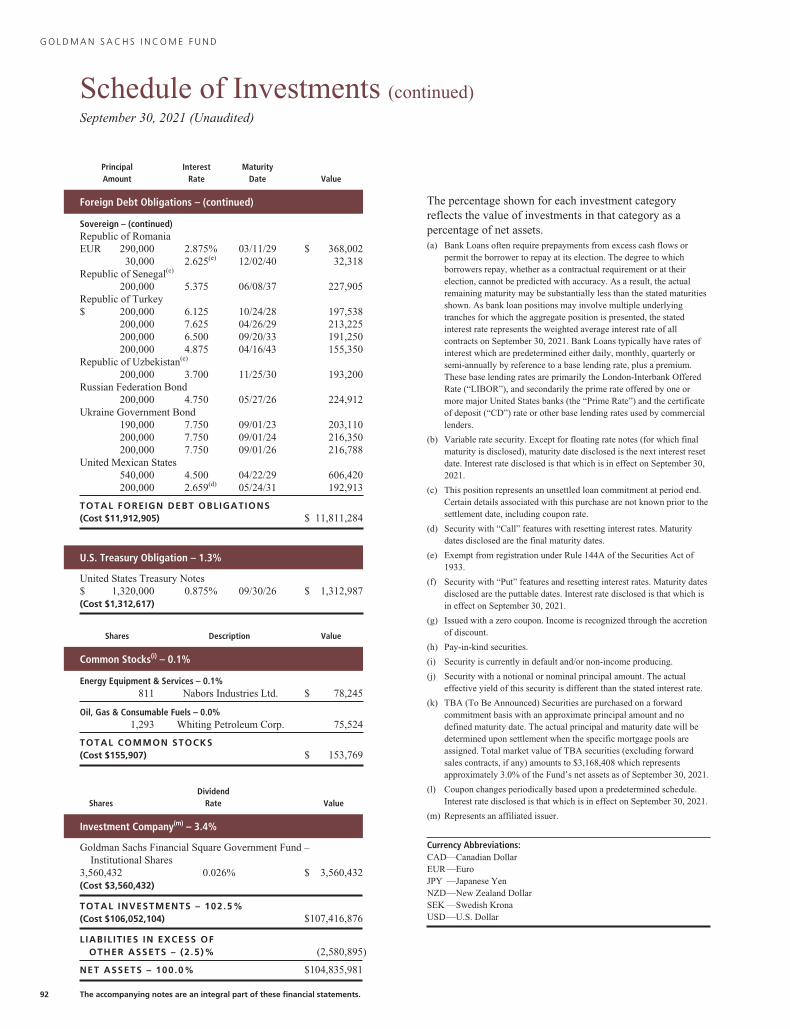
G O L D M A N S A C H S I N C O M E F U N D
Schedule of Investments (continued)September 30, 2021 (Unaudited)
PrincipalAmount
InterestRate
MaturityDate Value
Foreign Debt Obligations – (continued)
Sovereign – (continued)Republic of RomaniaEUR 290,000 2.875% 03/11/29 $ 368,002
30,000 2.625(e) 12/02/40 32,318Republic of Senegal(e)
200,000 5.375 06/08/37 227,905Republic of Turkey$ 200,000 6.125 10/24/28 197,538
200,000 7.625 04/26/29 213,225200,000 6.500 09/20/33 191,250200,000 4.875 04/16/43 155,350
Republic of Uzbekistan(e)
200,000 3.700 11/25/30 193,200Russian Federation Bond
200,000 4.750 05/27/26 224,912Ukraine Government Bond
190,000 7.750 09/01/23 203,110200,000 7.750 09/01/24 216,350200,000 7.750 09/01/26 216,788
United Mexican States540,000 4.500 04/22/29 606,420200,000 2.659(d) 05/24/31 192,913
TOTAL FOREIGN DEBT OBLIGATIONS(Cost $11,912,905) $ 11,811,284
U.S. Treasury Obligation – 1.3%
United States Treasury Notes$ 1,320,000 0.875% 09/30/26 $ 1,312,987(Cost $1,312,617)
Shares Description Value
Common Stocks(i) – 0.1%
Energy Equipment & Services – 0.1%811 Nabors Industries Ltd. $ 78,245
Oil, Gas & Consumable Fuels – 0.0%1,293 Whiting Petroleum Corp. 75,524
TOTAL COMMON STOCKS(Cost $155,907) $ 153,769
SharesDividend
Rate Value
Investment Company(m) – 3.4%
Goldman Sachs Financial Square Government Fund –Institutional Shares
3,560,432 0.026% $ 3,560,432(Cost $3,560,432)
TOTAL INVESTMENTS – 102.5%(Cost $106,052,104) $107,416,876
LIABIL IT IES IN EXCESS OFOTHER ASSETS – (2.5)% (2,580,895)
NET ASSETS – 100.0% $104,835,981
The percentage shown for each investment categoryreflects the value of investments in that category as apercentage of net assets.(a) Bank Loans often require prepayments from excess cash flows or
permit the borrower to repay at its election. The degree to whichborrowers repay, whether as a contractual requirement or at theirelection, cannot be predicted with accuracy. As a result, the actualremaining maturity may be substantially less than the stated maturitiesshown. As bank loan positions may involve multiple underlyingtranches for which the aggregate position is presented, the statedinterest rate represents the weighted average interest rate of allcontracts on September 30, 2021. Bank Loans typically have rates ofinterest which are predetermined either daily, monthly, quarterly orsemi-annually by reference to a base lending rate, plus a premium.These base lending rates are primarily the London-Interbank OfferedRate (“LIBOR”), and secondarily the prime rate offered by one ormore major United States banks (the “Prime Rate”) and the certificateof deposit (“CD”) rate or other base lending rates used by commerciallenders.
(b) Variable rate security. Except for floating rate notes (for which finalmaturity is disclosed), maturity date disclosed is the next interest resetdate. Interest rate disclosed is that which is in effect on September 30,2021.
(c) This position represents an unsettled loan commitment at period end.Certain details associated with this purchase are not known prior to thesettlement date, including coupon rate.
(d) Security with “Call” features with resetting interest rates. Maturitydates disclosed are the final maturity dates.
(e) Exempt from registration under Rule 144A of the Securities Act of1933.
(f) Security with “Put” features and resetting interest rates. Maturity datesdisclosed are the puttable dates. Interest rate disclosed is that which isin effect on September 30, 2021.
(g) Issued with a zero coupon. Income is recognized through the accretionof discount.
(h) Pay-in-kind securities.
(i) Security is currently in default and/or non-income producing.
(j) Security with a notional or nominal principal amount. The actualeffective yield of this security is different than the stated interest rate.
(k) TBA (To Be Announced) Securities are purchased on a forwardcommitment basis with an approximate principal amount and nodefined maturity date. The actual principal and maturity date will bedetermined upon settlement when the specific mortgage pools areassigned. Total market value of TBA securities (excluding forwardsales contracts, if any) amounts to $3,168,408 which representsapproximately 3.0% of the Fund’s net assets as of September 30, 2021.
(l) Coupon changes periodically based upon a predetermined schedule.Interest rate disclosed is that which is in effect on September 30, 2021.
(m) Represents an affiliated issuer.
Currency Abbreviations:CAD—Canadian DollarEUR—EuroJPY —Japanese YenNZD—New Zealand DollarSEK —Swedish KronaUSD—U.S. Dollar
92 The accompanying notes are an integral part of these financial statements.
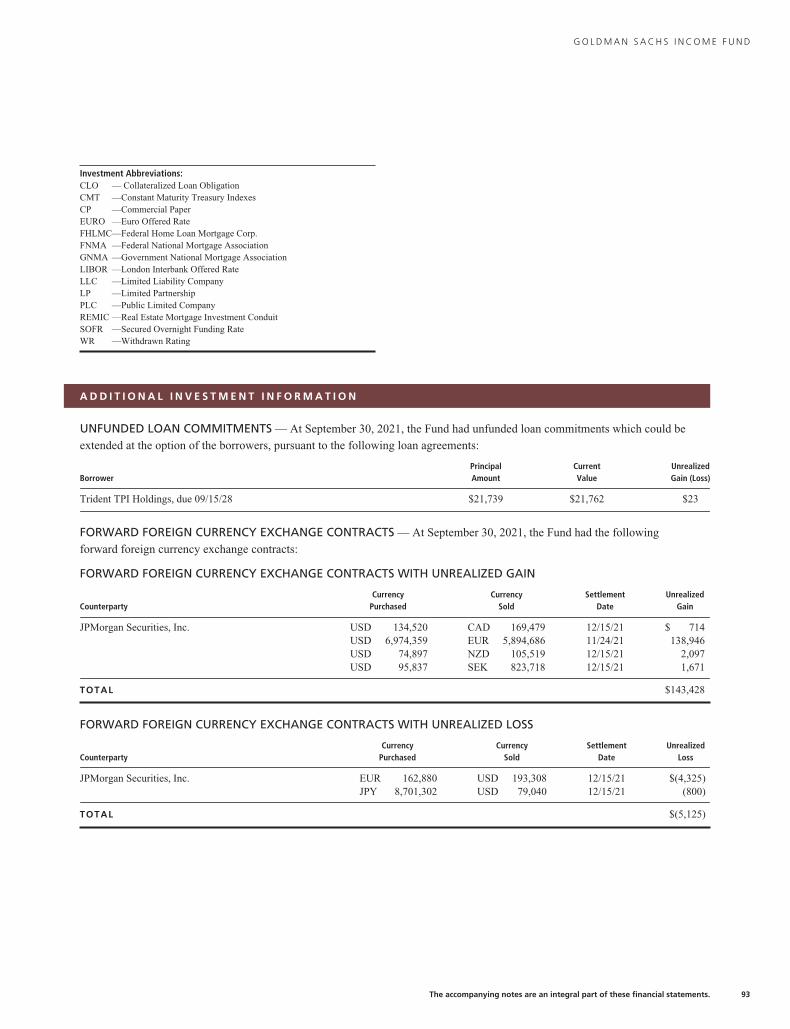
G O L D M A N S A C H S I N C O M E F U N D
Investment Abbreviations:CLO — Collateralized Loan ObligationCMT —Constant Maturity Treasury IndexesCP —Commercial PaperEURO —Euro Offered RateFHLMC—Federal Home Loan Mortgage Corp.FNMA —Federal National Mortgage AssociationGNMA —Government National Mortgage AssociationLIBOR —London Interbank Offered RateLLC —Limited Liability CompanyLP —Limited PartnershipPLC —Public Limited CompanyREMIC —Real Estate Mortgage Investment ConduitSOFR —Secured Overnight Funding RateWR —Withdrawn Rating
A D D I T I O N A L I N V E S T M E N T I N F O R M A T I O N
UNFUNDED LOAN COMMITMENTS — At September 30, 2021, the Fund had unfunded loan commitments which could be
extended at the option of the borrowers, pursuant to the following loan agreements:
BorrowerPrincipalAmount
CurrentValue
UnrealizedGain (Loss)
Trident TPI Holdings, due 09/15/28 $21,739 $21,762 $23
FORWARD FOREIGN CURRENCY EXCHANGE CONTRACTS — At September 30, 2021, the Fund had the following
forward foreign currency exchange contracts:
FORWARD FOREIGN CURRENCY EXCHANGE CONTRACTS WITH UNREALIZED GAIN
CounterpartyCurrency
PurchasedCurrency
SoldSettlement
DateUnrealized
Gain
JPMorgan Securities, Inc. USD 134,520 CAD 169,479 12/15/21 $ 714USD 6,974,359 EUR 5,894,686 11/24/21 138,946USD 74,897 NZD 105,519 12/15/21 2,097USD 95,837 SEK 823,718 12/15/21 1,671
TOTAL $143,428
FORWARD FOREIGN CURRENCY EXCHANGE CONTRACTS WITH UNREALIZED LOSS
CounterpartyCurrency
PurchasedCurrency
SoldSettlement
DateUnrealized
Loss
JPMorgan Securities, Inc. EUR 162,880 USD 193,308 12/15/21 $(4,325)JPY 8,701,302 USD 79,040 12/15/21 (800)
TOTAL $(5,125)
The accompanying notes are an integral part of these financial statements. 93
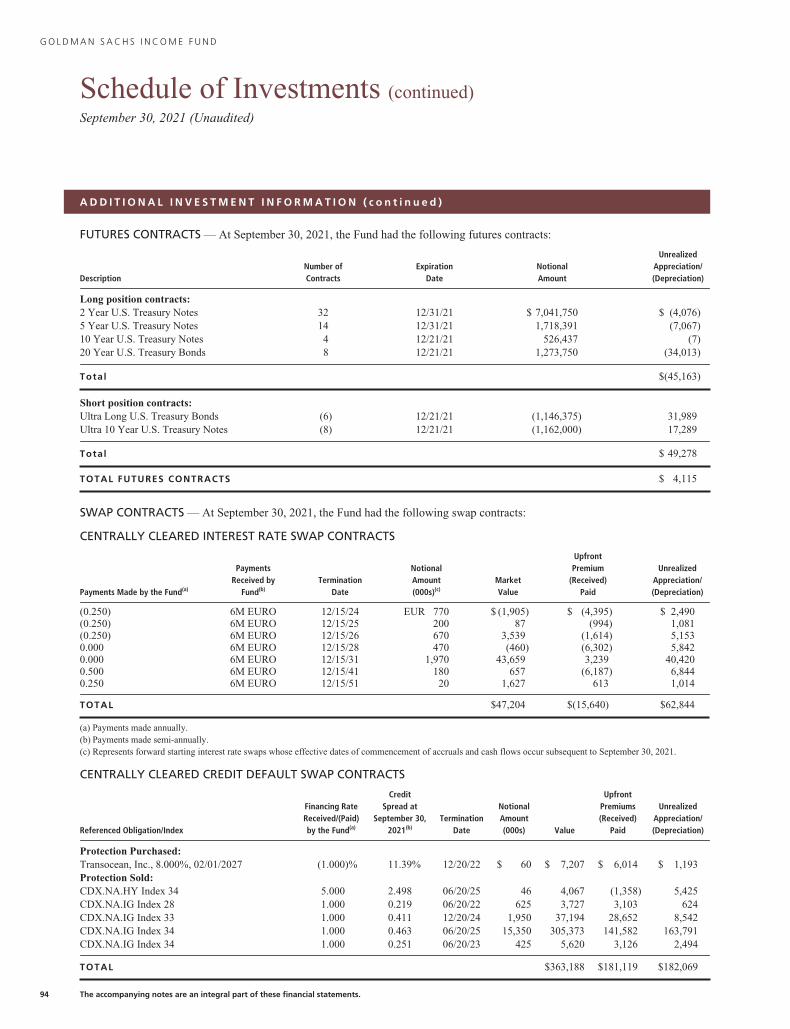
G O L D M A N S A C H S I N C O M E F U N D
Schedule of Investments (continued)September 30, 2021 (Unaudited)
A D D I T I O N A L I N V E S T M E N T I N F O R M A T I O N ( c o n t i n u e d )
FUTURES CONTRACTS — At September 30, 2021, the Fund had the following futures contracts:
DescriptionNumber ofContracts
ExpirationDate
NotionalAmount
UnrealizedAppreciation/(Depreciation)
Long position contracts:2 Year U.S. Treasury Notes 32 12/31/21 $ 7,041,750 $ (4,076)5 Year U.S. Treasury Notes 14 12/31/21 1,718,391 (7,067)10 Year U.S. Treasury Notes 4 12/21/21 526,437 (7)20 Year U.S. Treasury Bonds 8 12/21/21 1,273,750 (34,013)
Total $(45,163)
Short position contracts:Ultra Long U.S. Treasury Bonds (6) 12/21/21 (1,146,375) 31,989Ultra 10 Year U.S. Treasury Notes (8) 12/21/21 (1,162,000) 17,289
Total $ 49,278
TOTAL FUTURES CONTRACTS $ 4,115
SWAP CONTRACTS — At September 30, 2021, the Fund had the following swap contracts:
CENTRALLY CLEARED INTEREST RATE SWAP CONTRACTS
Payments Made by the Fund(a)
PaymentsReceived by
Fund(b)Termination
Date
NotionalAmount(000s)(c)
MarketValue
UpfrontPremium
(Received)Paid
UnrealizedAppreciation/(Depreciation)
(0.250) 6M EURO 12/15/24 EUR 770 $ (1,905) $ (4,395) $ 2,490(0.250) 6M EURO 12/15/25 200 87 (994) 1,081(0.250) 6M EURO 12/15/26 670 3,539 (1,614) 5,1530.000 6M EURO 12/15/28 470 (460) (6,302) 5,8420.000 6M EURO 12/15/31 1,970 43,659 3,239 40,4200.500 6M EURO 12/15/41 180 657 (6,187) 6,8440.250 6M EURO 12/15/51 20 1,627 613 1,014
TOTAL $47,204 $(15,640) $62,844
(a) Payments made annually.(b) Payments made semi-annually.(c) Represents forward starting interest rate swaps whose effective dates of commencement of accruals and cash flows occur subsequent to September 30, 2021.
CENTRALLY CLEARED CREDIT DEFAULT SWAP CONTRACTS
Referenced Obligation/Index
Financing RateReceived/(Paid)by the Fund(a)
CreditSpread at
September 30,2021(b)
TerminationDate
NotionalAmount(000s) Value
UpfrontPremiums(Received)
Paid
UnrealizedAppreciation/(Depreciation)
Protection Purchased:Transocean, Inc., 8.000%, 02/01/2027 (1.000)% 11.39% 12/20/22 $ 60 $ 7,207 $ 6,014 $ 1,193Protection Sold:CDX.NA.HY Index 34 5.000 2.498 06/20/25 46 4,067 (1,358) 5,425CDX.NA.IG Index 28 1.000 0.219 06/20/22 625 3,727 3,103 624CDX.NA.IG Index 33 1.000 0.411 12/20/24 1,950 37,194 28,652 8,542CDX.NA.IG Index 34 1.000 0.463 06/20/25 15,350 305,373 141,582 163,791CDX.NA.IG Index 34 1.000 0.251 06/20/23 425 5,620 3,126 2,494
TOTAL $363,188 $181,119 $182,069
94 The accompanying notes are an integral part of these financial statements.
G O L D M A N S A C H S I N C O M E F U N D
(a) Payments made quarterly.(b) Credit spread on the referenced obligation, together with the term of the swap contract, are indicators of payment/performance risk. The likelihood of a credit event
occurring which would require a fund or its counterparty to make a payment or otherwise be required to perform under the swap contract is generally greater as thecredit spread and the term of the swap contract increase.
Abbreviations:CDX.NA.IG Index 28—CDX North America Investment Grade Index 28CDX.NA.IG Index 33—CDX North America Investment Grade Index 33CDX.NA.IG Index 34—CDX North America Investment Grade Index 34
The accompanying notes are an integral part of these financial statements. 95
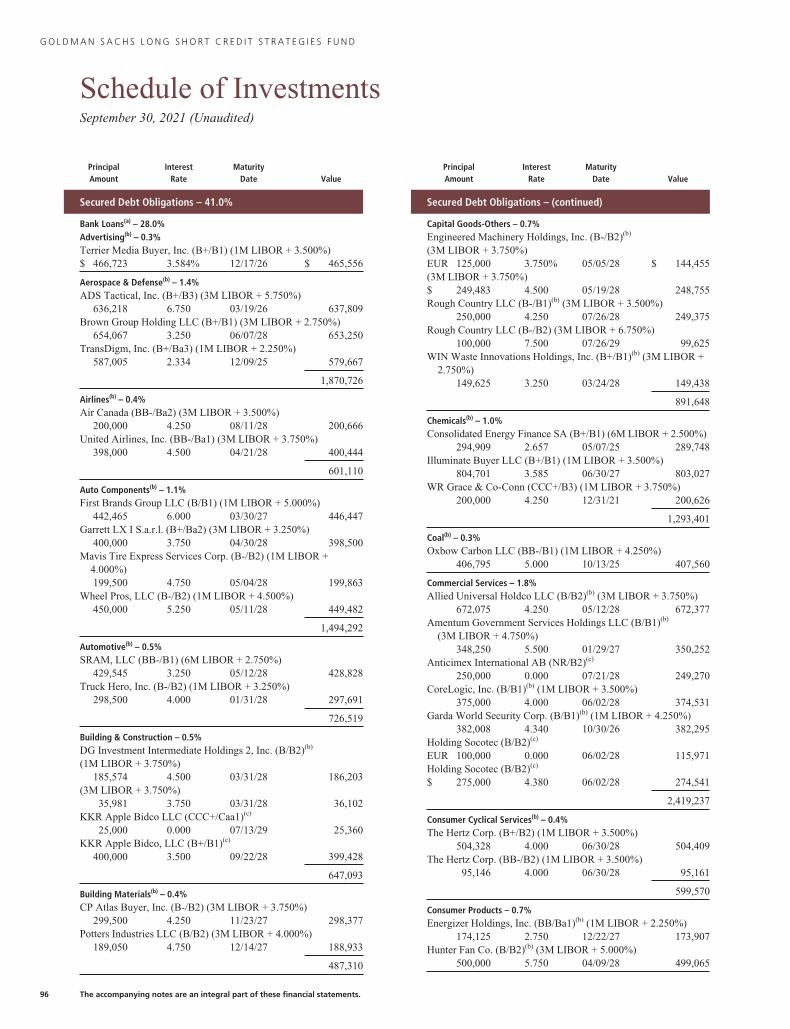
G O L D M A N S A C H S L O N G S H O R T C R E D I T S T R A T E G I E S F U N D
Schedule of InvestmentsSeptember 30, 2021 (Unaudited)
PrincipalAmount
InterestRate
MaturityDate Value
Secured Debt Obligations – 41.0%
Bank Loans(a) – 28.0%Advertising(b) – 0.3%Terrier Media Buyer, Inc. (B+/B1) (1M LIBOR + 3.500%)$ 466,723 3.584% 12/17/26 $ 465,556
Aerospace & Defense(b) – 1.4%ADS Tactical, Inc. (B+/B3) (3M LIBOR + 5.750%)
636,218 6.750 03/19/26 637,809Brown Group Holding LLC (B+/B1) (3M LIBOR + 2.750%)
654,067 3.250 06/07/28 653,250TransDigm, Inc. (B+/Ba3) (1M LIBOR + 2.250%)
587,005 2.334 12/09/25 579,667
1,870,726
Airlines(b) – 0.4%Air Canada (BB-/Ba2) (3M LIBOR + 3.500%)
200,000 4.250 08/11/28 200,666United Airlines, Inc. (BB-/Ba1) (3M LIBOR + 3.750%)
398,000 4.500 04/21/28 400,444
601,110
Auto Components(b) – 1.1%First Brands Group LLC (B/B1) (1M LIBOR + 5.000%)
442,465 6.000 03/30/27 446,447Garrett LX I S.a.r.l. (B+/Ba2) (3M LIBOR + 3.250%)
400,000 3.750 04/30/28 398,500Mavis Tire Express Services Corp. (B-/B2) (1M LIBOR +
4.000%)199,500 4.750 05/04/28 199,863
Wheel Pros, LLC (B-/B2) (1M LIBOR + 4.500%)450,000 5.250 05/11/28 449,482
1,494,292
Automotive(b) – 0.5%SRAM, LLC (BB-/B1) (6M LIBOR + 2.750%)
429,545 3.250 05/12/28 428,828Truck Hero, Inc. (B-/B2) (1M LIBOR + 3.250%)
298,500 4.000 01/31/28 297,691
726,519
Building & Construction – 0.5%DG Investment Intermediate Holdings 2, Inc. (B/B2)(b)
(1M LIBOR + 3.750%)185,574 4.500 03/31/28 186,203
(3M LIBOR + 3.750%)35,981 3.750 03/31/28 36,102
KKR Apple Bidco LLC (CCC+/Caa1)(c)
25,000 0.000 07/13/29 25,360KKR Apple Bidco, LLC (B+/B1)(c)
400,000 3.500 09/22/28 399,428
647,093
Building Materials(b) – 0.4%CP Atlas Buyer, Inc. (B-/B2) (3M LIBOR + 3.750%)
299,500 4.250 11/23/27 298,377Potters Industries LLC (B/B2) (3M LIBOR + 4.000%)
189,050 4.750 12/14/27 188,933
487,310
PrincipalAmount
InterestRate
MaturityDate Value
Secured Debt Obligations – (continued)
Capital Goods-Others – 0.7%Engineered Machinery Holdings, Inc. (B-/B2)(b)
(3M LIBOR + 3.750%)EUR 125,000 3.750% 05/05/28 $ 144,455(3M LIBOR + 3.750%)$ 249,483 4.500 05/19/28 248,755Rough Country LLC (B-/B1)(b) (3M LIBOR + 3.500%)
250,000 4.250 07/26/28 249,375Rough Country LLC (B-/B2) (3M LIBOR + 6.750%)
100,000 7.500 07/26/29 99,625WIN Waste Innovations Holdings, Inc. (B+/B1)(b) (3M LIBOR +
2.750%)149,625 3.250 03/24/28 149,438
891,648
Chemicals(b) – 1.0%Consolidated Energy Finance SA (B+/B1) (6M LIBOR + 2.500%)
294,909 2.657 05/07/25 289,748Illuminate Buyer LLC (B+/B1) (1M LIBOR + 3.500%)
804,701 3.585 06/30/27 803,027WR Grace & Co-Conn (CCC+/B3) (1M LIBOR + 3.750%)
200,000 4.250 12/31/21 200,626
1,293,401
Coal(b) – 0.3%Oxbow Carbon LLC (BB-/B1) (1M LIBOR + 4.250%)
406,795 5.000 10/13/25 407,560
Commercial Services – 1.8%Allied Universal Holdco LLC (B/B2)(b) (3M LIBOR + 3.750%)
672,075 4.250 05/12/28 672,377Amentum Government Services Holdings LLC (B/B1)(b)
(3M LIBOR + 4.750%)348,250 5.500 01/29/27 350,252
Anticimex International AB (NR/B2)(c)
250,000 0.000 07/21/28 249,270CoreLogic, Inc. (B/B1)(b) (1M LIBOR + 3.500%)
375,000 4.000 06/02/28 374,531Garda World Security Corp. (B/B1)(b) (1M LIBOR + 4.250%)
382,008 4.340 10/30/26 382,295Holding Socotec (B/B2)(c)
EUR 100,000 0.000 06/02/28 115,971Holding Socotec (B/B2)(c)
$ 275,000 4.380 06/02/28 274,541
2,419,237
Consumer Cyclical Services(b) – 0.4%The Hertz Corp. (B+/B2) (1M LIBOR + 3.500%)
504,328 4.000 06/30/28 504,409The Hertz Corp. (BB-/B2) (1M LIBOR + 3.500%)
95,146 4.000 06/30/28 95,161
599,570
Consumer Products – 0.7%Energizer Holdings, Inc. (BB/Ba1)(b) (1M LIBOR + 2.250%)
174,125 2.750 12/22/27 173,907Hunter Fan Co. (B/B2)(b) (3M LIBOR + 5.000%)
500,000 5.750 04/09/28 499,065
96 The accompanying notes are an integral part of these financial statements.
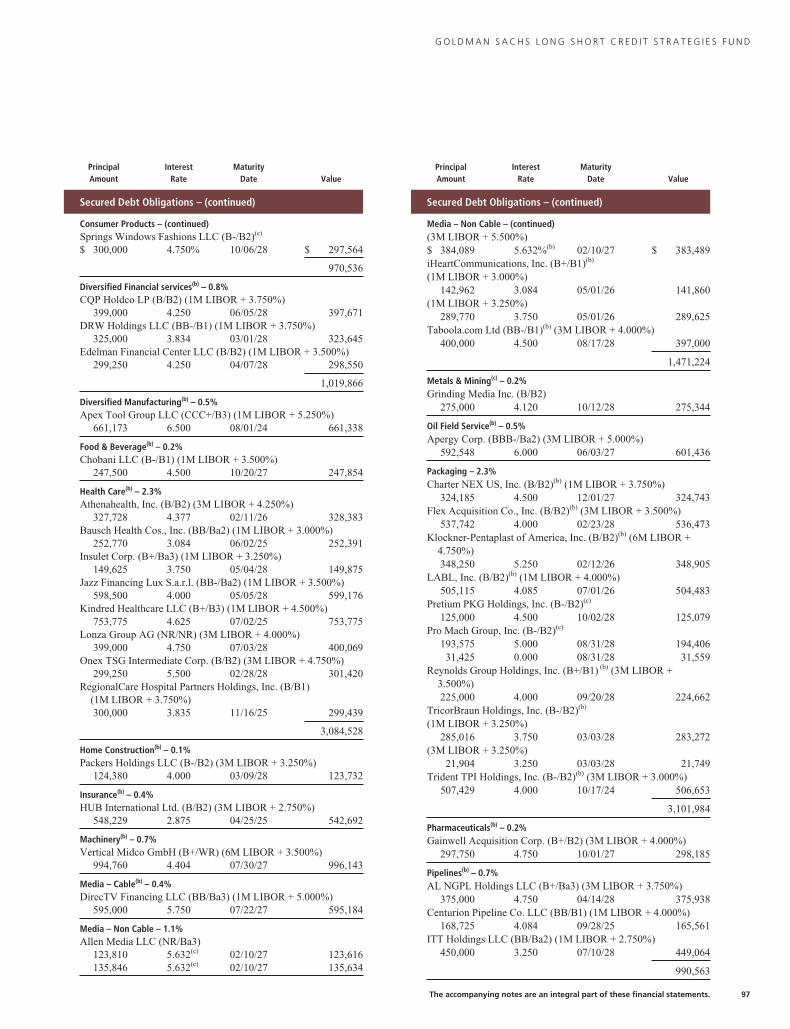
G O L D M A N S A C H S L O N G S H O R T C R E D I T S T R A T E G I E S F U N D
PrincipalAmount
InterestRate
MaturityDate Value
Secured Debt Obligations – (continued)
Consumer Products – (continued)Springs Windows Fashions LLC (B-/B2)(c)
$ 300,000 4.750% 10/06/28 $ 297,564
970,536
Diversified Financial services(b) – 0.8%CQP Holdco LP (B/B2) (1M LIBOR + 3.750%)
399,000 4.250 06/05/28 397,671DRW Holdings LLC (BB-/B1) (1M LIBOR + 3.750%)
325,000 3.834 03/01/28 323,645Edelman Financial Center LLC (B/B2) (1M LIBOR + 3.500%)
299,250 4.250 04/07/28 298,550
1,019,866
Diversified Manufacturing(b) – 0.5%Apex Tool Group LLC (CCC+/B3) (1M LIBOR + 5.250%)
661,173 6.500 08/01/24 661,338
Food & Beverage(b) – 0.2%Chobani LLC (B-/B1) (1M LIBOR + 3.500%)
247,500 4.500 10/20/27 247,854
Health Care(b) – 2.3%Athenahealth, Inc. (B/B2) (3M LIBOR + 4.250%)
327,728 4.377 02/11/26 328,383Bausch Health Cos., Inc. (BB/Ba2) (1M LIBOR + 3.000%)
252,770 3.084 06/02/25 252,391Insulet Corp. (B+/Ba3) (1M LIBOR + 3.250%)
149,625 3.750 05/04/28 149,875Jazz Financing Lux S.a.r.l. (BB-/Ba2) (1M LIBOR + 3.500%)
598,500 4.000 05/05/28 599,176Kindred Healthcare LLC (B+/B3) (1M LIBOR + 4.500%)
753,775 4.625 07/02/25 753,775Lonza Group AG (NR/NR) (3M LIBOR + 4.000%)
399,000 4.750 07/03/28 400,069Onex TSG Intermediate Corp. (B/B2) (3M LIBOR + 4.750%)
299,250 5.500 02/28/28 301,420RegionalCare Hospital Partners Holdings, Inc. (B/B1)
(1M LIBOR + 3.750%)300,000 3.835 11/16/25 299,439
3,084,528
Home Construction(b) – 0.1%Packers Holdings LLC (B-/B2) (3M LIBOR + 3.250%)
124,380 4.000 03/09/28 123,732
Insurance(b) – 0.4%HUB International Ltd. (B/B2) (3M LIBOR + 2.750%)
548,229 2.875 04/25/25 542,692
Machinery(b) – 0.7%Vertical Midco GmbH (B+/WR) (6M LIBOR + 3.500%)
994,760 4.404 07/30/27 996,143
Media – Cable(b) – 0.4%DirecTV Financing LLC (BB/Ba3) (1M LIBOR + 5.000%)
595,000 5.750 07/22/27 595,184
Media – Non Cable – 1.1%Allen Media LLC (NR/Ba3)
123,810 5.632(c) 02/10/27 123,616135,846 5.632(c) 02/10/27 135,634
PrincipalAmount
InterestRate
MaturityDate Value
Secured Debt Obligations – (continued)
Media – Non Cable – (continued)(3M LIBOR + 5.500%)$ 384,089 5.632%(b) 02/10/27 $ 383,489iHeartCommunications, Inc. (B+/B1)(b)
(1M LIBOR + 3.000%)142,962 3.084 05/01/26 141,860
(1M LIBOR + 3.250%)289,770 3.750 05/01/26 289,625
Taboola.com Ltd (BB-/B1)(b) (3M LIBOR + 4.000%)400,000 4.500 08/17/28 397,000
1,471,224
Metals & Mining(c) – 0.2%Grinding Media Inc. (B/B2)
275,000 4.120 10/12/28 275,344
Oil Field Service(b) – 0.5%Apergy Corp. (BBB-/Ba2) (3M LIBOR + 5.000%)
592,548 6.000 06/03/27 601,436
Packaging – 2.3%Charter NEX US, Inc. (B/B2)(b) (1M LIBOR + 3.750%)
324,185 4.500 12/01/27 324,743Flex Acquisition Co., Inc. (B/B2)(b) (3M LIBOR + 3.500%)
537,742 4.000 02/23/28 536,473Klockner-Pentaplast of America, Inc. (B/B2)(b) (6M LIBOR +
4.750%)348,250 5.250 02/12/26 348,905
LABL, Inc. (B/B2)(b) (1M LIBOR + 4.000%)505,115 4.085 07/01/26 504,483
Pretium PKG Holdings, Inc. (B-/B2)(c)
125,000 4.500 10/02/28 125,079Pro Mach Group, Inc. (B-/B2)(c)
193,575 5.000 08/31/28 194,40631,425 0.000 08/31/28 31,559
Reynolds Group Holdings, Inc. (B+/B1) (b) (3M LIBOR +3.500%)225,000 4.000 09/20/28 224,662
TricorBraun Holdings, Inc. (B-/B2)(b)
(1M LIBOR + 3.250%)285,016 3.750 03/03/28 283,272
(3M LIBOR + 3.250%)21,904 3.250 03/03/28 21,749
Trident TPI Holdings, Inc. (B-/B2)(b) (3M LIBOR + 3.000%)507,429 4.000 10/17/24 506,653
3,101,984
Pharmaceuticals(b) – 0.2%Gainwell Acquisition Corp. (B+/B2) (3M LIBOR + 4.000%)
297,750 4.750 10/01/27 298,185
Pipelines(b) – 0.7%AL NGPL Holdings LLC (B+/Ba3) (3M LIBOR + 3.750%)
375,000 4.750 04/14/28 375,938Centurion Pipeline Co. LLC (BB/B1) (1M LIBOR + 4.000%)
168,725 4.084 09/28/25 165,561ITT Holdings LLC (BB/Ba2) (1M LIBOR + 2.750%)
450,000 3.250 07/10/28 449,064
990,563
The accompanying notes are an integral part of these financial statements. 97
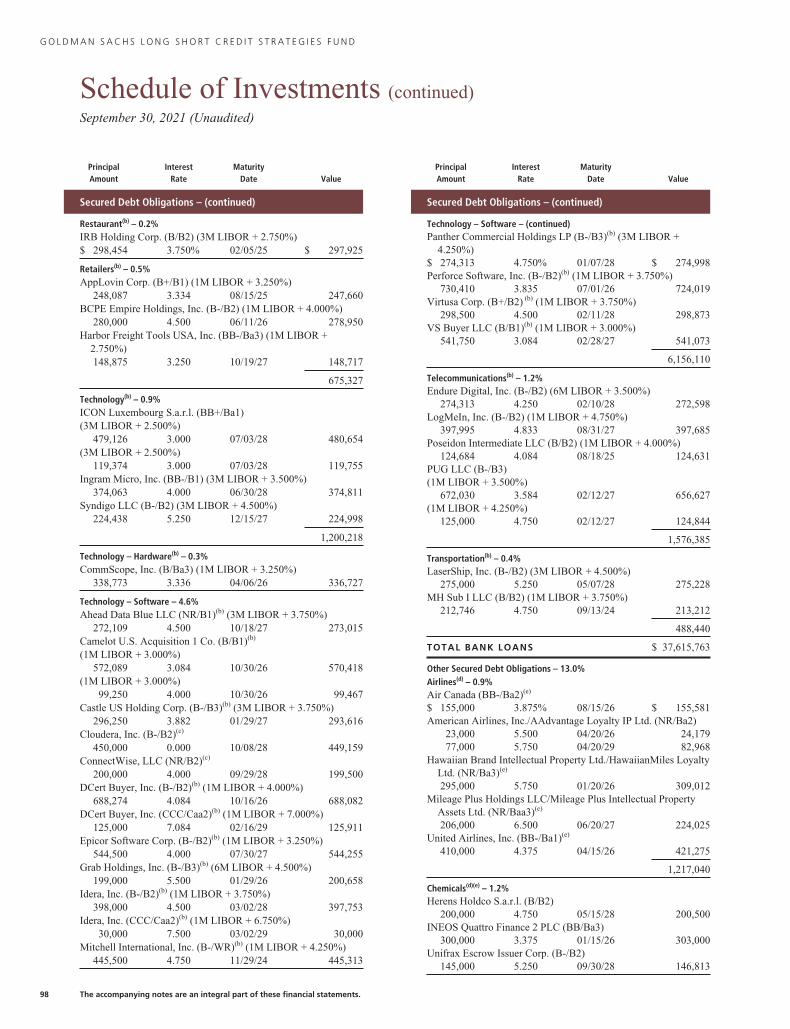
G O L D M A N S A C H S L O N G S H O R T C R E D I T S T R A T E G I E S F U N D
Schedule of Investments (continued)September 30, 2021 (Unaudited)
PrincipalAmount
InterestRate
MaturityDate Value
Secured Debt Obligations – (continued)
Restaurant(b) – 0.2%IRB Holding Corp. (B/B2) (3M LIBOR + 2.750%)$ 298,454 3.750% 02/05/25 $ 297,925
Retailers(b) – 0.5%AppLovin Corp. (B+/B1) (1M LIBOR + 3.250%)
248,087 3.334 08/15/25 247,660BCPE Empire Holdings, Inc. (B-/B2) (1M LIBOR + 4.000%)
280,000 4.500 06/11/26 278,950Harbor Freight Tools USA, Inc. (BB-/Ba3) (1M LIBOR +
2.750%)148,875 3.250 10/19/27 148,717
675,327
Technology(b) – 0.9%ICON Luxembourg S.a.r.l. (BB+/Ba1)(3M LIBOR + 2.500%)
479,126 3.000 07/03/28 480,654(3M LIBOR + 2.500%)
119,374 3.000 07/03/28 119,755Ingram Micro, Inc. (BB-/B1) (3M LIBOR + 3.500%)
374,063 4.000 06/30/28 374,811Syndigo LLC (B-/B2) (3M LIBOR + 4.500%)
224,438 5.250 12/15/27 224,998
1,200,218
Technology – Hardware(b) – 0.3%CommScope, Inc. (B/Ba3) (1M LIBOR + 3.250%)
338,773 3.336 04/06/26 336,727
Technology – Software – 4.6%Ahead Data Blue LLC (NR/B1)(b) (3M LIBOR + 3.750%)
272,109 4.500 10/18/27 273,015Camelot U.S. Acquisition 1 Co. (B/B1)(b)
(1M LIBOR + 3.000%)572,089 3.084 10/30/26 570,418
(1M LIBOR + 3.000%)99,250 4.000 10/30/26 99,467
Castle US Holding Corp. (B-/B3)(b) (3M LIBOR + 3.750%)296,250 3.882 01/29/27 293,616
Cloudera, Inc. (B-/B2)(c)
450,000 0.000 10/08/28 449,159ConnectWise, LLC (NR/B2)(c)
200,000 4.000 09/29/28 199,500DCert Buyer, Inc. (B-/B2)(b) (1M LIBOR + 4.000%)
688,274 4.084 10/16/26 688,082DCert Buyer, Inc. (CCC/Caa2)(b) (1M LIBOR + 7.000%)
125,000 7.084 02/16/29 125,911Epicor Software Corp. (B-/B2)(b) (1M LIBOR + 3.250%)
544,500 4.000 07/30/27 544,255Grab Holdings, Inc. (B-/B3)(b) (6M LIBOR + 4.500%)
199,000 5.500 01/29/26 200,658Idera, Inc. (B-/B2)(b) (1M LIBOR + 3.750%)
398,000 4.500 03/02/28 397,753Idera, Inc. (CCC/Caa2)(b) (1M LIBOR + 6.750%)
30,000 7.500 03/02/29 30,000Mitchell International, Inc. (B-/WR)(b) (1M LIBOR + 4.250%)
445,500 4.750 11/29/24 445,313
PrincipalAmount
InterestRate
MaturityDate Value
Secured Debt Obligations – (continued)
Technology – Software – (continued)Panther Commercial Holdings LP (B-/B3)(b) (3M LIBOR +
4.250%)$ 274,313 4.750% 01/07/28 $ 274,998Perforce Software, Inc. (B-/B2)(b) (1M LIBOR + 3.750%)
730,410 3.835 07/01/26 724,019Virtusa Corp. (B+/B2) (b) (1M LIBOR + 3.750%)
298,500 4.500 02/11/28 298,873VS Buyer LLC (B/B1)(b) (1M LIBOR + 3.000%)
541,750 3.084 02/28/27 541,073
6,156,110
Telecommunications(b) – 1.2%Endure Digital, Inc. (B-/B2) (6M LIBOR + 3.500%)
274,313 4.250 02/10/28 272,598LogMeIn, Inc. (B-/B2) (1M LIBOR + 4.750%)
397,995 4.833 08/31/27 397,685Poseidon Intermediate LLC (B/B2) (1M LIBOR + 4.000%)
124,684 4.084 08/18/25 124,631PUG LLC (B-/B3)(1M LIBOR + 3.500%)
672,030 3.584 02/12/27 656,627(1M LIBOR + 4.250%)
125,000 4.750 02/12/27 124,844
1,576,385
Transportation(b) – 0.4%LaserShip, Inc. (B-/B2) (3M LIBOR + 4.500%)
275,000 5.250 05/07/28 275,228MH Sub I LLC (B/B2) (1M LIBOR + 3.750%)
212,746 4.750 09/13/24 213,212
488,440
TOTAL BANK LOANS $ 37,615,763
Other Secured Debt Obligations – 13.0%Airlines(d) – 0.9%Air Canada (BB-/Ba2)(e)
$ 155,000 3.875% 08/15/26 $ 155,581American Airlines, Inc./AAdvantage Loyalty IP Ltd. (NR/Ba2)
23,000 5.500 04/20/26 24,17977,000 5.750 04/20/29 82,968
Hawaiian Brand Intellectual Property Ltd./HawaiianMiles LoyaltyLtd. (NR/Ba3)(e)
295,000 5.750 01/20/26 309,012Mileage Plus Holdings LLC/Mileage Plus Intellectual Property
Assets Ltd. (NR/Baa3)(e)
206,000 6.500 06/20/27 224,025United Airlines, Inc. (BB-/Ba1)(e)
410,000 4.375 04/15/26 421,275
1,217,040
Chemicals(d)(e) – 1.2%Herens Holdco S.a.r.l. (B/B2)
200,000 4.750 05/15/28 200,500INEOS Quattro Finance 2 PLC (BB/Ba3)
300,000 3.375 01/15/26 303,000Unifrax Escrow Issuer Corp. (B-/B2)
145,000 5.250 09/30/28 146,813
98 The accompanying notes are an integral part of these financial statements.
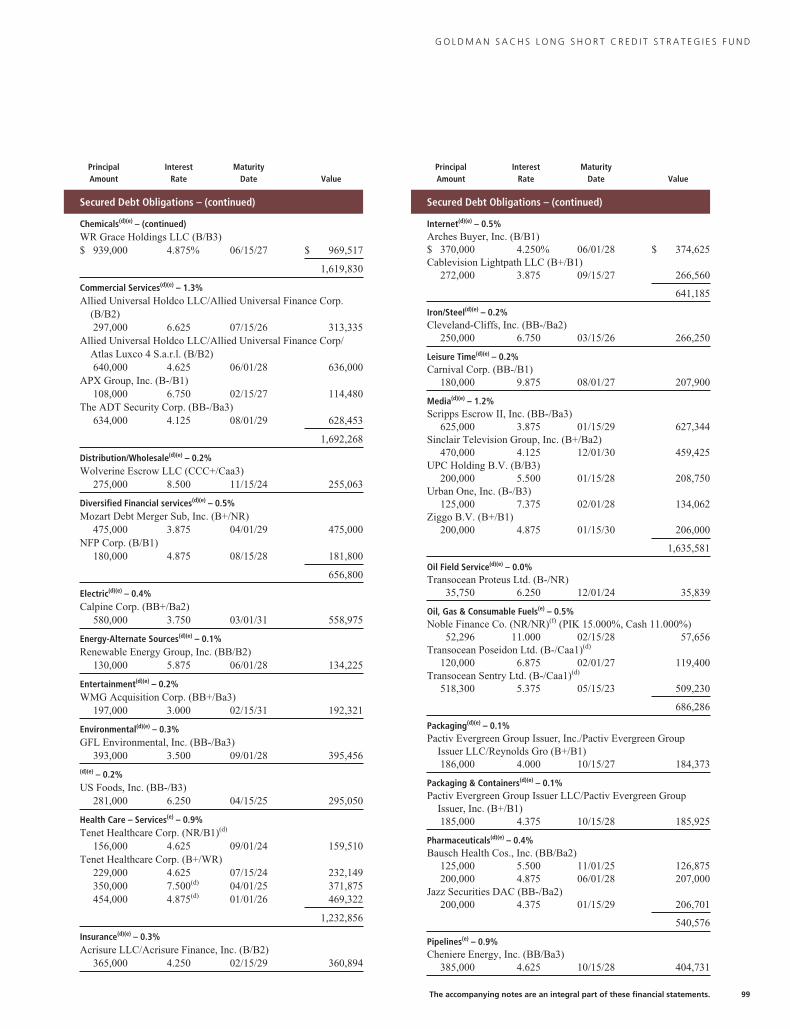
G O L D M A N S A C H S L O N G S H O R T C R E D I T S T R A T E G I E S F U N D
PrincipalAmount
InterestRate
MaturityDate Value
Secured Debt Obligations – (continued)
Chemicals(d)(e) – (continued)WR Grace Holdings LLC (B/B3)$ 939,000 4.875% 06/15/27 $ 969,517
1,619,830
Commercial Services(d)(e) – 1.3%Allied Universal Holdco LLC/Allied Universal Finance Corp.
(B/B2)297,000 6.625 07/15/26 313,335
Allied Universal Holdco LLC/Allied Universal Finance Corp/Atlas Luxco 4 S.a.r.l. (B/B2)640,000 4.625 06/01/28 636,000
APX Group, Inc. (B-/B1)108,000 6.750 02/15/27 114,480
The ADT Security Corp. (BB-/Ba3)634,000 4.125 08/01/29 628,453
1,692,268
Distribution/Wholesale(d)(e) – 0.2%Wolverine Escrow LLC (CCC+/Caa3)
275,000 8.500 11/15/24 255,063
Diversified Financial services(d)(e) – 0.5%Mozart Debt Merger Sub, Inc. (B+/NR)
475,000 3.875 04/01/29 475,000NFP Corp. (B/B1)
180,000 4.875 08/15/28 181,800
656,800
Electric(d)(e) – 0.4%Calpine Corp. (BB+/Ba2)
580,000 3.750 03/01/31 558,975
Energy-Alternate Sources(d)(e) – 0.1%Renewable Energy Group, Inc. (BB/B2)
130,000 5.875 06/01/28 134,225
Entertainment(d)(e) – 0.2%WMG Acquisition Corp. (BB+/Ba3)
197,000 3.000 02/15/31 192,321
Environmental(d)(e) – 0.3%GFL Environmental, Inc. (BB-/Ba3)
393,000 3.500 09/01/28 395,456(d)(e) – 0.2%US Foods, Inc. (BB-/B3)
281,000 6.250 04/15/25 295,050
Health Care – Services(e) – 0.9%Tenet Healthcare Corp. (NR/B1)(d)
156,000 4.625 09/01/24 159,510Tenet Healthcare Corp. (B+/WR)
229,000 4.625 07/15/24 232,149350,000 7.500(d) 04/01/25 371,875454,000 4.875(d) 01/01/26 469,322
1,232,856
Insurance(d)(e) – 0.3%Acrisure LLC/Acrisure Finance, Inc. (B/B2)
365,000 4.250 02/15/29 360,894
PrincipalAmount
InterestRate
MaturityDate Value
Secured Debt Obligations – (continued)
Internet(d)(e) – 0.5%Arches Buyer, Inc. (B/B1)$ 370,000 4.250% 06/01/28 $ 374,625Cablevision Lightpath LLC (B+/B1)
272,000 3.875 09/15/27 266,560
641,185
Iron/Steel(d)(e) – 0.2%Cleveland-Cliffs, Inc. (BB-/Ba2)
250,000 6.750 03/15/26 266,250
Leisure Time(d)(e) – 0.2%Carnival Corp. (BB-/B1)
180,000 9.875 08/01/27 207,900
Media(d)(e) – 1.2%Scripps Escrow II, Inc. (BB-/Ba3)
625,000 3.875 01/15/29 627,344Sinclair Television Group, Inc. (B+/Ba2)
470,000 4.125 12/01/30 459,425UPC Holding B.V. (B/B3)
200,000 5.500 01/15/28 208,750Urban One, Inc. (B-/B3)
125,000 7.375 02/01/28 134,062Ziggo B.V. (B+/B1)
200,000 4.875 01/15/30 206,000
1,635,581
Oil Field Service(d)(e) – 0.0%Transocean Proteus Ltd. (B-/NR)
35,750 6.250 12/01/24 35,839
Oil, Gas & Consumable Fuels(e) – 0.5%Noble Finance Co. (NR/NR)(f) (PIK 15.000%, Cash 11.000%)
52,296 11.000 02/15/28 57,656Transocean Poseidon Ltd. (B-/Caa1)(d)
120,000 6.875 02/01/27 119,400Transocean Sentry Ltd. (B-/Caa1)(d)
518,300 5.375 05/15/23 509,230
686,286
Packaging(d)(e) – 0.1%Pactiv Evergreen Group Issuer, Inc./Pactiv Evergreen Group
Issuer LLC/Reynolds Gro (B+/B1)186,000 4.000 10/15/27 184,373
Packaging & Containers(d)(e) – 0.1%Pactiv Evergreen Group Issuer LLC/Pactiv Evergreen Group
Issuer, Inc. (B+/B1)185,000 4.375 10/15/28 185,925
Pharmaceuticals(d)(e) – 0.4%Bausch Health Cos., Inc. (BB/Ba2)
125,000 5.500 11/01/25 126,875200,000 4.875 06/01/28 207,000
Jazz Securities DAC (BB-/Ba2)200,000 4.375 01/15/29 206,701
540,576
Pipelines(e) – 0.9%Cheniere Energy, Inc. (BB/Ba3)
385,000 4.625 10/15/28 404,731
The accompanying notes are an integral part of these financial statements. 99
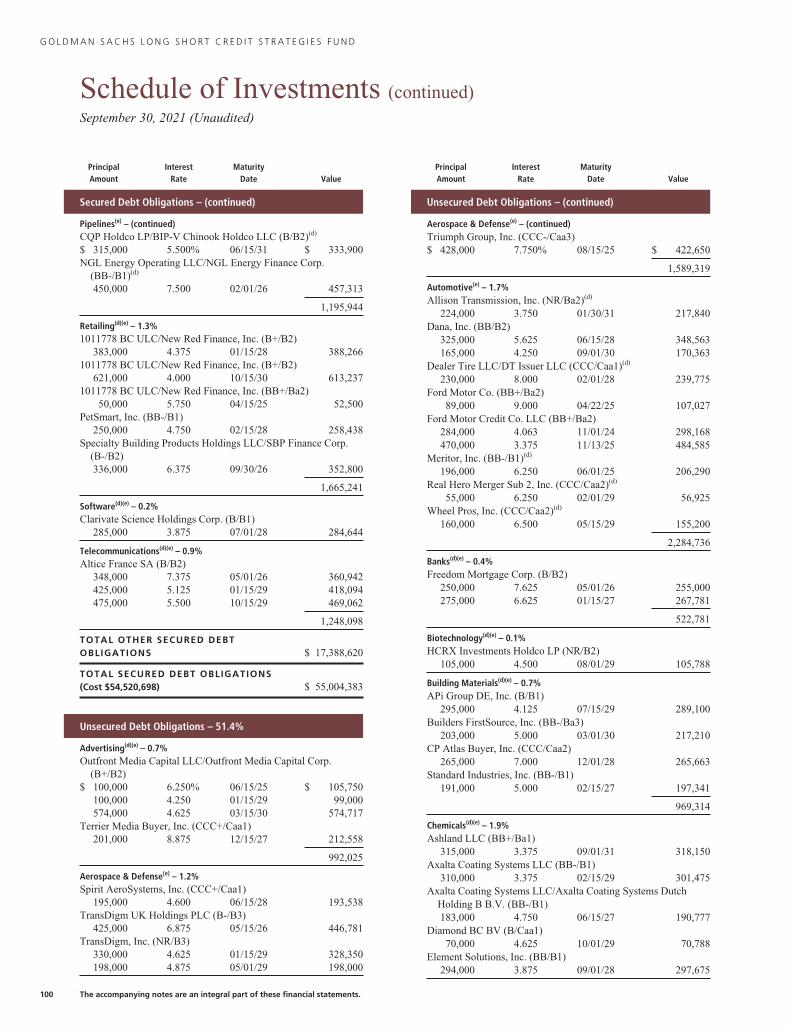
G O L D M A N S A C H S L O N G S H O R T C R E D I T S T R A T E G I E S F U N D
Schedule of Investments (continued)September 30, 2021 (Unaudited)
PrincipalAmount
InterestRate
MaturityDate Value
Secured Debt Obligations – (continued)
Pipelines(e) – (continued)CQP Holdco LP/BIP-V Chinook Holdco LLC (B/B2)(d)
$ 315,000 5.500% 06/15/31 $ 333,900NGL Energy Operating LLC/NGL Energy Finance Corp.
(BB-/B1)(d)
450,000 7.500 02/01/26 457,313
1,195,944
Retailing(d)(e) – 1.3%1011778 BC ULC/New Red Finance, Inc. (B+/B2)
383,000 4.375 01/15/28 388,2661011778 BC ULC/New Red Finance, Inc. (B+/B2)
621,000 4.000 10/15/30 613,2371011778 BC ULC/New Red Finance, Inc. (BB+/Ba2)
50,000 5.750 04/15/25 52,500PetSmart, Inc. (BB-/B1)
250,000 4.750 02/15/28 258,438Specialty Building Products Holdings LLC/SBP Finance Corp.
(B-/B2)336,000 6.375 09/30/26 352,800
1,665,241
Software(d)(e) – 0.2%Clarivate Science Holdings Corp. (B/B1)
285,000 3.875 07/01/28 284,644
Telecommunications(d)(e) – 0.9%Altice France SA (B/B2)
348,000 7.375 05/01/26 360,942425,000 5.125 01/15/29 418,094475,000 5.500 10/15/29 469,062
1,248,098
TOTAL OTHER SECURED DEBTOBLIGATIONS $ 17,388,620
TOTAL SECURED DEBT OBLIGATIONS(Cost $54,520,698) $ 55,004,383
Unsecured Debt Obligations – 51.4%
Advertising(d)(e) – 0.7%Outfront Media Capital LLC/Outfront Media Capital Corp.
(B+/B2)$ 100,000 6.250% 06/15/25 $ 105,750
100,000 4.250 01/15/29 99,000574,000 4.625 03/15/30 574,717
Terrier Media Buyer, Inc. (CCC+/Caa1)201,000 8.875 12/15/27 212,558
992,025
Aerospace & Defense(e) – 1.2%Spirit AeroSystems, Inc. (CCC+/Caa1)
195,000 4.600 06/15/28 193,538TransDigm UK Holdings PLC (B-/B3)
425,000 6.875 05/15/26 446,781TransDigm, Inc. (NR/B3)
330,000 4.625 01/15/29 328,350198,000 4.875 05/01/29 198,000
PrincipalAmount
InterestRate
MaturityDate Value
Unsecured Debt Obligations – (continued)
Aerospace & Defense(e) – (continued)Triumph Group, Inc. (CCC-/Caa3)$ 428,000 7.750% 08/15/25 $ 422,650
1,589,319
Automotive(e) – 1.7%Allison Transmission, Inc. (NR/Ba2)(d)
224,000 3.750 01/30/31 217,840Dana, Inc. (BB/B2)
325,000 5.625 06/15/28 348,563165,000 4.250 09/01/30 170,363
Dealer Tire LLC/DT Issuer LLC (CCC/Caa1)(d)
230,000 8.000 02/01/28 239,775Ford Motor Co. (BB+/Ba2)
89,000 9.000 04/22/25 107,027Ford Motor Credit Co. LLC (BB+/Ba2)
284,000 4.063 11/01/24 298,168470,000 3.375 11/13/25 484,585
Meritor, Inc. (BB-/B1)(d)
196,000 6.250 06/01/25 206,290Real Hero Merger Sub 2, Inc. (CCC/Caa2)(d)
55,000 6.250 02/01/29 56,925Wheel Pros, Inc. (CCC/Caa2)(d)
160,000 6.500 05/15/29 155,200
2,284,736
Banks(d)(e) – 0.4%Freedom Mortgage Corp. (B/B2)
250,000 7.625 05/01/26 255,000275,000 6.625 01/15/27 267,781
522,781
Biotechnology(d)(e) – 0.1%HCRX Investments Holdco LP (NR/B2)
105,000 4.500 08/01/29 105,788
Building Materials(d)(e) – 0.7%APi Group DE, Inc. (B/B1)
295,000 4.125 07/15/29 289,100Builders FirstSource, Inc. (BB-/Ba3)
203,000 5.000 03/01/30 217,210CP Atlas Buyer, Inc. (CCC/Caa2)
265,000 7.000 12/01/28 265,663Standard Industries, Inc. (BB-/B1)
191,000 5.000 02/15/27 197,341
969,314
Chemicals(d)(e) – 1.9%Ashland LLC (BB+/Ba1)
315,000 3.375 09/01/31 318,150Axalta Coating Systems LLC (BB-/B1)
310,000 3.375 02/15/29 301,475Axalta Coating Systems LLC/Axalta Coating Systems Dutch
Holding B B.V. (BB-/B1)183,000 4.750 06/15/27 190,777
Diamond BC BV (B/Caa1)70,000 4.625 10/01/29 70,788
Element Solutions, Inc. (BB/B1)294,000 3.875 09/01/28 297,675
100 The accompanying notes are an integral part of these financial statements.
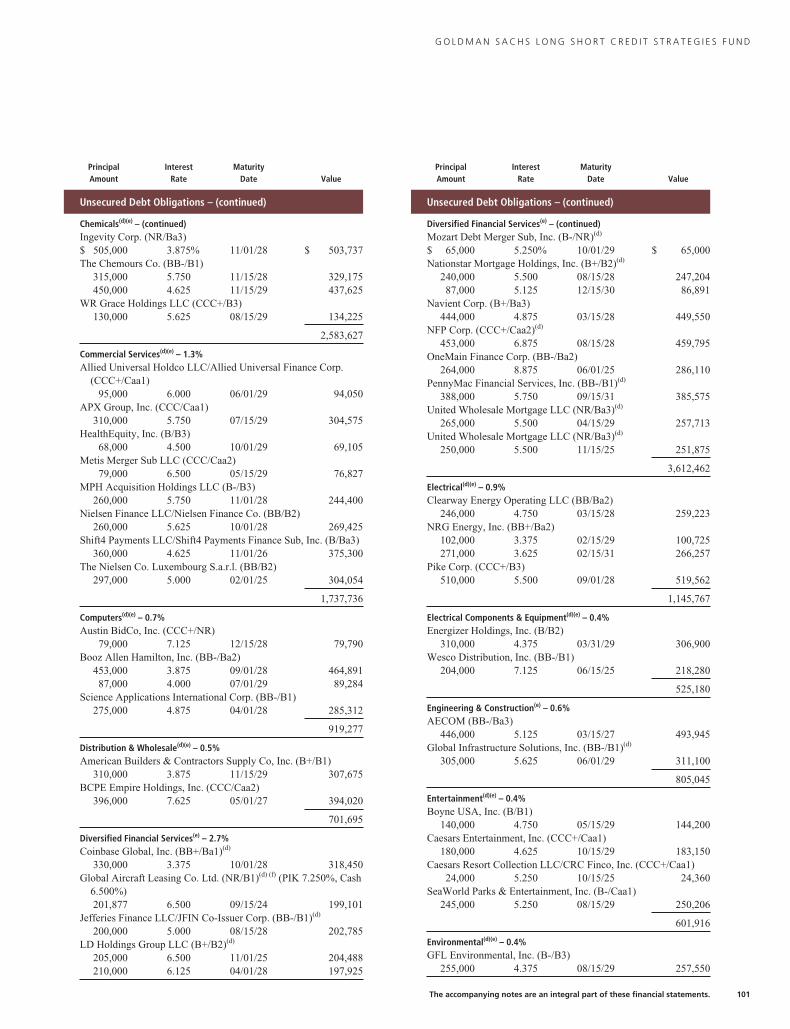
G O L D M A N S A C H S L O N G S H O R T C R E D I T S T R A T E G I E S F U N D
PrincipalAmount
InterestRate
MaturityDate Value
Unsecured Debt Obligations – (continued)
Chemicals(d)(e) – (continued)Ingevity Corp. (NR/Ba3)$ 505,000 3.875% 11/01/28 $ 503,737The Chemours Co. (BB-/B1)
315,000 5.750 11/15/28 329,175450,000 4.625 11/15/29 437,625
WR Grace Holdings LLC (CCC+/B3)130,000 5.625 08/15/29 134,225
2,583,627
Commercial Services(d)(e) – 1.3%Allied Universal Holdco LLC/Allied Universal Finance Corp.
(CCC+/Caa1)95,000 6.000 06/01/29 94,050
APX Group, Inc. (CCC/Caa1)310,000 5.750 07/15/29 304,575
HealthEquity, Inc. (B/B3)68,000 4.500 10/01/29 69,105
Metis Merger Sub LLC (CCC/Caa2)79,000 6.500 05/15/29 76,827
MPH Acquisition Holdings LLC (B-/B3)260,000 5.750 11/01/28 244,400
Nielsen Finance LLC/Nielsen Finance Co. (BB/B2)260,000 5.625 10/01/28 269,425
Shift4 Payments LLC/Shift4 Payments Finance Sub, Inc. (B/Ba3)360,000 4.625 11/01/26 375,300
The Nielsen Co. Luxembourg S.a.r.l. (BB/B2)297,000 5.000 02/01/25 304,054
1,737,736
Computers(d)(e) – 0.7%Austin BidCo, Inc. (CCC+/NR)
79,000 7.125 12/15/28 79,790Booz Allen Hamilton, Inc. (BB-/Ba2)
453,000 3.875 09/01/28 464,89187,000 4.000 07/01/29 89,284
Science Applications International Corp. (BB-/B1)275,000 4.875 04/01/28 285,312
919,277
Distribution & Wholesale(d)(e) – 0.5%American Builders & Contractors Supply Co, Inc. (B+/B1)
310,000 3.875 11/15/29 307,675BCPE Empire Holdings, Inc. (CCC/Caa2)
396,000 7.625 05/01/27 394,020
701,695
Diversified Financial Services(e) – 2.7%Coinbase Global, Inc. (BB+/Ba1)(d)
330,000 3.375 10/01/28 318,450Global Aircraft Leasing Co. Ltd. (NR/B1)(d) (f) (PIK 7.250%, Cash
6.500%)201,877 6.500 09/15/24 199,101
Jefferies Finance LLC/JFIN Co-Issuer Corp. (BB-/B1)(d)
200,000 5.000 08/15/28 202,785LD Holdings Group LLC (B+/B2)(d)
205,000 6.500 11/01/25 204,488210,000 6.125 04/01/28 197,925
PrincipalAmount
InterestRate
MaturityDate Value
Unsecured Debt Obligations – (continued)
Diversified Financial Services(e) – (continued)Mozart Debt Merger Sub, Inc. (B-/NR)(d)
$ 65,000 5.250% 10/01/29 $ 65,000Nationstar Mortgage Holdings, Inc. (B+/B2)(d)
240,000 5.500 08/15/28 247,20487,000 5.125 12/15/30 86,891
Navient Corp. (B+/Ba3)444,000 4.875 03/15/28 449,550
NFP Corp. (CCC+/Caa2)(d)
453,000 6.875 08/15/28 459,795OneMain Finance Corp. (BB-/Ba2)
264,000 8.875 06/01/25 286,110PennyMac Financial Services, Inc. (BB-/B1)(d)
388,000 5.750 09/15/31 385,575United Wholesale Mortgage LLC (NR/Ba3)(d)
265,000 5.500 04/15/29 257,713United Wholesale Mortgage LLC (NR/Ba3)(d)
250,000 5.500 11/15/25 251,875
3,612,462
Electrical(d)(e) – 0.9%Clearway Energy Operating LLC (BB/Ba2)
246,000 4.750 03/15/28 259,223NRG Energy, Inc. (BB+/Ba2)
102,000 3.375 02/15/29 100,725271,000 3.625 02/15/31 266,257
Pike Corp. (CCC+/B3)510,000 5.500 09/01/28 519,562
1,145,767
Electrical Components & Equipment(d)(e) – 0.4%Energizer Holdings, Inc. (B/B2)
310,000 4.375 03/31/29 306,900Wesco Distribution, Inc. (BB-/B1)
204,000 7.125 06/15/25 218,280
525,180
Engineering & Construction(e) – 0.6%AECOM (BB-/Ba3)
446,000 5.125 03/15/27 493,945Global Infrastructure Solutions, Inc. (BB-/B1)(d)
305,000 5.625 06/01/29 311,100
805,045
Entertainment(d)(e) – 0.4%Boyne USA, Inc. (B/B1)
140,000 4.750 05/15/29 144,200Caesars Entertainment, Inc. (CCC+/Caa1)
180,000 4.625 10/15/29 183,150Caesars Resort Collection LLC/CRC Finco, Inc. (CCC+/Caa1)
24,000 5.250 10/15/25 24,360SeaWorld Parks & Entertainment, Inc. (B-/Caa1)
245,000 5.250 08/15/29 250,206
601,916
Environmental(d)(e) – 0.4%GFL Environmental, Inc. (B-/B3)
255,000 4.375 08/15/29 257,550
The accompanying notes are an integral part of these financial statements. 101
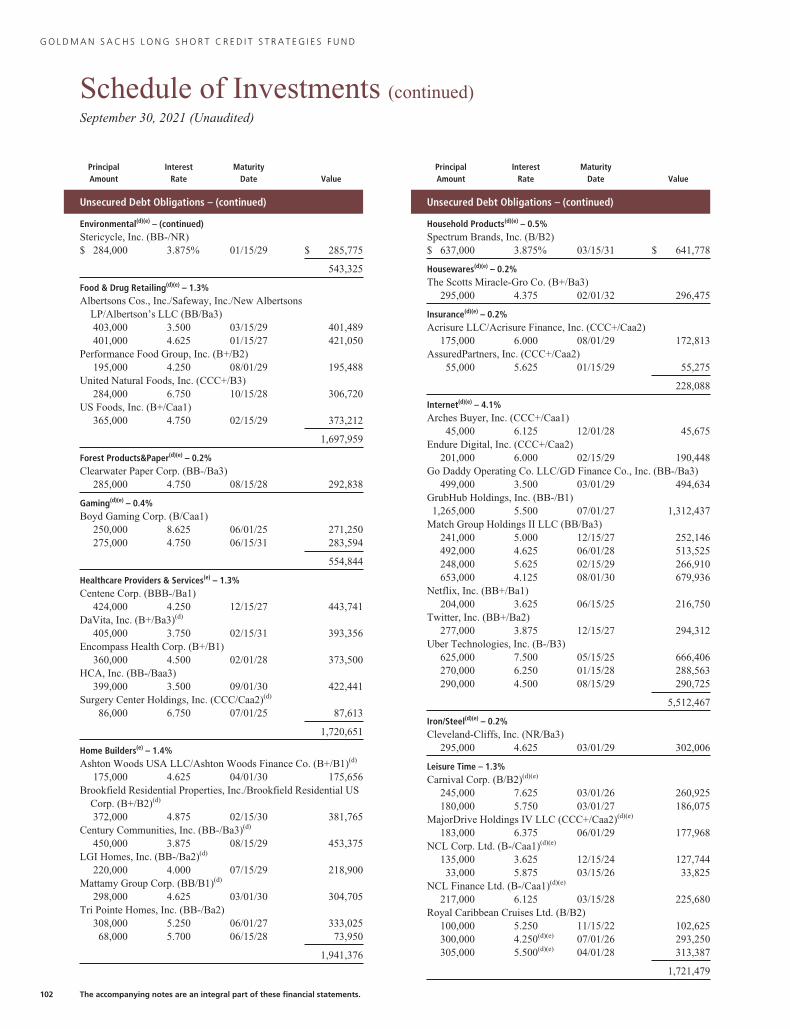
G O L D M A N S A C H S L O N G S H O R T C R E D I T S T R A T E G I E S F U N D
Schedule of Investments (continued)September 30, 2021 (Unaudited)
PrincipalAmount
InterestRate
MaturityDate Value
Unsecured Debt Obligations – (continued)
Environmental(d)(e) – (continued)Stericycle, Inc. (BB-/NR)$ 284,000 3.875% 01/15/29 $ 285,775
543,325
Food & Drug Retailing(d)(e) – 1.3%Albertsons Cos., Inc./Safeway, Inc./New Albertsons
LP/Albertson’s LLC (BB/Ba3)403,000 3.500 03/15/29 401,489401,000 4.625 01/15/27 421,050
Performance Food Group, Inc. (B+/B2)195,000 4.250 08/01/29 195,488
United Natural Foods, Inc. (CCC+/B3)284,000 6.750 10/15/28 306,720
US Foods, Inc. (B+/Caa1)365,000 4.750 02/15/29 373,212
1,697,959
Forest Products&Paper(d)(e) – 0.2%Clearwater Paper Corp. (BB-/Ba3)
285,000 4.750 08/15/28 292,838
Gaming(d)(e) – 0.4%Boyd Gaming Corp. (B/Caa1)
250,000 8.625 06/01/25 271,250275,000 4.750 06/15/31 283,594
554,844
Healthcare Providers & Services(e) – 1.3%Centene Corp. (BBB-/Ba1)
424,000 4.250 12/15/27 443,741DaVita, Inc. (B+/Ba3)(d)
405,000 3.750 02/15/31 393,356Encompass Health Corp. (B+/B1)
360,000 4.500 02/01/28 373,500HCA, Inc. (BB-/Baa3)
399,000 3.500 09/01/30 422,441Surgery Center Holdings, Inc. (CCC/Caa2)(d)
86,000 6.750 07/01/25 87,613
1,720,651
Home Builders(e) – 1.4%Ashton Woods USA LLC/Ashton Woods Finance Co. (B+/B1)(d)
175,000 4.625 04/01/30 175,656Brookfield Residential Properties, Inc./Brookfield Residential US
Corp. (B+/B2)(d)
372,000 4.875 02/15/30 381,765Century Communities, Inc. (BB-/Ba3)(d)
450,000 3.875 08/15/29 453,375LGI Homes, Inc. (BB-/Ba2)(d)
220,000 4.000 07/15/29 218,900Mattamy Group Corp. (BB/B1)(d)
298,000 4.625 03/01/30 304,705Tri Pointe Homes, Inc. (BB-/Ba2)
308,000 5.250 06/01/27 333,02568,000 5.700 06/15/28 73,950
1,941,376
PrincipalAmount
InterestRate
MaturityDate Value
Unsecured Debt Obligations – (continued)
Household Products(d)(e) – 0.5%Spectrum Brands, Inc. (B/B2)$ 637,000 3.875% 03/15/31 $ 641,778
Housewares(d)(e) – 0.2%The Scotts Miracle-Gro Co. (B+/Ba3)
295,000 4.375 02/01/32 296,475
Insurance(d)(e) – 0.2%Acrisure LLC/Acrisure Finance, Inc. (CCC+/Caa2)
175,000 6.000 08/01/29 172,813AssuredPartners, Inc. (CCC+/Caa2)
55,000 5.625 01/15/29 55,275
228,088
Internet(d)(e) – 4.1%Arches Buyer, Inc. (CCC+/Caa1)
45,000 6.125 12/01/28 45,675Endure Digital, Inc. (CCC+/Caa2)
201,000 6.000 02/15/29 190,448Go Daddy Operating Co. LLC/GD Finance Co., Inc. (BB-/Ba3)
499,000 3.500 03/01/29 494,634GrubHub Holdings, Inc. (BB-/B1)1,265,000 5.500 07/01/27 1,312,437
Match Group Holdings II LLC (BB/Ba3)241,000 5.000 12/15/27 252,146492,000 4.625 06/01/28 513,525248,000 5.625 02/15/29 266,910653,000 4.125 08/01/30 679,936
Netflix, Inc. (BB+/Ba1)204,000 3.625 06/15/25 216,750
Twitter, Inc. (BB+/Ba2)277,000 3.875 12/15/27 294,312
Uber Technologies, Inc. (B-/B3)625,000 7.500 05/15/25 666,406270,000 6.250 01/15/28 288,563290,000 4.500 08/15/29 290,725
5,512,467
Iron/Steel(d)(e) – 0.2%Cleveland-Cliffs, Inc. (NR/Ba3)
295,000 4.625 03/01/29 302,006
Leisure Time – 1.3%Carnival Corp. (B/B2)(d)(e)
245,000 7.625 03/01/26 260,925180,000 5.750 03/01/27 186,075
MajorDrive Holdings IV LLC (CCC+/Caa2)(d)(e)
183,000 6.375 06/01/29 177,968NCL Corp. Ltd. (B-/Caa1)(d)(e)
135,000 3.625 12/15/24 127,74433,000 5.875 03/15/26 33,825
NCL Finance Ltd. (B-/Caa1)(d)(e)
217,000 6.125 03/15/28 225,680Royal Caribbean Cruises Ltd. (B/B2)
100,000 5.250 11/15/22 102,625300,000 4.250(d)(e) 07/01/26 293,250305,000 5.500(d)(e) 04/01/28 313,387
1,721,479
102 The accompanying notes are an integral part of these financial statements.
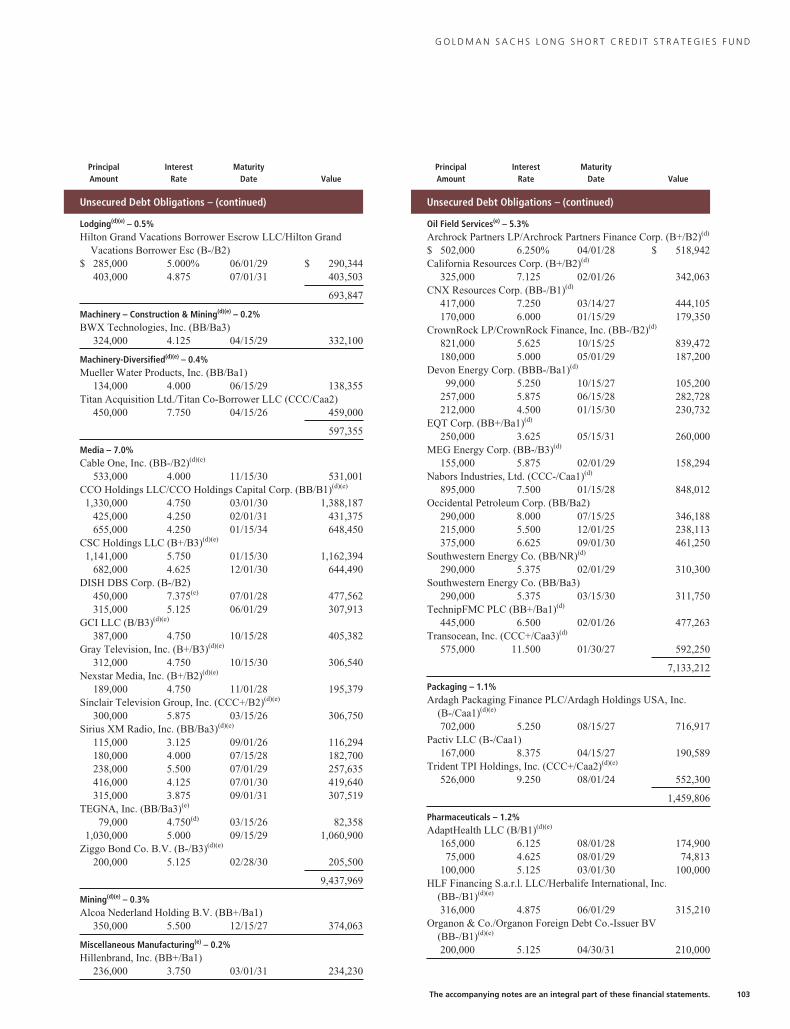
G O L D M A N S A C H S L O N G S H O R T C R E D I T S T R A T E G I E S F U N D
PrincipalAmount
InterestRate
MaturityDate Value
Unsecured Debt Obligations – (continued)
Lodging(d)(e) – 0.5%Hilton Grand Vacations Borrower Escrow LLC/Hilton Grand
Vacations Borrower Esc (B-/B2)$ 285,000 5.000% 06/01/29 $ 290,344
403,000 4.875 07/01/31 403,503
693,847
Machinery – Construction & Mining(d)(e) – 0.2%BWX Technologies, Inc. (BB/Ba3)
324,000 4.125 04/15/29 332,100
Machinery-Diversified(d)(e) – 0.4%Mueller Water Products, Inc. (BB/Ba1)
134,000 4.000 06/15/29 138,355Titan Acquisition Ltd./Titan Co-Borrower LLC (CCC/Caa2)
450,000 7.750 04/15/26 459,000
597,355
Media – 7.0%Cable One, Inc. (BB-/B2)(d)(e)
533,000 4.000 11/15/30 531,001CCO Holdings LLC/CCO Holdings Capital Corp. (BB/B1)(d)(e)
1,330,000 4.750 03/01/30 1,388,187425,000 4.250 02/01/31 431,375655,000 4.250 01/15/34 648,450
CSC Holdings LLC (B+/B3)(d)(e)
1,141,000 5.750 01/15/30 1,162,394682,000 4.625 12/01/30 644,490
DISH DBS Corp. (B-/B2)450,000 7.375(e) 07/01/28 477,562315,000 5.125 06/01/29 307,913
GCI LLC (B/B3)(d)(e)
387,000 4.750 10/15/28 405,382Gray Television, Inc. (B+/B3)(d)(e)
312,000 4.750 10/15/30 306,540Nexstar Media, Inc. (B+/B2)(d)(e)
189,000 4.750 11/01/28 195,379Sinclair Television Group, Inc. (CCC+/B2)(d)(e)
300,000 5.875 03/15/26 306,750Sirius XM Radio, Inc. (BB/Ba3)(d)(e)
115,000 3.125 09/01/26 116,294180,000 4.000 07/15/28 182,700238,000 5.500 07/01/29 257,635416,000 4.125 07/01/30 419,640315,000 3.875 09/01/31 307,519
TEGNA, Inc. (BB/Ba3)(e)
79,000 4.750(d) 03/15/26 82,3581,030,000 5.000 09/15/29 1,060,900
Ziggo Bond Co. B.V. (B-/B3)(d)(e)
200,000 5.125 02/28/30 205,500
9,437,969
Mining(d)(e) – 0.3%Alcoa Nederland Holding B.V. (BB+/Ba1)
350,000 5.500 12/15/27 374,063
Miscellaneous Manufacturing(e) – 0.2%Hillenbrand, Inc. (BB+/Ba1)
236,000 3.750 03/01/31 234,230
PrincipalAmount
InterestRate
MaturityDate Value
Unsecured Debt Obligations – (continued)
Oil Field Services(e) – 5.3%Archrock Partners LP/Archrock Partners Finance Corp. (B+/B2)(d)
$ 502,000 6.250% 04/01/28 $ 518,942California Resources Corp. (B+/B2)(d)
325,000 7.125 02/01/26 342,063CNX Resources Corp. (BB-/B1)(d)
417,000 7.250 03/14/27 444,105170,000 6.000 01/15/29 179,350
CrownRock LP/CrownRock Finance, Inc. (BB-/B2)(d)
821,000 5.625 10/15/25 839,472180,000 5.000 05/01/29 187,200
Devon Energy Corp. (BBB-/Ba1)(d)
99,000 5.250 10/15/27 105,200257,000 5.875 06/15/28 282,728212,000 4.500 01/15/30 230,732
EQT Corp. (BB+/Ba1)(d)
250,000 3.625 05/15/31 260,000MEG Energy Corp. (BB-/B3)(d)
155,000 5.875 02/01/29 158,294Nabors Industries, Ltd. (CCC-/Caa1)(d)
895,000 7.500 01/15/28 848,012Occidental Petroleum Corp. (BB/Ba2)
290,000 8.000 07/15/25 346,188215,000 5.500 12/01/25 238,113375,000 6.625 09/01/30 461,250
Southwestern Energy Co. (BB/NR)(d)
290,000 5.375 02/01/29 310,300Southwestern Energy Co. (BB/Ba3)
290,000 5.375 03/15/30 311,750TechnipFMC PLC (BB+/Ba1)(d)
445,000 6.500 02/01/26 477,263Transocean, Inc. (CCC+/Caa3)(d)
575,000 11.500 01/30/27 592,250
7,133,212
Packaging – 1.1%Ardagh Packaging Finance PLC/Ardagh Holdings USA, Inc.
(B-/Caa1)(d)(e)
702,000 5.250 08/15/27 716,917Pactiv LLC (B-/Caa1)
167,000 8.375 04/15/27 190,589Trident TPI Holdings, Inc. (CCC+/Caa2)(d)(e)
526,000 9.250 08/01/24 552,300
1,459,806
Pharmaceuticals – 1.2%AdaptHealth LLC (B/B1)(d)(e)
165,000 6.125 08/01/28 174,90075,000 4.625 08/01/29 74,813
100,000 5.125 03/01/30 100,000HLF Financing S.a.r.l. LLC/Herbalife International, Inc.
(BB-/B1)(d)(e)
316,000 4.875 06/01/29 315,210Organon & Co./Organon Foreign Debt Co.-Issuer BV
(BB-/B1)(d)(e)
200,000 5.125 04/30/31 210,000
The accompanying notes are an integral part of these financial statements. 103
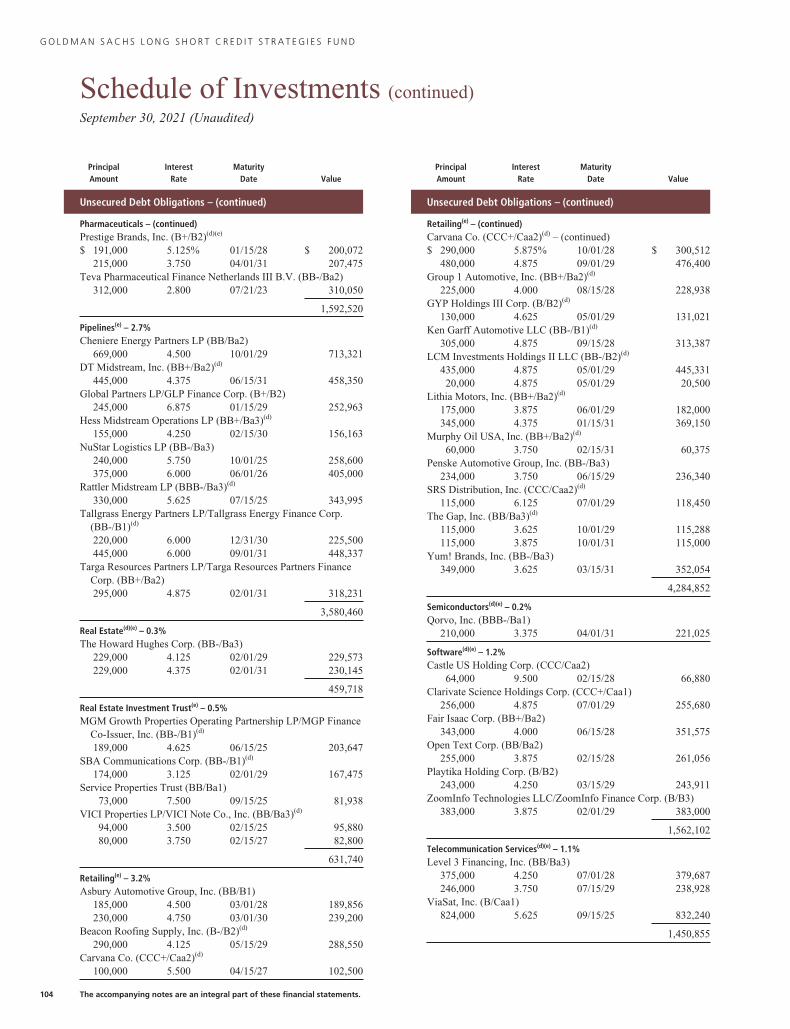
G O L D M A N S A C H S L O N G S H O R T C R E D I T S T R A T E G I E S F U N D
Schedule of Investments (continued)September 30, 2021 (Unaudited)
PrincipalAmount
InterestRate
MaturityDate Value
Unsecured Debt Obligations – (continued)
Pharmaceuticals – (continued)Prestige Brands, Inc. (B+/B2)(d)(e)
$ 191,000 5.125% 01/15/28 $ 200,072215,000 3.750 04/01/31 207,475
Teva Pharmaceutical Finance Netherlands III B.V. (BB-/Ba2)312,000 2.800 07/21/23 310,050
1,592,520
Pipelines(e) – 2.7%Cheniere Energy Partners LP (BB/Ba2)
669,000 4.500 10/01/29 713,321DT Midstream, Inc. (BB+/Ba2)(d)
445,000 4.375 06/15/31 458,350Global Partners LP/GLP Finance Corp. (B+/B2)
245,000 6.875 01/15/29 252,963Hess Midstream Operations LP (BB+/Ba3)(d)
155,000 4.250 02/15/30 156,163NuStar Logistics LP (BB-/Ba3)
240,000 5.750 10/01/25 258,600375,000 6.000 06/01/26 405,000
Rattler Midstream LP (BBB-/Ba3)(d)
330,000 5.625 07/15/25 343,995Tallgrass Energy Partners LP/Tallgrass Energy Finance Corp.
(BB-/B1)(d)
220,000 6.000 12/31/30 225,500445,000 6.000 09/01/31 448,337
Targa Resources Partners LP/Targa Resources Partners FinanceCorp. (BB+/Ba2)295,000 4.875 02/01/31 318,231
3,580,460
Real Estate(d)(e) – 0.3%The Howard Hughes Corp. (BB-/Ba3)
229,000 4.125 02/01/29 229,573229,000 4.375 02/01/31 230,145
459,718
Real Estate Investment Trust(e) – 0.5%MGM Growth Properties Operating Partnership LP/MGP Finance
Co-Issuer, Inc. (BB-/B1)(d)
189,000 4.625 06/15/25 203,647SBA Communications Corp. (BB-/B1)(d)
174,000 3.125 02/01/29 167,475Service Properties Trust (BB/Ba1)
73,000 7.500 09/15/25 81,938VICI Properties LP/VICI Note Co., Inc. (BB/Ba3)(d)
94,000 3.500 02/15/25 95,88080,000 3.750 02/15/27 82,800
631,740
Retailing(e) – 3.2%Asbury Automotive Group, Inc. (BB/B1)
185,000 4.500 03/01/28 189,856230,000 4.750 03/01/30 239,200
Beacon Roofing Supply, Inc. (B-/B2)(d)
290,000 4.125 05/15/29 288,550Carvana Co. (CCC+/Caa2)(d)
100,000 5.500 04/15/27 102,500
PrincipalAmount
InterestRate
MaturityDate Value
Unsecured Debt Obligations – (continued)
Retailing(e) – (continued)Carvana Co. (CCC+/Caa2)(d) – (continued)$ 290,000 5.875% 10/01/28 $ 300,512
480,000 4.875 09/01/29 476,400Group 1 Automotive, Inc. (BB+/Ba2)(d)
225,000 4.000 08/15/28 228,938GYP Holdings III Corp. (B/B2)(d)
130,000 4.625 05/01/29 131,021Ken Garff Automotive LLC (BB-/B1)(d)
305,000 4.875 09/15/28 313,387LCM Investments Holdings II LLC (BB-/B2)(d)
435,000 4.875 05/01/29 445,33120,000 4.875 05/01/29 20,500
Lithia Motors, Inc. (BB+/Ba2)(d)
175,000 3.875 06/01/29 182,000345,000 4.375 01/15/31 369,150
Murphy Oil USA, Inc. (BB+/Ba2)(d)
60,000 3.750 02/15/31 60,375Penske Automotive Group, Inc. (BB-/Ba3)
234,000 3.750 06/15/29 236,340SRS Distribution, Inc. (CCC/Caa2)(d)
115,000 6.125 07/01/29 118,450The Gap, Inc. (BB/Ba3)(d)
115,000 3.625 10/01/29 115,288115,000 3.875 10/01/31 115,000
Yum! Brands, Inc. (BB-/Ba3)349,000 3.625 03/15/31 352,054
4,284,852
Semiconductors(d)(e) – 0.2%Qorvo, Inc. (BBB-/Ba1)
210,000 3.375 04/01/31 221,025
Software(d)(e) – 1.2%Castle US Holding Corp. (CCC/Caa2)
64,000 9.500 02/15/28 66,880Clarivate Science Holdings Corp. (CCC+/Caa1)
256,000 4.875 07/01/29 255,680Fair Isaac Corp. (BB+/Ba2)
343,000 4.000 06/15/28 351,575Open Text Corp. (BB/Ba2)
255,000 3.875 02/15/28 261,056Playtika Holding Corp. (B/B2)
243,000 4.250 03/15/29 243,911ZoomInfo Technologies LLC/ZoomInfo Finance Corp. (B/B3)
383,000 3.875 02/01/29 383,000
1,562,102
Telecommunication Services(d)(e) – 1.1%Level 3 Financing, Inc. (BB/Ba3)
375,000 4.250 07/01/28 379,687246,000 3.750 07/15/29 238,928
ViaSat, Inc. (B/Caa1)824,000 5.625 09/15/25 832,240
1,450,855
104 The accompanying notes are an integral part of these financial statements.
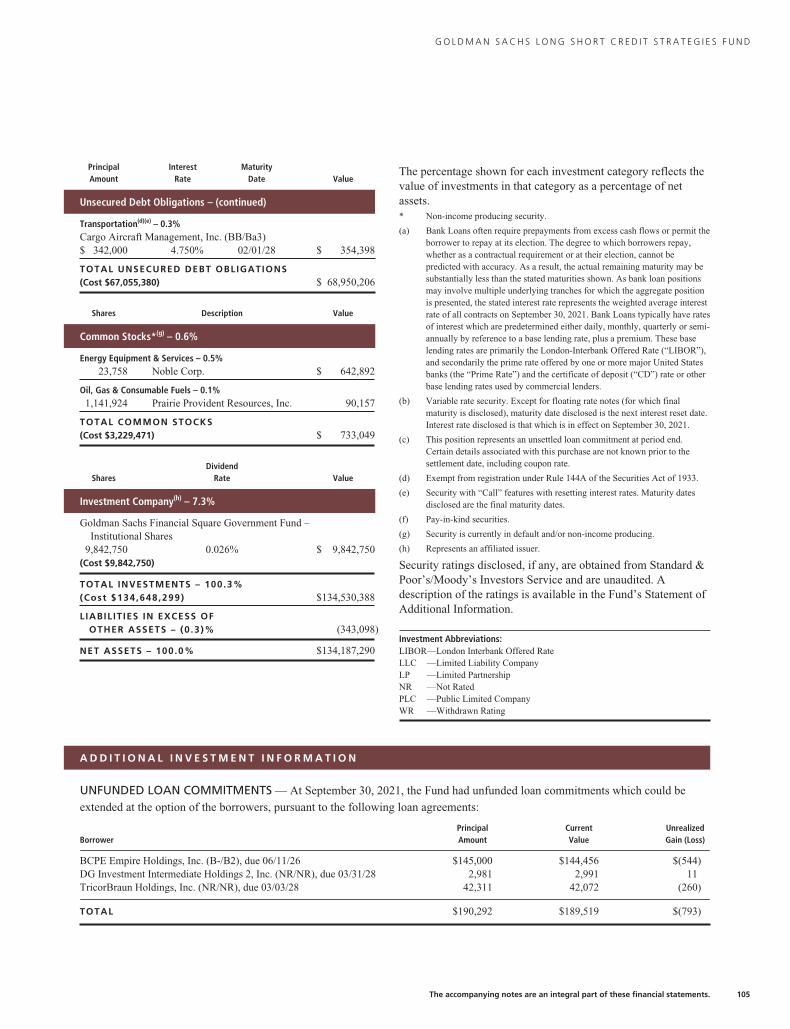
G O L D M A N S A C H S L O N G S H O R T C R E D I T S T R A T E G I E S F U N D
PrincipalAmount
InterestRate
MaturityDate Value
Unsecured Debt Obligations – (continued)
Transportation(d)(e) – 0.3%Cargo Aircraft Management, Inc. (BB/Ba3)$ 342,000 4.750% 02/01/28 $ 354,398
TOTAL UNSECURED DEBT OBLIGATIONS(Cost $67,055,380) $ 68,950,206
Shares Description Value
Common Stocks*(g) – 0.6%
Energy Equipment & Services – 0.5%23,758 Noble Corp. $ 642,892
Oil, Gas & Consumable Fuels – 0.1%1,141,924 Prairie Provident Resources, Inc. 90,157
TOTAL COMMON STOCKS(Cost $3,229,471) $ 733,049
SharesDividend
Rate Value
Investment Company(h) – 7.3%
Goldman Sachs Financial Square Government Fund –Institutional Shares
9,842,750 0.026% $ 9,842,750(Cost $9,842,750)
TOTAL INVESTMENTS – 100.3%(Cost $134,648,299) $134,530,388
LIABIL IT IES IN EXCESS OFOTHER ASSETS – (0.3)% (343,098)
NET ASSETS – 100.0% $134,187,290
The percentage shown for each investment category reflects thevalue of investments in that category as a percentage of netassets.* Non-income producing security.
(a) Bank Loans often require prepayments from excess cash flows or permit theborrower to repay at its election. The degree to which borrowers repay,whether as a contractual requirement or at their election, cannot bepredicted with accuracy. As a result, the actual remaining maturity may besubstantially less than the stated maturities shown. As bank loan positionsmay involve multiple underlying tranches for which the aggregate positionis presented, the stated interest rate represents the weighted average interestrate of all contracts on September 30, 2021. Bank Loans typically have ratesof interest which are predetermined either daily, monthly, quarterly or semi-annually by reference to a base lending rate, plus a premium. These baselending rates are primarily the London-Interbank Offered Rate (“LIBOR”),and secondarily the prime rate offered by one or more major United Statesbanks (the “Prime Rate”) and the certificate of deposit (“CD”) rate or otherbase lending rates used by commercial lenders.
(b) Variable rate security. Except for floating rate notes (for which finalmaturity is disclosed), maturity date disclosed is the next interest reset date.Interest rate disclosed is that which is in effect on September 30, 2021.
(c) This position represents an unsettled loan commitment at period end.Certain details associated with this purchase are not known prior to thesettlement date, including coupon rate.
(d) Exempt from registration under Rule 144A of the Securities Act of 1933.
(e) Security with “Call” features with resetting interest rates. Maturity datesdisclosed are the final maturity dates.
(f) Pay-in-kind securities.
(g) Security is currently in default and/or non-income producing.
(h) Represents an affiliated issuer.
Security ratings disclosed, if any, are obtained from Standard &Poor’s/Moody’s Investors Service and are unaudited. Adescription of the ratings is available in the Fund’s Statement ofAdditional Information.
Investment Abbreviations:LIBOR—London Interbank Offered RateLLC —Limited Liability CompanyLP —Limited PartnershipNR —Not RatedPLC —Public Limited CompanyWR —Withdrawn Rating
A D D I T I O N A L I N V E S T M E N T I N F O R M A T I O N
UNFUNDED LOAN COMMITMENTS — At September 30, 2021, the Fund had unfunded loan commitments which could be
extended at the option of the borrowers, pursuant to the following loan agreements:
BorrowerPrincipalAmount
CurrentValue
UnrealizedGain (Loss)
BCPE Empire Holdings, Inc. (B-/B2), due 06/11/26 $145,000 $144,456 $(544)DG Investment Intermediate Holdings 2, Inc. (NR/NR), due 03/31/28 2,981 2,991 11TricorBraun Holdings, Inc. (NR/NR), due 03/03/28 42,311 42,072 (260)
TOTAL $190,292 $189,519 $(793)
The accompanying notes are an integral part of these financial statements. 105
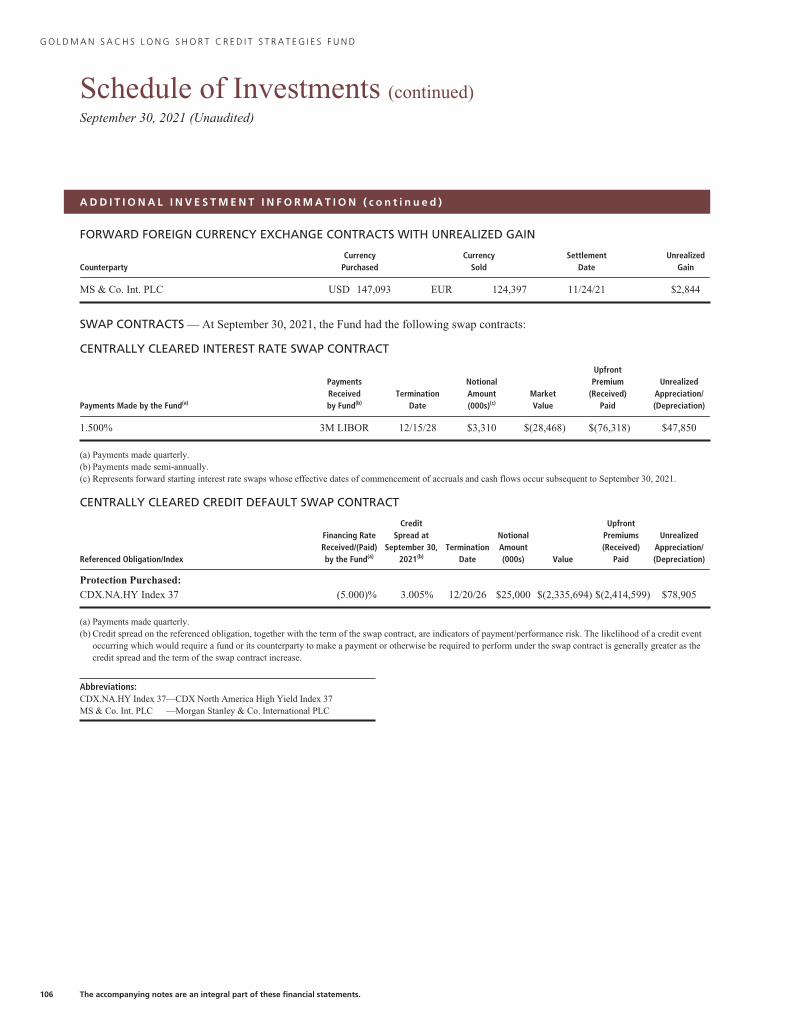
G O L D M A N S A C H S L O N G S H O R T C R E D I T S T R A T E G I E S F U N D
Schedule of Investments (continued)September 30, 2021 (Unaudited)
A D D I T I O N A L I N V E S T M E N T I N F O R M A T I O N ( c o n t i n u e d )
FORWARD FOREIGN CURRENCY EXCHANGE CONTRACTS WITH UNREALIZED GAIN
CounterpartyCurrency
PurchasedCurrency
SoldSettlement
DateUnrealized
Gain
MS & Co. Int. PLC USD 147,093 EUR 124,397 11/24/21 $2,844
SWAP CONTRACTS — At September 30, 2021, the Fund had the following swap contracts:
CENTRALLY CLEARED INTEREST RATE SWAP CONTRACT
Payments Made by the Fund(a)
PaymentsReceivedby Fund(b)
TerminationDate
NotionalAmount(000s)(c)
MarketValue
UpfrontPremium
(Received)Paid
UnrealizedAppreciation/(Depreciation)
1.500% 3M LIBOR 12/15/28 $3,310 $(28,468) $(76,318) $47,850
(a) Payments made quarterly.(b) Payments made semi-annually.(c) Represents forward starting interest rate swaps whose effective dates of commencement of accruals and cash flows occur subsequent to September 30, 2021.
CENTRALLY CLEARED CREDIT DEFAULT SWAP CONTRACT
Referenced Obligation/Index
Financing RateReceived/(Paid)by the Fund(a)
CreditSpread at
September 30,2021(b)
TerminationDate
NotionalAmount(000s) Value
UpfrontPremiums(Received)
Paid
UnrealizedAppreciation/(Depreciation)
Protection Purchased:CDX.NA.HY Index 37 (5.000)% 3.005% 12/20/26 $25,000 $(2,335,694) $(2,414,599) $78,905
(a) Payments made quarterly.(b) Credit spread on the referenced obligation, together with the term of the swap contract, are indicators of payment/performance risk. The likelihood of a credit event
occurring which would require a fund or its counterparty to make a payment or otherwise be required to perform under the swap contract is generally greater as thecredit spread and the term of the swap contract increase.
Abbreviations:CDX.NA.HY Index 37—CDX North America High Yield Index 37MS & Co. Int. PLC —Morgan Stanley & Co. International PLC
106 The accompanying notes are an integral part of these financial statements.
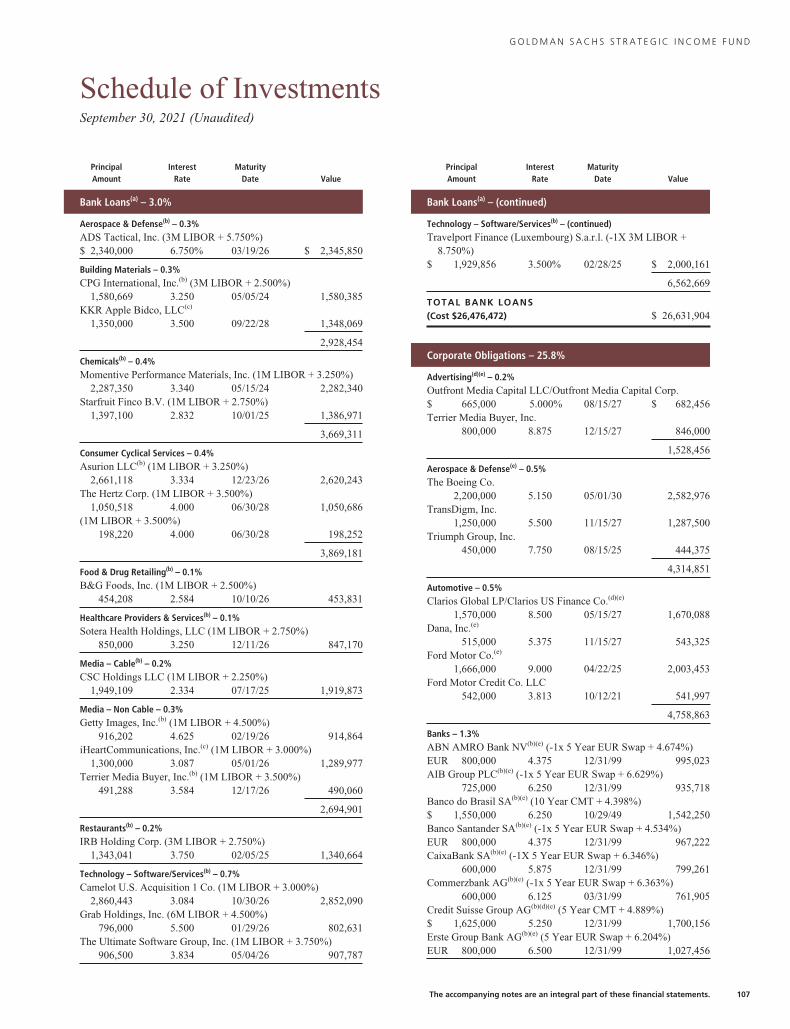
G O L D M A N S A C H S S T R A T E G I C I N C O M E F U N D
Schedule of InvestmentsSeptember 30, 2021 (Unaudited)
PrincipalAmount
InterestRate
MaturityDate Value
Bank Loans(a) – 3.0%
Aerospace & Defense(b) – 0.3%ADS Tactical, Inc. (3M LIBOR + 5.750%)$ 2,340,000 6.750% 03/19/26 $ 2,345,850
Building Materials – 0.3%CPG International, Inc.(b) (3M LIBOR + 2.500%)
1,580,669 3.250 05/05/24 1,580,385KKR Apple Bidco, LLC(c)
1,350,000 3.500 09/22/28 1,348,069
2,928,454
Chemicals(b) – 0.4%Momentive Performance Materials, Inc. (1M LIBOR + 3.250%)
2,287,350 3.340 05/15/24 2,282,340Starfruit Finco B.V. (1M LIBOR + 2.750%)
1,397,100 2.832 10/01/25 1,386,971
3,669,311
Consumer Cyclical Services – 0.4%Asurion LLC(b) (1M LIBOR + 3.250%)
2,661,118 3.334 12/23/26 2,620,243The Hertz Corp. (1M LIBOR + 3.500%)
1,050,518 4.000 06/30/28 1,050,686(1M LIBOR + 3.500%)
198,220 4.000 06/30/28 198,252
3,869,181
Food & Drug Retailing(b) – 0.1%B&G Foods, Inc. (1M LIBOR + 2.500%)
454,208 2.584 10/10/26 453,831
Healthcare Providers & Services(b) – 0.1%Sotera Health Holdings, LLC (1M LIBOR + 2.750%)
850,000 3.250 12/11/26 847,170
Media – Cable(b) – 0.2%CSC Holdings LLC (1M LIBOR + 2.250%)
1,949,109 2.334 07/17/25 1,919,873
Media – Non Cable – 0.3%Getty Images, Inc.(b) (1M LIBOR + 4.500%)
916,202 4.625 02/19/26 914,864iHeartCommunications, Inc.(c) (1M LIBOR + 3.000%)
1,300,000 3.087 05/01/26 1,289,977Terrier Media Buyer, Inc.(b) (1M LIBOR + 3.500%)
491,288 3.584 12/17/26 490,060
2,694,901
Restaurants(b) – 0.2%IRB Holding Corp. (3M LIBOR + 2.750%)
1,343,041 3.750 02/05/25 1,340,664
Technology – Software/Services(b) – 0.7%Camelot U.S. Acquisition 1 Co. (1M LIBOR + 3.000%)
2,860,443 3.084 10/30/26 2,852,090Grab Holdings, Inc. (6M LIBOR + 4.500%)
796,000 5.500 01/29/26 802,631The Ultimate Software Group, Inc. (1M LIBOR + 3.750%)
906,500 3.834 05/04/26 907,787
PrincipalAmount
InterestRate
MaturityDate Value
Bank Loans(a) – (continued)
Technology – Software/Services(b) – (continued)Travelport Finance (Luxembourg) S.a.r.l. (-1X 3M LIBOR +
8.750%)$ 1,929,856 3.500% 02/28/25 $ 2,000,161
6,562,669
TOTAL BANK LOANS(Cost $26,476,472) $ 26,631,904
Corporate Obligations – 25.8%
Advertising(d)(e) – 0.2%Outfront Media Capital LLC/Outfront Media Capital Corp.$ 665,000 5.000% 08/15/27 $ 682,456Terrier Media Buyer, Inc.
800,000 8.875 12/15/27 846,000
1,528,456
Aerospace & Defense(e) – 0.5%The Boeing Co.
2,200,000 5.150 05/01/30 2,582,976TransDigm, Inc.
1,250,000 5.500 11/15/27 1,287,500Triumph Group, Inc.
450,000 7.750 08/15/25 444,375
4,314,851
Automotive – 0.5%Clarios Global LP/Clarios US Finance Co.(d)(e)
1,570,000 8.500 05/15/27 1,670,088Dana, Inc.(e)
515,000 5.375 11/15/27 543,325Ford Motor Co.(e)
1,666,000 9.000 04/22/25 2,003,453Ford Motor Credit Co. LLC
542,000 3.813 10/12/21 541,997
4,758,863
Banks – 1.3%ABN AMRO Bank NV(b)(e) (-1x 5 Year EUR Swap + 4.674%)EUR 800,000 4.375 12/31/99 995,023AIB Group PLC(b)(e) (-1x 5 Year EUR Swap + 6.629%)
725,000 6.250 12/31/99 935,718Banco do Brasil SA(b)(e) (10 Year CMT + 4.398%)$ 1,550,000 6.250 10/29/49 1,542,250Banco Santander SA(b)(e) (-1x 5 Year EUR Swap + 4.534%)EUR 800,000 4.375 12/31/99 967,222CaixaBank SA(b)(e) (-1X 5 Year EUR Swap + 6.346%)
600,000 5.875 12/31/99 799,261Commerzbank AG(b)(e) (-1x 5 Year EUR Swap + 6.363%)
600,000 6.125 03/31/99 761,905Credit Suisse Group AG(b)(d)(e) (5 Year CMT + 4.889%)$ 1,625,000 5.250 12/31/99 1,700,156Erste Group Bank AG(b)(e) (5 Year EUR Swap + 6.204%)EUR 800,000 6.500 12/31/99 1,027,456
The accompanying notes are an integral part of these financial statements. 107
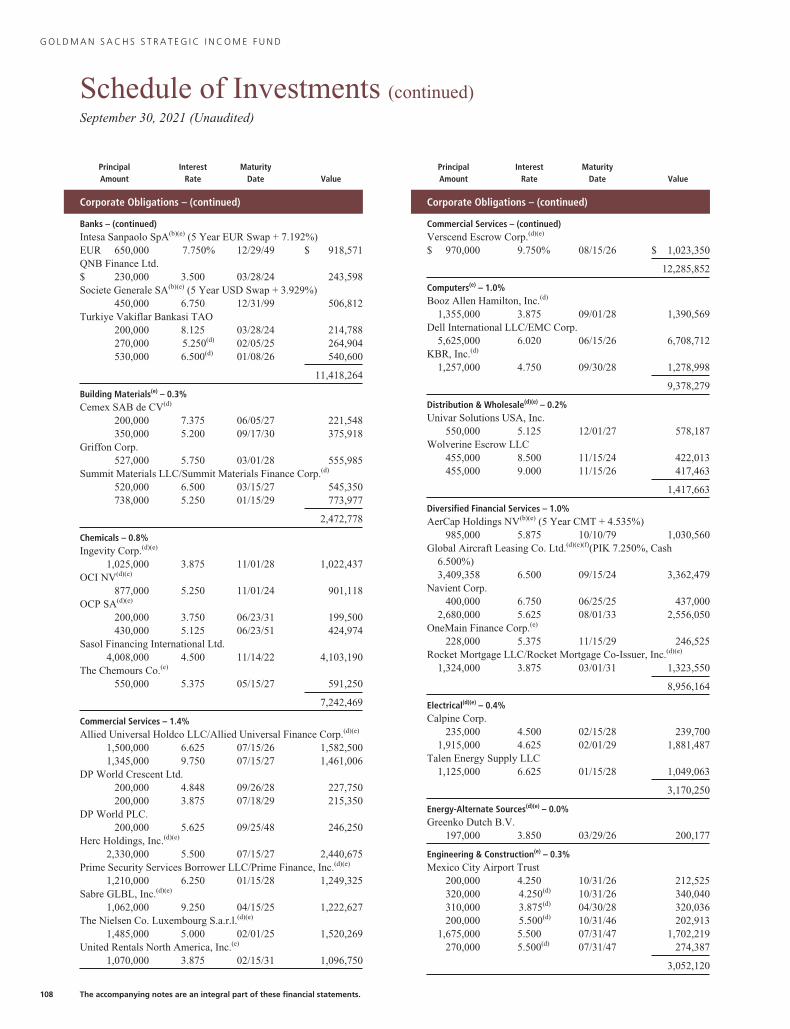
G O L D M A N S A C H S S T R A T E G I C I N C O M E F U N D
Schedule of Investments (continued)September 30, 2021 (Unaudited)
PrincipalAmount
InterestRate
MaturityDate Value
Corporate Obligations – (continued)
Banks – (continued)Intesa Sanpaolo SpA(b)(e) (5 Year EUR Swap + 7.192%)EUR 650,000 7.750% 12/29/49 $ 918,571QNB Finance Ltd.$ 230,000 3.500 03/28/24 243,598Societe Generale SA(b)(e) (5 Year USD Swap + 3.929%)
450,000 6.750 12/31/99 506,812Turkiye Vakiflar Bankasi TAO
200,000 8.125 03/28/24 214,788270,000 5.250(d) 02/05/25 264,904530,000 6.500(d) 01/08/26 540,600
11,418,264
Building Materials(e) – 0.3%Cemex SAB de CV(d)
200,000 7.375 06/05/27 221,548350,000 5.200 09/17/30 375,918
Griffon Corp.527,000 5.750 03/01/28 555,985
Summit Materials LLC/Summit Materials Finance Corp.(d)
520,000 6.500 03/15/27 545,350738,000 5.250 01/15/29 773,977
2,472,778
Chemicals – 0.8%Ingevity Corp.(d)(e)
1,025,000 3.875 11/01/28 1,022,437OCI NV(d)(e)
877,000 5.250 11/01/24 901,118OCP SA(d)(e)
200,000 3.750 06/23/31 199,500430,000 5.125 06/23/51 424,974
Sasol Financing International Ltd.4,008,000 4.500 11/14/22 4,103,190
The Chemours Co.(e)
550,000 5.375 05/15/27 591,250
7,242,469
Commercial Services – 1.4%Allied Universal Holdco LLC/Allied Universal Finance Corp.(d)(e)
1,500,000 6.625 07/15/26 1,582,5001,345,000 9.750 07/15/27 1,461,006
DP World Crescent Ltd.200,000 4.848 09/26/28 227,750200,000 3.875 07/18/29 215,350
DP World PLC.200,000 5.625 09/25/48 246,250
Herc Holdings, Inc.(d)(e)
2,330,000 5.500 07/15/27 2,440,675Prime Security Services Borrower LLC/Prime Finance, Inc.(d)(e)
1,210,000 6.250 01/15/28 1,249,325Sabre GLBL, Inc.(d)(e)
1,062,000 9.250 04/15/25 1,222,627The Nielsen Co. Luxembourg S.a.r.l.(d)(e)
1,485,000 5.000 02/01/25 1,520,269United Rentals North America, Inc.(e)
1,070,000 3.875 02/15/31 1,096,750
PrincipalAmount
InterestRate
MaturityDate Value
Corporate Obligations – (continued)
Commercial Services – (continued)Verscend Escrow Corp.(d)(e)
$ 970,000 9.750% 08/15/26 $ 1,023,350
12,285,852
Computers(e) – 1.0%Booz Allen Hamilton, Inc.(d)
1,355,000 3.875 09/01/28 1,390,569Dell International LLC/EMC Corp.
5,625,000 6.020 06/15/26 6,708,712KBR, Inc.(d)
1,257,000 4.750 09/30/28 1,278,998
9,378,279
Distribution & Wholesale(d)(e) – 0.2%Univar Solutions USA, Inc.
550,000 5.125 12/01/27 578,187Wolverine Escrow LLC
455,000 8.500 11/15/24 422,013455,000 9.000 11/15/26 417,463
1,417,663
Diversified Financial Services – 1.0%AerCap Holdings NV(b)(e) (5 Year CMT + 4.535%)
985,000 5.875 10/10/79 1,030,560Global Aircraft Leasing Co. Ltd.(d)(e)(f)(PIK 7.250%, Cash
6.500%)3,409,358 6.500 09/15/24 3,362,479
Navient Corp.400,000 6.750 06/25/25 437,000
2,680,000 5.625 08/01/33 2,556,050OneMain Finance Corp.(e)
228,000 5.375 11/15/29 246,525Rocket Mortgage LLC/Rocket Mortgage Co-Issuer, Inc.(d)(e)
1,324,000 3.875 03/01/31 1,323,550
8,956,164
Electrical(d)(e) – 0.4%Calpine Corp.
235,000 4.500 02/15/28 239,7001,915,000 4.625 02/01/29 1,881,487
Talen Energy Supply LLC1,125,000 6.625 01/15/28 1,049,063
3,170,250
Energy-Alternate Sources(d)(e) – 0.0%Greenko Dutch B.V.
197,000 3.850 03/29/26 200,177
Engineering & Construction(e) – 0.3%Mexico City Airport Trust
200,000 4.250 10/31/26 212,525320,000 4.250(d) 10/31/26 340,040310,000 3.875(d) 04/30/28 320,036200,000 5.500(d) 10/31/46 202,913
1,675,000 5.500 07/31/47 1,702,219270,000 5.500(d) 07/31/47 274,387
3,052,120
108 The accompanying notes are an integral part of these financial statements.
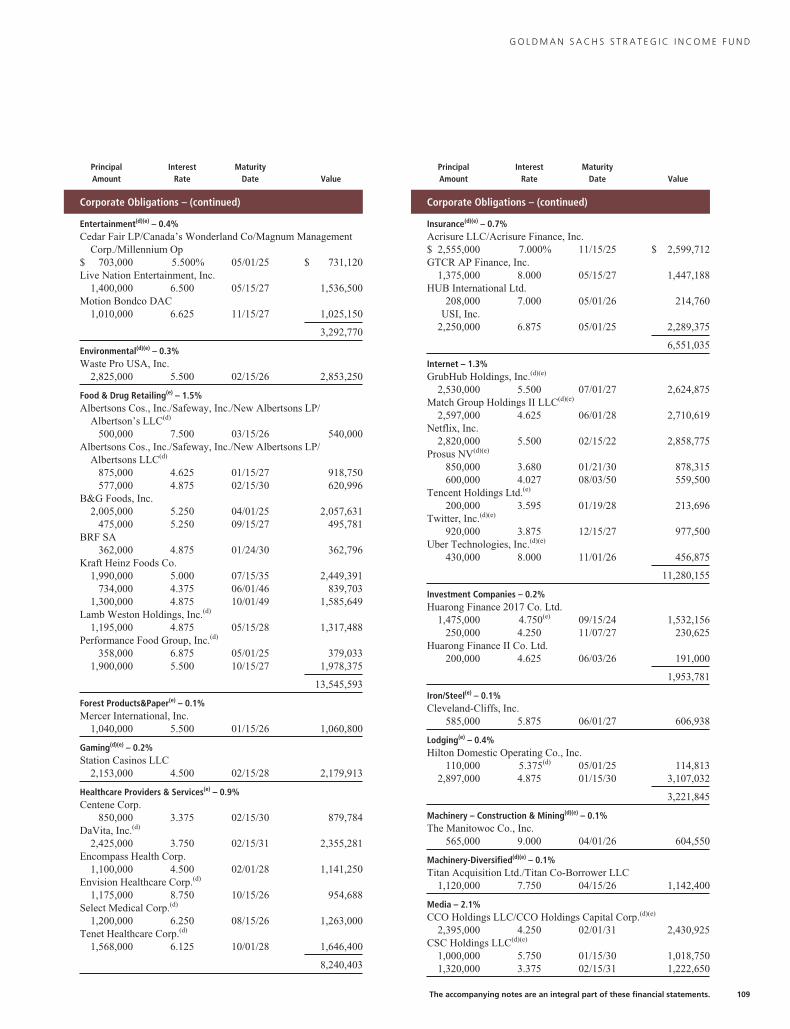
G O L D M A N S A C H S S T R A T E G I C I N C O M E F U N D
PrincipalAmount
InterestRate
MaturityDate Value
Corporate Obligations – (continued)
Entertainment(d)(e) – 0.4%Cedar Fair LP/Canada’s Wonderland Co/Magnum Management
Corp./Millennium Op$ 703,000 5.500% 05/01/25 $ 731,120Live Nation Entertainment, Inc.
1,400,000 6.500 05/15/27 1,536,500Motion Bondco DAC
1,010,000 6.625 11/15/27 1,025,150
3,292,770
Environmental(d)(e) – 0.3%Waste Pro USA, Inc.
2,825,000 5.500 02/15/26 2,853,250
Food & Drug Retailing(e) – 1.5%Albertsons Cos., Inc./Safeway, Inc./New Albertsons LP/
Albertson’s LLC(d)
500,000 7.500 03/15/26 540,000Albertsons Cos., Inc./Safeway, Inc./New Albertsons LP/
Albertsons LLC(d)
875,000 4.625 01/15/27 918,750577,000 4.875 02/15/30 620,996
B&G Foods, Inc.2,005,000 5.250 04/01/25 2,057,631
475,000 5.250 09/15/27 495,781BRF SA
362,000 4.875 01/24/30 362,796Kraft Heinz Foods Co.
1,990,000 5.000 07/15/35 2,449,391734,000 4.375 06/01/46 839,703
1,300,000 4.875 10/01/49 1,585,649Lamb Weston Holdings, Inc.(d)
1,195,000 4.875 05/15/28 1,317,488Performance Food Group, Inc.(d)
358,000 6.875 05/01/25 379,0331,900,000 5.500 10/15/27 1,978,375
13,545,593
Forest Products&Paper(e) – 0.1%Mercer International, Inc.
1,040,000 5.500 01/15/26 1,060,800
Gaming(d)(e) – 0.2%Station Casinos LLC
2,153,000 4.500 02/15/28 2,179,913
Healthcare Providers & Services(e) – 0.9%Centene Corp.
850,000 3.375 02/15/30 879,784DaVita, Inc.(d)
2,425,000 3.750 02/15/31 2,355,281Encompass Health Corp.
1,100,000 4.500 02/01/28 1,141,250Envision Healthcare Corp.(d)
1,175,000 8.750 10/15/26 954,688Select Medical Corp.(d)
1,200,000 6.250 08/15/26 1,263,000Tenet Healthcare Corp.(d)
1,568,000 6.125 10/01/28 1,646,400
8,240,403
PrincipalAmount
InterestRate
MaturityDate Value
Corporate Obligations – (continued)
Insurance(d)(e) – 0.7%Acrisure LLC/Acrisure Finance, Inc.$ 2,555,000 7.000% 11/15/25 $ 2,599,712GTCR AP Finance, Inc.
1,375,000 8.000 05/15/27 1,447,188HUB International Ltd.
208,000 7.000 05/01/26 214,760USI, Inc.
2,250,000 6.875 05/01/25 2,289,375
6,551,035
Internet – 1.3%GrubHub Holdings, Inc.(d)(e)
2,530,000 5.500 07/01/27 2,624,875Match Group Holdings II LLC(d)(e)
2,597,000 4.625 06/01/28 2,710,619Netflix, Inc.
2,820,000 5.500 02/15/22 2,858,775Prosus NV(d)(e)
850,000 3.680 01/21/30 878,315600,000 4.027 08/03/50 559,500
Tencent Holdings Ltd.(e)
200,000 3.595 01/19/28 213,696Twitter, Inc.(d)(e)
920,000 3.875 12/15/27 977,500Uber Technologies, Inc.(d)(e)
430,000 8.000 11/01/26 456,875
11,280,155
Investment Companies – 0.2%Huarong Finance 2017 Co. Ltd.
1,475,000 4.750(e) 09/15/24 1,532,156250,000 4.250 11/07/27 230,625
Huarong Finance II Co. Ltd.200,000 4.625 06/03/26 191,000
1,953,781
Iron/Steel(e) – 0.1%Cleveland-Cliffs, Inc.
585,000 5.875 06/01/27 606,938
Lodging(e) – 0.4%Hilton Domestic Operating Co., Inc.
110,000 5.375(d) 05/01/25 114,8132,897,000 4.875 01/15/30 3,107,032
3,221,845
Machinery – Construction & Mining(d)(e) – 0.1%The Manitowoc Co., Inc.
565,000 9.000 04/01/26 604,550
Machinery-Diversified(d)(e) – 0.1%Titan Acquisition Ltd./Titan Co-Borrower LLC
1,120,000 7.750 04/15/26 1,142,400
Media – 2.1%CCO Holdings LLC/CCO Holdings Capital Corp.(d)(e)
2,395,000 4.250 02/01/31 2,430,925CSC Holdings LLC(d)(e)
1,000,000 5.750 01/15/30 1,018,7501,320,000 3.375 02/15/31 1,222,650
The accompanying notes are an integral part of these financial statements. 109
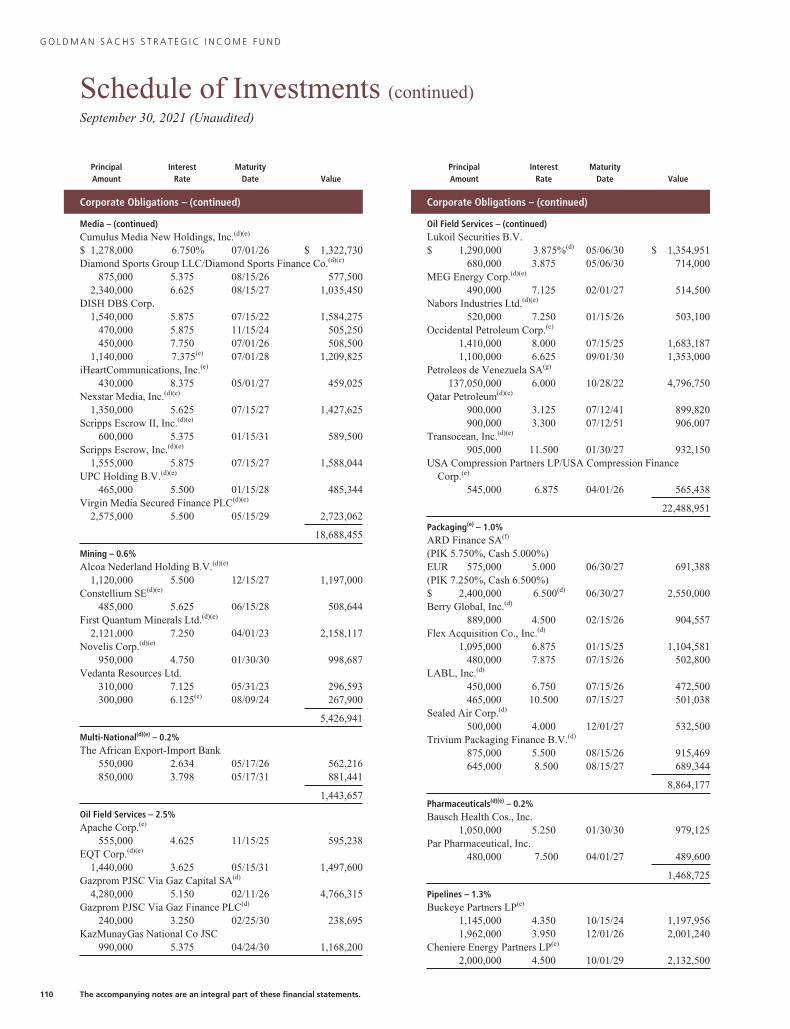
G O L D M A N S A C H S S T R A T E G I C I N C O M E F U N D
Schedule of Investments (continued)September 30, 2021 (Unaudited)
PrincipalAmount
InterestRate
MaturityDate Value
Corporate Obligations – (continued)
Media – (continued)Cumulus Media New Holdings, Inc.(d)(e)
$ 1,278,000 6.750% 07/01/26 $ 1,322,730Diamond Sports Group LLC/Diamond Sports Finance Co.(d)(e)
875,000 5.375 08/15/26 577,5002,340,000 6.625 08/15/27 1,035,450
DISH DBS Corp.1,540,000 5.875 07/15/22 1,584,275
470,000 5.875 11/15/24 505,250450,000 7.750 07/01/26 508,500
1,140,000 7.375(e) 07/01/28 1,209,825iHeartCommunications, Inc.(e)
430,000 8.375 05/01/27 459,025Nexstar Media, Inc.(d)(e)
1,350,000 5.625 07/15/27 1,427,625Scripps Escrow II, Inc.(d)(e)
600,000 5.375 01/15/31 589,500Scripps Escrow, Inc.(d)(e)
1,555,000 5.875 07/15/27 1,588,044UPC Holding B.V.(d)(e)
465,000 5.500 01/15/28 485,344Virgin Media Secured Finance PLC(d)(e)
2,575,000 5.500 05/15/29 2,723,062
18,688,455
Mining – 0.6%Alcoa Nederland Holding B.V.(d)(e)
1,120,000 5.500 12/15/27 1,197,000Constellium SE(d)(e)
485,000 5.625 06/15/28 508,644First Quantum Minerals Ltd.(d)(e)
2,121,000 7.250 04/01/23 2,158,117Novelis Corp.(d)(e)
950,000 4.750 01/30/30 998,687Vedanta Resources Ltd.
310,000 7.125 05/31/23 296,593300,000 6.125(e) 08/09/24 267,900
5,426,941
Multi-National(d)(e) – 0.2%The African Export-Import Bank
550,000 2.634 05/17/26 562,216850,000 3.798 05/17/31 881,441
1,443,657
Oil Field Services – 2.5%Apache Corp.(e)
555,000 4.625 11/15/25 595,238EQT Corp.(d)(e)
1,440,000 3.625 05/15/31 1,497,600Gazprom PJSC Via Gaz Capital SA(d)
4,280,000 5.150 02/11/26 4,766,315Gazprom PJSC Via Gaz Finance PLC(d)
240,000 3.250 02/25/30 238,695KazMunayGas National Co JSC
990,000 5.375 04/24/30 1,168,200
PrincipalAmount
InterestRate
MaturityDate Value
Corporate Obligations – (continued)
Oil Field Services – (continued)Lukoil Securities B.V.$ 1,290,000 3.875%(d) 05/06/30 $ 1,354,951
680,000 3.875 05/06/30 714,000MEG Energy Corp.(d)(e)
490,000 7.125 02/01/27 514,500Nabors Industries Ltd.(d)(e)
520,000 7.250 01/15/26 503,100Occidental Petroleum Corp.(e)
1,410,000 8.000 07/15/25 1,683,1871,100,000 6.625 09/01/30 1,353,000
Petroleos de Venezuela SA(g)
137,050,000 6.000 10/28/22 4,796,750Qatar Petroleum(d)(e)
900,000 3.125 07/12/41 899,820900,000 3.300 07/12/51 906,007
Transocean, Inc.(d)(e)
905,000 11.500 01/30/27 932,150USA Compression Partners LP/USA Compression Finance
Corp.(e)
545,000 6.875 04/01/26 565,438
22,488,951
Packaging(e) – 1.0%ARD Finance SA(f)
(PIK 5.750%, Cash 5.000%)EUR 575,000 5.000 06/30/27 691,388(PIK 7.250%, Cash 6.500%)$ 2,400,000 6.500(d) 06/30/27 2,550,000Berry Global, Inc.(d)
889,000 4.500 02/15/26 904,557Flex Acquisition Co., Inc.(d)
1,095,000 6.875 01/15/25 1,104,581480,000 7.875 07/15/26 502,800
LABL, Inc.(d)
450,000 6.750 07/15/26 472,500465,000 10.500 07/15/27 501,038
Sealed Air Corp.(d)
500,000 4.000 12/01/27 532,500Trivium Packaging Finance B.V.(d)
875,000 5.500 08/15/26 915,469645,000 8.500 08/15/27 689,344
8,864,177
Pharmaceuticals(d)(e) – 0.2%Bausch Health Cos., Inc.
1,050,000 5.250 01/30/30 979,125Par Pharmaceutical, Inc.
480,000 7.500 04/01/27 489,600
1,468,725
Pipelines – 1.3%Buckeye Partners LP(e)
1,145,000 4.350 10/15/24 1,197,9561,962,000 3.950 12/01/26 2,001,240
Cheniere Energy Partners LP(e)
2,000,000 4.500 10/01/29 2,132,500
110 The accompanying notes are an integral part of these financial statements.
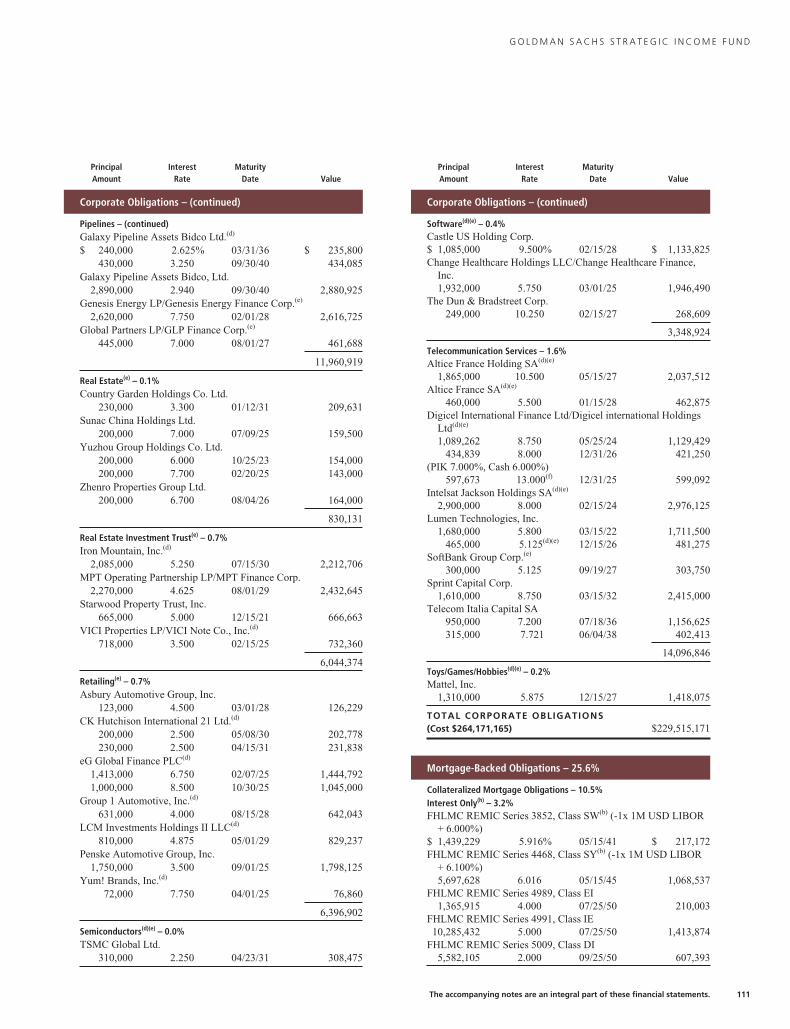
G O L D M A N S A C H S S T R A T E G I C I N C O M E F U N D
PrincipalAmount
InterestRate
MaturityDate Value
Corporate Obligations – (continued)
Pipelines – (continued)Galaxy Pipeline Assets Bidco Ltd.(d)
$ 240,000 2.625% 03/31/36 $ 235,800430,000 3.250 09/30/40 434,085
Galaxy Pipeline Assets Bidco, Ltd.2,890,000 2.940 09/30/40 2,880,925
Genesis Energy LP/Genesis Energy Finance Corp.(e)
2,620,000 7.750 02/01/28 2,616,725Global Partners LP/GLP Finance Corp.(e)
445,000 7.000 08/01/27 461,688
11,960,919
Real Estate(e) – 0.1%Country Garden Holdings Co. Ltd.
230,000 3.300 01/12/31 209,631Sunac China Holdings Ltd.
200,000 7.000 07/09/25 159,500Yuzhou Group Holdings Co. Ltd.
200,000 6.000 10/25/23 154,000200,000 7.700 02/20/25 143,000
Zhenro Properties Group Ltd.200,000 6.700 08/04/26 164,000
830,131
Real Estate Investment Trust(e) – 0.7%Iron Mountain, Inc.(d)
2,085,000 5.250 07/15/30 2,212,706MPT Operating Partnership LP/MPT Finance Corp.
2,270,000 4.625 08/01/29 2,432,645Starwood Property Trust, Inc.
665,000 5.000 12/15/21 666,663VICI Properties LP/VICI Note Co., Inc.(d)
718,000 3.500 02/15/25 732,360
6,044,374
Retailing(e) – 0.7%Asbury Automotive Group, Inc.
123,000 4.500 03/01/28 126,229CK Hutchison International 21 Ltd.(d)
200,000 2.500 05/08/30 202,778230,000 2.500 04/15/31 231,838
eG Global Finance PLC(d)
1,413,000 6.750 02/07/25 1,444,7921,000,000 8.500 10/30/25 1,045,000
Group 1 Automotive, Inc.(d)
631,000 4.000 08/15/28 642,043LCM Investments Holdings II LLC(d)
810,000 4.875 05/01/29 829,237Penske Automotive Group, Inc.
1,750,000 3.500 09/01/25 1,798,125Yum! Brands, Inc.(d)
72,000 7.750 04/01/25 76,860
6,396,902
Semiconductors(d)(e) – 0.0%TSMC Global Ltd.
310,000 2.250 04/23/31 308,475
PrincipalAmount
InterestRate
MaturityDate Value
Corporate Obligations – (continued)
Software(d)(e) – 0.4%Castle US Holding Corp.$ 1,085,000 9.500% 02/15/28 $ 1,133,825Change Healthcare Holdings LLC/Change Healthcare Finance,
Inc.1,932,000 5.750 03/01/25 1,946,490
The Dun & Bradstreet Corp.249,000 10.250 02/15/27 268,609
3,348,924
Telecommunication Services – 1.6%Altice France Holding SA(d)(e)
1,865,000 10.500 05/15/27 2,037,512Altice France SA(d)(e)
460,000 5.500 01/15/28 462,875Digicel International Finance Ltd/Digicel international Holdings
Ltd(d)(e)
1,089,262 8.750 05/25/24 1,129,429434,839 8.000 12/31/26 421,250
(PIK 7.000%, Cash 6.000%)597,673 13.000(f) 12/31/25 599,092
Intelsat Jackson Holdings SA(d)(e)
2,900,000 8.000 02/15/24 2,976,125Lumen Technologies, Inc.
1,680,000 5.800 03/15/22 1,711,500465,000 5.125(d)(e) 12/15/26 481,275
SoftBank Group Corp.(e)
300,000 5.125 09/19/27 303,750Sprint Capital Corp.
1,610,000 8.750 03/15/32 2,415,000Telecom Italia Capital SA
950,000 7.200 07/18/36 1,156,625315,000 7.721 06/04/38 402,413
14,096,846
Toys/Games/Hobbies(d)(e) – 0.2%Mattel, Inc.
1,310,000 5.875 12/15/27 1,418,075
TOTAL CORPORATE OBLIGATIONS(Cost $264,171,165) $229,515,171
Mortgage-Backed Obligations – 25.6%
Collateralized Mortgage Obligations – 10.5%Interest Only(h) – 3.2%FHLMC REMIC Series 3852, Class SW(b) (-1x 1M USD LIBOR
+ 6.000%)$ 1,439,229 5.916% 05/15/41 $ 217,172FHLMC REMIC Series 4468, Class SY(b) (-1x 1M USD LIBOR
+ 6.100%)5,697,628 6.016 05/15/45 1,068,537
FHLMC REMIC Series 4989, Class EI1,365,915 4.000 07/25/50 210,003
FHLMC REMIC Series 4991, Class IE10,285,432 5.000 07/25/50 1,413,874
FHLMC REMIC Series 5009, Class DI5,582,105 2.000 09/25/50 607,393
The accompanying notes are an integral part of these financial statements. 111
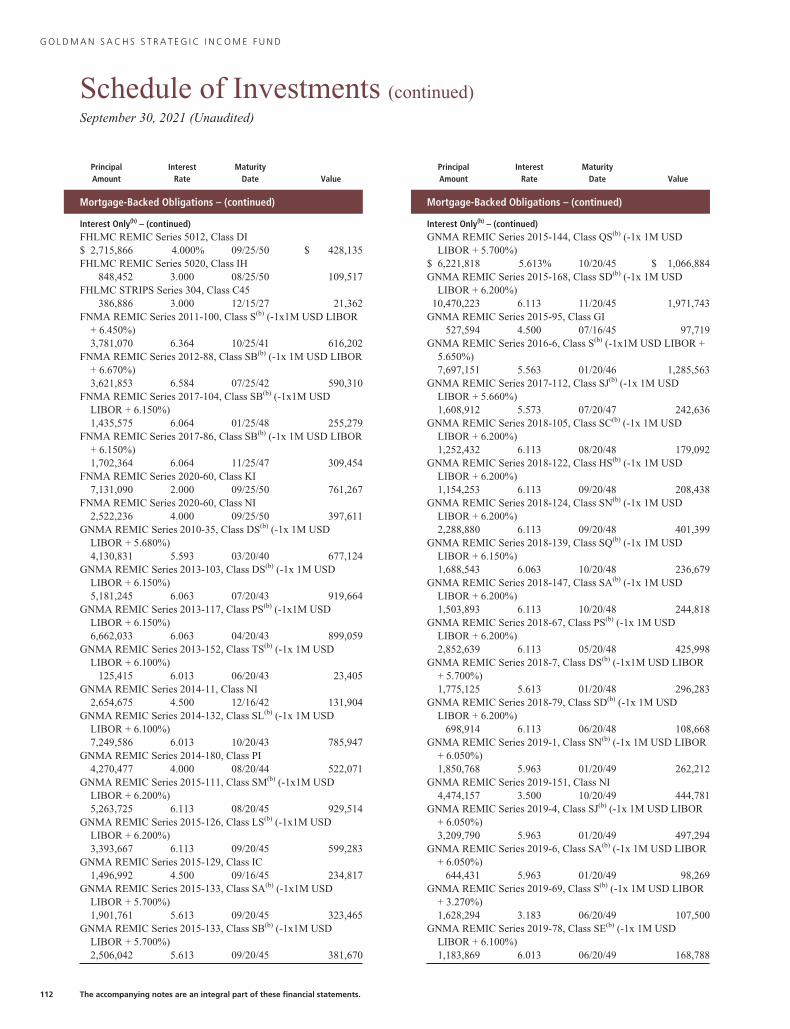
G O L D M A N S A C H S S T R A T E G I C I N C O M E F U N D
Schedule of Investments (continued)September 30, 2021 (Unaudited)
PrincipalAmount
InterestRate
MaturityDate Value
Mortgage-Backed Obligations – (continued)
Interest Only(h) – (continued)FHLMC REMIC Series 5012, Class DI$ 2,715,866 4.000% 09/25/50 $ 428,135FHLMC REMIC Series 5020, Class IH
848,452 3.000 08/25/50 109,517FHLMC STRIPS Series 304, Class C45
386,886 3.000 12/15/27 21,362FNMA REMIC Series 2011-100, Class S(b) (-1x1M USD LIBOR
+ 6.450%)3,781,070 6.364 10/25/41 616,202
FNMA REMIC Series 2012-88, Class SB(b) (-1x 1M USD LIBOR+ 6.670%)3,621,853 6.584 07/25/42 590,310
FNMA REMIC Series 2017-104, Class SB(b) (-1x1M USDLIBOR + 6.150%)1,435,575 6.064 01/25/48 255,279
FNMA REMIC Series 2017-86, Class SB(b) (-1x 1M USD LIBOR+ 6.150%)1,702,364 6.064 11/25/47 309,454
FNMA REMIC Series 2020-60, Class KI7,131,090 2.000 09/25/50 761,267
FNMA REMIC Series 2020-60, Class NI2,522,236 4.000 09/25/50 397,611
GNMA REMIC Series 2010-35, Class DS(b) (-1x 1M USDLIBOR + 5.680%)4,130,831 5.593 03/20/40 677,124
GNMA REMIC Series 2013-103, Class DS(b) (-1x 1M USDLIBOR + 6.150%)5,181,245 6.063 07/20/43 919,664
GNMA REMIC Series 2013-117, Class PS(b) (-1x1M USDLIBOR + 6.150%)6,662,033 6.063 04/20/43 899,059
GNMA REMIC Series 2013-152, Class TS(b) (-1x 1M USDLIBOR + 6.100%)
125,415 6.013 06/20/43 23,405GNMA REMIC Series 2014-11, Class NI
2,654,675 4.500 12/16/42 131,904GNMA REMIC Series 2014-132, Class SL(b) (-1x 1M USD
LIBOR + 6.100%)7,249,586 6.013 10/20/43 785,947
GNMA REMIC Series 2014-180, Class PI4,270,477 4.000 08/20/44 522,071
GNMA REMIC Series 2015-111, Class SM(b) (-1x1M USDLIBOR + 6.200%)5,263,725 6.113 08/20/45 929,514
GNMA REMIC Series 2015-126, Class LS(b) (-1x1M USDLIBOR + 6.200%)3,393,667 6.113 09/20/45 599,283
GNMA REMIC Series 2015-129, Class IC1,496,992 4.500 09/16/45 234,817
GNMA REMIC Series 2015-133, Class SA(b) (-1x1M USDLIBOR + 5.700%)1,901,761 5.613 09/20/45 323,465
GNMA REMIC Series 2015-133, Class SB(b) (-1x1M USDLIBOR + 5.700%)2,506,042 5.613 09/20/45 381,670
PrincipalAmount
InterestRate
MaturityDate Value
Mortgage-Backed Obligations – (continued)
Interest Only(h) – (continued)GNMA REMIC Series 2015-144, Class QS(b) (-1x 1M USD
LIBOR + 5.700%)$ 6,221,818 5.613% 10/20/45 $ 1,066,884GNMA REMIC Series 2015-168, Class SD(b) (-1x 1M USD
LIBOR + 6.200%)10,470,223 6.113 11/20/45 1,971,743
GNMA REMIC Series 2015-95, Class GI527,594 4.500 07/16/45 97,719
GNMA REMIC Series 2016-6, Class S(b) (-1x1M USD LIBOR +5.650%)7,697,151 5.563 01/20/46 1,285,563
GNMA REMIC Series 2017-112, Class SJ(b) (-1x 1M USDLIBOR + 5.660%)1,608,912 5.573 07/20/47 242,636
GNMA REMIC Series 2018-105, Class SC(b) (-1x 1M USDLIBOR + 6.200%)1,252,432 6.113 08/20/48 179,092
GNMA REMIC Series 2018-122, Class HS(b) (-1x 1M USDLIBOR + 6.200%)1,154,253 6.113 09/20/48 208,438
GNMA REMIC Series 2018-124, Class SN(b) (-1x 1M USDLIBOR + 6.200%)2,288,880 6.113 09/20/48 401,399
GNMA REMIC Series 2018-139, Class SQ(b) (-1x 1M USDLIBOR + 6.150%)1,688,543 6.063 10/20/48 236,679
GNMA REMIC Series 2018-147, Class SA(b) (-1x 1M USDLIBOR + 6.200%)1,503,893 6.113 10/20/48 244,818
GNMA REMIC Series 2018-67, Class PS(b) (-1x 1M USDLIBOR + 6.200%)2,852,639 6.113 05/20/48 425,998
GNMA REMIC Series 2018-7, Class DS(b) (-1x1M USD LIBOR+ 5.700%)1,775,125 5.613 01/20/48 296,283
GNMA REMIC Series 2018-79, Class SD(b) (-1x 1M USDLIBOR + 6.200%)
698,914 6.113 06/20/48 108,668GNMA REMIC Series 2019-1, Class SN(b) (-1x 1M USD LIBOR
+ 6.050%)1,850,768 5.963 01/20/49 262,212
GNMA REMIC Series 2019-151, Class NI4,474,157 3.500 10/20/49 444,781
GNMA REMIC Series 2019-4, Class SJ(b) (-1x 1M USD LIBOR+ 6.050%)3,209,790 5.963 01/20/49 497,294
GNMA REMIC Series 2019-6, Class SA(b) (-1x 1M USD LIBOR+ 6.050%)
644,431 5.963 01/20/49 98,269GNMA REMIC Series 2019-69, Class S(b) (-1x 1M USD LIBOR
+ 3.270%)1,628,294 3.183 06/20/49 107,500
GNMA REMIC Series 2019-78, Class SE(b) (-1x 1M USDLIBOR + 6.100%)1,183,869 6.013 06/20/49 168,788
112 The accompanying notes are an integral part of these financial statements.
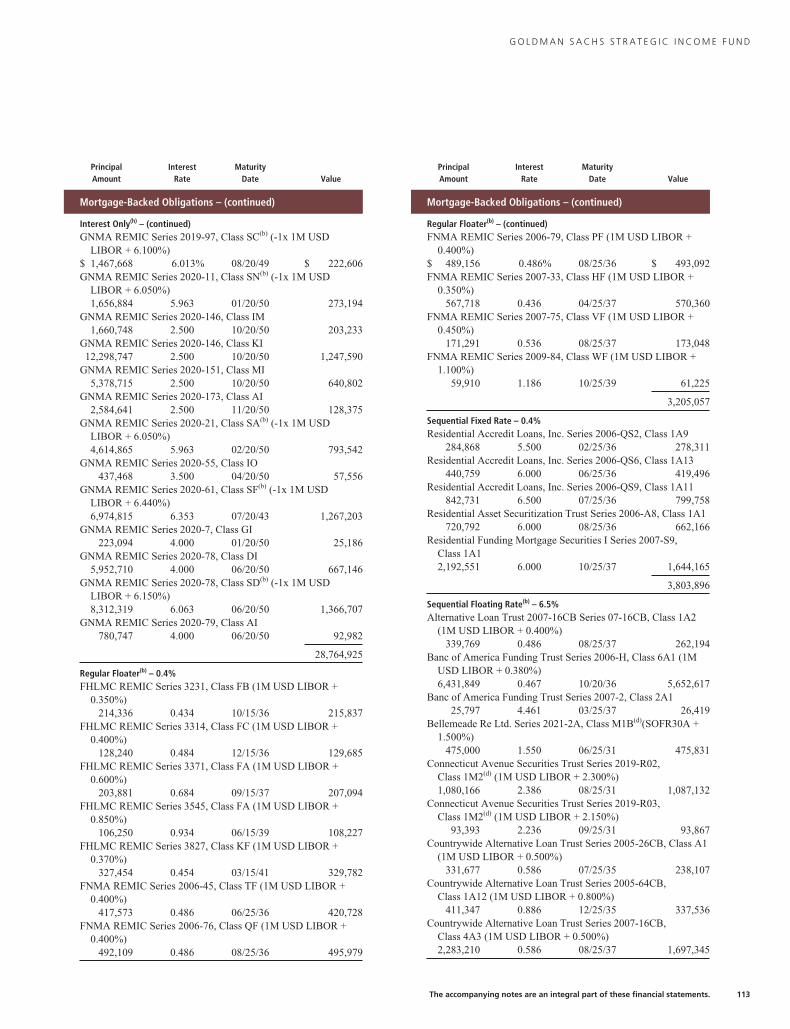
G O L D M A N S A C H S S T R A T E G I C I N C O M E F U N D
PrincipalAmount
InterestRate
MaturityDate Value
Mortgage-Backed Obligations – (continued)
Interest Only(h) – (continued)GNMA REMIC Series 2019-97, Class SC(b) (-1x 1M USD
LIBOR + 6.100%)$ 1,467,668 6.013% 08/20/49 $ 222,606GNMA REMIC Series 2020-11, Class SN(b) (-1x 1M USD
LIBOR + 6.050%)1,656,884 5.963 01/20/50 273,194
GNMA REMIC Series 2020-146, Class IM1,660,748 2.500 10/20/50 203,233
GNMA REMIC Series 2020-146, Class KI12,298,747 2.500 10/20/50 1,247,590
GNMA REMIC Series 2020-151, Class MI5,378,715 2.500 10/20/50 640,802
GNMA REMIC Series 2020-173, Class AI2,584,641 2.500 11/20/50 128,375
GNMA REMIC Series 2020-21, Class SA(b) (-1x 1M USDLIBOR + 6.050%)4,614,865 5.963 02/20/50 793,542
GNMA REMIC Series 2020-55, Class IO437,468 3.500 04/20/50 57,556
GNMA REMIC Series 2020-61, Class SF(b) (-1x 1M USDLIBOR + 6.440%)6,974,815 6.353 07/20/43 1,267,203
GNMA REMIC Series 2020-7, Class GI223,094 4.000 01/20/50 25,186
GNMA REMIC Series 2020-78, Class DI5,952,710 4.000 06/20/50 667,146
GNMA REMIC Series 2020-78, Class SD(b) (-1x 1M USDLIBOR + 6.150%)8,312,319 6.063 06/20/50 1,366,707
GNMA REMIC Series 2020-79, Class AI780,747 4.000 06/20/50 92,982
28,764,925
Regular Floater(b) – 0.4%FHLMC REMIC Series 3231, Class FB (1M USD LIBOR +
0.350%)214,336 0.434 10/15/36 215,837
FHLMC REMIC Series 3314, Class FC (1M USD LIBOR +0.400%)
128,240 0.484 12/15/36 129,685FHLMC REMIC Series 3371, Class FA (1M USD LIBOR +
0.600%)203,881 0.684 09/15/37 207,094
FHLMC REMIC Series 3545, Class FA (1M USD LIBOR +0.850%)
106,250 0.934 06/15/39 108,227FHLMC REMIC Series 3827, Class KF (1M USD LIBOR +
0.370%)327,454 0.454 03/15/41 329,782
FNMA REMIC Series 2006-45, Class TF (1M USD LIBOR +0.400%)
417,573 0.486 06/25/36 420,728FNMA REMIC Series 2006-76, Class QF (1M USD LIBOR +
0.400%)492,109 0.486 08/25/36 495,979
PrincipalAmount
InterestRate
MaturityDate Value
Mortgage-Backed Obligations – (continued)
Regular Floater(b) – (continued)FNMA REMIC Series 2006-79, Class PF (1M USD LIBOR +
0.400%)$ 489,156 0.486% 08/25/36 $ 493,092FNMA REMIC Series 2007-33, Class HF (1M USD LIBOR +
0.350%)567,718 0.436 04/25/37 570,360
FNMA REMIC Series 2007-75, Class VF (1M USD LIBOR +0.450%)
171,291 0.536 08/25/37 173,048FNMA REMIC Series 2009-84, Class WF (1M USD LIBOR +
1.100%)59,910 1.186 10/25/39 61,225
3,205,057
Sequential Fixed Rate – 0.4%Residential Accredit Loans, Inc. Series 2006-QS2, Class 1A9
284,868 5.500 02/25/36 278,311Residential Accredit Loans, Inc. Series 2006-QS6, Class 1A13
440,759 6.000 06/25/36 419,496Residential Accredit Loans, Inc. Series 2006-QS9, Class 1A11
842,731 6.500 07/25/36 799,758Residential Asset Securitization Trust Series 2006-A8, Class 1A1
720,792 6.000 08/25/36 662,166Residential Funding Mortgage Securities I Series 2007-S9,
Class 1A12,192,551 6.000 10/25/37 1,644,165
3,803,896
Sequential Floating Rate(b) – 6.5%Alternative Loan Trust 2007-16CB Series 07-16CB, Class 1A2
(1M USD LIBOR + 0.400%)339,769 0.486 08/25/37 262,194
Banc of America Funding Trust Series 2006-H, Class 6A1 (1MUSD LIBOR + 0.380%)6,431,849 0.467 10/20/36 5,652,617
Banc of America Funding Trust Series 2007-2, Class 2A125,797 4.461 03/25/37 26,419
Bellemeade Re Ltd. Series 2021-2A, Class M1B(d)(SOFR30A +1.500%)
475,000 1.550 06/25/31 475,831Connecticut Avenue Securities Trust Series 2019-R02,
Class 1M2(d) (1M USD LIBOR + 2.300%)1,080,166 2.386 08/25/31 1,087,132
Connecticut Avenue Securities Trust Series 2019-R03,Class 1M2(d) (1M USD LIBOR + 2.150%)
93,393 2.236 09/25/31 93,867Countrywide Alternative Loan Trust Series 2005-26CB, Class A1
(1M USD LIBOR + 0.500%)331,677 0.586 07/25/35 238,107
Countrywide Alternative Loan Trust Series 2005-64CB,Class 1A12 (1M USD LIBOR + 0.800%)
411,347 0.886 12/25/35 337,536Countrywide Alternative Loan Trust Series 2007-16CB,
Class 4A3 (1M USD LIBOR + 0.500%)2,283,210 0.586 08/25/37 1,697,345
The accompanying notes are an integral part of these financial statements. 113
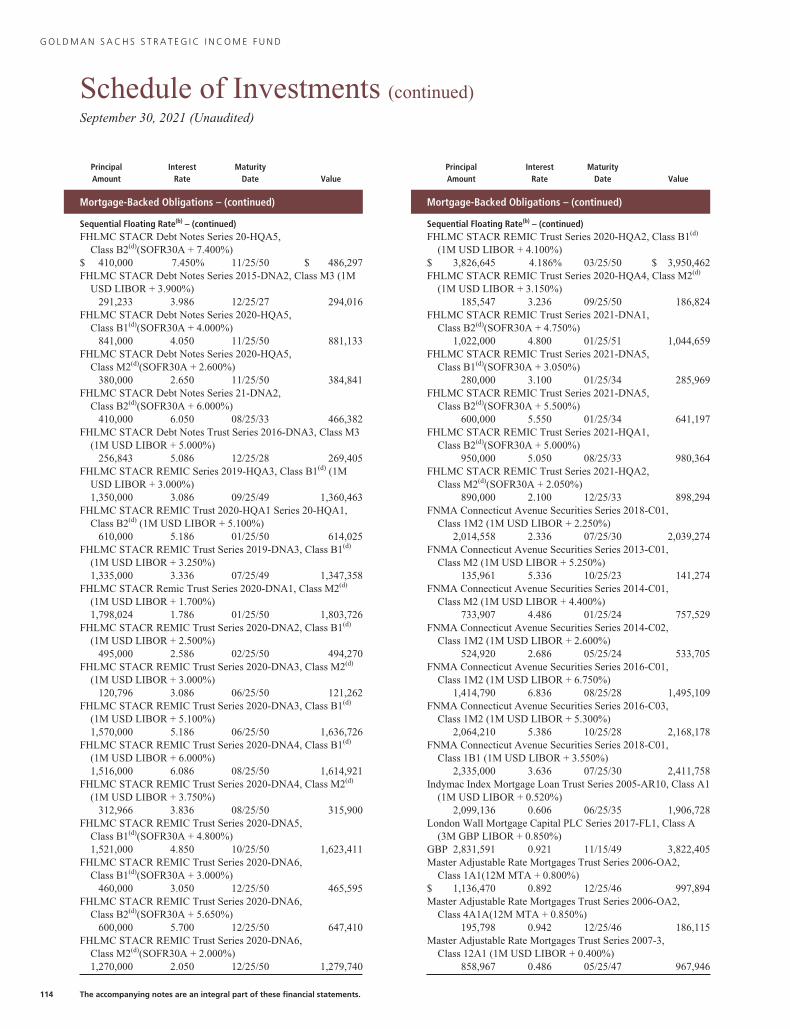
G O L D M A N S A C H S S T R A T E G I C I N C O M E F U N D
Schedule of Investments (continued)September 30, 2021 (Unaudited)
PrincipalAmount
InterestRate
MaturityDate Value
Mortgage-Backed Obligations – (continued)
Sequential Floating Rate(b) – (continued)FHLMC STACR Debt Notes Series 20-HQA5,
Class B2(d)(SOFR30A + 7.400%)$ 410,000 7.450% 11/25/50 $ 486,297FHLMC STACR Debt Notes Series 2015-DNA2, Class M3 (1M
USD LIBOR + 3.900%)291,233 3.986 12/25/27 294,016
FHLMC STACR Debt Notes Series 2020-HQA5,Class B1(d)(SOFR30A + 4.000%)
841,000 4.050 11/25/50 881,133FHLMC STACR Debt Notes Series 2020-HQA5,
Class M2(d)(SOFR30A + 2.600%)380,000 2.650 11/25/50 384,841
FHLMC STACR Debt Notes Series 21-DNA2,Class B2(d)(SOFR30A + 6.000%)
410,000 6.050 08/25/33 466,382FHLMC STACR Debt Notes Trust Series 2016-DNA3, Class M3
(1M USD LIBOR + 5.000%)256,843 5.086 12/25/28 269,405
FHLMC STACR REMIC Series 2019-HQA3, Class B1(d) (1MUSD LIBOR + 3.000%)1,350,000 3.086 09/25/49 1,360,463
FHLMC STACR REMIC Trust 2020-HQA1 Series 20-HQA1,Class B2(d) (1M USD LIBOR + 5.100%)
610,000 5.186 01/25/50 614,025FHLMC STACR REMIC Trust Series 2019-DNA3, Class B1(d)
(1M USD LIBOR + 3.250%)1,335,000 3.336 07/25/49 1,347,358
FHLMC STACR Remic Trust Series 2020-DNA1, Class M2(d)
(1M USD LIBOR + 1.700%)1,798,024 1.786 01/25/50 1,803,726
FHLMC STACR REMIC Trust Series 2020-DNA2, Class B1(d)
(1M USD LIBOR + 2.500%)495,000 2.586 02/25/50 494,270
FHLMC STACR REMIC Trust Series 2020-DNA3, Class M2(d)
(1M USD LIBOR + 3.000%)120,796 3.086 06/25/50 121,262
FHLMC STACR REMIC Trust Series 2020-DNA3, Class B1(d)
(1M USD LIBOR + 5.100%)1,570,000 5.186 06/25/50 1,636,726
FHLMC STACR REMIC Trust Series 2020-DNA4, Class B1(d)
(1M USD LIBOR + 6.000%)1,516,000 6.086 08/25/50 1,614,921
FHLMC STACR REMIC Trust Series 2020-DNA4, Class M2(d)
(1M USD LIBOR + 3.750%)312,966 3.836 08/25/50 315,900
FHLMC STACR REMIC Trust Series 2020-DNA5,Class B1(d)(SOFR30A + 4.800%)1,521,000 4.850 10/25/50 1,623,411
FHLMC STACR REMIC Trust Series 2020-DNA6,Class B1(d)(SOFR30A + 3.000%)
460,000 3.050 12/25/50 465,595FHLMC STACR REMIC Trust Series 2020-DNA6,
Class B2(d)(SOFR30A + 5.650%)600,000 5.700 12/25/50 647,410
FHLMC STACR REMIC Trust Series 2020-DNA6,Class M2(d)(SOFR30A + 2.000%)1,270,000 2.050 12/25/50 1,279,740
PrincipalAmount
InterestRate
MaturityDate Value
Mortgage-Backed Obligations – (continued)
Sequential Floating Rate(b) – (continued)FHLMC STACR REMIC Trust Series 2020-HQA2, Class B1(d)
(1M USD LIBOR + 4.100%)$ 3,826,645 4.186% 03/25/50 $ 3,950,462FHLMC STACR REMIC Trust Series 2020-HQA4, Class M2(d)
(1M USD LIBOR + 3.150%)185,547 3.236 09/25/50 186,824
FHLMC STACR REMIC Trust Series 2021-DNA1,Class B2(d)(SOFR30A + 4.750%)
1,022,000 4.800 01/25/51 1,044,659FHLMC STACR REMIC Trust Series 2021-DNA5,
Class B1(d)(SOFR30A + 3.050%)280,000 3.100 01/25/34 285,969
FHLMC STACR REMIC Trust Series 2021-DNA5,Class B2(d)(SOFR30A + 5.500%)
600,000 5.550 01/25/34 641,197FHLMC STACR REMIC Trust Series 2021-HQA1,
Class B2(d)(SOFR30A + 5.000%)950,000 5.050 08/25/33 980,364
FHLMC STACR REMIC Trust Series 2021-HQA2,Class M2(d)(SOFR30A + 2.050%)
890,000 2.100 12/25/33 898,294FNMA Connecticut Avenue Securities Series 2018-C01,
Class 1M2 (1M USD LIBOR + 2.250%)2,014,558 2.336 07/25/30 2,039,274
FNMA Connecticut Avenue Securities Series 2013-C01,Class M2 (1M USD LIBOR + 5.250%)
135,961 5.336 10/25/23 141,274FNMA Connecticut Avenue Securities Series 2014-C01,
Class M2 (1M USD LIBOR + 4.400%)733,907 4.486 01/25/24 757,529
FNMA Connecticut Avenue Securities Series 2014-C02,Class 1M2 (1M USD LIBOR + 2.600%)
524,920 2.686 05/25/24 533,705FNMA Connecticut Avenue Securities Series 2016-C01,
Class 1M2 (1M USD LIBOR + 6.750%)1,414,790 6.836 08/25/28 1,495,109
FNMA Connecticut Avenue Securities Series 2016-C03,Class 1M2 (1M USD LIBOR + 5.300%)
2,064,210 5.386 10/25/28 2,168,178FNMA Connecticut Avenue Securities Series 2018-C01,
Class 1B1 (1M USD LIBOR + 3.550%)2,335,000 3.636 07/25/30 2,411,758
Indymac Index Mortgage Loan Trust Series 2005-AR10, Class A1(1M USD LIBOR + 0.520%)
2,099,136 0.606 06/25/35 1,906,728London Wall Mortgage Capital PLC Series 2017-FL1, Class A
(3M GBP LIBOR + 0.850%)GBP 2,831,591 0.921 11/15/49 3,822,405Master Adjustable Rate Mortgages Trust Series 2006-OA2,
Class 1A1(12M MTA + 0.800%)$ 1,136,470 0.892 12/25/46 997,894Master Adjustable Rate Mortgages Trust Series 2006-OA2,
Class 4A1A(12M MTA + 0.850%)195,798 0.942 12/25/46 186,115
Master Adjustable Rate Mortgages Trust Series 2007-3,Class 12A1 (1M USD LIBOR + 0.400%)
858,967 0.486 05/25/47 967,946
114 The accompanying notes are an integral part of these financial statements.
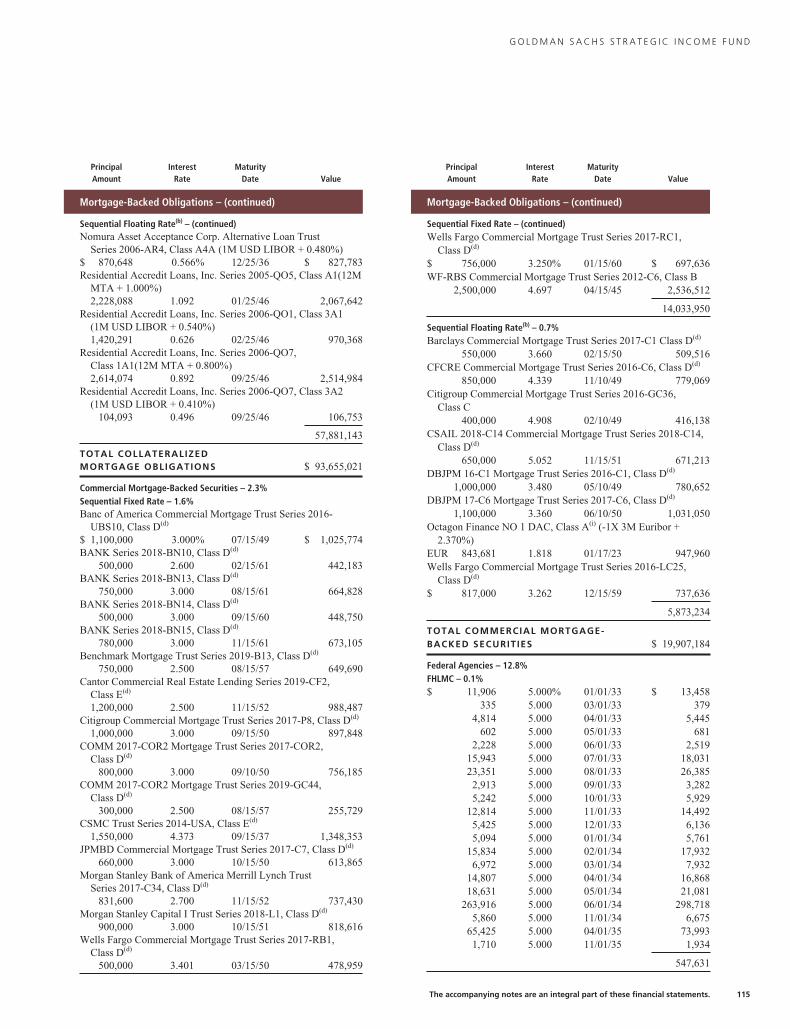
G O L D M A N S A C H S S T R A T E G I C I N C O M E F U N D
PrincipalAmount
InterestRate
MaturityDate Value
Mortgage-Backed Obligations – (continued)
Sequential Floating Rate(b) – (continued)Nomura Asset Acceptance Corp. Alternative Loan Trust
Series 2006-AR4, Class A4A (1M USD LIBOR + 0.480%)$ 870,648 0.566% 12/25/36 $ 827,783Residential Accredit Loans, Inc. Series 2005-QO5, Class A1(12M
MTA + 1.000%)2,228,088 1.092 01/25/46 2,067,642
Residential Accredit Loans, Inc. Series 2006-QO1, Class 3A1(1M USD LIBOR + 0.540%)1,420,291 0.626 02/25/46 970,368
Residential Accredit Loans, Inc. Series 2006-QO7,Class 1A1(12M MTA + 0.800%)2,614,074 0.892 09/25/46 2,514,984
Residential Accredit Loans, Inc. Series 2006-QO7, Class 3A2(1M USD LIBOR + 0.410%)
104,093 0.496 09/25/46 106,753
57,881,143
TOTAL COLLATERALIZEDMORTGAGE OBLIGATIONS $ 93,655,021
Commercial Mortgage-Backed Securities – 2.3%Sequential Fixed Rate – 1.6%Banc of America Commercial Mortgage Trust Series 2016-
UBS10, Class D(d)
$ 1,100,000 3.000% 07/15/49 $ 1,025,774BANK Series 2018-BN10, Class D(d)
500,000 2.600 02/15/61 442,183BANK Series 2018-BN13, Class D(d)
750,000 3.000 08/15/61 664,828BANK Series 2018-BN14, Class D(d)
500,000 3.000 09/15/60 448,750BANK Series 2018-BN15, Class D(d)
780,000 3.000 11/15/61 673,105Benchmark Mortgage Trust Series 2019-B13, Class D(d)
750,000 2.500 08/15/57 649,690Cantor Commercial Real Estate Lending Series 2019-CF2,
Class E(d)
1,200,000 2.500 11/15/52 988,487Citigroup Commercial Mortgage Trust Series 2017-P8, Class D(d)
1,000,000 3.000 09/15/50 897,848COMM 2017-COR2 Mortgage Trust Series 2017-COR2,
Class D(d)
800,000 3.000 09/10/50 756,185COMM 2017-COR2 Mortgage Trust Series 2019-GC44,
Class D(d)
300,000 2.500 08/15/57 255,729CSMC Trust Series 2014-USA, Class E(d)
1,550,000 4.373 09/15/37 1,348,353JPMBD Commercial Mortgage Trust Series 2017-C7, Class D(d)
660,000 3.000 10/15/50 613,865Morgan Stanley Bank of America Merrill Lynch Trust
Series 2017-C34, Class D(d)
831,600 2.700 11/15/52 737,430Morgan Stanley Capital I Trust Series 2018-L1, Class D(d)
900,000 3.000 10/15/51 818,616Wells Fargo Commercial Mortgage Trust Series 2017-RB1,
Class D(d)
500,000 3.401 03/15/50 478,959
PrincipalAmount
InterestRate
MaturityDate Value
Mortgage-Backed Obligations – (continued)
Sequential Fixed Rate – (continued)Wells Fargo Commercial Mortgage Trust Series 2017-RC1,
Class D(d)
$ 756,000 3.250% 01/15/60 $ 697,636WF-RBS Commercial Mortgage Trust Series 2012-C6, Class B
2,500,000 4.697 04/15/45 2,536,512
14,033,950
Sequential Floating Rate(b) – 0.7%Barclays Commercial Mortgage Trust Series 2017-C1 Class D(d)
550,000 3.660 02/15/50 509,516CFCRE Commercial Mortgage Trust Series 2016-C6, Class D(d)
850,000 4.339 11/10/49 779,069Citigroup Commercial Mortgage Trust Series 2016-GC36,
Class C400,000 4.908 02/10/49 416,138
CSAIL 2018-C14 Commercial Mortgage Trust Series 2018-C14,Class D(d)
650,000 5.052 11/15/51 671,213DBJPM 16-C1 Mortgage Trust Series 2016-C1, Class D(d)
1,000,000 3.480 05/10/49 780,652DBJPM 17-C6 Mortgage Trust Series 2017-C6, Class D(d)
1,100,000 3.360 06/10/50 1,031,050Octagon Finance NO 1 DAC, Class A(i) (-1X 3M Euribor +
2.370%)EUR 843,681 1.818 01/17/23 947,960Wells Fargo Commercial Mortgage Trust Series 2016-LC25,
Class D(d)
$ 817,000 3.262 12/15/59 737,636
5,873,234
TOTAL COMMERCIAL MORTGAGE-BACKED SECURITIES $ 19,907,184
Federal Agencies – 12.8%FHLMC – 0.1%$ 11,906 5.000% 01/01/33 $ 13,458
335 5.000 03/01/33 3794,814 5.000 04/01/33 5,445
602 5.000 05/01/33 6812,228 5.000 06/01/33 2,519
15,943 5.000 07/01/33 18,03123,351 5.000 08/01/33 26,3852,913 5.000 09/01/33 3,2825,242 5.000 10/01/33 5,929
12,814 5.000 11/01/33 14,4925,425 5.000 12/01/33 6,1365,094 5.000 01/01/34 5,761
15,834 5.000 02/01/34 17,9326,972 5.000 03/01/34 7,932
14,807 5.000 04/01/34 16,86818,631 5.000 05/01/34 21,081
263,916 5.000 06/01/34 298,7185,860 5.000 11/01/34 6,675
65,425 5.000 04/01/35 73,9931,710 5.000 11/01/35 1,934
547,631
The accompanying notes are an integral part of these financial statements. 115
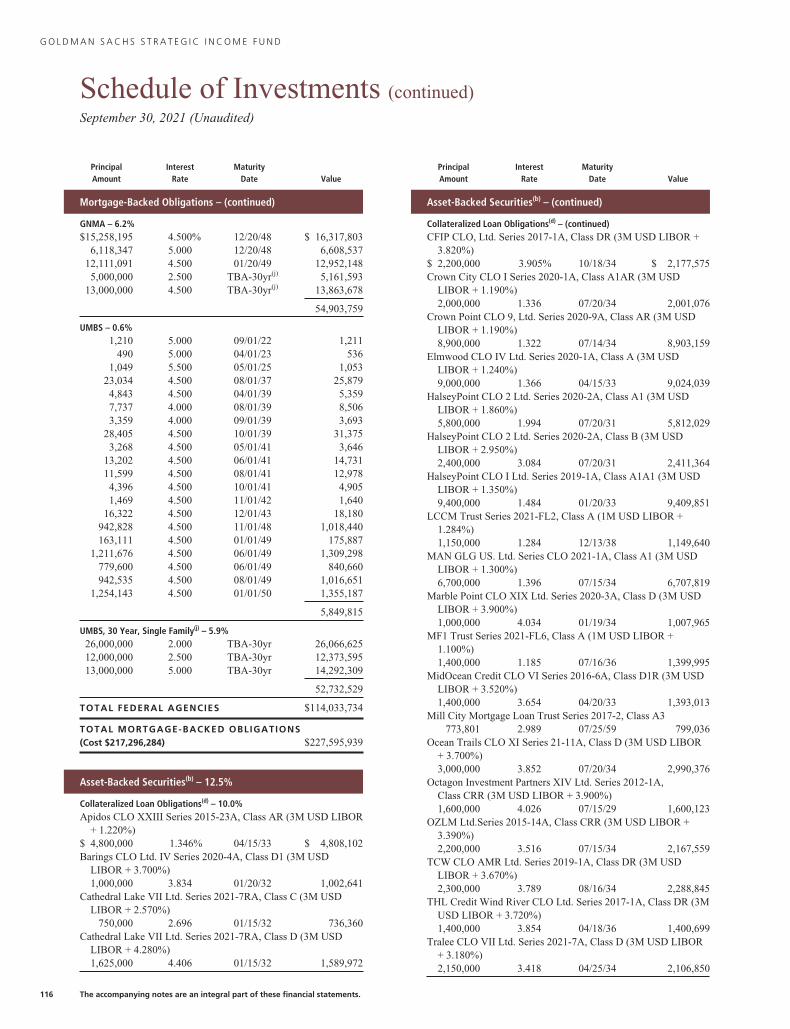
G O L D M A N S A C H S S T R A T E G I C I N C O M E F U N D
Schedule of Investments (continued)September 30, 2021 (Unaudited)
PrincipalAmount
InterestRate
MaturityDate Value
Mortgage-Backed Obligations – (continued)
GNMA – 6.2%$15,258,195 4.500% 12/20/48 $ 16,317,803
6,118,347 5.000 12/20/48 6,608,53712,111,091 4.500 01/20/49 12,952,1485,000,000 2.500 TBA-30yr(j) 5,161,593
13,000,000 4.500 TBA-30yr(j) 13,863,678
54,903,759
UMBS – 0.6%1,210 5.000 09/01/22 1,211
490 5.000 04/01/23 5361,049 5.500 05/01/25 1,053
23,034 4.500 08/01/37 25,8794,843 4.500 04/01/39 5,3597,737 4.000 08/01/39 8,5063,359 4.000 09/01/39 3,693
28,405 4.500 10/01/39 31,3753,268 4.500 05/01/41 3,646
13,202 4.500 06/01/41 14,73111,599 4.500 08/01/41 12,9784,396 4.500 10/01/41 4,9051,469 4.500 11/01/42 1,640
16,322 4.500 12/01/43 18,180942,828 4.500 11/01/48 1,018,440163,111 4.500 01/01/49 175,887
1,211,676 4.500 06/01/49 1,309,298779,600 4.500 06/01/49 840,660942,535 4.500 08/01/49 1,016,651
1,254,143 4.500 01/01/50 1,355,187
5,849,815
UMBS, 30 Year, Single Family(j) – 5.9%26,000,000 2.000 TBA-30yr 26,066,62512,000,000 2.500 TBA-30yr 12,373,59513,000,000 5.000 TBA-30yr 14,292,309
52,732,529
TOTAL FEDERAL AGENCIES $114,033,734
TOTAL MORTGAGE-BACKED OBLIGATIONS(Cost $217,296,284) $227,595,939
Asset-Backed Securities(b) – 12.5%
Collateralized Loan Obligations(d) – 10.0%Apidos CLO XXIII Series 2015-23A, Class AR (3M USD LIBOR
+ 1.220%)$ 4,800,000 1.346% 04/15/33 $ 4,808,102Barings CLO Ltd. IV Series 2020-4A, Class D1 (3M USD
LIBOR + 3.700%)1,000,000 3.834 01/20/32 1,002,641
Cathedral Lake VII Ltd. Series 2021-7RA, Class C (3M USDLIBOR + 2.570%)
750,000 2.696 01/15/32 736,360Cathedral Lake VII Ltd. Series 2021-7RA, Class D (3M USD
LIBOR + 4.280%)1,625,000 4.406 01/15/32 1,589,972
PrincipalAmount
InterestRate
MaturityDate Value
Asset-Backed Securities(b) – (continued)
Collateralized Loan Obligations(d) – (continued)CFIP CLO, Ltd. Series 2017-1A, Class DR (3M USD LIBOR +
3.820%)$ 2,200,000 3.905% 10/18/34 $ 2,177,575Crown City CLO I Series 2020-1A, Class A1AR (3M USD
LIBOR + 1.190%)2,000,000 1.336 07/20/34 2,001,076
Crown Point CLO 9, Ltd. Series 2020-9A, Class AR (3M USDLIBOR + 1.190%)8,900,000 1.322 07/14/34 8,903,159
Elmwood CLO IV Ltd. Series 2020-1A, Class A (3M USDLIBOR + 1.240%)9,000,000 1.366 04/15/33 9,024,039
HalseyPoint CLO 2 Ltd. Series 2020-2A, Class A1 (3M USDLIBOR + 1.860%)5,800,000 1.994 07/20/31 5,812,029
HalseyPoint CLO 2 Ltd. Series 2020-2A, Class B (3M USDLIBOR + 2.950%)2,400,000 3.084 07/20/31 2,411,364
HalseyPoint CLO I Ltd. Series 2019-1A, Class A1A1 (3M USDLIBOR + 1.350%)9,400,000 1.484 01/20/33 9,409,851
LCCM Trust Series 2021-FL2, Class A (1M USD LIBOR +1.284%)1,150,000 1.284 12/13/38 1,149,640
MAN GLG US. Ltd. Series CLO 2021-1A, Class A1 (3M USDLIBOR + 1.300%)6,700,000 1.396 07/15/34 6,707,819
Marble Point CLO XIX Ltd. Series 2020-3A, Class D (3M USDLIBOR + 3.900%)1,000,000 4.034 01/19/34 1,007,965
MF1 Trust Series 2021-FL6, Class A (1M USD LIBOR +1.100%)1,400,000 1.185 07/16/36 1,399,995
MidOcean Credit CLO VI Series 2016-6A, Class D1R (3M USDLIBOR + 3.520%)1,400,000 3.654 04/20/33 1,393,013
Mill City Mortgage Loan Trust Series 2017-2, Class A3773,801 2.989 07/25/59 799,036
Ocean Trails CLO XI Series 21-11A, Class D (3M USD LIBOR+ 3.700%)3,000,000 3.852 07/20/34 2,990,376
Octagon Investment Partners XIV Ltd. Series 2012-1A,Class CRR (3M USD LIBOR + 3.900%)1,600,000 4.026 07/15/29 1,600,123
OZLM Ltd.Series 2015-14A, Class CRR (3M USD LIBOR +3.390%)2,200,000 3.516 07/15/34 2,167,559
TCW CLO AMR Ltd. Series 2019-1A, Class DR (3M USDLIBOR + 3.670%)2,300,000 3.789 08/16/34 2,288,845
THL Credit Wind River CLO Ltd. Series 2017-1A, Class DR (3MUSD LIBOR + 3.720%)1,400,000 3.854 04/18/36 1,400,699
Tralee CLO VII Ltd. Series 2021-7A, Class D (3M USD LIBOR+ 3.180%)2,150,000 3.418 04/25/34 2,106,850
116 The accompanying notes are an integral part of these financial statements.
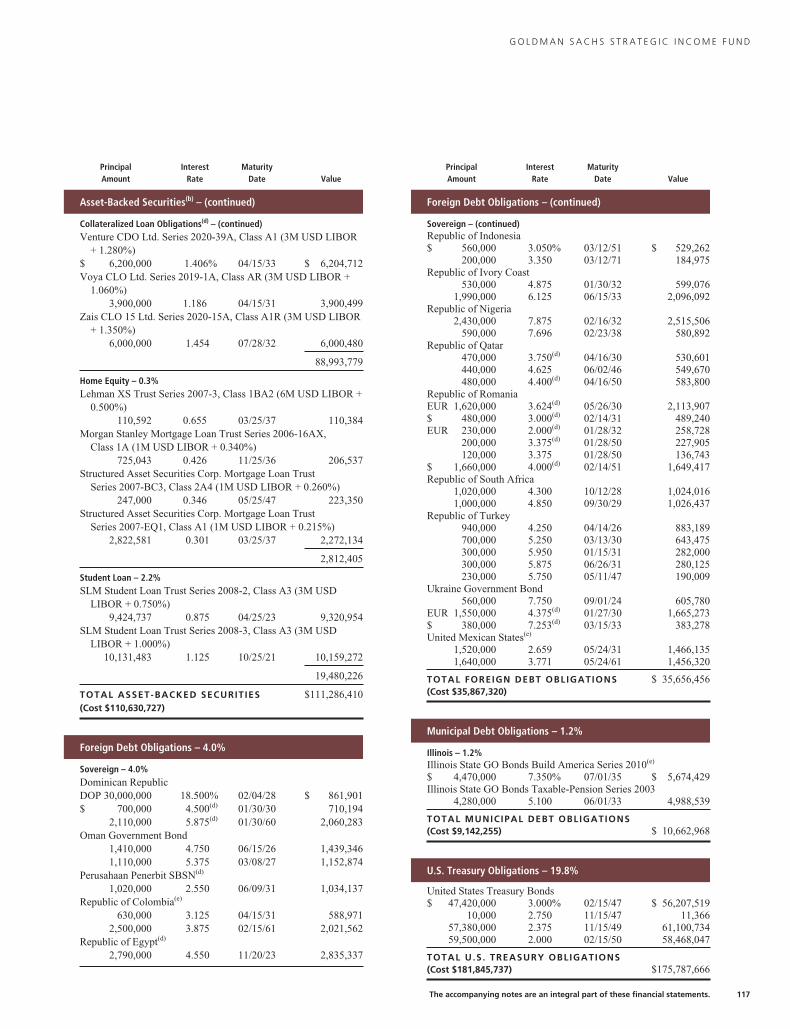
G O L D M A N S A C H S S T R A T E G I C I N C O M E F U N D
PrincipalAmount
InterestRate
MaturityDate Value
Asset-Backed Securities(b) – (continued)
Collateralized Loan Obligations(d) – (continued)Venture CDO Ltd. Series 2020-39A, Class A1 (3M USD LIBOR
+ 1.280%)$ 6,200,000 1.406% 04/15/33 $ 6,204,712Voya CLO Ltd. Series 2019-1A, Class AR (3M USD LIBOR +
1.060%)3,900,000 1.186 04/15/31 3,900,499
Zais CLO 15 Ltd. Series 2020-15A, Class A1R (3M USD LIBOR+ 1.350%)
6,000,000 1.454 07/28/32 6,000,480
88,993,779
Home Equity – 0.3%Lehman XS Trust Series 2007-3, Class 1BA2 (6M USD LIBOR +
0.500%)110,592 0.655 03/25/37 110,384
Morgan Stanley Mortgage Loan Trust Series 2006-16AX,Class 1A (1M USD LIBOR + 0.340%)
725,043 0.426 11/25/36 206,537Structured Asset Securities Corp. Mortgage Loan Trust
Series 2007-BC3, Class 2A4 (1M USD LIBOR + 0.260%)247,000 0.346 05/25/47 223,350
Structured Asset Securities Corp. Mortgage Loan TrustSeries 2007-EQ1, Class A1 (1M USD LIBOR + 0.215%)
2,822,581 0.301 03/25/37 2,272,134
2,812,405
Student Loan – 2.2%SLM Student Loan Trust Series 2008-2, Class A3 (3M USD
LIBOR + 0.750%)9,424,737 0.875 04/25/23 9,320,954
SLM Student Loan Trust Series 2008-3, Class A3 (3M USDLIBOR + 1.000%)
10,131,483 1.125 10/25/21 10,159,272
19,480,226
TOTAL ASSET-BACKED SECURITIES $111,286,410(Cost $110,630,727)
Foreign Debt Obligations – 4.0%
Sovereign – 4.0%Dominican RepublicDOP 30,000,000 18.500% 02/04/28 $ 861,901$ 700,000 4.500(d) 01/30/30 710,194
2,110,000 5.875(d) 01/30/60 2,060,283Oman Government Bond
1,410,000 4.750 06/15/26 1,439,3461,110,000 5.375 03/08/27 1,152,874
Perusahaan Penerbit SBSN(d)
1,020,000 2.550 06/09/31 1,034,137Republic of Colombia(e)
630,000 3.125 04/15/31 588,9712,500,000 3.875 02/15/61 2,021,562
Republic of Egypt(d)
2,790,000 4.550 11/20/23 2,835,337
PrincipalAmount
InterestRate
MaturityDate Value
Foreign Debt Obligations – (continued)
Sovereign – (continued)Republic of Indonesia$ 560,000 3.050% 03/12/51 $ 529,262
200,000 3.350 03/12/71 184,975Republic of Ivory Coast
530,000 4.875 01/30/32 599,0761,990,000 6.125 06/15/33 2,096,092
Republic of Nigeria2,430,000 7.875 02/16/32 2,515,506
590,000 7.696 02/23/38 580,892Republic of Qatar
470,000 3.750(d) 04/16/30 530,601440,000 4.625 06/02/46 549,670480,000 4.400(d) 04/16/50 583,800
Republic of RomaniaEUR 1,620,000 3.624(d) 05/26/30 2,113,907$ 480,000 3.000(d) 02/14/31 489,240EUR 230,000 2.000(d) 01/28/32 258,728
200,000 3.375(d) 01/28/50 227,905120,000 3.375 01/28/50 136,743
$ 1,660,000 4.000(d) 02/14/51 1,649,417Republic of South Africa
1,020,000 4.300 10/12/28 1,024,0161,000,000 4.850 09/30/29 1,026,437
Republic of Turkey940,000 4.250 04/14/26 883,189700,000 5.250 03/13/30 643,475300,000 5.950 01/15/31 282,000300,000 5.875 06/26/31 280,125230,000 5.750 05/11/47 190,009
Ukraine Government Bond560,000 7.750 09/01/24 605,780
EUR 1,550,000 4.375(d) 01/27/30 1,665,273$ 380,000 7.253(d) 03/15/33 383,278United Mexican States(e)
1,520,000 2.659 05/24/31 1,466,1351,640,000 3.771 05/24/61 1,456,320
TOTAL FOREIGN DEBT OBLIGATIONS $ 35,656,456(Cost $35,867,320)
Municipal Debt Obligations – 1.2%
Illinois – 1.2%Illinois State GO Bonds Build America Series 2010(e)
$ 4,470,000 7.350% 07/01/35 $ 5,674,429Illinois State GO Bonds Taxable-Pension Series 2003
4,280,000 5.100 06/01/33 4,988,539
TOTAL MUNICIPAL DEBT OBLIGATIONS(Cost $9,142,255) $ 10,662,968
U.S. Treasury Obligations – 19.8%
United States Treasury Bonds$ 47,420,000 3.000% 02/15/47 $ 56,207,519
10,000 2.750 11/15/47 11,36657,380,000 2.375 11/15/49 61,100,73459,500,000 2.000 02/15/50 58,468,047
TOTAL U.S. TREASURY OBLIGATIONS(Cost $181,845,737) $175,787,666
The accompanying notes are an integral part of these financial statements. 117
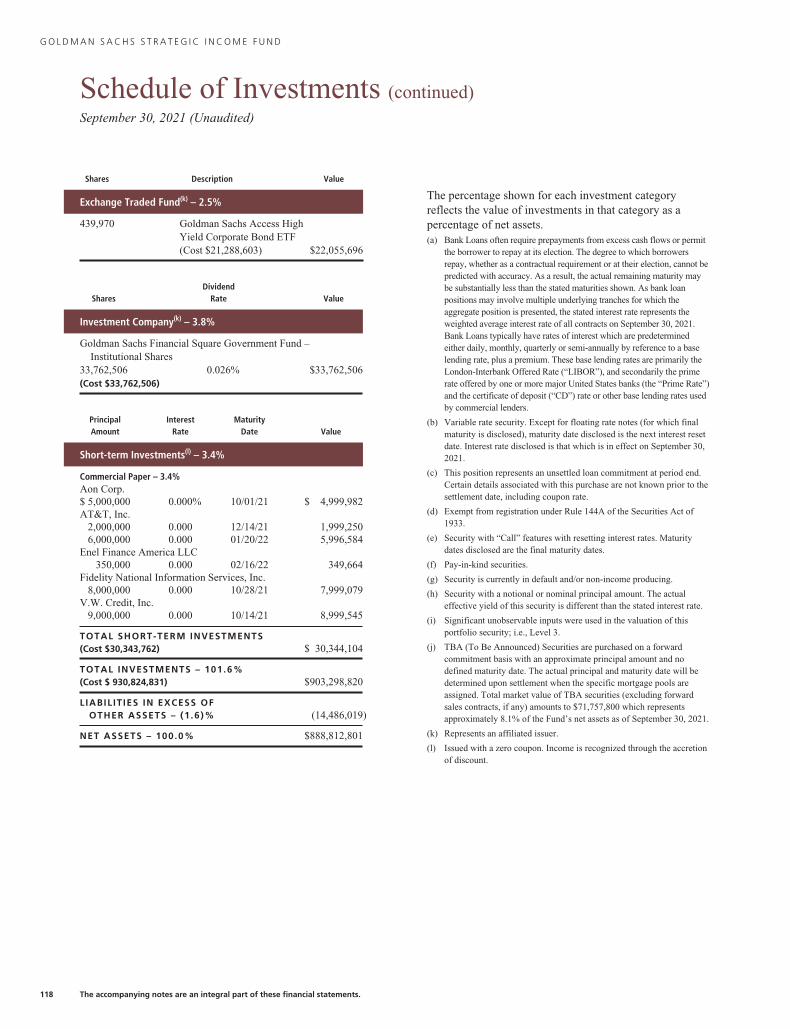
G O L D M A N S A C H S S T R A T E G I C I N C O M E F U N D
Schedule of Investments (continued)September 30, 2021 (Unaudited)
Shares Description Value
Exchange Traded Fund(k) – 2.5%
439,970 Goldman Sachs Access HighYield Corporate Bond ETF(Cost $21,288,603) $22,055,696
SharesDividend
Rate Value
Investment Company(k) – 3.8%
Goldman Sachs Financial Square Government Fund –Institutional Shares
33,762,506 0.026% $33,762,506(Cost $33,762,506)
PrincipalAmount
InterestRate
MaturityDate Value
Short-term Investments(l) – 3.4%
Commercial Paper – 3.4%Aon Corp.$ 5,000,000 0.000% 10/01/21 $ 4,999,982AT&T, Inc.
2,000,000 0.000 12/14/21 1,999,2506,000,000 0.000 01/20/22 5,996,584
Enel Finance America LLC350,000 0.000 02/16/22 349,664
Fidelity National Information Services, Inc.8,000,000 0.000 10/28/21 7,999,079
V.W. Credit, Inc.9,000,000 0.000 10/14/21 8,999,545
TOTAL SHORT-TERM INVESTMENTS(Cost $30,343,762) $ 30,344,104
TOTAL INVESTMENTS – 101.6%(Cost $ 930,824,831) $903,298,820
LIABIL IT IES IN EXCESS OFOTHER ASSETS – (1.6)% (14,486,019)
NET ASSETS – 100.0% $888,812,801
The percentage shown for each investment categoryreflects the value of investments in that category as apercentage of net assets.(a) Bank Loans often require prepayments from excess cash flows or permit
the borrower to repay at its election. The degree to which borrowersrepay, whether as a contractual requirement or at their election, cannot bepredicted with accuracy. As a result, the actual remaining maturity maybe substantially less than the stated maturities shown. As bank loanpositions may involve multiple underlying tranches for which theaggregate position is presented, the stated interest rate represents theweighted average interest rate of all contracts on September 30, 2021.Bank Loans typically have rates of interest which are predeterminedeither daily, monthly, quarterly or semi-annually by reference to a baselending rate, plus a premium. These base lending rates are primarily theLondon-Interbank Offered Rate (“LIBOR”), and secondarily the primerate offered by one or more major United States banks (the “Prime Rate”)and the certificate of deposit (“CD”) rate or other base lending rates usedby commercial lenders.
(b) Variable rate security. Except for floating rate notes (for which finalmaturity is disclosed), maturity date disclosed is the next interest resetdate. Interest rate disclosed is that which is in effect on September 30,2021.
(c) This position represents an unsettled loan commitment at period end.Certain details associated with this purchase are not known prior to thesettlement date, including coupon rate.
(d) Exempt from registration under Rule 144A of the Securities Act of1933.
(e) Security with “Call” features with resetting interest rates. Maturitydates disclosed are the final maturity dates.
(f) Pay-in-kind securities.
(g) Security is currently in default and/or non-income producing.
(h) Security with a notional or nominal principal amount. The actualeffective yield of this security is different than the stated interest rate.
(i) Significant unobservable inputs were used in the valuation of thisportfolio security; i.e., Level 3.
(j) TBA (To Be Announced) Securities are purchased on a forwardcommitment basis with an approximate principal amount and nodefined maturity date. The actual principal and maturity date will bedetermined upon settlement when the specific mortgage pools areassigned. Total market value of TBA securities (excluding forwardsales contracts, if any) amounts to $71,757,800 which representsapproximately 8.1% of the Fund’s net assets as of September 30, 2021.
(k) Represents an affiliated issuer.
(l) Issued with a zero coupon. Income is recognized through the accretionof discount.
118 The accompanying notes are an integral part of these financial statements.
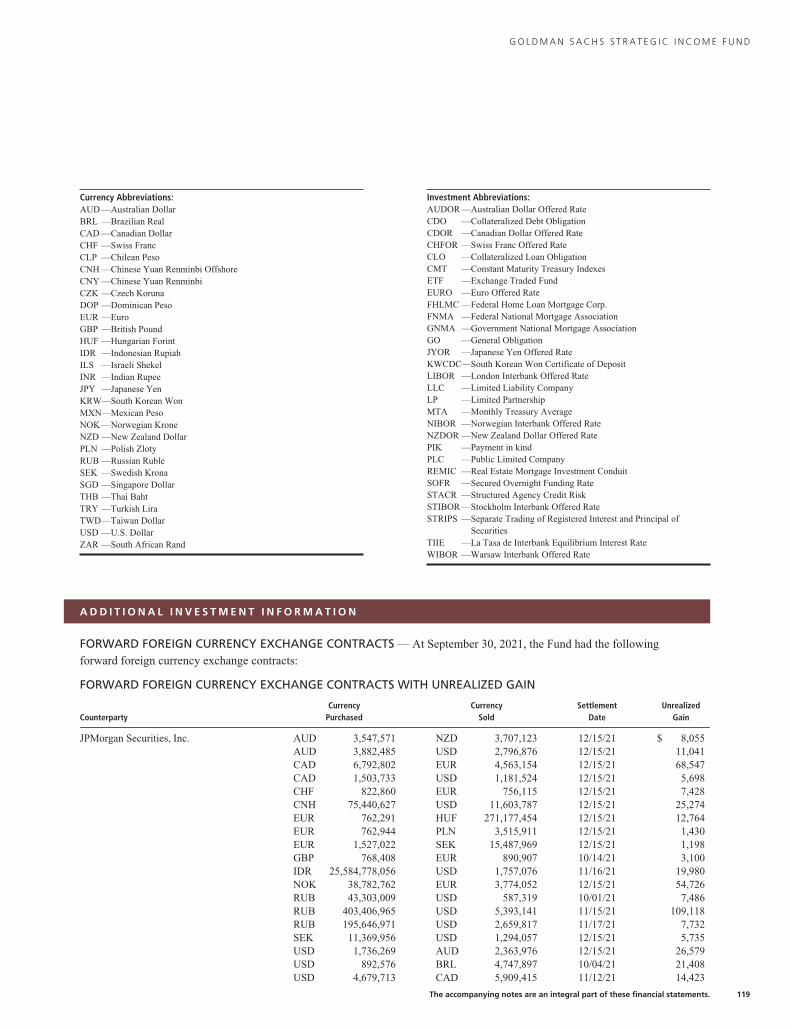
G O L D M A N S A C H S S T R A T E G I C I N C O M E F U N D
Currency Abbreviations:AUD —Australian DollarBRL —Brazilian RealCAD —Canadian DollarCHF —Swiss FrancCLP —Chilean PesoCNH —Chinese Yuan Renminbi OffshoreCNY —Chinese Yuan RenminbiCZK —Czech KorunaDOP —Dominican PesoEUR —EuroGBP —British PoundHUF —Hungarian ForintIDR —Indonesian RupiahILS —Israeli ShekelINR —Indian RupeeJPY —Japanese YenKRW—South Korean WonMXN—Mexican PesoNOK —Norwegian KroneNZD —New Zealand DollarPLN —Polish ZlotyRUB —Russian RubleSEK —Swedish KronaSGD —Singapore DollarTHB —Thai BahtTRY —Turkish LiraTWD—Taiwan DollarUSD —U.S. DollarZAR —South African Rand
Investment Abbreviations:AUDOR —Australian Dollar Offered RateCDO —Collateralized Debt ObligationCDOR —Canadian Dollar Offered RateCHFOR —Swiss Franc Offered RateCLO —Collateralized Loan ObligationCMT —Constant Maturity Treasury IndexesETF —Exchange Traded FundEURO —Euro Offered RateFHLMC —Federal Home Loan Mortgage Corp.FNMA —Federal National Mortgage AssociationGNMA —Government National Mortgage AssociationGO —General ObligationJYOR —Japanese Yen Offered RateKWCDC—South Korean Won Certificate of DepositLIBOR —London Interbank Offered RateLLC —Limited Liability CompanyLP —Limited PartnershipMTA —Monthly Treasury AverageNIBOR —Norwegian Interbank Offered RateNZDOR —New Zealand Dollar Offered RatePIK —Payment in kindPLC —Public Limited CompanyREMIC —Real Estate Mortgage Investment ConduitSOFR —Secured Overnight Funding RateSTACR —Structured Agency Credit RiskSTIBOR —Stockholm Interbank Offered RateSTRIPS —Separate Trading of Registered Interest and Principal of
SecuritiesTIIE —La Tasa de Interbank Equilibrium Interest RateWIBOR —Warsaw Interbank Offered Rate
A D D I T I O N A L I N V E S T M E N T I N F O R M A T I O N
FORWARD FOREIGN CURRENCY EXCHANGE CONTRACTS — At September 30, 2021, the Fund had the following
forward foreign currency exchange contracts:
FORWARD FOREIGN CURRENCY EXCHANGE CONTRACTS WITH UNREALIZED GAIN
CounterpartyCurrency
PurchasedCurrency
SoldSettlement
DateUnrealized
Gain
JPMorgan Securities, Inc. AUD 3,547,571 NZD 3,707,123 12/15/21 $ 8,055AUD 3,882,485 USD 2,796,876 12/15/21 11,041CAD 6,792,802 EUR 4,563,154 12/15/21 68,547CAD 1,503,733 USD 1,181,524 12/15/21 5,698CHF 822,860 EUR 756,115 12/15/21 7,428CNH 75,440,627 USD 11,603,787 12/15/21 25,274EUR 762,291 HUF 271,177,454 12/15/21 12,764EUR 762,944 PLN 3,515,911 12/15/21 1,430EUR 1,527,022 SEK 15,487,969 12/15/21 1,198GBP 768,408 EUR 890,907 10/14/21 3,100IDR 25,584,778,056 USD 1,757,076 11/16/21 19,980NOK 38,782,762 EUR 3,774,052 12/15/21 54,726RUB 43,303,009 USD 587,319 10/01/21 7,486RUB 403,406,965 USD 5,393,141 11/15/21 109,118RUB 195,646,971 USD 2,659,817 11/17/21 7,732SEK 11,369,956 USD 1,294,057 12/15/21 5,735USD 1,736,269 AUD 2,363,976 12/15/21 26,579USD 892,576 BRL 4,747,897 10/04/21 21,408USD 4,679,713 CAD 5,909,415 11/12/21 14,423
The accompanying notes are an integral part of these financial statements. 119
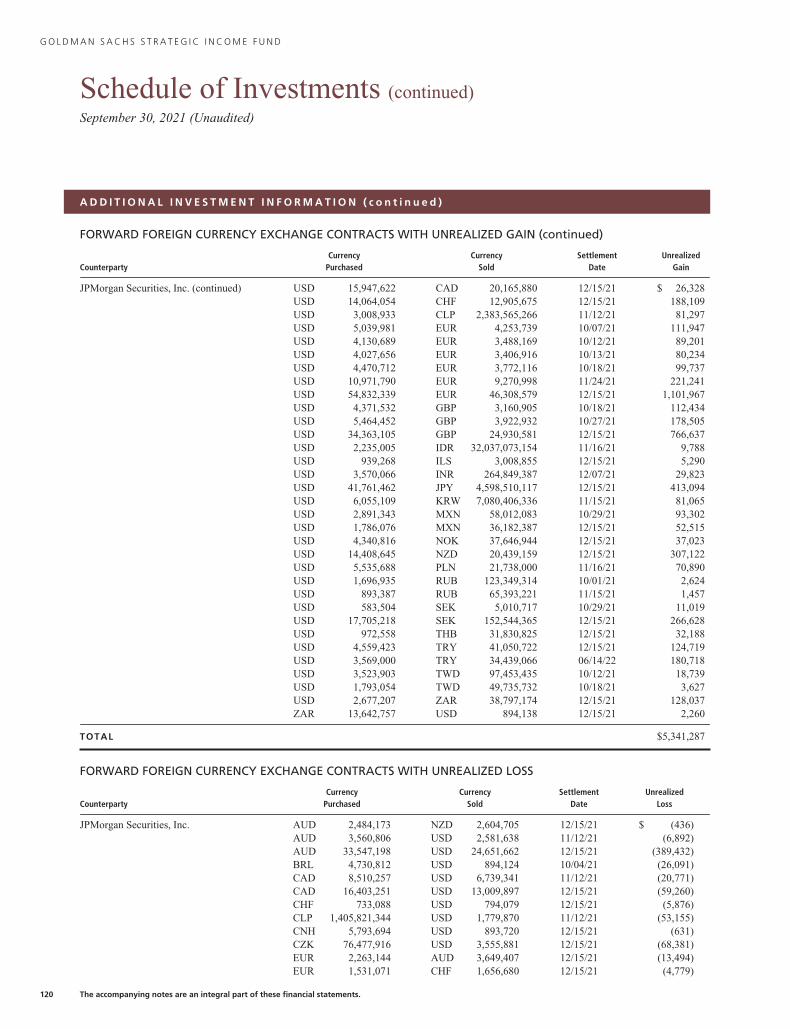
G O L D M A N S A C H S S T R A T E G I C I N C O M E F U N D
Schedule of Investments (continued)September 30, 2021 (Unaudited)
A D D I T I O N A L I N V E S T M E N T I N F O R M A T I O N ( c o n t i n u e d )
FORWARD FOREIGN CURRENCY EXCHANGE CONTRACTS WITH UNREALIZED GAIN (continued)
CounterpartyCurrency
PurchasedCurrency
SoldSettlement
DateUnrealized
Gain
JPMorgan Securities, Inc. (continued) USD 15,947,622 CAD 20,165,880 12/15/21 $ 26,328USD 14,064,054 CHF 12,905,675 12/15/21 188,109USD 3,008,933 CLP 2,383,565,266 11/12/21 81,297USD 5,039,981 EUR 4,253,739 10/07/21 111,947USD 4,130,689 EUR 3,488,169 10/12/21 89,201USD 4,027,656 EUR 3,406,916 10/13/21 80,234USD 4,470,712 EUR 3,772,116 10/18/21 99,737USD 10,971,790 EUR 9,270,998 11/24/21 221,241USD 54,832,339 EUR 46,308,579 12/15/21 1,101,967USD 4,371,532 GBP 3,160,905 10/18/21 112,434USD 5,464,452 GBP 3,922,932 10/27/21 178,505USD 34,363,105 GBP 24,930,581 12/15/21 766,637USD 2,235,005 IDR 32,037,073,154 11/16/21 9,788USD 939,268 ILS 3,008,855 12/15/21 5,290USD 3,570,066 INR 264,849,387 12/07/21 29,823USD 41,761,462 JPY 4,598,510,117 12/15/21 413,094USD 6,055,109 KRW 7,080,406,336 11/15/21 81,065USD 2,891,343 MXN 58,012,083 10/29/21 93,302USD 1,786,076 MXN 36,182,387 12/15/21 52,515USD 4,340,816 NOK 37,646,944 12/15/21 37,023USD 14,408,645 NZD 20,439,159 12/15/21 307,122USD 5,535,688 PLN 21,738,000 11/16/21 70,890USD 1,696,935 RUB 123,349,314 10/01/21 2,624USD 893,387 RUB 65,393,221 11/15/21 1,457USD 583,504 SEK 5,010,717 10/29/21 11,019USD 17,705,218 SEK 152,544,365 12/15/21 266,628USD 972,558 THB 31,830,825 12/15/21 32,188USD 4,559,423 TRY 41,050,722 12/15/21 124,719USD 3,569,000 TRY 34,439,066 06/14/22 180,718USD 3,523,903 TWD 97,453,435 10/12/21 18,739USD 1,793,054 TWD 49,735,732 10/18/21 3,627USD 2,677,207 ZAR 38,797,174 12/15/21 128,037ZAR 13,642,757 USD 894,138 12/15/21 2,260
TOTAL $5,341,287
FORWARD FOREIGN CURRENCY EXCHANGE CONTRACTS WITH UNREALIZED LOSS
CounterpartyCurrency
PurchasedCurrency
SoldSettlement
DateUnrealized
Loss
JPMorgan Securities, Inc. AUD 2,484,173 NZD 2,604,705 12/15/21 $ (436)AUD 3,560,806 USD 2,581,638 11/12/21 (6,892)AUD 33,547,198 USD 24,651,662 12/15/21 (389,432)BRL 4,730,812 USD 894,124 10/04/21 (26,091)CAD 8,510,257 USD 6,739,341 11/12/21 (20,771)CAD 16,403,251 USD 13,009,897 12/15/21 (59,260)CHF 733,088 USD 794,079 12/15/21 (5,876)CLP 1,405,821,344 USD 1,779,870 11/12/21 (53,155)CNH 5,793,694 USD 893,720 12/15/21 (631)CZK 76,477,916 USD 3,555,881 12/15/21 (68,381)EUR 2,263,144 AUD 3,649,407 12/15/21 (13,494)EUR 1,531,071 CHF 1,656,680 12/15/21 (4,779)
120 The accompanying notes are an integral part of these financial statements.
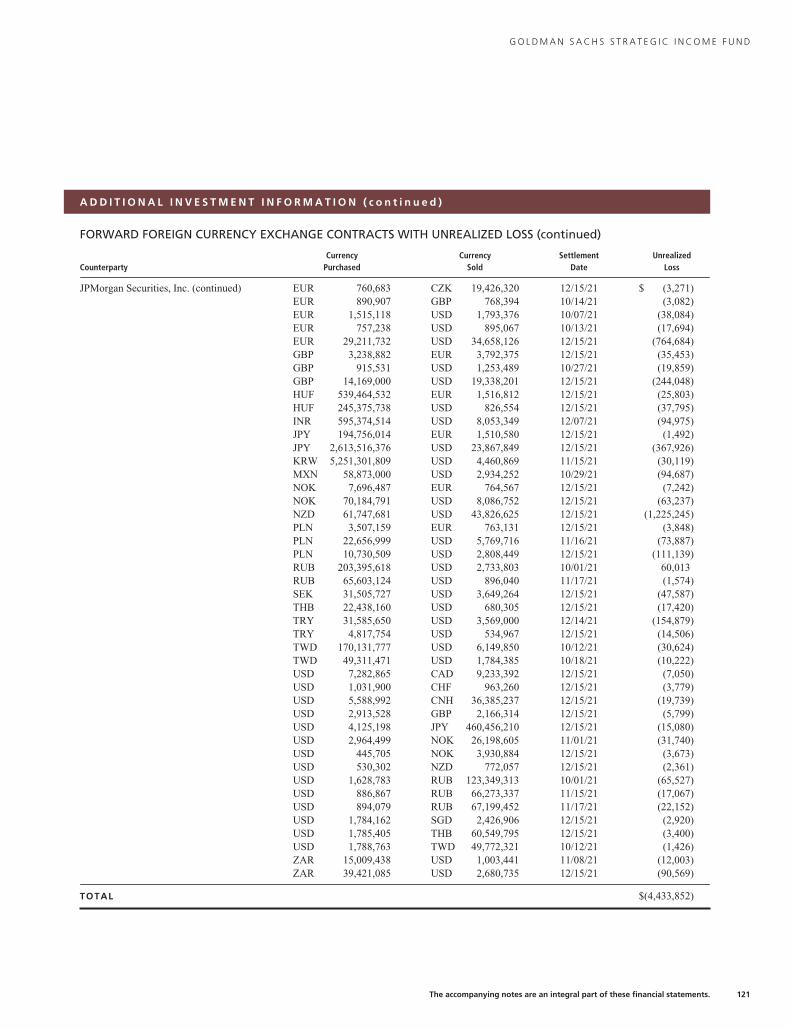
G O L D M A N S A C H S S T R A T E G I C I N C O M E F U N D
A D D I T I O N A L I N V E S T M E N T I N F O R M A T I O N ( c o n t i n u e d )
FORWARD FOREIGN CURRENCY EXCHANGE CONTRACTS WITH UNREALIZED LOSS (continued)
CounterpartyCurrency
PurchasedCurrency
SoldSettlement
DateUnrealized
Loss
JPMorgan Securities, Inc. (continued) EUR 760,683 CZK 19,426,320 12/15/21 $ (3,271)EUR 890,907 GBP 768,394 10/14/21 (3,082)EUR 1,515,118 USD 1,793,376 10/07/21 (38,084)EUR 757,238 USD 895,067 10/13/21 (17,694)EUR 29,211,732 USD 34,658,126 12/15/21 (764,684)GBP 3,238,882 EUR 3,792,375 12/15/21 (35,453)GBP 915,531 USD 1,253,489 10/27/21 (19,859)GBP 14,169,000 USD 19,338,201 12/15/21 (244,048)HUF 539,464,532 EUR 1,516,812 12/15/21 (25,803)HUF 245,375,738 USD 826,554 12/15/21 (37,795)INR 595,374,514 USD 8,053,349 12/07/21 (94,975)JPY 194,756,014 EUR 1,510,580 12/15/21 (1,492)JPY 2,613,516,376 USD 23,867,849 12/15/21 (367,926)KRW 5,251,301,809 USD 4,460,869 11/15/21 (30,119)MXN 58,873,000 USD 2,934,252 10/29/21 (94,687)NOK 7,696,487 EUR 764,567 12/15/21 (7,242)NOK 70,184,791 USD 8,086,752 12/15/21 (63,237)NZD 61,747,681 USD 43,826,625 12/15/21 (1,225,245)PLN 3,507,159 EUR 763,131 12/15/21 (3,848)PLN 22,656,999 USD 5,769,716 11/16/21 (73,887)PLN 10,730,509 USD 2,808,449 12/15/21 (111,139)RUB 203,395,618 USD 2,733,803 10/01/21 60,013RUB 65,603,124 USD 896,040 11/17/21 (1,574)SEK 31,505,727 USD 3,649,264 12/15/21 (47,587)THB 22,438,160 USD 680,305 12/15/21 (17,420)TRY 31,585,650 USD 3,569,000 12/14/21 (154,879)TRY 4,817,754 USD 534,967 12/15/21 (14,506)TWD 170,131,777 USD 6,149,850 10/12/21 (30,624)TWD 49,311,471 USD 1,784,385 10/18/21 (10,222)USD 7,282,865 CAD 9,233,392 12/15/21 (7,050)USD 1,031,900 CHF 963,260 12/15/21 (3,779)USD 5,588,992 CNH 36,385,237 12/15/21 (19,739)USD 2,913,528 GBP 2,166,314 12/15/21 (5,799)USD 4,125,198 JPY 460,456,210 12/15/21 (15,080)USD 2,964,499 NOK 26,198,605 11/01/21 (31,740)USD 445,705 NOK 3,930,884 12/15/21 (3,673)USD 530,302 NZD 772,057 12/15/21 (2,361)USD 1,628,783 RUB 123,349,313 10/01/21 (65,527)USD 886,867 RUB 66,273,337 11/15/21 (17,067)USD 894,079 RUB 67,199,452 11/17/21 (22,152)USD 1,784,162 SGD 2,426,906 12/15/21 (2,920)USD 1,785,405 THB 60,549,795 12/15/21 (3,400)USD 1,788,763 TWD 49,772,321 10/12/21 (1,426)ZAR 15,009,438 USD 1,003,441 11/08/21 (12,003)ZAR 39,421,085 USD 2,680,735 12/15/21 (90,569)
TOTAL $(4,433,852)
The accompanying notes are an integral part of these financial statements. 121
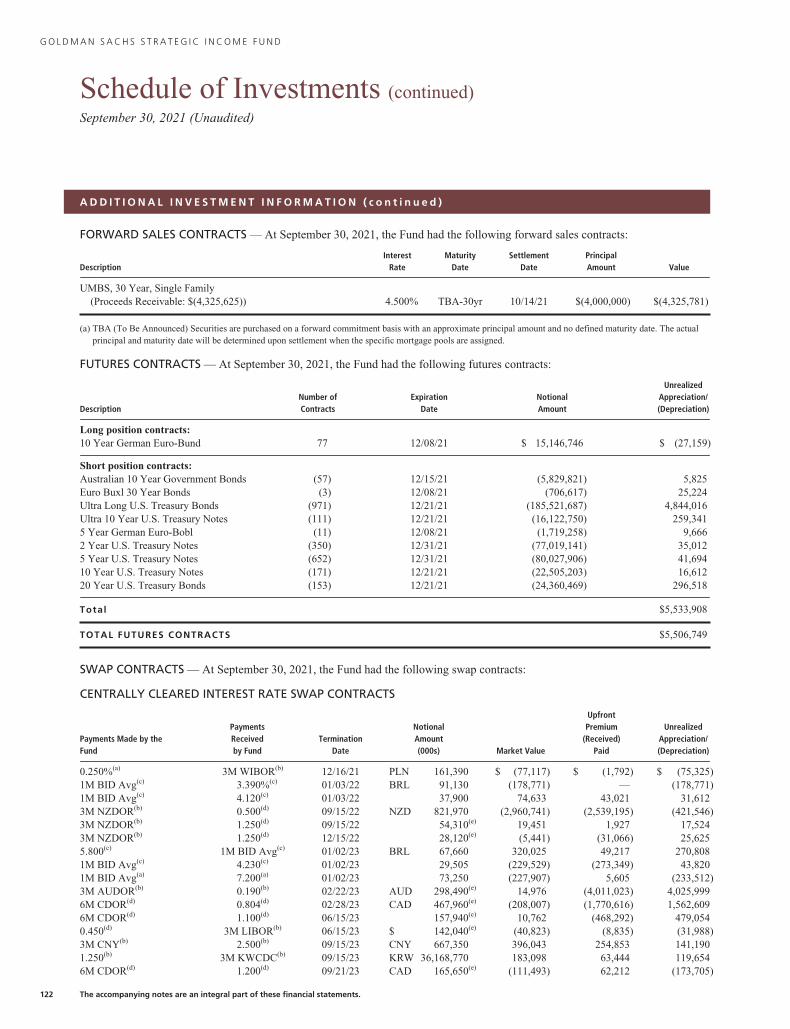
G O L D M A N S A C H S S T R A T E G I C I N C O M E F U N D
Schedule of Investments (continued)September 30, 2021 (Unaudited)
A D D I T I O N A L I N V E S T M E N T I N F O R M A T I O N ( c o n t i n u e d )
FORWARD SALES CONTRACTS — At September 30, 2021, the Fund had the following forward sales contracts:
DescriptionInterest
RateMaturity
DateSettlement
DatePrincipalAmount Value
UMBS, 30 Year, Single Family(Proceeds Receivable: $(4,325,625)) 4.500% TBA-30yr 10/14/21 $(4,000,000) $(4,325,781)
(a) TBA (To Be Announced) Securities are purchased on a forward commitment basis with an approximate principal amount and no defined maturity date. The actualprincipal and maturity date will be determined upon settlement when the specific mortgage pools are assigned.
FUTURES CONTRACTS — At September 30, 2021, the Fund had the following futures contracts:
DescriptionNumber ofContracts
ExpirationDate
NotionalAmount
UnrealizedAppreciation/(Depreciation)
Long position contracts:10 Year German Euro-Bund 77 12/08/21 $ 15,146,746 $ (27,159)
Short position contracts:Australian 10 Year Government Bonds (57) 12/15/21 (5,829,821) 5,825Euro Buxl 30 Year Bonds (3) 12/08/21 (706,617) 25,224Ultra Long U.S. Treasury Bonds (971) 12/21/21 (185,521,687) 4,844,016Ultra 10 Year U.S. Treasury Notes (111) 12/21/21 (16,122,750) 259,3415 Year German Euro-Bobl (11) 12/08/21 (1,719,258) 9,6662 Year U.S. Treasury Notes (350) 12/31/21 (77,019,141) 35,0125 Year U.S. Treasury Notes (652) 12/31/21 (80,027,906) 41,69410 Year U.S. Treasury Notes (171) 12/21/21 (22,505,203) 16,61220 Year U.S. Treasury Bonds (153) 12/21/21 (24,360,469) 296,518
Total $5,533,908
TOTAL FUTURES CONTRACTS $5,506,749
SWAP CONTRACTS — At September 30, 2021, the Fund had the following swap contracts:
CENTRALLY CLEARED INTEREST RATE SWAP CONTRACTS
Payments Made by theFund
PaymentsReceivedby Fund
TerminationDate
NotionalAmount(000s) Market Value
UpfrontPremium
(Received)Paid
UnrealizedAppreciation/(Depreciation)
0.250%(a) 3M WIBOR(b) 12/16/21 PLN 161,390 $ (77,117) $ (1,792) $ (75,325)1M BID Avg(c) 3.390%(c) 01/03/22 BRL 91,130 (178,771) — (178,771)1M BID Avg(c) 4.120(c) 01/03/22 37,900 74,633 43,021 31,6123M NZDOR(b) 0.500(d) 09/15/22 NZD 821,970 (2,960,741) (2,539,195) (421,546)3M NZDOR(b) 1.250(d) 09/15/22 54,310(e) 19,451 1,927 17,5243M NZDOR(b) 1.250(d) 12/15/22 28,120(e) (5,441) (31,066) 25,6255.800(c) 1M BID Avg(c) 01/02/23 BRL 67,660 320,025 49,217 270,8081M BID Avg(c) 4.230(c) 01/02/23 29,505 (229,529) (273,349) 43,8201M BID Avg(a) 7.200(a) 01/02/23 73,250 (227,907) 5,605 (233,512)3M AUDOR(b) 0.190(b) 02/22/23 AUD 298,490(e) 14,976 (4,011,023) 4,025,9996M CDOR(d) 0.804(d) 02/28/23 CAD 467,960(e) (208,007) (1,770,616) 1,562,6096M CDOR(d) 1.100(d) 06/15/23 157,940(e) 10,762 (468,292) 479,0540.450(d) 3M LIBOR(b) 06/15/23 $ 142,040(e) (40,823) (8,835) (31,988)3M CNY(b) 2.500(b) 09/15/23 CNY 667,350 396,043 254,853 141,1901.250(b) 3M KWCDC(b) 09/15/23 KRW 36,168,770 183,098 63,444 119,6546M CDOR(d) 1.200(d) 09/21/23 CAD 165,650(e) (111,493) 62,212 (173,705)
122 The accompanying notes are an integral part of these financial statements.
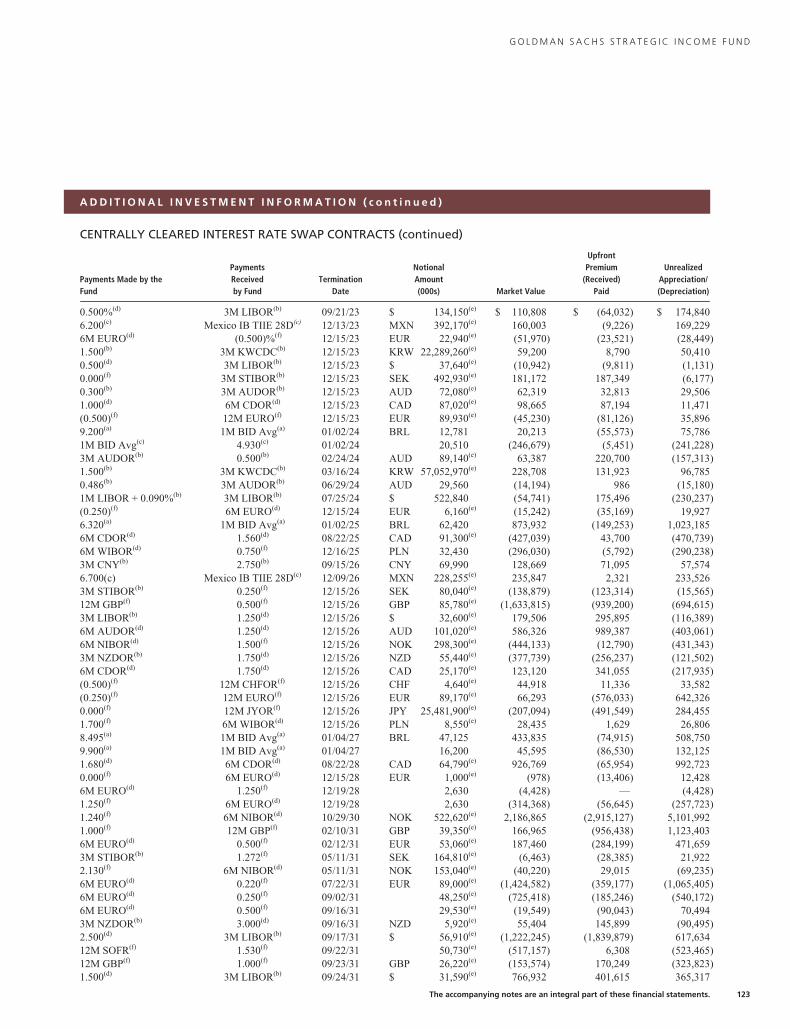
G O L D M A N S A C H S S T R A T E G I C I N C O M E F U N D
A D D I T I O N A L I N V E S T M E N T I N F O R M A T I O N ( c o n t i n u e d )
CENTRALLY CLEARED INTEREST RATE SWAP CONTRACTS (continued)
Payments Made by theFund
PaymentsReceivedby Fund
TerminationDate
NotionalAmount(000s) Market Value
UpfrontPremium
(Received)Paid
UnrealizedAppreciation/(Depreciation)
0.500%(d) 3M LIBOR(b) 09/21/23 $ 134,150(e) $ 110,808 $ (64,032) $ 174,8406.200(c) Mexico IB TIIE 28D(c) 12/13/23 MXN 392,170(e) 160,003 (9,226) 169,2296M EURO(d) (0.500)%(f) 12/15/23 EUR 22,940(e) (51,970) (23,521) (28,449)1.500(b) 3M KWCDC(b) 12/15/23 KRW 22,289,260(e) 59,200 8,790 50,4100.500(d) 3M LIBOR(b) 12/15/23 $ 37,640(e) (10,942) (9,811) (1,131)0.000(f) 3M STIBOR(b) 12/15/23 SEK 492,930(e) 181,172 187,349 (6,177)0.300(b) 3M AUDOR(b) 12/15/23 AUD 72,080(e) 62,319 32,813 29,5061.000(d) 6M CDOR(d) 12/15/23 CAD 87,020(e) 98,665 87,194 11,471(0.500)(f) 12M EURO(f) 12/15/23 EUR 89,930(e) (45,230) (81,126) 35,8969.200(a) 1M BID Avg(a) 01/02/24 BRL 12,781 20,213 (55,573) 75,7861M BID Avg(c) 4.930(c) 01/02/24 20,510 (246,679) (5,451) (241,228)3M AUDOR(b) 0.500(b) 02/24/24 AUD 89,140(e) 63,387 220,700 (157,313)1.500(b) 3M KWCDC(b) 03/16/24 KRW 57,052,970(e) 228,708 131,923 96,7850.486(b) 3M AUDOR(b) 06/29/24 AUD 29,560 (14,194) 986 (15,180)1M LIBOR + 0.090%(b) 3M LIBOR(b) 07/25/24 $ 522,840 (54,741) 175,496 (230,237)(0.250)(f) 6M EURO(d) 12/15/24 EUR 6,160(e) (15,242) (35,169) 19,9276.320(a) 1M BID Avg(a) 01/02/25 BRL 62,420 873,932 (149,253) 1,023,1856M CDOR(d) 1.560(d) 08/22/25 CAD 91,300(e) (427,039) 43,700 (470,739)6M WIBOR(d) 0.750(f) 12/16/25 PLN 32,430 (296,030) (5,792) (290,238)3M CNY(b) 2.750(b) 09/15/26 CNY 69,990 128,669 71,095 57,5746.700(c) Mexico IB TIIE 28D(c) 12/09/26 MXN 228,255(e) 235,847 2,321 233,5263M STIBOR(b) 0.250(f) 12/15/26 SEK 80,040(e) (138,879) (123,314) (15,565)12M GBP(f) 0.500(f) 12/15/26 GBP 85,780(e) (1,633,815) (939,200) (694,615)3M LIBOR(b) 1.250(d) 12/15/26 $ 32,600(e) 179,506 295,895 (116,389)6M AUDOR(d) 1.250(d) 12/15/26 AUD 101,020(e) 586,326 989,387 (403,061)6M NIBOR(d) 1.500(f) 12/15/26 NOK 298,300(e) (444,133) (12,790) (431,343)3M NZDOR(b) 1.750(d) 12/15/26 NZD 55,440(e) (377,739) (256,237) (121,502)6M CDOR(d) 1.750(d) 12/15/26 CAD 25,170(e) 123,120 341,055 (217,935)(0.500)(f) 12M CHFOR(f) 12/15/26 CHF 4,640(e) 44,918 11,336 33,582(0.250)(f) 12M EURO(f) 12/15/26 EUR 89,170(e) 66,293 (576,033) 642,3260.000(f) 12M JYOR(f) 12/15/26 JPY 25,481,900(e) (207,094) (491,549) 284,4551.700(f) 6M WIBOR(d) 12/15/26 PLN 8,550(e) 28,435 1,629 26,8068.495(a) 1M BID Avg(a) 01/04/27 BRL 47,125 433,835 (74,915) 508,7509.900(a) 1M BID Avg(a) 01/04/27 16,200 45,595 (86,530) 132,1251.680(d) 6M CDOR(d) 08/22/28 CAD 64,790(e) 926,769 (65,954) 992,7230.000(f) 6M EURO(d) 12/15/28 EUR 1,000(e) (978) (13,406) 12,4286M EURO(d) 1.250(f) 12/19/28 2,630 (4,428) — (4,428)1.250(f) 6M EURO(d) 12/19/28 2,630 (314,368) (56,645) (257,723)1.240(f) 6M NIBOR(d) 10/29/30 NOK 522,620(e) 2,186,865 (2,915,127) 5,101,9921.000(f) 12M GBP(f) 02/10/31 GBP 39,350(e) 166,965 (956,438) 1,123,4036M EURO(d) 0.500(f) 02/12/31 EUR 53,060(e) 187,460 (284,199) 471,6593M STIBOR(b) 1.272(f) 05/11/31 SEK 164,810(e) (6,463) (28,385) 21,9222.130(f) 6M NIBOR(d) 05/11/31 NOK 153,040(e) (40,220) 29,015 (69,235)6M EURO(d) 0.220(f) 07/22/31 EUR 89,000(e) (1,424,582) (359,177) (1,065,405)6M EURO(d) 0.250(f) 09/02/31 48,250(e) (725,418) (185,246) (540,172)6M EURO(d) 0.500(f) 09/16/31 29,530(e) (19,549) (90,043) 70,4943M NZDOR(b) 3.000(d) 09/16/31 NZD 5,920(e) 55,404 145,899 (90,495)2.500(d) 3M LIBOR(b) 09/17/31 $ 56,910(e) (1,222,245) (1,839,879) 617,63412M SOFR(f) 1.530(f) 09/22/31 50,730(e) (517,157) 6,308 (523,465)12M GBP(f) 1.000(f) 09/23/31 GBP 26,220(e) (153,574) 170,249 (323,823)1.500(d) 3M LIBOR(b) 09/24/31 $ 31,590(e) 766,932 401,615 365,317
The accompanying notes are an integral part of these financial statements. 123
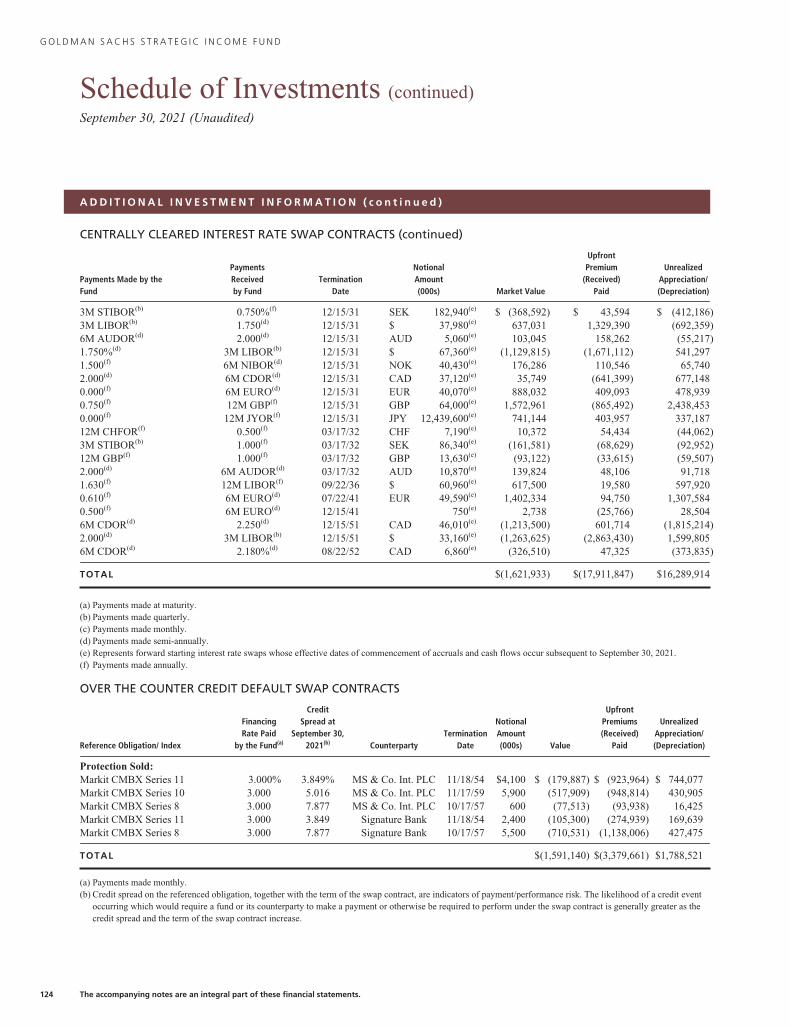
G O L D M A N S A C H S S T R A T E G I C I N C O M E F U N D
Schedule of Investments (continued)September 30, 2021 (Unaudited)
A D D I T I O N A L I N V E S T M E N T I N F O R M A T I O N ( c o n t i n u e d )
CENTRALLY CLEARED INTEREST RATE SWAP CONTRACTS (continued)
Payments Made by theFund
PaymentsReceivedby Fund
TerminationDate
NotionalAmount(000s) Market Value
UpfrontPremium
(Received)Paid
UnrealizedAppreciation/(Depreciation)
3M STIBOR(b) 0.750%(f) 12/15/31 SEK 182,940(e) $ (368,592) $ 43,594 $ (412,186)3M LIBOR(b) 1.750(d) 12/15/31 $ 37,980(e) 637,031 1,329,390 (692,359)6M AUDOR(d) 2.000(d) 12/15/31 AUD 5,060(e) 103,045 158,262 (55,217)1.750%(d) 3M LIBOR(b) 12/15/31 $ 67,360(e) (1,129,815) (1,671,112) 541,2971.500(f) 6M NIBOR(d) 12/15/31 NOK 40,430(e) 176,286 110,546 65,7402.000(d) 6M CDOR(d) 12/15/31 CAD 37,120(e) 35,749 (641,399) 677,1480.000(f) 6M EURO(d) 12/15/31 EUR 40,070(e) 888,032 409,093 478,9390.750(f) 12M GBP(f) 12/15/31 GBP 64,000(e) 1,572,961 (865,492) 2,438,4530.000(f) 12M JYOR(f) 12/15/31 JPY 12,439,600(e) 741,144 403,957 337,18712M CHFOR(f) 0.500(f) 03/17/32 CHF 7,190(e) 10,372 54,434 (44,062)3M STIBOR(b) 1.000(f) 03/17/32 SEK 86,340(e) (161,581) (68,629) (92,952)12M GBP(f) 1.000(f) 03/17/32 GBP 13,630(e) (93,122) (33,615) (59,507)2.000(d) 6M AUDOR(d) 03/17/32 AUD 10,870(e) 139,824 48,106 91,7181.630(f) 12M LIBOR(f) 09/22/36 $ 60,960(e) 617,500 19,580 597,9200.610(f) 6M EURO(d) 07/22/41 EUR 49,590(e) 1,402,334 94,750 1,307,5840.500(f) 6M EURO(d) 12/15/41 750(e) 2,738 (25,766) 28,5046M CDOR(d) 2.250(d) 12/15/51 CAD 46,010(e) (1,213,500) 601,714 (1,815,214)2.000(d) 3M LIBOR(b) 12/15/51 $ 33,160(e) (1,263,625) (2,863,430) 1,599,8056M CDOR(d) 2.180%(d) 08/22/52 CAD 6,860(e) (326,510) 47,325 (373,835)
TOTAL $(1,621,933) $(17,911,847) $16,289,914
(a) Payments made at maturity.(b) Payments made quarterly.(c) Payments made monthly.(d) Payments made semi-annually.(e) Represents forward starting interest rate swaps whose effective dates of commencement of accruals and cash flows occur subsequent to September 30, 2021.(f) Payments made annually.
OVER THE COUNTER CREDIT DEFAULT SWAP CONTRACTS
Reference Obligation/ Index
FinancingRate Paid
by the Fund(a)
CreditSpread at
September 30,2021(b) Counterparty
TerminationDate
NotionalAmount(000s) Value
UpfrontPremiums(Received)
Paid
UnrealizedAppreciation/(Depreciation)
Protection Sold:Markit CMBX Series 11 3.000% 3.849% MS & Co. Int. PLC 11/18/54 $4,100 $ (179,887) $ (923,964) $ 744,077Markit CMBX Series 10 3.000 5.016 MS & Co. Int. PLC 11/17/59 5,900 (517,909) (948,814) 430,905Markit CMBX Series 8 3.000 7.877 MS & Co. Int. PLC 10/17/57 600 (77,513) (93,938) 16,425Markit CMBX Series 11 3.000 3.849 Signature Bank 11/18/54 2,400 (105,300) (274,939) 169,639Markit CMBX Series 8 3.000 7.877 Signature Bank 10/17/57 5,500 (710,531) (1,138,006) 427,475
TOTAL $(1,591,140) $(3,379,661) $1,788,521
(a) Payments made monthly.(b) Credit spread on the referenced obligation, together with the term of the swap contract, are indicators of payment/performance risk. The likelihood of a credit event
occurring which would require a fund or its counterparty to make a payment or otherwise be required to perform under the swap contract is generally greater as thecredit spread and the term of the swap contract increase.
124 The accompanying notes are an integral part of these financial statements.
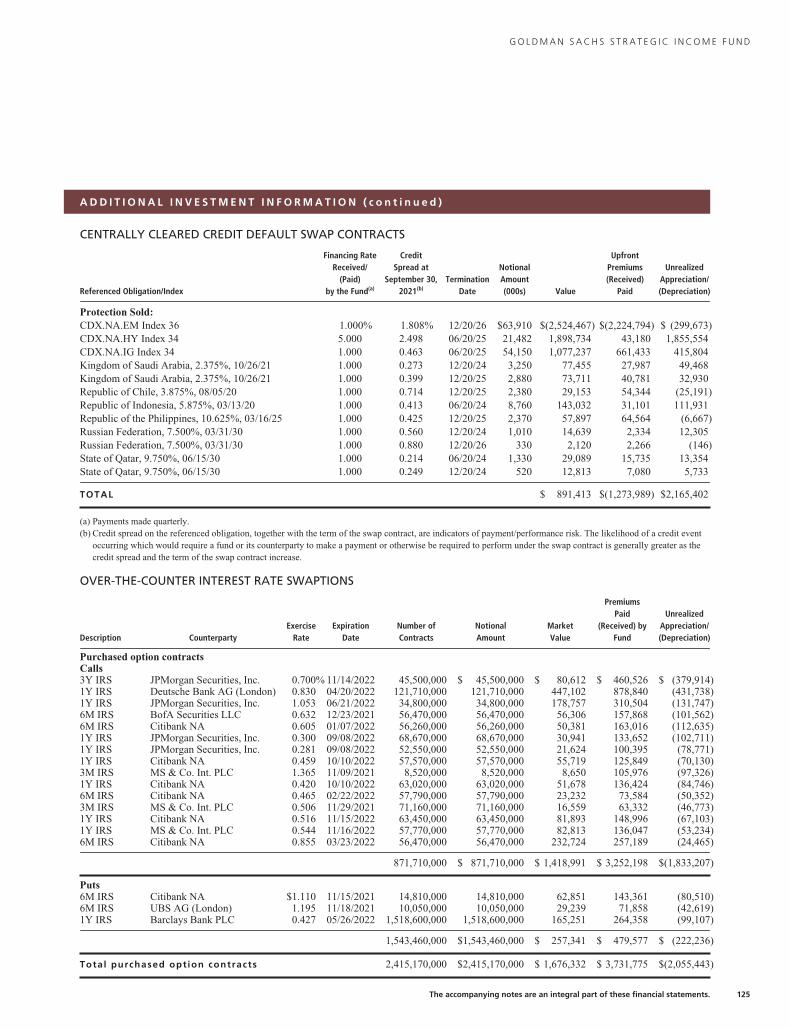
G O L D M A N S A C H S S T R A T E G I C I N C O M E F U N D
A D D I T I O N A L I N V E S T M E N T I N F O R M A T I O N ( c o n t i n u e d )
CENTRALLY CLEARED CREDIT DEFAULT SWAP CONTRACTS
Referenced Obligation/Index
Financing RateReceived/
(Paid)by the Fund(a)
CreditSpread at
September 30,2021(b)
TerminationDate
NotionalAmount(000s) Value
UpfrontPremiums(Received)
Paid
UnrealizedAppreciation/(Depreciation)
Protection Sold:CDX.NA.EM Index 36 1.000% 1.808% 12/20/26 $63,910 $(2,524,467) $(2,224,794) $ (299,673)CDX.NA.HY Index 34 5.000 2.498 06/20/25 21,482 1,898,734 43,180 1,855,554CDX.NA.IG Index 34 1.000 0.463 06/20/25 54,150 1,077,237 661,433 415,804Kingdom of Saudi Arabia, 2.375%, 10/26/21 1.000 0.273 12/20/24 3,250 77,455 27,987 49,468Kingdom of Saudi Arabia, 2.375%, 10/26/21 1.000 0.399 12/20/25 2,880 73,711 40,781 32,930Republic of Chile, 3.875%, 08/05/20 1.000 0.714 12/20/25 2,380 29,153 54,344 (25,191)Republic of Indonesia, 5.875%, 03/13/20 1.000 0.413 06/20/24 8,760 143,032 31,101 111,931Republic of the Philippines, 10.625%, 03/16/25 1.000 0.425 12/20/25 2,370 57,897 64,564 (6,667)Russian Federation, 7.500%, 03/31/30 1.000 0.560 12/20/24 1,010 14,639 2,334 12,305Russian Federation, 7.500%, 03/31/30 1.000 0.880 12/20/26 330 2,120 2,266 (146)State of Qatar, 9.750%, 06/15/30 1.000 0.214 06/20/24 1,330 29,089 15,735 13,354State of Qatar, 9.750%, 06/15/30 1.000 0.249 12/20/24 520 12,813 7,080 5,733
TOTAL $ 891,413 $(1,273,989) $2,165,402
(a) Payments made quarterly.(b) Credit spread on the referenced obligation, together with the term of the swap contract, are indicators of payment/performance risk. The likelihood of a credit event
occurring which would require a fund or its counterparty to make a payment or otherwise be required to perform under the swap contract is generally greater as thecredit spread and the term of the swap contract increase.
OVER-THE-COUNTER INTEREST RATE SWAPTIONS
Description CounterpartyExercise
RateExpiration
DateNumber ofContracts
NotionalAmount
MarketValue
PremiumsPaid
(Received) byFund
UnrealizedAppreciation/(Depreciation)
Purchased option contractsCalls3Y IRS JPMorgan Securities, Inc. 0.700% 11/14/2022 45,500,000 $ 45,500,000 $ 80,612 $ 460,526 $ (379,914)1Y IRS Deutsche Bank AG (London) 0.830 04/20/2022 121,710,000 121,710,000 447,102 878,840 (431,738)1Y IRS JPMorgan Securities, Inc. 1.053 06/21/2022 34,800,000 34,800,000 178,757 310,504 (131,747)6M IRS BofA Securities LLC 0.632 12/23/2021 56,470,000 56,470,000 56,306 157,868 (101,562)6M IRS Citibank NA 0.605 01/07/2022 56,260,000 56,260,000 50,381 163,016 (112,635)1Y IRS JPMorgan Securities, Inc. 0.300 09/08/2022 68,670,000 68,670,000 30,941 133,652 (102,711)1Y IRS JPMorgan Securities, Inc. 0.281 09/08/2022 52,550,000 52,550,000 21,624 100,395 (78,771)1Y IRS Citibank NA 0.459 10/10/2022 57,570,000 57,570,000 55,719 125,849 (70,130)3M IRS MS & Co. Int. PLC 1.365 11/09/2021 8,520,000 8,520,000 8,650 105,976 (97,326)1Y IRS Citibank NA 0.420 10/10/2022 63,020,000 63,020,000 51,678 136,424 (84,746)6M IRS Citibank NA 0.465 02/22/2022 57,790,000 57,790,000 23,232 73,584 (50,352)3M IRS MS & Co. Int. PLC 0.506 11/29/2021 71,160,000 71,160,000 16,559 63,332 (46,773)1Y IRS Citibank NA 0.516 11/15/2022 63,450,000 63,450,000 81,893 148,996 (67,103)1Y IRS MS & Co. Int. PLC 0.544 11/16/2022 57,770,000 57,770,000 82,813 136,047 (53,234)6M IRS Citibank NA 0.855 03/23/2022 56,470,000 56,470,000 232,724 257,189 (24,465)
871,710,000 $ 871,710,000 $ 1,418,991 $ 3,252,198 $(1,833,207)
Puts6M IRS Citibank NA $1.110 11/15/2021 14,810,000 14,810,000 62,851 143,361 (80,510)6M IRS UBS AG (London) 1.195 11/18/2021 10,050,000 10,050,000 29,239 71,858 (42,619)1Y IRS Barclays Bank PLC 0.427 05/26/2022 1,518,600,000 1,518,600,000 165,251 264,358 (99,107)
1,543,460,000 $1,543,460,000 $ 257,341 $ 479,577 $ (222,236)
Total purchased option contracts 2,415,170,000 $2,415,170,000 $ 1,676,332 $ 3,731,775 $(2,055,443)
The accompanying notes are an integral part of these financial statements. 125
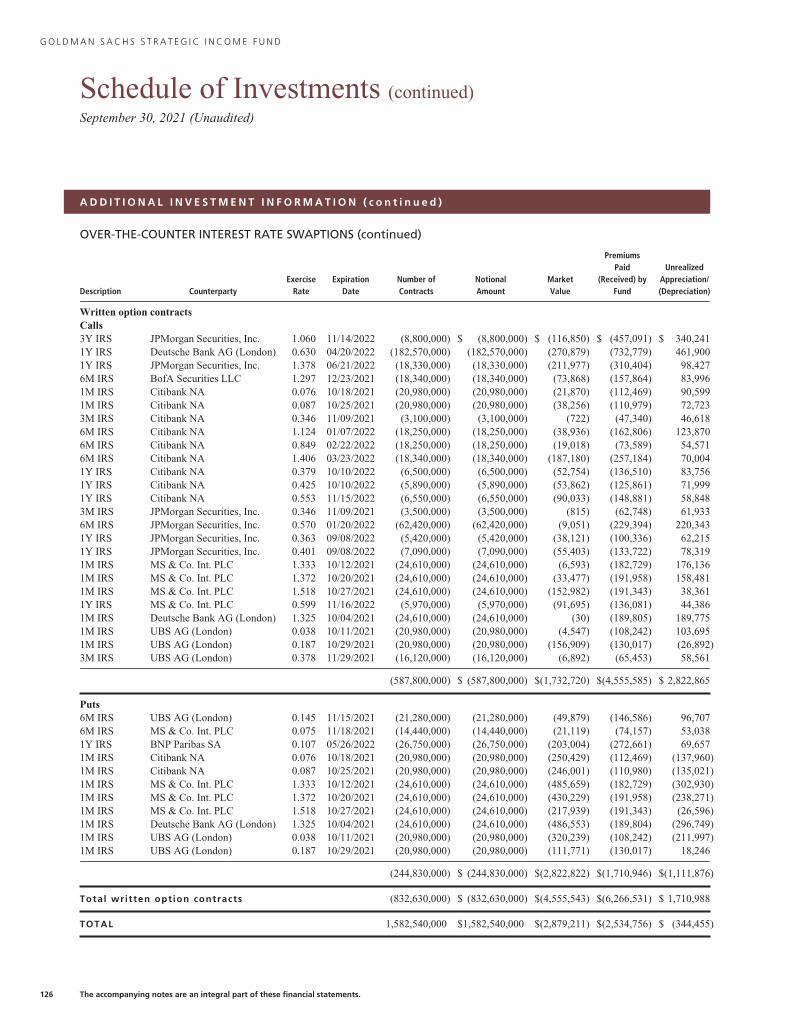
G O L D M A N S A C H S S T R A T E G I C I N C O M E F U N D
Schedule of Investments (continued)September 30, 2021 (Unaudited)
A D D I T I O N A L I N V E S T M E N T I N F O R M A T I O N ( c o n t i n u e d )
OVER-THE-COUNTER INTEREST RATE SWAPTIONS (continued)
Description CounterpartyExercise
RateExpiration
DateNumber ofContracts
NotionalAmount
MarketValue
PremiumsPaid
(Received) byFund
UnrealizedAppreciation/(Depreciation)
Written option contractsCalls3Y IRS JPMorgan Securities, Inc. 1.060 11/14/2022 (8,800,000) $ (8,800,000) $ (116,850) $ (457,091) $ 340,2411Y IRS Deutsche Bank AG (London) 0.630 04/20/2022 (182,570,000) (182,570,000) (270,879) (732,779) 461,9001Y IRS JPMorgan Securities, Inc. 1.378 06/21/2022 (18,330,000) (18,330,000) (211,977) (310,404) 98,4276M IRS BofA Securities LLC 1.297 12/23/2021 (18,340,000) (18,340,000) (73,868) (157,864) 83,9961M IRS Citibank NA 0.076 10/18/2021 (20,980,000) (20,980,000) (21,870) (112,469) 90,5991M IRS Citibank NA 0.087 10/25/2021 (20,980,000) (20,980,000) (38,256) (110,979) 72,7233M IRS Citibank NA 0.346 11/09/2021 (3,100,000) (3,100,000) (722) (47,340) 46,6186M IRS Citibank NA 1.124 01/07/2022 (18,250,000) (18,250,000) (38,936) (162,806) 123,8706M IRS Citibank NA 0.849 02/22/2022 (18,250,000) (18,250,000) (19,018) (73,589) 54,5716M IRS Citibank NA 1.406 03/23/2022 (18,340,000) (18,340,000) (187,180) (257,184) 70,0041Y IRS Citibank NA 0.379 10/10/2022 (6,500,000) (6,500,000) (52,754) (136,510) 83,7561Y IRS Citibank NA 0.425 10/10/2022 (5,890,000) (5,890,000) (53,862) (125,861) 71,9991Y IRS Citibank NA 0.553 11/15/2022 (6,550,000) (6,550,000) (90,033) (148,881) 58,8483M IRS JPMorgan Securities, Inc. 0.346 11/09/2021 (3,500,000) (3,500,000) (815) (62,748) 61,9336M IRS JPMorgan Securities, Inc. 0.570 01/20/2022 (62,420,000) (62,420,000) (9,051) (229,394) 220,3431Y IRS JPMorgan Securities, Inc. 0.363 09/08/2022 (5,420,000) (5,420,000) (38,121) (100,336) 62,2151Y IRS JPMorgan Securities, Inc. 0.401 09/08/2022 (7,090,000) (7,090,000) (55,403) (133,722) 78,3191M IRS MS & Co. Int. PLC 1.333 10/12/2021 (24,610,000) (24,610,000) (6,593) (182,729) 176,1361M IRS MS & Co. Int. PLC 1.372 10/20/2021 (24,610,000) (24,610,000) (33,477) (191,958) 158,4811M IRS MS & Co. Int. PLC 1.518 10/27/2021 (24,610,000) (24,610,000) (152,982) (191,343) 38,3611Y IRS MS & Co. Int. PLC 0.599 11/16/2022 (5,970,000) (5,970,000) (91,695) (136,081) 44,3861M IRS Deutsche Bank AG (London) 1.325 10/04/2021 (24,610,000) (24,610,000) (30) (189,805) 189,7751M IRS UBS AG (London) 0.038 10/11/2021 (20,980,000) (20,980,000) (4,547) (108,242) 103,6951M IRS UBS AG (London) 0.187 10/29/2021 (20,980,000) (20,980,000) (156,909) (130,017) (26,892)3M IRS UBS AG (London) 0.378 11/29/2021 (16,120,000) (16,120,000) (6,892) (65,453) 58,561
(587,800,000) $ (587,800,000) $(1,732,720) $(4,555,585) $ 2,822,865
Puts6M IRS UBS AG (London) 0.145 11/15/2021 (21,280,000) (21,280,000) (49,879) (146,586) 96,7076M IRS MS & Co. Int. PLC 0.075 11/18/2021 (14,440,000) (14,440,000) (21,119) (74,157) 53,0381Y IRS BNP Paribas SA 0.107 05/26/2022 (26,750,000) (26,750,000) (203,004) (272,661) 69,6571M IRS Citibank NA 0.076 10/18/2021 (20,980,000) (20,980,000) (250,429) (112,469) (137,960)1M IRS Citibank NA 0.087 10/25/2021 (20,980,000) (20,980,000) (246,001) (110,980) (135,021)1M IRS MS & Co. Int. PLC 1.333 10/12/2021 (24,610,000) (24,610,000) (485,659) (182,729) (302,930)1M IRS MS & Co. Int. PLC 1.372 10/20/2021 (24,610,000) (24,610,000) (430,229) (191,958) (238,271)1M IRS MS & Co. Int. PLC 1.518 10/27/2021 (24,610,000) (24,610,000) (217,939) (191,343) (26,596)1M IRS Deutsche Bank AG (London) 1.325 10/04/2021 (24,610,000) (24,610,000) (486,553) (189,804) (296,749)1M IRS UBS AG (London) 0.038 10/11/2021 (20,980,000) (20,980,000) (320,239) (108,242) (211,997)1M IRS UBS AG (London) 0.187 10/29/2021 (20,980,000) (20,980,000) (111,771) (130,017) 18,246
(244,830,000) $ (244,830,000) $(2,822,822) $(1,710,946) $(1,111,876)
Total written option contracts (832,630,000) $ (832,630,000) $(4,555,543) $(6,266,531) $ 1,710,988
TOTAL 1,582,540,000 $1,582,540,000 $(2,879,211) $(2,534,756) $ (344,455)
126 The accompanying notes are an integral part of these financial statements.
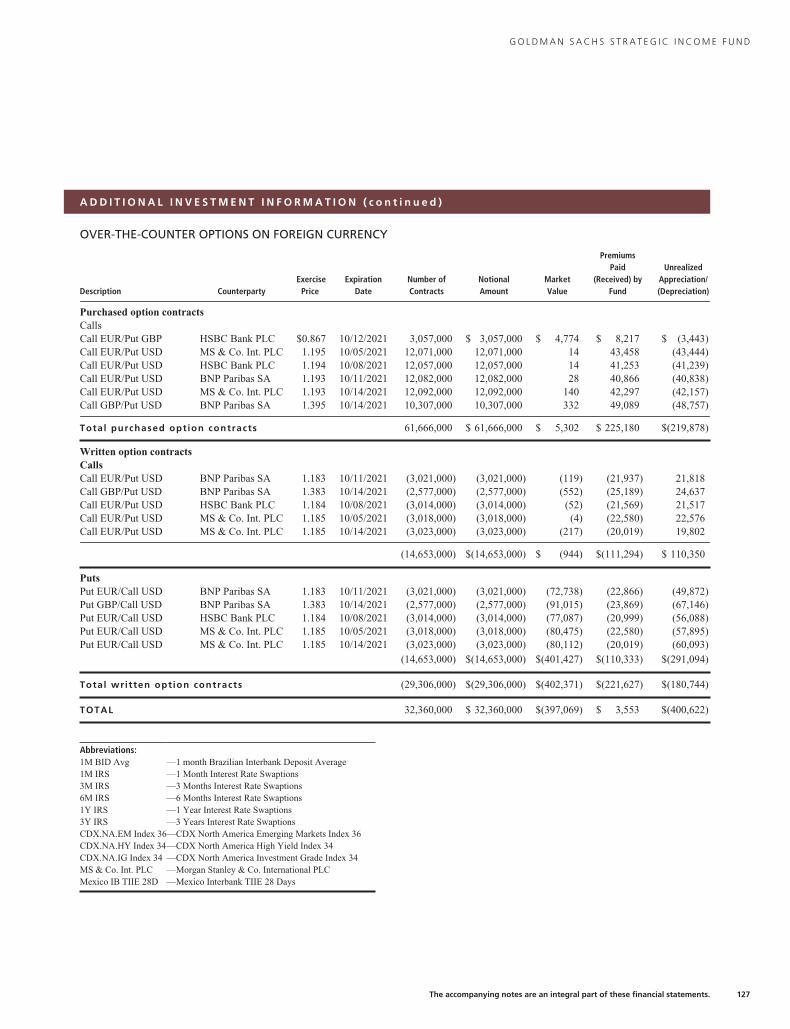
G O L D M A N S A C H S S T R A T E G I C I N C O M E F U N D
A D D I T I O N A L I N V E S T M E N T I N F O R M A T I O N ( c o n t i n u e d )
OVER-THE-COUNTER OPTIONS ON FOREIGN CURRENCY
Description CounterpartyExercise
PriceExpiration
DateNumber ofContracts
NotionalAmount
MarketValue
PremiumsPaid
(Received) byFund
UnrealizedAppreciation/(Depreciation)
Purchased option contractsCallsCall EUR/Put GBP HSBC Bank PLC $0.867 10/12/2021 3,057,000 $ 3,057,000 $ 4,774 $ 8,217 $ (3,443)Call EUR/Put USD MS & Co. Int. PLC 1.195 10/05/2021 12,071,000 12,071,000 14 43,458 (43,444)Call EUR/Put USD HSBC Bank PLC 1.194 10/08/2021 12,057,000 12,057,000 14 41,253 (41,239)Call EUR/Put USD BNP Paribas SA 1.193 10/11/2021 12,082,000 12,082,000 28 40,866 (40,838)Call EUR/Put USD MS & Co. Int. PLC 1.193 10/14/2021 12,092,000 12,092,000 140 42,297 (42,157)Call GBP/Put USD BNP Paribas SA 1.395 10/14/2021 10,307,000 10,307,000 332 49,089 (48,757)
Total purchased option contracts 61,666,000 $ 61,666,000 $ 5,302 $ 225,180 $(219,878)
Written option contractsCallsCall EUR/Put USD BNP Paribas SA 1.183 10/11/2021 (3,021,000) (3,021,000) (119) (21,937) 21,818Call GBP/Put USD BNP Paribas SA 1.383 10/14/2021 (2,577,000) (2,577,000) (552) (25,189) 24,637Call EUR/Put USD HSBC Bank PLC 1.184 10/08/2021 (3,014,000) (3,014,000) (52) (21,569) 21,517Call EUR/Put USD MS & Co. Int. PLC 1.185 10/05/2021 (3,018,000) (3,018,000) (4) (22,580) 22,576Call EUR/Put USD MS & Co. Int. PLC 1.185 10/14/2021 (3,023,000) (3,023,000) (217) (20,019) 19,802
(14,653,000) $(14,653,000) $ (944) $(111,294) $ 110,350
PutsPut EUR/Call USD BNP Paribas SA 1.183 10/11/2021 (3,021,000) (3,021,000) (72,738) (22,866) (49,872)Put GBP/Call USD BNP Paribas SA 1.383 10/14/2021 (2,577,000) (2,577,000) (91,015) (23,869) (67,146)Put EUR/Call USD HSBC Bank PLC 1.184 10/08/2021 (3,014,000) (3,014,000) (77,087) (20,999) (56,088)Put EUR/Call USD MS & Co. Int. PLC 1.185 10/05/2021 (3,018,000) (3,018,000) (80,475) (22,580) (57,895)Put EUR/Call USD MS & Co. Int. PLC 1.185 10/14/2021 (3,023,000) (3,023,000) (80,112) (20,019) (60,093)
(14,653,000) $(14,653,000) $(401,427) $(110,333) $(291,094)
Total written option contracts (29,306,000) $(29,306,000) $(402,371) $(221,627) $(180,744)
TOTAL 32,360,000 $ 32,360,000 $(397,069) $ 3,553 $(400,622)
Abbreviations:1M BID Avg —1 month Brazilian Interbank Deposit Average1M IRS —1 Month Interest Rate Swaptions3M IRS —3 Months Interest Rate Swaptions6M IRS —6 Months Interest Rate Swaptions1Y IRS —1 Year Interest Rate Swaptions3Y IRS —3 Years Interest Rate SwaptionsCDX.NA.EM Index 36—CDX North America Emerging Markets Index 36CDX.NA.HY Index 34—CDX North America High Yield Index 34CDX.NA.IG Index 34 —CDX North America Investment Grade Index 34MS & Co. Int. PLC —Morgan Stanley & Co. International PLCMexico IB TIIE 28D —Mexico Interbank TIIE 28 Days
The accompanying notes are an integral part of these financial statements. 127
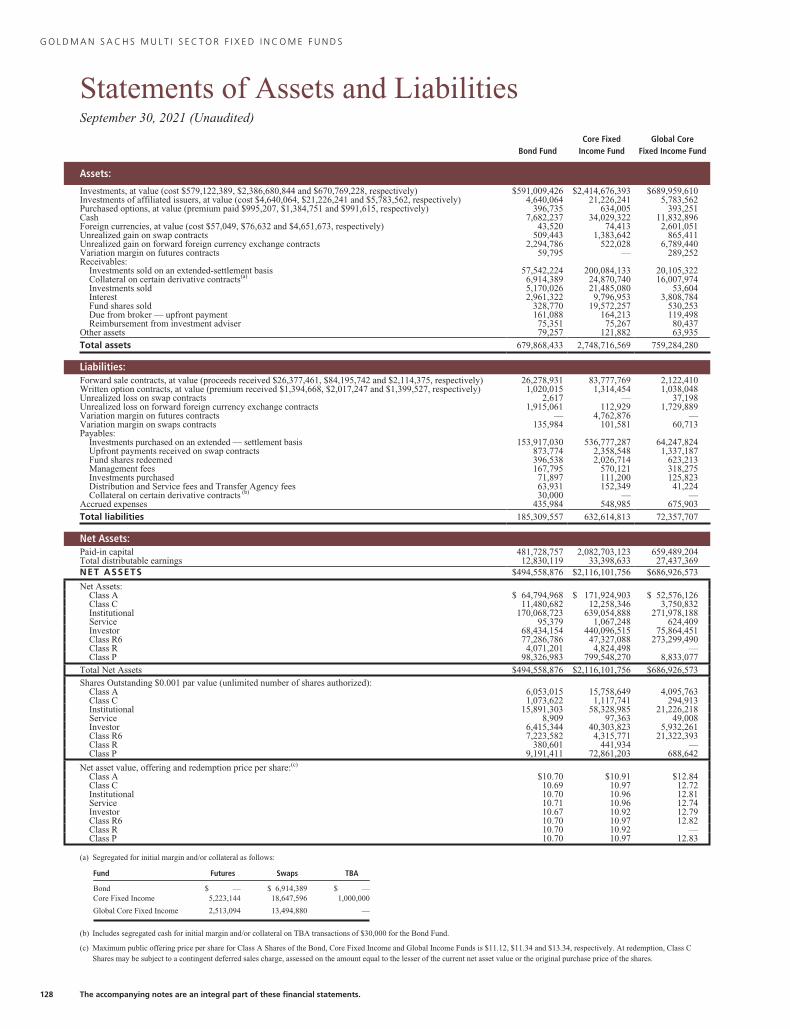
G O L D M A N S A C H S M U L T I S E C T O R F I X E D I N C O M E F U N D S
Statements of Assets and LiabilitiesSeptember 30, 2021 (Unaudited)
Bond FundCore Fixed
Income FundGlobal Core
Fixed Income Fund
Assets:
Investments, at value (cost $579,122,389, $2,386,680,844 and $670,769,228, respectively) $591,009,426 $2,414,676,393 $689,959,610Investments of affiliated issuers, at value (cost $4,640,064, $21,226,241 and $5,783,562, respectively) 4,640,064 21,226,241 5,783,562Purchased options, at value (premium paid $995,207, $1,384,751 and $991,615, respectively) 396,735 634,005 393,251Cash 7,682,237 34,029,322 11,832,896Foreign currencies, at value (cost $57,049, $76,632 and $4,651,673, respectively) 43,520 74,413 2,601,051Unrealized gain on swap contracts 509,443 1,383,642 865,411Unrealized gain on forward foreign currency exchange contracts 2,294,786 522,028 6,789,440Variation margin on futures contracts 59,795 — 289,252Receivables:
Investments sold on an extended-settlement basis 57,542,224 200,084,133 20,105,322Collateral on certain derivative contracts(a) 6,914,389 24,870,740 16,007,974Investments sold 5,170,026 21,485,080 53,604Interest 2,961,322 9,796,953 3,808,784Fund shares sold 328,770 19,572,257 530,253Due from broker — upfront payment 161,088 164,213 119,498Reimbursement from investment adviser 75,351 75,267 80,437
Other assets 79,257 121,882 63,935
Total assets 679,868,433 2,748,716,569 759,284,280
Liabilities:Forward sale contracts, at value (proceeds received $26,377,461, $84,195,742 and $2,114,375, respectively) 26,278,931 83,777,769 2,122,410Written option contracts, at value (premium received $1,394,668, $2,017,247 and $1,399,527, respectively) 1,020,015 1,314,454 1,038,048Unrealized loss on swap contracts 2,617 — 37,198Unrealized loss on forward foreign currency exchange contracts 1,915,061 112,929 1,729,889Variation margin on futures contracts — 4,762,876 —Variation margin on swaps contracts 135,984 101,581 60,713Payables:
Investments purchased on an extended — settlement basis 153,917,030 536,777,287 64,247,824Upfront payments received on swap contracts 873,774 2,358,548 1,337,187Fund shares redeemed 396,538 2,026,714 623,213Management fees 167,795 570,121 318,275Investments purchased 71,897 111,200 125,823Distribution and Service fees and Transfer Agency fees 63,931 152,349 41,224Collateral on certain derivative contracts (b) 30,000 — —
Accrued expenses 435,984 548,985 675,903
Total liabilities 185,309,557 632,614,813 72,357,707
Net Assets:Paid-in capital 481,728,757 2,082,703,123 659,489,204Total distributable earnings 12,830,119 33,398,633 27,437,369NET ASSETS $494,558,876 $2,116,101,756 $686,926,573
Net Assets:Class A $ 64,794,968 $ 171,924,903 $ 52,576,126Class C 11,480,682 12,258,346 3,750,832Institutional 170,068,723 639,054,888 271,978,188Service 95,379 1,067,248 624,409Investor 68,434,154 440,096,515 75,864,451Class R6 77,286,786 47,327,088 273,299,490Class R 4,071,201 4,824,498 —Class P 98,326,983 799,548,270 8,833,077
Total Net Assets $494,558,876 $2,116,101,756 $686,926,573
Shares Outstanding $0.001 par value (unlimited number of shares authorized):Class A 6,053,015 15,758,649 4,095,763Class C 1,073,622 1,117,741 294,913Institutional 15,891,303 58,328,985 21,226,218Service 8,909 97,363 49,008Investor 6,415,344 40,303,823 5,932,261Class R6 7,223,582 4,315,771 21,322,393Class R 380,601 441,934 —Class P 9,191,411 72,861,203 688,642
Net asset value, offering and redemption price per share:(c)
Class A $10.70 $10.91 $12.84Class C 10.69 10.97 12.72Institutional 10.70 10.96 12.81Service 10.71 10.96 12.74Investor 10.67 10.92 12.79Class R6 10.70 10.97 12.82Class R 10.70 10.92 —Class P 10.70 10.97 12.83
(a) Segregated for initial margin and/or collateral as follows:
Fund Futures Swaps TBA
Bond $ — $ 6,914,389 $ —Core Fixed Income 5,223,144 18,647,596 1,000,000
Global Core Fixed Income 2,513,094 13,494,880 —
(b) Includes segregated cash for initial margin and/or collateral on TBA transactions of $30,000 for the Bond Fund.
(c) Maximum public offering price per share for Class A Shares of the Bond, Core Fixed Income and Global Income Funds is $11.12, $11.34 and $13.34, respectively. At redemption, Class CShares may be subject to a contingent deferred sales charge, assessed on the amount equal to the lesser of the current net asset value or the original purchase price of the shares.
128 The accompanying notes are an integral part of these financial statements.
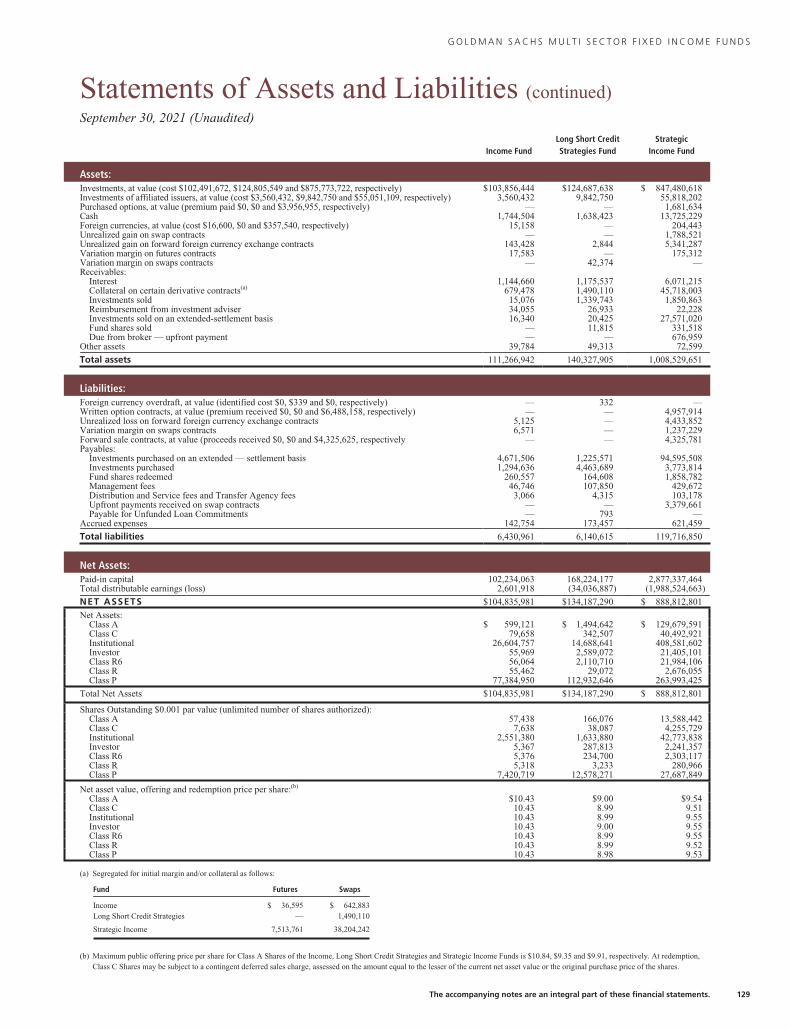
G O L D M A N S A C H S M U L T I S E C T O R F I X E D I N C O M E F U N D S
Statements of Assets and Liabilities (continued)September 30, 2021 (Unaudited)
Income FundLong Short CreditStrategies Fund
StrategicIncome Fund
Assets:Investments, at value (cost $102,491,672, $124,805,549 and $875,773,722, respectively) $103,856,444 $124,687,638 $ 847,480,618Investments of affiliated issuers, at value (cost $3,560,432, $9,842,750 and $55,051,109, respectively) 3,560,432 9,842,750 55,818,202Purchased options, at value (premium paid $0, $0 and $3,956,955, respectively) — — 1,681,634Cash 1,744,504 1,638,423 13,725,229Foreign currencies, at value (cost $16,600, $0 and $357,540, respectively) 15,158 — 204,443Unrealized gain on swap contracts — — 1,788,521Unrealized gain on forward foreign currency exchange contracts 143,428 2,844 5,341,287Variation margin on futures contracts 17,583 — 175,312Variation margin on swaps contracts — 42,374 —Receivables:
Interest 1,144,660 1,175,537 6,071,215Collateral on certain derivative contracts(a) 679,478 1,490,110 45,718,003Investments sold 15,076 1,339,743 1,850,863Reimbursement from investment adviser 34,055 26,933 22,228Investments sold on an extended-settlement basis 16,340 20,425 27,571,020Fund shares sold — 11,815 331,518Due from broker — upfront payment — — 676,959
Other assets 39,784 49,313 72,599
Total assets 111,266,942 140,327,905 1,008,529,651
Liabilities:Foreign currency overdraft, at value (identified cost $0, $339 and $0, respectively) — 332 —Written option contracts, at value (premium received $0, $0 and $6,488,158, respectively) — — 4,957,914Unrealized loss on forward foreign currency exchange contracts 5,125 — 4,433,852Variation margin on swaps contracts 6,571 — 1,237,229Forward sale contracts, at value (proceeds received $0, $0 and $4,325,625, respectively — — 4,325,781Payables:
Investments purchased on an extended — settlement basis 4,671,506 1,225,571 94,595,508Investments purchased 1,294,636 4,463,689 3,773,814Fund shares redeemed 260,557 164,608 1,858,782Management fees 46,746 107,850 429,672Distribution and Service fees and Transfer Agency fees 3,066 4,315 103,178Upfront payments received on swap contracts — — 3,379,661Payable for Unfunded Loan Commitments — 793 —
Accrued expenses 142,754 173,457 621,459
Total liabilities 6,430,961 6,140,615 119,716,850
Net Assets:Paid-in capital 102,234,063 168,224,177 2,877,337,464Total distributable earnings (loss) 2,601,918 (34,036,887) (1,988,524,663)
NET ASSETS $104,835,981 $134,187,290 $ 888,812,801
Net Assets:Class A $ 599,121 $ 1,494,642 $ 129,679,591Class C 79,658 342,507 40,492,921Institutional 26,604,757 14,688,641 408,581,602Investor 55,969 2,589,072 21,405,101Class R6 56,064 2,110,710 21,984,106Class R 55,462 29,072 2,676,055Class P 77,384,950 112,932,646 263,993,425
Total Net Assets $104,835,981 $134,187,290 $ 888,812,801
Shares Outstanding $0.001 par value (unlimited number of shares authorized):Class A 57,438 166,076 13,588,442Class C 7,638 38,087 4,255,729Institutional 2,551,380 1,633,880 42,773,838Investor 5,367 287,813 2,241,357Class R6 5,376 234,700 2,303,117Class R 5,318 3,233 280,966Class P 7,420,719 12,578,271 27,687,849
Net asset value, offering and redemption price per share:(b)
Class A $10.43 $9.00 $9.54Class C 10.43 8.99 9.51Institutional 10.43 8.99 9.55Investor 10.43 9.00 9.55Class R6 10.43 8.99 9.55Class R 10.43 8.99 9.52Class P 10.43 8.98 9.53
(a) Segregated for initial margin and/or collateral as follows:
Fund Futures Swaps
Income $ 36,595 $ 642,883Long Short Credit Strategies — 1,490,110
Strategic Income 7,513,761 38,204,242
(b) Maximum public offering price per share for Class A Shares of the Income, Long Short Credit Strategies and Strategic Income Funds is $10.84, $9.35 and $9.91, respectively. At redemption,Class C Shares may be subject to a contingent deferred sales charge, assessed on the amount equal to the lesser of the current net asset value or the original purchase price of the shares.
The accompanying notes are an integral part of these financial statements. 129
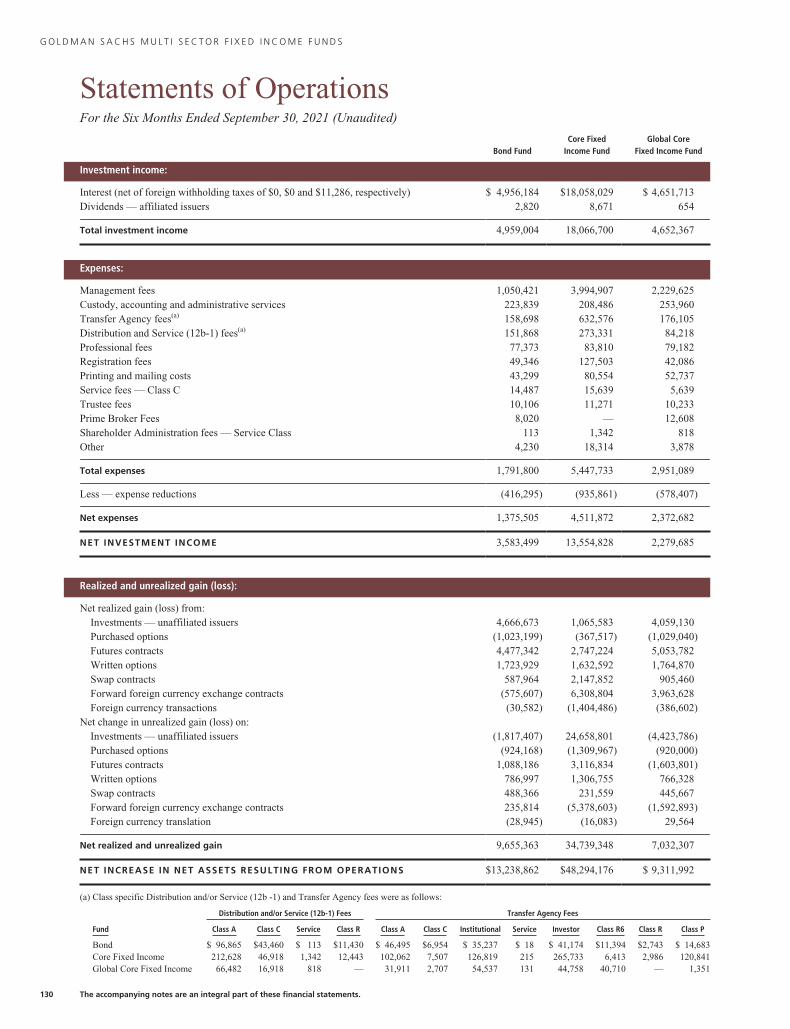
G O L D M A N S A C H S M U L T I S E C T O R F I X E D I N C O M E F U N D S
Statements of OperationsFor the Six Months Ended September 30, 2021 (Unaudited)
Bond FundCore Fixed
Income FundGlobal Core
Fixed Income Fund
Investment income:
Interest (net of foreign withholding taxes of $0, $0 and $11,286, respectively) $ 4,956,184 $18,058,029 $ 4,651,713Dividends — affiliated issuers 2,820 8,671 654
Total investment income 4,959,004 18,066,700 4,652,367
Expenses:
Management fees 1,050,421 3,994,907 2,229,625Custody, accounting and administrative services 223,839 208,486 253,960Transfer Agency fees(a) 158,698 632,576 176,105Distribution and Service (12b-1) fees(a) 151,868 273,331 84,218Professional fees 77,373 83,810 79,182Registration fees 49,346 127,503 42,086Printing and mailing costs 43,299 80,554 52,737Service fees — Class C 14,487 15,639 5,639Trustee fees 10,106 11,271 10,233Prime Broker Fees 8,020 — 12,608Shareholder Administration fees — Service Class 113 1,342 818Other 4,230 18,314 3,878
Total expenses 1,791,800 5,447,733 2,951,089
Less — expense reductions (416,295) (935,861) (578,407)
Net expenses 1,375,505 4,511,872 2,372,682
NET INVESTMENT INCOME 3,583,499 13,554,828 2,279,685
Realized and unrealized gain (loss):
Net realized gain (loss) from:Investments — unaffiliated issuers 4,666,673 1,065,583 4,059,130Purchased options (1,023,199) (367,517) (1,029,040)Futures contracts 4,477,342 2,747,224 5,053,782Written options 1,723,929 1,632,592 1,764,870Swap contracts 587,964 2,147,852 905,460Forward foreign currency exchange contracts (575,607) 6,308,804 3,963,628Foreign currency transactions (30,582) (1,404,486) (386,602)
Net change in unrealized gain (loss) on:Investments — unaffiliated issuers (1,817,407) 24,658,801 (4,423,786)Purchased options (924,168) (1,309,967) (920,000)Futures contracts 1,088,186 3,116,834 (1,603,801)Written options 786,997 1,306,755 766,328Swap contracts 488,366 231,559 445,667Forward foreign currency exchange contracts 235,814 (5,378,603) (1,592,893)Foreign currency translation (28,945) (16,083) 29,564
Net realized and unrealized gain 9,655,363 34,739,348 7,032,307
NET INCREASE IN NET ASSETS RESULTING FROM OPERATIONS $13,238,862 $48,294,176 $ 9,311,992
(a) Class specific Distribution and/or Service (12b -1) and Transfer Agency fees were as follows:
Distribution and/or Service (12b-1) Fees Transfer Agency Fees
Fund Class A Class C Service Class R Class A Class C Institutional Service Investor Class R6 Class R Class P
Bond $ 96,865 $43,460 $ 113 $11,430 $ 46,495 $6,954 $ 35,237 $ 18 $ 41,174 $11,394 $2,743 $ 14,683Core Fixed Income 212,628 46,918 1,342 12,443 102,062 7,507 126,819 215 265,733 6,413 2,986 120,841Global Core Fixed Income 66,482 16,918 818 — 31,911 2,707 54,537 131 44,758 40,710 — 1,351
130 The accompanying notes are an integral part of these financial statements.
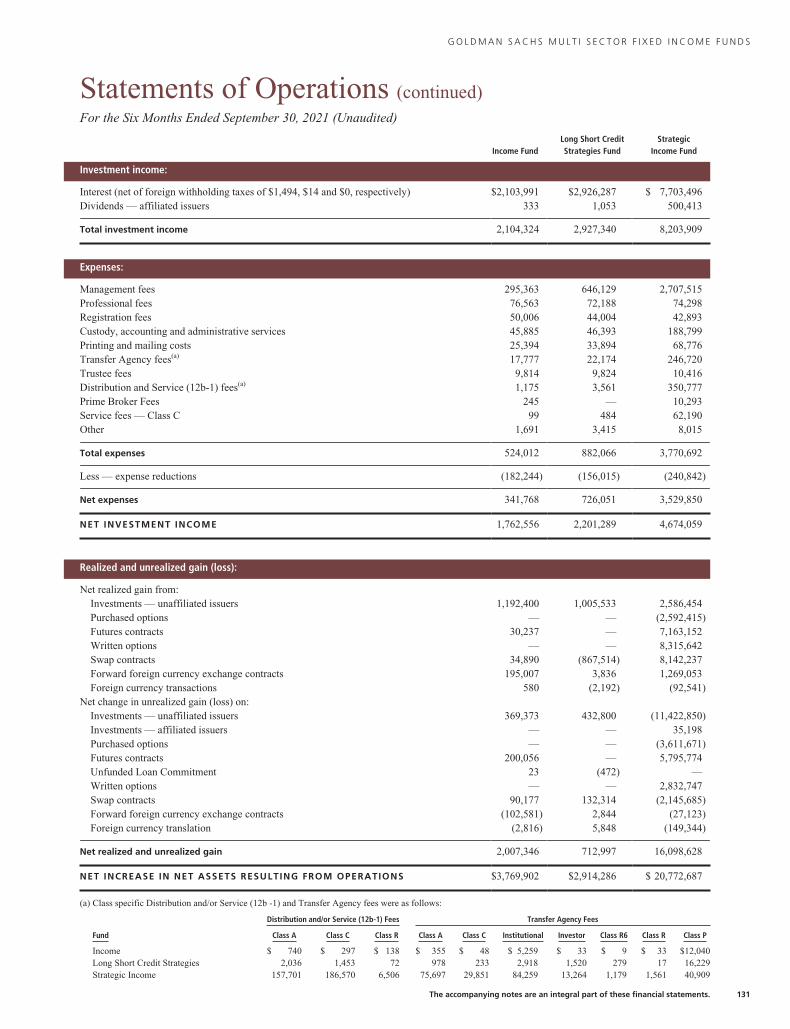
G O L D M A N S A C H S M U L T I S E C T O R F I X E D I N C O M E F U N D S
Statements of Operations (continued)For the Six Months Ended September 30, 2021 (Unaudited)
Income FundLong Short CreditStrategies Fund
StrategicIncome Fund
Investment income:
Interest (net of foreign withholding taxes of $1,494, $14 and $0, respectively) $2,103,991 $2,926,287 $ 7,703,496Dividends — affiliated issuers 333 1,053 500,413
Total investment income 2,104,324 2,927,340 8,203,909
Expenses:
Management fees 295,363 646,129 2,707,515Professional fees 76,563 72,188 74,298Registration fees 50,006 44,004 42,893Custody, accounting and administrative services 45,885 46,393 188,799Printing and mailing costs 25,394 33,894 68,776Transfer Agency fees(a) 17,777 22,174 246,720Trustee fees 9,814 9,824 10,416Distribution and Service (12b-1) fees(a) 1,175 3,561 350,777Prime Broker Fees 245 — 10,293Service fees — Class C 99 484 62,190Other 1,691 3,415 8,015
Total expenses 524,012 882,066 3,770,692
Less — expense reductions (182,244) (156,015) (240,842)
Net expenses 341,768 726,051 3,529,850
NET INVESTMENT INCOME 1,762,556 2,201,289 4,674,059
Realized and unrealized gain (loss):
Net realized gain from:Investments — unaffiliated issuers 1,192,400 1,005,533 2,586,454Purchased options — — (2,592,415)Futures contracts 30,237 — 7,163,152Written options — — 8,315,642Swap contracts 34,890 (867,514) 8,142,237Forward foreign currency exchange contracts 195,007 3,836 1,269,053Foreign currency transactions 580 (2,192) (92,541)
Net change in unrealized gain (loss) on:Investments — unaffiliated issuers 369,373 432,800 (11,422,850)Investments — affiliated issuers — — 35,198Purchased options — — (3,611,671)Futures contracts 200,056 — 5,795,774Unfunded Loan Commitment 23 (472) —Written options — — 2,832,747Swap contracts 90,177 132,314 (2,145,685)Forward foreign currency exchange contracts (102,581) 2,844 (27,123)Foreign currency translation (2,816) 5,848 (149,344)
Net realized and unrealized gain 2,007,346 712,997 16,098,628
NET INCREASE IN NET ASSETS RESULTING FROM OPERATIONS $3,769,902 $2,914,286 $ 20,772,687
(a) Class specific Distribution and/or Service (12b -1) and Transfer Agency fees were as follows:
Distribution and/or Service (12b-1) Fees Transfer Agency Fees
Fund Class A Class C Class R Class A Class C Institutional Investor Class R6 Class R Class P
Income $ 740 $ 297 $ 138 $ 355 $ 48 $ 5,259 $ 33 $ 9 $ 33 $12,040Long Short Credit Strategies 2,036 1,453 72 978 233 2,918 1,520 279 17 16,229Strategic Income 157,701 186,570 6,506 75,697 29,851 84,259 13,264 1,179 1,561 40,909
The accompanying notes are an integral part of these financial statements. 131
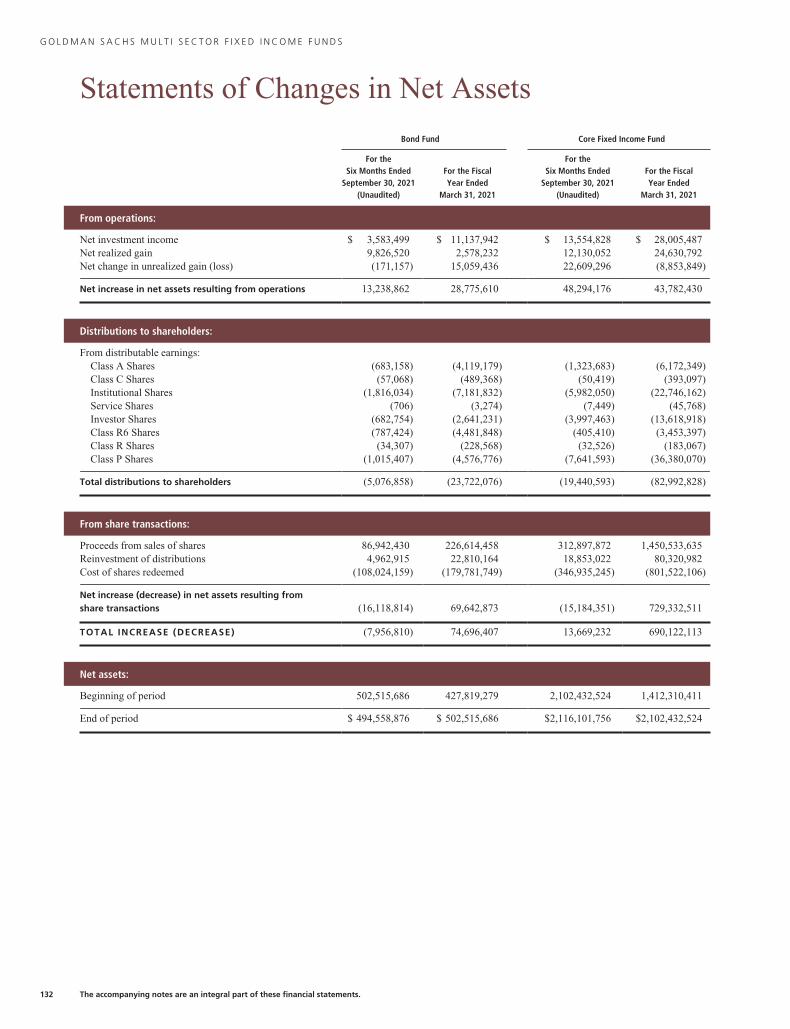
G O L D M A N S A C H S M U L T I S E C T O R F I X E D I N C O M E F U N D S
Statements of Changes in Net Assets
Bond Fund Core Fixed Income Fund
For theSix Months Ended
September 30, 2021(Unaudited)
For the FiscalYear Ended
March 31, 2021
For theSix Months Ended
September 30, 2021(Unaudited)
For the FiscalYear Ended
March 31, 2021
From operations:
Net investment income $ 3,583,499 $ 11,137,942 $ 13,554,828 $ 28,005,487Net realized gain 9,826,520 2,578,232 12,130,052 24,630,792Net change in unrealized gain (loss) (171,157) 15,059,436 22,609,296 (8,853,849)
Net increase in net assets resulting from operations 13,238,862 28,775,610 48,294,176 43,782,430
Distributions to shareholders:
From distributable earnings:Class A Shares (683,158) (4,119,179) (1,323,683) (6,172,349)Class C Shares (57,068) (489,368) (50,419) (393,097)Institutional Shares (1,816,034) (7,181,832) (5,982,050) (22,746,162)Service Shares (706) (3,274) (7,449) (45,768)Investor Shares (682,754) (2,641,231) (3,997,463) (13,618,918)Class R6 Shares (787,424) (4,481,848) (405,410) (3,453,397)Class R Shares (34,307) (228,568) (32,526) (183,067)Class P Shares (1,015,407) (4,576,776) (7,641,593) (36,380,070)
Total distributions to shareholders (5,076,858) (23,722,076) (19,440,593) (82,992,828)
From share transactions:
Proceeds from sales of shares 86,942,430 226,614,458 312,897,872 1,450,533,635Reinvestment of distributions 4,962,915 22,810,164 18,853,022 80,320,982Cost of shares redeemed (108,024,159) (179,781,749) (346,935,245) (801,522,106)
Net increase (decrease) in net assets resulting fromshare transactions (16,118,814) 69,642,873 (15,184,351) 729,332,511
TOTAL INCREASE (DECREASE) (7,956,810) 74,696,407 13,669,232 690,122,113
Net assets:
Beginning of period 502,515,686 427,819,279 2,102,432,524 1,412,310,411
End of period $ 494,558,876 $ 502,515,686 $2,116,101,756 $2,102,432,524
132 The accompanying notes are an integral part of these financial statements.
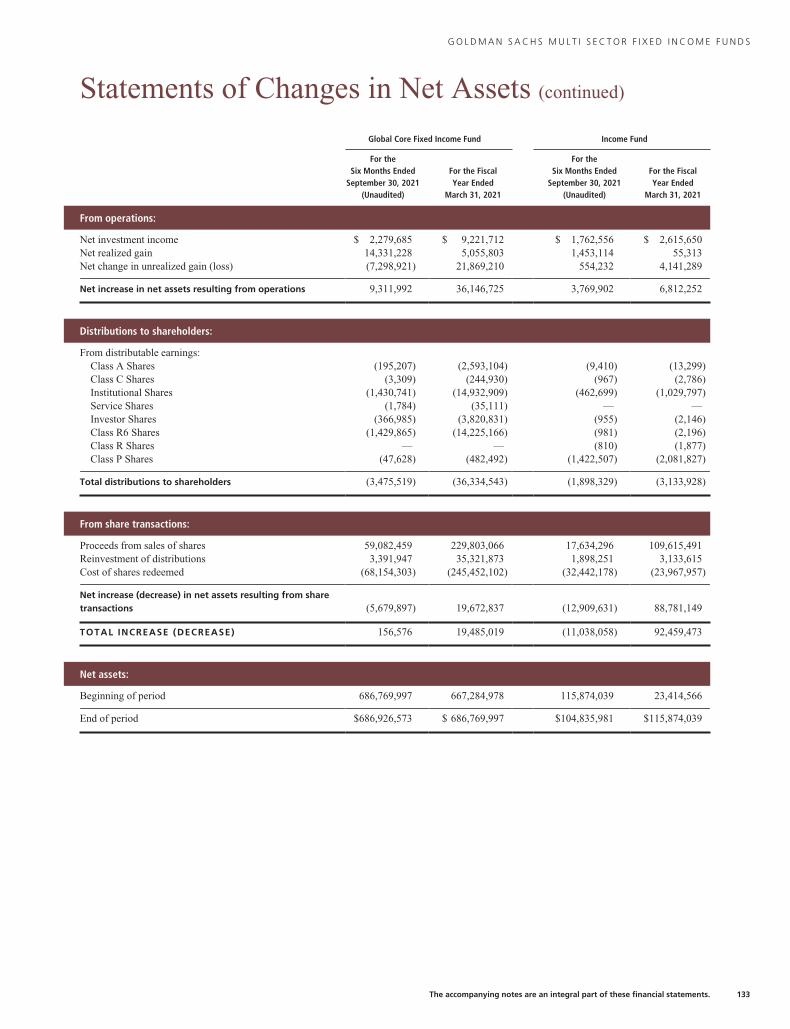
G O L D M A N S A C H S M U L T I S E C T O R F I X E D I N C O M E F U N D S
Statements of Changes in Net Assets (continued)
Global Core Fixed Income Fund Income Fund
For theSix Months Ended
September 30, 2021(Unaudited)
For the FiscalYear Ended
March 31, 2021
For theSix Months Ended
September 30, 2021(Unaudited)
For the FiscalYear Ended
March 31, 2021
From operations:
Net investment income $ 2,279,685 $ 9,221,712 $ 1,762,556 $ 2,615,650Net realized gain 14,331,228 5,055,803 1,453,114 55,313Net change in unrealized gain (loss) (7,298,921) 21,869,210 554,232 4,141,289
Net increase in net assets resulting from operations 9,311,992 36,146,725 3,769,902 6,812,252
Distributions to shareholders:
From distributable earnings:Class A Shares (195,207) (2,593,104) (9,410) (13,299)Class C Shares (3,309) (244,930) (967) (2,786)Institutional Shares (1,430,741) (14,932,909) (462,699) (1,029,797)Service Shares (1,784) (35,111) — —Investor Shares (366,985) (3,820,831) (955) (2,146)Class R6 Shares (1,429,865) (14,225,166) (981) (2,196)Class R Shares — — (810) (1,877)Class P Shares (47,628) (482,492) (1,422,507) (2,081,827)
Total distributions to shareholders (3,475,519) (36,334,543) (1,898,329) (3,133,928)
From share transactions:
Proceeds from sales of shares 59,082,459 229,803,066 17,634,296 109,615,491Reinvestment of distributions 3,391,947 35,321,873 1,898,251 3,133,615Cost of shares redeemed (68,154,303) (245,452,102) (32,442,178) (23,967,957)
Net increase (decrease) in net assets resulting from sharetransactions (5,679,897) 19,672,837 (12,909,631) 88,781,149
TOTAL INCREASE (DECREASE) 156,576 19,485,019 (11,038,058) 92,459,473
Net assets:
Beginning of period 686,769,997 667,284,978 115,874,039 23,414,566
End of period $686,926,573 $ 686,769,997 $104,835,981 $115,874,039
The accompanying notes are an integral part of these financial statements. 133
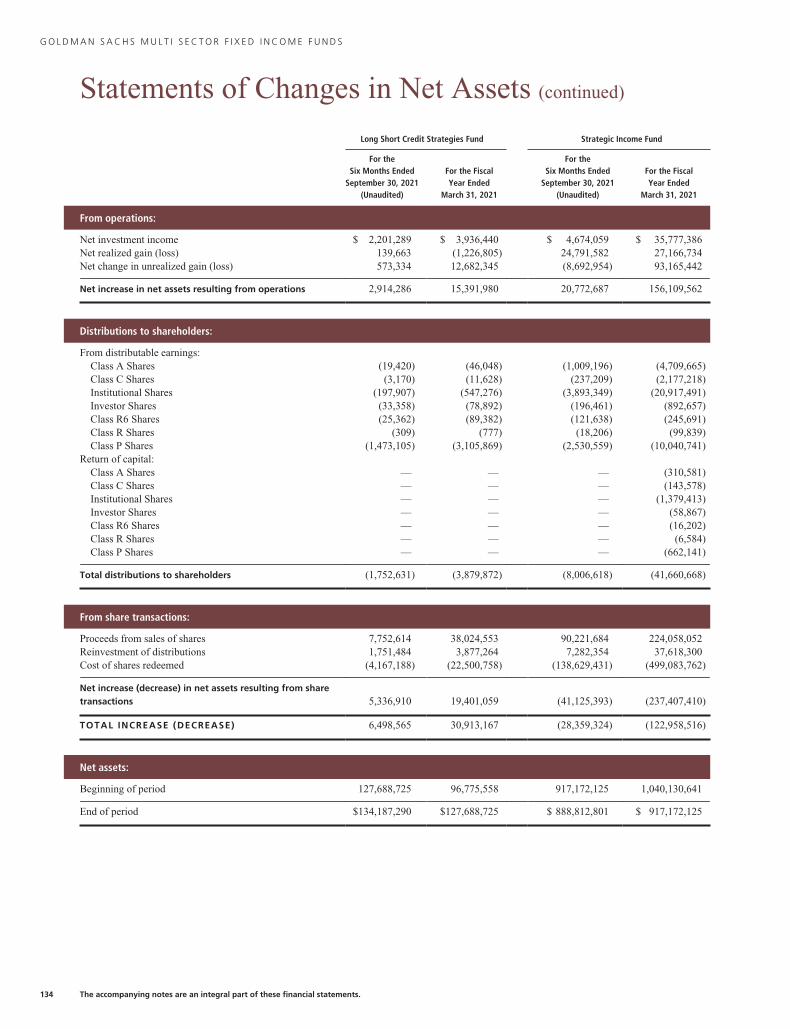
G O L D M A N S A C H S M U L T I S E C T O R F I X E D I N C O M E F U N D S
Statements of Changes in Net Assets (continued)
Long Short Credit Strategies Fund Strategic Income Fund
For theSix Months Ended
September 30, 2021(Unaudited)
For the FiscalYear Ended
March 31, 2021
For theSix Months Ended
September 30, 2021(Unaudited)
For the FiscalYear Ended
March 31, 2021
From operations:
Net investment income $ 2,201,289 $ 3,936,440 $ 4,674,059 $ 35,777,386Net realized gain (loss) 139,663 (1,226,805) 24,791,582 27,166,734Net change in unrealized gain (loss) 573,334 12,682,345 (8,692,954) 93,165,442
Net increase in net assets resulting from operations 2,914,286 15,391,980 20,772,687 156,109,562
Distributions to shareholders:
From distributable earnings:Class A Shares (19,420) (46,048) (1,009,196) (4,709,665)Class C Shares (3,170) (11,628) (237,209) (2,177,218)Institutional Shares (197,907) (547,276) (3,893,349) (20,917,491)Investor Shares (33,358) (78,892) (196,461) (892,657)Class R6 Shares (25,362) (89,382) (121,638) (245,691)Class R Shares (309) (777) (18,206) (99,839)Class P Shares (1,473,105) (3,105,869) (2,530,559) (10,040,741)
Return of capital:Class A Shares — — — (310,581)Class C Shares — — — (143,578)Institutional Shares — — — (1,379,413)Investor Shares — — — (58,867)Class R6 Shares — — — (16,202)Class R Shares — — — (6,584)Class P Shares — — — (662,141)
Total distributions to shareholders (1,752,631) (3,879,872) (8,006,618) (41,660,668)
From share transactions:
Proceeds from sales of shares 7,752,614 38,024,553 90,221,684 224,058,052Reinvestment of distributions 1,751,484 3,877,264 7,282,354 37,618,300Cost of shares redeemed (4,167,188) (22,500,758) (138,629,431) (499,083,762)
Net increase (decrease) in net assets resulting from sharetransactions 5,336,910 19,401,059 (41,125,393) (237,407,410)
TOTAL INCREASE (DECREASE) 6,498,565 30,913,167 (28,359,324) (122,958,516)
Net assets:
Beginning of period 127,688,725 96,775,558 917,172,125 1,040,130,641
End of period $134,187,290 $127,688,725 $ 888,812,801 $ 917,172,125
134 The accompanying notes are an integral part of these financial statements.
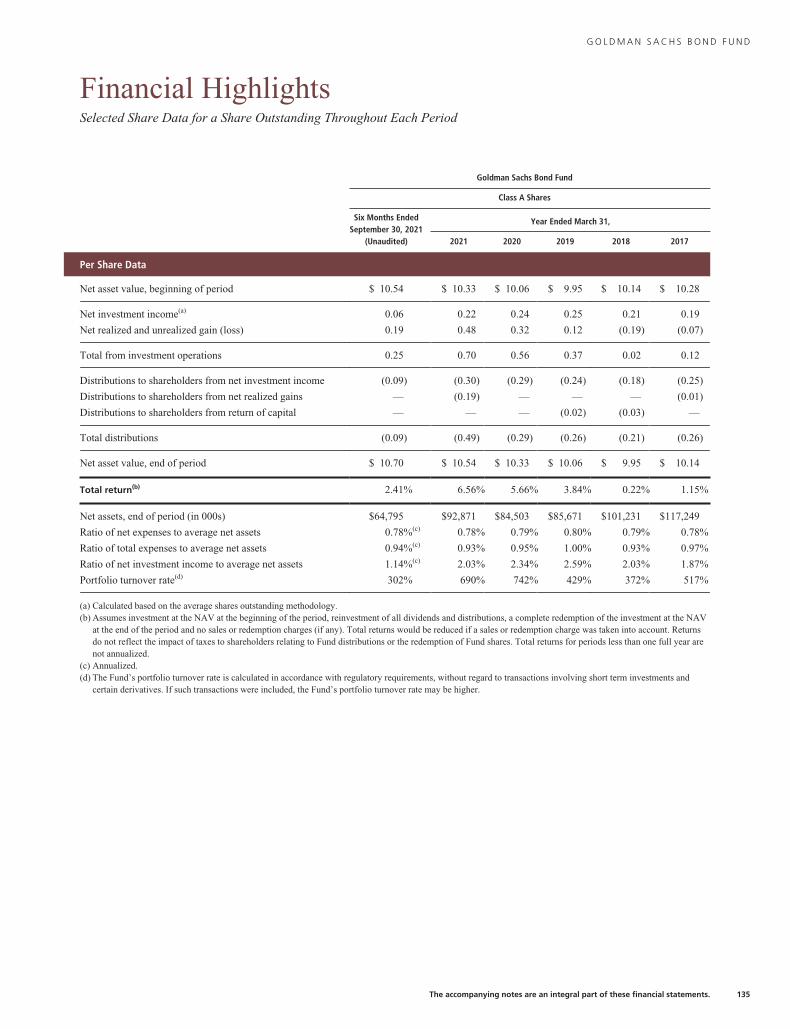
G O L D M A N S A C H S B O N D F U N D
Financial HighlightsSelected Share Data for a Share Outstanding Throughout Each Period
Goldman Sachs Bond Fund
Class A Shares
Six Months EndedSeptember 30, 2021
(Unaudited)
Year Ended March 31,
2021 2020 2019 2018 2017
Per Share Data
Net asset value, beginning of period $ 10.54 $ 10.33 $ 10.06 $ 9.95 $ 10.14 $ 10.28
Net investment income(a) 0.06 0.22 0.24 0.25 0.21 0.19
Net realized and unrealized gain (loss) 0.19 0.48 0.32 0.12 (0.19) (0.07)
Total from investment operations 0.25 0.70 0.56 0.37 0.02 0.12
Distributions to shareholders from net investment income (0.09) (0.30) (0.29) (0.24) (0.18) (0.25)
Distributions to shareholders from net realized gains — (0.19) — — — (0.01)
Distributions to shareholders from return of capital — — — (0.02) (0.03) —
Total distributions (0.09) (0.49) (0.29) (0.26) (0.21) (0.26)
Net asset value, end of period $ 10.70 $ 10.54 $ 10.33 $ 10.06 $ 9.95 $ 10.14
Total return(b) 2.41% 6.56% 5.66% 3.84% 0.22% 1.15%
Net assets, end of period (in 000s) $64,795 $92,871 $84,503 $85,671 $101,231 $117,249
Ratio of net expenses to average net assets 0.78%(c) 0.78% 0.79% 0.80% 0.79% 0.78%
Ratio of total expenses to average net assets 0.94%(c) 0.93% 0.95% 1.00% 0.93% 0.97%
Ratio of net investment income to average net assets 1.14%(c) 2.03% 2.34% 2.59% 2.03% 1.87%
Portfolio turnover rate(d) 302% 690% 742% 429% 372% 517%
(a) Calculated based on the average shares outstanding methodology.(b) Assumes investment at the NAV at the beginning of the period, reinvestment of all dividends and distributions, a complete redemption of the investment at the NAV
at the end of the period and no sales or redemption charges (if any). Total returns would be reduced if a sales or redemption charge was taken into account. Returnsdo not reflect the impact of taxes to shareholders relating to Fund distributions or the redemption of Fund shares. Total returns for periods less than one full year arenot annualized.
(c) Annualized.(d) The Fund’s portfolio turnover rate is calculated in accordance with regulatory requirements, without regard to transactions involving short term investments and
certain derivatives. If such transactions were included, the Fund’s portfolio turnover rate may be higher.
The accompanying notes are an integral part of these financial statements. 135
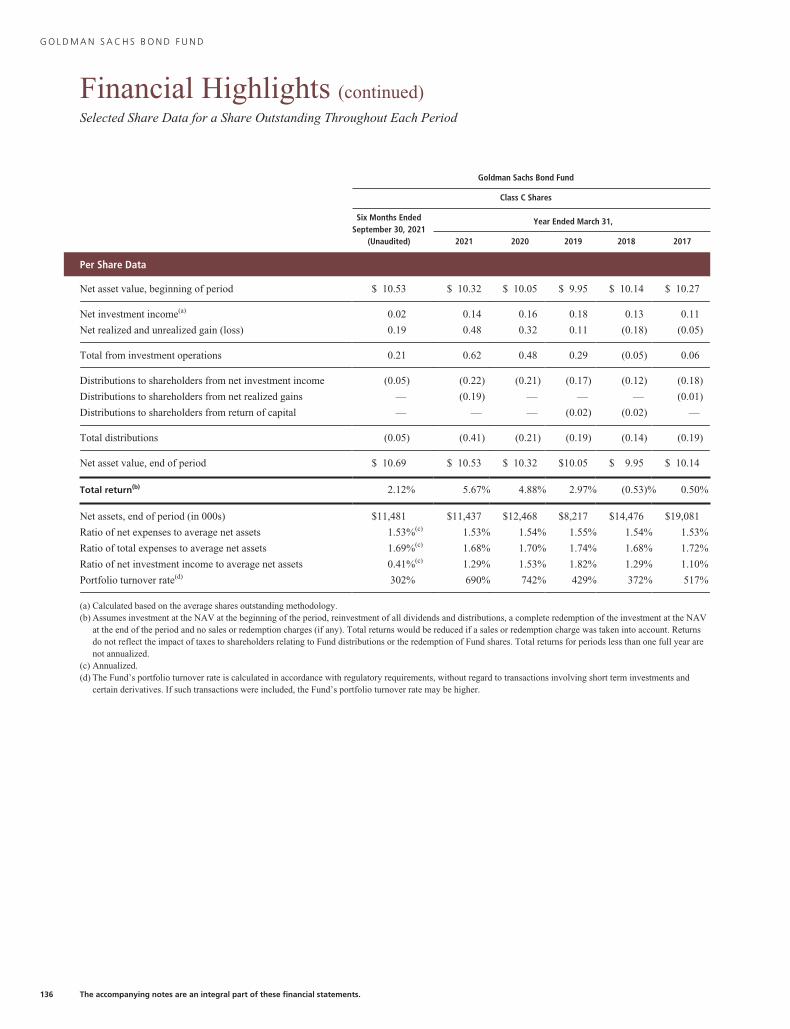
G O L D M A N S A C H S B O N D F U N D
Financial Highlights (continued)Selected Share Data for a Share Outstanding Throughout Each Period
Goldman Sachs Bond Fund
Class C Shares
Six Months EndedSeptember 30, 2021
(Unaudited)
Year Ended March 31,
2021 2020 2019 2018 2017
Per Share Data
Net asset value, beginning of period $ 10.53 $ 10.32 $ 10.05 $ 9.95 $ 10.14 $ 10.27
Net investment income(a) 0.02 0.14 0.16 0.18 0.13 0.11
Net realized and unrealized gain (loss) 0.19 0.48 0.32 0.11 (0.18) (0.05)
Total from investment operations 0.21 0.62 0.48 0.29 (0.05) 0.06
Distributions to shareholders from net investment income (0.05) (0.22) (0.21) (0.17) (0.12) (0.18)
Distributions to shareholders from net realized gains — (0.19) — — — (0.01)
Distributions to shareholders from return of capital — — — (0.02) (0.02) —
Total distributions (0.05) (0.41) (0.21) (0.19) (0.14) (0.19)
Net asset value, end of period $ 10.69 $ 10.53 $ 10.32 $10.05 $ 9.95 $ 10.14
Total return(b) 2.12% 5.67% 4.88% 2.97% (0.53)% 0.50%
Net assets, end of period (in 000s) $11,481 $11,437 $12,468 $8,217 $14,476 $19,081
Ratio of net expenses to average net assets 1.53%(c) 1.53% 1.54% 1.55% 1.54% 1.53%
Ratio of total expenses to average net assets 1.69%(c) 1.68% 1.70% 1.74% 1.68% 1.72%
Ratio of net investment income to average net assets 0.41%(c) 1.29% 1.53% 1.82% 1.29% 1.10%
Portfolio turnover rate(d) 302% 690% 742% 429% 372% 517%
(a) Calculated based on the average shares outstanding methodology.(b) Assumes investment at the NAV at the beginning of the period, reinvestment of all dividends and distributions, a complete redemption of the investment at the NAV
at the end of the period and no sales or redemption charges (if any). Total returns would be reduced if a sales or redemption charge was taken into account. Returnsdo not reflect the impact of taxes to shareholders relating to Fund distributions or the redemption of Fund shares. Total returns for periods less than one full year arenot annualized.
(c) Annualized.(d) The Fund’s portfolio turnover rate is calculated in accordance with regulatory requirements, without regard to transactions involving short term investments and
certain derivatives. If such transactions were included, the Fund’s portfolio turnover rate may be higher.
136 The accompanying notes are an integral part of these financial statements.

G O L D M A N S A C H S B O N D F U N D
Financial Highlights (continued)Selected Share Data for a Share Outstanding Throughout Each Period
Goldman Sachs Bond Fund
Institutional Shares
Six Months EndedSeptember 30, 2021
(Unaudited)
Year Ended March 31,
2021 2020 2019 2018 2017
Per Share Data
Net asset value, beginning of period $ 10.53 $ 10.33 $ 10.05 $ 9.95 $ 10.14 $ 10.28
Net investment income(a) 0.08 0.26 0.28 0.28 0.24 0.23
Net realized and unrealized gain (loss) 0.20 0.47 0.32 0.12 (0.18) (0.07)
Total from investment operations 0.28 0.73 0.60 0.40 0.06 0.16
Distributions to shareholders from net investment income (0.11) (0.34) (0.32) (0.28) (0.21) (0.29)
Distributions to shareholders from net realized gains — (0.19) — — — (0.01)
Distributions to shareholders from return of capital — — — (0.02) (0.04) —
Total distributions (0.11) (0.53) (0.32) (0.30) (0.25) (0.30)
Net asset value, end of period $ 10.70 $ 10.53 $ 10.33 $ 10.05 $ 9.95 $ 10.14
Total return(b) 2.67% 6.82% 6.01% 4.19% 0.56% 1.50%
Net assets, end of period (in 000s) $170,069 $158,080 $133,067 $155,541 $314,928 $329,358
Ratio of net expenses to average net assets 0.45%(c) 0.45% 0.45% 0.46% 0.45% 0.44%
Ratio of total expenses to average net assets 0.61%(c) 0.60% 0.62% 0.64% 0.59% 0.63%
Ratio of net investment income to average net assets 1.48%(c) 2.36% 2.69% 2.89% 2.37% 2.19%
Portfolio turnover rate(d) 302% 690% 742% 429% 372% 517%
(a) Calculated based on the average shares outstanding methodology.(b) Assumes investment at the NAV at the beginning of the period, reinvestment of all dividends and distributions, a complete redemption of the investment at the NAV
at the end of the period and no sales or redemption charges (if any). Total returns would be reduced if a sales or redemption charge was taken into account. Returnsdo not reflect the impact of taxes to shareholders relating to Fund distributions or the redemption of Fund shares. Total returns for periods less than one full year arenot annualized.
(c) Annualized.(d) The Fund’s portfolio turnover rate is calculated in accordance with regulatory requirements, without regard to transactions involving short term investments and
certain derivatives. If such transactions were included, the Fund’s portfolio turnover rate may be higher.
The accompanying notes are an integral part of these financial statements. 137
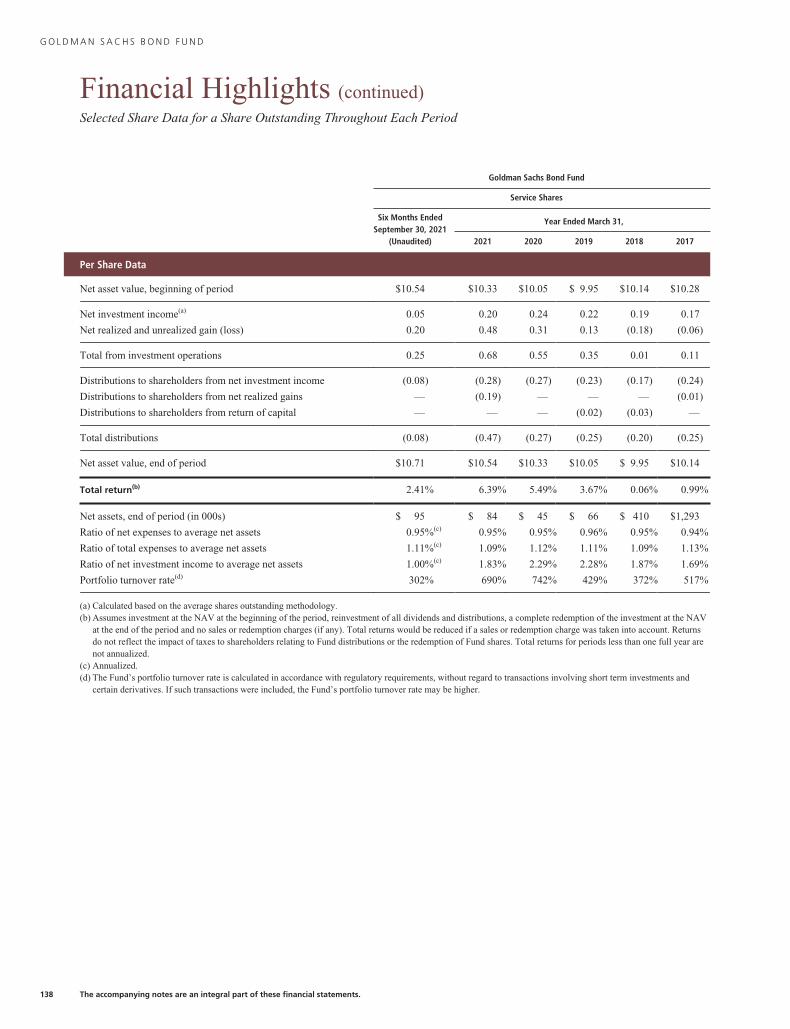
G O L D M A N S A C H S B O N D F U N D
Financial Highlights (continued)Selected Share Data for a Share Outstanding Throughout Each Period
Goldman Sachs Bond Fund
Service Shares
Six Months EndedSeptember 30, 2021
(Unaudited)
Year Ended March 31,
2021 2020 2019 2018 2017
Per Share Data
Net asset value, beginning of period $10.54 $10.33 $10.05 $ 9.95 $10.14 $10.28
Net investment income(a) 0.05 0.20 0.24 0.22 0.19 0.17
Net realized and unrealized gain (loss) 0.20 0.48 0.31 0.13 (0.18) (0.06)
Total from investment operations 0.25 0.68 0.55 0.35 0.01 0.11
Distributions to shareholders from net investment income (0.08) (0.28) (0.27) (0.23) (0.17) (0.24)
Distributions to shareholders from net realized gains — (0.19) — — — (0.01)
Distributions to shareholders from return of capital — — — (0.02) (0.03) —
Total distributions (0.08) (0.47) (0.27) (0.25) (0.20) (0.25)
Net asset value, end of period $10.71 $10.54 $10.33 $10.05 $ 9.95 $10.14
Total return(b) 2.41% 6.39% 5.49% 3.67% 0.06% 0.99%
Net assets, end of period (in 000s) $ 95 $ 84 $ 45 $ 66 $ 410 $1,293
Ratio of net expenses to average net assets 0.95%(c) 0.95% 0.95% 0.96% 0.95% 0.94%
Ratio of total expenses to average net assets 1.11%(c) 1.09% 1.12% 1.11% 1.09% 1.13%
Ratio of net investment income to average net assets 1.00%(c) 1.83% 2.29% 2.28% 1.87% 1.69%
Portfolio turnover rate(d) 302% 690% 742% 429% 372% 517%
(a) Calculated based on the average shares outstanding methodology.(b) Assumes investment at the NAV at the beginning of the period, reinvestment of all dividends and distributions, a complete redemption of the investment at the NAV
at the end of the period and no sales or redemption charges (if any). Total returns would be reduced if a sales or redemption charge was taken into account. Returnsdo not reflect the impact of taxes to shareholders relating to Fund distributions or the redemption of Fund shares. Total returns for periods less than one full year arenot annualized.
(c) Annualized.(d) The Fund’s portfolio turnover rate is calculated in accordance with regulatory requirements, without regard to transactions involving short term investments and
certain derivatives. If such transactions were included, the Fund’s portfolio turnover rate may be higher.
138 The accompanying notes are an integral part of these financial statements.
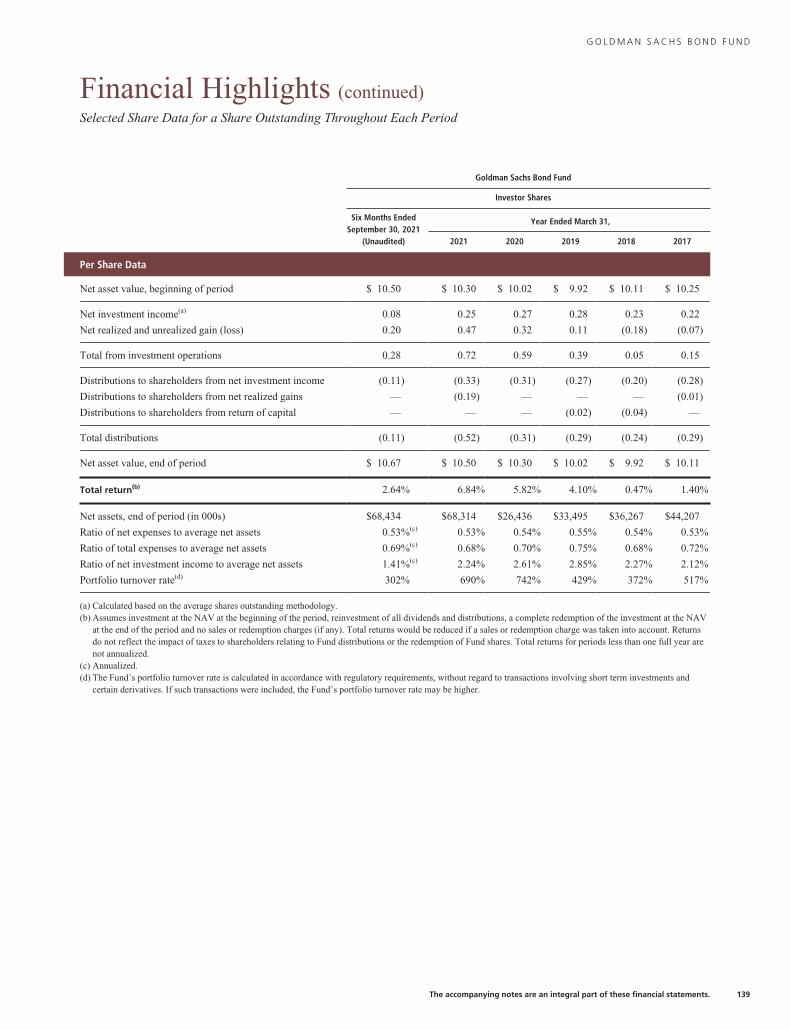
G O L D M A N S A C H S B O N D F U N D
Financial Highlights (continued)Selected Share Data for a Share Outstanding Throughout Each Period
Goldman Sachs Bond Fund
Investor Shares
Six Months EndedSeptember 30, 2021
(Unaudited)
Year Ended March 31,
2021 2020 2019 2018 2017
Per Share Data
Net asset value, beginning of period $ 10.50 $ 10.30 $ 10.02 $ 9.92 $ 10.11 $ 10.25
Net investment income(a) 0.08 0.25 0.27 0.28 0.23 0.22
Net realized and unrealized gain (loss) 0.20 0.47 0.32 0.11 (0.18) (0.07)
Total from investment operations 0.28 0.72 0.59 0.39 0.05 0.15
Distributions to shareholders from net investment income (0.11) (0.33) (0.31) (0.27) (0.20) (0.28)
Distributions to shareholders from net realized gains — (0.19) — — — (0.01)
Distributions to shareholders from return of capital — — — (0.02) (0.04) —
Total distributions (0.11) (0.52) (0.31) (0.29) (0.24) (0.29)
Net asset value, end of period $ 10.67 $ 10.50 $ 10.30 $ 10.02 $ 9.92 $ 10.11
Total return(b) 2.64% 6.84% 5.82% 4.10% 0.47% 1.40%
Net assets, end of period (in 000s) $68,434 $68,314 $26,436 $33,495 $36,267 $44,207
Ratio of net expenses to average net assets 0.53%(c) 0.53% 0.54% 0.55% 0.54% 0.53%
Ratio of total expenses to average net assets 0.69%(c) 0.68% 0.70% 0.75% 0.68% 0.72%
Ratio of net investment income to average net assets 1.41%(c) 2.24% 2.61% 2.85% 2.27% 2.12%
Portfolio turnover rate(d) 302% 690% 742% 429% 372% 517%
(a) Calculated based on the average shares outstanding methodology.(b) Assumes investment at the NAV at the beginning of the period, reinvestment of all dividends and distributions, a complete redemption of the investment at the NAV
at the end of the period and no sales or redemption charges (if any). Total returns would be reduced if a sales or redemption charge was taken into account. Returnsdo not reflect the impact of taxes to shareholders relating to Fund distributions or the redemption of Fund shares. Total returns for periods less than one full year arenot annualized.
(c) Annualized.(d) The Fund’s portfolio turnover rate is calculated in accordance with regulatory requirements, without regard to transactions involving short term investments and
certain derivatives. If such transactions were included, the Fund’s portfolio turnover rate may be higher.
The accompanying notes are an integral part of these financial statements. 139
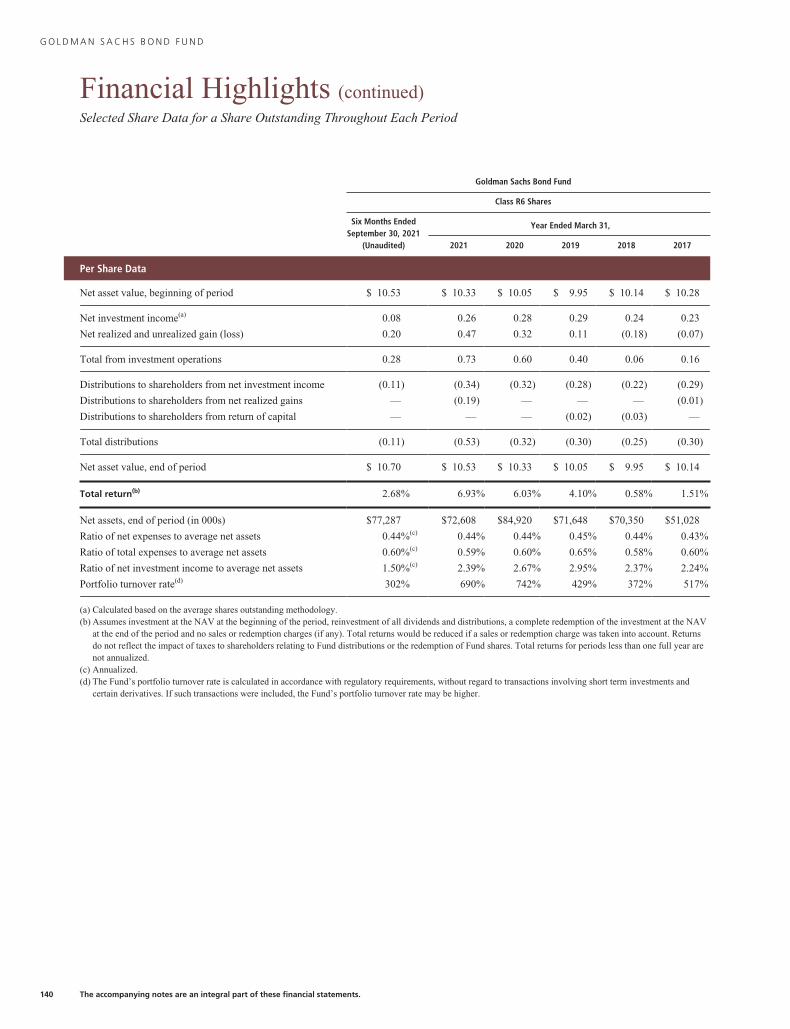
G O L D M A N S A C H S B O N D F U N D
Financial Highlights (continued)Selected Share Data for a Share Outstanding Throughout Each Period
Goldman Sachs Bond Fund
Class R6 Shares
Six Months EndedSeptember 30, 2021
(Unaudited)
Year Ended March 31,
2021 2020 2019 2018 2017
Per Share Data
Net asset value, beginning of period $ 10.53 $ 10.33 $ 10.05 $ 9.95 $ 10.14 $ 10.28
Net investment income(a) 0.08 0.26 0.28 0.29 0.24 0.23
Net realized and unrealized gain (loss) 0.20 0.47 0.32 0.11 (0.18) (0.07)
Total from investment operations 0.28 0.73 0.60 0.40 0.06 0.16
Distributions to shareholders from net investment income (0.11) (0.34) (0.32) (0.28) (0.22) (0.29)
Distributions to shareholders from net realized gains — (0.19) — — — (0.01)
Distributions to shareholders from return of capital — — — (0.02) (0.03) —
Total distributions (0.11) (0.53) (0.32) (0.30) (0.25) (0.30)
Net asset value, end of period $ 10.70 $ 10.53 $ 10.33 $ 10.05 $ 9.95 $ 10.14
Total return(b) 2.68% 6.93% 6.03% 4.10% 0.58% 1.51%
Net assets, end of period (in 000s) $77,287 $72,608 $84,920 $71,648 $70,350 $51,028
Ratio of net expenses to average net assets 0.44%(c) 0.44% 0.44% 0.45% 0.44% 0.43%
Ratio of total expenses to average net assets 0.60%(c) 0.59% 0.60% 0.65% 0.58% 0.60%
Ratio of net investment income to average net assets 1.50%(c) 2.39% 2.67% 2.95% 2.37% 2.24%
Portfolio turnover rate(d) 302% 690% 742% 429% 372% 517%
(a) Calculated based on the average shares outstanding methodology.(b) Assumes investment at the NAV at the beginning of the period, reinvestment of all dividends and distributions, a complete redemption of the investment at the NAV
at the end of the period and no sales or redemption charges (if any). Total returns would be reduced if a sales or redemption charge was taken into account. Returnsdo not reflect the impact of taxes to shareholders relating to Fund distributions or the redemption of Fund shares. Total returns for periods less than one full year arenot annualized.
(c) Annualized.(d) The Fund’s portfolio turnover rate is calculated in accordance with regulatory requirements, without regard to transactions involving short term investments and
certain derivatives. If such transactions were included, the Fund’s portfolio turnover rate may be higher.
140 The accompanying notes are an integral part of these financial statements.
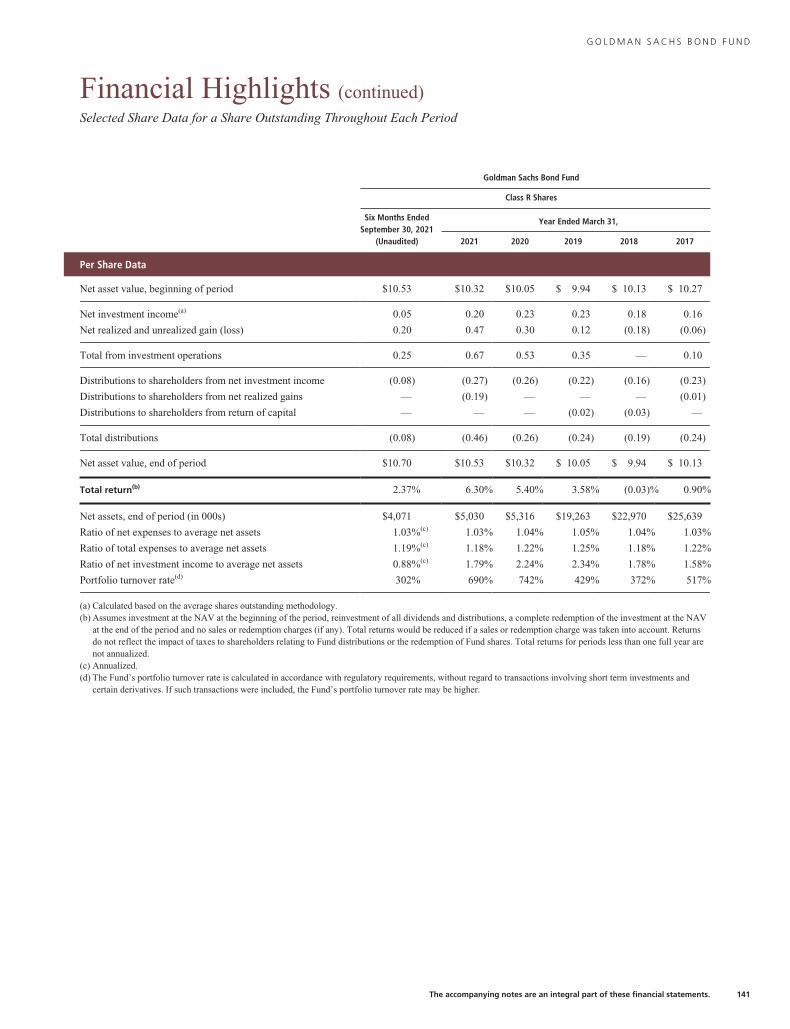
G O L D M A N S A C H S B O N D F U N D
Financial Highlights (continued)Selected Share Data for a Share Outstanding Throughout Each Period
Goldman Sachs Bond Fund
Class R Shares
Six Months EndedSeptember 30, 2021
(Unaudited)
Year Ended March 31,
2021 2020 2019 2018 2017
Per Share Data
Net asset value, beginning of period $10.53 $10.32 $10.05 $ 9.94 $ 10.13 $ 10.27
Net investment income(a) 0.05 0.20 0.23 0.23 0.18 0.16
Net realized and unrealized gain (loss) 0.20 0.47 0.30 0.12 (0.18) (0.06)
Total from investment operations 0.25 0.67 0.53 0.35 — 0.10
Distributions to shareholders from net investment income (0.08) (0.27) (0.26) (0.22) (0.16) (0.23)
Distributions to shareholders from net realized gains — (0.19) — — — (0.01)
Distributions to shareholders from return of capital — — — (0.02) (0.03) —
Total distributions (0.08) (0.46) (0.26) (0.24) (0.19) (0.24)
Net asset value, end of period $10.70 $10.53 $10.32 $ 10.05 $ 9.94 $ 10.13
Total return(b) 2.37% 6.30% 5.40% 3.58% (0.03)% 0.90%
Net assets, end of period (in 000s) $4,071 $5,030 $5,316 $19,263 $22,970 $25,639
Ratio of net expenses to average net assets 1.03%(c) 1.03% 1.04% 1.05% 1.04% 1.03%
Ratio of total expenses to average net assets 1.19%(c) 1.18% 1.22% 1.25% 1.18% 1.22%
Ratio of net investment income to average net assets 0.88%(c) 1.79% 2.24% 2.34% 1.78% 1.58%
Portfolio turnover rate(d) 302% 690% 742% 429% 372% 517%
(a) Calculated based on the average shares outstanding methodology.(b) Assumes investment at the NAV at the beginning of the period, reinvestment of all dividends and distributions, a complete redemption of the investment at the NAV
at the end of the period and no sales or redemption charges (if any). Total returns would be reduced if a sales or redemption charge was taken into account. Returnsdo not reflect the impact of taxes to shareholders relating to Fund distributions or the redemption of Fund shares. Total returns for periods less than one full year arenot annualized.
(c) Annualized.(d) The Fund’s portfolio turnover rate is calculated in accordance with regulatory requirements, without regard to transactions involving short term investments and
certain derivatives. If such transactions were included, the Fund’s portfolio turnover rate may be higher.
The accompanying notes are an integral part of these financial statements. 141
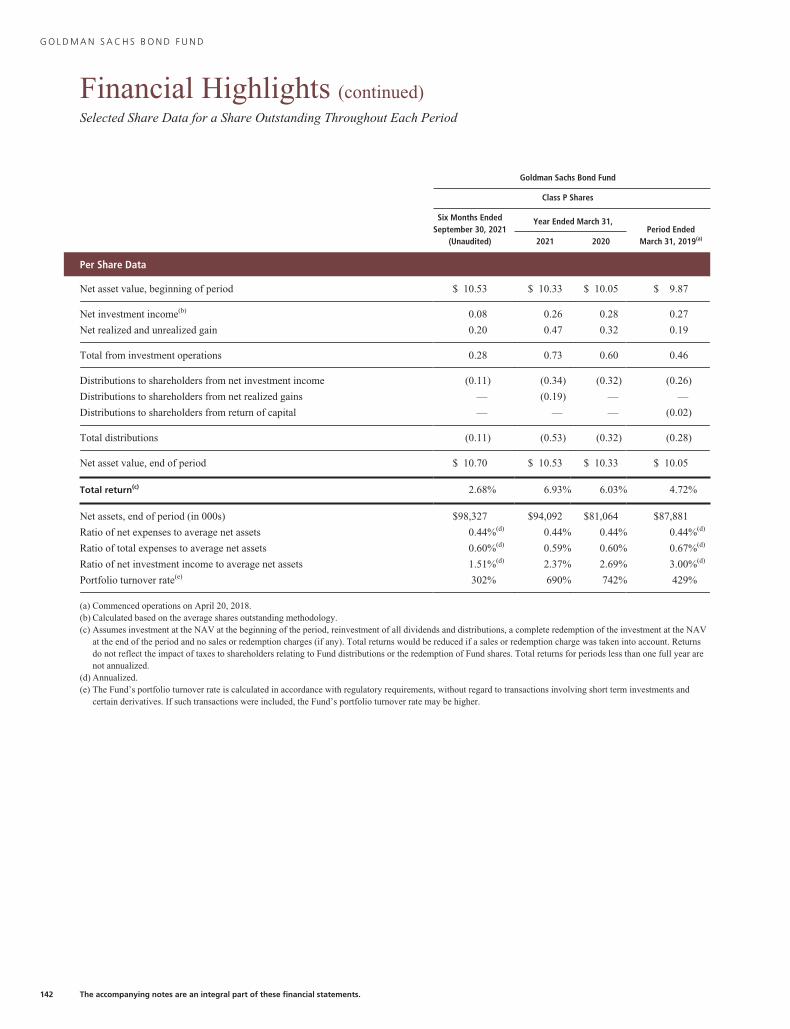
G O L D M A N S A C H S B O N D F U N D
Financial Highlights (continued)Selected Share Data for a Share Outstanding Throughout Each Period
Goldman Sachs Bond Fund
Class P Shares
Six Months EndedSeptember 30, 2021
(Unaudited)
Year Ended March 31,Period Ended
March 31, 2019(a)2021 2020
Per Share Data
Net asset value, beginning of period $ 10.53 $ 10.33 $ 10.05 $ 9.87
Net investment income(b) 0.08 0.26 0.28 0.27
Net realized and unrealized gain 0.20 0.47 0.32 0.19
Total from investment operations 0.28 0.73 0.60 0.46
Distributions to shareholders from net investment income (0.11) (0.34) (0.32) (0.26)
Distributions to shareholders from net realized gains — (0.19) — —
Distributions to shareholders from return of capital — — — (0.02)
Total distributions (0.11) (0.53) (0.32) (0.28)
Net asset value, end of period $ 10.70 $ 10.53 $ 10.33 $ 10.05
Total return(c) 2.68% 6.93% 6.03% 4.72%
Net assets, end of period (in 000s) $98,327 $94,092 $81,064 $87,881
Ratio of net expenses to average net assets 0.44%(d) 0.44% 0.44% 0.44%(d)
Ratio of total expenses to average net assets 0.60%(d) 0.59% 0.60% 0.67%(d)
Ratio of net investment income to average net assets 1.51%(d) 2.37% 2.69% 3.00%(d)
Portfolio turnover rate(e) 302% 690% 742% 429%
(a) Commenced operations on April 20, 2018.(b) Calculated based on the average shares outstanding methodology.(c) Assumes investment at the NAV at the beginning of the period, reinvestment of all dividends and distributions, a complete redemption of the investment at the NAV
at the end of the period and no sales or redemption charges (if any). Total returns would be reduced if a sales or redemption charge was taken into account. Returnsdo not reflect the impact of taxes to shareholders relating to Fund distributions or the redemption of Fund shares. Total returns for periods less than one full year arenot annualized.
(d) Annualized.(e) The Fund’s portfolio turnover rate is calculated in accordance with regulatory requirements, without regard to transactions involving short term investments and
certain derivatives. If such transactions were included, the Fund’s portfolio turnover rate may be higher.
142 The accompanying notes are an integral part of these financial statements.
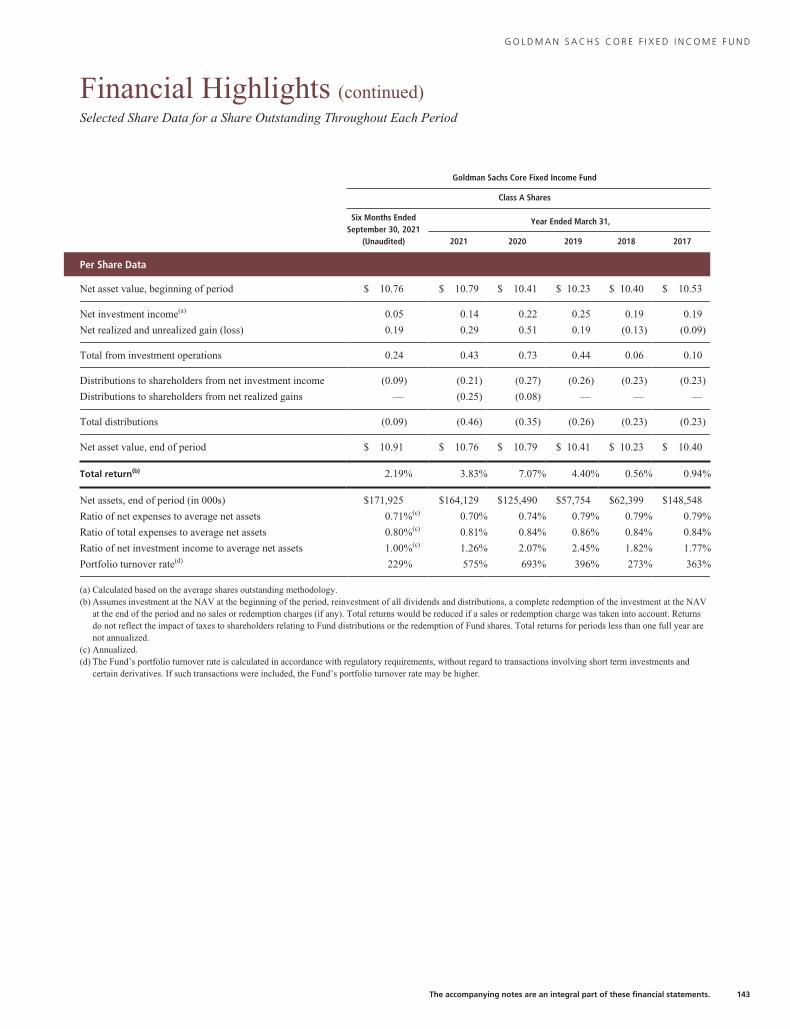
G O L D M A N S A C H S C O R E F I X E D I N C O M E F U N D
Financial Highlights (continued)Selected Share Data for a Share Outstanding Throughout Each Period
Goldman Sachs Core Fixed Income Fund
Class A Shares
Six Months EndedSeptember 30, 2021
(Unaudited)
Year Ended March 31,
2021 2020 2019 2018 2017
Per Share Data
Net asset value, beginning of period $ 10.76 $ 10.79 $ 10.41 $ 10.23 $ 10.40 $ 10.53
Net investment income(a) 0.05 0.14 0.22 0.25 0.19 0.19
Net realized and unrealized gain (loss) 0.19 0.29 0.51 0.19 (0.13) (0.09)
Total from investment operations 0.24 0.43 0.73 0.44 0.06 0.10
Distributions to shareholders from net investment income (0.09) (0.21) (0.27) (0.26) (0.23) (0.23)
Distributions to shareholders from net realized gains — (0.25) (0.08) — — —
Total distributions (0.09) (0.46) (0.35) (0.26) (0.23) (0.23)
Net asset value, end of period $ 10.91 $ 10.76 $ 10.79 $ 10.41 $ 10.23 $ 10.40
Total return(b) 2.19% 3.83% 7.07% 4.40% 0.56% 0.94%
Net assets, end of period (in 000s) $171,925 $164,129 $125,490 $57,754 $62,399 $148,548
Ratio of net expenses to average net assets 0.71%(c) 0.70% 0.74% 0.79% 0.79% 0.79%
Ratio of total expenses to average net assets 0.80%(c) 0.81% 0.84% 0.86% 0.84% 0.84%
Ratio of net investment income to average net assets 1.00%(c) 1.26% 2.07% 2.45% 1.82% 1.77%
Portfolio turnover rate(d) 229% 575% 693% 396% 273% 363%
(a) Calculated based on the average shares outstanding methodology.(b) Assumes investment at the NAV at the beginning of the period, reinvestment of all dividends and distributions, a complete redemption of the investment at the NAV
at the end of the period and no sales or redemption charges (if any). Total returns would be reduced if a sales or redemption charge was taken into account. Returnsdo not reflect the impact of taxes to shareholders relating to Fund distributions or the redemption of Fund shares. Total returns for periods less than one full year arenot annualized.
(c) Annualized.(d) The Fund’s portfolio turnover rate is calculated in accordance with regulatory requirements, without regard to transactions involving short term investments and
certain derivatives. If such transactions were included, the Fund’s portfolio turnover rate may be higher.
The accompanying notes are an integral part of these financial statements. 143

G O L D M A N S A C H S C O R E F I X E D I N C O M E F U N D
Financial Highlights (continued)Selected Share Data for a Share Outstanding Throughout Each Period
Goldman Sachs Core Fixed Income Fund
Class C Shares
Six Months EndedSeptember 30, 2021
(Unaudited)
Year Ended March 31,
2021 2020 2019 2018 2017
Per Share Data
Net asset value, beginning of period $ 10.82 $ 10.84 $10.46 $10.29 $10.46 $ 10.59
Net investment income(a) 0.01 0.06 0.15 0.17 0.11 0.11
Net realized and unrealized gain (loss) 0.18 0.29 0.50 0.19 (0.13) (0.09)
Total from investment operations 0.19 0.35 0.65 0.36 (0.02) 0.02
Distributions to shareholders from net investment income (0.04) (0.12) (0.19) (0.19) (0.15) (0.15)
Distributions to shareholders from net realized gains — (0.25) (0.08) — — —
Total distributions (0.04) (0.37) (0.27) (0.19) (0.15) (0.15)
Net asset value, end of period $ 10.97 $ 10.82 $10.84 $10.46 $10.29 $ 10.46
Total return(b) 1.89% 3.05% 6.25% 3.52% (0.18)% 0.20%
Net assets, end of period (in 000s) $12,258 $12,416 $8,331 $6,585 $9,817 $15,714
Ratio of net expenses to average net assets 1.46%(c) 1.45% 1.50% 1.54% 1.54% 1.54%
Ratio of total expenses to average net assets 1.55%(c) 1.56% 1.60% 1.61% 1.59% 1.59%
Ratio of net investment income to average net assets 0.25%(c) 0.50% 1.37% 1.67% 1.09% 1.02%
Portfolio turnover rate(d) 229% 575% 693% 396% 273% 363%
(a) Calculated based on the average shares outstanding methodology.(b) Assumes investment at the NAV at the beginning of the period, reinvestment of all dividends and distributions, a complete redemption of the investment at the NAV
at the end of the period and no sales or redemption charges (if any). Total returns would be reduced if a sales or redemption charge was taken into account. Returnsdo not reflect the impact of taxes to shareholders relating to Fund distributions or the redemption of Fund shares. Total returns for periods less than one full year arenot annualized.
(c) Annualized.(d) The Fund’s portfolio turnover rate is calculated in accordance with regulatory requirements, without regard to transactions involving short term investments and
certain derivatives. If such transactions were included, the Fund’s portfolio turnover rate may be higher.
144 The accompanying notes are an integral part of these financial statements.

G O L D M A N S A C H S C O R E F I X E D I N C O M E F U N D
Financial Highlights (continued)Selected Share Data for a Share Outstanding Throughout Each Period
Goldman Sachs Core Fixed Income Fund
Institutional Shares
Six Months EndedSeptember 30, 2021
(Unaudited)
Year Ended March 31,
2021 2020 2019 2018 2017
Per Share Data
Net asset value, beginning of period $ 10.81 $ 10.83 $ 10.45 $ 10.27 $ 10.45 $ 10.57
Net investment income(a) 0.07 0.17 0.26 0.27 0.23 0.22
Net realized and unrealized gain (loss) 0.18 0.30 0.51 0.21 (0.14) (0.07)
Total from investment operations 0.25 0.47 0.77 0.48 0.09 0.15
Distributions to shareholders from net investment income (0.10) (0.24) (0.31) (0.30) (0.27) (0.27)
Distributions to shareholders from net realized gains — (0.25) (0.08) — — —
Total distributions (0.10) (0.49) (0.39) (0.30) (0.27) (0.27)
Net asset value, end of period $ 10.96 $ 10.81 $ 10.83 $ 10.45 $ 10.27 $ 10.45
Total return(b) 2.35% 4.17% 7.41% 4.75% 0.81% 1.38%
Net assets, end of period (in 000s) $639,055 $645,062 $292,906 $181,702 $850,477 $776,135
Ratio of net expenses to average net assets 0.38%(c) 0.37% 0.41% 0.45% 0.45% 0.44%
Ratio of total expenses to average net assets 0.47%(c) 0.47% 0.51% 0.51% 0.50% 0.50%
Ratio of net investment income to average net assets 1.33%(c) 1.55% 2.46% 2.66% 2.20% 2.11%
Portfolio turnover rate(d) 229% 575% 693% 396% 273% 363%
(a) Calculated based on the average shares outstanding methodology.(b) Assumes investment at the NAV at the beginning of the period, reinvestment of all dividends and distributions, a complete redemption of the investment at the NAV
at the end of the period and no sales or redemption charges (if any). Total returns would be reduced if a sales or redemption charge was taken into account. Returnsdo not reflect the impact of taxes to shareholders relating to Fund distributions or the redemption of Fund shares. Total returns for periods less than one full year arenot annualized.
(c) Annualized.(d) The Fund’s portfolio turnover rate is calculated in accordance with regulatory requirements, without regard to transactions involving short term investments and
certain derivatives. If such transactions were included, the Fund’s portfolio turnover rate may be higher.
The accompanying notes are an integral part of these financial statements. 145
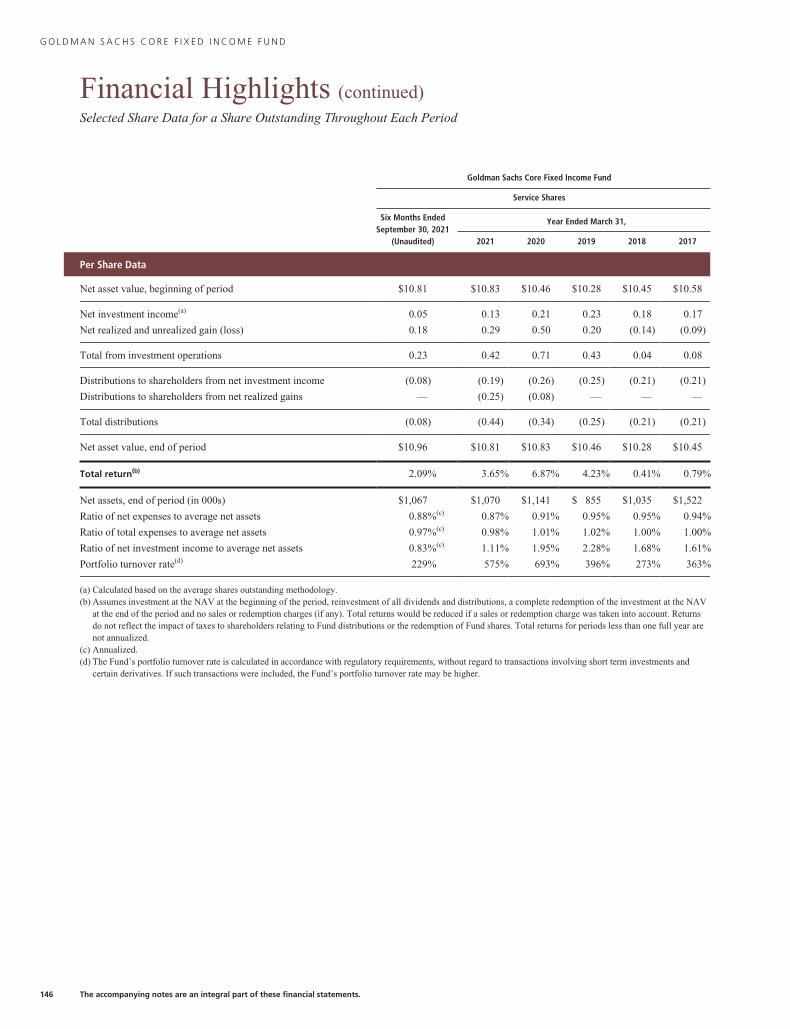
G O L D M A N S A C H S C O R E F I X E D I N C O M E F U N D
Financial Highlights (continued)Selected Share Data for a Share Outstanding Throughout Each Period
Goldman Sachs Core Fixed Income Fund
Service Shares
Six Months EndedSeptember 30, 2021
(Unaudited)
Year Ended March 31,
2021 2020 2019 2018 2017
Per Share Data
Net asset value, beginning of period $10.81 $10.83 $10.46 $10.28 $10.45 $10.58
Net investment income(a) 0.05 0.13 0.21 0.23 0.18 0.17
Net realized and unrealized gain (loss) 0.18 0.29 0.50 0.20 (0.14) (0.09)
Total from investment operations 0.23 0.42 0.71 0.43 0.04 0.08
Distributions to shareholders from net investment income (0.08) (0.19) (0.26) (0.25) (0.21) (0.21)
Distributions to shareholders from net realized gains — (0.25) (0.08) — — —
Total distributions (0.08) (0.44) (0.34) (0.25) (0.21) (0.21)
Net asset value, end of period $10.96 $10.81 $10.83 $10.46 $10.28 $10.45
Total return(b) 2.09% 3.65% 6.87% 4.23% 0.41% 0.79%
Net assets, end of period (in 000s) $1,067 $1,070 $1,141 $ 855 $1,035 $1,522
Ratio of net expenses to average net assets 0.88%(c) 0.87% 0.91% 0.95% 0.95% 0.94%
Ratio of total expenses to average net assets 0.97%(c) 0.98% 1.01% 1.02% 1.00% 1.00%
Ratio of net investment income to average net assets 0.83%(c) 1.11% 1.95% 2.28% 1.68% 1.61%
Portfolio turnover rate(d) 229% 575% 693% 396% 273% 363%
(a) Calculated based on the average shares outstanding methodology.(b) Assumes investment at the NAV at the beginning of the period, reinvestment of all dividends and distributions, a complete redemption of the investment at the NAV
at the end of the period and no sales or redemption charges (if any). Total returns would be reduced if a sales or redemption charge was taken into account. Returnsdo not reflect the impact of taxes to shareholders relating to Fund distributions or the redemption of Fund shares. Total returns for periods less than one full year arenot annualized.
(c) Annualized.(d) The Fund’s portfolio turnover rate is calculated in accordance with regulatory requirements, without regard to transactions involving short term investments and
certain derivatives. If such transactions were included, the Fund’s portfolio turnover rate may be higher.
146 The accompanying notes are an integral part of these financial statements.

G O L D M A N S A C H S C O R E F I X E D I N C O M E F U N D
Financial Highlights (continued)Selected Share Data for a Share Outstanding Throughout Each Period
Goldman Sachs Core Fixed Income Fund
Investor Shares
Six Months EndedSeptember 30, 2021
(Unaudited)
Year Ended March 31,
2021 2020 2019 2018 2017
Per Share Data
Net asset value, beginning of period $ 10.77 $ 10.80 $ 10.42 $ 10.24 $ 10.41 $ 10.54
Net investment income(a) 0.07 0.16 0.24 0.27 0.22 0.21
Net realized and unrealized gain (loss) 0.18 0.30 0.52 0.20 (0.13) (0.08)
Total from investment operations 0.25 0.46 0.76 0.47 0.09 0.13
Distributions to shareholders from net investment income (0.10) (0.24) (0.30) (0.29) (0.26) (0.26)
Distributions to shareholders from net realized gains — (0.25) (0.08) — — —
Total distributions (0.10) (0.49) (0.38) (0.29) (0.26) (0.26)
Net asset value, end of period $ 10.92 $ 10.77 $ 10.80 $ 10.42 $ 10.24 $ 10.41
Total return(b) 2.31% 4.09% 7.33% 4.66% 0.81% 1.19%
Net assets, end of period (in 000s) $440,097 $426,467 $122,100 $17,645 $45,129 $38,620
Ratio of net expenses to average net assets 0.46%(c) 0.45% 0.48% 0.54% 0.54% 0.53%
Ratio of total expenses to average net assets 0.55%(c) 0.56% 0.59% 0.60% 0.59% 0.59%
Ratio of net investment income to average net assets 1.25%(c) 1.46% 2.27% 2.66% 2.11% 2.01%
Portfolio turnover rate(d) 229% 575% 693% 396% 273% 363%
(a) Calculated based on the average shares outstanding methodology.(b) Assumes investment at the NAV at the beginning of the period, reinvestment of all dividends and distributions, a complete redemption of the investment at the NAV
at the end of the period and no sales or redemption charges (if any). Total returns would be reduced if a sales or redemption charge was taken into account. Returnsdo not reflect the impact of taxes to shareholders relating to Fund distributions or the redemption of Fund shares. Total returns for periods less than one full year arenot annualized.
(c) Annualized.(d) The Fund’s portfolio turnover rate is calculated in accordance with regulatory requirements, without regard to transactions involving short term investments and
certain derivatives. If such transactions were included, the Fund’s portfolio turnover rate may be higher.
The accompanying notes are an integral part of these financial statements. 147
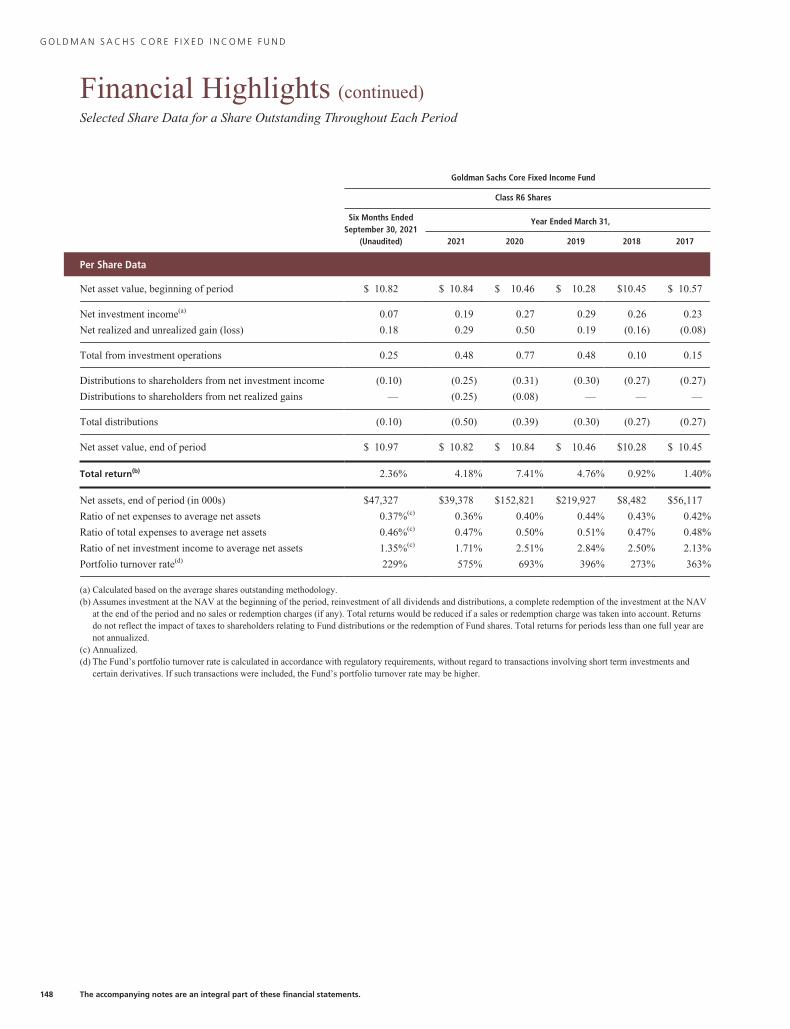
G O L D M A N S A C H S C O R E F I X E D I N C O M E F U N D
Financial Highlights (continued)Selected Share Data for a Share Outstanding Throughout Each Period
Goldman Sachs Core Fixed Income Fund
Class R6 Shares
Six Months EndedSeptember 30, 2021
(Unaudited)
Year Ended March 31,
2021 2020 2019 2018 2017
Per Share Data
Net asset value, beginning of period $ 10.82 $ 10.84 $ 10.46 $ 10.28 $10.45 $ 10.57
Net investment income(a) 0.07 0.19 0.27 0.29 0.26 0.23
Net realized and unrealized gain (loss) 0.18 0.29 0.50 0.19 (0.16) (0.08)
Total from investment operations 0.25 0.48 0.77 0.48 0.10 0.15
Distributions to shareholders from net investment income (0.10) (0.25) (0.31) (0.30) (0.27) (0.27)
Distributions to shareholders from net realized gains — (0.25) (0.08) — — —
Total distributions (0.10) (0.50) (0.39) (0.30) (0.27) (0.27)
Net asset value, end of period $ 10.97 $ 10.82 $ 10.84 $ 10.46 $10.28 $ 10.45
Total return(b) 2.36% 4.18% 7.41% 4.76% 0.92% 1.40%
Net assets, end of period (in 000s) $47,327 $39,378 $152,821 $219,927 $8,482 $56,117
Ratio of net expenses to average net assets 0.37%(c) 0.36% 0.40% 0.44% 0.43% 0.42%
Ratio of total expenses to average net assets 0.46%(c) 0.47% 0.50% 0.51% 0.47% 0.48%
Ratio of net investment income to average net assets 1.35%(c) 1.71% 2.51% 2.84% 2.50% 2.13%
Portfolio turnover rate(d) 229% 575% 693% 396% 273% 363%
(a) Calculated based on the average shares outstanding methodology.(b) Assumes investment at the NAV at the beginning of the period, reinvestment of all dividends and distributions, a complete redemption of the investment at the NAV
at the end of the period and no sales or redemption charges (if any). Total returns would be reduced if a sales or redemption charge was taken into account. Returnsdo not reflect the impact of taxes to shareholders relating to Fund distributions or the redemption of Fund shares. Total returns for periods less than one full year arenot annualized.
(c) Annualized.(d) The Fund’s portfolio turnover rate is calculated in accordance with regulatory requirements, without regard to transactions involving short term investments and
certain derivatives. If such transactions were included, the Fund’s portfolio turnover rate may be higher.
148 The accompanying notes are an integral part of these financial statements.
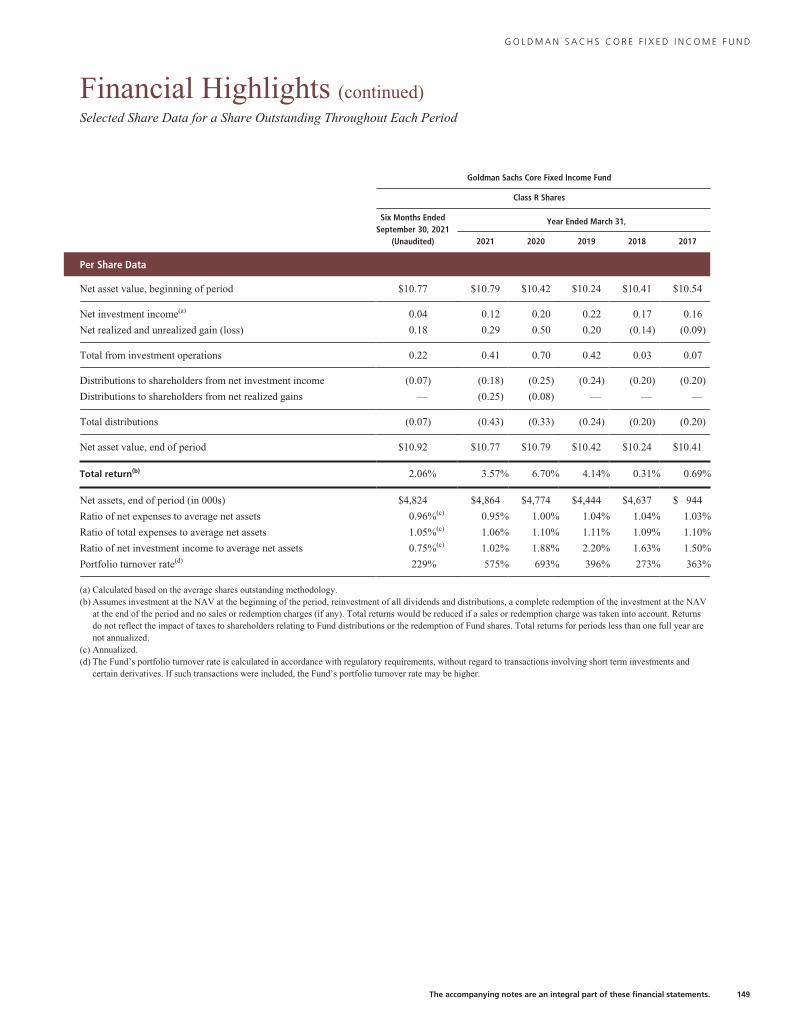
G O L D M A N S A C H S C O R E F I X E D I N C O M E F U N D
Financial Highlights (continued)Selected Share Data for a Share Outstanding Throughout Each Period
Goldman Sachs Core Fixed Income Fund
Class R Shares
Six Months EndedSeptember 30, 2021
(Unaudited)
Year Ended March 31,
2021 2020 2019 2018 2017
Per Share Data
Net asset value, beginning of period $10.77 $10.79 $10.42 $10.24 $10.41 $10.54
Net investment income(a) 0.04 0.12 0.20 0.22 0.17 0.16
Net realized and unrealized gain (loss) 0.18 0.29 0.50 0.20 (0.14) (0.09)
Total from investment operations 0.22 0.41 0.70 0.42 0.03 0.07
Distributions to shareholders from net investment income (0.07) (0.18) (0.25) (0.24) (0.20) (0.20)
Distributions to shareholders from net realized gains — (0.25) (0.08) — — —
Total distributions (0.07) (0.43) (0.33) (0.24) (0.20) (0.20)
Net asset value, end of period $10.92 $10.77 $10.79 $10.42 $10.24 $10.41
Total return(b) 2.06% 3.57% 6.70% 4.14% 0.31% 0.69%
Net assets, end of period (in 000s) $4,824 $4,864 $4,774 $4,444 $4,637 $ 944
Ratio of net expenses to average net assets 0.96%(c) 0.95% 1.00% 1.04% 1.04% 1.03%
Ratio of total expenses to average net assets 1.05%(c) 1.06% 1.10% 1.11% 1.09% 1.10%
Ratio of net investment income to average net assets 0.75%(c) 1.02% 1.88% 2.20% 1.63% 1.50%
Portfolio turnover rate(d) 229% 575% 693% 396% 273% 363%
(a) Calculated based on the average shares outstanding methodology.(b) Assumes investment at the NAV at the beginning of the period, reinvestment of all dividends and distributions, a complete redemption of the investment at the NAV
at the end of the period and no sales or redemption charges (if any). Total returns would be reduced if a sales or redemption charge was taken into account. Returnsdo not reflect the impact of taxes to shareholders relating to Fund distributions or the redemption of Fund shares. Total returns for periods less than one full year arenot annualized.
(c) Annualized.(d) The Fund’s portfolio turnover rate is calculated in accordance with regulatory requirements, without regard to transactions involving short term investments and
certain derivatives. If such transactions were included, the Fund’s portfolio turnover rate may be higher.
The accompanying notes are an integral part of these financial statements. 149

G O L D M A N S A C H S C O R E F I X E D I N C O M E F U N D
Financial Highlights (continued)Selected Share Data for a Share Outstanding Throughout Each Period
Goldman Sachs Core Fixed Income Fund
Class P Shares
Six Months EndedSeptember 30, 2021
(Unaudited)
Year Ended March 31,Period Ended
March 31, 2019(a)2021 2020
Per Share Data
Net asset value, beginning of period $ 10.82 $ 10.85 $ 10.47 $ 10.20
Net investment income(b) 0.07 0.18 0.27 0.28
Net realized and unrealized gain 0.18 0.29 0.50 0.27
Total from investment operations 0.25 0.47 0.77 0.55
Distributions to shareholders from net investment income (0.10) (0.25) (0.31) (0.28)
Distributions to shareholders from net realized gains — (0.25) (0.08) —
Total distributions (0.10) (0.50) (0.39) (0.28)
Net asset value, end of period $ 10.97 $ 10.82 $ 10.85 $ 10.47
Total return(c) 2.35% 4.18% 7.41% 5.50%
Net assets, end of period (in 000s) $799,548 $809,047 $704,747 $595,010
Ratio of net expenses to average net assets 0.37%(d) 0.36% 0.40% 0.44%(d)
Ratio of total expenses to average net assets 0.46%(d) 0.46% 0.50% 0.52%(d)
Ratio of net investment income to average net assets 1.34%(d) 1.60% 2.47% 2.91%(d)
Portfolio turnover rate(e) 229% 575% 693% 396%
(a) Commenced operations on April 20, 2018.(b) Calculated based on the average shares outstanding methodology.(c) Assumes investment at the NAV at the beginning of the period, reinvestment of all dividends and distributions, a complete redemption of the investment at the NAV
at the end of the period and no sales or redemption charges (if any). Total returns would be reduced if a sales or redemption charge was taken into account. Returnsdo not reflect the impact of taxes to shareholders relating to Fund distributions or the redemption of Fund shares. Total returns for periods less than one full year arenot annualized.
(d) Annualized.(e) The Fund’s portfolio turnover rate is calculated in accordance with regulatory requirements, without regard to transactions involving short term investments and
certain derivatives. If such transactions were included, the Fund’s portfolio turnover rate may be higher.
150 The accompanying notes are an integral part of these financial statements.

G O L D M A N S A C H S G L O B A L C O R E F I X E D I N C O M E F U N D
Financial Highlights (continued)Selected Share Data for a Share Outstanding Throughout Each Period
Goldman Sachs Global Core Fixed Income Fund
Class A Shares
Six Months EndedSeptember 30, 2021
(Unaudited)
Year Ended March 31,
2021 2020 2019 2018 2017
Per Share Data
Net asset value, beginning of period $ 12.73 $ 12.72 $ 12.47 $ 12.17 $ 12.21 $ 12.24
Net investment income(a) 0.03 0.14 0.14 0.17 0.09 0.09
Net realized and unrealized gain 0.13 0.54 0.47 0.31 0.08 0.05
Total from investment operations 0.16 0.68 0.61 0.48 0.17 0.14
Distributions to shareholders from net investment income (0.05) (0.32) (0.20) (0.18) (0.21) (0.12)
Distributions to shareholders from net realized gains — (0.35) (0.16) — — (0.05)
Total distributions (0.05) (0.67) (0.36) (0.18) (0.21) (0.17)
Net asset value, end of period $ 12.84 $ 12.73 $ 12.72 $ 12.47 $ 12.17 $ 12.21
Total return(b) 1.32% 5.15% 4.88% 3.99% 1.38% 1.14%
Net assets, end of period (in 000s) $52,576 $52,270 $42,358 $63,453 $78,752 $136,317
Ratio of net expenses to average net assets 0.97%(c) 1.00% 1.01% 1.03% 1.03% 1.03%
Ratio of total expenses to average net assets 1.15%(c) 1.17% 1.13% 1.20% 1.14% 1.13%
Ratio of net investment income to average net assets 0.39%(c) 1.07% 1.08% 1.39% 0.76% 0.71%
Portfolio turnover rate(d) 240% 522% 610% 302% 172% 289%
(a) Calculated based on the average shares outstanding methodology.(b) Assumes investment at the NAV at the beginning of the period, reinvestment of all dividends and distributions, a complete redemption of the investment at the NAV
at the end of the period and no sales or redemption charges (if any). Total returns would be reduced if a sales or redemption charge was taken into account. Returnsdo not reflect the impact of taxes to shareholders relating to Fund distributions or the redemption of Fund shares. Total returns for periods less than one full year arenot annualized.
(c) Annualized.(d) The Fund’s portfolio turnover rate is calculated in accordance with regulatory requirements, without regard to transactions involving short term investments and
certain derivatives. If such transactions were included, the Fund’s portfolio turnover rate may be higher.
The accompanying notes are an integral part of these financial statements. 151
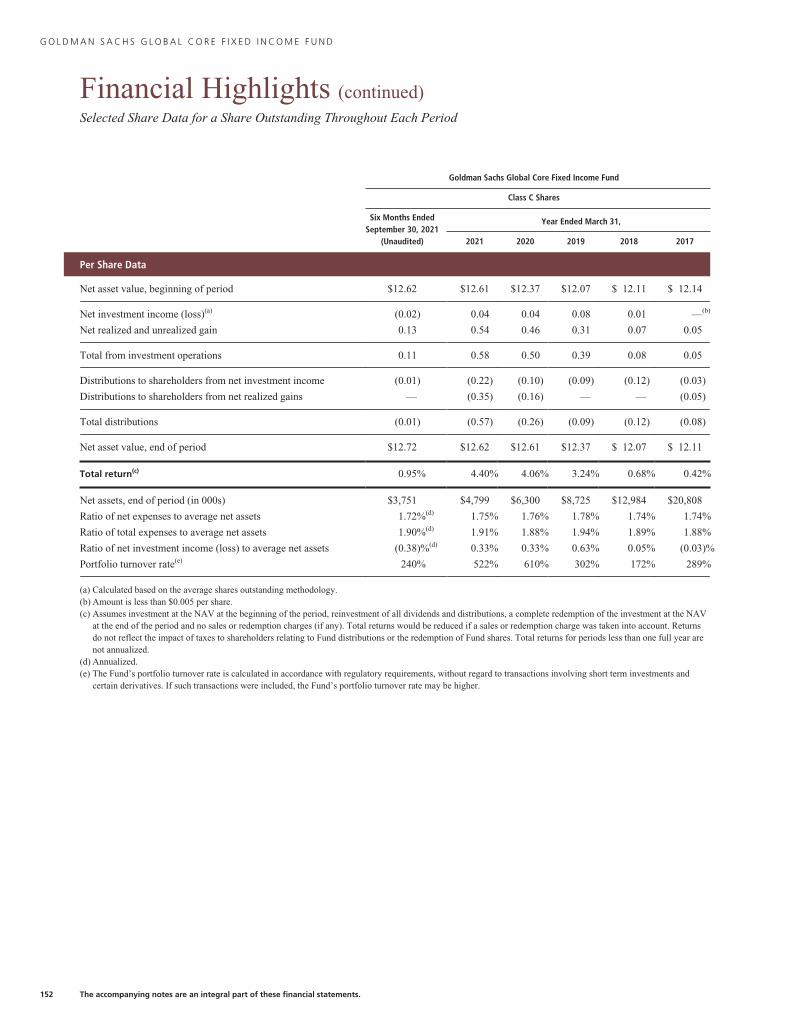
G O L D M A N S A C H S G L O B A L C O R E F I X E D I N C O M E F U N D
Financial Highlights (continued)Selected Share Data for a Share Outstanding Throughout Each Period
Goldman Sachs Global Core Fixed Income Fund
Class C Shares
Six Months EndedSeptember 30, 2021
(Unaudited)
Year Ended March 31,
2021 2020 2019 2018 2017
Per Share Data
Net asset value, beginning of period $12.62 $12.61 $12.37 $12.07 $ 12.11 $ 12.14
Net investment income (loss)(a) (0.02) 0.04 0.04 0.08 0.01 —(b)
Net realized and unrealized gain 0.13 0.54 0.46 0.31 0.07 0.05
Total from investment operations 0.11 0.58 0.50 0.39 0.08 0.05
Distributions to shareholders from net investment income (0.01) (0.22) (0.10) (0.09) (0.12) (0.03)
Distributions to shareholders from net realized gains — (0.35) (0.16) — — (0.05)
Total distributions (0.01) (0.57) (0.26) (0.09) (0.12) (0.08)
Net asset value, end of period $12.72 $12.62 $12.61 $12.37 $ 12.07 $ 12.11
Total return(c) 0.95% 4.40% 4.06% 3.24% 0.68% 0.42%
Net assets, end of period (in 000s) $3,751 $4,799 $6,300 $8,725 $12,984 $20,808
Ratio of net expenses to average net assets 1.72%(d) 1.75% 1.76% 1.78% 1.74% 1.74%
Ratio of total expenses to average net assets 1.90%(d) 1.91% 1.88% 1.94% 1.89% 1.88%
Ratio of net investment income (loss) to average net assets (0.38)%(d) 0.33% 0.33% 0.63% 0.05% (0.03)%
Portfolio turnover rate(e) 240% 522% 610% 302% 172% 289%
(a) Calculated based on the average shares outstanding methodology.(b) Amount is less than $0.005 per share.(c) Assumes investment at the NAV at the beginning of the period, reinvestment of all dividends and distributions, a complete redemption of the investment at the NAV
at the end of the period and no sales or redemption charges (if any). Total returns would be reduced if a sales or redemption charge was taken into account. Returnsdo not reflect the impact of taxes to shareholders relating to Fund distributions or the redemption of Fund shares. Total returns for periods less than one full year arenot annualized.
(d) Annualized.(e) The Fund’s portfolio turnover rate is calculated in accordance with regulatory requirements, without regard to transactions involving short term investments and
certain derivatives. If such transactions were included, the Fund’s portfolio turnover rate may be higher.
152 The accompanying notes are an integral part of these financial statements.

G O L D M A N S A C H S G L O B A L C O R E F I X E D I N C O M E F U N D
Financial Highlights (continued)Selected Share Data for a Share Outstanding Throughout Each Period
Goldman Sachs Global Core Fixed Income Fund
Institutional Shares
Six Months EndedSeptember 30, 2021
(Unaudited)
Year Ended March 31,
2021 2020 2019 2018 2017
Per Share Data
Net asset value, beginning of period $ 12.70 $ 12.70 $ 12.45 $ 12.15 $ 12.19 $ 12.22
Net investment income(a) 0.05 0.18 0.18 0.21 0.13 0.13
Net realized and unrealized gain 0.13 0.53 0.47 0.31 0.08 0.05
Total from investment operations 0.18 0.71 0.65 0.52 0.21 0.18
Distributions to shareholders from net investment income (0.07) (0.36) (0.24) (0.22) (0.25) (0.16)
Distributions to shareholders from net realized gains — (0.35) (0.16) — — (0.05)
Total distributions (0.07) (0.71) (0.40) (0.22) (0.25) (0.21)
Net asset value, end of period $ 12.81 $ 12.70 $ 12.70 $ 12.45 $ 12.15 $ 12.19
Total return(b) 1.48% 5.48% 5.22% 4.34% 1.72% 1.48%
Net assets, end of period (in 000s) $271,978 $282,633 $250,976 $252,456 $321,021 $627,253
Ratio of net expenses to average net assets 0.66%(c) 0.69% 0.69% 0.69% 0.69% 0.69%
Ratio of total expenses to average net assets 0.82%(c) 0.83% 0.79% 0.86% 0.80% 0.79%
Ratio of net investment income to average net assets 0.70%(c) 1.38% 1.37% 1.73% 1.08% 1.05%
Portfolio turnover rate(d) 240% 522% 610% 302% 172% 289%
(a) Calculated based on the average shares outstanding methodology.(b) Assumes investment at the NAV at the beginning of the period, reinvestment of all dividends and distributions, a complete redemption of the investment at the NAV
at the end of the period and no sales or redemption charges (if any). Total returns would be reduced if a sales or redemption charge was taken into account. Returnsdo not reflect the impact of taxes to shareholders relating to Fund distributions or the redemption of Fund shares. Total returns for periods less than one full year arenot annualized.
(c) Annualized.(d) The Fund’s portfolio turnover rate is calculated in accordance with regulatory requirements, without regard to transactions involving short term investments and
certain derivatives. If such transactions were included, the Fund’s portfolio turnover rate may be higher.
The accompanying notes are an integral part of these financial statements. 153

G O L D M A N S A C H S G L O B A L C O R E F I X E D I N C O M E F U N D
Financial Highlights (continued)Selected Share Data for a Share Outstanding Throughout Each Period
Goldman Sachs Global Core Fixed Income Fund
Service Shares
Six Months EndedSeptember 30, 2021
(Unaudited)
Year Ended March 31,
2021 2020 2019 2018 2017
Per Share Data
Net asset value, beginning of period $12.63 $12.62 $12.38 $12.09 $12.12 $12.16
Net investment income(a) 0.01 0.11 0.13 0.15 0.07 0.07
Net realized and unrealized gain 0.14 0.55 0.44 0.30 0.09 0.04
Total from investment operations 0.15 0.66 0.57 0.45 0.16 0.11
Distributions to shareholders from net investment income (0.04) (0.30) (0.17) (0.16) (0.19) (0.10)
Distributions to shareholders from net realized gains — (0.35) (0.16) — — (0.05)
Total distributions (0.04) (0.65) (0.33) (0.16) (0.19) (0.15)
Net asset value, end of period $12.74 $12.63 $12.62 $12.38 $12.09 $12.12
Total return(b) 1.15% 4.98% 4.71% 3.75% 1.31% 0.90%
Net assets, end of period (in 000s) $ 624 $ 653 $ 196 $1,930 $1,799 $2,772
Ratio of net expenses to average net assets 1.16%(c) 1.18% 1.19% 1.19% 1.19% 1.19%
Ratio of total expenses to average net assets 1.32%(c) 1.34% 1.30% 1.36% 1.30% 1.29%
Ratio of net investment income to average net assets 0.19%(c) 0.85% 1.02% 1.24% 0.60% 0.56%
Portfolio turnover rate(d) 240% 522% 610% 302% 172% 289%
(a) Calculated based on the average shares outstanding methodology.(b) Assumes investment at the NAV at the beginning of the period, reinvestment of all dividends and distributions, a complete redemption of the investment at the NAV
at the end of the period and no sales or redemption charges (if any). Total returns would be reduced if a sales or redemption charge was taken into account. Returnsdo not reflect the impact of taxes to shareholders relating to Fund distributions or the redemption of Fund shares. Total returns for periods less than one full year arenot annualized.
(c) Annualized.(d) The Fund’s portfolio turnover rate is calculated in accordance with regulatory requirements, without regard to transactions involving short term investments and
certain derivatives. If such transactions were included, the Fund’s portfolio turnover rate may be higher.
154 The accompanying notes are an integral part of these financial statements.

G O L D M A N S A C H S G L O B A L C O R E F I X E D I N C O M E F U N D
Financial Highlights (continued)Selected Share Data for a Share Outstanding Throughout Each Period
Goldman Sachs Global Core Fixed Income Fund
Investor Shares
Six Months EndedSeptember 30, 2021
(Unaudited)
Year Ended March 31,
2021 2020 2019 2018 2017
Per Share Data
Net asset value, beginning of period $ 12.68 $ 12.67 $ 12.43 $ 12.13 $ 12.17 $ 12.20
Net investment income(a) 0.04 0.17 0.17 0.20 0.12 0.11
Net realized and unrealized gain 0.13 0.54 0.46 0.31 0.08 0.06
Total from investment operations 0.17 0.71 0.63 0.51 0.20 0.17
Distributions to shareholders from net investment income (0.06) (0.35) (0.23) (0.21) (0.24) (0.15)
Distributions to shareholders from net realized gains — (0.35) (0.16) — — (0.05)
Total distributions (0.06) (0.70) (0.39) (0.21) (0.24) (0.20)
Net asset value, end of period $ 12.79 $ 12.68 $ 12.67 $ 12.43 $ 12.13 $ 12.17
Total return(b) 1.45% 5.43% 5.07% 4.25% 1.63% 1.39%
Net assets, end of period (in 000s) $75,864 $73,477 $47,717 $53,615 $62,988 $97,332
Ratio of net expenses to average net assets 0.72%(c) 0.75% 0.76% 0.78% 0.78% 0.78%
Ratio of total expenses to average net assets 0.90%(c) 0.92% 0.88% 0.95% 0.89% 0.88%
Ratio of net investment income to average net assets 0.64%(c) 1.31% 1.31% 1.64% 1.00% 0.90%
Portfolio turnover rate(d) 240% 522% 610% 302% 172% 289%
(a) Calculated based on the average shares outstanding methodology.(b) Assumes investment at the NAV at the beginning of the period, reinvestment of all dividends and distributions, a complete redemption of the investment at the NAV
at the end of the period and no sales or redemption charges (if any). Total returns would be reduced if a sales or redemption charge was taken into account. Returnsdo not reflect the impact of taxes to shareholders relating to Fund distributions or the redemption of Fund shares. Total returns for periods less than one full year arenot annualized.
(c) Annualized.(d) The Fund’s portfolio turnover rate is calculated in accordance with regulatory requirements, without regard to transactions involving short term investments and
certain derivatives. If such transactions were included, the Fund’s portfolio turnover rate may be higher.
The accompanying notes are an integral part of these financial statements. 155
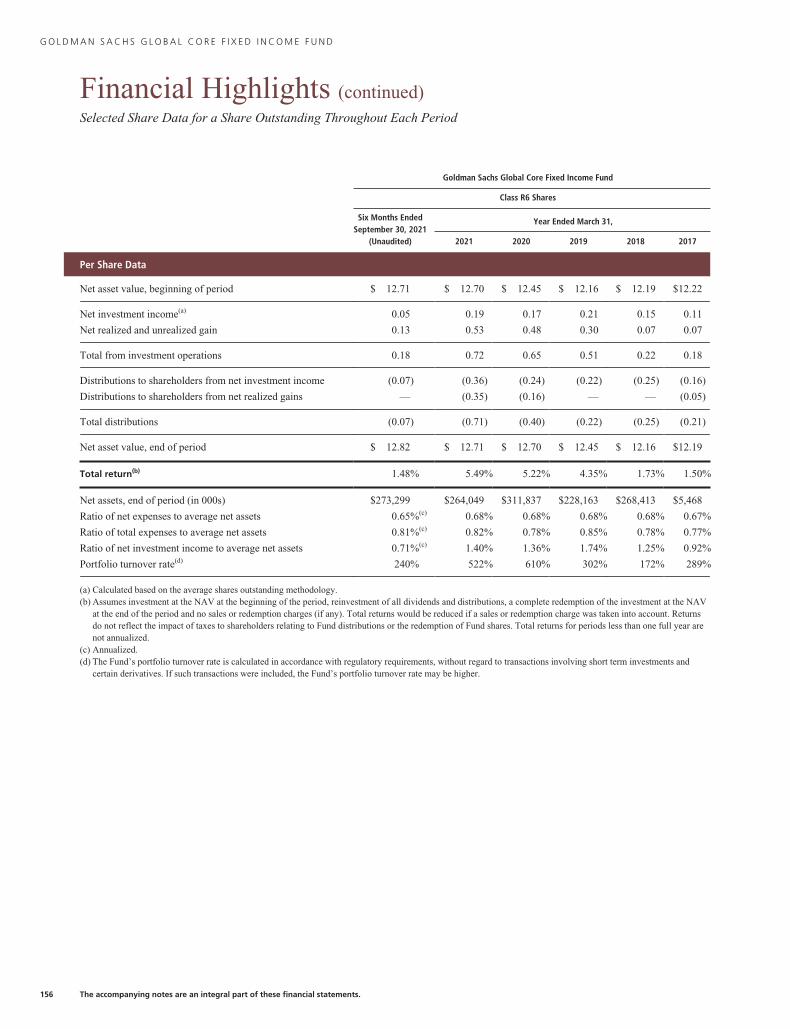
G O L D M A N S A C H S G L O B A L C O R E F I X E D I N C O M E F U N D
Financial Highlights (continued)Selected Share Data for a Share Outstanding Throughout Each Period
Goldman Sachs Global Core Fixed Income Fund
Class R6 Shares
Six Months EndedSeptember 30, 2021
(Unaudited)
Year Ended March 31,
2021 2020 2019 2018 2017
Per Share Data
Net asset value, beginning of period $ 12.71 $ 12.70 $ 12.45 $ 12.16 $ 12.19 $12.22
Net investment income(a) 0.05 0.19 0.17 0.21 0.15 0.11
Net realized and unrealized gain 0.13 0.53 0.48 0.30 0.07 0.07
Total from investment operations 0.18 0.72 0.65 0.51 0.22 0.18
Distributions to shareholders from net investment income (0.07) (0.36) (0.24) (0.22) (0.25) (0.16)
Distributions to shareholders from net realized gains — (0.35) (0.16) — — (0.05)
Total distributions (0.07) (0.71) (0.40) (0.22) (0.25) (0.21)
Net asset value, end of period $ 12.82 $ 12.71 $ 12.70 $ 12.45 $ 12.16 $12.19
Total return(b) 1.48% 5.49% 5.22% 4.35% 1.73% 1.50%
Net assets, end of period (in 000s) $273,299 $264,049 $311,837 $228,163 $268,413 $5,468
Ratio of net expenses to average net assets 0.65%(c) 0.68% 0.68% 0.68% 0.68% 0.67%
Ratio of total expenses to average net assets 0.81%(c) 0.82% 0.78% 0.85% 0.78% 0.77%
Ratio of net investment income to average net assets 0.71%(c) 1.40% 1.36% 1.74% 1.25% 0.92%
Portfolio turnover rate(d) 240% 522% 610% 302% 172% 289%
(a) Calculated based on the average shares outstanding methodology.(b) Assumes investment at the NAV at the beginning of the period, reinvestment of all dividends and distributions, a complete redemption of the investment at the NAV
at the end of the period and no sales or redemption charges (if any). Total returns would be reduced if a sales or redemption charge was taken into account. Returnsdo not reflect the impact of taxes to shareholders relating to Fund distributions or the redemption of Fund shares. Total returns for periods less than one full year arenot annualized.
(c) Annualized.(d) The Fund’s portfolio turnover rate is calculated in accordance with regulatory requirements, without regard to transactions involving short term investments and
certain derivatives. If such transactions were included, the Fund’s portfolio turnover rate may be higher.
156 The accompanying notes are an integral part of these financial statements.
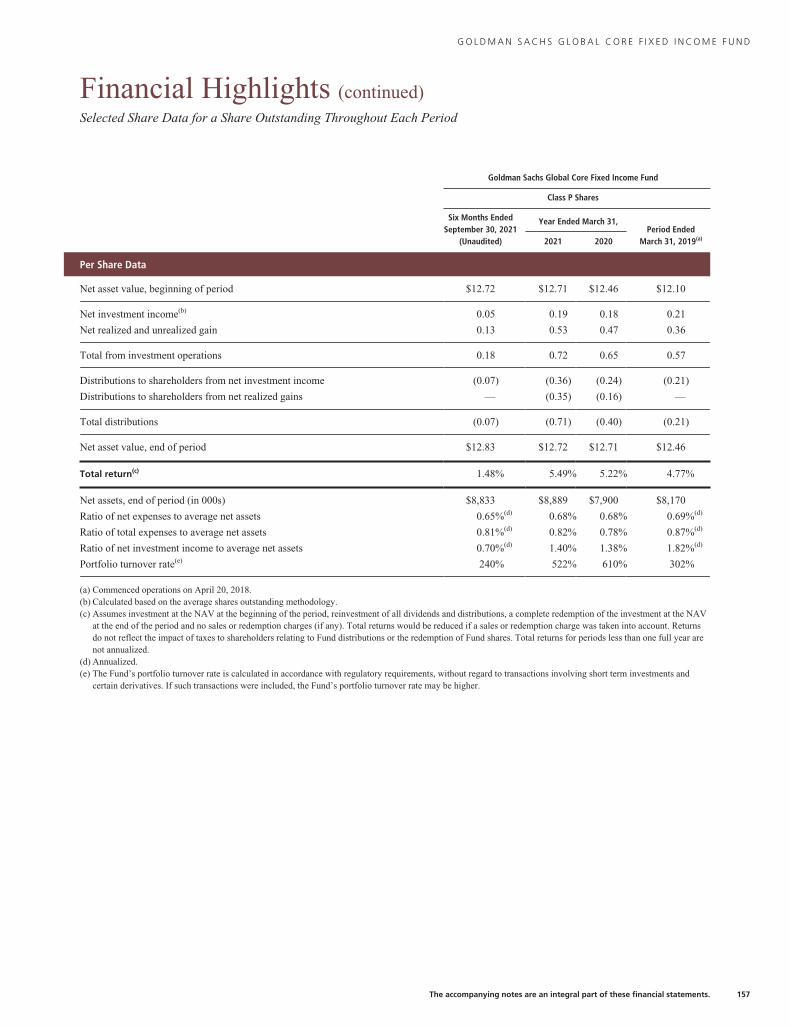
G O L D M A N S A C H S G L O B A L C O R E F I X E D I N C O M E F U N D
Financial Highlights (continued)Selected Share Data for a Share Outstanding Throughout Each Period
Goldman Sachs Global Core Fixed Income Fund
Class P Shares
Six Months EndedSeptember 30, 2021
(Unaudited)
Year Ended March 31,Period Ended
March 31, 2019(a)2021 2020
Per Share Data
Net asset value, beginning of period $12.72 $12.71 $12.46 $12.10
Net investment income(b) 0.05 0.19 0.18 0.21
Net realized and unrealized gain 0.13 0.53 0.47 0.36
Total from investment operations 0.18 0.72 0.65 0.57
Distributions to shareholders from net investment income (0.07) (0.36) (0.24) (0.21)
Distributions to shareholders from net realized gains — (0.35) (0.16) —
Total distributions (0.07) (0.71) (0.40) (0.21)
Net asset value, end of period $12.83 $12.72 $12.71 $12.46
Total return(c) 1.48% 5.49% 5.22% 4.77%
Net assets, end of period (in 000s) $8,833 $8,889 $7,900 $8,170
Ratio of net expenses to average net assets 0.65%(d) 0.68% 0.68% 0.69%(d)
Ratio of total expenses to average net assets 0.81%(d) 0.82% 0.78% 0.87%(d)
Ratio of net investment income to average net assets 0.70%(d) 1.40% 1.38% 1.82%(d)
Portfolio turnover rate(e) 240% 522% 610% 302%
(a) Commenced operations on April 20, 2018.(b) Calculated based on the average shares outstanding methodology.(c) Assumes investment at the NAV at the beginning of the period, reinvestment of all dividends and distributions, a complete redemption of the investment at the NAV
at the end of the period and no sales or redemption charges (if any). Total returns would be reduced if a sales or redemption charge was taken into account. Returnsdo not reflect the impact of taxes to shareholders relating to Fund distributions or the redemption of Fund shares. Total returns for periods less than one full year arenot annualized.
(d) Annualized.(e) The Fund’s portfolio turnover rate is calculated in accordance with regulatory requirements, without regard to transactions involving short term investments and
certain derivatives. If such transactions were included, the Fund’s portfolio turnover rate may be higher.
The accompanying notes are an integral part of these financial statements. 157

G O L D M A N S A C H S I N C O M E F U N D
Financial Highlights (continued)Selected Share Data for a Share Outstanding Throughout Each Period
Goldman Sachs Income Fund
Class A Shares
Six Months EndedSeptember 30, 2021
(Unaudited)Year Ended
March 31, 2021Period Ended
March 31, 2020(a)
Per Share Data
Net asset value, beginning of period $10.25 $ 8.88 $ 10.00
Net investment income(b) 0.15 0.33 0.11
Net realized and unrealized gain (loss) 0.20 1.43 (1.11)
Total from investment operations 0.35 1.76 (1.00)
Distributions to shareholders from net investment income (0.17) (0.35) (0.12)
Distributions to shareholders from net realized gains — (0.04) —
Total distributions (0.17) (0.39) (0.12)
Net asset value, end of period $10.43 $10.25 $ 8.88
Total return(c) 3.39% 19.94% (10.14)%
Net assets, end of period (in 000s) $ 599 $ 501 $ 142
Ratio of net expenses to average net assets 0.97%(d) 0.97% 0.98%(d)
Ratio of total expenses to average net assets 1.31%(d) 1.71% 2.58%(d)
Ratio of net investment income to average net assets 2.93%(d) 3.19% 3.44%(d)
Portfolio turnover rate(e) 76% 363% 110%
(a) Commenced operations on December 3, 2019.(b) Calculated based on the average shares outstanding methodology.(c) Assumes investment at the NAV at the beginning of the period, reinvestment of all dividends and distributions, a complete redemption of the investment at the NAV
at the end of the period and no sales or redemption charges (if any). Total returns would be reduced if a sales or redemption charge was taken into account. Returnsdo not reflect the impact of taxes to shareholders relating to Fund distributions or the redemption of Fund shares. Total returns for periods less than one full year arenot annualized.
(d) Annualized.(e) The Fund’s portfolio turnover rate is calculated in accordance with regulatory requirements, without regard to transactions involving short term investments and
certain derivatives. If such transactions were included, the Fund’s portfolio turnover rate may be higher.
158 The accompanying notes are an integral part of these financial statements.

G O L D M A N S A C H S I N C O M E F U N D
Financial Highlights (continued)Selected Share Data for a Share Outstanding Throughout Each Period
Goldman Sachs Income Fund
Class C Shares
Six Months EndedSeptember 30, 2021
(Unaudited)Year Ended
March 31, 2021Period Ended
March 31, 2020(a)
Per Share Data
Net asset value, beginning of period $10.25 $ 8.88 $ 10.00
Net investment income(b) 0.11 0.26 0.09
Net realized and unrealized gain (loss) 0.20 1.42 (1.12)
Total from investment operations 0.31 1.68 (1.03)
Distributions to shareholders from net investment income (0.13) (0.27) (0.09)
Distributions to shareholders from net realized gains — (0.04) —
Total distributions (0.13) (0.31) (0.09)
Net asset value, end of period $10.43 $10.25 $ 8.88
Total return(c) 3.01% 19.06% (10.35)%
Net assets, end of period (in 000s) $ 80 $ 77 $ 65
Ratio of net expenses to average net assets 1.72%(d) 1.72% 1.73%(d)
Ratio of total expenses to average net assets 2.06%(d) 2.71% 3.40%(d)
Ratio of net investment income to average net assets 2.19%(d) 2.52% 2.67%(d)
Portfolio turnover rate(e) 76% 363% 110%
(a) Commenced operations on December 3, 2019.(b) Calculated based on the average shares outstanding methodology.(c) Assumes investment at the NAV at the beginning of the period, reinvestment of all dividends and distributions, a complete redemption of the investment at the NAV
at the end of the period and no sales or redemption charges (if any). Total returns would be reduced if a sales or redemption charge was taken into account. Returnsdo not reflect the impact of taxes to shareholders relating to Fund distributions or the redemption of Fund shares. Total returns for periods less than one full year arenot annualized.
(d) Annualized.(e) The Fund’s portfolio turnover rate is calculated in accordance with regulatory requirements, without regard to transactions involving short term investments and
certain derivatives. If such transactions were included, the Fund’s portfolio turnover rate may be higher.
The accompanying notes are an integral part of these financial statements. 159
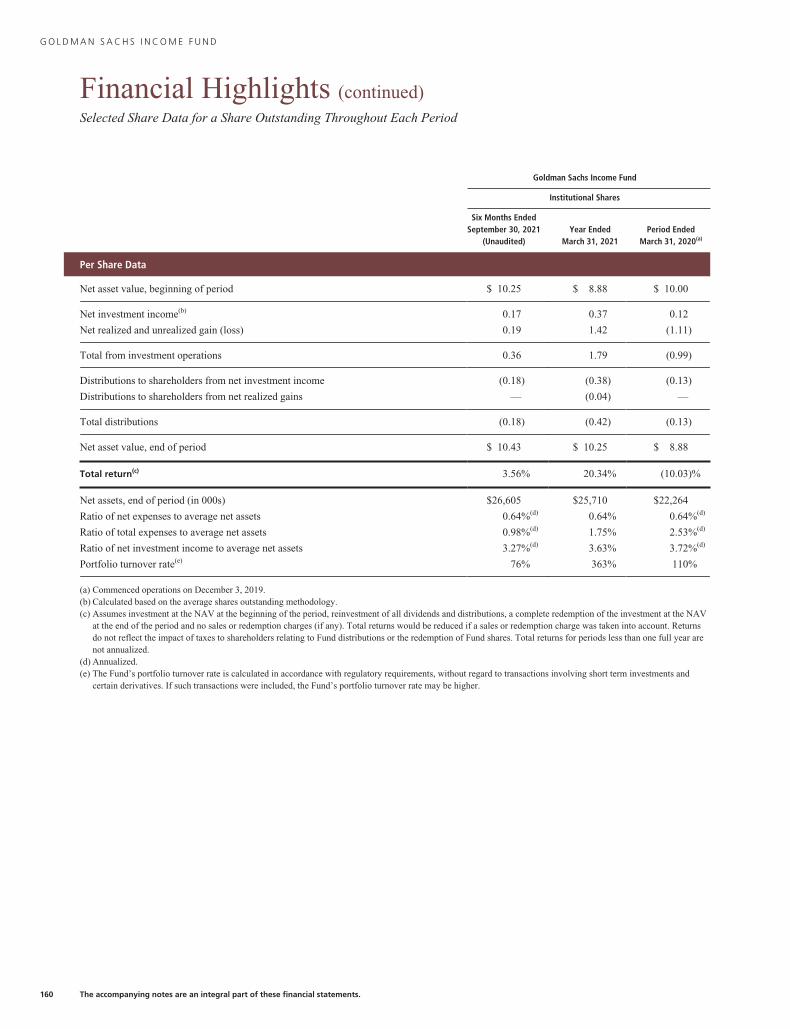
G O L D M A N S A C H S I N C O M E F U N D
Financial Highlights (continued)Selected Share Data for a Share Outstanding Throughout Each Period
Goldman Sachs Income Fund
Institutional Shares
Six Months EndedSeptember 30, 2021
(Unaudited)Year Ended
March 31, 2021Period Ended
March 31, 2020(a)
Per Share Data
Net asset value, beginning of period $ 10.25 $ 8.88 $ 10.00
Net investment income(b) 0.17 0.37 0.12
Net realized and unrealized gain (loss) 0.19 1.42 (1.11)
Total from investment operations 0.36 1.79 (0.99)
Distributions to shareholders from net investment income (0.18) (0.38) (0.13)
Distributions to shareholders from net realized gains — (0.04) —
Total distributions (0.18) (0.42) (0.13)
Net asset value, end of period $ 10.43 $ 10.25 $ 8.88
Total return(c) 3.56% 20.34% (10.03)%
Net assets, end of period (in 000s) $26,605 $25,710 $22,264
Ratio of net expenses to average net assets 0.64%(d) 0.64% 0.64%(d)
Ratio of total expenses to average net assets 0.98%(d) 1.75% 2.53%(d)
Ratio of net investment income to average net assets 3.27%(d) 3.63% 3.72%(d)
Portfolio turnover rate(e) 76% 363% 110%
(a) Commenced operations on December 3, 2019.(b) Calculated based on the average shares outstanding methodology.(c) Assumes investment at the NAV at the beginning of the period, reinvestment of all dividends and distributions, a complete redemption of the investment at the NAV
at the end of the period and no sales or redemption charges (if any). Total returns would be reduced if a sales or redemption charge was taken into account. Returnsdo not reflect the impact of taxes to shareholders relating to Fund distributions or the redemption of Fund shares. Total returns for periods less than one full year arenot annualized.
(d) Annualized.(e) The Fund’s portfolio turnover rate is calculated in accordance with regulatory requirements, without regard to transactions involving short term investments and
certain derivatives. If such transactions were included, the Fund’s portfolio turnover rate may be higher.
160 The accompanying notes are an integral part of these financial statements.

G O L D M A N S A C H S I N C O M E F U N D
Financial Highlights (continued)Selected Share Data for a Share Outstanding Throughout Each Period
Goldman Sachs Income Fund
Investor Shares
Six Months EndedSeptember 30, 2021
(Unaudited)Year Ended
March 31, 2021Period Ended
March 31, 2020(a)
Per Share Data
Net asset value, beginning of period $10.25 $ 8.88 $ 10.00
Net investment income(b) 0.17 0.36 0.12
Net realized and unrealized gain (loss) 0.19 1.43 (1.12)
Total from investment operations 0.36 1.79 (1.00)
Distributions to shareholders from net investment income (0.18) (0.38) (0.12)
Distributions to shareholders from net realized gains — (0.04) —
Total distributions (0.18) (0.42) (0.12)
Net asset value, end of period $10.43 $10.25 $ 8.88
Total return(c) 3.52% 20.24% (10.06)%
Net assets, end of period (in 000s) $ 56 $ 54 $ 45
Ratio of net expenses to average net assets 0.72%(d) 0.72% 0.73%(d)
Ratio of total expenses to average net assets 1.06%(d) 1.81% 2.62%(d)
Ratio of net investment income to average net assets 3.20%(d) 3.54% 3.63%(d)
Portfolio turnover rate(e) 76% 363% 110%
(a) Commenced operations on December 3, 2019.(b) Calculated based on the average shares outstanding methodology.(c) Assumes investment at the NAV at the beginning of the period, reinvestment of all dividends and distributions, a complete redemption of the investment at the NAV
at the end of the period and no sales or redemption charges (if any). Total returns would be reduced if a sales or redemption charge was taken into account. Returnsdo not reflect the impact of taxes to shareholders relating to Fund distributions or the redemption of Fund shares. Total returns for periods less than one full year arenot annualized.
(d) Annualized.(e) The Fund’s portfolio turnover rate is calculated in accordance with regulatory requirements, without regard to transactions involving short term investments and
certain derivatives. If such transactions were included, the Fund’s portfolio turnover rate may be higher.
The accompanying notes are an integral part of these financial statements. 161

G O L D M A N S A C H S I N C O M E F U N D
Financial Highlights (continued)Selected Share Data for a Share Outstanding Throughout Each Period
Goldman Sachs Income Fund
Class R6 Shares
Six Months EndedSeptember 30, 2021
(Unaudited)Year Ended
March 31, 2021Period Ended
March 31, 2020(a)
Per Share Data
Net asset value, beginning of period $10.25 $ 8.88 $ 10.00
Net investment income(b) 0.17 0.37 0.12
Net realized and unrealized gain (loss) 0.19 1.43 (1.11)
Total from investment operations 0.36 1.80 (0.99)
Distributions to shareholders from net investment income (0.18) (0.39) (0.13)
Distributions to shareholders from net realized gains — (0.04) —
Total distributions (0.18) (0.43) (0.13)
Net asset value, end of period $10.43 $10.25 $ 8.88
Total return(c) 3.57% 20.35% (10.03)%
Net assets, end of period (in 000s) $ 56 $ 54 $ 45
Ratio of net expenses to average net assets 0.63%(d) 0.63% 0.63%(d)
Ratio of total expenses to average net assets 0.97%(d) 1.72% 2.52%(d)
Ratio of net investment income to average net assets 3.28%(d) 3.64% 3.73%(d)
Portfolio turnover rate(e) 76% 363% 110%
(a) Commenced operations on December 3, 2019.(b) Calculated based on the average shares outstanding methodology.(c) Assumes investment at the NAV at the beginning of the period, reinvestment of all dividends and distributions, a complete redemption of the investment at the NAV
at the end of the period and no sales or redemption charges (if any). Total returns would be reduced if a sales or redemption charge was taken into account. Returnsdo not reflect the impact of taxes to shareholders relating to Fund distributions or the redemption of Fund shares. Total returns for periods less than one full year arenot annualized.
(d) Annualized.(e) The Fund’s portfolio turnover rate is calculated in accordance with regulatory requirements, without regard to transactions involving short term investments and
certain derivatives. If such transactions were included, the Fund’s portfolio turnover rate may be higher.
162 The accompanying notes are an integral part of these financial statements.
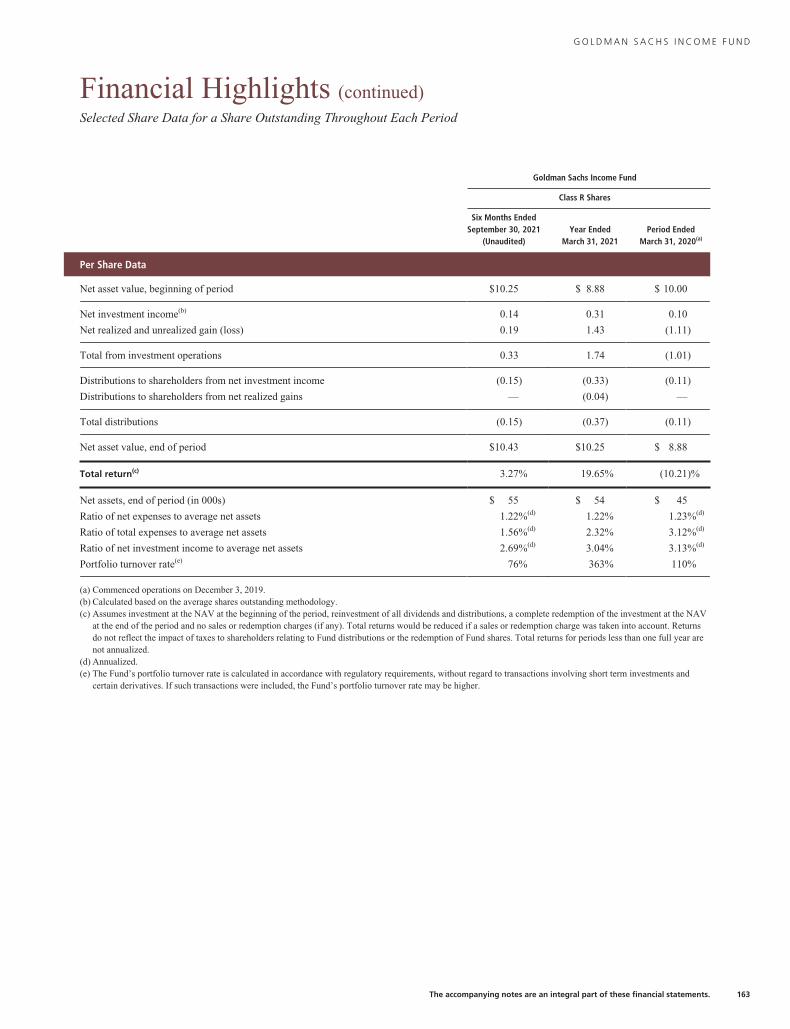
G O L D M A N S A C H S I N C O M E F U N D
Financial Highlights (continued)Selected Share Data for a Share Outstanding Throughout Each Period
Goldman Sachs Income Fund
Class R Shares
Six Months EndedSeptember 30, 2021
(Unaudited)Year Ended
March 31, 2021Period Ended
March 31, 2020(a)
Per Share Data
Net asset value, beginning of period $10.25 $ 8.88 $ 10.00
Net investment income(b) 0.14 0.31 0.10
Net realized and unrealized gain (loss) 0.19 1.43 (1.11)
Total from investment operations 0.33 1.74 (1.01)
Distributions to shareholders from net investment income (0.15) (0.33) (0.11)
Distributions to shareholders from net realized gains — (0.04) —
Total distributions (0.15) (0.37) (0.11)
Net asset value, end of period $10.43 $10.25 $ 8.88
Total return(c) 3.27% 19.65% (10.21)%
Net assets, end of period (in 000s) $ 55 $ 54 $ 45
Ratio of net expenses to average net assets 1.22%(d) 1.22% 1.23%(d)
Ratio of total expenses to average net assets 1.56%(d) 2.32% 3.12%(d)
Ratio of net investment income to average net assets 2.69%(d) 3.04% 3.13%(d)
Portfolio turnover rate(e) 76% 363% 110%
(a) Commenced operations on December 3, 2019.(b) Calculated based on the average shares outstanding methodology.(c) Assumes investment at the NAV at the beginning of the period, reinvestment of all dividends and distributions, a complete redemption of the investment at the NAV
at the end of the period and no sales or redemption charges (if any). Total returns would be reduced if a sales or redemption charge was taken into account. Returnsdo not reflect the impact of taxes to shareholders relating to Fund distributions or the redemption of Fund shares. Total returns for periods less than one full year arenot annualized.
(d) Annualized.(e) The Fund’s portfolio turnover rate is calculated in accordance with regulatory requirements, without regard to transactions involving short term investments and
certain derivatives. If such transactions were included, the Fund’s portfolio turnover rate may be higher.
The accompanying notes are an integral part of these financial statements. 163

G O L D M A N S A C H S I N C O M E F U N D
Financial Highlights (continued)Selected Share Data for a Share Outstanding Throughout Each Period
Goldman Sachs Income Fund
Class P Shares
Six Months EndedSeptember 30, 2021
(Unaudited)Year Ended
March 31, 2021Period Ended
March 31, 2020(a)
Per Share Data
Net asset value, beginning of period $ 10.25 $ 8.88 $ 10.00
Net investment income(b) 0.17 0.36 0.12
Net realized and unrealized gain (loss) 0.19 1.44 (1.11)
Total from investment operations 0.36 1.80 (0.99)
Distributions to shareholders from net investment income (0.18) (0.39) (0.13)
Distributions to shareholders from net realized gains — (0.04) —
Total distributions (0.18) (0.43) (0.13)
Net asset value, end of period $ 10.43 $ 10.25 $ 8.88
Total return(c) 3.57% 20.35% (10.03)%
Net assets, end of period (in 000s) $77,385 $89,424 $ 809
Ratio of net expenses to average net assets 0.63%(d) 0.63% 0.60%(d)
Ratio of total expenses to average net assets 0.97%(d) 1.10% 0.63%(d)
Ratio of net investment income to average net assets 3.29%(d) 3.46% 3.76%(d)
Portfolio turnover rate(e) 76% 363% 110%
(a) Commenced operations on December 3, 2019.(b) Calculated based on the average shares outstanding methodology.(c) Assumes investment at the NAV at the beginning of the period, reinvestment of all dividends and distributions, a complete redemption of the investment at the NAV
at the end of the period and no sales or redemption charges (if any). Total returns would be reduced if a sales or redemption charge was taken into account. Returnsdo not reflect the impact of taxes to shareholders relating to Fund distributions or the redemption of Fund shares. Total returns for periods less than one full year arenot annualized.
(d) Annualized.(e) The Fund’s portfolio turnover rate is calculated in accordance with regulatory requirements, without regard to transactions involving short term investments and
certain derivatives. If such transactions were included, the Fund’s portfolio turnover rate may be higher.
164 The accompanying notes are an integral part of these financial statements.
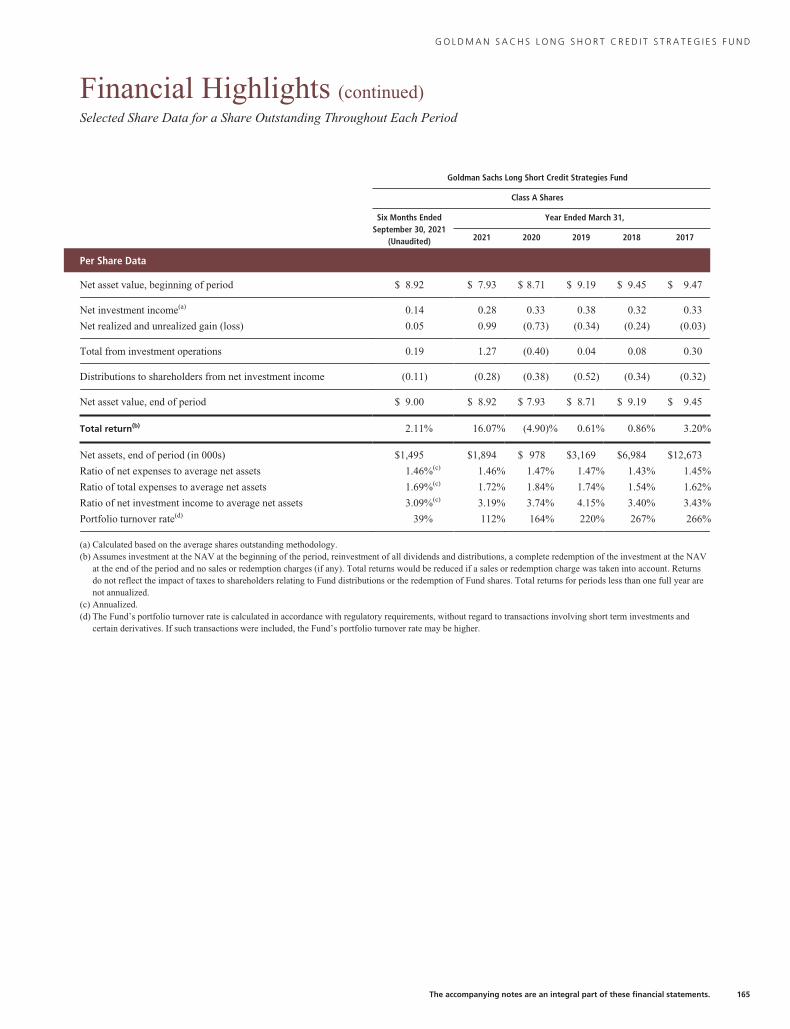
G O L D M A N S A C H S L O N G S H O R T C R E D I T S T R A T E G I E S F U N D
Financial Highlights (continued)Selected Share Data for a Share Outstanding Throughout Each Period
Goldman Sachs Long Short Credit Strategies Fund
Class A Shares
Six Months EndedSeptember 30, 2021
(Unaudited)
Year Ended March 31,
2021 2020 2019 2018 2017
Per Share Data
Net asset value, beginning of period $ 8.92 $ 7.93 $ 8.71 $ 9.19 $ 9.45 $ 9.47
Net investment income(a) 0.14 0.28 0.33 0.38 0.32 0.33
Net realized and unrealized gain (loss) 0.05 0.99 (0.73) (0.34) (0.24) (0.03)
Total from investment operations 0.19 1.27 (0.40) 0.04 0.08 0.30
Distributions to shareholders from net investment income (0.11) (0.28) (0.38) (0.52) (0.34) (0.32)
Net asset value, end of period $ 9.00 $ 8.92 $ 7.93 $ 8.71 $ 9.19 $ 9.45
Total return(b) 2.11% 16.07% (4.90)% 0.61% 0.86% 3.20%
Net assets, end of period (in 000s) $1,495 $1,894 $ 978 $3,169 $6,984 $12,673
Ratio of net expenses to average net assets 1.46%(c) 1.46% 1.47% 1.47% 1.43% 1.45%
Ratio of total expenses to average net assets 1.69%(c) 1.72% 1.84% 1.74% 1.54% 1.62%
Ratio of net investment income to average net assets 3.09%(c) 3.19% 3.74% 4.15% 3.40% 3.43%
Portfolio turnover rate(d) 39% 112% 164% 220% 267% 266%
(a) Calculated based on the average shares outstanding methodology.(b) Assumes investment at the NAV at the beginning of the period, reinvestment of all dividends and distributions, a complete redemption of the investment at the NAV
at the end of the period and no sales or redemption charges (if any). Total returns would be reduced if a sales or redemption charge was taken into account. Returnsdo not reflect the impact of taxes to shareholders relating to Fund distributions or the redemption of Fund shares. Total returns for periods less than one full year arenot annualized.
(c) Annualized.(d) The Fund’s portfolio turnover rate is calculated in accordance with regulatory requirements, without regard to transactions involving short term investments and
certain derivatives. If such transactions were included, the Fund’s portfolio turnover rate may be higher.
The accompanying notes are an integral part of these financial statements. 165
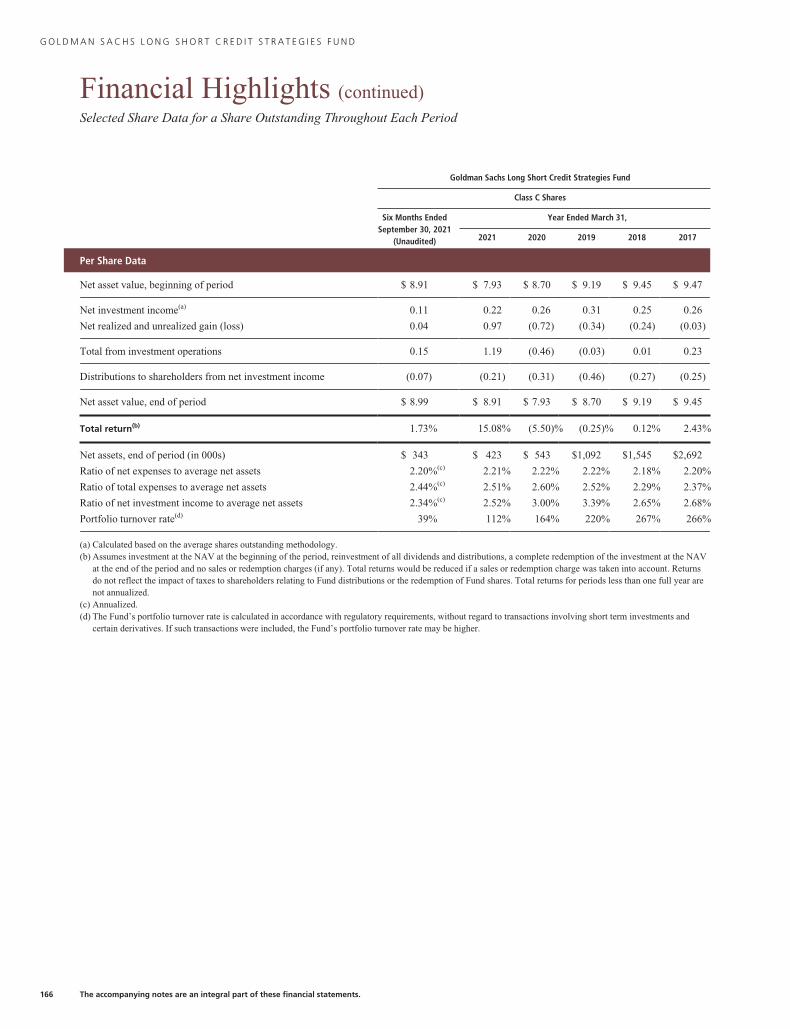
G O L D M A N S A C H S L O N G S H O R T C R E D I T S T R A T E G I E S F U N D
Financial Highlights (continued)Selected Share Data for a Share Outstanding Throughout Each Period
Goldman Sachs Long Short Credit Strategies Fund
Class C Shares
Six Months EndedSeptember 30, 2021
(Unaudited)
Year Ended March 31,
2021 2020 2019 2018 2017
Per Share Data
Net asset value, beginning of period $ 8.91 $ 7.93 $ 8.70 $ 9.19 $ 9.45 $ 9.47
Net investment income(a) 0.11 0.22 0.26 0.31 0.25 0.26
Net realized and unrealized gain (loss) 0.04 0.97 (0.72) (0.34) (0.24) (0.03)
Total from investment operations 0.15 1.19 (0.46) (0.03) 0.01 0.23
Distributions to shareholders from net investment income (0.07) (0.21) (0.31) (0.46) (0.27) (0.25)
Net asset value, end of period $ 8.99 $ 8.91 $ 7.93 $ 8.70 $ 9.19 $ 9.45
Total return(b) 1.73% 15.08% (5.50)% (0.25)% 0.12% 2.43%
Net assets, end of period (in 000s) $ 343 $ 423 $ 543 $1,092 $1,545 $2,692
Ratio of net expenses to average net assets 2.20%(c) 2.21% 2.22% 2.22% 2.18% 2.20%
Ratio of total expenses to average net assets 2.44%(c) 2.51% 2.60% 2.52% 2.29% 2.37%
Ratio of net investment income to average net assets 2.34%(c) 2.52% 3.00% 3.39% 2.65% 2.68%
Portfolio turnover rate(d) 39% 112% 164% 220% 267% 266%
(a) Calculated based on the average shares outstanding methodology.(b) Assumes investment at the NAV at the beginning of the period, reinvestment of all dividends and distributions, a complete redemption of the investment at the NAV
at the end of the period and no sales or redemption charges (if any). Total returns would be reduced if a sales or redemption charge was taken into account. Returnsdo not reflect the impact of taxes to shareholders relating to Fund distributions or the redemption of Fund shares. Total returns for periods less than one full year arenot annualized.
(c) Annualized.(d) The Fund’s portfolio turnover rate is calculated in accordance with regulatory requirements, without regard to transactions involving short term investments and
certain derivatives. If such transactions were included, the Fund’s portfolio turnover rate may be higher.
166 The accompanying notes are an integral part of these financial statements.
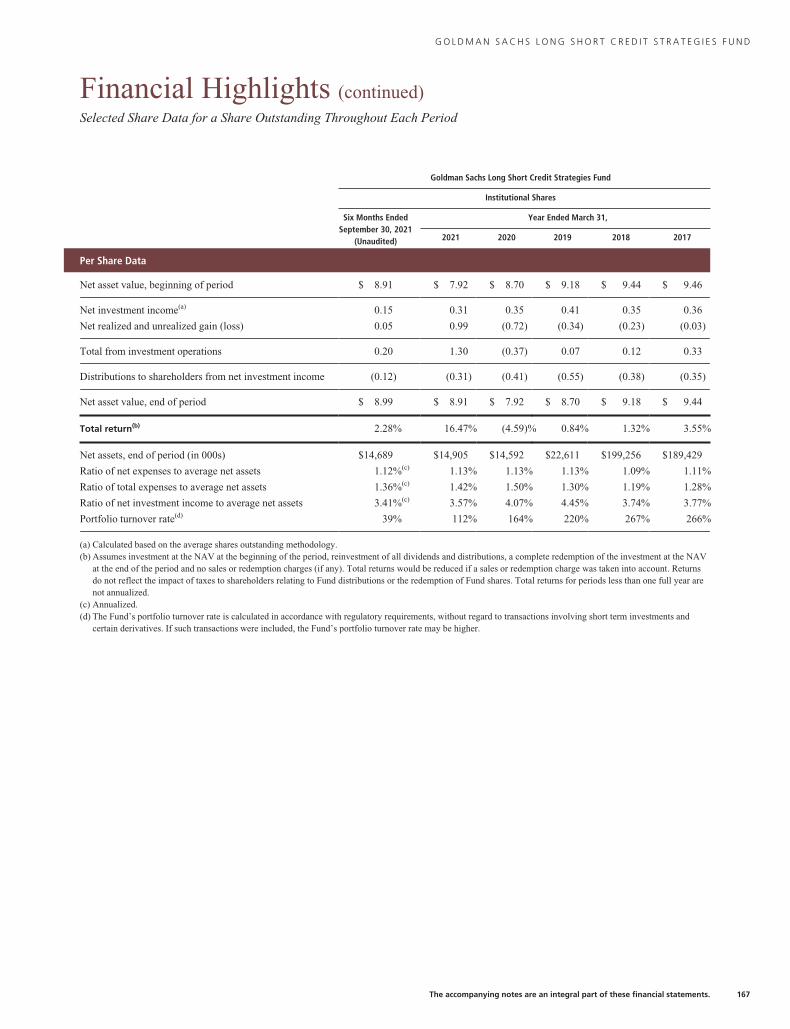
G O L D M A N S A C H S L O N G S H O R T C R E D I T S T R A T E G I E S F U N D
Financial Highlights (continued)Selected Share Data for a Share Outstanding Throughout Each Period
Goldman Sachs Long Short Credit Strategies Fund
Institutional Shares
Six Months EndedSeptember 30, 2021
(Unaudited)
Year Ended March 31,
2021 2020 2019 2018 2017
Per Share Data
Net asset value, beginning of period $ 8.91 $ 7.92 $ 8.70 $ 9.18 $ 9.44 $ 9.46
Net investment income(a) 0.15 0.31 0.35 0.41 0.35 0.36
Net realized and unrealized gain (loss) 0.05 0.99 (0.72) (0.34) (0.23) (0.03)
Total from investment operations 0.20 1.30 (0.37) 0.07 0.12 0.33
Distributions to shareholders from net investment income (0.12) (0.31) (0.41) (0.55) (0.38) (0.35)
Net asset value, end of period $ 8.99 $ 8.91 $ 7.92 $ 8.70 $ 9.18 $ 9.44
Total return(b) 2.28% 16.47% (4.59)% 0.84% 1.32% 3.55%
Net assets, end of period (in 000s) $14,689 $14,905 $14,592 $22,611 $199,256 $189,429
Ratio of net expenses to average net assets 1.12%(c) 1.13% 1.13% 1.13% 1.09% 1.11%
Ratio of total expenses to average net assets 1.36%(c) 1.42% 1.50% 1.30% 1.19% 1.28%
Ratio of net investment income to average net assets 3.41%(c) 3.57% 4.07% 4.45% 3.74% 3.77%
Portfolio turnover rate(d) 39% 112% 164% 220% 267% 266%
(a) Calculated based on the average shares outstanding methodology.(b) Assumes investment at the NAV at the beginning of the period, reinvestment of all dividends and distributions, a complete redemption of the investment at the NAV
at the end of the period and no sales or redemption charges (if any). Total returns would be reduced if a sales or redemption charge was taken into account. Returnsdo not reflect the impact of taxes to shareholders relating to Fund distributions or the redemption of Fund shares. Total returns for periods less than one full year arenot annualized.
(c) Annualized.(d) The Fund’s portfolio turnover rate is calculated in accordance with regulatory requirements, without regard to transactions involving short term investments and
certain derivatives. If such transactions were included, the Fund’s portfolio turnover rate may be higher.
The accompanying notes are an integral part of these financial statements. 167

G O L D M A N S A C H S L O N G S H O R T C R E D I T S T R A T E G I E S F U N D
Financial Highlights (continued)Selected Share Data for a Share Outstanding Throughout Each Period
Goldman Sachs Long Short Credit Strategies Fund
Investor Shares
Six Months EndedSeptember 30, 2021
(Unaudited)
Year Ended March 31,
2021 2020 2019 2018 2017
Per Share Data
Net asset value, beginning of period $ 8.92 $ 7.93 $ 8.70 $ 9.19 $ 9.45 $ 9.47
Net investment income(a) 0.15 0.31 0.35 0.40 0.35 0.35
Net realized and unrealized gain (loss) 0.05 0.98 (0.72) (0.34) (0.24) (0.03)
Total from investment operations 0.20 1.29 (0.37) 0.06 0.11 0.32
Distributions to shareholders from net investment income (0.12) (0.30) (0.40) (0.55) (0.37) (0.34)
Net asset value, end of period $ 9.00 $ 8.92 $ 7.93 $ 8.70 $ 9.19 $ 9.45
Total return(b) 2.24% 16.36% (4.56)% 0.75% 1.12% 3.45%
Net assets, end of period (in 000s) $2,589 $2,406 $2,187 $4,261 $7,357 $9,347
Ratio of net expenses to average net assets 1.20%(c) 1.21% 1.22% 1.22% 1.18% 1.20%
Ratio of total expenses to average net assets 1.44%(c) 1.49% 1.59% 1.50% 1.28% 1.38%
Ratio of net investment income to average net assets 3.32%(c) 3.49% 3.99% 4.41% 3.66% 3.69%
Portfolio turnover rate(d) 39% 112% 164% 220% 267% 266%
(a) Calculated based on the average shares outstanding methodology.(b) Assumes investment at the NAV at the beginning of the period, reinvestment of all dividends and distributions, a complete redemption of the investment at the NAV
at the end of the period and no sales or redemption charges (if any). Total returns would be reduced if a sales or redemption charge was taken into account. Returnsdo not reflect the impact of taxes to shareholders relating to Fund distributions or the redemption of Fund shares. Total returns for periods less than one full year arenot annualized.
(c) Annualized.(d) The Fund’s portfolio turnover rate is calculated in accordance with regulatory requirements, without regard to transactions involving short term investments and
certain derivatives. If such transactions were included, the Fund’s portfolio turnover rate may be higher.
168 The accompanying notes are an integral part of these financial statements.
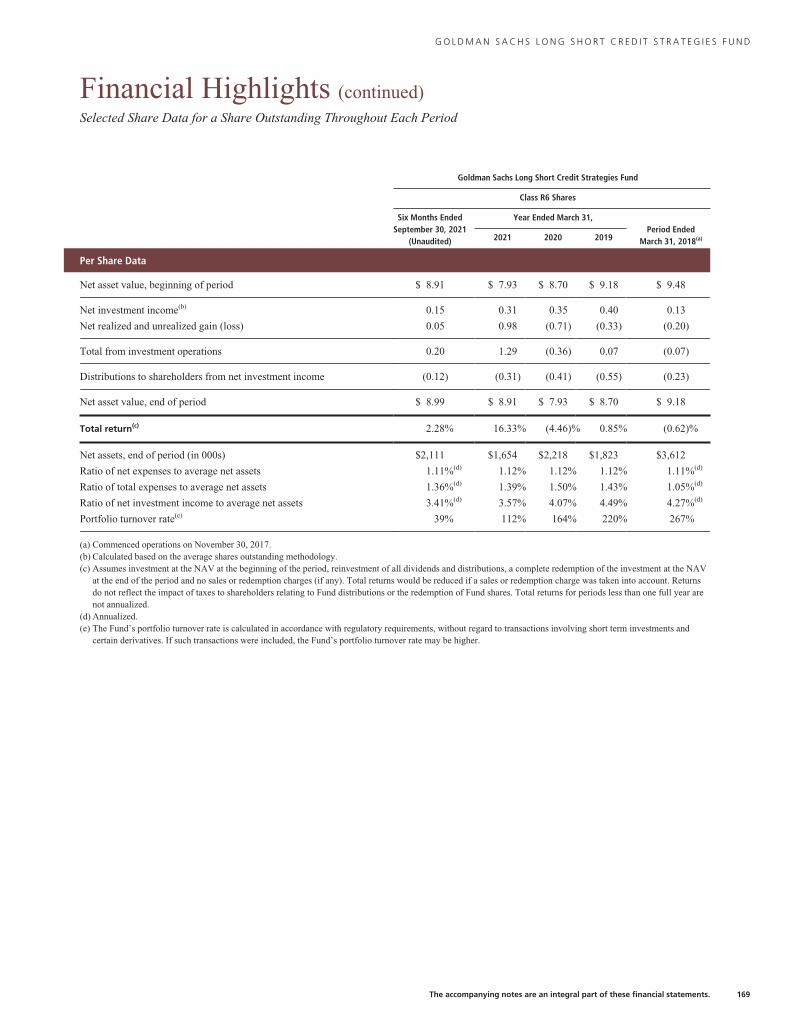
G O L D M A N S A C H S L O N G S H O R T C R E D I T S T R A T E G I E S F U N D
Financial Highlights (continued)Selected Share Data for a Share Outstanding Throughout Each Period
Goldman Sachs Long Short Credit Strategies Fund
Class R6 Shares
Six Months EndedSeptember 30, 2021
(Unaudited)
Year Ended March 31,Period Ended
March 31, 2018(a)2021 2020 2019
Per Share Data
Net asset value, beginning of period $ 8.91 $ 7.93 $ 8.70 $ 9.18 $ 9.48
Net investment income(b) 0.15 0.31 0.35 0.40 0.13
Net realized and unrealized gain (loss) 0.05 0.98 (0.71) (0.33) (0.20)
Total from investment operations 0.20 1.29 (0.36) 0.07 (0.07)
Distributions to shareholders from net investment income (0.12) (0.31) (0.41) (0.55) (0.23)
Net asset value, end of period $ 8.99 $ 8.91 $ 7.93 $ 8.70 $ 9.18
Total return(c) 2.28% 16.33% (4.46)% 0.85% (0.62)%
Net assets, end of period (in 000s) $2,111 $1,654 $2,218 $1,823 $3,612
Ratio of net expenses to average net assets 1.11%(d) 1.12% 1.12% 1.12% 1.11%(d)
Ratio of total expenses to average net assets 1.36%(d) 1.39% 1.50% 1.43% 1.05%(d)
Ratio of net investment income to average net assets 3.41%(d) 3.57% 4.07% 4.49% 4.27%(d)
Portfolio turnover rate(e) 39% 112% 164% 220% 267%
(a) Commenced operations on November 30, 2017.(b) Calculated based on the average shares outstanding methodology.(c) Assumes investment at the NAV at the beginning of the period, reinvestment of all dividends and distributions, a complete redemption of the investment at the NAV
at the end of the period and no sales or redemption charges (if any). Total returns would be reduced if a sales or redemption charge was taken into account. Returnsdo not reflect the impact of taxes to shareholders relating to Fund distributions or the redemption of Fund shares. Total returns for periods less than one full year arenot annualized.
(d) Annualized.(e) The Fund’s portfolio turnover rate is calculated in accordance with regulatory requirements, without regard to transactions involving short term investments and
certain derivatives. If such transactions were included, the Fund’s portfolio turnover rate may be higher.
The accompanying notes are an integral part of these financial statements. 169

G O L D M A N S A C H S L O N G S H O R T C R E D I T S T R A T E G I E S F U N D
Financial Highlights (continued)Selected Share Data for a Share Outstanding Throughout Each Period
Goldman Sachs Long Short Credit Strategies Fund
Class R Shares
Six Months EndedSeptember 30, 2021
(Unaudited)
Year Ended March 31,
2021 2020 2019 2018 2017
Per Share Data
Net asset value, beginning of period $ 8.91 $ 7.93 $ 8.70 $ 9.19 $ 9.45 $ 9.47
Net investment income(a) 0.13 0.26 0.30 0.35 0.30 0.30
Net realized and unrealized gain (loss) 0.05 0.98 (0.71) (0.34) (0.24) (0.02)
Total from investment operations 0.18 1.24 (0.41) 0.01 0.06 0.28
Distributions to shareholders from net investment income (0.10) (0.26) (0.36) (0.50) (0.32) (0.30)
Net asset value, end of period $ 8.99 $ 8.91 $ 7.93 $ 8.70 $ 9.19 $ 9.45
Total return(b) 1.98% 15.65% (5.03)% 0.24% 0.61% 2.94%
Net assets, end of period (in 000s) $ 29 $ 29 $ 24 $ 26 $ 36 $ 35
Ratio of net expenses to average net assets 1.70%(c) 1.71% 1.72% 1.72% 1.68% 1.70%
Ratio of total expenses to average net assets 1.94%(c) 1.98% 2.09% 2.01% 1.78% 1.87%
Ratio of net investment income to average net assets 2.83%(c) 2.98% 3.48% 3.88% 3.15% 3.18%
Portfolio turnover rate(d) 39% 112% 164% 220% 267% 266%
(a) Calculated based on the average shares outstanding methodology.(b) Assumes investment at the NAV at the beginning of the period, reinvestment of all dividends and distributions, a complete redemption of the investment at the NAV
at the end of the period and no sales or redemption charges (if any). Total returns would be reduced if a sales or redemption charge was taken into account. Returnsdo not reflect the impact of taxes to shareholders relating to Fund distributions or the redemption of Fund shares. Total returns for periods less than one full year arenot annualized.
(c) Annualized.(d) The Fund’s portfolio turnover rate is calculated in accordance with regulatory requirements, without regard to transactions involving short term investments and
certain derivatives. If such transactions were included, the Fund’s portfolio turnover rate may be higher.
170 The accompanying notes are an integral part of these financial statements.
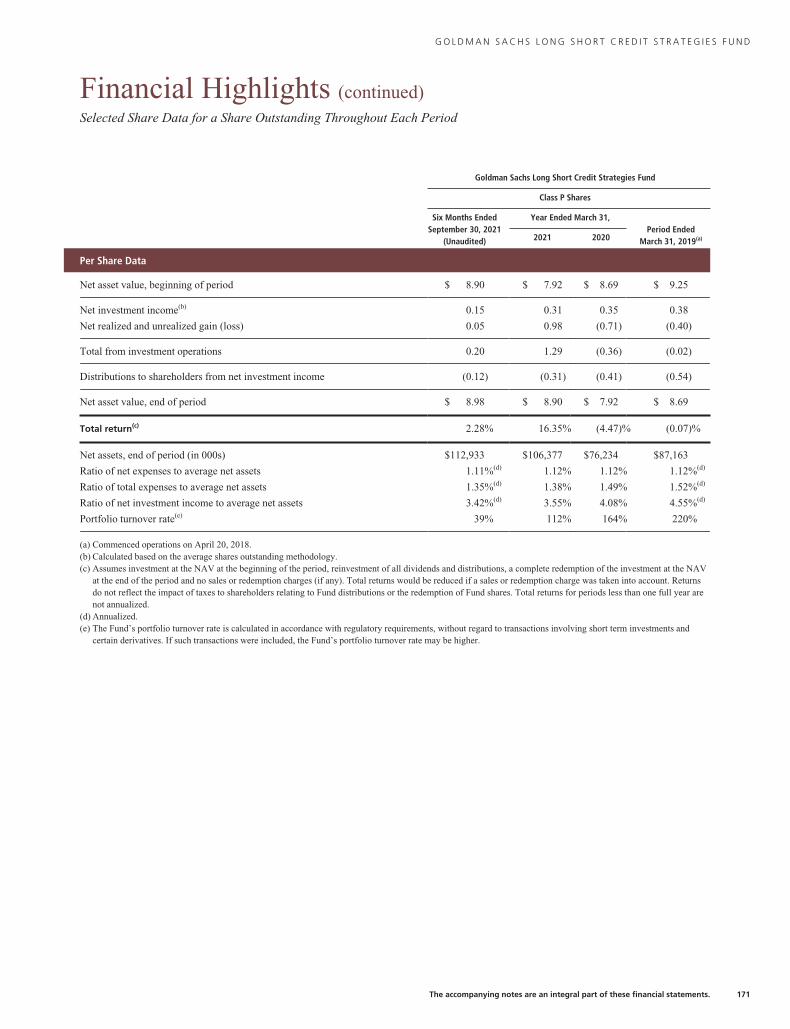
G O L D M A N S A C H S L O N G S H O R T C R E D I T S T R A T E G I E S F U N D
Financial Highlights (continued)Selected Share Data for a Share Outstanding Throughout Each Period
Goldman Sachs Long Short Credit Strategies Fund
Class P Shares
Six Months EndedSeptember 30, 2021
(Unaudited)
Year Ended March 31,Period Ended
March 31, 2019(a)2021 2020
Per Share Data
Net asset value, beginning of period $ 8.90 $ 7.92 $ 8.69 $ 9.25
Net investment income(b) 0.15 0.31 0.35 0.38
Net realized and unrealized gain (loss) 0.05 0.98 (0.71) (0.40)
Total from investment operations 0.20 1.29 (0.36) (0.02)
Distributions to shareholders from net investment income (0.12) (0.31) (0.41) (0.54)
Net asset value, end of period $ 8.98 $ 8.90 $ 7.92 $ 8.69
Total return(c) 2.28% 16.35% (4.47)% (0.07)%
Net assets, end of period (in 000s) $112,933 $106,377 $76,234 $87,163
Ratio of net expenses to average net assets 1.11%(d) 1.12% 1.12% 1.12%(d)
Ratio of total expenses to average net assets 1.35%(d) 1.38% 1.49% 1.52%(d)
Ratio of net investment income to average net assets 3.42%(d) 3.55% 4.08% 4.55%(d)
Portfolio turnover rate(e) 39% 112% 164% 220%
(a) Commenced operations on April 20, 2018.(b) Calculated based on the average shares outstanding methodology.(c) Assumes investment at the NAV at the beginning of the period, reinvestment of all dividends and distributions, a complete redemption of the investment at the NAV
at the end of the period and no sales or redemption charges (if any). Total returns would be reduced if a sales or redemption charge was taken into account. Returnsdo not reflect the impact of taxes to shareholders relating to Fund distributions or the redemption of Fund shares. Total returns for periods less than one full year arenot annualized.
(d) Annualized.(e) The Fund’s portfolio turnover rate is calculated in accordance with regulatory requirements, without regard to transactions involving short term investments and
certain derivatives. If such transactions were included, the Fund’s portfolio turnover rate may be higher.
The accompanying notes are an integral part of these financial statements. 171
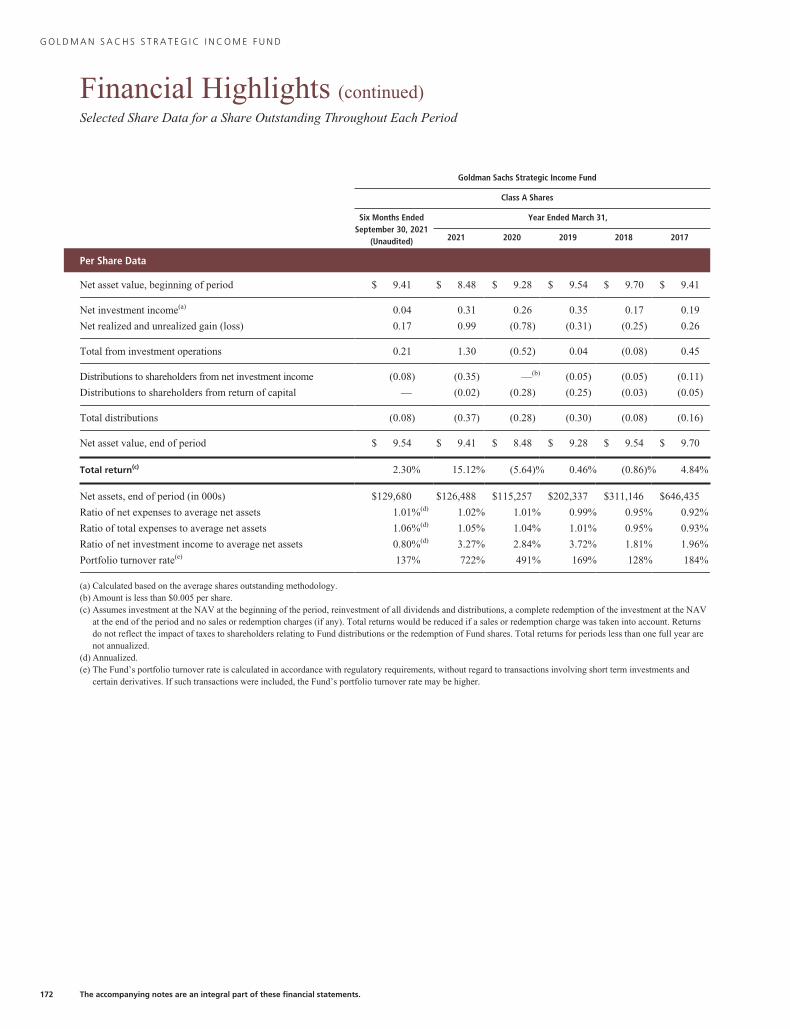
G O L D M A N S A C H S S T R A T E G I C I N C O M E F U N D
Financial Highlights (continued)Selected Share Data for a Share Outstanding Throughout Each Period
Goldman Sachs Strategic Income Fund
Class A Shares
Six Months EndedSeptember 30, 2021
(Unaudited)
Year Ended March 31,
2021 2020 2019 2018 2017
Per Share Data
Net asset value, beginning of period $ 9.41 $ 8.48 $ 9.28 $ 9.54 $ 9.70 $ 9.41
Net investment income(a) 0.04 0.31 0.26 0.35 0.17 0.19
Net realized and unrealized gain (loss) 0.17 0.99 (0.78) (0.31) (0.25) 0.26
Total from investment operations 0.21 1.30 (0.52) 0.04 (0.08) 0.45
Distributions to shareholders from net investment income (0.08) (0.35) —(b) (0.05) (0.05) (0.11)
Distributions to shareholders from return of capital — (0.02) (0.28) (0.25) (0.03) (0.05)
Total distributions (0.08) (0.37) (0.28) (0.30) (0.08) (0.16)
Net asset value, end of period $ 9.54 $ 9.41 $ 8.48 $ 9.28 $ 9.54 $ 9.70
Total return(c) 2.30% 15.12% (5.64)% 0.46% (0.86)% 4.84%
Net assets, end of period (in 000s) $129,680 $126,488 $115,257 $202,337 $311,146 $646,435
Ratio of net expenses to average net assets 1.01%(d) 1.02% 1.01% 0.99% 0.95% 0.92%
Ratio of total expenses to average net assets 1.06%(d) 1.05% 1.04% 1.01% 0.95% 0.93%
Ratio of net investment income to average net assets 0.80%(d) 3.27% 2.84% 3.72% 1.81% 1.96%
Portfolio turnover rate(e) 137% 722% 491% 169% 128% 184%
(a) Calculated based on the average shares outstanding methodology.(b) Amount is less than $0.005 per share.(c) Assumes investment at the NAV at the beginning of the period, reinvestment of all dividends and distributions, a complete redemption of the investment at the NAV
at the end of the period and no sales or redemption charges (if any). Total returns would be reduced if a sales or redemption charge was taken into account. Returnsdo not reflect the impact of taxes to shareholders relating to Fund distributions or the redemption of Fund shares. Total returns for periods less than one full year arenot annualized.
(d) Annualized.(e) The Fund’s portfolio turnover rate is calculated in accordance with regulatory requirements, without regard to transactions involving short term investments and
certain derivatives. If such transactions were included, the Fund’s portfolio turnover rate may be higher.
172 The accompanying notes are an integral part of these financial statements.

G O L D M A N S A C H S S T R A T E G I C I N C O M E F U N D
Financial Highlights (continued)Selected Share Data for a Share Outstanding Throughout Each Period
Goldman Sachs Strategic Income Fund
Class C Shares
Six Months EndedSeptember 30, 2021
(Unaudited)
Year Ended March 31,
2021 2020 2019 2018 2017
Per Share Data
Net asset value, beginning of period $ 9.39 $ 8.46 $ 9.25 $ 9.52 $ 9.71 $ 9.41
Net investment income(a) —(b) 0.24 0.19 0.28 0.10 0.12
Net realized and unrealized gain (loss) 0.17 0.98 (0.77) (0.32) (0.26) 0.28
Total from investment operations 0.17 1.22 (0.58) (0.04) (0.16) 0.40
Distributions to shareholders from net investment income (0.05) (0.27) —(b) (0.04) (0.02) (0.07)
Distributions to shareholders from return of capital — (0.02) (0.21) (0.19) (0.01) (0.03)
Total distributions (0.05) (0.29) (0.21) (0.23) (0.03) (0.10)
Net asset value, end of period $ 9.51 $ 9.39 $ 8.46 $ 9.25 $ 9.52 $ 9.71
Total return(c) 1.90% 14.24% (6.27)% (0.41)% (1.60)% 4.25%
Net assets, end of period (in 000s) $40,493 $55,099 $89,308 $150,514 $252,929 $448,657
Ratio of net expenses to average net assets 1.76%(d) 1.77% 1.77% 1.74% 1.70% 1.60%
Ratio of total expenses to average net assets 1.81%(d) 1.80% 1.79% 1.76% 1.70% 1.68%
Ratio of net investment income to average net assets 0.06%(d) 2.54% 2.10% 2.97% 1.01% 1.26%
Portfolio turnover rate(e) 137% 722% 491% 169% 128% 184%
(a) Calculated based on the average shares outstanding methodology.(b) Amount is less than $0.005 per share.(c) Assumes investment at the NAV at the beginning of the period, reinvestment of all dividends and distributions, a complete redemption of the investment at the NAV
at the end of the period and no sales or redemption charges (if any). Total returns would be reduced if a sales or redemption charge was taken into account. Returnsdo not reflect the impact of taxes to shareholders relating to Fund distributions or the redemption of Fund shares. Total returns for periods less than one full year arenot annualized.
(d) Annualized.(e) The Fund’s portfolio turnover rate is calculated in accordance with regulatory requirements, without regard to transactions involving short term investments and
certain derivatives. If such transactions were included, the Fund’s portfolio turnover rate may be higher.
The accompanying notes are an integral part of these financial statements. 173
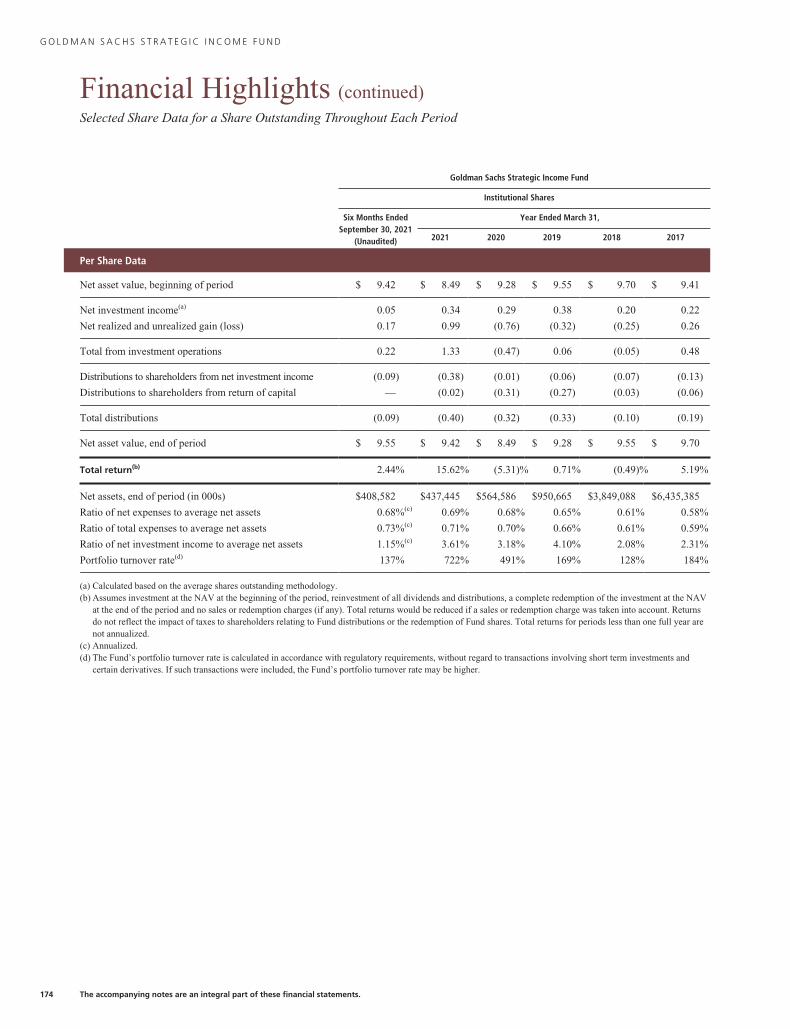
G O L D M A N S A C H S S T R A T E G I C I N C O M E F U N D
Financial Highlights (continued)Selected Share Data for a Share Outstanding Throughout Each Period
Goldman Sachs Strategic Income Fund
Institutional Shares
Six Months EndedSeptember 30, 2021
(Unaudited)
Year Ended March 31,
2021 2020 2019 2018 2017
Per Share Data
Net asset value, beginning of period $ 9.42 $ 8.49 $ 9.28 $ 9.55 $ 9.70 $ 9.41
Net investment income(a) 0.05 0.34 0.29 0.38 0.20 0.22
Net realized and unrealized gain (loss) 0.17 0.99 (0.76) (0.32) (0.25) 0.26
Total from investment operations 0.22 1.33 (0.47) 0.06 (0.05) 0.48
Distributions to shareholders from net investment income (0.09) (0.38) (0.01) (0.06) (0.07) (0.13)
Distributions to shareholders from return of capital — (0.02) (0.31) (0.27) (0.03) (0.06)
Total distributions (0.09) (0.40) (0.32) (0.33) (0.10) (0.19)
Net asset value, end of period $ 9.55 $ 9.42 $ 8.49 $ 9.28 $ 9.55 $ 9.70
Total return(b) 2.44% 15.62% (5.31)% 0.71% (0.49)% 5.19%
Net assets, end of period (in 000s) $408,582 $437,445 $564,586 $950,665 $3,849,088 $6,435,385
Ratio of net expenses to average net assets 0.68%(c) 0.69% 0.68% 0.65% 0.61% 0.58%
Ratio of total expenses to average net assets 0.73%(c) 0.71% 0.70% 0.66% 0.61% 0.59%
Ratio of net investment income to average net assets 1.15%(c) 3.61% 3.18% 4.10% 2.08% 2.31%
Portfolio turnover rate(d) 137% 722% 491% 169% 128% 184%
(a) Calculated based on the average shares outstanding methodology.(b) Assumes investment at the NAV at the beginning of the period, reinvestment of all dividends and distributions, a complete redemption of the investment at the NAV
at the end of the period and no sales or redemption charges (if any). Total returns would be reduced if a sales or redemption charge was taken into account. Returnsdo not reflect the impact of taxes to shareholders relating to Fund distributions or the redemption of Fund shares. Total returns for periods less than one full year arenot annualized.
(c) Annualized.(d) The Fund’s portfolio turnover rate is calculated in accordance with regulatory requirements, without regard to transactions involving short term investments and
certain derivatives. If such transactions were included, the Fund’s portfolio turnover rate may be higher.
174 The accompanying notes are an integral part of these financial statements.
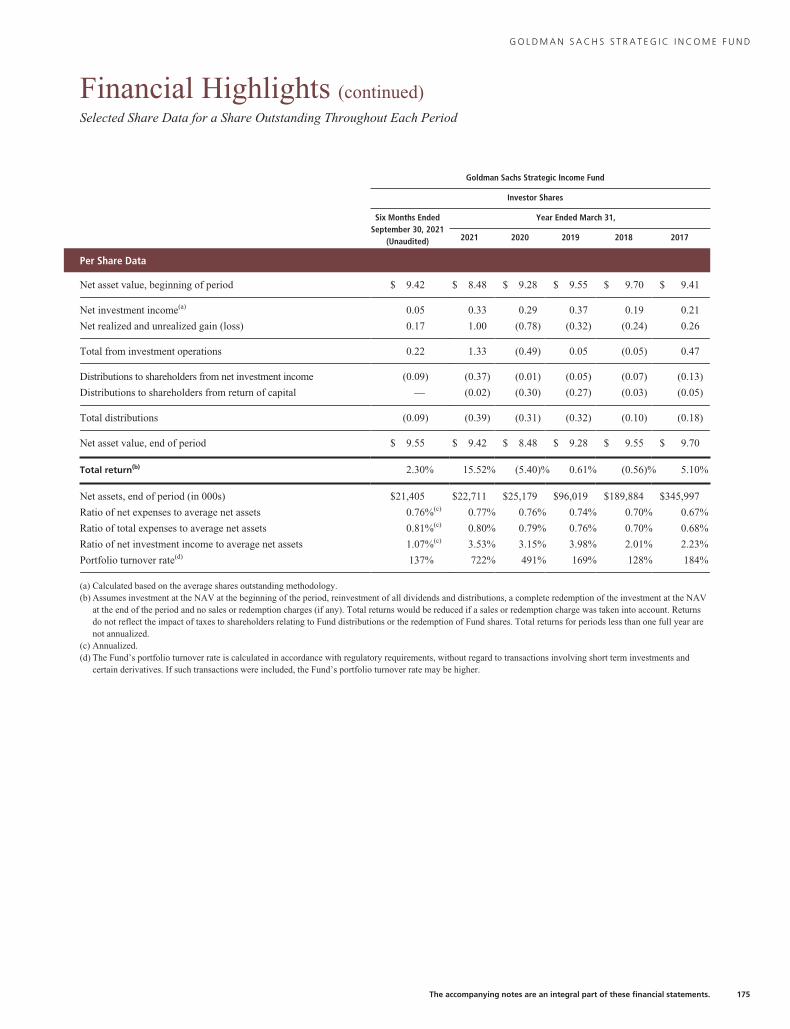
G O L D M A N S A C H S S T R A T E G I C I N C O M E F U N D
Financial Highlights (continued)Selected Share Data for a Share Outstanding Throughout Each Period
Goldman Sachs Strategic Income Fund
Investor Shares
Six Months EndedSeptember 30, 2021
(Unaudited)
Year Ended March 31,
2021 2020 2019 2018 2017
Per Share Data
Net asset value, beginning of period $ 9.42 $ 8.48 $ 9.28 $ 9.55 $ 9.70 $ 9.41
Net investment income(a) 0.05 0.33 0.29 0.37 0.19 0.21
Net realized and unrealized gain (loss) 0.17 1.00 (0.78) (0.32) (0.24) 0.26
Total from investment operations 0.22 1.33 (0.49) 0.05 (0.05) 0.47
Distributions to shareholders from net investment income (0.09) (0.37) (0.01) (0.05) (0.07) (0.13)
Distributions to shareholders from return of capital — (0.02) (0.30) (0.27) (0.03) (0.05)
Total distributions (0.09) (0.39) (0.31) (0.32) (0.10) (0.18)
Net asset value, end of period $ 9.55 $ 9.42 $ 8.48 $ 9.28 $ 9.55 $ 9.70
Total return(b) 2.30% 15.52% (5.40)% 0.61% (0.56)% 5.10%
Net assets, end of period (in 000s) $21,405 $22,711 $25,179 $96,019 $189,884 $345,997
Ratio of net expenses to average net assets 0.76%(c) 0.77% 0.76% 0.74% 0.70% 0.67%
Ratio of total expenses to average net assets 0.81%(c) 0.80% 0.79% 0.76% 0.70% 0.68%
Ratio of net investment income to average net assets 1.07%(c) 3.53% 3.15% 3.98% 2.01% 2.23%
Portfolio turnover rate(d) 137% 722% 491% 169% 128% 184%
(a) Calculated based on the average shares outstanding methodology.(b) Assumes investment at the NAV at the beginning of the period, reinvestment of all dividends and distributions, a complete redemption of the investment at the NAV
at the end of the period and no sales or redemption charges (if any). Total returns would be reduced if a sales or redemption charge was taken into account. Returnsdo not reflect the impact of taxes to shareholders relating to Fund distributions or the redemption of Fund shares. Total returns for periods less than one full year arenot annualized.
(c) Annualized.(d) The Fund’s portfolio turnover rate is calculated in accordance with regulatory requirements, without regard to transactions involving short term investments and
certain derivatives. If such transactions were included, the Fund’s portfolio turnover rate may be higher.
The accompanying notes are an integral part of these financial statements. 175
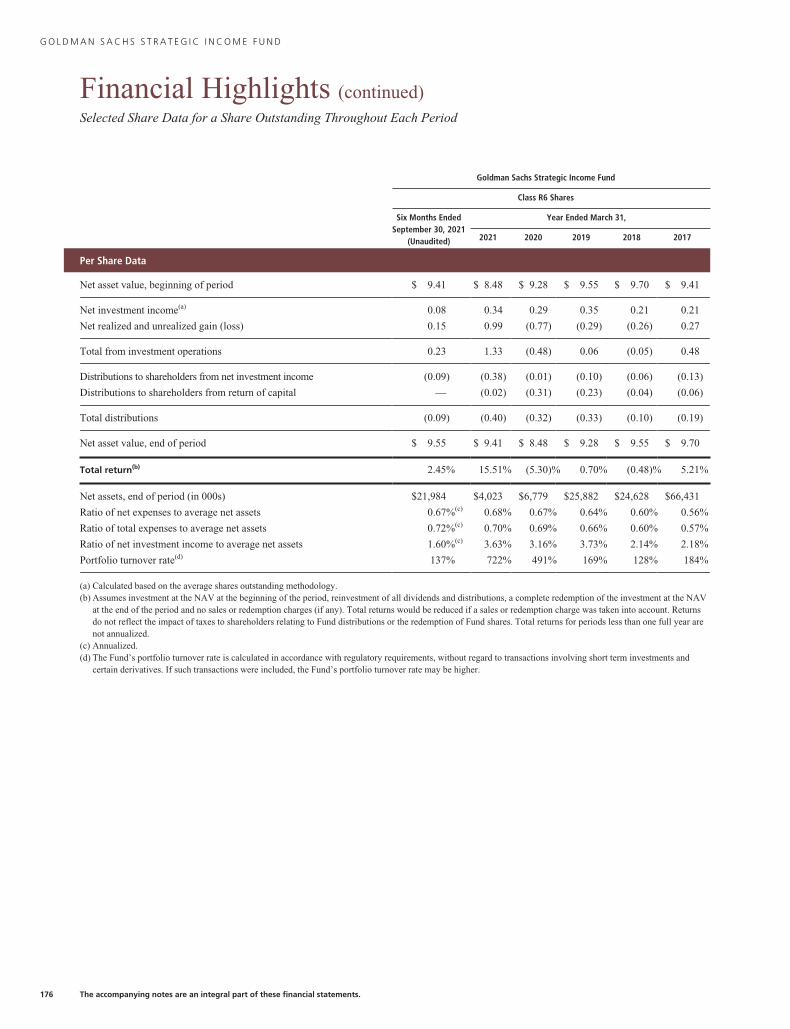
G O L D M A N S A C H S S T R A T E G I C I N C O M E F U N D
Financial Highlights (continued)Selected Share Data for a Share Outstanding Throughout Each Period
Goldman Sachs Strategic Income Fund
Class R6 Shares
Six Months EndedSeptember 30, 2021
(Unaudited)
Year Ended March 31,
2021 2020 2019 2018 2017
Per Share Data
Net asset value, beginning of period $ 9.41 $ 8.48 $ 9.28 $ 9.55 $ 9.70 $ 9.41
Net investment income(a) 0.08 0.34 0.29 0.35 0.21 0.21
Net realized and unrealized gain (loss) 0.15 0.99 (0.77) (0.29) (0.26) 0.27
Total from investment operations 0.23 1.33 (0.48) 0.06 (0.05) 0.48
Distributions to shareholders from net investment income (0.09) (0.38) (0.01) (0.10) (0.06) (0.13)
Distributions to shareholders from return of capital — (0.02) (0.31) (0.23) (0.04) (0.06)
Total distributions (0.09) (0.40) (0.32) (0.33) (0.10) (0.19)
Net asset value, end of period $ 9.55 $ 9.41 $ 8.48 $ 9.28 $ 9.55 $ 9.70
Total return(b) 2.45% 15.51% (5.30)% 0.70% (0.48)% 5.21%
Net assets, end of period (in 000s) $21,984 $4,023 $6,779 $25,882 $24,628 $66,431
Ratio of net expenses to average net assets 0.67%(c) 0.68% 0.67% 0.64% 0.60% 0.56%
Ratio of total expenses to average net assets 0.72%(c) 0.70% 0.69% 0.66% 0.60% 0.57%
Ratio of net investment income to average net assets 1.60%(c) 3.63% 3.16% 3.73% 2.14% 2.18%
Portfolio turnover rate(d) 137% 722% 491% 169% 128% 184%
(a) Calculated based on the average shares outstanding methodology.(b) Assumes investment at the NAV at the beginning of the period, reinvestment of all dividends and distributions, a complete redemption of the investment at the NAV
at the end of the period and no sales or redemption charges (if any). Total returns would be reduced if a sales or redemption charge was taken into account. Returnsdo not reflect the impact of taxes to shareholders relating to Fund distributions or the redemption of Fund shares. Total returns for periods less than one full year arenot annualized.
(c) Annualized.(d) The Fund’s portfolio turnover rate is calculated in accordance with regulatory requirements, without regard to transactions involving short term investments and
certain derivatives. If such transactions were included, the Fund’s portfolio turnover rate may be higher.
176 The accompanying notes are an integral part of these financial statements.
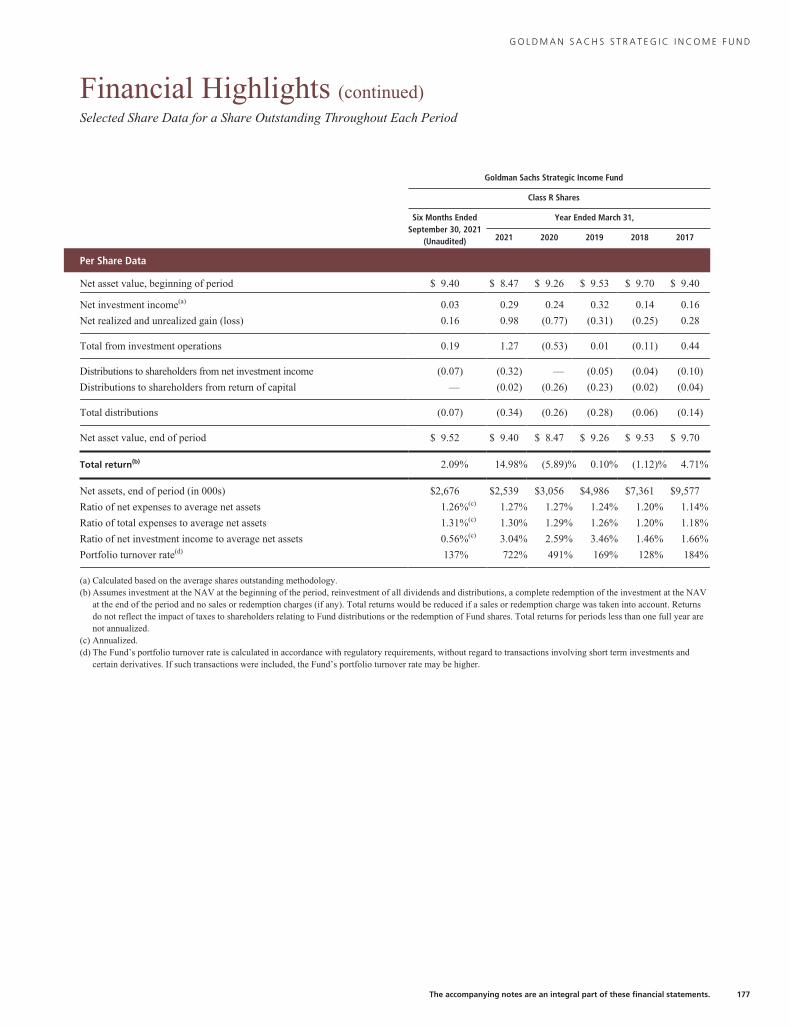
G O L D M A N S A C H S S T R A T E G I C I N C O M E F U N D
Financial Highlights (continued)Selected Share Data for a Share Outstanding Throughout Each Period
Goldman Sachs Strategic Income Fund
Class R Shares
Six Months EndedSeptember 30, 2021
(Unaudited)
Year Ended March 31,
2021 2020 2019 2018 2017
Per Share Data
Net asset value, beginning of period $ 9.40 $ 8.47 $ 9.26 $ 9.53 $ 9.70 $ 9.40
Net investment income(a) 0.03 0.29 0.24 0.32 0.14 0.16
Net realized and unrealized gain (loss) 0.16 0.98 (0.77) (0.31) (0.25) 0.28
Total from investment operations 0.19 1.27 (0.53) 0.01 (0.11) 0.44
Distributions to shareholders from net investment income (0.07) (0.32) — (0.05) (0.04) (0.10)
Distributions to shareholders from return of capital — (0.02) (0.26) (0.23) (0.02) (0.04)
Total distributions (0.07) (0.34) (0.26) (0.28) (0.06) (0.14)
Net asset value, end of period $ 9.52 $ 9.40 $ 8.47 $ 9.26 $ 9.53 $ 9.70
Total return(b) 2.09% 14.98% (5.89)% 0.10% (1.12)% 4.71%
Net assets, end of period (in 000s) $2,676 $2,539 $3,056 $4,986 $7,361 $9,577
Ratio of net expenses to average net assets 1.26%(c) 1.27% 1.27% 1.24% 1.20% 1.14%
Ratio of total expenses to average net assets 1.31%(c) 1.30% 1.29% 1.26% 1.20% 1.18%
Ratio of net investment income to average net assets 0.56%(c) 3.04% 2.59% 3.46% 1.46% 1.66%
Portfolio turnover rate(d) 137% 722% 491% 169% 128% 184%
(a) Calculated based on the average shares outstanding methodology.(b) Assumes investment at the NAV at the beginning of the period, reinvestment of all dividends and distributions, a complete redemption of the investment at the NAV
at the end of the period and no sales or redemption charges (if any). Total returns would be reduced if a sales or redemption charge was taken into account. Returnsdo not reflect the impact of taxes to shareholders relating to Fund distributions or the redemption of Fund shares. Total returns for periods less than one full year arenot annualized.
(c) Annualized.(d) The Fund’s portfolio turnover rate is calculated in accordance with regulatory requirements, without regard to transactions involving short term investments and
certain derivatives. If such transactions were included, the Fund’s portfolio turnover rate may be higher.
The accompanying notes are an integral part of these financial statements. 177
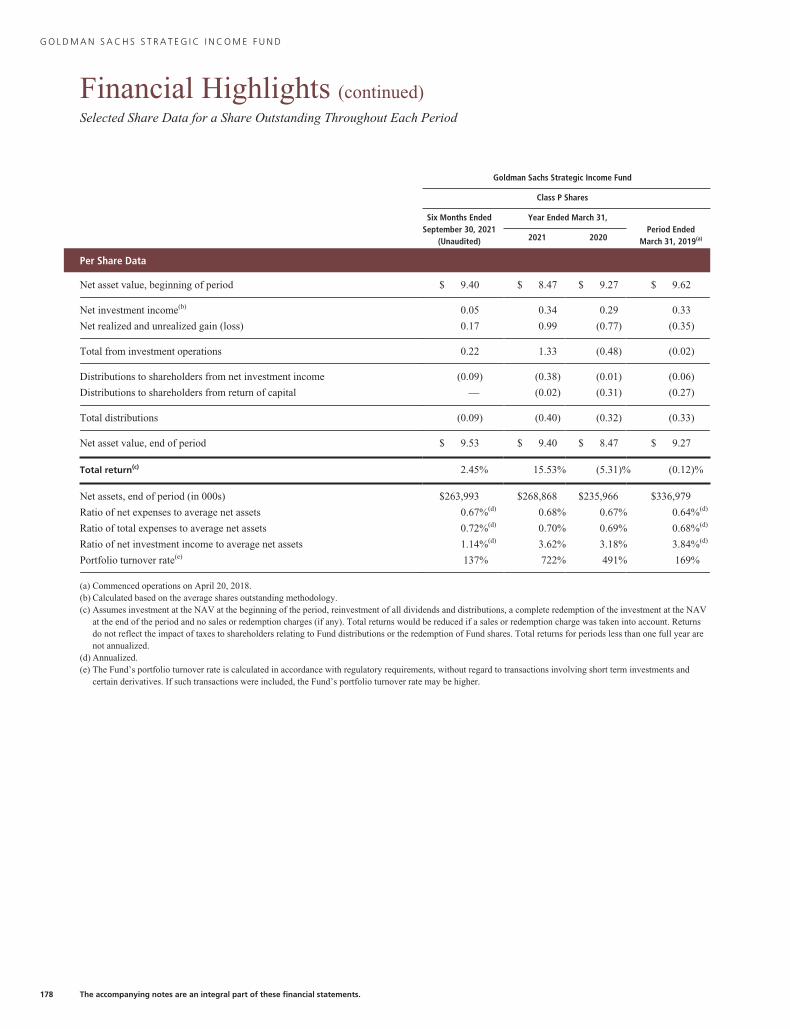
G O L D M A N S A C H S S T R A T E G I C I N C O M E F U N D
Financial Highlights (continued)Selected Share Data for a Share Outstanding Throughout Each Period
Goldman Sachs Strategic Income Fund
Class P Shares
Six Months EndedSeptember 30, 2021
(Unaudited)
Year Ended March 31,Period Ended
March 31, 2019(a)2021 2020
Per Share Data
Net asset value, beginning of period $ 9.40 $ 8.47 $ 9.27 $ 9.62
Net investment income(b) 0.05 0.34 0.29 0.33
Net realized and unrealized gain (loss) 0.17 0.99 (0.77) (0.35)
Total from investment operations 0.22 1.33 (0.48) (0.02)
Distributions to shareholders from net investment income (0.09) (0.38) (0.01) (0.06)
Distributions to shareholders from return of capital — (0.02) (0.31) (0.27)
Total distributions (0.09) (0.40) (0.32) (0.33)
Net asset value, end of period $ 9.53 $ 9.40 $ 8.47 $ 9.27
Total return(c) 2.45% 15.53% (5.31)% (0.12)%
Net assets, end of period (in 000s) $263,993 $268,868 $235,966 $336,979
Ratio of net expenses to average net assets 0.67%(d) 0.68% 0.67% 0.64%(d)
Ratio of total expenses to average net assets 0.72%(d) 0.70% 0.69% 0.68%(d)
Ratio of net investment income to average net assets 1.14%(d) 3.62% 3.18% 3.84%(d)
Portfolio turnover rate(e) 137% 722% 491% 169%
(a) Commenced operations on April 20, 2018.(b) Calculated based on the average shares outstanding methodology.(c) Assumes investment at the NAV at the beginning of the period, reinvestment of all dividends and distributions, a complete redemption of the investment at the NAV
at the end of the period and no sales or redemption charges (if any). Total returns would be reduced if a sales or redemption charge was taken into account. Returnsdo not reflect the impact of taxes to shareholders relating to Fund distributions or the redemption of Fund shares. Total returns for periods less than one full year arenot annualized.
(d) Annualized.(e) The Fund’s portfolio turnover rate is calculated in accordance with regulatory requirements, without regard to transactions involving short term investments and
certain derivatives. If such transactions were included, the Fund’s portfolio turnover rate may be higher.
178 The accompanying notes are an integral part of these financial statements.
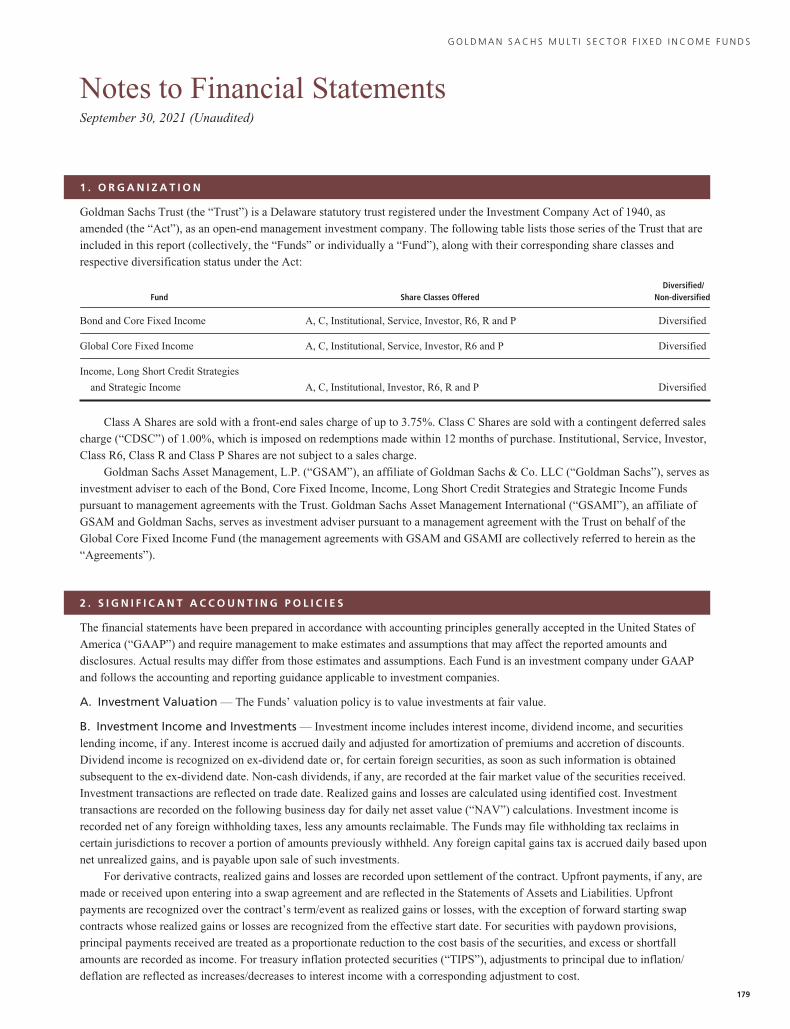
G O L D M A N S A C H S M U L T I S E C T O R F I X E D I N C O M E F U N D S
Notes to Financial StatementsSeptember 30, 2021 (Unaudited)
1 . O R G A N I Z A T I O N
Goldman Sachs Trust (the “Trust”) is a Delaware statutory trust registered under the Investment Company Act of 1940, as
amended (the “Act”), as an open-end management investment company. The following table lists those series of the Trust that are
included in this report (collectively, the “Funds” or individually a “Fund”), along with their corresponding share classes and
respective diversification status under the Act:
Fund Share Classes OfferedDiversified/
Non-diversified
Bond and Core Fixed Income A, C, Institutional, Service, Investor, R6, R and P Diversified
Global Core Fixed Income A, C, Institutional, Service, Investor, R6 and P Diversified
Income, Long Short Credit Strategies
and Strategic Income A, C, Institutional, Investor, R6, R and P Diversified
Class A Shares are sold with a front-end sales charge of up to 3.75%. Class C Shares are sold with a contingent deferred sales
charge (“CDSC”) of 1.00%, which is imposed on redemptions made within 12 months of purchase. Institutional, Service, Investor,
Class R6, Class R and Class P Shares are not subject to a sales charge.
Goldman Sachs Asset Management, L.P. (“GSAM”), an affiliate of Goldman Sachs & Co. LLC (“Goldman Sachs”), serves as
investment adviser to each of the Bond, Core Fixed Income, Income, Long Short Credit Strategies and Strategic Income Funds
pursuant to management agreements with the Trust. Goldman Sachs Asset Management International (“GSAMI”), an affiliate of
GSAM and Goldman Sachs, serves as investment adviser pursuant to a management agreement with the Trust on behalf of the
Global Core Fixed Income Fund (the management agreements with GSAM and GSAMI are collectively referred to herein as the
“Agreements”).
2 . S I G N I F I C A N T A C C O U N T I N G P O L I C I E S
The financial statements have been prepared in accordance with accounting principles generally accepted in the United States of
America (“GAAP”) and require management to make estimates and assumptions that may affect the reported amounts and
disclosures. Actual results may differ from those estimates and assumptions. Each Fund is an investment company under GAAP
and follows the accounting and reporting guidance applicable to investment companies.
A. Investment Valuation — The Funds’ valuation policy is to value investments at fair value.
B. Investment Income and Investments — Investment income includes interest income, dividend income, and securities
lending income, if any. Interest income is accrued daily and adjusted for amortization of premiums and accretion of discounts.
Dividend income is recognized on ex-dividend date or, for certain foreign securities, as soon as such information is obtained
subsequent to the ex-dividend date. Non-cash dividends, if any, are recorded at the fair market value of the securities received.
Investment transactions are reflected on trade date. Realized gains and losses are calculated using identified cost. Investment
transactions are recorded on the following business day for daily net asset value (“NAV”) calculations. Investment income is
recorded net of any foreign withholding taxes, less any amounts reclaimable. The Funds may file withholding tax reclaims in
certain jurisdictions to recover a portion of amounts previously withheld. Any foreign capital gains tax is accrued daily based upon
net unrealized gains, and is payable upon sale of such investments.
For derivative contracts, realized gains and losses are recorded upon settlement of the contract. Upfront payments, if any, are
made or received upon entering into a swap agreement and are reflected in the Statements of Assets and Liabilities. Upfront
payments are recognized over the contract’s term/event as realized gains or losses, with the exception of forward starting swap
contracts whose realized gains or losses are recognized from the effective start date. For securities with paydown provisions,
principal payments received are treated as a proportionate reduction to the cost basis of the securities, and excess or shortfall
amounts are recorded as income. For treasury inflation protected securities (“TIPS”), adjustments to principal due to inflation/
deflation are reflected as increases/decreases to interest income with a corresponding adjustment to cost.
179
G O L D M A N S A C H S M U L T I S E C T O R F I X E D I N C O M E F U N D S
Notes to Financial Statements (continued)September 30, 2021 (Unaudited)
2 . S I G N I F I C A N T A C C O U N T I N G P O L I C I E S ( c o n t i n u e d )
C. Class Allocations and Expenses — Investment income, realized and unrealized gain (loss), if any, and non-class specific
expenses of each Fund are allocated daily based upon the proportion of net assets of each class. Non-class specific expenses
directly incurred by a Fund are charged to that Fund, while such expenses incurred by the Trust are allocated across the applicable
Funds on a straight-line and/or pro-rata basis depending upon the nature of the expenses. Class-specific expenses, where
applicable, are borne by the respective share classes and include Distribution and Service, Transfer Agency and Service and
Shareholder Administration fees.
D. Federal Taxes and Distributions to Shareholders — It is each Fund’s policy to comply with the requirements of the
Internal Revenue Code of 1986, as amended (the “Code”), applicable to regulated investment companies and to distribute each
year substantially all of its investment company taxable income and capital gains to its shareholders. Accordingly, each Fund is not
required to make any provisions for the payment of federal income tax. Distributions to shareholders are recorded on the
ex-dividend date. Income and capital gains distributions, if any, are declared and paid according to the following schedule:
FundIncome Distributions
Declared/PaidCapital Gains Distributions
Declared/Paid
Bond Daily/Monthly Annually
Core Fixed Income Daily/Monthly Annually
Global Core Fixed Income Daily/Monthly Annually
Income Daily/Monthly Annually
Long Short Credit Strategies Daily/Monthly Annually
Strategic Income Monthly/Monthly Annually
Net capital losses, if any, are carried forward to future fiscal years and may be used to the extent allowed by the Code to offset
any future capital gains. Losses that are carried forward will retain their character as either short-term or long-term capital losses.
Utilization of capital loss carryforwards will reduce the requirement of future capital gains distributions.
The characterization of distributions to shareholders for financial reporting purposes is determined in accordance with federal
income tax rules, which may differ from GAAP. The source of each Fund’s distributions may be shown in the accompanying
financial statements as either from distributable earnings or capital. Certain components of the Funds’ net assets on the Statements
of Assets and Liabilities reflect permanent GAAP/tax differences based on the appropriate tax character.
E. Foreign Currency Translation — The accounting records and reporting currency of a Fund are maintained in U.S. dollars.
Assets and liabilities denominated in foreign currencies are translated into U.S. dollars using the current exchange rates at the close
of each business day. The effect of changes in foreign currency exchange rates on investments is included within net realized and
unrealized gain (loss) on investments. Changes in the value of other assets and liabilities as a result of fluctuations in foreign
exchange rates are included in the Statements of Operations within net change in unrealized gain (loss) on foreign currency
translation. Transactions denominated in foreign currencies are translated into U.S. dollars on the date the transaction occurred, the
effects of which are included within net realized gain (loss) on foreign currency transactions.
3 . I N V E S T M E N T S A N D F A I R V A L U E M E A S U R E M E N T S
U.S. GAAP defines the fair value of a financial instrument as the amount that would be received to sell an asset or paid to transfer
a liability in an orderly transaction between market participants at the measurement date (i.e., the exit price); the Funds’ policy is to
use the market approach. GAAP establishes a fair value hierarchy that prioritizes the inputs to valuation techniques used to
measure fair value. The hierarchy gives the highest priority to unadjusted quoted prices in active markets for identical assets or
liabilities (Level 1 measurements) and the lowest priority to unobservable inputs (Level 3 measurements). The level in the fair
value hierarchy within which the fair value measurement in its entirety falls shall be determined based on the lowest level input180
G O L D M A N S A C H S M U L T I S E C T O R F I X E D I N C O M E F U N D S
3 . I N V E S T M E N T S A N D F A I R V A L U E M E A S U R E M E N T S ( c o n t i n u e d )
that is significant to the fair value measurement in its entirety. The levels used for classifying investments are not necessarily an
indication of the risk associated with investing in these investments. The three levels of the fair value hierarchy are described
below:
Level 1 — Unadjusted quoted prices in active markets that are accessible at the measurement date for identical, unrestricted
assets or liabilities;
Level 2 — Quoted prices in markets that are not active or financial instruments for which significant inputs are observable
(including, but not limited to, quoted prices for similar investments, interest rates, foreign exchange rates, volatility and credit
spreads), either directly or indirectly;
Level 3 — Prices or valuations that require significant unobservable inputs (including GSAM’s and GSAMI’s assumptions in
determining fair value measurement).
The Board of Trustees (“Trustees”) has approved Valuation Procedures that govern the valuation of the portfolio investments held
by the Funds, including investments for which market quotations are not readily available. The Trustees have delegated to GSAM
and GSAMI day-to-day responsibility for implementing and maintaining internal controls and procedures related to the valuation
of the Fund’s investments. To assess the continuing appropriateness of pricing sources and methodologies, GSAM and GSAMI
regularly perform price verification procedures and issues challenges as necessary to third party pricing vendors or brokers, and
any differences are reviewed in accordance with the Valuation Procedures.
A. Level 1 and Level 2 Fair Value Investments — The valuation techniques and significant inputs used in determining the
fair values for investments classified as Level 1 and Level 2 are as follows:
Debt Securities — Debt securities for which market quotations are readily available are valued daily on the basis of quotations
supplied by dealers or an independent pricing service approved by the Trustees. The pricing services may use valuation models or
matrix pricing, which consider: (i) yield or price with respect to bonds that are considered comparable in characteristics such as
rating, interest rate and maturity date or (ii) quotations from securities dealers to determine current value. With the exception of
treasury securities of G7 countries, which are generally classified as Level 1, these investments are generally classified as Level 2
of the fair value hierarchy.
i. Bank Loans — Bank loans (“Loans”) are interests in amounts owed by corporate, governmental, or other borrowers to
lenders or lending syndicates. Loans are arranged through private negotiations between the borrower and one or more
financial institutions (“Lenders”). The Fund’s investments in Loans are in the form of either participations in Loans
(“Participations”) or assignments of all or a portion of Loans from third parties (“Assignments”). With respect to
Participations, the Fund has the right to receive payments of principal, interest and any fees to which it is entitled from the
Lender selling the Participations and only upon receipt by the Lender of the payments from the borrower. The Fund generally
has no right to enforce compliance by the borrower with the terms of the loan agreement with respect to Participations.
Conversely, assignments result in the Fund having a direct contractual relationship with the borrower, and the Fund may be
permitted to enforce compliance by the borrower with the terms of the loan agreement.
The Income, Long Short Credit Strategies and Strategic Income Funds may also enter into certain credit arrangements,
all or a portion of which may be unfunded. Unfunded loan commitments represent the remaining obligation of a Fund to the
borrower. A Fund is obligated to fund these commitments at the borrower’s discretion. A Fund may receive a commitment fee
based on the undrawn portion of the underlying line of credit of a loan. All loans and unfunded loan commitments involve
interest rate risk, liquidity risk and credit risk, including the potential default or insolvency of the borrower. Loans, including
unfunded loan commitments, are marked to market daily using pricing vendor quotations and the change in value, if any, is
recorded as an unrealized gain or loss.
ii. Inverse Floaters — The interest rate on inverse floating rate securities (“inverse floaters”) resets in the opposite direction
from the market rate of interest to which the inverse floaters are indexed. An inverse floater may be considered to be
leveraged to the extent that its interest rate varies by a magnitude that exceeds the magnitude of the change in the index rate of
interest. The higher the degree of leverage of an inverse floater, the greater the volatility of its market value.
181
G O L D M A N S A C H S M U L T I S E C T O R F I X E D I N C O M E F U N D S
Notes to Financial Statements (continued)September 30, 2021 (Unaudited)
3 . I N V E S T M E N T S A N D F A I R V A L U E M E A S U R E M E N T S ( c o n t i n u e d )
iii. Mortgage-Backed and Asset-Backed Securities — Mortgage-backed securities represent direct or indirect
participations in, or are collateralized by and payable from, mortgage loans secured by residential and/or commercial real
estate property. Asset-backed securities include securities whose principal and interest payments are collateralized by pools of
other assets or receivables. The value of certain mortgage-backed and asset-backed securities (including adjustable rate
mortgage loans) may be particularly sensitive to changes in prevailing interest rates. The value of these securities may also
fluctuate in response to the market’s perception of the creditworthiness of the issuers.
Asset-backed securities may present credit risks that are not presented by mortgage-backed securities because they
generally do not have the benefit of a security interest in collateral that is comparable to mortgage assets. Some asset-backed
securities may only have a subordinated claim on collateral.
Stripped mortgage-backed securities are usually structured with two different classes: one that receives substantially all
interest payments (interest-only, or “IO” and/or high coupon rate with relatively low principal amount, or “IOette”), and the
other that receives substantially all principal payments (principal-only, or “PO”) from a pool of mortgage loans. Little to no
principal will be received at the maturity of an IO; as a result, periodic adjustments are recorded to reduce the cost of the
security until maturity. These adjustments are included in interest income.
iv. Mortgage Dollar Rolls — Mortgage dollar rolls are transactions whereby a Fund sells mortgage-backed-securities and
simultaneously contracts with the same counterparty to repurchase similar securities on a specified future date. During the
settlement period, a Fund will not be entitled to accrue interest and receive principal payments on the securities sold. The
Funds account for mortgage dollar roll transactions as purchases and sales and realize gains and losses on these transactions.
v. When-Issued Securities and Forward Commitments — When-issued securities, including TBA (“To Be
Announced”) securities, are securities that are authorized but not yet issued in the market and purchased in order to secure
what is considered to be an advantageous price or yield to a Fund. A forward commitment involves entering into a contract to
purchase or sell securities, typically on an extended settlement basis, for a fixed price at a future date. The purchase of
securities on a when-issued or forward commitment basis involves a risk of loss if the value of the security to be purchased
declines before the settlement date. Conversely, the sale of securities on a forward commitment basis involves the risk that the
value of the securities sold may increase before the settlement date. Although a Fund will generally purchase securities on a
when-issued or forward commitment basis with the intention of acquiring the securities for its portfolio, the Fund may dispose
of when-issued securities or forward commitments prior to settlement, which may result in a realized gain or loss. For
financial reporting purposes, cash collateral that has been pledged to cover obligations of a Fund and cash collateral received,
if any, is reported separately on the Statements of Assets and Liabilities as receivables/payables for collateral on other
investments. Non-cash collateral pledged by a Fund, if any, is noted in the Schedules of Investments.
Equity Securities — Equity securities traded on a United States (“U.S.”) securities exchange or the NASDAQ system, or those
located on certain foreign exchanges, including but not limited to the Americas, are valued daily at their last sale price or official
closing price on the principal exchange or system on which they are traded. If there is no sale or official closing price or such price
is believed by GSAM and GSAMI to not represent fair value, equity securities will be valued at the valid closing bid price for long
positions and at the valid closing ask price for short positions (i.e. where there is sufficient volume, during normal exchange
trading hours). If no valid bid/ask price is available, the equity security will be valued pursuant to the Valuation Procedures
approved by the Trustees and consistent with applicable regulatory guidance. To the extent these investments are actively traded,
they are classified as Level 1 of the fair value hierarchy, otherwise they are generally classified as Level 2. Certain equity securities
containing unique attributes may be classified as Level 2.
Unlisted equity securities for which market quotations are available are valued at the last sale price on the valuation date, or if
no sale occurs, at the last bid price for long positions or the last ask price for short positions, and are generally classified as Level 2.
Securities traded on certain foreign securities exchanges are valued daily at fair value determined by an independent fair value
service (if available) under Fair Valuation Procedures approved by the Trustees and consistent with applicable regulatory guidance.
The independent fair value service takes into account multiple factors including, but not limited to, movements in the securities
markets, certain depositary receipts, futures contracts and foreign currency exchange rates that have occurred subsequent to the
close of the foreign securities exchange. These investments are generally classified as Level 2 of the fair value hierarchy.182
G O L D M A N S A C H S M U L T I S E C T O R F I X E D I N C O M E F U N D S
3 . I N V E S T M E N T S A N D F A I R V A L U E M E A S U R E M E N T S ( c o n t i n u e d )
Underlying Funds (including Money Market Funds) — Underlying funds (“Underlying Funds”) include other investment
companies and exchange-traded funds (“ETFs”). Investments in the Underlying Funds (except ETFs) are valued at the NAV per
share on the day of valuation. ETFs are valued daily at the last sale price or official closing price on the principal exchange or
system on which the investment is traded. Because the Funds invest in Underlying Funds that fluctuate in value, the Funds’ shares
will correspondingly fluctuate in value. To the extent these investments are actively traded, they are classified as Level 1 of the fair
value hierarchy, otherwise they are generally classified as Level 2. For information regarding an Underlying Fund’s accounting
policies and investment holdings, please see the Underlying Fund’s shareholder report.
Derivative Contracts — A derivative is an instrument whose value is derived from underlying assets, indices, reference rates or
a combination of these factors. A Fund enters into derivative transactions to hedge against changes in interest rates, securities
prices, and/or currency exchange rates, to increase total return, or to gain access to certain markets or attain exposure to other
underliers. For financial reporting purposes, cash collateral that has been pledged to cover obligations of a Fund and cash collateral
received, if any, is reported separately on the Statements of Assets and Liabilities as receivables/payables for collateral on certain
derivatives contracts. Non-cash collateral pledged by a Fund, if any, is noted in the Schedules of Investments.
Exchange-traded derivatives, including futures and options contracts, are generally valued at the last sale or settlement price
on the exchange where they are principally traded. Exchange-traded options without settlement prices are generally valued at the
midpoint of the bid and ask prices on the exchange where they are principally traded (or, in the absence of two-way trading, at the
last bid price for long positions and the last ask price for short positions). Exchange-traded derivatives typically fall within Level 1
of the fair value hierarchy. Over-the-counter (“OTC”) and centrally cleared derivatives are valued using market transactions and
other market evidence, including market-based inputs to models, calibration to market-clearing transactions, broker or dealer
quotations, or other alternative pricing sources. Where models are used, the selection of a particular model to value OTC and
centrally cleared derivatives depends upon the contractual terms of, and specific risks inherent in, the instrument, as well as the
availability of pricing information in the market. Valuation models require a variety of inputs, including contractual terms, market
prices, yield curves, credit curves, measures of volatility, voluntary and involuntary prepayment rates, loss severity rates and
correlations of such inputs. For OTC and centrally cleared derivatives that trade in liquid markets, model inputs can generally be
verified and model selection does not involve significant management judgment. OTC and centrally cleared derivatives are
classified within Level 2 of the fair value hierarchy when significant inputs are corroborated by market evidence.
i. Forward Contracts — A forward contract is a contract between two parties to buy or sell an asset at a specified price on a
future date. A forward contract settlement can occur on a cash or delivery basis. Forward contracts are marked-to-market daily
using independent vendor prices, and the change in value, if any, is recorded as an unrealized gain or loss. Cash and certain
investments may be used to collateralize forward contracts.
A forward foreign currency exchange contract is a forward contract in which a Fund agrees to receive or deliver a fixed
quantity of one currency for another, at a pre-determined price at a future date. All forward foreign currency exchange
contracts are marked to market daily by using the outright forward rates or interpolating based upon maturity dates, where
available. Non-deliverable forward foreign currency exchange contracts are settled with the counterparty in cash without the
delivery of foreign currency.
ii. Futures Contracts — Futures contracts are contracts to buy or sell a standardized quantity of a specified commodity or
security. Upon entering into a futures contract, a Fund deposits cash or securities in an account on behalf of the broker in an
amount sufficient to meet the initial margin requirement. Subsequent payments are made or received by a Fund equal to the
daily change in the contract value and are recorded as variation margin receivable or payable with a corresponding offset to
unrealized gains or losses.
iii. Options — When a Fund writes call or put options, an amount equal to the premium received is recorded as a liability
and is subsequently marked-to-market to reflect the current value of the option written. Swaptions are options on swap
contracts.
Upon the purchase of a call option or a put option by a Fund, the premium paid is recorded as an investment and
subsequently marked-to-market to reflect the current value of the option. Certain options may be purchased with premiums to
183
G O L D M A N S A C H S M U L T I S E C T O R F I X E D I N C O M E F U N D S
Notes to Financial Statements (continued)September 30, 2021 (Unaudited)
3 . I N V E S T M E N T S A N D F A I R V A L U E M E A S U R E M E N T S ( c o n t i n u e d )
be determined on a future date. The premiums for these options are based upon implied volatility parameters at specified
terms.
iv. Swap Contracts — Bilateral swap contracts are agreements in which a Fund and a counterparty agree to exchange
periodic payments on a specified notional amount or make a net payment upon termination. Bilateral swap transactions are
privately negotiated in the OTC market and payments are settled through direct payments between a Fund and the
counterparty. By contrast, certain swap transactions are subject to mandatory central clearing. These swaps are executed
through a derivatives clearing member (“DCM”), acting in an agency capacity, and submitted to a central counterparty
(“CCP”) (“centrally cleared swaps”), in which case all payments are settled with the CCP through the DCM. Swaps are
marked-to-market daily using pricing vendor quotations, counterparty or clearinghouse prices or model prices, and the change
in value, if any, is recorded as an unrealized gain or loss. Upon entering into a swap contract, a Fund is required to satisfy an
initial margin requirement by delivering cash or securities to the counterparty (or in some cases, segregated in a triparty
account on behalf of the counterparty), which can be adjusted by any mark-to-market gains or losses pursuant to bilateral or
centrally cleared arrangements. For centrally cleared swaps the daily change in valuation, if any, is recorded as a receivable or
payable for variation margin.
An interest rate swap is an agreement that obligates two parties to exchange a series of cash flows at specified intervals,
based upon or calculated by reference to changes in interest rates on a specified notional principal amount. The payment flows
are usually netted against each other, with the difference being paid by one party to the other.
A credit default swap is an agreement that involves one party (the buyer of protection) making a stream of payments to
another party (the seller of protection) in exchange for the right to receive protection on a reference security or obligation,
including a group of assets or exposure to the performance of an index. A Fund’s investment in credit default swaps may
involve greater risks than if the Fund had invested in the referenced obligation directly. Credit events are contract specific but
may include bankruptcy, failure to pay, restructuring and obligation acceleration. If a Fund buys protection through a credit
default swap and no credit event occurs, its payments are limited to the periodic payments previously made to the
counterparty. Upon the occurrence of a specified credit event, a Fund, as a buyer of credit protection, is entitled to receive an
amount equal to the notional amount of the swap and deliver to the seller the defaulted reference obligation in a physically
settled trade. A Fund may also receive a net settlement amount in the form of cash or securities equal to the notional amount
of the swap reduced by the recovery value of the reference obligation in a cash settled trade.
As a seller of protection, a Fund generally receives a payment stream throughout the term of the swap, provided that
there is no credit event. In addition, if a Fund sells protection through a credit default swap, the Fund could suffer a loss
because the value of the referenced obligation and the premium payments received may be less than the notional amount of
the swap paid to the buyer of protection. Upon the occurrence of a specified credit event, a Fund, as a seller of credit
protection, may be required to take possession of the defaulted reference obligation and pay the buyer an amount equal to the
notional amount of the swap in a physically settled trade. A Fund may also pay a net settlement amount in the form of cash or
securities equal to the notional amount of the swap reduced by the recovery value of the reference obligation in a cash settled
trade. Recovery values are at times established through the credit event auction process in which market participants are
ensured that a transparent price has been set for the defaulted security or obligation. In addition, a Fund is entitled to a return
of any assets, which have been pledged as collateral to the counterparty upon settlement.
The maximum potential amount of future payments (undiscounted) that a Fund as seller of protection could be required
to make under a credit default swap would be an amount equal to the notional amount of the agreement. These potential
amounts would be partially offset by any recovery values of the respective referenced obligations or net amounts received
from a settlement of a credit default swap for the same reference security or obligation where a Fund bought credit protection.
A total return swap is an agreement that gives a Fund the right to receive or pay the appreciation or depreciation, as
applicable, in the value of a specified security, an index, a basket of securities or indices or other instrument in return for a fee
paid to the counterparty, which will typically be an agreed upon interest rate. If the underlying asset declines in value over the
term of the swap, a Fund may also be required to pay the dollar value of that decline to the counterparty.
184
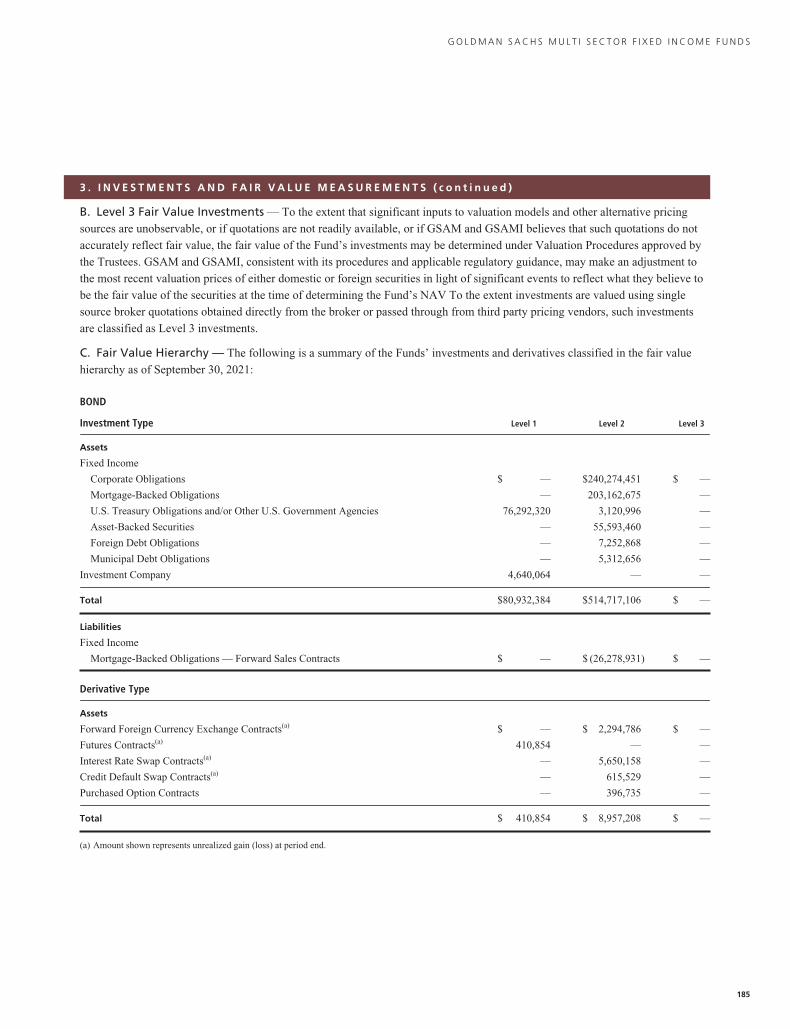
G O L D M A N S A C H S M U L T I S E C T O R F I X E D I N C O M E F U N D S
3 . I N V E S T M E N T S A N D F A I R V A L U E M E A S U R E M E N T S ( c o n t i n u e d )
B. Level 3 Fair Value Investments — To the extent that significant inputs to valuation models and other alternative pricing
sources are unobservable, or if quotations are not readily available, or if GSAM and GSAMI believes that such quotations do not
accurately reflect fair value, the fair value of the Fund’s investments may be determined under Valuation Procedures approved by
the Trustees. GSAM and GSAMI, consistent with its procedures and applicable regulatory guidance, may make an adjustment to
the most recent valuation prices of either domestic or foreign securities in light of significant events to reflect what they believe to
be the fair value of the securities at the time of determining the Fund’s NAV To the extent investments are valued using single
source broker quotations obtained directly from the broker or passed through from third party pricing vendors, such investments
are classified as Level 3 investments.
C. Fair Value Hierarchy — The following is a summary of the Funds’ investments and derivatives classified in the fair value
hierarchy as of September 30, 2021:
BOND
Investment Type Level 1 Level 2 Level 3
Assets
Fixed Income
Corporate Obligations $ — $240,274,451 $ —
Mortgage-Backed Obligations — 203,162,675 —
U.S. Treasury Obligations and/or Other U.S. Government Agencies 76,292,320 3,120,996 —
Asset-Backed Securities — 55,593,460 —
Foreign Debt Obligations — 7,252,868 —
Municipal Debt Obligations — 5,312,656 —
Investment Company 4,640,064 — —
Total $80,932,384 $514,717,106 $ —
Liabilities
Fixed Income
Mortgage-Backed Obligations — Forward Sales Contracts $ — $ (26,278,931) $ —
Derivative Type
Assets
Forward Foreign Currency Exchange Contracts(a) $ — $ 2,294,786 $ —
Futures Contracts(a) 410,854 — —
Interest Rate Swap Contracts(a) — 5,650,158 —
Credit Default Swap Contracts(a) — 615,529 —
Purchased Option Contracts — 396,735 —
Total $ 410,854 $ 8,957,208 $ —
(a) Amount shown represents unrealized gain (loss) at period end.
185
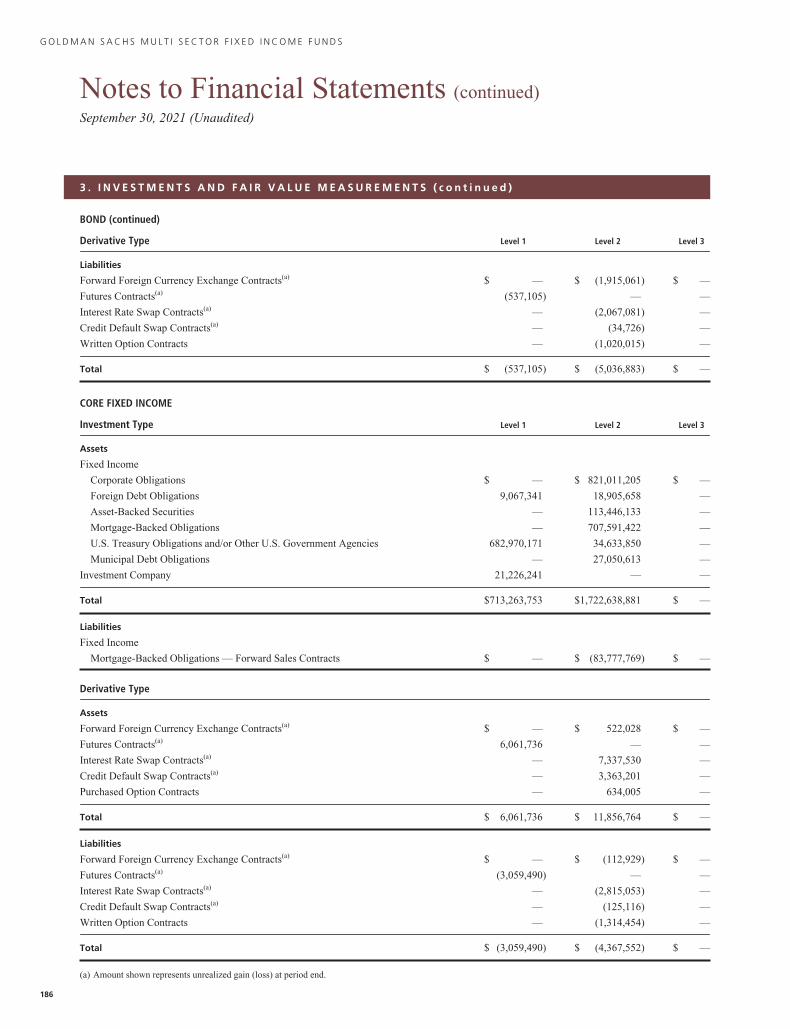
G O L D M A N S A C H S M U L T I S E C T O R F I X E D I N C O M E F U N D S
Notes to Financial Statements (continued)September 30, 2021 (Unaudited)
3 . I N V E S T M E N T S A N D F A I R V A L U E M E A S U R E M E N T S ( c o n t i n u e d )
BOND (continued)
Derivative Type Level 1 Level 2 Level 3
Liabilities
Forward Foreign Currency Exchange Contracts(a) $ — $ (1,915,061) $ —
Futures Contracts(a) (537,105) — —
Interest Rate Swap Contracts(a) — (2,067,081) —
Credit Default Swap Contracts(a) — (34,726) —
Written Option Contracts — (1,020,015) —
Total $ (537,105) $ (5,036,883) $ —
CORE FIXED INCOME
Investment Type Level 1 Level 2 Level 3
Assets
Fixed Income
Corporate Obligations $ — $ 821,011,205 $ —
Foreign Debt Obligations 9,067,341 18,905,658 —
Asset-Backed Securities — 113,446,133 —
Mortgage-Backed Obligations — 707,591,422 —
U.S. Treasury Obligations and/or Other U.S. Government Agencies 682,970,171 34,633,850 —
Municipal Debt Obligations — 27,050,613 —
Investment Company 21,226,241 — —
Total $713,263,753 $1,722,638,881 $ —
Liabilities
Fixed Income
Mortgage-Backed Obligations — Forward Sales Contracts $ — $ (83,777,769) $ —
Derivative Type
Assets
Forward Foreign Currency Exchange Contracts(a) $ — $ 522,028 $ —
Futures Contracts(a) 6,061,736 — —
Interest Rate Swap Contracts(a) — 7,337,530 —
Credit Default Swap Contracts(a) — 3,363,201 —
Purchased Option Contracts — 634,005 —
Total $ 6,061,736 $ 11,856,764 $ —
Liabilities
Forward Foreign Currency Exchange Contracts(a) $ — $ (112,929) $ —
Futures Contracts(a) (3,059,490) — —
Interest Rate Swap Contracts(a) — (2,815,053) —
Credit Default Swap Contracts(a) — (125,116) —
Written Option Contracts — (1,314,454) —
Total $ (3,059,490) $ (4,367,552) $ —
(a) Amount shown represents unrealized gain (loss) at period end.
186
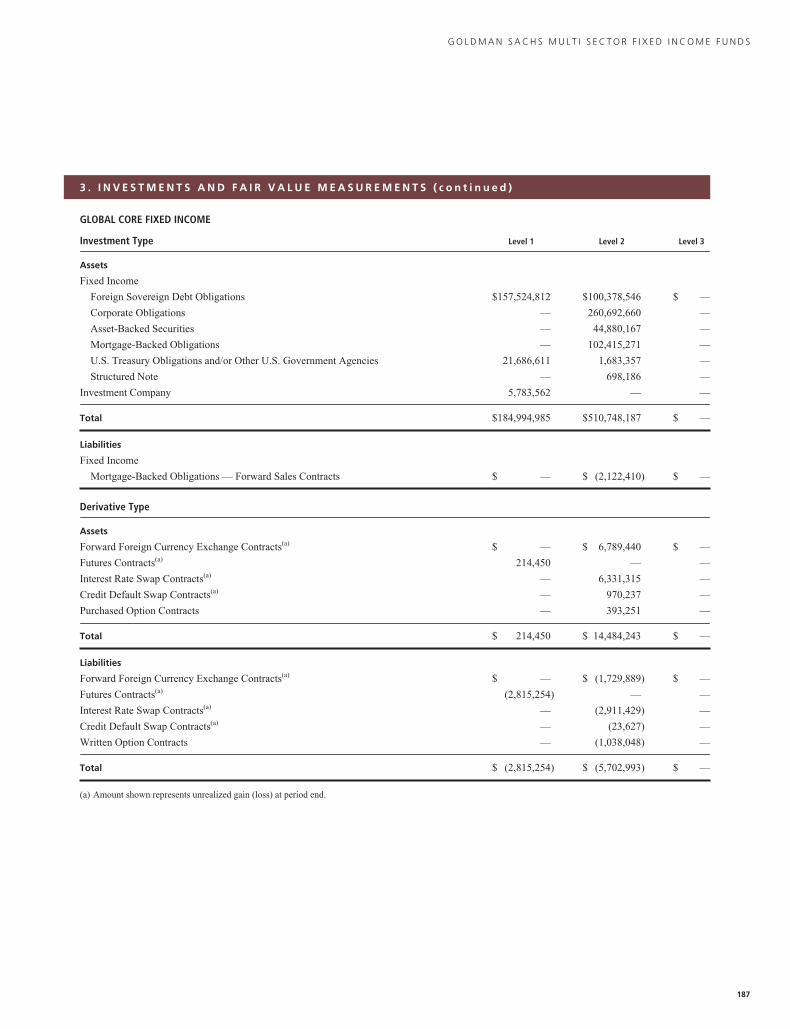
G O L D M A N S A C H S M U L T I S E C T O R F I X E D I N C O M E F U N D S
3 . I N V E S T M E N T S A N D F A I R V A L U E M E A S U R E M E N T S ( c o n t i n u e d )
GLOBAL CORE FIXED INCOME
Investment Type Level 1 Level 2 Level 3
Assets
Fixed Income
Foreign Sovereign Debt Obligations $157,524,812 $100,378,546 $ —
Corporate Obligations — 260,692,660 —
Asset-Backed Securities — 44,880,167 —
Mortgage-Backed Obligations — 102,415,271 —
U.S. Treasury Obligations and/or Other U.S. Government Agencies 21,686,611 1,683,357 —
Structured Note — 698,186 —
Investment Company 5,783,562 — —
Total $184,994,985 $510,748,187 $ —
Liabilities
Fixed Income
Mortgage-Backed Obligations — Forward Sales Contracts $ — $ (2,122,410) $ —
Derivative Type
Assets
Forward Foreign Currency Exchange Contracts(a) $ — $ 6,789,440 $ —
Futures Contracts(a) 214,450 — —
Interest Rate Swap Contracts(a) — 6,331,315 —
Credit Default Swap Contracts(a) — 970,237 —
Purchased Option Contracts — 393,251 —
Total $ 214,450 $ 14,484,243 $ —
Liabilities
Forward Foreign Currency Exchange Contracts(a) $ — $ (1,729,889) $ —
Futures Contracts(a) (2,815,254) — —
Interest Rate Swap Contracts(a) — (2,911,429) —
Credit Default Swap Contracts(a) — (23,627) —
Written Option Contracts — (1,038,048) —
Total $ (2,815,254) $ (5,702,993) $ —
(a) Amount shown represents unrealized gain (loss) at period end.
187
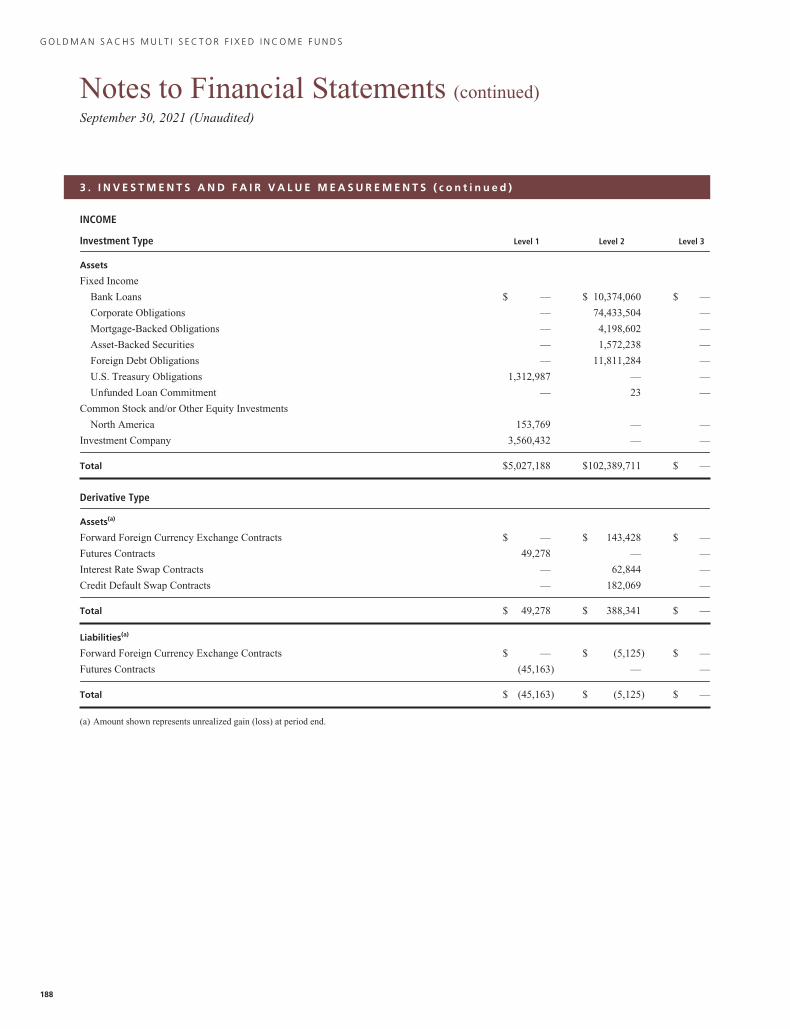
G O L D M A N S A C H S M U L T I S E C T O R F I X E D I N C O M E F U N D S
Notes to Financial Statements (continued)September 30, 2021 (Unaudited)
3 . I N V E S T M E N T S A N D F A I R V A L U E M E A S U R E M E N T S ( c o n t i n u e d )
INCOME
Investment Type Level 1 Level 2 Level 3
Assets
Fixed Income
Bank Loans $ — $ 10,374,060 $ —
Corporate Obligations — 74,433,504 —
Mortgage-Backed Obligations — 4,198,602 —
Asset-Backed Securities — 1,572,238 —
Foreign Debt Obligations — 11,811,284 —
U.S. Treasury Obligations 1,312,987 — —
Unfunded Loan Commitment — 23 —
Common Stock and/or Other Equity Investments
North America 153,769 — —
Investment Company 3,560,432 — —
Total $5,027,188 $102,389,711 $ —
Derivative Type
Assets(a)
Forward Foreign Currency Exchange Contracts $ — $ 143,428 $ —
Futures Contracts 49,278 — —
Interest Rate Swap Contracts — 62,844 —
Credit Default Swap Contracts — 182,069 —
Total $ 49,278 $ 388,341 $ —
Liabilities(a)
Forward Foreign Currency Exchange Contracts $ — $ (5,125) $ —
Futures Contracts (45,163) — —
Total $ (45,163) $ (5,125) $ —
(a) Amount shown represents unrealized gain (loss) at period end.
188
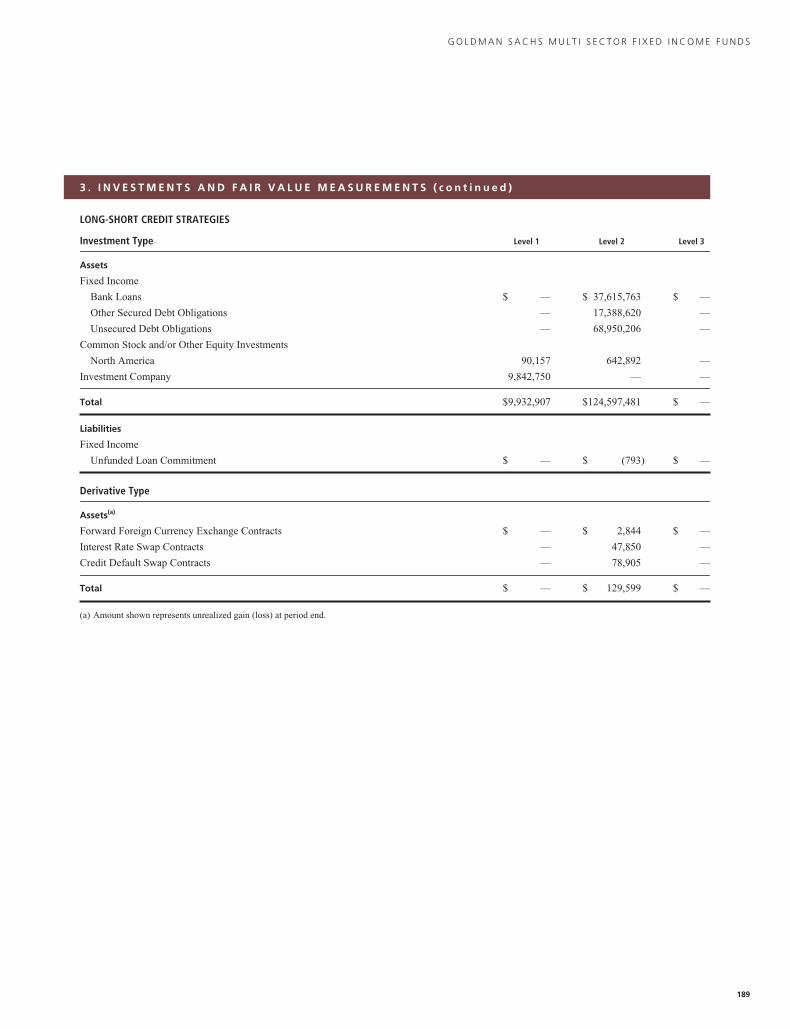
G O L D M A N S A C H S M U L T I S E C T O R F I X E D I N C O M E F U N D S
3 . I N V E S T M E N T S A N D F A I R V A L U E M E A S U R E M E N T S ( c o n t i n u e d )
LONG-SHORT CREDIT STRATEGIES
Investment Type Level 1 Level 2 Level 3
Assets
Fixed Income
Bank Loans $ — $ 37,615,763 $ —
Other Secured Debt Obligations — 17,388,620 —
Unsecured Debt Obligations — 68,950,206 —
Common Stock and/or Other Equity Investments
North America 90,157 642,892 —
Investment Company 9,842,750 — —
Total $9,932,907 $124,597,481 $ —
Liabilities
Fixed Income
Unfunded Loan Commitment $ — $ (793) $ —
Derivative Type
Assets(a)
Forward Foreign Currency Exchange Contracts $ — $ 2,844 $ —
Interest Rate Swap Contracts — 47,850 —
Credit Default Swap Contracts — 78,905 —
Total $ — $ 129,599 $ —
(a) Amount shown represents unrealized gain (loss) at period end.
189
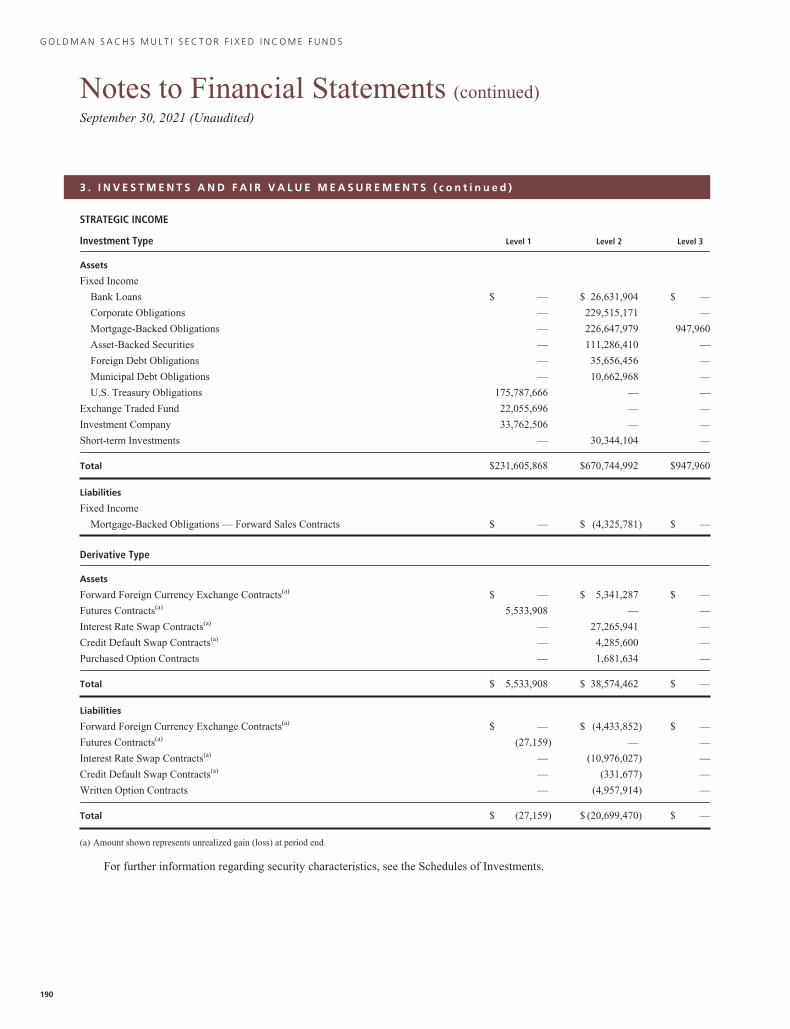
G O L D M A N S A C H S M U L T I S E C T O R F I X E D I N C O M E F U N D S
Notes to Financial Statements (continued)September 30, 2021 (Unaudited)
3 . I N V E S T M E N T S A N D F A I R V A L U E M E A S U R E M E N T S ( c o n t i n u e d )
STRATEGIC INCOME
Investment Type Level 1 Level 2 Level 3
Assets
Fixed Income
Bank Loans $ — $ 26,631,904 $ —
Corporate Obligations — 229,515,171 —
Mortgage-Backed Obligations — 226,647,979 947,960
Asset-Backed Securities — 111,286,410 —
Foreign Debt Obligations — 35,656,456 —
Municipal Debt Obligations — 10,662,968 —
U.S. Treasury Obligations 175,787,666 — —
Exchange Traded Fund 22,055,696 — —
Investment Company 33,762,506 — —
Short-term Investments — 30,344,104 —
Total $231,605,868 $670,744,992 $947,960
Liabilities
Fixed Income
Mortgage-Backed Obligations — Forward Sales Contracts $ — $ (4,325,781) $ —
Derivative Type
Assets
Forward Foreign Currency Exchange Contracts(a) $ — $ 5,341,287 $ —
Futures Contracts(a) 5,533,908 — —
Interest Rate Swap Contracts(a) — 27,265,941 —
Credit Default Swap Contracts(a) — 4,285,600 —
Purchased Option Contracts — 1,681,634 —
Total $ 5,533,908 $ 38,574,462 $ —
Liabilities
Forward Foreign Currency Exchange Contracts(a) $ — $ (4,433,852) $ —
Futures Contracts(a) (27,159) — —
Interest Rate Swap Contracts(a) — (10,976,027) —
Credit Default Swap Contracts(a) — (331,677) —
Written Option Contracts — (4,957,914) —
Total $ (27,159) $ (20,699,470) $ —
(a) Amount shown represents unrealized gain (loss) at period end.
For further information regarding security characteristics, see the Schedules of Investments.
190
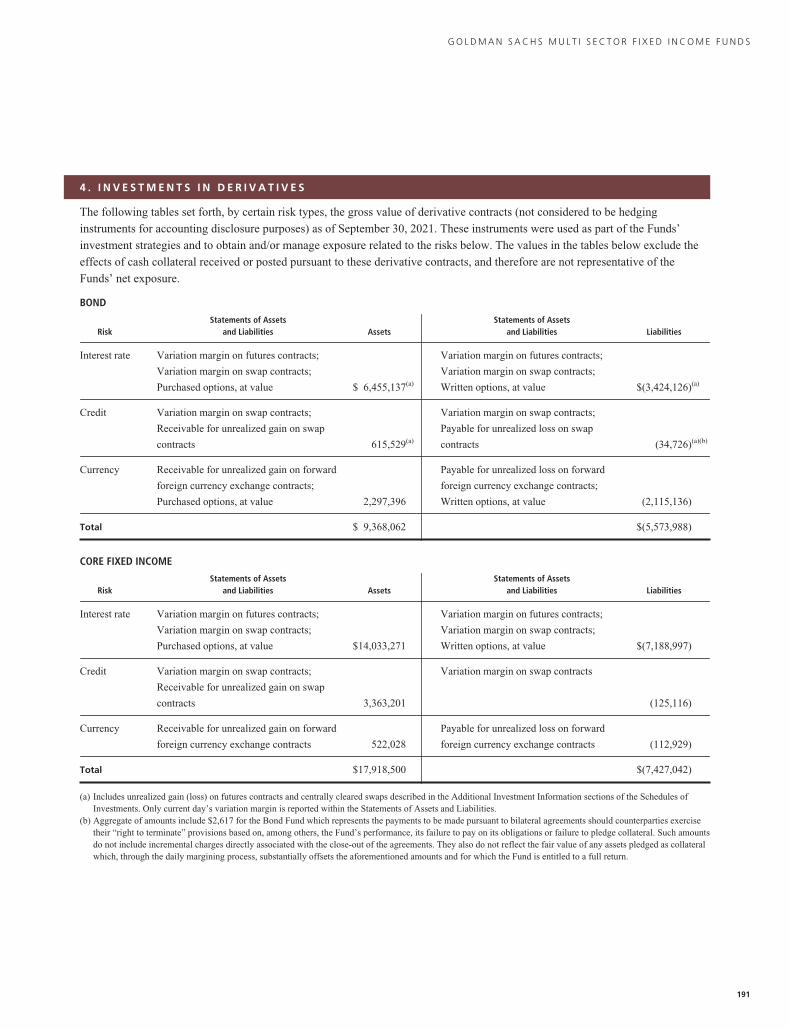
G O L D M A N S A C H S M U L T I S E C T O R F I X E D I N C O M E F U N D S
4 . I N V E S T M E N T S I N D E R I V A T I V E S
The following tables set forth, by certain risk types, the gross value of derivative contracts (not considered to be hedging
instruments for accounting disclosure purposes) as of September 30, 2021. These instruments were used as part of the Funds’
investment strategies and to obtain and/or manage exposure related to the risks below. The values in the tables below exclude the
effects of cash collateral received or posted pursuant to these derivative contracts, and therefore are not representative of the
Funds’ net exposure.
BOND
RiskStatements of Assets
and Liabilities AssetsStatements of Assets
and Liabilities Liabilities
Interest rate Variation margin on futures contracts;
Variation margin on swap contracts;
Purchased options, at value $ 6,455,137(a)
Variation margin on futures contracts;
Variation margin on swap contracts;
Written options, at value $(3,424,126)(a)
Credit Variation margin on swap contracts;
Receivable for unrealized gain on swap
contracts 615,529(a)
Variation margin on swap contracts;
Payable for unrealized loss on swap
contracts (34,726)(a)(b)
Currency Receivable for unrealized gain on forward
foreign currency exchange contracts;
Purchased options, at value 2,297,396
Payable for unrealized loss on forward
foreign currency exchange contracts;
Written options, at value (2,115,136)
Total $ 9,368,062 $(5,573,988)
CORE FIXED INCOME
RiskStatements of Assets
and Liabilities AssetsStatements of Assets
and Liabilities Liabilities
Interest rate Variation margin on futures contracts;
Variation margin on swap contracts;
Purchased options, at value $14,033,271
Variation margin on futures contracts;
Variation margin on swap contracts;
Written options, at value $(7,188,997)
Credit Variation margin on swap contracts;
Receivable for unrealized gain on swap
contracts 3,363,201
Variation margin on swap contracts
(125,116)
Currency Receivable for unrealized gain on forward
foreign currency exchange contracts 522,028
Payable for unrealized loss on forward
foreign currency exchange contracts (112,929)
Total $17,918,500 $(7,427,042)
(a) Includes unrealized gain (loss) on futures contracts and centrally cleared swaps described in the Additional Investment Information sections of the Schedules ofInvestments. Only current day’s variation margin is reported within the Statements of Assets and Liabilities.
(b) Aggregate of amounts include $2,617 for the Bond Fund which represents the payments to be made pursuant to bilateral agreements should counterparties exercisetheir “right to terminate” provisions based on, among others, the Fund’s performance, its failure to pay on its obligations or failure to pledge collateral. Such amountsdo not include incremental charges directly associated with the close-out of the agreements. They also do not reflect the fair value of any assets pledged as collateralwhich, through the daily margining process, substantially offsets the aforementioned amounts and for which the Fund is entitled to a full return.
191
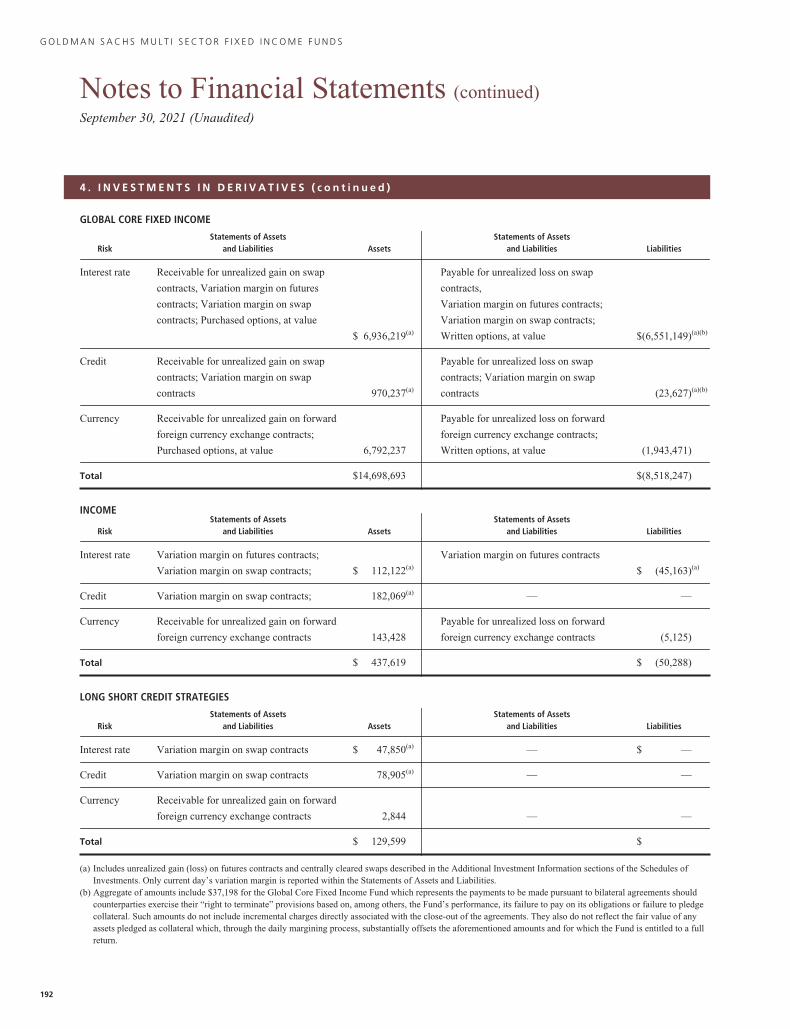
G O L D M A N S A C H S M U L T I S E C T O R F I X E D I N C O M E F U N D S
Notes to Financial Statements (continued)September 30, 2021 (Unaudited)
4 . I N V E S T M E N T S I N D E R I V A T I V E S ( c o n t i n u e d )
GLOBAL CORE FIXED INCOME
RiskStatements of Assets
and Liabilities AssetsStatements of Assets
and Liabilities Liabilities
Interest rate Receivable for unrealized gain on swap
contracts, Variation margin on futures
contracts; Variation margin on swap
contracts; Purchased options, at value
$ 6,936,219(a)
Payable for unrealized loss on swap
contracts,
Variation margin on futures contracts;
Variation margin on swap contracts;
Written options, at value $(6,551,149)(a)(b)
Credit Receivable for unrealized gain on swap
contracts; Variation margin on swap
contracts 970,237(a)
Payable for unrealized loss on swap
contracts; Variation margin on swap
contracts (23,627)(a)(b)
Currency Receivable for unrealized gain on forward
foreign currency exchange contracts;
Purchased options, at value 6,792,237
Payable for unrealized loss on forward
foreign currency exchange contracts;
Written options, at value (1,943,471)
Total $14,698,693 $(8,518,247)
INCOME
RiskStatements of Assets
and Liabilities AssetsStatements of Assets
and Liabilities Liabilities
Interest rate Variation margin on futures contracts;
Variation margin on swap contracts; $ 112,122(a)
Variation margin on futures contracts
$ (45,163)(a)
Credit Variation margin on swap contracts; 182,069(a) — —
Currency Receivable for unrealized gain on forward
foreign currency exchange contracts 143,428
Payable for unrealized loss on forward
foreign currency exchange contracts (5,125)
Total $ 437,619 $ (50,288)
LONG SHORT CREDIT STRATEGIES
RiskStatements of Assets
and Liabilities AssetsStatements of Assets
and Liabilities Liabilities
Interest rate Variation margin on swap contracts $ 47,850(a) — $ —
Credit Variation margin on swap contracts 78,905(a) — —
Currency Receivable for unrealized gain on forward
foreign currency exchange contracts 2,844 — —
Total $ 129,599 $
(a) Includes unrealized gain (loss) on futures contracts and centrally cleared swaps described in the Additional Investment Information sections of the Schedules ofInvestments. Only current day’s variation margin is reported within the Statements of Assets and Liabilities.
(b) Aggregate of amounts include $37,198 for the Global Core Fixed Income Fund which represents the payments to be made pursuant to bilateral agreements shouldcounterparties exercise their “right to terminate” provisions based on, among others, the Fund’s performance, its failure to pay on its obligations or failure to pledgecollateral. Such amounts do not include incremental charges directly associated with the close-out of the agreements. They also do not reflect the fair value of anyassets pledged as collateral which, through the daily margining process, substantially offsets the aforementioned amounts and for which the Fund is entitled to a fullreturn.
192
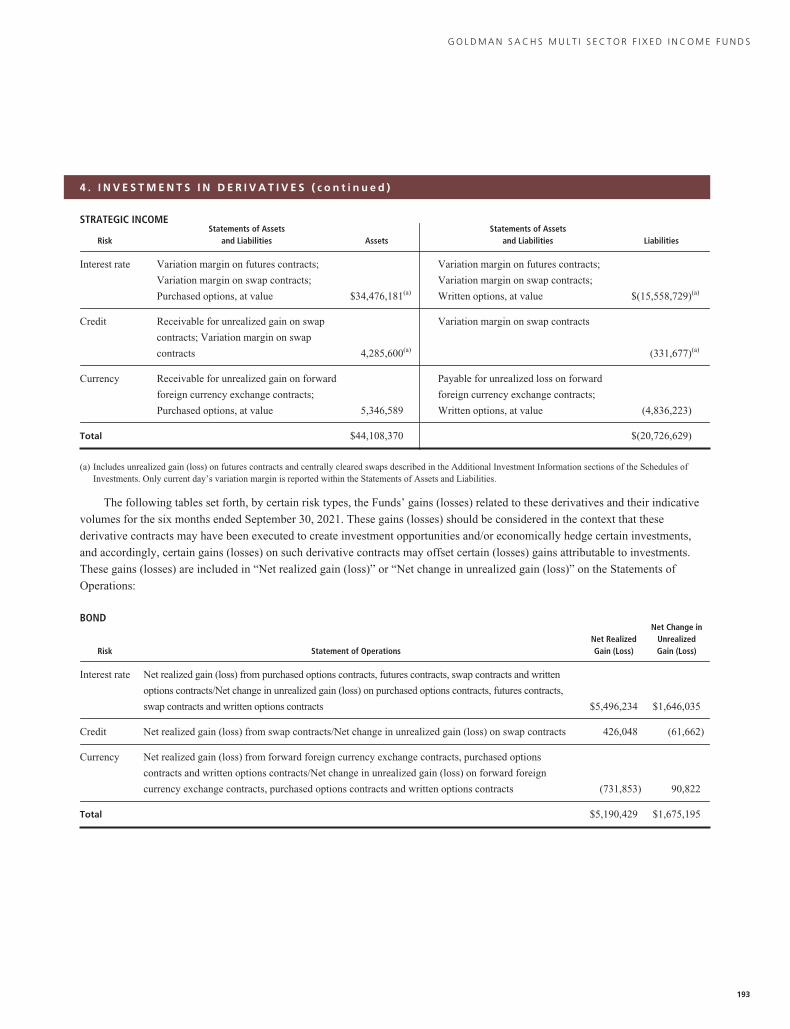
G O L D M A N S A C H S M U L T I S E C T O R F I X E D I N C O M E F U N D S
4 . I N V E S T M E N T S I N D E R I V A T I V E S ( c o n t i n u e d )
STRATEGIC INCOME
RiskStatements of Assets
and Liabilities AssetsStatements of Assets
and Liabilities Liabilities
Interest rate Variation margin on futures contracts;
Variation margin on swap contracts;
Purchased options, at value $34,476,181(a)
Variation margin on futures contracts;
Variation margin on swap contracts;
Written options, at value $(15,558,729)(a)
Credit Receivable for unrealized gain on swap
contracts; Variation margin on swap
contracts 4,285,600(a)
Variation margin on swap contracts
(331,677)(a)
Currency Receivable for unrealized gain on forward
foreign currency exchange contracts;
Purchased options, at value 5,346,589
Payable for unrealized loss on forward
foreign currency exchange contracts;
Written options, at value (4,836,223)
Total $44,108,370 $(20,726,629)
(a) Includes unrealized gain (loss) on futures contracts and centrally cleared swaps described in the Additional Investment Information sections of the Schedules ofInvestments. Only current day’s variation margin is reported within the Statements of Assets and Liabilities.
The following tables set forth, by certain risk types, the Funds’ gains (losses) related to these derivatives and their indicative
volumes for the six months ended September 30, 2021. These gains (losses) should be considered in the context that these
derivative contracts may have been executed to create investment opportunities and/or economically hedge certain investments,
and accordingly, certain gains (losses) on such derivative contracts may offset certain (losses) gains attributable to investments.
These gains (losses) are included in “Net realized gain (loss)” or “Net change in unrealized gain (loss)” on the Statements of
Operations:
BOND
Risk Statement of OperationsNet RealizedGain (Loss)
Net Change inUnrealizedGain (Loss)
Interest rate Net realized gain (loss) from purchased options contracts, futures contracts, swap contracts and written
options contracts/Net change in unrealized gain (loss) on purchased options contracts, futures contracts,
swap contracts and written options contracts $5,496,234 $1,646,035
Credit Net realized gain (loss) from swap contracts/Net change in unrealized gain (loss) on swap contracts 426,048 (61,662)
Currency Net realized gain (loss) from forward foreign currency exchange contracts, purchased options
contracts and written options contracts/Net change in unrealized gain (loss) on forward foreign
currency exchange contracts, purchased options contracts and written options contracts (731,853) 90,822
Total $5,190,429 $1,675,195
193
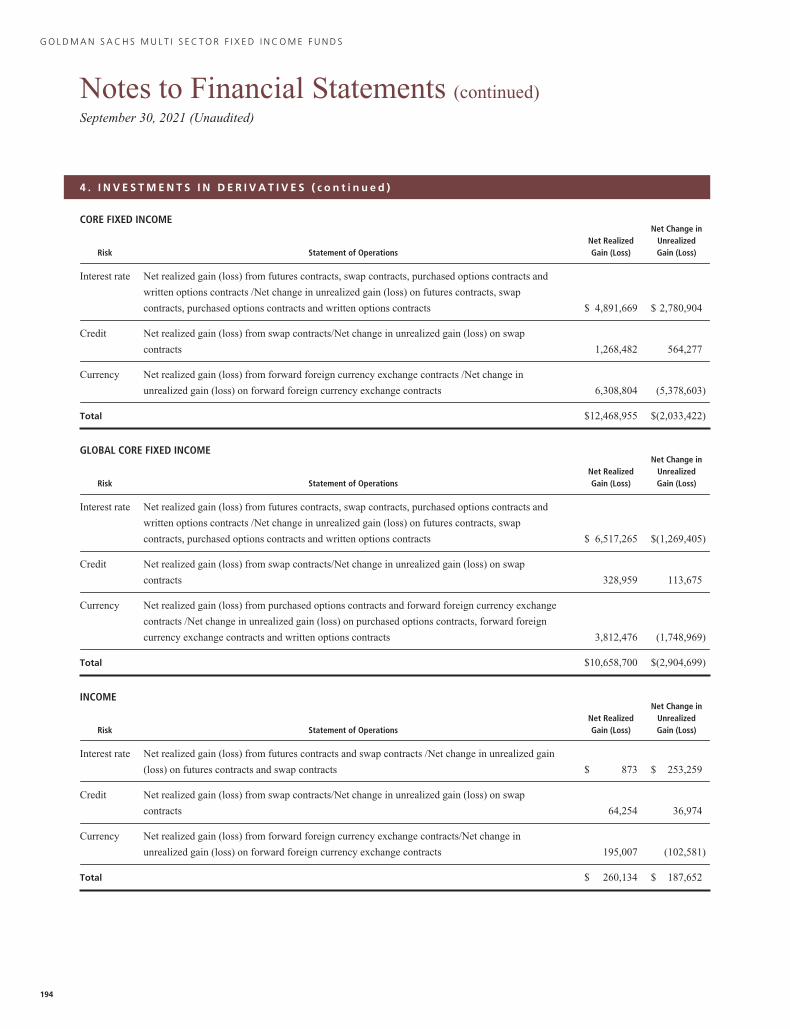
G O L D M A N S A C H S M U L T I S E C T O R F I X E D I N C O M E F U N D S
Notes to Financial Statements (continued)September 30, 2021 (Unaudited)
4 . I N V E S T M E N T S I N D E R I V A T I V E S ( c o n t i n u e d )
CORE FIXED INCOME
Risk Statement of OperationsNet RealizedGain (Loss)
Net Change inUnrealizedGain (Loss)
Interest rate Net realized gain (loss) from futures contracts, swap contracts, purchased options contracts and
written options contracts /Net change in unrealized gain (loss) on futures contracts, swap
contracts, purchased options contracts and written options contracts $ 4,891,669 $ 2,780,904
Credit Net realized gain (loss) from swap contracts/Net change in unrealized gain (loss) on swap
contracts 1,268,482 564,277
Currency Net realized gain (loss) from forward foreign currency exchange contracts /Net change in
unrealized gain (loss) on forward foreign currency exchange contracts 6,308,804 (5,378,603)
Total $12,468,955 $(2,033,422)
GLOBAL CORE FIXED INCOME
Risk Statement of OperationsNet RealizedGain (Loss)
Net Change inUnrealizedGain (Loss)
Interest rate Net realized gain (loss) from futures contracts, swap contracts, purchased options contracts and
written options contracts /Net change in unrealized gain (loss) on futures contracts, swap
contracts, purchased options contracts and written options contracts $ 6,517,265 $(1,269,405)
Credit Net realized gain (loss) from swap contracts/Net change in unrealized gain (loss) on swap
contracts 328,959 113,675
Currency Net realized gain (loss) from purchased options contracts and forward foreign currency exchange
contracts /Net change in unrealized gain (loss) on purchased options contracts, forward foreign
currency exchange contracts and written options contracts 3,812,476 (1,748,969)
Total $10,658,700 $(2,904,699)
INCOME
Risk Statement of OperationsNet RealizedGain (Loss)
Net Change inUnrealizedGain (Loss)
Interest rate Net realized gain (loss) from futures contracts and swap contracts /Net change in unrealized gain
(loss) on futures contracts and swap contracts $ 873 $ 253,259
Credit Net realized gain (loss) from swap contracts/Net change in unrealized gain (loss) on swap
contracts 64,254 36,974
Currency Net realized gain (loss) from forward foreign currency exchange contracts/Net change in
unrealized gain (loss) on forward foreign currency exchange contracts 195,007 (102,581)
Total $ 260,134 $ 187,652
194
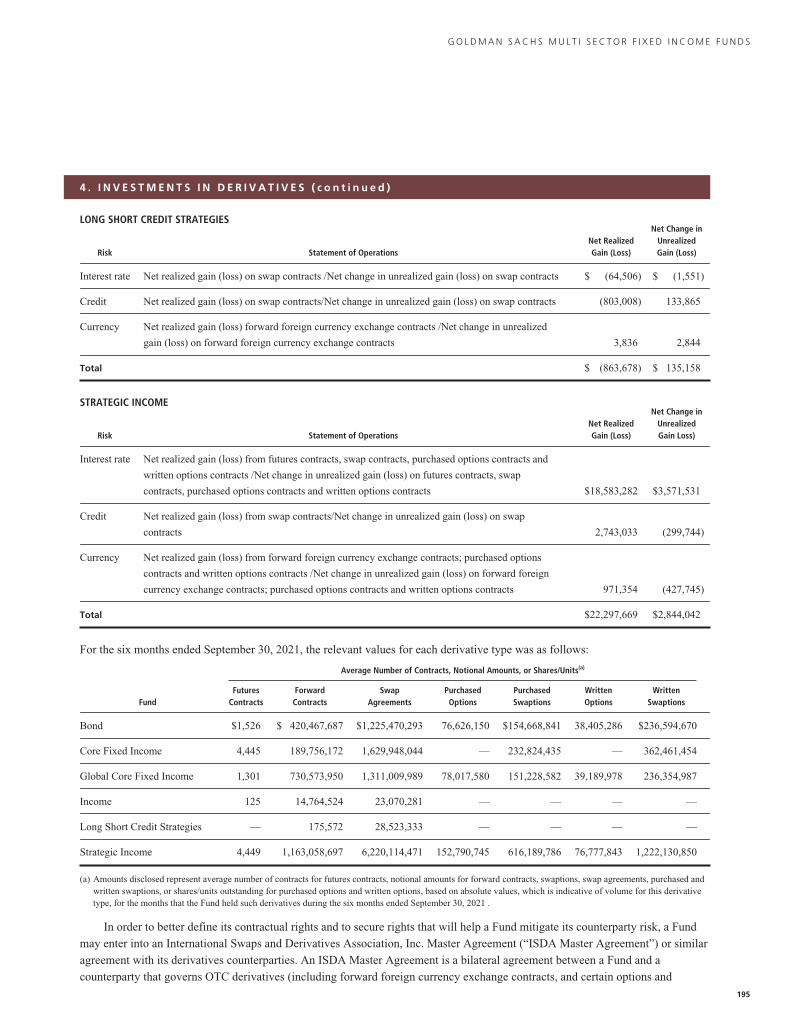
G O L D M A N S A C H S M U L T I S E C T O R F I X E D I N C O M E F U N D S
4 . I N V E S T M E N T S I N D E R I V A T I V E S ( c o n t i n u e d )
LONG SHORT CREDIT STRATEGIES
Risk Statement of OperationsNet RealizedGain (Loss)
Net Change inUnrealizedGain (Loss)
Interest rate Net realized gain (loss) on swap contracts /Net change in unrealized gain (loss) on swap contracts $ (64,506) $ (1,551)
Credit Net realized gain (loss) on swap contracts/Net change in unrealized gain (loss) on swap contracts (803,008) 133,865
Currency Net realized gain (loss) forward foreign currency exchange contracts /Net change in unrealized
gain (loss) on forward foreign currency exchange contracts 3,836 2,844
Total $ (863,678) $ 135,158
STRATEGIC INCOME
Risk Statement of OperationsNet RealizedGain (Loss)
Net Change inUnrealizedGain Loss)
Interest rate Net realized gain (loss) from futures contracts, swap contracts, purchased options contracts and
written options contracts /Net change in unrealized gain (loss) on futures contracts, swap
contracts, purchased options contracts and written options contracts $18,583,282 $3,571,531
Credit Net realized gain (loss) from swap contracts/Net change in unrealized gain (loss) on swap
contracts 2,743,033 (299,744)
Currency Net realized gain (loss) from forward foreign currency exchange contracts; purchased options
contracts and written options contracts /Net change in unrealized gain (loss) on forward foreign
currency exchange contracts; purchased options contracts and written options contracts 971,354 (427,745)
Total $22,297,669 $2,844,042
For the six months ended September 30, 2021, the relevant values for each derivative type was as follows:
Average Number of Contracts, Notional Amounts, or Shares/Units(a)
FundFutures
ContractsForwardContracts
SwapAgreements
PurchasedOptions
PurchasedSwaptions
WrittenOptions
WrittenSwaptions
Bond $1,526 $ 420,467,687 $1,225,470,293 76,626,150 $154,668,841 38,405,286 $236,594,670
Core Fixed Income 4,445 189,756,172 1,629,948,044 — 232,824,435 — 362,461,454
Global Core Fixed Income 1,301 730,573,950 1,311,009,989 78,017,580 151,228,582 39,189,978 236,354,987
Income 125 14,764,524 23,070,281 — — — —
Long Short Credit Strategies — 175,572 28,523,333 — — — —
Strategic Income 4,449 1,163,058,697 6,220,114,471 152,790,745 616,189,786 76,777,843 1,222,130,850
(a) Amounts disclosed represent average number of contracts for futures contracts, notional amounts for forward contracts, swaptions, swap agreements, purchased andwritten swaptions, or shares/units outstanding for purchased options and written options, based on absolute values, which is indicative of volume for this derivativetype, for the months that the Fund held such derivatives during the six months ended September 30, 2021 .
In order to better define its contractual rights and to secure rights that will help a Fund mitigate its counterparty risk, a Fund
may enter into an International Swaps and Derivatives Association, Inc. Master Agreement (“ISDA Master Agreement”) or similar
agreement with its derivatives counterparties. An ISDA Master Agreement is a bilateral agreement between a Fund and a
counterparty that governs OTC derivatives (including forward foreign currency exchange contracts, and certain options and
195
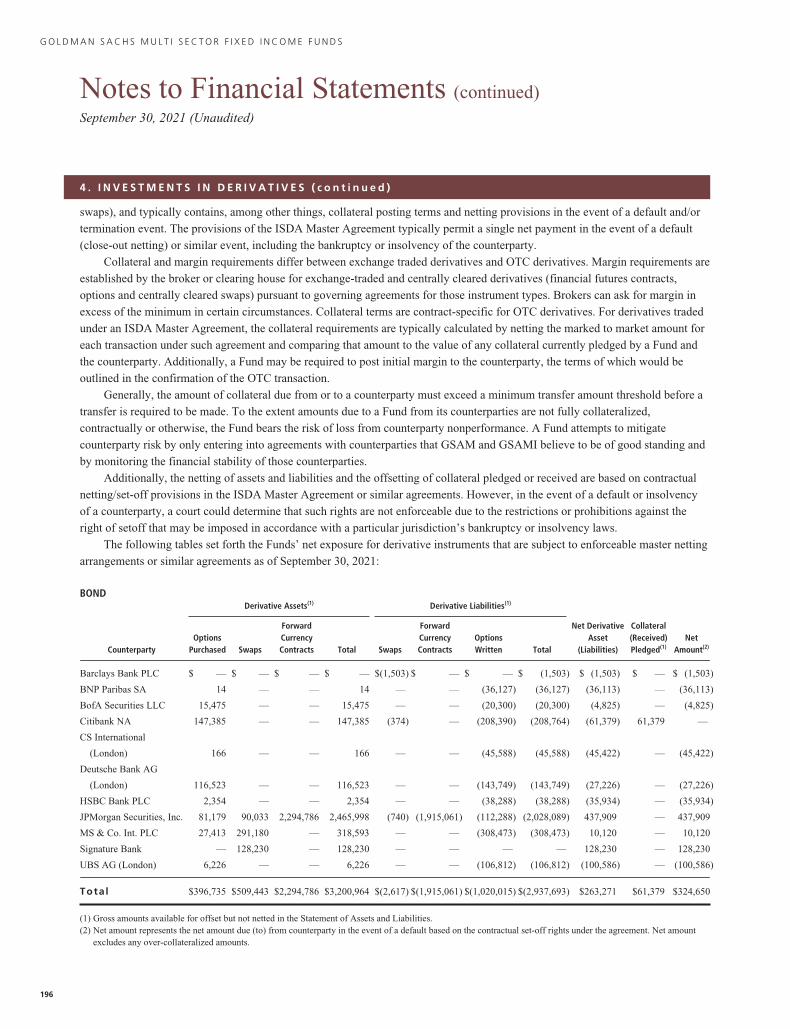
G O L D M A N S A C H S M U L T I S E C T O R F I X E D I N C O M E F U N D S
Notes to Financial Statements (continued)September 30, 2021 (Unaudited)
4 . I N V E S T M E N T S I N D E R I V A T I V E S ( c o n t i n u e d )
swaps), and typically contains, among other things, collateral posting terms and netting provisions in the event of a default and/or
termination event. The provisions of the ISDA Master Agreement typically permit a single net payment in the event of a default
(close-out netting) or similar event, including the bankruptcy or insolvency of the counterparty.
Collateral and margin requirements differ between exchange traded derivatives and OTC derivatives. Margin requirements are
established by the broker or clearing house for exchange-traded and centrally cleared derivatives (financial futures contracts,
options and centrally cleared swaps) pursuant to governing agreements for those instrument types. Brokers can ask for margin in
excess of the minimum in certain circumstances. Collateral terms are contract-specific for OTC derivatives. For derivatives traded
under an ISDA Master Agreement, the collateral requirements are typically calculated by netting the marked to market amount for
each transaction under such agreement and comparing that amount to the value of any collateral currently pledged by a Fund and
the counterparty. Additionally, a Fund may be required to post initial margin to the counterparty, the terms of which would be
outlined in the confirmation of the OTC transaction.
Generally, the amount of collateral due from or to a counterparty must exceed a minimum transfer amount threshold before a
transfer is required to be made. To the extent amounts due to a Fund from its counterparties are not fully collateralized,
contractually or otherwise, the Fund bears the risk of loss from counterparty nonperformance. A Fund attempts to mitigate
counterparty risk by only entering into agreements with counterparties that GSAM and GSAMI believe to be of good standing and
by monitoring the financial stability of those counterparties.
Additionally, the netting of assets and liabilities and the offsetting of collateral pledged or received are based on contractual
netting/set-off provisions in the ISDA Master Agreement or similar agreements. However, in the event of a default or insolvency
of a counterparty, a court could determine that such rights are not enforceable due to the restrictions or prohibitions against the
right of setoff that may be imposed in accordance with a particular jurisdiction’s bankruptcy or insolvency laws.
The following tables set forth the Funds’ net exposure for derivative instruments that are subject to enforceable master netting
arrangements or similar agreements as of September 30, 2021:
BONDDerivative Assets(1) Derivative Liabilities(1)
CounterpartyOptions
Purchased Swaps
ForwardCurrencyContracts Total Swaps
ForwardCurrencyContracts
OptionsWritten Total
Net DerivativeAsset
(Liabilities)
Collateral(Received)Pledged(1)
NetAmount(2)
Barclays Bank PLC $ — $ — $ — $ — $(1,503) $ — $ — $ (1,503) $ (1,503) $ — $ (1,503)
BNP Paribas SA 14 — — 14 — — (36,127) (36,127) (36,113) — (36,113)
BofA Securities LLC 15,475 — — 15,475 — — (20,300) (20,300) (4,825) — (4,825)
Citibank NA 147,385 — — 147,385 (374) — (208,390) (208,764) (61,379) 61,379 —
CS International
(London) 166 — — 166 — — (45,588) (45,588) (45,422) — (45,422)
Deutsche Bank AG
(London) 116,523 — — 116,523 — — (143,749) (143,749) (27,226) — (27,226)
HSBC Bank PLC 2,354 — — 2,354 — — (38,288) (38,288) (35,934) — (35,934)
JPMorgan Securities, Inc. 81,179 90,033 2,294,786 2,465,998 (740) (1,915,061) (112,288) (2,028,089) 437,909 — 437,909
MS & Co. Int. PLC 27,413 291,180 — 318,593 — — (308,473) (308,473) 10,120 — 10,120
Signature Bank — 128,230 — 128,230 — — — — 128,230 — 128,230
UBS AG (London) 6,226 — — 6,226 — — (106,812) (106,812) (100,586) — (100,586)
Total $396,735 $509,443 $2,294,786 $3,200,964 $(2,617) $(1,915,061) $(1,020,015) $(2,937,693) $263,271 $61,379 $324,650
(1) Gross amounts available for offset but not netted in the Statement of Assets and Liabilities.(2) Net amount represents the net amount due (to) from counterparty in the event of a default based on the contractual set-off rights under the agreement. Net amount
excludes any over-collateralized amounts.
196
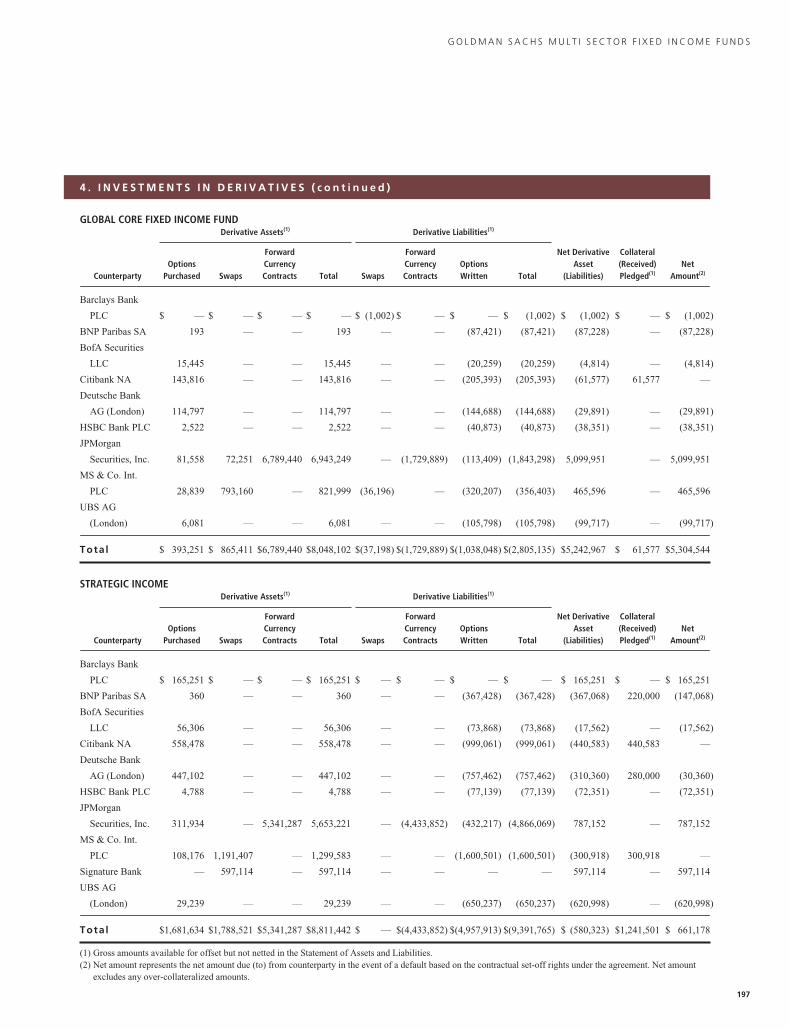
G O L D M A N S A C H S M U L T I S E C T O R F I X E D I N C O M E F U N D S
4 . I N V E S T M E N T S I N D E R I V A T I V E S ( c o n t i n u e d )
GLOBAL CORE FIXED INCOME FUNDDerivative Assets(1) Derivative Liabilities(1)
CounterpartyOptions
Purchased Swaps
ForwardCurrencyContracts Total Swaps
ForwardCurrencyContracts
OptionsWritten Total
Net DerivativeAsset
(Liabilities)
Collateral(Received)Pledged(1)
NetAmount(2)
Barclays Bank
PLC $ — $ — $ — $ — $ (1,002) $ — $ — $ (1,002) $ (1,002) $ — $ (1,002)
BNP Paribas SA 193 — — 193 — — (87,421) (87,421) (87,228) — (87,228)
BofA Securities
LLC 15,445 — — 15,445 — — (20,259) (20,259) (4,814) — (4,814)
Citibank NA 143,816 — — 143,816 — — (205,393) (205,393) (61,577) 61,577 —
Deutsche Bank
AG (London) 114,797 — — 114,797 — — (144,688) (144,688) (29,891) — (29,891)
HSBC Bank PLC 2,522 — — 2,522 — — (40,873) (40,873) (38,351) — (38,351)
JPMorgan
Securities, Inc. 81,558 72,251 6,789,440 6,943,249 — (1,729,889) (113,409) (1,843,298) 5,099,951 — 5,099,951
MS & Co. Int.
PLC 28,839 793,160 — 821,999 (36,196) — (320,207) (356,403) 465,596 — 465,596
UBS AG
(London) 6,081 — — 6,081 — — (105,798) (105,798) (99,717) — (99,717)
Total $ 393,251 $ 865,411 $6,789,440 $8,048,102 $(37,198) $(1,729,889) $(1,038,048) $(2,805,135) $5,242,967 $ 61,577 $5,304,544
STRATEGIC INCOMEDerivative Assets(1) Derivative Liabilities(1)
CounterpartyOptions
Purchased Swaps
ForwardCurrencyContracts Total Swaps
ForwardCurrencyContracts
OptionsWritten Total
Net DerivativeAsset
(Liabilities)
Collateral(Received)Pledged(1)
NetAmount(2)
Barclays Bank
PLC $ 165,251 $ — $ — $ 165,251 $ — $ — $ — $ — $ 165,251 $ — $ 165,251
BNP Paribas SA 360 — — 360 — — (367,428) (367,428) (367,068) 220,000 (147,068)
BofA Securities
LLC 56,306 — — 56,306 — — (73,868) (73,868) (17,562) — (17,562)
Citibank NA 558,478 — — 558,478 — — (999,061) (999,061) (440,583) 440,583 —
Deutsche Bank
AG (London) 447,102 — — 447,102 — — (757,462) (757,462) (310,360) 280,000 (30,360)
HSBC Bank PLC 4,788 — — 4,788 — — (77,139) (77,139) (72,351) — (72,351)
JPMorgan
Securities, Inc. 311,934 — 5,341,287 5,653,221 — (4,433,852) (432,217) (4,866,069) 787,152 — 787,152
MS & Co. Int.
PLC 108,176 1,191,407 — 1,299,583 — — (1,600,501) (1,600,501) (300,918) 300,918 —
Signature Bank — 597,114 — 597,114 — — — — 597,114 — 597,114
UBS AG
(London) 29,239 — — 29,239 — — (650,237) (650,237) (620,998) — (620,998)
Total $1,681,634 $1,788,521 $5,341,287 $8,811,442 $ — $(4,433,852) $(4,957,913) $(9,391,765) $ (580,323) $1,241,501 $ 661,178
(1) Gross amounts available for offset but not netted in the Statement of Assets and Liabilities.(2) Net amount represents the net amount due (to) from counterparty in the event of a default based on the contractual set-off rights under the agreement. Net amount
excludes any over-collateralized amounts.
197
G O L D M A N S A C H S M U L T I S E C T O R F I X E D I N C O M E F U N D S
Notes to Financial Statements (continued)September 30, 2021 (Unaudited)
5 . A G R E E M E N T S A N D A F F I L I A T E D T R A N S A C T I O N S
A. Management Agreement — Under the Agreement, GSAM and GSAMI manage the Funds, subject to the general
supervision of the Trustees.
As compensation for the services rendered pursuant to the Agreement, the assumption of the expenses related thereto and
administration of the Funds’ business affairs, including providing facilities, GSAM and GSAMI are entitled to a management fee,
accrued daily and paid monthly, equal to an annual percentage rate of each applicable Fund’s average daily net assets.
For the six months ended September 30, 2021, contractual and effective net management fees with GSAM and GSAMI were
at the following rates:
FundFirst
$1 billionNext
$1 billionNext
$3 billionNext
$3 billionOver
$8 billionEffective
Rate
Effective NetManagement
Rate#
Bond 0.41% 0.37% 0.35% 0.34% 0.34% 0.41% 0.40%
Core Fixed Income 0.40 0.36 0.34 0.33 0.32 0.38 0.33*
Global Core Fixed Income 0.65 0.59 0.56 0.55 0.54 0.65 0.61**
Income 0.55 0.50 0.47 0.46 0.45 0.55 0.55
Long Short Credit Strategies 1.00 0.90 0.86 0.84 0.82 1.00 0.99
Strategic Income 0.60 0.54 0.51 0.50 0.49 0.60 0.58
# Effective Net Management Rate includes impact of management fee waivers of underlying funds, if any.* The Investment Adviser agreed to waive a portion of the Management Fee so that the net management fee will not exceed 0.33% as an annual percentage rate of the
Fund’s average net assets. This management fee waiver arrangement will remain in effect through at least July 29, 2022, and prior to such date, GSAM may notterminate the arrangement without the approval of the Board of Trustees.
** Effective July 29, 2021, the Investment Adviser agreed to waive a portion of the Management Fee in order to achieve an effective net management fee rate of 0.56%as an annual percentage rate of the average daily net assets of the Fund. This management fee waiver arrangement will remain in effect through at least July 29,2022, and prior to such date, GSAMI may not terminate the arrangement without the approval of the Board of Trustees. Prior to July 29, 2021, the InvestmentAdviser had agreed to waive a portion of its management fee equal to 0.01% of the Fund’s average daily net assets.
The Funds invest in Institutional Shares of the Goldman Sachs Financial Square Government Fund and in shares of the
Goldman Sachs Access High Yield Corporate Bond ETF, which are affiliated Underlying Funds. GSAM and GSAMI have agreed
to waive a portion of their management fee payable by the Funds in an amount equal to the management fee they earn as
investment advisers to the affiliated Underlying Funds in which the Funds invest, except those management fees it earns from the
Funds’ investment of cash collateral received in connection with securities lending transactions in the Government Money Market
Fund. For the six months ended September 30, 2021, GSAM waived $16,790, $51,089, $1,890, $6,226 and $91,324 of the Fund’s
management fee for the Bond, Core Fixed Income, Income, Long Short Credit Strategies and Strategic Income Funds, respectively.
For the six months ended September 30, 2021, GSAMI waived $3,642 of the Fund’s management fee for the Global Core Fixed
Income Fund.
B. Distribution and/or Service (12b-1) Plans — The Trust, on behalf of Class A and Class R Shares of each applicable Fund,
has adopted Distribution and Service Plans subject to Rule 12b-1 under the Act. Under the Distribution and Service Plans,
Goldman Sachs, which serves as distributor (the “Distributor”), is entitled to a fee accrued daily and paid monthly for distribution
services and personal and account maintenance services, which may then be paid by Goldman Sachs to authorized dealers. These
fees are equal to an annual percentage rate of the average daily net assets attributable to Class A or Class R Shares of the Funds, as
applicable, as set forth below.
The Trust, on behalf of Class C Shares of each applicable Fund, has adopted a Distribution Plan subject to Rule 12b-1 under
the Act. Under the Distribution Plan, Goldman Sachs as Distributor is entitled to a fee accrued daily and paid monthly for
distribution services, which may then be paid by Goldman Sachs to authorized dealers. These fees are equal to an annual
percentage rate of the average daily net assets attributable to Class C Shares of the Funds, as set forth below.
The Trust, on behalf of Service Shares of each applicable Fund, has adopted a Service Plan subject to Rule 12b-1 under the
Act to allow Service Shares to compensate service organizations (including Goldman Sachs) for providing personal and account
maintenance services to their customers who are beneficial owners of such shares. The Service Plan provides for compensation to198
G O L D M A N S A C H S M U L T I S E C T O R F I X E D I N C O M E F U N D S
5 . A G R E E M E N T S A N D A F F I L I A T E D T R A N S A C T I O N S ( c o n t i n u e d )
the service organizations equal to an annual percentage rate of the average daily net assets attributable to Service Shares of the
Funds, as set forth below.
Distribution and/or Service Plan Rates
Class A* Class C Class R* Service
Distribution and/or Service Plan 0.25% 0.75% 0.50% 0.25%
* With respect to Class A and Class R Shares, the Distributor at its discretion may use compensation for distribution services paid under the Distribution and/or ServicePlan to compensate service organizations for personal and account maintenance services and expenses as long as such total compensation does not exceed themaximum cap on “service fees” imposed by the Financial Industry Regulatory Authority.
C. Distribution Agreement — Goldman Sachs, as Distributor of the shares of the Funds pursuant to a Distribution Agreement,
may retain a portion of the Class A Shares’ front end sales charge and Class C Shares’ CDSC. During the six months ended
September 30, 2021, Goldman Sachs retained the following amounts:
Front EndSales Charge
Contingent DeferredSales Charge
Fund Class A Class C
Bond $5,724 $ 7
Core Fixed Income 3,861 332
Global Core Fixed Income 426 —
Income 1,710 —
Long Short Credit Strategies 1 —
Strategic Income 321 1
D. Service and Shareholder Administration Plans — The Trust, on behalf of each applicable Fund, has adopted a Service
Plan to allow Class C Shares and Shareholder Administration Plans to allow Service Shares, respectively, to compensate service
organizations (including Goldman Sachs) for providing varying levels of personal and account maintenance services to their
customers who are beneficial owners of such shares. The Service and Shareholder Administration Plans each provide for
compensation to the service organizations equal to an annual percentage rate of 0.25% of the average daily net assets attributable to
Class C and Service Shares of the Funds, respectively.
E. Transfer Agency Agreement — Goldman Sachs also serves as the transfer agent of the Funds for a fee pursuant to the
Transfer Agency Agreement. The fees charged for such transfer agency services are accrued daily and paid monthly at annual rates
as follows: 0.12% of the average daily net assets of Class A, Class C, Investor and Class R Shares; 0.03% of the average daily net
assets of Class R6 and Class P Shares; and 0.04% of the average daily net assets of Institutional and Service Shares. Goldman
Sachs has agreed to waive a portion of its transfer agency fee equal to 0.02% as an annual percentage rate of the average net assets
attributed to Class A, Class C and Investor Shares of the Global Core Fixed Income Fund.
F. Other Expense Agreements and Affiliated Transactions — GSAM and GSAMI have agreed to reduce or limit certain
“Other Expenses” of the Funds (excluding acquired fund fees and expenses, transfer agency fees and expenses, service fees and
shareholder administration fees (as applicable), taxes, interest, brokerage fees, expenses of shareholder meetings, litigation and
indemnification, and extraordinary expenses) to the extent such expenses exceed, on an annual basis, a percentage rate of the
average daily net assets of each Fund. Such Other Expense reimbursements, if any, are accrued daily and paid monthly. In
addition, the Funds are not obligated to reimburse GSAM and GSAMI for prior fiscal year expense reimbursements, if any. The
Other Expense limitations as an annual percentage rate of average daily net assets for the Bond, Core Fixed Income, Global
Income, Income, Long Short Credit Strategies and Strategic Income Funds are 0.004%, 0.014%, 0.004%, 0.054%, 0.094% and
0.054%, respectively. These Other Expense limitations will remain in place through at least July 29, 2022 for the Funds, and prior199
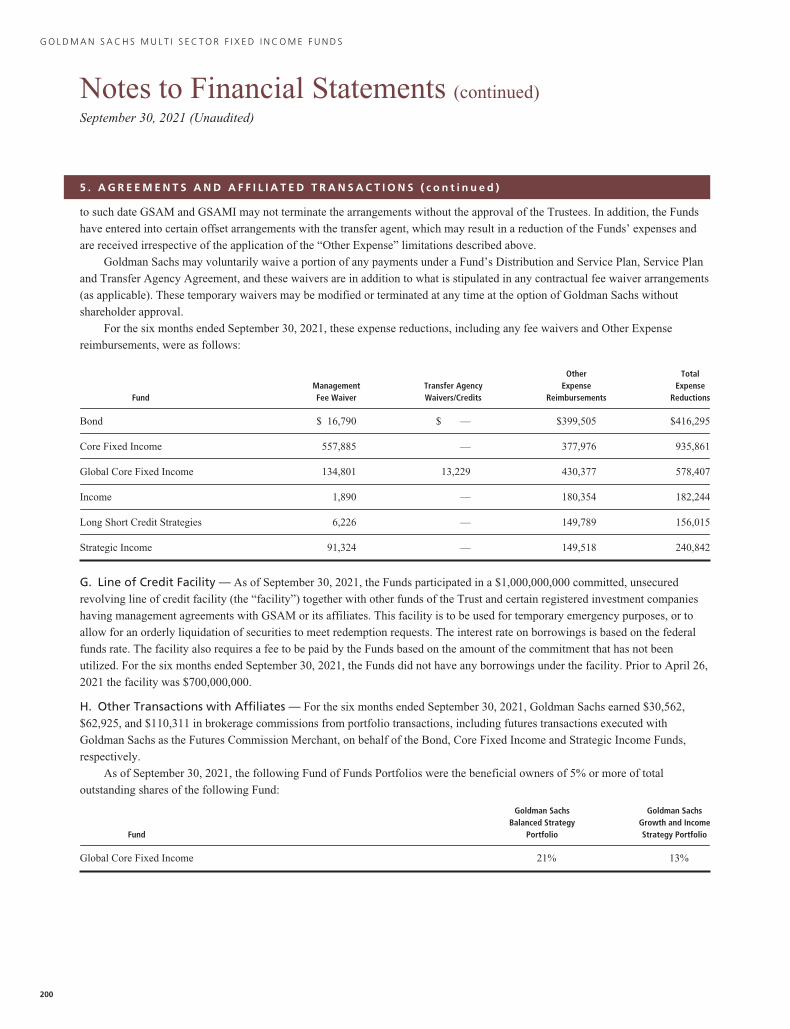
G O L D M A N S A C H S M U L T I S E C T O R F I X E D I N C O M E F U N D S
Notes to Financial Statements (continued)September 30, 2021 (Unaudited)
5 . A G R E E M E N T S A N D A F F I L I A T E D T R A N S A C T I O N S ( c o n t i n u e d )
to such date GSAM and GSAMI may not terminate the arrangements without the approval of the Trustees. In addition, the Funds
have entered into certain offset arrangements with the transfer agent, which may result in a reduction of the Funds’ expenses and
are received irrespective of the application of the “Other Expense” limitations described above.
Goldman Sachs may voluntarily waive a portion of any payments under a Fund’s Distribution and Service Plan, Service Plan
and Transfer Agency Agreement, and these waivers are in addition to what is stipulated in any contractual fee waiver arrangements
(as applicable). These temporary waivers may be modified or terminated at any time at the option of Goldman Sachs without
shareholder approval.
For the six months ended September 30, 2021, these expense reductions, including any fee waivers and Other Expense
reimbursements, were as follows:
FundManagementFee Waiver
Transfer AgencyWaivers/Credits
OtherExpense
Reimbursements
TotalExpense
Reductions
Bond $ 16,790 $ — $399,505 $416,295
Core Fixed Income 557,885 — 377,976 935,861
Global Core Fixed Income 134,801 13,229 430,377 578,407
Income 1,890 — 180,354 182,244
Long Short Credit Strategies 6,226 — 149,789 156,015
Strategic Income 91,324 — 149,518 240,842
G. Line of Credit Facility — As of September 30, 2021, the Funds participated in a $1,000,000,000 committed, unsecured
revolving line of credit facility (the “facility”) together with other funds of the Trust and certain registered investment companies
having management agreements with GSAM or its affiliates. This facility is to be used for temporary emergency purposes, or to
allow for an orderly liquidation of securities to meet redemption requests. The interest rate on borrowings is based on the federal
funds rate. The facility also requires a fee to be paid by the Funds based on the amount of the commitment that has not been
utilized. For the six months ended September 30, 2021, the Funds did not have any borrowings under the facility. Prior to April 26,
2021 the facility was $700,000,000.
H. Other Transactions with Affiliates — For the six months ended September 30, 2021, Goldman Sachs earned $30,562,
$62,925, and $110,311 in brokerage commissions from portfolio transactions, including futures transactions executed with
Goldman Sachs as the Futures Commission Merchant, on behalf of the Bond, Core Fixed Income and Strategic Income Funds,
respectively.
As of September 30, 2021, the following Fund of Funds Portfolios were the beneficial owners of 5% or more of total
outstanding shares of the following Fund:
Fund
Goldman SachsBalanced Strategy
Portfolio
Goldman SachsGrowth and IncomeStrategy Portfolio
Global Core Fixed Income 21% 13%
200
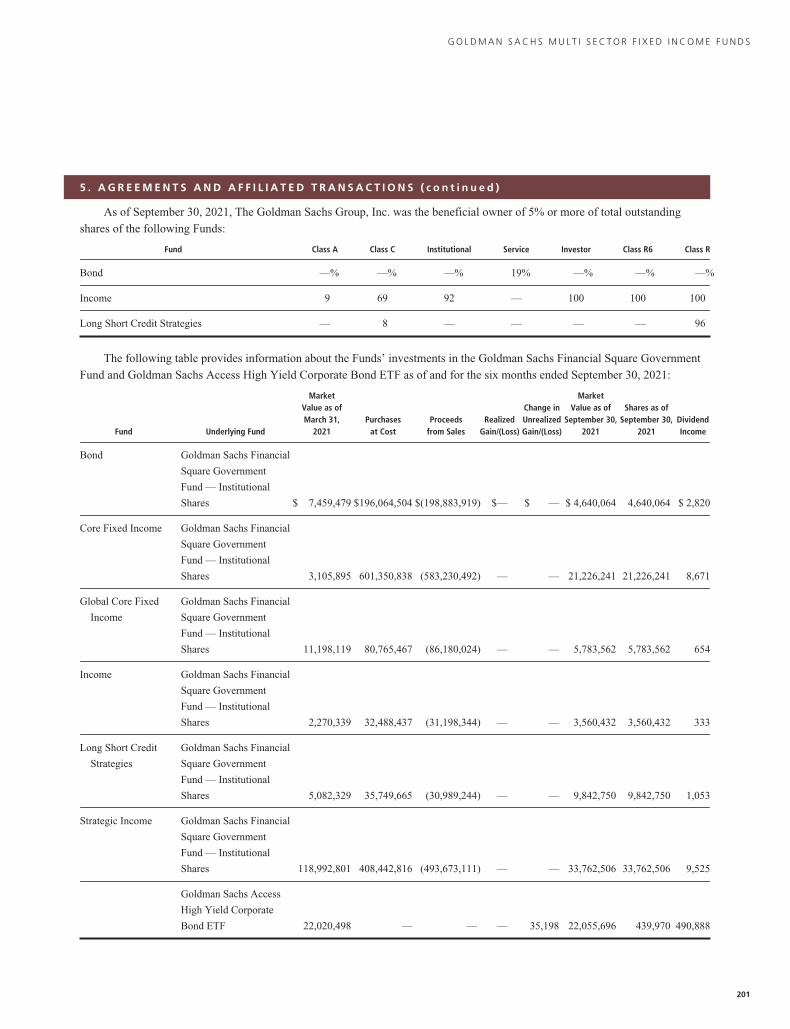
G O L D M A N S A C H S M U L T I S E C T O R F I X E D I N C O M E F U N D S
5 . A G R E E M E N T S A N D A F F I L I A T E D T R A N S A C T I O N S ( c o n t i n u e d )
As of September 30, 2021, The Goldman Sachs Group, Inc. was the beneficial owner of 5% or more of total outstanding
shares of the following Funds:
Fund Class A Class C Institutional Service Investor Class R6 Class R
Bond —% —% —% 19% —% —% —%
Income 9 69 92 — 100 100 100
Long Short Credit Strategies — 8 — — — — 96
The following table provides information about the Funds’ investments in the Goldman Sachs Financial Square Government
Fund and Goldman Sachs Access High Yield Corporate Bond ETF as of and for the six months ended September 30, 2021:
Fund Underlying Fund
MarketValue as ofMarch 31,
2021Purchases
at CostProceeds
from SalesRealized
Gain/(Loss)
Change inUnrealizedGain/(Loss)
MarketValue as of
September 30,2021
Shares as ofSeptember 30,
2021DividendIncome
Bond Goldman Sachs Financial
Square Government
Fund — Institutional
Shares $ 7,459,479 $196,064,504 $(198,883,919) $— $ — $ 4,640,064 4,640,064 $ 2,820
Core Fixed Income Goldman Sachs Financial
Square Government
Fund — Institutional
Shares 3,105,895 601,350,838 (583,230,492) — — 21,226,241 21,226,241 8,671
Global Core Fixed
Income
Goldman Sachs Financial
Square Government
Fund — Institutional
Shares 11,198,119 80,765,467 (86,180,024) — — 5,783,562 5,783,562 654
Income Goldman Sachs Financial
Square Government
Fund — Institutional
Shares 2,270,339 32,488,437 (31,198,344) — — 3,560,432 3,560,432 333
Long Short Credit
Strategies
Goldman Sachs Financial
Square Government
Fund — Institutional
Shares 5,082,329 35,749,665 (30,989,244) — — 9,842,750 9,842,750 1,053
Strategic Income Goldman Sachs Financial
Square Government
Fund — Institutional
Shares 118,992,801 408,442,816 (493,673,111) — — 33,762,506 33,762,506 9,525
Goldman Sachs Access
High Yield Corporate
Bond ETF 22,020,498 — — — 35,198 22,055,696 439,970 490,888
201
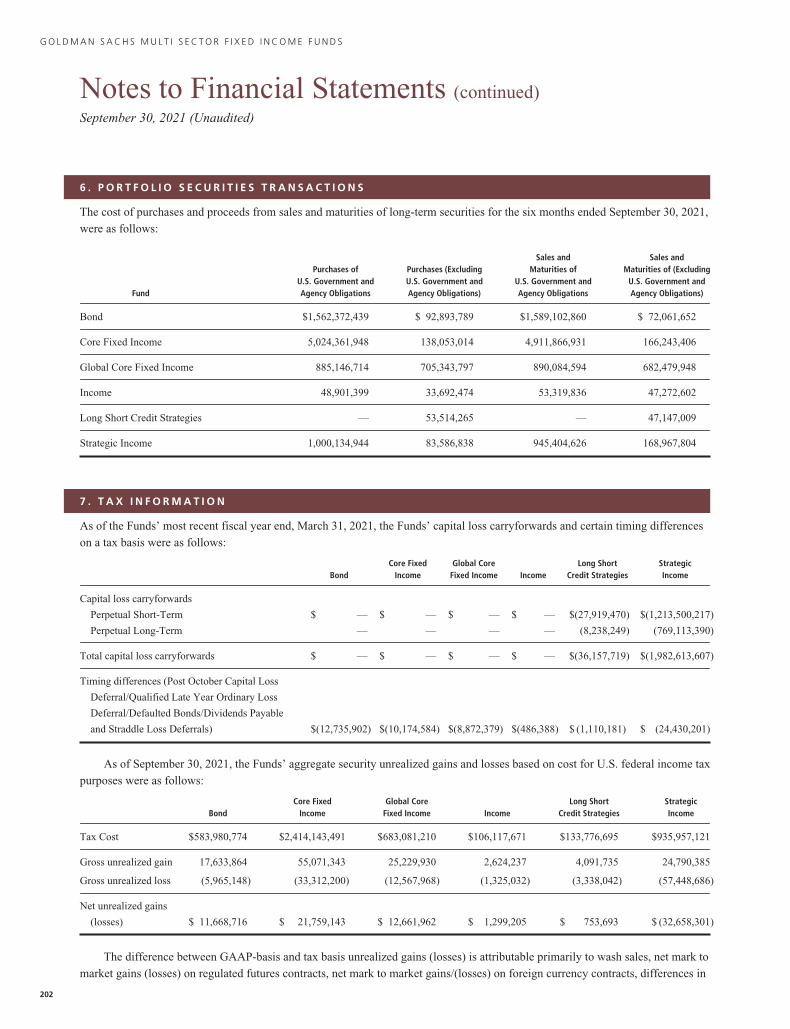
G O L D M A N S A C H S M U L T I S E C T O R F I X E D I N C O M E F U N D S
Notes to Financial Statements (continued)September 30, 2021 (Unaudited)
6 . P O R T F O L I O S E C U R I T I E S T R A N S A C T I O N S
The cost of purchases and proceeds from sales and maturities of long-term securities for the six months ended September 30, 2021,
were as follows:
Fund
Purchases ofU.S. Government andAgency Obligations
Purchases (ExcludingU.S. Government andAgency Obligations)
Sales andMaturities of
U.S. Government andAgency Obligations
Sales andMaturities of (Excluding
U.S. Government andAgency Obligations)
Bond $1,562,372,439 $ 92,893,789 $1,589,102,860 $ 72,061,652
Core Fixed Income 5,024,361,948 138,053,014 4,911,866,931 166,243,406
Global Core Fixed Income 885,146,714 705,343,797 890,084,594 682,479,948
Income 48,901,399 33,692,474 53,319,836 47,272,602
Long Short Credit Strategies — 53,514,265 — 47,147,009
Strategic Income 1,000,134,944 83,586,838 945,404,626 168,967,804
7 . T A X I N F O R M A T I O N
As of the Funds’ most recent fiscal year end, March 31, 2021, the Funds’ capital loss carryforwards and certain timing differences
on a tax basis were as follows:
BondCore Fixed
IncomeGlobal Core
Fixed Income IncomeLong Short
Credit StrategiesStrategicIncome
Capital loss carryforwards
Perpetual Short-Term $ — $ — $ — $ — $(27,919,470) $(1,213,500,217)
Perpetual Long-Term — — — — (8,238,249) (769,113,390)
Total capital loss carryforwards $ — $ — $ — $ — $(36,157,719) $(1,982,613,607)
Timing differences (Post October Capital Loss
Deferral/Qualified Late Year Ordinary Loss
Deferral/Defaulted Bonds/Dividends Payable
and Straddle Loss Deferrals) $(12,735,902) $(10,174,584) $(8,872,379) $(486,388) $ (1,110,181) $ (24,430,201)
As of September 30, 2021, the Funds’ aggregate security unrealized gains and losses based on cost for U.S. federal income tax
purposes were as follows:
BondCore Fixed
IncomeGlobal Core
Fixed Income IncomeLong Short
Credit StrategiesStrategicIncome
Tax Cost $583,980,774 $2,414,143,491 $683,081,210 $106,117,671 $133,776,695 $935,957,121
Gross unrealized gain 17,633,864 55,071,343 25,229,930 2,624,237 4,091,735 24,790,385
Gross unrealized loss (5,965,148) (33,312,200) (12,567,968) (1,325,032) (3,338,042) (57,448,686)
Net unrealized gains
(losses) $ 11,668,716 $ 21,759,143 $ 12,661,962 $ 1,299,205 $ 753,693 $ (32,658,301)
The difference between GAAP-basis and tax basis unrealized gains (losses) is attributable primarily to wash sales, net mark to
market gains (losses) on regulated futures contracts, net mark to market gains/(losses) on foreign currency contracts, differences in
202
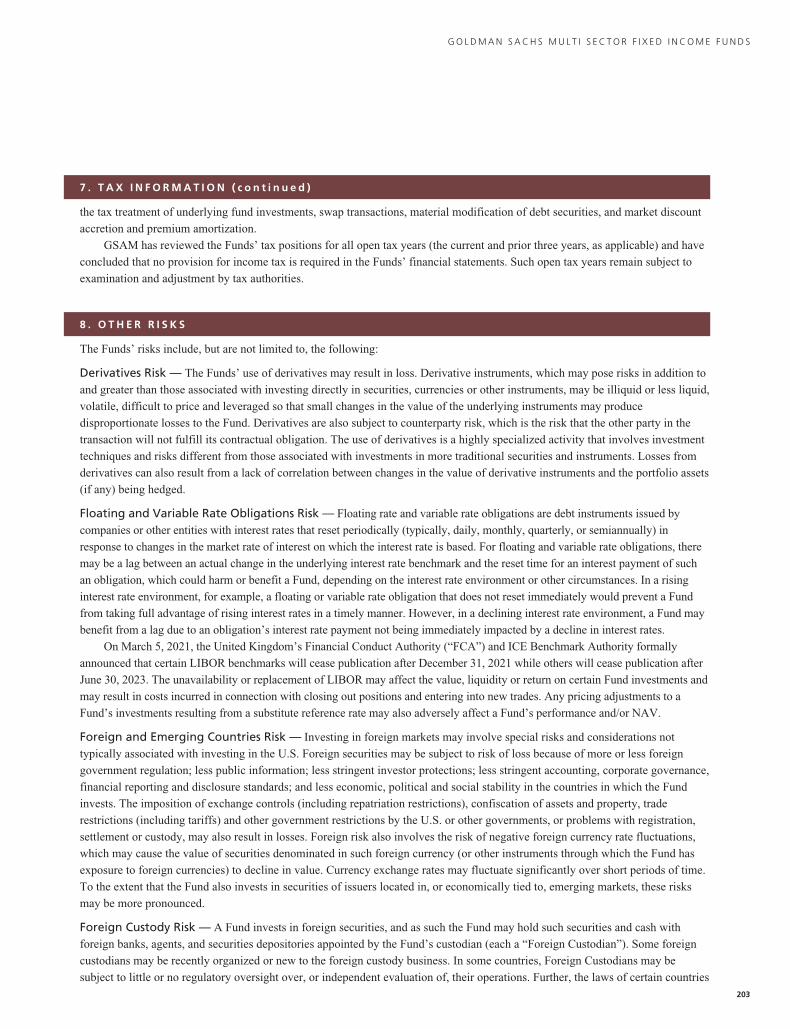
G O L D M A N S A C H S M U L T I S E C T O R F I X E D I N C O M E F U N D S
7 . T A X I N F O R M A T I O N ( c o n t i n u e d )
the tax treatment of underlying fund investments, swap transactions, material modification of debt securities, and market discount
accretion and premium amortization.
GSAM has reviewed the Funds’ tax positions for all open tax years (the current and prior three years, as applicable) and have
concluded that no provision for income tax is required in the Funds’ financial statements. Such open tax years remain subject to
examination and adjustment by tax authorities.
8 . O T H E R R I S K S
The Funds’ risks include, but are not limited to, the following:
Derivatives Risk — The Funds’ use of derivatives may result in loss. Derivative instruments, which may pose risks in addition to
and greater than those associated with investing directly in securities, currencies or other instruments, may be illiquid or less liquid,
volatile, difficult to price and leveraged so that small changes in the value of the underlying instruments may produce
disproportionate losses to the Fund. Derivatives are also subject to counterparty risk, which is the risk that the other party in the
transaction will not fulfill its contractual obligation. The use of derivatives is a highly specialized activity that involves investment
techniques and risks different from those associated with investments in more traditional securities and instruments. Losses from
derivatives can also result from a lack of correlation between changes in the value of derivative instruments and the portfolio assets
(if any) being hedged.
Floating and Variable Rate Obligations Risk — Floating rate and variable rate obligations are debt instruments issued by
companies or other entities with interest rates that reset periodically (typically, daily, monthly, quarterly, or semiannually) in
response to changes in the market rate of interest on which the interest rate is based. For floating and variable rate obligations, there
may be a lag between an actual change in the underlying interest rate benchmark and the reset time for an interest payment of such
an obligation, which could harm or benefit a Fund, depending on the interest rate environment or other circumstances. In a rising
interest rate environment, for example, a floating or variable rate obligation that does not reset immediately would prevent a Fund
from taking full advantage of rising interest rates in a timely manner. However, in a declining interest rate environment, a Fund may
benefit from a lag due to an obligation’s interest rate payment not being immediately impacted by a decline in interest rates.
On March 5, 2021, the United Kingdom’s Financial Conduct Authority (“FCA”) and ICE Benchmark Authority formally
announced that certain LIBOR benchmarks will cease publication after December 31, 2021 while others will cease publication after
June 30, 2023. The unavailability or replacement of LIBOR may affect the value, liquidity or return on certain Fund investments and
may result in costs incurred in connection with closing out positions and entering into new trades. Any pricing adjustments to a
Fund’s investments resulting from a substitute reference rate may also adversely affect a Fund’s performance and/or NAV.
Foreign and Emerging Countries Risk — Investing in foreign markets may involve special risks and considerations not
typically associated with investing in the U.S. Foreign securities may be subject to risk of loss because of more or less foreign
government regulation; less public information; less stringent investor protections; less stringent accounting, corporate governance,
financial reporting and disclosure standards; and less economic, political and social stability in the countries in which the Fund
invests. The imposition of exchange controls (including repatriation restrictions), confiscation of assets and property, trade
restrictions (including tariffs) and other government restrictions by the U.S. or other governments, or problems with registration,
settlement or custody, may also result in losses. Foreign risk also involves the risk of negative foreign currency rate fluctuations,
which may cause the value of securities denominated in such foreign currency (or other instruments through which the Fund has
exposure to foreign currencies) to decline in value. Currency exchange rates may fluctuate significantly over short periods of time.
To the extent that the Fund also invests in securities of issuers located in, or economically tied to, emerging markets, these risks
may be more pronounced.
Foreign Custody Risk — A Fund invests in foreign securities, and as such the Fund may hold such securities and cash with
foreign banks, agents, and securities depositories appointed by the Fund’s custodian (each a “Foreign Custodian”). Some foreign
custodians may be recently organized or new to the foreign custody business. In some countries, Foreign Custodians may be
subject to little or no regulatory oversight over, or independent evaluation of, their operations. Further, the laws of certain countries203
G O L D M A N S A C H S M U L T I S E C T O R F I X E D I N C O M E F U N D S
Notes to Financial Statements (continued)September 30, 2021 (Unaudited)
8 . O T H E R R I S K S ( c o n t i n u e d )
may place limitations on a Fund’s ability to recover its assets if a Foreign Custodian enters bankruptcy. Investments in emerging
markets may be subject to even greater custody risks than investments in more developed markets. Custody services in emerging
market countries are very often undeveloped and may be considerably less well regulated than in more developed countries, and
thus may not afford the same level of investor protection as would apply in developed countries.
Geographic Risk — If a Fund focuses its investments in securities of issuers located in a particular country or geographic region,
the Fund may be subjected, to a greater extent than if its investments were less focused, to the risks of volatile economic cycles
and/or conditions and developments that may be particular to that country or region, such as: adverse securities markets; adverse
exchange rates; adverse social, political, regulatory, economic, business, environmental or other developments; or natural disasters.
Interest Rate Risk — When interest rates increase, fixed income securities or instruments held by a Fund will generally decline
in value. Long-term fixed income securities or instruments will normally have more price volatility because of this risk than short-
term fixed income securities or instruments. The risks associated with changing interest rates may have unpredictable effects on the
markets and a Fund’s investments. Fluctuations in interest rates may also affect the liquidity of fixed income securities and
instruments held by the Funds.
Investments in Other Investment Companies Risk — As a shareholder of another investment company, including an exchange-
traded fund (“ETF”), a Fund will indirectly bear its proportionate share of any net management fees and other expenses paid by such
other investment companies, in addition to the fees and expenses regularly borne by the Fund. ETFs are subject to risks that do not apply
to conventional mutual funds, including but not limited to the following: (i) the market price of the ETF’s shares may trade at a premium
or a discount to their NAV; and (ii) an active trading market for an ETF’s shares may not develop or be maintained.
Large Shareholder Transactions Risk — A Fund may experience adverse effects when certain large shareholders, such as
other funds, institutional investors (including those trading by use of non-discretionary mathematical formulas), financial
intermediaries (who may make investment decisions on behalf of underlying clients and/or include a Fund in their investment
model), individuals, accounts and Goldman Sachs affiliates, purchase or redeem large amounts of shares of a Fund. Such large
shareholder redemptions, which may occur rapidly or unexpectedly, may cause a Fund to sell portfolio securities at times when it
would not otherwise do so, which may negatively impact a Fund’s NAV and liquidity. These transactions may also accelerate the
realization of taxable income to shareholders if such sales of investments resulted in gains, and may also increase transaction costs.
In addition, a large redemption could result in a Fund’s current expenses being allocated over a smaller asset base, leading to an
increase in the Fund’s expense ratio. Similarly, large Fund share purchases may adversely affect a Fund’s performance to the
extent that the Fund is delayed in investing new cash or otherwise maintains a larger cash position than it ordinarily would.
Liquidity Risk — A Fund may make investments that are illiquid or that may become less liquid in response to market developments or
adverse investor perceptions. Illiquid investments may be more difficult to value. Liquidity risk may be the result of, among other things,
the reduced number and capacity of traditional market participants to make a market in fixed income securities or the lack of an active
market. The potential for liquidity risk may be magnified by a rising interest rate environment or other circumstances where investor
redemptions from fixed income funds may be higher than normal, potentially causing increased supply in the market due to selling
activity. These risks may be more pronounced in connection with a Fund‘s investments in securities of issuers located in emerging
market countries. Redemptions by large shareholders may have a negative impact on a Fund’s liquidity.
Loan-Related Investments Risk — In addition to risks generally associated with debt investments (e.g., interest rate risk and default
risk), loan-related investments such as loan participations and assignments are subject to other risks. Although a loan obligation may be
fully collateralized at the time of acquisition, the collateral may decline in value, be or become illiquid or less liquid, or lose all or
substantially all of its value subsequent to investment. Many loan investments are subject to legal or contractual restrictions on resale and
certain loan investments may be or become illiquid or less liquid and more difficult to value, particularly in the event of a downgrade of
the loan or the borrower. There is less readily available, reliable information about most loan investments than is the case for many other
types of securities. Substantial increases in interest rates may cause an increase in loan obligation defaults. With respect to loan
participations, a Fund may not always have direct recourse against a borrower if the borrower fails to pay scheduled principal and/or
interest; may be subject to greater delays, expenses and risks than if a Fund had purchased a direct obligation of the borrower; and may204
G O L D M A N S A C H S M U L T I S E C T O R F I X E D I N C O M E F U N D S
8 . O T H E R R I S K S ( c o n t i n u e d )
be regarded as the creditor of the agent lender (rather than the borrower), subjecting a Fund to the creditworthiness of that lender as well.
Investors in loans, such as a Fund, may not be entitled to rely on the anti-fraud protections of the federal securities laws, although they
may be entitled to certain contractual remedies. The market for loan obligations may be subject to irregular trading activity, wide bid/ask
spreads and extended trade settlement periods. Because transactions in many loans are subject to extended trade settlement periods, a
Fund may not receive the proceeds from the sale of a loan for a period after the sale. As a result, sale proceeds related to the sale of loans
may not be available to make additional investments or to meet a Fund’s redemption obligations for a period after the sale of the loans,
and, as a result, a Fund may have to sell other investments or engage in borrowing transactions, such as borrowing from its credit
facility, if necessary to raise cash to meet its obligations.
Senior Loans hold the most senior position in the capital structure of a business entity, and are typically secured with specific
collateral, but are nevertheless usually rated below investment grade. Because Second Lien Loans are subordinated or unsecured
and thus lower in priority of payment to Senior Loans, they are subject to the additional risk that the cash flow of the borrower and
property securing the loan or debt, if any, may be insufficient to meet scheduled payments after giving effect to the senior secured
obligations of the borrower. Second Lien Loans generally have greater price volatility than Senior Loans and may be less liquid.
Market and Credit Risks — In the normal course of business, a Fund trades financial instruments and enters into financial
transactions where risk of potential loss exists due to changes in the market (market risk). The value of the securities in which a Fund
invests may go up or down in response to the prospects of individual companies, particular sectors or governments and/or general
economic conditions throughout the world due to increasingly interconnected global economies and financial markets. Events such
as war, acts of terrorism, social unrest, natural disasters, the spread of infectious illness or other public health threats could also
significantly impact a Fund and its investments. Additionally, a Fund may also be exposed to credit risk in the event that an issuer or
guarantor fails to perform or that an institution or entity with which the Fund has unsettled or open transactions defaults.
Sector Risk — To the extent a Fund focuses its investments in securities of issuers in one or more sectors (such as the financial
services or telecommunications sectors), the Fund may be subjected, to a greater extent than if its investments were diversified
across different sectors, to the risks of volatile economic cycles and/or conditions and developments that may be particular to that
sector, such as: adverse economic, business, political, environmental or other developments.
9 . I N D E M N I F I C A T I O N S
Under the Trust’s organizational documents, its Trustees, officers, employees and agents are indemnified, to the extent permitted
by the Act and state law, against certain liabilities that may arise out of performance of their duties to the Funds. Additionally, in
the course of business, the Funds enter into contracts that contain a variety of indemnification clauses. The Funds’ maximum
exposure under these arrangements is unknown, as this would involve future claims that may be made against the Funds that have
not yet occurred. However, GSAM and GSAMI believe the risk of loss under these arrangements to be remote.
1 0 . O T H E R M A T T E R S
In March 2020, the FASB issued Accounting Standard Update (“ASU”) No. 2020-04, “Reference Rate Reform (Topic 848):
Facilitation of the Effects of Reference Rate Reform on Financial Reporting.” This ASU provides optional exceptions for applying
GAAP to contract modifications, hedging relationships and other transactions affected reference rate reform if certain criteria are
met. ASU 2020-04 is elective and is effective on March 12, 2020 through December 31, 2022. As of the financial reporting period,
GSAM and GSAMI are currently evaluating the impact, if any, of applying ASU 2020-04.
1 1 . S U B S E Q U E N T E V E N T S
Subsequent events after the Statements of Assets and Liabilities date have been evaluated, and GSAM and GSAMI have concluded
that there is no impact requiring adjustment or disclosure in the financial statements.205
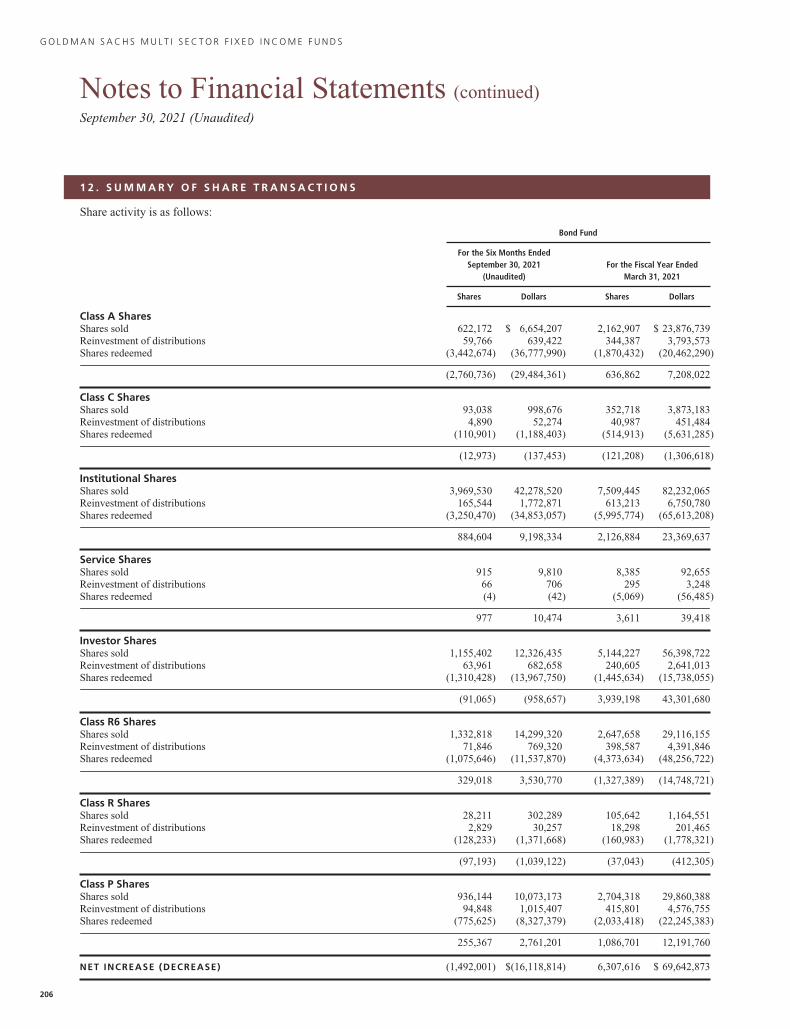
G O L D M A N S A C H S M U L T I S E C T O R F I X E D I N C O M E F U N D S
Notes to Financial Statements (continued)September 30, 2021 (Unaudited)
1 2 . S U M M A R Y O F S H A R E T R A N S A C T I O N S
Share activity is as follows:
Bond Fund
For the Six Months EndedSeptember 30, 2021
(Unaudited)For the Fiscal Year Ended
March 31, 2021
Shares Dollars Shares Dollars
Class A SharesShares sold 622,172 $ 6,654,207 2,162,907 $ 23,876,739Reinvestment of distributions 59,766 639,422 344,387 3,793,573Shares redeemed (3,442,674) (36,777,990) (1,870,432) (20,462,290)
(2,760,736) (29,484,361) 636,862 7,208,022
Class C SharesShares sold 93,038 998,676 352,718 3,873,183Reinvestment of distributions 4,890 52,274 40,987 451,484Shares redeemed (110,901) (1,188,403) (514,913) (5,631,285)
(12,973) (137,453) (121,208) (1,306,618)
Institutional SharesShares sold 3,969,530 42,278,520 7,509,445 82,232,065Reinvestment of distributions 165,544 1,772,871 613,213 6,750,780Shares redeemed (3,250,470) (34,853,057) (5,995,774) (65,613,208)
884,604 9,198,334 2,126,884 23,369,637
Service SharesShares sold 915 9,810 8,385 92,655Reinvestment of distributions 66 706 295 3,248Shares redeemed (4) (42) (5,069) (56,485)
977 10,474 3,611 39,418
Investor SharesShares sold 1,155,402 12,326,435 5,144,227 56,398,722Reinvestment of distributions 63,961 682,658 240,605 2,641,013Shares redeemed (1,310,428) (13,967,750) (1,445,634) (15,738,055)
(91,065) (958,657) 3,939,198 43,301,680
Class R6 SharesShares sold 1,332,818 14,299,320 2,647,658 29,116,155Reinvestment of distributions 71,846 769,320 398,587 4,391,846Shares redeemed (1,075,646) (11,537,870) (4,373,634) (48,256,722)
329,018 3,530,770 (1,327,389) (14,748,721)
Class R SharesShares sold 28,211 302,289 105,642 1,164,551Reinvestment of distributions 2,829 30,257 18,298 201,465Shares redeemed (128,233) (1,371,668) (160,983) (1,778,321)
(97,193) (1,039,122) (37,043) (412,305)
Class P SharesShares sold 936,144 10,073,173 2,704,318 29,860,388Reinvestment of distributions 94,848 1,015,407 415,801 4,576,755Shares redeemed (775,625) (8,327,379) (2,033,418) (22,245,383)
255,367 2,761,201 1,086,701 12,191,760
NET INCREASE (DECREASE) (1,492,001) $(16,118,814) 6,307,616 $ 69,642,873
206
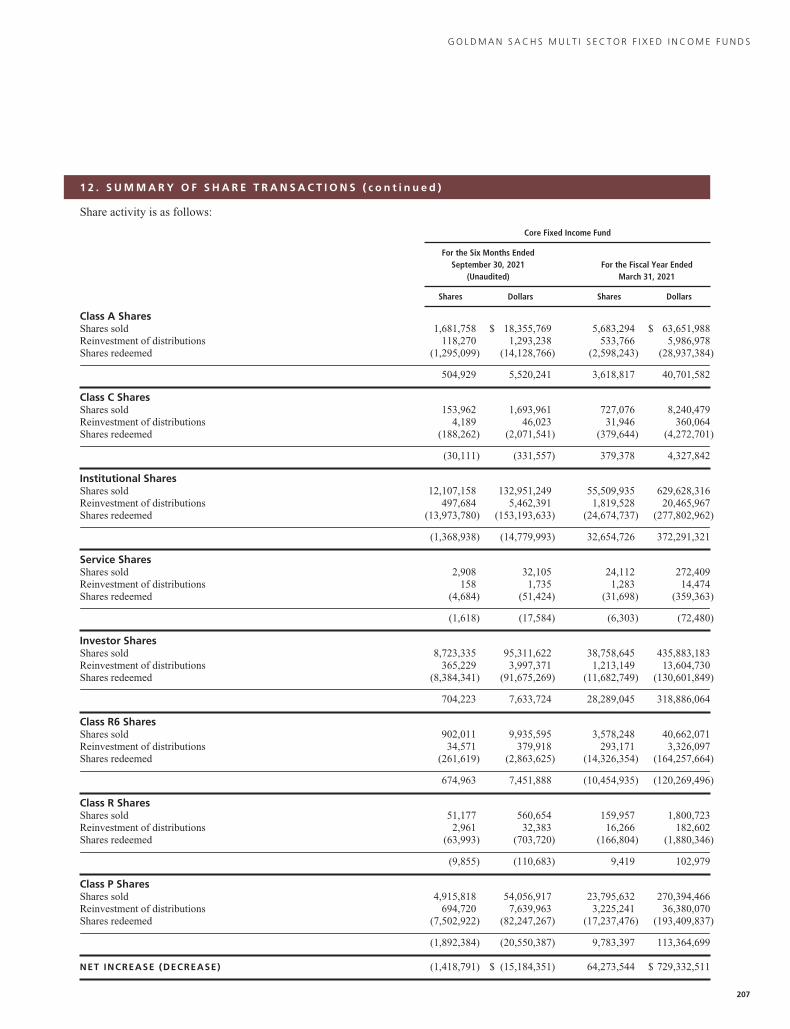
G O L D M A N S A C H S M U L T I S E C T O R F I X E D I N C O M E F U N D S
1 2 . S U M M A R Y O F S H A R E T R A N S A C T I O N S ( c o n t i n u e d )
Share activity is as follows:
Core Fixed Income Fund
For the Six Months EndedSeptember 30, 2021
(Unaudited)For the Fiscal Year Ended
March 31, 2021
Shares Dollars Shares Dollars
Class A SharesShares sold 1,681,758 $ 18,355,769 5,683,294 $ 63,651,988Reinvestment of distributions 118,270 1,293,238 533,766 5,986,978Shares redeemed (1,295,099) (14,128,766) (2,598,243) (28,937,384)
504,929 5,520,241 3,618,817 40,701,582
Class C SharesShares sold 153,962 1,693,961 727,076 8,240,479Reinvestment of distributions 4,189 46,023 31,946 360,064Shares redeemed (188,262) (2,071,541) (379,644) (4,272,701)
(30,111) (331,557) 379,378 4,327,842
Institutional SharesShares sold 12,107,158 132,951,249 55,509,935 629,628,316Reinvestment of distributions 497,684 5,462,391 1,819,528 20,465,967Shares redeemed (13,973,780) (153,193,633) (24,674,737) (277,802,962)
(1,368,938) (14,779,993) 32,654,726 372,291,321
Service SharesShares sold 2,908 32,105 24,112 272,409Reinvestment of distributions 158 1,735 1,283 14,474Shares redeemed (4,684) (51,424) (31,698) (359,363)
(1,618) (17,584) (6,303) (72,480)
Investor SharesShares sold 8,723,335 95,311,622 38,758,645 435,883,183Reinvestment of distributions 365,229 3,997,371 1,213,149 13,604,730Shares redeemed (8,384,341) (91,675,269) (11,682,749) (130,601,849)
704,223 7,633,724 28,289,045 318,886,064
Class R6 SharesShares sold 902,011 9,935,595 3,578,248 40,662,071Reinvestment of distributions 34,571 379,918 293,171 3,326,097Shares redeemed (261,619) (2,863,625) (14,326,354) (164,257,664)
674,963 7,451,888 (10,454,935) (120,269,496)
Class R SharesShares sold 51,177 560,654 159,957 1,800,723Reinvestment of distributions 2,961 32,383 16,266 182,602Shares redeemed (63,993) (703,720) (166,804) (1,880,346)
(9,855) (110,683) 9,419 102,979
Class P SharesShares sold 4,915,818 54,056,917 23,795,632 270,394,466Reinvestment of distributions 694,720 7,639,963 3,225,241 36,380,070Shares redeemed (7,502,922) (82,247,267) (17,237,476) (193,409,837)
(1,892,384) (20,550,387) 9,783,397 113,364,699
NET INCREASE (DECREASE) (1,418,791) $ (15,184,351) 64,273,544 $ 729,332,511
207
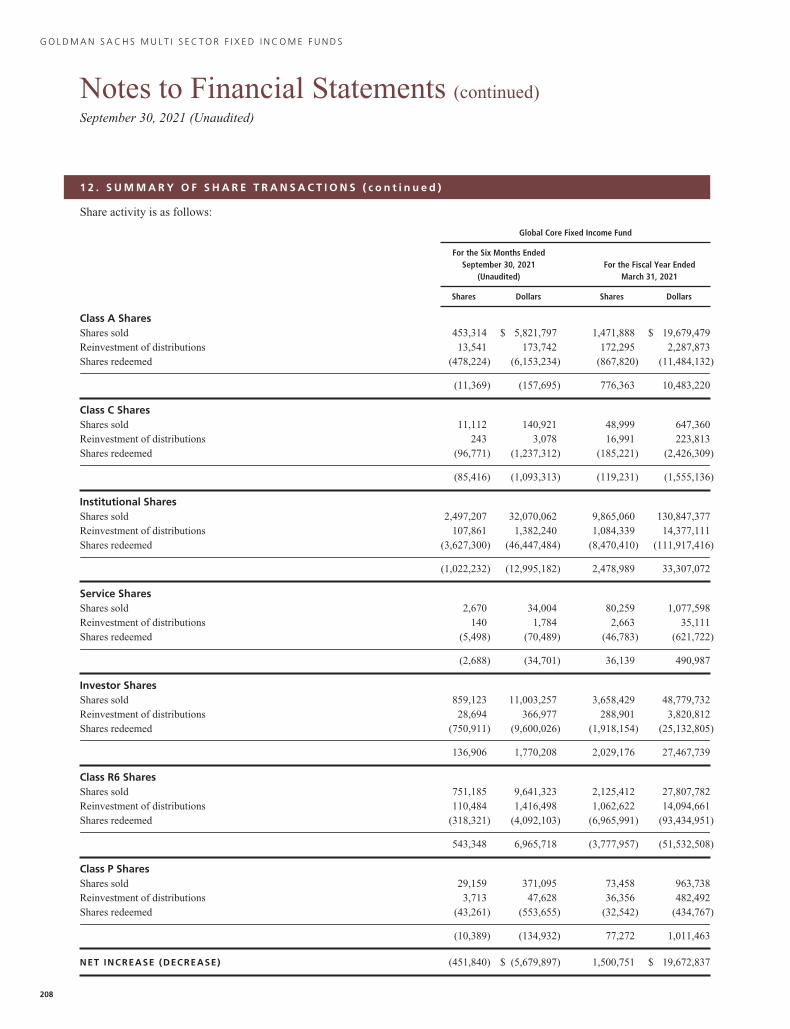
G O L D M A N S A C H S M U L T I S E C T O R F I X E D I N C O M E F U N D S
Notes to Financial Statements (continued)September 30, 2021 (Unaudited)
1 2 . S U M M A R Y O F S H A R E T R A N S A C T I O N S ( c o n t i n u e d )
Share activity is as follows:
Global Core Fixed Income Fund
For the Six Months EndedSeptember 30, 2021
(Unaudited)For the Fiscal Year Ended
March 31, 2021
Shares Dollars Shares Dollars
Class A SharesShares sold 453,314 $ 5,821,797 1,471,888 $ 19,679,479Reinvestment of distributions 13,541 173,742 172,295 2,287,873Shares redeemed (478,224) (6,153,234) (867,820) (11,484,132)
(11,369) (157,695) 776,363 10,483,220
Class C SharesShares sold 11,112 140,921 48,999 647,360Reinvestment of distributions 243 3,078 16,991 223,813Shares redeemed (96,771) (1,237,312) (185,221) (2,426,309)
(85,416) (1,093,313) (119,231) (1,555,136)
Institutional SharesShares sold 2,497,207 32,070,062 9,865,060 130,847,377Reinvestment of distributions 107,861 1,382,240 1,084,339 14,377,111Shares redeemed (3,627,300) (46,447,484) (8,470,410) (111,917,416)
(1,022,232) (12,995,182) 2,478,989 33,307,072
Service SharesShares sold 2,670 34,004 80,259 1,077,598Reinvestment of distributions 140 1,784 2,663 35,111Shares redeemed (5,498) (70,489) (46,783) (621,722)
(2,688) (34,701) 36,139 490,987
Investor SharesShares sold 859,123 11,003,257 3,658,429 48,779,732Reinvestment of distributions 28,694 366,977 288,901 3,820,812Shares redeemed (750,911) (9,600,026) (1,918,154) (25,132,805)
136,906 1,770,208 2,029,176 27,467,739
Class R6 SharesShares sold 751,185 9,641,323 2,125,412 27,807,782Reinvestment of distributions 110,484 1,416,498 1,062,622 14,094,661Shares redeemed (318,321) (4,092,103) (6,965,991) (93,434,951)
543,348 6,965,718 (3,777,957) (51,532,508)
Class P SharesShares sold 29,159 371,095 73,458 963,738Reinvestment of distributions 3,713 47,628 36,356 482,492Shares redeemed (43,261) (553,655) (32,542) (434,767)
(10,389) (134,932) 77,272 1,011,463
NET INCREASE (DECREASE) (451,840) $ (5,679,897) 1,500,751 $ 19,672,837
208
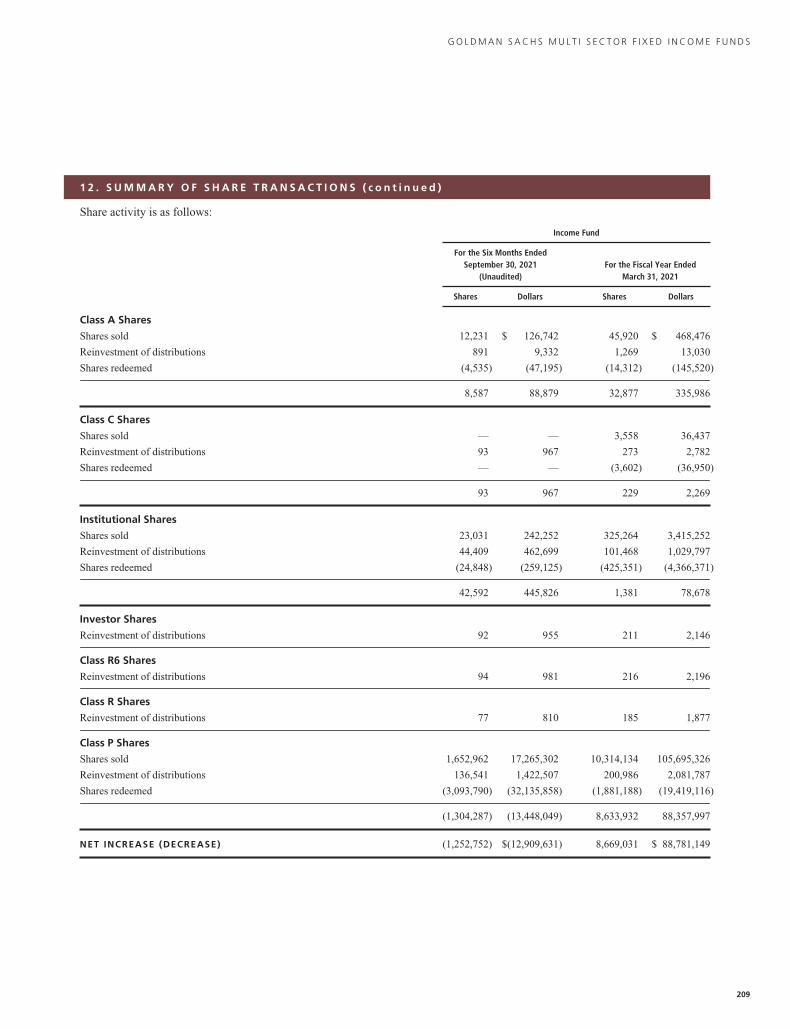
G O L D M A N S A C H S M U L T I S E C T O R F I X E D I N C O M E F U N D S
1 2 . S U M M A R Y O F S H A R E T R A N S A C T I O N S ( c o n t i n u e d )
Share activity is as follows:
Income Fund
For the Six Months EndedSeptember 30, 2021
(Unaudited)For the Fiscal Year Ended
March 31, 2021
Shares Dollars Shares Dollars
Class A Shares
Shares sold 12,231 $ 126,742 45,920 $ 468,476
Reinvestment of distributions 891 9,332 1,269 13,030
Shares redeemed (4,535) (47,195) (14,312) (145,520)
8,587 88,879 32,877 335,986
Class C Shares
Shares sold — — 3,558 36,437
Reinvestment of distributions 93 967 273 2,782
Shares redeemed — — (3,602) (36,950)
93 967 229 2,269
Institutional Shares
Shares sold 23,031 242,252 325,264 3,415,252
Reinvestment of distributions 44,409 462,699 101,468 1,029,797
Shares redeemed (24,848) (259,125) (425,351) (4,366,371)
42,592 445,826 1,381 78,678
Investor Shares
Reinvestment of distributions 92 955 211 2,146
Class R6 Shares
Reinvestment of distributions 94 981 216 2,196
Class R Shares
Reinvestment of distributions 77 810 185 1,877
Class P Shares
Shares sold 1,652,962 17,265,302 10,314,134 105,695,326
Reinvestment of distributions 136,541 1,422,507 200,986 2,081,787
Shares redeemed (3,093,790) (32,135,858) (1,881,188) (19,419,116)
(1,304,287) (13,448,049) 8,633,932 88,357,997
NET INCREASE (DECREASE) (1,252,752) $(12,909,631) 8,669,031 $ 88,781,149
209
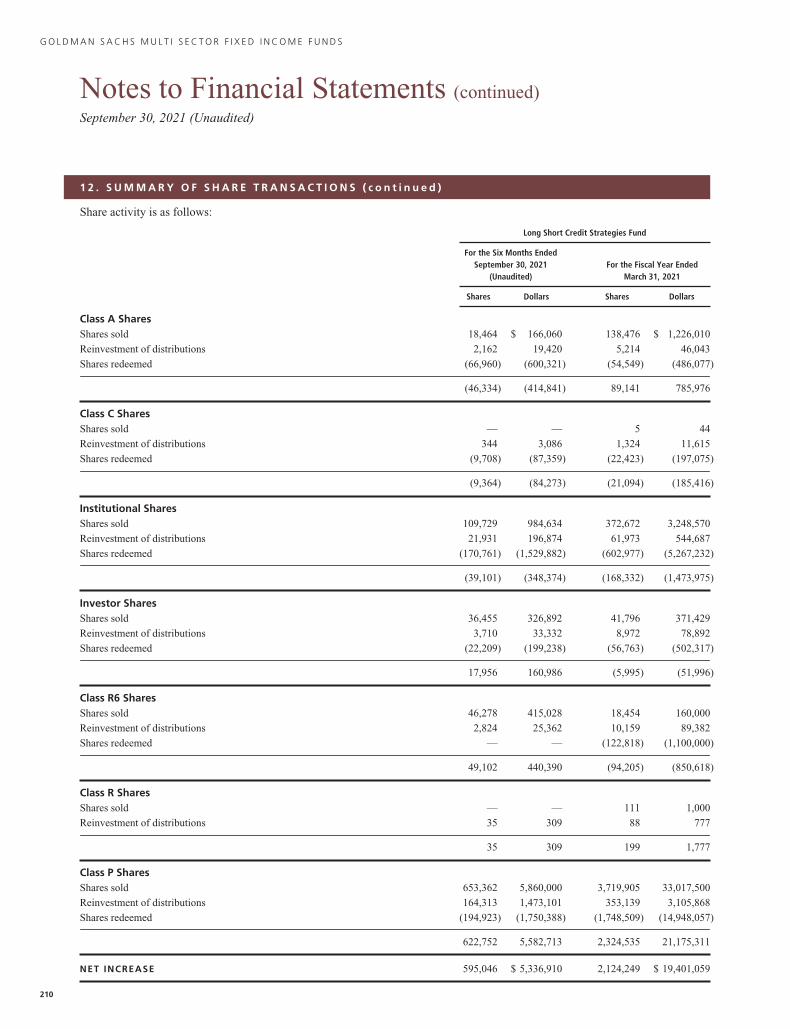
G O L D M A N S A C H S M U L T I S E C T O R F I X E D I N C O M E F U N D S
Notes to Financial Statements (continued)September 30, 2021 (Unaudited)
1 2 . S U M M A R Y O F S H A R E T R A N S A C T I O N S ( c o n t i n u e d )
Share activity is as follows:
Long Short Credit Strategies Fund
For the Six Months EndedSeptember 30, 2021
(Unaudited)For the Fiscal Year Ended
March 31, 2021
Shares Dollars Shares Dollars
Class A SharesShares sold 18,464 $ 166,060 138,476 $ 1,226,010
Reinvestment of distributions 2,162 19,420 5,214 46,043
Shares redeemed (66,960) (600,321) (54,549) (486,077)
(46,334) (414,841) 89,141 785,976
Class C SharesShares sold — — 5 44
Reinvestment of distributions 344 3,086 1,324 11,615
Shares redeemed (9,708) (87,359) (22,423) (197,075)
(9,364) (84,273) (21,094) (185,416)
Institutional SharesShares sold 109,729 984,634 372,672 3,248,570
Reinvestment of distributions 21,931 196,874 61,973 544,687
Shares redeemed (170,761) (1,529,882) (602,977) (5,267,232)
(39,101) (348,374) (168,332) (1,473,975)
Investor SharesShares sold 36,455 326,892 41,796 371,429
Reinvestment of distributions 3,710 33,332 8,972 78,892
Shares redeemed (22,209) (199,238) (56,763) (502,317)
17,956 160,986 (5,995) (51,996)
Class R6 SharesShares sold 46,278 415,028 18,454 160,000
Reinvestment of distributions 2,824 25,362 10,159 89,382
Shares redeemed — — (122,818) (1,100,000)
49,102 440,390 (94,205) (850,618)
Class R SharesShares sold — — 111 1,000
Reinvestment of distributions 35 309 88 777
35 309 199 1,777
Class P SharesShares sold 653,362 5,860,000 3,719,905 33,017,500
Reinvestment of distributions 164,313 1,473,101 353,139 3,105,868
Shares redeemed (194,923) (1,750,388) (1,748,509) (14,948,057)
622,752 5,582,713 2,324,535 21,175,311
NET INCREASE 595,046 $ 5,336,910 2,124,249 $ 19,401,059
210
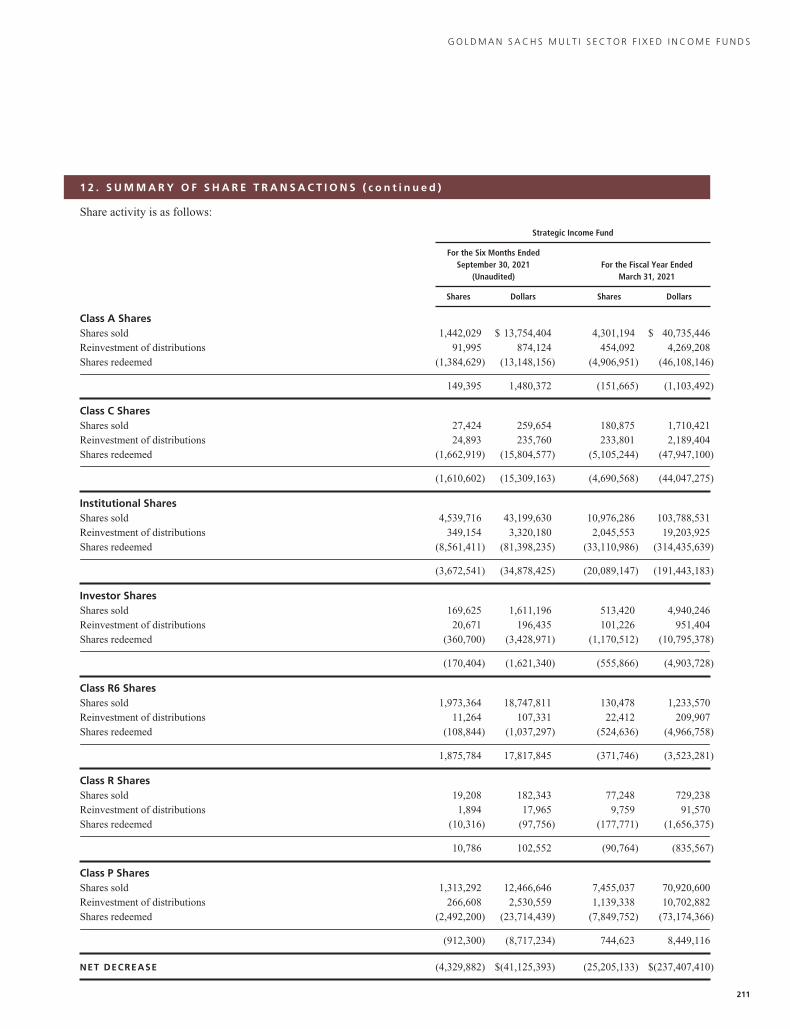
G O L D M A N S A C H S M U L T I S E C T O R F I X E D I N C O M E F U N D S
1 2 . S U M M A R Y O F S H A R E T R A N S A C T I O N S ( c o n t i n u e d )
Share activity is as follows:
Strategic Income Fund
For the Six Months EndedSeptember 30, 2021
(Unaudited)For the Fiscal Year Ended
March 31, 2021
Shares Dollars Shares Dollars
Class A SharesShares sold 1,442,029 $ 13,754,404 4,301,194 $ 40,735,446Reinvestment of distributions 91,995 874,124 454,092 4,269,208Shares redeemed (1,384,629) (13,148,156) (4,906,951) (46,108,146)
149,395 1,480,372 (151,665) (1,103,492)
Class C SharesShares sold 27,424 259,654 180,875 1,710,421Reinvestment of distributions 24,893 235,760 233,801 2,189,404Shares redeemed (1,662,919) (15,804,577) (5,105,244) (47,947,100)
(1,610,602) (15,309,163) (4,690,568) (44,047,275)
Institutional SharesShares sold 4,539,716 43,199,630 10,976,286 103,788,531Reinvestment of distributions 349,154 3,320,180 2,045,553 19,203,925Shares redeemed (8,561,411) (81,398,235) (33,110,986) (314,435,639)
(3,672,541) (34,878,425) (20,089,147) (191,443,183)
Investor SharesShares sold 169,625 1,611,196 513,420 4,940,246Reinvestment of distributions 20,671 196,435 101,226 951,404Shares redeemed (360,700) (3,428,971) (1,170,512) (10,795,378)
(170,404) (1,621,340) (555,866) (4,903,728)
Class R6 SharesShares sold 1,973,364 18,747,811 130,478 1,233,570Reinvestment of distributions 11,264 107,331 22,412 209,907Shares redeemed (108,844) (1,037,297) (524,636) (4,966,758)
1,875,784 17,817,845 (371,746) (3,523,281)
Class R SharesShares sold 19,208 182,343 77,248 729,238Reinvestment of distributions 1,894 17,965 9,759 91,570Shares redeemed (10,316) (97,756) (177,771) (1,656,375)
10,786 102,552 (90,764) (835,567)
Class P SharesShares sold 1,313,292 12,466,646 7,455,037 70,920,600Reinvestment of distributions 266,608 2,530,559 1,139,338 10,702,882Shares redeemed (2,492,200) (23,714,439) (7,849,752) (73,174,366)
(912,300) (8,717,234) 744,623 8,449,116
NET DECREASE (4,329,882) $(41,125,393) (25,205,133) $(237,407,410)
211
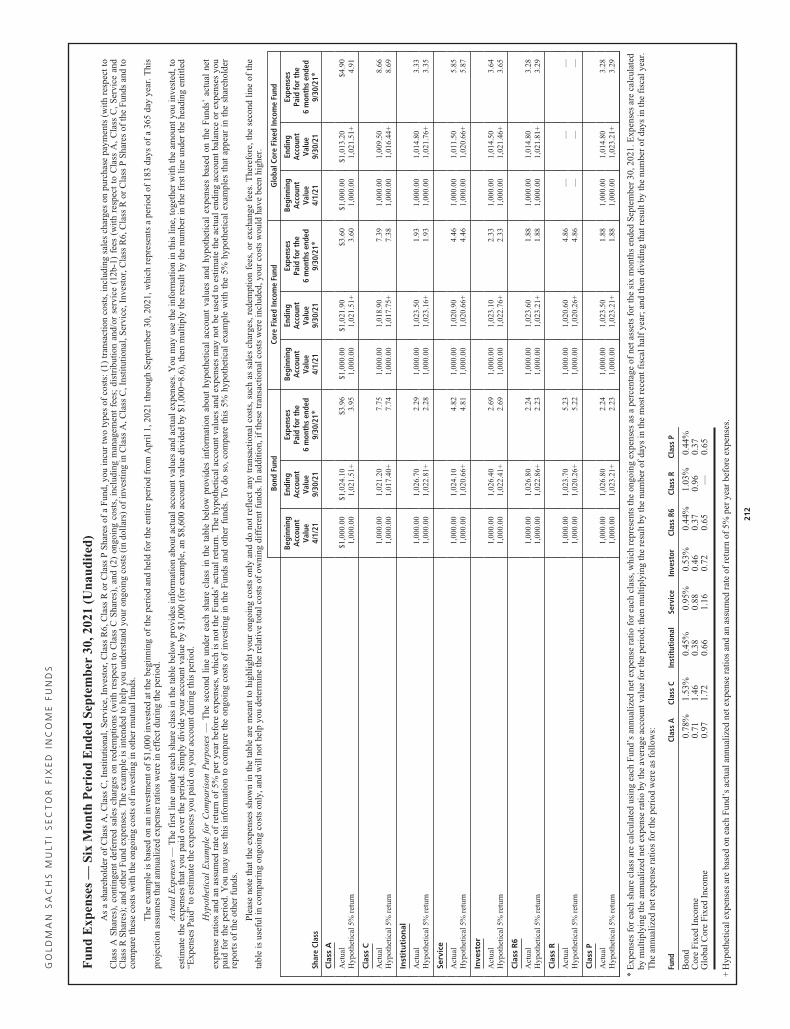
GO
LD
MA
NS
AC
HS
MU
LT
IS
EC
TO
RF
IXE
DIN
CO
ME
FU
ND
S
Fun
dE
xpen
ses
—Si
xM
onth
Per
iod
End
edSe
ptem
ber
30,2
021
(Una
udit
ed)
As
ash
areh
olde
rof
Cla
ssA
,Cla
ssC
,Ins
titu
tion
al,S
ervi
ce,I
nves
tor,
Cla
ssR
6,C
lass
Ror
Cla
ssP
Sha
res
ofa
Fun
d,yo
uin
cur
two
type
sof
cost
s:(1
)tr
ansa
ctio
nco
sts,
incl
udin
gsa
les
char
ges
onpu
rcha
sepa
ymen
ts(w
ith
resp
ectt
oC
lass
AS
hare
s),
cont
inge
ntde
ferr
edsa
les
char
ges
onre
dem
ptio
ns(w
ith
resp
ect
toC
lass
CS
hare
s),
and
(2)
ongo
ing
cost
s,in
clud
ing
man
agem
ent
fees
;di
stri
buti
onan
d/or
serv
ice
(12b
-1)
fees
(wit
hre
spec
tto
Cla
ssA
,C
lass
C,
Ser
vice
and
Cla
ssR
Sha
res)
;and
othe
rF
und
expe
nses
.The
exam
ple
isin
tend
edto
help
you
unde
rsta
ndyo
uron
goin
gco
sts
(in
doll
ars)
ofin
vest
ing
inC
lass
A,C
lass
C,I
nsti
tuti
onal
,Ser
vice
,Inv
esto
r,C
lass
R6,
Cla
ssR
orC
lass
PS
hare
sof
the
Fun
dsan
dto
com
pare
thes
eco
sts
wit
hth
eon
goin
gco
sts
ofin
vest
ing
inot
her
mut
ualf
unds
.
The
exam
ple
isba
sed
onan
inve
stm
ento
f$1
,000
inve
sted
atth
ebe
ginn
ing
ofth
epe
riod
and
held
for
the
enti
repe
riod
from
Apr
il1,
2021
thro
ugh
Sep
tem
ber
30,2
021,
whi
chre
pres
ents
ape
riod
of18
3da
ysof
a36
5da
yye
ar.T
his
proj
ecti
onas
sum
esth
atan
nual
ized
expe
nse
rati
osw
ere
inef
fect
duri
ngth
epe
riod
.
Act
ual
Exp
ense
s—
The
firs
tli
neun
der
each
shar
ecl
ass
inth
eta
ble
belo
wpr
ovid
esin
form
atio
nab
out
actu
alac
coun
tval
ues
and
actu
alex
pens
es.Y
oum
ayus
eth
ein
form
atio
nin
this
line
,tog
ethe
rw
ith
the
amou
ntyo
uin
vest
ed,t
oes
tim
ate
the
expe
nses
that
you
paid
over
the
peri
od.S
impl
ydi
vide
your
acco
unt
valu
eby
$1,0
00(f
orex
ampl
e,an
$8,6
00ac
coun
tva
lue
divi
ded
by$1
,000
=8.
6),t
hen
mul
tipl
yth
ere
sult
byth
enu
mbe
rin
the
firs
tli
neun
der
the
head
ing
enti
tled
“Exp
ense
sP
aid”
toes
tim
ate
the
expe
nses
you
paid
onyo
urac
coun
tdur
ing
this
peri
od.
Hyp
othe
tica
lE
xam
ple
for
Com
pari
son
Pur
pose
s—
The
seco
ndli
neun
der
each
shar
ecl
ass
inth
eta
ble
belo
wpr
ovid
esin
form
atio
nab
out
hypo
thet
ical
acco
unt
valu
esan
dhy
poth
etic
alex
pens
esba
sed
onth
eF
unds
’ac
tual
net
expe
nse
rati
osan
dan
assu
med
rate
ofre
turn
of5%
per
year
befo
reex
pens
es,w
hich
isno
tth
eF
unds
’ac
tual
retu
rn.T
hehy
poth
etic
alac
coun
tva
lues
and
expe
nses
may
not
beus
edto
esti
mat
eth
eac
tual
endi
ngac
coun
tba
lanc
eor
expe
nses
you
paid
for
the
peri
od.
You
may
use
this
info
rmat
ion
toco
mpa
reth
eon
goin
gco
sts
ofin
vest
ing
inth
eF
unds
and
othe
rfu
nds.
To
doso
,co
mpa
reth
is5%
hypo
thet
ical
exam
ple
wit
hth
e5%
hypo
thet
ical
exam
ples
that
appe
arin
the
shar
ehol
der
repo
rts
ofth
eot
her
fund
s.
Ple
ase
note
that
the
expe
nses
show
nin
the
tabl
ear
em
eant
tohi
ghli
ght
your
ongo
ing
cost
son
lyan
ddo
not
refl
ect
any
tran
sact
iona
lco
sts,
such
assa
les
char
ges,
rede
mpt
ion
fees
,or
exch
ange
fees
.The
refo
re,t
hese
cond
line
ofth
eta
ble
isus
eful
inco
mpa
ring
ongo
ing
cost
son
ly,a
ndw
illn
othe
lpyo
ude
term
ine
the
rela
tive
tota
lcos
tsof
owni
ngdi
ffer
entf
unds
.In
addi
tion
,if
thes
etr
ansa
ctio
nalc
osts
wer
ein
clud
ed,y
our
cost
sw
ould
have
been
high
er.
Bond
Fund
Core
Fixe
dIn
com
eFu
ndG
loba
lCor
eFi
xed
Inco
me
Fund
Shar
eCl
ass
Begi
nnin
gA
ccou
ntVa
lue
4/1/
21
Endi
ngA
ccou
ntVa
lue
9/30
/21
Expe
nses
Paid
for
the
6m
onth
sen
ded
9/30
/21*
Begi
nnin
gA
ccou
ntVa
lue
4/1/
21
Endi
ngA
ccou
ntVa
lue
9/30
/21
Expe
nses
Paid
for
the
6m
onth
sen
ded
9/30
/21*
Begi
nnin
gA
ccou
ntVa
lue
4/1/
21
Endi
ngA
ccou
ntVa
lue
9/30
/21
Expe
nses
Paid
for
the
6m
onth
sen
ded
9/30
/21*
Cla
ssA
Act
ual
$1,0
00.0
0$1
,024
.10
$3.9
6$1
,000
.00
$1,0
21.9
0$3
.60
$1,0
00.0
0$1
,013
.20
$4.9
0H
ypot
heti
cal5
%re
turn
1,00
0.00
1,02
1.51
+3.
951,
000.
001,
021.
51+
3.60
1,00
0.00
1,02
1.51
+4.
91
Cla
ssC
Act
ual
1,00
0.00
1,02
1.20
7.75
1,00
0.00
1,01
8.90
7.39
1,00
0.00
1,00
9.50
8.66
Hyp
othe
tica
l5%
retu
rn1,
000.
001,
017.
40+
7.74
1,00
0.00
1,01
7.75
+7.
381,
000.
001,
016.
44+
8.69
Inst
itu
tio
nal
Act
ual
1,00
0.00
1,02
6.70
2.29
1,00
0.00
1,02
3.50
1.93
1,00
0.00
1,01
4.80
3.33
Hyp
othe
tica
l5%
retu
rn1,
000.
001,
022.
81+
2.28
1,00
0.00
1,02
3.16
+1.
931,
000.
001,
021.
76+
3.35
Serv
ice
Act
ual
1,00
0.00
1,02
4.10
4.82
1,00
0.00
1,02
0.90
4.46
1,00
0.00
1,01
1.50
5.85
Hyp
othe
tica
l5%
retu
rn1,
000.
001,
020.
66+
4.81
1,00
0.00
1,02
0.66
+4.
461,
000.
001,
020.
66+
5.87
Inve
sto
r
Act
ual
1,00
0.00
1,02
6.40
2.69
1,00
0.00
1,02
3.10
2.33
1,00
0.00
1,01
4.50
3.64
Hyp
othe
tica
l5%
retu
rn1,
000.
001,
022.
41+
2.69
1,00
0.00
1,02
2.76
+2.
331,
000.
001,
021.
46+
3.65
Cla
ssR
6
Act
ual
1,00
0.00
1,02
6.80
2.24
1,00
0.00
1,02
3.60
1.88
1,00
0.00
1,01
4.80
3.28
Hyp
othe
tica
l5%
retu
rn1,
000.
001,
022.
86+
2.23
1,00
0.00
1,02
3.21
+1.
881,
000.
001,
021.
81+
3.29
Cla
ssR
Act
ual
1,00
0.00
1,02
3.70
5.23
1,00
0.00
1,02
0.60
4.86
——
—H
ypot
heti
cal5
%re
turn
1,00
0.00
1,02
0.26
+5.
221,
000.
001,
020.
26+
4.86
——
—
Cla
ssP
Act
ual
1,00
0.00
1,02
6.80
2.24
1,00
0.00
1,02
3.50
1.88
1,00
0.00
1,01
4.80
3.28
Hyp
othe
tica
l5%
retu
rn1,
000.
001,
023.
21+
2.23
1,00
0.00
1,02
3.21
+1.
881,
000.
001,
023.
21+
3.29
*E
xpen
ses
for
each
shar
ecl
ass
are
calc
ulat
edus
ing
each
Fun
d’s
annu
aliz
edne
texp
ense
rati
ofo
rea
chcl
ass,
whi
chre
pres
ents
the
ongo
ing
expe
nses
asa
perc
enta
geof
neta
sset
sfo
rth
esi
xm
onth
sen
ded
Sep
tem
ber
30,2
021.
Exp
ense
sar
eca
lcul
ated
bym
ulti
plyi
ngth
ean
nual
ized
nete
xpen
sera
tio
byth
eav
erag
eac
coun
tval
uefo
rth
epe
riod
;the
nm
ulti
plyi
ngth
ere
sult
byth
enu
mbe
rof
days
inth
em
ostr
ecen
tfis
calh
alf
year
;and
then
divi
ding
that
resu
ltby
the
num
ber
ofda
ysin
the
fisc
alye
ar.
The
annu
aliz
edne
texp
ense
rati
osfo
rth
epe
riod
wer
eas
foll
ows:
Fund
Clas
sA
Clas
sC
Inst
itut
iona
lSe
rvic
eIn
vest
orCl
ass
R6Cl
ass
RCl
ass
P
Bon
d0.
78%
1.53
%0.
45%
0.95
%0.
53%
0.44
%1.
03%
0.44
%C
ore
Fix
edIn
com
e0.
711.
460.
380.
880.
460.
370.
960.
37G
loba
lCor
eF
ixed
Inco
me
0.97
1.72
0.66
1.16
0.72
0.65
—0.
65
+H
ypot
heti
cale
xpen
ses
are
base
don
each
Fun
d’s
actu
alan
nual
ized
nete
xpen
sera
tios
and
anas
sum
edra
teof
retu
rnof
5%pe
rye
arbe
fore
expe
nses
.
212
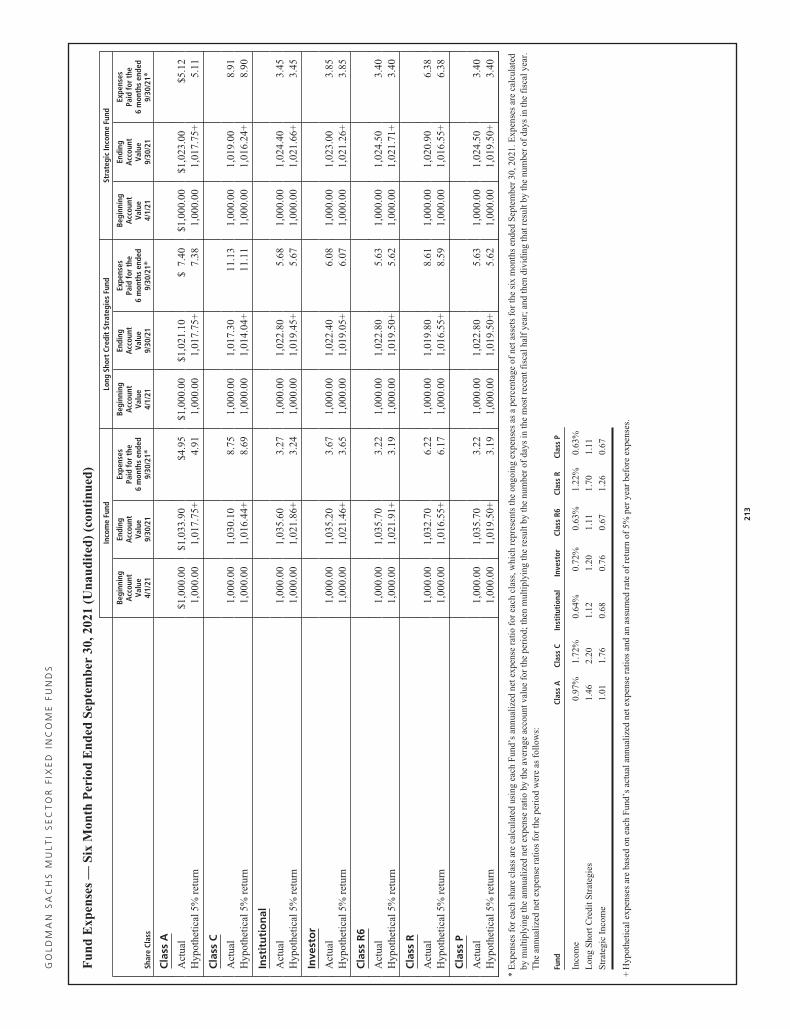
GO
LD
MA
NS
AC
HS
MU
LT
IS
EC
TO
RF
IXE
DIN
CO
ME
FU
ND
S
Fun
dE
xpen
ses
—Si
xM
onth
Per
iod
End
edSe
ptem
ber
30,2
021
(Una
udit
ed)
(con
tinu
ed)
Inco
me
Fund
Long
Shor
tCr
edit
Stra
tegi
esFu
ndSt
rate
gic
Inco
me
Fund
Shar
eCl
ass
Begi
nnin
gA
ccou
ntVa
lue
4/1/
21
Endi
ngA
ccou
ntVa
lue
9/30
/21
Expe
nses
Paid
for
the
6m
onth
sen
ded
9/30
/21*
Begi
nnin
gA
ccou
ntVa
lue
4/1/
21
Endi
ngA
ccou
ntVa
lue
9/30
/21
Expe
nses
Paid
for
the
6m
onth
sen
ded
9/30
/21*
Begi
nnin
gA
ccou
ntVa
lue
4/1/
21
Endi
ngA
ccou
ntVa
lue
9/30
/21
Expe
nses
Paid
for
the
6m
onth
sen
ded
9/30
/21*
Cla
ssA
Act
ual
$1,0
00.0
0$1
,033
.90
$4.9
5$1
,000
.00
$1,0
21.1
0$
7.40
$1,0
00.0
0$1
,023
.00
$5.1
2H
ypot
heti
cal5
%re
turn
1,00
0.00
1,01
7.75
+4.
911,
000.
001,
017.
75+
7.38
1,00
0.00
1,01
7.75
+5.
11
Cla
ssC
Act
ual
1,00
0.00
1,03
0.10
8.75
1,00
0.00
1,01
7.30
11.1
31,
000.
001,
019.
008.
91H
ypot
heti
cal5
%re
turn
1,00
0.00
1,01
6.44
+8.
691,
000.
001,
014.
04+
11.1
11,
000.
001,
016.
24+
8.90
Inst
itu
tio
nal
Act
ual
1,00
0.00
1,03
5.60
3.27
1,00
0.00
1,02
2.80
5.68
1,00
0.00
1,02
4.40
3.45
Hyp
othe
tica
l5%
retu
rn1,
000.
001,
021.
86+
3.24
1,00
0.00
1,01
9.45
+5.
671,
000.
001,
021.
66+
3.45
Inve
sto
r
Act
ual
1,00
0.00
1,03
5.20
3.67
1,00
0.00
1,02
2.40
6.08
1,00
0.00
1,02
3.00
3.85
Hyp
othe
tica
l5%
retu
rn1,
000.
001,
021.
46+
3.65
1,00
0.00
1,01
9.05
+6.
071,
000.
001,
021.
26+
3.85
Cla
ssR
6
Act
ual
1,00
0.00
1,03
5.70
3.22
1,00
0.00
1,02
2.80
5.63
1,00
0.00
1,02
4.50
3.40
Hyp
othe
tica
l5%
retu
rn1,
000.
001,
021.
91+
3.19
1,00
0.00
1,01
9.50
+5.
621,
000.
001,
021.
71+
3.40
Cla
ssR
Act
ual
1,00
0.00
1,03
2.70
6.22
1,00
0.00
1,01
9.80
8.61
1,00
0.00
1,02
0.90
6.38
Hyp
othe
tica
l5%
retu
rn1,
000.
001,
016.
55+
6.17
1,00
0.00
1,01
6.55
+8.
591,
000.
001,
016.
55+
6.38
Cla
ssP
Act
ual
1,00
0.00
1,03
5.70
3.22
1,00
0.00
1,02
2.80
5.63
1,00
0.00
1,02
4.50
3.40
Hyp
othe
tica
l5%
retu
rn1,
000.
001,
019.
50+
3.19
1,00
0.00
1,01
9.50
+5.
621,
000.
001,
019.
50+
3.40
*E
xpen
ses
for
each
shar
ecl
ass
are
calc
ulat
edus
ing
each
Fun
d’s
annu
aliz
edne
texp
ense
rati
ofo
rea
chcl
ass,
whi
chre
pres
ents
the
ongo
ing
expe
nses
asa
perc
enta
geof
neta
sset
sfo
rth
esi
xm
onth
sen
ded
Sep
tem
ber
30,2
021.
Exp
ense
sar
eca
lcul
ated
bym
ulti
plyi
ngth
ean
nual
ized
nete
xpen
sera
tio
byth
eav
erag
eac
coun
tval
uefo
rth
epe
riod
;the
nm
ulti
plyi
ngth
ere
sult
byth
enu
mbe
rof
days
inth
em
ostr
ecen
tfis
calh
alf
year
;and
then
divi
ding
that
resu
ltby
the
num
ber
ofda
ysin
the
fisc
alye
ar.
The
annu
aliz
edne
texp
ense
rati
osfo
rth
epe
riod
wer
eas
foll
ows:
Fund
Clas
sA
Clas
sC
Inst
itut
iona
lIn
vest
orCl
ass
R6Cl
ass
RCl
ass
P
Inco
me
0.97
%1.
72%
0.64
%0.
72%
0.63
%1.
22%
0.63
%
Lon
gS
hort
Cre
ditS
trat
egie
s1.
462.
201.
121.
201.
111.
701.
11
Str
ateg
icIn
com
e1.
011.
760.
680.
760.
671.
260.
67
+H
ypot
heti
cale
xpen
ses
are
base
don
each
Fun
d’s
actu
alan
nual
ized
nete
xpen
sera
tios
and
anas
sum
edra
teof
retu
rnof
5%pe
rye
arbe
fore
expe
nses
.
213
G O L D M A N S A C H S M U L T I S E C T O R F I X E D I N C O M E F U N D S
Statement Regarding Basis for Approval of Management Agreements (Unaudited)
BackgroundThe Goldman Sachs Bond Fund, Goldman Sachs Core Fixed Income Fund, Goldman Sachs Global Core Fixed Income Fund,
Goldman Sachs Income Fund, Goldman Sachs Long Short Credit Strategies Fund and Goldman Sachs Strategic Income Fund (the
“Funds”) are investment portfolios of Goldman Sachs Trust (the “Trust”). The Board of Trustees oversees the management of the
Trust and reviews the investment performance and expenses of the Funds at regularly scheduled meetings held throughout the year.
In addition, the Board of Trustees determines annually whether to approve the continuance of the Trust’s investment management
agreements (the “Management Agreements”) on behalf of the Bond, Core Fixed Income, Income, Long Short Credit Strategies and
Strategic Income Funds with Goldman Sachs Asset Management, L.P. (“GSAM”) and on behalf of the Global Core Fixed Income
Fund with Goldman Sachs Asset Management International (together with GSAM, the “Investment Advisers”).
The Management Agreements were most recently approved for continuation until June 30, 2022 by the Board of Trustees,
including those Trustees who are not parties to the Management Agreements or “interested persons” (as defined in the Investment
Company Act of 1940, as amended) of any party thereto (the “Independent Trustees”), at a meeting held on June 15-16, 2021 (the
“Annual Meeting”).
The review process undertaken by the Trustees spans the course of the year and culminates with the Annual Meeting. To
assist the Trustees in their deliberations, the Trustees have established a Contract Review Committee (the “Committee”),
comprised of the Independent Trustees. The Committee held two meetings over the course of the year since the Management
Agreements were last approved. At those Committee meetings, regularly scheduled Board or other committee meetings, and/or the
Annual Meeting, matters relevant to the renewal of the Management Agreements were considered by the Board, or the Independent
Trustees, as applicable. With respect to each Fund, such matters included:
(a) the nature and quality of the advisory, administrative, and other services provided to the Fund by the Investment Adviser
and its affiliates, including information about:
(i) the structure, staff, and capabilities of the Investment Adviser and its portfolio management teams;
(ii) the groups within the Investment Adviser and its affiliates that support the portfolio management teams or provide
other types of necessary services, including fund services groups (e.g., accounting and financial reporting, tax,
shareholder services, and operations); controls and risk management groups (e.g., legal, compliance, valuation
oversight, credit risk management, internal audit, compliance testing, market risk analysis, finance, and central
funding); sales and distribution support groups, and others (e.g., information technology and training);
(iii) trends in employee headcount;
(iv) the Investment Adviser’s financial resources and ability to hire and retain talented personnel and strengthen its
operations; and
(v) the parent company’s support of the Investment Adviser and its mutual fund business, as expressed by the firm’s
senior management;
(b) information on the investment performance of the Fund, including comparisons to the performance of similar mutual
funds, as provided by a third-party mutual fund data provider engaged as part of the contract review process (the
“Outside Data Provider”), a benchmark performance index, and (in the case of the Bond Fund, Core Fixed Income Fund,
and Global Core Fixed Income Fund) a composite of accounts with comparable investment strategies managed by the
Investment Adviser; and information on general investment outlooks in the markets in which the Fund invests;
(c) information provided by the Investment Adviser indicating the Investment Adviser’s views on whether the Fund’s peer
group and/or benchmark index had high, medium, or low relevance given the Fund’s particular investment strategy;
(d) the terms of the Management Agreements and other agreements with affiliated service providers entered into by the
Trust on behalf of the Fund;
(e) fee and expense information for the Fund, including:
(i) the relative management fee and expense levels of the Fund as compared to those of comparable funds managed by
other advisers, as provided by the Outside Data Provider;
(ii) the Fund’s expense trends over time (except for the Income Fund, which commenced operations on December 3,
2019); and
(iii) to the extent the Investment Adviser manages other types of accounts (such as bank collective trusts, private wealth
management accounts, institutional separate accounts, sub-advised mutual funds, and non-U.S. funds) having
investment objectives and policies similar to those of the Fund, comparative information on the advisory fees
charged and services provided to those accounts by the Investment Adviser;
(f) with respect to the extensive investment performance and expense comparison data provided by the Outside Data
Provider, its processes in producing that data for the Fund;
214
G O L D M A N S A C H S M U L T I S E C T O R F I X E D I N C O M E F U N D S
Statement Regarding Basis for Approval of Management Agreements (Unaudited) (continued)
(g) the undertakings of the Investment Adviser and its affiliates to implement fee waivers and/or expense limitations;
(h) information relating to the profitability of the Management Agreements and the transfer agency and distribution and
service arrangements of the Fund to the Investment Adviser and its affiliates;
(i) whether the Fund’s existing management fee schedule adequately addressed any economies of scale;
(j) a summary of the “fall-out” benefits derived by the Investment Adviser and its affiliates from their relationships with the
Fund, including the fees received by the Investment Adviser’s affiliates from the Fund for transfer agency, portfolio
trading, distribution and other services;
(k) a summary of potential benefits derived by the Fund as a result of its relationship with the Investment Adviser;
(l) information regarding portfolio trading and how the Investment Adviser carries out its duty to seek best execution;
(m) portfolio manager ownership of Fund shares; the manner in which portfolio manager compensation is determined; and
the number and types of accounts managed by the portfolio managers;
(n) the nature and quality of the services provided to the Fund by its unaffiliated service providers, and the Investment
Adviser’s general oversight and evaluation (including reports on due diligence) of those service providers as part of the
administrative services provided under the Management Agreements; and
(o) the Investment Adviser’s processes and policies addressing various types of potential conflicts of interest; its approach to
risk management; the annual review of the effectiveness of the Fund’s compliance program; and periodic compliance
reports.
The Trustees also received an overview of the Funds’ distribution arrangements. They received information regarding the
Funds’ assets, share purchase and redemption activity, and payment of distribution, service, and shareholder administration fees, as
applicable. Information was also provided to the Trustees relating to revenue sharing payments made by and services provided by
the Investment Advisers and their affiliates to intermediaries that promote the sale, distribution, and/or servicing of Fund shares.
The Independent Trustees also discussed the broad range of other investment choices that are available to Fund investors, including
the availability of comparable funds managed by other advisers.
The presentations made at the Board and Committee meetings and at the Annual Meeting encompassed the Funds and other
mutual funds for which the Board of Trustees has responsibility. In evaluating the Management Agreements at the Annual
Meeting, the Trustees relied upon their knowledge, resulting from their meetings and other interactions throughout the year, of the
Investment Advisers and their affiliates, their services, and the Funds. In conjunction with these meetings, the Trustees received
written materials and oral presentations on the topics covered, and the Investment Advisers addressed the questions and concerns
of the Trustees, including concerns regarding the investment performance of certain of the funds they oversee. The Independent
Trustees were advised by their independent legal counsel regarding their responsibilities and other regulatory requirements related
to the approval and continuation of mutual fund investment management agreements under applicable law. In addition, the
Investment Advisers and their affiliates provided the Independent Trustees with a written response to a formal request for
information sent on behalf of the Independent Trustees by their independent legal counsel. During the course of their deliberations,
the Independent Trustees met in executive sessions with their independent legal counsel, without representatives of the Investment
Advisers or their affiliates present.
Nature, Extent, and Quality of the Services Provided Under the Management AgreementsAs part of their review, the Trustees considered the nature, extent, and quality of the services provided to the Funds by the
Investment Advisers. In this regard, the Trustees considered both the investment advisory services and non-advisory services that
are provided by the Investment Advisers and their affiliates. The Trustees noted the transition in the leadership and changes in
personnel of various of the Investment Advisers’ portfolio management teams that had occurred in recent periods, and the ongoing
recruitment efforts aimed at bringing high quality investment talent to the Investment Advisers. They also noted the Investment
Advisers’ commitment to maintaining high quality systems and expending substantial resources to respond to ongoing changes to
the market, regulatory and control environment in which the Funds and their service providers operate, including changes
associated with the COVID-19 pandemic, as well as the efforts of the Investment Advisers and their affiliates to combat cyber
security risks. The Trustees also considered information regarding the Investment Advisers’ business continuity planning and
remote operations capabilities. The Trustees concluded that the Investment Advisers continued to commit substantial financial and
operational resources to the Funds and expressed confidence that the Investment Advisers would continue to do so in the future.
The Trustees also recognized that the Investment Advisers had made significant commitments to address regulatory compliance
requirements applicable to the Funds and the Investment Advisers and their affiliates.
215
G O L D M A N S A C H S M U L T I S E C T O R F I X E D I N C O M E F U N D S
Statement Regarding Basis for Approval of Management Agreements (Unaudited) (continued)
Investment PerformanceThe Trustees also considered the investment performance of the Funds. In this regard, they compared the investment
performance of each Fund to its peers using rankings and ratings compiled by the Outside Data Provider as of December 31, 2020,
and updated performance information prepared by the Investment Advisers using the peer group identified by the Outside Data
Provider as of March 31, 2021. The information on each Fund’s investment performance was provided for the one-, three-, five-,
and ten-year periods ending on the applicable dates, to the extent that each Fund had been in existence for those periods. The
Trustees also reviewed each Fund’s investment performance relative to its performance benchmark. As part of this review, they
considered the investment performance trends of the Funds over time, and reviewed the investment performance of each Fund in
light of its investment objective and policies and market conditions. The Trustees also received information comparing the Bond
Fund, Core Fixed Income Fund, and Global Core Fixed Income Fund’s performance to that of composites of accounts with
comparable investment strategies managed by the Investment Advisers.
In addition, the Trustees considered materials prepared and presentations made by the Investment Advisers’ senior
management and portfolio management personnel in which Fund performance was assessed. The Trustees also considered the
Investment Advisers’ periodic reports with respect to the Funds’ risk profiles, and how the Investment Advisers’ approach to risk
monitoring and management influences portfolio management.
The Trustees observed that the Bond Fund’s Institutional Shares had placed in the top half of the Fund’s peer group and had
outperformed the Fund’s benchmark index for the one-, three-, five-, and ten-year periods ended March 31, 2021. They noted that
the Core Fixed Income Fund’s Institutional Shares had placed in the top half of the Fund’s peer group and had outperformed the
Fund’s benchmark index for the one-, three-, five-, and ten-year periods ended March 31, 2021. They considered that the Global
Core Fixed Income Fund’s Institutional Shares had placed in the top half of the Fund’s peer group for the three-, five, and ten-year
periods and in the third quartile for the one-year period, and had outperformed the Fund’s benchmark index for the one-, three-,
five-, and ten-year periods ended March 31, 2021. The Board noted that in February 2020, the Global Core Fixed Income Fund had
been repositioned from the Global Income Fund, which involved changes to the Fund’s investment objective and principal
investment strategy. They also noted that the Global Core Fixed Income Fund had experienced certain portfolio management
changes in 2020. They observed that the Income Fund’s Institutional Shares had placed in the top half of the Fund’s peer group and
had outperformed the Fund’s benchmark index for the one-year period ended March 31, 2021. The Trustees recalled that the Long
Short Credit Strategies Fund was launched in April 2014 in connection with the reorganization of the Goldman Sachs Credit
Strategies Fund, a closed-end interval fund, with and into the Fund. The Trustees noted that the Long Short Credit Strategies
Fund’s Institutional Shares (when viewed together with its predecessor for the applicable periods) had placed in the top half of the
Fund’s peer group for the one- and three-year periods and in the fourth quartile for the five- and ten-year periods; had
outperformed the Fund’s LIBOR-based benchmark index by 15.83%, 2.04%, 1.80%, and 2.50% respectively, for the one-, three-,
five-, and ten-year periods; and had outperformed the average performance of a group of competitor funds, as determined by the
Investment Adviser (the “Competitor Fund Average”), for the one- and three-year periods and underperformed for the five-year
period ended March 31, 2021. However, they noted that the Fund currently implements a long/short credit strategy, while the
Goldman Sachs Credit Strategies Fund implemented a long-only credit strategy. They also noted that the Long Short Credit
Strategies Fund had experienced certain portfolio management changes in early 2021. The Trustees considered that the Strategic
Income Fund’s Institutional Shares had placed in the top half of the Fund’s peer group for the one-year period and the third quartile
for the three-, five-, and ten-year periods; had outperformed the Fund’s LIBOR-based benchmark index by 14.98%, 1.47%, 1.42%,
and 1.80% respectively, for the one-, three-, five-, and ten-year periods; and had outperformed the Fund’s Competitor Fund
Average for the one-year period and underperformed for the three- and five-year periods ended March 31, 2021.
Costs of Services Provided and Competitive InformationThe Trustees considered the contractual terms of the Management Agreements and the fee rates payable by each Fund
thereunder. In this regard, the Trustees considered information on the services rendered by the Investment Advisers to the Funds,
which included both advisory and administrative services that were directed to the needs and operations of the Funds as registered
mutual funds.
In particular, the Trustees reviewed analyses prepared by the Outside Data Provider regarding the expense rankings of the
Funds. The analyses provided a comparison of each Fund’s management fee and breakpoints to those of a relevant peer group and
category universe; an expense analysis which compared each Fund’s overall net and gross expenses to a peer group and a category
universe; and data comparing each Fund’s net expenses to the peer and category medians. The analyses also compared each Fund’s
other expenses and fee waivers/reimbursements to those of the peer group and category medians. The Trustees concluded that the
comparisons provided by the Outside Data Provider were useful in evaluating the reasonableness of the management fees and total
expenses paid by the Funds.
216
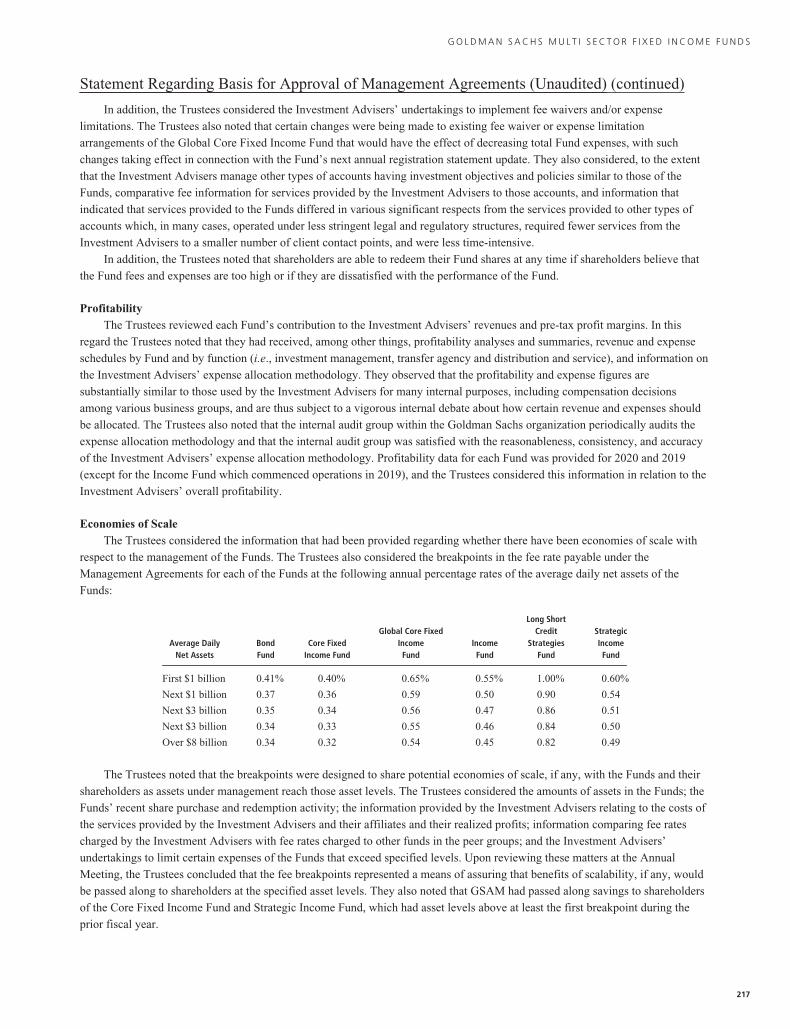
G O L D M A N S A C H S M U L T I S E C T O R F I X E D I N C O M E F U N D S
Statement Regarding Basis for Approval of Management Agreements (Unaudited) (continued)
In addition, the Trustees considered the Investment Advisers’ undertakings to implement fee waivers and/or expense
limitations. The Trustees also noted that certain changes were being made to existing fee waiver or expense limitation
arrangements of the Global Core Fixed Income Fund that would have the effect of decreasing total Fund expenses, with such
changes taking effect in connection with the Fund’s next annual registration statement update. They also considered, to the extent
that the Investment Advisers manage other types of accounts having investment objectives and policies similar to those of the
Funds, comparative fee information for services provided by the Investment Advisers to those accounts, and information that
indicated that services provided to the Funds differed in various significant respects from the services provided to other types of
accounts which, in many cases, operated under less stringent legal and regulatory structures, required fewer services from the
Investment Advisers to a smaller number of client contact points, and were less time-intensive.
In addition, the Trustees noted that shareholders are able to redeem their Fund shares at any time if shareholders believe that
the Fund fees and expenses are too high or if they are dissatisfied with the performance of the Fund.
ProfitabilityThe Trustees reviewed each Fund’s contribution to the Investment Advisers’ revenues and pre-tax profit margins. In this
regard the Trustees noted that they had received, among other things, profitability analyses and summaries, revenue and expense
schedules by Fund and by function (i.e., investment management, transfer agency and distribution and service), and information on
the Investment Advisers’ expense allocation methodology. They observed that the profitability and expense figures are
substantially similar to those used by the Investment Advisers for many internal purposes, including compensation decisions
among various business groups, and are thus subject to a vigorous internal debate about how certain revenue and expenses should
be allocated. The Trustees also noted that the internal audit group within the Goldman Sachs organization periodically audits the
expense allocation methodology and that the internal audit group was satisfied with the reasonableness, consistency, and accuracy
of the Investment Advisers’ expense allocation methodology. Profitability data for each Fund was provided for 2020 and 2019
(except for the Income Fund which commenced operations in 2019), and the Trustees considered this information in relation to the
Investment Advisers’ overall profitability.
Economies of ScaleThe Trustees considered the information that had been provided regarding whether there have been economies of scale with
respect to the management of the Funds. The Trustees also considered the breakpoints in the fee rate payable under the
Management Agreements for each of the Funds at the following annual percentage rates of the average daily net assets of the
Funds:
Average DailyNet Assets
BondFund
Core FixedIncome Fund
Global Core FixedIncomeFund
IncomeFund
Long ShortCredit
StrategiesFund
StrategicIncomeFund
First $1 billion 0.41% 0.40% 0.65% 0.55% 1.00% 0.60%
Next $1 billion 0.37 0.36 0.59 0.50 0.90 0.54
Next $3 billion 0.35 0.34 0.56 0.47 0.86 0.51
Next $3 billion 0.34 0.33 0.55 0.46 0.84 0.50
Over $8 billion 0.34 0.32 0.54 0.45 0.82 0.49
The Trustees noted that the breakpoints were designed to share potential economies of scale, if any, with the Funds and their
shareholders as assets under management reach those asset levels. The Trustees considered the amounts of assets in the Funds; the
Funds’ recent share purchase and redemption activity; the information provided by the Investment Advisers relating to the costs of
the services provided by the Investment Advisers and their affiliates and their realized profits; information comparing fee rates
charged by the Investment Advisers with fee rates charged to other funds in the peer groups; and the Investment Advisers’
undertakings to limit certain expenses of the Funds that exceed specified levels. Upon reviewing these matters at the Annual
Meeting, the Trustees concluded that the fee breakpoints represented a means of assuring that benefits of scalability, if any, would
be passed along to shareholders at the specified asset levels. They also noted that GSAM had passed along savings to shareholders
of the Core Fixed Income Fund and Strategic Income Fund, which had asset levels above at least the first breakpoint during the
prior fiscal year.
217
G O L D M A N S A C H S M U L T I S E C T O R F I X E D I N C O M E F U N D S
Statement Regarding Basis for Approval of Management Agreements (Unaudited) (continued)
Other Benefits to the Investment Advisers and Their AffiliatesThe Trustees also considered the other benefits derived by the Investment Advisers and their affiliates from their relationships
with the Funds as stated above, including: (a) transfer agency fees received by Goldman Sachs & Co. LLC (“Goldman Sachs”);
(b) futures commissions earned by Goldman Sachs for executing futures transactions on behalf of the Funds; (c) trading
efficiencies resulting from aggregation of orders of the Funds with those for other funds or accounts managed by the Investment
Advisers; (d) the Investment Advisers’ ability to leverage the infrastructure designed to service the Funds on behalf of their other
clients; (e) the Investment Advisers’ ability to cross-market other products and services to Fund shareholders; (f) Goldman Sachs’
retention of certain fees as Fund Distributor; (g) the Investment Advisers’ ability to negotiate better pricing with custodians on
behalf of their other clients, as a result of the relationship with the Funds; (h) the investment of cash and cash collateral in money
market funds managed by the Investment Advisers that will result in increased assets under management for those money market
funds; (i) the investment in exchange-traded funds (“ETFs”) managed by GSAM that will result in increased assets under
management for those ETFs and may facilitate the development of GSAM’s ETF advisory business; and (j) the possibility that the
working relationship between the Investment Advisers and the Funds’ third-party service providers may cause those service
providers to be more likely to do business with other areas of Goldman Sachs. In the course of considering the foregoing, the
Independent Trustees requested and received further information quantifying certain of these fall-out benefits.
Other Benefits to the Funds and Their ShareholdersThe Trustees also noted that the Funds receive certain other potential benefits as a result of their relationship with the
Investment Advisers, including: (a) trading efficiencies resulting from aggregation of orders of the Funds with those of other funds
or accounts managed by the Investment Advisers; (b) enhanced servicing from vendors due to the volume of business generated by
the Investment Advisers and their affiliates; (c) enhanced servicing from broker-dealers due to the volume of business generated by
the Investment Advisers and their affiliates; (d) the Investment Advisers’ ability to negotiate favorable terms with derivatives
counterparties on behalf of the Funds as a result of the size and reputation of the Goldman Sachs organization; (e) the advantages
received from the Investment Advisers’ knowledge and experience gained from managing other accounts and products; (f) the
Investment Advisers’ ability to hire and retain qualified personnel to provide services to the Funds because of the reputation of the
Goldman Sachs organization; (g) the Funds’ access, through the Investment Advisers, to certain firm-wide resources (e.g.,
proprietary risk management systems and databases), subject to certain restrictions; and (h) the Funds’ access to certain affiliated
distribution channels. In addition, the Trustees noted the competitive nature of the mutual fund marketplace, and considered that
many of the Funds’ shareholders invested in the Funds in part because of the Funds’ relationship with the Investment Advisers and
that those shareholders have a general expectation that the relationship will continue.
ConclusionIn connection with their consideration of the Management Agreements, the Trustees gave weight to each of the factors
described above, but did not identify any particular factor as controlling their decision. After deliberation and consideration of all
of the information provided, including the factors described above, the Trustees concluded, in the exercise of their business
judgment, that the management fees paid by each of the Funds were reasonable in light of the services provided to it by its
respective Investment Adviser, the Investment Advisers’ costs and each Fund’s current and reasonably foreseeable asset levels.
The Trustees unanimously concluded that the Investment Advisers’ continued management likely would benefit each applicable
Fund and its shareholders and that the Management Agreements should be approved and continued with respect to each applicable
Fund until June 30, 2022.
218

(This page intentionally left blank)

(This page intentionally left blank)
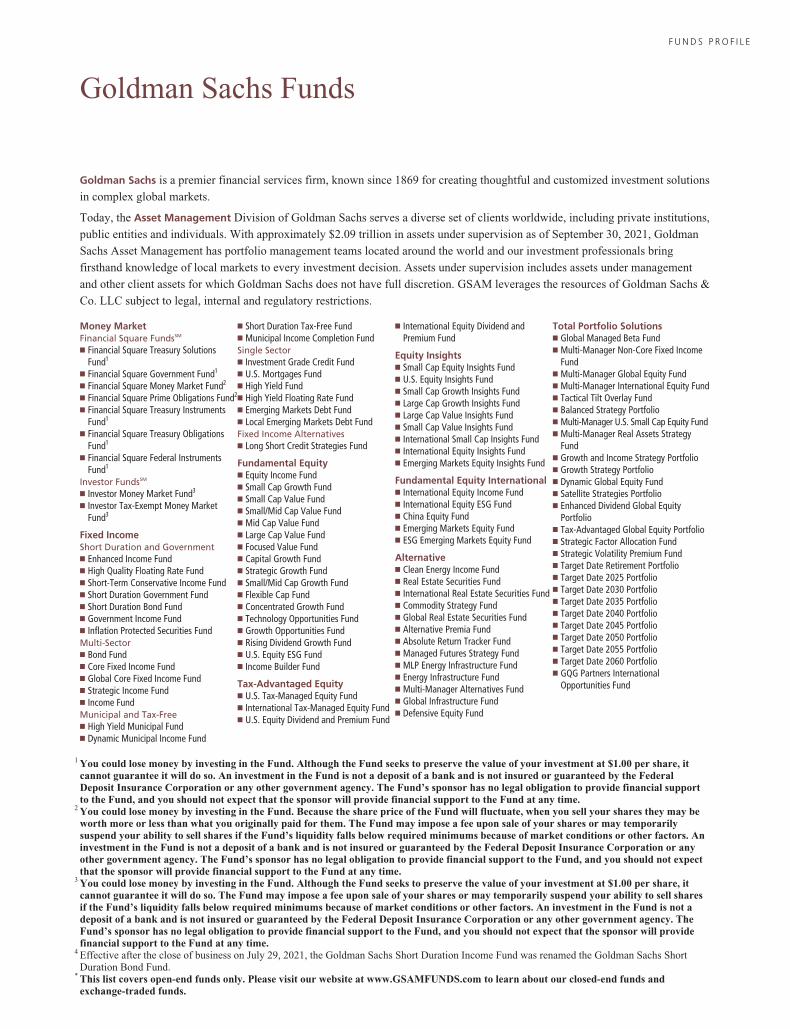
F U N D S P R O F I L E
Goldman Sachs Funds
Goldman Sachs is a premier financial services firm, known since 1869 for creating thoughtful and customized investment solutions
in complex global markets.
Today, the Asset Management Division of Goldman Sachs serves a diverse set of clients worldwide, including private institutions,
public entities and individuals. With approximately $2.09 trillion in assets under supervision as of September 30, 2021, Goldman
Sachs Asset Management has portfolio management teams located around the world and our investment professionals bring
firsthand knowledge of local markets to every investment decision. Assets under supervision includes assets under management
and other client assets for which Goldman Sachs does not have full discretion. GSAM leverages the resources of Goldman Sachs &
Co. LLC subject to legal, internal and regulatory restrictions.
Money MarketFinancial Square FundsSM
� Financial Square Treasury SolutionsFund1
� Financial Square Government Fund1
� Financial Square Money Market Fund2
� Financial Square Prime Obligations Fund2
� Financial Square Treasury InstrumentsFund1
� Financial Square Treasury ObligationsFund1
� Financial Square Federal InstrumentsFund1
Investor FundsSM
� Investor Money Market Fund3
� Investor Tax-Exempt Money MarketFund3
Fixed IncomeShort Duration and Government� Enhanced Income Fund� High Quality Floating Rate Fund� Short-Term Conservative Income Fund� Short Duration Government Fund� Short Duration Bond Fund� Government Income Fund� Inflation Protected Securities FundMulti-Sector� Bond Fund� Core Fixed Income Fund� Global Core Fixed Income Fund� Strategic Income Fund� Income FundMunicipal and Tax-Free� High Yield Municipal Fund� Dynamic Municipal Income Fund
� Short Duration Tax-Free Fund� Municipal Income Completion FundSingle Sector� Investment Grade Credit Fund� U.S. Mortgages Fund� High Yield Fund� High Yield Floating Rate Fund� Emerging Markets Debt Fund� Local Emerging Markets Debt FundFixed Income Alternatives� Long Short Credit Strategies Fund
Fundamental Equity� Equity Income Fund� Small Cap Growth Fund� Small Cap Value Fund� Small/Mid Cap Value Fund� Mid Cap Value Fund� Large Cap Value Fund� Focused Value Fund� Capital Growth Fund� Strategic Growth Fund� Small/Mid Cap Growth Fund� Flexible Cap Fund� Concentrated Growth Fund� Technology Opportunities Fund� Growth Opportunities Fund� Rising Dividend Growth Fund� U.S. Equity ESG Fund� Income Builder Fund
Tax-Advantaged Equity� U.S. Tax-Managed Equity Fund� International Tax-Managed Equity Fund� U.S. Equity Dividend and Premium Fund
� International Equity Dividend andPremium Fund
Equity Insights� Small Cap Equity Insights Fund� U.S. Equity Insights Fund� Small Cap Growth Insights Fund� Large Cap Growth Insights Fund� Large Cap Value Insights Fund� Small Cap Value Insights Fund� International Small Cap Insights Fund� International Equity Insights Fund� Emerging Markets Equity Insights Fund
Fundamental Equity International� International Equity Income Fund� International Equity ESG Fund� China Equity Fund� Emerging Markets Equity Fund� ESG Emerging Markets Equity Fund
Alternative� Clean Energy Income Fund� Real Estate Securities Fund� International Real Estate Securities Fund� Commodity Strategy Fund� Global Real Estate Securities Fund� Alternative Premia Fund� Absolute Return Tracker Fund� Managed Futures Strategy Fund� MLP Energy Infrastructure Fund� Energy Infrastructure Fund� Multi-Manager Alternatives Fund� Global Infrastructure Fund� Defensive Equity Fund
Total Portfolio Solutions� Global Managed Beta Fund� Multi-Manager Non-Core Fixed Income
Fund� Multi-Manager Global Equity Fund� Multi-Manager International Equity Fund� Tactical Tilt Overlay Fund� Balanced Strategy Portfolio� Multi-Manager U.S. Small Cap Equity Fund� Multi-Manager Real Assets Strategy
Fund� Growth and Income Strategy Portfolio� Growth Strategy Portfolio� Dynamic Global Equity Fund� Satellite Strategies Portfolio� Enhanced Dividend Global Equity
Portfolio� Tax-Advantaged Global Equity Portfolio� Strategic Factor Allocation Fund� Strategic Volatility Premium Fund� Target Date Retirement Portfolio� Target Date 2025 Portfolio� Target Date 2030 Portfolio� Target Date 2035 Portfolio� Target Date 2040 Portfolio� Target Date 2045 Portfolio� Target Date 2050 Portfolio� Target Date 2055 Portfolio� Target Date 2060 Portfolio� GQG Partners International
Opportunities Fund
1 You could lose money by investing in the Fund. Although the Fund seeks to preserve the value of your investment at $1.00 per share, itcannot guarantee it will do so. An investment in the Fund is not a deposit of a bank and is not insured or guaranteed by the FederalDeposit Insurance Corporation or any other government agency. The Fund’s sponsor has no legal obligation to provide financial supportto the Fund, and you should not expect that the sponsor will provide financial support to the Fund at any time.
2 You could lose money by investing in the Fund. Because the share price of the Fund will fluctuate, when you sell your shares they may beworth more or less than what you originally paid for them. The Fund may impose a fee upon sale of your shares or may temporarilysuspend your ability to sell shares if the Fund’s liquidity falls below required minimums because of market conditions or other factors. Aninvestment in the Fund is not a deposit of a bank and is not insured or guaranteed by the Federal Deposit Insurance Corporation or anyother government agency. The Fund’s sponsor has no legal obligation to provide financial support to the Fund, and you should not expectthat the sponsor will provide financial support to the Fund at any time.
3 You could lose money by investing in the Fund. Although the Fund seeks to preserve the value of your investment at $1.00 per share, itcannot guarantee it will do so. The Fund may impose a fee upon sale of your shares or may temporarily suspend your ability to sell sharesif the Fund’s liquidity falls below required minimums because of market conditions or other factors. An investment in the Fund is not adeposit of a bank and is not insured or guaranteed by the Federal Deposit Insurance Corporation or any other government agency. TheFund’s sponsor has no legal obligation to provide financial support to the Fund, and you should not expect that the sponsor will providefinancial support to the Fund at any time.
4 Effective after the close of business on July 29, 2021, the Goldman Sachs Short Duration Income Fund was renamed the Goldman Sachs ShortDuration Bond Fund.
* This list covers open-end funds only. Please visit our website at www.GSAMFUNDS.com to learn about our closed-end funds andexchange-traded funds.
TRUSTEESJessica Palmer, ChairDwight L. BushKathryn A. CassidyDiana M. DanielsJoaquin DelgadoEileen H. DowlingJames A. McNamaraRoy W. TemplinGregory G. Weaver
OFFICERSJames A. McNamara, PresidentJoseph F. DiMaria, Principal Financial Officer, PrincipalAccounting Officer and TreasurerCaroline L. Kraus, Secretary
GOLDMAN SACHS ASSET MANAGEMENTINTERNATIONALInvestment Adviser
GOLDMAN SACHS & CO. LLCDistributor and Transfer Agent
GOLDMAN SACHS ASSET MANAGEMENT, L.P.Investment Adviser
Visit our web site at www.GSAMFUNDS.com to obtain the most recent month-end returns.
Goldman Sachs Asset Management, L.P., 200 West Street, New York, New York 10282
The reports concerning the Funds included in this shareholder report may contain certain forward-looking statements about the factors that may affect theperformance of the Funds in the future. These statements are based on Funds management’s predictions and expectations concerning certain future events andtheir expected impact on the Funds, such as performance of the economy as a whole and of specific industry sectors, changes in the levels of interest rates, theimpact of developing world events, and other factors that may influence the future performance of the Funds. Management believes these forward-lookingstatements to be reasonable, although they are inherently uncertain and difficult to predict. Actual events may cause adjustments in portfolio managementstrategies from those currently expected to be employed.A description of the policies and procedures that the Funds use to determine how to vote proxies relating to portfolio securities and information regarding how aFund voted proxies relating to portfolio securities during the most recent 12-month period ended June 30 is available (i) without charge, upon request by calling1-800-526-7384 (for Retail Shareholders) or 1-800-621-2550 (for Institutional Shareholders); and (ii) on the Securities and Exchange Commission (“SEC”) website at http://www.sec.gov.The Funds will file portfolio holdings information for each month in a fiscal quarter within 60 days after the end of the relevant fiscal quarter on Form N-PORT.Portfolio holdings information for the third month of each fiscal quarter will be made available on the SEC’s web site at http://www.sec.gov. Portfolio holdingsinformation may be obtained upon request and without charge by calling 1-800-526-7384 (for Retail Shareholders) or 1-800-621-2550 (for InstitutionalShareholders).Economic and market forecasts presented herein reflect our judgment as of the date of this report and are subject to change without notice. These forecasts donot take into account the specific investment objectives, restrictions, tax and financial situation or other needs of any specific client. Actual data will vary andmay not be reflected here. These forecasts are subject to high levels of uncertainty that may affect actual performance. Accordingly, these forecasts should beviewed as merely representative of a broad range of possible outcomes. These forecasts are estimated, based on assumptions, and are subject to significantrevision and may change materially as economic and market conditions change. Goldman Sachs has no obligation to provide updates or changes to theseforecasts. Case studies and examples are for illustrative purposes only.Goldman Sachs & Co. LLC (“Goldman Sachs”) does not provide legal, tax or accounting advice. Any statement contained in this communication (including anyattachments) concerning U.S. tax matters was not intended or written to be used, and cannot be used, for the purpose of avoiding penalties under the InternalRevenue Code, and was written to support the promotion or marketing of the transaction(s) or matter(s) addressed. Clients of Goldman Sachs should obtain theirown independent tax advice based on their particular circumstances.Fund holdings and allocations shown are as of September 30, 2021 and may not be representative of future investments. Fund holdings should not be relied onin making investment decisions and should not be construed as research or investment advice regarding particular securities. Current and future holdings aresubject to risk.This material is not authorized for distribution to prospective investors unless preceded or accompanied by a current Prospectus or summaryprospectus, if applicable. Investors should consider a Fund’s objective, risks, and charges and expenses, and read the summary prospectus, ifavailable, and/or the Prospectus carefully before investing or sending money. The summary prospectus, if available, and the Prospectuscontain this and other information about a Fund and may be obtained from your authorized dealer or from Goldman Sachs & Co. LLC by calling(retail – 1-800-526-7384) (institutional – 1-800-621-2550).
Goldman Sachs & Co. LLC is the distributor of the Goldman Sachs Funds.
© 2021 Goldman Sachs. All rights reserved. 259732-OTU-1514009/MSFISAR-21