information and economic voting
TRANSCRIPT
Political Science Research and Methodshttp://journals.cambridge.org/RAM
Additional services for Political Science Research and Methods:
Email alerts: Click hereSubscriptions: Click hereCommercial reprints: Click hereTerms of use : Click here
Information and Economic Voting
Jonathan Rogers and Marcelo Tyszler
Political Science Research and Methods / FirstView Article / June 2016, pp 1 - 18DOI: 10.1017/psrm.2016.27, Published online: 23 June 2016
Link to this article: http://journals.cambridge.org/abstract_S2049847016000273
How to cite this article:Jonathan Rogers and Marcelo Tyszler Information and Economic Voting. Political ScienceResearch and Methods, Available on CJO 2016 doi:10.1017/psrm.2016.27
Request Permissions : Click here
Downloaded from http://journals.cambridge.org/RAM, IP address: 128.122.230.132 on 24 Jun 2016

Political Science Research and Methods Page 1 of 18
© The European Political Science Association, 2016 doi:10.1017/psrm.2016.27
Information and Economic Voting*
JONATHAN ROGERS AND MARCELO TYSZLER
T he connection between the economy and vote choice continues to garner interest both inthe academic and popular press. To isolate the effects of economic considerations, wedevelop a laboratory experiment that allows us to vary these considerations at three
levels: the individual, community, and national economy. Choices by policymakers directlyaffect outcomes at each of these levels, allowing us to test for egotropic, “communotropic,”and sociotropic voting, as well as examine information search. We observe significant demandfor information and that demand decreases with the complexity of the environment. Moreover,information demand is positively associated with other-regarding behavior.
In any particular election, especially at the national level, there are many salient politicalissues. Yet, whether there is a war or a domestic social movement, whether the electorate ispolarized or unified, the state of the economy is always a pertinent campaign issue to at least
one of the major parties. However, while the idea that the economy matters now borders onconventional wisdom, the definitions of “the economy” used both in popular and academicliterature vary widely.
Following the “Responsibility Hypothesis” (Lewis-Beck and Paldam 2000), it is understoodin the literature that voters hold the government responsible for “the economy.” Two commoninterpretations tend to dominate the discussion: egotropic and sociotropic voting (Nannestadand Paldam 1994). Egotropic (also known as pocketbook) voting is the principle of rewardingor punishing leaders based on changes in the voter’s personal financial circumstances. Whilethe choices of politicians are rarely intended to result in direct personal gain or loss for anindividual, that individual may credit or blame the politician. On the other end, sociotropicvoting is where voters choose based on which politician they believe has been (or will be) betterfor the national economy. Again, leaders have only limited influence over macroeconomicconditions, but may still be judged based on economic performance.
However, economic conditions are not uniformly distributed across geographic areas.Variation in tax rates, relative concentrations of industries, and demographics, among manyother factors, make some regions more prosperous than others. As an example, while much ofthe United States experienced reasonably strong growth during the 1990s and early 2000s, theeconomies of the traditional steel and manufacturing regions of the Midwest (including citieslike Detroit and Cleveland) suffered, along with their industries. Thus, while voters in much ofthe United States may have been pleased with economic conditions during the 1996 presidential
* Jonathan Rogers, PhD, Visiting Assistant Research Professor, Division of Social Science, New YorkUniversity Abu Dhabi, PO Box 129188 Abu Dhabi, UAE ([email protected]). Marcelo Tyszler, PhD,Senior Advisor, Royal Tropical Institute (KIT), Postbus 95001, 1090 HA Amsterdam Nederland ([email protected]). Previous versions of this paper have been presented at the APSA and MPSA conferences, as well asat the IMEBE Conference in Barcelona. This project has benefited greatly from the advice and wisdom of JensGrosser and Arthur Schram, also from comments by the seminar participants at CREED, NYU, and the xs/fs cluster atFlorida State University. Funding for this project was provided by Jens Grosser, the Department of Political Science atFlorida State University, and the Research Priority Area Behavioral Economics of the University of Amsterdam. Toview supplementary material for this article, please visit http://dx.doi.org/10.1017/psrm.2016.27

campaign, those in regions directly harmed by expanded free trade policies may have beenfar less so. For these voters, local economic conditions may have outweighed nationallevel interests.
The national economy is not a concept with which most voters have direct interaction. Somehave blamed the decline of manufacturing areas in the Midwestern United States on theratification of the North American Free Trade Agreement. While egotropic motives may haveresulted in reduced approval rates among those who lost their jobs, contact with laid-off friends,family, and neighbors may have reduced approval, even among those not directly affected byjob cuts (Glasgow 2005). It has also been shown that citizens have certain expectations as to afederal government response to natural disasters (Chamlee-Wright and Storr 2010) and blamefor a lack of short- or long-term (local) economic recovery may be attributed to the president,rather than only to local officials. Thus, a degree of empathy, in-group solidarity, or preferencefor community strength may result in a level of economic voting that is neither egotropic norsociotropic, but “communotropic.” To define it formally, communotropic voting is the electoralrewarding or punishing of incumbents for general economic conditions within a particularcommunity or region (Rogers 2014). These are pro-social preferences, but are geographicallyconstrained and the incumbent has responsibilities to areas other than the relevant region.
In terms of cognitive difficulty, egotropic voting is easy, as individuals tend to know whethertheir own situation is improving or worsening. To be either communotropic or sociotropic,information is required. The goal of this study is to test what level of economic information votersseek and what is most useful in making a vote choice. To do this, we have created a stylizeddemocracy, where politicians set tax rates and redistribution policies, while voters signal their(dis)approval to officials through elections and opinion polls. A key advantage of our design isthat conditions at the national, community, and personal level are directly attributable to the leaderand so we are able to disentangle preferences at each of the three levels.
ECONOMIC VOTING
From the perspective of egotropic voting, voters attribute improvements in personal finances(Fiorina 1978), loss of employment or inability to find a job (Grafstein 2005), or outstandingdebt problems to the current administration. For each, improved conditions are associatedwith greater levels of support for leaders. Among the relatively few who find support foregotropic voting, Markus (1988) finds a link between personal conditions and individual votechoice. He argues that the lack of a connection found in aggregate level studies is due to therelative proportion of voters suffering economic hardships during any given campaign isrelatively stable.
Sociotropic voters reward politicians who are attributed credit for higher rates of economicgrowth (Lewis-Beck and Rice 1984; Lewis-Beck and Tien 1996), lower rates of inflation(Norpoth 1996), lower consumer prices (Lepper 1974; Arcelus and Meltzer 1975), or anotherwise stronger economy according to leading economic indicators (Wlezien & Erikson1996). Kinder and Kiewiet (1979) further argue that voters may have preconceptions as towhich party is better suited to handle national economic problems. Whatever the problems inquestion may be, the argument is sociotropic in nature. However, it is not clear how votersperceive national economic conditions, with some studies suggesting bias introduced by localconditions, personal finances, political attitudes, demographics, and the media (Hetherington1996; Duch, Palmer and Anderson 2000; Rogers 2014; Rogers 2016). Finally, Powell andWhitten (1993), among others, argue that the ability of voters to sanction government for itseconomic performance is contingent on the clarity of its political responsibility.
2 ROGERS AND TYSZLER

Any claim of economic voting at the various levels assumes that voters are aware of the state ofthe economy. Socioeconomic status, among many other demographic variables, is known to affectthe accuracy of economic perceptions (Holbrook and Garand 1996). Duch, Palmer and Anderson(2000) find that perceptions of the national economy are conditioned by a number of factors,including political attitudes. It is also possible that voters shift their attributions of responsibilityfor changes in the economy, based on partisanship (Tilley and Hobolt 2011). In either case,perceptions of conditions and responsibility may vary from reality, but must be correlated.Moving to the local level, it has been found that objective state-level economic conditionsincrease self-interest in survey respondents (Lau and Heldman 2009). Berry and Howell (2007)use school board elections and find that voters hold officials accountable for performance. It mayalso be the case that political sophistication affects sociotropic or egotropic behavior. Gomez andWilson (2001, 2007) assert a theory of heterogeneous attribution, wherein low sophisticatesassume that the national economy is under the control of the president high sophisticates, incontrast, understand that the economy is complex and that there is little connection between thepresident’s actions and the national economy. These high sophisticates do, however, recognizeconnections between policies set by the national government and personal economic circum-stances. Thus, high sophisticates are more likely to vote egotropically.
One aspect of economic conditions that politicians can (together) control is tax and redis-tribution policy. Peterson (1981) argues that at the local level, politicians are sensitive to notsetting tax rates too high, out of fear that employers and residents might relocate to a morefavorable tax environment. By the same right, they avoid setting taxes too low, as withoutsufficient revenue, government would be unable to provide the basic services necessary forindustry. In a federal system, multiple levels of government have the ability to tax citizens, soone would expect economic voting to be weaker, as citizens are less able to attribute blame orcredit to specific levels of government. If only a central authority can set taxes, however, thencitizens can determine who is responsible (Anderson 2006). Rich or poor, liberal or con-servative, citizens want their country to be economically prosperous. That said, they do not allagree on what tax structure will best advance this end (Lewis-Beck and Nadeau 2011). Theirpreferences will depend both on their own circumstances and what information is available tothem about how objectively well or poorly the economy is performing (Rogers 2016).
While a degree of economic information is obviously known to a voter (e.g., theiremployment status), other information is likely to require active search. For example, people aregenerally aware that they pay taxes, but systematically overestimate how much (Gemmell,Morrissey and Pinar 2004). Lau and Redlawsk (2006) and Redlawsk (2004) find variouscorrelates with content and depth of search, including the abilities of the voter and thecomplexity of the environment. Indeed, more complex political choices may induce voters toemploy simpler strategies, to limit the cognitive difficulty of the decision (Lodge and McGraw1995). One way in which complexity can be introduced is through inter- and intra-communityheterogeneity in income. This makes it harder for voters to easily and accurately associatepolicy with performance and may affect demand for information. Thus, while egotropic votinginvolves a very low (or trivial) information requirement, communotropic or sociotropic pre-ferences are much more demanding.
All of these studies have contributed to our understanding of economic voting and ofinformation search, but to disentangle the three levels of economic voting and their relationship toinformation search, something more is needed. In particular, it would be useful to isolate votersfrom all but economic considerations. This would allow us to avoid the effects of partisanship,social issues, campaigns, and candidate personalities on vote choice. Because of this, we havedesigned an experiment that captures the key components necessary to the theories.
Information and Economic Voting 3

Among the required elements are politicians, voters, various economic policies, and theestablishment of reference groups for the voters. To do this, voters will be split into minimallylinked communities. People have long been found to form in-group connections based on eventhe most simple of bonds (Tajfel and Billig 1974; Tajfel and Turner 1979). The actions of thepoliticians (tax and redistribution policies) will be directly responsible for the welfare of eachindividual, each community, and the society (the group as a whole). By examining whatinformation voters then seek about the actions of politicians, and observing how this affectsapproval and vote choice, we will be able to measure egotropic, communotropic, and/orsociotropic voting.
EXPERIMENTAL DESIGN
The experimental design creates a stylized democratic society, capturing the essential elementsintroduced in the previous sections. It consists of three communities of five voters each and twopoliticians. Voters are randomly assigned to a community and endowment, with both remainingfixed throughout the experiment. Endowments can be low (100 ECUs) or high (500 ECUs).This composition allows for enough variation within and between communities allowing us toverify the impact of income distribution on the search patterns for information. Initially, one ofthe politicians is randomly selected to be in office and the other is assigned to be a candidateseeking to replace the incumbent. The incumbent receives a fixed salary of 500 ECUs while thecandidate receives a salary of 100 ECUs. This was done to ensure that the politicians’ onlydirect incentive would be to win votes and receive the higher salary of the incumbent.Experimental points are converted at the rate of 500 ECUs/US$.
The incumbent’s initial task is to select a tax rate. This rate, multiplied by the tax base (thesum of all endowments) yields the tax burden, the total amount of taxes paid by all voters.However, as governments can provide some goods and services more efficiently than indi-viduals could on their own, there is an efficiency gain g for initial levels of taxation. Forexample, a government might be able to build a bridge more cheaply than an individualcould on their own, because the government already employs engineers and owns relevantequipment. But as the tax rate increases, there is also an efficiency loss l. This reflectsdeadweight losses, administrative bloat, and also potential capital flight that might occur,when taxes are too high. To account for the interplay of efficiency gains and losses, the taxburden is transformed into tax revenue via the following function: Tax Revenue = (w × t) ×[(1 + g)− t× l], where w is the nation’s aggregate endowment (i.e., tax base) and t the tax rate.Thus, the tax burden is w × t, while the tax revenues are thus generated following a formatsimilar to a Laffer Curve.
In the experimental design g is set to 0.40, implying a 40 percent efficiency gain over thecollected taxes, and l is set to 1, implying an inefficiency effect that increases in proportion tothe increase in the tax rate. This means that the tax burden (the taxes extracted from thepopulation) is different from the tax revenue (the funds available for politicians to spend). Thereason for this use of the Laffer Curve is that there is a theoretical, non-linear relationshipbetween the tax rate and revenues collected by government. If taxes are set too high, then this isargued to decrease the incentive to work or increase the incentive to dodge taxes.
Now while this would seem complicated, subjects are not required to do any math. Instead,subjects are provided with a table describing every possible combination of tax rate, burden, andrevenue. Table 1 illustrates the tax revenue functions for the various treatments, to be described inthe following subsection. Note that at 20 percent the net welfare is maximized and at 40 percent itbreaks even. At 70 percent the politician maximizes the tax revenue under her control. Subjects are
4 ROGERS AND TYSZLER

given one of the two tables (depending on the treatment). The highlighting and the “Difference”column are provided for the reader’s convenience and were not shown to subjects.
The incumbent must then divide the tax revenue among the three communities. Within eachcommunity, the amount provided is shared equally among its members. This is all that theincumbent can do. The tax rate is naturally not the only way in which politicians can affect theeconomy, but this simplification does allow for a direct connection between policy outputs andoutcomes. It also makes it possible for performance to differ at the community and national levels.The candidate’s task is to simultaneously present a hypothetical alternative plan: a tax rate and adivision proposal. All information about the candidate’s hypothetical plan is presented to voters inthe same manner as information about the incumbent’s enforced plan.
Every third period, there is an election decided by majority vote. The newly elected politiciancomes into office and the losing one becomes the candidate. In the periods without electionthere is an approval survey on the job performance of the incumbent. Results are alwayspublicly announced. Survey and election results are the only signals that politicians get in termsof what the voters do and do not like, though they also know how many rich and poor voters arein each community. This is meant to capture the inability of politicians to perfectly respond topublic preferences. Politicians do know the average welfare change caused by their policy forthe low and high endowed voters in each community separately and for the average voter in agiven community and nation. They can also see the past policy decisions of the other politician.There are 16 periods, with the exact number of periods not announced, in order to avoidend-game effects.
TABLE 1 Impact of Tax Rates Across Treatments
Tax Rate (%) Tax Burden Tax Revenue Difference
(a) Treatments: baseline, clustered, and heterogeneous0 0 0 010 390 507 11720 780 936 15630 1170 1287 11740 1560 1560 050 1950 1755 − 19560 2340 1872 − 46870 2730 1911 − 81980 3120 1872 − 124890 3510 1755 − 1755100 3900 1560 − 2340(b) Treatment: poor0 0 0 010 270 351 8120 540 648 10830 810 891 8140 1080 1080 050 1350 1215 − 13560 1620 1296 − 32470 1890 1323 − 56780 2160 1296 − 86490 2430 1215 − 1215100 2700 1080 − 1620
Note: Tables show the tax rates and how they relate to values of Tax Burden and Revenuein the different treatments (cf. Treatments section). The fourth column shows the differencebetween burden and revenue, where positive values reflect a net benefit to society. Boldhighlights the optimal level (20 percent), the break-even level (40 percent), and themaximum revenue level (70 percent).
Information and Economic Voting 5
The different levels of economic information that could influence voting behavior are theindividual, the community, and the national levels. Understanding which information voterslook for in order to support their voting and approval decision is a primary goal of this study. Todirectly observe which levels are relevant for a given subject, information is provided in a costlyway. As demand for information has been shown to have a discontinuity at 0, subjects face asmall but positive cost, set to 2 ECUs/item. We believe this induces a more carefulconsideration of the pieces of information, allowing us to better understand their search patterns(Schram and Sonnemans 2011). This provides a direct mechanism to observe the informationrequested by subjects, while incentivizing subjects to seek only the information that they wantto use in making their decisions.
Voters are always informed about their endowment and final payoff. They also know thenumber of rich and poor voters in their own community and each of the other communities.They can then purchase additional information about the tax rate and on the welfare change oftheir own community, other communities, and the whole nation. Voters can see the sameinformation (including any purchased information) for both politicians. That means, if a voterpurchases a piece of information, she will have access to that piece of information about bothpoliticians. Note that while the experimental design may seem complicated, it has been made assimple as possible, but no simpler. If the subjects were provided with any further information orthe game made any more simple, then subjects would be able to easily calculate all of theinformation. We would then not know whether subjects did not purchase information, becausethey did not want it, or because they could calculate it for free (and possibly incorrectly), in theirminds. As it stands, it is generally not possible to exactly calculate one piece of information,given that a voter has purchased another.1
A full copy of the instructions can be found in the Appendix. After reading the instructions,subjects took a quiz to ensure that they understood the experimental environment. Subjects wererequired to get every question correct to proceed.2 After the experiment was over and beforereceiving their payment, subjects were asked to answer an open-ended question as to how theyused the information provided in the experiment.3
Treatments
As the income distribution is expected to affect the demand for information, the treatmentvariable is the income compositions of the three communities. Our baseline composition is thehomogeneous income distribution in which each community contains three low endowed andtwo high endowed voters. We refer to this distribution as baseline: (3,2); (3,2); (3,2). Thispresents a total of nine low endowed and six high endowed voters, and thus a total nationalendowment of 3900 ECUs.
In order to test the effect of the intra-community heterogeneity in the information decisionwhile keeping the national distribution constant, we introduce the income distribution
1 In those instances where it is technically possible, it remains so cognitively difficult that a subject is morelikely to pay the trivial cost than work out the calculations themselves.
2 If a subject got a question incorrect on their first attempt, the computer would notify them of the error andpoint them to the relevant part of the instructions to try again.
3 All experimental sessions were run in a dedicated laboratory at a large research university. For the16 sessions, a total of 272 subjects were recruited (17/session) via ORSEE, the Online Recruitment System forEconomic Experiments (Greiner 2004). All subjects who arrived on time, regardless of whether or not they wereused, were paid a $10 show up fee. Total per subject payments averaged $18.07 and sessions typically lastedbetween 75 and 90 minutes. The experiment was programmed and conducted with the software z-Tree(Fischbacher 2007).
6 ROGERS AND TYSZLER

clustered: (1,4); (4,1); (4,1). This distribution differs from the baseline, however, also on thedegree of inter-community heterogeneity. To disentangle these effects, we look additionallyat the distribution poor: (4,1); (4,1); (4,1), which has the same degree of inter-communityheterogeneity as the baseline (i.e., homogeneous) and the same degree of intra-communityheterogeneity as clustered. This comes at the cost of changing the national endowment andnational income distribution (now 12 low endowed and three high endowed voters, and thus anational endowment of 2700 ECUs).
In order to complete the picture a final income distribution is needed: heterogeneous: (2,3);(3,2); (4,1). This distribution has the same national endowment as baseline, with a higher degreeof inter-community heterogeneity.
Table 2 summarizes the design highlighting how the different distributions can be compared.
PREDICTIONS
Based on the theories discussed earlier and the experimental design outlined in the previoussection, it is possible to derive a set of hypotheses. What we predict depends, however, on boththe preferences of voters and on the beliefs of politicians regarding those preferences. For thesake of convenience, and because we are interested in examining information and other-regarding behavior, we will use egotropic behavior by voters as the null.
To explain, first assume that voters are purely self-interested. That is, voters care only aboutwhich politician would provide the largest net gain, or smallest net loss, in after policy welfare.As this information is provided for free and is sufficient to let voters distinguish betweencandidates, there would be 0 information purchase. Further, changes in income distributionwithin and between communities would not be expected to have any effect on informationdemand, so there would be no treatment effects. If politicians believe voters to be egotropic,then they will set the tax rate at the revenue maximizing 70 percent rate, and attempt towin the minimum needed number of votes. That is, they will compete by redistributing taxdollars in an attempt to win any two random communities. Under certain circumstances,low endowment voters would prefer this, assuming risk neutrality. A tax rate of 70 percentgives the government 1911 ECU in revenue, which, if evenly split between two randomlychosen communities, would give each poor voter an expected after policy payoff of23
� � ð1911 = 10Þ + 30½ � + 13
� �30=167:33 ECU, as opposed to (936/15) + 80 = 142.4 ECU under
the “optimal” 20 percent tax rate, with even redistribution across all three communities. Giventhat both rich and poor voters pay the same tax rate in this experiment, rich voters are generallynet losers from taxes and thus if they are egotropic, they would strictly prefer lower taxes,regardless of redistribution.
TABLE 2 Experimental Treatments
DistributionNational
DistributionIntra-CommunityHeterogeneity
Inter-CommunityHeterogeneity
C1 C2 C3Baseline: {(3,2), (3,2), (3,2)} 9,6 Low LowClustered: {(1,4), (4,1), (4,1)} 9,6 Moderate ModeratePoor: {(4,1), (4,1), (4,1)} 12,3 Moderate LowHeterogeneous: {(2,3), (3,2), (4,1)} 9,6 (3,2): low; (4,1): moderate High
Note: C1, C2, and C3 are Communities 1, 2, and 3, respectively. Each ordered pair in the chart shows the numberof (low, high) endowment voters present.
Information and Economic Voting 7

To derive alternative predictions, assume some degree of other-regarding preferences amongvoters. That is, voters care not only about their own personal welfare, but also about the welfare ofneighbors and citizens at large. In this case, information purchase must be higher than under pureegoism, because other-regarding voters would need information about the consequences ofpolicies for other voters. Therefore, we would predict significantly positive levels of informationpurchase among sociotropic and communotropic voters. The nature of this information, however,depends on whether voters care about the whole nation and/or about the community level.
If voters have mainly national concerns, we should expect positive information demand, asvoters would need to know the tax rate and national average welfare change in order to rewardor punish incumbents. For sociotropic voters, this would not change across treatments as a givenpolicy would have identical effects at the national level in each condition. If voters have specificcommunity level concerns, more information is needed, as income heterogeneity increases. Thisfollows, because as heterogeneity increases, so does the complexity, making it more difficult todetermine the exact connection between a policy and its effect on each of the three commu-nities. Finally, information demand at the community and/or national levels must be connectedto voting and approval behavior. If participants are spending money and cognitive effort on thisinformation, it should be connected to vote choices.
Politicians must act accordingly if they anticipate communo- and/or sociotropic behavior,rather than if they expect voters to be egotropic. In the first two cases, they will set the tax rate ator near the optimal rate of 20 percent, as this is where national welfare is maximized and theburden placed on a given community is efficient. Beyond this, if they expect sociotropicbehavior, the tax revenue will be distributed in a relatively even manner across communities,with any particular community rarely bearing more than its fair share of the burden. That is,where communities begin as equal to one another, they will remain more or less equal aftertaxation and redistribution.
Following this reasoning, we present the following set of predictions, where in each case thenull is egoism (selfish/low information):
P1 : Politicians will choose the “optimal” tax rate (20 percent).
At the 20 percent tax rate, politicians are providing the greatest net benefits to society (seeTable 1). They are placing relatively little burden on voters and, based on the revenue function,have a relatively large amount of money to redistribute. The manner in which they do thisredistribution depends on what they believe voters will prefer.
P2 : Politicians will redistribute revenue proportionally in all treatments.
Recall that politicians cannot direct tax revenue to their own pockets and only receivepersonal benefits in the form of their flat salaries of 500 ECU (incumbent) or 100 ECU(candidate). Because every voter faces the same tax rate, more of a burden is placed oncommunities that have a larger tax base. Therefore, if politicians believe that voters care aboutfairness in outcomes, they will distribute revenues, relative to how much is extracted from eachcommunity.
P3 : Information purchase will be significantly higher than 0.
If voters are purely self-interested, then they will only care how much better or worse off theyare made by each politician’s policies. This information is provided for free. If they care about
8 ROGERS AND TYSZLER

community or society level conditions, then they will purchase this information. Even thoughthe information is trivially cheap, they will only purchase the information, if they plan to use it.
P4 : Information purchase will increase as inequalities within and between communitiesincrease. Specifically, information purchase will increase in the following order: baseline,poor, clustered, heterogeneous.
As complexity of the information environment increases (see Table 2), it becomes increas-ingly difficult for voters to determine how a set of policies affects each community and eachvoter within those communities. Because of this, more information is needed, in order for votersto choose based on other-regarding preferences.
P5 : Approval and vote choices will be influenced by changes in community and national levelconditions, as well as how fairly the incumbent has chosen to reallocate tax revenue.
Finally, if voters have other-regarding preferences, then this must be reflected in approval andvote choice. Those who purchase information are expected to do so for a reason, so informationpurchase will be taken as a measure of other-regarding preferences.
RESULTS
As the focus of this study is the behavior of voters, this will be the main component of theanalysis. We start this section, however, by providing a description of how politicians set taxesand how they redistributed revenue.
Politicians’ Behavior
Table 3 shows the average tax rates chosen by politicians, aggregated, as well as by treatment.As it illustrates, both incumbents and candidates select, on average, a tax rate close to theoptimal (20 percent). As for redistributive policies, Figure 1 shows triplots of the percentage ofthe after tax national endowment given to each community. For example, a point at the very topof a triplot would indicate that the politician has allocated 100 percent of the tax revenue tocommunity 1. A point exactly on the midpoint of the line between C1 and C2 would mean thatthe politician has given 50 percent to C1, 50 percent to C2, and 0 percent to C3. This figure thenshows that politicians structure tax returns such that they do not heavily modify the initialdistributions. This is demonstrated in the clustering of points near the center of the triangle.A point exactly at the center of the plot would mean a perfectly even split of the tax revenueamong the three communities.
Combined, this suggests that differences between the incumbent and candidate are moreabout specific values than about the structure of the policies. If politicians are electorallymotivated, then this behavior would be consistent with expecting voters to behave in line withother-regarding preferences, as outlined in predictions P1 and P2.4 An alternative explanation is
4 Using average behavior per electorate, t-tests reject the null hypothesis that the tax rate is 70 percent bothfor the incumbent and candidate (p≤ 0.01, N = 16). Likewise, they can only marginally reject if the hypothe-sized value is 20 percent (p = 0.0534, N = 16 for the incumbent and p = 0.0150, N = 16 for the candidate).Regarding redistributive policies, the average SD of the fractions for each community is 0.0645 (with a95 percent CI of (0.0318; 0.0971)) for the incumbent and 0.0638 (with a 95 percent CI of (0.0309; 0.0967)) forthe candidate. This is much lower than the SD of 0.2886 one would expect under targeting.
Information and Economic Voting 9

TABLE 3 Politicians’ Average Choice
Treatment Tax Rate
BaselineIncumbent 23.75Candidate 21.72
ClusteredIncumbent 27.19Candidate 30.31
PoorIncumbent 24.38Candidate 27.81
HeterogeneousIncumbent 22.97Candidate 23.59
TotalIncumbent 24.57Candidate 25.86
Note: The second column shows the average tax rate chosen by the incumbent andcandidate. The average is across all rounds and groups within each treatment.
Community 1
Baseline Treatment
Poor Treatment Heterogeneous Treatment
Clustered Treatment
Community 2
Community 3100% C3
100% C1
100% C2
CandidateIncumbent
Community 1 Community 2
Community 3100% C3
100% C1
100% C2
CandidateIncumbent
Community 1 Community 2
Community 3100% C3
100% C1
100% C2
CandidateIncumbent
Community 1 Community 2
Community 3100% C3
100% C1
100% C2
CandidateIncumbent
(a) (b)
(c) (d)
Fig. 1. Politicians’ after policy dispersionNote: Triplots show the percentage of the after tax national endowment allocated by politicians (eitherincumbent or candidate) to each community. Each panel shows data from all rounds in a given treatment(cf. Treatments section). The triplot is an equilateral triangle in which the top, bottom right, and bottom leftcorners indicate an allocation of 100 percent to communities 1, 2, and 3, respectively (endowmentdistributions for each community are defined in Table 2). The “Y” in the center divides the triangle intoregions in which two communities receive the same percentage, with the crossing of the three lines indicatingan equal split (i.e., one-third to each community).
10 ROGERS AND TYSZLER

that politicians were following a norm of even redistribution and this is possible (Fehr andFischbacher 2003). However, in the clustered treatment, considerably more was allocated tocommunity one, the wealthy community.5
Voters’ Behavior
In order to understand voters’ behavior we consider two aspects of the experimental data. Westart by looking at information demand and then move into voting and approval behavior.
Figure 2 presents lowess curves of the proportion of information purchased over time foreach treatment, in total and by endowment. Information purchase began at relatively high levels,but as voters focused in on what information was most relevant to them, they purchased less ofthe other information. Indeed for low endowment voters in the heterogeneous treatment andhigh endowment voters in the poor treatment, information purchase in late rounds becomesvirtually 0.
A cursory glance at Figure 2 suggests that information demand is significantly positive, insupport of P3 (which claimed that exactly this would happen). This suggestion is indeedconfirmed by a one-sided truncated t-test (p≤ 0.001, N = 16). Note that this test uses averageinformation purchase per electorate as independent observations. Across all periods, voterspurchased 17.18 percent of available information (with roughly 2 percent more purchased bypoor voters). This is in line with other-regarding preferences, and reveals some degree ofsociotropic behavior.
P4 predicted that information demand would increase from treatment to treatment in the orderbaseline, poor, clustered, heterogeneous.6 We find little support for this claim. To show thisusing Figure 2, notice that among high endowment voters, average information purchase waslowest in the poor and heterogeneous treatments, which are on the opposite ends of thespectrum, in terms of complexity for these voters. In the poor, there is only one rich voter ineach community, so the information environment is quite simple. The heterogeneous treatmentis much more complex, as there are different distributions in each community. Taken together,high endowed voters’ demand for information in these two treatments is statistically lower thanin baseline and clustered treatments (p = 0.0457, Rank-Sum Mann–Whitney test, N = 16).Moreover, information purchase was at the lowest for all voters in the heterogeneous treatment(p = 0.0391, Rank-Sum Mann–Whitney test, N = 16)7 and especially for low endowmentvoters (p = 0.0522, Rank-Sum Mann–Whitney test, N = 16). Therefore, there is no support forP4 and perhaps some evidence to suggest a curvilinear relationship between complexity andinformation demand. That is, in very simple situations, not much information is needed and thuslittle is demanded, while in complex environments, it becomes too difficult to meaningfullyprocess and is again not demanded. Information is only useful and therefore demanded,in situations of moderate complexity.
Disaggregated by information type, Table 4 shows information demand across all periods,broken down by high and low endowment types. This shows that most of the informationpurchased is about the national level,8 followed by the voter’s own community. Overall, Table 4reinforces the patterns observed in Figure 2, with particular attention to be paid to the poor and
5 There is some evidence of this in the heterogeneous treatment, as well, but it is very slight.6 Treatments are described in Table 2.7 In these tests we use each electorate as an independent observation and test whether a sub-group of
sessions/treatments were different from the remaining ones.8 The piece of information purchased most often is “Tax Rate.” If combined with information about the
average voter on the nation (column 4 of Table 4), it reaches an average of 0.31.
Information and Economic Voting 11
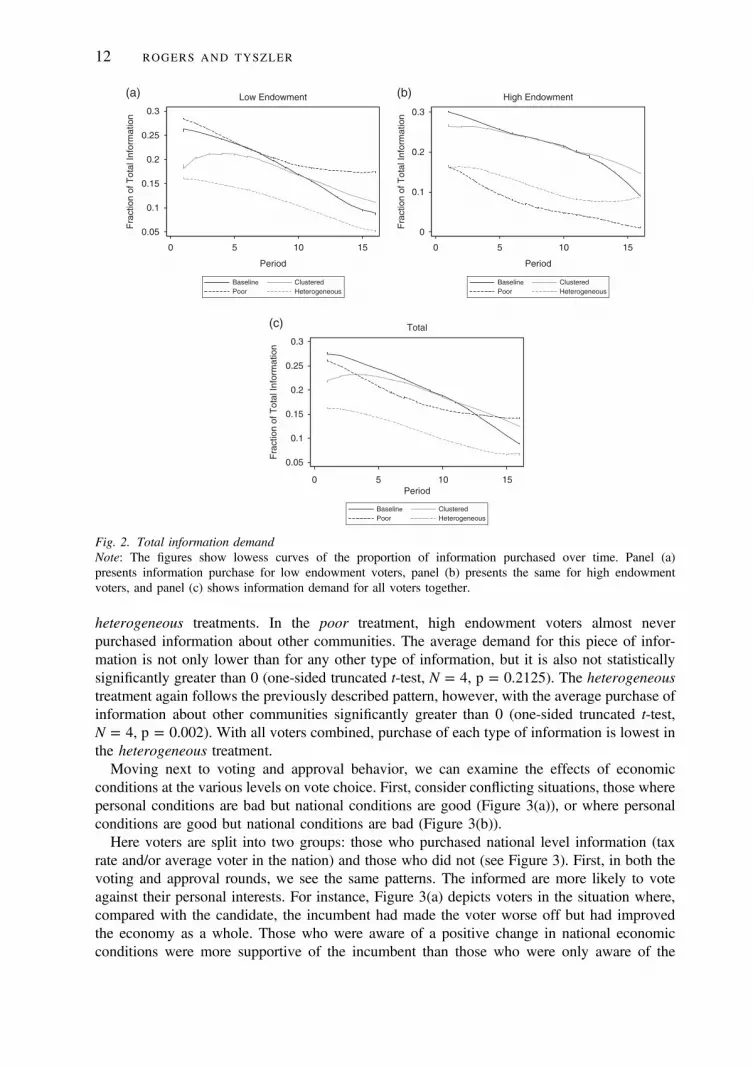
heterogeneous treatments. In the poor treatment, high endowment voters almost neverpurchased information about other communities. The average demand for this piece of infor-mation is not only lower than for any other type of information, but it is also not statisticallysignificantly greater than 0 (one-sided truncated t-test, N = 4, p = 0.2125). The heterogeneoustreatment again follows the previously described pattern, however, with the average purchase ofinformation about other communities significantly greater than 0 (one-sided truncated t-test,N = 4, p = 0.002). With all voters combined, purchase of each type of information is lowest inthe heterogeneous treatment.
Moving next to voting and approval behavior, we can examine the effects of economicconditions at the various levels on vote choice. First, consider conflicting situations, those wherepersonal conditions are bad but national conditions are good (Figure 3(a)), or where personalconditions are good but national conditions are bad (Figure 3(b)).
Here voters are split into two groups: those who purchased national level information (taxrate and/or average voter in the nation) and those who did not (see Figure 3). First, in both thevoting and approval rounds, we see the same patterns. The informed are more likely to voteagainst their personal interests. For instance, Figure 3(a) depicts voters in the situation where,compared with the candidate, the incumbent had made the voter worse off but had improvedthe economy as a whole. Those who were aware of a positive change in national economicconditions were more supportive of the incumbent than those who were only aware of the
0.05
0.1
0.15
0.2
0.25
0.3
Fra
ctio
n of
Tot
al In
form
atio
n
0 5 10 15
Period
Low Endowment High Endowment
Baseline ClusteredPoor Heterogeneous
0
0.1
0.2
0.3
Fra
ctio
n of
Tot
al In
form
atio
n
0 5 10 15
Period
0.05
0.1
0.15
0.2
0.25
0.3
Fra
ctio
n of
Tot
al In
form
atio
n
0 5 10 15Period
Total
Baseline ClusteredPoor Heterogeneous
Baseline ClusteredPoor Heterogeneous
(a) (b)
(c)
Fig. 2. Total information demandNote: The figures show lowess curves of the proportion of information purchased over time. Panel (a)presents information purchase for low endowment voters, panel (b) presents the same for high endowmentvoters, and panel (c) shows information demand for all voters together.
12 ROGERS AND TYSZLER

personal negative conditions. While it is tempting to say that the informed are more sociotropic(which they are), there is perhaps a selection effect. There may simply be types of voters that asimple informed versus uninformed comparison cannot reveal, as uninformed voters canobviously not behave more sociotropically than informed voters. What can be said is that thissupports the assumption in our design that sociotropic behavior is correlated with higherinformation demand, with the caveat that the differences between the informed and uninformed
0
0.2
0.4
0.6
0.8
1
No In
form
ation
Info
rmat
ion
No In
form
ation
Info
rmat
ion
Negative Personal Welfare vs. Positive National Welfare Positive Personal Welfare vs. Negative National Welfare
Voting Approval
Pro
babi
lity
of V
otin
g fo
r th
e In
cum
bent
0
0.2
0.4
0.6
0.8
1
No In
form
ation
Info
rmat
ion
No In
form
ation
Info
rmat
ion
Voting Approval
Pro
babi
lity
of V
otin
g fo
r th
e In
cum
bent
(a) (b)
Fig. 3. Voting and approval behavior conditional on conflicting situationNote: Shown are the probabilities of voting for or approving of the incumbent under conflicting situations.Panel (a) shows situations in which the incumbent offers less personal net after policy welfare but morenational net after policy welfare than the candidate, while panel (b) shows the opposite case, that is,situations in which the incumbent offers more personal net after policy welfare but less national net afterpolicy welfare than the candidate. “No information” refer to voters that, in that particular round, did notpurchase national information. “Information” indicates that the voter purchased tax rate information and/orinformation about the average voter in the nation.
TABLE 4 Proportion of Information Purchased
Own Community Other Communities Aggregate Tax Rate
Baseline 0.24 0.15 0.18 0.27Low endowment 0.22 0.14 0.17 0.25High endowment 0.26 0.17 0.19 0.32
Clustered 0.21 0.15 0.17 0.30Low endowment 0.18 0.14 0.15 0.27High endowment 0.25 0.16 0.19 0.35
Poor 0.25 0.12 0.13 0.30Low endowment 0.29 0.14 0.15 0.32High endowment 0.05 0.02 0.04 0.21
Heterogeneous 0.13 0.06 0.11 0.20Low endowment 0.13 0.06 0.10 0.21High endowment 0.13 0.06 0.12 0.20
Total 0.21 0.12 0.14 0.27Low endowment 0.21 0.12 0.14 0.27High endowment 0.19 0.11 0.15 0.28
Note: Cells show, for each type of information, the proportion of the available information purchased. For “OtherCommunities” we aggregate the two communities to which the voter does not belong. “Aggregate” refers toinformation about the average voter in the nation.
Information and Economic Voting 13

in the chart are endogenous. An attempt to measure how much more sociotropic these voters areis presented further below.
Next, we compare voting rounds to approval rounds. While the graph suggests little differ-ence between voting and approval rounds for uninformed voters, it does suggest differences forinformed voters. Specifically, informed voters appear more likely to approve sociotropically(i.e., report approving of an incumbent who is good for the nation at the expense of individualsand disapprove of an incumbent who is good for individuals at the expense of the nation) thanthey are to vote sociotropically. In this sense, informed voters may be using cheap talk, voicinga preference for improved national conditions, when they really prefer better personal condi-tions. This is also in line with previous work by Feddersen, Gailmard and Sandroni (2009), whoargue that voters are more likely to make their choices based on ethical considerations, when thechance of being pivotal is low.
To generalize the previous analysis, Tables 5 and 6 show marginal effects after randomeffects probit estimations. The dependent variable is the probability of voting for (Table 5) orapproving of (Table 6) the incumbent. These tests are needed to attempt to observe preferencesover the different levels of economic conditions. While egotropic voting is free, it is costly toseek information that would make communo- or sociotropic voting possible. An effect ofinformation purchase can be taken as evidence of other-regarding preferences. The modelspresent results of aggregate behavior, further decomposed into low and high endowment voters.
In the regressions in Tables 5 and 6, the first variable (Self Indicator) is an indicator withvalue 1 if the incumbent offers the highest net after policy welfare to that particular voter, −1 ifthe candidate does and 0 in case of a tie. The next three variables present interaction effects ofthis indicator with whether or not the voter purchased information concerning her own
TABLE 5 Voting Behavior, Marginal Effects
Total (b (SE)) Low Endowment (b (SE)) High Endowment (b (SE))
Prediction at 0 0.550 0.663 0.410Self indicator 0.407* 0.443* 0.318*
(0.025) (0.055) (0.042)Self × own community information − 0.148* − 0.152* − 0.193
(0.061) (0.077) (0.099)Self × other communities information − 0.018 − 0.007 − 0.089
(0.064) (0.077) (0.110)Self × national information − 0.060 − 0.096 0.033
(0.046) (0.057) (0.077)(known) Own community indicator 0.167* 0.184* 0.146
(0.043) (0.055) (0.075)(known) Other communities indicator − 0.203* − 0.224* − 0.131
(0.048) (0.062) (0.083)(known) National indicator 0.028 − 0.024 0.148*
(0.042) (0.053) (0.071)N 1200 780 420
Note: Cells show marginal effects and standard errors of a probit panel regression with random effects at theindividual level and session fixed effects (not reported). The dependent variable is a dummy indicating whetheror not a voter voted for the incumbent. Self Indicator is an indicator variable if value 1 if the incumbent providesa voter with more net after policy income than the candidate, −1 on the opposite case and 0 on an tie. The nextthree variables are interaction effects with a dummy variable indicating whether or not a voter purchasedinformation about her own community, any of the other communities or national indicators (tax rate or averagevoter in the nation). The final three variables are indicator variables defined similarly to Self Indicator interactingwith the dummies presented before, respectively. They, thus, compare the known differences in net after policyincome for a voter’s own community (negative of the), dispersion across communities, and national welfare.*Statistical significance at the 5 percent level or better.
14 ROGERS AND TYSZLER

community, at least one of the other communities, or any national level indicators, respectively.All voters are expected to react positively to gains in own income, but sociotropic preferences,signaled by the purchase of information, should reduce this effect. The next three variables areindicators comparing incumbent and candidate policies, with respect to their effects on the threelevels of welfare. These variables enter the regression only when the voter purchased infor-mation on the level concerned. The coefficients for these three variables are expected to bepositive, if voters have other-regarding preferences.
Several interesting observations can be made. We start at the aggregate level (“Total”). First,as expected, improvement in a voter’s own conditions positively increases the voting andapproval probabilities. Other things equal, receiving a higher income from one of the politiciansincreases the probability of voting for (by 40.7 percentage points) and approving of (by 42.9percentage points) this politician, compared with the case where both offer the same. However,in support of P5, informed voters are less sensitive to personal gains. This can be seen in thenegative interaction coefficients for Self Indicator, which are significant in at least one of thethree cases in both regressions. The last three indicators show that knowledge of positive(negative) community, distributional and national conditions also favor the incumbent (candi-date). This also sheds light on the meaningful difference between uninformed voting andinformed egotropic voting. Informed egotropic voting would be revealed if the interaction termson Self Indicator were 0, which would indicate that acquisition of information leads to nochange in behavior. If voters are using information to make social comparisons with their ownwelfare, then negative estimates for the last three variables would indicate voting/approvalbehavior against others’ best interest. Neither are observed, which supports the argument thatthe purchase of information reveals other-regarding behavior.
TABLE 6 Approval Behavior, Marginal Effects
Total (b (SE)) Low Endowment (b (SE)) High Endowment (b (SE))
Prediction at 0 0.621 0.596 0.684Self indicator 0.429* 0.451* 0.385*
(0.028) (0.031) (0.060)Self × own community information − 0.122* − 0.105 − 0.171*
(0.043) (0.054) (0.073)Self × other communities information − 0.056 − 0.114* 0.078
(0.044) (0.053) (0.079)Self × national information − 0.128* − 0.150* − 0.094
(0.031) (0.040) (0.050)(known) Own community indicator 0.122* 0.108* 0.171*
(0.030) (0.039) (0.053)(known) Other communities indicator − 0.059 − 0.055 − 0.109
(0.031) (0.038) (0.060)(known) National indicator 0.080* 0.014 0.168*
(0.027) (0.034) (0.049)N 2640 1716 924
Note: Cells show the marginal effects and standard errors of a probit panel regression with random effects at theindividual level and session fixed effects (not reported). The dependent variable is a dummy indicating whetheror not a voter approved of the incumbent. Self Indicator is an indicator variable if value 1 if the incumbentprovides a voter with more net after policy income than the candidate, −1 on the opposite case and 0 on an tie.The next three variables are interaction effects with a dummy variable indicating whether or not a voterpurchased information about her own community, any of the other communities, or national indicators (tax rateor average voter in the nation). The final three variables are indicator variables defined similarly to Self Indicatorinteracting with the dummies presented before, respectively.*Statistical significance at the 5 percent level or better.
Information and Economic Voting 15

All analysis presented here has considered average behavior, but some further observationscan be made. For example, we do observe that 58 voters (24.2 percent of the sample) never buya single piece of information, while three voters (1.25 percent) buy all information available.Likewise, while 66 voters (27.5 percent) never purchase national level indicators, 16 (6.67percent) do so in every single round. Reading the post-experiment questionnaire, we canclassify 177 (74 percent) voters as basing their decision-making process on selfish motives9 and55 (23 percent) on sociotropic motives.10
When comparing endowment types, the general patterns are in line with the aggregateanalysis. For example, both react positively to higher own income and are more “extreme” inapproval rounds than in voting rounds. Important differences emerge, however. In particular,while low endowed voters react mostly to community level information, high endowed votersare primarily concerned with national conditions. Moreover, low endowed voters seem to reactquite strongly to distributional concerns in voting rounds while neither type are affected by thisindicator about conditions in other communities in approval rounds. Fundamentally, however,we are interested in the behavior of voters and how their vote choice is influenced by their ownwelfare and that of others. More on this can be found in the Appendix.
DISCUSSION
In all, the data supports most of the research hypotheses, indicating the presence of other-regarding preferences. Strong support is found for hypotheses P1 and P2, specifically thatpoliticians choose tax levels close to the “optimal” tax rate of 20 percent and do not heavily alterthe initial income distributions. Next, we find that information purchase is significantly positive,thus supporting P3. P4 was not supported, as this predicted the highest information purchase atthe heterogeneous treatment. Instead, the evidence suggests something of a curvilinear rela-tionship between complexity and information demand. Initially, as complexity increased,demand increased. However, after a point, increasing complexity may have lead to a decrease indemand for information. Further research is needed to examine this relationship.
Finally, the fifth hypothesis (P5) is supported, as the evidence suggests that informed votersare less sensitive to changes in their own income and that once aware of improved communityor national conditions, they tend to favor incumbents, even if it comes at their own expense.
The data also suggests that voters are more “extreme” in approval rounds, specially regardingnational indicators. Differences are also shown across endowment types. More specifically, highendowed voters react mostly to national conditions while low endowed voters seem moreconcerned with the community level and distributional indicators.
To highlight some of our main findings, first, there is evidence of sociotropic and commu-notropic voting, even though there was no direct financial incentive to do so. While there is nomonetary incentive to engage in anything much more sophisticated than uninformed egotropicvoting, information purchase remains non-trivial and other-regarding behavior occurs at sig-nificant levels.
Second, voters are responsive to economic conditions at the various levels, when they areaware of incumbent performance. That is, voters respond to changes in both tax and redis-tribution policies in a systematic manner. Specifically, high endowment voters demonstratemore sensitivity to national conditions while low endowment voter react more to communitylevel indicators.
9 Statements such as “I voted for the candidate that best helped me.”10 Statements such as “I chose whichever candidate was offering the fairest tax rates and incomes.”
16 ROGERS AND TYSZLER

Third, politicians rarely engage in targeting specific communities. While it would always havebeen feasible for politicians to set taxes and redistribution in a manner that would have maximizedprofit to two communities, at the expense of the third, this is not observed. This structure ofredistribution, combined with the choice of the “optimal” tax rate, possibly reflects a belief amongpoliticians that voters prefer more egalitarian and socially maximizing outcomes. Finally, there isevidence that some informed voters are engaging in cheap talk, signaling that they 1will votesociotropically but then voting (more) egotropically. This may suggest that the considerationsinvolved in the approval choice are not necessarily the same as those that induce vote choice.
In sum, we have presented an experimental investigation of information search and economicvoting. While there is significant potential for further innovation with modification of this design, thisstudy has contributed insight into the mechanisms underlying egotropic, communotropic, andsociotropic behavior. Still, more work is needed to better understand communotropic preferences.Rogers (2014) and Rogers (2016) provide observational evidence that these preferences exist, but itremains to be seen just how aware of local conditions and how well (or poorly) objective measures canconvey sentiment to politicians. So, what information is relevant in economic voting? The answerdepends not only on who the individual is, but also on where she lives and on her endowment.
REFERENCES
Anderson, Cameron D. 2006. ‘Economic Voting and Multilevel Governance: A Comparative Individual-Level Analysis’. American Journal of Political Science 50(2):449–63.
Arcelus, Francisco, and Allen Meltzer. 1975. ‘The Effect of Aggregate Economic Variables onCongressional Elections’. American Political Science Review 69(4):1232–39.
Berry, Christopher, and William Howell. 2007. ‘Accountability and Local Elections: RethinkingRetrospective Voting’. The Journal of Politics 69(3):844–58.
Chamlee-Wright, Emily, and Virginia Storr. 2010. ‘Expectations of Government’s Response to Disaster’.Public Choice 144(1):253–74.
Duch, Raymond, Harvey Palmer, and Christopher Anderson. 2000. ‘Heterogeneity in Perceptions ofNational Economic Conditions’. American Journal of Political Science 44(4):635–52.
Feddersen, Timothy, Sean Gailmard, and Alvara Sandroni. 2009. ‘Moral Bias in Large Elections: Theoryand Experimental Evidence’. American Political Science Review 203(2):175–92.
Fehr, Ernst, and Urs Fischbacher. 2003. ‘The Nature of Human Altruism’. Nature 425:785–91.Fiorina, Morris. 1978. ‘Economic Retrospective Voting in American National Elections: A Micro-
Analysis’. American Journal of Political Science 22(2):426–43.Fischbacher, Urs. 2007. ‘z-Tree: Zurich Toolbox for Ready-Made Economic Experiments’. Experimental
Economics 10(2):171–78.Gemmell, Norman, Oliver Morrissey, and Abuzer Pinar. 2004. ‘Tax Perceptions and Preferences Over Tax
Structure in the United Kingdom’. The Economic Journal 114:F117–38.Glasgow, Garrett. 2005. ‘Evidence of Group-Based Economic Voting: NAFTA and Union Households in
the 1992 U.S. Presidential Election’. Political Research Quarterly 58(3):427–34.Gomez, Brad T., and J. Matthew Wilson. 2001. ‘Political Sophistication and Economic Voting in the
American Electorate: A Theory of Heterogeneous Attribution’. American Journal of PoliticalScience 45(4):899–914.
Gomez, Brad T., and J. Matthew Wilson. 2007. ‘Economic Voting and Political Sophistication: DefendingHeterogeneous Attribution’. Political Research Quarterly 60(3):555–58.
Grafstein, Robert. 2005. ‘The Impact of Employment Status on Voting Behavior’. Journal of Politics67(3):804–24.
Greiner, Ben. 2004. ‘An Online Recruitment System for Economic Experiments’. In Kurt Kremer andVolker Macho (eds), Forschung und wissenschaftliches Rechnen 2003. GWDG Bericht 63, 79–93.Gottingen: Ges. fr Wiss. Datenvararbeitung.
Information and Economic Voting 17
Hetherington, Marc. 1996. ‘The Media’s Role in Forming Voters’ National Economic Evaluationsin 1992’. American Journal of Political Science 40(2):372–95.
Holbrook, Thomas, and James C. Garand. 1996. ‘Homo Economus? Economic Information andEconomic Voting’. Political Research Quarterly 49:351–75.
Kinder, Donald, and Roderick Kiewiet. 1979. ‘Economic Discontent and Political Behavior: The Role ofPersonal Grievances and Collective Economic Judgements in Congressional Voting’. AmericanJournal of Political Science 23:495–527.
Lau, Richard R., and Caroline Heldman. 2009. ‘Self-Interest, Symbolic Attitudes, and Support for PublicPolicy: A Multilevel Analysis’. Political Psychology 30:513–37.
Lau, Richard R., and David Redlawsk. 2006. How Voters Decide. New York: Cambridge University Press.Lepper, Susan. 1974. ‘Voting Behavior and Aggregate Policy Targets’. Public Choice 25(2):67–82.Lewis-Beck, Michael S., and Charles Tien. 1996. ‘The Future in Forecasting: Prospective Presidential
Models’. American Politics Quarterly 24:468–91.Lewis-Beck, Michael S., and Martin Paldam. 2000. ‘Economic Voting: An Introduction’. Electoral Studies
19:113–21.Lewis-Beck, Michael S., and Richard Nadeau. 2011. ‘Economic Voting Theory: Testing New Dimensions’.
Electoral Studies 30:288–94.Lewis-Beck, Michael S., and Tom W. Rice. 1984. ‘Forecasting U.S. House Elections’. Legislative Studies
Quarterly 9:475–86.Lodge, Milton, and Kathleen M. McGraw. 1995. Political Judgement: Structure and Process. Ann Arbor,
MI: University of Michigan Press.Markus, Gregory. 1988. ‘The Impact of Personal and National Economic Conditions on the
Presidential Vote’. American Journal of Political Science 29:137–54.Nannestad, Peter, and Martin Paldam. 1994. ‘The VP-Function: A Survey of the Literature on Vote and
Popularity Functions After 25 Years’. Public Choice 79:213–45.Norpoth, Helmut. 1996. ‘Of Time and Candidates: A Forecast for 1996’. American Politics Quarterly
24:443–67.Peterson, Paul. 1981. City Limits. Chicago: Chicago University Press.Powell, G. Bingham, and Guy Whitten. 1993. ‘A Cross-National Analysis of Economic Voting: Taking
Account of the Political Context’. American Journal of Political Science 37(2):391–414.Redlawsk, David. 2004. ‘What Voters Do: Information Search During Election Campaigns’. Political
Psychology 25(4):595–610.Rogers, Jonathan. 2014. ‘A Communotropic Theory of Economic Voting’. Electoral Studies 36:107–16.Rogers, Jonathan. 2016. ‘Tea Party Support and Perceptions of Local Economic Conditions’. Electoral
Studies 42:91–98.Schram, Arthur, and Joep Sonnemans. 2011. ‘How Individuals Choose Health Insurance: An Experimental
Analysis’. European Economic Review 55:799–819.Tajfel, Henri, and John C. Turner. 1979. ‘An Integrative Theory of Intergroup Conflict’. In W.G. Austin
and S. Worchel (eds), The Social Psychology of Intergroup Relations, 33–47. Monterey, CA:Brooks/Cole.
Tajfel, Henri, and Michael Billig. 1974. ‘Familiarity and Categorization in Intergroup Behavior’. Journalof Experimental Social Psychology 10:159–70.
Tilley, James, and Sara Hobolt. 2011. ‘Is the Government to Blame? An Experimental Test of HowPartisanship Shapes Perceptions of Performance and Responsibility’. Journal of Politics 73(2):316–30.
Wlezien, Christopher, and Robert S. Erikson. 1996. ‘Temporal Horizons and Presidential ElectionForecasts’. American Politics Quarterly 24:492–505.
18 ROGERS AND TYSZLER