mapping diversities and tracing trends of cultural
TRANSCRIPT
Mapping Diversities and Tracing Trends ofCultural Homogeneity/Heterogeneityin Cyberspace
Elad Segev
School of Politics, International Relations, & Philosophy
Keele University
Niv Ahituv
The Faculty of Management
Tel Aviv University
Karine Barzilai-Nahon
The Information School
University of Washington
Many Internet global commercial services were originally initiated in the United States
and later exported to other countries, continents, and cultures. By analyzing content
and form characteristics of two leading portal sites—MSN and Yahoo!—on 33 and 23
(respectively) of their local country homepages in a comparative and longitudinal study
over a period of six months, this study addresses two research questions: What differ-
ences, if any, are found among homepages of the same parent site located in different
cultures (or targeted at audiences in different cultures)? What trends, if any, do those
differences show over time? Although MSN is a U.S. brand, the analysis of its home-
pages reveals increasing cultural heterogeneity and localization of content and form. In
contrast, Yahoo!’s homepages are found to be more similar to each other and to the
‘‘parent’’ American portal. A metric was developed to measure the distance between var-
ious websites in terms of form and content, along with a structured procedure to analyze
and cluster groups of websites. The results suggest that the diversity of local homepages
in MSN and Yahoo! follows the geographic and ethnographic scatter of their countries.
doi:10.1111/j.1083-6101.2007.00373.x
Introduction
Many Internet global commercial services (news portals, ISPs, weather portals, andthe like) were originally initiated in the United States and later exported to other
countries, continents, and cultures. An interesting question is to what extent cultural
Journal of Computer-Mediated Communication
Journal of Computer-Mediated Communication 12 (2007) 1269–1297 ª 2007 International Communication Association1269
Dow
nloaded from https://academ
ic.oup.com/jcm
c/article/12/4/1269/4582996 by guest on 14 February 2022
variance is reflected through the Internet and whether one dominant culture, such asthat of the U.S., enforces cultural homogeneity in cyberspace. The Internet is a unique
cultural space in that it combines a variety of means and forms of communication(e.g., mutual interaction, broadcasting, self-searching for information, forum
groups, human computer interaction) and different types of content (e.g., text,image, voice, video). This provides a wide range of opportunities, which in turnhave significant social and cultural implications (DiMaggio, Hargittai, Neuman, &
Robinson, 2001).
Cultural Diversity in Cyberspace
Some scholars have suggested that mass communication channels shaped by earlymedia forms (e.g., written press, radio, television) might create a global uniform
taste. They argued that commercial considerations and dependence on advertise-ments might produce homogeneous and popular programs or texts in order toattract the attention of maximally large audiences (Adorno, 1991; Bagdikian, 2004;
Mattelart, 1991; Shils, 1963). Eventually, together with the advent of the Internet andthe increasing availability and openness of information (Ahituv, 2001), some media
channels would be likely to represent a certain universal homogeneity. This claimstands in contrast to the increasing customization of production (Caves, 2000;
Shapiro & Varian, 1999; Sunstein, 2001) and the long-tail theory, which shows thatprofit follows the economics of abundance (Anderson, 2006).
Other researchers suggest that economic imperatives will keep the Internet fromrealizing its technical potential as a source of cultural abundance (Castells, 1996;
Neuman, McKnight, & Solomon, 1998). They indicate that although entrance bar-riers to the network may be low, competitors can bias the attention of users andconsequently confine it (Barzilai-Nahon, 2006). In fact, 80% of visits are to only
0.5% of websites (Waxman, 2000). Similarly, some scholars suggest that onlineinformation is not equally spread throughout the global network but rather is chan-
neled by economic, technological, cultural, and social factors (Barabasi, 2001). Fromthis perspective, online information is controlled by dominant actors and is concen-
trated in ‘‘live-zones,’’ i.e., information-saturated centers that have a global culturalimpact (Kellerman, 2002; Lash, 2002). Moreover, evidence has been reported that the
English language dominates online content out of proportion to its share of nativespeaker Internet users (Global Reach, 2004).
The question is whether the Internet promotes individual and local expressions
and therefore heterogeneous culture, or whether it serves as an instrument fordominant organizations (and nations) to increase markets and reinforce common,
homogeneous dispositions. This study proposes quantitative tools to explore cul-tural heterogeneity through popular online artifacts. The idea of exploiting quanti-
tative tools to study cultural differences is not new in the social sciences; however, theattempt to establish a metrics of distance between the content and form of different
websites is quite new.
1270Journal of Computer-Mediated Communication 12 (2007) 1269–1297 ª 2007 International Communication Association
Dow
nloaded from https://academ
ic.oup.com/jcm
c/article/12/4/1269/4582996 by guest on 14 February 2022
A recent study by Norris (2004) measured the bridging and bonding functions ofvarious online groups in the context of ideological, political, and social homogeneity
and heterogeneity. Her study used an ordinary least squares (OLS) regression modelto predict these measures, while taking into account cultural attributes such as
interests, lifestyle, religious group, and more.Hofstede (1997) suggested that national culture has significant implications for
organizational behavior. He defined culture as ‘‘the collective mental programming’’
(p. 5) that occurs along various dimensions. Hofstede measured cultural differencesin the workplace using survey data from IBM employees in over 50 countries.
Ultimately, he designed a special index for each dimension and ranked the countriesby their cultural differences in the workplace.
Content and Form as Cultural Artifacts
Various recent studies have implemented Hofstede’s (1997) framework to explorethe design and content of websites in different countries (Callahan, 2005; Cyr &
Trevor-Smith, 2004; Lo & Gong, 2005; Sheridan, 2001; Zhao, Massey, Murphy, &Liu, 2003). Their findings suggest that differences in website form and content reflect
a variety of cultural attributes. Relatedly, a recent study by Wurtz (2005) comparedthe form and content of transnational corporation websites in different countries. It
revealed that the websites of high-context cultures (Hall & Hall, 1990) such as Japan,China, and Korea, in which communication is relatively indirect and rich in gestures,
displayed more extensive use of graphic elements and indirect messages. By contrast,websites of low-context cultures, such as Germany, Norway, and the U.S., in which
communication is relatively direct, were more static and displayed rather directmessages. In terms of content, it was found that websites of high-context culturestended to emphasize family and social values, while websites of low-context cultures
tended to emphasize freedom and personal lifestyle. Similar trends were observed inother studies (Leonardi, 2002; Marcus & Gould, 2000), indicating that different
national websites place different emphases on collective and individual values.While a growing number of studies have focused on website design and layout
(e.g., animations, colors, graphical density, and navigation menus) as culturalmarkers (Badre, 2000; Becker, 2002; Callahan, 2005; Cyr & Trevor-Smith, 2004;
Sun, 2001; Tsui & Paynter, 2004), fewer studies have been conducted on differencesin content and their cultural implications. Most content analyses are based onHofstede’s (1997) frameworks and thus are limited in focus.
Robbins and Stylianou (2003) looked at the information provided by the largestglobal corporation websites. They found that website content is significantly different
across national cultures. Singh and Baack (2004), Singh, Furrer, and Ostinelli (2004),and Singh, Xhao, and Hu (2003) compared the content of American, Mexican,
European, Indian, and Chinese websites, identifying significant differences inemphasis on family and social values, masculinity, and power. Additionally, the
authors argued that online users prefer localized over standardized web content.
Journal of Computer-Mediated Communication 12 (2007) 1269–1297 ª 2007 International Communication Association1271
Dow
nloaded from https://academ
ic.oup.com/jcm
c/article/12/4/1269/4582996 by guest on 14 February 2022
In contrast to cultural sensitivity and localization of content and form, Kang andCorbitt (2001) revealed trends of homogeneity and standardization in web design.
They examined the differences in display colors, images, animation, and function-ality of 10 U.S.-based IT companies and their Australian and Singaporean versions.
Their study concluded that local homepages used a design similar to the parent U.S.website, taking only minor account of cultural issues.
Finally, a study by Schmied (2003) looked at websites of transnational corpo-
rations, and particularly websites of airline companies, finding certain trends ofstandardization in content and form, but at the same time identifying distinctive
local cultural markers. In short, there are very few studies that indicate trends ofhomogeneity in web design and content, and even then their findings still suggest
that there are local elements that cannot be ignored.By exploring cultural diversity through differences in the content and form of
national homepages, it is presumed that online culture may be reflected throughcontent and form. Barber and Badre (1998) defined the term ‘‘culturability’’ as therelationship between culture and usability in the design of webpages. They argued
that the interface design, interactivity and content reflect cultural sensitivity andunderstanding of the targeted audience. Their study indicated that there are design
patterns (or what they also called ‘‘cultural markers’’), which are highly prevalentwithin different cultures and different genres. Their study indicates, for example, that
Brazilian websites tend to be more colorful and Lebanese websites tend to use lightgraphics and more text (Badre, 2000; Barber & Badre, 1998). Similarly, the present
study uses the term ‘‘culture’’ somewhat loosely, as a means to distinguish among thedifferent countries and their respective websites. There is no intention to explore the
various aspects of this term but rather to enable a comparison of national websites ascultural products or ‘‘artifacts’’ (Appadurai, 1996) with different form and contentattributes. Thus, the term ‘‘online culture’’ is used here to refer to national cultures as
reflected on the Internet.While most of the aforementioned studies compared content and form elements
using Hofstede’s framework, in this study we develop an original metric to measurethe diversity of content and form online. We choose to study the Internet portals
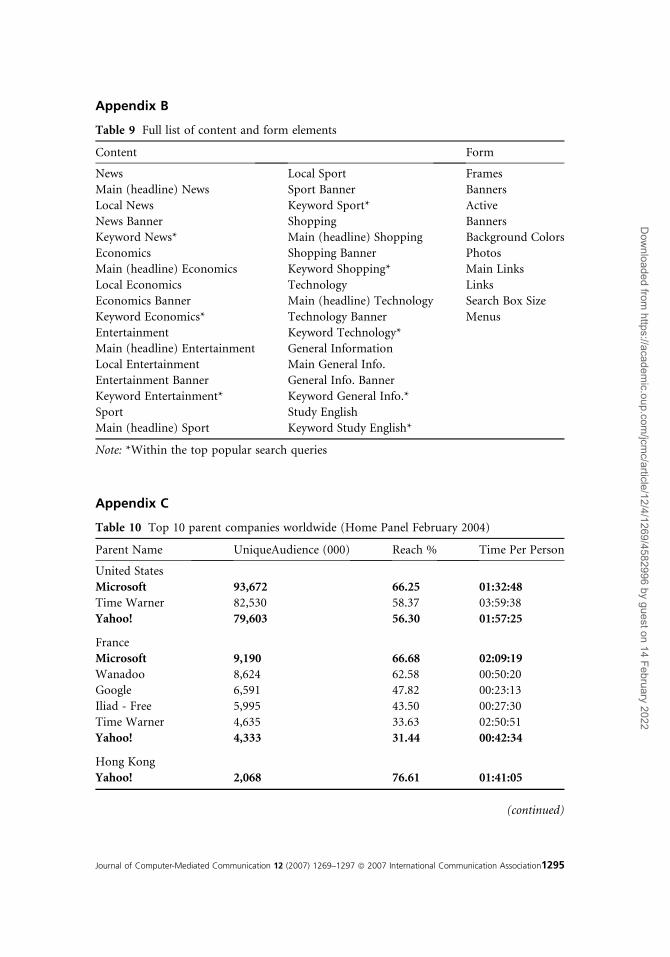
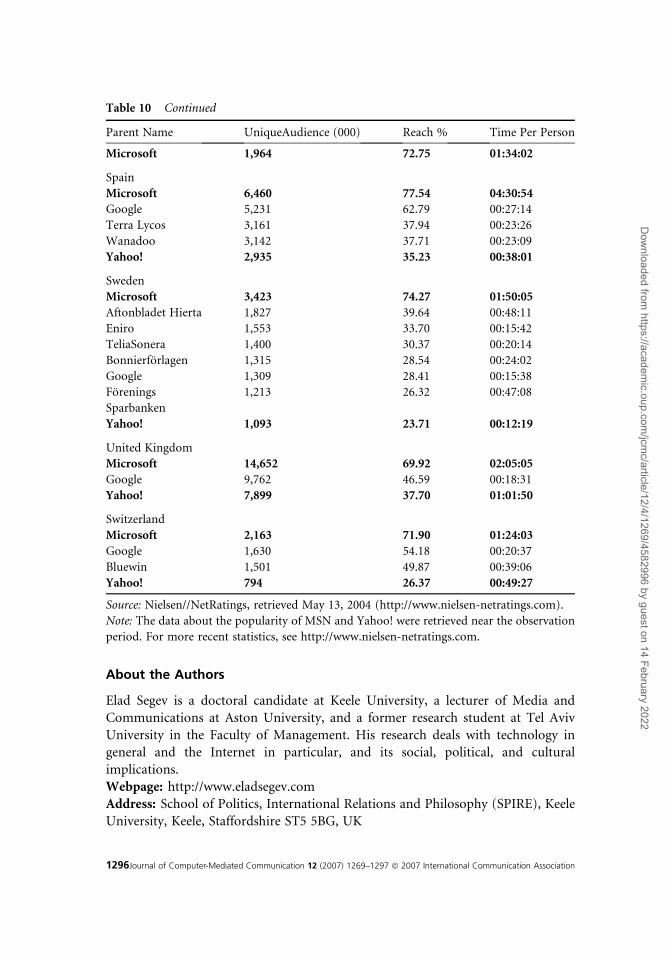
MSN and Yahoo! mainly due to their significant rating and popularity in theobserved countries (Nielsen/Netratings, 2004; see also Appendix C). We focus on
the differences in their local homepages, assuming that the previous decisions of webdesigners and corporate strategies are incorporated in their content and form, andthat they are constantly affected by the values and norms of their local audiences.
Van Couvering (2004) suggested that MSN and Yahoo! conform to the masscommunication business model known as the ‘‘dual product’’ market. On the one
hand, they produce cultural artifacts for individuals, and on the other hand, theyproduce advertisements. But here the business models of MSN and Yahoo! differ, in
that MSN gets 29% of its revenue from advertisements, while Yahoo! gets 82% of itsrevenue from advertisements (Van Couvering, 2004). These different revenue strat-
egies also suggest that MSN benefits more from direct subscription, and therefore
1272Journal of Computer-Mediated Communication 12 (2007) 1269–1297 ª 2007 International Communication Association
Dow
nloaded from https://academ
ic.oup.com/jcm
c/article/12/4/1269/4582996 by guest on 14 February 2022
compels its customers to pay more attention to local and customized cultural arti-facts, than its competitor Yahoo!. Consequently, it was expected that the content and
form of national homepages in MSN would be more diverse and localized than inYahoo!. The results of this study strongly support that hypothesis.
Research Questions
This article addressed two primary research questions:
RQ1: What are the differences in content and form among local homepages of the same parent
site?
RQ2: What trends, if any, do these differences display over a period of time?
The first question explores diversity and raises sub-questions such as: What arethe similarities of each homepage to the parent U.S. site? Is there any relation
between geographical or ethnographical diversity and online cultural diversity?The second question explores trends and raises sub-questions such as: Is it possible
to trace trends in content and form of popular Internet portals? If so, are theyprogressing toward cultural homogeneity or toward heterogeneity?
Since both MSN and Yahoo! originated in the U.S., we expected to find cultural
homogeneity in local homepages, reflecting the form and content of the parent U.S.site, and an increasing similarity in their form and content over time.
Methodology
In order to capture the content and form of different local homepages, an observa-tion item list was constructed. The item list is an electronic form that was used toreport content and form in the different local homepages of MSN and Yahoo!. One
month of observations (May 2003) served as a pilot sample to fine-tune the item list.Subsequently, samplings of content and form were taken over a period of six months
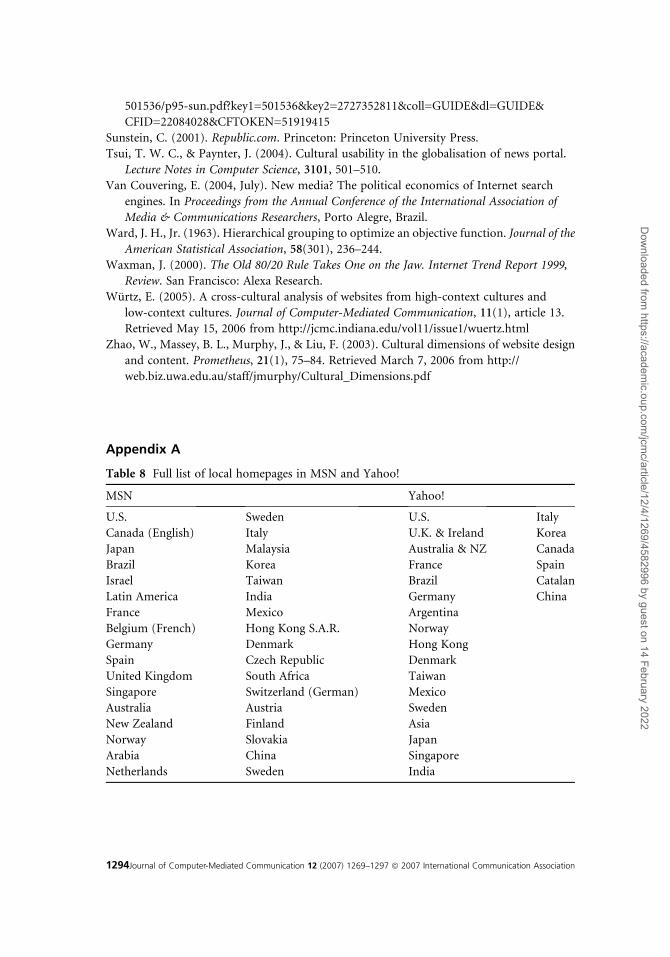
(June-November 2003) from the 33 MSN local homepages and 23 Yahoo! localhomepages (see Appendix A for the full list of countries). Since six months is
a relatively short period, we focus our analysis on the diversity of local homepages,and suggest implications concerning their trends mainly to encourage further inves-
tigation in this domain.The content and form elements of the item list that served as a basis for com-
parison across local homepages followed two main principles: consistency and
remarkableness. Consistency refers to the form and content elements that appearin all or most local homepages. Thus, it is useful to compare the number of pictures
in different local homepages only if it is a consistent element, that is, it appears in allor most local homepages. It is less useful to compare elements that are not consistent,
such as the number of banners with sound, which hardly ever appear.Remarkableness refers to the form and content elements that are most distin-
guishable and that are referred to as ‘‘cultural markers’’ by Badre (2000). Some form
Journal of Computer-Mediated Communication 12 (2007) 1269–1297 ª 2007 International Communication Association1273
Dow
nloaded from https://academ
ic.oup.com/jcm
c/article/12/4/1269/4582996 by guest on 14 February 2022
elements, such as banners and active (animated) banners, were identified in previousstudies as remarkable form elements (Cyr & Trevor-Smith, 2004; Lo & Gong, 2005;
Wurtz, 2005; Zhao et al., 2003); these may further reflect high-context cultures (Hall& Hall, 1990). Similarly, number of links, number of menus, number of headlines,
search box, and page layout have been identified as remarkable form elements withdistinctive cultural attributes (Barber & Badre, 1998; Callahan, 2005; Cyr & Trevor-Smith, 2004).
Based on previous studies of ‘‘cultural markers’’ and our ongoing observations ofMSN and Yahoo!, we identified 10 form elements for examination: number of
frames, number of banners, number of active banners, number of background col-ors, number of photos, number of main links (headline links), number of links in
general, size of search box, number of menus, and number of pop up windows. Eachone of these elements was further operationalized in detail; thus, for example, the
number of pictures is the number of any graphics above 40 pixels. Although oneresearcher conducted the coding, the detailed operationalization of each elementhelped to maintain the consistency of the coding process.
Measuring content quantitatively is often a less straightforward process. Here wefocus on topical classification of seven categories: news, economics, entertainment,
sports, shopping, technology, and general information. These topics were chosen dueto their high frequency of appearance in all local homepages. Classifying content by
topics was a natural choice also because both MSN and Yahoo! use topical classifi-cation to differentiate graphically and conceptually among different kinds of content.
Excluding rare exceptions, most content could be sorted into those seven cate-gories. Each category had structured and detailed rules regarding the inclusion of
content in it. For example, links to purchase products and services would be cate-gorized under the ‘‘shopping’’ category. A particular challenge was to define the rulesof inclusion and exclusion for the category ‘‘news,’’ which can be relevant for many
different topics, such as economics or sports. In order to maintain the consistency ofthe classification process, it was decided to count as news only content that deals with
politics and society in general.All local homepages were translated by means of online dictionaries into English.
Since local homepages inMSNandYahoo! consist of very short sentences and are oftenalready graphically divided into topics, the classification of content into the seven
broad categories was straightforward. Additionally, a research student was employedto validate the online translation of the Japanese, Chinese, and Korean homepages.
Apart from the general number of links from each category, content was further
subdivided by its location and function. Thus content variables could be, for exam-ple, the number of news, economics, or sports headlines, or the number of enter-
tainment or shopping banners (see Appendix B for the full item list).To conclude, 44 different attributes of content and form were analyzed monthly
over a period of six months in 33 countries for MSN and 23 countries for Yahoo!.In order to explore the diversity of content and form, three indices were developed
(General Diversity Index, Difference Diversity Index, and National Similarity Index)
1274Journal of Computer-Mediated Communication 12 (2007) 1269–1297 ª 2007 International Communication Association
Dow
nloaded from https://academ
ic.oup.com/jcm
c/article/12/4/1269/4582996 by guest on 14 February 2022
and a structured statistical analysis was employed (factor and cluster analyses). Bothindices and statistical analyses examined the diversity of local homepages of the same
parent site and its trends over time; thus they complemented and supported eachother.
Three Diversity Indices
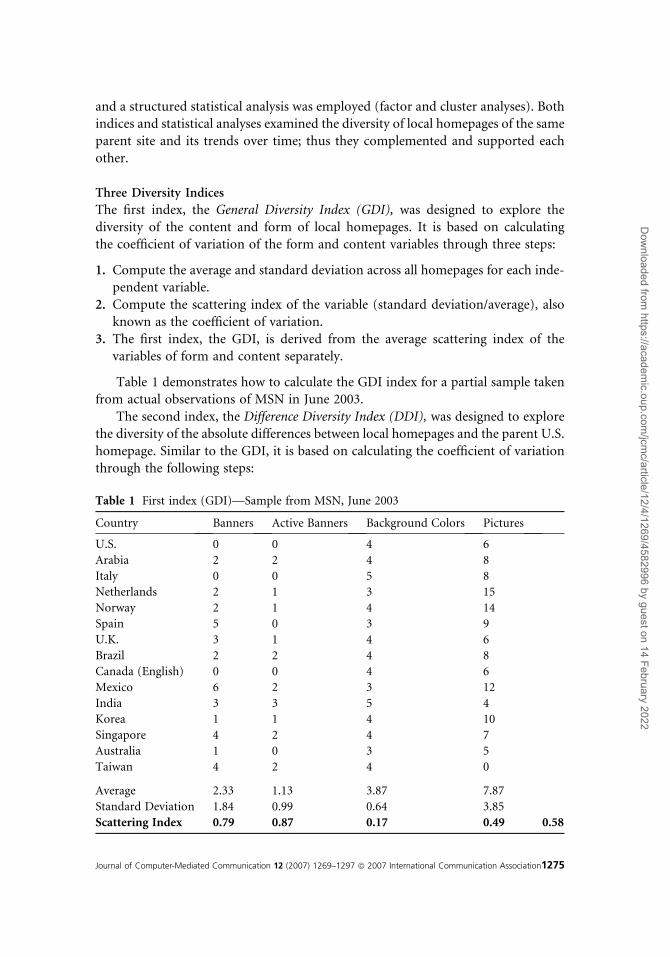
The first index, the General Diversity Index (GDI), was designed to explore the
diversity of the content and form of local homepages. It is based on calculatingthe coefficient of variation of the form and content variables through three steps:
1. Compute the average and standard deviation across all homepages for each inde-pendent variable.
2. Compute the scattering index of the variable (standard deviation/average), alsoknown as the coefficient of variation.
3. The first index, the GDI, is derived from the average scattering index of thevariables of form and content separately.
Table 1 demonstrates how to calculate the GDI index for a partial sample takenfrom actual observations of MSN in June 2003.
The second index, the Difference Diversity Index (DDI), was designed to explorethe diversity of the absolute differences between local homepages and the parent U.S.
homepage. Similar to the GDI, it is based on calculating the coefficient of variationthrough the following steps:
Table 1 First index (GDI)—Sample from MSN, June 2003
Country Banners Active Banners Background Colors Pictures
U.S. 0 0 4 6
Arabia 2 2 4 8
Italy 0 0 5 8
Netherlands 2 1 3 15
Norway 2 1 4 14
Spain 5 0 3 9
U.K. 3 1 4 6
Brazil 2 2 4 8
Canada (English) 0 0 4 6
Mexico 6 2 3 12
India 3 3 5 4
Korea 1 1 4 10
Singapore 4 2 4 7
Australia 1 0 3 5
Taiwan 4 2 4 0
Average 2.33 1.13 3.87 7.87
Standard Deviation 1.84 0.99 0.64 3.85
Scattering Index 0.79 0.87 0.17 0.49 0.58
Journal of Computer-Mediated Communication 12 (2007) 1269–1297 ª 2007 International Communication Association1275
Dow
nloaded from https://academ
ic.oup.com/jcm
c/article/12/4/1269/4582996 by guest on 14 February 2022
1. Compute the absolute differences between each local homepage and the U.S.homepage for each observation.
2. Compute the average and the standard deviation among all homepages for eachindependent variable.
3. Compute the scattering index of the variable (standard deviation/average), alsoknown as the coefficient of variation.
4. The second index, the DDI, is derived from the average scattering index of the
variables of form and content separately.
A trend of decline in the second index does not indicate that the local homepagesbecome similar to the U.S. homepage. It only indicates that the absolute differencesbecome more homogenous. The full meaning of the second index will be further
discussed in the analysis of the results.The first and the second indices engender a dimensionless number, which is
meaningful only if compared over a period of time to track diversity trends. Sincethe calculation of indices is based on the coefficient of variation, it can be imple-
mented easily in other fields to explore the scattering level and its trends.The third index, the National Similarity Index (NSI), is different from the first
two in the sense that it does not describe the level of diversity among all localhomepages of the same parent site, but rather indicates the level of similarity of each
local homepage to the parent U.S. homepage (MSN or Yahoo!). The steps to calcu-late the third index are as follows:
1. Compute the ratio between each local homepage and the U.S. homepage for eachobservation.
2. If the ratio is greater than 1, use the reciprocal value (absolute ratio), so that it willbe possible to intersect the ratio’s average per each local homepage.
3. The third index, the NSI, is derived from the average of those ratios among all
independent variables for each local homepage.
Table 2 demonstrates how to calculate the third index for a partial sample takenfrom actual observations of MSN, June 2003.
The third index indicates the percentage of similarity for each local homepage to
the U.S. homepage. The NSI value ranges from 0 to 1, where a value of 0 indicatesa large difference from the U.S. homepage, while a value of 1 designates the highest
possible similarity to the U.S. homepage. The NSI applies to both form and contentattributes.
Factor and Cluster Analyses
In addition to the three indices, we use statistical analysis to validate and support thenew metrics of indices and to examine the scatter of local homepages in detail. This
was performed through a sequence of three stages:
1. Factor analysis was used to identify correlated variables and replace them with
fewer components that explain the content and form.
1276Journal of Computer-Mediated Communication 12 (2007) 1269–1297 ª 2007 International Communication Association
Dow
nloaded from https://academ
ic.oup.com/jcm
c/article/12/4/1269/4582996 by guest on 14 February 2022
2. Cluster analysis was used in order to group local homepages according to similarcharacteristics. The homepages in each cluster share common factors of content
or form. The distance between clusters can be measured either by the least squaresmethod, or by the Ward method based on variation analysis. The Ward (1963)
method was found more adequate for this study, as will be later argued.3. The common factors in each cluster were traced. Since the clustering process was
based on the new components that the factor analysis generated, we could indi-cate the common factors of homepages in the same cluster.
All stages of the diversity analysis were carried out each month for six months oneach site for the content and form variables separately, thus enabling us also to
construct a trend component to the study. The observation item list contained44 variables (10 of form, 34 of content) that were sampled over 332 homepages
(33 MSN1 23 Yahoo!3 6 months). Consequently, 14,608 observations were collected.
Results
Analysis of the Three Indices
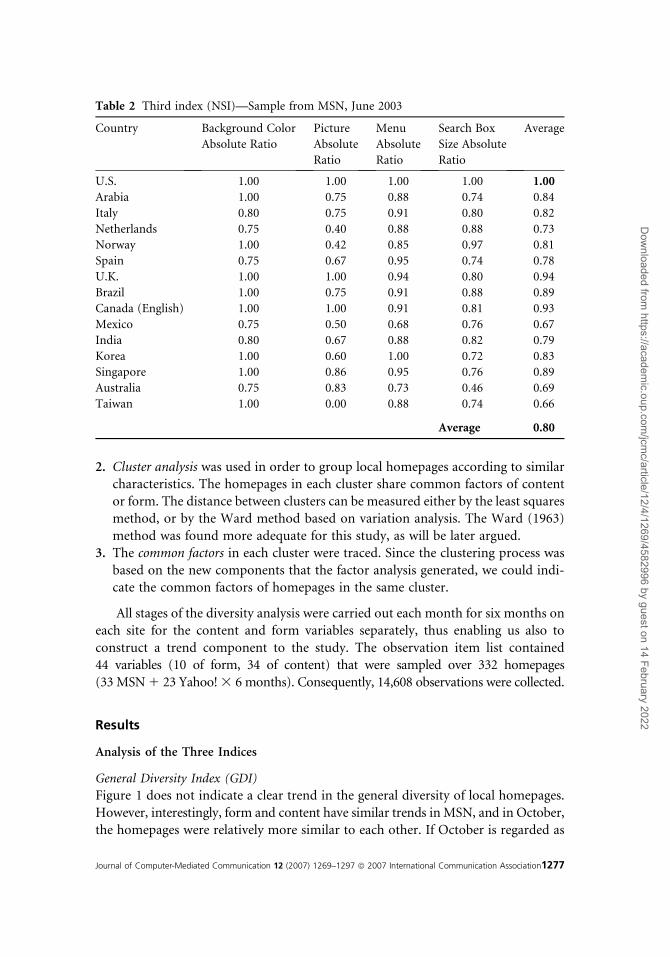
General Diversity Index (GDI)
Figure 1 does not indicate a clear trend in the general diversity of local homepages.
However, interestingly, form and content have similar trends in MSN, and in October,the homepages were relatively more similar to each other. If October is regarded as
Table 2 Third index (NSI)—Sample from MSN, June 2003
Country Background Color
Absolute Ratio
Picture
Absolute
Ratio
Menu
Absolute
Ratio
Search Box
Size Absolute
Ratio
Average
U.S. 1.00 1.00 1.00 1.00 1.00
Arabia 1.00 0.75 0.88 0.74 0.84
Italy 0.80 0.75 0.91 0.80 0.82
Netherlands 0.75 0.40 0.88 0.88 0.73
Norway 1.00 0.42 0.85 0.97 0.81
Spain 0.75 0.67 0.95 0.74 0.78
U.K. 1.00 1.00 0.94 0.80 0.94
Brazil 1.00 0.75 0.91 0.88 0.89
Canada (English) 1.00 1.00 0.91 0.81 0.93
Mexico 0.75 0.50 0.68 0.76 0.67
India 0.80 0.67 0.88 0.82 0.79
Korea 1.00 0.60 1.00 0.72 0.83
Singapore 1.00 0.86 0.95 0.76 0.89
Australia 0.75 0.83 0.73 0.46 0.69
Taiwan 1.00 0.00 0.88 0.74 0.66
Average 0.80
Journal of Computer-Mediated Communication 12 (2007) 1269–1297 ª 2007 International Communication Association1277
Dow
nloaded from https://academ
ic.oup.com/jcm
c/article/12/4/1269/4582996 by guest on 14 February 2022
an exception, it is possible to observe a slight increase in the general diversity level
both in form and content. The sampling covered a relatively short period, however;thus a further statistical investigation is required to support this trend.
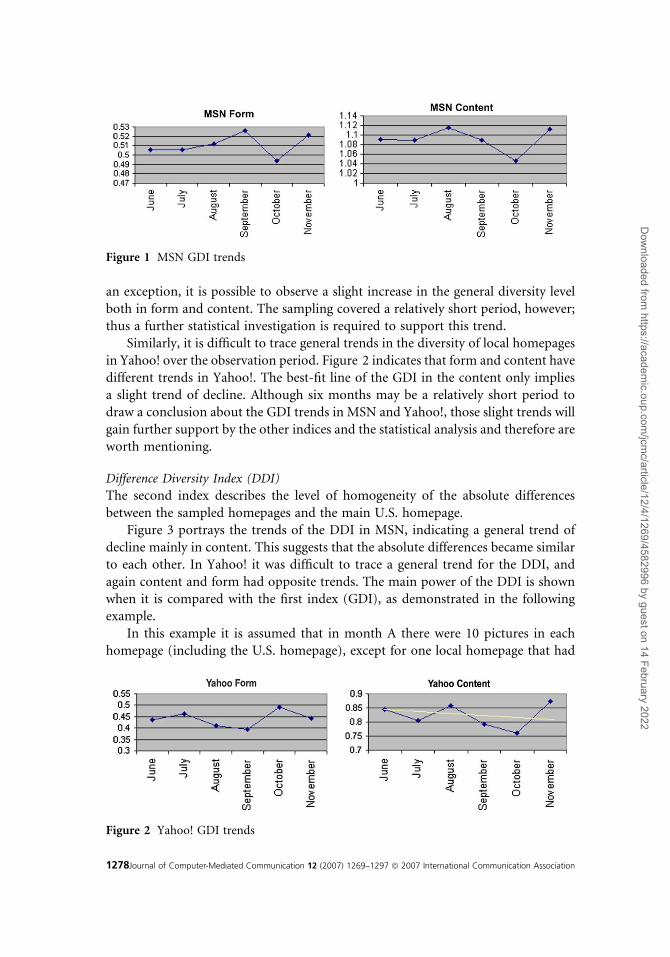
Similarly, it is difficult to trace general trends in the diversity of local homepages
in Yahoo! over the observation period. Figure 2 indicates that form and content havedifferent trends in Yahoo!. The best-fit line of the GDI in the content only implies
a slight trend of decline. Although six months may be a relatively short period todraw a conclusion about the GDI trends in MSN and Yahoo!, those slight trends will
gain further support by the other indices and the statistical analysis and therefore areworth mentioning.
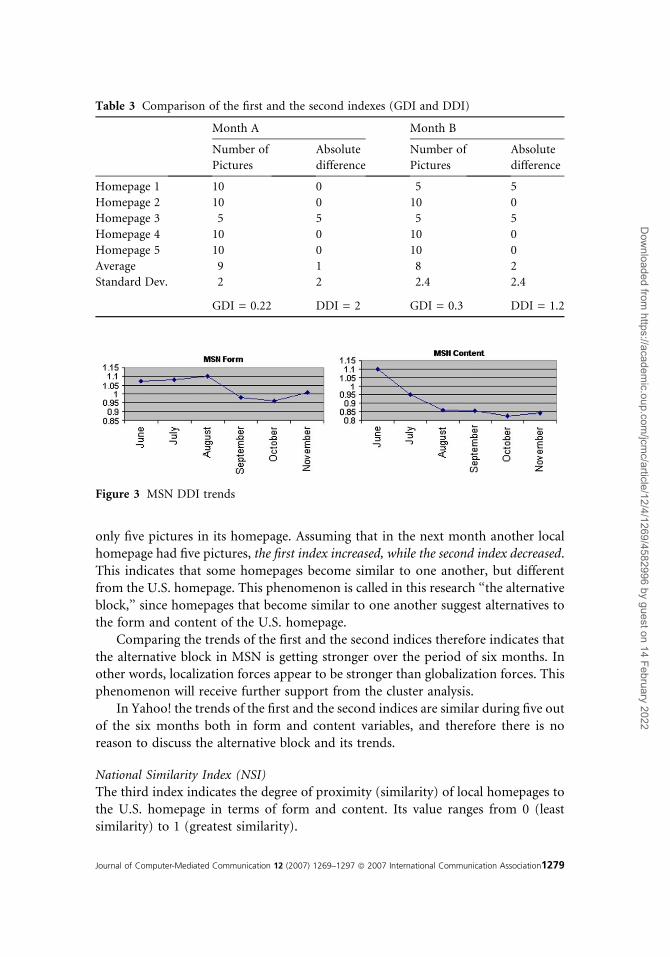
Difference Diversity Index (DDI)
The second index describes the level of homogeneity of the absolute differences
between the sampled homepages and the main U.S. homepage.Figure 3 portrays the trends of the DDI in MSN, indicating a general trend of
decline mainly in content. This suggests that the absolute differences became similarto each other. In Yahoo! it was difficult to trace a general trend for the DDI, and
again content and form had opposite trends. The main power of the DDI is shownwhen it is compared with the first index (GDI), as demonstrated in the followingexample.
In this example it is assumed that in month A there were 10 pictures in eachhomepage (including the U.S. homepage), except for one local homepage that had
Figure 2 Yahoo! GDI trends
Figure 1 MSN GDI trends
1278Journal of Computer-Mediated Communication 12 (2007) 1269–1297 ª 2007 International Communication Association
Dow
nloaded from https://academ
ic.oup.com/jcm
c/article/12/4/1269/4582996 by guest on 14 February 2022
only five pictures in its homepage. Assuming that in the next month another localhomepage had five pictures, the first index increased, while the second index decreased.
This indicates that some homepages become similar to one another, but differentfrom the U.S. homepage. This phenomenon is called in this research ‘‘the alternative
block,’’ since homepages that become similar to one another suggest alternatives tothe form and content of the U.S. homepage.
Comparing the trends of the first and the second indices therefore indicates that
the alternative block in MSN is getting stronger over the period of six months. Inother words, localization forces appear to be stronger than globalization forces. This
phenomenon will receive further support from the cluster analysis.In Yahoo! the trends of the first and the second indices are similar during five out
of the six months both in form and content variables, and therefore there is noreason to discuss the alternative block and its trends.
National Similarity Index (NSI)
The third index indicates the degree of proximity (similarity) of local homepages to
the U.S. homepage in terms of form and content. Its value ranges from 0 (leastsimilarity) to 1 (greatest similarity).
Figure 3 MSN DDI trends
Table 3 Comparison of the first and the second indexes (GDI and DDI)
Month A Month B
Number of
Pictures
Absolute
difference
Number of
Pictures
Absolute
difference
Homepage 1 10 0 5 5
Homepage 2 10 0 10 0
Homepage 3 5 5 5 5
Homepage 4 10 0 10 0
Homepage 5 10 0 10 0
Average 9 1 8 2
Standard Dev. 2 2 2.4 2.4
GDI = 0.22 DDI = 2 GDI = 0.3 DDI = 1.2
Journal of Computer-Mediated Communication 12 (2007) 1269–1297 ª 2007 International Communication Association1279
Dow
nloaded from https://academ
ic.oup.com/jcm
c/article/12/4/1269/4582996 by guest on 14 February 2022
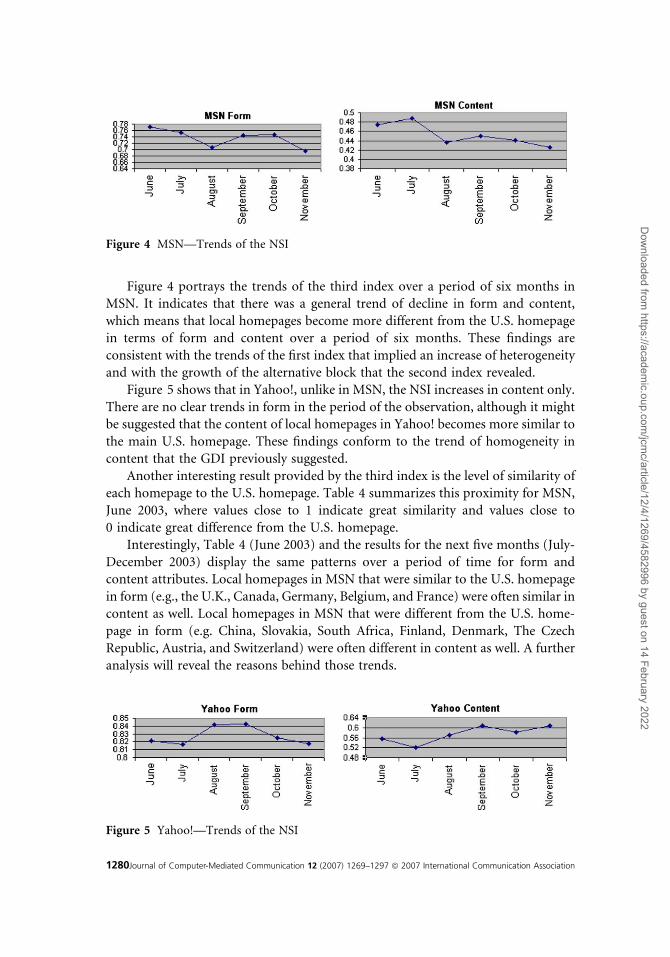
Figure 4 portrays the trends of the third index over a period of six months inMSN. It indicates that there was a general trend of decline in form and content,
which means that local homepages become more different from the U.S. homepagein terms of form and content over a period of six months. These findings are
consistent with the trends of the first index that implied an increase of heterogeneityand with the growth of the alternative block that the second index revealed.
Figure 5 shows that in Yahoo!, unlike in MSN, the NSI increases in content only.
There are no clear trends in form in the period of the observation, although it mightbe suggested that the content of local homepages in Yahoo! becomes more similar to
the main U.S. homepage. These findings conform to the trend of homogeneity incontent that the GDI previously suggested.
Another interesting result provided by the third index is the level of similarity ofeach homepage to the U.S. homepage. Table 4 summarizes this proximity for MSN,
June 2003, where values close to 1 indicate great similarity and values close to0 indicate great difference from the U.S. homepage.
Interestingly, Table 4 (June 2003) and the results for the next five months (July-
December 2003) display the same patterns over a period of time for form andcontent attributes. Local homepages in MSN that were similar to the U.S. homepage
in form (e.g., the U.K., Canada, Germany, Belgium, and France) were often similar incontent as well. Local homepages in MSN that were different from the U.S. home-
page in form (e.g. China, Slovakia, South Africa, Finland, Denmark, The CzechRepublic, Austria, and Switzerland) were often different in content as well. A further
analysis will reveal the reasons behind those trends.
Figure 4 MSN—Trends of the NSI
Figure 5 Yahoo!—Trends of the NSI
1280Journal of Computer-Mediated Communication 12 (2007) 1269–1297 ª 2007 International Communication Association
Dow
nloaded from https://academ
ic.oup.com/jcm
c/article/12/4/1269/4582996 by guest on 14 February 2022
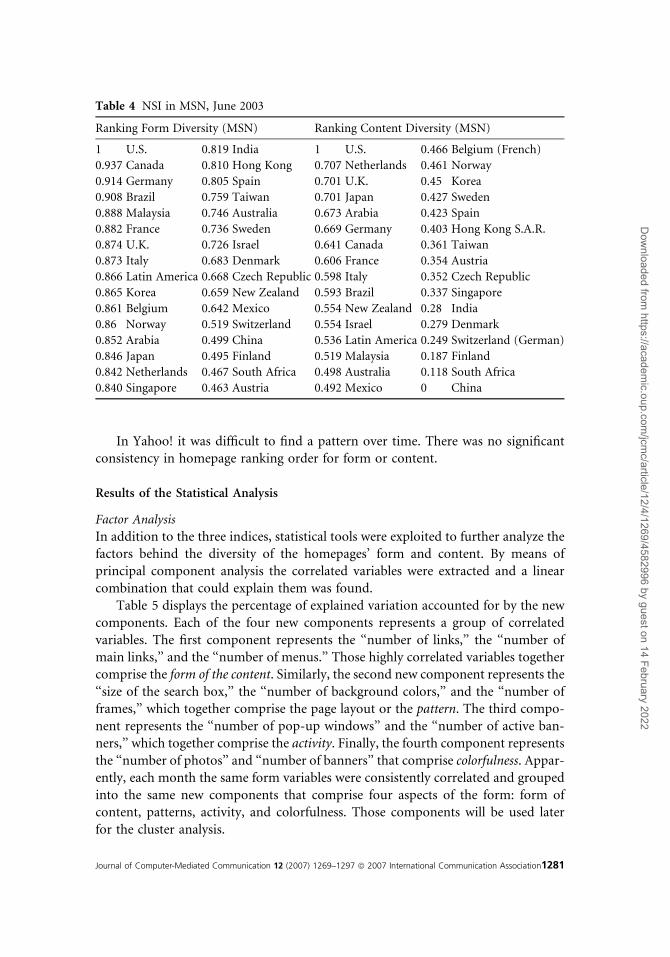
In Yahoo! it was difficult to find a pattern over time. There was no significantconsistency in homepage ranking order for form or content.
Results of the Statistical Analysis
Factor Analysis
In addition to the three indices, statistical tools were exploited to further analyze thefactors behind the diversity of the homepages’ form and content. By means of
principal component analysis the correlated variables were extracted and a linearcombination that could explain them was found.
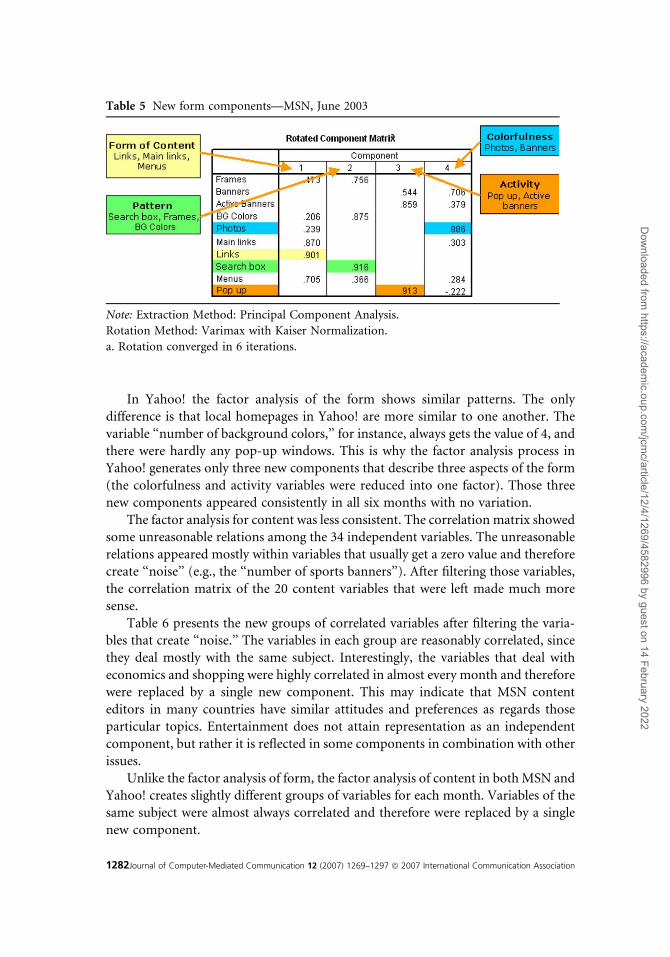
Table 5 displays the percentage of explained variation accounted for by the newcomponents. Each of the four new components represents a group of correlated
variables. The first component represents the ‘‘number of links,’’ the ‘‘number ofmain links,’’ and the ‘‘number of menus.’’ Those highly correlated variables togethercomprise the form of the content. Similarly, the second new component represents the
‘‘size of the search box,’’ the ‘‘number of background colors,’’ and the ‘‘number offrames,’’ which together comprise the page layout or the pattern. The third compo-
nent represents the ‘‘number of pop-up windows’’ and the ‘‘number of active ban-ners,’’ which together comprise the activity. Finally, the fourth component represents
the ‘‘number of photos’’ and ‘‘number of banners’’ that comprise colorfulness. Appar-ently, each month the same form variables were consistently correlated and grouped
into the same new components that comprise four aspects of the form: form ofcontent, patterns, activity, and colorfulness. Those components will be used later
for the cluster analysis.
Table 4 NSI in MSN, June 2003
Ranking Form Diversity (MSN) Ranking Content Diversity (MSN)
1 U.S. 0.819 India 1 U.S. 0.466 Belgium (French)
0.937 Canada 0.810 Hong Kong 0.707 Netherlands 0.461 Norway
0.914 Germany 0.805 Spain 0.701 U.K. 0.45 Korea
0.908 Brazil 0.759 Taiwan 0.701 Japan 0.427 Sweden
0.888 Malaysia 0.746 Australia 0.673 Arabia 0.423 Spain
0.882 France 0.736 Sweden 0.669 Germany 0.403 Hong Kong S.A.R.
0.874 U.K. 0.726 Israel 0.641 Canada 0.361 Taiwan
0.873 Italy 0.683 Denmark 0.606 France 0.354 Austria
0.866 Latin America 0.668 Czech Republic 0.598 Italy 0.352 Czech Republic
0.865 Korea 0.659 New Zealand 0.593 Brazil 0.337 Singapore
0.861 Belgium 0.642 Mexico 0.554 New Zealand 0.28 India
0.86 Norway 0.519 Switzerland 0.554 Israel 0.279 Denmark
0.852 Arabia 0.499 China 0.536 Latin America 0.249 Switzerland (German)
0.846 Japan 0.495 Finland 0.519 Malaysia 0.187 Finland
0.842 Netherlands 0.467 South Africa 0.498 Australia 0.118 South Africa
0.840 Singapore 0.463 Austria 0.492 Mexico 0 China
Journal of Computer-Mediated Communication 12 (2007) 1269–1297 ª 2007 International Communication Association1281
Dow
nloaded from https://academ
ic.oup.com/jcm
c/article/12/4/1269/4582996 by guest on 14 February 2022
In Yahoo! the factor analysis of the form shows similar patterns. The onlydifference is that local homepages in Yahoo! are more similar to one another. The
variable ‘‘number of background colors,’’ for instance, always gets the value of 4, andthere were hardly any pop-up windows. This is why the factor analysis process inYahoo! generates only three new components that describe three aspects of the form
(the colorfulness and activity variables were reduced into one factor). Those threenew components appeared consistently in all six months with no variation.
The factor analysis for content was less consistent. The correlation matrix showedsome unreasonable relations among the 34 independent variables. The unreasonable
relations appeared mostly within variables that usually get a zero value and thereforecreate ‘‘noise’’ (e.g., the ‘‘number of sports banners’’). After filtering those variables,
the correlation matrix of the 20 content variables that were left made much moresense.
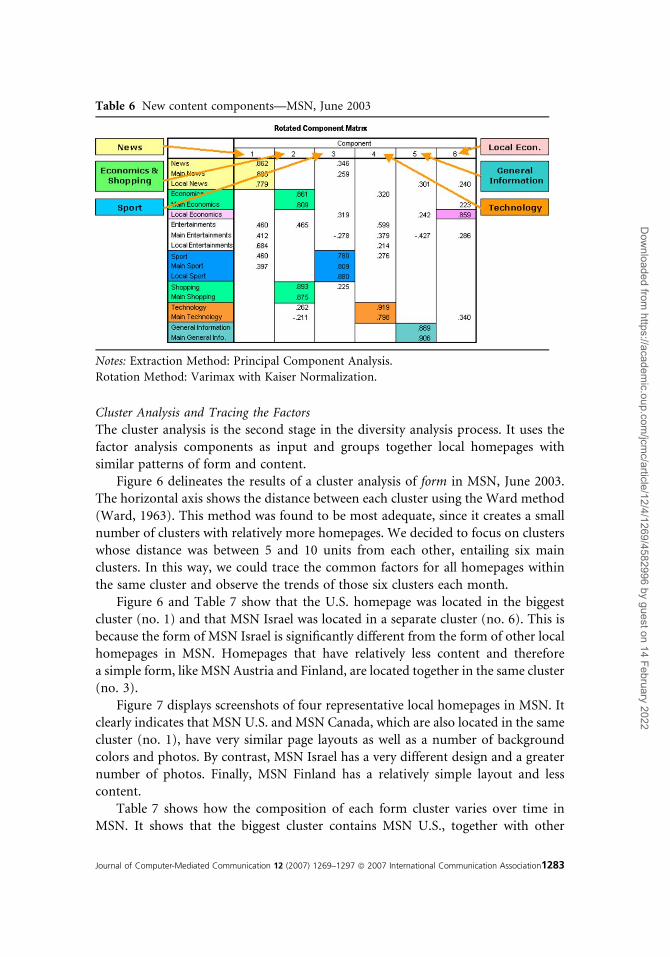
Table 6 presents the new groups of correlated variables after filtering the varia-bles that create ‘‘noise.’’ The variables in each group are reasonably correlated, sincethey deal mostly with the same subject. Interestingly, the variables that deal with
economics and shopping were highly correlated in almost every month and thereforewere replaced by a single new component. This may indicate that MSN content
editors in many countries have similar attitudes and preferences as regards thoseparticular topics. Entertainment does not attain representation as an independent
component, but rather it is reflected in some components in combination with otherissues.
Unlike the factor analysis of form, the factor analysis of content in both MSN andYahoo! creates slightly different groups of variables for each month. Variables of thesame subject were almost always correlated and therefore were replaced by a single
new component.
Table 5 New form components—MSN, June 2003
Note: Extraction Method: Principal Component Analysis.
Rotation Method: Varimax with Kaiser Normalization.
a. Rotation converged in 6 iterations.
1282Journal of Computer-Mediated Communication 12 (2007) 1269–1297 ª 2007 International Communication Association
Dow
nloaded from https://academ
ic.oup.com/jcm
c/article/12/4/1269/4582996 by guest on 14 February 2022
Cluster Analysis and Tracing the Factors
The cluster analysis is the second stage in the diversity analysis process. It uses thefactor analysis components as input and groups together local homepages with
similar patterns of form and content.Figure 6 delineates the results of a cluster analysis of form in MSN, June 2003.
The horizontal axis shows the distance between each cluster using the Ward method
(Ward, 1963). This method was found to be most adequate, since it creates a smallnumber of clusters with relatively more homepages. We decided to focus on clusters
whose distance was between 5 and 10 units from each other, entailing six mainclusters. In this way, we could trace the common factors for all homepages within
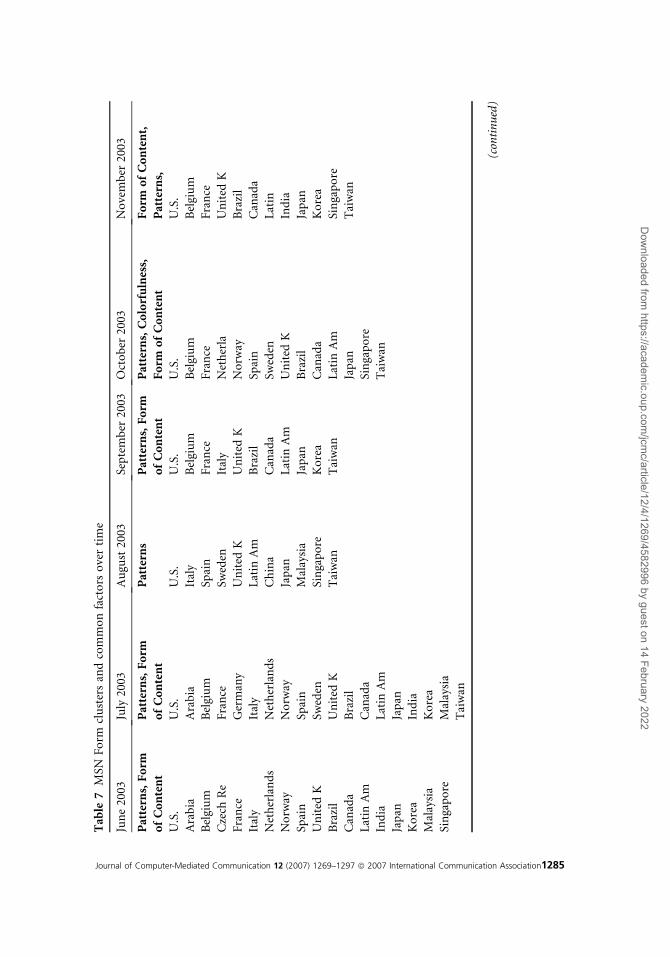
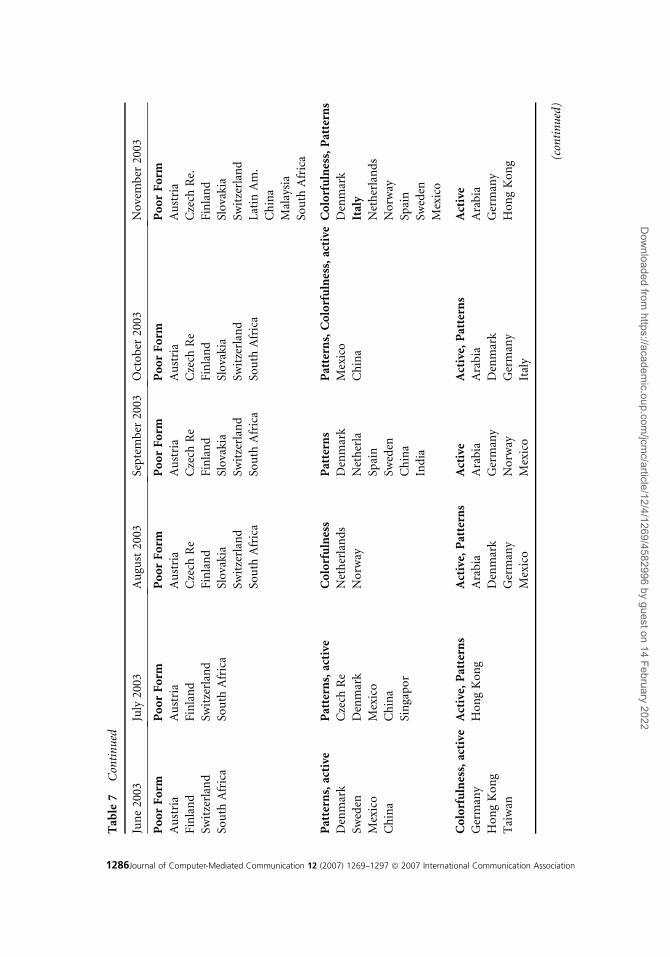
the same cluster and observe the trends of those six clusters each month.Figure 6 and Table 7 show that the U.S. homepage was located in the biggest
cluster (no. 1) and that MSN Israel was located in a separate cluster (no. 6). This isbecause the form of MSN Israel is significantly different from the form of other localhomepages in MSN. Homepages that have relatively less content and therefore
a simple form, like MSN Austria and Finland, are located together in the same cluster(no. 3).
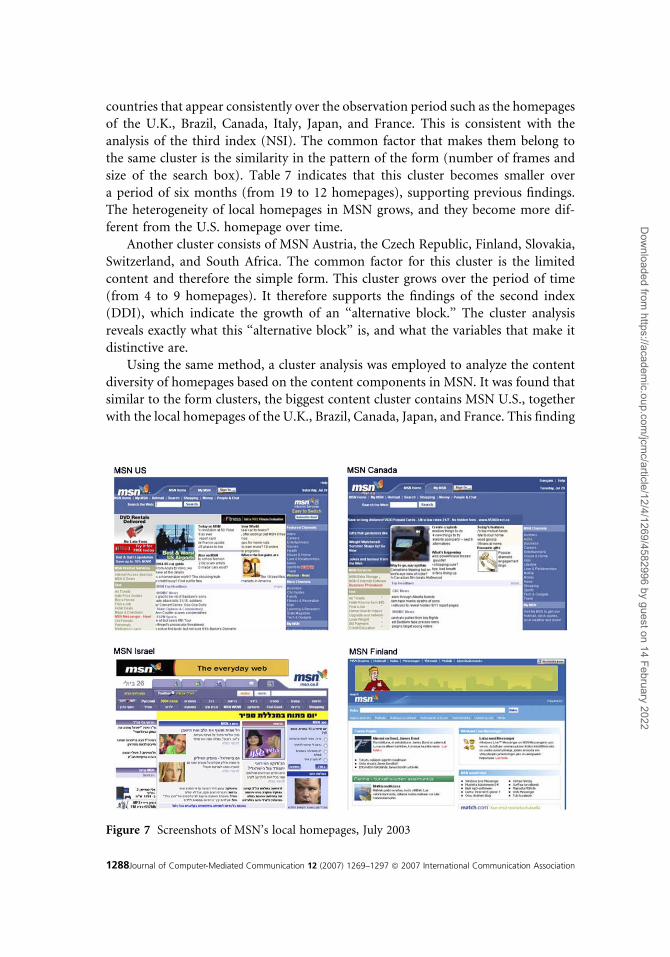
Figure 7 displays screenshots of four representative local homepages in MSN. Itclearly indicates that MSN U.S. and MSN Canada, which are also located in the same
cluster (no. 1), have very similar page layouts as well as a number of backgroundcolors and photos. By contrast, MSN Israel has a very different design and a greater
number of photos. Finally, MSN Finland has a relatively simple layout and lesscontent.
Table 7 shows how the composition of each form cluster varies over time inMSN. It shows that the biggest cluster contains MSN U.S., together with other
Table 6 New content components—MSN, June 2003
Notes: Extraction Method: Principal Component Analysis.
Rotation Method: Varimax with Kaiser Normalization.
Journal of Computer-Mediated Communication 12 (2007) 1269–1297 ª 2007 International Communication Association1283
Dow
nloaded from https://academ
ic.oup.com/jcm
c/article/12/4/1269/4582996 by guest on 14 February 2022
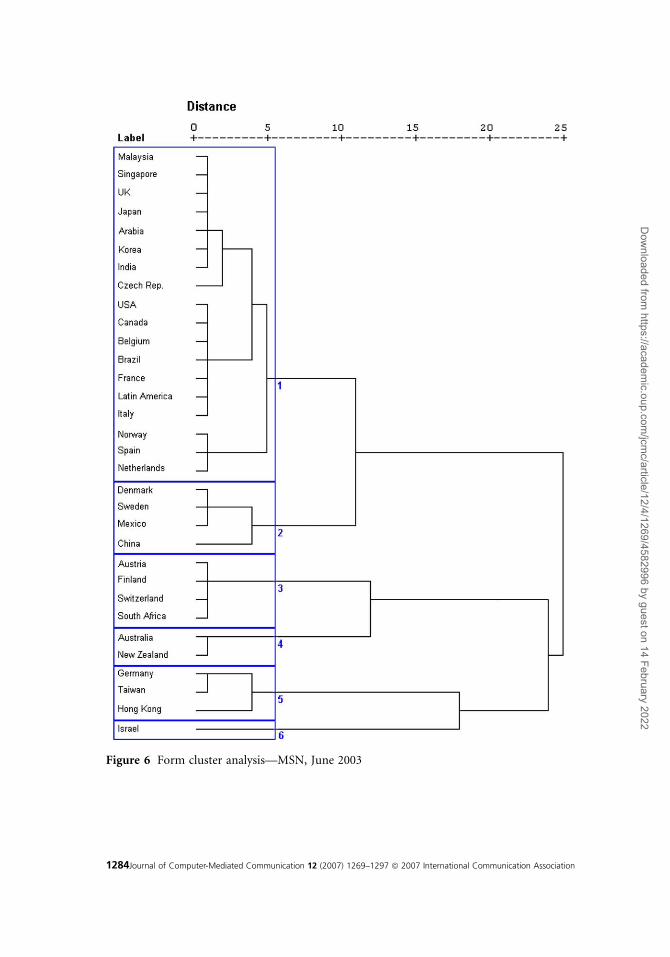
Figure 6 Form cluster analysis—MSN, June 2003
1284Journal of Computer-Mediated Communication 12 (2007) 1269–1297 ª 2007 International Communication Association
Dow
nloaded from https://academ
ic.oup.com/jcm
c/article/12/4/1269/4582996 by guest on 14 February 2022
Table
7MSN
Form
clustersandcommonfactors
overtime
June2003
July2003
August2003
September
2003
October
2003
November
2003
Patterns,Form
ofContent
Patterns,Form
ofContent
Patterns
Patterns,Form
ofContent
Patterns,Colorfulness,
Form
ofContent
Form
ofContent,
Patterns,
U.S.
U.S.
U.S.
U.S.
U.S.
U.S.
Arabia
Arabia
Italy
Belgium
Belgium
Belgium
Belgium
Belgium
Spain
France
France
France
Czech
Re
France
Sweden
Italy
Netherla
United
K
France
Germany
United
KUnited
KNorw
ayBrazil
Italy
Italy
Latin
Am
Brazil
Spain
Canada
Netherlands
Netherlands
China
Canada
Sweden
Latin
Norw
ayNorw
ayJapan
Latin
Am
United
KIndia
Spain
Spain
Malaysia
Japan
Brazil
Japan
United
KSw
eden
Singapore
Korea
Canada
Korea
Brazil
United
KTaiwan
Taiwan
Latin
Am
Singapore
Canada
Brazil
Japan
Taiwan
Latin
Am
Canada
Singapore
India
Latin
Am
Taiwan
Japan
Japan
Korea
India
Malaysia
Korea
Singapore
Malaysia
Taiwan
(con
tin
ued
)
Journal of Computer-Mediated Communication 12 (2007) 1269–1297 ª 2007 International Communication Association1285
Dow
nloaded from https://academ
ic.oup.com/jcm
c/article/12/4/1269/4582996 by guest on 14 February 2022
Table
7C
onti
nu
ed
June2003
July2003
August2003
September
2003
October
2003
November
2003
PoorForm
PoorForm
PoorForm
PoorForm
PoorForm
PoorForm
Austria
Austria
Austria
Austria
Austria
Austria
Finland
Finland
Czech
Re
Czech
Re
Czech
Re
Czech
Re.
Switzerland
Switzerland
Finland
Finland
Finland
Finland
South
Africa
South
Africa
Slovakia
Slovakia
Slovakia
Slovakia
Switzerland
Switzerland
Switzerland
Switzerland
South
Africa
South
Africa
South
Africa
Latin
Am.
China
Malaysia
South
Africa
Patterns,active
Patterns,active
Colorfulness
Patterns
Patterns,Colorfulness,active
Colorfulness,Patterns
Denmark
Czech
Re
Netherlands
Denmark
Mexico
Denmark
Sweden
Denmark
Norw
ayNetherla
China
Italy
Mexico
Mexico
Spain
Netherlands
China
China
Sweden
Norw
ay
Singapor
China
Spain
India
Sweden
Mexico
Colorfulness,active
Active,Patterns
Active,Patterns
Active
Active,Patterns
Active
Germany
HongKong
Arabia
Arabia
Arabia
Arabia
HongKong
Denmark
Germany
Denmark
Germany
Taiwan
Germany
Norw
ayGermany
HongKong
Mexico
Mexico
Italy
(con
tin
ued
)
1286Journal of Computer-Mediated Communication 12 (2007) 1269–1297 ª 2007 International Communication Association
Dow
nloaded from https://academ
ic.oup.com/jcm
c/article/12/4/1269/4582996 by guest on 14 February 2022
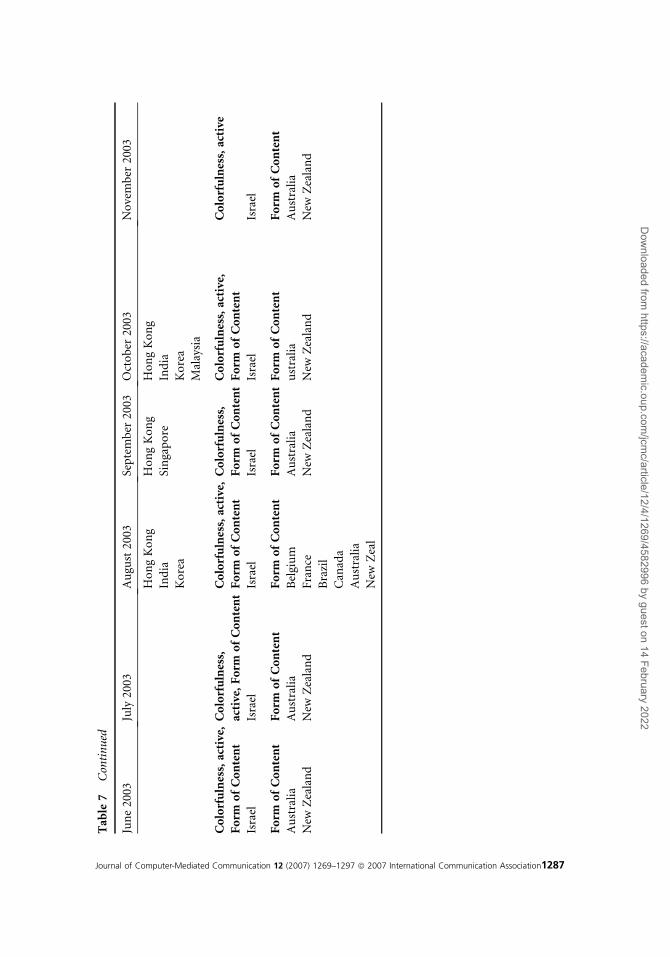
Table7
Con
tin
ued
June2003
July2003
August2003
September
2003
October
2003
November
2003
HongKong
HongKong
HongKong
India
Singapore
India
Korea
Korea
Malaysia
Colorfulness,active,
Form
ofContent
Colorfulness,
active,Form
ofContent
Colorfulness,active,
Form
ofContent
Colorfulness,
Form
ofContent
Colorfulness,active,
Form
ofContent
Colorfulness,active
Israel
Israel
Israel
Israel
Israel
Israel
Form
ofContent
Form
ofContent
Form
ofContent
Form
ofContentForm
ofContent
Form
ofContent
Australia
Australia
Belgium
Australia
ustralia
Australia
New
Zealand
New
Zealand
France
New
Zealand
New
Zealand
New
Zealand
Brazil
Canada
Australia
New
Zeal
Journal of Computer-Mediated Communication 12 (2007) 1269–1297 ª 2007 International Communication Association1287
Dow
nloaded from https://academ
ic.oup.com/jcm
c/article/12/4/1269/4582996 by guest on 14 February 2022
countries that appear consistently over the observation period such as the homepagesof the U.K., Brazil, Canada, Italy, Japan, and France. This is consistent with the
analysis of the third index (NSI). The common factor that makes them belong tothe same cluster is the similarity in the pattern of the form (number of frames and
size of the search box). Table 7 indicates that this cluster becomes smaller overa period of six months (from 19 to 12 homepages), supporting previous findings.The heterogeneity of local homepages in MSN grows, and they become more dif-
ferent from the U.S. homepage over time.Another cluster consists of MSN Austria, the Czech Republic, Finland, Slovakia,
Switzerland, and South Africa. The common factor for this cluster is the limitedcontent and therefore the simple form. This cluster grows over the period of time
(from 4 to 9 homepages). It therefore supports the findings of the second index(DDI), which indicate the growth of an ‘‘alternative block.’’ The cluster analysis
reveals exactly what this ‘‘alternative block’’ is, and what the variables that make itdistinctive are.
Using the same method, a cluster analysis was employed to analyze the content
diversity of homepages based on the content components in MSN. It was found thatsimilar to the form clusters, the biggest content cluster contains MSN U.S., together
with the local homepages of the U.K., Brazil, Canada, Japan, and France. This finding
Figure 7 Screenshots of MSN’s local homepages, July 2003
1288Journal of Computer-Mediated Communication 12 (2007) 1269–1297 ª 2007 International Communication Association
Dow
nloaded from https://academ
ic.oup.com/jcm
c/article/12/4/1269/4582996 by guest on 14 February 2022
is consistent with the analysis of the third index (NSI), in which those countriesranked first as the most similar to MSN U.S. in both content and form. The common
factor that makes them belong to the same cluster is the relatively frequent appearanceof economics and shopping-related content. Similar to the main form cluster, the main
content cluster shrinks over a period of six months (from 14 to 5 homepages), sup-porting previous findings. The heterogeneity in content grows as well, and local home-pages in MSN become more different from the U.S. homepage over time.
Similarly, cluster analysis was used to explore the diversity of form in Yahoo!’slocal homepages over time. It was found that the biggest cluster contains Yahoo!
U.S., together with the homepages of Asia, Brazil, India, Mexico, and Canada. Thecommon factor of this cluster is the similarity in the patterns of the content (number
of links and menus). There is no clear trend for this cluster to become smaller orbigger over time. These findings are consistent with the third index analysis.
Interestingly, the composition of countries in each cluster is consistent over time.One cluster consists of Yahoo! Catalan only, which provides little content andtherefore has a simple form; another cluster consists of the homepages of Scandina-
vian countries: Denmark, Sweden, and Norway, all of which have relatively colorfuland active homepages. Another cluster consists of the homepages of European
countries: France, Germany, and Italy, all of which have a relatively high numberof links in their homepages; another cluster consists of the Asian countries home-
pages: Japan, Hong Kong, and Taiwan, each of which has a relatively small number oflinks in their homepages; and finally there is a cluster for Yahoo! China, which has
a relatively colorful, active, and content-full homepage.The composition of factors was further explored in each content cluster over
time in Yahoo!. It was found that the cluster that contains Yahoo! U.S. has no stablecomposition and therefore no stable common factor. The cluster that contains theU.S. homepage grows over the period of six months (from 2 to 13 homepages). This
supports the results of the first and third indices analyses. The homogeneity incontent increases and the homepages become more similar to the U.S. homepage
over time.
Discussion: Towards A Dictated Heterogeneity?
This article presented new methods, indices, and metrics to explore cultural diversityonline and implemented them to measure the similarities among homepages of MSNand Yahoo! in a large number of countries over time. The tools and methodology
proved useful in measuring content and form proximities of affiliated websites. Sinceprevious comparative studies in the field were limited to a small number of countries
and often used Hofstede’s (1997) framework to analyze content and form, we hopeto encourage further use of these new analytical tools and approaches to explore
online trends of heterogeneity and localization on a large scale.The study posed two main research questions, the first about cultural diversity
online and the second about trends toward homogeneity or heterogeneity over time.
Journal of Computer-Mediated Communication 12 (2007) 1269–1297 ª 2007 International Communication Association1289
Dow
nloaded from https://academ
ic.oup.com/jcm
c/article/12/4/1269/4582996 by guest on 14 February 2022
Despite the relatively short observation period, the findings clearly implied that MSNtended to increase the customization of form and content in its local homepages.
Additionally, it was found that local homepages in MSN tended to differ from theU.S. homepage over time in terms of both content and form.
Conversely, Yahoo!’s analysis identified a trend toward homogeneity of content.The resemblance of the local homepages to the U.S. homepage grew in term ofcontent. However, in terms of form, the cluster analysis indicated the distinctive
differentiation of local homepages by their region: America, Europe, Scandinavia,and the Far East. The relatively high activity and colorfulness of Asian homepages
in both MSN and Yahoo! support previous studies, which found similar trendsin websites of transnational corporations and e-businesses as a reflection of
high-context cultures (Becker, 2002; Cyr, Bonanni, Bowes, & Ilsever, 2005; Wurtz,2005).
In general, the hypothesis that assumed trends toward homogeneity was rejected.MSN, an American brand and popular content provider, displayed heterogeneoushomepages and trends toward localization. These findings may therefore support
similar studies that found cultural heterogeneity and localization of web design andusability (Badre, 2000; Becker, 2002; Cyr & Trevor-Smith, 2004; Lo & Gong, 2005;
Marcus & Gould, 2000; Sheridan, 2001; Singh & Baack, 2004; Singh, Xhao, et al.,2003; Singh, Furrer, et al., 2004; Sun, 2001; Tsui & Paynter, 2004; Wurtz, 2005;
Zhao et al., 2003). Moreover, our study found a growing diversity of content inMSN local homepages, suggesting a new perspective for further investigation in the
field.These trends may be also explained as a result of the business model of MSN that
focuses on direct subscription and production of customized cultural artifacts (VanCouvering, 2004). Heterogeneity and localization trends do not imply less controlby the parent site over the local sites. On the contrary, these may be analyzed as a
stronger leverage to control users’ preferences. Through addressing local content,big portals and content providers strengthen their grip on users, attracting
attention that non-American users might not otherwise pay to more global contentand form.
In contrast to MSN, the relative homogeneity in the content of Yahoo!’s localhomepages and their similarity to the U.S. parent site imply that Yahoo! takes less
account of cultural issues. A few studies (Kang & Corbitt, 2001; Schmied, 2003) maysupport this trend; they propose a certain level of standardization in websites of trans-national (and particularly U.S.-based) corporations. These findings are consistent
with the different business model of Yahoo!, which is based mainly on advertisement(Van Couvering, 2004) rather than on the provision of customized information
products.To conclude, the increasing diversity of local homepages in MSN and the
regional division of form clusters in Yahoo! clearly indicate trends of localizationand cultural diversity in cyberspace and a gradual departure from their U.S. sources.
Consequently, we may expect further customization of local homepages, especially in
1290Journal of Computer-Mediated Communication 12 (2007) 1269–1297 ª 2007 International Communication Association
Dow
nloaded from https://academ
ic.oup.com/jcm
c/article/12/4/1269/4582996 by guest on 14 February 2022
MSN, in the Far East and Latin America, as MSN adds new ethnic cultures to itscustomer base. This is probably why during the observation period MSN launched
another homepage entitled ‘‘Latin.’’ This homepage is culture and Spanish-languageoriented, rather than geography oriented.
It may be argued that the customization process of content and form proceeds inphases, starting with geographical and national distinctions and progressing towardsa focus on ethnographic differences. A reason for that could be that it is technically
easier for a corporation to conduct a geographical customization than an ethno-graphic and more specific one.
Future research into the increasing customization of local homepages, especiallyin popular and influential U.S.-based companies such as MSN and Yahoo!, may
further contribute to the understanding of cultural globalization (Appadurai,1996; Basch, Schiller, & Blanc, 1994; Foster, 1991; Friedman, 1990). In this sense,
our findings support previous studies that highlighted the centrality of customiza-tion and cultural diversity (Anderson, 2006; Caves, 2000; Shapiro & Varian, 1999;Sunstein, 2001). Additionally, our findings suggest that future studies of this diver-
sity should increasingly focus on ethnographic as well as geographical differences.
Acknowledgments
The research for this article was supported by the faculty of management, Tel AvivUniversity. We would like to thank the administration staff, and especially Mrs. Orit
Aviv-Prihed, who helped us to carry out this research. We would like to thankDr. Glenn McGregor and Dr. Yaojun Li of Birmingham University for their contri-
bution to designing the methodology of this research. A special thanks to ProfessorRobert E.F. Smith for his comments on an earlier version of this article.
Note
1 Information search plays a prominent role in websites such as MSN and Yahoo!, and
therefore the size of the search box was considered a notable element of form (see also
Cyr & Trevor-Smith [2004], who compared the search layout of various national
websites). The size of the search box was measured in pixels and ranged between 140px,
which is relatively small (3.7cm), and 620px, which is relatively large (16.3cm).
References
Adorno, T. W. (1991). The Culture Industry: Selected Essays on Mass Culture. London:
Routledge.
Ahituv, N. (2001). The open information society. Communications of the ACM, 44(6), 48–52.
Anderson, C. (2006). The Long Tail. London: Random House Business.
Appadurai, A. (1996). Diversity and disciplinarity as cultural artifacts. In C. Nelson &
D. P. Gaonkar (Eds.), Disciplinarily and Dissent in Cultural Studies (pp. 23–36).
New York: Routledge.
Journal of Computer-Mediated Communication 12 (2007) 1269–1297 ª 2007 International Communication Association1291
Dow
nloaded from https://academ
ic.oup.com/jcm
c/article/12/4/1269/4582996 by guest on 14 February 2022
Badre, A. N. (2000). The effects of cross-cultural interface design orientation on World Wide
Web user performance. GVE Research Technical Reports. Retrieved June 22, 2007 from
ftp://ftp.cc.gatech.edu/pub/gvu/tr/2001/01-03.html
Bagdikian, B. (2004). The New Media Monopoly. Boston, MA: Beacon Press Books.
Barabasi, A. (2001). The physics of the Web. Physics World, 14(7), 33–38.
Barber, W., & Badre A. N. (1998, June).Culturability: The merging of culture and usability. In
Proceedings from the 4th Conference on Human Factors and the Web. Retrieved March 21,
2006 from http://research.microsoft.com/users/marycz/hfweb98/barber/index.htm
Barzilai-Nahon, K. (2006). Gatekeeping, virtual communities, and their gated:
Multidimensional tensions in cyberspace. International Journal of Communications, Law
and Policy, 11, Autumn. Retrieved July 15, 2007 from http://projects.ischool.washington.
edu/karineb/html/pub/IJCLPGatekeeping.pdf
Basch, L. G., Schiller, N. G., & Blanc, C. S. (1994). Nations Unbound: Transnational Projects,
Postcolonial Predicaments, and Deterritorialized Nation-States. Amsterdam: Gordon and
Breach.
Becker, S. A. (2002). An exploratory study on web usability and the internationalization of
U.S. e-business. Journal of Electronic Commerce Research, 3(4), 265–278.
Callahan, E. (2005). Cultural similarities and differences in the design of university websites.
Journal of Computer-Mediated Communication, 11(1), article 12. Retrieved July 15, 2007
from http://jcmc.indiana.edu/vol11/issue1/callahan.html
Castells, M. (1996). The Information Age: Economics, Society and Culture (Vol. 1.): The Rise of
the Network Society. Oxford: Basil Blackwell.
Caves, R. (2000). Creative Industries: Contracts between Art and Commerce. Cambridge:
Harvard University Press.
Cyr, D., Bonanni, C., Bowes, J., & Ilsever, J. (2005). Beyond trust: Website design preferences
across cultures. Journal of Global Information Management, 13(4), 24–52.
Cyr, D., & Trevor-Smith, H. (2004). Localization of web design: An empirical comparison of
German, Japanese, and United States web site characteristics. JASIST, 55(1), 1199–1208.
DiMaggio, P., Hargittai, E., Neuman, W. R., & Robinson, J. P. (2001). Social implications of
the Internet. Annual Review of Sociology, 27, 307–336.
Foster, R. J. (1991). Making national cultures in the global ecumene. Annual Review of
Anthropology, 20, 235–260.
Friedman, J. (1990). Being in the world: Globalization and localization. In M. Featherstone
(Ed.), Global Culture: Nationalism, Globalization and Modernity (pp. 311–328).
London: Sage.
Global Reach. (2004). Global Internet statistics: Sources & references. Retrieved June 22, 2007
from http://global-reach.biz/globstats/refs.php3
Hall, E. T., & Hall, M. R. (1990). Understanding Cultural Differences. Yarmouth, ME:
Intercultural Press Inc.
Hofstede, G. (1997). Cultures and Organizations: Software of the Mind. New York:
McGraw-Hill.
Kang, K. S., & Corbitt, B. (2001). Effectiveness of graphical components in web site
e-commerce application: A cultural perspective. The Electronic Journal Systems in
Developing Countries, 7(2), 1-6. Retrieved September 22, 2006 from http://
www.ejisdc.org/ojs/include/getdoc.php?id=35&article =35&mode=pdf
Kellerman, A. (2002). The Internet on Earth: A Geography of Information. London: Wiley.
1292Journal of Computer-Mediated Communication 12 (2007) 1269–1297 ª 2007 International Communication Association
Dow
nloaded from https://academ
ic.oup.com/jcm
c/article/12/4/1269/4582996 by guest on 14 February 2022
Lash, S. (2002). Critique of Information. London: Sage.
Leonardi, P. M. (2002). Cultural variability in web interface design: Communicating U.S.
Hispanic cultural values on the Internet. In F. Sudweeks & C. Ess (Eds.), Proceedings of
Cultural Attitudes towards Communications and Technology (pp. 297–315). Murdoch,
Australia: Murdoch University.
Lo, B. W. N., & Gong, P. (2005). Cultural impact on the design of e-commerce websites:
Part I: Site format and layout. Issues in Information Systems, VI(2), 182–189. Retrieved
March 7, 2006 from http://www.jcis-online.org/iis/2005_IIS/PDFs/Lo_Gong.pdf
Marcus, A., & Gould, E.W. (2000, June). Cultural dimensions and global web user-interface
design: What? So what? Now what? In Proceedings from the 6th Conference on Human
Factors and the Web. Retrieved March 5, 2006 from http://www.amanda.com/resources/
hfweb2000/AMA_CultDim.pdf
Mattelart, A. (1991). Advertising International: The Privatization of Public Space. London:
Routledge.
Neuman, W. R., McKnight, L. W., & Solomon, R. J. (1998). The Gordian Knot: Political
Gridlock on the Information Highway. Cambridge: MIT Press.
Nielsen/NetRatings. (2004). Audience measurement service. Retrieved March 17, 2004 from
http://www.nielsen-netratings.com/press.jsp?section=pr_netv&nav=3
Norris, P. (2004). The bridging and bonding role of online communities. In P. N. Howard &
S. Jones (Eds.), Society Online: The Internet in Context (pp. 31–43). Thousand Oaks,
CA: Sage Publications.
Robbins, S. S., & Stylianou, A. C. (2003). Global corporate websites: An empirical
investigation of content and design. Information and Management, 40(3), 205–212.
Schmied, J. (2003). Cultural discourse in Internet business. In E. H. Oleksy &
B. Lewandowska-Tomaszczyk (Eds.), Research and Scholarship in Integration Processes:
Poland-USA-EU (pp. 273–283). Lodz: Lodz U.P.
Shapiro, C., & Varian, H. (1999). Information Rules: A Strategic Guide to the Network
Economics. Boston: Harvard Business School Press.
Sheridan, E. F. (2001). Cross-cultural web design: Considerations for developing and
strategies for validating locale appropriate on-line content. Multilingual Computing &
Technology, 12(7), 53–56.
Shils, E. (1963). The theory of mass society. In P. O. Glencoe (Ed.), America as a Mass Society
(pp. 30–50). Glencoe, IL: Free Press.
Singh, N., & Baack D. W. (2004). Web site adaptation: A cross-cultural comparison of U.S.
and Mexican web sites. Journal of Computer-Mediated Communication, 9(4). Retrieved
September 20, 2006 from http://jcmc.indiana.edu/vol9/issue4/singh_baack.html
Singh, N., Furrer, O., & Ostinelli, M. (2004). To localize or standardize on the Web: Empirical
evidence from Italy, India, Netherlands, Spain, and Switzerland. Multinational Business
Review, 12(1), 69–87.
Singh, N., Xhao, H., & Hu, X. (2003). Cultural adaptation on the Web: A study of American
companies’ domestic and Chinese websites. Journal of Global Information Management,
11(3), 63–80.
Sun, H. (2001). Building a culturally-competent corporate web site: An explanatory study of
cultural markers in multilingual web design. In Proceedings from SIGDOC 2001
(pp. 95–102). Retrieved June 22, 2007 from http://delivery.acm.org/10.1145/510000/
Journal of Computer-Mediated Communication 12 (2007) 1269–1297 ª 2007 International Communication Association1293
Dow
nloaded from https://academ
ic.oup.com/jcm
c/article/12/4/1269/4582996 by guest on 14 February 2022
501536/p95-sun.pdf?key1=501536&key2=2727352811&coll=GUIDE&dl=GUIDE&
CFID=22084028&CFTOKEN=51919415
Sunstein, C. (2001). Republic.com. Princeton: Princeton University Press.
Tsui, T. W. C., & Paynter, J. (2004). Cultural usability in the globalisation of news portal.
Lecture Notes in Computer Science, 3101, 501–510.
Van Couvering, E. (2004, July). New media? The political economics of Internet search
engines. In Proceedings from the Annual Conference of the International Association of
Media & Communications Researchers, Porto Alegre, Brazil.
Ward, J. H., Jr. (1963). Hierarchical grouping to optimize an objective function. Journal of the
American Statistical Association, 58(301), 236–244.
Waxman, J. (2000). The Old 80/20 Rule Takes One on the Jaw. Internet Trend Report 1999,
Review. San Francisco: Alexa Research.
Wurtz, E. (2005). A cross-cultural analysis of websites from high-context cultures and
low-context cultures. Journal of Computer-Mediated Communication, 11(1), article 13.
Retrieved May 15, 2006 from http://jcmc.indiana.edu/vol11/issue1/wuertz.html
Zhao, W., Massey, B. L., Murphy, J., & Liu, F. (2003). Cultural dimensions of website design
and content. Prometheus, 21(1), 75–84. Retrieved March 7, 2006 from http://
web.biz.uwa.edu.au/staff/jmurphy/Cultural_Dimensions.pdf
Appendix A
Table 8 Full list of local homepages in MSN and Yahoo!
MSN Yahoo!
U.S. Sweden U.S. Italy
Canada (English) Italy U.K. & Ireland Korea
Japan Malaysia Australia & NZ Canada
Brazil Korea France Spain
Israel Taiwan Brazil Catalan
Latin America India Germany China
France Mexico Argentina
Belgium (French) Hong Kong S.A.R. Norway
Germany Denmark Hong Kong
Spain Czech Republic Denmark
United Kingdom South Africa Taiwan
Singapore Switzerland (German) Mexico
Australia Austria Sweden
New Zealand Finland Asia
Norway Slovakia Japan
Arabia China Singapore
Netherlands Sweden India
1294Journal of Computer-Mediated Communication 12 (2007) 1269–1297 ª 2007 International Communication Association
Dow
nloaded from https://academ
ic.oup.com/jcm
c/article/12/4/1269/4582996 by guest on 14 February 2022
Appendix B
Appendix C
Table 9 Full list of content and form elements
Content Form
News Local Sport Frames
Main (headline) News Sport Banner Banners
Local News Keyword Sport* Active
News Banner Shopping Banners
Keyword News* Main (headline) Shopping Background Colors
Economics Shopping Banner Photos
Main (headline) Economics Keyword Shopping* Main Links
Local Economics Technology Links
Economics Banner Main (headline) Technology Search Box Size
Keyword Economics* Technology Banner Menus
Entertainment Keyword Technology*
Main (headline) Entertainment General Information
Local Entertainment Main General Info.
Entertainment Banner General Info. Banner
Keyword Entertainment* Keyword General Info.*
Sport Study English
Main (headline) Sport Keyword Study English*
Note: *Within the top popular search queries
Table 10 Top 10 parent companies worldwide (Home Panel February 2004)
Parent Name UniqueAudience (000) Reach % Time Per Person
United States
Microsoft 93,672 66.25 01:32:48
Time Warner 82,530 58.37 03:59:38
Yahoo! 79,603 56.30 01:57:25
France
Microsoft 9,190 66.68 02:09:19
Wanadoo 8,624 62.58 00:50:20
Google 6,591 47.82 00:23:13
Iliad - Free 5,995 43.50 00:27:30
Time Warner 4,635 33.63 02:50:51
Yahoo! 4,333 31.44 00:42:34
Hong Kong
Yahoo! 2,068 76.61 01:41:05
(continued)
Journal of Computer-Mediated Communication 12 (2007) 1269–1297 ª 2007 International Communication Association1295
Dow
nloaded from https://academ
ic.oup.com/jcm
c/article/12/4/1269/4582996 by guest on 14 February 2022
About the Authors
Elad Segev is a doctoral candidate at Keele University, a lecturer of Media andCommunications at Aston University, and a former research student at Tel Aviv
University in the Faculty of Management. His research deals with technology ingeneral and the Internet in particular, and its social, political, and cultural
implications.Webpage: http://www.eladsegev.comAddress: School of Politics, International Relations and Philosophy (SPIRE), Keele
University, Keele, Staffordshire ST5 5BG, UK
Table 10 Continued
Parent Name UniqueAudience (000) Reach % Time Per Person
Microsoft 1,964 72.75 01:34:02
Spain
Microsoft 6,460 77.54 04:30:54
Google 5,231 62.79 00:27:14
Terra Lycos 3,161 37.94 00:23:26
Wanadoo 3,142 37.71 00:23:09
Yahoo! 2,935 35.23 00:38:01
Sweden
Microsoft 3,423 74.27 01:50:05
Aftonbladet Hierta 1,827 39.64 00:48:11
Eniro 1,553 33.70 00:15:42
TeliaSonera 1,400 30.37 00:20:14
Bonnierforlagen 1,315 28.54 00:24:02
Google 1,309 28.41 00:15:38
Forenings 1,213 26.32 00:47:08
Sparbanken
Yahoo! 1,093 23.71 00:12:19
United Kingdom
Microsoft 14,652 69.92 02:05:05
Google 9,762 46.59 00:18:31
Yahoo! 7,899 37.70 01:01:50
Switzerland
Microsoft 2,163 71.90 01:24:03
Google 1,630 54.18 00:20:37
Bluewin 1,501 49.87 00:39:06
Yahoo! 794 26.37 00:49:27
Source: Nielsen//NetRatings, retrieved May 13, 2004 (http://www.nielsen-netratings.com).
Note: The data about the popularity of MSN and Yahoo! were retrieved near the observation
period. For more recent statistics, see http://www.nielsen-netratings.com.
1296Journal of Computer-Mediated Communication 12 (2007) 1269–1297 ª 2007 International Communication Association
Dow
nloaded from https://academ
ic.oup.com/jcm
c/article/12/4/1269/4582996 by guest on 14 February 2022
Niv Ahituv is the Marko and Lucie Chaoul Chair for Research in InformationEvaluation and the Academic Director of the Institute of Internet Studies of Tel
Aviv University. His research deals with information economics, information systemstrategy and management, and social and business implications of the Internet.
Webpage: http://recanati.tau.ac.il/Index.asp?ArticleID=76&CategoryID=164Address: Faculty of Management, Tel Aviv University, Tel Aviv, 69978, Israel
Karine Barzilai-Nahon is Assistant Professor in the Information School at the Uni-versity of Washington. Formerly she held senior positions in Research and Devel-
opment in hi-tech industry. Her research deals with social and business aspects of theInternet and telecommunications.Webpage: http://projects.ischool.washington.edu/karineb/
Address: The Information School, University of Washington, Mary Gates Hall,Seattle, WA 98195, USA
Journal of Computer-Mediated Communication 12 (2007) 1269–1297 ª 2007 International Communication Association1297
Dow
nloaded from https://academ
ic.oup.com/jcm
c/article/12/4/1269/4582996 by guest on 14 February 2022