mall use 8 attitudes
TRANSCRIPT
USPS Library ReferenceUSPS-LRJ-104/R2001-1
FY 2000 Household Diary Study copy i# 1
2
Mall Use 8 Attitudes
UNITED 5TATES POSTAL SERVICE,
Dr. Malcolm Harris, Manager George Buoiocore, Economist Greg Dawson. Economist Stephanie Majors, Contract Management Speclalist Demand Forecasting n ~ d Economic Andysrs, FiMance Division
United States Postal Service Headquarters 475 L'Enfant Plaza, SW RM 8600 'Nashington. D.C 20260-5323
May 200 1 , Coiziract # 102590-99-B-I 720
NuStats 3006 Bee Caves Road, Suite A-300

Introduction
Background
Study Design
Sample Design
Anolvfic Weights
Report Organization
Chapter 1: T ~ t a l Mail Overview
Total Household Moil
Total Moil Received by Postal Classification
Attitudes Toward Advertising Mail
Chapter 2: First-Class Mail
Fint-Class Volumes Total First-Class Moil Received
Facton Affecting Mail Received
First-Class Mail Sent
Factors Affecting Moil Sent
Chapter 3: Standard Mail (A)
Use of Standard Moil (A)
Stondard Mail (A) Chorocteristics
Facton Affecting Receipt of Standard Moil (A)
Recipient Response to Standord Moil (A)
Chapter 4 Direct Mail Advertising
Advertising Volume
Factors Affecting Volume Altitudes Toward Advertising
Response to Advertising
Chapter 5: Periodicals Mail
Total Periodicals Volumes Destinating in Households Toto1 Periodicals Received by Other Means
Facton Affecting Receipt of Periodicals Satisfaction with Delivery
7
7 E
I t
13
13 14 16 17 19
21
22 23 26 28
31
31 34 36 38
39
39 40 41 42
2 0 0 0 H O U S E H O L D D I A R Y S l U D Y Teble of Contents

A
Chapter 6: Packages
Packages Received by Households
Received Package Characteristics
Focton Affecting Package Receipt
Pockoges Sent by Households
Foctors Affecting Packages Sent
Chapter 7: Electronic Communication
Profile of o Likely Internet User
Access to Technology
Electronic Communication/Online Consumption
Online Bill Payment
Chapter 8: Summary and Conclusions
Nonhousehold-to-Household Mail
Household-to-Nonhousehold Mail
Household-to-Household Mail Con c I u s i o n s
Appendix A Comparative Tables 1987,1999,2000
Concordonce A1 . Total Moil Overview
A2. First-Class Moil A3. Standard Moil (A)
A4. Direct Moil Advertising
A5. Periodicals
A6. Packages
A7. Electronic Communication
Appendix 6: Survey Instruments
81. Recruitment Questionnaire
82. Diory Pockoge
Advanced Letter
Instruction Booklet
Diary
Quick Start
Reminder Cord
Gift Form
Instruction Card
Certificate of Appreciation
45
45 46 46 47 47
51
51 52 53 55
57
57 58 58 5a
Tabla of Contents 2 0 0 0 H O U S E H O L D D I A R Y S T U D Y

J
P
2 Appendix C Technical Documentation of Methods
C1 Sampling Plan
C2 Data Collection Meihcd
C3. Data Processing
C4. Data Weighting and Expansion
- d Appendix D: Revenue, Pieces and Weight Volume Table
2 0 0 0 H O U S E H O L D D I A R Y S T U D Y T m b l e of C o n t e n t s

t
List of Tables and Figures
i Introduction 1
Table A: Incentive Choice by Household Income
Table 8: Sample by Postal Quarter
3 4
3 Chapter 1 : Total Mail Overview 7
Table 1.1: Pieces per Household per Week, Total Domestic Moil by Sector, P N 1987 and 2000 8
9
9 10 11
Table 1.2: Pieces per Household per Week by Postal Classification
Toble 1.3: Percentage of Total and Pieces per Household per Week, Firsi-Class ond Standard Mail (A) by Maior Business I Organization
Table 1.4: Household Reading Patterns of Adveltising Mail by Class
Table 1.5: Attitudes Toword Advertising Moil - Trends
Figure 1 .l: Percentage of Totol Domestic Mail by Sector, PFY 1987 and 2000
Figure 1.2: Household Reading Patterns by Household Income
Figure 1.3: Household Attitudes Toward Advertising Mail by Medium
8
10 1 1
.ail
.,.-- i Chapter 2: Firsl-Class Mail 13
13 14
14 15 16
18
Toble 2.1 : Firrt-Class Moil Pieces per Household per Week by Sector, P N 1987 and 2000
Table 2.2: First-class Moil Pieces per Household per Week Received by Rote
Toble 2.3: Fint-Closr Moil Received by Mail Type
Toble 2.4: Fint-Closs Moil Pieces per Household per Week Received by Moil Type
Table 2.5: First-Class Mail Pieces per Household per Week Received by Shape
Table 2.6: First-class Moil Pieces per Household per Week and Percentage of Totol Sent by Moil Type
Figure 2.1: Percentage of Firs-Closs Moil by Sector, PFY 1987 and 2000
Figure 2.2: First-class Mail Pieces per Household per Week Received by Income
Figure 2.3: First-Class Mail Pieces per Household per Week Received by
Figure 2.4: First-Class Mail Pieces per Household per Week Sent and Received by Income
Figure 2.5: First-Class Mail Pieces Sent pet Household p e r Week by Household
Figure 2.6: Fint-Class Moil Pieces per Household per Week Sent by Number of
14
16
17
19
Income and Ownership Status 19
Credit Cards and Financial Accounts 20
Education01 Altoinment of Head of Household
Chapter 3: Standard Mail (A) 21
Toble 3.1: Stondord Moil (A) Pieces per Household per Week ond Percentage of Totol
Table 3.2: Top Five Distnbvton of Standord Moil (A) Pieces
21 22
Organization by Household Familiarity 23 Table 3.3: Standard Moil (A) Pieces per Household per Week by Moior Business I
2 0 0 0 H O U S E H O L D D I A R Y S l U D Y L i s t o f l a b l e r and Figures E

Table 3.4: Standard Mail (A] Pieces per Household per Week by Shape, P M 1987 ond 2M)o
Table 3.5: Percentage of Standard Mail (A) Pieces Sent, Maiar Business /
Table 3.6: Percentage of Standard Mail (A] Packages by Contents
Table 3.7: Standard Mail (A) pieces per Household per Week by Household
Table 3.8: Standard Mail (A) Pieces per Household per Week, Shape of Mail Piece
Organization by Shape
Size and Household lncame
by Household Reading Patterns
Figure 3.1: Standard Mail (A] Pieces per Household per Week by Business f
Figure 3.2: Standard Mail (A) Pieces per Household per Week by Addressee
Figure 3.3: Selected Mail Classifications, Pieces per Household per Week by
Figure 3.4: Standard Mail (A] Pieces per Household per Week by
Figure 3.5: Standard Mail (A] Pieces per Household per Week by
Figure 3.6: Standard Mail (A) Pieces per Household per Week by
Figure 3.7: Percentage of Standard Mail (A) Pieces by Household Reading Patterns
Figure 3.8: Percentage of Standard Mail (A) Pieces, Household Fomiliority of Sender by Reaction Toward Standard Mail (A] Piece
Figure 3.9: Percentage of Standard Mail (A] Pieces, Household Familiarity of Sender by Response to Mail Piece
Organization Type
Ratio of Postal Quarter to Annual
Educational Attainment of Head of Household
Household Number af Financial Accounts f Credit Cards
Number of Previous Household Online Purchases
," Chapter 4 Direct Mail Advertising . ~.
Toble 4.1 : Advertising Moil by Postal Clossificotion, Percentage of
Table 4.2: Advertising Moil by Moior Business / organization, Percentage of Total Advertising
Toble 4.3: Attitudes Toward Advertising Mail - Trends Percentoge of Households
Toble 4.4: Attitudes Toward Advertising Mail by Postal Clossification, First-class and Standard Mail (A), Percentage of Mail Pieces
Toble 4.5: Likelihood of Response to Advertising Mail Piece by Postal Classification, Percentage of Mail Pieces
Table 4.6: Type of Response by Household to Advertising Moil, Percentage of Mail Pieces
Figure 4.1 : Advertising Pieces per Household per Week by Postal Clossification and Household Income
Figure 4.2: Advertising Pieces per Household per Week by Postal Classification and Education of Head of Household
Figure 4.3: Advertising Pieces per Household per Week by Postal
Figure 4.4: Household Attitudes Toword Advertising Mail by Medium
Figure 4.5: Household Reading Patterns of Advertising Mail -Trends
Total Advertising and Pieces per Household per Week
and Pieces per Household per Week, First-Class and Standard Moil (A)
Classification and Household Size
24
25 25
26
28
22
23
24
26
27
27
28
29
29
31
32
33
36
37
38
38
34
35
35
36 37
L i s t of T a b l e s and Figurer 2 0 0 0 H O U S E H O L D D I A R Y S T U D Y
Chapter 5: Periodicals Mail
Table 5.1 : Periodicol Pieces per Household per Week and Percentage of Toiol by Type
Table 5.2: Periodicol Pieces per Household per Week ond Percentage of Total
Toble 5.3: Percentoge of Totoi Periodicols by Type of Subscription
Table 5.4: Newspopen ond Mogozines, Pieces per Household per Week,
Table 5.5: Periodicol Pieces per Household per Week and Percentoge
Table 5.6: Periodicols - Percentoge of Total by Attitude Toword Timing of Amvol
Table 5.7: Periodicols - Percentoge within Attitude Toword Timing
by Sender Type
Monner of Receipt
of Totol by Arrival Times
of Arrivol by Geographic Region
Figure 5.1 : Periodicals per Household per Week by Household Income
Figure 5.2: Periodicol Pieces per Household per Week by Educational Anoinmenl
Figure 5.3: Percentage of Periodicals Arriving On-Time by Geogrophic Region
Chapter 6 Packages
Table 6.1: Pockoges Received by Households ond Delivered by USPS,
Table 6.2: Pockoges Sent by Households using USPS. Percentage
Table 6.3: Reasons for Sending Packoges
Table 6.4: Pockoges Sent per Household per Week by Geographic Region
Percentage of Totol
of Totol by Postal Clossificotions
Figure 6.1 : Pockoges Received per Household per Week by Household Income
Figure 6.2: Pockoges Received per Household per Week by Educotionol Attainment of Head of Household
Figure 6.3: Packoges Sent per Household per Week by Household Income
Figure 6.4: Pockoges Sent per Household per Week by Educotionol Attainment of Head of Household
Chapter 7: Electronic Communication
Table 7.1: Average Number of Monthly E-moils, Cards 8. Letters, and Phone Colls Overseas
Figure 7.1: PC Ownership by Household Income
Figure 7.2: PC Ownership in 2000 and Those Likely to Buy o PC by Household Income
Figure 7.3: Fox Capobiliiy by Household Income
Figure 7.4: Household Internet Access by Household Income Figure 7.5: PFY 2000 Online Purchases Made in Post 12 Months by Income
Chapter 8: Summary and Conclusions
39
39
39 40
40
42 43
43
41 41
42
45
45
47
47 48
46
47 48
48
51
54
52
52 53 53 54
57
2 0 0 0 H O U S E H O L D D l 4 P Y S l U D Y L i s t 01 Tables end Figures

This report documents the design, implementation, and findings of the Postal Fiscal Year (PFY) 2000 Household Diary Study (HDS). The HDS is a multi- year market research study of mail flowing into and out of U.S. households. This study addresses three significant mail segments: (1) household-to-household (2) household-to-nonhousehold and (3) nonhousehold- to-household. Obtaining direct information on nonhousehold-to-nonhousehold mail is outside the study's scope. The HDS is administered by the Demand Forecasting & Economic Analysis section of the United States Postal Service (USPS) Finance Department.
:
i
.;
Background The purpose of the HDS is to gather information on the contents of mail sent and received by U S . households. USPS conducts the study in order to track the flow and volume of mail, the uses of the mail, and how these relate to socio-demographic information about the households. It is based on a stratified random sample of 5,300 households annually.
Demand Forecasting & Economic Analysis (in the USPS Finance function) has administered the HDS since its inception in 1987. The study has been done annually since then, following the USPS fiscal year calendar. PFY 2000 began on September 12, 1999 and ended on September 11.2000. The Tostal Fiscal Year" is made up of 13 four-week USPS accounting periods and is divided into four quarters. Each of the first three quarters is twelve weeks long and contains three accounting periods. The fourth quarter is sixteen weeks long and contains four accounting periods. r
i i ~ C~
.
.
.
. .
.
.
.
.
.
How many mail pieces originate and destinde in U.S. households?
Whot ore mojor trends in mail flows behreen households ond businesses?
How do households use the USPS for their penonal ond business communications?
What ore Standard Moil (A) usage patterns?
Whof are Direct Moil volumes and how ore these affected by household demographics?
What are household members' attitudes toward advertising moil and their in-home responses to it?
Whot ore total Periodicals Volumes delivered by USPS and received by households?
What is the level of sotisfoction with periodicals delivery?
Whot is the overoll picture of Packoge volumes ond the chorocteristics of USPS custom e rs ?
Whot ore current Internet usage potterns ond the demooroohic charocteristics of users?
This information is used for the volume forecasting, planning, marketing and ratemaking functions of USPS. In addition to the issues that relate to traditional mail volumes, USPS has been increasingly interested in tracking the adoption and use of electronic communications technologies. The HDS tracks the use of e-mail, online shopping and online bill payments, among other technologies. USPS uses these data to assess what impact these technologies have on traditional mail volumes to and from households.

NuStats, a survey research tirm located in Austin, Texas, conducted the PFY 2000 HDS. This report presents findings from that study. Where appropriate, data from PFY 2000 is compared to previous years to -identify underlying trends in household mail usage and receipt. Except where noted in this report, the survey questions have remained consistent between PFY ZOO0 and PFY 1999 studies. All survey instrument modifications, data collection, and data analyses were conducted by NuStats, under contract with the USPS.
Study Design One objective of the HDS is to collect data to support the estimation of household-based mail flow demand models and support analyses of mail-use characteristics of U.S. households and businesses. The hapsehold is the basic interviewing unit in this study for all elements of the survey.
The HDS study uses a two-stage survey design in which Stage 1 is an interviewer-mediated household interview and Stage 2 is a self-completion mail diary. Appendix B contains the survey instruments.
The household interview collects informotion on household and personal demogrophics, recoll of moil sent ond received, odoption and use of communicotions technologies and attitudes about
[ Mail Diary 1 The mail diary covers o seven-day period from Monday to Sundoy and collects informotion on numbers of moil pieces received ond sent, industq source, mail Characteristics and attitudes reaordino moil received.
Prior to P N 2000, the household interview was conducted exclusively via in-home interviews. Household interview recruitment and diary placement were done by "door-to-door" canvassing of surveyors. Demographic trends (including the growth of gated communities), growing concerns about safety, increased complexity of household life, greater polling and research activity and increased commuting times all conspired to make the conduct of household research more difficult. This appears to have put pressure on response rates, causing increased concern about stability of under-reporting. In the exclusively "door-to-door" methodology used prior to P N 2000, participating households completed the diary mostly on their own with guidance from the various individual field contractors placing the diary. The
Postal Service determined that it would improve accuracy by creating a process that encouraged rapid feedback and interaction with the respondent and which reduced the time between household recording of information and editing the data by trained experts.
The PFY 2000 study was conducted using a multi- mode approach that sought to provide greater control of household participation to minimize response bias, to improve data accuracy through faster data checking and householder re-contacts, and to provide immediate telephone assistance to householders during their diary week.
An address specific sampling design was adopted which eliminated field recruiter discretion.
Computer-assisted telephone survey techniques replaced the initial door-to-door recruitment of households. Thus, household interview data checks were automated during the interview process itself, and, subsequent to the interview, checked and clarified within days of collection.
If a householder agreed to participate, helshe had the option of having a surveyor visit the residence, or being mailed a self-administered diary instrument that explained how to record the mail received and sent in the household. For P N 2000, only four percent of householders requested that a surveyor visit the residence.
A toll-free "hotline" was established to answer participant questions before, during, and after their diary weeks. Questions could be answered immediately and at the "source."
Diary packets were mailed back to NuStats in postage-paid Priority Mail envelopes. Returned diary packets immediately went through a three- stage edit and review process. The gap between diary completion and data checking was reduced from several weeks to just a few days.
.
Stage 1: Household Interview The household interview was used to collect information as noted above and to "recruit" the household to participate in stage two -- the mail diary. In total, 9,692 households were recruited to participate in the mail diary stage.
Most of these households were recruited by telephone (96 percent) and the diary package was mailed to the household via Priority Mail. This diary package contained instructions, diaries for seven days, a card to identify the choice of incentive and a Priority Mail return envelope. Other households opted for an in- home interview (four percent) or were completed in-
2 l n l r e d u < i i o n 2 0 0 0 H O U S E H O L D D I A R Y S T U D Y
.~

TABLE A
Incentive Choice by Household Income
$25 Donohh 26
69 I 76 I 69 I 68 I 59 I 19 26 27 35
T-shirt or Cop 5 5 5 5 I 6
home because a telephone number could not be located (13 percent of in-home interviews). For these latter households, an appointment was made at which a surveyor would conduct the household interview, drop off the diary package and go over the instructions for its completion.
To enhance participation, respondents were given a choice among four incentives: $25 cash, $25 donation to the Lance Armstrong Cancer Foundation, USPS Tour de France Team T-shirt, or USPS Tour de France cap (See Table A). While most respondents chose the cash incentive, the choice of cash versus the donation was associated with household income.
The response rate for the recruitment stage was 47 percent’. Most refusals took place prior to even hearing who NuStats was and why the firm was calling. Households that refused and that were later re-contacted cited time constraints and privacy concerns as their reasons for not participating.
Stage 2: Mail Diary Package Households were sent diaries along with instructions and a toll-free “help” telephone number. The night before the assigned diary week was to begin, a reminder call was made to each household to confirm receipt of the packet and to answer any last minute questions. If the packet was not received by this time, the address was re-confirmed, a new diary week was assigned, and the packet was re-sent.
Households were instructed to enclose pertinent information from each mail piece received in the returned diary packages to enable NuStats editors to
I Kesponse rate was calculated using a formula provided by the American Association of Public Opinion Research~
I I I Total 100 100 100
verify or clarify quantity and classes of mail recorded in the diaries. A three-stage editing process was used to check the accuracy of the diary information recorded by each household. First, returned diary packets were culled for those that represented a reasonable attempt to complete the diary. Second, the diary information recorded for each day was checked to assure sufficient and logical answers and to verify recorded information against mail markings returned in the package by the householder. Third, a second editor re-checked the diary information recorded for each day as noted above. This second edit was a quality control check that assured the accuracy of the data. During the editing process, correction callbacks were made to households to cla& information or to fill-in missing information. About three percent of returned diaries did not pass the edit checking process. Sixty-one percent required some form of respondent re-contact to clarlfy or correct diary information.
Of the 9,692 households recruited to receive a diary package, 5,314 actually returned acceptable2 completed diaries to NuStats for a completion rate of 55 percent.
Sample Design The sample was designed to allow projections of results to all US. households. Generally, the study was conducted using telephone sampling for household selection and screening, followed by diaries mailed to eligible households and completed by each household unit. The sample design involved a three- stage probability sample with stratification by county
100 100
Acceptable was defined as returning diaries with data suitable for analysis
2 0 0 0 H O U S E H O L D D I A R Y S T U D Y Introduction a

clusters a t the primary sampling stage and by a single county at the secondary stage. At the third stage, household clusters were selected. The sample was continuously “fielded,” throughout all 52 weeks of the year. Allocations were temporally disproportionate in order to ensure greater amounts of data collection during peak mail flow periods. While Table E below indicates a small undercount between completed and required households, these differences are reconciled by the fact that for all four quarters, the number of completed households was higher than required.
Quarter 1
Quarter 2
Quarter 3
Quarter 4
Total
Quarter 2: November 28, 1999 - Februoq 19,2000
Quarter 3: Februory 20,2000 - May 13,2000
1,940 2.786 1,752
1,400 2,833 1,628
600 1,308 749
1,360 2,765 1,185
5,300 9,692 5,314
TABLE B
Sample by Portal Quarter
Stage 1: Primary Sampling Unit (PSU) Definition and Selection
The Primary Sampling Units (PSUs) were clusters of counties. The 30 largest Metropolitan Statistical Areas (MSAs) were treated as individual units (each was a cluster of counties) and each was a self- representing PSU. The other 288 MSAs were sampled proportionately to their population; approximately 20 of the MSAs were individually sampled. The remaining counties of the US (all 800+ non-metropolitan counties) were area-clusters sampled in proportion to the population. There were a total of 87 PSUs categorized into three strata:
1.
2.
3.
Large Metra areas - all 30 largest MSAa,
Other Metro areas - 21 (out of 288) other MSAs, and
Non-Metro areas - 36 non-metropolitan counties or groups of counties (out of 800+).
Stage 2: Secondary Sampling Unit (SSU) Definition and Selection
The Secondary Sampling Unit (SSU) was a county. Sampling of SSUs was by probability of selection according to population (number of households). Selection was from the national sample of PSUs and was stratified by geographic region and then by size. This insured that the SSU selection was properly allocated to the geographic regions. Not every SSU was fielded every Postal Quarter (reporting period), but every Postal Quarter had a national probability sample of SSUs.
Stage 3: Tertiary Sampling Unit (TSU) Definition and Selection
The final (Tertiary) Sampling Unit (TSIJ) was a household cluster. Clusters contain approximately 10 households and are defined by estimated income classification, as defined by zip code average income estimates.
The probability sample of households was drawn by the USPS from the national database of addresses following specitications produced by NuStats. The probability sample households were drawn using a highly stratified geographic design to ensure that the final sample would be representative of households comprising the five geographic regions: East, Northeast, South, Central, and West. Technical documentation for the sampling plan can be found in Appendix C.
Analytic Weights Analytical weights permit an analyst to use and combine subsets of the sample in the proper proportions to calculate correct inferences about the comparable groups in the population. From a finite population sampling theory perspective, analytic weights are needed to develop estimates of population parameters and more generally, to draw inferences about the population that was sampled. Without the use of analytic weights, population estimates are subject to biases of unknown (possibly large)
4 Introduction Z O O 0 H O U S E H O L D D I A R Y S T U D Y

magnitude. Weighting compensates for these “departures” from simple random sampling. M e r e n t weighting schemes were used for the Household Interview and the Mail Diary data sets.
Household Interview
An analytic weight was applied to the Household Interview (recruitment) data to compensate for differential response rates (or nonresponse) across sample cells. First, a nonresponse adjustment was calculated within cells formed by moss-classifying region and PSU. Second, the data were adjusted to U.S. population parameters for household income. The documentation for these adjustments can be found in Appendix C: Technical Documentation of Methods.
Mail Diary
Post processirig adjustmerits were used to align the sample to known population distributions from census or other reliable data. First, the sample of households reporting mail diary data were expanded to represent all U S . households (104.8 million households). In addition, adjustment factors were applied to the diary data to compensate for under- reporting of mail volumes by households participating in the survey. Three types of adjustment processes were used.
Adjustment factors were calculated using data from the City Cost Carrier and Rural Carrier Costing System for PF’Y 2000. For the first time, specific adjustment factors were calculated for each class of mail volumes reported received by households.
The principle that total incoming and outgoing domestic household mail should equal each other over time was used to calculate a factor that would adjust outgoing mail to equal incoming mail volumes.
The diary data were adjusted to compensate for expected underreporting of bill payments.
Documentation for the adjustments made to the mail diary data can be found Appendix C.
Report Organization This report focuses on the analyses and results pertaining to the PFY 2000 Household Diary Study. Its contents are organized as follows.
Comparing 2000 with 1999 Data
Comparisons among 2000 and prior year data should be done with caution. The 2000 data represent refinements in survey methodology from previous years, as well as mcdifications in the procedures for weighting and adjustment for mail flow underreporb. These data may also reflect changes in the operational definitions of mail classifications.
3hapter 1 - Tat01 Mail overview. This chapter ,resents oggregote moil flows ocross 011 classes.
3hapter 2 - First-Class Mail. This chapter uomines Firs-Class moil received and sent by louseholds in 2000.
choptar 3 - Standard Moil (A). This chapter 2resents details on Stondord Moil (A) volumes. jtondord Moil (A) consists of moil pieces sent ’resorted Standard, Bulk Rote, or nonprofit. It 3ko consists of unsolicited publications and oockoges.
Chapter 4 - Direct Mail Advetiising. This chapter oresents onnuol Direct Moil Advertising volumes for PFY 2000, os well os demographic factors influencing these volumes OS they pertain to US. households.
Chapter 5 - Periodicals. This chopter presents Periodicals Volumes. Periodicols moil, formerly Second Class, consists of doily or weekly newspapers, weekly or monthly magazines, and ony other periodic newspoper or magazine delivered to households by the U P S .
Chapter 6 - Packages. This chapter presents on overoll picture of Pockoge volumes, including clossificotians, delivety method, use of special services, among others. Chapter 7 - Electronic Cornmunicution. This chapter presents information collected during the HDS pertaining to email usoge, Internet usoge, and other forms of electronic communicotion.
Chapter 8 - Summary and Conclusions. This chapter surnmorizes the moin findings of the HDS.
In oddition to these specific chapters, the repori contains three oppendicesr
Continued on next p g e .
5 In t rodwt ion 2 0 0 0 H O U S f H O L D D I A R Y S T U D Y
si.
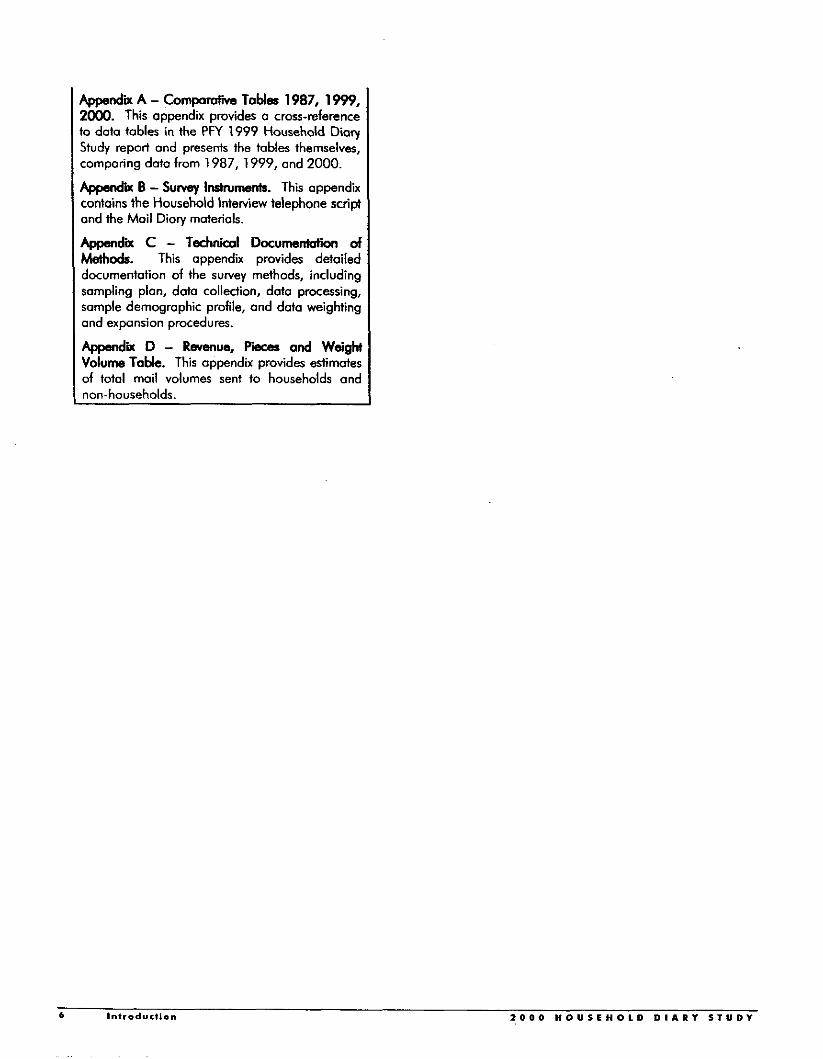
Appendix A - Cornpardive Tables 1987,1999, 2000. This appendix provides a cross-reference to data tables in the PFY 1999 Household Diary Study report and presents the tables themselves, comporing data from 1987, 1999, and 2000.
AppenSa B - S u m Inshumenis. This appendix contains the Household Interview telephone scripi and the Mail Diary materials.
Appendix C - Techniml D c c u m ~ o n oi Methods. This appendix provides detailed documentation of the suwey methods, including sampling plan, data collection, data processing, sample demographic profile, and data weighting and expansion procedures.
Appendix D - Revmus, pieces and Wei& Volume Tabla. This appendix provides estimates of total moil volumes sent to households and non-households.
6 Introduction 2 0 0 0 H O U S E H O L D DIARI STUDI

f f
Chapter 1 : Total Mail Overview Households across the United States depend on the services of the USPS to communicate with family, friends, businesses and public agencies. In addition, huge volumes of mail are sent from businesses to households for the purpose of bill collection, advertising, services and other forms of business communication. This section examines commercial and household mail volumes in the United States; specifically, mail flows between households and businesses, trends, and volumes by postal classification and sector. This section also introduces advertising mail volumes and attitudes of households in relation to advertising mail.
Data from the PFY 2000 HDS show an increase in total household mail volumes and higher mail volumes across all postal classifications.
While household profiles are useful from a behavioral perspective, aggregate mail flows demonstrate how the mail is used as a communications medium among all users. In this way, USPS can study what mail flows drive household communications and how patterns of use develop by specific mail classification. This will help USPS develop strategies for meeting mail growth in the future.
Total Household Mail One useful way to look at the total mail overview is to present volumes as a percentage of total domestic mail, by sector. This section applies three categories for different mail users: households, nonhouseholds and the Federal government. The five sectors in which these users interact are: (1) Household-to-
household, (2) Household-to-nonhousehold, (3) Nonhousehold-to-household, (4) Government-to- household, and (5) Nonhousehold-to-nonhowhold.
1 1. Household-io-Household (HH-io-HH)
2. Household-to-Nonhousehold (HH-to-NHH)
3. Nonhousehold-io-Household (NHH-to-HH)
4. Government-to-Household (Govt-to-HH)
5. Nonhousehold-to-Nonhousehold (NHH-to-NHH)
These sectors help to distinguish a household's personal greetings from their business transactions, and, further, interactions with the government. Household-to-household mail is sent by households and received by households. This includes letters, invitations, announcements and greeting cards. It is a very reliable measure of mail volumes in the diary study because these communications by nature exist in a closed loop: what is sent hy one household is received by another.
Household-to-nonhousehold mail is sent from households to nonhouseholds, predominantly bill payments for everything from credit cards to mail orders to utilities. Nonhousehold-to-household mail is the reverse communication and while it includes bills, it also can be the products or services requested by the household, such as an investment portfolio or periodicals3. A final sector, nonhousehold-to nonhousehold, cannot be calculated using the household diary and is therefore represented as the residual amount of total domestic mail.
Mail destinating in households includes a i mail received via First-class or Standard Mail (A), as well as periodicals and packages. Mail originating in households includes all First-class mail as well as packages sent.
~
3 Nonhousehold-t~household mail can include communications ham the federal government. In the case of Flgure 1.1. government mail to households wa8 separated O U ~ w show a total percentage.
2 0 0 0 H O U S E H O L D D I A R Y S l U D Y Ch-pler I : l o l o l M m i l O r e r v l c w 7
- P 70, 65.4
H H - I d i H 1.6 I
HH-bHH HH-hNHH 6cul-hHH NHH-hHH NHHhNHH
Domestic Mail Secton
1.4
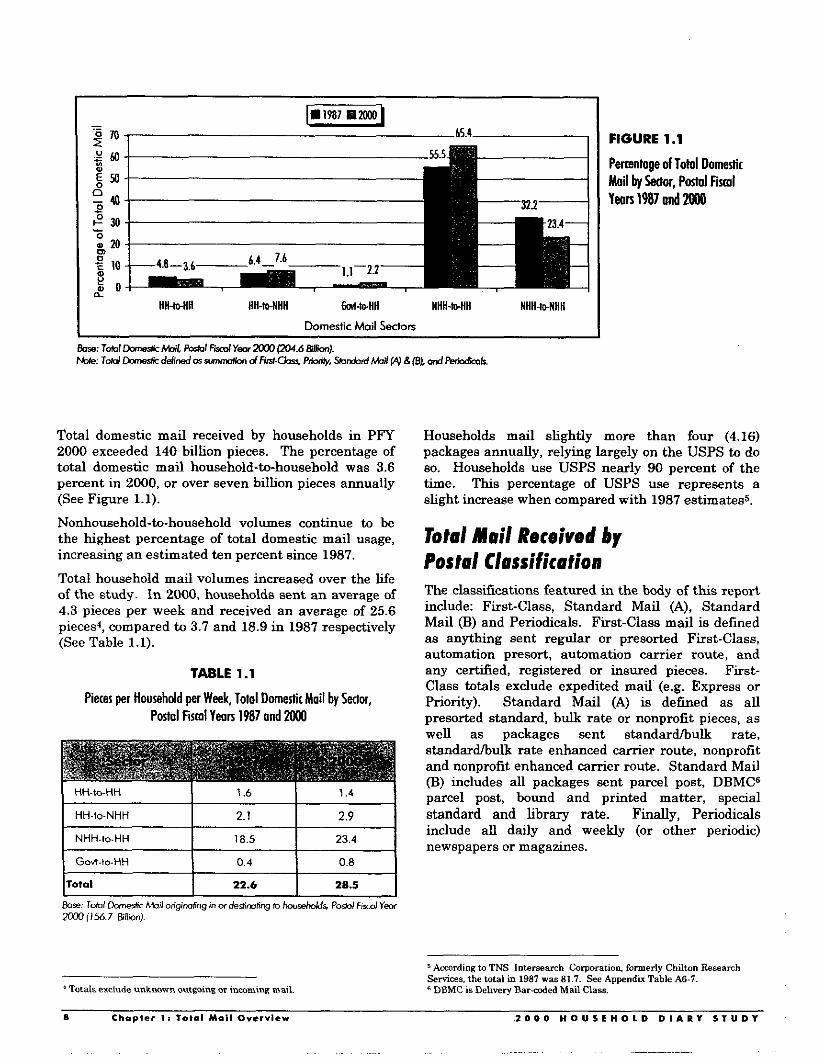
Total domestic mail received by households in PFY 2000 exceeded 140 billion pieces. The percentage of total domestic mail household-to-household was 3.6 percent in 2000, or over seven billion pieces annually (See Figure 1.1).
Nonhousehold-to-household volumes continue to be the highest percentage of total domestic mail usage, increasing an estimated ten percent since 1987.
Total household mail volumes increased over the life of the study. In 2000, households sent an average of 4.3 pieces per week and received an average of 25.6 pieces4, compared to 3.7 and 18.9 in 1987 respectively (See Table 1.1).
TABLE 1.1
Pieces per Household per Week, Total Domestic Mail by Sector, Postal Fisml Ywa 1987 and 2ooo
HH-lo-NHH 2.1 2.9
I NHH-to-HH I 18.5 I 23.4 I \ God-to-HH I 0.4 I 0.8 I c I l1otal I 22.6 I 28.5 I
Totals exclude unknown outgoing or inmminc marl
FIGURE 1.1
Pementoge of Total Domestic Mail by Mor, Postal Fiml Years 1987 and Moo
Households mail slightly more than four (4.16) packages annually, relying largely on the USPS to do so. Households use USPS nearly 90 percent of the time. This percentage of USPS use represents a slight increase when compared with 1987 estimatess.
The classfications featured in the body of this report. include: First-class, Standard Mail (A), Standard Mail @) and Periodicals. First-class mail is defined as anything sent regular or presorted First-class, automation presort, automation carrier route, and any certified, registered or insured pieces. First- Class totals exclude expedited mail (e.g. Express or Priority). Standard Mail (A) is d e h e d as all presorted standard, bulk rate or nonprofit pieces, as well as packages sent standardhulk rate, standardlbulk rate enhanced carrier route, nonprofit and nonprofit enhanced carrier route. Standard Mail (B) includes all packages sent parcel post, DBMCG parcel post, bound and printed matter, special standard and library rate. Finally, Periodicals include all daily and weekly (or other periodic) newspapers or magazines.
SAcmrding to TNS Intersearch Corporatios formerly Chilton Research Services. the total in 1987 was 81.7. See Appendix Table AS-7. e DBMC i s Delivery Barcoded Mail Class.
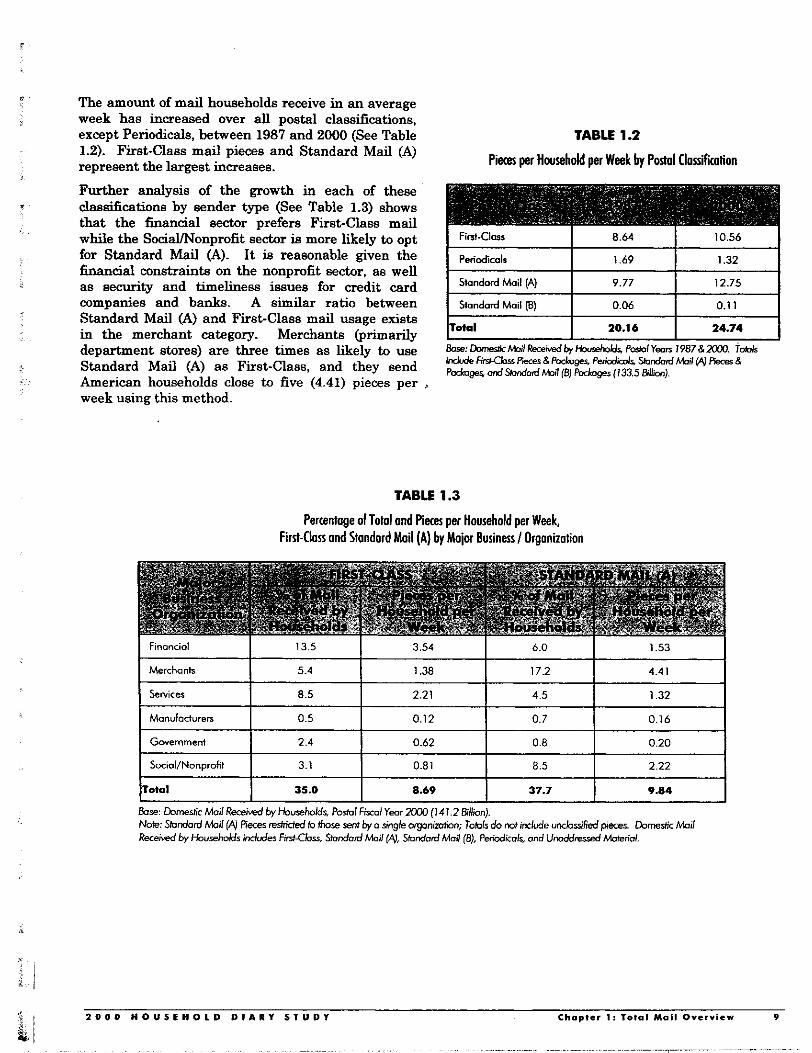
* The amount of mail households receive in an average week has increased over all postal classifications, except Periodicals, between 1987 and 2000 (See Table 1.2). First-class mail pieces and Standard Mail (A) represent the largest increases.
Financiol
TABLE 1.2
13.5 3.54 6.0 1.53 I
Pieaes per Household per Week by P o d Classification
Merchants
Further analysis of the growth in each of these classi6cations by sender type (See Table 1.3) shows that the financial sector prefers First-Class mail
5.4 1.38 17.2 4.41
while the SocialMonprofit sictor is more likely to opt for Standard Mail (A). It is reasonable given the financial constraints on the nonprofit sector, as well as security and timeliness issues for credit card companies and banks. A similar ratio between Standard Mail (A) and First-class mail usage exists
, in the merchant category. Merchants (primarily department stores) are three times as likely to use
!: Standard Mail (A) as First-class, and they send American households close to five (4.41) pieces per ~
week using this method.
Manufocbrecs
Government
SocialINonprofit
Total
Fiat-Closr 10.56
Psfiodicol.
Standard Mail [A) 9.77 12.75
Standard Mail 18) 0.06
0.5 0.12 0.7 0.16
2.4 0.62 0.8 0.20
3.1 0.81 8.5 2.22
35.0 8.69 37.7 9.84
ITotal I 20.16 I 24.74 I
TABLE 1.3
Percentage of Total and Pieca per Household per Week, First-Class and Standard Mail (A) by Major Business / Orgonizotion
I Sewices I 8.5 I 2.21 I 4.5 I 1.32 I
:$ I 2 0 0 0 H O U S E H O L D D I A R Y S T U D Y Chapter 1: Tola1 Mail Overv iew 9
~ .. . . ~~~
~
~~ ~~ . ~

Table 1.4 demonstrates that households’ responses to advertising mail also vary by postal classification. First-class mail is the most read classification of advertising mail, followed by Standard Mail (A), while unaddressed mail received the lowest response. In fact, reading patterns for First-class and Standard Mail (A) advertising are similar. Fifty-two percent (52.2 percent) of First-class advertising is read by a t least one household member, compared to 43 percent (42.9 percent) of Standard Mail (A). These percentages jump to 57 and 50 percent respectively if it includes mail that is not discarded but “set aside for later.”
Since 72 percent of Standard Mail (A) is advertising, compared to 23 percent of First-Class, Standard Mail (A) benefits advertisers by reaching more than half of its audience a t a lower cost per piece. Households are almost as likely to read Standard Mail (A) advertising mail 8% they are First-class, and just as likely to discard both classes.
Unaddressed mail is almost two times more likely to be discarded by households as Standard Mail (A) and First-class. Nevertheless, the portion of advertising mail “looked a t but not r e a d is relatively equal across all classifications.
Discarded, not
TABLE 1.4
Household Rwding Paitems of Advertising Moil by Qoa
19.4 17.8 27.8
42.2 34.1 26.7
8.8 8.9
membw of HH Read hy more fhon one member of HH ~
Set aside far later
I L m k e d a t , n o t r w d l 15.6 I 14.7 I 14.0 I
5.1 7.3 3.7
Likeliness to read also seems dependent on additional factors, including income. Figure 1.2 shows that 20 percent of households who say they usually read their advertising mail have annual incomes under $25,000. Willingness to at least scan mail is relatively consistent across income levels. Additional analysis on reading patterns is contained in Chapter Four.
Uwollv lead Ql Uruolly %on 0 Read rm Uruolly dm’t lead
I FIGURE 1.2
Household Reading Polterm by Household Income

Attitudes Toward Advertising Moil Fourteen years after the diary study began, advertising is still the greatest proportion of mail received by households, accounting for 59 percent of the total mail received by households in 2000. Total advertising volumes in 2000 exceeded 72 billion pieces. After advertising, bills are the second largest proportion of mail received by households, representing 11 percent of total household mail or almost 16 billion pieces annually.
Households have demonstrated a declining interest in advertising mail since 1987. Table 1.5 indicates that 57 percent of households wish they received less advertising mail in 2000, compared to 30 percent in 1987. The percentage of advertising mail that households find interesting, or are likely to read, has fallen kom almost 63 percent in 1987 to 37 percent in 2000.
Would like mora 5.6 I
z
5.4
TABLE 1.5
Attifvdes Toward Advertising Mail -Trends
1 some are intensting' I 62.5 I 36.7 I
Nempopr Radio N Moil Plastic Bop on Internet Emoil Telemorketini OaWkllCb
Advertising Medium
Bare: US brehdds P o d Firml Yeor 2600 (1 04.8 Minim); Infommkm coileaed dutirq recruherd i w w
FIGURE 1.3
Household Attitudes Toward Advertising Moil by Medium
7 Respanse changed from 'Don't mind getting some that daesn't interest me as long as I also get some that does interest me" in PFY 1999 to 'Some are interesting and enjoyable" in PFY 2000.
9 0 0 0 H O U S E H O L D D I A R Y S T U D Y Chmpter 1: T o t a l M-I1 O v e r v i e w 1 1

2 0 0 0 H O U S E H O L D D I A R Y S T U D Y 1 2 Chepter 1: Tota l M a i l O v e r v i e w
.. . ~.~ ~ ~~ . . . . ..

Chapter 2: First-class Mail
HH-to-NHH
This chapter explores a key research question of the Household Diary Study: how do households use the USPS for them personal and business communications? The household mailstream is an important component of total volumes for USPS. Changes in household behaviors (i.e. what type of mail they are sending and how they send it) have important implications on revenues and workload.
I
2.1 2.9
In many ways, First-class mail is synonymous with household communications. Households use First- Class mail more than any other postal classification. Traditionally, they depended on USPS for two primary purposes: to send personal greetings and to pay bills. With the advent of electronic communications and the expansion of Internet bill pay services and automatic deduction, USPS must monitor household use of First-class mail closely to gauge changes in household behavior.
This chapter looks a t First-class mail received and sent by households in 20008. Overall, the use of First- Class mail for personal communications fell slightly since 1987, but this decrease was offset by an increased use of First-class mail for business communications. A s a result, the data show an increased number of First-class pieces both sent and received by households in PFY 2000.
NHH-lo-HH
t 'Household to household volumes were adjusted M that mail Sent by households equals mail received by households *
7.0 8.6
* 2 0 0 0 H O U 5 E H O L D D I A R Y S l U D Y
k
First-Clws Volumes There were almost 103 billion total First-class mail pieces in PFY 20009. Fifty-seven billion pieces either originated or destinated in households for an average of 10.5 pieces per week, up from 8.6 in 198'7. Nonhousehold-to-household communications remain the highest proportion (48.6 percent) of First-class mail usage at more than nine pieces per week.
Households sent an average of four pieces per week in 2000. This average represents a slight increase from 1987 levels (See Table 2.1).
TABLE 2.1
First-Class Mail Pieces per Household per Week by Sector, Posh1 Fistol Years 1987 8 MM)
I HH-to-HH I 1.6 I 1.3 1
I Unclassified Incoming I 0.1 I 0.6 I I Unclorrified Outgoing I 0.1 I 0.1 I I ~0101 mail oriqinotinq in H H ~ I 3.8 I 4.3 I
Toto1 moil dertinofing in HHr 8.7 10.5 I Bas: Filst-Cbrr Moil Fiees. EpJdg padmges P a l Fisml Yeor XCO (5.58 &II;mJ~
*Source: USPS RPW data for Postal Flscal Year 2OW. First-class mail totaled 102.9 Billion Pieces. Souree: Demand Forecasting and Economic Analysis. See Appends D.
I H H - h H H H H - h N H H N H H - h H H NHH-lo-NHH I - Domestic Mail Sectoon
Single Piece Moil
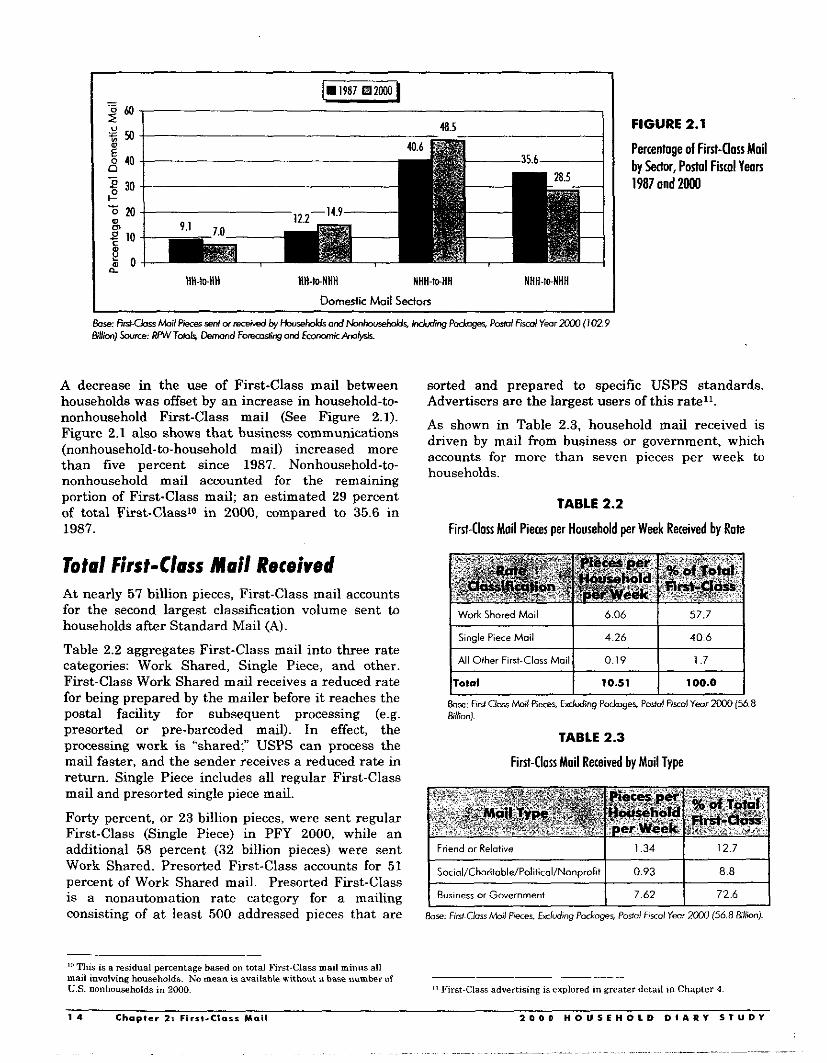
A decrease in the use of First-class mail between households was offset by an increase in household-to- nonhousehold First-class mail (See Figure 2.1). Figure 2.1 also shows that business communications (nonhousehold-to-household mail) increased more than five percent since 1987. Nonhousehold-to- nonhousehold mail accounted for the remaining portion of First-class mail; an estimated 29 percent of total First-Classlo in 2000, compared to 35.6 in 1987.
Tofu/ First-Chss Muil Received At nearly 57 billion pieces, First-class mail accounts for the second largest classification volume sent ta households after Standard Mail (A).
Table 2.2 aggregates First-class mail into three rate categories: Work Shared, Single Piece, and other. First-class Work Shared mail receives a reduced rate for being prepared by the mailer before it reaches the postal facility for subsequent processing (e.g. presorted or pre-barcoded mail). In effect, the processing work is "shared USPS can process the mail faster, and the sender receives a reduced rate in return. Single Piece includes all regular First-class mail and presorted single piece mail.
Forty percent, or 23 billion pieces, were sent regular First-class (Single Piece) in PFY 2000, while an additional 58 percent (32 billion pieces) were sent Work Shared. Presorted First-class accounts for 51 percent of Work Shared mail. Presorted First-class is a nonautomation rate category for a mailing consisting of a t least 500 addressed pieces that are
4.26 40.6
'oThk is a residual percentage based on total First-class mail minus all mail involving households. No mean IF^ available without a base number of U.S. nonhouseholds in 2WO.
All Other First-Clorr Mail 0.19
FIGURE 2.1
Percentage of First-class Mail by Sector, Postal Fisml Years 1987 ond 2000
1.7
sorted and prepared to specific USPS standards. Advertisers are the largest users of this rate".
As shown in Table 2.3, household mail received is driven by mail from business or government, which accounts for more than seven pieces per week to households.
TABLE 2.2
First-Class Mail Pieces per Household per Week Received by Rate
I WorkSharedMoil I 6.06 1 57.7 I
1 I I I ITo*.l 1 10.51 I 100.0 I Bore: F~dCbrs Moil pieces. Fxcluding PaJsges PoaOl Firm1 Yeor Xno (56.8 &IliO"j.
TABLE 2.3
First-Class Moil Received by Moil Type
11 First-class advertising IS explored in greater detail ,n Chapter 4.
1 4 Chapter 2: F icr l -CImss Mail 2 0 0 0 H O U S E H O L D D I A R Y S T U D Y
~.~ ~ . . . . ~~. ~ ~ . . ~ ~~~~~ --

Table 2.4 is a breakdown of these First-class mail types by their subcomponents, compared to 1987 data. Over the thirteen-year study period, mail pieces from a friend or relative, predominantly greeting cards and letters, fell from 1.6 in 1987 to 1.3 in 2000. SocidCharitable mail received by households has almost doubled since 1987, due in large part to the increased number of announcementdmeeting noticeslinvitations and requests for donations received by households in 2000.
Holiday/Searonr Greeting Card
While the number of household-to-household communications fell, nonhousehold-to-household communications increased substantially. In 1987, mail from business or government generated an average of six pieces per week received by households. In 2000, that number is closer to eight pieces per week. Bills and invoices (including credit card statementmills) are almost a third of all First-class business or government mail to households in 2000, followed by advertising and financial statements. First-class advertising mail to households doubled since 1987.
0.55 0.44
TABLE 2.4
First-Class Mail Pieces per Household per Week Received by Mail Type
Other Greeting Card 0.29 0.31
I lnvitotion I 0.12 I 0.13 I
Announcement (Birth, Momage, etc)
I Letier from Friend/Relotive I 0.46 I 0.33 I 0.03 0.04
Olher Pemonal
ISocial/Olari~able/Politic.l/Nonprofit I 0.59 I 0.93 I 0.09 1 0.09
Payment or Other CheckIMoney OrderICredit (No Rebafe)
Rebate Received in Response to Coupon Submined
Holiday/GreetingAha"k You Cord from Business
Business Invitation/Announcemenf
Other BurinerdGovemment
Unclassified
Total
2 0 0 0 H O U S E H O L D D I A R Y S T U D Y Chmpler 2: F i r s t - c l a s s Moil 1 5
0.32 0.27
0.01 0.03
0.05 0.09
0.26 0.40
1.20 0.70
0.11 0.62
8.61 10.51

TABLE 2.5
Firsi-Uorr Mail Pieces per Household per Week Received by Shape
Households classified the “shape” of First-class mail they received into one of three categories: envelope, postcard or cataloghlyer (See Table 2.5). First-class mail received by households is predominantly envelopes, which make up 87 percent of all First- Class mail received by households in 2000 and an average of nine pieces per week. Postcards accounted for an average of almost one piece per week to households (nine percent), while First-class catalogs are just 0.4 pieces per week or four percent of the total First-class mail received by households.
Households also eommented on the timeliness of First-class mail delivery, reporting a high level of satisfaction with First-Class mail service. Of the 57 billion pieces of First-class mail received by households in 2000, more than 20 billion were not expected to arrive on a particular day. However, of the First-class mail expected to arrive on a particular day, 98 percent arrived on time.
Factors Affecting Mail Received Income categories are based on the head of household‘s stated annual income in 2000. In all previous thirteen years of the HDS, income is strongly related to household First-class mail volumeslz. The year 2000 is no exception. In fact, volumes change rapidly over the eleven income categories listed in Figure 2.2. Households with annual incomes exceeding $100,000 receive three times as much First-class mail as households with
20 , 1 FIGURE 2.2
First-Class Moil Piecer per Household per Week Received by Income
Saurce TNS Intersearch Corporation. formerly Chitton Research Services. PFY 1199 HDS Final Report
1 6 C h a p t e r 2 5 F i r s t - C I m s s Mdl 2 0 0 0 H O U S E H O L D D I A R Y S T U D Y

incomes under $7,000 annually; an average of 18 pieces per household per week compared to five. Educational attainment is related to income and is compared against total volumes for 1987 and 2000. Households where the head of household has done postgraduate work receive twice as much First-class mail than households where the head of household has an eighth grade or less educational attainment level: 14.1 average pieces per week compared to 6.7. Acmss all categories, households with higher levels of educational attainment receive more First-class mail (See Figure 2.3).
First-Class Mail Sent Households sent 23 billion pieces of mail in 2000, an average of four pieces per household per week. Almost half of this outgoing mail was bill payments. This category alone represents an average of two outgoing First-class mail pieces a week. Table 2.6 (refer to following page) displays First-Class mail sent by households in 2000 by mail type.
FIGURE 2.3
Fi rMass Mail Pieces per Household per Week Received by Educationol Attainment of
Head of Household
I6 2 14 a,
g 12 2 IO 5 8
$ 4
" 0
8 6
$ 2
8th bode OT Lw Some High %hod High Shod Some (dlege lerhnicol khod (dlege Groduote Patgroduote
Educotionol Anainmenl of Heod of Household
Graduate Grodume Wrvk
I
1 0 0 0 H O U S E H O L D O I L 1 1 1 S l U D Y Chepter 2: F i r s t - C l o r s M o i l 1 7
8%

TABLE 2.6
First-Class Moil Pieces per Household per Week and Percentoge oFTotol Sent by Mail Type
NonHousehold
Order
Inquiry
Poymenl
(Household I 1.33 I 31.3 I
2.88 67.6
0.16 3.7
0.09 2.2
2 0 9 49.1
I HolidayPjeaionr Greeting Cord I 0.37 I 8.7 I
Donotion
Inquiry
LeHer
Other Sociol
Unclassified
Total Fint-aoa Mail knt
I O h & Greeting Cords (Birfhdoy, Sympdhy, Thank Yw) I 0.39 I 9.2 I
0.1 1 2.5
0.03 0.8
0.04 1 .o 0.07 1.6
0.05 1.1
4.26 100.0
~
I invitotiw I 0.09 I 2.1 I I Lalter to Friend or Relative I 0.38 I 9.0 I 1 Announcement (Bitih, Marriage, etc] I 0.02 I 0.4 I
'. I Orher Perrcilol I 0.08 I 1.9 I
I Orher BvrinerdGovernment I 0.29 I 6.8 I
In 1987, households sent about two pieces per week to pieces per week in the household-to-household sector nonhouseholds~3, compared to almost three in 2000. are the same for both First-class mail sent and First- This data shows an increased use of First-class mail Class mail received. This is because these for business communications in 2000, counteracting communications exist within a closed loop, and are decreases in household-to-household mail. adiusted to be identical to comuensate for an t iha t ed
un2erreporting by households: As with First-Class mail received, First-class mail sent by households is twice as likely to be a holidaylgreeting card as a personal letter.
The remaining portion of outgoing household mail (personal greetings) accounted for an average 1.3 pieces per week sent from households in 2000, compared to 1.5 in 1987. Note that the average
'3 Source: TNS Intersearch Corporation. formerly Chilton Research Services. PPI 1999 HDS Final Repon.
? a Chmpler 2: F i r s l - C I e s s Mail 2 0 0 0 H O U S E H O L D D I A R Y S T U D Y

f
Factors Affecting Moil Sent Households send and receive more Fmt-Class mail as household income increases. Figure 2.4 shows data previously reported in this chapter (First-class mail received) compared to First-class mail sent by households in 2000 across all income categories. This comparison reveals that mail sent from households is not as strongly correlated with income as mail received.
FIGURE 2.4
First-Class Mail Pieces per Household per Week Sent and
Received by Income
Bill payments comprise the greatest portion (49 percent) of First-class mail sent. It is likely then that factors associated with having bills to pay would influence the amount of First-class mail sent by households.
Home ownership, for example, is strongly correlated with First-class mail sent (See Figure 2.5). Homeowners reported an average of 4.71 pieces per household per week compared to 2.97 pieces reported by renters. This association was stable across income categories.
1 7 7 I
Under25K 25K-49.9K MK-79.9K 80Ki
Household Income
FIGURE 2.5
First-Class Mail Pieces Sent per Household per Week by Household Income and Ownership Status

The total number of household financial accounts or between the number of credit cards and First-class credit cards also positively influences the reported mail sent is very close to that observed with financial volume of First-Class mail sent (See Figure 2.6). accounts. Households with zero credit cards reported Households with zero financial accounts reported an an average of 2.10 pieces per week compared to 5.33 average of 2.76 pieces per household per week pieces reported by households with five or more credit compared to 5.64 pieces reported by households with cards. five or more financial accounts. The relationship
0 1 2 3 4 5 i
NunberdAcmunb
FIGURE 2.6
First-class Mail Pieces per Household per Week Sent by Number of Credit Cords ond Financial h n b
2 0 Chopter 2: F i r s t - C l a s s Mail 2 0 0 0 H O U S E H O L D D I A R Y S T U D Y

I
Chapter 3: Standard Mail (A)
Presorted Standard, or Bulk Rate
Nonprofit Orgonization
Unclassified Moil Piece
Unsolicited PublicalioN
Standard Mail (A) volumes accounted for almost half of total domestic mail to households in 2000. Total volumes exceeded 68 billion pieces, translating to an average of 13 pieces per week per household. This is an increase of almost two pieces per week sine 1987 (See Appendix Table A3-1). Table 3.1 is a breakdown of Standard Mail (A) pieces per household per week
and percentage of total Standard Mail (A) by selected categories. Standard Mail (A) consists of mail pieces, unsolicited publications, and packages. Presorted Standard or Bulk Rate clearly drives Standard Mail (A) volumes. This rate comprised 69 percent of all Standard Mail (A) or 47.8 billion pieces in 2000.
8.80 69.3
2.39 18.9
.94 7.4
.42 3.3
____
TABLE 3.1
Standard Mail (A) Pieces per Hourehold per Week and Percentage of Total
Nonprofit
Standard Mail (A) Packager
Total Standard Mail (A)
IStandard Mail (A) Pieces I 12.12 I ~ 95.5- I
.10 0.8
0.16 1.2
12.75 100.0
1 Commercial I .32 I 2.5 I
? 2 0 0 0 H O U S E H O L D D I A R Y S T U D Y Chapter 3: Stmndord M o l l (A) 2 1

Use of Standard Moil (A) Standard Mail (A) is used by a wide variety of industries and organizations. The use patterns of these senders are a valuable measure of where Standard Mail (A) volumes originate and where USPS might expect growth in the future. Figure 3.1 and Table 3.2 indicate use of Standard Mail (A) by businesses and organizations. Table 3.2 compares total Standard Mail (A) volumes between the top five businesses or organizations which distribute Standard Mail (A). Figure 3.1 aggregates businesses or organizations into six summary categories14. Merchants account for almost five pieces of Standard Mail (A) to households in PFY 2000 (24.4 billion pieces) with Social/Charitable/PoliticaVNonprofit in second with almost three pieces per week, or 12.1 billion pieces annually. Taken together, these two industry categories make up more than half of Standard Mail (A) volumes.
Not surprisingly, Merchants are the heaviest users of Standard Mail (A), as three of the largest individual sender types fall into this category. Mail order companies are the largest individual user (14.4 percent, for about 10 billion pieces annually), followed by department/discount stores, publishers, charities and finally, credit card companies.
Consistent with these use patterns, more than 92 percent of Standard Mail (A) pieces contain material from one organization. The remaining eight percent, less than five billion pieces, contain matenal from several organizations.
DepotimentIDircwnt Stwe
Publisher
Chon’fies
TABLE 3.2
Top Five Distributors of Standard Mail (A) P i i
~ ~
0.85 6.6
0.80 6.3
0.75 5.9 ~
I Credit Cord I 0.59 I 4.7 I
While Standard Mail (A) packages ace a fairly small portion of total Standard Mail (A) volumes, (only 844 million in ZOOO), their use patterns are interesting. This rate is used primarily by businesses to provide goods or services to households. Almost two-thirds of all Standard Mail (A) packages are sent to households by businesses in response to an order by a member of that household. The next highest percentage is unsolicited samples, which account for 21 percent of total Standard Mail (A) packages sent to households in 2000.
Y : 5.0 3 4.5
4.0 9 3.5 ,O 3.0 2 2.5 a 2.0 ? 1.5 E 1.0 2 0.5 .z 0.0 a
Meichonk S~iolhonpiofft finontiol %Ml6 h r n m e n t Monufoduretr
Mojor BusinessIOrgonizotion
FIGURE 3.1
Standard Mail (A) Pieces per Household per Week by Business I Organization Type
“Table 3.2 appears in this chapter as the only instance of this more defailed breakdown. Throughout the remainder of Chapter 3. the six aggregate groups appearing in Figure 3.1 will be used for cornpanson.
2 2 Chqpter 3: S t a n d a r d Moil ( A ) 2 0 0 0 H O U S E H O L D D I A R Y S T U D Y
. ~.
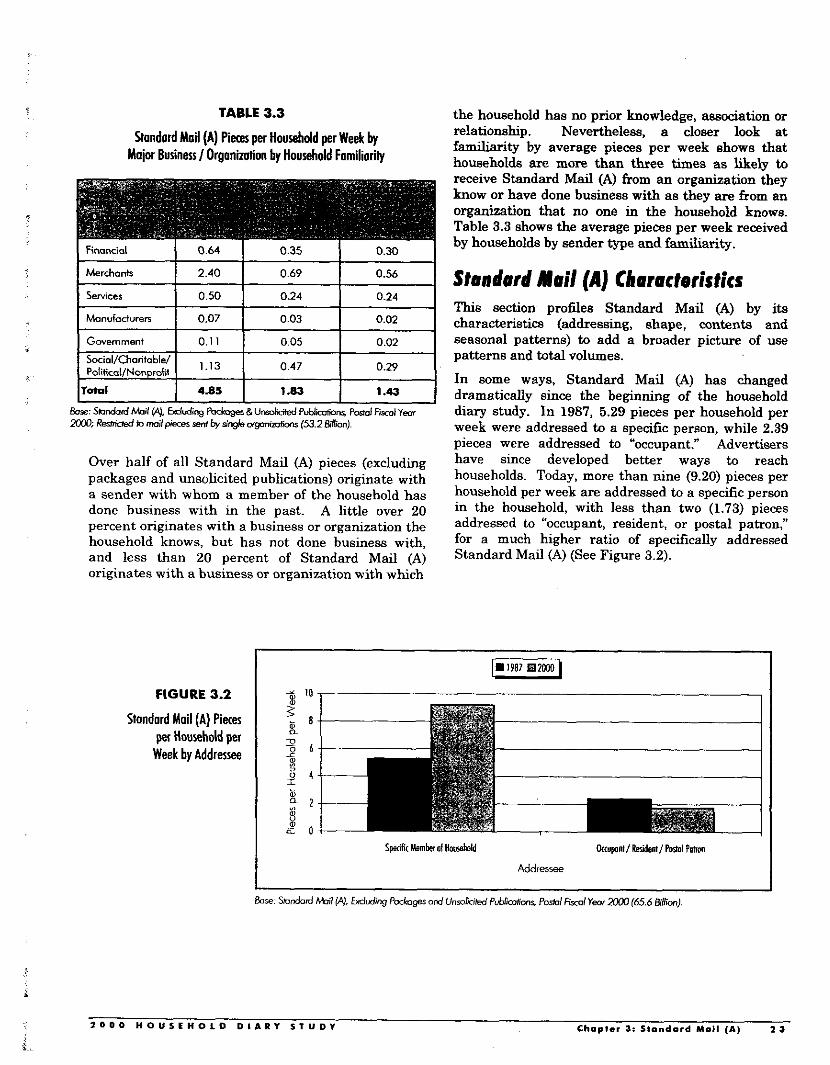
TABLE 3.3
Stondord Mail (A) Pieces per Household per Week by Maior Business I Organization by Househdd Familiariiy
the household has no prior knowledge, association or relationship. Nevertheless, a closer look at familiarity by average pieces per week shows that households are more than three times as likelv to
Over half of all Standard Mail (A) pieces (excluding packages and unsolicited publications) originate with a sender with whom a member of the household has done business with in the past. A little over 20 percent originates with a business or organization the household knows, but has not done business with, and less than 20 percent of Standard Mail (A) originates with a business or organization with which
Standard hiail (A) Citaracteristicr This section profiles Standard Mail (A) by ita characteristics (addressing, shape, contents and seasonal patterns) to add a broader picture of use patterns and total volumes.
In some ways, Standard Mail (A) has changed dramatically since the beginning of the household diary study. In 1987, 5.29 pieces per household per week were addressed to a specific person, while 2.39 pieces were addressed to “occupant.” Advertisers have since developed better ways to reach households. Today, more than nine (9.20) pieces per household per week are addressed to a specific person in the household, with less than two (1.73) pieces addressed to “occupant, resident, or postal patron,” for a much higher ratio of specifically addressed Standard Mail (A) (See Figure 3.2).
FIGURE 3.2
Standard Mail (A) Pieces per Household per
Week by Addressee
2 0 0 0 H O U S E H O L D D I A R Y S T U D Y Chapter 3: Stondmrd Mail (A) 2 3
2

I
LeHer size envelope
FIGURE 3.3 I 2 1.4 1 I
1.83 3.13
- 3 1.2
Seleded Mail Classifications, Z B 1 Pieces per Household per 0
Quarter to Annual Z ? 02
g 2 0.8 + 0.6 * 2 0.4
O B 0
Week by Ratio of Postal
Catalog (no1 in envelope)
Figure 3.3 compares each postal quarter's contribution to the annual pieces per household per week for selected postal classifications. Pieces per household per week are presented for each quarter as a ratio between quarterly averages and annual averages. A look at these seasonal patterns shows that the Presorted Standard, or Bulk Rate within Standard Mail (A) most closely mirrors seasonal patterns for total Standard Mail (A). The highest pieces per household per week are recorded in quarter one with the lowest estimates recorded in quarter four, with similar volumes for quarters two and three.
ZIP plus four usage is highly common within Standard Mail (A) and is another feature of Standard Mail (A) that changed dramatically over the life of the study. In 1987, 92.5 percent of Standard Mail (A) received by households had a five-digit ZIP code. Only two percent included the regional four-digit code. Since most advertisers today must get their mailing lists certified by USPS, and many computer programs exist to automatically add the four-digit code, most incoming mail to households should be coded in accordance with postal regulations. In fact, 74 percent of Standard Mail (A) received by households in 2000 was coded ZIP+four. Only 14 percent included a simple five-digit ZIP code'5.
However, businesses are not as efficient when it comes to listing their return address. In 2000, businesses were almost as likely to include their ZIP+four than not. A little more than 28 billion pieces simply listed a five-digit ZIP code, while 24.3 billion included the additional four digits.
1.50 2.09
The look of Standard Mail (A) has changed over the years as well (See Table 3.4). Letter size envelopes now make up a larger portion of Standard Mail (A), and households receive twice as many of them compared to 1987. Postcards and catalogs are more common, while the use of circulars and detached label cards diminished somewhat.
TABLE 3.4
Standard Mail (A) Pieces per Household per Week by Shape, Postal Fiscal Years 1987 and 2000''
FlvenICirculon 2.12 I 1.99
I Detached Lobel Card 1 0.61 I 0.28 I
Magazines/Newrlelten 0.18 0.77
7.70 Total Smndard Mail (A) Pieces per Household per Week
ISThe remairung two percent were without a ZIPcode.
12.12
16 See also Appendix Table A3-5.
2 0 0 0 H O U S E H O L D D I A R Y S T U D Y 1 4 Chapter 3: Standard M o l l (A)

TABLE 3.5
Pertentoge of Stondard Moil (A) pieces Sent, Moior Business/ Orgonizotion by Shopel'
A look at these same characteristics by industry sender type shows which users prefer which shapes. It is important to note that the percentages shown here represent a proportion of total Standard Mail (A) originating within each industry sender type. In other words, volumes may not be the same across categories, but proportions can be compared.
Table 3.5 shows that the financial sector prefers envelopes, usually letter size, while Merchants opt for unpackaged catalogs. Services, which include utility companies and the health care and entertainment industries, use addressed circulars/flyers with about the same frequency as letter size envelopes. Manufacturers and Government display preferences for addressed circulars/flyers, while SociaVNonprofit use letter-sized envelopes most frequently.
Government and SociaYNonprofit use newspapers, magazines, and newsletters a t about the same rate (9-10 percent), while Manufacturers use the largest portion of detached label cards, more than three times the rate of other businesslorganization types.
Standard Mail (A) package characteristics have less to do with shape than content and the use of special services, which include special handling or delivery, insurance, certification, registration and C.O.D. The use of special services is not common for Standard Mail (A) packages. Almost 92 percent of Standard Mail (A) packages are delivered without them. Of the 844 million Standard Mail (A) packages, only eleven million are tagged for special handling and an additional three million for special delivery. Three
million pieces are sent certified, with receipt requested, and an additional 2.6 million are insured.
The contents of Standard Mail (A) packages in P N 2000 reveal why special services are used so infrequently (See Table 3.6). Audio-video materials are rarely shipped with any special services unless requested by the customer. The second highest proportion of Standard Mail (A) packages is unsolicited samples.
TABLE 3.6
Perrentoge of Standard Mail (A) Pockages by Contents
li Totals exdude unclassified data
a 0 0 0 H O U S E H O L D D I ~ R Y S T U D Y Chapter 3: Slondmrd M a l l ( A ) 2 5

Fuctors Affecting Receipt of Stundurd Moil (A)
~~
n 8h 6rode a Len Some High khwl High khd Sam Cdlge lxhniml Shcd (dlqe Groduote Patgroduote
boduote Gioduote Wak
Educohonol Attoinmen1 of Head of Househou !
There are various factors that might influence an individual household's receipt of Standard Mail (A). Several of these variables are demographic, while others may have more to do with the household's behavior or characteristics.
Educational attainment is highly correlated with income and will be used in this chapter to make Standard Mail (A) volume comparisons. Figure 3.4 shows that as educational attainment increases, Standard Mail (A) volumes increase as well.
Standard Mail (A) volumes crossed by household size also have the expected effect (See Table 3.7). Since a two-person household is typically two adults, Standard Mail (A) volumes increase. The third person is typically a child (in fact, in the 2000 diary
study, three person households contained the largest percentage of children under six) and therefore we expect pieces to plateau a t this household size. Volumes then increase slightly as household size (and potential wage earners) increase.
TABLE 3.7
Standard Mail [A) Pi- oer Household w r Week bv
I 2 I 10.76 I 17.43 I I I I 3 I 8.08 I 15.73 I I 4 I 9.47 I 17.46 I
FIGURE 3.4
Standard Mail (A) Pieces per Household per Week by Educational Attainment
of Head of Household
1
2 6 Chapter 3: I t andord Moll (A) 2 0 0 0 H O U S E H O L D D I A R Y S T U D Y

Households also have different financial In addition, households’ online purchasing affects characteristics or behaviors that influence their their Standard Mail (A) volumes. The more previous Standard Mail (A) volumes. Figure 3.5 shows that purchases they have made online, the more Standard the amount of Standard Mail (A) pieces received by Mail (A) they receive (See Figure 3.6). This is households increase as the number of household understandable since many direct mail lists are financial accounts and credit cards increase. generated from online transactions.
FIGURE 3.5 3 ?o I Smndard Mail (A) Pieces per
Household per Week by Household Number of Finandal
h u n t s / Credit Cords
0 1 2 3 4 5 w Mae
Household Number of Accounfs
Bore; %&rd Moil W, Pmhl Fircol Yeor 2wo (69 Bdlim]. Note prrurnt InfommVm mlkaed during leouimnt ink-.
5 15
IO 2 g 5
$ 0
>
8
Nane 1-3 j~ 4-6 7-10 11 -20 21 a Mate
Number of Household Internet Purchases - Past I2 Months
FIGURE 3.6
Standard Mail (A) Pieces per Household per Week by Number of Previous Household Online Purchases
2 0 0 0 H O U S E H O L D D I A R Y S l U D Y Chapter 3: Stmndmrd Malt ( A ) 2 7
L.

FIGURE 3.7
Percentage al Standard Mail (A) Pieces by Household
Reading Patterns”
Read bv Hcmhdd Member
0 Read by Mae man One HH Me&
O W U, Not Read byhy HH Member
El Dircarded, Not Read
Set b i d e fa late^ Reading
Recipient Response to Standard Mail (A)
by a t least one member of the household. Less than one-quarter is discarded without being looked a t (See Figure 3.7).
This section looks a t the treatment of Standard Mail Table 3.8 shows that letter size envelopes are the (A) by households to determine what, if anything, most likely “shape” to be read by a t least one member influences their decision to read, use or respond to the of the household (48.5 percent), followed by catalogs Standard Mail (A) thev receive’*. not in envelopes (42 percent) and addressed . ,
flyers/circulars/folded piece; (40 percent).
Letter size envelopes are also the most likely shape of In general, households respond favorably to Standard Mail (A). Over half of all Standard Mail (A) is read
Standard Mail (A) to be discarded and not read.
TABLE 3.8
Stondord Moil (A) Pieces per Household per Week, Shope of Moil Piece by Household Reoding Potterns
/‘Standard Mail (A) packages are excluded from this analysm since households were not asked to respond to unsolmted samples ‘-See also Appendm Table A3 18
2 8 C h a p t e r 3: Slondard Mail (A) 2 0 0 0 n o u s r n o ~ ~ D I A R Y S T U D Y

However, they are almost twice as likely to arrive a t households as envelopes larger than letter size, addressed flyerdcirculardfolded pieces and catalogs not in envelopes; and a t least t h e e times as likely as every other shape within Standard Mail (A). Households categorize 37 percent of their Standard Mail (A) as ‘useful information,’ while 26 percent is described as being ‘neither interesting. enjoyable nor useful’ and additional 15 percent as ‘interesting or enjoyable.’ Only five percent is labeled ‘objectionable,’
A comparison of these attitudes against household familiarity with the business or organization sending the mail reveals that households are more likely to respond favorably to Standard Mail (A) from organizations with which they are familiar (See
Figure 3.8). Households classified 63 percent of mail from a business or organization they recognized as ‘useful.’ These businesses also fared the best when households found a mail piece to be ‘neither interesting or enjoyable.’ However, a closer lmk a t this data reveals less distinct preferences. For example, households declared about the same percentage of mail across all t h e e household familiarity categories to be ‘interesting or enjoyable, not useful.’
Response rates (whether or not a household said they would respond to a particular piece of mail) show a similar relationship. Households are more receptive to mail from organizations or businesses they are familiar with, as evidenced by Figure 3.9.
70
.- $ a
I 340 “54
30
s 20 8 2 10
0
Obieaioooble Ureful lnfmmotim ne lib to Inkresting ca Eniwble, Not Neither Interwing l a Ureful 1NfiVe Useful
Rwcfion Toword Mail Piece
Bare: SIOndord Mail (41. k l d i n g Podoge ond U N d W Publimkm, P&l F;ml Yeor Note: Rehkid b Mail P-s rent bysingk o,ppn;mfnn.
(53.2 &Il;m).
FIGURE 3.9
Percentage of Standard Mail (A) Pieces, Household
Familiarity of Sender by Response to Mail Piece
FIGURE 3.8
Percentage of Standard Mail (A) Pieces, Household Familiarity of Sender by Reaction Toward Standard Mail (A) Piece
Yes No Response Toward Moil Piece
I I Base: Slondad Moil W, k M n g podmger and Unroliciled PuMmtioionz P&l Fisc01 Yeoi 2wo (44.3 Eilli.mj Note: Rertnaed b Mail Rets ont tiding d d w w n g or rdkilolion of funds.
2 0 0 0 H O U S E H O L D D I A R Y S l U D Y Chapter 5 : Standard Moil (A) 2 9

3 0 C h m p l e r 3: Standard Moil (A) 1 0 0 0 H O U S E H O L D D I A R Y S T U D Y

f
Chapter 4: Direct Mail Advertising
Direct mail advertising has long been an effective way for businesses to reach consumers. Advertisers rely on USPS to reach new clienta and repeat customers. Direct mail is a flexible approach for advertisers because it allows various forms of correspondence, i.e. letters, postcards, free samples. It is also measurable since USPS allows advertisers to track the effectiveness of their advertisements through response rates. Finally, it is private: advertisers share their offers with customers, not competitors.
This chapter presents annual advertising volumes for PFY 2000, as well as demographic factors influencing these volumes in American households. Reactions and response rates, introduced in Chapter One, are explored in greater detail here.
Accurate comparison of advertising mail volumes is dif6cult, since volumes were calculated differently throughout the years of the Household Diary Study. For the purposes of this report, advertising mail is classified as any advertising, promotional or sales material received by households in 2000. This description is not interpreted; it is an exact tabulation of responses from households in the diary.
Advertising mail in 2000 exists across several postal classifications, e.g. First-class, Standard Mail (A), and Standard Mail (B). First-class Mail and Standard Mail (A) include any advertising-only mail, promotional materiaYadvertisements enclosed with household mail, or unsolicited publications. Standard Mail (A) and (B) packages are advertising if the household described it as an "unsolicited sample." Unaddressed material may also contain product samples or coupons, but this data is not categorized in the same fashion a8 First-class, Standard Mail (A) or Standard Mail @). There were 3.2 billion pieces of unaddressed advertising mail in PFY 2000, accounting for almost five (4.9) percent of advertising volumes20.
It should be assumed that totals represented in th is chapter include both advertising-enclosed mail and advertising-only, in addition to unaddressed advertisements sent to the household in PFY 2000.
Advertising Volume American households receive over a billion pieces of sales, advertising or promotional material (induding catalogs) per week. Advertising mail is the greatest proportion of mail received by households, accounting for over half (59 percent) of the total mail received by households in 2000.
Total advertising volumes in 2000 exceeded 72 billion pieces. By comparison, bills are the next largest proportion of mail received by households at 16 billion pieces annually.
Within each postal classification, advertising mail is categorized in a variety of ways. First-class advertising mail is sent either regular First-class, presorted First-class, automation presort or automation carrier route. Standard Mail (A) advertising mail can be standard, presorted standard or bulk rate, standard or bulk rate enhanced camer route, nonprofit or nonprofit enhanced carrier route. Standard Mail (B), the least expensive of the three classifications, is mailed parcel post, DBMC parcel post, bound and printed matter or special standard mail.
Unaddressed materials are part of total advertising volumes. but are not compared against volume^ reported within postal classifications.
1 0 0 0 H O U S € H O L D D I A R Y S T U D Y C h a p t e r 4: Direr t M m l l A d v e r t i s i n g 3 1

Table 4.1 is a breakdown of total advertising mail volumes by postal classification, including the subcategories to those classifications described abovez’. The advertising volumes represented in the table do not include advertising mail described by the household as a “solicitation for funds” or “request for donation.” Requests for donations account for just over nine hundred million pieces (9.45) of First-class mail and over six billion (6.27) within Standard Mail (A). If these totals are combined with total advertising volumes, then households received over 81 billion pieces of advertising mail in 2000, less than one percent of which were requests for donations.
Unaddressed Material
As shown in the Table 4.1, the large majority of advertising mail received by households is sent Standard Mail (A). Standard Mail (A) is driven by the use of several rates, namely presorted standard and bulk rate, but more specifically, presorted standard or bulk rate and enhanced carrier route, the so-called “saturation” and “high density” rates. Almost half of the users of this rate are departmentldiwunt stares or mail order companies. This classification alone makes up 19 percent of annual advertising volumes and accounts for close to three pieces of household advertising mail weekly.
0.59 4.4 I
TABLE 4.1
Advertising Mail by Postal Clarsifimtion, Percentage of Total Advertising and Piew per Household per Week
Total Advertising
]Domedic First-Class Mail Pieces I 3.1 1 I 23.3 I
12.80 100.0
I Advertising Only I 0.28 I 2.1 I I Advertising Enclosed I 2.83 I 21.1 I IStandard Mail (A) I 9.65 I 72.1 I I Presorted Stondotd, or Bulk Rote I 7.98 I 59.6 I I Nonprofit Orgganizotion I 1.14 I 8.5 I I Unsolicited Publications I 0.42 I 3.1 I I Commercial I 0.32 I 2.4 I I Nonprofit I 0.10 I 0.8 I I Unsolicited Sampler (All Portal Classes) I 0.04 I 0.3 I I Standord Moil (A) Unclassified I 0.1 I I 0.8 I
*‘ Standard Mail (B) is the only exception. Due to low volumes in the study percentages were too small to be noteworthy. and therefore. only Standard Mail (B) totals are represented here. For the p u w s e s of this chapter. First Class volumes will be compared against Standard Mail (A) only.
3 2 Chapter 4: D i r e c t Mail A d v e r t i s i n g 2 0 0 0 H O U S E H O L D D I A R Y S T U D Y

First-class advertising makes up almost one quarter of all advertising mail and is used primarily by the financial sector. Thirty-nine percent of all First-class advertising originates here (See Table 4.2). Financial advertising is defined as advertising from a credit card company, bank, credit union, securities broker, money market account, insurance company, or real estate broker. In contrast, only 17 percent of Standard Mail (A) advertising originates in the financial sector.
Merchants, such as department stores, mail order companies or publishers, are the second highest user
Merchants
Sewices
Monufaduren
of First-class advertising, followed by Services (utilities, medical professionals or insurance companies, computer companies, entertainment) and SociaVNonprofit (political. charitable or nonprofit organizations). This group of advertisers drives the volumes of Standard Mail (A) advertising to American households. Over 50 percent of all Standard Mail (A) advertising mail originates in this sector and results in four pieces of advertising mail per week to households. The financial sector is a distant second, sending 17 percent of their advertising mail Standard Mail (A), followed by Social/Nonprofit and finally, Services.
When taking note of this rank order, it is obvious that these four user categories generate a large percentage of advertising mail to households. Their combined percentage within each postal classiiication exceeds 90 percent.
0.88 28.2 4.24 51.1
0.71 22.8 1.08 13.0
0.06 2.0 0.16 1.9
TABLE 4.2
Adverfising Mail by Majar Business I Organization, Percentage of Total Advertising and Pieces per Household per Week, First-Closs and Standard Mail (A)
SocialINonprofit
Unclassified
Total
I Financial I 1.22 I 39.3 I 1.43 I 17.3 I
0.16 5.3 I .09 13.2
0.03 0.9 0.1 1 1.3
3.1 1 100.0 8.28 100.0
I Government I 0.05 I 1.6 I 0.17 I 2.1 I
1 0 0 0 ~ O U S E ~ O L D D I A R Y S T U D Y Chopler 4: D i r e c t Mail Advert i r ing 3 3

Furtors Affecting Advertising Volume It is interesting to look at how demographic fadors for households may affect their mail volumes, in this case, the amount of advertising mail received by the household. In most cases, income, educational attainment and age of head of household, as well as household size, are compared against total volumes to observe a relationship. This chapter uses these demographic characteristics, with the exception of age. Whereas income and education can indicate socioeconomic status, age in itself means little unless we determine the ages of a l l household members, resulting in a mean age per household. Additionally, this measure has potential for error, as older or younger members of the household can distort the mean.
The first household characteristic analyzed is income. Figure 4.1 shows advertising volumes across all postal classifications increasing with income.
Households with an annual income exceeding $100,000 receive an average of 23 advertising pieces per week, while households earning under $7,000 annually receive only 6.1.
Additional analysis shows that Standard Mail (A) advertising mail also increases a t a more rapid pace than First-class across income categories. When observing differences across collapsed income categories (households with annual incomes below $50,000 and those above $50,000). Standard Mail (A) increases a t nearly three times the rate of First- Class: 23 percent compared to eight.
1 FIGURE 4.1
I 2 2 5 1 I I Advertirina Pieces Der
3 s 20 Householdper Week a by P o d Classification
% r IS and Household Income 2
IO I s a 5 3 Y
$ 0
3 4 C h a p t e r 4: Direct M o i l A d v e r t i s i n g 2 0 0 0 H O U S E H O L D D I A R Y S T U D Y
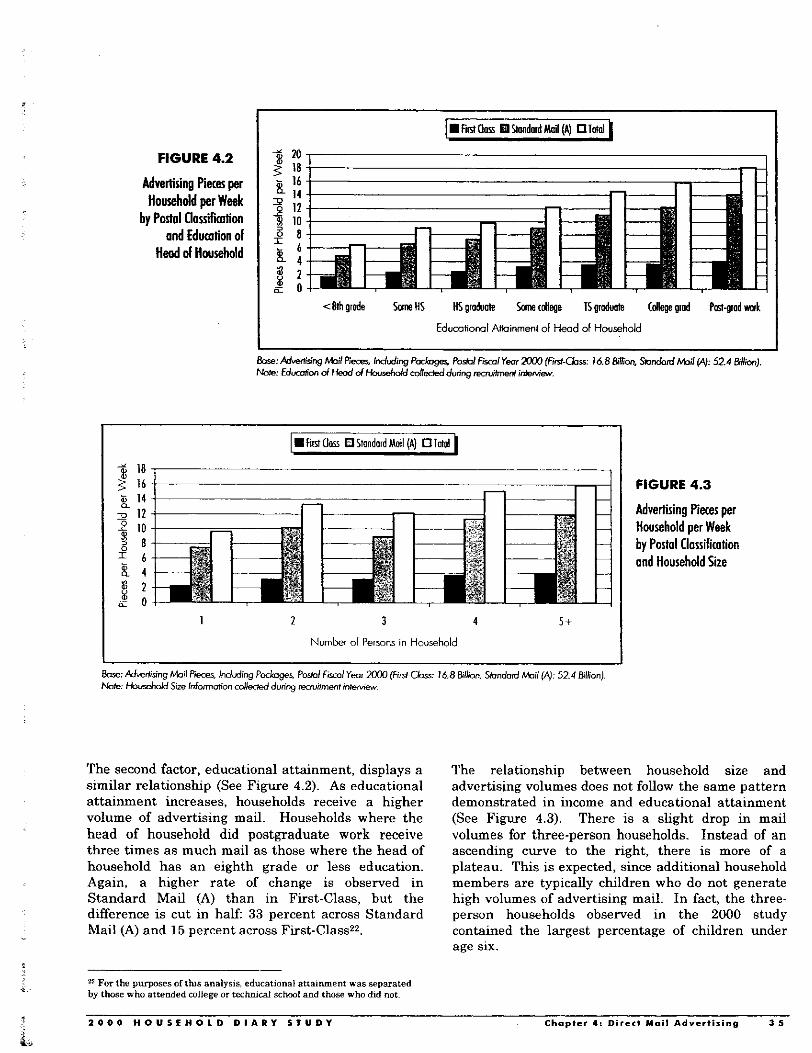
FIGURE 4.2
Advertising Piem per Household per Week
by Postal Classifidon and Edurntion of
Head of Household
I -r I n 1 I 3 20 2 1 8 4
i 4 t h grade Sane HS HS graduate Sane cdlega IS graduota Cdlege glad Pmt-grod uwk
Edumtionol Altoinmen1 of Head of Household
mhrstdOon QStondordMoil(A) Olatol
% 18 , 1
2 I6 g 14 2 12 2 IO 91 $ 8 I 6 & 4 $ 1 6 0
1 2 3 4 5 1
Number of Persons m Household
The second factor, educational attainment, displays a similar relationship (See Figure 4.2). As educational attainment increases, households receive a higher volume of advertising mail. Households where the head of household did postgraduate work receive three times as much mail as those where the head of household has an eighth grade or less education. Again, a higher rate of change is observed in Standard Mail (A) than in First-class, but the difference is cut in half: 33 percent across Standard Mail (A) and 15 percent across First-Class22.
zp For the pu~poses ofthis analysis educational attainment was separated by those who attended college or techmcal whml and those who did not *
FIGURE 4.3
Advertising Pieces per Household per Week by Postal Clossifimtion and Household Size
The relationship between household size and advertising volumes does not follow the same pattern demonstrated in income and educational attainment (See Figure 4.3). There is a slight drop in mail volumes for three-person households. Instead of an ascending curve to the right, there is more of a plateau. This is expected, since additional household members are typically children who do not generate high volumes of advertising mail. In fact, the three- person households observed in the 2000 study contained the largest percentage of children under age six.
7 2 0 0 0 H O U S E H O L D D I A R Y S T U D Y Chapter 4: D i r e c t M o i l A d v e r t i s i n g 3 5
&*

Attitudes Toward Advertising Households demonstrated a declining interest in advertising mail overall since 1987. Respondents rated their attitudes about advertising mail using a scale of 'would like more,' 'some are interesting' and 'wish there were less.' Table 4.3 indicates that 55 percent of households wish they received less advertising mail in 2000, compared to 30 percent in 1987. The percentage of advertising mail households find interesting, i.e. are likely to read, fell from almost 63 percent in 1987 to 38 percent in 2OOO.
Beyond declining attitudes toward advertising mail overall, the results show that American households distinguish between different types of advertising. Based on the same scale of attitudes from Table 4.3, households gave higher negatives than positives for nearly all of the eight advertising mediums tested, with the exception of newspaper and radio (See Figure 4.4). Telemarketing fared the worst, followed by mail, plastic bags on doorknobs, television, e-mail, radio, Internet and finally, newspaper.
FIGURE 4.4
Household Attitudes Toword Advertising Moil by Medium
TABLE 4.3
Anitudes Toward Advertising Mail -Trends Pertentage of Households
Response changed from "Dodt mind getting some that doesn't interest me as long as I a150 get some that does interest me" ~n PFY 1999 to "Some are interesting and enjoyable" in PFY 2OW
3 6 C h a p t e r 4: D i r e c t M m i l A d v e r t i s i n g 2 0 0 0 H O U S f H O L D D I A R Y S T U D Y

I
Not Interesting
-r; 50, 1 2 I
34.4 29.6
Households’ treatment of advertising mail changed in two significant ways since 1987. First, the percentage of those who “usually r ead fell (See Figure 4.5). Second, the percentage of those who “usually don’t read” doubled. In 1987, nine percent of households said they usually do not read their advertising mail, compared to 18 percent in 2000. However, the percentage of households that “usually scan” has remained consistent over the life of the study.
When household reactions to advertising mail by class were analyzed, Standard Mail (A) received a more favorable response than First-class (See Table 4.4). In fact, households labeled 59.9 percent of Standard Mail (A) “useful” or “interesting,” compared to 51 percent of First-class mail. As a result, households labeled 40.6 percent of First-class advertising mail “not interesting” or “objectionable,” compared to roughly 35 percent of Standard Mail (A). Unaddressed mail, while not a classification, received a favorable response by households, who described nearly sixty percent of it as interesting or usefuP4.
Obiectionoble 6.2
?‘ Note that unaddrrssed advertising mail volume^ are only 3.2 billron pieces a””“allY.
4.9
FIGURE 4.5
Household Reading Patterns of Advertising Mail - Trends
TABLE 4.4
Attitudes Toward Advertising Mail by Postal Classification, First-Class and Standard Mail (A), Percentage of Mail Pieces
I 35.9 I 43.7 I I lnlererling I 15.1 I 16.2 I
2 0 0 0 H O U S E H O L D D I A R Y S T U D Y C h a p t e r 4; D i r e r 1 H.aII A d v e r t i s i n g 3 7
L

Response to Advertising Response rates are relatively consistent across postal classifications. There is a perception by marketers that households are more responsive to First-class mail: it is usually personally addressed to someone in the household and has a more official appearance. In fact, households are quicker to dismiss First-class advertisements than Standard Mail (A), something for advertisers to note (See Table 4.5). When asked whether anyone in the household considered responding to the advertisement, 24.2 percent of First-class advertising received a favorable response (.yes or maybe), compared to 32 percent of Standard Mail (A). A higher proportion of credit-card solicitations within First-class advertising could explain the higher proportion of negative responses to First-class advertising. In fact, credit-card solicitations make up the largest percentage of First- Class advertising mail pieces in PE'Y 2000.
Households typically respond to advertising mail through the mail, as shown in Table 4.6. They are nearly twice as likely to do so than by phone or in person, a t least in the case of First-class mail. The varying types of advertising mail sent in each class can explain different response rates between the First-class and Standard Mail (A) advertising. Previous data explained in this section allows that 40 percent of First-class advertising comes from the financial sector, which lends itself to response by mail. For example, responses to credit card solicitations, loan offers, or life insurance require the completion of a written application.
In contrast, Standard Mail (A) advertising, driven by merchants, might consist of department store advertisements, or offers from other local merchants, warranting an "in-person" response.
By Phone
TABLE 4.5
Likelihood of Response to Advertising Moil Piece by Portal Clossifiration, Percentoge of Moil V I
21.3 23.5
I 11.7 I
TABLE 4.6
Type of Response by Household to Advertising Mail, Percentage of Moil Pieces
I I I 1 I" Person I 25.8 1 32.8 I I I I
I I I Via Internet I 3.8 I 2.7 I I I
3 8 C h a p t e r 4: Direct Moil A d v e r t i s i n g Z O O 0 H O U S E H O L D D I A R Y S T U D Y

Chapter 5: Periodicals
Monthly Magazine
Periodicals mail, formerly Second Class, consists largely of daily or weekly newspapers, weekly or monthly magazines, and any other periodic newspapers or magazines sent to households in 2000. The Periodical Volumes presented in this chapter include only those delivered by USPS. Newspapers or magazines delivered by a local carrier or purchased at a newsstand or grocery store are not included in household diary data. In addition, the volumes presented here are only a portion of total Periodicals Volumes, since over a quarter of periodicals a r e received by nonhouseholds, such as doctors’ offices or other businesses.
Total Periodicals Volumes Dettinating in Households Of the mail pieces sent to households in 2000, 7.2 billion pieces were periodicals. This equates to 70 percent of all periodicals and five percent of the total domestic mail to households. Table 5.1 shows a breakdown of periodicals received by households in 2000. Households receive an average of 1.32 periodicals per week. Almost half of all periodicals are monthly magazines (46.2 percent). The next largest percentage is weekly magazines, followed by other periodic magazines (quarterly, bi-annual, etc.). Newspapers make up nearly 30 percent of periodicals in 2000.
A closer look a t these volumes by sender type shows that publishers, rather than member organizations, send the vast majority of periodicals (See Table 5.2). Member organizations include unions, nonprofit or religious organizations, and professional affiliations. Table 5.2 reveals that member organizations mail only slightly more than 20 percent of all periodicals to households, mostly publications from professional organizations. “Commercial Organization” is the largest contributor to household Periodicals Volumes, accounting for an average of almost one piece per week per household.
0.61 46.2
TABLE 5.1
Periodical Piem per Household per Week and Percentage of Total by Type
Other Moaazine I 0.13
0.14
9.9
hotal NemnaDers I 0.34 I 26.3 I
Total Periodicals lo Hovscholds
I Weeklv Moaazine I 0.23 1 17.6 I
1.32 100.0 I
I , - I I I
I - I I I ITotal Magazines I 0.97 I 73.7 I
TABLE 5.2
Periodical Pieces per Household per Week and Percentage of Total by Sender Type
Commercial Orgonizotion 0.94 71.1
Professional Orgonizdion 0.14 I 10.4
Religious Organirotion 0.w 6.8
Educotionol Orgonimtion 0.06 4.8
Union 0.03 2.0
Charitable Orgonirotion 1 :::: 1 i: 1 Veteran’s Organimlion
Unclassified 0.03
rota! 1.32 100.0
lase: Petiodimls Receid by Houreholdr P o d fiwol Yeor Mo (7~2 EIIimJ.
2 0 0 0 H O U S E H O L D D I A R Y S T U D Y C h a p t e r 5 : Periodicolr 3 9
4.

Supporting the data is an overview of Periodical Volumes by type of subscription (See Table 5.3). As shown in the above table, ‘Commercial Organization’ accounts for the largest volumes by sender type. In 2000. a household member ordered and paid for 70 percent of periodids received by households, or more than 5 billion periodicals. An additional 21.2 percent, or 1.5 billion, were free - either ordered by household member or delivered as a benefit of membership in an organization.
roto1 Periodicoh Received by Other Means While the diary study records incoming mail to households delivered by USPS, households also received periodicals through other means (e.g. newsstand or private delivery). Volumes were collected during the recruitment interview of the 2000 diary study.
The survey captured the number of newspapers or magazines (ordered by a household member) a household receives by mail and the periodicity of the publications; i.e. how many are daily newspapers, how many are monthly magazines, etc. Next, the survey collected information about how many different newspapers or magazines the household receives that do not come through the mail, along with the periodicity questions.
In 2000, households estimated that they received 5.2 billion newspapers or magazines through means other than USPS. Table 5.4 compares newspaper and magazine volumes, received by mail and not by mail, using 1987 and 2000 totals from household recruitment interviews.
According to households, the number of periodicals received by mail decreased slightly since 1987. Data shows little significant variation for those periodicals households say they received by mail.
In addition, households say they received fewer periodicals through other means. The average pieces households received per week fell from 2.3 in 1987 to 1.6 in 2000.
NfWp0pWS
Mogarinas
Total Pieces per Week
TABLE 5.3
Percentage of Total Periodicals by Type of Subscription
0.55 0.50 1.23 0.92
3.23 3.21 1.10 0.68
3.78 3.71 2.33 1.60
I Paid, Ordered by Household Member I 70.3 I I Free, Ordered by Household Member I 8.0 I I Free, Come wiim Membenhip I 13.2 . I
TABLE 5.4
Newspapers and Mogozines, Pieces per Household per Week, Manner of Receipt
4 0 C h a p t e r 5: Periodicals 2 0 0 0 H O U S E H O L D D I A R Y S l U D V

i
FIGURE 5.2
Periodical Pieces per Household per Week by Edurntionol Attainment
Furtors Affecting Receipt of P eriodicols
4 2 3.5 $ 3
- L1 z 2 5 2 2 3
g s 1.5 $ 2 1
o a
? 0.5 0
8th Giode 01 ks Same High High khwl %me Cdlege Tehnirol khd (dlege Gioduote Port Groduote smod boduole Grodunte WdK
Educotionol Altoinmen1 of Hwd of Household
There are various factors that might influence a households receipt of periodicals. Several of these variables are demographic while others are geographic.
Income would seem to influence volumes since periodicals are typically received through a paid
subscription (55 percent in 2000). Figure 5.1 shows that as income increases, Periodical Volumes increase.
Educational attainment - is highly correlated with income and is used in this chapter to make Periodicals Volume comparisons. Figure 5.2 shows that as educational attainment increases, households receive more periodicals. However, volumes for college graduates and those who have done post- graduate work fell considerably since 1987.
FIGURE 5.1
Periodicals per Household per Week by Household Income
Z O O 0 H O U S E H O L D D I A R Y S T U D Y Chapter 5 : Perlodicols 4 1
I
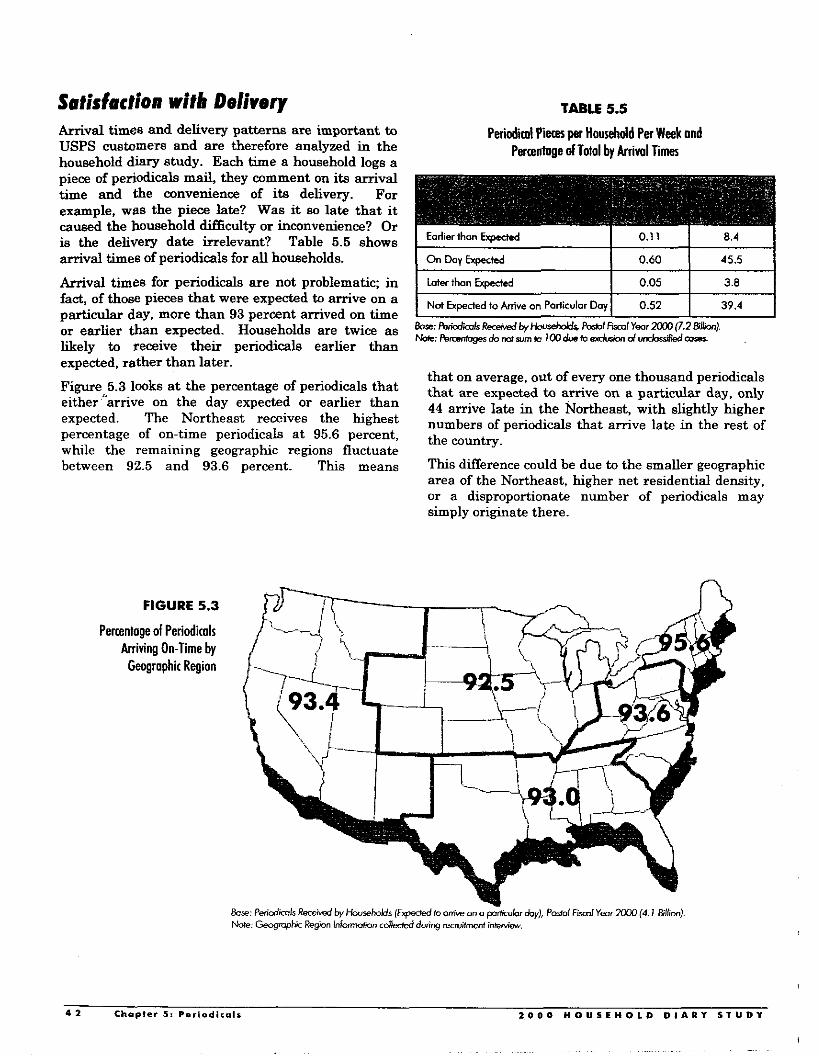
Sutisfuction with Delivery Arrival times and delivery patterns are important to USPS customers and are therefore analyzed in the household diary study. Each time a household logs a piece of periodicals mail, they wmment on its arrival time and the convenience of ita delivery. For example. was the piece late? Was it 80 late that it caused the household difficulty or inconvenience? Or is the delivery date irrelevant? Table 5.5 shows arrival times of periodicals for all households.
Arrival times for periodicals are not problematic; in fact, of those pieces that were expected to arrive on a particular day, more than 93 percent arrived on time or earlier than expected. Households are twice as likely to receive their periodicals earlier than expected, rather than later.
Figure 5.3 looks a t the percentage of periodicals that either "arrive on the day expected or earlier than expected. The Northeast receives the highest percentage of on-time periodicals a t 95.6 percent, while the remaining geographic regions fluctuate between 92.5 and 93.6 percent. This means
FIGURE 5.3
Percentage of Periodimls Arriving On-Time by Gwgrophic Region
TABLE 5.5
Peiiodiml Pieces per Household Per Week ond Percentage of Total by Arrival Times
I I I I
that on average, out of every one thousand periodicals that are expected to arrive on a particular day, only 44 arrive late in the Northeast, with slightly higher numbers of periodicals that amve late in the rest of the country.
This difference could be due to the smaller geographic area of the Northeast, higher net residential density, or a disproportionate number of periodicals may simply originate there.

Of the 7.2 billion Periodicals mailed to households in 2000, less than one percent arrived so late as to cause inconvenience to households. This percentage is slightly less than in 1987. Table 5.6 shows households' need for delivery of Periodicals in 2000, as compared to 1987.
In Table 5.7, totals across delivery categories are compared by geographic region. The data shows that households in the central region account for the largest percentage of late-arriving mail. In fact, this region i s at least two times as likely as every other geographic region to receive Periodicals mail late.
Don? KnowiNo Answer
I i l
7.2 . 3.8
TABLE 5.6
Pwiodimk - Pwmtuge of Toto1 by Anitude Toword Timing of mi
oial
I Could h i v e LotedNo DiHiculh, I 40.2 I 32.2 I
100.0 100.0
I Should Cane M Proper DOY I 19.5 I 25.2 I Has No Regular Delivery Day 9.0 17.4
Anives LateICaures Difficulty I 0.9 I 0.8
I Delivery Dale Not Important I 22.7 I 20.3 I I Other I 0.4 I 0.2 I
TABLE 5.7
Periodicals- Percentage within Attitude Toward Timing of Arrival by hgrOphK Region
2 0 0 0 H O U S E H O L D D I A R Y S l U D Y Chmpter 5 : P w i o d i c o l s 4 3

Chmpier 5: P e r i o d i . a l s 2 0 0 0 H O U S E H O L D D I A R Y S l U D Y 4 a

Chapter 6: Packages The diary study collects a variety of information about the packages received and sent by households in PFY 2000. This information includes package classification, delivery method, use of special services, sender type, contents and reason for sending the package. This chapter presents an overall picture of package volumes as well as characteristics of households who sent and received packages using USPS in PFY 2000.
There are various classifications available for households and nonhouseholds to send packages through USPS. They are: First-class, Priority and Express, Standard Mail (A) (nonhouseholds only), Standard Mail (E%) and Special Standard.
First-class mail receives prompt handling and transportation. I t is generally delivered overnight to locally designated cities and within two days to locally designated states. Delivery by the third day can be expected for outlying areas. Priority mail offers preferential handling and expedited delivery. AU First-class mail exceeding 13 ounces is treated as Priority. Express mail is the fastest mail delivery service the USPS offers. I t provides guaranteed overnight delivery service 365 days of the year and is automatically insured up to $500. Standard Mail (A) is used primarily by retailers, catalogers and other advertisers to promote their products or services. I t has minimum volume requirements and is often used to send items ordered by households. Standard Mail @) consists of mailable matter that is not required to be mailed as First-class, not mailed as Standard Mail (A), and not entered as Periodicals. It must weigh over a pound. Standard Mail (B) consists of several subclasses, including Parcel Post, Bound Printed Matter, and Special Standard (a special category for books, film, printed music and test materials, manuscripts, sound recordings and computer- readable media). Advertising restrictions apply.
Pochges Received by Households Households received 3.4 billion packages in 2000, a significant increase from 1.2 billion25 in 1987. In 2000, households received an average of 0.64 packages per week per household, compared to 0.26 in 1987.
Fint Clorr
Volumes calculated using 198i mean volumes and "lntercensal Estimates ofTotal Households.'' July 1. 1987. Bureau ofthe Cenaus Issued October 1994~ There were an estimated 88.8 million households in 198i.
19.4
USPS delivered seventy-one percent, or approximately 2.5 billion of these packages. This includes First-class, Priority and Express, Standard Mail (A) and (B), as well as packages delivered to foreign destinations (See Table 6.1). The second most common delivery method was UPS Ground Service, a t 8.1 percent or 278 million packages.
Prionw ond Express
Previous data presented in Chapter Three illustrates that a large proportion of Standard Mail (A) packages were sent to households in response to an order by a member of the household. Not surprisingly, Standard Mail (A) and Standard Mail (B) packages make up almost two-thirds of all packages received by households in 2000, since both classifications are used for this type of delivery. Priority and Express packages account for the smallest portion of USPS- delivered packages received by households in 2000.
TABLE 6.1
Packages Received by Households and Delivered by USPS, Percentage of Toto1
18.5
I Stmdord Moil (A) I 35.3 I
Foreign Pockager
I Standard Mail (6) I 24.1 I
0.3
Unclorrified 2.4
Toid Packager
2 0 0 0 H O U S E H O L D D I A R Y S T U D Y Chmpter 6 : P a c k a g e r 4 5
Ix
100.0

Received Puchge Cburecteris tics Sixty percent of packages received by households, or slightly more than two billion packages, were sent by a business to a household member. These deliveries were either in response to an order from a household or for another reason, such as a free gift in exchange for membership. Households sent only nine percent of packages received by households in 2000.
In fact, a closer look a t sender type and contents among packages received showed that 80.5 percent of items ordered from a catalog or retail store and sent to a household were mailed using USPS26. USPS is also retailers' delivery method of choice for 92 percent of books and audio materials sent to households and almost 100 percent (99.4) of unsolicited samples or advertising.
Retailers, or merchants as they are called in the HDS, are the largest user for every delivery method. They are responsible for 61 percent of packages delivered to households by USPS.
Special services available for a fee in addition to postage included special handling, insured mail, collect on delivery (COD), registered mail and
FIGURE 6.1
Packages Received per Household per Week by
Household income
certificate of mailing. Special handling made up the only significant percentage of seleded seMces, which is 2.4 percent (81.6 million) of total packages received by households in 2000. Special handling provides preferential handling but not preferential delivery and was available for First-class Mail, Priority Mail and Standard Mail (B).
Factors Affecting Puchge Receipt Package receipt increases with income in 2000 but levels off across middle-income categories (See Figure 6.1). This could be due to household purchasing patterns changing with income.
In PFY 2000, almost one-quarter of households with an annual income exceeding $64,000 has five or more credit cards from retail stores, compared to 13 percent of households earning between $25,000 and $50,000 annually. The same ratio is true for major credit cards, e.g. Mastercard and Visa. In fact, the average number of major and retail credit cards per household is 4.0 for households earning $25,000 to $45,000 annually and 6.3 among households with annual incomes exceeding $65,000.
1.2 I
* I t should be noted that these are not mutually exclusive categories since households were allowed to Select more than one contPnt and sender type
4 6 Chaplev 6 : Packmger 2 , 0 0 0 H O U S E H O L D D I A R Y S T U D Y
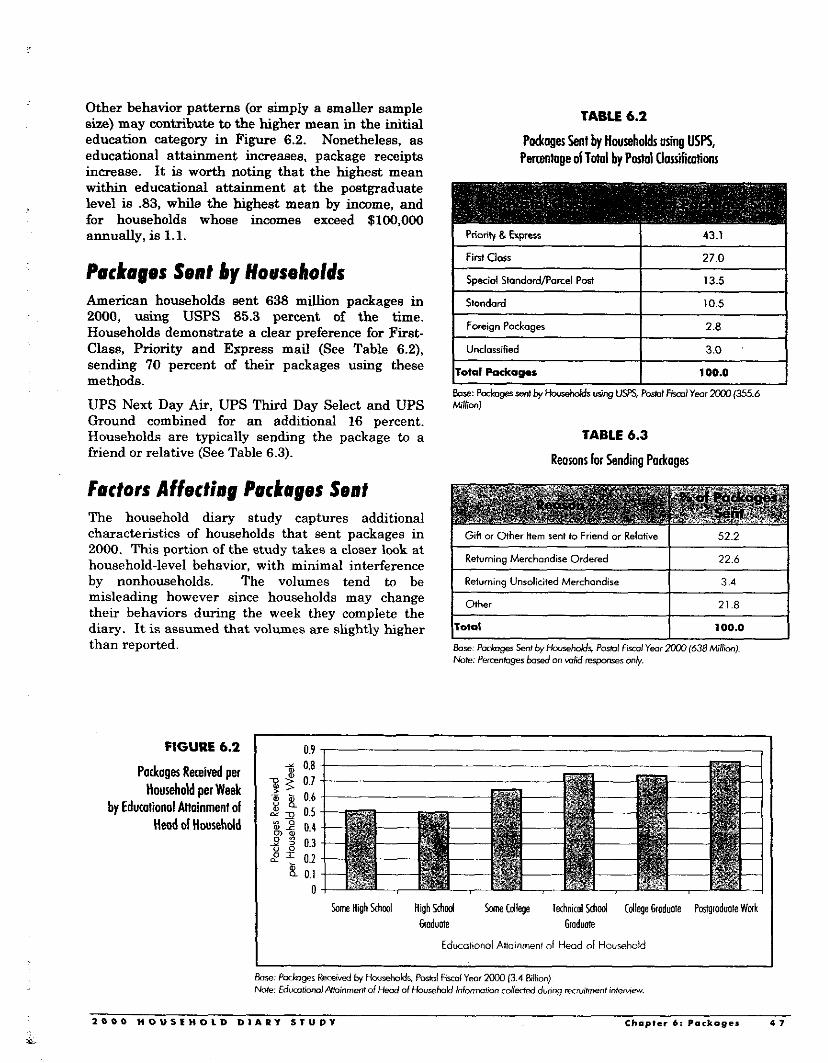
TABLE 6.2
Packoges Sent by Households using USE, Permtoge of Total by Post01 Classifications
Other behavior patterns (or simply a smaller sample size) may contribute to the higher mean in the initial education category in Figure 6.2. Nonetheless, as educational attainment increases, package receipts increase. It is worth noting that the highest mean
Gik or Other Item sent to Fnend or Relative
Returning Merchandise Ordered
Returning Unsolicited Merchondire
m e r
Total
w i t h educational attainment a t the pktgraduate level is 33, while the highest mean by income, and for households whose incomes exceed S100.000
52.2
22.6
3.4
21 .a 100.0
annually, is 1.1.
Packuges Sent by Households American households sent 638 million packages in 2000, using USPS 85.3 percent of the time. Households demonstrate a clear preference for First- Class, Priority and Express mail (See Table 6.2), sending 70 percent of their packages using these methods.
UPS Next Day Air, UPS Third Day Select and UPS Ground combined for an additional 16 percent. Households are typically sending the package to a friend or relative (See Table 6.3).
I 43.1
I 27.0 I I Special SbndordParcel Port I 13.5 I I Stondad I 10.5 I I Foreign Pockqer I 2.8 I I Unclassified I 3 a I
~Se:f'odmger~lkyHanehddruijngusK PosbFFismlYeorXCO(355.6 M.lh]
TABLE 6.3
Reasons lor Sending Pockages
Factors Affecting Packuges Sent The household diary study captures additional characteristics of households that sent packages in 2000. This portion of the study takes a closer look at household-level behavior, with minimal interference by nonhouseholds. The volumes tend to be misleading however since households may change their behaviors during the week they complete the diary. It is assumed that volumes are slightly higher than reported.
FIGURE 6.2 I 0.9 I I
Packoges Received per Household per Week
by Educational Anoinment 01 Head of Household
h e High Qhml High Schd Sane (allege Technical Schwl Cdlege Gioduote Pcstgroduote Wak h d u o t e Groduote
Edwotmnol Anoinmenl 01 Heod of Household

FIGURE 6.3
Packager Sent per Household per Week by Household Income
Eort
Northwst
S0"th
0.25 1 1
0.12
0.14
0.11
Same High Schcd High Shod Same (dlege Iechnicol Schcd College Gtoduote Portgtoduote Wotk Goduote 6mduote
Educotionol Attainment of Head of Household
Figures 6.3 and 6.4 complete the picture of packages sent by households in 2000, comparing packages sent against household income and educational attainment. This data mirrors package receipts comparisons, but on a much smaller scale. In the case of income,'higher income households tend to send more packages. Dips in this curve are most likely due to smaller sample sizes within each category.
In general, educational attainment has a positive impact on the number of packages sent. While differences in the number of packages sent seem to fluctuate among lower levels of educational attainment, the positive impact of higher education (Le. college graduate, postgraduate work) appears to maintain a strong effect.
Packages sent by households are relatively consistent across geographic regions (See Table 6.4).
FIGURE 6.4
Pockages Sent per Household per Week by Educational Attainment of Head of Household
TABLE 6.4
Packages Sent per Household per Week by Geographic Region
I Central I 0.09 I I West I 0.14 I
4 a Chapter 6 : P a c k a g e r 2 0 0 0 H O U S E H O L D D I A R Y S T U D Y

Additional factors might also influence when households use USPS to send their packages. For example, are households that rent PO boxes more likely to use USPS to mail their packages? Do they visit the post office more frequently? Recruitment data was analyzed to determine whether there was a relationship between these household characteristics.
Results indicate that use of a PO box does not influence a household's decision to use USPS. Households with a PO box use USPS to mail their packages 61 percent of the time, choose a private mailing service or shipping company 30 percent of the time, and the-remaining portion say they use neither.
These percentages are not significantly different from those households who do not have a PO box. The latter use USPS 58 percent of the time, opting for an alternative shipping method 29 percent of the time.
Households' primary reason for choosing another delivery method over USPS is that they find the other service is more convenient or simply closer (32 percent), offers longer or later hours (eight percent), has faster overnight delivery (eight percent) or a shorter wait time since it is less crowded (six percent).
\
2 0 0 0 H O U S E H O L D D I A R Y S l U D Y Chmpier 6 : P a r k a g e s 4 9
L

Chmpter 6: P o c k a g e s z o o 0 H O U S E H O L D D I ~ P Y S T U D Y 5 0
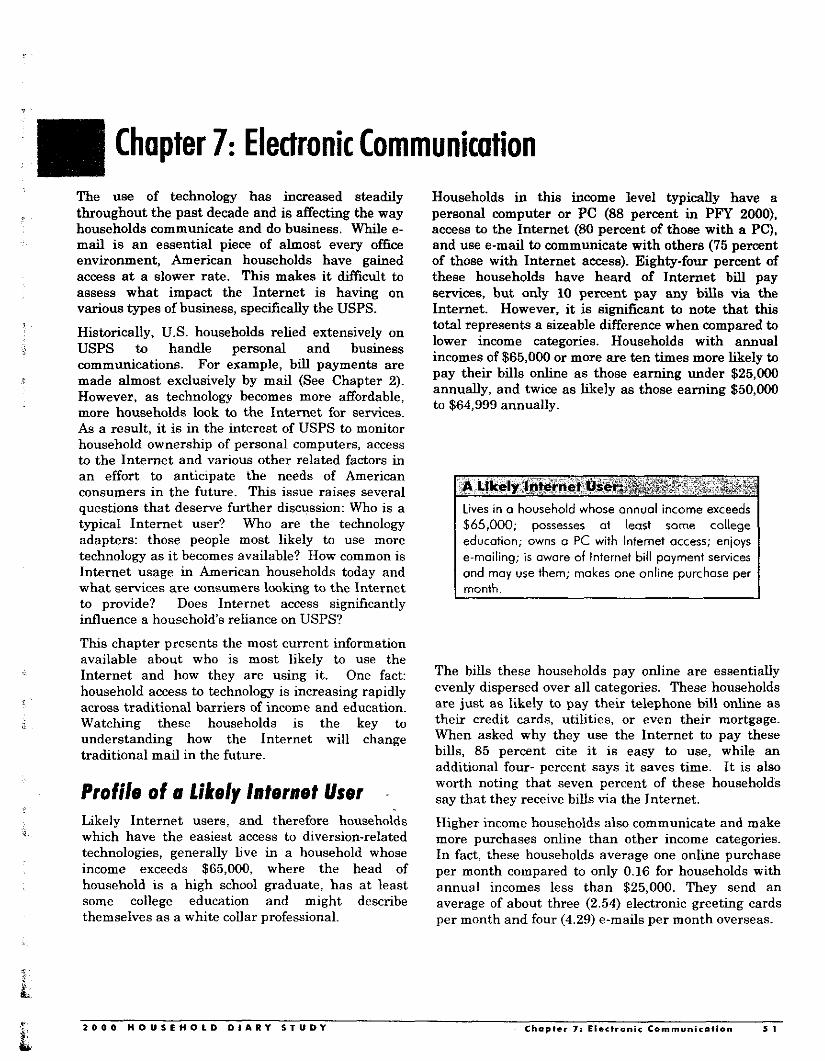
Chapter 7: Electronic Communication The use of technology has increased steadily throughout the past decade and is affecting the way households communicate and do business. While e- mail is an essential piece of almost every office environment, American households have gained access a t a slower rate. This makes it difficult to assess what impact the Internet is having on various types of business, specifically the USPS. Historically, US . households relied extensively on USPS to handle personal and business communications. For example, bill payments are made almost exclusively by mail (See Chapter 2). However, as technology becomes more affordable, more households look to the Internet for services. As a result, it is in the interest of USPS to monitor household ownership of personal computers, access to the Internet and various other related factors in an effort to anticipate the needs of American consumers in the future. This issue raises several questions that deserve further discussion: Who is a typical Internet user? Who are the technology adapters: those people most likely to use more technology as it becomes available? How common is Internet usage in American households today and what services are consumers looking to the Internet to provide? Does Internet access significantly influence a households reliance on USPS?
This chapter presents the most current information available about who is most likely to use the Internet and how they are using it. One fact: household access to technology is increasing rapidly across traditional barriers of income and education. Watching these households is the key to understanding how the Internet will change traditional mail in the future.
Profile of a likely lnternet User Likely Internet users, and therefore households which have the easiest access to diversion-related technologies, generally Live in a household whose income exceeds $65,000, where the head of household is a high school graduate, has a t least some college education and might describe themselves as a white collar professional.
Households in this income level typically have a personal computer or PC (88 percent in PFY ZOOO), access to the Internet (SO percent of those with a PC), and use e-mail to communicate with others (75 percent of those with Internet access). Eighty-four percent of these households have heard of Internet bill pay seMces, but only 10 percent pay any bills via the Internet. However, it is significant to note that this total represents a sizeable difference when compared to lower income categories. Households with annual incomes of $65,000 or more are ten times more likely to pay their bills online as those earning under $25,000 annually, and twice as likely as those earning $50,000 to $64,999 annually.
Lives in a household whose onnuol income exceeds $65,000; possesses at least some college educotion; owns o PC with lnternet access; enjoys e-mailing; is owore of Internet bill payment services ond moy use them; makes one online purchase per month.
The bills these households pay online are essentially evenly dispersed over all categories. These households are just as likely to pay their telephone bill online as their credit cards, utilities, or even their mortgage. When asked why they use the Internet to pay these hills, 85 percent cite it is easy to use, while an additional four- percent says it saves time. It is also worth noting that seven percent of these households say that they receive hills via the Internet.
Higher income households also communicate and make more purchases online than other income categories. In fact, these households average one online purchase per month compared to only 0.16 for households with annual incomes less than $25,000. They send an average of about three (2.54) electronic greeting cards per month and four (4.29) e-mails per month overseas.
2 0 0 0 H O U S E H O L D D I A R Y S T U D Y Chapter 7: Els. l roni< Communication 5 1

Access to Technology to PFY 1999 totals. In addition, a large percentage of households in lower income categories anticipate
Fifty-eight percent, or over 60 million households, own a PC21 with the ability to own a PC largely dependent on income. More than ninety percent of households with an annual income exceeding $100,000 own a PC, compared to 23 percent of those with annual incomes under $7,000 (See Figure 7.1). Generally, computer ownership is more widespread acToss income p ~ y 2000, PC ownership is most prevalent in households with households in middle-income said they three or more members, and is crossing traditional have a pc (See also Appendix Table A7-1) educational attainment barriers. Slightly more than
getting a PC in the near future (See Figure 7.2).
YI loo FIGURE 7.1 2
PC Ownership a by Household Income 2 60
4 80
3 I
40
20
" 0
rn - Y 0,
YI 100
2 BO 3 0
2 0
2 m 3
0 0, 0
I
O 40
.e 20 8 m " 0
FIGURE 7.2
PC Ownership in 2000 and Those Likely to Buy o PC by Household lntome
"There were 104 8 million households tn the US in 2W0. Source: Current Population Survey. March 2000. Bureau ofthe Census. An cxpan~ion factor of 1081 1.0 was used to compute a i l volumetric totals~
5 2 Chapter 7: Electronic Communication 2 0 0 0 H O U S E H O L D D I A R Y S l U D Y
1 .~

FlGURE7.3
Fax Capability by Household Income
cS7K 4 1 O K cS15K 420K 4 2 5 K 4 3 5 K <SW 4 6 % <%OK CSlWK SlWK+ Household Income
80 i; 3
3 ,
9 ~
& ~ r n 5
- 0
a
m
Cs7K <SIOK 4.151: <SZOK 4 2 5 K cS35K <SW 4 6 % <90X <SlWK $loOK+
Household Income
FIGURE 7.4
Household Internet Access by Household Income
twenty percent of head of households with an 8 t h
grade or less education own a PC in 2000. This percentage is more than twice the 1999 total of 8.2 percent (See Appendix Table A7-2).
Although 24 percent of all households use a fax machine or a PC with fax-capabilities to send fax communications, household fax capability is not increasing as rapidly as PC ownership (See Figure 7.3).
How common is e-mail usage among households? Forty-seven percent of households have PCs with Internet access, translating to 49 million households
nationwide. Almost seven million of these households have access on more than one computer. The income barrier is again prevalent: households with annual incomes exceeding $65,000 annually are four times as likely to have access to the Internet than those earning less than $25,000 annually (See Figure 7.4) (See also Appendix Table A?-1).
Of those households with Internet access, higher income households (those with annual incomes over $65,000) are most likely to use the Internet to send personal greetings. When respondents were asked about the number of electronic greeting cards sent in the past month, the average number reported was 2.54 in households with annual incomes exceeding $65,000, compared to 0.87 for households with annual incomes of less than $25,000.
.I’ 2 0 0 0 H O U S E H O L D D I A R Y S T U D Y Chapter 7: Electronic Communiration 5 3 i I

TABLE 7.1
Average Number of Monthly E-mails, Cards and Letters, and Phone Calls Overseas
Phone Cdlr
0.43 I 2.4 2.05 I
This linear relationship can also be seen when respondents were asked how many times they e- mailed f iends or relatives overseas in the past year. Higher income households were four times as likely to have done so than those households with annual incomes less than $25,000. Does this mean these households are substituting some of their letters, cards, or telephone d s with e-mail? Not according to additional data. As shown in Table 7.1, households with Internet access use traditional forms of communication (telephone calls, cards, and letters) with about the same frequency as households without Internet access. Therefore, Internet access serves to supplement overseas communications, rather than replace traditional means.
Cards ond Lenen 2.02 2.73
American households reported making 46.4 million online purchases in the last month=. Although a monthly average of 0.45 online purchases per household makes up a relatively small percentage in the overall economy, it is significant to establishing a proiile of households who use the Internet. Twenty-six percent of all households said they made an online purchase last year, compared .to 10 percent of households with an annual income less than $25,000. This is evidence of increasing access across all income categories (See Figure 7.5).
FIGURE 7.5
PFY 2oW Online Purchases Made in Port
12 Months by Income
~
I Under S25K 0 525X-49.9 0 $501-64.9 S65K+ h ", 20
2 16 5 14 r = IO
" 6
% 18
"7 I ?
~a ' - m
1-3 4-6 1-10 11-20 21-54 51 w mwe DWNA Number of Online Purchases ~ Previous 12 Months
=Since p o p l e are more likely to accurately recall their activities in the past month, annual volumes are probably low due to underreporting
5 4 C h a p t e r 7 : Ele.tronic C o m m u n i w t i o n 2 0 0 0 H O U S E H O L D D I A R Y S T U D Y

percent in PFY 2000 (See Appendix Table A2-49). As a portion of total volume, households in PFY 2000 make 24.7 million online bill payments per month; two percent of the total monthly bills paid per household.
Households’ Internet purchasing increases with PCm ownership and Internet access, and therefore mirrors patterns seen in the profile of the likely Internet user. There is an additional relationship between households who shop online and those who use the Internet to pay bills. In fact, of households who pay b a s online, 79.7 percent made one or more Internet purchases in the past year. Over half (54.3 percent) made an Internet purchase in the past month. Just over six percent of households that pay bills by traditional mail said they made at least one online purchase in the past year, compared to 5.9 percent in the past month.
Online Bill Pmyment Online bill payment has increased from less than two percent of households in PFY 1999 to four
Nearly 10 percent of those households with a PC pay bills online. In terms of income and educational level of the household, 37.4 percent of those who pay bills online graduated from college, while an additional 21 percent did a t least some postgraduate work. Sixty- four percent categorize themselves as white-collar professionals, while 47 percent are households with annual incomes of $65,000 or higher.
Ninety percent of households who pay bills online say they do so because it is easy to use.
E( Just over forty percent of households that own a PC made at least one Internet purchase in the past year. wmpamd to 3.4 percent of households
Is wulthout PCs.
: 1 0 0 0 H O U S E H O L D D I a R Y S T U D Y Chapter 7 ; E I e c l r ~ n i i Comrnuniralion 5 5
i& . ~,

5 6 Chapter 7 : E l e c t r o n i c Communicat ion 2 0 0 0 H O U S f H O L D D I A R Y S T U D Y

Chapter 8: Summary and Conclusions
e
Total mail volumes grew in 2000. Total domestic mail reached 204.6 billion pieces. Of this total, 156.7 billion mail pieces (77 percent) were sent or received by households. While the 2000 HDS is segmented primarily by postal classification, this chapter summarizes key points of the HDS by sedor: nonhousehold-to-household mail, household-to- nonhousehold mail, and finally, the closed loop that is household-to-household mail.
Wonhousehold-to-Household Muil Mail from nonhouseholds dominated the household- based market a t 133.8 billion pieces. Fifty-one percent of nonhousehold-to-household mail was sent Standard Mail (A). One-third was mailed First-class.
Merchants (department stores, mail order companies, and publishers) are the largest senders within this sector. Households received more mail from Merchants than any other industry sender type. Merchants were three times as likely to use Standard Mail (A) as First-class. Mail from the financial sector was a distant second. This latter sector overwhelmingly used First-class.
2000 diary data suggests that a large portion of Standard Mail (A) is used for cross-marketing new products and services to existing customers. Over half of Standard Mail (A) was sent by a business organization with whom the household has done business in the past. Standard Mail (A) is also changing its “look to appear more like First-class. In 2000, Standard Mail (A) was more likely to be addressed to specific member of the household than in 1987 and to use letter size envelopes.
First-class catalog advertising appeared to be a strong niche market. Forty-two percent of households receiving First-class catalogs reported that they were considering responding (compared to 11 percent of Standard Mail (A) catalogs). First-class catalog responders tended to be older (age 45 and older) than nonresponders.
online shopping did not yet appear to have had a strong impact on this catalog market. Eight percent of respondents reported enjoying shopping via the Internet ”quite a bit or very much,” and 14 percent disclosed making a t least one online purchase in the last month.
Both catalog and online shopping behaviors resulted in business for USPS. Eighty percent of items ordered from a catalog or retail store and sent to a household were mailed using USPS. USPS is also retailers’ delivery method of choice for 92 percent of books and audio materials sent to households.
Bills and invoices comprised almost one-third of the First-class mail sent by nonhouseholds. Currently, this source of USPS revenue has not been affected by Internet delivery of bills and invoices. Only four percent of households reported receiving any bills via the Internet, whereas 47 percent of households reported having access to the Internet. Receipt of bills via the Internet was limited to households with annual incomes greater than $65,000, while the majority of households with annual incomes greater than $35,000 had access to the Internet.
As might be expected, the majority of mail sent to households by nonhouseholds was in the form of advertising. In fact, advertising, including requests for donations, is the greatest proportion of mail received by households, accounting for 59 percent. Household‘s reactions to the increase in advertising mail are mixed. On the one hand, more than half of all households say at least one person in the households reads advertising sent First-class or Standard Mail (A). On the other hand, 57 percent of households wish they received less advertising mail (compared to 30 percent in 1987). The percentage of advertising mail that households find interesting or are likely to read has fallen from 63 percent in 1987 to 37 percent in 2000.
Of periodicals received by households through the mail, most are monthly magazines (46 percent) followed by weekly magazines (18 percent), weekly newspapers (12 percent), and daily newspapers (11 percent). The number of newspapers received by mail decreased since 1987, while the number of magazines received through the mail increased slightly. In fact, it appears that the number of magazines households receive through means other than the mail decreased.
2 0 0 0 H O U S E H O L D D I A R Y S T U D Y Chapler 8 : Summary and Conr lvr ionr 5 7
. _ .

Packages received by households increased significantly from 1987. Of these packages, 71 percent were delivered by USPS. The second most common delivery mechanism was UPS ground service (8.1 percent).
Household-to-lVonhousehold Moil Household-to-nonhousehold mail totaled 4.5 billion pieces or 7.6 percent of total domestic mail in 2000. This total represents an increase in volume - from 2.1 pieces per household per week in 1987 to 2.9 pieces per week in 2000. Virtually all household-to- nonhousehold mail was sent First-class (98.5 percent), with the remaining 1.5 percent sent Priority Mail.
Bill payments accounted for 49 percent of all First- Class mail sent by households. Mail is stiLl the dominant vehicle for bill payments. Ninety-four percent of households reported using the mail to pay their bills. Utility bills (telephone and electric) were the most frequently mentioned types of bills paid by mail. Households primarily use the mail because it is ”easy to use,” and cite “habit” as a very distance second.
Only four percent of households say they use the Internet to pay their bills. Credit cards were the most frequently mentioned type of bills paid by Internet. Most people who used the Internet to pay bills did so because “it’s easy to use” _ _ an important finding for eBillPay market expansion.
Households were asked if they were considering responding to the advertisements contained in mail pieces received. For those pieces that arrived ma First-class, households indicated that they would most likely respond by mail (44 percent), followed by in-person (26 percent) and phone (21 percent). Few (four percent) indicated that they would respond via the Internet.
Household-toIHousehold Moil Household-to-household mail totaled 7.4 billion pieces and comprised only 3.6 percent of total domestic mail, declining from 4.8 percent in 1987. Its affect on the overall mail stream was slight however; this decline represented only a small drop in pieces per household per week, from 1.6 to 1.4. Household-to-household mail primarily was sent First-class (98 percent), with the remaining two percent sent Priority Mail.
Use of First-class mail for personal communications declined since 1987. In 2000, about 18 percent of all First-class mail sent by household was greeting cards, including holiday cards, and nine percent was
letters to a friend or relative. In total, First-Class mail sent for any personal reason comprised 31 percent of First-Class mail pieces compared to 68 percent of pieces that were sent for household business reasons.
PFY 2000 found 43 percent of al l households using e- mail to communicate with others and 21 percent sending electronic greeting cards. Yet, 81 percent of households reported sending at least one personal letter in an average month, and 82 percent reported sending at least one non-holiday greeting card in an average month. Of households with friends or relative in a foreign country, 12 percent have used e- mail to communicate in the last twelve months, while 25 percent have sent cards or letters.
Conclusions Total mail sent or received by households increased from 22.6 pieces per week in 1987 to 28.5 pieces per week in 2000.
The most significant increase in pieces per household per week was evidenced for Standard Mail (A), but pieces within all mail classifcations with the exception of periodicals increased since 1987. Most of the mail received by households contained some form of advertising and a slight majority of households still reported reading direct mail advertising. However, households are becoming increasingly intolerant of advertising appeals regardless of means of delivery. This trend may influence future readership levels.
Bill payments comprised the largest single portion of mail sent by households. Electronic payment of bills will not influence these volumes for the near future.
Overall, use of the mail for personal communications is declining. Whether this is due to increased use of email and electronic greeting cards or to broader lifestyle or generational shifts has yet to be researched. A technology augment has been added to the HDS for 2001. It is anticipated that this data will offer additional insight into how the Internet will impact traditional mail in the future.
5 8 Chmptsr I: Svmmqry mnd Con.lusioni 2 0 0 0 H O U S E H O L D D I A R Y S T U D Y

2 0 0 0 H O U S E H O L D D I A R Y S T U D Y Appendix 3 9
i

Concordance of Tables

Concordance of Appendix Tables
PFY 2000 Description
Tables Tables PFY 1999
~~~ ~
3 - 1
3 - 3
4 - 1 0 4 - 2
4 - 20
4 - 5
4 - 24 4 - 23
4 - 25
4 - 18 4 - 19
4 - 21
4 - 1 7
4 - 9 4 - 8
4 - 7
4 - 6
4 - 4
4 - 27
4 - 26 4 - 32 4 - 33 4 - 34
4 - 38
4 - 4 0
4 - 4 1
4 - 42
4 - 43 4 - 44 4 - 45 4 - 46 4 - 48 4 - 01
3 - 2 ~ ~~~~ ~~~
~
4 - 3- ~ ~~~
~~ ~
~~
4 - 22
.~
4 - 35
4 - 39
ML-J ~~~~ ~ ~ ~~~~~~ ~~~~ ~~ ~ ~
(Percentage o f Pieces) A2-6 A2-7
FirstlClass Mail - - Industry Usage of Reply Envelopes A2-8
First-class Mail ~- Industry Mail to Households ~~ A2-9 A2-10 A2-1 1 A2-12
A2-13
~~ A2-14 ~ A2- 15
A2-16
A2-17
~ A2-18
A2-19
A2-20 A2-21
~~~ A2-22
A2-23 ~~~~
~. A2-24 A2-25 A2-26 A2-27
A2-28
~~ First-class Mail Usage of Reply Envelopes -- by Industry (Percentage ~~~ ~ of~Pieces) ~ ~ ~ ~~ ~ ~ ~~~
First-class Mail -- Enclosure of Reply Envelopes -- by Content ~~ (Percentage ~~ of Pieces)
[Percentage of Pieces From Each Industry That Contain Reply Moil) ~ ~ ~~
First-class Mail - - Bills and Statements -~~~~ ~ . ~ ~~~~~ ~
Use of First-class Business Invitations/Announcements~Mo,l - - by Industry ~~ Use ~ of ~~ First-Class Advertising-Enclosed Mail - - by Industry
Activities Very Much or Quite a Bit) ~~ ~.
~~ First-Class Mail Received - - by Number of Credit Cards
(Pieces P e r Household Per Week)
~ ~ ~~~~~~
~~ ~ -..
~ ~~~~
First-Class Mail -- Interest in Nine Activities (Percentoge of Househaldi Which Enioyed These
First-class Moil Received --by Number of Finonctal Accounts and Insurance Policies
First-Class Moll Receipt -- Content by Ageof Heod of Household
First-class Mail Receipt -- Content by Education of Head i f Household ~ ~
(Pieces Per Household Per Week) First-Class Receipt -~ Content by Income (Pieces Per household Per Week) First-Closs Mail -- Percent of Nonperson01 Mail Received by Households Which
~ ~~~ ~
~~~ ~
~ ~~~~
~ is ~~ Sent~Pjesort~-- by Content Total ~~ ~~ ~ Percentage ~. First-class Moil -- Total Envelopes by Sector (Percentage of Pieces)
..~ of Industry's First-class Mail Received ~~ by Households Which is Sent Presort
~ ~ - -~
First-ClaJs Moil 1- Total Envelopes by Content (Percentage of Total Envelopes) First-Class Mail -- Total ~~ Envelopes by Industry (Percentage of Total~Enyelopes)~
~ First-class ~~~~~~ Mai l -- Nonpresort Envelopes by Sedar (Percentage of Pieces) ~~~~~ First-Class ~
First-class . .. ~~ Mail -: Total Cards b y Industry ~ [Percentage ~~~ ~ 2 ~ Total ~ -. Cards)- ... ~
~~
~~~ Mail -- Total Cards by Sector [Percentage of Pieces)- ~~' ~~~ ~ .. .. ~~ ~~~
~ ~ ~~ ~~ ~~ ~
~~ First-class ~ .. Moil -- Total Cards by Content (Percentage of Total Cards) First-class Moil -- Cards Received by Households -- Householdls Percentage of Total Mail Sent ot Each Card Rate Cqte-9o.v First-class Mail - - Cards Received by Households --
~~ ~~ ~~~ ~
A?, l o nL-L7
~~ Households Percentage of Total Mail Sent at Each Card Rate Category -- by Industry ~~~~~
First-class Mail - - Timeliness of Arrival ~ A2-30 . . A2-31
~ First-class Mai l - ~~ Reason ~ . for Lateness ~ ~ . . (Percentage .~ ~ of Pieces - That ~~~ Arrived Late) . First-Class Mail Received --'%meliness of Arrival - - by Quarter
First-Class Mail Sent by~Households to Nonhouseholds
.A2-3?..- Firsi:Class Mail Rece;ved'--.Timeliness of Arrival ~~~~~ -- by Postal ~Reglon ~~ A2-33 ~
~~ Fi.rst-Class Mail Originating in Households ondNonhousehoids
A2-34 . A2-35 ~
.. -~ ~~
4 - 50 First-Class. .~ Mail - - Telephone Bill Paying (Percent of Households) A?-36 ..

PM 2000 Description Tables Tables
PW 1999
~ ~~
First-class Mall Media by Which Mail Order Purchases Made in Past Month Were Ordered .^ -- H L - d /
A2-38
'2-39
4 - 1 5 X - 4 0
4 - 1 2 A2-41 -. ~ ~
4 - 1 1 A2-42
- ~
. - 4 - I.¶ ~ ~ bytjouseholds ~~ ~~~ in a: verage mth - - byAge of Head~of:Household ~ -~
First-class Mail -- hu,iday/Season's Greeting Cards Sent by Households - -
First-class Mail -- P-rsonal Letters and Cards-(not greeting cards) Sent
by~l_qoseholds in an average Month ~~~ ~~. -- by Education ~~~~~~ of Head of Household
Personal Letters, Cards (not greeting cards) Sent
~~~~~~ by_Educatton of Head ~~ of Household ~~~ prom Entry_!nterview) ~ ~~~ ~ ~ -
~ ~ ~~~~~~~ ____
~ ~~~ ~ ~~ ~~~ ~~ ~~ by~Households i n~on Average Month - - byjncome ~~~~~~~~ , ~~ ~
. . , First-Class Mail -- Holidav/Season's Greetingcards Sent bv Households - - . . 4 - 16 - ~ ~~ by Age ofHead of Household(From Entry ln<erview)~~-- ' -~ ~ ~
, First-class Mail -- Holiday/Season's Greetingcards Sent by Househoids~. b y Income
A2-43
, 4 - 5 6
4 - 58
4 - 59
4 - 57
4 - 5 1
(Percentage or Households) ~~ ~ ~
T i m q o f Bill Payment ~~~~ by Edlcotion ~ of Head of Household (Percentage of Households) ~~~ ~ ~ ~
First-Class MA1 -- Timinq of Bill Pavment - - bv Household Income - (Percentage of Households) ~~
~- First:Class ~~ Mail -- Useof Automotic Deductions (Percent~of ~ Hausehdds) ~~
~ ~~
4 - 52 First-class Mail - - Use of Automatic Deductions - - by Income (Percentage of Households) A2-50
~ ~~~~ ~- ~ ~ - ~~ ~~~~~~ ~~ ~~~ ~~~ ~ ~
Standard Mail(A) Content of'Mailpiece A3- 1
A3-2 6 . 6 A3-3 A3-4 6 . 5 A3-5
6 . 8~~ _-~~A3-60 ~. A3-6b ~-
6 . 9 ~Standard~Mail (A) Shape by Industry (Percentage of Pieces) ~ ~~ . ~ A3-70 A3-7b
6 - 1.1 Standard ~~~~ Mail (A)Shope .. bAddressee ~~ (Percentage ~~~ of Pieces) ~ - ~ ~ A3-8
6 - 12 Standard Mail (A) Zip Code Usage by Shape (Percentage of Mail Received by Households) A3-9
~~~~~~~~ 6 - 13 ~ Standayd ~~ Mail (A)~ Demographip -- Pieces Received Per Household Per Week A3-10 Receipt of First-class and Total Standard Mail (A) (Including Nonprofit Mail) by Number of Mail
6 - 1 4 A3-11
Standard Mail (A) by Familiarity With Institution A3-12
A3- 13 ~
~ ~ ~ ~ A3- 14 ~~
A3-15
6 - 20 ~~~ Standacd,Mail ~ ~~~ ~~ (A) Receipt .. byNurnber ~~ ~~ of -~~~~ Financial ~~~~~ Accounts and lnsurance2Poicies ~ ~~~ ~ ~~ ~~~~ ,. A3-16 A3-17
A3-18
~~ - IPercentoge of Standard Mail (A) Recelved by Households)- ~ ~ ~~
~Stondard Mail (A) by Major Industry by Quarter (Mean Pieces Per Household PerWeek)
6 . 4 Stondard Mal l [A) Addressee (Percentage of Toto1 Standard Mail (A)) ~~ ~ ~~~ ~ ~ ~ ~ .. Standard Mail (A) Addresseeby Industry (Percentage of ~~ Pieces) ~
Standard Mall (A) by-Shope
~ .
~~~~~~
~6 . 7 ~ ~~ ~- ~
Standard Mail (A) Industry'byShape (Percentage ~~ ~ ~~~~ of Pieces Received ~ ~ by Households)- I ~ ~, ~,
6 . 8 cont. Standard Maii~(A) Industry byshape (Percentage of Pieces Received ~ by ~~~~ Households) ~ ~ ~
6- 9 cont. Standard ~ Mail (A) Shape by industry (Percentage ~~~ of ~ Pieces) ~ ~ ~~ ~ ~~ ~.~ ~ .... ~
~~ ~~~~~ ~ ~~ ~~~~
~~~ ~~ - . Order ~~~ Purchases Made .~~ in the . Past YeprjPieces PerlHo~s~ehold Per Week] ~~ ~ - . ~ ~_
~~ - . I P e r ~ ~ ~ ~ . 3 ! h e C ~ - R e ~ e i v e d PY Household% ~~~ . ~ ~ ~~ ~~~~~ ~ ~~ . ~ ~ ~
6 - 16 Standard Mail fi) by Industry ~~~ . . ~ and ~ Familiarity (Percentage of Pieces) .~
6 ~ - 17 ~ ~~ Standard Mo.1 (A) shape by Familiari~yWithOrganjzation (Percentage . .~ -~ ~~ of Pjeces) ~~
6 -(Percentage of Mai!Pie:es-Received by Households)---~ ~ ~ ~~ .~
6 - 19 Standard Mail (A)~ Receipt~by Number of Credit Card Accounts ~~ ~ ~ . ~ ~~~~
' 2 ~ percentage of Mail Received b y Households) ~ ~ ~ ~ ~~ ~~~~~~ ~ ~ , ~~~~ -
STandord Moil (A) _- Mail Order Industry Shape-by F a m & h y With Organization
. .. ~ ~-
Standard Mail (A) Treatment of Moil Piece by Familiarity Wth~Organi ia ion

PFY 2000 Description
Tables Tables PFY 1999
Standard Mail (A) Usefulness of Moil Pieces by Familiarity With Oroonization 6 - 2 3
6 - 24
6 - 25 6 1~26 6 I 27 6 - 28 6 - 29 6 - 3 0 ~
6 - 31
6 ~ 32
6 - 33
6 - 34
d ~ 35
6 - 36
6 - 37
6 ~ 38
6 ~ 39
6 - 40
6 ~ 41
6 ~ 42
6 - 43
6 - 44
6 - 45
6 - 46
6 - 47
6 - 4a
6 - 49
6 - 50
- (Percentage of Mail Rece!ved by Households) ~ ~~
Standard Mail (A) Response to Advertising by Familiarity With Organization (If Pieces Contoined an Advertisement or Request for Donation and Was from One Organization Only) Standard Mail (A] Treatment~by- Usefulness ~ ~~ (Percentage ~ ~ ~ ~~~~~ JPiecesj ~~~~
Standard ~~ Mail-(A) ~~~ ~ Usefulness ~~~ by Treatment (Percentage ~~~~ of Pieces) ~~~ ~~~~ ~~ ~ ~~~~~~ ~~~~ ~~
~ Standard ~~~~~ ~~~~~~ Mail (YTceaLment by Intended Response ~ ~ ~ (Percentap ~~~~~~~~~ ~~~~~ of Pieces1 ~~~~ ~
Standard Mail (A] Intended Response by Treatment (Percentage ~~~ ~ ~~~~ of Pieces) ~~~~~ ~
Standard Mail (A) Usefuln_essbylntended R..ponse~lPercent~g~e.o~P~~c.es),-~ ~ ~ ~~ ~ ~ ~
Standard Mail (A) Intended-Response by Usefulness ~ ~~~~~ (Percentage ~~ ~ ~ ~~ of ~ piece el)^_ ~ ~ ~~ ~ ~
Standard Mail (A) Pieces From Credit Card Industry Response to Mail Piece by Familiarity With Organization (Percentage of Pieces) Standard Mad (A) Pieces From Insurance Companies Response to Moil Piece by Familiarity With Organization (Percentage of Pieces)~ ~
Standard Mail (A) Pieces From Department Stores Response to Mail Piece by Familiarity With Organization (Percentage of Pieces) Stondord Mail (A) Pieces From Moil Order Companies Response~to Moil Piece by Familiarity With Orgonizotjon (Percentage of Pieces) Stondard Mail (A) Pieces From Publishers Response to Mail Piece by Familiarity With Organization (Percentoge of Pieces) Stondard Mail (A) Treatment of Moil Piece by Shape (Percentage of Mail Pieces Received by Households) Stondard Mail [A) Usefulness of Mail Piece by Shape [Percentoge of Mail Pieces Received by Households) Stondord Mail (A) Response to Advertising by Shape (If Mail Pieces Contained Advertising or Request Donation) Standard Mail (A) Percentage of Pieces Read lmmediotely and Set Aside
Standard Moil (A) Percentage of Pieces Eliciting Intended Response by Shope and Familiarity With Organizotion Standard Moil (A) Percentage of Pieces Found Useful
by Shape and Fcmiliarity With Organization ~ .~ ~
Standard Mail (A) From Department Stores Reaction to Mail Piece b y Shape (Percentage of Pieces] Standard Mail (A) From Department Stares Reactiohto Mail Piece by Familiarity and ShapeJPercentage of Pieces) Standard Mail (A) From Mail Order Companies Readion to Moil Piece by Shape
~~ ~ ~~ ~ ~ ~~.~~~ ~~
~~ . ~~~ ~~~
~
~~ ~~ ~~ ~ ~~~~~~~ ~~~~~ .
~ ~ ~ ~
~
by Shape and Familiarity With Organization ~~
(Percentage-of Pieces)~ ~~ ~~
Standard Mail (A) From Mail Order Companies Reaction to Mail~Piece~ by Familiarity and Shape (Percentage of Pieces) Standard Mail (A) from Publishers Reaction to Mail Piece by Shape [Percentage oi Pieces) Standard Mail (A) from Publishers Rea&ion to Mail Piece by F%lia'rity and Shape (Percentage of Pieces) Standard Mail (A) from Credit Cord Cornponies Reaction to Mail Piece by Shape
A3-20
A3-34
A3-35 ~~~~
A3-36
A3-37
A3-38
A3-39
A3-40
A3-4 1
A X A 3
A X A ? , 1"--1
A3-44 (Percentage of Pieces)~ ~. Standard Mail (A) from Credit Card Companies Reaction to Mail Pieces by Familiarity and Shape A3-45 (Percentage of Pieces) Standard Mail (A) from Insuronce Cornponies Reaction to Mail Pieces by Shope A X A f , (Percentage of Pieces) - _ ~ _


PM 2000 Description Tables Tables
PFY 1999
Nonprofit Standard Mail (A) Response to Advertising by Familiarity With Organlzatlon 6 -
6 -
6 -
6 -
6 -
88 (If Piece Contained an Advertisement or Request for Donation and
Ip_e~e~!os_e~o!~Moi~~.cewed bLHouseh!ds)-- ~ ~~ ~~ ~~~ .
~~(P_erce~!a~fMol!-Re~eived bY ~ Household%-- .~ ~- ~~
fi Piece ContainedAdvertising_or Request for Donot ionL- ---
percentageof of^ Mail Pieces Rqcetved by~Household4
Nonprofit Standard Mail (A) Usefulness of Mail Piece by Shope
Nonprofit Standard Mail (A) Response lo Advertising by Shape
Nonprofit Standard Moil (A) Reaction by Industry ~
~~~~ ~~~~~~
A3-76
A3-80
~~~ ~~ ~ ~ ~~ ~~ ~~ ~~~~ -~ ~ ~~ ~ ~ ~ ~~~~~~ ~
.~ 3 - 7 . ~ A4-1 ~~ 3 - 8~ ~ Total ~ ~. Pieces ~~~~ of Advertising ~ ~ ~ ~~ Mail Received ~~~~~ - Per Week by_Age ~~ of Household .. ~ .~ Head ~~~~~~~ - - A4-2 3 --9 ~~ Total ~ Pieces of Advertising ~~ Mail ~ Received ~ Per .. Week ~~ ~~~ by - Educoion ~ of Head of ~~. Household .. ~. A4-3
3 - 15 A4-4
Total Pieces of Advertising Mail Received Per Week by ~~~~~~~ Income
Total Mail Overview: Treatment of Advertising Mail by Actual Weekly Standard
~~~ ~ ~~ Moil ~~ (A) Recelpt~(Percentoge~0f~ Households~ - From~Enty Interview] ~ ~ ~~~~ ~~~ .~ , Total Mail Overview: Intended Response to Advertismg Mail by Class . . r
3 - 4
[Percentoge o f Pieces) ~ ~ ~
~ Response Rates to Advertising: First-C%s Advertisinu Onlv vs. Stondord
A4-5
. . . ~
J - 3 A 4 4
3 - 14 A4-7
3 - 1 7 A4-8
A4-9 ~~ 3 . ~~~ 1 1 ~ Entry Interview ~~ ~ Attitude Towards Moil~Advertising ~ ~ ~~ . (Percentage ~~~~~~ ~~ of ~~~~~ Households) ~~~. ~~ ~~~~~ - ~ ~ ~~ A4-10
Entry Interview Attitude Towards Mai l Advertising (Percentage of Households) 3 - 1 2 A4-11
Total Moil Overview: Anitude Towords Mail Advertising byActuol Weekly Standard Mail (A) 3 - 13 A4-12
~ Mail ~~~~ (Aj~E-nvelopes and Cords (Percentage of~Piecesl ~~ - ~~~ . ~~ ~ ~~~ ~~~~~~~~
Pieces Received~ PerWeek [Percentoge~of Households ~~~~~~~~~ - From EntryJnteyLe-wj ~~
~~ (Pe[cefltage~of Households) ~ ~~
Total Moil Overview: Treatment of Advertising Mail by Perceived Volume of
Entry Interview Treotrnent of Advertising Maiiby Household Income -~~ ~~ ~ -~ - __
~~~~ ~ . ~~~~ ~ ~ ~~~~.
3 - 10 Entry ~ ~~ ~~~~~ InteNjew Treatment of Advertising Moil (Percentage ~ of Households) -~ ~~ ~ - ~
by Perceived Volume of Pieces Recelved Per week^
Receipt of Advertising~ Mail (Percentage of Households - From Entn/Interview) Entrv Interview Attitude Towards Moil Advertisina bv Household Income
~~ -
~ ~~. ~ . , ._ A4- I3
A4-14
A4-15
- . 5 - 16 . ~~ ~~ [Pe~cecgge of Households) ~~ . ~ ~-~ ~~~~ ~~ ~
(Percentage of Households) ~~~ ~ ~
Entry Interview Attitude Towards Mail Advertising by Education of Head of Household
Attitude Towards Mail Advertising by Age of Heod of Household
Entry Interview Attitude Towards Mod Advertising by Age of Hen2 bf Household ~ ~. ~ . ~ ~
1 9 ~ ~ ~ 1P_ercen!ageoifouseholds) ~ ~~ . . ~ .... . ~~~~~~~~ ___ II ~~ . . .,
~~ NErnb~er~of~Djfferent Newspapers Per Household (From Entrylntewiew) ~ - ~ ~ ~~~
Periodicals -- Households Where Newspapers are Received
Magozines Received by Moil and Not by Mail --
Periodicals -- Households Where Magazines are Recewed
5 - 4 A5-4
A5-5
5 - 6 A5-6
~ ~ ~ [ByType~~of_Newspaper~ and by Receipt_ Medium)
Number of Different Mogozines Per Household (From Entry~lnterview)
(by,Type of~Magazine and .. by ~~~ Receipt Medium) . ~~ ~ .
~~
. ~
~ ~ ~~ ~~ ~ ~ ~

P M 2000 Description Tables Tables
5 - 9 ~ Periodical ~~~~~ Demographics_-- ~~~ _~ ~ ~ Pieces ~~ _ ~~ Received ~~ Per~Household ~ ~ ~~~ Per Week ~_ ~ . -~ ~ A5-7 ~~ A5-8
PFY 1999
~~~
~~~~ 5 _~ - IO Perio4cal Mail Type_oi_Suhscription ~ _ ~~- , ~ ~ ~ ~ ~ ~ ~ ~~~
5 - 1 1 Periodical Mail - - Source of Publications ~ _ . ~ ~ ~. ~ p ~ ~ - ~ ~ ~ ~ ~- A5-9 -~ ~~~ ~ ~ ~~~ ~ ~~
A 5 1 0 ~~ (Percentage of Skc r ip t j on Type b y Source) ~~~
5 - 13 Periodicals ~ ~~ ~~~~ - - Satisfaction ~~~~~~ With Delivery ~~~ ~~~~ (Percentageof~PiecesL ~ _~ ~ ~ ~ ~ ~- A5-1 1 _ A5-12
A5-13
A5-14
Periodical Mail - - Type and Source of Mail Received by Households
~ ~ ~ ~ ~~~ ~~ ~~~~
.
~ ~- ~~ 5 ~ - 14
5 - 1 6
5 - 17
~~ Periodicals -- Need Far D e l i v e ~ IPe~c~ntage~Of~Pieces)~ ~~~ ~ ~ ~
Penodicols -- Satisiadion With Delivery by Postal Region
Periodicals -- Households' Need far Delivery by Postal Region
~~~~~~~~ ~ .- ~ ~~~ ~ _ _ ~
~ ~_ ~ J ~ c e n t tpieceSRece!ved b~?!ouseholdsL~- ~~. ~~ - ~ _ ~~
~~ _ _(Perc_entoge o f p i e ~ d ~ ~ . ~ ~ ~ ~ ~ .~~ ~~~ ~~ ~~ ~~ - ~ ~ ~ ~ ~ ~~ ~~ ~ .~
~~ ~~ ~ ~~ ~~ ~ ~~ ~~ ~. .~~
A6- 1
A6-2
A6-3
A6-4
Ab-5 ~ ~~ A6-6
A6-7 ~~ ~ A6-8
A6-9 ~ A6-10
A6-11 A6- I2
Packages Received I- By Delivery Compony
Packages Received -- Packages Delivered by the Pasta1 Sewice by Class and Sender (Percentage
7 - 1 (Percentage oi~Packages Received ~ b y Households)
~~ ~. ~ ~ ~ _ _ _ _
of Packages by Class) ~ ~ ~
~~ .~.____ 7 ~ 3 Packages Received -- SenderKontent bycorner
~~~ ~~~ ~~~ ~ -~
(Percentage~of Pa~ckqges ~~ Delivered- by the Postal Service) ~ ~ ~ ~~
Packages Received -- Cmrier by Income (Percentage of Pieces) Packages Received - - Carrier by Postal Region (Percentage of Pieces) Packages Sent by Delivery Company (Percentage of Packages by Class and Coirjer) Packages Sent Via the Postal Service by Class and Recipient (Percenfage~of ~~ Pieces)~ ~~~.~
Packages Sent by Distance (Percentage of Packages Sent by~H~ouseholdsl- -~
Packages Received--- by Special Services 7 - 4
7 - 5 7 - 6 7 - 8 7 - 9
7 - 1 I 7 - 13
~ ~ ~_ ~ ~~~ ~~~~
- ~~ . _ _ ~
~
~~ ~ ~~~ 7 . I O Packages Sent b y Con& ~
7 . 14 ~~~ ~ Packages ~ Sent by_Distance ~~ and carrier (Percentage of Distance) ~
Packages Sent -- Choice of Carrier by Income (Percentage of Pieces)
.. ~~
~~~~ ~ ~ .~~ ~
~~~p~
A7- 1 Entry Interview Household Electronic Mail Capability by Household lncome~
EntN Interview Household Electronic Mail CaDabtlitv bv Education of Head of Household ' 22 (Percentage of Households) ~~~~
-- ' (Percentageof Households) Entry Interview Household Electronic Mail Copability by Age of Head of Household
a I L'i [Percentage of Households)

Appendix A1 : Total Mail Overview
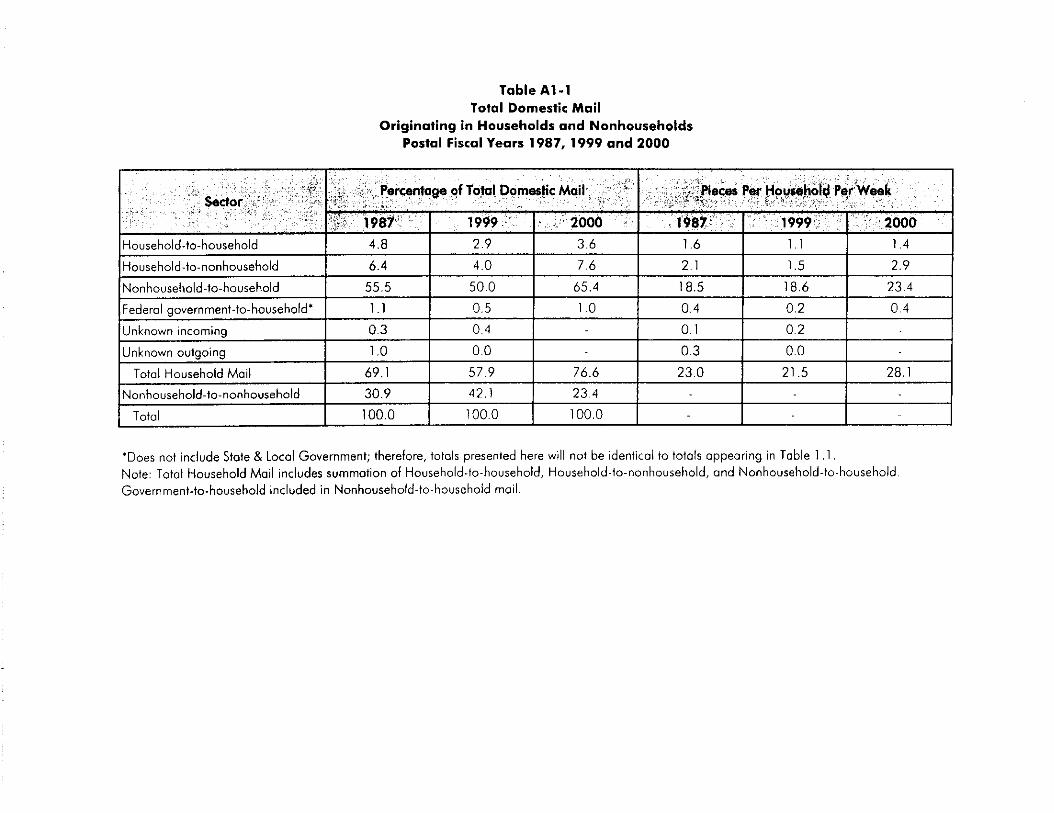
Table A l - 1 Total Domestic Mail
Originating in Households and Nonhouseholds Postal Fiscal Years 1987, 1999 and 2000
Household-to-nonhousehold
Nonhousehold-to-household
Federal government-to-household'
6.4 4.0 7.6 2.1 1.5 2.9 55.5 50.0 65.4 18.5 18.6 23.4 1 .1 0.5 1 .o 0.4 0.2 0.4
Unknown incoming 0.3 0.4 0.1 0.2 Unknown outgoing 1 .o 0.0 0.3 0.0
Total Household Moil 69.1 57.9 76.6 23.0 21.5 28.1 Nonhousehold-to-nonhousehold 30.9 42.1 23 .4 -

Table A1 -2 Mail Received by Households (0
by Class Postal Fiscal Years 1987, 1999, and 2000
Periodicals
Standard Mail (A) O
Government
Standard Mail (8)
Total
Percent of Total Pieces Per Week ieces Per Housahold Per Week
8.2 5. I 5.2 I .69 1.03 1.32 47,6 50.7 49.9 9.77 10.14 12.75 0.3 0.2 0.4 0.06 0.04 0.1 I 1.8 0.9 3.2 0.36 0.19 0.83
100.0 100.0 100.0 20.52 20.01 25.59
IFirst 0 I 42.1 I 43.0 I 41.3 I 8.64 1 8.61 1 10.58 I
@includes priority mail
Olncludes single piece mail

Table A1-3 Total MaiKD Overview:
Content of Mail Received by Households (Percentage of Pieces)
Postal Fiscal Years 1987, 1999 and 2000
0 Does not include packages.
0 Mostly other First-class.
0 Equals more than 100% because First-class advertising enclosed is counted twice.
0 First-class advertising enclosed is only counted once..
GI Includes credit card stotementlbill.
@ Request for donations is now a separate category under advertising.

Appendix A2: First-class Mail

Table A2-1 First-class Mail Contents of Mail Received by Households
Postal Fiscal Years 1987,1999 and 2000
* Includes credit card statement/bill.

Table A2-2 First-Class Mail Received -- Content by Quarter
(Pieces Per Household Per Week) Postal Fiscal Years 1967,1999 and 2000
* Includes credit card stotemenVbill.

Table A2-3 First-class Demographics -- Pieces Received Per Household Per Week
Postal Fiscal Years 1967,1999 and 2000
Sinale-family house I 9.6 I 9.6 I 11.5 Multi-fomilv house 1 7 .2 I 7.3 I 7.6
I A 7 L I c . 1
oardina house 0 I 7 . 4 I I Mobile house I 5.8 I 7.3 I 3 .9 Gro-o avo ners 0 I 7 4 I I
Cen~cr of malo, mew0 urea Itv I 1987 I 1999 I 2000
- - .
L I Y I Y I I I 1.3 1 1 I 10.5 I 11.9
4t 1 1 1 . 5 I 11.3 I 15.9
0 Fluctuations may be due to small sample sizes Note: 2000 Estimates far Income Levels $25K-$29,9K are identical to those in $30K-$34.9K smce categories used to collect data only included $25K-$34.9K. Note: Missing estimates not available due to change in definition between Postal Fiscal Year 1999 and 2000.

Table A2-4 Use of First-class Advertising-Only Mail -- by Industry
Postal Fiscal Years 1987, 1999 and 2000

Table A2-5 Percentage of First-Class Mail Containing Advertising by Household Income
(Percentage of Pieces) Postal Fiscal Years 1987, 1999 and 2000
$65K - 879.9K W O K - $99.9K sinnK+
29.9 49.7 34.6 33.3 47.0 34.0 31.6 44 3 .74 n
~ ~~~
0 Includes advertising only, advertising enclosed, and business invitotions/announcements.

Table A2-6 First-class Mail Usage of Reply Envelopes -- by Industry
(Percentage of Pieces) Postal Fiscal Years 1987,1999 and 2000

Table A2-7 First-Class Mail -- Enclosure of Reply Envelopes -- by Content
(Percentage of Pieces) Postal Fiscal Years 1987, 1999 and 2000
'Includes credit card staternent/bill

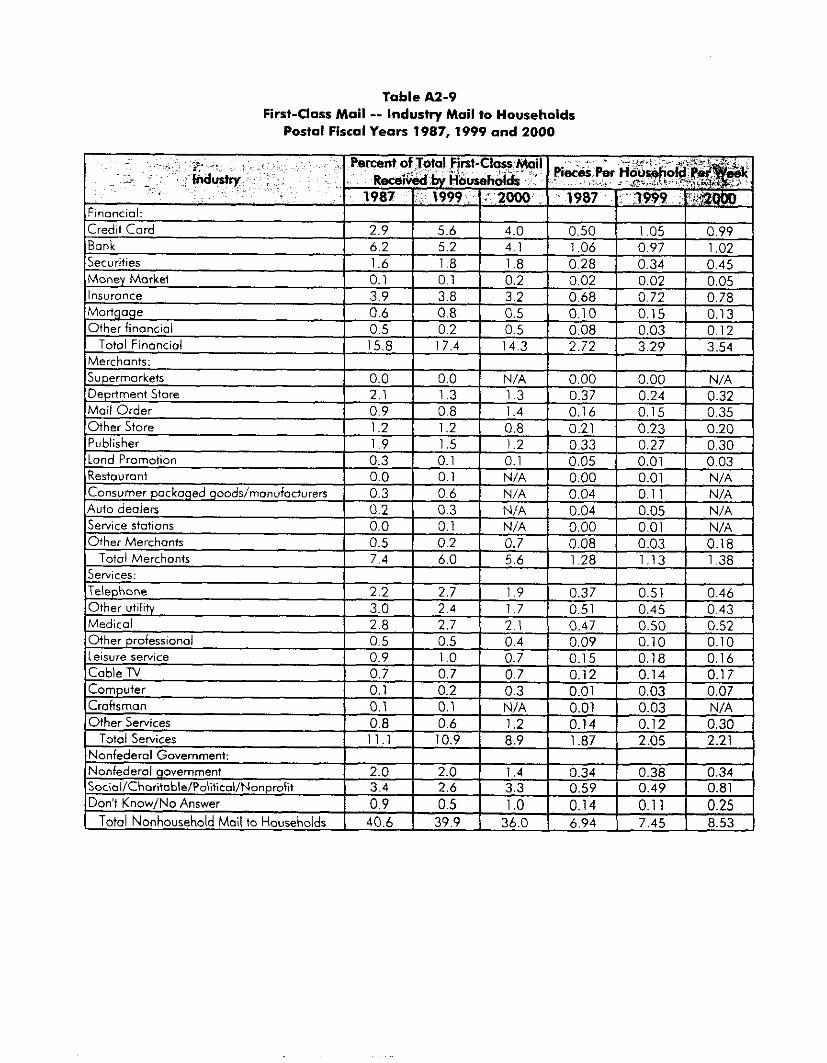
Table A2-9 First-Class Mail -- Industry Mail to Households
Postal Fiscal Years 1987.1999 and 2000


Table A2-11 Use of First-class Business Invitaiions/Announcements Mail -- by Industry
Postal Fiscal Years 1987.1999 and 2000

I
Table 1\2-12 Use of First-class Advertising-Enclosed MailD -- by Industv
Postal Fiscal Years 1987, 1999 and 2000
1

Table A2-13 First-Class Mail -- Interest in Nine Activities
(Percentage of Households Which Enjoyed these Activities Very Much or Quite a Bit) Postal Fiscal Years 1987, 1999 and 2000
Listening to Radio
Reading Cords and Letters
Telephoninq Family and Friends
Writing Letters I 27.1 I 27.1 I 38.5 Readino NewsDoDers 1 65.7 I 55.8 I 63.2
59 8 59 2 N/A
69 5 55 9 68 8 62 8 62 4 7 9 5
Listening to Records I 5 0 4 I 5 0 8 1 N/A
E-rnailina via the Internet' I N/A I N/A I 79 7
Shopping via the Internet' 1 N/A 1 N/A 1 7.8 'Added in Postal Fiscal Yeor 2000 I

Table A2-14 First-class Mail Received -- by Number of Financial Accounts and Insurance Policies
Post01 Fiscal Yeors 1987, 1999 and 2000
I

Table A2-15 First-Class Mail Received -- by Number of Credit Cards
Postal Fiscal Years 1987, 1999 and 2000
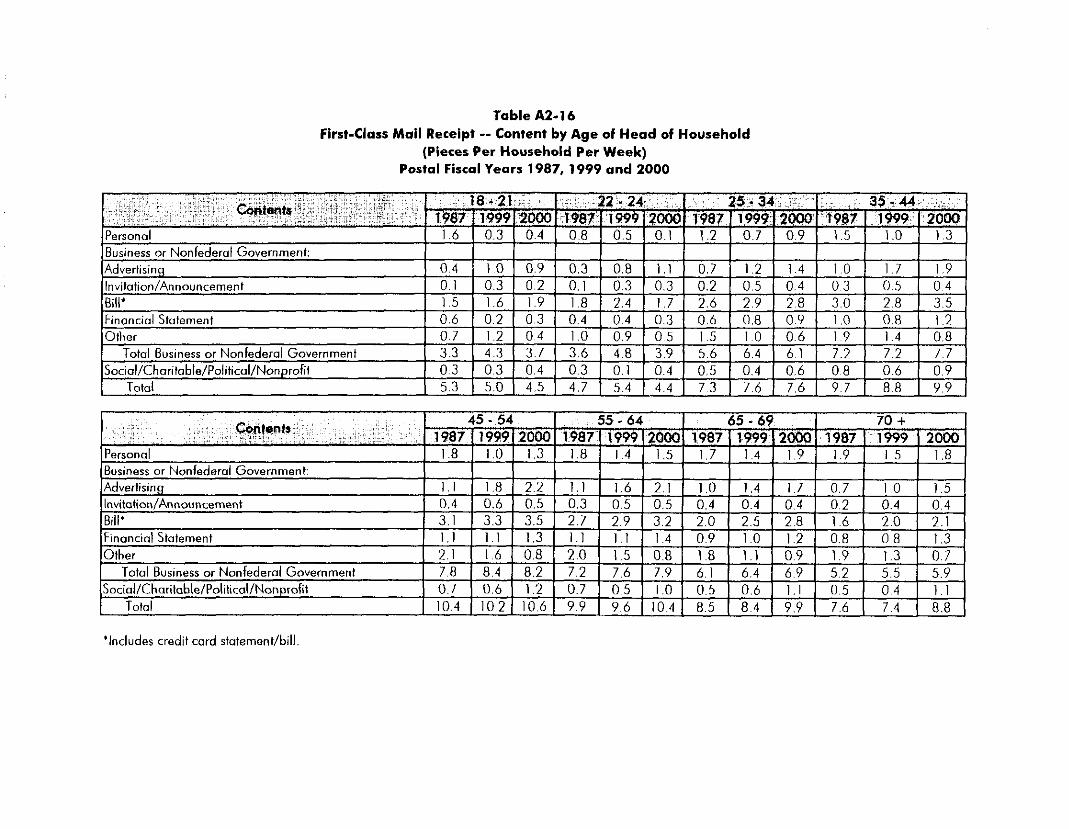
Table A2-16 First-Class Mail Receipt -- Content by Age of Head of Household
(Pieces Per Household Per Week) Postal Fiscal Years 1987, 1999 and 2000
18 - 21 I 22 - 24 I 25 - 34 I 35-44 198711999120001 19871199912000l198711999120001 19871 1999 12000 Contents
Advertising I 1 . 1 1 1.8 1 2 . 2 1 1 . 1 I 1.6 1 2 . 1 1 1.0 I 1 . 4 I 1.7 I 0.7 1 L O 1 1 . 5 Invitation/Announcement I 0.4 1 0 . 6 1 0.5 I 0.3 I 0.5 1 0 . 5 1 0.4 1 0.4 I 0.4 I 0.2 1 0.4 1 0.4 Rill' I ? I I . ? ? I .75 I 7 7 1 7 9 I 7 7 I 7 n 1 7 6 I V R I i x I 7 1
Financial Statement I 1 . 1 1 1 . 1 1 1 . 3 I 1 Othor I 7 1 I I A I n~ I 7
Total I 104 1 1 0 2 ( 1 0 6 1 9
'Includes credit card statement/bill
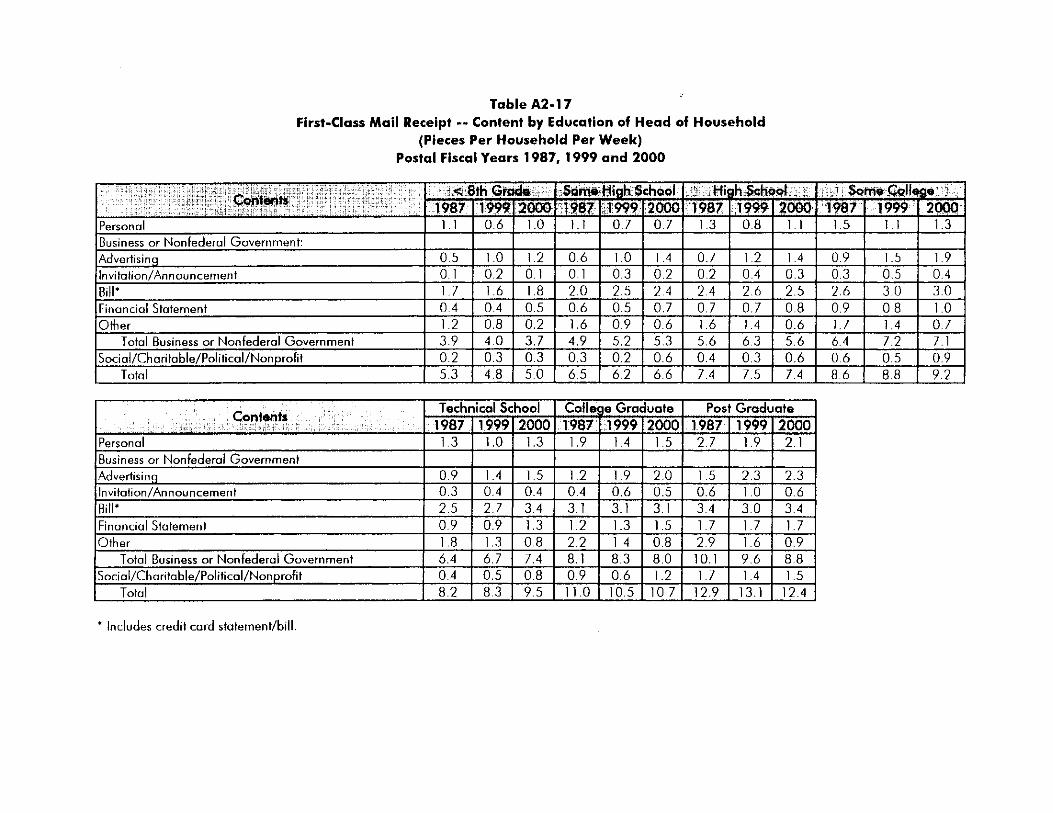
Table A2-17 First-class Mail Receipt -- Content by Education of Head of Household
(Pieces Per Household Per Week) Postal Fiscal Years 1987, 1999 and 2000
Total Business or Nonfederol Government
Total Sociol/Charifable/Politicol/Nonprofit
c 8th Gmdc I S a m High School 1 High School Some College 1987 I199912oOol 19871 1999120001 1987 119991 20001 1987 1 1999 12000
I Contsnh
6.4 6.7 7.4 8.1 8.3 8 . O [ l O . l 9.6 8.8 0.4 0.5 0.8 0.9 0.6 1.2 I 1.7 1.4 1.5 8.2 8.3 9.5 11.0 10.5 10 7 I 12.9 13.1 12.4
* Includes credit cord staternent/bill

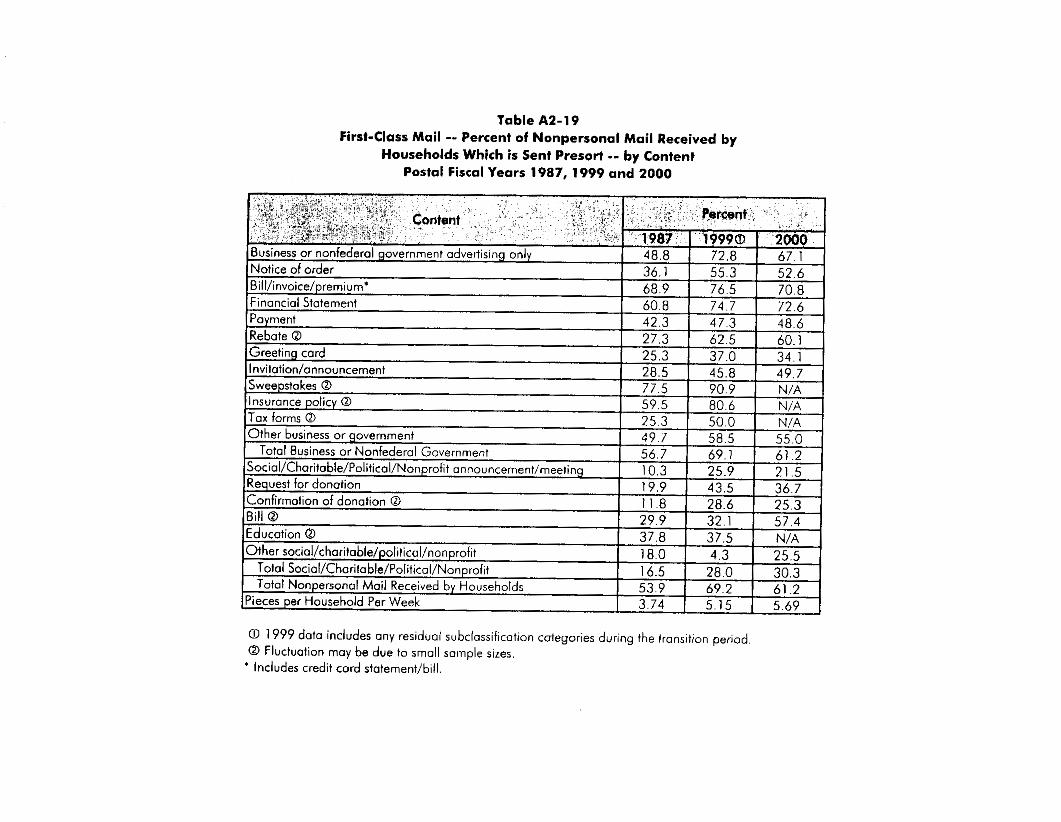
Table AZ-19 First-Class Mail -- Percent of Nonpersonal Mail Received by
Households Which is Sent Presort -- by Content Postal Fiscal Years 1987, 1999 and 2000
0 1999 data includes any residual subclassification categories during the transition period 0 Fluctuation may be due to small sample sizes.
* Includes credit card statement/bill.

Table A2-20 Total Percentage of Industry's First-class Mail Received by
Households Which is Sent Presort Postal Fiscal Years 1987, 1999 and 2000
0 1999 data includes any residual subclassification categories during the transition period 0 Fluctuation may be due to small sample sizes.
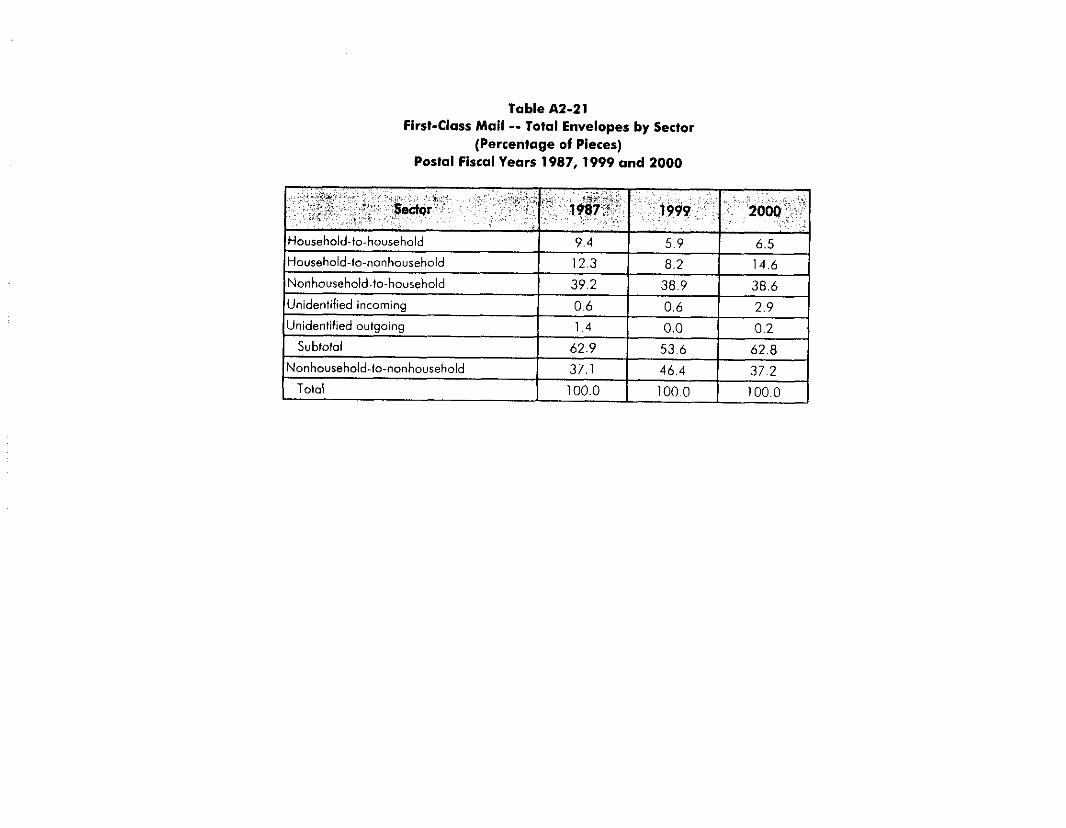
Table AZ-21 First-class Mail -- Total Envelopes by Sector
(Percentage of Pieces) Postal Fiscal Years 1987, 1999 and 2000
.. . SeetQr' . . .I> .. .
1967 ' 1999 2000
Household-to-household 9 4
Nonhousehold-to-household 39.2 38.9 38.6 Unidentified incoming 0.6 0.6 2.9
Subtotal
Nonhousehold-to-nonhousehold
Total
62.9 53.6 62.8
37.1 46.4 37.2 100.0 100 0 100.0

1 n

7

Table A2-24 First-class Mail -- Nonpresart Envelopes by Sector
(Percentage of Pleces) Postal Fiscal Years 1987,1999 and 2000

Table A2-25 First-Class Mail -- Total Cards by Sector
(Percentage of Pieces) Postal Fiscal Years 1967,1999 and 2000
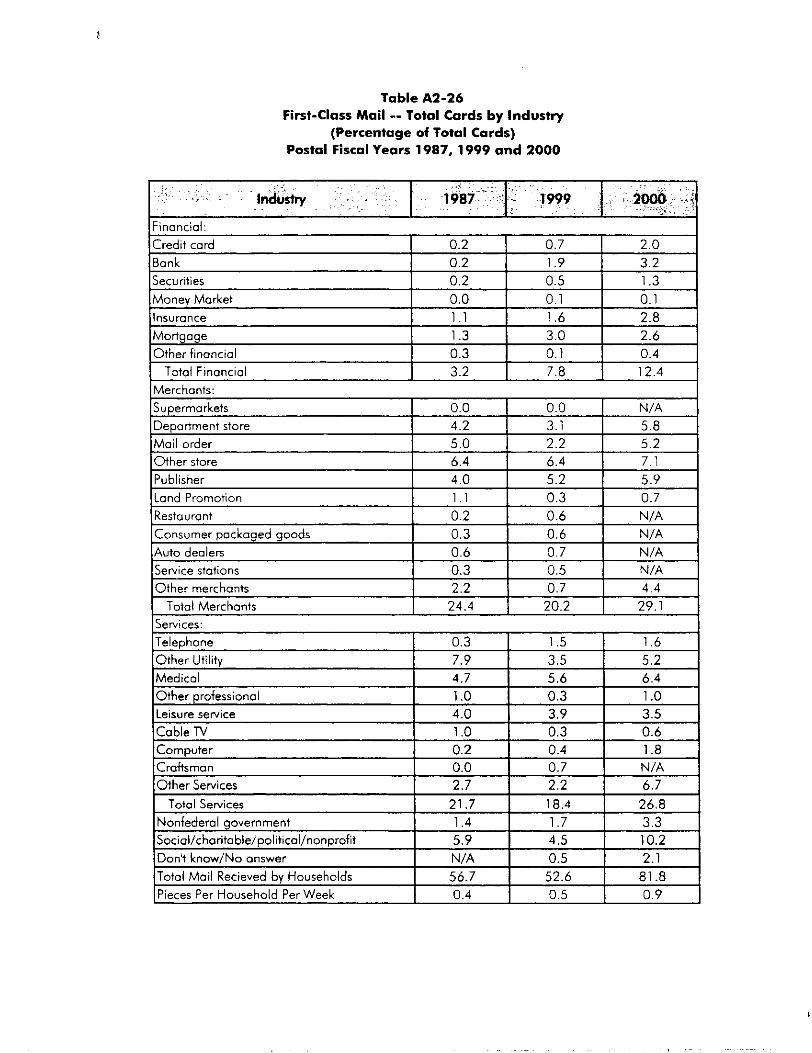
Table A2-26 First-Class Mail -- Total Cords by Industry
(Percentage of Total Cards) Postal Fiscal Years 1987, 1999 and 2000
I

Table A2-27 First-Class Mail -- Total Cards by Content
(Percentage of Total Cards) Postal Fiscal Years 1987, 1999 and 2000
* Includes credit card stotement/bill.

Table A2-28 First-class Mail -- Cards Received by Households -- Household's
Percentage of Total Mail Sent at Each Category Postal Fiscal Years 1987, 1999 and 2000
0 1999 data includes any residual subclassification categories during the transition period. * Includes credit cord staternentibill.

Table A?-29 First-class Mail -- Cards Received bv Households -- Households Percentage of
Total Mail Sent at Each Card Rate Category -- by Industry Postal Fiscal Years 1987, 1999 and 2000
Mortgage Other financial
Total Financial
1 . 4 4 . 3 1.6 0.6 1.9 1.9 0.3 0.3 0.1 0.2 0.2 0.5 3.3 7 3 4.4 2.4 8.3 15.1
0 1999 data includes any residual subclassification categories c-nng the transition period

Table A2-30 First-Class Mail -- Timeliness of Arrival
Postal Fiscal Years 1987.1999 and 2000
Arrived on time or sooner:
Arrived on the day needed
Arrived eorlier than needed
12.7 17.4 34.7
6.4 7.0 14.2
Total Arrived on time or sooner 19.0 I 24.4 48.9
I Total I 100.0 I 100.0 I 100.0 I Arrived late I 1.4 I 0.8 1 . I Don't know/No answer 13.6 1 10.1 14.3

Table 1\2-31 First-class Mail -- Reason for Lateness
(Percentage of Pieces that Arrived Late) Postal Fiscal Years 1987, 1999 and 2000
Don't know when mailed 22.7 21.5 31.1
l N o t mailed late I 2 2 1 I 1 8 2 I 2 4 9 1
Don't know/No answer 19.0 28.6 14.3
I Total I 100.0 I 100.0 1 100.0 I

0'00 L
1 . 1 L
0'00 I 0.00 L 0'00 L 0'00 L 0'00 L ID101
L'6 9' I L 9'Z L E'8 Z ' P I JaMIUO ON/MOU] +,UOa
0'00 1
F P I 0' I
5'9&
0'00 1 0'00 I 0'00 L 0'00 1 0'00 L 1~101
0 IL 8 .2 L 8 ' L I & ' I 1 P'S I JaMSUD ON/MOU)I +,UOa
L 'O &' I L ' L 1'0 S ' L a+Ol PaA!JJV
Z ' S 9 L ' 9 9 6'SE 1.29 S ' S 9 hop lopads huo UO aA!JJO O+ papadxa +Ou SDM

Table A2-33 First-Class Mail Received -- Timeliness of Arrival -- by Postal Region
Postal Fiscal Years 1987, 1999 and 2000

Table A2-34 First-class Mail Sent by Households to Nonhouseholds
Postal Fiscal Years 1987, 1999 and 2000
~~ ~
0.6 I 0.01 I 0.07 I 0 05 1 1.48 1 2.93
Don't know / No answer
1 12.2 1 7 . 8 6 I 15.1 I 2.1 Total Mail Sent by Households to Nonhouseholds

Table A2-35 First-Class Mail Originating in Households and Nonhouseholds
Postal Fiscal Years 1987, 1999 and 2000
0 Includes packages. Does not include franked or penalty mail

Table A2-36 First-Class Mail -- Telephone Bill Paying
(Percent of Households) Portal Fiscal Years 1987, 1999 and 2000
Yes No Don't know/No answer
Toial
4.2 4.4 11.4 I .u I .8 5 .8 95.1 96.1 88.4 98.8 97.8 93.8 ,
0.8 0.2 0.2 0.2 0.4 0.4 100.0 100.0 100.0 100.0 100.0 100.0

Table A2-37 first-Class Mail Media by Which Mail Order Purchases Made in the
Past Month Were Ordered (Percentage of Orders)
Postal Fiscal Years 1987,1999 and 2000
Mail Other
Total
67.2 37.9 39.3 1.7 4.9 8.6
100.0 l O O . 0 lOO.0


Table A249 First-Class Mail -- Personal Letters and Cards (not greeting cards) Sent by
Households in an Average Month -- by Age of Head of Household Postal Fiscal Years 1987, 1999 and 2000
0 includes thank you notes
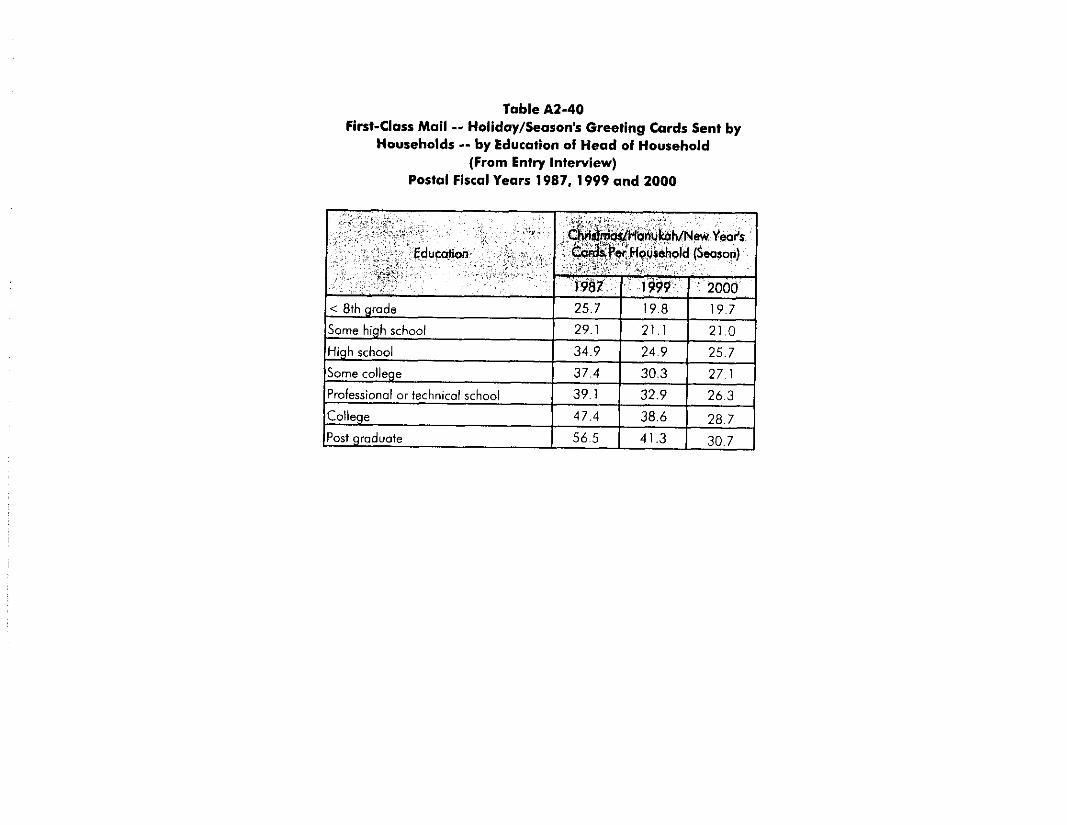
Table A2-40 First-Class Mail -- Holiday/Season's Greeting Cards Sent by
Households -- by Education of Head of Household (From Entry Interview)
Postal Fiscal Years 1987, 1999 and 2000
. .
Education _ - ;.. 2000

Table 1\2-41 First-class Mail -- Personal Letters and Cards (not greeting cards) Sent by
Households in an Average Month -- by Education of Head of Household Postal Fiscal Years 1987, 1999 and 2000
0 Includes thank you notes

Table A2-42 Personal letters and Cards (not greeting cards) Sent by
Households in an Average Month -- by Income Postal Fiscal Years 1987, 1999 and 2000
0 Includes thank YOU notes

Table A2-43 First-Class Mail -- Holiday/Season's Greeting Cards Sent by
Households -- by Age of Head of Household Postal Fiscal Years 1987, 1999 and 2000
35 - 44 45 - 54 5 5 . 6 4
22 - 24 19.7 15.3 15.8
25 - 34 I 31.9 I 22.7 I 22.1 35.2 28.0 25.7 42.0 29 ,8 26 .6 45.4 39.4 29 .0
65 - 69 45.9 32.4 32.2
70t 44.9 34.0 32.9
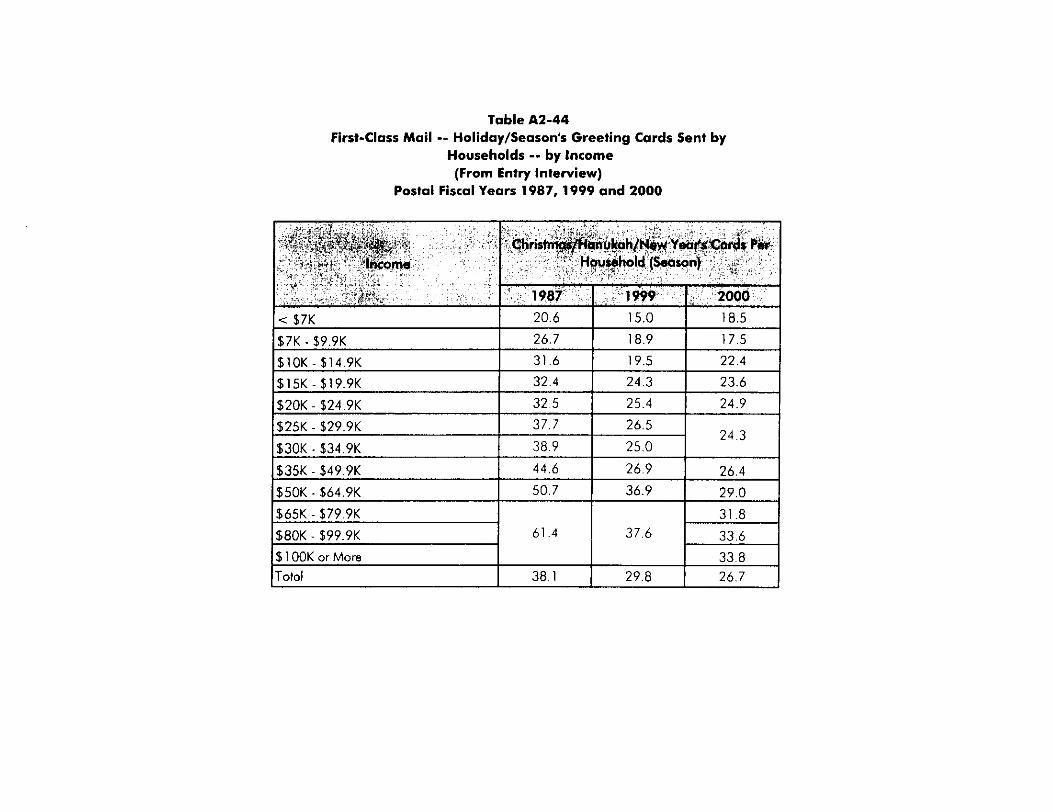
Table A2-44 First-Class Mail -- Holiday/Season's Greeting Cards Sent by
Households -- by Income (From Entry Interview)
Postal Fiscal Years 1987.1999 and 2000
$10K - $14.9K 31.6 19.5 22.4
$15K-$19.9K 32.4 I 24.3 23.6
$20K - $24.9K
$25K - 829.9K
$30K - $34.9K
$35K - $49.9K
$50K - $64.9K
$65K - $79.9K
$BOK - $99.9K
32.5 25.4 24.9
37.7 26.5 24.3
38.9 25.0
44.4 26.9 26.4
50.7 36.9 29.0
31.8 61.4 37.6 33.6
$ 1 OOK or More 33.8 Total 38.1 I 29.8 I 26.7
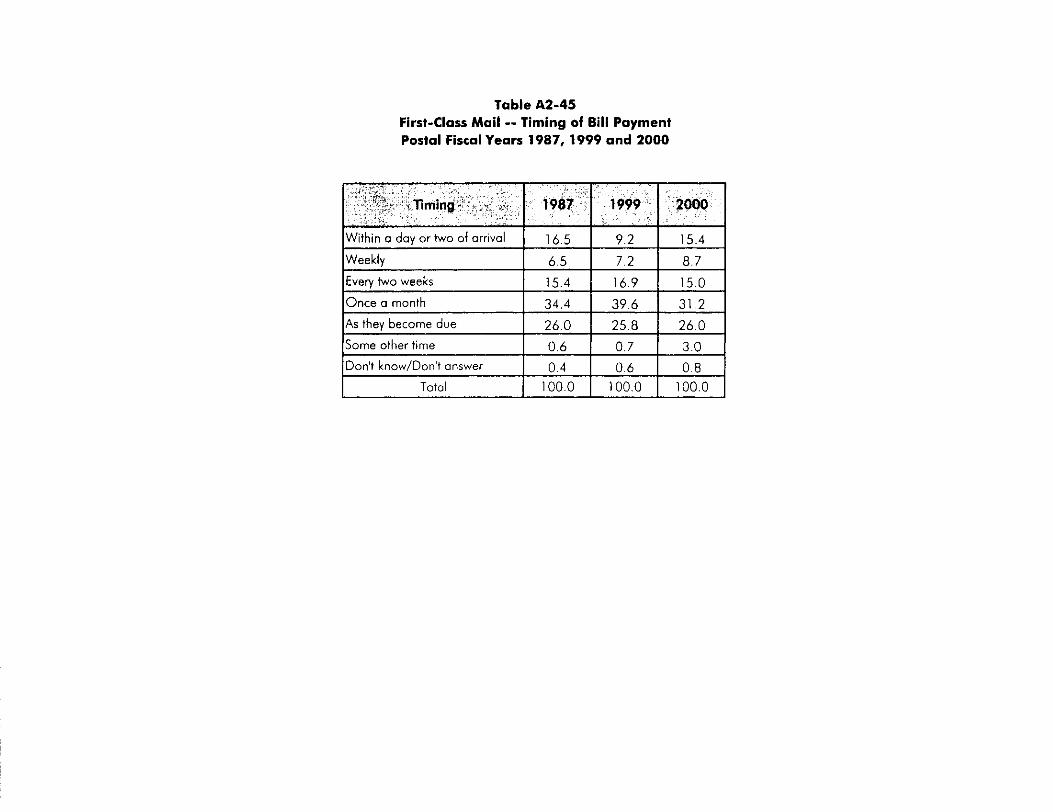
Table 82-45 First-class Mail -- Timing of Bill Payment Postal Fiscal Years 1987, 1999 and 2000
Within a day or two of orrival
Weekly
Every two weeks
Once 0 month
As thev become due
16.5 9.2 15.4 6 5 7.2 8.7 ~
15.4 16.9 15.0 34.4 39.6 31.2 7fr n 7 5 R 7fr n
Some other time
Don't knowIDon't answer
Totol
0 6 0 7 3 0 0 4 0 6 0 8
1000 1000 100 0
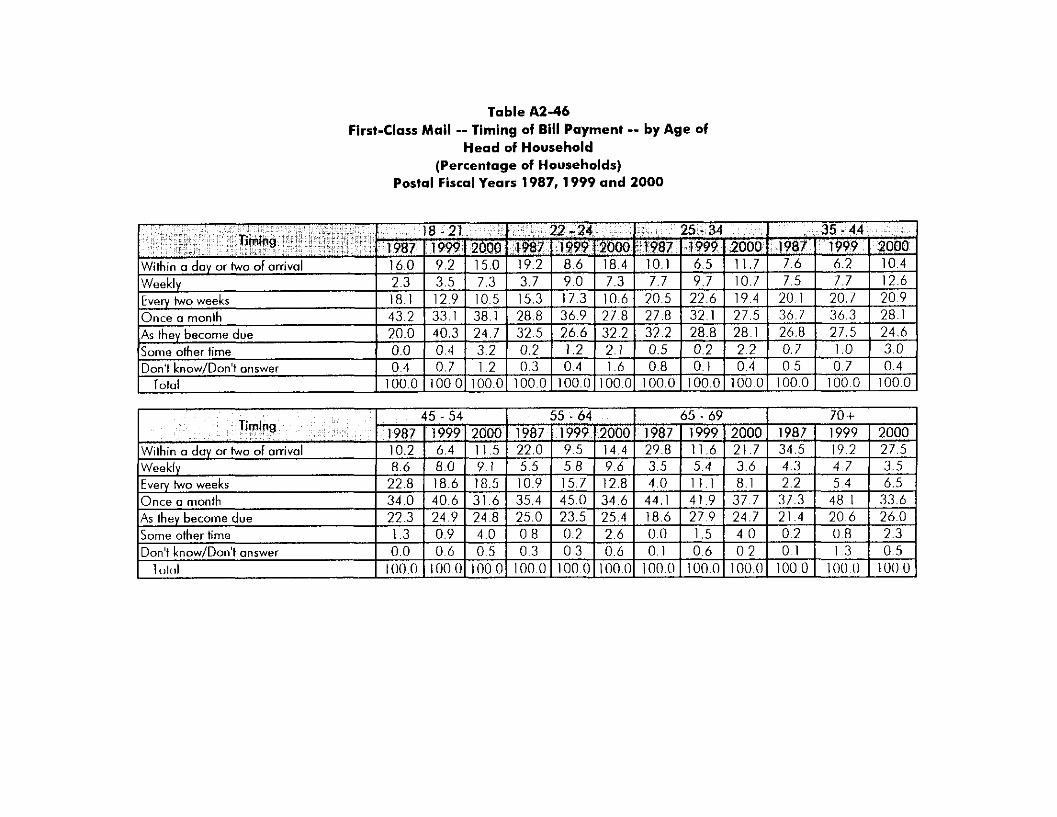
Table A2-46 First-Class Mail -- liming of Bill Payment -- by Age of
Head of Household (Percentage of Households)
Postal Fiscal Years 1987,1999 and 2000

Table A2-47 Timing of Bill Payment by Education of Head of Household
(Percentage of Households) Postal Fiscal Years 1987,1999 and 2000
Some other time
Don't knowfDon't answer
Total
0.5 0.2 1.6 0.5 0.9 3.4 0.7 0.4 3.3 0.0 0.2 0.4 0.3 0.8 0.8 0.5 0.6 0.3
100.0 100.0 100.0 100.0 I000 100.0. 100.0 100.0 100.0

Table A2-48 First-Class Mail -- Timing of Bill Payment -- by Household Income
(Percent of Households) Postal Fiscal Years 1987,1999 and 2000
$2DK - $24 9K I 8 $25K-$29.9K I $30K - $34 9K I 53=' $49 9K 1987 I 1999 I 2000 I 1987 I 1999 I 2000 1 1087 I 1999 1.2000 I 1987 I 1999 I 2000 Timing
Nole: 2000 tslimotes for Income Levels S25K-129.YK are iderilicul lo lhose in $30K-$34,YK since categories used lo collecl data ody irlcluded $25K-$34,9K.

Table A2-49 First-Class Mail -- Use of Automatic Deductions
(Percent of Households) Postal Fiscal Years 1987, 1999 and 2000
NOTE: 1998 and 1999 figures reflect the responses to, "About how many of your monthly bills are poid by automatic deduction from o bank account?" 1987 figures reflect the response to, "How many payments each month are auloniatically deducted on o
prearranged basis from savings or checking occounts?"


Table AZ-51 First-class Moil -- Use of Automatic Deductions -- by Age
(Percentage of Households) Postal Fiscal Years 1987, 1999 and 2000
~ ~~
4 + Don't know/No answer
Total Mean
I? I n n I 7 5 I 9 0 I n 7 I n-, I I X I 1 5 I I A I 1 7 I 1 0 I 7 1 I A I I
0.5 0.0 3.7 0.2 0.8 1.8 1 . 1 1 . 5 4 .1 1 .4 3.1 6 2 0.4 0.0 0 0 1.3 0.0 0.0 0.8 0.0 0.4 1.8 0.4 0.3
100.0 100.0 100.0 100.0 100.0 100.0 100.0 100.0 100.0 100.0 100.0 100.0 0.2 0.1 0.6 0.1 0.1 0.4 0.4 0.3 0.7 0.4 0.4 0 9
4 -t Don't know/No answer
Totol Meon
0 NOTE: 1999 figures reflect the response to "About how many of your monthly bills are paid by automatic deduction iron1 a bonk account?" 1987 figurer reflect the response to "How many paymenfs each month ore outomaticolly deducted on a
prearranged basis from savings or checking accounts?"
1.0 4.3 7 0 1,6 2.8 7.2 2 1 4 8 7.9 1 . 1 5.9 8,4 2.7 0.0 0.3 1.6 0.0 0.3 0.9 0.1 0.2 0.8 0.1 0.4
100.0 1000 100.0 I000 100.0 100.0 100.0 100.0 100.0 100.0 100.0 IO00 0.4 0.6 0.9 0.3 0.4 0.8 0.4 0.5 0.8 0.2 0.6 0.9

Appendix A3: Standard Mail (A)

Table A3-1 Standard Mail (A) Content of Mailpiece
(Percentage of Standard Mail (A) Received by Households) Postal Fiscal Years 1987, 1999 and 2000
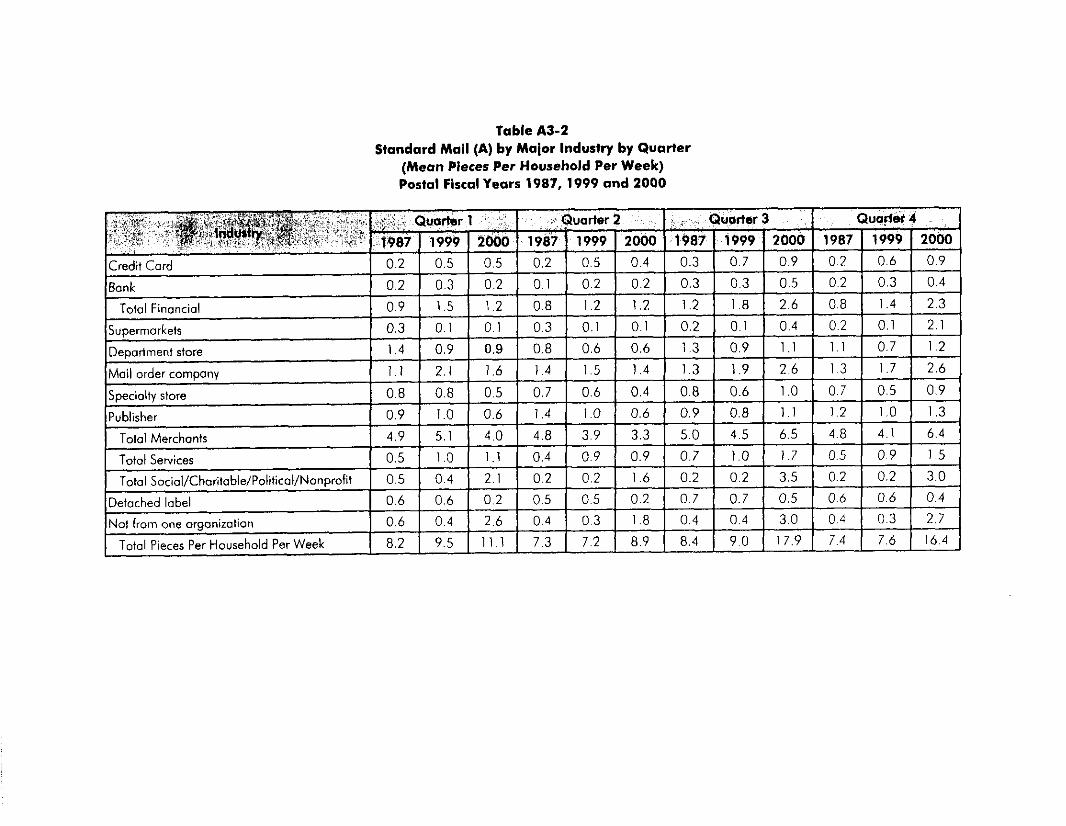
Table A3-2 Standard Mail (A) by Major Industry by Quarter
(Mean Pieces Per Household Per Week) Postal Fiscal Years 1987, 1999 and 2000

Table A3-3 Standard Mail (A) Addressee
(Percentage of Total Standard Mail (A)) Postal Fiscal Years 1987, 1999 and 2000
Addressed to occupant
Don't know/No onswer
Toto1 Pieces Received by Household
22.7 14.4 10.5 2.39 1.91 1.73 0.9 0.9 7.2 0.1 1 0.12 1.19 73.7 62.6 73.5 7.78 8.31 12.12
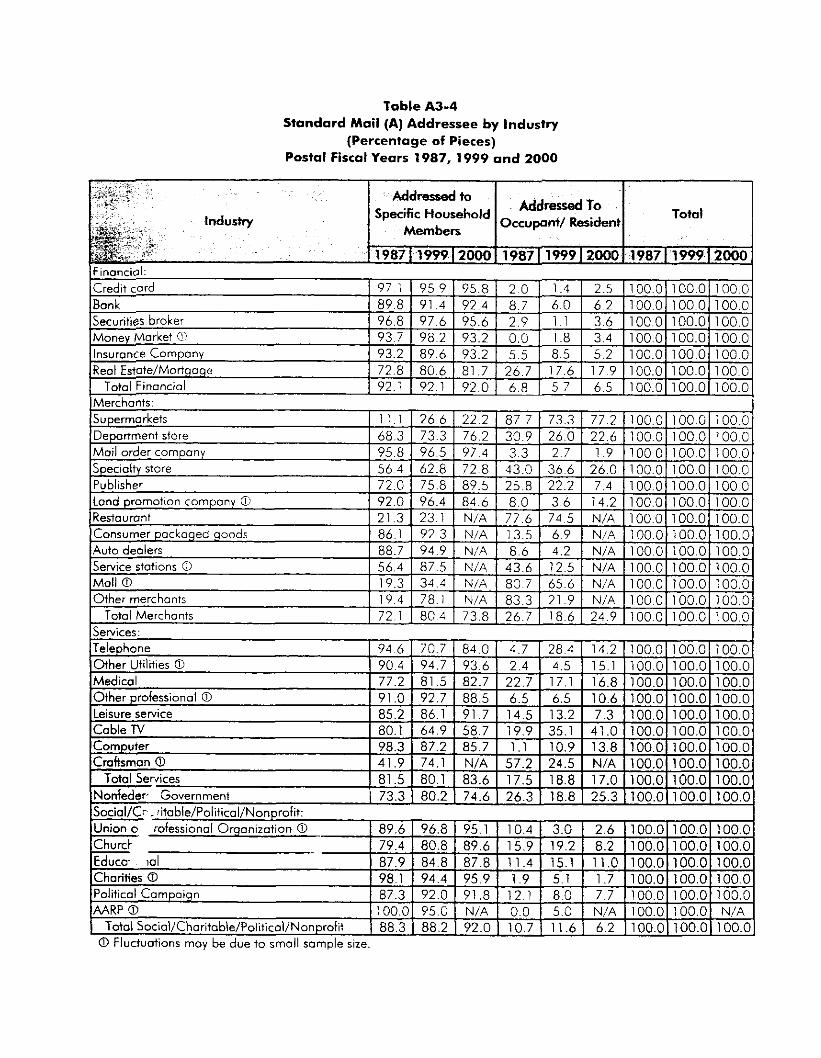
Table A3-4 Standard Mail (A) Addressee by Industry
(Percentage of Pieces) Postal Fiscal Years 1987, 1999 and 2000
Addressed To Occupant/ Resident
Specific Household
0 Fluctuations may be due to small sample size.

Table A3-5 Standard Mail (A) by Shape
Postal Fiscal Years 1987,1999 and 2000

Table A3-6a Stondard Mail (A) Industry by Shape
(Percentage of Pieces Received by Households) Postal Fiscal Years 1987, 1999,2000
0 Fluctuations may be due to small sample size.

Table A3-6b Standard Mail (A) Industry by Shape
(Percentage of Pieces Received by Households) Postal Fiscal Years 1987,1999 and 2000
0 Fluctuations may be due to small sample size.

Table A3-70 Standard Mail (A) Shape by Industry
(Percentage of Pieces) Postal Fiscal Years 1987, 1999 and 2000
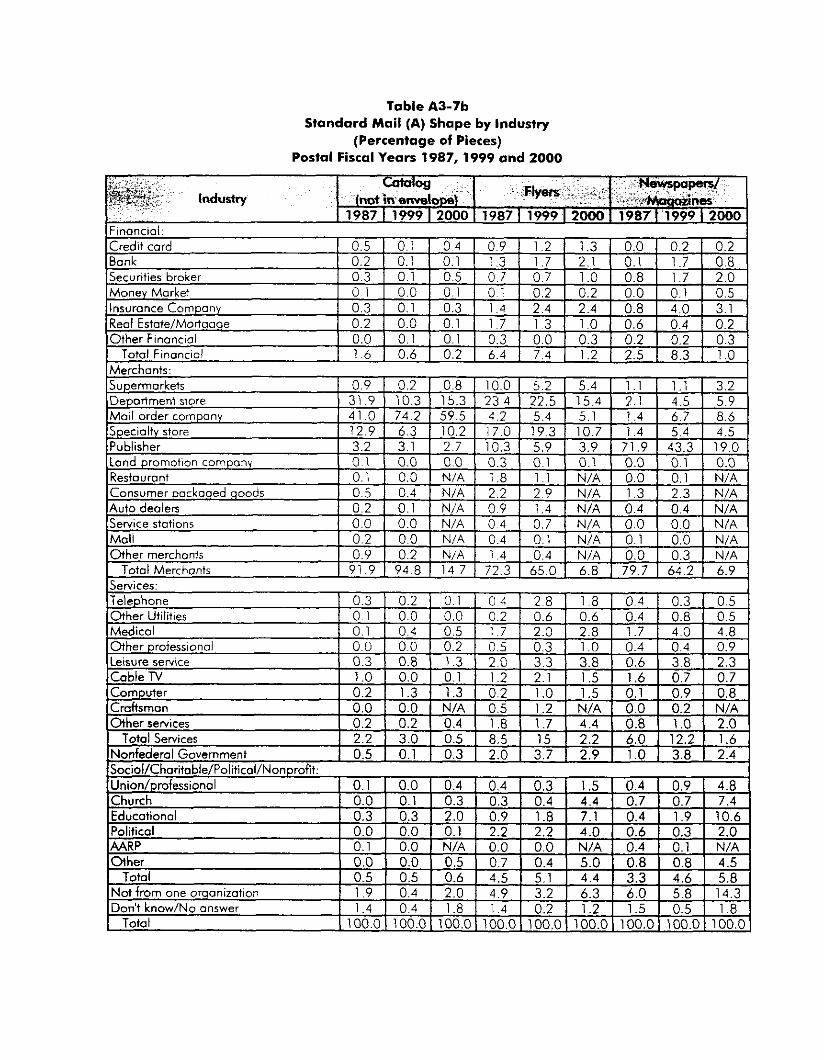
Table A3-7b Standard Mail (A) Shape by Industry
(Percentage of Pieces) Postal Fiscal Years 1987, 1999 and 2000
~~ L Total Merchants I 91.9 I 94.8 I 14 7 I 72.3 I 65.0~1 6.8 r 79.7 I 64.2 I 6.9 1

Table A3-8 Standard Mail (A) Shape by Addressee
(Percentage of Pieces) Postal Fiscal Years 1987, 1999 and 2000

Table A3-9 Standard Mail (A) ZIP Code Usage by Shape (Percentage of Mail Received by Households)
Postal Fiscal Years 1987, 1999 and 2000

Standard Moll Table A3-10
Oemographics -- Pieces Received Per Household Per Week Postal Fiscal Years 1987, 1999 and 2000
~~~~ ~~ ~
0 Fluctuations may be due to small sample sizes. Note: 2000 Estimates for Income Levels $25K-$29.9K are identicol to those in $30K-$34.9K since coiegories used lo colleci daia only included $35K-$34.9

table A3-11 Receipt of First-Class and Total Standard Mail (A)
(Including Non-Profit Mail) by Number of Mail Order Purchases Made in the Last Year
(Pieces Per Household Per Week) Postal Fiscal Years 1987, 1999 and 2000

Table A3-12 Standard Mail (A) by
Familiarity With Institution (Percentage of Mail Pieces Received by Households)
Postal Fiscal Years 1987,1999 and 2000
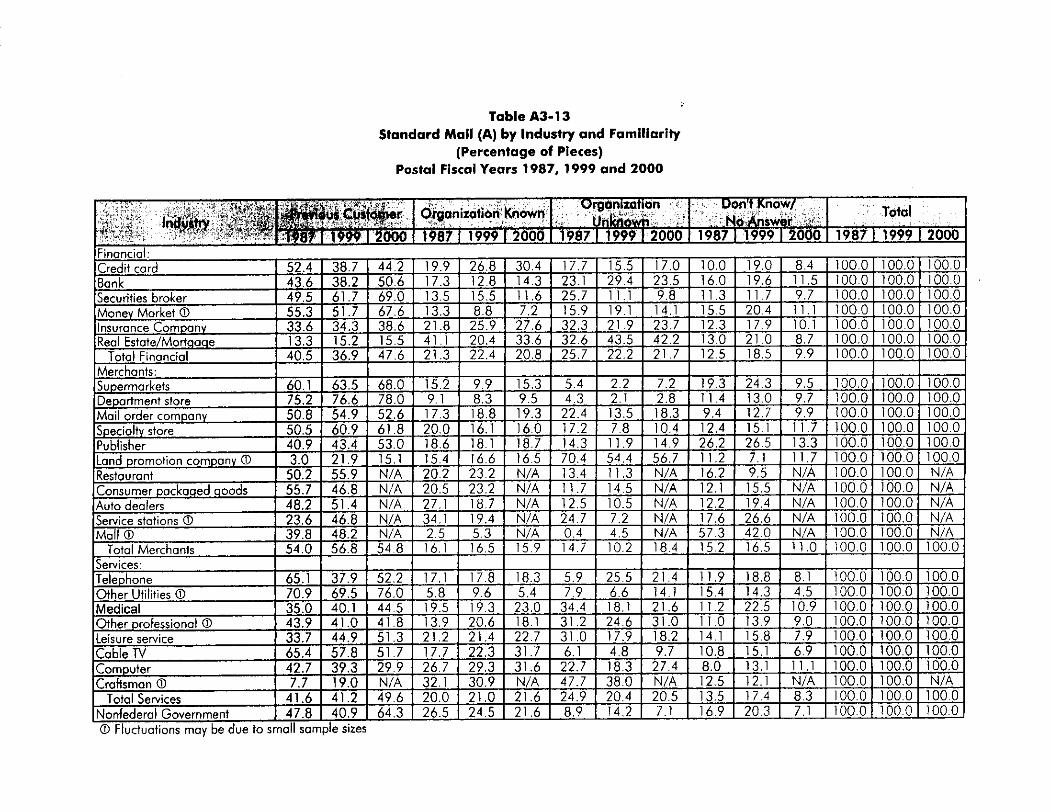
Table A3-13 Standard Mail (A) by Industry and Familiarity
(Percentage of Pieces) Postal Fiscal Years 1987, 1999 and 2000
No An Orgonizotion Don't Know/
swer Total Organizotion Known
, .
. . 00 I 1987 I 1999 I2000 I 1987 I 2000 I 1987 I 1999 I 200 0 I 1987 I 1999 I 2000
0 Fluctuations may be due to small samp e sizes

Table A3-14 Standard Mail (A) -- Shape by Familiarity With Organization
(Percentage of Pieces) Postal Fiscal Years 1987, 1999 and 2000
. . .. . . , . /. .. . . . "
. .%" ! Farniliority I . . . . .. I
; .;.o; . .
.,.% : i,w Met size Envetope Larger Than Letter Envelope
, 1987 t 1999 I 2000 1987 I 1999 I 2000 . . _. . . . . -. ~ ~ . , .
Previous customer I 44.5 I 39.4 I 39.7 I 48.6 I 39.9 1 43.0
Don't know/No answer
~~~ ~~~ ~
Organization known 1 19.8 I 19.8 1 18.3 I 18.8 I 19.0 I 17.3 Ornnniin~inn tinknown I 23.9 I 20.5 I 15.0 I 19.8 I 14.6 1 13.9
. . . . -. . v t h o n o n e company/
I 1 1 9 I 2 0 3 I 2 7 0 I 128 I 2 6 5 I 2 5 8 35.7 I 39.6 I 25.4 I I
1039 I IO00 I I000
Postcard
17.6 I 20.3 1 17.4
w 100.0 100.0 100.0

Table A3-15 Standard Mail (A) -- Mail Order Industry Shape
by Fomihrity With Organization (Percentage of Mail Pieces Received by Households)
Postal Fiscal Years 1987, 1999 and 2000

Table A3-16 Standard Mail (A) Receipt
by Number of Financial Accounts and insurance Policies Postal Fiscal Years 1987, 1999, and 2000
11 999 I 2.9 I 5.5 I 9.0 I 11.8 I 2000 1 1 1 . 0 I 8.5 I 12.1 I 14.9

Table A3-17 Standard Mail (A) Receipt
by Number of Credit Card Accounts Postal Fiscal Years 1987,1999 and 2000
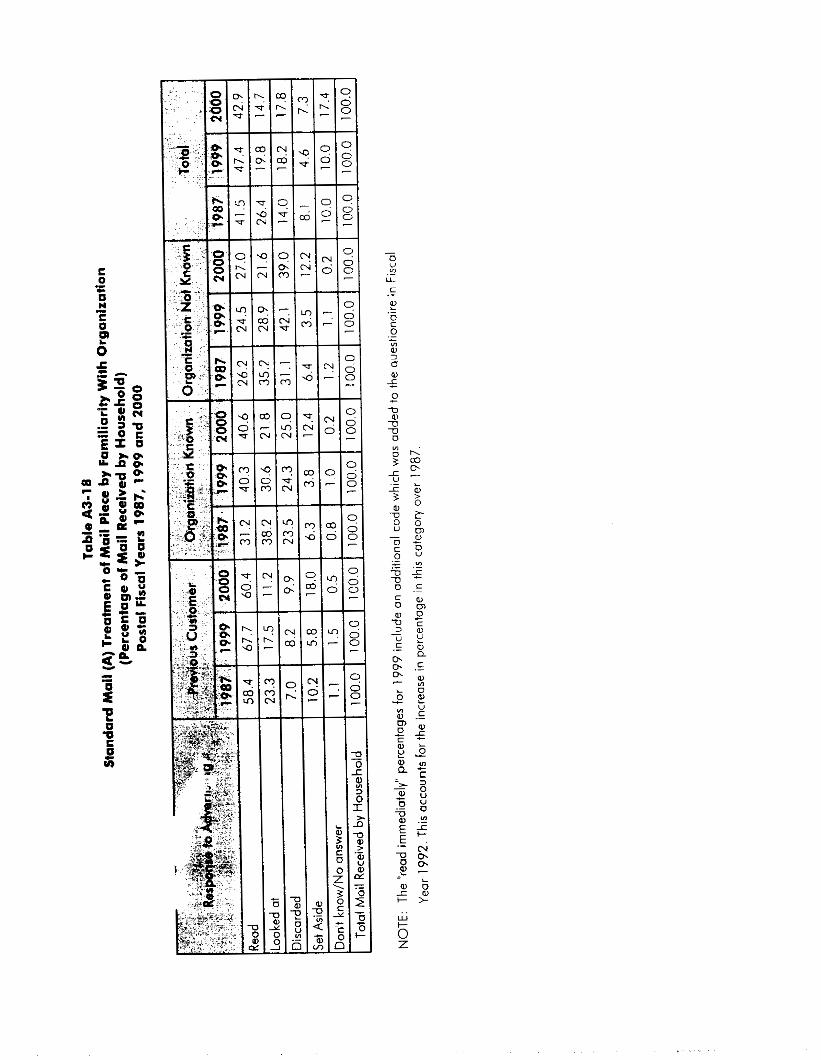
E 0 - c s P - C 0
0

Table A3-19 Standard Mall (A) Usefulness of Mall Pieces by Famlliarlty With Organization
(Percentage of Mail Received by Households) Postal Fiscal Years 1987,1999 and 2000

Table A3-20 Standard Mail (A) Response to Advertising by Familiarity With Organization
Postal Fiscal Years 1987,1999 and 2000 .I.: Contained an Advertisement of Request for Donation and was from One Organization Only)
0 Includes pieces for which no response wos given for forniliority with institution.

Table A3-21 Standard Mail (A) Treatment by Usefulness
(Percentage of Pieces) Postal Fiscal Years 1987, 1999 and 2000
68.0
24.4
4.5
58.2
Read
Looked at
Discarded
Set aside
, Usefulness -, 61 7 68.0 20.2 24.5 17.9 7.0 9.1 9.9
18.2 17.6 36.5 31.7 30 5 21.5 40 9 44 4
3.5 4.3 12.9 11.3 11.6 66 0 66.3 72.4
59.4 66.9 25.6 26.0 17.9 8.4 8.9 9.1
Read
Looked at
Discarded
Set aside
2.2 2.5 3.2 100.0 100.0 100.0 5.2 4.5 5.8 100.0 100.0 100.0
12.9 13.5 10.1 100.0 100.0 100.0
4.6 4.2 4.2 100.0 100.0 100.0
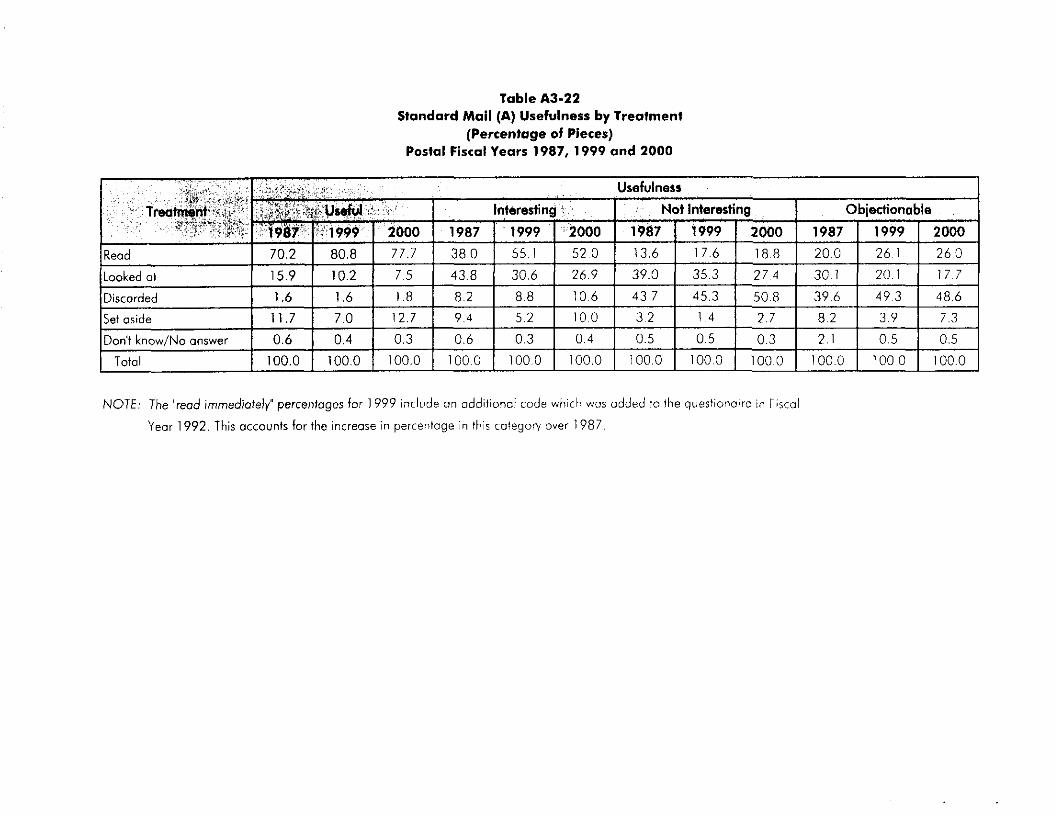
Table A3-22 Standard Mail (A) Usefulness by Treatment
(Percentage of Pieces) Postal Fiscal Years 1987, 1999 and 2000
Set aside 11.7 7.0 12.7 9.4 5,2 10,o 3.2 1 .4 2 .7 8.2 3.9 7.3
Don't know/Na answer 0.6 0.4 0.3 0.6 0.3 0.4 0.5 0.5 0.3 2. I 0.5 0.5 Total 100.0 100.0 100.0 IO00 100.0 100.0 100.0 100.0 100.0 100.0 1000 100.0
NOTE: The "read immediately'' percentages for 1999 include an odditionol code which wos added to the questionoire in Fiscal
Year 1992. This accounts far the increase in percentage in this categoiy over 1987.

Table A3-23 Standard Mail (A) Treatment by Intended Response
(Percentage of Pieces) Postal Fiscal Years 1987, 1999 and 2000
of household 0 Looked at 4.9 3.0 3.1 77.9 86.3 79.9 14.1 7.4 9.5 3.1 3.4 7.5 100.OlOOO100.0
100.0 Discarded
100.01OO.O 100.0 Set aside
0.9 1.0 0.9 92 5 94.4 89.6 2.4 0.9 1 . 4 4.3 3 7 8 2 100.0 IO00
15.4 12.8 10.6 35.3 38.4 34.7 46.2 43.2 47.9 3.0 5.6 6.8
0 This code wos not presented in household diaries prior lo 1992

Table A3-24 Standard Mail (A) Intended Response by Treatment
(Percentage of Pieces) Postal Fiscal Years 1987, 1999 and 2000
0 This code was not presented in household diaries prior to 1992

Table A 3 4 5 Standard Mail (A) Usefulness by Intended Response
(Percentage of Pieces) Postal Fiscal Years 1987, 1999 and 2000

Table A3-26 Standard Mail (A) Intended Response by Usefulness
(Percentage of Pieces) Postal Fiscal Years 1987, 1999 and 2000
~~~~~~
Intended Responre
I No I ,Maybe , . . ,,
2000 I 1987 I 1999 f 2000 I 1987 f 1999 I

Table A3-27 Standard Moil (A) Pleces from Credit Card Industry
Response to Moil Piece by Familiarity With organization (Percentage of Pieces)
Postal Fiscal Years 1987, 1999 and 2000
I I . " , .,. - . . . . . 51.4 61.6 3 I .3 f . L L . I Previous customer
Organizotion known
Organization unknown 30.2
17.7 16.3 10.5 5.6 4 .a 1 . 7 1 .o 21.3 7 . 4 4 3 7.8 I .2 2.4
28.4 35.4 24.6 7.9 I .6 3.4 18.2 20.2 4.2 2.9
NOTE: Percentages do not add up to 100% due to multiple responses from multiple questions.
NOTE: The "read immediately" percentages for 1999 include on additional code which wos added to the questionoire in Fiscal
questionaire in Fiscal Year 1992. This accounts for the increase in percentage in this category over 1987.

Table A3-28 Standard Mail (A) Pieces from Insurance Companies
Response to Mail Piece by Familiarity With Organization (Percentage of Pieces)
Postal Fiscal Years 1987, 1999 and 2000
NOTE: Percentages do not add up to 100% due to multiple responses from multiple questions.
NOTE: The "read immediately" percentages for 1999 include an additional code which was added to the questionoire in Fiscal
questionaire in Fiscal Year 1992. This accounts for the increase in percentage in this category over 1907.

Table A3-29 Standard Mail (A) Pieces from Department Stores
Response to Mail Piece by Familiarity With Organization (Percentage of Pieces)
Postal Fiscal Years 1987, 1999 and 2000
5.1 Aside
1987 1. 1999 [ 2000 .! '*-196?:'\ 1999 , I 2000
Will Respond found Usdul
1987 I 1999 I 2000 1987 1999 I 2000
Previous customer
Organization known
Organization unknown 0
52.4 68. I 66.2 11.2 5.9 9.7 64.4 63.7 67.6 17.6 20.6 19.4
25.5 41.2 47.3 6.4 2.9 3.4 23.4 10.6 25.6 6.0 3.2 6.3 24.4 31.3 23.9 4.5 4.0 18.3 17.5 7.5 13,4 7. I 5.4 1.4

Table A3-30 Standard Mail (A) Pieces from Mail Order Companies
Response to Mail Piece by Familiarify With Organization (Percentage of Pieces)
Postal Fiscal Years 1987, 1999 and 2000
NOTE: Percentages do not add up to 100% due to multiple responses from multiple questions.
NOTE: The "read immediately" percentages for 1999 include an additional code which was added to the questionaire in Fiscal
Year 1992. This accounts for the increase in percentage in this category over 1987.

Table A3-31 Standard Moil (A) Pieces from Publishers
Response to Mail Piece by Familiarity With Organization (Percentage of Pieces)
Postal Fiscal Years 1987, 1999 and 2000
NOTE: Percentages do not add up to 100% due to multiple responses from multiple questions.
NOTE: The "read immediately" percentages for 1999 include on additional code which wos added to the questionaire in Fiscal
Year 1992. This accounts for the increase in percentage in this categov over 1907.

Table A 3 4 2 Standard Mail (A) Treatment of Mail Piece by Shape (Percentage of Mail Pieces Received by Households)
Postal Fiscal Years 1987, 1999 and 2000
Read by more than one member of household 0 looked at
Discarded
/Read bv member of household I 44.5 I 39.5 1 40.2 I 44.0 I 39.9 I 40.5 I 30.8 I 21.1 I 27.6 I 50.1 I 41.2 I 42.5 N/A 8.5 6.1 N/A 8.3 7 .4 N/A 6.6 6,4 N/A 9.8 9.5 26.1 20.9 17.7 26.0 20.8 17.9 33.8 25.7 21.1 2 4 . 7 20.5 18.4 15.3 18.9 22.8 13.8 18.1 21.3 19.6 24.2 29.7 15.7 IS R 2 0 9
Set aside
Don't know/No answer
Total Mail Received by Households
4.8 2.0 4 . 7 8.8 2.6 6.6 3.9 1.6 2.7 2.2 1 . 4 2.0 9.3 10.1 8.5 7.4 10.3 6.3 11.9 20.7 12.5 7.4 11.4 6.7
100.0 100.0 100.0 100.0 100.0 100.0 100.0 100.0 100.0 100.0 100.0 100.0
0 This code was not presented in household diaries prior to 1992. 0 Total includes pieces for which no response was given os to shape.
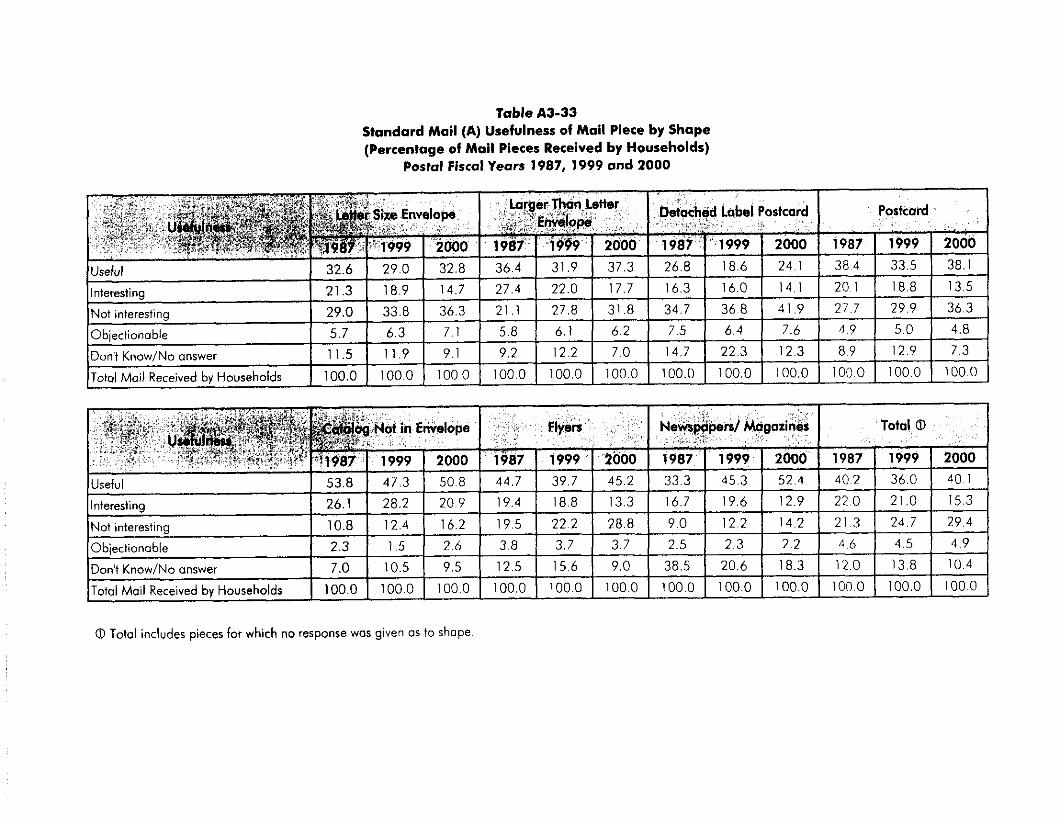
Table A3-33 Standard Mail (A) Usefulness of Mail Piece by Shape (Percentage of Mail Pieces Received by Households)
Postal Fiscal Years 1987, 1999 and 2000

Table A3-34 Standard Mail (A) Response to Advertising by Shape
(If Mail Piece Contained Advertising or Request for Donation) Postal Fiscal Years 1987, 1999 and 2000
I. . ,\.-. . I . > . ' ', .cotbla~ Not in Envelope .. ' . , ~.
Rsrponse . ( : . I .,
1987 ' 1 1999 I 2000
Toial 0 Flyers Newspapers/ Magazines
1987 1 1999 I 2000 1987 I 1999 I 2000 1987 1 1999 I 2000 Yes
No
Maybe
No onswer
Total
0 Total includes pieces for which no
16.1 19.5 16.9 15.6 13.5 10.0 lO,2 11.3 6.9 14.6 12.4 9.4
46.6 4.2 41.8 54.2 54.9 41.1 44.3 4 7 3 29.4 58 6 61.2 46.2
32.5 3.9 23.6 21.2 15.0 14.0 16.9 15.1 13.6 19.9 13.5 13.7
4.8 9 .6 5.2 9. I 1 6 6 12.2 28.6 26.3 21.6 7.0 12.8 13.9 100.0 100.0 100.0 100.0 100.0 100.0 100.0 100.0 100.0 100 0 100.0 100.0

Table A3-35 Standard Mail (A) Percentage of Pieces Read Immediately and Set Aside by Shape and Familiarity With Organization
Postal Fiscal Years 1988, 1999 and 2000
NOTE: The "read immediately" percentages for 1999 include an additional code which was added to the questionaire in Fiscal
Year 1992. This accounts for the increase in percentage in this category over 1987.
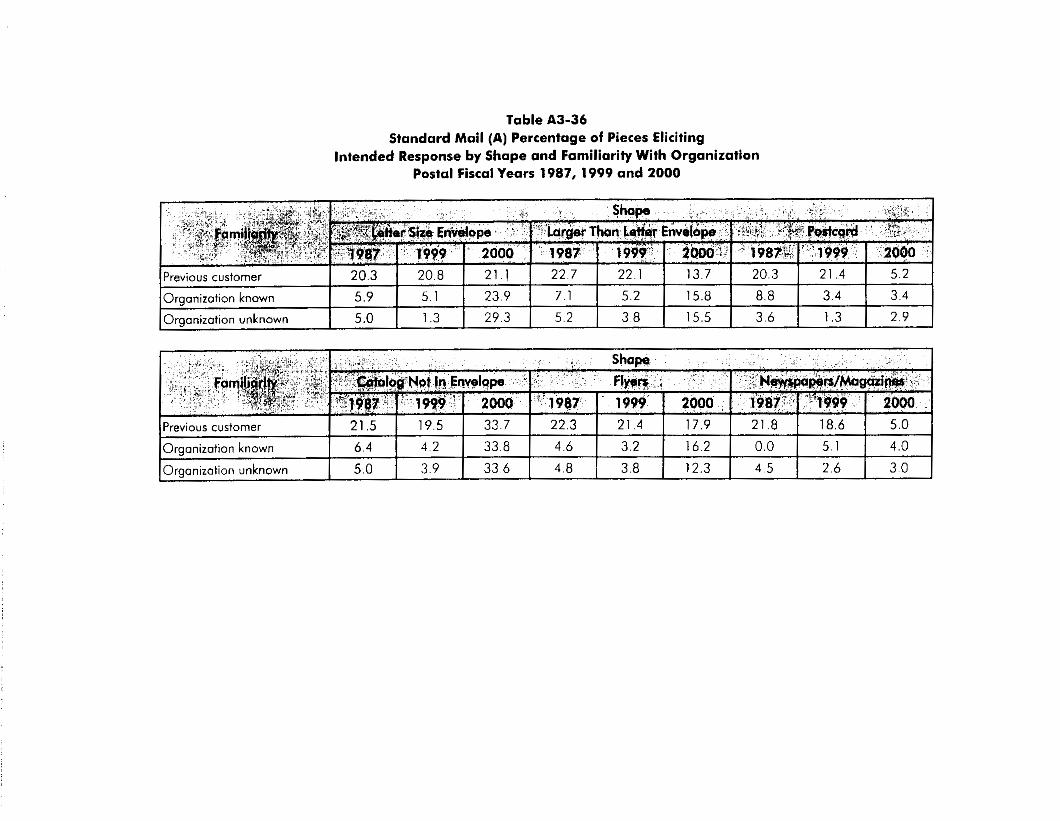
Table A3-36 Standard Mail (A) Percentage of Pieces Eliciting
Intended Response by Shape and Familiarity With Organization Postal Fiscal Years 1987, 1999 and 2000

Table A.3-37 Standard Mail (A) Percentage of Pieces Found
Useful by Shape and Familiarity With Organization Postal Fiscal Years 1987, 1999 and 2000
NOTE: Percentages do not add up to 100% due to multiple response to multiple questions

Table A3-38 Standard Mail (A) from Department Stores
Reaction io Mail Piece by Shape (Percentage of Pieces)
Postal Fiscal Years 1987, 1999 and 2000
Larger envelope
Postcard
Catalog not in envelope
Flyers
5 7 2 I 6.1 8.3 1 51.2 I 51.9 I 20.4 I
10.9 17 9 8.6 3.6 4 . 5 25.8 12.3 15.8 14.2 3.3 9.1 24 .7 17.1 20,2 13.1 40.8 20.4 19.0 15.4 15 7 20.8 42.5 54.1 23.1
NOTE: Percentages do not add up to 100% due to multiple responses from multiple questions.
NOTE: The "read immediately" percentages lor 1999 include an additional code which was added to the questionnaire in Fiscal
Year 1992. This accounts for the increase in percentage in this category over 1987.
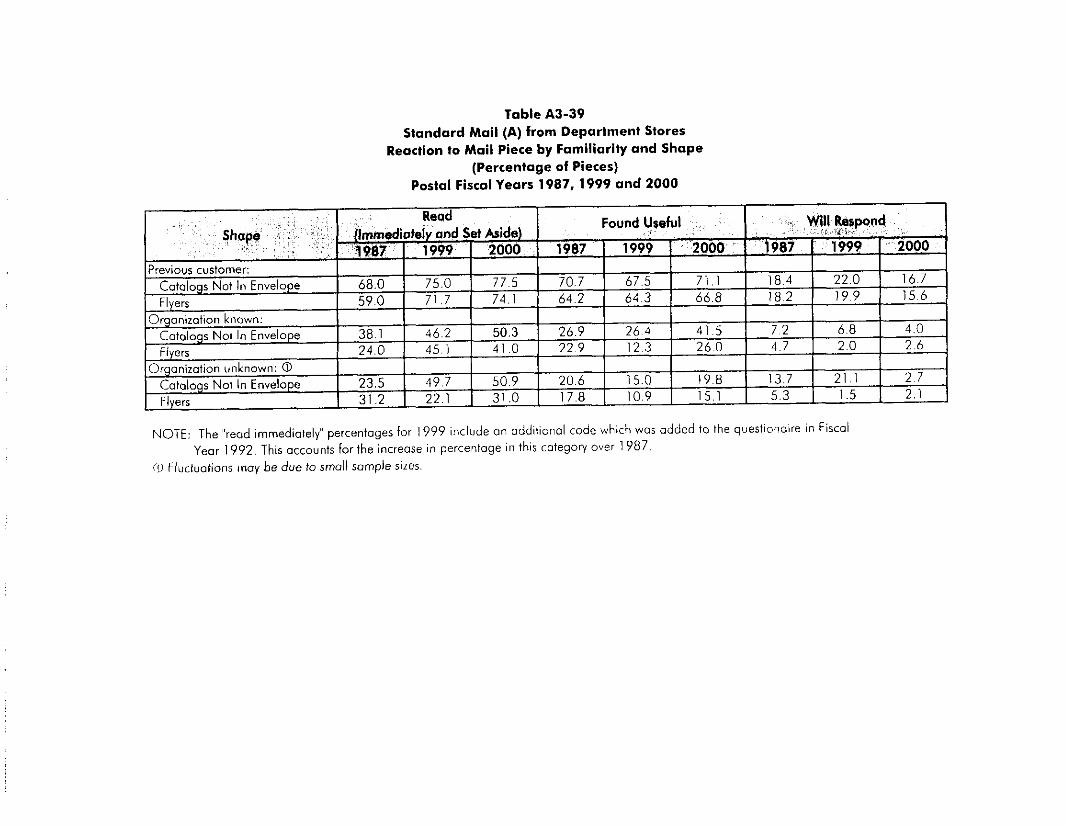
Table A3-39 Standard Mail (A) from Department Stores
Reaction to Mail Piece by Familiarity and Shape (Percentage of Pieces)
Postal Fiscal Years 1987, 1999 and 2000
NOTE: The "read immediately" percentages for 1999 include on additional code which was added to the questionaire in Fiscal
(IJ Fluctuations may be due to small sample sizes. Year 1992. This accounts for the increase in percentage in this category over 1987.

Table A3-40 Standard Mail (A) from Mail Order Companies
Reaction to Mail Piece by Shape (Percentage of Pieces)
Postal Fiscal Years 1987, 1999 and 2000
Larger envelope 14.9 I 16.9 I 22.0 I 16.2 I 12.6 Postcord 0 I 18.6 I 4.3 I 3.9 I 0.8 I 0.9 I 1.2 ~
Catalog not in envelope I 15.8 I 12.8 I 10.9 I 48.5 I 63.3 I 65.6 Flyers I 10.0 I 11.2 I 6.7 I 7.0 I 5.6 I 5.1 Newspapers/Mogozines 0 I 19.8 I 14.2 I 8.8 I 12.1 I 1.7 I 2.9
NOTE: Percentages do not add up io 100% due to multiple responses from multiple questions.
NOTE: The "read immediately" perceniages for 1999 include an additional code which wos added to the questionaire in Fiscal
0 Flucuations moy be due to small sample size.
Yeor 1992. This accounts for the increose in percentage in this categoly over 1987.


Table A3-42 Standard Mail (A) from Publishers Reaction to Mail Piece by Shape
(Percentage of Pieces) Postal Fiscal Years 1987, 1999 and 2000
NOTE: Percentages do not add up to 100% due to multiple responses from multiple questions.
0 Flucualions rnoy be due to small sample size.

Table A3-43 Standard Mail (A) from Publishers
Reaction to Mail Piece by Familiarity and Shape (Percentage of Pieces)
Postal Fiscal Years 1987, 1998, and 2000
0 Fluctuations may be due to small sample sizes
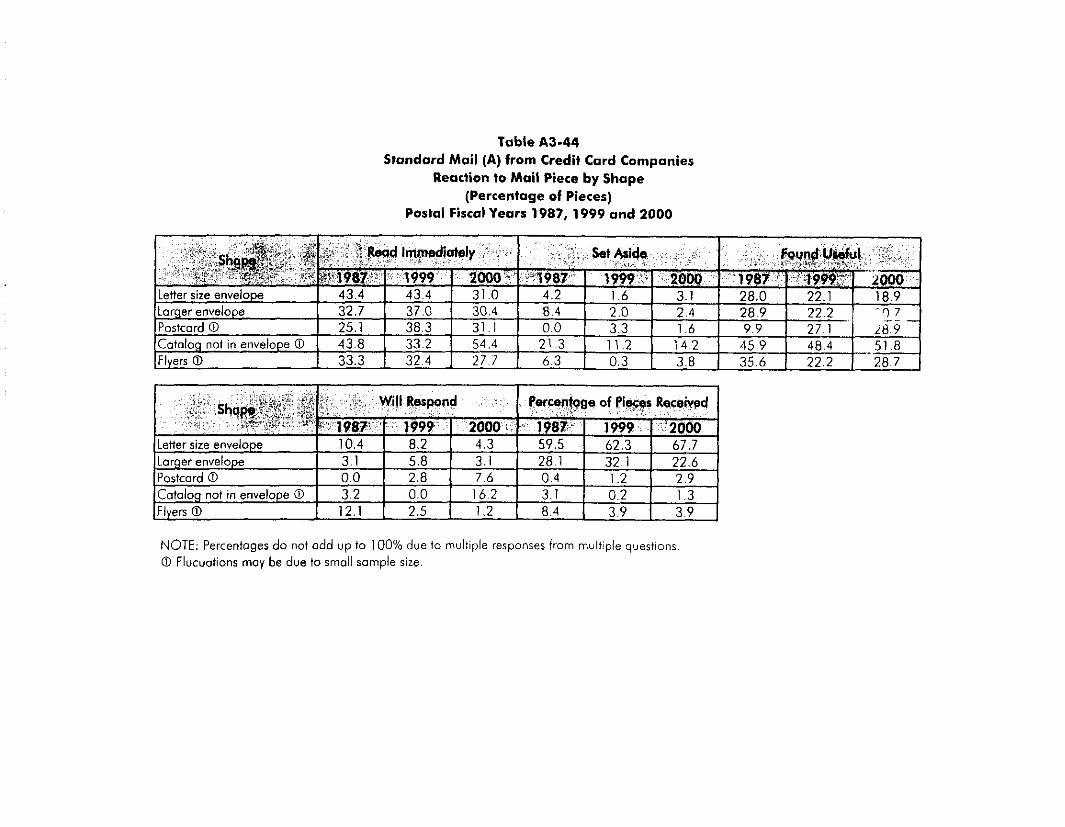
Table A3-44 Standard Mail (A) from Credit Card Companies
Reaclion to Mail Piece by Shape (Percentage of Pieces)
Poslal Fiscal Years 1987, 1999 and 2000
Letter size envelope Larger envelope Postcard 0 Cotolog not in envelope 0 Flyers 0
43.4 43.4 31.0 4.2 1.6 3.1 28.0 22.1 I 18.9 ''0 7 32.7 37.0 30.4 8.4 2.0 2.4 28.9 22.2 1
25.1 38.3 31 . 1 0.0 3.3 1.6 9.9 27.1 L8.Y 43.8 33.2 54.4 21.3 1 1 .2 i 4.2 45.9 48.4 51.8 33.3 32.4 27.7 6.3 0.3 3.8 35.6 22.2 28.7
-
NOTE: Percentages do not odd up to 100% due to multiple responses from multiple questions 0 Flucuotions may be due to small sample size.

Table A3-45 Standard Mail (A) from Credit Card Companies
Reaction to Mail Pieces by Familiarity and Shape0 (Percentage of Pieces)
Postal Fiscal Years 1987, 1999 and 2000
0 Fluctuations may be due to small sample sizes

Table A3-46 Standard Mail (A) from Insurance Companies
Reaction to Mail Piece by Shape (Percentage of Pieces)
Postal Fiscal Years 1987, 1999 and 2000
NOTE: Petcentages do not add up lo 100% due to muliiple responses from multiple questions. 0 Flucuations may be due to small sample size.

Table A3-47 Standard Mail (A) from Insurance Companies
Reaction lo Mail Pieces by Familiarity and ShapeQ (Percentage of Pieces)
Postal Fiscal Years 1987, 1999 and 2000
0 Flucluofions may be due to small sample sizes

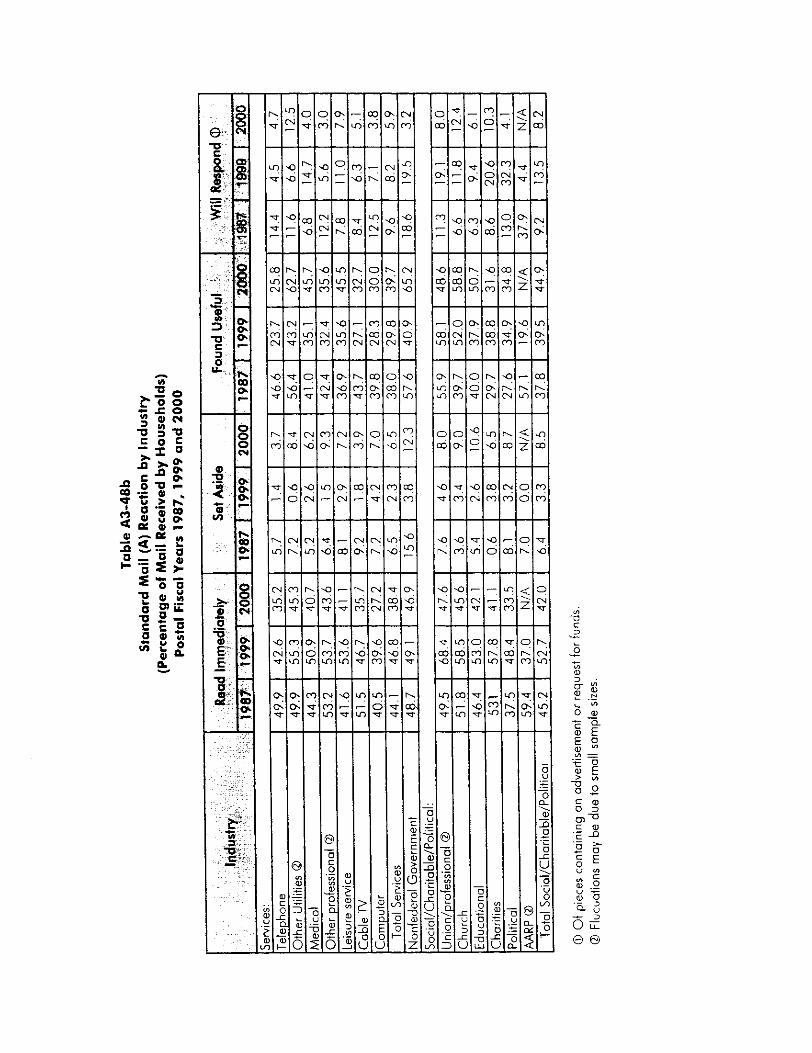


Table A3-50 Standard Mail (A) Reaction to Mail Piece by Age of Head of Household
Postal Fiscal Years 1987, 1999 and 2000
25 - 34 35 - 4 4 4 5 . 5 4
.. .
42.7 37.5 36.4 2 8 2.4 3 3 15.9 12 ,9 7.9 0.9 0.7 0.7 40.8 35.1 38 3 3.4 2.8 4.4 16.1 13.5 8.6 1 1 1 .o I .o .?A R 37.0 38.3 3.4 3.6 5.2 I3 0 13.3 8.3 0.9 1.2 1 . 1
55 - 64 65 - 69 70 I
0 Of pieces containing an advertisement or request for funds.
0 Flucualions may be due to small sample sizes.
41.2 35.1 38.8 4 , O 3.5 5.7 12.7 11.8 8.7 1 .o 1 .o I .3 38.1 37.9 37.6 3.1 3.5 5.5 13.2 1 1 . 1 7.8 0 .9 0 9 1 . 1 37.6 34.1 35.3 2 , 9 2.8 5 5 1 4 . 8 9 .8 9.4 0.9 0.7 I . 4

Table A 3 4 1 Standard Mail (A) Reaction to Mail Piece by Education of Head of Household
(Percentage of Pieces) Postal Fiscal Years 1987, 1999 and 2000
0 Of pieces containing an advedisement or request for funds.

Table 1\3-52 Standard Mail (A) Users of Reply Envelopes by Industry
(Percentage of Pieces) Postal Fiscal Years 1987, 1999 and 2000
~ ~ ~~ ~ _ _ _
Deoortment store 5.6 1.8 I 1.8 4.0 2.2 1 2.3 5.1 2.0 2.1 Mail order 19.0 19.9 1 1 2 . 9 46.8 56.9 1 3 2 . 1 31.6 37.4 22.5 Sceciolty store 3.4 1 1 I N/A 6.8 2.6 1 N/A 5.0 1.8 N/A Publisher 2 2 ~ 1 19.3 1 1 4 . 8 21.1 1 6 . 5 1 9.5 21.4 17.9 12.2
IS u permarkets I 0.2 I 0.1 I 0.2 I 0.2 I 0.0 I 0.3 I 0.3 I 0.1 I 0.3 I
____ ~ ~ ~~
Land promotion I 0 .4 I 0.0 1 0.2 I 0.1 1 0.1 I 0.1 I 0.3 Restouront I 0.1 1 0.0 1 N/A I 0.0 I 0~0 I N/A I 0.1 Consumer packaged goods I 0.9 I 1.5 I N/A I 0.5 I 0.9 I N/A I 0.8
0.1 I 0.1 0.0 I N/A 1.2 I N/A
Auto dealers 0.3 0.2 N/A 0.1 0.1 N/A 0.2 0.1 I N/A Service stations 0.0 0.0 N/A 0.0 0.0 N/A 0.0 0.0 N/A Moll 0.0 0.0 N/A 0.0 0.0 N/A 0.0 0.0 N/A Other merchants 1 1 0.2 I .6 2.1 0.1 1 1 1 . 4 0.1 1.4
Total Merchants 53.1 44.1 31.6 81.7 7 9 4 45.4 66.2 60.7 38.5 -
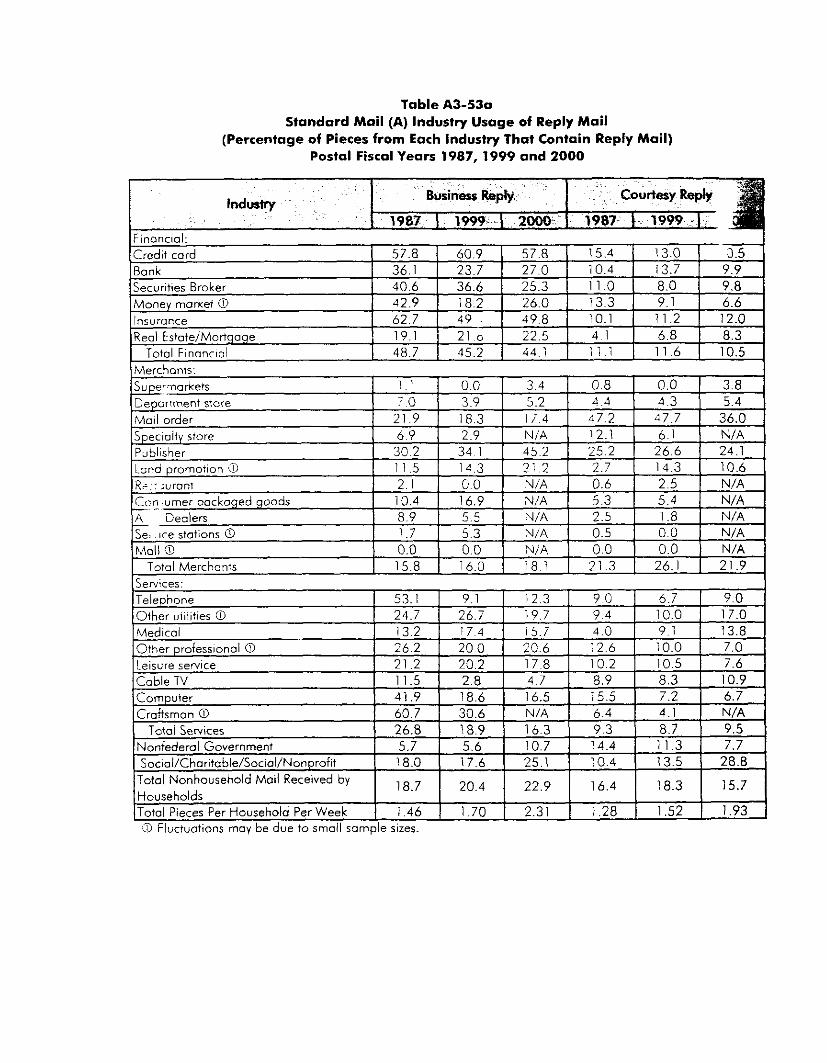
Table A3-530 Standard Mail (A) Industry Usage of Reply Mail
(Percentage of Pieces from Each Industry That Contain Reply Mail) Postal Fiscal Years 1987, 1999 and 2000
Specialhi store I N f A Publisher I 3 0 2 I 34 1 I 4 5 2 I 25 2 I 2 6 6 I 24 1
Total Pieces Per Household Per Week I 1.46 I 1.70 I 2.31 I 1.28 I 1.52 1 1.93 Fiuctuotions may be due to small sample sizes.
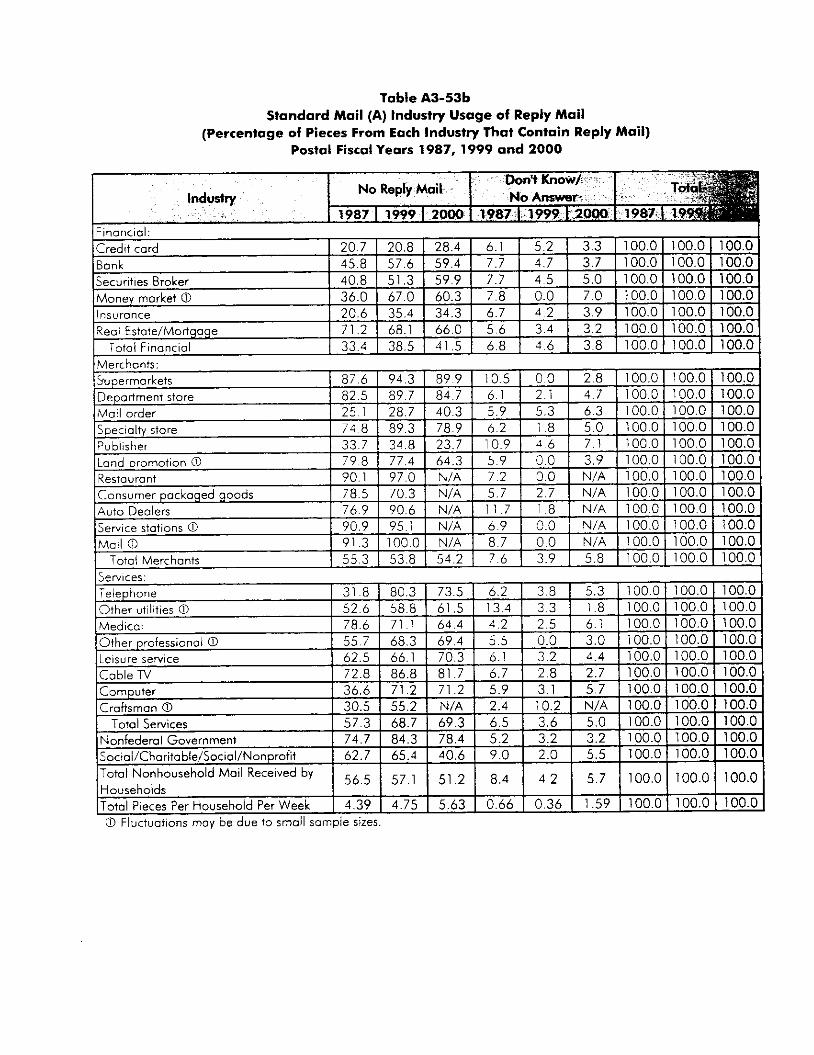
Table A3-53b Standard Mail (A) Industry Usage of Reply Mail
(Percentage of Pieces From Each Industv That Contain Reply Mail) Postal Fiscal Years 1987, 1999 and 2000
Households I I I I I I I I I Total Pieces Per Household PerWeek I 4.39 I 4.75 I 5.63 I 0.66 I 0.36 I 1.59 I 100.0 I 100.0 I 100.0 C? Fluctuotions may be due to srnoil sarnpie sizes.

Table A3-54 Standard Mail (A) Intended Response Rates for
Major Industries by Enclosure of Reply Envelopes/Cards (Percentage of Pieces to Which Recipients Intend to Respond)
Postal Fiscal Years 1987, 1999 and 2000

Table A345 Standard Mail (A) Reaction to Mail Piece by Addressee
(Percentage of Pieces) Postal Fiscal Years 1987, 1999 and 2000
Type of Address
NOTE: Percentoges do inof odd up to 100% because these categories reflect responses froin inultiple qLJestlonS

Table A3-56 Standard Mail (A) Reaction to Pieces from Department Stores by Addressee
(Percentage of Pieces) Postal Fiscal Years 1987, 1999 and 2000

Table A3-57 Standard Mail (A) Reaction to Pieces from Publishers by Addressee
(Percenioge of Pieces) Postal Fiscal Years 1987, 1999 and 2000
I .~
Addressed io specific household members I 46.2 1 49.7 1 48.0 1 7.3 1 3.5 1 6.9 1 3 5 . 1 1 3 3 . 5 1 3 8 . 3 18.1 I 15.9 1 11.4 Addressed to occupadresident I 37.7 I 42.6 I 27.4 1 8.8 I 3.6 I 7.4 1 38.5 I 39.0 1 25.5 14.0 I 10.0 I 10.0
J
I Found Useful I . , Will . Respond Read Immediately I Set Aside Type of Addrera I 1987 I 1999 I 2000 I 1987 I 1999 I 2000 I 1987 I 1999 1 ZOOU’ 1 1987 1’1999 I .2000


Table A3-59 Number of Mail Order PurchasesO
Within the Last Year by Education of Head of Household (Percentage of Households)
Postal Fiscal Years 1987, 1999 and 2000
16 - 30 3.7 I 8.4
16- 10 I 12.8 I 16.6 I 11.3 I 11.9 I 10.4 I 9.2 1 16.4 1 10.5 I 13.5 I 10.0 I 8.7 I 8.7 I
3.0 2.6 4 . 1 1 2.3 1 5.2 I 6.9 1 4.3 I 2.5 I 3.1 I 2.9 31 -t
Don't know/No answer
Total
2.6 1 .o 0.8 0.9 1.5 1 .4 1 . 1 3.1 0.9 0.7 0.8 0.7 1.2 2.3 0.0 2.1 3.9 0.0 1.3 2.8 0.0 1.4 2.6 0.0
100.0 100.0 100.0 100.0 100.0 100.0 100.0 100.0 100.0 100.0 100.0 100.0 0 From Entry Intetview.

Table A340 Number of Mail Order Purchasesm Within the Last Year by Age of Head of Household
(Percentage of Households) Postal Fiscal Years 1987. 1999 and 2000
16-30 31 + Don't knowlNo answer
Total
3.5 5.0 1.6 0.7 4.7 4.6 1.2 1 .a 1.8 2.5 3.1 2.8 0.9 1.3 1.3 0.3 0.5 0.1 0.0 0.3 0.2 0.7 0.8 0.6 2.0 3.0 0.0 1 . 1 1 . 4 0.0 2.3 1 . 4 0.0 I . 4 2.6 0.0
100.0 100.0 100.0 100.0 100.0 100.0 100.0 100.0 100.0 100.0 100.0 100.0
0 From Entry Interview.

Table A3-61 Number of Mail Order PurchasesO Within the Lost Year by Number of Adults
(Percentage of Households) Postal Fiscal Years 1987, 1999 and 2000

Table A3-62 Standard Mail (A) Order Pieces Received by
Number of Mail Order Purchases Made Within the Last Year Postal Fiscal Years 1987, 1999 and 2000
.

Table A 3 4 3 Standard Mail (A) Reaction to Pieces from Mail Order Industry by Number of Mail Order Purchases Made Within the Last Year
(Percentage of Pieces) Postal Fiscal Years 1987, 1999 and 2000
NOTE: Percentages do i ioi odd up to 100% because ihese categories reflect responses froin Inulllple questions
NOTE: The "read immediately" percentoges from 1999 include on additional code which was odded to tl ie
questionairre in Fiscal year 1992. This accounts for t l ie Increase in percentage in this category.
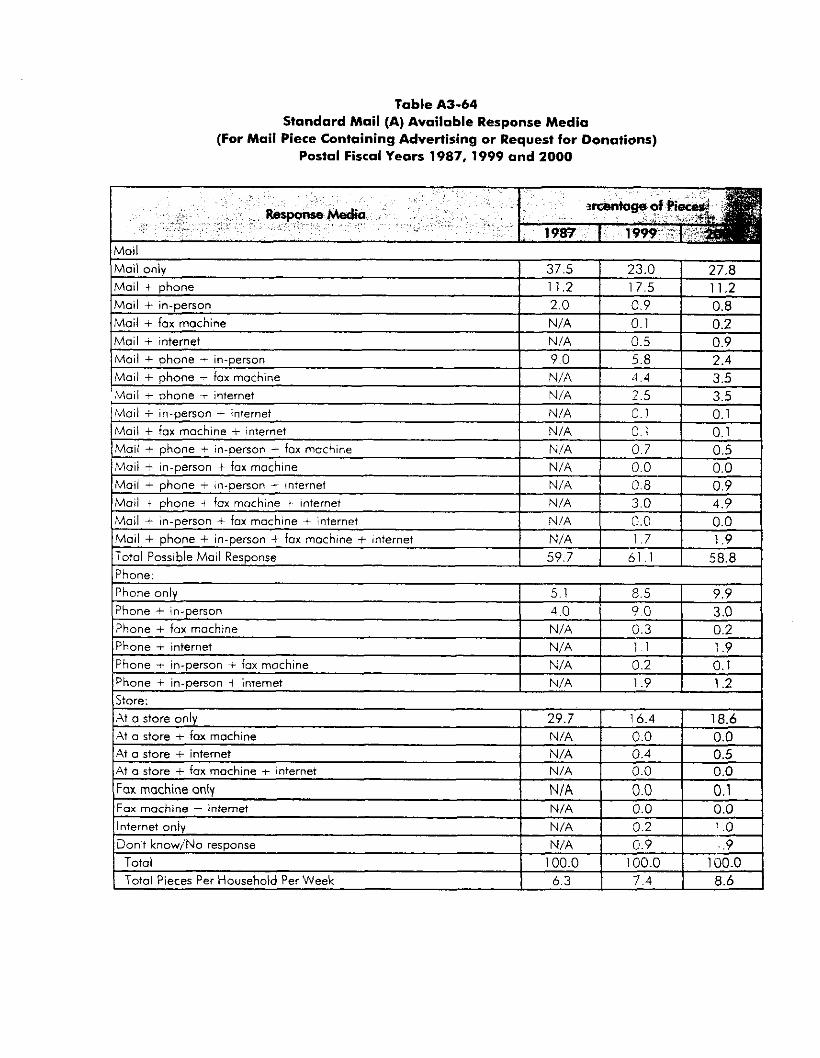
Table A3-64 Standard Mail (A) Available Response Media
(For Mail Piece Containing Advertising or Request for Donations) Postal Fiscal Years 1987, 1999 and 2000

Table A 3 4 5 Standard Mail (A) Available Response Media from Major Industries
(Percentage of Pieces) Postal Fiscal Years 1987, 1999 and 2000
Mail + phone + in-person + fax machine Mail t. in-person t fax machine Moil + phone + in-person -+ internet Mail + phone + fax machine t iniernet Mail + in-person + fox machine + internet
Deportment Store
N/A 0 ,9 0.4 NIA 0 7 0.5 NIA 1 .o 0.0 N I A 0.0 0.2 N I A 0.0 0.0 NIA 0.0 0.0 N I A 1 .o 1.5 N/A 0.5 0.6 NIA 0.6 0.3 N/A 0.1 0.9 N I A 9.0 14.9 NIA 1.8 2.4 ,
N/A 0.0 0.0 N I A 0.0 0.1 NIA 0.0 1 .o
Phone ~t in-person t internet I NIA I 6.1 I 2.9 I NIA I 0.1 I 0.2 I N I A I 0.6 I 0.0 At a store only I 54.2 I 51.9 1 52.3 I 1.3 I 0.9 I 0.8 1 12.3 I 4.2 I 2.6

Table A3-66 Standard Mail (A) Intended Response Medium
to Pieces from the Mail Order Industry (Percentage of Pieces)
Postal Fiscal Years 1987,1999 and 2000

Table 1\3-67 Unaddressed Mail Received
Bundled Flyers Usage by Industry (Percentage of Mail Received by Households)
Postal Fiscal Years 1987, 1999 and 2000

Table A3-68 Unoddressed Moil Received Reoction to Bundled Flyers
Postal Fiscol Yeors 1987, 1999 ond 2000
Treatment
Read by member of household
Read bv more t h a n one rnernb oi househord 0
2000 1987 1999 29 3 19 8 26 7 N /A 6 7 a 9
Looked at
Discarded
Set aside
Doni know/No answer
Total
24.0 19. I 14.1 20.0 17.8 27.0 3.9 1 . 1 3.7
100.0 100.0 100.0
22.7 35.6 I 8.8

Table A3-69 Unaddressed Mail Received Response to Bundled Flyers by Industry
(Percentage of Mail Received by Households) Postal Fiscal Years 1987.1999 and 2000
0 Fluctuations may be due to small sample sizes.

Table A3-70 Nonprofit Standard Mail (A) Received by Households by Shape
Postal Fiscal Years 1987,1999 and 2000
IEnvelooes: I
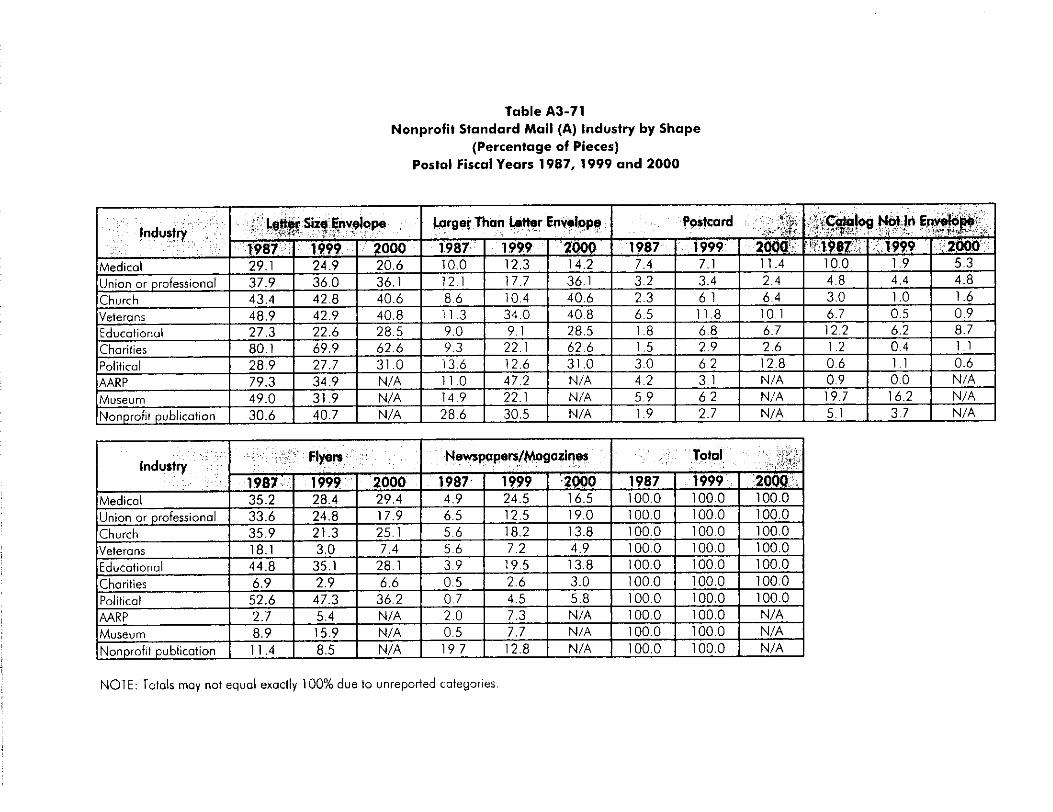
Table A3-71 Nonprofit Standard Mail (A) industry by Shape
(Percentage of Pieces) Postal Fiscal Years 1987, 1999 and 2000
NOTE: Totals may not equal exactly 100% due to unreported categories.

Table A3-72 Nonprofit Standard Mail (A) by Content by Industry
(Percentage of Moil Received by Households) Postol Fiscal Years 1987, 1999 and 2000
0 Fluctuations may be due t o small sample sizes
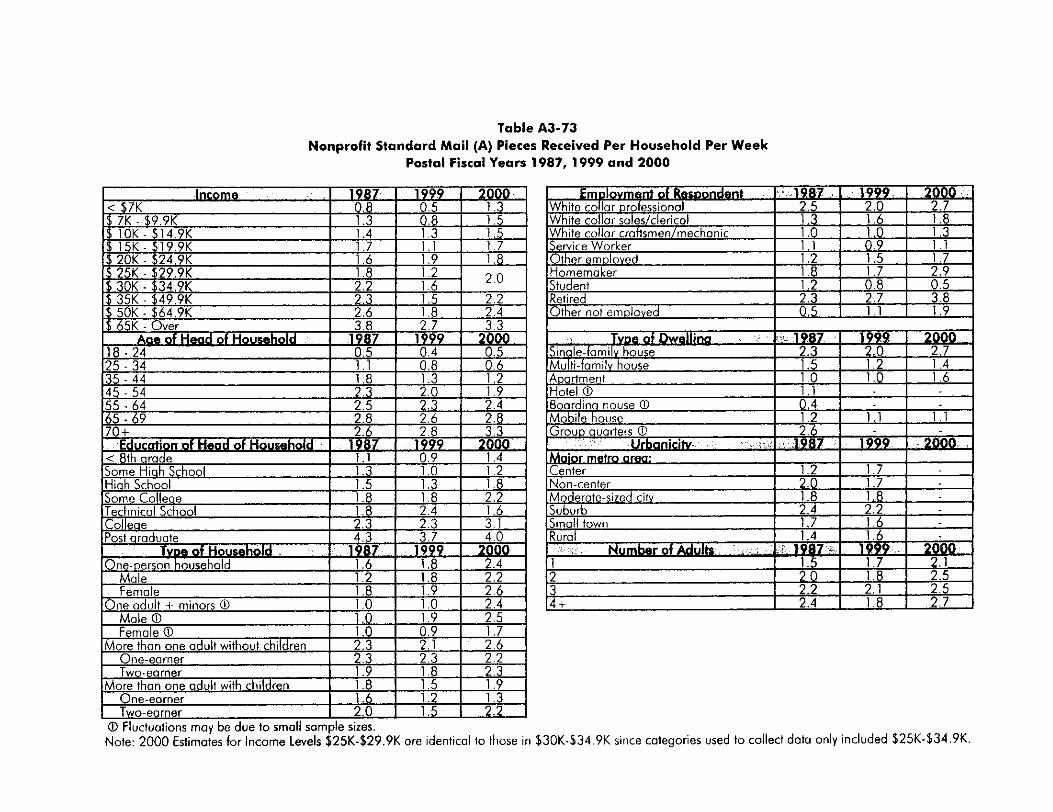
Table A3-73 Nonprofit Standard Mail (A) Pieces Received Per Household Per Week
Postal Fiscal Years 1987. 1999 and 2000
0 Fluctuations may be due to small sample sizes. Note: 2000 Estimates for Income Levels $25K-$29.9K are identical to those in $30K-$34.9K since categories used to collect data only included $25K-$34.9K.
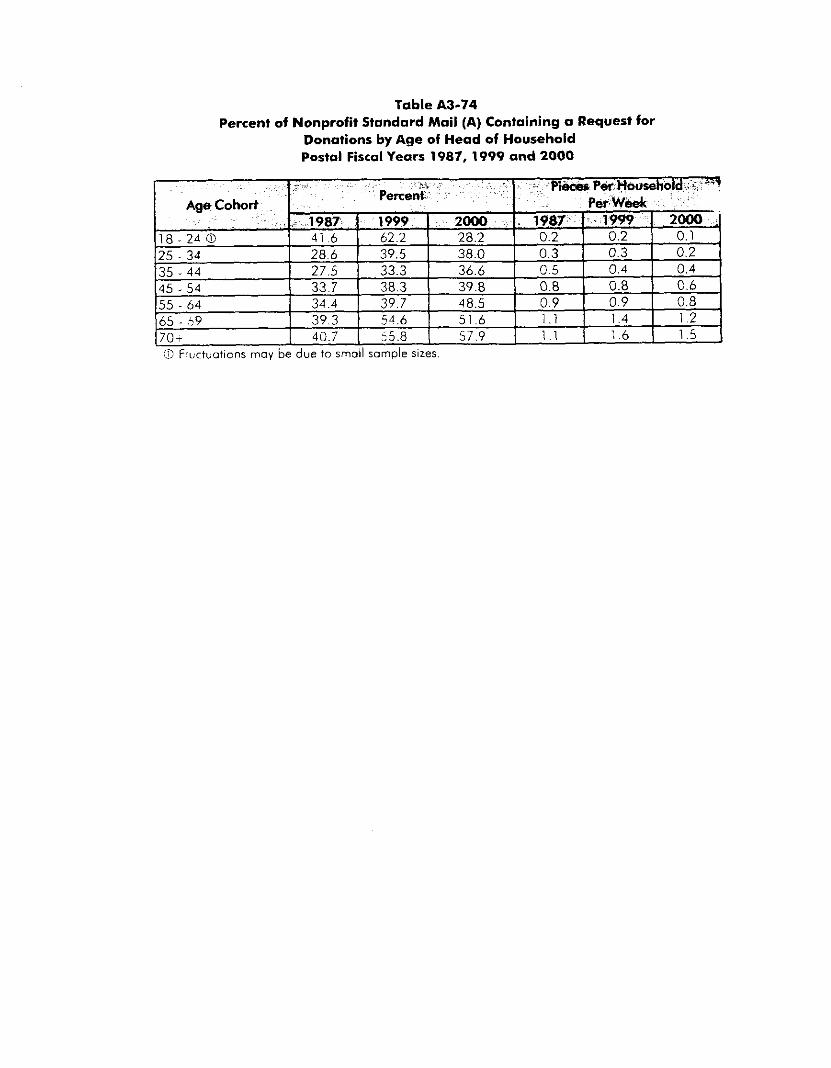
Table A3-74 Percent of Nonprofit Standard Mail (A) Containing a Request for
Donations by Age of Head of Household Postal Fiscal Years 1987, 1999 and 2000
0 Fluctuotions may be due to smoll somple sizes.

Table 1\3-75 Nonprofit Standard Mail (A) Treatment of Mail Piece by Familiarity With Organization
(Percentage of Pieces Received by Households) Postal Fiscal Years 1987, 1999 and 2000
0 Includes pieces for which no response was given for familiarity with institution. 0 This code wos not presented n household diories prior to 1992.

Table A3-76 Nonprofit Standard Mail (A) Response to Advertising by Familiarity With Organization
(If Piece Contained an Advertisement or Request for Donation and was from One Organization Only) Postal Fiscal Years 1987, 1999 and 2000
0 lncliides pieces for which no response was given for iamillariv with insliiiitinn

Table A3-77 Nonprofit Standard Mail (A) Treatment of Mail Piece by Shape
(Percentage of Mail Received by Households) Postal Fiscal Years 1987, 1999 and 2000
0 This code wos not represented in household diaries proir to 1992

Table A3-78 Nonprofit Standard Mail (A) Usefulness of Mail Piece by Shape
(Percentage of Mail Received by Households) Postal Fiscal Years 1987, 1999 and 2000

Table A3-79 Nonprofit Standard Mail (A) Response to Advertising by Shape (If Mail Piece Contained Advertising or Request for Donation)
Postal Fiscal Years 1987.1999 and 2000
0 Total includes pieces for which no response was given os to shape.
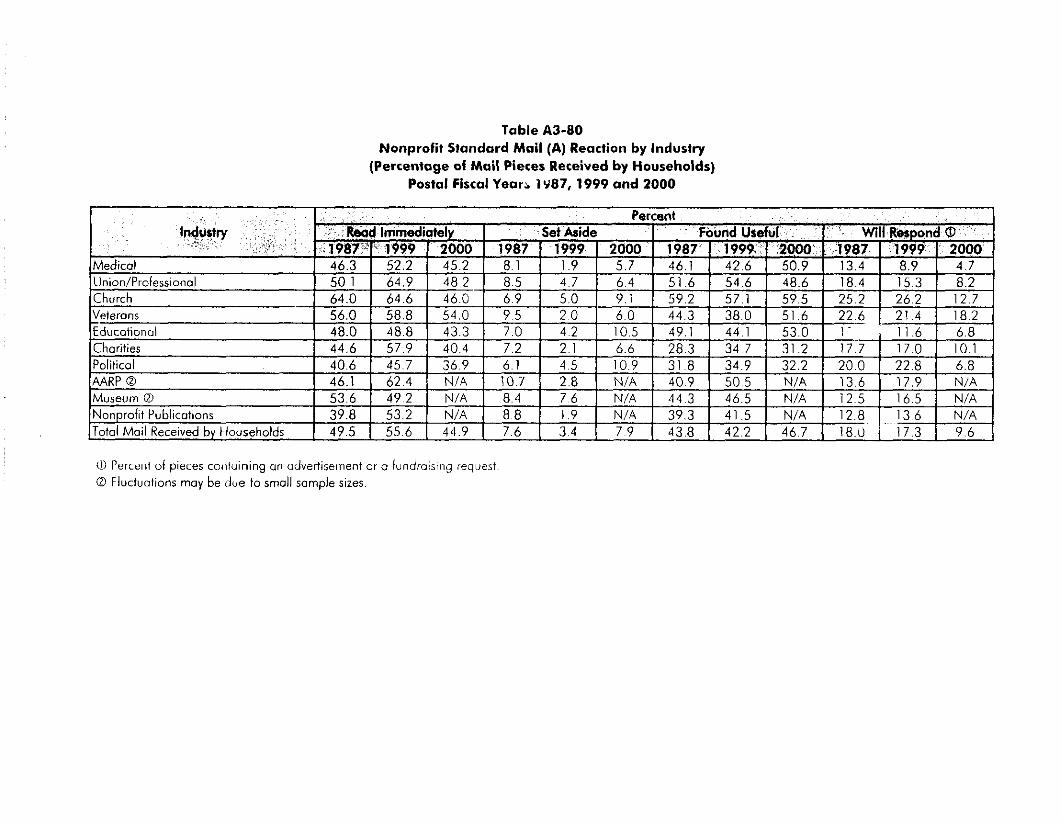
Table A 3 4 0 Nonprofit Standard Mail (A) Reaction by Industry
(Percentage of Mail Pieces Received by Households) Postal Fiscal Yeari 1987, 1999 and 2000
U Percent of pieces coiituining on advertisement or o fundroislng request. 0 Fluctuotionr may be due to small sample sizes.

Appendix A4: Direa Mail Advertising


Table A4-2 Total Pieces of Advertising Mail@ Received Per Week by Age of Household Head
Postal Fiscal Years 1987, 1999 and 2000
I 35-44 I I I 4 5 - 5 4 I I I 55 - 64 I 1987 I 1999 I 2000 I 1987 I 1999 I 2 000 I 1987 I 1999 I 2 000 Type of Ad Mail
I 65 - 6 9 I I I 70+ I 1987 I 1999 I 2000 I 1987 I 1999 I 2000 Type of Ad Mail
0 Includes First-Class adverfising only, First-class adveitising enclosed, business invitations/announcetnents, and Standard Mail (A)
0 Total First-class and total odeveitising are over-reporied because some stuffers ore counted twice, non-package mail.

Table A4-3 Total Pieces of Advertising Maila Received Per Week by Education of Head of Household
Postal Fiscal Years 1987, 1999 and 2000
. TechSchool College Pod Graduate
0 Includes First-class advertising only, First-Class advertising enclosed, business invitations/announcements, and Standard Mail (A)
0 Total First-Class and total adevertising are aver-repoited because some stuffers are counted twice non-package mail.

Table A4-4 Total Mail Overview: Treatment of Advertising Mail by
Actual Weekly Standard Mail (A) Receipt (Percentage of Households -- from Entry Interview)
Postal Fiscal Years 1987, 1999 and 2000
Usually read
Usually scan
Read Some
Usually don't read
16.0 7.1 10.4 12.9 6.1 6.2 11.5 9.6 10.0
28.5 46.5 25.7 34.8 47.5 34.1 39.1 39.2 35.9
46.3 31.3 46.2 42.6 36.2 45.6 41.3 41.8 39.6
9.2 1 5 0 17.4 9.2 10.3 13 4 7 9 9, l 1 4 . 4

Table A 4 4 Total Mail Overview:
Intended Response to Advertising Mail by Class (Percentage of Pieces)
Postal Fiscal Years 1987, 1999 and 2000
0 Includes both advertising only and advertising stuffer enclosed mail.
0 Standard Moil (A) ond Nonprofit Standard Mail (A) include request for donations.

Table A4-6 Response Rates To Advertising: First-class
Advertising Only vs. Standard Mail (A) Envelopes and CardsO (Percentage of Pieces)
Postal Fiscal Years 1987, 1999 and 2000
0 All Standard Moil (A) percentages are based on Standard Moil (A) except sociol/charitoble/political
/nonprofit which is based on Standard Mail [A) nonprofit
Fluctuations may be due to small sample sizes
0 Includes medical nonprofit mat/ after 1992.

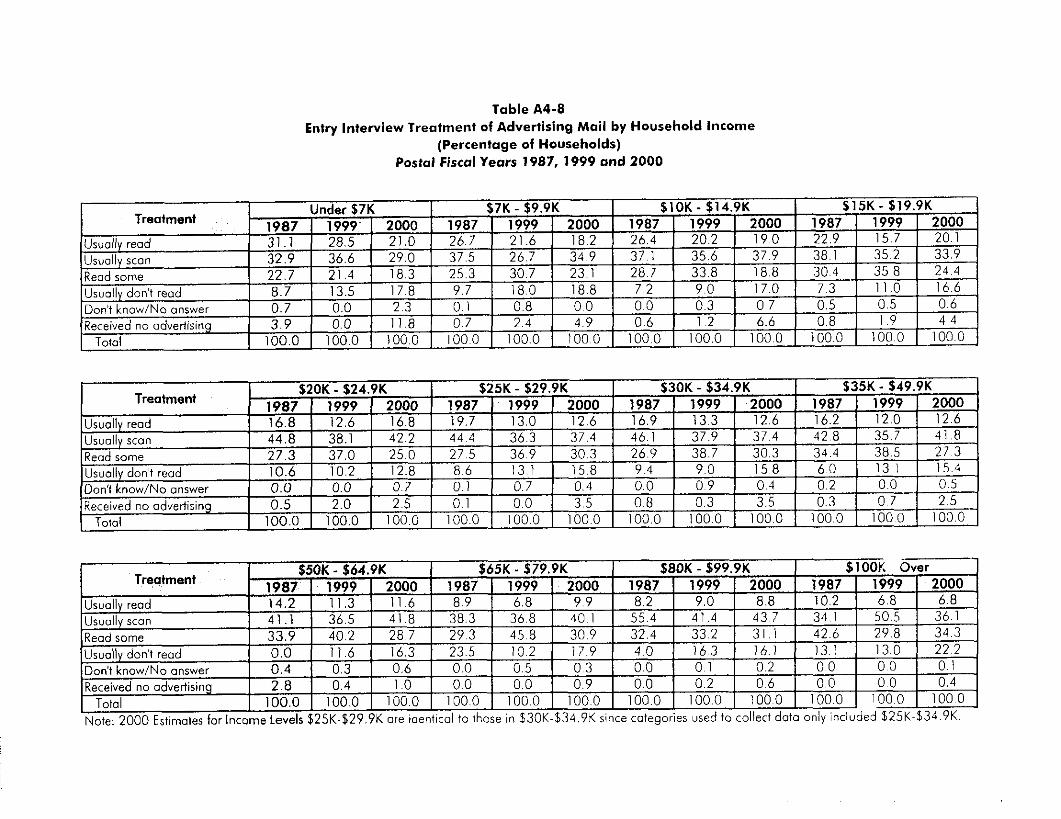
Table A4-8 Entry Interview Treatment of Advertising Mail by Household Income
(Percentage of Households) Postal Fiscal Years 1987, 1999 and 2000
2.0 I 2.5 I u. I I u.u I &5 I U.8 I u . 3 I u . / 1 2.5 Keceived no advertising I 0.5 I Total I 100.0 I 100.0 I 100.0 I 100.0 I 1no.o I 100.0 I 1nn.n I 100.0 1 100.0 I 100.0 I 100 o 1 100.0
Don't know/No answer U.6 I u.5 I u.u I u. I I U . L I Received no advertising I 2.8 I 0.4 I 1.0 I 0.0 I 0.0 I 0.9 I 0.0 I 0.2 I 0.6 I 0.0 I 00 I 0,4
Total I 100.0 I 100.0 I 100.0 I io0.n I 100.0 I 100.0 I 100.0 I 1on.n I 100 o I 1nn.o I iOo.0 I loo 0 Note: 2000 Estimates for Income Levels $25K-$29,9K ore identical to those in $30K-$34,9K since categories used to collect data only included $25K-$34.9K.
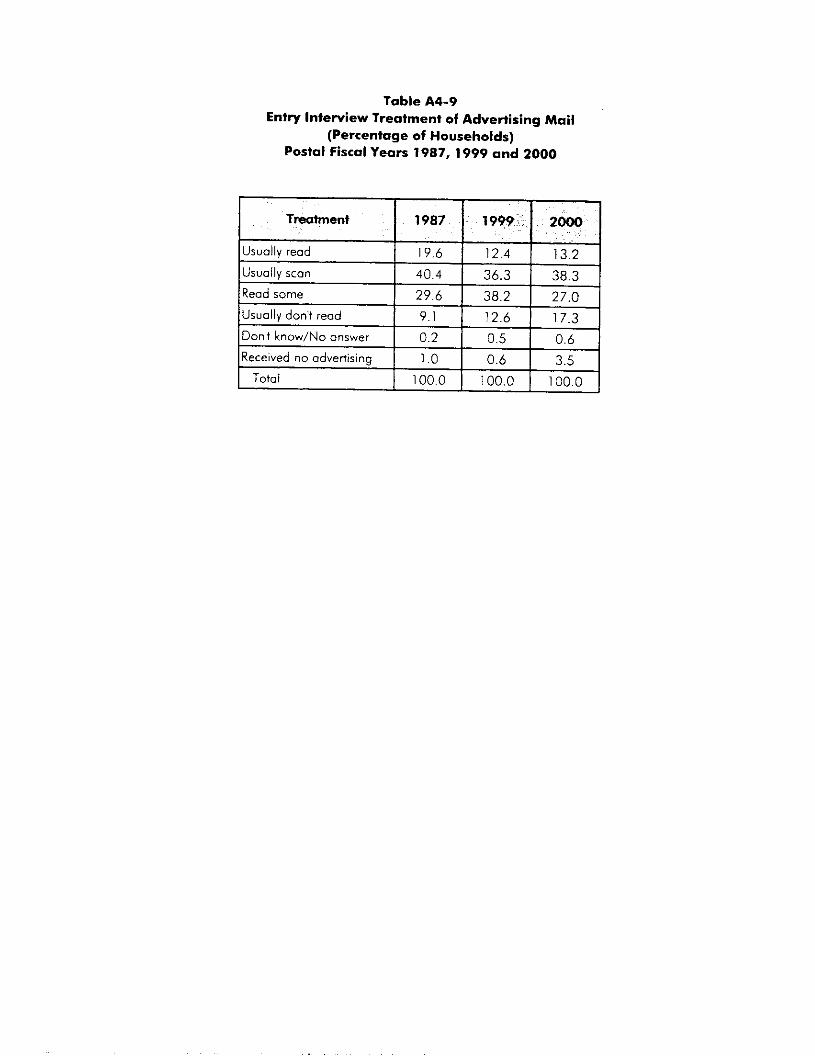
Table A4-9 Entry Interview Treatment of Advertising Mail
(Percentage of Households) Postal Fiscal Years 1987, 1999 and 2000

Table A4-10 Entry Interview Attitude Towards Mail Advertising
(Percentage of Households) Postal Fiscal Years 1987, 1999 and 2000

Table A4-11 Total Mail Overview: Attitude Towards Mail Advertising by
Perceived Volume of Pieces Received Per Week (Percentage of Households - from Entry Interview)
Postal Fiscal Years 1987, 1999 and 2000
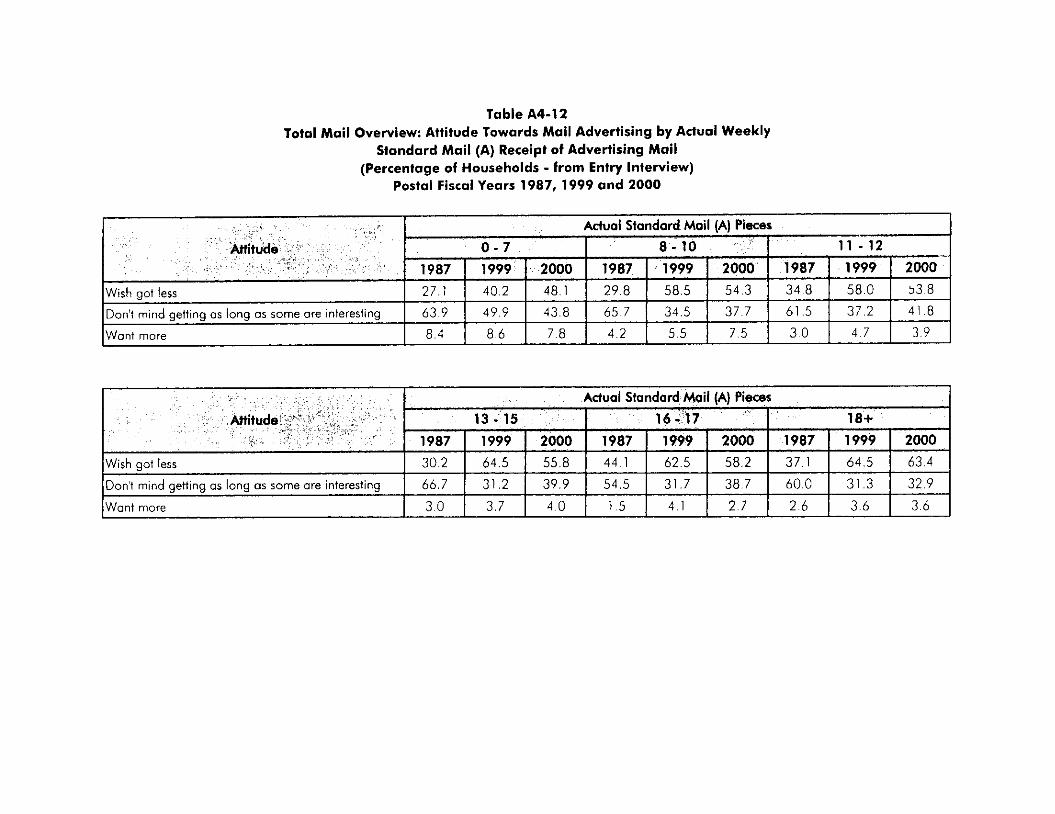
Table A4-12 Total Moil Overview: Attitude Towards Mail Advertising by Actual Weekly
Standard Mail (A) Receipt of Advertising Mail (Percentage of Households - from Entry Interview)
Postol Fiscal Years 1987, 1999 and 2000
" " Want more I 3 0 I 3 7 4 0 1 5 4 1 I 2 7 I 2 6 I 3 6 I 3 6

Table A4-13 Entry Interview Attitude Towards Mail Advertising by Household Income
(Percentage of Households) Postal Fiscal Years 1987, 1999 and 2000
Received no advertising 1 3.9 1 0 . 0 1 1 1 . 8 1 0.7 1 2.4 I 4.9 I 0.6 1 1.2 I 6.6 1 0.8 1 1.9 I 4 . 4 Total 1 l O 0 , O I 100.0 1 100.0 1 100.0 I 100.0 I 100.0 I 100.0 1 100.0 I IO00 I 100.0 I 100.0 I 100.0

Table A4-14 Anitude Towards Mail Advertising by Age of Head of Household
(Percentage of Households) Postal Fiscal Years 1987, 1999 and 2000
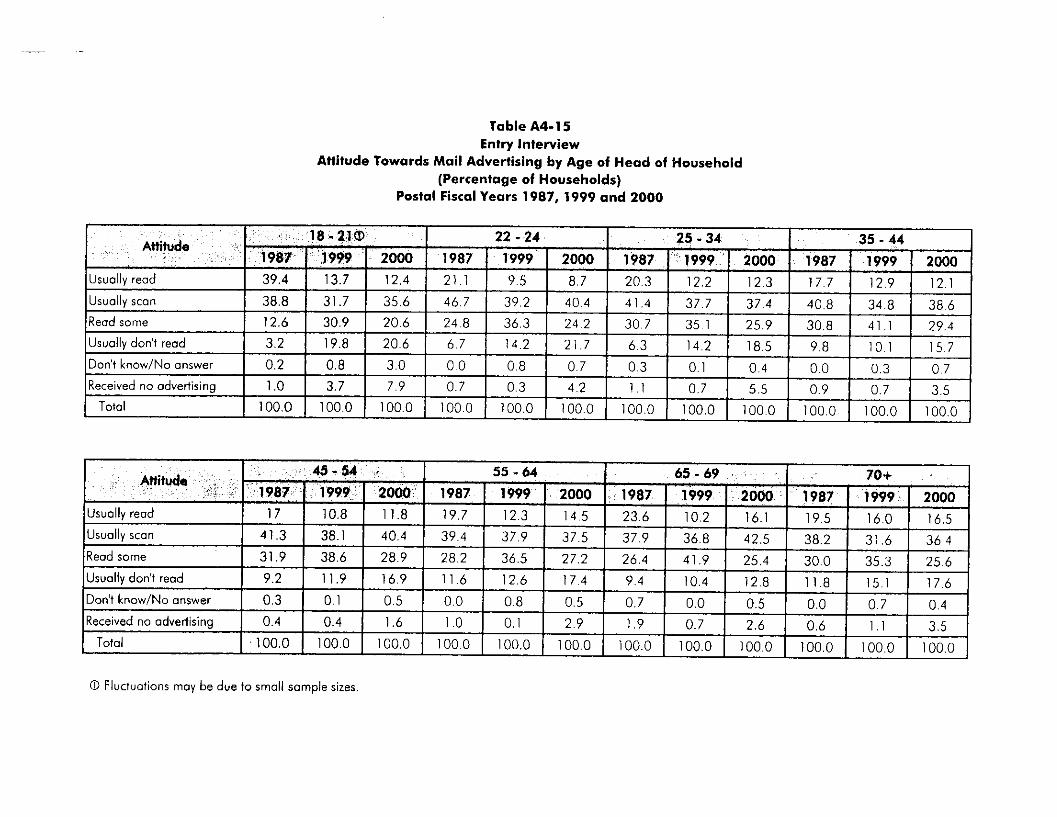
Table A4-15 Entry Interview
Attitude Towards Mail Advertising by Age of Head of Household (Percentage of Households)
Postal Fiscal Years 1987, 1999 and 2000
3.7 I 7 .9 I 0.7 I 0.3 I 4 . 2 I 1 . 1 I 0.7 I 5.5 I 0.9 I 0.7 1 3.5 Received no advertising
Total I 100.0 I 100.0 I 100.0 I 100.0 I 100.0 I 100.0 1 100.0 1 100.0 I 100.0 I 100.0 I 100.0 I 100.0
0 Fluctuations may be due to small sample sizes.

Table A4-16 Entry Interview
Attitude Towards Mail Advertising by Education of Head of Household (Percentage of Households)
Postal Fiscal Years 1987, 1999 and 2000
Wish got less
Don't mind as long as some are interesting
Want more
34.2 47.5 44.9 28.8 41.1 44 .4 26.2 44.3 49.5 28.6 52.9 51.5 56.4 36.3 38.9 59.2 47.1 36.9 66.5 46.8 36.6 64.7 39.1 36.9 5.3 12.6 6.7 8.5 9.3 6.7 6.1 7.7 6.9 5.0 5.7 6.3
Don't know/No answer I 2.1 I 0.9 I 2.8 I 0.7 I 1.5 I 1.9 I 0.3 I 0.7 I 0.6 I 0.8
- 1 I "., C . , . .- ". I .. .
Total I 100.0 I 100.0 I 100.0 I 100.0 I 100.0 I 100.0 I 100.0 1 100.0 I IO00 I 100.0 1 100.0 1 100.0
1.4 0.4

Table 1\4-17 Entry Interview
Treatment of Advertising Mail by Education of Head of Household (Percentage of Households)
Postal Fiscal Years 1987, 1999 and 2000
-,.- , , . . ., , Usually scan 37.0 33.0 26.7 33.0 Read some '22.0 23.1 26.7 27.8 Usually don't read 9.0 18.1 20.7 1 1 .E Don't know/No answer 0.7 0.0 1 .4 0.0
. , . . . . , . . . . , . . .- . . .. 30.8 31.3 42.4 I 35.4 37.5 39.9 35.7 42 .2 34.3 23.5 26.2 I 30.9 23.8 30.8 36.8 25.2 13.2 15.3 7.0 I 10.5 16.4 10.8 1 4 . 7 16.4 0.4 1.6 0.1 I 0.5 0 7 0.3 0.2 0.5
Received no advertising I 2.1 I 2.7 I 6.7 I 2.9 I 1 . 4 1 10.1 I 0.9 1 0.5 I 4 . 5 I 0.6 1 0.7 1 2.9 Total I 100.0 I 100.0 I 100.0 I 100.0 I 100.0 I 100.0 I 100.0 I 100.0 I 100.0 I 100.0 I 100.0 I 100.0
lusually reod 13.6 I 12.4 I 12.2 I 7.5 I 8.0 I 8.9 I 3.3 1 8.1 I

Appendix A5: Periodicals

Table A5-1 Periodicals Received
Postal Fiscol Years 1987,1999 and 2000
Periodicals 1987 1999 2000
75 3 53 E 70 1 Percent of Periodicals which are sent to Households
Pieces per household per week 1 6 9 1 03 1 3 2
I

.

Table A5-3 Newspapers Received by Mail and Not by Mail -- Number of Different Newspapers Per Household
(From Entry Interview) Postal Fiscal Years 1967,1999 and 2000
I I Distribution Method 1 I I ': Frequency By Mail I Not Bv Mail
~
1987 I 1999 I 2000 I 1987 I 1999 I 2000 Doily (7-doy) I 0 0 6 1 004 1 0 2 0 I 0 5 7 I 0 4 6 I 0 61
Dailv (5-6 days) I 0 0 4 I 001 I 0 0 5 I 0 2 3 I 0 1 3 I 0 09 Weekly I 0 3 5 I 0 1 9 I 0 1 6 I 0 1 7 I 0 1 3 I n i o Sunooy only I 0.01 I 0.01 I 0.02 I 0.21 I 0.17 I 0.09 Monrhlv I 0.04 I 0.06 1 0.02 I I I n n i
~
Other I 0.05 I 0.02 1 0.05 I 0.05 I 0.04 1 0.03
I 0.55 I 0.33 1 0.50 I 1.23 I 0.93 1 0.92 - I3101

Table A5-4 Periodicals -- Households Where Newspapers are Received
(By Type of Newspaper and by Receipt Medium) Postal Fiscal Years 1987, 1999 and 2000

Table A5-5 Magazines Received by Mail and Not by Mail -- Number of
Different Magazines Received Per Household (From Entry Interview)
Postal Fiscal Years 1987, 1999 and 2000

Weekly 24.1 19.3 23.6
Monthlv 75.5 66.6 I 72.7
Type of Magazine (Not By Mail)
Bi-Monthly 3.3 9.9 9 7
1 Total 80.6 72.8 78.8
Other 3.2 1.3 1.4
Total 45.8 32.0 29.3

Table A5-7 Periodical Demographics -- Pieces Received Per Household Per Week
Postal Fiscal Years 1987, 1999 and 2000
Other not emdoved I 0.4 I U.Y I 1 . 1 Tvoe of D wellina 1987 I 1999 I 20 00
Sinale-family house I . 2.0 . . I . 1.2 I 1.5
0.9 J . - 135 - 44 1 1 . 8 I 0.8 I .,. - .
Note: 2000 Estimates for Income Levels $25K-$29.9K are identical to those in $30K-$34.9K since cote ories used to collect data only included $25K-$34.9K. Note: Missing estimates not available due to change in definition between Postal Fiscal Year 1999 and '?OOO.

Table A5-8 Periodical Mail -- Type of Subscription
Postal Fiscal Years 1987, 1999 and 2000
Other
Type of Subscription
2.6 I 1 . 1 0.8
Total Mail Received by Households 1 75.3 1 53.8 1 70.1

Table A5-9 Periodicals -- Source of Publications
Postal Fiscal Years 1987, 1999 and 2000
Source of Publicotion
Toto1 Publications Received by
I Households

Table A5-10 Periodicals -- Type and Source of Mail Received by Households
(Percentage of Subscription Type by Source) Postal Fiscal Years 1987, 1999 and 2000
0 Fluctuations may be due to small sample sizes
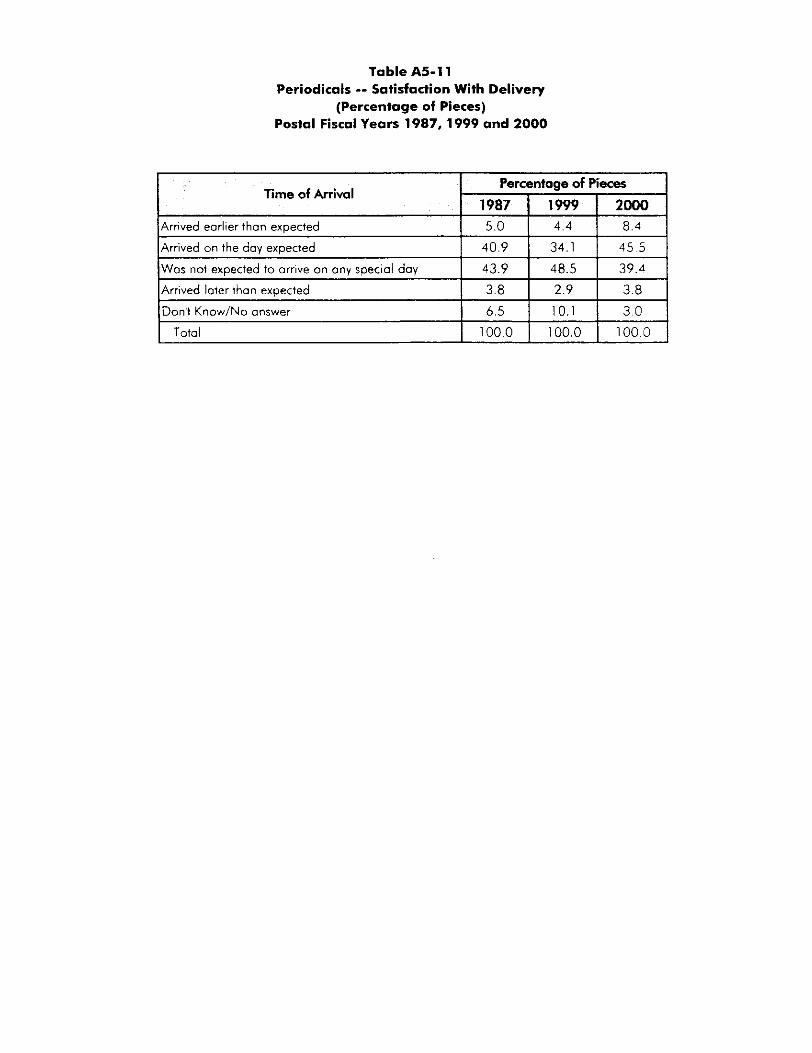
Table A5-11 Periodicals -- Satisfaction With Delivery
(Percentage of Pieces) Postal Fiscal Years 1987,1999 and 2000
Arrived earlier than expected 1 5.0 I 4.4
Percentoge of Pieces Time of Arrival
1987 I 1999 I 2000 8.4
Was not expected to arrive an any special day I 43.9 I 48.5 I 39.4
Arrived later than exoected I 3.8 I 2 . 9 I 3.8 Don't Knaw/Na answer I 6.5 I 10.1 1 3.0
Total I 100.0 I 100.0 I 100.0

Table A5-12 Periodicals -- Need for Delivery
(Percentage of Pieces) Postal Fiscal Years 1987, 1999 and 2000

Table A5-13 Periodicals -- Satisfaction With Delivery by Postal Region
(Percent of Pieces Received by Households) Postal Fiscal Years 1987, 1999 and 2000
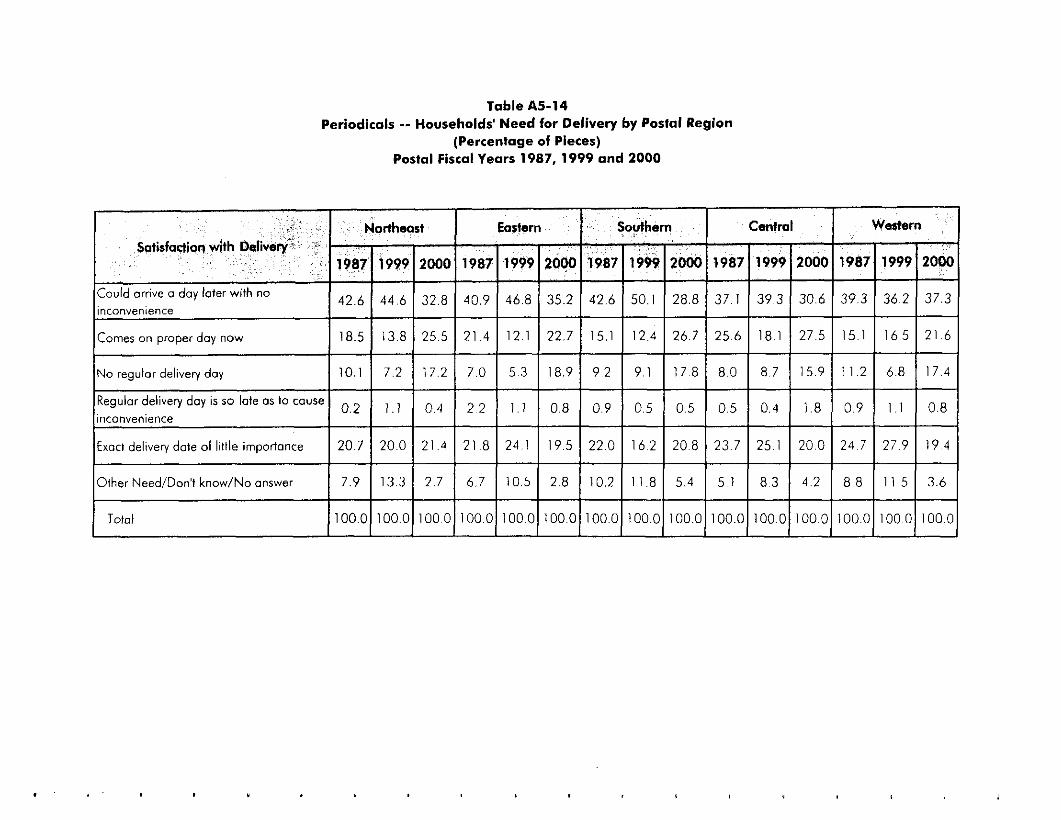
Table A5-14 Periodicals -- Households' Need for Delivery by Postal Region
(Percentage of Pieces) Postal Fiscal Years 1987, 1999 and 2000
:ernes on proper day now 18.5 13.8 25.5
lo regular delivery day 10.1 7.2 17.2
egulor delivery day is so late as to cause
iconvenience 0.2 1 . 1 0.4
xoct delivev date of little irnporionce 20.7 20.0 21.4 I l l Ither Need/Don'l know/Noanswer I 7.9 I 13.3 I 2 .7
~
Total I100.0) 100.01 loo,(
21.4
7.0
22 -
21 .a
6.7
l0O.C -
12.1
5.3
1 . 1
-
24.1 -
10.5
1oo.c -
2 2 7 151 1 2 4
1 9 5 2 2 0 162
1 0 2 1 1 8
IO00 1000 I O O C

Appendix AQ: Packages
!

Airborne
DHL Other
Total Other
Don't know/no answer
Total
Total Packages Per Household
0.7 0.9
0.1 0.5 0.2 0.5 27.8 15.1 14.1 3.6 0.1 14.1
100.0 100.0 100.0 0.3 0.3 0.6
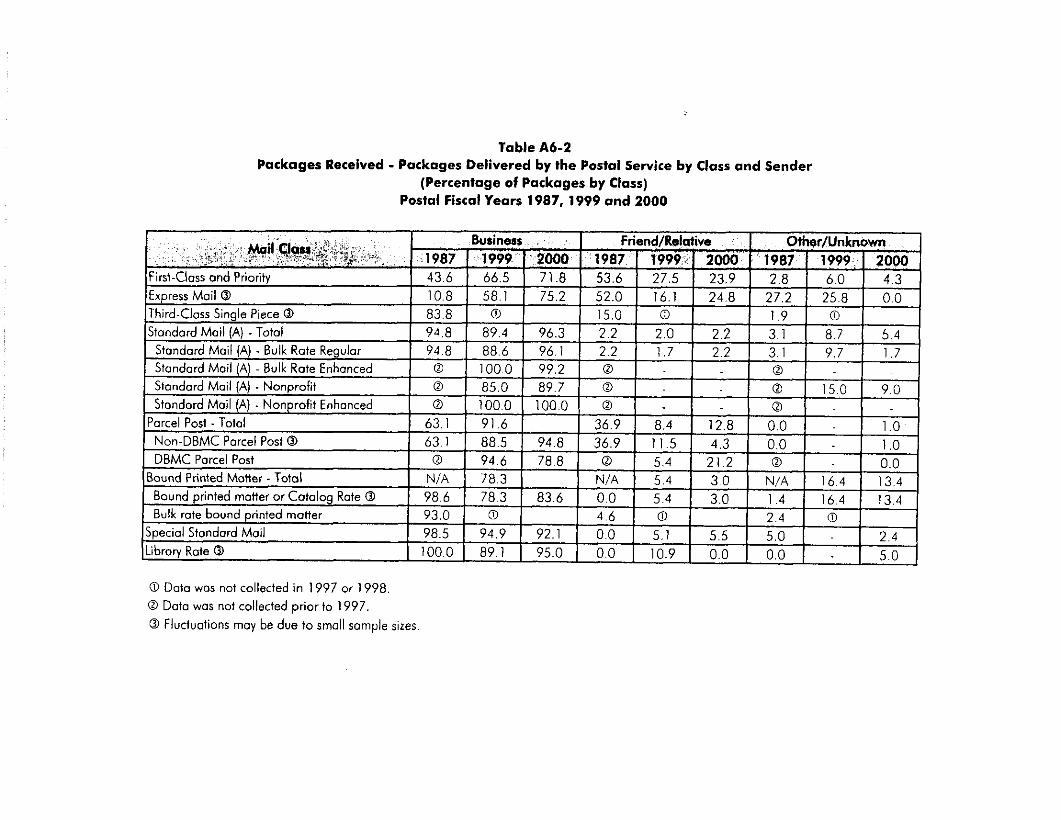
Table A6-2 Packages Received - Packages Delivered by the Postal Service by Class and Sender
(Percentage of Packages by Class) Postal Fiscal Years 1987, 1999 and 2000
0 Doto wos not collected in 1997 or 1998. 0 Data was not collected prior to 1997. 0 Fluctuations may be due !o srnoll somple sizes

Table A6-3 Packages Received - SenderKontenKD by Carrier
Postal Fiscal Years 1987, 1999 and 2000
0 Packages can contain more ihan one type of content.
0 Fluctuations may be due to small sample sizes.
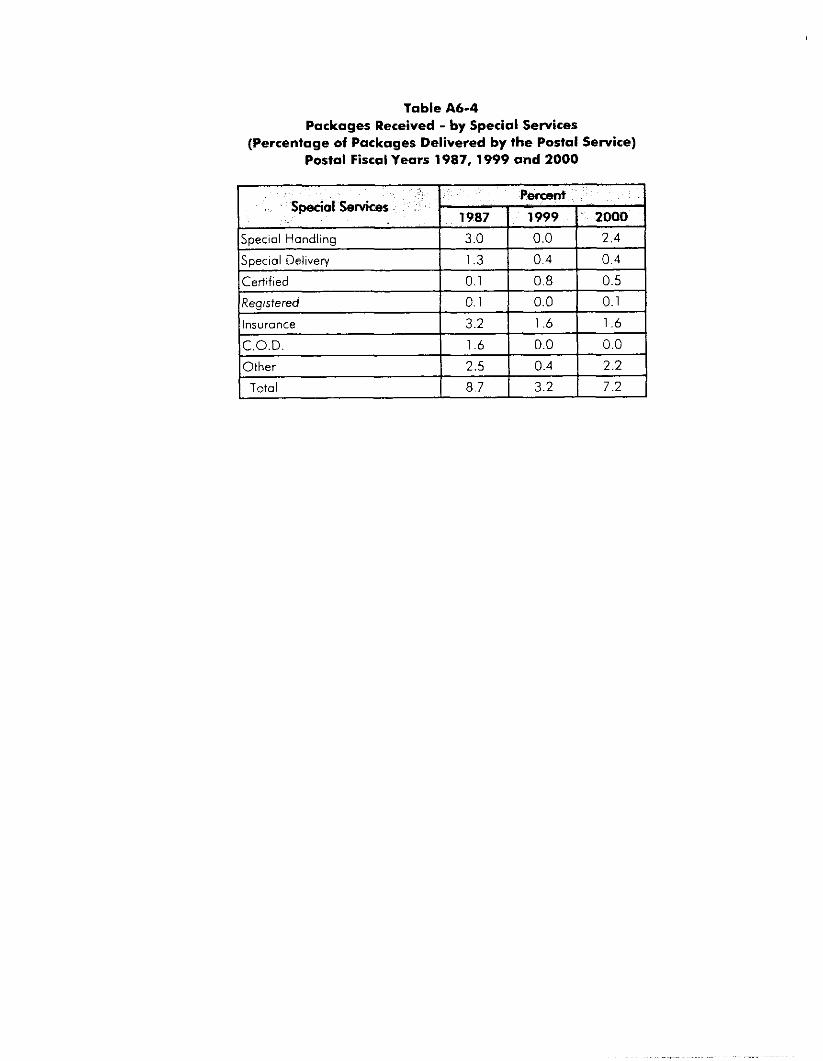
Table A6-4 Packages Received - by Special Services
(Percentage of Packages Delivered by the Postal Service) Postal Fiscal Years 1987, 1999 and 2000
Certified
kDec ia Deiiverv I 1.3 I 0.4 I 0.4 I 0.1 0.8 1 0.5
Insurance 3.2 1.6 I 1.6
Other 2.5 1 0.4 2.2
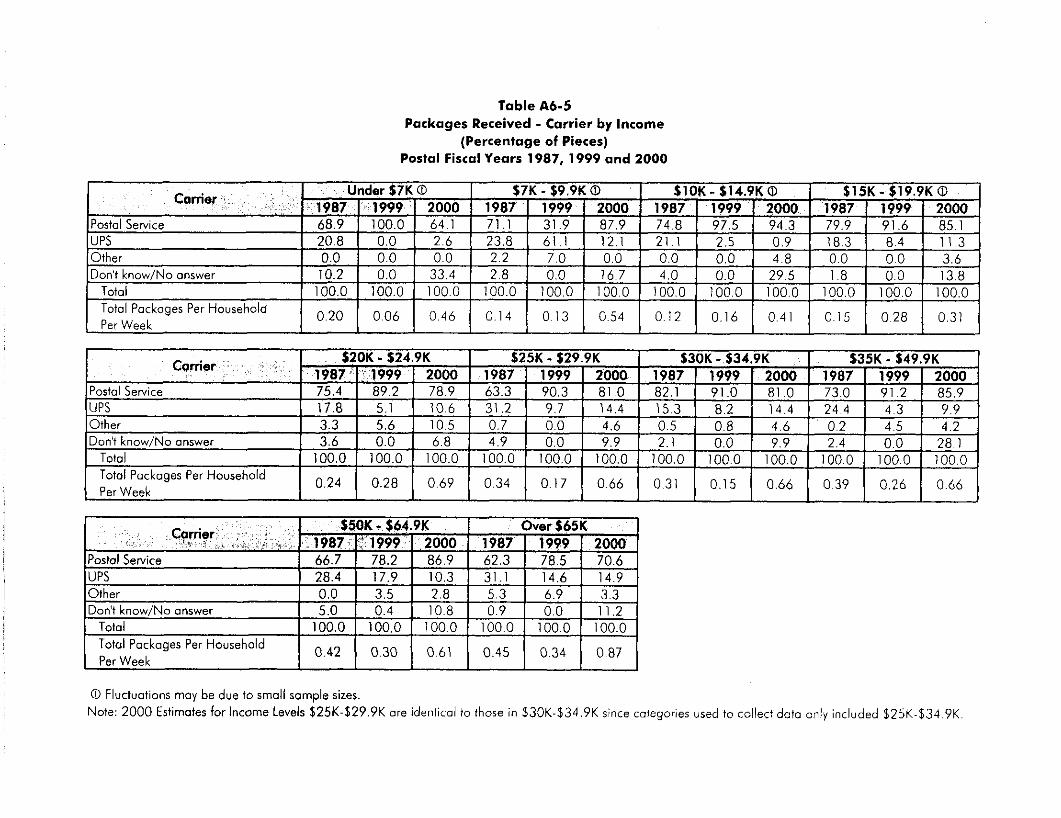
Table A 6 4 Packages Received - Carrier by Income
(Percentage of Pieces) Postal Fiscal Years 1987, 1999 and 2000
0.20 Total Packoges Per Household Per Week
0.06 0.46 0.14 0.13 0.54 0.12 0.16 0.41 0.15 0.28 0.31
0 Fluctuotions may be due i o smoll sample sizes. Note: 2000 Estimates for Income Levels $25K-$29.9K are identical to those in $30K-$34.9K since cotegories used to collect doio only included $25K-$34,9K
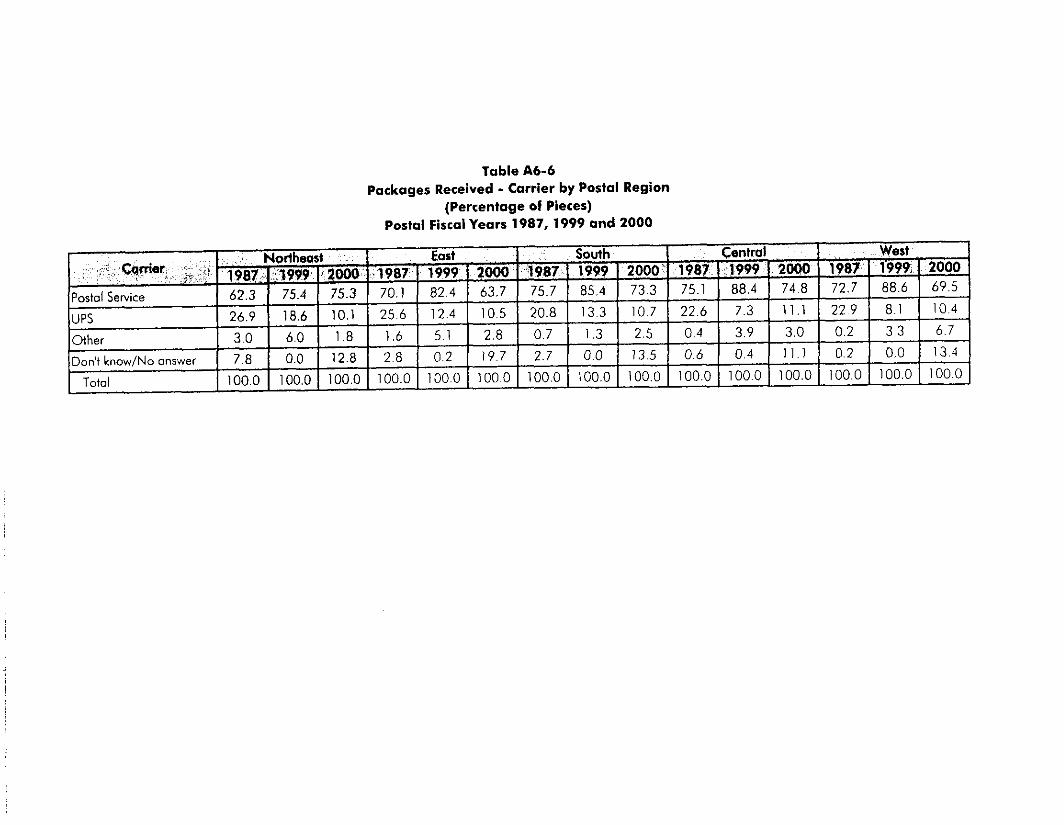
Table A 6 4 Packages Received - Carrier by Postal Region
(Percentage of Pieces) Postal Fiscal Years 1987,1999 and 2000

Table A6-7 Packages Sen1 by Delivery Company
(Percentage of Packages by Class and Carrier) Postal Fiscal Years 1987, 1999 and 2000

Toble A6-8 Packges Sent Via the Postal Service by Class and Recipient
(Percentage of Pieces) Postal Fiscal Yeors 1987.1999 and 2000
0 Fluctuations may be due to small sample sizes.

Table A6-9 Packages Sent by ContentQ
Postal Fiscal Years 1987, 1999 and 2000
ercent Sent Via UPS@
0 Packages rncy contcin more than one item.
0 Fluctuations may be due to small sample sizes

Table A6-10 Packages Sent -- Choice of Carrier by Income
(Percentage of Pieces) Postal Fiscal Years 1987, 1999 and 2000
0 Fluctuations may be due to m o l l sornple sizes

Table 1\6-11 Packages Sent by Distance
(Percentoge of Packages Sent by Households) Postal Fiscal Years 1987,1999 and 2000

Table A6-12 Packages Sent by Distance and Carrier
(Percentage of Distance) Postal Fiscal Years 1987, 1999 and 2000
0 Fluctuations may be due to small sample sizes.

Appendix A7: Elechonic Communications

Table A7-1 Entry Interview
Household Electronic Mail Capability by Household Income (Percentage of Households)
Postal Fiscal Years 1987, 1999 and 2000

c 8th Grade Some High School High School 1987 1999 2000 1987 1999 2000 1987 1999 2000
Have personal cornpuier N/A 8 2 /207 NIA 1 6 2 2 9 8 N/A 2 8 6 4 4 0 Have modem N/A 2 3 1 1 7 NIA 1 1 2 1 8 5 NIA 2 0 9 3 3 0
Capability
0.7 I 3 4 I N/A I 3 8 I 9 8 I NIA I 9 6 I 1 6 3 1 NIA I 1 9 4 I 2 6 2 1 Il iave fax machine or board I N/A 1
Some College
1987 1999 2000 NIA 5 1 4 6 2 0 NIA 38 9 4 8 9
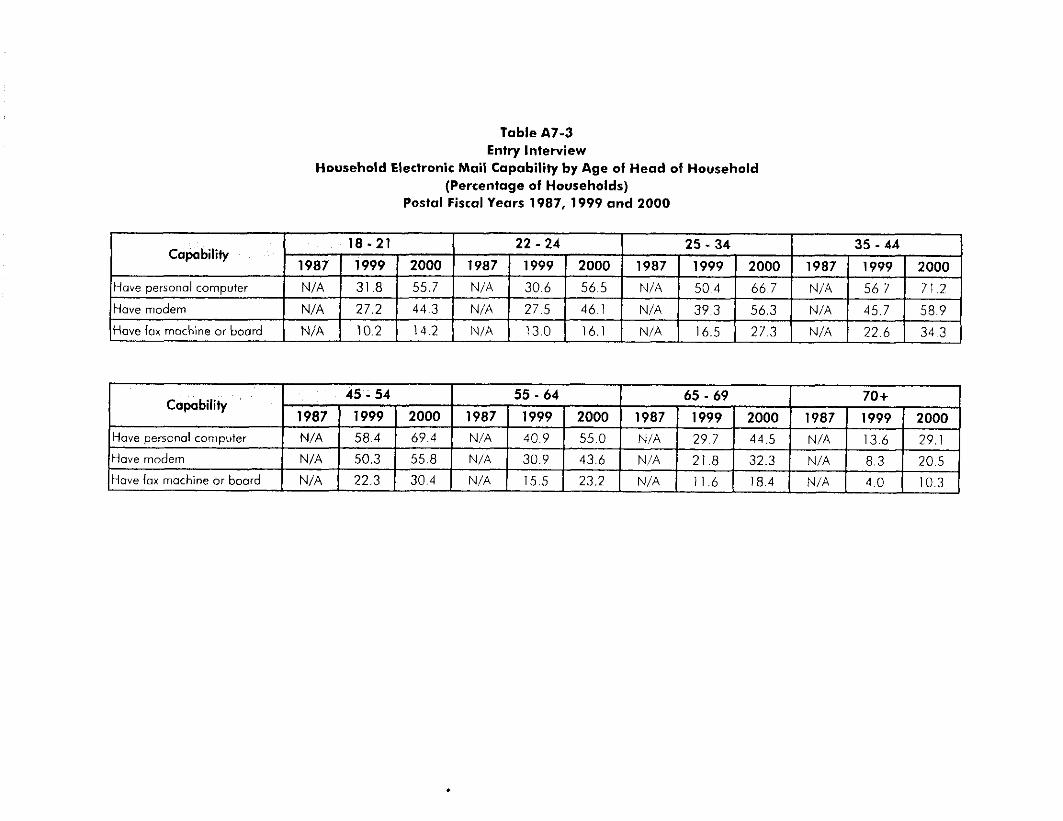
Table A7-3 Entry Interview
Household Electronic Mail Capability by Age of Head of Household (Percentage of Households)
Postal Fiscal Years 1987, 1999 and 2000
Have personal computer
Hove modem
Hove lox machine or board
~~~
N/A 58.4 69.4 N/A 40.9 55.0 N/A 29.7 44.5 NiA 13.6 2 9 1 1 N/A 50.3 55.8 N/A 30.9 43.6 N/A 21.8 32.3 N i A 8.3 20.5 N/A 22.3 30.4 NiA 15.5 23.2 N/A 11.6 18.4 N/A 4 0 103

endix B9 : Recruitment Questionnaire

USP4 01/01/16 11:20 1
1: TZONE l o + l i f 120 I
COMPUTED 1 11 48)
. ..........................
h i & ........................... ............... ~ .............. 6 Hawaii .......................... .............................. 8
2: S A W N ->+! i f I*
IMPORTED SAMPLE NUMBER I
(1149) 9999999
IMPORTED LISTU) OR UNLISTED NUMBER?
LISTW ................................................................... I UNLISTED ............................................................. 2
(11561
4: S T W E I-.>+lif I >n I
IMPORTED SAMPLE TYPE
$E SAMPLE TYPE ONE ........................................... 01 SAMPLY TYPE TWO .......................................... 02
5: HHNAM
(1157)
[=>+! i f I* I HOUSEHOLD NAME
111591
PSU
1
Chicago+ IL-IN-WI ...... ......... . ............... .. m
SmFranei - tCA ....................................... M Philedelphist PA-NJ-DE-MD ............................... 06 Bosloo+ MA-NH-ME-Cl ..................................... O l
.......
Tamp+ FL J9 Phoenix AZ .......................................................... 20 Dsnvm co ......................................................... 21
........................ 24
......................... 31
.......... . .... ........................... .. . ... ..._.
Salim. CA ........................................................... 4s Fwf Pierce. FL .................................................. 46 Cumbcrlmd. MD-WV ........................................... 47
48 49
n
- INFO ZERO UN, INTERVIEWER version 3.81
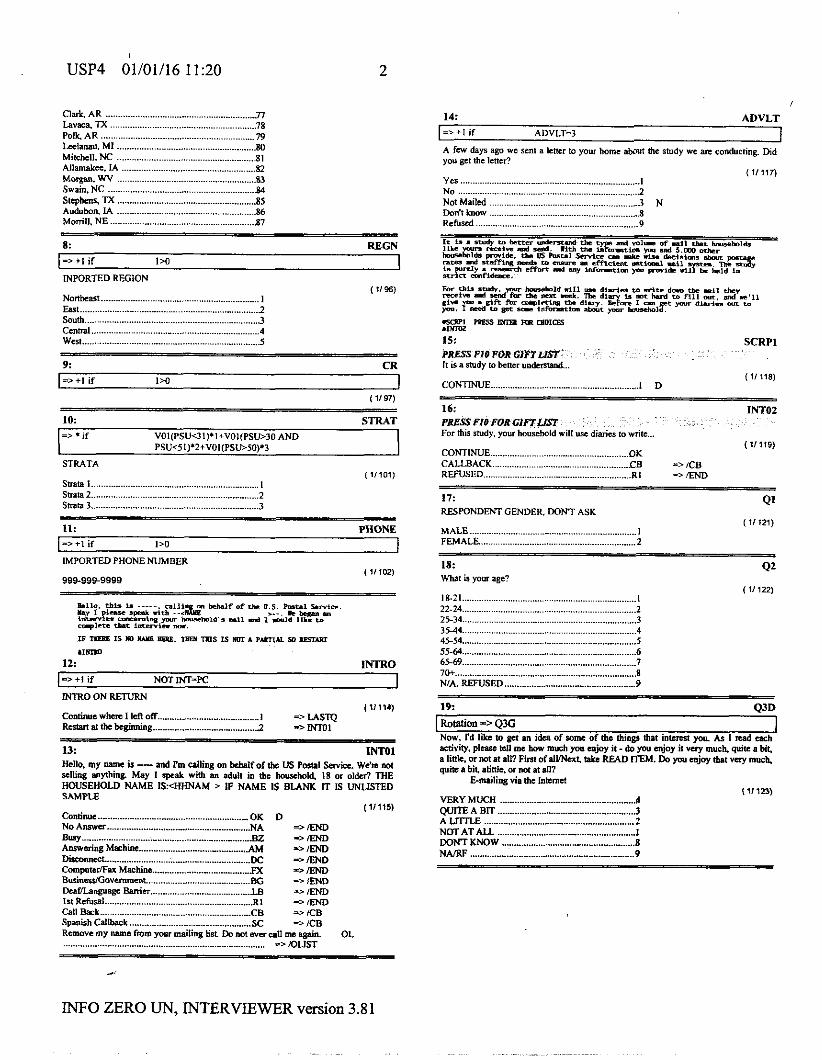
USP4 01/01/16 11:20 2
Allamake. IA ...................................
Swain. NC ......................................... Stcphsnr. TX .....................................
8: REGN =,+I if lZ0
INPORTED REGION I
8: REGN =,+I if lZ0
INPORTED REGION I
...................................... 5 ~~
9 CR =>+I if 120 1
(1197)
STRATA
sws 1 I sms2 2 swa 3 ..................................................................... 3
(11101)
....... ->+I if NOT INT-PC I MTRO ON FSTURN
(11 114) C o n h e w h m I I& off I => U S l Q RCstarlatthcbcgirming ........................................... 1 nml
13: INTO1 Hello, my m e ir - and I’m d i n g on Wf of thc US P m l Si. We’n mt Jelling anything May I speak with an sdutl in thc hnuchold. 18 or oldn? THE HWSEHOLD NAME IScHHNAM > IF NAME IS B U N K IT IS VNLISTED SAMPLE
(rl115)
...................
.......... ...I% =>END DcaVLsngusgs Bsrria .......................................... LB *) m IStRdUJal ............................................................ RI =>m Call Bsk . . . . ................... CB =-ICB Spanish cnll Rmrove my ................... ......... = > O U S T
14: A D V L T =z + I if ADVLT=3 I A few days ago we sent a Icmr fo your home about Uw shldy we are conducting. Did you p f the lemr?
(11117)
Rsfuscd ................................................................... 9
(11118) CONTINUE 1 D
1 6 INTO2 PRESS PI@ FOR GIFT
( 11 119) ........................ OK ........................ TB =>icLI
REFUSED ............................................................. RI =>m
17: RESPONDENT GENDER. DONT ASK
MALE ..................................................................... I FEMALE. .................................................. 2
Q1
(11121)
I 8 Qz ( 11 122)
M a 1 is your age?
8
VERY MUCH ....... QUITE A BIT ............................................... A LlTTLE 2
DONTKNOW . 8 NAlRF 9
INFO ZERO UN, INTERVIEWER version 3.81

USP4 01/01/16 11:20 3
20: Q3E Now. I'd likc to get an idea of m e of the things that intcrnt you. As I =ad each activity. plcars tell me how much you enjoy it. do you enjoy it w r y mush quite a hit. a IiNc. or not at all? First of dvNsiL take READ ITEM. Do YW cniov that vcv much . ~~~~ ~. quits a b i t dink. or na( at all?
Writing sardn and letfen to frienh
VERY MUCH ......................................................... 4 Q A N ....................... WNTKNOW ....................................................... 8 NAIRF ..........................
..
1111241
21: Q3G Now, Pd like to gel an idea of s ~ m e of thc things h t inlere~t you. As I read each activity. plaass hll me baw much you mjoy it. do you enjoy it very mush. quits P bit. a linls, or not at all? Fmt of allRlc4 take READ ITEM. Do you snjoy hl vcv much. guite B h i t aliNc. or OM at nll?
Reading cards and 1etfers i l l 125)
VERY MUCH .................... QUITE A Bm .................... A LlTl7.E ....................... N O T A T A U ......................................................... I DON7 KNOW ............ NAIRF 9
-7. 0 3 A
F " = > Q j l I Now. I'd like to get an idea of some of the things that inlma you. An I rcad each activity, pl- hll me how mush you mjoy it. do you enjoy it ~ e r y mush qvitc a hit. n linlc. or not at all? Fin1 of slvNcrt mke READ ITEM. Do you enjoy that very much. quih a bit, aliolc. or not a1 all?
VERY MUCH ......................................................... 4 .3 ..2
NOT AT ALL ................. ..I WNT KNOW ..... .......................... 8
23: Q3B NOW. I'd like to get an idea of m e of thc things that infnest you. As I *ad cash =etivity. pl- tell me how much y w enjoy it. do y w mjoy i t V E ~ much. wih I h i t a 1inIc. or llot ai all? Firu of alVNuf take READ m. Do you enjoy ha! YY mush quits a hit alinlc. or nn at all?
W i g bmh and m a w ( 1 1 1271
VERY MUCH . . . . 1 QUITE A BIT .................................... A L m ................ NOT AT A U I DONT KNOW ............. NA/RF ............
Watching tclcvirion (11126)
NAlRF .................................................................... 9
- 4
24: Q3C Now, Pd like m @an idea of m e of thc thbp ma! InIemI 9. As I I& e ativity. pkass tell me how much 9 -joy it - do yournjoy itwy much Svilc a W a liuk. or not at all? Fin1 of dUNnt lnlre R U D mM. b you enjoy tfut q much
A L m L E ........... N O T A T A U ...
( 1 1 129)
25: Q3F Now. I'd like to get an idca of wmc of the things that intena you. As I read each activity. please tell me how mush you enjoy i t - do you enjoy it very much. quite *hit. a IiNs. or nor at all? First of alUNeit. mkc READ ITEM. Do you enjoy that w r y much qui- a bit. alinls. or not at all?
Reading newspapers (11129)
VERY MUCH ...................................... QUITE A BIT ............................ A LITTLE ..... .......................................... 2 NOT AT ALL DON7 KNOW ....................................................... 8 NAIRF
26 Q3H Now. Pd like to gel an idsa of some of the ~hings h t inmca you. As I mad cash mivity. plearc hII me how much you enjoy it - do you cnjoy it very mush. guile I hit. a l i l~e. or mt at all? Firnr of allmien. take READ ITEM. Do you emjoy that "CY mvch quile a bit. sliule. or not at all?
VERY MUCH .................... 4 QUITE A BIT ......................................................... 3 A Ll"LE ............................... ................ 2 NOTATALL 1 DONT KNOW .............. __ ............. 8 NAIW 9
Shopping on the Inhmct
............ (11130)
27: Q31 Now, I'd like 10 gsl an idca of mmc of the thins thal i n m S yoy. As 1 rcad cash activity, please tell me how mush you enjoy it - do you mjoy i t very much qui= a hi t a IiNc. or ML at all? Fin1 of alvNcit, mkc READ I E M . Do y w cnjoy IhaI very much, quite a bit sliols, or not at all?
Tclcphoning family and him& (11 131)
VERY MUCH ........................................................ 4 ~ 1 1 1 7 ~ ~ am ......................................................... 3
......................................... LL .........................................................
........................
28: SCRPL The questions h t follow arr asked of dl mcmbm of your household. So when I my, "in p u r household", or "household members". pl- be fo i n c m yowvlf md all ofher prsonr in your household when giving yaw amwen.
( I 1 1321 CONrrrmE .................. ....................... I D
5E DOXT KNOW ......... 98 RENSW - 99
$E W?4TKNOW ...................................................... 98 RENSW - 99 - -
c
INFO ZERO UN, INTERVIEWER version 3.81

USP4 01/01/16 ll:20 4
-- DON? KNOW 98 REFUSED ............................................................. 99
32: Q7
T k ncxt question is about the 51 PBOUEFOR
bouschold has m t Aboul hav many meting cards (rd cmail messages) did yow household ncnd ulmvgh the ln rnm lad e?
( 11 139) $E DON7 KNOW .......... ... 9s REFUSED ........ ..59
33: os PROBE FORSPECIFICNWWEI~? No1 counting the Ch&mas Md H - W m y - hwschoM undr. abmt how m a y wk4w did yovr household mil in the M month?
DON‘TKNOW ...................................................... 98 REFUSED 59
34: Q9 W i s h of lhs following methods of mailing pnonal package (real letter mail) have household mcmben used in the last six months?
( I f 143.141 - 145- 148 - 147) ORiCUl U.S. Part m i s c I private mailing reniss. like Mailboxn, Ea. Po* ORie Plus. a P-1 Plasc
Rivnte pkge shipping company. like UPS a~ F e d d Erpcas
N- ................................................
3 ............................. ....................................
~
35: D a n yovr howhold rml P P w MTrc box?
(111481 YES
........................................
.......................
3 6 Qll Do any members of your how&& mt a box Tmm a priv.a mailing rervisc. Ink Mailbarcr. h.. Post Office plur or P a l P k d
YES .. L I (11 143)
............................ s RF
3 2 Q12 Hoar “ o y bu in an a- mcmh do howcbold msmbsr go to a -I ofssc aprrusd hY Poetnl SeNiw employe? VWFY KESFONSE IF MORE W A N 30
( I1 1%) $E
3 8 4 1 3 Hoar many ti- in m wmgc mmth do hawchold mantes go m a privaoc mailing service like Mailboxes. E=.. Post OMss Phu. n P-I PI-? VERlFY RESPONSE IF MORETHAN 30
(11152) $E
INFO ZERO UN, INTERVIEWER version 3.81
I why dan yoy’ hnuehold me P mailing nmice Nher than lhc p s i oRicc? IF THEY SAY T O N V E N a K T OR “FASIER” OR OTHFR VAGU6 RESPONSE ASK
~ ... THEM WHY TrS CONVENlENTOR EASIER ~~ ~~
(11154) ................................... I Do ............................................. 9
* 4 0 Q15 Do m b n a of yo\u hwselmld have my hima or relstivss who live in a facign country?
(11155)
NO .................................................. -> Q20 DK ....................................... ..... 8 =>a20
..... 9 =>azo
41: Q16 A b v l how many ssrdr md Icltsn. if any. have msmbm of your h-hold s m d IO them in the pas1 hudvs months?
( 11 158) SE DK ......................................................................... 98 RF .......................................................................... 99
42: Q17 Abaut how many tim- has ynu h-hold telephoned hima or ~ l a t i v s a livingin a foreign coumtry in the p ~ s t wchrc m a n b ?
(11158) SE DK ......................................................................... 98 RF .......................................................................... 99
43: Q18 About how many time ha6 your household e m a i l d fiends or relatives living in a foreign country in the pasf twelve months?
IF { 11 160) _ _
OK ......................................................................... 98 RF.“ 99
44: m 9 --- An4 about how many timn has your hosehold w i d money to them io the p s i ryelye manthr?
( %I 162) SF -- DK 98 w 99
47: Q21 Doearour haushold m ane a r m pMlvl sampltus?ASK HOW MANY
( 11 Ed] $E DK 98 ->Q26A RF ................. 99 * Q26A

USP4 01/01/16 11:20 5
48: QU => Q26A if 922-3 H a many Of these cornp~ten haw lnlcmcl -? THEY HAVEUX2XOMPUIERS. DO NOT ACCEPT A NUMBER GREATER 7 ~ ~ ~ ~ 0 2 2 ~ .
I l l 168) $E DK ...................... .................................... 98 RF 99
49: 024
PRODIGY .... -. 2 COMPUSUlVE ...................................................... 3 MCI WORLXOM ................................................. 4 ATT WORLDNET ....... ~3 INTERNES AMUUCA
OTHER LOCAL ................ DWRF .... 9
50: 4 % DomcmbmofywrhovJsholdusrthtln~nto~~~~lSviUlomaSviaemil?
(I1 171) YES .. I NO -. DK B RF ..........................................................
51: Q26A =>+I if Q22>0 AND Q 2 2 W J H a likely is it that mcmbm of Ibis household will gn any of thc following IechnolDgiCs in the near &m1=7 Very liksly. lomewhat likely, vnnswhat unlikely or not at a11 likely? READ ITEM
VERY UKELY ....................................................... 4 SOMEWHAT LIKELY 3 SOMEWHAT UNLIKELY ..................................... 2 NOT ATALLLIKELY ........................................... I DWRF ................................................. ~ 9
I111721
52: 0 2 6 8 \=>+I if Q2C-1 I
Hoar likely is it th.1 mombas of h i s hauuhdd wiU gn m y of th following techologk in thc near bum? V a y likely. somewhat lihly. samewhat unlikely or nat s( all likelv? READ mM
Fax a PC with fax czpabilik
VERY LMELY .............................. " 4 SOMEWHATWKELX ...... 3 SOMEWHATUNUKELY 2 NOT AT ALL LIKELY I
54. Q26D H w likely h it WI m m k n of this houwhold will get any of Ule following achwlogics in lbe fuN-7 Very likely, m o l h a l likely. somewhat unlikely or OM iu all likely? READ ITEM
Web N
VERY LIKELY .................................. 4
9
111175)
55: Q26E How likely h it the.1 mcmherj of thh household will get any of the following fcchnologk in thc IMI bNm? Very likely, somewha1 likely. somewhat unlikely or not a1 111 likely? READ lTEM
VERY LIKELY ............ .............. 4 SOMEWHAT LIKELY . . . . . . . . . . . . 3 SOMEWUT UNLIKELY . . . . . . . . . . . . . . . . . . 2 NOT AT ALL LKELY ........................................... I A W D Y HAVE IT .............................................. 0 DWRF 9
111176)
5 6 scw3 m e i r r i r a m CONTINUB Tnditlonally, -1s pay bills io that a l l w s YOU IO pay bills by lelephow - you call the bank snd hll lbem whish bills you wish m pay and ths moynm. Banks arc also &ng IO offer Intsmt banking whcrr yon CI(I pay bills ovm Ur I n l S w ~
( 11 177) CONTINUE ............................................................. I D
57: Q27A Have YOU hcard of bank w w i k that allow you m pay bills by Telephone7
(11178) ............................. I ........................... 1 ............................. 8
N M l F ...............
58: Q28A ->+I if Q27A>I I Are Telcphanc paying 6 - a ~ availabk in your communifl
I II 179)
5 9 42'18
I l l 7.90) Have you heard of bank rrrVi~cs th.l allow you lo p y b i b by lolmm7
YES 1
H w lihly is it tha1 mnnbm of his bauchold will gel any of he following
wI 5 all likely? READ ITEN 1ntmrt accm
AI= Intmxtpaying d -hbk in your UrmmUniIy? echooloaica in mc M bW%? v a y IiMy. aomcvha I**. snon*hlt mmdy OT
I 11 181)
_.. - (11 174)
VERY LKEL SOMEWHAT .................................... 3 SOMEWHAT NOT AT ALL UKELY ........................................... 1 DKlRF .. 9 - ___L ___.
- INFO ZERO UN, INTERVIEWER version 3.81

USP4 01/01/16 11:20 6
429 61: 00 S w a g e . about how “My bills in -!A wovld you say yn,r household pap srch month? PROBE mR SPECIFIC NUMBER.
( 11 182) $E DK ................................ .... 98 RF 99
Q30A 62: Now. l’m Pobg 10 ask Yw a h 1 lhe melhods You oy 10 pay yw bills In which of the following ways do YW pay your billa?
BY& ( 11 184)
OMB 63:
~- Q30C M:
= > + I if Q27ASl
Now. i-m going 10 ask yn, about ule meIkds yw ysc m pay m b i l k . lowhish of tk following ways do you pay yoyr bill.?
I By tekphone
( 1 1 te8)
65: Q 3 0 D =>+Iif Q 2 7 B 1 Now. rm going m ulr YW about the methods yw UE 10 pay ymr bills. In which of the following ways do you pay your bins?
I via Intcme1
Q31A 611:
=> t l if Q30A>I
About how many of yovr monthly bills me paid By Mail ? IF THE S U M OF BILLS IS MORE THAN THE TOTAL YOU WILL BE TAKEN BACK TO THE BEGINNING TO TRY AGAM.
( 11 190) SE DK 98
I
w ... 99
Q3lB 69: = > + I if M O B 1 A h 1 how many ofyourmonthly btlls am Wd In Person? IFTHE S l r M OF RILLS Is MORE nlAN THE TOTAL YOU WILL BETAKtN BACK TO THE BEGINNING TOTRY AGAM
(11192) $E DK ......................................................................... 98 KF 99
Q31C ->+I if Q 3 0 0 1 OR Q3OC-WR A h 1 how many of your monthly bills ars paid By Tclcphonc? IF M E SUM OF BILLS IS MORE THAN THE TOTAL. YOU WILL BE TAKEN BACK TO THE
I BEGINNING m TRY AGAIN.
( 1 1 1 9 4 ) $E DK 98 w .......................................................................... 99
Q30lDI OR QJOG-WR Q 3 l D = > + I if
Abaut how mnny of your monthly bills M paid Via Intcmcr? IF M E SUM OF BILLS IS MORE THAN THE TOTAL YOU WILL BE TAKEN BACK TO THE BEGINNING TO TRY AGAIN.
(111911) $E
Q31E 72:
*>+I B Q30DI Abaut how many of your monthly bill, M paid By ATM (su1omalcd fsllcr maehlu)? IF THE SUM OF BILLS IS MORE THAN THE TOTAL YOU WILL BE TAKEN
(11188) SE
I BACK m THE BEGINNING m TRY AGAIN.
............................ 98
Q31F 73: =>+la Q30-I
About bow many of your monthly b i b am paid By au1Omlic deduction hom b a n h o t ? IF THE SUM OF BILLS IS MORE THAN THE TOTAL, YOU WILL
( 1 1 m o ) I€
BE TAKEN BACK m THE BEGMINO m TRY AGAIN.
75: Q32A ->+I if Q30A>I 1 Wb.ttypaofblllsdoyoupayByMail7
NONE OF THFSE..... NATURAL GASlPRO ELECTRIC
WA TEWSEWER..... CFSDIT CARDS..... REKT/MORTGAGE. ...... 6 CABLE Ty
9
INFO ZERO UN, INTERVIEWER version 3.81

USP4 01/01/16 11:20 I
7b Q33A =>+I if Q30A> I
Why do you pay Uvrc bills By Mail? 1112101
ENTER RESPONSE ................................................ I DO nKlRF .................................................................. 9
... - + I if Q308>1 I what t y p r of bills do you pay In Person?
(11211 -212-213-214-215-216-217) NONE OFTHFSE .................................................. 0
E L E ~ R I C ................................... TELEPHONE .............................. WATEWSEWER ........................ CREDIT CARDS ................ RENTMORTGAGE ............................................... 6 CABLE TV ................... INSURANCE .......................................................... 8 WANIS) .......................
78: Q33B = > + I if Q30Bzl I Why do y w pay there bills In Pnron?
ENTER RESPONSE ....................................... D W ................ ....................................... 9
79: Q32C =>+I if Q3001 OR Q3oC=WR I What typs of bills do y w pay By Telephone?
(11218)
111210 -m-m -222-223 -224 -225) ......................... D L OIVFTC ....... I
.... .... WATEWSEWER .................................................... 4
80: Q32D =>+I if Q30IPI OR Q30WWR
W b t typtr of bills do yw pay Via Intanct?
NONE OF THESE .................................................. D NATURAL GAYPROPANF/nrrL OIlJEE. ...... I
( 11226 -227 -f28 -229.23a - 231 -2321
cRF,Drr CARDS .......................... Fm4TlMORTGAGE ................................. CABLETV ............................... INSJRANCF. .............
Q32E
0 NATURAL GAYPROPANF/FUEL OIWETC. ...... 1 ELEClRlC ........................................................ 2 TELEPHONE ......................................................... 3 WATEWSEWER ......... RENTMORTGAGE CABLE N ..................... INSURANCE .................
82: Q32F = , i l i f Q 3 0 h l
what N ~ I of bills do you pay By a u l m ~ l i s deduction from bank accovnI? (11240-241 -242-243-244-245-246)
NONE OF THESE .................................................. D NATURAL GAWROPANVFUEL OIUETC. ...... I ELECTRIC ............................................................. 2 ~~ ~~~ ~
TELEPHONE 3 WATEWSEWER .................................................... 1 CREDIT CARDS .................................................... 5 RENTMORTGAGE. .............................................. 6 CABLETV .............................................................. 7 INSURANCE .......................................................... 8 LOAN(% 9
83: Q33C ->+I if Q 3 0 0 1 ORQ3oC=WR
why do yw pay the% bilk By Telephone? I
,.,9"7\ ~ I, _.,
ENTER RESPONSE ................................................ 1 DO DWRF .................................................................... 9
84: Q33D => +I if Q 3 0 D I OR Q3OBWR I ~ ~~~
why do you pay these bills Via Internet? ( I1 248)
ENTERRESPONSE ................................................ I DO DWRF ..................................................................... 9 - 85: Q33E =,+I lf Q3ODI I Why do you p y these bills By ATM (automated teller machine)?
1 11 249) ENTER RESPONSE ................................................ 1 DO DWRF ..................................................................... 9
8 6 Q33F =>+I if Q 3 0 P I I why do y" pay these bills By automatic deduction from bank rsurvnt?
1 11 250) MTERRESPONSE ................................................ I DO DWRF 9
87: Q34 Pmplc pay Uvir bilk in diffmnt w a y : some pay bill6 a dsy m Iwo aRcr thcy corn in n k pay bilk weekly. once wry two w&. once a month II they bssoms &euc. or m e other time How nbaut your housshold? Ars bills vsually pia..
Ill251)
....................... 2
............................... - ..... ................................................ 9 -
(UI: QX = > + I if Q 2 3 4 I P-IC wditionrlly &"e thcir bills in the Mil. Some EompiCI are o f f h a clcstmnis prCPrntati00 of bills wkrs y w wwld receive bills OYII the L n f n n t H m m a n y b i l k d o y o u & v e v i a t b e h ~
$E DK
( I1 252)
........ 98 .............................................. 99
INFO ZERO UN, INTERVIEWER version 3.81

USP4 01/01/16 11:20 8
89: Q36 PROBE FOB The followowing Id M weh as magad- 01 ~vsp1prs. How many different m l g a r i ~ l do mcmbm of p r household rCetivc through the mail7
1112541 $E
.............................. 99 -> 0 3 8
9 6 Q39A I=>040if I X R 4 I
90: 037A
VERlFY IF OVER 10
SE OK 98 RF 99
91: Q37B PROIX2 FORSPECiFi
msgadms?
$E DK ......................................................................... 98 RF 99
VERIFY IF OVER 15
92: Q37C PROBE FOBSPEClFIChVMBER
magazines? IF THE SUM OF MAGAZl GFT.YOUWlUBETAKMBACI(TOTHEBEGlNNINGfOTRYAGAM.
VERWIFOYERIS (11260)
98 RF ........................................... ...99
93: Q37D =>*i f QM
~IF~~Q37Acg8~,Q37A,O~lF((Q37B~8).Q37B,O~lF((Q37C~ 98).Q37C.O))
COMPUTED OTHER
SE (11rn)
94: CKMGl -> Q36 else - + I if Q 3 1 W
COMPUTED TO CUUWT MAGS AND CHECK AGAlNST TOTAL 1
1112811
- ' INFO ZERO UN, INTERVIEWER version 3.8 1
Of thcQ3g.mSgaooss yc4r household daJ cot mnve b ml. how many m Weekly Mag.nm7 IF THE S U M OF MAGAZINES IS MORE THAN THE TOTAL TIEY GET. YOU WILL BE TAKEN BACK TO THE BEGMNING TO TRY AGAIN.
VERWY IF OVER 10
$E DK ......................................................................... 98 RF 99
111267)
PROBE FORSPECIFICNWMER Of mcQ38>maeUinss y m houwhold does a' ~ D W I by mu( how m y M Mwthly m a w ? IF THE SUM OF MAGAZINES IS MORE THAN THE TOTAL THEY GET. YOU WILL BE TAKEN BACK TO THE BEGINNING TO THY A c A m
VERIFYIFOVERIS ( 112s91
$E DK ........................ __. ............................... ..98 RF.. w
98: Q39C PB Of monthly magazines? IF THE SUM OF MAGAANFS IS MORE THAN THE TOTAL THEY GET. YOU WILL BE TAKEN BACK TO THE BEGINNING TO TRY AGAM.
VERIFY IF OVER IS ( l l n l l
SE
99: 039D
COMPWED OTHEFI
SE
Of 1 - w yoy household recam by -1. bm m y ouh, rm=+apm (7 &F)? IF THE SUM OF NEWSPAPERS IS MORE T U N M E TOTAL THEY GCT. YOU WILL BE TAKM BACK rn THE BEGINNING TO TRY AGAIN
V W F Y IF OVER 6
SE DK ..... 98 RF ............................. 2 _ 99 -

USP4 01/01/16 11:20 9
103: O d l R x -- PROBE FOR SPECIFICNUMRER Of t h s c m n n u s p a w your household lc~civc~ by mal. har many arc h l y newspaperr (M-F w l y or Sal only)" IF THE SUM OF NEWSPAPERS IS MORE THAN THE TOTAL THEY GET, YOU WILL BE TAKEN BACK TO THE BEGINNING TO TRY AGAIN
VERIFY IF OVER 4 ( 11 280)
SE DK ......................................................................... 98 RF ......................................................................... 99
104: PROBE FOR .U'EClFICNiIMRBR Of Ur<WWnwspaw your h a c h o nwrpqms? IF THE SUM OF NEWSPAPERS IS MORE THAN THE TOTAL THEY GET. YOU WILL BE TAKEN BACK rn THE BEGINNING TU TRY AGAIN.
VERIFY IF OVER 4 ( 11 282)
105: "
PROREFOR SPEUFICNUbfB.7R Of lhc-ncwrplpcrr your household r ncwrpspcn? IF THE SUM OF NEWSPAPERS IS MORE THAN THE TOTAL THEY GET, YOU WILL BE TAKEN BACK TO THE BEGINNING TO TRY AGAIN.
VERIFY IF OVER 3 111284)
SE DK ......................................................................... 98 RF ......................................................................... 99
106 nA1u ~
PROBE FOKSPEUFICNUMRER Of thSQ4Wmwspaw your hovJshold moves by -1 how many an Mwthly newspapem? IF THE SUM OF NEWSPAPERS IS MORE THAN THE TOTAL THEY GET. YOU WILL BETAKEN BACK TO THE BEGINNING TO TRY AGAIN
VERIFY IF OVER 5 1 11 286)
SE DK 98 RF .......................................................................... 99
P
107: Q41F I-,.if I
I -- I I
COMPWED OTHER
$E (11288)
108: C H W l [->WerP=>+l if Q41Fd I COMPUTU) TO COUNT NEWS AND CHFCK AGAINST TOTAL
r,,m,
SE DK ......................................................................... 98 . RF 99
111: m7rI
. ~~ ~~ . ....... ...I ._ GET. YOU WlLL BE TAKEN BACK TO THE BEGINNING TO
VERIFY IF OVER 4 111295)
$E DK 98 RF .......................................................................... 99
Q43c 112: PROBE FORSPECIFXNVMBER Of thc<Q42>nwrpapn MI moved by mail. how m y M Wcckly nnurpapns? IF THE SLIM OF NEWSPAPERS IF MORE THAN THE TOTAL THFY GET YOU WII L BE TAKEN BACK TOTHE BEGINYING TO TRY AGAIN
VERIFY Ib OVER 4
112: PROBEFORSPECIFK ,,",~_
~ r ~ , ~ ~. ~. Of lhc<442>nwrpapn MI m a ? THE SLIM OF NEWSPAPERS I S MORE THAN THETOTAL THEY GET. YOU W1I.L BE TAKEN BACK TOTHE BEGINYING TO TRY .AGAIN
VERIFY I). OVER 4 111297)
$E DK ....................... ............................ 98
113: PROBE FORSPR of t h c c Q 4 2 a w p a p not m nwrpapsn? IF THE SUM OF NEWSPAPERS IS MORE THAN THE TOTAL THEY GR. YOU WILL BE TAKEN BACK To THE BEGINNING TO TRY AGAIN
VERIFY IF OVER 3 ( 11 299)
$E DK ..98
..99 ........... .
(11301) $E DK 98
115: M I U
I COMPUED OTHER
SE (11303)
116: rmm --- .- - I -> 442 CIY => +I if Q43Fd I COMPUTED TO COUNT NEWS AND CHECK AGAINST TOTAL
(11305)
-
INFO ZERO UN, INTERVIEWER version 3.81

USP4 01/01/16 11:20 10
DK 98 RF ......................................................................... 99
1,s. N C ..I. -. =>+I if ( Q 4 1 A 4 OR Q41AM)AND(WIDFO OR
Q4ltD97)AND(Q43A=¶ OR Q43A>97)AND(Q43D=Q OR m ? w n
Dar your Sunday nw-r m ncwrprpn include a magadne supplmmt such asparade or Family Wcekly?
YES I 1
9
(rim)
- 119 Q46 Now. Pd Illre m as* you ylms qusJtiom a b 1 the vyiwi typJ of rdve r l i s inmr household raciver. About har many pi- of urlrj. Sdvcdving m pmmobboal material. including a6log% would you say your household M i v U thrmgh the mail
DK ......................................................................... 98 RF ............................................................ " ........... 99
1 2 0 Q47 Whm msmbcrs of your hovschold mcivc des. rdvmising or pmmotionnl mtcrial thmugh the mail do you (that is. you & Omn mmbsrs of your household).
(11311) UslIdlYreadit ... ....................................... 1 U d l y IM it. .. 2 Read m e . don't rsad othm ... 3 Urvallydodtnrdit ................................................. 4 DomKNow.. ............................... 8
121: 448 Now. &biking only about advmimms and cwpons you mceivd mFough the m i l in the Imt mmtb, did m y m m k m of your &hold p a s m y of thcsc i t em an m friends. family, co-workm. or otbm?
(11312)
NO ................................ RF
" ............
.................... ...................................... 1 Sam ads ad Q-QOM are i n e m 6 8 nad a$sp,blc. I don't mind &ng m e rtut dodIrnmU mL as b n g v I a b @ SCmIz ulaldo. 2 I wish then were h .drc&ing and pmmoumal m h l in tbu way. 3
DK ........................................................................... 8 RF ............................................................................ 9
126: Q49D Which Jtamnmf bea hi how you m l l y feel sbovt rseciving r d v d n i o g m pmmotionnl miterial READ ITEM ?
Thmugh -I (c l smnic mail maw) (11317)
I would l i k m &vc mote addsing and pmmotiooal material in this way. 1
DK "- ............ 8 RF ll,__" .. 9
RF ........ 9
INFO ZERO UN, INTERVIEWER version 3.8 1

USP4 01/01/16 11:20 11
Some ad, and pmmotios a n inlmsting ad mjoYablc. I don't mind getting - that don't intnsst me BE long a6 I 91s gel some h i do.. 2 I wish *ere wen 1- advettising and p m m d m l in this way. 3
DK .......................................................................... S w 9
130 0 4 9 H -
Which ~Qtcmcnl bea d c w n k how you pasonally feel sbovt w i v i n g advatising or ommotional material READ ITEM ?
Tbmugh radio d d P O I ( C n 6 (11521)
1 would like m rnrivc mom advatiring and ~ t i d maminl in this way.
Smnc sdr and pmmotions M interesting and Cnjopbk. I don't mind getting m c tha don't i n m me BE long a6 I also get wmc thsl do.. 2 I wish thm wee le* advatiring and p m m d d matninl in this way.
..............................
3 .......................... .. ..
131: ~ 9 1 Whish Jtslemal bea hk how you pnsonally feel a h 1 Fsssiving sdvatiriog or pmmotionnl material READ ITEM ?
I would like D m i w mOR advmtiring and pmmotionrl mrtcrid in Uur way. ............................................... 1
Some ads and pmmotions am interesting and enjoyable. I don7 mind g m i q yrmc thal don't i n f M t me BE long as I a b got som h r do.. 2 i.uirhthsnwmlensadvatisingadpmmotioMLmPfmalinth~way. 3
nmugh the far w h i n s 1 11 322)
DK 8 RF ........................................................................... 9
132: 0495
111323) I a d d iikc fo rssdvc mow advafiring and pmmotiml msfaial in this way. ................................................................................ 1 Sans a& and pomotions M i n t d n g and o j o p b k . I h ' l mind getting mmc h.1 don? interest me as h g ui I plao gct some thsl &..2 I wish Urrr w m lrra .dvntisiog and pmnotinul mabri.1 in this way. 3
. . you...
Rela it ... I ( 11 324)
Oppmc it 2 No( care- way athc Mha 3 DcM7 KNOW 8 w .............. ~ 9
135: 452
nuke u a 4 1 of getting d e s , dvrnidng or p m m o t i d rmmials in thc main VERIFY IF MORETHAN i00.
i11326) $E DK .................. R€ 99 => QS5 - - 136: 053
DK ................................. 98 =>Q55
13R 454.4
OfthsQ5>>ordrrs in ths lm m n h how many were plrcd by p b n r ? IF THE SUM OF ORDERS IS MORE THAN THE TOTAL YOU WILL BE TAKEN BACK TO THE BEGMNING m TRY AGAIN.
VEFWY IF O W 20 ~~
l I 1 u o l $E DK 98 Rf .......................................................................... 59
138: 05dR FROBE Of M Q S > o r & m 10 h e la61 month. how mmy were plaecd by mi' IF THE SUM
THE BEGMING TO TRY AGAIN. W F Y IF OVER I5
OF ORDERS IS MORE THAN ms TOTAL YOU WILL BE TAKEN BACK TO
( 11 3.321 $E
................................................. 9E ........ 59
.a
139: Q54c .=> . if Q 5 3 - ~ I F ~ ( Q ~ A ~ S ~ . Q 5 4 A . O ) + I F ( ( Q ~ B ~ ~ , Q 5 4 B . O ) ) I C0MF"ED OTHER
$E ( 1 I W -
14Q Q55 => Q53 if m-3 Wlthia fhe PMI Wdvc monthr. .bout bm m y pmcbasm did ywhauchald nuke online (a m r fhe lnhM d k ) 7 VERIFY IF MORE THAN 100.
111 336) $E
5% -sews 999 -scm
Wh.1 about in k 1-1 month? PROBE FOR SpEcmC NUMBER (1IUS)
$E DK 98 RF " ..... 99
INFO ZERO UN, INTERVIEWER version 3.81

USP4 01101116 11:20 12
142: SCRPS
makes up ici mail voIumc. AE-t t0-n~ fmm b l n h and other fuandl inrtirvtions rt-t a rignifiunt portion of that volume. The following qucMbnr focus on bank rccamt~. mdit urd aeeounfq and oUvr aemunt$ swh m muud fwk. IRA'S. money marLsf s tnk bmkmgs. ce.
(11341)
143: Q57A
(11342)
............................................................. I D
N w . how many of your acsoynfl M READ ITEM ? IRA w Keogh accwnB
SE
144: Q57B &mlL Savings & Lorn. or e d i t ynion zcmml3
( 1 l Y ) SE DK ......................................................................... 98 RF ......................................................................... 99 _____~ _____ ~ ~~~~
145: Q57c Stnk bmkaap, commodity. mutual fund n Money m W lsmvou
l115(61 SE DK ......................................................................... 98
146: Qs8A How many of the following inrurance policies do pmpk in your household bvvc?PI- nc lvde any policicr held thmugh their jobo.
SE DK ......................................................................... 98
1113d8l Roprty
..........................
147: 4588 H w many of the following i m m c c palicks do pmpls in youour household have?Plcass srcludc any polisics held thmugh their jobs.
Life ( I I W )
..... 98 w 99
148: Q58C How m y of Ur folkwing immcce polidsr do people in yom houwhoM bvc?Plcsrc nclUdC any politics held h v g h thcirjobr.
111552) SE Lx... " ..............
Hcslth
- B__ P
149: W D H a m y of the fd-g hmnce policies do hwc?Pl- n c W any poliEM held Umqh ejok
Aummbik
SE DK ............. 98
in p u r bseho!d
( 11 3n)
- 1M: Q59A Inmtsl. hm mayditcnrd.dopmplc in ywhauchold b e h READ ITEM ?
( 11 356) SE
&aril stom - S w . IC Pcnrq. Wardr. M e s
.....%
....59 PP -
151: Q59B In to01 h m y dl car& do pmplc in your household have fmm READ mM ?
(1I3yI) Gasoline ad oil companies
SE
152: Q59c
(113W)
In mal.hm m y d t car& dopmpls in ywrhnucboldhrve h RFADmM 7
SE DK ............... ....... 98 RF .......................................................................... w
Brink credit cuda like Mrrm clrd &d VlSA
DK ... 98 RF w
155: 961 How m y of km. are under ap 67
SE Refuscd 99
(113S)
156: b r m n y ~ k r u m k s g e r o f 6 a n d l 2 7
9 6 2
( 113681
SE Rsfwed ................................................................. 99
. .
1M). PSAMP =.>.if SAMPN I
~
PERSON SAMPLENUMBER
8889899 [ 11 374)
INFO ZERO UN, INTERVIEWER version 3.81
.

USP4 01/01/16 11:20 13
161: PERNO r=, SR 1
PERSON NUMBER
SE ONE 01
............................................. os
SEVEN ............ ....................................... 07 ElCHI ............................................ TEN .. 10
.............................................
(11381)
- 1 62: YOU -> * if lF((5R- ]).I 2) I PRONOUNS
y w ........................................................................... I ury ......................................................................... 2
11383)
~ ~
164: RESTG =z It1 d SR-I 1 And how about the next adult 18 or older. wh.1 iscYOUR >gmdcrl
MALE ..................................................................... I FEMALE ................................................................. 2 RF ........................................................................... 9
(11385)
................................. 5
m .................................
166: CEND =,.if IF((SR-I).QI.REST(j) I COMPUTELI GENDm
MALE ............................ "- I FEMALE . 2
(11387)
25 . 34 ........................................ 35 . 44 ................................ ..
65 . 69 ...... ̂ 7 ~ 7oc ........ 3
NIA. Rshuud 9
C W
(11389)
168: what ircYOUR xmital mhs?
............................ .........................
169: ...
Q W 3 No1 mployed7 ........................................................ 4 NIA. rrfuwd ........................................................... 9
170: 070
YES I =z Q'rr NO 2 NIA. R s f u d 9
m o u .-g... ( 11 392)
A sN&nt ................ I
................................... ....... 3 => 979 4 -> Q79
._ ..................... 6 0 =>a79
....................... 9
Whiamllar-pmfcuional,mmgu.oamn ............ I Whitcsollu-ralcr,slsricd.kchnid ..................... 2 Blvc rnllea - c m f i s m s d f m l a m&h.nrc ............. 3 Service wotlsr- fm4 hcnlth ckmr, y U a ............. 4 mn: SPECIW 7 0 N l h rs. ............................................................ 9
1 7 3 Q79 -
whatw~thethclaa<YOU>eom~lc(cdinashool?
Vmm 1 BIACWAFIUCAN AMERICAN .......................... 2 HISP .Nyc 3
175: ( 3 2 Would<YOU >nay W<YOU z w m a hcsd of houlchold?
Yes ................... I NO ...... ...... 2 RF ...... 9
(I13881
I
I INFO ZERO UN, INTERVIEWER version 3.81

USP4 01/01/16 11:ZO I
14
176 SCORE ->.if
VOI(Q82-1)*((VOI(GDIB I).IWOP(VOI (GEND-Z)*SW
CALCUIATE SCORE BASED ON WHETHU( HFAD Of HOUSEHOLD. SEX AN0 AGE
$E
PAGE)
(11357)
17'7: PRKND ~
PERSONeERNO END OF PERSON ROSTER YOU H A V E FINISHEWPERNO > m A<065-ADULT PERSON HOUSEHOLD
(114001) GOTONEXT ADULTPERSON ........................... 1 D O N E W HH MEMBERS ............................... 2
178: WHOHH [=, . i t rMxmmnnm l
=> WHOHH
WHO IS HEAD OF HOUSEHOLD. IF mls NUMBER IS M WE lows. HH IS MALE. IF IT I S IN THE SWS. HH IS FEMALE. THE LAST DIGIT IS W E AGE CATEGORY.
I 7 9 HHACE => * if If((WHOHH21 WO).WHOHH-IW.WHOHH-SLW) I HH'S AGE
............................................................. I 22 - 24 ...................................................
45 -54 ..................................................................... 5
%
180: LKI => *if RXY(I.SC0RE) I LOOK AT ROW I
SE (11631)
181: LKZ -> if RXY~(2,SC0n€) I LDOK AT ROW 2
1 8 2 LK3 -?. * if RTY(3.SCORE) 1 LOOK AT ROW 3
SE
18% LK4 =.> . if RXY14.SCOREI 1 l C 0 K AT ROW 4
18Q LK5 => * if nxY(5.sconE) 1 W O K AT ROW 5
1.35: LK6 -z. I f RyY(6,SCORE) I LOOK AT ROW 6
SE
1 8 6 LK7
(11651)
-7 * if RXY0,SCORE) 1 LOOK AT ROW 7
$E (11655)
182 LK8 -7 * I f RYy(8,SCORE) I LOOK ATROW 8
$E (11659)
18% LK9 =.> I f RXY(9,SCORE) 1 LOOK AT ROW 9
SE 111663)
HHROW => . if IND(WHOHH.LKI.LK2,W.LK4.LKS.UC4LK7,LKS,U(9) WHICH ROW IS THE OLDEST HH
(11667) $E
190: HHSCH = > * i f FXY(HHROW,Q79) I HIGHEST SCHOOL A"ENDED BY HH
( 11 S 9 )
2 .......................................... 3
4
6 Portgndunte work 3
4
191: Qe4 Falarti~poposcs. lmsdto~yw,hoorsholdmuxncfmInayear.Plcaxrcl l m e S ~ t o t n l b o u s o h o l d i n m w f o r M y s . r , b c f m c t u n , w ~ 1 5 O . W O n ~ IM.wo? InCludc ymu llwo income and th.1 of dl m c m b s r s o f w housebold who M lmngrihyou.
Uodn150,MO.ys.r I OvaSS4MO.W.." 2 DI(IRF 9
( iim)
SE 1
17.m - 1 9 9 9 a SlOOw n5;m- 119.9 xz0.m - s 2 4 . 9 xz5,oM. s34.9 s3s.m- w, DDNT I RF ........
INFO ZERO UN, INTERVIEWER version 3.81

USP4 01/01/16 11:20 15
200: Q90 => +l if NUT Q89=5 1
$E811 sso.wo . 164.9 99 .................................................. 08 165.wO - 179.999. ............................. m 1m.m - 599.999. ............................. 10 1IM.MX) - 5119.9 99 ............................... 11 5l2O.wO . 1149.999 12
........................................ 13 WNT KNOW ...................................................... 98
................................................ 99
194: INCOM => . if IF((QW-%IF((NOT Q8S-WR).Q85.Q86).99)
INCOME STRATA 1 11 675)
under 1 7 . m a yeu ...... 01 17.m - 19.999 a yur ............................. 5IO.m - 514 .999 .................................................. 03 5I5.wO . 119 .999 .......................
525,MX)- 134.999 .............
18o.m. 199.999 . . . . . . . . . . . . . . . . . 1u I Io0,OW - I I 19,999 ................. I 1
I2 ...............................
N? KNOW .....................................................
195: Q66 How many wage came16 (workm) m i n g at 1-1 SS,wO pcr year are lhcn in yovr hwchold?
( 11 677) $E DK ....................................... ..98 RF ......................................................................... 99
196: Q67 "3
How many wage m r s . w i n g any income. M there in your howhold? 1 11 679)
tE _- DK ......................................................................... 98 RF ........................................................................ .99
197: Q87 Do yw own or rent ~r home?
ow" .......... 1 RSR. .................. 2 NIA RF . I11680
198: Q88 H w lmg have p u lived in ywr p m t home? P LESS THAN ONE YEAR ENTER ZERO
(11682) SE DK .......................
199: Q89
111684) Which of the following ban d e & i w h e ?
H- ............................ AprmmL .................... Mobile Hme .... Gomp @mierr (rush as I w p house or damimry)
Hotel .. 5 Rmming Hnur ....................................................... 6 w 9
4 .................................. .....................
-
Which trp of hotel do yw live in? 1 11 6851
Regular Hotel ........................................................... 1
Hwring Unit in I Pcrmaoent T m i s n t Hotel .......... 3 N ~ n - T ~ n ~ i c n t Hotel 2
D W ..................................................................... 9
A h 1 haw many "nib are connected 10 the ppm"
I I 2 ........................... .................... 2 3 4 . 3 5-9
5 RF ...................
( 11 886)
202: Q92 Do you or any mcmbcr of y o w houJchold have a businas fhsl in -led fmm pxr household?
It lBBI) YES ........................................................
=> Q96 => Q96
203 Q93 Abut how many picccs of mail doer the business receive each week? vERIp( RESPONSE IF'W
( 11 888) $E
204: Q94
( 11 680)
And h u t how many pi- of mail don Ihe businw wnd each week? VERIFY RESPONSE IF '0'
_ .......................................... 98 RF .............................................
205: Q95 ~oyoudo~lotofbvsincsrworlrfm~yauhomc?
( 11 692) ~ ..............
............................................
2 0 6 scRF-7 Ranrmbcrwhrn you do yanhovamold dimymatwe are i n m a o n l y in hmrsbold mil. so plnre do MI uy1m this bvsinur mail MI -rd it in your diy. PRESS m m CON~RIUE
c o r n .... .......................... 1 D
207: Qw Do y ~ p b n t o d ~ t ~ l n p c ~ b u m b a D f i D m s l i l a Chris lmsr~.prtyinviat imq
1 11 693) - wedding invirstiona. club -I. &.. dnI% lhc nert wrn days?
1 11 6 9 0 ......................................... I
9
INFO ZERO UN, INTERVIEWER version 3.81
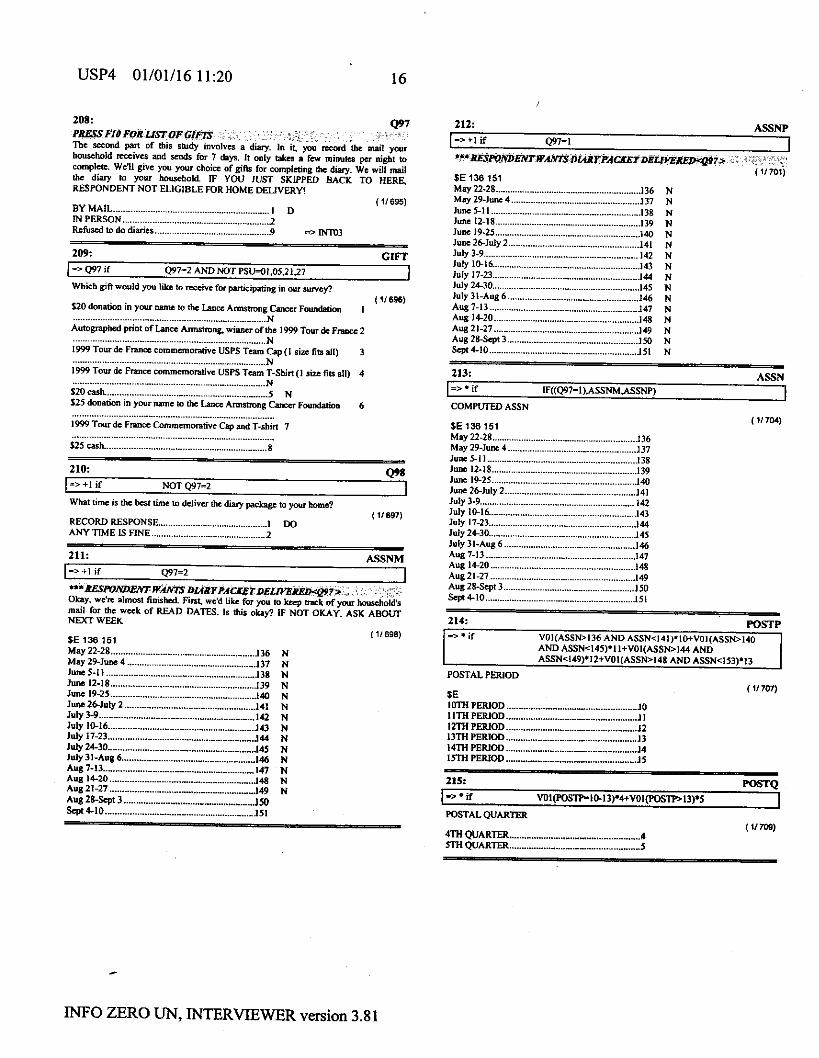
01/01/16 11:20 16
208:
-.. . 1-497 if Q97-2 ANDNOTPSU=OI,OS,21Z7 J
Which dfl would yoy like to -vc fa h c i o a t i n ~ in nn w c v ? . . - ( (1696)
I20 donntiw in yovr m e IO Ihc Lansc A m n g h s r Fmdstion I ............................................................................... N
Auto@aphed print of h e Armshonk ainncr of & I999 Tow de F- 2 ............................................................................... N 1999 Tour de Fran~c eommcmomtive USPS Team Cap (I si= f i ~ dl) 3 ............................................................................... N I999 T a u de France commemorabw USPS T m T-shirt 11 size 60 dll 4 ~,
N 5 2 0 ~ a s h .................................................................. 5 N I25 dooation in your m e 10 thc Lansc Amamng Cancn Fovndntioo 6
1999 Tour de Fnncs Commmontivc Cap and T-shirt 7
12I, cash 8 ...................................................................................
498 2 1 0 ->+I if NOT Q97=2
What time is he best time U, deliver thr d q pc% b yw h e ? I
RECORD RESPONSE ............................................. I DO ANYTIME IS FINE ............................................ 2
(11697)
211: ASSNM .I -.-. v , = L
"*EE.WOh!DENTWAMs DL4RFPACKETDEUYERERqp Okay. we're dmwl finshed Fmt we'd Ink for you b tmck of yw hounehold's mail for the wsck of READ DATES Is ttUr okay7 IF NOT OKAY. ASK ABOUT NEXT WEEK
I
$E 136 151
May 29-1- 4 137 N May 22-28 .................... 136 N
June 5-11 ............................... .......................... -138 N J-12-18 J39 N J-19-25 140 N JvnC 261Ub 2 141 N
.....................
............
111698)
ASSNP 212: I - t l i f M h l I ... ~~. . I
11701) $E 136 151 May 22-28 ..............
137 N May 29-June 4 1"ne 5-1 I ............................. I38 N
........ ........... .................
............................... 141 N
........... 1 4 N July 2430 ... 145 N lvly31-Aug6 146 N Aug 7-13 141 N Aug 1420 I48 N Aug21-27 I49 N Aug 2-1 3 1. N Sspt4-IO 151 N
213: . cc..
$E136151 May 22-28 J36 May 29Junc 4 ..................................................... 137 June 5-11 .............................................................. I38 Junc 12-18 .............. 120
J- 19-25 ............................................................ 140 June 26-July 2 141 ~~~ ~
July 3-9 .............................................................. 142 July 10-16 143 July 17-23 ............................................................ JViY 2 ~ 3 0 145 July 31-Aug 6 ......................................................
147
149 Aug 1420 ......................................
...................................
( 11 704)
- 214: POSTP I> * i, VOI(ASSN>136 AND ASSN~l41)~I[HVOI(ASSN-.140
AND ASSN445)'I l+VOI(ASSN>I44 AND ASSN449)*12+VOI(ASSN>148 AND ASSN453)*13
POSTAL P W O D (11707l
POSTAL QUARTER
4TH QUARTER 1 5TH QUARTER S
- INFO ZERO UN, INTERVIEWER version 3.81

USP4 01/01/16 11:20 17
RESPN
111710)
217: VAOD WAS ADDRESS CORRECT?
YES I D => NPHON NO 2
1 11 740)
218: ADDRESS IMPORTED CAN CHANGE
SP
MADDR
(11741)
2 1 9 APT #
MSUIT
1117761
2 2 0 MCTN ~~~ ~
ClTK NAME MAILING IMPORTED CAN CHANGE
SP 1 11 764)
221: STATE IMWRTEDCAN CHANGE
AA ..........................................
............................ AK
............................. ._
.......................... M A
.......................................... MI
................................ MS
NEVADA ..................................
........................ NY
............................................ .......................
MSTAT
111763)
- P - ZIP CODE IMPORT6D CAN CHANGE
98889 D W - 99999
2u:
2 2 2 Mzrpl
lll(D1)
PLUS 4 IMPORTESI CAN CHANGE
D M D W 9999
22C WHON WAS PHONE NUMBER CORRECI?
( r laro) YES I D =Z 1+2 NO 2
*
INFO ZERO UN, INTERVIEWER version 3.81

USP4 01/01/16 11:20 18
US: TEMl NEW PHONE NUMBER
( 1 1 8 1 0 999-889-9999
226 ISALT k there an almnatc phom number UL ws M x-each you et?
(11823) Ycs 1 No ........................................................................... 2 => +2
22'1: ALTPH And what is fhat alknmte number? FORMAT #W##W##
(11824) 999-999-9999
228: DlFPH A few &p a b wc mail your dinries, we want m call m make sue p ' w received mCm sod also m rsmind you of UU dam we need y m to m c k yovrmil fm. whcn we do this, should we all you at ulis number or is thcrr a d i m * n v m k where you would pxtfer m be alled? THE NUMBER IS: I N READ NUMBER TO RESPONDENT
(118381 YES. THIS NUMBER OK ...................................... I D => APFT NO, CALL DIFFERENT NUMBER ....................... 2
229 And what is ths numbn? FORMAT %w&%#W#
09%999-9999
OTHPH
1 lI837)
230 APPT iwo Would
Mo- I A R c m n ................................................................ 2 E"&"& ........................ 3 No bat time ............................................................. 4 DWRF .............................................. 9
(116491
231: INTO3 1 = > + 1 i f NOT 997-9 I
DAY OF WEFK lNl€RMEW COMPLETED
SUNDAY ................... 'NFSDAY - 3
....... 4 5 6 __ ........................... 7
(11653)
- 4
234: QlW => .if IF((SH~l2M).I.IF((Sf012W AND SH~1600)2.1F((SH>ISS9
AND SH48W1.3.4))I
TlMEOF CONTACT
BEFORE NOON .................................................... 1 NOON - 159PM .................................................... 2 4PM - 6PM .... 3 AFI'ER 6pM 4
235:
~ ~~
236 m ( 11 859)
E n t n F i i Dispxitim.
N =>END Comp~krlFax Muhin e...... N *>END
Spanish Wlbsclr ........... P d d Complnc ............ Om WQ ........................................................... DQ N ->/END h o v e my name fmm your mailing lisL Do rot ever call me again. . ->OUST Not Qualified .................................. NQ N ->IEND
U7: NOTES ENTER NOTES FOR SUPERVISOR YOU WONT BE ABLE TO READ YOUR NOTE LATER So MAKE SURE IT SAYS WHAT YOU WANT.
LWER NOTES
238: Fa
OL
-
ENTER NOTES TO MTERVIEWERS BE CAWIOUS! ANYONE CAN READ WHAT YOU PUT HERE.
I .,-e*\ $
ENTERNOTES ...................................................... 1 0
CONTINUE ................... I D
CB
( 1 1 E w SCHS
241: NAME who shouldlask fmwhcnl dlbPsL?ASK FOR FULLNAME
(11876) -
/
INFO ZERO UN, INTERVIEWER version 3.81

USP4 01/01/16 11:20 19
242: OLIST = > + I if NOT lNTOl=OL AND NOT INTQL I Wwld you PI- tell me why y w do not want to partlsipstc io our mrvcj4
ENTERRESPONSE .............................................. I Do (1101
- INFO ZERO UN, INTERVIEWER version 3.81

ix B2: Diary Package
Advonced Letter

William J. Henderson PoStmasIer General, CEO
UNITED STATES POSTAL SERVICE
March 8,2001
John Smith 123 Main Street Metropolis, MD 00001
Dear Smith Family:
Like most Americans, you depend on an unintermpted flow of mail to and from your home. The US. Postal Service aims to provide exceptional delivery performance and now boasts a 94 percent on-time service record nationwide for First-class Mail. To help ensure this superior level of service well into the next century, the US. Postal Service is conducting its Househod Diaw Study.
By participating in this study, you will help us continue to improve postal services. You, together with a few other families in the -ZIP. ZIP Code, have been selected to provide a snapshot of mail received and sent, delivery service quality. and customer satisfaction. Your household will be provided a postal diary in which to record this information. The information you provide will help us make important decisions on how improve our performance and invest in equipment, facilities, new programs, and new technologies to better serve you.
In appreciation for your participation in this study, we are offering a choice of several gifts: - - A charitable donation of $20 inyournameto the Lance Armstrong Cancer Foundation. Autographed print of Lance Armstrong, member of Team USPS, winner of the 1999 Tour de France. One of the following 1999 Tour de France commemorative items from the United States Postal Service (team sponsor) and outfitter Pearl lzumi USPS Team Cap or T-shirt.
- - Twenty dollars in cash.
A survey specialist from NuStats, our partner in this study, will call you in the next few days to confirm your participation, answer quest is about the survey, and ask you some general questions about your household and the mail it receives and sends. All information collected will be strictly confidential in order to protect your privacy. A diary package to record your household's mailing activity will then be delivered to your home.
To learn more about this important survey, please visit our Web site at www.nustats..cwnor telephone your local postmaster at your local post office. Thank you for joining us in our Household Diary Sue. Sincerely,
- 475 CEnfanl plaza W Washington DC 2026ooo10

Appendix B2: Diary Package
Instruction Booklet

UNITEDSTATES POSTAL SERVICE.
Household Diary Instruction Booklet
Sort and number your mail according to the type of postage. (see page 1 of the MONDAY diary for the categories)
Count the number of pieces of each type of mail and record this number on page 1 of the MONDAY diary.
@ Go to the QUESTION SHEETS tab in the instruction booklet. Read each question and record the answers in the MONDAY diary for each mail piece received. The examples under the MAIL MARKINGS tab will help you classify your mail.
If you have any questions as you complete your diary, read this instruction booklet or call:
1-888-643-USPS (8 777) available l l a m to 9pm Central Standard Rme (Mon-Fri)
12pm to dpm Central Standard Rme (Sat and Sun)
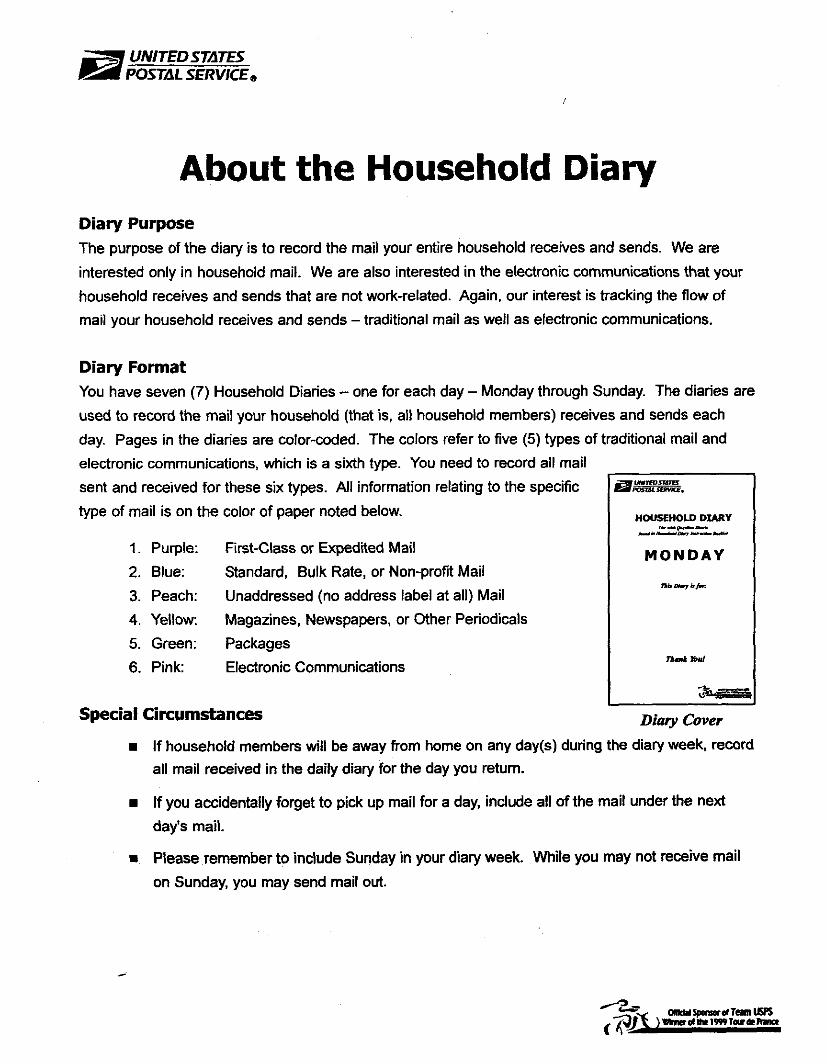
UNITEDSTATES POSTAL SERVICEe
About the Household Diary Diary Purpose The purpose of the diary is to record the mail your entire household receives and sends. We are
interested only in household mail. We are also interested in the electronic communications that your
household receives and sends that are not work-related. Again, our interest is tracking the flow of mail your household receives and sends -traditional mail as well as electronic communications.
Diary Format You have seven (7) Household Diaries - one for each day - Monday through Sunday. The diaries are
used to record the mail your household (that is, all household members) receives and sends each
day. Pages in the diaries are color-coded. The colors refer to five (5) types of traditional mail and electronic communications, which is a sixth type. You need to record all mail
type of mail is on the color of paper noted below.
sent and received for these six types. All information relating to the specific
HOUSEHOW DIARY I.--".---
M O N D A Y
m*km
1. Purple: First-class or Expedited Mail
2. Blue: Standard, Bulk Rate, or Non-profit Mail 3. Peach: Unaddressed (no address label at all) Mail
4. Yellow:
5. Green: Packages 6. Pink: Electronic Communications
Magazines, Newspapers, or Other Periodicals
Special Circumstances
If household members will be away from home on any day(s) during the diary week, record all mail received in the daily diary for the day you return.
If you accidentally forget to pick up mail for a day, include all of the mail under the next
day's mail.
m Please remember to include Sunday in your diary week. While you may not receive mail
on Sunday, you may send mail out.

UNITEDSTATES POSTAL SERVICEo
Frequently Asked Questions (FAQ)
1. How long does it take to fill out the diary each day? The first time you fill out the diary, it may take the average household up to 30 minutes because you are just becoming familiar with the instructions, questions, diary, and mail markings. After the first day, it should take no longer than 10 or 15 minutes depending on how much mail you receive.
2. What are mail markings? Mail markings indicate the type of mail and the amount of postage paid. Mail markings are typically in the top right-hand comer of the mail piece, above or below the address and inside the window of an envelope. Go to the MAIL MARKINGS tab in the instruction booklet for examples of mail markings.
3. Is the postage paid to mail back the diaries and mail markings? Yes, a pre-paid Priority Mail envelope is included. Return all completed diaries and your mail markings. You do not need to return any of the instruction materials.
4. I have some personal mail (or e-mail) sent to me at my ofice. Should I include the mail in the wunt of mail I receive? No, include only personal household mail sent to your home address.
5. Do we include mail markfngs with our completed diaries? Yes, place mail markings, with the mail piece number and classification you have assigned written on them, in the daily envelopes with your completed diaries.
6. What if tbere an? mail markings inside a window envelope? Do I send it in? If the mail marking is on a mail piece that you don't need to keep, please send it in. If you need to keep it, please provide a description of the markings inside the window on the portion that you do send.
continued on next page + -

UNITED STATES POSTAL SERVICEa
7. Do we keep track of mail we send out? Yes, answer the MAIL SENT question sheet (purple) and record your answers on pages 4 and 5 of the Household Diary for each day.
8. Are catalogs recorded as magazines, newspapem, or other periodica/s? Most catalogs are sent BULK or STANDARD rate so check the mail marking, and record the catalog under the appropriate mail classification.
9. I. The return address is sometimes hard to find paHikuIarly on magazines, newspaper, and some other types of maiL Where should I look? Return addresses on magazines are often inside the front cover, or on the title page with publishing information, or on the paper wrapper the magazine is shipped in. Return address information on newspapers is sometimes at the top of the front page, above the headline, or inside the paper, near the publishing information or masthead on the editorial page.
10. How do we include advertising that is included in bills? If the bill is a first-class mail piece, questions about the advertisements are asked on the REGULAR FIRST-CLASS, PRESORTED FIRST-CLASS OR EXPEDITED MAIL RECEIVED question sheet (purple). (Questions K-P)
If the bill is a standard, bulk rate or nonprofit mail piece, questions about the advertisements are asked on the PRESORTED STANDARD, BULK RATE OR NONPROFIT ORGANIZATION MAIL RECEIVED question sheet (blue). (Questions 0-R)
11. No one petson in our household opens all the maiL How can Ianswer questtons about other people 3 mail without opening it? Record as much information as you can without opening mail addressed to others. Ask other people the questions you can't answer and record their answers. Leave anything you can't answer blank.
If you have any questions calk
I-888-643-USPS (8777) available l lam to 9pm Central Standard lime (Mon - Fri)
l2pm to 6pm Central Standard lime (Sat and Sun)

UNITED STATES POSTAL SERVICE.
= For First-class or Expedited mail, there are spaces for recording several
different kinds of errors in delivery and addressing.
8 Wrong Address, Right Person: Answer questions about mail
Instructions for Filling Out the Diary
E=""' ----.- e -.--I- * - -.- }-. _.---- -- -#----I=. I...---- _-.----.-
1. Sort your "traditional" mail. Go to "Sorting Mail" tab for instructions on sorting your mail.
Review examples of mail markings under the "Mail Markings" tab. If you have problems sorting
your mail, call the hotline at 1-888-643-USPS (8777).
Right Address, Wrong Person: Do not answer questions about this mail piece.
8 Wrong Address, Wrong Person: Do not answer questions about
2. Number the mail pieces within each type of mail. First write the
on each piece of mail and then number the mail pieces. The top First-
Class mail piece is #I, the next is #2, and so on until you have
numbered all First-class mail. Then number the four other types of
traditional mail.
_-.--I-- - - --*----o - _-.----- -- _- ..--.- a. _-.--I",
ms-- -_-- ---.- - -...- ---.-
3. Go to "Example Diary" tab and review the example diary page. An example of a
completed diary page is included to indicate how to properly fill out the diary.
4. Complete page 1 of the daily diary. On this page, record the total number of mail pieces of
each type that the household received and sent on that day.
- . -
piece using the purple pages. I-----
this mail piece.
Thek are spaces for logging different kinds of electronic
communications. Logging the information here will help you answer questions about the
electronic communications in the diary.

UNITED STATES POSTAL SERVICE@
5. Locate and read the question sheets. The question sheets are
under the "Question Sheets" tab and are color-coded for each type of mail. There is one question sheet for each type of mail (Le. First-
class, Standard/Bulk etc.) Each question sheet contains both the
questions and the answer codes. For each mail piece, record the
answer codes on the answer sheets found in the dianes. (See below)
DO NOT RECORD YOUR ANSWERS ON THE QUESTION SHEETS.
. ---
Question Sheet (See tab)
down the page and all mail pieces across the page.
6. Record answers on the answer sheets found in the diaries. Answer sheets are color-coded by the type of mail to match the question sheets.
Answer sheets are found in the diary booklets (Monday, Tuesday, etc.). I a r r p d l P d ~ d
@ M T p i c q
RqUlW Rnt-aas, RLIwtcd Filrt-Clls
v m - 2
To correctly classify the mail, (as in Question F on the question sheet above) you need to
look at both the postage or permit markings in the top, right-hand corner, the markings
above or below the address line and inside the window of an envelope.
Mail Markings can k:
in the top, right-hand corner,
above p~ below the address, or
inside the window of an envelope
A U T m I G I T 999
123 MAIN STREET ANYWHERE. USA 53999-9999
armlSpvsdTWusR ~ o ) l r 1 9 9 9 1 W d l R r r
Mail Marking Erample

UNITED STATES POsTdL SERVlCEa
7. Place completed diaries and mail pieces in the envelopes marked Monday through Sunday. The completed diaries should be placed in the corresponding daily envelope. Please include the envelopes from your mail pieces with the mail piece number and classification
you have assigned.
If there are mail markings on a mail piece inside a clear window envelope and you don’t need to
keep it, please send it in. If you need to keep it, please provide a description of the markings
inside the window on the portion that you do send.
8. Place daily envelopes in pre-paid Priority Mail envelope. The daily envelopes with the
completed diaries, and mail markingslmail pieces should be mailed back to NuStats in the pre-paid
Priority Mail envelope.
Special Instructions for Electronic Communications: Electronic Communications involves contact with someone (a person, a company, an institution, etc.)
This contact must be active such as sending or receiving e-mail, reviewing account information on-
line, ordering something over the internet or spending time and/or interacting in a chat room, etc. We
are only interested in your personal electronic communications.
Don’t record work-related electronic communications.
Don’t record e-mail sent to a client or colleague as part of your job.
Do record the CD you purchased over the internet for your son or daughter.
Don’t record the airline ticket you purchased over the internet for a business trip.
Remember.. . Record all mail received or sent by all members of your household.
Do not include mail for a business operated from home or other work-related mail.
Do not include mail sent for a club or association from your home.
If you have any questions about filling out the diary, call the hotline at:
1-888-643-USPS (8777)

Blue DIARY EXAMPLE
-A=* 1
. Question Sheet (See tab)
0 Creditcardoffer
Answer Sheet (In Diary)
SampIe Mail Piece
tt-tt*- AUTOCR"C-013 JANE DOE 123 MAIN STREET ANYWHERE. USA 99999-9999
Monday BlYC
-. "Bulk Rate"on Permit and
"AUTOCR or EA" above address

UNITED STATES POSTdL SERVICE,
Guidelines for Sorting Mail Each day during your diary week, you should SORT your mail into five groups. The guidelines below will help
you to sort your mail correctly.
To correctly classify the mail, look at
both the postage or permit markings in
the top, right-hand corner, above or
window of an envelope. Also refer to
the examples of mail markings under the "Mail Markings" tab for assistance.
Mail Markings can be:
8 in the lop, righi-hmnd corner,
8 above
inside the window of an envelope.
AUTO"3-DIGIT 999 -......- below the address, or
123 MAIN STREET ANYWHERE. USA 99999-9999 below the address and inside the
Mail Morking Example
You may not find an exact match for each mail marking. In these cases, find the most similar mail marking.
If you still cannot classify the mail piece, indicate on the mail piece that you had trouble identifying it and also make a note in the "Comments" section on the back of the answer sheet for the mail type you think it is.
If you have problems sorting your mail, call the hotline at 1-888-643-USPS (8777)
Group 1: Regular First-class, Presorted First-class or Expedited Mail (Purple page) See purple pages under the "Mail Markings" tab for examples of First-class postage andpermit markings.
Letter-size envelopes or very large envelopes marked "First-class.*
Postcards regardless of size with postage of 20# or more.
Expedited letters or express paks (not boxes) that have been sent next day air, next day
service, or 2day service. These can be delivered via the USPS, United Parcel Service
(UPS), Federal Express. Airborne or other express mail service.
Mail sent via special treatment, such as Special Delivery, Certified, Registered, or Mailgram.
Postage is 334, 554, 7'74, or more.
Magazines, newsletters or other periodicals that are marked "First-class."

Group 2 Presorted Standard, Bulk Rate, or Nonprofit Organization Mail (Blue page) See blue pages under the "Moil Markings" tab for examples of Standor4 Bulk or Nonprofit postage ondpermit morkings.
Advertising mail from department stores, credit card companies, insurance companies, etc.,
marked "Presorted Standard" or "Bulk Rate."
Mail from charities, schools, hospitals, churches, etc., marked "Nonprofit".
Magazines, newsletters or other periodicals that are marked "Presorted Standard" or
"Bulk Rate."
Detached label cards that include the following message and one of the markings for
automated mail.
Postal Sewiec Regulations quire that this addm card be delivend together with its accompanying postage paid mail advert&mcnts. If you should receive this card without its accompanying mail, please notify your local pasmaster.
Group 3: Unaddressed Mail - Delivered by USPS only (Peach page) - - Mail that doesn't have an address label (not even "Occupant" or "Resident").
Mail that is not in an envelope, such as advertising flyers, circulars, samples, coupons, or
mail order offers and often accompanied by the detached label card noted above.
The unaddressed mail may be one piece alone or may be separate pieces folded together.
If there are separate pieces folded together, record each piece separately in the diary.
.
Group 4 Magazines, Newspapers, or other Periodicals (vellow page)
Delivered by the United States Postal Service only.
Daily, weekly, or monthly magazines, newspapers, or newsletters (not already sorted into
First-class, or Standard or Bulk Rate Mail).
.
Group 5: Packages or Product Samples (Green *gel = All packages received or sent by the United States Postal Service or other organizations
such as United Parcel Service (UPS), Federal Express, etc.
Record any product samples delivered by the United States Postal Service or any other
organization but not samples included in the newspaper.
.
If you have any questions about sorting your mail, call the h o t l i e at:
1-888-643-USPS (8777)

Purple FIRST-CLASS MAIL EXAMPLES
1. Regular First-class
33$ - stamp Metered
US. POSTAGE PAID COMPANY NAME
PERMIT #OW
Permit
Metered Postcard
2. Presorted First-class, or Presorted or FP
First-class Mail US. Postage Paid
Mailed from Zip Code 27101 PERMIT #OOO
M
Y E T C R
“Presorted First Class” on Metered Strip
“Presorted First Class’’ on Permit
“Presorted First Class” on Stamp
5698 I @ 0.305 “CRI3 Look above the JANE DOE [ addressand ] 123 MAIN STREET in lower left corner ANYWHERE, USA 99999-9999 /’
5698 I($ 0.305
“First Class” on Permit “FP”above address or lower left

Purple FIRST-CLASS MAIL EXAMPLES
3. AUTO 4. AB, orAF, orAT, orAV
AUTOM3-DIGIT 999 --**-m*
JANE DOE 123 MAIN STREET ANYWHERE, USA 99999-9999
5895@ 0.261 1 JANE DOE 123 MAIN STREET ANYWHERE. USA 99999-9999
99999 AUTO - “AUTO” above or below the address “AB, or AF, or AT, or AV”
above address
5. AUTOCR, orAC
AUTOCR” C-013 --*e*
JANE DOE 123 MAIN STREET ANYWHERE, USA 99999-9999
A C T - 0 1 3 ---- JANE DOE 123 MAIN STREET ANWHERE, USA 99999-9999
“AUTOCR” above address “AC” above address
6. Single Piece, orSNGLP, orSP
JANE DOE 123 MAIN STREET ANYWHERE, USA 99999-9999
Single piece
“Presorted First-class” left of Metered Strip “Single piece” in lower left
k
JANE DOE 123 MAIN STREET ANYWHERE. USA 99999-9999
I SNGLP a . . ~ ~ J ~ l , L , L $ J ~ ~ ~ ~ , ~ , ~
“Presorted First-class” left of Metered Strip “SNGLP” left of Barcode
Hint: Find closest match

Purple FIRST-CLASS MAIL EXAMPLES
7. Special Delivery 8. Certified
SPECIAL DELIVERY
JANE DOE 123 MAIN STREET ANYWHERE. USA 99999-9999
Z 970 383 17L
“Special Delivery” under postage
9. Registered
“Certified” Letter
10. Insured
“Registered” Letter
11. Mail from outside the US
JANE DOE 123 MAIN STREET ANYWHERE, USA 99999-9999
“Air Mail”
13. Government Mail (Franked)
1
“Official Government Signature”(Franked)
“Insured” Letter or Parcel
12. Mailgram
Mailgram
14. Government Mail (Penalty)
I
“Eagle”(Penalty)
Hint: Find closest match

I Purple EXPEDITED MAIL EXAMPLES
15. Express Mail 16. Priority Mail
17. Airborne
AIRBORNE EXPRESS.
19. UPS
18. Federal Express

I Blue STANDARD, BULK RATE, AND
’NONPROFIT ORGANIZATION MAIL EXAMPLES
I ‘ I PERMIT 10
AUTOCR-GO13 “P
JANE DOE 123 MAIN STREET ANYWHERE, USA 99999-9999
1. Nonprofit, or FD, or BA
Nonprofit Organization U.S. Postage
Boston, Massachusetts Permit No. 99999
‘Wonprofit Organization” “Nonprofit Org.” on Permit on Metered Strip
“Nonprofit Org.” on Stamp
U S P o w Paid ANYWHERE USA
PERMITWO
3 Look above the address and
lower left corner
5698 I@ 0.305 “CR13
ANYWHERE, USA 99999-9999
“Nonprofit Organization” on Permit and
“FD or BA”above address or lower left comer
2. Nonprofit andAUTOCR, orCP orECRLOT
Nonpmlil Olgnnkdm us. Pc&aoe Paid n ANYWHERE USA
I -1 -,----. ECRLOT- COO4 JANE DOE 123 MAIN STREET ANYWHERE, USA 99999-9999
“Nonprofit Organization or Nonprofit Org.”on Permit Ond
“AUTOCR or CP” above address /
“Nonprofit Organization or Nonprofit Org.”on Permit and
“ECRLOT or CP” above address

Blue STANDARD, BULK RATE, AND
NONPROFIT ORGANIZATION MAIL EXAMPLES
3. Nonprofit andcarrier Route Presort, or CAR-RT SORT
US. Pmlage Paid ANYWHERE USA
I PERMITM I
Carrier Route Presort ” C-004 *.-- JANE DOE 123 MAIN STREET
,,ANYWHERE, USA 99999-9999
“Nonprofit 0rganization”on Permit and
“Carrier Route Presort”
U.S. Postage Paid ANYWHERE USA
PERMITM
CAR-RT SORT ” C-004 .”.- JANE DOE 123 MAIN STREET ANYWHERE, USA 99999-9999
‘Wonprofit 0rganization”on Permit and
“CAR-RT SORT”
4. Nonprofit and ECRWSH, or ECRWSS, or=, or WS
us. POsQW Pid ANYWHERE USA
ECRWSH-C-013 -mm+
JANE DOE 123 MAIN STREET ANYWHERE. USA 99999-9999
Nonpmm r2pnlomn
nm”WSS“C-013 .+.-
JANE DOE 123 MAIN STREET I ANYWHERE, USA 99999-9999
‘Wonprofit 0rganization”on Permit and
“ECR and Nonprofit 0rganization”on Permit and
“ECRWSH or ECRWSS” above address “WSS or WSH” above address
us. PWagll P M -ERE USA
JANE DOE 123 MAIN STREET ANYWHERE, USA 99999-9999
‘Wonprofit 0rganization”on Permit and
“ST or WS” on lower left comer
Hint: Find closest match

Blue STANDARD, BULK RATE, AND
NONPROFIT ORGANIZATION MAIL EXAMPLES
5. Nonprofit andAUTO, orBB, orTB, orZB, orZN, orZP
we-. AUT0-5DIGIT 999 JANE DOE 123 MAIN STREET ANYWHERE. USA 99999-9999
~
“Nonprofit 0rganization”on Permit and
“AUTO or BB, or TB, or ZB, or ZN, or ZP” above address
6. Bulk Rate, or BLK RT, or RBI or RA
I I I
“Bulk Rate” “BLK RT” on Metered Strip on Metered Strip
BULK RATE U.S. POSTAGE
BUDA, TX Permit No. 000
“Bulk Rate” on Permit
JANE DOE 123 MAIN STREET ANYWHERE. USA 999999999
“Bulk Rate”on Permit and
‘‘W, or “W’ on lower left comer

Blue STANDARD, BULK RATE, AND
NONPROFIT ORGANIZATION MAIL EXAMPLES
7. Standard, or Bulk Rate andAUTOCR, or EA
US. Poslage Pad ANYWHERE USA
PERMIT XO
AUTOCR-C-013 trn*tttCIH*t
JANE DOE 123 MAIN STREET ANYWHERE, USA 99999-9999
“Presort Standard”on Permit and
“AUTOCR or EA” above address
US. Postage Paid ANYWHERE USA
PERMITXO
AUTOCR**C-013 *w-*
JANE DOE 123 MAIN STREET ANYWHERE, USA 99999-9999
“PRSRT STDon Permit and
“AUTOCR or EA” above address
U.S. Postage Paid A N W E R E USA
PERMIT 1M
AUT0CR“C-013 **--- JANE DOE 123 MAIN STREET ANYWHERE, USA 99999-9999
“Bulk Rate”on Permit and
“AUTOCR or EA” above address
8. Standard, orBulk Rate andcarrier Route Presort, or CAR-RT SORT
lzzY PERMIT XO
CAR-RT SORT * C-004 - JANE DOE 123 MAIN STREET ANYWHERE, USA 99999-9999
U.S. PaStqa Paw ANYWHERE USA
PERMIT 1M
mkm- CAR-RT SORT ** C-004 JANE DOE 123 MAIN STREET ANYWHERE, USA 99999-9999
“Presort Standard”or “PRSRT STD”on Permit and
“CAR-RT SORT” or “Carrier Route Presort”
“Bulk Rate’lon Permit and
“CAR-RT SORT” or “Carrier Route Presort”
Hint! Find closest match

STANDARD, BULK RATE, AND NONPROFIT ORGANIZATION MAIL EXAMPLES j
9. Standard, orBulk Rate andECRWSH, orECRWSS, orEB, orEH, orES
U.S. Palawa P1M AKYWHERE USA
ECRL0T”C-013 m.*m*-*.
JANE DOE 123 MAIN STREET ANYWHERE. USA 99999-9999
“Presort Standard”or “PRSRT STDon Permit and
“ECRLOT, or ECRWSH or ECRWSS” above address
JANE DOE 123 MAIN STREET ANYWHERE, USA 99999-9999
“ECR & Presort StandarPor “PRSRT STD”on Permit and
“WSS or WSH? above address
U.S - h l d
JANE DOE 123 MAIN STREET ANYWHERE, USA 99999-9999
“Presort Standard”or “PRSRT STD”on Permit and
U.S. P o q * Paid ANYWHERE USA
ECRLOT*’C-OI 3 JANE W E 123 MAIN STREET ANYWHERE, USA 99999-9999 I
“Bulk Rate”on Permit and
“ECRLOT” above address
Bulk Rue
ANYWHERE US4 PERMIT 10
U.S. POIDpD Piul
mmmmm 7NSS”C-013 JANE DOE 123 MAIN STREET ANYWHERE. USA 99999-9999
“ECR and Bulk Rate”on Permit and
“WSS or WSH’ above address
123 MAIN STREET I ANYWHERE, USA 99999-9999
0427@ 0.093
“Bulk Rate”on Permit and
“EB”, or “EH, or “ES”on lower left comer “EB”, or “EH”, or “ES”on lower left comer -
Hint: Find c/6sest match
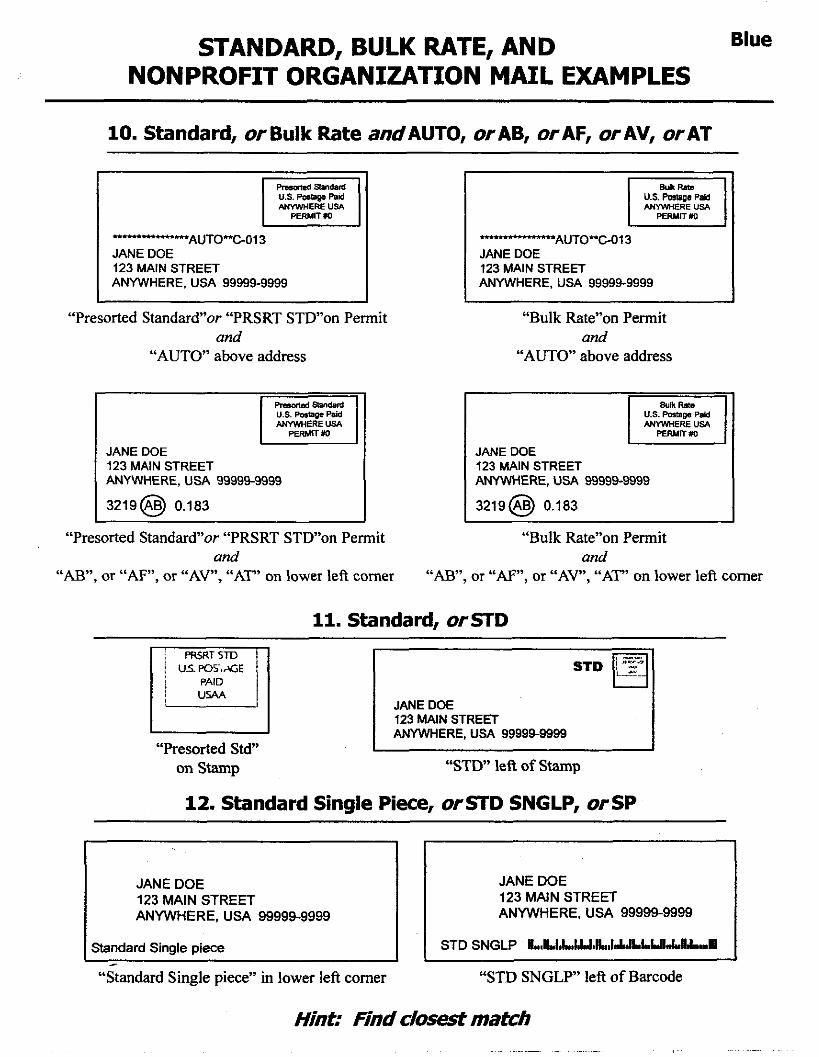
STANDARD, BULK RATE, AND
I JANE DOE 123 MAIN STREET ANYWHERE, USA 99999-9999
STD SNGLP L ~ U ~ L h U t I L ~ I A ~ I L L L A E
Blue
I
NONPROFIT ORGANIZATION MAIL EXAMPLES
10. Standard, orBulk Rate andAUTO, orAB, orAF, orAV, orAT
us. pomes Pad M E R E USA
AUTO-C013 JANE DOE 123 MAIN STREET ANYWHERE. USA 99999-9999
“Presorted Standard”or “PRSRT STDon Permit and
“AUTO above address
123 MAIN STREET JANE DOE 123 MAIN STREET
I ANYWHERE, USA 99999-9999 I I 3219@ 0.183
AUTO-GO13 ...-+nnr+.
JANE DOE 123 MAIN STREET ANYWHERE, USA 99999-9999
“Bulk Rate”on Permit and
“AUTO above address
us. Fmlaps Pam ANYWHERE USA
JANE DOE 123 MAIN STREET ANYWHERE, USA 99999-9999 I 3219@ 0.183
“Presorted StandarPor “PRSRT STDon Permit and
“Bulk Rate”on Permit and
“AB”, or “AF”, or “AV”, “AT” on lower left comer “AB”, or “AF”, or “AV”, “AT” on lower left comer
11. Standard, orSTD
1 I
“Presorted Std” on Stamp
12. Standard Sit-J
JANE DOE 123 MAIN STREET ANYWHERE, USA 99999-9999
I
“STD” left of Stamp
Piece, orSTD SNGLP, orSP
I
JANE DOE 123 MAIN STREET ANYWHERE, USA 99999-9999
Standard Single piece - 1 “Standard Single piece” in lower left comer
Hint: Find c/osW mafch

UNITED STATES POSTAL SERVICEQ
Question Sheets DO NOT RECORD YOUR ANSWERS ON THE QUESTION SHEETS.
These sheets contain the questions you answer about each mail piece. Record your answers on the
corresponding answer sheets in the Household Diary for each day.
There is one color-coded question sheet for each type of mail. The colors refer to five (5) types of traditional mail and electronic communications, which is a sixth type.
1. Purple: Regular First-class or Expedited Mail 2. Blue: Presorted Standard, Bulk Rate, or Non-profit Organization Mail
3. Peach: Unaddressed (no address label at all) Mail
4. Yellow:
5. Green: Packages (received and sent) 6. Pink: Electronic Communications (received and sent)
Magazines, Newspapers, or Other Periodicals
Match up the color-coded question sheet with the corresponding answer sheet in the Household Diary. For
detailed instructions on how to fill out the diary go to page 5 under the "Filling Out Diary" tab in this
instruction booklet and review the photos on the Household Diary Quick Start Sheet.
If you have any questions, call the hotline at:
1-888-643-USPS (8777)
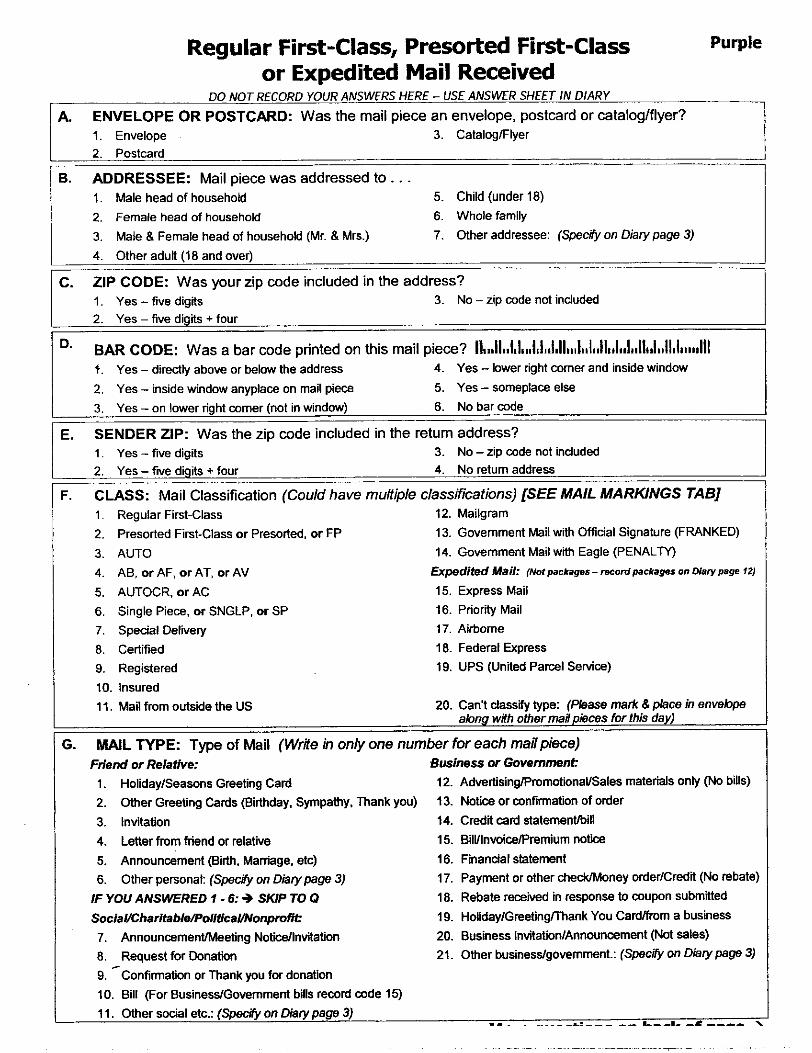
Regular First-class, Presorted First-class Purple
or Expedited Mail Received DO NOT RECORD YOUR ANSWERS HERE - USE ANSWER SHEET IN DIARY
A. ENVELOPE OR POSTCARD: Was the mail piece an envelope, postcard or catalog/flyer? 1. Envelope 3. CataloglFlyer 2. Postcard
ADDRESSEE: Mail piece was addressed to.. . 1. Male head of household 5. Child (under 18) 2. Female head of household 6. Whole family
3. Male & Female head of household (Mr. & Mrs.) 4. Other aduil(18 and over)
ZIP CODE: Was your zip code included in the address?
6.
7. Other addressee: (Specify on Diary page 3)
C. 1. Yes - five digits 3. No -zip code not included 2. Yes - five digits +four
D. BAR CODE: Was a bar code printed on this mail piece? Ii,.II,,I,I,,,~,1,$III1~~II~II111i~11~1i1(1~~/111111iii~i1~( t. Yes - directly above or below the address 2. Yes - inside window anyplace on mail piece 5. Yes - someplace else 3. Yes - on lower right comer (not in window) 6. Nobarcode
SENDER ZIP: Was the zip code included in the return address? 1 Yes - five digits 3. No - zip code not included 2. Yes - fw digits + four 4. No return address
CLASS: Mail Classification (Could have multiple classfications) [SEE MAIL MARKINGS TAB] 1. Regular First-class 12. Mailgram
2. Presorted First-class or Presorted. or FP 3. AUTO 14. Government Mail with Eagle (PENALlY)
4. 5. AUTOCR. or AC 15. Express Mail 6. Single Piece. or SNGLP. or SP 16. Priority Mail 7. Special Delivery 17. Airborne 8. Certified 18. Federal Express 9. Registered 19. UPS (United Parcel Service)
I O . Insured 11. Mail from outside the US
MAIL TYPE: Type of Mail (Write in only one number for each mail piece)
4. Yes - lower right comer and inside window
E.
F.
13. Government Mail with Official Signature (FRANKED)
AB, or AF. or AT, or AV Expedited Mail: (Notpackager- m o r d p c k a g e s on Diawpage fZl
20. Can't classify type: (Please mark 8 place in envebpe abng with othermadpieces for this day)
G. Fr!end or Relative:
1. Holiday/Seasons Greeting Card 2. Other Greeting Cards (Bilthday. Sympathy, Thank you) 3. Invitation 4. Letter from friend or relative 5. Announcement (Bilul. Marriage, etc) 6. Other personal: (Spew on Diary page 3)
IF YOU ANSWERED 1 - 6: + SKIP TO 0 SociaUCharitabl~oll~cavNonpm~ 7. AnnouncementlMeeting Noticellnvitation 8. Request for Donatiin 9. -Confirmation or Thank you for donation 10. Bill (For BusinesslGovemment bills record code 15)
Business or Government 12. Advertising/Promot~naUSales materials only (No bills) 13. Notice or confirmation of order 14. Credl card statementbill 15. BilUlnwicePremium notice 16. Finanaal statement 17. Payment or other cheddMoney order/Credt (No rebate) 18. Rebate reeked in response to coupon submitted 19. HdidaylGreetinglThank You CardMom a business 20. Business InvitationIAnnouncement (Not sales) 21. Other businessfgovemment.: (Specify on Diary page 3)
-- ~ . -- L --I- -e ---- . 1 1. Other social etc.: (Spec@ on Diary page 3)

4. SENDER TYPE: What type of industry did the mail piece come from? (Ifnot from FriendJRelatMe) Financial Services: 1. 2.
Credit Card (Visa, American Express, etc.) Bank. Savings B Loan, Credit Union. Loan Co., etc.
14. TelephoneLong distance company 15. ElectriclGasMlaterNtilii company
3. Securities brokerlCompany (Stockbroker) 16. Medical (doctor, dentist, hospital, not insurance a).)
4.
5. Insurance company 6. Real estatemortgage 7.
8. DepartmenVdiscount store 9. Mail order company 10. Other store (jewelry. shoes, clothes, hardware, etc.)
Money market (not with broker or bank)
Other financial: (Specify on Diary page 3) Merchants:
17. Other professional (lawyer, accountant. engineer, etc.) 18. Leisurelentertainment service (travel agent, hotel, etc.) 19. Cable TV related 20. Computer related 21. Other selvices: (Spec@ on Diarypage 3)
22. All manufacturers Manufacturers:
Government: 11. Publisher (newspapers, books, magazines) 12. Land promotion company 13. Other merchants: (Spec@ on Diarypage 3)
RETURN ENV.: Was a return envelope or card included? 1. Yes - pre-stamped or postage paid
23. Federal (soda1 secunty. veterans administration, IRS) 24. State and Local
25. All SociaVCharitablelPoliticaVNonproft organizations SociaUCharitable/PoliticaUNonprofit:
. 3. No return envelope or card included+ SKIP TO K
2. Yes - needs a stamp
RETURN ZIP: Did the address on the retum envelope or card include a zip code? 1. Yes - five digts 3 No - zip code not included 2. Yes - fwe digits +four
ADVERTISING: Was any advertising or promotional material enclosed? 1. Yes 2. No + SKIP TO Q
READING: Was the mail piece . . . (Write in one number only) 1. Read by a member of the household 4. Discarded without being read 2. Read by more than one member of the household 3. Looked at but not read by any member of household
REACTION: Would this mail piece be described as. . . 1. Useful information we like to receive 3. Neither interesting, enjoyable, nor useful 2. Interesting or enjoyable, but not useful 4. Objectbnable
HOW ORDER: How could the item(s) or sewice(s) be ordered? (Write in all that apply) 1. Mail 4. Fax 2. Phone 5. Internet
1.
C
-.
5. Set aside for reading later
M.
N.
3. In-person
RESPONSE: Is anyone in your household considering responding to the advertisement? 1. Yes 3. Maybe
0.
2. No + SKIP TO Q
HOW RESPOND: How would the response most likely be made? 1. Mail 4. Fax 2. Phone 5. Internet 3. In-person 6. Other: (Spec& on Diawpaw 3)
ARRIVAL TIME: The mail piece . . .
P.
Q. 1. Arrived on day needed + GO TO NEXT MAIL PIECE 3. Not expected to anive + GO TO NEXT W L PIECE
2. Arrived earlier than needed + GO TO NEXT MAIL PIECE 4. Arrived late
-NED LATE: If the mail piece arrived late, was it . . . R. 1. Mailed late 3. Don't know when mailed 2. Not mailed late

Mail Sent Purple
(If Uackage: Record on Diary page 72)
DO NOT RECORD YOUR ANSWERS HERE - USE ANSWER SHEET IN DIARY
A. ENVELOPE OR POSTCARD: Was the mail piece an envelope or a postcard? 1. Envebpe 2. Postcard
B. CLASS: Mail Classification 1. Regular First-class 2. Mail to outside the US 8. Express Mail 3. Special Delivery 9. Priority Mail 4. Certifid - receipt requested 10. Airborne 5. Certified - receipt not requested 11. Federal Express 6. Registered 12. UPS (United Parcel Service)
7. Mailgram
Expedited Mail: (No1 packages - record packagar on Dlary page 12)
13. Other dassifmtion: (Specify on Diarypage 5)
C. W L TYPE: Type of Mail (Write in only one number for each mailpiece)
1. HolidaylSeasons Greeting Card 11. Donation
2. Other Greeting Cards (Birthday, Sympathy, Thank you) 12. Inquiry 3. Invitation 13. Letter
4. Letter to friend or relative 5. Announcement (Birth, Marriage, etc) 6. Other personal: (Specify on Diary page 5)
IF YOU ANSWERED 1 - 6: + SKIP TO J
Business or Government:
Frlend or Relative: Socia WCharitablePolldicaiNonpmf~
14. Other social etc.: (Specify on Diarypage 5)
7. Order 8. Inquiry 9. Payment 10. Other business.lgovmnt.: (Specify on Diary page 5)
ADDRESSEE TYPE: What type of industry did you send the mail piece to? (If not to friendrelative) Financial: Services: 1. Credit Card Vsa , American Express, etc.) 14. TelephoneLong distance company 2. Bank, Savings 8 Loan, Credd Union. Loan M., etc. 15. ElecbWGasWater/Utilii company 3. Securifies broker/Mmpany (Stockbroker) 16. Medical (doctor. dentst. hospital, not insurance m.) 4. Money market (not with broker or bank) 17. Other professional (lawyer. accountant. engineer, etc.) 5. Insurance company 18. Leisure/entetiainmnt service (travel agent, hotel, etc.) 6. Real estatehbrtgage 19. Cable TV related 7. Other financial: (Specifyon Diarypage 5) 20. Computer related
8. Departmenffdiscount store Manufacturers: 9. Mail order wmpany 22. All manufaduren 10. Other store (jewelry. shoes, dothes, hardware, etc.) 11. Publisher (newspapers, books, magazines) 12. Land promotion company 13rOther merchants: (Spec@ on Diarypage 5)
D.
Merchants: 21. Other services: (SpecxV on Diary p a p 5)
Government 23. Federal (social security, veterans administration, IRS) 24. State and Local
S o c l a l / C h a r l t a b l ~ o l l ~ c a ~ o n p ~ ~ 25. All SodaUCharitablalPoliticaVNonprofit organizations
More questions on back of page + .. . ~~~~~~ . . ~ ~ ~ . . .~ .~ ~ ~.

E. AD RESPONSE: Was the mail piece sent in response to advertising or solicitation for funds? 1. Yes I
2. No + SKIP TO G
F. AD MATERIAL: Was the advertising/promotional/solicitation material . . . 1. Received in mail (not in magazine) 5. Heard on radio 2. Seen in magazine 6. Received over telephone 3. Seen in newspaper 7. Other adverlising: (Specify on Diarypage 5) 4. Seen on Television
G. RETURN ENV.: Did you use your own envelope or card? 1. Yes + SKlP TO J 2. No - a mailing envelope or card was provided
BAR CODE: Was a bar code printed on the envelope or card? n,,,il,,r,I,,,I,l,,l,rl,,,l,,l,.H,,l,,l,,11,,1,,11,1,,,,,1111 1. Yes 2. No
".
. 1. POSTAGE TYPE: What type of postage was on the envelope or card?
1. Business reply mail + SKIP TO K 2. Regular postage stamp + SKIP TO K 5. No postage at all 3. Meter stamp + SKlP TO K
4. Other: (Spec@ on Diarypage 5) + SKIP TO K
J. POSTAGE f: How much postage did you pay? 1. 20 cents 3. More than 33 cents 2. 33cents 4. Other: (Specty on Diary page 5)
ZIP CODE: Was the zip code included in the address? 1. Yes - five digits 3. No -zip code not induded 2. Yes - f i digits + four
K.
I L. PO BOX: Was the mail piece sent to a PO Box? 1. Yes
- UP: Was your zip code included in the return address?
1. Yes - f i digits 3. No -zip d e not induded
4. No return address induded -

Blue Presorted Standard, Bulk Rate or Nonprofit Organization Mail Received
( I f Package: Record on Diary page 12) ,
DO NOT RECORD YOUR ANSWERS HERE - USE ANSWER SHEET IN DIARY
A ADDRESSEE: Mail piece was addressed to. . . 1. Spedfic member(s) of the household 2. 'Occupant', 'residenr, 'postal patron". with or without street address
B. ZIP CODE: Was your zip code included in the address? 1. Yes - fnre digits 3. No -zip code not induded 2. Yes - fve digits + four
'' BAR CODE: Was a bar code printed on this mail piece? l l ~ ~ ~ i l ~ ~ l ~ l ~ ~ ~ i ~ l ~ ~ l ~ l l ~ . ~ l ~ ~ i ~ ~ H ~ : l ~ ~ l ~ ~ l l ~ ~ ~ : l l ~ ~ ~ ~ l ~ ~ i l i 1. Yes - directiy above or below the address 2. Yes - inside window anyplace on mail piece 5. Yes - someplace else 3. Yes - on lower right corner (not in window) 6. No barmde
SENDER ZIP: Was the zip code included in the return address? 1 . Yes - five digits 3. No - zip code not induded 2. Yes - fwe digits + four 4. No relurn address
4. Yes - lower right mrner and inside window
D.
E. CLASS: Mail Classification (Mail piece could have rnuftiple classifications)
To help classlfy your mail Look at markings in top right 6. Bulk Rate, or BLK RT. or RB. or RA dght-hand corner. aboveorbelow the a d d a s and inside 7 , presorted Standard, or Bulk Rate and AUTOCR, or EA a window of an envelope.
Presorted Standard, or Bulk Rate:
8. Presorted Standard. or Bulk Rate and Carrier Route Presort, or CAR-RT SORT
9. Presorted Standard, or Bulk Rate and ECRLOT. or ECRWSH, or ECRWSS, or EB. or EH, or ES
10. Presorted Standard, or Bulk Rate and AUTO, or AB, or AF. or AV. or AT
11. Presorted Standard, or STD 12. Standard Single Piece, or STD SNGLP, or SP 13. Can't classiry type: (please mark &place in envebpe
abng with other maapieces for this day)
Nonprofit Organization:
1. Nonprofh or FD. or BA
2. Nonprofit and AUTOCR. or CP or ECRLOT 3. Nonprofd and Camer Route Presort. or CAR-RT SORT 4. Nonprofd and ECRWSH, or ECRWSS. or ST, or WS
5. Nonprofit and AUTO. or BB. or TB, or ZB. or ZN. or ZP ~~~~ ~
F. MAIL TYPE: Was mail piece . . . (Write in only one number for each mar7 piece) 1. In M e r sue envelope 6. Postcard 2. In envelope larger than letter sue (not catabg) 7. Addressed FlyerslCirculardFolded piece (no envebp) 3. Catalog m envelope E. NewspaperslMagazineslNewsletters 4. Catalog not in envelope 5. Detachedlabelpostcard 9. Can't dassiry type: (please mark 8 place m envebpe
COUPONS: Did the mail piece contain coupons? 1. Yes
IF PACKAGE: RECORD ON DIARY PAGE 12
abng d h other mafpisces for this day)
G.
H. MULTIPLE Did the mail piece contain . . . 1. -Material from one organization onk 2. Material from several organizations + SKIP TO K
More questions on back of page +
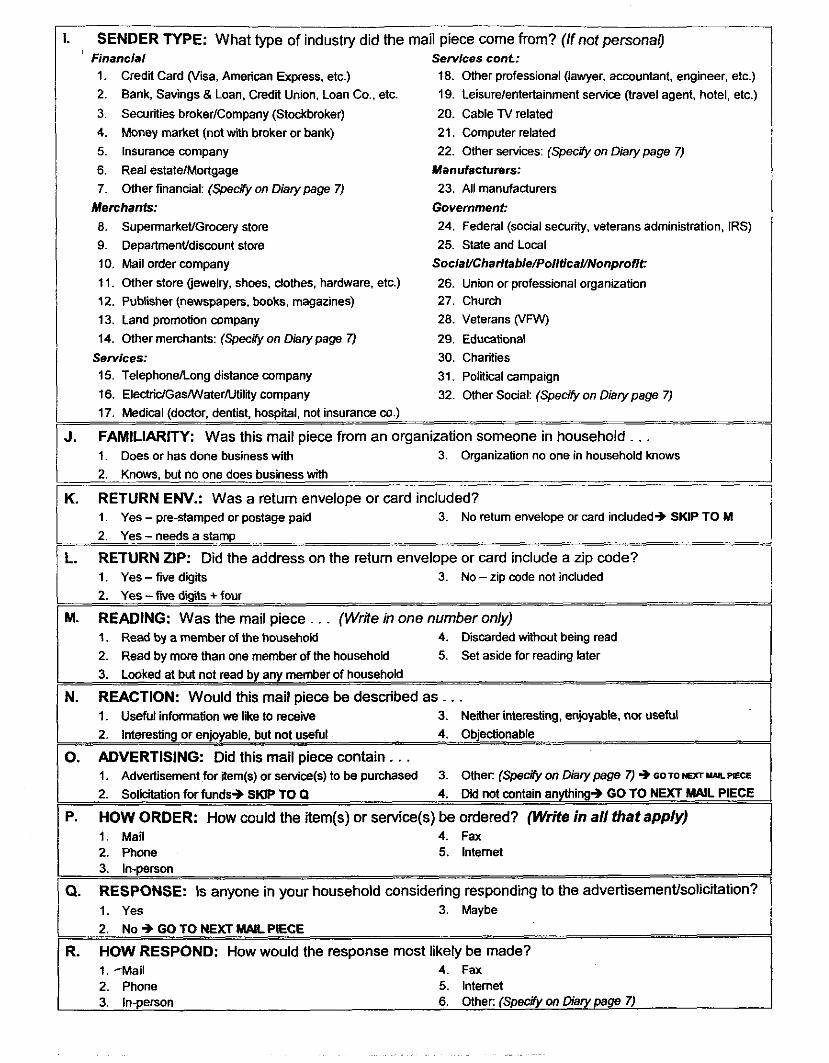
. SENDER TYPE: What type of industry did the mail piece come from? (lf not personal) ' Financial
1. Credit Card (Visa, American Express. etc.) 2. Bank, Savings & Loan. Credit Union. Loan Co.. etc. 3. Securities brokerKompany (Stockbroker) 4. Money market (not with broker or bank) 5. Insurance company 6. Real estateMortgage 7. Other financial: (Spec@ on Diary page 7)
8. SupermarkeffGrocery store 9. Depaltmenffdiscount store 10. Mail order company 11. Other store (jewelry, shoes, clothes. hardware, etc.) 12. Publisher (newspapers, books, magazines) 13. Land promotion company 14. Other merchants: (Specffyon Diarypage 7)
15. TelephoneLong distance company 16. ElecbidGasMlaterNtility company
Merchants:
Services:
17. Medical (doctor, dentist, hospital, not insurance u).)
FAMILIARITY: Was this mail piece from an organization someone in household . . . 1. Does or has done business with 3. Organization no one in household knows 2. Knows, but no one does business with
RETURN EN. : Was a return envelope or card included?
J.
K. 1. Yes - pre-stamped or postage paid 3. No return envelope or card included+ SKIP TO M
Services cont: 18. Other professional (lawyer. accountant. engineer, etc.) 19. Leisurelentertainment service (travel agent, hotel, etc.) 20. Cable TV related 21. Computer related 22. Other services: (Specify on Diary page 7)
23. All manufacturers
24. Federal (social security, veterans administration, IRS) 25. State and Local
SociaVCharitabie/Poliffcai/Nonprofit:
26. Union or professional organization 27. Church 28. Veterans (VFW)
29. Educational 30. Charities 31. Political campaign 32. Other Social: (Specify on Diary page 7)
Manufacturers:
Government:
2
RETURN ZIP: Did the address on the return envelope or card include a zip code? 1. Yes - tive digits 3. No - zip code not included 2. Yes - fwe d i s +four
READING: Was the mail piece . . . (Write in one number only) 1. Read by a member of the household 4. Discarded without being read 2. Read by more than one member of the household 3. Lwked at but not read by any member of household
REACTION: Would this mail piece be described as . . . 1. Useful information we like to receive 3. Neither interesting, enjoyable, nor useful 2. Interesting or enjoyable, but not useful 4. Objectionable
Yes - needs a stamp
L.
M.
5. Set aside for reading later
N.
0. ADVERTISING: Did this mail piece contain , . . 1. Adveltisement for item(s) or service(s) to be purchased 2. Solicitation for funds+ SKIP TO Q
3. Other (Sped)' on Diarypage 7) 9 GOTO LmyIhPecE
4. Did not contain anything9 GO TO NEXT hWL PIECE
P. HOW ORDER: How could the item@) or service(s) be ordered? (Write in a// that apply) 1. Mail 4. Fax 2. Phone 5. Internet 3. In-person
RESPONSE: Is anyone in your household considering responding to the advertisementlsolicition? 1. Yes 3. Maybe 2. No + GO TO NEXT MNL PIECE
HOW RESPOND: How would the response most likely be made? 1. -Mail 4. Fax 2. Phone 5. Internet 3. In-perron 6. Other (Spec& on Diarypage 7)
Q.
R.

Unaddressed Material Received Peach
DO NOT RECORD YOUR ANSWERS HERE -USE ANSWER SHEET IN DIARY
A. COUPONS: Did the mail piece contain coupons? 1. Yes
B. SAMPLES: Did the mail piece contain a product sample? 1. Yes
~ ~~
2. SENDER TYPE: What type of industry did the mail piece come from? ..
Financlal 1. Credii Card (%a. American Express, etc.) 2. Bank. Savings & Loan, Credit Union, Loan Co., etc. 3. Securities bmker/Company (Stockbroker) 4. Money market (not with broker OT bank) 5. Insurance company 6. Real estatehlortgage 7. Other financial: (Spec& on Diary page 9)
8. SupermarketlGrocery store 9. Departmentldiswunt store 10. Mail order company 11. Other store (jewelry. shoes, hardware. etc.) 12. Publisher (newspapers, books, magazines) 13. Land promotion company 14. Other merchants: (Specify on Diary page 9)
15. TelephoneAong distance company 16. ElectridGaslWaterNtilii company 17. Medical (doctor, dentist, hospital. not insurance m.)
Merchants:
Services:
Services cont: 18. Other professional (lawyer, accountant, engineer, etc.) 19. Leisurelentertainment service (travel agent. hotel, etc.) 20. Cable TV related 21. Computer related 22. Other services: (Spec@ on Dia~ypage 9)
Manufacturers: 23. All manufacturers
Government 24. Federal (soda1 security. veterans administration, IRS) 25. State and Local
SociaVCharltable/Political/Nonpmfit
26. Union or professional organization 27. Church 28. Veterans 29. Educational 30. Charities 31. Political campaign 32. Other Social: (Speciry on Diary page 9)
D. FAMILIARITY Was this mail piece from an organization someone in household . . . 1. Does or has done business wiM 3. Organization no one in household knows 2. Knows, but no one does business with
READING: Was the mail piece . . . (Write in one number only) 1. Read by a household member 4. Discarded without being read 2. Read by more than one household member 5. Set aside for reading later 3. Looked at but not read by any househdd member
REACTION: Would this mail piece be described as. . . 1. Useful information we like to receive 3. Neaher interesting, enjoyable. nor useful 2. Interesting or enjoyable, but not useful 4. Objectionable
E.
F.
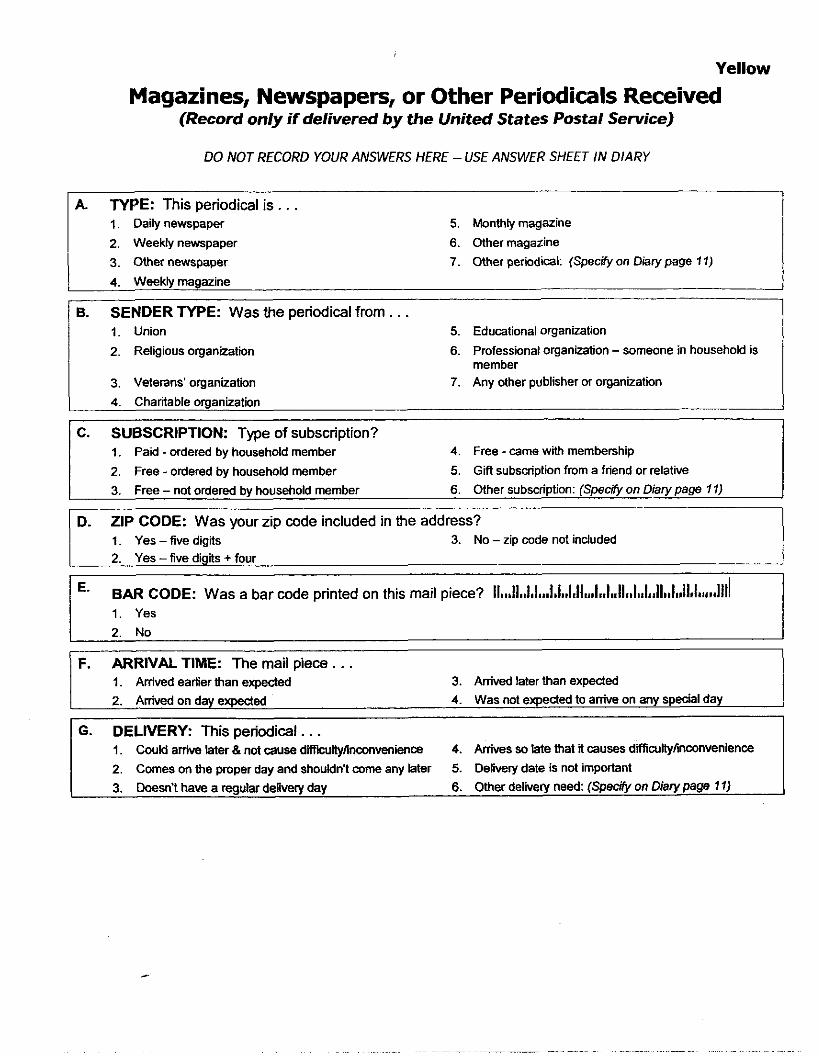
Yellow
Magazines, Newspapers, or Other Periodicals Received (Record only if delivered by the United States Postal Service)
DO NOT RECORD YOUR ANSWERS HERE -USE ANSWER SHEET IN DIARY
A. TYPE: This periodical is. . . 1. Daily newspaper 5. Monthly magazine 2. Weekly newspaper 6. Other magazine 3. Other newspaper 7. Other periodical: (Specify on Diarypage 11)
4. Weekly magazine
1 6. SENDER TYPE: Was the periodical from . . . 1. Union 5. Educational organization I 2. Religious organization
3. Veterans' organization
6. Professional organization - someone in household is member
7. Any other publisher or organization 4. Charitable organization
~~ ~ ~ ~~
C. SUBSCRIPTION: Type of subscription? 1. Paid - ordered by household member 4. Free -came with membenhip 2. Free -ordered by household member 5. Gift subscliption from a friend or relative 3. Free - not ordered by household member
ZIP CODE: Was your zip code included in the address? 1. Yes - five digits 3. No - zip code not included 2. Yes -five digits + four
BAR CODE: Was a bar code printed on this mail piece? ...............................................................
1. Yes 2. No
6. Other subscription: (Specify on Diary page I f )
D.
E.
F. ARRIVAL TIME: The mail piece . . . 1. Arrived earlier than expected 3. Arrived later than expeded 2. Ar~ived on day expected 4. Was not expected to arrive on any special day
G. DELIVERY: This periodical.. . 1. Could arrive later 8 not cause dfiityhnconvenience 2. Comes on the proper day and shouldn't come any later 3. Doesn't have a regular d e r i i y day
4. Arrives so late that it causes dfficuityiinWnvenienG? 5. Delivery date is not important 6. Other delivery need: (Specify on Diary page I f )

Package or Product Sample Received Green
DO NOT RECORD YOUR ANSWERS HERE -USE ANSWER SHEET IN DIARY
A. FROM: Was the package from . . . 1. Friend or relative 4. Business - for other reasons 2. Business - ordered by household member 5. Unsolicited sample 3. Business - ordered by friend or relative
B. ADDRESS: Was the address on the package . . . 1. Correct 2. Incorrect
ZIP CODE: Did the address include a zip code? 1. Yes - fve digits 3. No - zip code not induded 2. Yes - five digits + four
C.
BAR CODE: Was a bar code printed on the package? ~ ~ ~ ~ ~ ~ ~ ~ ~ ~ ~ ~ ~ ~ ~ ~ ~ ~ ~ ~ ~ ~ ~ ~ ~ l l l ~ l ~ ~ ~ ~ ~ ~ ~ ~ l l ~ ~ l ~ ~ l ~ ~ l ~ ~ ~ ~ ~ l l l l ~ ~ ~ ~ 1. Yes 2. No
RETURN ZIP: Did the return address include a zip code?
D.
E. 1. Yes - fwe digits 3. No -zip code not induded 2. Yes - fwe digits +four 4. No return address included
F. DELIVERY Package was delivered/handled by. . . 1. United States Postal Service 0. Emery Air Freight 2. UPS Next Day Air 9. Airborne Overnight 3. UPS Second Day Air 10. Airborne Second Day 4. UPS Third Day Select 11. DHL 5. UPS Ground Service 12. Roadway 6. Federal Express Overnight 7. Federal Express Second Day
13. Other delivery type: (Specfi on Diary page 13) IF YOU ANSWERED 2 - 13:+ SKIP TO I
G. CLASS: Package Classification 1. First-class 2. Priority 3. Express Mail
4. Standard or Bulk Rate 5. Standard or Bulk Rate Enhanced Carrier Route 6. Parcel Post, or Bulk Rate Parcel Post, or Bulk PP 7. DBMC Parcel Post or DBMC PP (to Bulk Mail Center)
8. Nonprofit 9. Nonproft Enhanced Canier Raute 10. Bound Printed Matter, or CATALOG, or CATALOG
11. Special Standard Mail 12. Library Rate or Library Mail 13. Package received from outside the US
RATE
14. Can't classify: (Please mark 8 place in envelope abng with other ma l pieces for this day)
I H. SPECIAL SERVICES: Did your package have any of the following special services? w n s n a # t h a t a ~ a - _ . 1. Special Handling 6. Insured
3. Certified - receipt requested 8. Nospedalservices 4. Certified - receipt not requested 9. Other. (Specify on Diary page 13) 5. -Registered
2. Special Delivery 7. C.O.D.
More questions on back of page +

SENDER TYPE: What type of industry did the package come from? (If not personal) Financial, 1. 2. 3. Securities broker/Company (Stockbroker) 4. 5. Insurance company 6. Real estate/Mooctgage 7.
8. SupermarkeWGmcery store 9. DepartmenWdiscount store 10. Mail order company 11. Other store (jewelry, shoes, dathes, hardware. etc.) 12. Publisher (newspapers. books, magazines) 13. Land promotion company 14. Other merchants: (Specify on Diary page 13)
15. Telephone/Long distance company 16. ElectridGasMlaterRnilii company 17. Medical (doctor. dentist. hosoital. not insurance co.)
Credit Card (visa. American Express. etc.) Bank, Savings B Loan, Credit Union, Loan Co.. etc.
Money market (not with broker or bank)
Other financial: (Spew on Diarypage 13)
Merchants:
Services:
Services cont: 18. Other professional (lawyer, accountant, engineer, etc.) 19. Leisure/enterlainment service (travel agent. hotel, etc.) 20. Cable TV related 21. Computer related 22. Other services: (Specify on Diary page 13)
23. All manufacturers
24. Federal (social security, veterans administration, IRS) 25. State and Local
Social/Charitabie/PoiiticaUNonprofit:
26. Union or professional organization 27. Church 28. Veterans
29. Educational 30. Chalities 31. PoMical campaign 32. Other Social: (Specify on Diary page 13)
Manufacturers:
Government
.I. CONTENTS: Did this package contain . . . wi*e in allhat aww) 1. Book@) 7. Unsolicited samples or advertising 2. Cassette or video tape(s), or compact disc($ 8. lnwice 3. Gf l or other item from friend or relative 9. Catalog 4. Item ordered from catalog 10. Telephone book
5. Item ordered from store 6.
11. Other contents: (Specfy on Diary page 13)
Other type of mail order merchandise
K. PKG CONDITION: Did the package. . . 1. Look all right before opening 2. Look damaged before opening
L. CONDITION The contents were . . . 1. Notdamaged 2. Damaged (Please describe on Diarypage 13)

Package Sent Green
2. Yes - fwe digits + four ~
C. RETURN ZIP: Was your zip code included in the return address? 1. Yes - five digas 3. No -zip code not included 2. Yes - fwe digits + four 4. No return address included
DELIVERY: Package was deliveredlhandled by. . . 1. United States Postal Service 8. Emery Air Freight
D.
DO NOT RECORD YOUR ANSWERS HERE -USE ANSWER SHEET IN DIARY
E. CLASS: Package Classification (Write in all that apply) 1. First-class (up to llozs.) 5. Special Standard Mail 2. Standard (over 1102s.) 6. ParcelPost 3. Priority 7. Mail sent outside the US 4. Express Mail 8. None of these: (Spew on Diarypage 13)
F. SPECIAL SVCS: Did your package have any of the following special services? (wraen allhafapplyl
1. Special Handling 6. Insured 2. Special Delivery 7. C.O.D. 3. Certified - receipt requested 8. No special services 4. Certified - receipt not requested 9. Other: (Spec@ on Diary page 13) 5. Registered
DISTANCE: How far away did you send your package? inside the Unlted States: 5. 301 to 600 miles 1. Local 6. 601 to 1,OOO miles
out of town: 7. 1,001 to 1,400 miles 2. 50 miles or less 8. 1,401 to 1.800rnib 3. 51 to 150 miles 9. More than 1,800 miles
G.
4. 151 to 300 miles 10. Out ofthe United States
CONTENTS: Did this package contain . . . (Write in a// that apply) 1. Book@) 5. Toys 2. Cassette or video tape@), or compact disc@) 6. Household items 3. Clothing 7. Other contents: (Spcify on Diary page 13) 4. Food
H.
~~~
1. REASON: Why did you send this package. . . 1. -Gift or other item sent to friend or relative 2. Returning merchandise ordered 4. m e r reason: (Spedyon Diarypage 13)
3. Returning unsolicited merchandise

Pink Electronic Communication Received and Sent
DO NOT RECORD YOUR ANSWERS HERE -USE ANSWER SHEET IN DIARY
A DIRECTION: Electronic communications was ... 1. Sent (outbound) 2. Received (inbound)
WHO: Age of person in your household who either sent or received this communication? 1. Lessthan 18 6. 4554 2. 18-21 7. 55-64 3. 22-24 8. 6569 4. 25-34 9. Over70 5. 3544
TYPE: What type of electronic communication was it? (Write in only one number for each) Frlend or Relative: Business or Government cont: 1. E-mail 8. BilU Invoice/ Premium notice 2. Greeting Card (Birthday, Sympathy, Thank you) 9. Financial statement 3. HolidayISeasons Greeting Card 10. Other: (specdVon Diarypage 15) 4. Other: (SpcFyonDia~~paga 15) SociaWCharftable/Politfcal/Nonpm~: IF YOU ANSWERED 14: 3 GOTO IEXTELECTROMCOWJNCATION
B.
C.
11. AnnouncementlMeeting Notiidlnvitation 12. Request for Donatimn 13. Confirmation or Thank you for donation 14. All Other Soc~VCharitaMelPoliticavNonpmf~ orgs
Buslness or Government: 5. AdvetiiinglPmmotionaUSales materials only (No bills) 6. Notice or confirmation of order 7. Credl c a ~ I statementmill
TOIFROM: What type of industry was the communication to/from? (Ifnot t d fmn friend or relative) I D. Financial: 1. Credl Card (Visa. American Express, etc.) 2. Bank, Savings 8 Loan, Creda Union, Loan Co., etc. 3. Secuinies brokerlcompany (Stockbroker) 4. Money market (not with broker or bank) 5. Insurance company 6. Real estatelMottgage 7. Other financial: (.Spx#y on Diarypage 15)
8. Department or discount store 9. Gmcerystore
Menhanb:
Services: 14. TelephoneILong distance company 15. ElectriclGasMlater/Utility company 16. Medical (doctor. dentist, hospital, not insurance a).) 17. Other professional (lawyer. accountant. engineer, etc.) 18. Leisurelentettainment servb (lravel agent, hotel, etc.) 19. Cable TV related 20. Computer or Internet-related 21. Otherservices: (SpecdlyonDiarypaga 15)
22. All manufadurers Manufacturers:
10. Specialty store (clothes. Rowers, art, computer, etc.) 11. Publisher (newspapers, books, magazines) 12. Realtor1 Land promotion company 13. Other metchants SociaKChar i tabf~o l iUca~anpm~
Government: 23. Federal (social security, veterans administration, IRS) 24. State and Local
25. Educational 26. All Other SociaVCharitable/PoliticaVNonprofit orgs.
E. WHY: Was the communication a response to advertising? 1. No 3 GO TO NEXT QUESTION 4. Radio advertising
Yes + Which kind? 5. Direct mail advertising 2 Internet advertising 6. Email advertising 3. Television advertising 7. Other advertising: ( S p e w on Diary page 15)
*
More questions on back of page +

PURCHASE: Did or will this result in a purchase of merchandise? 1. Yes
i 1' 2. No+ GO TO NEXT ELECTRONIC COMMUNICATION ~~ ~~
G. DELIVERY Was or will the merchandise be delivered by. . . 1. United States Postal Service 2. UPS Next Day Air
3. UPS Second Day Air 4. UPS Third Day Select 5. UPS Ground Service
9. Airborne Overnight 10. Airborne Semnd Day
11. DHL 12. Roadway 13. E-mail
6. Federal Express Overnight 14. Download from the internet 7. Federal Express Second Day 8. Emery Air Freight
15. Other delivery type: (Specrfy on Diaw page 15)
c

pendix B2: Diary Package
Diu9

UNITED STATES POSTAL SERVlCEm
HOUSEHOLD DIARY Use with Question Sheets
found in Household Diary Instruction Booklet
M O N D A Y
This Diary is for:

No Mail/Packages Sent or Received Today: - 0 g;y Mail Received Monday: Total # Record the total received above and then record under each of the 6 groups.
1.
2.
3.
4.
5.
6.
Regular First-Clas, Presorted firs-Class or Ekpedited:
Envelopes: - Total # received
Postcards: - Total # received
Catalcg/Flyer: - Total # received
Errors:
USE DIARY PAGE 2 (PURPLE) I- - #Wrong address, right person
# Right address, wrong person DO NOT -!- RECORD IN #Wrong address, wrong person J
Presorted Standad, Bulk Rate, or NonpmtTt Otganization:
~ Total # received -.) USE DIARYPAGE 6 (BLUE)
U n a d d d Material:
- Total# received 4 USE DIARYPAGE 8 (PEACH)
Magazinw Newspapem, or Other Petioditals:
Total # received -+ USE DIARY PAGE 10 (YELLOW)
Packages or Pmduct Samples: - Total # received 4 USE DIARY PAGE 12 (GREEN)
Electronic Communiwtions: (non wor&-n?late@!
E-mail: Total # + USE DIARY PAGE 14 (PINK)
On-line shopping: - Total # - USE DIARY PAGE 14 (PINK)
Other: - Total # + USE DIARY PAGE 14 (PINK)
Mail Sent Monday: Total # Envelopes: - TOM # Sent 4 USE DIARY PAGE 4 (PURPLE)
POStCardS: __ Total# Sent USE DIARY PAGE 4 (PURPLE)
Packages: __ Total # Sent - USE DIARY PAGE 12 (GREEN)
Page 1

Regular First-class, Presorted First-class or Expedited Received
Monday Purple Page 2
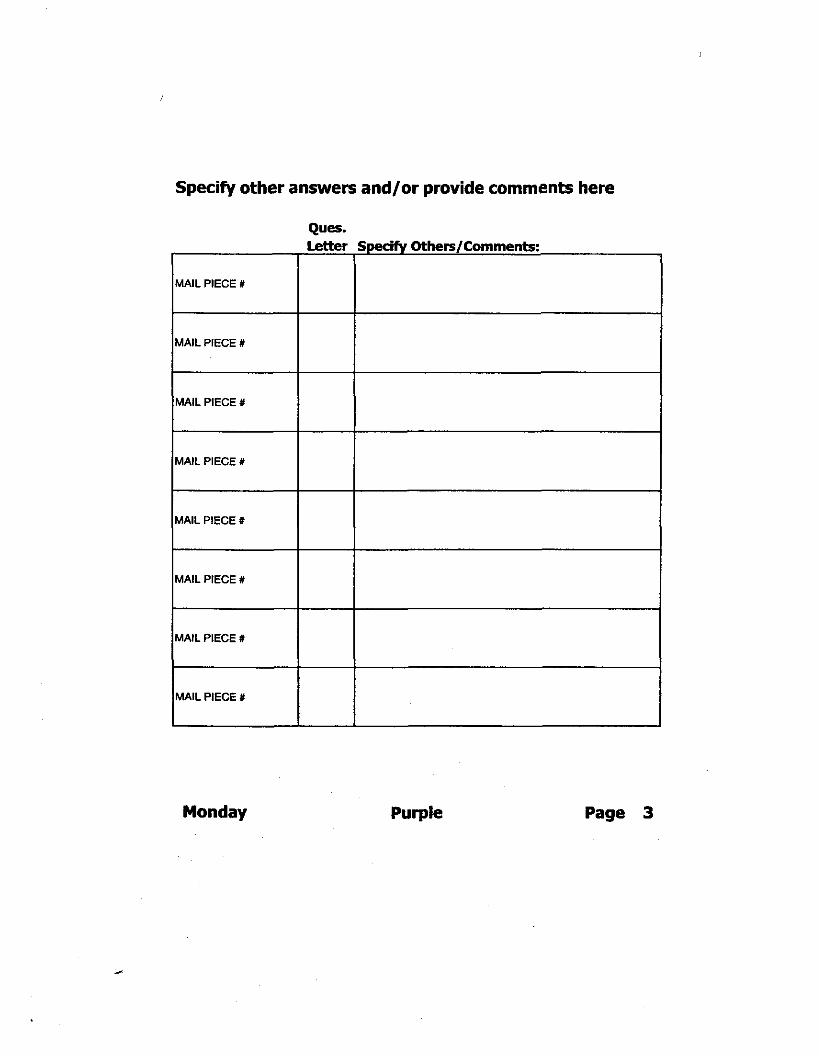
Specify other answers and/or provide comments here
Ques.
MAIL PIECE X
MAIL PIECE X
MAIL PIECE X
MAIL PIECE Y
MAIL PIECE X
MAIL PIECE X
MAIL PIECE X
MAIL PIECE X
Monday Purple Page 3

First-Class or Expedited Mail Sent
Monday Purple Page 4
!

Specify other answers and/or provide comments here
J
MAIL PIECE #
Monday Purple Page 5
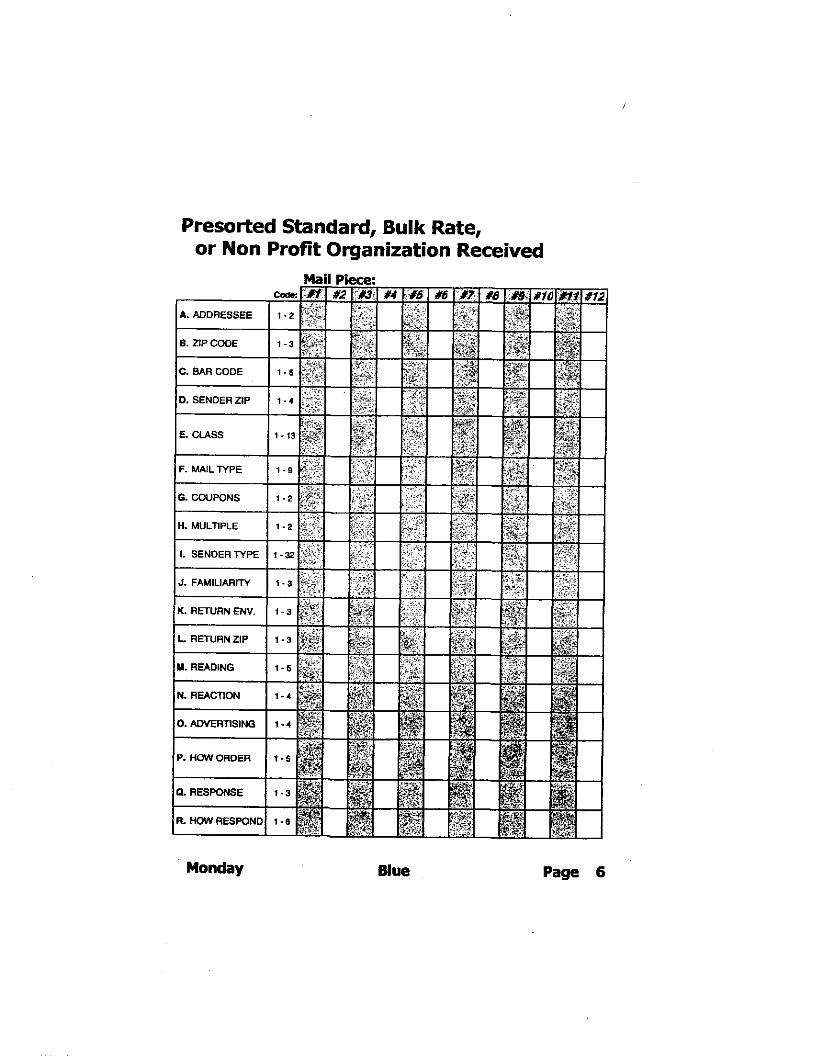
Presorted Standard, Bulk Rate, or Non Profit Organization Received
Monday Blue Page 6

Specify other answers and/or provide comments here
Ques. i ec' Othen/Comments: :
Blue Page 7

Unaddressed Materia I Received
Mail Piece:
Monday Peach Page 8

Specify other answers and/or provide comments here
Qua. +cify Others/Comments:
Monday Peach Page 9

Monday Yellow Page 10
Specify other answers and/or provide comments here
Ques.
MAIL PIECE #
MAIL PIECE #
MAIL PIECE #
MAIL PIECE #
Monday Yellow Page 11

Packages Received
Packaaes Sent
Monday Green Page 12
Specify other answers and/or provide comments here
MAIL PIECE P I- MAIL PIECE #
MAIL PIECE #
MAIL PIECE #
MAIL PIECE #
MAIL PIECE #
MAIL PIECE X
MAIL PIECE P L Monday
Ques. Letter Specify Othen/Commenk:
Green Page 13

Electronic Communications Received and Sent
Mail P e a :
Monday Plnk Page 14

Specify other answers and/or provide comments here
MAIL PIECE I
MAIL PIECE 1)
MAIL PIECE It
MAIL PIECE I
MAIL PIECE X
MAIL PIECE #
MAIL PIECE X
MAIL PIECE X
Monday Pink Page 15

Appendix B2: Diary Package
Other Diwry Mwteriols

Sort Your Mail into the 5 types of mail listed in the instruction booklet.
Mail Markings Mail Markings can be:
m in the top, right-hanc corner,
Complete page 1 of the Household D i a v Record the total amounts of mail you received for each type.
e
Use the mail markings to help you sort your mail. Label and number the mail pieces within the 5 types of mail.
0 %- Ir
-
\ Use Question Sheets in the Instruction booklet to answer questions in the Household Diav.
Place completed Diaries and Mail PiecedMail Markings into corresponding daily envelopes and mail back in the pre-paid Priority Mail envelope.
Don't forget to include your orange gi@ seleciion form!
e
9 3
Reminder Cud
.......................................... A
,
.............................................. Return your completed diaries and mail pieces to us in the pre-paid Priority Mail envelope.
2. Mark your choice on the orange gqt selection form and return with your diaries.
We will mail your gift as soon as we receive your completed diaries!
/2.= -*.I1IIm
b?J~-d---- ---- ~~ ........................................................................................
UNITED SZA7ES POSTAL SERVICE.
c/o N- ~eoearch and conwm~ 801 E. William C a m , Suite 115
Audln,Texas 78745

UNITEDSTATES POSZAL SERVICE.
I n appreciation for your participation, choose one of the following gifts:
0 ChanMBble donation of525 in your name to the Lance Armstrong Cancer Foundation
0 I999 Tour de France commemorative Team USPS T-shirt 8, Cap from the United
R Twenty-five dollan
States Post Office (team sponsor) and outfitter Pearl lzumi
Is your mailing address correct? If not check here and update below: 0
Name
Addntss
Crlv. Stale, Zip
Phone
~ arUg.aoldTWuPr mR*)rlR)lar**Rn. ci3 myltawm
Please mail back with your completed diaries!
.

Instmction Cud
1 I'm finished How do I return my diaries? 0 Place your completed diaries and mail markings I mail
ieces in the pre-paid Priority Mail envelope ncluded in this package.
@ Drop in any public U.S. Post Service mail box or at your local post office.
Questions? Call our hotline at: 1-888-643-USPS (8777) Mon - Fri: llam - 9pm E7 Sat & Sun: 12pm - 6pm CST
/-%- A ,v ofricial Sponsor of Team USPS
) Wlmer of he 1999 Twr de France c JY W Unlted States Postal Senrice

Appendix C: Technical Documentation of Methods

Appendix C1: Sample Plan I

Design urd Methodology The purpose of the study is to obtain comprehensive market data on mail sent and received by households and, specifically, to supply:
A detailed picture of the household mailstream, including mail class and subclass, characterize recipient households and mail senders by sector and industry, identify contents of mail. and describe household attitudes and responses patterns concerning mail received.
A comparison of underlying trends in household mail usage and receipt between 1987 and succeeding years of the study.
Detailed data on households’ use of the Internet for various purchases (e.g. e-commerce, bill paying, emails, and e-cards that wiU impact the household mailstream).
These data are useful to the volume forecasting, planning, marketing, and rate-making functions of USPS.
Sumpling Plun This sampling plan description provides information on how households were selected for the study. A sample is the subset of the population that is used to gain information about the entire population. The population of inference for the HDS comprised all US. households. A stratified three-stage probability sample was used to select a sample that would truly represent all U S . households. The probability design ensures that each household will have an equal chance of selection.
To accomplish this, a master national sample was specified and drawn by in-house sampling statisticians. The probability sample of households was drawn by USPS from the national database of addresses following specifications produced by NuStats. Then a stratitied random selection from the master sample was made .to iden@ the quarterly samples. The master sample design involved a three- stage probability sample with stratification by county (clusters) a t the primary sampling stage and by a county at the secondary stage. At the third stage, household clusters were selected.
Stage 1: Primary Sampling Unit (PSU) Definition and Selection
The Primary Sampling Units (PSUs) were clusters of counties. The 30 largest Metropolitan Statistical Areas (MSAs) were treated as individual units (each was a cluster of counties) and was a self-representing PSU. The other 288 MSAs were sampled proportionately to their population; approximately 20 of the MSAS were individually sampled. The remaining counties of the US. (all BOO+ non- metropolitan counties) were area-clusters sampled in proportion to the population. The probability sample households were drawn using a highly stratitied geographic design to ensure that the 6nal sample would be representative of households comprising five geographic regions: East, Northeast, South, Central, and West. There were a total of 87 PSUs categorized into three strata:
1. Large Metro areas - 30 largest MSAs, 2. Other Metro areas - 21 other MSAs, and 3. Non-Metro areas - 36 non-metropolitan counties
or groups of counties.
Stage 2: Secondary Sampling Unit (SSU) Definition and Selection
The Secondary Sampling Unit was a county. Sampling of SSUs was by probability of selection according to population (number of households). Selection was from the national sample of PSUs and was stratified by geographic region and then by size. This insured that the SSU selection was properly allocated to the geographic regions. Not every SSU was fielded every Postal Quarter (reporting period), but every Postal Quarter had a national probability sample of SSUs.
Stage 3: Tertiary Sampling Unit (TSU) Definition and Selection The final (Tertiary) Sampling Unit (TSU) was a household cluster. Clusters contain approximately 10 households and are delined by estimated income classitication, as defined by zip code average income estimates.
The sample was continuously fielded, throughout all 52 weeks of the year. Allocations were temporally disproportionate in order to ensure greater amounts of data collection during peak mail flow periods.

Appendix C2: Data Collection Method

Data Collection Method
Data Collection Method The study uses a two-stage design in which households are recruited to participate in the d m y study in a household interview (Stage 1) and recruited households complete a 7-day diary of mail received and sent (Stage 2). In the PFY 2000 study, 9,692 households were recruited to participate in the diary study, and 5,314 households actually completed 7-day mail diaries.
Stage 1: Household Interview
The main function of the household interview is to recruit households to participate in the diary study. However, it is also used to collect information on household and person demographics, recall of mail sent and received, adoption and use of communication technologies, and attitudes about mail received.
The household interview consisted of 9,692 completed interviews with an adult member (age 18 or older) in the household. These respondents represented a cross-section of US . households by geography and household income. The household interview contained 157 items and took an average of 22 minutes to administer. The flow of the interview included all of the following elements.
Introduction. As a springboard for detailed questions, each interview began with an introduction, the purpose of the interview, and a battery of questions on how much respondents enjoy doing certain types of communications activities (e.g. emailing, writing cards and letters, reading cards and letters).
Mail volume recall. The respondent was asked to summarize how many personal letters, greeting cards, electronic greeting cards, and packages, all members of the household have received in a particular time period.
Use of postal services. The use of post offices, post office boxes, private mailing services was explored.
Communication with non-US friends and relatives. If members of the households had any friends or relatives living oversees, they were asked about cards, letters, emails, telephone calls, and wire transfers sent.
Technology adoption and use. Questions were asked about ownership and use of personal computers, fax machines, Internet, and other new communications technologies.
BiU payments. Bill payment volumes, methods, and timing were explored in depth.
Periodicals. Summary volumes of magazines and newspapers received by the household were collected.
Advertising. Descriptions of advertising received by the household as well as attitudes about the advertising, and orders placed because of it, were elicited.
Online shopping. Respondents were asked about their online shopping habits.
Financial accounts and credit cards. Respondents were asked to summarize the total accounts and credit cards held.
Household and person demographics. Demographic items included gender, age, marital status, employment status, educational attainment, race/ethnicity, household income, wage earners in household. home ownership, residence tenure, and dwelling type.
Most of the households were recruited by telephone (96 percent) and the diary package was mailed to the household via Priority Mail. This diary package contained instructions, diaries for seven days, a card to identify the choice of incentive and a Priority Mail return envelope. Other households opted for an in- home interview (four percent) or were completed in- home because a telephone number could not be located (13 percent of in-home interviews). For these latter households, an appointment was made at which a surveyor would conduct the household interview, drop off the diary package and go over the instntctions for its completion.
The response rate for the recruitment stage was 47 percent.' Most refusals took place prior to even hearing who N S t a t s was and why the firm was calling. Households that refused and that were later

re-contacted cited time constraints and privacy concerns as their reasons for not participating.
Stage 2: Mail Diary Package
Households were sent diaries along with instructions and a toll-free “help” telephone number. The night before the assigned diary week was to begin, a reminder call was made to each household to confirm receipt of the packet and to answer any last minute questions. If the packet was not received by this time, the address was re-confirmed, a new diary week was assigned, and the packet was re-sent.
The diary package contained a Certificate of Appreciation, Instruction Booklet, and a “Quick Start” sheet that was photo-based. The Instruction Booklet was multi-purpose. It provided information about the study, answers to frequently asked questions, instructions for filling out the diary, guidelines for sorting mail, and examples of mail markings.
The diary instrument was comprised of two parts:
1. Question sheets were contained in the Instruction Booklet. Question sheets were organized by mail classification (e.g. First-class mail received, First-class mail sent, Standard. Bulk Rate, or Nonprofit, etc.). The question sheets were color- coded by mail classification. Information to be collected about each mail classification included: type of mail piece (i.e. envelope, postcard, catalog), receiver zip code, sender zip code, mail classification, mail type, sender type, information about advertising enclosed and receiver reaction or responses to it, and timeliness of the mail piece arrival.
2. Answer booklets were specific to each day (e.g. Monday, Tuesday, Wednesday, etc.). The diary packages contained seven answer booklets. Each booklet was arranged by mail classification and color-coded to correspond to the question sheets.
Households were instructed to enclose pertinent information from each mail piece received in the returned diary packages to enable NuStats editors to verify or clarify quantity and classes of mail recorded in the diaries. A three-stage editing process was used to check the accuracy of the diary information recorded by each household. First, returned diary packets were culled for those that represented a reasonable attempt to complete the diary. Second, the diary information recorded for each day was checked to assure sufficient and logical answers and also to venfy recorded information against mail markings returned in the package by the househglder. Third, a second editor re-checked the
diary information recorded for each day as noted above. This second edit was a quality control check that assured the accuracy of the data. Completed diaries were given a rating of 1 fittle follow-up ,
needed), 2 (follow-up call needed), or 3 (unusable).
During the editing process, correction call-backs were made to households to clarlfy information or to fill-in missing information. About 3% of returned diaries did not pass the edit checking process, while over half required some form of respondent re-contact to clanfy or correct diary information.
Of the 9,692 households recruited to receive a diary package, 5,314 actually returned acceptable2 completed diaries to NuStats for a completion rate of 55 percent.
Methodological Changes for PFY 2000 Prior to PFY 2000, the household interview was conducted via in-home interviews. Household interview recruitment and diary placement were done by “door-to-door” canvassing of surveyors. However in recent years, it had become apparent that the “door-to-door” methodology was subject to response bias due to safety and security concerns among householders. Also prior to PFY 2000, participating households completed the diary mostly on their own with minimal guidance kom the survey team once the householder received the diary. Often a long time- delay resulted between the time the household completed the diary and any re-contacts were made to correct or clanfy diary or household interview information. Thus, respondent recall of the recorded information was subject.
The PFY 2000 study was conducted using a multi- mode approach that sought to provide greater control of household participation to minimize response bias, to improve data accuracy through faster data checking and householder re-contacts, and to provide telephone assistance to householders during their diary week.
Computer-assisted telephone survey techniques replaced the initial door-to-door recruitment of households. Thus, household interview data checks were automated during the interview process, itself, and subsequent to the interview checked and clarified within days of collection.
If a householder agreed to participate, helshe had the option of having a surveyors visit the residence, or being mailed a self-administered diary instrument that explained how to record the mail received and sent in the household. For PFY
ZAeeeptable was defined as returning diaries with data suitable for analysis

2000, only four percent of householders requested that a surveyor visit the residence.
Diary packets were mailed back to NuStats in postage-paid priority mail envelopes. Returned diary packets immediately went through a three- stage edit and review process. The gap between diary completion and data checking was reduced from several weeks to just a few.
A toll-free “hotline” was established to answer participant questions before, during, and after their diary weeks. Questions could be answered immediately and at the “source.”
I
c

Appendix C3: Data Processing

Data Management Data management entails how the information resulting fmm the Household Interview and Mail Diaries were processed, made available for analysis, documented and stored. Household interviews that were conducted via telephone were done using computer-assisted telephone interviewing (CATI) technologies. The questionnaire and relevant data checks were programmed into a master questionnaire that was then distributed to the individual computer terminals used by interviewers to administer the survey. In-home interviewers were completed on a paper questionnaire and these were subsequently entered into the same CATI questionnaire at NuStats. The diary information was entered into a data entry program that was pre-programmed with data checking routines.
After completion of data collection, editing, and entry tasks, the survey data were contained in eight data files. One data file contained the Household Interview data. It was developed as an SAS file. The Mail Diary data is in seven files - one for each mail classification (First-class mail received, First-class mail sent, etc.). These files were developed as SAS files.
The file variables are identified by variable name. For each file variable, the File Information contains:
Label, which is a brief description of the variable,
Measurement level, which specifies the level of measurement as scale (numeric data on an interval or ratio scale), ordinal, or nominal. Nominal and ordinal data can be either string (alphanumeric) or numeric,
Value formats, which identify the response codes, and
Column width and alignment.
Several SAS programming operations were necessary to put the Mail Diary data in the desired form for analysis. The structure for these programs in contained in a separate File Information document that accompanied the data delivery.
Various edit routines were implemented to check the consistency of the reported data and to identify reporting or entry errors. Routine edit checks were conducted to examine questionnaire responses for reasonableness and consistency across items. Routine checks included such items as:
Response code range checks,
Checks for proper data skips and patterns of answering questions consistent with prior answers,
Checks for realistic responses (e.g., number of online purchases possible in one month), and
Checks for high &equency of item non-response (missing data).
When conducting these checks, data were compared against the actual survey forms or respondents were recontacted. Extreme values that were either impossible or unlikely were identified, and inconsistent data were corrected when possible. For example, extremely high numbers of computers owned by a household were examined to determine whether they were legitimate data or probable entry errors. Some extreme or inconsistent data values that could not be corrected were edited to missing values.
In addition, in-depth customized data checks were done to ensure that data within each record of the Household Interview was logically consistent. For example, a respondent reported paying bills by Internet only if he/she also reported having Internet access. Customized checks were also completed to ensure consistency between the Household Interview and Mail Diary data. For example, addressee was identified as a child (under 18) in the diary only if the household also reported having a child in the Household Interview.
Documentation of raw variables, derived variables, and analytical programs were provided in a data documentation binder that accompanied the data delivery. Identifiable information, such as respondent names, addresses, and telephone numbers, were removed to protect respondent confidentiality and privacy. Such information has been stored in a locked archival file.

Appendix C4: Data Weighting and Expansion

Sa m p I e De m og r a p h ic Prof i I e [ulcoum un we&bted
Under $7,000
$7,000 - $9,999
$10.000 - $14,999
$15,000- $19,999
120,000 - $24,999
$25,000 - $34,999
$35,000 - $49,999
$50,000 - $64,999
$65,000 - $79,999
$80,000 - $99.999
TABLE I
Annual Household Income by Recruitment I Retrieval Stabs
79 88 167
87 1 IO 197
191 178 369
224 213 437
304 218 522
546 434 980
782 594 1,376
800 573 1,373
608 414 1,022
413 34 1 754
Three
Four
Five or Mon
TOtOl
I Don't Know I 128 I 124 I 252 I
~~~~
688 64 1 1,329
217 209 426
57 76 133
5.314 4.378 Pd92
I Refused I 667 I 672 I 1,339 I ITotrll I 5.314 I 4.378 I 9,692 I
TABLE II
lumber of Adults in Household by Recruitment I Retrieval Status
I One I 1.261 1.058 I 2319 I I 3,091 I 2.394 ~ I 5.485 ~~ I
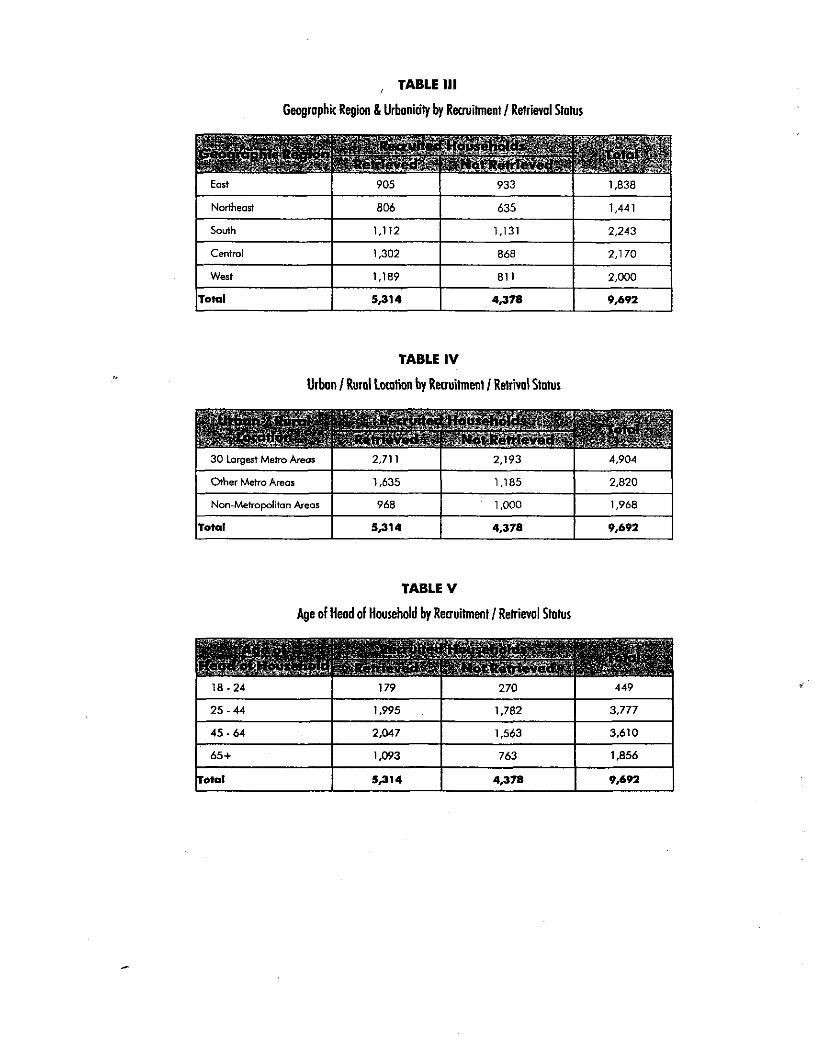
, TABLE 111
Geographic Region 8 Urbaniafy by Recruitment / Retrieval Status
30 Largert Metro Areas
Other Metro Areas
Non-Metropolifon Areas
Total
I 905 I 933
2.71 1 2,193 4,904
1,635 1,185 2,820
968 1,000 1.968
5,314 4.378 9.692
I 806 I 635 1 1.441 1 I South I 1,112 I 1,131 I 2.243 I I Centrol I 1,302 I 868 I 2.170 I I West I 1,189 I 81 1 I 2.0OJ2 I
TABLE IV
Urban / Rurnl Location by Recruitment / Reirival Stotus
TABLE V
Age of Head of Household by Remitment / Retrieval Status
I 18-24 I 179 I 270 I 449 I 1 25-44 I 1,995 I 1.782 I 3.777 I
65+ 1,093 763 1,856
Om1 3,314 4,3m 9.692 I I I

TABLE VI I
Educational Aminment of Head of Household by Recruitment I Rehievol Status
some coll3ge
I 8th grade or less I 67 I 100
~
1,134 888 2,022
I Some high school I 230 I 301 I 531 I
Technical School Gradueie
I High school graduate I 1,447 I 1,421 I 2.868 1
131 I I09 I 240
College groduafe ~
1,542 1,072 2.61 4
Postqroduote work I 763 487 I 1.250

Data Weighting and Expansion Section
Tom1
The PFY 2000 HDS utilizes both weighting and expansion factors ta 1) adjust the sample data to match population parameters and 2) expand mail volumes exhibited in the diary sample to all households in the United States.
This section illustrates the methodology selected in creating sampling and expansion weights for the PFY 2000 Household Diary Study.
9,692 100.0
Weighting Procedures - PFY 2000 Recruitment Sampling weights were produced separately for the households that participated in the recruitment phase of the PFY 2000 HDS, and those that completed and returned a diary. There were two main weighting variables: Geography and Income. PFY 2000 recruitment geographic weights were derived from the following variables:
Strata: Strata consists of three separate categories that define the urbadrural location of each household while region consists of five categories that define geographic location. A household may be classified within strata as residing in the top 30 metropolitan areas nationwide, any other metropolitan area, or a non-metropolitan area3. Table A provides unweighted sample counts from PFY 2000 recruitment data for strata:
TABLE A
HDS 2oM) Rwuitment Data: UrbanRurol Lamtian
I Non-Metrocounties I 1.968 I 20.3 1 100.0 I
sMetmpolitan area is defined within the sample aceording to the official defiuition utilized by the US Census Bureau. eomrnonly rekmd to as Metropolitan Statistical Areas WAS). M e v o p o l i ~ areas are defined as single- 01 multi-county areas. Non-metropolitan -88 are muntiea which do not belong to a metmpolitan area. Each sample county was categorized under stdata aceording to ita metropolitan stat-.
Region: Counties were also grouped according to their geographical location within the United States (See Table B). There are five mutually exclusive regions (along with respective states):
E& District of Columbia, Delaware, Kentucky, Marlland, North Carolina, Ohio, Pennsylvania, South Carolina, Virginio, West Virginia.
Northeask Connecticut, Massachusetts, Maine, New Hampshire, New Jersey, New York, Rhode Island, Vermont.
South: Alobama, Arkansas, Florida, Georgia, Louisiana, Mississippi, Oklahoma, Tennessee, Texos.
Centrol: Colorado, Iowa, Illinois, Indiona, Kansas, Michigan, Minnesoto, Missouri, North Dakota, Nebraska, South Dakoto, Wisconsin, Wyoming.
West: Alaska, Arizona, California, Hawaii, Idaho, Montana, New Mexico, Nevado, Oregon, Utah, Washington.
TABLE B
HDS 2000 Recruitment Data: Geographic Region
1 1,838 1 19.0 I 19.0 I I Eo*
I I I soulh I 2,243 I 23.1 I 57.0 I 2,170
100.0

fttata/Reglon: Strata and Region are combined to according to its location within stratalregion cells, form a concatenated variable 15 ' resulting in 15 mutually exclusive and exhaustive stratakegion cells. Table C indicates the distribution geographic categories (See Table D). of households from the PFY 2000 recruitment sample T~ the weight for each
interval, the population percentage was divided by within Strata and Region.
Population parameters for the intersection of strata the sample percentage. Geography weights appear in and region were based on 1990 census counts of the last column to the right in Table D. households by county. Each county was grouped
Natheost
South
Centml
West
Column Totals
TABLE C
Distribution of Households within Strata and Region
1,081 218 142 1,441
762 951 530 2,243
1,078 483 609 2,170
1,272 518 210 2 m
4,904 2,820 1,968 9.691
TABLE D
HDS 2000 Recruitment Data: Constmaion of Geographic Weight
Eort 7,803,481 8.5% 71 1 7.3% 1.16
30 Northeast 6,727,144 7.3% 1.081 11.2% 0.66
4,434,248 4.8% 762 7.9% 0.61 Metro South
Cenlrol 9,815,598 10.7% 1,078 11.1% 0.96
Lorgert
west 3,278,735 3.6% 1,272 13.1% 0.27
Eort 1282.41 4 1.4% I 650 6.7% I 0.21
Nodheart 6,039.662 6.6% 218 2.2% 2.92 m e r Metro South 10,230,339 11.1% 951 9.8% 1.13 Areor
Central 5,170,892 483 I 5.0% I 1.13
lwert I 9,328,426 I 10.1% I 518 I 5.3% I 1.90 I East 4,777,813 5.2% 477 4.9% 1.06
Northeoa 5574.518 6.1% 142 1.5% 4.14 NO". Metro South 11,367,556 12.4% 530 5.5% 2.26 Areor
Central 3.862.675 609 6.3% I 0.67
lwert I 2,253,909 1 2.5% 1 210' 1 2.2% I 1.13 1 'otals 1 91,947,410 I 100.0% 1 9,692 I 100.0% I 1.00 1

Income Impurorion Procedures , In addition to weighting for differences in geography between the sample and the population, an additional weight was created based on differences in income distribution. Weights were calculated for income based upon the following sequence:
First, income was imputed for those respondents who either did not know their household income or refused to answer the question. This was accomplished using a “hot deck approach to imputation. To achieve this, the sample was stratified according to a number of variables correlated with income.
These include stratafregion, age and educational attainment of the head of household, and the number of wage earners. To be effective, each of these explanatory variables used in s t r a e n g the file must have a valid response. Therefore, non-responses for these variables were imputed. In the case of age. non- responses were coded according to the age distribution for valid responses. Wage earners were imputed based on the ratio between household size and wage earners for valid responses. Educational attainment was imputed based on the distribution of valid responses, maintaining consistency between educational attainment and age.
Once all four variables used in stratifymg the data to prepare for income imputation were populated with valid cases, the sample was stratified according to the following sort order:
2) Educational Attoinmenl of Head of Household,
1) Stroto/Region,
3) Number of Wage Eomen, and
I 4) Age of the Heod of Household. I Non-responses to the income question were then re- coded into a new variable containing original valid cases and imputed non-responses. Imputation was accomplished manually by donating neighbor cases to those coded as don’t know or refused. Cases directly above non-responses were used as donors up to two times (for consecutive non-responses). For those instances in which there were three or more consecutive non-responses, cases directly below these cases were used as the donor case. This process continued until all responses to the income question were recoded as valid responses. The resulting distribution was then evaluated against the original income distribution to determine consistency. Figure A illustrates the resultant changes between the original income distribution and the imputed income distribution.
FIGURE A
Comparison Between Originol and Imputed l n m Distribution
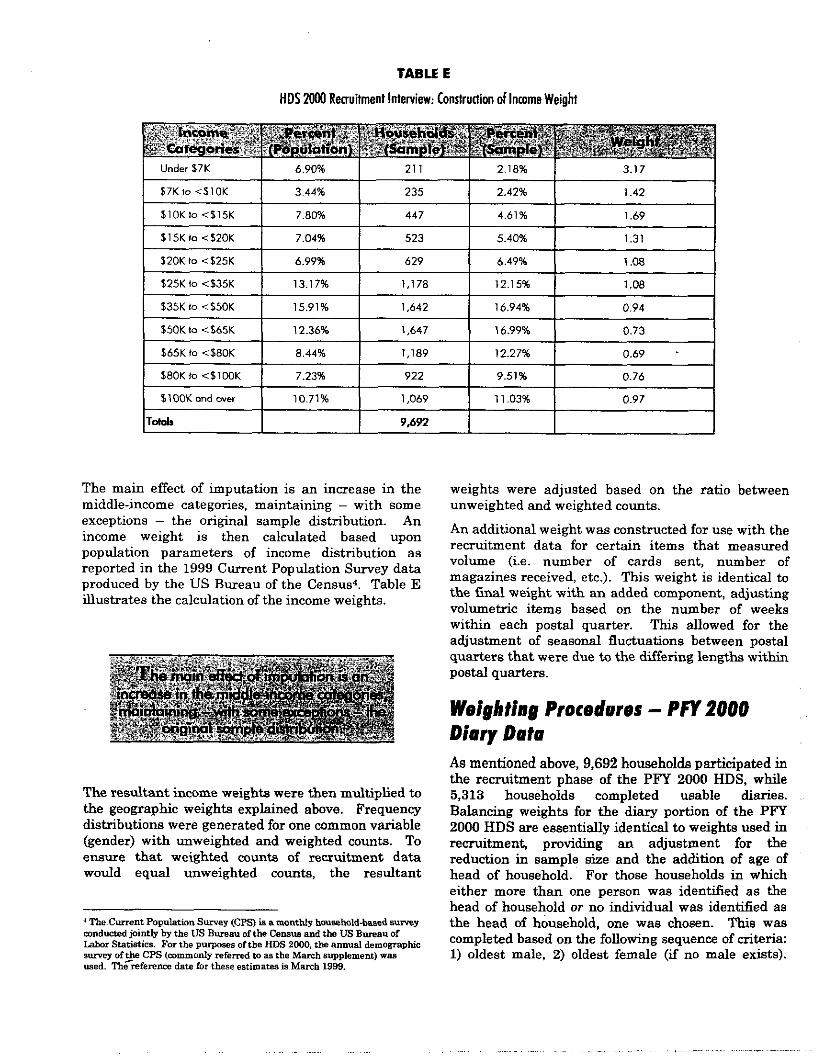
TABLE E
HDS 2000 Recruitment Interview: Construction of Income Weight
Under $7K 6.90% 21 1 2.18% 3.17
I SlOKIo<$15K I 7.80% I 447 I 4.61% I 1.69 I $7Km <$10K 3.44% 235 2.42% 1.42
I S25Klo<S35K I 13.17% I 1,178 I 12.15% 1 1.08 I
115KIo <120K
I $35Klo<$50K I 15.91% I 1,642 I 16.94% I 0.94 I
7.04% 523 5.40% 1.31
$50KIo <S65K
1 S80Kto <$loOK 1 7.23% I 922 I 9.51% I 0.76 I
12.36% 1,647 16.99% 0.73 I
1 $loOKandover 1 10.71% 1 1,069 1 11.03% I 0.97 I
165K to <%OK
I 9,692 I
8.44% 1,189 12.27% I 0.69
The main effect of imputation is an increase in the middle-income categories, maintaining - with some exceptions - the original sample distribution. An income weight is then calculated based upon population parameters of income distribution as reported in the 1999 Current Population Survey data produced by the US Bureau of the Census4. Table E illustrates the calculation of the income weights.
The resultant income weights were then multiplied to the geographic weights explained above. Frequency distributions were generated for one common variable (gender) with unweighted and weighted counts. To ensure that weighted counts of recruitment data would equal unweighted counts, the resultant
The Current Population S w a y (CPS) is a monthly hseho1d-b-d s-y mnduded jointly by the LIS Bureau of the Censw and the US Bureau of Labor Statistics. For the purposes oftbe HDS 2000. the annual demographic s-ey of the CPS (commonly referred to as the March supplement) was used. Th&ference date for these estimates is March 1999.
weights were adjusted based on the ratio between unweighted and weighted counts.
An additional weight was constructed for use with the recruitment data for certain items that measured volume (i.e. number of cards sent, number of magazines received, etc.). This weight is identical to the final weight with an added component, adjusting volumetric items based on the number of weeks within each postal quarter. This allowed for the adjustment of seasonal fluctuations between postal quarters that were due to the differing lengths within postal quarters.
ks mentioned above, 9,692 households participated in the recruitment phase of the PFY 2000 HDS, while 5,313 households completed usable diaries. Balancing weights for the diary portion of the PFY 2000 HDS are essentially identical to weights used in recruitment, providing an adjustment for the reduction in sample size and the addition of age of head of household. For those households in which either more than one person was identified as the head of household or no individual was identified as the head of household, one was chosen. This was completed based on the following sequence of criteria: 1) oldest male, 2) oldest female (if no male exists).
. ~ ... . ~ ~ . ~.. .
For cases in which two candidates for the head of the household were of the same age, the respondent was chosen. Heads of household were grouped into eight age cohorts: 18-21, 22-24, 25-34, 35-44, 45-54, 55-64, 65-69, and 70 years or more.
Weights were computed based on the quotient of each cohort’s percentage of the population divided by each cohort’s percentage of the sample. The resultant weight was then multiplied to the final weight produced in the recruitment phase. Other adjustments to weights used in the diary data included a quarterly adjustment, which accounted for sampling across postal quarters. Since the survey period for each household is one ‘?-day span, an expansion factor was applied to diary data to adjust weekly volumes to annual volumes. A h a l
adjustment was made to expand the sample to the level of total households in the United States, which a t the time of data collection was 104.8 million.
Expansion factors are applied in order to derive both the number of mail pieces per household per week and annual volumes received by households nationwide. The number of households that participated in the diary portion of the survey were divided into the number of households in the United States a t the time of the survey: 104.8 Million. The resultant factor was applied to each household in the survey. The expansion fador wag multiplied by the sampling weight and then multiplied by 52 (the number of calendar weeks in one year) to derive nationwide annual volume estimates from the sample data.

,
stondard Mail (A) 1.08 NIA
Adjustment Factors
NIA
In order to account for under-reporting of household mail volumes, a variety of adjustment factors have been used. There are three types of adjustment factors: Destination adjustment factors: Household- to-Household adjustment factors, and Household-to- Nonhousehold adjustment factors.
Destination adjustment factors were calculated from differences between weighted volumes derived from PFY 2000 HDS sample data and mailing volumes calculated under the City Cost Carrier System (CCCS) and Rural Cost Carrier System (RCCS) operated by USPS. These destination adjustment factors were applied to First-class, Priority, Standard Mail (A), Standard Mail (B), and Periodicals.
Household-to-household adjustment factors were applied based on the logic that mail originating and destinating in households should consist of a "closed loop". In other words, mail that is sent to households by households should equal mail received by
-
households from households. This situation does not necessady exist within the confines of a finite sample since households may receive mail from households outside the sampling frame. Therefore, is adjusted household mail sent to equal household mail received. This factor is applied to First-class Mail (1.48) and Packages (1.27). Household-to-nonhousehold adjustment factors were applied to acmunt for under-reporting of mail sent by households to nonhouseholds. The use of this adjustment factor is based on a comparison between the amount of mail sent by households to non- households derived from the recruitment phase of the survey and amounts derived from actual diary data. This factor (1.35) is applied to First-class mail sent by households to non-households.
The following table indicates adjustment factors applied by postal classification:
HDS 2000: Adl/ushnent Fadoa Utilized by Postal Clossifimtion
11.05 I I .48 11.35 I I I I
PriOriiV 11.16 I N/A IN/A
IPe"Zcol5 10.97 IN/A IN/A I

Appendix D: Revenue, Pieces and Weight Volume Tab1

Appendix D Revenue, Pieces and Weight Volume
/ (millions)
Postal Fiscal Years 1987,1999, and 2000
'This sub-class was phased out in 2000
Source: Demand Forecasting and Economic Analysis
~- ~.