mall shopping motivations among south african black
TRANSCRIPT
Mall shopping motivations among South African black Generation Y students
HELEI JOOSTE
STUDENT NUMBER: 10083898
Dissertation submitted in fulfilment of the requirements for the degree
MAGISTER COMMERCII
in the discipline of
MARKETING MANAGEMENT
in the
FACULTY OF ECONOMIC SCIENCES AND INFORMATION TECHNOLOGY
at the
VAAL TRIANGLE CAMPUS
of the North-West University
Supervisor: Prof N de Klerk Co-supervisor: Prof AL Bevan-Dye Vanderbijlpark 2016

i
DECLARATION
I declare that:
“Mall shopping motivations among South African black Generation Y students”
is my own work and that all the sources I have used or quoted have been indicated and
acknowledged by means of complete references, and that this dissertation has not
previously been submitted by me at any other university.
SIGNATURE DATE
Helei Jooste November 2016 Vanderbijlpark
27 March 2017
H C Sieberhagen Translator and Editor SATI no 1001489 082 3359846 [email protected] 018 2994554
CERTIFICATE issued on 02 December 2016
I hereby declare that I have edited the language of the dissertation
MALL SHOPPING MOTIVATIONS AMONG SOUTH AFRICAN BLACK GENERATION Y STUDENTS
by
HELEI JOOSTE STUDENT NUMBER: 10083898
submitted in fulfilment of the requirements for the degree
MAGISTER COMMERCII in the discipline of
MARKETING MANAGEMENT in the
FACULTY OF ECONOMIC SCIENCES AND INFORMATION TECHNOLOGY
at the VAAL TRIANGLE CAMPUS
OF THE NORTH-WEST UNIVERSITY
The responsibility to accept recommendations and effect changes remains with the author.
H C Sieberhagen
SATI no 1001489 ID 4504190077088

iii
ACKNOWLEDGEMENTS
With the submission of this dissertation, I acknowledge with gratitude the assistance,
encouragement, and support of all the persons involved in this study. In particular, I
would like to sincerely thank the following:
• My Lord, for the grace, courage and the strength to persevere.
• My family and friends that helped me with words of encouragement and support.
• My supervisor Prof. Natasha de Klerk and co-supervisor Prof. Ayesha Bevan-Dye for
the advice, help and guidance. Thank you for all the long hours you had to sacrifice.
• Ms Aldine Oosthuyzen of the North-West University (Vaal Triangle Campus) for her
assistance with the statistical aspects of this study.
• Ms Hendra Pretorius at the library of the North-West University (Vaal Triangle
Campus) for her friendly assistance.
• My friend Annette Willemse who encouraged and supported me through my studies.
• Prof Herman van der Merwe for granting me the opportunity to study and to pursue
my dreams.
• Ms Girley Kwakwa who always assisted me in the office, especially when I took
study leave.
• To Hettie Sieberhagen for her professionalism in the language editing of this study.
• The lecturers and students who took part in the initial pre-testing and piloting of the
research instrument.
• The students who took part in the final study.
Phil 4:13 I can do all things through Christ who strengthens me.
Helei Jooste Vanderbijlpark 2016
iv
ABSTRACT
Mall shopping motivations among South African black Generation Y students
KEY WORDS: motivations, shopping mall, black Generation Y students, South Africa
Globally, shopping malls are growing rapidly both in number and in size. South Africa,
viewed as the gateway to Africa, has moved increasingly towards mall-based retailing.
Currently, in 2016, there are 1 785 shopping malls in the country. The role of shopping
malls in consumers’ lifestyles is significant and has changed over time from selling
needed products to providing one-stop convenience shopping and entertainment to
increasingly more empowered, sophisticated and demanding consumers. As a distinct
form of consumer behaviour, consumers’ motives for shopping at a mall differ
significantly from one individual to another. As such, shopping mall management and
marketers are compelled to continuously develop marketing strategies, to meet the
changing consumer demand in order to retain current and attract new customers. The
Generation Y cohort, born between 1986 and 2005, account for approximately 37
percent of South Africa’s population and are characterised as high spenders and
influential pacesetters who spend a significant amount of time and money at shopping
malls. More specifically, when segmenting this cohort, black Africans account for 84
percent of the Generation Y cohort. Owing to the significant size, the black Generation
Y cohort makes for an attractive and lucrative market segment, specifically those
involved in higher education, as they are linked with higher future earning potential and
a higher social status, which together are likely to make them opinion leaders amongst
their peers. Understanding black Generation Y students’ mall shopping motivations
makes an important contribution in that it will help guide the development of specific
targeting and positioning strategies for this specific target market.
As such, the primary objective of this study was to determine black Generation Y
students’ mall shopping motivations within the South African context, in order to guide
the formation of marketing strategies for effectively targeting this market.
For the purpose of this study, the sampling frame consisted of the 26 registered South
African public Higher Education Institutions (HEIs). A judgement sample of two
v
institutions in the Gauteng province was selected from the initial list of 26 registered
institutions. A convenience sample of 400 full-time undergraduate black Generation Y
students was then conveniently selected in order to conduct this study. The relevant
primary data were obtained using a self-administered questionnaire. The statistical
analysis of the collected data included exploratory factor analysis, descriptive statistical
analysis, correlation analysis, a one-sample t-test and a one-way analysis of variance
(ANOVA).
The findings of this study suggest that aesthetic stimulation, escape activity, preference
for flow, desire for exploration, need to enact a role, desire for social interaction and
desire for shopping convenience are strong motivators for black Generation Y students
in South Africa to visit a shopping mall. Moreover, they find the convenience offered by
shopping at a mall to be the most important mall shopping motive. The aesthetic
stimulation of a mall was found to be the second most significant positive motivation for
shopping at malls amongst black Generation Y students in South Africa. In addition,
Black Generation Y students reported that the desire for flow – having the opportunity to
lose sense of time because of the pleasurable state of absorption – is the third most
important mall shopping motivator. Insights gained from this study will aid shopping mall
managers and marketers seeking to profile and target the lucrative Generation Y
consumer shopping market in South Africa.
vi
TABLE OF CONTENTS
DECLARATION .............................................................................................................. i
LETTER FROM THE LANGUAGE EDITOR .................................................................. ii
ACKNOWLEDGEMENTS ............................................................................................. iii
ABSTRACT ................................................................................................................... iv
TABLE OF CONTENTS ................................................................................................ vi
LIST OF TABLES .......................................................................................................... x
LIST OF FIGURES ........................................................................................................ xi
CHAPTER 1 INTRODUCTION AND PROBLEM STATEMENT .................................... 1
1.1 INTRODUCTION AND BACKGROUND ........................................................... 1
1.2 PROBLEM STATEMENT .................................................................................. 4
1.3 OBJECTIVES OF THE STUDY ......................................................................... 5
1.3.1 Primary objective ............................................................................................... 5
1.3.2 Theoretical objectives ........................................................................................ 5
1.3.3 Empirical objectives ........................................................................................... 5
1.4 HYPOTHESES .................................................................................................. 6
1.5 RESEARCH DESIGN AND METHODOLOGY .................................................. 7
1.5.1 Literature Review ............................................................................................... 8
1.5.2 Empirical study................................................................................................... 8
1.5.2.1 Target population ............................................................................................... 8
1.5.2.2 Sampling frame .................................................................................................. 8
1.5.2.3 Sample method .................................................................................................. 9
1.5.2.4 Sample size ....................................................................................................... 9
1.5.2.5 Measuring instrument and data collection method ............................................. 9
1.5.3 Statistical analysis ............................................................................................ 10
1.5.4 Ethical considerations ...................................................................................... 11
1.6 CHAPTER CLASSIFICATION......................................................................... 11
CHAPTER 2 CONSUMER MALL SHOPPING MOTIVATIONS ................................... 13
vii
2.1 INTRODUCTION ............................................................................................. 13
2.2 OVERVIEW OF SHOPPING MALLS .............................................................. 13
2.3 INTRODUCTION TO CONSUMER BEHAVIOUR ........................................... 16
2.3.1 Defining consumer behaviour .......................................................................... 17
2.3.2 Model of consumer decision-making ................................................................ 18
2.4 CONSUMER MOTIVATION ............................................................................ 23
2.4.1 Defining motivation .......................................................................................... 23
2.4.2 Maslow’s hierarchy of needs ............................................................................ 24
2.4.3 Important factors in consumer motivation ........................................................ 26
2.4.4 Consumer motives for shopping ...................................................................... 28
2.5 POSSIBLE MOTIVES FOR MALL SHOPPING .............................................. 31
2.5.1 Aesthetics stimulation ...................................................................................... 31
2.5.2 Escape activity ................................................................................................. 32
2.5.3 Searching for diversion .................................................................................... 32
2.5.4 Preference for flow ........................................................................................... 33
2.5.5 Desire for exploration ....................................................................................... 33
2.5.6 Role enactment ................................................................................................ 34
2.5.7 Social interaction.............................................................................................. 35
2.5.8 Shopping convenience ..................................................................................... 35
2.6 GENERATION Y COHORT ............................................................................. 36
2.7 SYNOPSIS ...................................................................................................... 38
CHAPTER 3 RESEARCH METHODOLOGY ............................................................... 39
3.1 INTRODUCTION ............................................................................................. 39
3.2 RESEARCH DESIGN ...................................................................................... 40
3.3 RESEARCH APPROACH ............................................................................... 41
3.4 SAMPLING STRATEGY ................................................................................. 42
3.4.1 Target population ............................................................................................. 42
3.4.2 Sampling frame ................................................................................................ 43
3.4.3 Sample method ................................................................................................ 43
viii
3.4.4 Sample size ..................................................................................................... 45
3.5 DATA COLLECTION METHOD ...................................................................... 46
3.5.1 Questionnaire design ....................................................................................... 47
3.5.2 Questioning format ........................................................................................... 48
3.5.3 Questionnaire layout ........................................................................................ 51
3.6 PRE-TESTING OF THE QUESTIONNAIRE .................................................... 52
3.7 ADMINISTRATION OF THE QUESTIONNAIRE ............................................. 53
3.8 PRELIMINARY DATA ANALYSIS .................................................................. 54
3.9 STATISTICAL ANALYSIS .............................................................................. 54
3.9.1 Factor analysis ................................................................................................. 55
3.9.2 Reliability analysis ............................................................................................ 57
3.9.3 Validity analysis ............................................................................................... 58
3.9.4 Descriptive statistical analysis ......................................................................... 59
3.9.5 Correlation analysis ......................................................................................... 61
3.9.6 Test of significance .......................................................................................... 61
3.9.6.1 One-sample t-test ............................................................................................ 62
3.9.7 One-way analysis of variance (ANOVA) .......................................................... 62
3.10 SYNOPSIS ...................................................................................................... 63
CHAPTER 4 ANALYSIS AND INTERPRETATION OF EMPIRICAL FINDINGS ........ 64
4.1 INTRODUCTION ............................................................................................. 64
4.2 PILOT TEST RESULTS .................................................................................. 64
4.3 DATA GATHERING PROCESS ...................................................................... 65
4.4 PRELIMINARY DATA ANALYSIS .................................................................. 65
4.4.1 Coding ............................................................................................................. 65
4.4.2 Data cleaning ................................................................................................... 67
4.4.3 Tabulation of variables ..................................................................................... 67
4.5 DEMOGRAPHIC AND MALL SHOPPING HABITS ANALYSIS ..................... 69
4.5.1 Sample description .......................................................................................... 70
4.5.2 Mall shopping habits information...................................................................... 75
ix
4.6 EXPLORATORY PRINCIPAL COMPONENTS ANALYSIS ............................ 78
4.7 INTERNAL-CONSISTENCY RELIABILITY ASSESSMENT ........................... 81
4.8 DESCRIPTIVE STATISTICS ........................................................................... 83
4.9 CORRELATION ANALYSIS ........................................................................... 84
4.10 HYPOTHESES TESTING ................................................................................ 85
4.10.1 One-sample t-test ............................................................................................ 86
4.10.2 One-way ANOVA ............................................................................................. 89
4.11 SYNOPSIS ...................................................................................................... 91
CHAPTER 5 CONCLUSION AND RECOMMENDATIONS ......................................... 92
5.1 INTRODUCTION ............................................................................................. 92
5.2 OVERVIEW OF THE STUDY .......................................................................... 92
5.3 MAIN FINDINGS OF THE STUDY .................................................................. 94
5.4 RECOMMENDATIONS ................................................................................... 97
5.4.1 Offer convenient shopping ............................................................................... 97
5.4.2 Offer a mall environment that is pleasing to multiple senses ........................... 98
5.4.3 Offer a pleasant shopping environment ........................................................... 99
5.4.4 Cater for different types of consumers ............................................................. 99
5.4.5 Provide a variety of entertainment facilities .................................................... 100
5.4.6 Offer a variety of stores and products ............................................................ 100
5.5 CONTRIBUTIONS OF THE STUDY .............................................................. 101
5.6 LIMITATIONS AND FUTURE RESEARCH OPPORTUNITIES..................... 101
5.7 CONCLUDING REMARKS ........................................................................... 102
REFERENCE LIST ..................................................................................................... 103
ANNEXURE A Questionnaire ................................................................................... 120
ANNEXURE B Tukey HSD ........................................................................................ 124
ANNEXURE C Ethics clearnance document .......................................................... 128
x
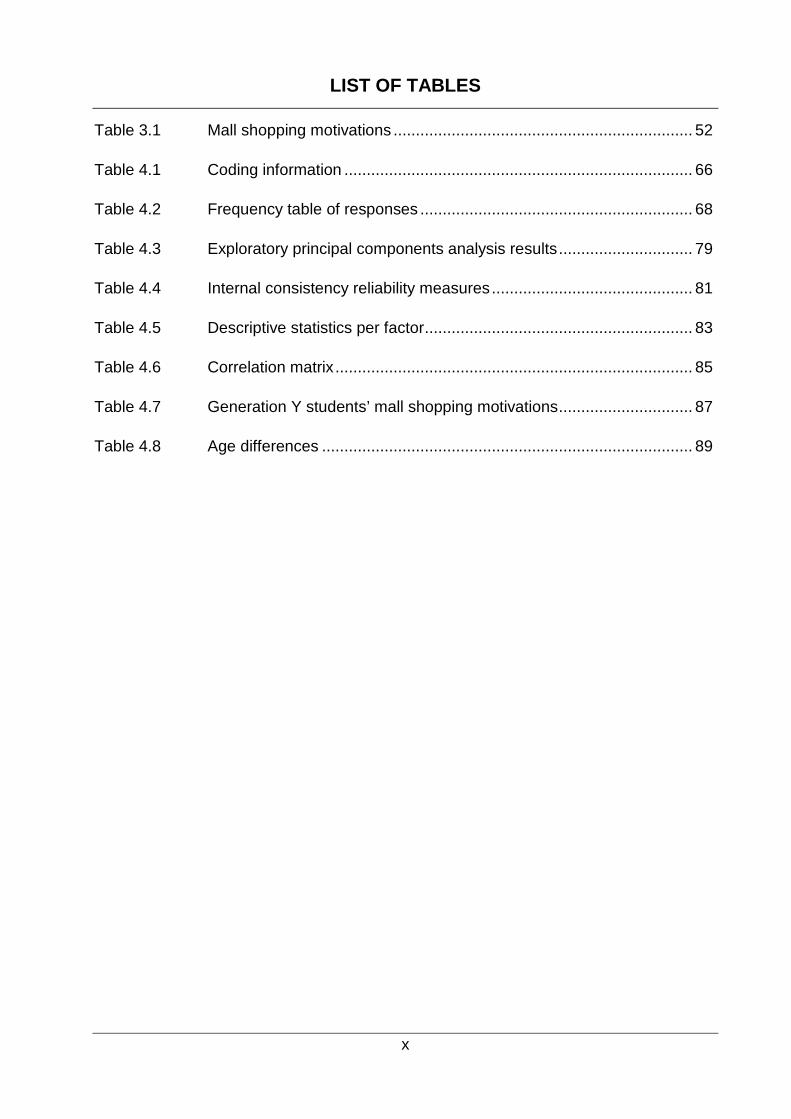
LIST OF TABLES
Table 3.1 Mall shopping motivations ................................................................... 52
Table 4.1 Coding information .............................................................................. 66
Table 4.2 Frequency table of responses ............................................................. 68
Table 4.3 Exploratory principal components analysis results .............................. 79
Table 4.4 Internal consistency reliability measures ............................................. 81
Table 4.5 Descriptive statistics per factor ............................................................ 83
Table 4.6 Correlation matrix ................................................................................ 85
Table 4.7 Generation Y students’ mall shopping motivations .............................. 87
Table 4.8 Age differences ................................................................................... 89
xi
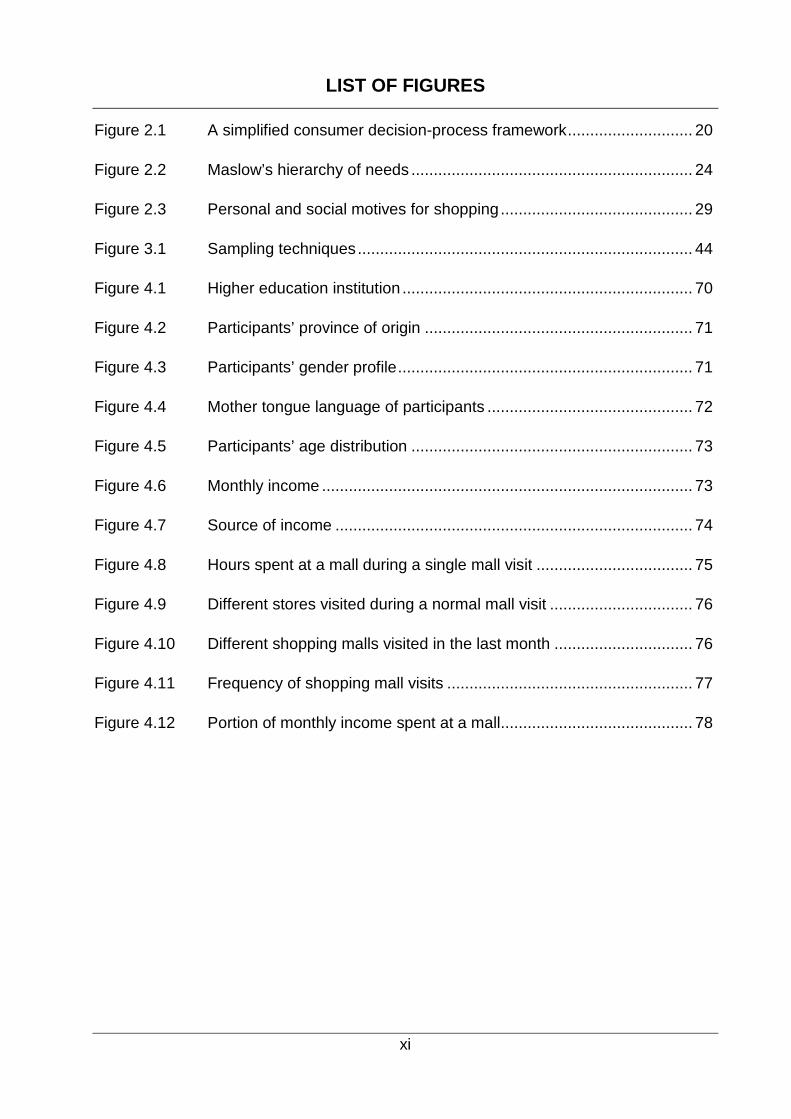
LIST OF FIGURES
Figure 2.1 A simplified consumer decision-process framework ............................ 20
Figure 2.2 Maslow’s hierarchy of needs ............................................................... 24
Figure 2.3 Personal and social motives for shopping ........................................... 29
Figure 3.1 Sampling techniques ........................................................................... 44
Figure 4.1 Higher education institution ................................................................. 70
Figure 4.2 Participants’ province of origin ............................................................ 71
Figure 4.3 Participants’ gender profile .................................................................. 71
Figure 4.4 Mother tongue language of participants .............................................. 72
Figure 4.5 Participants’ age distribution ............................................................... 73
Figure 4.6 Monthly income ................................................................................... 73
Figure 4.7 Source of income ................................................................................ 74
Figure 4.8 Hours spent at a mall during a single mall visit ................................... 75
Figure 4.9 Different stores visited during a normal mall visit ................................ 76
Figure 4.10 Different shopping malls visited in the last month ............................... 76
Figure 4.11 Frequency of shopping mall visits ....................................................... 77
Figure 4.12 Portion of monthly income spent at a mall ........................................... 78
Chapter 1: Introduction and problem statement 1
CHAPTER 1 INTRODUCTION AND PROBLEM STATEMENT
1.1 INTRODUCTION AND BACKGROUND
Shopping malls, along with antibiotics and personal computers, are one of the best 50
innovations that have changed the lives of people worldwide, subsequently having a
significant influence on consumers’ shopping behaviour (Consumer Reports, 1986).
Shopping malls are growing rapidly throughout the European geography both in number
and in size (Gilboa, 2009:136). Correspondingly, developing countries across Africa and
Asia are experiencing optimistic growth from shopping mall developments and are
benefitting economically from this innovation (Hinson et al., 2012:98). According to
research done by Urban Studies, shopping mall retail outlets contributed 43 percent
towards the total income of R450 billion of the retail industry in South Africa in 2012,
making the shopping mall retail industry a very lucrative market (Prinsloo, 2013).
A shopping mall is a large retail development comprising different types of retail outlets,
restaurants and busines establishments, housed in a single large building or a series of
connected or adjacent buildings (Levy & Weitz, 2012:175). Ahmed et al. (2007:333)
opine that shopping malls are the most recognised site for shopping and are
characterised as a distinct type of shopping environment where people engage in
buying as well as activities, such as socialising with friends. The role of shopping malls
in consumers’ lifestyles is significant (Ahmed et al., 2007:334; Bloch et al., 1994:24;
Terblanché, 1999:141) and has changed over time (Kirkup & Rafiq, 1999:120; Michon
et al., 2008:457; Terblanché, 1999:141) from selling needed products to providing one-
stop convenience shopping and entertainment (Hinson et al., 2012:98) to increasingly
more empowered, sophisticated and demanding consumers (Venkatachalam, 2014).
Initially conceptualised and created in the mid-1950s, shopping malls has become
fixtures in most major markets by the early 1970s (Feinberg, 1991:426), with
department stores and large supermarkets traditionally fulfilling the role of anchor
tenants (Terblanché, 1999:141). Owing to changes in the market, such as increased
competition (Moolman, 2011:129), an increase in consumers’ time and money
resources, coupled with an increase in consumers’ willingness to travel further to shop,
the need for more entertainment-oriented malls was aroused (Kirkup & Rafiq, 1999:119;
Martin & Turley, 2004:465). As a result, leisure and entertainment opportunities at
Chapter 1: Introduction and problem statement 2
shopping malls have increased significantly (Moolman, 2011:129). Therefore, food
courts, restaurants, theatres, children’s play areas, exhibition zones, recreation and
meeting spaces are fulfilling the role of anchor tenants in shopping malls (Bloch et al.,
1994:24; Martin & Turley, 2004:465; Terblanché, 1999:141).
Shopping motivations are behavioural impulses motivating consumers to visit the
marketplace to satisfy their needs (Jin & Kim, 2003:399). Consumers’ shopping
motivations are a distinct form of consumer behaviour and often differ significantly from
one individual to another; hence, two consumers can have different motives for
shopping at the same store. Consumers shop for various reasons, such as seeking the
best value for money, socialising, escaping from the routine of daily life (Tiwari &
Abraham, 2010:11), the influence of individual and psychological consumer
characteristics (Hinson et al., 2012:102), cultural (Dhurup, 2008:65), social and
environmental influences, promotional strategies (Hinson et al., 2012:102), as well as
for experiential and emotional reasons (Singh & Sahay, 2012:237). Notably, Tiwari and
Abraham (2010:12) point out that, while consumers visit shopping malls for different
reasons, they all expect an exceptional experience from visiting a mall.
From an extensive search of the literature, eight dimensions pertaining to consumers’
motivations for visiting shopping malls have been identified, including aesthetic
stimulation, escape activity (Ahmed et al., 2007:335; Bloch et al., 1994:34), search of
diversion (Tauber, 1972:47), preference for flow, desire for exploration, role enactment,
social interaction (Ahmed et al., 2007:335; Bloch et al., 1994:34), and shopping
convenience (Ahmed et al., 2007:335; Hinson et al., 2012:114-115; Terblanché,
1999:142). According to Wakefield and Baker (1998:520), aesthetic stimulation pertains
to the architectural and interior design of the mall, including the layout and the design
features, such as high ceilings, the use of colours and music. Escape activity entails
getting away from the demands and stress at work or home (Yoon & Uysal 2005:50).
Desire for diversion refers to consumers’ visiting a mall to break away from their
repetitious routine daily lives as well as to avoid bad weather or traffic congestion (Jin &
Kim, 2003:406; Nicholls et al., 2000:107). Preference for flow is associated with the
pleasurable sense of engagement, which is related to losing track of time (Bloch et al.,
1994:34). According to Tiwari and Abraham (2010:2), the desire for exploration refers to
learning about new products and gathering information. Role enactment pertains to the
satisfaction derived from shopping for other people instead of for oneself (Arnold &
Chapter 1: Introduction and problem statement 3
Reynolds, 2003:80). Social interaction involves socialising with others, such as meeting
with friends or making new acquaintances (Guido, 2006:64). Shopping convenience
refers to the mall’s operating hours, the location of the mall and the expansive
assortments of products and stores to facilitate one-stop shopping (Tiwari & Abraham,
2010:2).
Mall shopping motives is a valuable marketing tool that can be used for market
segmentation and developing strategies for targeting a particular market segment and
are therefore essential to marketers and shopping mall managers (Bloch et al.,
1994:23). Owing to shopping malls being viewed as planned developments that are
managed and marketed as a unified whole (Kirkup & Rafiq, 1999:119), the positive
impact of the environment on consumers’ shopping behaviour is increasingly
recognised by mall management and retailers (Laroche et al., 2005:157). While there
has been a significant increase in consumer shopping mall spending, in order to stay
competitive, mall-management and retailers need to invest resources to create
attractive and entertaining mall surroundings to retain current customers and attract new
customers (Bloch et al., 1994:24; Terblanché, 1999:142).
Generation Y is a valuable market segment with ample time and sufficient money to
spend (Bakewell & Mitchell, 2003:95). Generational studies, indicated that Generation Y
includes those individuals born during the years from 1986 to 2005 (Markert, 2004:21).
The Generation Y cohort accounted for around 37 percent of South Africa’s population,
of 55.91 million in 2016. The African segment of this cohort accounted for 84 percent of
the total Generation Y cohort in 2016 (Statistics South Africa, 2016). The considerable
size of the Generation Y market segment renders them important to marketers as well
as those engaged in marketing shopping malls (Bakewell & Mitchell, 2003:97; Martin &
Turley, 2004:466). Compared to previous generations, Generation Y members have
adjusted to a culture of materialism and consumption due to the influence of television
and technological innovations (Bakewell & Mitchell, 2003:97). Generation Y consumers
have specific wants and needs, are tolerant and open-minded, early-adopters, trend-
setters and aim at upholding high living standards. Furthermore, this cohort receives
significant attention from retailers due to their being raised in a consumption-driven
society (Noble et al., 2009:617), where product and retail outlet choices are in
abundance (Foscht et al., 2009:219). Bakewell and Mitchell (2003:98) concur, stating
that members of the Generation Y cohort have been brought up in dual-income
Chapter 1: Introduction and problem statement 4
households and have learnt to make purchase and brand choices earlier in their lives,
when compared to previous generations. Noble et al. (2009:618) further denote that
even though Generation Y is a large consumer group and an important market
segment, this group’s motivation for consumption and support is still undiscovered.
1.2 PROBLEM STATEMENT
Shopping mall management and retail outlets are compelled to continuously develop
marketing strategies, to meet the changing consumer demand in order to retain current
and attract new customers (Du Preez et al., 2007:7). The increased role of the media
and technology in consumers’ lives, such as the threat of internet-based shopping
(Hemalatha & Ravichandran, 2009:169), makes strategic planning challenging to the
shopping mall marketer and retailer, especially to those targeting the Generation Y
cohort (Du Preez et al., 2007:5). Serving the shopping mall needs of the Generation Y
market segment essentially depends on having insight into their mall shopping
motivations, as well as understanding their shopping mall behaviour (Cardoso & Pinto,
2010:555). Ahmed et al. (2007:331) advise that mall management and retailers will
benefit significantly from understanding consumers’ mall behaviour, orientation and
consumption motivations (Bakewell & Mitchell, 2003:95).
Although a growing body of academic literature relating to shopping malls does exist
(Gilboa, 2009:135), empirical research on consumers’ shopping mall motivations and
behaviour is limited (Du Preez et al., 2007:7) considering the importance it holds for
consumers (Bloch et al., 1994:24) especially to the Generation Y market segment
(Martin & Turley, 2004:464). This study focuses specifically on black Generation Y
students, as Africans account for an estimated 84 percent of the country’s Generation Y
cohort (Statistics South Africa, 2016), and those involved in higher education are likely
to play a significant trend-setting role in the cohort’s consumer behaviour (Bevan-Dye et
al., 2009:174). To date, little is known about the mall shopping motivations of South
African black Generation Y members, and through exploring the shopping motivations
that influence this market segment’s shopping mall behaviour, this research will
contribute to developing targeting and positioning strategies for this specific target
market.
Chapter 1: Introduction and problem statement 5
1.3 OBJECTIVES OF THE STUDY
The following objectives were formulated for the study:
1.3.1 Primary objective
The primary objective of this study was to determine black Generation Y students’ mall
shopping motivations within the South African context, in order to guide the formation of
marketing strategies for effectively targeting this market.
1.3.2 Theoretical objectives
In order to achieve the primary objective, the following theoretical objectives were
formulated for the study:
• Review the literature on shopping malls.
• Review the literature on consumer decision making.
• Conduct a review of the literature regarding consumer motivation.
• Conduct a review of the literature on mall shopping motivation.
• Conduct a review on the literature pertaining to the Generation Y cohort.
1.3.3 Empirical objectives
In accordance with the primary objective of the study, the following empirical objectives
were formulated:
• Determine black Generation Y students’ preference for aesthetic stimulation as a
mall shopping motivation.
• Determine black Generation Y students’ desire for escape activity as a mall
shopping motivation.
• Determine black Generation Y students’ desire for diversion as a mall shopping
motivation.
• Determine black Generation Y students’ preference for flow as a mall shopping
motivation.
• Determine black Generation Y students’ desire for exploration as a mall shopping
motivation.
Chapter 1: Introduction and problem statement 6
• Determine black Generation Y students’ drive to enact a role as a mall shopping
motivation.
• Determine black Generation Y students’ desire for social interaction, as a mall
shopping motivation.
• Determine black Generation Y students’ desire for shopping convenience as a mall
shopping motivation.
• Determine if there is a difference between different age groups concerning black
Generation Y students’ mall shopping motivations (aesthetic, escape, diversion,
flow, exploration, role enactment, social, and convenience).
1.4 HYPOTHESES
Subsequent to the literature review in Chapter 2, the following nine hypotheses were
formulated for the study:
H01: Black Generation Y students do not exhibit a significant positive
preference for aesthetic stimulation as a mall shopping motivation.
Ha1: Black Generation Y students do exhibit a significant positive preference for
aesthetic stimulation as a mall shopping motivation.
H02: Black Generation Y students do not exhibit a significant positive desire for
escape activity as a mall shopping motivation.
Ha2: Black Generation Y students do exhibit a significant positive desire for
escape activity as a mall shopping motivation.
H03: Black Generation Y students do not exhibit a significant positive need for
diversion as a mall shopping motivation.
Ha3: Black Generation Y students do exhibit a significant positive need for
diversion as a mall shopping motivation.
H04: Black Generation Y students do not exhibit a significant positive
preference for flow as a mall shopping motivation.
Ha4: Black Generation Y students do exhibit a significant positive preference for
flow as a mall shopping motivation.
Chapter 1: Introduction and problem statement 7
H05: Black Generation Y students do not exhibit a significant positive desire for
exploration as a mall shopping motivation.
Ha5: Black Generation Y students do exhibit a significant positive desire for
exploration as a mall shopping motivation.
H06: Black Generation Y students do not exhibit a significant positive drive to
enact a role as a mall shopping motivation.
Ha6: Black Generation Y students do exhibit a significant positive drive to enact
a role as a mall shopping motivation.
H07: Black Generation Y students do not exhibit a significant positive desire for
social interaction, as a mall shopping motivation.
Ha7: Black Generation Y students do exhibit a significant positive desire for
social interaction, as a mall shopping motivation.
H08: Black Generation Y students do not exhibit a significant positive desire for
shopping convenience as a mall shopping motivation.
Ha8: Black Generation Y students do exhibit a significant positive desire for
shopping convenience as a mall shopping motivation.
H09: There is no difference between different age groups of black Generation Y
students’ mall shopping motivations (aesthetic, escape, diversion, flow,
exploration, role enactment, social, convenience).
Ha9: There is a difference between different age groups of black Generation Y
students’ mall shopping motivations (aesthetic, escape, diversion, flow,
exploration, role enactment, social, convenience).
The following section describes the research design and methodology used within the
study.
1.5 RESEARCH DESIGN AND METHODOLOGY
The study comprised a literature review and an empirical study. Quantitative research,
using the survey method, was used for the empirical portion of the study. A descriptive
research design with a single, cross-sectional sample was followed.
Chapter 1: Introduction and problem statement 8
1.5.1 Literature Review
The empirical portion of this study was supported by reviewing South African and
international literature. Secondary data sources that were used included relevant
textbooks, journal articles, business articles, newspaper articles, the Internet and online
academic databases including EBSCOhost, Google Scholar and Emerald Insight.
1.5.2 Empirical study
The empirical portion of this study comprised the following methodology dimensions:
1.5.2.1 Target population
The target population, relevant to this study were black Generation Y full-time
undergraduate students, aged between 18 and 24, registered at South African higher
education institutions (HEIs) in 2014. The target population was defined as follows:
• Element: Black Generation Y full-time undergraduate students aged between 18
and 24 years.
• Sampling unit: South African registered public HEIs.
• Extent: Gauteng, South Africa.
• Time: 2014.
1.5.2.2 Sampling frame
The sampling frame consisted of 26 registered South African public HEIs, as listed by
Higher Education South Africa. Of these, there are 11 universities, six comprehensive
universities and 9 universities of technology (Higher Education in South Africa, 2015).
From this initial sampling frame, non-probability judgement sampling was used to
narrow the sampling frame to two HEI campuses located in the Gauteng province, one
a traditional university and the other a university of technology. In South Africa, the
largest portion of the South African population resides in the Gauteng province, namely
24 percent (Stats SA, 2016). As such the Gauteng province was selected as the main
sample of this study. The two HEIs were chosen due to their close geographic
proximity, thereby decreasing cost and time, which makes the research more
manageable.
Chapter 1: Introduction and problem statement 9
1.5.2.3 Sample method
The sampling method that was applied in this study was a non-probability, convenience
sample of full-time undergraduate black Generation Y students, between the ages of 18
and 24 years. The questionnaires were distributed equally between the two selected
HEIs.
1.5.2.4 Sample size
The sample size selected for this study was 400 full-time undergraduate black
Generation Y students. This sample size was considered to be sufficiently large and
correlates with previous studies of this nature, such as Laroche et al. (2005) (sample
size of 351), Millan and Howard, (2007) (sample size of 355), Hemalatha et al. (2009)
(sample size of 300), Bevan-Dye et al. (2012) (sample size of 400). The sample size of
400 full-time undergraduate black Generation Y students was divided equally between
the two selected HEI campuses, with a sample size of 200 per campus.
1.5.2.5 Measuring instrument and data collection method
For the purpose of this study, a structured self-administered questionnaire was used to
collect the required data. The questionnaire employed in this study, includes items from
existing scales that were used in previously published research. The measuring scale in
the questionnaire included scale items that were adapted from previous published
research (Ahmed et al., 2007; Bloch et al., 1994; Tauber, 1972). The participants were
requested to complete a questionnaire comprising three sections. In the first section
(Section A), the participants’ demographic data were requested. The second section
(Section B, 5 items), measured the students’ mall shopping habits. The third section
(Section C) included the 31-item scale measuring the students’ mall shopping
motivations. This scale comprised eight dimensions, namely aesthetics (4 items),
escape (5 items), diversion (3 items), flow (4 items), exploration (3 items), role
enactment (3 items), social (4 items) and convenience (5 items). The students’
responses were measured based on their agreement or disagreement with the
statements that relate to the various shopping motivation dimensions. A six-point Likert
scale ranging from 1=strongly disagree, to 6=strongly agree was used to indicate the
participants’ degree of agreement or disagreement with the statements that relate to
motives for visiting malls.
Chapter 1: Introduction and problem statement 10
In the questionnaire was a letter explaining the purpose of the study, providing
instructions on how to complete the questionnaire as well as requesting participation. In
order to attain reliability by means of convenience sampling, the questionnaire was
piloted on a sample of 48 students on a South African HEI campus that does not form
part of the sampling frame of the main study. The results obtained from the pilot test
were coded and tabulated accordingly.
In this study, a structured format was applied. Lecturers at the HEI campuses that
formed part of the sampling frame were contacted and permission was requested to
carry out the survey. The questionnaire together with the ethics clearance certificate
obtained from the Ethics Committee of the Faculty of Economic-Sciences and
Information Technology at the North-West University (Vaal Triangle Campus) were
shown to these lecturers. Thereafter, the hand-delivered, self-administered
questionnaire was handed out for completion to the students during the scheduled class
times of the full-time undergraduate students. The participating lecturers were given
strict instructions to inform their students that participation in the survey was on a
voluntary basis and that no student was to be coerced into completing the
questionnaire. This was done for the two HEI campuses, which participated in the study
in 2014.
1.5.3 Statistical analysis
The captured data were analysed using the statistical package IBM SPSS Statistics,
Version 23. The following statistical methods were used on the empirical data sets:
• Frequency analysis
• Exploratory factor analysis
• Reliability and validity analysis
• Descriptive statistical analysis
• Correlation analysis
• One-sample t-test
• One-way analysis of variance (ANOVA).
Chapter 1: Introduction and problem statement 11
1.5.4 Ethical considerations
This research study complied with the ethical standards of academic research. The
participants were guaranteed confidentiality. The necessary approval was obtained from
the heads of departments where the survey would be conducted. Participation in the
survey was voluntary.
The questionnaire and a description of the research methodology for the study were
viewed by the North-West University’s Ethics Committee in order to ensure that the
measurement instrument did not request any sensitive information from the participants,
In addition, members of the committee viewed the measurement instrument to confirm
that the target population and sampling frame from which the sample of participants was
selected did not involve any individuals who could be categorised as being vulnerable.
The following ethical clearance number was issued after the questionnaire had
successfully passed the Committee’s standards: Econit-Econ-2014-019.
1.6 CHAPTER CLASSIFICATION
In accordance with the gap in the literature relating to the mall shopping motivations
among South African black Generation Y students, one primary objective, five
theoretical objectives and nine empirical objectives were formulated in this chapter,
Chapter 1. In order to address these objectives, the remainder of this dissertation
incorporates the following chapters:
In Chapter 2, a detailed discussion on consumer behaviour and consumer decision-
making process is given. The chapter presents an overview of shopping malls.
Furthermore, the chapter presents a literature review regarding consumer motives for
shopping. It includes a definition of motivation, with a short explanation of Maslow’s
hierarchy of motivation. Issues regarding shopping mall management and identifying
characteristics of the Generation Y cohort are addressed.
The focus of Chapter 3 is on the research design and approach used in collecting and
analysing the data captured in the study. The sampling strategy, data collection method,
pre-testing of the questionnaire, administration of the questionnaire and data
preparation are discussed. The population, sample frame, sample method and data
collection method are discussed. Data analysis, statistical techniques and the problems
Chapter 1: Introduction and problem statement 12
experienced are outlined, and the data analysis and statistical procedures used in the
study are discussed.
Chapter 4 comprises an analysis and interpretation of the research findings, a report of
the pilot test and the main survey, an analysis of the exploratory factor analysis
including a report on the internal-consistency reliability of the measurement instrument
utilised in the main study. The results of the descriptive statistical analysis, correlation
analysis and the empirical testing of the mall shopping motivations of South African
black Generation Y students are reported. The chapter concludes with a discussion of
the one-way ANOVA results.
Chapter 5 provides a review of the entire study and makes conclusions drawn from the
research study, together with the recommendations based on the findings of the study.
Suggestions for further research are also given in this chapter.
Chapter 2: Consumer mall shopping motivations 13
CHAPTER 2 CONSUMER MALL SHOPPING MOTIVATIONS
2.1 INTRODUCTION
In accordance with the theoretical objectives outlined in Chapter 1, this chapter
discusses the shopping mall motivations of the black Generation Y student consumer
segment. Therefore, the purpose of Chapter 2 is to review the literature that relates to
shopping malls, consumer behaviour, shopping motivations and the Generation Y
cohort.
Consumers are driven and confronted by an endless number of needs that are not
always clearly known or defined to them. Furthermore, the manner in which any two
consumers will go about to satisfy these needs, will differ. As such, the main purpose of
marketing is not only to successfully identify these needs, but also to find innovative and
sustainable ways in which to satisfy them (Aljewari, 2015; Joubert, 2010:64). In addition,
conventional marketing can only be successfully applied when researchers discover
what these needs are and why these needs exist (Solomon et al., 2013:7).
As indicated in Chapter 1, the primary objective of this study is to determine the
shopping mall motivations of black Generation Y students. As such, the aim of this
chapter is to provide a theoretical outline of the study to accomplish the study’s primary
objective. Therefore, in Section 2.2, an overview of shopping malls is given, outlining a
definition, background and the value of shopping malls. Section 2.3 introduces
consumer behaviour, with specific reference to the definition of consumer behaviour and
the consumer decision-making model. In Section 2.4, consumer motivation is reviewed,
particularly with regard to the definition of motivation, Maslow’s hierarchy of needs and
a brief discussion on consumer shopping motives are provided. The possible variables
influencing mall shopping motivation are discussed in Section 2.5. This chapter
concludes with a discussion of the Generation Y segment, the target market of this
study, in Section 2.6. The following section provides an overview of shopping malls.
2.2 OVERVIEW OF SHOPPING MALLS
While the literature contains several definitions for the term shopping mall, there are a
number of noticeable similarities. Rajasekar and Chadar (2016:80) define a shopping
Chapter 2: Consumer mall shopping motivations 14
mall as a large shopping area with a wide array of shops and a parking area for
customer convenience situated in a building or a set of buildings, which are
interconnected with walkways. In addition, Rajasekar and Chadar (2016:80) describe a
mall as a “market for all” as it aims to serve numerous target markets. Dawson and Lord
(2013:1) as well as (Merriam-Webster Online Dictionary 2013) define a shopping mall
as a collection of different retail outlets that are designed, planned, marketed and
managed as one unit. Carter (2009:165) posits that shopping malls are usually
enclosed, with a temperature-regulating pathway between two fronting strips of stores.
Therefore, for the purpose of this study a shopping mall is defined as one or more
buildings comprising a variety of shops, with joint walkways that offer access and
flexibility of movement to consumers (Abdy, nd:4).
Initially triggered by suburbanisation, higher economic growth and mass ownership of
cars, following the end of World War II, the need for shopping malls was recognised
(Carter, 2009:165). The shopping mall concept was first introduced in the 1950s in the
United States of America (USA), with the development of the North Gate Mall, Thornton
Creek in Seattle (Rajasekar & Chadar, 2016:80). The shopping mall phenomenon is
more than 50 years old globally and has become an essential part of consumers’ daily
lives (Varman & Belk, 2012:63). The significant increase in the number of shopping
malls globally, together with the growth in population size, income, and expenditure
levels, has resulted in consumers becoming accustomed to larger shopping malls,
resulting in a significant increase in the total size of shopping malls’ floor area from 4
million square metres to more than 23 million square metres (Prinsloo, 2013). In recent
decades, the notion of the shopping mall has proliferated globally, with the five largest
malls in the world residing in Asia of which China’s New South China Mall in Dongguan
is the largest, comprising 2.9 million square metres (Fantoni et al., 2014).
South Africa, viewed as the gateway to Africa, has moved increasingly towards mall-
based retailing and has various major shopping malls from which consumers can
choose to shop (Terblanche, 2013:138). South Africa’s shopping malls are situated
throughout the country with the highest concentration of malls in, or in close proximity
to, the metropolitans and city centres, of which 75 percent are located in the Gauteng,
Western Cape and KwaZulu-Natal provinces (BusinessTech, 2016). Currently, in 2016,
there are 1 785 shopping malls in the country of which the Gateway mall, in Durban, is
the largest mall in South Africa and in Africa, comprising a floor capacity of 220,000
Chapter 2: Consumer mall shopping motivations 15
square metres followed by the recently developed Mall of Africa, opening in April 2016,
being the second largest at 131 000 square metres (BusinessTech, 2016). Shopping
malls in South African cater for consumers’ entertainment needs, such as modern
movie theatres, and have pleasant food courts and a variety of restaurants within a
secured and enclosed environment. Furthermore, the majority of shopping malls are
conveniently situated near major highways and have ample parking available.
Moreover, shopping malls have high security, offering shoppers peace of mind while
shopping (Van Melsen, 2013). In terms of the average number of visitors in total to
shopping malls in the country, this number varies between 40 000 and 60 000 visitors
during weekdays, and between 70 000 and 80 000 visitors on weekends, making mall
shoppers a lucrative target market for marketers and retailers (BusinessTech, 2016).
In contrast to alternative shopping locations, such as markets, separate autonomous
stores and online stores, shopping malls play a significant role in consumers’ lives and
offer the consumer several advantages (Levy & Weitz, 2012:175). Various authors
agree that shopping malls are not only a place to engage in buying activities, but also
for social and recreational activities (Ahmed et al., 2007:333; Chithralega, 2013:146; El-
Adly, 2007:936; El Hedhli et al., 2013:857), such as interacting with other people, or
simply to break away from everyday life (Ahmed et al., 2007:332). Levy and Weitz
(2012:175) opine that shopping malls have become a leisure destination offering
consumers a unique shopping environment by combining shopping and entertainment.
Avello et al. (2011:16) concur, stating that shopping malls offer consumers an
inexpensive form of entertainment while shopping. In addition, shopping malls offer
diverse products, such as clothes and household goods, a variety of services, such as
banking and entertainment, from different types of stores, including supermarkets and
boutiques, and different service providers, such as banks and cinemas, all in one
location (Zolfani et al., 2013:711).
Rajasekar and Chadar (2016:82) highlight various factors attracting consumers to
shopping malls, such as a quality shopping experience, a large quantity and variety of
product choices, ambience, recreational and entertainment facilities. El Hedhli et al.
(2013:857) explain that a shopping mall can add considerably towards consumer
happiness. This may be attributed to a shopping mall being able to provide consumers
with the needed goods and services, such as hair styling (Ahmed et al., 2007:333) and
dining (Rajasekar & Chadar, 2016:82), as well as other venues to entertain, meet,
Chapter 2: Consumer mall shopping motivations 16
interact and socialise with other people, including friends and relatives (El Hedhli et al.,
2013:857). Another advantage outlined by Levy and Weitz (2012:175) is that due to
shopping malls being enclosed, climate-controlled areas, visitors can visit throughout
the year without being concerned about the weather conditions, such as hot summers
and cold winters.
However, in contrast to alternative shopping locations, shopping malls also pose various
challenges for marketers and retailers. These include high mall occupancy costs, strict
mall management control, intense competition amongst stores in the shopping mall and
distant parking areas (Levy & Weitz, 2012:175). As a result, Hu and Jasper (2007:18)
posit that, while the increasing number of shopping malls offers consumers more
options to shop at, it also drives the intense competition amongst different shopping
malls. As such, it is important that shopping mall managers create a unique experience
to ensure customer attraction and continuous retention. Therefore, as the number of
shopping malls continues to grow, and the competition among the different shopping
malls continues to intensify, it is important that shopping malls differentiate themselves
from one another to remain competitive (Breytenbach, 2014:15; El Adly, 2007:936).
Being knowledgeable about the benefits consumers want when visiting shopping malls
can assist mall management and marketers to rethink their shopping environments in
order to meet their target market’s needs better, thus increase customer satisfaction,
ensure repeat visits, and positive word of mouth (Ahmed et al., 2007:333). Joubert
(2010:1) concurs, stating that consumer behaviour is of significant importance to
shopping mall marketers and retailers. Through understanding consumers’ behaviour,
particularly the consumer decision-making process, shopping mall management can
offer a conducive shopping environment. Therefore, in order to gain better insight into
mall shopping motivations amongst black Generation Y university students in South
Africa, a discussion pertaining to the theory of consumer behaviour is outlined in the
following section.
2.3 INTRODUCTION TO CONSUMER BEHAVIOUR
Cant (2010:23) defines a consumer as an individual who recognises a need or desire,
purchases a product or service, and subsequently uses the acquired product or service
to satisfy the identified need or desire (Solomon et al., 2013:18; Kardes, et al., 2015:7).
Cant (2010:23) furthermore states that consumers, with their specific demands and
Chapter 2: Consumer mall shopping motivations 17
adequate financial resources, represent the core resources within the market milieu.
Their behaviour, therefore, plays an essential role in the dynamics of any community.
As such, it is important to take heed of consumer actions and measures employed to
guide these behaviours (Solomon et al., 2013:5; Haghshenas et al., 2013:20)
Consumers are challenged with selecting products from a wide assortment. This,
coupled with the immense market competition, should alert researchers, marketers and
business owners to the importance of understanding consumer behaviour in all its
facets (Lawrence, 2012). Understanding consumer behaviour can be difficult, as it is not
simple, organised or automated (Hawkins & Mothersbaugh, 2013:24). Therefore,
sufficient time and effort should be afforded in order to fully and clearly comprehend the
behaviour of consumers.
Hawkins and Mothersbaugh (2013:3) suggest that if marketers and retailers can
successfully explain and understand consumer behaviour, including that of the shopping
mall consumer, it will be less complicated to develop and put into action effective
marketing strategies. Webb (2010:9) emphasises that lucrative enterprises of the future,
such as shopping malls, will be those that best fulfil the needs of consumers.
Consequently, it is valuable for marketers to have a clear insight into consumer
behaviour, as this will assist them with satisfying consumer needs accordingly. Dhurup
(2008:65) agrees that retailers need to identify consumers’ motives for shopping to
make sound marketing decisions. For this reason, Hawkins and Mothersbaugh
(2013:126) opine that rigorous conventional marketing tactics and campaigns have
been established, based on palpable or entrenched views about consumer behaviour.
In order to conceptualise consumer behaviour and lay the foundation for an in-depth
discussion on consumer motivation, it is necessary to define consumer behaviour and
describe the consumer decision-making process. Because this study pertains to
consumer motivation, which is a psychological motive of consumer behaviour (Joubert,
2010:67), it is essential to understand what consumer behaviour entails.
2.3.1 Defining consumer behaviour
Consumer behaviour is defined as the actions individuals perform to fulfil their needs
(Hawkins & Mothersbaugh, 2013:6; Webb, 2010:4). According to East et al. (2013:3),
consumer behaviour involves the way in which consumers buy and consume products
Chapter 2: Consumer mall shopping motivations 18
and services, and focuses on what consumers’ reactions are towards marketing
activities such as price, promotion and aesthetic arrangements, as well as the drivers
behind these reactions. Parumasur and Roberts-Lombard (2012:2) define consumer
behaviour as the group of actions that originate prior to, throughout, and once the
product or service has been purchased or consumed. From these definitions, the
conclusion could be made that consumer behaviour involves much more than just the
approach a consumer deploys to purchase a product or service. Cognisance should
also be taken of the consumer’s usage of a service or product, as well as the availability
of choice during the acquisition process (Hoyer et al., 2013:3). Therefore, for the
purpose of this study, consumer behaviour is defined as individuals’ decision-making
behaviour when seeking, purchasing, consuming and evaluating products and services
in order to satisfy specific needs and desires (Schiffman et al., 2013:2). This definition
underpins the fundamental building blocks for the consumer decision-making model to
be discussed.
A review of the literature revealed that the consumer decision-making model is a widely
used model for understanding consumers’ behaviour. This theoretical model aids
marketers and retailers to comprehend the nature of the consumer decision-making
process and identifies the internal and external factors influencing this process, hence
consumer behaviour (Hawkins & Mothersbaugh, 2013:461; Webb, 2010:23).
2.3.2 Model of consumer decision-making
According to Hawkins and Mothersbaugh (2013:461), it is essential for marketers to be
knowledgeable about the factors that influence consumers’ decision-making. The
consumer decision-making process consists of three interrelated stages namely the
input, the process and the output stages. These stages influence the activities involved
from recognising a consumption-related need to evaluate the product or service
purchased (Schiffman et al., 2013:36). Owing to consumers having to choose amongst
more than one option or alternative to satisfy their needs and desires, consumer
decision making takes place (Solomon et al., 2013:296). Hawkins and Mothersbaugh
(2013:490) explain that, during the consumer decision-making process, a consumer
takes time and makes the effort to assess the qualities of different products, brands, or
services and logically chooses the alternative that resolves a noticeable and predictable
need at the minimum cost. The consumer decision-making can therefore in essence be
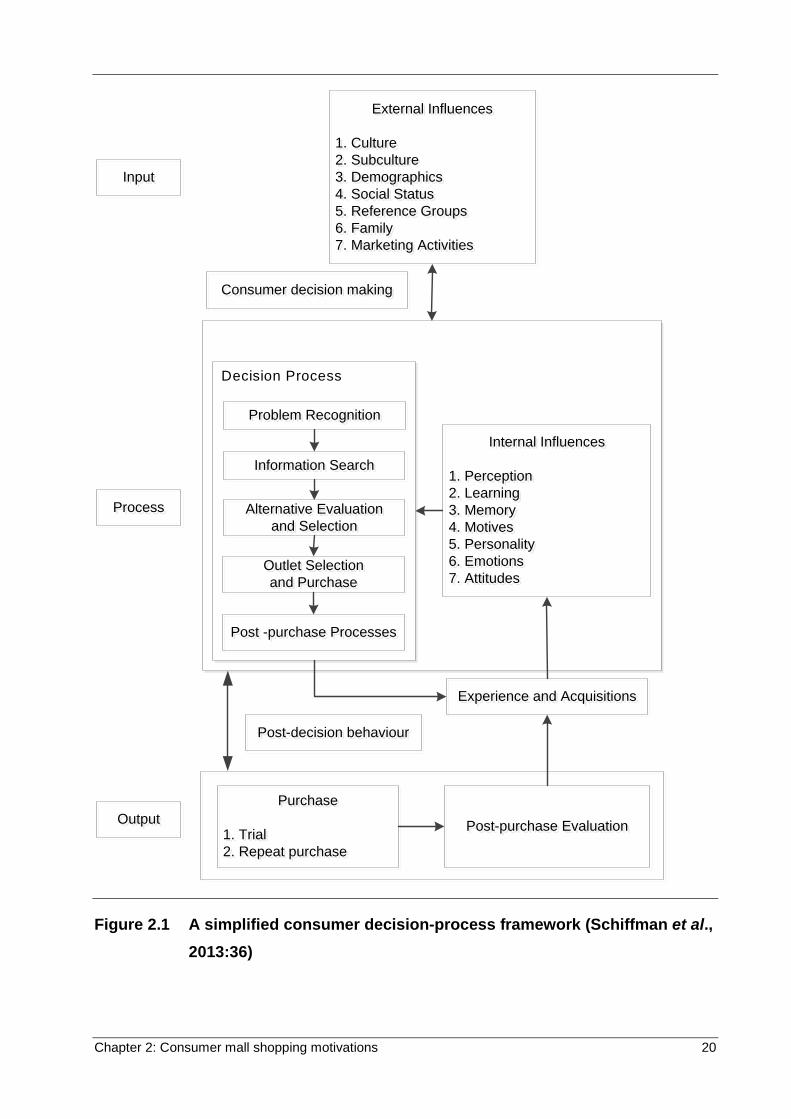
Chapter 2: Consumer mall shopping motivations 19
described as the avenues consumers explore in purchase decision-making, as well as
the influence feelings and emotions can have on consumer behaviour and decision-
making (Hoyer et al., 2013:222). Figure 2.1 illustrates a model of the consumer
decision-making process.
Chapter 2: Consumer mall shopping motivations 20
Decision Process
External Influences
1. Culture2. Subculture3. Demographics4. Social Status5. Reference Groups6. Family7. Marketing Activities
External Influences
1. Culture2. Subculture3. Demographics4. Social Status5. Reference Groups6. Family7. Marketing Activities
Consumer decision makingConsumer decision making
Problem RecognitionProblem Recognition
Internal Influences
1. Perception2. Learning3. Memory4. Motives5. Personality6. Emotions7. Attitudes
Internal Influences
1. Perception2. Learning3. Memory4. Motives5. Personality6. Emotions7. Attitudes
Experience and AcquisitionsExperience and Acquisitions
Post-decision behaviourPost-decision behaviour
Purchase
1. Trial2. Repeat purchase
Purchase
1. Trial2. Repeat purchase
Post-purchase EvaluationPost-purchase Evaluation
InputInput
ProcessProcess
OutputOutput
Information SearchInformation Search
Alternative Evaluation and Selection
Alternative Evaluation and Selection
Post -purchase ProcessesPost -purchase Processes
Outlet Selection and Purchase
Outlet Selection and Purchase
Figure 2.1 A simplified consumer decision-process framework (Schiffman et al., 2013:36)
Chapter 2: Consumer mall shopping motivations 21
As illustrated in Figure 2.1, the consumer decision-process model has three main
components, including the input stage, the process stage and the output stage. The
process component of the decision-process model is focused on the way in which
consumers make decisions. This stage starts when the consumer recognises a problem
or need. In order for a consumer to take action during the problem recognition phase,
the consumer has to acknowledge the existence of a problem or need (Schiffman &
Kanuk, 2010:484). Perreau (2013:24) concurs and states that without a recognised
need there will be no action taken by the consumer, hence problem recognition only
takes place when there is a gap between the consumer’s tangible status quo and
his/her envisioned one. According to Hawkins and Mothersbaugh (2013:493),
consumers recognise several problems or needs daily that can be addressed by
purchasing products and services.
When a consumer identifies a need that can be fulfilled by purchasing and consuming a
product, the pre-purchase search starts (Schiffman & Kanuk, 2010:485). As a result,
consumers search for information on products and services that may possibly satisfy
their needs and wants. According to Perreau (2013:27), consumers’ search for
information, will depend on the complexity of the alternatives available and the level of
consumer involvement. It is important that marketers and retailers provide relevant and
accurate information, as Hawkins and Mothersbaugh (2013:531) is of the view that the
information consumers receive about products and brands, directly influence their
purchasing decisions.
Once sufficient information has been collected, the consumer enters the third stage of
the process, namely evaluating potential alternatives (Hawkins & Mothersbaugh,
2013:543). During this stage consumers evaluate the different alternatives available, by
comparing different products, brands or services, followed by selecting the alternative
that is most suitable to satisfy their need or want (Perreau, 2013:28). Hawkins and
Mothersbaugh (2013:577) point out that, consumers select a specific retail outlet to
purchase a product of service from. The nine most important factors consumers
consider when purchasing from a particular retail outlet include the store image, product
assortment, other consumers, physical amenities, store convenience, promotional
activities, store atmosphere, store status and fulfilment of needs.
Chapter 2: Consumer mall shopping motivations 22
After the product or service offering has been purchased and used, consumers will have
a certain level of satisfaction or dissatisfaction (Lancaster & Massingham, 2011:53).
During this last phase of decision-making, referred to as post-decision behaviour, the
consumer analyses whether the product purchased suits the original need and whether
the right choice has been made by purchasing or not purchasing the product (Perreau,
2013:30).
As part of the consumer decision making process, there are certain psychological and
external factors that influence consumers’ decisions. The consumer will be swayed by
whichever influence is the most predominant (Lawrence, 2012; Perreau, 2013:27).
Parumasur and Roberts-Lombard (2012:28) describe the psychological factors, also
referred to as internal factors, influencing the consumer decision-making process as
the factors which inspire consumer behaviour, including the individual’s motivation,
perceptions, learning, personality and attitudes (Schiffman & Kanuk, 2010:37). Perreau
(2013:27) adds that psychological influences exist in the consumer’s memory and stem
from previous interactions with a product or brand, and the subsequent opinion formed
of this product or brand.
The origin of external influences on the consumer decision-making process stems from
sources noticeable from a consumer’s immediate surroundings/environment. The
external influences that direct the decision making process include the marketing efforts
from the organisation as well as factors in the consumer’s sociocultural environment,
namely family, reference groups, non-commercial information sources, social class,
culture and subculture (Joubert, 2010:130). Parumasur and Roberts-Lombard (2012:28)
as well as Perreau (2013:27) agree that consumers’ decision making processes are
influenced by the opinions of friends or family and those of other consumers, as well as
the reviews provided by the press or targeted advertising. Hawkins and Mothersbaugh
(2013:35) explain that this may be because consumers are social beings preferring to
be part of a group when external factors are at play. For this reason, consumer
behaviour takes place within a group setting (Lawrence, 2012).
The focus in this study is on aspects in the consumer’s psychological field, namely mall
shopping motivations. Hawkins and Mothersbaugh (2013:6) emphasise that, although
understanding and accurately interpreting consumers’ needs, wants and motivations is
valuable, it is challenging to marketers. As such, it is important to determine and
Chapter 2: Consumer mall shopping motivations 23
understand the factors that motivate consumers to behave in a certain way. Therefore,
in accordance with the primary objective of this study, a complete discussion on
consumer motivation follows in the subsequent section.
2.4 CONSUMER MOTIVATION
Consumer motivation is fundamental to the nature and behaviour of humans as it drives
them to action (Breytenbach, 2014:154). Given that this study is concerned with mall
shopping motivations, it is necessary to give an overview of consumer motivation. As
such, the following section will comprise a definition of motivation, followed by a
discussion of psychologist Abraham Maslow’s needs hierarchy theory of motivation,
followed by a discussion pertaining to important factors that play a role in consumer
motivation. This section also lays the foundation for shopping mall motivation to be
discussed. As such, this section concludes with an overview of consumer motives for
shopping.
2.4.1 Defining motivation
Motivation emanates from the Latin word movere, which means to move (Botha et al.,
2013:36). Forgas and Harmon-Jones (2014:4), point out that standard dictionaries
define motivation as the need to act, or a drive, whereas psychologists define motivation
as the process that stimulates, endures and controls behaviour. Webb (2010:130)
describes motivation as a dynamic energy within individuals, which necessitates action
generated by a state of pressure or stress that occurs because of an unsatisfied need.
Forgas and Harmon-Jones (2014:4) highlight that motivation is a mechanism that
directs and energises action. Webb (2010:130) as well as Hawkins and Mothersbaugh
(2013:284) concur that this dynamic energy serves as an encouraging force that drives
consumers to act and therefore influences their behaviour.
Cant (2010:23) posits that knowledge of consumers’ needs and wants is significant and
essential for the successful targeting of any market in an increasingly competitive retail
landscape. According to Webb (2010:135), there appears to be a general order of
consumer needs, which is consistent with what Maslow postulates in his hierarchy of
needs theory. To better understand and classify consumer motivation, this study
focuses on Maslow’s hierarchy of needs, since it offers macro theory designed to
encompass human behaviour in universal terms (Joubert, 2013:69), provides a useful
Chapter 2: Consumer mall shopping motivations 24
framework for marketers to segment the market (Parumasur & Roberts-Lombard,
2012:171) and helps to order consumers’ needs and motivations (Kotler, 2000:172).
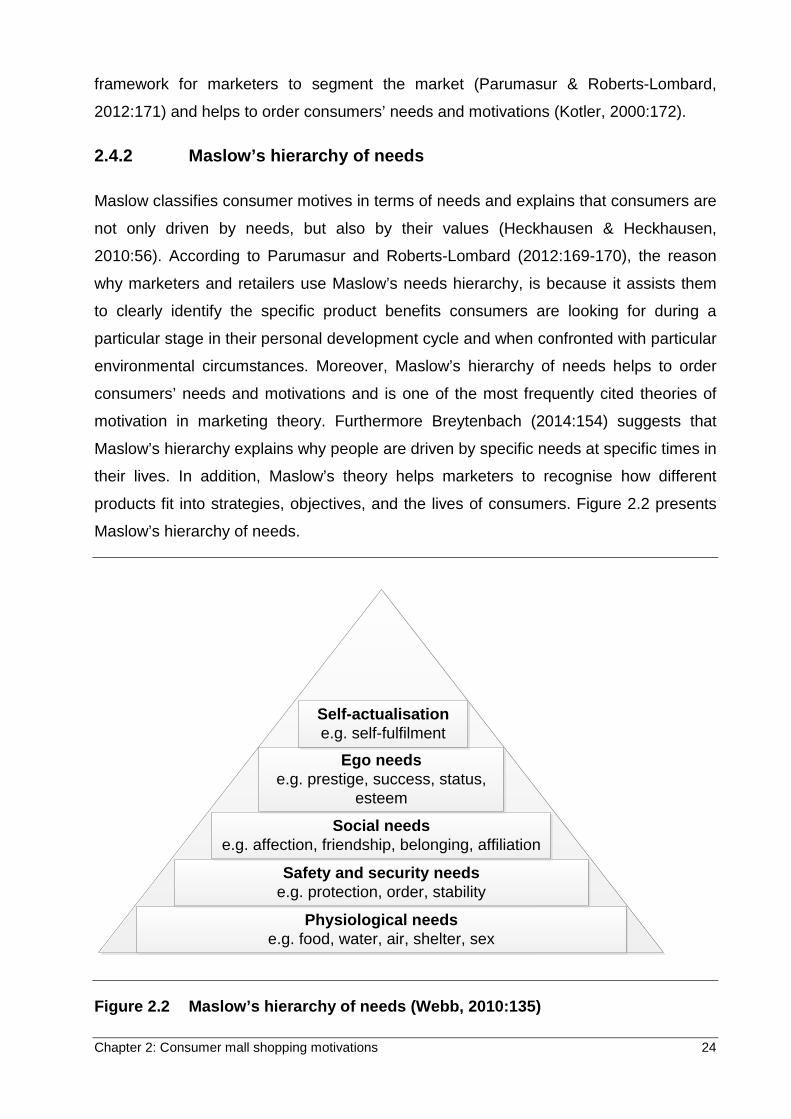
2.4.2 Maslow’s hierarchy of needs
Maslow classifies consumer motives in terms of needs and explains that consumers are
not only driven by needs, but also by their values (Heckhausen & Heckhausen,
2010:56). According to Parumasur and Roberts-Lombard (2012:169-170), the reason
why marketers and retailers use Maslow’s needs hierarchy, is because it assists them
to clearly identify the specific product benefits consumers are looking for during a
particular stage in their personal development cycle and when confronted with particular
environmental circumstances. Moreover, Maslow’s hierarchy of needs helps to order
consumers’ needs and motivations and is one of the most frequently cited theories of
motivation in marketing theory. Furthermore Breytenbach (2014:154) suggests that
Maslow’s hierarchy explains why people are driven by specific needs at specific times in
their lives. In addition, Maslow’s theory helps marketers to recognise how different
products fit into strategies, objectives, and the lives of consumers. Figure 2.2 presents
Maslow’s hierarchy of needs.
Physiological needse.g. food, water, air, shelter, sex
Safety and security needse.g. protection, order, stability
Social needse.g. affection, friendship, belonging, affiliation
Ego needse.g. prestige, success, status,
esteem
Self-actualisatione.g. self-fulfilment
Figure 2.2 Maslow’s hierarchy of needs (Webb, 2010:135)
Chapter 2: Consumer mall shopping motivations 25
According to Parumasur and Roberts-Lombard (2012:169), Maslow was one of the first
psychologists who developed a broad-spectrum structure in which specific human
motives are identified and classified. Perreau (2013:26) states that Maslow’s hierarchy
of needs is the most well-known and widely used classification structure and best
represents the myriad of human needs. Parumasur and Roberts-Lombard (2012:169)
indicate that Maslow’s hierarchy is based on inherent legacy, communal relations and
influence motives. This theory postulates that a consumer has certain basic needs that
have to be satisfied before the next category of needs can be satisfied. However,
Maslow also explicates that even if a specific set of needs was not completely satisfied,
consumers could still be motivated by the needs of a higher category. This is because
consumers are often motivated by more than one level of needs simultaneously and as
a result, they assign fluctuating rankings to their range of needs, depending on their
circumstances. In addition, Webb (2010:136) highlights that consumers may change the
urgency of satisfying a need or desire over time.
The first and most essential human needs are physiological needs. These needs have
to be satisfied in order for individuals to live and survive their daily lives, as well as to
add meaning to their environment (Breytenbach, 2014:154; Thielke et al., 2012: 475).
The need for safety and security are recognised as the second level of human needs.
These needs stem from individuals’ behaviour and do not only include physical safety,
but amongst others, order, constancy and routine (Webb, 2010:76). For example,
commercials produced by car manufacturing companies will normally emphasise the
safety and durability qualities of their products in an attempt to encourage consumers to
purchase their cars (Special report 248:81). The third level of needs is known as social
needs, or the need to belong. Consumers normally buy gifts or participate in group
activities, because they have a need to belong and be loved (Webb, 2010:76). The
fourth level of needs comprise ego needs or the need for self-esteem. Needs on this
level of the hierarchy can only be fulfilled once the social needs or the need to belong
has been satisfied (Thielke et al., 2012:473). The need for self-acceptance,
independence and personal fulfilment are inwardly focused, whereas the need for
respect, status, position and acknowledgement from others are outwardly focused
(Perreau, 2013:16). The need for self-actualisation is the fifth and highest level on
Maslow’s hierarchy of needs. These higher-order needs refer to the need to give back
to society, relating to fulfilling one’s full potential in life (Botha et al., 2013:37).
Chapter 2: Consumer mall shopping motivations 26
While motivation is based on various theories, such as indicated in Maslow’s hierarchy
of needs, other elements play a role in the motivation of the consumer (Oliver,
2015:143). Therefore, a discussion on specific factors that may influence consumer
motivation follows.
2.4.3 Important factors in consumer motivation
Various factors may influence a consumer’s motivation, including individual differences,
rational and emotional motives, intrinsic and extrinsic motives, conscious and
unconscious motives, and positive and negative motives (Botha et al., 2013:47).
• Individual differences
Consumers are different as they have different personalities, values and demographics,
which influence their behaviour (Vainikka, 2015:21). As a result, consumers interpret
promotional activities differently based on their personal needs, desires, experiences
and expectations (Hawkins & Mothersbaugh, 2013:163). For the purpose of market
segmentation and understanding consumers’ behaviour, marketers and retailers need
to have a sound understanding of consumers’ individual characteristics (Vainikka,
2015:14).
• Rational versus emotional motives
According to Schiffman et al. (2013:82), when a consumer makes a final buying
decision, he/she is influenced by two types of motives, namely rational and emotional
buying motives. The rational motivational approach is when the consumer’s decision is
based on the objective criteria such as the product’s weight, price, profit, health and
security (Mouna & El Asbi, 2013). In contrast, the emotional motivation approach
focuses on subjective criteria (Mouna et al., 2013) when the consumer selects a product
based on emotions such as pride, fear, happiness, desire for individuality, affection,
status and vanity (Schiffman et al., 2013:82). In order to appeal to consumers’ rational
motives, marketers and retailers should focus on emphasising the product’s quality and
price. In order to appeal to consumers’ emotions, marketers may use a variety of
techniques such as giving attention to the tone, lighting, colour scheme, of for instance
a shopping mall (Misonzhnik, 2007).
Chapter 2: Consumer mall shopping motivations 27
• Intrinsic and extrinsic motives
Extrinsic motivation and intrinsic motivation are both important drivers of consumer
behaviour. Motivation may arise from either inside (intrinsic) or outside (extrinsic) the
individual (Botha et al., 2013:46). Intrinsic motivation implies being engaged in a specific
behaviour because it is personally rewarding, while extrinsic motivation occurs when
motivation to perform a particular behaviour happens to receive a reward or to avoid
punishment (Cherry, 2016). The internal influences that influence consumer behaviour
comprise an individual’s perception, learning, memory, motives, personality, emotions
and attitudes (Hawkins & Mothersbaugh, 2013, 274-275). According to (Webb et al.,
2013:60), it is more sustainable to target intrinsically motivated behaviour, as
consumers experiencing the pleasure of involvement with an activity ensures longer
interest and participation in the activity compared to extrinsically motivated behaviour.
• Conscious and unconscious motives
While consumers may be conscious of certain needs, they also may be completely
oblivious to other needs (Botha et al., 2013:47). Miller (2010) concurs, stating that, while
consumers’ behaviour is motivated by conscious motives, the power of their
unconscious motives may drive them to ignore their conscious motives. For example, a
consumer visits the mall to purchase stationery at the bookshop, but after seeing a
display of reading books, which triggered his or her unconscious need to relax, is
prompted to buy a book. In order to appeal to consumers’ conscious and unconscious
motives, marketers and retailers should create products and brands that fulfil
consumers’ needs, as well as make use of marketing phenomena, such as promotional
themes, displays and images to influence consumers’ behaviour (Chebat et al.,
2010:735).
• Positive and negative motives
Huzefa (2009) opines that a motivation can influence a consumer to act in a positive or
negative manner. Consumers may sense a strong positive driving force towards an
object or state, or a strong negative driving force away from an object or state.
According to PsychMechanics (2016), a consumer is positively motivated to perform an
activity when a reward is expected. The expectation of receiving a reward is what drives
the consumer to act positively. In contrast, negative motivation is the driving force that
Chapter 2: Consumer mall shopping motivations 28
motivates a consumer to avoid an activity, as it may have negative consequences. In
order to appeal to consumers’ positive motives, directing them towards the products or
service, marketers and retailers should accentuate the positive aspect of a product or
service (Botha et al., 2013:47).
2.4.4 Consumer motives for shopping
Ghani (2011:2) views shopping as an everyday activity that entails consumers’ need to
socialise. Shopping involves various senses, including sight, smell, taste, touch and
hearing. These senses form the foundation for selecting or declining specific brands,
products, and, more generally, retail environments (Ahmed et al., 2007:332; Apparel,
2014). In addition, shopping is not only about responsibility and about action, but also
relates to disposal and pleasure (Sadeghi & Bijandi, 2011:566). Ghani and Hamid
(2011:2) conclude that shopping is an everyday activity, which amongst others,
concerns social relations (Ghani & Hamid, 2011:2).
A consumer’s motivation to shop is the force that drives him/her to purchase products or
services (Jamal et al., 2006; Patney, 2010:12). Wagner and Rudolph (2010:415)
indicate that marketing scholars do not agree about the definition of shopping
motivation.
Prior to the 1950s, studies of consumers’ motivations for shopping mainly focused on
consumers’ needs for actual products and the reasons for preferring one store over the
other (Angell et al., 2012:259). However, since the 1950s, shopping motivation research
has aimed at understanding consumers’ motivations behind the act of shopping (Mikalef
et al., 2013:19). One of the first works in this field was developed by Stone (1954), who
analysed urban consumers’ shopping orientations and their social relationships. Stone
(1954) carried out in-depth interviews to collect information from a sample of
department store female shoppers to identify shopper categories (Angell et al.,
2012:260). Two decades later, Tauber (1972) makes a notable departure from previous
studies seeking to understand shopper preferences by focusing on the reason why
people shop, rather than simply to assume the need for a product as the only reason for
shopping (Wong et al., 2012:241). From this seminal work on shopping motivations of
Tauber (1972), various reasons other than buying have been identified, which can be
divided into two categories, namely personal motives and social motives for shopping
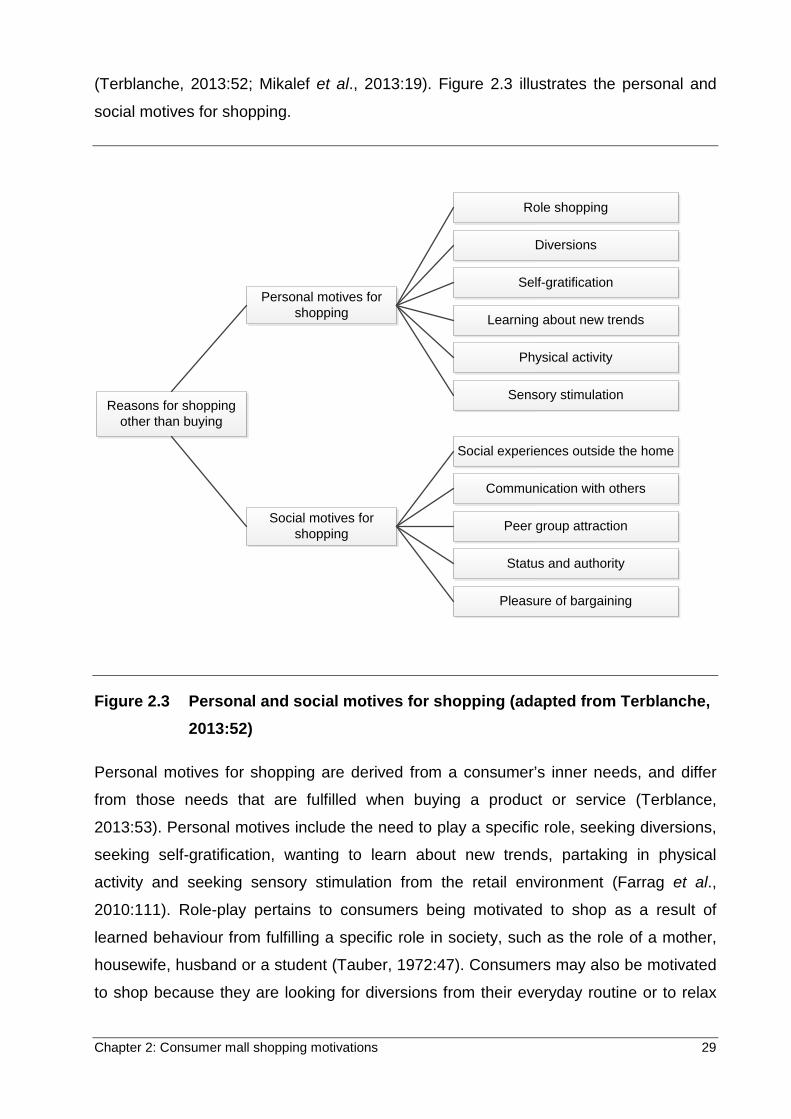
Chapter 2: Consumer mall shopping motivations 29
(Terblanche, 2013:52; Mikalef et al., 2013:19). Figure 2.3 illustrates the personal and
social motives for shopping.
Role shopping
Diversions
Self-gratification
Learning about new trends
Physical activity
Sensory stimulation
Social experiences outside the home
Communication with others
Peer group attraction
Status and authority
Pleasure of bargaining
Social motives for shopping
Personal motives for shopping
Reasons for shopping other than buying
Figure 2.3 Personal and social motives for shopping (adapted from Terblanche, 2013:52)
Personal motives for shopping are derived from a consumer’s inner needs, and differ
from those needs that are fulfilled when buying a product or service (Terblance,
2013:53). Personal motives include the need to play a specific role, seeking diversions,
seeking self-gratification, wanting to learn about new trends, partaking in physical
activity and seeking sensory stimulation from the retail environment (Farrag et al.,
2010:111). Role-play pertains to consumers being motivated to shop as a result of
learned behaviour from fulfilling a specific role in society, such as the role of a mother,
housewife, husband or a student (Tauber, 1972:47). Consumers may also be motivated
to shop because they are looking for diversions from their everyday routine or to relax
Chapter 2: Consumer mall shopping motivations 30
and get away from it all (Terblanche, 2013:54). Another motivation to shop is the
consumer’s need for self-gratification, which is concerned with the consumer’s need to
alleviate emotional stress (Terblanche, 2013:53), loneliness or boredom (Chebat, et al.,
2014:77). Learning relates to the consumer’s need to be knowledgeable about current
fashion and trends and to get ideas (Terblanche, 2013:53). Consumers may also be
motivated to shop as an opportunity to walk for exercise (Scharoun, 2012:84). Seeking
sensory stimulation from the retail environment is the sensory impetus that makes
shopping more attractive, relating to the consumer’s need to have physical interaction
with the products and shopping environment, such as through light, colours and
fragrances (Hawkins & Mothersbaugh (2013:590).
According to Cardoso and Pinto (2010:540), consumers are motivated to go shopping to
interact socially with friends outside their residence or to meet new people. Social
motives for shopping include the consumer’s desire to interact with other individuals or
groups, such as social interaction outside the residence, communicating with others,
socialising with peer groups, fulfilling status and authority needs, the pleasure of
bargaining and negotiation (Hawkins & Mothersbaugh, 2013:590). Consumers may be
motivated to shop to gain social experiences away from their home, such as meeting
with friends or observing other shoppers (Hemalatha et al., 2009:176). Consumers may
also be motivated to shop because they want to spend time communicating with others
who share similar interests, such as a hobby or a sport (Cardoso & Pinto, 2010:540).
Socialising with peers pertains to consumer’s needs to shop, to spend time with
reference groups, such as teenagers spending time at a Cinema (Sit, 2003:303).
Fulfilling status and authority needs relates to the consumer’s need to have a sense of
being assisted or served by the store employees (Chang et al., 2006:936). The pleasure
of bargaining and negotiation pertains to the consumer’s psychological and personal
needs, which are derived from shopping around to obtain the best deal (Tiwari &
Abraham, 2010:11).
A background pertaining to consumer behaviour, consumer motivation and consumer
motives for shopping was provided in this section. The following section provides
insights into the possible motives for consumers to shop at a mall.
Chapter 2: Consumer mall shopping motivations 31
2.5 POSSIBLE MOTIVES FOR MALL SHOPPING
Several factors influence consumer behaviour in that they shape consumer decision
making, and subsequently, motivation to shop at a mall. For the purpose of this study,
shopping mall motivations include aesthetics, escape, diversion, flow, exploration, role
enactment, the social dimension and convenience. The following sections comprise a
discussion of each of these motives in order to gain insight into how it affects mall
shopping behaviour.
2.5.1 Aesthetics stimulation
Mall aesthetics, also known as atmospherics, refers to the overall ambience of the mall
as seen by visitors; that is, whether consumers perceive the mall as depressing or
cheerful, uninteresting or attractive (Ahmed et al., 2006:335). Various authors
(Breytenbach, 2014:29; Chithralega, 2016:1460; Chebat et al., 2010:739) agree that the
atmosphere of a mall has a significant impact on mall shoppers’ behaviour and
customer satisfaction. According to Hong Yu et al. (2008:458), consumers who are
motivated by the aesthetic features of a shopping mall value all the physical aspects of
the mall, such as the ambience of the mall and the mall’s environment, including the
lighting, music played, displays and colours used. Other aesthetic features that might
influence consumers’ mall shopping motivation include sounds, such as noisiness or
soft background music, as well as scents (Tauber, 1972:47). Chithralega (2016:1460)
adds that the physical aspects of a mall also include the air conditioning, toilets, layout,
aisle placement and width, floor cover and architecture. The seminal work done by
Tauber (1972:47) reports that atmospheric features are likely to have a positive
influence on those consumers’ shopping behaviour. A mall with excellent atmospherics
will motivate shoppers to stay longer, extend the amount of time they shop, and entice
visitors to visit the mall for leisure, social, and community activities (El Hedhli et al.,
2013:858). In order for shopping mall managers and marketers to differentiate
themselves from other malls, and to influence consumers’ motivation to shop, attention
should be given to the malls’ aesthetic design. By defining the role of the shopping
mall’s environment in the strategic goals, the planned atmosphere can be developed to
augment the shopping mall’s image and to distinguish it from those of competitors
(Ahmed et al., 2007:335).
Chapter 2: Consumer mall shopping motivations 32
2.5.2 Escape activity
From the seminal work of Tauber (1995:59), it is evedent that consumers find shopping
to be fun, exciting and a means to escape from their problems and be relieved from
stress. Terblanche (2013:53) concurs that consumers visit shopping malls to alleviate
emotional stress and to relax. According to Ahmed et al. (2007:336), mall shopping is a
form of recreation as it offers the consumer something to do when he/she is bored and
lonely. Moreover, Ghee and Ahmad (2010:16) report that shopping malls have a
positive effect on a consumer’s mood. The shopping mall environment offers consumers
an opportunity to relax by experiencing high levels of sensory stimulation including
seeing different products such as clothes and jewellery, smelling different products such
as bread from the bakery, and hearing music and other people talking (Anning-Dorson
et al., 2013:370). In addition, visitors to a shopping mall can enjoy low cost family
entertainment, browsing as well as interacting with and observing other people (Ahmed
et al., 2006:336; Tauber, 1972:47). Ahmed et al. (2007:336) further explain that visiting
a mall not only provides for family entertainment but also offers budget entertainment,
as shopping malls offer free entry. In order to appeal to consumers searching for a
means to escape from their stress and to relax, shopping mall marketers and managers
should therefore enhance the entertainment aspects of the mall.
2.5.3 Searching for diversion
Diversion refers to consumers visiting a mall to get away from their daily life routine (To
& Sung, 2014:2223). A shopping excursion can offer a consumer the chance of
diversion away from the routine of daily life and, as such, is a form of recreation
(Budisantoso, 2006:21). Tiwari and Abraham (2010:14 explain that shopping malls give
consumers a sense of relief from their habitual routine of work and personal
responsibilities, due to their exciting, extravagant and stylish shopping environment.
Arnold and Reynolds (2012:399) report that consumers who are motivated to shop
because of their need for diversion seek out opportunities to avoid undesirable
situations, such as bad weather and traffic congestion. As such, Anning-Dorson et al.
(2013:370) opine that shopping malls offer visitors with a need for diversion, an
opportunity to abscond from their hectic daily life and seek much needed solace, such
as being away from work and congested traffic. Telci (2013:2521) concurs and states
that shopping malls offer consumers who are in need of diversion and an opportunity to
Chapter 2: Consumer mall shopping motivations 33
break free from their daily routine. Therefore, shopping mall marketers and managers
are positioned to offer mall shoppers a unique experience to escape from daily life, if
only briefly (Arnold & Reynolds, 2012:399).
2.5.4 Preference for flow
Bloch et al. (1994:34) define flow as a rare and desirable state, where a consumer loses
sense of time because of the pleasurable state of absorption he/she experiences while
doing an activity. Ahmed et al. (2007:336) explain that flow pertains to the consumer
being completely focused and involved in a specific activity, such as shopping (Ahmed
et al., 2007:336). The main characteristic of flow is a sense of spontaneous pleasure,
even euphoria, while doing a task. Flow has been defined as an ideal psychological
state achieved while engaging in an activity, such as participating in a sport, writing,
working, playing a game, and practising a hobby (Novak et al., 2000). Consumers who
are motivated by the flow dimension will browse or wander through shopping malls
(Tauber, 1995:59). Marketers and mall management are encouraged to create a
shopping experience that will make consumers feel welcome and happy to be in the
mall. Ahmed et al. (2007:336) compare a consumers’ state of mind when in a shopping
mall as similar to being for example in a Las Vegas themed casino which is famous for
their elaborate décor and displays where visitors become unaware of cues such as the
time and weather. Thus, one may think that the achievement of flow whilst in a shopping
mall may persuade and encourage visitors to stay longer (Tiwari & Abraham, 2010:15).
Therefore, shopping mall marketers and managers should offer mall visitors a pleasant,
attractive and entertaining environment to ensure a desirable state of mind, thereby
enticing visitors to spend more time in the mall, such as cinema theatres, restaurants,
game arcades and exhibitions (Khare, 2011:111).
2.5.5 Desire for exploration
Consumers are constantly looking for new and improved products. This desire for
seeking and learning about new fashions, trends and technology, can only be met by
exploring what is currently available on the market (Ahmed, 2007:336; Anning-Dorson
et al., 2013:370; Kaufman & Lane, 1996:11). The seminal work of Tauber (1972)
revealed that consumers are attracted to shopping malls because of the opportunity to
learn about new fashion and trends; hence, to explore. According to Hemalatha and
Ravichandran (2009:176), mall shopping offers consumers a unique opportunity to
Chapter 2: Consumer mall shopping motivations 34
explore new trends and improved products, as they provide consumers with a sense of
entering a different universe of exciting sights, smells, and sounds which motivate them
to explore. Tiwari & Abraham (2010:15) opine that consumers who visit shopping malls
to explore are likely to make a purchase. El-Adly (2007:946) explains that because of
this exploring in search of possible new fashion, trends and technology, certain
shoppers, especially trend setters, are likely to purchase new items. In light of this,
shopping mall management and marketers are advised to create a pleasant shopping
experience for those consumers wanting to explore, touch, smell, and hear new things.
Therefore, in order to meet the needs of different types of consumers, it is essential that
shopping mall marketers and managers should offer visitors a variety of store, product
and service options for an enhanced mall experience (Kaufmann & Lane, 1996:9;
Ahmed et al., 2007:336).
2.5.6 Role enactment
Consumers often partake in activities that they consider essential to their roles in life
(Sadeh & Samadi, 2014:328). According to Ahmed et al. (2007:337), many consumer
activities are learned behaviours that are usually anticipated or recognised by a specific
role in society. A consumer internalises these behaviours as necessary, which
motivates them to take part in the required activities. Khare (2011:111) opines that this
role a consumer has to play in society influences his/her shopping motives. For
example, it is expected by Malaysian society that the homemaker has to do the food
shopping (Ahmed et al., 2007:337). Karande and Merchant (2012:60) explain that
consumers who feel they have to enact a role engage in shopping because they need to
purchase products and services to fulfil this role; therefore have little or no inherent
satisfaction from the shopping activity itself. Therefore, while many consumers enjoy
shopping for other people and enjoy the positive feelings they experience from finding
the perfect gift for someone (Arnold & Reynolds, 2003:81), various consumers visit
malls because they are propelled by motives for enacting social roles (Khare,
2011:111). As such, shopping mall marketers and managers should cater for different
kinds of consumers who visit the mall for different reasons, such as offering price
bargaining and sales.
Chapter 2: Consumer mall shopping motivations 35
2.5.7 Social interaction
Shopping at a mall provides consumers the opportunity to socialise with friends, peer
groups or new acquaintances as well as to communicate with people who have similar
interests and hobbies (Tauber, 1995:59; Green, 2001:xi). Karande and Merchant
(2012:63) concur that some consumers like to look at and meet other people while
shopping, and find delight in being part of a crowd. Furthermore, Hemalatha et al.
(2009:176) found that consumers enjoy purchasing gifts for friends and family members,
and in doing so, fulfil a social need. Shopping excursions commonly end in planned or
unplanned encounters with friends. Hence, the social benefit of connection with other
people makes shopping malls an appealing place to visit for leisure purposes. Malls
offer visitors various recreational options, such as going to the theatre, eating at
restaurants and playing games. In addition, since shopping malls offer free entry for
visitors, they provide affordable entertainment facilities for families (Ahmed et al.,
2007:337). Therefore, Zhuang et al. (2005:39) highlight that shopping mall marketers
and managers can extend social shoppers’ visiting time at a mall by providing a wide
variety of entertainment facilities.
2.5.8 Shopping convenience
A key motivation for rather shopping at a mall than at alternative outlets is the
convenience if offers consumers, namely saving time, energy and travelling costs to
travel to different stores (Breytenbach, 2014:191). In addition, mall shopping also offers
the consumer the convenience of selecting and evaluating between different product-
assortments available in one location. Moreover, in response to changing consumer
needs, shopping malls offer one-stop shopping convenience with the inclusion of
service outlets and entertainment facilities, such as food courts, restaurants, game
arcades, movie theatres and hair salons (Ahmed et al., 2007:334). As such, to attract
consumers who are motivated to shop at a shopping mall for convenience, shopping
mall marketers and managers should focus their marketing strategies on promoting
one-stop shopping, easy access and sufficient parking (Tiwari & Abraham 2010:14).
Lloyd et al. (2014:36) suggest that shopping mall developers and management should
cluster similar or complementary product category stores together and install moving
walkways and escalators to save consumers even more time and effort.
Chapter 2: Consumer mall shopping motivations 36
Evidence from the literature suggests that the location of a shopping mall is essential in
shopping mall preference, as consumers wish to shop as near as possible to their place
of residence in order to save travelling time as many consumers are pressured for time
due to busy lifestyles and schedules (Loudon & Bitta, 1993; Grewal et al., 2012:443). As
such, convenience is essential, especially for those consumers who do not like to shop,
and prefer to make few mall visits and few purchases (Loudon and Bitta, 1993). Anti-
shoppers see shopping as demanding and, therefore, consider it a chore to be
completed as quickly as possible (Ahmed et al., 2007:338). Shopping mall marketers
and managers offering a convenient, climate controlled indoor shopping environment
away from extreme weather conditions, will motivate consumers to shop at a mall
compared to alternative shopping environments (Beals, 2011). In addition, convenient
shopping hours could influence consumers’ perception about the attractiveness of a
shopping mall (Breytenbach, 2014:193)
2.6 GENERATION Y COHORT
There are five main generational cohorts alive today, including the seniors, the Baby
Boomers, Generation X, Generation Y, Generation Z and one currently unnamed
generation (Schroer, 2015). The focus of this study is on the second youngest of the
four generational cohorts, namely Generation Y. While researchers do not agree on the
beginning and end dates of the Generation Y cohort. Eastman and Liu (2012:94) as well
as Markert, (2004:21) classify the youth of today as Generation Y and define them as
those individuals born between 1986 and 2005. Hence, in 2016, the Generation Y
members include those aged between 12 and 31 years old, and in marketing terms, is
known as the largest consumer segment in the world (Foscht et al., 2009:223, Fry,
2015). Previously published studies (Cui et al., 2003; Kumar & Lim, 2008) define tertiary
Generation Y students as those individuals aged between 18 and 24 years.
Generation Y individuals have grown up in a period of economic growth, social media
and reality television; of adopting modernist values, supported by internationalisation
and the strong influences from different cultures (Parment, 2013:3). Compared to
previous generations, Generation Y members have adjusted to a culture of materialism
and consumption due to the influence of television and technological innovations
(Nordenståhl & Viklund, 2013:14). Generation Y consumers are very specific about
what they want and need, tolerant and open-minded to new-ideas, early-adopters,
Chapter 2: Consumer mall shopping motivations 37
trend-setters and aim at upholding high living standards. As self-proclaimed citizens of a
global community, they are driven to make significant changes to make the world a
better place to live (Yarrow & O’Donnell, 2009:xi). Furthermore, compared to previous
generations, members of this cohort strive to think and do things differently and do not
settle for a one size-fits-all solution to a problem. They are susceptible to new ideas and
use new products easier (Webb, 2010:189).
Compared to previous generations, Generation Y individuals are more media savvy
(Webb, 2010:178). Growing up in the digitally-connected world of the internet, mobile
technology and social networking sites such as Facebook, Twitter and Instagram, they
are continuously engaged in communicating and searching for information (Acquino,
2012), and as a result thereof marketers find it challenging to keep their attention
(Webb, 2010:178). This unlimited access to information has made this generation
extremely demanding and questioning (Aquino, 2012). Moreover, Madden (2011:4)
opines that members of the cohort have become increasingly more sceptical of
marketing efforts and have very little trust in both advertisements and salespeople.
Even so, they are known as the “instant gratification” generation (Webb, 2010:189) due
to being raised in a consumption-driven society (Noble et al., 2009:617), where product
and retail outlet choices are in abundance (Foscht et al., 2009:219). Furthermore,
members of this generation were brought up in a time of dual-income households and
learnt to shop and make brand choices from an early age, hence making them salient to
marketers (Muller, 2011:25). However, Noble et al. (2009:618) denote that even though
Generation Y is a large consumer group and an important market segment, this group’s
motivation for consumption and support is still undiscovered; hence they keep the
attention of marketers that are interested in gaining a deeper understanding about them
(Webb, 2010:189). Muller (2011:24) agrees that marketers strive to understand how to
attract and retain this prominent group’s attention.
According to Yarrow and O’Donnell (2009:xii), Generation Y consumers are
characterised as high spenders and influential pacesetters in a progressively youth and
technology-focused society. As a lucrative and growing market segment (Yarrow &
O’Donnell, 2009:xi; Nordenståhl & Viklund, 2013:8) with ample time and sufficient
money to spend, they like to indulge in luxury products such as technology, holidays,
exclusive fashion brands, and to socialise (Webb, 2010:189). According to Shim et al.
(2011:290), Generation Y consumers visit shopping malls on a regular basis where they
Chapter 2: Consumer mall shopping motivations 38
spend a significant amount of time and money. As such, their impact on shopping is
prevalent worldwide. Lachman and Brett (2013:11) posit that Generation Y members
enjoy and frequently visit shopping malls looking for the latest trends, new sensory
experiences and entertainment.
As indicated in Chapter 1, in South Africa, the Generation Y cohort accounted for
approximately 37 percent of South Africa’s population of 55.91 million in 2016, where
the black African segment of this cohort currently accounts for 84 percent of the total
Generation Y cohort (Statistics South Africa, 2016). The significant size of South
Africa’s black Generation Y cohort makes them salient to marketers, including shopping
mall marketers and managers. Those with a tertiary qualification are likely to play a
significant trend-setting role amongst the wider black Generation Y cohort (Bevan-Dye
et al., 2009:174). This is because tertiary education is associated with a high earning
potential and a higher social standing in the community (Schwalbe, 2009). As such,
understanding black Generation Y students’ mall shopping motivations will have
important implications on guiding the development of specific targeting and positioning
strategies for this specific target market.
2.7 SYNOPSIS
The purpose of this chapter was to lay the theoretical foundation of the study in
accordance with the theoretical objectives formulated in Chapter 1. As such, this
chapter provided a discussion pertaining to the overview of shopping malls. An
introduction to consumer behaviour was given and the dynamics of consumer behaviour
were deliberated on. Consumer motivation, referring to Maslow’s hierarchy of needs,
and important factors in consumer motivation and motives for shopping were discussed.
Possible motives for mall shopping were evaluated. The chapter concluded with a
discussion pertaining to the Generation Y cohort.
Chapter 3: Research methodology 39
CHAPTER 3 RESEARCH METHODOLOGY
3.1 INTRODUCTION
Marketing research is the documenting, gathering, investigating, distributing and using
of information. As an analytical and objective process, marketing research assists
marketers and managers in recognising problems or opportunities in the market and are
therefore essential (Malhotra, 2010:39). The previous chapter, Chapter 2, presented a
literature review on consumer decision making, consumer motivation, mall shopping
motivations and the characteristics of the Generation Y cohort. The purpose of this
chapter is to discuss the research methodology followed in this study.
As stated in Chapter 1, the primary objective of this study was to determine black
Generation Y students’ mall shopping motivations. This primary objective was then
deconstructed into nine empirical objectives (refer to Section 1.3.3), which directed the
collection of the following data:
• Black Generation Y students’ preference for aesthetic stimulation as a mall shopping
motivation.
• Black Generation Y students’ desire for escape activity as a mall shopping
motivation.
• Black Generation Y students’ need for diversion as a mall shopping motivation.
• Black Generation Y students’ preference for flow as a mall shopping motivation.
• Black Generation Y students’ desire for exploration as a mall shopping motivation.
• Black Generation Y students’ drive to enact a role as a mall shopping motivation.
• Black Generation Y students’ desire for social interaction, as a mall shopping
motivation.
• Black Generation Y students’ desire for shopping convenience as a mall shopping
motivation.
• The difference between different age groups of black Generation Y students’ mall
shopping motivations (aesthetic, escape, diversion, flow, exploration, role
enactment, social, convenience).
Chapter 3: Research methodology 40
The purpose of this chapter, Chapter 3, is to describe the research methodology
followed in collecting and analysing the data for the empirical part of this study, which is
divided into nine sections. The first section, Section 3.2, describes the research design
process for the study. Section 3.3 describes the research approach followed in this
study. The sampling strategy is discussed in Section 3.4. Section 3.5 describes the data
collection method, comprising the questionnaire design, question format and the
questionnaire layout. In Section 3.6, the pre-testing and the pilot testing of the
questionnaire used for this study are described. Section 3.7 provides an overview of the
operational procedures by which the questionnaire was administered. The preliminary
data analysis, also known as data preparation, is outlined in Section 3.8. In the last
section, Section 3.9, the statistical analysis techniques applied in this study, specifically
the reliability and validity analysis, descriptive analysis and tests of significance, are
explained.
In the next section, Section 3.2, the research design is described.
3.2 RESEARCH DESIGN
In order to address the research objectives and hypothesis, a well-structured plan, a
research design, is essential (Cohen et al., 2011:118). The selection of the appropriate
research design is directed by the research objective and information requirements of
the study (Phophalia, 2010:15). There are three types of marketing research designs,
including exploratory-, causal- and descriptive research (Sarstedt & Mooi, 2014:14).
An exploratory research design is used to acquire insights and ideas on research
problems (Iacobucci & Churchill, 2010:60) as well as to develop questions and
hypotheses for more specific investigation (Sahu, 2013:27). This type of research
requires information that is characterised as loose, flexible and unstructured. The
methods used to conduct exploratory research involve secondary data analysis, expert
surveys, pilot studies and case studies (Cohen et al., 2011:131-134). Causal research is
a research design used to explore cause-and-effect relationships established among
multiple variables. The purpose of causal research is to assess, by means of
experiments, the extent to which one or more variables result in a change in other
variables, including evaluating the association among the causal variables and the
effect (Malhotra, 2010:113).
Chapter 3: Research methodology 41
Descriptive research is a form of conclusive research that is used to measure a
marketing phenomenon and provide answers to questions on who, what, when, where
and how, as well as to project a study’s outcome to a larger population sample (Burns &
Bush, 2014:103). Sahu (2013:27) states that this type of research is used to define the
characteristics and behaviour of a population. According to (Phophalia, 2010:16),
descriptive research is an effort to describe rather than explain a market situation,
problem, occurrence, attitudes, beliefs and opinions. This research design can be
further divided into two categories, namely longitudinal and cross-sectional research
designs (Iacobucci & Churchill, 2010:86). Longitudinal research designs are
investigations encompassing the repeated collection of data of the same sample of
participants over a specific period of time (Babbie & Mouton, 2009:92-93). In contrast,
cross-sectional research designs pertain to collecting data from a single sample of the
population only once (Burns & Bush, 2014:103). A cross-sectional research design can
be divided further into multiple cross-sectional design and single cross-sectional design.
While in a multiple cross-sectional design data are collected from two or more samples
of participants, in a single cross-sectional design data are collected from a single
sample of participants only once (Malhotra, 2010:103).
In this study, a descriptive research design was adopted, as this study sought to
determine the mall shopping motivations that drive black Generation Y students to visit
malls. A single cross-sectional approach was used, as advised by Malhotra (2010:108),
as the information was attained once from only one sample. A discussion on the
research approach used in this study follows in the next section.
3.3 RESEARCH APPROACH
Quantitative and qualitative research are two basic research approaches that may be
used for collecting primary data in a research study (Mackey & Gass, 2016:4).
Qualitative research attempts to uncover the participants’ underlying motivations and is
associated with exploratory research designs (Zikmund et al., 2013:97). The objective is
to unfold and comprehend the participant’s experience of a particular occurrence or
incident (Babbie & Mouton, 2009:53). Sahu (2013:6) agrees that the aim of a qualitative
research design is to analyse the participants experience in order to gain greater
understanding of their thoughts, motivations and feelings.
Chapter 3: Research methodology 42
In contrast to qualitative research, quantitative research uses numerical data to
understand the relationships amongst variables. Therefore, the nature of quantitative
studies is commonly associated with descriptive and causal research designs, either
descriptive or experimental, comprising a large number of participants (Burns & Bush,
2014:146), and data are gathered by means of formal instruments such as
questionnaires (Cohen et al., 2011:377)
As this research lends itself to statistical analysis of large number of representative
cases, for the purpose of this study, a quantitative research approach was chosen. The
sampling strategy is described in the section that follows.
3.4 SAMPLING STRATEGY
The sampling strategy refers to the process pursued in carrying out the sample design
and sample methods (Terre Blanche et al., 2011:85). According to Sarstedt and Mooi
(2014:38), sampling pertains to the process of selecting a set of elements or objects
possessing the specific characteristics or information needed for the marketing research
problem. The size of the sample and the technique that is used to select the sample is
referred to as the sampling strategy; hence, encompassing all the decisions relating to
the sample design (Malhotra, 2010:375). The information that is needed can be
collected from a census or a sample (Hair et al., 2010:38). While in the case of a
census, data are collected from all the elements within the population, with a sample,
only a particular segment of the elements within the population is selected to participate
in the research study (Malhotra, 2010:370). In contrast to a sample, a census can be
time-consuming and very costly (Iacobucci & Churchill, 2010:282), therefore, it is not
always feasible to conduct (Wiid & Diggines, 2015:182). Cohen et al. (2011:151)
concur, and advise making use of a sample of the population of interest.
The following sub-sections outline the sampling strategy employed to select the sample
for this study, which includes a discussion of the target population, the sample frame,
the sample methods and the sample size.
3.4.1 Target population
The sampling process starts with defining the target population (McDaniel & Gates,
2007:380). Hair et al. (2010:129) indicate that the target population includes the total
group of elements or objects, such as individuals, who have similar characteristics,
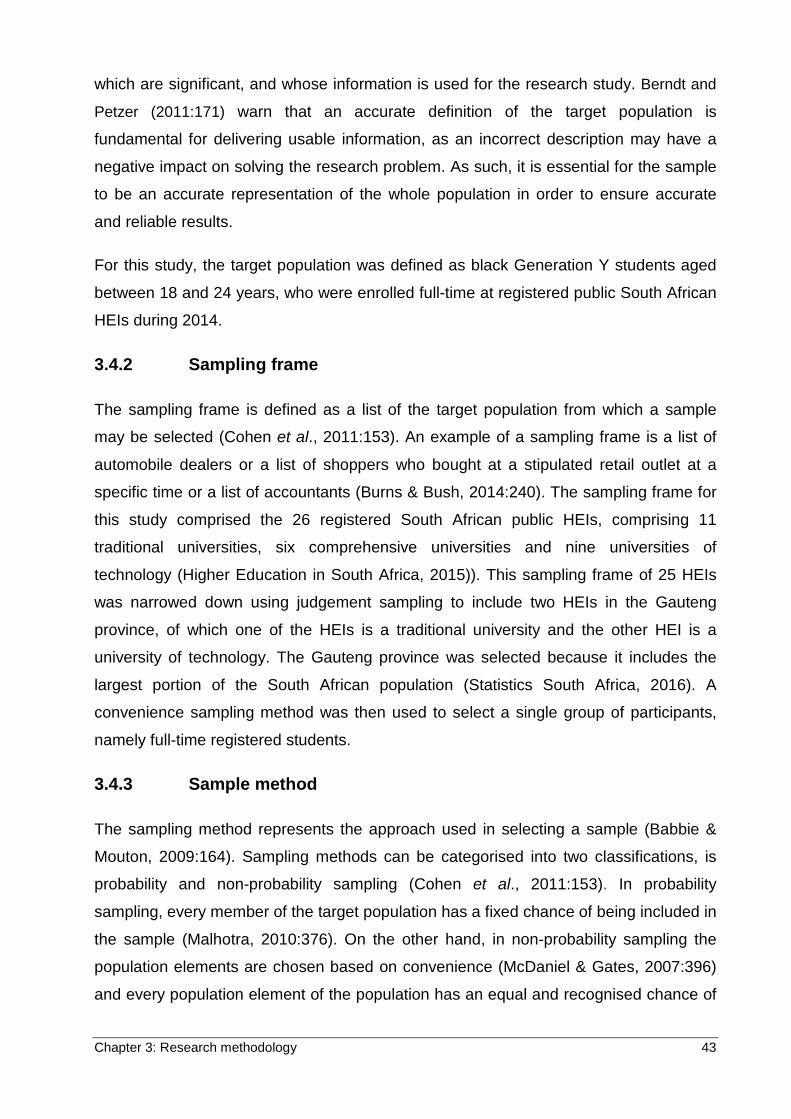
Chapter 3: Research methodology 43
which are significant, and whose information is used for the research study. Berndt and
Petzer (2011:171) warn that an accurate definition of the target population is
fundamental for delivering usable information, as an incorrect description may have a
negative impact on solving the research problem. As such, it is essential for the sample
to be an accurate representation of the whole population in order to ensure accurate
and reliable results.
For this study, the target population was defined as black Generation Y students aged
between 18 and 24 years, who were enrolled full-time at registered public South African
HEIs during 2014.
3.4.2 Sampling frame
The sampling frame is defined as a list of the target population from which a sample
may be selected (Cohen et al., 2011:153). An example of a sampling frame is a list of
automobile dealers or a list of shoppers who bought at a stipulated retail outlet at a
specific time or a list of accountants (Burns & Bush, 2014:240). The sampling frame for
this study comprised the 26 registered South African public HEIs, comprising 11
traditional universities, six comprehensive universities and nine universities of
technology (Higher Education in South Africa, 2015)). This sampling frame of 25 HEIs
was narrowed down using judgement sampling to include two HEIs in the Gauteng
province, of which one of the HEIs is a traditional university and the other HEI is a
university of technology. The Gauteng province was selected because it includes the
largest portion of the South African population (Statistics South Africa, 2016). A
convenience sampling method was then used to select a single group of participants,
namely full-time registered students.
3.4.3 Sample method
The sampling method represents the approach used in selecting a sample (Babbie &
Mouton, 2009:164). Sampling methods can be categorised into two classifications, is
probability and non-probability sampling (Cohen et al., 2011:153). In probability
sampling, every member of the target population has a fixed chance of being included in
the sample (Malhotra, 2010:376). On the other hand, in non-probability sampling the
population elements are chosen based on convenience (McDaniel & Gates, 2007:396)
and every population element of the population has an equal and recognised chance of
Chapter 3: Research methodology 44
being selected as part of the sample (Burns & Bush, 2014:242). Probability and non-
probability sampling comprise several techniques, as represented in Figure 3.1.
Sampling techniques
Non-probability sampling techniques
Probability sampling sampling techniques
Convenience samplingJudgement sampling
Quota samplingSnowball sampling
Simple random samplingSystematic sampling
Cluster samplingStratified sampling
Figure 3.1 Sampling techniques (Adams et al., 2007:87-91; Babbie & Mouton, 2009:164-166)
As illustrated in Figure 3.1, there are four diverse types of probability sampling
techniques, namely simple random sampling, systematic sampling, cluster sampling
and stratified sampling. Simple random sampling entails that every element of the
population is chosen independently and directly by using a random process in order to
guarantee that each population element in the sample frame has the same possibility of
being chosen into the sample (Hancock & Mueller, 2010:400). Systematic sampling
refers to the way every element is selected from a sample frame according to
prearranged intervals (Bradley, 2010:161). The cluster sampling method ensures that
the population elements are sited into mutually exclusive and collectively
comprehensive subpopulations, referred to as clusters, before being selected
separately (Adams et al. 2007:89). According to Malhotra (2010:384), the stratified
sampling method comprises two steps. First, the heterogeneous population is separated
into equally exclusive and comprehensive homogeneous strata, and secondly the
subsamples are then randomly selected from each group.
Chapter 3: Research methodology 45
There are four different types of non-probability sampling methods: convenience
sampling judgement sampling, snowball sampling and quota sampling. The judgement
sampling method entails the deliberate and subjective selection of sample elements
grounded on the researcher’s expert judgement of choosing the most suitable
participants needed for the sample (Struwig & Stead, 2010:111). Similar to this
technique, convenience sampling pertains to a technique where the sample elements
are conveniently accessible, whereby the researcher selects and employ willing
individuals as participants (Maree, 2007:176-178). This method is perceived as
convenient because the participants can be intercepted at a high-traffic location (Burns
& Bush, 2014:255), such as mall intercepts (Malhotra, 2010:377). According to (Bradley,
2010:167), the snowball sampling method involves the researcher selecting a group of
sampling elements that correspond with the predetermined criteria; thereafter, those
sampling elements are asked to suggest additional participants with specific
characteristics, who may partake in the research. The quota sampling method entails
selecting prospective participants based on a set of predetermined criteria, such as
demographic characteristics and specific attitudes and/or behaviours (Cohen et al.,
2011:156).
For the purpose of this study, a non-probability convenience sampling of black
Generation Y full-time undergraduate students, registered at two South African HEI
campuses, aged between 18 and 24 years between April 2014 and May 2014, was
drawn from the sample frame. The questionnaires were divided equally between the two
HEI campuses.
3.4.4 Sample size
A sample size is described as the entire number of sample elements chosen to take
part in the research (Malhotra, 2010:374). Struwig and Stead (2010:120) advise
selecting a sample size in the range of similar studies in order to do comparisons with
other researchers’ findings. A sample size of 400 black Generation Y full-time
undergraduate students was chosen for this study. This sample size is in line with
previous studies done of a similar nature such as Laroche et al. (2005:159) (sample
size of 351), Millan and Howard (2007:477) (sample size of 355), Hemalatha and
Ravichandran (2009:173) (sample size of 300), Bevan-Dye et al. (2012:5582) (sample
size of 400) and, therefore, was deemed sufficiently large. This sample size of 400
Chapter 3: Research methodology 46
black Generation Y full-time undergraduate students was divided evenly between the
two selected HEI campuses, thus allowing a sample size of 200 students per HEI
campus.
This section provided a discussion of the sampling procedure applied in this study. In
the succeeding section, the process undertaken to collect the required data from this
sample of 400 black Generation Y full-time students is discussed.
3.5 DATA COLLECTION METHOD
The data collection method refers to the method that the researcher uses to collect the
required research data (Berndt & Petzer, 2011:202). Data collection is an essential part
of research. The success of the data collection will determine if the research questions
are answered and if the research objectives are met (Adams et al., 2007:107).
According to Adams et al. (2007:107-111) and Malhotra (2010:211), data can be
collected by making use of different methods, depending on the data to be collected.
There are two key methods for collecting quantitative data, namely the observation
method and the survey method (Malhotra, 2010:209). The observation method includes
a systematic collection of actual behavioural patterns of individuals, objects and/or
occurrences (Malhotra, 2010:230). The survey method involves collecting information
from a large population of participants by means of a structured questionnaire
(McDaniel & Gates, 2007:116).
The survey method is the most preferred method for collecting primary data, as it is
easy to manage, analyse, code and interpret (Adams et al., 2007:128). Different
methods can be used to administer this survey, such as personal interviews, telephone
surveys, mail surveys, online interviews, self-administered questionnaires and drop-off
surveys (Hancock & Mueller 2010:402). The drop-off survey in particular involves the
physical drop off of the questionnaire at a location which is convenient for the
participant. The completed questionnaire is then collected at a specific time as agreed
upon (Burns & Bush, 2014:288). According to Malhotra (2010:211), this survey method
is a valuable method for obtaining a higher response rate.
A questionnaire can be self-administered or administered by an interviewer. With self-
administered questionnaires, the questionnaire can be distributed to the participants in
various manners, such as via postal services, online or personally by the researcher
Chapter 3: Research methodology 47
(Cohen et al., 2011:404). Sahu (2013:68) points out several advantages of using a self-
administered questionnaire survey, such as no interviewer-participant bias, participant
control, cost effectiveness and the fact that because the participants’ identity is not
revealed, they are more comfortable in providing honest responses.
The method of data collection chosen for this study was the drop-off survey method.
The reason for selecting the survey method was due to the advantages this method
provides in screening potential participants. A standardised self-administered
questionnaire was utilised to collect information pertaining to mall shopping motivations
of black Generation Y students. The questionnaire was submitted for approval and
ethics clearance to the Ethics Committee of the Faculty of Economic Sciences and
Information Technology at the North-West University (Vaal Triangle Campus). Once the
ethics clearance certificate had been issued (Ethics Clearance Number: ECONIT-ECON-2014-019), lecturers at each of the two selected HEI campuses who agreed to
participate in the study were contacted telephonically in order to obtain their consent for
the distribution of the questionnaires to their students. Thereafter, the questionnaires
were hand-delivered to the lecturers who distributed the questionnaires to their students
for voluntary participation and completion of the questionnaire during a class, which was
convenient for them. The research instrument in this study, namely the questionnaire,
will be discussed in the next section.
3.5.1 Questionnaire design
A questionnaire is a structured data collection tool comprising specific questions
designed to gather information from participants with the primary purpose of achieving
the study’s research objectives (Berndt & Petzer, 2011:198). A questionnaire is a formal
document that consists of questions and scales to gather primary data. It must be
compiled in such a manner that every question is directed in precisely the same way for
every single participant (Zikmund et al., 2013:171).
Babbie and Mouton (2009:239) opine that a successful questionnaire necessitates clear
and concise instructions regarding the completion of the questionnaire, as well as a
professional physical appearance. In order to gather information that focuses on the
research, it is important for the participants to interpret the questionnaire items correctly.
As such, the wording of the questionnaire design should be clear and easy to
Chapter 3: Research methodology 48
understand for the participants; therefore, attention should be given to using simple
direct questions and familiar terms (Babbie & Mouton, 2009:233). Furthermore, to avoid
questions that could result in ambiguity, questions should be specific, therefore avoid
asking about two issues in a single question (Adams et al., 2007:131; Maree,
2007:160). Moreover, Adams et al. (2007:135) propose placing easy questions in the
beginning of the questionnaire and sensitive questions at the end. A self-administered
questionnaire should comprise a cover letter introducing the study, stipulating the
purpose of the questionnaire and provide relevant contact details (Cohen et al.,
2011:400). According to Adams et al., (2007:130) and Maree (2007:160), the
administration of questionnaires should not exceed 20 minutes, as the participants may
view an extensive questionnaire as unappealing, which can negatively affect the
response quality.
The questionnaire of this study consists of simple and brief objectives, as guided by the
abovementioned recommendations. In order to assist the participants in understanding
the questions correctly, the questions where phrased in a clear manner, using
unambiguous and simple words. The questionnaire used in this study could be
completed within ten minutes, which makes the length of the questionnaire acceptable.
The questionnaire was accompanied by a cover letter, explaining the aim of the
research as well as relevant contact details. The cover letter, together with the final
questionnaire, is presented in Annexure A.
3.5.2 Questioning format
The questionnaire utilised in this study, was developed in accordance with attaining the
empirical objectives of the research study. In accordance with the data required to
achieve these objectives, the measuring scale in the questionnaire used to determine
black Generation Y students’ mall shopping motivations included scaled items that were
adapted from previous published research (Ahmed et al., 2007; Bloch et al., 1994;
Tauber, 1972). These items comprised eight dimensions, namely aesthetics (four
items), escape (five items), diversion (three items), flow (four items), exploration (three
items), role enactment (three items), social (four items) and convenience (five items).
The students’ mall shopping motivations were measured on a six-point Likert scale (1 =
strongly disagree, 6 = strongly agree) based on the participants’ extent of agreement or
disagreement to the statements that related to the dimensions of shopping motivations.
Chapter 3: Research methodology 49
There are two main types of question formats, namely unstructured (open-ended) and
structured (closed). An unstructured questionnaire consists of open-ended questions
where participants are allowed to answer the questions in their own words, phrases or
comments (Terre Blanche et al., 2011:486). Generally used in exploratory research,
unstructured questions aim at gaining an understanding of the participants’ opinions and
outlook (Adams et al., 2007:132; Maree, 2007:9). In contrast, a structured questionnaire
comprises closed questions, such as multiple-choice questions, dichotomous questions
or scaled questions, stipulating a set of pre-determined responses from which the
participants may select one or more options (Malhotra, 2010:344 and Zikmund et al.,
2013:285). Multiple-choice questions comprise either questions or statements with a
selection of answers, of which the participant must choose one or more responses
(Terre Blanche et al., 2011:489). Conversely, dichotomous questions require the
participant to select one alternative from only two alternatives given (Cohen et al.,
2011:383). Scaled questions, which are formulated to capture the participants’ attitudes
and perceptions, require the participant to rate his/her degree of agreement or
disagreement with a specific scale item (Maree, 2007:166).
After the research design has been determined, measurement and scaling procedures
follow. The procedure of gathering numerical values to characteristics of the object
being measured is referred to as measurement (Burns & Bush, 2014:204). As an
addition to measurement, scaling involves employing a scale in the measuring
instrument in order to measure the specified characteristics (Leedy & Ormrod,
2010:189). Different measurements influence the interpretation and analysis of the data
produced, therefore it is important for the researcher to understand and apply the
correct scaling technique.
An itemised rating scale comprises brief descriptions of numerical values connected to
each category (McDaniel & Gates, 2007:300). The participants are requested to indicate
their degree of agreement or disagreement to a series of items, thereby rating the object
according to the perceived attitude or opinion (Malhotra, 2010:308). The three most
frequently used scales are the semantic differential scale, the Staple scale and the
Likert scale (Malhotra, 2010:308). The semantic differential scale comprises a number
of statements or bipolar adjectival phrases concerning the object being measured,
which are placed at opposite ends of the scale (Malhotra, 2010:310). The staple scale is
an adaptation of the semantic differentiation scale, given that the descriptive phrases,
Chapter 3: Research methodology 50
each comprising one term, are measured individually. The scale usually consists of ten
numerical categories, ranging from +5 to -5, with no neutral point (McDaniel & Gates,
2007:306). Owing to this scale being confusing and difficult to apply, it is not a
commonly applied technique for measuring attitudes (Malhotra, 2010:311). Developed
by Rensis Likert, the Likert scale comprises a set of statements that expresses a
favourable or unfavourable attitude towards the object being measured (Cohen et al.,
2011:386). Numerical numbers are attached to each statement, ranging from agree to
disagree, whereby participants indicate their agreement or disagreement to a series of
scaled items (Babbie & Mouton, 2009:644). This scale is widely used because it is easy
to develop (Maree, 2007:9).
The aforementioned techniques and effects were taken into consideration in formulating
the questions. For the purpose of this study, an undisguised, structured, self-
administered questionnaire was used. The questions employed in obtaining the
participants’ demographic information (Section A) comprised three dichotomous
questions, where the participants had to indicate their university, country of origin and
gender. In addition, there were six multiple-choice questions, where the participants had
to indicate their province of origin, ethnic group, mother tongue language, age, monthly
income and main source of monthly income. The questions that were used in obtaining
the participants’ mall shopping habits (Section B of the questionnaire) comprised five
multiple-choice questions where the participants had to indicate the number of hours
they spent at a mall during a single mall visit; the amount of different stores they visit;
the number of different malls had visited in the last month; their mall shopping
frequency, and the percentage of their monthly income spend in malls. Section C of the
questionnaire comprises the questions relating directly to the topic of the study in the
form of a multi-item scale. A six-point Likert scale, ranging from strongly disagree (1) to
strongly agree (6) was used to measure the participants’ rate of agreement or
disagreement with each specific statement pertaining to the participants’ attitudes
towards mall shopping motivations. This is consistent with other similar studies
measuring shopping motivations (Ahmed et al., 2007; Ammani, 2013; Dhurup, 2008; Du
Preez et al., 2007; Hemalatha & Ravichandran, 2009; Martin & Turley, 2004).
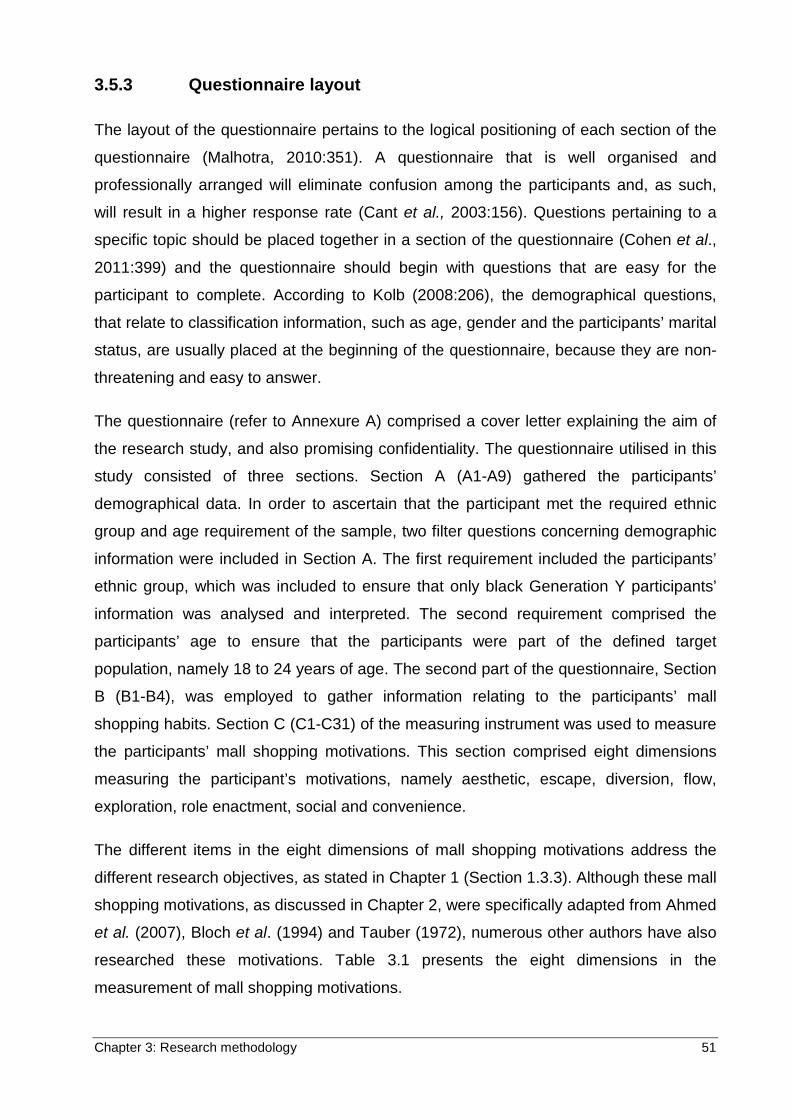
Chapter 3: Research methodology 51
3.5.3 Questionnaire layout
The layout of the questionnaire pertains to the logical positioning of each section of the
questionnaire (Malhotra, 2010:351). A questionnaire that is well organised and
professionally arranged will eliminate confusion among the participants and, as such,
will result in a higher response rate (Cant et al., 2003:156). Questions pertaining to a
specific topic should be placed together in a section of the questionnaire (Cohen et al.,
2011:399) and the questionnaire should begin with questions that are easy for the
participant to complete. According to Kolb (2008:206), the demographical questions,
that relate to classification information, such as age, gender and the participants’ marital
status, are usually placed at the beginning of the questionnaire, because they are non-
threatening and easy to answer.
The questionnaire (refer to Annexure A) comprised a cover letter explaining the aim of
the research study, and also promising confidentiality. The questionnaire utilised in this
study consisted of three sections. Section A (A1-A9) gathered the participants’
demographical data. In order to ascertain that the participant met the required ethnic
group and age requirement of the sample, two filter questions concerning demographic
information were included in Section A. The first requirement included the participants’
ethnic group, which was included to ensure that only black Generation Y participants’
information was analysed and interpreted. The second requirement comprised the
participants’ age to ensure that the participants were part of the defined target
population, namely 18 to 24 years of age. The second part of the questionnaire, Section
B (B1-B4), was employed to gather information relating to the participants’ mall
shopping habits. Section C (C1-C31) of the measuring instrument was used to measure
the participants’ mall shopping motivations. This section comprised eight dimensions
measuring the participant’s motivations, namely aesthetic, escape, diversion, flow,
exploration, role enactment, social and convenience.
The different items in the eight dimensions of mall shopping motivations address the
different research objectives, as stated in Chapter 1 (Section 1.3.3). Although these mall
shopping motivations, as discussed in Chapter 2, were specifically adapted from Ahmed
et al. (2007), Bloch et al. (1994) and Tauber (1972), numerous other authors have also
researched these motivations. Table 3.1 presents the eight dimensions in the
measurement of mall shopping motivations.
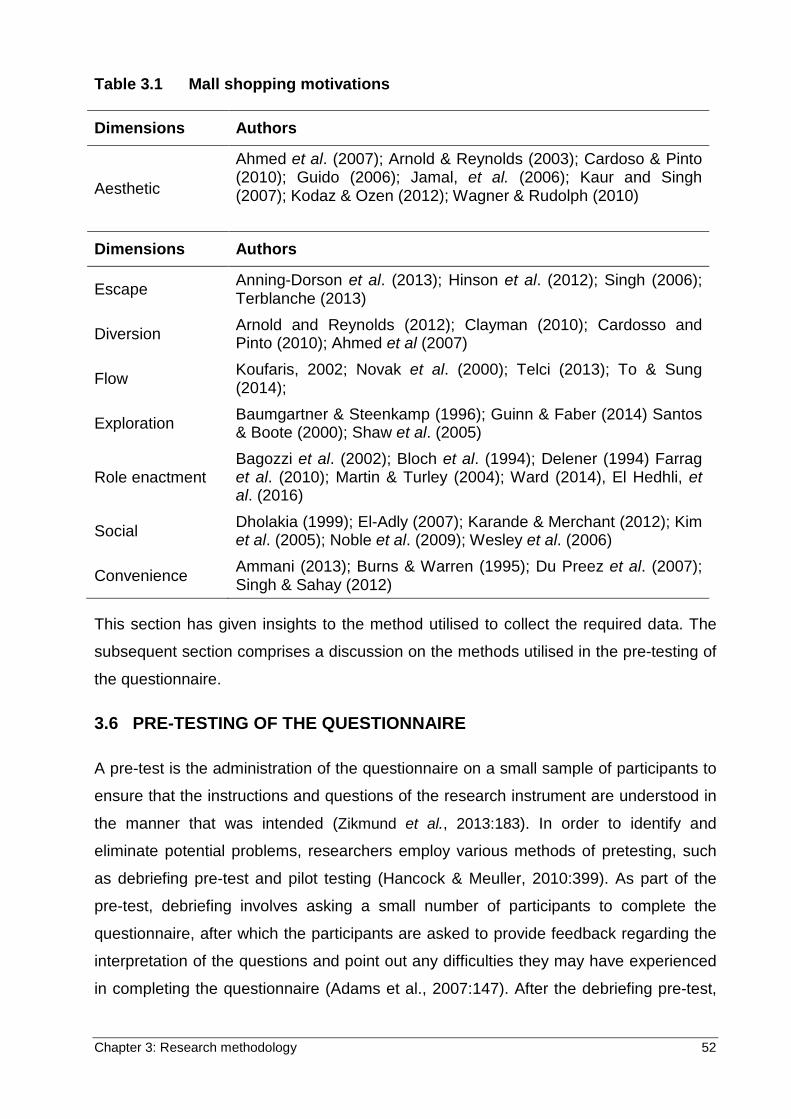
Chapter 3: Research methodology 52
Table 3.1 Mall shopping motivations
Dimensions Authors
Aesthetic
Ahmed et al. (2007); Arnold & Reynolds (2003); Cardoso & Pinto (2010); Guido (2006); Jamal, et al. (2006); Kaur and Singh (2007); Kodaz & Ozen (2012); Wagner & Rudolph (2010)
Dimensions Authors
Escape Anning-Dorson et al. (2013); Hinson et al. (2012); Singh (2006); Terblanche (2013)
Diversion Arnold and Reynolds (2012); Clayman (2010); Cardosso and Pinto (2010); Ahmed et al (2007)
Flow Koufaris, 2002; Novak et al. (2000); Telci (2013); To & Sung (2014);
Exploration Baumgartner & Steenkamp (1996); Guinn & Faber (2014) Santos & Boote (2000); Shaw et al. (2005)
Role enactment Bagozzi et al. (2002); Bloch et al. (1994); Delener (1994) Farrag et al. (2010); Martin & Turley (2004); Ward (2014), El Hedhli, et al. (2016)
Social Dholakia (1999); El-Adly (2007); Karande & Merchant (2012); Kim et al. (2005); Noble et al. (2009); Wesley et al. (2006)
Convenience Ammani (2013); Burns & Warren (1995); Du Preez et al. (2007); Singh & Sahay (2012)
This section has given insights to the method utilised to collect the required data. The
subsequent section comprises a discussion on the methods utilised in the pre-testing of
the questionnaire.
3.6 PRE-TESTING OF THE QUESTIONNAIRE
A pre-test is the administration of the questionnaire on a small sample of participants to
ensure that the instructions and questions of the research instrument are understood in
the manner that was intended (Zikmund et al., 2013:183). In order to identify and
eliminate potential problems, researchers employ various methods of pretesting, such
as debriefing pre-test and pilot testing (Hancock & Meuller, 2010:399). As part of the
pre-test, debriefing involves asking a small number of participants to complete the
questionnaire, after which the participants are asked to provide feedback regarding the
interpretation of the questions and point out any difficulties they may have experienced
in completing the questionnaire (Adams et al., 2007:147). After the debriefing pre-test,
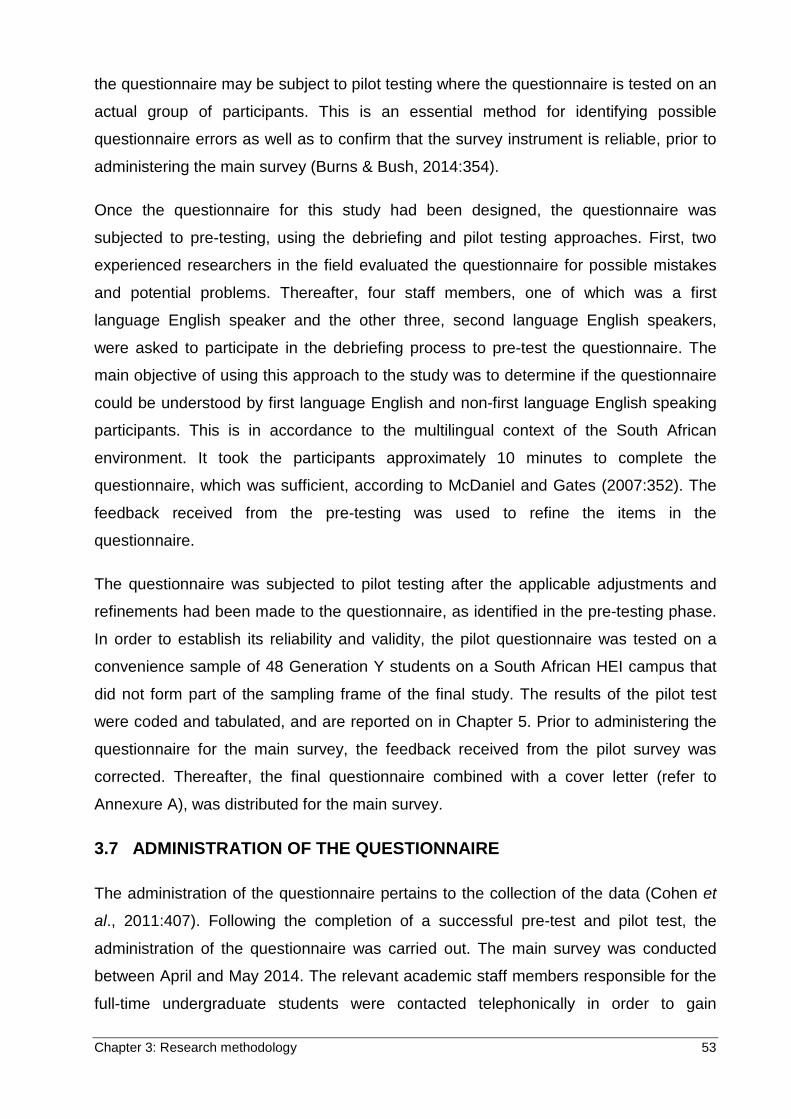
Chapter 3: Research methodology 53
the questionnaire may be subject to pilot testing where the questionnaire is tested on an
actual group of participants. This is an essential method for identifying possible
questionnaire errors as well as to confirm that the survey instrument is reliable, prior to
administering the main survey (Burns & Bush, 2014:354).
Once the questionnaire for this study had been designed, the questionnaire was
subjected to pre-testing, using the debriefing and pilot testing approaches. First, two
experienced researchers in the field evaluated the questionnaire for possible mistakes
and potential problems. Thereafter, four staff members, one of which was a first
language English speaker and the other three, second language English speakers,
were asked to participate in the debriefing process to pre-test the questionnaire. The
main objective of using this approach to the study was to determine if the questionnaire
could be understood by first language English and non-first language English speaking
participants. This is in accordance to the multilingual context of the South African
environment. It took the participants approximately 10 minutes to complete the
questionnaire, which was sufficient, according to McDaniel and Gates (2007:352). The
feedback received from the pre-testing was used to refine the items in the
questionnaire.
The questionnaire was subjected to pilot testing after the applicable adjustments and
refinements had been made to the questionnaire, as identified in the pre-testing phase.
In order to establish its reliability and validity, the pilot questionnaire was tested on a
convenience sample of 48 Generation Y students on a South African HEI campus that
did not form part of the sampling frame of the final study. The results of the pilot test
were coded and tabulated, and are reported on in Chapter 5. Prior to administering the
questionnaire for the main survey, the feedback received from the pilot survey was
corrected. Thereafter, the final questionnaire combined with a cover letter (refer to
Annexure A), was distributed for the main survey.
3.7 ADMINISTRATION OF THE QUESTIONNAIRE
The administration of the questionnaire pertains to the collection of the data (Cohen et
al., 2011:407). Following the completion of a successful pre-test and pilot test, the
administration of the questionnaire was carried out. The main survey was conducted
between April and May 2014. The relevant academic staff members responsible for the
full-time undergraduate students were contacted telephonically in order to gain
Chapter 3: Research methodology 54
permission to distribute the self-administered questionnaire to the participating students.
After permission had been solicited, the non-probability convenience sample of 400
black Generation Y full-time undergraduate students was applied. The questionnaires
were hand-delivered to the participating academic staff members to be distributed to the
students for voluntary completion. The completion of the questionnaire took 10 minutes,
therefore one class period was sufficient. The questionnaires were collected from the
relevant academic staff members after two weeks. The preliminary data analysis is
discussed in the next section.
3.8 PRELIMINARY DATA ANALYSIS
A comprehensive data analysis plan is important to ensure a strong focus on the
objectives of the study. Three steps are typically followed in data analysis, namely data
editing, coding and tabulation (Iacobucci & Churchill, 2010:350). Data editing involves
inspecting the collected data to ensure that the data are accurate, precise and complete
(Adams et al., 2007:171). Coding is the process assigning a measurement symbol to
each specific question asked in the questionnaire (Adams et al., 2007:160), whereas
tabulation is the process of counting the number of responses and orderly presenting
and arranging the collected data in a systematic manner, classified into certain
categories (Malhotra, 2010:484).
The questionnaire used in this study comprised three sections. Section A (A1-A9) was
designed to obtain demographic data from the participants, where the participants had
to indicate their university, country of origin, province of origin, gender, ethnic group,
mother-tongue language, age, monthly income and main source of monthly income.
Section B (B1-B4) was allocated to collecting mall shopping habits. Section C (C1-C31)
included the 31-item scale pertaining to the motivations for shopping at a mall, including
aesthetic (C1-4), escape (C5-C9), diversion (C10-C12), flow (C13-C16), exploration
(C17-C19), role enactment (C20-C22), social (C23-C26) and convenience (C27-C31).
The statistical analysis, implemented to represent the data obtained from the survey, is
discussed next.
3.9 STATISTICAL ANALYSIS
Statistical analysis is the statistical techniques used to provide a summary of the
collected data (Wiid and Diggines, 2015:242) . The captured data were analysed using
Chapter 3: Research methodology 55
the statistical package for IBM SPSS Statistics, Version 23. The following statistical
methods were used on the empirical data sets:
• Frequency analysis
• Exploratory factor analysis
• Reliability and validity analysis
• Descriptive statistical analysis
• Correlation analysis
• One-sample t-test
• One-way analysis of variance (ANOVA).
The aforementioned statistical approaches will be deliberated on in the next chapter.
3.9.1 Factor analysis
Factor analysis is the process of reducing a large number of original variables into a
more manageable smaller number of related variables, called factors (Cohen, et al.,
2011:674; Terre Blanche et al., 2011:248). This data reduction technique is an
important statistical method for establishing inter-correlations amongst variables in a
large data set (Malhotra, 2010:636). Confirmatory factor analysis and exploratory factor
analysis are the two main types of factor analysis often employed by researchers. While
exploratory factor analysis explores the inter-relationships between variables to explore
formerly unknown groupings of variables (Cohen et al., 2011:675), confirmatory factor
analysis confirms the relationships between underlying factors and observed variables
(Struwig & Stead, 2010:142).
In order to conduct an exploratory factor analysis, Pallant (2013:182) advises that a
suitable sample size is required; that is, the larger the sample size, the better. Hancock
& Mueller (2010:98) suggest a five to one ratio, that is, five observations for every item
to be factor analysed. The factorability of the data is evaluated by employing the
Bartlett’s test of sphericity and the Kaiser-Meyer-Olkin (KMO) measure of sampling
adequacy (Cohen et al., 2011:676). Sampling adequacy is indicated by a KMO value
above 0.60 and a significant Bartlett’s test of sphericity value (Pallant, 2013:183).
Chapter 3: Research methodology 56
There are two general approaches to factor analysis, namely common factor analysis
and principle components factor analysis. Common factor analysis pertains to
estimating the factors based on only the common variables; as such, as many latent
variables as possible to explain the correlations among items are extracted (Cohen et
al., 2011:674). In principle components factor analysis, the number of variables is
reduced into a minimum number of factors while still accounting for maximum variance
(Terre Blanche et al., 2011:249).
There are various methods that may be used to determine the optimal factor solution, of
which the most popular are Kaiser’s criterion, Catell’s scree test (Pallant, 2013:184) and
the priori criterion method (Yong & Pearce, 2013:85). The eigenvalue approach involves
retaining all components with an eigenvalue greater than 1.0 and discarding the factors
with eigenvalues below 1.0 (Terre Blanche et al., 2011:250). The scree plot method
entails plotting the number of dimensions of the x-axis and the corresponding
eigenvalues on the y-axis (Cohen et al., 2011:677). The factors above the break of the
plot, where the shape of the curve changes direction and becomes horizontal, are
retained (Terre Blanche et al., 2011:251). The priori criterion method is based on prior
knowledge of the anticipated number of variables (Yong & Pearce, 2013:85).
According to Pallant (2013:185), both the interpretation and the naming of the factors
grounded on their factor loadings are challenging; hence, factor rotation can be used to
overcome this obstacle. The two key categories for rotating factors are orthogonal
rotation and non-orthogonal rotation (Cohen et al., 2011:678). Orthogonal rotation
ensures that the factors remain uncorrelated during factor rotation, which comprises
rotation methods such as Varimax, Quartimax and Equamax (Brown, 2009:21). In
contrast, with non-orthogonal rotation the factors are allowed to correlate, which
comprises rotation methods such as Direct Obliman and Promax (Brown, 2009:21).
According to Malhotra (2010:645), the Varimax rotation, as part of orthogonal rotation
methods, is a typical approach employed for factor rotation.
For the purpose of this study, exploratory factor analysis, using Varimax rotation, was
utilised to establish the underlying factors of the measurement scale. A discussion
relating to reliability analysis follows.
Chapter 3: Research methodology 57
3.9.2 Reliability analysis
According to Adams et al. (2007:235) reliability relates to the consistency of a measure.
A measuring instrument is considered reliable when consistent results are produced in
repeated measurement (Malhotra, 2010:318). Malhotra (2010:318-319) indicates that
different techniques can be utilised to evaluate reliability, namely test-retest, alternative
forms and internal-consistency.
The test-retest method of reliability involves using the same measure or scale for the
same group of participants on two separate occasions under the same circumstances in
order to test for constancy (Adams et al., 2007:236). The degree of similarity between
the results of the first and second measurement is determined by calculating a
correlation coefficient (Cohen et al., 2011:200), where a higher correlation coefficient is
indicative of higher reliability. Iacobucci and Churchill (2010:259) advise that the time
lapse between the first test and the retest is important. A too short time lapse may result
in the target population suffering from fatigue, while a too long time lapse may result in
the target population suffering from effect growth (McDaniel & Gates, 2007:275).
Iacobucci and Churchill (2010:259) recommend a two-week interval between the tests.
Cohen et al. (2011:200) point out that due to personal or environmental factors that
have changed, or due to a lack of cooperation from the participants for a second testing,
differences may occur in the results of two measurements.
The alternative-forms method of determining reliability involves using two similar forms
of a measuring instruments and administering these to subjects at different times
(McDaniel & Gates, 2007:277). The scores of the subjects are then correlated to
determine consistency across the two forms. A high correlation between the two forms
suggests that the scale is reliable. Malhotra (2010:319) opines that this reliability
technique is challenging, as it is extremely difficult to develop two equivalent measuring
instruments, time-consuming and expensive to administer.
The internal consistency method of determining reliability involves determining the
internal consistency of a number of summated items for developing a total score for the
scale (Malhotra, 2010:319). In order to determine internal consistency, the split-half or
Cronbach alpha techniques are used (Cohen et al., 2011:639). The simplest measure of
internal consistency is the split-half method where the items in the scale are divided into
two halves and the resulting half scores are correlated (Adams et al., 2007: 236). High
Chapter 3: Research methodology 58
correlations between the two halves indicate high internal consistency (Cohen et al.,
2011:640). This method computes the average correlation of all possible ways of
splitting the scale items (Maree et al., 2011:216). This coefficient varies from 0 to 1, and
a value of 0.6 or less generally indicates unsatisfactory internal consistency reliability
(Cohen et al., 2011:640). The Cronbach alpha technique, whereby the mean reliability
of coefficient is calculated, is one of the most popular ways of measuring internal
consistency of a multi-item measurement scale (Malhotra, 2010:319). This method is
viewed by researchers as sophisticated, popular and accurate in measuring internal
reliability of a scale (Malhotra 2010:319). Internal consistency is estimated by
establishing the extent to which each item in a scale correlates with one another (Tang
et al., 2014:207). The coefficient alpha values range from zero to one. Greater reliability
is illustrated by a higher value, closer to one (Hair et al., 2010:286). While coefficient
alpha values of above 0.80 are deemed to indicate good internal consistency reliability,
values between 0.60 and 0.80 are considered acceptable (Cohen et al., 2011:640).
For the purpose of this study, the internal reliability approach was employed to
determine the reliability of the scale, through implementing the Cronbach’s coefficient
alpha technique.
3.9.3 Validity analysis
The validity of a scale refers to the extent to which changes in measurement scores
reproduce accurate results, even if the measuring instrument is applied on a different
occasion (Malhotra, 2010:320). Cohen et al. (2011:179) define the validity of a
measuring instrument as the degree to which it measures what it is supposed to
measure. There are various different perspectives from which validity may be examined,
namely content validity, criterion validity and construct validity (Sahu, 2013:26).
Content validity, which is closely linked to face validity, indicates if the items in the scale
represent the entire theoretical dimension that is set out to be measured (Malhotra,
2010:320). According to Cohen et al. (2011:188), content validity of a measuring
instrument is defined by the level to which it provides sufficient report of all the
questions needed to guide the research. According to McDaniel and Gates (2007:278),
the process of content validity may be challenging. In order to determine the measuring
instrument’s content validity, Malhotra (2010:320) advises that the measuring
instrument be viewed by an expert or a group of experts.
Chapter 3: Research methodology 59
Criterion validity pertains to the link between scale scores in relation to other variables
selected as meaningful criteria (Cant et al., 2003:235). Criterion validity can take two
forms, namely concurrent validity and predictive validity. With concurrent validity, the
measurement instrument can predict another variable measured at the same time as
the variable of interest, whilst with predictive validity a future level of criterion variable
can be forecast by a current measurement scale (Iacobucci & Churchill, 2010:257).
Construct validity assesses the degree to which a research instrument measures what it
is supposed to measure (Cohen et al., 2011:188). The research instrument used must
be internally consistent, and each item in the scale must match the construct and
correlate with the other items in the instrument (Cant et al., 2003:236). Construct validity
encompasses convergent, discriminant and nomological validity. While convergent
validity is the degree of correlation between different measures of the same construct
(McDaniel & Gates, 2007:282), discriminant validity measures the extent to which
construct measures vary from other construct measures (Malhotra, 2010:321).
According to Malhotra (2010:321), nomological validity is the extent to which the
constructs correlate with a measure that is not similar; however, in theory, the
constructs are interrelated.
In this study, two experienced researchers were asked to evaluate the measurement
instrument in order to determine the research instrument’s content validity.
Subsequently, in order to assess the internal consistency of the scaled items, as
reported in Chapter 4, the questionnaire was piloted on a small sample of participants.
For the main survey, the scaled items were evaluated using the measures of internal-
consistency reliability, convergent validity, discriminant validity and nomological validity
of which the results are reported in Chapter 4. The descriptive statistical analysis
techniques applied in the study are described in the next section.
3.9.4 Descriptive statistical analysis
Cohen et al. (2011:622) indicate that descriptive statistical analysis is employed to
summarise complex frequency tables in order to simplify the information provided.
There are three types of statistics that relate to descriptive analysis, including the
measures of location (mean, median and mode), measures of variability (range,
variance and standard deviation) and measures of shape (skewness and kurtosis).
Chapter 3: Research methodology 60
Measures of location, also known as a measure of central tendency, comprise the
mean, median and mode (Malhotra, 2010:486). The mean is the arithmetic average,
which is determined by adding the values for all of the participants for a specific variable
and dividing the resulting sum by the total number of participants (McDaniel & Gates,
2007:461). The median is the midpoint value of the distribution when the data are in a
hierarchical pattern (Kolb, 2008:254), whereas the mode is the most frequently
occurring value (Struwig & Stead, 2010:158).
Measures of variability, also referred to as measures of dispersion, measure how
spread out the data are (Burns & Bush, 2014:466). Measures of variability consist of
three regularly used methods, namely the range, the standard deviation and the
variance (McDaniel & Gates, 2007:462). According to Malhotra (2010:487), the range is
used to measure the distance between the smallest and largest value of the variables.
The standard deviation indicates how far the values are, on average, from the mean,
whereas, the variance is the average squared deviation from the mean (Malhotra,
2010:487).
The measures of shape are concerned with the distribution of the variables when
graphically presented, and involve the evaluation of the skewness and kurtosis of the
distribution of the variables (Malhotra, 2010:488). While skewness denotes the
assessment of the symmetry of the distribution, kurtosis measures the relative
peakedness or flatness of the curve as presented by the frequency distribution (Struwig
& Stead, 2010:159). A symmetrical distribution refers to normally distributed data with a
skewness and kurtosis value of zero (Malhotra, 2010:488). Deviation from the symmetry
indicates either positive skewness or negative skewness (Doane & Seward, 2011:7).
Positive kurtosis values show the distribution sharper than a normal distribution, while
negative values signify a flatter than normal distribution (Griffith, 2010:54, 335).
Descriptive statistics were applied in this study by calculating the mean, mode, median,
standard deviation, skewness and kurtosis values. This provided insights into whether
the data were normally distributed. The following section provides an overview of the
correlation analysis employed in this study.
Chapter 3: Research methodology 61
3.9.5 Correlation analysis
Correlation analysis is the statistical process used to measure the link of association
between two or more variables, including the strength of the association (Pallant,
2013:128). According to Hair et al. (2010:710), the nomological validity of a
measurement can be assessed by creating a matrix of construct correlations. The
Pearson Product-Moment correlation coefficient specifically determines the linear
relationships between two or more metric variables and the nomological validity of the
research instrument (Struwig and Stead, 2010:140). A change in one variable creates or
affects a change in another variable, hence indicating a relationship (Cohen et al.,
2011:636). Coefficient values range from -1 to +1 and the level of strength of
association between two variables is denoted with r. Moreover, a positive correlation,
denoted by a +1, can be found when an increase in one variable has the same effect on
the other variables, whilst a negative correlation, denoted by -1, has an opposite effect
to the variables by decreasing the one when the other is increased (Cohen et al.,
2011:636). A non-existence relationship between two variables is indicated by a
correlation value of zero or close to zero (McDaniel & Gates, 2007:530).
For the purpose of this study, Pearson’s correlation coefficient was employed in order to
identify any positive or negative relationships between the dimensions, and the strength
of such relationships. The following section explains the significance tests employed in
this study.
3.9.6 Test of significance
In order to test the hypotheses formulated in a research study, significance testing is
conducted. The significance level that is selected refers to the level of risk that is
appropriate for the study in terms of the accuracy required for the hypotheses being
tested (Shiu et al., 2009:537); in other words, the level of error deemed acceptable in
generalising the evidence in the sample to the whole target population (Bradley,
2010:327). A hypothesis is a statement concerning a parameter pertaining to the target
population (Aaker et al., 2011:401). In hypothesis testing, there is a null hypothesis and
an alternative hypothesis, and whereas a null hypothesis (H0) indicates no change in
the status quo, the opposing alternative hypothesis (Ha) indicates a change in the
status quo (Wiid & Diggines, 2015:4). In this regard, it is the null hypothesis that is
tested. Naturally, it is not feasible that both the null and the alternative hypotheses be
Chapter 3: Research methodology 62
concluded; subsequently, in order to determine which one is to be concluded, the test
statistics probability is compared with the specified significance level (Malhotra,
2010:490). In the case of this study, hypothesis testing focused on mean differences
between independent samples. As such, 12 hypotheses were formulated and the
significant level was set at α = 0.05 (Malhotra, 2010:492). A discussion on the statistical
techniques used to test these hypotheses follows.
3.9.6.1 One-sample t-test
According to Cohen et al. (2011:642), a t-test is a parametric test that is frequently used
in statistical analysis to test differences between means or proportions. A significant t-
test indicates that the means of the two groups are largely different (Malhotra,
2010:504). Malhotra (2010:503) identifies three types of t-tests, namely the one-sample
t-test, the two independent-samples t-test and the paired sample t-test. While an
independent-sample t-test compares mean values of two diverse groups of people or
situations, a paired-samples t-test compares the mean values of an identical group of
people or situations, although at different points in time (Zikmund et al., 2013:394). A
one-sample t-test can be used to determine a hypothesis when only one variable is
included that should be tested against a known or given standard (Malhotra, 2010:504).
In this sense, by employing the one-sample t-test, the mean value of the variable is
compared against the expected mean value of the known or given standard. To
determine the primary objective of this study, namely the motivations driving Generation
Y students to shop at a mall, a one-sample t-test was conducted.
3.9.6.2 One-way analysis of variance (ANOVA)
The analysis of variance test is a statistical analysis technique, commonly known as
ANOVA and most suitable for testing differences between mean scores for more than
two independent samples (Cohen et al., 2011:645). According to Malhotra (2010:531),
in order to conduct ANOVA, a dependent variable that is metric is required, meaning
that it is measured on an interval or ratio scale, and one or more independent variable
that is categorical, or nonmetric. There are two types of ANOVA, namely one-way
ANOVA and two-way ANOVA. While one-way ANOVA has only one independent
variable, two-way ANOVA has more than one independent variable. This study made
use of one-way ANOVA to test the hypotheses developed for the differences between
the different age groups of black Generation Y students’ mall shopping motivations.
Chapter 3: Research methodology 63
3.10 SYNOPSIS
The purpose of this chapter was to discuss the research methodology that was applied
for the empirical portion of this study. As such, the chapter provided an outline of the
research design, research approach, sampling strategy, data collection method, pre-
testing of questionnaire, administration of questionnaire, preliminary data analysis and
the statistical analyses. The results of the statistical analysis of the pilot and main study
will be discussed in the next chapter.
Chapter 4: Analysis and interpretation of empirical findings 64
CHAPTER 4 ANALYSIS AND INTERPRETATION OF EMPIRICAL FINDINGS
4.1 INTRODUCTION
The aim of this chapter is to report on the analysis and interpretation of the empirical
findings gathered from the study. This chapter begins with a summary of the results
from the pilot test in Section 4.2 and an explanation of the data collection process in
Section 4.3. Section 4.5 presents a description of the sample and a summary of their
mall shopping habits. Subsequently, in Section 4.6, the study explains the confirmatory
principal component factor analysis conducted. The internal-consistency reliability and
validity of the measuring instrument used in the main study is reported on in Section
4.7, while Section 4.8 discusses the descriptive statistics. Section 4.9 pertains to the
correlation analysis conducted in the study. Section 4.10 comprises the formulation and
testing of the study’s hypotheses.
The statistical package IBM SPSS Statistics, Version 23, was used to perform the data
analysis. The data analysis was done in two phases. The first phase was to analyse the
results of the pilot test of the questionnaire. The second phase was to analyse the
results of the data set of the main survey. A discussion on the data analysis performed
during the pilot phase is reported on in the subsequent section.
4.2 PILOT TEST RESULTS
The questionnaire used in this study was pre-tested before conducting the pilot study,
as outlined in Section 3.6. The feedback obtained from the pre-test were used to refine
the questionnaire. The refined questionnaire comprised 31 Likert-scaled items for the
mall shopping motivations scale. Subsequent to the initial pre-testing the questionnaire
was subject to pilot testing, which asserts the reliability of the scale used in the
measuring instrument. Hence, the questionnaire was pilot tested on a convenience
sample of 48 full-time undergraduate students at a HEI campus that did not form part of
the demarcated area of the main study. This pilot study was undertaken to establish
internal-consistency reliability of the scale employed within the questionnaire. The six-
point scale returned a Cronbach alpha value of 0.888 for the entire scale that is above
the recommended level of 0.70 (Pallant, 2013:97; Wiid & Diggines, 2015:238), thereby
Chapter 4: Analysis and interpretation of empirical findings 65
suggesting that the scale is reliable. The average inter-item correlation of 0.211 for the
entire scale falls within the recommended range of 0.15 and 0.5 (Clark & Watson,
1995:316). This suggests that the items included in the questionnaire were suitable to
address the research problem. Therefore, none of the items included in the scale were
removed. These 31 items from the mall shopping motivations scale, were then used to
prepare the main survey questionnaire (refer to Annexure A), which was administered to
a larger sample size.
4.3 DATA GATHERING PROCESS
In accordance with the sampling plan set out in Chapter 3, the data required for this
study were collected from 400 South African black Generation Y students enrolled at
two South African HEI campuses. A self-administered questionnaire was used to collect
the required data. As stated in Section 3.5, once permission had been obtained from the
lecturers at each of the two campuses to distribute the questionnaire, following the drop-
off survey approach, the questionnaires were hand-delivered to the lecturers to be
distributed to their students during class time. Before the questionnaires were
distributed, the participating lecturers were shown the questionnaire as well as the
ethics clearance certificate obtained from the Social and Technological Sciences
Research Ethics Committee of the Faculty of Economic Sciences and Information
Technology at the North-West University (Vaal Triangle Campus). In accordance with
the specified sample size, 400 questionnaires were distributed – 200 per campus. After
two weeks, the completed questionnaires were collected from the lecturers at the time
agreed upon. Students were informed that participation was strictly voluntary and that
all information provided, would remain confidential.
4.4 PRELIMINARY DATA ANALYSIS
Before the data set is analysed it is preferable to do a preliminary data analysis. The
following three sections provide an overview of the coding, data cleaning and the
tabulation employed on the collected data set of this study.
4.4.1 Coding
In this study, the questionnaire used was divided into three sections. Section A, the first
section, requested demographical data from the participants. The second section,
Section B, measured the participants’ mall shopping habits and the third section,
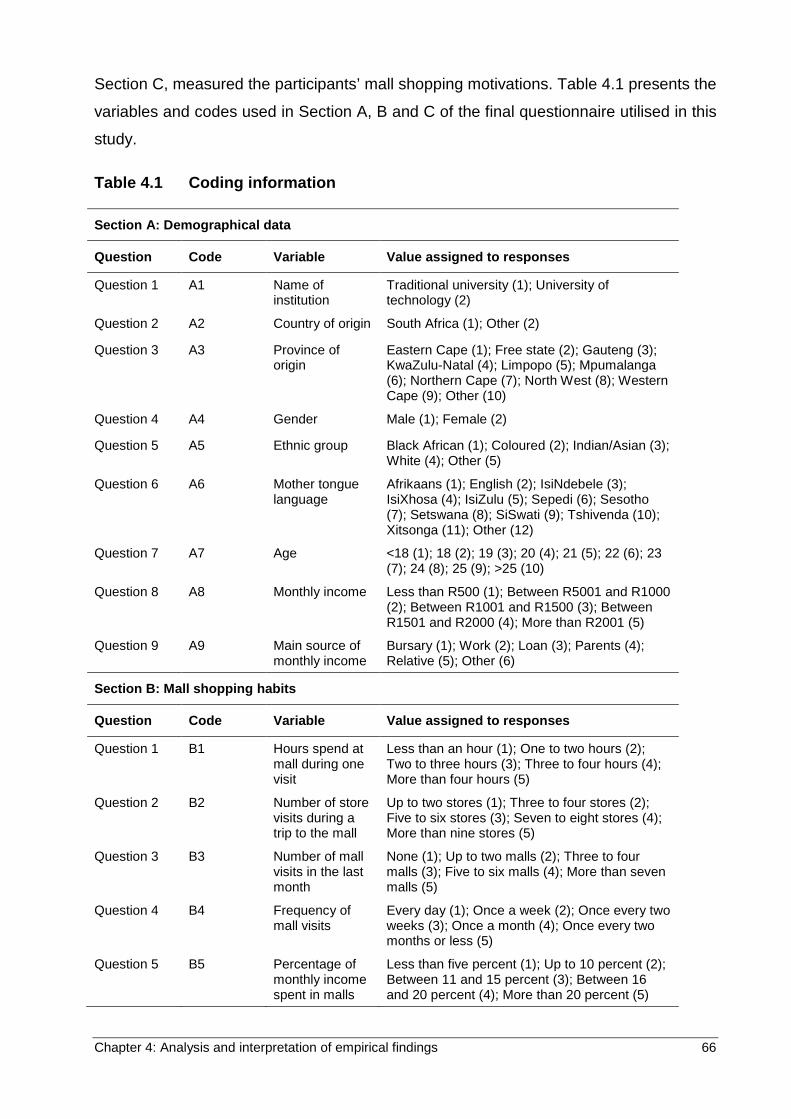
Chapter 4: Analysis and interpretation of empirical findings 66
Section C, measured the participants’ mall shopping motivations. Table 4.1 presents the
variables and codes used in Section A, B and C of the final questionnaire utilised in this
study.
Table 4.1 Coding information
Section A: Demographical data
Question Code Variable Value assigned to responses
Question 1 A1 Name of institution
Traditional university (1); University of technology (2)
Question 2 A2 Country of origin South Africa (1); Other (2)
Question 3 A3 Province of origin
Eastern Cape (1); Free state (2); Gauteng (3); KwaZulu-Natal (4); Limpopo (5); Mpumalanga (6); Northern Cape (7); North West (8); Western Cape (9); Other (10)
Question 4 A4 Gender Male (1); Female (2)
Question 5 A5 Ethnic group Black African (1); Coloured (2); Indian/Asian (3); White (4); Other (5)
Question 6 A6 Mother tongue language
Afrikaans (1); English (2); IsiNdebele (3); IsiXhosa (4); IsiZulu (5); Sepedi (6); Sesotho (7); Setswana (8); SiSwati (9); Tshivenda (10); Xitsonga (11); Other (12)
Question 7 A7 Age <18 (1); 18 (2); 19 (3); 20 (4); 21 (5); 22 (6); 23 (7); 24 (8); 25 (9); >25 (10)
Question 8 A8 Monthly income Less than R500 (1); Between R5001 and R1000 (2); Between R1001 and R1500 (3); Between R1501 and R2000 (4); More than R2001 (5)
Question 9 A9 Main source of monthly income
Bursary (1); Work (2); Loan (3); Parents (4); Relative (5); Other (6)
Section B: Mall shopping habits
Question Code Variable Value assigned to responses
Question 1 B1 Hours spend at mall during one visit
Less than an hour (1); One to two hours (2); Two to three hours (3); Three to four hours (4); More than four hours (5)
Question 2 B2 Number of store visits during a trip to the mall
Up to two stores (1); Three to four stores (2); Five to six stores (3); Seven to eight stores (4); More than nine stores (5)
Question 3 B3 Number of mall visits in the last month
None (1); Up to two malls (2); Three to four malls (3); Five to six malls (4); More than seven malls (5)
Question 4 B4 Frequency of mall visits
Every day (1); Once a week (2); Once every two weeks (3); Once a month (4); Once every two months or less (5)
Question 5 B5 Percentage of monthly income spent in malls
Less than five percent (1); Up to 10 percent (2); Between 11 and 15 percent (3); Between 16 and 20 percent (4); More than 20 percent (5)
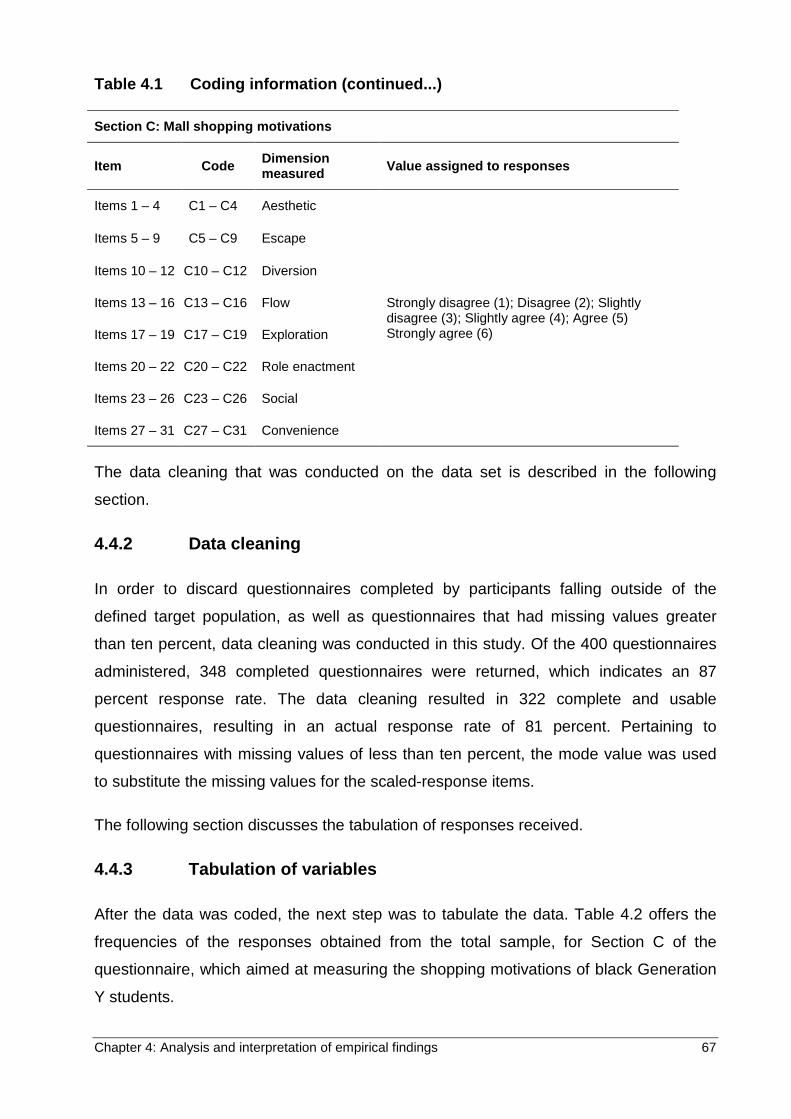
Chapter 4: Analysis and interpretation of empirical findings 67
Table 4.1 Coding information (continued...)
Section C: Mall shopping motivations
Item Code Dimension measured Value assigned to responses
Items 1 – 4 C1 – C4 Aesthetic
Strongly disagree (1); Disagree (2); Slightly disagree (3); Slightly agree (4); Agree (5) Strongly agree (6)
Items 5 – 9 C5 – C9 Escape
Items 10 – 12 C10 – C12 Diversion
Items 13 – 16 C13 – C16 Flow
Items 17 – 19 C17 – C19 Exploration
Items 20 – 22 C20 – C22 Role enactment
Items 23 – 26 C23 – C26 Social
Items 27 – 31 C27 – C31 Convenience
The data cleaning that was conducted on the data set is described in the following
section.
4.4.2 Data cleaning
In order to discard questionnaires completed by participants falling outside of the
defined target population, as well as questionnaires that had missing values greater
than ten percent, data cleaning was conducted in this study. Of the 400 questionnaires
administered, 348 completed questionnaires were returned, which indicates an 87
percent response rate. The data cleaning resulted in 322 complete and usable
questionnaires, resulting in an actual response rate of 81 percent. Pertaining to
questionnaires with missing values of less than ten percent, the mode value was used
to substitute the missing values for the scaled-response items.
The following section discusses the tabulation of responses received.
4.4.3 Tabulation of variables
After the data was coded, the next step was to tabulate the data. Table 4.2 offers the
frequencies of the responses obtained from the total sample, for Section C of the
questionnaire, which aimed at measuring the shopping motivations of black Generation
Y students.
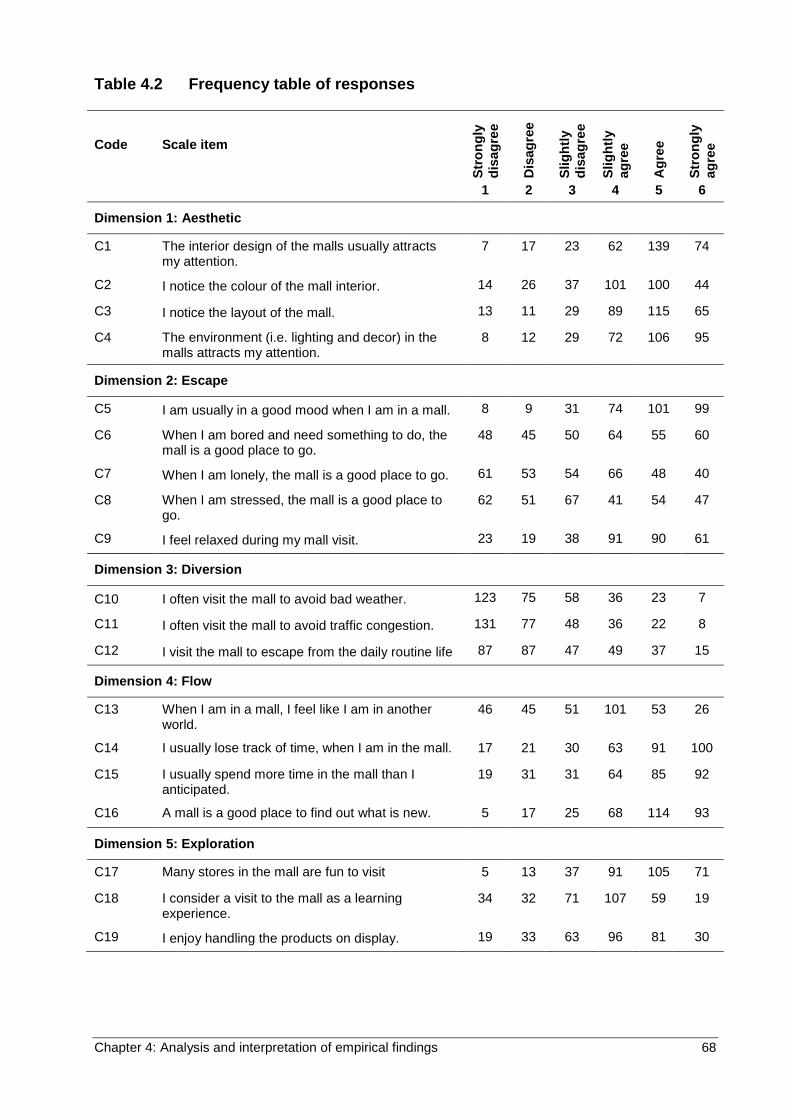
Chapter 4: Analysis and interpretation of empirical findings 68
Table 4.2 Frequency table of responses
Code Scale item
Stro
ngly
di
sagr
ee
Dis
agre
e
Slig
htly
di
sagr
ee
Slig
htly
ag
ree
Agr
ee
Stro
ngly
ag
ree
1 2 3 4 5 6
Dimension 1: Aesthetic
C1 The interior design of the malls usually attracts my attention.
7 17 23 62 139 74
C2 I notice the colour of the mall interior. 14 26 37 101 100 44
C3 I notice the layout of the mall. 13 11 29 89 115 65
C4 The environment (i.e. lighting and decor) in the malls attracts my attention.
8 12 29 72 106 95
Dimension 2: Escape
C5 I am usually in a good mood when I am in a mall. 8 9 31 74 101 99
C6 When I am bored and need something to do, the mall is a good place to go.
48 45 50 64 55 60
C7 When I am lonely, the mall is a good place to go. 61 53 54 66 48 40
C8 When I am stressed, the mall is a good place to go.
62 51 67 41 54 47
C9 I feel relaxed during my mall visit. 23 19 38 91 90 61
Dimension 3: Diversion
C10 I often visit the mall to avoid bad weather. 123 75 58 36 23 7
C11 I often visit the mall to avoid traffic congestion. 131 77 48 36 22 8
C12 I visit the mall to escape from the daily routine life 87 87 47 49 37 15
Dimension 4: Flow
C13 When I am in a mall, I feel like I am in another world.
46 45 51 101 53 26
C14 I usually lose track of time, when I am in the mall. 17 21 30 63 91 100
C15 I usually spend more time in the mall than I anticipated.
19 31 31 64 85 92
C16 A mall is a good place to find out what is new. 5 17 25 68 114 93
Dimension 5: Exploration
C17 Many stores in the mall are fun to visit 5 13 37 91 105 71
C18 I consider a visit to the mall as a learning experience.
34 32 71 107 59 19
C19 I enjoy handling the products on display. 19 33 63 96 81 30
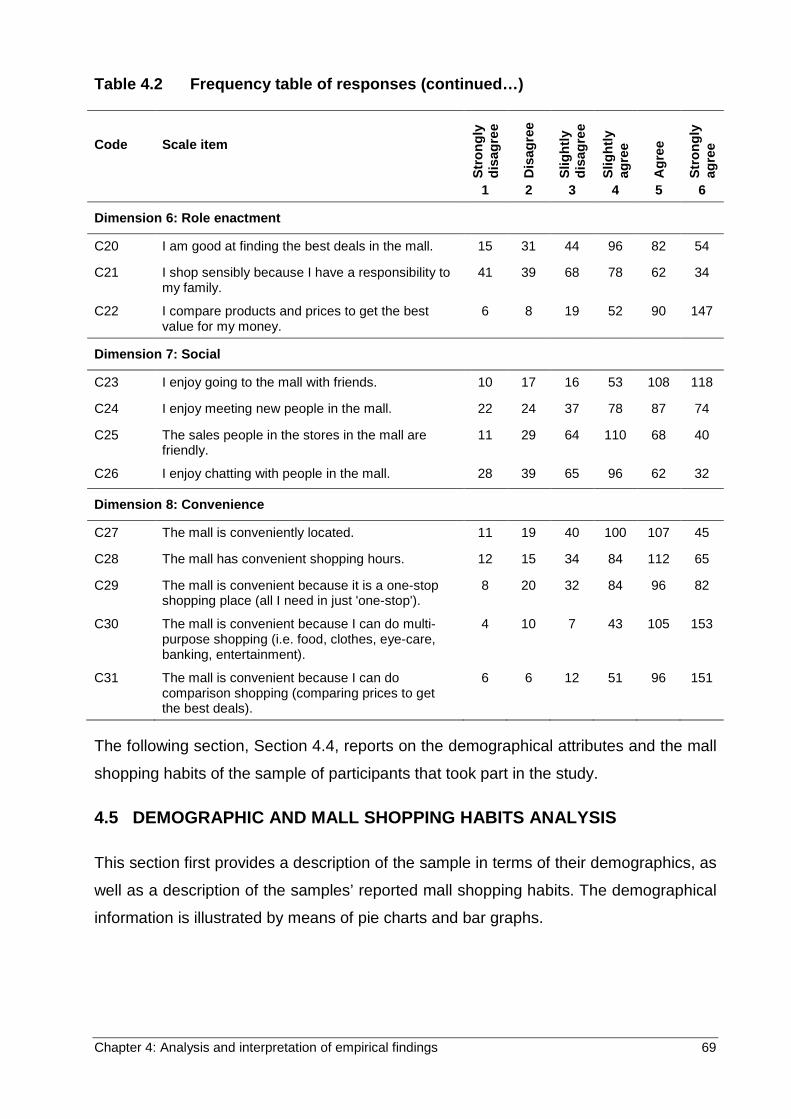
Chapter 4: Analysis and interpretation of empirical findings 69
Table 4.2 Frequency table of responses (continued…)
Code Scale item
Stro
ngly
di
sagr
ee
Dis
agre
e
Slig
htly
di
sagr
ee
Slig
htly
ag
ree
Agr
ee
Stro
ngly
ag
ree
1 2 3 4 5 6
Dimension 6: Role enactment
C20 I am good at finding the best deals in the mall. 15 31 44 96 82 54
C21 I shop sensibly because I have a responsibility to my family.
41 39 68 78 62 34
C22 I compare products and prices to get the best value for my money.
6 8 19 52 90 147
Dimension 7: Social
C23 I enjoy going to the mall with friends. 10 17 16 53 108 118
C24 I enjoy meeting new people in the mall. 22 24 37 78 87 74
C25 The sales people in the stores in the mall are friendly.
11 29 64 110 68 40
C26 I enjoy chatting with people in the mall. 28 39 65 96 62 32
Dimension 8: Convenience
C27 The mall is conveniently located. 11 19 40 100 107 45
C28 The mall has convenient shopping hours. 12 15 34 84 112 65
C29 The mall is convenient because it is a one-stop shopping place (all I need in just 'one-stop').
8 20 32 84 96 82
C30 The mall is convenient because I can do multi-purpose shopping (i.e. food, clothes, eye-care, banking, entertainment).
4 10 7 43 105 153
C31 The mall is convenient because I can do comparison shopping (comparing prices to get the best deals).
6 6 12 51 96 151
The following section, Section 4.4, reports on the demographical attributes and the mall
shopping habits of the sample of participants that took part in the study.
4.5 DEMOGRAPHIC AND MALL SHOPPING HABITS ANALYSIS
This section first provides a description of the sample in terms of their demographics, as
well as a description of the samples’ reported mall shopping habits. The demographical
information is illustrated by means of pie charts and bar graphs.
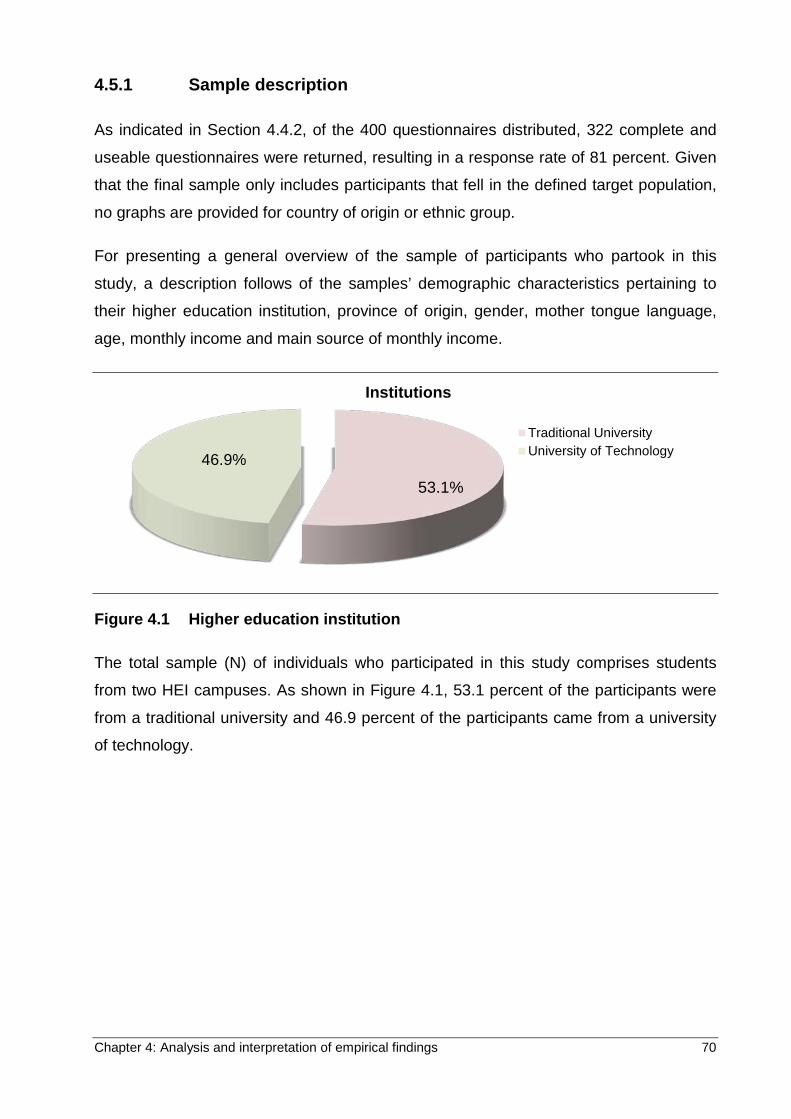
Chapter 4: Analysis and interpretation of empirical findings 70
4.5.1 Sample description
As indicated in Section 4.4.2, of the 400 questionnaires distributed, 322 complete and
useable questionnaires were returned, resulting in a response rate of 81 percent. Given
that the final sample only includes participants that fell in the defined target population,
no graphs are provided for country of origin or ethnic group.
For presenting a general overview of the sample of participants who partook in this
study, a description follows of the samples’ demographic characteristics pertaining to
their higher education institution, province of origin, gender, mother tongue language,
age, monthly income and main source of monthly income.
Figure 4.1 Higher education institution
The total sample (N) of individuals who participated in this study comprises students
from two HEI campuses. As shown in Figure 4.1, 53.1 percent of the participants were
from a traditional university and 46.9 percent of the participants came from a university
of technology.
53.1%
46.9%
Institutions
Traditional UniversityUniversity of Technology
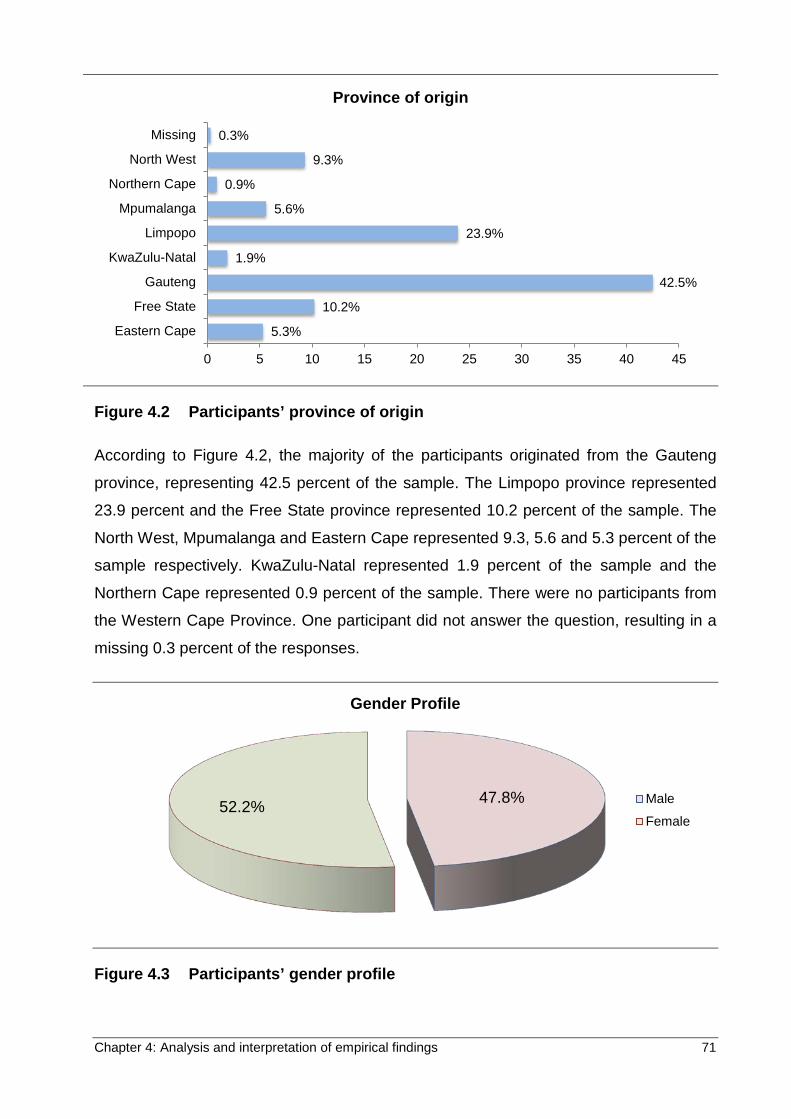
Chapter 4: Analysis and interpretation of empirical findings 71
Figure 4.2 Participants’ province of origin
According to Figure 4.2, the majority of the participants originated from the Gauteng
province, representing 42.5 percent of the sample. The Limpopo province represented
23.9 percent and the Free State province represented 10.2 percent of the sample. The
North West, Mpumalanga and Eastern Cape represented 9.3, 5.6 and 5.3 percent of the
sample respectively. KwaZulu-Natal represented 1.9 percent of the sample and the
Northern Cape represented 0.9 percent of the sample. There were no participants from
the Western Cape Province. One participant did not answer the question, resulting in a
missing 0.3 percent of the responses.
Figure 4.3 Participants’ gender profile
5.3%
10.2%
42.5%
1.9%
23.9%
5.6%
0.9%
9.3%
0.3%
0 5 10 15 20 25 30 35 40 45
Eastern Cape
Free State
Gauteng
KwaZulu-Natal
Limpopo
Mpumalanga
Northern Cape
North West
Missing
Province of origin
47.8% 52.2%
Gender Profile
Male
Female
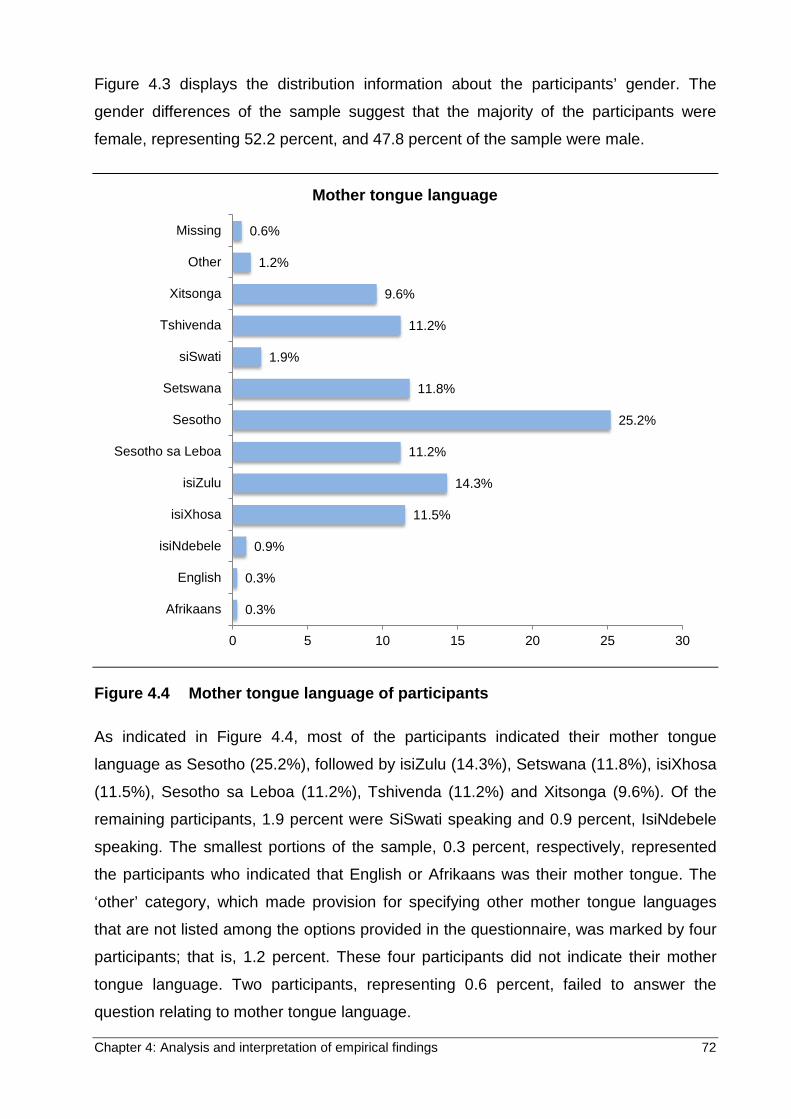
Chapter 4: Analysis and interpretation of empirical findings 72
Figure 4.3 displays the distribution information about the participants’ gender. The
gender differences of the sample suggest that the majority of the participants were
female, representing 52.2 percent, and 47.8 percent of the sample were male.
Figure 4.4 Mother tongue language of participants
As indicated in Figure 4.4, most of the participants indicated their mother tongue
language as Sesotho (25.2%), followed by isiZulu (14.3%), Setswana (11.8%), isiXhosa
(11.5%), Sesotho sa Leboa (11.2%), Tshivenda (11.2%) and Xitsonga (9.6%). Of the
remaining participants, 1.9 percent were SiSwati speaking and 0.9 percent, IsiNdebele
speaking. The smallest portions of the sample, 0.3 percent, respectively, represented
the participants who indicated that English or Afrikaans was their mother tongue. The
‘other’ category, which made provision for specifying other mother tongue languages
that are not listed among the options provided in the questionnaire, was marked by four
participants; that is, 1.2 percent. These four participants did not indicate their mother
tongue language. Two participants, representing 0.6 percent, failed to answer the
question relating to mother tongue language.
0.3%
0.3%
0.9%
11.5%
14.3%
11.2%
25.2%
11.8%
1.9%
11.2%
9.6%
1.2%
0.6%
0 5 10 15 20 25 30
Afrikaans
English
isiNdebele
isiXhosa
isiZulu
Sesotho sa Leboa
Sesotho
Setswana
siSwati
Tshivenda
Xitsonga
Other
Missing
Mother tongue language
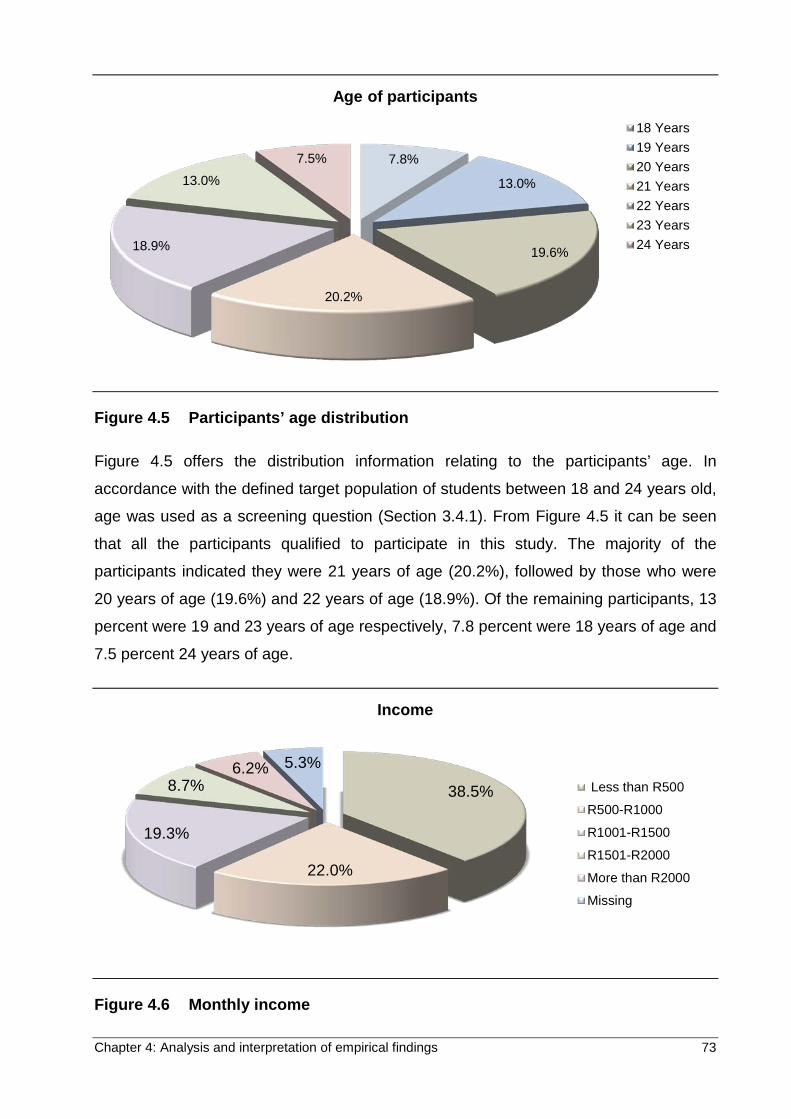
Chapter 4: Analysis and interpretation of empirical findings 73
Figure 4.5 Participants’ age distribution
Figure 4.5 offers the distribution information relating to the participants’ age. In
accordance with the defined target population of students between 18 and 24 years old,
age was used as a screening question (Section 3.4.1). From Figure 4.5 it can be seen
that all the participants qualified to participate in this study. The majority of the
participants indicated they were 21 years of age (20.2%), followed by those who were
20 years of age (19.6%) and 22 years of age (18.9%). Of the remaining participants, 13
percent were 19 and 23 years of age respectively, 7.8 percent were 18 years of age and
7.5 percent 24 years of age.
Figure 4.6 Monthly income
7.8%
13.0%
19.6%
20.2%
18.9%
13.0%
7.5%
Age of participants
18 Years19 Years20 Years21 Years22 Years23 Years24 Years
38.5%
22.0%
19.3%
8.7% 6.2% 5.3%
Income
Less than R500
R500-R1000
R1001-R1500
R1501-R2000
More than R2000
Missing
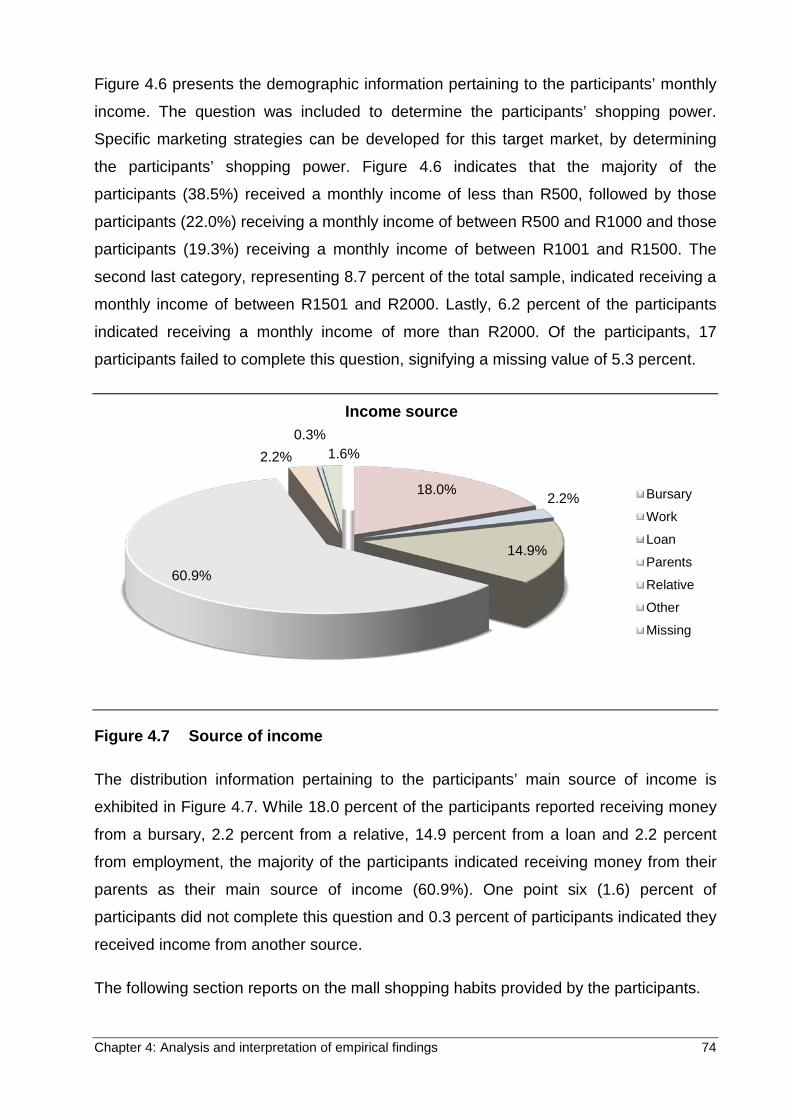
Chapter 4: Analysis and interpretation of empirical findings 74
Figure 4.6 presents the demographic information pertaining to the participants’ monthly
income. The question was included to determine the participants’ shopping power.
Specific marketing strategies can be developed for this target market, by determining
the participants’ shopping power. Figure 4.6 indicates that the majority of the
participants (38.5%) received a monthly income of less than R500, followed by those
participants (22.0%) receiving a monthly income of between R500 and R1000 and those
participants (19.3%) receiving a monthly income of between R1001 and R1500. The
second last category, representing 8.7 percent of the total sample, indicated receiving a
monthly income of between R1501 and R2000. Lastly, 6.2 percent of the participants
indicated receiving a monthly income of more than R2000. Of the participants, 17
participants failed to complete this question, signifying a missing value of 5.3 percent.
Figure 4.7 Source of income
The distribution information pertaining to the participants’ main source of income is
exhibited in Figure 4.7. While 18.0 percent of the participants reported receiving money
from a bursary, 2.2 percent from a relative, 14.9 percent from a loan and 2.2 percent
from employment, the majority of the participants indicated receiving money from their
parents as their main source of income (60.9%). One point six (1.6) percent of
participants did not complete this question and 0.3 percent of participants indicated they
received income from another source.
The following section reports on the mall shopping habits provided by the participants.
18.0% 2.2%
14.9%
60.9%
2.2% 0.3%
1.6%
Income source
Bursary
Work
Loan
Parents
Relative
Other
Missing
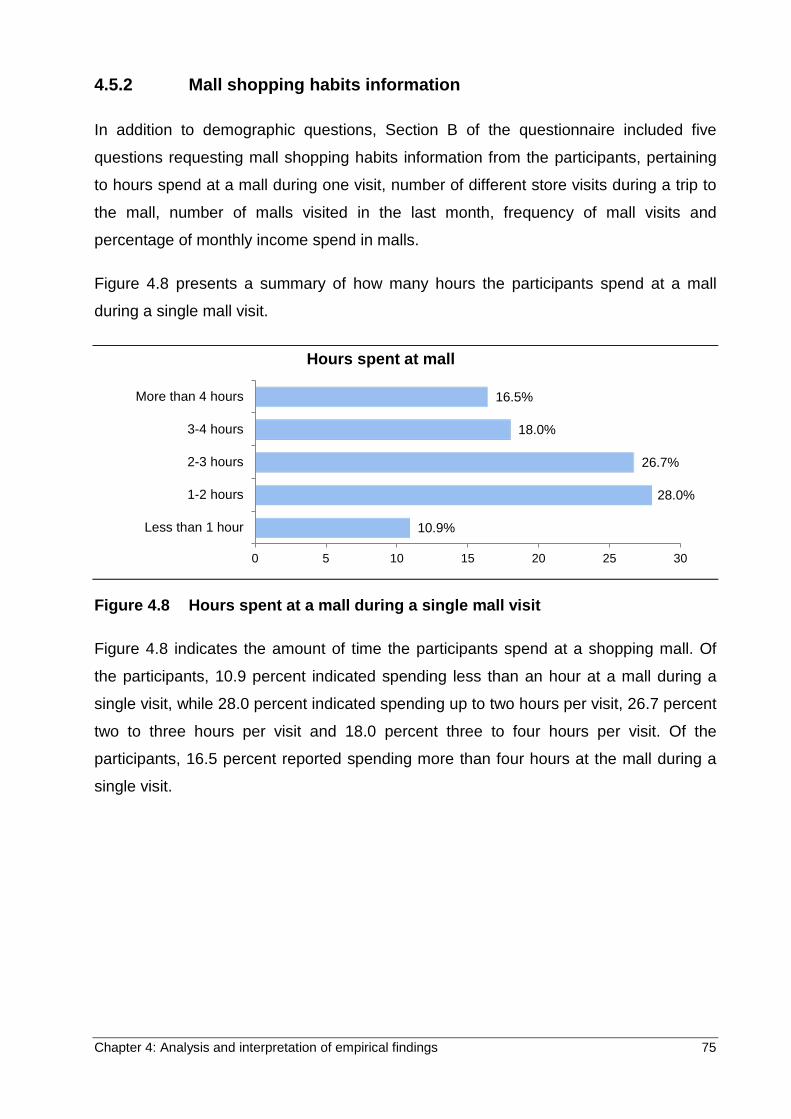
Chapter 4: Analysis and interpretation of empirical findings 75
4.5.2 Mall shopping habits information
In addition to demographic questions, Section B of the questionnaire included five
questions requesting mall shopping habits information from the participants, pertaining
to hours spend at a mall during one visit, number of different store visits during a trip to
the mall, number of malls visited in the last month, frequency of mall visits and
percentage of monthly income spend in malls.
Figure 4.8 presents a summary of how many hours the participants spend at a mall
during a single mall visit.
Figure 4.8 Hours spent at a mall during a single mall visit
Figure 4.8 indicates the amount of time the participants spend at a shopping mall. Of
the participants, 10.9 percent indicated spending less than an hour at a mall during a
single visit, while 28.0 percent indicated spending up to two hours per visit, 26.7 percent
two to three hours per visit and 18.0 percent three to four hours per visit. Of the
participants, 16.5 percent reported spending more than four hours at the mall during a
single visit.
10.9%
28.0%
26.7%
18.0%
16.5%
0 5 10 15 20 25 30
Less than 1 hour
1-2 hours
2-3 hours
3-4 hours
More than 4 hours
Hours spent at mall
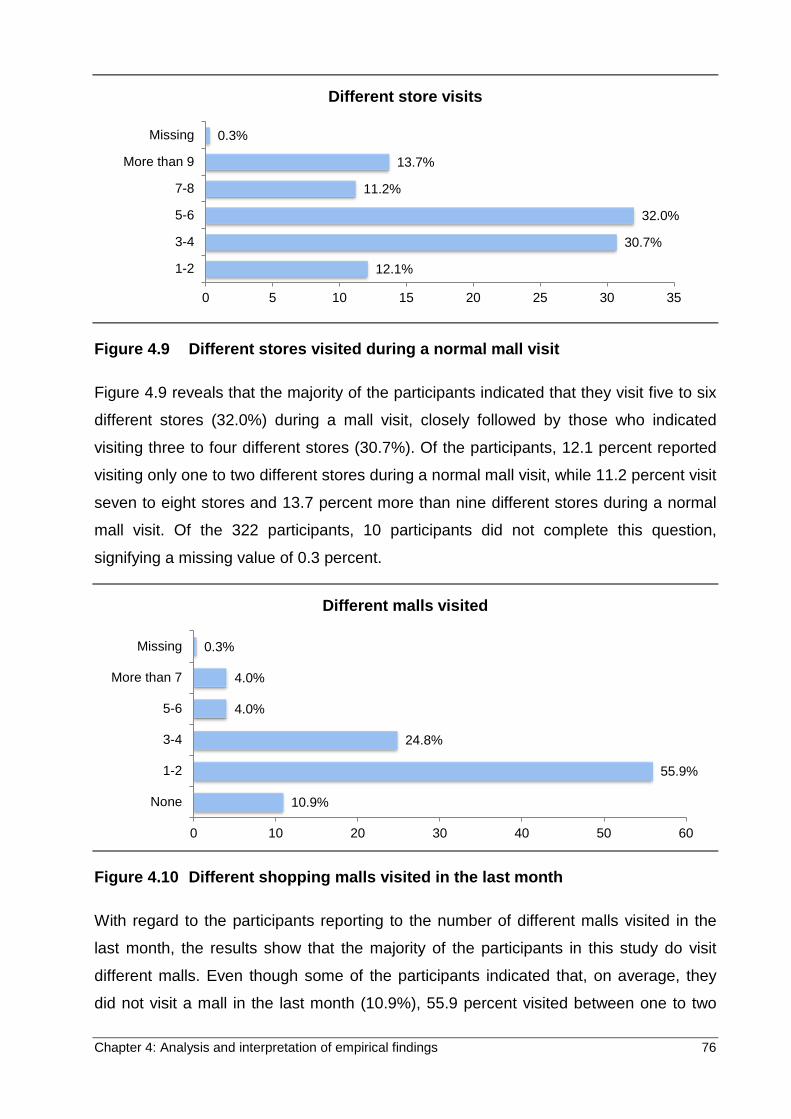
Chapter 4: Analysis and interpretation of empirical findings 76
Figure 4.9 Different stores visited during a normal mall visit
Figure 4.9 reveals that the majority of the participants indicated that they visit five to six
different stores (32.0%) during a mall visit, closely followed by those who indicated
visiting three to four different stores (30.7%). Of the participants, 12.1 percent reported
visiting only one to two different stores during a normal mall visit, while 11.2 percent visit
seven to eight stores and 13.7 percent more than nine different stores during a normal
mall visit. Of the 322 participants, 10 participants did not complete this question,
signifying a missing value of 0.3 percent.
Figure 4.10 Different shopping malls visited in the last month
With regard to the participants reporting to the number of different malls visited in the
last month, the results show that the majority of the participants in this study do visit
different malls. Even though some of the participants indicated that, on average, they
did not visit a mall in the last month (10.9%), 55.9 percent visited between one to two
12.1%
30.7%
32.0%
11.2%
13.7%
0.3%
0 5 10 15 20 25 30 35
1-2
3-4
5-6
7-8
More than 9
Missing
Different store visits
10.9%
55.9%
24.8%
4.0%
4.0%
0.3%
0 10 20 30 40 50 60
None
1-2
3-4
5-6
More than 7
Missing
Different malls visited
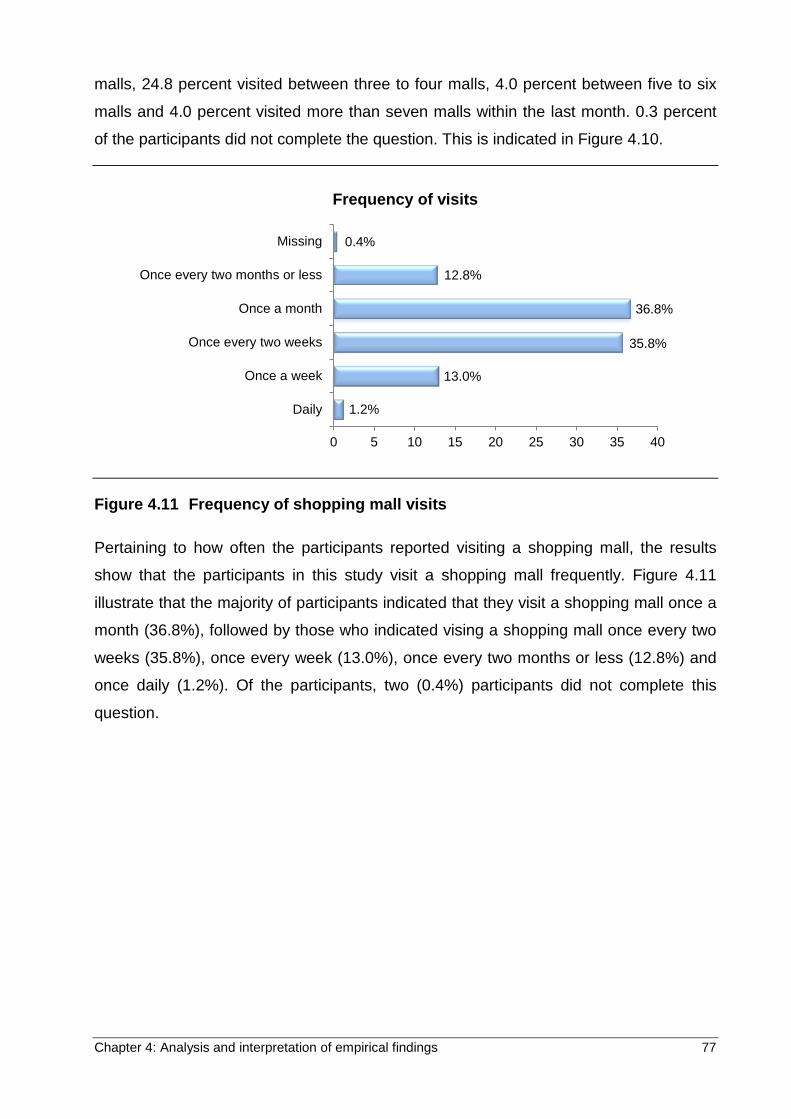
Chapter 4: Analysis and interpretation of empirical findings 77
malls, 24.8 percent visited between three to four malls, 4.0 percent between five to six
malls and 4.0 percent visited more than seven malls within the last month. 0.3 percent
of the participants did not complete the question. This is indicated in Figure 4.10.
Figure 4.11 Frequency of shopping mall visits
Pertaining to how often the participants reported visiting a shopping mall, the results
show that the participants in this study visit a shopping mall frequently. Figure 4.11
illustrate that the majority of participants indicated that they visit a shopping mall once a
month (36.8%), followed by those who indicated vising a shopping mall once every two
weeks (35.8%), once every week (13.0%), once every two months or less (12.8%) and
once daily (1.2%). Of the participants, two (0.4%) participants did not complete this
question.
1.2%
13.0%
35.8%
36.8%
12.8%
0.4%
0 5 10 15 20 25 30 35 40
Daily
Once a week
Once every two weeks
Once a month
Once every two months or less
Missing
Frequency of visits
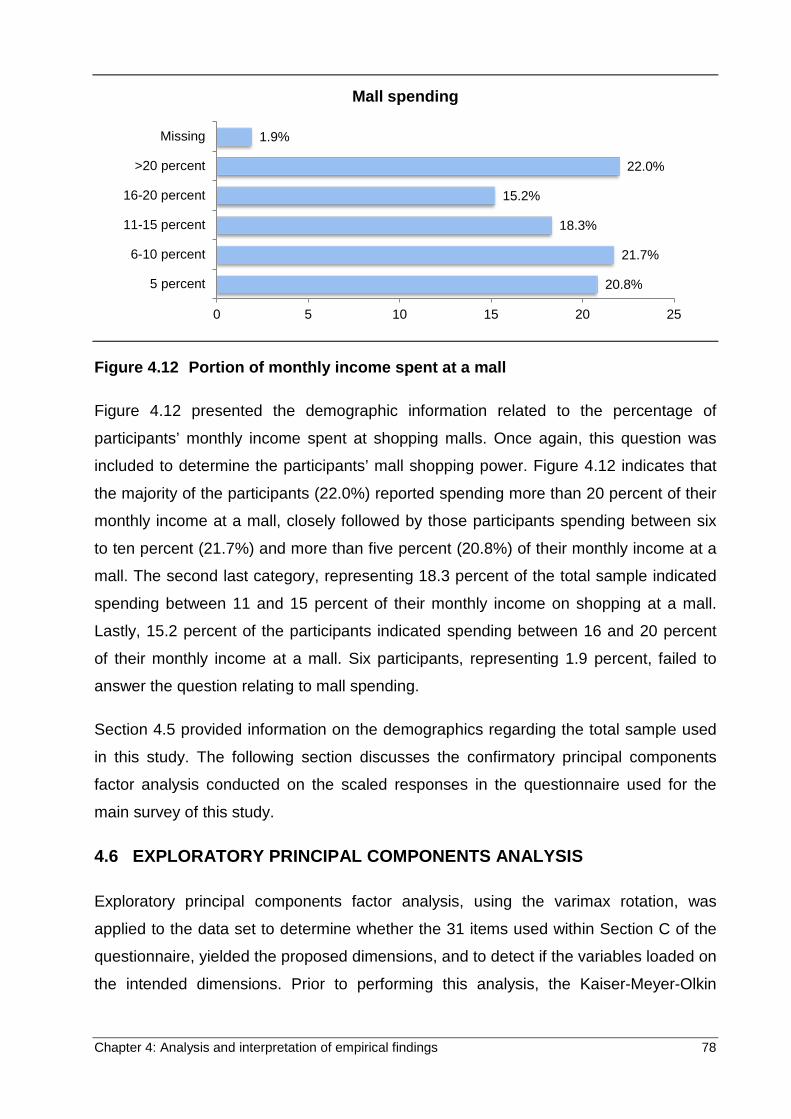
Chapter 4: Analysis and interpretation of empirical findings 78
Figure 4.12 Portion of monthly income spent at a mall
Figure 4.12 presented the demographic information related to the percentage of
participants’ monthly income spent at shopping malls. Once again, this question was
included to determine the participants’ mall shopping power. Figure 4.12 indicates that
the majority of the participants (22.0%) reported spending more than 20 percent of their
monthly income at a mall, closely followed by those participants spending between six
to ten percent (21.7%) and more than five percent (20.8%) of their monthly income at a
mall. The second last category, representing 18.3 percent of the total sample indicated
spending between 11 and 15 percent of their monthly income on shopping at a mall.
Lastly, 15.2 percent of the participants indicated spending between 16 and 20 percent
of their monthly income at a mall. Six participants, representing 1.9 percent, failed to
answer the question relating to mall spending.
Section 4.5 provided information on the demographics regarding the total sample used
in this study. The following section discusses the confirmatory principal components
factor analysis conducted on the scaled responses in the questionnaire used for the
main survey of this study.
4.6 EXPLORATORY PRINCIPAL COMPONENTS ANALYSIS
Exploratory principal components factor analysis, using the varimax rotation, was
applied to the data set to determine whether the 31 items used within Section C of the
questionnaire, yielded the proposed dimensions, and to detect if the variables loaded on
the intended dimensions. Prior to performing this analysis, the Kaiser-Meyer-Olkin
20.8%
21.7%
18.3%
15.2%
22.0%
1.9%
0 5 10 15 20 25
5 percent
6-10 percent
11-15 percent
16-20 percent
>20 percent
Missing
Mall spending
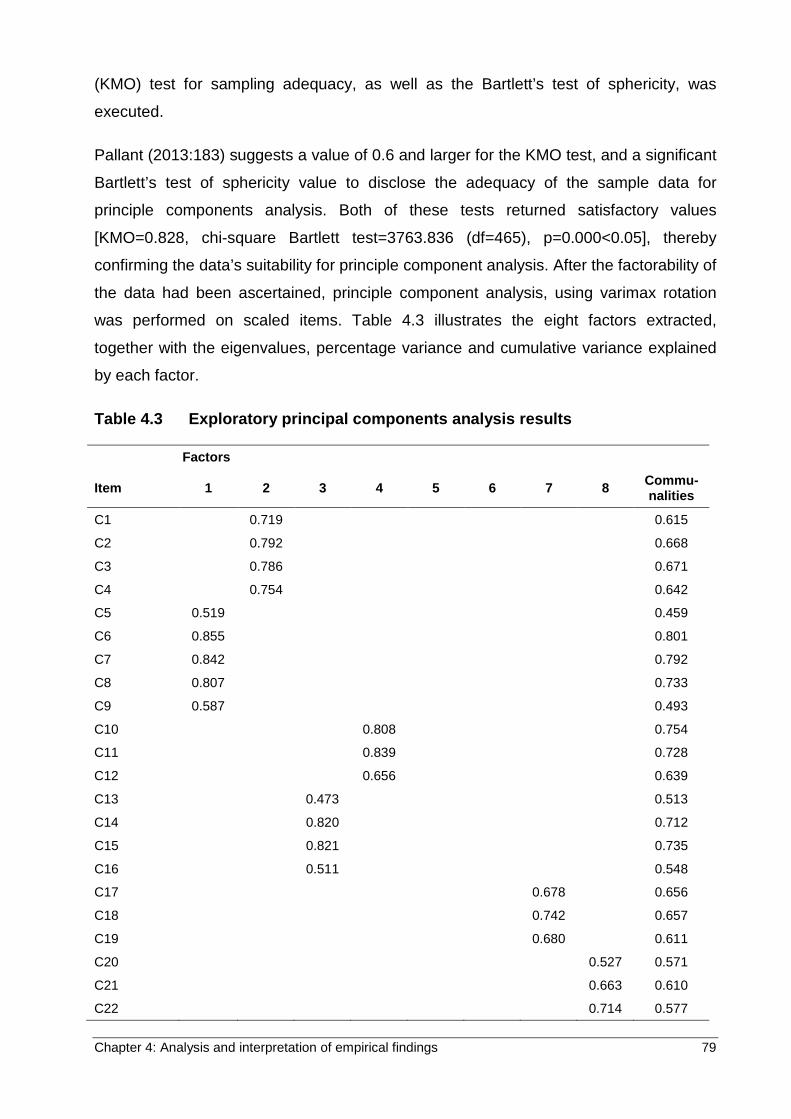
Chapter 4: Analysis and interpretation of empirical findings 79
(KMO) test for sampling adequacy, as well as the Bartlett’s test of sphericity, was
executed.
Pallant (2013:183) suggests a value of 0.6 and larger for the KMO test, and a significant
Bartlett’s test of sphericity value to disclose the adequacy of the sample data for
principle components analysis. Both of these tests returned satisfactory values
[KMO=0.828, chi-square Bartlett test=3763.836 (df=465), p=0.000<0.05], thereby
confirming the data’s suitability for principle component analysis. After the factorability of
the data had been ascertained, principle component analysis, using varimax rotation
was performed on scaled items. Table 4.3 illustrates the eight factors extracted,
together with the eigenvalues, percentage variance and cumulative variance explained
by each factor.
Table 4.3 Exploratory principal components analysis results
Factors
Item 1 2 3 4 5 6 7 8 Commu-nalities
C1 0.719 0.615
C2 0.792 0.668
C3 0.786 0.671
C4 0.754 0.642
C5 0.519 0.459
C6 0.855 0.801
C7 0.842 0.792
C8 0.807 0.733
C9 0.587 0.493
C10 0.808 0.754
C11 0.839 0.728
C12 0.656 0.639
C13 0.473 0.513
C14 0.820 0.712
C15 0.821 0.735
C16 0.511 0.548
C17 0.678 0.656
C18 0.742 0.657
C19 0.680 0.611
C20 0.527 0.571
C21 0.663 0.610
C22 0.714 0.577
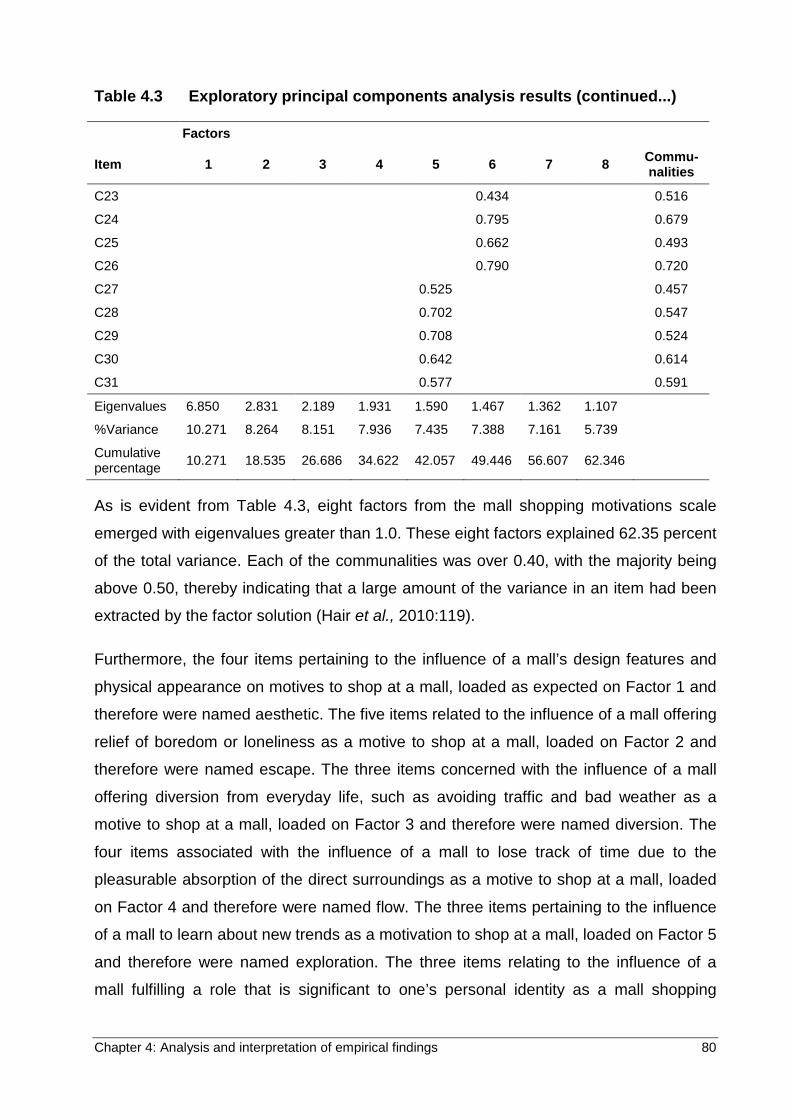
Chapter 4: Analysis and interpretation of empirical findings 80
Table 4.3 Exploratory principal components analysis results (continued...)
Factors
Item 1 2 3 4 5 6 7 8 Commu-nalities
C23 0.434 0.516
C24 0.795 0.679
C25 0.662 0.493
C26 0.790 0.720
C27 0.525 0.457
C28 0.702 0.547
C29 0.708 0.524
C30 0.642 0.614
C31 0.577 0.591
Eigenvalues 6.850 2.831 2.189 1.931 1.590 1.467 1.362 1.107
%Variance 10.271 8.264 8.151 7.936 7.435 7.388 7.161 5.739
Cumulative percentage 10.271 18.535 26.686 34.622 42.057 49.446 56.607 62.346
As is evident from Table 4.3, eight factors from the mall shopping motivations scale
emerged with eigenvalues greater than 1.0. These eight factors explained 62.35 percent
of the total variance. Each of the communalities was over 0.40, with the majority being
above 0.50, thereby indicating that a large amount of the variance in an item had been
extracted by the factor solution (Hair et al., 2010:119).
Furthermore, the four items pertaining to the influence of a mall’s design features and
physical appearance on motives to shop at a mall, loaded as expected on Factor 1 and
therefore were named aesthetic. The five items related to the influence of a mall offering
relief of boredom or loneliness as a motive to shop at a mall, loaded on Factor 2 and
therefore were named escape. The three items concerned with the influence of a mall
offering diversion from everyday life, such as avoiding traffic and bad weather as a
motive to shop at a mall, loaded on Factor 3 and therefore were named diversion. The
four items associated with the influence of a mall to lose track of time due to the
pleasurable absorption of the direct surroundings as a motive to shop at a mall, loaded
on Factor 4 and therefore were named flow. The three items pertaining to the influence
of a mall to learn about new trends as a motivation to shop at a mall, loaded on Factor 5
and therefore were named exploration. The three items relating to the influence of a
mall fulfilling a role that is significant to one’s personal identity as a mall shopping
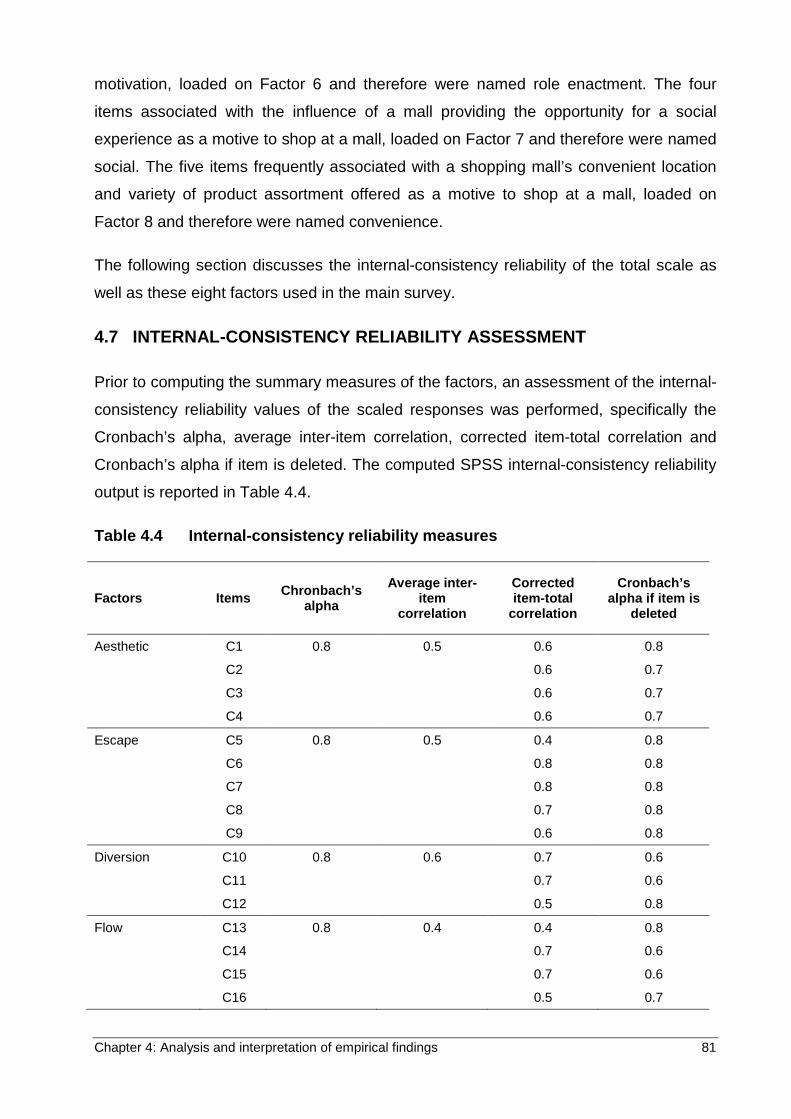
Chapter 4: Analysis and interpretation of empirical findings 81
motivation, loaded on Factor 6 and therefore were named role enactment. The four
items associated with the influence of a mall providing the opportunity for a social
experience as a motive to shop at a mall, loaded on Factor 7 and therefore were named
social. The five items frequently associated with a shopping mall’s convenient location
and variety of product assortment offered as a motive to shop at a mall, loaded on
Factor 8 and therefore were named convenience.
The following section discusses the internal-consistency reliability of the total scale as
well as these eight factors used in the main survey.
4.7 INTERNAL-CONSISTENCY RELIABILITY ASSESSMENT
Prior to computing the summary measures of the factors, an assessment of the internal-
consistency reliability values of the scaled responses was performed, specifically the
Cronbach’s alpha, average inter-item correlation, corrected item-total correlation and
Cronbach’s alpha if item is deleted. The computed SPSS internal-consistency reliability
output is reported in Table 4.4.
Table 4.4 Internal-consistency reliability measures
Factors Items Chronbach’s alpha
Average inter-item
correlation
Corrected item-total
correlation
Cronbach’s alpha if item is
deleted
Aesthetic C1 0.8 0.5 0.6 0.8
C2 0.6 0.7
C3 0.6 0.7
C4 0.6 0.7
Escape C5 0.8 0.5 0.4 0.8
C6 0.8 0.8
C7 0.8 0.8
C8 0.7 0.8
C9 0.6 0.8
Diversion C10 0.8 0.6 0.7 0.6
C11 0.7 0.6
C12 0.5 0.8
Flow C13 0.8 0.4 0.4 0.8
C14 0.7 0.6
C15 0.7 0.6
C16 0.5 0.7
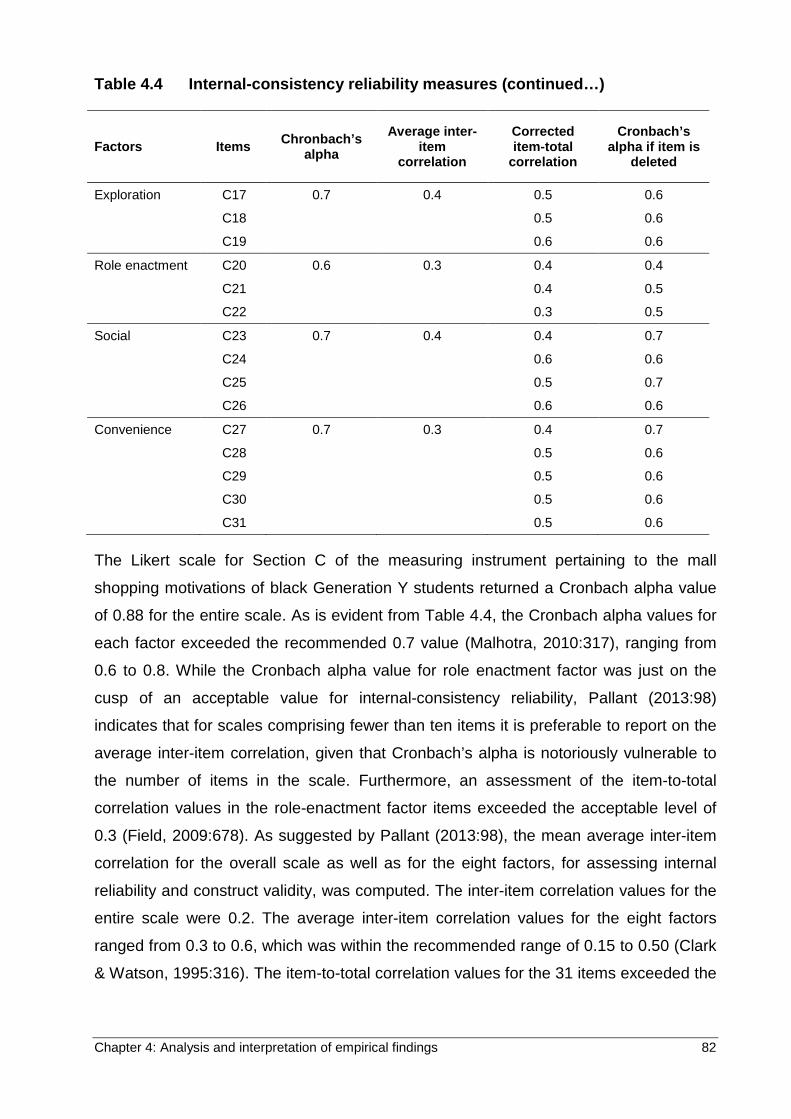
Chapter 4: Analysis and interpretation of empirical findings 82
Table 4.4 Internal-consistency reliability measures (continued…)
Factors Items Chronbach’s alpha
Average inter-item
correlation
Corrected item-total
correlation
Cronbach’s alpha if item is
deleted
Exploration C17 0.7 0.4 0.5 0.6
C18 0.5 0.6
C19 0.6 0.6
Role enactment C20 0.6 0.3 0.4 0.4
C21 0.4 0.5
C22 0.3 0.5
Social C23 0.7 0.4 0.4 0.7
C24 0.6 0.6
C25 0.5 0.7
C26 0.6 0.6
Convenience C27 0.7 0.3 0.4 0.7
C28 0.5 0.6
C29 0.5 0.6
C30 0.5 0.6
C31 0.5 0.6
The Likert scale for Section C of the measuring instrument pertaining to the mall
shopping motivations of black Generation Y students returned a Cronbach alpha value
of 0.88 for the entire scale. As is evident from Table 4.4, the Cronbach alpha values for
each factor exceeded the recommended 0.7 value (Malhotra, 2010:317), ranging from
0.6 to 0.8. While the Cronbach alpha value for role enactment factor was just on the
cusp of an acceptable value for internal-consistency reliability, Pallant (2013:98)
indicates that for scales comprising fewer than ten items it is preferable to report on the
average inter-item correlation, given that Cronbach’s alpha is notoriously vulnerable to
the number of items in the scale. Furthermore, an assessment of the item-to-total
correlation values in the role-enactment factor items exceeded the acceptable level of
0.3 (Field, 2009:678). As suggested by Pallant (2013:98), the mean average inter-item
correlation for the overall scale as well as for the eight factors, for assessing internal
reliability and construct validity, was computed. The inter-item correlation values for the
entire scale were 0.2. The average inter-item correlation values for the eight factors
ranged from 0.3 to 0.6, which was within the recommended range of 0.15 to 0.50 (Clark
& Watson, 1995:316). The item-to-total correlation values for the 31 items exceeded the
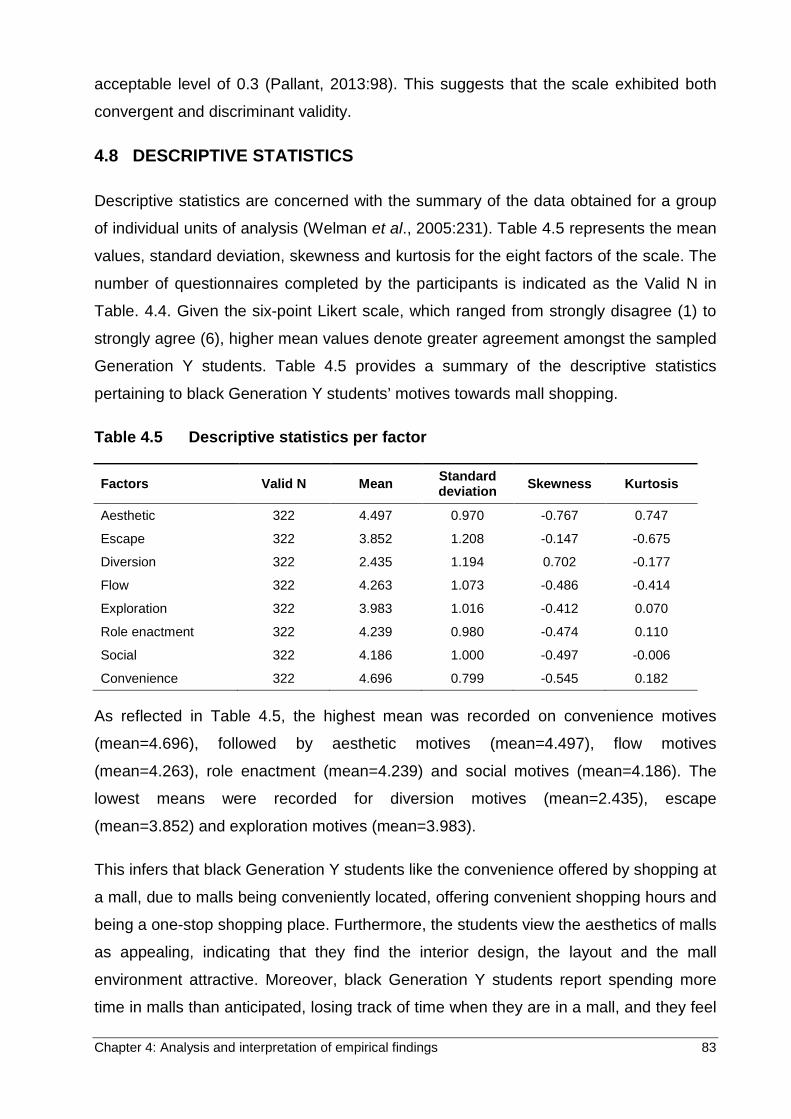
Chapter 4: Analysis and interpretation of empirical findings 83
acceptable level of 0.3 (Pallant, 2013:98). This suggests that the scale exhibited both
convergent and discriminant validity.
4.8 DESCRIPTIVE STATISTICS
Descriptive statistics are concerned with the summary of the data obtained for a group
of individual units of analysis (Welman et al., 2005:231). Table 4.5 represents the mean
values, standard deviation, skewness and kurtosis for the eight factors of the scale. The
number of questionnaires completed by the participants is indicated as the Valid N in
Table. 4.4. Given the six-point Likert scale, which ranged from strongly disagree (1) to
strongly agree (6), higher mean values denote greater agreement amongst the sampled
Generation Y students. Table 4.5 provides a summary of the descriptive statistics
pertaining to black Generation Y students’ motives towards mall shopping.
Table 4.5 Descriptive statistics per factor
Factors Valid N Mean Standard deviation Skewness Kurtosis
Aesthetic 322 4.497 0.970 -0.767 0.747
Escape 322 3.852 1.208 -0.147 -0.675
Diversion 322 2.435 1.194 0.702 -0.177
Flow 322 4.263 1.073 -0.486 -0.414
Exploration 322 3.983 1.016 -0.412 0.070
Role enactment 322 4.239 0.980 -0.474 0.110
Social 322 4.186 1.000 -0.497 -0.006
Convenience 322 4.696 0.799 -0.545 0.182
As reflected in Table 4.5, the highest mean was recorded on convenience motives
(mean=4.696), followed by aesthetic motives (mean=4.497), flow motives
(mean=4.263), role enactment (mean=4.239) and social motives (mean=4.186). The
lowest means were recorded for diversion motives (mean=2.435), escape
(mean=3.852) and exploration motives (mean=3.983).
This infers that black Generation Y students like the convenience offered by shopping at
a mall, due to malls being conveniently located, offering convenient shopping hours and
being a one-stop shopping place. Furthermore, the students view the aesthetics of malls
as appealing, indicating that they find the interior design, the layout and the mall
environment attractive. Moreover, black Generation Y students report spending more
time in malls than anticipated, losing track of time when they are in a mall, and they feel
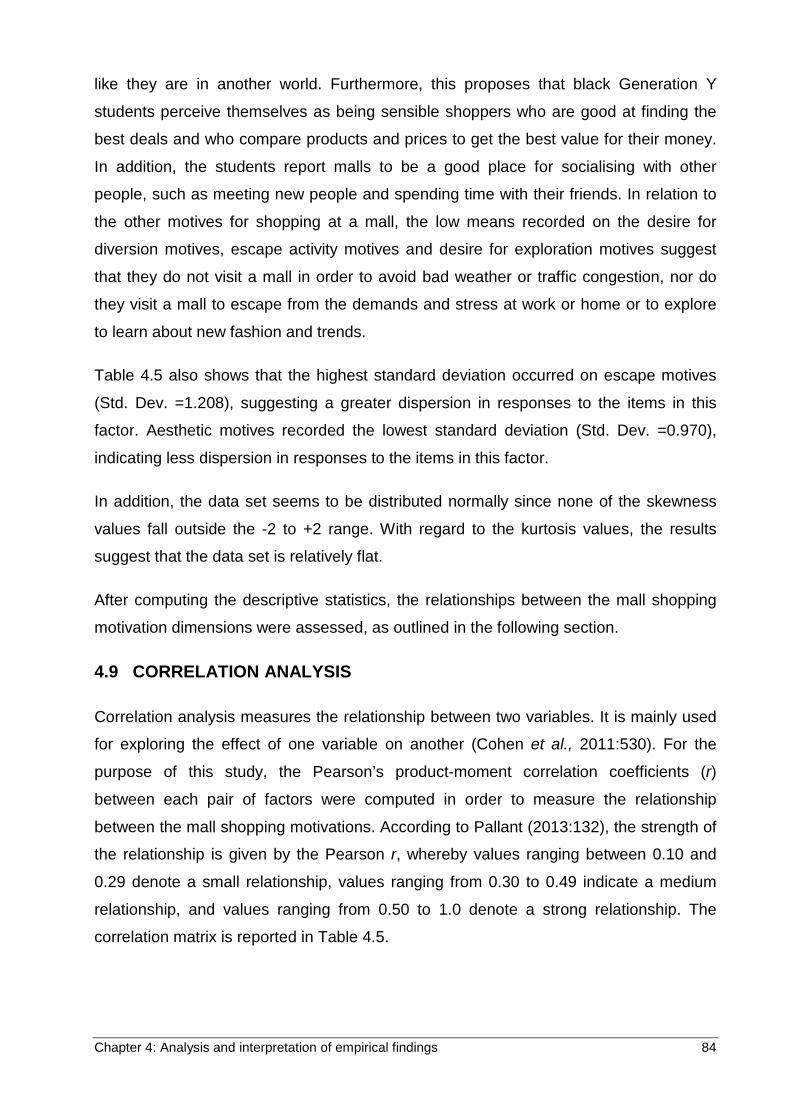
Chapter 4: Analysis and interpretation of empirical findings 84
like they are in another world. Furthermore, this proposes that black Generation Y
students perceive themselves as being sensible shoppers who are good at finding the
best deals and who compare products and prices to get the best value for their money.
In addition, the students report malls to be a good place for socialising with other
people, such as meeting new people and spending time with their friends. In relation to
the other motives for shopping at a mall, the low means recorded on the desire for
diversion motives, escape activity motives and desire for exploration motives suggest
that they do not visit a mall in order to avoid bad weather or traffic congestion, nor do
they visit a mall to escape from the demands and stress at work or home or to explore
to learn about new fashion and trends.
Table 4.5 also shows that the highest standard deviation occurred on escape motives
(Std. Dev. =1.208), suggesting a greater dispersion in responses to the items in this
factor. Aesthetic motives recorded the lowest standard deviation (Std. Dev. =0.970),
indicating less dispersion in responses to the items in this factor.
In addition, the data set seems to be distributed normally since none of the skewness
values fall outside the -2 to +2 range. With regard to the kurtosis values, the results
suggest that the data set is relatively flat.
After computing the descriptive statistics, the relationships between the mall shopping
motivation dimensions were assessed, as outlined in the following section.
4.9 CORRELATION ANALYSIS
Correlation analysis measures the relationship between two variables. It is mainly used
for exploring the effect of one variable on another (Cohen et al., 2011:530). For the
purpose of this study, the Pearson’s product-moment correlation coefficients (r)
between each pair of factors were computed in order to measure the relationship
between the mall shopping motivations. According to Pallant (2013:132), the strength of
the relationship is given by the Pearson r, whereby values ranging between 0.10 and
0.29 denote a small relationship, values ranging from 0.30 to 0.49 indicate a medium
relationship, and values ranging from 0.50 to 1.0 denote a strong relationship. The
correlation matrix is reported in Table 4.5.
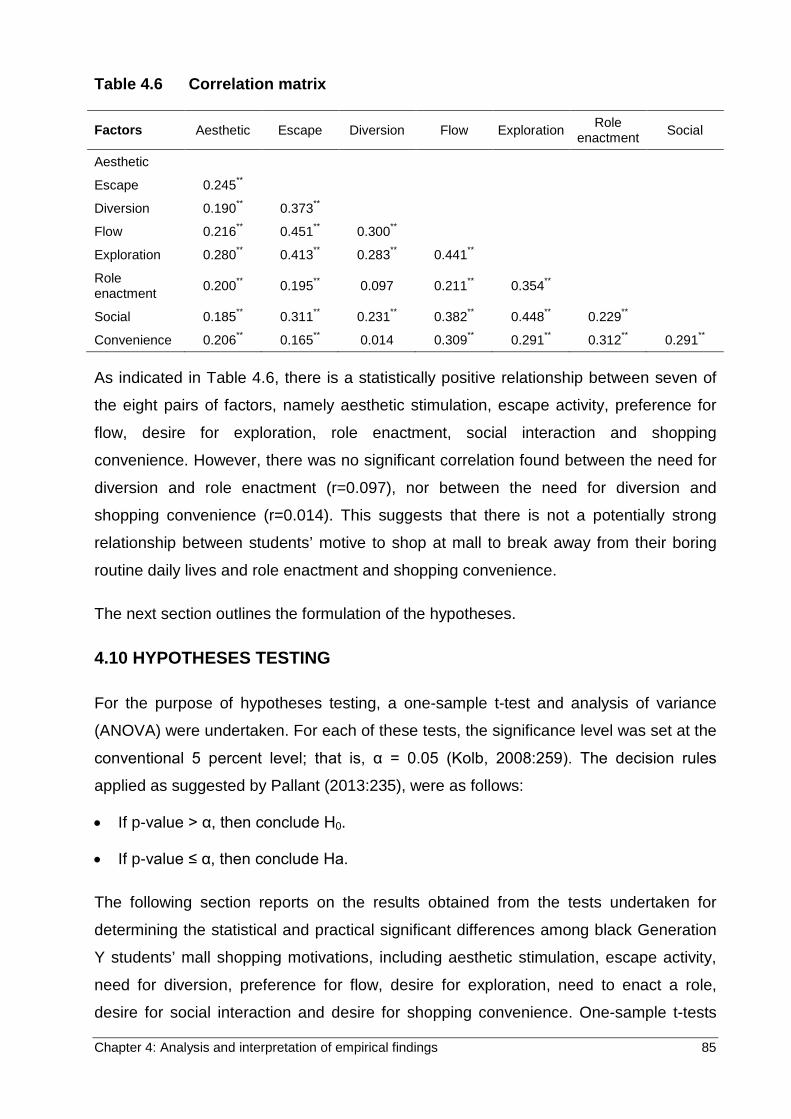
Chapter 4: Analysis and interpretation of empirical findings 85
Table 4.6 Correlation matrix
Factors Aesthetic Escape Diversion Flow Exploration Role enactment Social
Aesthetic
Escape 0.245**
Diversion 0.190** 0.373**
Flow 0.216** 0.451** 0.300**
Exploration 0.280** 0.413** 0.283** 0.441**
Role enactment 0.200** 0.195** 0.097 0.211** 0.354**
Social 0.185** 0.311** 0.231** 0.382** 0.448** 0.229**
Convenience 0.206** 0.165** 0.014 0.309** 0.291** 0.312** 0.291**
As indicated in Table 4.6, there is a statistically positive relationship between seven of
the eight pairs of factors, namely aesthetic stimulation, escape activity, preference for
flow, desire for exploration, role enactment, social interaction and shopping
convenience. However, there was no significant correlation found between the need for
diversion and role enactment (r=0.097), nor between the need for diversion and
shopping convenience (r=0.014). This suggests that there is not a potentially strong
relationship between students’ motive to shop at mall to break away from their boring
routine daily lives and role enactment and shopping convenience.
The next section outlines the formulation of the hypotheses.
4.10 HYPOTHESES TESTING
For the purpose of hypotheses testing, a one-sample t-test and analysis of variance
(ANOVA) were undertaken. For each of these tests, the significance level was set at the
conventional 5 percent level; that is, α = 0.05 (Kolb, 2008:259). The decision rules
applied as suggested by Pallant (2013:235), were as follows:
• If p-value > α, then conclude H0.
• If p-value ≤ α, then conclude Ha.
The following section reports on the results obtained from the tests undertaken for
determining the statistical and practical significant differences among black Generation
Y students’ mall shopping motivations, including aesthetic stimulation, escape activity,
need for diversion, preference for flow, desire for exploration, need to enact a role,
desire for social interaction and desire for shopping convenience. One-sample t-tests
Chapter 4: Analysis and interpretation of empirical findings 86
were used to examine if there was a difference between students’ motivations for
shopping at a mall.
4.10.1 One-sample t-test
For the purpose of addressing the first eight empirical objectives of this study,
formulated in Chapter 1 (refer to Section 1.3.3), a single-tailed, one-sample t-test was
conducted to determine whether black Generation Y students have statistically
significant positive mall shopping motivations. The expected mean was set at X > 3.5.
The hypotheses (H01/Ha1–H08/Ha8) were formulated as follows:
H01: Black Generation Y students do not exhibit a significant positive preference for
aesthetic stimulation as a mall shopping motivation.
Ha1: Black Generation Y students do exhibit a significant positive preference for
aesthetic stimulation as a mall shopping motivation.
H02: Black Generation Y students do not exhibit a significant positive desire for
escape activity as a mall shopping motivation.
Ha2: Black Generation Y students do exhibit a significant positive desire for escape
activity as a mall shopping motivation.
H03: Black Generation Y students do not exhibit a significant positive need for
diversion as a mall shopping motivation.
Ha3: Black Generation Y students do exhibit a significant positive need for diversion as
a mall shopping motivation.
H04: Black Generation Y students do not exhibit a significant positive preference for
flow as a mall shopping motivation.
Ha4: Black Generation Y students do exhibit a significant positive preference for flow
as a mall shopping motivation.
H05: Black Generation Y students do not exhibit a significant positive desire for
exploration as a mall shopping motivation.
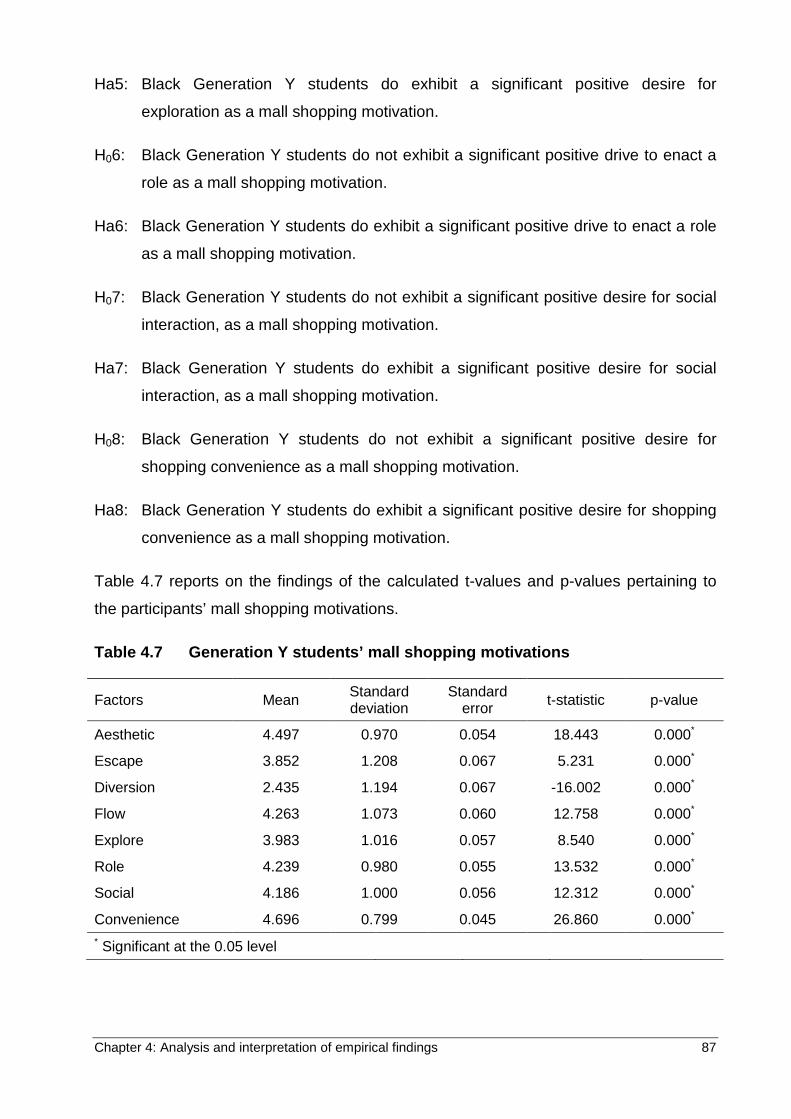
Chapter 4: Analysis and interpretation of empirical findings 87
Ha5: Black Generation Y students do exhibit a significant positive desire for
exploration as a mall shopping motivation.
H06: Black Generation Y students do not exhibit a significant positive drive to enact a
role as a mall shopping motivation.
Ha6: Black Generation Y students do exhibit a significant positive drive to enact a role
as a mall shopping motivation.
H07: Black Generation Y students do not exhibit a significant positive desire for social
interaction, as a mall shopping motivation.
Ha7: Black Generation Y students do exhibit a significant positive desire for social
interaction, as a mall shopping motivation.
H08: Black Generation Y students do not exhibit a significant positive desire for
shopping convenience as a mall shopping motivation.
Ha8: Black Generation Y students do exhibit a significant positive desire for shopping
convenience as a mall shopping motivation.
Table 4.7 reports on the findings of the calculated t-values and p-values pertaining to
the participants’ mall shopping motivations.
Table 4.7 Generation Y students’ mall shopping motivations
Factors Mean Standard deviation
Standard error t-statistic p-value
Aesthetic 4.497 0.970 0.054 18.443 0.000*
Escape 3.852 1.208 0.067 5.231 0.000*
Diversion 2.435 1.194 0.067 -16.002 0.000*
Flow 4.263 1.073 0.060 12.758 0.000*
Explore 3.983 1.016 0.057 8.540 0.000*
Role 4.239 0.980 0.055 13.532 0.000*
Social 4.186 1.000 0.056 12.312 0.000*
Convenience 4.696 0.799 0.045 26.860 0.000* * Significant at the 0.05 level
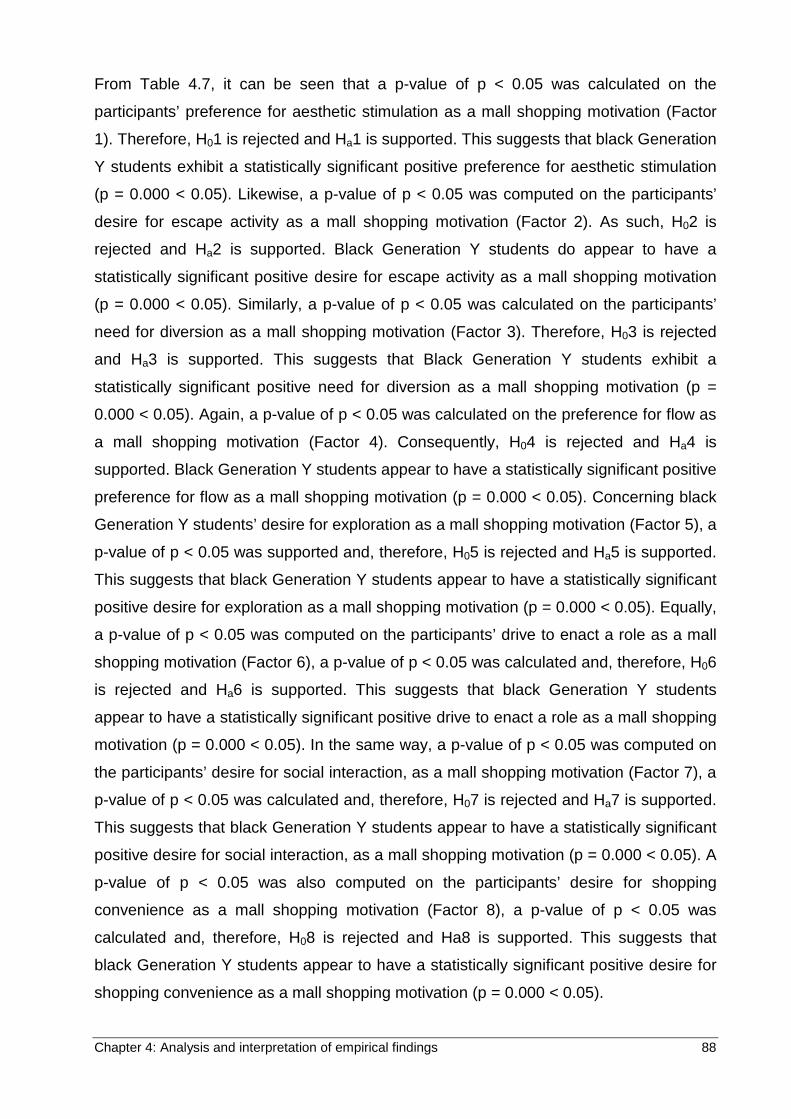
Chapter 4: Analysis and interpretation of empirical findings 88
From Table 4.7, it can be seen that a p-value of p < 0.05 was calculated on the
participants’ preference for aesthetic stimulation as a mall shopping motivation (Factor
1). Therefore, H01 is rejected and Ha1 is supported. This suggests that black Generation
Y students exhibit a statistically significant positive preference for aesthetic stimulation
(p = 0.000 < 0.05). Likewise, a p-value of p < 0.05 was computed on the participants’
desire for escape activity as a mall shopping motivation (Factor 2). As such, H02 is
rejected and Ha2 is supported. Black Generation Y students do appear to have a
statistically significant positive desire for escape activity as a mall shopping motivation
(p = 0.000 < 0.05). Similarly, a p-value of p < 0.05 was calculated on the participants’
need for diversion as a mall shopping motivation (Factor 3). Therefore, H03 is rejected
and Ha3 is supported. This suggests that Black Generation Y students exhibit a
statistically significant positive need for diversion as a mall shopping motivation (p =
0.000 < 0.05). Again, a p-value of p < 0.05 was calculated on the preference for flow as
a mall shopping motivation (Factor 4). Consequently, H04 is rejected and Ha4 is
supported. Black Generation Y students appear to have a statistically significant positive
preference for flow as a mall shopping motivation (p = 0.000 < 0.05). Concerning black
Generation Y students’ desire for exploration as a mall shopping motivation (Factor 5), a
p-value of p < 0.05 was supported and, therefore, H05 is rejected and Ha5 is supported.
This suggests that black Generation Y students appear to have a statistically significant
positive desire for exploration as a mall shopping motivation (p = 0.000 < 0.05). Equally,
a p-value of p < 0.05 was computed on the participants’ drive to enact a role as a mall
shopping motivation (Factor 6), a p-value of p < 0.05 was calculated and, therefore, H06
is rejected and Ha6 is supported. This suggests that black Generation Y students
appear to have a statistically significant positive drive to enact a role as a mall shopping
motivation (p = 0.000 < 0.05). In the same way, a p-value of p < 0.05 was computed on
the participants’ desire for social interaction, as a mall shopping motivation (Factor 7), a
p-value of p < 0.05 was calculated and, therefore, H07 is rejected and Ha7 is supported.
This suggests that black Generation Y students appear to have a statistically significant
positive desire for social interaction, as a mall shopping motivation (p = 0.000 < 0.05). A
p-value of p < 0.05 was also computed on the participants’ desire for shopping
convenience as a mall shopping motivation (Factor 8), a p-value of p < 0.05 was
calculated and, therefore, H08 is rejected and Ha8 is supported. This suggests that
black Generation Y students appear to have a statistically significant positive desire for
shopping convenience as a mall shopping motivation (p = 0.000 < 0.05).
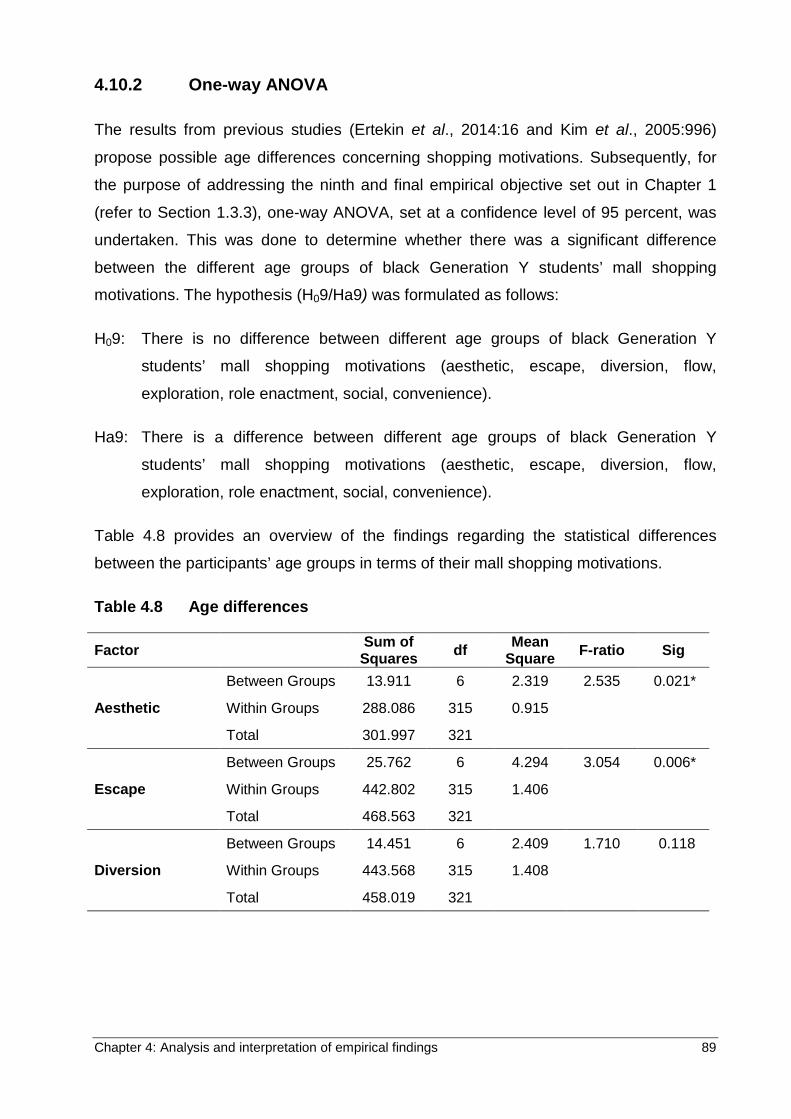
Chapter 4: Analysis and interpretation of empirical findings 89
4.10.2 One-way ANOVA
The results from previous studies (Ertekin et al., 2014:16 and Kim et al., 2005:996)
propose possible age differences concerning shopping motivations. Subsequently, for
the purpose of addressing the ninth and final empirical objective set out in Chapter 1
(refer to Section 1.3.3), one-way ANOVA, set at a confidence level of 95 percent, was
undertaken. This was done to determine whether there was a significant difference
between the different age groups of black Generation Y students’ mall shopping
motivations. The hypothesis (H09/Ha9) was formulated as follows:
H09: There is no difference between different age groups of black Generation Y
students’ mall shopping motivations (aesthetic, escape, diversion, flow,
exploration, role enactment, social, convenience).
Ha9: There is a difference between different age groups of black Generation Y
students’ mall shopping motivations (aesthetic, escape, diversion, flow,
exploration, role enactment, social, convenience).
Table 4.8 provides an overview of the findings regarding the statistical differences
between the participants’ age groups in terms of their mall shopping motivations.
Table 4.8 Age differences
Factor Sum of Squares df Mean
Square F-ratio Sig
Aesthetic
Between Groups 13.911 6 2.319 2.535 0.021*
Within Groups 288.086 315 0.915
Total 301.997 321
Escape
Between Groups 25.762 6 4.294 3.054 0.006*
Within Groups 442.802 315 1.406
Total 468.563 321
Diversion
Between Groups 14.451 6 2.409 1.710 0.118
Within Groups 443.568 315 1.408
Total 458.019 321
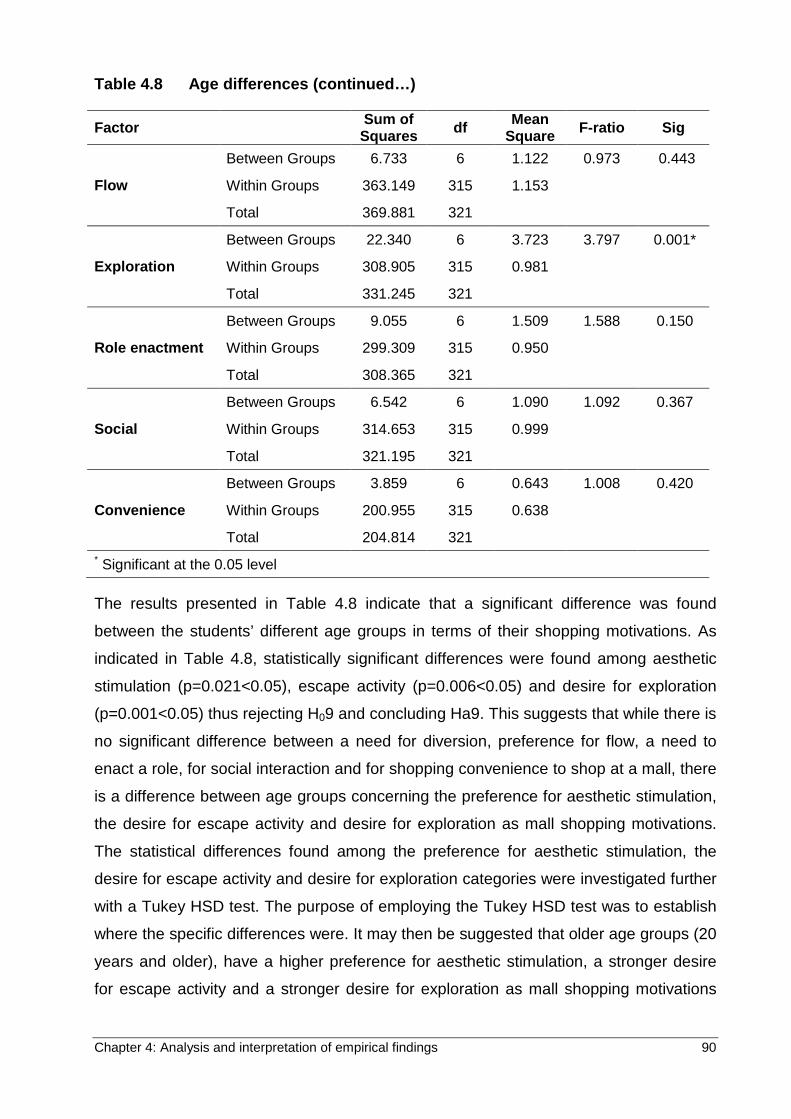
Chapter 4: Analysis and interpretation of empirical findings 90
Table 4.8 Age differences (continued…)
Factor Sum of Squares df Mean
Square F-ratio Sig
Flow
Between Groups 6.733 6 1.122 0.973 0.443
Within Groups 363.149 315 1.153
Total 369.881 321
Exploration
Between Groups 22.340 6 3.723 3.797 0.001*
Within Groups 308.905 315 0.981
Total 331.245 321
Role enactment
Between Groups 9.055 6 1.509 1.588 0.150
Within Groups 299.309 315 0.950
Total 308.365 321
Social
Between Groups 6.542 6 1.090 1.092 0.367
Within Groups 314.653 315 0.999
Total 321.195 321
Convenience
Between Groups 3.859 6 0.643 1.008 0.420
Within Groups 200.955 315 0.638
Total 204.814 321 * Significant at the 0.05 level
The results presented in Table 4.8 indicate that a significant difference was found
between the students’ different age groups in terms of their shopping motivations. As
indicated in Table 4.8, statistically significant differences were found among aesthetic
stimulation (p=0.021<0.05), escape activity (p=0.006<0.05) and desire for exploration
(p=0.001<0.05) thus rejecting H09 and concluding Ha9. This suggests that while there is
no significant difference between a need for diversion, preference for flow, a need to
enact a role, for social interaction and for shopping convenience to shop at a mall, there
is a difference between age groups concerning the preference for aesthetic stimulation,
the desire for escape activity and desire for exploration as mall shopping motivations.
The statistical differences found among the preference for aesthetic stimulation, the
desire for escape activity and desire for exploration categories were investigated further
with a Tukey HSD test. The purpose of employing the Tukey HSD test was to establish
where the specific differences were. It may then be suggested that older age groups (20
years and older), have a higher preference for aesthetic stimulation, a stronger desire
for escape activity and a stronger desire for exploration as mall shopping motivations
Chapter 4: Analysis and interpretation of empirical findings 91
than younger students. The Tukey HSD test, indicating where the specific variances lay,
can be found in Annexure B.
4.11 SYNOPSIS
This chapter embodied the results gathered from the empirical portion of the study. In
the first section, Section 4.2, results concerning the pilot test of the study were outlined,
with specific reference to reliability and validity analyses. In Section 4.3, the data
collection process was discussed. The following section, Section 4.4, presented the
preliminary data analysis, comprising coding, data cleaning and tabulation. In Section
4.5, the sample was described in terms of demographic information and mall shopping
habits analysis. The exploratory principal components analysis was analysed in Section
4.6, and in Section 4.7 the internal-consistency reliability assessment was explained
and deliberated on. Section 4.8 specified the descriptive statistics per factor to indicate
the shopping mall motivations of black Generation Y students. The correlation analysis
was presented in Section 4.9. The last section, Section 4.10, outlined the tests of
significance used to test the hypotheses formulated for this study. These tests include a
one-sample t-test and one-way ANOVA. In the succeeding chapter, Chapter 5, a
summary of the study concerning the recommendations, limitations and opportunities
for future research is provided. Additionally, an overall conclusion pertaining to this
study is included.
Chapter 5: Conclusion and recommendations 92
CHAPTER 5 CONCLUSION AND RECOMMENDATIONS
5.1 INTRODUCTION
Shopping malls changed the lives of consumers worldwide and therefore, have had a
significant influence on consumers’ shopping behaviour. Consumers relax and enjoy
themselves while shopping in a shopping mall. Shopping malls were developed to offer
consumers a convenient one stop shopping experience. Shopping malls are planned
developments that are managed and marketed as a unified whole. The positive impact
of the environment on shopping behaviour is increasingly recognised by mall
management and retailers. Although research indicates a significant increase in
consumer shopping mall spending, in order to stay competitive, mall management and
retailers need to invest in resources to offer attractive and entertaining mall
surroundings to retain current customers and attract new customers. As such, the
primary objective of this study was to determine black Generation Y students’ mall
shopping motivations within the South African context, in order to guide marketing
strategies for effectively targeting this market.
The purpose of this chapter is to provide an overview of the study (Section 5.2), present
the main findings of this study (Section 5.3), and to make recommendations (Section
5.4) based on the findings of the study. This chapter includes a discussion on the
limitations of the study as well as suggestions for future research opportunities (Section
5.5), and the contribution made by the (Section 5.6). The chapter ends with concluding
remarks (Section 5.7).
5.2 OVERVIEW OF THE STUDY
To provide applicable recommendations, it is essential to discuss the insights gained
over the previous four chapters.
Chapter 1 introduced the study and identified the research problem. In this chapter, the
importance of shopping malls was highlighted, with particular emphasis on the various
dimensions pertaining to consumers’ motivations for visiting shopping malls.
Furthermore, the motivations for using black Generation Y students as the target
population in this study are provided in Chapter 1. Based on the identified problem, one
Chapter 5: Conclusion and recommendations 93
primary objective, six theoretical objectives and nine empirical objectives were
formulated in Section 1.3. The hypotheses formulated in Chapter 4 were also presented
in this chapter (Section 1.4). The remainder of this chapter comprised a summary of the
proposed research design and methodology (Section 1.5), followed by the empirical
portion of the study and an overview of the ethical considerations (Section 1.5.4) and
the chapter classification (Section 1.6).
The aim of Chapter 2 was to address the theoretical objectives of this study in the form
of a literature review. The chapter began by giving an overview of shopping malls
(Section 2.2), followed by a discussion on the dynamics of consumer behaviour in
Section 2.3. Consumer motivation and motives for shopping were discussed in Section
2.4. In Section 2.5, possible motives for mall shopping were evaluated. The
characteristics of the Generation Y cohort were discussed in Section 2.6.
The purpose of Chapter 3 was to describe the research methodology followed in
collecting and analysing the data for the empirical part of this study. The study was
guided by a descriptive research design (Section 3.2), and a quantitative research
approach was followed (Section 3.3). The relevant target population for this study was
defined as black Generation Y full-time undergraduate students, aged between 18 and
24, registered at South African public HEIs in 2014 (Section 3.4.1). From the sampling
frame of 26 public registered HEIs in South Africa (Section 3.4.2), two HEIs were
selected, one comprehensive university and one university of technology, using the
judgement sampling method. Thereafter, a single cross-sectional non-probability,
convenience sample of 400 full-time undergraduate black Generation Y students was
selected (Section 3.4.3 & Section 3.4.4). Following the survey approach, a self-
administered questionnaire was used for collecting the required data (Section 3.5). The
various statistical techniques used in this study were outlined in Section 3.9 and
included exploratory factor analysis (Section 3.9.1), reliability analysis (Section 3.9.2),
validity analysis (Section 3.9.3), descriptive statistical analysis (Section 3.9.4),
correlation analysis (Section 3.9.5) and tests of significance, using one-sample t-test
(Section 3.9.6) and one-way analysis of variance (ANOVA) (Section 3.9.7).
Against the background of Chapter 3, Chapter 4 reported on the statistical analysis and
interpretation of the empirical portion of the study. As such, the results concluded in this
Chapter 5: Conclusion and recommendations 94
chapter were in keeping with the empirical objectives formulated in Chapter 1, Section
1.3.3.
5.3 MAIN FINDINGS OF THE STUDY
The main findings of this study, in accordance with the empirical objectives formulated
in Chapter 1, were as follows:
• Determine black Generation Y students’ preference for aesthetic stimulation as a
mall shopping motivation.
• Determine black Generation Y students’ desire for escape activity as a mall
shopping motivation.
• Determine black Generation Y students’ desire for diversion as a mall shopping
motivation.
• Determine black Generation Y students’ preference for flow as a mall shopping
motivation.
• Determine black Generation Y students’ desire for exploration as a mall shopping
motivation.
• Determine black Generation Y students’ drive to enact a role as a mall shopping
motivation.
• Determine black Generation Y students’ desire for social interaction, as a mall
shopping motivation.
• Determine black Generation Y students’ desire for shopping convenience as a mall
shopping motivation.
• Determine if there is a difference between different age groups concerning black
Generation Y students’ mall shopping motivations (aesthetic, escape, flow,
diversion, exploration, role enactment, social, and convenience).
In order to address the first eight empirical objectives of the study, a single-tailed, one-
sample t-test was conducted, whereby the expected mean was set at X > 3.5. The first
empirical objective was to determine black Generation Y students’ preference for
aesthetic stimulation as a mall shopping motivation. As is evident from Table 4.7, black
Generation Y students appeared to have a statistically significant preference for
Chapter 5: Conclusion and recommendations 95
aesthetic stimulation as a mall shopping motivation. The descriptive statistics in Table
4.5 indicated that black Generation Y students reported aesthetic stimulation as the
second most important motivation to shop at a mall. This finding is in keeping with the
studies conducted by Ahmed et al. (2007:343) and Anning-Dorson et al. (2013:376) who
found aesthetic stimulation to be an important motive for consumers to visit a mall.
The next empirical objective aimed at determining black Generation Y students’ desire
for escape activity as a mall shopping motivation. As indicated in Table 4.7, black
Generation Y students appeared to have a statistically significant desire for escape
activity as a mall shopping motivation. The descriptive statistics in Table 4.5 indicated
that, compared to the other motivations for shopping at a mall, black Generation Y
students reported that the desire to escape from everyday stress was the seventh most
important mall shopping motivation. This corresponds with the findings of Anning-
Dorson et al. (2013:376), and Arnold and Reynolds (2012:407) who found the desire to
escape to be an important motive for visiting a mall.
The third empirical objective was to determine black Generation Y students’ desire for
diversion as a mall shopping motivation. As can be seen in Table 4.7, black Generation
Y students appeared to have a statistically significant negative desire for diversion as a
mall shopping motivation. This is in contrast to the other mall shopping motivations,
which all returned significantly positive results. The descriptive statistics in Table 4.5
indicated that black Generation Y students reported that the desire for diversion
motivation was the least important mall shopping motivator. This is inconsistent with the
studies conducted by Telci (2013:2521) and To and Sung (2014:2223) who found that
the desire for diversion is a strong motivator for consumers to shop at a mall.
The fourth empirical objective was to investigate black Generation Y students’
preference for flow as a mall shopping motivation. As is evident from Table 4.7, black
Generation Y students appeared to have a statistically significant preference for flow as
a mall shopping motivation. The descriptive statistics in Table 4.5 indicated that black
Generation Y students reported that the desire for flow was the third most important
mall shopping motivator. This corresponds with the studies conducted by Tauber
(1995:59) and Hemalatha et al. (2009:311) who found the preference for flow to be an
essential motive for mall shopping.
Chapter 5: Conclusion and recommendations 96
The fifth empirical objective of this research study aimed at determining black
Generation Y students’ desire for exploration as a mall shopping motivation. As
presented in Table 4.7, black Generation Y students appeared to have a statistically
significant desire for exploration as a mall shopping motivation. The descriptive statistics
in Table 4.5 indicated that black Generation Y students reported the desire for
exploration to be the sixth most important motivation for mall shopping. This is in
keeping with the studies of Ahmed et al. (2007:343), Hemalatha et al. (2009:311) and
Singh (2015:63) who found the desire for exploration to be an important motivational
factor for visiting a mall.
The sixth empirical objective was to determine black Generation Y students’ drive to
enact a role as a mall shopping motivation. As is evident from Table 4.7, black
Generation Y students appeared to have a statistically significant drive to enact a role
as a mall shopping motivation. The descriptive statistics in Table 4.5 indicated that black
Generation Y students reported that the drive to enact a role was the fourth most
important mall shopping motivator. This corresponds with the study conducted by
Hemalatha et al. (2009:311) who found the desire to enact a role as an important mall
shopping motivator.
The seventh empirical objective was to investigate black Generation Y students’ desire
for social interaction, as a mall shopping motivation. As is evident from Table 4.7, black
Generation Y students appear to have a statistically significant desire for social
interaction as a mall shopping motivation. The descriptive statistics in Table 4.5
indicated that black Generation Y students reported that the desire for social interaction
motivation was the fifth most important mall shopping motivator. This is consistent with
the studies done by Wagner et al. (2010:420) and Hemalatha et al. (2009:311) who
found that socialisation was an important motive for mall shopping.
The penultimate empirical objective of this research study aimed at determining black
Generation Y students’ desire for shopping convenience as a mall shopping motivation.
As is evident from Table 4.7, black Generation Y students appeared to have a
statistically significant desire for shopping convenience as a mall shopping motivation.
The descriptive statistics in Table 4.5 indicated that black Generation Y students
reported the desire for shopping convenience motivation to be the most important
motivation for shopping at a mall. This is consistent with the findings from the research
Chapter 5: Conclusion and recommendations 97
of Breytenbach (2014:317) and Ahmed et al., (2007:343) who found convenience an
important mall shopping motivator.
The last empirical objective was to determine whether there is a difference between
different age groups concerning black Generation Y students’ mall shopping motivations
(aesthetic, escape, flow, diversion, exploration, role enactment, social, and
convenience). A one-way ANOVA, set at a confidence level of 95 percent, was
undertaken. The results presented in Table 4.8 indicated that a significant difference
was found between the students’ different age groups in terms of their shopping
motivations, concerning the preference for aesthetic stimulation, the desire for escape
activity and desire for exploration as mall shopping motivations. Older students’ appear
to have statistically different motivations for shopping at a mall.
Therefore, it is apparent that black Generation Y students exhibit statistically significant
positive convenience motives, aesthetic motives, motives for flow, motives for role
enactment, social interaction motives, exploration motives and escape motives to visit a
mall.
5.4 RECOMMENDATIONS
The following section contains recommendations based on the literature review
(Chapter 2) along with the empirical findings (Chapter 4) obtained from the sample
(black South African Generation Y students) regarding mall shopping motivations. The
findings of this study suggest that while diversion motives seem to have a negative
influence on black Generation Y students’ mall shopping motives, they do exhibit
statistically significant positive mall shopping motives in terms of their desire for
shopping convenience, preference for aesthetic stimulation, preference for flow, drive to
enact a role, desire for social interaction, desire for exploration and escape activity. In
accordance with the findings of this study, the following section provides a number of
recommendations for encouraging mall shopping amongst the black South African
Generation Y cohort.
5.4.1 Offer convenient shopping
The findings of this study suggest that black Generation Y students in South Africa find
the convenience offered by shopping at a mall to be the most important mall shopping
motive. Owing to these consumers’ desire for convenience, the location of a mall, its’
Chapter 5: Conclusion and recommendations 98
operating hours and different types of stores available, will influence their mall
preference. Therefore, this study recommends that, to attract black Generation Y
students to shopping malls, shopping mall developers, managers and marketers should
offer a more convenient experience. When planning and developing a shopping mall,
developers should consider the proposed location, the distance of the mall from the
residential areas, and the availability and accessibility of public transport to the mall.
Furthermore, the shopping malls’ parking area must be designed to be conveniently
located close to mall entrances. Mall managers and marketers should provide a wide
variety of different tenant mix, offer attractive business operating hours, such as
extended operating hours during school holidays, develop an app providing promotions,
in-store and parking navigation, free Wi-Fi, and restaurant and movie booking services.
It is also recommended that shopping malls should focus on more than simply retailing,
but rather be an entire community centre, focusing on consumers’ commercial,
residential and entertainment needs, such as incorporating offices, apartments,
museums, childcare facilities and outdoor spaces like tennis courts, all in one area.
5.4.2 Offer a mall environment that is pleasing to multiple senses
In this study, the aesthetics of a mall were found to be a significant positive motivation
for shopping at malls amongst black Generation Y students in South Africa. To adhere
to black Generation Y students’ preference for aesthetic stimulation as a mall shopping
motivation, shopping mall management and marketers should develop strategies to
improve and continuously enhance the look and ambience of the shopping mall. This
particular market segment seeks a complete experience of engagement, empowerment
and excitement when visiting a mall (Misonzhnik, 2007). Since the aesthetics appeal of
the mall is an important motivation for black Generation Y students to visit a mall,
shopping mall managers and marketers should give attention to offering modern décor
designs such as incorporating glass roofs, green terraces and glass domes, exciting
mall themes; they should frequently update the interior of the mall and give attention to
the mall’s music, lighting, and colour usage. In order to keep up with this trend-oriented
generation, mall managers and marketers need to regularly update the appearance of
the mall, such as using different lighting techniques, photographs, and playing
contemporary music.
Chapter 5: Conclusion and recommendations 99
5.4.3 Offer a pleasant shopping environment
The findings of this study suggest that preference for flow is a significant positive mall
shopping motivation amongst black Generation Y students in South Africa. To adhere to
this market segment’s motivation to visit malls, mall management and marketers should
create an environment for them to relax and lose track of time. This study recommends
that attention be given to the layout of the shopping mall in order to enable consumers
to stroll, and to browse products on display. Furthermore, mall managers and marketers
must give attention to the décor of the mall to promote an environment where
Generation Y consumers can have fun, socialize and have a unique experience.
Shopping mall management and marketers should design the mall with spaces for
socialising and entertainment, various mall entrances, offer lively and vibrant stores with
attractive product merchandises, impressive glass, steel and concrete structures,
refined atmospheres, integrated flowing spaces with bridges connecting different
walkways, and attractive lighting in order to attract and retain black Generation Y
consumers.
5.4.4 Cater for different types of consumers
While many consumers enjoy shopping for others (Arnold & Reynolds, 2003:81), many
consumers visit malls to enact a social role (Khare, 2011:111). This may influence
consumers’ shopping behaviour (Khare, 2011:111), resulting in their not necessarily
gaining satisfaction from the shopping experience itself (Karande & Merchant, 2012:60).
This study found that black Generation Y students are motivated to visit a mall in order
to enact a role. Owing to these consumers’ desire to finding bargains, do comparative
shopping and shop sensibly as a responsibility towards their family, mall managers and
marketers should offer price bargaining and sales. This study recommends that specific
marketing strategies should be developed in order to cater for different mall shopper
types. In order to attract black Generation Y shoppers, shopping malls should have
information desks, interactive touch-screen platforms that provide instant customer
information, visible and attractive signage, humanoid retail robots who are fluent in
different languages to enhance customer service maximise the use of mall catalogues
to advertise the stores, and informative advertising displays to make shopping easy. It is
also recommended that malls offer visitors the option to text questions to the mall’s
information desk in order to receive fast and convenient assistance.
Chapter 5: Conclusion and recommendations 100
5.4.5 Provide a variety of entertainment facilities
The statistical results from this study indicate that social interaction is a strong motivator
to visit the mall suggesting that black Generation Y like to go to the mall to socialise with
friends and to meet with people. In order to attract black Generation Y students to visit
the mall, this study recommends that shopping malls should offer an exciting, fun and
experiential mall experience by offering various entertainment options such as theme
parks, mega movie theatres, bowling alleys, go-kart tracks, beauty spas, a wide
selection of fast food outlets and restaurants where consumers can socialise. Mall
management and marketers should promote these entertainment options as a social
gathering place for students to meet with their friends. It is also recommended that malls
create futuristic events to attract black Generation Y students, such as a pop up
exhibition offering augmented-reality selfie videos with popular fashion brand
representatives and models.
5.4.6 Offer a variety of stores and products
The Generation Y segment of consumers want to discover products themselves,
therefore management and marketers need to concentrate on visual merchandising
(Kinley et al., 2010:572). Management and marketers should find out what stores are
most popular and establish a branch in their mall (Chebat et al., 2010:739). The
statistical results from this study indicate that desire for exploration and escape activity
are strong motivators that influence black Generation Y students’ to visit a mall. This
study recommends that in order to motivate black Generation Y students to visit a mall,
mall managers and marketers should ensure that there is a wide variety of different
tenant mix, use technology for consumers to explore and experience stores, such as
virtual stores whereby consumers use their smartphones to browse virtual aisles and
add items by touching the screen. It is also recommended that mall managers and
marketers use social-messaging apps such as WeChat to connect with consumers
when they are not at the mall, keeping them informed about promotions and loyalty
programmes.
Chapter 5: Conclusion and recommendations 101
5.5 CONTRIBUTIONS OF THE STUDY
The number of shopping malls has increased significantly in the last decade, globally as
well as in South Africa. This growth has intensified the competition amongst different
shopping malls. In an attempt to attract new shoppers and retain current shoppers, a
shopping mall has to stand out from competing malls; therefore, shopping mall
developers, managers and marketers are required to effectively differentiate their malls
from competing malls and create a competitive advantage. Because of the intensifying
competition, it has become essential for shopping malls to understand what motivates
shoppers to visit a mall, in order to develop successful marketing strategies.
The aim of this research study was to determine black Generation Y students’ mall
shopping motivations within the South African context in order to guide the development
of marketing strategies for effectively targeting this market. The findings from this
research study provide clarity into the understanding of South African black Generation
Y students’ motivations for shopping at a mall. They have essential marketing
implications for shopping mall marketers and managers involved in designing and
implementing marketing strategies. In order to attract potential black Generation Y
students to shopping malls, the marketing strategies developed may be used. The
suggested recommendations from the statistical results in this study, on students’
motivations for visiting shopping malls, can provide direction to mall managers and
marketers on how to effectively achieve the shopping mall’s marketing objectives.
5.6 LIMITATIONS AND FUTURE RESEARCH OPPORTUNITIES
This study applied a quantitative research approach to measure black Generation Y
students’ mall shopping motivations within the South African context. The reasons for
these motivations may be determined by following a qualitative research approach.
Furthermore, this study was limited to students’ motivations only and not their
perceptions of the available shopping malls, which creates the opportunity to measure
consumers’ perceptions of the current shopping malls.
Two HEIs in the Gauteng province were used in this study. Future studies may conduct
more extensive research, including students from more provinces, thereby comparing
the different students’ motivations of the different provinces. Furthermore, only
undergraduate students attending HEIs were the participants of this study. An
Chapter 5: Conclusion and recommendations 102
opportunity might exist to investigate mall shopping motivations of part-time and post-
graduate students who might be employed and compare the results with this study. The
study could also be conducted on the non-student portion of the South African black
Generation Y cohort to establish whether there is a difference in mall shopping
motivations. The focus was on Generation Y and the members of this cohort, therefore
only students between the ages of 18 and 24 were included in this study. The study
presents an opportunity to determine younger black Generation Y members’ mall
shopping motivations, as well as those members from other generations, whereby
differences can then be recognised. The focused designated group for this study was
black Generation Y students, excluding students from any other designated groups. A
study can be done to establish whether there are any differences between various
ethnic groups in terms of mall shopping motivations.
5.7 CONCLUDING REMARKS
To develop effective marketing strategies to attract a specific target market is very
important in the current competitive shopping mall industry. Understanding how and
why consumers visit shopping malls is pivotal in developing effective shopping mall
marketing strategies. Consumer shopping behaviour controls the success or failure of a
shopping mall, and therefore it is essential for shopping mall managers and marketers
to understand the shopping motivations of their consumers.
This study assessed black Generation Y students’ shopping mall motives.
Understanding these motives, and taking notice of the findings and recommendations
made by this study, shopping mall managers and marketers can be able develop
marketing strategies to attract and retain black Generation Y consumers. As a result,
such shopping malls will be different from competing malls, and competitively positioned
in the consumer’s mind.
Reference list 103
REFERENCE LIST
Aaker, D.A., Kumar, V., George, S.D., Robert, P.L. 2011. Marketing research. 10th ed.
Hoboken, NJ: Wiley.
Abdy, I-M, n.d. Factors affecting customers towards shopping malls.
https://www.academia.edu/4008864/Factors_effecting_customers_towards_shopping_
mall?auto=download Date of access: 12 Oct. 2016.
Acquino, J. 2012. Gen Y: The next generation of spenders. Customer relationship
management. http://www.destinationCRM.com Date of access: 14 Nov. 2016.
Adams, J., Khan, H.T.A., Reaside, R. & White, D. 2007. Research methods for graduate
business and social science students. 1st ed. New Delhi: Response Books.
Aljewari, S. 2015. Does marketing create or satisfy needs.
https://www.linkedin.com/pulse/does-marketing-create-satisfy-needs-sinan-al-jewari
Date of access: 16 Nov. 2016.
Ahmed, Z.U., Ghingold, M. & Dahari, Z. 2007. Malaysian shopping mall behavior: an
exploratory study. Asia Pacific Journal of Marketing and Logistics, 19(4):331–348.
Ammani, P. 2013. A study of the factors that influence customer preference for
shopping malls over local markets. IUP Journal of Management Research, XII(1):7–21.
Angell, R., Megicks, P., Memery, J., Heffernan, T. & Howell, K. 2012. Understanding the
older shopper: A behavioural typology. Journal of Retailing and Consumer Services,
19:259–269.
Anning-Dorson, T., Kastner, A. & Mahmoud, M.A. 2013. Investigation into mall visitation
motivation and demographic idiosyncrasies in Ghana. Management Science Letters,
3:367–384.
Arnold, M.J. & Reynolds, K.E. 2003. Hedonic shopping motivations. Journal of Retailing,
79(2):77–95.
Arnold, M.J. & Reynolds, K.E. 2012. Approach and avoidance motivation: Investigating
hedonic consumption in a retail setting. Journal of Retailing, 88(3):399–411.
Reference list 104
Apparel. 2014. Why do people go shopping. http://apparel.edgl.com/news/Why-Do-
People-Go-Shopping-92256 Date of access: 23 Aug. 2016.
Avello, M., Gavilán, D., Abril, C. & Manzano, R. 2011. Experiential shopping at the mall:
influence on consumer behaviour. Business Review, 10(1):16–24.
Babbie, E. & Mouton, J. eds. 2009. The practice of social research. Cape Town: Oxford
University Press.
Bagozzi, R.P., Gurhan-Chanli, Z. & JR., P. 2002. The social psychology of consumer
behaviour. Buckingham: Open University Press.
Bakewell, C. & Mitchell, V-W. 2003. Generation Y female consumer decision-making
styles. International Journal of Retail and Distribution Management, 31(2):95–106.
Baumgartner, H. & Steenkamp, J.E.M. 1996. Exploratory consumer buying behavior :
Conceptualization and measurement. International Journal of Research in Marketing,
13(13):121–137.
Beals, J. 2011. Lessons from the shopping mall.
https://jeffbeals.com/blog/2011/03/05/lessons-from-the-shopping-mall/ Date of access:
27 Jul 2015.
Berndt, A. & Petzer, D. 2011. Marketing research. Cape Town: Pearson.
Bevan-Dye, A.L., Dhurup, M. & Surujlal, J. 2009. Black Generation Y students’
perceptions of national sport celebrity endorsers as role models. African Journal for
Physical, Health Education, Recreation and Dance, 9(1):172–188.
Bevan-Dye, A. L., Garnett, A. & De Klerk, N. 2012. Materialism, status consumption and
consumer ethnocentrism amongst black generation Y students in South Africa. African
Journal of Business Management, 6(16):5578–5586.
Bloch, P.H., Ridgway, N.M. & Dawson, S.A. 1994. The shopping mall as consumer
habitat. Journal of Retailling, 70(1):23–42.
Botha, E., Dos Santos, M., Du Toit, D.H., Erasmus, A.C., Maree, T. & Mugobo, V. 2013.
Consumer behaviour: South African psychology and marketing applications, edited by
Mpinganjira, M. & Dos Santos, M.A.O. Oxford: OUP Southern Africa.
Reference list 105
Bradley, N. 2010. Marketing research: tools & techniques. 2nd ed. New York, NY: Oxford
University Press.
Breytenbach, A. 2014. Black consumers' shopping patronage and perceptions of the
Riverside mall's attractiveness. Pretoria: UP (Thesis - DCom).
Budisantoso, T. 2006. Shopping motivations and their influence on shopping experience
in Australia and Indonesia. Fremantle, Australia: University of Notre Dame Australia.
(Thesis - PhD).
Brown, J.D. 2009. Choosing the right type of rotation in PCA and EFA. Shiken: JALT
Testing & Evaluation SIG Newsletter, 13 (3):20–25
Burns, A.C. & Bush. R.F. 2014. Marketing research. 6th ed. Upper Saddle River, NJ:
Prentice Hall.
Burns, D.J. & Warren, H.B. 1995. Need for uniqueness: shopping mall preference and
choice activity. International Journal of Retail & Distribution Management, 23(12):4–12.
Business Tech. 2016. This is how many shopping malls are in South Africa.
http://businesstech.co.za/news/lifestyle/121847/this-is-how-many-shopping-malls-are-in-
south-africa// Date of access: 19 Aug. 2016.
Cant, M. 2010. Introduction to retailing 2nd ed. Claremont: Juta.
Cant, M., Gerber-Nel, C., Nel, D. & Kotze, T. 2003. Marketing research. Claremont:
New Africa Books.
Cardoso, P.R., & Pinto, S.C. 2010. Hedonic and utilitarian shopping motivations among
Portuguese young adult consumers. International Journal of Retail & Distribution
Management, 38(7):538–558.
Carter, C.C. 2009. Review Articles: What We Know About Shopping Centers. Journal of
Real Estate Literature, 17(2):163–180.
Chang, J., Yang, B-T. & Yu, C-G. 2006. The moderating effect of salespersons' selling
behaviour on shopping motivation and satisfaction: Taiwan tourists in China. Tourism
Management, 27:934–942.
Reference list 106
Chebat, J-C., Sirgy, M.J. & Grzeskowiak, S. 2010. How can shopping mall management
best capture mall image? Journal of Business Research, 63:735–740.
Chebat, J.C., Haj-Salem, N. & Oliveira, S. 2014. Why shopping pals make mall different.
Journal of Retailing and Consumer Services, 21 (2):77–85.
Cherry, K. 2016. What are extrinsic motivation and rewards?
https://www.verywell.com/difference-betweenextrinsic-and-intrinsic-motivation-2795384
Date of access: 12 Nov. 2016.
Chithralega, J. 2013. A study on influence of shopping motivation, mall atmosphere and
vlue relationship with reference to mega malls in Chennai. International Journal of
Marketing, Financial Services & Management Research, 2(6):145–156
Chithralega, J. 2016. The impact of shopping motivation on mall atmosphere-value
relationship: with reference to mega malls in Chennai. Imperial Journal of
Interdisciplinary Research (IJIR), 2(5):1460–1469
Clark, L.A. & Watson D. 1995. Constructing validity: basic issues in objective scale
development. Psychological Assessment, 7(3):309–319.
Cohen, L., Manion, L. & Morrison, K. 2011. Research methods in education 7th ed.
London and New York: Routledge.
Consumer Reports. 1986. I'll buy that: 50 small wonders and big deals that
revolutionized the lives of consumers. New York: Consumers Union of the United
States. http://www.uh.edu/engines/epi1755.htm Date of access: 26 Nov. 2016.
Cui, Y., Trent, E.S., Sullivan, P.M. & Matiru, G.N. 2003. Cause-related marketing: how
generation Y responds. International Journal of Retail & Distribution Management,
31(6):310–320.
Dawson, J.A. & Lord, J.D. eds. 2013. Shopping centre development: policies and
prospects. New York, NY: Routledge.
Delener, N. 1994. Religious contrasts in consumer decision behaviour patterns : Their
dimensions. European Journal of Marketing, 28(5):36–53.
Reference list 107
Dholakia, R.R. 1999. Going shopping: key determinants of shopping behaviors and
motivations. International Journal of Retail & Distribution Management, 27(4):154–165.
Dhurup, M. 2008. A generic taxonomy of shopping motives among hypermarkets
(hyper-stores) customers and the repationship with demographic varialbes. Acta
Commercii, 8(1):64–79.
Doane, D.P. & Seward, L.E. 2011. Measuring skewness: a forgotten statistic? Journal of
Statistics Education, 19:1–18.
Du Preez, R., Visser, E. & Zietsman, L. 2007. Profiling male apparel consumers:
lifestyle, shopping orientation, patronage behaviour and shopping mall behaviour.
Management Dynamics, 16(1):2–19.
East, R., Wright, M. & Vanhuele, M. 2013. Consumer behaviour. Applications in
marketing 2nd ed. London: Sage.
Eastman, J.K. & Liu, J. 2012. The impact of generational cohorts on status
consumption: an exploratory look at generational cohort and demographics on status
consumption. Journal of Consumer Marketing, 29(2):93–102.
El-Adly, M.I. 2007. Shopping malls attractiveness: a segmentation approach.
International Journal of Retail & Distribution Management, 35(11):936–950.
El Hedhli, K., Chebat, J-C, Sirgy, M.J. 2013. Shopping well-being at the mall: contruct,
antecedents, and consequences. Journal of Business Research, 66:856–863.
El Hedhli, K., Zourrig, H. & Chebat, J-C. 2016. Shopping well-being: is it just a matter of
pleasure or doing the task? The role of shopper's gender and self-congruity. Journal of
Retailing and Consumer Services, 31:1–6
Ertekin, Z.O., Bayraktaroglu, G. & Gurkaynak, N. 2014. Role of shopping motives, age
and gender in evaluating retail atmospheric cues. Asian Journal of Marketing, 8(1):24–
43.
Fantoni, R., Hoefel, F. & Mazzarolo, M. 2014. The future of the shopping mall.
http://www.mckinseyonmarketingandsales.com/the-future-of-the-shopping-mall Date of
access: 15 Nov. 2016.
Reference list 108
Farrag, D., Sayed, I. El. & Belk, R. 2010. Mall shopping motives and activities: A
multimethod approach. Journal of International Consumer Marketing, 22(2):95–115.
Feinberg, R.A. 1991. A brief history of the mall. Advances in Consumer Research,
18:426–427.
Field, A. 2009. Discovering statistics using SPSS, 3rd ed. Los Angeles: Sage.
Forgas, J.P & Harmon-Jones, E. (eds) 2014. Motivation and its regulation. The control
within. New York, NY: Psychology Press.
Foscht, T., Schloffer, J., Maloles III,C. & Chia, S.L. 2009. Assessing the outcomes of
Generation Y customers’ loyalty. International Journal of Bank Marketing, 27(3):218–
241.
Fry, R. 2015. Millennials surpass Gen Xers as the largest generation in U.S. labor force.
http://www.pewresearch.org/fact-tank/2015/05/11/millennials-surpass-gen-xers-as-the-
largest-generation-in-u-s-labor-force/ Date of access: 15 Nov. 2016
Ghani, A.A.A. & Hamid, Md.Y. 2011. Defining shopping mall from Malaysia perspective.
International Journal of Multidisciplinary Thought, 1(05):1–12.
Ghee, W.Y & Ahmad, K.Z. 2010. How do in-store environmental cues influence
Malaysian shoppers? A study of hypermarket customers in Malaysia. (Unpublished).
Faculty of Entrepreneurship and Business. University Malaysia, Kelantan. p1–19.
Gilboa, S. 2009. A segmentation study of Israeli mall customers. Journal of Retailing
and Consumer Services, 16:135–144.
Green, W. 2001. The retail store: design and construction. 2nd ed. Lincoln:
iUniverse.com, Inc.
Grewal, D., Kopalle, P., Marmorstein, H. & Roggeveen, A.L. 2012. Does travel time to
stores matter? The role of merchandise availability. Journal of Retailing, 88(3):437–444.
Griffith, A. 2010. SPSS for dummies. 2nd ed. Hoboken, NY: Wiley publishing.
Guido, G. 2006. Shopping motives, big five factors, and the hedonic/utilitarian shopping
value: an integration and factorial study. Innovative Marketing, 2(2):57–67.
Reference list 109
Guinn, T.C.O. & Faber, R.J. 2014. Compulsive exploration buying: phenomenological.
Journal of Consumer Research, Inc., 16(2):147–157.
Haghshenas, L., Abedi, A., Ghorbani, E., Kamali, A. & Harooni, M. 2013. Review
consumer behavior and factors affecting on purchasing decisions. Singaporean Journal
of Business Economics and Management Studies 1(10):17–24.
Hair, J.F.Jr., Black, W.C., Babin, B.J. & Anderson, R.E. 2010. Multivariate data analysis.
7th ed. Harlow, Essex, UK : Pearson Educated Limited.
Hancock, G.R. & Mueller, R.O. eds. 2010. The reviewer's guide to quantitative methods
in the social sciences. 1st ed. New York, NY: Routledge.
Hawkins, D.I. & Mothersbaugh, D.L. 2013. Consumer behavior: Building marketing
strategy 12th ed. New York, NY: McGraw-Hill.
Heckhausen, J. & Heckhausen, H. eds. 2010. Motivation and action 1st ed. Cape Town:
Cambridge University Press.
Hemalatha, K.G., Jagannathan, L. & Ravichandran, K. 2009. Shopping behaviour in
malls in globalised economies. In 3rd IIMA Conference on Marketing Paradigms for
Emerging Economies, 308-312. Ahmedabad.
Hemalatha, K.G. & Ravichandran, K. 2009. Mall visit behaviour of older Generation-Y
consumers. Serbian Journal of Management, 4(2):169–182.
Higher Education in South Africa, 2015. An overview of the South African Higher
Education System.
http://www.che.ac.za/focus_areas/higher_education_data/2013/overview. Date of
access 16 Nov. 2016.
Hinson, R.E., Anning-Dorson, T. & Kastner, A.A.N.A. 2012. Consumer attitude towards
shopping malls in Sub-Saharan Africa: an exploration of the “new” retail format in
Ghana. African Journal of Business and Economic Research, 7(2–3):97–134.
Hong Yu, R.M., Smith, D. & Chebat, J-C. 2008. The influence of mall environment on
female fashion shoppers’ value and behaviour. Journal of Fashion Marketing and
Management, 12(4):456–468.
Reference list 110
Hoyer, W.D., Macinnis, D.J. & Pieters, R. 2013. Consumer behaviour 6th ed. Mason,OH:
South Western Cengage Learning.
Hu, H. & Jasper, C.R. 2007. A qualitative study of mall shopping behaviors of mature
consumers. Journal of Shopping Center Research, 14(1):17–38.
Huzefa, M. 2009. Consumer needs and motivation. http://huzefaonline-
marketing.blogspot.co.za/2009/10/consumer-needs-and-motivation.html. Date of access
16 Nov. 2016.
Iacobucci, D. & Churchill, G.A. 2010. Marketing research. 10th ed. Mason,OH: South
Western Cengage Learning.
Jamal, A., Davies, F., Chudry, F. & Al-Marri, M. 2006. Profiling consumers: a study of
Qatari consumers’ shopping motivations. Journal of Retailing and Consumer Services,
13(1):67–80.
Jin, B. & Kim, J.O. 2003. A typology of Korean discount shoppers: shopping motives,
store attributes, and outcomes. International Journal of Service Industry Management,
14(4):396–419.
Joubert, P. 2010. Introduction to Consumer Behaviour. Cape Town: Juta and Company
Ltd.
Joubert, P. ed. 2013. Introduction to Consumer Behaviour. 2nd ed. Cape Town: Juta.
Karande, K. & Merchant, A. 2012. The impact of time and planning orientation on an
individual’s recreational shopper identity and shopping behavior. The Journal of
Marketing Theory and Practice, 20(1):59–72.
Kardes, F.R., Cronley, M.L. & Cline, T.W. 2015. Consumer behavior. 2nd ed. Stamford,
CT: Cengage Learning.
Kaufmann, C.F. & Lane, P.M. 1996. A new look at one-stop shopping: a TIMES model
approach to matching store hours and shopper schedules. Journal of Consumer
Marketing, 13(1):4–25
Kaur, P. & Singh, R. 2007. Uncovering retail shopping motives of Indian youth. Young
Consumers: Insight and Ideas for Responsible Marketers, 8(2):128–138.
Reference list 111
Khare, A. 2011. Mall shopping behaviour of Indian small town consumers. Journal of
Retailing and Consumer Services, 18:110–118.
Kim, Y.-K., Kang, J. & Kim, M. 2005. The relationships among family and social
interaction, loneliness, mall shopping motivation, and mall spending of older consumers.
Psychology & Marketing, 22(12):995–1015.
Kinley, T.R., Josiam, B.M. & Lockett, F. 2010. Journal of Fashion Marketing and
Management, 14(4):562–575.
Kirkup, M.H. & Rafiq, M. 1999. Marketing shopping centres: challenges in the UK
context. Journal of Marketing Practice: Applied Marketing Science, 5(5):119–133.
Kodaz, N. & Ozen, H. 2012. Utilitarian or hedonic? A crosscultural study in online
shopping. Organizations and Markets in Emerging Economies, 3(2):80–90.
Kolb, B. 2008. Marketing Research. A Practical approach. Los Angeles : Sage.
Kotler, P. 2000. Marketing management. The millennium edition (International). Upper
Saddle River, NJ: Prentice Hall, Inc.
Koufaris, M. 2002. Applying the technology acceptance model and flow theory to online
consumer behavior. Information Systems Research, 13(2):205–223.
Kumar, A. & Lim, H. 2008. Age differences in mobile service perceptions: comparison
of Generation Y and baby boomers. Journal of Services Marketing, 22(7):568–577.
Lachman, M.L. & Brett, D.L. 2013. Generation Y: shopping and entertainment in the
digital age. Washington, DC: Urban Land Institute Foundation.
Lancaster, G. & Massingham, L. 2011. Essentials of marketing management. London:
Routledge.
Laroche, M., Teng, L., Michon, R. & Chebat, J.-C. 2005. Incorporating service quality
into consumer mall shopping decision making: a comparison between English and
French Canadian consumers. Journal of Services Marketing, 19(3):157–163.
Reference list 112
Lawrence, M. 2012. External influences in consumer behavior.
http://www.slideshare.net/MathewLawrence/consumer-behaviour-external-factors
Date of access 16 Nov. 2016.
Leedy, P.D. & Ormrod, J.E. 2010. Practical research. Planning and design. 9th ed.
Upper Saddle River, NJ: Pearson Education Inc.
Levy, M. & Weitz, B.A. 2012. Retail management. 8th ed. New York, NY: McGraw Hill.
Lloyd, A.E., Chan, Y.K., Yip, L.S.C. & Chan, A. 2014. Time buying and time saving:
effects on service convenience and the shopping experience at the mall. Journal of
Service Marketing, 28(1):36–49.
Loudon, D.L. & Bitta, A.J.D. 1993. Consumer behaviour. Concepts and applications. 4th
ed. New York, NY: McGraw-Hill.
Mackey, A. & Gass, S.M. 2016. Second language research: methodology and design.
2nd ed. New York,NY: Routledge.
Madden, C.S, 2011. Three American generations and the real estate marketer. Keller
Center research report. Waco, TX: Baylor University.
Malhotra, N.K. 2010. Marketing research: an applied orientation. 6th ed. Upper Saddle
River, NJ: Prentice Hall.
Maree, K. ed. 2007. First steps in research. 1st ed. Pretoria: Van Schaik.
Markert, J. 2004. Demographics of age: generational and cohort confusion. Journal of
Current Issues & Research in Advertising, 26(2):11–25,
Martin, C.A. & Turley, L.W. 2004. Malls and consumption motivation: an exploratory
examination of older Generation Y consumers. International Journal of Retail &
Distribution Management, 32(10):464–475.
McDaniel, C. F. & Gates, R. 2007. Marketing research essentials 7th ed. Toronto: John
Wiley & Sons Canada.
Reference list 113
Michon, R., Yu, M., Smith, D., & Chebat, J.C. 2008. The influence of mall environment
on female fashion shoppers’ value and behaviour. Journal of Fashion Marketing and
Management, 12(4):456–468.
Mikalef, P., Giannakos, M. & Pateli, A. 2013. Shopping and word-of-mouth intentions on
social media. Journal of Theoretical and Applied Electronic Commerce Research,
8(1)17–34.
Millan, E.S. & Howard, E. 2007. Shopping for pleasure? Shopping experiences of
Hungarian consumers. International Journal of Retail & Distribution Management, 35(6):
474–487.
Miller, L. 2010. Conscious and Unconscious motivation.
http://www.articlesbase.com/education-articles/conscious-and-unconscious-motivation-
1852620.html. Date of access 11 Nov. 2016.
Merriam-Webster. 2013. Online Dictionery. https://www.merriam-webster.com/word-of-
the-day. Date of access 11 Nov. 2016.
Misonzhnik, E. 2007. Back to the future. National Real Estate Investor.
http://nreionline.com/retail/back-future. Date of access 3 Nov. 2016.
Moolman, H.J. 2011. Restaurant customer satisfaction and return patronage in a
Bloemfontein shopping mall. Acta Commercii, 11:129–146.
Mouna, H. & El Asbi, F. 2013. Rational versus emotional motives.
https://prezi.com/com2wzgj8rwv/rational-versus-emotional-motives/. Date of access 3
Nov. 2016.
Muller, R. 2011. Influence of colour on the consumer behaviour of Generation Y
students in the Vaal Triangle. Vanderbijlpark: NWU. (Dissertation - MCom).
Nicholls, J.A.F., Li, F., Mandokovic, T., Roslow, S. & Kranendonk, C.J. 2000. US-
Chilean mirrors: shoppers in two countries. Journal of Consumer Marketing, 17(2):106–
119.
Noble, S.M., Haytko, D.L. & Phillips, J. 2009. What drives college-age Generation Y
consumers? Journal of Business Research, 62(6):617–628.
Reference list 114
Nordenståhl, A. & Viklund, J. 2013. Generation Y. Do their belonging to a generation
determine choice of communication tool? Halmstad: The International Marketing
Program. (Thesis - Marketing).
Novak, T.P., Hoffman, D.L. & Yng, Y-F. 2000. Measuring the customer experience in
online environments: a structural modeling approach. Marketing Science, 19(1):22–42.
Oliver, R.L. 2015. Satisfaction. A behavioral perspective on the consumer, 2nd ed. New
York, NY: Routledge.
Pallant, J. 2013. SPSS survival manual: A step by step guide to data analysis using IBM
SPSS. 5th ed. Maidenhead, England: McGraw Hill.
Parment, A. 2013. Generation Y vs. Baby Boomers: Shopping behavior, buyer
involvement and implications for retailing. Journal of Retailing and Consumer Services,
20:189–199.
Parumasur, S.B. & Roberts-Lombard, M., eds. 2012. Consumer behaviour 2nd ed. Cape
Town: Juta.
Patney, M.B. 2010. Indian consumers and their mall patronage: Application of cultural-
self and the theory of planned behavior to patronage intentions. Ames: Iowa State
University. (Dissertation – D.Phil)
Perreau, F. 2013. The forces that drive consumer and how to learn from it to increase
your sales. http://www.theconsumerfactor.com/en/ Date of access: 13 Nov. 2016.
Phophalia, A.K. 2010. Modern research methodology (new trends and techniques).
Jaipur, New Delhi: Paradise.
Psychmechanics. 2016. Methods of motivation: Positive and negative motivation.
http://www.psychmechanics.com/2014/11/the-methods-of-motivation-positive-and.html
Date of acces: 11 Nov. 2016.
Prinsloo, D. 2013. Benchmarking South African shopping centre industry. We are doing
extremely well! Urban studies. http://www.urbanstudies.co.za/wp-
content/uploads/2016/07/SACSC-Research-Report-Benchmark-March-2013.pdf
Date of access 9 Apr 2016.
Reference list 115
Rajasekar, S. & Chadar, C.S. 2016. A study on factors determining consumer buying
behaviour in shopping malls. International Journal of Advanced Research. 4(3):80–83.
Sadeh, D.H. & Samadi, M. 2014. Analysis of consumer's behavior in Tehran city mall
shopping. International Journal of Innovative Research in Advanced Engineering
(IJIRAE), 1(10):327–333
Sadeghi, T. & Bijandi, F. 2011. The effect of shopping mall environment on shopping
behavior under a model. Middle-East Journal of Scientific Research, 8(3):566–574.
Sahu, P.K. 2013. Research methodology: a guide for researchers in agricultural
science, social science and other related fields. New Delhi: Springer India.
Santos, J. & Boote, J. 2000. A theoretical exploration and model of consumer
expectations, post-purchase affective states and affective behaviour. Journal of
Consumer Behaviour, 3(2):142–156.
Scharoun, L. 2012. America at the Mall: The cultural role of a retail Utopia. Jefferson,
NC: McFarland & Company, Inc.
Schwalbe, C.B. 2009. Leveraging the digital media habits of the millennials: strategies
for teaching journalism courses. Southwestern Mass Communication Journal, 25(1):53–
68
Schiffman, L. O'Cass, A., Paladino, A. & Carlson, J. 2013. Consumer behaviour. 6th ed.
French's Forest, NSW: Pearson Australia.
Schiffman, L.G., Kanuk, L.L. & Wisenblit, J. 2010. Consumer behavior. 10th ed. London:
Pearson Prentice Hall.
Schroer, W.J. 2015. Generations X,Y, Z and the others.
http://socialmarketing.org/archives/generations-xy-z-and-the-others/
Date of access 19 Nov. 2016.
Shaw, D., Grehan, E., Shiu, E., Hassan, L. & Thomson, J. 2005. An exploration of
values in ethical consumer decision making. Journal of Consumer Behaviour, 4(3):185–
200.
Reference list 116
Singh, D.P. 2015. Effect of shopping motivations on Indian consumers’ mall patronage
intention. Asia-Pacific Journal of Management Research and Innovation, 11(1):57–65.
Shim, S., Serido, J. & Barber, B.L. 2011. A consumer way of thinking: Linking consumer
socialization and consumption motivation perspectives to adolescent development.
Journal of Research on Adoloscence, 21(1):290–299.
Shiu, E., Hair, J., Bush, R.P. & Ortinau, D.J. 2009. Marketing research. European ed.
McGraw-Hill Education – Europe.
Singh, H. & Sahay, V. 2012. Determinants of shopping experience: exploring the mall
shoppers of national capital region (NCR) of India. International Journal of Retail &
Distribution Management, 40(3):235–248.
Singh, R. 2006. An empirical investigation into the effects of shopping motivation on
store environment-value relationship. The Florida State University College of Business.
Sit, J. 2003. Understanding youth motivations of entertainment consumption at
shopping centres: implications for shopping centre marketing. ANZMAC Conference
Proceedings. p300–306.
Solomon, M.R., Russell-Bennet, R. & Previte, J. 2013. Consumer behaviour. 3rd ed.
Australia group: Pearson.
Special report 248. Shopping for safety. Providing consumer automotive safety
information. Transportation Research Board: National Research Council.
https://www.nap.edu/read/9698/chapter/6. Date of access 19 Nov. 2016.
Starstedt, M. & Mooi, E. 2014. A concise guide to market research. The process, data,
and methods using IBM SPSS statistics. Berlin, Heidelberg: Springer-Verlag.
Statistics South Africa. 2016. http://cs2016.statssa.gov.za/wp-
content/uploads/2016/07/NT-30-06-2016-RELEASE-for-CS-2016-_Statistical-releas_1-
July-2016.pdf Accessed 27 Nov. 2016
Stone, G.P. 1954. City and urban identification: observation on the social psychology of
city life. American Journal of Sociology, 60:36–45.
Reference list 117
Struwig, F.W. & Stead, G.B. 2010. Planning, designing and reporting research. 7th ed.
Cape Town: Pearson.
Tang, W., Cui, Y. & Babenko, O. 2014. Internal consistency: Do we really know what it
is and how to assess it? Journal of Psychology and Behavioral Science, 2(2):205–220.
Tauber, E.M. 1972. Why do people shop? American Marketing Association, 36(4):46–
49.
Tauber, E.M. 1995. Why do people shop? Retailers need to refine their role in the
market place. Marketing Management, 4(2):58-60.
Telci, E.E. 2013. High shopping mall patronage: is there a dark side? Quality and
Quantity, 47:2517–2528
Terblanché, N.S. 1999. The perceived benefits derived from visits to a super regional
shopping centre: an exploratory study. South African Journal of Business Management,
30(4):141–146.
Terblanche, N. 2013. Role of retailing. (In Terblanche, N., Beneke, J., Bruwer, J.P.,
Corbishley, K., Frazer, M., Pentz, C. & Venter, P., eds. Retail management: a South
African perspective. Cape Town: Oxford University Press. p. 2–24).
Terre Blanche, M., Durrheim, K. & Painter, D. 2011. Research in Practice - Applied
methods for the social sciences. 2nd ed. Cape Town: University of Cape Town Press
(Pty) Ltd.
Thielke, S., Harniss, M., Thompson, H., Patel, S., Demiris, G. & Johnson, K. 2012.
Maslow's hierarchy of human needs and the adoption of health-related technologies for
older adults. Ageing International, (37):470–488.
Tiwari, R.K. & Abraham, A. 2010. Understanding the consumer behavior towards
shopping malls in Raipur city. International Journal of Management & Strategy, 1(1):11–
21.
To, P-L. & Sung E-P. 2014. Hedonic motivations for online shopping. World Academy of
Science, Engineering and Technology. International Journal of Social, Behavioral,
Educational, Economic, Business and Industrial Engineering, 8(7):2222–2224.
Reference list 118
Turley, L. & Chebat, J.-C. (2002). Linking retail strategy, atmospheric design and
shopping behaviour. Journal of Marketing Management, 18:125–144
Van Melsen, N. 2013. Parking solutions at shopping centre convention.
http://www.parking-net.com/parking-industry-blog/parkhelp-sistemas-de-aparcamiento-
s-l/-shopping-centre Date of access: 13 Oct. 2016.
Vainikka, B. 2015. Psychological factors influencing consumer behavior. Central
University of Applied Sciences. (Bachelor’s thesis).
Varman, R. & Belk, R.W. 2012. Consuming postcolonial shopping malls. Journal of
Marketing Management, 28(1-2):62–84.
Venkatachalam, S. 2014. Five things that make you an empowered consumer.
Retrieved from https://www.weforum.org/agenda/2014/11/five-things-that-make-you-an-
empowered-consumer/ Date of acces: 9 Apr. 2016.
Wagner, T. & Rudolph, T. 2010. Towards a hierarchical theory of shopping motivation.
Journal of Retailing and Consumer Services, 17(5):415–429.
Wakefield, K.L. & Baker, J. 1998. Excitement at the mall: Determinants and effects on
shopping response. Journal of Retailing, 74(4):515–539.
Ward, S. 2014. Consumer Socialization. Journal of Consumer Research, Inc., 1(2):1–
14.
Webb, D., Soutar, G.N., Mazzarol, T. & Saldaris, P. 2013. Self-determination theory and
consumer behavrioural change. Evidence from a household energy-saving behaviour
study. Journal of Environmental Psychology, 35:59–66.
Webb, K. 2010. Consumer behaviour. 2nd ed. Sydney: McGraw-Hill Australia.
Welman, C., Kruger, F. & Mitchell, B. 2005. Research methodology. 3rd ed. Cape
Town : Oxford University Press.
Wesley, S., LeHew, M. & Woodside, A.G. 2006. Consumer decision-making styles and
mall shopping behavior: building theory using exploratory data analysis and the
comparative method. Journal of Business Research, 59(5):535–548.
Reference list 119
Wiid, J. & Diggines, C. 2015. Marketing research. 3rd ed. Cape Town: Juta.
Wong, Y-T., Osman, S., Jamaluddin, A. & Yin-Fah, B.C. 2012. Shopping motives, sotre
attributes and shopping enjoyment among Malaysian youth. Journal of retailing and
consumer services, 19(2):240–248.
Yarrow, K. & O’Donnell, J. 2009. Gen Buy: How tweens, teens and twenty-somethings
are revolutionizing retail. San Francisco, CA: Jossey-Bass (An imprint of Wiley).
Yoon, Y. & Uysal, M. 2005. An examination of the effects of motivation and satisfaction
on destination loyalty: A structural model. Tourism Management, 26:45–56.
Yong, A.G. & Pearce, S. 2013. A beginner’s guide to factor analysis: Focusing on
exploratory factor analysis tutorials in quantitative methods for psychology. Tutorials in
Quantitative Methods for Psychology, 9(2):79–94.
Zhuang, G., Tsang, A., Zhou, N., Li, F. & Nicholls, J. 2005. Impacts of situational factors
on buying decisions in shopping malls. An empirical study with multinational data.
European Journal of Marketing, 40(1/2):17–44.
Zikmund, W.G., Babin, B.J., Carr, J.C. & Griffin, M. 2013. Business research methods.
9th ed. Mason, OH: South-Western Cengage Learning.
Zolfani, S.H.; Aghaie, M.H.; Derakhti, A; Zavadskas, E.K. & Varzandeh, M.H.M. 2013.
Decision making on business issues with foresight perspective; an application of new
hybrid MCDM model in shopping mall locating. Expert Systems with Applications.
40:7111–7121.

Annexure A: Questionnaire 120
ANNEXURE A QUESTIONNAIRE
MALL SHOPPING MOTIVATIONS AMONG SOUTH AFRICAN GENERATION Y STUDENTS
I am currently working towards completing my dissertation under the supervision of Dr N de Klerk as part of the requirements for completing my M.Com in Marketing Management at the North-West University (Vaal Triangle Campus). The purpose of this research project is to determine what motivate South African Generation Y students’ to shop at the mall.
Please assist me by completing the attached questionnaire. The questionnaire is user-friendly and should take approximately 10 minutes to complete. All responses are confidential and the results will only be used for research purposes, outlined in the form of statistical data.
Thank you - your assistance and contribution is highly appreciated. Helei Jooste ([email protected]), School of Economic Sciences & IT Department of Marketing & Business Management, North-West University (Vaal Campus) _______________________________________________________________________ SECTION A: Demographical Information.
Please mark the appropriate box with a cross (X) or write down your answer.
A1 Name of your institution: Traditional University University of Technology
A2 Country of origin: South Africa Other (Please specify):
A3 Province of origin: Eastern Cape Free State Gauteng KwaZulu-Natal
Limpopo Mpumalanga Northern Cape North West Western Cape
Other (Please specify):
A4 Gender: Male Female
A5 Ethnic group: Black/African Coloured Indian/Asian White
Other (Please specify):
A6 Please indicate your mother tongue language: Afrikaans English
IsiNdebele IsiXhosa IsiZulu Sesotho sa Leboa Sesotho
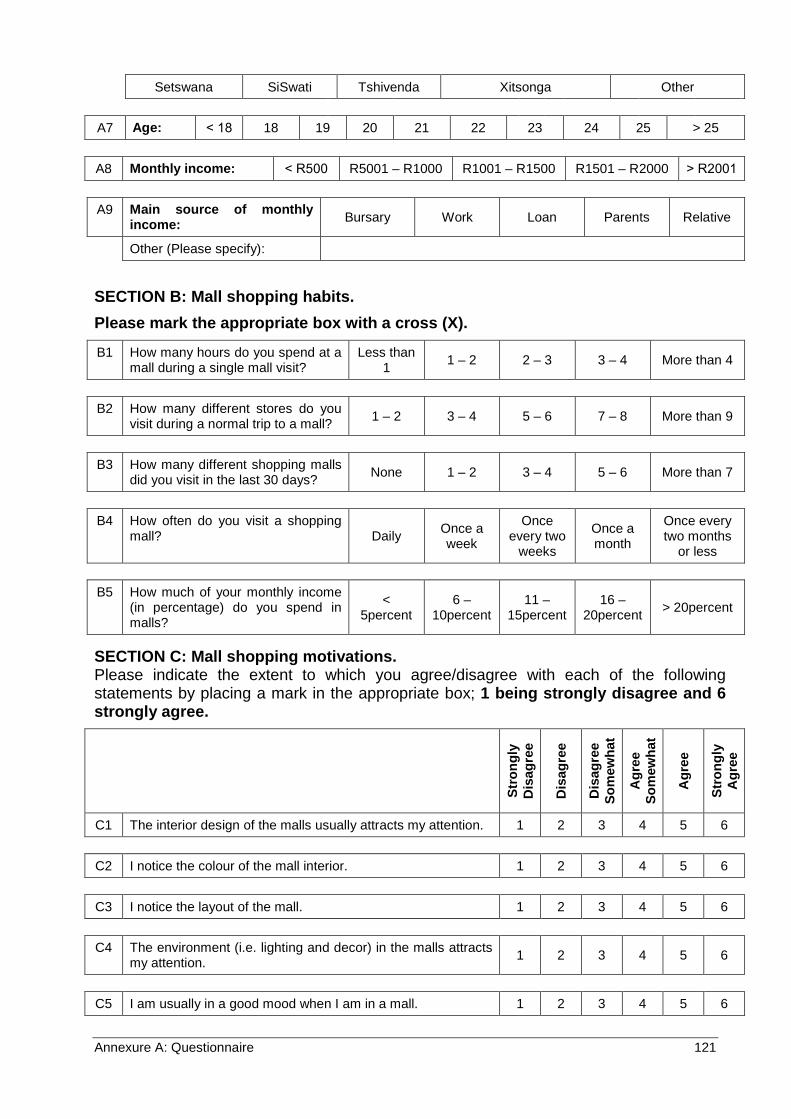
Annexure A: Questionnaire 121
Setswana SiSwati Tshivenda Xitsonga Other
A7 Age: ˂ 18 18 19 20 21 22 23 24 25 > 25
A8 Monthly income: ˂ R500 R5001 – R1000 R1001 – R1500 R1501 – R2000 ˃ R2001
A9 Main source of monthly income: Bursary Work Loan Parents Relative
Other (Please specify):
SECTION B: Mall shopping habits. Please mark the appropriate box with a cross (X).
B1 How many hours do you spend at a mall during a single mall visit?
Less than 1 1 – 2 2 – 3 3 – 4 More than 4
B2 How many different stores do you visit during a normal trip to a mall? 1 – 2 3 – 4 5 – 6 7 – 8 More than 9
B3 How many different shopping malls did you visit in the last 30 days? None 1 – 2 3 – 4 5 – 6 More than 7
B4 How often do you visit a shopping mall? Daily Once a
week
Once every two
weeks
Once a month
Once every two months
or less
B5 How much of your monthly income (in percentage) do you spend in malls?
< 5percent
6 – 10percent
11 – 15percent
16 – 20percent > 20percent
SECTION C: Mall shopping motivations. Please indicate the extent to which you agree/disagree with each of the following statements by placing a mark in the appropriate box; 1 being strongly disagree and 6 strongly agree.
Stro
ngly
D
isag
ree
Dis
agre
e
Dis
agre
e So
mew
hat
Agr
ee
Som
ewha
t
Agr
ee
Stro
ngly
A
gree
C1 The interior design of the malls usually attracts my attention. 1 2 3 4 5 6
C2 I notice the colour of the mall interior. 1 2 3 4 5 6
C3 I notice the layout of the mall. 1 2 3 4 5 6
C4 The environment (i.e. lighting and decor) in the malls attracts my attention. 1 2 3 4 5 6
C5 I am usually in a good mood when I am in a mall. 1 2 3 4 5 6
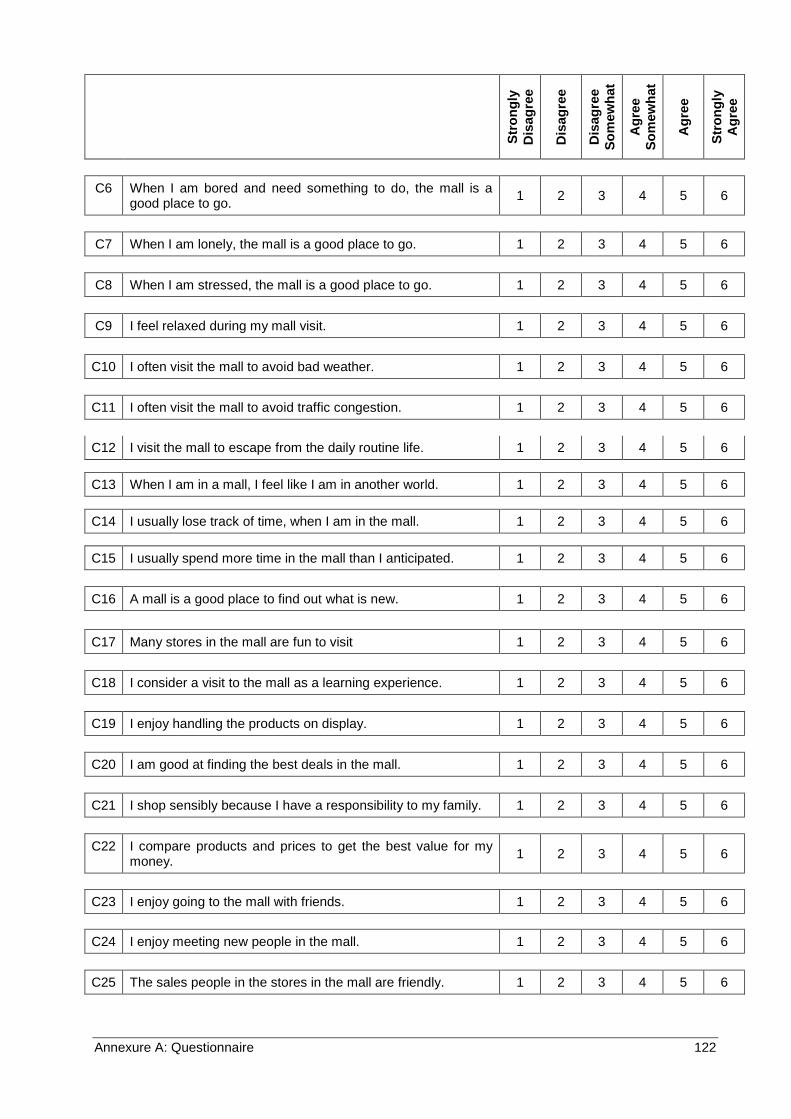
Annexure A: Questionnaire 122
Stro
ngly
D
isag
ree
Dis
agre
e
Dis
agre
e So
mew
hat
Agr
ee
Som
ewha
t
Agr
ee
Stro
ngly
A
gree
C6 When I am bored and need something to do, the mall is a good place to go. 1 2 3 4 5 6
C7 When I am lonely, the mall is a good place to go. 1 2 3 4 5 6
C8 When I am stressed, the mall is a good place to go. 1 2 3 4 5 6
C9 I feel relaxed during my mall visit. 1 2 3 4 5 6
C10 I often visit the mall to avoid bad weather. 1 2 3 4 5 6
C11 I often visit the mall to avoid traffic congestion. 1 2 3 4 5 6
C12 I visit the mall to escape from the daily routine life. 1 2 3 4 5 6
C13 When I am in a mall, I feel like I am in another world. 1 2 3 4 5 6
C14 I usually lose track of time, when I am in the mall. 1 2 3 4 5 6
C15 I usually spend more time in the mall than I anticipated. 1 2 3 4 5 6
C16 A mall is a good place to find out what is new. 1 2 3 4 5 6
C17 Many stores in the mall are fun to visit 1 2 3 4 5 6
C18 I consider a visit to the mall as a learning experience. 1 2 3 4 5 6
C19 I enjoy handling the products on display. 1 2 3 4 5 6
C20 I am good at finding the best deals in the mall. 1 2 3 4 5 6
C21 I shop sensibly because I have a responsibility to my family. 1 2 3 4 5 6
C22 I compare products and prices to get the best value for my money. 1 2 3 4 5 6
C23 I enjoy going to the mall with friends. 1 2 3 4 5 6
C24 I enjoy meeting new people in the mall. 1 2 3 4 5 6
C25 The sales people in the stores in the mall are friendly. 1 2 3 4 5 6
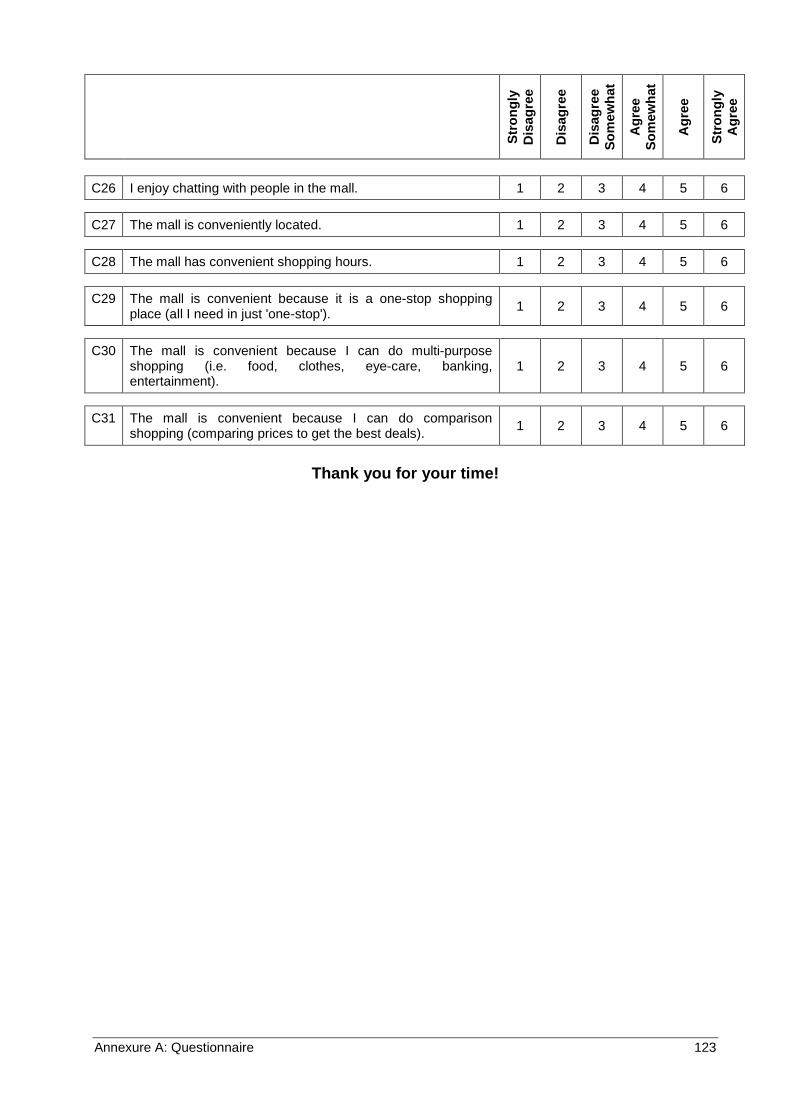
Annexure A: Questionnaire 123
Stro
ngly
D
isag
ree
Dis
agre
e
Dis
agre
e So
mew
hat
Agr
ee
Som
ewha
t
Agr
ee
Stro
ngly
A
gree
C26 I enjoy chatting with people in the mall. 1 2 3 4 5 6
C27 The mall is conveniently located. 1 2 3 4 5 6
C28 The mall has convenient shopping hours. 1 2 3 4 5 6
C29 The mall is convenient because it is a one-stop shopping place (all I need in just 'one-stop'). 1 2 3 4 5 6
C30 The mall is convenient because I can do multi-purpose shopping (i.e. food, clothes, eye-care, banking, entertainment).
1 2 3 4 5 6
C31 The mall is convenient because I can do comparison shopping (comparing prices to get the best deals). 1 2 3 4 5 6
Thank you for your time!
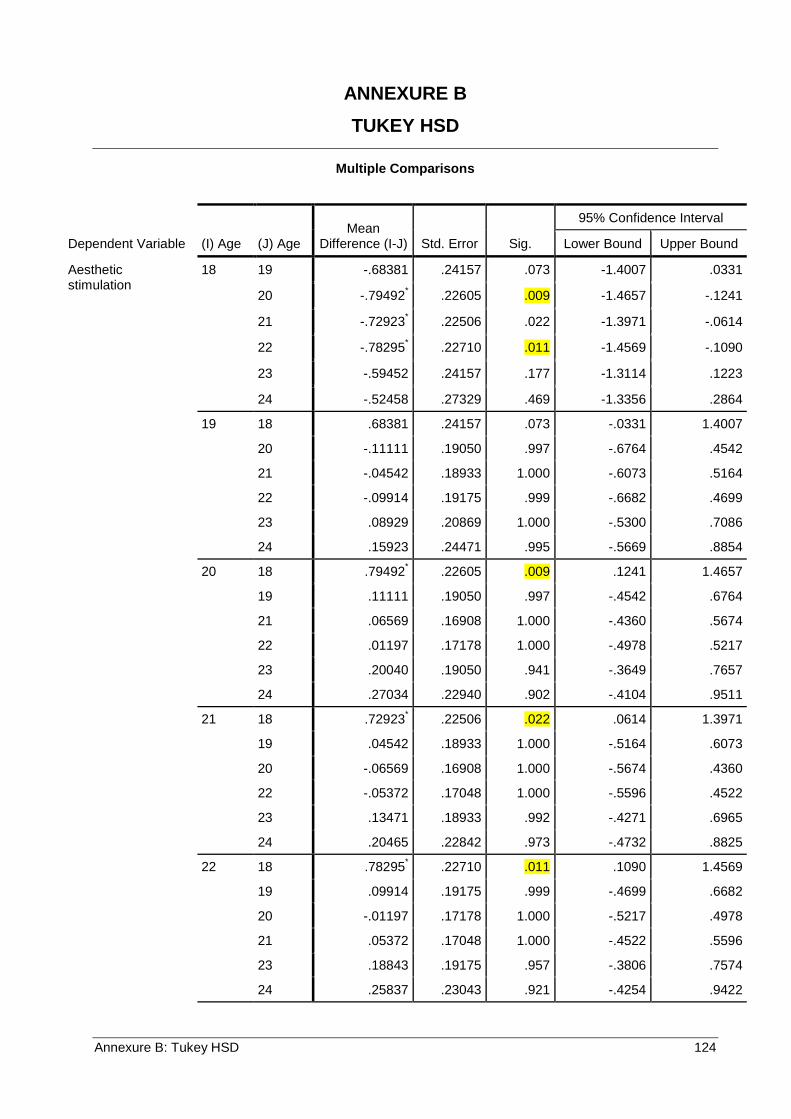
Annexure B: Tukey HSD 124
ANNEXURE B TUKEY HSD
Multiple Comparisons
Dependent Variable (I) Age (J) Age Mean
Difference (I-J) Std. Error Sig.
95% Confidence Interval
Lower Bound Upper Bound
Aesthetic stimulation
18 19 -.68381 .24157 .073 -1.4007 .0331
20 -.79492* .22605 .009 -1.4657 -.1241
21 -.72923* .22506 .022 -1.3971 -.0614
22 -.78295* .22710 .011 -1.4569 -.1090
23 -.59452 .24157 .177 -1.3114 .1223
24 -.52458 .27329 .469 -1.3356 .2864
19 18 .68381 .24157 .073 -.0331 1.4007
20 -.11111 .19050 .997 -.6764 .4542
21 -.04542 .18933 1.000 -.6073 .5164
22 -.09914 .19175 .999 -.6682 .4699
23 .08929 .20869 1.000 -.5300 .7086
24 .15923 .24471 .995 -.5669 .8854
20 18 .79492* .22605 .009 .1241 1.4657
19 .11111 .19050 .997 -.4542 .6764
21 .06569 .16908 1.000 -.4360 .5674
22 .01197 .17178 1.000 -.4978 .5217
23 .20040 .19050 .941 -.3649 .7657
24 .27034 .22940 .902 -.4104 .9511
21 18 .72923* .22506 .022 .0614 1.3971
19 .04542 .18933 1.000 -.5164 .6073
20 -.06569 .16908 1.000 -.5674 .4360
22 -.05372 .17048 1.000 -.5596 .4522
23 .13471 .18933 .992 -.4271 .6965
24 .20465 .22842 .973 -.4732 .8825
22 18 .78295* .22710 .011 .1090 1.4569
19 .09914 .19175 .999 -.4699 .6682
20 -.01197 .17178 1.000 -.5217 .4978
21 .05372 .17048 1.000 -.4522 .5596
23 .18843 .19175 .957 -.3806 .7574
24 .25837 .23043 .921 -.4254 .9422
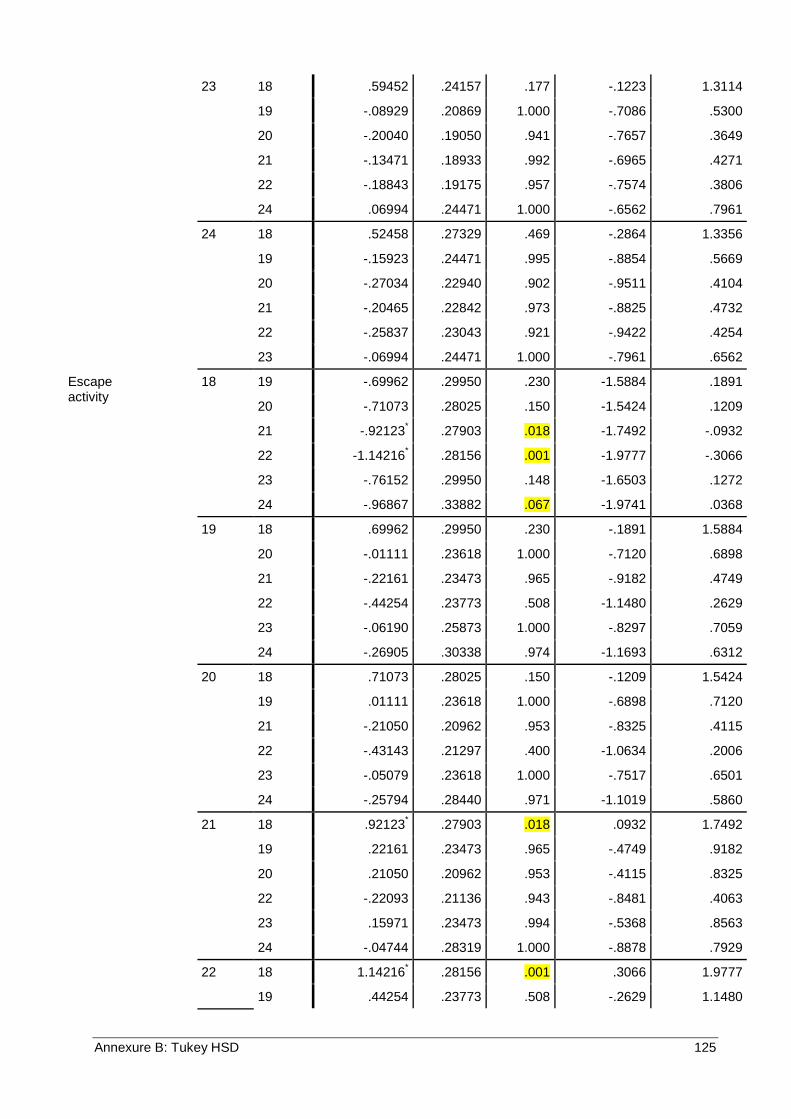
Annexure B: Tukey HSD 125
23 18 .59452 .24157 .177 -.1223 1.3114
19 -.08929 .20869 1.000 -.7086 .5300
20 -.20040 .19050 .941 -.7657 .3649
21 -.13471 .18933 .992 -.6965 .4271
22 -.18843 .19175 .957 -.7574 .3806
24 .06994 .24471 1.000 -.6562 .7961
24 18 .52458 .27329 .469 -.2864 1.3356
19 -.15923 .24471 .995 -.8854 .5669
20 -.27034 .22940 .902 -.9511 .4104
21 -.20465 .22842 .973 -.8825 .4732
22 -.25837 .23043 .921 -.9422 .4254
23 -.06994 .24471 1.000 -.7961 .6562
Escape activity
18 19 -.69962 .29950 .230 -1.5884 .1891
20 -.71073 .28025 .150 -1.5424 .1209
21 -.92123* .27903 .018 -1.7492 -.0932
22 -1.14216* .28156 .001 -1.9777 -.3066
23 -.76152 .29950 .148 -1.6503 .1272
24 -.96867 .33882 .067 -1.9741 .0368
19 18 .69962 .29950 .230 -.1891 1.5884
20 -.01111 .23618 1.000 -.7120 .6898
21 -.22161 .23473 .965 -.9182 .4749
22 -.44254 .23773 .508 -1.1480 .2629
23 -.06190 .25873 1.000 -.8297 .7059
24 -.26905 .30338 .974 -1.1693 .6312
20 18 .71073 .28025 .150 -.1209 1.5424
19 .01111 .23618 1.000 -.6898 .7120
21 -.21050 .20962 .953 -.8325 .4115
22 -.43143 .21297 .400 -1.0634 .2006
23 -.05079 .23618 1.000 -.7517 .6501
24 -.25794 .28440 .971 -1.1019 .5860
21 18 .92123* .27903 .018 .0932 1.7492
19 .22161 .23473 .965 -.4749 .9182
20 .21050 .20962 .953 -.4115 .8325
22 -.22093 .21136 .943 -.8481 .4063
23 .15971 .23473 .994 -.5368 .8563
24 -.04744 .28319 1.000 -.8878 .7929
22 18 1.14216* .28156 .001 .3066 1.9777
19 .44254 .23773 .508 -.2629 1.1480
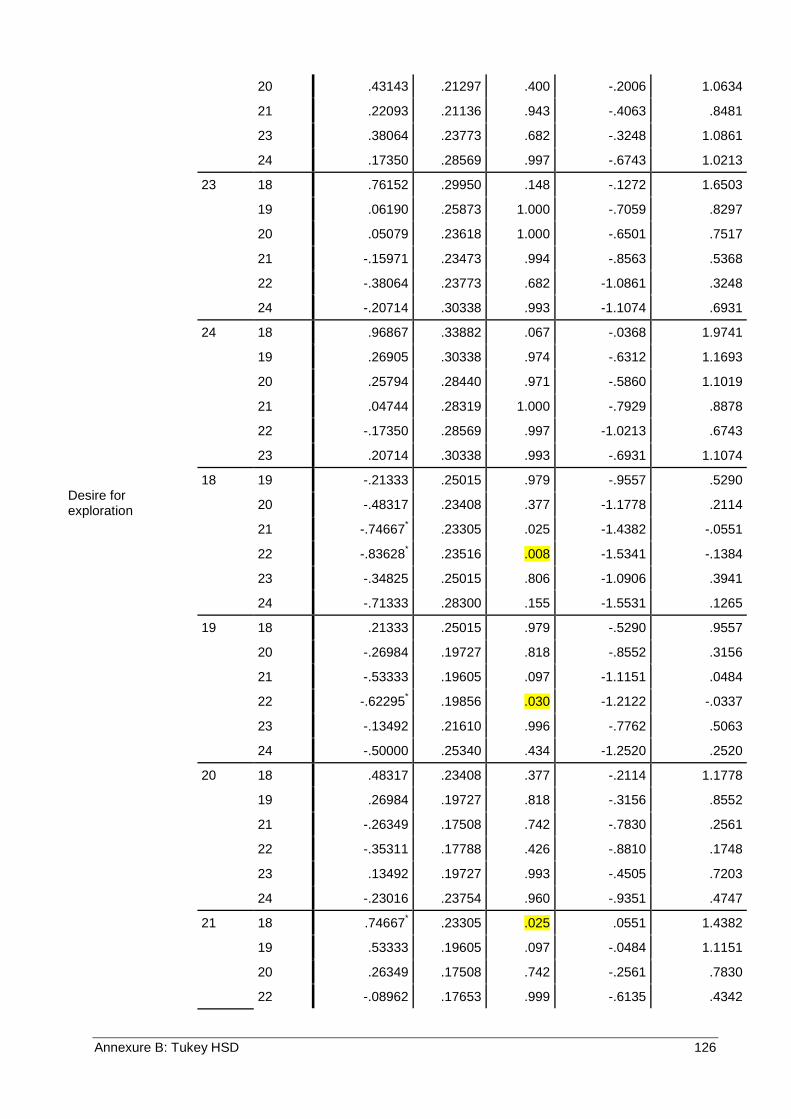
Annexure B: Tukey HSD 126
20 .43143 .21297 .400 -.2006 1.0634
21 .22093 .21136 .943 -.4063 .8481
23 .38064 .23773 .682 -.3248 1.0861
24 .17350 .28569 .997 -.6743 1.0213
23 18 .76152 .29950 .148 -.1272 1.6503
19 .06190 .25873 1.000 -.7059 .8297
20 .05079 .23618 1.000 -.6501 .7517
21 -.15971 .23473 .994 -.8563 .5368
22 -.38064 .23773 .682 -1.0861 .3248
24 -.20714 .30338 .993 -1.1074 .6931
24 18 .96867 .33882 .067 -.0368 1.9741
19 .26905 .30338 .974 -.6312 1.1693
20 .25794 .28440 .971 -.5860 1.1019
21 .04744 .28319 1.000 -.7929 .8878
22 -.17350 .28569 .997 -1.0213 .6743
23 .20714 .30338 .993 -.6931 1.1074
Desire for exploration
18 19 -.21333 .25015 .979 -.9557 .5290
20 -.48317 .23408 .377 -1.1778 .2114
21 -.74667* .23305 .025 -1.4382 -.0551
22 -.83628* .23516 .008 -1.5341 -.1384
23 -.34825 .25015 .806 -1.0906 .3941
24 -.71333 .28300 .155 -1.5531 .1265
19 18 .21333 .25015 .979 -.5290 .9557
20 -.26984 .19727 .818 -.8552 .3156
21 -.53333 .19605 .097 -1.1151 .0484
22 -.62295* .19856 .030 -1.2122 -.0337
23 -.13492 .21610 .996 -.7762 .5063
24 -.50000 .25340 .434 -1.2520 .2520
20 18 .48317 .23408 .377 -.2114 1.1778
19 .26984 .19727 .818 -.3156 .8552
21 -.26349 .17508 .742 -.7830 .2561
22 -.35311 .17788 .426 -.8810 .1748
23 .13492 .19727 .993 -.4505 .7203
24 -.23016 .23754 .960 -.9351 .4747
21 18 .74667* .23305 .025 .0551 1.4382
19 .53333 .19605 .097 -.0484 1.1151
20 .26349 .17508 .742 -.2561 .7830
22 -.08962 .17653 .999 -.6135 .4342
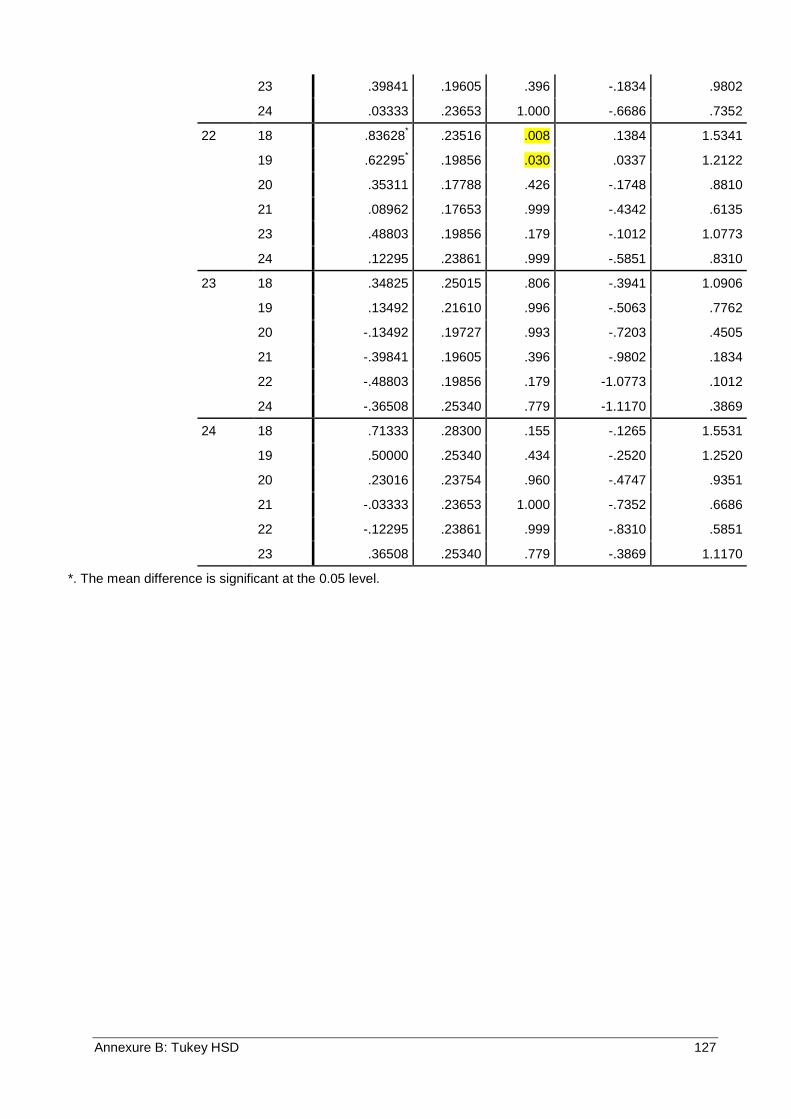
Annexure B: Tukey HSD 127
23 .39841 .19605 .396 -.1834 .9802
24 .03333 .23653 1.000 -.6686 .7352
22 18 .83628* .23516 .008 .1384 1.5341
19 .62295* .19856 .030 .0337 1.2122
20 .35311 .17788 .426 -.1748 .8810
21 .08962 .17653 .999 -.4342 .6135
23 .48803 .19856 .179 -.1012 1.0773
24 .12295 .23861 .999 -.5851 .8310
23 18 .34825 .25015 .806 -.3941 1.0906
19 .13492 .21610 .996 -.5063 .7762
20 -.13492 .19727 .993 -.7203 .4505
21 -.39841 .19605 .396 -.9802 .1834
22 -.48803 .19856 .179 -1.0773 .1012
24 -.36508 .25340 .779 -1.1170 .3869
24 18 .71333 .28300 .155 -.1265 1.5531
19 .50000 .25340 .434 -.2520 1.2520
20 .23016 .23754 .960 -.4747 .9351
21 -.03333 .23653 1.000 -.7352 .6686
22 -.12295 .23861 .999 -.8310 .5851
23 .36508 .25340 .779 -.3869 1.1170
*. The mean difference is significant at the 0.05 level.

Annexure C: Ethics clearance document 128
ANNEXURE C ETHICS CLEARNANCE DOCUMENT
````````