let's solve - bse
TRANSCRIPT

C
Let's Solve
LTI/SE/STAT /2022-23/44
National Stock Exchange of India Limited Exchange Plaza, Bandra-Kurla Complex
Bandra {E),
Mumbai - 400 051
NSE Symbol: LTI
Dear Sir{s)/Madam,
The BSE Limited, Phiroze Jeejeebhoy Towers,
Dalal Street,
Mumbai - 400 001
BSE Scrip Code: 540005
June 17, 2022
Subject: Integrated Annual Report FY2021-22 and Notice convening 26th Annual General Meeting ('AGM')
Pursuant to Regulation 34(1) of the Securities and Exchange Board of India {Listing Obligations and
Disclosure Requirements) Regulations, 2015, we are submitting herewith the Integrated Annual Report for
Financial year 2021-22 along with the Notice convening 26th AGM, and the same is also being sent through
electronic mode to those Members who have registered their e-mail addresses with the
Company /Depositories.
The same is also available on the Company's website at www.lntinfotech.com/investors.
Please take the above intimation on record.
Thanking you,
(Jridib Barat) r
Company Secretary & Compliance
Encl.: As above
Larsen & Toubro Infotech Ltd.
Technology Tower I, Gate No.S, Saki Vihar Road, Powai, Mumbai-400072, India T +9122 6776 67761 F +9122 2858 1130
Registered Office .L&T House, Ballard Estate, Mumbai 400 00 I, India www.Lntinfotech.com I E-mail: [email protected] CIN: L 72900MH I 996PLC I 0469 3
(L). I A Larsen & Toubro 'CD Group Company
LI I

LARSEN & TOUBRO INFOTECH LIMITEDCIN: L72900MH1996PLC104693
Registered Office: L&T House, Ballard Estate, Mumbai 400 001, India Tel: +91 22 6776 6776; Fax: +91 22 2858 1130
E-mail: [email protected]; Website: www.Lntinfotech.com
Notice
NOTICE IS HEREBY GIVEN THAT the Twenty Sixth (26th) Annual General Meeting (‘AGM’) of the members of Larsen & Toubro Infotech Limited will be held on Thursday, July 14, 2022 at 3:45 p.m. (IST) through Video Conference (VC)/Other Audio Visual Means (OAVM) to transact the following business:
1. To receive, consider and adopt the Audited Standalone Financial Statements of the Company for the year ended March 31, 2022 and the reports of the Board of Directors and Auditor thereon; and the Audited Consolidated Financial Statements of the Company for the year ended March 31, 2022 and the report of the Auditor thereon;
2. To declare final dividend on equity shares for the Financial Year 2021-2022;
3. To appoint a Director in place of Mr. Nachiket Deshpande (DIN: 08385028), who retires by rotation, and being eligible, has offered himself for re-appointment;
4. To appoint a Director in place of Mr. R. Shankar Raman (DIN: 00019798), who retires by rotation, and being eligible, has offered himself for re-appointment;
5. To appoint M/s. Deloitte Haskins & Sells Chartered Accountants LLP, as Statutory Auditor
To consider and, if thought fit, pass the following resolutions as ORDINARY RESOLUTION:
“RESOLVED THAT pursuant to the provisions of Sections 139, 142 and other applicable provisions, if any of the Companies Act, 2013 read with the Companies (Audit and Auditors) Rules, 2014, M/s. Deloitte Haskins & Sells Chartered Accountants LLP (ICAI Registration No. 117364W/W100739), be and are hereby appointed as Statutory Auditor of the Company, to hold office for a term of five consecutive years, from the conclusion of the 26th (Twenty Sixth) Annual General Meeting until the conclusion of the 31st (Thirty First) Annual General Meeting of the Company to be held in the year 2027.
RESOLVED FURTHER THAT the Audit Committee and/or the Board of Directors be and are hereby authorized to decide and finalize the terms and conditions of appointment, including remuneration of the Statutory Auditor.”
By Order of the Board of DirectorsFor Larsen & Toubro Infotech Limited
May 19, 2022 Tridib BaratMumbai Company Secretary and Compliance Officer

02 Integrated Report 2021-22 03NOTICE
NOTES:
a) The Statement pursuant to Section 102 of the Companies Act, 2013 (‘Act’) in respect of Item No. 5 of the Notice, is annexed hereto. Further, disclosures in relation to Item Nos. 3 and 4 of the Notice, as required under the Securities and Exchange Board of India (Listing Obligations and Disclosure Requirements) Regulations, 2015 (‘SEBI Listing Regulations’) and the Secretarial Standard-2 on General Meetings issued by the Institute of Company Secretaries of India (‘SS-2’) forms part of this Notice.
b) In view of continuing COVID-19 pandemic, pursuant to General Circular No. 2/2022 dated May 5, 2022 issued by Ministry of Corporate Affairs (‘MCA Circular’) and in compliance with the provisions of the Companies Act, 2013, read with the rules made thereunder and SEBI Listing Regulations, the 26th Annual General Meeting of the Members of the Company is being convened through Video Conference / Other Audio Visual Means (VC/OAVM), without the physical presence of members at a common venue. In view of the same, the registered office of the Company shall be deemed to be the venue of the AGM.
Accordingly, Notice of the AGM along with the Annual Report for FY22 is being sent by electronic mode to those members whose e-mail address is registered with the Company/Depositories, unless any member has requested for a physical copy of the same.
c) Since the AGM is held through VC/OAVM, route map to the venue is not required and therefore, the same is not annexed to this Notice.
d) Members attending the meeting through VC/OAVM shall be reckoned for the purpose of quorum under Section 103 of the Act. Members holding equity shares of the Company as on Thursday, July 7, 2022 (‘Cut-off date’) can join the meeting anytime 30 minutes before the commencement of the AGM by following the procedure as outlined in Annexure – 2 of the Notice.
e) Attendance through VC/OAVM is restricted and hence, members will be allowed on first come first serve basis. However, attendance of members holding more than 2% of the paid-up share capital of the Company, institutional investors, directors and key managerial personnel, Chairperson of Audit Committee, Nomination and Remuneration Committee, Stakeholders Relationship Committee and the Auditor will not be restricted on first come first serve basis.
f) Appointment of Proxy and Attendance Slip: Section 105 of the Act read with Rule 19 of the Companies (Management and Administration) Rules, 2014 provides for appointment of proxy to attend and vote at a general meeting on behalf of the member who is not able to physically attend the AGM. Since the 26th AGM is being held through VC/OAVM and in accordance with the MCA Circular, physical attendance of Members has been dispensed with. Accordingly, the facility of appointment of proxy would not be available to the Members for attending the 26th AGM and therefore, proxy form and attendance slip are not annexed to this Notice.
g) Corporate shareholders/institutional shareholders intending to send their authorised representative(s) to attend and vote at the 26th AGM are requested to send from their registered email address, scan copy of the relevant Board Resolution/ Authority Letter, etc. authorizing their representative(s) to vote, to the Scrutinizer on her e-mail ID at [email protected] with a copy marked to [email protected] and [email protected]
h) Record Date: Members may kindly note that Friday, July 1, 2022 has been fixed as the Record Date to determine entitlement of members to the final dividend for the financial year 2021-22.
i) Dividend:
(i) Pursuant to Finance Act, 2020, dividend income is taxable in the hands of members effective April 1, 2020. Accordingly, the final dividend, as recommended by the Board of Directors, and if approved at this AGM, shall be paid after deducting tax at source (‘TDS’) in accordance with the provisions of the Income Tax Act, 1961 at the prescribed rates, within 30 days from the date of declaration:
• to members in respect of equity shares held by them in physical form, whose name appear as a member in the Company’s Register of Members as on Friday, July 1, 2022; and
• to beneficial owners in respect of equity shares held by them in dematerialized form whose name appear in the statement of beneficial owners furnished by National Securities Depository Limited (‘NSDL’) and Central Depository Services (India) Limited (‘CDSL’), on close of business hours on Friday, July 1, 2022.

02 Integrated Report 2021-22 03NOTICE
(ii) For information on Tax Deduction at Source (‘TDS’), please refer ANNEXURE-1 to this Notice on “TDS Instructions on Dividend Distribution”.
(iii) In case of members whose bank details are not updated before the close of business hours on Friday, July 1, 2022 or in case the Company is unable to pay the dividend to any member directly in his/her bank account via electronic clearing service, the Company shall dispatch the dividend draft/cheque to such member(s) by post.
j) Mandatory updation of PAN, KYC, nomination and bank details by Members
Members holding shares in physical form
SEBI vide Circular No. SEBI/HO/MIRSD/MIRSD_RTAMB/P/CIR/2021/655 dated November 3, 2021 read with Circular No. SEBI/HO/MIRSD/MIRSD_RTAMB/P/CIR/2021/687 dated December 14, 2021, has mandated all listed entities to ensure that shareholders holding equity shares in physical form shall update their PAN, KYC, nomination and bank account details (if not updated or provided earlier) through the respective Registrar and Share Transfer Agent (RTA). In line with the same, the Company has sent individual letters to all the Members holding shares of the Company in physical form to furnish the required details to the Company’s Registrar and Share Transfer Agent (‘Company’s RTA’) on e-mail ID: [email protected] and has also hosted the said communication on Company’s website at www.Lntinfotech.com/investors. Any service request or complaint from member, cannot be processed by RTA untill registration/updation of their PAN, KYC, nomination and bank account details in RTA’s records. The relevant forms for updating the records are available on Company’s website www.lntinfotech.com/investors, and the duly filled forms may be sent to the Company’s RTA at the earliest, preferably on or before Thursday, July 7, 2022.
Members holding shares in demat form
Members holding shares in demat form are requested to update PAN and other details with their Depository Participant(s).
k) SEBI vide Circular No. SEBI/HO/MIRSD/MIRSD_RTAMB/P/CIR/2022/8 dated January 25, 2022, has mandated companies to issue securities in dematerialized form only, while processing service requests viz. issue of duplicate securities certificate; claim from unclaimed suspense account; renewal/ exchange of securities certificate; endorsement, sub-division/splitting, consolidation of securities certificate, transmission and transposition. Members are accordingly advised to get their shares held in physical form dematerialized through their Depository Participant.
l) Unclaimed Dividend: Details of unclaimed dividend are available on the Company’s website, https://www.lntinfotech.com/investors/
In compliance with Section 124 of the Act and rules made thereunder, unpaid/unclaimed dividend for the Financial Year 2015-2016 and equity shares in respect whereof dividend remains unpaid/unclaimed for a period of seven consecutive years shall be transferred to the Investor Education and Protection Fund (IEPF) during Calender Year 2023, as per details given below:
Particulars Date of declaration Due date for transfer to IEPF
Interim Dividend Monday, January 18, 2016 Wednesday, February 22, 2023Final Dividend Tuesday, May 31, 2016 Thursday, July 6, 2023
Members who wish to claim their unpaid/unclaimed dividend(s) may send a written request to the Corporate Secretarial Department on e-mail ID: [email protected] or to the Company’s RTA on e-mail ID: [email protected] or by post to RTA’s address at C-101, 247 Park, L.B.S. Marg, Vikhroli West, Mumbai-400 083, Maharashtra, India, at least 30 days prior to the due date for transfer to IEPF.
m) Electronic dissemination of AGM Notice and Integrated Annual Report: Electronic/digital copy of the Integrated Annual Report for FY22 and Notice of 26th AGM are being sent to all the Members whose e-mail ID is registered with the Company/Depositories. Members who have not registered their e-mail ID may get the same registered by following the instruction mentioned at (j) above. The Integrated Annual Report for FY22 and Notice of 26th AGM of the Company are available on the Company’s website viz.- https://www.lntinfotech.com/investors, websites of BSE Limited and National Stock Exchange of India Limited, and on the website of NSDL at https://www.evoting.nsdl.com

04 Integrated Report 2021-22 05NOTICE
n) Inspection of documents: Besides the statutory registers maintained under Section 170 and Section 189 of the Act, electronic copy of all the documents referred to in the Notice of 26th AGM and the statement annexed thereto, shall be made available for inspection to the members by accessing the NSDL e-voting platform at https://www.evoting.nsdl.com, during the remote e-voting period and during the 26th AGM.
o) Speaker registration/facility for non-speakers:
PROCESS
Registration as speaker at the AGM
Members who wish to raise queries at the AGM may register themselves as ‘Speaker’ by sending request to the said effect from their registered email address, to the e-mail ID: [email protected] quoting their name, DP ID and Client ID/folio number, on or before Thursday, July 7, 2022.
Facility for non-speakers
Members who wish to receive any information on the Integrated Annual Report for FY22 or have questions on the financial statements and/or matters to be placed at the 26th AGM, may send a communication from their registered email address to the e-mail ID: [email protected] quoting their name, DP ID and Client ID/folio number, on or before Thursday, July 7, 2022.
The Company reserves the right to restrict the number of questions and/or number of speakers during the AGM, depending upon availability of time and for smooth conduct of the meeting. However, the Company will endeavour to respond to the questions which have remained unanswered during the meeting, over email.
p) E-voting:
• In accordance with the provisions of Section 108 of the Act read with Rule 20 of the Companies (Management and Administration) Rules, 2014, SS-2 and Regulation 44 of SEBI Listing Regulations, the Company has extended the facility of voting through electronic means including ‘Remote e-voting’ (e-voting other than at the AGM) to transact the business mentioned in the notice of 26th AGM.
• Necessary arrangements have been made by the Company with NSDL to facilitate ‘Remote e-voting’ as well as e-voting at the AGM to be held through VC/OAVM facility. Members shall have the option to vote either through remote e-voting or voting through electronic means at the AGM.
• The Company has appointed Ms. Krupa Joisar, Practising Company Secretary (Membership No. FCS 11117 and Certificate of Practice No. 15263) as the Scrutinizer for scrutinizing the remote e-voting process as well as voting at the AGM in a fair and transparent manner.
• Voting rights of members shall be reckoned on the paid-up value of equity shares registered in their name as on the ‘Cut-off date’ i.e. Thursday, July 7, 2022.
• Members whose name is recorded in the Register of Members or in the Register of Beneficial Owners maintained by the Depositories as on the ‘Cut-off date’, shall be entitled to avail the facility of remote e-voting or e-voting at the AGM, as the case may be.
• The procedure for e-voting on the day of the AGM is identical to remote e-voting instructions as outlined in ANNEXURE-2 to this Notice.
• Any person who becomes a Member of the Company after dispatch of the Notice of 26th AGM and holds equity shares as on the ‘Cut-off date’ may also follow the procedure as outlined in ANNEXURE-2 to this Notice. Any person who is not a Member as on the ‘Cut-off date’ should treat this Notice for information purpose only.
• Members present at the 26th AGM through VC/OAVM facility and who have not cast their vote on resolutions set out in the 26th AGM Notice through remote e-voting, and who are not otherwise barred from doing so, shall be allowed to vote through e-voting facility during the 26th AGM. However, Members who have exercised their right to vote by remote e-voting may attend the 26th AGM but shall not be entitled to cast their vote again.

04 Integrated Report 2021-22 05NOTICE
• Once the vote on a resolution is cast, the Member shall not be allowed to change the same subsequently or cast the vote again.
• Members can opt for only one mode of voting i.e. either through remote e-voting or e-voting at the 26th AGM. If a Member casts votes by both modes, then voting done through remote e-voting shall prevail.
• In case of joint holders attending the 26th AGM through VC/OAVM facility, only such joint holder who is higher in the order of names will be entitled to vote.
q) Declaration of results of voting: After conclusion of the meeting, the Scrutinizer will submit the report on votes cast in favour or against and invalid votes, if any, to the Chairman or any other person authorized by him, who shall countersign the same, and the result of the voting will be declared within the time stipulated under the applicable laws.
The voting results along with the Scrutinizer’s report, will be hosted on the Company’s website, https://www.lntinfotech.com/investors/, website of NSDL, https://www.evoting.nsdl.com/, displayed on the Notice Board of the Company at the Registered Office and Corporate Office, and will be simultaneously forwarded to the Stock Exchanges i.e. National Stock Exchange of India Limited and BSE Limited.
STATEMENT PURSUANT TO SECTION 102(1) OF THE COMPANIES ACT, 2013
The following statement sets out material facts relating to Item No. 5 of the accompanying Notice:
Item No. 5
M/s. B.K. Khare & Co. Chartered Accountants (ICAI Registration No. 105102W) (‘BKK’), was appointed as Statutory Auditor at the Annual General Meeting held on August 24, 2017 for a term of five consecutive years, commencing from conclusion of the 21st AGM till conclusion of the 26th AGM.
Considering that the tenure of BKK will come to an end upon conclusion of the 26th AGM, the Board of Directors at its meeting held on April 19, 2022, upon recommendation of the Audit Committee, have recommended for approval of the members, appointment of M/s. Deloitte Haskins & Sells Chartered Accountants, LLP (‘Deloitte’) as Statutory Auditor of the Company for a term of five consecutive years, to hold office from the conclusion of the 26th AGM till the 31st AGM and payment of audit fee of H9.5 Mn (excluding applicable taxes and reimbursement of out-of-pocket expenses) to Deloitte for audit of financial statements for each of FY23 & FY24.
Deloitte has given consent to act as Statutory Auditor and confirmed that their appointment, if made, shall be within the limits specified under Section 143 of the Companies Act, 2013 and that they are not disqualified to be appointed as Statutory Auditor.
Brief profile, terms & conditions of appointment and the proposed fee of the proposed statutory auditor, are as follows:
a. Brief profile: Deloitte Haskins & Sells Chartered Accountants LLP (‘Deloitte’) is registered with the Institute of Chartered Accountants of India (ICAI) with Registration No. 117364W/W100739, and is part of Deloitte Haskins & Sells & Affiliates being the network of Firms registered with the ICAI. The registered office of Deloitte is 19th Floor, “Shapath V”, S. G. Highway, Ahmedabad – 380 015, Gujarat, India.
Deloitte was constituted in 1997 (converted to LLP in 2021). Deloitte and the other firms which are part of Deloitte Haskins & Sells & Affiliates being the network of firms registered with the ICAI, have been engaged in statutory audit of large software companies based out of India.
b. Term of Appointment: First term of five consecutive years, from conclusion of 26th AGM till conclusion of 31st AGM.
c. Proposed Fee: H9.5 Mn (excluding applicable taxes and reimbursement of out-of-pocket expenses) for audit of financial statements for each of FY23 & FY24. The Audit Committee and/or the Board of Directors be authorized to decide and finalize the fee for the balance period of the tenure of Deloitte as Statutory Auditor.
d. Material changes, if any, in proposed fees: The total fees paid to BKK for FY22 was H3.1 Mn and the proposed fee to Deloitte for FY23 is H9.5 Mn.

06 Integrated Report 2021-22 07NOTICE
Rationale of appointment including audit fee
Various audit firms were evaluated on diverse parameters like experience, expertise, proven track record, capability of handling diverse & complex business landscape, clientele served, geographical presence, experience of audit of large companies and in particular, IT / ITes sector companies, experience of engagement partner, use of technology, transition experience, etc. Upon recommendation of Audit Committee, the Board of Directors approved appointment of Deloitte as the Statutory Auditor, considering the business growth of the Company and the vast experience, expertise and proven track record of Deloitte in the IT industry, and the above mentioned audit fee. The proposed fee is in line with the industry benchmarks. The fees for services in the nature of limited review, statutory certifications and other professional work will be in addition to the audit fee as above, and will be decided by the management in consultation with the Statutory Auditor, subject to approval of the Board of Directors and/or Audit Committee, wherever required.
None of the Directors/Key Managerial Personnel of the Company or their relatives are, in any way, concerned or interested, financially or otherwise, in the resolutions set out at Item No. 5 of the Notice.
Considering the relevant experience and expertise of Deloitte and upon recommendation of Audit Committee, Board recommends appointment of Deloitte as Statutory Auditor, for approval of the members by way of Ordinary Resolution.
By Order of the Board of DirectorsFor Larsen & Toubro Infotech Limited
May 19, 2022 Tridib Barat Mumbai Company Secretary and Compliance Officer

06 Integrated Report 2021-22 07NOTICE
Details of Directors seeking re-appointment pursuant to Regulation 36(3) of the SEBI Listing Regulations and Secretarial Standard on General Meetings (SS-2) issued by the Institute of Company Secretaries of India
Name of the Director Mr. Nachiket Deshpande Mr. R. Shankar Raman
Relevant Item No. of the Notice 3 4
Age (in Years) 48 63
Qualification Bachelor in Engineering from College of Engineering, Pune
Chartered Accountant and Cost Accountant
Experience and nature of expertise in specific functional area (brief resume)
Has more than 25 years of experience in delivery management, customer relationship management and P&L management.
Has more than 38 years of experience and expertise in finance, taxation, risk management, legal and investor relations.
Date of first appointment on the Board
May 2, 2019 May 3, 2013
Terms and conditions of appointment
Appointed as Whole-time Director, liable to retire by rotation, w.e.f. May 2, 2019 for a period of five years
Appointed as Non-Executive Director, liable to retire by rotation w.e.f. May 3, 2013
Details of remuneration
(last remuneration drawn & remuneration proposed to be paid)
FY2022: H8,99,64,079 (including perquisite on exercise of Stock Options) The remuneration to be paid will be in accordance with the approval accorded by the members at the 23rd AGM held on July 20, 2019
Nil
Shareholding in the Company (number of shares as on May 19, 2022)
12,000 1,00,000
Relationship with other Directors, Manager and other Key Managerial Personnel (inter-se)
None None
Number of Board Meetings attended during FY22
6 out of 6 6 out of 6
Directorships held in other public companies (excluding foreign and private companies as on May 19, 2022)
Nil 1. Larsen & Toubro Limited
2. L&T Finance Holdings Limited
3. L&T Infrastructure Development Projects Limited
4. L&T Metro Rail (Hyderabad) Limited
5. L&T Seawoods Limited
6. L&T Investment Management Limited
7. L&T Realty Developers Limited
8. Mindtree Limited
Membership/ Chairmanship of Committees in other Public Companies as on May 19, 2022#
Nil Member of Audit Committee:
1. L&T Finance Holdings Limited
2. L&T Infrastructure Development Projects Limited
3. L&T Metro Rail (Hyderabad) Limited
4. Mindtree Limited
Member of Stakeholder Relationship Committee:
L&T Finance Holdings Limited
Name of listed companies from which Director has resigned in past three years
None None
#Includes membership/chairmanship of Audit Committee and Stakeholders’ Relationship Committee only.

08 Integrated Report 2021-22 09NOTICE
ANNEXURE-1 TO AGM NOTICE
TDS instructions on dividend distribution
Title Description
Applicability In compliance with Income Tax Act, 1961 (‘the Act’) read with Finance Act, 2020, for any dividend distribution to shareholders on or after April 1, 2020, tax will be deducted at source (‘TDS’) by the Company.
In view of the above, in the current financial year 2022-23, the Company shall be deducting TDS as per applicable provisions and TDS rates, while paying dividend.
No TDS will be deducted for the exempted category of shareholders, provided they furnish the requisite documents with the Company’s Share Registrar and Transfer Agent (RTA) on or before ‘Record date’ (mentioned below).
Record date Friday, July 1, 2022i
Exempted Category a) LIC/GIC/The New India Assurance Company Ltd / United India Insurance Company Ltd / The Oriental Insurance Company Limited / National Insurance Company Ltd and other Insurance Companies in respect of shares owned by them or in which they have full beneficial interest;
b) A “business trust” as defined in section 2(13A) of the Act, by a special purpose vehicle referred to in explanation to section 10(23FC) of the Act;
c) Government; Reserve Bank of India; a corporation established by or under a Central Act which is, under any law for the time being in force, exempt from income-tax on its income; mutual funds;
d) Any person for, or on behalf of, the New Pension System Trust referred to in section 10(44) of the Act; Alternative Investment Fund (Category I&II) or any other exempted entity;
e) Resident shareholders furnishing valid Form 15G or Form 15H;
f) In case of non-resident shareholders, no TDS shall be deducted subject to furnishing valid self-attested documentary evidence like copy of registration, order or notification issued by the Indian Income Tax Authority;
g) Any other person as may be notified by the Central Government in the Official Gazette in this behalf.
Lower TDS / Withholding tax rates
a) In case of Resident shareholders: TDS shall be deducted at the rate prescribed in the lower tax withholding certificate issued by competent tax authority, if same is submitted with RTA before the Record date.
b) In case of non-resident shareholders (including FII/FPI): TDS as per the Act or Tax Treaty rate, whichever is beneficial shall be applied, provided the non-resident shareholder submits the following documents:
i) Self-attested copy of Permanent Account Number (PAN);
ii) Self-attested copy of TRC for FY2022-23, issued by the tax authority of the country of which shareholder is resident;
iii) Self-declaration in Form 10F; and
iv) Self-declaration on ‘No-Permanent Establishment in India’, in the format annexed. TDS rates for FY23 Resident Shareholdersii Non-Resident Shareholdersiii
With PAN Without PAN/ Invalid PAN
10% 20% 20% (plus applicable surcharge & cess)

08 Integrated Report 2021-22 09NOTICE
Title Description
Higher rate of TDS in case of non-filing of income tax return*
TDS shall be deducted at higher rates in case of Specified Persons (as defined below):
a) Higher of below rate shall be applicable:
i) twice the rate specified in the relevant provision of the Act; or
ii) twice the rate or rates in force; or
iii) at the rate of 5%.
b) Specified person means-
i) a person who has not filed return of income for the financial year immediately preceding the year in which tax is required to be deducted, for which the time limit of filing return of income has expired; and
ii) the aggregate of TDS and TCS (tax collected at source) in the said financial year is J50,000 or more in his/her case.
c) This does not apply on payment to non-residents who do not have a permanent establishment in India.
d) Where the specified person does not hold a valid PAN and has not filed the return; tax shall be deducted at higher of the rate applicable for non-compliance of the requirements to hold PAN and filing of return, as required under the Act.
*Government has made available a mechanism/utility on the Income tax reporting portal. The same shall be used by the Company to determine applicability of the above provisions.
Higher rate of TDS in case of non-linking of Aadhar & PAN
a) An Individual shareholder who is eligible to obtain Aadhar number is required to link PAN with Aadhar on or before March 31, 2023.
b) PAN shall become inoperative if the Individual shareholder has not linked PAN - Aadhar on or before the above date & all the consequences under the Income Tax Act 1961 for not furnishing PAN shall apply.
Reporting of dividend paid under Statement of Financial Transactions (SFT)
a) W.e.f. April 1, 2021, dividend paid by a company is a reportable transaction under SFT.
b) Accordingly, the shareholder’s details such as name, PAN, registered address, email ID, dividend amount would be reported under SFT.
Notes:iNo communication in relation to submission of document(s) shall be accepted after the Record date.
iiNo TDS shall be deducted, if aggregate dividend distributed or paid or likely to be distributed or paid during the financial year to resident individual shareholder does not exceed H5,000/-.
iiiIn case of non-resident shareholders, for whom tax is withheld as per the Act, the applicable surcharge & cess for FY23 shall be as under:
#AOP: Association of Persons, BOI: Body of Individuals, HUF: Hindu Undivided Family, AJP: Artificial Juridical Person
Dividend Income Individual, AOP, BOI, HUF, Trust, AJP#
Registered Co-op. Society or Firm/FII registered as LLP
Foreign Company/ FII registered as Foreign
Company
FII / FPI characterized as
AOP
• Upto H50 Lakhs NIL NIL NIL NIL• Exceeding H50 Lakhs but upto
H1 Crore 10% NIL NIL 10%
• Exceeding H1 Crore but upto H10 Crores 15% 12% 2% 15%
• Exceeding H10 Crores 15% 12% 5% 15%
In addition to the surcharge rates as mentioned above, ‘Health & Education Cess’ @ 4% shall be applicable for FY23 for non-resident shareholders.

10 Integrated Report 2021-22 11NOTICE
General Notes:
I. Tax rate that is applicable to shareholders depend upon their residential status and classification. All shareholders are requested to update their residential status and category in their respective demat accounts if the shareholding is in demat form or with Company’s RTA, if the shareholding is held in physical form, as may be applicable, before the Record date.
II. Application for exemption from TDS/ lower / beneficial rate of tax is subject to submission of the requisite & valid documents with RTA before the Record date and also verification of the documents submitted to the Company. If the documents submitted by the shareholder are found incomplete or ambiguous, exemption/lower/beneficial rate of tax shall not be applied. Shareholders have the option to claim refund of excess tax deducted from their respective tax authorities, in case the Company has deducted tax at source at higher rate due to non-submission / incomplete submission of documents with the RTA. No claim shall lie against the Company for such tax deducted.
III. If Form 15G/H is already submitted for a particular financial year, revised form is to be shared in case of change in estimated total income or dividend income. In case revised form is not provided by the shareholder, the Company shall determine the TDS amount based on estimated total income and dividend income specified in the latest form available with the Company.
IV. In case the requisite documents are submitted by the shareholder through his/her registered email, the Company has the right to demand the original documents and the shareholder undertakes to abide by such request. Documents received by Registered Post or from registered e-mail ID will only be accepted.
V. TDS certificate will be emailed to the shareholder’s registered e-mail ID in due course. Shareholders can also view the credit of TDS in their respective Form 26AS.
VI. In case dividend income is assessable in the hands of a person other than the registered shareholder as on the Record date, the registered shareholder shall furnish a declaration to the satisfaction of RTA / Company, containing the name, address and valid PAN of the person to whom the tax credit is to be given, along with reasons for giving credit to such person. In case the PAN provided as above is invalid, tax credit shall continue to be given to the registered shareholder.
VII. In case of joint shareholders, the shareholder named first in the Register of Members shall furnish the requisite documents for claiming any beneficial tax rate.
VIII. The required documents can be submitted with Company’s RTA before the Record date at https://linkintime.co.in/formsreg/submission-of-form-15g-15h.html or through email from the registered e-mail ID or at the following address:
M/s. Link Intime India Private Limited
Kind Attention: Mr. Jayprakash VP
C-101, 247 Park, L.B.S. Marg,
Vikhroli West,
Mumbai-400 083,
Maharashtra, India
E-mail ID: [email protected]
IX. Shareholders may contact Company for any query related to dividend on [email protected]

10 Integrated Report 2021-22 11NOTICE
FORMAT OF DECLARATION FOR NO PERMANENT ESTABLISHMENT IN INDIA
Larsen & Toubro Infotech LimitedTechnology Tower 1, Gate No.5,Saki Vihar Road, Powai, Mumbai-400072, IndiaE-mail:- [email protected]
Subject: Self-declaration for Indian Financial Year (FY) 2022-23 with respect to availment of tax treaty benefits in relation to receipt of dividend income from Larsen & Toubro Infotech Limited
With reference to the captioned subject and in relation to the appropriate deduction of taxes on the dividend payable to me / us by Larsen & Toubro Infotech Limited (“the Company”), I / We hereby declare as under:
• I / We, _______________________ (full name of the shareholder), having Permanent Account Number (PAN) under the Indian Income Tax Act, 1961 (‘the Act’) _________ (mention PAN), and holding ____________(mention number of shares held) number of shares of the Company as on the record date, I / We am / are a tax resident of ____________ (country name). A copy of the valid tax residency certificate for the period April 1, 2022 to March 31, 2023, is attached herewith.
• I / We, am / are tax resident of _________________ (country name) as defined under Article __ of the tax treaty between India and ______________ (‘the applicable tax treaty’). I / We, am / are eligible to be governed by the provisions of the applicable tax treaty as modified by the “Multilateral Instrument (MLI)” and meet all the necessary conditions to avail the benefits under the applicable tax treaty.
• I / We, do not have any Permanent Establishment (‘PE’) or fixed base in India as construed under relevant Articles of the applicable tax treaty nor do we have any PE or business connection in India as construed under the relevant provisions of the Act.
• As required to claim the benefit of the lower tax rate under the applicable tax treaty in relation to the dividend income to be received by me / us from the Company, I / We specifically confirm that I / We am / are the beneficial owner of the above referred equity shares of the Company and the dividend income receivable from the Company in relation to the said shares.
• I / We, further declare that I/ We have the right to use and enjoy the dividend received/ receivable from the above shares and such right is not constrained by any contractual and/ or legal obligation to pass on such dividend to another person.
• I / We, specifically confirm that my affairs / affairs of _______________________(full name of the shareholder) were arranged such that the main purpose or the principal purpose thereof was not to obtain tax benefits available under the applicable tax treaty.
• Further, our claim for relief under the tax treaty is not restricted by application of Limitation of Benefit clause, if any, thereunder.
This declaration is valid for the period 1 April, 2022 to 31 March, 2023.
I / We, confirm that the above is true to the best of my / our knowledge and I / We shall be solely responsible for any adverse income-tax consequences (tax, including interest and penalty) arising under Income Tax Act, 1961 in relation to the dividend income to be received from the Company.
Further, I / We, agree and undertake: (1) to indemnify the Company in relation to any income tax consequences (tax, including interest and penalty) arising under the income tax laws if any of the above is questioned and held otherwise by the Income Tax Authorities; (2) to provide all the necessary documentation as sought by the Income Tax Authorities in this regard.
For…………………………………………(Mention the name of the payee)Authorised Signatory
Name: Designation:
Place:Date:
Notes:
a) In case of the Authorised Signatory being other than Director/ Managing Director, please attach the valid Power of Attorney authorising the individual as an Authorised Signatory.
b) In case of a Company, issue on a letter head.c) Members are required to provide the declaration strictly as per the specified format given above, failing which the Company reserves the right to
deny the treaty benefits.

12 Integrated Report 2021-22 13NOTICE
ANNEXURE 2 - TO AGM NOTICE
Instructions for remote E-Voting and access to 26th AGM
Members are requested to follow the instructions given below to cast their vote through e-voting and to access the Video Conference facility at the AGM:
A. The remote e-voting period begins on Monday, July 11, 2022, at 9:00 a.m. (IST) (Server time) and ends on Wednesday, July 13, 2022 at 5:00 p.m. (IST) (Server time). During this period, shareholders holding shares either in physical form or in dematerialized form, as on the ‘Cut-off date’ i.e. Thursday, July 7, 2022 may cast their vote electronically by logging to NSDL website at https://www.evoting.nsdl.com/
The e-voting module shall be disabled by NSDL for voting thereafter.
B. Detailed steps on the process and manner for remote e-voting/e-voting at the AGM and to access the VC facility at the AGM, is given below:
How do I vote electronically using NSDL e-Voting system?
The procedure to vote electronically on NSDL e-Voting system consists of “Two Steps” which are outlined below:
Step 1: Access to NSDL e-Voting system
A) Login method for e-Voting for individual shareholders holding securities in demat mode
In terms of SEBI circular dated December 9, 2020 on e-Voting facility provided by listed companies, individual shareholders holding securities in demat mode are allowed to vote through their demat account maintained with Depositories and Depository Participants. Shareholders are advised to update their mobile number and email Id in their demat accounts in order to access e-Voting facility.
Login method for Individual shareholders holding securities in demat mode is given below:
Type of shareholders Login method
Individual Shareholders holding securities in demat mode with NSDL.
1. Existing IDeAS user can visit the e-Services website of NSDL viz. https://eservices.nsdl.com either on a Personal Computer or on a mobile. On the e-Services home page click on the “Beneficial Owner” icon under “Login” which is available under ‘IDeAS’ section, this will prompt you to enter your existing User ID and Password. After successful authentication, you will be able to see e-Voting services under Value added services. Click on “Access to e-Voting” under e-Voting services and you will be able to see e-Voting page. Click on company name or e-Voting service provider i.e. NSDL and you will be re-directed to e-Voting website of NSDL for casting your vote during the remote e-Voting period.
2. If you are not registered for IDeAS e-Services, option to register is available at https://eservices.nsdl.com. Select “Register Online for IDeAS Portal” or click at https://eservices.nsdl.com/SecureWeb/IdeasDirectReg.jsp
3. Visit the e-Voting website of NSDL. Open web browser by typing the following URL: https://www.evoting.nsdl.com/ either on a Personal Computer or on a mobile. Once the home page of e-Voting system is launched, click on the icon “Login” which is available under ‘Shareholder/Member’ section. A new screen will open. You will have to enter your User ID (i.e. your sixteen digit demat account number held with NSDL), Password/OTP and a Verification Code as shown on the screen. After successful authentication, you will be redirected to NSDL Depository site wherein you can see e-Voting page. Click on company name or e-Voting service provider i.e. NSDL and you will be redirected to e-Voting website of NSDL for casting your vote during the remote e-Voting period.
12 Integrated Report 2021-22 13NOTICE
Type of shareholders Login method
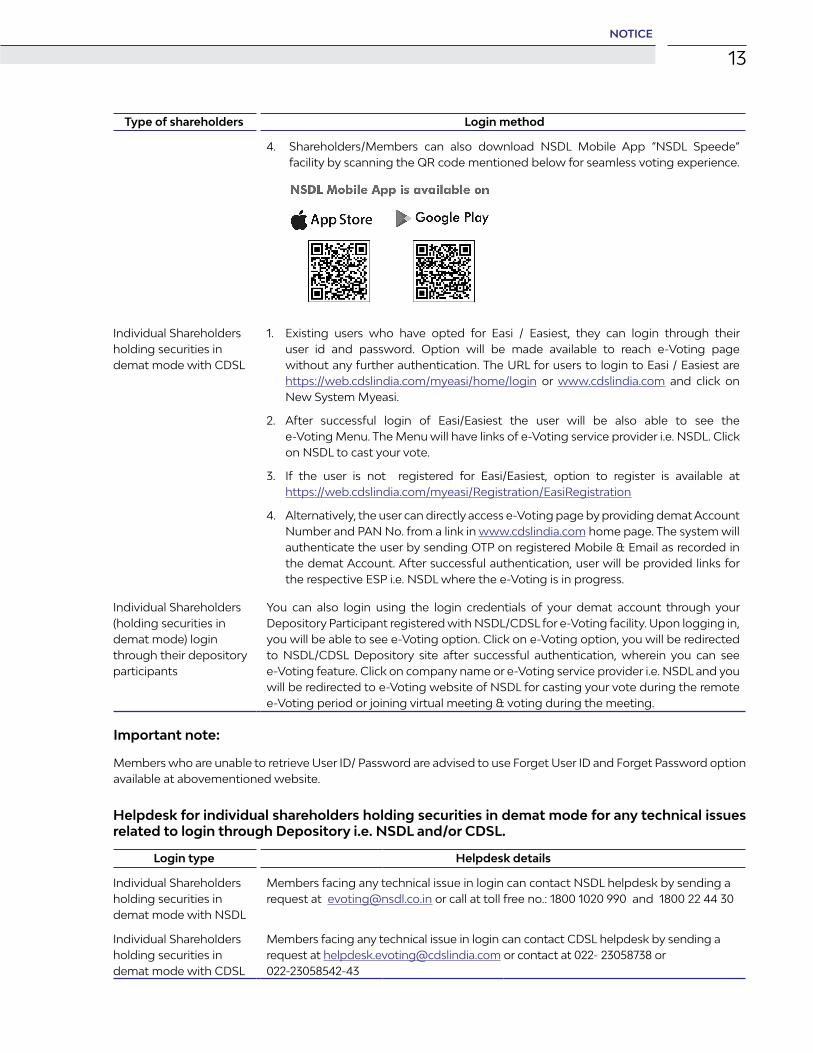
4. Shareholders/Members can also download NSDL Mobile App “NSDL Speede” facility by scanning the QR code mentioned below for seamless voting experience.
Individual Shareholders holding securities in demat mode with CDSL
1. Existing users who have opted for Easi / Easiest, they can login through their user id and password. Option will be made available to reach e-Voting page without any further authentication. The URL for users to login to Easi / Easiest are https://web.cdslindia.com/myeasi/home/login or www.cdslindia.com and click on New System Myeasi.
2. After successful login of Easi/Easiest the user will be also able to see the e-Voting Menu. The Menu will have links of e-Voting service provider i.e. NSDL. Click on NSDL to cast your vote.
3. If the user is not registered for Easi/Easiest, option to register is available at https://web.cdslindia.com/myeasi/Registration/EasiRegistration
4. Alternatively, the user can directly access e-Voting page by providing demat Account Number and PAN No. from a link in www.cdslindia.com home page. The system will authenticate the user by sending OTP on registered Mobile & Email as recorded in the demat Account. After successful authentication, user will be provided links for the respective ESP i.e. NSDL where the e-Voting is in progress.
Individual Shareholders (holding securities in demat mode) login through their depository participants
You can also login using the login credentials of your demat account through your Depository Participant registered with NSDL/CDSL for e-Voting facility. Upon logging in, you will be able to see e-Voting option. Click on e-Voting option, you will be redirected to NSDL/CDSL Depository site after successful authentication, wherein you can see e-Voting feature. Click on company name or e-Voting service provider i.e. NSDL and you will be redirected to e-Voting website of NSDL for casting your vote during the remote e-Voting period or joining virtual meeting & voting during the meeting.
Important note:
Members who are unable to retrieve User ID/ Password are advised to use Forget User ID and Forget Password option available at abovementioned website.
Login type Helpdesk details
Individual Shareholders holding securities in demat mode with NSDL
Members facing any technical issue in login can contact NSDL helpdesk by sending a request at [email protected] or call at toll free no.: 1800 1020 990 and 1800 22 44 30
Individual Shareholders holding securities in demat mode with CDSL
Members facing any technical issue in login can contact CDSL helpdesk by sending a request at [email protected] or contact at 022- 23058738 or 022-23058542-43
Helpdesk for individual shareholders holding securities in demat mode for any technical issues related to login through Depository i.e. NSDL and/or CDSL.
14 Integrated Report 2021-22 15NOTICE
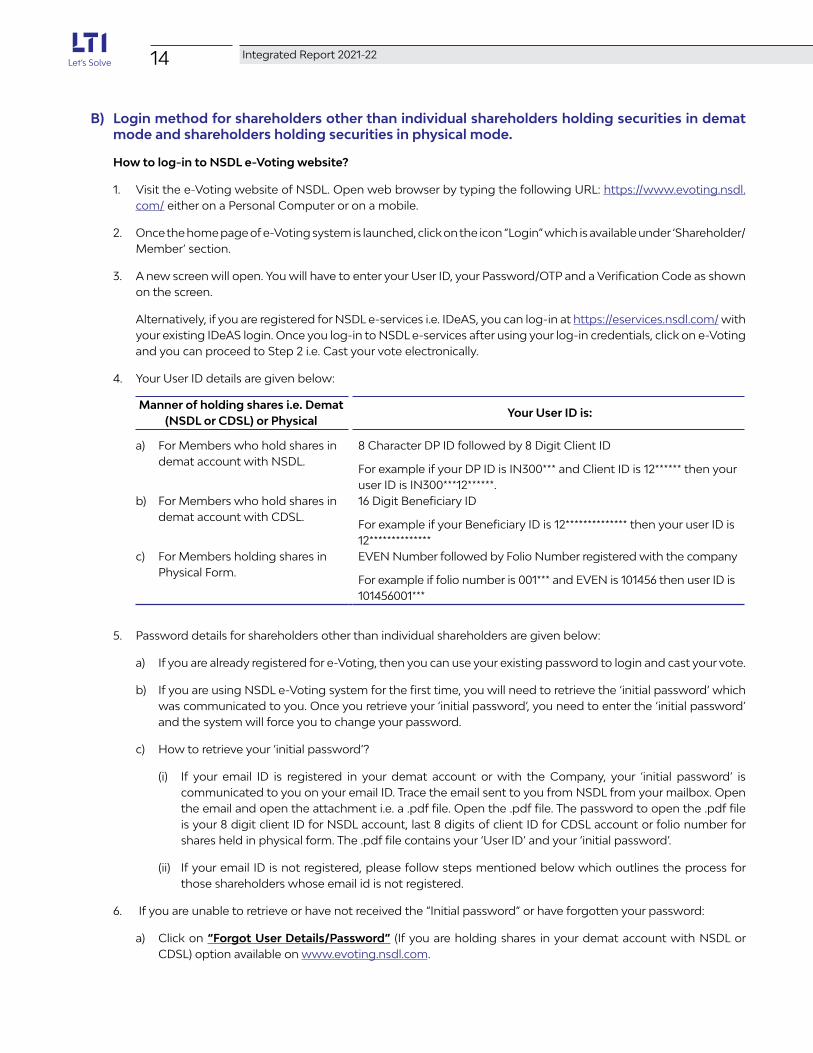
B) Login method for shareholders other than individual shareholders holding securities in demat mode and shareholders holding securities in physical mode.
How to log-in to NSDL e-Voting website?
1. Visit the e-Voting website of NSDL. Open web browser by typing the following URL: https://www.evoting.nsdl.com/ either on a Personal Computer or on a mobile.
2. Once the home page of e-Voting system is launched, click on the icon “Login” which is available under ‘Shareholder/Member’ section.
3. A new screen will open. You will have to enter your User ID, your Password/OTP and a Verification Code as shown on the screen.
Alternatively, if you are registered for NSDL e-services i.e. IDeAS, you can log-in at https://eservices.nsdl.com/ with your existing IDeAS login. Once you log-in to NSDL e-services after using your log-in credentials, click on e-Voting and you can proceed to Step 2 i.e. Cast your vote electronically.
4. Your User ID details are given below:
Manner of holding shares i.e. Demat (NSDL or CDSL) or Physical
Your User ID is:
a) For Members who hold shares in demat account with NSDL.
8 Character DP ID followed by 8 Digit Client ID
For example if your DP ID is IN300*** and Client ID is 12****** then your user ID is IN300***12******.
b) For Members who hold shares in demat account with CDSL.
16 Digit Beneficiary ID
For example if your Beneficiary ID is 12************** then your user ID is 12**************
c) For Members holding shares in Physical Form.
EVEN Number followed by Folio Number registered with the company
For example if folio number is 001*** and EVEN is 101456 then user ID is 101456001***
5. Password details for shareholders other than individual shareholders are given below:
a) If you are already registered for e-Voting, then you can use your existing password to login and cast your vote.
b) If you are using NSDL e-Voting system for the first time, you will need to retrieve the ‘initial password’ which was communicated to you. Once you retrieve your ‘initial password’, you need to enter the ‘initial password’ and the system will force you to change your password.
c) How to retrieve your ‘initial password’?
(i) If your email ID is registered in your demat account or with the Company, your ‘initial password’ is communicated to you on your email ID. Trace the email sent to you from NSDL from your mailbox. Open the email and open the attachment i.e. a .pdf file. Open the .pdf file. The password to open the .pdf file is your 8 digit client ID for NSDL account, last 8 digits of client ID for CDSL account or folio number for shares held in physical form. The .pdf file contains your ‘User ID’ and your ‘initial password’.
(ii) If your email ID is not registered, please follow steps mentioned below which outlines the process for those shareholders whose email id is not registered.
6. If you are unable to retrieve or have not received the “Initial password” or have forgotten your password:
a) Click on “Forgot User Details/Password” (If you are holding shares in your demat account with NSDL or CDSL) option available on www.evoting.nsdl.com.

14 Integrated Report 2021-22 15NOTICE
b) “Physical User Reset Password” (If you are holding shares in physical mode) option available on www.evoting.nsdl.com.
c) If you are still unable to get the password by aforesaid two options, you can send a request at [email protected] mentioning your demat account number/folio number, your PAN, your name and your registered address, etc.
d) Members can also use the OTP (One Time Password) based login for casting the votes on the e-Voting system of NSDL.
7. After entering your password, tick on Agree to “Terms and Conditions” by selecting on the check box.
8. Now, you will have to click on “Login” button.
9. After you click on the “Login” button, Home page of e-Voting will open.
Step 2: Cast your vote electronically on NSDL e-Voting system
How to cast your vote electronically on NSDL e-Voting system?
1. After successful login at Step 1, you will be able to see all the companies “EVEN” in which you are holding shares and whose voting cycle is in active status.
2. Select “EVEN” of company for which you wish to cast your vote during the remote e-Voting period.
3. Now you are ready for e-Voting as the Voting page opens.
4. Cast your vote by selecting appropriate options i.e. assent or dissent, verify/modify the number of shares for which you wish to cast your vote and click on “Submit” and also “Confirm” when prompted.
5. Upon confirmation, the message “Vote cast successfully” will be displayed.
6. You can also take the printout of the votes cast by you by clicking on the print option on the confirmation page.
7. Once you confirm your vote on the resolution, you will not be allowed to modify your vote.
GENERAL GUIDELINES FOR SHAREHOLDERS
1. Members can attend the AGM through VC/OAVM after following the steps for Login as outlined above. After successful Login, Members will be able to see the VC/OAVM link placed under Join meeting menu against the Company’s name. Members are requested to click on the VC/OAVM link placed under Join meeting menu.
2. Institutional shareholders (i.e. other than individuals, HUF, NRI, etc.) are required to send scan copy (PDF/JPG format) of the relevant Board Resolution/ Authority letter etc. authorising their representative(s) to vote, to the Scrutinizer by e-mail to [email protected] with a copy marked to [email protected].
3. It is strongly recommended not to share your password with any other person and take utmost care to keep your password confidential. Login to the e-voting website will be disabled after five unsuccessful attempts to key in the correct password. In such an event, you will need to go through the “Forgot User Details/Password?” or “Physical User Reset Password?” option available on www.evoting.nsdl.com to reset the password.
4. In case of any queries, you may refer the Frequently Asked Questions (FAQs) for Shareholders and e-voting user manual for Shareholders available in the download section of www.evoting.nsdl.com or call on toll free no.: 1800 1020 990 and 1800 22 44 30 or send a request to Mr. Anubhav Saxena at [email protected]

16 Integrated Report 2021-22 PBNOTICE
Process for those shareholders whose e-mail id is not registered with the depositories to procure user id and password and registration of e-mail id for e-Voting for the resolutions set out in this notice:
1. In case shares are held in demat mode, please provide DPID-CLID (16 digit DPID + CLID or 16 digit beneficiary ID), name, client master or copy of Consolidated Account Statement, PAN (self attested scan copy of PAN card), Aadhar (self attested scan copy of Aadhar Card) to [email protected]
If you are an individual shareholder holding securities in demat mode, please refer to the login method explained at Step 1 (A) i.e. Login method for e-Voting for individual shareholders holding securities in demat mode.
If you are a non-individual shareholder holding securities in demat mode, please refer to the login method explained at Step 1 (B) i.e. Login method for e-Voting for non-individual shareholders holding securities in demat mode.
2. In case shares are held in physical mode please provide Folio No., name of shareholder, scan copy of the share certificate (front and back), PAN (self attested scanned copy of PAN card), Aadhar (self attested scan copy of Aadhar Card) by email to [email protected]
If you are an Individual shareholder holding securities in physical mode, please refer to the login method explained at Step 1 (B) i.e. Login method for e-Voting for individual shareholders holding securities in physical mode.
3. Alternatively, shareholder may send a request to [email protected] for procuring user id and password for e-Voting by providing above mentioned documents.
4. In terms of SEBI circular dated December 9, 2020 on e-Voting facility provided by listed companies, individual shareholders holding securities in demat mode are allowed to vote through their demat account maintained with Depositories and Depository Participants. Shareholders are required to update their mobile number and email ID correctly in their demat account in order to access e-Voting facility.
Integrated Annual Report
2021-22
Guts
Story
No
No

you create a story.
When you commit totruth and
imagination,you create a
story.
When you beat the
odds and go beyond the
brief, you create a story.
When you challenge the norm and push
harder, you create a
story.
A tribe that creates its own stories of courage, resilience, and grit.
NOUN /stôrē/
To decorate with scenes representing historical or legendary events.
An anecdote: We are all made up of stories.
The quality of being brave and determined.
It takes guts to do something: Guts are the strands of our story.
NOUN PLURAL /LT ahyts/
Guts LTItes
Our war cry
No Guts,No Story
NOUN PLURAL /guhts/
When you go beyond
your mind and might,
you create a story.
When you commit totruth and
imagination,you create a
story.
When you are stronger
than the pretext, you
create a story.
When you beat the
odds and go beyond the
brief, you create a story.
When you challenge the norm and push
harder, you create
a story.
When you defy
clichésand mark
a niche, you
create a story.
StoryWe are LTItes; we curate stories of client centricity that are purpose-driven. Stories that scream commitment.
With heart and head at the right place, we are that version of ourselves when no one’s watching.
We continue to be excited about our deep engagements with clients. We contemplate their challenges and our solutions to solve them.
We raise the bar on ourselves and deliver to the expectations of all our stakeholders.
P.S. A ‘limited edition’ 46,000+ solver community who are part-time dreamers and full-time achievers.

Commencedoperations as asubsidiary of L&T.
1st large multi-year contract from a Global Energy Company. 1st acquisition –
US-basedGDA Tech Inc.
Acquired transfer agency business unit of Citigroup services.
Merged ISRC with LTI.
Acquired Syncordis India & Syncordis S.A. – December 2017.
LTI’s brand value crossed $1 Bn.
Ranked 22nd among top 25 most valuable IT services brands in the Brand Finance IT Services 25, 2022 ranking.
Entered the Nifty Next 50 Index.
Acquired Cuelogic – July 2021.
Launched Fosfor,Data-to-DecisionsProduct Suite.
Positioned in top 20 IT serviceproviders by the Everest Group.
Launched Initial Public Offering (IPO) – July 2016.
Acquired AugmentIQ – November 2016.
Acquired Ruletronics – March 2019.
Acquired Nielsen+Partner – March 2019.
Acquired Lymbyc – August 2019.
Acquired Powerupcloud – October 2019.
LTI Celebrates
Beginner’s Mind | Infinite Innova�on | Enginee�ng DNA
25 years of creating unmatched experiences and being extraordinary every day.
It’s about making a difference, it’s about thinking lateral and enjoying challenges.
With agility and sensibility, LTI @25 personifies global excellence.
25 years of bolder questions and braver answers. 25 years of Let’s Solve.

01Corporate Overview
02 LTI Celebrates 25
05 About the Report
06 About LTI
08 Chairman’s Message
10 CEO’s Message
12 Fosfor is Here to Lead the Way!
13 Partnership Ecosystem, Fuelling Growth
14 It’s All Happening on the Cloud!
15 In the Top League
16 Key Highlights
18 Sustainable Development Goals
20 Our ESG Roadmap
21 Board of Directors
22 Corporate and Vertical Heads
23 Corporate Information
Cont
ents
Co
nte
nts
www.lntinfotech.com
To get a copy of this report online, please log on to:
For digital version of this report, scan this QR Code
03Statutory Reports
90 to 186
02Integrated Report
26 to 88
04Financial Statements
187 to 328
05Independent Assurance Statement
329 to 331
About the Report
LTI is proud to publish its Integrated Annual Report 2021-22, with qualitative and quantitative information and disclosures on our organization’s financial and non-financial performance for the period between April 1, 2021, and March 31, 2022. We remain committed to disclosing relevant information about material issues with the highest standards of transparency and integrity.
This is our second report prepared following the International Integrated Reporting <IR> Framework, outlined by the International Integrated Reporting Council (IIRC), providing details about our annual performance and future strategy. The IIRC framework showcases our detailed value creation model, performance against the six capitals, governance, risk management, and outlook.
Forward-looking statementsThis report contains forward looking statements that describe our projections and expectations, based on reasonable assumptions and past performance. These are subject to change in light of developments in the industry, geographical market conditions, government regulations, laws and other incidental factors. These statements must not be used as a guarantee of our future performance, as the underlying assumptions could change materially.
Reporting scope and boundary
This report covers the performance of all our business verticals across our global operations. This includes operations in over 33 countries across the globe.*
Assurance
The content covered in the six capitals of the integrated report section have been independently assured by Bureau Veritas (India) Pvt. Ltd., as depicted in the assurance statement (attested as an Annexure to the report on page 329).
Reporting principles
Along with the framework, the report is in line with the applicable requirements and principles of the following:
• Companies Act, 2013 (and rules made thereunder).
• Securities and Exchange Board of India (Listing Obligations and Disclosure Requirements) Regulations, 2015.
• Secretarial standards issued by the Institute of Company Secretaries of India.
• Indian Accounting standards prescribed by the Institute of Chartered Accountants of India.
• The disclosures in the report also draw inspiration from the Global Reporting Initiative (GRI) framework and the principles of the United Nations Sustainable Development Goals (UN SDGs).
Approach to materiality
This report presents our approach and performance on the issues that are material to us and our stakeholders. Our material topics cover key stakeholder concerns, that can substantively affect the organization’s ability to create value over the short, medium and long term. These have been identified, based on our interactions with our internal and external stakeholders.
Integrated Annual Report 2021-22
*The non-financial information (except the data relevant to Natural Capital and CSR activities) covers our global operations.

Enviable client profile
About LTI25 years of conviction and commitment
For over 25 years, LTI has been solving complex business problems as a global IT services and solutions provider, leveraging real-world expertise and client centricity. The IT industry was still in its infancy when the company started, but the vision of the founders was clear and strong. LTI was envisioned as an IT services company that would solve for the exponential technologies and the rapidly changing world. And here we are today, our operations spread across 33 countries, accelerating the digital transformation journey for our clients.
With courage, determination, and perseverance, the founding team created LTI with business knowledge acquired from decades of experience within the globally acclaimed Larsen and Toubro group ($21 Bn turnover). Our unique heritage provides us the confidence and capabilities to solve the most complex challenges of enterprises across all industries.
Pioneering Solutions in a Converging WorldV
isio
n
Core
Vis
ion Bel
iefs
Core
Bel
iefs
Go the extra mile
Be agile
Push frontiers of innovation
Keep learning
Solve for society
Quick facts
486 clients including 73 Fortune 500 companies.
46,000+ Formidable talent pool working out of 36 delivery centers.
53 sales offices across 33 locations in the US, EMEA & APAC.
Among the Top 20 Global IT services companies.
Revenue $2.10 Bn.
6th largest Indian IT services company.
Nu
mb
er o
f cl
ien
ts
Pro
ject
wo
rth
($)
Co
re b
usi
nes
s
$100 Mn+
$50 Mn+
$20 Mn+
$10 Mn+
$5 Mn+
1
8
24
44
US-based global bank.
Large P&C insurer | Professional services giant | Global O&G major.
Global investment bank | Global tech giant | CPG giant | Big M&E company.
US tech company | French utility | Global HVAC manufacturer | Global CPG player.
Large manufacturer | US based M&E company | European bank.74
6 Integrated Annual Report 2021-22 7Corporate Overview | Statutory Reports | Financial Statements
About LTI

Chairman’s Message Dear Shareholders,
Industries around the world are rapidly learning to navigate uncertainty and anticipate the unexpected as an unavoidable part of doing business. Just as economies emerged cautiously from successive waves of the pandemic, the fragile process of recovery was upset by the war in Europe. Obviously, in today’s interdependent world, a conflict extends beyond its frontline combatants to cause wide-ranging impact, spiking inflationary pressures and causing disruptions in the global supply chain.
I am happy to state that your Company has successfully countered these challenges to exceed the milestone of $2 Bn in revenue this financial year. This is on the back of consistent industry-leading performance year after year. LTI’s strategic focus on Digital, Data, and Cloud, as well as its increasing investments in building future-ready capabilities for enterprises is making it the growth leader in the IT industry. You will also be happy to know that during this year, the LTI brand crossed $1 Bn in valuation.
The success that LTI has consistently been able to achieve is built on the sound foundations set up in the early 2000s when we first charted the growth path of the fledgling company. Since then, LTI has drawn extensively from the parent company’s experience, expertise and global connect. A talented and innovative team also deserve commendation to making a critical contribution to the Company’s performance during a period of challenge and uncertainty.
Your Company has won several accolades from industry influencers and alliance partners. In addition to winning prestigious engagements and delivering complex projects to global clients, your Company has launched new products and offerings including the Fosfor data-to-decisions suite and infinity platform for cloud transformation. I am confident that with its strong customer and employee centricity, LTI will continue its trajectory of profitable growth.
Your Company is conscious of its social obligations and remains strongly committed to giving back to the society. It has supported thousands of citizens with programs designed to enhance empowerment, facilitate education, and protect the environment. This unwavering focus on ESG initiatives has seen the Company emerge among the leaders in CRISIL ESG rating.
We may have learnt to live with the pandemic, but variants of the virus continue to pose a threat. It is
therefore of paramount importance that we remain alert and observe all health and safety protocols to keep us physically and psychologically strong.
I am confident that under the stewardship of its astute management team, LTI will continue to scale greater heights and deliver value to all stakeholders.
Regards,
A. M. Naik Founder Chairman
8 9Corporate Overview | Statutory Reports | Financial Statements
Chairman’s MessageIntegrated Annual Report 2021-22
The success that LTI has consistently been able to achieve is built on the sound foundations set up in the early 2000s when we first charted the growth path of the fledgling company.

CEO’s Message25 years of crafting stories of guts and grit
Starting with a solid foundation and working with unmatched perseverance and dedication, we have created a unique position for LTI. During last two years, the pandemic tested our spirit and resilience further. I am happy to share that despite these challenges, we have been able to meet the expectations of our clients, employees, and create value for all our stakeholders.
We partner with our global clients to help them navigate the era of Great Restructuring and accelerate their digital transformation journey. The result is that we have witnessed wholesome growth across verticals, service lines, and geographies. We are building on the experience and expertise that we have garnered in these 25 years to script new stories of achievement.
The story of LTI is written with the ink of guts and perseverance, and it is closely aligned with our core beliefs. We are now the 6th largest Indian IT services company, and we are creating a robust framework to institutionalise success for the next 25 years.
The year under review has been a landmark year for us. It not only marks the completion of our 25 years, but also the year in which we registered our highest growth since listing. I am happy to announce that we have crossed the $2 Bn revenue milestone this year and finished the year with a strong liquidity buffer.
Our financial performance during the year has once again brought to fore the strength of our portfolio and our execution excellence. We achieved a consolidated revenue of H15,668.7 Crores, compared to H12,369.8 Crores
in the previous year, registering a growth of 26.7% YoY. Our net income stood at H2,298.5 Crores in FY22 as against H1,938.2 Crores in FY21 with a margin of 14.7%.
We made significant investment in our people and technology, validated the utility of our technology, and fostered new partnerships. During the year, we launched Fosfor, the data-to-decisions product suite which is helping enterprises fundamentally repivot what data can do for them. Fosfor is an integrated suite of products that is uniquely positioned in the market for AI-driven data products. We are confident it will be a quantum leap in unlocking value for our clients.
Similarly, LTI Infinity, our unified multi-cloud platform is powering the cloud lifecycle for enterprises with its technology-led suite of modern engineering tools. This platform hosts solution-focused efficiency kits for simplifying and accelerating the cloud transformation journey. With its cognitive engine, Infinity enables value stream dashboards, recommendations, automated resolutions, intelligent monitoring, and predictive problem management for our clients.
Our relentless strides towards our ambitious targets continue to attract industry recognitions. During the year under review, we received several recognitions from leading observers of our sector, such as Gartner, Forrester, Everest, IDC, Avasant, and ISG. We also received the prestigious ‘Golden Peacock National Quality Award 2021’ for our consistent endeavour to deliver excellence, while maintaining optimum quality benchmarks. These accolades are a result of deep
expertise, excellence, and resilience of LTItes during a challenging period. Our continued commitment to social responsibility is reflected in our signing of the UNGC to promote 10 principles in the areas of human rights, labor standards, environment, and anti-corruption.
Our performance reflects our commitment to meet the needs of our technologically maturing customers and emerge as the catalyst that will accelerate their digital transformation journey. While we are seeing elevated inflation, supply chain challenges and the pandemic across some countries, our optimism is underpinned in the conversations with our clients about their plans to invest in technology-led transformation.
We are well positioned to capitalise on growth prospects, with digital technology being one of the most powerful value multipliers for businesses globally. We are in the midst of a grand technology upcycle and are equipped to play a pivotal role in handholding clients in their transformation journey. We will continue to listen intently to our clients, invest in upskilling our talent pool, and support communities in the best way we can.
I thank all our stakeholders for keeping their invaluable faith in us.
Regards,
Sanjay Jalona, CEO and Managing Director
Dear Shareholders,
I am delighted to share my thoughts at a very important period in the history of LTI. This year marks the 25th year in our journey as a global technology consulting and digital solutions company.
The story of LTI is written with the ink of guts and perseverance, and it is closely aligned with our core beliefs. We are now the 6th largest Indian IT services company, and we are creating a robust framework to institutionalise success for the next 25 years.
10 11Corporate Overview | Statutory Reports | Financial Statements
Integrated Annual Report 2021-22 CEO’s Message

Fosfor is Here to Lead the Way! Partnership Ecosystem, Fuelling GrowthData commerce is all about monetizing data at speed and scale. Last
year LTI launched Fosfor, the data-to-decisions product suite, to explore unlimited opportunities for enterprises. Organizations must shift their focus from leveraging data as an enabler to directing monetization opportunities. It is crucial to optimize the data-to-insights cycle and facilitate what LTI calls the ‘Data Commerce’.
This is the era of data and its value, and organizations that excel at extracting, leveraging, and monetizing that value will become dominant in their respective fields. LTI’s Fosfor (derived from ‘phosphorescence’ — a substance’s natural emission of light) intuitively solves the organization’s biggest data challenges by naturally bringing insights to light and illuminating the way forward.
Overview
At LTI, we are committed to curating go-to-market strategies with a select group of partners focused on creating new markets, executing demand generation initiatives, and co-innovating to invest early in emerging tech bets. FY22 had 12 key partnerships aligned to our priorities and strategic growth areas, including Microsoft, AWS, IBM, Google Cloud, Pega, Salesforce, Oracle, SAP, Snowflake, ServiceNow, Cisco, and Microfocus.
We are dedicated to developing a 360-degree relationship with our key partners positioned as global growth engines. Our alliance team collaborates with our strategic partners to define joint go-to-market strategies and business plans, improve capacity and readiness, co-innovate to develop differentiated offerings and spread best practices among customers and ecosystem players. Our focus is primarily on key alliances across channels, including partnerships in cloud, data, security, Industry 4.0, digital, and automation, among others.
The Fosfor suite of products helps businesses rule data by providing best-in-class capabilities. They have an extensive set of go-to-market and technology partnerships with leading cloud companies and have been recognized by leading industry analysts.
The Fosfor suite represents the evolution of erstwhile LTI product brands — Mosaic and Leni. These products have seen great success in the market and are now brought together into a more powerful suite — Fosfor. Several marquee clients rely on Fosfor for mission-critical data and AI needs, which speaks for itself.
It’s time to #FosforyourData.
LTI elevated its Partnership Tier with AWS and hence has the highest Tier of partnership with all leading Hyperscalers.
Recognition
• LT has been recognized as the Global Innovation Partner of the Year by Snowflake, the data cloud company.
• LTI Syncordis has been recognized as a Service Partner of the Year by Temenos at this year’s virtual TCF Online 2021.
• LTI was awarded as the Top Performing Partner — Public Sector at the RedHat Partner Awards — India & South Asia 2021 for delivering significant incremental value to Indian enterprises leveraging RedHat technology.
New partnerships
LTI has expanded its existing partnerships with leading hyperscalers such as AWS, Google Cloud, and Microsoft by signing partnership agreements to be onboarded into additional geographies and included in new program investments.
LTI has also formed new alliances with key players in the Digital, Security, and Data space, including CyberArk, Xm Cyber, Tricentis, Armis, Ignition, Databricks, Securonix, Ilantus Technologies, 1E Software, SecuPi Reseller, Block Armour, Liferay, and Genuine Genius Technologies. We have renewed our Industry 4.0 partnership agreements with PTC and OSI Soft.
LTI was recognized as the leader across all six quadrants in the ISG Provider Lens™ AWS Ecosystem Partners Report USA 2021.
LTI was also recognized as an AWS Energy competency launch partner at Reinvent.
LTI expanded its partnership with Google Cloud across key regions in Europe, which further strengthens its existing Premier Partner credentials globally.
During the year, LTI also signed up as a Google Workspace reseller in India.
During FY22, LTI has significantly grown its Microsoft credentials by achieving 5 new advanced specializations — SAP on Azure, Kubernetes on Azure, analytics on Azure, web application modernization on Azure and Windows, and SQL server migration to Azure.
LTI and IBM have expanded their Global Alliance to help organizations accelerate digital transformation with an open hybrid cloud.
LTI along with IBM launched its first ever partner co-branded, state-of-the-art Innovation & Experience Center for its clients, in Bengaluru (India).
The suite consists of five independent yet connected products.
A comprehensive DataOps product enabling the fastest way to harness data.
An autonomous data fabric product to facilitate discovery-to-consumption data journeys.
A data science and MLOps product automating operations across entire lifecycle.
A no-code, unstructured data processing product.
An integrated suite of products across the data-to-decisions lifecycle.
An augmented analytics product that provides a search-like interface for all types of insights.
12 Integrated Annual Report 2021-22 13Corporate Overview | Statutory Reports | Financial Statements
Fosfor is Here to Lead the Way! | Partnership Ecosystem, Fuelling Growth

It’s All Happening on the Cloud! In the Top League
At LTI, we launched A dedicated cloud business unit that consists of services from AWS, Microsoft, and Google Cloud. LTI, a top-tier partner for Microsoft (Azure Gold Partner with 15 Gold Competencies and 5 Advanced Specializations), AWS (Premier Tier Services Partner with 9 competencies), and Google Cloud (Premier Partner with 1 Expertise), is a trusted advisor for enterprise cloud transformation with 250 active customers, including 40+ Fortune 500 companies, 70% YoY growth, 50% growth in cloud practitioners, and 100+ successful transformation programs.
We performed impressively in analyst ratings and rankings across a broad spectrum of capabilities during the year. Prominent analyst firms recognized the Company with 50+ leadership positions and identified it as one of the few select providers for a wide range of services and solutions.
To solve our customers’ toughest challenges in adopting cloud @ scale through a purposeful, efficient, and hyperscaler
aligned approach, LTI created C=BT2 — Cloud Transformation @ Exponential Speed Strategy, which follows the fundamental dimensions of:
*GARTNER is a registered trademark and service mark of Gartner, Inc. and its affiliates in the U.S. and internationally and is used herein with permission. All rights reserved. Gartner does not endorse any vendor, product, or service depicted in its research publications and does not advise technology users to select only those vendors with the highest ratings or other designation. Gartner’s research publications consist of the opinions of Gartner’s research organization and should not be construed as statements of fact. Gartner disclaims all warranties, expressed or implied, concerning this research, including any warranties of merchantability or fitness for a particular purpose.
Key industry analyst coverages 2021-2022.
These recognitions have helped LTI cement its place in the top league of IT service providers.
Gartner• LTI positioned in the Niche Players Quadrant in
Gartner®2021 Magic Quadrant™ for Oracle Cloud Application Services, Worldwide.
• LTI positioned in the Niche Players Quadrant in Gartner®2021 Magic Quadrant™ for SAP S/4HANA Application Services, Worldwide.
• LTI recognized in Honourable Mentions category in the 2022 Gartner® Magic Quadrant™ for Data and Analytics Service Providers.
Everest• LTI positioned as a Leader in Everest Group’s Insurance
Platforms IT Services PEAK Matrix® Assessment 2022.
• LTI recognized as a Leader in Everest Group’s Temenos IT Services PEAK Matrix® Assessment 2022.
• LTI in ITS Top 10 list in Everest Group’s PEAK Matrix® IT Service Provider of the Year 2022.
• LTI ranked #1 in Top ITS Challengers list in Everest Group’s PEAK Matrix® IT Service Provider of the Year 2022.
HFS• LTI ranked 5th in HFS Energy Services Top 10, 2021.
IDC• LTI Positioned as a Major Player in IDC MarketScape:
Worldwide Managed Multicloud Services 2021 Vendor Assessment.
ISG• LTI recognized as a Leader in ServiceNow Consulting
Services — US in ISG Provider Lens™: ServiceNow Ecosystem Partners 2021.
• LTI recognized as a Leader in Digital Business Consulting Services — US in ISG Provider Lens™: Digital Business — Solutions and Service Partners 2021.
• LTI recognized as a Leader Across All Quadrants in the ISG Provider Lens™ AWS Ecosystem Partners Report 2021 for the US.
Forrester• LTI recognized in the Forrester Wave™: Application
Modernization and Migration Services, Q3 2021.
• LTI recognized in The Forrester Wave™: Continuous Automation and Testing Services, Q3 2021.
• LTI recognized in The Forrester Wave™: Data Management Service Providers, Q4 2021.
• LTI’s fosfor Optic recognized in The Forrester Now Tech: Enterprise Data Fabric, Q1 2022 report.
• LTI’s fosfor Refract recognized in The Forrester Now Tech: AI/ML Platforms, Q1 2022 report.
We have invested in partnerships, competencies, and capabilities to accelerate our customers’ purposeful cloud journeys.
• Expanded strategic relationship with Amazon Web Services.
• Earned AWS IoT Competency.
• Earned AWS Energy Competency (Launch Partner).
• Deployment Partner for AWS Refinery Monitoring & Surveillance solution.
• Ranked 1st among all AWS SI partners for the highest number of accreditations in CY 2021.
• Global reseller and PLES (Partner Led Enterprise Support) partner for AWS.
• Strengthened partnership with Microsoft by expanding the strategic relationship through Project YODA.
• Successfully renewed the Azure Expert MSP accreditation.
• Ranked among top 10 Microsoft NLS and GSI partners within US.
• Security partner MSSP and MISA (both invitation programs).
• Strengthened partnership through inclusion to Google Cloud’s GSI program.
• Expanded the Google Cloud partnership in Europe.
• Became a Google Workspace reseller in India.
Our tier 1 partnerships with hyperscalers recognize our proven ability to deliver the best seamless-in-class cloud services at scale across the globe.
Cloud is the new and the next — FY22 snapshot
Purpose-led
Purposeful cloud (industry, function, platform) enabled by LTI’s North Star framework and Cloud Ways of Working.
Productized
Packaged service offerings across the life cycle of cloud transformation.
Platform enabled
A unified multi-cloud platform, LTI Infinity is powered by a technology-led suite of modern engineering tools and processes that enable cloud lifecycle excellence from decisions to operations.
Practitioner delivered
Elite rainmakers driving cloud adoption across customers.
Partner aligned
GTM and competency teams dedicated to AWS, Microsoft, and Google Cloud.
.
14 Integrated Annual Report 2021-22 15Corporate Overview | Statutory Reports | Financial Statements
It’s All Happening on the Cloud! | In the Top League

Key Highlights
Revenue($ in Mn)
Revenue(H in Mn)
FY18 FY18
2,102 156,687
1,670123,698
1,525 108,786
1,34994,458
1,132 73,065
FY19 FY19FY20 FY20FY21 FY21FY22 FY22
Profit after tax(H in Mn)
FY18
22,985
19,382
15,20515,155
11,124
FY19 FY20 FY21 FY22
14.7%
16.0%
15.2%
14.0%
15.7%
PAT margin %
Operating cash flow (H in Mn)
Dividend per share (in H)
Employee metrics (in Nos.)
FY18
24,139
28,169
FY19
31,437
FY20
35,991
FY21
46,648
FY22FY18
55.0
40.0
28.028.0
21.5
FY19 FY20 FY21 FY22
79.4%
80.6%
79.5%
80.5%
81.3%
Utilization (Including Trainees)
Client Metrics (in Nos.)
FY18
486
427424
343
300
FY19 FY20 FY21 FY22
$20 Mn + Customers$10 Mn + Customers
23
13
26
17
27
16
35
18
44
24
FY18
16,520
13,950
8,438
FY19 FY20 FY21 FY22
75.9%
92.0%
108.1%
123.8%
71.9%
16,434
23,996
OCF as % to PAT
16 Integrated Annual Report 2021-22 17Corporate Overview | Statutory Reports | Financial Statements
Key Highlights

Sustainable Development GoalsThe United Nations Sustainable Development Goals (SDGs), as adopted by all UN member states, outline the universal goals to end poverty, protect the planet and drive shared prosperity by 2030.
• Economical value created through IT jobs:
K6.77 Crores p.m.
• 2,952 women trained on artisans and tailoring skills empowering them to be financially independent.
1
• Providing mid-day meals to students in government schools and contributing towards enhancing access to safe, nutritious and sufficient food.
2
• Striving to ensure zero work-related accidents.
• An array of initiatives such as ‘help yourself’ and creation of online medical platforms are undertaken to ensure health and well-being of employees.
3
• Providing quality education to the underprivileged and students with disabilities.
• 379,000+ digital learning hours provided to students.
4
• Building a diverse and inclusive workforce under of initiative ‘LTI Belong’.
• Empowering women in the communities in which we operate through various societal initiatives.
5
• Reduce, reuse and recycle waste water for consumption.
6
• Contributing towards the overall growth of the economy.
• Our USA, Poland, France and Denmark offices recognized as ‘Great Place to Work’ for FY22.
8
• Increasing the mix of renewable energy and undertaking energy conservation initiatives.
• 8.4 Lakhs kWh of yearly energy savings possible through initiatives implemented during FY22.
7
• We are the signatory to
United Nations Global Compact (UNGC) and
UN Women Empowerment Principles (UNWEP) and have aligned our commitments
with Science Based Targets Initiative (SBTi).
17
• Ensuring effective and transparent dialogues with various stakeholder groups.
• Upholding ethical code of conduct at all time.
16
• Initiatives such as tree plantation and freshwater replenishment through rainwater harvesting help us restore biodiversity.
• We have planted trees across 680 acres of land.
15
• Continuously investing towards bringing new technologies and platforms as well as strengthening our internal operations through adoption of state-of-the-art technologies.
9
• Being a responsible company, we ensure sustainability through optimum consumption of the resources and implementing the 3R (Reduce, Reuse & Recycle) policy.
12
• We are an equal opportunity employer and undertake initiatives such as Ref(H)er and ‘revive with LTI’ to provide equal opportunities to all.
10
• In line with our commitment to attaining carbon neutrality by 2030, we continue to undertake initiatives in reducing our carbon footprint as well as assist our clients and end customers and value chain partners to achieve and maintain their carbon emission levels below the prescribed limits.
13
Our contribution against 12 SDGs is highlighted below:
We, at LTI, have identified the SDGs and its targets to which we contributed significant value by
analysing our operations, corporate citizenship and our customer-facing
activities against the underlying 17 goals and 169 targets.
LTI Global Goals
18 Integrated Annual Report 2021-22 19Corporate Overview | Statutory Reports | Financial Statements
Sustainable Development Goals

20 Integrated Annual Report 2021-22 21Corporate Overview | Statutory Reports | Financial Statements
Our ESG Roadmap | Board of Directors
Our ESG RoadmapAt LTI, we strive to maintain an excellent track record and strong credentials in addressing ESG-related priorities. As our ESG journey continues, we work towards identifying newer and improved methods of achieving our bold sustainability aspirations.
12% reduction in attrition rate.
50% of new role requirements to be fulfilled by internally developed team members by IJP.
Achieve water neutrality for
our India operations.Maintain zero work-related accidents.
30% increase in diversity.
Leverage technology to create opportunities for growth and prosperity through meaningful interventions in Education, Empowerment and Environment.
Reaching out to more than
1 Mn lives through our CSR initiatives.
Achieve carbon neutrality for of our India operations.
goalsgoals2030
FY22 progress
*The reduction was significantly higher owing to WFH and Covid restriction
32.5% share of renewable energy used in total energy mix.
2.43 Lakhs trees planted.
67.5%* reduction in electricity consumption.
24.0% attrition rate.
52% Internal Job fulfilment.
~30% women in workforce.
Zero LTIFR and loss time.
83.5%* reduction in travel emissions.
165,820 beneficiaries of our community initiatives.
Board of Directors
50% increased share of renewable resources.
30% reduction in electricity consumption than business as usual.
R. Shankar Raman (Non-Executive Director), Sudhir Chaturvedi (Whole-time Director and President Sales), S. N. Subrahmanyan (Non-Executive Vice Chairman), James Abraham (Independent Director), Nachiket Deshpande (Whole time director & COO), Sudip Banerjee (Independent Director), Vinayak Chatterjee (Independent Director).
Sanjeev Aga (Independent Director), Rajnish Kumar (Independent Director), A. M. Naik (Founder Chairman), Sanjay Jalona (Chief Executive Officer and Managing Director), Aruna Sundararajan (Independent Director).
Standing — Left to Right:
Sitting — Left to Right:

22 Integrated Annual Report 2021-22 23Corporate Overview | Statutory Reports | Financial Statements
Corporate and Vertical Heads | Corporate Information22 Integrated Report 2021-22 23
Corporate Overview | Statutory Reports | Financial Statements
Materiality assessment
Sanjay JalonaChief Executive Officer andManaging Director
Sudhir ChaturvediWhole-time Director andPresident Sales
Nachiket DeshpandeWhole-time Director andChief Operating Officer
Anil RanderChief Financial Officer
Peeyush DubeyChief Marketing Officer
Tridib Barat Company Secretary andCompliance Officer
Balaji KumarChief Human Resources Officer
Arun SankaranarayananNordic Region
David AltoffInsurance Americas
Deepak KhoslaEmerging Markets
Dibyendu HalderMedia and Entertainment
Harsh NaiduBanking and Financial Services, Americas
Ashish DeshpandeLife Sciences
Ramesh KannanOil and Gas
Rohit KediaManufacturing and IntelligentEnterprise
Siddharth BohraRetail, CPG, Hi-Tech, Utilities, Americas,Data Products, Cloud Global
Srini RaoEurope
Board of Directors
Mr. A. M. Naik Founder Chairman
Mr. S. N. Subrahmanyan Non – Executive Vice Chairman
Mr. Sanjay Jalona Chief Executive Officer & Managing Director
Mr. R. Shankar Raman Non - Executive Director
Mr. Sudhir Chaturvedi Whole – time Director & President Sales
Mr. Nachiket Deshpande Whole – time Director & Chief Operating Officer
Mr. Sanjeev Aga Independent Director
Mr. Sudip Banerjee Independent Director
Ms. Aruna Sundararajan Independent Director
Mr. James Varghese Abraham Independent Director
Mr. Rajnish Kumar Independent Director
Mr. Vinayak Chatterjee Independent Director (w.e.f. April 1, 2022)
Board Committees
Audit Committee Mr. Rajnish Kumar - Chairperson Ms. Aruna Sundararajan Mr. R. Shankar Raman
Nomination and RemunerationCommittee Mr. Sanjeev Aga – Chairperson Mr. A. M. Naik Mr. James Varghese Abraham
Stakeholders Relationship Committee Ms. Aruna Sundararajan – Chairperson Mr. Sanjay Jalona Mr. Sudhir Chaturvedi
Corporate Social ResponsibilityCommittee Mr. Sanjay Jalona – Chairperson Mr. Sudhir Chaturvedi Mr. Sudip Banerjee
Risk Management Committee Mr. Vinayak Chatterjee – Chairperson Mr. Nachiket Deshpande Mr. Sanjeev Aga
Strategic Investment Committee Mr. A. M. Naik – Chairperson Mr. S. N. Subrahmanyan Mr. R. Shankar Raman Mr. Sanjay Jalona
Other Information
Registered Office L&T House, Ballard Estate, Mumbai – 400 001
Corporate Office Technology Tower 1, Gate No. 5, Saki Vihar Road, Powai, Mumbai – 400 072
Statutory Auditors M/s. B. K. Khare & Co., Chartered Accountants
Registrar and Share Transfer Agent Link Intime India Private Limited
Bankers Citibank N.A Standard Chartered Bank Barclays Bank PLC ICICI Bank Limited The Hongkong and Shanghai Banking Corporation Limited
Corporate and Vertical HeadsSanjay JalonaChief Executive Officer andManaging Director (upto 03.06.2022)
Sudhir ChaturvediWhole-time Director andPresident Sales
Nachiket DeshpandeWhole-time Director andChief Operating Officer
Anil RanderChief Financial Officer
Peeyush DubeyChief Marketing Officer
Tridib Barat Company Secretary andCompliance Officer
Balaji KumarChief Human Resources Officer (upto 24.05.2022)
Arun SankaranarayananNordic Region
David AltoffInsurance Americas
Deepak KhoslaEmerging Markets
Dibyendu HalderMedia and Entertainment
Harsh NaiduBanking and Financial Services, Americas
Ashish DeshpandeLife Sciences
Ramesh KannanOil and Gas
Rohit KediaManufacturing and IntelligentEnterprise
Siddharth BohraRetail, CPG, Hi-Tech, Utilities, Americas,Data Products, Cloud Global
Srinivas RaoEurope
Corporate Information
Board of Directors
A. M. Naik Founder Chairman
S. N. Subrahmanyan Non-Executive Vice Chairman
Sanjay Jalona Chief Executive Officer & Managing Director(upto 03.06.2022)
R. Shankar Raman Non-Executive Director
Sudhir Chaturvedi Whole-time Director & President Sales
Nachiket Deshpande Whole-time Director & Chief Operating Officer
M. M. ChitaleIndependent Director(upto 31.03.2022)
Sanjeev Aga Independent Director
Sudip Banerjee Independent Director(upto 19.05.2022)
Aruna Sundararajan Independent Director
James Abraham Independent Director
Rajnish Kumar Independent Director
Vinayak Chatterjee Independent Director (w.e.f. 01.04.2022)
Other Information
Registered Office L&T House Ballard Estate Mumbai – 400 001
Corporate Office Technology Tower 1 Gate No. 5 Saki Vihar Road, Powai Mumbai – 400 072
Statutory Auditors M/s. B. K. Khare & Co., Chartered Accountants
Registrar and Share Transfer Agent Link Intime India Private Limited
Bankers Citibank N.A. Standard Chartered Bank Barclays Bank PLC ICICI Bank Limited The Hongkong and Shanghai Banking Corporation Limited

25Corporate Overview | Statutory R
IntegratedReport
eportRIntegrated
26 Business Model28 Stakeholder Engagement29 Materiality Assessment30 Financial Capital36 Manufactured Capital42 Intellectual Capital60 Human Capital70 Natural Capital78 Social and Relationship Capital
26—88

26 Integrated Annual Report 2021-22 27Corporate Overview | Statutory Reports | Financial Statements
Business Model
Business Model
Inputs OutputsValue creation model Outcomes SDGs
• Net worth H88,203 Mn.
• Cash and cash equivalents H39,139 Mn.
• Robust governance framework.
Financial Capital• Strongest growth since listing with revenue at $2,102 Mn, up 25.9% YoY.
• Added over $430 Mn in FY22, 3x of FY21 addition and more than aggregate addition across FY21 & FY20.
• PAT: H22,985 Mn; 18.6% YoY growth.
• Dividend pay-out ratio of 41.9%, dividend per share of H55; highest since listing.
Financial Capital• Industry-leading revenue growth.
• Significant increase in market capitalization since listing.
• Superior value to shareholders.
Financial Capital
• 46,000+ workforce.• Added 10,600+ people on net basis, headcount up ~30%; added more
people in FY22 than net aggregate additions of prior 2 years.• Yin-Yang Model to facilitate hybrid working model.• Learning and development programs to create top talent
in the industry.
Human Capital • 52% positions filled internally.
• Approx. 30% women in workforce.
• 27,000+ employees reskilled in new technologies.
• LTI Shoshin school providing access to 500+ ‘Subject Matter Expert’ curated learning pathways.
Human Capital• Culture of diversity, inclusion and transparency.
• Future-ready and skilled workforce.
• LTI USA recognized Great Place to Work® certified & LTI UK recognized as ‘Top Employer 2022’, both for 2 consecutive years.
• Certified as Great Place to Work™ in Denmark, Poland & France.
• Gold recognition from EcoVadis for ESG including environment, labor and human rights, ethics and sustainable procurement.
Human Capital
• Commitment to make India operations carbon and water neutral by 2030.
• Committed to source 50% of energy requirements from renewable sources by 2030.
• Promoting responsible use of water in-house and through community initiatives.
• Optimizing business travel.
Natural Capital
• 4,702 tCO2 emissions mitigated through renewable energy.
• 8.4 Lakhs kWh yearly energy savings possible through initiatives implemented.
• 32.5% energy requirements from renewable sources.
Natural Capital• Transitioning to a low-carbon business model.
• Driving resource conservation within our organization and communities.
Natural Capital
• Set up of Global Technology Office for focus on ‘Beyond-the-Horizon’ capabilities.
• Fosfor, Data to Decisions Product Suite (Spectra, Optic, Refract, Aspect, Lumin) for Monetizing Data.
• Capability-led acquisitions — Cuelogic Technologies, a Digital Engineering firm.
Intellectual Capital
• 230+ homegrown IPs, Data products on Data to Decisions cycle.
• Strong capabilities in cloud, data and digital as well as pioneering new frontiers like sustainability and metaverse.
Intellectual Capital• Recognition as industry thought leader through premier partnerships.
• Partnerships with leading hyperscalers, platform players, industry solution providers.
• Tech analyst recognitions: Topped list of ‘IT Services Challenger 2022’ in Everest Group’s PEAK Matrix Service Provider of the YearTM Awards.
• Awarded Golden Peacock National Quality Award 2021.
• Several industry recognitions for Fosfor.
Intellectual Capital
• Introduced new sales strategy — CHIP framework.
• 50+ strategic partnerships with global service providers.
• Well-defined investor relations program.
• Strong marketing, branding and communications strategy.
• CSR spend H393.45 Mn.
• Signatory to Ten Principles of UN Global Compact.
Social and Relationship Capital
• New client additions of 100 in FY22, highest since listing.
• Additions in client buckets FY22: $50 Mn up by 3, $20 Mn up by 6, $10 Mn up by 9, $5 Mn up by 11, $1 Mn up by 31.
• Strong broad based growth across verticals, service lines & geographies.
• Total CSR beneficiaries 165,820.
Social and Relationship Capital • Recognized as ‘Global Innovation Partner of the Year’ by Snowflake.
• LTI Syncordis has been recognized as ‘Temenos Service Partner of the Year’.
• Ranked 22 among the Top 25 most valuable IT services brands in the Brand Finance IT Services 25 2022 ranking.
• Won multiple accolades at the Institutional Investor 2021 Rest of Asia ex-Mainland China Executive Team rankings.
• Significant contribution in solving for society.
• LTI ranks among Top 10 companies in CRISIL ESG Compendium 2021.
Social and Relationship Capital
• 36 delivery centers, 53 sales offices across 33 countries.
• Added satellite centers in Tier 2 cities.
• Strengthened presence in the US through Hartford Engagement Center, part of localization strategy.
Manufactured Capital• ISO certifications of facilities drive quality, information security, health and safety.
• Past investments ensuring success in new Yin-Yang Model (hybrid working).
Manufactured Capital
• LEED-certified Platinum Powai and Bengaluru campuses.
• Fosfor Experience Center, IoT Center of Excellence, Design Studios, LTI Borderless Innovation and Experience Theatre for Oracle Cloud.
• 70% of India offices are operating from certified Green Buildings.
• Supported strong domain expertise and flawless execution.
Manufactured Capital
Purpose Let’s Solve
Mission Powering the Breakaway
Enterprise: O2T^, D2O@, DTC#, EX*
VisionPioneering solutions in a
converging world
Core Beliefs Go the Extra Mile, Be Agile, Push
Frontiers of Innovation, Keep Learning, Solve for Society
Governance Robust Governance
Culture Shoshin, Mission Ubuntu
Strategy Solving for the Great
Restructuring
^O2T (Operate to Transform)#DTC (Digitizing the Core)
@D2O (Data-Driven Organization)*EX (Experience Transformation)
Refining our value-creation approach

Key stakeholders Why they are important to us Communication channels Frequency
Our entire business revolves around the needs of the clients. They are the end users of our services and our operations are designed to meet their expectations.
Client satisfaction survey Annual
Community initiatives As required
Customer visits
Media and digital communication
Our most valuable resources, contributing to delivery excellence and profit.
Employee forums As required
Leadership forums As required
Employee surveys As required
‘Workplace’ platform As required
Unified helpdesk As required
Providers of the capital.
Investor meets Annual
Website As required
AGM Annual
Media and digital communication
As required
Annual report Annual
Sustainability report Annual
Earnings calls Quarterly
Investor meetings As required
Integral part of the value chain for smooth functioning of our operations.
Meetings As required
Communities form the pillars upon which our clients’ success is built, and our NGO partners are instrumental in helping us make a difference.
Face-to-face meeting Quarterly
Focused group discussions Monthly
Enforce policies which impact our operations and long-term business objectives.
Public policy advocacy As required
Provide us with the required human capital and collaborate with us for projects.
Recruitment drives Periodically
Stakeholder EngagementShaping together a better tomorrow
Materiality Assessment
Defining our priorities precisely
Delivering best-in-class solutions and services for our stakeholders is the core to how we operate.
Materiality assessment helps us identify, prioritize, track and report the most important sustainability issues. The materiality topics provide insight into our stakeholder concerns as well as the internal and external risk factors that impact our business. We also ensure that these topics are thoroughly reviewed in line with the evolving global business environment.
Material topics selection
• Sustainability topics identified from peer review, Global Reporting Initiative and other relevant frameworks.
• Identification of topics based on risks and opportunities at an organizational level.
Material topics assessment
• Shortlisting topics based on significance of the economic, environmental and social impacts and substantive influence on the assessments and decisions of the stakeholders.
Material topics prioritization
• Interaction with functional heads and senior management.
• Inputs from internal and external stakeholders.
Imp
ort
ance
to
sta
keh
old
ers
Medium
Med
ium
High
Hig
h
Very high
Ver
y h
igh
• Waste management
Importance to businessFinancial Capital Manufactured Capital Human Capital
Natural CapitalIntellectual Capital Social and Relationship Capital
• Learning opportunities and career development
• Occupational health and safety
• Innovation
• Green IT
• Economic performance
• Delivery capability
• Energy management
• Emission
• CSR
• Diversity and inclusion
• Client privacy
• Data privacy
• Corporate governance
• Employee well-being
• Employee retention
• Services, quality and accuracy
28 Integrated Annual Report 2021-22 29Corporate Overview | Statutory Reports | Financial Statements
Stakeholder Engagement | Materiality Assessment
• Supply chain
• Brand marketing
Over the years, we have evolved a robust stakeholder engagement mechanism to maintain enduring relationships with our growing stakeholder fraternity in a changing business landscape. Detailed stakeholder interactions are conducted periodically to address their aspirations.
Clients
Employees
Investors
Service Providers
Regulators
Academic Institutions
NGOs/ Communities

Financial
Material issues addressed
SDGs covered
In a dynamic operating environment, our constant focus is always on optimising returns for the capital that we deploy for our business. Our financial capital is generated from our business operations, financing activities and strategic planning, which we invest in various growth opportunities.
CapitalCapitalFinancial
Highlights for FY22
25.9%USD Revenue growth
18.6% Net profit growth
17.3% EBIT margin
14.7% PAT margin
41.9% Dividend payout
Economic performance
Corporate governance
Financial CapitalIntegrated Annual Report 2021-2230Corporate Overview | Statutory Reports | Financial Statements
31
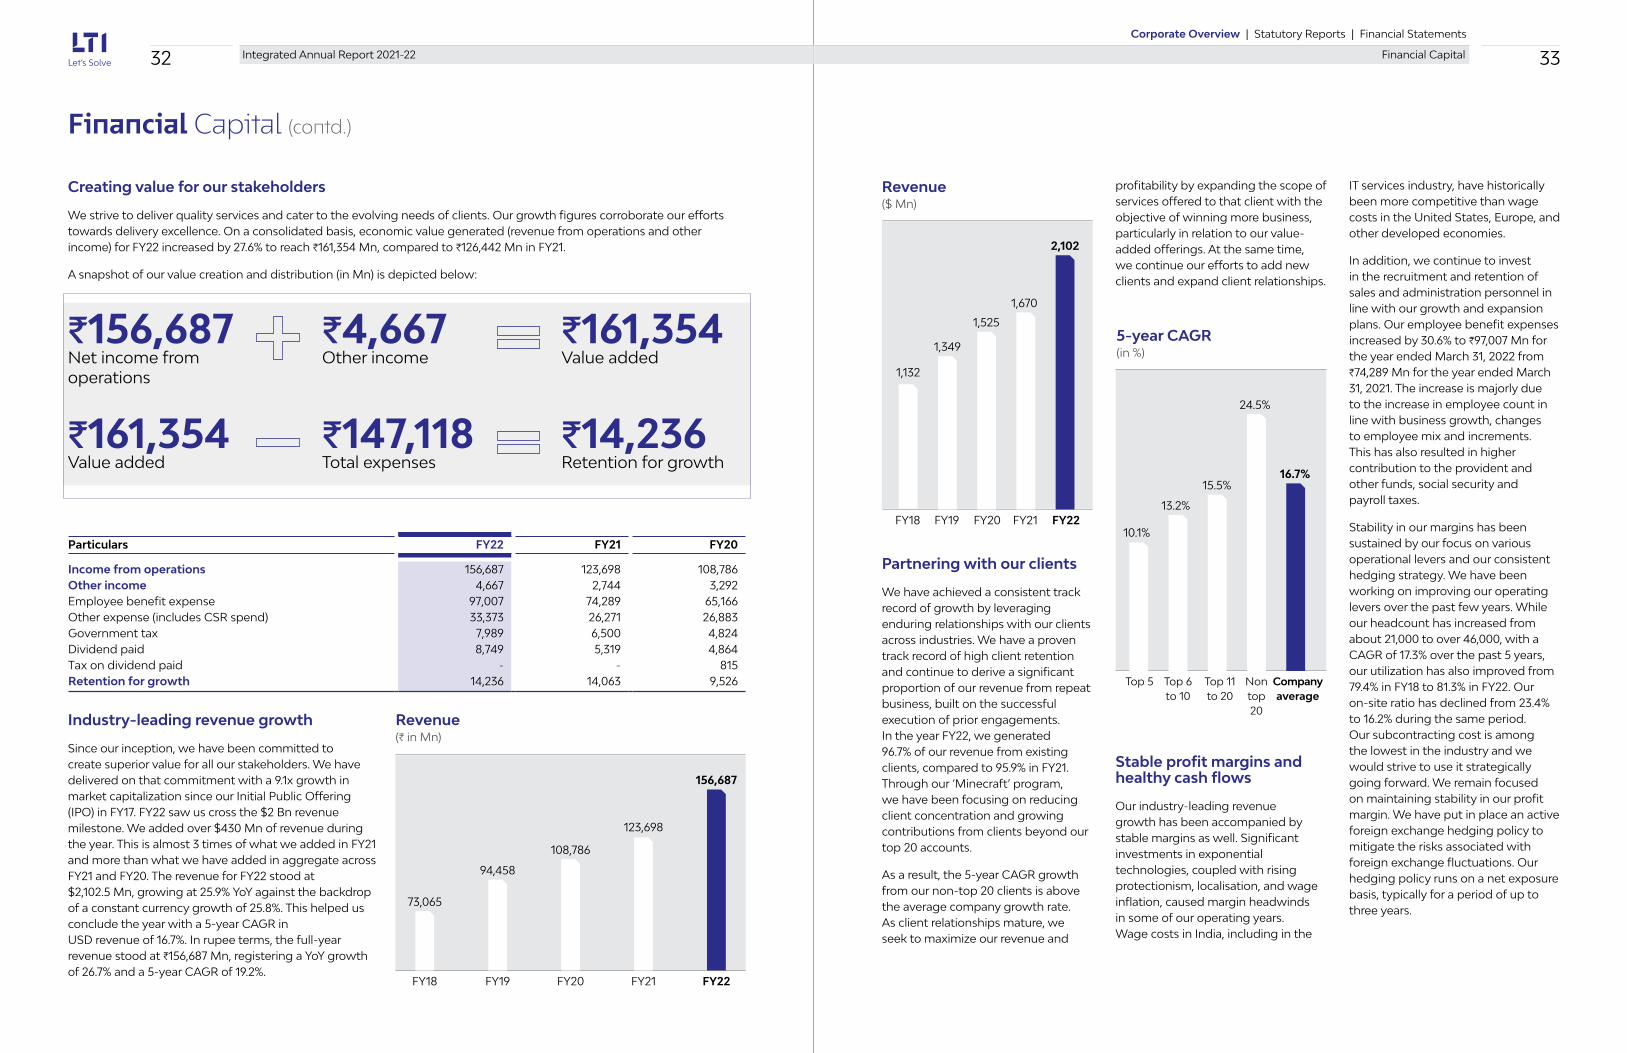
Financial Capital (contd.)
Creating value for our stakeholders
We strive to deliver quality services and cater to the evolving needs of clients. Our growth figures corroborate our efforts towards delivery excellence. On a consolidated basis, economic value generated (revenue from operations and other income) for FY22 increased by 27.6% to reach H161,354 Mn, compared to H126,442 Mn in FY21.
A snapshot of our value creation and distribution (in Mn) is depicted below:
Industry-leading revenue growth
Since our inception, we have been committed to create superior value for all our stakeholders. We have delivered on that commitment with a 9.1x growth in market capitalization since our Initial Public Offering (IPO) in FY17. FY22 saw us cross the $2 Bn revenue milestone. We added over $430 Mn of revenue during the year. This is almost 3 times of what we added in FY21 and more than what we have added in aggregate across FY21 and FY20. The revenue for FY22 stood at $2,102.5 Mn, growing at 25.9% YoY against the backdrop of a constant currency growth of 25.8%. This helped us conclude the year with a 5-year CAGR in USD revenue of 16.7%. In rupee terms, the full-year revenue stood at H156,687 Mn, registering a YoY growth of 26.7% and a 5-year CAGR of 19.2%.
J156,687Net income from operations
J4,667Other income
J161,354 Value added
J161,354 Value added
J147,118 Total expenses
J14,236 Retention for growth
Particulars FY22 FY21 FY20
Income from operations 156,687 123,698 108,786 Other income 4,667 2,744 3,292 Employee benefit expense 97,007 74,289 65,166 Other expense (includes CSR spend) 33,373 26,271 26,883 Government tax 7,989 6,500 4,824 Dividend paid 8,749 5,319 4,864 Tax on dividend paid - - 815 Retention for growth 14,236 14,063 9,526
Revenue(H in Mn)
FY18
156,687
123,698
108,786
94,458
73,065
FY19 FY20 FY21 FY22
Revenue($ Mn)
FY18
2,102
1,670
1,525
1,349
1,132
FY19 FY20 FY21 FY22
Partnering with our clients
We have achieved a consistent track record of growth by leveraging enduring relationships with our clients across industries. We have a proven track record of high client retention and continue to derive a significant proportion of our revenue from repeat business, built on the successful execution of prior engagements. In the year FY22, we generated 96.7% of our revenue from existing clients, compared to 95.9% in FY21. Through our ‘Minecraft’ program, we have been focusing on reducing client concentration and growing contributions from clients beyond our top 20 accounts.
As a result, the 5-year CAGR growth from our non-top 20 clients is above the average company growth rate. As client relationships mature, we seek to maximize our revenue and
profitability by expanding the scope of services offered to that client with the objective of winning more business, particularly in relation to our value-added offerings. At the same time, we continue our efforts to add new clients and expand client relationships.
5-year CAGR(in %)
Top 5 Top 6 to 10
Top 11 to 20
Non top 20
16.7%
13.2%
10.1%
Company average
15.5%
24.5%
Stable profit margins and healthy cash flows
Our industry-leading revenue growth has been accompanied by stable margins as well. Significant investments in exponential technologies, coupled with rising protectionism, localisation, and wage inflation, caused margin headwinds in some of our operating years. Wage costs in India, including in the
IT services industry, have historically been more competitive than wage costs in the United States, Europe, and other developed economies.
In addition, we continue to invest in the recruitment and retention of sales and administration personnel in line with our growth and expansion plans. Our employee benefit expenses increased by 30.6% to H97,007 Mn for the year ended March 31, 2022 from H74,289 Mn for the year ended March 31, 2021. The increase is majorly due to the increase in employee count in line with business growth, changes to employee mix and increments. This has also resulted in higher contribution to the provident and other funds, social security and payroll taxes.
Stability in our margins has been sustained by our focus on various operational levers and our consistent hedging strategy. We have been working on improving our operating levers over the past few years. While our headcount has increased from about 21,000 to over 46,000, with a CAGR of 17.3% over the past 5 years, our utilization has also improved from 79.4% in FY18 to 81.3% in FY22. Our on-site ratio has declined from 23.4% to 16.2% during the same period. Our subcontracting cost is among the lowest in the industry and we would strive to use it strategically going forward. We remain focused on maintaining stability in our profit margin. We have put in place an active foreign exchange hedging policy to mitigate the risks associated with foreign exchange fluctuations. Our hedging policy runs on a net exposure basis, typically for a period of up to three years.
32 33Corporate Overview | Statutory Reports | Financial Statements
Financial CapitalIntegrated Annual Report 2021-22

Financial Capital (contd.)
Efforts mix (in %)
Utilization (excluding trainees) (in %)
FY18 FY19 FY20 FY21 FY22
80.4
81.9
80.9
82.0
82.6
For FY22, our operating margin stood at 17.3%, compared to 19.3% in FY21. Our full-year PAT stood at H22,985 Mn, helping us deliver a full-year PAT margin of 14.7% and a 5-year CAGR of 18.8%. In FY21, our other income included a write-back of certain earn outs payable towards an earlier acquisition amounting to H571 Mn. If we exclude this, PAT margin for full year FY21 was 15.2%.
For the full year, the net cash flow from operations stood at H16,520 Mn at 71.9% conversion of the net income. We have a comfortable liquidity position, apart from having access to bank lines and overdraft facilities. Our long-term AAA rating from CRISIL reflects our established market position in several segments that we operate in, as well as our strong financial risk profile marked by a
Profit after tax(H in Mn)
FY18
22,985
19,382
15,20515,155
11,124
FY19 FY20 FY21 FY22
14.7%
16.0%
15.2%
14.0%
15.7%
PAT margin %
Operating cash flow (H in Mn)
FY18
16,520
13,950
8,438
FY19 FY20 FY21 FY22
75.9%
92.0%
108.1%
123.8%
71.9%
16,434
23,996
OCF as % to PAT
debt-free balance sheet, healthy cash generating ability, and robust liquidity.
We had cash and liquid investment of H39,139 Mn as on March 31, 2022.
Creating shareholder wealth
Our consistent double-digit revenue growth and stable profit margins have helped us double our EPS from FY18. EPS and diluted EPS for the full year stood at H131.19 and H130.81 per share, respectively. The Board of Directors recommended a final dividend of H30 per share, bringing the total FY22 dividend payment to H55 per share, including the interim dividend of H15 and special dividend of H10 per equity share declared in October 2021 and July 2021, respectively. Dividend for FY21 was H40 per share. Further, our dividend payout ratio for FY22 stood at 41.9%.
Dividend per share (in H)
FY18
55.0
40.0
28.028.0
21.5
FY19 FY20 FY21 FY22
EPS (in H)
FY18
131.2
110.9
87.487.6
64.9
FY19 FY20 FY21 FY22
Focus areas
Building next-gen capabilities
Focus on next-gen capabilities & services to maintain industry leading growth.
Partnerships & alliances
Strategic collaborations to enhance our capabilities.
Talent management
Continue to build a diverse and inclusive workforce with focus on re-skilling.
ESG
Committed to sustainable development through Sustainability Roadmap 2030.
FY18
23.4
76.6
FY19
22.3
77.7
FY20
21.8
78.2
FY21
19.1
80.9
FY22
16.2
83.8
On-site Offshore
34 35Corporate Overview | Statutory Reports | Financial Statements
Financial CapitalIntegrated Annual Report 2021-22

Manufactured CapitalManufactured At LTI, our tangible assets
comprise the physical infrastructure that make up our manufactured capital. We consistently modernize and upgrade our telecommunication equipment, IT support systems and hardware, all integral elements of our manufactured capital. It enables us to seamlessly conduct operations and enhance value creation for our clients.
Capital
Material issues addressed
SDGs covered
70% of our India offices are operating from certified green building
Expanding footprint to accommodate a growing workforce — offices across 10 cities in India
J 4,968 Mn Tangible assets
J 7,430 Mn Investment in infrastructure
State-of-the-art Engagement Center Hartford
Highlights for FY22
Occupational Health and Safety
Manufactured CapitalIntegrated Annual Report 2021-22 37Corporate Overview | Statutory Reports | Financial Statements
36

Manufactured Capital (contd.)
Building capabilities to remain future-ready
Equipped to meet diverse client and end customer expectations, our workspaces are continuously modified to deliver uninterrupted services to clients across geographies and sectors. To improve productivity and bolster cross-team collaborations, we endeavour to create smarter and future-ready workspaces.
1. Delivery centers (DCs) and sales offices
• To ensure seamless services are provided to our clients worldwide, we added two more sales offices during the year under review, resulting in cumulative 53 sales offices and 36 DCs equipped with state-of-the-art infrastructure.
• LTI’s new Hartford office, with capacity of 200 people, is equipped with the latest video conferencing technologies, such as the WebEx teleconferencing boards, Samsung Flip devices, and high-speed low latency
Fiber Optic internet connectivity. The space was designed with configurability in mind, to support multiple business needs.
• We upgraded our infrastructure set-up by adding new satellite offices in Tier 2 cities such as Noida, Nagpur, Coimbatore and Mysuru.
• Aggressively expanding our footprint in India with majority offices situated within Special Economic Zones spanning across 10 cities as compared to 5 cities in the previous years.
2. LTI design studios
• Virtually enabled 6 design studios.
• Providing incredible experiences by the confluence of design, technology and talent pool into products, services, and process.
• Conducting workshops and co-ideation sessions as a part of our customer engagement initiative.
3. Greener and leaner operations
• Making strides towards carbon and water neutrality for India operations by 2030.
• Making sustained investments in energy-efficient equipment, replacement of old or inefficient conventional equipment and adoption of energy from renewable sources.
• LTI headquarters at Powai has 100% of power sourced from renewable energy and since July 2021 we opted for Green Tariff at our Airoli office.
• Reduction in power consumption on the back of various investments and initiatives has resulted in significant cost savings.
4. IT infrastructure
a. Cloud connectivity
• Cloud-agnostic applications development and DevOps, ensuring seamless experience across devices and locations.
• 100% operations of Management Information System (MIS) on cloud infrastructure.
• Enterprise applications utilize an optimum mix of IaaS, PaaS and SaaS platform across different vendors and solutions to provide best-in-class user experience.
• For faster on-boarding of users in customer-facing developments and client support projects, we adopted Citrix Cloud Virtual Desktops on Azure with LTI Hardened Images.
• Cloud-managed gateway for secure internet access, patches deployments and next-gen antivirus across LTI endpoints for continuous protection.
b. Rewired network
• Invested in network rewiring for optimal performance and supporting critical business applications hosted on the cloud, on-prem and network sensitive applications.
• Leveraged best-in-class technologies to refresh network switches at offshore locations as part of the SD-LAN project.
• Secure multiple VPN Gateways with Network Access Control for compliance and posture assessment of all LTI Endpoints using Cisco Technologies with Multi-Factor Authentication.
• Expansion of IT Clinic to all locations, providing one-stop-support for new laptop users.
• Service desk enhancements for user support, automation for on-boarding new users using BOTs, dynamic configuration for enabling agile desking with Cisco ISE/DNAC.
c. Data protection and information security
• Deployed Cloud Security Posture Management (CSPM) solution and cloud-based NextGen Firewall (NGFW) services for all LTI cloud providers and subscriptions for unified controls compliance framework assessment and risk reporting to plan timely mitigation and track to closure.
• Revised and baselined enterprise security policies, procedures, standards and guidelines to incorporate control requirements compliance in line with SOC 2 Type II, CIS, NIST 800-53, NIST CSF frameworks in addition to current existing compliance for ISO27001 standard.
• Included all LTI international global delivery sites into enterprise SOC 2 Type II attestation program and successfully achieved compliance certificate from our attestation partner, demonstrating LTI’s commitment to cyber security posture management and governance.
• Upgraded our attack surface monitoring capabilities by adding newer modules related to Verizon Data Breach Investigation Report (DBIR) and
recorded future incident and threat repository for deeper insights on deep and dark web intel on LTI related risks / vulnerabilities/exploits.
• Implemented state-of-the-art next-gen Security Incident and Event Management (SIEM) solution integrated with Security Orchestration and Automated Remediation (SOAR) solution for faster cyber threat response and protection/recovery. This is supervised by threat experts team based in LTI’s Cyber Defence Resiliency Center (CDRC).
Back to office
The Yin-Yang model (Y2M)
In the preceding 18 months, our business has evolved considerably. At the same time, these changes have pushed us to re-think the way we do business and re-imagine the future. We realized that it is important to start imagining how our workplace will look like in view of the dynamic external environment, including that of our clients and the customers.
Significant efforts were put in to prepare the groundwork for such a workplace pivoted around balance and flexibility, keeping in mind the interests of our clients and employees. This has resulted in our Yin-Yang model.
Under this, all roles were categorized under different persona on the basis of role, client/project requirements and personal preferences. This will allow us to find the right balance between working from office and remote location based on the business requirements.
For details of environmental footprint, refer to Natural Capital section of the report.
38 39Corporate Overview | Statutory Reports | Financial Statements
Manufactured CapitalIntegrated Annual Report 2021-22
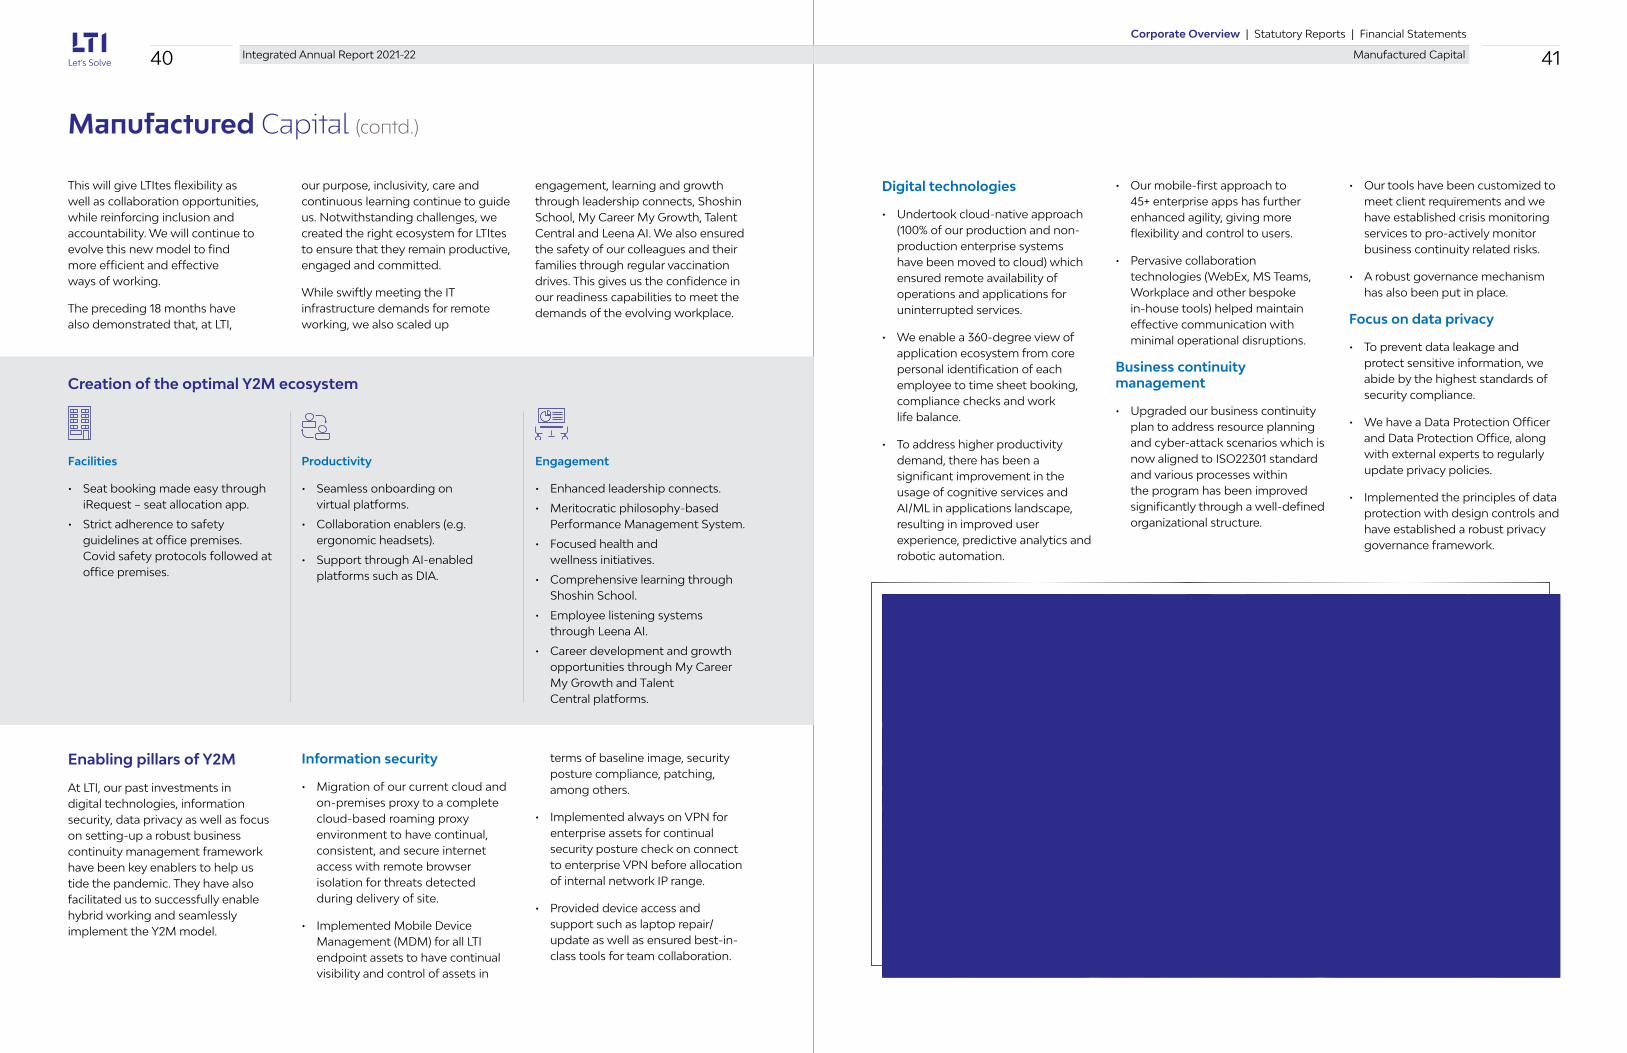
This will give LTItes flexibility as well as collaboration opportunities, while reinforcing inclusion and accountability. We will continue to evolve this new model to find more efficient and effective ways of working.
The preceding 18 months have also demonstrated that, at LTI,
Manufactured Capital (contd.)
Creation of the optimal Y2M ecosystem
Enabling pillars of Y2M
At LTI, our past investments in digital technologies, information security, data privacy as well as focus on setting-up a robust business continuity management framework have been key enablers to help us tide the pandemic. They have also facilitated us to successfully enable hybrid working and seamlessly implement the Y2M model.
Engagement
• Enhanced leadership connects.
• Meritocratic philosophy-based Performance Management System.
• Focused health and wellness initiatives.
• Comprehensive learning through Shoshin School.
• Employee listening systems through Leena AI.
• Career development and growth opportunities through My Career My Growth and Talent Central platforms.
our purpose, inclusivity, care and continuous learning continue to guide us. Notwithstanding challenges, we created the right ecosystem for LTItes to ensure that they remain productive, engaged and committed.
While swiftly meeting the IT infrastructure demands for remote working, we also scaled up
engagement, learning and growth through leadership connects, Shoshin School, My Career My Growth, Talent Central and Leena AI. We also ensured the safety of our colleagues and their families through regular vaccination drives. This gives us the confidence in our readiness capabilities to meet the demands of the evolving workplace.
Digital technologies
• Undertook cloud-native approach (100% of our production and non-production enterprise systems have been moved to cloud) which ensured remote availability of operations and applications for uninterrupted services.
• We enable a 360-degree view of application ecosystem from core personal identification of each employee to time sheet booking, compliance checks and work life balance.
• To address higher productivity demand, there has been a significant improvement in the usage of cognitive services and AI/ML in applications landscape, resulting in improved user experience, predictive analytics and robotic automation.
• Our mobile-first approach to 45+ enterprise apps has further enhanced agility, giving more flexibility and control to users.
• Pervasive collaboration technologies (WebEx, MS Teams, Workplace and other bespoke in-house tools) helped maintain effective communication with minimal operational disruptions.
Business continuity management
• Upgraded our business continuity plan to address resource planning and cyber-attack scenarios which is now aligned to ISO22301 standard and various processes within the program has been improved significantly through a well-defined organizational structure.
• Our tools have been customized to meet client requirements and we have established crisis monitoring services to pro-actively monitor business continuity related risks.
• A robust governance mechanism has also been put in place.
Focus on data privacy
• To prevent data leakage and protect sensitive information, we abide by the highest standards of security compliance.
• We have a Data Protection Officer and Data Protection Office, along with external experts to regularly update privacy policies.
• Implemented the principles of data protection with design controls and have established a robust privacy governance framework.
Information security
• Migration of our current cloud and on-premises proxy to a complete cloud-based roaming proxy environment to have continual, consistent, and secure internet access with remote browser isolation for threats detected during delivery of site.
• Implemented Mobile Device Management (MDM) for all LTI endpoint assets to have continual visibility and control of assets in
terms of baseline image, security posture compliance, patching, among others.
• Implemented always on VPN for enterprise assets for continual security posture check on connect to enterprise VPN before allocation of internal network IP range.
• Provided device access and support such as laptop repair/update as well as ensured best-in-class tools for team collaboration.
Productivity
• Seamless onboarding on virtual platforms.
• Collaboration enablers (e.g. ergonomic headsets).
• Support through AI-enabled platforms such as DIA.
Facilities
• Seat booking made easy through iRequest – seat allocation app.
• Strict adherence to safety guidelines at office premises. Covid safety protocols followed at office premises.
40 41Corporate Overview | Statutory Reports | Financial Statements
Manufactured CapitalIntegrated Annual Report 2021-22

IntellectualCapitalIntellectual
Capital
Our extensive knowledge base, culture of innovation and collaboration enable us to partner with global clients, as well as help them improve the effectiveness of their business and technology operations. This ecosystem, in its entirety, represents our intellectual capital. We have invested significantly in strengthening our intellectual assets, and will continue to do so to remain ahead of the curve in an essentially knowledge-based industry.
Our problem-solving abilities, along with an emphasis on developing ingenious solutions allow our clients to remain competitive, profitable and secured in an evolving business environment.
Our intellectual capital forms the cornerstone for developing strategic partnerships with diverse clients. It also acts as a force multiplier for businesses in their transformation journeys.
Material issues addressed
SDGs covered
Data privacy
Client privacy
Services, quality and accuracy
Innovation
Delivery capability
Highlights for FY22
230+ Home grown IPs
Highest Tier Partnerships With all the hyperscalers
Capability-led acquisition Cuelogic Technologies
Launch of Fosfor Data-to-Decisions Product Suite for Monetizing Data
LTI Ranked #1 in Top ITS Challengers list in Everest Group’s PEAK Matrix® IT Service Provider of the Year 2022
LTI in ITS Top 10 list in Everest
Group’s PEAK Matrix® IT Service Provider of the Year 2022
Intellectual CapitalIntegrated Annual Report 2021-22
Corporate Overview | Statutory Reports | Financial Statements
4342

Building the right foundation and capabilities
Culture of innovation
We are building a robust framework to institutionalize success for the next 25 years and empower our clients. Backed by the culture of a ‘beginner’s mind’ or Shoshin, we remain motivated to explore solutions that drive the success of the present, as well as future business leaders. This, combined with the L&T Group’s engineering DNA, has helped us power industry leaders of the present and future.
Employee development
The strength of our intellectual capital lies in our people. Through the adoption of modern ways of working and regular training, we continue to enhance their skills sets and enable them to remain competitive.
Innovation spaces
We have established several physical and virtual spaces that facilitate driving an inclusive and innovative culture. They augment the strong domain and technology expertise of our people, thus enhancing our capability for innovation and enabling high performance.
Our enhanced capabilities aligned with evolving digital landscape strengthens our leadership position, culminating in several significant digital transformation deals and new logo wins. During the year under review, we added three new innovative spaces.
Global technology office
The strengthening of technology systems for business outcomes is of strategic importance for LTI. The emergent business world is experiencing unprecedented degree of interventions and technologies as enablers.
Our Global Technology Office (GTO) is a centralized function which is chartered to strengthen the technology office’s role and to prepare the organization for ‘Beyond-the-Horizon’ capabilities in a deterministic, accelerated, fail-fast, and fail-safe way. We are moving from a competence-based structure (erstwhile NWOW) to a strongly outcome-driven organizational structure.
During the year under review, we started six charters with a high degree of accountability interlock with external and internal stakeholders. The GTO charters have drivers and measures defined across the following dimensions:
Intellectual Capital (contd.)
Fosfor experience center
Delivering first-hand experience of our digital transformation capabilities to clients, it showcases the impact of LTI’s flagship solutions on businesses.
IBM innovation & experience center
LTI, in association with IBM, inaugurated ‘IBM Innovation & Experience Center’ at LTI Bengaluru. The endeavour of the center is to showcase our solutions that have been co-created using IBM technologies and empower customers to experience new and unique solutions before adopting them, in turn helping them predict, automate, secure, and modernize their business operations.
Hartford Engagement Center
The center is in the heart of Hartford, Connecticut located in the iconic ‘boat’ building. Its futuristic design is built in collaboration with ‘we’ spaces with open, pod style and lounge seating.
It has a security operations center and two innovation labs, which are operated in collaboration with AWS and ServiceNow.
Design studios
Leveraging the principles of design through the U-First (User First) methodology, these creative spaces help us to deliver impactful and compelling customer experiences.
‘Le LAB’ (innovation center)
It creates an interactive environment for designing practical solutions based on technologies such as Connected Devices, Automation and Big Data.
LTI borderless innovation and experience theatre
We have inaugurated the ‘LTI Borderless Innovation and Experience Theatre for Oracle Cloud’ at our campus in Mumbai, India. The state-of-the-art experience theatre will assist enterprises in reimagining their business models by modernizing operations and accelerating their Oracle Cloud transformation journeys.
Margin share Where the drivers and
measures focus on enabling efficient and effective delivery
and execution.
Market share Where the drivers and the measures focus on improving the market share, through sales and revenues, enabling
the delivering units.
Mind share Where the drivers and the
measures focus on improving the margin share, through
influencing and projecting the value propositions.
44 45Corporate Overview | Statutory Reports | Financial Statements
Intellectual CapitalIntegrated Annual Report 2021-22

To drive thought leadership and amplify the above dimensions, we have built a strong and committed team of 300+ technical practitioners and tech architects. The team identifies ‘Beyond-the-Horizon’ capabilities relevant for LTI through a proven process, methodology and all-inclusive collaboration across various delivery and practice units.
AT LTI, we have always been at the forefront of evolving technological landscape and deploying our expertise in nurturing capabilities. We have built strong capabilities in cloud, data and digital as well as pioneering new frontiers like sustainability, Industry 4.0 and Metaverse. We believe, this enables us to stay ahead of the industry curve and serve our clients and customers better.
1. Data
The Data Practice, at LTI, enables our clients to achieve enhanced business agility by leveraging our business first approach, rich technology experience and innovative solutions powered by reusable artefacts and accelerators. As part of transformation, we are following Services-as-Software approach i.e. a blend of people and software approach for different classes of problem such as Cloud Modernization, Next Gen Data Management, AI and Data Science. Here are a few of the IP assets where LTI is investing, helping our customers with their digital transformation journey:
2. Cloud & cybersecurity
We leverage our cloud practice to empower digital enterprises innovate, experiment and scale to market demands swiftly. We provide full spectrum of services across the cloud transformation journey from strategy to monetization. aLTIus is LTI’s cloud strategy to deliver business transformation at exponential speed. Moreover, we offer a portfolio of mature cloud computing service for successful enablement and adoption of cloud computing technologies in order to help enterprises innovate faster with cloud enabled business models.
We, at LTI, have devised unique offers across cloud strategy, migration, modernization, engineering, Connect at Edge, ways of working and autonomous operations. These offerings empower organizations to adopt and manage cloud and to unlock limitless potential. LTI has the highest tier partnerships with all hyperscalers – GCP, Azure, AWS & IBM.
Nurturing and investing in cutting-edge capabilities to stay ahead
300+Technical practitioners and architects at our GTO
Our innovation approach
Data on cloud
Intellectual Capital (contd.)
— Modernizing data ecosystem using software engineering
Protect the intellectual property
Develop, deploy, manage and industrialize the solution via the Blue Book
Present the solutions ideas/deep research outcomes to the deliberation committee
Organize hackathons/Design thinking/Innovation workshops to generate ideas
Collaborate with internal and external stakeholders
Engage and identify business challenges
PolarSled Scarlet EurekaSunshine Plex
Simplifying & accelerating adoption of
Snowflake by leveraging pre-built
utilities
Pre-built data utilities across AWS Redshift platform to ease adoption
GCP Smart Analytics using tools & utilities
across data value chain
Intelligent cloud adoption migration
to Azure data ecosystem
Unified data analytics and AI
at scale using automated utilities
and frameworks
AInA
End-to-end re-usable templates for model operationalisation, monitoring, governance & testing
PrivateEye
Intelligent, AI-enabled data privacy solution for a comprehensive adherence of regulations
(GDPR, Data/AI Regulations etc.)
iMaster
Multi-domain, AI-enabled MDM with stewardship process
DQ Anywhere
AI-enabled DQ with auto rule creation and discovery
ReCast
BI Tool conversion from legacy technologies to self-service next-gen technologies
Next-gen data management For more details, please refer to the section ‘Partnership Ecosystem, fuelling growth’ on page 13.
46 47Corporate Overview | Statutory Reports | Financial Statements
Intellectual CapitalIntegrated Annual Report 2021-22

Intellectual Capital (contd.)
3. Digital
We leverage our robust platform and product engineering expertise to support the digital transformation journey of our clients. Organizations are realizing the importance of delivering seamless, contextualized, and hyper-personalized experiences on the multiple channels through which their customers interact with them.
At LTI, we mindfully design user experiences that optimize customer engagement, with ‘convenience’ at the forefront of the services being offered, coupled with a keen eye on the latest trends to engineer and deliver Experience @ Speed. We aim to deliver solutions that are agile with a faster time-to-market, helping clients and customers maximize revenue and productivity.
Digital engineering
Experience transformation — Customer expectations are rapidly evolving, with increasing digital adoption. We take a user-centric approach to help companies define the strategies necessary to tackle evolving customer expectations and deliver superior experiences.
Product engineering — Our engineers utilize cutting-edge technologies to build software applications that can provide its users excellent product experience. We craft future-ready products and platforms that deliver your needs through an end-to-end frictionless product that provides end-users with a delightful experience. These products and platforms are an outcome of leveraging the Program development life cycle in tandem with our Pods that comprise of cross-functional engineers who leverage our engineering frameworks.
Connected enterprise — In today’s scenario, with greater usage of cloud infrastructure and cloud applications, it’s imperative that all systems and applications of an enterprise must work together as a well-oiled machine. We support organizations in their integration modernization journey by ‘digitizing the core’ powered by innovative in-house digital solutions.
Cross-functional pods for all needs across PDLC — LTI has three pods – Consulting, Innovation and Engineering. These pods fit into different stages of the product development lifecycle, as per their use case, right from visioning, defining, ideation and designing stages to prototyping, sustenance and modernizing stages.
LTI also offers cybersecurity strategy and consulting, engineering and global cyber defence categorized under cyber defence, cloud threat defence, digital trust and digital defence. We have our own LTI Cyber Defence Resiliency Center (CDRC) in Canada, Poland, India and USA that deliver an array of services. The services include security orchestration and automation, cyber defence response and recovery, threat prevention and detection, active threat intelligence and advance threat and vulnerability management to name a few.
Experience transformation Connected ente
rpris
e
Establishing seamless integration across enterprise
systems and application layers
Build large-scale products and innovations to craft amazing experiences for clients and end customers
Enabling fluid interactions
across multiple platforms
Prod
uct design and engineering
Engineering Experience @ Speed by transforming the
entire application value chain with
people, process and state-of-the-art
technologies
Productised services
Fro
nt-
end
tran
sform
ation
Hyperautomation
aLTIus is LTI's cloud strategy to deliver Business transformation at exponential speed. It is achieved through these key pillars.
1. Purpose-led — C4X — Purposeful Cloud (Industry, Function, Platform) enabled by LTI’s North Star framework and Cloud Ways of Working.
2. Productised — Cloud Offers — Packaged service offerings across the life cycle of cloud transformation.
3. Platform enabled — Infinity Cloud — LTI’s delivery excellence platform providing scalability, automated and scalable paths to achieve true cloud innovation, consistency & visibility across cloud lifecycle.
4. Partner aligned — AWS I Azure I GCP — GTM & competency teams dedicated to partners driving business outcome-based partnership models & growth strategy.
5. Practitioner delivered — Rainmakers — Elite team of consultants bringing a holistic approach for cloud journey.
Digital defence services
We have a deep technical know-how of industry domains from corporate
heritage of engineering, infrastructure and construction, to digital transformation of
engineering engagements at scale and cyber operations of large and complex
projects across airports, power plants and oil rigs. We have solutions to identify, track
and report Scope 1, Scope 2 and Scope 3 emissions.
Digital trust services
We enable the right user, under the right conditions to have the right access
to the right data through our digital trust services.
Cloud threat defence services
We leverage our comprehensive cloud security framework and cloud threat defence framework for multi cloud monitoring and incident response; Security Operations Center (SOC) Framework to integrate and monitor multiple cloud services provider and managed security services provider; automation templates for DevSecOps; and Security-as-a-Code and Securing Infrastructure-as-a-Code initiatives for Cloud Threat Defence Services.
Digital identity services
We leverage our orchestration framework and reusable artefacts, self-service chatbots, DevOps framework for implementation, application, integration factory framework, SOD library and operations accelerators for digital identity services.
48 49Corporate Overview | Statutory Reports | Financial Statements
Intellectual CapitalIntegrated Annual Report 2021-22

Intellectual Capital (contd.)
4. Solving ESG challenges for enterprises
Ensuring business continuity in an operating environment fraught with multiple risks (environmental degradation, climate change, societal and governance challenges) enterprises are expected to undertake practices and report KPIs, much beyond the simple bottom line. We have created solutions to address ESG concerns of enterprises and help them create a more valuable impact, based on data and insights.
It is focused around reimagining possibilities and providing solutions for issues that need urgent attention. We believe it is imperative for clients today to leverage innovation while they continue to grow responsibly
ESG concerns Our solutions
Emissions and energy management
Tightening emission and energy management regulations requires businesses to follow stringent controls. Businesses today face significant challenges in identifying emission inventory and measuring carbon emissions.
Most businesses are monitoring their carbon footprint as a part of their focus on sustainable operations. To do so, it is imperative to adopt systems and tools that would help identify, track and report Scope 1, Scope 2 and Scope 3 emissions.
Renewable energy
Electricity generation is now transitioning from carbon intensive to carbon neutral technology, shifting away from coal fired to Solar PV-based and wind energy-based electricity.
The growing scale of renewable energy sources has made it an imperative for asset managers to operate their assets at optimum efficiencies.
Renewable energy assets face a major challenge of being geographically distributed, limiting their visibility and operability to standalone assets rather than single large-scale entities with standard operations, maintenance and trade strategy.
Energy storage
Efficient energy storage is the missing link between the intermittent renewable power source and a stable grid system with a 24*7 power supply. Energy storage has wide implications in power (renewable energy) and transportation (electric mobility) sectors.
Energy storage technologies will become the backbone for both EVs and renewable power landscapes with advanced analytics for improving storage and dispatch efficiency, track and trace technology for monitoring assets, integrations for fleet management, theft prevention, and so on.
Integrated emissions management framework
The platform allows business to apply digital interventions in an unprecedented manner that will ease the process of achieving net-zero objectives.
Carbon accounting and trading
Comprehensive carbon accounting to monitor track, report and trade carbon emission at every stage of operations.
Integrated digital command center
Our integrated digital command center powered by IoT, edge technology and advanced analytics will help developers and asset managers visualize and operate distributed assets as a single integrated power generating asset.
Micro grid management
Comprehensive visualization and analytics platform to help operate micro-grid for optimum performance as well as trading.
Battery 360
The platform addresses the problem at its root by leveraging the power of IoT and advanced analytics.
Energy management
Comprehensive energy management solutions to optimize energy consumption and trade.
and deliver value across the triple bottom line. We are leveraging our expertise of implementing complex systems spanning enterprises, our
IPs and partner network to delivery-comprehensive capabilities to support ‘digital-first’ approach to holistic ESG reporting.
Our product engineering frameworks
LTI-Cuelogic product engineering frameworks have unique intellectual properties that help us approach your business goals and push them forward on the technology ladder. We leverage three IPs/frameworks to make us product engineering thought leaders of the industry.
Compass (Research framework)
Our automated research framework that scans the horizon to detect trends across technology, markets, and domains. The Compass in LTI — CG is looked upon as a method of choosing the right technology intel that regulates a data mountain into actionable insights.
Tenet (Engineering framework)
Tenet is our core engineering framework which aims to improve product engineering maturity, continuous improvement, enhanced visibility, and reduced tech debt. Tenet allows teams to automate their efforts, hence increasing roll-out speed and decreasing maintenance costs.
Atlas (Engineering blueprints)
The team moves onto the Atlas Framework, where a scalable and customizable set of Lego-style boilerplates for businesses are provided which can be adopted in any software product life cycle phase. The outcomes of the framework provide various benefits such as reduced development risks, shorter learning cycles, and accelerated time of deployment.
eMobility
Global trends, such as urbanization, climate change and digitalization, pose significant challenges to automotive industry. Mobility has become both shared and autonomous. A new evolving ecosystem that includes charging infrastructure developers, new mobility service providers and battery manufacturers is pushing OEMs to work with new players to develop a consistent offering of vehicles, services and charging experience.
Smart charging
Data acquisition and analytics across charging ecosystem and infrastructure for operations and supply chain optimization.
EV fleet management
Monitoring of electric fleet charge and analyse the routes to make recommendations for vehicle assignments.
Intelligent charging point network
Energy analytics across charging infrastructure using predictive models to drive efficiency in operations and management.
50 51Corporate Overview | Statutory Reports | Financial Statements
Intellectual CapitalIntegrated Annual Report 2021-22

Intellectual Capital (contd.)
6. Industry 4.0
With increasing interconnectivity and smart automation, we have formulated Industry 4.0 practices to create value at the intersection of domain, digital engineering, and smart technologies and accelerate digital transformation journeys of our clients and customers. We have established a dedicated Center of Excellence to develop technology accelerators, industry-specific solutions and Proof of Concepts (PoCs) for use cases in next-generation technologies such as 5G and blockchain.
Aligning ourselves with the customers’ key transformation goals around Factory of the Future, servitization for new revenue models and sustainability, we have pivoted our Industry 4.0 practice around three broad solution themes:
Driving convenience and efficiency in navigating IPs
We can provide our clients the right intellectual properties out of our strong portfolio of 230+ IPs. We have established the Blue Book — our own internal marketplace. It is a one-stop destination to navigate across all our IPs in one place. It is a single-source platform to get updates and the most trending tools to help track usage and improve efficiency.
Screen view of Blue Book
Staying ahead with strategic platforms
We put significant emphasis on various facets of organizational productivity by developing innovative data, cloud and Artificial Intelligence (AI)-powered solutions that offer a competitive edge to our clients in an evolving digital landscape.
5. Metaverse
The past few years have set off a new trend for us through extended virtual connectivity. This virtual connectivity is now taking the world by storm as it is embracing virtual reality. From real to virtual, our interactions are at the cusp of an experiential transformation. The recent advances in Metaverse have only accelerated our dimensions beyond our physical world. The Metaverse practice at LTI has been created with a focused intent to unlock the next frontier of immersive digital experiences.
Metaverse promises to unveil huge business opportunities across every industry; and we will leverage our investments in design, domain, and digital technologies to deliver awe-inspiring experiences to our clients
and customers, across industries. LTI is working with its clients to decipher the art of possible in the Metaverse realm and in its quest to do so, has setup its own Metaverse ecosystem
to further fuel research in Metaverse. As part of its Metaverse offerings, LTI will focus on helping companies build a Metaverse strategy and identify metart-of-possibilities aligned to their industry and domain.
Accomplishing excellence and competitive edge with IP development
As an integral aspect of our IP and platform portfolio enhancement strategy, we have devised 230+ innovative IPs and 5 core platforms that enable us to deliver exceptional services and ensure robust revenue growth.
Smart manufacturing
An array of solutions under our IXC (Industry X.0 Canvas) framework, powered by IoT, edge and cloud computing and other smart technologies (computer vision. AR/VR) to drive efficient, agile, safer and sustainable manufacturing operations.
Smart spaces
On-campus real-time view for different building systems (HVAC, lighting systems, sewage and water treatment plant, air quality, security and access, DG sets, solar, and so on), powered by digital twin and AR/VR for energy optimization and smarter and safer operations.
Connected solutions
An end-to-end solution for realization of connected vision of our customers. It includes onboarding IoT devices, data acquisition and integration of different data sources (engineering design, PLM, ERP and asset management) in a contextualized manner to create asset digital twin for remote asset monitoring, predictive maintenance, automated regulation, and cognitive assistance.
52 53Corporate Overview | Statutory Reports | Financial Statements
Intellectual CapitalIntegrated Annual Report 2021-22

Intellectual Capital (contd.)
LTI Canvas is a modern software engineering platform based on our xFH framework. It is a curated platform consisting of LTI solutions, Microsoft technologies and select third-party tools. It brings together various processes, tools, and methodologies to drive technology and business outcomes for teams operating in a distributed environment.
Encompassing a comprehensive suite of accelerators, it is a self-service DevSecOps platform for automated enablement and persona-based governance.
It is built for hardening applications to deliver business resilience through chaos engineering, continuous observability, and proactive resilience insights. It helps improve system availability by identifying the potential failures during early phases of SDLC and in production.
AI-powered agile platform to boost software development productivity. It empowers software engineers with rich insights for better decision-making, enabling improved delivery quality, higher productivity, faster and more frequent implementations.
DevOps Resilience Insights
This platform helps measure and enhance digital customer experience by evaluating against 120+ parameters and has sentiment analysis embedded with design thinking techniques.
Integrated with leading open-source industry standard IDEs, it is a rapid application development tool that creates ready-to-deploy, end-to-end cloud applications, based on 12-factor-app principles.
With a capacity for multi-channel compatibility, it is a persona-driven, one-stop governance platform for transparent, real-time tracking and reporting of transition. It offers 20+ comprehensive pre-set reports.
CX Studio
Accelerating data-driven cloud transformation on Azure Synapse Analytics through an automation-first approach towards the whole migration/modernization value chain. Canvas Sunshine reduces the overall manual efforts required to move from on-premises to the cloud, by making the data migration journey timely, predictable, and cost-effective.
Canvas Eureka is a mindful automation framework and tool kit for GCP Smart Analytics services, to forge end-to-end transformational change at scale and speed. Canvas Eureka with its automated dataflows enables an optimized pathway to BigQuery, eliminating operational complexities and de-risking modernization.
Simplifying and accelerating the adoption of Snowflake by leveraging pre-built utilities. Canvas PolarSled addresses the core challenges of designing, accelerating, and governing a data transformation journey.
PolarSled Sunshine Eureka
Canvas Workplace accelerates workplace digitization by templatizing team onboarding and enabling insights-driven collaboration. It is designed for the workforce to be productive from day 0, collaborate and deliver excellence from anywhere, anytime and on any device.
Canvas Scarlet provides an ability to accelerate the data modernization journey to AWS.
Canvas Glide helps organizations manage all financial aspects related to cost allocation, charge-back, monitoring, and planning of Amazon Redshift clusters. Canvas Glide with its 360-degree approach to cloud governance streamlines operations and saves on cost by providing insights into cluster usage, providing reports, predicting spend, and sending notifications on events.
Workplace Scarlet Glide
50 Integrated Report 2021-22 51Corporate Overview | Statutory Reports | Financial Statements
Intellectual Capital
DevOps
Encompassing a comprehensive suite of accelerators, it is a self-service DevSecOps platform for automated enablement and persona-based governance.
Resilience
It is built for hardening applications to deliver business resilience through chaos engineering, continuous observability, and proactive resilience insights. It helps improve system availability by identifying the potential failures during early phases of SDLC and in production.
Insights
AI-powered agile platform to boost software development productivity. It empowers software engineers with rich insights for better decision-making, enabling improved deliveryquality, higher productivity, faster and more frequent implementations.
CX
This platform helps measure and enhance digital customer experience by evaluating against 120+ parameters and has sentiment analysis embedded with design thinking techniques.
Studio
Integrated with leading open-source industry standard IDEs, it is a rapid application development tool that creates ready-to-deploy, end-to-end cloud applications, based on 12-factor-app principles.
With a capacity for multi-channel compatibility, it is a persona driven, one-stop governance platform fortransparent, real-time tracking and reporting of transition. It offers 20+ comprehensive pre-set reports.
PolarSled Sunshine
Simplifying and accelerating the adoption of snowflake by leveraging pre-built utilities.. Canvas PolarSled addresses the core challenges of designing, accelerating, and governing a data transformation journey.
Accelerating data-driven cloud transformation on Azure Synapse Analytics through automation first approach towards whole migration/modernization value chain. Canvas Sunshine reduces the overall manual efforts required to move from on-premises to the cloud, by making the data migration journey timely, predictable, and cost-effective.
Eureka
Canvas Eureka is a mindful automation framework and toolkit forGCP Smart Analytics services, to forge end-to-end transformational change at scale and speed. Canvas Eureka with its automated dataflows enables an optimized pathway to BigQuery, eliminating operational complexities and de-risking modernization.
Workplace
Canvas Workplace accelerates workplace digitization by templatizing team onboarding and enabling insights driven collaboration. It is designed for a workforce to be productive from day 0, collaborate and deliver excellence from anywhere, anytime and on any device.
Scarlet
Canvas Scarlet provides ability to accelerate the data modernization journey to AWS.
Glide
LTI Canvas Glide helps organizations manage all financial aspects related to cost allocation, chargeback, monitoring, and planning of Amazon Redshift clusters. Canvas Glide with its 360-degree approach to cloud governance streamlines operations and saves on cost by providing insights into cluster usage, providing reports, predicting spend, and sending notifications on events.
Intellectual Capital (contd.)
LTI Canvas is a modern software engineering platform based on our xFH framework. It is a curated platform consisting of LTI solutions, Microsoft technologies and select third-party tools. It brings together various processes, tools, and methodologies to drive technology and business outcomes for teams operating in a distributed environment.
Canvas has the following platform components and solutions:
Canvas has the following platform components and solutions:
54 55Corporate Overview | Statutory Reports | Financial Statements
Intellectual CapitalIntegrated Annual Report 2021-22

Fosfor growth
30+Global clients
10+Cross-industry applications
1,000+Users across products
3xIncrease since FY21
8+ Patents filed
Intellectual Capital (contd.)
Fosfor
We are in the age of Data Commerce, where the opportunities are limitless. To help enterprises capitalize on the ever-growing opportunities and emerge as an unlimited enterprise, we have launched Fosfor – the Data-to-Decisions Product Suite – an integrated suite of products across the data-to-decisions lifecycle.The launch of the platform also signifies our focus on the multi-billion-dollar AI and data products market. As Fosfor, LTI brings together the synergies of erstwhile Mosaic and Leni products to unleash unlimited opportunities for enterprises with next-generation AI products.
Fosfor is a complete re-imagination of the data-to-decisions journey that brings method, speed and amplification to data monetization, what LTI defines as Data Commerce for the Unlimited Enterprise. Products within Fosfor suite assist in organizing data, mining information from unstructured data, building a data fabric for information discoverability, build and deploy ML models at scale and perform experience driven insight generation.
Fosfor product suite:
Data-to-Decisions Product Suite — an integrated suite of
products across the data-to-decisions
lifecycle.
The Fosfor suite of products has an extensive set of go-to-market and technology partnerships with leading cloud companies and has been recognized by industry analysts.
• Lumin by Fosfor (formerly LTI Leni) recognized as a sample vendor in The Forrester Tech Tide™: Customer Insights Methods, Q2 2021.
• LTI (Fosfor Lumin, Formerly LTI Leni) recognized as a Representative Vendor in 2021 Gartner Market Guide for Augmented Analytics Tools, Austin Kronz, etc.
• Aspect by Fosfor recognized as ‘Disruptor’ in Avasant’s Intelligent Document Processing Platforms 2021-2022 Radarview™.
• LTI recognized in 2022 Gartner® Market Guide for Intelligent Document Processing Solutions for its Aspect by Fosfor solution.
• LTI’s Fosfor Optic recognized in The Forrester Now Tech: Enterprise Data Fabric, Q1 2022 report.
• LTI’s Fosfor Refract recognized in The Forrester Now Tech: AI/ML Platforms, Q1 2022 report.
Industry recognitions
LTI rated 4.8/5 for its Lumin by Fosfor solution as of May 16, 2022 from 6 reviews.
Optic by Fosfor wins Data Breakthrough Award for ‘Data Catalogue Solution of the year 2022’.
Awards, accolades and customer recognition
The Gartner content described herein, (the “Gartner Content”) represent(s) research opinion or viewpoints published, as part of a syndicated subscription service, by Gartner, Inc. (“Gartner”), and are not representations of fact. Gartner Content speaks as of its original publication date (and not as of the date of this [type of filing]) and the opinions expressed in the Gartner Content are subject to change without notice. GARTNER is a registered trademark and service mark of Gartner, Inc. and/or its affiliates in the U.S. and internationally and is used herein with permission. All rights reserved. Gartner does not endorse any vendor, product or service depicted in its research publications, and does not advise technology users to select only those vendors with the highest ratings or other designation. Gartner research publications consist of the opinions of Gartner’s research organization and should not be construed as statements of fact. Gartner disclaims all warranties, expressed or implied, with respect to this research, including any warranties of merchantability or fitness for a particular purpose. Gartner Peer Insights reviews constitute the subjective opinions of individual end users based on their own experiences and do not represent the views of Gartner or its affiliates. https://www.gartner.com/reviews/market/analytics-business-intelligence-platforms/vendor/lti/product/lumin-by-fosfor
Infinity
A unique and unified platform that delivers industry-aligned cloud transformations at exponential speed. It comprises advanced solutions and processes, enabling industry blueprint-based cloud lifecycle excellence from decisions to operations. It offers accelerated assessment, migration and modernization, better governance, operations and FinOps at cloud speed for agile, scalable and consistent outcomes.
Industry, platform and function-specific North Star blueprints for purposeful cloud transformations.
Business process lens to devise the right cloud strategies.
Ready-to-use efficiency kits delivering speed and value.
Multi-cloud governance and FinOps.
Value stream-based visibility into business performance and operations.
Cognitive dashboards powered through AI-based knowledge engine.
Green Cloud Advisor for sustainable cloud.
Infinity’s exclusive offerings
A marketplace equipped with 75+ best-in-class cloud lifecycle solutions.
56 57Corporate Overview | Statutory Reports | Financial Statements
Intellectual CapitalIntegrated Annual Report 2021-22

Intellectual Capital (contd.)
Key facts
60% Faster assessment
2x Faster cloud migration
Enhanced governance and visibility on cloud
40% Reduction in TCO
Infiniteon-demand scaling
on cloud, data, digital while scaling business, focusing on innovation, and achieving sustainable goals to name a few. PoVs on emerging next-gen trends like Metaverse, Quantum and Web 3.0 are in progress as well.
LTI recognized as a Leader in Everest Group’s Temenos IT Services PEAK Matrix® Assessment 2022
280+ Whitepapers, blogs, and podcasts released in FY22
1. LTI positioned itself as a Leader in Managed Digital Workplace Services for Mid-markets — US in ISG Provider Lens™: Future of Work — Services and Solutions 2021.
2. LTI positioned as a Leader in Digital Business Consulting Services — US in ISG Provider Lens™: Digital Business — Solutions and Service Partners 2021.
3. LTI recognized as Leader Across all Six Quadrants in the ISG Provider Lens™ AWS Ecosystem Partners Report USA 2021.
These significant milestones recognize LTI’s deep expertise and industry capabilities to deliver a wide range of digital solutions globally.
Analyst recognitions in FY22
Building a powerful innovation ecosystem
We complement our offerings by acquisitions that align with our strategy as well as partnering with hyperscalers and other solution providers in the industry to create an ecosystem of innovation.
It streamlines the maintenance of client records and facilitates administrative processes including handling of transaction entries, generating account investment values, interfacing with external systems, and communicating with clients.
LTI’s digital banking platform
A comprehensive banking software, powered by Temenos, has been developed to provide ‘digital to core’ banking capabilities, with infinity front-end solutions. With comprehensive financial crime mitigation capability, it seeks to modernize legacy core banking systems in the Nordic region and continental Europe. It allows financial institutions to make their operations scalable and agile, to reduce their operating costs. It also facilitates faster launch of new products and services.
It also facilitates fintech solutions like regulatory reporting, authentication, KYC solutions, card services, and payment solutions available on Temenos Exchange.
Efficiency kits
The platform is equipped with efficiency kits that deliver plug-n-play capabilities, supporting heterogeneous tools available in the enterprise ecosystem.
Unitrax®
Unitrax®, the flagship product of LTI Canada, is the focal point of Canada’s Leading Wealth Platform ecosystem. This SaaS-based solution specializes in exceeding the record-keeping needs of fund managers, banks and insurance providers. Leveraged by more than 190 clients with over $1 Trillion in Assets Under Administration, Unitrax® is Canada’s premier TA record keeping platform.
Publications
Our intellectual capital is further enriched by our extensive knowledge base and diverse perspectives. Various publications and thought leadership papers have mentioned our contributions and we saw over 280 publications.
Some of the dominant themes revolved around embracing the new normal, business resilience, focus
During the year under review, we made one capability-led acquisition and one strategic partnership aligned with our future strategy. We acquired Cuelogic Technologies which has enhanced our digital engineering and outsourced product development capabilities.
We also formed a strategic partnership with eClinicalHealth Limited, to accelerate digital innovation in R&D Clinical Trials Management process for patient-centric drug development, thereby helping clients decentralize clinical trials. We also upgraded to top tier partnership with most of our strategic partners.
Relationship with globally-leading hyperscalers
LTI now has the highest tier partnership with all the hyperscalers — AWS, Google Cloud, Microsoft & IBM.
Solution partners
Over the years, we have built a long-standing and mutually beneficial relationship with a number of solution partners that empower us to develop IPs and deliver superior products and solutions for our clients.
offerings and focusing on next-gen research aimed at creation of new disruptive products. Some of the key engagements with global academia partners undertaken during the year are in the following areas:
a) 5G – Collaborative research with IIT-Madras in the field of 5G. The aim is to innovate in the emerging 5G space and enable 5G frameworks validation, low frequency RF deployments and use case testing with 5G test bed.
b) Quantum computing – ‘Setup of Industry-Academia consortium for Quantum Computing’, a research and innovation related project in collaboration with IIT Madras.
Collaboration with start-ups and academia
The New Innovative LTI Ecosystem (NILE) enables a culture of open innovation through associations with start-ups and academia engagements. It allows us to onboard many start-ups to support client deals and projects. It also offers us an advantage to deliver faster and de-risked adoption of new technologies in the realms of Data, Artificial Intelligence, 5G, Augmented and Virtual reality, and so on.
Our University Alliance program aims to create strong collaborations with academia and research institutes for researching and co-innovating to complement our client
Duckcreek14
Guidewire15
CyberArk16
Liferay17
Databricks18
1E Software19
Salesforce7
SAP8
Servicenow9
Snowflake10
Temenos11
MuleSoft12
Google cloud13
Adobe1
CISCO2
IBM3
Microsoft 4
Oracle5
PEGA6
c) Emerging business models in the Manufacturing sector – Teams from National Institute of Industrial Engineering (NITIE) & Manufacturing vertical of LTI working closely to solve for areas like prognostic health management, servitization and intelligent supply chain in the manufacturing sector.
d) Future of hybrid work – Got into a collaboration agreement with Copenhagen University and DIREC (Digital Research Center Denmark) on exploring remote working and the challenges which emerge in hybrid settings of synchronous work.
For more details, please refer to the section ‘Partnership Ecosystem, fuelling growth’ on page 13.
58 59Corporate Overview | Statutory Reports | Financial Statements
Intellectual CapitalIntegrated Annual Report 2021-22

Human Capital is our most valuable asset and it refers to our employees and their zeal and commitment to serve organizational goals. Our human capital drives our competitive market advantage, and enables us to deliver best-in-class services for our clients as well as ensures long-term business sustainability.
Our endeavour is to create a formidable pipeline of talent that can deliver for diverse businesses in a dynamic operating environment, while conforming to the organization’s cherished values and mission. Our unwavering focus is on engaging, developing and retaining talent from different cultures and geographies, with emphasis on inclusivity, diversity and transparency.
HumanCapitalHuman
Capital
Material issues addressed
SDGs covered
Employee well-being
Learning opportunities and career development
Occupational Health and Safety
Employee retention
Diversity and InclusionHighlights for FY22
46,648Total headcount
~30%
Women in workforce
80+Nationalities
27,000+
Employees re-skilled in new technologies
47%Employee <30 years
26,033New joiners
5,212Trainees onboarded
Human CapitalIntegrated Annual Report 2021-2260Corporate Overview | Statutory Reports | Financial Statements
61

Refreshed and realigned people strategy
The pandemic has forced organizations to re-look at their ways of working and engaging with their teams. We have embarked on a journey of structural change in our ways of working. Our primary focus areas were to provide flexibility to our employees, while continuing to deliver best-in-class products and services. We launched the ‘Yin-Yang Model’ as a means to bring the best of both worlds. This was an attempt to future-proof the organization as the industry is moving towards an outcome-focused rather than activity-based approach.
Under this ecosystem, the role of office as a physical construct will be diluted and the work ecosystem will focus on ideation, interactive communication for planning and execution with higher levels of trust. This entails renewed focus on giving the employee flexibility, essentially making work-location agnostic.
To enable this transition, an organization-wide change management plan was created and multiple sessions with employees was conducted to get their buy-in the transition. The entire process was run with an employee-centric lens and the HR hand-held employees every step of the way. To support this transition, we created a knowledge repository for ready reference across geographies.
We have supported employees by opening up satellite offices in Coimbatore, Mysore and Nagpur to allow employees to work from their preferred locations, while delivering services for our clients. We have made our offices ready for returning employees with a keen focus on first-time returning to office employees.
Accelerating digital transformation
The organization has embarked on a journey towards digital transformation to drive business outcomes and enhance the overall user experience both for the employee as well as HR as a function. The focus is not only business service transformation, but a larger umbrella for technology transformation for the function. The system redesign keeps the organization’s future scalability in mind, with global implementation plans while catering to local requirements.
A crucial element within the scope is to create data-driven mindset transformation for decision making. Our key themes include an overall improvement in employee lifecycle, touching various touchpoints in the employee journey, improving system integration, overall UI improvement of apps and mobile adoption.
During the year under review, as a part of our digital transformation journey, we automated the manual process of sending offer letters. Now, offer letters can be issued from a single platform with built-in authorization
signatures. Automatic email triggers at various recruitment stages provide real time progression view to prospective candidates. Overall, this automation has removed multiple manual interventions, resulting in faster and more efficient process, documentation, and cost saving.
Talent strategy
While we are mindful of the ‘Talent War’ in the global IT sector, as an organization we have adopted multiple processes to attract, retain and enable talent at LTI. Our focus has been to understand the multi-generational workforce and tailor-made strategies to attract and retain talent in the organization.
To ensure quality experience, we have upgraded our talent acquisition processes at LTI. During the year under review, we introduced the talent acquisition process automation for offshore hiring. This new upgrade has multiple functionalities, which will make our candidate hiring process faster and more efficient.
Another significant improvement in our people strategy is to enable a
strong talent pool through internal fulfilment. It is our commitment that the future talent needs of the organization are fulfilled through leveraging internal talent pool. This not only reduces our overall recruitment costs, but provides an opportunity for employees to progress and develop their skills in other areas as well.
As a part of our global talent acquisition strategy, we are acquiring local talent through our program PLUS (Proactive Localization in the US). It is a program aimed at attracting, training and grooming talent from our delivery centers in the US. We follow a bespoke method to fulfil employee needs or aspirations in line with our endeavour to ensure best-in-class services to our clients.
Human Capital (contd.)
52%Internal succession rate for FY22
26,033New employees hired
Building a diverse workforce
Diversity, Equity and Inclusion (DEI) is an integral part of life at LTI, and this is institutionalized under ‘LTI Belong’. We promote a performance-driven and customer-centric work culture to help clients achieve their business goals.
A diverse and highly talented workforce is key for us to achieve this objective. We imbibe policies and practices within the organization to create a diverse and inclusive workforce to encourage thought and creative diversity.
‘LTI Belong’ is committed to extend an environment of equal opportunity to all candidates, employees and partners where they can achieve their full potential and feel valued and appreciated for who they are.
Region Male Female Others Grand Total
India 27,457 12,854 40,311North America 3,341 765 1 4,107Europe (including Nordics) 979 220 1,199RoW 894 137 1,031Grand Total 32,671 13,976 1 46,648
Headcount mix
70.03%
0.01%29.96%
Male 32,671Female 13,976Others 1
Gender mix
Age mix
<30 21,61830-50 23,159>50 950
2%
47%51%
62 63Corporate Overview | Statutory Reports | Financial Statements
Human CapitalIntegrated Annual Report 2021-22

~30%Diversity ratio
12.24%Women in senior management
For our operations in the Americas, we have introduced the following initiatives:
• In partnership with NPower — a not-for-profit focussing on technology education for people from the underserved communities — we conducted mentoring and knowledge sharing sessions from LTI leaders on technology topics and sponsorship of technology subjects for NPower students.
• Supporting the underserved communities with The Salvation Army (TSA) through our support in the US and Canada.
• Providing technology mentorship opportunities for students through iMentor.
• Partnering with Ryerson University’s WITM (Women in Information Technology Management) in Canada by providing opportunities to promote women in technology and STEM area with competition, workshops and panel discussions.
It is executed based on 3Ws — Workforce, Workplace and World. We are committed to deliver on targets on key initiatives. We have the geography councils that deliver the geography agenda and the charter.
Human Capital (contd.)
Creating a competitive compensation strategy
Our business model is dependent heavily on our ability to attract and retain talent in the global marketplace. At LTI, our focus is to create a fair, transparent and merit-based compensation strategy that motivates our employees to deliver the best services for our clients. Rather than a task-oriented compensation strategy, our focus has been to create a goal-oriented compensation strategy, encompassing the organization, team and an individual.
We undergo periodic revisions in our compensation cycle to remain market relevant. During the pandemic, the organization has run various transformation projects to ensure that we adopt a progressive compensation framework worldwide. To create competitive advantage, we created a dynamic compensation strategy during the pandemic to attract and retain talent in the ‘Talent War’.
Additionally, we created a combination of strategic and tactical interventions to improve user experience and essentially build an employee-friendly culture within the organization.
Revive with LTI
‘Revive with LTI’ program aims to attract experienced women professionals and provide opportunities to re-enter the workforce. 6-month retainership /permanent opportunities will be extended to the eligible candidates.
The program is an opportunity for experienced women professionals to re-enter the workplace and continue their career in a high-performing environment. During the program, participants will work and network with colleagues and senior leaders from across the organization and receive training and support to refresh their skills, whilst working in one team. At the end of the program, participants will be ready to take the next steps in their career, with the possibility of a permanent role at LTI.
LTI Women in Tech
LTI Women in Tech was launched on November 11, 2021 with the endeavour to provide a platform for the entire ecosystem to come together to support, mentor, and encourage women to achieve greater things within the Technology community. We have a core team which represents all LTI’s geographies and our executive sponsor is Sudhir Chaturvedi, President and Executive Board Member. We have six individual new initiatives being run by LTI WIT which include:
• Internal workplace page
• Recognition program
• LTI Women in Tech round tables series
• LTI coffee chat
• Monthly LTI Woman in Tech video interview program
• External sponsorships/mentoring
Some of the key initiatives
launched
E-module for LTI employees on unconscious bias‘BreaktheBias’
workshops
LTI Women in Tech initiative
Interactive sessions on safety in
relationships and hormonal imbalance
LTI Belong video
Awareness Campaign — ‘Bias at
Workplace series’
Ref(H)er
Ref(H)er is a unique program to embrace gender diversity within the organization. It accentuates LTI’s presence as an equal opportunity employer by additionally incentivising the referrers with special bonuses, while solving for the society.
For each successful hire, LTI will plant a tree in Nimbhora village in the state of Maharashtra, India. The program kick-started on March 8, 2022 and will continue to run till Q1 – 2022-23.
64 65Corporate Overview | Statutory Reports | Financial Statements
Human CapitalIntegrated Annual Report 2021-22

Nurturing a future-ready workforce
We have launched the Talent Central platform for employees that helps them identify their learning gaps and learn appropriate skills using our LTI Shoshin platform. They also have easy access to the internal marketplace for various development and growth opportunities.
Some of our key L&D Initiatives include:
LTI 7-steps program incorporates a blended learning model with focus on e-Learning, webinars, assessments, group case study discussion and leadership connect sessions. The program is in alignment with the modern learning principles on a
GET training program
Communication skills
Graduate Engineer Trainees (GET) Communication Skills Training Program is a 3-day program covering various facets of behavioural and communication skills to enable new hires effectively transition their campus to corporate journey. It provides them opportunity to develop new skills and have the prospect for career progression.
65,000+Learning hours
13,285Unique employees benefited
2,600+Employees covered in 20 batches
Human Capital (contd.)
98%Active users in FY22
A one-stop learning platform, it provides access to 500+ SME curated learning pathways for all technical, functional, behavioural and leadership skill development requirements with content from the best learning providers. Powered by the latest AI and ML engine, this smart learning platform provides enhanced and personalized learning experience using new-age learning principles. It enables employees to track, share, curate and measure learning from any source such as live and online courses, articles, blogs, videos, podcasts, work experience, skills, and events. With 53 learning hours per employee last year, the platform is accessed by 98% active users at LTI.
Shaping and streamlining career driving organizational growth — My Career My Growth
The program is designed to guide employees in their current and future role(s) with the flexibility to take charge of their own career. Facilitating understanding of leadership, functional and professional competencies required for a specific role, it helps employees determine career progression potential and
set milestones along with providing development opportunities to achieve them. It is designed to help them navigate through the various career opportunities and empower them to influence their own career progression.
Succession planning
Identification and development of future leaders is an important part of our HR strategy to equip the LTI leadership pipeline for all contingencies by preparing high-potential employees for role advancement. This is classified into three broad levels as follows:
1. CEO level — leaders of tomorrow: It is a mentoring program chaired by the CEO. Structured in collaboration with industry experts and designed as a journey, the program provides a holistic learning experience to nurture and develop leaders. Following are the components of this experiential learning journey:
• Assessment and development of professional competencies and behaviours.
• 360-degree feedback from managers, peers and clients.
• Leadership coaching for self-reflection and discovery.
• Mentoring sessions for Individual Development Plan (IDP) and to realize limitless potential.
Level 1 iAchieve
Level 2 iAchieve Plus
Level 3 iLead
Level 4 iLead Plus
Level 5 & 6 iImpact
Level 7 & 8 iVenture
E Level iChampion
Coverage across 50+ countries
Runs on device-agnostic
Encourages peer learning
Encourages inclusive and
diverse culture
Globally acceptable, agile and
flexible content
Key features
LTI 7-steps program
The 7-step program was launched with an objective of enabling employees across different levels to bolster their readiness and sharpen their skills to lead teams effectively and take on leadership roles across the organization. This program enables leaders to accelerate their performance to their highest potential.
The list of leadership journeys as part of LTI 7-steps:
Category/Level/Grade of Employees
Average hours of training per year per employee (April 2021-March 2022)
Behavioural training
Technical training
Compliance training
Sr. Management 2.67 9 2.88Jr. Management 2.18 18.2 3.08Consultant 1.76 31.3 3.17Trainee* 46.05 7.3 2.42
‘Digital platform’, thereby providing an enriching learning experience to the participants.
Vision: To deliver consistent learning value to our stakeholders for sustainable profitable growth by:
• Building skill and competency within the associates aligned to the business needs.
• Skill development — cross-skilling & up skilling for fulfilment of business demands.
• Providing strong learning ecosystem to enable continuous learning.
Talent central
It is an AI-based platform that uses domain intelligence to help identify, retain and grow the right talent. It enables demand-supply cross pollination by generating ‘Richness Index’ to understand the closest match to the job requirement. The learning module enriches the skill profile and promotes capability building through proactive re-skilling. Contextual gap aggregation aids in faster curriculum design and personalized learning. This portal comprises of global data and is process-compliant.
Promoting continuous learning with LTI Shoshin school
Our belief to ‘Keep Learning’ is at the core of everything we do. Launched in 2020, LTI Shoshin School’s framework is centered around the same philosophy. It creates an ecosystem that brings multiple learning content together and provides a standardized learning experience, thereby promoting a culture of continuous learning.
Enabling the champions
‘Enabling the Champions’ is the organization’s benchmark of Fresher Induction Training program as per the requirement from Business units designed to get a fresher ‘Project-ready’ as rapidly and effectively as possible.
*Does not include average 332 hours/trainee as part of Graduate Engineer Trainee program
66 67Corporate Overview | Statutory Reports | Financial Statements
Human CapitalIntegrated Annual Report 2021-22

2. GEMS: Key focus of the program is to elevate the LTI Leadership team and enhance their positioning amongst the potential roles. It also displays their uniqueness by providing real world proficiency and skills to handle the future leadership roles. The program has 88 participants spread across the geographies. Components of this program include:
• Understanding the top talent based on 360-degree feedback from the team, managers, and peers.
• Strengths-based developmental plan by using Gallup Strengths finder.
• Focused learning journey includes workshops, leader interactions and e-Learning.
• Group coaching sessions by experts and mentoring by CXOs.
• Review of candidates to meet the internal fulfilment.
3. Business Unit (BU) level program: We identify high potential employees at level 5 and 6 to take up enhanced roles at BU level. These are customized programs catering to the specific developmental needs of the talent identified. These programs are supported with leadership, personality, and competency-based assessments. This is supported with IDPs and real-time assignments to help acquire the required knowledge and experience.
Ensuring health and well-being
In FY22, offices and facilities of LTI were closed due to Covid-19 as Work from Home was being followed. However, employee health and safety was our top most priority during these testing times. LTI set up multi disciplinary safety committees at all locations with renewed focus on employee participation, training and awareness and with an aim to foster safe working culture. The challenging times we are living in, has necessitated access to reliable medical advice/consultation round the clock. Besides, all of us have unique healthcare requirements and only experts can guide us to take the right steps at the right time.
To ensure quality medical advice 24x7, LTItes now have access to an online platform specializing in primary care and urgent response management
providing an end-to-end healthcare ecosystem. This corporate membership provides access to a wide network of doctors, nutritionists, health coaches, 24x7 emergency care experts, counselling sessions, testing facilities, ambulance network, telemedicine service, OPD network and much more.
Tele/video consultation services are provided by qualified, experienced, and multi-lingual general practitioners for all LTI employees and their families (up to 4 dependants) free of cost. Moreover, employees can avail any of the other facilities at discounted rates and choose from a wide range of options for specialist consultation and get assistance for emergency response like ambulance and hospitalization assistance, Covid tests and Covid home quarantine packages, Covid isolation and vaccination facilities.
Human Capital (contd.)
We also have an ongoing partnership with some of the leading Employee Assistance Program (EAP) service providers in India, Europe and USA for the wellness of employees. They provide confidential and voluntary assistance in the area of personal as well as workplace concerns. This program at LTI is called ‘Help Yourself’, which encourages an organizational culture that is both goal-oriented and caring.
LTI strongly believes that addressing problems early can prevent complications, which negatively affect both work performance and overall well-being. These proactive measures enhances productivity and improved quality of life for employees and their families.
We are also proud to report that there were no reportable injuries/incidents and fatalities during this year. LTI has also been awarded with the ‘Prashasti Patra’ by National Safety Council of India for the first time under the service sector category in 2021.
Employee engagement
Our HR practices are designed to provide our teams the best experience in terms of both tangible and intangible gains. We run multiple interventions to gauge, monitor and improve employee satisfaction.
Some of the major initiatives that we engaged during the pandemic were:
• Launch of We Care initiative to aid employees and their families during the peak of the pandemic.
• Introduction of Covid sick leaves and Covid help desk.
• Vaccination drives across various locations covering our entire employee workforce.
• Continuous information dissemination through ‘Break the Chain’ campaign.
• Launch of CNH app to ensure employee well-being.
During this period, we created various touchpoints with the employees focussing on a composite of experiences with robust leadership and HR connects. Additionally, we continue to employ AI chatbots to understand the pulse of our workforce. To enable new joiners during the pandemic, a ‘Deep Engagement’ program was run to connect with them on a regular basis to understand their challenges and support them throughout the onboarding process.
At LTI, we also regularly initiate GoMx awards to recognise employees every quarter who have delivered over and above their usual role for the clients, their teams or the organization.
Recognized for excellence
Our efforts in people strategy have been recognized in multiple forums such as:
• LTI bagged the Golden Peacock National Quality Award 2021 for its efforts in corporate excellence. Golden Peacock National Quality Award (GPNQA) scheme has
been instituted to encourage total quality improvements in both manufacturing as well as service organizations in India.
• LTI’s innovative MyRefer Program won the coveted Brandon Hall Group Gold award for excellence in the ‘Social Talent Acquisition Strategy’ category. LTI improved its offer to joining ratio by using social referrals, which led to this recognition.
• LTI USA was certified as a Great Place to Work® (GPTW) for the second year in a row. Areas rated include treating employees equally, regardless of their race and gender, our efforts to support employees during the pandemic and being a safe workplace.
• Additionally, Poland, France and Denmark have been certified as Great Place to Work for our efforts in FY22.
• LTI UK recognized as the ‘Top Employer 2022’ by Top Employers Institute for the second time which in over 25 years has certified over 1,600 organizations in 119 countries/regions.
68 69Corporate Overview | Statutory Reports | Financial Statements
Human CapitalIntegrated Annual Report 2021-22

We are cognizant of the fact that with the growth and expansion of our business, the utilization of natural resources on our part is bound to escalate. This necessitates more focused, calibrated and outcome-based initiatives around conservation of natural resources, as well as reducing our environmental footprint. We remain steadfast at reducing our environmental footprint and becoming a carbon and water neutral Company by 2030. Our policies towards building climate resilience and environmental conservation are correlated to social sustainability.
NaturalCapital
NaturalCapital
Material issues addressed
SDGs covered
Waste management
Green IT
Energy management
Emission
Highlights for FY22
32.5% Renewable energy
4,702 tCO2 Mitigated through renewable energy
70% of our India offices are operating from certified green building
Excellent Energy Efficient Unit Awarded to Powai campus by CII. Bangalore Campus also awarded ‘Energy Efficient Unit’
Natural CapitalIntegrated Annual Report 2021-2270Corporate Overview | Statutory Reports | Financial Statements
71

Our approach
We realize the importance of addressing environmental challenges. Being an environment conscious company, we undertake measures and practices that make our business sustainable. We constantly analyse the environmental risks associated with our operations and implement measures and technologies to mitigate those risks. We have also aligned our commitments with the United Nations Global Compact (UNGC) and Science Based Targets initiative (SBTi) to promote sustainability and remain dedicated towards contributing to the global climate action. To minimize our environmental footprint, we focus on the following areas:
Energy optimization and reduction in carbon emission
Water optimization
Waste management and resource efficiency
Global environmental commitments
To strengthen our sustainability commitment, we constantly benchmark our practices and policies against best global practises and applicable standards. We have joined hands with leading global organizations to promote our inclusive efforts towards sustainability.
At LTI, we believe that setting a target for greenhouse gas emission in tune with global climate priorities, is a proven way to demonstrate our commitments. We are proud to be a signatory to SBTi and joining the growing group of leading companies that are setting emissions reduction targets in line with what is necessary as per climate science. We have also dedicated ourselves to the development of a science-based emission reduction target that is in line with SBTi requirements.
We are also the signatory of UNGC that promotes 10 principles in the areas of human rights, labor standards, environment and anti-corruption. UNGC is a non-binding pact for encouraging businesses worldwide to adopt sustainable and socially responsible policies and report its implementation. We will be preparing and uploading the Communication on Progress (COP) report this year highlighting the progress of our organization across the 10 principles.
Building climate resilience
Rising awareness on the impact of climate change has pushed organizations to think out-of-the-box and adopt measures that not only reduces their carbon footprint, but also assists its customers and value chain partners to achieve their carbon
emission levels. The Government of India has taken a pledge, at the COP26 Summit in Glasgow in November 2021, to reduce our country’s overall estimated carbon emissions by 1 Bn tonnes by 2030, reduce the carbon intensity of the nation’s economy by less than 45% by the end of the decade and attain net-zero carbon emissions by 2070.
We, at LTI, are ahead of our time and initiated our carbon neutrality journey in FY19 on predicted growth projections. Over a two-year span, we are expanding at a much faster pace, compared to the projections.
Natural Capital (contd.)
Energy consumption trends (GJ) and specific energy consumption (GJ/Employee)
Specific scope 1 GHG emissions (tCO2/Employee)
Specific scope 2 GHG emissions (tCO2/Employee)
Specific Scope 3 GHG Emissions (tCO2/Employee)
FY20 FY20FY21 FY21FY22 FY22 FY20 FY21 FY22
0.88
00
0.38
00
0.2
421
0.01
30
0.00
50
0.0
04
4
Direct Energy Indirect Energy
Emissions & data
Key performance indicators UoM FY22 Emissions Scope
Use of Diesel for DG set liters 64,262 170.36Scope 1176.53
PNG SCM 2,864 6.17
Purchase of grid electricity kWh 11,759,614 9,760.48
Scope 29,760.48
Purchase of solar electricity kWh 3,119,480 0
Purchase of wind electricity kWh 981,083 0
Other renewable source: developer-based kWh 1,564,864 0
Employee commute through cabs — diesel km 2,573,241 464.62
Scope 33,147.27
Employee commute through cabs — CNG km 631,201 84.98
Domestic flight travel km 2,358,643 404.44
International flight travel km 19,376,527 2,193.23
0.62
00
0.05
00
0.0
781
FY20 FY21 FY22
2,18
9
2,4
16
127,
255.
0
5.18
49,7
20.3
2.31
42,
334
.61.11
5,35
5
Specific Energy Consumption (GJ/Employee)
One of the trends that the pandemic has ushered in is the shift towards hybrid work policies, which resulted in significant reduction in carbon footprint, per capita emissions and resource utilization. We will continue to revisit our interim targets and implement adequate measures to ensure we attain our goals within the timeline.
We are committed towards achieving our aim of attaining carbon and water neutrality of Indian operations by 2030 by enhancing our efforts and measures
72 73Corporate Overview | Statutory Reports | Financial Statements
Natural CapitalIntegrated Annual Report 2021-22
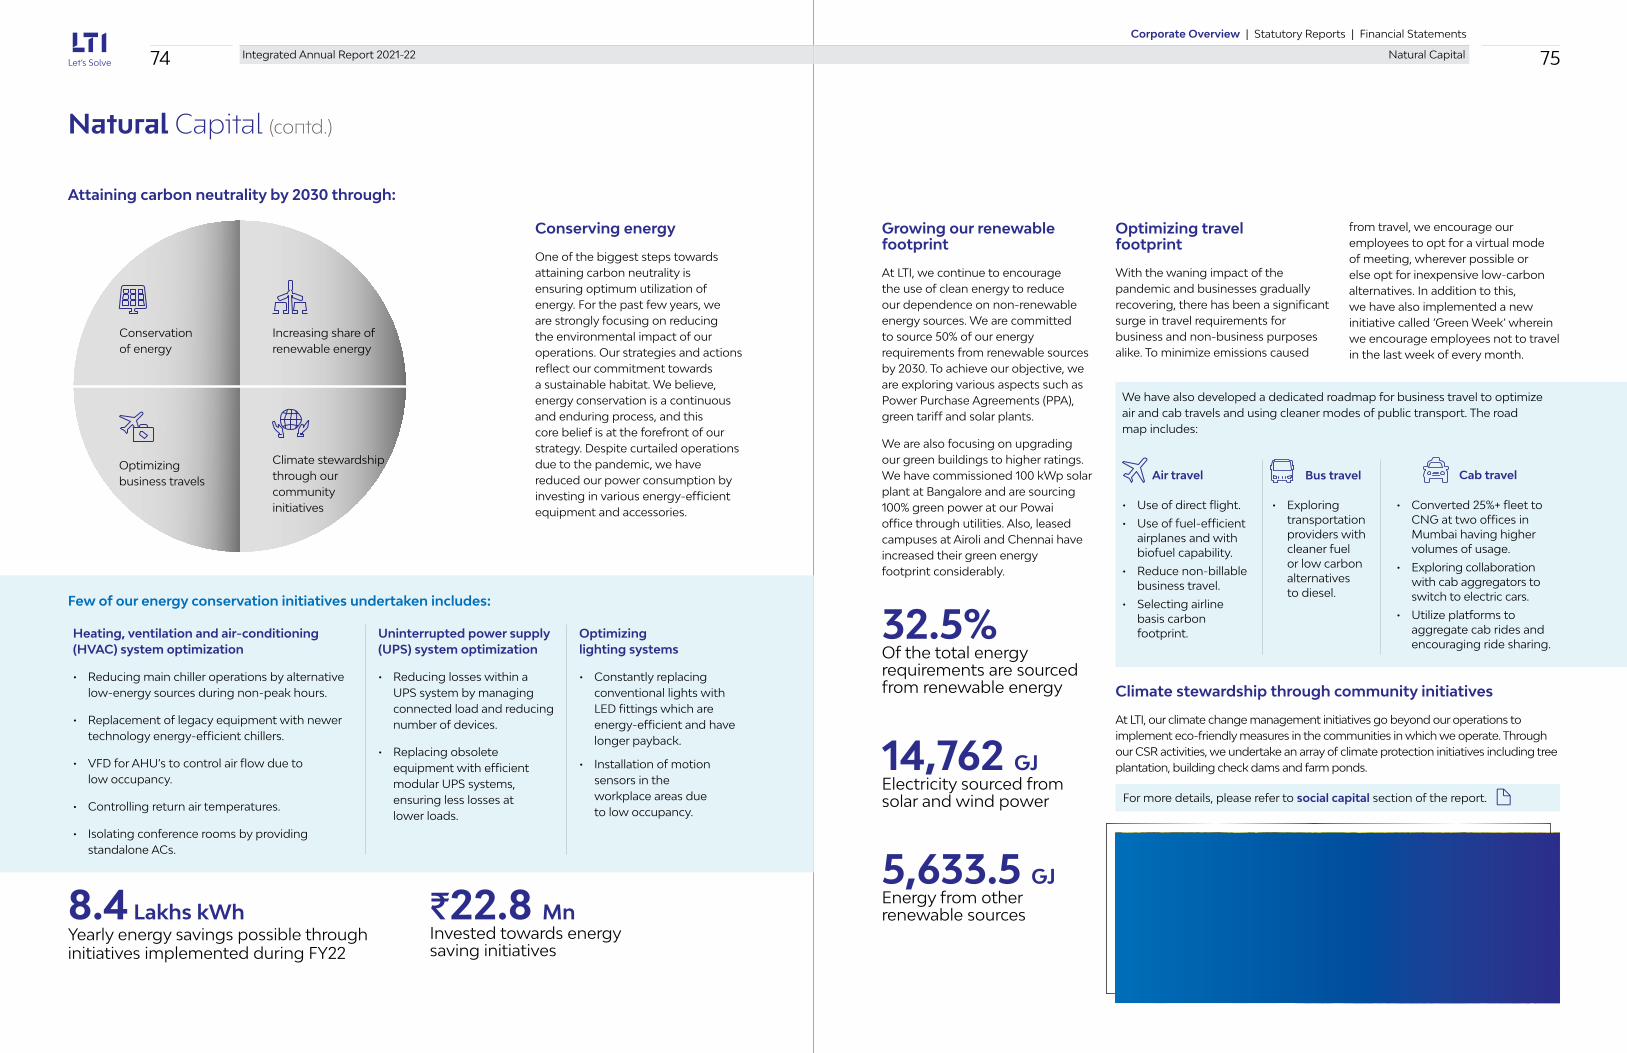
14,762 GJ Electricity sourced from solar and wind power
5,633.5 GJEnergy from other renewable sources
Growing our renewable footprint
At LTI, we continue to encourage the use of clean energy to reduce our dependence on non-renewable energy sources. We are committed to source 50% of our energy requirements from renewable sources by 2030. To achieve our objective, we are exploring various aspects such as Power Purchase Agreements (PPA), green tariff and solar plants.
We are also focusing on upgrading our green buildings to higher ratings. We have commissioned 100 kWp solar plant at Bangalore and are sourcing 100% green power at our Powai office through utilities. Also, leased campuses at Airoli and Chennai have increased their green energy footprint considerably.
8.4 Lakhs kWhYearly energy savings possible through initiatives implemented during FY22
J22.8 MnInvested towards energy saving initiatives
Uninterrupted power supply (UPS) system optimization
• Reducing losses within a UPS system by managing connected load and reducing number of devices.
• Replacing obsolete equipment with efficient modular UPS systems, ensuring less losses at lower loads.
Optimizing lighting systems
• Constantly replacing conventional lights with LED fittings which are energy-efficient and have longer payback.
• Installation of motion sensors in the workplace areas due to low occupancy.
Heating, ventilation and air-conditioning (HVAC) system optimization
• Reducing main chiller operations by alternative low-energy sources during non-peak hours.
• Replacement of legacy equipment with newer technology energy-efficient chillers.
• VFD for AHU’s to control air flow due to low occupancy.
• Controlling return air temperatures.
• Isolating conference rooms by providing standalone ACs.
Natural Capital (contd.)
Optimizing travel footprint
With the waning impact of the pandemic and businesses gradually recovering, there has been a significant surge in travel requirements for business and non-business purposes alike. To minimize emissions caused
from travel, we encourage our employees to opt for a virtual mode of meeting, wherever possible or else opt for inexpensive low-carbon alternatives. In addition to this, we have also implemented a new initiative called ‘Green Week’ wherein we encourage employees not to travel in the last week of every month.
We have also developed a dedicated roadmap for business travel to optimize air and cab travels and using cleaner modes of public transport. The road map includes:
Bus travel
• Exploring transportation providers with cleaner fuel or low carbon alternatives to diesel.
• Converted 25%+ fleet to CNG at two offices in Mumbai having higher volumes of usage.
• Exploring collaboration with cab aggregators to switch to electric cars.
• Utilize platforms to aggregate cab rides and encouraging ride sharing.
Air travel
• Use of direct flight.
• Use of fuel-efficient airplanes and with biofuel capability.
• Reduce non-billable business travel.
• Selecting airline basis carbon footprint.
Cab travel
Climate stewardship through community initiatives
At LTI, our climate change management initiatives go beyond our operations to implement eco-friendly measures in the communities in which we operate. Through our CSR activities, we undertake an array of climate protection initiatives including tree plantation, building check dams and farm ponds.
Few of our energy conservation initiatives undertaken includes:
32.5%Of the total energy requirements are sourced from renewable energy
Conserving energy
One of the biggest steps towards attaining carbon neutrality is ensuring optimum utilization of energy. For the past few years, we are strongly focusing on reducing the environmental impact of our operations. Our strategies and actions reflect our commitment towards a sustainable habitat. We believe, energy conservation is a continuous and enduring process, and this core belief is at the forefront of our strategy. Despite curtailed operations due to the pandemic, we have reduced our power consumption by investing in various energy-efficient equipment and accessories.
Attaining carbon neutrality by 2030 through:
Conservation of energy
Increasing share of renewable energy
Optimizing business travels
Climate stewardship through our community initiatives
For more details, please refer to social capital section of the report.
74 75Corporate Overview | Statutory Reports | Financial Statements
Natural CapitalIntegrated Annual Report 2021-22

Managing waste responsibly
As a responsible Company, our approach is to eliminate, reduce, reuse and recycle waste across our operations. Major wastes that are generated from our operations include e-waste, paper and food. We constantly emphasize on avoiding unnecessary paper consumption, re-using paper and recycling shredded paper. We also ensure proper disposal of e-waste in an environment-friendly way through government authorized vendors.
59,494 KgE-waste disposed
8,834 KgCanteen waste disposed
Natural Capital (contd.)
Specific water consumption (KL/Employee)
Water withdrawal / consumed by source (KL)
FY20 FY21 FY22
10.83
6.67
3.39
223,982
FY20 FY21 FY22
107,626
28,999.0
Municipal Water Ground Water
53,047.0
176,416
25,185.0
Awards and recognition
Accurate monitoring of water consumption, along with categorization pertaining to the withdrawal, consumption, recycling, and discharge with categorization into blue, green and grey water.
Reduce overall water consumption by benchmarking best practices in water usage.
Work towards reducing freshwater consumption by activities such as rainwater harvesting.
Recycle water through sewage treatment plants and reuse the water in flushing, gardening and so on.
Geographic replenishment of freshwater by setting up farm ponds and check dams that benefit farmers and local communities. This forms a part of our CSR activities.
Committed towards water neutrality
Water being a scarce and valuable natural resource, it is critical for organizations and individuals to ensure optimum utilization of every drop of water. Understanding the need of the hour, during the year under review, we have taken a pledge to achieve water neutrality for Indian operations by 2030. This is our roadmap to achieving water neutrality.
Rated as ‘AA’ category by MSCI (global agency).
MSCI ESG rating is designed to measure a company’s resilience to
long-term, environmental, social and governance
(ESG) risks.
Recognized for contribution towards
climate change by SayTrees at India Earth
Summit 2021.
CSR Journal Excellence Awards 2021 (2nd Runner up) for Digital Sakshar under Education & Skill Training
category.
Ranked among the Top 10
by CRISIL in their first ESG Compendium
2021.
Ranked #3 for ESG in All
Asia Executive Team
Rankings 2021.
Gold rating in EcoVadis
Sustainability Assessment.
During this financial year, due to the prevailing pandemic, majority of the employees have been constantly working from home. By virtue of this zero contact period, our operations have transformed into digital processes. Even as employees resume office in a phased manner, our paper waste generation has been so less that recycling agencies were not able to reach economies of scale. We are focused and committed to resume paper recycling as soon as we start generating a required minimum volume of paper waste.
76 77Corporate Overview | Statutory Reports | Financial Statements
Natural CapitalIntegrated Annual Report 2021-22

The sustainability and success of our business depends on the enduring relationships that we have nurtured for decades. Our relationships with our clients, customers, supply chain partners, alliances and communities are extremely important to us and they are intrinsic to our decision-making process. These valuable relationships with our esteemed stakeholders form the basis of our social and relationship capital.
Social andRelationship
CapitalSocial and
RelationshipCapital
Highlights for FY22
96.7%Repeat business
50+ Hospitals supported with medical equipment and infrastructure
100 New clients additions, highest since listing
165,820 Total beneficiaries of our CSR initiatives (including those for Covid relief)
7,246 Employee volunteers
Material issues addressed
SDGs covered
Supply Chain
Brand Marketing
Delivery capability
CSR
Services, Quality and Accuracy
Social & Relationship CapitalIntegrated Annual Report 2021-22 79Corporate Overview | Statutory Reports | Financial Statements
78

Social and Relationship Capital (contd.)
We are responsible to safeguard the interests of our stakeholders, and we are undertaking multiple initiatives to enable our clients achieve purpose-led growth. At the same time, we are ensuring industry-leading experiences to them. Our impact on them is crucial for shared value creation over the longer term.
We believe in inclusive growth, and upliftment of the marginalized segments of the population. We continue to focus on collaboration and communication as well as building sustained communities through our CSR initiatives.
Client experience is crucial
We strive to create a win-win scenario in which our success is closely interlinked with that of our clients. We are enabling digital transformation for clients across a wide spectrum of size, vertical, and location to help them make their business future-proof and resilient. Our partnerships and associations are integral to accomplishing this objective, by supporting us with knowledge and tools needed to solve business complexities on behalf of our clients.
Client satisfaction is paramount
• Brand and marketing — Staying true to our brand identity of ‘Let’s Solve’, effectively engaging with existing and prospective clients.
• Active engagement — Understanding and meeting client needs.
• Alliances and associations — Enhancing our capabilities to meet the ever-evolving requirements of our clients.
Expanding client base through proactive engagement
We thrive on the strength of client relationships. We strive to build more than trust, trust with resilience. Some of the sales and marketing programs that we have implemented since our listing have helped us to expand our client base over the years:
ASPIRE to win large deals
Minecraft to grow our top accounts
Must-have accounts
Analytics and Digital in Every Account (ADEA)
Grit Alliance — response to the pandemic
Minecraft has been on the vanguard of our account mining and has helped us diversify revenues from our Top 20 clients from about 67% in FY17 to about 55% in FY22. New logos have always been a source of growth for LTI. This year had the highest new logo additions of 100 since listing. Two of those were Global Fortune 500 clients, taking our total Global Fortune 500 client count to 73.
Our revenue growth in FY22 has been broad-based and supported by additions in several client buckets. BFS, our largest vertical has grown at over 37% this year. Our Hi-Tech and Media and Entertainment vertical also grew over 37% for the year, while the Others vertical, which includes some of our marquee clients in services sector, grew over 34% in FY22.
All our service lines grew over 20% for the year with our Analytics, AI and Cognitive service line growing 35% and Enterprise Integration and Mobility growing 38% for the year. All the geographies witnessed strong growth in FY22 with North America, Europe and India having the highest growth rates since our listing. We added 3 clients to our 50 Mn bucket,
Consolidate (and grow) existing areas of strengthS
trat
egic
Pro
gra
ms Incubate
new growth engines
Harvest existing growth engines
Consolidate: Focus is to consolidate and grow existing areas of strength to create a bedrock for our future. We have identified a set of accounts, which can be the next $50 Mn accounts, the next $20 Mn accounts, and the next $100 Mn accounts.
We will ensure we have the optimal mix of team leadership, account investments, executive sponsorships, sales support, alliances and marketing support to create an entire ecosystem for each of these accounts to enable them to grow into the next 20, 50, 100-Mn-dollar account, providing the base to ensure growth.
Harvest: We are steadily scaling the reservoirs of growth that already exist in the Company through cross sales. We have received several Fortune 500 accounts, which have high growth potential. We also have over 135 new logos opened in the last six quarters. Almost all new logos are related to our transformation programs, where sales cycles were typically shorter than the traditional sales cycles. Some of the new sub-verticals we will be focussing on are Biotech, Streaming, Payment & InsureTech. Geographically, some of the new regions we will be looking at
are UK, Australia, Switzerland and the Middle East. We will also be able to leverage the strong presence that the L&T Group has in some of these markets.
Incubate: This encompasses our new growth engines. New verticals and sub-verticals such as green energy, Metaverse, EVs, which we plan to progressively incubate and grow. Such a strategy will also include the modalities of engagement with next-generation of technology vendors, based on digital solutions and next-generation alliances.
Our annual Client Satisfaction Survey, which is a third party conducted survey allows clients to rate us on satisfaction, loyalty, advocacy and value for money. Other than that, feedback is sought every six months at an account, engagement, employee and project level and insights are used to enhance offerings and ensure continuous improvement. As an agile partner to our clients, we stay in touch with them regularly through multi-layer communications at leadership and account level.
Brand and marketing
Our marketing and communications strategy is designed to solidify our reputation as the partner of choice for the ‘breakaway’ enterprise. We believe that a carefully crafted brand management is intrinsic to achieving client advocacy and growing our brand recall and respect.
Our tagline ‘Let’s Solve’ and the core idea ‘Pioneering Solutions in a Converging World’ demonstrate how we design, innovate and invest in solutions to aid clients’ digital transformation journeys. During FY22, no cases of non-compliance concerning marketing communications by LTI were reported.
Recognition for our brand in FY22
• Ranked 22 among the top 25 most valuable IT services brands in the Brand Finance IT Services 25 2022 ranking.
• Recognized as a leading provider for digital, cloud, data and other offerings in reports by industry analysts.
6 to our 20 Mn bucket, 9 to our 10 Mn bucket, 11 to our 5 Mn bucket and 31 clients to our 1 Mn bucket.
We have created a framework called the Consolidate, Harvest, Incubate Strategic Programs (CHIP) framework for all our active client engagements.
80 81Corporate Overview | Statutory Reports | Financial Statements
Social & Relationship CapitalIntegrated Annual Report 2021-22

Social and Relationship Capital (contd.)
Alliances and associations
Strategic collaborations help us retain our esteemed clients, giving us access to an even wider set of skills and expertise to tap into, including white spaces, which help us win deals. We collaborate with over 50 partner organizations to power the ‘breakaway’ enterprises.
Our acquisitions have also helped us accelerate innovation and delivering breakthrough solutions to clients. Our acquisitions of Lymbyc, Powerupcloud and Nielsen+Partner have enhanced our AI, cloud, Fosfor and Temenos offerings. Ruletronics has helped our clients elevate their customer engagement efforts and earned us a ‘Gold’ partnership with Pega. This year, we acquired Cuelogic Technologies, to enhance our digital engineering and outsourced product development capabilities.
Our New Innovative LTI Ecosystem (NILE) nurtures a culture of open innovation through associations with start-ups and academia engagements. It allows us to nurture a start-up ecosystem by onboarding many start-ups to support client deals
Our partners see us as a co-creator and innovation partner, rather than someone who they only sell with. Some of the awards and recognitions that we have won this year reflect this. Snowflake, the data cloud company recognized LTI as. Global Innovation Partner of the Year LTI Syncordis has been recognized as Temenos Service Partner of the Year.
and projects. It also helps deliver faster and de-risked adoption of emerging technologies in the realms of data, artificial intelligence, 5G, augmented and virtual reality, and so on. Collaboration with peers through association with various industry bodies is also done to harness our collective knowledge for technological progress.
Our University Alliance program aims to create strong collaborations with academia and research institutes for researching and co-innovating to complement our client offerings and focusing on next-gen research aimed at creation of new disruptive products.
Well-articulated investor relations program
We have a robust investor outreach program through which we engage with a broad range of investors both nationally and internationally. Our communication helps ensure that our investment proposition is properly understood by our growing fraternity of investors. In FY22, the Company’s multiple channels of communication were deployed to keep investors updated about various developments and updates. This was done through a mix of virtual and in-person interactions, including meetings, NDRs and conferences as well as the Company’s first Hybrid Analyst Day.
We regularly hold quarterly earnings calls to communicate our progress and quarterly numbers to the market. We won multiple accolades at the Institutional Investor 2021 Rest of Asia ex-Mainland China Executive Team rankings in Technology/ IT Services and Software space. LTI was ranked
among the top 3 across all sell-side categories in the Technology/IT Services & Software space: #2 Best CEO, #3 Best CFO, #3 Best ESG, #2 Best IR Program and #1 Best IR Professional. It was also recognized in the ‘Most-Honoured’ Companies Asia List 2021.
Supply chain
Our commitment to creating shared value also extends to our partners, whose products and services help us succeed in an ever-evolving world order. Our Supplier Code of Conduct applies to vendors, service providers, agents, subcontractors, consultants and business partners. It ensures industry-leading Environmental, Social and Governance practices across our value chain. We prioritise local sourcing. Wherever possible, we procure our non-IT products from local businesses. It supports and helps uplift the communities in which we function and also reduces our supply chain cost, time to market and environmental footprint.
We have also undertaken automation of internal procurement processes to enhance efficiency and transform our procurement department into a ‘less paper’ enterprise. This includes the use of data management system to digitally store all purchase orders related documents of RFP and Reverse / Forward Auctioning platform.
Community outreach
Ensuring community welfare and upliftment forms an integral part of our long-term growth strategy. We are committed to engaging with local communities through initiatives in certain priority areas such as environmental protection, education and empowerment.
Our involvement with local communities also occurs through employee engagement, in which our employees dedicate their own time to CSR activities. To maximize our societal outreach, we partner with various non-governmental organizations (NGOs) who are aligned with our CSR objectives.
165,820Total beneficiaries (including those for Covid relief)
50.22%Percentage of women beneficiaries
7,246Volunteers
243,334Trees planted
Education Empowerment Environment
Our reach
Maharashtra
Telangana
Andhra Pradesh
Uttarakhand
Karnataka
Tamil Nadu
Our focus areas
Multiple accolades at Institutional Investor 2021 Rest of Asia ex-Mainland China
82 83Corporate Overview | Statutory Reports | Financial Statements
Social & Relationship CapitalIntegrated Annual Report 2021-22

35,088Total beneficiaries
Our Covid relief efforts
With vulnerable sections of the community deeply impacted by the pandemic, we leveraged our reach to help them navigate it. Our Covid-19 response is in line with our commitment to solving for society. Some of our efforts towards this end include:
• Setting up three oxygen generation plants at 3 hospitals in South India.
• Distributing medical equipment such as RT-PCR testing machines, ventilators, oxygen concentrators and microdebrider donated to 38 hospitals across India.
• Providing solar energy to 10 rural public health centers across Karnataka and Tamil Nadu.
• Distributing medical kits to schools and communities across India and providing vaccination dosage to the underprivileged across Mumbai.
• Supporting young innovators and start-ups who are working to overcome the public health and supply chain challenges posed by the pandemic.
• Creating virtual classrooms to ensure uninterrupted learning and skill development.
Enabling quality education
Our education endeavours are focused towards initiatives/ projects that support the underprivileged and students with disabilities. With the adoption of new blended or digital learning models, schools and students were brought up to adapt to the new world of digital education. Our efforts are aimed at enhancing access to high-quality education and increase in interest of children to continue the schooling.
In FY22, owing to the new normal, our CSR efforts continued to provide digital and experiential learning environment conducive for students in hybrid model. Growing accessibility of e-Learning, online resources and the continued need for the learning experience combine both traditional classroom and digital learning methodologies. We ensured the delivery of quality teaching to remote parts of the country by using technology-based solutions.
Experimental learning platforms helped students to prepare science and technology-based projects for responding to Covid-19 scenario and resolve community issues. The support of happiness kits made a big difference for students as well as the community since meals were distributed to households due to the closure of schools.
LTI’s 1Step volunteers continued to give back to society and played a vital role by conducting virtual classes and focused on teaching Science, Technology, Engineering, and Mathematics (STEM) subjects and English, and conducted awareness sessions on Covid-19.
Key outcomes
38,529 students reached through Digital/ STEM Learning — 20,361 Boys | 18,168 Girls.
3.7 Lakhs+ digital learning hours delivered.
Distributed 18,200 students happiness kit consisting dry ration, nutrition, and educational aids.
390+ 1Step volunteers engaged through various one-time/ ongoing activities.
465 appeared in competitive exams,
91 scholarships received.
48,707 lives touched through our educational programs.
Social and Relationship Capital (contd.)
84 85Corporate Overview | Statutory Reports | Financial Statements
Social & Relationship CapitalIntegrated Annual Report 2021-22

At LTI, we believe that quality education is essential for all-round development and growth. Our various initiatives in the field of education are aimed at developing interest in education through innovative methods thus reducing the dropout rate as well as empowering students to think out of the box.
Our digital learning program has brought about a transformative change in the community’s perspective.
Virtual and experiential learning
Two siblings, Diksha and Aarti, are from Uttarakhand studying in 8th and 9th standards, respectively. Through our program, we were able to increase their interest in education, thereby increasing their attendance. Their determination convinced their family to invest in smartphones during the pandemic so that they don’t lose out on their studies. Diksha wishes to be a police officer, while Aarti a science teacher.
On the other hand, through LTI’s IBT program with STEM learning, two 8th grade students from Pune, Suraj and Sarthak, innovated an ‘affordable onion stem and root cutter machine’. The machine will empower farmers to prevent time and cost overruns during harvesting. For this innovation, they were awarded the 2nd prize out of 30 shortlisted projects in Technovation 2022.
Empowering women, youth and the specially-abled
LTI is working with youth, women and the differently-abled from marginalized sections to provide them skills, which can enable them to earn their livelihoods. The project which aims at empowering youth and women, include skill development trainings for IT, Warli art and tailoring. We are also working with specially-abled young people by providing them IT skill and vocational skills training. By providing employment opportunities, we have witnessed an increase in the income by 20% to 50%.
Key outcomes
17,784 youth trained through digital learning experience.
2,952 women trained as artisans, tailoring and coconut shell product making.
6,781 youth placed through job fairs.
205 specially
abled are trained in IT and
vocational skills.
Women entrepreneurs
To empower lives and broaden scope for economic opportunities, we have undertaken various initiatives to support sustainable livelihood generation. One of our beneficiaries,
Savitha, a housewife from Aangaon, Thane, wanted to be financially independent. In 2018, we helped her enroll in Warli artisan training program. Today, she has not only mastered the art of Warli but has trained over 200 women. Savitha’s passion and contribution elevated her to the position of president of the artisans’ community.
Youth – IT skills
With increasing consumption of IT services, there lies a huge skill-gap in the industry. We supported Kavya –
one of our beneficiaries, in joining Data Analytics course through which she learned MySQL, Python and Tableau skills and successfully completed the 6 months course. Moreover, we facilitated her job placement as GIS Data and Geoscientist with a salary of H3 Lakhs per annum.
Social and Relationship Capital (contd.)
86 87Corporate Overview | Statutory Reports | Financial Statements
Social & Relationship CapitalIntegrated Annual Report 2021-22

Protecting the environment
With rising pollution levels and growing concerns about climate change, the creation of green belts has become vital. Our environmental protection initiatives go beyond our commitment to reduce our environmental footprint to make our communities greener. One of the common practices undertaken by us has been the tree plantation drive, which spans the country.
We initiated a pilot project of providing eco-chulhas to the marginalized communities of Maharashtra. The initiative aims at sustaining the depleting forest area and providing an eco-efficient cooking medium. This initiative would have multifold benefits of improving health of the women and avoiding cutting down of trees for firewood to cook daily meals. The eco-chulhas would also serve as a carbon sequestration medium during our carbon neutrality journey.
Key outcomes
243,000+ trees planted while also providing livelihood opportunities to the communities.
300 farm ponds constructed for providing scope to farmers for cultivating multiple crops thereby also experiencing increase in family income.
61,084 lives touched though our environmental initiatives.
2,500+ acres of land irrigated.
1,800 Mn+ liters of water conserved.
Farm ponds
With rising awareness of climate change, LTI, along with the community, is undertaking steps to help restore the green cover of the planet. We
supported Umesh, a farmer from a village in Karnataka, in building a farm pond. Through our support, he cultivates multiple crops such as cotton and onion and was able to invest in drip irrigation and other machineries. He managed to increase his income from H50,000 to 2 Lakhs per annum.
Eco-chulhas
One of our beneficiaries, Nirmala Namdev, a tribal woman from a forest in Maharashtra, used 16 Kg of firewood every week for cooking. This
contributed significantly to pollution and caused health problems. With eco-chulhas provided by LTI, she now consumes only 4.2 Kg of agro-waste/ wooden chips that are abundantly available in the forests. This ensures conservation of biodiversity with clean indoor cooking, forest conservation and reduced respiratory illness.
Distributed 300
eco-chulhas in the community as part of environmental conservation and reduce respiratory illness among women.
Statutory &FinancialFinancial
Statutory &
90 Management Discussion & Analysis114 Enterprise Risk Management115 Board’s Report127 Form AOC-I130 Conservation of Energy, Technology Absorption,
Foreign Exchange Earnings & Outgo134 Annual Report on CSR144 Report on Corporate Governance168 Statement under Section 197 of the Companies
Act, 2013170 Business Responsibility Report182 Compliance Certificate under SEBI (SBEB and
Sweat Equity) Regulations, 2021184 Secretarial Audit Report
90-186Standalone
187 Independent Auditors’ Report200 Balance Sheet201 Statement of Profit and Loss202 Cash Flow Statement204 Statement of Changes in Equity206 Notes forming part of Financial Statements
Consolidated
259 Independent Auditors’ Report268 Balance Sheet269 Statement of Profit and Loss270 Cash Flow Statement272 Statement of Changes in Equity274 Notes forming part of Financial Statements
187-328
Social and Relationship Capital (contd.)
For details on our environmental commitment, please refer to the natural capital section of the report.
88 Integrated Annual Report 2021-22

90 Integrated Annual Report 2021-22 91Corporate Overview | Statutory Reports | Financial Statements
Management Discussion and Analysis
Elevated inflation is expected to persist for longer than envisioned with ongoing supply chain disruptions and high energy prices continuing in 2022. Assuming inflation expectations stay well anchored, inflation should gradually decrease as supply-demand imbalances wane in 2022 and monetary policy in major economies responds.
Risks to the global baseline are tilted to the downside. The emergence of new Covid-19 variants could prolong the pandemic and induce renewed economic disruptions. Moreover, supply chain disruptions, energy price volatility, and localized wage pressures could create uncertainty around inflation and policy paths.
As advanced economies lift policy rates, risks to financial stability and emerging market and developing economies’ capital flows, currencies, and fiscal positions, especially with debt levels having increased significantly in the past two years, may emerge. Other global risks may crystallize as geopolitical tensions remain high, and the ongoing climate emergency means that the probability of major natural disasters remains elevated.
Monetary policy in many countries will need to continue on a tightening path to curb inflation pressures, while fiscal policy, operating with more limited space than earlier in the pandemic, will need to prioritize health and social
Management Discussion and Analysis
spending while focusing support on the worst affected. In this context, international cooperation will be essential to preserve access to liquidity and expedite orderly debt restructurings where needed. Investing in climate policies remains imperative to reduce the risk of catastrophic climate change.
Source: International Monetary Fund — World Economic Outlook, January 2022
I. Global economic review
Global growth prospects are expected to slow as economies grapple with supply disruptions, elevated inflation, record debt and persistent uncertainty. Growth is expected to moderate from 5.9% in 2021 to 4.4% in 2022 largely reflecting forecast markdowns in the two largest economies, the United States (US) and China.
While Omicron will weigh on activity in the first quarter of 2022, this effect will fade starting in the second quarter. A revised assumption removing the “Build Back Better” fiscal policy package from the baseline, earlier withdrawal of monetary accommodation, and continued supply shortages produced a downward 1.2 percentage-points revision for the United States. In China, pandemic-induced disruptions related to the zero-tolerance Covid-19 policy and protracted financial stress among property developers have induced a 0.8 percentage-point downgrade. Global growth is expected to slow to 3.8 percent in 2023. The forecast is conditional on adverse health outcomes declining to low levels in most countries by end-2022, assuming vaccination rates improve worldwide, and therapies become more effective.
3.8%Estimated global growth rate for 2023

92 Integrated Annual Report 2021-22 93Corporate Overview | Statutory Reports | Financial Statements
Management Discussion and Analysis
Management Discussion and Analysis (contd..)
Opportunities
a. Banking and Financial Services: LTI has seen strong year-on-year growth of 37.4% in this vertical. Digital transformation continues to be a strategic priority and key area of focus for Banking and Financial Services firms.
Firms are spending more on change the bank initiatives relative to run compared to 2-3 years back. Technology investments are seen across large and medium-sized banks and across sub-verticals such as capital markets, payments, retail banking, wealth management, and so on.
Unprecedented liquidity in the economy due to massive global stimulus programmes and new ways of working because of the pandemic, have further fuelled these investments. Companies are investing in improving customer experience by shrinking the core and building a layer of service-oriented interfaces. This gives them agility to launch a new product and offers a higher degree of straight-through processing.
Shift from cash to online transactions further drives opportunities for payments and cards companies. In addition, technology spend on automation of processes and workflows help reduce manual effort and physical presence, and contribute to operational efficiency. Firms are confident that technology investments will pay off either in terms of top-line or bottom-line expansion.
37.4% Year-on-year growth
registered in Banking and Financial Services segment
b. Insurance: LTI grew 11.2% year-on-year in this vertical. Global insurance companies have been impacted by large payouts. Beyond supporting customers through an ongoing global health crisis, they have also faced increased competition from a growing number of insurtechs and pressure from customers to deliver a seamless and digital-first experience.
Changes in consumer demand are driving the need to bring new, more responsive products and services to the market at an even faster pace. Automated underwriting, claim processing and fraud detection driven by
advanced analytics, have been key areas of spend in 2021.
We expect 2022 to continue to disrupt the status quo even more dramatically across all sectors. Players in leading markets are expected to increase their tech spend and further accelerate plans for cloud-enabled, digital transformation. Major initiatives will be focused on enhancing online user experiences with an increased emphasis on hyper-personalisation and data-driven ecosystems as well as remote distribution networks, augmented reality and IoT.
II. Industry overview
According to NASSCOM, the Indian IT services industry crossed the $200 Bn revenue mark this financial year to touch a record $227 Bn. Technology was the panacea that enabled firms to not just keep the lights on, but also repivot their business models to an online mode, adapt to changing market dynamics and customer needs, and enable collaboration in a distributed work model.
During the year, the industry saw $30 Bn of incremental revenues and an overall growth rate of 15.5%, the fastest since 2011. All sub-sectors of the industry recorded double-digit growth. Exports (including hardware) grew 17.2% with revenues of $178 Bn and e-commerce grew 39% to reach $79 Bn in FY22.
India has also emerged as a global hub for digital talent with more than 5 Mn tech workers. Tech firms quickly adapted to hybrid work models and scaled up their capability-building programmes. The industry recorded nearly 10% estimated growth in direct employees in FY22, with the highest-ever net addition of approximately 450,000 to its employee base.
Further, with one out of three employees already digitally skilled, the digital tech talent pool stands at 1.6 Mn, growing at a CAGR of 25%. With massive focus on reskilling and upskilling, the tech industry reskilled around 280,000 employees in FY22.
Going forward, the industry will continue working on priorities like attracting and retaining talent, ramping up hiring for skill and scale, especially for digital, campus and non-engineering talent. The industry will also continue to see positive revenue growth driven by strong deal pipelines, enhanced digital demand and high tech spends.
1.6 Mn Digital tech talent pool
$30 Bn Incremental revenues in
the industry
III. Our business
LTI is a global technology consulting and digital solutions company helping more than 485 clients succeed in a converging world. With operations in 33 countries, the business goes that extra mile for its clients, and accelerates their digital transformation.
Automated underwriting, claim processing and fraud detection driven by advanced analytics, have been key areas of spend in 2021.
Further details are available in the ‘LTI at a Glance section’ on Page 6 of Annual Report.
Details on our strategy and how we create value are available on Page 26 of Annual Report.

94 Integrated Annual Report 2021-22 95Corporate Overview | Statutory Reports | Financial Statements
Management Discussion and Analysis
c. Manufacturing: This sector includes Industrial Manufacturing, Automotive and Aerospace and was one of the most impacted sectors by the pandemic. LTI delivered a 23.4% year-on-year growth in this vertical. Recovery gained momentum in 2021, riding on the back of vaccine rollouts and rising demand.
As industrial production and capacity utilisation surpassed pre-pandemic levels midyear, strong increases in new orders for all major subsectors indicated continuing growth in 2022. However, optimism was held in check by caution from ongoing risks such as inflation, workforce shortages and supply chain instability. In this environment, business agility and resilience are critical requirements for organisations. The sector saw healthy budgets and capital allocation for digital transformation in 2021.
In 2022, the industry is likely to continue to see an influx of investment in automation and digitisation. Manufacturers are adopting a more cost-conscious mindset with companies shifting investment towards digital solutions that support increased agility and better risk management. Tools that capitalise on the use of data are also of prime importance.
23.4% YoY growth delivered in manufacturing vertical
d. Energy and Utilities: LTI delivered a 10.8% year-on-year growth in this vertical. The Oil & Gas industry has rebounded strongly in the second half of FY22 with both demand and oil prices bouncing back to pre-pandemic levels. However, there remains uncertainty over market dynamics and sustenance of prices through the year.
The journey of transformation has just begun for the industry and it is increasingly relying on technology and automation to make its operations more efficient. Companies are mostly investing in legacy modernisation, cloud migration, data, cyber security and IT-OT integration. We expect investments on energy transition and sustainability to go up even more in 2022.
The utilities sector has been observing a key trend around energy transitions led by
de-carbonisation, focus on reliability and resilience of energy delivery, modernisation of grid to address disaster and emergency response, and so on.
Data/ AI, digital industry platforms and cloud are key technology enablers with a major focus on cyber security.
e. Consumer Packaged Goods (CPG), Retail and Pharma: LTI achieved 16.9% year-on-year growth in this vertical. The pandemic accelerated technology investments for both consumer product companies and retailers as each was forced to ‘find’ a way to meet consumer demand stepping outside conventional ways.
This led to direct-to-consumer approach in their logistics and supply chain systems. Driven by the same, we have seen a significant trend in digital transformation initiatives in the
form of customer engagement and experience, process digitisation, ERP modernisation and data centric investments.
Companies are increasingly betting on customer data platforms that unify fragmented customer data across multiple systems to become more resilient to consumer behaviour and supply chain dynamics. In 2022, we are likely to see continued investments in the data platforms and digitisation initiatives with a focus on resilient supply chains and consumer experience led by direct-to-consumer strategies.
After a year of strong demand for IT services across the healthcare and life sciences space, growth is likely to stabilise in 2022. Covid medication and vaccines were driven by technology, rapid trials and FDA approval cycles during the year.
Industry will see a similar problem-solving and clinical approach deployed for cancer, alzheimer’s, diabetes and other long-term diseases. These will increase investments in R&D, data analytics, clinical trials and related services.
New Decentralized Clinical Trials (DCT) will continue to increase and DCT vendors are set to take an ecosystem approach in their quest to scale and differentiate. Sourcing initiatives for a unified clinical development platform will increase and pharmaceutical firms will be looking at service providers to orchestrate this platform.
The Media and Entertainment industry continues to experience the influence of consumer behaviour dynamism, mergers and acquisitions fuelled by competition and reshaping of the industry due to technological innovation.
Amid such undercurrents, technology has continued to elevate customer experience through innovative special effects, virtual reality gaming and new delivery channels for news, music and advertising.
During the pandemic, the few traditional segments of entertainment that have remained analog, like music concerts and theatre, moved to the digital domain. As consumer spending continues to contract in 2022 for some of the traditional segments, there is a natural transition towards building a secure but attention-based ecosystem where creators and producers will continue to drive innovation in the field.
The year has also seen the emergence of the ‘metaverse’ which is likely to see increased levels of spend going forward.
Human capital
LTI crossed the 46,000 headcount mark in FY22. Our unwavering focus on engaging, developing and retaining talent is part of every people decision we make.
f. Hi-Tech, Media and Entertainment: LTI achieved a strong 37.4% year-on-year revenue growth in this vertical. High-tech industries have recovered from the pandemic in FY2022 at different speeds based on varied exposure, demand for their products and reliance on sourcing networks. This has triggered companies to revisit their strategies to accelerate digitisation, AI/ML techniques to improve predictions in supply chain along with better partner collaboration for seamless integration of processes.
Companies are in the process of identifying new avenues for growth to help position themselves for a better future. They have made analytics, data management and customer data platforms a top technological priority.
Moving forward, we see an increasing trend of new innovation in this space with 5G and edge computing driving the eco-system of connected devices and smart products, hardware firms moving to new business models and heightened focus on supply chain resilience.
Further details on our human capital is available on Page 60 of Annual Report.
Management Discussion and Analysis (contd..)
Companies are increasingly betting on customer data platforms that unify fragmented customer data across multiple systems to become more resilient to consumer behavior and supply chain dynamics

96 Integrated Annual Report 2021-22 97Corporate Overview | Statutory Reports | Financial Statements
Management Discussion and Analysis
IV. Significant factors affecting our results of operations
Our results of operations have been, and will be, affected by many factors, some of which are beyond our control. This section sets out certain key factors that our management believes have affected our results of operations, or which could affect our results in the future.
Client relationships
Client relationships are at the core of our business. We have a history of high client retention and continue to derive a significant proportion of our revenue from repeat business built on our successful execution of prior engagements. In the year that ended March 31, 2022, we generated 96.7% of our revenue from existing clients as compared to 95.9% in the previous year.
As client relationships mature, we seek to maximise our revenue and profitability by expanding the scope of services offered to that client with the objective of winning more business from our clients, particularly in relation to our substantive and value-added offerings. At the same time, we continue our efforts to add new clients and expand client relationships.
Client contribution
28.0%29.3%
Top 5 Clients
40.1%42.0%
Top 10 Clients
55.1%56.8%
Top 20 Clients
FY22
FY21
Composition of revenue portfolio
Our export service revenue consists of both onsite and offshore revenue from IT services. The mix of IT services performed onsite and offshore has an impact on our ability to achieve higher profit margins. The following table shows the proportionate contribution from our onsite and offshore service revenue on a consolidated basis for the year ended March 31, 2022 as compared to the year ended March 31, 2021.
Employees and employee costs
In order to compete effectively, our ability to attract and retain qualified employees is critical.
Our total headcount increased to 46,648 as of March 31, 2022 from 35,991 as of March 31, 2021. Our attrition rate for FY22 was 24.0% as against 12.3% in FY21.
Employee benefits expenses constituted 60.1% and 58.8% of our total income in the year ended March 31, 2022 and March 31, 2021, respectively. Wage costs in India, including in the IT services industry, have historically been more competitive than wage costs in the US, Europe and other developed economies. In addition, we continue to invest in the recruitment and retention of sales and administration staff in line with our growth and expansion of our markets.
46,648 Total headcount as of
March 31, 2022
Foreign currency fluctuations
Since majority of our revenue is in foreign currency, we carry foreign exchange risks on transactions as well as translation. Although our foreign currency expenses partly provide a natural hedge, we are exposed to foreign exchange rate risk in respect of revenue or expenses entered in a currency where corresponding expenses or revenue are denominated in different currencies.
Major currencies in which we have exposures are US Dollars, Euro, Canadian Dollars, Swedish Krone, Danish Krone, Emirati Dirham, South African Rand, and British Pound Sterling.
Revenue mix
Onsite
59.2%54.1%
Offshore
FY21
FY22
40.8%
45.9%
We have put in place an active foreign exchange hedging policy to mitigate the risks arising out of foreign exchange fluctuations. In addition, the overall competitiveness of the Indian IT industry in the global market is also significantly dependent on favourable exchange rates.
Tax benefits for Indian IT companies
The Company historically benefited from the direct and indirect tax benefits given by the Government for the export of IT services from SEZs. As a result, considerable portion of our profits was exempt from income tax leading to a lower overall
effective tax rate in the previous years than that which we would have otherwise been subjected to if we were doing business outside SEZs.
During the year under review, the Company has opted for lower tax regime under the Tax Ordinance introduced by the Government in September 2019, being beneficial to the Company. Accordingly, the Company will forgo the direct tax benefits available on export of IT services from SEZs. The Company continues to avail indirect tax benefits for its business carried out through software development centres registered as STPI and SEZ units.
Management Discussion and Analysis (contd..)

98 Integrated Annual Report 2021-22 99Corporate Overview | Statutory Reports | Financial Statements
Management Discussion and Analysis
Property, plant and equipment
Plant, property and equipment has increased to H4,968 Mn as of March 31, 2022 from H3,857 Mn on March 31, 2021, since net additions are higher than depreciation during the year. The additions mainly include cost of acquiring laptops to support headcount growth.
Right of use assets
Right of use assets have been recognized at H6,391 Mn as on March 31, 2022. These assets are primarily related to office premises occupied by the Group across locations in India and overseas. Increase in Right of Use assets is majorly due to renewals and additions of office spaces in India and overseas in line with overall growth.
Capital work-in-progress
Increase in capital work-in-progress is mainly on account of construction work for building an office campus in Navi Mumbai to enable future headcount growth.
Goodwill and other intangible assets
Increase in goodwill is primarily in relation to the acquisition of Cuelogic which led to an addition of H374 Mn. The net increase in other intangible assets during the year is mainly on account of capitalisation of internally developed software during the year. Intangible assets under development represent efforts spent on assets which are under development.
2. Tangible and intangible assets (H Mn)
As atMarch 31, 2022
As atMarch 31, 2021
Property, plant and equipment 4,968 3,857
Right of use assets 6,391 6,221
Capital work-in-progress 4,374 403
Goodwill 6,900 6,574
Other intangible assets 2,718 2,408
Intangible assets under development 439 259
Total 25,790 19,722
V. Financial conditions consolidated
Assets
1. Acquisition during the year
Cuelogic
During the year, the group acquired 100% stake in Cuelogic Technologies Private Limited along with its 100% subsidiary Cuelogic Technologies,
Inc. (collectively referred as ’Cuelogic’) for an enterprise value of $8.4 Mn which includes upfront consideration, performance based earn-outs and retention payouts.
Cuelogic is a digital engineering company which specialises in product development capabilities with expertise in scaling exponential technologies. Cuelogic’s primary focus is on
building and modernising digital products leveraging cloud native methodologies across web and mobile. The Company has used the cut-off date of July 1, 2021 as the date of acquiring effective control. The financial results for the year ended March 31, 2022 includes 9 months revenue of H431 Mn and profit after tax of H5 Mn, pertaining to this acquisition.
Management Discussion and Analysis (contd..)

100 Integrated Annual Report 2021-22 101Corporate Overview | Statutory Reports | Financial Statements
Management Discussion and Analysis
3. Other non-current and current assets (H Mn)
As at March 31, 2022 As at March 31, 2021
Non-current Current Total Non-current Current Total
Other financial assets 3,020 2,830 5,850 2,052 2,158 4,210Other assets Tax assets 1,135 - 1,135 930 - 930Other assets 2,089 9,319 11,408 1,515 8,373 9,888Total other assets 3,224 9,319 12,543 2,445 8,373 10,818Total 6,244 12,149 18,393 4,497 10,531 15,028
Total other non-current and current assets increased to H18,393 Mn as of March 31, 2022 as compared to H15,028 Mn as of March 31, 2021 mainly due to higher market gains on hedges included in other financial assets and increase in unbilled revenue for fixed price contract included in other assets.
During the year, the Company has invested in fixed deposits with banks which amounts to H318 Mn as on March 31, 2022 which is included in Other Non-Current financial assets.
As required under Ind AS 115 ‘revenue from contracts with customers’, unbilled revenue for fixed-price contracts, where the contractual right to consideration is dependent on completion of contractual milestones and not upon passage of time, is classified as non-financial asset. The increase in other current assets is primarily related to such unbilled revenue for fixed-price contracts of H5,948 Mn included in other current assets as of March 31, 2022, compared to H5,335 Mn as of March 31, 2021.
4. Trade receivables
Trade receivables amounted to H28,335 Mn (net of provision for doubtful debts amounting to H765 Mn) as of March 31, 2022, compared to H20,835 Mn (net of provision for doubtful debts amounting to H642 Mn) as of March 31, 2021.
Days of sales outstanding of trade receivables as on March 31, 2022 is 65 days as against 61 days in March 31, 2021.
5. Unbilled revenue Unbilled revenue represents
value of services performed for customers not yet billed. Unbilled revenue stood at H9,033 Mn as on March 31, 2022 as against H6,071 Mn on March 31, 2021.
Days of sales outstanding of unbilled revenue (including that classified as non-financial asset) is 34 days as on March 31, 2022 compared to 33 days as on March 31, 2021.
6. Funds invested (H Mn)
As ofMarch 31, 2022
As ofMarch 31, 2021
Investments: Non-current 3,454 1,013Investments: Current 31,366 36,282Cash and cash equivalents 3,949 7,594Other bank balances 3,824 -Fund invested 42,593 44,889
The Company has invested in debt mutual funds and in equity arbitrage funds having investments in sound rated instruments and in schemes with large assets under management, thus mitigating counterparty risk. Further, the Company has invested in Corporate Deposits, and marketable Bonds. Put together, investments stood at H34,820 Mn as on March 31, 2022 as against H37,295 Mn as on March 31, 2021.
Cash and cash equivalents include both rupee accounts and foreign currency accounts with banks. The bank balances in overseas accounts are maintained to meet the expenditure of the overseas operations.
Other bank balances are term deposits, in rupee as well as foreign currency, having maturity of more than 3 months.
7. Share capital
(H Mn)
As atMarch 31, 2022
As atMarch 31, 2021
Authorized:
275 260274,500,000 equity shares of H1 each
(Previous year 260,000,000 of H1 each)
Issued, paid up and subscribed:
175 175175,270,156 equity shares for H1 each
(Previous year 174,750,608 of H1 each)
Equity share capital 175 175
8. Other equity
(H Mn)
As atMarch 31, 2022
As atMarch 31, 2021
Other reserves 12,187 11,294
Retained earnings 75,784 61,565
Non-controlling interest 57 37
Other Equity 88,028 72,896
9. Deferred tax assets / liabilities
(H Mn)
As atMarch 31, 2022
As atMarch 31, 2021
Deferred tax assets 549 546
Deferred tax liabilities 105 35
The Issued, paid up and subscribed share capital increased on account of shares allotted on exercise of employee stock options during the year ended March 31, 2022.
Other equity at the end of March 31, 2022 stood at H88,028 Mn as against H72,896 Mn at the end of March 31, 2021. The increase in other reserves from H11,294 Mn at the end of March 31, 2021 to H12,187 Mn at the end of March 31, 2022 is primarily attributed to increase in hedging reserve on account of marked to market gains on outstanding hedges along with increased quantum of hedges. The increase in retained earnings from H61,565 Mn at the end of March 31, 2021 to H75,784 Mn at the end of March 31, 2022 is on account of net profit for the year, reduced by dividend paid.
Deferred tax assets and liabilities are recognised for temporary differences arising between the tax base of assets and liabilities and their carrying amounts in the financial statements. Deferred income tax assets and liabilities are measured using tax rates and tax laws that have been enacted or substantively enacted as on the balance sheet date and are expected to apply to taxable income in the years in which those temporary differences are expected to be recovered or settled.
Deferred tax liabilities have increased to H105 Mn as on March 31, 2022 from H35 Mn as on March 31, 2021 mainly on account creation of deferred tax liability on intangible asset recognised on acquisition of Cuelogic.
Management Discussion and Analysis (contd..)

102 Integrated Annual Report 2021-22 103Corporate Overview | Statutory Reports | Financial Statements
Management Discussion and Analysis
10. Other non-current and current liabilities
(H Mn)
As at March 31, 2022 As at March 31, 2021
Non-current Current Total Non-current Current Total
Borrowings - 519 519 - 414 414Trade payables - 8,028 8,028 - 8,277 8,277Other financial liabilities 134 9,360 9,494 445 7,831 8,276Lease liabilities 6,675 1,161 7,836 6,375 1,194 7,569Other liabilities - 5,812 5,812 479 4,921 5,400Provisions 393 3,874 4,267 363 3,542 3,905Current income tax liabilities (Net)
- 429 429 - 144 144
Total 7,202 29,183 36,385 7,662 26,323 33,985
Non-current other financial liabilities and current other financial liabilities as of March 31, 2022 mainly include employee liabilities towards annual incentives and contingent consideration payable for acquisitions. The increase in current other financial liabilities is
mainly for increase in employee related liabilities which is in line with the increase in headcount.
Other non-current liabilities and other current liabilities mainly comprise unearned and deferred revenue, and statutory dues across geographies. Other non-current liabilities of H479 Mn as of March 31, 2021 relates to deferred social security contribution payable after a year which have been transferred to other current liabilities in the current year.
Provisions comprise of employee benefits on account of compensated absences and post-retirement medical benefits.
Current income tax liabilities include tax liability for current year net off advance taxes paid.
Total other non-current and current liabilities stood at H36,385 Mn as of March 31, 2022 as compared to H33,985 Mn as of March 31, 2021.
Borrowings relate to working capital facilities taken by certain overseas subsidiaries.
VI. Results of our consolidated operations
2021-22 2020-21
(J Mn) % of Total Income
(J Mn) % of Total Income
Income
Revenue from operations 156,687 97.11% 123,698 97.80%Other income 4,667 2.89% 2,744 2.20%Total Income 161,354 100.00% 126,442 100.00%Expenses Employee benefit expenses 97,007 60.12% 74,289 58.80%Operating expenses 26,565 16.46% 20,194 16.00%Finance costs 728 0.45% 788 0.60%Depreciation and amortization 3,549 2.20% 3,325 2.60%Other expenses 2,531 1.57% 1,964 1.60%Total expenses 130,380 80.80% 100,560 79.50%Profit before tax 30,974 19.20% 25,882 20.50%Tax expenses - Current tax 8,181 5.07% 6,314 5.00%- Deferred tax (net) (192) (0.12%) 186 0.10% 7,989 4.95% 6,500 5.10%Net profit for the period 22,985 14.25% 19,382 15.30%Other comprehensive income 787 4,788Total comprehensive income for the period 23,772 24,170Profit attributable to: Owners of the company 22,968 19,361Non-controlling interests 17 21 22,985 19,382Total comprehensive income attributable to: Owners of the Company 23,752 24,146Non-controlling interests 20 24 23,772 24,170Earnings per share Basic H131.19 H110.98Diluted H130.81 H110.26
Management Discussion and Analysis (contd..)

104 Integrated Annual Report 2021-22 105Corporate Overview | Statutory Reports | Financial Statements
Management Discussion and Analysis
Comparison between FY22 and FY21
1. Income
Our total income comprises revenue from operations and other income.
Our total income increased by 27.6% to H161,354 Mn for the year ended March 31, 2022 from H126,442 Mn for the year ended March 31, 2021.
Revenue from operations
Revenue mix by verticals
FY21 FY22
BFS
32.5%29.8%
Energy & Utilities
8.9%10.1%
Insurance
13.8%15.6%
CPG, Retail & Pharma
10.3%11.1%
Manufacturing
16.1%16.5%
Hi-Tech and M&E
12.2%11.1%
Others
6.2%5.8%
Revenue mix by services
FY21 FY22
ADM & Testing
33.6%34.6%
Analytics, AI & Cognitive
12.4%11.5%
Enterprise Solutions
30.8%31.1%
Enterprise Integration
and Mobility
9.3%8.4%
Cloud Infrastructure
& Security
13.9%14.4%
Our revenue increased by 26.7% to H156,687 Mn for the year ended March 31, 2022 from H123,698 Mn for the year ended March 31, 2021, due to growth in Hi-Tech, Media & Entertainment (growth of 38.3%), Banking and Financial Services (growth of 38.1%), other verticals (growth of 35.5%), Manufacturing (growth of 24.2%), CPG Retail and Pharma (growth of 17.6%), Insurance (growth of 11.7%) and Energy and Utilities (growth of 11.4%).
Our service revenue increased due to growth in Enterprise Integration and Mobility (growth of 38.8%), Analytics, AI and Cognitive (growth of 35.8%), Enterprise Solutions (growth of 25.5%), ADM and Testing (growth of 23.1%) and Cloud Infrastructure and Security (growth of 22.7%).
2. Other income
Other income primarily consists of income from foreign exchange gains/ losses, income from investments and miscellaneous income. Other income for the year ended March 31, 2022 is H4,667 Mn as against H2,744 Mn for the year ended March 31, 2021.
Income from investments
Income from mutual funds and other investments marginally decreased to H1,602 Mn in the year ended March 31, 2022 compared to H1,704 Mn for the year ended March 31, 2021. The investment income was higher in the previous year
mainly on account of interest rate reduction which led to mark to market gains on mutual fund investments. Active management of duration and sharp focus on portfolio quality ensured that we continue generating healthy returns during the year despite not having the benefit of interest rate reduction this year.
Foreign exchange gains / (losses)
To mitigate our foreign exchange risk, we have a long-term hedging policy. We hedge exposures in major currencies such as the US dollar and the Euro. Our hedging policy runs on a net exposure basis, typically for a period of up to three years. These hedges provide for payments by banks to us in the situations where the spot exchange rate on maturity is lower than the rate at which hedges were entered and payment by us to the banks in situations where the spot exchange rate on maturity is higher than the rate at which the hedges were entered. Our foreign exchange gain has increased to H2,854 Mn for the year ended March 31, 2022 as against H62 Mn for the year ended March 31, 2021 mainly due to INR depreciation during the year resulting in increased realised and un-realised gains on receivables. The Company further availed benefit of better average hedge rates during the year as compared to previous year.
K2,854 Mn Foreign exchange gain
for FY22
Miscellaneous income
Miscellaneous income was lower at H211 Mn in the year ended March 31, 2022 compared to H978 Mn for the year ended March 31, 2021. The decrease is mainly due to write back of certain earnouts payable to Syncordis S.A. amounting to H571 Mn due to an earlier acquisition of business.
3. Expenses
Our expenses include employee benefit expenses, operating expenses, finance costs, depreciation and amortisation and other expenses. Our total expenses increased by 29.7% to H130,380 Mn for the year ended March 31, 2022 from H100,560 Mn for the year ended March 31, 2021.
Employee benefit expenses
Employee benefit expenses comprise salaries (including overseas); staff welfare; contributions to provident and other funds, superannuation funds and gratuity funds.
Our employee benefit expenses increased by 30.6% to H97,007 Mn for the year ended March 31, 2022 from H74,289 Mn for
Management Discussion and Analysis (contd..)

106 Integrated Annual Report 2021-22 107Corporate Overview | Statutory Reports | Financial Statements
Management Discussion and Analysis
the year ended March 31, 2021. The increase is majorly due to increase in employee count in line with business growth, changes to employee mix and increments. This has also resulted in higher contribution to the provident and other funds, social security and payroll taxes.
Operating expenses
Operating expenses comprise consultancy charges, cost of equipment, hardware and software packages, travelling and conveyance expenses, repair and maintenance expenses.
Our operating expenses increased by 31.5% to H26,565 Mn for the year ended March 31, 2022 from H20,194 Mn for the year ended March 31, 2021 mainly due to increase in travelling and conveyance expenses, consultancy and subcontracting charges, cost for equipment, hardware and software packages and recruitment expenses.
Finance costs
Finance costs primarily comprise interest on lease liabilities recognised on adoption of Ind AS 116 ‘leases’, interest on contingent consideration payable with respect to acquisitions and interest on deposit received under credit support agreements entered with banks to limit our counterparty risk in relation to our hedges.
Our finance costs reduced to H728 Mn for the year ended March 31, 2022 from H788 Mn for the year ended March 31, 2021 primarily due to reduction in interest on lease liabilities.
Depreciation and amortisation
Tangible and intangible assets including Right of Use assets are amortised over periods corresponding to their estimated useful lives.
Our depreciation and amortisation expense increased by 6.7% to H3,549 Mn for the year ended March 31, 2022 from H3,325 Mn for the year ended March 31, 2021, primarily due to additions of assets during the year.
Other expenses
Other expenses increased by 28.9% to H2,531 Mn for the year ended March 31, 2022 from H1,964 Mn for the year ended on March 31, 2021. Legal and professional fees increased to H2,010 Mn for the year ended March 31, 2022 from H1,688 Mn for the year ended March 31, 2021. The CSR spend increased to H383 Mn for the year ended March 31, 2022 from H141 Mn for the year ended March 31, 2021. The Company had utilised the excess spend on CSR in the previous year to fulfil its CSR obligations for the year ended on March 31, 2021.
4. Profit before tax
Our profit before tax increased by 19.7% to H30,974 Mn for the year ended March 31, 2022 from H25,882 Mn for the year ended March 31, 2021.
5. Tax expense
Income tax expense comprises current tax and deferred tax. Current tax is the amount expected to be paid to the tax authorities in accordance with the applicable tax laws in relevant jurisdictions. Deferred tax assets and liabilities reflect the impact of temporary differences arising between the tax base of assets and liabilities and their carrying amounts in the financial statements as well as other deferred tax assets recognised and carried forward to the extent there is a reasonable certainty that sufficient future taxable income will be available.
During the year, the Company has opted for lower tax regime under the tax ordinance introduced by the Government in September 2019, being beneficial to the company.
Current tax expense increased to H8,181 Mn for the year that ended March 31, 2022 from H6,314 Mn for the year that ended March 31, 2021 mainly on account of increase in profit.
Deferred tax credit of H192 Mn for the year that ended March 31, 2022 as against the charge of
H186 Mn for the year that ended March 31, 2021 primarily due to MAT utilisation in the previous year.
Total tax expense has increased by 22.9% to H7,989 Mn for the year that ended March 31, 2022 from H6,500 Mn for the year that ended March 31, 2021 mainly due to increase in profits.
6. Net profit after tax
As a result of the foregoing factors, our net profit increased by 18.6% to H22,985 Mn for the year ended March 31, 2022 from H19,382 Mn for the year ended March 31, 2021.
18.6% Increase in net profit
7. Earnings per share (EPS)
Our basic EPS has increased by 18.2% to H131.19 per share for the year ended March 31, 2022 from H110.98 per share for the year ended March 31, 2021. Our diluted EPS has increased by 18.6% to H130.81 per share for the year ended March 31, 2022 from H110.26 per share in the year ended March 31, 2021.
Segment Results
We have identified Banking, Financial Services and Insurance, Manufacturing, Energy and Utilities,
High–Tech, Media and Entertainment, and CPG, Retail, Pharma and Others as our business segments and accordingly presented its segment results as summarised below.
2021-22 2020-21
(J Mn) % of total revenue
(J Mn) % of total revenue
Revenue from operationsBanking, Financial Services and Insurance 72,583 46.3% 56,191 45.4%Manufacturing 25,280 16.1% 20,353 16.5%Energy and Utilities 13,930 8.9% 12,501 10.1%High-Tech, Media and Entertainment 19,055 12.2% 13,778 11.1%CPG, Retail, Pharma and others 25,839 16.5% 20,875 16.9%Total revenue from operations 156,687 100.0% 123,698 100.0%
2021-22 2020-21
(J Mn) % of total revenue
(J Mn) % of total revenue
Segmental ResultsBanking, Financial Services and Insurance
14,714 47.3% 12,519 22.3%
Manufacturing 5,519 17.7% 5,058 24.9%
Energy and Utilities 2,674 8.6% 2,629 21.0%
High-Tech, Media and Entertainment
3,376 10.8% 2,874 20.9%
CPG, Retail, Pharma and others
4,837 15.5% 4,374 21.0%
Total segment results 31,120 100.0% 27,454 22.2%
Management Discussion and Analysis (contd..)

108 Integrated Annual Report 2021-22 109Corporate Overview | Statutory Reports | Financial Statements
Management Discussion and Analysis
2021-22 2020-21
(J Mn) % of total revenue
(J Mn) % of total revenue
North America 104,195 66.50% 84,513 68.30%Europe 25,325 16.16% 19,529 15.80%India 13,029 8.32% 9,712 7.90%Asia Pacific 3,839 2.45% 3,567 2.90%Rest of the world 10,299 6.57% 6,377 5.20%Total revenue 156,687 100.00% 123,698 100.00%
The following tables provides breakup of our revenue on the basis of the geographic location of our clients.
VII. Liquidity
The Company continues to maintain healthy liquidity position for the year, meeting the cash requirements through its internal accruals. Apart from cash and cash equivalents, the Company’s overall investment position in mutual funds, corporate deposits, bonds, commercial paper and bank deposits has increased to H38,962 Mn as on March 31, 2022 from H37,295 Mn as on March 31, 2021.
The table below summarises our consolidated cash flows.
VIII. Key Financial Ratios
(H Mn)
2021-22 2020-21
Net cash generated from operating activities 16,520 23,996
Net cash (used) in investing activities (9,594) (16,560)
Net cash (used) in financing activities (10,458) (5,088)
Net increase / (decrease) in cash and cash equivalents (3,532) 2,348
Cash and cash equivalents at the beginning of the period 7,594 5,252
Effect of exchange differences on translation of foreign currency cash and cash equivalents
(113) (6)
Cash and cash equivalents at the end of the period 3,949 7,594
(H Mn)
Ratios 2021-22 2020-21 2020-21
DSO (Billed) 65 61 7.0%
Current Ratio ^ 3.0 3.1 -1.7%
Operating Profit Margin (%) * 17.3% 19.3% -10.8%
Net Profit Margin (%) * 14.7% 15.7% -6.4%
Return on Net Worth ** 28.5% 30.5% -6.5%
Debt-Equity Ratio # 0.09 0.11 -13.3%
Debt Service Coverage Ratio # 17.6 14.8 18.8%
The Company’s long-term rating has been maintained by CRISIL at AAA/Stable.
The Company has considered the possible effects that may result from Covid-19 on the recoverable values of its financial and non-financial assets. The impact of Covid-19 on the financial statements may differ from that estimated at the time of approval of these financial statements.
IX. Internal controls
LTI has established a framework for internal controls, commensurate with the size and nature of its operations. Process has been set up for periodically apprising the senior management and the Audit Committee of the Board about internal audit observations of the Company with respect to internal controls and status of statutory compliances.
Business heads and support function heads are responsible for establishing effective internal controls within their respective functions. Standard operating procedures and internal control manuals are defined and continuously updated.
The Company has laid down internal financial controls as detailed in the Companies Act, 2013. These have been established across the levels and are designed to ensure compliance to internal
control requirements, regulatory compliance and appropriate recording of financial and operational information.
The internal audit team periodically conducts audits across the Company, which include review of operating effectiveness of internal controls. The Company, wherever necessary, engages third party consultants for specific audits or reviews. The Audit Committee oversees internal audit function.
X. Outlook, risks and concerns
This section lists forward-looking statements that involve risks and uncertainties. Our actual results could differ materially from those anticipated in these statements as a result of certain factors. LTI does not undertake to update any forward-looking statement that may be made from time to time by us or on our behalf.
^ Current Ratio includes current investments and other bank balances.
*Higher wage costs due to wage hike and acquiring niche skill talent has led to drop in Operating & Net Profit Margin for the year ended March 31, 2022.
** Lower margins explained above during the year dragged the Return on Net Worth for the year ended March 31, 2022.
# Debt comprises of Lease Liabilities and Overdraft balances.
Management Discussion and Analysis (contd..)

110 Integrated Annual Report 2021-22 111Corporate Overview | Statutory Reports | Financial Statements
Management Discussion and Analysis
Risk Description Mitigation approach
Resource retention and fulfilment
Risk in operating model
• Challenges in retaining top talent and talent with niche skills.
• Fulfilment demand with shorter lead time results into higher cost of resources impacting profitability.
A. Future of work
• Business dynamics are changing rapidly in context to flexible working model, remote working and change in workplace design. These drivers will require changes in our operating model balancing the needs of clients / employees.
B. Localisation
• Reduced availability of work visas or stringent eligibility criteria or costs could lead to project delays and increased costs.
• Competitive compensation grid for niche skills.
• Multiple retention and fulfilment programmes at organisation and individual business unit level.
• Demand forecast to be provided by business to plan the supply proactively.
• Reskilling/upskilling internal people for high volume and new age skills demand.
A. Future of work
Various programmes have been initiated to prepare the organisation for the changing business dynamics and work model.
Employee communication and training
• Robust communication strategies are deployed for employee awareness on modified processes to enable work in changed environment.
System, process, and policy readiness
• Relevant policies are revised to suit the changing business and work model.
Facility readiness
• The facilities and administrations are redesigned in perspective of the flexible work model and employee health and safety.
Laptop (LTI asset / client asset) and security tools enablement
• Security enablement on LTI or client laptops is being executed to make the data on the devices secured.
B. Localisation
• Reduction in dependency on work visas through increased hiring of local talent.
• Reskilling / upskilling of employees in all major geographies.
Organisation level risks and mitigation approach
Risk Description Mitigation approach
Risk in operating model (contd..)
C. Geopolitical
• Establish a process that evaluates all risks related to starting a business in new country.
• Subscribing to global services organisation that can provide timely alerts on risk events.
C. Geopolitical
• Geopolitical risk in starting business in new geography.
• Changes in political conditions / regulations can affect the business in that specific country.
Cyber security
Lack of appropriate controls in cyber security may result in vulnerabilities leading to:
• Cyber threats and cyber attacks.
• Non-compliance of contractual obligations.
• Critical business data loss.
• Ensure mandatory trainings are completed within target dates.
• Ensure that data criticality, backup requirements and restoration testing plan is defined in coordination with business owner.
• Investment in licenses to cover wider spectrum of assets to implement all enterprise security controls.
• Patching of vulnerabilities and deployment of security patches across enterprise systems within timelines.
Data privacy
• Non-compliance to privacy laws can attract heavy financial penalties including loss of reputation.
• Effective governance of data privacy practices through implementation of various tools.
• Engage external consultancy for detailed assessments of various functions and improvisation of policies and procedures.
Business concentration
Business concentration in top accounts and geography.
• Maximum revenue being contributed by select top accounts.
• Revenue concentration in US Geography.
• Focus on opening new quality logos.
• Strategic planning and focus to mine account ranked 51-100.
• Focus and investment to grow accounts in geographies outside US.
Business continuity plans for the projects may not be adequate to cater to pandemic scenario.
• Critical projects to do a granular resource unavailability planning to avoid billing loss due to any crisis.
• Tracking of the resource-level planning to be done by the delivery heads.
• BCMS ISO 22301 certification journey underway and is expected to be completed in FY23.
Operational resiliency
Management Discussion and Analysis (contd..)

112 Integrated Annual Report 2021-22 113Corporate Overview | Statutory Reports | Financial Statements
Management Discussion and Analysis
Risk Description Mitigation approach
Organisation level risks and mitigation approach (contd..)
• Company’s operations could be adversely affected due to impact of the pandemic on employee’s health and safety.
Various programmes have been implemented in the organisation to maintain employee health and safety:
• Vaccination drives for employee safety (India).
• 24*7 emergency medical helpline.
• Handling queries for Covid-19 through Connect & Heal programme and through location level committee (India).
• Establishment of Covid-19 emergency response cell (India).
Pandemic: Employee health and safety
Foreign exchange
International mobility
• With majority business being export driven the Company is exposed to foreign exchange risk.
Risk of legal liabilities and reputational loss due to non-compliances to:
• Client documentation processes.
• Country specific wage regulations.
• Work location as against the one per the petition.
LTI as an organisation has a Board approved Financial Risk Management policy which provides a framework for managing the foreign exchange risk related to its business. The policy enables implementing a layered hedging programme at the Company level.
Implement tool-based control to introduce stringent controls on:
• Client documents and its accountability.
• Payment of wages per local regulations.
• Work location change / intercity movement request as against the employee work location.
Rapid change in technology and digital disruption
• Potential challenge to cater to digital disruption will lead to business loss.
• Ability to adapt to new digital business.
• Strengthen Digital Solution Architect (DSA) group.
• Work with geography SMEs to strengthen go-to-market strategy.
• Building solutioning capability for end-to-end digital transformation.
a. Competency development in newer technologies.
b. Increasing revenue from newer technologies.
Risk Description Mitigation approach
Regulatory compliances
Execution
• Non-compliances towards changing regulations across multiple jurisdictions could result in penalties, business loss, debarment, reputational damage, and criminal prosecution.
• Impact of Covid on critical delivery milestone.
Following mitigation measures are implemented to ensure compliances on regulations:
• Implementation of compliance monitoring system to effectively monitor the compliances across various jurisdictions globally.
• Constitution of Internal Compliance Committee for governance on compliances globally.
• Engagement with external consultancy firms for timely updation of the Compliance Obligation Registers in line with changing laws.
• All delivery parameters are reviewed and monitored through digitised governance process.
• Critical and high risks projects are being reviewed by the leadership through regular Escalation Risk Review process.
• Delivery health assessment of projects on daily basis by PMs to identify risks.
A class action lawsuit was filed in the southern district of New York in US against the Company alleging discrimination by an ex-employee and an ex-contractor. The Company is taking necessary actions to defend the claim. The Company is presently unable to predict the duration or the outcome of this matter.
During FY20, the US Department of Justice and US Immigration and Customs Enforcement initiated an investigation of the Company related to its use of US non-immigrant visas for its employees. Pursuant to the same, the Company has provided the
requested details to the authorities. There is no formal charge filed in the matter as on date.
The year under review has been an exceptionally strong year for us. The world continues to change rapidly around us. We also need to acknowledge the uncertainties given the volatile macro situation. While we have not seen any slowdown in the demand environment, we have noticed a level of caution due to rising input costs and geopolitical tensions.
Based on the visibility we have today, we remain confident of our strong
momentum. We are entering FY23 with strong tailwinds in terms of large deals, robust pipeline, highest number of new clients and headcount additions.
All the pillars of our revenue growth strategy, such as our growth accounts, invest accounts, new account openings and large deals, are on a strong footing. Our continued proven ability to execute in a challenging and changing environment gives us the confidence that we will, once again, be in the leaders’ quadrant for growth in FY23
Management Discussion and Analysis (contd..)
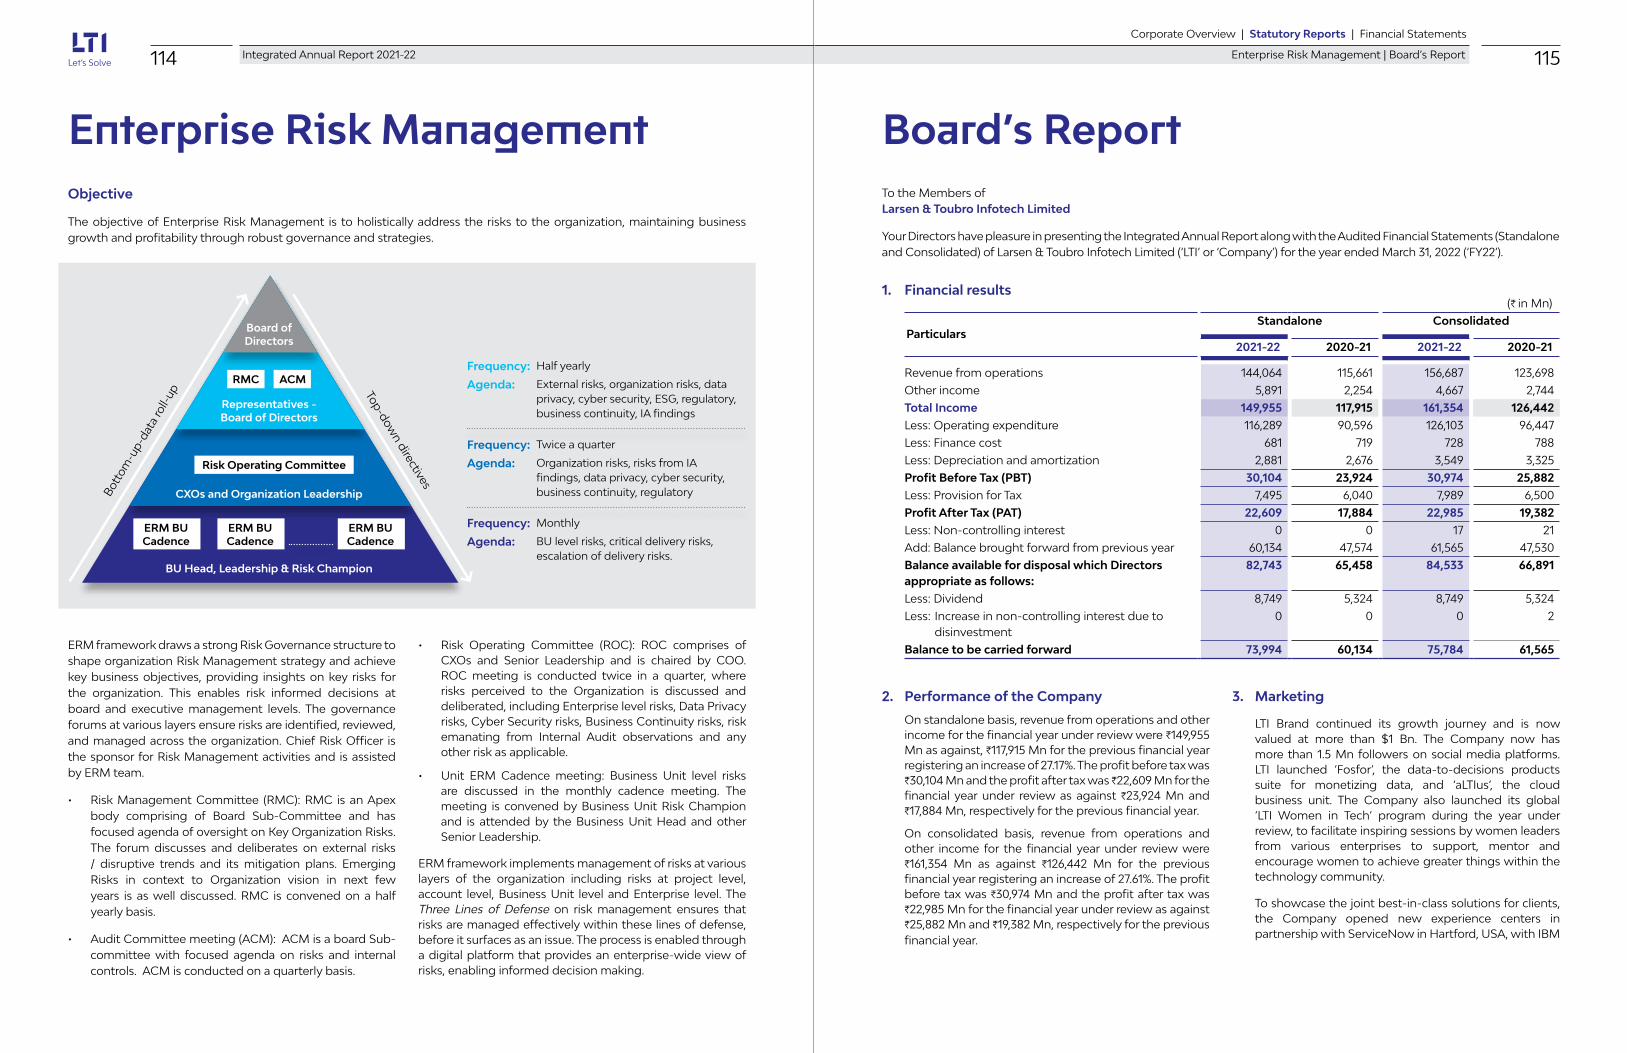
114 Integrated Annual Report 2021-22 115Corporate Overview | Statutory Reports | Financial Statements
Enterprise Risk Management | Board’s Report
Enterprise Risk Management Objective
The objective of Enterprise Risk Management is to holistically address the risks to the organization, maintaining business growth and profitability through robust governance and strategies.
ERM framework draws a strong Risk Governance structure to shape organization Risk Management strategy and achieve key business objectives, providing insights on key risks for the organization. This enables risk informed decisions at board and executive management levels. The governance forums at various layers ensure risks are identified, reviewed, and managed across the organization. Chief Risk Officer is the sponsor for Risk Management activities and is assisted by ERM team.
• Risk Management Committee (RMC): RMC is an Apex body comprising of Board Sub-Committee and has focused agenda of oversight on Key Organization Risks. The forum discusses and deliberates on external risks / disruptive trends and its mitigation plans. Emerging Risks in context to Organization vision in next few years is as well discussed. RMC is convened on a half yearly basis.
• Audit Committee meeting (ACM): ACM is a board Sub-committee with focused agenda on risks and internal controls. ACM is conducted on a quarterly basis.
• Risk Operating Committee (ROC): ROC comprises of CXOs and Senior Leadership and is chaired by COO. ROC meeting is conducted twice in a quarter, where risks perceived to the Organization is discussed and deliberated, including Enterprise level risks, Data Privacy risks, Cyber Security risks, Business Continuity risks, risk emanating from Internal Audit observations and any other risk as applicable.
• Unit ERM Cadence meeting: Business Unit level risks are discussed in the monthly cadence meeting. The meeting is convened by Business Unit Risk Champion and is attended by the Business Unit Head and other Senior Leadership.
ERM framework implements management of risks at various layers of the organization including risks at project level, account level, Business Unit level and Enterprise level. The Three Lines of Defense on risk management ensures that risks are managed effectively within these lines of defense, before it surfaces as an issue. The process is enabled through a digital platform that provides an enterprise-wide view of risks, enabling informed decision making.
Frequency:
Agenda:
Frequency:
Agenda:
Frequency:
Agenda:
Monthly
BU level risks, critical delivery risks, escalation of delivery risks.
Twice a quarter
Organization risks, risks from IA findings, data privacy, cyber security, business continuity, regulatory
Half yearly
External risks, organization risks, data privacy, cyber security, ESG, regulatory, business continuity, IA findings
Bott
om-u
p-da
ta ro
ll-up Top-dow
n directives
Board of Directors
Representatives - Board of Directors
CXOs and Organization Leadership
BU Head, Leadership & Risk Champion
RMC ACM
Risk Operating Committee
ERM BU Cadence
ERM BU Cadence
ERM BU Cadence
(H in Mn)
ParticularsStandalone Consolidated
2021-22 2020-21 2021-22 2020-21
Revenue from operations 144,064 115,661 156,687 123,698Other income 5,891 2,254 4,667 2,744Total Income 149,955 117,915 161,354 126,442Less: Operating expenditure 116,289 90,596 126,103 96,447Less: Finance cost 681 719 728 788Less: Depreciation and amortization 2,881 2,676 3,549 3,325Profit Before Tax (PBT) 30,104 23,924 30,974 25,882Less: Provision for Tax 7,495 6,040 7,989 6,500Profit After Tax (PAT) 22,609 17,884 22,985 19,382Less: Non-controlling interest 0 0 17 21Add: Balance brought forward from previous year 60,134 47,574 61,565 47,530Balance available for disposal which Directors appropriate as follows:
82,743 65,458 84,533 66,891
Less: Dividend 8,749 5,324 8,749 5,324Less: Increase in non-controlling interest due to
disinvestment0 0 0 2
Balance to be carried forward 73,994 60,134 75,784 61,565
Board’s ReportTo the Members ofLarsen & Toubro Infotech Limited
Your Directors have pleasure in presenting the Integrated Annual Report along with the Audited Financial Statements (Standalone and Consolidated) of Larsen & Toubro Infotech Limited (‘LTI’ or ‘Company’) for the year ended March 31, 2022 (‘FY22’).
1. Financial results
2. Performance of the Company
On standalone basis, revenue from operations and other income for the financial year under review were H149,955 Mn as against, H117,915 Mn for the previous financial year registering an increase of 27.17%. The profit before tax was H30,104 Mn and the profit after tax was H22,609 Mn for the financial year under review as against H23,924 Mn and H17,884 Mn, respectively for the previous financial year.
On consolidated basis, revenue from operations and other income for the financial year under review were H161,354 Mn as against H126,442 Mn for the previous financial year registering an increase of 27.61%. The profit before tax was H30,974 Mn and the profit after tax was H22,985 Mn for the financial year under review as against H25,882 Mn and H19,382 Mn, respectively for the previous financial year.
3. Marketing
LTI Brand continued its growth journey and is now valued at more than $1 Bn. The Company now has more than 1.5 Mn followers on social media platforms. LTI launched ‘Fosfor’, the data-to-decisions products suite for monetizing data, and ‘aLTIus’, the cloud business unit. The Company also launched its global ‘LTI Women in Tech’ program during the year under review, to facilitate inspiring sessions by women leaders from various enterprises to support, mentor and encourage women to achieve greater things within the technology community.
To showcase the joint best-in-class solutions for clients, the Company opened new experience centers in partnership with ServiceNow in Hartford, USA, with IBM

116 Integrated Annual Report 2021-22 117Corporate Overview | Statutory Reports | Financial Statements
Board’s Report
in Bengaluru, India and with Oracle in Mumbai, India. Responding to the changing future of work, workplace, and workforce, the Company rolled-out the ‘Yin-Yang’ Model which is associated with the best practices around collaboration, flexibility, inclusion, and accountability.
4. Human resource
People are key to our customer’s success and therefore LTI’s success. Our skilled and committed talent pool has adapted itself to the dynamic needs of our customers and technological changes. They have been pivotal in delivering best-in-class solutions and services to our clients thereby exceeding industry benchmarks.
Our hybrid Y2M (Yin-Yang Model), is pivoted on the belief that what is good for our people and our customers, is good for LTI. It has helped us operationalize our future of work strategy by introducing balance and flexibility at the workplace. Consequently, programs, policies and practices aimed at augmenting the well-being, engagement and up-skilling of our people have been put in place. These will lay the foundation of our program for future-readiness globally as we grow.
For details on human resource development, please refer to the ‘Human Capital’ section of the Integrated Report section in this Annual Report.
5. Infrastructure
LTI’s footprint is spread across 9 cities in India, where majority of office space are in SEZ premise. The Company has added space capacity during the year under review in 3 cities viz. Hyderabad, Pune, and Coimbatore. LTI plans to further scale up space capacity in the coming financial year to accommodate growing business. Your Company is committed to focus on maintaining global standards in infrastructure with a sustainable approach, thereby ensuring seamless services to all internal and external stakeholders.
Despite continuation of the pandemic situation during FY22, LTI has been successful in overcoming the challenges witnessed in the socio-economical sector. To optimise the need for infrastructure and to maintain the work-life balance, the hybrid working model (Y2M) has been put in place.
LTI was one of the few corporates to initiate vaccination drives for employees & their family members within office premises in collaboration with top hospitals. The effort towards 100% coverage of vaccination is ongoing. We took a step further and created isolation facilities at our office locations for use by employees and their families.
Significant accolades in FY22
• LTI Headquarter at Powai is currently sourcing 100% power from renewable energy.
• LTI awarded with “CII National Energy Award” for excellence in energy management.
• LTI has been awarded the “Prashansa Patra Winner 2021” under service sector by National Safety Council of India (NSCI)
As on March 31, 2022, the total seating capacity of Indian centres stood at 27,588.
6. Quality initiatives
Client Centricity is the core of LTI’s Quality Policy. LTI strives to be the most client centric partner by delivering rich and meaningful experiences not only to its clients but also to its client’s customers. It endeavours to continuously improve its services and solutions, with focus on agility and creativity by nurturing an environment that promotes learning and growth.
LTI’s endeavour to be unmatched in client centricity including its real time, transparent, yet forward-thinking response, amid the unprecedented challenges, were acknowledged and appreciated in the recently concluded CSAT survey. We have held on to the CSAT Experience Index score compared to previous cycle. Positive feedbacks have been received on agility/ flexibility, understanding business domain and customer centricity expectations.
LTI’s proprietary Capability Maturity Framework (LTI-CMF) was deployed in FY22 for the fourth consecutive year. It continued to instil a culture of self-discipline combined with strong collaboration within & across units. Prime benefits include increase in earnings via 53 new innovation platforms, frameworks, governance & analytics tools, industrialization of existing Intellectual Property & best practices. Project management using high maturity (HM) practices also brought in significant savings. Other benefits included productivity improvements in 39 accounts/sub practices and enrichment of the Central Knowledge Repository(myKM) with good practices, case studies & reusable components from all units.
Service Management COE is established to further enhance service quality through focused consultancy. It is enabled by ITIL Assessment framework (to assess effectiveness of ITIL process implementation) & ITIL 4 foundation training & certification module.
LTI’s Quality Management Systems (QMS) was strengthened with 52+ QMS process enhancements, including estimations for new technology, new
processes, and enhancements for Device Engineering in IIOT, Lifesciences SDLC process & Security lifecycle processes. Digitization achieved to monitor & track account improvement plans & quarterly business reviews, through portals.
BGenie- LTIs proprietary Liferay based tool, automating the benchmarking process, completed 1000 baselines. High maturity practices of LTI was presented in HMBP conference.
The Company’s Escalation Risk Review (ERR) framework with escalation path right up to the Chief Operating Officer was very effective in getting timely attention at the appropriate level, thus arresting possible client escalations & ensuring a positive client experience at every stage during the engagements.
Certifications
The Company continues to demonstrate its ability to drive its Quality, Service Management, Information Security, Environmental & Health commitments effectively and efficiently through its ISO 9001, ISO 27001, ISO 14001, ISO 20000, and ISO 45001 certification accreditations by Bureau Veritas. Compliance to ISAE 3402 for projects in the insurance domain and for client specific engagements in the other domains across all Delivery Units was sustained. The Company continues to retain its Level 5 status on the CMMI DEV & CMMI SVC constellations. CMMI 2.0 Level 5 assessment will be completed by April-2022.
Our commitment to client centricity and culture of continuous improvement thus continues – enabled by a firm commitment to our belief to ‘Go the Extra Mile’, “Keep Learning” & ‘Push Frontiers of Innovation’.
7. Transfer to reserves
The Directors do not propose to transfer any amount to reserves during the current financial year.
8. Dividend A. Dividend – FY22
During FY22, the Company paid a special dividend of H10/- per equity share of face value of H1/- each and an interim dividend of H15/- per equity share of face value of H1/- each. The Board of Directors at their meeting held on April 19, 2022 have recommended a final dividend of H30/- per equity share of face value of H1/- each. Accordingly, the total dividend for FY22, including the recommended final dividend, if approved by the members at the ensuing 26th Annual General Meeting, would amount to H55/-
per equity share. The final dividend, if approved by the members, would be paid to those members whose name appear in the Register of Members as on the Record Date mentioned in the Notice convening the 26th AGM.
The Dividend payment is based upon the parameters outlined in the Dividend Distribution Policy of the Company which is in line with Regulation 43A of the SEBI (Listing Obligations and Disclosure Requirements) Regulations, 2015, and is available on the Company’s website at www.Lntinfotech.com/Investors.
B. Unclaimed Dividend
In accordance with the provisions of Section 125 and other applicable provisions, if any, of the Companies Act, 2013 read the with Investor Education and Protection Fund Authority (Accounting, Audit, Transfer and Refund) Rules, 2016, following dividends declared by the Company for FY2016 and remaining unpaid/unclaimed for seven years, will be transferred to the Investor Education and Protection Fund (‘IEPF’):
Date of declarationDue date for transfer to IEPF
January 18, 2016 February 22, 2023May 31, 2016 July 6, 2023
Further, the shares corresponding to the dividend(s) which have remained unclaimed/unpaid for seven consecutive years will also be transferred to the IEPF.
Members are requested to claim the dividend(s), which have remained unclaimed/unpaid, by sending a written request to Corporate Secretarial Department at [email protected] or to the Company’s RTA at [email protected] or at their address at C-101, 247 Park, L.B.S. Marg, Vikhroli West, Mumbai-400 083, Maharashtra, India.
9. Changes in share capital
During FY22, the Company allotted 519,548 equity shares of H1 each on exercise of the vested stock options by the eligible employees under Larsen & Toubro Infotech Limited Employee Stock Option Scheme 2015 (‘ESOP Scheme 2015’). Accordingly, the paid-up equity share capital of the Company increased from H174.75 Mn as at March 31, 2021 to H175.27 Mn as at March 31, 2022. After March 31, 2022, the Company has further allotted 32,005 equity shares of H1 each on April 1, 2022 and 4,219 equity shares of H1 each on April 19,

118 Integrated Annual Report 2021-22 119Corporate Overview | Statutory Reports | Financial Statements
Board’s Report
2022, on exercise of vested stock options by the eligible employees under the ESOP Scheme 2015. The equity shares allotted under the ESOP Scheme 2015 rank pari-passu with the existing shares of the Company. As on the date of this report, the paid-up equity share capital of the Company is H175.30 Mn.
10. Capital expenditure
On standalone basis, as at March 31, 2022, the gross fixed and intangible assets stood at H12,715 Mn (previous year H11,102 Mn) out of which assets amounting to H3,179 Mn (previous year H1,728 Mn) were added during the year, and the net fixed and intangible assets stood at H10,273 Mn (previous year H4,795 Mn).
On consolidated basis, as at March 31, 2022, the gross fixed and intangible assets stood at H28,406 Mn (previous year H25,524 Mn) out of which assets amounting to H3,515 Mn (previous year H3,233 Mn) were added during the year and assets of H547 Mn were recognized pursuant to acquisition of business (previous year Nil) and the net fixed and intangible assets stood at H19,399 Mn (previous year H13,501 Mn).
11. Deposits
During the year ended March 31, 2022, the Company has not accepted any public deposits and as such, no amount on account of principal or interest on public deposits was outstanding as on the date of the Balance Sheet. Further, in accordance with the provisions of Rule 16 of the Companies (Acceptance of Deposits) Rules, 2014 (‘Deposit Rules’), the Company has filed with the Registrar of Companies (‘ROC’) the return for particulars of transactions by the Company not considered as deposit as per Rule2(1)(c) of the Deposit Rules.
12. Subsidiary/ Associate/ Joint Venture Companies
As on March 31, 2022, the Company had 27 subsidiaries. During the year under review, there were following material changes in the subsidiaries of the Company:
A. Acquisition Your Company acquired Cuelogic Technologies
Private Limited along with its wholly-owned subsidiary in the US, Cuelogic Technologies, Inc., on July 7, 2021, with the effective date of acquiring control from July 1, 2021.
B. Amalgamation i. The Hon’ble National Company Law Tribunal,
Mumbai Bench (‘NCLT’) passed an order on
July 16, 2021 sanctioning the Scheme of Amalgamation between Syncordis Software Services India Private Limited and Ruletronics Systems Private Limited, wholly owned subsidiaries, with the Company, under Sections 230-232 of the Companies Act, 2013. The amalgamation was effective on September 8, 2021, upon filing of the certified true copy of the NCLT order with Registrar of Companies, Mumbai.
ii. The Audit Committee and the Board of Directors of the Company have, at their respective meetings held on January 19, 2022, approved a scheme of amalgamation under the Companies Act, 2013 for merger of three wholly-owned subsidiaries namely, PowerUpCloud Technologies Private Limited, Lymbyc Solutions Private Limited & Cuelogic Technologies Private Limited (“Transferor Companies”) with the Company, subject to requisite approvals, as applicable.
C. Buyback by L&T Infotech Financial Services Technologies Inc.
During the year, the Company accepted the offer of L&T Infotech Financial Services Technologies Inc., (‘LTIFST’) to buyback its 2,00,000 shares. Post completion of the buyback by LTIFST, the Company continues to hold 100% shareholding in LTIFST.
In line with the requirements of Regulation 16(1)(c) of SEBI Listing Regulations, the Company has a policy on identification of material subsidiaries, which is available on the Company’s website, www.Lntinfotech.com/ Investors. As on March 31, 2022, there were no material subsidiaries of the Company.
A statement containing the salient features of the financial statement of subsidiaries in form AOC-1 is annexed as Annexure A to this Report. Pursuant to the requirements of Section 136 of the Act, the standalone financial statements and consolidated financial statements of the Company along with relevant documents & audited financial statements of the subsidiaries are available on the Company’s website, www.Lntinfotech.com/Investors.
13. Particulars of loans given, investments made, guarantees given or security provided
Details of investments made and/or loans or guarantees given and security provided, if any, are given in the notes forming part of the Standalone and Consolidated financial statements forming part of this Annual Report.
14. Related party transactions
Pursuant to the amendment in SEBI Listing Regulations, during the year under review, Audit Committee has approved amendments to the existing Related Party Transactions Policy of the Company including the limits that will constitute material modification of an approved RPT, and the same is available on the Company’s website, www.Lntinfotech.com/Investors.
All related party transactions during FY22 were in the ordinary course of business and at arm’s length terms. During FY22, Audit Committee has reviewed on quarterly basis, the related party transactions of the Company against the omnibus approval accorded by Audit Committee.
During FY22, there were no material related party transactions including transaction involving payments made to related party with respect to brand usage/ royalty, requiring approval of the shareholders. Furthermore, there were no contracts/arrangements with related parties referred to in sub-section (1) of Section 188 of the Companies Act, 2013.
Related party transactions during FY22, were in compliance with the Companies Act, 2013, SEBI Listing Regulations and Accounting Standards and are disclosed in the notes forming part of the financial statements.
15. Material changes and commitments affecting the financial position of the company, between the end of the financial year and the date of this report
There have been no material changes and commitments affecting the financial position of the Company, between the end of the financial year and the date of this Report.
16. Conservation of energy, technology absorption, foreign exchange earnings and outgo
Information as per Section 134 of the Companies Act, 2013 read with Rule 8(3) of the Companies (Accounts) Rules, 2014 relating to conservation of energy, technology absorption, foreign exchange earnings and outgo is given in Annexure B to this Report.
17. Risk management
The Company has formulated a risk management policy and has put in place a mechanism to apprise the Board Members about risk assessment, minimization
procedures and periodic review to ensure that executive management controls risk by means of a properly designed framework. A detailed note on risk management is given in Management Discussion & Analysis/ Integrated Report section forming part of this Annual Report.
18. Corporate sustainability
Your Company is committed to fulfil its Environmental, Social and Governance (ESG) responsibilities while building an ethical workplace, and following the legacy and practices of Larsen & Toubro Limited, the Parent Company. We believe in conducting business sustainably through sound practices which conserve our natural resources, reduce carbon footprint, increase social equity and good governance practices for a sustainable tomorrow thereby creating sustainable value chain. Through community development programs, LTI works towards building resilience in underprivileged members of society. LTI’s ESG framework leverages its core competencies to deliver greater and more sustainable impact across its focus areas of Education, Empowerment & Environment and disaster management such as providing Covid relief as and when required. These are further set forth through specific objectives identified and commitments made through the ESG roadmap. LTI’s alignment to the overarching objectives of the United Nations Sustainable Development Goals, outlines its contribution to the sustainable practices. LTI is also a signatory to the United Nations Global Compact (UNGC) Principles and United Nation Women’s Empowerment Principles (UN WEPs). LTI has committed to become carbon and water neutral for India operations by the year 2030 and has also committed to set emission reduction targets through Science Based Target initiative (SBTi).
Insights on CSR & Sustainability initiatives and reports are available on the Company’s website, www.Lntinfotech. com/social-responsibility.
19. Corporate social responsibility
The disclosures required to be given under Section 135 of the Companies Act, 2013 read with Rule 8(1) of the Companies (Corporate Social Responsibility Policy) Rules, 2014 and Companies (Corporate Social Responsibility Policy) Amendment Rules, 2021, are outlined in the Annual Report on CSR Activities for FY22, which is Annexure C to this Report.

120 Integrated Annual Report 2021-22 121Corporate Overview | Statutory Reports | Financial Statements
Board’s Report
The CSR Policy and CSR Annual Action Plan of the Company for FY22 is available on the Company’s website, www.Lntinfotech.com/social-responsibility.
20. Directors & key managerial personnel
Appointment(s)/re-appointment(s) during FY22
• Mr. Anil Rander was appointed as Chief Financial Officer, w.e.f April 14, 2021;
• Mr. James Abraham was appointed as Independent Director (Additional) for a term of five years, w.e.f. July 18, 2021 till July 17, 2026;
• Mr. Rajnish Kumar was appointed as Independent Director (Additional) for a term of five years, w.e.f. August 26, 2021 till August 25, 2026;
• Mr. Sanjeev Aga was re-appointed as Independent Director for the second term of five consecutive years, w.e.f. November 9, 2021 till November 8, 2026;
• Mr. Sudhir Chaturvedi was re-appointed as Whole-time Director for five years, w.e.f. November 9, 2021 till November 8, 2026;
• Mr. Tridib Barat was appointed as Company Secretary & Compliance Officer, w.e.f. January 19, 2022;
• Mr. Vinayak Chatterjee was appointed as Independent Director (Additional) for a term of five years, w.e.f. April 1, 2022 till March 31, 2027.
In terms of Rule 8(5)(iiia) of the Companies (Accounts) Rules, 2014, in the opinion of the Board, all appointments/ re-appointments of Independent Directors during the financial year were made after due veracity of their integrity, expertise and experience (including the proficiency).
Cessation(s) during FY22
• Mr. Manoj Koul ceased to be Company Secretary & Compliance Officer, due to his resignation, w.e.f. close of business hours of November 8, 2021.
• Mr. M. M. Chitale ceased to hold office as Independent Director with effect from close of business hours of March 31, 2022, consequent upon completion of his second term as Independent Director.
The Board places on record its appreciation for the services rendered by Mr. M. M. Chitale during his tenure as Independent Director and Mr. Manoj Koul during his tenure as Company Secretary & Compliance Officer.
Proposed re-appointment(s) in AGM
The Notice convening the 26th AGM includes the proposals for re-appointment of Mr. Nachiket Deshpande, Whole-time Director & Mr. R. Shankar Raman, Non-Executive Director, who are liable to retire by rotation, and being eligible, have offered themselves for re-appointment, for approval of members.
Members may refer the notice convening the 26th AGM for the disclosures under Section 102 of Companies Act, 2013, Regulation 36(3) of the SEBI Listing Regulations and Secretarial Standard-2 on General Meetings issued by the Institute of Company Secretaries of India.
21. Corporate governance report
The report on Corporate Governance is annexed as Annexure D to this Report.
22. Meetings of the board of directors
During FY22, 6 (six) Board meetings were held, mostly through video conferencing in compliance with Rule 3 of the Companies (Meetings of Board and its Powers) Rules, 2014. For details regarding these meetings, please refer ‘Report on Corporate Governance’ which is Annexure D to this Report.
23. Independent directors’ meeting
During FY22, two meetings of Independent Directors were held on May 3, 2021 and October 14, 2021, in accordance with the requirements of Schedule IV to the Companies Act, 2013, Secretarial Standard-1 on Board Meetings (‘SS-1’) and SEBI Listing Regulations.
Further, a meeting of Independent Directors was held on April 5, 2022 to discuss, inter-alia, performance evaluation of the Board, its Committees, and the individual Directors for FY22 and assessment of flow of information from management to the Board.
24. Board committees
In terms of the requirements of the Companies Act, 2013 and SEBI Listing Regulations, the Board has constituted Audit Committee, Stakeholders’ Relationship Committee, Nomination & Remuneration Committee, Corporate Social Responsibility (‘CSR’) Committee and Risk Management Committee. The Board has also constituted Strategic Investment Committee and Share Transfer Committee.
Details of each of the Committees outlining their composition, terms of reference & details of meetings held during FY22, are provided in the Report on Corporate Governance, which is Annexure D to this Report.
During FY22, recommendations made by the Committees to the Board of Directors were accepted by the Board, after necessary deliberations.
25. Company’s policy on director’s appointment and remuneration
The Nomination and Remuneration Policy is in place laying down the role of NRC, criteria of appointment, qualifications, term/tenure, etc. of Executive Directors & Independent Directors, annual performance evaluation, remuneration of Executive Directors, Non-Executive/ Independent Directors, Key Managerial Personnel and Senior Management, and criteria to determine qualifications, positive attributes and independence of Director. NRC policy is available on the Company’s website, www.Lntinfotech.com/Investors.
26. Declaration by independent directors
The Company has received declaration of independence from all the Independent Directors as stipulated under Section 149(7) of the Companies Act, 2013 and Regulation 16(1)(b) of the SEBI (Listing Obligations & Disclosure Requirements) Regulations, 2015, confirming that they meet the criteria of independence, which has been duly assessed by the Board as part of the performance evaluation of Independent Directors. Further, in terms of Regulation 25(8) of the SEBI Listing Regulations, Independent Directors have confirmed that they are not aware of any circumstance or situation, which exists or may be reasonably anticipated, that could impair or impact their ability to discharge their duties with an objective independent judgement and without any external influence.
The Independent Directors have confirmed that they have complied with the Code for Independent Directors prescribed in Schedule IV to the Companies Act, 2013.
A certificate from the Chief Executive Officer & Managing Director regarding confirmation on behalf of the Board that the Independent Directors fulfill the conditions of independence, is annexed as Annexure - 2 to the Report on Corporate Governance.
27. Annual return
The annual return for FY22 is available on the Company’s website, www.Lntinfotech.com/Investors
28. Internal financial controls
The Company has designed and implemented a process driven framework for Internal Financial Controls (‘IFC’) within the meaning of the explanation to Section 134(5)(e) of the Companies Act, 2013. For the year ended March 31, 2022, the Board is of the opinion that the Company has sound IFC commensurate with the nature and size of its business operations and they are operating effectively and no material weakness exists. Further, the Company has a process in place to continuously monitor the internal financial controls and identify gaps, if any, and implement new and/or improved controls wherever the effect of such gaps would have a material effect on the Company’s operations.
29. Compliance monitoring system
At LTI, ensuring regulatory compliance is of utmost importance. The Company ensures that appropriate business processes and adequate tools are in place for adherence to the statutory obligations. Regulatory compliances which are applicable to LTI globally, are monitored/tracked through an in-house web-based tool. On a quarterly basis, a certificate from CEO & Managing Director is presented to the Board of Directors outlining status of compliances, along with remediation plan for non-conformities, if any. Audit Committee, on bi-annual basis, reviews the status of compliances and remediation plan for non-conformities, if any.
Any amendment to the law(s) is also reviewed, updated in the system and monitored by the Company. The Company also engages external consultants to review and update the compliance requirements for new geographies and update the existing list of compliances. As part of Statutory Audit, the Company’s Statutory Auditor also reviews the status of regulatory compliances.
The Company has put in place a framework on “Global Corporate Compliances” which outlines the Company’s philosophy towards compliance culture, understanding compliances, coverage, approach, responsibilities, reporting matrix and trainings. The framework focuses on taking up compliance as an integral element for conducting business and create a corporate culture characterized with integrity and law-abiding behavior. Under this framework, identified key stakeholders across business units and respective heads of corporate functions, ensure and confirm compliance with the provisions of all applicable laws on a continuous basis.
During the reporting financial year, Company has further enhanced the mechanism to monitor compliances by setting up the ‘Internal Compliance Committee’ (‘ICC’) which monitors the regulatory compliance performance,

122 Integrated Annual Report 2021-22 123Corporate Overview | Statutory Reports | Financial Statements
Board’s Report
remediation plans for non-conformities, on an ongoing basis. Periodic updates on regulatory compliance performance along with status of remediation plan is also reviewed by Risk Operating Committee comprising of CXOs and Operational Leadership, chaired by Chief Operating Officer. Key risk indicators of regulatory compliances are periodically reviewed by the Risk Management Committee of the Board.
30. Directors’ responsibility statement
Pursuant to Section 134(5) of the Companies Act, 2013, your Directors state that:
• in the preparation of the annual accounts, the applicable accounting standards have been followed and there has been no material departure;
• the Directors have selected such accounting policies and applied them consistently and made judgments and estimates that are reasonable and prudent so as to give a true and fair view of the state of affairs of the Company and of the profit of the Company for the year ended March 31, 2022;
• the Directors have taken proper and sufficient care for the maintenance of adequate accounting records in accordance with the provisions of the Companies Act, 2013 for safeguarding the assets of the Company and for preventing and detecting fraud and other irregularities;
• the Directors have prepared the annual accounts on a going concern basis;
• the Directors have laid down an adequate system of internal financial controls to be followed by the Company and such internal financial controls are adequate and operating effectively; and
• the Directors have devised proper systems to ensure compliance with the provisions of all applicable laws and that such systems were adequate and operating effectively.
31. Performance evaluation of board of directors
The annual evaluation of the performance of the Board for FY22 was carried out with the help of an external agency with due compliance of provisions of the Companies Act, 2013 and Regulation 17(10) of the SEBI Listing Regulations. Online evaluation of Board, Board Committees, Chairman and individual Directors was carried out in line with the Guidance Note on Board Evaluation issued by SEBI.
The evaluation of the performance of the Board, its Committees, Chairman and Directors was also reviewed by the Independent Directors at their meeting held on April 5, 2022, Nomination & Remuneration Committee and the Board of Directors, at their respective meetings, held on April 19, 2022. Outcome of the evaluation indicated overall improvement in the performance of the Board, Committees, Directors, etc. vis-à-vis last year.
Individual members of the Board were evaluated against the skills/ expertise/ competencies identified and approved by the Board of Directors, as are required in the context of Company’s business which, inter-alia, include competence/ expertise in areas of
• Strategy and Planning
• Governance, Risk Management and Compliance
• Finance, Accounts & Audit
• Global experience / international exposure
• Contributor and Collaborator
• Information Technology
• Client Engagement
• Stakeholders Engagement and Industry Advocacy.
The evaluation indicates that the Board of Directors has an optimal mix of skills/ expertise to function effectively. The mapping of board skills/ expertise vis-à-vis individual Directors is outlined in the Report on Corporate Governance, which is Annexure D to this Report.
32. Disclosure of remuneration
The information under Section 197(12) of the Companies Act, 2013 (‘Act’) and Rule 5(1) of the Companies (Appointment & Remuneration of Managerial Personnel) Rules, 2014, is provided in Annexure E to this Report.
The details of employees’ remuneration under Rule 5(2) & 5(3) of the Companies (Appointment & Remuneration of Managerial Personnel) Rules, 2014 is provided in Annexure F to this Report. In terms of the second proviso to Section 136(1) of the Act and the rules made thereunder, the Board’s Report is being sent to the members without the aforesaid Annexure. Members interested in obtaining copy of the same may send an email to the Company Secretary and Compliance Officer at [email protected] None of the employees listed in the said Annexure are related to any Director of the Company.
33. Compliance with secretarial standards
Your Directors state that the Company has complied with the Secretarial Standards issued by the Institute of Company Secretaries of India on Meetings of the Board of Directors (SS-1) and General Meetings (SS-2).
34. Prevention of sexual harassment at workplace
LTI is committed to provide a safe, secure and congenial work environment for all its employees that is free from sexual harassment. The Company has formulated a robust Policy for Prevention of Sexual Harassment at Workplace (‘POSH’) with clear guidelines for reporting acts of sexual harassment at the workplace and procedure for resolution and redressal of complaints of sexual harassment. LTI’s Policy is in line with the Sexual Harassment of Women at Workplace (Prevention, Prohibition and Redressal) Act, 2013, and in fact goes beyond, to make it gender-neutral and thus applicable to every employee in the organization. The Company has complied with provisions relating to the constitution of Internal Complaints Committee as required by law. The Policy is available on the website of the Company at www.Lntinfotech.com/investors
Awareness sessions and communication campaigns are conducted at regular intervals to promote a safe space for all genders and to sensitize employees. The training program on POSH has been made mandatory for all employees annually, across the globe.
During FY22, the Company received three complaints of sexual harassment. All such complaints have been resolved with appropriate action, with no complaint pending at the end of FY22.
35. Business responsibility report
Pursuant to Regulation 34 of the SEBI Listing Regulations, ‘Business Responsibility Report’ forms part of this Report as Annexure G, which outlines the initiatives taken by the Company from an environmental, social and governance perspective.
36. Integrated reporting
In our endeavour to enhance the quality of disclosures, an Integrated Report (‘IR’) encompassing financial and non-financial information forms part of the Annual Report.
The Integrated Report has been prepared in terms of the guiding principles laid down by the International Integrated Reporting Council (‘IIRC’) and has details about Company’s approach towards creating and sustaining value for its stakeholders, its strategy, governance framework, performance and prospects of value creation based on the six forms of capital viz. financial capital, manufactured capital, intellectual capital, human capital, social & relationship capital and natural capital.
37. Employee stock option scheme
The Employee Stock Option Scheme 2015 (‘ESOP Scheme 2015’) is in place to attract and retain talent. There is no material change in the ESOP Scheme 2015 during the financial year under review. The ESOP Scheme 2015 is in compliance with the Companies Act, 2013 and SEBI (Share Based Employee Benefits and Sweat Equity) Regulations, 2021 and the disclosures relating to the ESOP Scheme 2015 as required under SEBI (Share Based Employee Benefits and Sweat Equity) Regulations, 2021 is available on the Company’s website, www. Lntinfotech.com/Investors.
The certificate of the Secretarial Auditor, confirming compliance of ESOP Scheme 2015, with the Companies Act 2013 and SEBI (Share Based Employee Benefits and Sweat Equity) Regulations, 2021, is given in Annexure H to this Report.
38. CEO & CFO Certificate
In accordance with the provisions of Regulation 17(8) of SEBI Listing Regulations, certificate of Chief Executive Officer & Managing Director and Chief Financial Officer in relation to the Financial Statements for the year ended March 31, 2022, is Annexure - 1 to the Report on Corporate Governance.
39. Whistle blower mechanism
The Whistle Blower Policy of the Company meets the requirement of the Vigil Mechanism framework prescribed under the Companies Act, 2013 (‘Act’). Whistle Blower Policy and Guidelines on Vigil Mechanism are available on the Company’s website, www.Lntinfotech. com/Investors.
The Whistle Blower Policy facilitates the Directors and employees to report concerns about unethical behavior, actual/suspected fraud, any wrongdoing or unethical or improper practice. Further, to strengthen

124 Integrated Annual Report 2021-22 125Corporate Overview | Statutory Reports | Financial Statements
Board’s Report
the Vigil Mechanism framework and to ensure timely and efficient redressal of complaints, ‘Guidelines on Vigil Mechanism’ are in place laying down the procedure and process flow for investigation to be conducted. The Policy also provides for adequate safeguards against victimization of the Whistle Blower. During the reporting financial year, the Company has further enhanced the mechanism by issuing the Policy on Prevention of Fraud to spread awareness among employees about LTI’s zero tolerance towards any unethical or dishonest behaviour which constitutes fraud. The Audit Committee bi-annually reviews complaints received under the Vigil Mechanism. No employee was denied access to the Audit Committee and/or its Chairman.
40. Details of significant and material orders passed by regulators, courts or tribunals
During the year under review, there were no significant and material orders passed by regulators, courts or tribunals impacting the going concern status and the Company’s operations in future.
41. Consolidated financial statements
The consolidated financial statements pursuant to Section 129(3) of the Companies Act, 2013, prepared in accordance with the Accounting Standards prescribed by the Institute of Chartered Accountants of India, forms part of this Annual Report.
42. Auditors
A. Statutory Auditor
M/s. B. K. Khare & Co., Chartered Accountants [ICAI Registration No. 105102W] (‘BKK’) were appointed as Statutory Auditor of the Company by the members at the 21st AGM held on August 24, 2017, for a period of 5 years to hold office from conclusion of the 21st AGM till conclusion of the 26th AGM.
The Reports issued by Statutory Auditor on the audited standalone and consolidated financial statements of the Company for the year ended March 31, 2022, do not contain any qualification, observation, comment or remark(s) which has adverse effect on the functioning of the Company, and therefore do not call for any comments from Directors. Further, the Statutory Auditor has not reported any fraud as specified under Section 143(12) of the Companies Act, 2013.
The Board of Directors of the Company at its meeting held on April 19, 2022, upon recommendation of the Audit Committee, approved appointment of M/s. Deloitte Haskins & Sells Chartered Accountants LLP [ICAI Registration No. 117364W/W100739] as Statutory Auditor of the Company, to hold office from the conclusion of the 26th AGM till conclusion of the 31st AGM, subject to approval of the members, and this proposal has been included in the notice convening the 26th AGM.
M/s. Deloitte Haskins & Sells Chartered Accountants LLP have confirmed:
• their eligibility to act as Statutory Auditor and that their appointment, if made, will be within the limits specified under the Companies Act, 2013;
• that they have subjected themselves to the peer review process of Institute of Chartered Accountants of India (‘ICAI’) and hold valid certificate issued by the Peer Review Board of ICAI; and
• independence as well as their arm’s length relationship with the Company and declared that they have not taken up any prohibited non- audit assignments for the Company.
B. Secretarial Auditor
The Secretarial Audit Report issued by M/s. Alwyn Jay & Co., Practising Company Secretaries is annexed as Annexure I to this Report. The Secretarial Auditor’s Report to the members does not contain any qualification or reservation which has any material adverse effect on the functioning of the Company, save and except an observation regarding non-compliance of Board composition in terms of Regulation 17(1) of SEBI Listing Regulations for the quarters ended March 31, 2021, and June 30, 2021 and upto August 25, 2021, on account of delay in filling up the vacancies in the office of Independent Director.
Even after sincere and genuine efforts to identify and finalise the candidates to fill the vacancies in the Board of Directors which arose due to completion of term of Mr. Arjun Gupta on October 27, 2020 and Mr. Samir Desai on March 31, 2021, the Company could not fill the same within the time prescribed by law therefor. The outbreak of Covid-19 from March 2020 onwards and lock-down and other curbs imposed thereafter, compounded the Company’s constraints to fill the above vacancies. As on date, the Board composition of LTI is compliant with
the requirements under Regulation 17(1) of SEBI Listing Regulations. During the year under review, the Company paid fine aggregating to H12,39,000 ‘under protest’ to each of National Stock Exchange Limited (NSE) and The BSE Limited (BSE) for the aforesaid delay in filling in the vacancies in the Board of Directors. The Company has represented to the stock exchanges for waiver of the fine paid, in view of the constraints outlined above.
43. Cost records and audit
Maintenance of cost records and requirement of cost audit as prescribed under Section 148 of the Companies Act, 2013 are not applicable for the business activities carried out by the Company.
44. Other disclosures
• Remuneration received by Whole-time Director from subsidiary company: During the financial year, no Whole-time Director received remuneration from any of the subsidiary(ies) of the Company.
• During the year, no corporate insolvency resolution process was initiated under the Insolvency and Bankruptcy Code, 2016, either by or against LTI, before National Company Law Tribunal or other court(s).
45. Awards & recognition
Corporate/ Marketing awards:
• Mr. Sanjay Jalona won the ‘Business Today: Best CEO Award’ in the IT/ITeS category.
• LTI is among the top 25 most valuable IT services brands in the Brand Finance IT Services 25 2022 ranking.
• Duck Creek recognizes Ecosystem Partner, LTI, as Formation’22 Hatch-a-thon Champion.
• LTI leads the Institutional Investor’s 2021 All Asia Executive Team Ranking in the IT Services & Software space.
• LTI USA is certified as a Great Place to Work US (GPTW), for the second consecutive year.
• LTI recognized as a Top Employer in the UK for second time in a row.
• LTI recognized as Great Place to Work in Denmark.
• LTI bags Golden Peacock National Quality Award, 2021.
• LTI bagged two prestigious awards at the 22nd National Award Ceremony for Excellence in Energy Management, hosted by Confederation of Indian Industry (CII).
• LTI awarded the winner in both Risk Management and Cyber Security categories in L&T Risk Management Awards 2021.
• LTI ranks among top 10 Companies with a score of 71 in CRISIL ESG Compendium 2021.
• LTI won the ‘Customer Award for Workplace’, in Hybrid working, APAC region’ by Meta (erstwhile Facebook).
• LTI won Honda’s 2021 Indirect Procurement Supplier Award.
Analyst and Advisory recognitions:
• LTI topped the list of ‘IT Services Challenger 2021’ in Everest Group’s PEAK Matrix Service Provider of the Year TM Awards and ranked among the Top 10 in the overall PEAK Matrix® rankings for IT services.
• ‘Lumin’, an augmented analytics product by Fosfor (formerly LTI Leni) recognized in the Forrester Tech Tide™: Enterprise Business Insights and Analytics, Q1 2021.
• Spectra, a comprehensive DataOps product by Fosfor (formerly LTI Mosaic Decisions) recognized in the Forrester Tech Tide™: Enterprise Business Insights and Analytics, Q1 2021.
• LTI positioned as an ‘Innovator’ in Avasant’s IoT Services RadarView™ Report 2021.
• LTI recognized as a representative vendor in the Gartner Market Guide for Artificial Intelligence Service Providers.
• LTI recognized as a Leader in the ISG Provider Lens™ Utilities Industry – Services and Solutions – North America 2021 Report.
• LTI recognized in the Forrester report: Experience Design Provider Trends, 2021.
• ISG Provider Lens™: Digital Business — Solutions and Service Partners 2021
a. LTI Positioned as a ‘Leader’ in Digital Business Consulting Services – US.
b. LTI Positioned as a ‘Leader’ in Digital Business Experience Services – US.
• LTI Syncordis positioned as a ‘Leader’ in Everest Group’s Temenos IT Services PEAK Matrix® Assessment 2022.
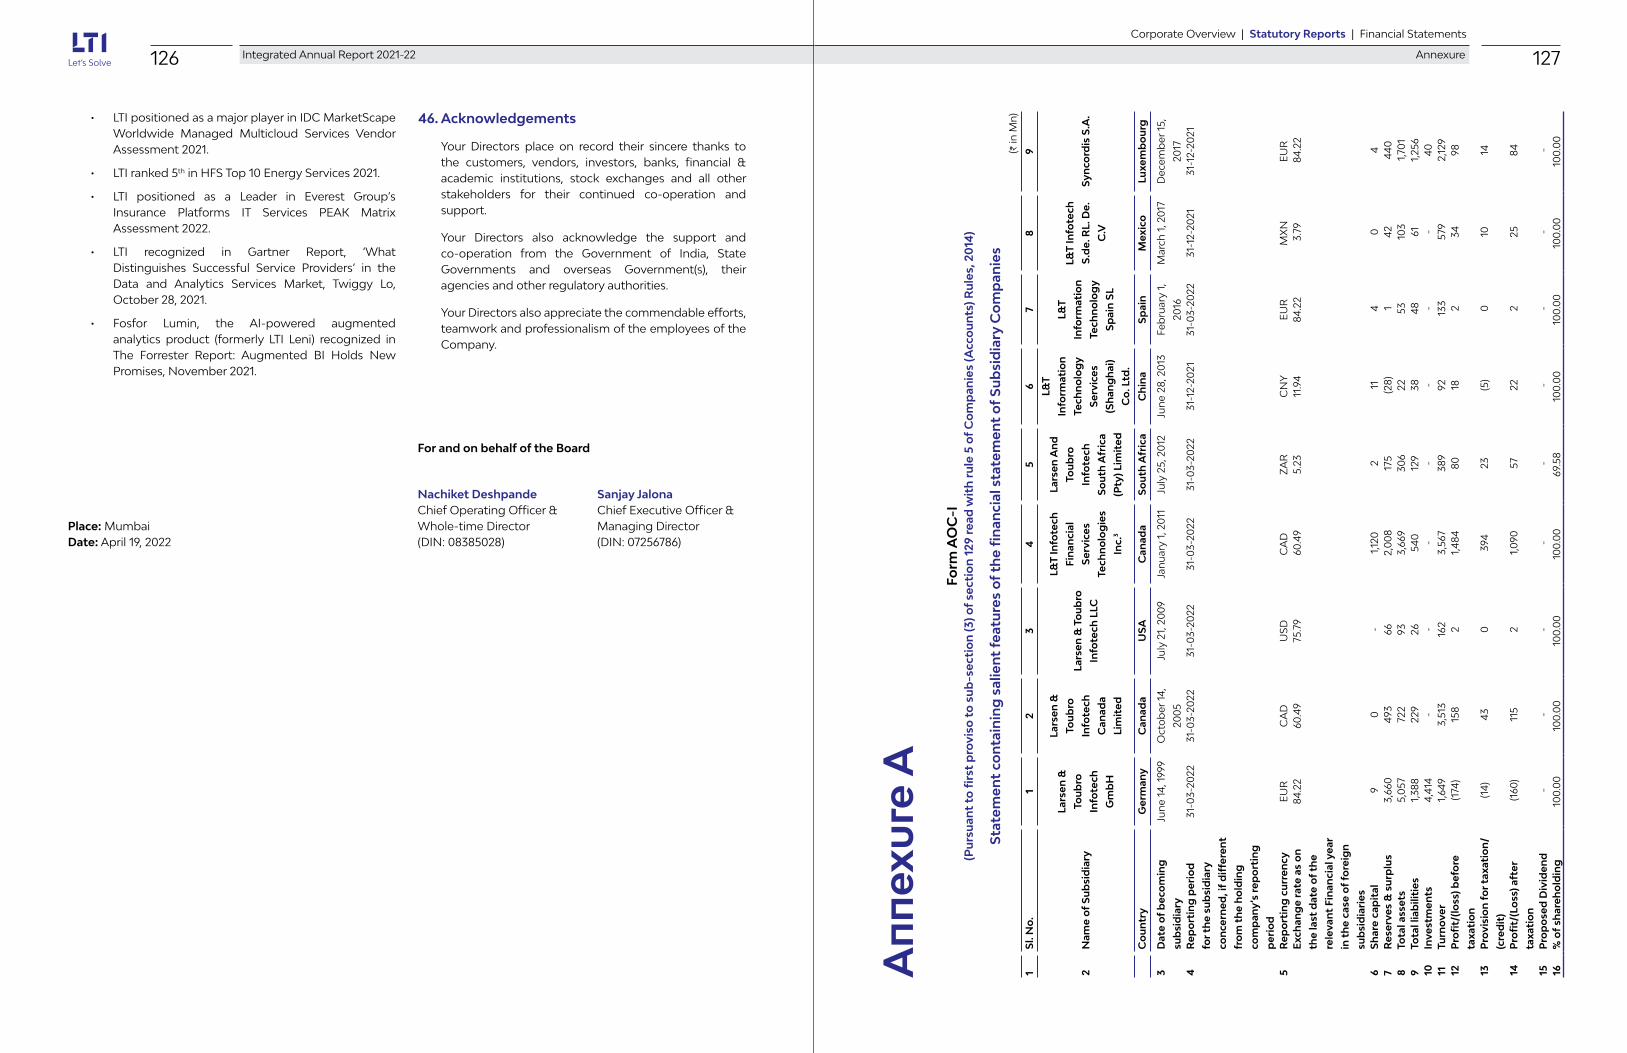
126 Integrated Annual Report 2021-22 127Corporate Overview | Statutory Reports | Financial Statements
• LTI positioned as a major player in IDC MarketScape Worldwide Managed Multicloud Services Vendor Assessment 2021.
• LTI ranked 5th in HFS Top 10 Energy Services 2021.
• LTI positioned as a Leader in Everest Group’s Insurance Platforms IT Services PEAK Matrix Assessment 2022.
• LTI recognized in Gartner Report, ‘What Distinguishes Successful Service Providers’ in the Data and Analytics Services Market, Twiggy Lo, October 28, 2021.
• Fosfor Lumin, the AI-powered augmented analytics product (formerly LTI Leni) recognized in The Forrester Report: Augmented BI Holds New Promises, November 2021.
46. Acknowledgements
Your Directors place on record their sincere thanks to the customers, vendors, investors, banks, financial & academic institutions, stock exchanges and all other stakeholders for their continued co-operation and support.
Your Directors also acknowledge the support and co-operation from the Government of India, State Governments and overseas Government(s), their agencies and other regulatory authorities.
Your Directors also appreciate the commendable efforts, teamwork and professionalism of the employees of the Company.
For and on behalf of the Board
Nachiket Deshpande Sanjay Jalona Chief Operating Officer & Chief Executive Officer & Place: Mumbai Whole-time Director Managing Director Date: April 19, 2022 (DIN: 08385028) (DIN: 07256786)
(H in
Mn)
1S
l. N
o.
12
34
56
78
9
2N
ame
of
Su
bsi
dia
ry
Lars
en &
Tou
bro
Info
tech
Gm
bH
Lars
en &
Tou
bro
Info
tech
Can
ada
Lim
ited
Lars
en &
To
ub
ro
Info
tech
LLC
L&T
Info
tech
Fin
anci
al
Ser
vice
s
Tech
no
log
ies
Inc.
3
Lars
en A
nd
Tou
bro
Info
tech
So
uth
Afr
ica
(Pty
) Lim
ited
L&T
Info
rmat
ion
Tech
no
log
y
Ser
vice
s
(Sh
ang
hai
)
Co
. Ltd
.
L&T
Info
rmat
ion
Tech
no
log
y
Sp
ain
SL
L&T
Info
tech
S.d
e. R
L. D
e.
C.V
Syn
cord
is S
.A.
Co
un
try
Ger
man
yC
anad
aU
SA
Can
ada
So
uth
Afr
ica
Ch
ina
Sp
ain
Mex
ico
Luxe
mb
ou
rg
3D
ate
of
bec
om
ing
sub
sid
iary
Jun
e 14
, 199
9O
cto
ber
14,
2005
July
21,
200
9Ja
nua
ry 1
, 201
1Ju
ly 2
5, 2
012
Jun
e 28
, 201
3Fe
bru
ary
1,
2016
Mar
ch 1
, 201
7D
ecem
ber
15,
2017
4R
epo
rtin
g p
erio
d
for t
he
sub
sid
iary
con
cern
ed, i
f d
iffe
ren
t
fro
m t
he
ho
ldin
g
com
pan
y’s
rep
ort
ing
per
iod
31-0
3-20
2231
-03-
2022
31-0
3-20
2231
-03-
2022
31-0
3-20
2231
-12-
2021
31-0
3-20
2231
-12-
2021
31-1
2-20
21
5R
epo
rtin
g c
urr
ency
EUR
CA
DU
SDC
AD
ZA
RC
NY
EUR
MX
NEU
RE
xch
ang
e ra
te a
s o
n
the
last
dat
e o
f th
e
rele
van
t Fi
nan
cial
yea
r
in t
he
case
of
fore
ign
sub
sid
iari
es
84.2
2 60
.49
75.7
9 6
0.49
5.
23
11.9
4 84
.22
3.7
9 8
4.22
6S
har
e ca
pit
al 9
0
-
1
,120
2
11
4
0
4
7R
eser
ves
& s
urp
lus
3,6
60
493
6
6 2
,008
1
75
(28)
1
42
440
8
Tota
l ass
ets
5,0
57
722
9
3 3
,669
3
06
22
53
103
1
,701
9
Tota
l lia
bili
ties
1,3
88
229
2
6 5
40
129
3
8 4
8 6
1 1
,256
10
Inve
stm
ents
4,4
14
-
-
-
-
-
-
-
40
11Tu
rno
ver
1,6
49
3,5
13
162
3
,567
3
89
92
133
5
79
2,12
9 12
Pro
fit/
(loss
) bef
ore
taxa
tio
n
(174
) 1
58
2
1,4
84
80
18
2
34
98
13P
rovi
sio
n f
or t
axat
ion
/
(cre
dit
)
(14)
43
0
394
2
3 (5
) 0
1
0 1
4
14P
rofi
t/(L
oss
) aft
er
taxa
tio
n
(160
) 1
15
2
1,0
90
57
22
2
25
84
15P
rop
ose
d D
ivid
end
-
-
-
-
-
-
-
-
-
16%
of
shar
eho
ldin
g10
0.00
100.
0010
0.00
100.
0069
.58
100.
0010
0.00
100.
0010
0.00
An
nex
ure
AFo
rm A
OC
-I(P
urs
uan
t to
firs
t p
rovi
so t
o s
ub
-sec
tio
n (3
) of
sect
ion
129
rea
d w
ith
ru
le 5
of
Co
mp
anie
s (A
cco
un
ts) R
ule
s, 2
014
)
Sta
tem
ent
con
tain
ing
sal
ien
t fe
atu
res
of
the
fin
anci
al s
tate
men
t o
f S
ub
sid
iary
Co
mp
anie
s
Annexure

128 Integrated Annual Report 2021-22 129Corporate Overview | Statutory Reports | Financial Statements
Annexure
(H in
Mn)
1S
l. N
o.
1011
1213
1415
1617
18
2N
ame
of
Su
bsi
dia
ryS
ynco
rdis
PS
F S
.A.
Syn
cord
is
Lim
ited
, U
K
Syn
cord
is
SA
RL,
Fran
ce
Lars
en &
Tou
bro
Info
tech
No
rge
AS
Nie
lsen
+
Par
tner
Un
tern
ehm
e
nsb
erat
er
Gm
bH
Nie
lsen
+
Par
tner
Un
tern
ehm
e
nsb
erat
er A
G
Nie
lsen
+
Par
tner
PTE
.
Ltd
.
Nie
lsen
&
Par
tner
PTY
Ltd
Nie
lsen
&
Par
tner
Co
mp
any
Lim
ited
Co
un
try
Luxe
mb
ou
rgU
KFr
ance
No
rway
Ger
man
yS
wit
zerl
and
Sin
gap
ore
Au
stra
liaTh
aila
nd
3D
ate
of
bec
om
ing
su
bsi
dia
ryD
ecem
ber
15
, 201
7D
ecem
ber
15
, 201
7D
ecem
ber
15
, 201
7N
ovem
ber
20,
20
18M
arch
1, 2
019
Mar
ch 1
, 201
9M
arch
1, 2
019
Mar
ch 1
, 20
19M
arch
1, 2
019
4R
epo
rtin
g p
erio
d
for t
he
sub
sid
iary
co
nce
rned
, if
dif
fere
nt
fro
m t
he
ho
ldin
g
com
pan
y’s
rep
ort
ing
p
erio
d
31-1
2-20
2131
-12-
2021
31-1
2-20
2131
-03-
2022
31-0
1-20
2231
-12-
2021
31-1
2-20
2131
-12-
2021
31-1
2-20
21
5R
epo
rtin
g c
urr
ency
EUR
GB
PEU
RN
OK
EUR
CH
FSG
DA
UD
THB
Exc
han
ge
rate
as
on
th
e la
st d
ate
of
the
rele
van
t Fi
nan
cial
yea
r in
th
e ca
se o
f fo
reig
n
sub
sid
iari
es
84.
22
99.
46
84.
22
8.6
9 8
4.22
8
2.03
5
5.97
5
6.74
2
.28
6S
har
e ca
pit
al 3
2 0
1
0
1
7 7
5
0
2
7R
eser
ves
& s
urp
lus
58
(249
) (7
6) 9
3 8
4 2
5 2
69
(51)
(27)
8To
tal a
sset
s 4
30
421
1
22
413
2
18
127
4
46
66
16
9To
tal l
iab
iliti
es 3
39
670
1
97
320
1
17
95
172
1
17
40
10In
vest
men
ts -
-
-
-
1
7 -
-
-
-
11Tu
rno
ver
530
4
61
319
1
,184
166
2
51
591
6
3 2
0
12P
rofi
t/(lo
ss) b
efo
re
taxa
tio
n 9
2 (5
8) (2
7) 6
5 (1
8) (7
) (9
6) (3
9) (8
)
13P
rovi
sio
n f
or t
axat
ion
/(c
red
it)
30
12
(11)
8
(3)
(2)
(16)
3
-
14P
rofi
t/(L
oss
) aft
er
taxa
tio
n 6
2 (7
0) (1
5) 5
7 (1
5) (5
) (8
0) (4
2) (8
)
15P
rop
ose
d D
ivid
end
-
-
-
-
-
-
-
-
-
16%
of
shar
eho
ldin
g10
0.00
100.
0010
0.00
100.
0010
0.00
100.
0010
0.00
100.
0010
0.00 (H
in M
n)
1S
l. N
o.
1920
2122
2324
2526
27
2N
ame
of
Su
bsi
dia
ryR
ule
tro
nic
s Li
mit
ed
Ru
letr
on
ics
Sys
tem
s In
c
Lym
byc
S
olu
tio
ns
Pri
vate
Ltd
Lym
byc
S
olu
tio
ns
Inc.
Po
wer
up
clo
ud
Te
chn
olo
gie
s P
riva
te L
imit
ed
Lars
en &
To
ub
ro
Info
tech
UK
Li
mit
ed
LTI M
idd
le
Eas
t FZ
-LLC
Cu
elo
gic
Te
chn
olo
gie
s P
riva
te lt
d2
Cu
elo
gic
Te
chn
olo
gie
s In
c2
Co
un
try
UK
US
AIn
dia
US
AIn
dia
UK
Du
bai
Ind
iaU
SA
3D
ate
of
bec
om
ing
su
bsi
dia
ryM
arch
15,
20
19M
arch
15,
20
19A
ugus
t 29
, 20
19A
ugus
t 29
, 201
9O
cto
ber
25,
20
19A
ugus
t 17
, 202
0N
ovem
ber
25
, 202
0Ju
ly 7
, 202
1Ju
ly 7
, 202
1
4R
epo
rtin
g p
erio
d
for t
he
sub
sid
iary
co
nce
rned
, if
dif
fere
nt
fro
m t
he
ho
ldin
g
com
pan
y’s
rep
ort
ing
p
erio
d
28-0
2-20
2231
-12-
2021
31-0
3-20
2231
-03-
2022
31-0
3-20
2231
-03-
2022
31-0
3-20
2231
-03-
2022
31-0
3-20
22
5R
epo
rtin
g c
urr
ency
GB
PU
SDIN
RU
SDIN
RG
BP
AED
INR
USD
Exc
han
ge
rate
as
on
th
e la
st d
ate
of
the
rele
van
t Fi
nan
cial
yea
r in
th
e ca
se o
f fo
reig
n
sub
sid
iari
es
99.
46
75.
79
1.0
0 7
5.79
1
.00
99.
46
20.
64
1.0
0 75
.79
6S
har
e ca
pit
al 0
-
11
6
0
0
37
0 0
7
Res
erve
s &
su
rplu
s (0
) 1
0 (6
) (9
) 6
5 1
27
143
1
36
10
8To
tal a
sset
s -
1
1 33
-
85
887
3
,113
291
3
0 9
Tota
l lia
bili
ties
0
1
28
4
21
760
2
,934
1
54
20
10In
vest
men
ts -
-
6
-
-
-
-
-
0
11Tu
rno
ver
16
73
0 -
9
7 3
,263
3
,702
4
31
81
12P
rofi
t/(lo
ss) b
efo
re
taxa
tio
n (3
) 3
(1
8) (0
) 2
0 1
59
162
(2
) 8
13P
rovi
sio
n f
or t
axat
ion
/(c
red
it)
(0)
1
4 -
0
3
1 -
(1
) 2
14P
rofi
t/(L
oss
) aft
er
taxa
tio
n (3
) 2
(2
2) (0
) 2
0 1
28
162
(1
) 6
15P
rop
ose
d D
ivid
end
-
-
-
-
-
-
-
-
-
16%
of
shar
eho
ldin
g10
0.00
100.
0010
0.00
100.
0010
0.00
100.
0010
0.00
100.
0010
0.00
No
tes:
1.
Ind
ian
rup
ee e
qui
vale
nts
of t
he
figur
es in
fore
ign
cur
ren
cies
in t
he
acco
unts
of t
he
sub
sid
iary
co
mp
anie
s, a
re b
ased
on
th
e ex
chan
ge
rate
s as
on
Mar
ch 3
1, 2
022.
2.
The
Co
mp
any
acq
uire
d C
uelo
gic
Tec
hn
olo
gie
s P
rivat
e Li
mite
d a
lon
g w
ith
its
wh
olly
-ow
ned
sub
sid
iary
in U
S, C
uelo
gic
Tec
hn
olo
gie
s, In
c. ,
on
Jul
y 7,
202
1, w
ith
th
e ef
fect
ive
dat
e o
f acq
uirin
g
con
tro
l fro
m J
uly
1, 2
021.
3.
Dur
ing
th
e ye
ar, L
&T
Info
tech
Fin
anci
al S
ervi
ces
Tech
no
log
ies
Inc.
(“LT
IFST
”) c
arrie
d o
ut b
uy b
ack
of 3
3.33
% o
f its
to
tal e
qui
ty c
apit
al (i
.e. 2
00,0
00 s
har
es) f
rom
its
shar
eho
lder
(th
e C
om
pan
y).
San
jay
Jalo
na
Nac
hik
et D
esh
pan
de
Ch
ief E
xecu
tive
Offi
cer &
Man
agin
g D
irect
or
Ch
ief O
per
atin
g O
ffice
r & W
ho
le-t
ime
Dire
cto
r(D
IN: 0
7256
786)
DIN
: 083
8502
8
Pla
ce: M
umb
aiA
nil
Ran
der
Trid
ib B
arat
Dat
e: A
pril
19,
202
2C
hie
f Fin
anci
al O
ffice
rC
om
pan
y Se
cret
ary
& C
om
plia
nce
Offi
cer

130 Integrated Annual Report 2021-22 131Corporate Overview | Statutory Reports | Financial Statements
Annexure
Annexure BInformation on conservation of energy, technology absorption,
foreign exchange earnings & outgo as per Section 134(3)(m) of the Companies Act, 2013 read with rule 8(3) of the Companies (accounts) rules, 2014
A. Conservation of energy
(i) Steps taken or impact on conservation of energy:
LTI has been focusing on reducing the environmental impact of operations for many years. Our strategies and actions reflect our commitment towards a sustainable habitat. LTI stands by its commitment towards Energy Conservation to achieve Carbon Neutral & Water Neutral for India Operations by the year 2030. Energy Conservation is a continuous and enduring process, and it has been at the forefront of Company’s strategy in curbing emissions. Despite curtailed operations due to the pandemic, we have reduced our power consumption by investing in various energy efficient equipment and accessories. The energy conservation initiatives taken at various locations accrued savings of approximately 8.4 L kWh
(ii) Steps taken by the company for utilising alternate sources of energy:
We are committed to substitute 50% of our energy from renewable sources by the year 2030 and various aspects are being explored like Power Purchase Agreements (PPA), Green Tariff and Solar Plants. There is constant focus to upgrade our green buildings to higher ratings. We have commissioned 100 kWp solar plant at our Bengaluru campus in Whitefield and sourcing 100% green power at Powai, Mumbai through utilities. Also, leased campuses at Airoli, Navi Mumbai and Chennai have increased their green energy footprint considerably. LTI is currently sourcing 32.3% of the total energy requirements from renewable sources.
(iii) Capital investment on energy conservation equipment:
H22.8 Mn
Investments were majorly towards replacement of old equipment with New Gen energy efficient equipment like the following:
(a) Inverter AC Units (b) LED Light Fittings (c) Motion Sensors (d) Energy Efficient Motors (e) Modular UPS Systems (f) VFD
B. Technology absorption & research and development
(i) Efforts made towards technology absorption; and
(ii) Benefits derived like product improvement, cost reduction, product development or import substitution:
Your Company is leveraging technology to create sustainable advantage not only for itself but more importantly, for its clients. While the Company has the real-world expertise in diverse domains, it has also invested consciously towards building expertise in exponential technologies namely in the areas of Metaverse, Cloud, Analytics, Industry 4.0, Artificial Intelligence (‘AI’) and Automation, etc. These are further enumerated below:
Metaverse
Metaverse is a complete paradigm shift on how interactions on the internet will take place. LTI believes that Metaverse will have a trajectory of adoption similar to that of cloud, though at an accelerated pace. Similar to the Digital First launches and OTT exclusive releases, we will see “Metaverse First” strategies from enterprises in the near future.
Your Company has setup a dedicated unit for Metaverse under the Global Technology Office to service the client needs in this area. The dedicated unit brings in the new Metaverse capabilities as well as unifies other capabilities that LTI has around design, block chain and 5G under a single umbrella. The Metaverse unit will focus on co-innovation and implementing use cases for our clients as well as provide advisory services for those embarking on the journey. Your Company already have built a “3E” framework for Metaverse and the services will be around that. The 3E’s are Experience, Economy, Enablement. Our Experience services deal with AR / VR implementations and design. Economy services revolve around Crypto, NFTs and Block-chain whereas the Enablement services are around AI/ML, IOT and 5G in the Metaverse context.
There are active conversations with several of our top clients around our Metaverse capabilities. While there is lot of excitement that we are seeing off late, there is
also an equal amount of confusion in the minds of our clients on how to go about it. Hence, we have dedicated advisory service offerings where our Metaverse experts work with the clients to help them understand what Metaverse is and how does it impact their industry. While we all are aware of the use cases in the entertainment industry, we see more enterprise use cases coming into it. Some of it are-securing and monetizing IP using NFT and blockchain especially in retail sectors. Metaverse based collaborative product development within manufacturing or, NFTs insurance backed by cryptocurrency settlements are a few of these.
Cloud
Today, organizations are shifting rapidly towards differentiation through business platforms. There is a huge growth in demand for digitization and modernization at scale and speed, which essentially requires modern technology platforms to support business composability, data process and AI engineering, distributed compute, privacy and security. These technology breakthroughs are primarily delivered by cloud platforms and cloud native engineering. LTI is continuously helping enterprises to deliver exponential business transformation leveraging cloud through its C=BT2 strategy aligned to a well-defined industry North Star. This involves taking decisions aligned to their business priorities to select the right cloud platform and services, migrating the workloads from Data Centers to scalable cloud infrastructure and services, architecting for appropriate model (public, private, hybrid or multi cloud), building innovative business capabilities, adopt modern engineering services line edge computing, containers, serverless, observability, data mesh etc., continuous monitoring for security, compliance and cost. Your Company has made the right investment to stay ahead of the curve and emerge as a leader in the cloud space. LTI has setup strategic business units aligned to hyperscalers such as Microsoft Azure, AWS (Amazon Web Services) and GCP (Google Cloud Platform) to bring in the right focus for go to market strategy and capability development.
LTI has a robust end-to-end cloud enablement and management platforms eco-system to enable breakaway enterprises digitize the core, which includes:
• “Infinity Cloud” end to end cloud solutions and service platform to deliver capabilities across cloud with integrated business north star across lifecycle including assessment, migration, modernization, DevSecOps, observability, cloud operation and Sustainability through cloud. Infinity Cloud platform is a combination of multiple sub platforms and
atomic efficiency kits to enable faster adoption of cloud and an intelligence layer helps enterprises getting the right insights into their cloud ecosystem.
• “Canvas Sunshine” end to end data platform modernization and management suite to help customer adopt and leverage data capabilities on cloud.
• “Canvas DevOps” to help value-stream based management and end to end DevOps/ DevSecOps automation and governance.
• “Infinity Ensure” to enable autonomous Cloud Governance, Cloud Security Posture Management, Compliance and FinOps.
• “Infinity LAMPS” platform to accelerate SAP migration and modernization journey to cloud across all hyperscalers with comprehensive insights throughout the migration lifecycle.
Additionally, in current challenging business scenarios, LTI has been helping customers through multiple Cloud focused offerings like:
• “DC Uplift” – End to end Migration Readiness Assessment, Migration, Modernization and Managed services
• “Purposeful transformation strategy” – tailored cloud adoption strategy aligned to business and industry north star with measurable outcomes
• “Portfolio rejuvenation” – Industry North star aligned cloud native transformation of application landscape with embedded future state cloud architecture, engineering best practices and efficiency kits
• “FinOps for Cloud” – proactive and predictive financial operations management for cloud to reduce overall TCO of cloud adoption
• “Data & Analytics on Cloud” – building modern, intelligent and secure data platform ecosystem on cloud to support business decisions and outcomes
• “Cloud Ways of Working” – establish a scaled and federated Cloud Centre of Excellence for our customers to manage end to end cloud lifecycle
• “Sustainability through cloud” – enable enterprises to adopt right cloud platform services and architecture patterns to ensure reduction in carbon footprint
LTI believes cloud will continue to be the pedestal for driving all digital transformation and will continue to invest in creating innovative solutions and services in this space.

132 Integrated Annual Report 2021-22 133Corporate Overview | Statutory Reports | Financial Statements
Annexure
Analytics, AI & Cognitive
“DATA is the oil of the 21st century, and analytics is the combustion engine”. Your Company believes in executing @speed and monetizing @scale and transforming business at exponential speed. LTI’s Analytics, AI & Cognitive practice assists in achieving business agility with a data-first approach, as well as the democratization of data, analytics and use cases. Your Company has an integrated suite of products and services that helps businesses monetize data at speed and at scale enabling data commerce for client’s through solutions around comprehensive no-code/low-code platforms & Lego blocks for data, AI and automation.
Your Company is solving for breakaway outcomes to empower customer experiences and experience transformation. LTI’s Analytics, AI & Cognitive practice has offerings on data-on cloud, next-gen data management, AI engineering and Data products. For building modern data-driven enterprises, your Company has been innovating for organizations through future-proof architectural blueprints positioned around the right technology stacking to meet the industry demands through niche domain expertise. The business model focuses on accelerating data and analytics services through pre-built IPs and accelerators across data-to-decision value chain.
Your Company is deeply focused on building strategic partnerships with technology partners, startups and academia. Through our people, process, and technology approach, we envision building a data-driven culture fueled by passionate tech tribes. Our workforce is continuously striving for excellence in terms of service delivery and innovation by providing state of art tools/accelerators/platforms to clients for a transformational digital journey.
LTI recently launched Fosfor, the only end-to-end product suite for optimizing all aspects of the data-to-decisions lifecycle. Fosfor helps make better decisions, ensuring there is a right data in more hands in the fastest time possible. The Fosfor Product Suite is made up of Spectra, a comprehensive DataOps platform; Optic, a data fabric to facilitate data discovery-to-consumption journeys; Refract, a Data Science and MLOps platform; Aspect, a no-code unstructured data processing platform; and Lumin, an augmented analytics platform. Taken together, the Fosfor suite helps businesses discover the hidden value in their data.
Your Company believes in democratizing analytics & AI. LTI believes in achieving business agility with a data-first approach and continues to build a data-driven culture across key functions like Operations, IT Support, Finance, HR etc.
Industry 4.0
Industry 4.0 Practice is formulated with a mission to create value at the intersection of domain, digital engineering, and smart technologies and accelerate digital transformation journeys of our customers. We had established a dedicated CoE (Centre of Excellence) to develop technology accelerators, industry specific solutions and POCs (Proof of Concept) for use cases in next generation technologies like 5G & block chain.
Aligning ourselves with the customers key transformation goals around Factory of the Future, servitization for new revenue models and sustainability, we have pivoted our industry 4.0 practice around three broad solution themes- Smart Manufacturing, Connected Solutions and Smart Spaces.
• Smart Manufacturing: An array of solutions under our IXC (Industry X.0 Canvas) framework, powered by IoT (Internet of Things), edge & cloud computing and other smart technologies AI/ML (Artificial Intelligence/Machine Learning), computer vision, AR/VR (Augmented & Virtual Reality) to drive efficient, agile, safer & sustainable manufacturing operations.
• Connected Solutions: An end-to-end solution for realization of connected vison of our customers. It included onboarding IoT devices, data acquisition & integration of different data sources (engineering design, PLM (Product Lifecycle management), ERP, Asset management etc.) in a contextualized manner to create asset digital twin for remote asset monitoring, predictive maintenance, automated regulation, and cognitive assistance.
• Smart Spaces: Onboarding the different components of building systems HVAC (Heating, Ventilation & Air Conditioning), lighting systems, sewage and water treatment plant, air quality, security access, DG sets, solar etc.) on one single platform for real time monitoring. Powered by Digital Twin and data driven insights, it helps organizations optimize energy consumption, reduce carbon footprints and enhance the end user experience.
Automation
With automation slowly emerging to be a pivot and not just a key lever for businesses, IT enterprises and service providers are continuing to invest in business and IT automation programs. Also, as the race is on for cloudification, digital supply chains and improved customer experience, the need to pick the right path becomes important. While the maturity of automation techniques like Runbook Automation (RBA), Robotic Process Automation (RPA), IT Process Automation (ITPA),
Intelligent Process Automation (IPA), Data Analytics (DA), and Artificial Intelligence (AI) are advancing rapidly, organizations are facing multiple challenges (internal and external) in automation adoption, acceleration and finally benefit realization. LTI continues to invest in a 360-degree approach to enable businesses to prevent/ overcome the challenges and industrialize ‘Automation as a way of working’ across the organization which yielded excellent outcome in FY22.
LTI’s continued investments towards Automation transformation includes (a) Establishment of exclusive Center of Excellence (COE) to drive Digital initiatives which includes Automation transformation across all of client engagements; (b) AI enabled automation tools/ platform development & industrialization (IPs) team; (c) Exclusive automation academy for skill transformation; (d) Account/ Client experience transformation governance; (e) AIOPS Automation factory (shared) to create re-usable BOTs & optimize development effort; (f) Automation COEs – Business and IT Automation; (g) Setup of inclusive ‘Automation task force’ with representation from all competencies and business units; (h) Automation life cycle standards and methodology; and (i) Robust Audit and Compliance mechanisms for assurance.
LTI’s constant measures towards automation industrialization yielded positive outcome. Some of the highlights includes (a) Created an industrialized framework, ‘AUTOGRIT’ for IT Automation (trademark pending) (b) Continued Investment in Automation IPs - Platforms (CANVAS JORTIZ AIOPS Platform, Canvas BRAIO Orchestrator, SAP Profiler, Oracle Digital command center) which have also gone live in multiple clients as part of ‘BIG Foot transformation program’; (c) 1360 + BOTs gone live across multiple clients; (d) Our re-usable BOTs repository up by 750+; (e) Increased Automation coverage from 80 accounts in FY21 to 111 accounts in FY22; (f) Realized 68% productivity improvement and 25% reduction in Mean time to Repair (‘MTTR’) due to the incremental coverage; (g) Reskilled more than 8000 lateral associates and 90% of new campus hire associates (3,000+); (h) Recognized as a ‘LEADER’ by key analysts for ‘Intelligent Automation Solution / Service Provider’ (ISG) and ‘Cognitive & Self-healing IT Infrastructure services’ (NelsonHall); and (i) Established crowd sourcing platform (Canvas Gig) to incubate continuous innovation;
LTI will continue to invest and accelerate automation adoption to enable/ accelerate client’s digital transformation. In addition to ongoing initiatives, as part of the strategy, LTI will continue to focus on - (1) accelerating AIOPS adoption across client engagements; (2) leverage our learnings, domain knowledge and assessment tools to offer advisory and/ or automation as a service (3) modernize current offerings with AI, automation and IPs embedded; (4) institutionalize automation as part of our Newgen CONVERGED hybrid IT operation model; (5) utilization of reskilled / cross skilled associates in developing automation solutions as part of our strategy; (6) security compliance as core within all automation solutions; (7) education series for leaders and managers both within LTI as well client teams; (8) continue to build end-to-end automation solutions with integrated business and IT processes; (9) enhance automation coverage / maturity across client engagements; and (10) Go To Market (‘GTM’) with our strategic alliances and partners.
(iii) In case of imported technology (imported during the last three years reckoned from the beginning of the financial year):
a. details of technology imported:
Nil
b. year of import:
c. whether the technology been fully absorbed:
d. if not fully absorbed, areas where absorption has not taken place, and the reasons thereof:
(iv) Expenditure on Research & Development: H692 Mn
C. Foreign exchange earnings and outgo
(H in Mn)
Particulars 2021-22 2020-21
Foreign exchange earned
132,251 105,873
Foreign exchange used
51,633 47,865
For and on behalf of the Board
Nachiket Deshpande Sanjay Jalona Chief Operating Officer & Chief Executive Officer & Place: Mumbai Whole-time Director Managing Director Date: April 19, 2022 (DIN: 08385028) (DIN: 07256786)

134 Integrated Annual Report 2021-22 135Corporate Overview | Statutory Reports | Financial Statements
Annexure
Annexure CAnnual report on CSR activities for financial year ended on March 31, 2022
1. Brief outline on CSR Policy of the Company:
Our social initiatives are aimed to empower communities with due focus on improving the quality of education among children from underprivileged communities and helping them with learning outcomes, enhancing skills of the marginalized youth and women, providing special education & skills for physically and intellectually challenged people to make them employable, and addressing the critical issue of environment conservation. Our projects help promote sustainable community development, with a commitment to promote the cause of creating a more inclusive society. LTI’s CSR policy can be viewed at https://www.lntinfotech.com/social-responsibility/
2. Composition of CSR Committee:
Sl. No.
Name of DirectorDesignation /
Nature of Directorship
Number of meetings of CSR Committee held
during the year
Number of meetings attended
1 Mr. Sanjay Jalona Chairperson (Executive Director) 3 32 Mr. Sudhir Chaturvedi Member (Executive Director) 3 33 Mr. Sudip Banerjee Member (Independent Director) 3 3
3. Provide the web-link where composition of CSR Committee, CSR Policy and CSR Projects approved by the Board are disclosed on the website of the Company:
• Weblink for composition of CSR Committee — https://www.lntinfotech.com/investors/corporate-governance/
• CSR Policy & CSR Projects — https://www.lntinfotech.com/social-responsibility/
4. Provide the details of impact assessment of CSR projects carried out in pursuance of sub-rule (3) of rule 8 of the Companies (Corporate Social Responsibility Policy) Rules, 2014, if applicable (attach the report):
Third party impact assessment for two projects were completed for FY19-20 viz. Virtual Teaching with eVidyaloka and Digital Sakshar with Pratham Infotech Foundation as these projects had outlay in excess of H1 Crore. The key assessment framework adopted for the impact assessment was from the OECD DAC criteria (The Organization for Economic Co-operation and Development — Development Assistance Committee). The OECD DAC Network on Development Evaluation (EvalNet) has defined 6 evaluation criteria – Relevance, Coherence, Effectiveness, Efficiency, Impact and Sustainability. These criteria provide a framework to determine the merit or worth of an intervention (policy, strategy, programme, project or activity). They serve as the basis upon which evaluative judgements are made.
Attached are the Impact Assessment Report for both the above mentioned projects, and given below are their MOU values:
Thrust Area Project MOU Value for FY19-20 (J in Mn)
Education Virtual Teaching with eVidyaloka 20.9Empowerment Digital Sakshar with Pratham Infotech Foundation 37.1
5. Details of the amount available for set off in pursuance of sub-rule (3) of rule 7 of the Companies (Corporate Social Responsibility Policy) Rules, 2014 and amount required for set off for the financial year, if any:
Sl. No.
Financial YearAmount available for set-off
from preceding financial years Amount required to be set-off
for the financial year, if any
-----------------------------------------------------------NIL-----------------------------------------------------------
6. Average net profit of the company as per section 135(5): H19,584 Mn
7. (a) Two percent of average net profit of the company as per section 135(5): H391.68 Mn
(b) Surplus arising out of the CSR projects or programmes or activities of the previous financial years: Nil
(c) Amount required to be set off for the financial year, if any: Nil
(d) Total CSR obligation for the financial year (7a+7b-7c): H391.68 Mn
8. (a) CSR amount spent or unspent for the financial year 2021-22: Nil
(b) Details of CSR amount spent against ongoing projects for the financial year: Not applicable
(c) Details of CSR amount spent against other than ongoing projects for the financial year: H382.96 Mn
Sl. No.
Name of the project
Item from the list of activitiesin Schedule VII to the Act
Local area(Yes/ No)
Location ofthe project Amount
spent for the
project (in J Mn)
Mode of implementation
- Direct (Yes/No)
Mode of implementation – Through Implementing Agency
State District NameCSR
Registration number
1 Virtual Teaching with eVidyaloka
(ii) Yes Karnataka,
Tamil Nadu,
Andhra Pra-
desh, Maha-
rashtra and
Uttarakhand
Dharward, Koppal, Raichur,
KR Nagar, Mysuru,
Tiruvannamalai,Chitoor, Krishna,Ahmad Nagar,
Satara, Gadchiroliand Nainital
15.99 No eVidyaloka Trust CSR00000867
2 Virtual Teaching
with eVidyaloka
(ii) Yes Tamil Nadu Chennai 14.20 No eVidyaloka Trust CSR00000867
3 Virtual Teaching
with Prerana
(ii) Yes Karnataka Dharward,
Koppal and
Bengaluru
8.07 No Prerana CSR00002477
4 Junior
Aryabhatta
Computer
Education
(ii) Yes Maharashtra Pune 7.90 No Seva
International
Akshar Bharati
CSR00000559
5 Introduction
to basic
technology
(ii) Yes Maharashtra Pune 9.41 No Vigyan Ashram CSR00003659
6 Avishkar (ix) Yes Maharashtra Mumbai 9.00 No Veermata Jijabai Technological
Institute Technology
Business Incubator (VJTI TBI)
CSR00003365

136 Integrated Annual Report 2021-22 137Corporate Overview | Statutory Reports | Financial Statements
Annexure
Sl. No.
Name of the project
Item from the list of activitiesin Schedule VII to the Act
Local area(Yes/ No)
Location ofthe project Amount
spent for the
project (in J Mn)
Mode of implementation
- Direct (Yes/No)
Mode of implementation – Through Implementing Agency
State District NameCSR
Registration number
7 Quizabled with
Seva in Action
(ii) Yes Karnataka, Maharashtra
and Tamil Nadu
Bengaluru, Mumbai and
Chennai
3.60 No Seva in Action Association
CSR00003408
8 Incubation
Project
(ix) Yes Tamil Nadu Chennai 5.06 No IIT Madras CSR00004320
9 Mid-day meals
with Akshaya
Patra
(ii) Yes Karnataka Bengaluru 10.00 No The Akshaya Patra
Foundation
CSR00000286
10 Social Catalyst
Fund
(ii) Yes Karnataka, Tamil Nadu
and Maharashtra
Bengaluru, Chennai,
Mumbai and Pune
4.50 No Collective Good Foundation
CSR00001648
11 Incubation and
Research NITIE
(ix) Yes Maharashtra Mumbai 6.00 No NITIE CSR00015300
12 IITM Quantum
Hub Project
(ix) Yes Tamil Nadu Chennai 8.10 No IIT Madras CSR00004320
13 Digital Sakshar
(Mumbai)
(ii) & (iii) Yes Maharashtra Mumbai 25.01 No Pratham Infotech
Foundation
CSR00002475
14 Digital Sakshar
(Pune)
(ii) & (iii) Yes Maharashtra Pune 5.50 No Pratham
Infotech
Foundation
CSR00002475
15 Data Analytics
Skilling
(ii) & (iii) Yes Tamil Nadu Chennai 4.00 No Hope Foundation
CSR00000472
16 Digital Skills
with Lokbharti
(ii) & (iii) Yes Maharashtra Mumbai 1.80 No Lokbharti CSR00001361
17 Skill and
Knowledge
Development
Center
(iii) Yes Maharashtra Mumbai and Pune
5.01 No Sankalp Manav Vikas Sanstha
CSR00002603
18 Women Artisans
Skill based
Project
(iii) Yes Maharashtra Mumbai 10.04 No Charities Aid Foundation (CAF) India
CSR00001692
19 Women
Livelihood
Project
(iii) Yes Maharashtra Mumbai 4.19 No Development Alternatives
CSR00000829
20 IT Skills Project
with Sujaya
Foundation
(ii) Yes Maharashtra Mumbai 4.23 No Sujaya Foundation
CSR00001235
21 Vocation
Training Center
(ii) Yes Tamil Nadu Chennai 1.80 No The Spastics Society of Tamil Nadu (SPASTN)
CSR00001373
22 Tree Plantation (iv) Yes Karnataka, Maharashtra
and Tamil Nadu
Bengaluru, Mumbai and
Chennai
22.50 No SayTrees Environmental
Trust
CSR00000702
23 Tree Plantation (iv) Yes Telangana Hyderabad 5.14 No SayTrees Environmental
Trust
CSR00000702
24 Greenathon -
Tree Plantation
(iv) Yes Maharashtra Pune 3.98 No Being Volunteer Foundation
CSR00000932
25 Tree Plantation (iv) Yes Karnataka and Kerala
Mysuru, Uttara Kannada,
Chikkamagaluru and Wayanad
1.04 No Wildlife Conservation Society - India
CSR00001273
26 Tree Plantation (iv) Yes Maharashtra Raigad 10.00 No Swades Foundation
CSR00000440
Sl. No.
Name of the project
Item from the list of activitiesin Schedule VII to the Act
Local area(Yes/ No)
Location ofthe project Amount
spent for the
project (in J Mn)
Mode of implementation
- Direct (Yes/No)
Mode of implementation – Through Implementing Agency
State District NameCSR
Registration number
27 Palghar Tree
Plantation
Project
(iv) Yes Maharashtra Palghar 3.55 No Shop for Change Fair
Trade
CSR00007165
28 Farm Pond (iv) Yes Karnataka Hubli and Dharwad
7.50 No Deshpande Foundation
CSR00001646
29 Tree Plantation (iv) Yes Maharashtra Pune 3.00 No Being Volunteer Foundation
CSR00000932
30 Ecochulhas -
Biostove
(iv) Yes Maharashtra Alibaug 1.54 No Applied Environmental
Research Foundation
CSR00005317
31 Covid relief
support with
UNGC Network
India
(i) & (xii) Yes Karnataka Bengaluru 64.12 No Charities Aid Foundation
(CAF)
CSR00001692
32 Covid relief
support with
Collective Good
Foundation
(i) & (xii) Yes Karnataka Bengaluru 26.95 No Collective Good Foundation
CSR00001648
33 Covid relief
support with
Deshpande
Foundation
(i) & (xii) Yes Karnataka Bengaluru 7.63 No Deshpande Foundation
CSR00001646
34 Covid relief
support
with SELCO
Foundation
(i) & (xii) Yes Karnataka Bengaluru 6.14 No SELCO Foundation
CSR00002487
35 Covid relief
support with
Akshar Bharati
(i) & (xii) Yes Maharashtra Pune 9.90 No Akshar Bharati CSR00000559
36 Covid relief
support with
Vigyan Ashram
(i) & (xii) Yes Maharashtra Pune 0.76 No Vigyan Ashram CSR00003659
37 Covid relief
support with
Sankalp Manav
Vikas Sanstha
(i) & (xii) Yes Maharashtra Mumbai and
Pune
0.37 No Sankalp Manav Vikas Sanstha
CSR00002603
38 Covid relief
support with
Pratham
Education
(i) & (xii) Yes Maharashtra Mumbai 2.38 No Pratham Education
CSR00000751
39 Covid relief
support with
FUEL
(i) & (xii) Yes Maharashtra Pune 3.48 No Friends Union for Energising Lives (FUEL)
CSR00000051
40 Covid relief
support
with Sujaya
Foundation
(i) & (xii) Yes Maharashtra Mumbai 10.58 No Sujaya Foundation
CSR00001235
41 Contribution for
PSA O2 Plant
(i) & (xii) Yes Tamil Nadu and Telangana
Chennai and
Warangal
28.99 No Not Applicable Not Applicable
Total 382.96
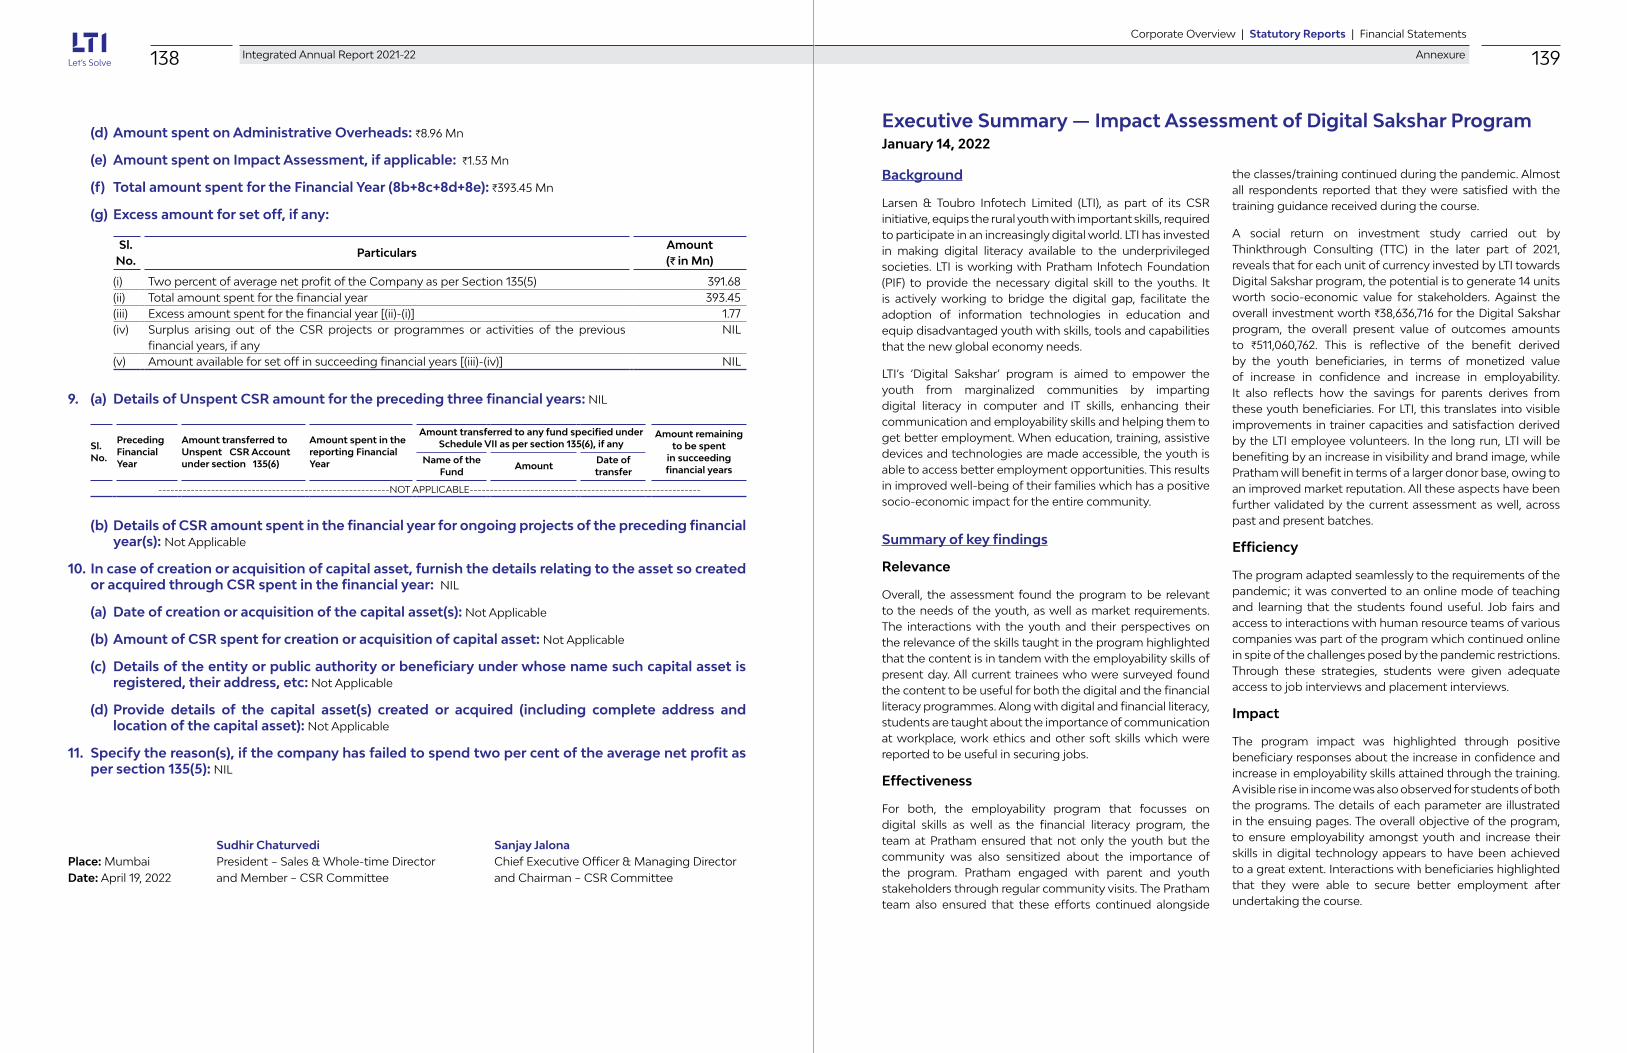
138 Integrated Annual Report 2021-22 139Corporate Overview | Statutory Reports | Financial Statements
Annexure
(d) Amount spent on Administrative Overheads: H8.96 Mn
(e) Amount spent on Impact Assessment, if applicable: H1.53 Mn
(f) Total amount spent for the Financial Year (8b+8c+8d+8e): H393.45 Mn
(g) Excess amount for set off, if any:
Sl. No.
ParticularsAmount (J in Mn)
(i) Two percent of average net profit of the Company as per Section 135(5) 391.68(ii) Total amount spent for the financial year 393.45(iii) Excess amount spent for the financial year [(ii)-(i)] 1.77(iv) Surplus arising out of the CSR projects or programmes or activities of the previous
financial years, if anyNIL
(v) Amount available for set off in succeeding financial years [(iii)-(iv)] NIL
9. (a) Details of Unspent CSR amount for the preceding three financial years: NIL
Sl. No.
Preceding Financial Year
Amount transferred to Unspent CSR Account under section 135(6)
Amount spent in thereporting Financial Year
Amount transferred to any fund specified under Schedule VII as per section 135(6), if any
Amount remaining to be spent
in succeeding financial years
Name of the Fund
Amount Date of transfer
---------------------------------------------------------NOT APPLICABLE---------------------------------------------------------
(b) Details of CSR amount spent in the financial year for ongoing projects of the preceding financial year(s): Not Applicable
10. In case of creation or acquisition of capital asset, furnish the details relating to the asset so created or acquired through CSR spent in the financial year: NIL
(a) Date of creation or acquisition of the capital asset(s): Not Applicable
(b) Amount of CSR spent for creation or acquisition of capital asset: Not Applicable
(c) Details of the entity or public authority or beneficiary under whose name such capital asset is registered, their address, etc: Not Applicable
(d) Provide details of the capital asset(s) created or acquired (including complete address and location of the capital asset): Not Applicable
11. Specify the reason(s), if the company has failed to spend two per cent of the average net profit as per section 135(5): NIL
Sudhir Chaturvedi Sanjay JalonaPlace: Mumbai President – Sales & Whole-time Director Chief Executive Officer & Managing DirectorDate: April 19, 2022 and Member – CSR Committee and Chairman – CSR Committee
Executive Summary — Impact Assessment of Digital Sakshar ProgramJanuary 14, 2022
Background
Larsen & Toubro Infotech Limited (LTI), as part of its CSR initiative, equips the rural youth with important skills, required to participate in an increasingly digital world. LTI has invested in making digital literacy available to the underprivileged societies. LTI is working with Pratham Infotech Foundation (PIF) to provide the necessary digital skill to the youths. It is actively working to bridge the digital gap, facilitate the adoption of information technologies in education and equip disadvantaged youth with skills, tools and capabilities that the new global economy needs.
LTI’s ‘Digital Sakshar’ program is aimed to empower the youth from marginalized communities by imparting digital literacy in computer and IT skills, enhancing their communication and employability skills and helping them to get better employment. When education, training, assistive devices and technologies are made accessible, the youth is able to access better employment opportunities. This results in improved well-being of their families which has a positive socio-economic impact for the entire community.
Summary of key findings
Relevance
Overall, the assessment found the program to be relevant to the needs of the youth, as well as market requirements. The interactions with the youth and their perspectives on the relevance of the skills taught in the program highlighted that the content is in tandem with the employability skills of present day. All current trainees who were surveyed found the content to be useful for both the digital and the financial literacy programmes. Along with digital and financial literacy, students are taught about the importance of communication at workplace, work ethics and other soft skills which were reported to be useful in securing jobs.
Effectiveness
For both, the employability program that focusses on digital skills as well as the financial literacy program, the team at Pratham ensured that not only the youth but the community was also sensitized about the importance of the program. Pratham engaged with parent and youth stakeholders through regular community visits. The Pratham team also ensured that these efforts continued alongside
the classes/training continued during the pandemic. Almost all respondents reported that they were satisfied with the training guidance received during the course.
A social return on investment study carried out by Thinkthrough Consulting (TTC) in the later part of 2021, reveals that for each unit of currency invested by LTI towards Digital Sakshar program, the potential is to generate 14 units worth socio-economic value for stakeholders. Against the overall investment worth H38,636,716 for the Digital Sakshar program, the overall present value of outcomes amounts to H511,060,762. This is reflective of the benefit derived by the youth beneficiaries, in terms of monetized value of increase in confidence and increase in employability. It also reflects how the savings for parents derives from these youth beneficiaries. For LTI, this translates into visible improvements in trainer capacities and satisfaction derived by the LTI employee volunteers. In the long run, LTI will be benefiting by an increase in visibility and brand image, while Pratham will benefit in terms of a larger donor base, owing to an improved market reputation. All these aspects have been further validated by the current assessment as well, across past and present batches.
Efficiency
The program adapted seamlessly to the requirements of the pandemic; it was converted to an online mode of teaching and learning that the students found useful. Job fairs and access to interactions with human resource teams of various companies was part of the program which continued online in spite of the challenges posed by the pandemic restrictions. Through these strategies, students were given adequate access to job interviews and placement interviews.
Impact
The program impact was highlighted through positive beneficiary responses about the increase in confidence and increase in employability skills attained through the training. A visible rise in income was also observed for students of both the programs. The details of each parameter are illustrated in the ensuing pages. The overall objective of the program, to ensure employability amongst youth and increase their skills in digital technology appears to have been achieved to a great extent. Interactions with beneficiaries highlighted that they were able to secure better employment after undertaking the course.

140 Integrated Annual Report 2021-22 141Corporate Overview | Statutory Reports | Financial Statements
Annexure
Sustainability
The sustainability of the program depends on a strong backward and forward linkage; the program ensures a strong engagement with the community on helping them understand the importance of undertaking this training as well as ensures to a large extent the connect with industry for employment. The training goes beyond digital skills and ensures that trainees understand the importance of soft skills in everyday life especially when securing a job. It imparts in them, the knowledge and skill of interacting with different kinds of people at workplace and teaches work-place ethics and rights.
Recommendations
The Digital Sakshar program has evolved over time and ensured that it adapts to the need of the time and situation smoothly. It has also ensured that there is continuity in beneficiary’s learning and has adapted quickly whilst also achieving its primary objectives of employability and skill enhancement.
Interactions with program stakeholders have highlighted some aspects that can be strengthened going forward:
• Greater involvement of LTI volunteers through a systematic employee engagement program is needed. This will ensure transfer of knowledge and drive greater effectiveness, efficiency and sustainability of the program. LTI can explore the development of a dedicated volunteer program in line with key flagship projects being supported by them to make the involvement more structured.
• Post placement feedback from recruiters and relationship building should provide the program useful feedback and guidance on key emerging market trends.
• Strengthened engagement with alumni to trace the long-term impact of the program. The alumni engagement needs to be structured better for greater visibility and impact.
• Concurrent assessments and a centralized system for tracking learning outcomes on a regular basis will provide participants greater engagement. These elements can be incorporated into the application going forward.
Executive Summary — Impact Assessment of e-Vidyaloka ProgramJanuary 14, 2022
Executive summary
Larsen & Toubro Infotech Limited (LTI) as part of its CSR initiatives across India, partnered with eVidyaloka in 2017 to launch the Digital Classroom Program, to improve learning outcomes for children in under-resourced government schools through digital learning. The idea was to provide children access to innovative learning models supported by a class assistant, these assistants primarily being from the local community. Learning inputs were further augmented with teaching content which facilitated critical thinking. The sessions were supported by volunteers from LTI as well as volunteer teachers from the community, who have a passion for teaching. The program was implemented in 75 rural schools across Karnataka, Andhra Pradesh, Maharashtra, Tamil Nadu and Uttarakhand, particularly for students enrolled in the 5th to 8th grades. In March 2020, the rampant spread of Covid-19 forced governments to impose strict lockdown measures, the Digital Classroom Programme came to an abrupt halt, being re-commenced on April 20, 2020. The program reached out to 5498 children between FY19-20 and FY20-21.
Thinkthrough Consulting (TTC) Private Limited was hired by LTI to conduct an Impact Assessment of the Digital Classroom Program. The aim of the impact assessment was to assess the continuation of the program through the Covid-19 pandemic, with the key assessment framework being adopted from the OECD DAC criteria. Herein, the key objectives included verification and analysis of the program relevance in lieu of the pandemic restrictions; effectiveness in terms of operational functioning and stakeholder engagement; efficiency in mitigating challenges and mobilizing volunteer field cadres; impact in terms of continuing student engagement and maximizing stakeholder outreach; and sustainability in terms of ensuring stakeholder interest. In line with these objectives, this Impact Assessment Report presents key findings as part of the assessment and provides key recommendations for the long-term sustainability of the program.
Relevance
The relevance of the eVidyaloka program stems from its focus on ensuring that children in under resourced government schools have continued access to enhanced ways and means of learning despite challenges brought forth by the Covid-19 pandemic. The challenges herein,
included lack of student access to digital devices and internet; geographic remoteness and inaccessibility; and conversion of government schools into Covid facilities among others. Through continuous pilots across states in close association with volunteer assistants and teachers, the program was adapted into a multi-delivery approach to ensure continuation in education for the intended student target population. The multi-modal approach of the program proved to be crucial in ensuring that children across states had continued access to education, thereby showing the program design to be relevant.
Effectiveness
The program has been effective in terms of pivoting itself into a completely digital delivery model to account for the pandemic induced disruption. According to a Social Return on Investment assessment, the Virtual Classroom program has been successful in creating value for its beneficiaries, owing to the program structure; use of digital mediums for pedagogy; staffing strategies of taking local personnel as class assistants. Additionally, the presence of volunteers and class assistants puts pressure on the school system to deliver and function. These are tacit elements that the program also impacts. The effectiveness of the program is especially highlighted in the achievement of learning outcomes, with students witnessing a 30-50% gain in learning in Mathematics, English and Science as per eVidyaloka’s internal assessments. The strategy of having local personnel as class assistants has enabled the program to coordinate effectively with all parents and get classes scheduled based on availability of the digital devices at home. This basically ensured that the program was able to constantly keep in touch with children while sensitizing parents about the key role their support will play in their child’s learning journey.
Efficiency
The efficiency of the Digital Classroom program is established due to the efforts of LTI and eVidyaloka in moving the program into a completely virtual mode. This is in consideration of the inherent infrastructural challenges which were mitigated such that it ensured retaining the number of children due to the grassroot mobilization by class assistants, sensitization of parents and building alternate pathways. The manner in which the class assistants were able to mobilize themselves, establish closer rapport with parents and the

142 Integrated Annual Report 2021-22 143Corporate Overview | Statutory Reports | Financial Statements
Annexure
overall program design was able to ensure that all other elements operate in close coordination. This makes a case for the assessment team to state that the program, despite disruptions in the external environment continued to deliver on its key objectives.
The disruptions herein were caused by the mandatory lockdown measures imposed due to the rampant spread of the Covid-19 pandemic, this including closure of schools; conversion of government schools to Covid facilities; and the overall hindrances caused by inaccessibility to digital infrastructure and geographical locations. In order to overcome these challenges, a robust mechanism was adopted, such that with continuous pilot tests and feedback loops, a multi-delivery model could be implemented to ensure continuation of class transactions.
Impact
As part of this study, the key impact areas of the program included its outreach; continuation of the learning focus for children; volunteer engagement and parent involvement. The adaptability of the program during the Covid-19 pandemic was successful in creating a significant impact in these areas. Having achieved an outreach of 5498 students in March 2021, the program, as reported by nearly 74% of the assessment sample, allowed students to understand and grasp concepts more clearly than they would otherwise through purely physical classroom interactions. This was possible due to the manner in which the local volunteer network was established and developed, with 256 community volunteer teachers and 65 LTI volunteers being part of the ground efforts.
The program was able to instill within children a sense of awareness regarding the differences between offline and online class transaction, thus allowing them to distinguish between different models of delivery and also develop a preference towards the kind of pedagogy approach required going forward with this program. Results indicate that 70% of the students have a preference towards a model combining regular class room and audio-visual content. Parental Interactions have also revealed that children appear to be more involved and confident, while children feel that the program has enabled them to approach learning in a more engaged manner. Nearly the entire student sample reported an increase in confidence while answering questions in class. While nearly 98% of them felt that they could approach teachers and facilitators in case of any learning challenges, 89% of the students reported that they received help from class assistants during assignments.
Sustainability
Sustainability of social development programs needs to be seen in terms of the stakeholder ownership of the program; perception of value the program brings in; ability of stakeholders to discern the differentiated program offerings and a dotted line linkage between the program and its end objectives. Seen from this lens, the assessment has revealed that the program is seen as valuable by parents, students and teachers alike. The program value has been especially enhanced during the lockdown and school closure period when nationally there have been widespread fears on loss of learning outcomes for children across grades. The program has through its myriad efforts, enabled students to continue learning. This is especially important, given that due to the pandemic, eVidyaloka adapted not only its program but also its outcome indicators to include student attendance and level of achievement of learning outcomes.
Furthermore, students are now in a position to compare and articulate the model of learning they would prefer going forward. The ability to discern and make a choice is a favorable outcome, arising out of efforts to induce behavior change at the student and parent level, particularly in relation to how the program adaptations are viewed and received by beneficiary stakeholder. In this regard, parent sensitization has led them to become more engaged with their children’s learning journey and as children speak more and more about their experiences, parents have a unique opportunity to see their children learn and grow.
Key stakeholder interactions with the eVidyaloka leadership have revealed that there is an effort to define sustainability through a stakeholder capacitation perspective. There is a plan being developed to focus on training of teachers on the eVidyaloka platform in a way that they do not need class assistants in the near future. This model will be applicable to schools supported for over 4-5 years by LTI. Additionally, while a focused capacity building plan for school management committees is understood as a focus area, a structured plan to define the goals of the same are on the anvil, for the time being.
Recommendations
• The eVidyaloka program may want to build on the foundational efforts that have ensured that children do not drop out and remain connected with the program. This is particularly important considering that children are moving grades despite disruptions in academic calendars due to the pandemic or allied factors. It will be useful to have visibility on learning levels of each child,
across platforms so that a learning level appropriate plan of action can be put in place.
• Assessment of the skill levels of class assistants is important as their roles and expectations may see a change if another academic year gets disrupted. This will help eVidyaloka to plan a structured capacitation effort for their community cadre.
• It is important for eVidyaloka to define program sustainability from a system strengthening perspective. This can be done by identification and capacitation of key stakeholders like school management committees and parent groups to understand their roles and responsibilities towards the education of their children and to make the school a completely functional and effective unit. It will be useful to engage with School Management Committees (SMCs) and parents on right
to education aspects, which makes SMCs responsible for the school development plan. In this way, a closer parent school engagement can be fostered which may contribute to greater teacher interest towards their teaching and nurturing responsibilities.
• LTI may also need to define sustainability from such interventions in a time bound manner. The MOUs with partners on such projects need to clearly define a capacity building time frame which will contribute to an exit plan as well. Given that education projects have a longer gestation period and may need greater investments towards broader stakeholder engagement, it will be useful to develop a comprehensive school focused program in the future. This will enable closer government collaborations and greater recognition of the efforts being made by the project.

144 Integrated Annual Report 2021-22 145Corporate Overview | Statutory Reports | Financial Statements
Annexure
Annexure DReport on Corporate Governance
1. Corporate Governance
1.1 Company’s philosophy on Corporate Governance
LTI considers Corporate Governance as one of the pillars to build and maintain the trust reposed by its stakeholders. LTI’s character is embedded with the value system of L&T Group which rests on transparency, integrity and accountability.
1.2 Governance structure
While the Board is accountable for oversight of the governance process, the Executive Management is responsible for implementing the policies and procedures
by way of which governance is imbibed within the organization. LTI holds the belief that governance is a continuous journey as a result of the ever evolving developments in the business environment, both internally and externally. The governance structure at LTI comprises of following four levels with the objective to garner involvement of the Executive Management under adequate oversight of the Board and its Committees:
1) Board of Directors
2) Board Committees
3) Executive Committee
4) Management Sub-Committees
Acronyms:
Tier 1: BOD: Board of Directors
Tier 2: AC: Audit Committee
SIC: Strategic Investment Committee
RMC: Risk Management Committee
CSR: Corporate Social Responsibility Committee
SRC: Stakeholders’ Relationship Committee
NRC: Nomination and Remuneration Committee
Tier 3: ExCom: Executive Committee
Tier 4: SDC: Securities Dealing Committee
WBC: Whistle Blower Investigation Committee
COC: Code of Conduct Committee
POSH IC: Internal Complaint Committee for Prevention of Sexual Harassment at Workplace
ICC: Internal Compliance Committee
Supl.COC: Committee on Supplier Code of Conduct
Try.Com.: Treasury Committee
Mgt. Con.: Management Council
ROC: Risk Operating Committee
CSR Ex.Com.: CSR Executive Committee
Governance Structure at LTI
Mgt.con
ROC
CSR
Ex.
Co
m.
SDC
WBC
CO
CP
OSH
-ICIC
C
Supl.COC
Try.Com
ExCom
ExC
om
ExC
om
ExCom
ExCo
m
AC
SIC
RMC
CSR
SRC
NRC
BOD
2. Board of Directors
A. Board composition
Details of composition of the Board of Directors, attendance of Directors at the Board meetings and at the last Annual General Meeting held during FY22, number of other Directorships, Membership/ Chairpersonship in Committees held by them as on March 31, 2022, are as follows:
Name of the Director
No. of Board meetings held
during FY22 during tenure of
the Director
Attendance at Board
Meetings
Attendance at last AGM held on July
17, 2021
Directorships in other
Companies1
No. of Committee
Membership2
No. of Committee
Chairpersonship2
Mr. A. M. Naik(Non-Executive Founder Chairman)
6 5 Yes 6 0 0
Mr. S. N. Subrahmanyan(Non-Executive Vice Chairman)
6 5 Yes 7 0 0
Mr. R. Shankar Raman(Non-Executive Director)
6 6 Yes 9 6 0
Mr. Sanjay Jalona(Chief Executive Officer & Managing Director)
6 6 Yes 1 1 0
Mr. Sudhir Chaturvedi(Whole-time Director & President-Sales)
6 6 Yes 1 1 0
Mr. Nachiket Deshpande(Whole-time Director & Chief Operating Officer)
6 6 Yes 1 0 0
Mr. M. M. Chitale3
(Independent Director)6 6 Yes 5 7 3
Mr. Sanjeev Aga(Independent Director)
6 6 Yes 5 5 2
Mr. Sudip Banerjee(Independent Director)
6 6 Yes 4 2 0
Mrs. Aruna Sundararajan(Independent Director)
6 5 Yes 1 3 1
Mr. James Abraham4
(Independent Director)3 3 N.A. 1 0 0
Mr. Rajnish Kumar 5
(Independent Director)3 3 N.A. 2 1 0
Notes:
1. Includes Directorship of all public limited companies (including LTI) whether listed or not, and excludes private limited companies, foreign companies and Section 8 companies.
2. Includes membership/ chairpersonship of Audit Committee and Stakeholders’ Relationship Committee only as per Regulation 26 of SEBI Listing Regulations, including Committee membership/ chairpersonship in LTI. Number of committee membership includes Committee chairpersonship(s).
3. Mr. M. M. Chitale ceased to hold office of Director w.e.f. March 31, 2022 (closing business hours) upon completion of his second term as Independent Director.
4. Mr. James Abraham was appointed as Independent Director w.e.f. July 18, 2021.
5. Mr. Rajnish Kumar was appointed as Independent Director w.e.f. August 26, 2021.

146 Integrated Annual Report 2021-22 147Corporate Overview | Statutory Reports | Financial Statements
Annexure
Mr. Vinayak Chatterjee was appointed as Independent Director w.e.f. April 1, 2022.
None of the Directors hold directorship in more than 10 public companies and none of the Independent Directors are serving as Independent Director in more than seven listed companies.
Directors have given necessary disclosures regarding Committee positions held by them in other Indian public companies as at March 31, 2022.
None of the Directors of the Company are inter-se related to each other.
As on March 31, 2022, the composition of the Board was in compliance with Regulations 17 and 25 of SEBI (Listing Obligations and Disclosure Requirements) Regulations, 2015 (‘SEBI Listing Regulations’) read with Section 149 of the Companies Act, 2013 (‘Act’).
Further, details of Directorships held by Directors in other listed entities (excluding Directorship in LTI) as on March 31, 2022, are as follows:
Name of the Director Name of other listed entity(ies) Category of Directorship
Mr. A. M. Naik Larsen & Toubro Limited Group Chairman
L&T Technology Services Limited Non-Executive Chairman
Mindtree Limited Non-Executive Chairman
Mr. S. N. Subrahmanyan Larsen & Toubro Limited Chief Executive Officer and Managing Director
L&T Technology Services Limited Non-Executive Vice Chairman
Mindtree Limited Non-Executive Vice Chairman
L&T Finance Holdings Limited Chairman
Mr. R. Shankar Raman Larsen & Toubro Limited Whole Time Director
L&T Finance Holdings Limited Non-Executive Director
Mindtree Limited Non-Executive Director
Mr. Sanjay Jalona None -
Mr. Sudhir Chaturvedi None -
Mr. Nachiket Deshpande None -
Mr. M. M. Chitale Larsen & Toubro Limited Independent Director
Atul Limited Independent Director
Macrotech Developers Limited Independent Director
Bhageria Industries Limited Independent Director
Mr. Sudip Banerjee L&T Technology Services Limited Independent Director
IFB Industries Limited Non-Executive Director
Kesoram Industries Limited Independent Director
Mr. Sanjeev Aga Larsen & Toubro Limited Independent Director
UFO Moviez India Limited Independent Director
Pidilite Industries Limited Independent Director
Mahindra Holidays & Resorts India Limited Independent Director
Mrs. Aruna Sundararajan None -
Mr. James Abraham None -
Mr. Rajnish Kumar Hero Motocorp Limited Independent Director
B. Board Meetings
Board Meetings are convened at appropriate intervals by giving advance notice and agenda papers to the Directors, and the gap between two consecutive meetings does not exceed 120 days. The Company adheres to the Secretarial Standards on Board and Committee Meetings as prescribed by the Institute of Company Secretaries of India. In consultation with the head of business units, the Company Secretary prepares the draft agenda, and post confirmation by Chairman of the Board/respective Committees, finalizes the same. The yearly calendar of Board and Committee meetings is finalized before beginning of the year. The Directors are given the option to attend Board/Committee meetings via video conferencing. The Board has complete access to any information within the Company. In case of exigency or urgency of the matter, resolutions are passed by circulation for such matter as permitted by law and the same is taken on record in the succeeding Board/Committee meeting.
Due to the ongoing pandemic, majority of the Board meetings and Committee meetings during FY22 were held through Video Conferencing or Other Audio-Visual Means, in compliance with the Rule 3 of the Companies (Meetings of Board and its Powers) Rules, 2014. During the year under review, six Board Meetings were held on April 14, 2021, May 4, 2021, July 15, 2021, October 18, 2021, January 19, 2022 and March 17, 2022 and information as required in Part A of Schedule II under Regulation 17 (7) of SEBI Listing Regulations were placed before the Board for its consideration. The quorum was present in all the meetings.
As a green initiative, agenda of the Board and Committee meetings are circulated to the Directors via the secured in-house web-based application viz. iboard, which is accessed on i-Pad. All important decisions taken at Board/ Committee meetings are promptly communicated to the concerned departments for their follow-up action. In compliance with the Secretarial Standards, draft and signed minutes of Board & Committee meetings are circulated amongst the Board/Committee members within the prescribed time.
C. Matrix of skills/expertise/competencies of the Board of Directors
In terms of the requirements of the SEBI Listing Regulations, the Board has identified the core skills/ expertise/ competencies of Directors which are relevant in the context of Company’s business(es). Broadly, the essential skill sets identified by the Board are categorised as under:
a. Strategy and Planning
b. Governance, Risk Management and Compliance
c. Finance, Accounts and Audit
d. Global experience / international exposure
e. Contributor and Collaborator
f. Information Technology
g. Client Engagement
h. Stakeholders Engagement and Industry Advocacy
Number of Directors as on March 31, 2022 – 12
As part of performance evaluation of the Board/individual Directors for FY22, analysis of the skills, experience and expertise of the Directors was carried out, which outlined that Board of Directors of the Company possess the right and optimal skill sets fundamental for the effective functioning of the Company. The results of the analysis are presented below:
Governance, Risk Management and Compliance
88% 12%
85% 15%
84% 16%
83% 17%
74% 26%
73% 27%
73% 27%
69% 31%
Contributor and Collaborator
Finance, Accounts and Audit
Global Experience/ International Exposure
Strategy and Planning
Stakeholders Engagement and Industry Advocacy
Client Engagement
Information Technology
Expert Proficient

148 Integrated Annual Report 2021-22 149Corporate Overview | Statutory Reports | Financial Statements
Annexure
Skill mapping at Individual Director level
Name of Director
Strategy &
Planning
Governance, Risk Management and
Compliance
Finance, Accounts and Audit
Global Experience/ International
Exposure
Information Technology
Client Engagement
Stakeholders Engagement
& Industry Advocacy
Contributor & Collaborator
1 2 3 4 5 6 7 8
Mr. A. M. Naik
Mr. S. N. Subrahmanyan
Mr. R. Shankar Raman
Mr. Sanjay Jalona
Mr. Sudhir Chaturvedi
Mr. Nachiket Deshpande
Mr. M. M. Chitale
Mr. Sanjeev Aga
Mr. Sudip Banerjee
Mrs. Aruna Sundararajan
Mr. James Abraham
Mr. Rajnish Kumar
The identified skills/ competencies are broad-based and marking of ‘Proficient’ against a particular director does not imply that he/she does not possess the corresponding skill/ competency.
3. Board committees
The Committees of the Board are guided by their Charter or Terms of Reference, which outline their composition, scope, power, duties and responsibilities. Basis the recommendations, suggestions and observations of these Committees, the Board of Directors take an informed decision. The Chairman of respective Committees update the Board on the deliberations at the Committee meetings. As on March 31, 2022, there were six standing Committees, namely: -
(a) Audit Committee
(b) Nomination and Remuneration Committee
(c) Stakeholders’ Relationship Committee
(d) Risk Management Committee
(e) Corporate Social Responsibility Committee
(f) Strategic Investment Committee
The details of terms of reference and composition of the Committees and the number of meetings held during FY22 and attendance therein, are provided below:
Expert Proficient
A. Audit Committee
The Audit Committee meets the criteria laid down under Section 177 of the Act and Regulation 18 of the SEBI Listing Regulations. As on March 31, 2022, the Audit Committee comprised of three Independent Directors and one Non-Executive Director. Consequent upon completion of term of Mr. M. M. Chitale as Independent Director of the Company, he ceased to be the Chairman and Member of Audit Committee, w.e.f. close of business hours of March 31, 2022 and Mr. Rajnish Kumar was appointed as the Chairman of the Audit Committee in his place w.e.f. April 1, 2022.
During FY22, seven meetings of Audit Committee were held with gap not exceeding 120 days between two consecutive meetings. These meetings were held on April 14, 2021, May 4, 2021, July 15, 2021, October 18, 2021, November 18, 2021, January 19, 2022 and March 30, 2022, as per following details:
Name of Director Category Position in
the Committee
No. of meetings held during the year vis-à- vis
member’s tenure
No. of meetings attended
Mr. M. M. Chitale1 Independent Director Chairman 7 7Mr. R. Shankar Raman Non-Executive Director Member 7 7Mrs. Aruna Sundararajan Independent Director Member 7 7Mr. Rajnish Kumar2 Independent Director Member 1 1
Notes:
1. Mr. M. M. Chitale ceased to be Chairman & Member w.e.f. close of business hours of March 31, 2022.
2. Mr. Rajnish Kumar inducted as Member w.e.f. March 17, 2022 and appointed as Chairperson w.e.f. April 1, 2022.
3. Invitees/participants: Chief Executive Officer & Managing Director, President Sales & Whole-time Director, Chief Operating Officer & Whole-time Director, Chief Financial Officer, Head Finance Function, Partner/ Representative of the Statutory Auditor and the Internal Auditor are invitees to the meetings of Audit Committee. Vice President-Legal, Risk Head and other Corporate Heads deliver presentations to the Audit Committee at periodic intervals. The Company Secretary acts as the Secretary to the Committee.
Terms of reference
The terms of reference of the Audit Committee are in accordance with Part C of Schedule II of the SEBI Listing Regulations.
B. Nomination and Remuneration Committee
The Nomination and Remuneration Committee (‘NRC’) of the Board of Directors meets the criteria laid down under Section 178 of the Act and Regulation 19 of the SEBI Listing Regulations. As on March 31, 2022, NRC comprised of two Independent Directors and one Non-Executive Director.
During FY22, five meetings of NRC were held on April 14, 2021, May 4, 2021, July 15, 2021, October 18, 2021 and January 19, 2022, as per following details:
Name of Director Category Position in the Committee
No. of meetings held during the year vis-à- vis
member’s tenure
No. of meetings attended
Mr. Sanjeev Aga1 Independent Director Chairman 5 5Mr. A. M. Naik Non-Executive Director Member 5 4Mrs. Aruna Sundararajan2 Independent Director Member 4 4Mr. James Abraham3 Independent Director Member 1 1
Notes:
1. Mr. Sanjeev Aga was re-designated as Chairman of the Committee w.e.f. April 1, 2021.
2. Mrs. Aruna Sundararajan ceased to be Member w.e.f. October 18, 2021.
3. Mr. James Abraham was inducted as Member w.e.f. October 18, 2021.

150 Integrated Annual Report 2021-22 151Corporate Overview | Statutory Reports | Financial Statements
Annexure
Terms of reference
The terms of reference of the NRC are in accordance with Part D of Schedule II of the SEBI Listing Regulations.
Board membership criteria
NRC identifies and recommends to the Board, suitable candidates for the position of Director, basis the skills, competencies, attributes and criteria laid down, and the Board Skill Matrix identified and approved by the Board. NRC considers attendance, participation, contribution and involvement in Company’s strategic matters by a Director during the Board/ Committee meetings, while recommending re-appointment of Directors.
NRC ensures that the Board of Directors has an optimum composition of Directors with diversity of thought, knowledge, perspective, age, gender, expertise and skill, to support the Company in attainment of its objectives.
Additionally, for the appointment or re-appointment of Independent Director, NRC while giving its recommendation to the Board ensures that the candidate fulfills the criteria of independence as prescribed under the Act and SEBI Listing Regulations, including his/her independence from the management.
Performance evaluation criteria for Independent Directors
An indicative list of criteria on which evaluation of Independent Directors was carried out included participation and contribution to the Board’s decision making, understanding of Company’s strategy and business model, update on business and industry, effective communication of knowledge and expertise in Board discussions and maintenance of independence & disclosure of conflict of interest.
During the year, in terms of the requirement of the Act and SEBI Listing Regulations, annual performance evaluation of the Board, its Committees, Chairman and other individual Directors was carried out with the help of an external agency, details of which have been provided in the Board’s Report forming part of this Integrated Annual Report.
Remuneration of Directors
Remuneration of Directors is based on various factors like Company’s size, global presence, economic and financial position and Directors’ participation in Board and Committee meetings. Based on these factors and performance evaluation of the concerned director, NRC recommends to the Board the remuneration payable to Directors.
The remuneration of Executive Directors includes base salary, stock options and variable compensation which is based on variable compensation plan as per Company’s policy and achievement of the milestones/ goals laid out in the said policy, while remuneration to Independent Directors is based on various factors like committee position(s) held, chairpersonship, attendance, participation and performance evaluation. The Independent Directors are entitled to sitting fee, reimbursement of expenses for participation in Board/Committee meetings and commission on profit.
Non-Executive Directors are paid commission upto 1% of the net profit of the Company for each financial year, in accordance with the approval accorded at the Annual General Meeting held on May 31, 2016. Further, in terms of Regulation 46 of the SEBI Listing Regulations, the criteria for payment to Non-Executive Directors is available on the investor section of the Company’s website, www.lntinfotech.com/Investors
Details of remuneration paid to the Directors for FY22 is as under:
i. Executive Directors(Amount in H)
Name of Director Salary
Perquisite (on exercise
of Stock Options)
Retirement benefits
Variable Compensation# & Commission*
Total
Mr. Sanjay Jalona* 6,17,93,844 28,06,34,865 21,24,133 5,69,38,279 40,14,91,121Mr. Sudhir Chaturvedi 5,14,45,925 2,47,98,004 1,09,93,318 1,97,47,406 10,69,84,653 Mr. Nachiket Deshpande 1,42,88,404 6,82,07,760 4,64,559 70,03,356 8,99,64,079
ii. Non-Executive Directors(Amount in H)
Name of Director Sitting Fees Commission Total
Mr. M. M. Chitale 4,75,000 24,00,000 28,75,000Mr. Sanjeev Aga 4,75,000 23,00,000 27,75,000Mr. Sudip Banerjee 3,75,000 16,50,000 20,25,000Mrs. Aruna Sundararajan 5,75,000 24,25,000 30,00,000Mr. James Abraham* 1,75,000 7,75,000 9,50,000Mr. Rajnish Kumar# 2,00,000 8,75,000 10,75,000Mr. A. M. Naik 3,50,000 1,00,00,000 1,03,50,000Mr. S.N.Subrahmanyan - - -Mr. R. Shankar Raman - - -
*Mr. James Abraham was appointed as Independent Director w.e.f. July 18, 2021 #Mr. Rajnish Kumar was appointed as Independent Director w.e.f. August 26, 2021
Details of service contracts (Executive Directors)
a. Notice Period
In case of cessation/termination: Three month’s notice on either side or right to basic salary in lieu thereof and compensation, as per the terms and conditions in the respective agreements, as applicable.
b. Stock Options: During FY22, no stock options were granted to Executive Directors.
During FY22, there was no material pecuniary relationship or transaction between the Company and any of its Non-Executive/ Independent Directors apart from payment towards sitting fee, commission and reimbursement of out of pocket expenses.
C. Stakeholders’ Relationship Committee
The Stakeholders’ Relationship Committee (‘SRC’) of the Board of Directors meets the criteria laid down under Section 178 of the Act and Regulation 20 of the SEBI Listing Regulations. As on March 31, 2022, SRC comprised of one Independent Director and two Executive Directors.
During FY22, two meetings of SRC were held on May 3, 2021 and October 14, 2021, as per following details:
Name of Director Category Position in
the Committee
No. of meetings held during the year vis-à- vis
member’s tenure
No. of meetings attended
Mrs. Aruna Sundararajan Independent Director Chairperson 2 2Mr. Sanjay Jalona Chief Executive Officer
& Managing DirectorMember 2 2
Mr. Sudhir Chaturvedi Whole-time Director Member 2 2
Terms of reference
The terms of reference of the SRC are in accordance with Part D of Schedule II of the SEBI Listing Regulations.
Number of complaints
During FY22, no investor complaints were received from SEBI/ Stock Exchanges/ Depositories by the Company and the Registrar and Share Transfer Agent.
#Linked to individual and Company’s performance

152 Integrated Annual Report 2021-22 153Corporate Overview | Statutory Reports | Financial Statements
Annexure
D. Risk Management Committee
As on March 31, 2022, Risk Management Committee (‘RMC’) comprised of two Independent Directors and one Executive Director.
During FY22, two meetings of RMC were held on August 19, 2021 and February 11, 2022, as per following details:
Name of Director Category Position in
the Committee
No. of meetings held during the year vis-à- vis
member’s tenure
No. of meetings attended
Mr. Rajnish Kumar1 Independent Director Chairperson 1 1Mr. Anil Rander2 Chief Financial Officer Member 1 1Mr. Sanjeev Aga3 Independent Director Member 2 2Mr. Nachiket Deshpande Whole-time Director Member 2 2
Notes:
1. Mr. Rajnish Kumar was appointed as Chairman w.e.f. October 18, 2021 and held this office till March 31, 2022.
2. Mr. Anil Rander ceased to be Member w.e.f. October 18, 2021.
3. Mr. Sanjeev Aga was re-designated as Member (from Chairman) w.e.f. October 18, 2021.
Mr. Vinayak Chatterjee was inducted in the RMC as Chairman w.e.f. April 1, 2022.
Terms of reference
The terms of reference of the RMC are in accordance with Part D of Schedule II of the SEBI Listing Regulations.
E. Corporate Social Responsibility Committee
As on March 31, 2022, CSR Committee comprised of one Independent Director and two Executive Directors.
During FY22, three meetings of CSR Committee were held on May 3, 2021, October 14, 2021 and January 19, 2022 as per following details:
Name of Director Category Position in
the Committee
No. of meetings held during the year vis-à- vis
member’s tenure
No. of meetings attended
Mr. Sanjay Jalona Chief Executive Officer & Managing Director
Chairman 3 3
Mr. Sudip Banerjee Independent Director Member 3 3Mr. Sudhir Chaturvedi Whole-time Director Member 3 3
Terms of Reference
The terms of reference of the CSR Comiittee are in accordance with Schedule VII of the Companies Act, 2013, and CSR policy of the Company.
For details of Company’s CSR Policy, CSR activities and CSR spent, please refer the Annual Report on CSR, appearing as Annexure C to Board’s Report.
Name of Director Category Position in
the Committee
No. of meetings held during the year vis-à- vis
member’s tenure
No. of meetings attended
Mr. A. M. Naik Non-Executive Director Chairman 3 2Mr. S. N. Subrahmanyan Non-Executive Director Member 3 3Mr. R. Shankar Raman Non-Executive Director Member 3 3Mr. Sanjay Jalona Chief Executive Officer &
Managing DirectorMember 3 0
F. Strategic Investment Committee
As on March 31, 2022, the Strategic Investment Committee (‘SIC’) comprised of three Non-Executive Directors and one Executive Director.
During FY22, three meetings of SIC were held on April 10, 2021, June 15, 2021 & August 20, 2021, as per following details:
Terms of reference
The terms of reference of SIC, inter-alia, includes the following:
• Identification, due diligence, reviewing and approving proposals for acquisition and investment in terms of broad business objectives and within the limits and parameters in-principally approved by the Board of Directors;
• Consideration, review and approval of investment proposals in subsidiaries within the limits delegated by the Board of Directors;
• Periodically reviewing the status of acquisitions and investments, in terms of business objectives, status of integration of acquired companies & financial returns and other key strategic activities.
4. Other information
A. General body meetings
Details of last three Annual General Meetings (‘AGM’) of the Company along with particulars of Special Resolution(s) passed by members of the Company in the said meetings are as under:
Financial Year VenueDate and
TimeSpecial Resolutions
passed
2020-21 In compliance with General Circular No. 02/2021 dated January 13, 2021 read with General Circular No. 20/2020 dated May 5, 2020 issued by the Ministry of Corporate Affairs and SEBI’s Circular No. SEBI/HO/CFD/CMD2/CIR/P/2021/11 dated January 15, 2021 read with SEBI’s Circular No. SEBI/HO/CFD/CMD1/CIR/P/2020/79 dated May 12, 2020, the AGM was conducted via Video Conference (VC) / Other Audio Visual Means (OAVM) in compliance with Section 96 of the Companies Act, 2013. The deemed venue of AGM was the registered office of the Company i.e. L&T House, Ballard Estate, Mumbai 400 001
July 17, 2021at 4:00 p.m.
Re-appointment of Mr. Sanjeev Aga (DIN: 00022065) as IndependentDirector for second term of five years.
2019-20 - do - July 18, 2020at 4:30 p.m.
None
2018-19 Birla Matushri Sabhagar, 19, Marine Lines, Mumbai 400 020
July 20, 2019 at 11:00 a.m.
None

154 Integrated Annual Report 2021-22 155Corporate Overview | Statutory Reports | Financial Statements
Annexure
B. Approval of members through Postal Ballot
During FY22, no resolutions were passed through Postal Ballot.
There are certain matters for which approval of members may be sought by way of Postal Ballot. Members shall be suitably communicated regarding the same in due course.
C. Means of communication
The Company communicates with all its stakeholders via multiple channels of communication as outlined below:
• Financial Results announcement: The quarterly, half-yearly and annual financial results of the Company (both standalone and consolidated) are submitted to National Stock Exchange of India Limited and BSE Limited on their respective web portal viz. “NEAPS” and “BSE Listing Center” within the prescribed timelines, and they are published in prominent newspapers, which include The Financial Express and local newspaper Loksatta. Simultaneously, the results are hosted on the Company’s website: www.Lntinfotech.com/Investors. During the year, members were also communicated via e-mails, the financial results of the Company immediately upon their submission to the Stock Exchanges.
• News Releases: Official news releases by the Company are filed with stock exchanges electronically on “NEAPS” and “BSE Listing Centre”. The same are also available on the Company’s website: www.Lntinfotech.com/Investors
• Website: The Company’s website contains a separate “Investors” section wherein shareholder related information is available. Besides the mandatory documents required to be uploaded on the Company’s website under SEBI Listing Regulations, details of earnings call, presentations, press releases, factsheets and quarterly reports of the Company are hosted on the website: www.Lntinfotech.com/Investors
• Chairman’s Speech: Chairman’s speech to be delivered at the 26th AGM will be uploaded on the website of the Company in due course.
• Presentation made to Institutional Investors and Analysts: The schedule of analyst/ institutional investors’ meetings & Analyst Day, and presentations made thereat are filed with the National Stock Exchange of India Limited and BSE Limited. The same are also available on the Company’s website: https://www.lntinfotech.com/investors/events/
5. General shareholders’ information
A. 26th Annual General Meeting
Day & Date Time Venue
Thursday, July 14, 2022 3:45 p.m. (IST) In compliance with General Circular No. 2/2022 dated May 5, 2022, issued by the Ministry of Corporate Affairs, AGM will be conducted through Video Conference (VC) / Other Audio Visual Means (OAVM). Accordingly, there is no requirement to have a venue for the AGM.
For the purpose of compliance of Section 96 of the Companies Act, 2013, the registered office of the Company at L&T House, Ballard Estate, Mumbai 400 001, shall be deemed to be the venue of the AGM.
B. Financial year and tentative calendar of the Company for FY23
The Company follows April to March as the financial year.
Tentative calendar of Board meetings for consideration of financial results during the financial year ending March 31, 2023 is as under:
Results for quarter ending June 30, 2022 On or before August 14, 2022Results for quarter ending September 30, 2022 On or before November 14, 2022Results for quarter ending December 31, 2022 On or before February 14, 2023Results for the quarter and year ending March 31, 2023 On or before May 30, 2023
C. Final Dividend
The Board of Directors of the Company have recommended a final dividend of H30/- per equity share of face value of H1/- each. The final dividend, if approved, by the members at the 26th AGM, would be paid/dispatched within 30 days from the date of the AGM. The Company shall deduct tax at source at prescribed rates on the dividend paid to the members, as stipulated under the Income Tax Act, 1961. For more details, members are requested to refer to the ‘TDS instructions on dividend distribution’ appended as Annexure-1 to the Notice convening the 26th AGM.
As on March 31, 2022, no amount is liable to be transferred to the Investor Education and Protection Fund (IEPF). Details of unpaid/unclaimed dividend(s) declared during FY2015-16 which is liable to be transferred to the IEPF during Calender Year 2023 is provided in the Board’s Report.
D. Listing of Equity Shares on Stock Exchanges & ISIN
The Equity Shares of the Company are listed on following Stock Exchanges:
Name of the Stock Exchange Address of the Stock Exchange Stock Code/Symbol
National Stock Exchange of India Limited Exchange Plaza, C-1, Block G, Bandra Kurla Complex, Bandra (E), Mumbai - 400 051
LTI
BSE Limited Phiroze Jeejeebhoy Towers, Dalal Street, Mumbai - 400 001
540005
The Company has paid listing fee for FY22 to the above Stock Exchanges.
ISIN of the Equity Shares of the Company is INE214T01019.

156 Integrated Annual Report 2021-22 157Corporate Overview | Statutory Reports | Financial Statements
Annexure
Month
BSE NSE
High (J) Low (J)
No. of equity shares traded
High (J) Low (J)
No. of equity shares traded
(in Lakhs)
April 2021 4,450.00 3,831.00 2,93,872 4,450.00 3,830.00 50.77May 2021 3,996.65 3,525.95 4,58,969 3,994.90 3,525.00 81.18June 2021 4,247.95 3,771.00 3,91,027 4,247.85 3,770.00 68.50July 2021 4,726.00 3,970.20 7,43,267 4,727.80 3,970.00 99.10August 2021 5,373.85 4,650.00 4,76,682 5,375.00 4,648.50 67.88September 2021 6,498.00 5,265.35 4,43,384 6,498.50 5,265.75 73.48October 2021 7,155.00 5,612.05 7,55,378 7,155.00 5,610.00 125.31November 2021 7,562.00 6,396.55 3,22,062 7,564.95 6,392.35 53.13December 2021 7,359.00 6,465.00 3,29,248 7,362.00 6,464.10 76.84January 2022 7,595.25 5,725.20 3,86,242 7,588.80 5,722.00 89.89February 2022 6,420.00 5,580.20 2,59,261 6,432.30 5,580.00 52.29March 2022 6,520.00 5,770.80 2,93,982 6,524.80 5,755.20 70.86
E. Stock price data for FY22
Comparison of performance of share price of the Company with NIFTY 50 and BSE SENSEX
Movement of LTI share price at BSE during FY22
300
250
200
150
100
50
0
Ap
r-21
May
-21
Jun
-21
Jul-
21
Aug
-21
Sep
-21
Oct
-21
Nov
-21
Dec
-21
Jan
-22
Feb
-22
Mar
-22
BSE Sensex LTI share price
Note: LTI’s share price, BSE SENSEX and NSE NIFTY 50 index values on April 1, 2021 have been baselined to 100.
F. Distribution of Shareholding as on March 31, 2022
No. of Equity Shares heldShareholders Shareholding
Number % Number %
Upto 500 3,11,260 99.17 6,473,161 3.69
501-1000 972 0.31 721,055 0.41
1001-2000 502 0.16 710,505 0.41
2001-3000 190 0.06 473,219 0.27
3001-4000 145 0.05 511,450 0.29
4001-5000 97 0.03 452,452 0.26
5001-10000 254 0.08 1,804,951 1.03
10001 & Above 457 0.14 164,123,363 93.64
Total 3,13,877 100.00 175,270,156 100.00
300
250
200
150
100
50
0
Ap
r-21
May
-21
Jun
-21
Jul-
21
Aug
-21
Sep
-21
Oct
-21
Nov
-21
Dec
-21
Jan
-22
Feb
-22
Mar
-22
NIFTY 50 LTI share price
Movement of LTI share price at NSE during FY22

158 Integrated Annual Report 2021-22 159Corporate Overview | Statutory Reports | Financial Statements
Annexure
G. Categories of Shareholders as on March 31, 2022
Category No. of shares held % shareholding
Body Corporate (Promoter Company) 129,784,034 74.05
Foreign Portfolio Investors (Corporate) 17,647,116 10.07
Mutual Funds 9,351,246 5.34
Alternate Investment Funds 577,198 0.33
Other Body Corporate 384,484 0.22
Insurance Companies 2,588,419 1.48
Clearing Members 123,715 0.07
NBFCs registered with RBI 4,602 0.00
Banks 28,961 0.02
Central Government 720 0.00
Public 11,830,336 6.75
Directors* 527,731 0.30
Hindu Undivided Family (HUF) 281,888 0.16
Non-Resident Indians (Repatriable) 1,486,842 0.85
Non-Resident Indians (Non Repatriable) 558,542 0.32
Foreign Nationals 27,691 0.01
Trusts 25,228 0.01
Foreign Institutional Investors 11,700 0.00
Limited Liability Partenership (LLP) 29,703 0.02
TOTAL 175,270,156 100.00
Name of the DirectorNo. of equity shares held
Mr. A. M. Naik 1,522
Mr. S. N. Subrahmanyan 200,000
Mr. R. Shankar Raman 100,000
Mr. Sanjay Jalona 100,581
Mr. Sudhir Chaturvedi 125,590
Mr. Nachiket Deshpande 0
Mr. M. M. Chitale 38
*Details of equity shares held by Directors as on March 31, 2022 are as under:
Particulars No. of shares% of Issued
Capital
Equity Shares held in dematerialised form in NSDL 170,359,215 97.20
Equity Shares held in dematerialised form in CDSL 4,612,427 2.63
Equity Shares held in Physical form 298,514 0.17
TOTAL 175,270,156 100.00
H. Dematerialization of shares & liquidity
The Company has dematerialised its equity shares with both the depositories viz. National Securities Depository Limited (NSDL) and Central Depository Services (India) Limited (CDSL). ISIN allotted to the Company is INE214T01019.
As on March 31, 2022, 99.83% of the Company’s paid-up capital was held in dematerialised form. The particulars of number of shares held in dematerialised and physical form are as under:
Members are advised to convert their physical shareholding into electronic holding which will mitigate the risks associated with holding physical certificates and avail other benefits of dematerialisation, which include easy liquidity, electronic transfer, etc. Pursuant to an amendment to the SEBI Listing Regulations effective from April 1, 2019, any request for transfer of shares, shall be processed for shares held in dematerialised form only. Further, SEBI vide Circular No. SEBI/HO/MIRSD/MIRSD_RTAMB/P/CIR/2022/8 dated January 25, 2022, has mandated to issue securities in dematerialized form only, while processing service requests viz. issue of duplicate securities certificate; claim from unclaimed suspense account; renewal/ exchange of securities certificate; endorsement, sub-division/splitting, consolidation of securities certificates, transmission and transposition etc.
SEBI vide Circular no. SEBI/HO/MIRSD/MIRSD_RTAMB/P/CIR/2021/655 dated November 3, 2021 read with Circular no. SEBI/HO/MIRSD/MIRSD_RTAMB/P/CIR/2021/687 dated December 14, 2021 has mandated all listed entities to ensure that shareholders holding equity shares in physical form shall update their PAN, KYC, nomination and bank account details (if not updated or provided earlier) through the Registrar & Share Transfer Agent.
Members are requested to update the above details by submitting the forms available on the Company’s website https://www.lntinfotech.com/investors/investor-services/ or the Company’s RTA’s website i.e. Link Intime India Pvt. Ltd, through the weblink: www.linkintime.co.in ---> Resources ---> Downloads ---> General ---> Formats for KYC.
Members holding shares in dematerialised form are requested to intimate change of address, e-mail id, bank details etc. to their Depository Participants.
I. Outstanding GDRs/ ADRs/ warrants or any convertible instruments, conversion date and likely impact on equity
There are no outstanding GDRs/ ADRs/ warrants/ convertible instruments of the Company.
J. Share transfer system
Transfer of shares in electronic form are processed and approved by NSDL/CDSL through their Depository Participant, without involvement of the Company.
The Board of Directors have constituted a ‘Share Transfer Committee’ comprising of Chief Executive Officer & Managing Director, Chief Financial Officer and Company Secretary to approve requests for transmission or transposition of securities of the Company.

160 Integrated Annual Report 2021-22 161Corporate Overview | Statutory Reports | Financial Statements
Annexure
K. Address for correspondence
Registrar and Share Transfer Agent Compliance Officer
Link Intime India Private LimitedC-101, 1st Floor, 247 Park,L.B.S. Marg, Vikhroli (West), Mumbai 400083, Maharashtra, IndiaTel: +91 22 4918 6270Fax: +91 22 4918 6060E-mail: [email protected]: www.linkintime.co.in
Tridib Barat,Company Secretary & Compliance Officer,Larsen & Toubro Infotech LimitedCorporate Office:L&T Technology Center, Gate No.5, Saki Vihar Road, Powai, Mumbai 400072, Maharashtra, IndiaTel: +91 22 6776 6776Fax: +91 22 2858 1130E-mail: [email protected]
6. Familiarisation programme for Independent Directors
The Directors are updated on significant changes/developments in the Company’s business strategies, business model, risk minimization procedures, new initiatives by the Company, changes in domestic/overseas legislation impacting the Company and the IT Industry etc.
Independent Directors are given insight on the operations of the Company and its subsidiaries, business, industry and environment in which the Company operates, at the time of their induction. An Induction-cum-Familiarization kit for Independent Directors has been compiled to acquaint the incoming Board Members with Company’s businesses, its operations, governance practices, policies, procedures, etc.
Members may visit the Company’s website, www.Lntinfotech.com/Investors for more details.
7. Prevention of insider trading
The Company has adopted the Securities Dealing Code (‘the Code’ or ‘SDC’) in compliance with the SEBI (Prohibition of Insider Trading) Regulations, 2015 (‘PIT Regulations’) to regulate, monitor and report trading by the Designated Person(s)/ and other connected person(s). Pursuant to the PIT Regulations, structured digital database of Unpublished Price Sensitive Information (UPSI) is maintained with adequate internal controls.
During FY22, following measures were taken by the Company to further strengthen the control mechanism under the Code:
• Circulars, notifications, etc. were issued to the designated persons and insiders, sensitizing them on the importance/ need to comply with the Code.
• Facility extended to apply online for approvals, submission of disclosures, etc. for compliance of the Code and the PIT Regulations.
Mr. Tridib Barat, Company Secretary is designated as the Compliance Officer, while Mr. Nitin Mohta, Principal Director, Financial Planning & Analysis, is the Chief Investor Relation Officer of the Company.
The Company’s Code of practices and procedures for fair disclosure of unpublished price sensitive information is available on the Company’s website: https://www.lntinfotech.com/investors/corporate-governance/
8. Fee paid to statutory auditor
Details of fees paid to Statutory Auditor for all services rendered by them to the Company and its subsidiaries, on a consolidated basis, and to all entities in the network firm/ network entity of which the statutory auditor is a part, are provided in the notes to accounts forming part of this Integrated Annual Report.
9. Plant locations/ global footprint
The Company, being in IT industry, has development centers/ offices in India & overseas and does not require manufacturing plant. The address of development centers/ offices of the Company globally, are available on the Company’s website under Global Footprint section: www.Lntinfotech.com/global-footprints/
10. Disclosures
A. Disclosure of materially significant related party transaction & Policy on dealing with Related Party Transactions
During FY22, there was no materially significant related party transaction entered into by the Company with its related parties that has potential conflict with the interests of the Company at large. All the related party transactions entered during the financial year were in the ordinary course of business and at arm’s length terms and approved by the Audit Committee. The Board has approved a policy for related party transactions which is available on the Company’s website: https://www.lntinfotech.com/investors/corporate-governance/
B. Details of non-compliance by the Company, penalties and strictures imposed on the Company by Stock Exchanges or SEBI or any statutory authority, on any matter related to capital markets, during the last three years
There is no instance of non-compliance by the Company or penalty and stricture imposed on the Company by the Stock Exchanges or SEBI or any statutory authority on any matter related to capital markets, during the last three years.
There is no non-compliance of any requirement of Corporate Governance Report as prescribed under sub-paras (2) to (10) of Part C of Schedule V of SEBI Listing Regulations.
C. Whistle Blower Policy & Vigil Mechanism
The Company has formulated a Whistle Blower Policy and has established a Vigil Mechanism for directors and employees to report concerns about unethical behavior, actual or suspected fraud and any wrong-doing or unethical or improper practice. Whistle Blower Investigation Committee has been constituted to address the concerns reported under this policy. The Company affirms that no personnel has been denied access to the Audit Committee. Details of the Whistle Blower Policy are provided in the Board’s Report section of this Integrated Annual Report and is also available on the Company’s website: https://www.lntinfotech.com/investors/corporate-governance/
D. Disclosures under the Sexual Harassment of Women at Workplace (Prevention, Prohibition and Redressal) Act, 2013
The Company has framed the Policy for Prevention of Sexual Harassment at Workplace to ensure prevention, prohibition and protection against sexual harassment. The policy provides the guidelines for reporting such harassment, and the procedure for redressal of complaints of such nature.
Details of such complaints for FY22 are as follows:
Number of complaints pending at the beginning of the financial year 0Number of complaints filed during the financial year 3Number of complaints disposed of during the financial year 3Number of complaints pending as at end of the financial year 0
For more details, please refer the Board’s Report in this Integrated Annual Report.

162 Integrated Annual Report 2021-22 163Corporate Overview | Statutory Reports | Financial Statements
Annexure
E. Policy for determining ‘material subsidiaries’
The Company has formulated a policy for determining ‘material subsidiaries’ in compliance of the SEBI Listing Regulations. This Policy is available on the Company’s website: https://www.lntinfotech.com/investors/corporate-governance/
During FY22, the Company did not have any material subsidiary, whether listed or unlisted, in India or outside India. The Audit Committee and Board reviews the financial statements & significant transactions of the subsidiaries, and minutes of these subsidiaries are placed before the Board.
F. Disclosure of commodity price risks and commodity hedging activities
The Company does not deal in commodity price risk and commodity hedging activities.
G. Code of Conduct
A Code of Conduct for the Board members and senior management of the Company is in place and the same is available on the Company’s website: www.Lntinfotech.com/Investors. All Directors and Senior Management Personnel of the Company have affirmed compliance with the Company’s Code of Conduct for the financial year ended March 31, 2022. A declaration by Chief Executive Officer & Managing Director affirming compliance with the Code of Conduct is annexed as Annexure - 3 to this Corporate Governance Report.
H. Practising Company Secretary’s certificate on non-disqualification of directors
A certificate has been issued by M/s. Alwyn Jay & Co., Company Secretaries, confirming that none of the Directors on the Board of the Company have been debarred or disqualified from being appointed or continuing as directors of companies by the Securities and Exchange Board of India, Ministry of Corporate Affairs or any such statutory authority. The certificate is annexed as Annexure - 4 to this Corporate Governance Report.
I. Disclosure on acceptance of recommendations made by Board committees
During FY22, various recommendations were made by the Committees to the Board of Directors, which were all accepted by the Board, after due deliberations.
J. Compliance certificate
In terms of Schedule V of the SEBI Listing Regulations, the certificate of compliance of conditions of Corporate Governance from Secretarial Auditor is annexed as Annexure - 5 to this Corporate Governance Report.
K. Other disclosures
During the year under review, the Company has complied with all the mandatory requirements specified in Regulations 17 to 27 and clause (b) to (i) of Regulation 46(2) of SEBI Listing Regulations, as applicable, save and except instance of the delay in filling the vacancy in the Board of Directors arising out of cessation of office of two Independent Directors.
These vacancies were filled on July 18, 2021 and August 26, 2021, by way of induction of two Independent Directors viz. Mr. James Abraham & Mr. Rajnish Kumar, respectively.
As at March 31, 2022, the composition of the Board of Directors was in compliance with the SEBI Listing Regulations.
11. Credit rating
During the year, CRISIL, a credit rating agency, re-affirmed its ratings on the bank facilities of the Company at CRISIL AAA/Stable as long-term rating and CRISIL A1+ as short-term rating.
12. Discretionary requirements as prescribed in part e of Schedule II of SEBI listing regulations
Among the discretionary requirements under SEBI Listing Regulations, the Company has complied with the following:
• The auditor’s report on standalone and consolidated financial statements of the Company are unqualified.
• Mr. A. M. Naik is the Chairman and Mr. Sanjay Jalona is the Chief Executive Officer & Managing Director of the Company.
• The Head of Internal Audit of the Company reports directly to the Audit Committee.

164 Integrated Annual Report 2021-22 165Corporate Overview | Statutory Reports | Financial Statements
Annexure
To The Board of Directors Larsen & Toubro Infotech Limited
Dear Sirs/ Madam,
Sub: CEO/ CFO Certificate
[Issued in accordance with the provisions of Regulation 17(8) of
the SEBI (Listing Obligations and Disclosure Requirements) Regulations, 2015]
We have reviewed the financial statements, read with the cash flow statement of Larsen & Toubro Infotech Limited for the year ended March 31, 2022 and that to the best of our knowledge and belief, we state that:
a. These statements do not contain any materially untrue statement or omit any material fact or contain statements that may be misleading;
These statements present a true and fair view of the Company’s affairs and are in compliance with current accounting standards, applicable laws and regulations.
b. There are, to the best of our knowledge and belief, no transactions entered into by the Company during the year which are fraudulent, illegal or in violation of the Company’s Code of Conduct.
c. We accept the responsibility for establishing and maintaining internal controls for financial reporting. We have evaluated the effectiveness of internal control systems of the Company pertaining to financial reporting and have disclosed to the Auditors and Audit Committee, deficiencies, if any, in the design or operation of such internal controls of which we are aware of and steps have been taken or proposed to be taken for rectifying these deficiencies.
d. We have indicated to the Auditors and Audit Committee that:
i. there were no significant changes in internal control over financial reporting during the aforesaid period;
ii. there were no significant changes in accounting policies during the aforesaid period; and
iii. there were no instances of significant fraud of which we have become aware.
Anil Rander Sanjay Jalona Place: Mumbai Chief Financial Officer Chief Executive Officer Date: April 19, 2022 & Managing Director
Annexure - 1
Board confirmation on independence of Independent Directors
Based on the assessment carried out by the Board of Directors of the Company (‘Board’) and the declaration of independence submitted by the Independent Directors, this is to confirm that in the opinion of the Board, the Independent Directors fulfill the conditions specified in the SEBI (Listing Obligations and Disclosure Requirements) Regulations, 2015, and are independent of the management.
Place: Mumbai Sanjay JalonaDate: April 19, 2022 Chief Executive Officer & Managing Director
Annexure - 2
I hereby confirm that all Directors and Senior Management Personnel of the Company have affirmed adherence to the “Code of Conduct for Board members and Senior Management” during the financial year ended on March 31, 2022.
Declaration pursuant to Schedule V of the Securities and Exchange Board of India (Listing Obligations and Disclosure Requirements) Regulations, 2015
Annexure - 3
Place: Mumbai Sanjay JalonaDate: April 19, 2022 Chief Executive Officer & Managing Director
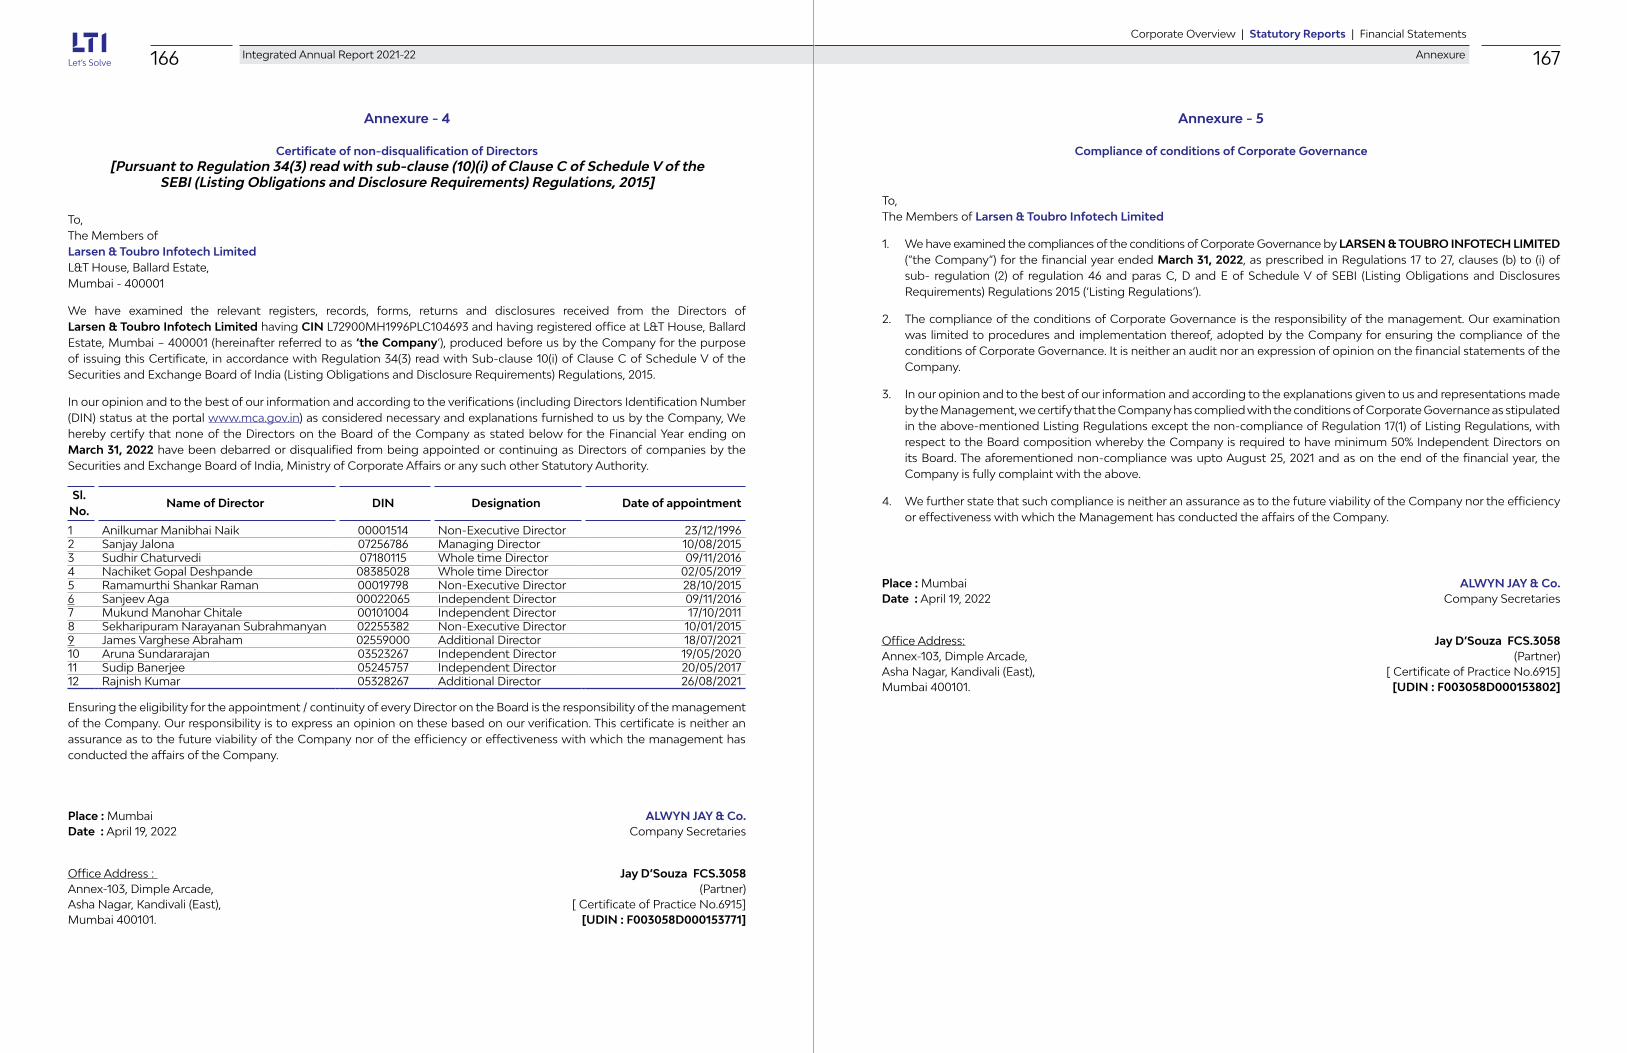
166 Integrated Annual Report 2021-22 167Corporate Overview | Statutory Reports | Financial Statements
Annexure
Annexure - 4
Certificate of non-disqualification of Directors [Pursuant to Regulation 34(3) read with sub-clause (10)(i) of Clause C of Schedule V of the
SEBI (Listing Obligations and Disclosure Requirements) Regulations, 2015]
To, The Members ofLarsen & Toubro Infotech LimitedL&T House, Ballard Estate, Mumbai - 400001
We have examined the relevant registers, records, forms, returns and disclosures received from the Directors of Larsen & Toubro Infotech Limited having CIN L72900MH1996PLC104693 and having registered office at L&T House, Ballard Estate, Mumbai – 400001 (hereinafter referred to as ‘the Company’), produced before us by the Company for the purpose of issuing this Certificate, in accordance with Regulation 34(3) read with Sub-clause 10(i) of Clause C of Schedule V of the Securities and Exchange Board of India (Listing Obligations and Disclosure Requirements) Regulations, 2015.
In our opinion and to the best of our information and according to the verifications (including Directors Identification Number (DIN) status at the portal www.mca.gov.in) as considered necessary and explanations furnished to us by the Company, We hereby certify that none of the Directors on the Board of the Company as stated below for the Financial Year ending on March 31, 2022 have been debarred or disqualified from being appointed or continuing as Directors of companies by the Securities and Exchange Board of India, Ministry of Corporate Affairs or any such other Statutory Authority.
Sl. No.
Name of Director DIN Designation Date of appointment
1 Anilkumar Manibhai Naik 00001514 Non-Executive Director 23/12/19962 Sanjay Jalona 07256786 Managing Director 10/08/20153 Sudhir Chaturvedi 07180115 Whole time Director 09/11/20164 Nachiket Gopal Deshpande 08385028 Whole time Director 02/05/20195 Ramamurthi Shankar Raman 00019798 Non-Executive Director 28/10/20156 Sanjeev Aga 00022065 Independent Director 09/11/20167 Mukund Manohar Chitale 00101004 Independent Director 17/10/20118 Sekharipuram Narayanan Subrahmanyan 02255382 Non-Executive Director 10/01/20159 James Varghese Abraham 02559000 Additional Director 18/07/202110 Aruna Sundararajan 03523267 Independent Director 19/05/202011 Sudip Banerjee 05245757 Independent Director 20/05/201712 Rajnish Kumar 05328267 Additional Director 26/08/2021
Ensuring the eligibility for the appointment / continuity of every Director on the Board is the responsibility of the management of the Company. Our responsibility is to express an opinion on these based on our verification. This certificate is neither an assurance as to the future viability of the Company nor of the efficiency or effectiveness with which the management has conducted the affairs of the Company.
Place : Mumbai ALWYN JAY & Co. Date : April 19, 2022 Company Secretaries
Office Address : Jay D’Souza FCS.3058 Annex-103, Dimple Arcade, (Partner)Asha Nagar, Kandivali (East), [ Certificate of Practice No.6915] Mumbai 400101. [UDIN : F003058D000153771]
Compliance of conditions of Corporate Governance
To, The Members of Larsen & Toubro Infotech Limited
1. We have examined the compliances of the conditions of Corporate Governance by LARSEN & TOUBRO INFOTECH LIMITED (“the Company”) for the financial year ended March 31, 2022, as prescribed in Regulations 17 to 27, clauses (b) to (i) of sub- regulation (2) of regulation 46 and paras C, D and E of Schedule V of SEBI (Listing Obligations and Disclosures Requirements) Regulations 2015 (‘Listing Regulations’).
2. The compliance of the conditions of Corporate Governance is the responsibility of the management. Our examination was limited to procedures and implementation thereof, adopted by the Company for ensuring the compliance of the conditions of Corporate Governance. It is neither an audit nor an expression of opinion on the financial statements of the Company.
3. In our opinion and to the best of our information and according to the explanations given to us and representations made by the Management, we certify that the Company has complied with the conditions of Corporate Governance as stipulated in the above-mentioned Listing Regulations except the non-compliance of Regulation 17(1) of Listing Regulations, with respect to the Board composition whereby the Company is required to have minimum 50% Independent Directors on its Board. The aforementioned non-compliance was upto August 25, 2021 and as on the end of the financial year, the Company is fully complaint with the above.
4. We further state that such compliance is neither an assurance as to the future viability of the Company nor the efficiency or effectiveness with which the Management has conducted the affairs of the Company.
Place : Mumbai ALWYN JAY & Co. Date : April 19, 2022 Company Secretaries
Office Address: Jay D’Souza FCS.3058 Annex-103, Dimple Arcade, (Partner)Asha Nagar, Kandivali (East), [ Certificate of Practice No.6915] Mumbai 400101. [UDIN : F003058D000153802]
Annexure - 5

168 Integrated Annual Report 2021-22 169Corporate Overview | Statutory Reports | Financial Statements
Annexure
Statement of disclosure of remuneration under Section 197(12) of the Companies Act, 2013 read with Rule 5(1) of the Companies (Appointment and Remuneration of Managerial Personnel) Rules, 2014
A. The ratio of remuneration of each Director to the median remuneration of the employees for FY22 and percentage increase in remuneration of each Director & Key Managerial Personnel (‘KMP’) during the financial year ended on March 31, 2022, is as under:
Name of the Director/KMP Designation
Ratio of remuneration of each Director to median
remuneration of employees in FY221
% increase in remuneration
in FY222
Mr. A. M. Naik Non-Executive Chairman 8.85 (19.46)Mr. S. N. Subrahmanyan3 Non-Executive Vice Chairman Not Applicable Not ApplicableMr. Sanjay Jalona4 Chief Executive Officer &
Managing Director343.41 58.88
Mr. R. Shankar Raman3 Non-Executive Director Not Applicable Not ApplicableMr. Sudhir Chaturvedi4 President-Sales & Whole-time
Director 91.51 (31.01)
Mr. Nachiket Deshpande Chief Operating Officer & Whole-time Director
76.95 41.77
Mr. M. M. Chitale5 Independent Director 2.46 27.78Mr. Sanjeev Aga Independent Director 2.37 70.77Mr. Sudip Banerjee Independent Director 1.73 35.00Mrs. Aruna Sundararajan Independent Director 2.57 71.43Mr. James Abraham6a Independent Director 0.81 Not ApplicableMr. Rajnish Kumar6b Independent Director 0.92 Not ApplicableMr. Anil Rander6c Chief Financial Officer - Not ApplicableMr. Manoj Koul6d Company Secretary &
Compliance Officer- Not Applicable
Mr. Tridib Barat6e Company Secretary & Compliance Officer
- Not Applicable
Annexure E
Notes:
1. Median remuneration of employees during FY22 was H11,69,131/-. Ratio of remuneration of Director to the median remuneration of employees is calculated on pro-rata basis for those Directors who served for part of FY22.
2. Exercise of vested stock options during FY21 and/or FY22 has been considered for calculation of increase/decrease of remuneration during FY22.
3. No remuneration was paid.
4. Mr. Sanjay Jalona and Mr. Sudhir Chaturvedi have been paid remuneration in USD and GBP respectively.
5. Mr. M. M. Chitale ceased to hold office as Director w.e.f. March 31, 2022, consequent upon completion of his tenure as Independent Director.
6. Disclosure of percentage increase in remuneration during FY22 is not applicable for following Directors & KMPs:
a. Mr. James Abraham – Appointed as Independent Director w.e.f. July 18, 2021
b. Mr. Rajnish Kumar – Appointed as Independent Director w.e.f. August 26, 2021
c. Mr. Anil Rander – Appointed as Chief Financial Officer w.e.f. April 14, 2021
d. Mr. Manoj Koul – Ceased to be the Company Secretary & Compliance Officer w.e.f. November 8, 2021
e. Mr. Tridib Barat – Appointed as Company Secretary & Compliance Officer w.e.f. January 19, 2022
B. Percentage increase in the median remuneration of employees in FY22:
The median remuneration of employees of the Company during the financial year was H11,69,131. In FY22, there was an increase of 18.27% in the median remuneration of employees.
C. Number of permanent employees on the rolls of Company as on March 31, 2022:
The total number of permanent employees on the rolls of Company (excluding subsidiaries) as on March 31, 2022 was 43,924, and as on March 31, 2021 it was 32,422.
D. Average percentage increase already made in the salaries of employees other than the managerial personnel in the last financial year and its comparison with the percentage increase in the managerial remuneration and justification thereof and point out if there are any exceptional circumstances for increase in the managerial remuneration:
During the year, IT Industry experienced supply demand gap and huge pressure on employee attrition. Keeping the same in mind, LTI took prompt measures to increase the compensation moderately to manage attrition & retention challenges. In this exercise, an average increase in the salary of employees, other than managerial personnel, for FY22 was around 13% in India and 5% outside India, whereas the average increase in managerial remuneration was 26.99% inclusive of perquisite value associated with exercise of vested stock options.
E. Affirmation that the remuneration is as per the remuneration policy of the Company:
It is hereby affirmed that the remuneration paid during FY22 is as per the Remuneration Policy of the Company.
For and on behalf of the Board
Nachiket Deshpande Sanjay Jalona Chief Operating Officer & Chief Executive Officer & Place: Mumbai Whole-time Director Managing Director Date: April 19, 2022 (DIN: 08385028) (DIN: 07256786)

170 Integrated Annual Report 2021-22 171Corporate Overview | Statutory Reports | Financial Statements
Annexure
Annexure GBusiness Responsibility Report 2021-2022
[See Regulation 34(2)(f) of SEBI (LODR) Regulations, 2015]
Section A: General information about the Company
Particulars Details
Corporate Identity Number (CIN) of the Company L72900MH1996PLC104693Name of the Company Larsen & Toubro Infotech Limited (‘LTI’)Registered address L&T House, Ballard Estate, Mumbai- 400001Website www.lntinfotech.comE-mail id [email protected] Year reported April 1, 2021 to March 31, 2022 (FY22)Sector(s) that the Company is engaged in (industrial activity code-wise)
IT Software, Services, and related activities. [892 (1987 NIC Code) & 620 (NIC Code)]
List three key products/services that the Company manufactures / provides
• IT Consulting• Digital Services • Enterprise Solutions
Total number of locations where business activity is undertaken by the Company
Please refer to www.lntinfotech.com/global-footprints a. Number of international locationsb. Number of national locationsMarkets served by the Company Local/State/National/International
Both local and international
Section B: Financial details of the Company as on March 31, 2022
S.No. Particulars Details
1 Paid up Capital H175.27 Mn2 Total Turnover H144,064 Mn3 Total Profit after Taxes H22,609 Mn4 Total spending on Corporate Social Responsibility
(CSR) as percentage of profit after tax (%)Total amount spent on CSR for FY22 H393.45 Mn
5 List of activities in which expenditure in 4 above has been incurred
Please refer to Annual Report on Corporate Social Responsibility Activities for FY22, annexed as Annexure C to the Boards’ Report
Section C: Other details
1. Does the Company have any Subsidiary Company/ Companies? Yes
2. Do the Subsidiary Company/Companies participate in the BR Initiatives of the parent company? If yes, then indicate the number of such subsidiary company(s): Yes. BR related policies extend to all the Subsidiaries of the Company.
3. Do any other entity/entities (e.g. suppliers, distributors etc.) that the Company does business with, participate in the BR initiatives of the Company? If yes, then indicate the percentage of such entity/entities? [Less than 30%, 30-60%, More than 60%]: Yes. Company’s BR initiatives are extended to its suppliers, vendors, service providers, agents, subcontractors, consultants, business partners and their representatives (‘LTI Suppliers’) through LTI Supplier Code of Conduct
Section D: BR information
1. Details of Director/Directors responsible for BR
(a) Details of the Director/Director responsible for implementation of the BR policy/ policies
S.No. Particulars Details
1 DIN Number 083850282 Name Mr. Nachiket Deshpande3 Designation Chief Operating Officer & Whole-time Director
(b) Details of the BR head
S.No. Particulars Details
1 DIN Number (if applicable) Not Applicable2 Name Mr. Anil Rander3 Designation Chief Financial Officer 4 Telephone number +9122-6776 67765 e-mail id [email protected]
2. Principle-wise (as per NVGs) BR Policy/policies (a) Details of compliance (Reply in Y/N)
S.No. P 1 P 2 P 3 P 4 P 5 P 6 P 7 P 8 P 9
1 Do you have a policy/ policies for.... Y Y Y Y Y Y N Y Y2 Has the policy being formulated in
consultation with the relevant stakeholders? Y Y Y Y Y Y N.A. Y Y
3 Does the policy conform to any national/ international standards? If yes, specify? (50 words)
Other than P7, Company’s policies are aligned with the national/ international standards including ISO 9001, ISO 14001, ISO20000-1, ISO27001, ISO 45001, CMMI Dev & SVC L5 principles.
4 Has the policy been approved by the Board? If yes, has it been signed by MD/ owner/ CEO/ appropriate Board Director?
Except P7, all the Policies have been approved by the Board or Head of respective functions, as applicable.
5 Does the company have a specified committee of the Board/Director/Official to oversee the implementation of the policy?
Y Y Y Y Y Y N.A. Y Y
6 Indicate the link for the policy to be viewed online?
Please refer Note below.
7 Has the policy been formally communicated to all relevant internal and external stakeholders?
Yes. All the policies have been communicated to internal & external stakeholders and are available either on Company’s website or intranet.
8 Does the company have in-house structure to implement the policy/ policies Y Y Y Y Y Y N.A. Y Y
9 Does the company have a grievance redressal mechanism related to the policy/ policies to address stakeholders’ grievances related to the policy/ policies?
Y Y Y Y Y Y N.A. Y Y
10 Has the company carried out independent audit/ evaluation of the working of this policy by an internal or external agency?
Yes. Regular audits are carried out to check compliance to the corporate policies pertaining to the area of audits. Further all cases referred to Whistle Blowing Investigation Committee are investigated or co-ordinated by the Internal Audit Department and are also reported to the Audit Committee.

172 Integrated Annual Report 2021-22 173Corporate Overview | Statutory Reports | Financial Statements
Annexure
Note:
Principles Policies/ Guidelines Availability/ Location
P1. Governance with Ethics, Transparency and Accountability
• Code of Conduct (‘COC’) for Employees www.lntinfotech.com/investors
• COC for Board and Senior Management www.lntinfotech.com/investors• Supplier Code of Conduct www.lntinfotech.com/investors• Policy and Guidelines on Vigil Mechanism www.lntinfotech.com/investors• Policy for Prevention of Sexual Harassment
at Workplacewww.lntinfotech.com/investors
• Policy for Safety of Women Employees Company’s intranet• Anti-harassment Policy Company’s intranet• Global Corporate Compliance Framework Company’s intranet• Anti-Bribery and Anti-Corruption Policy Company’s intranet• Anti-Money Laundering Company’s intranet• Policy on prevention of fraud Company’s intranet
P2: Providing sustainable services
• Supplier Code of Conduct www.lntinfotech.com/investors• Quality Policy Manual Company’s intranet
P3: Promote Employee Wellbeing
• Equal Opportunity Policy Company’s intranet• Policy for Prevention of Sexual Harassment
at Workplacewww.lntinfotech.com/investors
• Policy for Safety of Women Employees Company’s intranet• Anti-harassment Policy Company’s intranet• Grievance Management Guidelines Company’s intranet• Drug Free Workplace Company’s intranet• Higher Study Policy Company’s intranet• Group Personal Accident Policy Company’s intranet• Group Term Life Insurance Scheme Company’s intranet• Medical Benefits Scheme Company’s intranet• Creche Benefit Policy Company’s intranet
P4: Stakeholder Engagement
• Policy on Corporate Social Responsibility www.lntinfotech.com/social-responsibility
P5: Promote Human Rights
• COC for Employees www.lntinfotech.com/investors• Policy for Prevention of Sexual Harassment
at Workplacewww.lntinfotech.com/investors
• Policy for Safety of Women Employees Company’s intranet• Equal Opportunity Policy Company’s intranet• Anti-Slavery and Human Trafficking
Policy - UKCompany’s intranet
• Supplier Code of Conduct www.lntinfotech.com/investorsP6: Protect
Environment• Employee Health & Safety (EHS) Policy
• Supplier Code of Conduct
Company’s intranet
www.lntinfotech.com/investorsP8: Inclusive growth
and equitable development
• Policy on Corporate Social Responsibility www.lntinfotech.com/social-responsibility
P9: Customer Value • Quality Policy Manual Company’s intranet
(b) If answer to the question at serial number 1 against any principle, is ‘No’, please explain why: (Tick up to 2 options)
S.No. Questions P 1 P 2 P 3 P 4 P 5 P 6 P 7 P 8 P 9
1 The Company has not understood the Principles
- - - - - - - - -
2 The Company is not at a stage where it finds itself in a position to formulate and implement the policies on specified principles
- - - - - - - - -
3 The Company does not have financial or manpower resources available for the task
- - - - - - - - -
4 It is planned to be done within next 6 months
- - - - - - - - -
5 It is planned to be done within the next 1 year
- - - - - - - - -
6 Any other reason (please specify) - - - - - - * - -
*P7: The Company does not have a separate policy on Public Advocacy, however the Company lobbies with the Government, through its membership with various trade associations. LTI, being a member of The National Association of Software and Services Companies (NASSCOM), provides its views, opinions, and inputs on possible way forward for various matters as and when called for by NASSCOM.
3. Governance related to BR
(a) I ndicate the frequency with which the Board of Directors, Committee of the Board or CEO to assess the BR performance of the Company. Within 3 months, 3-6 months, Annually, More than 1 year.
During FY22, the Corporate Social Responsibility Committee annually reviewed the BR initiatives related to CSR & Sustainability.
(b) Does the Company publish a BR or a Sustainability Report? What is the hyperlink for viewing this report? How frequently it is published?
Company voluntarily publishes Sustainability Report annually since FY17. The sustainability reports of the Company are available on the Company’s website at www.lntinfotech.com/social-responsibility
Section E: Principle-Wise Performance
Principle 1: Businesses should conduct and govern themselves with Ethics, Transparency and Accountability
LTI has always had a keen eye not only on the outcome but also the way it conducts its business. Even in testing times of Covid-19 pandemic which continued during FY22, LTI has had a no-compromise approach on doing business the right way. Our Code of Conduct is the guiding light for all our business interactions, and it makes sure that every employee conducts himself/herself with the highest standards of ethics and integrity. We respect the laws and regulations of each geography that we operate in and take every measure to make sure that we adhere to all required standards of disclosure and reporting. This transparency and accountability are an important part of our business and is more than just a checkbox activity for us, which helps us in building lasting relationships with stakeholders who have reposed their faith in us.
1. Does the policy relating to ethics, bribery and corruption cover only the company? Yes/ No. Does it extend to the Group/Joint Ventures/ Suppliers/Contractors/NGOs /Others?
Yes. Policies relating to ethics, bribery and corruption covers LTI, its subsidiaries, associates and LTI suppliers globally.

174 Integrated Annual Report 2021-22 175Corporate Overview | Statutory Reports | Financial Statements
Annexure
2. How many stakeholder complaints have been received in the past financial year and what percentage was satisfactorily resolved by the management? If so, provide details thereof, in about 50 words or so.
The Company has various forums for redressal of grievances from its stakeholders. Details of various stakeholder grievances and complaints are as follows:
S.No. ParticularsReceived
during the yearResolved
during the yearPending
1 Employee grievance• Whistle blower 4 4# 2• Discriminatory employment 0 0 0• Sexual harassment 3 3 0• Child labour /forced labour /involuntary labour 0 0 0
2 Customer query/complaint 43 43 03 Other stakeholder grievance* 0 0 0
Total 50 50# 2
Note: #This includes 2 complaints pending from previous year.
*Other stakeholder grievance referred herein is with respect to complaints/ grievance of shareholders received from SEBI/ Stock Exchanges/ Depositories by the Company and its Registrar & Share Transfer Agent
Principle 2: Businesses should provide goods and services that are safe and contribute to sustainability throughout their life cycle.
At LTI, sustainability has always been a hallmark of our culture and a part of our DNA. The L&T Group has been enriching millions of lives and that same spirit also forms the backbone of our commitment to solving for the communities, globally. LTI incorporates environmental and social considerations in all its business operations and ensures engagements with stakeholders are conducted in keeping with the norms of good governance, ethics, and transparency. We work closely with our suppliers to tackle challenges through strategies and initiatives that drive efficiency and cost optimization in these processes.
"You cannot escape the responsibility of tomorrow by evading it today" – Abraham Lincoln.
As we progress in the age of technology, we have identified that it is our responsibility to engage in more sustainable ways of working, enable clients to operate in a more energy-efficient manner and work for the betterment of communities. We always keep an eye on the value we deliver for the client and its impact on Environment, Social and Governance factors. We plan to leverage our Cloud expertise to reduce the overall energy footprint while helping clients migrate from their energy-intensive legacy systems. Through our Digital Engineering practices, such as Business Process Management and Automation, we try to help the client ensure sustainable operations and allow AI and Analytics to
improve governance. We leverage our platform and product engineering to enhance the total experience. Cybersecurity supports these critical practices to enable clients operate hassle-free in a digital world in their journey to sustainability.
1. List up to 3 of your products or services whose design has incorporated social or environmental concerns, risks and/or opportunities.
A. Mobile Apps developed by Company
(i) SmartCommute
SmartCommute has been introduced to enhance employee experience and optimize the operations. Following are some of the major aspects of SmartCommute from sustainability point of view:
• App on driver mobile phone for trip details – Resulting in zero usage of paper for driver and supervisors to keep track and record of trips.
• Vendor Portal- digitization of vehicle & driver onboarding process by uploading their documents in the system which helps in reduction of paper usage.
• Auto Rostering & Routing – optimization of routes which would result in reduction of carbon emissions.
(ii) Pazo
Pazo has been built from the ground up with keeping in mind high levels of scalability making use of the latest technology in terms of infrastructure, programming languages and storage. With the ongoing thrust on digitized approach towards operations, Pazo tool has been implemented at all locations to improve efficiency and adopt sustainable practices. Few key aspects of this tool which helped improve sustainability, are as below:
• All checklist’s have been converted to digital checklist, eliminating paper usage.
• Eliminating plastic holders for displaying checklists.
• Schedules are well maintained on mobile phones without register books.
• Advantage in training the new and existing staff to perform their job effectively.
B. Transforming to Digital Ecosystem
India’s undisputed market leader for bathroom and lighting solutions, needed a robust digital ecosystem. The client was working with the paper-based manual process causing a high turn-around time. Another challenge was lack of process governance across various warehouses due to customizations at each warehouse.
LTI’s team started working with the client and delivered a lighting solution. LTI’s solution standardized their common policies and process across all the warehouses, leading to the scaling up of the warehouses post-implementation. Our solution has eliminated the paper-based process resulting in higher operational efficiency.
One of the core principles of the client is ‘Go Green’ Philosophy and they also support initiatives for conserving water. Our solution helped the client in achieving this, by streamlining various processes in warehouse management.
The solution was tightly coupled with Oracle Software as a Services (SaaS), and customized solutions were built based on the inventory and the order management system. With this, the user was able to do all the transactions and track the plans on their devices from anywhere in the warehouses.
LTI has extended and integrated the order management and inventory of Oracle Supply Chain Management (SCM) for a custom Warehouse Magement System (WMS). A high-performance web portal using the Oracle Platform as a Service (PaaS) platform was built to address the various requirements. This whole system was integrated with barcode scanner to digitize and standardize the process. To eliminate the paper-based process and automate it, a mobile application was developed and integrated. The app also produces different reports to study and analyse across the warehouse in real-time. This has helped the client in eliminating the paper-based process resulting in higher operational efficiency and easy to scale system for the new warehouse.
Businesses in the past few years have started focusing more towards becoming sustainable. There is a growing trend towards adopting a more holistic approach to meet their various sustainability goals. Initiatives towards decarbonizing, go green, conserving water and reducing the carbon footprint are taking priority. Technology is playing an imperative role in monitoring and innovating solutions that can help businesses achieve their goals. With the LTI’s innovative solution the client has been able to reduce its paperwork and is one step closer towards its go-green commitment.
C. Live emissions report for a co-generation facility at client premise
One of LTI’s client uses co-generation turbines for inhouse power generation from residual process heat, which otherwise will go waste. A Continuous Emission Monitoring System (CEMS) is the control system necessary for the determination of a gas or particulate matter concentration or emission rate using sampling, analyzing, calculating and monitoring for emissions exceeding preset levels and further shutting down units if required prior to emission exceeding preset levels. The CEMS emissions report is necessary pre-requisite to run the turbines starting March 2022. If this report was not completed by the beginning of March, the Turbine could no longer run for in-house power resulting client to buy power from Pacific Gas and Electric Company (PG&E) to run process equipment thus increasing carbon emission footprint.

176 Integrated Annual Report 2021-22 177Corporate Overview | Statutory Reports | Financial Statements
Annexure
LTI Introduced the Co-gen facility in the CEMS Emission Power-BI reporting to display the emission report in CEMS Emission Portal, serving compliance regulatory requirement for the state regulatory body. Annually approx.~ 100 hours of saving for researching, analyzing, and reporting of emission data per facility was achieved.
D. SAP based automated solution for Asset Retirement Obligation (ARO):
An Asset Retirement Obligation (ARO) is a legal obligation associated with the retirement of a tangible long-lived asset. ARO accounting is particularly significant for remediation work needed to restore a property, such as decontaminating a nuclear power plant site, removing underground fuel storage tanks, clean-up around an oil well, or removal of improvements to a site. It does not apply to unplanned clean-up costs, such as costs incurred because of an accident.
LTI has addressed some of the ‘must have’ business requirements for the client’s business to deliver the fit-to-use ARO solution for a leading oil & gas Company in US, helping reduce carbon footprint.
2. For each such product, provide the following details in respect of resource use (energy, water, raw material etc.) per unit of product (optional): Reduction during sourcing/production/distribution achieved since the previous year throughout the value chain, Reduction during usage by consumers (energy, water) that has been achieved since the previous year?
LTI offers a range of IT services and solutions like cloud based services, managed services, internet of things, digital offerings which significantly help improve process efficiency and business outcomes for our customers. All these solutions directly or indirectly also improve the environmental impacts for our customers (refer examples listed in point 1 above). However, due to the nature of our services, it is difficult to quantify.
3. Does the company have procedures in place for sustainable sourcing (including transportation)? If yes, what percentage of your inputs was sourced sustainably? Also, provide details thereof, in about 50 words or so.
LTI prefers to procure goods and services from local suppliers. While most of our non-IT products/services are sourced locally, the Company claims to ensure the procurement of high quality and energy efficient IT products from reputed suppliers. Due to the local nature of procurement, it’s difficult to gauge the transparency of their processes.
4. Has the company taken any steps to procure goods and services from local & small producers, including communities surrounding their place of work? If yes, what steps have been taken to improve their capacity and capability of local and small vendors?
Yes. As mentioned above, Company prefers to procure goods and services from local & small vendors who are within the state. EHS Policy of the Company also emphasize on sustainable procurement. At regular intervals, Company meets its contractors and suppliers to understand challenges and implement best business practices.
5. Does the company have a mechanism to recycle products and waste? If yes what is the percentage of recycling of products and waste (separately as <5%, 5-10%, >10%). Also, provide details thereof, in about 50 words or so.
During the year, we recycled paper waste to create notepads that can be used for office consumption. Organic waste converters in our campuses helped created manure for gardening and sewage treatment plants recycled water that was eventually used for gardening or flushing. However, during the last 2-year, waste generation has been reduced to nil or negligible. As a practice, we closely monitor our consumption and use latest technologies to reduce the consumption of various resources in all areas. All our hazardous wastes are disposed through State/Central Pollution Control Board (SPCB/CPCB) authorized dealers. Non-hazardous waste is disposed using the waste disposal facilities available at all our campuses in India.
LTI is ISO 14001 certified and the process for environmental management are in place to reduce the impact of our operations.
Principle 3: Businesses should promote the wellbeing of all employees
In the ever-changing landscape of our industry, the only way for us to keep setting new growth records is to keep improving the advantage that our family of employees bring to the table. Hence, LTI spends significant time, effort, and resources in making sure that our employees have access to opportunities for growth and development and are empowered to drive their own career at LTI.
LTI is committed to provide a safe, secure, and congenial work environment for all its employees that is free from sexual harassment. The Company has formulated a robust Prevention of Sexual Harassment (POSH) policy with clear guidelines for reporting acts of sexual harassment at the workplace and procedures for resolution and redressal
of complaints of sexual harassment. Monthly awareness sessions as well as communication campaigns are conducted to promote a safe space for all genders. Besides that, the training program on POSH is mandatory for all employees annually across the globe.
LTI carried out 58 free vaccination drives in its office campuses across locations in India covering employees, their family members and contract staff thereby administering approx. 35,000 doses. For employees and their families located in cities other than LTI office locations, vaccination drives were facilitated through an integrated health-tech company having tie-ups with local hospitals.
During the year, the Covid Leave Policy of LTI was extended to provide ‘Covid Leave and Covid Care Giver Leave’, for employees to combat the Covid pandemic for self or their immediate family members.
LTI also took pro-active step to modify the ‘Mediclaim Coverage’ for employees to cover Covid treatment.
To learn more about our efforts in the human resource development space, please refer to the “Human Capital” section of Integrated Report section of this Annual Report.
Details of employees of the Company including its subsidiaries as on March 31, 2022, are as mentioned below.
S.No. Details
1 Please indicate the total number of employees
46,648
2 Please indicate the total number of employees hired on temporary/contractual/casual basis
2,125
3 Please indicate the number of permanent women employees
13,976
4 Please indicate the number of permanent employees with disabilities
17
5 Do you have an employee association that is recognized by management
Yes
6 What percentage of your permanent employees is members of this recognized employee association?
3 elected members
representing 96 employees (3.13%)
7 Please indicate the number of complaints relating to child labour, forced labour, involuntary labour, sexual harassment in the last financial year and pending, as on the end of the financial year
Refer the table in Principle 1.
At LTI, we provide three types of trainings to our employees. The details of the same are as follows:
Category of Employees
Type of Training
Behavioral Training
Technical Training
Leadership Training
Permanent Male employees
28,427 23,707 13,247
Permanent Female employees
16,940 10,661 5,903
Casual/Temporary/Contractual Employees
450 1,672 0
Total Employees Covered*
45,817 36,041 19,150
*Includes training to employees with disabilities
Principle 4: Businesses should respect the interests of, and be responsive towards all stakeholders, especially those who are disadvantaged, vulnerable and marginalized.
At LTI, stakeholders play vital role where the engagement process is focused on stakeholder identification, consultation, prioritization, collaboration, engagement, and reporting, etc. We work in close collaboration with our identified stakeholders by regularly engaging with them through established communication channels, which helps us to continually address challenges in the sustainability realm and nurture long-lasting relationships. Our approach to corporate sustainability is based on analyzing stakeholder expectations as well as determine the internal and external risk factors that impact our business. We periodically assess the material issues based on short, medium, and long-term risks and opportunities. Our materiality analysis demonstrates areas of focus on issues that are truly critical to achieve the organization’s goals, strengthen its business model and manage its impact on society.
At LTI, we believe that our actions, aimed at fulfilling the Sustainable Development Goals, and our commitment to United Nations Global Compact (UNGC) Principles and United Nation Women’s Empowerment Principles will be effective contribution to make the world better place and create good business opportunities across the globe. Even during pandemic, we ensure our approach to businesses are conducted in a responsible manner that prioritizes sustainability and empowers the people, communities and protects the environment.
For more details, please refer Sustainability Report at www.Lntinfotech.com/social-responsibility

178 Integrated Annual Report 2021-22 179Corporate Overview | Statutory Reports | Financial Statements
Annexure
1. Has the company mapped its internal and external stakeholders?
Yes. We have identified the following eight as our important stakeholders.
1. Clients 2. Employees 3. Shareholders/Investors 4. Suppliers 5. NGOs 6. Communities 7. Regulators 8. Academic Institutions
2. Out of the above, has the company identified the disadvantaged, vulnerable & marginalized stakeholders.
Yes. Communities are the marginalized stakeholders.
3. Are there any special initiatives taken by the company to engage with the disadvantaged, vulnerable and marginalized stakeholders? If so, provide details thereof, in about 50 words or so.
LTI, as a socially responsible company, is committed to continuing its work in 3E’s – Education, Empowerment, and Environment as per our CSR policy. During pandemic, LTI has been steadfast in providing necessary support to communities on various relief measures announced by the government to combat Covid-19.
For more details, please refer Annual Report on CSR activities attached to this Annual Report.
Principle 5: Businesses should respect and promote human rights
At LTI, diversity, equity, inclusion, and respect for human rights have always been more than just policies and headcounts - it’s an important part of life at LTI. Our ‘Code of Conduct’ as well as our policies and guidelines around equal opportunity, anti-slavery, anti-discrimination, anti-harassment are well ingrained into each employee and in the way we conduct our business. LTI has no tolerance for discrimination based on caste, creed, race, religion, national origin, age, gender, sexual orientation, region, appearance or any disability or other protected classifications, while in India or abroad. We respect the unique needs and perspectives of all employees and make sure that such policies and guidelines are well-implemented and accommodated in every decision that we take.
The Supplier Code of Conduct expects its suppliers to embrace their commitment to integrity by complying with the applicable regulatory requirements including related to labour practices and human rights, health, safety and environment etc. and act with diligence, while conducting business with or on behalf of LTI.
1. Does the policy of the Company on human rights cover only the company or extend to the Group/Joint Ventures/Suppliers/Contractors/NGOs/Others?
The Company has a detailed supplier code of conduct which is a compulsory requisite- https://www.lntinfotech.com/wp-content/uploads/2018/06/LTI_Supplier_Code_of_Conduct_March-13_2018_Branding_Guidelines.pdf?pdf=download
The Supplier Code of Conduct expects its suppliers to embrace their commitment to integrity by complying with the applicable regulatory requirements including related to labour practices and human rights, health, safety and environment etc. and act with diligence, while conducting business with or on behalf of LTI.
2. How many stakeholder complaints have been received in the past financial year and what percent was satisfactorily resolved by the management?
Please refer Principle 1 of this Report for details on the complaints received during the year.
Principle 6: Business should respect, protect, and make efforts to restore the environment
Energy conservation has been one of our spearheading strategies to fight climate change and reduce environmental impact. LTI stands by its commitment to achieve Carbon Neutrality by the year 2030.
Over the years, LTI has always focused on reducing the environmental impact of our operations. Our strategies and actions reflect our commitment towards a sustainable habitat. Over the span of last year, we have planted more than 2.4 L trees through various initiatives. LTI stands by its commitment to achieve Carbon Neutral & Water Neutral for India operations by the year 2030.
Energy conservation is a continuous and enduring process, and it has been at the forefront of Company’s strategy in curbing emissions. Despite curtailed operations due to the pandemic, we have reduced our power consumption by investing in various energy efficient equipment and accessories. The energy conservation initiatives taken at various locations accrued a savings of approximately 8.4 L kWh by investing H22.8 Mn.
1. Does the policy related to Principle 6 cover only the company or extends to the Group/Joint Ventures/ Suppliers/ Contractors/ NGOs/ others.
All policies cover LTI group and extends to LTI suppliers and the same is shared with them at the time of vendor registration.
2. Does the company have strategies/ initiatives to address global environmental issues such as climate change, global warming, etc.? Y/N. If yes, please give hyperlink for webpage etc.
Yes. LTI is committed to be Carbon Neutral and Water Neutral by the year 2030. We have chalked out a roadmap with intermediate targets to achieve this remarkable feat. A detailed report on our environmental activities is mentioned in the below sections
• LTI has also committed to Science Based Targets initiatives (SBTi)
• For more details refer Sustainability Report available on www.lntinfotech.com/social-responsibility.
3. Does the company identify and assess potential environmental risks? Y/N
Yes. All office locations of LTI in India are accredited as ISO 14001:2015 certified campuses. We have a location-wise Aspect-Impact Register maintained as per requirement by the ISO 14001:2015 Standard and is audited yearly by a third Party.
4. Does the company have any project related to Clean Development Mechanism? If so, provide details thereof, in about 50 words or so. Also, if Yes, whether any environmental compliance report is filed?
Currently, our energy conservation projects are not registered under Clean Development Mechanism.
5. Has the company undertaken any other initiatives on – clean technology, energy efficiency, renewable energy, etc. Y/N. If yes, please give hyperlink for web page etc.
Yes. An important part of roadmap to carbon neutrality is our commitment to substitute up to 50% of energy from clean & green sources by the year 2030. LTI Head Quater at Powai is sourcing 100% power from renewable energy since July 2021. We have a long-term open access agreement at our Bangaluru campus and have opted for Green Tariff at our Airoli office. LTI is currently sourcing 32.5% of the total energy requirements from renewable sources.
6. Are the Emissions/Waste generated by the company within the permissible limits given by CPCB/SPCB for the financial year being reported?
Yes.
7. Number of show cause/ legal notices received from CPCB/SPCB which are pending (i.e. not resolved to satisfaction) as on end of Financial Year.
During the period, no show cause / legal notices from Central/State Pollution Control Board (CPCB/SPCB) have been received and nothing is pending.
Principle 7: Businesses, when engaged in influencing public and regulatory policy, should do so in a responsible manner
1. Is your company a member of any trade and chamber or association? If Yes, Name only those major ones that your business deals with:
Yes. Below are the associations/ chamber of which Company is member of:
1. National Association of Software & Service Companies (NASSCOM)
2. Bombay Chamber of Commerce & Industry
3. Swedish Chamber of Commerce India
4. HYSEA – Hyderabad Software Enterprises Association
2. Have you advocated/lobbied through above associations for the advancement or improvement of public good? Yes/No; if yes specify the broad areas (drop box: Governance and Administration, Economic Reforms, Inclusive Development Policies, Energy security, Water, Food Security, Sustainable Business Principles, Others)
The Company continues to be a good corporate citizen and contributes to different industry associations and forums to share relevant insights, experiences, and views to develop policies related to its business. The Company’s interactions with these associations are in the areas of innovation, talent development, industry development, research, and Diversity Equity and Inclusion (DEI) initiatives. The inputs and perspectives shared by the Company have helped shape policies and initiatives by the government.
Principle 8: Businesses should support inclusive growth and equitable development
In line with our commitment towards contributing to a better world by 2030, every year LTI has been reporting on the progress of our sustainability roadmap. Our business strategies are guided by the actions we take to operate as a responsible business while also enabling our clients with sustainable solutions. Our community initiatives continue to target integrated development across our operations, globally and in India. The aim and endeavour are to create economic value and inculcate self-reliance. Through our focused activities in the areas of Education, Empowerment and Environment, we are striving towards environment conservation, enabling vulnerable and marginalized communities to stand on their own feet and become more resilient to change & uncertainty with undeterred efforts, during pandemic too. Our projects help promote sustainable community development, with a commitment to promote the cause of creating a more inclusive society. Our approach to corporate social responsibility is built on delivering with impact and long-term value creation.

180 Integrated Annual Report 2021-22 181Corporate Overview | Statutory Reports | Financial Statements
Annexure
1. Does the company have specified programmes/ initiatives/ projects in pursuit of the policy related to Principle 8? If yes details thereof.
Yes, as per our CSR policy, we have our annual action plan which is demonstrated on Company’s website at www.lntinfotech.com/social-responsibility.
2. Are the programmes/projects undertaken through in-house team/own foundation/external NGO/government structures/any other organization?
As per the CSR policy, our projects are implemented through NGOs and Universities/Academic Institutions.
3. Have you done any impact assessment of your initiative?
Yes.
4. What is your company’s direct contribution to community development projects- Amount in INR and the details of the projects undertaken. Have you taken steps to ensure that this community development initiative is successfully adopted by the community? Please explain in 50 words, or so.
For details on Company’s CSR initiatives and CSR spend, refer to CSR Report, which forms part of this Annual Report.
LTI, as a socially responsible company, is committed to continuing its work in Education, Empowerment, and Environment. We have been steadfast in providing necessary support to various relief measures announced by the government to combat Covid-19. Our social initiatives help empower communities with focus on improving the quality of education among children from marginalized communities and helping them stay in school, enhancing skills of the marginalized youth and women, providing special education &skills for physically and intellectually challenged people, and addressing the critical issue of environment conservation.
Principle 9: Businesses should engage with and provide value to their customers and consumers in a responsible manner
1. What percentage of customer complaints/consumer cases are pending as on the end of financial year?
There are ‘Nil’ pending client complaints/consumer cases as at the end of financial year.
LTI considers each client complaint as an opportunity for improvement and has different mechanism to capture the same early. Account managers, onsite sales and the delivery teams share client feedback/complaints to the project manager. The complaint is captured in COMPASS Issue log and triggers causal analysis and resolution to address the client complaint and to prevent such instances in future.
At LTI there is defined structured approach to identify specific actionable and, subsequent discussions are held with clients to gather more clarity on the feedback. The action plan is shared with the client and monitored during governance meetings/ steering committee meetings on monthly and quarterly basis. Both, the action plan, and its execution, are very closely monitored and reviewed by the senior management.
2. Does the company display product information on the product label, over and above what is mandated as per local laws? Yes/No/N.A. /Remarks (additional information)
Yes. LTI complies all major International Organization for Standardization (ISO) and Capability Maturity Model Integration (CMMI) standards. All the ISO certifications undergo recertification or surveillance audit every year, as part of the combined external audit.
• ISO 9001:2015: Quality Management System
LTI is amongst the first few software organizations in India to have been awarded the ISO 9001 certification. ISO 9001 is one of the most widely recognized in the world that presents guidelines intended to increase business efficiency and client satisfaction. We hold ISO 9001 certification since March 2007.
• ISO 14001:2015 + ISO 45001:2018 (Integrated)
14001:2015 - It sets out the criteria for an Environmental Management System. The primary goal is to protect and prevent environment while respecting socio-economic requirements. 45001:2018 – It is a standard for management systems of occupational health and safety. The goal is to reduce occupational injuries and diseases. We hold integrated certification since 2019 for both the standards.
• ISO 20000-1: 2018: IT Service Management
ISO 20000 is an International Standard for IT Service Management. One of the distinguishing factors is that LTI has achieved this certification for the six centers in India, and for following 3 services across all Business Units: Internal Infrastructure Support, Infrastructure Management Services to external clients, Application support services for clients. We hold this certification since 2009, which we transitioned from 2011 to 2018 version in 2021.
• ISO27001:2013: Information Security Management System
ISO 27001 is an International Standard defining the desired methods of controlling the confidentiality, integrity, and availability of information. ISO 27001 is the upgraded version of BS 7799-2:2002. We hold this certification since 2004 (BS7799).
• CMMI Dev and SVC L5 certification
At LTI, we were first appraised for CMMI way back in 2000 and have been continuously re-appraised every 3 years with the respective latest version of the model by Quality and Accreditation Institute (QAI).
LTI has been rated at Maturity Level 5 for both CMMI-DEV V 1.3 and CMMI SVC V 1.5 in May 2019 through a very stringent SCAMPI method of appraisal.
As a part of the continuous journey, we are towards the next milestone of CMMI V 2.0 ML5 Appraisal for Development and Services view in April-22. Scope included all development, testing, ERP and maintenance projects with large enhancements and support projects, across all locations, with the new benchmarking method of appraisal. Projects executed in agile methodology are also covered in this new feature.
CMMI 2.0 developed by CMMI Institute now part of Information Systems Audit and Control Association (ISACA) focuses on business strategy and outcomes and value delivered to Clients.
3. Is there any case filed by any stakeholder against the company regarding unfair trade practices, irresponsible advertising and/or anti-competitive behavior during the last five years and pending as on end of financial year? If so, provide details thereof, in about 50 words or so.
No such case has been filed during the preceding five years against the Company and no such case is pending against the Company as on the date.
4. Did your company carry out any consumer survey/ consumer satisfaction trends?
We, at LTI, firmly believe that a regular survey mechanism, supported by transparent improvement plan, is the foundation for ensuring a high level of client satisfaction. To provide clients with ample avenues to provide feedback, we have the following major levels at which feedback is taken:
(a) Feedback through LTI Client Satisfaction Survey Tool
We have a structured and user-friendly process of assessing the satisfaction level of clients through an online ‘Client Satisfaction Survey’ (CSAT) tool. The tool enables clients to rate the services of LTI across different categories like project execution, quality, communication, culture and value delivered. This feedback is taken for each project every 6 months. In addition to project level, feedback is also taken at an account level, engagement level or individual employee level. The feedback obtained is analyzed and corrective actions are taken wherever required. These actions are also shared with the client.
(b) Account level through independent third party consultant
In addition to the project level survey there is an annual Client Satisfaction Survey (‘CSAT’) done by a research-led independent consulting firm who administers the survey on LTI’s behalf. In this survey various levels of clients are covered right from Chief Executive Officer (CXO), senior management to middle management level. As a part of this survey, CXOs of our key clients are personally interviewed and an online survey link is shared with all client participants to provide an unbiased feedback. Through this survey, we measure the level of client experience we deliver to our clients through key parameters like satisfaction, loyalty, advocacy and business value for money. To increase the visibility of actions to clients, three levels of communication are done for each engagement. L1 communication where client feedback is acknowledged and actions planned are validated, L2 communication where midterm progress on improvement actions is shared and L3 communication where closure of actions and value delivered is communicated. For LTI, this survey is a very important exercise for gathering insights from clients to improve their experience with LTI and for us to deliver amplified outcomes.
We have held on to CSAT Experience Index score compared to previous cycle. Positive feedbacks have been received on agility/flexibility, understanding business domain and customer centricity expectations. Evidently, LTI is seen as a key differentiator towards customer centricity.

182 Integrated Annual Report 2021-22 183Corporate Overview | Statutory Reports | Financial Statements
Annexure
Compliance Certificate[Pursuant to Regulation 13 of the Securities and Exchange Board of India
(Share Based Employee Benefits and Sweat Equity) Regulations, 2021]
To,The Members,Larsen & Toubro Infotech Limited
We, Alwyn Jay & Co., Company Secretary in practice, have been appointed as the Secretarial Auditor vide a resolution passed at its meeting held on May 4, 2021 by the Board of Directors of Larsen & Toubro Infotech Limited (hereinafter referred to as ‘the Company’), having CIN L72900MH1996PLC104693 and having its registered office at L&T House, Ballard Estate, Mumbai - 400001. This certificate is issued under Securities and Exchange Board of India (Share Based Employee Benefits and Sweat Equity) Regulations, 2021 (hereinafter referred to as “the Regulations’), for the year ended March 31, 2022.
Management Responsibility:
It is the responsibility of the Management of the Company to implement the scheme(s) including designing, maintaining records and devising proper systems to ensure compliance with the provisions of all applicable laws and regulations and to ensure that the systems are adequate and operate effectively.
Verification:
The Company has implemented “Larsen & Toubro Infotech Limited Employee Stock Option Scheme, 2015” in accordance with the Regulations and the Special Resolution passed by the members at the Extra Ordinary General Meeting of the Company held on September 14, 2015.
For the purpose of verifying the compliance of the Regulations, we have examined the following:
1. Scheme(s) received from/furnished by the Company;
2. Articles of Association of the Company;
3. Resolutions passed at the meeting of the Board of Directors;
4. Shareholders resolutions passed at the General Meeting(s);
5. Minutes of the meetings of the Nomination & Remuneration Committee;
6. Relevant Accounting Standards as prescribed by the Central Government;
7. Detailed terms and conditions of the scheme as approved by Nomination & Remuneration Committee;
8. Bank Statements towards Application money received under the scheme(s);
9. Exercise Price / Pricing formula;
10. Statement filed with recognised Stock Exchange(s) in accordance with Regulation 10 of these Regulations;
11. Disclosure by the Board of Directors;
12. Relevant provisions of the Regulations, Companies Act, 2013 and Rules made thereunder;
Annexure H Certification:
In our opinion and to the best of our knowledge and according to the verifications as considered necessary and explanations furnished to us by the Company and its Officers, we certify that the Company has implemented the “Larsen & Toubro Infotech Limited Employee Stock Option Scheme, 2015” in accordance with the applicable provisions of the Regulations and Resolution of the Company in the General Meeting(s).
Assumption & Limitation of Scope and Review:
1. Ensuring the authenticity of documents and information furnished is the responsibility of the Board of Directors of the Company.
2. Our responsibility is to give certificate based upon our examination of relevant documents and information. It is neither an audit nor an investigation.
3. This certificate is neither an assurance as to the future viability of the Company nor of the efficiency or effectiveness with which the management has conducted the affairs of the Company.
4. This certificate is solely for your information and it is not to be used, circulated, quoted, or otherwise referred to for any purpose other than for the Regulations.
Place : Mumbai ALWYN JAY & Co.
Date : April 19, 2022 Company Secretaries
Office Address : [ Jay D’Souza FCS.3058 ]
Annex-103, Dimple Arcade, (Partner)
Asha Nagar, Kandivali (East), [ Certificate of Practice No.6915]
Mumbai 400101. [UDIN : F003058D000153857]

184 Integrated Annual Report 2021-22 185Corporate Overview | Statutory Reports | Financial Statements
Annexure
Annexure I
To,The Members,Larsen & Toubro Infotech Limited
We have conducted the secretarial audit of the compliance of applicable statutory provisions and the adherence to good corporate practices by Larsen & Toubro Infotech Limited (CIN: L72900MH1996PLC104693) (hereinafter called “the Company”).
Subject to limitation of physical interaction and verification of records caused by Covid-19 pandemic restrictions, the Secretarial Audit was conducted in a manner that provided us a reasonable basis for evaluating the corporate conducts and statutory compliances to express our opinion thereon.
Based on our verification of the Company's statutory registers, books, papers, minute books, forms and returns filed and other records maintained by the Company and the information provided by the Company, its officers, agents and authorized representatives during the conduct of secretarial audit, we hereby report that in our opinion, the Company has, during the audit period covering the financial year ended on March 31, 2022 complied with the statutory provisions listed hereunder and also that the Company has followed proper Board-processes and has required compliance mechanism in place to the extent, in the manner and subject to the reporting made hereinafter:
We have examined the books, papers, minute books, forms and returns filed and other records maintained by the Company for the financial year ended on March 31, 2022 according to the provisions of:
(i) The Companies Act, 2013 (the Act) and the Rules made thereunder;
(ii) The Securities Contracts (Regulation) Act, 1956 (‘SCRA’) and the Rules made thereunder;
(iii) The Depositories Act, 1996 and the Regulations and Bye-laws framed thereunder;
(iv) Foreign Exchange Management Act, 1999 and the Rules and Regulations made thereunder for compliance to the extent of Foreign Direct Investment and Overseas Direct Investment and External Commercial Borrowings, as applicable;
(v) The following Regulations and Guidelines prescribed under the Securities and Exchange Board of India Act, 1992 (‘SEBI Act’) as amended from time to time: -
(a) The Securities and Exchange Board of India (Substantial Acquisition of Shares and Takeovers) Regulations, 2011;
(b) The Securities and Exchange Board of India (Prohibition of Insider Trading) Regulations, 2015;
(c) The Securities and Exchange Board of India (Issue of Capital and Disclosure Requirements) Regulations, 2018 – Not Applicable to the Company;
(d) The Securities and Exchange Board of India (Share Based Employee Benefits and Sweat Equity) Regulations, 2021;
(e) The Securities and Exchange Board of India (Registrars to an Issue and Share Transfer Agents) Regulations, 1993 regarding the Companies Act and dealing with client – Not Applicable to the Company;
(f) The Securities and Exchange Board of India (Buyback of Securities) Regulations, 2018 - Not applicable to the Company;
(g) The Securities and Exchange Board of India (Delisting of Equity Shares) Regulations, 2021 - Not applicable to the Company;
(h) The Securities and Exchange Board of India (Issue and Listing of Non-Convertible Securities) Regulations, 2021 - Not applicable to the Company;
(i) The Securities and Exchange Board of India (Depositories and Participants) Regulations, 2018.
(vi) Other specific business/industry related laws applicable to the Company:
The Company has complied with specific applicable laws, rules, regulations and guidelines viz.,
• The Information Technology Act, 2000 and rules made thereunder;
• Special Economic Zones Act, 2005 and rules made thereunder;
• Software Technology Parks of India rules and regulations;
Form No. MR-3Secretarial Audit Report
For the financial year ended March 31, 2022[Pursuant to Section 204(1) of the Companies Act, 2013 and Rule No. 9 of the Companies
(Appointment and Remuneration of Managerial Personnel) Rules, 2014]
• Telecom Regulatory Authority of India (TRAI)/Department of Telecommunication (DOT);
• The Indian Copyright Act, 1957; • The Patents Act, 1970; • The Trade Marks Act, 1999
and other applicable general laws, rules, regulations and guidelines.
We have also examined compliance with the applicable clauses of the following:
(i) Secretarial Standards with regard to Meeting of Board of Directors (SS-1) and General Meetings (SS-2) issued by The Institute of Company Secretaries of India; and
(ii) SEBI (Listing Obligations and Disclosures Requirements) Regulations, 2015.
During the period under review, the Company has complied with the provisions of the Act, Rules, Regulations, Guidelines, Standards, etc. mentioned above subject to the following observations:
During the period under review, the Company paid fine aggregating to H12,39,000 (including GST) ‘under protest’ to each of National Stock Exchange Limited (NSE) and The BSE Limited (BSE), for non-compliance of the SEBI (Listing Obligations and Disclosure Requirements) Regulations, 2015, upto August 25, 2021, regarding Board composition in relation to appointment of Independent Directors on the Board.
Despite the constraints arising out of the Covid-19 pandemic, the Company made continuous efforts to fill the vacancy(ies) in the office of Independent Director(s), and one vacancy was filled on July 18, 2021 upon appointment of Mr. James Abraham, while the other vacancy was filled by appointment of Mr. Rajnish Kumar on August 26, 2021.
We further report that
As on the end of the reporting period, the Board of the Company is duly constituted with proper balance of Executive Directors, Non-Executive Directors and Independent Directors. The changes in the composition of the Board of Directors that took place during the period under review were carried out in compliance with the provisions of the Act.
Adequate notice was given to all Directors to schedule the Board Meetings, agenda and detailed notes on agenda were sent at least seven days in advance and a system exists for seeking and obtaining further information and clarifications on the agenda items before the meeting and for a meaningful participation at the meeting.
The minutes of the Board Meetings and Committee Meetings have not identified any dissent by members of the Board/Committee of the Board, hence we have no reason to believe that the decisions by the Board were not approved by all the directors present. The Minutes of the Board Meetings and Committee Meetings were duly approved at the meeting by the Chairman of the Meeting.
We further report that there are adequate systems and processes in the Company commensurate with its size and operations, to monitor and ensure compliance with applicable laws, rules, regulations and guidelines. As informed, the Company has responded appropriately to communication received from various statutory / regulatory authorities including initiating actions for corrective measures, wherever found necessary.
We further report that during the audit period the following events/actions have taken place, having a major bearing on the Company’s affairs in pursuance of the above referred laws, rules, regulations, guidelines and standards:
1. The Scheme of Amalgamation under Sections 230 to 232 of Companies Act, 2013, between Syncordis Software Services Private Limited (‘Syncordis’) and Ruletronics System Private Limited (‘Ruletronics’) (wholly-owned subsidiaries) with the Company was approved by the Hon’ble National Company Law Tribunal vide its order dated July 16, 2021. Consequently, Syncordis and Ruletronics stands merged with the Company, with effect from April 1, 2021 (‘Appointed date’).
2. The Board of Directors of the Company at its meeting held on January 19, 2022 had approved the Scheme of Amalgamation under Sections 230 to 232 of Companies Act, 2013, between Powerupcloud Technologies Private Limited, Lymbyc Solutions Private Limited and Cuelogic Technologies Private Limited (wholly-owned subsidiaries) with the Company.
Place : Mumbai ALWYN JAY & Co.
Date : April 19, 2022 Company Secretaries
Office Address : [ Jay D’Souza FCS.3058 ]
Annex-103, Dimple Arcade, (Partner)
Asha Nagar, Kandivali (East), [ Certificate of Practice No.6915]
Mumbai 400101. [UDIN : F003058D000153725]

186 Integrated Annual Report 2021-22 PBCorporate Overview | Statutory Reports | Financial Statements
Annexure
ToThe Members,Larsen & Toubro Infotech Limited
Our Secretarial Audit Report of even date is to be read along with this letter.
1. The compliance of provisions of all laws, rules, regulations, standards applicable to Larsen & Toubro Infotech Limited (hereinafter called ‘the Company’) is the responsibility of the management of the Company. Our examination was limited to the verification of records and procedures on test check basis for the purpose of issue of the Secretarial Audit Report.
2. Maintenance of secretarial and other records of applicable laws is the responsibility of the management of the Company. Our responsibility is to issue Secretarial Audit Report, based on the audit of the relevant records maintained and furnished to us by the Company, along with explanations where so required.
3. We have followed the audit practices and processes as were appropriate to obtain reasonable assurance about the correctness of the contents of the secretarial and other legal records, legal compliance mechanism and corporate conduct. Further part of the verification was done on the basis of electronic data provided to us by the Company due to Covid-19 Pandemic restrictions and on test check basis to ensure that correct facts as reflected in secretarial and other records produced to us. We believe that the processes and practices we followed, provides a reasonable basis for our opinion for the purpose of issue of the Secretarial Audit Report.
4. We have not verified the correctness and appropriateness of financial records and Books of Accounts of the Company.
5. Wherever required, we have obtained the management representation about list of applicable laws, compliance of laws, rules and regulations and major events during the audit period.
6. The Secretarial Audit Report is neither an assurance as to the future viability of the Company nor of the efficacy or effectiveness with which the management has conducted the affairs of the Company.
Annexure A
Place : Mumbai ALWYN JAY & Co.
Date : April 19, 2022 Company Secretaries
[ Jay D’Souza FCS.3058 ]
Office Address :
Annex-103, Dimple Arcade, (Partner)
Asha Nagar, Kandivali (East), [ Certificate of Practice No.6915]
Mumbai 400101. [UDIN : F003058D000153725]
Note: This report is to be read with our letter of even date which is annexed as Annexure A and forms an integral part of this report.
PB Integrated Annual Report 2021-22 187Standalone
Financial StatementsStatutory ReportsCorporate Overview | |
Independent Auditors’ ReportTo the Members of Larsen & Toubro Infotech Limited
Report on the audit of the Standalone Financial Statements
Opinion
We have audited the accompanying Standalone Financial Statements of Larsen & Toubro Infotech Limited (“the Company”), which comprise the Balance Sheet as at March 31, 2022, the Statement of Profit and Loss including Other Comprehensive Income, the Statement of Cash Flows and the Statement of Changes in Equity for the year then ended, and a summary of significant accounting policies and other explanatory information (hereinafter referred to as “the Standalone Financial Statements”).
In our opinion and to the best of our information and according to the explanations given to us, the aforesaid Standalone Financial Statements give the information required by the Companies Act, 2013 (“the Act”) in the manner so required and give a true and fair view in conformity with the Indian Accounting Standards as prescribed under Section 133 of the Act read with the Companies (Indian Accounting Standards) Rules, 2015 as amended (“Ind AS”) and other accounting principles generally accepted in India, of the state of affairs of the Company as at March 31, 2022, its profit and total comprehensive income, its changes in equity and its cash flows for the year ended on that date.
Basis for Opinion
We conducted our audit of the Standalone Financial Statements in accordance with the Standards on Auditing (SAs) specified under Section 143(10) of the Act (SAs). Our responsibilities under those Standards are further described in the ‘Auditor’s Responsibilities for the audit of the Standalone Financial Statements’ section of our report. We are independent of the Company in accordance with the Code of Ethics issued by the Institute of Chartered Accountants of India (‘the ICAI”) together with the ethical requirements that are relevant to our audit of the Standalone Financial Statements under the provisions of the Act and the Rules made thereunder, and we have fulfilled our other ethical responsibilities in accordance with these requirements and the ICAI’s Code of Ethics. We believe that the audit evidence obtained by us is sufficient and appropriate to provide a basis for our audit opinion on the Standalone Financial Statements.
Key Audit Matters
Key audit matters are those matters that, in our professional judgment, were of most significance in our audit of the Standalone Financial Statements of the current period. These matters were addressed in the context of our audit of the financial statements as a whole, and in forming our opinion thereon, and we do not provide a separate opinion on these matters. We have determined the matters described below to be the key audit matters to be communicated in our report:
Revenue Recognition
Key Audit Matter Accuracy of recognition, measurement, presentation and disclosures of revenue and other related balances in view of the principles laid down under Ind AS 115 “Revenue from Contracts with Customers”.
The application of the revenue accounting standard (Ind AS 115) involves significant judgements/material estimates relating to identification of distinct performance obligations, determination of transaction price of the identified performance obligations, the appropriateness of the basis used to measure revenue recognised over a period.
Additionally, the standard requires disclosures, which involve collation of information in respect of disaggregated revenue, and periods over which the remaining performance obligations will be satisfied subsequent to the Balance Sheet date.
The Company has also assessed (i) the possibility of constraints to render services which may require revision of estimations of costs to complete the contract because of additional efforts, (ii) onerous obligations, (iii) penalties relating to breaches of service level agreements and (iv) termination or deferment of contracts by customers.
Refer Note 2(d) and Note 27 to the Standalone Financial Statements for relevant accounting policy and disclosure respectively.

188 Integrated Annual Report 2021-22 189Standalone
Financial StatementsStatutory ReportsCorporate Overview | |
Revenue Recognition
Principal Audit Procedures • We have evaluated the design and operating controls in relation to the compliance tracker maintained by the Company with respect to compliance with local and international laws and regulations.
• We read the summary of litigation matters provided by management and held discussions with the Company’s legal counsel.
• We have also enquired with some of the Company’s external legal advisors with respect to the matters and examined related correspondence including advices for foreign branch compliances and obtained an external legal confirmation, wherever appropriate.
• In respect of provisions against litigation and the assessment of contingent liabilities, we tested the calculation of the provisions/contingent liability assessment; we reviewed the assumptions against third party data, where available, and assessed the estimates against historical trends. We considered management’s judgements on the level of provisioning/recognition of contingent liability as appropriate.
Investment in Subsidiaries
Key Audit Matter The carrying amount of investments in subsidiaries held at cost less impairment representing 5.65 % of the Company’s total assets are reviewed annually for impairment.
The carrying amount of investment is assessed based on financial performance of subsidiaries and projected cash flows, where necessary. This activity requires significant management judgement and estimates. Management has also carried out sensitivity analysis for all key assumptions, including the cash flow projections.
Refer Note 2(p)(II) and Note 5 to the Standalone Financial Statements for relevant accounting policy and disclosure respectively.
Principal Audit Procedures • We compared the carrying amount of investments with the relevant subsidiary Balance Sheet to identify whether their net assets, being an approximation of their minimum recoverable amount were in excess of their carrying amount and assessing whether those subsidiaries have historically been profit-making.
• For the investments where the carrying amount exceeded the net asset value, compared the carrying amount of the investment with the expected value of the business based on a suitable multiple of the subsidiaries’ earnings or discounted cash flow analysis including reviewing the sensitivity analysis carried out by the management .
• Tested the assumptions and underlying cash flows based on our knowledge of the Company and the markets in which the subsidiaries operate; and
• We also considered the adequacy of disclosures in the financial statements relating to the valuation of investments in subsidiaries, including those made with respect to judgements and estimates.
Revenue Recognition
Principal Audit Procedures Our audit approach consisted of testing the design and operating effectiveness of the internal controls and substantive testing as follows:
• Evaluated the design and operating effectiveness of internal controls relating to the application of revenue accounting standard specifically, those relating to identification of the distinct performance obligations and determination of transaction price. Procedures performed included enquiry and observation, reperformance and inspection of evidence in respect of operation of these controls.
• Tested the relevant information technology systems’ access and change management controls relating to contracts and related information used in recording and disclosing revenue in accordance with the revenue accounting standard.
• Selected a sample of continuing and new contracts and performed the following procedures:
o Read, analysed and identified the distinct performance obligations in these contracts.
o Compared such performance obligations with those identified and recorded by the Company.
o Reviewed contracts terms to determine the transaction price including any variable consideration to determine the appropriate transaction price for computing revenue and to test the basis of estimation of the variable consideration.
o Samples in respect of revenue recorded for time and material contracts were tested through a review of approved time sheets including customer acceptances, subsequent invoicing and historical trend of collections and disputes.
o In respect of samples relating to fixed price contracts, progress towards satisfaction of performance obligation used to compute recorded revenue was verified with actual and estimated efforts from the time recording and contracting systems. We also tested the access and change management controls relating to these systems.
• Performed analytical procedures for reasonableness of revenue disclosed by type and service offerings.
• We reviewed the collation of information and the logic of the report generated from the management system used to prepare the disclosure relating to the periods over which the remaining performance obligations will be satisfied after the Balance Sheet date.
Assessment of provisions and contingent liability in respect of compliance with various laws and regulations as applicable
Key Audit Matter Adequacy of provisioning and assessing contingent liabilities in respect of compliance with applicable laws and regulations including Income tax assessments.
The Company’s operations are spread across several jurisdictions including those outside India requiring the Company to ensure compliance with relevant laws and regulations. Recognition of provisions and disclosure of contingent liabilities on account of potential claims in relation to same may require critical evaluation of legal positions/opinions taken by the Company involving a complex matter and a high degree of professional judgment.
Refer Note 2(s) and Note 36 to the Standalone financial statements for relevant accounting policy and disclosure respectively.

190 Integrated Annual Report 2021-22 191Standalone
Financial StatementsStatutory ReportsCorporate Overview | |
on the audit evidence obtained, whether a material uncertainty exists related to events or conditions that may cast significant doubt on the Company’s ability to continue as a going concern. If we conclude that a material uncertainty exists, we are required to draw attention in our auditors’ report to the related disclosures in the Standalone Financial Statements or, if such disclosures are inadequate, to modify our opinion. Our conclusions are based on the audit evidence obtained up to the date of our auditors’ report. However, future events or conditions may cause the Company to cease to continue as a going concern.
• Evaluate the overall presentation, structure and contents of the Standalone Financial Statements, including the disclosures, and whether the Standalone Financial Statements represent the underlying transactions and events in a manner that achieves fair presentation.
Materiality is the magnitude of misstatements in the Standalone Financial Statements that, individually or in aggregate, makes it probable that the economic decisions of a reasonably knowledgeable user of the Standalone Financial Statements may be influenced. We consider quantitative materiality and qualitative factors in (i) planning the scope of our audit work and in evaluating the results of our work; and (ii) to evaluate the effect of any identified misstatements in the Standalone Financial Statements.
We communicate with those charged with governance regarding, among other matters, the planned scope and timing of the audit and significant audit findings, including any significant deficiencies in internal control that we identify during our audit.
We also provide those charged with governance with a statement that we have complied with relevant ethical requirements regarding independence, and to communicate with them all relationships and other matters that may reasonably be thought to bear on our independence, and where applicable, related safeguards.
From the matters communicated with those charged with governance, we determine those matters that were of most significance in the audit of the Standalone Financial Statements of the current year and are therefore the key audit matters. We describe these matters in our auditors’ report unless law or regulation precludes public disclosure about the matter or when, in extremely rare circumstances, we determine that a matter should not be communicated in our report because the adverse consequences of doing so would reasonably be expected to outweigh the public interest benefits of such communication.
Report on other Legal and Regulatory Requirements
1. As required by the Companies (Auditor’s Report) Order, 2020 (“the Order”), issued by the Central Government of India in terms of sub-Section (11) of Section 143 of the Act and on the basis of such checks of the books and records of the Company as we considered appropriate and according to the information and explanations given to us, we give in Annexure A, a statement on the matters specified in paragraphs 3 and 4 of the Order, to the extent applicable.
2. As required by Section 143(3) of the Act, we report that:
(a) We have sought and obtained all the information and explanations which to the best of our knowledge and belief were necessary for the purposes of our audit.
(b) In our opinion, proper books of account as required by law have been kept by the Company so far as it appears from our examination of those books.
(c) The Balance Sheet, the Statement of Profit and Loss including Other Comprehensive income, the Statement of Changes in Equity and the Statement of Cash Flows dealt with by this report are in agreement with the books of account.
(d) In our opinion, the aforesaid Standalone Financial Statements comply with the Accounting Standards specified under Section 133 of the Act.
(e) On the basis of the written representations received from the directors as on March 31, 2022 taken on record by the Board of Directors, none of the directors is disqualified as on March 31, 2022 from being appointed as a director in terms of Section 164(2) of the Act.
(f) With respect to the adequacy of the internal financial controls with reference to Standalone Financial Statements of the Company and the operating effectiveness of such controls, refer to our separate report in Annexure B. Our report expresses an unmodified opinion on the adequacy and operating effectiveness of the Company’s internal financial controls with reference to Standalone Financial Statements.
(g) In our opinion, the managerial remuneration for the year ended March 31, 2022 has been paid/ provided by the Company to its directors in accordance with the provisions of Section 197 read with Schedule V to the Act.
Information Other than the Standalone Financial Statements and Auditors’ Report thereon
The Company’s Board of Directors is responsible for the other information. The other information comprises the information in the Annual Report but does not include the Standalone Financial Statements and our Auditors’ Report thereon.
Our opinion on the Standalone Financial Statements does not cover the other information and we do not express any form of assurance conclusion thereon.
In connection with our audit of the Standalone Financial Statements, our responsibility is to read the other information and, in doing so, consider whether the other information is materially inconsistent with the Standalone Financial Statements or our knowledge obtained during the course of our audit or otherwise appears to be materially misstated.
If, based on the work we have performed, we conclude that there is a material misstatement of this other information, we are required to report that fact. We have nothing to report in this regard.
Responsibilities of management for the Standalone Financial Statements
The Company’s Board of Directors is responsible for the matters stated in Section 134(5) of the Act with respect to the preparation of these Standalone Financial Statements that give a true and fair view of the financial position, financial performance including other comprehensive income, changes in equity and cash flows of the Company in accordance with the accounting principles generally accepted in India.
This responsibility also includes maintenance of adequate accounting records in accordance with the provisions of the Act for safeguarding the assets of the Company and for preventing and detecting frauds and other irregularities; selection and application of appropriate accounting policies; making judgments and estimates that are reasonable and prudent; and design, implementation and maintenance of adequate internal financial controls, that were operating effectively for ensuring the accuracy and completeness of the accounting records, relevant to the preparation and presentation of the Standalone Financial Statements that give a true and fair view and are free from material misstatement, whether due to fraud or error.
In preparing the Standalone Financial Statements, management is responsible for assessing the Company’s ability to continue as a going concern, disclosing, as applicable, matters related to going concern and using the
going concern basis of accounting unless management either intends to liquidate the Company or to cease operations, or has no realistic alternative but to do so.
Those Board of Directors are also responsible for overseeing the Company’s financial reporting process.
Auditors’ Responsibilities for the audit of the Standalone Financial Statements
Our objectives are to obtain reasonable assurance about whether the Standalone Financial Statements as a whole are free from material misstatement, whether due to fraud or error, and to issue an auditors’ report that includes our opinion. Reasonable assurance is a high level of assurance, but is not a guarantee that an audit conducted in accordance with SAs will always detect a material misstatement when it exists. Misstatements can arise from fraud or error and are considered material if, individually or in the aggregate, they could reasonably be expected to influence the economic decisions of users taken on the basis of these Standalone Financial Statements.
As part of an audit in accordance with SAs, we exercise professional judgment and maintain professional skepticism throughout the audit.
We also:
• Identify and assess the risks of material misstatement of the Standalone Financial Statements, whether due to fraud or error, design and perform audit procedures responsive to those risks, and obtain audit evidence that is sufficient and appropriate to provide a basis for our opinion. The risk of not detecting a material misstatement resulting from fraud is higher than for one resulting from error, as fraud may involve collusion, forgery, intentional omissions, misrepresentations, or the override of internal control.
• Obtain an understanding of internal financial control relevant to the audit in order to design audit procedures that are appropriate in the circumstances. Under Section 143(3)(i) of the Act, we are also responsible for expressing our opinion on whether the Company has adequate internal financial controls system in place and the operating effectiveness of such controls.
• Evaluate the appropriateness of accounting policies used and the reasonableness of accounting estimates and related disclosures made by the management.
• Conclude on the appropriateness of management’s use of the going concern basis of accounting and, based

192 Integrated Annual Report 2021-22 193Standalone
Financial StatementsStatutory ReportsCorporate Overview | |
Annexure A to the Independent Auditors’ Report[Referred to in paragraph 1 under ‘Report on other Legal and Regulatory Requirements’ section of our report of even date]
(i) (a) (A) According to the information and explanations given to us, the Company has maintained proper records showing full particulars, including quantitative details and situation of property, plant and equipment.
(B) According to the information and explanations given to us, the Company has maintained proper records showing full particulars of intangible assets.
(b) The Company has a regular programme for physical verification of its property, plant and equipment by which the property, plant and equipment are verified by the management according to a phased programme designed to cover all the items over a period of three years. In our opinion, this periodicity of physical verification is reasonable having regard to the size of the Company and the nature of its property, plant and equipment. In accordance with the programme, the Company has physically verified certain property, plant and equipment during the year and no material discrepancies were noticed on such verification.
(c) According to the information and explanations given to us, the Company does not have any immovable properties (other than properties where the company is the lessee and the lease agreements are duly executed in favour of the lessee).
(d) According to the information and explanations given to us, the Company has not revalued any of its property, plant and equipment (including right of use assets) or intangible assets or both during the year.
(e) Based on the audit procedures performed by us and according to the information, explanations and representations given to us, no proceedings have been initiated or are pending against the Company for holding any benami property under the Benami Transactions (Prohibition) Act, 1988 (45 of 1988) and rules made thereunder.
(ii) (a) The Company is in the business of rendering services and consequently, does not hold any inventory. Accordingly, the reporting under Clause 3(ii)(a) of the Order is not applicable to the Company.
(b) According to the information and explanations given to us, the Company has been sanctioned
working capital limits in excess of five crore rupees, in aggregate, from banks on the basis of security of a first pari passu charge on the trade receivables. The statements of trade receivables filed by the Company with the banks on a monthly basis are in agreement with the respective unaudited books of account as certified by the management.
(iii) (a) According to the information and explanations given to us, during the year, the Company has not provided any guarantee or security or granted any loans or advances in the nature of loans, secured or unsecured, to companies, firms, Limited Liability Partnerships or any other parties. Accordingly, the reporting under Clauses 3(iii)(a) of the Order is not applicable to the Company.
(b) According to the information and explanations given to us, the terms and conditions of the investment made by the Company during the year is not prejudicial to the Company’s interest.
(c) According to the information and explanations given to us, the subsidiary companies have been regular in repayment of principal amounts and payments of interest as per the stipulated terms in respect of loans granted in earlier years.
(d) According to the information and explanations given to us, the principal and interest amounts of the loans granted by the Company to the subsidiaries in earlier years are not overdue. Accordingly, the reporting under Clauses 3(iii)(d) of the Order is not applicable to the Company.
(e) According to the information and explanations given to us, there are no loans granted to the subsidiaries which have fallen due during the year. Accordingly, the reporting under Clauses 3(iii)(e) of the Order is not applicable to the Company.
(f) According to the information and explanations given to us, the Company has not granted any loans or advances in the nature of loans either repayable on demand or without specifying any terms or period of repayment. Accordingly, the reporting under Clauses 3(iii)(f) of the Order is not applicable to the Company.
(h) With respect to the other matters to be included in the Auditors’ Report in accordance with the requirements of Rule 11 of the Companies (Audit and Auditors) Rules, 2014, as amended, in our opinion and to the best of our information and according to the explanations given to us:
(i) The Company has disclosed the impact of pending litigations on its financial position in its Standalone Financial Statements – Refer Note 36 to the Standalone Financial Statements;
(ii) The Company did not have any long-term contracts including derivative contracts for which there were any material foreseeable losses;
(iii) There were no amounts which were required to be transferred to the Investor Education and Protection Fund by the Company;
(iv) (a) The management has represented that, to the best of its knowledge and belief, no funds have been advanced or loaned or invested (either from borrowed funds or share premium or any other sources or kind of funds) by the Company to or in any other person(s) or entity(ies), including foreign entities (“Intermediaries”), with the understanding, whether recorded in writing or otherwise, that the Intermediary shall:
(i) directly or indirectly lend or invest in other persons or entities identified in any manner whatsoever (“Ultimate Beneficiaries”) by or on behalf of the Company or
(ii) provide any guarantee, security or the like on behalf of the Ultimate Beneficiaries;
(b) The management has represented that, to the best of its knowledge and belief, no funds have been received by the Company from any person(s) or entity(ies), including foreign entities (“Funding Parties”), with the understanding, whether recorded in writing or otherwise, that the Company shall:
(i) directly or indirectly, lend or invest in other persons or entities identified in any manner whatsoever (“Ultimate Beneficiaries”) by or on behalf of the Funding Party or
(ii) provide any guarantee, security or the like on behalf of the Ultimate Beneficiaries;
(c) Based on such audit procedures as considered reasonable and appropriate in the circumstances, nothing has come to our notice that has caused us to believe that the representations under sub-clause (a) and (b) contain any material misstatement; and
(v) The dividend declared/paid/declared and paid during the year by the Company is in compliance with Section 123 of the Act.
For B. K. Khare & Co.Chartered Accountants
Firm Registration No. 105102W
Padmini Khare KaickerPartner
Place: Mumbai Membership No. 044784Date: April 19, 2022 UDIN is 22044784AHIEJJ6424

194 Integrated Annual Report 2021-22 195Standalone
Financial StatementsStatutory ReportsCorporate Overview | |
Name of statute Nature of the duesAmountJ in Mn*
Period to which the amount relates
Forum where dispute is pending
Disputes regarding calculation of notional interest on transactions with related party and disallowance of foreign tax credit
1.21 FY2010-2011(AY 2011-2012)
Commissioner (Appeals)
Disputes regarding exclusion of interest income from Section 10A calculation, addition of notional interest on transactions with related party and disallowance of foreign tax credit
2.08 FY2008-2009(AY 2009-2010)
Assessing Officer (Assistant Commissioner of Income Tax)
Disputes regarding non deduction of With Holding Tax under Section 195
1.04 FY2018-2019 (AY 2019-2020)
Commissioner (Appeals)
*Net of amounts paid including under protest.
(viii) According to the information and explanations given to us, there are no transactions not recorded in the books of account which have been surrendered or disclosed as income during the year in the tax assessments under the Income-tax Act, 1961. Accordingly, the reporting under Clause 3(viii) of the Order is not applicable to the Company.
(ix) (a) According to the information and explanations given to us and based on the audit procedures performed by us, the Company has not availed any loans or other borrowings during the year. Accordingly, the reporting under Clause 3(ix)(a) of the Order is not applicable to the Company.
(b) According to the information and explanations given to us, the Company has not been declared a wilful defaulter by any bank or financial institution or any other lender till the date of our audit report.
(c) According to the information and explanations given to us and based on the audit procedures performed by us, the Company has not availed any term loans during the year. Accordingly, the reporting under Clause 3(ix)(c) of the Order is not applicable to the Company.
(d) In our opinion and according to the information and explanations given to us and on an overall examination of the Balance Sheet of the Company,
we report that no funds are raised on short-term basis. Accordingly, the reporting under Clause 3(ix)(d) of the Order is not applicable to the Company.
(e) According to the information and explanations given to us and on an overall examination of the Financial Statements of the Company, we report that the Company has not taken any funds from any entity or person on account of or to meet the obligations of its subsidiaries.
(f) According to the information and explanations given to us and based on the audit procedures performed by us, we report that the Company has not raised any loans during the year on the pledge of securities held in its subsidiaries. Accordingly, the reporting under Clause 3(ix)(f) of the Order is not applicable to the Company.
(x) (a) According to the information and explanations given to us, the Company has not raised any moneys by way of initial public offer or further public offer (including debt instruments) during the year. Accordingly, the reporting under Clause 3(x)(a) of the Order is not applicable to the Company.
(b) According to the information and explanations given to us, the Company has not made any preferential allotment or private placement of
(iv) In our opinion and according to the information and explanations given to us, the Company has complied with the provisions of Sections 185 and 186 of the Act, with respect to loans granted, guarantees provided and investments made by the Company. The Company has not provided any security during the year to the parties covered under Sections 185 and 186 of the Act.
(v) According to the information and explanations given to us, the Company has not accepted deposits under the provisions of Sections 73 to 76 or any other relevant provisions of the Act and the rules framed thereunder. Accordingly, the reporting under Clause 3(v) of the Order is not applicable to the Company.
(vi) The Company’s operations do not involve processing or manufacturing activities. Accordingly, the reporting under Clause 3(vi) of the Order is not applicable to the Company.
(vii) (a) According to the information and explanations given to us and on the basis of our examination of records of the Company, the amounts deducted / accrued
in the books of account in respect of undisputed statutory dues including Goods and Services Tax, Provident Fund, Employees’ State Insurance, Income-tax, Cess and other material statutory dues have been regularly deposited during the year by the Company with the appropriate authorities. According to the information and explanations given to us and on the basis of our examination of records of the Company, there were no undisputed statutory dues payable in respect of Sales tax, Service tax, Duty of Customs, Duty of Excise and Value Added Tax.
According to the information and explanations given to us and on the basis of our examination of records of the Company, there were no arrears of outstanding statutory dues in respect of Goods and Services tax, Provident fund, Employees’ State Insurance, Income-tax, Sales tax, Service tax, Duty of Customs, Duty of Excise, Value Added Tax, Cess and other material statutory dues as on the last day of the financial year for a period of more than six months from the date they became payable.
Name of statute Nature of the duesAmountJ in Mn*
Period to which the amount relates
Forum where dispute is pending
West Bengal Value Added Tax
Demand raised based on subcontractor turnover
8.42 FY2015-2016 and 2016-2017
Senior Joint Commissioner Kolkata South Circle
Maharashtra Value Added Tax (MVAT)
MVAT refund rejected and demand raised of liability adjusted against Input Tax Credit
7.78 FY2016-2017 and FY2017-2018
Commissioner Appeals
The Goods and Services Tax Act, 2017
Tamil Nadu SEZ GST Audit 109.10 FY2017-2018, 2018-2019 and 2019-2020
Commissioner Appeals
The Income-tax Act, 1961
Disallowance of exemption under Income Tax
84.26 FY2008-2009 (AY 2009-2010)
Income Tax Appellate Tribunal
Disallowance of exemption under Income Tax
0.18 FY2010-2011 (AY 2011-2012)
Income Tax Appellate Tribunal
Penalty 131.38 FY2006-2007 (AY 2007-2008)
Commissioner (Appeals)
(b) According to the information and explanations given to us and on the basis of our examination of records of the Company, there are no statutory dues in respect of Provident Fund, Employees’ State Insurance, Sales tax, Service tax, Duty of Customs, Duty of Excise, Cess and any other material statutory dues as at March 31, 2022, which have not been deposited with the appropriate authorities on account of any dispute. The statutory dues in respect of Goods and Services Tax, Income-tax and Value Added Tax as at March 31, 2022, which have not been deposited with the appropriate authorities on account of a dispute, are as under:

196 Integrated Annual Report 2021-22 197Standalone
Financial StatementsStatutory ReportsCorporate Overview | |
(xix) According to the information and explanations given to us and on the basis of the financial ratios, ageing and expected dates of realisation of financial assets and payment of financial liabilities, other information accompanying the financial statements, our knowledge of the Board of Directors and management plans and based on our examination of the evidence supporting the assumptions, nothing has come to our attention, which causes us to believe that any material uncertainty exists as on the date of the audit report that the Company is not capable of meeting its liabilities existing at the date of Balance Sheet as and when they fall due within a period of one year from the Balance Sheet date. We, however, state that this is not an assurance as to the future viability of the Company. We further state that our reporting is based on the facts up to the date of the audit report and we neither give any guarantee nor any assurance that all liabilities falling due within a period of one year from the Balance Sheet date, will get discharged by the Company as and when they fall due.
(xx) (a) According to the information and explanations given to us, in respect of other than ongoing projects, the Company has no unspent amount that needs to be transferred to a Fund specified in Schedule VII to the Act in compliance with second proviso to sub-section (5) of Section 135 of the Act.
(b) According to the information and explanations given to us, there are no ongoing projects relating to corporate social responsibility. Accordingly, the reporting under Clause 3(xx)(b) is not applicable to the Company.
For B. K. Khare & Co.Chartered Accountants
Firm Registration No. 105102W
Padmini Khare KaickerPartner
Place: Mumbai Membership No. 044784Date: April 19, 2022 UDIN is 22044784AHIEJJ6424
shares or convertible debentures (fully, partially or optionally convertible) during the year. Accordingly, the reporting under Clause 3(x)(b) of the Order is not applicable to the Company.
(xi) (a) During the course of our examination of the books and records of the Company, carried out in accordance with the generally accepted auditing practices in India and according to the information and explanations given to us, we have neither come across any instance of material fraud by the Company or on the Company noticed or reported during the year, nor have we been informed of any such case by the management.
(b) There has been no report filed by us under sub-section (12) of Section 143 of the Act in Form ADT-4 as prescribed under Rule 13 of the Companies (Audit and Auditors) Rules, 2014 with the Central Government. Accordingly, the reporting under Clause 3(xi)(b) of the Order is not applicable to the Company.
(c) We have taken into consideration the whistle blower complaints received by the Company during the year while determining the nature, timing and extent of our audit procedures.
(xii) According to the information and explanations given to us, the Company is not a Nidhi company and the Nidhi Rules, 2014 are not applicable to it. Accordingly, the reporting under Clause 3(xii) of the Order is not applicable to the Company.
(xiii) In our opinion and according to the information and explanations given to us, the Company has entered into transactions with related parties in compliance with the provisions of Sections 177 and 188 of the Act. The details of such related party transactions have been disclosed in the Standalone Financial Statements as required by Indian Accounting Standard (Ind AS) 24, Related Party Disclosures specified under Section 133 of the Act.
(xiv) (a) In our opinion and according to the information and explanations given to us and based on our examination, the Company has an internal audit system commensurate with the size and nature of its business.
(b) We have considered the Internal Audit reports of the Company issued till date for the period under audit.
(xv) According to the information and explanations given to us, the Company has not entered into any non-cash transactions with its directors or directors of its holding company, or subsidiary companies or persons connected with them during the year and hence, the provisions of Section 192 of the Act are not applicable to the Company. Accordingly, the reporting under Clause 3(xv) of the Order is not applicable to the Company.
(xvi) (a) According to the information and explanations given to us, the Company is not required to be registered under Section 45-IA of the Reserve Bank of India Act, 1934. Accordingly, the reporting under Clause 3(xvi)(a) of the Order is not applicable to the Company.
(b) In our opinion and according to the information and explanations given to us, the Company has not conducted any Non-Banking Financial or Housing Finance activities. Accordingly, the reporting under Clause 3(xvi)(b) of the Order is not applicable to the Company.
(c) In our opinion and according to the information and explanations given to us, the Company is not a Core Investment Company (CIC) as defined in the regulations made by the Reserve Bank of India. Accordingly, the reporting under Clause 3(xvi)(c) of the Order is not applicable to the Company.
(d) Based on the information and explanations given to us, we report that the Group (as defined in the Core Investment Companies (Reserve Bank) Directions, 2016) has two Core Investment Companies.
(xvii) In our opinion and according to the information and explanations given to us, the Company has not incurred cash losses in the current financial year as well as in the immediately preceding financial year. Accordingly, the reporting under Clause 3(xvii) of the Order is not applicable to the Company.
(xviii) There has been no resignation of the statutory auditors during the year. Accordingly, the reporting under Clause 3(xviii) of the Order is not applicable to the Company.

198 Integrated Annual Report 2021-22 199Standalone
Financial StatementsStatutory ReportsCorporate Overview | |
reflect the transactions and dispositions of the assets of the Company; (2) provide reasonable assurance that transactions are recorded as necessary to permit preparation of financial statements in accordance with generally accepted accounting principles, and that receipts and expenditures of the Company are being made only in accordance with authorisations of management and directors of the Company; and (3) provide reasonable assurance regarding prevention or timely detection of unauthorised acquisition, use, or disposition of the Company’s assets that could have a material effect on the financial statements.
Inherent Limitations of Internal Financial Controls with reference to financial statements
Because of the inherent limitations of internal financial controls with reference to financial statements, including the possibility of collusion or improper management override of controls, material misstatements due to error or fraud may occur and not be detected. Also, projections of any evaluation of the internal financial controls with reference to financial statements to future periods are subject to the risk that the internal financial control with reference to financial statements may become inadequate because of changes in conditions, or that the degree of compliance with the policies or procedures may deteriorate.
Opinion
In our opinion, to the best of our information and according to the explanations given to us, the Company has, in all material respects, an adequate internal financial controls system with reference to financial statements and such internal financial controls with reference to financial statements were operating effectively as at March 31, 2022, based on the criteria for internal financial control with reference to financial statements established by the Company considering the essential components of internal control stated in the Guidance Note on Audit of Internal Financial Controls Over Financial Reporting issued by the Institute of Chartered Accountants of India.
For B. K. Khare & Co.Chartered Accountants
Firm Registration No. 105102W
Padmini Khare KaickerPartner
Place: Mumbai Membership No. 044784Date: April 19, 2022 UDIN is 22044784AHIEJJ6424
Annexure B to the Independent Auditors’ Report [Referred to in paragraph 2(f) under ‘Report on other Legal and Regulatory Requirements’ section of our report of even date]
Report on the Internal Financial Controls with reference to financial statements under Clause (i) of sub-section (3) of Section 143 of the Companies Act, 2013 (“the Act”)
We have audited the internal financial controls with reference to financial statements of Larsen & Toubro Infotech Limited (“the Company”) as of March 31, 2022 in conjunction with our audit of the Standalone Financial Statements of the Company for the year ended on that date.
Management’s Responsibility for Internal Financial Controls
The Company’s management is responsible for establishing and maintaining internal financial controls based on the internal control over financial reporting criteria established by the Company considering the essential components of internal control stated in the Guidance Note on Audit of Internal Financial Controls Over Financial Reporting issued by the Institute of Chartered Accountants of India. These responsibilities include the design, implementation and maintenance of adequate internal financial controls that were operating effectively for ensuring the orderly and efficient conduct of its business including adherence to the Company’s policies, the safeguarding of its assets, the prevention and detection of frauds and errors, the accuracy and completeness of the accounting records, and the timely preparation of reliable financial information, as required under the Act.
Auditors’ Responsibility
Our responsibility is to express an opinion on the Company’s internal financial controls with reference to financial statements of the Company based on our audit. We conducted our audit in accordance with the Guidance Note on Audit of Internal Financial Controls Over Financial Reporting (“the Guidance Note”) issued by the Institute of Chartered Accountants of India and the Standards on
Auditing prescribed under Section 143(10) of the Act, to the extent applicable to an audit of internal financial controls. Those Standards and the Guidance Note require that we comply with ethical requirements and plan and perform the audit to obtain reasonable assurance about whether adequate internal financial controls with reference to financial statements was established and maintained and if such controls operated effectively in all material respects.
Our audit involves performing procedures to obtain audit evidence about the adequacy of the internal financial controls system with reference to financial statements and their operating effectiveness. Our audit of internal financial controls with reference to financial statements included obtaining an understanding of internal financial controls with reference to financial statements, assessing the risk that a material weakness exists, and testing and evaluating the design and operating effectiveness of internal control based on the assessed risk. The procedures selected depend on the auditor’s judgement, including the assessment of the risks of material misstatement of the financial statements, whether due to fraud or error.
We believe that the audit evidence we have obtained is sufficient and appropriate to provide a basis for our audit opinion on the Company’s internal financial controls system with reference to financial statements.
Meaning of Internal Financial Controls with reference to financial statements
A company’s internal financial control with reference to financial statements is a process designed to provide reasonable assurance regarding the reliability of financial reporting and the preparation of financial statements for external purposes in accordance with generally accepted accounting principles. A company’s internal financial control with reference to financial statements includes those policies and procedures that (1) pertain to the maintenance of records that, in reasonable detail, accurately and fairly
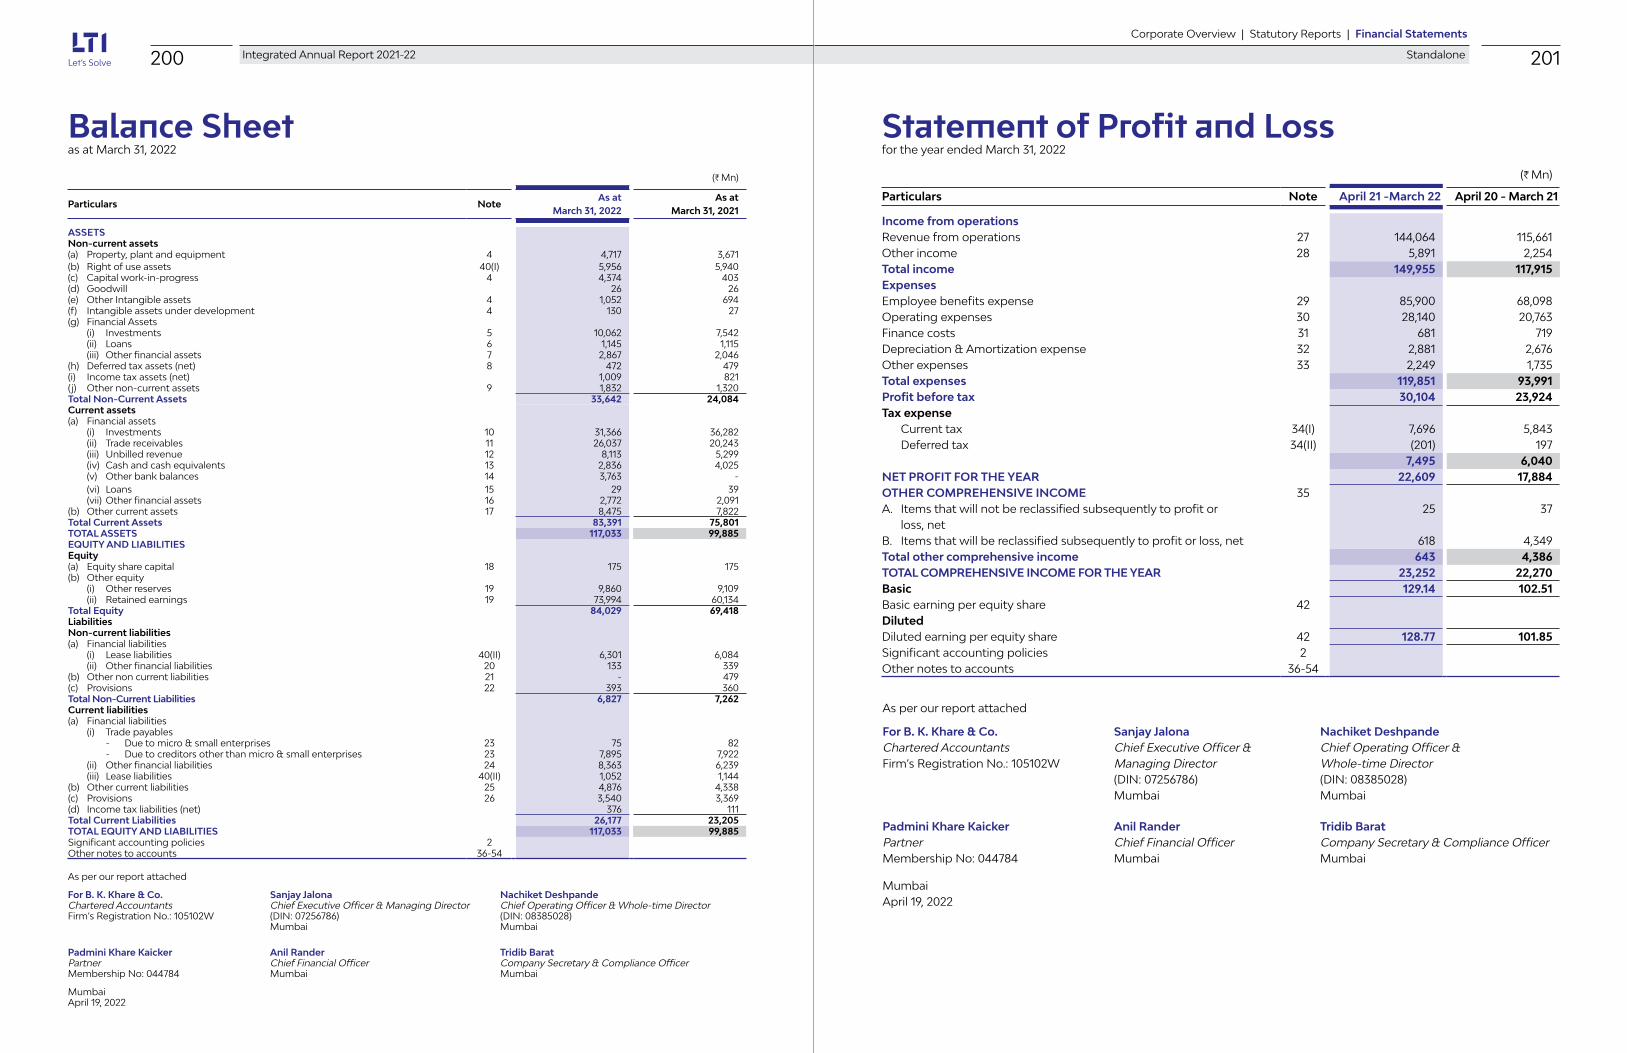
200 Integrated Annual Report 2021-22 201Standalone
Financial StatementsStatutory ReportsCorporate Overview | |
(H Mn)
Particulars Note April 21 -March 22 April 20 - March 21
Income from operationsRevenue from operations 27 144,064 115,661 Other income 28 5,891 2,254 Total income 149,955 117,915 ExpensesEmployee benefits expense 29 85,900 68,098 Operating expenses 30 28,140 20,763 Finance costs 31 681 719 Depreciation & Amortization expense 32 2,881 2,676 Other expenses 33 2,249 1,735 Total expenses 119,851 93,991 Profit before tax 30,104 23,924 Tax expense Current tax 34(I) 7,696 5,843 Deferred tax 34(II) (201) 197
7,495 6,040 NET PROFIT FOR THE YEAR 22,609 17,884OTHER COMPREHENSIVE INCOME 35A. Items that will not be reclassified subsequently to profit or loss, net
25 37
B. Items that will be reclassified subsequently to profit or loss, net 618 4,349 Total other comprehensive income 643 4,386 TOTAL COMPREHENSIVE INCOME FOR THE YEAR 23,252 22,270 Basic 129.14 102.51 Basic earning per equity share 42DilutedDiluted earning per equity share 42 128.77 101.85 Significant accounting policies 2Other notes to accounts 36-54
Statement of Profit and Lossfor the year ended March 31, 2022
As per our report attached
For B. K. Khare & Co. Sanjay Jalona Nachiket DeshpandeChartered Accountants Chief Executive Officer & Chief Operating Officer & Firm’s Registration No.: 105102W Managing Director Whole-time Director (DIN: 07256786) (DIN: 08385028) Mumbai Mumbai
Padmini Khare Kaicker Anil Rander Tridib BaratPartner Chief Financial Officer Company Secretary & Compliance OfficerMembership No: 044784 Mumbai Mumbai
MumbaiApril 19, 2022
(H Mn)
Particulars NoteAs at
March 31, 2022 As at
March 31, 2021
ASSETSNon-current assets(a) Property, plant and equipment 4 4,717 3,671 (b) Right of use assets 40(I) 5,956 5,940 (c) Capital work-in-progress 4 4,374 403 (d) Goodwill 26 26 (e) Other Intangible assets 4 1,052 694 (f) Intangible assets under development 4 130 27 (g) Financial Assets (i) Investments 5 10,062 7,542 (ii) Loans 6 1,145 1,115 (iii) Other financial assets 7 2,867 2,046 (h) Deferred tax assets (net) 8 472 479 (i) Income tax assets (net) 1,009 821 (j) Other non-current assets 9 1,832 1,320 Total Non-Current Assets 33,642 24,084 Current assets(a) Financial assets (i) Investments 10 31,366 36,282 (ii) Trade receivables 11 26,037 20,243 (iii) Unbilled revenue 12 8,113 5,299 (iv) Cash and cash equivalents 13 2,836 4,025 (v) Other bank balances 14 3,763 - (vi) Loans 15 29 39 (vii) Other financial assets 16 2,772 2,091 (b) Other current assets 17 8,475 7,822 Total Current Assets 83,391 75,801 TOTAL ASSETS 117,033 99,885 EQUITY AND LIABILITIESEquity(a) Equity share capital 18 175 175 (b) Other equity (i) Other reserves 19 9,860 9,109 (ii) Retained earnings 19 73,994 60,134 Total Equity 84,029 69,418 LiabilitiesNon-current liabilities(a) Financial liabilities (i) Lease liabilities 40(II) 6,301 6,084 (ii) Other financial liabilities 20 133 339 (b) Other non current liabilities 21 - 479 (c) Provisions 22 393 360 Total Non-Current Liabilities 6,827 7,262 Current liabilities(a) Financial liabilities (i) Trade payables - Due to micro & small enterprises 23 75 82 - Due to creditors other than micro & small enterprises 23 7,895 7,922 (ii) Other financial liabilities 24 8,363 6,239 (iii) Lease liabilities 40(II) 1,052 1,144 (b) Other current liabilities 25 4,876 4,338 (c) Provisions 26 3,540 3,369 (d) Income tax liabilities (net) 376 111 Total Current Liabilities 26,177 23,205 TOTAL EQUITY AND LIABILITIES 117,033 99,885 Significant accounting policies 2Other notes to accounts 36-54
Balance Sheet as at March 31, 2022
As per our report attached
For B. K. Khare & Co. Sanjay Jalona Nachiket DeshpandeChartered Accountants Chief Executive Officer & Managing Director Chief Operating Officer & Whole-time DirectorFirm’s Registration No.: 105102W (DIN: 07256786) (DIN: 08385028) Mumbai Mumbai
Padmini Khare Kaicker Anil Rander Tridib BaratPartner Chief Financial Officer Company Secretary & Compliance OfficerMembership No: 044784 Mumbai Mumbai
MumbaiApril 19, 2022

202 Integrated Annual Report 2021-22 203Standalone
Financial StatementsStatutory ReportsCorporate Overview | |
Standalone Cash Flow Statementfor the year ended March 31, 2022
As per our report attached
For B. K. Khare & Co. Sanjay Jalona Nachiket DeshpandeChartered Accountants Chief Executive Officer & Chief Operating Officer & Firm’s Registration No.: 105102W Managing Director Whole-time Director (DIN: 07256786) (DIN: 08385028) Mumbai Mumbai
Padmini Khare Kaicker Anil Rander Tridib BaratPartner Chief Financial Officer Company Secretary & Compliance OfficerMembership No: 044784 Mumbai Mumbai
MumbaiApril 19, 2022
(H Mn)
Particulars April 21 -March 22 April 20 - March 21
C. CASH FLOW FROM FINANCING ACTIVITIES
Proceeds from issue of share capital 0 1
Payment towards lease liabilities (net) (1,590) (1,559)
Deposit under credit support agreement received/(paid) (89) 1,759
Interest paid (41) (15)
Dividend paid (8,749) (5,319)
Net cash (used in) financing activities (10,469) (5,133)
Net increase/(decrease) in cash and cash equivalents (1,086) 290
Effect of exchange differences on translation of foreign currency cash and cash equivalents
(102) 12
Cash and cash equivalents at beginning of the period 4,025 3,723
Cash and cash equivalents at end of the period* 2,836 4,025
*Refer note 13 to Standalone Financial Statements
(H Mn)
Particulars April 21 -March 22 April 20 - March 21
A. CASH FLOW FROM OPERATING ACTIVITIES
Net profit after tax 22,609 17,884
Adjustments to reconcile net profit to net cash provided by operating activities:
Depreciation and amortization 2,881 2,676
Income tax expense 7,495 6,040
Employee stock options amortised 108 168
Realised income from current investment in mutual funds (1,076) (982)
Unrealised income from current investment (133) (560)
Interest income (433) (164)
Interest expense 681 719
Provision for doubtful debts (net) 262 191
Unrealised foreign exchange gain/loss (net) (160) (369)
Change in fair value of contingent consideration 113 -
Gain on buyback of shares by subsidiary (1,172) (9)
Gain from lease short close (14) (82)
Gain from lease - asset as a service (11) (145)
Gain on sale of property, plant and equipment (9) (1)
Operating profit before working capital changes 31,141 25,366
Changes in working capital
Increase in trade receivables & unbilled revenue (8,703) (337)
Increase in other receivables (1,020) (1,692)
Increase in trade & other payables 2,159 4,338
(Increase)/decrease in working capital (7,564) 2,309
Cash generated from operations 23,578 27,675
Income taxes paid (7,508) (5,882)
Net cash generated from operating activities 16,070 21,793
B. CASH FLOW FROM INVESTING ACTIVITIES
Purchase of fixed assets (7,552) (1,791)
Sale of fixed assets 34 47
Purchase of investments (net) (1,574) (14,611)
Investment in subsidiaries (451) (37)
Receipt on buyback by subsidiary (net of tax) 1,585 10
Loan (given to)/repaid by subsidiaries 9 (1,098)
Payment towards business acquisition (164) (34)
Realised income from current investments 1,076 982
Interest received 350 162
Net cash (used in) investing activities (6,687) (16,370)
Standalone Cash Flow Statementfor the year ended March 31, 2022

204 Integrated Annual Report 2021-22 205Standalone
Financial StatementsStatutory ReportsCorporate Overview | |
(H M
n)
Par
ticu
lars
Sh
are
app
licat
ion
m
on
ey o
n
pen
din
g
allo
tmen
t
Res
erve
s an
d S
urp
lus
Eff
ecti
ve
po
rtio
n o
f C
ash
Flo
w
Hed
ges
Oth
er it
ems
of
Oth
er
Co
mp
reh
ensi
ve
Inco
me
Tota
lC
apit
al
Res
erve
Sec
uri
ties
P
rem
ium
Gen
eral
R
eser
ve
Em
plo
yee
Sto
ck
op
tio
ns
ou
tsta
nd
ing
Def
erre
d
Em
plo
yee
Co
mp
ensa
tio
n
Exp
ense
Ret
ain
ed
Ear
nin
gs
Bal
ance
as
on
Ap
ril 1
, 20
20 -
(6
0) 2
,514
3
,469
1
,063
(3
79)
47,
564
(2,14
9) 9
2 5
2,11
4
Res
tate
men
t d
ue
to a
mal
gam
atio
n* -
-
-
-
-
-
1
0 -
(0
) 1
0
Res
tate
d B
alan
ce
as o
n A
pri
l 1, 2
020
-
(60)
2,5
14
3,4
69
1,0
63
(379
) 4
7,57
4
(2,1
49)
92
52,
124
Tota
l C
om
pre
hen
sive
In
com
e fo
r th
e ye
ar
-
-
-
-
-
-
-
4,3
49
37
4,3
86
Div
iden
ds
-
-
-
-
-
-
(5,3
24)
-
-
(5,3
24)
Tran
sfer
to
reta
ined
ea
rnin
gs
-
-
-
-
-
-
17,
884
-
-
17,
884
Emp
loye
e St
ock
C
om
pen
sati
on
Ex
pen
se
-
-
-
-
196
(1
96)
-
-
-
-
Oth
er c
han
ges
/ Tr
ansf
er t
o g
ener
al
rese
rve
-
-
348
2
(4
64)
287
-
-
-
1
73
Bal
ance
as
on
M
arch
31,
20
21 -
(6
0) 2
,862
3
,471
7
95
(288
) 6
0,1
34
2,2
00
1
29
69,
243
B
Oth
er E
qu
ity
Fo
r th
e ye
ar e
nd
ed M
arch
31,
20
21
As
per
our
rep
ort
att
ach
ed
For
B. K
. Kh
are
& C
o.
San
jay
Jalo
na
Nac
hik
et D
esh
pan
de
An
il R
and
erC
hart
ered
Acc
ount
ants
C
hief
Exe
cutiv
e O
ffic
er &
C
hief
Op
erat
ing
Off
icer
&
Chi
ef F
inan
cial
Off
icer
Firm
’s R
egis
trat
ion
No.
: 105
102W
M
anag
ing
Dire
ctor
W
hole
-tim
e D
irect
or
Mum
bai
(D
IN: 0
7256
786)
(D
IN: 0
8385
028)
M
umb
ai
Mum
bai
Pad
min
i Kh
are
Kai
cker
Tr
idib
Bar
atPa
rtne
r C
omp
any
Secr
etar
y &
Com
plia
nce
Off
icer
Mem
ber
ship
No:
044
784
Mum
bai
Mum
bai
Ap
ril 1
9, 2
022
(H M
n)
Par
ticu
lars
Sh
are
app
licat
ion
m
on
ey o
n
pen
din
g
allo
tmen
t
Res
erve
s an
d S
urp
lus
Eff
ecti
ve
po
rtio
n o
f C
ash
Flo
w
Hed
ges
Oth
er it
ems
of
Oth
er
Co
mp
reh
ensi
ve
Inco
me
Tota
lC
apit
al
Res
erve
Sec
uri
ties
P
rem
ium
Gen
eral
R
eser
ve
Em
plo
yee
Sto
ck
op
tio
ns
ou
tsta
nd
ing
Def
erre
d
Em
plo
yee
Co
mp
ensa
tio
n
Exp
ense
Ret
ain
ed
Ear
nin
gs
Bal
ance
as
on
A
pri
l 1, 2
021
-
(60)
2,8
62
3,4
71
795
(2
88)
60
,134
2
,20
0
129
6
9,24
3
Tota
l C
om
pre
hen
sive
In
com
e fo
r th
e ye
ar
-
-
-
-
-
-
-
618
2
5 6
43
Div
iden
ds
-
-
-
-
-
-
(8,7
49)
-
-
(8,7
49)
Tran
sfer
to
reta
ined
ea
rnin
gs
-
-
-
-
-
-
22,
609
-
-
22,
609
Emp
loye
e St
ock
C
om
pen
sati
on
Ex
pen
se
-
-
-
-
211
(2
11)
-
-
-
-
Oth
er c
han
ges
/ Tr
ansf
er t
o g
ener
al
rese
rve
0
-
286
-
(4
23)
245
-
-
-
1
08
Bal
ance
as
on
M
arch
31,
20
22 0
(6
0) 3
,14
8 3
,471
5
83
(254
) 7
3,99
4
2,8
18
154
8
3,85
4
(H M
n)
Bal
ance
as
on
Ap
ril 1
, 20
21C
han
ges
in e
qu
ity
shar
e ca
pit
al d
uri
ng
th
e ye
arB
alan
ce a
s o
n M
arch
31,
20
22
175
0
175
(H M
n)
Bal
ance
as
on
Ap
ril 1
, 20
20C
han
ges
in e
qu
ity
shar
e ca
pit
al d
uri
ng
th
e ye
arB
alan
ce a
s o
n M
arch
31,
20
21
174
1
175
Sta
nd
alo
ne
Sta
tem
ent
of
Ch
ang
es in
Eq
uit
y
Sta
nd
alo
ne
Sta
tem
ent
of
Ch
ang
es in
Eq
uit
y
A
Eq
uit
y S
har
e C
apit
al
For t
he
year
en
ded
Mar
ch 3
1, 2
022
B
Oth
er E
qu
ity
Fo
r th
e ye
ar e
nd
ed M
arch
31,
20
22
Fo
r th
e ye
ar e
nd
ed M
arch
31,
20
21
*R
efer
no
te 4
4

206 Integrated Annual Report 2021-22 207Standalone
Notes forming part of Standalone Financial Statements Notes forming part of Standalone Financial Statements
Financial StatementsStatutory ReportsCorporate Overview | |
Revenue from services performed on fixed-price basis is recognised using the input method as defined in Ind AS-115 - Revenue from Contracts with customers. The Company uses efforts or cost expended to measure progress towards completion as there is a direct relationship between input and productivity. If the company does not have a sufficient basis to measure the progress of completion or to estimate total contract revenues and costs, revenue is recognised only to the extent of contract cost incurred for which recoverability is probable.
When total cost estimates exceed revenue in arrangement, the estimated losses are recognised in the statement of profit and loss in the period in which such losses become probable based on the current contract estimates.
Revenue from sale of licenses / hardware, where the customer obtains a “right to use” the licenses / hardware is recognised at the point in time when the related license / hardware is made available to the customer. Revenue from licenses / hardware where the customer obtains a “right to access” is recognised over the access period. For allocating the transaction price to sale of licenses / hardware and related implementation and maintenance services, the Company measures the revenue in respect of each performance obligation of a contract as its relative standalone selling price. In case, where the licenses are required to be substantially customized as part of implementation service, the entire arrangement fee is considered as single performance obligation and revenue is recognised as per input method.
Contract modifications are accounted for when additions, deletions or changes are approved either to the contract scope or contract price. Contract modifications involving services added that are not distinct are accounted for on a cumulative catch up basis, while those that are distinct are accounted for prospectively as a separate contract.
‘Unbilled revenues’ (contract asset) represent revenue earned in excess of billings as at the end of the reporting period. Where right to consideration is unconditional upon passage of time is classified as a financial asset however, for fixed price development contracts, where milestone is not due as per contract terms as on date of reporting, the same is classified as non-financial asset.
‘Unearned & deferred revenue’ (contract liabilities) represent billing in excess of revenue recognised.
Deferred contract costs are costs to fulfil a contract which are recognised as assets and amortized over the term of the contract.
Use of significant judgements in revenue recognition:
The Company uses the percentage-of-completion method in accounting for its fixed-price contracts. Use of the percentage-of-completion method requires the Company to estimate efforts or costs expended to date as a proportion of the total efforts or costs to be expended. Efforts or costs expended have been used to measure progress towards completion as there is a direct relationship between input and productivity.
Further, the Company uses significant judgements while determining the transaction price to be allocated to performance obligations.
Provision for estimated losses, if any, on uncompleted contracts are recorded in the period in which such losses become probable based on the expected contract estimates at the reporting date.
e. Other income
Other income comprises primarily of interest income, dividend income, gain/loss on investment and foreign exchange gain/loss.
I) Interest income is recognised using effective interest method.
II) Dividend income is accounted in the period in which the right to receive the same is established.
f. Employee benefits
I) Short term employee benefits
All employee benefits falling due wholly within twelve months of rendering the service are classified as short-term employee benefits. The benefits like salaries, wages, and short term compensated absences and performance incentives are recognised in the period in which the employee renders the related service.
II) Post-employment benefits
i) Defined contribution plan:
The Company’s superannuation fund and state governed provident fund scheme are classified
1. Company overview
Larsen & Toubro Infotech Limited (‘the Company’) offers extensive range of IT services like application development, maintenance and outsourcing, enterprise solutions, infrastructure management services, testing, digital solutions and platform-based solutions to the clients in diverse industries.
The Company is a public limited company incorporated and domiciled in India and has its registered office at L&T House, Ballard Estate, Mumbai - 400 001, Maharashtra, India. The Company’s equity shares are listed on the National Stock Exchange of India Limited and BSE Limited in India.
2. Significant accounting policies
a. Basis of accounting and Statement of compliance
The financial statements have been prepared in accordance with Indian Accounting Standards (Ind AS), under the historical cost convention on accrual basis except for certain financial instruments which are measured at fair values, as prescribed under Section 133 of the Companies Act, 2013, read with Rule 3 of the Companies (Indian Accounting Standards) Rules, 2015 (as amended from time to time).
Accounting policies have been consistently applied except where a newly issued accounting standard is initially adopted or a revision to an existing accounting standard requires a change in the accounting policy hitherto in use.
Amounts in the financial statements are presented in Indian Rupees in millions [10 Lakhs = 1 Mn] as permitted by Schedule III to the Companies Act, 2013. Per share data are presented in Indian Rupees.
Preparation of financial statements in conformity with Indian Accounting Standards (Ind AS) requires the management of the Company to make estimates and assumptions that affect the income and expense reported for the period and assets, liabilities and disclosures reported as of the date of the financial statements. Examples of such estimates include useful lives of tangible and intangible assets, provision for doubtful debts, future obligations in respect of retirement benefit plans, etc. Actual results could vary from these
estimates. Estimates and underlying assumptions are reviewed on an ongoing basis. Revisions to accounting estimates are recognised in the period in which the estimates are revised, and by giving prospective impact in the standalone financial statements.
The Company has considered the possible effects that may result from Covid-19 on the recoverable values of its financial and non-financial assets. The impact of Covid-19 on the standalone financial statements may differ from that estimated as at the date of approval of these standalone financial statements.
b. Presentation of financial statements
The statement of financial position (including statement of changes in equity) and the statement of profit and loss are prepared and presented in the format prescribed in Division II of Schedule III to the Companies Act, 2013, as amended from time to time. The cash flow statement has been prepared and presented as per the requirements of Ind AS 7 “Cash Flow Statements”. The disclosure requirements with respect to items in the balance sheet and statement of profit and loss, as prescribed in Schedule III to the Act, are presented by way of notes forming part of financial statements along with the other notes required to be disclosed under the notified Accounting Standards.
c. Operating cycle for current and non-current classification
The Company identifies asset/liabilities as current if the same are receivable/payable within twelve months. else the same are considered as non-current.
d. Revenue from Contracts with Customers
Revenue is recognised upon transfer of control of promised products or services to customers. Revenue is measured based on the consideration specified in a contract with a customer, and is reduced for volume discounts, rebates, and other similar allowances. Revenue from contracts priced on time and material basis is recognised when services are rendered, and the related costs are incurred.
Revenue related to fixed price maintenance and support services contracts where the Company is ready to provide services is recognised based on time elapsed mode and revenue is straight lined over the period of performance.

208 Integrated Annual Report 2021-22 209Standalone
Notes forming part of Standalone Financial Statements Notes forming part of Standalone Financial Statements
Financial StatementsStatutory ReportsCorporate Overview | |
acquisition or construction of the asset and cost incurred for bringing the asset to its present location and condition.
i. Intangible assets
Assets like customer relationship, computer software, and internally developed software are stated at cost, less accumulated depreciation, amortisation and impairment.
j. Impairment
I) Impairment of trade receivables, unbilled receivables and lease receivables
The Company assesses at each date of statement of financial position whether a financial asset in form of trade receivables and unbilled receivables is impaired. In accordance with Ind AS 109, the Company applies Expected Credit Loss (ECL) model for measurement and recognition of impairment loss. As a practical expedient, the Company uses a provision matrix to determine impairment loss on portfolio of its trade receivables and unbilled receivables. The provision matrix is based on available external and internal credit risk factors such as credit default, credit rating from credit rating agencies and Company’s historically observed default rates over the expected life of trade receivables and unbilled receivables. ECL impairment loss allowance or reversal is recognised during the period as expense or income respectively in the statement of profit and loss.
II) Impairment of intangible assets
At the end of each reporting period, the Company reviews the carrying amounts of intangible assets to determine if there is any indication of loss suffered. If such indication exists, the recoverable amount of the asset is estimated to determine the extent of the impairment loss. Recoverable amount is the higher of the value in use or fair value less cost to sell. When it is not possible to estimate the recoverable amount of an individual asset, the Company estimates the recoverable amount of the cash-generating unit to which the asset belongs.
k. Leases
The Company as a lessee
The Company’s lease asset classes primarily consist of leases for buildings, furniture & fixtures and vehicles. The
Company assesses whether a contract contains a lease, at inception of a contract. A contract is, or contains, a lease if the contract conveys the right to control the use of an identified asset for a period of time in exchange for consideration. To assess whether a contract conveys the right to control the use of an identified asset, the company assesses whether: (1) the contract involves the use of an identified asset (2) the company has substantially all of the economic benefits from use of the asset throughout the period of the lease and (3) the company has the right to direct the use of the asset throughout the period of use.
At the date of commencement of the lease, the company recognizes a right-of-use asset (“ROU”) and a corresponding lease liability for all lease arrangements in which it is a lessee, except for leases with a term of twelve months or less (short-term leases) and low value leases. For these short-term and low value leases, the company recognizes the lease payments as an operating expense on a straight-line basis over the term of the lease.
Certain lease arrangements include the options to extend or terminate the lease before the end of the lease term. ROU assets and lease liabilities includes these options when it is reasonably certain that they will be exercised.
The right-of-use assets are initially recognized at cost, which comprises the initial amount of the lease liability adjusted for any lease payments made at or prior to the commencement date of the lease plus any initial direct costs less any lease incentives. They are subsequently measured at cost less accumulated depreciation and impairment losses.
Right-of-use assets are depreciated from the commencement date on a straight-line basis over the shorter of the lease term and useful life of the underlying asset. Right of use assets are evaluated for recoverability whenever events or changes in circumstances indicate that their carrying amounts may not be recoverable. For the purpose of impairment testing, the recoverable amount (i.e. the higher of the fair value less cost to sell and the value-in-use) is determined on an individual asset basis unless the asset does not generate cash flows that are largely independent of those from other assets. In such cases, the recoverable amount is determined for the Cash Generating Unit (CGU) to which the asset belongs.
The lease liability is initially measured at amortized cost at the present value of the future lease payments. The lease
as defined contribution plans. The contribution paid /payable under the schemes is recognised during the period in which the employee renders the related service.
ii) Defined benefit plans:
The provident fund scheme managed by trust, employee’s gratuity fund scheme managed by Life Insurance Corporation of India and post-retirement medical benefit scheme are the Company’s defined benefit plans. Wherever applicable, the present value of the obligation under such defined benefit plans is determined based on actuarial valuation using the Projected Unit Credit Method, which recognises each period of service as giving rise to additional unit of employee benefit entitlement and measures each unit separately to build up the final obligation.
The obligation is measured at the present value of the estimated future cash-flows. The discount rates used for determining the present value of the obligation under defined benefit plans is based on the market yields on government bonds as at the balance sheet date, having maturity periods approximating to the terms of related obligations. Actuarial gains and losses through re-measurement of the defined benefit liability/ (asset) are recognised in other comprehensive income. The actual return of portfolio of plan assets, in excess of yields computed by applying the discount rate used to measure the defined benefit obligation are recognised in other comprehensive income. The effect of any plan amendment is recognised in statement of profit and loss. Gains or losses on the curtailment or settlement of any defined benefit plan are recognised when the curtailment or settlement occurs. Past service cost resulting from a plan amendment or curtailment are recognised immediately in the statement of profit and loss.
Gains or losses on the curtailment or settlement of any defined benefit plan are recognised when the curtailment or settlement occurs. Past service cost resulting from a plan amendment or curtailment are recognised immediately in the statement of profit and loss.
iii) Long term employee benefits:
The obligation for long term employee benefits like long term compensation absences is recognised as determined by actuarial valuation performed by independent actuary at each balance sheet date using Projected Unit Credit Method on the additional amount expected to be paid/ availed as a result of unused entitlement that has accumulated at balance sheet date. Actuarial gains and losses are recognised immediately in statement of profit and loss.
iv) Social security plans
Employer’s contribution payable with respect to the social security plans, which are defined contribution plans, is charged to the statement of profit and loss in the period in which employee renders the services.
The Code on Social Security, 2020 has been enacted by the Indian Parliament, which would impact the contributions by the Company towards Provident Fund and Gratuity. The effective date from which the changes will be applicable and the corresponding Rules, are yet to be notified. The Company will complete its evaluation and will give appropriate impact in the period in which, the Code and the corresponding Rules become effective.
g. Government grants
The Company recognizes government grants only when there is reasonable assurance that the conditions attached to them will be complied with, and the grants will be received. Government grants related to assets are treated as deferred income and are recognized in the net profit in the Statement of Profit and Loss on a systematic and rational basis over the useful life of the asset. Government grants related to revenue are recognized on a systematic basis in the net profit in the Statement of Profit and Loss over the periods necessary to match them with the related costs which they are intended to compensate.
h. Property, plant and equipment
Property plant and equipment are stated at cost less accumulated depreciation and impairment losses if any. Cost includes expenditure directly attributable to the

210 Integrated Annual Report 2021-22 211Standalone
Notes forming part of Standalone Financial Statements Notes forming part of Standalone Financial Statements
Financial StatementsStatutory ReportsCorporate Overview | |
denominated in foreign currency are reported using the exchange rate at the date of the transaction.
p. Financial Instruments
Financial assets and liabilities are recognised when the Company becomes a party to the contractual provisions of the instrument.
I) Initial measurement
Financial assets and liabilities are initially measured at fair value, which are measured at transaction price. Transaction costs that are directly attributable to the acquisition or issue of financial assets and financial liabilities (other than financial assets and financial liabilities at fair value through profit or loss) are added to or deducted from the fair value measured on initial recognition of financial asset or financial liability.
II) Subsequent classification and measurement
i) Non-derivative financial assets
A) Financial assets at amortised cost
Financial assets are subsequently measured at amortised cost if:
a) the financial asset is held within a business model whose objective is to hold financial assets in order to collect contractual cash flows and
b) the contractual terms of financial assets give rise on specified dates that are solely payments of principal and interest on the principal amount outstanding.
Financial assets at amortised cost are subsequently measured using effective interest method
B) Financial assets at fair value through other comprehensive income (FVTOCI)
Financial assets are subsequently measured at fair value through other comprehensive income if the financial asset is held within a business model whose objective is achieved by both collecting contractual cash flows on specified dates that are solely payments of principal and interest on the principal amount outstanding and selling the financial asset
C) Financial assets at fair value through profit and loss (FVTPL)
Financial assets are measured at fair value through profit or loss unless they are measured at amortised cost or at fair value through other comprehensive income on initial recognition. The transaction costs directly attributable to the acquisition of financial assets and liabilities at fair value through profit or loss are immediately recognised in statement of profit and loss.
ii) Non-derivative financial liability
Financial liabilities are initially recognised at fair value, and subsequently carried at amortized cost using the effective interest method except for contingent consideration recognised in a business combination which is subsequently measured at fair value through profit and loss.
iii) Investment in subsidiaries
Investment in Subsidiaries is carried at cost less impairment, if any in the Standalone Financial Statements.
iv) Derivative financial instrument
The Company holds derivative financial instrument such as foreign exchange forward contracts and options contracts including a combination of purchased and written options to mitigate the risk of changes in exchange rates on foreign currency exposures and forecast transactions.
The Company uses hedging instruments that are governed by the risk management policy which is approved by the board of directors. The policy provides written principles on the use of such derivative financial instruments. The Company designates such instruments as hedges and performs assessment of hedge effectiveness based on consideration of terms of the hedging instrument, the economic relationship between the hedging instrument and hedged item and the objective of the hedging.
A) Cash flow hedges
The Company designates certain foreign exchange forward and option contracts as cash flow hedges to mitigate the risk of foreign exchange exposure on highly probable forecast transactions.
payments are discounted using the interest rate implicit in the lease or, if not readily determinable, using the incremental borrowing rates in the country of domicile of the leases. Lease liabilities are remeasured with a corresponding adjustment to the related right of use asset if the company changes its assessment if whether it will exercise an extension or a termination option.
Lease liability and ROU asset have been separately presented in the Balance Sheet and lease payments have been classified as financing cash flows.
The Company as a lessor
Leases for which the Company is a lessor is classified as a finance or operating lease. Whenever the terms of the lease transfer substantially all the risks and rewards of ownership to the lessee, the contract is classified as a finance lease. All other leases are classified as operating leases.
When the Company is an intermediate lessor, it accounts for its interests in the head lease and the sub-lease separately. The sublease is classified as a finance or operating lease by reference to the right-of-use asset arising from the head lease.
For operating leases, rental income is recognized on a straight-line basis over the term of the relevant lease.
For Finance leases, initially asset held under finance lease is recognised in balance sheet and presented as a receivable at an amount equal to the net investment in the lease. Finance income is recognised over the lease term, based on a pattern reflecting a constant periodic rate of return on Company’s net investment in the lease.
l. Depreciation
I) Tangible assets
Depreciation on assets have been provided on straight line basis as mentioned in below table except for the leasehold improvements which is depreciated over the lease period or life of asset, whichever is lower. Depreciation or amortization on additions and disposals are calculated on pro-rata basis from and to the month of additions and disposals.
Particulars Useful lifeBuildings Upto 60 yearsComputers and IT peripherals
Upto 6 years
Particulars Useful lifePlant and machinery Upto 15 yearsOffice equipment Upto 5 yearsVehicles Upto 8 yearsFurniture and fixtures Upto 10 years
II) Intangible assets and amortization
The estimated useful life of an intangible asset is based on number of factors including the effects of obsolescence, demand, competition and other economic factors and the level of maintenance expenditures required to obtain the expected future cash flows from the asset. The basis of amortization of intangible assets on straight line basis is as follows:
Particulars Useful lifeComputer software Upto 5 years
m. Share based payments
In respect of stock options granted pursuant to the Company’s stock options scheme, the excess of fair value of the share over the exercise price of the option is treated as discount and accounted as employee compensation cost over the vesting period. The amount recognised as expense each year is arrived at based on the number of grants expected to vest. If options granted lapse after the vesting period, the cumulative discount recognised as expense in respect of such options is transferred to the general reserve. If options granted lapse before the vesting period, the cumulative discount recognised as expense in respect of such options is transferred to the profit and loss.
n. Functional and presentation currency
The functional and presentation currency of the Company is the Indian Rupee as it is the currency of the primary economic environment in which the Company operates.
o. Foreign currency transactions and balances
Foreign currency transactions are initially recorded at the rates prevailing on the date of the transaction. At the balance sheet date, foreign currency monetary items are reported using the closing rate. Exchange gains and losses arising on settlement and restatement are recognised in the Statement of profit and loss. Non-monetary items which are carried at historical cost

212 Integrated Annual Report 2021-22 213Standalone
Notes forming part of Standalone Financial Statements Notes forming part of Standalone Financial Statements
Financial StatementsStatutory ReportsCorporate Overview | |
s. Provisions, contingent liabilities, and contingent assets
Provisions are recognised for liabilities that can be measured only by using a substantial degree of estimation, if
I) the Company has a present obligation as a result of a past event;
II) a probable outflow of resources is expected to settle the obligation; and
III) the amount of the obligation can be reliably estimated
Provision is measured using the cash flows estimated to settle the present obligation and when the effect of time value of money is material, the carrying amount of the provision is the present value of those cash flow. Reimbursement expected in respect of expenditure required to settle a provision is recognised only when it is virtually certain that the reimbursement will be received.
Contingent liability is disclosed in case of,
I) a present obligation arising from a past event when it is not probable that an outflow of resources will be required to settle the obligation; or
II) a possible obligation unless the probability of outflow of resources is remote.
Contingent assets are neither recognised nor disclosed.
Provisions, contingent liabilities, and contingent assets are reviewed at each balance sheet date.
t. Earnings per share
Basic earnings per share is computed by dividing the net profit after tax by the weighted average number of equity shares outstanding during the period, adjusted for bonus elements in equity shares, if any, issued during the period.
Diluted EPS is computed by dividing the net profit after tax by the weighted average number of equity shares considered for deriving basic EPS and also weighted average number of equity shares that could have been issued upon conversion of all dilutive potential equity shares. Dilutive potential equity shares are deemed converted as of the beginning of the period, unless issued at a later date. Dilutive potential equity shares are determined independently for each period presented.
u. Cash flow statement
Cash flow statement is prepared segregating the cash flows from operating, investing and financing activities. Cash flow is reported using indirect method as per the requirements of Ind AS 7 (“Cash flow statements”), whereby profit for the year is adjusted for the effects of transactions of a non cash nature, any deferrals or accruals of past or future operating cash receipts or payments and item of income or expenses associated with investing or financing cash flows.
v. Business Combination
Business combinations other than the common control transactions are accounted for using the purchase (acquisition) method. The cost of an acquisition is measured as the fair value of the assets given, equity instruments issued and liabilities incurred or assumed at the date of exchange. The cost of acquisition also includes the fair value of any contingent consideration. Identifiable assets acquired and liabilities and contingent liabilities assumed in a business combination are measured initially at their fair value on the date of acquisition.
Business combinations through common control transactions are accounted on a pooling of interest method in accordance with Appendix C to Ind AS 103.
Transaction costs incurred in connection with a business acquisition are expensed as incurred.
w. Recent accounting pronouncement
Ministry of Corporate Affairs (“MCA”) notifies new standard or amendments to the existing standards under Companies (Indian Accounting Standards) Rules as issued from time to time. On March 23, 2022, MCA amended the Companies (Indian Accounting Standards) Amendment Rules, 2022, applicable from April 1, 2022, as below:
Ind AS 103 – Reference to Conceptual Framework
The amendments specify that to qualify for recognition as part of applying the acquisition method, the identifiable assets acquired and liabilities assumed must meet the definitions of assets and liabilities in the Conceptual Framework for Financial Reporting under Indian Accounting Standards (Conceptual Framework) issued by the Institute of Chartered Accountants of India at the acquisition date. These changes do not
When a derivative is designated as a Cash flow hedge instrument, the effective portion of changes in fair value of the derivative is recognised in other comprehensive income and presented within equity as hedging reserve. Any ineffective portion of changes in the fair value of the derivative is recognized immediately in the Statement of Profit and Loss. If the hedging instrument no longer meets the criteria for hedge accounting, then hedge accounting is discontinued prospectively. If the hedging instrument expires or is sold, terminated or exercised, the cumulative gain or loss on the hedging instrument recognized in Cash flow hedge reserve is transferred to the Statement of Profit and Loss upon the occurrence of related forecasted transaction.
B) Fair value hedges
Changes in the fair value of the derivative instruments designated as fair value hedges are recognised in statement of profit and loss.
III) Derecognition
The Company derecognises a financial asset when the contractual rights to the cash flows from the financial assets expire or it transfers the financial asset and the transfer qualifies for derecognition under Ind AS 109. A financial liability is derecognised from the Company’s balance sheet where the obligation specified in the contract is discharged or cancelled or expired.
IV) Offsetting
Financial assets and financial liabilities are offset and the net amounts are presented in the balance sheet when, and only when, the Company currently has a legally enforceable right to set off the amounts and it intends either to settle them on a net basis or to realise the asset and settle the liability simultaneously.
q. Taxes on income
Income tax expense comprises current and deferred income tax. Tax on income for the current period is determined on the basis of taxable income and tax credits computed in accordance with the provisions
of the Indian Income tax Act, 1961. Foreign branches recognise current tax /deferred tax liabilities and assets in accordance with the applicable local laws.
Income tax and deferred tax expense is recognised in the statement of profit and loss except to the extent that it relates to items recognised directly in other comprehensive income, in which case income tax expense is recognised in other comprehensive income. Current income tax for current and prior periods is recognised at the amount expected to be paid to or recovered from the tax authorities.
The Company offsets current tax assets and current tax liabilities, where it has a legally enforceable right to set off the recognised amounts and where it intends either to settle on a net basis, or to realize the asset and settle the liability simultaneously. Deferred income tax assets and liabilities are recognised for all temporary differences arising between the tax bases of assets and liabilities and their carrying amounts in the financial statements except when the deferred income tax arises from the initial recognition of goodwill or an asset or liability in a transaction that is not a business combination and affects neither accounting nor taxable profit or loss at the time of the transaction. Other deferred tax assets are recognised and carried forward to the extent that there is a reasonable certainty that sufficient future taxable income will be available against which such deferred tax assets can be realized. Deferred tax assets are reviewed at each reporting date and are reduced to the extent that it is no longer probable that the related tax benefit will be realized.
Deferred income tax assets and liabilities are measured using tax rates and tax laws that have been enacted or substantively enacted as on the balance sheet date and are expected to apply to taxable income in the years in which those temporary differences are expected to be recovered or settled. Deferred income taxes are not provided on the undistributed earnings of branches where it is expected that the earnings of the branch will not be distributed in the foreseeable future.
r. Borrowing costs
Borrowing costs include finance costs, commitment charges, interest expense on lease liabilities and exchange differences arising from foreign currency borrowing to the extent they are regarded as an adjustment to finance costs.

214 Integrated Annual Report 2021-22 215Standalone
Financial StatementsStatutory ReportsCorporate Overview | |
214 Integrated Annual Report 2021-22 215Standalone
Notes forming part of Standalone Financial Statements
significantly change the requirements of Ind AS 103. The Company does not expect the amendment to have any significant impact in its financial statements.
Ind AS 16 – Proceeds before intended use
The amendments mainly prohibit an entity from deducting from the cost of property, plant and equipment amounts received from selling items produced while the company is preparing the asset for its intended use. Instead, an entity will recognise such sales proceeds and related cost in profit or loss. The Company does not expect the amendments to have any impact in its recognition of its property, plant and equipment in its financial statements.
Ind AS 37 – Onerous Contracts - Costs of Fulfilling a Contract
The amendments specify that that the ‘cost of fulfilling’ a contract comprises the ‘costs that relate directly to the contract’. Costs that relate directly to a contract can
either be incremental costs of fulfilling that contract (examples would be direct labour, materials) or an allocation of other costs that relate directly to fulfilling contracts. The amendment is essentially a clarification, and the Company does not expect the amendment to have any significant impact in its financial statements.
Ind AS 109 – Annual Improvements to Ind AS (2021)
The amendment clarifies which fees an entity includes when it applies the ‘10 percent’ test of Ind AS 109 in assessing whether to derecognise a financial liability. The Company does not expect the amendment to have any significant impact in its financial statements.
The amendments remove the illustration of the reimbursement of leasehold improvements by the lessor in order to resolve any potential confusion regarding the treatment of lease incentives that might arise because of how lease incentives were described in that illustration. The Company does not expect the amendment to have any significant impact in its financial statements.
(H Mn)
Class of Assets As at March 31, 2022 As at March 31, 2021Useful life Carrying amount Useful life Carrying amount
Internally developed Software Upto 5 Years 835 Upto 5 Years 447Total 835 447
3. Intangible Assets
The balance useful life of internally developed intangible asset as on the respective balance sheet dates is as follows:
4A
. Pro
per
ty, P
lan
t an
d E
qu
ipm
ent
and
Inta
ng
ible
Ass
ets
- as
of
Mar
ch 3
1, 2
022
(H M
n)
Par
ticu
lars
Gro
ss B
lock
D
epre
ciat
ion
/Am
ort
isat
ion
Net
Blo
ck
As
at
31-0
3-20
22A
s at
0
1-0
4-2
021
Ad
dit
ion
s D
edu
ctio
ns
As
at
31-0
3-20
22A
s at
0
1-0
4-2
021
Fo
r th
e ye
ar
On
d
edu
ctio
ns
As
at
31-0
3-20
22
Tan
gib
le a
sset
s Le
aseh
old
lan
d 1
0 -
-
1
0 1
0
-
1
9
Bui
ldin
gs
126
-
1
26
-
126
-
1
26
-
-
Leas
eho
ld im
pro
vem
ents
926
1
18
57
987
3
89
141
4
5 4
85
502
P
lan
t an
d m
ach
iner
y 1
,179
209
6
0 1
,328
5
21
130
5
8 5
93
735
O
wn
ed c
om
put
ers
3,2
88
1,8
62
104
5
,046
1
,847
7
11
89
2,4
69
2,5
77
Off
ice
equi
pm
ents
996
8
6 1
8 1
,064
6
68
122
1
7 7
73
291
Fu
rnit
ure
and
fix
ture
s 1
,121
65
79
1,10
7 5
47
109
5
8 5
98
509
V
ehic
les
283
1
7 5
9 2
41
159
3
0 4
2 1
47
94
Cap
ital
wo
rk in
pro
gre
ss -
-
-
-
-
-
-
-
4
,374
To
tal t
ang
ible
ass
ets
7,9
29
2,3
57
50
3 9
,783
4
,258
1
,24
3 4
35
5,0
66
9,0
91
Inta
ng
ible
ass
ets
Soft
war
e 3
,173
822
1
,063
2
,932
2
,479
4
62
1,0
61
1,8
80
1,0
52
Inta
ng
ible
ass
ets
und
er
dev
elo
pm
ent
-
-
-
-
-
-
-
-
130
Tota
l in
tan
gib
le a
sset
s 3
,173
8
22
1,0
63
2,9
32
2,4
79
462
1
,061
1
,880
1
,182
A
s o
n t
he
dat
e o
f bal
ance
sh
eet,
ther
e ar
e n
o c
apit
al w
ork
-in
-pro
gre
ss p
roje
cts
wh
ose
co
mp
leti
on
is o
verd
ue o
r has
exc
eed
ed t
he
cost
, bas
ed o
n a
pp
rove
d p
lan
.
C
WIP
ag
ein
g s
ched
ule
as
at M
arch
31,
20
22
In
tan
gib
le a
sset
s u
nd
er d
evel
op
men
t ag
ein
g s
ched
ule
as
at M
arch
31,
20
22
(H M
n)
Par
ticu
lars
Am
ou
nt
in C
WIP
fo
r a
per
iod
of
To
tal
Les
s th
an 1
yea
r 1
- 2
yea
rs
2 -
3 y
ears
M
ore
th
an 3
yea
rs
Pro
ject
s in
Pro
gre
ss 3
,980
4
9 3
45
-
4,3
74
3,9
80
49
34
5 -
4
,374
(H M
n)
Par
ticu
lars
Am
ou
nt
in C
WIP
fo
r a
per
iod
of
To
tal
Les
s th
an 1
yea
r 1
- 2
yea
rs
2 -
3 y
ears
M
ore
th
an 3
yea
rs
Pro
ject
s in
Pro
gre
ss 1
25
5
-
-
130
1
25
5
-
-
130
No
tes
form
ing
par
t o
f S
tan
dal
on
e Fi
nan
cial
Sta
tem
ents

216 Integrated Annual Report 2021-22 217Standalone
Notes forming part of Standalone Financial Statements
Financial StatementsStatutory ReportsCorporate Overview | |
216 Integrated Annual Report 2021-22 217Standalone
5 Non-Current Investments(H Mn)
Particulars As at
31-03-2022 As at
31-03-2021
Long term investment in subsidiaries: Equity Shares (Unquoted) : 5 fully paid equity shares of EUR 25,000 each in Larsen & Toubro Infotech
GmbH 3,404 3,404
100 fully paid equity shares of CAD 1 each in Larsen & Toubro Infotech Canada Limited
7 7
400,000 (previous year 600,000) equity shares at no par value in L&T Infotech Financial Services Technologies Inc1
1,126 1,686
254,750 equity shares at no par value in Larsen And Toubro Infotech South Africa (Pty) Ltd
2 2
175,000 fully paid equity shares of USD 1 each in L&T Information Technology Services (Shanghai) Co. Ltd.
11 11
50,000 fully paid equity shares of EUR 1 each in L&T Information Technology Spain, SL
4 4
30,000 fully paid shares of NOK 1 each in Larsen & Toubro Infotech Norge AS
0 0
1,145,421 fully paid equity shares of H10 each in Lymbyc Solutions Private Limited
324 324
17,328 fully paid equity shares of H10 each in Powerupcloud Technologies Private Limited
1,056 1,056
1,000 fully paid equity shares of GBP 1 each in Larsen & Toubro Infotech UK Limited
0 0
1,860 shares of AED 1,000 each in Larsen & Toubro Infotech Middle East FZ-LLC
37 37
10,000 fully paid equity shares of H10 each in Cuelogic Technologies Private Limited2
639 -
Other: Membership interest of MXN 2,970 in L&T Infotech, S. DE R.L. DE C.V. 0 0 Other equity investments (Unquoted) : 2,500 equity shares of USD 1 each in Larsen & Toubro LLC 1 1 Non trade investments (Unquoted) : Treasury Notes Philippines Govt.3 2 2 Corporate deposits 1,420 - Non trade investments (Quoted) : Corporate bonds 2,029 1,009
10,062 7,542 Other Disclosures : (i) Aggregate amount of quoted investments 2,029 1,009 Market Value of quoted investments 1,973 1,010 (ii) Aggregate amount of unquoted investments 8,033 6,533
1. On June 14, 2021, L&T Infotech Financial Services Technologies Inc. (“LTIFST”) bought back 33.33% of its total equity capital (i.e. 200,000 shares) from its Shareholder (the Company) for a consideration of H1,732 Mn against cost of H560 Mn.
2. The Company acquired “Cuelogic Technologies Private Limited” on July 1, 2021 (refer note 45).
3. The Company has invested in Philippines Govt. Treasury notes and have deposited same with local Securities and Exchange Commission, as per Corporation Code of Philippines-126. The company has not held this investment primarily for the purpose of being traded and does not intend to sale or consume for normal business operation. The company intends to keep the deposit till the existence of its operations in Philippines.N
ote
s fo
rmin
g p
art
of
Sta
nd
alo
ne
Fin
anci
al S
tate
men
ts
4B
. Pro
per
ty, P
lan
t an
d E
qu
ipm
ent
and
Inta
ng
ible
Ass
ets
- A
s o
f M
arch
31,
20
21(H
Mn)
Par
ticu
lars
Gro
ss B
lock
D
epre
ciat
ion
/Am
ort
isat
ion
Net
Blo
ck
As
at
31-0
3-20
21A
s at
0
1-0
4-2
020
Pu
rsu
ant
to
amal
gam
atio
n*
Ad
dit
ion
s D
edu
ctio
ns
As
at
31-0
3-20
21A
s at
0
1-0
4-2
020
Pu
rsu
ant
to
amal
gam
atio
n*
Fo
r th
e ye
ar
On
d
edu
ctio
ns
As
at
31-0
3-20
21
Tan
gib
le a
sset
s Le
aseh
old
lan
d 1
0 -
-
-
1
0 1
-
0
-
1
9
Bui
ldin
gs
126
-
-
0
1
26
41 -
8
5 -
1
26
-
Leas
eho
ld
imp
rove
men
ts 8
69
2
58
3
926
25
11
138
1
3
89
537
Pla
nt
and
mac
hin
ery
1,14
1 2
6
3 2
7 1
,179
398
1 1
41
19
521
6
58
Ow
ned
co
mp
uter
s 2
,398
1
6 8
94
20
3,2
88
1291
10 5
60
14
1,8
47
1,4
41
Off
ice
equi
pm
ents
929
1
7
4 8
9
96
542
0 1
33
7
668
3
28
Furn
itur
e an
d f
ixtu
res
1,12
8 2
3
0 3
9 1
,121
431
1 1
44
29
547
5
74
Veh
icle
s 3
07
-
9
33
283
14
4 -
3
5 2
0 1
59
124
C
apit
al w
ork
in
pro
gre
ss -
-
-
-
-
-
-
-
-
-
4
03
Tota
l tan
gib
le a
sset
s 6
,90
8 2
3 1
,128
1
30
7,9
29
3,0
99
13
1,2
36
90
4
,258
4
,074
In
tan
gib
le a
sset
sSo
ftw
are
2,8
20
2
600
2
49
3,17
3 2
,466
2
2
56
245
2
,479
6
94
Inta
ng
ible
ass
ets
und
er
dev
elo
pm
ent
-
-
-
-
-
-
-
-
-
-
27
Tota
l in
tan
gib
le a
sset
s 2
,820
2
6
00
2
49
3,1
73
2,4
66
2
256
2
45
2,4
79
721
*R
efer
no
te 4
4
A
s o
n t
he
dat
e o
f bal
ance
sh
eet,
ther
e ar
e n
o c
apit
al w
ork
-in
-pro
gre
ss p
roje
cts
wh
ose
co
mp
leti
on
is o
verd
ue o
r has
exc
eed
ed t
he
cost
, bas
ed o
n a
pp
rove
d p
lan
.
C
WIP
ag
ein
g s
ched
ule
as
at M
arch
31,
20
21
In
tan
gib
le a
sset
s u
nd
er d
evel
op
men
t ag
ein
g s
ched
ule
as
at M
arch
31,
20
21
(H M
n)
Par
ticu
lars
Am
ou
nt
in C
WIP
fo
r a
per
iod
of
To
tal
Les
s th
an 1
yea
r 1
- 2
yea
rs
2 -
3 y
ears
M
ore
th
an 3
yea
rs
Pro
ject
s in
Pro
gre
ss 5
8 3
45
-
-
403
5
8 3
45
-
-
40
3
(H M
n)
Par
ticu
lars
Am
ou
nt
in C
WIP
fo
r a
per
iod
of
To
tal
Les
s th
an 1
yea
r 1
- 2
yea
rs
2 -
3 y
ears
M
ore
th
an 3
yea
rs
Pro
ject
s in
Pro
gre
ss 2
7 -
-
-
2
7 2
7 -
-
-
2
7

218 Integrated Annual Report 2021-22 219Standalone
Notes forming part of Standalone Financial Statements Notes forming part of Standalone Financial Statements
Financial StatementsStatutory ReportsCorporate Overview | |
9 Other Non Current Assets
10 Current Investments
(H Mn)
Particulars As at
31-03-2022 As at
31-03-2021
Deferred contract costs 348 576 Advance recoverable other than cash 1,061 546 Prepaid expenses 123 198 Capital advances 300 -
1,832 1,320
(H Mn)
Particulars As at
31-03-2022 As at
31-03-2021
Mutual funds - Quoted 26,008 32,720 Corporate deposits - Unquoted 2,800 3,020 Corporate bonds - Quoted 2,064 542 Commercial Paper - Quoted 494 -
31,366 36,282
8 Deferred Tax Assets (Contd..)
8 (II) Deferred tax liabilities/assets as at March 31, 2021 (H Mn)
Particulars
Deferred tax asset/(liability)
as at March 31, 2020
Current year (charge)/credit to Profit & Loss
(Charge)/credit to Other
Comprehensive Income
Deferred Tax asset/(liability)
as at March 31, 2021
Deferred tax assets/(liabilities)Deferred taxes on derivative instruments
848 (16) (1,463) (631)
Branch profit tax (683) - - (683)Unrealised (gains) / losses on investments
(142) (132) - (274)
Provision for doubtful debts & advances 156 (28) - 128 Provision for employee benefits 426 317 - 744 Depreciation / amortisation 421 100 - 521 Capital loss on buyback by L&T Infotech Financial Services Technologies Inc.
13 (13) - -
Lease assets net of lease liabilities 284 48 - 332 Others 322 20 - 342 MAT credit 493 (493) - - Net deferred tax assets/(liabilities) 2,139 (197) (1,463) 479
Other Disclosures : (i) Aggregate amount of quoted investments 28,566 33,262 Market Value of quoted investments 28,541 33,261 (ii) Aggregate amount of unquoted investments 2,800 3,020
6 Non Current Loans
7 Other Non Current Financial Assets
8 Deferred Tax Assets
8 (I) Deferred tax liabilities/assets as at March 31, 2022
(H Mn)
Particulars As at
31-03-2022 As at
31-03-2021
Advance to subsidiary* (refer note 43)Unsecured, considered good 1,145 1,115
1,145 1,115
(H Mn)
Particulars As at
31-03-2022 As at
31-03-2021
Derivative contracts receivables 1,922 1,440 Security deposits# 535 451 Bank deposits with more than 12 months maturity 318 - Lease receivables 77 155 Interest accrued but not due 15 -
2,867 2,046
(H Mn)
Particulars As at
31-03-2022 As at
31-03-2021
Deferred tax asset / (liability) 472 479 472 479
(H Mn)
Particulars
Deferred tax asset/(liability)
as at March 31, 2021
Current year (charge)/credit to Profit & Loss
(Charge)/credit to Other
Comprehensive Income
Deferred Tax asset/(liability)
as at March 31, 2022
Deferred tax assets/ (liabilities)Deferred taxes on derivative instruments
(631) (104) (208) (943)
Branch profit tax (683) 108 - (575)Unrealised (gains) / losses on investments
(274) (0) - (274)
Provision for doubtful debts & advances 128 81 - 209 Provision for employee benefits 744 180 - 924 Depreciation / amortisation 521 118 - 639 Lease liabilities net of lease assets 332 (28) - 304 Others 342 (154) - 188 Net deferred tax assets/ (liabilities) 479 201 (208) 472
* Advance given to wholly owned subsidiary “Larsen & Toubro Infotech Middle East FZ-LLC” for its business and operations.
# Security deposits have been reclassified from loans to other financial assets.

220 Integrated Annual Report 2021-22 221Standalone
Notes forming part of Standalone Financial Statements Notes forming part of Standalone Financial Statements
Financial StatementsStatutory ReportsCorporate Overview | |
12 Unbilled Revenue
11 Trade Receivables (Contd..)Trade Receivables ageing schedule as at March 31, 2021
(H Mn)
Particulars As at
31-03-2022 As at
31-03-2021
Unbilled revenue* 8,113 5,299 8,113 5,299
(H Mn)
Particulars Outstanding for following periods from due date of payment
Total Not Due
Less than 6 months
6 months - 1 year
1 - 2 years
2 - 3 years
More than 3 years
(i) Undisputed Trade receivables — considered good
18,386 1,922 672 266 86 121 21,453
(ii) Undisputed Trade Receivables — which have significant increase in credit risk
- - - - - - -
(iii) Undisputed Trade Receivables — credit impaired
- - - - - - -
(iv) Disputed Trade Receivables — considered good
- - - - - - -
(v) Disputed Trade Receivables — which have significant increase in credit risk
- - - - - 24 24
(vi) Disputed Trade Receivables — credit impaired
- - - - - - -
18,386 1,922 672 266 86 145 21,477 Less: Loss allowance - - - - - - (642)
20,835
* Classified as financial asset as the contractual right to consideration is unconditional upon passage of time.
13 Cash and Cash Equivalent (H Mn)
Particulars As at
31-03-2022 As at
31-03-2021
Cash on hand 0 0Balances with bank- in current accounts Overseas 1,877 2,044 Domestic 457 1,242 Remittance in transit 463 713 Cash and bank balance not available for immediate use 27 17 Earmarked balances with banks (unclaimed dividend) 12 9
2,836 4,025
11 Trade Receivables
Allowance for doubtful trade receivables movement
Trade Receivables ageing schedule as at March 31, 2022
(H Mn)
Particulars As at
31-03-2022 As at
31-03-2021
Due from related parties (refer note 43) 2,302 2,143 Due from others 24,391 18,637 Less : Allowance for doubtful trade receivables (656) (537)Unsecured, considered good 26,037 20,243
(H Mn)
Particulars As at
31-03-2022 As at
31-03-2021
Balance at the beginning of the year 537 545 Additions during the year, net 182 115 Uncollectable receivables charged against allowances (refer note 30) (70) (130)Exchange (gain)/loss 7 7 Balance at the end of the year 656 537
(H Mn)
Particulars Outstanding for following periods from due date of payment
Total Not Due
Less than 6 months
6 months - 1 year
1 - 2 years
2 - 3 years
More than 3 years
(i) Undisputed Trade receivables — considered good
18,242 6,549 1,205 244 112 317 26,669
(ii) Undisputed Trade Receivables — which have significant increase in credit risk
- - - - - - -
(iii) Undisputed Trade Receivables — credit impaired
- - - - - - -
(iv) Disputed Trade Receivables — considered good
- - - - - - -
(v) Disputed Trade Receivables — which have significant increase in credit risk
- - - - - 24 24
(vi) Disputed Trade Receivables — credit impaired
- - - - - - -
18,242 6,549 1,205 244 112 341 26,693 Less: Loss allowance - - - - - - (656)
26,037

222 Integrated Annual Report 2021-22 223Standalone
Notes forming part of Standalone Financial Statements Notes forming part of Standalone Financial Statements
Financial StatementsStatutory ReportsCorporate Overview | |
18 Share CapitalI) Share capital authorised, issued, subscribed and paid up:
(H Mn)
Particulars As at
31-03-2022 As at
31-03-2021
Authorised :274,500,000 equity shares of H1 each 275 260 (Previous year 260,000,000 of H1 each)
275 260 Issued, paid up and subscribed175,270,156 equity shares for H1 each 175 175 (Previous year 174,750,608 of H1 each)
175 175
Name of Shareholder Number of
Shares Shareholding %
% Change during the year
As at 31-03-2022Larsen & Toubro Limited (Promoter) 129,784,034 74.05% 0.22%
As at 31-03-2021 Larsen & Toubro Limited (Promoter) 129,784,034 74.27% 0.24%
II) Terms/rights attached to equity shares
The Company has only one class of equity shares having a par value of H1 per share. Each holder of equity shares is entitled to one vote per share. The Company declares and pays dividend in Indian rupees.
III) Shareholders holding more than 5% of equity shares as at the end of the year:
IV) Reconciliation of the number of equity shares and share capital:
Due to allotment of shares on exercise of stock options by employees, there was a movement in share capital for the year ended March 31, 2022 and March 31, 2021 as given below:
Particulars As at
31-03-2022 As at
31-03-2021
Issued, subscribed and fully paid up equity shares outstanding at the beginning
174,750,608 174,126,769
Add: Shares issued on exercise of employee stock options 519,548 623,839Issued, subscribed and fully paid up equity shares 175,270,156 174,750,608
16 Other Current Financial Assets
17 Other Current Assets
15 Current Loans
14 Other Bank Balances
(H Mn)
Particulars As at
31-03-2022 As at
31-03-2021
Advances to employees 290 165 Derivative contracts receivables 1,944 1,497 Security deposits# 188 249 Lease receivable 102 86 Interest accrued but not due 230 63 Others 18 31
2,772 2,091
(H Mn)
Particulars As at
31-03-2022 As at
31-03-2021
Unbilled revenue* 5,448 5,118 Prepaid expenses 2,073 1,371 Advances recoverable other than in cash 604 862 Deferred contract costs 350 471
8,475 7,822
(H Mn)
Particulars As at
31-03-2022 As at
31-03-2021
Advance to subsidiary* (refer note 43)Unsecured, considered good 29 39
29 39
(H Mn)
Particulars As at
31-03-2022 As at
31-03-2021
Bank deposits 3,763 - 3,763 -
* Loans to subsidiaries (Lymbyc Solutions Private Limited and Powerupcloud Technologies Private Limited) towards their working capital requirements.
#Security deposits have been reclassified from loans to other financial assets.
*Classified as non financial asset as the contractual right to consideration is dependent on completion of contractual milestones.

224 Integrated Annual Report 2021-22 225Standalone
Notes forming part of Standalone Financial Statements Notes forming part of Standalone Financial Statements
Financial StatementsStatutory ReportsCorporate Overview | |
19 Other Equity (H Mn)
ParticularsAs at
31-03-2022As at
31-03-2021
I) General reserve 1
Opening balance 3,471 3,469 Add: Additions during the year - 2
3,471 3,471 II) Hedging reserve2
Opening balance (net of taxes) 2,200 (2,149) Add/(Less): Movement in forward contracts receivable 2,882 5,969 Add/(Less): Amount reclassified to profit or loss (2,056) (158) Add/(Less): Deferred tax related to above (208) (1,462)
2,818 2,200 III) Share premium3 Opening balance 2,862 2,514 Add: Additions during the year 286 348
3,148 2,862 Iv) Employee stock options outstanding4
Opening balance 795 1,063 Add: Additions during the year 211 196 Less: Deductions during the year (423) (464) (a) 583 795 Deferred employee compensation expense4
Opening balance (288) (379) Add: Additions during the year (211) (196) Less: Deductions during the year 245 287 (b) (254) (288) Balance to be carried forward (a) + (b) 329 507 V) Capital reserve on business combination5
Opening balance (60) (60) Add: Additions during the year - -
(60) (60)VI) OCI - Remeasurements of net defined benefit plans (net of tax) Opening balance 129 92 Restatement due to amalgamation (refer note 44) (0) Restated Balance as on April 1, 2020 92 Add: Additions during the year 25 37
154 129 VII)Retained Earnings6
Opening balance 60,134 47,564 Restatement due to amalgamation (refer note 44) 10 Restated Balance as on April 1, 2020 47,574 Add: Profit for the year 22,609 17,884 Less: Dividend (8,749) (5,324)
73,994 60,134 Total (I + II + III + IV + V + VI + VII) 83,854 69,243
Sr. No. Particulars 2021-22 2020-21
i Weighted average risk-free interest rate 5.00% 4.62%ii Weighted average expected life of options 3 Years 3 Yearsiii Weighted average expected volatility 27.67% 25.17%iv Weighted average expected dividends over the life of option H189.16 H148.59v Weighted average share price H4,668 H2,349vi Weighted average exercise price Re. 1 Re. 1vii Method used to determine expected volatility The expected
volatility has been calculated based on
historic company share price.
The expected volatility has been
calculated based on historic volatility
IT Index.
Sr. No. ParticularsESOP scheme 20152021-22 2020-21
i Grant Price H1 H1ii Grant Date June 10, 2016 onwardsiii Vesting commences on June 10, 2017 onwardsiv Options granted & outstanding at the beginning of the year 882,606 1,525,395 v Options reinstated during the year - - vi Options granted during the year 45,285 83,650 vii Options allotted/execised during the year 519,548 623,839 viii Options Lapsed/cancelled during the year 82,428 102,600 ix Options granted & outstanding at the end of the year 325,915 882,606 x Options vested at the end of the year out of (ix) 143,122 122,208 xi Options unvested at the end of the year out of (ix) 182,793 760,398 xii Weighted average remaining contractual life of options (in years) 3.5 3.3
18 Share Capital (Contd..)V) Stock option plans:
Employee Stock Ownership Scheme ('ESOS Plan')
VI) The aggregate number of equity shares allotted as fully paid up by way of bonus shares in immediately preceding five years ended March 31, 2022 are Nil (previous period of five years ended March 31, 2020 - Nil)
VII)The aggregate number of equity shares issued pursuant to contract, without payment being received in cash in immediately preceding five years ended March 31, 2022 – Nil (previous period of five years ended March 31, 2021 - Nil)
VIII)During the year ended March 31, 2022, the amount of special dividend of H10 per share (previous year Nil per share) and interim dividend distributed to equity shareholder was H15 per share (previous year H15 per share).
IX) Weighted average share price at the date of exercise for stock options exercised during the year is H4,889 per share (previous year H2,691 per share).
X) Weighted average fair value of options granted during the year is H4,668 (previous year H2,349).
XI) The fair value has been calculated using the Black-Scholes Option Pricing model and significant assumptions and inputs to estimate the fair value options granted during the year are as follows:

226 Integrated Annual Report 2021-22 227Standalone
Notes forming part of Standalone Financial Statements Notes forming part of Standalone Financial Statements
Financial StatementsStatutory ReportsCorporate Overview | |
22 (II) Disclosure pursuant to Accounting Standard (Ind-AS) 37 “Provisions, Contingent Liabilities and Contingent Assets” movement in provisions.
(H Mn)
Particulars Class of provisions
Sales Tax Others Total
Balance as at March 31, 2020 4 107 111Additional provision during the year - - -Provision used during the year - - -Provision reversed during the year - - -Balance as at March 31, 2021 4 107 111Additional provision during the year - - -Provision used during the year - - -Provision reversed during the year - - -Balance as at March 31, 2022 4 107 111
23 Trade Payables(H Mn)
Particulars As at
31-03-2022 As at
31-03-2021
Total outstanding dues of micro enterprises and small enterprises 75 82 Total outstanding dues of creditors other than micro enterprises and small enterprises : Due to related parties (refer note 43) 546 277 Due to others 2,408 3,380 Accrued expenses 4,941 4,265
7,895 7,922
Trade Payables ageing schedule as at March 31, 2022(H Mn)
Particulars Unbilled Not Due
Outstanding for following periods from due date of payment Total
Less than 1 year
1 - 2 years
2 - 3 years
More than 3 years
(i) MSME - 75 - - - - 75 (ii) Others 4,941 2,156 683 90 20 5 7,895 (iii) Disputed dues - MSME - - - - - - - (iv) Disputed dues - Others - - - - - - -
4,941 2,231 683 90 20 5 7,970
1. The Company created a General reserve in earlier years pursuant to the provisions of the Companies Act,1956 where in certain percentage of profits was required to be transferred to General reserve before declaring dividends. As per Companies Act 2013, the requirements to transfer profits to General reserve is not mandatory. General reserve is a free reserve available to the Company.
2. The hedging reserve represents the cumulative effective portion of gains or losses arising on changes in fair value of designated portion of hedging instruments entered into for cash flow hedges. Such gains or losses will be reclassified to statement of profit and loss in the period in which the hedged transaction occurs.
3. Share premium includes:
a. The difference between the face value of the equity shares and the consideration received in respect of shares issued;
b. The fair value of the stock options which are treated as expense, if any, in respect of shares allotted pursuant to Stock Options Scheme.
4. It represents the fair value of services received against employee stock options.
5. Capital reserve on business combination represents the gains of capital nature which mainly include the excess of value of net assets acquired over consideration paid by the Company for business amalgamation transactions in earlier years. It also represents capital reserve on business combination which arises on transfer of business between entities under common control.
6. Retained earnings represents the undistributed profits of the Company accumulated as on Balance Sheet date.
19 Other Equity (Contd..)
20 Other Non Current Financial Liabilities
21 Other Non Current Liabilities
22 (I) Non Current Provisions
(H Mn)
Particulars As at
31-03-2022 As at
31-03-2021
Payable for acquisition of business 133 337 Other financial liability - 2
133 339
(H Mn)
Particulars As at
31-03-2022 As at
31-03-2021
Post retirement medical benefits (refer note 38) 282 250 Others 111 111
393 360
(H Mn)
Particulars As at
31-03-2022 As at
31-03-2021
Deferred Social Security Obligation - 479 - 479

228 Integrated Annual Report 2021-22 229Standalone
Notes forming part of Standalone Financial Statements Notes forming part of Standalone Financial Statements
Financial StatementsStatutory ReportsCorporate Overview | |
27 Revenue From Operations
Revenue consists of the following:(H Mn)
Particulars Year ended
March 31, 2022 Year ended
March 31, 2021
Revenue from software services Fixed Price & Maintenance 91,400 71,680 Time & Material 48,335 39,884 Revenue from products 4,329 4,097
144,064 115,661
(H Mn)
Particulars Year ended
March 31, 2022 Year ended
March 31, 2021
Balance at the beginning of the year 5,118 4,227 Less : Invoices raised during the year (3,903) (1,983)Add : Revenue recognised during the year 4,228 2,889 Add : Translation exchange difference 5 (15)Balance at the end of the year 5,448 5,118
(H Mn)
Particulars Year ended
March 31, 2022 Year ended
March 31, 2021
Balance at the beginning of the year 1,495 1,425 Less : Revenue recognised during the year from opening balance (1,092) (1,010)Add : Invoices raised during the year 765 1,080 Add/ (Less) : Translation exchange difference (26) (0)Balance at the end of the year 1,142 1,495
Performance obligations and remaining performance obligations:
The remaining performance obligation disclosure provides the aggregate amount of the transaction price yet to be recognized as at the end of the reporting period and an explanation as to when the Company expects to recognize these amounts in revenue. Applying the practical expedient as given in Ind AS 115, the Company has not disclosed the remaining performance obligation related disclosures for contracts where the revenue recognized is on time and material basis. Remaining performance obligation estimates are subject to change and are affected by several factors, including terminations, changes in the scope of contracts, periodic revalidations, adjustment for revenue that has not materialized and adjustments for currency.
The aggregate value of performance obligations that are completely or partially unsatisfied as at March 31, 2022, other than those meeting the exclusion criteria mentioned above, is H113,767 Mn (previous year H105,876 Mn). Out of this, the Company expects to recognize revenue of around 62% (previous year 58%) within the next one year and the remaining thereafter. This includes contracts that can be terminated for convenience without a substantive penalty since, based on current assessment, the occurrence of the same is expected to be remote.
Changes in contract assets is as follows:
Changes in contract liabilities is as follows:
24 Other Current Financial Liabilities
25 Other Current Liabilities
26 Current Provisions
(H Mn)
Particulars As at
31-03-2022 As at
31-03-2021
Liabilities for employee benefits 6,841 5,113 Liability for gratuity (refer note 38) 379 260 Payable for acquisition of business 533 163 Liability towards credit support agreements 594 683 Unclaimed dividend 13 9 Others 3 11
8,363 6,239
(H Mn)
Particulars As at
31-03-2022 As at
31-03-2021
Unearned and deferred revenue 1,142 1,495 Other payable 3,734 2,843
4,876 4,338
(H Mn)
Particulars As at
31-03-2022 As at
31-03-2021
Compensated absences 3,536 3,366 Post-retirement medical benefits (refer note 38) 4 3
3,540 3,369
(H Mn)
Particulars Unbilled Not Due
Outstanding for following periods from due date of payment Total
Less than 1 year
1 - 2 years
2 - 3 years
More than 3 years
(i) MSME - 74 8 - - - 82 (ii) Others 4,265 2,011 1,571 34 26 15 7,922 (iii) Disputed dues - MSME - - - - - - - (iv) Disputed dues - Others - - - - - - -
4,265 2,085 1,579 34 26 15 8,004
Trade Payables ageing schedule as at March 31, 202123 Trade Payables (Contd..)

230 Integrated Annual Report 2021-22 231Standalone
Notes forming part of Standalone Financial Statements Notes forming part of Standalone Financial Statements
Financial StatementsStatutory ReportsCorporate Overview | |
(H Mn)
ParticularsYear ended
March 31, 2022 Year ended
March 31, 2021
Communication expenses 264 279 Allowance for doubtful debts and advances 262 191 Power and fuel 210 205 Advertisement 260 118 Bad debts 70 130 Less: Provision written back (70) (130)Insurance charges 83 77 Commission 37 45 Miscellaneous expenses 484 388
28,140 20,763
30 Operating Expenses (Contd..)
*Includes Lease rentals for short term lease – H772 Mn (previous year H719 Mn) and low value lease – H140 Mn (previous year H27 Mn)
31 Finance Cost
32 Depreciation & Amortization Expense
33 Other Expenses
(H Mn)
ParticularsYear ended
March 31, 2022 Year ended
March 31, 2021
Interest expense on lease liabilities 584 685 Interest on financial liabilities* 28 27 Interest on deposits with respect to credit support agreement 21 2 Others 48 5
681 719
(H Mn)
ParticularsYear ended
March 31, 2022 Year ended
March 31, 2021
Depreciation of property, plant and equipment (refer note 4) 1,243 1,236 Amortization of other intangible assets (refer note 4) 462 256 Depreciation of right of use assets (refer note 40) 1,176 1,184
2,881 2,676
(H Mn)
ParticularsYear ended
March 31, 2022 Year ended
March 31, 2021
Legal and professional charges 1,770 1,494 Corporate social responsibility expenses (refer note 48) 383 141 Directors fees 21 25 Books and periodicals 12 11 Other miscellaneous expenses 63 64
2,249 1,735
*includes contingent consideration payable on business acquisitions.
28 Other Income
29 Employee Benefits Expense
30 Operating Expenses
(H Mn)
ParticularsYear ended
March 31, 2022 Year ended
March 31, 2021
Foreign exchange gain1 2,920 156 Net gain on investments carried at fair value through profit or loss 1,209 1,541 Miscellaneous income 157 384 Interest received from bank and others2 433 164 Gain on buy-back of shares by subsidiary 1,172 9
5,891 2,254
(H Mn)
ParticularsYear ended
March 31, 2022 Year ended
March 31, 2021
Salaries including overseas staff expenses * 80,501 63,449 Share based payments to employees 108 168 Staff welfare 656 598 Contribution to social security and other funds 2,731 2,605 Contribution to provident and other funds 1,519 965Contribution to gratuity fund 346 276Contribution to superannuation fund 39 37
85,900 68,098
(H Mn)
ParticularsYear ended
March 31, 2022 Year ended
March 31, 2021
Consultancy charges 15,589 10,521 Cost of equipment, hardware and software packages 6,237 5,530 Repairs and maintenance 827 931 Lease rentals and establishment expenses* 946 768 Travelling and conveyance 1,102 640 Recruitment expenses 1,161 415 Rates and taxes 279 362 Telephone charges and postage 399 293
1. The foreign exchange gain reported above includes gain on Derivative financial instrument which are designated as cash flow hedges of H2,056 Mn (previous year H158 Mn) and as fair value hedges of H77 Mn (previous year H469 Mn). Since, the Company hedges its operational business exposure on a net basis (i.e. expected revenue in foreign currency less expected expenditure in related currency), the aforesaid gain relates to the business operations of the company.
2. Includes interest income on financial assets measured at amortised cost, which has been recorded on the basis of Effective interest method.
*During the year ended March 31, 2021 the Company received government grants amounting to H5 Mn from governments of various countries on compliance of several employment-related conditions consequent to the outbreak of Covid-19 pandemic and accordingly, accounted as a credit to employee benefits expense.

232 Integrated Annual Report 2021-22 233Standalone
Notes forming part of Standalone Financial Statements Notes forming part of Standalone Financial Statements
Financial StatementsStatutory ReportsCorporate Overview | |
36 Contingent Liabilities (H Mn)
ParticularsYear ended
March 31, 2022 Year ended
March 31, 2021
Income tax liability that may arise in respect of which the Company is in appeal* 2,915 2,899 Corporate guarantee given on behalf of subsidiary** 764 736 Service tax / VAT refund disallowed in respect of which the Company is in the appeal#
124 156
3,803 3,791 * Out of contingent Tax liability disclosed above, H2,750 Mn (including interest of H141 Mn), pertains to the tax demand arising on account of disallowance of exemption u/s 10A/10AA on profits earned by STPI Units/SEZ units on onsite export revenue. Company is pursuing appeals against these demands before the relevant Appellate Authorities. The company believes that its position is likely to be upheld by appellate authorities and considering the facts, the ultimate outcome of these proceedings is not likely to have material adverse effect on the results of operations or the financial position of the Company.
**Guarantee issued to HSBC on behalf of wholly owned subsidiary LTI Middle East FZ-LLC towards working capital facility availed by the subsidiary. #Out of the liability disclosed above, the major portion is towards the application filed for refund of accumulated service tax credit in accordance with relevant CENVAT credit Rules. However, the department has disallowed certain portion of such refunds considering the same as ineligible as not related with output services. The Company is in appeal against these disallowances before the relevant Authorities and is hopeful of getting a favourable order.
Others
A class action lawsuit was filed in the United States District Court, Southern District of New York against the Company alleging discrimination by an ex-employee and an ex-contractor. The Company is taking necessary actions to defend the claim. The Company is presently unable to predict the duration or the outcome of this matter.
37 Estimated amount of contracts remaining to be executed on capital account (net of advances) and not provided for: H 4,048 Mn (previous year H118 Mn).
38 Employee benefits
I) General descriptions of defined benefit plans:
i) Gratuity plan
The Company makes contributions to the Company’s employees’ Company Gratuity-cum-Life Assurance Scheme of the Life Insurance Corporation of India, a funded defined benefit plan for qualifying employees. The scheme provides for lump sum payment to employees at retirement or death while in employment or termination of employment of an amount equivalent to 15 days salary for every completed year of service or part thereof in excess of six months, provided the employee has completed five years in service.
ii) Post-retirement medical benefit plan
The post-retirement medical benefit plan provides for reimbursement of health care costs to certain categories of employees post their retirement. The reimbursement is subject to an overall ceiling limit sanctioned at the time of retirement. The ceiling limits are based on cadre of the employee at the time of retirement.
iii) Provident fund plan
The Company’s provident fund plan is managed by its holding company through a Trust permitted under the Provident Fund Act, 1952. The plan envisages contribution by employer and employees and guarantees interest at the rate notified by the Provident Fund Authority. The contribution by employer and employee together with interest are payable at the time of separation from service or retirement whichever is earlier. The benefit under this plan vests immediately on rendering of service.
34 (I) Current Tax
34 (II) Deferred Tax
34 (III) A reconciliation of the income tax provision to the amount computed by applying enacted income tax rate to the profit before income taxes is summarized below:
(H Mn)
ParticularsYear ended
March 31, 2022 Year ended
March 31, 2021
Current Tax 7,619 5,897 Provision for earlier year written (back)/off 78 (54)
7,696 5,843
(H Mn)
ParticularsYear ended
March 31, 2022 Year ended
March 31, 2021
Deferred tax charge/(credit) (201) (296)MAT utilisation (net) - 493
(201) 197
(H Mn)
ParticularsYear ended
March 31, 2022 Year ended
March 31, 2021
Profit before income taxes 30,104 23,924 Enacted tax rates in India* 25.17% 34.94%Computed expected tax expense 7,577 8,360 Tax effect due to non-taxable income for Indian tax purposes (13) (2,225)Overseas taxes 47 65 Effect of differential tax rates (271) (69)Effect of non-deductible expenses 107 35 Tax pertaining to prior years 78 (54)Others (30) (72)Tax expense as per statement of profit and loss 7,495 6,040
* The Government of India, vide Taxation Laws (Amendment) Ordinance, 2019 dated September 20, 2019, introduced section 115 BAA in the Income Tax Act, 1961, providing domestic companies an irrevocable option to adopt reduced corporate tax rate, subject to certain conditions. The company has decided to adopt reduced corporate tax rate from FY21-22.
35 Statement of Other Comprehensive Income(H Mn)
ParticularsYear ended
March 31, 2022 Year ended
March 31, 2021
Items that will not be reclassified subsequently to profit or lossDefined benefit plan actuarial gain/(loss) 33 50 Income tax on defined benefit plan actuarial gain/(loss) (8) (13)
25 37 Items that will be reclassified subsequently to profit or lossNet changes in fair value of cash flow hedges 826 5,812 Income tax on net changes in fair value of cash flow hedges (208) (1,463)
618 4,349 643 4,386

234 Integrated Annual Report 2021-22 235Standalone
Notes forming part of Standalone Financial Statements Notes forming part of Standalone Financial Statements
Financial StatementsStatutory ReportsCorporate Overview | |
38 Employee benefits (Contd..)
(H Mn)
ParticularsGratuity plan
2021-22 2020-21
i Current service cost 336 267 ii Past service cost - - iii Administration expenses - - iv Interest on net defined benefit liability / (asset) 10 9 v (Gains) / losses on settlement - - Total expense charged to profit and loss account 346 276
(H Mn)
ParticularsPost-retirement medical benefit plan 2021-22 2020-21
i Current service cost 66 57 ii Past service cost - - iii Administration expenses - - iv Interest on net defined benefit liability / (asset) 17 14 v (Gains) / losses on settlement - - Total expense charged to profit and loss account 83 71
#Employer’s and employee’s contribution for March 2022 paid in April 2022.
*Net asset is not recognised in the balance sheet
III) The amounts recognised in statement of profit and loss are as follows:
(H Mn)
ParticularsProvident fund plan
As at 31-03-2022
As at 31-03-2021
B. Amounts reflected in the balance sheet Liability 255 161 Assets - - Net liability/(asset)# 255 161 Net liability/(asset)-current 255 161 Net liability/(asset)-non current - -
(H Mn)
ParticularsProvident fund plan
2021-22 2020-21
i Current service cost 956 550 ii Interest cost 983 808 iii Expected return on plan assets (983) (808) Total expense for the year included in Employee benefit expense 956 550
38 Employee benefits (Contd..)
The interest payment obligation of trust managed provident fund is assumed to be adequately covered by the interest income on long term investments of the fund. Any shortfall in the interest income over the interest obligation is recognised immediately in the statement of profit and loss as actuarial loss. Any loss arising out of the investment risk and actuarial risk associated with the plan is also recognised as expense in the period in which such loss occurs. Further, Nil has been provided for year ending March 31, 2022 and March 31, 2021 based on actuarial valuation towards the future obligation arising out of interest rate guarantee associated with the plan.
II) The amounts recognised in balance sheet are as follows:(H Mn)
ParticularsGratuity plan
As at 31-03-2022
As at 31-03-2021
a) Present value of defined benefit obligation - Wholly funded 1,685 1,429 - Wholly unfunded - - b) Fair value of plan assets 1,306 1,169 Amount to be recognised as liability or (asset) (a-b) 379 260 Net liability/(asset)-current 379 260 Net liability/(asset)- non current - -
(H Mn)
ParticularsPost-retirement medical benefit plan
As at 31-03-2022
As at 31-03-2021
A. a) Present value of defined benefit obligation - Wholly funded - - - Wholly unfunded 286 253 b) Fair value of plan assets - - Amount to be recognised as liability or (asset) (a-b) 286 253 B. Amounts reflected in the balance sheet Liability 286 253 Assets - - Net liability/(asset) 286 253 Net liability/(asset)-current 4 3 Net liability/(asset)-non current 282 250
(H Mn)
ParticularsProvident fund plan
As at 31-03-2022
As at 31-03-2021
A. a) Present value of defined benefit obligation - Wholly funded 14,228 11,117 - Wholly unfunded - - b) Fair value of plan assets 15,310 12,142 Amount to be recognised as liability or (asset) (a-b)* (1,081) (1,025)

236 Integrated Annual Report 2021-22 237Standalone
Notes forming part of Standalone Financial Statements Notes forming part of Standalone Financial Statements
Financial StatementsStatutory ReportsCorporate Overview | |
(H Mn)
ParticularsGratuity plan Provident fund plan
2021-22 2020-21 2021-22 2020-21
Opening balance of the fair value of the plan assets 1,169 917 12,142 9,482 Employer’s contributions 260 242 915 536 Expected return on plan assets 75 61 983 808 Actuarial gains/(loss) 243 534 Re-measurements due to:Actual return on plan assets less interest on plan assets (9) 10 - - Contribution by plan participants - - 1,619 1,102 Benefits paid (189) (60) (1,787) (768)Assets acquired/(settled)* - - 1,195 448 Closing balance of plan assets 1,306 1,169 15,310 12,142
38 Employee benefits (Contd..)
VI) Changes in the fair value of plan assets representing reconciliation of the opening and closing balances thereof are as follows:
(H Mn)
ParticularsProvident fund plan
2021-22 2020-21
Opening balance of defined benefit obligation 11,117 8,948 Add : Interest cost 983 808 Add : Current service cost 956 550 Add : Contribution by plan participants 1,764 1,131 Add/(Less) : Actuarial (gains)/losses - - Liabilities assumed on acquisition/ (settled on divestiture) 1,195 448 Less : Benefits paid (1,787) (768)Closing balance of defined benefit obligation 14,228 11,117
* On account of business combination or inter-company transfer
The Company expects to contribute H379 Mn (H260 Mn in 2020-21) towards its gratuity, in the next financial year.
Particulars Gratuity plan 2021-22 2020-21
Provident fund plan
Government of India securities
Scheme with LIC
17.47% 22.17%State government securities 27.81% 23.13%Corporate bonds 30.50% 29.38%Fixed deposits under Special Deposit Scheme framed by central government for provident funds
3.29% 3.69%
Public sector bonds 10.38% 12.60%Mutual Funds 5.23% 5.42%Others 5.32% 3.61%
VII) The major categories of plan assets as a percentage of total plan assets are as follows:
(H Mn)
ParticularsGratuity plan
Post retirement medical benefit plan
2021-22 2020-21 2021-22 2020-21
Opening amount recognized in OCI 41 58 (200) (164)Re-measurements during the period due to:Changes in financial assumptions (40) 10 (21) 5 Changes in demographic assumptions - - - - Experience adjustments 46 (17) (27) (41)Actual return on plan assets less interest on plan assets 9 (10) - - Closing amount recognized in OCI 56 41 (248) (200)
38 Employee benefits (Contd..)
IV) The amounts recognised in statement of other comprehensive income (OCI) are as follows:
V) The changes in the present value of defined benefit obligation representing reconciliation of opening and closing balances thereof are as follows:
(H Mn)
ParticularsGratuity plan
2021-22 2020-21
Opening balance of defined benefit obligation 1,429 1,159 Current service cost 336 267 Interest on defined benefit obligation 85 70 Re-measurements due to:Actuarial loss/(gain) arising from change in financial assumption (40) 10 Actuarial loss/(gain) arising from change in demographic assumptions - - Actuarial loss/(gain) arising on account of experience changes 46 (17)Benefits paid (189) (60)Liabilities assumed / (settled)* 18 - Closing balance of defined benefit obligation 1,685 1,429
(H Mn)
ParticularsPost-retirement medical benefit plan 2021-22 2020-21
Opening balance of defined benefit obligation 253 218 Current service cost 66 57 Past service cost - - Interest on defined benefit obligation 17 14 Re-measurements due toActuarial loss/(gain) arising from change in financial assumption (21) 5 Actuarial loss/(gain) arising from change in demographic assumptions - - Actuarial loss/(gain) arising on account of experience changes (27) (41)Benefits paid (2) (0)Closing balance of defined benefit obligation 286 253
*On account of business combination or inter-company transfer

238 Integrated Annual Report 2021-22 239Standalone
Notes forming part of Standalone Financial Statements Notes forming part of Standalone Financial Statements
Financial StatementsStatutory ReportsCorporate Overview | |
38 Employee benefits (Contd..)
ParticularsPeriod ended
March 31, 2022Period ended
March 31, 2021
Discount RateImpact of increase in 100 bps on defined benefit obligation (16.88%) (17.41%)Impact of decrease in 100 bps on defined benefit obligation 22.26% 23.08%Healthcare costs rateImpact of increase in 100 bps on defined benefit obligation 12.53% 13.30%Impact of decrease in 100 bps on defined benefit obligation (10.18%) (10.72%)Life expectancyImpact of increase by 1 year on defined benefit obligation 1.41% 1.41%Impact of decrease by 1 year on defined benefit obligation (1.48%) (1.47%)
X) Sensitivity analysis
i) Post-retirement benefits:
Although the obligation of the Company under the post-retirement medical benefit plan is limited to the overall ceiling limits, assumed healthcare cost trend rates may affect the amounts recognised in the statement of profit and loss. The benefit obligation results for the cost of paying future hospitalization premiums to insurance company and reimbursement of domiciliary medical expenses in future for the employee / beneficiaries during their lifetime is sensitive to discount rate, future increase in healthcare costs and longevity. The following table summarizes the impact in percentage terms on the reported defined benefit obligation at the end of the reporting period arising on account changes in these three key parameters:
ii) Gratuity:
Gratuity is a lump sum plan and the cost of providing these benefits is typically less sensitive to small changes in demographic assumptions. The key actuarial assumptions to which the benefit obligation results are particularly sensitive to are discount rate and future salary escalation rate. The following table summarizes the impact in percentage terms on the reported defined benefit obligation at the end of the reporting period arising on account of an increase or decrease in the reported assumption as below:
Particulars
Period ended March 31, 2022
Period ended March 31, 2021
Discount rate
Salary escalation
rate
Discount rate
Salary escalation
rate
Impact of increase in 100 bps on defined benefit obligation
(6.30%) 7.08% (6.61%) 7.41%
Impact of decrease in 100 bps on defined benefit obligation
7.10% (6.40%) 7.46% (6.69%)
VIII) Principal actuarial assumptions at the balance sheet date :
IX) Projected plan cash flow:
As on March 31, 2021
38 Employee benefits (Contd..)
ParticularsAs at
31-03-2022As at
31-03-2021
i Discount rate For gratuity 6.65% 6.30% For post -retirement medical benefits 6.65% 6.30%ii Annual increase in healthcare costs (see note below) 5.00% 5.00%iii Attrition rate : Varies between
8% to 19%Varies between
8% to 19%iv Salary growth rate * 6.00% 6.00%
* Salary growth rate assumption reflects the Company’s average salary growth rate and current market conditions.
(H Mn)
Maturity profile Gratuity Post-Retirement medical
benefit
Expected benefits for year 1 151 3 Expected benefits for year 2 156 4 Expected benefits for year 3 168 5 Expected benefits for year 4 170 6 Expected benefits for year 5 161 7 Expected benefits for year 6 152 8 Expected benefits for year 7 135 9 Expected benefits for year 8 128 9 Expected benefits for year 9 121 10 Expected benefits for year 10 and above 1,076 1,224
(H Mn)
Maturity profile Gratuity Post-Retirement
medical benefit
Expected benefits for year 1 232 4 Expected benefits for year 2 184 5 Expected benefits for year 3 192 6 Expected benefits for year 4 192 8 Expected benefits for year 5 194 9 Expected benefits for year 6 173 10 Expected benefits for year 7 160 11 Expected benefits for year 8 152 12 Expected benefits for year 9 139 13 Expected benefits for year 10 and above 1,269 1,484
The table below shows the expected cash flow profile of the benefits to be paid to the current membership of the plan (which in case of serving employees, if any, is based on service accrued by employee up to valuation date):
As on March 31, 2022
The estimates of future salary increases considered in actuarial valuation, take into account inflation, seniority, promotion and other relevant factors, such as supply and demand in the employment market.

240 Integrated Annual Report 2021-22 241Standalone
Financial StatementsStatutory ReportsCorporate Overview | |
Notes forming part of Standalone Financial Statements
II) Fair value hierarchy used by the Company for valuation of financial assets and liabilities recognised at FVTPL and FVTOCI is as below:
Level 1- Quoted prices (unadjusted) in the active markets for identical assets or liabilities.
Level 2- Inputs other than quoted prices included with in level 1 that are observable for assets or liabilities either directly (i.e. as prices) or indirectly (i.e. derived from prices).
Level 3- Inputs for assets or liabilities that are not based on observable market data (unobservable inputs)(H Mn)
As at 31-03-2022 As at 31-03-2021 Particulars Level 1 Level 2 Level 3 Total Level 1 Level 2 Level 3 Total
AssetsInvestments 26,008 - 1 26,009 32,720 - 1 32,721 Derivative financial instruments
- 3,866 - 3,866 - 2,938 - 2,938
Total 26,008 3,866 1 29,875 32,720 2,938 1 35,659 LiabilitiesDerivative financial instruments
- - - - - - - -
Liability towards contingent consideration*
- - 666 666 - - 500 500
Total - - 666 666 - - 500 500 *Pertains to contingent consideration payable to the selling shareholders for acquisition of business
Reconciliation of Level 3 fair value measurement of financial liabilities is as follows: (H Mn)
ParticularsAs at
31-03-2022As at
31-03-2021
Balance at the beginning of the year 500 663 Acquisitions during the year 187 - Finance cost recognized in profit and loss 27 27 Amounts settled during the year (164) (179)Remeasurement recognized as FVTPL 113 - Foreign exchange difference 3 (11)Balance at the end of the year 666 500
A one percentage point change in the unobservable inputs used in fair valuation of Level 3 assets and liabilities does not have a significant impact on the value.
There have been no transfers among Level 1, Level 2 and Level 3 during the years ended March 31, 2022 and March 31, 2021.
The fair value of the financial assets and liabilities is included at the amount at which the instrument could be exchanged in a current transaction between willing parties, other than in a forced or liquidation sale.
III) Financial risk management
The Company’s primary focus is to foresee the uncertainty of financial markets and seek to minimize the potential adverse effects on its financial performance. The primary market risk to the company is foreign exchange risk. The company uses derivative financial instruments to mitigate the risks arising out of foreign exchange related exposures. The company's exposure to credit risk is influenced mainly by the individual characteristic of each customer and the concentration of risk from the top few customers.
39 Financial instruments by category (Contd..)
39 F
inan
cial
inst
rum
ents
by
cate
go
ryI)
C
arry
ing
val
ue
of
fin
anci
al in
stru
men
ts b
y ca
teg
ori
es a
re a
s fo
llow
s:(H
Mn)
As
at 3
1-0
3-20
22
As
at 3
1-0
3-20
21
Par
ticu
lars
Fair
val
ue
thro
ug
h P
&L
(FV
TPL)
Fair
val
ue
thro
ug
h O
CI
(FV
TOC
I)
Am
ort
ised
co
st
Tota
l ca
rryi
ng
va
lue
Tota
l fai
r va
lue
Fair
val
ue
thro
ug
h P
&L
(FV
TPL)
Fair
val
ue
thro
ug
h O
CI
(FV
TOC
I)
Am
ort
ised
co
st
Tota
l ca
rryi
ng
va
lue
Tota
l fai
r va
lue
Fin
anci
al a
sset
sIn
vest
men
ts(o
ther
th
an
in s
ubsi
dia
ries)
26,
009
-
8,8
09
34,
818
34,
737
32,
721
-
4,5
74
37,
295
37,
295
Trad
e re
ceiv
able
s -
-
2
6,03
7 2
6,03
7 2
6,03
7 -
-
2
0,24
3 2
0,24
3 2
0,24
3 U
nb
illed
reve
nue
* -
-
8
,113
8,11
3 8
,113
-
-
5,2
99
5,2
99
5,2
99
Cas
h a
nd
cas
h
equi
vale
nts
-
-
2,8
36
2,8
36
2,8
36
-
-
4,0
25
4,0
25
4,0
25
Ban
k D
epo
sits
-
-
4,0
81
4,0
81
4,0
81
-
-
-
-
-
Loan
s -
-
1
,174
1,17
4 1
,174
-
-
1,15
4 1
,154
1,15
4 D
eriv
ativ
e fin
anci
al
inst
rum
ents
#
4
3,8
62
-
3,8
66
3,8
66
72
2,8
66
-
2,9
38
2,9
38
Oth
er f
inan
cial
ass
ets
-
-
1,4
55
1,4
55
1,4
55
-
-
1,2
00
1,2
00
1,2
00
Tota
l26
,013
3,86
252
,50
482
,380
82,2
9932
,793
2,86
636
,495
72,1
5472
,154
(H M
n)
As
at 3
1-0
3-20
22
As
at 3
1-0
3-20
21
Par
ticu
lars
Fair
val
ue
thro
ug
h P
&L
(FV
TPL)
Fair
val
ue
thro
ug
h O
CI
(FV
TOC
I)
Am
ort
ised
cost
Tota
l
carr
yin
g
valu
e
Tota
l fai
r
valu
e
Fair
val
ue
thro
ug
h P
&L
(FV
TPL)
Fair
val
ue
thro
ug
h O
CI
(FV
TOC
I)
Am
ort
ised
cost
Tota
l
carr
yin
g
valu
e
Tota
l fai
r
valu
e
Fin
anci
al li
abili
tyTr
ade
pay
able
s -
-
7
,970
7
,970
7
,970
-
-
8
,004
8
,004
8
,004
Le
ase
liab
iliti
es -
-
7
,353
7
,353
7
,353
-
-
7
,229
7
,229
7
,229
O
ther
fin
anci
al li
abili
ties
666
-
7
,830
8
,496
8
,496
5
00
-
6,0
78
6,5
78
6,5
78
Tota
l 6
66
-
23,
153
23,
819
23,
819
50
0
-
21,
311
21,
811
21,
811
*E
xclu
des
Un
bill
ed R
even
ue o
n F
ixed
Pric
e C
on
trac
ts w
her
e th
e rig
ht
to c
on
sid
erat
ion
is c
on
dit
ion
al o
n fa
cto
rs o
ther
th
an p
assa
ge
of t
ime
#D
eriv
ativ
e Fi
nan
cial
inst
rum
ents
fair
valu
ed t
hro
ugh
Pro
fit a
nd
loss
on
acc
oun
t o
f Fai
r val
ue h
edg
es
No
tes
form
ing
par
t o
f S
tan
dal
on
e Fi
nan
cial
Sta
tem
ents

242 Integrated Annual Report 2021-22 243Standalone
Notes forming part of Standalone Financial Statements Notes forming part of Standalone Financial Statements
Financial StatementsStatutory ReportsCorporate Overview | |
(i) The details in respect of outstanding foreign currency forward and options contracts are as follows:
39 Financial instruments by category (Contd..)
As at 31-03-2022 As at 31-03-2021Particulars (in Mn) (In J Mn) (in Mn) (In J Mn)
Instruments designated as cash flow hedgesForward contracts In US Dollar 1,715 139,567 1,354 107,787 In South African Rand - - 136 635 In Swedish Krona 60 482 125 1,085 In Danish Krone - - 33 389 In Euro 45 3,897 25 2,147 In Norwegian Krone 12 103 22 186 In Australian Dollar 3 167 13 721 In Canadian Dollar 2 135 7 378 In United Kingdom Pound Sterling 2 225 4 430 Options Contracts In Euro 106 9,594 95 8,269 Instruments designated as fair value hedges In US Dollar 112 8,547 65 4,767 In Emirati Dirham 56 1,158 56 1,129 In Swedish Krona - - 12 100 In Euro 8 634 10 863 In United Kingdom Pound Sterling 1 132 7 670 In South African Rand - - 4 19 In Canadian Dollar 1 46 1 35 In Australian Dollar 2 108 1 33 In Norwegian Krone 2 16 - - In Danish Krone 5 61 - - Total Forward and Options contracts 164,872 129,643
(ii) The foreign exchange forward and option contracts designated as cash flow hedges mature over a maximum period of 36 months. The company manages its exposures normally for a period of up to 3 years based on the estimated exposure over that period.
The table below analyses the derivative financial instrument into relevant maturity based on the remaining period as of the balance sheet date. Contracts with maturity not later than twelve months include certain contracts which can be rolled over to subsequent periods in line with underlying exposures.
(H Mn)
ParticularsAs at
31-03-2022As at
31-03-2021
Not later than twelve months 80,304 67,810 Later than twelve months 84,568 61,833 Total 164,872 129,643
(H Mn)
ParticularsUS
DollarEuro
Emirati Dirham
Swedish Krona
Australian Dollar
Other currencies*
Total
Net assets/(liabilities) 12,802 3,231 1,370 923 233 1,210 19,769
(H Mn)
ParticularsUS
DollarEuro
Emirati Dirham
Swedish Krona
Australian Dollar
Other currencies*
Total
Net assets/(liabilities) 25,490 2,650 1,487 771 211 2,334 32,943
39 Financial instruments by category (Contd..)
i) Currency risk
The Company operates in multiple geographies and contracts in currencies other than the domestic currency exposing it to risks arising from fluctuation in the foreign exchange rates. The Company uses derivative financial instruments to mitigate foreign exchange related exposures. All derivative activities for risk management purposes are carried out by specialist teams that have the appropriate skills, experience and supervision.
The Company's revenues are principally in foreign currencies and the maximum exposure is in US dollars.
The Board of Directors has approved the Company’s financial risk management policy covering management of foreign currency exposures. The treasury department monitors the foreign currency exposures and enters into appropriate hedging instruments to mitigate its risk. The Company hedges its exposure on a net basis (i.e. expected revenue in foreign currency less expected expenditure in related currency). These hedges are cash flow hedges as well as fair value hedges.
The Foreign Currency Risk from Monetary assets and liabilities as at March 31, 2022 is as follows
* Other currencies include currencies such as Pound sterling, Norwegian Krone, Japanese Yen, Saudi Riyal, South African Rand, etc.
The Foreign Currency Risk from Monetary assets and liabilities as at March 31, 2021 is as follows
* Other currencies include currencies such as Pound sterling, Norwegian Krone, Japanese Yen, Saudi Riyal, South African Rand, etc.
To provide a meaningful assessment of the foreign currency risk associated with the Company’s foreign currency derivative positions against off balance sheet exposures and unhedged portion of on-balance sheet exposures, the Company uses a multi-currency correlated VaR model. The VaR model uses a Monte Carlo simulation to generate thousands of random market price paths for foreign currencies against Indian rupee taking into account the correlations between them. The VaR is the expected loss in value of the exposures due to overnight movement in spot exchange rates, at 95% confidence interval. The VaR model is not intended to represent actual losses but is used as a risk estimation tool. The model assumes normal market conditions and is a historical best fit model. Because the Company uses foreign currency instruments for hedging purposes, the loss in fair value incurred on those instruments are generally offset by increases in the fair value of the underlying exposures for on-balance sheet exposures. The overnight VaR of the Company at 95% confidence level is H618 Mn as at March 31, 2022 (H687 Mn as at March 31, 2021).
A) Derivative Financial Instruments
The company regularly reviews its foreign exchange forward and options positions, both on a standalone and in conjunction with its underlying foreign exchange exposures. The outstanding forward and option contracts at the year end, their maturity profile and sensitivity analysis are as under.

244 Integrated Annual Report 2021-22 245Standalone
Notes forming part of Standalone Financial Statements Notes forming part of Standalone Financial Statements
Financial StatementsStatutory ReportsCorporate Overview | |
The Company’s exposure to credit risk is influenced mainly by the individual characteristic of each customer and the concentration of risk from the top few customers. Exposure to customers is diversified and the percentage of revenue from its top five customers is 30.4% for 2021-22 (31.2% for 2020-21).
ECL allowance for non-collection and delay in collection of receivable and unbilled revenue, on a combined basis was H343 Mn and H296 Mn for the financial years ending on March 31, 2022 and March 31, 2021 respectively. The movement in allowance for doubtful debts comprising provision for both non-collection and delay in collections of receivable and unbilled revenue is as follows:
39 Financial instruments by category (Contd..)
(H Mn)
Particulars 2021-22 2020-21
Opening balance 296 211 Impairment loss recognised or (reversed) 47 85 Closing balance 343 296
(H Mn)
As at 31-03-2022 As at 31-03-2021
ParticularsWithin a
yearMore than
one yearTotal
Within a year
More than one year
Total
Trade payables 7,970 - 7,970 8,004 - 8,004 Lease liabilities 1,599 8,408 10,007 1,471 7,992 9,463 Other financial liabilities 8,367 144 8,511 6,239 367 6,606 Total 17,936 8,552 26,488 15,714 8,359 24,073
The Company is also exposed to counter-party risk in relation to financial instruments taken to hedge its foreign currency risks. The counter-parties are banks and the Company has entered into contracts with the counter-parties for all its hedge instruments and in addition, entered into suitable credit support agreements to limit counter party risk where necessary.
The Company’s investments primarily include investment in mutual fund units, quoted bonds, commercial papers, non-convertible debentures, deposits with banks and financial institutions. The Company mitigates the risk of counter-party failure by investing in mutual fund schemes with large assets under management, investing in debt instruments issued with sound credit rating and placing corporate deposits with banks and financial institutions with high credit ratings assigned by domestic and international credit rating agencies.
iv) Liquidity risk
The Company’s treasury department monitors the cash flows of the Company and surplus funds are invested in non- speculative financial instruments that include highly liquid funds and corporate deposits.
The Company has no borrowings as at March 31, 2022 but it has credit facilities with banks that will help it in generating funds for the business if required.
The contractual maturities of financial liabilities is as follows:
Credit risk on cash and cash equivalents is limited as the company generally invest in deposits with banks and financial institutions with high ratings assigned by international and domestic credit rating agencies and analysing market information on a continuous and evolving basis. Ratings are monitored periodically and the company has considered the latest available credit ratings as well any other market information which may be relevant at the date of approval of these standalone financial statements.
39 Financial instruments by category (Contd..)
(H Mn)
ParticularsAs at
31-03-2022As at
31-03-2021
Balance at the Beginning of the year 2,200 (2,149)Changes in fair value of forward and options contract designated as hedging instruments
2,882 5,969
Amount reclassified to profit and loss during the year (2,056) (158)Tax impact on the above (208) (1,462)Total 2,818 2,200
(iii) During the year ended March 31, 2022, the company has designated certain foreign exchange forward and options contracts as cash flow hedges to mitigate the risk of foreign exchange exposure on highly probable forecast cash transactions. The related hedge transactions which for a part of hedge reserve as at March 31, 2022 will occur and be reclassified to the statement of Profit and loss over a period of 36 months.
The reconciliation for the cash flow Hedge Reserve for the years ended March 31, 2022 and March 31, 2021 is as follows:
Actual future gains and losses associated with forward contracts designated as cash flow hedge may differ materially from the sensitivity analysis performed as of March 31, 2022 due to the inherent limitations associated with predicting the timing and amount of changes in foreign currency exchanges rates and the Company’s actual exposures and position.
ii) Interest risk
Interest rate risk is the risk that the fair value of future cash flows of a financial instrument will fluctuate because of changes in market interest rates. The Company has no interest rate risk with respect to borrowings as on March 31, 2022.
iii) Credit risk
Credit risk refers to the risk of default on its obligation by a counterparty resulting in a financial loss. The carrying amount of all financial assets represents the maximum credit exposure. The maximum exposure to credit risk was H82,380 Mn and H72,154 Mn as at March 31, 2022 and March 31, 2021 respectively being the total of the carrying amount of Investments, Trade Receivables, Unbilled Revenue, Cash and other bank balances and all other financial assets.
The principal credit risk that the Company exposed to is non-collection of trade receivable and late collection of receivable and on unbilled revenue leading to credit loss. The risk is mitigated by reviewing creditworthiness of the prospective customers prior to entering into contract and post contracting, through continuous monitoring of collections by a dedicated team.
The Company makes adequate provision for non-collection of trade receivable and unbilled receivables. Further, the Company has not suffered significant payment defaults by its customers.
In addition, for delay in collection of receivable, the Company has made a provision for Expected Credit loss (‘ECL’) based on an ageing analysis of its trade receivables, finance leases and unbilled revenue. For trade receivables and finance leases, these range from 1.2% for dues outstanding up to six months to 13.8% for dues outstanding for more than 36 months for 2021-22 (Previous year 1.5% and 15.7% for dues outstanding up to 6 months and for more than 36 months respectively) and for unbilled revenue 1.2% for dues outstanding up to six months to 3.4% for dues outstanding for more than 12 months for 2021-22 (Previous year 1.4% for dues outstanding up to six months to 3.9% for dues outstanding for more than 12 months).

246 Integrated Annual Report 2021-22 247Standalone
Notes forming part of Standalone Financial Statements Notes forming part of Standalone Financial Statements
Financial StatementsStatutory ReportsCorporate Overview | |
40 Leases (Contd..)
40 (IV) The following is the movement in the net investment in sublease in ROU asset during the year ended March 31, 2022
(H Mn)
ParticularsAs at
31-03-2022As at
31-03-2021
Balance at the beginning of the year 15 24 Interest income accrued during the year 1 2 Lease receipts during the year (11) (12)Translation difference 2 1 Balance at the end of the year 7 15
(H Mn)
ParticularsAs at
31-03-2022As at
31-03-2021
Less than one year 7 11 One to five years - 7 Total 7 18
(H Mn)
ParticularsAs at
31-03-2022As at
31-03-2021
Not later than one year 101 92 Later than one year but not later than five years 80 155 Gross investment in lease 181 247 Less: Unearned finance income 5 16 Present value of minimum lease payment receivables 176 231
(H Mn)
ParticularsAs at
31-03-2022As at
31-03-2021
Not later than one year 97 81 Later than one year but not later than five years 79 150 Gross investment in lease 176 231 Less: Unearned finance income - - Present value of minimum lease payment receivables 176 231
40 (V) The table below provides details regarding the contractual maturities of net investment in sublease of ROU asset as at March 31, 2022 on an undiscounted basis:
40 (VI) Leasing arrangements
Finance lease receivables consist of assets that are leased to customers for contract terms ranging from 3 to 4 years, with lease payments due in monthly installments. Details of finance lease receivables are given below:
Minimum Lease Payment
Present Value of Minimum Lease Payment
(H Mn)
ParticularsAs at
31-03-2022As at
31-03-2021
Current lease liabilities 1,052 1,144 Non-current lease liabilities 6,301 6,084
7,353 7,228
(H Mn)
ParticularsAs at
31-03-2022As at
31-03-2021
Balance at the Beginning of the year(refer note 2.k) 7,228 8,405 Additions on amalgamation (refer note 44) - 46 Additions during the year 1,256 304 Finance cost accrued during the year 584 685 Deletions during the year (130) (661)Payment of lease liabilities (1,601) (1,571)Translation difference 16 20 Balance at the end of the year 7,353 7,228
(H Mn)
Category of ROU Asset
Particulars Office
Premises Furniture & Fixtures
Vehicles Total
Balance as at March 31, 2021 5,886 51 3 5,940 Additions during the year 1,308 - - 1,308 Deletions during the year (116) - - (116)Depreciation for the year (1,158) (17) (1) (1,176)Balance as at March 31, 2022 5,920 34 2 5,956
(H Mn)
Category of ROU Asset
Particulars Office
Premises Furniture & Fixtures
Vehicles Total
Balance as at March 31, 2020 7,284 68 0 7,352 Additions on amalgamation (refer note 44) 42 - - 42 Additions during the year 339 - 3 342 Deletions during the year (612) - - (612)Depreciation for the year (1,167) (17) (0) (1,184)Balance as at March 31, 2021 5,886 51 3 5,940
40 Leases
40 (I) Following are the changes in the carrying value of right of use assets for the year ended March 31, 2022
Following are the changes in the carrying value of right of use assets for the year ended March 31, 2021
The aggregate depreciation expense on ROU assets is included under depreciation and amortization expense in the Statement of Profit and Loss.
40 (II) The following is the break-up of current and non-current lease liabilities as at March 31, 2022
40 (III) The following is the movement in lease liabilities during the year ended March 31, 2022

248 Integrated Annual Report 2021-22 249Standalone
Notes forming part of Standalone Financial Statements Notes forming part of Standalone Financial Statements
Financial StatementsStatutory ReportsCorporate Overview | |
43 Related Party Disclosure: (Contd..)
Name Relationship
Larsen & Toubro Infotech South Africa (Proprietary) Limited SubsidiaryL&T Information Technology Services (Shanghai) Co. Limited Wholly owned subsidiaryL&T Information Technology Spain, Sociedad Limitada Wholly owned subsidiaryL&T Infotech S. DE R.L. DE C.V. Wholly owned subsidiarySyncordis S.A.1 Wholly owned subsidiarySyncordis France SARL Wholly owned subsidiarySyncordis Limited Wholly owned subsidiarySyncordis Software Services S.A. Wholly owned subsidiaryLarsen & Toubro Infotech Norge AS Wholly owned subsidiaryRuletronics Limited Wholly owned subsidiaryRuletronics Systems Inc Wholly owned subsidiaryNielsen + Partner Unternehmensberater GmbH Wholly owned subsidiaryNielsen + Partner Unternehmensberater AG Wholly owned subsidiaryNielsen+Partner Pte. Ltd. Wholly owned subsidiaryNielsen + Partner S.A.1 Wholly owned subsidiaryNielsen&Partner Pty Ltd Wholly owned subsidiaryNielsen&Partner Company Limited Wholly owned subsidiaryLymbyc Solutions Private Limited Wholly owned subsidiaryLymbyc Solutions Inc. Wholly owned subsidiaryPowerup Cloud Technologies Private Limited Wholly owned subsidiaryLarsen & Toubro Infotech UK Limited (incorporated on August 17, 2020) Wholly owned subsidiaryLTI Middle East FZ-LLC (incorporated November 25, 2020) Wholly owned subsidiaryCuelogic Technologies Inc. (w.e.f July 1, 2021) Wholly owned subsidiaryCuelogic Technologies Private Limited (w.e.f July 1, 2021) Wholly owned subsidiary
1. Nielsen + Partner S.A. has been merged with Syncordis S.A. w.e.f December 21, 2020
(III) Key Management Personnel:
Name Status
Mr. Sanjay Jalona Chief Executive Officer (CEO) & Managing Director (MD) Mr. Sudhir Chaturvedi President – Sales & Whole time Director (WTD) Mr. Nachiket Deshpande Chief Operating Officer (COO) & Whole Time Director (WTD) Mr. Ashok Kumar Sonthalia1 Chief Financial Officer (CFO) Mr. Anil Rander2 Chief Financial Officer (CFO)
Name Relationship
L&T Hydrocarbon Engineering Limited# Fellow SubsidiaryL&T Technology Services Limited Fellow SubsidiaryL&T Valves Limited Fellow Subsidiary
1. Ceased to be CFO from the close of business hours of January 25, 2021
2. Appointed as CFO w.e.f. April 14, 2021
(IV) List of other related parties with whom there were transactions during the year:
40 Leases (Contd..)
40 (VI) Leasing arrangements (Contd...)
41 Auditor’s Remuneration (excluding taxes) charged to the accounts include:
42 Basic and Diluted Earnings Per Share (EPS) at Face Value of J 1
43 Related Party Disclosure:
(I) Parent company / Ultimate holding company: Larsen & Toubro Limited
(II) List of related parties over which control exists/exercised:
(H Mn)
ParticularsAs at
31-03-2022As at
31-03-2021
Non-current finance lease receivables 79 150 Current finance lease receivables 97 81 Total 176 231
(H Mn)
Particulars 2021-22 2020-21
Audit fees 3 3 Tax audit fees 1 1 Other services 3 4 Expense reimbursement 0 1
7 9
ParticularsAs at
31-03-2022As at
31-03-2021
Profit after tax (H in Mn) 22,609 17,884 Weighted average number of shares outstanding 175,073,125 174,460,220 Basic EPS (J) 129.14 102.51 Weighted average number of shares outstanding 175,073,125 174,460,220 Add: Weighted average number of potential equity shares on account of employee stock options
505,078 1,135,891
Weighted average number of shares outstanding 175,578,203 175,596,111 Diluted EPS (J) 128.77 101.85
Name Relationship
Larsen & Toubro Infotech GmbH Wholly owned subsidiaryLarsen & Toubro Infotech Canada Limited Wholly owned subsidiaryLarsen & Toubro Infotech LLC Wholly owned subsidiaryL&T Infotech Financial Services Technologies Inc. Wholly owned subsidiary
Included in the balance sheet as follows:
Finance income on Finance Lease Receivables was H11 Mn for the year ended March 31, 2022 (Previous year : H11 Mn)
Selling profit on Finance Lease Receivables has been recognised amounting to H11 Mn for the year ended March 31, 2022 (Previous year : H145 Mn)

250 Integrated Annual Report 2021-22 251Standalone
Notes forming part of Standalone Financial Statements Notes forming part of Standalone Financial Statements
Financial StatementsStatutory ReportsCorporate Overview | |
Outstanding Balances Holding company
As at March 31, 2022
As at March 31, 2021
Trade receivable 321 220 Capital Commitments 3,115 - Security Deposits 1 2
(H Mn)
B. Transaction Joint venture of Holding Company
2021-22 2020-21
Sale of services / products 46 39 - L&T Infrastructure Development Projects Limited 22 39 - L&T Chiyoda Limited 24 - Overheads charged to 0 - - L&T MHI Power Boilers Private Limited 0 -
(H Mn)
C. Transaction Post employment benefit plans
2021-22 2020-21
Contribution to Post employment benefit plans 957 536 - L&T Officers & Supervisory Staff Providend Fund 957 536
Outstanding BalancePost employment benefit plans
As at March 31, 2022
As at March 31, 2021
Contribution to Post employment benefit plans 255 161 - L&T Officers & Supervisory Staff Providend Fund 255 161
Outstanding BalanceJoint venture of Holding Company
As at March 31, 2022
As at March 31, 2021
Trade receivable 4 17 - L&T Infrastructure Development Projects Limited 3 17
43 Related Party Disclosure: (Contd..)
(H Mn)
D. Transaction Fellow subsidiaries
2021-22 2020-21
Sale of services / products 1,496 829 - L&T Technology Services Limited 516 457 - L&T Hydrocarbon Engineering Limited - 249 - Mindtree Limited 914 16 Sale of assets - 0 -Mindtree Limited - 0 Purchases of services / products 981 772
Name Relationship
L&T Investment Management Limited Fellow SubsidiaryL&T Thales Technology Services Private Limited Fellow SubsidiaryL&T Construction Equipment Limited (formerly known as L&T Construction Machinery Limited)
Fellow Subsidiary
L&T Finance Limited Fellow SubsidiaryLarsen & Toubro LLC Fellow SubsidiaryNabha Power Limited Fellow SubsidiaryL&T Metro Rail (Hyderabad) Limited Fellow SubsidiaryLarsen & Toubro (East Asia) SDN BHD. Fellow SubsidiaryL&T Technology Services LLC Fellow SubsidiaryL&T Saudi Arabia LLC Fellow SubsidiaryMindtree Limited Fellow SubsidiaryL&T Sargent & Lundy Limited Joint venture of Holding CompanyL&T Chiyoda Limited Joint venture of Holding CompanyL&T Infrastructure Development Projects Limited Joint venture of Holding CompanyL&T-MHI Power Turbine Generators Private Limited Joint venture of Holding CompanyL&T MHI Power Boilers Private Limited Joint venture of Holding CompanyL&T Officers & Supervisory Staff Providend Fund Post employment benefit plansNexant Limited* Company in which Directors are InterestedCalient Technologies Inc* Company in which Directors are Interested
43 Related Party Disclosure: (Contd..)
*Ceased to be a related party from October 28, 2020
#L&T Hydrocarbon Engineering Limited has amalgamated with Larsen & Toubro Limited w.e.f April 1, 2021
(V) Details of transactions between the Company and other related parties are disclosed below:
The Company’s material related party transactions and outstanding balances are with related parties with whom the Company routinely enter into transactions in the ordinary course of business. (H Mn)
A. Transaction Holding company
2021-22 2020-21
Sale of services/product 1,557 1,154 Purchases of services / products 82 68 Purchases of assets 3,789 32 Overheads charged by 630 577 Overheads charged to 57 41 Trademark fees 399 309 Corporate Social Responsibility Expense 29 - Security Deposit refund received 1 - Capital advances given 700 - Interim dividend paid 3,245 1,947 Final dividend paid 3,245 2,012

252 Integrated Annual Report 2021-22 253Standalone
Notes forming part of Standalone Financial Statements Notes forming part of Standalone Financial Statements
Financial StatementsStatutory ReportsCorporate Overview | |
(H Mn)
E. Transaction Subsidiaries
2021-22 2020-21
Overheads charged by 738 317 - L&T Information Technology Spain, Sociedad Limitada 45 40 - L&T Information Technology Services (Shanghai) Co. Ltd. 264 161 - Powerup Cloud Technologies Private Limited 28 43 - Larsen & Toubro Infotech UK Limited 326 - Overheads charged to 734 328 - Larsen & Toubro Infotech GmbH 102 86 - Larsen & Toubro Infotech Norge AS 25 110 - Larsen & Toubro Infotech UK Limited 265 20 - LTI Middle East FZ-LLC 207 12 Guarantee Commission charged to 9 2 - LTI Middle East FZ-LLC 9 2 Interest income on Loans given to subsidiaries 48 14 - LTI Middle East FZ-LLC 46 10 - Lymbyc India Solutions Private Limited 2 2 - Powerup Cloud Technologies Private Limited 0 2 Buyback of Shares 1,732 10 - Larsen & Toubro Infotech South Africa (Proprietary) Limited - 10 - L&T Infotech Financial Services Technologies Inc. 1,732 - Purchase of Assets 0 1 - Powerup Cloud Technologies Private Limited 0 1 Sale of Assets 45 - - Larsen & Toubro Infotech UK Limited 45 - Loan Given to Subsidiary - 1,116 - LTI Middle East FZ-LLC - 1,105 Loan Repaid by Subsidiary 10 28 - Powerup Cloud Technologies Private Limited 8 28 - Lymbyc India solutions private Limited 2 - Investment in Subsidiary - 37 - LTI Middle East FZ-LLC - 37 Guarantees given on behalf of Subsidiary 770 736 - LTI Middle East FZ-LLC 770 736
43 Related Party Disclosure: (Contd..)
Outstanding balance Subsidiaries
As at March 31, 2022
As at March 31, 2021
Trade receivable 1,918 1,516 - Larsen & Toubro Infotech GmbH 642 654 - Larsen & Toubro Infotech Norge AS 113 263 - LTI Middle East FZ-LLC 392 117 - Larsen & Toubro Infotech UK Limited 302 77 Trade payable 375 275 - Larsen & Toubro Infotech Canada Limited 325 240 - Ruletronics Limited - 31 Loan outstanding 1,173 1,143 - LTI Middle East FZ-LLC 1,145 1,105 Guarantees given on behalf of Subsidiary 764 736 - LTI Middle East FZ-LLC 764 736
Outstanding Balance Fellow subsidiaries
As at March 31, 2022
As at March 31, 2021
Trade receivable 59 391 - Mindtree Limited 54 0 - L&T Technology Services Limited - 227 - L&T Hydrocarbon Engineering Limited - 118 Trade Payable 171 3 - L&T Technology Services Limited 169 - - L&T Technology Services LLC 1 1 - Larsen & Toubro (East Asia) SDN BHD. 1 2 Security Deposits 6 - - L&T Metro Rail (Hyderabad) Ltd 6 - Investment (Principal amount) in debt securities 996 - - L&T Finance Limited 996 -
43 Related Party Disclosure: (Contd..)(H Mn)
D. Transaction Fellow subsidiaries
2021-22 2020-21
- L&T Technology Services Ltd. 874 663 - Mindtree Limited 106 106 Overheads charged by 13 30 - Larsen & Toubro (East Asia) SDN BHD. 8 14 - L&T Technology Services Limited 2 13 - L&T Technology Services LLC 2 2 Overheads charged to 34 64 - L&T Technology Services Limited 31 46 - L&T Hydrocarbon Engineering Limited - 17 Security Deposit paid 6 - - L&T Metro Rail (Hyderabad) Ltd 6 - Interest Income on Debt Securities 19 - - L&T Finance Limited 19 -
(H Mn)
E. Transaction Subsidiaries
2021-22 2020-21
Sale of services / products 5,794 3,351 - Larsen & Toubro Infotech GmbH 1,142 869 - L&T Infotech Financial Services Technologies Inc. 506 366 - Larsen & Toubro Infotech Canada Limited 1,059 1,022 - Larsen & Toubro Infotech Norge AS 434 332 - Larsen & Toubro Infotech UK Limited 1,112 64 Purchases of services / products 4,721 2,206 - Larsen & Toubro Infotech Canada Limited 2,057 1,451 - Nielsen+Partner Pte. Ltd 227 264 - Larsen & Toubro Infotech UK Limited 1,586 -

254 Integrated Annual Report 2021-22 255Standalone
Notes forming part of Standalone Financial Statements Notes forming part of Standalone Financial Statements
Financial StatementsStatutory ReportsCorporate Overview | |
The following balances as on April 1, 2020 have been added to the respective opening balances of the Company
The amount recognised as goodwill pursuant to amalgamation is as follows:
44 Amalgamation of Subsidiaries (Contd..)
(H Mn)
Particulars As at
31-03-2022 As at
31-03-2021
i) the principal amount and the interest due thereon remaining unpaid to any supplier as at the end of each accounting year;
75 82
ii) the amount of interest paid by the Company in terms of section 16 of MSMED Act, 2006, along with the amounts of the payment made to the suppliers beyond the appointed day during the year
- -
iii) the amount of interest due and payable for the period of delay in making payment (which have been paid but beyond the appointed day during the year without adding the interest specified under MSMED Act, 2006
- -
iv) the amount of interest accrued and remaining unpaid at the end of each accounting year; and
- -
v) the amount of further interest remaining due and payable even in the succeeding years, until such date when the interest dues as above are actually paid to the small enterprise, for the purpose of disallowance as a deductible expenditure under section 23 of the MSMED Act, 2006.
- -
(H Mn)
Retained Earnings 10 Other comprehensive income (0)
(H Mn)
Investment in amalgamating company 80 Share capital taken over from the amalgamating company 10 Amount adjusted against reserves and surplus 44 Goodwill 26
45 Acquisition of Subsidiary
On July 1, 2021, the Company has acquired 100% stake in Cuelogic Technologies Private Limited (‘Cuelogic’), along with its 100% subsidiary Cuelogic Technologies Inc for a total enterprise value of USD 8.4 Mn.
46 Segment Reporting
In accordance with Ind AS 108 ‘Operating Segment’, the Company has disclosed Segment information on consolidated basis for the year ended March 31, 2022 which is available as part of the audited consolidated financial statements of the Company
47 Dues to Micro Enterprises and Small Enterprises:
#The management has identified dues to micro and small enterprises as defined under Micro, Small and Medium Enterprises Development Act, 2006 (MSMED) on the basis of information made available by the supplier or vendors of the Company.
43 Related Party Disclosure: (Contd..)(H Mn)
F. Transaction Joint venture of Holding Company
2021-22 2020-21
Sale of services / products - 5 - Calient Technologies Inc - 4
All balances are unsecured and to be settled in cash.
(VI) Managerial remuneration(H Mn)
Particulars 2021-22 2020-21
(i) Short term employee benefits 220 207 (ii) Contribution to funds 14 14 (iii) Share based payments (on employee stock options granted)* 15 -
Particulars 2021-22 2020-21
Mr. Sanjay Jalona 121 112 Mr. Sudhir Chaturvedi 82 75 Mr. Nachiket Deshpande 22 21 Mr. Ashok Kumar Sonthalia - 13 Mr. Anil Rander 24 -
*Share based payments on employee stock options granted (if any) are charged to P&L over vesting period of ESOPs
Note: The above figures do not include provisions for encashable leave, gratuity and premium paid for group health insurance, as separate actuarial valuation /premium paid are not available.
44 Amalgamation of Subsidiaries
Amalgmation of Syncordis Software Services India Private Limited and Ruletronics Systems Private Limited with Larsen & Toubro Infotech Limited
The Scheme of Arrangement (“the Scheme”) for amalgamation between Syncordis Software Services India Private Limited and Ruletronics Systems Private Limited ('Transferor Companies'), wholly owned subsidiaries, with the Company ('Transferee Company') was approved by the Mumbai Bench of National Company Law Tribunal and the Company received the certified true copy of the order on September 6, 2021. The Company has filed the same with Registrar of Companies, Mumbai on September 8, 2021 which is the effective date of amalgamation. The Appointed date of the Scheme is April 1, 2021.
The amalgamation has been accounted under the ‘pooling of interests’ method in accordance with Appendix C of Ind AS 103 'Business Combinations' and the Scheme, on the carrying value of the assets and liabilities of the Transferor Companies as included in the consolidated Balance Sheet of the Company as at the beginning of the previous year. Accordingly, comparatives have been restated to give effect of the amalgamation from the beginning of the previous year and goodwill of H26 Mn has been recognized in the standalone statement of asset and liabilities of the Company as a result of transfer of net assets of H64 Mn.

256 Integrated Annual Report 2021-22 257Standalone
Notes forming part of Standalone Financial Statements Notes forming part of Standalone Financial Statements
Financial StatementsStatutory ReportsCorporate Overview | |
Ratio Numerator Denominator Year ended March 31, 2022
Year ended March 31, 2021 Variance % Reason for
variance
Current Ratio Total current assets Total current liabilities
3.2 3.3 (2%)
Debt-Equity Ratio
Debt consists of lease liabilities
Total equity 0.1 0.1 (16%)
Debt Service Coverage Ratio
Earning for Debt Service = Net Profit after taxes + Non-cash operating expenses + Interest
Debt service= Lease payments
16.4 13.0 26% Improvement in profitability
Return on Equity Ratio
Profit for the year less Preference dividend (if any)
Average total equity
29.5% 29.4% 0%
Trade Receivables turnover ratio
Revenue from operations
Average trade receivables
6.2 5.5 13%
Trade payables turnover ratio
Operating expenses + Other expenses
Average trade payables
3.8 3.0 26% Extended credit period for certain vendors in previous year
Net capital turnover ratio
Revenue from operations
Average working capital (i.e. Total current assets less Total current liabilities)
2.6 2.5 4%
Net profit ratio Profit for the year Revenue from operations
15.7% 15.5% 1%
Return on Capital employed
Profit before tax and finance costs
Capital employed = Net worth + Lease liabilities + Deferred tax liabilities - Deferred tax assets - Goodwill
33.9% 32.4% 5%
Return on investment
Income generated from invested funds
Average invested funds in treasury investments
4.6% 5.7% (21%)
49 Ratios
Particulars As at
31-03-2022 As at
31-03-2021
i) Amount required to be spent by the company during the year
392 326
ii) Amount of expenditure incurred 393 328
iii) Shortfall at the end of the year - -
iv) Total of previous years shortfall - -
v) Reason for shortfall NA NA
vi) Nature of CSR activities The CSR initiatives are primarily in relation to 3 major thrust areas of Education, Empowerment and Environment along with the Covid relief related support initiatives.
vii) Details of related party transactions e.g.,contribution to a trust controlled by the company in relation to CSR expenditure as per relevant Accounting Standard
Entity: Larsen and Toubro Limited (Parent) Nature: Covid relief support- Donation of Oxygen Plant to Government Hospitals Amount: H29 Mn
NA
48 Corporate Social Responsibility (CSR)
Amount required to be spent by the Company on Corporate Social Responsibility (CSR) related activities during the year 2021-22 is H392 Mn. The actual amount spent by the company on Corporate Social Responsibility (CSR) related activities during the year 2021-22 is H393 Mn.
(H Mn)
ParticularsDisclosed under Year ended
March 31, 2022
CSR Expenses Other expenses in note no 33 383CSR Overheads Salary Cost included in note no 29 9Impact Assesment Other expenses in note no 33 1Total 393
Entire amount is spent during the year.

258 Integrated Annual Report 2021-22 PBStandalone
Notes forming part of Standalone Financial Statements
50 Events occurring after the reporting period:
The Board of Directors at its meeting held on April 19, 2022, has recommended final dividend of H30 per equity share (Face value H1) for the financial year ended March 31, 2022.
51 The company is not required to transfer any amount to Investor Education and Protection Fund.
52 In case of figures mentioned as ‘0’ in the financial statements, it denotes figures less than H0.5 Mn.
53 Previous year’s figures have been regrouped/reclassified wherever applicable to facilitate comparability.
54 The financial statements were approved by the Board of Directors on April 19, 2022.
As per our report attached
For B. K. Khare & Co. Sanjay Jalona Nachiket DeshpandeChartered Accountants Chief Executive Officer & Chief Operating Officer & Firm’s Registration No.: 105102W Managing Director Whole-time Director (DIN: 07256786) (DIN: 08385028) Mumbai Mumbai
Padmini Khare Kaicker Anil Rander Tridib BaratPartner Chief Financial Officer Company Secretary & Compliance OfficerMembership No: 044784 Mumbai Mumbai
MumbaiApril 19, 2022
259Corporate Overview | Statutory Reports | Financial Statements
Consolidated
Independent Auditors’ ReportTo the Members of Larsen & Toubro Infotech Limited
Report on the audit of the Consolidated Financial Statements
Opinion
We have audited the accompanying Consolidated Financial Statements of Larsen & Toubro Infotech Limited (hereinafter referred to as “the Parent”), and its subsidiaries (the Parent and its subsidiaries together referred to as “the Group”) which comprise the Consolidated Balance Sheet as at March 31, 2022, the Consolidated Statement of Profit and Loss including Other Comprehensive Income, the Consolidated Statement of Changes in Equity and the Consolidated Statement of Cash Flows for the year then ended, and notes to the Consolidated Financial Statements, including a summary of significant accounting policies and other explanatory information (hereinafter referred to as “the Consolidated Financial Statements”).
In our opinion and to the best of our information and according to the explanations given to us and based on the consideration of reports of the other auditors on separate Financial Statements of the subsidiaries referred to in the Other Matters section below, the aforesaid Consolidated Financial Statements give the information required by the Companies Act, 2013 (“the Act”) in the manner so required and give a true and fair view in conformity with Indian Accounting Standards prescribed under Section 133 of the Act read with the Companies (Indian Accounting Standards) Rules, 2015, as amended (“Ind AS”) and other accounting principles generally accepted in India, of the consolidated state of affairs of the Group as at March 31, 2022, its consolidated profit, its consolidated total comprehensive income, its consolidated changes in equity and its consolidated cash flows for the year ended on that date.
Basis for Opinion
We conducted our audit of the Consolidated Financial Statements in accordance with the Standards on Auditing (SAs) specified under Section 143(10) of the Act. Our responsibilities under those Standards are further described in the ‘Auditors’ Responsibilities for the audit of the Consolidated Financial Statements’ section of our report. We are independent of the Group in accordance with the Code of Ethics issued by the Institute of Chartered Accountants of India (“the ICAI”) together with the ethical requirements that are relevant to our audit of the Consolidated Financial Statements under the provisions of the Act and the Rules made thereunder, and we have fulfilled our other ethical responsibilities in accordance with these requirements and the ICAI’s Code of Ethics. We believe that the audit evidence obtained by us and the audit evidence obtained by the other auditors in terms of their reports referred to in the sub-paragraphs of the Other Matters section below is sufficient and appropriate to provide a basis for our audit opinion on the Consolidated Financial Statements.
Key Audit Matters
Key audit matters are those matters that, in our professional judgment, were of most significance in our audit of the Consolidated Financial Statements for the year ended March 31, 2022. These matters were addressed in the context of our audit of the Consolidated Financial Statements as a whole, and in forming our opinion thereon, and we do not provide a separate opinion on these matters.
We have determined the matters described below to be the key audit matters to be communicated in our report. The results of audit procedures performed by us provide the basis for our audit opinion on the accompanying Consolidated Financial Statements.
Revenue Recognition
Key Audit Matter Accuracy of recognition, measurement, presentation and disclosures of revenue and other related balances in view of the principles laid down under Ind AS 115 “Revenue from Contracts with Customers”.
The application of the revenue accounting standard (Ind AS 115) involves significant judgements/material estimates relating to identification of distinct performance obligations, determination of transaction price of the identified performance obligations, the appropriateness of the basis used to measure revenue recognized over a period.

260 Integrated Annual Report 2021-22 261Corporate Overview | Statutory Reports | Financial Statements
Consolidated
Revenue Recognition
Key Audit Matter Additionally, the standard requires disclosures, which involve collation of information in respect of disaggregated revenue, and periods over which the remaining performance obligations will be satisfied subsequent to the Balance Sheet date.
The Group has also assessed (i) the possibility of constraints to render services which may require revision of estimations of costs to complete the contract because of additional efforts, (ii) onerous obligations, (iii) penalties relating to breaches of service level agreements and (iv) termination or deferment of contracts by customers.
Refer Note 2(f) and Note 27 to the Consolidated Financial Statements for relevant accounting policy and disclosure respectively.
Principal Audit Procedures Our audit approach consisted of testing the design and operating effectiveness of the internal controls and substantive testing as follows:
• Evaluated the design and operating effectiveness of internal controls relating to the application of revenue accounting standard specifically, those relating to identification of the distinct performance obligations and determination of transaction price. Procedures performed included enquiry and observation, reperformance and inspection of evidence in respect of operation of these controls.
• Tested the relevant information technology systems’ access and change management controls relating to contracts and related information used in recording and disclosing revenue in accordance with the revenue accounting standard.
• Selected a sample of continuing and new contracts and performed the following procedures:
• Read, analysed and identified the distinct performance obligations in these contracts.
• Compared such performance obligations with those identified and recorded by the Company.
• Reviewed contract terms to determine the transaction price including any variable consideration to determine the appropriate transaction price for computing revenue and to test the basis of estimation of the variable consideration.
• Samples in respect of revenue recorded for time and material contracts were tested through a review of approved time sheets including customer acceptances, subsequent invoicing and historical trend of collections and disputes.
• In respect of samples relating to fixed price contracts, progress towards satisfaction of performance obligation used to compute recorded revenue was verified with actual and estimated efforts from the time recording and contracting systems. We also tested the access and change management controls relating to these systems.
• Performed analytical procedures for reasonableness of revenue disclosed by type and service offerings.
• We reviewed the collation of information and the logic of the report generated from the management system used to prepare the disclosure relating to the periods over which the remaining performance obligations will be satisfied after the Balance Sheet date.
Revenue Recognition
Assessment of provisions and contingent liability in respect of compliance with various laws and regulations as applicable
Key Audit Matter Adequacy of provisioning and assessing of contingent liabilities in respect of compliance with local and international laws and regulations including Income tax assessments.
The nature of Company’s operations carries a compliance risk as well as financial risk in terms of recognition and measurement of any provision and disclosure of contingent liability on account of possible non-compliance with local and international laws and regulations. In some cases, an auditor may require a critical evaluation of legal positions/opinions taken by the Company involving a complex matter and a high degree of professional judgment.
Refer Note 2(u) and Note 36 to the Consolidated Financial Statements for relevant accounting policy and disclosure respectively.
Principal Audit Procedures • We have evaluated the design and operating controls in relation to the compliance tracker maintained by the Company with respect to compliance with local and international laws and regulations.
• We read the summary of litigation matters provided by management and held discussions with the Company’s legal counsel.
• We have also enquired with some of the Company’s external legal advisors with respect to the matters and examined related correspondence including advices for foreign branch compliances and obtained an external legal confirmation, wherever appropriate.
• In respect of provisions against litigation and the assessment of contingent liabilities, we tested the calculation of the provisions/contingent liability assessment; we reviewed the assumptions against third party data, where available, and assessed the estimates against historical trends. We considered management’s judgements on the level of provisioning/recognition of contingent liability as appropriate.
Impairment testing of Goodwill in Consolidated Financial Statements
Key Audit Matter Auditing standards require at least an annual testing of carrying value of goodwill. Value of Goodwill is a result of management’s estimate of future cash flows from the relevant entity/cash generating unit.
As required by Ind AS 36 Impairment of Assets, the Company/Group annually carries impairment assessment of goodwill using a discounted cash flow model to estimate the recoverable value which is based on net present value of forecast earnings of cash generating units. The impairment test is a complex process. It involves high degree of judgement based on assumptions around discount rates, growth rates, cash flow forecasts that may contain certain inherent uncertainties in forecasting. Management has also carried out sensitivity analysis for all key assumptions, including the cash flow projections, consequent to the change in estimated future economic conditions.
Refer Note 2(l) and Note 5 to the Consolidated Financial Statements for relevant accounting policy and disclosure respectively.

262 Integrated Annual Report 2021-22 263Corporate Overview | Statutory Reports | Financial Statements
Consolidated
Revenue Recognition
Principal Audit procedures • We evaluated the appropriateness of management’s identification of the Group’s CGUs and the continued satisfactory operation of the Group’s controls over the impairment assessment process.
• Our procedures included discussion with management on the suitability of the impairment model and reasonableness of the assumptions, through performing the following procedures:
• Obtaining management’s assessment of recoverable amounts of relevant entities, testing the mathematical accuracy of the cash flow models and ensuring that the projections used agrees with the management approved long range plans. Assessing the reliability of management’s forecast through a review of actual performance against previous forecasts.
• Benchmarking company’s key market-related assumptions in management’s valuation models with industry comparators and with assumptions made in the prior years including revenue and margin trends, capital expenditure and market share and customer churn, foreign exchange rates and discount rates, against external data available.
Information other than the Financial Statements and Auditors’ Report thereon
The Parent Company’s Board of Directors is responsible for the other information. The other information at the date of this Auditors’ Report comprises the information included in the Annual Report, but does not include the Consolidated Financial Statements and our Auditors’ Report thereon. Our opinion on the Consolidated Financial Statements does not cover the other information and we do not express any form of assurance conclusion thereon.
In connection with our audit of the Consolidated Financial Statements, our responsibility is to read the other information, compare with the Financial statements of the Company and Financial Statements of the subsidiaries audited by the other auditors, to the extent it relates to those entities and, in doing so, place reliance on the work of the other auditors and consider whether such other information is materially inconsistent with the Consolidated Financial Statements or our knowledge obtained during the course of our audit or otherwise appears to be materially misstated. Other information so far as it relates to the subsidiaries is traced from their Financial Statements audited by the other auditors.
If, based on the work we have performed, we conclude that there is a material misstatement of this other information, we are required to report that fact. We have nothing to report in this regard.
Responsibilities of Management for the Consolidated Financial Statements
The Parent’s Board of Directors is responsible for the matters stated in Section 134(5) of the Act with respect to the preparation of these Consolidated Financial Statements
that give a true and fair view of the consolidated financial position, consolidated financial performance including other comprehensive income, consolidated changes in equity and consolidated cash flows of the Group in accordance with the Ind AS and other accounting principles generally accepted in India. The respective Board of Directors of the companies included in the Group are responsible for maintenance of adequate accounting records in accordance with the provisions of the Act for safeguarding of the assets of the Group and for preventing and detecting frauds and other irregularities; selection and application of appropriate accounting policies; making judgments and estimates that are reasonable and prudent; and the design, implementation and maintenance of adequate internal financial controls, that were operating effectively for ensuring the accuracy and completeness of the accounting records, relevant to the preparation and presentation of the Consolidated Financial Statements that give a true and fair view and are free from material misstatement, whether due to fraud or error, which have been used for the purpose of preparation of the Consolidated Financial Statements by the Directors of the Parent, as aforesaid.
In preparing the Consolidated Financial Statements, the respective Board of Directors of the companies included in the Group are responsible for assessing the ability of the respective entities to continue as a going concern, disclosing, as applicable, matters related to going concern and using the going concern basis of accounting unless the respective Board of Directors either intends to liquidate or cease operations, or has no realistic alternative but to do so.
Those respective Board of Directors of the companies included in the Group are also responsible for overseeing the financial reporting process of the Group.
Auditors’ Responsibilities for the audit of the Consolidated Financial Statements
Our objectives are to obtain reasonable assurance about whether the Consolidated Financial Statements as a whole are free from material misstatement, whether due to fraud or error, and to issue an auditors’ report that includes our opinion. Reasonable assurance is a high level of assurance, but is not a guarantee that an audit conducted in accordance with SAs will always detect a material misstatement when it exists. Misstatements can arise from fraud or error and are considered material if, individually or in the aggregate, they could reasonably be expected to influence the economic decisions of users taken on the basis of these Consolidated Financial Statements.
As part of an audit in accordance with SAs, we exercise professional judgment and maintain professional skepticism throughout the audit.
We also:
• Identify and assess the risks of material misstatement of the Consolidated Financial Statements, whether due to fraud or error, design and perform audit procedures responsive to those risks, and obtain audit evidence that is sufficient and appropriate to provide a basis for our opinion. The risk of not detecting a material misstatement resulting from fraud is higher than for one resulting from error, as fraud may involve collusion, forgery, intentional omissions, misrepresentations, or the override of internal control.
• Obtain an understanding of internal control relevant to the audit in order to design audit procedures that are appropriate in the circumstances. Under Section 143(3)(i) of the Act, we are also responsible for expressing our opinion on whether the Parent has adequate internal financial controls system in place and the operating effectiveness of such controls.
• Evaluate the appropriateness of accounting policies used and the reasonableness of accounting estimates and related disclosures made by the management.
• Conclude on the appropriateness of management’s use of the going concern basis of accounting and, based on the audit evidence obtained, whether a material uncertainty exists related to events or conditions that may cast significant doubt on the ability of the Group to continue as a going concern. If we conclude that a material uncertainty exists, we are required to draw attention in our auditors’ report to the related disclosures in the Consolidated Financial Statements or, if such disclosures are inadequate, to modify our opinion. Our conclusions are based on the audit evidence obtained
up to the date of our auditors’ report. However, future events or conditions may cause the Group to cease to continue as a going concern.
• Evaluate the overall presentation, structure and contents of the Consolidated Financial Statements, including the disclosures, and whether the Consolidated Financial Statements represent the underlying transactions and events in a manner that achieves fair presentation.
• Obtain sufficient appropriate audit evidence regarding the financial information of the entities or business activities within the Group of which we are the independent auditors and whose financial information we have audited, to express an opinion on the Consolidated Financial Statements. We are responsible for the direction, supervision and performance of the audit of the Financial Statements of such entities or business activities included in the Consolidated Financial Statements of which we are the independent auditors. For the other entities included in the Consolidated Financial Statements, which have been audited by other auditors, such other auditors remain responsible for the direction, supervision and performance of the audits carried out by them. We remain solely responsible for our audit opinion.
Materiality is the magnitude of misstatements in the Consolidated Financial Statements that, individually or in aggregate, makes it probable that the economic decisions of a reasonably knowledgeable user of the Consolidated Financial Statements may be influenced. We consider quantitative materiality and qualitative factors in (i) planning the scope of our audit work and in evaluating the results of our work; and (ii) to evaluate the effect of any identified misstatements in the Consolidated Financial Statements.
We communicate with those charged with governance of the Parent and such other companies included in the Consolidated Financial Statements of which we are the independent auditors regarding, among other matters, the planned scope and timing of the audit and significant audit findings, including any significant deficiencies in internal control that we identify during our audit.
We also provide those charged with governance with a statement that we have complied with relevant ethical requirements regarding independence, and to communicate with them all relationships and other matters that may reasonably be thought to bear on our independence, and where applicable, related safeguards.
From the matters communicated with those charged with governance, we determine those matters that were of most significance in the audit of the Consolidated Financial Statements for the financial year ended March 31, 2022 and

264 Integrated Annual Report 2021-22 265Corporate Overview | Statutory Reports | Financial Statements
Consolidated
are therefore the key audit matters. We describe these matters in our auditors’ report unless law or regulation precludes public disclosure about the matter or when, in extremely rare circumstances, we determine that a matter should not be communicated in our report because the adverse consequences of doing so would reasonably be expected to outweigh the public interest benefits of such communication.
Other Matters
We did not audit the financial statements of six subsidiaries included in the Consolidated Financial Statements, whose financial statements reflect total assets of H8,483 Mn as at March 31, 2022 and total revenues of H14,269 Mn, total net profit after tax of H1,498 Mn, total comprehensive income of H1,489 Mn and net cash inflows of H(2,251) Mn for the year ended March 31, 2022 as considered in the Consolidated Financial Statements. These financial statements have been audited by other auditors whose reports have been furnished to us by the management and our opinion on the Consolidated Financial Statements, in so far as it relates to the amounts and disclosures included in respect of these subsidiaries is based solely on the reports of the other auditors and the procedures performed by us as stated under ‘Auditors’ Responsibilities for the audit of the Consolidated Financial Statements’ section above.
Certain of the subsidiaries / step down subsidiaries of the Group are located outside India, whose Financial Statements and other financial information has been prepared in accordance with the accounting principles generally accepted in their respective countries and which have been audited by other auditors under generally accepted auditing standards applicable in their respective countries. The management of these entities have converted the Financial Statements of such subsidiaries / step down subsidiaries located outside India from accounting principles generally accepted in the respective countries to the accounting principles generally accepted in India. Our opinion in so far as it relates to the balances and affairs of such subsidiaries and step down subsidiaries located outside India is based on the report of the other auditors and the conversion adjustments prepared by the management of the Company and audited by us.
We or other auditors have not audited the Financial Statements of twenty one subsidiaries / step down subsidiaries whose Financial Statements reflect total assets of H9,949 Mn, total revenues of H9,336 Mn, total net profit after tax of H(83) Mn, total comprehensive income of H(56) Mn and net cash inflows of H(206) Mn as of and for the year ended March 31, 2022 as considered in the Consolidated Financial Statements. These Financial Statements are unaudited and have been furnished to us by the management and our
opinion on the Consolidated Financial Statements, in so far as it relates to the amounts and disclosures included in respect of these subsidiaries / step down subsidiaries, and our report in so far as it relates to the aforesaid subsidiaries, is based solely on such unaudited Financial Statements. In our opinion and according to the information and explanations given to us by the management, these Financial Statements are not material to the Group.
Our opinion on the Consolidated Financial Statements, and our report on other Legal and Regulatory requirements, is not modified in respect of the above matters with respect to our reliance on the work performed and the reports of the other auditors and the Financial Statements and other financial information certified by the management.
Report on other Legal and Regulatory requirements
1. The Company has certain subsidiaries incorporated outside India where reporting requirements under the Companies Act, 2013 are not applicable and hence, the provisions of Clause 3(xxi) of the Companies (Auditor’s Report) Order, 2020 are not applicable to the Company. Further, the Company has the following subsidiaries incorporated in India where the audit reports have not been issued till date:
(a) Powerupcloud Technologies Private Limited
(b) Lymbyc Solutions Private Limited
(c) Cuelogic Technologies Private Limited
2. As required by Section 143(3) of the Act, based on our audit and on the consideration of the reports of the other auditors on the separate financial information of the subsidiaries referred to in the Other Matters section above we report, to the extent applicable that:
(a) We have sought and obtained all the information and explanations which to the best of our knowledge and belief were necessary for the purposes of our audit of the aforesaid Consolidated Financial Statements.
(b) In our opinion, proper books of account as required by law relating to preparation of the aforesaid Consolidated Financial Statements have been kept so far as it appears from our examination of those books and reports of the other auditors.
(c) The Consolidated Balance Sheet, the Consolidated Statement of Profit and Loss including the Consolidated Statement of Other Comprehensive Income, the Consolidated Statement of Changes in Equity and the Consolidated Cash Flow Statement
dealt with by this report are in agreement with the books of account maintained for the purpose of preparation of the Consolidated Financial Statements.
(d) In our opinion, the aforesaid Consolidated Financial Statements comply with the Accounting Standards specified under Section 133 of the Act.
(e) On the basis of the written representations received from the directors of the Parent as on March 31, 2022 taken on record by the Board of Directors of the Company, none of the directors of the Parent is disqualified as on March 31, 2022 from being appointed as a director in terms of Section 164(2) of the Act.
(f) With respect to the adequacy of the internal financial controls with reference to financial statements and the operating effectiveness of such controls, refer to our separate report in Annexure A which is based on the auditors’ report of the Parent. Our report expresses an unmodified opinion on the adequacy and operating effectiveness of internal financial controls with reference to financial statements of those companies.
(g) In our opinion, the managerial remuneration for the year ended March 31, 2022 has been paid / provided by the Parent to their directors in accordance with the provisions of Section 197 read with Schedule V to the Act.
(h) With respect to the other matters to be included in the Auditors’ Report in accordance with Rule 11 of the Companies (Audit and Auditors) Rules, 2014, as amended, in our opinion and to the best of our information and according to the explanations given to us and based on the consideration of the reports of the other auditors on separate Financial Statements as also the other financial information of the subsidiaries as noted in the ‘Other Matters’ paragraph:
(i) The Consolidated Financial Statements disclose the impact of pending litigations on consolidated financial position of the Group in its Consolidated Financial Statements – Refer Note 36 to the Consolidated Financial Statements;
(ii) The Group did not have any long-term contracts including derivative contracts for which there were any material foreseeable losses;
(iii) There were no amounts which were required to be transferred to the Investor Education and Protection Fund by the Company;
(iv) (a) The management has represented that, to the best of its knowledge and belief, no funds have been advanced or loaned or invested (either from borrowed funds or share premium or any other sources or kind of funds) by the Company to or in any other person(s) or entity(ies), including foreign entities (“Intermediaries”), with the understanding, whether recorded in writing or otherwise, that the Intermediary shall:
(i) directly or indirectly lend or invest in other persons or entities identified in any manner whatsoever (“Ultimate Beneficiaries”) by or on behalf of the Company or
(ii) provide any guarantee, security or the like on behalf of the Ultimate Beneficiaries;
(b) The management has represented that, to the best of its knowledge and belief, no funds have been received by the Company from any person(s) or entity(ies), including foreign entities (“Funding Parties”), with the understanding, whether recorded in writing or otherwise, that the Company shall:
(i) directly or indirectly, lend or invest in other persons or entities identified in any manner whatsoever (“Ultimate Beneficiaries”) by or on behalf of the Funding Party or
(ii) provide any guarantee, security or the like on behalf of the Ultimate Beneficiaries;
(c) Based on such audit procedures as considered reasonable and appropriate in the circumstances, nothing has come to our notice that has caused us to believe that the representations under sub-clause (a) and (b) contain any material misstatement; and
(v) The dividend declared/paid/declared and paid during the year by the Parent is in compliance with Section 123 of the Act.
For B. K. Khare & Co.Chartered Accountants
Firm Registration No. 105102W
Padmini Khare KaickerPartner
Place: Mumbai Membership No. 044784Date: April 19, 2022 UDIN: 22044784AHIEMI6444

266 Integrated Annual Report 2021-22 267Corporate Overview | Statutory Reports | Financial Statements
Consolidated
Annexure A to the Independent Auditors’ Report[Referred to under ‘Report on Other Legal and Regulatory Requirements’ section of our report of even date]
Report on the Internal Financial Controls with reference to consolidated financial statements under Clause (i) of sub-section (3) of Section 143 of the Companies Act, 2013 (“the Act”)
In conjunction with our audit of the consolidated financial statements of Larsen & Toubro Infotech Limited as of and for the year ended March 31, 2022, we have audited the internal financial controls with reference to consolidated financial statements of Larsen & Toubro Infotech Limited (hereinafter referred to as the “Parent”) as of that date.
Management’s Responsibility for Internal Financial Controls
The respective Board of Directors of the Parent and its subsidiary companies which are companies incorporated in India, are responsible for establishing and maintaining internal financial controls based on the internal control over financial reporting criteria established by the respective companies considering the essential components of internal control stated in the Guidance Note on Audit of Internal Financial Controls Over Financial Reporting issued by the Institute of Chartered Accountants of India (“the ICAI”). These responsibilities include the design, implementation and maintenance of adequate internal financial controls that were operating effectively for ensuring the orderly and efficient conduct of its business, including adherence to the respective company’s policies, the safeguarding of its assets, the prevention and detection of frauds and errors, the accuracy and completeness of the accounting records, and the timely preparation of reliable financial information, as required under the Act.
Auditors’ Responsibility
Our responsibility is to express an opinion on the internal financial controls with reference to consolidated financial statements of the Parent based on our audit.
We conducted our audit in accordance with the Guidance Note on Audit of Internal Financial Controls Over Financial Reporting (“the Guidance Note”) issued by the Institute of Chartered Accountants of India and the Standards on
Auditing prescribed under Section 143(10) of the Act, to the extent applicable to an audit of internal financial controls. Those Standards and the Guidance Note require that we comply with ethical requirements and plan and perform the audit to obtain reasonable assurance about whether adequate internal financial controls with reference to consolidated financial statements was established and maintained and if such controls operated effectively in all material respects.
Our audit involves performing procedures to obtain audit evidence about the adequacy of the internal financial controls system with reference to consolidated financial statements and their operating effectiveness. Our audit of internal financial controls with reference to consolidated financial statements included obtaining an understanding of internal financial controls with reference to consolidated financial statements, assessing the risk that a material weakness exists, and testing and evaluating the design and operating effectiveness of internal control based on the assessed risk. The procedures selected depend on the auditor’s judgement, including the assessment of the risks of material misstatement of the financial statements, whether due to fraud or error.
We believe that the audit evidence we have obtained is sufficient and appropriate to provide a basis for our audit opinion on the internal financial controls system with reference to consolidated financial statements.
Meaning of Internal Financial Controls with reference to financial statements
A company’s internal financial control with reference to consolidated financial statements is a process designed to provide reasonable assurance regarding the reliability of financial reporting and the preparation of financial statements for external purposes in accordance with generally accepted accounting principles. A company’s internal financial control with reference to consolidated financial statements includes those policies and procedures that (1) pertain to the maintenance of records that, in reasonable detail, accurately and fairly reflect the transactions and dispositions of the assets of the company; (2) provide reasonable assurance that
transactions are recorded as necessary to permit preparation of financial statements in accordance with generally accepted accounting principles, and that receipts and expenditures of the company are being made only in accordance with authorisations of management and directors of the company; and (3) provide reasonable assurance regarding prevention or timely detection of unauthorised acquisition, use, or disposition of the company’s assets that could have a material effect on the financial statements.
Inherent Limitations of Internal Financial Controls with reference to financial statements
Because of the inherent limitations of internal financial controls with reference to consolidated financial statements, including the possibility of collusion or improper management override of controls, material misstatements due to error or fraud may occur and not be detected. Also, projections of any evaluation of the internal financial controls with reference to consolidated financial statements to future periods are subject to the risk that the internal financial control with reference to consolidated financial statements may become inadequate because of changes in conditions, or that the degree of compliance with the policies or procedures may deteriorate.
Opinion
In our opinion to the best of our information and according to the explanations given to us, the Parent, has, in all material respects, an adequate internal financial controls system with reference to consolidated financial statements and such internal financial controls with reference to consolidated financial statements were operating effectively as at March 31, 2022, based on the criteria for internal financial control with reference to consolidated financial statements established by the respective companies considering the essential components of internal control stated in the Guidance Note on Audit of Internal Financial Controls Over Financial Reporting issued by the Institute of Chartered Accountants of India.
For B. K. Khare & Co.Chartered Accountants
Firm Registration No. 105102W
Padmini Khare KaickerPartner
Place: Mumbai Membership No. 044784Date: April 19, 2022 UDIN: 22044784AHIEMI6444

268 Integrated Annual Report 2021-22 269Corporate Overview | Statutory Reports | Financial Statements
Consolidated
Balance Sheet as at March 31, 2022
As per our report attached
For B. K. Khare & Co. Sanjay Jalona Nachiket DeshpandeChartered Accountants Chief Executive Officer & Managing Director Chief Operating Officer & Whole-time DirectorFirm’s Registration No.: 105102W (DIN: 07256786) (DIN: 08385028) Mumbai Mumbai
Padmini Khare Kaicker Anil Rander Tridib BaratPartner Chief Financial Officer Company Secretary & Compliance OfficerMembership No: 044784 Mumbai Mumbai
MumbaiApril 19, 2022
(H Mn)
ParticularsNote No.
As atMarch 31, 2022
As atMarch 31, 2021
ASSETSNon-current assets(a) Property, Plant and Equipment 5 4,968 3,857 (b) Right of Use Asset 40(I) 6,391 6,221 (c) Capital work-in-progress 5 4,374 403 (d) Goodwill 5 6,900 6,574 (e) Other Intangible assets 5 2,718 2,408 (f) Intangible assets under development 5 439 259 (g) Financial Assets (i) Investments 6 3,454 1,013 (ii) Other financial assets 7 3,020 2,052 (h) Deferred Tax Assets(Net) 8 549 546 (i) Income tax Assets (net) 1,135 930 (j) Other non-current assets 9 2,089 1,515 Total Non-Current Assets 36,037 25,778 Current assets(a) Financial Assets (i) Investments 10 31,366 36,282 (ii) Trade receivable 11 28,335 20,835 (iii) Unbilled Revenue 12 9,033 6,071 (iv) Cash and Cash Equivalents 13 3,949 7,594 (v) Other bank balances 14 3,824 - (vi) Other Financial Assets 15 2,830 2,158(b) Other current assets 16 9,319 8,373Total Current Assets 88,656 81,313 TOTAL ASSETS 124,693 107,091 EQUITY AND LIABILITIESEquity(a) Equity Share capital 17 175 175 (b) Other Equity (i) Other Reserves 18 12,187 11,294 (ii) Retained Earnings 18 75,784 61,565 (c) Non controlling interest 18 57 37 Total Equity 88,203 73,071 LiabilitiesNon-current liabilities(a) Financial Liabilities (i) Lease Liabilities 40(II) 6,675 6,375 (ii) Other financial liabilities 19 134 445 (b) Other non current liabilities 20 - 479 (c) Deferred tax liabilities (net) 8 105 35 (d) Provisions 21 393 363 Total Non-Current Liabilities 7,307 7,697 Current liabilities(a) Financial Liabilities (i) Borrowings 22 519 414 (ii) Trade payables - Due to micro and small enterprises 23 75 82 - Due to other than micro and small enterprises 23 7,953 8,195 (iii) Other financial liabilities 24 9,360 7,831 (iv) Lease liabilities 40(II) 1,161 1,194 (b) Other Current Liabilities 25 5,812 4,921 (c) Provisions 26 3,874 3,542 (d) Income tax Liabilities (Net) 429 144 Total Current Liabilities 29,183 26,323 TOTAL EQUITY AND LIABILITIES 124,693 107,091 Significant Accounting Policies 2Other notes to accounts 36-49
Statement of Profit and Lossfor the year ended March 31, 2022
As per our report attached
For B. K. Khare & Co. Sanjay Jalona Nachiket DeshpandeChartered Accountants Chief Executive Officer & Chief Operating Officer & Firm’s Registration No.: 105102W Managing Director Whole-time Director (DIN: 07256786) (DIN: 08385028) Mumbai Mumbai
Padmini Khare Kaicker Anil Rander Tridib BaratPartner Chief Financial Officer Company Secretary & Compliance OfficerMembership No: 044784 Mumbai Mumbai
MumbaiApril 19, 2022
(H Mn)
ParticularsNote No.
April 21-March 22 April 20-March 21
Income from operationsRevenue from operations 27 156,687 123,698 Other income 28 4,667 2,744 Total income 161,354 126,442 Expenses:Employee Benefits Expense 29 97,007 74,289 Operating expenses 30 26,565 20,194 Finance costs 31 728 788 Depreciation and Amortisation expense 32 3,549 3,325 Other expenses 33 2,531 1,964 Total Expenses 130,380 100,560 Profit before tax 30,974 25,882 Tax expense Current tax 34 (I) 8,181 6,314 Deferred tax 34 (II) (192) 186
7,989 6,500 Net Profit for the period 22,985 19,382 Other Comprehensive Income 35A. Items that will not be reclassified subsequently to profit or loss, net 25 36 B. Items that will be reclassified subsequently to profit or loss, net 762 4,752 Total other comprehensive income 787 4,788 Total Comprehensive Income for the period 23,772 24,170 Profit Attributable to :Owners of the Company 22,968 19,361 Non- Controlling interests 17 21
22,985 19,382 Total Comprehensive Income Attributable to :Owners of the Company 23,752 24,146 Non- Controlling interests 20 24
23,772 24,170 BasicBasic earning per equity share 41 131.19 110.98 DilutedDiluted earning per equity share 41 130.81 110.26 Significant Accounting Policies 2Other notes to accounts 36-49

270 Integrated Annual Report 2021-22 271Corporate Overview | Statutory Reports | Financial Statements
Consolidated
Consolidated Cash Flow Statementfor the year ended March 31, 2022
(H Mn)
Particulars April 21- March 22 April 20- March 21
A. CASH FLOW FROM OPERATING ACTIVITIES
Net profit after tax 22,985 19,382
Adjustments to reconcile net profit to net cash provided by operating activities:
Depreciation and amortisation 3,549 3,325
Income tax expense 7,989 6,500
Expense recognised in respect of equity settled stock option 108 168
Realised income from current investment (1,076) (982)
Unrealised income from current investment (133) (560)
Interest received (393) (162)
Interest expense 728 788
Unrealised foreign exchange (gain)/loss 2 (176)
Provision for doubtful debts (net) 384 232
Change in fair value of contingent consideration 71 (592)
Gain from lease short close (20) (83)
Unrealised gain from finance lease (11) (145)
Gain on sale of property, plant and equipment (8) (3)
Operating profit before working capital changes 34,175 27,692
Changes in working capital
Increase in trade receivables & unbilled revenue (10,600) (203)
Increase in other receivables (1,507) (1,968)
Increase in trade & other payables 2,565 4,875
(Increase)/decrease in working capital (9,542) 2,704
Cash generated from operations 24,633 30,396
Income taxes paid (8,113) (6,400)
Net cash (used in)/generated from operating activities 16,520 23,996
B. CASH FLOW FROM INVESTING ACTIVITIES
Purchase of fixed assets (8,590) (2,719)
Sale of fixed assets 34 54
Purchase of investments (net) (1,635) (14,611)
Payment towards contingent consideration pertaining to acquisition of business
(427) (408)
Payment towards business acquisition (net of cash) (352) (18)
Interest received 300 160
Realized income from current investment 1,076 982
Net cash (used in) from investing activities (9,594) (16,560)
Consolidated Cash Flow Statementfor the year ended March 31, 2022
(H Mn)
Particulars April 21- March 22 April 20- March 21
C. CASH FLOW FROM FINANCING ACTIVITIES
Proceeds from issue of share capital 0 1
Proceeds from borrowings 105 94
Deposit under Credit support agreement received/(paid) (89) 1,759
Payment towards lease liabilities (net) (1,677) (1,602)
Interest paid (48) (21)
Dividend paid (8,749) (5,319)
Net cash (used in) from financing activities (10,458) (5,088)
Net increase/(decrease) in cash and cash equivalents (3,532) 2,348
Cash and cash equivalents at beginning of the period 7,594 5,252
Effect of exchange differences on translation of foreign currency cash and cash equivalents
(113) (6)
Cash and cash equivalents at end of the period (Refer Note 13) 3,949 7,594
As per our report attached
For B. K. Khare & Co. Sanjay Jalona Nachiket DeshpandeChartered Accountants Chief Executive Officer & Chief Operating Officer & Firm’s Registration No.: 105102W Managing Director Whole-time Director (DIN: 07256786) (DIN: 08385028) Mumbai Mumbai
Padmini Khare Kaicker Anil Rander Tridib BaratPartner Chief Financial Officer Company Secretary & Compliance OfficerMembership No: 044784 Mumbai Mumbai
MumbaiApril 19, 2022

272 Integrated Annual Report 2021-22 273Corporate Overview | Statutory Reports | Financial Statements
Consolidated
Consolidated Statement of Changes in EquityA. Equity Share Capital For the year ended March 31, 2022
(H Mn)
Particulars
Share application
money on pending
allotment
General Reserve
Share Premium
Retained Earnings
Employee Stock
options outstanding
Deferred employee
compensation expense
Capital reserve
Other Components of Equity Equity attributable
to equity holders
of the company
Non-controlling
interest
Total Equity Hedging
Reserve FCTR
Other Comprehensive
Income
Balance as on April 1, 2021
- 4,508 2,862 61,565 794 (288) 0 2,200 1,090 128 72,859 37 72,896
Employee Stock Compensation Expense
- - - - 211 (211) - - - - - - -
Net Profit for the year
- - - 22,968 - - - - - - 22,968 17 22,985
Other Comprehensive Income
- - - - - - - 618 141 25 784 3 787
Dividends - - - (8,749) - - - - - - (8,749) - (8,749)
Other changes/ transfer to general reserve
0 - 286 - (422) 245 - - - - 109 - 109
Balance as on March 31, 2022
0 4,508 3,148 75,784 583 (254) 0 2,818 1,231 153 87,971 57 88,028
(H Mn)
Balance as on April 1, 2021Changes in equity share capital
during the yearBalance as on March 31, 2022
175 0 175
(H Mn)
Balance as on April 1, 2020Changes in equity share capital
during the yearBalance as on March 31, 2021
174 1 175
For the year ended March 31, 2021
B Other Equity For the year ended March 31, 2022
Consolidated Statement of Changes in Equity
(H Mn)
Particulars
Share application
money on pending
allotment
General Reserve
Share Premium
Retained Earnings
Employee Stock
options outstanding
Deferred employee
compensation expense
Capital reserve
Other Components of Equity Equity attributable
to equity holders
of the company
Non-controlling
interest
Total Equity Hedging
Reserve FCTR
Other Comprehensive
Income
Balance as on April 1, 2020
- 4,506 2,514 47,530 1,062 (379) 0 (2,149) 690 92 53,866 11 53,877
Employee Stock Compensation Expense
- - - - 196 (196) - - - - - - -
Net Profit for the year
- - - 19,361 - - - - - - 19,361 21 19,382
Other Comprehensive Income
- - - - - - - 4,349 400 36 4,785 3 4,788
Dividends - - - (5,324) - - - - - - (5,324) - (5,324)
Increase in non-controlling interest due to Divestment
- - - (2) - - - - - - (2) 2 -
Other changes/ Transfer to general reserve
- 2 348 - (464) 287 0 - - - 173 - 173
Balance as on March 31, 2021
- 4,508 2,862 61,565 794 (288) 0 2,200 1,090 128 72,859 37 72,896
B Other Equity (Contd..) For the year ended March 31, 2021
As per our report attached
For B. K. Khare & Co. Sanjay Jalona Nachiket DeshpandeChartered Accountants Chief Executive Officer & Chief Operating Officer & Firm’s Registration No.: 105102W Managing Director Whole-time Director (DIN: 07256786) (DIN: 08385028) Mumbai Mumbai
Padmini Khare Kaicker Anil Rander Tridib BaratPartner Chief Financial Officer Company Secretary & Compliance OfficerMembership No: 044784 Mumbai Mumbai
MumbaiApril 19, 2022

274 Integrated Annual Report 2021-22 275Corporate Overview | Statutory Reports | Financial Statements
Consolidated
Notes forming part of Consolidated Financial Statements Notes forming part of Consolidated Financial Statements
1. Group overview
Larsen & Toubro Infotech Limited (‘the Company’) together with its subsidiaries shall mean Larsen & Toubro Infotech Limited (‘the Group’). The Group offers extensive range of IT services like application development, maintenance and outsourcing, enterprise solutions, infrastructure management services, testing, digital solutions, and platform-based solutions to the clients in diverse industries.
The Company is a public limited company incorporated and domiciled in India and has its registered office at L&T House, Ballard Estate, Mumbai - 400 001, Maharashtra, India. The Company’s equity shares are listed on the National Stock Exchange of India Limited and BSE Limited in India.
2. Significant accounting policies
a. Basis of accounting and Statement of compliance
The consolidated financial statements have been prepared in accordance with Indian Accounting Standards (Ind AS) as prescribed under Section 133 of the Companies Act, 2013 read with Rule 3 of the Companies (Indian Accounting Standards) Rules, 2015 (as amended from time to time).
The financial statements of Indian subsidiaries have been prepared in compliance with Ind AS, under the historical cost convention on accrual basis except for certain financial instruments which are measured at fair values, as prescribed under Section 133 of the Companies Act, 2013, read with Rule 3 of the Companies (Indian Accounting Standards) Rules, 2015 (as amended from time to time). Financial statements of foreign subsidiaries have been prepared in compliance with the local laws and applicable Accounting Standards. Necessary adjustments for differences in the accounting policies, if any, have been made in the consolidated financial statements.
Accounting policies have been consistently applied except where a newly issued accounting standard is initially adopted or a revision to an existing accounting standard requires a change in the accounting policy hitherto in use.
Amounts in the consolidated financial statements are presented in Indian Rupees in millions [10 Lakhs = 1 Mn]
as permitted by Schedule III to the Companies Act, 2013. Per share data are presented in Indian Rupees.
Preparation of financial statements in conformity with Indian Accounting Standards (Ind AS) requires the management of the Group to make estimates and assumptions that affect the income and expense reported for the period and assets, liabilities and disclosures reported as of the date of the financial statements. Examples of such estimates include useful lives of tangible and intangible assets, provision for doubtful debts, future obligations in respect of retirement benefit plans, etc. Actual results could vary from these estimates. Estimates and underlying assumptions are reviewed on an ongoing basis. Revisions to accounting estimates are recognised in the period in which the estimates are revised, and by giving prospective impact in the standalone financial statements.
The Group has considered the possible effects that may result from Covid-19 on the recoverable values of its financial and non-financial assets. The impact of Covid-19 on the consolidated financial statements may differ from that estimated as at the date of approval of these consolidated financial statements.
b. Presentation of consolidated financial statements
The statement of financial position (including statement of changes in equity) and the statement of profit and loss are prepared and presented in the format prescribed in Division II of Schedule III to the Companies Act, 2013, as amended from time to time. The cash flow statement has been prepared and presented as per the requirements of Ind AS 7 “Cash Flow Statements”. The disclosure requirements with respect to items in the balance sheet and statement of profit and loss, as prescribed in Schedule III to the Act, are presented by way of notes forming part of financial statements along with the other notes required to be disclosed under the notified Accounting Standards.
c. Operating cycle for current and non-current classification
The Group identifies asset/liabilities as current if the same are receivable/payable within twelve months else the same are considered as non-current.
d. Principles of consolidation
The consolidated financial statements comprise the financial statements of the Company and its subsidiaries.
Control is achieved when the company is exposed to or has rights to variable returns from its involvement with the investee and can affect those returns through its power over the investee. Specifically, the company controls an investee if and only if the company has:
i) Power over the investee,
ii) Exposure or rights to variable return from its involvement with the investee, and
iii) Ability to use its power over the investee to affect its returns.
Generally, it is presumed that, a majority of voting rights results in control. To support this presumption and when the company has less than a majority of the voting or similar rights of an investee, the company considers all relevant facts and circumstances in assessing whether it has power over an investee, including:
i) Contractual arrangement with the other vote holders of the investee,
ii) Rights arising from other contractual arrangements,
iii) The company’s voting rights and potential voting rights
e. Business Combination
Business combinations other than the common control transactions are accounted for using the purchase (acquisition) method. The cost of an acquisition is measured as the fair value of the assets given, equity instruments issued and liabilities incurred or assumed at the date of exchange. The cost of acquisition also includes the fair value of any contingent consideration. Identifiable assets acquired and liabilities and contingent liabilities assumed in a business combination are measured initially at their fair value on the date of acquisition.
Transaction costs incurred in connection with a business acquisition are expensed as incurred.
Goodwill represents the cost of the acquired businesses in excess of the fair value of identifiable tangible and intangible net assets purchased.
f. Revenue from Contracts with Customers
Revenue is recognised upon transfer of control of promised products or services to customers. Revenue
is measured based on the consideration specified in a contract with a customer, and is reduced for volume discounts, rebates and other similar allowances. Revenue from contracts priced on time and material basis is recognised when services are rendered, and the related costs are incurred.
Revenue related to fixed price maintenance and support services contracts where the Group is ready to provide services is recognised based on time elapsed mode and revenue is straight lined over the period of performance.
Revenue from services performed on fixed-price basis is recognised using the input method as defined in Ind AS 115 - Revenue from Contracts with customers. The Group uses efforts or cost expended to measure progress towards completion as there is a direct relationship between input and productivity. If the Group does not have a sufficient basis to measure the progress of completion or to estimate total contract revenues and costs, revenue is recognised only to the extent of contract cost incurred for which recoverability is probable.
When total cost estimates exceed revenue in arrangement, the estimated losses are recognised in the statement of profit and loss in the period in which such losses become probable based on the current contract estimates.
Revenue from sale of licenses / hardware, where the customer obtains a “right to use” the licenses / hardware is recognised at the point in time when the related license / hardware is made available to the customer. Revenue from licenses / hardware where the customer obtains a “right to access” is recognised over the access period. For allocating the transaction price to sale of licenses / hardware and related implementation and maintenance services, the Group measures the revenue in respect of each performance obligation of a contract as its relative standalone selling price. In case, where the licenses are required to be substantially customized as part of implementation service, the entire arrangement fee is considered as single performance obligation and revenue is recognised as per input method.
Contract modifications are accounted for when additions, deletions or changes are approved either to the contract scope or contract price. Contract modifications involving services added that are not distinct are accounted for on a cumulative catch-up basis, while those that are distinct are accounted for prospectively as a separate contract.

276 Integrated Annual Report 2021-22 277Corporate Overview | Statutory Reports | Financial Statements
Consolidated
Notes forming part of Consolidated Financial Statements Notes forming part of Consolidated Financial Statements
‘Unbilled revenues’ (contract asset) represent revenue earned in excess of billings as at the end of the reporting period. Where right to consideration is unconditional upon passage of time is classified as a financial asset however, for fixed price development contracts, where milestone is not due as per contract terms as on date of reporting, the same is classified as non-financial asset.
‘Unearned & deferred revenue’ (contract liabilities) represent billing in excess of revenue recognised.
Deferred contract costs are costs to fulfil a contract which are recognised as assets and amortized over the term of the contract.
Use of significant judgements in revenue recognition:
The Group uses the percentage-of-completion method in accounting for its fixed-price contracts. Use of the percentage-of-completion method requires the Group to estimate efforts or costs expended to date as a proportion of the total efforts or costs to be expended. Efforts or costs expended have been used to measure progress towards completion as there is a direct relationship between input and productivity.
Further, the Group uses significant judgements while determining the transaction price to be allocated to performance obligations.
Provision for estimated losses, if any, on uncompleted contracts are recorded in the period in which such losses become probable based on the expected contract estimates at the reporting date.
g. Other income
Other income comprises primarily of interest income, dividend income, gain/loss on investment and foreign exchange gain/loss.
i) Interest income is recognised using effective interest method.
ii) Dividend income is accounted in the period in which the right to receive the same is established.
h. Employee benefits
I) Short term employee benefits
All employee benefits falling due wholly within twelve months of rendering the service are classified
as short-term employee benefits. The benefits like salaries, wages, and short term compensated absences and performance incentives are recognised in the period in which the employee renders the related service.
II) Post-employment benefits
i) Defined contribution plan:
The Group’s superannuation fund and state governed provident fund scheme are classified as defined contribution plans. The contribution paid / payable under the schemes is recognised during the period in which the employee renders the related service.
ii) Defined benefit plans:
The provident fund scheme managed by trust, employee’s gratuity fund scheme managed by Life Insurance Corporation of India (except for Powerupcloud Technologies Private Limited which has unfunded gratuity plan) and post-retirement medical benefit scheme are the Group’s defined benefit plans. Wherever applicable, the present value of the obligation under such defined benefit plans is determined based on actuarial valuation using the Projected Unit Credit Method, which recognises each period of service as giving rise to additional unit of employee benefit entitlement and measures each unit separately to build up the final obligation.
The obligation is measured at the present value of the estimated future cash-flows. The discount rates used for determining the present value of the obligation under defined benefit plans, is based on the market yields on government bonds as at the balance sheet date, having maturity periods approximating to the terms of related obligations. Actuarial gains and losses through re-measurement of the defined benefit liability/ (asset) are recognised in other comprehensive income. The actual return of portfolio of plan assets, in excess of yields computed by applying the discount rate used to measure the defined benefit obligation are recognised in other comprehensive income. The effect of any plan amendment is recognised in statement of profit and loss.
Gains or losses on the curtailment or settlement of any defined benefit plan are recognised when the curtailment or settlement occurs. Past service cost resulting from a plan amendment or curtailment are recognised immediately in the statement of profit and loss.
iii) Long term employee benefits:
The obligation for long term employee benefits like long term compensation absences is recognised as determined by actuarial valuation performed by independent actuary at each balance sheet date using Projected Unit Credit Method on the additional amount expected to be paid/availed as a result of unused entitlement that has accumulated at balance sheet date. Actuarial gains and losses are recognised immediately in statement of profit and loss.
iv) Social security plans
Employer’s contribution payable with respect to the social security plans, which are defined contribution plans, is charged to the statement of profit and loss in the period in which employee renders the services.
The Code on Social Security, 2020 has been enacted by the Indian Parliament, which would impact the contributions by the Group towards Provident Fund and Gratuity. The effective date from which the changes will be applicable and the corresponding Rules, are yet to be notified. The Group will complete its evaluation and will give appropriate impact in the period in which, the Code and the corresponding Rules become effective.
i. Government grants
The Group recognizes government grants only when there is reasonable assurance that the conditions attached to them will be complied with, and the grants will be received. Government grants related to assets are treated as deferred income and are recognized in the net profit in the Statement of Profit and Loss on a systematic and rational basis over the useful life of the asset. Government grants related to revenue are recognized on a systematic basis in the net profit in the Statement of Profit and Loss over the periods necessary to match them with the related costs which they are intended to compensate.
j. Property, plant and equipment
Property plant and equipment are stated at cost less accumulated depreciation and impairment losses, if any. Cost includes expenditure directly attributable to the acquisition or construction of the asset and cost incurred for bringing the asset to its present location and condition.
k. Intangible assets
Assets like customer relationship, computer software, rights acquired under contracts, and internally developed software are stated at cost, less accumulated depreciation, amortisation and impairment. Goodwill represents the cost of acquired businesses in excess of the fair value of net identifiable assets acquired.
l. Impairment
I) Impairment of trade receivables, unbilled receivables and lease receivables:
The Group assesses at each date of statement of financial position whether a financial asset in form of trade receivables and unbilled receivables is impaired. In accordance with Ind AS 109, the Group applies Expected Credit Loss (ECL) model for measurement and recognition of impairment loss. As a practical expedient, the Group uses a provision matrix to determine impairment loss on portfolio of its trade receivables and unbilled receivables. The provision matrix is based on available external and internal credit risk factors such as credit default, credit rating from credit rating agencies and Group’s historically observed default rates over the expected life of trade receivables and unbilled receivables. ECL impairment loss allowance or reversal is recognised during the period as expense or income respectively in the statement of profit and loss.
II) Impairment of intangible assets:
i) Goodwill
Goodwill represents the cost of acquired businesses in excess of the fair value of net identifiable assets acquired. Goodwill is not amortized but is tested for impairment annually or immediately when events or changes in circumstances indicate that an impairment loss would have occurred. For the purposes of impairment testing, the carrying amount

278 Integrated Annual Report 2021-22 279Corporate Overview | Statutory Reports | Financial Statements
Consolidated
Notes forming part of Consolidated Financial Statements Notes forming part of Consolidated Financial Statements
of the reporting unit, including goodwill, is compared with its fair value. When the carrying amount of the reporting unit exceeds its fair value, a goodwill impairment loss is recognised, up to a maximum amount of the recorded goodwill related to the reporting unit. Goodwill impairment losses are not reversed. The growth rate and discount rates as applicable are used for impairment testing.
ii) Other intangible assets
At the end of each reporting period, the Group reviews the carrying amounts of intangible assets to determine if there is any indication of loss suffered. If such indication exists, the recoverable amount of the asset is estimated to determine the extent of the impairment loss. Recoverable amount is the higher of the value in use or fair value less cost to sell. When it is not possible to estimate the recoverable amount of an individual asset, the Group estimates the recoverable amount of the cash-generating unit to which the asset belongs.
m. Leases
The Group as a lessee
The Group’s lease asset classes primarily consist of leases for buildings, furniture & fixtures and vehicles. The Group assesses whether a contract contains a lease, at inception of a contract. A contract is, or contains, a lease if the contract conveys the right to control the use of an identified asset for a period of time in exchange for consideration. To assess whether a contract conveys the right to control the use of an identified asset, the Group assesses whether: (1) the contract involves the use of an identified asset (2) the Group has substantially all of the economic benefits from use of the asset throughout the period of the lease and (3) the Group has the right to direct the use of the asset throughout the period of use.
At the date of commencement of the lease, the Group recognizes a right-of-use asset (“ROU”) and a corresponding lease liability for all lease arrangements in which it is a lessee, except for leases with a term of twelve months or less (short-term leases) and low value leases. For these short-term and low value leases, the Group recognizes the lease payments as an operating expense on a straight-line basis over the term of the lease.
Certain lease arrangements include the options to extend or terminate the lease before the end of the lease term. ROU assets and lease liabilities includes these options when it is reasonably certain that they will be exercised.
The right-of-use assets are initially recognized at cost, which comprises the initial amount of the lease liability adjusted for any lease payments made at or prior to the commencement date of the lease plus any initial direct costs less any lease incentives. They are subsequently measured at cost less accumulated depreciation and impairment losses.
Right-of-use assets are depreciated from the commencement date on a straight-line basis over the shorter of the lease term and useful life of the underlying asset. Right of use assets are evaluated for recoverability whenever events or changes in circumstances indicate that their carrying amounts may not be recoverable. For the purpose of impairment testing, the recoverable amount (i.e., the higher of the fair value less cost to sell and the value-in-use) is determined on an individual asset basis unless the asset does not generate cash flows that are largely independent of those from other assets. In such cases, the recoverable amount is determined for the Cash Generating Unit (CGU) to which the asset belongs.
The lease liability is initially measured at amortized cost at the present value of the future lease payments. The lease payments are discounted using the interest rate implicit in the lease or, if not readily determinable, using the incremental borrowing rates in the country of domicile of the leases. Lease liabilities are remeasured with a corresponding adjustment to the related right of use asset if the Group changes its assessment if whether it will exercise an extension or a termination option.
Lease liability and ROU asset have been separately presented in the Balance Sheet and lease payments have been classified as financing cash flows.
The Group as a lessor
Leases for which the Group is a lessor is classified as a finance or operating lease. Whenever the terms of the lease transfer substantially all the risks and rewards of ownership to the lessee, the contract is classified as a finance lease. All other leases are classified as operating leases.
When the Group is an intermediate lessor, it accounts for its interests in the head lease and the sub-lease separately. The sublease is classified as a finance or operating lease by reference to the right-of-use asset arising from the head lease.
For operating leases, rental income is recognized on a straight-line basis over the term of the relevant lease.
For Finance leases, initially asset held under finance lease is recognised in balance sheet and presented as a receivable at an amount equal to the net investment in the lease. Finance income is recognised over the lease term, based on a pattern reflecting a constant periodic rate of return on Group’s net investment in the lease.
n. Depreciation
i) Tangible assets
Depreciation on assets have been provided on straight line basis as mentioned in below table except for the leasehold improvements which is depreciated over the lease period or life of asset, whichever is lower. Depreciation or amortization on additions and disposals are calculated on pro-rata basis from and to the month of additions and disposals.
Particulars Useful life
• Buildings Upto 60 years
• Computers and IT peripherals
Upto 6 years
• Plant and machinery Upto 15 years
• Office equipment Upto 5 years
• Vehicles Upto 8 years
• Furniture and fixtures Upto 10 years
ii) Intangible assets and amortization
The estimated useful life of an intangible asset is based on number of factors including the effects of obsolescence, demand, competition and other economic factors and the level of maintenance expenditures required to obtain the expected future cash flows from the asset. The basis of amortization
of intangible assets on straight line basis is as follows:
Particulars Useful life
• Computer software Upto 5 years
• Customer contracts Upto 10 years
• Rights under licensing agreement
Upto 6 years
o. Share based payments
In respect of stock options granted pursuant to the Group’s stock options scheme, the excess of fair value of the share over the exercise price of the option is treated as discount and accounted as employee compensation cost over the vesting period. The amount recognised as expense each year is arrived at based on the number of grants expected to vest. If options granted lapse after the vesting period, the cumulative discount recognised as expense in respect of such options is transferred to the general reserve. If options granted lapse before the vesting period, the cumulative discount recognised as expense in respect of such options is transferred to the profit and loss.
p. Functional and presentation currency
The functional currency of the Group is the Indian Rupee. The functional currency of Indian subsidiaries is the Indian Rupee and the functional currency of foreign subsidiaries is the currency of the primary economic environment in which these subsidiaries operate. The consolidated financial statements of the Group are prepared in the Indian Rupee.
q. Foreign currency transactions and balances
Foreign currency transactions are initially recorded at the rates prevailing on the date of the transaction. At the balance sheet date, foreign currency monetary items are reported using the closing rate. Exchange gains and losses arising on settlement and restatement are recognised in the statement of profit and loss. Non-monetary items which are carried at historical cost denominated in foreign currency are reported using the exchange rate at the date of the transaction.

280 Integrated Annual Report 2021-22 281Corporate Overview | Statutory Reports | Financial Statements
Consolidated
Notes forming part of Consolidated Financial Statements Notes forming part of Consolidated Financial Statements
Translation of foreign currency transactions of foreign subsidiaries into functional currency are treated as under:
• Profit and loss items at the average rate for the period;
• All assets and liabilities at closing rates
Exchange difference on settlement / year end conversion is recognised in foreign currency translation reserve.
r. Financial Instruments
Financial assets and liabilities are recognised when the Group becomes a party to the contractual provisions of the instrument.
I) Initial measurement
Financial assets and liabilities are initially measured at fair value, which are measured at transaction price. Transaction costs that are directly attributable to the acquisition or issue of financial assets and financial liabilities (other than financial assets and financial liabilities at fair value through profit or loss) are added to or deducted from the fair value measured on initial recognition of financial asset or financial liability.
II) Subsequent classification and measurement
i) Non-derivative financial assets
A) Financial assets at amortised cost
Financial assets are subsequently measured at amortised cost if:
a) the financial asset is held within a business model whose objective is to hold financial assets in order to collect contractual cash flows and
b) the contractual terms of financial assets give rise on specified dates that are solely payments of principal and interest on the principal amount outstanding.
Financial assets at amortised cost are subsequently measured using effective interest method
B) Financial assets at fair value through other comprehensive income (FVTOCI)
Financial assets are subsequently measured at fair value through other comprehensive income if the financial asset is held within a business model whose objective is achieved by both collecting contractual cash flows on specified dates that are solely payments of principal and interest on the principal amount outstanding and selling the financial asset
C) Financial assets at fair value through profit and loss (FVTPL)
Financial assets are measured at fair value through profit or loss unless they are measured at amortised cost or at fair value through other comprehensive income on initial recognition. The transaction costs directly attributable to the acquisition of financial assets and liabilities at fair value through profit or loss are immediately recognised in statement of profit and loss.
ii) Non-derivative financial liability
Financial liabilities are initially recognised at fair value, and subsequently carried at amortized cost using the effective interest method except for contingent consideration recognised in a business combination which is subsequently measured at fair value through profit and loss.
iii) Derivative financial instrument
The Group holds derivative financial instrument such as foreign exchange forward contracts and options contracts including a combination of purchased and written options to mitigate the risk of changes in exchange rates on foreign currency exposures and forecast transactions.
The Group uses hedging instruments that are governed by the risk management policy which is approved by the board of directors. The policy provides written principles on the use of such derivative financial instruments. The Group designates such instruments as hedges and performs assessment of hedge effectiveness based on consideration of terms of the hedging instrument, the economic relationship between the hedging instrument and hedged item and the objective of the hedging.
A) Cash flow hedges
The Group designates certain foreign exchange forward and option contracts as cash flow hedges to mitigate the risk of foreign exchange exposure on highly probable forecast transactions.
When a derivative is designated as a Cash flow hedge instrument, the effective portion of changes in fair value of the derivative is recognised in other comprehensive income and presented within equity as hedging reserve. Any ineffective portion of changes in the fair value of the derivative is recognized immediately in the Statement of Profit and Loss. If the hedging instrument no longer meets the criteria for hedge accounting, then hedge accounting is discontinued prospectively. If the hedging instrument expires or is sold, terminated or exercised, the cumulative gain or loss on the hedging instrument recognized in Cash flow hedge reserve is transferred to the Statement of Profit and Loss upon the occurrence of related forecasted transaction.
B) Fair value hedges
Changes in the fair value of the derivative instruments designated as fair value hedges are recognised in statement of profit and loss.
III) Derecognition
The Group derecognises a financial asset when the contractual rights to the cash flows from the financial assets expire or it transfers the financial asset and the transfer qualifies for derecognition under Ind AS 109. A financial liability is derecognised from the Group’s balance sheet where the obligation specified in the contract is discharged or cancelled or expired.
IV) Offsetting
Financial assets and financial liabilities are offset and the net amounts are presented in the balance sheet when, and only when, the Group currently has a legally enforceable right to set off the amounts and it intends either to settle them on a net basis or to realise the asset and settle the liability simultaneously.
s. Taxes on income
Income tax expense comprises current and deferred income tax. Tax on income for Indian companies for the current period is determined on the basis of taxable income and tax credits computed in accordance with the provisions of the Indian Income tax Act, 1961. Foreign subsidiaries recognise current tax/ deferred tax liabilities and assets in accordance with the applicable local laws.
Income tax and deferred tax expense is recognised in the statement of profit and loss except to the extent that it relates to items recognised directly in other comprehensive income, in which case income tax expense is recognised in other comprehensive income. Current income tax for current and prior periods is recognised at the amount expected to be paid to or recovered from the tax authorities.
The Group offsets current tax assets and current tax liabilities, where it has a legally enforceable right to set off the recognised amounts and where it intends either to settle on a net basis, or to realize the asset and settle the liability simultaneously.
Deferred income tax assets and liabilities are recognised for all temporary differences arising between the tax bases of assets and liabilities and their carrying amounts in the financial statements except when the deferred income tax arises from the initial recognition of goodwill or an asset or liability in a transaction that is not a business combination and affects neither accounting nor taxable profit or loss at the time of the transaction. Other deferred tax assets are recognised and carried forward to the extent that there is a reasonable certainty that sufficient future taxable income will be available against which such deferred tax assets can be realized. Deferred tax assets are reviewed at each reporting date and are reduced to the extent that it is no longer probable that the related tax benefit will be realized.
Deferred income tax assets and liabilities are measured using tax rates and tax laws that have been enacted or substantively enacted as on the balance sheet date and are expected to apply to taxable income in the years in which those temporary differences are expected to be recovered or settled. Deferred income taxes are not provided on the undistributed earnings of subsidiaries and branches where it is expected that the earnings of the subsidiary or branch will not be distributed in

282 Integrated Annual Report 2021-22 283Corporate Overview | Statutory Reports | Financial Statements
Consolidated
Notes forming part of Consolidated Financial Statements Notes forming part of Consolidated Financial Statements
the foreseeable future. Deferred Income taxes are not provided on dividend receivable from subsidiaries as the Group is able to control the timing of reversal of such temporary difference. Deferred tax is provided on unrealized intra Group profit at the rate of tax applicable to the purchasing entity.
t. Borrowing costs
Borrowing costs include finance costs, commitment charges, interest expense on lease liabilities and exchange differences arising from foreign currency borrowing to the extent they are regarded as an adjustment to finance costs.
u. Provisions, contingent liabilities and contingent assets
Provisions are recognised for liabilities that can be measured only by using a substantial degree of estimation, if:
I) the Group has a present obligation as a result of a past event,
II) a probable outflow of resources is expected to settle the obligation; and
III) the amount of the obligation can be reliably estimated.
Provision is measured using the cash flows estimated to settle the present obligation and when the effect of time value of money is material, the carrying amount of the provision is the present value of those cash flows. Reimbursement expected in respect of expenditure required to settle a provision is recognised only when it is virtually certain that the reimbursement will be received.
Contingent liability is disclosed in case of
I) a present obligation arising from a past event when it is not probable that an outflow of resources will be required to settle the obligation; or
II) a possible obligation unless the probability of outflow of resources is remote.
Contingent assets are neither recognised nor disclosed.
Provisions, contingent liabilities and contingent assets are reviewed at each balance sheet date.
v. Earnings per share
Basic earnings per share is computed by dividing the net profit after tax by the weighted average number of equity shares outstanding during the period, adjusted for bonus elements in equity shares, if any, issued during the period.
Diluted EPS is computed by dividing the net profit after tax by the weighted average number of equity shares considered for deriving basic EPS and also weighted average number of equity shares that could have been issued upon conversion of all dilutive potential equity shares. Dilutive potential equity shares are deemed converted as of the beginning of the period, unless issued at a later date. Dilutive potential equity shares are determined independently for each period presented.
w. Segment accounting
Operating segments are defined as components of an enterprise for which discrete financial information is used regularly by the Group’s Chief Operating Decision Maker in deciding how to allocate resources and assessing performance.
i) Segment revenue is the revenue directly identifiable with the segment.
ii) Expenses that are directly identifiable with or allocable to segments are considered for determining the segment result. Expenses which relate to the Group as a whole and not identifiable with / allocable to segments are included under “Unallocable expenses”.
iii) Other income relates to the Group as a whole and is not identifiable with / allocable to segments.
iv) Assets and liabilities used in the Group’s business are not identified to any of the reportable segments as these are used interchangeably.
x. Cash flow statement
Cash flow statement is prepared segregating the cash flows from operating, investing and financing activities. Cash flow is reported using indirect method as per the requirements of Ind AS 7 (“Cash flow statements”), whereby profit for the year is adjusted for the effects
of transactions of a non cash nature, any deferrals or accruals of past or future operating cash receipts or payments and item of income or expenses associated with investing or financing cash flows.
y. Recent accounting pronouncement
Ministry of Corporate Affairs (“MCA”) notifies new standard or amendments to the existing standards under Companies (Indian Accounting Standards) Rules as issued from time to time. On March 23, 2022, MCA amended the Companies (Indian Accounting Standards) Amendment Rules, 2022, applicable from April 1, 2022, as below:
Ind AS 103 – Reference to Conceptual Framework
The amendments specify that to qualify for recognition as part of applying the acquisition method, the identifiable assets acquired and liabilities assumed must meet the definitions of assets and liabilities in the Conceptual Framework for Financial Reporting under Indian Accounting Standards (Conceptual Framework) issued by the Institute of Chartered Accountants of India at the acquisition date. These changes do not significantly change the requirements of Ind AS 103. The Group does not expect the amendment to have any significant impact in its financial statements.
Ind AS 16 – Proceeds before intended use
The amendments mainly prohibit an entity from deducting from the cost of property, plant and equipment amounts received from selling items produced while the company is preparing the asset for its intended use.
Instead, an entity will recognise such sales proceeds and related cost in profit or loss. The Group does not expect the amendments to have any impact in its recognition of its property, plant and equipment in its financial statements.
Ind AS 37 – Onerous Contracts - Costs of Fulfilling a Contract
The amendments specify that that the ‘cost of fulfilling’ a contract comprises the ‘costs that relate directly to the contract’. Costs that relate directly to a contract can either be incremental costs of fulfilling that contract (examples would be direct labour, materials) or an allocation of other costs that relate directly to fulfilling contracts. The amendment is essentially a clarification, and the Group does not expect the amendment to have any significant impact in its financial statements.
Ind AS 109 – Annual Improvements to Ind AS (2021)
The amendment clarifies which fees an entity includes when it applies the ‘10 percent’ test of Ind AS 109 in assessing whether to derecognise a financial liability. The Company does not expect the amendment to have any significant impact in its financial statements.
The amendments remove the illustration of the reimbursement of leasehold improvements by the lessor in order to resolve any potential confusion regarding the treatment of lease incentives that might arise because of how lease incentives were described in that illustration. The Group does not expect the amendment to have any significant impact in its financial statements.
3. Intangible Assets
The balance useful life of internally developed intangible asset as on the respective balance sheet dates is as follows:
(H Mn)
Class of AssetsAs at March 31, 2022 As at March 31, 2021
Useful life Carrying amount Useful life Carrying amount
Internally developed Software Upto 5 Years 1,249 Upto 5 Years 671
Total 1,249 671

284 Integrated Annual Report 2021-22 285Corporate Overview | Statutory Reports | Financial Statements
Consolidated
Notes forming part of Consolidated Financial Statements Notes forming part of Consolidated Financial Statements
4 (I) The list of subsidiaries included in the consolidated financial statements are as under
Name of the Subsidiary Company Country of
incorporation
Proportion of ownership as at
March 31, 2022
Proportion of ownership as at
March 31, 2021(%) (%)
1 Larsen & Toubro Infotech Canada Limited Canada 100 100
2 Larsen & Toubro Infotech GmbH Germany 100 100
3 Larsen & Toubro Infotech LLC USA 100 100
4 L&T Infotech Financial Services Technologies Inc. Canada 100 100
5 Larsen And Toubro Infotech South Africa (Pty) Limited South Africa 69.6 69.6
6 L&T Information Technology Services (Shanghai) Co. Limited
China 100 100
7 L&T Information Technology Spain, Sociedad Limitada Spain 100 100
8 L&T Infotech S. DE. R.L. DE. C.V. Mexico 100 100
9 Larsen & Toubro Infotech Norge AS Norway 100 100
10 LTI Middle East FZ - LLC UAE 100 100
11 L&T Infotech UK Limited UK 100 100
12 Syncordis S.A. Luxembourg 100 100
13 Syncordis Software Services India Private Limited * India - 100
14 Syncordis France SARL France 100 100
15 Syncordis Limited UK 100 100
16 Syncordis Support Services S.A. Luxembourg 100 100
17 Ruletronics Systems Inc. USA 100 100
18 Ruletronics Limited UK 100 100
19 Ruletronics Systems Private Limited * India - 100
20 Nielsen + Partner Unternehmensberator GmbH Germany 100 100
21 Nielsen + Partner Unternehmensberator AG Switzerland 100 100
22 Nielsen + Partner PTE Limited Singapore 100 100
23 Nielsen & Partner Pty Limited Australia 100 100
24 Nielsen & Partner Co Limited Thailand 100 100
25 Lymbyc Solutions Private Limited India 100 100
26 Lymbyc Solutions Inc. USA 100 100
27 Powerupcloud Technologies Private Limited India 100 100
28 Cuelogic Technologies Inc (w.e.f. from July 1, 2021 refer note 44)
USA 100 -
29 Cuelogic Technologies Private ltd (w.e.f. from July 1, 2021 refer note 44)
India 100 -
* Merged with the Company w.e.f. April 1, 2021
4 (II) Additional Disclosure as per Schedule III of Companies Act 2013:(H Mn)
Name of entity
Net assets, i.e. total assets minus total
liabilitiesShare in profit
Share in other comprehensive income
Share in total comprehensive income
As % of consolidated
net assetsAmount
As % of consolidated profit or loss
Amount
As % of consolidated
other comprehensive
income
Amount
As % of consolidated
total comprehensive
income
Amount
A - Parent - Larsen & Toubro Infotech
Limited95.27% 84,029 98.36% 22,609 81.70% 643 97.81% 23,252
SubsidiariesB - Indian 1. Lymbyc Solutions Private
Limited0.01% 5 (0.09%) (22) 0.00% - (0.09%) (22)
2. Powerupcloud Technologies Private Limited
0.07% 65 0.09% 20 (0.02%) (0) 0.08% 20
3. Cuelogic Technologies Private ltd
0.15% 136 (0.01%) (1) 0.00% - (0.01%) (1)
Sub Total 0.23% 206 (0.01%) (3) (0.02%) (0) (0.01%) (3)C - Foreign 1. Larsen & Toubro Infotech
Canada Limited0.56% 493 0.50% 115 2.21% 17 0.56% 132
2. Larsen & Toubro Infotech GmbH
4.16% 3,669 (0.69%) (160) 1.68% 13 (0.62%) (147)
3. Larsen & Toubro Infotech LLC 0.08% 66 0.01% 2 0.30% 2 0.02% 5 4. L&T Infotech Financial Services
Technologies Inc.3.55% 3,128 4.74% 1,090 (3.67%) (29) 4.46% 1,061
5. Larsen And Toubro South Africa (Pty) Limited
0.20% 178 0.25% 57 1.13% 9 0.28% 66
6. L&T Information Technology Services (Shanghai) Co. Ltd.
(0.02%) (17) 0.10% 22 (0.26%) (2) 0.09% 20
7. L&T Information Technology Spain, Sociedad Limitada
0.01% 5 0.01% 2 (0.01%) (0) 0.01% 1
8. L&T Infotech S. DE. R.L. DE C.V. 0.05% 42 0.11% 25 0.24% 2 0.11% 26 9. Larsen & Toubro Infotech
Norge AS 0.11% 93 0.25% 57 0.15% 1 0.24% 58
10. LTI Middle East FZ - LLC 0.20% 180 0.71% 162 0.42% 3 0.70% 166 11. L&T Infotech UK Limited 0.14% 127 0.56% 128 (0.38%) (3) 0.53% 125 12. Syncordis S.A., Luxembourg 0.50% 445 0.37% 84 (1.04%) (8) 0.32% 76 13. Syncordis France SARL (0.08%) (75) (0.07%) (15) 0.19% 2 (0.06%) (14) 14. Syncordis Limited, UK (0.28%) (249) (0.30%) (70) 0.50% 4 (0.28%) (66) 15. Syncordis Support Services
S.A., Luxembourg0.10% 90 0.27% 62 (0.29%) (2) 0.25% 60
16. Ruletronics Systems Inc., USA 0.01% 10 0.01% 2 0.04% 0 0.01% 2 17. Ruletronics Limited, UK 0.00% (0) (0.01%) (3) 0.02% 0 (0.01%) (3) 18. Nielsen + Partner
Unternehmensberator GmbH, Germany
0.11% 101 (0.06%) (15) (0.18%) (1) (0.07%) (16)
19. Nielsen + Partner Unternehmensberator AG, Switzerland
0.04% 32 (0.02%) (5) 0.25% 2 (0.01%) (3)

286 Integrated Annual Report 2021-22 287Corporate Overview | Statutory Reports | Financial Statements
Consolidated
Notes forming part of Consolidated Financial Statements
(H Mn)
Name of entity
Net assets, i.e. total assets minus total
liabilitiesShare in profit
Share in other comprehensive income
Share in total comprehensive income
As % of consolidated
net assetsAmount
As % of consolidated profit or loss
Amount
As % of consolidated
other comprehensive
income
Amount
As % of consolidated
total comprehensive
income
Amount
20. Nielsen + Partner Pte Ltd, Singapore
0.31% 274 (0.35%) (80) 1.17% 9 (0.30%) (70)
21. Nielsen & Partner Pty Ltd, Australia
(0.06%) (51) (0.18%) (42) (0.18%) (1) (0.18%) (43)
22. Nielsen + Partner Co Ltd, Thailand
(0.03%) (25) (0.03%) (8) 0.06% 0 (0.03%) (8)
23. Lymbyc Solutions Inc., USA 0.00% (4) 0.00% (0) 0.00% (0) 0.00% (0) 24. Cuelogic Technologies Inc 0.01% 10 0.03% 6 0.02% 0 0.03% 6 Sub Total 9.66% 8,523 6.17% 1,418 2.39% 19 6.04% 1,436 Total A+B+C 105.16% 92,759 104.52% 24,024 84.06% 662 103.84% 24,685 Less : CFS adjustments and
eliminations5.16% 4,556 4.52% 1,039 (15.94%) (125) 3.84% 913
Total share 100.00% 88,203 100.00% 22,985 100.00% 787 100.00% 23,772 Minority Interest 57 17 3 20 Attributable to equity shareholders 88,146 22,968 784 23,752
4 (II) Additional Disclosure as per Schedule III of Companies Act 2013: (Contd..)
Not
es fo
rmin
g p
art o
f Con
solid
ated
Fin
anci
al S
tate
men
ts
(H M
n)
Pro
per
ty P
lan
t an
d E
qu
ipm
ent
and
In
tan
gib
le A
sset
s
Gro
ss B
lock
Dep
reci
atio
n/A
mo
rtiz
atio
nN
et
Blo
ck
As
at
01-
04
-20
21
Pu
rsu
ant
to
acq
uis
itio
n o
f b
usi
nes
s (R
efer
No
te 4
4)
Ad
dit
ion
sD
edu
ctio
ns
Fore
ign
cu
rren
cy
tran
slat
ion
re
serv
e
As
at
31-0
3-20
22
As
at
01-
04
-20
21
For
the
year
On
d
edu
ctio
ns
Fore
ign
cu
rren
cy
tran
slat
ion
re
serv
e
As
at31
-03-
2022
As
at31
-03-
2022
Pro
per
ty P
lan
t an
d E
qu
ipm
ent
Leas
eho
ld L
and
10
-
-
-
-
10
1
0
-
-
1
9
Bui
ldin
gs
126
-
-
1
26
-
-
126
-
1
26
-
-
-
Leas
eho
ld Im
pro
vem
ents
934
2
1
19
34
0
1,0
21
393
1
46
33
0
506
5
15
Pla
nt
and
mac
hin
ery
1,18
0 -
2
09
60
0
1,3
29
522
1
30
58
0
594
7
35
Co
mp
uter
s 3
,759
6
1
,967
8
4 1
6 5
,664
2
,147
801
8
4 1
2 2
,876
2
,788
O
ffic
e Eq
uip
men
ts 1
,025
0
8
9 2
5 1
1
,090
6
88
127
2
3 0
7
92
298
Fu
rnit
ure
and
fix
ture
s 1
,151
0
66
60
2
1,15
9 5
76
110
5
6 1
6
31
528
V
ehic
les
283
-
1
7 5
9 -
2
41
158
3
0 4
2 -
1
46
95
Cap
ital
Wo
rk in
Pro
gre
ss -
-
-
-
-
-
-
-
-
-
-
4
,374
To
tal o
f P
rop
erty
Pla
nt
and
Eq
uip
men
t 8
,468
8
2
,467
4
48
19
10,5
14
4,6
11 1
,34
4
422
1
3 5
,54
6 9
,34
2 In
tan
gib
le A
sset
sG
oo
dw
ill o
n a
cqui
siti
on
398
-
-
-
1
5 4
13
-
-
-
-
-
413
G
oo
dw
ill o
n c
on
solid
atio
n 6
,176
374
-
-
(6
3) 6
,487
-
-
-
-
-
6
,487
So
ftw
are
7,6
40
0
1,0
48
971
1
76
7,8
93
6,4
75
647
9
71
170
6
,321
1
,572
C
usto
mer
co
ntr
acts
1,5
99
165
-
-
4
6 1
,810
1
,566
9
3 -
4
6 1
,705
1
05
Rig
hts
un
der
lice
nsi
ng
ag
reem
ent
1,2
43
-
-
-
46
1,2
89
33
210
-
5
2
48
1,0
41
Inta
ng
ible
ass
ets
und
er d
evel
op
men
t -
-
-
-
-
-
-
-
-
-
-
4
39
Tota
l of
inta
ng
ible
ass
ets
17,
056
5
39
1,0
48
971
2
20 1
7,89
2 8
,074
9
50
971
2
21
8,27
4
10,0
57
5 C
on
solid
ated
Pro
per
ty, P
lan
t A
nd
Eq
uip
men
t an
d In
tan
gib
le A
sset
s -
As
of
Mar
ch 3
1, 2
022

288 Integrated Annual Report 2021-22 289Corporate Overview | Statutory Reports | Financial Statements
Consolidated
Notes forming part of Consolidated Financial Statements
5 Consolidated Property, Plant And Equipment and Intangible Assets - As of March 31, 2022 (Contd..)
CWIP ageing schedule as at March 31, 2022(H Mn)
Amount in CWIP for a period of Total Less than 1
year 1 - 2 years 2 - 3 years
More than 3 years
Projects in Progress 3,980 49 345 - 4,374 3,980 49 345 - 4,374
(H Mn)
Amount in CWIP for a period of Total Less than 1
year 1 - 2 years 2 - 3 years
More than 3 years
Projects in Progress 370 69 - - 439 370 69 - - 439
As on the date of balance sheet, there are no capital work-in-progress projects whose completion is overdue or has exceeded the cost, based on approved plan.
Intangible assets under development ageing schedule as at March 31, 2022
Not
es fo
rmin
g p
art o
f Con
solid
ated
Fin
anci
al S
tate
men
ts
(H M
n)
Pro
per
ty P
lan
t an
d E
qu
ipm
ent
and
Inta
ng
ible
Ass
ets
Gro
ss B
lock
Dep
reci
atio
n/A
mo
rtiz
atio
nN
et B
lock
As
at
01-
04
-20
20
Pu
rsu
ant
to
acq
uis
itio
n
of
bu
sin
ess
Ad
dit
ion
sD
edu
ctio
ns
Fore
ign
cu
rren
cy
tran
slat
ion
re
serv
e
As
at
31-0
3-20
21
As
at
01-
04
-20
20
For
the
year
On
d
edu
ctio
ns
Fore
ign
cu
rren
cy
tran
slat
ion
re
serv
e
As
at31
-03-
2021
As
at31
-03-
2021
Pro
per
ty P
lan
t an
d E
qu
ipm
ent
Leas
eho
ld L
and
10
-
-
-
-
10
-
1
-
-
1
9
Bui
ldin
gs
126
-
-
0
-
1
26
40
86
0
-
126
-
Le
aseh
old
Imp
rove
men
ts 8
77
-
60
4
1
934
2
52
142
1
0
3
93
541
P
lan
t an
d m
ach
iner
y 1
,146
-
62
28
0
1,18
0 4
01
141
2
0 0
5
22
658
C
om
put
ers
2,9
10
-
939
1
38
48
3,7
59
1,6
13
635
1
31
30
2,14
7 1
,612
O
ffic
e Eq
uip
men
ts 9
58
-
78
13
2
1,0
25
556
1
40
11
3
688
3
37
Furn
itur
e an
d f
ixtu
res
1,16
1 -
3
1 4
3 2
1
,151
459
1
45
29
1
576
5
75
Veh
icle
s 3
07
-
9
33
-
283
1
43
35
20
-
158
1
25
Cap
ital
Wo
rk in
Pro
gre
ss -
-
-
-
-
-
-
-
-
-
-
4
03
Tota
l of
Pro
per
ty P
lan
t an
d
Eq
uip
men
t 7
,495
-
1
,179
2
59
53
8,4
68
3,4
64
1,32
5 2
12
34
4
,611
4
,260
Inta
ng
ible
Ass
ets
Go
od
will
on
acq
uisi
tio
n 3
64
-
-
-
34
398
-
-
-
-
-
3
98
Go
od
will
on
co
nso
lidat
ion
6,0
04
-
-
-
172
6
,176
-
-
-
-
-
6,17
6 So
ftw
are
6,8
44
-
811
3
86
371
7
,640
5
,970
5
47
382
34
0 6
,475
1
,165
Cus
tom
er c
on
trac
ts 1
,483
-
-
-
1
16
1,5
99
1,2
51
198
-
1
17
1,5
66
33
Rig
hts
un
der
lice
nsi
ng
ag
reem
ent
-
-
1,2
43
-
-
1,2
43
-
33
-
-
33
1,2
10
Inta
ng
ible
ass
ets
und
er
dev
elo
pm
ent
-
-
-
-
-
-
-
-
-
-
-
259
Tota
l of
inta
ng
ible
ass
ets
14
,695
-
2
,054
3
86
693
1
7,0
56
7,2
21
778
3
82
457
8
,074
9
,24
1
5 C
on
solid
ated
Pro
per
ty, P
lan
t A
nd
Eq
uip
men
t an
d In
tan
gib
le A
sset
s -
As
of
Mar
ch 3
1, 2
022
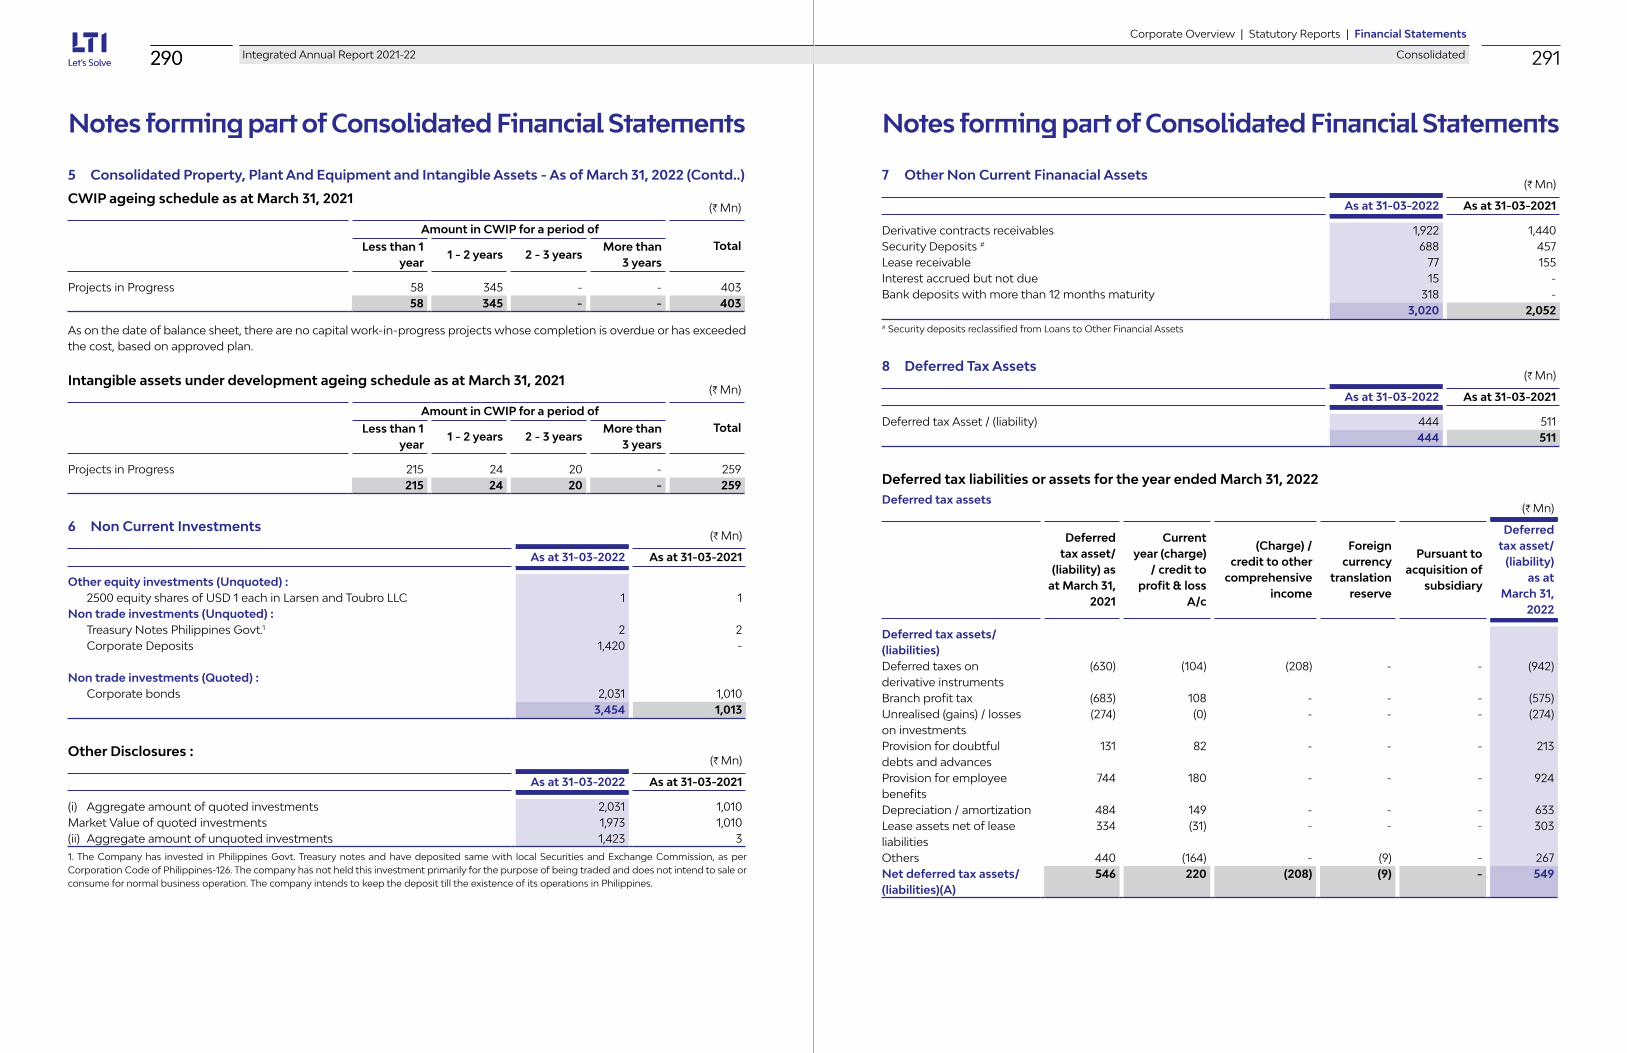
290 Integrated Annual Report 2021-22
Notes forming part of Consolidated Financial Statements Notes forming part of Consolidated Financial Statements
290 Integrated Annual Report 2021-22 291Corporate Overview | Statutory Reports | Financial Statements
Consolidated
5 Consolidated Property, Plant And Equipment and Intangible Assets - As of March 31, 2022 (Contd..)
CWIP ageing schedule as at March 31, 2021
6 Non Current Investments
(H Mn)
Amount in CWIP for a period of Total Less than 1
year 1 - 2 years 2 - 3 years
More than 3 years
Projects in Progress 58 345 - - 403 58 345 - - 403
(H Mn)
Amount in CWIP for a period of Total Less than 1
year 1 - 2 years 2 - 3 years
More than 3 years
Projects in Progress 215 24 20 - 259 215 24 20 - 259
As on the date of balance sheet, there are no capital work-in-progress projects whose completion is overdue or has exceeded the cost, based on approved plan.
Intangible assets under development ageing schedule as at March 31, 2021
(H Mn)
As at 31-03-2022 As at 31-03-2021
Other equity investments (Unquoted) : 2500 equity shares of USD 1 each in Larsen and Toubro LLC 1 1 Non trade investments (Unquoted) : Treasury Notes Philippines Govt.1 2 2 Corporate Deposits 1,420 -
Non trade investments (Quoted) : Corporate bonds 2,031 1,010
3,454 1,013
(H Mn)
As at 31-03-2022 As at 31-03-2021
(i) Aggregate amount of quoted investments 2,031 1,010 Market Value of quoted investments 1,973 1,010 (ii) Aggregate amount of unquoted investments 1,423 3
Other Disclosures :
1. The Company has invested in Philippines Govt. Treasury notes and have deposited same with local Securities and Exchange Commission, as per Corporation Code of Philippines-126. The company has not held this investment primarily for the purpose of being traded and does not intend to sale or consume for normal business operation. The company intends to keep the deposit till the existence of its operations in Philippines.
7 Other Non Current Finanacial Assets(H Mn)
As at 31-03-2022 As at 31-03-2021
Derivative contracts receivables 1,922 1,440 Security Deposits # 688 457 Lease receivable 77 155 Interest accrued but not due 15 - Bank deposits with more than 12 months maturity 318 -
3,020 2,052
(H Mn)
As at 31-03-2022 As at 31-03-2021
Deferred tax Asset / (liability) 444 511 444 511
# Security deposits reclassified from Loans to Other Financial Assets
8 Deferred Tax Assets
Deferred tax liabilities or assets for the year ended March 31, 2022Deferred tax assets
(H Mn)
Deferred tax asset/
(liability) as at March 31,
2021
Current year (charge)
/ credit to profit & loss
A/c
(Charge) / credit to other
comprehensive income
Foreign currency
translation reserve
Pursuant to acquisition of
subsidiary
Deferred tax asset/
(liability) as at
March 31, 2022
Deferred tax assets/(liabilities)Deferred taxes on derivative instruments
(630) (104) (208) - - (942)
Branch profit tax (683) 108 - - - (575)Unrealised (gains) / losses on investments
(274) (0) - - - (274)
Provision for doubtful debts and advances
131 82 - - - 213
Provision for employee benefits
744 180 - - - 924
Depreciation / amortization 484 149 - - - 633 Lease assets net of lease liabilities
334 (31) - - - 303
Others 440 (164) - (9) - 267 Net deferred tax assets/(liabilities)(A)
546 220 (208) (9) - 549

292 Integrated Annual Report 2021-22
Notes forming part of Consolidated Financial Statements Notes forming part of Consolidated Financial Statements
292 Integrated Annual Report 2021-22 293Corporate Overview | Statutory Reports | Financial Statements
Consolidated
Deferred tax liabilities or assets for the year ended March 31, 2022Deferred tax liabilities
Deferred tax liabilities or assets for the year ended March 31, 2021Deferred tax liabilities
Deferred tax asset/
(liability) as at March 31,
2021
Current year (charge)
/ credit to profit & loss
A/c
(Charge) / credit to other
comprehensive income
Foreign currency
translation reserve
Pursuant to acquisition
of subsidiary (Refer
Note 44)
Deferred tax asset/
(liability) as at
March 31, 2022
Deferred tax assets/ (liabilities)Depreciation / amortization (35) (40) - (9) (38) (122)Others 12 0 5 17 Net deferred tax assets/(liabilities)(B)
(35) (28) - (9) (33) (105)
Net deferred tax assets/(liabilities)(A+B)
511 192 (208) (18) (33) 444
(H Mn)
Deferred tax asset/
(liability) as at March 31,
2020
Current year (charge) /
credit to profit & loss A/c
(Charge) / credit to other
comprehensive income
Foreign currency
translation reserve
Pursuant to acquisition of
subsidiary
Deferred tax asset/
(liability) as at March 31,
2021
Deferred tax assets/ (liabilities)Deferred taxes on derivative instruments
849 (16) (1,463) - - (630)
Branch profit tax (683) - - - - (683)Unrealised (gains) / losses on investments
(142) (132) - - - (274)
Provision for doubtful debts and advances
157 (26) - - - 131
Provision for employee benefits
425 319 - - - 744
Depreciation / amortization 418 67 - (1) - 484 Capital loss on buyback of shares by L&T Infotech Financial Services Technologies Inc.
14 (14) - - - -
Lease assets net of lease liabilities
286 48 - - - 334
Others 405 (4) - 39 - 440 MAT credit 493 (493) - - - - Net deferred tax assets/(liabilities)(A)
2,222 (251) (1,463) 38 - 546
8 Deferred Tax Assets (Contd..)
Deferred tax liabilities or assets for the year ended March 31, 2021Deferred tax liabilities
Deferred tax asset/
(liability) as at March 31,
2020
Current year (charge)
/ credit to profit & loss
A/c
(Charge) / credit to other
comprehensive income
Foreign currency
translation reserve
Pursuant to acquisition of
subsidiary
Deferred tax asset/
(liability) as at
March 31, 2021
Deferred tax assets/ (liabilities)Depreciation / amortization (101) 65 - 1 - (35)Net deferred tax assets/(liabilities)(B)
(101) 65 - 1 - (35)
Net deferred tax assets/(liabilities)(A+B)
2,121 (186) (1,463) 39 - 511
8 Deferred Tax Assets (Contd..)
9 Other Non-Current Assets
10 Current Investments
(H Mn)
As at 31-03-2022 As at 31-03-2021
Deferred Contract Costs 492 679 Capital advances 300 - Advances recoverable other than in cash 1,116 548 Prepaid expenses 181 288
2,089 1,515
(H Mn)
As at 31-03-2022 As at 31-03-2021
Mutual funds - Quoted 26,008 32,720 Corporate deposits - Unquoted 2,800 3,020 Corporate bonds - Quoted 2,064 542 Commercial papers - Quoted 494 -
31,366 36,282
(H Mn)
As at 31-03-2022 As at 31-03-2021
(i) Aggregate amount of quoted investments 28,566 33,262 Market Value of quoted investments 28,541 33,261 (ii) Aggregate amount of unquoted investments 2,800 3,020
Other Disclosures :

294 Integrated Annual Report 2021-22 295Corporate Overview | Statutory Reports | Financial Statements
Consolidated
Notes forming part of Consolidated Financial Statements Notes forming part of Consolidated Financial Statements
11 Trade Receivables(H Mn)
As at 31-03-2022 As at 31-03-2021
Unsecured, considered good Due from related parties (refer note 42) 384 635 Due from others 28,716 20,842 Less : Allowance for doubtful trade receivables (765) (642)
28,335 20,835
(H Mn)
As at 31-03-2022 As at 31-03-2021
Balance at the beginning of the year 642 630 Additions during the year, net 298 147 Uncollectable receivables charged against allowances (78) (131)Exchange gain/(loss) (97) (4)Balance at the end of year 765 642
Allowance for doubtful trade receivables movement
The Group determines the allowance for credit losses based on historical loss experience adjusted to reflect current and estimated future economic conditions.
Trade Receivables ageing schedule as at March 31, 2022(H Mn)
Outstanding for following periods from due date of payment
Total Not Due
Less than 6
months
6 months - 1 year
1 - 2 years
2 - 3 years
More than 3 years
(i) Undisputed Trade receivables — considered good
21,424 6,149 975 286 110 132 29,076
(ii) Undisputed Trade Receivables — which have significant increase in credit risk
- - - - - - -
(iii) Undisputed Trade Receivables — credit impaired
- - - - - - -
(iv) Disputed Trade Receivables — considered good
- - - - - - -
(v) Disputed Trade Receivables — which have significant increase in credit risk
- - - - - - -
(vi) Disputed Trade Receivables — credit impaired
- - - - - 24 24
21,424 6,149 975 286 110 156 29100 Less: Loss allowance - - - - - - (765)
28,335
11 Trade Receivables (Contd..)
12 Unbilled Revenue
13 Cash & Cash Equivalent
(H Mn)
As at 31-03-2022 As at 31-03-2021
Unbilled revenue * 9,033 6,071 9,033 6,071
(H Mn)
As at 31-03-2022 As at 31-03-2021
Cash on hand 0 0 Balances with bank- in current accounts Overseas 2,520 3,396 Domestic 547 1,309 - in deposit accounts 319 2,104 Remittance in transit 463 714 Cash and bank balance not available for immediate use 88 62 Earmarked balances with banks (Unclaimed dividend) 12 9
3,949 7,594
(H Mn)
Outstanding for following periods from due date of payment
Total Not Due
Less than 6
months
6 months - 1 year
1 - 2 years
2 - 3 years
More than 3 years
(i) Undisputed Trade receivables — considered good
18,386 1,922 672 266 86 121 21,453
(ii) Undisputed Trade Receivables — which have significant increase in credit risk
- - - - - - -
(iii) Undisputed Trade Receivables — credit impaired
- - - - - - -
(iv) Disputed Trade Receivables — considered good
- - - - - - -
(v) Disputed Trade Receivables — which have significant increase in credit risk
- - - - - - -
(vi) Disputed Trade Receivables — credit impaired
- - - - - 24 24
18,386 1,922 672 266 86 145 21,477 Less: Loss allowance - - - - - - (642)
20,835
Trade Receivables ageing schedule as at March 31, 2021
*Unbilled revenue has been classified as financial asset where the contractual right to consideration is unconditional upon passage of time.

296 Integrated Annual Report 2021-22 297Corporate Overview | Statutory Reports | Financial Statements
Consolidated
Notes forming part of Consolidated Financial Statements Notes forming part of Consolidated Financial Statements
14 Other Bank Balances
15 Other Current Financial Assets
16 Other Current Assets
(H Mn)
As at 31-03-2022 As at 31-03-2021
Bank Deposits 3,824 - 3,824 -
(H Mn)
As at 31-03-2022 As at 31-03-2021
Advances to employees 321 186 Derivative contracts receivables 1,944 1,497 Lease receivable 102 86 Security deposits# 213 300 Interest accrued but not due 230 63 Others 20 26
2,830 2,158
(H Mn)
As at 31-03-2022 As at 31-03-2021
Unbilled revenue* 5,948 5,335 Prepaid expenses 2,334 1,496 Advances recoverable other than in cash 644 1,049 Deferred contract costs 393 493
9,319 8,373
(H Mn)
As at 31-03-2022 As at 31-03-2021
Authorized :274,500,000 equity shares of H1 each 275 260 (Previous year 260,000,000 of H1 each)
275 260 Issued, paid up and subscribed175,270,156 equity shares for H1 each 175 175 (Previous year 174,750,608 of H1 each)EQUITY SHARE CAPITAL 175 175
#Security deposits reclassified from Loans to Other Financial Assets
*Classified as non financial asset as the contractual right to consideration is dependent on completion of contractual milestones.
17 Share Capital(I) Share capital authorized, issued, subscribed and paid up:
Sr. no
ParticularsESOP scheme 20152021-22 2020-21
i Grant Price H1 H1ii Grant Dates June 10, 2016 onwardsiii Vesting commences on June 10, 2017 onwardsiv Options granted & outstanding at the beginning of the year 882,606 1,525,395 v Options reinstated during the year - - vi Options granted during the year 45,285 83,650vii Options allotted/exercised during the year 519,548 623,839viii Options Lapsed/cancelled during the year 82,428 102,600ix Options granted & outstanding at the end of the year 325,915 882,606x Options vested at the end of the year out of (ix) 143,122 122,208xi Options unvested at the end of the year out of (ix) 182,793 760,398xii Weighted average remaining contractual life of options (in years) 3.5 3.3
As at 31-03-2022 As at 31-03-2021
Issued, subscribed and fully paid up equity shares outstanding at the beginning
174,750,608 174,126,769
Add: Shares issued on exercise of employee stock options 519,548 623,839 Issued, subscribed and fully paid up equity shares outstanding at the end 175,270,156 174,750,608
Name of Shareholder Number of Shares Shareholding %% Change during
the year
As at 31-03-2022Larsen & Toubro Limited (Promoter) 129,784,034 74.05% 0.22%
As at 31-03-2021Larsen & Toubro Limited (Promoter) 129,784,034 74.27% 0.24%
17 Share Capital (Contd..)
(II) Terms/rights attached to equity shares
The Company has only one class of equity shares having a par value of H1 per share. Each holder of equity shares is entitled to one vote per share. The Group declares and pays dividend in Indian rupees.
(III) Shareholders holding more than 5% of equity shares as at the end of the year:
(IV) Reconciliation of the number of equity shares and share capital
Due to allotment of shares on exercise of stock options by employees, there was a movement in share capital for the year ended March 31, 2022 and March 31, 2021 as given below:
(V) Stock option plans: Employee Stock Ownership Scheme (‘ESOS Plan’)
The grant of options to the employees under ESOS Plan is on the basis of their performance and other eligibility criteria.

298 Integrated Annual Report 2021-22 299Corporate Overview | Statutory Reports | Financial Statements
Consolidated
Notes forming part of Consolidated Financial Statements Notes forming part of Consolidated Financial Statements
17 Share Capital (Contd..)
18 Other Equity
VI) The aggregate number of equity shares allotted as fully paid up by way of bonus shares in immediately preceding five years ended March 31, 2022 are Nil (previous period of five years ended March 31, 2021 - Nil)
VII) The aggregate number of equity shares issued pursuant to contract, without payment being received in cash in immediately preceding five years ended March 31, 2022 – Nil (previous period of five years ended March 31, 2021 - Nil)
VIII) During the year ended March 31, 2022, the amount of special dividend of H10 per share (previous year Nil per share) and interim dividend distributed to equity shareholder was H15 per share (previous year H15 per share).
IX) Weighted average share price at the date of exercise for stock options exercised during the year is H4889 per share (previous year H2,691 per share).
X) Weighted average fair value of options granted during the year is H4668 (previous year H2,349).
XI) The fair value has been calculated using the Black-Scholes Option Pricing model and significant assumptions and inputs to estimate the fair value options granted during the year are as follows:
Sr. no
Particulars 2021-22 2020-21
i Weighted average risk-free interest rate 5.00% 4.62%ii Weighted average expected life of options 3 Years 3 yearsiii Weighted average expected volatility 27.67% 25.17%iv Weighted average expected dividends over the life of option H189 H149v Weighted average share price H4668 H2349vi Weighted average exercise price H1 H1vii Method used to determine expected volatility The expected
volatility has been calculated
based on historic company share
price.
The expected volatility has been
calculated based on historic volatility
IT Index.
(H Mn)
Particulars As at 31-03-2022 As at 31-03-2021
I) General Reserve1
Opening Balance 4,508 4,506 Add: Employee stock compensation outstanding - 2
4,508 4,508 II) Hedging Reserve2 (Refer Note 2.q.iii)
Opening balance (net of taxes) 2,200 (2,149)Add: Movement in derivative contracts 2,882 5,969 Less: Amount reclassified to profit or loss (2,056) (158)Less: Deferred tax related to above (208) (1,462)
2,818 2,200 III) Share Premium3
Opening balance 2,862 2,514 Add: Additions during the year 286 348
3,148 2,862
18 Other Equity (Contd..)(H Mn)
Particulars As at 31-03-2022 As at 31-03-2021
IV) Capital reserve5
Opening balance 0 0 Add: Additions during the year 0 0
0 0 V) OCI - Remeasurement of net defined benefit plans (Net of Tax)
Opening balance 128 92 Add: Additions during the year 25 36
153 128 VI) Employee Stock Options outstanding4 (Refer Note 2.n.)
Opening Balance 794 1,062 Add: Additions during the year 211 196 Less: Deductions during the year (422) (464)
(a) 583 794 Deferred Employee Compensation ExpenseOpening Balance (288) (379)Add: Additions during the year (211) (196)Less: Deductions during the year 245 287
(b) (254) (288)Balance to be carried forward (a)+(b) 329 506
VII) Foreign currency translation reserve (Refer Note 2.p.)Opening Balance 1,090 690 Add: Transfer to other comprehensive income 141 400
1,231 1,090 VIII) Retained Earnings5
Opening Balance 61,565 47,530 Add: Profit for the year 22,968 19,361 Less: Increase in non-controlling interest due to divestment * - (2)Less: Dividend (8,749) (5,324)Less: Impact on account of adoption of Ind AS 116 - -
75,784 61,565 Total (I + II + III + IV + V + VI + VII + VIII) 87,971 72,859
IX Non Controlling InterestOpening Balance 37 11 Add: Net profit for the year 17 21 Add: Increase in non-controlling interest due to divestment * - 2 Add: Transfer from / (to) other comprehensive income 3 3
57 37
1. The Group created a General reserve in earlier years pursuant to the provisions of the Companies Act,1956 where in certain percentage of profits was required to be transferred to General reserve before declaring dividends. As per Companies Act 2013, the requirements to transfer profits to General reserve is not mandatory. General reserve is a free reserve available to the Group.
2. The hedging reserve represents the cumulative effective portion of gains or losses arising on changes in fair value of designated portion of hedging instruments entered into for cash flow hedges. Such gains or losses will be reclassified to statement of profit and loss in the period in which the hedged transaction occurs.

300 Integrated Annual Report 2021-22 301Corporate Overview | Statutory Reports | Financial Statements
Consolidated
Notes forming part of Consolidated Financial Statements Notes forming part of Consolidated Financial Statements
3. Share premium includes
A . The difference between the face value of the equity shares and the consideration received in respect of shares issued;
B. The fair value of the stock options which are treated as expense in respect of shares allotted pursuant to Stock Options Scheme.
4. It represents the fair value of services received against employee stock options.
5. Retained earnings represents the undistributed profits of the Group accumulated as on Balance Sheet date.
* On August 19, 2020, LTI South Africa (Pty) Ltd, a subsidiary of the Company bought back 5.32% of its shares from the Company. Resultantly, Company’s shareholding in this subsidiary reduced from 74.90% to 69.58%.
18 Other Equity (Contd..)
19 Other Non Current Financial Liabilities
20 Other Non Current Liabilities
21 Non Current Provisions
(H Mn)
As at 31-03-2022 As at 31-03-2021
Payable for acquisition of business 133 443 Other financial liabilities 1 2
134 445
(H Mn)
As at 31-03-2022 As at 31-03-2021
Deferred social security obligation - 479 - 479
(H Mn)
As at 31-03-2022 As at 31-03-2021
Post-retirement medical benefit (Refer Note 38) 282 250 Others 111 113
393 363
21 (I)
21 (II) Disclosure pursuant to Accounting Standard (Ind- AS) 37 “Provisions, Contingent Liabilities and Contingent Assets” movement in provisions:
(H Mn)
Particulars Class of provisions
Sales tax Others Total
Balance as at March 31, 2020 4 111 115 Additional provision during the year - - - Provision used during the year - - - Provision reversed during the year - (2) (2)Balance As at March 31, 2021 4 109 113 Additional provision during the year - - - Provision used during the year - - - Provision reversed during the year - (2) (2)Balance As at March 31, 2022 4 107 111
22 Current Borrowings
23 Trade Payables
(H Mn)
As at 31-03-2022 As at 31-03-2021
Unsecured loansOther loans from banks* 519 414
519 414
(H Mn)
As at 31-03-2022 As at 31-03-2021
Total outstanding dues of micro enterprises and small enterprises 75 82 Total outstanding dues of creditors other than micro enterprises and small enterprises : Due to related parties (Refer Note 42) 177 3 Due to others 2,498 3,473 Accrued expenses 5,278 4,719
7,953 8,195
*Loan repayable on demand from bank outside India which is a fund based working capital facility carrying a rate of interest between 1% to 2.5% p.a.
Trade Payables ageing schedule as at March 31, 2022
Trade Payables ageing schedule as at March 31, 2021
(H Mn)
Unbilled Not Due
Outstanding for following periods from due date of payment
Total Less than 1
year
1-2 years
2 - 3 years
More than 3 years
(i) MSME - 75 - - - - 75 (ii) Others 5,278 1,861 689 99 21 5 7,953 (iii) Disputed dues - MSME - - - - - - - (iv) Disputed dues - Others - - - - - - -
5,278 1,936 689 99 21 5 8,028
(H Mn)
Unbilled Not Due
Outstanding for following periods from due date of payment
Total Less than 1
year
1 - 2 years
2 - 3 years
More than 3 years
(i) MSME - 74 8 - - - 82 (ii) Others 4,719 1,910 1,490 32 29 15 8,195 (iii) Disputed dues - MSME - - - - - - - (iv) Disputed dues - Others - - - - - - -
4,719 1,984 1,498 32 29 15 8,277

302 Integrated Annual Report 2021-22 303Corporate Overview | Statutory Reports | Financial Statements
Consolidated
Notes forming part of Consolidated Financial Statements Notes forming part of Consolidated Financial Statements
24 Other Current Financial Liabilities
25 Other Current Liabilities
26 Current Provisions
(H Mn)
As at 31-03-2022 As at 31-03-2021
Liabilities for employee benefits 7,315 5,382
Payable for acquisition of business 1,055 878
Liability towards credit support agreements 594 683
Liability for gratuity 379 260
Unclaimed dividend 13 9
Capital creditors - 619
Others 4 -
9,360 7,831
(H Mn)
As at 31-03-2022 As at 31-03-2021
Unearned & deferred revenue 1,418 1,697
Other payables 4,394 3,224
5,812 4,921
(H Mn)
As at 31-03-2022 As at 31-03-2021
Compensated absences 3,870 3,539
Post retirement medical benefits 4 3
3,874 3,542
(H Mn)
Year ended March 31, 2022
Year ended March 31, 2021
Balance at the beginning of the year 5,335 4,342 Less : Invoices raised during the period (4,072) (2,085)Add : Revenue recognised during the year 4,686 3,088 Add : Translation exchange difference (1) (10)Balance at the end of the year 5,948 5,335
(H Mn)
Year ended March 31, 2022
Year ended March 31, 2021
Balance at the beginning of the year 1,697 1,559 Less : Revenue Recognised during the period from opening (1,294) (1,144)Add : Invoices raised during the period 1,044 1,284Add/ (Less) : Translation exchange difference (29) (2)Balance at the end of the year 1,418 1,697
Performance obligations and remaining performance obligations:
The remaining performance obligation disclosure provides the aggregate amount of the transaction price yet to be recognized as at the end of the reporting period and an explanation as to when the Group expects to recognize these amounts in revenue. Applying the practical expedient as given in Ind AS 115, the Group has not disclosed the remaining performance obligation related disclosures for contracts where the revenue recognized for those contracts where invoicing is on time and material basis. Remaining performance obligation estimates are subject to change and are affected by several factors, including terminations, changes in the scope of contracts, periodic revalidations, adjustment for revenue that has not materialized and adjustments for currency.
The aggregate value of performance obligations that are completely or partially unsatisfied as at March 31, 2022, other than those meeting the exclusion criteria mentioned above, is H143,867 Mn (previous year H129,774 Mn). Out of this, the Group expects to recognize revenue of around 57 % (previous year 54 %) within the next one year and the remaining thereafter. This includes contracts that can be terminated for convenience without a substantive penalty since, based on current assessment, the occurrence of the same is expected to be remote.
Changes in contract assets is as follows:
Changes in contract liabilities is as follows:
27 Revenue From Operations
(H Mn)
Year ended March 31, 2022
Year ended March 31, 2021
Revenue from software services Fixed Price & Maintenance 97,746 74,146 Time & Material 51,511 42,745 Revenue from products 7,430 6,807
156,687 123,698
Revenue disaggregation by nature of services is as follows:
Revenue disaggregation as per industry vertical and geography has been included in segment information (Refer note 43).
(H Mn)
Year ended March 31, 2022
Year ended March 31, 2021
Foreign exchange gain* 2,854 62 Income from current investment in mutual funds 1,209 1,542 Interest received from bank and others** 393 162 Miscellaneous income # 211 978
4,667 2,744
28 Other Income
*The foreign exchange gain reported above includes gain on Derivative financial instrument which are designated as cash flow hedges of H2,056 Mn (previous year March 31, 2021 H158 Mn) and as fair value hedges of H77 Mn (previous year ended March 31, 2021 gain of H469 Mn). Since, the Company hedges its operational business exposure on a net basis (i.e. expected revenue in foreign currency less expected expenditure in related currency), the aforesaid gain relates to the business operations of the company.#Miscelleneous Income includes change in fair value of Contingent consideration amounting to charge of H71 Mn (previous year ended March 31, 2021 credit of H571 Mn).
**Includes interest income on financial assets measured at amortised cost, which has been recorded on the basis of Effective interest method.
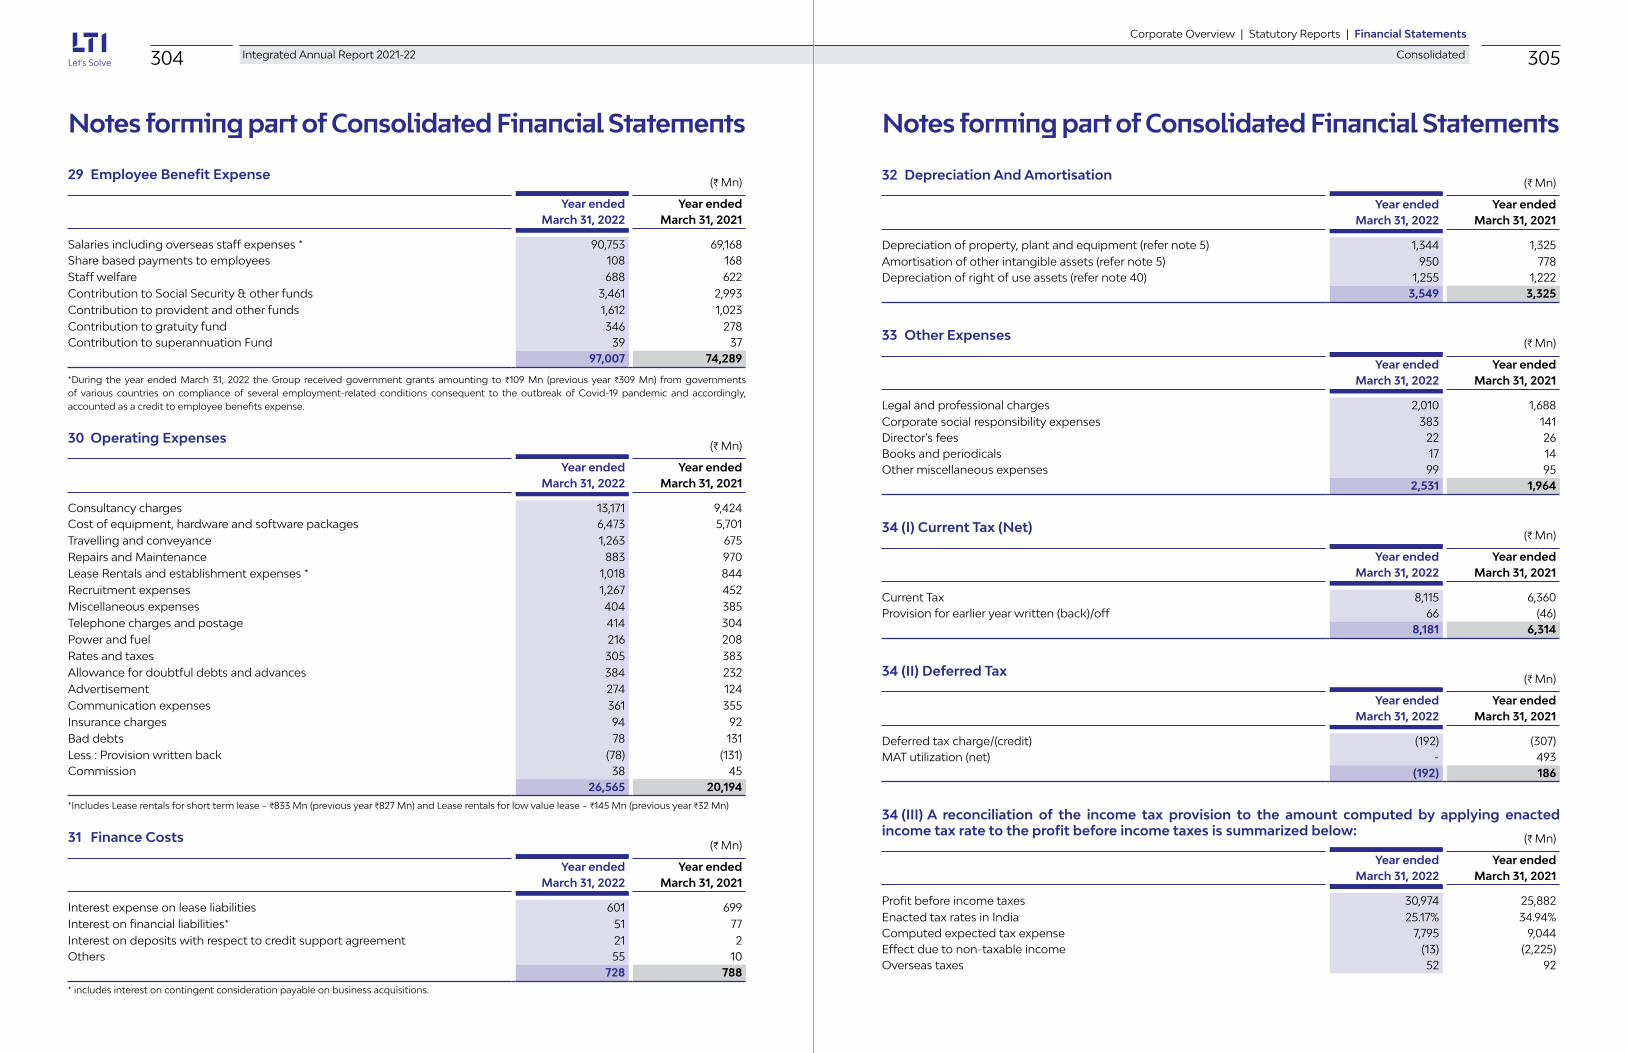
304 Integrated Annual Report 2021-22 305Corporate Overview | Statutory Reports | Financial Statements
Consolidated
Notes forming part of Consolidated Financial Statements Notes forming part of Consolidated Financial Statements
(H Mn)
Year ended March 31, 2022
Year ended March 31, 2021
Salaries including overseas staff expenses * 90,753 69,168 Share based payments to employees 108 168 Staff welfare 688 622 Contribution to Social Security & other funds 3,461 2,993 Contribution to provident and other funds 1,612 1,023 Contribution to gratuity fund 346 278 Contribution to superannuation Fund 39 37
97,007 74,289
(H Mn)
Year ended March 31, 2022
Year ended March 31, 2021
Consultancy charges 13,171 9,424 Cost of equipment, hardware and software packages 6,473 5,701 Travelling and conveyance 1,263 675 Repairs and Maintenance 883 970 Lease Rentals and establishment expenses * 1,018 844 Recruitment expenses 1,267 452 Miscellaneous expenses 404 385 Telephone charges and postage 414 304 Power and fuel 216 208 Rates and taxes 305 383 Allowance for doubtful debts and advances 384 232 Advertisement 274 124 Communication expenses 361 355 Insurance charges 94 92 Bad debts 78 131 Less : Provision written back (78) (131)Commission 38 45
26,565 20,194
*During the year ended March 31, 2022 the Group received government grants amounting to H109 Mn (previous year H309 Mn) from governments of various countries on compliance of several employment-related conditions consequent to the outbreak of Covid-19 pandemic and accordingly, accounted as a credit to employee benefits expense.
30 Operating Expenses
* includes interest on contingent consideration payable on business acquisitions.
*Includes Lease rentals for short term lease – H833 Mn (previous year H827 Mn) and Lease rentals for low value lease – H145 Mn (previous year H32 Mn)
31 Finance Costs
32 Depreciation And Amortisation
33 Other Expenses
(H Mn)
Year ended March 31, 2022
Year ended March 31, 2021
Interest expense on lease liabilities 601 699 Interest on financial liabilities* 51 77 Interest on deposits with respect to credit support agreement 21 2 Others 55 10
728 788
(H Mn)
Year ended March 31, 2022
Year ended March 31, 2021
Depreciation of property, plant and equipment (refer note 5) 1,344 1,325 Amortisation of other intangible assets (refer note 5) 950 778 Depreciation of right of use assets (refer note 40) 1,255 1,222
3,549 3,325
(H Mn)
Year ended March 31, 2022
Year ended March 31, 2021
Legal and professional charges 2,010 1,688 Corporate social responsibility expenses 383 141 Director's fees 22 26 Books and periodicals 17 14 Other miscellaneous expenses 99 95
2,531 1,964
29 Employee Benefit Expense
34 (I) Current Tax (Net)
34 (II) Deferred Tax
(H Mn)
Year ended March 31, 2022
Year ended March 31, 2021
Current Tax 8,115 6,360 Provision for earlier year written (back)/off 66 (46)
8,181 6,314
(H Mn)
Year ended March 31, 2022
Year ended March 31, 2021
Deferred tax charge/(credit) (192) (307)MAT utilization (net) - 493
(192) 186
34 (III) A reconciliation of the income tax provision to the amount computed by applying enacted income tax rate to the profit before income taxes is summarized below:
(H Mn)
Year ended March 31, 2022
Year ended March 31, 2021
Profit before income taxes 30,974 25,882 Enacted tax rates in India 25.17% 34.94%Computed expected tax expense 7,795 9,044 Effect due to non-taxable income (13) (2,225)Overseas taxes 52 92

306 Integrated Annual Report 2021-22 307Corporate Overview | Statutory Reports | Financial Statements
Consolidated
Notes forming part of Consolidated Financial Statements Notes forming part of Consolidated Financial Statements
35 Statement of other Comprehensive Income(H Mn)
Year ended March 31, 2022
Year ended March 31, 2021
Items that will not be reclassified to profit or lossDefined benefit plan actuarial gain/(loss) 33 48 Income tax on defined benefit plan actuarial gain/(loss) (8) (12)
25 36 Items that will be reclassified to profit or lossNet changes in fair value of cash flow hedges 826 5,812 Income tax on net changes in fair value of cash flow hedges (208) (1,463)Foreign currency translation reserve 144 403
762 4,752 787 4,788
36 Contingent liabilities(H Mn)
As at 31-03-2022 As at 31-03-2021
1. Income tax liability that may arise in respect of which the Group is in appeal* 2,915 2,899 2. Service tax refund disallowed, in respect of which the Group is in the appeal # 124 156
3,039 3,055
37 Estimated amount of contracts remaining to be executed on capital account (net of advances) and not provided for: H4,048 Mn (previous year H118 Mn).
38 Employee benefits
I) General descriptions of defined benefit plans:
i) Gratuity plan
The Group makes contributions to the Company’s employees’ , Company Gratuity-cum-Life Assurance Scheme of the Life Insurance Corporation of India, a funded defined benefit plan for qualifying employees. The scheme provides for lump sum payment to employees at retirement or death while in employment or termination of employment of an amount equivalent to 15 days salary for every completed year of service or part thereof in excess of six months, provided the employee has completed five years in service.
ii) Post-retirement medical benefit plan
The post-retirement medical benefit plan provides for reimbursement of health care costs to certain categories of employees post their retirement. The reimbursement is subject to an overall ceiling limit sanctioned at the time of retirement. The ceiling limits are based on cadre of the employee at the time of retirement.
iii) Provident fund plan
The Group’s provident fund plan is managed by its holding company through a Trust permitted under the Provident Fund Act, 1952. The plan envisages contribution by employer and employees and guarantees interest at the rate notified by the Provident Fund Authority. The contribution by employer and employee together with interest are payable at the time of separation from service or retirement whichever is earlier. The benefit under this plan vests immediately on rendering of service.
The interest payment obligation of trust managed provident fund is assumed to be adequately covered by the interest income on long term investments of the fund. Any shortfall in the interest income over the interest obligation is recognised immediately in the statement of profit and loss as actuarial loss. Any loss arising out of the investment risk and actuarial risk associated with the plan is also recognised as expense in the period in which such loss occurs. Further, Nil has been provided for year ending March 31, 2022 and March 31, 2021 based on actuarial valuation towards the future obligation arising out of interest rate guarantee associated with the plan.
II) The amounts recognised in balance sheet are as follows:
* The Government of India, vide Taxation Laws (Amendment) Ordinance, 2019 dated September 20, 2019, introduced section 115 BAA in the Income Tax Act, 1961, providing domestic companies an irrevocable option to adopt reduced corporate tax rate, subject to certain conditions.
The company and its Indian subsidiaries have decided to adopt reduced corporate tax rate from FY21-22.
(H Mn)
Year ended March 31, 2022
Year ended March 31, 2021
Effect of allowances of eligible expenses 27 (396)Effect of non-deductible expenses 100 52 Tax pertaining to prior years 66 (46)Others (38) (21)Tax expense as per statement of profit and loss 7,989 6,500
34 (III) A reconciliation of the income tax provision to the amount computed by applying enacted income tax rate to the profit before income taxes is summarized below: (Contd..)
* Out of contingent Tax liability disclosed above, H2,750 Mn (including interest of H141 Mn), pertains to the tax demand arising on account of disallowance of exemption u/s 10A/10AA on profits earned by STPI Units/SEZ units on onsite export revenue. Company is pursuing appeals against these demands before the relevant Appellate Authorities. The company believes that its position is likely to be upheld by appellate authorities and considering the facts, the ultimate outcome of these proceedings is not likely to have material adverse effect on the results of operations or the financial position of the Company.
# Out of the liability disclosed above, the major portion is towards the application filed for refund of accumulated service tax credit in accordance with relevant CENVAT credit Rules. However, the department has disallowed certain portion of such refunds considering the same as ineligible as not related with output services. The Company is in appeal against these disallowances before the relevant Authorities and is hopeful of getting a favourable order.
Others
A class action lawsuit was filed in the United States District Court, Southern District of New York against the Company alleging discrimination by an ex-employee and an ex-contractor. The Company is taking necessary actions to defend the claim. The Company is presently unable to predict the duration or the outcome of this matter.
(H Mn)
Gratuity plan As at 31-3-2022 As at 31-3-2021
a) Present value of defined benefit obligation - Wholly funded 1,685 1,432 - Wholly unfunded - 3 b) Fair value of plan assets as on 1,306 1,171 Amount to be recognised as liability or (asset) (a-b) 379 264 Net liability/(asset)-current 379 261 Net liability/(asset)- non current - 3

308 Integrated Annual Report 2021-22 309Corporate Overview | Statutory Reports | Financial Statements
Consolidated
Notes forming part of Consolidated Financial Statements Notes forming part of Consolidated Financial Statements
38 Employee benefits (Contd..)
(H Mn)
Post-retirement medical benefit plan As at 31-3-2022 As at 31-3-2021
A.a) Present value of defined benefit obligation- Wholly funded - - - Wholly unfunded 286 253 b) Fair value of plan assets - - Amount to be recognised as liability or (asset) (a-b) 286 253 B.Amounts reflected in the balance sheetLiability 286 253 Assets - - Net liability/(asset) 286 253 Net liability/(asset)-current 4 3 Net liability/(asset)- non current 282 250
(H Mn)
Provident fund plan As at 31-3-2022 As at 31-3-2021
A.a) Present value of defined benefit obligation - Wholly funded 14,228 11,117 - Wholly unfunded - - b) Fair value of plan assets 15,310 12,142 Amount to be recognised as liability or (asset) (a-b)* (1,082) (1,025)B.Amounts reflected in the balance sheetLiability 255 161 Assets - - Net liability/(asset)# 255 161 Net liability/(asset)-current 255 161 Net liability/(asset)- non current - -
38 Employee benefits (Contd..)
II) The amounts recognised in balance sheet are as follows: (Contd..) III) The amounts recognised in balance sheet are as follows: (Contd..)
(H Mn)
Gratuity plan 2021-22 2020-21
i Current service cost 336 269 ii Past service cost - - iii Administration expenses - - iv Interest on net defined benefit liability / (asset) 10 9 v (Gains) / losses on settlement - -
Total expense charged to profit and loss account 346 278
(H Mn)
Post-retirement medical benefit plan 2021-22 2020-21
i Current service cost 66 57 ii Past service cost - - iii Administration expenses - - iv Interest on net defined benefit liability / (asset) 17 14 v (Gains) / losses on settlement - -
Total expense charged to profit and loss account 83 71
(H Mn)
Provident fund plan 2021-22 2020-21
i Current service cost 956 550 ii Interest cost 983 808 iii Expected return on plan assets (983) (808)
Total expense charged to profit and loss account 956 550
III) The amounts recognised in statement of profit and loss are as follows:
#Employer’s and employee’s contribution for March 2022 is paid in April 2022
*Net asset is not recognised in the balance sheet
IV) The amounts recognised in statement of other comprehensive income (OCI) are as follows:
V) The changes in the present value of defined benefit obligation representing reconciliation of opening and closing balances thereof are as follows:
(H Mn)
Gratuity planPost retirement medical
benefit plan 2021-22 2020-21 2021-22 2020-21
Opening amount recognized in OCI 42 59 (200) (164)Re-measurements during the period due to:Changes in financial assumptions (40) 10 (21) 5 Changes in demographic assumptions - - - - Experience adjustments 46 (17) (27) (41)Actual return on plan assets less interest on plan assets
9 (10) - -
Closing amount recognized in OCI 57 42 (248) (200)
(H Mn)
Gratuity plan 2021-22 2020-21
Opening balance of defined benefit obligation 1,435 1,166 Current service cost 336 269 Past service costInterest on defined benefit obligation 85 70 Re-measurements due toActuarial loss/(gain) arising from change in financial assumption (40) 10 Actuarial loss/(gain) arising from change in demographic assumptions - - Actuarial loss/(gain) arising on account of experience changes 46 (17)Acquisition/Disinvestment 14 -Benefits paid (191) (60)Liabilities assumed / (settled) - (4)Closing balance of defined benefit obligation 1,685 1,435

310 Integrated Annual Report 2021-22 311Corporate Overview | Statutory Reports | Financial Statements
Consolidated
Notes forming part of Consolidated Financial Statements Notes forming part of Consolidated Financial Statements
38 Employee benefits (Contd..)
(H Mn)
Post-retirement medical benefit plan 2021-22 2020-21
Opening balance of defined benefit obligation 253 218 Current service cost 66 57 Past service cost - - Interest on defined benefit obligation 17 14 Re-measurements due toActuarial loss/(gain) arising from change in financial assumption (21) 5 Actuarial loss/(gain) arising from change in demographic assumptions - - Actuarial loss/(gain) arising on account of experience changes (27) (41)Benefits paid (2) (0)Closing balance of defined benefit obligation 286 253
V) The changes in the present value of defined benefit obligation representing reconciliation of opening and closing balances thereof are as follows: (Contd..)
VI) Changes in the fair value of plan assets representing reconciliation of the opening and closing balances thereof are as follows:
(H Mn)
Gratuity plan Provident fund plan 2021-22 2020-21 2021-22 2020-21
Opening balance of the fair value of the plan assets
1,171 918 12,142 9,482
Employer’s contributions 260 243 915 536 Expected return on plan assets 75 61 983 808 Actuarial gains/(loss) 243 534 Re-measurements due to:Actual return on plan assets less interest on plan assets
(9) 10 - -
Contribution by plan participants - - 1,619 1,102 Benefits paid (191) (60) (1,787) (768)Assets acquired/(settled)* - - 1,195 448 Closing balance of plan assets 1,306 1,171 15,310 12,142
(H Mn)
Provident fund plan 2021-22 2020-21
Opening balance of defined benefit obligation 11,117 8,948 Add : Interest cost 983 808 Add : Current service cost 956 550 Add : Contribution by plan participants 1,764 1,131 Add/(Less) : actuarial (gains)/losses - - Add: Business combination/acquisition - - Liabilities assumed on acquisition/ (settled on divestiture) 1,195 448 Less : Benefits paid (1,787) (768)Closing balance of defined benefit obligation 14,228 11,117
* On account of business combination or inter-company transfer
The Group expects to contribute H379 Mn (H261 Mn in 2020-21) towards its gratuity, in the next financial year.
VII) The major categories of plan assets as a percentage of total plan assets are as follows:
VIII) Principal actuarial assumptions at the balance sheet date :
38 Employee benefits (Contd..)
Gratuity planProvident fund plan
2021-22 2020-21
Government of India securities
Scheme with LIC
17.47% 22.17%State government securities 27.81% 23.13%Corporate bonds 30.50% 29.38%Fixed deposits under Special Deposit Scheme framed by central government for provident funds
3.29% 3.69%
Public sector bonds 10.38% 12.60%Mutual Funds 5.23% 5.42%Others 5.32% 3.61%
As at 31-03-2022 As at 31-03-2021
i Discount rate For gratuity 6.65% 6.30%For post -retirement medical benefits 6.65% 6.30%
ii Annual increase in healthcare costs (see note below) 5.00% 5.00%iii Attrition rate : Varies between 8%
to 19%Varies between 8%
to 19%iv Salary growth rate* 6.00% 6.00%
*Salary growth rate assumption reflects the Group’s average salary growth rate and current market conditions
IX) Projected plan cash flow:
The table below shows the expected cash flow profile of the benefits to be paid to the current membership of the plan (which in case of serving employees, if any, is based on service accrued by employee up to valuation date):
As on March 31, 2022(H Mn)
Maturity profile Gratuity Post-Retirement medical
benefit liability
Expected benefits for year 1 232 4 Expected benefits for year 2 184 5 Expected benefits for year 3 192 6 Expected benefits for year 4 192 8 Expected benefits for year 5 194 9 Expected benefits for year 6 173 10 Expected benefits for year 7 160 11 Expected benefits for year 8 152 12 Expected benefits for year 9 139 13 Expected benefits for year 10 and above 1,269 1,484

312 Integrated Annual Report 2021-22 313Corporate Overview | Statutory Reports | Financial Statements
Consolidated
Notes forming part of Consolidated Financial Statements Notes forming part of Consolidated Financial Statements
IX) Projected plan cash flow: (Contd..)
38 Employee benefits (Contd..)
Period ended March 31, 2022
Period ended March 31, 2021
Discount RateImpact of increase in 100 bps on defined benefit obligation (16.88%) (17.41%)Impact of decrease in 100 bps on defined benefit obligation 22.26% 23.08%Healthcare costs rateImpact of increase in 100 bps on defined benefit obligation 12.53% 13.30%Impact of decrease in 100 bps on defined benefit obligation (10.18%) (10.72%)Life expectancyImpact of increase by 1 year on defined benefit obligation 1.41% 1.41%Impact of decrease by 1 year on defined benefit obligation (1.48%) (1.47%)
(H Mn)
Maturity profile Gratuity Post-Retirement medical
benefit liability
Expected benefits for year 1 151 3 Expected benefits for year 2 156 4 Expected benefits for year 3 168 5 Expected benefits for year 4 170 6 Expected benefits for year 5 161 7 Expected benefits for year 6 152 8 Expected benefits for year 7 135 9 Expected benefits for year 8 128 9 Expected benefits for year 9 121 10 Expected benefits for year 10 and above 1,076 1,224
As on March 31, 2021
The estimates of future salary increases considered in actuarial valuation, take into account inflation, seniority, promotion and other relevant factors, such as supply and demand in the employment market.
X) Sensitivity analysis
i) Post retirement benefits:
Although the obligation of the Group under the post-retirement medical benefit plan is limited to the overall ceiling limits, assumed healthcare cost trend rates may affect the amounts recognised in the statement of profit and loss. The benefit obligation results for the cost of paying future hospitalization premiums to insurance company and reimbursement of domiciliary medical expenses in future for the employee / beneficiaries during their lifetime is sensitive to discount rate, future increase in healthcare costs and longevity. The following table summarizes the impact in percentage terms on the reported defined benefit obligation at the end of the reporting period arising on account changes in these three key parameters:
38 Employee benefits (Contd..)
X) Sensitivity analysis (Contd..)
ii) Gratuity:
Gratuity is a lump sum plan and the cost of providing these benefits is typically less sensitive to small changes in demographic assumptions. The key actuarial assumptions to which the benefit obligation results are particularly sensitive to are discount rate and future salary escalation rate. The following table summarizes the impact in percentage terms on the reported defined benefit obligation at the end of the reporting period arising on account of an increase or decrease in the reported assumption as below:
Period ended March 31, 2022 Period ended March 31, 2021
Discount rateSalary
escalation rate
Discount rateSalary
escalation rate
Impact of increase in 100 bps on defined benefit obligation
(6.30%) 7.08% (6.61%) 7.41%
Impact of decrease in 100 bps on defined benefit obligation
7.10% (6.40%) 7.46% (6.69%)
(H Mn)
As at 31-03-2022 As at 31-03-2021
Fair value
through P&L
(FVTPL)
Fair value through
OCI (FVTOCI)
Amortised cost
Total carrying
value
Total fair
value
Fair value through
P&L (FVTPL)
Fair value through
OCI (FVTOCI)
Amortised cost
Total carrying
value
Total fair
value
Financial assets Investments 26,009 - 8,811 34,820 34,737 32,721 - 4,573 37,294 37,294 Trade receivables - - 28,335 28,335 28,335 - - 20,835 20,835 20,835 Unbilled revenue* - - 9,033 9,033 9,033 - - 6,071 6,071 6,071 Cash and cash equivalents
- - 3,949 3,949 3,949 - - 7,594 7,594 7,594
Bank Deposits (Current+Non-current)
- - 4,142 4,142 4,142 - - - - -
Derivative financial instruments#
4 3,862 - 3,866 3,866 72 2,865 - 2,937 2,937
Other financial assets - - 1,666 1,666 1,666 - - 1,273 1,273 1,273 Total 26,013 3,862 55,936 85,811 85,728 32,793 2,865 40,346 76,004 76,004
39 Financial instruments by categoryI) Carrying value of financial instruments by categories are as follows:
*Excludes Unbilled Revenue on Fixed Price Contracts where the right to consideration is conditional on factors other than passage of time #Derivative Financial instruments fair valued through Profit and loss on account of Fair value hedges

314 Integrated Annual Report 2021-22 315Corporate Overview | Statutory Reports | Financial Statements
Consolidated
Notes forming part of Consolidated Financial Statements Notes forming part of Consolidated Financial Statements
(H Mn)
As at 31-03-2022 As at 31-03-2021
Fair value
through P&L
(FVTPL)
Fair value through
OCI (FVTOCI)
Amortised cost
Total carrying
value
Total fair
value
Fair value through
P&L (FVTPL)
Fair value through
OCI (FVTOCI)
Amortised cost
Total carrying
value
Total fair
value
Financial liability Borrowings - - 519 519 519 - - 414 414 414 Trade payables - - 8,028 8,028 8,028 - - 8,277 8,277 8,277 Lease Liabilities - - 7,836 7,836 7,836 - - 7,569 7,569 7,569 Other financial liabilities 1,188 - 8,306 9,494 9,494 1,321 - 6,955 8,276 8,276 Total 1,188 - 24,689 25,877 25,877 1,321 - 23,215 24,536 24,536
39 Financial instruments by category (Contd..)
I) Carrying value of financial instruments by categories are as follows: (Contd..)
II) Fair value hierarchy used by the group for valuation of financial assets and liabilities recognised at FVTPL and FVTOCI is as below:
Level 1- Quoted prices (unadjusted) in the active markets for identical assets or liabilities.
Level 2- Inputs other than quoted prices included with in level 1 that are observable for assets or liabilities either directly (i.e. as prices) or indirectly (i.e. derived from prices).
Level 3- Inputs for assets or liabilities that are not based on observable market data (unobservable inputs)(H Mn)
As at 31-03-2022 As at 31-03-2021
Level 1 Level 2 Level 3 Total Level 1 Level 2 Level 3 Total
AssetsInvestments 26,008 - 1 26,009 32,720 - 1 32,721 Derivative financial instruments - 3,866 - 3,866 - 2,938 - 2,938 Total 26,008 3,866 1 29,875 32,720 2,938 1 35,659 LiabilitiesLiability towards contingent consideration*
- - 1,188 1,188 - - 1,321 1,321
Total - - 1,188 1,188 - - 1,321 1,321 *Pertains to contingent consideration payable to the selling shareholders for acquisition of business
Reconciliation of Level 3 fair value measurement of financial liabilities is as follows:(H Mn)
31-03-2022 31-03-2021
Balance at the Beginning of the year 1,321 2,183 Acquisitions during the year 187 - Finance Cost recognized in profit and loss 50 75 Remeasurement recognized as FVTPL 71 (592)Amounts Settled during the year (433) (408)Foreign Exchange Difference (8) 63 Balance at the End of the year 1,188 1,321
39 Financial instruments by category (Contd..)
II) Fair value hierarchy used by the group for valuation of financial assets and liabilities recognised at FVTPL and FVTOCI is as below: (Contd..)
A one percentage point change in the unobservable inputs used in fair valuation of Level 3 assets and liabilities does not have a significant impact on the value.
There have been no transfers among Level 1, Level 2 and Level 3 during the years ended March 31, 2022 and March 31, 2021.
The fair value of the financial assets and liabilities is included at the amount at which the instrument could be exchanged in a current transaction between willing parties, other than in a forced or liquidation sale.
III) Financial risk management
The group’s activities expose it to a variety of financial risks - Market Risk, Credit Risk, interest rate risk and Liquidity Risk. The group’s primary focus is to foresee the uncertainty of finacial markets and seek to minimize the potential adverse effects on its financial performance. The primary market risk to the group is foreign exchange risk. The group uses derivative financial instruments to mitigate the risks arising out of foreign exchange related exposures. The group’s exposure to credit risk is influenced mainly by the individual characteristic of each customer and the concentration of risk from the top few customers.
i) Currency risk
The group operates in multiple geographies and contracts in currencies other than the domestic currency exposing it to risks arising from fluctuation in the foreign exchange rates. The group uses derivative financial instruments to mitigate foreign exchange related exposures. All derivative activities for risk management purposes are carried out by specialist teams that have the appropriate skills, experience and supervision.
The group’s revenues are principally in foreign currencies and the maximum exposure is in US dollars.
The Board of Directors of the Holding company has approved the Holding company’s financial risk management policy covering management of foreign currency exposures. The treasury department monitors the foreign currency exposures and enters into appropriate hedging instruments to mitigate its risk. The group hedges its exposure on a net basis (i.e. expected revenue in foreign currency less expected expenditure in related currency.) These hedges are cash flow hedges as well as fair value hedges.
The Foreign Currency Risk from Monetary assets and liabilities as at March 31, 2022 is as follows:(In Mn)
US Dollar EuroCanadian
DollarSwedish
KronaNorwegian
KroneOther
currencies*Total
Net Assets/(Liabilities)
25,816 2,453 2,179 771 376 3,504 35,099
* Other currencies include currencies such as Australian $, Singapore $, Pound sterling, Japanese Yen, Saudi Riyal, South African Rand, etc.
(In Mn)
US Dollar EuroCanadian
DollarSwedish
KronaNorwegian
KroneOther
currencies*Total
Net Assets/(Liabilities)
12,932 3,440 2,434 923 617 3,124 23,469
* Other currencies include currencies such as Australian $, Singapore $, Pound sterling, Japanese Yen, Saudi Riyal, South African Rand, etc.
The Foreign Currency Risk from Monetary assets and liabilities as at March 31, 2021 is as follows:

316 Integrated Annual Report 2021-22 317Corporate Overview | Statutory Reports | Financial Statements
Consolidated
Notes forming part of Consolidated Financial Statements Notes forming part of Consolidated Financial Statements
39 Financial instruments by category (Contd..)
III) Financial risk management (Contd..)
i) Currency risk (Contd..)
To provide a meaningful assessment of the foreign currency risk associated with the group’s foreign currency derivative positions against off balance sheet exposures and unhedged portion of on-balance sheet exposures, the group uses a multi-currency correlated VaR model. The VaR model uses a Monte Carlo simulation to generate thousands of random market price paths for foreign currencies against Indian rupee taking into account the correlations between them. The VaR is the expected loss in value of the exposures due to overnight movement in spot exchange rates, at 95% confidence interval. The VaR model is not intended to represent actual losses but is used as a risk estimation tool. The model assumes normal market conditions and is a historical best fit model. Because the group uses foreign currency instruments for hedging purposes, the loss in fair value incurred on those instruments are generally offset by increases in the fair value of the underlying exposures for on-balance sheet exposures. The overnight VaR of the group at 95% confidence level is H638 Mn as at March 31, 2022 (H669 Mn as at March 31, 2021).
A) Derivative Financial Instruments
The group regularly reviews its foreign exchange forward and options positions, both on a standalone and in conjuction with its underlying foreign exchange exposures. The outstanding forward and option contracts at the year end, their maturity profile and sensitivity analysis are as under.
(i) The details in respect of outstanding foreign currency forward and options contracts are as follows:
As at 31-03-2022 As at 31-03-2021in Mn In J Mn in Mn In J Mn
Instruments designated as cash flow hedgesForward contracts In US Dollar 1,715 139,567 1,354 107,787 In South African Rand - - 136 635 In Swedish Krona 60 482 125 1,085 In Danish Krone - - 33 389 In Euro 45 3,897 25 2,147 In Norwegian Krone 12 103 22 186 In Australian Dollar 3 167 13 721 In Canadian Dollar 2 135 7 378 In United Kingdom Pound Sterling 2 225 4 430 Options Contracts In Euro 106 9,594 95 8,269 Instruments designated as fair value hedges In US Dollar 112 8,547 65 4,767 In Emirati Dirham 56 1,158 56 1,129 In Swedish Krona - - 12 100 In Euro 8 634 10 863 In United Kingdom Pound Sterling 1 132 7 670 In South African Rand - - 4 19 In Canadian Dollar 1 46 1 35 In Australian Dollar 2 108 1 33 In Norwegian Krone 2 16 - - In Danish Krone 5 61 - - Total Forward and Options Contracts 164,872 129,643
39 Financial instruments by category (Contd..)
III) Financial risk management (Contd..)
(ii) The foreign exchange forward and option contracts designated as cash flow hedges mature over a maximum period of 36 months. The group manages its exposures normally for a period of up to 3 years based on the estimated exposure over that period.
The table below analyses the derivative financial instrument into relevant maturity based on the remaining period as of the balance sheet date. Contracts with maturity not later than twelve months include certain contracts which can be rolled over to subsequent periods in line with underlying exposures.
(H Mn)
As at 31-03-2022 As at 31-03-2021
Not later than twelve months 80,304 67,810 Later than twelve months 84,568 61,833 Total 164,872 129,643
(H Mn)
As at 31-03-2022 As at 31-03-2021
Balance at the Beginning of the year 2,200 (2,149)Changes in fair value of forward and options contract designated as hedging instruments
2,882 5,970
Amount reclassified to profit and loss during the year (2,056) (158)Tax Impact on the above (208) (1,463)Total 2,818 2,200
Actual future gains and losses associated with forward contracts designated as cash flow hedge may differ materially from the sensitivity analysis performed as of March 31, 2022 due to the inherent limitations associated with predicting the timing and amount of changes in foreign currency exchanges rates and the group’s actual exposures and position.
The Group has considered the effect of changes, if any, in both counterparty credit risk and its own credit risk in assessing hedge effectiveness and measuring hedge ineffectiveness.
ii) Interest risk
Interest rate risk is the risk that the fair value of future cash flows of a financial instrument will fluctuate because of changes in market interest rates. The Group has no interest rate risk with respect to borrowings as on March 31, 2022.
iii) Credit risk
Credit risk refers to the risk of default on its obligation by a counterparty resulting in a financial loss. The carrying amount of all financial assets represents the maximum credit exposure. The maximum exposure to credit risk was H85,811 Mn and H76,004 Mn as at March 31, 2022 and March 31, 2021 respectively being the total of the carrying amount of Investments, Trade Receivables, Unbilled Revenue, Cash and other bank balances and all other financial assets.
The principal credit risk that the group exposed to is non-collection of trade receivable and late collection of receivable
(iii) During the year ended March 31, 2022, the group has designated certain foreign exchange forward and options contracts as cash flow hedges to mitigate the risk of foreign exchange exposure on highly probable forecast cash transactions. The related hedge transactions which form a part of hedge reserve as at March 31, 2022 will occur and be reclassified to the statement of Profit and loss over a period of 36 months.
The reconciliation for the cash flow Hedge Reserve for the years ended March 31, 2022 and March 31, 2021 is as follows:

318 Integrated Annual Report 2021-22 319Corporate Overview | Statutory Reports | Financial Statements
Consolidated
Notes forming part of Consolidated Financial Statements Notes forming part of Consolidated Financial Statements
39 Financial instruments by category (Contd..)
and on unbilled revenue leading to credit loss. The risk is mitigated by reviewing creditworthiness of the prospective customers prior to entering into contract and post contracting, through continuous monitoring of collections by a dedicated team.
The group makes adequate provision for non-collection of trade receivable and unbilled receivables. Further, the group has not suffered significant payment defaults by its customers.
In addition, for delay in collection of receivable, the Group has made a provision for Expected Credit loss (‘ECL’) based on an ageing analysis of its trade receivables, finance leases and unbilled revenue. For trade receivables and finance leases, these range from 1.2% for dues outstanding up to six months to 13.8% for dues outstanding for more than 36 months for 2021-22 (Previous year 1.5% and 15.7% for dues outstanding up to 6 months and for more than 36 months respectively) and for unbilled revenue 1.2% for dues outstanding up to six months to 3.4% for dues outstanding for more than 12 months for 2021-22 (Previous year 1.4% for dues outstanding up to six months to 3.9% for dues outstanding for more than 12 months).
The group’s exposure to credit risk is influenced mainly by the individual characteristic of each customer and the concentration of risk from the top few customers. Exposure to customers is diversified and the percentage of revenue from its top five customers is 28.1 % for 2021-22 (29.3% for 2020-21).
ECL allowance for non-collection and delay in collection of receivable and unbilled revenue, on a combined basis was H442 Mn and H320 Mn for the financial years 2021-22 and 2020-21 respectively. The movement in allowance for doubtful debts comprising provision for both non-collection and delay in collections of receivable, unbilled revenue and finance leases is as follows:
39 Financial instruments by category (Contd..)
(H Mn)
2021-22 2020-21
Opening balance 320 249 Impairment loss recognised or (reversed) 122 71 Closing balance 442 320
The group is also exposed to counter-party risk in relation to financial instruments taken to hedge its foreign currency risks. The counter- parties are banks and the group has entered into contracts with the counter-parties for all its hedge instruments and in addition, entered into suitable credit support agreements to limit counter party risk where necessary.
The Group’s investments primarily include investment in mutual fund units, quoted bonds, commercial papers, non-convertible debentures, deposits with banks and financial institutions. The Group mitigates the risk of counter-party failure by investing in mutual fund schemes with large assets under management, investing in debt instruments issued with sound credit rating and placing corporate deposits with banks and financial institutions with high credit ratings assigned by domestic and international credit rating agencies.
iv) Liquidity risk
The group’s treasury department monitors the cash flows of the group and surplus funds are invested in non- speculative financial instruments that include highly liquid funds and corporate deposits.
The group has borrowings of H519 Mn as on March 31, 2022 (Previous Year: H414 Mn).
(H Mn)
As at 31-03-2022 As at 31-03-2021Within a
yearMore than
one yearTotal
Within a year
More than one year
Total
Trade payables 8,028 - 8,028 8,277 - 8,277 Borrowings 519 - 519 414 - 414 Derivative Financial Instruments
- - - - - -
Other financial liabilities 9,364 147 9,511 7,845 483 8,328 Total 17,911 147 18,058 16,536 483 17,019
The contractual maturities of financial liabilities is as follows:
(H Mn)
2021-22 2020-21
Less than one year 3,433 1,521 More than one year 10,276 8,324 Total undiscounted lease liabilities 13,709 9,845
The table below provides details regarding the contractual maturities of lease liabilities on an undiscounted basis:
Credit risk on cash and cash equivalents is limited as the group generally invest in deposits with banks and financial institutions with high ratings assigned by international and domestic credit rating agencies and analyzing market information on a continuous and evolving basis. Ratings are monitored periodically and the group has considered the latest available credit ratings as well any other market information which may be relevant at the date of approval of these financial statements.
40 Leases
I) Following are the changes in the carrying value of right of use assets for the year ended March 31, 2022
(H Mn)
Category of ROU AssetTotalOffice
PremisesFurniture &
FixturesVehicles
Balance at April 1, 2021 6,167 52 2 6,221 Addition 1,475 - - 1,475 Pursuant to acquisition of business (Refer Note 44)
10 - - 10
Deletion (67) - - (67)Depreciation (1,237) (17) (1) (1,255)Translation Difference 7 - - 7 Balance at March 31, 2022 6,355 35 1 6,391

320 Integrated Annual Report 2021-22 321Corporate Overview | Statutory Reports | Financial Statements
Consolidated
Notes forming part of Consolidated Financial Statements Notes forming part of Consolidated Financial Statements
V) The table below provides details regarding the contractual maturities of net investment in sublease of ROU asset on an undiscounted basis:
(H Mn)
As at 31-03-2022 As at 31-03-2021
Less than one year 7 11One to five years - 7Total 7 18
(H Mn)
Category of ROU AssetTotalOffice
PremisesFurniture &
FixturesVehicles
Balance at April 1, 2020 7,623 69 0 7,692 Addition 357 - 3 360 Deletion (627) - - (627)Depreciation (1,204) (17) (1) (1,222)Translation Difference 18 - - 18 Balance at March 31, 2021 6,167 52 2 6,221
The aggregate depreciation expense on ROU assets is included under depreciation and amortization expense in the Statement of Profit and Loss.
Following are the changes in the carrying value of right of use assets for the year ended March 31, 2021
II) The following is the break-up of current and non-current lease liabilities:
III) The following is the movement in lease liabilities:
IV) The following is the movement in the net investment in sublease in ROU asset:
(H Mn)
As at 31-03-2022 As at 31-03-2021
Balance at the beginning 7,569 8,799Additions 1,416 322Pursuant to acquisition of business (Refer Note 44) 11 - Finance cost accrued during the period 601 699Deletions (89) (672)Payment of lease liabilities (1,688) (1,614)Translation Difference 16 35Balance at the end 7,836 7,569
(H Mn)
As at 31-03-2022 As at 31-03-2021
Balance at the beginning of the period 15 24Interest income accrued during the period 1 2Lease receipts (11) (12)Translation Difference 2 1Balance at the end of the period 7 15
(H Mn)
As at 31-03-2022 As at 31-03-2021
Current lease liabilities 1,161 1,194 Non-current lease liabilities 6,675 6,375 Total 7,836 7,569
40 Leases (Contd..)40 Leases (Contd..)
VI) Finance lease receivables Leasing arrangements
Finance lease receivables consist of assets that are leased to customers for contract terms ranging from 3 to 4 years, with lease payments due in monthly installments. Details of finance lease receivables are given below:
As at 31-03-2022 As at 31-03-2021
Profit after tax (H in Mn) 22,968 19,361Weighted average number of shares outstanding 175,073,125 174,460,220Basic EPS (J) 131.19 110.98Weighted average number of shares outstanding 175,073,125 174,460,220Add: Weighted average number of potential equity shares on account of employee stock options
505,078 1,135,891
Weighted average number of shares outstanding 175,578,203 175,596,111Diluted EPS (J) 130.81 110.26
(H Mn)
ParticularsMinimum Lease Payments
Present value of minimum lease payments
31-03-2022 31-03-2021 31-03-2022 31-03-2021
Not later than one year 101 92 97 81 Later than one year but not later than five years 80 155 79 150 Gross investment in lease 181 247 176 231 Less: Unearned finance income (5) (16) - - Present value of minimum lease payment receivables
176 231 176 231
Included in the balance sheet as follows:- Non-current finance lease receivables - - 79 150 - Current finance lease receivables - - 97 81
Finance income on Finance Lease Receivables was H11 Mn for the year ended March 31, 2022 (Previous Year: H11 Mn). Selling profit on Finance Lease Receivables has been recognised amounting to H11 Mn for the year ended March 31, 2022 (Previous Year: H145 Mn).
41 Basic and Diluted Earnings Per Share (EPS) at Face Value of J 1

322 Integrated Annual Report 2021-22 323Corporate Overview | Statutory Reports | Financial Statements
Consolidated
Notes forming part of Consolidated Financial Statements Notes forming part of Consolidated Financial Statements
42 Related Party Disclosure:
(I) Key Management Personnel:
Name Status
Mr. Sanjay Jalona Chief Executive Officer (CEO) & Managing Director (MD) Mr. Sudhir Chaturvedi President – Sales & Whole time Director (WTD) Mr. Nachiket Deshpande Chief Operating Officer (COO) & Whole Time Director (WTD) Mr. Ashok Kumar Sonthalia1 Chief Financial Officer (CFO) Mr. Anil Rander2 Chief Financial Officer (CFO)
Name Status
Larsen & Toubro Limited Holding CompanyL&T Hydrocarbon Engineering Limited# Fellow SubsidiaryL&T Technology Services Limited Fellow SubsidiaryL&T Valves Limited Fellow SubsidiaryL&T Investment Management Limited Fellow SubsidiaryL&T Thales Technology Services Private Limited Fellow SubsidiaryL&T Construction Equipment Limited (formerly known as L&T Construction Machinery Limited)
Fellow Subsidiary
L&T Finance Limited Fellow SubsidiaryLarsen & Toubro LLC Fellow SubsidiaryNabha Power Limited Fellow SubsidiaryL&T Metro Rail (Hyderabad) Limited Fellow SubsidiaryLarsen & Toubro (East Asia) SDN BHD. Fellow SubsidiaryL&T Technology Services LLC Fellow SubsidiaryL&T Saudi Arabia LLC Fellow SubsidiaryMindtree Limited Fellow SubsidiaryL&T Sargent & Lundy Limited Joint venture of Holding CompanyL&T Chiyoda Limited Joint venture of Holding CompanyL&T Infrastructure Development Projects Limited Joint venture of Holding CompanyL&T-MHI Power Turbine Generators Private Limited Joint venture of Holding CompanyL&T MHI Power Boilers Private Limited Joint venture of Holding CompanyL&T Officers & Supervisory Staff Providend Fund Post employment benefit plansNexant Limited* Company in which Directors are InterestedCalient Technologies Inc* Company in which Directors are Interested
1.Ceased to be CFO from the close of business hours of January 25, 2021 2.Appointed as CFO w.e.f. April 14, 2021
(II) List of other related parties with whom there were transactions during the year:
*Ceased to be a related party from October 28, 2020 #L&T Hydrocarbon Engineering Limited has amalgamated with Larsen & Toubro Limited w.e.f April 1, 2021
Balances and transactions between the Company and its subsidiaries, which are related parties of the Company, have been eliminated on consolidation and are not disclosed in this note.
42 Related Party Disclosure:
(H Mn)
Outstanding balanceHolding company
As at March 31, 2022
As at March 31, 2021
Trade receivable 321 220 Capital commitments 3,115 - Security Deposits 1 2
(H Mn)
Outstanding balanceJoint venture of Holding Company
As at March 31, 2022
As at March 31, 2021
Trade receivable 4 17 - L&T Infrastructure Development Projects Limited 3 17
(III) Details of transactions between the Group and other related parties are disclosed below:
The Group’s material related party transactions and outstanding balances are with related parties with whom the Group routinely enter into transactions in the ordinary course of business.
(H Mn)
TransactionHolding company2021-22 2020-21
Sale of services / products 1,557 1,154 Purchases of services / products 82 68 Purchases of assets 3,789 32 Overheads charged by 630 577 Overheads charged to 57 41 Trademark fees paid 399 309 Corporate Social Responsibility Expense 29 - Security Deposit refund received 1 - Capital advances given 700 - Interim dividend paid 3,245 1,947 Final dividend paid 3,245 2,012
(A)
(H Mn)
TransactionJoint venture of Holding Company
2021-22 2020-21
Sale of services / products 46 39 - L&T Infrastructure Development Projects Limited 22 39 - L&T Chiyoda Limited 24 - Overheads charged to 0 - - L&T MHI Power Boilers Private Limited 0 -
(B)
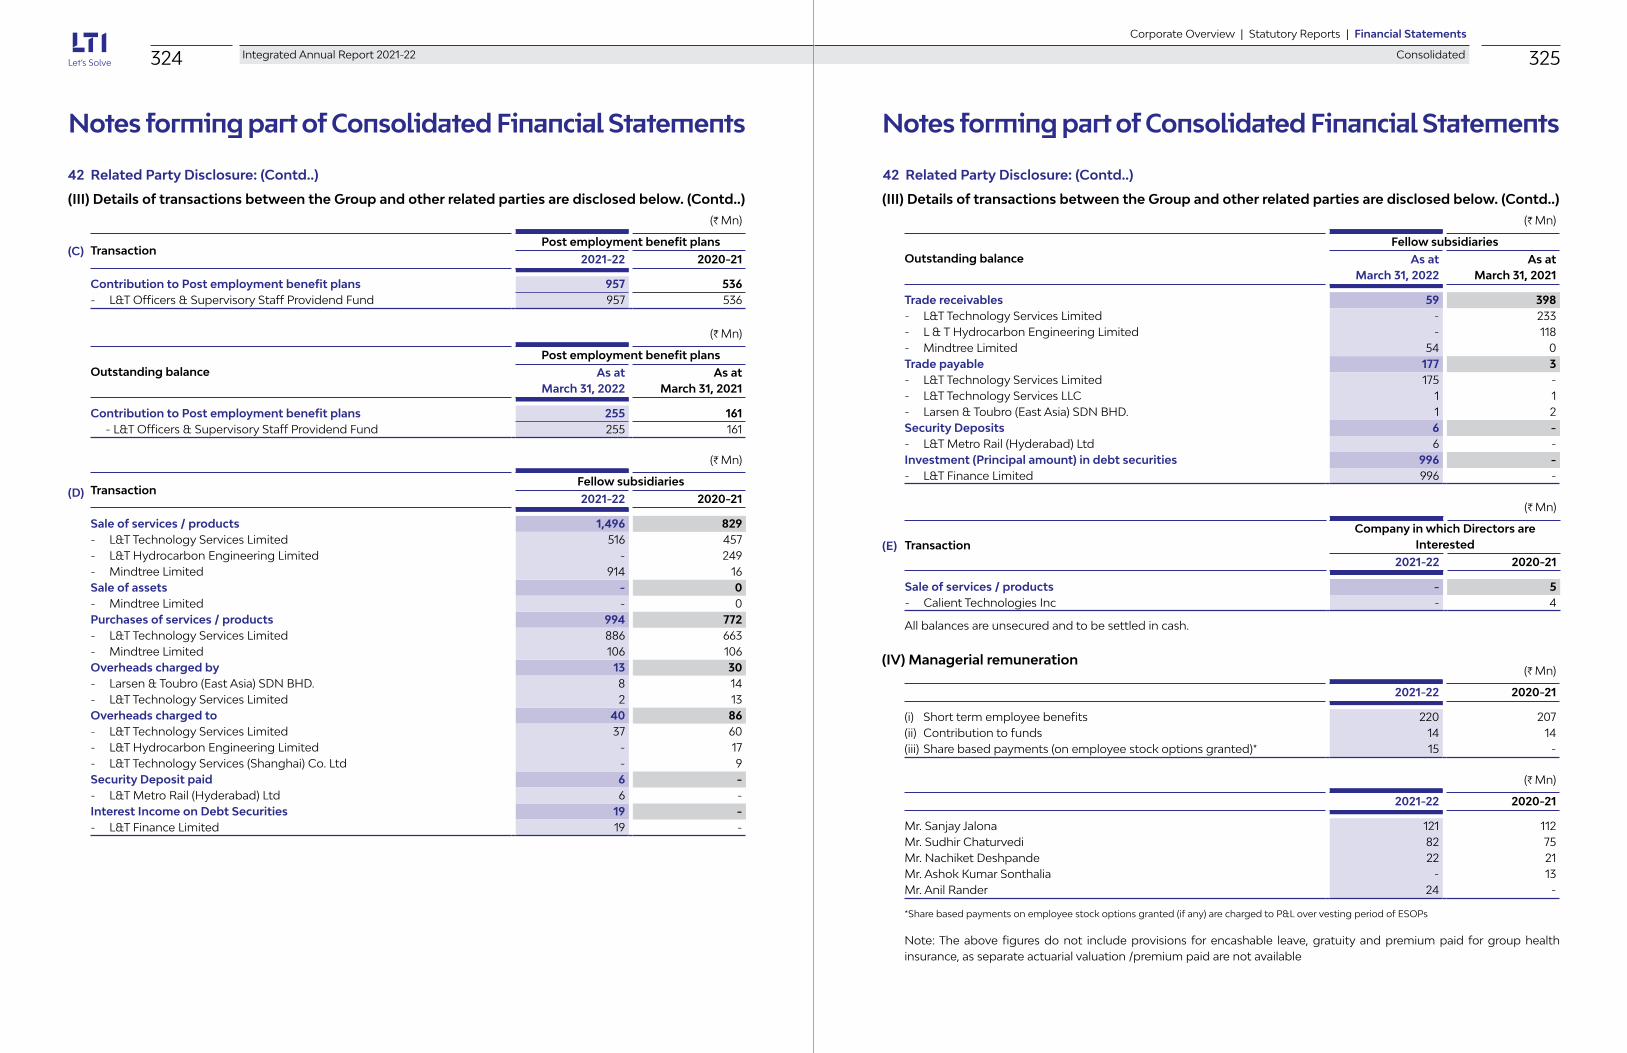
324 Integrated Annual Report 2021-22 325Corporate Overview | Statutory Reports | Financial Statements
Consolidated
Notes forming part of Consolidated Financial Statements Notes forming part of Consolidated Financial Statements
42 Related Party Disclosure: (Contd..)
(III) Details of transactions between the Group and other related parties are disclosed below. (Contd..)
(C)
(H Mn)
TransactionPost employment benefit plans
2021-22 2020-21
Contribution to Post employment benefit plans 957 536 - L&T Officers & Supervisory Staff Providend Fund 957 536
(H Mn)
Outstanding balancePost employment benefit plans
As at March 31, 2022
As at March 31, 2021
Contribution to Post employment benefit plans 255 161 - L&T Officers & Supervisory Staff Providend Fund 255 161
(H Mn)
TransactionFellow subsidiaries2021-22 2020-21
Sale of services / products 1,496 829 - L&T Technology Services Limited 516 457 - L&T Hydrocarbon Engineering Limited - 249 - Mindtree Limited 914 16 Sale of assets - 0 - Mindtree Limited - 0 Purchases of services / products 994 772 - L&T Technology Services Limited 886 663 - Mindtree Limited 106 106 Overheads charged by 13 30 - Larsen & Toubro (East Asia) SDN BHD. 8 14 - L&T Technology Services Limited 2 13 Overheads charged to 40 86 - L&T Technology Services Limited 37 60 - L&T Hydrocarbon Engineering Limited - 17 - L&T Technology Services (Shanghai) Co. Ltd - 9 Security Deposit paid 6 - - L&T Metro Rail (Hyderabad) Ltd 6 - Interest Income on Debt Securities 19 - - L&T Finance Limited 19 -
(D)
42 Related Party Disclosure: (Contd..)
(III) Details of transactions between the Group and other related parties are disclosed below. (Contd..)(H Mn)
Outstanding balanceFellow subsidiaries
As at March 31, 2022
As at March 31, 2021
Trade receivables 59 398 - L&T Technology Services Limited - 233 - L & T Hydrocarbon Engineering Limited - 118 - Mindtree Limited 54 0 Trade payable 177 3 - L&T Technology Services Limited 175 - - L&T Technology Services LLC 1 1 - Larsen & Toubro (East Asia) SDN BHD. 1 2 Security Deposits 6 - - L&T Metro Rail (Hyderabad) Ltd 6 - Investment (Principal amount) in debt securities 996 - - L&T Finance Limited 996 -
(H Mn)
TransactionCompany in which Directors are
Interested2021-22 2020-21
Sale of services / products - 5 - Calient Technologies Inc - 4
(E)
All balances are unsecured and to be settled in cash.
(IV) Managerial remuneration(H Mn)
2021-22 2020-21
(i) Short term employee benefits 220 207 (ii) Contribution to funds 14 14 (iii) Share based payments (on employee stock options granted)* 15 -
(H Mn)
2021-22 2020-21
Mr. Sanjay Jalona 121 112 Mr. Sudhir Chaturvedi 82 75 Mr. Nachiket Deshpande 22 21 Mr. Ashok Kumar Sonthalia - 13 Mr. Anil Rander 24 -
*Share based payments on employee stock options granted (if any) are charged to P&L over vesting period of ESOPs
Note: The above figures do not include provisions for encashable leave, gratuity and premium paid for group health insurance, as separate actuarial valuation /premium paid are not available

326 Integrated Annual Report 2021-22 327Corporate Overview | Statutory Reports | Financial Statements
Consolidated
Notes forming part of Consolidated Financial Statements Notes forming part of Consolidated Financial Statements
43 Segment Reporting
Segments have been identified in accordance with Indian Accounting Standards (“Ind AS”) 108 on Operating Segments, considering the risk or return profiles of the business. As required under Ind AS 108, the Chief Operating Decision Maker (CODM) evaluates the performance and allocates resources based on analysis of various performance indicators. Accordingly, information has been presented for the Group’s operating segments.
I) The revenue and operating profit by segment is as under:(H Mn)
Particulars 2021-22 2020-21
Segment revenueBanking, Financial Services & Insurance 72,583 56,191 Manufacturing 25,280 20,353 Energy & Utilities 13,930 12,501 High-Tech, Media & Entertainment 19,055 13,778 CPG, Retail, Pharma & Others 25,839 20,875 Revenue from operations 156,687 123,698 Segment resultsBanking, Financial Services & Insurance 14,714 12,519 Manufacturing 5,519 5,058 Energy & Utilities 2,674 2,629 High-Tech, Media & Entertainment 3,376 2,874 CPG, Retail, Pharma & Others 4,837 4,374 Segment results 31,120 27,454 Other Income 4,667 2,744 Unallocable expenses (net) 536 203 Finance costs 728 788 Depreciation & amortization expense 3,549 3,325 Profit before tax 30,974 25,882
II) Segmental reporting of revenues on the basis of the geographical location of the customers is as under:(H Mn)
GeographyRevenue from operations
2021-22 2020-21
North America 104,195 84,513Europe 25,325 19,529India 13,029 9,712APAC 3,839 3,567ROW 10,299 6,377Total 156,687 123,698
III) Information about Major Customers
One customer group accounts for more than 10 % of the total group revenue for the year ended March 2022 and March 2021 and is a part of Banking, Financial Services & Insurance segment.
(H Mn)
Particulars Total
Present value of consideration (A) 639 Non-current assets:PPE and Intangible assets 8 Right of Use assets 10 Deferred Tax Assets(Net) 8 Income Tax Assets(Net) 11 Current assets:Trade receivables 76 Cash and bank balances 99 Investments 0 Other Financial assets 9 Other Current assets 8 Total assets 229 Non-current liabilities:Long term provisionsCurrent liabilities:Lease Liability 11 Trade payables 22 Other Financial liabilities 42 Provisions 6 Other current liabilities 7 Total liabilities 88 Net Assets acquired (B) 141 Customer intangibles on consolidation (C) 165 Deferred tax liability on customer intangibles on consolidation (D) 41 Goodwill on consolidation (A)-(B)-(C)+(D) 374
44 Acquisition - Cuelogic
During the year, the company acquired 100% stake in Cuelogic Technologies Private Limited along with its 100% subsidiary Cuelogic Technologies, Inc. (collectively referred as ’Cuelogic’) for an enterprise value of USD 8.4 Mn which includes upfront consideration, performance based earn-outs and retention payouts. Cuelogic is a digital engineering Company who specialize in product development capabilities and expertise in scaling exponential technologies. Cuelogic’s primary focus is on building and modernizing digital products leveraging cloud native methodologies across web and mobile. The Company has used cut-off date of July 1, 2021 as the acquisition date being date of acquiring effective control.
Gross amount of Trade Receivables acquired and its fair value is H76 Mn. The same has been subsequently collected.
Statement showing Purchase Price Allocation
Initial recognition of goodwill on business combination is not deductible for tax purposes.
The financial results for the year ended March 31, 2022 includes 9 months revenue of H431 Mn and profit after tax of H5 Mn pertaining to this acquisition. If this acquisition had been at the beginning of the year then revenue would have been H575 Mn and profit after tax would be H10 Mn.
The transaction costs of H4 Mn related to the acquisition have been included in the Statement of Profit & Loss for the year ended March 31, 2022

329Corporate Overview | Statutory Reports | Financial Statements
Independent Assurance Statement 328 Integrated Annual Report 2021-22
Notes forming part of Consolidated Financial Statements
45 Events occurring after the reporting period:
The Board of Directors at its meeting held on April 19, 2022, has recommended final dividend of H 30 per equity share (Face value H1) for the financial year ended March 31, 2022.
46 The Group is not required to transfer any amount to Investor Education and Protection Fund.
47 In case of figures mentioned as ‘0’ in the financial statements, it denotes figures less than H0.5 Mn.
48 Previous year’s figures have been regrouped/reclassified wherever applicable to facilitate comparability.
49 The financial statements were approved by the Board of Directors on April 19, 2022.
As per our report attached
For B. K. Khare & Co. Sanjay Jalona Nachiket DeshpandeChartered Accountants Chief Executive Officer & Chief Operating Officer & Firm’s Registration No.: 105102W Managing Director Whole-time Director (DIN: 07256786) (DIN: 08385028) Mumbai Mumbai
Padmini Khare Kaicker Anil Rander Tridib BaratPartner Chief Financial Officer Company Secretary & Compliance OfficerMembership No: 044784 Mumbai Mumbai
MumbaiApril 19, 2022
Independent Assurance Statement
1
INDEPENDENT ASSURANCE STATEMENT
Introduction and objectives of work BUREAU VERITAS has been engaged by Larsen & Toubro Infotech Limited (hereinafter abbreviated “L&T Infotech” or “LTI”) to conduct an independent assurance of its Integrated Report for the year 2021-22. This Assurance Statement applies to the related information included within the scope of work described below. This information and its presentation in the Integrated Report 2021-22 are the sole responsibility of the management of LTI. Bureau Veritas was not involved in the drafting of the Report. Our sole responsibility was to provide independent assurance on its content.
Scope of work
The scope of work included:
Data and information included in Integrated Report 2021-22 for the reporting period 1st April 2021 to 31st March 2022;
Appropriateness and robustness of underlying reporting systems and processes, used to collect, analyse and review the information reported;
Methodology As part of its independent assurance, Bureau Veritas undertook the following activities:
1. Remote audit through video conferencing was conducted at Bangalore, Chennai, Shivaji Nagar Pune, Hinjewadi Pune, Airoli, Hyderabad, LTI’s Powai office in Mumbai on 16th May 2022 and remotely interviewed relevant personnel responsible. Bureau Veritas’ experienced assurors remotely conducted the assurance process. The off-site assessment consisted mainly of desk review of the draft Integrated Report.
2. LTI had submitted integrated performance data. The data pertaining to the same was sampled and assessed by Bureau Veritas through the process above described.
3. The data was assessed on a sampling basis. 4. Bureau Veritas reviewed evidence of stakeholder engagement activities that had been
undertaken by LTI. The methodology and criteria chosen in order to determine aspects material to LTI were also reviewed for their appropriateness.
Our work was conducted against Bureau Veritas’ standard procedures and guidelines for external Assurance, based on current best practice in independent assurance. Our findings
We summarize our key findings on the disclosures made by LTI regarding the various capitals impacted as a result of its business activities during the reporting period.
Financial Capital During the reporting year, the company’s net income (revenue) from operation was Rs.156687 million. Consolidated economic value generated (revenue from operations & other income) was Rs.161354 million & retention for growth of Rs.14236 million from its operations which has increased its financial capital.
Human Capital The company has identified key enablers for the management of its human capital. It has policies in place to increase employee capabilities through training and reports satisfactory

330 Integrated Annual Report 2021-22 331Corporate Overview | Statutory Reports | Financial Statements
Independent Assurance Statement
3
Competitive claims in the report claiming “first in India”, “first time in India”, “first of its kind”, etc, if any;
Our assurance does not extend to the activities and operations of LTI outside of the scope and geographical boundaries mentioned in the report as well as the operations undertaken by any other entity that may be associated with or have a business relationship with LTI;
Our assurance of the economic and financial performance data of LTI is based only on the audited annual reports of LTI and our conclusions rely entirely upon that audited report
This independent statement should not be relied upon to detect all errors, omissions or misstatements that may exist within the Report. Statement of independence, impartiality and competence Bureau Veritas is an independent professional services company that specialises in Quality, Health, Safety, Social and Environmental management with almost 194 years history in providing independent assurance services. Bureau Veritas has implemented a Code of Ethics across the business to maintain high ethical standards among staff in their day to day business activities. We are particularly vigilant in the prevention of conflicts of interest. No member of the assurance team has a business relationship with LTI, its Directors, Managers or officials beyond that required of this assignment. We have conducted this verification independently and there has been no conflict of interest.The assurance team has extensive experience in conducting assurance over environmental, social, ethical and health & safety information, systems and processes.
Bureau Veritas (India) Private Limited 72 Business Park, 9th Floor, MIDC Cross Road ‘C’, Opp. SEEPZ Gate #2, Andheri (East) Mumbai-400 093 India.
Jitendra Kadam Lead Assurer
Sanjay Patankar Technical Reviewer ICC Sustainability & Climate Change Services
Date: 19/05/2022 Mumbai.
2
employee-employer relations as a result of the implementation of employee friendly policies. Manufactured Capital
LTI has tangible assets comprising of physical infrastructure office for IT support with expanding footprint across 10 cities in India with Rs. 4968 million tangible assets. Also investment of Rs. 7430 million investment in infrastructure. LTI headquarter at Powai has 100% power sourced from renewable energy and since July 2021 opted for green tariff at Airoli Office.
Intellectual Capital The company has developed three new innovative spaces. Design studios which leverages principles of design through user first methodology which help deliver impactful customer experience. Also Fosfor experience centre gives first hand of digital transformation capabilities. LTI in association with IBM, inaugurated IBM Innovation & experience centre at LTI Benguluru.
Social & Relationship Capital As far as society and local communities are concerned, the company’s total CSR spending in the financial year 2021-22 was 393.45 Million rupees. The expenditure is in excess of the minimum mandated under the Companies Act 2013. LTI has undertaken CSR initiatives that includes education, empowerment, environment & contribution on Covid19. The CSR activities have impacted a large number of lives. Total beneficiaries under CSR was 165820 people. 50.22% were percentage of woman beneficiaries.
Natural Capital Electricity is major resource inputs that the company depends upon for running its business processes. The company has also addressed the issues of GHG emissions. Total 32.5% was renewable energy source and 4702 tCo2 was mitigated through renewable energy.
Our assessment was directed at arriving at an understanding of LTI’s business model, its internal processes and framework and resulting outputs and their impact on the six capitals hereinabove described.
Our opinion On the basis of our methodology and the activities described above, it is our opinion that:
Nothing has come to our attention to indicate that the reviewed statements within the scope of our verification are inaccurate or that the information included therein is not fairly stated;
We have not come across anything that indicates that the information and data included in LTI’s Integrated Report is not accurate, not reliable or not free from material mistake or misstatement;
There is no instance to indicate that the Report has not provided a fair representation of LTI’s activities over the reporting period;
The information within the Report is presented in a clear, understandable and accessible manner, and allows readers to form a balanced opinion over LTI’s performance and status during the reporting period (F.Y. 2021-22);
LTI has established appropriate systems for the collection, aggregation and analysis of relevant information;
Limitations and Exclusions Excluded from the scope of our work is any assurance of information relating to:
Activities outside the defined assurance period stated hereinabove; Positional statements (expressions of opinion, belief, aim or future intention) by LTI and
statements of future commitment;

Notes

www.Lntinfotech.com