date - bse
TRANSCRIPT

Adani Green Energy Limited Tel +91 79 2555 5555 Adani Corporate House, Shantigram, Fax +91 79 2555 5500 Nr Vaishno Devi Circle, S G Highway [email protected] Khodiyar, Ahmedabad 382 421 www.adanigreenenergy.com Gujarat, India CIN: L40106GJ2015PLC082007
Registered Office: Adani Corporate House, Shantigram, Nr. Vaishno Devi Circle,
S G Highway, Khodiyar, Ahmedabad – 382 421, Gujarat, India
Date: March 01, 2021
To
BSE Limited The National Stock Exchange of India Limited
P J Towers, “Exchange Plaza”,
Dalal Street, Bandra – Kurla Complex,
Mumbai – 400 001 Bandra (E), Mumbai – 400 051
Scrip Code: 541450 Scrip Code: ADANIGREEN
Dear Sir,
Sub: Intimation of Analysts / Institutional Investors Meeting - Presentation
Dear Sir,
Pursuant to Regulation 30 of the SEBI (Listing Obligations and Disclosure
Requirements) Regulations, 2015 and in furtherance to Company’s intimation
dated February 23, 2021, the presentation for the Debt Conference is enclosed
herewith and also being uploaded on website of the Company
www.adanigreenenergy.com.
You are requested to take the same on your records.
Thanking You
Yours Faithfully,
For, Adani Green Energy Limited
Pragnesh Darji
Company Secretary

Renewables
Adani Green Energy Limited
DEBT PRESENTATION
February 2021
1

CONTENTS1 Adani Group
2 AGEL: Company Profile
3 AGEL: Transformational Advantage
4 AGEL: ESG
5 Renewable Growth Story & Investment Rationale
Appendix

Renewables
Adani Group
3

4
Transport & Logistics Portfolio
63.5% 100%
APSEZ SRCPLPort & Logistics Rail
100%
Adani
75%
ATLT&D
Energy & Utility Portfolio
55%
AGELRenewables
75% 37.4%
APLIPP
Adani
Marked shift from B2B to B2C businesses -
ATGL - Gas distributionnetwork to serve keygeographies across India
ATGL 3
100%
AAHLAirports
100%
ATrLRoads
75%
AEL
Incubator
100%
AWLWater
~USD 76 bn Combined market cap
1
100%
DataCentre
Gas DisComAEML - Electricitydistribution network thatpowers the financial capital ofIndia
Locked in Growth 2020 -
Transport & Logistics -Airports and Roads
Energy & Utility - Waterand Data Centre
Adani Airports - To operate,manage and develop eightairports in the country
Adani Group: A world class infrastructure & utility portfolio
Opportunity identification, development and beneficiation is intrinsic to diversification and growth of the group
NQXT 2
1 . As on Feb 19 , 2021, USD/INR – 72.6 | Note - Percentages denote promoter holding
2. NQXT – North Queensland Export Terminal | Light purple color represent public traded listed verticals
3. ATGL – Adani Total Gas Ltd

5
Adani Group: Decades long track record of industry best growth rates across sectors
25%
161%
Industry AGEL
5%
12%
Industry APSEZ
30%
45%
Industry AGL
7%
21%
Industry ATL
Port Cargo Throughput (MT) Renewable Capacity (GW) Transmission Capacity (ckm) CGD7 (GAs8 covered)
2016 320,000 ckm 6,950 ckm
2020 423,000 ckm 14,739 ckm
2014 972 MT 113 MT
2020 1,339 MT 223 MT
2016 46 GW 0.3 GW
2020 114 GW 14.8 GW6
2015 62 GAs 6 GAs
2020 228 GAs 38 GAs
Transformative model driving scale, growth and free cashflow
2.5x 6x 3x 1.5x
APSEZ ATLAGEL ATGL
Highest Margin among Peers globallyEBITDA margin: 70%1,2
Next best peer margin: 55%
Worlds largest developerEBITDA margin:89%1,4
Among the best in industry
Highest availability among PeersEBITDA margin: 92%1,3,5
Next best peer margin: 89%
India’s Largest private CGD businessEBITDA margin: 31%1
Among the best in industry
Note: 1 Data for FY20; 2 Margin for ports business only, Excludes forex gains/losses; 3 EBITDA = PBT + Depreciation + Net Finance Costs – Other Income; 4 EBITDA Margin represents EBITDA earned from powersales and exclude other items; 5. EBITDA margin of transmission business only, does not include distribution business. 6. Contracted & awarded capacity 7. CGD – City Gas distribution 8. Geographical Areas -Including JV | Industry data is from market intelligence

6
Adani Group: Repeatable, robust & proven transformative model of investment
Ac
tiv
ity
Pe
rfo
rma
nc
e
OperationsDevelopment Post Operations
• Analysis & market intelligence
• Viability analysis
• Strategic value
• Site acquisition
• Concessions andregulatory agreements
• Investment case development
• Engineering & design
• Sourcing & quality levels
• Equity & debt funding at project
• Life cycle O&M planning
• Asset Management plan
• Redesigning thecapital structure of the asset
• Operational phase funding consistentwith asset life
Site Development Construction Operation Capital MgmtOrigination
In FY20 issued 7 international bonds across the yield curve totalling~USD4Bn
All listed entities maintain liquidity cover of 1.2x- 2x as a matter policy
India’s Largest Commercial Port (at Mundra)
Longest Private HVDC Line in Asia(Mundra – Mohindergarh)
648 MW Ultra Mega Solar Power Plant(at Kamuthi, TamilNadu)
Largest Single Location Private Thermal IPP(at Mundra)
Highest Margin among Peers
Highest lineavailability
Constructed andCommissioned innine months
High declared capacity utilization of 89%1
March 2016 March 2020
55%31%
14% 33%
20%
47%
Phase
PSU Pvt. Banks Bonds1. FY20 data for commercial availability declared under long term power purchase agreements
7
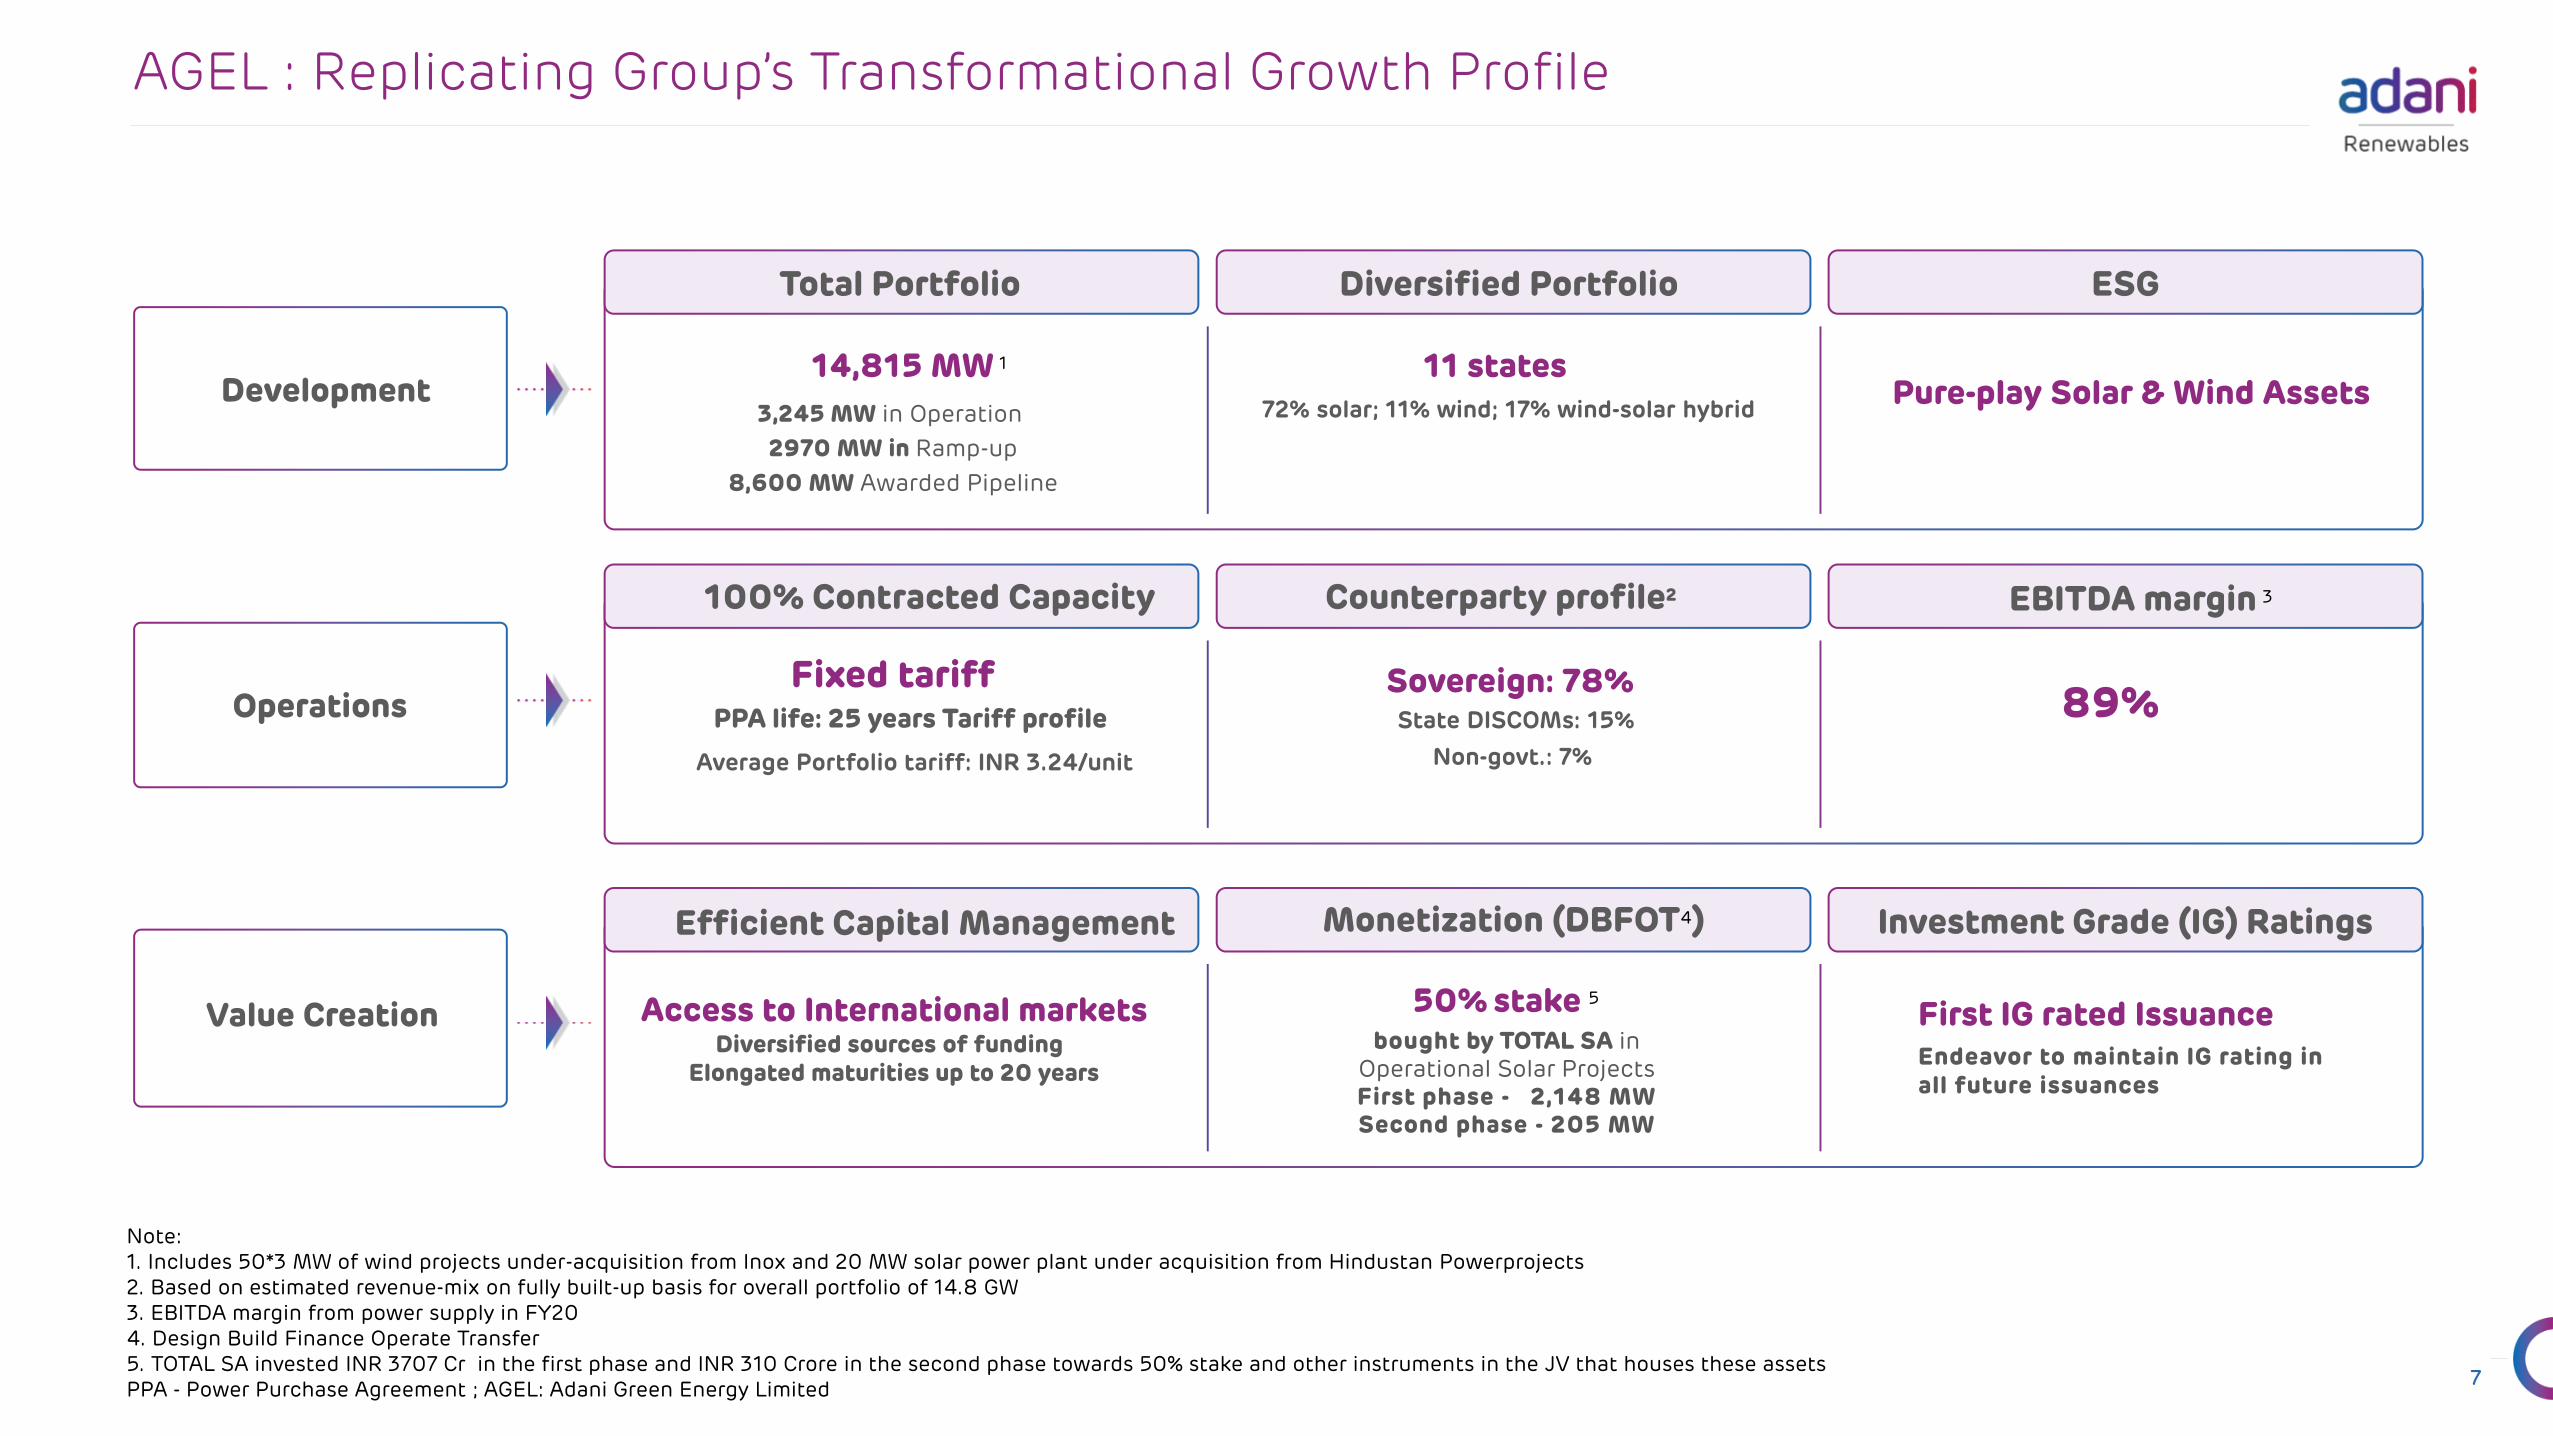
Development
Operations
Value Creation
14,815 MW 1
3,245 MW in Operation
2970 MW in Ramp-up
8,600 MW Awarded Pipeline
Sovereign: 78%State DISCOMs: 15% 89%
11 states72% solar; 11% wind; 17% wind-solar hybrid
PPA life: 25 years Tariff profile
Fixed tariff
Access to International marketsDiversified sources of funding
Elongated maturities up to 20 years
Pure-play Solar & Wind Assets
Note:1. Includes 50*3 MW of wind projects under-acquisition from Inox and 20 MW solar power plant under acquisition from Hindustan Powerprojects2. Based on estimated revenue-mix on fully built-up basis for overall portfolio of 14.8 GW3. EBITDA margin from power supply in FY204. Design Build Finance Operate Transfer5. TOTAL SA invested INR 3707 Cr in the first phase and INR 310 Crore in the second phase towards 50% stake and other instruments in the JV that houses these assetsPPA - Power Purchase Agreement ; AGEL: Adani Green Energy Limited
Total Portfolio Diversified Portfolio ESG
100% Contracted Capacity Counterparty profile2
Monetization (DBFOT4)
EBITDA margin 3
Efficient Capital Management Investment Grade (IG) Ratings
AGEL : Replicating Group’s Transformational Growth Profile
50% stake 5
bought by TOTAL SA in Operational Solar ProjectsFirst phase - 2,148 MW Second phase - 205 MW
Non-govt.: 7%Average Portfolio tariff: INR 3.24/unit
First IG rated Issuance Endeavor to maintain IG rating in all future issuances

Renewables
Adani Green Energy LimitedCompany Profile
8

9
AGEL: Transformational Renewable Company
Business and asset development philosophy mirrors Group’s focus on Quality Development, Operational Efficiency and Robust Capital Management
Total 50% Adani 50%
Solar – 50 MWWind – 1,230 MW
Hybrid – 1,690 MW
Solar – 8,000 MWHybrid - 600 MW
RG 1930 MW
TN SPVs648 MW
Operational Assets Solar - 495 MW 1
Wind – 397 MW 2
RG 2570 MW
Adani TOTAL JV Operational Solar
2,353 MW
3,245 MW – Operational
+ 2,970 MW – ramp up in 5–12 months
Largest Listed Renewable
Company in India
8,000 MW Solar
600 MW Hybrid
Development Pipeline
Over 30 GW sites identified &
under acquisitionSite Plan
Over 11,000 MW in pipelineUpcoming Tenders
Under ramp up2,970 MW
Other SPVs205 MW
1. Includes 20 MW solar plants under acquisition from Hindustan Powerprojects2. Includes 150 MW wind assets under acquisition from Inox
RG1: Restricted Group 1, RG2: Restricted Group 2
Development Pipeline 8,600 MW

10
14,815 MW Portfolio 1 | 3,245 MW operational
Operational Under Implementation
Wind Solar
Solar-Wind Hybrid
130
470
485
20
885
12
100
100
50
648
50 345
6,090
5,430
Presence acrossmultiple statesreduces resource risk
3.2
2.5
2.4
2.7
2.3
2.0
3.2
4
Apr'17 Dec'17 Jan'18 Aug'18 Jun'20 Dec'20 AGELPortfolio Avg.
Tariff
APPC @ 3.60/kWh
AGEL: Large, Geographically Diversified Portfolio
Average AGEL tariff below APPC 2
1 Includes 150 MW wind assets under acquisition from Inox and 20 MW solar plants under acquisition from Hindustan Powerprojects2 APPC: National average power purchase cost
Lowest Tariff discovered in renewable bidding across months
Presence across
11 resource-rich states
13 different counterparties
Resource and Counterparty
Diversification
25-year fixed tariff PPAsFully Contracted
Portfolio
78%Sovereign
Counterparties
100%Contracted
portfolio
Ranked as Largest Solar Power Developer in the World by US based MERCOM Capital

AGEL: Transformational Advantage
11
12
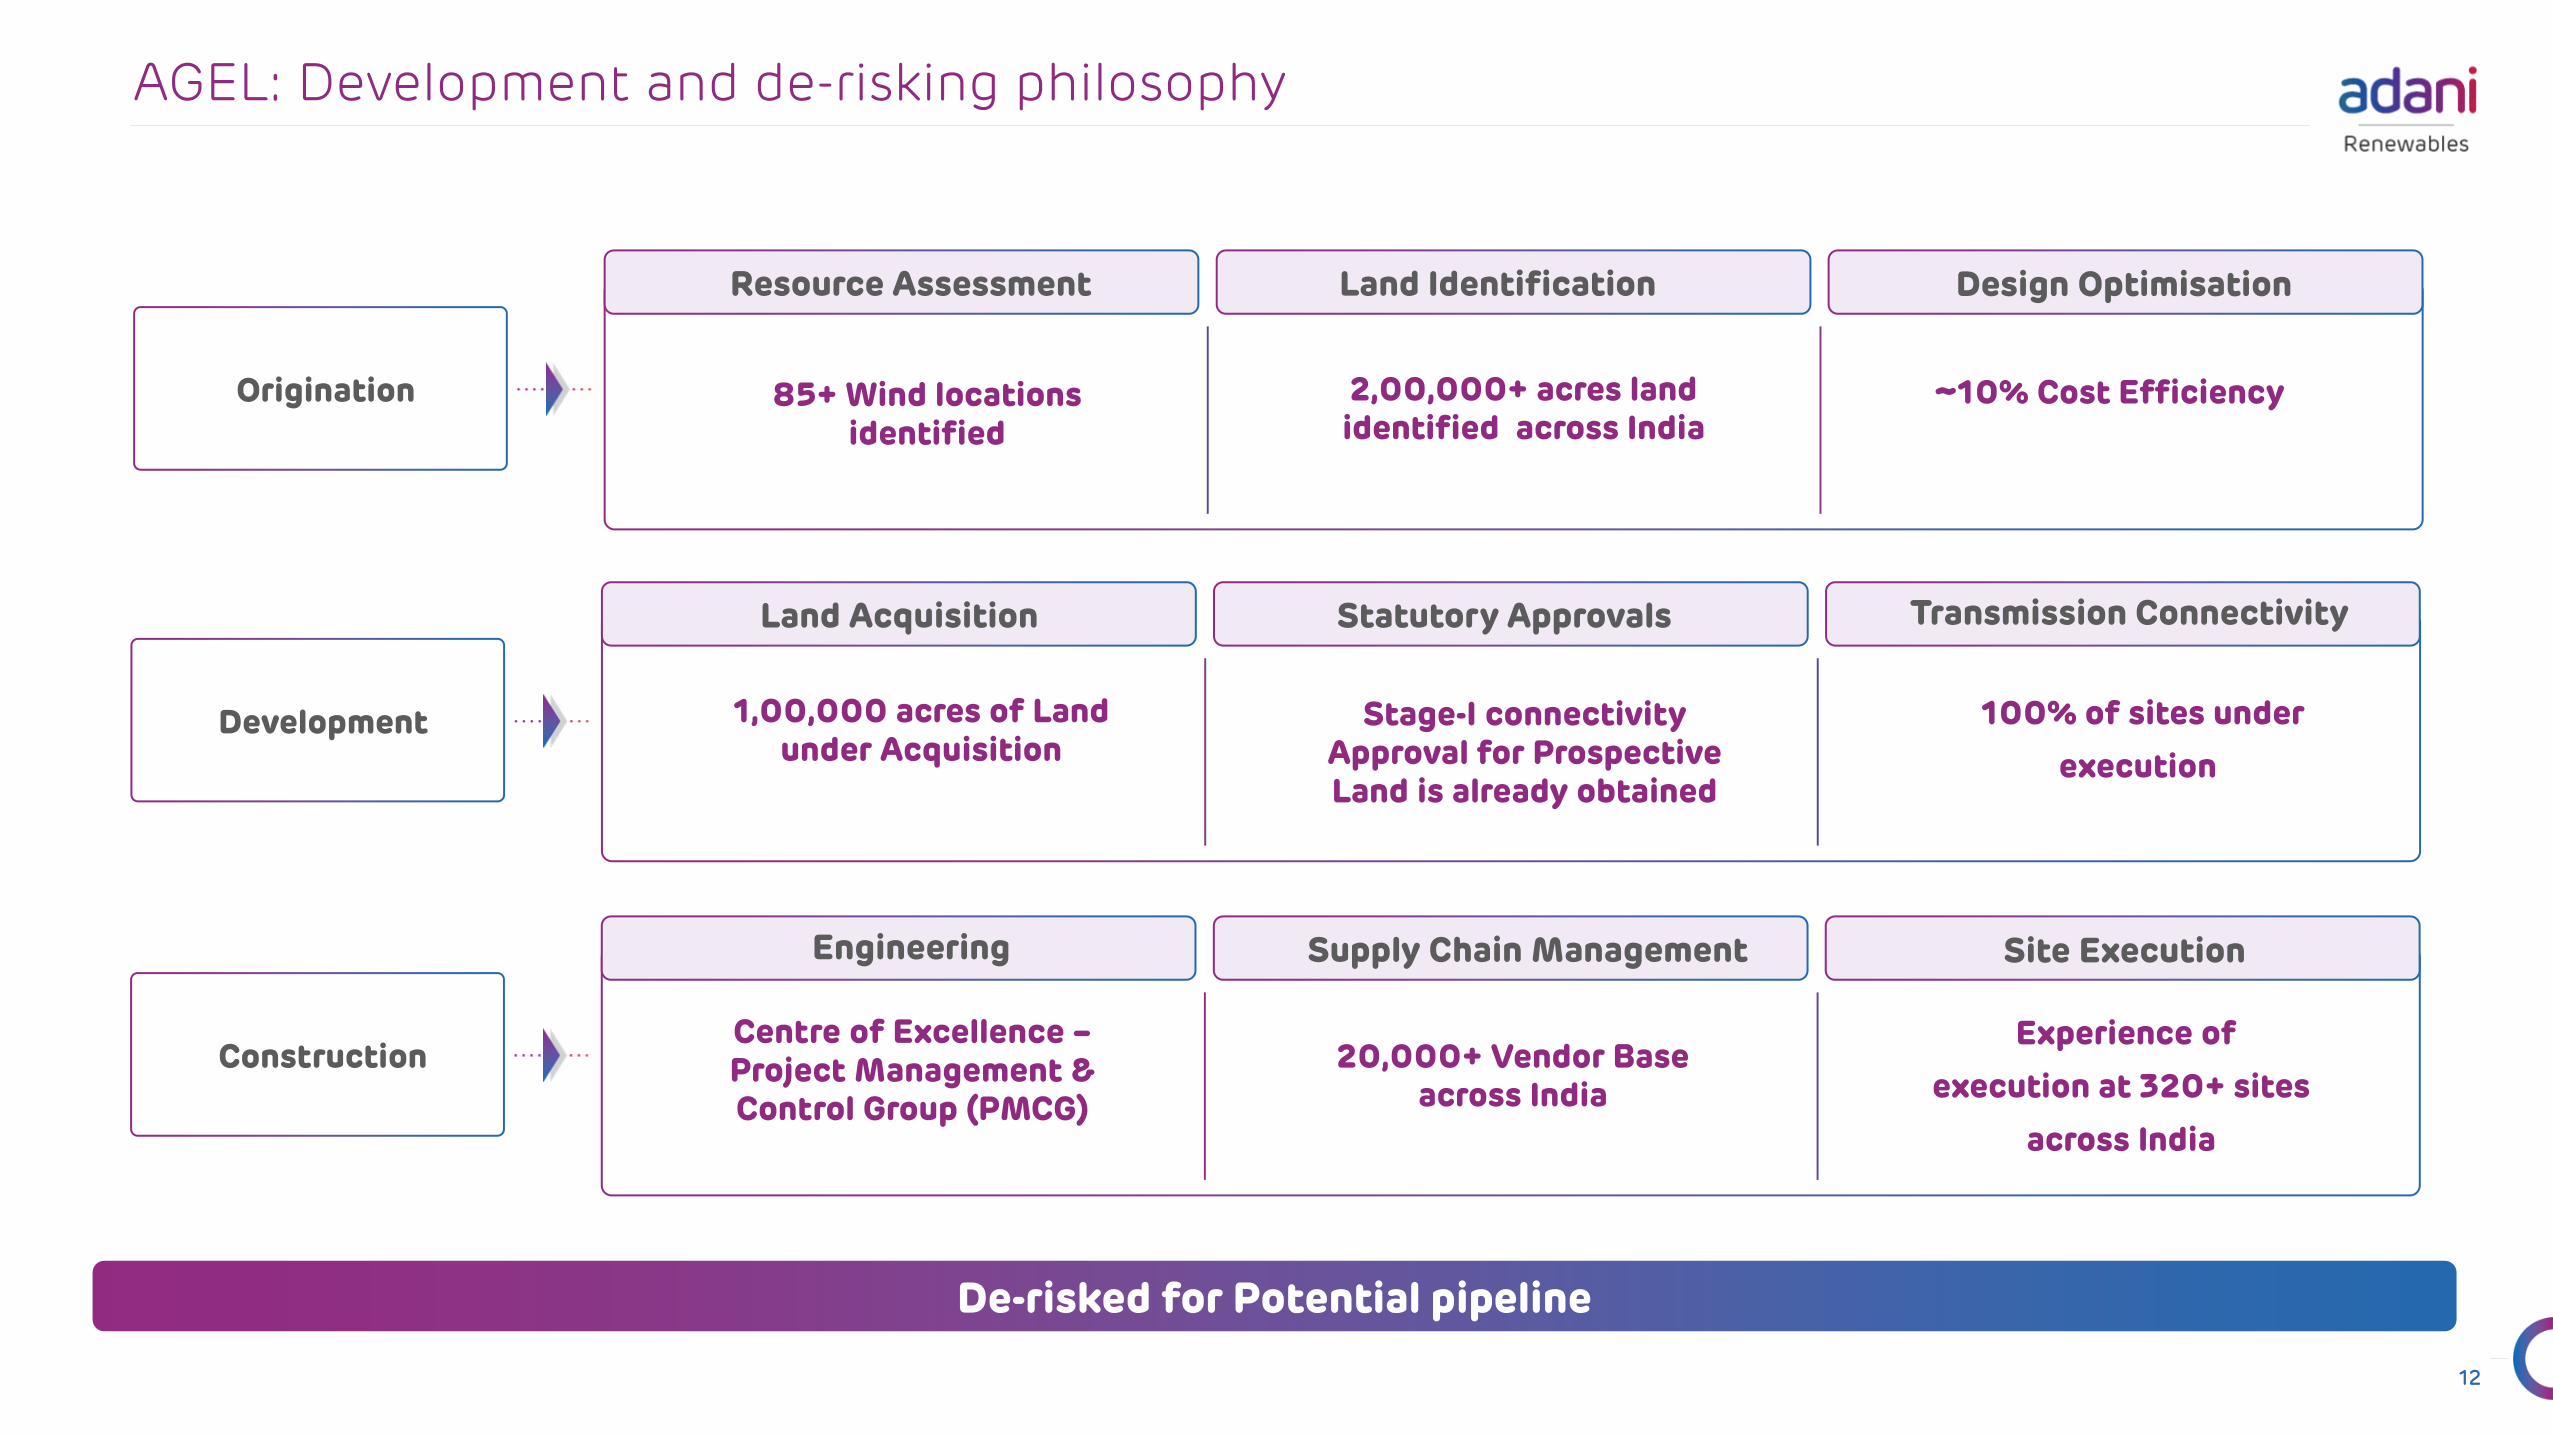
AGEL: Development and de-risking philosophy
Origination 85+ Wind locations identified
2,00,000+ acres land identified across India
~10% Cost Efficiency
Resource Assessment Land Identification Design Optimisation
Development 1,00,000 acres of Land under Acquisition
Stage-I connectivity Approval for Prospective Land is already obtained
100% of sites under
execution
Land Acquisition Statutory Approvals Transmission Connectivity
ConstructionCentre of Excellence –Project Management & Control Group (PMCG)
20,000+ Vendor Base across India
Experience of
execution at 320+ sites
across India
Engineering Supply Chain Management Site Execution
De-risked for Potential pipeline

13
AGEL - Case study : ~ 15,000 MW site at Khavda, Gujarat State
Wind potential map - Gujarat
Solar potential map - Gujarat
Resource Assessment
Land Acquisition
Construction Readiness
Over 3 years of on site resource estimated
70,000 acres of land allotted by Govt.
Geotech studies and logistics infra completed
Technical Studies
Detailed design planning and simulations completed
Supply Chaindevelopment
Detailed Supply chain planning is completed
Site area 2.7x of Paris City
Source : Solar GIS, Global Wind Atlas; RE stands for Renewable energy
De-risked GW scale construction and operational plan

14
AGEL: Operational Excellence driving Value
Plant level O&M Centralized Operations via ENOC
• Predictive O&M processes leading to reduction in:
✓ Frequency of scheduled maintenance
✓ On-site labor costs
✓ Overall O&M cost
• On a fleet of 11 Mn modules, capability to collect Data at string level of 22 modules
• Identification of faults preventing malfunction
• Reduces degradation of modules and need for replacement
Predictive Analytics leading to cost efficient O&M and high performance
86% 90% 89%
FY 18 FY 19 FY 20
EBITDA Margin (Power Supply)
99% 99% 99%
FY 18 FY 19 FY 20
Plant Availability (Solar)
100% 100% 100%
FY 18 FY 19 FY 20
Grid Availability (Solar)
20%22% 23%
FY 18 FY 19 FY 20
CUF (Solar)
Traditional Approach AGEL’s approach
Centralized Analytics driven O&M platform helping rapid scale-up of capacities

15
AGEL: De-risking through Capital Management
Capital Management throughout Project lifecycle
Diversification of financing with successful placement of two International Green Bonds for 863 mn in FY20
✓ Successful debut bond offering establishing a new source of funding
✓ Strong demand by marquee investors resulting in tightening of pricing by 25bps from initial guidance
✓ Reduction in effective cost post hedging from ~ 11.1% to ~ 10.5% ^
✓ This issuance will be refinanced for remaining PPA life elongating tenure to 23.8 years in line with RG2
Construction Finance from banks/ FIsRefinancing with International Bonds
with de-risked operational projectsReleasing Equity invested through Strategic
Partnership (TOTAL) to be used for future growth
Project Development Phase Project Stabilization Phase Equity release Phase
Issue RatingsBB+
(S&P & Fitch)Coupon 6.25% p.a.
Coupon payment Semi annual
Door-to-Door tenure 5.5 years
Maturity (Bullet) 10-Dec-2024
Issue RatingsBBB-/ BBB-/ Baa3
(S&P /Fitch/ Moody’s)*Coupon 4.625% p.a.Coupon payment Semi annualDoor-to-Door tenure 20 years
Maturity (Amortizing) 15-Oct-2039
✓ First Renewable Generation Asset Issuance from India with Investment Grade Rating from three Rating Agencies (S&P /Fitch/ Moody’s)
✓ Strong demand by marquee investors resulting in further tightening of pricing by 37.5bps from initial guidance
✓ Reduction in effective cost post hedging from ~ 10.9% to ~ 9.5% ^
✓ Amortizing bond structure with tenor closer to RG2’s PPA term thus de-risking debt servicing
* Ratings as of issuance date. Moody’s has later revised its rating of RG2 to Ba1 pursuant of sovereign rating change for India^ Estimated as of issuance date
930 MW Restricted Group 1 (RG1) - USD 500 mn 570 MW Restricted Group 2 (RG2) - USD 362.5 mn

16
Case Study: Strategic Alliance with TOTAL – Monetization of Capital Formation
AGEL
AGEL RG 1930 MW
TN SPVs648 MW
AGEL RG 2570 MW
TOTAL JV Co
Operational Solar Assets → 2,353 MW
50% 50%
Essel SPVs205 MW
20%55%
Public
25%
Strategic Partnership at AGEL Strategic Partnership at Asset Level
37.4% stake acquisition in Adani Gas &
50:50 Adani- TOTAL partnership in LNG Terminals
Concluded 50:50 AGEL-TOTAL JV in 2,148 MW operational Solar Assets
Expanded 50:50 AGEL-TOTAL JV with addition of 205 MW Operational Solar Assets
TOTAL acquired 20% Equity stake in AGEL
Oct 2019 Apr 2020 Oct 2020 Jan 2021
Evolving Strategic Alliance between Adani Portfolio and TOTAL across Energy Spectrum
TOTAL deepens Strategic Alliance towards Sustainable future with investment of USD 2.5 bn
AGEL
✓ TOTAL’s Global leadership in utility sector to help incorporate best management practices
✓ The partnership demonstrates global quality standard of AGEL’s O&M, Development and Governance practices
✓ Monetization to enhance Founders’ liquidity helping propel future growth
✓ Fully operational assets offer steady yield with minimal risk creating an easily replicable model for asset monetization
✓ Monetization to help drive future growth at AGEL

1717
AGEL: Value Creation through Transformative Investment Philosophy
1 Includes 50*3 MW of wind projects under-acquisition from Inox2 S&P & Fitch Credit rating for RG23 Capital Employed for Operational Assets4 Estimated EBITDA for full year of operations; Solar at P50; Wind at P75
CAGR: Cumulative Annual Growth Rate; RG: Restricted Group
Capacity (MW)
Credit Rating
Capital Employed3
CAGR of 47%
Investment Grade Rating
CAGR of 42%
748 MW
Not Rated
INR 50 bn
FY 17
2,545 MW 1
BBB- 2
INR 145 bn
FY 20
Run-rate EBITDA4 CAGR of 45%INR 8 bn INR 25 bn
EBITDA Return on Capital Employed
~ 16% ~ 17%Consistent
Cash Flow from Operations
28301
1625
1965
0
500
1000
1500
2000
2500
FY17 FY18 FY19 FY20
INR
Cro
re
Historic EBITDA Return & Strong Cash Generation expected to continue in coming future

Renewables
AGEL - ESG
18

19
AGEL : ESG Strategy Framework
Decarbonizing the Nation’s Growth
Purpose
Strategic Pillars
Corporate Citizenship & Enabling Social Transformation
Role in Global Climate Action Responsible Business
Practices
Focus Areas
✓ Decarbonization of value chain
✓ Biodiversity conservation
✓ Zero waste to landfills
✓ Water stewardship (neutrality)
✓ Human capital management
✓ Diversity, Equity and inclusivity
✓ Safety and well-being
✓ Local community development
✓ Ethics and integrity
✓ Enterprise Risk Management
✓ Responsible business partnerships
✓ Value creation for stakeholders
KPIs

20
Climate Awareness
AGEL: Role in Global Climate Action
CDP - Carbon Disclosure ProjectTCFD - Task Force on Climate related Financial DisclosureSBTi- Science Based Target initiative*5R - Recycle, Reduce, Reuse, Recover, Reprocess
• Supporting low carbon Economy
• Providing low carbon energy and decarbonizing the grid
• Caring and protecting biodiversity
• Optimal use and management of natural resources
• Maintaining 3R (Reduce, Recycle and Reuse) for Waste management
• On path to Single Use Plastic Free Company by 2022
Offsetting Carbon Emission Conservation of Resource/ Biodiversity
Waste Management
Environment related Factors
• Focus on CO2 emission reduction (3.6 mn ton reduced in 9M FY21)
• Matching the load curve through hybrid (solar + wind) power plant
• ENOC launched as digital monitoring platform for optimised responsiveness
• Biodiversity conservation to reduce impact on animals/ birds/ plants
• Water stewardship through use reduction & Water harvesting to become Water Positive company
• Effective usage of unproductive land for development
• Zero waste to landfills by FY23
• Lesser utilization of steel and concrete for structures
• Waste module recycling ensured at all sites
• Zero single use plastic by FY22
• Committed to Nationally Determined Contribution (NDC) by Govt. of India in line with Paris Agreement for Climate Change
• Supporter of Task Force on Climate-related Financial Disclosures (TCFD)
• Signatory to UN Global Compact (UNGC)
• Disclosure as per CDP submitted for FY20
ClimateReadiness
Climate Alignment

21
AGEL – Key Initiatives to Reduce Environmental Damage
5.0
3.2
FY15 FY20
Land use in Acres/MW
Efficiency in land usage
AGEL has been a pioneer in adoption of latest technologies for module cleaning purposes
Water consumption reduction initiatives
372 808 1,958 1,970 2,545 2,950
25,000
FY16 FY17 FY18 FY19 FY20 9M FY21 FY25E
Fast-paced Renewable Capacity addition leading to a greener future
Target
Achieved
Operational capacity (MW AC)
Target capacity (MW AC)

22
AGEL: Enabling Social Transformation
Education
Community Health
Sustainable Livelihood
Community Infrastructure
Social Initiatives through Adani Foundation 1 : Core Areas Adani Foundation’s presence across India
Inclusive Growth, Safety & Other Initiatives at AGEL
• Hiring a diversified pool of talent with due representation of local population
• Inclusive growth of employees/ workers along with the organization
• Ensuring safety and well-being of employees/ workers
▪ 7.34 hrs cumulative training on safety per employee in 9M FY21
▪ Zero LTIFR in 9M FY21
• Barren/Non-cultivated land used for plants preventing impact on farmers’ livelihood
• Land beneficiaries compensated at market determined rates
1. Adani Foundation leads various social initiatives at Adani Group level

23
AGEL: Adopting Responsible Business Practices
• Independent Board – implemented at AGEL & under implementation for subsidiaries:
• 50% of the Board comprises of Independent Directors
• 4 out of 5 Board Committees comprise of Majority Independent Directors
• Audit Committee headed by Independent Director
• Establishment of Corporate Responsibility Committee of the board to provide assurance for all ESG commitments
• IT enabled compliance management
• Greening of Supply chain by integration of ESG aspects in vendor selection and assessment
• Zero tolerance to Bribery & Corruption - Policy regularly reviewed by Board and posted on employee portals & company website
• Strategic partnership and development of local vendors
Ethics & Integrity
ESG-focused risk assessment and
mitigation
Responsible Business Partnerships
• Senior Management Remuneration linked to growth, sustainability and profitability of business with focus on safety and capital management
• Twelve Policies in place from the perspective of Good Governance, available on AGEL website, including policies on Insider Trading, Related Party Transactions, Whistle Blower, Land acquisition and so on
• Performance review of Non-Independent Directors and Board as a Whole by independent directors
• Published 1st Integrated report in FY20
✓ Provide organizational vision and overall direction to ESG program
✓ Review and approval on public disclosures on ESG (annual report, sustainability report, special disclosures)
✓ Allocate resources required by ESG Core Working Group
✓ Implementation of ESG Strategy
Roles & Responsibilities of ESG Apex Committee
ESG Apex Comittee
ESG Mentors
ESG Head
Roles & Responsibilities of ESG Mentors
✓ Provide specific guidance and operational insights to ESG Core Working Group and ESG Champions
✓ Undertake quarterly review of activities led by ESG Champions
ESG Governance Structure

Renewables
Investment Rationale - AGEL
24

25
AGEL: A Compelling Investment Case
Significant Growth Opportunity
▪ Locked-in capacity growth of 5x from 3.2 GW to 14.8 GW with already awarded projects
▪ Targeted capacity growth of 8x to 25 GW by 2025
▪ Disciplined Capital Management with ring fenced structures such as RG1 & RG2
De-risked Project Pipeline
▪ 200,000+ acres of land identified across India and out of this, 70,000 acres tied up
▪ Revolving Construction Facility of USD 1.35 bn being set up for project pipeline
▪ India targets Renewable capacity of 175 GW by 2022 & 450 GW by 2030 from 87 GW currently
▪ ‘Must-run’ status to renewable plants in India ensures continuous off-take of energy
▪ O&M driven by Analytics & Continuous monitoring with Energy Network Operation Centre
▪ Plant availability of ~ 100% (solar)
▪ Pedigree of Adani Group: leader in infrastructure –transport, logistics, energy and utility space
▪ Proven track record of excellence in development, O&M and capital management
Strong Government Push
▪ Long term PPA’s (25 years); ~78% sovereign counterparties
▪ Operations continued normally even during crises situations like COVID-19
▪ EBITDA from Power Supply of ~90% over the past years
Predictable & Stable cash-flows
World-class O&M practice
Infrastructure lineage

A
Appendix
26

AppendixAdani Green Energy LimitedRenewable Growth Story
27

28
AGEL: Renewable Growth Story
Mar’16 Mar'20 Mar'22 Mar'30
4687
175
450
India: Renewable Installed Capacity (GW) 2
Mar’16 Mar '20 Mar'22 Mar'25
0.37 2.556.30
25.00
AGEL: Market Leading Consistent Robust Growth in Capacity (GW)
• GW scale Development with up to 15 GW sites to optimize costs and delivery timelines
• Value driven Resource mix including Solar, Wind, Hybrid & RTC
• Automation & Analytics driven O&M (ENOC)
• Focus on Sovereign equivalent Counterparties
• Strategic partnerships with OEMs for optimal pricing and quality
• Unlocking value through strategic partnerships such as TOTAL
• Access to global capital markets for long debt maturities & optimized financing cost
Historic
Targeted
Historic
Targeted
1. Source: India wind energy potential as estimated by National Institute of Wind Energy (NIWE) on wastelands at 120 m height. Solar energy potential as estimated by National Institute of Solar Energy Central Electricity Authority (CEA), CRISIL Report, Bloomberg New Energy Finance
2. Source: Annual Reports of Ministry of New and Renewable Energy, Government of India and Hon’ble Prime Minister Narendra Modi’s statement at Climate Action Summit at UN Headquarters in Sep 2020 RTC: Round The Clock power generation model; ENOC: Energy Network Operation Centre
15
45
InstalledCapacity
Potential
35
749
InstalledCapacity
Potential
>21x potential
38
347
InstalledCapacity
Potential
>9x potential
3x potential
Solar Capacity (GW) Wind Capacity (GW) Other Capacity (GW)
Untapped resources in India - Significant potential for growth 1
Adani’s Strategy for Future Development
Projected CAGR: 18%
Historic CAGR: 17%
Projected CAGR: ~ 60%
Historic CAGR: 62%
AGEL’s accelerated growth to continue

AppendixAdani Green Energy Limited
Project Details29

30
Solar Wind Projects Hybrid
1 Tariff for TNUPL and EUPL for first 12 years. Tariff for next 13 years to be determined based on Average Power Purchase Price of UP in the 11th year
AGEL: Asset Level Details - Operational
SPV Project Name / Location Type Contracted Capacity (AC) Capacity (DC) COD Counterparty Name PPA Term Tariff
AGETNL
AGETNL Solar 216 260 Mar-16 TANGEDCO 25 7.01
RSPL Solar 72 86 Feb-16 TANGEDCO 25 7.01
KREL Solar 72 86 Mar-16 TANGEDCO 25 5.76
KSPL Solar 216 260 Sep-16 TANGEDCO 25 5.10
RREL Solar 72 86 Sep-16 TANGEDCO 25 5.10
AGEUPLKarnataka Solar 240 302 Sept-17 – Mar-18 Karnataka ESCOMS 25 4.56
Jhansi Solar 50 60 May-19 UPPCL 25 5.07
KSPPL Karnataka Solar 20 23 Jan-18 BESCOM 25 4.36
PDPL
Punjab 100 Solar 100 105 Jan-17 PSPCL 25 5.88
UP – II Solar 50 70 Jul-17 NTPC 25 4.78
AP – Ghani Solar 50 70 Oct-17 NTPC 25 5.13
Rajasthan – 20 Solar 20 26 Nov-17 NTPC 25 4.36
PSEPL
Telangana (open) Solar 50 66 Dec-17 NTPC 25 4.67
Telangana DCR Solar 50 66 Dec-17 NTPC 25 5.19
Karnataka – 100 Solar 100 140 Jan-18 NTPC 25 4.79
Chhattisgarh Solar 100 147 Mar-18 SECI 25 4.43
Karnataka Pavagada – DCR Solar 50 66 Feb-18 NTPC 25 4.86
Karnataka – DCR Solar 40 56 May-18 SECI 25 4.43
Karnataka – 10 Solar 10 13 Oct-17 GESCOM 25 5.35
Maharashtra Solar 20 29 Mar-18 SECI 25 4.16
Wardha Solar Karnataka Solar 350 515 Feb– May-18 SECI 25 4.43
ARERJL Rajasthan Solar 200 281 Aug-19 MSEDCL 25 2.71
Kilaj SMPL Rajasthan Solar 50 72 Jul-20 SECI 25 2.54
EUPL Uttar Pradesh Solar 50 55 Oct-15 UPPCL 25 9.27 1
TNUPL Uttar Pradesh Solar 50 55 Aug-17 UPPCL 25 7.02 1
PN Clean Punjab Solar 20 21 Mar-15 PSPCL 25 8.70
PN Renewable Punjab Solar 10 10.5 Feb-15 PSPCL 25 8.65
KN Sindagi Karnataka Solar 5 6.3 Oct-18 GESCOM 25 4.36
KN Indi Karnataka Solar 20 25 Mar-18 BESCOM 25 4.36
KN Bijapura Karnataka Solar 20 25 Feb-18 BESCOM 25 4.36
KN Muddebihal Karnataka Solar 20 25 Mar-18 HESCOM 25 4.36
Gulbarga Karnataka Solar 5 5.5 Jul-14 HESCOM 25 8.37
Bagalkot Karnataka Solar 5 5.5 Oct-15 UPPCL 25 8.46

31
Solar Wind Projects HybridAGEL: Asset Level Details – Operational (Contd.)
SPV Project Name / Location Type Contracted Capacity (AC) Capacity (DC) COD Counterparty Name PPA Term Tariff
ASEJTL Rajasthan Solar 50 74 20-Nov NA NA Merchant
GSBPL Gujarat Solar 100 150 Dec-20 GUVNL 25 2.44
AWETNL UP Solar 25 37 Jan-21 NPCL 25 3.08
AGEONEL Gujarat Solar 150 225 Jan-21 GUVNL 25 2.67
SEIL 1 UP Solar 20 23 Oct-17 UPPCL 25 7.54
Kilaj SMPL UP Solar 100 145 Feb-21 UPPCL 25 3.21
AGEL – Lahori Madhya Pradesh Wind 12 12 Mar-16 MPPMCL 25 5.92
AWEGPL Gujarat Wind 30 30 Mar-17 GUVNL 25 4.19
AWEGPL Gujarat Wind 18 18 Mar-17 GUVNL 25 3.46
Mundra Wind Gujarat Wind 12 12 Feb-19 MUPL 25 3.46
AGEMPL - SECI 1 Gujarat Wind 50 50 Nov-19 SECI 25 3.46
AREGJL Gujarat Wind 75 75 Jan-20 MSEDCL 25 2.85
AGEMPL - SECI 2 Gujarat Wind 50 50 Mar-20 SECI 25 2.65
INOX 1 2 Gujarat Wind 50 50 Apr-19 SECI 25 3.46
INOX 2 2 Gujarat Wind 50 50 May-19 SECI 25 3.46
INOX 2 Gujarat Wind 50 50 Jul-19 SECI 25 3.46
Total 3,245 4,170
1 AGEL has signed securities purchase agreement for acquisition of 20 MW operating solar project with Hindustan Powerprojects. Tariff for SEIL is for first 12 years. Tariff for next 13 years to be decided by UPERC based on RoE, O&M expenses and interest on working capital 2 AGEL has agreed to acquire 100% equity interest of 150 MW Wind projects, subject to the terms of the PPA

32
Solar Wind Projects Hybrid
1. Letter of Award has been received for these projects and PPAs are to be signed. Details such as location, planned capacity, DC capacity are indicated based on current planning and may undergo change.
Asset Level Details – Awarded & Under Construction
SPV Project Name / Location Type Contracted Capacity (AC) Capacity (DC) Tariff Counterparty Name PPA Term
AWETNL UP Solar 50 73 3.07 UPPCL 25
Various SPVs 1 TBD Solar+ Mfg 8000 11,600 2.92 SECI 25
AGEMPL - SECI 3 Gujarat Wind 250 250 2.45 SECI 25
ARETNL - SECI 4 Gujarat Wind 300 300 2.51 SECI 25
AWEGJL - SECI 5 Gujarat Wind 300 300 2.76 SECI 25
AGE THREE LTD Gujarat Wind 250 250 2.82 SECI 25
AGE FIVE LTD Gujarat Wind 130 130 2.83 SECI 25
Total 9,280 13,460
SPV Project Name / Location Type PPA Capacity (AC)Planned
Capacity (AC)Planned
Capacity (DC)Tariff
Counterparty Name
PPA Term
AGE EIGHTEEN LTD Rajasthan Hybrid 390Solar: 360 Solar: 540
2.69 SECI 25Wind: 100 Wind: 100
AGE SEVEN LTD Rajasthan Hybrid 600
Solar: 600 Solar: 8402.69 SECI 25
AGE SEVEN LTD Wind: 150 Wind: 150
RHPOL Rajasthan Hybrid 700Solar: 600 Solar: 870
3.24 AEML 25Wind: 510 Wind: 510
AREHFourteenL 1 Rajasthan Hybrid 600Solar: 570 Solar: 855
2.41 SECI 25Wind: 200 Wind: 200
Total Hybrid 2,290 2,320 3,010

AppendixAdani Green Energy Limited
Operational &Financial Highlights
33

34
99.6% 98.8% 99.5%
79.2%89.5% 94.9%
FY19 FY20 9M FY21
Solar Wind
22.4% 22.7% 21.9%21.2%
27.9% 28.8%
FY19 FY20 9M FY21
Solar Wind
* Wind capacity of 397 MW Includes 150 MW (50 MW *3) projects under-acquisition from Inox
AGEL: Operational Performance at Portfolio Level since FY19Solar Wind Projects
Plant AvailabilityCapacity (MW AC)
CUF % (AC) Volume (MUs) & Average Realization (Rs/kwh)
3,763 4,105
3,420
116 268 468
5.06
4.83
4.51
4.2
4.3
4.4
4.5
4.6
4.7
4.8
4.9
5
5.1
5.2
-
500
1,000
1,500
2,000
2,500
3,000
3,500
4,000
4,500
FY19 FY20 9M FY21
Solar (Mn Units) Wind (Mn Units) Average Realization (Rs. Per unit)
Robust operations with high plant availability & strong CUF performance
1,898 2,1482,553
72397
397
FY19 FY20 9M FY21
Solar Wind
*
*

35
AGEL: Consolidated Financial Performance since FY19
Particulars 9M FY21 9M FY20 % Change FY20 FY19
Total Income 2,439 1,910 28% 2,629 2,131
Revenue from Power Supply 1,729 1,464 18% 2,065 1,913
Total EBITDA 1 1,917 1,323 45% 1,531 1,598
EBITDA from Power Supply 2 1,582 1,313 20% 1,837 1,723
EBITDA from Power Supply (%) 91% 89% 89% 90%
PAT 81 (124) (68) (475)
Cash Profit 3 877 360 143% 787 792
Robust Financial Performance with consistent EBITDA of ~ 90%1. Total EBITDA = Total Income – Purchase of Stock in trade – Change in inventories – Employee Benefit Expenses – Other Expenses2. EBITDA from Power Supply = Revenue from Power Supply + prompt payment discount - Employee Benefit Expenses – Other Expenses excluding expenses pertaining to EPC/ sale of goods 3. Cash Profit = PAT + Depreciation + Deferred Tax + Exceptional Items + TOTAL Distribution (which is part of finance cost as per IndAS)

36
1.551.67
1.94 2.05
6% 10% 10% 10%
1.60 1.73 1.79 1.78
0
0.5
1
1.5
2
2.5
Stipulated Sep 19 Mar 20 Sep 20
DSCR FFO/Net Debt Project Life Coverage Ratio
1.55
2.222.01
6% 12% 16%
1.601.78 1.79
0
0.5
1
1.5
2
2.5
Stipulated Mar 20 Sep 20
DSCR FFO/Net Debt Project Life Coverage Ratio
AGEL: Debt Evolution and Key Ratios for Listed Green Bonds (RG1 & RG2)
Improved Debt mix with well ensured credit protection
10,639
13,943
16,321
9,138
11,470
13,362
Mar 19 Mar 20 Sep 20
Gross Debt Net Debt
RG1 – Key Ratios
38%28%
49%
52%
22%9%
1% 1%
11.1%
10.4%
0.0%
2.0%
4.0%
6.0%
8.0%
10.0%
12.0%
0%
20%
40%
60%
80%
100%
120%
Mar 19 Sep 20
USD Bonds ECB Rupee Term Loans Trade Credit Cash Credit Interest Rate
1. Gross debt excludes Inter corporate deposits from related party and others, Lease liability and Stapled instruments2. Net Debt = Gross Debt – Cash & Bank – Receivables (Cash & Bank includes Investment in liquid mutual fund and Balances held as Margin Money or security against borrowings)
RG2 – Key Ratios
Gross Debt Mix 1 & Average Interest RateGross Debt & Net Debt (Rs. Crore) 1, 2
* for maximum distribution level
**
* for maximum distribution level

37
6,712,41%
9,609,59%
Foreign Debt Indian Rupee Debt
15,055, 92%
1,266, 8%
Long Term Debt Short Term Debt
Consolidated Debt
Rs 16,321 Cr
Average interest rate
10.4%
Average door to door tenure for LT debt
12.4 years
LT vs. ST Debt Split (INR Cr)Debt Split by Currency (INR Cr)
Repayment Schedule of Long-term Debt up to FY30 (INR Cr)
Average interest rate - based on fully hedged basis and does not includes upfront fees and processing fees amortization
FX Rate INR 73.77 / USD
Consolidated debt does not include inter corporate deposits taken from related party and others of INR 309 Cr, Lease liability of INR 271 Cr and Stapled instruments of Rs 3703 Cr
First 4 years repayment includes INR 1444 Cr of Holdco mezzanine debt which is likely to be refinanced.
AGEL: Gross Debt Summary as on Sep 30, 2020
Includes Trade Credits of
INR1,067 Cr to be replaced with long term debt
400959 1,177
536
4,227
563 579 581 580 568
FY 21 FY 22 FY 23 FY 24 FY 25 FY 26 FY 27 FY 28 FY 29 FY 30
Long Term Debt capital with low staggered repayment schedule de-risks Debt servicing
Includes RG1 bond maturity of INR 3,688 Cr (USD 500 mn) to be
refinanced through long term maturity bond placement similar to RG2
Gross Debt (INR Cr)

Appendix
RG1 & RG2: Operational & Financial Highlights
Adani Group: Credit Portfolio
38

39
AGEL: RG1 Portfolio (930 MW) Performance in H1 FY21
• Net Export of Energy up by 2% YoY on the back ofincreased effective capacity of 17 MW and continuedstrong CUF performance
• CUF performance better than P90 target of 22.6% andnear P75 target of 23.4% on the back of:
- Continued high plant availability
- Consistent solar irradiation
RG1 CUF at 23.3% better than P90 target of 22.6% and near P75 target of 23.4%
99.3% 99.5%98.8% 99.1%
23.3% 23.3%
934 952
820
840
860
880
900
920
940
960
0%10%20%30%40%50%60%70%80%90%
100%
H1'20 H1'21
Plant Availability Grid Availability CUF (AC) Net Export (mn units)
Key Financials
Particulars (INR Cr.) H1 FY21 FY20
Revenue from Power supply 455 882
Total Income 515 951
EBITDA including Other income & VGF / GST receipt under change in law 520 828
Gross Debt 4,472 4,577
Net Debt 4,134 4,140
Off Takers (INR Cr)
Not Due*30-Sep-20
Overdue
0-60 days
61-90 days
91-120
days121-180
days>180
daysTotal
Overdue
NTPC 51 - - - - - -
SECI 30 - - - - - -
UPPCL 4 - - - - - -
KREDEL** 27 12 5 6 14 15 53
PSPCL 30 2 3 - 0 - 5
GESCOM 2 2 1 1 1 3 7 Total 145 15 9 7 15 19 65
Power Generation receivables Ageing
* includes unbilled revenue of INR 67 Cr ; ‘Not Due’ includes receivables in which as per PPA
** HESCOM, BESCOM, CESE, MESCOM are part of KREDEL.NTPC: National Thermal Power Corporation: SECI: Solar Energy Corporation of India Limited: UPPCL: Uttar Pradesh Power Corporation Limited PSPCL: Punjab State Power Corporation Limited:KREDEL: Karnataka Renewable Energy Development Ltd: GESCOM: Gulbarga Electricity Supply Company Limited: HESCOM: Hubli Electricity Supply Company Ltd; BESCOM: Bangalore Electricity supply company Ltd; MESCOM: Mangalore Electricity Supply Company Limited
EBITDA = Revenue from Operation + Other income & VGF / GST receipt under change in law (net of amortization) – Cost of Material consumed - Admin and General Expense including Employee benefit expense
Gross Debt = Long Term Borrowings + Short Term Borrowings + Current Maturities of long term borrowings – Unsecured loans from related parties – Lease Liablities – Derivative Assets – Hedge reserve fund
Net debt = Gross Debt - cash and cash equivalents - bank and other bank balances - current investments - Balance held as margin money

40
AGEL: RG2 Portfolio (570 MW) Performance in H1 FY21
40
RG2 achieved a record CUF of 26.4% even higher than P50 target of 26.3%
99.5% 99.8%95.9% 99.1%
24.6% 26.4%
399
661
0
100
200
300
400
500
600
700
0.0%
20.0%
40.0%
60.0%
80.0%
100.0%
H1'20 H1'21
Plant Availability Grid Availability CUF (AC) Net Export (mn units)
• Net Export of Energy up by 65% YoY on the back of:
- Capacity increase from 370 MW to 570_MW YoY
- Continued strong CUF performance
• CUF performance not only better than P90 target of 24.5%but also better than P50 target of 26.3% on the back of:
- Continued high plant availability
- Consistent solar irradiation
Key Financial number
Particulars (INR Cr) H1 FY21 FY20
Revenue from Power supply 243 416
Total Income 276 428
EBITDA including Other income & VGF / GST receipt under change in law 362 442
Gross Debt 2,582 2,623
Net Debt 2,242 2,289
Particulars 30-Sep-20
Receivables - Not due 47
Receivables – Overdue 0
* includes unbilled revenue of INR 36 Cr ; ‘Not Due’ includes receivables in which as per PPA
EBITDA = Revenue from Operation + Other income & VGF / GST receipt under change in law (net of amortization) – Cost of Material consumed - Admin and General Expense including Employee benefit expense
Gross Debt = Long Term Borrowings + Short Term Borrowings + Current Maturities of long term borrowings – Unsecured loans from related parties – Lease Liablities – Derivative Assets
Net debt = Gross Debt - cash and cash equivalents - bank and other bank balances - current investments - Balance held as margin money
(INR Cr) (INR Cr)

41
• Successfully raised ~USD 1.8Bn in FY21 so far and ~USD 7.4 bn in total• The Group now offers bonds in entire yield curve (tenor ranging from 5 years to 30 years)
Company Issue DateIssue Size (USD Mn.)
Coupon Current Yield# Maturity Date Debt Structure Rating
Renewables
AGEL
Oct, 19 362.5 4.625 4.40% 15-Oct-2039 AmortizingBBB- (S&P)/ BBB- (Fitch) /
Ba1 (Moody's)
Jun, 19 500 6.25% 5.60% 10-Dec-2024 Bullet BB+- (S&P)/BB+ (Fitch)
Transport & Logistics
APSEZ
Aug, 20 750 4.20% 3.90% 04-Aug-2027 Bullet BBB- (S&P, Fitch) / Baa3 (Moody's)
Jul, 19 650 3.38% 3.20% 24-Jul-2024 Bullet BBB- (S&P, Fitch) / Baa3 (Moody's)
Jun, 19 750 4.38% 4.00% 3-Jul-2029 Bullet BBB- (S&P, Fitch) / Baa3 (Moody's)
Jun, 17 500 4.00% 3.70% 30-Jul-2027 Bullet BBB- (S&P, Fitch) / Baa3 (Moody's)
Dec, 20 300 3.0% 3.0% 16-Feb-2031 Amortizing BBB- (S&P, Fitch) / Baa3 (Moody's)
Feb, 21 500 3.1% 3.1% 2-Feb-2031 Bullet BBB- (S&P, Fitch) / Baa3 (Moody's)
Transmission & Power
AEML Jan, 20 1000 3.95% 3.70% 12-Feb-2030 Bullet BBB- (S&P, Fitch) / Baa3 (Moody's)
ATL – Obligor 2 Nov, 19 500 4.25% 4.00% 21-May-2036 Amortizing BBB- (S&P, Fitch) / Baa3 (Moody's)
ATL – Obligor 1 Aug, 16 500 4.00% 3.70% 3-Aug-2026 Bullet BBB- (S&P, Fitch) / Baa3 (Moody's)
ATL – USPP ^ Mar, 20 400 5.20% NA 11-Mar-2050 Amortizing BBB- (Fitch)/ Baa3 (Moody’s)
#Yield data as on 01.02.2021^ ATL – USPP bonds are not listed
Adani Group: World-class credit portfolio attracting global investors

42
Certain statements made in this presentation may not be based on historical information or facts and may be “forward-looking statements,” including those relatingto general business plans and strategy of Adani Green Energy Limited (“AGEL”),the future outlook and growth prospects, and future developments of the business andthe competitive and regulatory environment, and statements which contain words or phrases such as ‘will’, ‘expected to’, etc., or similar expressions or variations ofsuch expressions. Actual results may differ materially from these forward-looking statements due to a number of factors, including future changes or developments intheir business, their competitive environment, their ability to implement their strategies and initiatives and respond to technological changes and political, economic,regulatory and social conditions in India. This presentation does not constitute a prospectus, offering circular or offering memorandum or an offer, or a solicitation ofany offer, to purchase or sell, any shares and should not be considered as a recommendation that any investor should subscribe for or purchase any of AGEL’s shares.Neither this presentation nor any other documentation or information (or any part thereof) delivered or supplied under or in relation to the shares shall be deemed toconstitute an offer of or an invitation by or on behalf of AGEL.
AGEL, as such, makes no representation or warranty, express or implied, as to, and does not accept any responsibility or liability with respect to, the fairness, accuracy,completeness or correctness of any information or opinions contained herein. The information contained in this presentation, unless otherwise specified is only currentas of the date of this presentation. AGEL assumes no responsibility to publicly amend, modify or revise any forward looking statements, on the basis of any subsequentdevelopment, information or events, or otherwise. Unless otherwise stated in this document, the information contained herein is based on management informationand estimates. The information contained herein is subject to change without notice and past performance is not indicative of future results. AGEL may alter, modifyor otherwise change in any manner the content of this presentation, without obligation to notify any person of such revision or changes.
No person is authorized to give any information or to make any representation not contained in and not consistent with this presentation and, if given or made, suchinformation or representation must not be relied upon as having been authorized by or on behalf of AGEL.
This presentation does not constitute an offer or invitation to purchase or subscribe for any securities in any jurisdiction, including the United States. No part of itsshould form the basis of or be relied upon in connection with any investment decision or any contract or commitment to purchase or subscribe for any securities. Noneof our securities may be offered or sold in the United States, without registration under the U.S. Securities Act of 1933, as amended, or pursuant to an exemption fromregistration therefrom.
VIRAL RAVAL
AGM - Investor [email protected]
+91 79 2555 8581
Disclaimer
UDAYAN SHARMA
DGM - Investor [email protected]
+91 79 2555 8114

Renewables
Thank You43