steel - bse
TRANSCRIPT

SteelBringing alive a billion dreams
Annual Report 2011-2012
Builds
www.jsw.in

Shri O.P. JindalAugust 7, 1930 - March 31, 2005
O.P. Jindal Group - Founder and Visionary
Shri O.P. Jindal was someone for whom destiny wasn’t
written; he penned it down for himself. His unbound
initiatives, selfless social services, unassuming generosity
and philanthropic contributions to individuals and
organizations have lit up thousands of lives.
Our tribute to the visionary of modern India and our
abiding source of inspiration whose great thoughts
even today, lead us in all our ventures!
A great man of extra-ordinary integrity and enthusiasm,
whose name would never be forgotten; he was a leader
who succeeded in every endeavour, a true Indian who
had not just dreamt of creating a prospering India but
also achieved it through his hard work.
Some footprints are ever lasting !

Steel Limited
1
Net Debt Equity Ratio
2008-09
2007-08
2009-10
2010-11
2011-12
0.91
1.36
1.14
0.57
0.69
HIGHLIGHTS 2011-12 (Standalone)
Crude Steel Output up by 16%
Saleable Steel up by 28%
Operating EBIDTA up by 18%
Profi t Before Tax
Gross Turnover up by 38%
Net Turnover up by 39%
Weighted average cost of Debt
Long Term Debts Repayment
Diluted EPS
Profi t After Tax
Net Debt Equity Ratio
Equity Dividend
0.69
7.429MnT
8.19%
7.815MnT
32,060crores
`
2,095crores
`
1,626crores
`
7.50per share
`
71.42`
5,631crores
`
1,432crores
`
34,658crores
`5 years CAGR 30.10 %
(` in crores)
12,518
15,131
19,396
25,092
34,658
2008-09
2007-08
2009-10
2010-11
2011-12
Gross Turnover
5 years CAGR 14.20 %
Operating EBIDTA (` in crores)
2008-09
2007-08
2009-10
2010-11
2011-12
3,496
2,985
4,384
4,777
5,631
Operating EBIDTA Margin (%)
2008-09
2007-08
2009-10
2010-11
2011-12
30.2%
21.1%
23.9%
20.4%
17.5%
Earning Per Share - Diluted
2008-09
2007-08
2009-10
2010-11
2011-12
94.18
22.70
105.94
96.33
71.42
(`)
2 Message from Chairman & Managing Director 4 JSW Builds 18 Board of Directors 22 Notice 30 Directors’ Report 45 Management Discussion and Analysis 80 Report on Corporate Governance 101 Auditor’s Report 104 Standalone Accounts 139 Consolidated AccountsCo
nten
ts
(` in crores)Contribution to Government and Society
Direct Taxes
2009 - 10 2011 - 12
589
1,081
1,696
26
610
2,325
2,967
2010 - 11
726
1,693
2,446
27 32
Indirect Taxes
CSR Initiatives*
21 % growth in contribution to Government & Society21 % growth in contribution to Government & Society
Total* including Capex

Eighteenth Annual Report 2011-12
2
...We will continue on our path to Build India...
Dear Shareholders,
Over the past century steel has emerged to become the most important element in the process of development. Manufacturing steel contributes significantly to the overall growth of a nation. India today is in its growth phase; with key areas such as infrastructure development coming into the limelight, the outlook for steel in India is positive in the medium to long term.
2011 has been a challenging year for most of the world. The advent of the sovereign debt crisis as well as a defaulting Greece plaguing Europe, slower than expected recovery crippling the USA and a reduction in global demand impacting China adversely, 2011 has been a very difficult year for the global economy. India too has suffered as a result, a GDP growth rate of 5.3% - the lowest it has been in 9 years is testimony to this fact. Even in this background your company has expanded its overall sales by 28% to 7.8 million tonnes. Domestic sales which accounted for 6.4 million tonnes grew by 23% whereas exports which accounted for 1.4 million tonnes grew by 61%. JSW Steel’s overall market share in the domestic market increased to 9% and our contribution to the country’s incremental demand growth of 4.5 million tonnes in 2011-12 stood at 26%.
The company also capitalised on its global competitiveness by increasing the amount of exports of its value-added steel products by 21% even though exports from the steel industry in India fell by 2% in the same time frame. This underlines the strong demand for our value added products overseas.
JSW Steel has touched 11 mtpa of steel-making capacity. The completion of an additional 2 mtpa at our Vijayanagar plant is expected by FY 2014. Work is ongoing in Salboni, West Bengal and with the support of the West Bengal government another integrated steel plant can be expected to become operational in due course.
With global pressures not expected to relent, 2012-13 is expected to be a challenging year. However we are hopeful
of achieving a significant improvement in our performance. Demand for our products domestically should help us in achieving our goals. Although this year has been a challenge for the country, if this past decade is anything to go by India’s potential cannot be questioned. With a large investment in infrastructure expected, the upcoming years will prove to be very exciting for the industry.
A look Back at the Year PassedIn 2011, the Honourable Supreme Court of India banned mining in the state of Karnataka. Consequently, we have faced significant shortages in the supply of good quality domestic iron ore. In this volatile economic environment, it is imperative that businesses have a clear strategy, underpinned by a set of core strengths. As the crisis of iron ore intensified in September 2011 pending commencement of E-auctions, we continued to operate our furnaces at lower capacity. The operational efficiency of our company significantly improved in the latter half of the year as the quality of iron ore received from the E auctions improved allowing us to increase our capacity utilization.
From this it can be seen that your company has been a victim in the entire illegal mining matter. Even after having had a presence in the state of Karnataka for more than two decades, investing more than ` 35,000 crores and creating thousands of jobs in the state, JSW steel remains the only major steel company in India with no captive mines.

Steel Limited
3
Earlier this year, the Honourable Supreme Court has accepted the recommendations of the Central Empowerment Committee and lifted the mining ban on category A mines subject to certain conditions. We expect the re-commencement of iron ore mining in Karnataka to take place within a few months. With category B mines expected to open sometime this year as well, iron ore availability within Karnataka should cease to be a major hurdle in the short run.
Way ForwardValue addition in India has often been compromised. It is imperative for more importance to be placed on transforming our countries natural resources into finished products. Exporting raw materials must be limited. Policies taking this into consideration, if calibrated, will go a long way in strengthening as well as enhancing Indian industry moving forward.
Moreover, a transparent process of allocating natural resources through auctions is the need of the hour. The Indian government must seriously consider and implement measures in this regard. JSW Steel continues to work hard to its commitment of nation building in a responsible and inclusive way, even during these trying times. We have reached a stage in our growth where we don’t just do things differently, we do different things! Our focus, hard work and innovativeness enable us to surpass our competitors in any venture we undertake.
Our focus moving forward will be bifold: cost optimization and value addition.
We are working to commission green field projects in Jharkhand and West Bengal which will significantly optimise our production costs.
At Salem, the newly commissioned blooming mill has enabled us to increase production to 15k tonnes per month as of March 2012. Following product approvals from various auto majors, we expect to further increase our value added steel output from this mill.
Our strategic collaboration with JFE Steel Corp, especially in the area of technological know-how, has opened up new avenues of growth which we wish to explore. This
partnership is an important milestone in your company’s mission to move up the value chain in steel products. Our goal is to become a one stop solution for all steel grades required by global and Indian customers.
Message to shareholdersOver the years, JSW Steel has developed tremendous resilience to external challenges. Whether domestic or global, growing in the midst of crisis has become our mantra. Let me take this opportunity to assure shareholders that our current and future expansion plans will be undertaken responsibly. The aim will be to continue to strengthen the JSW Steel brand, making it one of the most sought after steel brands in the world.
We will continue to innovate and strategise to retain our growth trajectory, by inculcating the latest technology and sustainable practices. Our cost competitiveness has given us an edge over our competitors. Your company has continuously delivered consistent cost improvements in all aspects of the business.
At the same time, it is imperative for the company to effectively transition from an era of ‘rapid growth’ to an era of ‘sustainable growth’. We have always believed in inclusive growth to facilitate the creation of an empowered society. As a responsible corporate, we have always strived to embed principles of sustainable development across our operations and processes.
I am pleased with the progress made by our company this year and commend not only the employees of JSW Steel but also our valued customers and suppliers for their effort and support. Our employees provide the foundation for our company, from which we draw inspiration and continuously strive to improve our strengths.
Finally, I would like to thank all stakeholders, board of directors and various state and central governments for their support and contribution to the company’s performance.
Warm regards,
Sajjan JindalChairman & Managing Director

Eighteenth Annual Report 2011-12
4
1982
First steel mill set up at Vasind
1983
Acquired a mini Steel unit at Tarapur
1994
Promoted Jindal Vijayanagar Steel
2000
Commissioned Corex unit
JSW is continuously evolving. Over the years, it has built capacity, built on technology; it has patiently and persistently worked towards fi nding innovative solutions in building business in a sustainable manner.
In addition to creating benchmarks in producing world-class steel, the core of this exponential growth is building a self-reliant India.
JSW Builds...
1997
Commissioned Hot Strip Mill

Steel Limited
5
2011
Commissioned Blast furnace IV
2006
Acquired Southern Iron & Steel Company Ltd. (Salem)
2009
Commissioned Blast furnace III
2010
Acquired majority stake in ISPAT Industries Ltd.
Commissioned Blast Furnace I
2004
11 mtpaIndia’s Leading
Steel Manufacturer
2012
Total Installed Capacity

Eighteenth Annual Report 2011-12
6
JSW Steel does not merely capitalize on national growth but catalyzes it as well. JSW Steel is not merely engaged in capturing market share but creating market space as well, benefi ting the country, customers and itself.
...Secure and Self-reliant...
JSW Builds...
Capacity additionIndia is committed to invest US $1.5 trillion in world-class infrastructure within a decade. Concurrently, JSW Steel resolved to create adequate manufacturing capacity, comprising of every steel grade needed by a growing nation, with the objective to create a secure and self-reliant India.
JSW Steel commissioned manufacturing capacity faster than any other Indian steel company. In 1997 with 1.6 mtpa Hot Rolling Mill at Vijayanagar, the Company emerged to the largest Indian private sector steel manufacturer
in less than two decades.
The Company is now adding 2 mtpa capacity at Vijayanagar Works, planning to create greenfield units in Salboni (West Bengal) and Jharkhand with the objective to reach 40 mtpa capacity by 2020. At JSW Steel, the journey never ends.
11 mtpaFY 2012
0.8 mtpaFY 2000
CAGR 27%
1 - Colour Coating Line, Tarapur 2 - Hot Strip Mill - 2, Vijayanagar
1
2

Steel Limited
7
Value-addition
JSW Steel is not just enhancing steel production; it is increasingly adding value to create the widest product basket from hot rolled coils to colour coated
steel to long products and specialized alloy steel.
Hot rolling: JSW Steel created 6.7 mtpa of HR capacity (being expanded by 1.5 mtpa in 2012-13). HSM 2 is India’s
widest and among the world’s best units.
CRCA and Galvanising capacity:JSW Steel is adding 2.3 mtpa of CRCA and Galvanising capacity at Vijayanagar to support
India’s manufacturing growth.
Galvalume products: JSW Steel is the leading Indian manufacturer (and among a few globally) to market products under the Galvalume trademark acquired from
BIEC International Inc., a worldwide licensor of the technology and know-how associated with the alloy coating of 55% aluminium and 45% zinc.
Oil and gas sector grades: JSW Steel is among few Indian companies to manufacture the sophisticated API X-70 grade steel (hitherto imported) used in the oil and gas pipelines, followed by a superior
variant called the API X-80 steel grade.
Auto grades: JSW Steel developed a number of specialised steel grades for the automotive sector finding applications in the outer body of passenger cars – large volume of this steel variety is imported into India.
Electrical steel: JSW Steel proposes to manufacture niche electrical steels. India imported about 0.3 million tonnes in 2011-
12, demand is expected to increase further.
3 - Cold Rolling Mill, Vijayanagar 4 - Vasind Works 5 - Salem Works
3 4
5

Eighteenth Annual Report 2011-12
8
JSW Steel’s conviction that ‘there is always room at the top’ leads to lateral out-of-the-box initiatives in its journey from a ‘good company to a great organisation’.
Creating benchmarks
Out-of-the-box thinking
JSW Steel’s R&D team introduced patented Cold Compact Strength (CCSR) and Coke Reactivity Index (CCRI)initiatives in the areas of coal evaluation and selection, improved coke making and reduced fuel rate in steel production.
Conventionally, sinter was used as a blast furnace feed. In a patented initiative, JSW Steel used sinter fines in the melter-gassifier unit of its Corex plant.
The company blended nine varieties of cheap soft coking coals (never intended as feedstock in iron making) with prime coking coal in the furnaces for the first ever time, a new global benchmark.
JSW needed to logistically connect the 3.8 mtpa hot metal area with SMS II meant for the new blast furnace – part of Project Cheetah (6.8 mtpa project). This connection was critical to stabilise the new steel-making unit, without which commissioning India’s largest blast furnace would not be a reality.
Conventional solution was to create a metal transfer shop, deploy a heavy-duty crane, use an additional loco and vessel in addition to laying a 12 km railway line with huge investment.
Through technical and process innovation, JSW Steel has emerged as an aspiration for global steel manufacturers, putting India on the global map.
...Great and Global...
JSW Builds...
The company introduced bottom purging in the tundish, leading to the manufacture of cleaner steel and received a global patent.
The company developed a customized pilot coke oven plant for the first time in India, resulting in a superior product with optimised production costs.
1 - Vijayanagar Works
1

Steel Limited
9
The JSW Steel - JFE collaboration opened opportunities in the manufacture of high-end auto steel in India. This was relevant in a country recognised as the global small car hub where more than 65% of the national requirement of steel was imported.
The JSW Steel - JFE tie-up promises to emerge as a probable game changer for the Company that raises performance
benchmarks with global standards, starting from 2011-12:
• In the raw material management system, infrastructure availability & reliability strengthened while spillage
belt away, belt cut and belt fire were minimised.
• In the iron-making zone, the prepared burden ratio in the blast furnace increased; burden distribution practices were aligned to global best practices and tapping practices were improved for superior hot metal and higher productivity.
• In the steel melting shop, ultra low carbon high end automotive grades were successfully developed and incorporation of world class maintenance practices improved the life of equipment.
• In the hot strip mill, productivity and plant availability had been improved.
• In the cold rolling mill, surface quality in automotive grades had been achieved for outer panel application meeting the stringent norms of the major auto customers.
By matching global best practices, JSW will reinforce its
position as a global benchmark.
The team connected the seemingly impossible by leveraging the surface-gradient and laying a 2 km railway track for very low investment. It commissioned India’s largest blast furnace in only 20 days thereafter – a national record.
Collaborating with the best
2 - USA Plant 3 - HSM Control Room4 - Iron ore mines, Chile
2 3
4

Eighteenth Annual Report 2011-12
10
JSW Steel builds India not merely through the supply of steel products, but through its enduring philosophy of ‘Give a man a fi sh and you feed him for a day, Teach a man to fi sh and you feed him for a lifetime.’
... Employed and employable
JSW Builds...
Employment storehouse: The company’s growth from 3.8 mtpa in 2007-08 to 11 mtpa in 2011-12 catalysed employment from 7060 members (April 1, 2008) to 9522 members (March 31, 2012) and team of its indirect employment associates concurrently expanded.
Growing the workforce withinGrowing the community around
JSW Steel transforms employees into entrepreneurs through a combination of authority, decision-making and risk-taking. Inspiring each individual to place the Company before self and align the personal with the professional.
The Company’s plan of more than ` 10,000 crore investments in next three years, will reinforce its position among the largest employment opportunity generator.
JSW Shoppe network: JSW Steel created and grew India’s first-of-its-kind retail chain dedicated to market steel in 350 non-metro outlets across India.
Strengthening skills: JSW Steel created multiple learning opportunities through an institutionalised training calendar, technical and behavioural development as well as workshops, seminars and skill development programmes.
The company entered into engagements with premier institutes to facilitate higher education through e-learning solutions.
On-job opportunities: JSW Steel created rich competence in project management, making it possible to commission several capex projects on schedule and within cost.
Growing the learning curve: JSW Steel engaged with BITS-Pilani to provide a Process Engineering programme to existing diploma holder employees, an opportunity for employees to enhance qualifications and keep in pace with evolving technology demands.
Vocational training: JSW Steel created vocational centres proximate to its manufacturing facilities to ensure sustainable development. At Vasind, the Shramsadhana Vocational Training Centre (SVTC) imparts training in various trades.
1 - Women empowerment - Vijayanagar
1

Steel Limited
11
At Vijayanagar, the JSW Foundation along with Nettur Technical Training Foundation (NTTF), imparts vocational training in mechanical maintenance, electrical maintenance and computer application to its participants. A total of 4907 students have been
trained through these centres.
JSW has adopted 16 ITIs and proposes to develop these into centres of excellence in different trades.
The Foundation tied up with Indira
Gandhi National Open University to empower individuals to improve career prospects. IGNOU approved the OPJC study centre and offers three programs – MBA, BDP (Bachelor Degree Program) and BPP (Bachelor Preparatory Program) in Hindi and English.
Women empowerment: JSW improved the lives of women in rural India through India through the following initiatives: • It trained rural women in earth-
moving equipment operations;
these women were provided employment in the Group companies.
• It established a non-voice BPO for rural women to enhance employability and their socio-economic condition through necessary IT knowledge and skills.
• JSW Foundation forms Self Help Group’s (SHG’s) with the sole objective of reaching out to the poor women in villages around plants through collateral free credit programmes aimed at income generation and thereby promoting sustainable livelihood opportunities to them. A sanitary napkin making unit has been set by a group of women after training and exposure visit organized by JSW Foundation. The main objective is to facilitate these women to start an entrepreneurial activity that will help them to provide livelihood opportunity and further bring menstrual health awareness among rural women. At Salem, 240 women have benefitted under Multi Skilled Garment Making Course.
Self Defence Training - JSW along with Thane district sports council for the past two years is organizing a self defence camp for women from rural Thane district. Where the basic skills of Karate, Taekwondo, Judo, Lathi – Kathi, Yoga, Fire fighting, swimming, first Aid Training and Aerobics are given. A total of 200 rural women have undergone this training.
Employable Indians through
vocational programs in last fi ve years
Employable women through
various initiatives in last fi ve years
26,000 4,900 2,000More than More than More than
Employment generated within
JSW Steel
2 - Non-voice BPO, Vijayanagar 3 - JSW Shoppe4 - Vocational Training Centre, Vijayanagar
2
3
4

Eighteenth Annual Report 2011-12
12
Minimising environmental contamination
Saving natural resources
The company’s Vijayanagar Works maintained a zero-effluent discharge status, reusing more than 95% of process waste.
JSW Steel invested in sophisticated ambient air control infrastructure beyond stipulated norms and reduced gas flaring to lower than accepted norms.
JSW Steel created a colony of 4,700 households adjacent to the plant – to facilitate a real-time check on the organisation’s environment management practices -- with no pollution issues since inception.
JSW Steel initiated the measurement of carbon footprint as per ISO 14064 for each process and product.
JSW Steel’s cascaded use of water enhanced water conservation and achieved one of the lowest freshwater
JSW Steel is committed to be a ‘green steel’ manufacturer. Its focus is not just on commerce but community, not merely products but holistic progress.
... Clean and Green...
JSW Builds...
JSW Steel is the only Indian steel manufacturer to have invested in ‘green steel’ manufacturing technology (Corex), saving precious coking coal and generating high calorifi c value gas utilised in power generation and other steel manufacturing processes.
JSW Steel implemented clean technologies - the Top Pressure Recovery Turbine Generating System in its Blast Furnace 3 and 4, waste heat recovery system from stove waste gases and sinter coolers - to reduce greenhouse gas emissions.
The coke dry quenching technology will commence operations in 2012-13 and signifi cantly reduce water consumption, facilitate energy recovery and reduce carbon footprint.
1 - Corex Tower, Vijayanagar 2 - Captive Power Plant, Vijayanagar
1
2

Steel Limited
13
Greening the earth
In line with its goal - a tree for every tonne of steel – JSW Steel planted about 40,000 trees in 2011-12 near its Vijayanagar facility, increasing the tree population to 1.35 million as on March 31, 2012. At the Salem unit, the Company planted 1.3 lakh tree saplings at various locations within the plant. JSW’s goal is to have its steel plants within gardens as opposed to the common convention of having gardens within steel plants.
Sanitation – JSW Foundation has taken a sustained drive for sanitation programme in partnership with Zilla Parishad and Gram Panchayat. JSW workers created awareness through door-to door visits and also screened films on health and sanitation in the evenings at a common meeting point. A total of 1404 Individual toilets have been constructed so far.
The JSW Earth Care Awards is for excellence in climate change mitigation and adaptation. The award focuses on three important areas, signifying action by industries, collaborative action by industry and community and by individuals covering a wide range of stakeholders. Earth Care Awards have been a big success in all these years 2008, 2010 and this year 2011. Total 22 Climate Crusaders have been awarded till now by JSW.
Rainfall received in Vijayanagar (an otherwise arid area before the unit was commissioned).
Coal saved in 2011-12 due to power generation from by-product gases and waste heat.
~ 700 ~ 5 lacsmm tonnes
consumption per tonne of crude steel in the Indian steel industry – 3.14 m3 per tonne of crude steel at Vijayanagar, against 4.5 m3 to 6 m3 per tonne of other integrated steel plants.
The Company established a 290-MW power generation plant fueled by recycled waste gases & heat generated in the steel manufacturing process, conserving fossil fuel.
JSW Steel invested / plans to invest in three facilities – a 0.2 mtpa Mill Scale Briquetting Project to convert mill
scales into briquettes, 0.6 mtpa coal fines briquetting plant and a 4,000 TPD facility to recover iron from slime. These will help to reduce the consumption of natural resources.
3 - Water Treament Plant, Vijayanagar 4 - Aerial view - Vijayanagar Township
3
4

Eighteenth Annual Report 2011-12
14
The Company believes that inclusive growth is not a destination but a journey facilitated by the progressive engagement of all stakeholders. JSW Steel is committed to create more smiles for every tonne of steel produced.
JSW Builds...
...Beyond Steel...
JSW Steel is committed to allocate 1.5% of its profi t after tax for conductingCSR initiatives.
Education
JSW Foundation entered into collaboration with the Azim Premji Foundation and Village School Management Committees to widen computer literacy. The Foundation trains teachers and persuades local schools to build facilities for computer education.
Computer-aided learning centres were established in 37 government schools, benefiting around 12,500 children.
JSW established 451 mobile libraries for children in 18 villages benefiting 3,200-plus children and providing a revenue source for library operators. JSW initiated evening tuition classes, conducted by
selected educated local women as a ‘bridge course’ for school dropouts in the age group of 6-14 years, an initiative that benefited 425 school students in 19 villages and 167 school dropouts in 17 villages.
The team also conducted motivational activities and special camps making it possible for school dropouts to re-join the educational mainstream; some 400 success stories were recorded.
JSW operates four schools -- Jindal Vidya Mandir in Vasind & Vijayanagar and Jindal Adarsh Vidyalaya in Shankar Gudda ( village near Vijayanagar), with CBSE and
1 - Training Center, Vijayanagar 2 - Tamanna School, Vijayanagar
1
2
Steel Limited
15
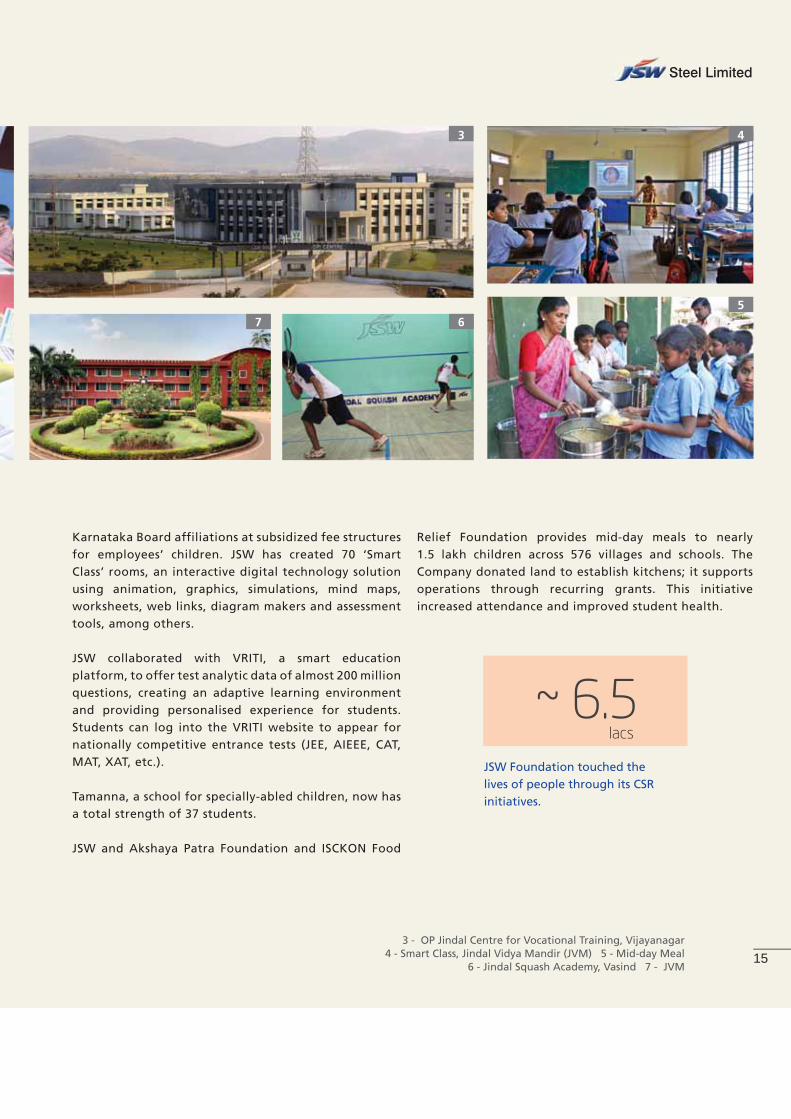
Karnataka Board affiliations at subsidized fee structures for employees’ children. JSW has created 70 ‘Smart Class’ rooms, an interactive digital technology solution using animation, graphics, simulations, mind maps, worksheets, web links, diagram makers and assessment tools, among others.
JSW collaborated with VRITI, a smart education platform, to offer test analytic data of almost 200 million questions, creating an adaptive learning environment and providing personalised experience for students. Students can log into the VRITI website to appear for nationally competitive entrance tests (JEE, AIEEE, CAT, MAT, XAT, etc.).
Tamanna, a school for specially-abled children, now has a total strength of 37 students.
JSW and Akshaya Patra Foundation and ISCKON Food
JSW Foundation touched the lives of people through its CSR initiatives.
~ 6.5 lacs
3 - OP Jindal Centre for Vocational Training, Vijayanagar 4 - Smart Class, Jindal Vidya Mandir (JVM) 5 - Mid-day Meal
6 - Jindal Squash Academy, Vasind 7 - JVM
3 4
567
Relief Foundation provides mid-day meals to nearly 1.5 lakh children across 576 villages and schools. The Company donated land to establish kitchens; it supports operations through recurring grants. This initiative increased attendance and improved student health.

Eighteenth Annual Report 2011-12
16
JSW spread awareness among employees, associates and the neighbouring community on issues related to sexual health, sexually transmitted diseases and HIV AIDS.
JSW encouraged HIV tests among community members and ensured care to the affected by networking with the nearest care and support centres. It conducted periodical health check-up camps with a focus on detection and complete treatment of sexually transmitted diseases among the target community.
It provided services in prompt
JSW LEAP
JSW Group is encouraging employees to contribute as JSW volunteers to enhance the life quality of the economically under-privileged, physically challenged and socially marginalised section of society.
Learn, Experience, Act, Persuade
JSW Steel conducted medical camps, eye camps, family welfare programs and cataract camps, among others in neighbouring villages, benefi ting more than 70,000 residents.
Health detection and treatment of sexually transmitted diseases and other ailments to improve the community’s health and well being.
JSW worked with local authorities to provide basic infrastructural amenities in government-run primary health centres.
It implemented a comprehensive sanitation package comprising tree plantation, village cleaning and construction of waste management pits, the local self-governments in two project villages were felicitated by the President of India with the Nirmal Gram Puraskar.
JSW set up the Jindal Sanjeevani
1 - Waste Management Project 2 - Jindal Sanjeevani Hospital 3 - Biofertilizer Training, Vijayanagar 4 - Medical Camp
1
2
34
JSW Builds...
...Beyond Steel...

Steel Limited
17
Art and culture
JSW has always taken a leading role in promoting art and culture. The JSW Foundation has collaborated with The National Culture Fund and The Archeological Survey of India for the conservation of the Krishna
Temple, one of the most impressive monuments at the UNESCO world heritage site of Hampi.
The JSW Foundation worked with renowned conservation architects and the state government to restore the premier art institution, Sir J J School of Arts (established 1858), and this involved documentation, conservation and display of invaluable paintings and sculptures.
The JSW Foundation’s quarterly publication Art India has won several national awards for its printing and content.
The magazine is internationally recognised as a key independent
voice of India’s contemporary art. It promotes a serious discussion on diverse art forms and disciplines. JSW Foundation has set up Kaladham, an art and cultural precinct, that includes three major buildings, dance and performance pavilions and artists studios.
The aim has been to create a stimulating environment that encourages creative pursuit and nurtures local budding talent & artists.
Hospital, covering 27,000 sq. ft area; comprises 75 beds, associated with Apollo hospital, Hyderabad for super speciality surgery.
This healthcare facility comprises casualty and emergency wards with resident medical officers and qualified nurses.
5 - Tree plantation 6 - Sir JJ School of Arts, Mumbai 7 - Kaladham, Vijayanagar
8 - Chandramouleshwar Temple, Hampi
78
65

Eighteenth Annual Report 2011-12
18
JSW Steel
Chairperson Emeritus
Board of Directors
Mrs. Savitri Devi Jindal
Mr. Sajjan JindalChairman & Managing Director
Mr. Jayant AcharyaDirector - [Commercial & Marketing]
Dr. Vinod NowalDirector & CEO
Mr. Seshagiri Rao M.V.S.Jt. Managing Director & Group CFO

Steel Limited
19
Mrs. Zarin DaruwalaNominee Director of ICICI Bank Ltd.
Mr. Yasushi KurokawaNominee Director of JFE Steel Corp., Japan
Dr. Rajneesh GoelNominee Director of KSIIDC
Dr. S. K. GuptaDirector
Mr. Anthony Paul PeddarDirector
Dr. Vijay KelkarDirector
Mr. Uday M. ChitaleDirector
Mr. Sudipto SarkarDirector
Mr. Kannan VijayaraghavanDirector

Eighteenth Annual Report 2011-12
20
Plant
Mining Resource
Corporate Office
JSW Builds...
Global Presence
Map for graphical representation purposes only. Not to scale.

21
Steel Limited
CHAIRPERSON EMERITUSMrs. Savitri Devi Jindal
BOARD OF DIRECTORS
MR. SAJJAN JINDALChairman & Managing Director
MR. SESHAGIRI RAO M.V.SJt. Managing Director & Group CFO
DR. VINOD NOWALDirector & CEO
MR. JAYANT ACHARYADirector (Commercial & Marketing)
DR. RAJNEESH GOELNominee Director of KSIIDC
MR. YASUSHI KUROKAWANominee Director of JFE Steel Corporation, Japan
MRS. ZARIN DARUWALANominee Director of ICICI Bank Limited
DR. S.K. GUPTADirector
MR. ANTHONY PAUL PEDDERDirector
DR. VIJAY KELKARDirector
MR. UDAY M. CHITALEDirector
MR. SUDIPTO SARKARDirector
MR. KANNAN VIJAYARAGHAVANDirector
COMPANY SECRETARYMr. Lancy Varghese
STATUTORY AUDITORSM/s. Deloitte Haskins & SellsChartered Accountants
BANKERSAllahabad BankBank of BarodaBank of IndiaICICI Bank LimitedIDBI Bank LimitedIndian BankIndian Overseas BankPunjab National BankState Bank of IndiaState Bank of MysoreState Bank of PatialaUnion Bank of IndiaVijaya Bank
REGISTERED OFFICEJindal Mansion5A, Dr. G. Deshmukh Marg,Mumbai 400 026.Tel. No. 022-23513000 Fax. No. 022-23526400Website : www.jsw.in
WORKSVijayanagar WorksP.O. Vidyanagar, Toranagallu Village,Sandur Taluk,Bellary District, Karnataka – 583 275.Tel: 08395-250120 to 30Fax: 08395-250138/250665
Vasind WorksShahapur Taluk,Thane District, Maharashtra 421 604.Tel: 02527-220022 to 025Fax: 02527-220020/84/92
Tarapur WorksMIDC Boisar, Thane DistrictMaharashtra 401 506.Tel: 02525 – 270147 / 270149Fax: 02525 – 270148
Salem WorksPottaneri, M. Kalipatti Village,Mecheri Post, Mettur Taluk,Salem District, Tamil Nadu-636 453.Tel: 04298 – 278400 to 404Fax: 04298 – 278618
REGISTRARS & SHARE TRANSFER AGENT
Karvy Computershare Private LimitedPlot No.17 to 24, Vittalrao Nagar,Madhapur, Hyderabad - 500 081.
Ph: 040 - 23420815-824Fax: 040 - 23420814
E-mail: [email protected]: www.karvy.com
Toll Free Number of R & T Agent’s exclusive call centre: 1-800-3454001

Eighteenth Annual Report 2011-12
22
Notice is hereby given that the EIGHTEENTH ANNUAL GENERAL MEETING of the Shareholders of JSW STEEL LIMITED will be held on Wednesday, the 25th July, 2012 at 11.00 a.m. at Birla Matushri Sabhagar, 19, New Marine Lines, Mumbai-400020, to transact the following business:
ORDINARY BUSINESS:
1. To receive, consider and adopt the Audited Balance Sheet as at 31st March, 2012, the Profi t and Loss Account for the year ended on that date, together with the Reports of the Board of Directors and the Auditors thereon.
2. To declare dividend on 10% Cumulative Redeemable Preference Shares.
3. To declare dividend on Equity Shares.
4. To appoint a Director in place of Mr. Sajjan Jindal, who retires by rotation and being eligible, offers himself for re-appointment.
5. To appoint a Director in place of Dr. Vinod Nowal, who retires by rotation and being eligible, offers himself for re-appointment.
6. To appoint a Director in place of Dr. S K Gupta, who retires by rotation and being eligible, offers himself for re-appointment.
7. To appoint M/s. Deloitte Haskins & Sells, Chartered Accountants, as Statutory Auditors of the Company to hold offi ce from the conclusion of this Annual General Meeting until the conclusion of the next Annual General Meeting of the Company and to fi x their remuneration.
SPECIAL BUSINESS:
8. To consider, and if thought fi t, to pass, with or without modifi cation(s) the following resolution as an Ordinary Resolution:
“RESOLVED THAT pursuant to the provisions of Sections 198, 269 and 309 read with Schedule XIII and other applicable provisions, if any, of the Companies Act, 1956, the Company hereby approves the re-appointment of Dr. Vinod Nowal as the Director & CEO of the Company, for a period of fi ve years, with effect from 30.04.2012 upon such terms and conditions as are set out in the Draft Agreement to be executed with Dr. Vinod Nowal (a copy of which is initialed by the Chairman for the purpose of identifi cation and placed before this meeting), with specifi c authority to the Board of Directors to alter or vary the terms and conditions of
NOTICE
the said appointment and / or agreement including the remuneration which shall not exceed a maximum limit of ` 50,00,000 p.m., as may be agreed to between the Board of Directors and Dr. Vinod Nowal”.
9. To consider, and if thought fi t, to pass, with or without modifi cation(s) the following resolution as an Ordinary Resolution:
“RESOLVED THAT pursuant to the provisions of Sections 198, 269, 309 and 317 read with Schedule XIII and other applicable provisions, if any, of the Companies Act, 1956, the Company hereby approves the re-appointment of Mr. Sajjan Jindal as the Managing Director of the Company, for a period of fi ve years, with effect from 07.07.2012, on the following terms and conditions which the Board of Directors may alter or vary in such manner as they may consider necessary, expedient and acceptable to Mr. Sajjan Jindal:
Remuneration:(Including Salary & Perquisites)
As may be agreed to between the Board of Directors and Mr. Sajjan Jindal within an overall ceiling of `1,00,00,000 p.m.
Commission: Not exceeding 0.5% of the Net Profi t as determined under Section 349 of the Companies Act, 1956.
Powers, Duties & Functions:
Mr. Sajjan Jindal shall have general control, management and superintendence of the business of the Company in the Ordinary Course of business and shall exercise and perform all such powers and duties, which in the ordinary course of business may be considered necessary, proper and in the interest of the Company, subject always to any directions or restrictions from time to time, given or imposed by the Board of Directors of the Company and by Law”.
By Order of the BoardFor JSW STEEL LIMITED
Place : Mumbai Lancy VargheseDate : May 14, 2012 Company Secretary

23
Steel Limited
NOTES:
1. The relative explanatory statement pursuant to Section 173(2) of the Companies Act, 1956, in respect of the business under item nos. 8 and 9 set out above and the details under Clause 49 of the Listing Agreement with Stock Exchanges in respect of Directors proposed to be appointed / re-appointed at the Annual General Meeting, is annexed hereto.
2. A MEMBER ENTITLED TO ATTEND AND VOTE AT THE MEETING IS ENTITLED TO APPOINT A PROXY TO ATTEND AND VOTE INSTEAD OF HIMSELF/HERSELF AND SUCH PROXY NEED NOT BE A MEMBER OF THE COMPANY.
3. The instrument(s) appointing the proxy, if any, shall be deposited at the Regd. Offi ce of the Company, at Jindal Mansion, 5A, Dr. G. Deshmukh Marg, Mumbai - 400 026 not less than forty eight (48) hours before the commencement of the Meeting and in default, the instrument of proxy shall be treated as invalid. Proxies shall not have any right to speak at the meeting.
4. The Register of Members and Share Transfer Books of the Company will remain closed from 14.07.2012 to 16.07.2012 (both days inclusive).
5. In order to provide protection against fraudulent encashment of Dividend Warrants, shareholders holding shares in physical form are requested to intimate the Company under the signature of the Sole/First joint holder, the following information which will be used by the Company for Dividend payments:
i) Name of Sole/First joint holder and Folio No.
ii) Particulars of Bank Account viz.:
• Name of the Bank.
• Name of Branch.
• Branch Code.
• Complete address of the Bank with Pin Code Number.
• Account type, whether Savings Bank (SB) or Current Account (CA).
• Bank Account number allotted by the Bank.
In case of Shareholders holding shares in electronic form, Bank account details provided by the Depository Participants (DPs) will be used by the Company for printing on dividend warrants. Shareholders who wish to change such bank accounts may advise their DPs about such change with complete details of Bank Account including MICR Code.
Shareholders residing at the centers where National Electronic Clearing Service (NECS) Facility is available are advised to avail of the option to collect Dividend by way of NECS.
Equity shareholders holding shares in physical form are requested to send their NECS Mandate Form in the format available for download on the Company’s website (www.jsw.in), duly fi lled in, to the Registrars and Share Transfer Agent of the Company - Karvy Computershare Pvt. Ltd. In case of Equity Shareholders holding shares in Electronic form, the NECS Mandate Form will have to be sent to the concerned Depository Participants (DPs) directly.
6. The amounts of the unclaimed dividend declared by the erstwhile Jindal Iron & Steel Company Limited (JISCO) upto the fi nancial year ended 31.03.1995 have been transferred to the General Revenue Account of the Central Government in terms of Section 205A of the Companies Act, 1956. Shareholders who have not yet encashed their Dividend Warrants for the said period are requested to forward their claims in Form No. II prescribed under The Companies Unpaid Dividend (Transfer to General Revenue Account of the Central Government) Rules, 1978, to the Registrar of Companies, Maharashtra, Hakoba Compound, 2nd Floor, Fancy Corpn. Ltd. Estate, Dattaram Lad Marg, Kalachowkie, Mumbai - 400 033.
Consequent upon amendment to Section 205A of the Companies Act, 1956 and introduction of Section 205C by the Companies (Amendment) Act, 1999, the amount of dividend for the subsequent years remaining unpaid or unclaimed for a period of seven years from the date of transfer to the Unpaid Dividend Account of the Company shall be transferred to the Investor Education and Protection Fund (IEPF) set up by the Government of India and no payments shall be made in respect of any such claims, by the Fund. Accordingly, all unclaimed/unpaid dividends of the erstwhile Jindal Iron & Steel Company Ltd (now merged with JSW Steel Limited) in respect of fi nancial years 1995-96 to 2003-04 has been transferred to IEPF. The Company’s unpaid or unclaimed interim Dividend for F.Y. 2004-05 has also been transferred to the IEPF. Members who have not encashed their fi nal dividend warrants for the F.Y 2004-2005 or thereafter are requested to write to the Company’s Registrar and Share Transfer Agent.
7. Members are requested to intimate the Registrar and Share Transfer Agent of the Company – Karvy Computershare Pvt. Ltd., Plot No.17 to 24, Vittalrao Nagar, Madhapur, Hyderabad – 500 081, immediately of any change in their address in respect of equity shares held in physical mode and to their Depository

Eighteenth Annual Report 2011-12
24
Participants (DPs) in respect of equity shares held in dematerialised form.
8. Members desirous of having any information regarding Accounts are requested to address their queries to the Chief Financial Offi cer at the Registered Offi ce of the Company at least seven days before the date of the meeting, so that the requisite information can be made available at the meeting.
9. All the Documents referred to in the accompanying Notice and Explanatory Statement are open for inspection at the Company’s Offi ce at Victoria House, Pandurang Budhkar Marg, Lower Parel (W), Mumbai - 400 013 on all working days of the Company, between
10.00 a.m. and 1.00 p.m. upto the date of the Annual General Meeting.
10. Members holding Share certifi cates under different folio numbers but in the same order of name are requested to apply for consolidation of such folios and send relevant Share certifi cates to the Registrar and Share Transfer Agents of the Company.
11. Members/Proxies are requested to bring the attendance slip duly fi lled in.
12. Copies of Annual Report will not be distributed at the Annual General Meeting. Members are requested to bring their copies to the meeting.

25
Steel Limited
ANNEXURE TO NOTICEEXPLANATORY STATEMENT:
The Explanatory Statement pursuant to Section 173 (2) of the Companies Act, 1956 for item numbers 8 to 9 of the accompanying notice is as under:
Item No. 8
The Members of the Company had in their 13th Annual General Meeting held on 13.06.2007 approved the appointment of Dr. Vinod Nowal as a Whole-time Director of the Company, designated as ‘Director (Commercial)’ for a period of fi ve years commencing from 30.04.2007. His re-designation as “Director & CEO” was subsequently approved by the members in their Extra-Ordinary General Meeting held on 26.08.2010. The term of Dr. Nowal expired on 29.04.2012.
Your Directors have in their meeting held on 20.01.2012 re-appointed Dr. Vinod Nowal as a Whole-time Director of the Company designated as ‘‘Director & CEO‘’, w.e.f. 30.04.2012 on the terms and conditions contained in the Draft Agreement to be executed with Dr. Nowal.
Dr. Vinod Nowal, holds a Masters Degree in Business Administration and Doctorate in Inventory Management. He is associated with the Group since 1984. He joined Jindal Iron & Steel Co. Ltd (JISCO) as Works Manager and was gradually elevated to the position of Executive Director, in charge of Operations of Vasind & Tarapur Plants and Commercial. From 2004, he has been stationed at the Company’s Vijayanagar Works as Executive Director (Commercial). Before his association with the Group, he was working with VSL Limited, Faziabad in the capacity of Works Manager and prior to that with KM Sugar Mills Ltd, Faridabad as Factory Manager.
He has also held commendable positions like:• President of Tarapur Industrial Manufacturers’
Association, which represents 1200 Industries of Tarapur MIDC.
• President – Lions Club of Tarapur in 1990-91.• Membership of International Association of Lions
Club. Zone Chairman in 1998-99, Region V.• Patron of Chinmaya Mission School, Tarapur.• Vice Chairman of Tarapur Industrial Manufacturers’
Association Hospital, Tarapur.
Members’ approval is sought for the said re-appointment of Dr. Vinod Nowal as a wholetime Director of the Company designated as ‘Director & CEO’ for a period of fi ve years with effect from 30.04.2012 and for the payment of salary and other perquisites to be fi xed from time to time by the Board of Directors of your Company.
Considering his rich and varied experience spanning a period of over three decades and the rich contribution he has been making to the growth of your Company, it would be in the best interest of the Company to reappoint Dr. Vinod Nowal
as a Whole-time Director of the Company designated as ‘Director’ & CEO. The remuneration of the Director & CEO is to be so fi xed by the Board of Directors from time to time, such that the Salary and the aggregate value of all the perquisites and allowances like furnished accommodation or house rent allowance in lieu thereof, house maintenance allowance together with reimbursement of expenses or allowances for utilities such as gas, electricity, water, furnishings and repairs; Bonus; medical reimbursement; club fees and leave travel concession for himself and his family; medical insurance and such other perquisites and allowances in accordance with the rules of the Company or as may be agreed to by the Board of Directors and Dr. Nowal, shall not exceed the overall ceiling on remuneration approved by the members in General Meeting.
Your Directors have recommended a maximum remuneration of ` 50,00,000 per month as approved by the Members earlier in their 17th Annual General Meeting held on 25.07.2011.
The following perquisites shall not be included in the computation of the ceiling on remuneration specifi ed above:
a) Contribution to Provident Fund, Superannuation Fund or Annuity Fund to the extent these either singly or put together are not taxable under the Income Tax Act, 1961;
b) Gratuity as per rules of the Company (which shall not exceed one half month’s Salary for each completed year of Service); and
c) Earned leave with full pay or encashment as per rules of the Company.
For the purposes of calculating the above ceiling, perquisites shall be evaluated as per Income-tax Rules, wherever applicable. In the absence of any such Rules, perquisites shall be evaluated at actual cost.
Provision for use of the Company’s car for offi cial duties and telephone at residence (including payment for local calls and long distance offi cial calls) shall not be included in the computation of perquisites for the purpose of calculating the said ceiling.
In the event of loss or inadequacy of profi ts in any fi nancial year, the Director & CEO shall be paid remuneration by way of salary and perquisites as specifi ed above, subject to the approval of the Central Government, if required.
The Director & CEO shall not be eligible for any sitting fees for attending the Company’s Board or Committee Meetings.
The Board of Directors may, at its discretion pay to Dr. Vinod Nowal, lower remuneration than the maximum remuneration herein above stipulated and revise the same from time to time within the maximum limit stipulated by this resolution.

Eighteenth Annual Report 2011-12
26
The terms of remuneration of Dr. Vinod Nowal has the approval of the Remuneration Committee. The approval of the Central Government for the remuneration payable would not be required in view of the adequacy of profi ts.
The above details may please be treated as an abstract of the terms of the draft agreement between the Company and Dr. Vinod Nowal under section 302 of the Companies Act, 1956.
A copy of the draft agreement to be executed with Dr. Vinod Nowal is available for inspection at the Company’s offi ce at Victoria House, Pandurang Budhkar Marg, Lower Parel (W), Mumbai 400 013 from 10.00 a.m. to 1.00 p.m. upto the date of the Annual General Meeting.
None of the Directors other than Dr. Vinod Nowal is in any way concerned or interested in the resolution.
Your Directors recommend the resolution as at item No.8 for your approval.
Item No. 9
Mr. Sajjan Jindal’s re-appointment as Vice Chairman & Managing Director of the Company for a period of 5 years w.e.f. 07.07.2007, was approved by the members of the Company at their 13th Annual General Meeting held on 13.06.2007.
Upon the resignation of Mrs. Savitri Devi Jindal as the Chairperson & as a Director and her appointment as Chairperson Emeritus, Mr. Jindal was appointed by the Board as its Chairman w.e.f 21.10.2011 at the Board Meeting held on 21.10.2011.
The term of Mr. Sajjan Jindal will expire on 06.07.2012. In view of the same, your Directors have in their meeting held on 14.05.2012, re-appointed Mr. Sajjan Jindal as the Managing Director of the Company for a further period of fi ve years w.e.f 07.07.2012, subject to the approval of the Members.
Mr. Sajjan Jindal holds a Bachelor’s degree in Mechanical Engineering from the Bangalore University. He has been associated with the Company right from its inception and is the principal promoter of the Company.
Mr. Jindal started his career in Mumbai by independently looking after the Western Region business of Steel Manufacturing of the O.P. Jindal Group. Since then he has followed an aggressive growth strategy that has led him to make JSW Steel as one of India’s leading private integrated steel makers. Mr. Jindal believes that India’s real challenge lies in pursuing the path of inclusive growth and taking a leadership role in sustainable development and that growth is meaningful only when it benefi ts all sections of the society and does not endanger the fragile environment.
He has served on several civic society bodies including as:
• Past President of ASSOCHAM.
• Past member on the Board of Airports Authority of India.
• Member, India Council for Sustainable Development.
• Member, Advisory Committee – TERI School of Management.
• Member, CII National Council.
• Council Member-Indian Institute of Metals.
Mr. Jindal was the pioneer in developing DD & EDD grades of mild steel in the Indian Steel Sector (an import substitute product) and has over 30 years’ experience in the Steel Industry. In fact it was his dream, vision and planning that led to the setting up of the State of the Art Corex Technology based Mega Integrated Steel Plant in Toranagallu, Bellary Dist, Karnataka. In 2007, Mr. Jindal was named the Ernst & Young ‘Entrepreneur of The Year’ in the manufacturing category. In 2009, Mr. Jindal was awarded the prestigious 19th Willy Korf/Ken Iverson Steel Vision Award at the Steel Survival Strategies XXIV Conference, New York for elevating JSW Steel amongst the selected few global steel producers.
Members’ approval is therefore sought for the said re-appointment of Mr. Sajjan Jindal as the Managing Director of the Company for a further period of fi ve years with effect from 07.07.2012 and for the payment of salary and other perquisites to be fi xed from time to time, by the Board of Directors of your Company within the overall ceiling approved by the Members. Mr.Sajjan Jindal upon his re-appointment as Managing Director shall continue to hold the offi ce of the Chairman.
The remuneration of Mr. Sajjan Jindal will be so fi xed by the Board of Directors from time to time, that the aggregate value of all the perquisites and allowances like furnished accommodation or house rent allowance in lieu thereof; house maintenance allowance together with reimbursement of expenses or allowances for utilities such as gas, electricity, water, furnishings and repairs, medical reimbursement, club fees and leave travel concession for himself and his family, medical insurance and such other perquisites and allowances in accordance with the rules of the Company or as may be agreed to by the Board of Directors and Mr. Jindal, shall not exceed the overall ceiling on remuneration approved by the members in General Meeting.
Your Directors have recommended an overall ceiling of ` 1,00,00,000/- per month.
The following perquisites shall not be included in the computation of the ceiling on remuneration specifi ed above:
a) Contribution to Provident Fund, Superannuation Fund or Annuity Fund to the extent these either singly or put together are not taxable under the Income Tax Act, 1961;
b) Gratuity as per rules of the Company (which shall not exceed one half month’s Salary for each completed year of Service); and
c) Earned leave with full pay or encashment as per rules of the Company.

27
Steel Limited
Important Communication to MembersIn an effort to make the earth a better place to live, the green movement has been sweeping over the globe. Not only are individuals doing things to help the environment, companies & governments are as well. The Ministry of Corporate Affairs (MCA) has taken a “Green Initiative in Corporate Governance” by allowing paperless compliance by Companies through electronic mode and has issued a circular bearing no.17/2011 dated April 21, 2011 stating that service of documents by a Company to its Members can be made through electronic mode. The move of the ministry allows public at large to contribute to the green movement. To support this green initiative of the Government in full measure, members who have not registered their e-mail addresses, so far, are requested to register their e-mail addresses, in respect of electronic holdings with the Depository through their concerned Depository Participants. Members who hold shares in physical form are requested to fi ll in the Registration form provided in this Annual Report and register the same with Karvy Computershare Private Limited.
For the purposes of calculating the above ceiling, perquisites shall be evaluated as per Income-tax Rules, wherever applicable. In the absence of any such Rules, perquisites shall be evaluated at actual cost.
Provision for use of the Company’s car for offi cial duties and telephone at residence (including payment for local calls and long distance offi cial calls) shall not be included in the computation of perquisites for the purpose of calculating the said ceiling.
Members’ approval is also sought for the payment of Commission to Mr. Sajjan Jindal @ 0.5% of Net Profi t which shall also not be included in the computation of the said ceiling of ` 1,00,00,000 per month.
Mr. Jindal would continue to draw remuneration from JSW Energy Limited, of which he is the Chairman and Managing Director. The aggregate of the remuneration paid to Mr. Jindal from both the Companies shall however be subject higher of the maximum limits admissible from any one of the Companies as per the provisions of the Companies Act 1956.
The terms of remuneration of Mr. Sajjan Jindal has the approval of the Remuneration Committee. The approval of the Central Government for the remuneration payable would not be required in view of the adequacy of the profi ts.
In the event of loss or inadequacy of profi ts in any fi nancial year, Mr. Sajjan Jindal shall be paid remuneration by way of salary and perquisites as specifi ed above subject to the approval of the Central Government, if required.
Mr. Sajjan Jindal shall not be eligible for any sitting fees for attending the Company’s Board or Committee Meetings.
The Board of Directors may, at its discretion pay to Mr. Sajjan Jindal lower remuneration than the maximum remuneration herein above stipulated and revise the same from time to time within the maximum limit stipulated by this resolution.
None of the Directors other than Mr. Sajjan Jindal is in any way concerned or interested in the resolution.
Your Directors recommend the resolution as at item No.9 for your approval.
By Order of the BoardFor JSW STEEL LIMITED
Place : Mumbai Lancy VargheseDate : May 14, 2012 Company Secretary

Eighteenth Annual Report 2011-12
28
DETAILS OF DIRECTORS SEEKING APPOINTMENT / RE-APPOINTMENTAT THE FORTHCOMING ANNUAL GENERAL MEETING
[Pursuant to Clause 49 of the Listing Agreements entered into with the Stock Exchanges]
Name of the Director Mr. Sajjan Jindal Dr. Vinod Nowal Dr. S K Gupta
Date of Birth 05.12.1959 11.06.1955 18.08.1938Date of Appointment 15.03.1994 30.04.2007 25.04.1994Expertise in specifi c functional area
Mr. Sajjan Jindal holds a Bachelor’s degree in Mechanical Engineering from the Bangalore University. He is the principal promoter of the Company and its Chairman and Managing Director. He is a member of India Council for Sustainable Development, member of the Advisory Committee of TERI School of Management, member of CII National Council, Council member of Indian Institute of Metals and member of the Board of Directors of Indian Institute of Management, Indore and was the president of ASSOCHAM from June 2008 to October 2009. In 2009, Mr. Jindal was awarded the prestigious 19th Willy Korf/Ken Iverson Steel Vision Award at the Steel Survival Strategies XXIV Conference, New York for elevating JSW Steel amongst the selected few global steel producers. In 2007, Mr. Jindal was named the Ernst & Young ‘Entrepreneur of The Year’ in the Manufacturing Category.
Dr. Vinod Nowal is associated with the O.P. Jindal Group since 1984. He joined Jindal Iron & Steel Co. Ltd (JISCO) as Works Manager and was elevated to the position of Executive Director, looking after Operations of Vasind & Tarapur Plants and Commercials. From 2004 he was placed at the Toranagallu Unit as Executive Director (Commercial). At present he is Director & CEO. Before his association with Jindal Group he was working with VSL Limited, Faziabad in the capacity of Works Manager and prior to that with KM Sugar Mills Ltd, Faridabad as Factory Manager. He has also held commendable positions like: • President of Tarapur
Industrial Manufact-urers Associations, which represents 1200 Industries of Tarapur MIDC.
• President-Lions Club of Tarapur in 1990-91.
• Membership of Interna-tional Association of LIONS CLUB.
Zone Chairman in 1998-99, Region V.
• Patron of Chinmaya Mission School, Tarapur
• Vice Chairman of TIMA Hospital, Tarapur
Dr. Saibal Kanti Gupta, is a B.Sc. in Metallurgical Engineering with Ph.D (Tech.) & D.Sc (Tech.) from Moscow. He has over 50 years of experience in the fi eld of metallurgy, engineering and management in the steel domain. He has vast experience in the fi elds of research and development, engineering and management of steel plants and large engineering companies and has held key positions such as Executive Vice Chairman, JSW Steel Limited, Managing Director of Rourkela Steel Plant, Steel Authority of India Limited, Chairman and Managing Director of MECON and Managing Director of Mishra Dhatu Nigam Limited (MIDHANI), Ministry of Defence. He was Professor and Head of the Department of Metallurgical Engineering at the Indian Institute of Technology, Bombay and a member of the Board of Industrial Development Bank of India (IDBI) and various other national institutions. He served as the Chairman of the Government of India task force on Steel Growth Plan. He was the recipient of the “Metallurgist of the Year” award instituted by the Government of India in 1980 and was conferred the National Metallurgist Award in 1998. On 14th November, 2008 he received IIM Platinum Medal. He has more than 100 research publications in leading journals on Metallurgy and Management.

29
Steel Limited
Name of the Director Mr. Sajjan Jindal Dr. Vinod Nowal Dr. S K GuptaQualifi cation B.Engg. (Mech) Masters Degree in Business
Administration and Doctorate in Inventory Management
B.Sc. (Met.Engg.), Ph.D (Tech)
& D.Sc. (Tech)
Directorship in other Indian Public Limited Companies as on 31.03.2012
JSW Energy Limited
Jindal South West Holdings
Limited
JSW Ispat Steel Limited
JSW Bengal Steel Limited
TCPL Packaging Limited
Jsoft Solutions Limited
Vrindavan Fintrade Limited
Jindal Steel & Alloys Limited
South West Port Limited
Jindal Saw Limited
Sobha Developers Limited
Jindal South West Holdings
Limited
Surana Industries Limited
Vesuvius India Limited
BMM Ispat Limited
Chairman/ Membership of Committees in other Indian Public Limited Companies as on 31.03.2012*(C = Chairman;M = Member)
- - Audit Committee
Vesuvius India Limited (C)
Jindal South West Holdings
Limited (M)
Sobha Developers Limited (M)
Shareholders/InvestorsGrievance Committee
Sobha Developers Limited (C)
Jindal South West Holdings
Limited (M)
Vesuvius India Limited (M)
Surana Industries Limited (M)No. of Shares held in the Company as on 31.03.2012
23,29,080 9,047 4,500
*only two Committees namely, Audit Committee, Shareholders/Investors Grievance Committee have been considered.

Eighteenth Annual Report 2011-12
30
DIRECTORS’ REPORTTo the Members ofJSW STEEL LIMITEDYour Directors take pleasure in presenting the eighteenth Annual Report of your Company, together with the Standalone and Consolidated Audited Statement of Financial Accounts for the year ended March 31, 2012.1. FINANCIAL RESULTS
(` in crores)
Particulars Standalone Consolidated
F.Y.2011-12
F.Y.2010-11
F.Y.2011-12
F.Y.2010-11
Gross Turnover 34,658.48 25,092.09 36,719.83 25,829.13
Less : Excise duty 2,598.01 1,967.52 2,596.18 1,967.56
Net Turnover 32,060.47 23,124.57 34,123.65 23,861.57
Add: Other Operating Revenues 62.19 242.54 244.40 244.32
Revenue from operations 32,122.66 23,367.11 34,368.05 24,105.89
Operating EBIDTA 5,630.80 4,776.90 6,101.89 4,867.90
Add: Other Income 179.30 234.51 76.85 189.97
Less: Finance costs 1,186.41 854.17 1,427.30 1,060.26
Less: Depreciation and amortization 1,708.17 1,378.71 1,933.15 1,559.71
Profi t before Exceptional Items and Tax 2,915.52 2,778.53 2,818.29 2,437.90
Less: Exceptional Items 820.96 - 824.94 -
Profi t before Tax (PBT) 2,094.56 2,778.53 1,993.35 2,437.90
Less: Tax expense 468.70 767.86 500.15 778.52
Profi t after Taxation but before minority interests and share of profi ts/loss of Associates
1,625.86 2,010.67 1,493.20 1,659.38
Less: Share of Profi t / (Losses) of Minority 18.92 (23.87)
Add: Share of (Losses) / Profi t from Associates (net)
Excluding exceptional items (226.21) 70.73
Exceptional items (710.39) -
Profi t for the year (PAT) 1,625.86 2,010.67 537.68 1,753.98
Add: Balance in profi t and loss account 2,788.36 5,327.78 1,899.35 4,695.46
Amount available for Appropriation 4,414.22 7,338.45 2,437.03 6,449.44
Less: Appropriations:
Transfer from Debenture Redemption Reserve 125.00 125.00
Dividend on Preference Shares (27.90) (27.90) (27.90) (27.90)
Proposed Final Dividend on Equity Shares (167.34) (273.32) (167.34) (273.32)
Corporate Dividend Tax (31.68) (48.87) (31.68) (48.87)
Transfer to General Reserve (2,325.00) (4,200.00) (2,325.77) (4,200.00)
Closing balance 1,987.30 2,788.36 9.34 1,899.35
2. FINANCIAL HIGHLIGHTS
(A) Standalone Results
The year under review was challenging due to non-availability of Iron ore caused by imposition of ban on Iron ore mining by the Honourable Supreme Court of India in the State of Karnataka. Inspite of this constraint the Company achieved a volume growth over previous year of 16% in crude steel production during the current year. It had achieved crude steel production of 7.429 million tonnes and volume of sales of 7.815 million tonnes. The growth in volumes could be achieved due to commissioning of the 3.2 mtpa Crude Steel Expansion Project at Vijayanagar Works in Q2 of 2011-12 enhancing the Crude Steel manufacturing capacity to 10 mtpa. The overall steel manufacturing

31
Steel Limited
capacity of the Company Stood at 11 mtpa. With the completion of this expansion project, the Company has scaled new heights as a leading player in the steel industry in the country. The Expansion facilities stabilized quickly and achieved hot metal production of 1.135 million tonnes during the current year, which worked out to around 72% of the Installed capacity.
The Gross Turnover and Net Turnover for the year stood at ` 34,658 crores and ` 32,060 crores, respectively, showing a growth of 38% and 39% over the previous year mainly driven by growth in volumes.
The operating EBIDTA for the year was ` 5,631 crores and operating EBIDTA margin for the year was 17.53%. Your Company posted PAT of ` 1,626 crores after considering exceptional item (Foreign exchange loss) of ` 821 crores. Due to the unusual depreciation in the value of the Rupee against US Dollar during the previous fi scal, the net loss of ` 821 crores on restatement of foreign currency monetary items at close of the year has been considered by the Company to be exceptional in nature.
In view of the rulings viz permitting National Mineral Development Corporation (NMDC) to mine 1 million tonne per month to be supplied to steel industry and sale of around 25 million tonnes of Iron ore stock pile through E-Auction, the Company could operate the plant at about 80% capacity in the year under review. Had the constraints of Iron ore supply not been there, the performance could have been much higher.
(B) Consolidated Results
As per the Consolidated Financial Statements, the Gross Turnover, Net Turnover, operating EBIDTA and PAT of the Company are ` 36,720 crores, ` 34,124 crores, ` 6,102 crores and ` 538 crores, respectively.
In accordance with the Accounting Standards AS-21, on Consolidated Financial Statements read with Accounting Standard AS-23 on Accounting for Investment in Associates and AS-27 on Financial Reporting of Investment in Joint Ventures, the audited Consolidated Financial Statments are provided in the Annual Report.
3. DIVIDEND
The Board has, subject to the approval of the Members at the ensuing Annual General Meeting, recommended dividend at the stipulated rate of `1.00 per share on the 27,90,34,907, 10% Cumulative Redeemable Preference Shares of `10 each of the Company, for the year ended March 31, 2012.
The Board has also, considering the Company’s performance and fi nancial position for the year under review, recommended a dividend of ` 7.50 (75%) per fully paid-up Equity Share of `10 each of the Company, for the year ended March 31, 2012, subject to the approval of the Members at the ensuing Annual General Meeting.
Together with Corporate Tax on dividend, the total outfl ow on account of equity dividend will be ̀ 194.49 crores, vis-à-vis ` 317.66 crores paid for fi scal 2010-11.
4. PROSPECTS
Indian GDP is estimated at 7.6% in FY 2012-13 as per Prime Minister’s Economic Advisory Council (PMEAC). Indian steel demand is also expected to track GDP growth supported by easing interest rate cycle and resultant revival in infrastructure, construction, industrial and manufacturing sectors. Prediction of good monsoon in the current year, declining commodity prices globally, lower interest rates are positives to spur economic activity in the country. Notwithstanding, fragile recovery in US, Sovereign debt crisis in Europe and slow down in China, domestic demand/consumption is one of the primary drivers of Indian Economy, to be optimistic to show a GDP growth of above 7%. The Company expects opening of category ‘A’ Iron ore mines in the near future followed by category ‘B’ mines improving the availability of Iron ore and consequently improve performance of the company.
5. PROJECTS AND EXPANSION PLANS
The progress made on various projects were as follows:
Vijayanagar Works
(a) Projects commissioned during FY 2011-12
The 3.2 mtpa expansion project at Vijayanagar works was completed and commissioned during the last fi nancial year.
Other projects completed during the year include:
• 4.2 mtpa - Pellet Plant 2.
• 300 MW - Captive Power Plant (CPP 4).
(b) Projects under progress
• 2.3 mtpa – Cold Rolling Mill Complex, being executed in two phases, the fi rst phase is expected to be commissioned in FY 2013-14 and second phase in FY 2014-15.

Eighteenth Annual Report 2011-12
32
• 2nd Phase (1.5 mtpa) of New Hot Strip Mill, taking the rolling capacity to 5 mtpa by September 2012.
• 2nd Phase of Benefi ciation Plant 2, taking total capacity to 20 mtpa by FY 2012-13 in phased manner.
(c) Projects proposed
• The Company has assessed the existing facilities at Vijayanagar works and started working on increasing plant capacity from 10 mtpa to 12 mtpa. Total project cost is about ̀ 2,695 crores The project is expected to be commissioned in FY 2013-14.
Salem Works
(a) Projects commissioned during F.Y. 2011-12
• Blooming mill phase 2 commissioned in June 2011, taking the total capacity to 0.5 mtpa. Ramping up of production is under progress.
(b) Projects under progress
• Installation of reducing and sizing block for capacity and quality enhancement of bar and rod Mill. Expected to be commissioned in Mar 13.
• Automatic inspection for blooming mill products to cater to reputed customers. Expected to be commissioned in Feb 13.
Vasind Works
(a) Projects commissioned during FY 2011-12
• Natural Gas pipeline project (completed during Feb, 2012)
Gas pipe line of 7.6 km was laid down along the National Highway, replacing use of natural gas in lieu of LPG/Furnace oil.
(b) Projects under progress
• Colour Coating Line Project
Two colour coating line with an aggregate capacity of 0.225 mtpa are in progress and to be commissioned in FY 2012-13.
Tarapur Works
Upcoming Projects in 2012-13
• Upgradation of Cold Rolling Mill (TM1) to enhance production capacity from 0.05 mtpa to 0.225 mtpa.
• New Galvanizing Line (CSD5) with dual products of Galvanised and Galvalume Steel with an annual capacity of 0.2 mtpa.
• Upgradation of Cold Rolling Mill (TM2) to enhance production capacity from 0.06 mtpa to 0.1 mtpa.
• Upgradation of Colour Coating Lines (CCL-1 & CCL-2) to enhance production capacity from 0.180 mtpa to 0.276 mtpa.
6. SUBSIDIARY, JOINT VENTURE AND ASSOCIATE COMPANIES
In the context of globalising Indian economy and the increase in the number of subsidiaries, the Ministry of Corporate Affairs, vide its General Circular No. 2/2011 dated 08.02.2011 has granted General Exemption to all companies from attaching the Balance Sheet, Profi t and Loss Account and other documents of the subsidiary companies to the Balance Sheet of the Company subject to fulfi lment of certain standard conditions generally prescribed while giving specifi c approvals. The Company will make available these documents/details upon request by any member or investor of the Company/subsidiary companies. Further, the Annual Accounts of the subsidiary companies will be kept open for inspection by any investor at the registered offi ce of the Company and also that of the subsidiary companies.
Details of major Subsidiaries, Joint Venture and Associate Companies are given below:
A. Indian subsidiaries
1. JSW Bengal Steel Limited (JSW Bengal), its Subsidiaries Barbil Benefi ciation Company Limited, JSW Natural Resources India Limited and JSW Energy (Bengal) Limited (JSWEBL)
JSW Bengal Steel Limited achieved good progress in connection with setting up an integrated steel plant in the State of West Bengal. While 33 Kms boundary wall work was completed over 4300 acres of land at Salboni, JSWBSL commenced construction of residential complex named “Ankur” for employees to be accommodated during plant construction and operation. All major survey work has already been completed at the site. Power as well as water for construction are available at the site. A reputed Canadian and Chinese joint venture company, M/s. HATCH-CISDI International is preparing basic design and plant layout for a 10 mtpa integrated steel plant along with a

33
Steel Limited
1,620 mw power plant at Salboni. The Company already received 75 mgd water allocation letter for sourcing water from Rupnarayana river and the route for laying a water pipeline has also been fi nalised. The work of ROW for the proposed 68 Kms water pipeline is in progress.
The drilling as well as three dimensional High Resolution Seismic Survey (3 DHRSS) have been successfully completed at Kulti-Sitarampur coal block by JSW Natural Resources India Ltd. In line with the MoEF clearance that has already been received for the steel plant, it is proposed to implement the project in phases, subject to satisfactory tie up of iron ore, to enable fi nancial closure and approval of MoEF for mining activities.
Target date for start of fi rst phase of commercial production in Bengal projects is FY 2015-16.
2. JSW Jharkhand Steel Limited
JSW Jharkhand Steel Limited was incorporated to set up a steel plant in the State of Jharkhand. The Company is pursuing to obtain various approvals/clearances for raw material linkages, land acquisition, environmental clearances, among others, for this project.
3. JSW Steel Processing Centres Limited (JSWSPCL)
JSW Steel Processing Centres Limited (JSWSPCL) is a 100% subsidiary of the Company. JSWSPCL was set up as a Steel Service Centre comprising HR/CR Slitter and cut to length facility with an annual slitting capacity of 5,00,000 tonnes. The Company processed 4,99,218 tonnes of steel during the FY 2011-12, as compared to 4,97,112 tonnes in the previous year.
During the previous year, JSWSPCL purchased three Slitting Lines and one Multi Strand Blanking lines from its fellow subsidiary JSW Steel Service Centre (UK) Limited. Out of which, the Company is in the process of commissioning one slitting line and identifying a suitable location to commission the remaining equipment.
4. Amba River Coke Limited (ARCL)
The Company has acquired 100% holding in ARCL to set up a 1 mtpa Coke oven to be supplied to JSW Ispat Steel Ltd. (JISL) under long term take or pay contract with return on equity of 25% to the Company. These projects are expected to be commissioned by March 2014.
It is also proposed to set up a 4 mtpa pellet plant in ARCL at an estimated project cost of
` 835 crores on similar terms as that of coke oven project. These projects will be taken up for implementation on receipt of requisite clearance and commissioned in 30 months.
B. Overseas Subsidiaries
1. JSW Steel (Netherlands) B.V. (JSW Netherlands)
JSW Netherlands is a holding Company for USA, UK, Chile and Kanya based subsidiaries. It also has 49% equity holding of Georgia-based Geo Steel LLC, incorporated under the laws of Georgia. The Company also invested in the plate and pipe mill in the US, coal mining assets in the US, iron ore mining concessions in Chile and fi xed assets at UK through the following step down subsidiaries.
(a) JSW Steel Holding (USA) Inc. and its subsidiaries viz. JSW Steel (USA) Inc – Plate and Pipe Mill Operation and Periama Holdings LLC and its subsidiaries – West Virginia, USA based Coal Mining Operation.
Plate and Pipe Mill operation
During FY 2011-12, the Plate and Pipe Mill performance in the US has improved signifi cantly as compared to that during previous year, mainly due to improvement in economic scenario, resulting in better capacity utilisation. In 2011-12, the 3,31,763 net tones of plates and 66,168 net tones of pipes were produced with capacity utilisation of 33% and 12% respectively.
The Subsidiary Company undertook various debottlenecking and corrective measures in the production process, due to which it is expected that US operations would show improved performance.
Coal mining operation
JSW Steel Holding (USA) Inc. has 100% equity interest in coal mining concessions and barge load out facility in USA.
While some of the mines are currently operational, statutory clearance/permits for other mines are in advanced stage of approval.
It is expected to produce around 0.50 million tonnes of coal in the next fi nancial year subject to approvals.
(b) JSW Panama Holdings Corporation and Chilean subsidiaries namely Inversiones Eurosh Limitada (IEL), Santa Fe Mining (SFM) and Santa Fe Puerto S.A (SFP)
During FY 2011-12, contract mining activity with a capacity of 1mtpa through dry process route

Eighteenth Annual Report 2011-12
34
was undertaken. The Company shipped twelve shipments of iron ore concentrate aggregating to 0.6 million tonnes. It is expected to produce around 1 million tonnes of iron ore concentrate in the next fi nancial year.
Work on establishing a wet benefi ciation plant is currently being pursued and necessary statutory and environmental approvals are awaited.
SFP, a subsidiary of SFM received maritime concession in April 2011 to develop a cape size port in North Caldera. The environmental and other regulatory approvals have been applied for and are being pursued with Authorities Concerned.
(c) JSW Steel East Africa Limited (JSWSEAL)
JSWSEAL was formed with the object of exploring mineral resources (manganese, iron ore and coal) and developing them to export in value-added form.
JSW Steel Netherlands BV holds 99% stake in JSWSEAL and JSW Steel (UK) Ltd holds the balance stake of 1%.
JSWSEAL, signed MOU on January 11, 2012 for exploration of manganese ore with Government of Kenya. The agreement gives it the right to explore manganese ore in the Coastal Province of Kenya (around 22,000 sq. km.).
2. JSW Natural Resources Limited (JSWNRL) and its subsidiaries JSW Natural Resources Mozambique Lda (JSWNRML), JSW ADMS Carvao Lda
JSW Natural Resources Limited was incorporated in Mauritius to acquire coal assets/other assets relating to the steel business.
JSW Natural Resources Limited formed a wholly-owned subsidiary – JSW Natural Resources Mozambique Lda in Mozambique to acquire coal assets and engage in prospecting and exploring coal, iron ore and manganese.
JSW Natural Resources Mozambique Lda incorporated JSW ADMS Carvão Lda on October 8, 2010 wherein 85% stake is owned by JSWNRML. It has a mining licence in Zumbo District Tete Province. The Company initiated drilling exploration activities in this area.
C. Joint Venture Companies
1. Geo Steel LLC
Georgia-based Joint Venture Geo Steel LLC, in which your Company holds 49% equity through
JSW Steel (Netherlands) B.V. set up a steel rolling mill in Georgia with a production capacity of 175,000 tonnes in Georgia. Geo Steel produced 113453 tonnes of rebars and 117818 tonnes of billets during 2011-12. The net turnover was USD 79.43 million.
2. Rohne Coal Company Private Limited
Your Company holds 49% equity in Rohne Coal Company Pvt. Ltd. (JSW Group holds 69.01%, including that of the Company), which is a joint venture with three other partners (two partners from outside the Group). Forest clearance and mining lease proposal are being pursued with government authorities.
3. MJSJ Coal Limited
In terms of the Joint Venture Agreement to develop Utkal – A Gopal Prasad (West) thermal coal block in Odisha, your Company agreed to participate in the 11% equity of MJSJ Coal Limited, Odisha along with four other partners. The Government of India has allotted 1,520 acres of Gopal Prasad west area to MJSJ Coal Limited. Mahanadi Coalfi elds Ltd, a public sector company holds 60% of the equity.
4. Gourangdih Coal Limited
Gourangdih Coal Ltd (GCL) is a 50:50 Joint venture between JSW Steel Limited and Himachal EMTA Power Corporation Ltd (HEPL) incorporated to develop and mine coal from Gourangdih, ABC thermal coal block in West Bengal. It is currently working on pre-mining activities. A mining plan was submitted to government authorities and is under consideration.
5. Toshiba JSW Turbine and Generator Private Limited
Toshiba JSW Turbine & Generator Pvt. Ltd is a Joint Venture with a shareholding of 75% by Toshiba Corporation Ltd., Japan, 21.33% by JSW Energy Ltd. and 3.67% by the Company, to design, manufacture, market and maintain services of mid to large-size supercritical steam turbines and generators of size 500 MW to 1000 MW.
The main plan was inaugurated for operation in February 2012.
6. Vijayanagar Minerals Private Limited (VMPL)
During 2011-12, VMPL supplied 0.66 million tonnes of iron ore from Thimmappanagudi Iron Ore Mines (TIOM), vis-à-vis 2.2 million tonnes in the last FY 2010-11.

35
Steel Limited
As per the Honourable Supreme Court’s directive to stop all iron ore mining operations in Karnataka, mining activity of TIOM mines operated by VMPL has been stopped since July 29, 2011. VMPL’s operations and fi nancial results were affected due to the above reasons.
7. JSW Severfi eld Structures Limited and its subsidiary JSW Structural Metal Decking Limited
JSW Severfi eld Structures Ltd (JSSL) set up a Greenfi eld project to design, fabricate and erect structural steelwork and ancillaries, including decking for construction projects with a total plant capacity of 35,000 tpa at Bellary in Karnataka. The Company produced a total of 20,384 tonnes during the year. The Company’s order book stood at ` 178 crores (33,916 tonnes) as on March 31, 2012.
JSW Structural Metal Decking Limited (JSWSMD), a subsidiary company of JSSL is engaged in the business of designing, roll forming and installation of structural metal decking and ancillaries, including shear connectors, for construction projects with a total plant capacity of 10,000 tpa at Bellary in Karnataka. It started its commercial production in October 2010. The Company has orders of around 1,33,914 square meters.
8. JSW MI Steel Service Center Private Limited (MISI JV)
JSW Steel and Marubeni-Itochu Steel signed a Joint Venture Agreement on September 23, 2011 to set up Steel Service Centers in India.
The JV Company, JSW MI Steel Service Center Pvt Ltd, proposes to set-up its fi rst Steel Service Center in North India (NCR) with an initial installed capacity of 180,000 tpa (Phase-I) which will subsequently be enhanced to 500,000 tpa. The estimated project cost for Phase-I is pegged at ` 122 crores and the estimated completion time is 12 months from date of completion of land acquisition.
The service centre will be equiped to process fl at products such as hot rolled and coated products with a view to offer just in time solutions to the automative, white goods, construction and other value added segments.
D. Associate Companies
1. Jindal Praxair Oxygen Company Private Limited (JPOCPL)
The oxygen plants of JPOCPL have been working satisfactorily primarily to meet the requirements
of steel plant operations at Vijayanagar Works. During 2011-12, the combined production of the oxygen plant module #1 and module # 2 of JPOCPL was: gaseous oxygen – 836 million Nm3; gaseous nitrogen – 275 million Nm3; Liquid oxygen – 25 million Nm3; Liquid nitrogen – 23 million Nm3 and Argon – 10 million Nm3.
2. JSW Ispat Steel Limited (JISL)
As approved by its members, the name of the Company was changed from Ispat Industries Limited to ‘JSW Ispat Steel Limited’ w.e.f. 28.06.2011.
During the year under review, the Company produced 2.39 million tonnes of HR coils and capacity utilisation achieved was 73%. The sales volume was 2.75 million tonnes with EBITDA of ` 1,126 crores. The Net Loss for the corresponding periods after considering Exceptional items was ` 1,930 crores.
The Board of Directors has taken note of the matters to which the Auditors of JISL has drawn attention in their report, regarding overdue trade receivables amounting to ` 255.61 crores. The Board of Directors have also taken note that the management of JISL is confi dent of recovery and relying on this, no provisioning has been considered necessary by the Board in respect of this item.
7. CREDIT RATING
The credit rating for the long-term debt/ facilities / NCDs of your Company continues to be “AA” by credit rating agency Credit Analysis & Research Ltd. (CARE). The short-term debt/facilities continue to be rated at the highest level of “A1+” by CARE.
The long-term rating was placed under “credit watch” in view of the ban imposed on iron ore mining in Karnataka by the Honourable Supreme Court.
The rating continues to derive strength from your Company’s signifi cant presence in the steel sector, management capability and well-diversifi ed mix of value-added products.
“AA” rating by CARE indicates a high safety for timely servicing of debt obligations and lowest credit risk.
“A1+” rating is the highest rating in the category and indicates a strong capacity for timely payment of short-term debt obligations and lowest credit risk.

Eighteenth Annual Report 2011-12
36
8. FIXED DEPOSITS
Your Company has not accepted any fi xed deposits from the public and is therefore not required to furnish information in respect of outstanding deposits under Non-Banking Non-Financial Companies (Reserve Bank) Directions, 1966 and Companies (Acceptance of Deposits) Rules, 1975.
9. SHARE CAPITAL
There was no change in the share capital of the Company during the fi nancial year under review.
At the end of 2011-12, your Company’s paid up equity share capital remained at ` 2,23,11,72,000 (comprising of 22,31,17,200 equity shares of ` 10 each).
10. WARRANTS ISSUED ON A PREFERENTIAL BASIS
Pursuant to the decisions taken in the Board meeting held on May 03, 2010 and the Extra Ordinary General Meeting held on June 02, 2010, the Share Allotment Committee of Directors of the Company, in its meeting held on June 16, 2010, had allotted 1,75,00,000 (One crore seventy fi ve lakhs) Warrants on a preferential basis, to a Promoter Group Entity.
As per the terms of issue of these warrants, upon payment of Exercise Price of `1,210 per warrant, as reduced by the 25% upfront money paid at the time of allotment of warrants, the warrant holder was entitled to apply for and obtain allotment of one equity share of `10 each against each warrant held. The last date for the exercise of the conversion right of the Warrant holder was December 15, 2011 (within 18 months from the date of their allotment).
As the Warrant Holder (Promoter Group Entity) did not exercise its option to convert the aforesaid 1,75,00,000 warrants allotted to it into equity shares of the Company, the amount of `529,37,50,000 being the initial 25% of the total consideration of `2117,50,00,000 received by the Company has been forfeited.
11. TECHNICAL COLLABORATION WITH JFE STEEL CORPORATION, JAPAN
Pursuant to the execution of several defi nitive technical collaboration agreements on July 27, 2010 between the Company and JFE Steel Corporation (“JFE”), one of the largest
integrated steel manufacturers in Japan, for the supply of certain technology and the provision of certain technical assistance to the Company, including foreign collaboration agreements, technical assistance agreement for automotive steel and general technical assistance agreement for plant performance improvement, JFE continues to be a foreign collaborator of the Company.
The collaboration helps the Company to achieve operational excellence and also move up in the value chain with access to cutting-edge technology.
The Company plans to set up an electrical steel manufacturing facility of 0.6 mtpa capacity at its integrated steel works at Vijayanagar. Initially, this facility will produce 0.4-0.5 mtpa of Cold Rolled Non-grain Oriented (CRNO) grade electrical steel.
The Company will also produce Cold Rolled Grain Oriented (CRGO) grade in the future. Implemented in a phased manner, your Company envisages becoming the largest electrical steel producer in the country. This will be taken up on fi nalisation of terms of technical collaboration arrangement.
12. IRON ORE STATUS
In 2011, the Honourable Supreme Court banned iron ore mining in Bellary, Chitradurga and Tumkur districts of Karnataka citing environmental violations, and asked the Central Empowered Committee (CEC) to carry out an environmental impact assessment.
Following the ban, the Honourable Supreme Court of India on 29th July 2011, based on the representation made by the Steel Industry in Karnataka, gave the following relief:
i. By permitting the National Mineral Development Corporation (NMDC) to mine 1 million tonne Iron Ore per month to be made available to the Steel Companies through E.auction.
ii. By permitting to E.auction 1.5 million tonnes of Iron Ore per month from the total stock pile of 25 million tonnes lying with various mining companies.
Eventhough the E.auction commenced on 14th September 2011, there were several procedural,

37
Steel Limited
logistics and pricing constraints due to which the Steel Companies could not get supply of Iron Ore in adequate quantities.
The Honourable Supreme court, Central Empowered Committee (CEC), Monitoring Committee and State Government took several steps to smoothen the process of E-Auction and quick dispatch of auction material.
After taking into account the Iron Ore auctioned and yet to be received, balance Iron Ore to be auctioned from stock piles & supplies from NMDC, Vijayanagar unit’s requirement can be met for 2 to 3 months. It is therefore essential that the Hon’ble Supreme Court lifts the ban on Iron Ore Mines in the Karnataka region to ensure additional supplies of Iron Ore for continuation of steel production in the region.
Subsequently, in April 2012 on recommendation of CEC, the Supreme Court allowed the resumption of mining in Category ‘A’ mines subject to certain conditions. It is expected that some of the category ‘A’ mines may resume mining operations in the month of Jul / Aug 2012.
It is expected that category ‘B’ mines will also be permitted to resume mining in line with CEC recommendations during the course of current fi nancial year.
The CEC has further recommended cancellation of Category ‘C’ mines and auction them based on a scheme to be presented by State Government and to be approved by Apex Court. The Company will have an opportunity to participate in the bidding to get some of these mines.
13. SEARCH & SEIZURE OPERATIONS BY INCOME TAX AUTHORITIES
Further to the Search & Seizure operations by the Income-tax Authorities in March 2011, the Department issued Notice u/s 153A (a) of the Income Tax Act, 1961 dated October 24, 2011 for submission of Income Tax Returns u/s 153A (a) from Assessment Year 2005-06 to 2010-11 in pursuance of the search conducted u/s 132 of the Income Tax Act, 1961. Accordingly, the Company fi led Income Tax Returns for the above assessment years and the assessments are in progress.
14. FOREIGN CURRENCY CONVERTIBLE BONDS (FCCBs)
During FY 2007-2008, your Company issued 3,250 Zero Coupon Foreign Currency Convertible Bonds (FCCBs) of US$ 100,000 each due 2012 (ISIN XS0302937031), aggregating to US$ 325 million to international investors to part fi nance the capital expenditure programme of the Company. Each bond is convertible into equity shares of the face value of `10 each of the Company at a conversion price of ` 953.40 per share, at any time on or after August 7, 2007 until the close of business on June 21, 2012, unless previously redeemed, converted or purchased and cancelled. The bonds, which are not redeemed, converted or purchased and cancelled, are redeemable on June 28, 2012 at an amount equal to the principal amount of the bonds multiplied by 142.801 per cent.
The principal amount of FCCBs outstanding after conversion of 8 bonds and repurchase and cancellation of 15.36% of the remaining outstanding FCCBs aggregating to US$ 49.80 million, is US$ 274.40 million.
15. EXTERNAL COMMERCIAL BORROWING OF US$ 275 MILLION (INCLUDING A GREEN SHOE OPTION OF US$75 MILLION) WITH A CONVERTIBILITY OPTION
The Finance Committee, a duly authorised sub-committee of the Board of Directors of the Company, has at its meeting held on February 20, 2012, approved to avail an external commercial borrowing (ECB) of US $ 275 million which includes a green shoe option of US $ 75 million. The Company has entered into an indicative, non-binding term sheet with an arranger for the ECB. The term of the ECB is 5 years plus 1 day from the date of drawdown.
Financial closure is subject to each party receiving all necessary approvals and compliance by the Company with certain conditions, including (without limitation) the execution of satisfactory documentation.
The ECB will be utilised for one or more of the following: (a) Buyback of outstanding Foreign Currency Convertible Bonds, (b) Redemption of outstanding Foreign Currency Convertible Bonds and (c) Capital expenditure.
The lenders of the ECB facility shall have an option to convert in whole or in part the

Eighteenth Annual Report 2011-12
38
outstanding ECB into fully paid equity shares of face value of ` 10 each, with full voting rights (“Equity Shares”) or GDRs with underlying Equity Shares.
16. DIRECTORS
Mr. Sajjan Jindal, Dr. Vinod Nowal and Dr. S K Gupta, Directors, retire by rotation at the forthcoming Annual General Meeting and being eligible, offer themselves for re-appointment.
Your Directors have in their meeting held on January 20, 2012 reappointed Dr. Vinod Nowal as a Whole time Director of your Company designated as ‘Director & CEO’ for a period of fi ve years with effect from April 30, 2012, subject to your approval. Your Directors have also in their meeting held on May 14, 2012, reappointed Mr. Sajjan Jindal as the Managing Director the Company for a period of fi ve years with effect from July 7, 2012, subject to your approval.
The proposals regarding the re-appointment of the aforesaid Whole Time Director and Managing Director are placed for your approval.
Other changes in the Board of Directors of your Company during the year under review are as follows:
Smt. Savitri Devi Jindal has, on account of her pre-occupation, stepped down from the Board with effect from October 21, 2011 as Chairperson and as Director.
Subsequent to her cessation as Chairperson and Director, she continues to be associated with the Company as Chairperson Emeritus with effect from October 21, 2011.
Mr. Sajjan Jindal was appointed by the Board as its Chairman with effect from October 21, 2011.
JFE Steel Corporation nominated Mr. Yasushi Kurokawa as its nominee on the Board of the Company, in place of Mr. Shigeru Ogura with effect from May 16, 2011.
Karnataka State Industrial Infrastructure and Development Corporation Limited (KSIIDC) nominated Mr. Raj Kumar Khatri, IAS as its nominee on the Board of your Company in place of Mr. M Maheshwar Rao, IAS with effect from June 17, 2011. Subsequently, KSIIDC nominated Dr. Rajneesh Goel, IAS as its nominee on the Board of your Company in place of Mr. Raj
Kumar Khatri, IAS with effect from November 17, 2011.
Your Directors place on record their deep appreciation of the valuable services rendered by Smt. Savitri Devi Jindal, Mr. Shigeru Ogura, Mr. M Maheshwar Rao and Mr. Raj Kumar Khatri during their tenure as Directors of the Company.
17. AUDITORS AND AUDITOR’S REPORT
M/s. Deloitte Haskins & Sells, Chartered Accountants, auditors of the Company, retire at the conclusion of the ensuing Annual General Meeting and have expressed their willingness to act as auditors of the Company, if appointed, and have further confi rmed that the said appointment would be in conformity with the provisions of Section 224 (1B) of the Act.
Explanation to Auditor’s Comment:
Auditors have in their report, drawn attention to note no. 26(4) of accounts for the year, relating to the Company’s assessment that no provision against the carrying amounts of its long term strategic investment and loans extended to its subsidiary, JSW Steel (USA) Inc. of Rs. 1,948.41 crores is presently necessary.
In the opinion of the Board of Directors, considering an independent valuation of a signifi cant portion of the underlying tangible assets, review and assessment of business plans and expected future cash fl ows of JSW Steel (USA) Inc., the decline in carrying amounts of investment and loans is temporary and no provision is required.
18. PARTICULARS REGARDING CONSERVATION OF ENERGY AND TECHNOLOGY ABSORPTION
Information in accordance with the provisions of Section 217(1)(e) of the Companies Act, 1956 read with Companies (Disclosure of Particulars in the Report of the Board of Directors) Rules, 1988 regarding conservation of energy, technology absorption and foreign exchange earnings and outgo is given in the statement annexed (Annexure “A”) hereto forming part of the report.
19. ENVIRONMENTAL INITIATIVES
The Company has undertaken various measures to address safety and environmental issues at its plant locations:

39
Steel Limited
Vijayanagar
• Installed a fume exhaust system at the fi nishing stand in HSM 1 to capture dust generated.
• Installed a waste heat recovery mechanism in the sinter cooling areas of sinter plants 1, 2 and 3, to generate steam for use in the blast furnace and other shop-fl oor processes.
• Commissioned a 0.2 mtpa mill-scale briquetting facility, which will be used as a coolant in steelmaking.
Salem
• Reduced raw water consumption for coke quenching to 0.55 m3/tonnes from 0.64 m3/tonnes by increasing recycled water usage and modifying the quenching technique.
• Increased EOF/steelmaking slag recycling to 22 kg/tonne of steel from 12 kg/tonnes of steel at salem.
• Converted EOF steelmaking slag to useful products (15,000 tonnes/month) namely road making, cement making fl ux, sinter feed and recovery of metal values.
• Established 100% disposal of fl y ash from CPP to reduce environmental concerns.
• Initiated co-processing of external wastes in the sinter plant sourced from Kerala Metals & Minerals Ltd after receiving CPCB approval on the in-house designed innovative process to utilise hazardous waste.
Vasind & Tarapur
• Celebrated World Environment Day on June 5, 2011 and 360 saplings were planted in garden areas of the Vasind plant and colony.
• Bio-digester plant of capacity 1 T per day was commissioned in colony no. 2 and 30 households were supplied with bio-gas. The organic waste from households is treated through this plant.
20. PARTICULARS OF EMPLOYEES
The information required under Section 217(2A) of the Companies Act, 1956 read with the Companies (Particulars of Employees) Rules, 1975 is set out in the Annexure to the Directors Report. Having regard to the provisions of section 219(1)(b)(iv) of the said Act, the Annual Report excluding the aforesaid information is being sent to all the members of the Company
and others entitled thereto. Any member interested in obtaining such particulars may write to the Company Secretary for a copy.
21. CERTIFICATION & RECOGNITION
Your Directors have pleasure in informing you that all the Company’s Vijayanagar townships viz. Vidyanagar, Vijay Vittal Nagar and Shankargudda Colony townships have been accredited for quality, environment systems, safety and health systems in operations and maintenance of residential townships. The townships received the following certifi cations:
1) ISO 9001 – 2008
2) ISO 1401 2004+cor.1:2008
3) BSOHSAS 18001 - 2007
22. AWARDS AND ACCOLADES
Your Company and its employees received the following awards during the year:
1. EEPC National Award for Export Excellence awarded by EEPC Kolkata: Gold Trophy for top Exporter for the year 2009-10, received on November 03, 2011.
2. EEPC National Award for Export Excellence awarded by EEPC Kolkata: Star Performer for the year 2010-11 received on March 24, 2012.
3. FKCCI Export Excellence Awards awarded by FKCCI Karnataka: Best District Exporter Award for the year 2010-11, awarded on June 15, 2011.
4. Visvesvaraya Industrial Trade Centre State Award awarded by VITC Karnataka for the year 2009-10 & 2010-11 Gold Trophy for Best Exporter, received on March 23, 2012.
5. SPJIMR Marketing Impact Awards (SMIA) 2012 awarded by SP Jain Institute of Management and Research: Second Prize for Best Practices & Current Thinking in Marketing, awarded on January 14, 2012.
6. Dun & Bradstreet Information Services: Best Company in Steel sector based on Total Income, Net Profi t, Net Worth, Export, Market Capitalisation, Net Profi t Margin, Return on Net Worth, received on April 26, 2011.
7. Ashok Leyland: Outstanding Performance Award for the year 2010-11 received on April 20, 2011.
8. Whirlpool: Certifi cate of Appreciation for the year 2010-11, received in November 2011.

Eighteenth Annual Report 2011-12
40
9. Brakes India: Certifi cate of Performance for the year 2010-11 received on November 11, 2011.
10. Hyundai: Appreciation Award for the year 2011-12 received on March 22, 2012.
11. National Sustainability Award awarded by Indian Institute of Metals: 2nd prize in Integrated Steel Plants category for the year 2010-11 received on November 14, 2011.
12. CII-EXIM award 2011 awarded by Confederation of Indian Industries (CII): Commendation certifi cate for signifi cant achievement, received on December 01, 2011.
13. International Convention on Quality Circle Chapters (ICQCC): Distinguished Category Award to “Genius Quality Circle” from SMS-1 received on September 14, 2011.
14. Spot Light Awards (Global Communication Competition) awarded by League of American Communication Professionals for its 2010-11 Annual Report- Bronze Award for excellence within its Competition Class.
15. EXIM Achievement Awards in the Category of Top 3 Exporter awarded by the Tamil Chamber of Commerce.
Individual and Team Recognitions:
16. 1st Prize to Ms. Anita Dunga for Oral Presentation in ‘Iron & Steel’ Category for ‘Study on Ladle Nozzle Choking during Liquid Steel Pouring from Ladle to Tundish at Continuous Casting’ at 65th Annual Technical Meeting, on November 16, 2011, at Hyderabad.
17. 3rd Prize to Mr. Pranav Kumar Tripathi for Poster Presentation in ‘Iron & Steel’ Category for ‘Optimisation of Submerged Entry Nozzle Design through ‘Mathematical Modelling’ at the 65th Annual Technical Meeting, on November 16, 2011 at Hyderabad.
23. CORPORATE GOVERNANCE
Your Company has complied with the requirements of Clause 49 of the Listing Agreement regarding Corporate Governance. A report on the Corporate Governance practices, the Auditors’ Certifi cate on compliance of mandatory requirements thereof and Management Discussion and Analysis are given as annexure to this report.
24. DIRECTORS’ RESPONSIBILITY STATEMENT
Pursuant to the requirements under Section 217 (2AA) of the Companies Act, 1956, your Directors hereby state and confi rm that:
(i) in the preparation of the annual accounts, the applicable accounting standards have been followed along with proper explanation relating to material departures;
(ii) they have selected such accounting policies and applied them consistently and made judgements and estimates that are reasonable and prudent so as to give a true and fair view of the state of affairs of the Company at the end of the fi nancial year and of the profi t or loss of the Company for that period;
(iii) they have taken proper and suffi cient care for the maintenance of adequate accounting records in accordance with the provisions of this Act for safeguarding the assets of the Company and for preventing and detecting fraud and other irregularities;
(iv) they have prepared the annual accounts on a going concern basis.
25. APPRECIATION
Your Directors take this opportunity to express their appreciation for the cooperation and assistance received from the Government of India, Republic of Chile, Central Government of Kenya, Mauritius, Mozambique, USA and UK; the State Government of Karnataka, Maharashtra, Tamil Nadu, West Bengal and Jharkhand; the fi nancial institutions, banks as well as the shareholders and debenture holders during the year under review. The Directors also wish to place on record their appreciation of the devoted and dedicated services rendered by all employees of the Company.
For and on behalf of the Board of Directors
Sajjan JindalDate : May 14, 2012 Chairman

41
Steel Limited
ANNEXURE ‘A’ TO DIRECTORS’ REPORTPARTICULARS REQUIRED UNDER THE COMPANIES (DISCLOSURE OF PARTICULARS IN THE REPORT OF BOARD OF
DIRECTORS) RULES, 1988
A. CONSERVATION OF ENERGYJSW has always been a front runner in continually improving its operational performance in all areas like improving production, yield, plant utilisation while reducing fuel, power, stores consumption.ENERGY CONSERVATION INITIATIVES AT VIJAYANAGAR• Achieved Specifi c energy consumption per ton of crude steel
of 5.97 Gcal/TCS for the year 2011-12.• Enhanced the power generation from 374 MW in 2010-11 to
542 MW in 2011-12.• LPG consumption dropped substantially by 3.05 Tons per Day
inspite of increase in production of crude steel.• During the year operations of the Energy Management
Centre (the heart of energy management – generation and distribution – for the entire plant) was stabilised with extensive classroom and hands-on training upto nine members at a time, to help them manage the equipment more effi ciently.
• Completed Installation of more than 170 meters across all gas-generating and consuming areas for real- time monitoring of the energy balance within the plant.
• Completed Installation of 13 CV analysers, which will provide real-time information to the concerned departments on the calorifi c value of gas and its fl ow – allowing them to make necessary adjustments (if necessary) to control energy consumption.
• Created a reliability group to undertake an in-depth study on equipment reliability, suggest action plans and implement the same; the training was provided by a globally reputed organisation in the fi eld – this predictive maintenance programme is expected to ensure maximum availability and optimum operation of the energy management infrastructure.
• Installed a heat tube in the waste heat recovery system of BF 3 and BF 4to collect fl ue gases which are recycled to heat the combustion air and BF gas being fi red into the furnaces.
• Completed Installation of waste heat recovery system for sinter cooler area at all sinter plants; the heat captured will be utilised to generate steam for various shop-fl oor processes.
• Installed oxy-fuel burners for stoves in BF 2 – this will replace injection of air with pure oxygen into the furnace which will help in reducion in fuel consumption rate.
• Successfully implemented ‘islanding scheme’ to eliminate plant shutdowns (the system isolates the plant from the state electricity grid in the occurrence of any disturbance or disruption, provides energy to the plant from captive power plants).
• Entered into a Collaboration with Siemens to install ‘CLIMS’, an intelligent real-time load management solution which balances power generation with consumption, eliminating the need for islanding due to overload.
• Entered into a Collaboration with Yantra Harvest Private Limited, a leading energy-saving solutions provider to conserve energy through various innovative measures.
ENERGY CONSERVATION INITIATIVES AT SALEM• Improvement in PCI (pulverized coal injection) from 100 kg/
ton of hot metal to 125 kg /ton in 2011-12.
• Reduction in specifi c energy consumption of crude steel.• Improvement in waste heat recovery in coke ovens for steam
generation from 96 tonnes/hr to 118 tonnes/hr.• Improvement in the utilization of blast furnace gas in
blooming mill reheating furnace.• Development of suitable control techniques to end oil support
in CPP1 boiler.• Control of excess air in BF gas boiler in CPP2 resulting in a
savings to the tune of ` 25 lakhs per annum.• Recovery of waste coke fi nes from settling pond and its
utilization in sinter plant.• Reduction in energy consumption per ton of steel in SMS as a
result of yield improvement.ENERGY CONSERVATION INITIATIVE AT VASIND & TARAPUR• Conversion of Radiant tube furnace fi ring to Pulse Firing
system of both Galvanising lines, resulting in fuel saving and better heating performance.
• To improve furnace health condition -- dew point, radiant tube fl anges welded instead of bolting in RTF section of Galvanizing lines (elimination of leakages).
• Installation of doctored scrappers for removing adhere zinc on briddle rolls, this resulted in reduction in dent defect, thus increasing yield (as well as safer practice).
• Use of Natural Gas in place of other fuel like FO, LDO and LPG: Furnaces of CGL1, CGL2, HRM, ARP & other utilities like Alloy furnace, Hot air drier have been converted to use Natural Gas (R-LNG) in the month of Feb 2012. NG is clean gas, free from CO2 & moisture, better for environment & process.
• Furnace oil fi red steam boiler for heating in Pickling Lines being used sparingly as steam demand is met by supplying dry saturated steam of Captive Power Plant (CPP). This initiative resulted in reduction of furnace oil consumption.
• VFD drives installed at water pumping system and optimised the operation of air compressor of CPP. This led to a reduction in CPP auxiliary power consumption.
• VFD drives installed at various locations of steel plant in Cold rolling, Galvanizing & Color Coating Lines.
B. TECHNOLOGY ABSORPTION, ADOPTION AND INNOVATION Efforts made in Technology Absorption are given in Form ‘B’.C. FOREIGN EXCHANGE EARNINGS AND OUTGOa) Activities relating to exports, initiatives taken to increase
exports, development of new export markets for products and services and export plans:
Exports haves always been a strategic move of the Company with a clear focus on value-addition, customisation and expanded geographical reach. Inspite of demand contraction in international markets during fi scal 2011-12, the Company exported 1.434 million tonnes.
b) Total foreign exchange used and earned` in crores
FY 2011-12 FY 2010-11i) Foreign Exchange earned 5,496.42 3,412.68ii) Foreign Exchange used 14,376.58 11,095.74

Eighteenth Annual Report 2011-12
42
FORM ‘A’
FORM FOR DISCLOSURE OF PARTICULARS WITH RESPECT TO CONSERVATION OF ENERGY
A POWER & FUEL CONSUMPTION Particulars 2011-12 2010-111. Electricity a) Purchased Unit (kwh) (in Lacs) 13,118.48 9,092.11 Total Amount (` in crores) 631.74 355.22 Rate / Unit (`) 4.82 3.91 b) Own Generation i) Through Captive power
plant Unit (kwh) (in Lacs) 44,884.76 30,188.08 Total Amount (` in crores) 1,708.39 976.96 Cost / Unit (`) 3.81 3.24 ii) Through diesel generator Unit (kwh) (in lacs) 30.14 259.61 Unit per ltr of diesel 0.09 0.98 Total Amount (` in crores) 3.04 16.35 Cost / Unit (`) 10.09 6.30 iii) Through Top Recovery
Turbine Units (kwh) (in lacs) 1,285.51 735.86 Total Amount (` in crores) 3.55 2.63 Cost / Unit (`) 0.28 0.362. Coal + Coke
Quantity (tonnes)86,25,093 t
of Coal+
1,05,384 t of Coke
75,54,477 t of Coal
+3,57,169 t
of Coke Total Amount (` in crores) 11,367.50 8,376.45 Coal Rate (`/t) 12,997 10,114 Coke Rate (`/t) 14,969 20,6063. Furnace Oil Quantity (K.Ltrs) 5,551 7,508 Total Amount (` in crores) 20.47 20.63 Average Rate (`/Ltrs) 36.88 27.48 4. LPG Quantity (tonnes) 21,704 24,077 Total Amount (` in crores) 106.76 98.61 Average Rate (`/t) 49,190 40,956 5. RLNG
Quantity (MMBTU) 57,409 -Total Amount (` in crores) 4.79 -Average Rate (`/MMBTU) 834 -
B CONSUMPTION PER UNIT OF PRODUCTION
Particulars 2011-12 2010-111. Crude Steel Electricity (kwh /t) 554 495 LPG (Kg /t) 0.7 0.82. Hot Rolled Coils/Steel plates/
sheets :
Electricity (kwh /t) 103 1053. Rolled Products – Long Electricity (kwh /t) 133 1534. Galvanised Coils/Sheets :
Electricity (kwh /t) 195 195 LPG (Kg /t) 16 17
FORM ‘B’
FORM OF DISCLOSURE OF PARTICULARS WITH RESPECT TO TECHNOLOGY ABSORPTION
RESEARCH AND DEVELOPMENT (R&D)
1. Specifi c areas in which R&D activities were carried out by the Company:
R&D sub center at the Company’s, Salem Works, was recognized by the Department of Scientifi c and Industrial Research (DSIR), Govt. of India, New Delhi, during the year 2011-12. The Memorandum of Understanding (MOU) with Anna University was renewed for 3 years to carry out collaborative research. The R&D centre at JSW Vijayanagar works will function as “Corporate R&D Centre” for the JSW Group companies and will extend its services to the group companies and other outside agencies. R&D will increase its focus on benefi ciation of low grade iron ores as well as Banded Hematite Quartzite (BHQ) ores, optimization of coal blends for better coke properties using lower grade coking coals and providing scientifi c inputs towards development of new steel products. R&D will also work towards plant performance improvement through developing expertise in physical and mathematical simulation. Product development wing will focus on high end line pipe steels, dual phase and IF steels.
Research and development activities were also carried out to develop value-added products in the form of 26 new grades of steel to meet specifi c requirements of customers in various sectors, including:
• Line pipe • Electrical • Medium carbon • Extra Deep Drawing (EDD) grades2. Benefi ts derived as a result of R&D efforts a. Vijayanagar • Improvement in mechanical properties of pellets
and reduction in fl ux consumption was achieved with the use of calcined lime.
• Recycling slimes through cold bonded pelletisation has been attempted and has provided encouraging results.
• Optimisation of coal blend with respect to MMR and fl uidity resulted in controlling wall pressures in coke ovens.
• New coal sources: Tested coals from seven sources in pilot coke oven for blending in coke making. Out of these coals, four have been found suitable for blending and hence are being used in coke making in the plant.
• Study on tap-hole clay mass led to development of internal testing procedure and specifi cations and necessary testing facilities to evaluate the various tap-hole clay mass sources for iron making units.

43
Steel Limited
• Design of “Caster Submerged Entry Nozzle” port angle was modifi ed using mathematical modeling software for SMS-II which led to reduction in surface defects.
• Lance design for hot metal desulphurisation station was modifi ed through mathematical modeling for reduced carbide consumption.
• Methodology developed for briquetting of high lime containing wastes generated at SMS. This development is under implementation.
• Single step desiliconisation and desulphurisation process has been developed and implemented in hot metal pre-treatment station at Vijayanagar Works.
• Formability diagrams have been developed for billet grades using “Thermo-mechanical Simulator (GLEEBLE)” for process optimisation.
• Modeling and simulation studies for line pipe steels were carried out for process optimisation.
• Scale impression defect has been minimised from 0.45 to 0.06% of total fi nished product at continuous pickling line at CRM-1 through monitoring and modifi cation in operating parameters.
b. Salem
• New Products Developed:
- Ultra low sulphur steel for sour gas application.
- Alloy steel for high temperature and creep resistance in boilers.
- Bearing steel for premier customers like FAG.
- Several new forging steel grades for Tata Motors, Bharat Forgings, Ashok Leyland, Ilgin and Sundaram Fasteners.
• Developing waste steel making slag into useful products such as:
- hearth layer of sinter plant.
- in road making.
- fl ux in cement plants.
- in brick making.
• Developing blast furnace waste fl ue dust as fl ux in cement making.
• Developed catalysts for improved coke properties.
• CHQ quality steel developed without double rolling.
• Utilisation of waste material generated in-house and also from other industries.
c. Vasind & Tarapur
• Development of HRPO and HRSPO > 1.4 mm.
• HR galvanising in 1.6X1200 mm size, 220 gsm, for structural applications.
• Structural grade GI grade EN 10326 : YS – 420 Mpa min; TS – 480 Mpa min.
• Development of structural grade GI with an alternate grade of raw material having % C 0.07 % max in place of 0.1% to achieve raw material fl exibility.
3. Way Ahead
• Develop structural grade GI ASTM A 653 HSLA grade 60.
• HR plates in grade EN 10215 : 355 J2 – 70 – 100 mm.
• Implementation of about ten research project proposals in the areas of coke making, sinter making, iron and steel making.
4. Expenditure on R&D (2011-12)
` in crores
Particulars Vijayanagar Salem Vasind/Tarapur
Total
Capital 49.52
(41.72)
2.01
(-)
-
(0.72)
51.53
(42.44)
Recurring 7.62
(3.85)
1.66
(1.88)
1.37
(1.51)
10.65
(7.24)
Total 57.14
(45.57)
3.67
(1.88)
1.37
(2.23)
62.18
(49.68)
Previous Year fi gures in ( )
TECHNOLOGY ABSORPTION, ADOPTION AND INNOVATION
1. Vijayanagar • Introduced different coal blend usage in Coke
Ovens , thereby leading to Ash reduction and yield improvement.
• Commissioned and stabilised operations of the Oxycoal Injection System.
• Altered the entry nozzle design into the casters, eliminating nitrogen pick-up during casting.
2. Vasind • New ABB make AGC commissioned in CRM4.
DC drives electronics which became obsolete replaced with latest ABB drive electronics. Old obsolete automation system replaced with latest ABB PEC automation.
• HR Slitter Recoiler DC motor and drive system changed to AC for energy effi ciency and reliability.
• Skin Pass Mill obsolete Siemens S5 PLC replaced with Siemens PLC for reliability.

Eighteenth Annual Report 2011-12
44
• Pickling revamped by replacing acid and rinse tanks. Pickling steam condensate recovery system commissioned to reduce fuel consumption.
3. Tarapur • Cold Rolling Mill -TM2 upgraded to increase
production and improve material quality through modifi cation of Automation system, Auto Gauge Control & Roll change system.
• Modifi cation of CSD-4 Flux Galvanizing Line to Heat to Coat Furnace Continuous Galvanizing Line.
• GP Slitter line speed increased from 150 MPM to 200 MPM through modifi cation of automation system. All DC motors & DC drives replaced by AC motors & AC drives.
4. Imported technologies
Innovation / Technology Year of Import /
Absorption
Status of Implementation
Sinter Plant 4, Technology 2011-12 Commissioned
Pellet Plant 2 2011-12 Commissioned
Blast furnace No. 4 2011-12 Commissioned
High Temp. Viscometer 2011-12 Commissioned
Multi Range Particle Size Analyser
2011-12 Commissioned
Slag granulation is SMS 1 & 2, Technology
2010-11 Commissioned
Ladle Heating Furnace (LHF) No. 5 of SMS-2
2010-11 Commissioned
Benefi ciation Plant 2, Technology
2010-11 Commissioned
Captive Power Plant (CPP) No. 3, Technology
2010-11 Commissioned
Sinter Plant 3, Technology 2010-11 Commissioned
Lime Calcination Kiln No. 8, Technology
2010-11 Commissioned
Coke Oven 4 – Battery A and B, Technology
2010-11 Commissioned
Slab Caster No. 4 in SMS 2 2010-11 Commissioned
Gas holder for SMS-2 2010-11 Commissioned
BOF Converter ‘F’, Technology 2010-11 Commissioned
Pot Sinter Testing Lab 2010-11 Commissioned
Coal Briquetting Plant for Corex
2010-11 Commissioned
Hot Strip Mill 2 Technology 2009-10 Commissioned
Innovation / Technology Year of Import /
Absorption
Status of Implementation
Thermo Mechanical Simulator 2009-10 Commissioned
Pilot Briquetting Machine 2009-10 Commissioned
Computational Fluid Dynamics (Mathematical Modelling Tool)
2009-10 Commissioned
Coke oven No. 3 Technology 2008-09 Commissioned
Sinter Plant 2 Technology 2008-09 Commissioned
Blast furnace No. 3 Technology
2008-09 Commissioned
Slab Caster, SMS-2 Technology 2008-09 Commissioned
Billet Caster Technology 2008-09 Commissioned
Wire Rod Mill Technology 2008-09 Commissioned
Bar Mill Technology 2008-09 Commissioned
Lime Calcination Plant Technology
2008-09 Commissioned
Scanning electron microscope 2008-09 Commissioned
Galvalume pots & controls 2007-08 Commissioned
Equipments for after pot cooling (APC)
2007-08 Commissioned
Coating control equipments 2007-08 Commissioned
Induction oven after coater 2007-08 Commissioned
Hot steering unit 2007-08 Commissioned
Colour coating line with RTO(Regenerative Thermal Oxidiser) to achieve fuel effi ciency while producing Colour coated products
2007-08 Commissioned
Hot Metal Pre-Treatment Plant, Technology
2007-08 Commissioned
RH Degasser Unit Technology 2007-08 Commissioned
Compact Cold Mill at Cold Rolling Mill
2007-08 Commissioned
Bell Annealing Furnaces at Cold
2007-08 Commissioned
Rolling Mill 2007-08 Commissioned
Skin Pass Mill at Cold Rolling Mill
2007-08 Commissioned
Re-coiling cum Levelling Line 2007-08 Commissioned

45
Steel Limited
MANAGEMENT DISCUSSION AND ANALYSIS(A) ECONOMY AND STEEL
(1) Global economy
Key Economic Indicators
Parameters Reference Unit 2010 2011 %-Variance
World GDP Growth IMF % 5.3 3.9 (1.4)
- Advance Economies IMF % 3.2 1.6 (1.6)
- Emerging Economies IMF % 7.5 6.2 (1.3)
Industrial Production World Bank % 9.2 4.2 (5.0)
Infl ation World Bank % 3.3 4.7 +1.4
Crude Oil Brent-Crude US$/bbl 79 107 +35
FDI Infl ow OECD US$-Bn 1,258 1,418 +13
Merchandize Export WTO US$-Bn 15,238 18,217 +5 (Real)
Economic performance
From a positive beginning in 2011, the global environment turned adverse in the second half of 2011 owing to the turmoil in the euro zone and monetary imbalances in emerging economies caused mainly by surging commodity prices. Capital fl ows to developing nations declined by almost half in 2011 compared to 2010.
Europe seemed to enter a recessionary phase. The Euro Zone severely impacted economic performance of its trade partners. Growth in several major developing countries (Brazil, India, and to a lesser extent Russia, South Africa and Turkey) slowed partly in reaction to domestic policy tightening.
Despite questions being raised by rating agencies on the outlook of the US economy, it delivered a heartening performance with declining unemployment, rising retail sales and growing new home sales, among others.
Notwithstanding the relatively strong activity in the US and Japan, global economic trade and growth slowed sharply. Global GDP grew 3.9% in 2011, lower than 5.3% in 2010.
Industrial production
Global industrial production was impacted due to series of adversities. Industrial output growth declined in early 2011 against a marginal growth in the second half of 2010 due to adverse weather in Europe and the US. Besides, uncertainty relating to the sovereign debt concerns in high-income countries affected consumer confi dence, delaying purchases of durable goods and businesses, which hampered an industrial recovery. Despite volatililty in the global economy, (global trade volume (merchandise and services) expanded 6.4% in 2011, which was 100 bps higher than the ten-year average)
Outlook
As per World Economic Outlook, global economic growth is expected to slow to 3.5% in 2012, largely because the euro area economy is expected to trip into a mild recession in 2012.
Growth in emerging and developing economies is expected to average 5.7% - a drop from the 6.2% growth in 2011. Despite a substantial downward revision, developing Asia is still projected to grow at 7.3% in 2012.
Infl ation in the advanced economies is likely to ease to 1.9% in 2012 (2.7% in 2011) and to 6.2% in 2012 in emerging economies (7.1% in 2011) refl ecting tempering of commodity prices due to subdued economic growth.
However latent risks of geo-political tensions affecting oil market, disruptions in global bond and currency market arising out of rising budget defi cits and weather extremeties can prove deterrents to improving global prospects.
Eurozone and IndiaThe European Union (EU) is India’s largest trading partner. It accounts for almost one-fi fth of India’s exports. The European Union accounted for nearly US$47 billion of India’s exports of US$251 billion in FY 2010-11, making it a larger destination than North America. Further, 75% of these exports are derived from the manufacturing sector. A slowdown in the EU has an adverse impact on India’s industrial production and could increase the already high current account defi cit. However, robust domestic consumption in India can cushion the impacts to some extent.
(2) Chinese economy
The highlights of the Chinese economy in 2011 were reigning in infl ation and managing growth. China’s GDP grew 9.2% in 2011 to US$ 7.3 trillion. Industry and services grew 10.6% and 8.9% respectively. Agriculture constituted 10.1% of the total GDP, while industry and services constituted 46.8% and 43.1% respectively.
Despite strong infl ationary headwinds throughout the year 2011 with average infl ation at 5.4%, the year ended with infl ation at about 4% due to a signifi cant clampdown on bank lending.
The Central Government’s tight credit policy for bank loans and house buying resulted in important fallouts:
• Cash fl ow constraints for small businesses and reduced housing sales.
• Interest rate increased sharply in the private fi nancial market.
Fixed Assets Investment (FAI) the key driver
In 2011, China’s FAI was up 24% to 34.4 trillion RMB (US$5.4 trillion). Its completed investment in fi xed assets in 2011 was 31.10 trillion RMB, up 23.6% over 2010. The real growth was 15.9%.
In recent years, China’s GDP growth has primarily relied on increasing FAI as detailed hereunder.
• From 2002 to 2010, the average FAI growth was 26%, while the GDP growth (at current price) was 16%. In 2011, FAI rose 24% and GDP grew only 14.3%. As a result,

Eighteenth Annual Report 2011-12
46
FAI has become the most important factor in China GDP growth.
• The share of GFCF (Gross Fixed Capital Formation) to GDP has risen from 35% in 2000 to 49% in 2011. The ratio in the US is only about 11-13%.
The high FAI rate is a cause of concern for various reasons: over-supply, increasing bad loans; and large amount of government debt among others.
The higher GFCF ratio has made China’s steel intensity (tonnes per million-RMB of GDP) very high in recent years. Since 2000, Chinese steel intensity rose from 9.6 tonnes to 16.5 tonnes in 2011. Chinese steel intensity per US$ of GDP is 6 times that of Japan and over 20 times that of the United States.
Source: National Bureau of Statistics
Estimates for 2012
In 2012, Chinese economic growth is projected to slow down with the Chinese Government’s offi cial estimate pegged at 7.5%. The IMF projects the same at 8.2% in its April, 2012 announcement.
Despite the risks, Chinese FAI will continue to increase in 2012 due to continuing some stimulus plans. As per World Steel Dynamics, growth of FAI in 2012 is expected to be 20% over 2011. The share of Gross Fixed Capital Formation to GDP will reach 50% - a growth of 0.7% over 2011.
(3) Indian economy
Managing growth and price stability are the major challenges in macroeconomic policy making. In 2011-12, India found itself in the heart of these confl icting demands without corresponding initiatives towards economic growth.
As a result, the Indian economy grew at 6.5% in 2011-12, down from 8.4% in 2010-11. The GDP growth in 2011-12 was the lowest in the past nine years.
Global factors such as euro zone crisis, geopolitical disturbances and weather extremities contributed to the domestic economic slowdown. Domestic factors like monetary tightening and raising repo rate to control infl ation slowed industrial investment and growth.
At the sectoral level, agriculture and allied sectors grew 2.8% in 2011-12 against 7% in 2010-11; the services sector grew 8.9% in 2011-12 against 9.3% in 2010-11; the industrial sector growth slowed to 3.4% in 2011-12 against 7.2% in 2010-11 and was primarily responsible for the slowdown of India’s economic progression. The economy’s resilience to shocks was owing to the services sector, which enjoyed the largest share with the most consistent growth.Industrial growth which crumbled, is likely to pickup by government’s National Manufacturing Policy to target a 25% share for Manufacturing in GDP is implemented. GDP and sectoral growth over the years
Source: CSOSectoral composition of GDP
Year Agriculture Industry Services1990-91 29.6 27.7 42.72000-01 22.3 27.3 50.42010-11 14.5 27.8 57.72011-12 14.0 27.0 59.0
Source: CSO
Industrial sector – the stumbling block Headline WPI infl ation remained high at around 9% during 2011 for the following reasons: • Higher prices of primary products (vegetables, eggs,
meat and fi sh) due to increasing demand from growing middle class population.
• Persistently high international crude petroleum prices.• Increasing global commodity prices. To counter infl ation, RBI tightened the monetary policy by hiking interest rates 13 times between March 2010 and October 2011, making borrowing expensive, consequently infrastructure projects become unviable and the manufacturing sector growth slowed during 2011-12. The fi xed investment rate (Gross Domestic Fixed Capital Formation) declined to 29.5% in 2011-12 from 30.4% in 2010-11, impacting the steel demand. Rupee depreciation The Indian rupee was under stress as overseas investors pared their exposure to Asia’s third-largest economy, resulting in net infl ows remaining under US$300 million in

47
Steel Limited
2011. The rupee lost more than 14% of its value during the year, making it one of the worst performing currencies in Asia, eroding India Inc.’s profi tability, widening India’s trade defi cit and adversely impacting India’s Current Account Defi cit.
Estimates for 2012-13
The government estimates a 7.6% GDP growth in 2012-13. However, infl ation will continue to be a signifi cant challenge for the government especially due to the recent hikes in excise duty, service tax, fuel prices and railway freight.
(4) Global steel
Global steel sector
Capacity Production Trade (approx.)
Per Capita Consumption
1988 MnT 1,527 MnT 291 MnT 215 MnT+4.7% +6.8% +5.8% +4.4%
Source: World Steel Association / ISSB
The steel sector indicates a region’s economic health. Over the last decade, the sector has grown phenomenally, primarily due to growth in the BRIC (Brazil, Russia, India and China) nations. Since 2001, the sector witnessed a major rally and downturn, but overall, global steel production grew at a compounded rate of around 6.0% while consumption increased at a CAGR 5.9%.
Shift in steel manufacturing
Over the last decade there has been a structural shift in the demand for steel from developed economies to emerging economies. The demand has shifted towards emerging markets primarily due to strong economic growth coupled with higher share in fi xed assets investments as a percentage of GDP.
Top-10 Steel Makers
During the last decade there is a radical shift in concentration of steel making capacities both in terms of location as well as volume. Earlier world steel market was driven by Japanese, Koreans and some of the European companies which have seen a shift to China. From a meager share of 2.0% in 2000, share of Chinese steel companies rose to 17.0% in 2011 in world steel output.
World steel has witnessed consolidation which resulted in not only the share of top ten moving up from 25% in 2000 to 27% in 2011 but also in terms of volume which has which has nearly doubled during this period from 216 MnT to 417 MnT.
World Capacity Utilization Rate
The World Economic slow down had its effect on steel sector maing it vulnerable to production cuts and capactity outages. European Nations like France and Italy were one of the worst to be impacted with their idled capacities of 33% and 24% respectively ; while China and India were on the lowest side with high capcity utilizations at 132 MnT and 15 MnT capacity unutilized in the year 2011.
Country Capacity Production Utilisation
(MnT) (MnT) (%)
USA 117 86 74%
Japan 132 108 81%
China 828 696 84%
Republic of Korea
81 68 85%
Brazil 48 35 74%
Russia 87 69 79%
India 89 74 83%
Turkey 47 34 72%
France 24 16 67%
Germany 53 44 83%
Italy 38 29 76%
World 1,988 1,527 77%
World-China 1,160 832 72%
BRIC 1,098 907 83%
Source : World Steel Association
Countries Year Apparent per capita crude steel
consumption growth
average (%)
Per capita GDP growth average (%)
China 1991-00 9.50 9.32
2001-10 13.60 9.88
India 1991-00 2.13 3.52
2001-10 6.24 6.10
United States 1991-00 1.67 2.17
2001-10 (2.40) 0.62
Germany 1991-00 (0.27) 0.37
2001-10 1.38 0.99
Japan 1991-00 (1.90) 0.93
2001-10 (0.76) 0.65
Source: World Steel Association

Eighteenth Annual Report 2011-12
48
Global steel production
The annualized global steel production peaked at June 2011 with 1,576 MnT which got reduced to a low of 1,420 MnT in Nov 2011 – a refl ection of economic slow down in certain parts of the Globe.
Global steel production touched 1,527 MnT in 2011 against 1,430 MnT in 2010, an increase of 6.8% over the previous year. All major steel-producing countries apart from Japan reported growth; this was particularly robust in Turkey, South Korea and Italy.
Regionwise steel production (In MnT)
Region 2011 2010 YoY growth
Europe 216 206 4.9%
CIS 113 108 4.6%
America 167 155 7.7%
Africa & Middle East 35 36 -2.8%
Asia & Oceania 995 924 7.7%
World 1,527 1,430 6.8%
China 696 639 8.9%
World Excl. China 831 791 5.1%
Source: World Steel Association
Consumption
Global steel consumption grew at 5.6% from 1,302 MnT in 2010 to 1,373 MnT 2011, owing to higher consumption from developing and emerging nations. Emerging nations accounted for 72% of global consumption - at 980 MnT in 2011 up from 928 MnT in 2010
Global steel consumption (In MnT)
Region 2011 2010 YoY growth
Europe 186 174 6.4%
CIS 54 48 12.1%
America 167 157 6.9%
Africa & Middle East 71 72 -1.2%
Asia & Oceania 896 850 5.3%
World 1,373 1,302 5.6%
China 624 587 6.2%
World ex. China 749 715 4.8%
Source : World Steel Association
(5) China’s steel industry
The Chinese steel industry is highly fragmented. Top 10 companies constitute only 50% of total output in 2011. Habei the largest steel makers in the country having a share of 11 % in 2011.There are 77 members of China Iron and Steel Association which constitute around 60% of crude steel production in the country.
The 12th Five Year Plan emphasized the Chinese steel industry to work on energy savings and emission cut and product mix adjustment so during this period the pace of capacity addition will remain low. Between 2010 and 2011 China has closed down its 72 MnT of iron making and 40 MnT of steel making capacity.
The various provincial governments in China view investment in steel as way to promote growth in GDP, employment and tax revenue, resulting in signifi cant investments in the sector over the years.
Steel capacity progression (In MnT)
Product 2007 2008 2009 2010 2011
Blast Furnace 570 616 688 754 779
Steel-making 587 639 728 798 842
Hot Rolled Coils and Strips
183 205 231 266 289
Cold Rolled Coils and Strips
54 68 78 87 95
Galvanized Steel 21 25 28 31 33
Plate 52 55 59 70 83
Wire Rod 102 103 117 119 124
Rebar 128 104 126 139 155
Source: World Steel Dynamics
In 2011, the Chinese steel industry reported a strong growth with a production of 696 MnT, an increase of 9% over 2010, growing its share in the world crude steel production to 45 percent. The rapid growth in steel production has transformed its global positioning from a net importer of steel to a net exporter.
(In MnT)
2007 2008 2009 2010 2011
Production 490 512 577 639 696
Export 69 61 25 43 49
Import 17 16 22 17 16
Net Export 52 45 2 26 33
Demand 423 447 551 587 624
Source : mysteel/World Steel Association
Apparent steel consumption in 2011 was 624 MnT, up 6.3% from 587 MnT in 2010. Per capita apparent steel consumption grew from 110 kg in 2000 to 460 kg by end of 2011.
Steel slide over the medium term
While the growth in steel demand is likely to remain robust in the short term, consumption growth is expected

49
Steel Limited
to weaken over the medium term due to the number of factors namely increasing reserve ratio, hike in lending rate, numerous restrictions on housing sector loans among others. Some indicators behind this estimate are as under:
• The higher FAI rate continues to be China’s biggest driving force behind its economic acceleration. In recent years, China’s FAI grew faster than its GDP. But this is unsustainable as it would result in industry led-oversupply and stoke infl ation. China would urgently need to adjust the rate back to lower than 30% by limiting FAI increase over the medium term. This could impact steel demand going ahead.
• In 2011, China invested 1.4 trillion RMB for 10 million social housing units. This number is expected to come down to 7million (2012) and 6 million (2013). Considering the average house construction period as 2 years, steel products demand of the social housing construction could slide post 2013.
Shouldering economic growth
To counter the world fi nancial crisis and sustain an 8%-plus GDP growth, the Central Government embarked on a 4 trillion RMB (US$600 billion) investment plan for infrastructure construction. According to CISA estimates, the plan would consume 110-120 million tonnes of additional steel during 2008-2012 which would boost domestic demand and offset the reduction in steel exports. In addition, Chinese local governments set up their own stimulus plans (2008-2013) with an estimated total investment of 13.4 trillion RMB (US$2 trillion) fuelling steel demand by an estimated 200-220 million tonnes.
(6) Indian steel sector
Capacity Production Import Export Demand
89 MnT 74 MnT 7 MnT 4 MnT 71 Mnt
+14.0% +4.4% (2.4%) (11.0%) +6.8%
Source: JPC
Overview
The Indian steel industry is largely iron-based through the Blast Furnace (BF) or the Direct Reduced Iron (DRI) route.
The Indian steel sector witnessed rapid growth over the past decade; domestic crude steel capacity more than doubled to reach 89 mtpa in the fi scal ended March 2012.
India’s steel industry is highly consolidated; about 60% of the crude steel capacity is resident with integrated steel producers (ISPs); a majority of ISPs are located in eastern India, contributing to 50% of total ISP capacity. But the changing ratio of hot metal to crude steel production indicates the increasing presence of secondary steel producers manufacturing steel through the scrap route, enhancing their dependence on imported raw material.
Capacity and utilization
Dominance of the secondary sector
Source: JPC
Technology status
Indian steel plants are globally recognised in the area of technology absorption. Today, India is the world’s largest producer of DRI. Some Indian companies are acknowledged as global leaders in the application of technologies like coal and gas-based DRI, hot charging of DRI in electric arc furnace, fl exible con-arc furnace, alternate route of iron making (COREX), thin slab casting and direct rolling. Over the years, this advantage has been dented through poor raw material quality and obsolete technologies in the old units.
Where India stands against global benchmarks
Item Unit Benchmark Indian steel sector
BF productivity (t / day / m3) 2.5-3.5 1.5-2.5/2.8
Coke rate (Kg / t HM) 350-400 500-600
PCI (kg / t HM) 150-250 50-100
Agglomerate (%) 85-90 65-75
BF slag rate (Kg / t HM) 200-300 300-400
Energyconsumption (G cal / TCS) 4.5-5.5 6-6.5
SMS slag rate (kg / TCS) Less than 40 180 – 200
CO2 emission (t / TCS) 1.7 – 1.9 2.8 – 3.0
Source: Working Group 12th Five Year Plan

Eighteenth Annual Report 2011-12
50
Demand and supply
In 2011, India emerged as the world’s fourth-largest steel producer after China, USA and Japan.
India produced 74 MnT of crude steel in 2011-12 against 71 million tonnes in 2010-11 at an average capacity utilisation of 83% in 2011-12, 91% in 2010-11, the steel demand in the country grew 6.8% in 2011-12, in accordance with the economic growth of the country
India’s strengthening domestic dependency
Source: JPC
Per capita steel consumption
Per capita steel consumption and the consumption pattern of long/fl at products are reliable indicators of national development. During early stages of India’s development, the bulk of steel requirement was for long products following an increase in the demand for fl at products (used in white goods and consumer products).
Status Per capita steel
consumption (kgs)
Consumption pattern (long/
fl at)
Underdeveloped nation 5-50 80-85: 15-20Developing nation 50-250 60-65: 35-40Developed nation >250 30-35: 65-70
India, at a per capita of 59 kgs, is just above the average across most of Africa and signifi cantly lower than the per capita consumption of Malaysia, Thailand, China and Vietnam.
Per capita consumption comparison (kgs)
World average
South Korea
Taiwan Germany The US Russia Turkey China India
215 1,157 784 480 285 292 342 460 59
The paradox
India’s steel consumption highlights two interesting points:
• At the current per capita steel consumption level, India qualifi es as a developing nation
• India’s consumption pattern of 49% fl ats to 51% longs is found in near developed countries
The challenges
Source: Thermex
Key infrastructure indicators
Particulars Reference UnitAddition Terminal
Capacity2010-11 2011-12 Increment
Power capacity addition CEA MW 12,161 20,501 +8340 199,877
Highway length addition MORT&H Km 1,780 2,248 +468 71,772
Port Traffi c MOS MnT 885 930 +45 1,247
Railway Freight (NTKM) MOR MnT-Km 57,079 60,707 +3,628 n.a.
Railway Freight Earning MOR MnT 922 970 +48 n.a.
Inland Water Ways Traffi c MOS MnT 4.9 7.4 +2.5 n.a.

51
Steel Limited
• Exempted import duty on coking coal/met coke, increasing cost-effective sourcing options of key raw materials
• Reduced import duty from 7.5% to 2.5% on plant and machinery for iron ore benefi ciation and pelletisation
• Increased import duty from 5% to 7.5% on selected non-alloy fl at steel products to act as an deterrent for dumping of steel by other countries in India.
(B) PLANT OPERATIONS
JSW Steel is India’s largest integrated steel manufacturer in private sector by capacity (11 mtpa) across four manufacturing locations:
• Vijayanagar Works (10 mtpa integrated steel facility), the world’s largest landlocked integrated steel plant
• Salem Works (1 mtpa integrated facility, rolling out long products for niche applications), the largest unit in India dedicated to special steels
• Tarapur and Vasind (value-added coated fl at products), referred to as downstream facilities
The Company is among a few coveted integrated steel producers with a presence across the value chain of fl ats and longs.
2011-12 in retrospect
The government’s ban on iron-ore mining in Karnataka (July 2011) affected production at Vijayanagar & Salem units. Despite this constraint, the Company increased crude steel and rolled products (fl ats and longs) output.
The operational problem in the blast furnaces at Vijayanagar Works, primarily due to an inferior quality of iron ore, impacted volume growth. Crude steel production stood at 7.43 Million Tonnes against 6.43 Million Tonnes in 2010-11.
The Company, however, reported some remarkable achievements: a number of products received approvals from globally-respected customers, new high-value products were developed to substitute imported grades and the benefi t of these is likely to refl ect in 2012-13. Besides, a number of projects were commissioned to strengthen the Company’s operations.
(In MnT)
2009-10 2010-11 2011-12
Crude steel production
5.99 6.43 7.43
Production of Rolled Flat products
3.71 4.94 5.37
Production of Rolled Long products
0.96 1.13 1.52
a) Depleting availability of key resources
Iron ore: Ironically, India possesses the world’s eighth largest iron ore reserves; it is the fourth-largest iron ore producer in the world. And yet, India fell short of supplying adequate quality iron ore to steel producers as 35% of its production was exported. Iron ore exports dipped by over 40% to 60 MnT in 2011-12 from 98 MnT in 2010-11 due to a ban on iron ore shipments from Karnataka, a hike in export duty and an increase in railway freight.
The ban on iron ore mining in Karnataka (July 2011) and subsequent directive by the Honourable Supreme Court (April 2012) are expected to ease the iron ore supply in domestic market and provide opportunities to responsible Integrated Steel Plants to acquire to be cancelled mining licenses in the Auction and preserve iron ore for the consumption of expanding domestic steel making capacities.
Coking coal: Coking coal, a primary ingredient in steel making, is in short supply. A majority of the coking coal requirement is imported from Australia. India has imported 43 Mn T of coking coal in 2011-12 which is 15 Mn T higher than the previous year. Natural calamities like rain and mine fl oods, labour issues and port congestion forced Indian steel majors to widen their sourcing bases to South Africa, Indonesia, US, Canada and Latin America. The other challenge faced by manufacturers was volatility management in global met coke and coking coal prices (spot prices higher than annual contract prices), threatening viability.
Water: The extraction of groundwater in India is by far the highest in the world. India is expected to face a severe water crisis in two decades and will have neither the cash to build new infrastructure nor the water needed by its growing economy and population.
b) Land availability and environmental issues
Land availability is a concern for industrial growth. Environmental concerns and non-approvals from regulatory agencies hampered infrastructure creation. Consider this: Of the 226 road projects operational in India, 58 are pending due to land acquisition delays.
Government facilitation
The government announced favourable policies to accelerate India’s steel sector growth:
• Imposed a 30% export duty on iron ore, discouraging the fl ight of key resources
• Abolished export duty on pellets, showcasing the need to add value to fi nite natural resources
• Imposed 15% export duty on iron and steel melting scrap, growing the availability of the critical input for the secondary steel sector

Eighteenth Annual Report 2011-12
52
(1) Vijayanagar Works – an aspiration
Vijayanagar Works is the Company’s fl agship steel making facility with a 10 mtpa steel making capacity and unique related features.
• The fi rst steel manufacturing unit with Corex technology in India.
• The only steel manufacturing unit to positively and responsibly alter the climatic condition of the neighbouring areas.
• Globally acknowledged as an innovation centre for the Indian steel sector
• Comprises the best technologies in every manufacturing unit, making it one of the most effi cient global steel plant (in terms of conversion cost)
This state-of-the-art facility is driven by JSW’s corporate philosophy: ‘Question every convention, replace the often quoted ‘why’ with the bolder ‘why not’.’
Vijayanagar Works – Setting the paceSuccessfully driven by the cutting-edge Corex technology; plant regarded as the world’s best Corex showpieceHouses India’s largest blast furnace Possesses the widest hot strip mill in India; only domestic capacity with the contemporary pair-cross technologyOnly twin-stand reversible cold-rolling mill in India; possesses a continuous pickling line, the fi rst in India’s steel industry
Preparatory section
Steel making has undergone a shift primarily due to an inadequate availability of quality raw materials at a reasonable cost. As a result, technologies and practices now utilise every ounce of resources.
The transformation is visible in a simple reality: the primary feed to the hot metal making furnaces has changed from coke/coal and iron ore lumps to prepared burden (pre-cooked inputs). The primary role of the preparatory section is grouped under three critical heads:
• Improve sub-standard raw material quality to make it usable as furnace feed.
• Utilise inputs which were earlier considered waste, namely coal and iron ore fi nes.
• Utilise process waste to ensure that every gram of metal derives commercial value.
Benefi ciation plant
JSW is the fi rst steel company in India to develop a large-scale, low-grade iron ore benefi ciation process. The unit processes low-grade ore with high gangue content. It ensures iron ore availability for steel production despite
depleting reserves of high grade iron ore. The basic and process fl ow of benefi ciation plant 2 was completed in-house with support of the equipment manufacturer.
Key initiatives in 2011-12
• Initiated process changes for the benefi ciation of low grade iron ore (Fe2O3 56-57%).
• Improved benefi ciated ore (superior chemistry and consistent grain size) which improved sinter and pellet quality.
Road map for 2012-13
Commission Benefi ciation Plant phase 2, ensuring that more than 80% of the ore used in steel manufacture is benefi ciated using low grade fi nes.
Coke oven
Vijayanagar Works boasts of the single largest coke manufacturing unit in a single facility with an annual capacity at 4.62 mtpa. In the coke making section, the Company adopted the vibro-compacting technology at its coke oven units, for improved product quality and higher productivity. Besides, the indigenously developed pilot coke oven plant – the fi rst-of-its-kind in India – facilitated coal blending from diverse sources to develop a superior product and optimise production costs.
Achievements, 2011-12
• Commissioned two coke oven batteries, expanding coke production to 11,300 TPD.
• Increased coke production 51% over the 2010-11 level; coke purchase from the open market declined substantially saving production costs.
• Emerged as the fi rst Indian steel producer to successfully produce coke with Mozambique coals and Teck coals from Canada.
Key initiatives in 2011-12
• Developed a number of coal sources (4-Countries) to de-risk an excessive dependence on a single source.
• Coal blend changed in coke making, which reduced ash content in coke by about 100 bps, reducing the fuel rate in the blast furnace during iron making.
• Improved coal: coke ratio in coke making from 1.41 in 2010-11 to 1.37.
Road map for 2012-13
• Optimise the coal mix procurement from various sources to reduce production costs.
Pellet plant
The pellet plant was originally conceived as the feeder unit for the Company’s iron making corex unit at Vijayanagar Works. Over time, pellets emerged as an important constituent of the blast furnace burden, improving productivity and output.
53
Steel Limited
The Company possesses the capacity to manufacture 9.2 mtpa pellets across two units. This infrastructure comprises India’s fi rst dry process pelletising plant, a technology ideally suited to soft iron in the Bellary-Hospet region. The technological superiority of the unit is refl ected in the following:
• It is the only plant to use corex gas instead of costly furnace oil and natural gas.
• It is only pellet plant worldwide which makes pellets out of iron ore with high alumina content.
Achievements, 2011-12
• Commissioned Pellet Plant 2 with a capacity of 4.2 mtpa in December, 2011.
Key initiatives in 2011-12
• Stabilised operations of Pellet Plant 2.
• Increased the use of benefi ciated ore (consistent grain size and superior chemistry), improving pellet quality and blast furnace productivity, while reducing fuel and slag rates.
• Increased use of pellets in the blast furnace burden feed increased the use of nut coke in the blast furnace.
Road map for 2012-13
• Achieve optimum capacity utilisation at pellet plants to increase pellet utilisation in the feed for the iron making zone.
Sinter plant
The Company can cumulatively manufacture 12.95 mtpa sinter as feed for its blast furnaces. Its third sinter plant (5.75 mtpa) is the largest of its kind in India. The cumulative sinter production can provide an average 80% feed for all four blast furnaces.
Achievements, 2011-12
• Increased sinter composition in the blast furnace burden from 67% in 2010-11 to about 80%, reducing the fuel rate in the blast furnace and improving product quality.
• Commissioned Sinter Plant 4 (2.60 mtpa) in July 2011 .
• Sinter Plant 3 production peaked at 4.9 lac tonnes in January 2012 ( higher than the labeled monthly capacity).
Key initiatives in 2011-12
• Stabilised Sinter Plant 4 and ramped production to 76.5% of capacity utilisation; return fi nes from in-house customers decline.
• Commissioned a 1.4 mtpa lime plant to provide consistent and quality calcined lime input for improved sinter quality.
• Rectifi ed issues with the process fan and ESPs in Sinter Plants 1 & 2, improving plant availability.
Road map for 2012-13
• Consolidate operations of all four units
• Install a mixing unit for homogenous material mixing of feed to the sinter plants.
• Install a waste heat recovery mechanism in the sinter cooling areas of sinter plants 1, 2 and 3, to generate steam for use in the blast furnace and other shop-fl oor processes.
Iron making zone
In this zone, fi nite natural resources namely iron ore and coal are burnt together to make iron also known as hot metal. The zone is the largest cost centre for any steel manufacturer. Hence, the focus here is to minimise resource consumption, reduce costs and ensure maximum plant availability for highest output.
JSW Steel is credited to have walked the road less traveled. When steel companies globally adopted the tried and tested blast furnace route for hot metal, JSW emerged as the fi rst Indian company to use the untested Corex technology and only the third in the world. Today, it is the best-run Corex unit globally, emerging as a learning institution for companies ready to adopt this green technology. For successive expansions, the Company deployed blast furnaces and is credited with commissioning India’s largest blast furnaces.
Currently, the Vijayanagar works has a 9.80 mtpa hot metal capacity of which 1.6 mtpa is through the Corex route, the balance comes from four blast furnaces.
Achievements, 2011-12
• Increased hot metal production 16% from 6.19 million tonnes in 2010-11 to 7.21 million tonnes.
• Achieved highest monthly production of 92,807 tonnes (2.70 t/m3/day productivity) in BF-1.
• Achieved highest power generation from TRT: 12.28 MW (Nov 2011).
• Achieved highest monthly production of 254,869 tonnes at BF-4 in December 2011 with high PCI average rate 135 kg/thm.
Key initiatives in 2011-12
a) The 3.8 mtpa facilities (comprising the Corex units and BF-1&2)
• Altered the slag regime through an optimum mix of inputs to maintain the optimum carbon rate.
• Re-routed the water treatment plant underground pipelines to above the ground level to eliminate underground water leakages.
• Commissioned Tunnel Ventilation systems (Corex-1&2) for easy operation and maintenance activities.
• Installed higher capacity (15 M3) softener plant at Corex-2.

Eighteenth Annual Report 2011-12
54
• Used 44,000 tonnes under-size coke (Nut Coke) in hot metal manufacture in the Corex units.
• Introduced variable speed drives for ID fans at coal drying plant in the Corex unit, saving energy.
• Installed the copper cooling plate in BF-1 to enhance cooling and eliminate hot spot/ cracking of furnace shell.
• Commissioned the Boiler 1 and 2 common steam header.
• Upgraded the SCADA monitoring system from 250 screens to an unlimited version for real-time monitoring of the progress of ongoing projects like additional de-dusting system and sinter fi nes transportation conveyors at BF#2.
• Installed a hydraulically-operated tilting runner in Cast House #4 of BF-1 to enhance its availability.
• Introduced a standby hydraulic drive for furnace charging conveyor at BF-1; enhancing plant availability.
• Modifi ed the air-cooling system in the main iron trough cooling system in BF-1 to enhance runner life.
• Increased sinter ratio in BF-1 burden to 69% and in BF-2 burden to 78%, increasing furnace productivity.
• Commissioned the U-seal for GCP network line to minimise shut down and start up time.
b) The 6.8 mtpa facilities (BF-3) – India’s largest blast furnace
• Used anthracite coal for PCI Injection, optimising production cost.
• Charged small sinter in the furnace, reducing return fi nes and production costs.
• Installed 5mm screens to improve net sinter availability.
• Commissioned and stabilised operations of Mill for coal grinding to improve PCI Coal availability for BF-3&4.
• Commissioned and stabilised operations of the Oxycoal Injection System.
c) The 10 mtpa facilities (BF-4)
• Installed diaphragm type instruments in BF-4 SGP, reducing breakdowns and improving equipment availability.
• Converted the manual ON/OFF switching system for BF-4 lighting into auto mode managed by PLC controls, optimising energy consumption.
• Reduced water consumption by regularly recirculating seepage water to the cooling tower.
• Fine tuned the BF-4 Top Recovery Turbine to maintain steady furnace top pressure; improved power generation of TRT by maintaining a steady load on the generator.
• Provided emergency power supply to the common blower house from BF-3 and BF-4, ensuring emergency power to the blower auxiliaries during power failure.
Road map for 2012-13
a) The 3.8 mtpa facilities
• Install the Aerial Gas distribution system at Corex Reduction Shaft Bustle; upgrading the DCS operating systems from UNIX to Windows-based system in Corex-1&2.
• Upgrade WTP MCC & DCS Remote I/O panels at Corex-2 for better plant availability
• Upgrade Corex-2 SGP PLC (MP200) to DCS (AC450) for better speed and plant availability.
• Change the charge distribution system in BF-2 to Bell less top (BLT).
• Upgrade the BF-1 Turbo Blower to BF-2 Turbo Blowers effi ciency; upgrade BF-1 boiler.
b) The 6.8 mtpa facilities (BF-3)
• Commission Stove-4 to increase hot blast temperature.
• Commission online granulated slag transport system.
c) The 10 mtpa facilities (BF-4)
• Achieve more than 95% slag granulation.
• Replace GB-03 in SGP (EAST) with belt conveyer.
Steelmaking section
Hot metal emerging from Corex & Blast Furnace can-not be used as such. There are undesirable impurities which are present, needs to be removed. Also for each application separate chemistry is required.
A steelmaking section has two units combined into one.
• One, where the hot metal is cleaned of impurities – primarily sulphur, phosphorus and elements of air which damage the strength and other qualities of steel.
• Two, where like a large chemistry work shop where various grades are created by adding alloys in a particular combination to produce steel suited for specifi ed applications.
The steelmaking section at Vijayanagar Works is unique for its volume management capability. It is India’s only steel melting shop which has a capacity to produces 9.80 mtpa of steel with a combination of seven converters and seven casters (SMS infrastructure under Project Cheetah and Project Falcon).
Achievements, 2011-12
• Commissioned Converters and Casters in April 2011 to enhance steelmaking capacity at Vijayanagar to 10 mtpa.
• Non-conformity declined from 3.93% in 2010-11 to 1.50%.
• Successfully completed four heats of auto grade steel earlier imported.

55
Steel Limited
• Achieved 102 heats on January 19, 2012 in SMS 2, a benchmark in operational effi ciency.
• Evolved the product mix in favour of value-added products.
• Commissioned a 0.2 mtpa mill-scale briquetting facility, which will be used as a coolant in steelmaking. It is also an important waste management and environment management initiative.
Key initiatives in 2011-12
• Introduced 22 product grades – two for long products, seven API grades, six IF grades and the rest being transport and export grades.
• Improved the life of the ID fan in SMS 1 from about 300-400 heats to about 2,000 heats
• Altered the rollers being used in the SMS units, enhancing roller life.
• Stabilised operations of SMS 2 through intelligent equipment management, facilitating proper material fl ow between ladle furnaces and casters and ensured optimum plant utilisation.
• Utilised slurry and dust from the SMS equipment along with fl ux; evaporated the mixture to generate feed for the micro-pelletisation unit.
• Implemented close to 50 improvement projects suggested by JFE, strengthening production process and improving performance parameters.
Road map for 2012-13
• Design software for automated equipment management (matching ladle furnaces with casters) to maximise steel output.
• Introduce a ladle furnace and a caster in SMS 1 to increase the steelmaking capacity of that unit.
• Increase the weight per heat to 180 kgs from the current average of 165 kgs.
• Install a sub-lance online temperature and quality measurement and correction system to improve productivity by 1.5 heats per day per caster.
• Entered into a partnership for an improved waste processing system to scientifi cally separate iron content from slag in the SMS facilities – improving iron recovery.
• Improve the desulphurisation process to eliminate LHF with the RH – resulting in superior steelmaking and cost saving.
Steel and cement – hand in hand
The huge slag generated is used by JSW Cement Limited, a Group Company which has already established a name in the market for producing quality cement.
Rolling section
These facilities add value to basic steel forms namely slabs, billets and blooms (output from the steel making units) to create user-convenient forms; product grades (thickness and sizes) are customised to user applications; mill productivity is of prime importance to product quality and organisational profi tability.
The uniqueness of the rolling mill at Vijaynagar Works is its capability to produce the widest product range in the long and fl ats segments. For example:
• HSM 2 is the widest hot strip mill in India, capable of rolling products more than 2 metres wide and a thickness range between 1.2 mm to 25.4 mm, creating a huge product basket.
• The CRM complex is capable of rolling the widest product range, catering to diverse and niche applications namely auto grade steel (the outer body, IF steel, among others).
• The BRM/Rebar mill produces a wide TMT bars basket between 8 mm to 40 mm.
• The WRM produces a wide product range from 5.5mm to 22mm and highest coil weight of 2.5 tonnes.
Hot strip mill: The Company possesses two hot strip mills with a combined label capacity of 6.7 mtpa. The fi rst unit (HSM 1) is capable of rolling up to 1350 mm width while the second unit (HSM 2) upto a width of 2,100 mm which is the widest mill in India, and technologically superior to the fi rst mill, positioning it as the fi rst mill-of-its-kind in India. These units possess capabilities that create an unmatched product basket – the largest by any Indian steel manufacturer.
Achievements, 2011-12
• Rolled auto grade steel in the unit which was otherwise imported.
• Optimised gas consumption from 305 Mcal per tonne of steel to 285 Mcal per tonne of steel largely due to better furnace operation and maintenance practices in HSM 1
• Improved yield by 0.2%, cobbles.
• HSM-2 plant operated at higher than the labeled capacity in some months.
• Achieved a prime yield of 98.55% against 94.94% in 2010-11; reduced the cobble rate.
Key initiatives in 2011-12
• Replaced conventional rolls with HSS rolls in HSM 1 (superior rolls), optimised roll consumption, minimising changeover time and improving product and surface quality
• Installed a fume exhaust system at the fi nishing stand in HSM 1 to capture dust generated, an environment management initiative.
• Installed an IMS (Isotope Measuring System) gauge at HSM-1 to minimise shape-related defects in the product.

Eighteenth Annual Report 2011-12
56
• Completed Level 2 automation in reheating furnace of HSM 2 in September 2011and streamlined furnace operations which reduced heating losses.
• Implemented 8-10 projects in HSM 2 where manual work was replaced with automation and additional interlocks were added to streamline plant operations.
• Implemented SPTS module (Level 3 automation) in HSM 2 – all modules from order to dispatch – it captured real-time data on the system.
• Implemented the coil yard management IT solution at the HSM2 coil yard - the coil yard is monitored on a real-time basis, every fi nished coil is mapped, coils stacked in the stock yard are remotely identifi ed based on diverse parameters (product specifi cation, customer name, destination, among others), these are populated on the dashboard of the crane operator for accurate outward dispatch – eliminating incorrect material movement and improving operational safety by eliminating manual intervention.
Road map for 2012-13
• Install a 1 mtpa hot skin pass mill for rolling auto grades as customers require products with close tolerance (shape and dimension tolerance).
• Commission a high-end grinding machine with an online inspection and grinding facility
• Implement a crop-end optimisation project to improve prime yield.
• Implement the coil yard management solution in HSM 1 coil yard.
• Implement Phase II at HSM 2; add a reheating furnace, a roughing mill, a fi nishing mill and a coiler which will expand the unit’s operating capacity from 3.50 mtpa to 5 mtpa.
• Install an online surface inspection equipment in HSM 2 for real-time material inspection – essential for automotive customers who demand close tolerance levels.
• Create a slab tracking system similar to the coil tracking solution in HSM 2.
Cold rolling mill: This cold rolling mill is state-of-the-art with contemporary technology, positioning it as among the few of its kind globally. It is the fi rst-of-its-kind in India with complete automation. This is the fi rst global instance of a single-stand skin pass mill in the electrolytic line. The shape-metre in the tail end of the skin pass mill for superior fl atness to the rolled products is a pioneering technology in India and a rare feature in the global steel industry.
Achievements, 2011-12
• Rolled out four new grades successfully for the outer body of automobiles for global OEMs, a fi rst time by JSW Steel.
• Commercialised fi ve new grades for internal automobile components.
• Certifi ed for ISO/TS 16949:2009 quality management system – mandatory for supply to the automotive industry.
• Improved prime yield from 90.19% in 2010-11 to 90.79%.
• Optimised roll and rolling oil consumption signifi cantly, thus optimising production costs.
Key initiatives in 2011-12
• Underwent intensive process and technology training/know-how from JFE to produce outer body steel grades (with extremely stringent surface and quality requirement).
• Implemented more than 50 continual improvement projects focusing on productivity, quality, cost, delivery and safety-related issues.
Road map for 2012-13
• Increase auto grade steel volumes for internal components.
• Commercialise auto grade steel for outer body panels.
Wire rod mill: The Company’s wire rod mill has a number of unique features which positions it as a new benchmark in manufacturing wire rods in India
• It is the fastest of its kind in India (rolling speed at 110m/sec in 5.5mm).
• It develops the largest product range (5.5 mm – 22 mm) and provides the maximum yield.
• It is also the only mill in India with retarded normal and accelerated cooling setups air cooling conveyor, allowing it to roll high carbon steel seamlessly.
• It is the only Indian unit which manufactures wire rods with a tolerance level +/- 0.10 mm in diameter and +/- 0.15mm ovality.
• It manufactures cold headed grade for the high-end bright bar industry – making JSW the only company in India to offer this grade.
• It produces 2.5T/coil, the heaviest in India, and can produce 22 mm dia coil which is also the highest wire rod coil size in the country.
Achievements, 2011-12
• Increased average monthly production by 9%.
• Improved plant utilisation from 72.71% to 78.49%; power consumption decline by 12 kwh/tonne and cobbles reduced by 0.27%.
• Launched a new grade in the electrode steel segment which received BIS certifi cation.

57
Steel Limited
Key initiatives in 2011-12
Increased the production of thinner sizes, strengthening business profi tability.
• Increased production volumes for electrode grade steel.
• Adopted unique maintenance practices which signifi cantly reduced cobbles, reduced breakdowns, increased mill availability and reduced power consumption.
• Increased roll hardness after collaborating with vendors, increasing roll life, reducing roll consumption and saving changeover time.
Road map for 2012-13
• Increase production of value-added products with a special focus on electrode grades and high-carbon grades.
• Install a wire tying compactor which will consume in-house wire against strapping (purchased from vendors) to pack fi nished products – a cost saving initiative.
• Install section gauges on the intermediate and fi nishing rolls, resulting in perfect sizes of the end product and lesser cobble generation.
Bar rod mill: This is the highest speed and widest range bar rod mill in India, capable of manufacturing a wide product mix (TMT, angle, engineered rounds, square round corners) and in multiple sizes (from 8mm to 40mm). The versatility extends to the product strength – the mill can develop products up to a maximum strength capability of 1150 mpa. Additionally, the mill is equipped with slit technology which forms a horizontal 8, which is then slit to make two re-bars at a time, doubling productivity of smaller size TMT bars (8 mm, 10 mm, 12mm and 16 mm). Through this mill, JSW pioneered this technology globally.
Achievements, 2011-12
• Grew average monthly production by 60%, gross and prime yields increased 109 bps and 229 bps respectively.
• Improved plant utilisation by 10%; power consumption declined by 36 kwh/tonne, and cobbles reduced by 0.66 %.
• Manufactured 500D grade TMT rods (earthquake-resistant).
• Commenced commercial supply of corrosion-resistant steel grade TMT bars.
Key initiatives in 2011-12
• Added a water box in the mill for small sizes, increasing mill speed (from 25 mtrs per second to 30 mtrs per second) and productivity without generating cobbles (prevalent in manufacturing thinner sizes).
• Adopted a length optimisation practice, installed a software to calculate the length of the entire rod and cut the length in a manner than reduced tail ends.
• Reduced shear length at the multiple rolling stands, optimising head and tail end wastage and improving yield.
• Optimised process parameters in maintaining closer yield strength tolerances – this increased mill speed and ensured that no product was rejected at the customers end.
• Changed the roll pass design and steel grade used for the roller, increasing its working life minimising roll changing time and reducing roll consumption.
• Adopted unique maintenance practices.
Road map for 2012-13
• Add a water box to the mill for thicker sizes (25 mm and above) to increase mill productivity and product quality
• Modify the single rolling process for thicker sized rods (20 mm) to accommodate the slitting technique – this will signifi cantly enhance production
• Install a billet welder which will weld billets together, facilitating continuous rolling, eliminate tail ends and improve gross yield
• Expand furnace capacity to match the unit’s rolling capacity.
(2) Salem – India’s largest special steel unit (Rolled longs segment)
Salem works is a 1 mtpa integrated steel manufacturing facility, specialising in manufacturing high value-added steel for critical application in the automobile and power sectors. This unit focuses on value addition in the long steel segment.
Achievements, 2011-12
• Increased bar and rod mill production by 1.5% from 0.341 million tonnes in 2010-11 to 0.343 million tonnes; blooming and billet mill production increased by 254% from 0.028 million tonnes in 2010-11 to 0.099 million tonnes.
• Increased sinter productivity to 1.50 t/m2/hr (above designed capacity) from 1.23 t/m2/hr by innovative methods, reducing lump ore consumption in BF.
• Increased pulverised coal injection in blast furnace from 100 Kg/tonne of hot metal in 2010-11 to 125 kg/tonne of hot metal.
• Increased charge to bloom yield at steelmaking shops from 85% to 85.75%.
• Commissioned Phase II of the blooming mill facility in June 2011.
• Reduced specifi c plant energy consumption from 8.5 Gcal/tonne of crude steel (April 2011) to 7.5 Gcal/tonne of steel (February 2012) (inclusive of Captive Power Plant and Air Separation Plant).

Eighteenth Annual Report 2011-12
58
• Generated 30MW of power (23MW in 2010-11) through the waste heat steam generation system by accurate process control, improved ID fans design and modifi ed battery – 3; at coke oven plant set a new benchmark for the unit.
• Achieved a 99% availability of the CPP plant excluding planned stoppage through improved operation and maintenance practices.
• Received approvals from Indian and overseas manufacturer and from the railways for spring steels.
Key initiatives in 2011-12
Preparatory section
• Increased usage of low cost coal up to 15% in the coal blend (earlier 10%) for coke-making, reducing coke cost.
• Introduced anthracite coal as sinter feed to overcome the fuel shortage (coke breeze) in the sinter plant.
• Utilised settling pond dust of the coke oven (containing about 35% carbon) in sinter making.
• Used crushed EOF slag as hearth layer in a innovative technique (patent applied for) in December 2011, which was further increased by 30% by the end of the year.
• Increased the use of burnt lime in the sinter feed, improving sinter quality (permeability) and in turn increased blast furnace productivity – burnt lime powder addition stood at 40 kgs per tonne against the industry average of 25 kgs per tonne.
• Increased sinter usage in the blast furnace from 60% in 2010-11 to 70%, enhancing blast furnace productivity and product quality.
Iron and steelmaking sections
• Modifi ed supersonic lance operations which improved oxygen effi ciency and minimised loss; minimised metal loss during fl ying-tundish operations in continuous casting by accurate process control – these factors improved steel productivity.
• Vaccum degassed 83% of heats to increase alloy steel production in response to the growing demands from the automotive and energy sectors.
• Introduced the 4-port nozzle to improve centre soundness of ‘as cast’ structure of continuous cast blooms; this reduced internal rejections of blooms at the blooming mill.
Rolling section
• Ramped up Bar and Rod Mill (BRM) production to an average of 1,050 TPD.
• Modifi ed the cooling bed at the BRM, improving surface quality and increasing plant availability; overall product quality increased as rejections declined from 3% of production in 2010-11 to about 0.6%.
• Introduced tungsten carbide rings in the fi nishing stand of the BRM facility for fl ats which increased roll life from 100 tonnes per pass to 400 tonnes per pass.
• Minimised head end material loss from 3.5 mtrs to about 150 cms, enhancing plant productivity.
• Implemented suitable modifi cations in the reversible mill (part of the blooming and billet mill), strengthening its capability to generate a wider product basket.
• Produced 10,908 tonnes of spring steel fl ats in Jan 2012 – highest production volume by the unit in a single month for spring steel fl ats.
Product development in 2011-12
• Ultra low sulfur steel for sour gas pipelines.
• T 22 – alloy steel for boilers with IBR approval.
• Developed new grades like 2CrMo (for Ashok Leyland, Chennai), MHM+B (for BEML, Bangalore), 30MnB4 (for Blue stamping, Faridabad), 40CrMo4H (for Bharat Forge), 10B35 wire rods (for Sundaram Fasteners) and SMn443 (for Bharat Forge).
• Developed bearing grade steel and supplied samples to customers for approval; received approval for 2-3 grades of bearing steel from customers.
• Developed large global and Indian auto-component manufacturers as customers, received product approvals from them; commercial production to commence in 2012-13.
• Received approvals from Hyundai (through ILGIN) and Ford Motors (through Sundaram Fastners) for multiple special grades.
• Developed new sections like 101.6 x11.11mm; 76.2x26.95mm; 100x23mm – Parabolic springs - 80x28, 80x30, 80x24mm, 75x10mm; 90x20mm – for Kamaz Vectra. 30mm wire rods through GC for fastener application and 56mm bars at BRM.
• Established R&D sub-centre with approvals from the Indian government (three patent applications fi led already).
Project implementation
• Commissioned a 120/40 T crane at the SMS unit to improve material handling of molten steel.
• Initiated trials of the new automatic inspection line in the BRM unit for bars <60 mm.
• Initiated the commissioning of a waste heat recovery boiler at the coke oven units which is expected to generate about 6-7 MW of power.
• Purchased a loco to facilitate hot metal transfer from the blast furnace to the steel melting shop.

59
Steel Limited
• Extended the shed for lime storage, increasing material storage at the plant site and eliminated demurrage charges otherwise paid to port authorities.
• Commissioned a liquid nitrogen system in the air separation plant as a backup system for the EOF and SMS units; minimised plant stoppages due to the shutdown of the air separation unit.
Road map for 2012-13
• Receive approvals from OEMs in the automotive, heavy engineering and other sectors.
• Increase capacity utilisation of the blooming mill and increase special steel production.
• Extend the two bays at the SMS unit.
• Complete the shed extension at the blooming mill, facilitating the storage of increased fi nished products.
• Complete online automated inspection system (Phase II) for the blooming mill.
• Extend the material and fi nished goods storage shed.
• Install the reducing and sizing block (Kocks Block) at the BRM unit to ensure that size, dimensions and surface quality are within the stringent tolerance levels specifi ed by OEMs.
• Concrete all roads within the plant.
• Install a wagon tippler and railway siding inside the plant for seamless movement of incoming material.
• Install a new boiler in the coke oven unit which will enhance the WHRB steam generation.
• Utilise sensible heat from coke ovens to reduce the moisture content in fi nal coke.
• Secure product approvals from large global and Indian consumers of special steels which are under different stages of evaluation
• Enter into new special steel grades which cater to diverse sectoral applications
Small is big
A 1% increase in sinter in the blast furnace burden saves about 1-1.25 kgs/THM of coke
Time is money
For size variation in rolling (from say 16.3 mm to 17.3 mm), the normal changeover time for infrastructure will be about 30-45 minutes. The Kocks Block reduces this changeover time to 5-10 minutes. The unit rolls an average of 50-60 sizes every month. Additionally, this fl exibility will enable the unit to make < 200 tonne batches, expanding its addressable market.
(3) Downstream units – Special steel units (Rolled fl ats segment)
JSW’s Tarapur and Vasind facilities convert steel into branded steel. These plants source steel slabs and HR Coil/CR Coil from the fl agship Vijayanagar facility and offer a diverse product basket comprising HR plates, CRCA products, galvanised, plain and corrugated products and colour-coated products for multi-sectoral applications which are sold either through the Company’s retail network.
JSW Steel possesses India’s one of the largest galvanised steel capacity; it is the only Indian facility with the prestigious Galvalume certifi cation; its colour-coated facility offers more than 200 shades of colour-coated galvanised and galvalume products; it provides any material shade on-demand within three weeks.
Achievements, 2011-12
Tarapur
• Achieved the highest galvanising and Galvalume production at 4.66 lacs tonnes. It includes 1.20 lac tonnes Galvalume products which was also the highest ever.
• Produced the largest volume of galvanising export hard steel at 1.65 lacs tones.
• Registered the highest production of colour coated product at 1.77 lacs tones.
Vasind
• Grew GI production by 6% from 4.03 lacs tonnes in 2010-11 to 4.29 lacs tonnes; yield improved by 0.6% over the previous year’s benchmark.
• Converted the furnaces of CGL1, CGL2, HRM, ARP and other utilities like alloy furnace, hot air drier to use natural gas (R-LNG) in February 2012 – a cleaner (free from CO2 and moisture) and cost-effective fuel.
Key initiatives in 2011-12
Tarapur
• Enhanced the capacity of CSD4 galvanising line which produces galvanised hard steel for exports.
• Installed VVVF drives at TM2 in fume exhaust blower, coolant pump, motor ventilation blower and fume exhaust blower in TM6; power consumption in the mills is reduced.
• Optimise operational process and increased effi ciency with highest-ever average line speeds; reduced the power and LPG consumption by 3.8 units/tonne and 1.6 Kgs/tonne respectively
• Achieved the highest-ever plant utilisation, installed VVVF drive in the pump house and blowers; replaced some underloaded motors from delta to star – as a result, power and LPG consumption reduced in the colour-coated line by 2.3 units/tonne and 2.6 Kgs/tonne respectively.

Eighteenth Annual Report 2011-12
60
• Installed VVVF drive in the condensate extraction pump; reduced auxiliary power consumption in the power plant.
Vasind
• Converted the radiant tube furnace fi ring to pulse fi ring system in the galvanising lines which improved heating performance and reduced fuel consumption.
• Welded together the radiant tube fl anges in the RTF section of the galvanising lines (earlier bolted together) which eliminated leakages and improved furnace health.
• Installed doctored scrappers to remove adhere zinc on briddle rolls; reduced dent defects and increased yields.
• Initiated work on installing two colour coating lines for appliance grade products (75,000 tpa capacity) and commercial grade products (150,000 tpa capacity) to meet the expanding market demand.
• Commissioned the pickling steam condensate recovery system which optimised fuel consumption.
• Implemented numerous energy conservation initiatives towards energy conservation; such efforts were appreciated by the Confederation of Indian Industry during its energy audit under the ‘Perform, Achieve and Trade’ scheme.
Product Development
Sr. No
Product Grade End Application/ Benefi ts Location
HRPO / HRSPO
1 HRPO/ HRSPO > 1.4 mm Press parts components for auto Vasind
Galvanized Coating
1 GI Soft stretch leveled quality with zinc coating 450 gsm Crash gard, silos application Tarapur
2 HR Galvanising: GI Soft stretch levelled quality, Z-220 GSM Size -1.60 x 1200 through HR Route
Forming and structural application Tarapur
3 HR Galvanising with higher zinc coating Z-500 GSM: GI Soft stretch levelled Quality, Z-500 GSM Size -1.60 x 1200 through HR Route
Forming and structural application Tarapur
4 GI as per EN10326, S420 GD, YS=420 Min, TS-480 Min & %Elong.-NA
Structural application Tarapur
5 Development of structural grade GI with HR coil 0.07% C max in place of HRC with 0.1% C
Development of alternate raw material grade
Vasind
6 Development of GI grade ASTM A 653 SS 50 Class I with 350 gsm coating
Engineering Structural Applications Tarapur
7 Development of GI with Coloured TOC Roofi ng Tarapur
Pre Painted GI/GL
8 Wood Grain Finish For wood fi nish furniture Tarapur
9 Extra Flexible Paint - 1T Bend Appliance Grade Products Tarapur
10 Cool Roof Paint System For roofi ng applications Tarapur
Road map for 2012-13
Tarapur
• Upgrade Cold Rolling Mill –TM1 with annual capacity of 0.225 mtpa.
• New Galvanising Line – CSD5 with dual products of galvanised and Galvalume Steel with annual capacity of 0.2 mtpa.
• Upgrade Cold Rolling Mill- TM2 from DC drives to AC drives to increase production from 0.06 mtap to 0.1 mtpa.
• Upgrade colour coating lines - (CCL1 & CCL2) with RT to enhance production capacity from 0.18 mtpa to 0.276 mtap.
Vasind
• Commission railway siding to facilitate seamless and cost-effective transportation of raw materials and fi nished goods.
• Commission of two new colour-coated lines by January 2013.

61
Steel Limited
• Implement the CGL1 modifi cation to make DD, EDD and IF grade GI to meet market needs. Commission the inline Skin Pass Mill, furnace modifi cation and inline oiler by September 2012.
(C) OTHER CRITICAL FUNCTIONS
(1) Material procurement
For a product which is completely dependent on fi nite, high-quality, natural resources namely coking coal and iron ore, business sustainability is critically linked to the consistent sourcing of adequate volumes of these fi nite resources in a cost-effective manner. Further, since mining operations disturb the area’s ecological balance, stringent compliance at the national and global levels restrict availability of natural resources, making raw material sourcing extremely critical for business sustenance and growth.
For JSW Steel, raw material sourcing is critically important for two reasons:
• At 11 million tonnes steel capacity which requires more than 3 times of natural resources.
• The Company does not possess its own coal or iron ore mines – coking coal is completely imported while iron ore is primarily sourced from near by mines.
Coal sourcing
Achievements, 2011-12
• Sourced around 25% of the coking coal from locations other than Australia; diversifying the sourcing basket.
• Reduced coal blend cost and thereby coke cost by introducing coal fi nes.
• Reduced the coal cost through unique initiatives.
Key initiatives, 2011-12
• Diversifi ed the procurement of coking coal from Australia to other places.
• Used 10-15% coal fi nes, reducing hard coking coal requirement by about 10%.
• Replaced corex fi nes with alternate coals, improving yield from 1.42 to 1.39 and reducing fuel rate (coke rate) by around15Kg/thm.
• Adjusted swiftly to evolving market dynamics the Company immediately procured large volumes from various nations at less than the benchmark price, resulting in signifi cant savings on a CNF basis.
• Negotiated for PCI coal (which substitute’s coke in blast furnace operations) and achieved a substantial reduction over the Australian benchmark price.
Road map for 2012-13
• Reduce dependence on Australia for coal sourcing while increasing imported volumes from other destinations.
• Increase blending of cheaper coal in the coal blend for coke making.
• Stabilise operations with increased usage of PCI.
Iron ore sourcing
Achievements, 2011-12
• Sourced iron ore despite the order of the Honourable Supreme Court banning iron ore mining in Karnataka.
• Purchased 10.68 million tonnes of iron ore in e-auctions and received 75% of it till March 2012 end.
Key initiatives in 2011-12
• Diversifi ed iron ore sourcing prior to ban on iron ore mining in Karnataka state (traditional mines to Chitradurga mines) and increased sourcing volumes in the fi rst quarter of the fi scal.
• Made numerous representations before various authorities to expedite the availability of Iron ore to the Steel Industry in Karnataka state.
• Created infrastructure (weighbridges, loading stations, radio frequency and wi-fi solutions) to smoothen the e-auction process.
Road map for 2012-13
• Pursue to permit Iron ore mining to get supply of Iron ore.
• Scout for opportunities to acquire resource assets to secure business sustainability.
(2) Material handling.
At JSW Steel, competent raw material management is critical on account of the sheer volume to be managed daily - around 36,000 tonnes of coal, 60,000 tonnes of iron ore and 15,000 tonnes of fl uxes for the 11 mtpa capacity. The complexity is further amplifi ed as the incoming materials are sourced globally. Additionally, the team also needs to institutionalise a system where multiple material handling is eliminated as every handling exercise generates fi nes which are not desirable.
Achievements, 2011-12
• Successfully managed 26 million tonnes of raw materials 16% higher than the volume in 2010-11.
• Increased monthly rake handling 17.49%, managed 5,969 rakes during FY 2011-12. Achieved the highest rake handling in Mach 2012 at an average of 20 rakes per day.
Key initiatives in 2011-12
• Commissioned 19 Magnetic Separators, increasing conveyor belt life and reduced belt consumption.
• Modifi ed the online sinter route conveyor, increasing the fl exibility in feeding BF3 and BF4.

Eighteenth Annual Report 2011-12
62
• Installed de-dusting system at the Crusher & Screen Complex, facilitating superior control and cleaner environment.
• Installed dust suppression systems and de-dusting systems at yards and conveyors to minimise dust emission.
• Modifi ed conveyor chutes, diverter gates, among others, resulting in reduced spillage.
• Commissioned wireless system in Stacker Reclaimer to replace the control cable system, increasing availability.
• Replaced roll crusher by hammer crusher, improving crushing index of coke.
Road map for 2012-13
• Commission twin wagon tippling - Wagon Tipplers, a fi rst-time installation in India.
• Minimise waste and fi ne generation by fewer handling.
(3) Logistics
Every tonne of steel produced requires more than four tonnes of material movement (inward and outward). Being heavy and voluminous, the majority is transported by rail – inward material namely, iron ore (lumps and fi nes), coal, limestone and dolomite, are primarily moved in rakes.
At 10 mtpa, Vijayanagar Works manages about 44 rakes (32 inward rakes and 12 outward rakes) and moves 28,000 tonnes of hot metal in torpedoes and ladles internally – every day for 365 days. Hence, logistics graduated from an enabling service to a business critical division, ensuring seamless operations of the unit.
The relevance of JSW’s logistics is refl ected in the following statistics: JSW Steel alone accounts for 60% of the South Western Railways revenue pie; it contributes about 4% of the revenue of Indian Railways for commodities, which it transports by rail (steel, iron ore, coal, limestone and dolomite) and contributes about 3% of the total freight receipts of the Indian Railways.
The Company created adequate logisitics management infrastructure to manage large volumes:
Material receipt infrastructure
• Dedicated rail loading yard. Three entry points into the yard ensuring seamless movement of three rakes simultaneously.
• 26 full-length rake lines with weigh bridges.
• Six wagon tipplers to unload coal, coke and fl uxes in BOXN rakes.
• Track hopper to handle iron ore in bottom discharge wagons, capacity to unload 12 rakes: 42,000 tonnes per day.
• Dedicated rake handling yards for coal requirements.
Material dispatch infrastructure
• Three fi nished goods loading stations
• North yard - Nine full rake lines, four loading lines, seven cranes, weigh bridges and stabling lines with a capacity to load 200 wagons per day.
• Hot strip mill (HSM 2) - Two full rake loading lines and stabling lines with three cranes with a capacity to load 200 wagons a day.
• Wire rod and bar mills - one loading line (18 wagons) and stabling line in each shop, rake loading using magnetic cranes with a capacity to load 80 wagons a day in each shop.
• Manages more than 200 trucks, around 6,000 tonnes of steel for outbound dispatch per day.
Internal movement infrastructure
• The in-facility logistics infrastructure comprises 166 km railway line inclusive of Hot metal yards, 41 locomotives and Six trailers for internal material transfer.
Unloading points
The Company’s imports are managed largely across four ports in Goa, Krishnapatnam, Chennai and Karaikal. The majority of imports are routed through Goa and transported to the Vijayanagar Works facility by rail. The Karaikal port feeds the Salem facility while the other two ports import for both facilities.
Achievements, 2011-12
Despite stiff challenges throughout the year, the team delivered the following results:
• Managed 28.5 MnT cargo against 24.4 MnT 2010-11, an increase of 17%.
• Successfully handled 3.15 million tonnes of cargo (68 vessels) at the Chennai port, emerged as the highest dry bulk cargo user at Chennai port for all four quarters.
• Commissioned the HSM-II despatch yard to load two rakes inside the yard, creating additional infrastructure to load 250 wagons - 15,000 tonnes daily.
• Achieved the best steel rake loading of 198 rakes in December 2011 at 6.2 rakes per day; highest loading in a single day stood at 13 steel rakes loaded on 31st December 2012.
• Increased proportion of rail dispatches from about 60% in 2010-11 to about 72%.
• Managed 820 rakes in March 2012, setting the bar high for the coming fi scal.
Key initiatives in 2011-12
• Improved loading at the Goa port (coal and fl uxes), average six rakes per day in the fourth quarter of 2011-

63
Steel Limited
12 (an average of 4.8 rakes in 2010-11) with maximum eight rakes loaded in a day; reduced logistics cost as handling and inland transit costs are lesser than other ports. The team worked on 77 vessels at the Goa port unloading 5.6 MnT of imported resources.
• Initiated operations at additional ports in Mangalore, Ennore, Ratnagiri, Karaikal and Gangavaram, ensuring seamless fl ow of raw materials.
• Created three-grid formation at the raw material receipt yard entry point for effi cient and safe movement of rakes in and out of the plant; three rakes can move in and out of the plant simultaneously.
• Added nine full-length rake lines at the raw material receipt yard taking the total number to 26, commissioned Tippler 5 and added pre-tippler and post-tippler lines, added three in-motion weigh bridges, increasing loading and unloading capability.
• Commissioned two tipplers at the Energy yard, capable of handling eight rakes per day, provided direct connectivity through conveyors to the energy plant (for coal) and to the benefi ciation plant (for iron ore fi nes).
• Installed two track hoppers in two lines for merry-go-round scheme on Engine-on-Load with an unloading capacity of 12 rakes per day with the BOBSN rakes; this helps unload a single wagon in about 3-4 hours against the existing 10-hour unloading time per rake.
• Successfully operated the fi rst set of BOBRN and BOBSN rakes on the dedicated iron ore unloading infrastructure. It also assures that when private mine operations commence, the team can achieve a minimum of four trips per rake daily.
• Invested in six DLW locomotive of 1350 HP and eight BHEL-make 700 HP loco’s; increased the loco fl eet to 36, improving effi cient internal movement and reducing railway rake detention.
• Increased the total track network to 166 kms inside Vijayanagar Works (107 kms as on March 31, 2011) – connecting production yards with raw material and dispatch yards
• Initiated special purpose vehicles for CR coil movement to ensure quality and timely product delivery.
• Undertook bay extensions at the wire and bar rod mills to allow an additional eight rakes for loading.
• Commissioned three new weigh bridges (earlier only one) at the despatch yard which are railway-calibrated and controlled, eliminating jamming at the despatch yard and enables faster product despatch .
• Invested in infrastructure at the CTL-5 unit to increase despatch capability from 15,000 to 30,000 tonnes per month.
Road map for 2012-13
• Maintain a prudent balance between rail and road logistics to partially offset the steep hike in railway freight rates in March 2012.
• Plan a Y-connection at the CRM 2 gate to eliminate congestion and facilitate faster material movement to Chennai.
• Complete interlocking and Central Control tower projects in line with Railway System. This unit will control rake movement into the plant, and internal and external movement. It will eliminate manual intervention in guiding rakes to a specifi ed line.
• Create a train examination facility inside JSW to check rakes regularly. This will save time by sending the rakes to Hospet for checking and return (about 16-18 hours) and will also ensure rake availability.
• The Guntakal-Bellary-Hospet section was sanctioned for railway electrifi cation in the current Railway budget. This is expected to improve rake turnaround.
(4) Energy management
In steelmaking, hot air is a critical input as it is synonymous with energy. It will be interesting to note that there is no external fi re source which melts iron ore in the blast furnace. It is simply a chemical reaction between coke (concentrated carbon) and hot air - an exothermic reaction - generating huge amounts of energy, more than suffi cient to melt iron ore to molten iron. Besides, the hot air which emits steam is further used to generate power and other key shop-fl oor operations across the plant.
At JSW, energy management comprises maximising the collection, recycling and reuse of hot air and process gasses to reduce fossil fuel consumption and specifi c energy consumption across the plant.
The Vijaynagar Works is among the few integrated Indian steel plants where a majority of the power generation is based on waste heat, process gas and solid waste. In doing so, the team minimises pollution, extends the useful life of resources (utilising waste gases in the operational process, replacing fossil fuel) and facilitates nation building (manufacturing steel, the infrastructure backbone).
Achievements, 2011-12
• Commenced operations of its 300 MW captive power plant (CPP 4).
• Reduced specifi c energy consumption to 5.98 GCal/tonne of crude steel in 2011-12 against 6.10 GCal/tonne of crude steel in 2010-11.
• Reduced corex fl are gas from 2% in 2010-11 to 1.5%.
Key initiatives, in 2011-12
• Stabilised operations of the Energy Management Centre (the heart of energy management – generation

Eighteenth Annual Report 2011-12
64
and distribution – for the entire plant) with automatic generation of power rate of individual shops; extensive classroom and hands-on training to manage the equipment.
• Installed more than 170 meters across all gas-generating and consuming areas for real- time monitoring of the energy balance within the plant.
• Installed 13 CV analysers to provide real-time information to departments on the calorifi c value of gas and its fl ow – allowing them to make necessary adjustments (if necessary) to control energy consumption.
• Created a reliability group to undertake an in-depth study on equipment reliability, suggest an action plan and implement the same; the group’s training was provided by a globally reputed organisation in the fi eld – this predictive maintenance programme is expected to ensure maximum availability and optimum operation of the energy management infrastructure.
• Installed a heat tube in the waste heat recovery system of BF 3 and BF 4 to collect fl ue gases which were recycled to heat the combustion air and BF gas being fi red into the furnaces.
• Installed a waste heat recovery system for sinter cooler area at all sinter plants; the heat captured was utilised to generate steam for various shop-fl oor processes.
• Installed oxy-fuel burners for stoves in BF 2 – this will replace injection of air with pure oxygen into the furnace and is expected to reduce the fuel rate.
• Utilised the islanding scheme to eliminate plant shutdowns (the system isolates the plant from the state electricity grid in the occurrence of any disturbance or disruption, providing energy to the plant from captive power plants).
• Collaborated with Siemens to install ‘CLIMS’, an intelligent real-time load management solution which balances power generation with consumption, eliminating the need for islanding due to overload.
• Collaborated with Yantra Harvest Private Limited, a leading energy-saving solutions provider to conserve energy.
Road map for 2012-13
• Self suffi cient after commissioning of CPP-4 300 MW capacity.
• Complete the module to generate the automatic specifi c power rate and specifi c overall energy report for each unit; daily reports will be sent to each unit to act as a check on wastages and subsequent improvements.
• Reduce fl aring of BF (<5%) and Corex (<1%) gases, eliminating the fl aring of other process-generated gases.
Small is large
A reduction of 0.1 GCal/tonne of crude in specifi c energy consumption results in an annual saving estimated in excess of ` 60 crore.
(5) Utilities
While water corrodes steel, the latter cannot be manufactured without water. Water is used in all steelmaking processes – ore benefi ciation, quenching hot coke and sinter, cooling casters in the steel melting unit, cooling rollers in the rolling section and power generation.
At Vijayanagar Works, the frequent capacity expansions multiplied the need for water and the hunt for new fresh water sources. The recent capacity expansion to 10 mtpa increased the annual water requirement, making the sourcing from the Tungabhadra river inadequate for plant operations at optimum capacity. To meet additional requirements, the Company created its second water source – it laid a 172-km pipeline connecting Almatty dam to Vijayanagar Works.
Achievements, 2011-12
• Received the CII national award for excellence in water management.
• Emerged as the only Indian company to commission a 172 km-long pipeline (from Almatty dam to Vijayanagar Works) in just 36 months.
Key initiatives in 2011-12
• Completed laying the balance 50 kms of the 172 km-long pipeline from Almatty dam to Vijayanagar Works.
• Created a raw water pond with a capacity of 6.5 million cubic metre to store water equivalent to one month’s consumption to cater to sudden demand spikes.
• Commissioned the reverse osmosis (RO) plant to recycle blowdown water from other processes to the benefi ciation plant.
Road map for 2012-13
• Create another raw water pond with a capacity of 15-17 million cubic metre to store water equivalent to three months consumption to tide over the water shortage owing to reduced water fl ow from the Tungabhadra river during summer.
• Shift a 30-km stretch of the pipeline (Tungabhadra river to Vijaynagar Works) which is beside National Highway 67, to facilitate the four-laning of the highway.
(6) Research and Development
In today’s competitive world, research & development and innovation plays a signifi cant role in the growth and success of any major steel producer. As opposed to convention, innovation at JSW emerged as the principal tool towards

65
Steel Limited
quality improvement, cost reduction, extending useful life of steel products and optimising key inputs for steel production.
At JSW, innovation is driven by its skilled R&D team. It works to redefi ne national and global benchmarks in iron and steel manufacture. The R&D team work along with shop-fl oor teams to design and implement shop-fl oor process modifi cations; its efforts are facilitated by a full-fl edged R&D centre equipped with state-of-the-art pilot testing and simulation facilities.
R&D activities are focused on plant performance improvement, new process development, new product and grade development, energy conservation and waste management. This results in improved productivity and consistently declining costs.
JSW’s innovation-centric mindset is refl ected in its investment in R&D – the Company invested large sum of money over the last few years to strengthen facilities and infrastructure.
The R&D centre at Vijayanagar Works is the corporate R&D Centre – the centre for all research activities with R&D sub-centres at other units namely Salem, Tarapur and Vasind. Most research and development activities are conducted at the corporate R&D centre, while its implementation is undertaken by sub-centre teams. Also, R&D activities are reviewed by the Board on a quarterly basis.
Utilisation of low-grade raw materials
• Developed the benefi ciation fl ow sheet using banded hematite quartzite (BHQ) iron ore samples – extremely low-grade iron ore (Fe-45%) from the Bellary-Hospet region were tested in laboratory scale and will be studied in the next stage in BHQ pilot plant.
• Developed benefi ciation fl ow sheet for low-grade iron ore fi nes to develop a suitable fl ow sheet to produce iron ore concentrates for sinter and pellet feed.
• Tested coals from seven sources in pilot coke oven. These coal samples were blended in different proportions and tested in the pilot coke oven. Of these, four varieties were found suitable and hence used in coke making – reducing the dependence on a single source.
• Initiated laboratory scale studies to replace 100% limestone with calcined lime in pelletisation, improving crushing strength and improved high temperature properties. This resulted in reduced bentonite usage by 0.3% and impurity content by 0.6%.
Process modifi cations
• Carried out laboratory scale studies to recover iron content from tailings of Benefi ciation Plant 1, improving the yield and better product grade.
• Studies on recovering iron values from BOF sludge for pellet making through magnetic separation, resulting in a concentrate with 63% Fe and a yield of 64%.
• Implemented laboratory scale trials on recycling slimes through cold bonded pelletisation.
• Developed internal testing procedure, specifi cations and testing facilities to evaluate various tap-hole clay mass sources for iron making units.
• Modifi ed the port angle design of the ‘Caster Submerged Entry Nozzle’ using mathematical modeling software for SMS-II, reducing surface defects.
• Modifi ed the lance design for hot metal desulphurisation station through mathematical modeling, reducing carbide consumption.
• Developed and implemented the single step desiliconisation and desulphurisation process at hot metal pre-treatment station, optimising steelmaking cycle time and improving productivity.
• Developed formability diagrams for billet grades using ‘Thermo-mechanical Simulator (GLEEBLE)’ for process optimization.
• Reduced scale impression defect from 0.45% in 2010-11 to 0.06% in 2011-12 of the total fi nished product at continuous pickling line at CRM-1 by monitoring and modifying operating parameters.
Technology absorption
Briquetting of semisoft -coking coal fi nes for Corex: Around 30 to 50% of imported semisoft-coking coal received at Vijayanagar for iron-making through the Corex route was in the form of fi nes. The team developed a process for coal fi ne briquetting which can be used for iron-making in the Corex modules.
Predictive models
Deadman temperature prediction model: Developed a model to predict the temperatures in the deadman zone of the blast furnace. The model provides an insight to understand the internal thermal regime of the blast furnace.
Product development
The team developed 24 new grades customised to customer specifi cations. The key products developed comprise line pipe, electrical, medium carbon and extra deep drawing (EDD) grades.
Patents fi led
The R&D team fi led the following three patents during 2011-12:
• A system to improve the hot strip process in hot strip mills.
• A pellet induration system and a process to improve the induration of pellets involving the same.
• A dynamic separator adapted for dual stage mineral separation.

Eighteenth Annual Report 2011-12
66
Copyrights registered
The Company registered copyrights with the regulatory authorities in 2011-12 for the following:
• Blast furnace stove heat balance model.
• Spread sheet model to estimate burden profi le in blast furnace.
• Mathematical model for effi cient dense media separation.
• Model to predict fl ux and iron bearing feed rate in blast furnace.
Publication of technical papers
Some of the research work was published, resulting in 10 publications in reputed national and international journals such as Iron and Steel Institute of Japan, Ironmaking and Steelmaking, World Iron and Steel, Transactions of the Indian Institute of Metals, Steel Tech, Steel & Metallurgy, among others. Of these, eight papers were published in international journals and two papers in national journals.
Collaboration with leading academic and research institutes in India
The R&D team initiated a process for scientifi c collaborations with leading Indian academic and research institutes namely the Indian Institute of Science, Bangalore; Indian Institute of Technology, Kharagpur; Indian Institute of Technology, Mumbai; and CSIR - National Metallurgical Laboratory, Jamshedpur, among others.
Roadmap for 2012-13
• Develop the methodology for briquetting of high lime containing wastes generated at SMS.
• Implement the action plan based on the joint audit by LECHLER and the R&D team to improve the work rolls cooling effi ciency in fi nishing mill at HSM-1; develop the revised roll cooling header design.
• Complete the collaborative project with JFE, Japan on hybrid pelletised sinter (HPS) which is expected to maximise the use of pellet grade fi nes in sinter making and improve sinter quality and productivity.
(7) Project management
For most Indian organisations, implementing mega capex projects happens possibly once a year, followed by stabilisation and deriving returns from the project before conceptualising the second.
In 2011-12, the team executed over ` 40 million project at various location.
Project execution
The Company’s project management strategy is unique.
All projects are implemented by in-house teams only
• Optimises project costs, faster-implementation as teams work parallelly.
• Facilitates seamless innovation and maintains equipment through complete project knowledge.
• Creates an in-house knowledge repository for future reference.
The project management team comprises cross-functional participation
• Select members from diverse departments bring different skills and capabilities to the team.
• It also includes members from the project management core team.
• On project completion, that team is responsible for operating and managing that facility.
The cement, TMT and steel required for the project (about 20% of the project cost) is available in-house
• Ensures seamless availability of quality material.
• Reduces capex costs.
Project review
• Project managed and reviewed on real-time basis by the centralised project management team responsible for the particular project.
• Institutionalised a system of regular project review meets by the Company’s senior management; undertook in-depth gap analysis between budgeted progress with actual performance and drew from organisational resources to accelerate project progress.
• Increased the average packet size of procurement from project vendors, making commercials more attractive for vendors and optimising capital investments.
As a result, the project management teams redefi ned global and Indian benchmarks in terms of time taken to commission projects and stabilise operations.
Speed of project implementation
6.8 mtpa 10 mtpa
Coke ovens24 months 26 months
(4x 56 ovens) (4x 72 ovens)
Sinter plant 426 months 19 months
(2.4 mtpa) (2.8 mtpa)
Sinter Plant 325 months
(5.75 mtpa)
Blast furnace31 months 28 months
(BF3 - 3 mtpa) (BF4 – 3 mtpa)
LCP20 months 18 months
(3x300 TPD) (3x600 TPD)

67
Steel Limited
Achievements, 2011-12
• Commissioned BF 4.
• Commissioned the 1.9 mtpa coke oven 4.
• Commissioned the 2.6 mtpa Sinter Plant 4.
• Commissioned kilns 9, 10 and 11 (3 x 600 TPD) at the lime calcining plant.
• Commissioned the 4.2 mtpa Pellet Plant 2.
• Commissioned the 172-km Alamatty pipe line project to secure fresh water availability for 10 mtpa operations.
• Commissioned 300 MW power plant (CPP-4)
Road map for 2012-13
The company plans to commission the following:
• 2nd phase of the Benefi ciation Plant 2 taking total capacity to 20 mtpa of the unit by FY 2012-13 in phased manner.
• New cold rolling unit (CRM 2) – in a phased manner; the fi rst phase is expected to commence operations in FY 2013-14.
• 2nd Phase (1.5 mtpa) of New Hot Strip Mill, taking the rolling capacity to 5mtpa by September 2012.
• Enhancement of Crude steel capacity at Vijayanagar works from 10 mtpa to 12 mtpa.
(8) Information technology
Information Technology (IT) is a critical business driver which ensures seamless functioning of an organisation. IT is a common thread running across the business’ various organs and integrates confl icting functions towards a common organisational goal.
The Company created a 400+-member strong IT team, headquartered in Mumbai with units at all locations, to manage diverse business requirements.
Achievements, 2011-12
The year under review was challenging and equally rewarding with signifi cant achievements. We laid the foundation to integrate and align IT with broader business goals across the Company.
• Reviewed, re-engineered and harmonised key processes for standardisation across the organisation’s different steel works.
• Initiated the Business Process Re-engineering (BPR) project as a prelude to the new ERP implementation programme, reducing business complexity, eliminating duplications thereby saving resources and enhancing operating effi ciency.
• Cleansed and standardised master data; adopted UNSPSC (United Nations Standard Products and Services Code).
• Undertook ERP implementation based on the BPR exercise; this transformation across the Company’s locations is expected to be completed in 2012-13.
• Strategised to implement Enterprise Performance Management (EPM) modules solution. This will improve the ability to integrate, organise, foresee and analyse a wide array of fi nancial, operational, competitor and marketplace information. This solution will provide a single IT platform for the entire enterprise to undertake the annual planning and budgeting exercise.
• Rolled out the JSW Plant Operations Dashboard in more units at Vijayanagar Works.
• Created software support for the newly commissioned HSM 2 unit at Vijayanagar Works and integrated the same with the entire plant network.
• Introduced a heat-tracking module for the SMS 2 unit at Vijayanagar Works.
• Provided software support to the bar mill at Vijayanagar Works and updated the system with additional grades introduced in 2011-12.
Road map for 2012-13
The IT team has drawn up a clear roadmap to make the organisation more cohesive and accelerate the team’s response to external and internal challenges. The blueprint includes:
• Streamline and strengthen shop fl oor operations and superior integration with decision-makers for seamless information transfer. The Company will deploy best-in-class Advanced Planning & Scheduling (APS) tools, optimising the complex scheduling of steel melt shop, rolling mills and service centre operations
• Enhance and reengineer legacy MES (Manufacturing Execution Systems) solutions to meet new business challenges.
• Integrate L2-L3 systems to acquire data directly from the automation systems, eliminating manual intervention and increasing data accuracy and authenticity.
(9) Marketing
At JSW, saleable volumes have grown in multi-fold. Consider this: in just six years, saleable steel volumes more than doubled. The Company maintains a unique marketing policy --- sell then make --- which ensures a short working cycle and hence comfortable liquidity.
To strengthen its focus on diverse segments, JSW Steel has created a marketing teams for individual product segments namely fl ats and long. In addition, it has carved out separate teams to focus on retail sales and for auto sales.

Eighteenth Annual Report 2011-12
68
The success of the marketing team is refl ected in the following
• Ability to sell increasing volumes despite adversities – 3.41 million tonnes in 2007-08 to 7.82 million tonnes in 2011-12 – a 23% CAGR.
• Approvals from global and leading Indian OEMs in the automotive segment which has only enhanced the respect for the brand.
• Pioneering the concept of retail sales in India, providing a unique awareness and purchase experience through its 350-strong retail chain in 150 plus districts of India which sold 1.40 million tonnes of value-added steel this year.
a) Flat products (Hot-rolled and cold-rolled products)
The Company’s fl at products– hot rolled products 5.365 million tonnes concentrated in Vijayanagar Works. Of the total production of rolled products, 1.762 million tonnes comprises value-added steels used in niche applications – this proportion is expected to increase signifi cantly with the Company’s focus on the auto segment complemented with the technical and technological support from JFE, Japan.
Achievements, 2011-12
• Marketed 4.27 million tonnes of HR products against 3.06 million tonnes in 2010-11 – a growth of 40%.
• Marketed 1.68 million tonnes of CR products against 1.64 million tonnes in 2010-11 – a growth of 2%.
• Received an approval from Ford India for supplies to their new SUV model B515 to be launched in 2013.
• Received an approval for supplies to Maruti vendors- CRCA grades.
• Received an approval from Nissan for CRCA grades.
• Received RDSO approvals for supplies to railways in hot-rolled grades IS1079, IS2062 Gr B & IS5986.
• Received the ‘Best Support’ award from Ashok Leyland.
Key initiatives in 2011-12
• Developed four HR steel grades for auto segment which is under evaluation by global OEMs.
• Developed the API X-80 grade (used in oil and gas pipelines) which is under trials with customers.
• Developed four CRCA grades for the automotive industry (inner and outer usage) which are under various stages of approval with OEMs.
• Strengthened presence in the North which is India’s largest HR product market.
• Entered into structured MoUs with leading customers with innovative schemes and multi-layered incentives which accelerated offtake – 43 partnerships were cemented in 2011-12.
• Strengthened relations with the pre-engineered building (PEB) sector which consumes the entire range of value-added fl at products.
• Increased business volumes with the pipeline segment with its API X-70 steel grade.
• Developed new user segments namely the energy sector which covered the decline in offtake from the automotive segment.
• Exported products to international destinations which represented an extension of domestic business relations to global boundaries.
• Organised meets and plant visits with customers and the product’s end-users to strengthen business relations and enhance product and process knowledge; organised the largest such meet in India in February 2012.
• Increased export volumes of rolled products by strengthening presence in the Middle East and African markets.
• Created a special strategic business unit (SBU-A) to focus on the automotive business
• Initiated periodic knowledge sharing sessions with SBU-A members pan-India.
• Initiated involvement in EVI (Early Vendor Involvement) activities with OEM customers.
• Spearheaded the approval processes with leading automobile companies like Maruti, Honda and Nissan.
Road map for 2012-13
• Market additional HR product volumes with the commissioning the second phase of HSM 2.
• Commercialise outer application steel grades with global OEMs which are at various stages of approval.
• Diversify presence into other user sectors – electrical steel being a new application initiated by the Company.
b) Coated products
This largely comprises the products from the downstream units of Tarapur and Vasind which manufactures products at the top-end of the value chain. The product basket largely caters to the consumer durable segment, roofi ng segment (Tier II, Tier III towns and villages), automotive segment among others. JSW Steel is the only manufacturer in India and among few others in the world to market the product under the “Galvalume” brand.
Achievements, 2011-12
• Sales volumes grew 13% from 0.86 million tonnes in 2010-11 to 0.97 million tonnes.
• Exports grew 24% from 0.38 million tonnes in 2010-11 to 0.47 million tonnes.

69
Steel Limited
Key initiatives in 2011-12
• Focused on growing export to compensate the decline in retail sales volumes.
• Focused on growing the value-added segments in the roofi ng segment in rural and semi-urban locations to replace conventional products.
Road map for 2012-13
Create markets from the additional product volumes by commissioning new colour-coated lines at Tarapur and Vasind.
c) Long products
The Company’s long products are manufactured at two units – Vijayanagar Works and Salem Works. While majority of the production of Vijayanagar Works is the low and medium value steels, Salem Works only concentrates on high value steel for the auto sector and for niche applications in other sectors. It is India’s largest special steels plant.
Achievements, 2011-12
• Sales volumes of long products increased 38% from 1.06 million tonnes in 2010-11 to 1.46 million tonnes in 2011-12.
• Sales volumes from Vijayanagar Works increased 56% over the previous year; TMT bars and electrode grade products were well received by the market.
• Sales volumes from Salem Works increased over the previous year; approvals and production ramp up at the blooming mill was the major contributory to the sales volume.
Key initiatives in 2011-12
• Established a strong presence in special grades for wire and electrode industry generating superior realization.
• Established strong presence with major projects executioners namely L&T, Lanco Infratech, Ultratech, Reliance, Jaypee Associates, Punj Lloyd, India Bulls for TMT bars.
• Received major approvals from auto majors namely Tata Motors, Bharath Forge and Mahindra & Mahindra.
• Commenced commercial supplies of steel for crankshaft (critical application steel) to Honda.
• Achieved successful trails for crank shaft & connecting Rods with global auto majors.
• Entered into MoU with various clients which promises assured annual off take.
Road map for 2012-13
• Create avenues to market the additional production at the wire and bar and blooming mills at Salem.
• Increase sales of TMT bars and market new grades of value added steel from the wire and bar mill at Vijayanagar Works – high carbon steel and electrode grade steels.
d) Retail sales
JSW created a fi rst-of-its-kind distribution network ‘JSW Shoppe’ with 350 outlets as on March 31, 2012.
It is an honest attempt to market quality steel products to steel consumers in these locations by educating consumers of product usage – allowing them to make informed decisions. It is a one-stop shop showcasing all JSW products; the outlets are like mini-departmental stores resulting in enhanced product branding and customer education. These outlets cater to retail customers with small quantity requirements and institutional customers with bulk orders.
JSW Shoppe emerged as an aspiration for entrepreneurs in semi-urban and rural locations – word of mouth emerging as an effective branding and network expansion tool. The Shoppe network currently covers 150+ districts across 22 states. Around 46% Shoppes are located in semi-urban and rural areas, making deeper inroads in areas with high growth potential. Sales from semi-urban and rural areas comprise about 14% of the overall sales volume and around 20% of the total and branded sales volumes.
Location Number of Shoppes Retail network growth
(%)
Sales volume growth
(%)
2010-11 2011-12 YoY YoY
Metros 75 103 37 20
Urban 67 68 1 33
Semi-urban 113 138 22 31
Rural 25 41 64 63
Total 280 350 25 25
Global watermark
The Harvard University has covered the organized steel retailing of JSW Steel through the JSW Shoppe concept as the most prominent in India which focuses on a relationship-based distribution model as opposed to the transactional distribution model forfranchising.
Achievements, 2011-12
• Sales through the JSW Shoppe increased 23% from 1.14 MnT in 2010-11 to 1.40 MnT
• Number of outlets increased from 280 as on March 31, 2011 to 350 as on March 31, 2012
• 60% sales volume achieved through the unique integrated MoU of all products.
Key initiatives in 2011-12
• Introduced an integrated MoU concept for all products, an unique initiative in the steel industry.

Eighteenth Annual Report 2011-12
70
• Increased penetration in non-metro areas increasing the Shoppe network from 138 in 2010-11 to 179 in 2011-12.
• Identifi ed retailers attached to JSW Shoppes across more than 150 districts and connected them with the Shoppe by leveraging the JSW brand – over 3,000 retailer boards installed.
• Deployed nine JSW Mobile vans across 12 states to increase awareness of branded products in semi-urban and rural areas.
• Organised numerous meets covering dealers, retailers and others in the distribution network across various towns to keep them abreast of company events and to gain consumer insights.
• Implemented wall paintings and bus panels (600 buses) across various states to enhance brand awareness.
Road map for 2012-13
• Increase the reach of JSW Shoppe by strengthening the network to 400+ by March 31, 2013.
• Streamline the supply chain and servicing effi ciency at all Shoppe outlets to ensure that the right product is available at the right place in time.
• Training program for Shoppe Sales Representative planned to enhance product knowledge & selling skills.
• Retail MoU initiative to be rolled out in Semi-urban and Rural Shoppes.
Vision-2015
About 600 Shoppes by 2015 and an average monthly sales volume of 1,000 tonnes per Shoppe cumulating to about 7.2 MnT annually (post 2015 when all 600 Shoppes are operational).
(10) Intellectual capital
“My people are my priceless assets.” – Sajjan Jindal
JSW’s global respect is derived from its rich intellectual capital, which is a mix of the three E’s - energy, enthusiasm and experience. These intangible forces are refl ected in two realities:
• The senior management’s average experience is over 20 years in the steel sector.
• The Company’s average age is about 34 years.
JSW’s uniqueness lies in the fact that it recruits employees and nurtures their skills to transform them into entrepreneurs with adequate authority, decision-making and risk-taking abilities – making each individual place the Company before self, and align personal career progression to accelerate the Company’s growth.
Counter-convention, determination and stretch achievements is what JSW is all about – built solely on the passion of its people who dare-to-dream and persevere-to-perform – delivering unbelievable results.
• Commissioned India’s largest blast furnace (3 mtpa capacity) in February 2009 when steel became an ‘untouchable’ commodity by users.
• Continued operations at lower level at its fl agship facility (Vijayanagar Works) despite scarcity of iron ore due to mining ban in Karnataka.
• Stabilised operations of BF 4 (India’s largest blast furnace) in only 86 days – a new benchmark for the Indian steel sector.
It is this niche that positioned JSW Steel as India’s fastest-growing steel company and among the lowest cost steel producers globally today.
The knowledge repository
JSW Steel’s energy, excitement and enthusiasm is refl ected in an important reality – a talent pool comprising 9522 employees (as on March 31, 2012) for a 11 mtpa integrated steel plant -- predictably the smallest team for such a massive operation. Interestingly, at JSW Steel, the labour cost per tonne of steel is one of the lowest globally.
The talent pool comprises a diverse mix of MBAs, CAs, CSs, ICWAs, engineers, graduates, postgraduates and diploma holders. The following is the employee composition:
Vision
Our vision is based on a sound HR model which emphasises the following factors which form the foundation of the Company’s HR strategy and practices:
• Transparency and employee care.
• HR systems and practices aligned with business needs and rounded in its culture.
• Managers and leaders acting as People Managers and Enablers for employee engagement and development.
Policy formulation
The HR team’s scope has widened to play an integral role in planning, developing and enhancing the capabilities of our people to align them with the Company’s core strategies and objectives.

71
Steel Limited
Mobilising talent
India Inc.’s irony: Skilled people resources are getting exceedingly scarce in the world’s second-most populous nation. Attracting qualifi ed professionals is becoming increasingly challenging in India.
The Company recruits graduates, diploma engineers and management students from leading engineering and management colleges. The Company participated in campus recruitment for management graduates from IIMs and engineers from NITs. The Company held walk-in interviews to recruit prospective employees. The Company’s lateral recruitment of experienced professionals is driven through references, connections, advertisements and placement agencies.
Induction training: Induction training integrates a recruit with the Company’s culture and practices, leading to enhanced productivity. Recruits undergo a structured 15-day induction training, covering the Company’s philosophy, operations, strategy and objectives. This programme also covers technical and operational shop fl oor training, plant visits, insights into steelmaking processes as well as behavioral, safety and environment-sensitivity training. Subsequent training modules are uploaded on the HR portal for reference. Induction program titled ‘Swagatam’ for campus recruits in MBAs/CAs has been put in place to enable the fresh recruits adapt to JSW in quick time.
Early day facilitation: The Company launched a mentoring programme to groom fresh recruits to understand JSW’s culture and make a meaningful contribution to the organisation. Seniors in the same department partnered fresh recruits to enable them to learn the ropes with ease and to seamlessly adapt to the organisation’s culture and practices with speed.
Additionally, the HR team organised development initiatives to groom mentee’s like Input Seeking Session by Thomas International, Mumbai. A workshop on “Achieving Personal & Professional Excellence” was organised for mentees to align personal goals with organisational goals.
Young professionals were provided with development feedback through psychometric assessment such as Thomas Profi ling and were encouraged to formulate self-development plans.
To strengthen mentoring skills, coaching sessions were conducted through the reputed Stephen Covey South Asia Center.
Growing the learning curve
Since its inception, the Company has consistently aggregated competencies from diverse cultures, educational backgrounds and domain experience with a singular objective: to accelerate growth. It reinforced this
focus through institutionalised multi-hierarchical training extending from steel manufacture to holistic personality development which commences from day one (through rigorous induction training) followed by specialised training at periodic intervals.
Additionally, the Company consciously encourages talent mobility across locations to provide growth and exposure. The policy of internal job posting ensures that employees apply for vacancies in other locations through internal advertisements in electronic and print media. In 2011-12, more than 175 employees moved between departments within the organisation, widening their knowledge horizon.
Employee welfare
‘Do unto others as you would have them do to you’ – JSW’s people philosophy
JSW Steel embodies this phrase when it comes to its people. The Company provides its Employees with facilities – it ensures that all necessities are taken care of – providing complete peace of mind for Employees and ensuring an effi cient, healthy and satisfi ed work force. This effort is rewarded by a single-minded focus of each Employee on consistently exceeding expectations.
Township: The Company set up four townships in Vidyanagar (Vijay Vithal Nagar Township, Shankar Gudda Township and Township planned in Basapur), spanning a total residential population of over 5000 families. These townships are supported by sound infrastructure and amenities (24x7 electricity, water supply, ATMs of major banks, grocery shops and other outlets for daily necessities). Weekly car services (for car owners at subsidised costs) and weekly auto exhibitions (for local car dealers) are organised in the township. In December 2010, the Company launched a Wi-Fi facility at Vijaynagar township for employees; 4,000 new houses have been planned in the existing townships to house the growing talent pool.
Transportation: The Company provides transportation facilities to employees through its 63 buses and 36 cars. It provides transportation to its team members and their families between Bellary, Hospet, Vidyanagar Township, V.V Nagar Township and Shankar Gouda Township.
Canteen: A total of 13 independent canteen facilities are provided, catering to every plant department. Healthy food at affordable prices is provided to employees. Further, 16 restaurants with different cuisines are maintained within its townships.
Medical assistance: A 75-bed multi-speciality hospital (Jindal Sanjivani Hospital) spread across 27,000 sq. ft was set up in 2003 in Toranagallu to provide medical aid. The non-profi t entity is a joint effort of JSW Steel, Jindal Education and Medical Trust.

Eighteenth Annual Report 2011-12
72
Knowledge Centre: JSW maintains the following schools for the children of employees at Vijaynagar:
• Jindal Vidyamandir –Affi liated to CBSE, providing world-class educational facilities.
• Jindal Adarsh Vidyamandir (JAV) – State board-affi liated school situated at Shankar Gouda Colony.
Scholarships: The Company granted scholarships to meritorious children of employees to pursue professional degree courses like engineering, medicine, management, architecture, and chartered accountancy, among others.
Fitness and recreation facilities: In order to create a healthy working environment, the Company encourages physical fi tness by providing facilities for squash, badminton, table tennis, billiards, swimming, football, cricket, volleyball and gymnasium at a state-of-the-art sports club. It also provides movie theatres.
Employee Benevolence Scheme: The Company provides an employee benevolence scheme where employees are compensated in case of an unfortunate accident or incident. It provides fi nancial assistance to the family of the deceased employee in case of sudden/prolonged illness or permanent disability while in service.
Performance management and reward system
JSW Steel’s functional meritocracy is based on individual performances. The Company’s performance management and review system evaluates employee performance across multiple KPIs (targets and achievements; working style and culture; business/domain knowledge and personal growth; organisational initiatives).
The performance management system ensures that the individual’s expectations and key result areas are formulated in alignment with the organisation’s business goal of sustaining a high performance culture.
The Company’s compensation package is linked to performance and benchmarked to better-than-industry standards.
Employee performance is further reinforced by various reward and recognition practices. The performance-based reward system allows the organisation to pursue its strategic goals and objectives and improve employee performance and retention.
The Company introduced ESOPs to senior executives, transforming them into proud partners in the Company’s growth. This initiative is expected to cement a stronger bond between the individual and the organisation.
Leaders of tomorrow
JSW’s proposed growth, the production capacity to 40 mtpa by 2020 will need to be driven by emerging leaders. The Company initiated HBPA and PAPI schemes to create a leadership pipeline.
HBPA (Helping Balance Personal Aspirations): Facilitates feedback for employees on leadership skills from colleagues. Helps compare self-perception with external feedback, creating a basis for gaps to be addressed.
Personality and Preference Inventory (PAPI): This personality instrument helps the organisation understand various (internal and external) behaviour drivers.
Thomas Profi le: This programme was initiated to identify high potential employees and create a talent pool to address growing organisational needs. JSW tied up with Thomas Internationals for a talent identifi cation process. Many employees (including middle management Employees) were covered across the group. All the Employees were assessed on interpersonal skills, learnability, execution, problem solving and decision making. Following extensive interaction in workshops and classroom interaction, more than 122 high potential employees (HPE) were shortlisted.
Training: The HPEs were sponsored to attend external seminars at reputed institutes such as IIMs, Harvard Business School and India Center, among others. Some of the programmes conducted for HPEs in different locations include – business acumen (Capston Business Simulation – USA), grid leadership and managerial skills, among others.
(11) Internal control and audit
Internal control
Internal control systems are integral to the Company’s corporate governance. The Company has a proper internal control system commensurate with the size and nature of its business. The key features of its internal control system are:
• Documents policies, guidelines, authorities and approval procedures covering the Company’s important functions.
• A contemporary ERP system which covers most of its operations and is supported by a defi ned online authorisation protocol.
• Ensures complete compliance with laws, regulations, standards and internal procedures and systems.
• De-risks the Company’s assets/resources and protects them from any loss.
• Ensures the integrity of the accounting system; the proper and authorised recording and reporting of all transactions.
• Prepares and monitors annual budgets for all operating and service functions.
• Ensures reliability of all fi nancial and operational information.
• Audit committee of Board of Directors, comprising Independent Directors. The Audit committee regularly reviews audit plans, signifi cant audit fi ndings, adequacy of internal controls, compliance with Accounting Standards, among others.

73
Steel Limited
• Quarterly review by sub-committee of the Directors’ consisting of Executive and Independent Directors‘.
The Company’s exposure to and capability to manage various risks is as under:
Macro economic factors affecting investments and best operations
With steel being a global commodity, the Company’s business prospects and growth is affected by its global demand and supply position in the long run, global steel trade in the medium term and interest and foreign exchange rates in the short term. These factors affect the Company’s business volume, organisational liquidity, profi tability margins and investment returns.
The Company’s market research cell keeps a stringent vigil on the changes in global economies that have a strong infl uence on the steel sector to analyse their impact on the sector and suggest and implement mitigation measures. Additionally, the Treasury Committee ensures effective hedging against volatility in interest/exchange rates.
Raw material security
Non-availability and price volatility for critically essential raw materials namely coal and iron ore can affect production.
The Company procures iron ore primarily from the Bellary and Chitradurga regions of Karanataka. The government regulation banning iron ore mining in the Karnataka state severely stifl ed iron ore availability.
The Company proactively tracks the factors affecting availability and plans its sourcing strategy accordingly. The Company entered into contracts with NMDC and actively participated in e-auctions to sustain the availability of this key input.
The Company imports a majority of its coal requirement. It broad-based it’s sourcing geographies to eliminate major dependence on a single nation or company.
Integration
Increasing size and cultural diversity results in integration challenges. This is more pertinent for the acquired units where cultural diversity along with diversity in business models and systems/processes make the challenge more pronounced.
For effective integration, the Company organises regular employee engagement programmes, inviting Employees from different locations to coordinate and work as a team for a particular cause – strengthening team bonding. Additionally, an integrated information and communication system ensures timely information dissemination, consensus development and prudent decision-making.
The Company ensures regulatory compliance through clear accountability and regular internal audit reviews.
• A comprehensive Information Security Policy and continuous update of IT systems.
The internal control systems and procedures are designed to identify and manage risks, the procedure-led verifi cation of all compliance as well as an enhanced control consciousness.
Internal audit
The Company has an internal audit function that inculcates global standards and practices of international majors into Indian operations. The Company has a strong internal audit department comprising more than 25 executives reporting to the Audit Committee (Independent Directors) who are experts in their fi eld. The Internal Audit Department obtained the ISO 9001:2008 certifi cation during the year.
The Company successfully integrated the COSO (Committee of Sponsoring Organizations of the Treadway Commission) framework with its audit process to enhance the quality of its fi nancial reporting, compatible with business ethics, effective controls and governance.
The Company extensively practices delegation of authority across its team, which creates effective checks and balance and eliminates possible gaps within the system. The internal audit team has access to all information in the organisation – this is largely facilitated by ERP implementation across the organisation.
Audit plan and execution
The Internal Audit department prepared a risk-based audit plan. The audit frequency is decided by risk ratings of areas/functions. The audit plan is carried out by the internal team.
Addition to the audit plan: The audit plan is reviewed periodically to include areas which have assumed signifi cant importance in line with the emerging industry trend and the Company’s aggressive growth. Additionally, the Audit Committee also places reliance on internal customer feedback and other external events for inclusion of areas into the audit plan.
(12) Risk management
The Company follows the globally recognised Committee of Sponsoring Organizations (COSO) framework for risk management to proactively manage risks and opportunities that impact organisational objectives.
The Company’s risk exposures are identifi ed and assessed, and the mitigation measures discussed in the context of its risk-taking appetite. The risk management framework provides:
• Owning process-specifi c risks by the respective risk owners.
• Timely interaction across functions at respective units where, cross-functional interdependencies exist.
• Timely escalation of issues to the Corporate Committee to ensure timely review of strategy, policies and processes for timely/effective response to risks/opportunities.

Eighteenth Annual Report 2011-12
74
Infrastructure and logistics support
The expanding business operations multiplied the material movement volumes into the plants; making material management at the ports, in transit (from port to plant) and within the plant (stock yard to customer locations) extremely challenging.
• The Company tracks the development at ports on a real-time basis; it increased the number of ports for offl oading imported resources.
• The Company communicates regularly with railway authorities to ensure adequate and timely availability of infrastructure and rakes.
• The Company streamlines distribution through yards by adequately connecting the yards with consuming stations.
• The Company proactively plans for adequate infrastructure for loading, unloading and storage in its plants.
Environment, Health and Safety (EHS)
Unpleasant events on account of (EHS) factors can adversely impact human life, property and operations.
The Company maintains the safety highest standards within its operating units which minimises calamities during day-to-day operations. The safety team conducts regular training programmes to instill the concept of maintaining safe operations among its Employees and to educate the team on the safety norms and procedures to be followed in an unfortunate situation.
(13) Safety fi rst
‘Hard work and a safe environment will accelerate our passion to deliver’ Sajjan Jindal
Safety is increasingly relevant for JSW Steel, expanding its operating capacity 3-fold in the last fi ve years.
Philosophy
At JSW, safety compliance is not a style statement, but an evolving science, meticulously practised by every team member. The Company’s operations are benchmarked to meet exacting global standards, refl ected in all its units being OHSAS 18001-certifi ed. Its proactive safety philosophy created multiple safety levels at all operational units, reinforced by extensive training programmes, ensuring information dissemination and 24X7 preventive safety measures – cementing team confi dence in returning home safely despite the hazards involved in steelmaking.
Dedicated safety management team: The 39-member safety management team ensures comprehensive compliance through adequate training. The team designated one safety
manager at every shop fl oor to ensure adherence to safety norms during operations.
Key initiatives, 2011-12
Improving safety standards and compliances
• Appointed EI Dupont India Private Limited, a world-renowned safety consultancy, for a period of fi ve years, to implement global best practices at its facilities, strengthening the organisational safety culture.
• Designated 70 Employees as safety trainers after extensive in-class and shop fl oor training; they will now impart safety training to other members in the team.
• Conducted monthly mock drills to strengthen Employees knowledge and awareness on personal safety and safety of organisational assets in any unfortunate mishap namely fi re, gas leakage, electrical short-circuit, among others.
• Instilled Employees commitment to safety at all times through the following:
o Penalty for violation in any safety rule.
o Mails were sent to the entire team highlighting safety violators in a particular week.
Works area improvement
• Installed a silencer for noise reduction at SMS-2 degasser vent, reducing noise levels from 110 db to 90 db, which is the permissible exposed limit (PEL).
• Modifi ed silencers at the Corex unit and the oil seals at the wire rod mill to reduce noise levels to PEL.
Hazard elimination
• Scrapped and disposed 12 chlorine toners, eliminating the risk of toxic gas leakage from tonners.
• Expanded crane walkways at the cold rolling mill (CRM) to provide a safe walkway
• Replaced the glass walls of the converter bay control room in SMS 2 with explosion-proof walls.
Road map for 2012-13
• Prepare an action plan in consultation with EI Dupont India Limited to meet global safety standards and create a world-class safety culture in the Company.
• Change the culture by providing safety training to employees and instill the importance of safety in them.
• Reorganise the organisational structure by creating committees and sub-committees and involving the senior management in the structure to infuse the importance of safety.

75
Steel Limited
(D) LOOKING INTO THE FINANCIAL STATEMENTS (STANDALONE)
Highlights 2011-12 ` In Crores
2011-12 2010-11 Growth %
Revenue from operations 32,123 23,367 37%
Operating EBIDTA 5,631 4,777 18%
PAT 1,626 2,011 -19%
Earnings per share (diluted) (`) 71.42 96.33 -26%
ROCE (%) 11.90% 13.31%
RONW (%) 9.1% 15.0%
EBIDTA margin (%) 17.5% 20.8%
Net Debt gearing ratio 0.69 0.57
Revenue from operations for the FY 2011-12 and FY 2010-11 is ` 32,123 crores and 23,367 crores, respectively, with a growth of 37%, over the previous year, mainly driven by better product-mix and volumes.
The Operating EBIDTA for the year was ` 5,631 crores and the EBIDTA margin for the year was 17.5%. The Company posted a Profi t after Tax of ` 1,626 crores.
The Company’s total net debt gearing was at 0.69 (as against 0.57, as on 31.03.2011). The weighted average interest cost of Debt was at 8.19% (as against 7.58% as on 31.03.2011).
Revenue analysis ` In Crores
2011-12 2010-11 Change Change %
Domestic Turnover 28,770 21,430 7,340 34%Export Turnover 5,888 3,662 2,226 61%Gross Turnover 34,658 25,092 9,566 38%Less: Excise duty 2,598 1,967 631 32%Net Turnover 32,060 23,125 8,935 39%
Product wise quantity break-up (In MnT)
2011-12 2010-11
Products Domestic Export Domestic Export
Semis 0.304 0.105 0.305 0.039
Rolled products – Flat 3.584 0.682 2.737 0.319
Rolled products – Long 1.419 0.038 1.024 0.031
Value-added products 1.074 0.609 1.142 0.502
Total 6.381 1.434 5.208 0.891
Saleable Steel 7.815 6.099
The signifi cant growth in revenues during the year was mainly attributable to focus on diverse various segment. In addition, the company has carved out separate teams to focus on retail and auto sales.
Highlights 2011-12
• Sales volumes increased 28% from 6.10 million tonnes in 2010-11 to 7.82 million tonnes in FY 2011-12
• Sales value grew by 39% in FY 2011-12 over the previous year.
• Sales from semi-urban and rural areas comprise about 14% of the overall sales volume and around 20% of the total and branded sales volumes.
• Number of JSW shoppe increased from 280 as on March 31, 2011 to 350 as on March 31, 2012.
Other income ` In Crores
2011-12 2010-11 Change Change %
Other Income 179 235 (55) -24%
Other income for the year is reduced by ` 55 crores mainly due to exchange gain of ` 67 crores was included in Other income in FY 2010-11.
Cost of materials consumed ` In Crores
2011-12 2010-11 Change Change %
Cost of materials consumed 20,960 14,803 6,157 42%
The Company’s expenditure on raw materials increased 42% from ` 14,803 crores in FY 2010-11 to ` 20,960 crores in FY 2011-12. The increase was largely due to the increase in crude steel production by 16% and Iron ore price by 3 % and coal/coke price by 19 % during FY 2011-12 compare to FY 2010-11.
Employee remuneration and benefi ts ` In Crores
2011-12 2010-11 Change Change %
Employees Remuneration and Benefi ts 626 534 91 17%

Eighteenth Annual Report 2011-12
76
Employee remuneration and benefi ts were mainly due to increase in salary and rise in manpower relating to operations, on commissioning of 3.2 mtpa project expansions at Vijayanagar. The Company employed about 9522 employees as on 31st March 2012, vis-a-vis 8925 as at the end March last year.
Manufacturing and other expenses ` In Crores
2011-12 2010-11 Change Change %
Manufacturing and Other Expenses 5,126 3,753 1,373 37%
Power consumption increased on account of higher volume of production, in particular, increase in production of Flat and Long products. Increase in other cost mainly relate to higher consumption of stores and spares (29% increase), repairs & maintenance (47% increase), due to increase in scale of operations.
Carriage & freight outward (42 % increase) due to increase in Sales volume by 28% and freight charges attributable to company focus on retail segment.
Finance Cost ` In Crores
2011-12 2010-11 Change Change %
Finance Cost 1,186 854 332 39%
The Company’s net fi nance cost for FY 2011-12 is higher by ` 332 crores, mainly due to Interest cost pertaining to 3.2 mtpa expansion project charged to revenue acccount this year.
Depreciation and amortization ` In Crores
2011-12 2010-11 Change Change %
Depreciation and amortization 1,708 1,379 329 24%
Depreciation increased by 24% from ` 1,379 crores in 2010-11 to ̀ 1,708 crores in 2011-12 mainly due to Commencement of various facility under 3.2 mtpa expansion project, CPP-3, Benefi ciation Plant, Pellet Plant during the year.
Exceptional items ` In Crores
2011-12 2010-11 Change Change %
Exchange Loss (net) 821 - 821 -
Due to the unusual depreciation in the value of the rupee against US dollar, the net foreign exchange loss for the year has been considered by the Company as exceptional in nature.
Fixed Asset ` In Crores
2011-12 2010-11 Change Change %
Tangible assets 27,072 21,089 5,983 28%
Intangible assets 19 13 6 45%
Capital work-in-progress 2,477 5,690 (3,213) -56%
Intangible assets under development 27 18 9 49%
Total 29,594 26,810 2,784 10%
Gross Block increased mainly during the year due to capitalization of the following projects:
• 3.2 mtpa expansion project.
• Benefi ciation plant.
• Pellet Plant 2.
• Power Plant CPP 4 300 MW.
Non current Investment ` In Crores
2011-12 2010-11 Change Change %
Non current Investments 4,212 3,832 380 10%
Infusion of equity capital in subsidiaries was ` 175 crores. The company has also acquired 8.99 crores equity shares in Ispat Industries for ` 200 crores through open offer.
Long-term loans and advances ` In Crores
2011-12 2010-11 Change Change %
Long-term loans and advances 2,436 1,982 454 23%
Loans and Advances increased by 454 crores from ` 1,982 crores in 2010-11 to ` 2,436 crores in 2011-12. The increase was mainly due to increase in Minimum Alternative Tax credit entitlement of ` 657 crores.

77
Steel Limited
Inventories ` In Crores
2011-12 2010-11 Change Change %
Raw Materials 2,380 1,896 484 26%
Work-in-Progress 507 264 243 92%
Semi Finished/ Finished Goods 1,466 1,379 87 6%
Production Consumables and Stores & Spares 827 600 226 38%
Total 5,179 4,138 1,041 25%
The average inventory holding in terms of number of days as on 31 March 2012 was 72 days vis-a-vis 81 as on 31 March 2011. Higher inventory of spares was mainly due to commencement of new facilities.
Trade receivables ` In Crores
2011-12 2010-11 Change Change %
Total Debtors 1,376 855 521 61%
Less: Provision for Doubtful debts (14) (16) 2 -13%
1,362 839 523 62%
Increase in debtors is mainly due to increase in Domestic Sales by 34% and increase in customer base. The average debtors i.e. collection period, in terms of number of days as on 31st March 2012 was 15 days, compared to 12 days as on 31 March 2011.
Short-term loans and advances ` In Crores
2011-12 2010-11 Change Change %
Short-term loans and advances 4,648 1,803 2,845 158%
Short term loans and advances increased mainly due to infusion of funds in subsidiaries during the year.
Long-term Borrowings ` In Crores
2011-12 2010-11 Change Change %
Long-term borrowings 11,528 8,868 2,660 30%
Long term borrowings increased by ` 2660 crores due to loan drawals for 3.2 mtpa expansion projects during the year.
` In Crores
2011-12 2010-11
Loan Repayment 1,432 666
Short-term Borrowings ` In Crores
2011-12 2010-11 Change Change %
Short-term borrowings 774 1,879 (1,105) -59%
Short term borrowings decreased from ` 1,879 to ` 774 crores due to repayment of PCFC Loans during the period.
Trade payables ` In Crores
2011-12 2010-11 Change Change %
Trade payables 9,254 6,010 3,244 54%
Trade payables increased by ` 3,244 crores mainly due to increase in raw materials consumption by 42 %
Other current liabilities ` In Crores
2011-12 2010-11 Change Change %
Other current liabilities 7,183 4,428 2,754 62%
Other current liabilities for FY 2011-12 includes ̀ 1969 crores payable on redemption of FCCB bonds issued by company and ` 600 Crores pertains to repayment due for short term loan taken by the company.
Capital employed
Total capital employed increased by 19% from ` 31,494 crores as on 31st March 2011 to ` 37,440 crores as on 31st March 2012.
Return on capital employed declined from 13.3 % in 2010-11 to 11.9 %. This is expected to correct over the next year, due to growing scale of operations and funds invested in expansion of ongoing projects that are to generate return from next year.
Own funds
Net worth increased from ` 16,946 crores as on 31st March 2011 to ̀ 18,218 crores as on 31st March 2012 due to plough-back of operational surplus into the business to fund the Company’s future growth initiatives. Return on networth was at 9.1% in 2011-12. The book value improved from ` 736 as on 31st March 2011 to ` 817 as on 31st March 2012.
Reserves: Reserves and surplus increased from ` 16,133 crores as on 31st March 2011 to ` 17,934 crores as on 31st March 2012. This is a zero cost fund which strengthens the ability of the company to undertake growth initiatives.

Eighteenth Annual Report 2011-12
78
(E) LOOKING INTO THE FINANCIAL STATEMENTS (CONSOLIDATED)
The Company’s consolidated fi nancial statements include the fi nancial performance of the following Subsidiaries, Joint Ventures and Associates.
Subsidiaries:
i. JSW Steel (Netherlands) B.V.
ii. JSW Steel (UK) Limited
iii. Argent Independent Steel (Holdings) Limited
iv. JSW Steel Service Centre (UK) Limited
v. JSW Steel Holding (USA) Inc.
vi. JSW Steel (USA) Inc.
vii. Periama Holdings, LLC
viii. Purest Energy, LLC
ix. Meadow Creek Minerals, LLC
x. Hutchinson Minerals, LLC
xi. R.C. Minerals, LLC
xii. Keenan Minerals, LLC
xiii. Peace Leasing, LLC
xiv. Prime Coal, LLC
xv. Planck Holdings, LLC
xvi. Rolling S Augering, LLC
xvii. Periama Handling, LLC
xviii. Lower Hutchinson Minerals, LLC
xix. Caretta Minerals, LLC
xx. JSW Panama Holdings Corporation
xxi. Inversiones Eroush Limitada
xxii. Santa Fe Mining
xxiii. Santa Fe Puerto S.A.
xxiv. JSW Natural Resources Limited
xxv. JSW Natural Resources Mozambique Limitada
xxvi. JSW ADMS Carvo Lda
xxvii. JSW East Africa Limited
xxviii. JSW Steel Processing Centres Limited
xxix. JSW Bengal Steel Limited
xxx. JSW Natural Resources India Limited
xxxi. Barbil Benefi ciation Company Limited
xxxii. JSW Energy (Bengal) Limited
xxxiii. JSW Jharkhand Steel Limited
xxxiv. JSW Building Systems Limited
xxxv. Amba River Coke Limited
Joint Venture:
i. Vijayanagar Minerals Private Limited
ii. Rohne Coal Company Private Limited
iii. Geo Steel LLC
iv. JSW Severfi eld Structures Limited
v. JSW Structural Metal Decking Limited
vi. Gourangdih Coal Limited
vii. JSW MI Steel Service Center Private Limited
Associates:
i. Jindal Praxair Oxygen Company Private Limited
ii. JSW Ispat Steel Limited
The Company has reported a Consolidated Gross Turnover, Net Turnover, EBIDTA and PAT of the Company of ` 36,720 crores, ` 34,124 crores, ` 6,102 crores and ` 538 crores, respectively.
(F) OUTLOOK
Global steel outlook
The global economy is navigating through the Euro Zone structural issues, a slow down in China and fi scal defi cit, infl ation challenges in emerging economies.
2012 would require bold and challenging economic decisions for monetary sustainability and fi scal balancing. While steel demand is expected to remain sluggish in certain global pockets, base level steel demand is expected to remain strong.
The World Steel Association projects global world steel demand to grow by 49 million tonnes to 1,422 million tonnes in 2012 – a growth of 3.6% against 5.6% in 2011. Global Steel demand across most of the economies is projected to increase with BRIC at 3.2%, MENA at 5.7%, US at 5.2%, Turkey at 7.9%. Europe is projected to witness negative steel demand growth at 1.2%.
Indian steel outlook
Despite testing times, the Indian economy is expected to exhibit an improved performance in 2012-13 with the GDP projected to grow at 7.6% (+/-) 0.25% as per the Economic Survey of Ministry of Finance. Indian steel demand is projected to exhibit a further improvement primarily due to rising demand from infrastructure, construction, industrial and manufacturing sectors.
Short-term estimates
The Indian steel sector will add 23 MnT capacity largely through brownfi eld expansions bringing the total capacity to 105 MnT. By 2013-14, India is projected to emerge as the world’s third-largest producer of crude steel as India is already a 3rd largest consumer of steel in 2011.

79
Steel Limited
Steel consumption drivers in the next few years
Robust long-term steel consumption drivers
9% Asia’s third-largest and the fastest-growing Asian economy (after China) is expected to sustain 9% GDP growth over the Twelth Plan with steel demand elasticity to GDP (2001-2009) of about 1: 2.
US$1 tr The Indian government indicated a US$ 1 trillion-plus investment in infrastructure during the Twelfth Plan; private sector spending is expected to rise from 36% in the Eleventh Plan to about 50%, catalysing steel demand.
59 kgs India’s steel consumption of about 59 kgs in 2011-12 was below the global benchmark of about 196 kgs. Following the Indian government’s thrust on infrastructure creation and increased discretionary spending, this aberration is expected to correct faster
Short term: Increased Government impetus on infrastructure and the industrial sectors is expected to accelerate steel demand in the current year - the Indian Steel section is expected to grow 7.9% in 2012-13
Long term: India’s steel demand is likely to grow from 71 MnT in 2011-12 to 113 MnT by 2016-17, a 10% CAGR, transforming India into a net exporter of steel by 2016-17. Per capita steel consumption is forecast to double within 5-7 years from the present 59 kgs on account of low per capita consumption of semi urban and rural area, which is likely to increase due to power availability and growing auto sector.
To capitalise on this opportunity, global steel giants committed an estimated US$60 billion investment in the steel sector.
The Working Group of the Twelfth Plan envisages India’s steel manufacturing capacity at 140 mtpa by 2016-17; production is estimated at 126 mtpa (90% capacity utilization) – a 11.3% CAGR growth (2011-12 to 2016-17).
Forward looking and Cautionary Statements:
Certain statements in the Management Discussion and Analysis concerning our future growth prospects are forward looking statements, which involve a number of risks, and uncertainties that could cause actual results to differ materially from those in such forward looking statements. The risks and uncertainties relating to these statements include, but are not limited to, risks and uncertainties regarding fl uctuations in earnings, our ability to manage growth, intense competition within Steel Industry including those factors which may affect our cost advantage, wage increases in India, our ability to attract and retain highly skilled professionals, time and cost overruns on fi xed-price, fi xed-time frame contracts, client concentration, restrictions on immigration, our ability to manage our internal operations, reduced demand for steel, our ability to successfully complete and integrate potential acquisitions, liability for damages on our service contracts, the success of the companies in which – has made strategic investments, withdrawal of fi scal governmental incentives, political instability, legal restrictions on raising capital or acquiring companies outside India, unauthorized use of our intellectual property and general economic conditions affecting our industry. The Company does not undertake to update any forward looking statements that may be made from time to time by or on behalf of the Company.

Eighteenth Annual Report 2011-12
80
REPORT ON CORPORATE GOVERNANCE FOR THE YEAR 2011-12(Pursuant to Clause 49 of the Listing Agreements entered into with the Stock Exchanges)
1. COMPANY’S GOVERNANCE PHILOSOPHY:
Corporate Governance at JSW Steel Limited has been a continuous journey and the business goals of the Company are aimed at the overall well-being and welfare of all the constituents of the system. The Company has laid a strong foundation for making Corporate Governance a way of life by constituting a Board with a balanced mix of experts of eminence and integrity, forming a core group of top level executives, inducting competent professionals across the organization and putting in place best systems, process and technology. The Company combines leading edge technology and innovation with superior application and customer service skills.
At the heart of Company’s Corporate Governance policy is the ideology of transparency and openness in the effective working of the management and Board. It is believed that the imperative for good Corporate Governance lies not merely in drafting a code of Corporate Governance but in practicing it.
Your Company confi rms the compliance of Corporate Governance as contained in Clause 49 of the Listing Agreement, the details of which are given below:
2. BOARD OF DIRECTORS:
2.1 Appointment and Tenure:
The Directors of the Company (except Nominee Directors) are appointed by the shareholders at General Meetings. All Directors except Nominee Directors are subject to retirement by rotation and at every Annual General Meeting 1/3rd of such Directors as are liable to retire by rotation, if eligible, generally offer themselves for re-election, in accordance with the provisions of Section 256 and 257 of the Companies Act, 1956 and that of the Articles of Association of the Company.
The Executive Directors on the Board serve in accordance with the terms of their contracts of service with the Company.
2.2 Composition, Meetings and attendance record of each Director:
The Company has a balanced mix of Executive and Non-Executive Independent Directors. As at 31.03.2012, the Board of Directors comprises of 13 Directors, of which 9 are Non-Executive. The Chairman is Executive and a Promoter of the Company. The number of Independent Directors is 7 which is in compliance with the stipulated one half of the total number of Directors. All Independent Directors are persons of eminence and bring a wide range of expertise and experience to the Board thereby ensuring the best interest of stakeholders and the Company.
No Director is related to any other Director on the Board in terms of the defi nition of “relative” given under the Companies Act, 1956.
None of the Directors on the Board is a member of more than 10 committees and Chairman of more than 5 committees (as specifi ed in Clause 49 of the Listing Agreement) across all the Companies in which he /she is a Director. The necessary disclosures regarding committee positions have been made by the Directors.
The information as required under Annexure1A to Clause 49 of the Listing Agreement is being made available to the Board.
The details of composition of the Board as at 31.03.2012, the attendance record of the Directors at the Board Meetings held during the fi nancial year 2011-12 and at the last Annual General Meeting (AGM), as also the number of Directorships, Committee Chairmanships and Memberships held by them in other Companies are given here below:

81
Steel Limited
Category Name of Director Position Date of Joining the
Board
No. of Board
Meetings held
No. of Board
Meetings attended
Atten- dance at last AGM
No. of Directorships
in other Indian Public Limited Cos.
No. of Chairmanship(s)/ Membership(s) of
Committees in other Indian Public Limited Cos **
Chairmanship(s)
Member- ship(s)
Executive Directors
Mr. Sajjan Jindal Chairman & Managing Director
15.03.1994 4 4 Yes 7 Nil Nil
Mr. Seshagiri Rao M.V.S. Jt. Managing Director & Group CFO
06.04.1999 4 4 Yes 1 Nil Nil
Dr. Vinod Nowal Director & CEO
30.04.2007 4 3 Yes 2 Nil Nil
Mr. Jayant Acharya Director (Commercial & Marketing)
07.05.2009 4 4 Yes 4 1 1
Non-Executive Independent Directors
Mr. Uday M. Chitale Director 20.10.2005 4 4 Yes 6 2 4Mr. Anthony Paul Pedder
Director 18.04.2005 4 4 Yes Nil Nil Nil
Mr. Sudipto Sarkar Director 09.05.2005 4 4 Yes 8 Nil 5Dr. S. K. Gupta Director 25.04.1994 4 4 No 6 2 5Mr. K. Vijayaraghavan Director 16.06.2008 4 4 Yes Nil Nil NilDr. Vijay Kelkar Director 20.01.2010 4 4 Yes 8 Nil 2
Nominee Director
Mrs. Zarin Daruwala Nominee of ICICI Bank Limited (Lender)
13.12.2005 4 3 No 2 Nil 1
Part of the YearNon-Executive Non-Independent Directors
Mrs. Savitri Devi Jindal (ceased to be Chairperson w.e.f 20.10.2011)
Chairperson 18.04.2005 3* None No -- -- --
Mr. M. Maheshwar Rao, I.A.S (ceased to be a Director w.e.f 17.06.2011)
Nominee of KSIIDC (Equity Investor)
04.02.2011 1* None NA # -- -- --
Dr. Raj Kumar Khatri I.A.S (ceased to be a Director w.e.f 17.11.2011)
-do- 17.06.2011 2* 1 No -- -- --
Dr. Rajneesh Goel I.A.S -do- 17.11.2011 1* 1 NA # 7 Nil NilMr. Shigeru Ogura (ceased to be a Director w.e.f 16.05.2011)
Nominee of JFE Steel Corporation, Japan (Equity Investor & ForeignCollaborator)
08.09.2010 0 None NA # -- -- --
Mr. Yasushi Kurokawa -do- 16.05.2011 4 4 Yes Nil Nil NilNotes:1. During the Financial Year 2011-12, four Board Meetings were held and the gap between two meetings did not
exceed four months. Board Meetings were held on 16.05.2011, 26.07.2011, 21.10.2011 and 20.01.2012.2. * No. of Board Meetings indicated is with reference to date of appointment or cessation of the Director.3. ** Only two Committees, namely, Audit Committee and Shareholders’/Investors’ Grievance Committee have
been considered.4. # Not a Director at the time of last AGM.

Eighteenth Annual Report 2011-12
82
2.3 Board Meetings, Board Committee Meetings and Procedures:
A. Institutionalised decision making process
The Board of Directors oversees the overall functioning of the Company. The Board provides and evaluates the strategic direction of the Company, management policies and their effectiveness and ensures that the long-term interests of the stakeholders are being served. The Chairman and Managing Director is assisted by the Executive Directors/ Senior Managerial Personnel in overseeing the functional matters of the Company.
The Board has constituted ten Standing Committees, namely Audit Committee, Project Review Committee, Shareholders/ Investors Grievance Committee, Remuneration Committee, Finance Committee, Nomination Committee, Risk Management Committee, Share Allotment Committee, Share/Debenture Transfer Committee and JSWSL Code of Conduct Implementation Committee. The Board constitutes additional functional committees, from time to time, depending on the business needs.
B. Scheduling and selection of Agenda Items for Board meetings
i. A minimum of four Board Meetings are held every year. Dates for the Board Meetings in the ensuing quarter are decided well in advance and communicated to the Directors. The Agenda along with the explanatory notes are sent in advance to the Directors. Additional meetings of the Board are held when deemed necessary to address the specifi c needs of the Company. In case of business exigencies or urgency of matters, resolutions are passed by circulation.
ii. The meetings are usually held at the Company’s Registered Offi ce at Jindal Mansion, 5A, Dr. G. Deshmukh Marg, Mumbai 400 026.
iii. All divisions/departments of the Company are advised to schedule their work plans well in advance, with regard to matters requiring discussion/ approval/ decision at the Board/ Committee meetings. All such matters are communicated to the Company Secretary in advance so that the same could be included in the Agenda for the Board/Committee Meetings.
iv. In addition to items which are mandated to be placed before the Board for its noting and/or approval, information is provided on various signifi cant items.
v. The Board is given presentations covering Global Steel Scenario, Economy, Company’s Financials, Sales, Production, Business Strategy, Subsidiary performance and Risk Management practices before taking on record the Quarterly/Half yearly/Nine Monthly/Annual fi nancial results of the Company.
C. Distribution of Board Agenda Material
Agenda and Notes on Agenda are circulated to the Directors, in advance, in the defi ned Agenda format. All material information is incorporated in the Agenda papers for facilitating meaningful and focused discussions at the meeting. Where it is not practicable to attach any document to the Agenda, the same is tabled before the meeting with specifi c reference to this effect in the Agenda. In special and exceptional circumstances, additional or supplementary item(s) on the Agenda are considered.
D. Recording Minutes of proceedings at Board and Committee meetings
The Company Secretary records the minutes of the proceedings of each Board and Committee meeting. Draft minutes are circulated to all the members of the Board/Committee for their comments. The fi nal minutes are entered in the Minutes Book within 30 days from conclusion of the meeting and are signed by the Chairman of the meeting/Chairman of the next meeting.
E. Post Meeting Follow-up Mechanism
The Company has an effective post meeting follow up, review and reporting process mechanism for the decisions taken by the Board/ Committees. The important decisions taken at the Board / Committee meetings are communicated to the concerned Functional Heads promptly. Action Taken Report on decisions of the previous meeting(s) is placed at the immediately succeeding meeting of the Board/Committee for noting by the Board/Committee members.
F. Compliance
While preparing the Agenda, Notes on Agenda, Minutes etc. of the meeting(s),

83
Steel Limited
adequate care is taken to ensure adherence to all applicable laws and regulations including the Companies Act, 1956 read with the Rules made thereunder.
2.4 Meetings of Independent Directors:
The Independent Directors of the Company meet at such intervals as they deem appropriate without the presence of Executive Directors or management personnel. These meetings are conducted in an informal and fl exible manner to enable the Independent Directors to discuss matters pertaining to the affairs of the Company and put forth their views to the Chairman and Managing Director.
2.5 Training of Board Members:
The Company believes that the Board be continuously empowered with the knowledge of the latest developments in the Company’s business and the external environment affecting the industry as a whole. To this end, the Directors were given presentations on the global business environment, as well as all business areas of the Company including business strategy, risks opportunities. Monthly updates on performance/developments giving highlights of performance of the Company during each month including the developments/events having impact on the business of the Company are also sent to all the Directors.
3. AUDIT COMMITTEE:
The Audit Committee comprises of four Non-Executive Directors, all of whom are Independent Directors. Mr. Uday M. Chitale is the Chairman of the Audit Committee. The Members possess adequate knowledge of Accounts, Audit, Finance, etc. The composition of the Audit Committee meets with the requirements of Section 292A of the Companies Act, 1956 and of Clause 49 of the Listing Agreement.
The broad terms and reference of Audit Committee are:
a. To review the fi nancial statements before submission to the Board;
b. To review reports of the Management Auditors and Internal Auditors;
c. To review the weaknesses in internal controls reported by Internal and Statutory Auditors;
d. To review the appointment, removal and terms of remuneration of the Chief Internal Auditor;
e. To approve the appointment of the Chief Financial Offi cer (CFO);
f. In addition, the powers and role of the Audit Committee are as laid down under clause 49 II
C and D of the Listing Agreement and Section 292A of the Companies Act, 1956.
10 meetings of the Audit Committee were held during the fi nancial year 2011-12, as against the minimum requirement of four meetings. The details are as follows:
Sl. No.
Date Committee Strength
No. of Members Present
1. 08.04.2011 4 32. 15.05.2011 4 43. 25.07.2011 4 44. 23.09.2011 4 35. 21.10.2011 4 46. 14.11.2011 4 27. 13.12.2011 4 48. 20.01.2012 4 49. 10.02.2012 4 310. 29.03.2012 4 3
The Constitution of the Committee as at 31.03.2012 and the attendance of each Member are as given below:
Sl. No. Name of the Members
Category No. of Meetings Attended
1 Mr. Uday M. Chitale Chairman
Non-Executive Independent
Director
10
2 Dr. S.K.Gupta Member
Non-Executive Independent
Director
8
3 Mr. Sudipto Sarkar Member
Non-Executive Independent
Director
7
4. Mr. K. Vijayaraghavan Member
Non-Executive Independent
Director
9
The Jt. Managing Director & Group CFO, Director & CEO, Director (Commercial & Marketing), Chief Financial Offi cer, Accounts Heads of each Unit, Vice President (Internal Audit), the Company Secretary and the representatives of the Statutory Auditors attend the Audit Committee meetings. The representatives of Management Auditors attend the Audit Committee Meeting whenever matters relating to management audit are considered. The Company Secretary is the Secretary of the Audit Committee.
Mr. Uday M. Chitale, Chairman of the Audit Committee was present at the last Annual General Meeting held on 25.07.2011.

Eighteenth Annual Report 2011-12
84
4. REMUNERATION COMMITTEE:
The Remuneration Committee, which is a non-mandatory requirement of Clause 49 of the Listing Agreement, was constituted on 27.03.2002.
The terms of reference of the committee are as follows:
i. To determine on behalf of the Board and on behalf of the Shareholders, the Company’s policy on specifi c remuneration packages for Executive Directors including pension rights and any compensation payment.
ii. To approve the payment of remuneration to Managerial Personnel as per the Policy laid down by the Committee.
The Remuneration Committee met thrice during the fi nancial year 2011-12 on 15th May 2011, 25th July 2011 and 20th Jan 2012.
The composition of the Remuneration Committee as at 31.03.2012 and attendance of each member at the committee meetings are as given below:
Sl. No.
Name of the Members
Category No. of Meetings
held
No. of Meetings Attended
1 Dr. S.K.Gupta Chairman
Non-Executive, Independent
Director
3 3
2 Mr. Uday M ChitaleMember
Non-Executive, Independent
Director
3 3
3 Mr. Anthony Paul Pedder Member
Non-Executive, Independent
Director
3 3
4. Mr. K.Vijayaraghavan Member
Non-Executive, Independent
Director
3 3
The Company has complied with the non-mandatory requirement of Clause 49 regarding the Remuneration Committee.
4.1 Remuneration Policy and Details of Remuneration paid to Directors:
The Remuneration Committee recommends the remuneration package for the Executive Directors (ED) of the Board. In framing the remuneration policy, the Committee takes into consideration the remuneration practices of companies of similar size and stature, the Industry Standards and competitive circumstances of each business so as to attract and retain quality talent and leverage performance signifi cantly.
The Directors’ compensation is based on the appraisal system wherein their individual goals are linked to the organizational goals. ED are paid compensation as per the agreements entered into between them and the Company, subject to the approval of the Board and of the members in General Meeting and such other approvals, as may be necessary.
The present remuneration structure of ED comprises of salary, perquisites, allowances, performance linked incentive, ESOPs and contributions to PF and Gratuity.
The Non-Executive Directors are paid remuneration by way of Commission and Sitting fees. The commission payable to the Non-Executive Directors is based on the number of meetings of the Board attended by them, their Chairmanship / Membership of Audit Committee during the year subject to an overall ceiling of 1% of the net profi ts approved by the Members. The Company pays sitting fees at the rate of `20,000/-for each meeting of the Board and sub-committees attended by them.
The details of remuneration paid / payable to the Non-Executive Directors for the period 1st April 2011 to 31st March 2012 is as follows:
Sr No
Name Sitting fees @ ` 20,000/- per
meeting
Commission Payable (F.Y.12)
(` in lakhs)
Commission paid (Arrears)
(F.Y.11)(` in lakhs)
Total(` in lakhs)
1 Mrs. Savitri Devi Jindal * -- 8.32 7.00 15.32
2 Dr. S K Gupta 5.00 19.50 8.50 33.00
3 Mr. Uday M Chitale 5.40 20.00 8.50 33.90
4 Dr. Vijay Kelkar 0.80 19.00 8.50 28.30

85
Steel Limited
Sr No
Name Sitting fees @ ` 20,000/- per
meeting
Commission Payable (F.Y.12)
(` in lakhs)
Commission paid (Arrears)
(F.Y.11)(` in lakhs)
Total(` in lakhs)
5 Mr. Anthony Paul Pedder 2.40 19.00 8.50 29.90
6 Mr. Sudipto Sarkar 2.20 19.50 10.00 31.70
7 Mr. K. Vijayaraghavan 5.40 19.50 8.50 33.40
8 Mrs. Zarin Daruwalla (Nominee ICICI Bank Limited)
0.60 # 19.00# 10.00# 29.60#
9 Mr. Maheshwar Rao, IAS (Nominee KSIIDC)*
--
17.00# 7.25# 24.65#Dr. Raj Kumar Khatri, IAS (Nominee KSIIDC)*
0.20
Dr. Rajneesh Goel, IAS (Nominee KSIIDC) 0.20
10 Mr. Shigeru Ogura (Nominee JFE Steel Corporation) *
--
Mr. Yasushi Kurokawa (Nominee JFE Steel Corporation)
1.40 # 19.00# 4.43# 24.83#
*Ceased to be director
# Payable to the respective Institutions they represent.
The Details of Remuneration paid /payable to the Whole-time Directors for the fi nancial year 2011-12 is as given below:
Name of Director and Designation
Salary including
Provident Fund (` in Crores)
Perks (` in
Crores)
Profi t linked Commission (` in Crores)
Total Period of Contract
Notice Period
Mr. Sajjan Jindal Chairman & Managing Director
6.94 0.77 10.47 18.18 From 07.07.2007 To
06.07.2012
NA
Mr. Seshagiri Rao M.V.S Jt. Managing Director & Group CFO
2.93 0.46 --- 3.39 From 06.04.2009to
05.04.2014
3 months from either side or salary
in lieu thereof.Dr. Vinod Nowal Director & CEO
2.18 0.34 --- 2.52 From 30.04.2012to
29.04.2017
3 months from either side or salary
in lieu thereof.Mr. Jayant Acharya Director (Commercial & Marketing)
1.9 0.31 --- 2.21 From 07.05.2009 to
06.05.2014
3 months from either side or salary
in lieu thereof.TOTAL 13.95 1.88 10.47 26.30
Note: The above fi gures exclude provision for leave encashment and contribution to the approved Group Gratuity Fund, which are actuarially determined for the Company as a whole.
Shareholding of the Non-Executive Directors in the Company as on 31.03.2012:
None of the Non-Executive Directors other than those named below hold any shares in the Company:
Sl. No. Director No. of equity shares of ` 10/- each held
1 Mrs. Savitri Devi Jindal * 7530
2 Dr. S.K.Gupta 4500
*ceased to be a director w.e.f 20.10.2011.

Eighteenth Annual Report 2011-12
86
5. SHAREHOLDERS/ INVESTORS GRIEVANCE COMMITTEE:
The Shareholders/Investors Grievance Committee comprises of 3 Non-Executive Directors all of whom are Independent Directors.
The terms of reference of the Committee are as follows:
a) To review the reports submitted by the Registrars and Share Transfer Agents of the Company at half yearly intervals.
b) To periodically interact with the Registrars and Share Transfer Agents to ascertain and look into the quality of the Company’s Shareholders/ Investors grievance redressal system and to review the report on the functioning of the Investor grievances redressal system.
c) To follow-up on the implementation of suggestions for improvement, if any.
d) To periodically report to the Board about serious concerns, if any.
The Shareholders /Investors Grievance Committee met twice during the fi nancial year 2011-12 on 23.09.2011 and on 29.03.2012. The constitution of the committee and the details of the meetings attended by the Members are as given below:
Sl. No.
Name of the Director
Category No. of Meetings
held
No. of Meetings attended
1. Mr. K. Vijayaraghavan Chairman
Non-Executive Independent
Director
2 2
2. Dr. S.K.Gupta Member
Non-Executive Independent
Director
2 1
3. Mr. Uday M. Chitale Member
Non-Executive Independent
Director
2 2
Mr. Lancy Varghese, the Company Secretary is the Compliance Offi cer for complying with the requirements of SEBI Regulations and the Listing Agreement with the Stock Exchanges in India. His address and contact details are as given below:
Address : Victoria House, Pandurang Budhkar Marg, Lower Parel (W), Mumbai - 400 013
Phone : 022-24927000 / 43437800
Fax : 022-24917933
Email : [email protected]
Investor Grievance Redressal
Number of complaints received and resolved to the satisfaction of Shareholders / Investors during the year under review and their break-up is as under:
No. of Shareholders’ Complaints received during the year ended 31.03.2012
: 512
Number not solved to the satisfaction of Shareholders
: Nil
No. of pending Complaints as on 31.03.2012
: Nil
No. of pending share Transfers as on 31.03.2012
: 22*
* There were no share transfers pending for registration for more than 15 days as on the said date.
Note: Complaints pertaining to the years subsequent to 2004-05 include investor complaints received from shareholders of Jindal Iron & Steel Co. Limited and Southern Iron & Steel Co. Limited upon its merger with the Company in the fi nancial years 2004-2005 & 2007- 2008 respectively.
6. OTHER MAJOR COMMITTEES OF DIRECTORS:
In addition to the above referred Committees which are constituted pursuant to the Corporate Governance Code, the Board has constituted the following major Committees of Directors and delegated thereto powers and responsibilities with respect to specifi c purposes. Time schedule for holding the meetings of such Functional Committees are fi nalized in consultation with the Committee Members:
283
73
16

87
Steel Limited
1. PROJECT REVIEW COMMITTEE
Terms of reference of the Committee Composition Frequency of Meetings
1.
2.
To closely monitor the progress of Large Projects, in addition to ensuring a proper and effective co-ordination amongst the various project modules essentially with the objective of timely project completion within the budgeted project outlay.
To review new strategic initiatives.
1. Mr. Anthony Paul Pedder (Chairman),
Non-Executive Independent Director
2. Dr. Vinod Nowal Executive Director
3. Dr. S.K.Gupta, Non-Executive
Independent Director
4. Mr. K.Vijayaraghavan, Non-Executive
Independent Director
5. Mr. Y. Kurokawa Nominee Director (JFE
Steel Corporation)
Four meetings were held on 15.05.2011, 24.07.2011, 20.10.2011 and 19.01.2012.
2. RISK MANAGEMENT COMMITTEE
Terms of reference of the Committee Composition Frequency of Meetings
1.
2.
To periodically review risk assessment and minimisation procedures to ensure that, Executive Management controls risk through means of a properly defi ned framework.
To review major risks and proposed action plan.
1. Dr. S.K.Gupta (Chairman) Non-Executive Independent Director
2. Mr. Seshagiri Rao MVS, Executive Director
3. Mr. Jayant Acharya Executive Director
4. Mr. Uday.M. Chitale Non-Executive Independent Director
5. Mr. K.Vijayaraghavan, Non-Executive Independent Director
Five meetings were held on 08.04.2011, 24.07.2011, 23.09.2011, 13.12.2011 and 29.03.2012.
The Risk Management Committee, a sub-committee of the Board has further constituted:
i. “Capex Risk Evaluation Committee” to evaluate the risks associated with capex proposals including mergers and acquisitions.
ii. Locational Committees namely (a) Corporate Locational Committee (b) Upstream Locational Committee (c) Downstream Locational Committee and (d) Salem Locational Committee to further review risk assessment at Locational Level.

Eighteenth Annual Report 2011-12
88
3. NOMINATION COMMITTEE
Terms of reference of the Committee Composition Frequency of Meetings
To consider Nomination of persons to be inducted on the Board
1. Mr. Sajjan Jindal (Chairman), Executive Director
2. Mr. Uday M. Chitale, Non-Executive, Independent Director
3. Mr. Anthony Paul Pedder, Non-Executive, Independent Director
Need based.
One meeting was held on 16.05.2011.
4. FINANCE COMMITTEE
Terms of reference of the Committee Composition Frequency of Meetings
1. To approve availing of credit / fi nancial facilities of any description from Banks / Financial Institutions/ Bodies Corporate within the limits approved by the Board.
1. Mr. Sajjan Jindal (Chairman), Executive Director
2. Mr. Seshagiri Rao MVS, Executive Director
3. Dr. Vinod Nowal, Executive Director
4. Mr. Jayant Acharya, Executive Director
Need based.
Meetings were held on 18.04.2011, 04.05.2011, 17.05.2011, 14.06.2011, 05.07.2011, 27.07.2011, 22.08.2011, 13.09.2011, 14.10.2011, 21.10.2011, 16.12.2011, 10.01.2012, 31.01.2012, 14.02.2012, 20.02.2012 and 16.03.2012.
2. To approve investments and dealings with any monies of the Company upon such security or without security in such manner as the committee may deem fi t, and from time to time to vary or realise such investments within the frame work of the guidelines laid down by the Board.
3. To open new Branch Offi ces of the Company, to declare the same as such under section 2(9) of the Companies Act, 1956 and to authorise personnel by way of Power of Attorney or otherwise, to register the aforesaid branches and to deal with various authorities such as the Central Excise, Profession Tax, Commercial Tax, State & Central Sales Tax, VAT Authorities and other Local Authorities.
4. To make loans to Individuals /Bodies Corporate and/or to place deposits with other Companies/Firms upon such security or without security in such manner as the committee may deem fi t within the limits approved by the Board.
5. To open Current Account(s), Collection Account(s), Operation Account(s), or any other Account(s) with Banks and also to close such accounts, which the ‘said Committee’ may consider necessary and expedient.

89
Steel Limited
7. GENERAL BODY MEETINGS:
A. Annual General Meetings:
The details of date and time of the Annual General Meetings (AGMs) of the Company held during the preceding three years, at Birla Matushri Sabhagar,19, New Marine Lines, Mumbai 400 020 and the Special Resolutions passed there at are as under:
AGM Date Time Special Resolutions Passed
15th AGM 06.07.2009 11.00 am 1. To issue, offer and allot Equity Shares and/or Securities other than Warrants, which are convertible into Equity Shares to Qualifi ed Institutional Buyers (QIB), by way of Qualifi ed Institutions Placement, for an aggregate amount not exceeding US$ 1 Billion and/or
2. To offer, issue, and allot in one or more tranches, Foreign Currency Convertible Bonds (FCCBs) / Global Depository Receipts (GDRs) / American Depository Receipts (ADRs) / Warrants and / or other Instruments convertible into Equity shares not exceeding US$ 1 Billion in the aggregate.
(Such that the total amount to be raised vide both of the above proposed issues would not in the aggregate exceed a sum of US $ 1 Billion or its Indian Rupee equivalent, inclusive of such premium as may be determined by the Board).
16th AGM 29.06.2010 11.00 am Payment of Commission not exceeding in the aggregate, one percent of the net profi ts of the Company to Non-Executive Directors of the Company for a period of fi ve years from the fi nancial year commencing from 1st April 2010, in addition to the sitting fees and reimbursement of expenses incurred.
17th AGM 25.07.2011 11.00 am ---
B. Extra Ordinary General Meetings:
The details of date, time and venue of the Extra General Meetings (EGMs) of the Company held during the preceding three years and the Special Resolutions passed thereat are as under:
EGM – Date & Time Venue Special Resolutions Passed
02.06.2010 – 11.00 am Birla Matushri Sabhagar,19 Marine Lines, Mumbai 400 020
To approve the issue of upto 1,75,00,000 Warrants convertible into Equity Shares of the Company to Sapphire Technologies Limited, a promoter group company on a preferential basis.
26.08.2010 – 11.00 am Patkar Convocation Hall of S.N.D.T Women’s University, 1, Nathibai Thackersey Road, New Marine Lines, Mumbai 400 020.
To create, offer, issue and allot either Equity Shares or a Fully Convertible Debenture of the Company representing not more than 14.99% of the paid up equity share capital of the Company to JFE Steel Corporation, Japan, on a preferential basis.
C. Special Resolutions passed through Postal Ballot during 2011-12:
No special resolution was passed through Postal Ballot during 2011-12. None of the Businesses proposed to be transacted in the ensuing Annual General Meeting require passing a special resolution through Postal Ballot.
8. DISCLOSURES:
i. There were no materially signifi cant related party transactions i.e. transactions of the Company of material nature with its Promoters, Directors or the Management, their relatives or Subsidiaries etc. which could confl ict with the interests of the Company.
ii. No penalties or strictures have been imposed on the Company by the Stock Exchanges or SEBI or any statutory authority on any matter related to capital markets during the last three years.
iii. The Company has laid down procedures to inform Board members about the risk assessment and minimization procedures, which are periodically reviewed.

Eighteenth Annual Report 2011-12
90
9. WHISTLE BLOWER POLICY:
The Whistle Blower Policy (WBP) adopted by the Company in line with Clause 7 of Annexure 1D to Clause 49 of the Listing Agreement, which is a non-mandatory requirement, encourages all employees, offi cers and directors to report any suspected violations promptly and intends to investigate any good faith reports of violations. The Whistle Blower Policy specifi es the procedure and reporting authority for reporting unethical behavior, actual or suspected fraud or violation of the Company’s Code of Conduct or ethics policy or any other unethical or improper activity including misuse or improper use of accounting policies and procedures resulting in misrepresentation of accounts and fi nancial statements.
WBP also provides safeguards against victimization or unfair treatment of the employees who avail of the mechanism and no personnel has been denied access to the Audit Committee.
10. SUBSIDIARY MONITORING FRAMEWORK:
All the Subsidiary Companies of the Company are Board managed with their Boards having the rights and obligations to manage such companies in the best interest of their stakeholders. As a majority shareholder, the Company nominates its representatives on the Boards of subsidiary companies and monitors the performance of such companies, inter alia, by the following means:
a) A copy of the Minutes of the Meetings of the Board of Directors of the Company’s subsidiaries along with Exception Reports and quarterly Compliance Certifi cates issued by CEO/CFO/CS are tabled before the Company’s Board, quarterly.
b) A summary of the Minutes of the Meetings of the Board of Directors of the Company’s subsidiaries are circulated to the Company’s Board, quarterly.
c) A statement containing all signifi cant transactions and arrangements entered into by the subsidiary companies is placed before the Company’s Board.
11. MEANS OF COMMUNICATION:
Timely disclosure of consistent, comparable, relevant and reliable information on corporate fi nancial performance is at the core of good governance. Towards this end:
a) Quarterly/Half Yearly/ Nine Monthly/ Annual Results: The Quarterly, Half Yearly, Nine Monthly and Annual Results of the Company are sent to the Stock Exchanges immediately after they are approved by the Board.
b) Publication of Quarterly/Half Yearly/ Nine Monthly/ Annual Results: The Quarterly, Half Yearly, Nine Monthly and Annual Results of the Company are published in the prescribed proforma within 48 hours of the conclusion of the meeting of the Board in which they are considered, at least in one English newspaper circulating in the whole or substantially the whole of India and in one Vernacular newspaper of the State of Maharashtra where the Registered Offi ce of the Company is situated.
The quarterly fi nancial results during the fi nancial year 2011-12 were published as detailed below:
Quarter (F.Y.
2011-12)
Date of Board
Meeting
Date of publication
Name of the Newspapers
1 26.07.2011 27.07.2011 The Financial Express and Navshakti
2 21.10.201114.11.2011*
22.10.201115.11.2011
The Financial Express and Navshakti
3 20.01.201210.02.2012*
21.01.201211.02.2012
The Financial Express and Navshakti
*consolidated results
c) Monthly production fi gures and other press releases: To provide information to Investors, monthly production fi gures and other press releases are sent to the Stock Exchanges as well as displayed on the Company’s website before it is released to the media.
d) Website: The Company’s website www.jsw.in contains a separate dedicated section “Investor Relations” where information for shareholders is available. The Quarterly/Annually Financial Results, Annual Reports, Analysts Presentations, Investor Forms, Stock Exchange Information, Shareholding Pattern, Corporate Benefi ts, Investors’ Contact details, etc., are posted on the website in addition to the information stipulated under Clause 54 of the Listing Agreement. The latest offi cial press releases are also available on the website.
e) Presentations to Analysts: Four presentations were made to analysts/investors during the F.Y. 2011-2012 on 16.05.2011, 26.07.2011, 21.10.2011 and 20.01.2012. The same are available on the Company’s website. The Presentations broadly covered operational and fi nancial performance of the Company and industry outlook.

91
Steel Limited
f) Corporate Filing and Dissemination System (CFDS) Filing: As per the requirements of Clause 52 of the Listing Agreement, all the data relating to fi nancial results, shareholding pattern etc. have been electronically fi led on the Corporate Filing and Dissemination System (CFDS) portal, www.corpfi ling.co.in, within the time frame prescribed in this regard.
g) NSE Electronic Application Processing System (NEAPS): NEAPS is a web based application designed by NSE for corporates. The Shareholding pattern and Corporate Governance Report are also fi led electronically on NEAPS.
h) Annual Report: Annual Report containing, inter alia, Audited Annual Accounts, Consolidated Financial Statements, Directors’ Report, Auditor’s Report and other important information is circulated to members and others entitled thereto. The Management Discussion and Analysis (MD&A) Report forms part of the Annual Report.
i) Chairman’s Communiqué: Printed copy of the Chairman’s Speech is distributed to all the shareholders at the Annual General Meetings. The same is also placed on the website of the Company.
j) Reminder to Investors: Reminders for unpaid dividend/unpaid interest on debentures are sent to the Shareholders/Debenture holders as per records at appropriate intervals.
12. GENERAL SHAREHOLDERS INFORMATION:
12.01 Annual General Meeting:
Date and Time : 25.07.2012 at 11.00 a.m.
Venue : Birla Matushree Sabhagar, New Marine Lines, Mumbai-400 020
Dates of Book : 14.07.2012 to 16.07.2012 Closure (both days inclusive)
Dividend : 30.07.2012 Payment Date
12.02 Financial Calendar 2012 -13:
First quarterly results : July, 2012 Second quarterly results : October, 2012 Third quarterly results : January, 2013
Annual results for the year Ending on 31.03.2013 : April/May, 2013
Annual General Meeting For the Year 2013 : June/July, 2013
12.03 Corporate Identity Number (CIN):
The CIN of the Company allotted by the Ministry of Corporate Affairs, Government of India is L27102MH1994PLC152925.
12.04 Listing on Stock Exchanges:
The Company’s Equity Shares & 10% Cumulative Redeemable Preference Shares are listed on the following Stock Exchanges in India:
BSE Limited (BSE) Phiroze Jeejeebhoy Towers, Dalal Street, Mumbai 400 001
National Stock Exchange of India Limited (NSE) Exchange Plaza, Bandra-Kurla Complex, Bandra East, Mumbai 400 051
The following Secured Redeemable Non-Convertible Debentures of the Company are listed on the BSE:
Sl. No. Description Face Value
01. 11.82 % Secured Redeemable Non-Convertible Debentures
` 10 Lakhs each
02. 11.82% Secured Redeemable Non-convertible Debentures
` 10 Lakhs each
03. 10.10% Secured Redeemable Non-convertible Debentures
` 10 Lakhs each
04. 10.10% Secured Redeemable Non-convertible Debentures
` 10 Lakhs each
05. 10.25% Secured Redeemable Non-convertible Debentures
` 10 Lakhs each
06. 10.60% Secured Redeemable Non-convertible Debentures
` 10 Lakhs each
07. 10.60% Secured Redeemable Non-convertible Debentures
` 10 Lakhs each
08 11% Secured Redeemable Non-convertible Debentures
` 10 Lakhs each
The Company has paid Annual Listing Fees as applicable, to the BSE and the NSE for the fi nancial years 2011-12 and 2012-13.
The Foreign Currency Convertible Bonds (FCCBs) issued by the Company in the International Market are listed on the Singapore Exchange Securities Trading Limited (the “SGX-ST”), 2 ShentonWay, #19-00 SGX Centre 1,Singapore 068804.
The Annual Listing fee as applicable for the Calendar Year 2012 has also been paid by the Company to the SGX-ST.

Eighteenth Annual Report 2011-12
92
Stock Code:
BSE Limited (BSE) National Stock Exchange of India Limited (NSE)
Singapore Exchange Securities Trading Limited (SGX-ST)
Equity Preference Debentures Equity Preference Debentures FCCB
500228 700085 934657 JSWSTEEL JSWSTEEL N.A 3IJB
945781
946540
946594
945893
946364
946501
947905
ISIN No. for Dematerialisation of listed Shares/Debentures/FCCBs:
Equity : INE019A01020
Preference: : INE019A04016
Debentures : : INE548G07014 - 11.82% NCDs of `10 Lakhs each
INE710B07011 - 11.82% NCDs of `10 Lakhs each
INE019A07175 - 10.10% NCDs of `10 Lakhs each
INE019A07191 - 10.10% NCDs of `10 Lakhs each
INE019A07126 - 10.25% NCDs of `10 Lakhs each
INE019A07167 - 10.60% NCDs of `10 Lakhs each
INE019A07183 - 10.60% NCDs of `10 Lakhs each
INE019A07233 - 11% NCDs of `10 Lakhs each
FCCBs : XSO302937031
Debenture Trustees:IDBI Trusteeship Services LimitedAsian Building, Ground Floor, 17th R.Kamani Marg, Ballard Estate, Mumbai – 400001
AXIS Bank LimitedRegd. Offi ce: Sakar 1, Ground Floor,Off Ashram Road, Ahmedabad 380 009Central Offi ce: 13th fl oor, Maker Tower ‘F’,Cuffe Parade, Colaba, Mumbai – 400 005
FCCB Trustees:CITIBANK N.ALondon Branch, 14th Floor, Citigroup Centre,Canada Square, Canary Wharf, London - E14 5LB
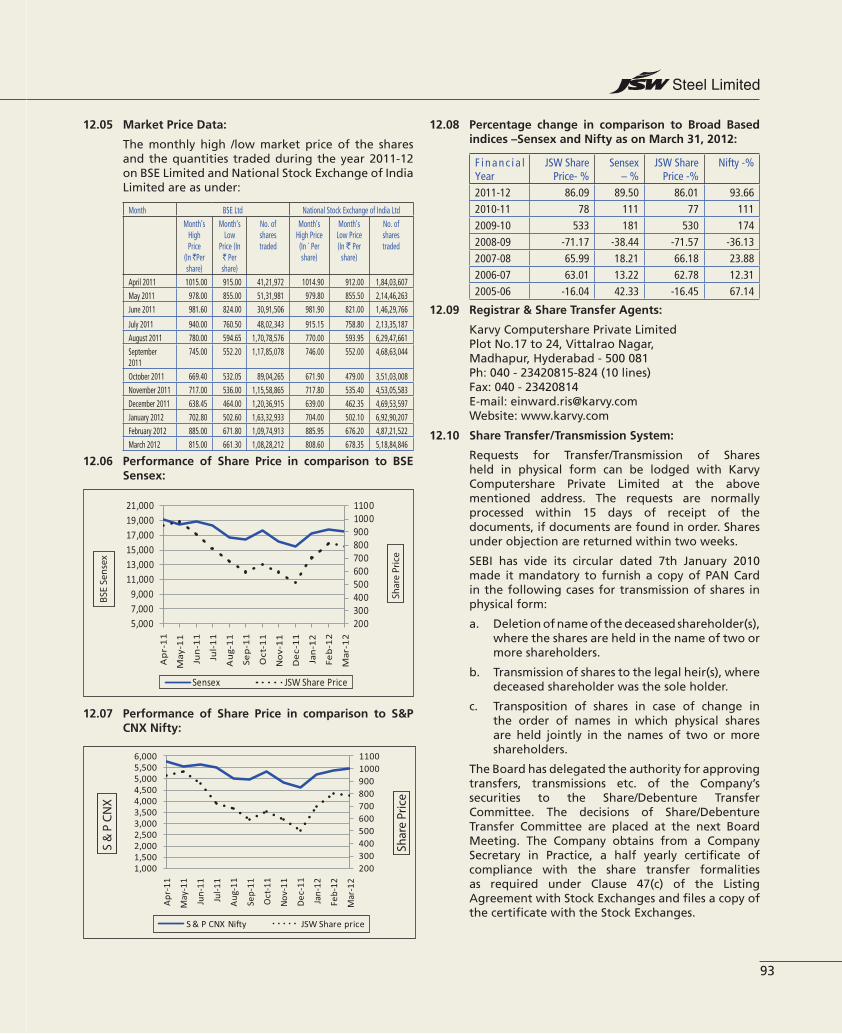
93
Steel Limited
12.05 Market Price Data:
The monthly high /low market price of the shares and the quantities traded during the year 2011-12 on BSE Limited and National Stock Exchange of India Limited are as under:
Month BSE Ltd National Stock Exchange of India LtdMonth’s
High Price
(In `Per share)
Month’s Low
Price (In ` Per share)
No. of shares traded
Month’s High Price (In ` Per share)
Month’s Low Price (In ` Per
share)
No. of shares traded
April 2011 1015.00 915.00 41,21,972 1014.90 912.00 1,84,03,607May 2011 978.00 855.00 51,31,981 979.80 855.50 2,14,46,263June 2011 981.60 824.00 30,91,506 981.90 821.00 1,46,29,766
July 2011 940.00 760.50 48,02,343 915.15 758.80 2,13,35,187August 2011 780.00 594.65 1,70,78,576 770.00 593.95 6,29,47,661September 2011
745.00 552.20 1,17,85,078 746.00 552.00 4,68,63,044
October 2011 669.40 532.05 89,04,265 671.90 479.00 3,51,03,008November 2011 717.00 536.00 1,15,58,865 717.80 535.40 4,53,05,583December 2011 638.45 464.00 1,20,36,915 639.00 462.35 4,69,53,597January 2012 702.80 502.60 1,63,32,933 704.00 502.10 6,92,90,207February 2012 885.00 671.80 1,09,74,913 885.95 676.20 4,87,21,522March 2012 815.00 661.30 1,08,28,212 808.60 678.35 5,18,84,846
12.06 Performance of Share Price in comparison to BSE Sensex:
12.07 Performance of Share Price in comparison to S&P CNX Nifty:
12.08 Percentage change in comparison to Broad Based indices –Sensex and Nifty as on March 31, 2012:
F i n a n c i a l Year
JSW Share Price- %
Sensex – %
JSW Share Price -%
Nifty -%
2011-12 86.09 89.50 86.01 93.662010-11 78 111 77 1112009-10 533 181 530 1742008-09 -71.17 -38.44 -71.57 -36.132007-08 65.99 18.21 66.18 23.882006-07 63.01 13.22 62.78 12.312005-06 -16.04 42.33 -16.45 67.14
12.09 Registrar & Share Transfer Agents:
Karvy Computershare Private Limited Plot No.17 to 24, Vittalrao Nagar, Madhapur, Hyderabad - 500 081 Ph: 040 - 23420815-824 (10 lines) Fax: 040 - 23420814 E-mail: [email protected] Website: www.karvy.com
12.10 Share Transfer/Transmission System:
Requests for Transfer/Transmission of Shares held in physical form can be lodged with Karvy Computershare Private Limited at the above mentioned address. The requests are normally processed within 15 days of receipt of the documents, if documents are found in order. Shares under objection are returned within two weeks.
SEBI has vide its circular dated 7th January 2010 made it mandatory to furnish a copy of PAN Card in the following cases for transmission of shares in physical form:
a. Deletion of name of the deceased shareholder(s), where the shares are held in the name of two or more shareholders.
b. Transmission of shares to the legal heir(s), where deceased shareholder was the sole holder.
c. Transposition of shares in case of change in the order of names in which physical shares are held jointly in the names of two or more shareholders.
The Board has delegated the authority for approving transfers, transmissions etc. of the Company’s securities to the Share/Debenture Transfer Committee. The decisions of Share/Debenture Transfer Committee are placed at the next Board Meeting. The Company obtains from a Company Secretary in Practice, a half yearly certifi cate of compliance with the share transfer formalities as required under Clause 47(c) of the Listing Agreement with Stock Exchanges and fi les a copy of the certifi cate with the Stock Exchanges.

Eighteenth Annual Report 2011-12
94
12.11 Distribution of Shareholding:
The distribution of shareholding by size as on 31.03.2012 is given below:
Sl. No
No. of Equity Shares
No. of Shareholders
% of Shareholders
No.of Shares held
% of shareholding
1 1 - 500 498090 99.23 11979978 5.372 501 - 1000 2021 0.40 1454735 0.65
3 1001 - 2000 839 0.17 1198347 0.544 2001 - 3000 239 0.05 590719 0.265 3001 - 4000 95 0.02 338721 0.156 4001 - 5000 73 0.01 335660 0.157 5001 - 10000 189 0.04 1328476 0.608 10001 -
20000107 0.02 1550632 0.69
9 20001 and above
306 0.06 204339932 91.58
TOTAL 501959 100.00 223117200 100.00
12.12 Shareholding Pattern:
Category As on 31.03.2012 As on 31.03.2011No. of
HoldersNo. of Shares
% of holding
No. of Holders
No. of Shares
% of holding
Promoters 72 84544635 37.89 111 84143661 37.71NRI 9167 2886998 1.29 11478 3111779 1.39FII 277 45719425 20.49 274 54740502 24.53OCB 5 37650 0.02 7 40712 0.02FBC 3 41686265 18.68 3 41201389 18.47
Category As on 31.03.2012 As on 31.03.2011No. of
HoldersNo. of Shares
% of holding
No. of Holders
No. of Shares
% of holding
IFI 12 8355206 3.74 11 8202236 3.68IMF 64 764214 0.34 83 1354265 0.61Banks 29 1396320 0.63 30 1358165 0.61Employees 1648 88096 0.04 2039 96247 0.04Bodies Corporate
2616 11596275 5.2 2902 8981353 4.03
Public 485222 18220511 8.17 527660 15308532 6.86Trust 10 3224506 1.45 13 1120268 0.5HUF 2827 1994992 0.89 2584 371081 0.17GDR 1 2600938 1.17 1 3085814 1.38Transit A/C 1 1169 0 1 1196 0Total 501954 223117200 100 547197 223117200 100
12.13 Top 10 Shareholders as on 31.03.2012:
Sl.No Name Shares %1 JFE STEEL CORPORATION 33467580 15.00
2 JINDAL SOUTH WEST HOLDINGS LIMITED 17284923 7.753 JSW ENERGY INVESTMENTS PRIVATE LIMITED 13764364 6.174 JSW INVESTMENTS PRIVATE LIMITED 8258061 3.705 JSW POWER TRADING COMPANY LIMITED 7003835 3.146 DUFERCO COKE INVESTMENTS LTD 5035241 2.267 NALWA SONS INVESTMENTS LTD 4548637 2.048 MAVI INVESTMENT FUND LIMITED 4417000 1.989 LIFE INSURANCE CORPORATION OF INDIA 4175363 1.8710 LOTUS GLOBAL INVESTMENTS LTD 4170965 1.87
12.14 Geographical Distribution of Shareholders as on 31.03.2012:Sl.No.
Electronic Physical TotalName of the City No. of
ShareholdersNo. ofShares
% of totalShareholding
No. ofShareholders
No. ofShares
% of totalShareholding
No. ofShareholders
No. ofShares
% of totalShareholding
1 AGRA 1136 40595 0.02 1873 15169 0.01 3009 55764 0.022 AHMEDABAD 10606 606830 0.27 9442 116451 0.05 20048 723281 0.323 BANGALORE 8776 1396378 0.63 6688 544734 0.24 15464 1941112 0.874 CALCUTTA 10018 992862 0.44 8069 122619 0.05 18087 1115481 0.505 CHANDIGARH 1533 58015 0.03 1812 17831 0.01 3345 75846 0.036 CHENNAI 7328 2296036 1.03 5512 91305 0.04 12840 2387341 1.077 COIMBATORE 3602 625944 0.28 4653 150279 0.07 8255 776223 0.358 GANDHI NAGAR 2754 66263 0.03 3701 26678 0.01 6455 92941 0.049 GHAZIABAD 1311 43653 0.02 1449 14043 0.01 2760 57696 0.0310 HISSAR 1371 4669322 2.09 2692 41855 0.02 4063 4711177 2.1111 HOWRAH 1626 57197 0.03 1356 19150 0.01 2982 76347 0.0312 HYDERABAD 4612 282934 0.13 3905 57276 0.03 8517 340210 0.1513 INDORE 1776 71490 0.03 2118 19341 0.01 3894 90831 0.0414 JAIPUR 3588 119374 0.05 4208 36689 0.02 7796 156063 0.0715 JAMNAGAR 1160 24016 0.01 1926 14449 0.01 3086 38465 0.0216 KANPUR 2049 171709 0.08 2991 29904 0.01 5040 201613 0.0917 LUCKNOW 1907 64464 0.03 2051 21101 0.01 3958 85565 0.0418 MEHSANA 1650 44872 0.02 2695 16919 0.01 4345 61791 0.0319 MUMBAI 37527 173299024 77.67 25715 668852 0.30 63242 173967876 77.9720 NEW DELHI 18219 14614245 6.55 23769 316307 0.14 41988 14930552 6.6921 PATNA 1105 41495 0.02 1652 19595 0.01 2757 61090 0.0322 PUNE 5077 257933 0.12 2969 49394 0.02 8046 307327 0.1423 RAJKOT 2317 91514 0.04 3122 23825 0.01 5439 115339 0.0524 SURAT 4243 191448 0.09 4109 34261 0.02 8352 225709 0.1025 THANE 3845 215807 0.10 2355 39270 0.02 6200 255077 0.1126 VADODARA 5181 199840 0.09 4911 44460 0.02 10092 244300 0.1127 OTHERS 94624 18092221 8.11 127268 1929962 0.86 221892 20022183 8.97
TOTAL 238941 218635481 97.99 263011 4481719 2.01 501952 223117200 100.00

95
Steel Limited
12.15 Corporate Benefi ts to Shareholders:
a) Dividend declared for the last seven years:
Financial Year Dividend Declaration Date
Dividend Rate (%)
2010-11 25.07.2011 122.5
2009-10 29.06.2010 95
2008-09 06.07.2009 10
2007-08 16.06.2008 140
2006-07 13.03.2007 125 (Interim cum Final Dividend)
2005-06 25.07.2006 80
2004-05 10.02.2005 30 (Interim Dividend)
13.06.2005 80 (Final Dividend including Interim
Dividend)
Note – Dates indicated above are date of declaration by the Board in case of Interim Dividend and by Members in case of Final Dividend.
b) Unclaimed Dividends
Under the Companies Act, 1956, dividends that are unclaimed for a period of seven years, are to be transferred statutorily to the Investor Education and Protection Fund (IEPF) administered by the Central Government and thereafter cannot be claimed by the investors. To ensure maximum disbursement of unclaimed dividend, the Company sends reminders to the concerned investors at appropriate intervals.
The unpaid / unclaimed dividends upto the fi nancial year ended 31.03.1995 had been transferred to the General Revenue Account of the Central Government. The Members, who have not claimed their dividend for the said period till date, may claim the amount from the Registrar of Companies- Mumbai. Apart from the above, the Company has transferred the unpaid dividends upto 31.03.2004 including interim dividend for the F.Y. 2004-05 to the IEPF. The Members of the Company who have not yet encashed their dividend warrant(s) for the F.Y. 2004-05 (fi nal dividend) and thereafter may write to the Company’s R & T Agent immediately.
Pursuant to Section 205A(5) of the Companies Act, 1956 the unpaid dividends that are due for transfer to the Investor Education and Protection Fund are as follows:
Financial Year
Date of Declaration of Dividend
Percentageof Dividend
Declared
Unclaimed Dividend
Amount as on 31.03.2012
Due for transfer to
IEPF
2004 - 2005 (Final)
13.06.2005 50% 1,17,48,254.57 20.07.2012
2005 - 2006 25.07.2006 80% 1,53,16,380.00 31.08.2013
2006 - 2007 13.03.2007 125% 2,15,25,064.14 19.04.2014
2007 - 2008 16.06.2008 140% 2,64,28,521.48 23.07.2015
2008 -.2009 06.07.2009 10% 30,13,631.00 12.08.2016
2009 - 2010 29.06.2010 95% 2,19,35,814.07 05.08.2017
2010-2011 25.07.2011 122.50% 2,75,87,352.00 28.07.2018
Members who have not encashed their dividend warrants pertaining to the aforesaid years may approach the Company or its Registrar, for obtaining payments thereof atleast 20 days before they are due for transfer to the said fund.
12.16 Unclaimed shares:
As per Clause 5A(II) of the Listing Agreement, the Company after sending three reminders on 23rd June 2011, 25th August 2011 and 31st October 2011 to the registered address of the shareholders, requesting for correct particulars to dispatch the undelivered share certifi cates, for shares issued in physical form which remained unclaimed, transferred 665702 shares to a dedicated demat account styled as “Unclaimed Suspense Account” duly opened with Stock Holding Corporation of India.
Any corporate benefi ts in terms of securities accruing on aforesaid shares viz. bonus shares, split etc., shall be credited to the “Unclaimed Suspense Account” duly opened with Vijaya Bank.
As and when the rightful owner of such shares approaches the Company at later date, the Company shall credit the shares lying in the “Unclaimed Suspense Account” to the rightful owner to the extent of his/her entitlement after proper verifi cation of the identity of the rightful owner.
As per Clause 5A(I) of the Listing Agreement, the Company reports the following details in respect of equity shares lying in the suspense account:
Description Number of Share Holders
Number of Equity
Shares
Aggregate Number of shareholders and the outstanding shares in the suspense account lying as on 27.03.2012.
43023 665702

Eighteenth Annual Report 2011-12
96
Description Number of Share Holders
Number of Equity
SharesNumber of Shareholders who approached issuer for transfer of shares from suspense account during the year ended 31.3.2012
Nil Nil
Number of shareholders to whom shares were transferred from suspense account during the year ended 31.3.2012
Nil Nil
Aggregate number of shareholders and the outstanding shares in the suspense account lying as at year ended 31.3.2012
43023 665702
The voting rights on the shares outstanding in the suspense account as on March 31, 2012 shall remain frozen till the rightful owner of such shares claims the shares.
12.17 Dematerialisation of Shares and Liquidity:
The Company has arrangements with both National Securities Depository Limited (NSDL) and Central Depository Services (India) Limited (CDSL) for demat facility. 218635481 Equity Shares aggregating to 97.99 % of the total Equity Capital is held in dematerialised form as on 31.03.2012 of which 95.85% (21,38,49,177 Equity Shares) of total equity capital is held in NSDL & 2.14% (47,86,304 Equity Shares) of total equity capital is held in CDSL as on 31.03.2012.
12.18 Holdings of Promoters & Promoters’ Group in Electronic Mode(100% demat) :
In order to further promote dematerialization of securities, encourage orderly development of the securities market and to improve transparency in the
dealings of shares by promoters including pledge / usage as collateral, SEBI vide its Circular No. SEBI/Cir/ISD/3/2011 dated June 17, 2011 had stipulated that the securities of companies shall be traded in the normal segment of the exchange if and only if, the Company has achieved 100% of promoter’s and promoter group’s shareholding in dematerialized form latest by the quarter ended September 2011 as reported to the stock exchanges (subsequently extended to December 2011 vide SEBI /Cir/ISD/5/2011 dated September 30, 2011).
In compliance with the aforesaid circular of SEBI, 100% de-materialisation of Promoters & Promoter Group’s shareholding was achieved well within the initially stipulated period of September 2011.
12.19 Physical Share Purchase Scheme:
Having regard to the diffi culties experienced by the shareholders in disposing of their shares held in physical form and to mitigate the hardship caused to them, the Company has, along with Karvy Computershare Private Limited (Karvy), formulated a Physical Share Purchase Scheme in 2005-06.
The Equity Shares in physical mode tendered by the shareholders under the scheme are sold by Karvy at the prevailing market price and the net sale proceeds thereof are distributed to the concerned shareholders. The shareholders who wish to avail benefi t of the scheme may kindly contact Karvy.
12.20 National Electronic Clearing Service (NECS) :
As per the directive from Securities and Exchange Board of India (SEBI), all Companies used to use Electronic Clearing Service (ECS) facility, introduced by Reserve Bank of India (RBI), for distributing dividends and other cash benefi ts to investors, wherever available. In this system, the investor’s bank account is credited with the dividend amount using the services of a Clearing House, based on the information provided by the Company, under advice to the investor.
As per RBI notifi cation, with effect from October 01, 2009, the remittance of the money through centralised ECS is replaced by National Electronic Clearing Service (NECS) and banks have been instructed to move to the NECS platform with immediate effect. The advantages of NECS over ECS include faster credit of remittance to benefi ciary’s account, coverage of more bank branches and ease of operations for remitting agencies.
NECS essentially operates on the new and unique bank account number, allotted by banks post implementation of Core Banking Solutions (CBS) for centralized processing of inward instructions and effi ciency in handling bulk transactions.
The Company will remit the dividend payment through National Electronic Clearing Service (NECS)
Physical 2.0%
NSDL95.85%
CDSL2.15%
NSDL95.85%

97
Steel Limited
to the shareholders having accounts with Branches of Banks covered under CBS (Core Banking Solution).
Equity Shareholders holding shares in physical form, who wish to avail the NECS facility, may send their NECS mandate in the format attached to the Company’s R & T Agents, in the event they have not done so earlier. Equity Shareholders holding shares in electronic mode may furnish their new Bank Account Number allotted to them by their bank after implementation of CBS, alongwith a photocopy of a cheque pertaining to the concerned account, or the NECS mandate to their Depositary Participant (DP), at the earliest.
12.21 Green Initiative for Paperless Communications:
The Ministry of Corporate Affairs (MCA) has taken a “Green Initiative in Corporate Governance” by allowing paperless compliance by Companies through electronic mode and has issued a circular bearing no.17/2011 dated April 21, 2011 stating that service of documents by a Company to its Members can be made through electronic mode. The move of the ministry allows public at large to contribute to the green movement.
Keeping in view the underlying theme and the circular issued by MCA, the Company proposes to send various communications and documents like notice calling general meetings, audited fi nancial statements, directors’ report, auditor’s report etc., henceforth, in electronic form, to the email address provided by the Members to the Depositories or to the Company.
This is also a golden opportunity for every shareholder of JSW Steel Limited to contribute to this Corporate Social Responsibility initiative of the Company. To support this green initiative in full measure, members who have not registered their e-mail addresses, so far, are requested to register their e-mail addresses, in respect of electronic holdings with the Depository through their concerned Depository Participant. Members who hold shares in physical form are requested to fi ll in the Registration form which can be obtained from Company’s Registrar Karvy Computershare Private Limited or downloaded from the Company’s website www.jsw.in under the section “Shareholders’ Information”, and register the same with the Company’s Registrar.
12.22 Nomination Facility:
Pursuant to the provisions of Section 109A of the Companies Act, 1956, members are entitled to make nominations in respect of shares held by them. Members holding shares in physical form and intending to make/change the nomination in respect of their shares in the Company may submit their requests in Form No. 2B to the Company’s Registrar, KARVY Computershare Private Limited. Members
holding shares in electronic form may submit their nomination requests to their respective Depository Participants directly. Form No. 2B can be obtained from Company’s Registrar KARVY Computershare Private Limited or downloaded from the Company’s website www.jsw.in under the section ‘Shareholder’s Information’.
12.23 Outstanding GDRs/ADRs or Warrants or any Convertible Instrument, conversion dates and likely impact on equity:
(a) FCCBs: The Company had issued 3,250 Foreign Currency
Convertible Bonds (FCCBs), of US$100,000 each during the fi nancial year 2007-08. As per the option attached to the FCCBs, each Bond is convertible into Equity Shares of face value of `10/- each of the Company at a conversion price of `953.40 per share, at any time on or after 07.08.2007 until the close of business on 21.06.2012, unless previously redeemed, converted or purchased and cancelled and except during a closed period.
In the Financial Year 2007-08, one of the Bond Holders i.e. Deutsche Bank AG London, had opted for the conversion of 8 Bonds into Equity Shares on 31.12.2007 and accordingly the Company had issued 33,799 Equity Shares of face value of `10/- each of the Company to Deutsche Bank AG London.
The Board of Directors at its meeting held on 28.01.2009, resolved to explore opportunities to buy back a portion of the Company’s outstanding Foreign Currency Convertible Bonds (FCCBs). In the Financial year 2008-09, 14.74% of the Company’s outstanding Zero Coupon Foreign Currency Convertible Bonds of US $ 1,00,000 each due on 2012 (ISIN XS0302937031), aggregating to US $ 47.80 million were repurchased in accordance with the A.P. (DIR Series) Circular No. 39 dated 08.12.2008 issued by the Reserve Bank of India and subsequently cancelled.
The principal amount of FCCBs outstanding as at 31.03.2012 after the above conversion, repurchase and cancellation is US $ 274.40 Million.
(b) Equity Warrants: 1,75,00,000 (One crore seventy fi ve lakhs)
warrants were allotted on June 16, 2010 to a Promoter Group Entity, on a preferential basis.
Each warrant entitles the holder to apply for and be allotted one equity share of the Company of par value of `10/- each, at a price of `1,210/- per equity share, at any time within 18 months from the date of allotment of the warrants, i.e. within December 15, 2011.

Eighteenth Annual Report 2011-12
98
The Warrant Holder (Promoter Group Entity) has not exercised its option to convert the aforesaid 1,75,00,000 warrants allotted to it, into Equity shares of the Company. The amount of `529,37,50,000 being the initial 25% of the total consideration of ̀ 2117,50,00,000/- received by the Company has been forfeited.
(c) Global Depository Receipts (GDRs):
Pursuant to the Subscription Agreement entered into by the Company with JFE Steel Corporation on 27.07.2010, 3,085,814 non-voting, non-transferable Global Depository Receipts representing 3,085,814 underlaying shares of the Company i.e. 1.38% of the issued and subscribed share capital were outstanding as on March 31, 2011.
During the Financial Year 2011-12, JFE Steel Corporation surrendered 4,84,876 Global Depository Receipts for withdrawal of the underlying Equity Shares. After the aforesaid withdrawal, 26,00,938 non-voting, non-transferable Global Depository Receipts representing 26,00,938 underlying shares of the Company i.e. 1.17% of the issued and subscribed share capital, are outstanding as on March 31, 2012.
12.24 Registered Offi ce:
Jindal Mansion, 5A, Dr.G.Deshmukh Marg, Mumbai – 400 026.
12.25 Plant Locations: Vijayanagar : P.O. Vidyanagar, Toranagallu Village,
Sandur Taluk, Bellary Dist, Karnataka – 583 275
Vasind : Shahapur Taluk, Thane District, Maharashtra – 421 604.
Tarapur : MIDC Boisar, Thane Dist., Maharashtra 401506
Salem : Pottaneri, M Kalipatti Village, Mecheri Post, Mettur Taluk, Salem Dist., Tamil Nadu 636453.
12.26 Address for Investor Correspondence:
I. Retail Investors
a) For Securities held in Physical form Registrar & Share Transfer Agents Karvy Computershare Private Limited Plot No.17 to 24, Vittalrao Nagar, Madhapur, Hyderabad - 500 081 Ph: 040 - 23420815-824 (10 lines) Fax: 040 - 23420814 E-mail: [email protected] Website: www.karvy.com
b) For Securities held in Demat form
The investor’s Depository Participant and / or Karvy Computershare Private Limited
c) JSW Steel Limited - Investor Relation Center Victoria House, Pandurang Budhkar Marg, Lower Parel (W), Mumbai – 400 013 Ph.: 022-24917930/31/94 Fax: 022-24917933 Email: [email protected]
II. Institutional Investors
Mr. Murari Rajan, Executive Director (Mergers & Acquisition and
Investor Relations) Jindal Mansion 5A, Dr. G. Deshmukh Marg, Mumbai 400 026 Tel. No. 022-23513000 Fax. No. 022-23526400
III. Designated exclusive email-id for Investor servicing: [email protected]
IV. Toll Free Number of R & T Agent’s exclusive call Centre: 1-800-3454001
V. Web-based Query Redressal System
Web-based Query Redressal System has been extended by the Registrars and Share Transfer Agent for redressal of Shareholders’ queries. The Shareholder can visit http://karisma.karvy.com and click on “investors” option for query registration after free identity registration.
After logging in, Shareholders can submit their query in the “QUERIES’ option provided on the website, which would give the grievance registration number. For accessing the status/response to their query, the same number can be used at the option “VIEW REPLY” after 24 hours. The Shareholders can continue to put additional queries relating to the case till they are satisfi ed.
13. CORPORATE ETHICS:
The Company adheres to the highest standards of business ethics, compliance with statutory and legal requirements and commitment to transparency in business dealings. A Code of Conduct for Board Members and Senior Management and a Code of Conduct for Prevention of Insider Trading as detailed below has been adopted pursuant to clause 49 (D) of the Listing Agreement & the Securities & Exchange Board of India (Prohibition of Insider Trading) Regulations, 1992 (as amended), respectively:

99
Steel Limited
a) Code of Conduct for Board Members and Senior Management
The Board of Directors of the Company adopted the Code of Conduct for its members and Senior Management at their meeting held on 20.10.2005. The Code highlights Corporate Governance as the cornerstone for sustained management performance, for serving all the stakeholders and for instilling pride of association.
Minor modifi cations were made to the Code of Conduct and the amended Code of Conduct was adopted by the Board in its meeting held on 24.10.2008
The Code is applicable to all Directors and specifi ed Senior Management Executives. The Code impresses upon Directors and Senior Management Executives to uphold the interest of the Company and its stakeholders and to endeavor to fulfi ll all the fi duciary obligations towards them. Another important principle on which the code is based is that the Directors and Senior Management Executives shall act in accordance with the highest standards of honesty, integrity, fairness and ethical conduct and shall exercise utmost good faith, due care and integrity in performing their duties. The Code has been posted on the website of the Company www.jsw.in.
Declaration affi rming compliance of Code of Conduct
The Company has received confi rmations from the Directors as well as Senior Management Executives regarding compliance of the Code of Conduct during the year under review.
A declaration by the Director and CEO affi rming compliance of Board Members and Senior Management Personnel to the Code is also annexed herewith.
b) Code of Conduct for Prevention of Insider Trading
The Company has adopted a Code of Conduct for Prevention of Insider Trading for its Management, Staff and Directors. The Code lays down guidelines and procedures to be followed and disclosures to be made by Directors, Top Level Executives and Staff whilst dealing in shares of the Company.
Minor modifi cations were made to the “JSWSL Code of Conduct for Prevention of Insider Trading” in line with the amendments made to the “Securities and Exchange Board of India (Prohibition of Insider Trading) (Amendment) Regulations, 2008, by SEBI. The amended code
was adopted by the Board in its meeting held on 07.05.2009.
The policy and the procedures are periodically communicated to the employees who are considered as insiders of the Company. Trading window closure is intimated to all employees in advance, whenever required.
The Company Secretary has been appointed as the Compliance Offi cer and is responsible for adherence to the Code.
c) Reconciliation of Share Capital Audit Report
SEBI has vide its Circular No. CIR/MRD/DP/30/2010 dated 06.09.2010 renamed the ‘Secretarial Audit Report’ as the ‘Reconciliation of Share Capital Audit Report’.
Reconciliation of Share Capital Audit Report in terms of SEBI Directive no. D&CC/FITTC/CIR-16/2002 dated 31.12.2002, confi rming that the total issued capital of the Company is in agreement with the total number of shares in physical form and the total number of dematerialised shares held with National Securities Depository Limited and Central Depository Services (India) Limited, is placed before the Board on a quarterly basis and is also submitted to the Stock Exchanges where the shares of the Company are listed.
d) Internal Checks and Balances
Wide use of technology in the Company’s fi nancial reporting processes ensures robustness and integrity. The Company deploys a robust system of internal controls to allow optimal use and protection of assets, facilitate accurate and timely compilation of fi nancial statements and management reports and ensure compliance with statutory laws, regulations and Company policies. The Company has both external and internal audit systems in place. Auditors have access to all records and information of the Company. The Board and the management periodically review the fi ndings and recommendations of the auditors and take necessary corrective actions whenever necessary. The Board recognises the work of the auditors as an independent check on the information received from the management on the operations and performance of the Company.
e) Legal Compliance of the Company’s Subsidiaries
Periodical Management audit ensures that the Company‘s Subsidiaries conducts its business with high standards of legal, statutory and regulatory compliances. As per the report of the Management Auditors, there has been no

Eighteenth Annual Report 2011-12
100
material non-compliance with the applicable statutory requirements by the Company and its subsidiaries.
f) Human Rights Policy
Human rights are the Standards of Treatment to which all people are entitled. On December 10, 1948, the General Assembly of the United Nations adopted and proclaimed the Universal Declaration of Human Rights (UDHR) which is the most widely recognised defi nition of Human Rights. The Declaration represents a contract between governments and their people, who have a right to demand that this document be respected. The Declaration continues to affi rm the inherent human dignity and worth of every person in the world, without distinction of any kind.
Although human rights are principally the responsibility of national governments, this
has become an increasingly important issue for business.
In line with JSW’s heritage as a responsible corporate citizen and its commitment to respecting the economic, social, cultural, political and civil rights of individuals involved in and impacted by its operations, the Board of Directors in its meeting held on 20.01.2010 has approved a Formal Human Rights Policy for adoption by the Company and all its Subsidiaries as part of its global personnel policies, in line with the practice followed internationally by Companies of Repute.
Compliance Certifi cate by Auditors:
The Company has obtained a certifi cate from the Statutory Auditors regarding compliance of conditions of Corporate Governance as stipulated in Clause 49 which is annexed herewith.
DECLARATION AFFIRMING COMPLIANCE OF CODE OF CONDUCT
As provided under Clause 49 of the Listing Agreement with the Stock Exchanges, the Board Members and the Senior Management Personnel have confi rmed compliance with the Code of Conduct for the year ended 31.03.2012.
For JSW Steel Limited
Place: Mumbai Dr. Vinod NowalDate: 14.05.2012 Director & CEO
AUDITOR’S CERTIFICATE ON COMPLIANCE OF CONDITIONS OF CORPORATE GOVERNANCE:
We have examined the compliance of the conditions of Corporate Governance by JSW Steel Limited for the year ended 31.03. 2012, as stipulated in Clause 49 of the Listing Agreement of the said Company with Stock Exchanges in India.
The compliance of conditions of Corporate Governance is the responsibility of the management. Our examination was limited to the procedures and implementation thereof, adopted by the Company for ensuring the compliance of the conditions of Corporate Governance. It is neither an audit nor an expression of opinion on the fi nancial statements of the Company.
In our opinion and to the best of our information and according to the explanations given to us, we certify that the Company has complied with the conditions of Corporate Governance as stipulated in the above mentioned Listing Agreement.
We state that such compliance is neither an assurance as to the future viability of the Company nor the effi ciency or effectiveness with which the management has conducted the affairs of the Company.
For Deloitte Haskins & SellsChartered Accountants
Registration No. 117366W
P. B. PARDIWALLAPlace : Mumbai PartnerDate : 14.05.2012 Membership No. 40005

101
Steel Limited
To the Members of JSW Steel Limited
1. We have audited the attached Balance Sheet of JSW STEEL LIMITED (“the Company”) as at 31 March 2012, the Statement of Profi t and Loss and the Cash Flow Statement of the Company for the year ended on that date, both annexed thereto. These fi nancial statements are the responsibility of the Company’s Management. Our responsibility is to express an opinion on these fi nancial statements based on our audit.
2. We conducted our audit in accordance with the auditing standards generally accepted in India. Those Standards require that we plan and perform the audit to obtain reasonable assurance about whether the fi nancial statements are free of material misstatements. An audit includes examining, on a test basis, evidence supporting the amounts and the disclosures in the fi nancial statements. An audit also includes assessing the accounting principles used and the signifi cant estimates made by the Management, as well as evaluating the overall fi nancial statement presentation. We believe that our audit provides a reasonable basis for our opinion.
3. Without qualifying our opinion, we draw attention to note 26(4) relating to the Company’s assessment that no provision against the carrying amounts of its long term strategic investment and loans extended to its subsidiary, JSW Steel (USA) Inc. of ` 1,948.41 crores is presently necessary, for the reasons stated in the note.
4. As required by the Companies (Auditor’s Report) Order, 2003 (CARO) issued by the Central Government in terms of Section 227(4A) of the Companies Act, 1956, we enclose in the Annexure a statement on the matters specifi ed in paragraphs 4 and 5 of the said Order.
5. Further to and read with our comments in paragraph 3 above and the Annexure referred to in paragraph 4 above, we report as follows:
a. we have obtained all the information and explanations which to the best of our knowledge and belief were necessary for the purposes of our audit;
b. in our opinion, proper books of account as required by law have been kept by the Company so far as it appears from our examination of those books;
Auditor’s Report
c. the Balance Sheet, the Statement of Profi t and Loss and the Cash Flow Statement dealt with by this report are in agreement with the books of account;
d. in our opinion, the Balance Sheet, the Statement of Profi t and Loss and the Cash Flow Statement dealt with by this report are in compliance with the Accounting Standards referred to in Section 211(3C) of the Companies Act, 1956;
e. in our opinion and to the best of our information and according to the explanations given to us, the said accounts give the information required by the Companies Act, 1956 in the manner so required and give a true and fair view in conformity with the accounting principles generally accepted in India:
(i) in the case of the Balance Sheet, of the state of affairs of the Company as at 31 March 2012;
(ii) in the case of the Statement of Profi t and Loss, of the profi t of the Company for the year ended on that date and
(iii) in the case of the Cash Flow Statement, of the cash fl ows of the Company for the year ended on that date.
6. On the basis of the written representations received from the Directors as on 31 March 2012 taken on record by the Board of Directors, none of the Directors is disqualifi ed as on 31 March 2012 from being appointed as a director in terms of Section 274(1) (g) of the Companies Act, 1956.
For Deloitte Haskins & SellsChartered Accountants
(Firm Registration No. 117366W)
P. B. PardiwallaPartner
(Membership No. 40005)Place: Mumbai Date: 14 May 2012

Eighteenth Annual Report 2011-12
102
(i) Having regard to the nature of the Company’s business/activities/result, clauses (i-c), (iii), (vi), (x), (xii), (xiii), (xiv), (xviii) and (xx) of CARO are not applicable to the Company.
(ii) In respect of its fi xed assets: (a) The Company has maintained proper records
showing full particulars, including quantitative details and situation of its fi xed assets.
(b) The fi xed assets were physically verifi ed during the year by the Management in accordance with a programme of verifi cation which, in our opinion, provides for physical verifi cation of all the fi xed assets at reasonable intervals. According to the information and explanation given to us, no material discrepancies were noticed on such verifi cation.
(iii) In respect of its inventory: (a) As explained to us, the inventories were
physically verifi ed during the year by the Management at reasonable intervals, except for inventories lying with third parties where confi rmations have been received.
(b) As the Company’s inventory of raw materials mostly comprises bulk materials such as iron ore, iron ore fi nes, coal, coke, pellets etc. requiring technical expertise for establishing the quality and the quantifi cation thereof; the Company has hired independent agencies for physical verifi cation of such stocks. Relying on the above, according to the information and explanations furnished to us, the procedure of physical verifi cation of inventory followed by the management are reasonable and adequate in relation to the size of the Company and the nature of its business.
(c) In our opinion and according to the information and explanations given to us, the Company has maintained proper records of its inventories and no material discrepancies were noticed on physical verifi cation.
(iv) In our opinion and according to the information and explanations given to us, having regard to the explanations that some of the items purchased/sold are of special nature and suitable alternate sources for obtaining comparable quotations are not readily available, there are adequate internal control systems commensurate with the size of the Company and the nature of its business for the purchase of inventory and fi xed assets and for the sale of goods. During the course of our audit, we have not observed any major weakness in such internal control.
Annexure to the Auditor’s Report(Referred to in paragraph 4 of our report of even date)
(v) In respect of contracts or arrangements entered in the Register maintained in pursuance of Section 301 of the Companies Act, 1956, and according to the information and explanations given to us:
(a) The particulars of contracts or arrangements referred to Section 301 that needed to be entered into the Register maintained under the said Section have been so entered.
(b) Where each of such transaction is in excess of ` 5 lakhs in respect of any party, the transactions have been made at prices which are prima facie reasonable having regard to the prevailing market prices at the relevant time.
(vi) In our opinion, the Company has an adequate internal audit system commensurate with the size of the company and the nature of its business.
(vii) We have broadly reviewed the books of account and records maintained by the Company pursuant to the rules made by the Central Government for the maintenance of cost records under Section 209(1) (d) of the Companies Act, 1956 in respect of steel, steel products and electricity and are of the opinion that prima facie the prescribed accounts and records have been made and maintained. We have, however, not made a detailed examination of the records with a view to determining whether they are accurate or complete. To the best of our knowledge and according to the information and explanations given to us, the Central Government has not prescribed the maintenance of cost records for any other product of the Company.
(viii) According to the information and explanations given to us in respect of statutory dues:
(a) The Company has generally been regular in depositing undisputed dues, including Provident Fund, Investor Education and Protection Fund, Income-tax, Sales Tax, Wealth Tax, Service Tax, Custom Duty , Excise Duty and other material statutory dues applicable to it with the appropriate authorities.
(b) There were no undisputed amounts payable in respect of Income-tax, Wealth Tax, Custom Duty, Excise Duty and other material statutory dues in arrears as at 31 March 2012 for a period of more than six months from the date they became payable.

103
Steel Limited
(c) Details of dues of Income-tax, Sales Tax, Wealth Tax, Service Tax, Custom Duty and Excise Duty which have not been deposited as on 31 March 2012 on account of disputes are given below:
Name of Statute
Nature of the Dues
Amount involved
` in Crores
Period to which the amount relates
Forum where Dispute is pending
Income Tax Act, 1961
Income Tax 0.49 2002-2003 Commissioner of Income Tax (Appeal)
The Bombay Sales Tax Act, 1959
Sales Tax 14.27 2000-2002, 2003-2005
The Joint Commissioner of Sales Tax (Appeals), Thane
The Karnataka Value Added Tax Act, 2003
Sales Tax 2.69 2006-2007 Karnataka Appellate Tribunal, Bangalore
Chapter V of the Finance Act, 1994
Service Tax 20.60 2005-2009 Customs, Excise and Service Tax Appellate Tribunal
Chapter V of the Finance Act, 1994
Service Tax 0.31 2005-2006 The Commissioner of Central Excise (Appeals), Mangalore
The Custom Act, 1962
Customs Duty
43.71 2001-2002 High Court of Karnataka
The Custom Act, 1962
Customs Duty
13.02 2001-2002, 2008-2009
Customs, Excise and Service Tax Appellate Tribunal
The Custom Act, 1962
Customs Duty
2.14 2004-2005 Supreme Court of Karnataka
The Central Excise Act, 1944
Excise Duty 1.33 2005-2006 The Commissioner of Central Excise (Appeals), Chennai
The Central Excise Act, 1944
Excise Duty 302.52 2002-2010 Customs, Excise and Service Tax Appellate Tribunal
The Central Excise Act, 1944
Excise Duty 0.31 2008 The Commissioner of Central Excise (Appeals), Mumbai
The Central Excise Act, 1944
Excise Duty 0.19 2005-2007 Additional Commissioner, Salem
The Central Excise Act, 1944
Excise Duty 0.19 2004-2005 The Joint Commissioner of Sales Tax (Appeals), Thane
The Central Excise Act, 1944
Excise Duty 0.23 2008 Commissioner, Central Excise, Mumbai
(ix) In our opinion and according to the information and explanations given to us, the Company has not defaulted in the repayment of dues to banks, fi nancial institutions and debenture holders.
(x) In our opinion and according to the information and explanations given to us, the terms and conditions of the guarantees given by the Company for loans taken by subsidiaries (including step down subsidiaries) from banks and fi nancial institutions are not prima facie prejudicial to the interests of the Company.
(xi) To the best of our knowledge and belief and according to the information and explanations given to us, in our opinion, term loans availed by the Company were, prima facie, applied by the Company during the year for the purposes for which the loans were obtained, other than temporary deployment pending application
(xii) According to the information and explanations given to us and on an overall examination of the balance sheet of the Company, fund raised on short- term basis have, prima facie, not been used during the year for long-term investment.
(xiii) According to the information and explanations given to us and the records examined by us, security/ charge have been created or are in the process of creation in respect of the debenture issued.
(xiv) To the best of our knowledge and belief and according to the information and explanations given to us, no material fraud on or by the Company was noticed or reported during the year.
For DELOITTE HASKINS & SELLSChartered Accountants
(Firm Registration No. 117366W)
P. B. PardiwallaPlace: Mumbai PartnerDate: 14 May 2012 (Membership No. 40005)

Eighteenth Annual Report 2011-12
104
Balance Sheet as at 31st March, 2012` in crores
Note No. As at
31.03.2012 As at
31.03.2011 I. EQUITY AND LIABILITIES
(1) Shareholders’ funds
2 Share capital 563.18 563.18 3 Reserves and surplus 17,934.31 16,132.71
Money received against share warrants - 529.38 18,497.49 17,225.27
(2) Non-current liabilities4 Long-term borrowings 11,528.09 8,867.90
5(d) Deferred Tax Liabilities (Net) 3,012.09 2,317.04 6 Other Long term liabilities 82.72 449.90 7 Long-term provisions 32.90 21.82
14,655.80 11,656.66 (3) Current liabilities
8 Short-term borrowings 774.13 1,879.43 9 Trade payables 9,254.25 6,009.82 10 Other current liabilities 7,182.52 4,428.42 11 Short-term provisions 226.92 358.78
17,437.82 12,676.45 TOTAL 50,591.11 41,558.38
II. ASSETS(1) Non-current assets
12 Fixed assets Tangible assets 27,071.69 21,089.11 Intangible assets 18.89 13.04 Capital work-in-progress 2,476.77 5,689.94 Intangible assets under development 27.04 18.12
29,594.39 26,810.21 13 Non-current investments 4,212.20 3,831.81 14 Long-term loans and advances 2,436.33 1,982.01 15 Other non-current assets 1.58 0.08
36,244.50 32,624.11 (2) Current assets
16 Current investments 201.22 267.00 17 Inventories 5,179.08 4,138.41 18 Trade receivables 1,362.06 838.65 19 Cash and Cash Equivalents 2,956.02 1,886.80 14 Short-term loans and advances 4,648.23 1,803.41
14,346.61 8,934.27 TOTAL 50,591.11 41,558.38
1 Signifi cant Accounting Policies
The accompanying Notes 1 to 26 are an integral part of the fi nancial statements
In terms of our report attached
For DELOITTE HASKINS & SELLS Chartered Accountants
For and on behalf of the Board of Directors
SAJJAN JINDAL Chairman & Managing Director
P. B. PARDIWALLA Partner
Place : Mumbai, Dated : 14 May 2012
LANCY VARGHESECompany Secretary
RAJEEV PAI Chief Financial Offi cer
SESHAGIRI RAO M.V.S. Jt. Managing Director & Group CFO

105
Steel Limited
Statement of Profi t and Loss for the year ended 31st March, 2012
In terms of our report attached
For DELOITTE HASKINS & SELLS Chartered Accountants
For and on behalf of the Board of Directors
SAJJAN JINDAL Chairman & Managing Director
P. B. PARDIWALLA Partner
Place : Mumbai, Dated : 14 May 2012
LANCY VARGHESECompany Secretary
RAJEEV PAI Chief Financial Offi cer
SESHAGIRI RAO M.V.S. Jt. Managing Director & Group CFO
` in crores
Note no. For the
year ended 31.03.2012
For the year ended
31.03.2011
20 I. Revenue from operations 34,720.67 25,334.63
Less: Excise duty 2,598.01 1,967.52
32,122.66 23,367.11
21 II. Other income 179.30 234.51
III. Total Revenue (I + II) 32,301.96 23,601.62
IV. Expenses:
Cost of materials consumed 20,960.11 14,803.09
Purchases of traded goods 77.50 182.23
22 Changes in inventories of Finished goods, Work-in- progress and Stock-in-Trade (297.81) (682.98)
23 Employee benefi ts expense 625.87 534.47
24 Finance costs 1,186.41 854.17
12 Depreciation and amortization 1,708.17 1,378.71
25 Other expenses 5,126.19 3,753.40
Total expenses 29,386.44 20,823.09
V. Profi t before Exceptional Items and Tax 2,915.52 2,778.53
VI. Exceptional Items
26(5) Exchange Loss (net) 820.96 -
VII. Profi t before Tax (V-VI) 2,094.56 2,778.53
VIII. Tax expense:
5(a) Current tax 402.39 578.34
5(b) Deferred tax 753.80 387.67
5(c) Less: MAT Credit Entitlement (687.49) (198.15)
468.70 767.86
IX. Profi t for the year (VII-VIII) 1,625.86 2,010.67
26(14) X. Earnings per equity share:
(1) Basic 71.42 97.17
(2) Diluted 71.42 96.33
1 Signifi cant Accounting Policies
The accompanying Notes 1 to 26 are an integral part of the fi nancial statements

Eighteenth Annual Report 2011-12
106
For the year ended31.03.2012
For the year ended31.03.2011
A. CASH FLOW FROM OPERATING ACTIVITIESNET PROFIT BEFORE TAX 2,094.56 2,778.53Adjustments for :Depreciation and amortisation 1,708.17 1,378.71(Profi t)/Loss on sale of Fixed Assets (0.08) 0.98Income from Current Investments (14.90) (32.05)Profi t on sale of Long Term Investment (16.45) -Interest Income (138.46) (123.69)Dividend Income (8.67) (9.92)Interest Expenses 800.37 576.92Unrealised exchange Loss/(gain) 253.85 (95.83)Amortisation of Employees Share Payments 10.28 7.55Provision for Diminution in Value of Investments 1.37 62.12
2,595.48 1,764.79Operating profi t before working capital changes 4,690.04 4,543.32Adjustments for :Increase in Inventories (1,040.67) (1,552.64)Increase in Trade Receivables and Loans and Advances* (3,559.60) (2,878.39)Increase in Liabilities and Provisions* 2,446.66 2,351.04
(2,153.61) (2,079.99)Cash fl ow before taxation 2,536.43 2,463.33Direct Taxes Paid (397.11) (420.35)NET CASH GENERATED FROM OPERATING ACTIVITIES 2,139.32 2,042.98
B. CASH FLOW FROM INVESTING ACTIVITIES Purchase of fi xed assets and capital advances (3,774.41) (4,911.65)Investment in subsidiaries, associates and Joint Ventures (365.02) (2,330.57)Purchase of Other Long Term Investments (Net) (0.29) (2.50)Purchase/Sale of Current Investments (Net) 80.68 (27.46)Proceeds from sale of Fixed Assets 4.76 2.71Interest received 117.48 99.24Dividend received 8.67 9.92NET CASH USED IN INVESTING ACTIVITIES (3,928.13) (7,160.31)
C CASH FLOW FROM FINANCING ACTIVITIESProceeds from Issue of Equity Share Capital/Share Warrants - 5,935.62Proceeds from Long Term Borrowings 5,871.73 3,009.90Repayment of Long Term Borrowings (1,431.89) (3,404.72)Short term borrowings (net) (1,139.11) 816.22Interest Paid (983.04) (837.89)Dividend Paid (including Corporate Dividend Tax) (350.09) (239.74)NET CASH GENERATED FROM FINANCING ACTIVITIES 1,967.60 5,279.39
NET INCREASE IN CASH AND CASH EQUIVALENTS(A+B+C) 178.79 162.06CASH AND CASH EQUIVALENTS - OPENING BALANCE 426.87 264.81CASH AND CASH EQUIVALENTS - CLOSING BALANCE# 605.66 426.87
Add : Margin Money / Fixed Deposit Balance (In Lien) 2,329.52 1,441.86Add : Balance in debenture interest/ installments/dividend payment accounts 20.84 18.07CASH AND CASH EQUIVALENTS ( As per Note 19) 2,956.02 1,886.80* Includes current and non current # Cash and Cash Equivalents (refer note 19) 1,259.47 1,623.68Less : Earmarked balances included above 653.81 1,196.81Cash and Cash Equivalents considered for Cash Flow 605.66 426.87
Cash Flow Statement for the year ended 31st March, 2012
In terms of our report attached
For DELOITTE HASKINS & SELLS Chartered Accountants
For and on behalf of the Board of Directors
SAJJAN JINDAL Chairman & Managing Director
P. B. PARDIWALLA Partner
Place : Mumbai, Dated : 14 May 2012
LANCY VARGHESECompany Secretary
RAJEEV PAI Chief Financial Offi cer
SESHAGIRI RAO M.V.S. Jt. Managing Director & Group CFO
` in crores

107
Steel Limited
Notes forming part of the fi nancial statements
Note 1 : Signifi cant Accounting Policies
1. Basis of accounting
The accompanying fi nancial statements have been prepared under the historical cost convention, in accordance with Indian Generally Accepted Accounting Principles (GAAP) and the provisions of the Companies Act, 1956 (The Act).
The Ministry of Corporate Affairs revised Schedule VI to the Act for fi nancial years commencing on or after 1 April 2011. The balance sheet, profi t and loss account and the comparative fi nancial information for the previous year have accordingly been prepared and presented with disclosures as required under the Revised Schedule VI.
2. Use of estimates
The preparation of fi nancial statements in conformity with Generally Accepted Accounting Principles require estimates and assumptions to be made that affect the reported amounts of assets and liabilities and disclosure of contingent liabilities on the date of fi nancial statements and the reported amounts of revenues and expenses during the reporting period. Actual results could differ from these estimates and differences between actual results and estimates are recognized in the periods in which the results are known/materialize.
3. Fixed assets and depreciation
Fixed Assets are stated at their cost of acquisition or construction less accumulated depreciation and impairment losses.
Costs of acquisition comprise all costs incurred to bring the assets to their location and working condition up to the date the assets are put to use. Costs of construction are composed of those costs that relate directly to specifi c assets and those that are attributable to the construction activity in general and can be allocated to specifi c assets up to the date the asset are put to use.
Depreciation on assets is provided, pro-rata for the period of use, by the Straight Line Method (SLM) at the SLM rates prescribed in Schedule XIV to the Act.
Leasehold land is amortized over the period of the lease, except where the lease is convertible to freehold land under lease agreements at future dates at no additional cost.
The company capitalizes software where it is reasonably estimated that the software has an enduring useful life. Software is depreciated over an estimated useful life of 3 to 5 years.
The carrying values of assets /cash generating units at each balance sheet date are reviewed for impairment in accordance with Accounting Standard 28 “Impairment of Assets”. If any indication of impairment exists, the recoverable amount of such assets is estimated and impairment is recognized, if the carrying amount of these assets exceeds their recoverable amount (i.e. the higher of the asset’s net selling price and value in use).
4. Investments
Investments are classifi ed as current or long-term in accordance with Accounting Standard 13 “Accounting for Investments”.
Current investments are stated at lower of cost and fair value. Any reduction in the carrying amount and any reversals of such reductions are charged or credited to the profi t and loss account.
Long term investments are stated at cost. Provision for diminution is made to recognize a decline, other than temporary, in the value of such investments.
5. Revenue recognition
Revenue is recognized when it is earned and no signifi cant uncertainty exists as to its realization or collection.
Revenue from sale of goods is recognized on delivery of the products, when all signifi cant contractual obligations have been satisfi ed, the property in the goods is transferred for a price, signifi cant risks and rewards of ownership are transferred to the customers and no effective ownership is retained. Sales are net of sales tax/value added tax. Export turnover includes related export benefi ts. Excise duty recovered is presented as a reduction from gross turnover.
6. Inventories
Inventories are valued at the lower of cost and net realizable value. Cost of inventories comprise all costs of purchase, costs of conversion and other costs incurred in bringing the inventories to their present location and condition. Cost is determined by the weighted average cost method.
Excise duty related to fi nished goods stock is included under changes in inventories of fi nished goods, work-in-progress and stock-in-trade (Refer note 22).
7. Borrowing costs
Borrowing costs attributable to the acquisition or construction of qualifying assets, as defi ned in Accounting Standard 16 “Borrowing Costs” are capitalized as part of the cost of such asset up to the date when the asset is ready for its intended use. Other borrowing costs are expensed as incurred.
8. Employee benefi ts
Employee benefi ts such as salaries, allowances, non-monetary benefi ts and employee benefi ts under defi ned contribution plans such as provident and other funds, which fall due for payment within a period of twelve months after rendering service, are charged as expense to the profi t and loss account in the period in which the service is rendered.
Employee benefi ts under defi ned benefi t plans, such as gratuity and compensated absences which fall due for payment after a period of twelve months from rendering service or after completion of employment, are measured by the projected unit credit method, on the basis of actuarial valuations carried out by third party actuaries at each balance sheet date. The company’s obligations recognized in the balance sheet represents the present value of obligations as reduced by the fair value of plan assets, where applicable.
Actuarial gains and losses are recognized immediately in the profi t and loss Account.
9. Foreign currency transactions
Foreign currency transactions are recorded at the exchange rates prevailing on the date of the transaction.
Monetary foreign currency assets and liabilities (monetary items) are reported at the exchange rate prevailing on the balance sheet date. Exchange differences relating to long term monetary items are dealt with in the following manner:
i. Exchange differences relating to long-term monetary items, arising during the year, in so far as they relate to the acquisition of a depreciable capital asset are added to/deducted from the cost of the asset and depreciated over the balance life of the asset.
ii. In other cases such differences are accumulated in a “Foreign Currency Monetary Item Translation Difference Account” and amortized to the profi t and loss account over the balance life of the long-term monetary item, however that the period of amortization does not extend beyond 31 March 2020.
All other exchange differences are dealt with in the profi t and loss account.

Eighteenth Annual Report 2011-12
108
Non-monetary items such as investments are carried at historical cost using the exchange rates on the date of the transaction- also refer note 1-4.
10. Derivative fi nancial instruments
The Company enters into derivative fi nancial instruments such as foreign exchange forward contracts, interest rate swaps and currency options to manage its exposure to interest rate and foreign exchange risks.
Derivatives are initially recognized at fair value at the date a derivative contract is entered into and are subsequently re-measured to their fair value at each balance sheet date.
The Company designates certain derivatives as either hedges of the fair value of recognized assets or liabilities (fair value hedges) or hedges of highly probable forecast transactions or hedges of foreign currency risk of fi rm commitments (cash fl ow hedges). The Company does not enter into derivative contracts for trading or speculative purposes.
A derivative is presented under “Short term loans and advances (Note14 ) or “Other Current Liabilities” (Note 10).
Changes in the fair value of derivatives that are designated and qualify as fair value hedges are recorded in the profi t and loss account immediately, together with any changes in the fair value of the hedged item that are attributable to the hedged risk. The change in the fair value of the hedging instrument and the change in the hedged item attributable to the hedged risk are recognized in the same line of the profi t and loss account relating to the hedged item.
Changes in the fair value of derivatives that are designated and qualify as cash fl ow hedges are deferred in a “Hedging Reserve Account”. The gain or loss relating to the ineffective portion is recognized immediately in profi t and loss account. Amounts deferred in the Hedging Reserve Account are recycled in the profi t and loss account in the periods when the hedged item is recognized in the profi t and loss account, in the same line as the hedged item.
Hedge accounting is discontinued when the Company revokes the hedging relationship, the hedging instrument expires or is sold, terminated, or exercised, or no longer qualifi es for hedge accounting. In case of fair value hedges the adjustment to the carrying amount of the hedged item arising from the hedged risk is amortized to the profi t and loss account from that date. In case of cash fl ow hedges any cumulative gain or loss deferred in the Hedging Reserve Account at that time is retained and is recognized when the forecast transaction is ultimately recognized in the profi t and loss account. When a forecast transaction is no longer expected to occur, the cumulative gain or loss that was deferred is recognized immediately in the profi t and loss account.
11. Income taxes
Income taxes are accounted for in accordance with Accounting Standard 22 “Accounting for Taxes on Income”. Taxes comprise both current and deferred tax.
Current tax is measured at the amount expected to be paid/ recovered from the revenue authorities, using the applicable tax rates and tax laws. Minimum Alternate Tax (MAT) credit entitlement available under the provisions of Section 115 JAA of the Income Tax Act, 1961 is recognized to the extent that the credit will be available for discharge of future normal tax liability.
The tax effect of the timing differences that result between taxable income and accounting income and are capable of reversal in one or more subsequent periods are recorded as a deferred tax asset or a deferred tax liability. They are measured using the substantively enacted tax rates and tax laws.
Notes forming part of the fi nancial statements The carrying amount of MAT credit and deferred tax assets at each balance sheet date is reduced to the extent that it is no longer reasonably certain that suffi cient future taxable income will be available against which the assets can be realized.
Where certain expenses or credits which are otherwise required to be charged to the profi t and loss account are adjusted directly to reserves in accordance with a court order or as permitted by law/accounting standards, the tax benefi ts or charge, arising from the admissibility or taxability of such expenses or income for tax purpose is also recognized in the reserves.
Tax on distributed profi ts payable in accordance with the provisions of section 115O of the Income Tax Act, 1961 which is accounted for in accordance with the Guidance Note on Accounting for Corporate Dividend Tax is regarded as a tax on distribution of profi ts and is not considered in determination of profi ts for the year.
12. Earnings per share
The Company reports basic and diluted earnings per share (EPS) in accordance with Accounting Standard 20 “Earnings per Share”. Basic EPS is computed by dividing the net profi t or loss for the year attributable to equity shareholders by the weighted average number of equity shares outstanding during the year. Diluted EPS is computed by dividing the net profi t or loss for the year attributable to equity shareholders by the weighted average number of equity shares outstanding during the year as adjusted for the effects of all dilutive potential equity shares, except where the results are anti-dilutive.
13. Operating leases
Operating lease receipts and payments are recognized as income or expense in the profi t and loss account on a straight-line basis over the lease term.
14. Cash Flow Statement
The cash fl ow statement is prepared using the “indirect method” set out in Accounting Standard 3 Cash Flow Statements” and presents the cash fl ows by operating, investing and fi nancing activities of the Company.
Cash and cash equivalents presented in the cash fl ow statement consist of cash on hand and unencumbered, highly liquid bank balances.
15. Securities expenses
Expenses on issue of securities are written off to the Securities Premium Account in accordance with Section 78 of the Act.
Premium payable on redemption of bonds is provided for over the life of the bonds. The Securities Premium Account is applied in providing for premium on redemption in accordance with Section 78 of the Act. On conversion of the bonds to equity the provision for the redemption premium is reversed.
16. Stock based compensation
The compensation cost of stock options granted to employees is calculated using the intrinsic value of the stock options. The compensation expense is amortized uniformly over the vesting period of the option.
17. Contingent liabilities
Contingent liabilities as defi ned in Accounting Standard 29 “Provisions, Contingent Liabilities and Contingent Assets” are disclosed by way of notes to the accounts. Disclosure is not made if the possibility of an outfl ow of future economic benefi ts is remote. Provision is made if it is probable that an outfl ow of future economic benefi ts will be required to settle the obligation.

109
Steel Limited
` in crores
As at 31.03.2012
As at 31.03.2011
Note 2
Share Capital
a Authorised :
2,00,00,00,000 Equity Shares of the par value of ` 10 each 2,000.00 2,000.00
1,00,00,00,000 Preference Shares of the par value of ` 10 each 1,000.00 1,000.00
3,000.00 3,000.00
b Issued and Subscribed:
22,31,17,200 Equity Shares fully paid up 223.12 223.12
Equity Shares Forfeited (Amount originally paid-up) 61.03 61.03
27,90,34,907 10% Cumulative Redeemable Preference Shares fully paid up 279.03 279.03
563.18 563.18
c Reconciliation of number of shares outstanding at the beginning and end of the year :
Equity (including shares represented by underlying GDRs):
Outstanding at the beginning of the year 223,117,200 187,048,682
Issued during the year - 36,068,518
Outstanding at the end of the year 223,117,200 223,117,200
Preference :
Outstanding at the beginning and at the end of the year 279,034,907 279,034,907
d Rights, preferences and restrictions attached to Equity shares
The company has a single class of equity shares. Each shareholder is eligible for one vote per share held (other than the shares represented by underlying GDR’s which do not carry a voting right). The dividend proposed by the Board of Directors is subject to the approval of the shareholders. In the event of liquidation, the equity shareholders are eligible to receive the remaining assets of the company after distribution of all preferential amounts, in proportion to their shareholding.
26,00,938 (previous year 30,85,814) equity shares represent the shares underlying outstanding Global Depository Receipts (GDRs). Each GDR represents 1 underlying equity share.
e Rights, preferences and restrictions attached to Preference shares
The company has a single class of preference shares. They are redeemable at par in four equal ‘quarterly installments
Notes forming part of the fi nancial statements commencing from 15 December 2017. The shares carry a right to receive 10% dividend every year till redempton. In the event of liquidation, the preference shareholders are eligible to receive the outstanding amount after distribution of all other preferential amounts, in proportion to their shareholding.
f Shareholders holding more than 5% shares in the company is set out below:Equity (excluding shares represented by underlying GDRs)
JFE SteelCorporation
No of Shares%
33,467,580 15.00%
32,982,704 14.78%
Jindal South WestHoldings Limited
No of Shares%
17,284,923 7.75%
17,284,923 7.75%
JSW Energy Investments Private Limited
No of Shares%
13,764,364 6.17%
13,764,364 6.17%
PreferenceICICI Bank Limited No of Shares
% 125,707,730
45.05%125,707,730
45.05%IDBI Bank Limited No of Shares
% 69,734,847
24.99% 69,734,847
24.99%Life Insurance Corporation of India
No of Shares%
36,348,783 13.03%
36,348,783 13.03%
IFCI Limited No of Shares%
21,262,362 7.62%
21,262,362 7.62%
g Equity shares alloted as fully paid-up pursuant to contracts without payment being received in cash during the period of fi ve years immediate preceding the date of the Balance Sheet are as under:
1,50,35,712 equity shares to the shareholders of the erstwhile Southern Iron and Steel Company Limited pursuant to a scheme of Amalgamation.
h Foreign Currency Convertible Bonds (FCCB) (refer note 4.1.(i))
` in crores
As at 31.03.2012
As at 31.03.2011
Note 3Reserves and Surplus a Capital Reserve:
Money received against equity share warrants forfeited, option not exercised by warrant holders 529.38 -
529.38 - b Capital Redemption Reserve:
As per last Balance Sheet 9.90 9.90 9.90 9.90
c Securities Premium Reserve: As per last Balance Sheet 5,667.53 368.89 Add: Premium received on
issue of Equity Shares / GDRs - 5,374.21
5,667.53 5,743.10 Less: Preferential issue
expenses - (4.04) Provision for premium
on redemption of FCCBs (131.28) (71.53) 5,536.25 5,667.53

Eighteenth Annual Report 2011-12
110
` in crores
As at 31.03.2012
As at 31.03.2011
d Debenture Redemption Reserve: As per last Balance Sheet 129.04 129.04 Less : Transfer to Surplus in
Statement of Profi t and Loss (125.00) -
4.04 129.04 e Share Options Outstanding:
Share Options Outstanding 23.84 23.57 Less: Deferred Compensation (5.96) (16.37)
17.88 7.20 f Hedging Reserve Account:
As per last Balance Sheet (8.34) 5.52 Movement during the year (6.12) (13.86)
(14.46) (8.34)g General Reserve:
As per last Balance Sheet 7,539.02 3,326.34 Add : Transfer from Surplus in
Statement of Profi t and Loss 2,325.00 4,200.00
Transfer from Shares Options Outstanding - 12.68
9,864.02 7,539.02
Notes forming part of the fi nancial statements
` in crores
As at 31.03.2012
As at 31.03.2011
h Surplus in Statement of Profi t and Loss
As per last Balance Sheet 2,788.36 5,327.78
Add: Profi t for the year 1,625.86 2,010.67
Transfer from Debenture Redemption Reserve 125.00 -
Less: Appropriations :
Dividend on Preference Shares 27.90 27.90
Proposed Final Dividend on Equity Shares 167.34 273.32
Corporate Dividend Tax 31.68 48.87
Transfer to General Reserve 2,325.00 4,200.00
1,987.30 2,788.36
Total: 17,934.31 16,132.71
` in crores
As at 31.3.2012
As at 31.3.2011
As at 31.3.2012
As at 31.3.2011
Non-CurrentCurrent
(Refer Note 10)
Note 4
Long Term Borrowings
Bonds / Debentures
Bonds (Unsecured)
2,744 Zero Coupon Foreign Currency Convertible Bonds (FCCB) of USD 1,00,000 each - 1,225.20 1403.73 -
Debentures (Secured)
11 % Non Convertible Debentures of ` 10 lacs each 1,000.00 - - -
10.25 % Non Convertible Debentures of ` 10 lacs each 500.00 500.00 - -
10.60 % Non Convertible Debentures of ` 10 lacs each 350.00 350.00 - -
10.10 % Non Convertible Debentures of ` 10 lacs each 1,000.00 1,000.00 - -
11.82 % (Previous Year 10.20%)Non Convertible Debentures of ` 10 lacs each 14.66 23.03 8.38 8.38
11.82 % (Previous Year 10.20%)Non Convertible Debentures of ` 10 lacs each 25.35 33.15 7.80 7.80
2,890.01 1,906.18 16.18 16.18

111
Steel Limited
Notes forming part of the fi nancial statements
` in crores
As at 31.3.2012
As at 31.3.2011
As at 31.3.2012
As at 31.3.2011
Non-CurrentCurrent
(Refer Note 10)
Term Loans (Secured) Rupee Term Loans from Banks 5,073.45 2,833.00 390.88 208.92Foreign Currency Term Loans from Banks 1,061.72 1,363.91 489.54 461.87Rupee Term Loans from Financial Institutions 25.45 37.61 12.16 13.91(Unsecured) Rupee Term Loans from Banks - 900.00 900.00 300.00 Foreign Currency Term Loans from Banks 2,237.33 133.95 187.40 -
8,397.95 5,268.47 1,979.98 984.70 Long Term Advance from a Customer 128.48 356.40 227.91 203.13 Deferred Payment Liabilities Deferred Sales Tax Loan (Unsecured) 111.65 111.65 - -
11,528.09 8,867.90 3,627.80 1,204.01
Details of Security (i) The 11% NCDs aggregating to ` 1,000 crores are secured
/ to be secured by way of fi rst pari passu charge on fi xed assets related to 2.8 mtpa expansion project located at Upstream division and a fl at at Vasind situated in the state of Maharashtra.
(ii) The 10.25% NCDs aggregating to ` 500 crores are secured by way of mortgage in respect of all immovable and movable properties both present and future located at Tarapur Works and Vasind Works in the State of Maharashtra.
(iii) The 10.60% NCDs aggregating to ` 350 crores are secured by: - pari passu fi rst charge by way of legal mortgage on land
situated in the State of Gujarat. - pari passu fi rst charge by way of equitable mortgage
on fi xed assets of the new 5 mtpa Hot Strip Mill at Toranagallu village in the State of Karnataka.
(iv) The 10.10 % NCDs aggregating to ` 1,000 crores are secured by:
- pari passu fi rst charge by way of legal mortgage on all immovable properties both present and future located at Tarapur Works and Vasind Works in the State of Maharashtra.
- pari passu fi rst charge on all immovable properties and movable assets both present and future located at Salem Works in the State of Tamil Nadu.
(v) The 11.82% NCDs aggregating to ` 23.04 crores are secured by:
- First charge on land situated in the State of Gujarat. - Second charge on Fixed Assets situated at Salem Works in
the state of Tamilnadu.
(vi) The 11.82 % NCDs aggregating to ` 33.15 crores are secured by:
- pari passu fi rst charge by way of legal mortgage on a fl at situated at Mumbai, in the State of Maharashtra.
- pari passu fi rst charge by way of equitable mortgage of
the Company’s immovable properties relating to the 100MW and 130MW Power Plants at Toranagallu village in the State of Karnataka.
(vii) Rupee Term Loans from Banks aggregating to ` 18.75 crores, Rupee Term Loan from fi nancial Institution aggregating to ` 1.13 crores and Foreign Currency Term Loans from Banks aggregating to ` 51.16 crores are secured by:
- pari passu fi rst charge by way of equitable mortgage in respect of immovable properties of Upstream Division situated at Vaddu, Kurekuppe and Toranagallu villages in the State of Karnataka and
- pari passu fi rst charge by way of hypothecation of movable properties of Upstream Division both present and future excluding inventories and book debts.
(viii) Rupee Term Loans from Banks/Foreign Currency Term Loan from Bank are secured / to be secured as under :
- Rupee Term Loans aggregating to ` 13.42 crores and Foreign Currency Term Loans aggregating to ` 145.43 crores are secured by a fi rst charge supported by an equitable/ registered Mortgage of movable and immovable properties and assets situated at Salem Works in the state of Tamilnadu and a second pari passu charge on the current assets at Salem Works.
- Rupee Term Loans aggregating to ̀ 176 crores and Foreign Currency Term Loans aggregating to ` 290.95 crores by exclusive fi rst charge by way of equitable mortgage in respect of all movable and immovable properties of Cold Rolling Mill Complex at Toranagallu village in the State of Karnataka.
- Rupee Term Loans aggregating to ` 28.05 crores and Foreign Currency Term Loans aggregating to ` 258 crores by exclusive fi rst charge by way of equitable mortgage in respect of all movable and immovable properties both present and future of 2.8 mtpa expansion project at Toranagallu village, in the State of Karnataka.

Eighteenth Annual Report 2011-12
112
- Foreign Currency Term Loans aggregating to ` 805.71 crores by exclusive fi rst charge by way of equitable mortgage in respect of all movable and immovable properties of Hot Strips Mill at Toranagallu village in the State of Karnataka.
- Rupee Term Loans aggregating to ` 4,573.12 crores by pari passu fi rst charge by way of mortgage in respect of all movable and immovable properties both present and future, fi rst charge/Assignment of all the assets and fi rst charge on all the Bank Accounts of 3.2 mtpa expansion project at Toranagallu village in the State of Karnataka.
- Rupee Term Loan aggregating to ` 40 crores by exclusive fi rst mortgage and charge on all movable and immovable properties both present and future, and fi rst charge on the Bank Accounts of the 300 MW Power Plant - CPP IV at Toranagallu village in the State of Karnataka.
- Rupee Term Loan aggregating to ` 615 crores by fi rst mortgage and charge of all immovable properties both present and future, and a fi rst charge by way of hypothecation of all movable properties both present and future of the Benefi ciation Plant (6 x 500 tph) and Pellet Plant (4.2 mtpa) at Toranagallu village in the State of Karnataka.
(ix) Rupee Term Loan from Financial Institution aggregating to ` 36.48 crores are secured by exclusive fi rst charge by way of hypothecation of Bombardier Challenger 300 aircraft.
Terms of Repayment/ Redemption/ Conversion 1. Terms of Conversion/ Redemption of Bonds/ Non-Convertible
Debentures ( NCDs ) (i) The FCCB’s are convertible into Equity Shares at the option
of the bondholders at any time on or after 7 August 2007 and prior to the close of business on 21 June, 2012 at ` 40.28 = 1 USD$.
(ii) The 11% Secured NCDs of ` 10 lacs each aggregating ` 1,000 crores are redeemable as under with call and put option excersiable on 16.03.17 and 16.03.19 :
- ` 330 crores each from 16.3.2021 - ` 330 crores each from 16.3.2022 - ` 340 crores each from 16.3.2023 (iii) The 10.25% Secured NCDs of ` 10 lacs each aggregating
` 500 crores are redeemable in 3 equal annual installments of ` 166.67 crores each from 17.02.2016 to 17.02.2018.
(iv) The 10.60% Secured NCDs of ` 10 lacs each aggregating ` 350 crores are redeemable in two tranches as under :
- 8 half yearly installments of ` 21.875 crores each from 02.01.2016 to 02.07.2019.
- 8 half yearly installments of ` 21.875 crores each from 02.08.2016 to 02.02.2020.
(v) The 10.10% Secured NCDs of ` 10 lacs each aggregating ` 1,000 crores are redeemable in two tranches as under :
- 16 quarterly installments of ` 31.25 crores each from 04.02.2014 to 04.11.2017.
- 16 quarterly installments of ` 31.25 crores each from 15.06.2014 to 15.03.2018.
(vi) The 11.82% Secured NCDs of ` 10 lacs each aggregating ` 23.04 crores are redeemable in 11 quarterly installments of ` 2.09 crores each from 01.07.2012 to 01.01.2015.
(vii) The 11.82% Secured NCDs of ` 10 lacs each aggregating ` 33.15 crores are redeemable in 17 quarterly installments of ` 1.95 crores each from 15.04.2012 to 15.04.2016.
Notes forming part of the fi nancial statements 2. Terms of Repayment of Secured Term Loans (A) Rupee Term Loan from Banks of : (i) ` 18.75 crores is repayable in 4 monthly installments
of ` 4.69 crores each from 28.4.2012 to 28.7.2012. (ii) ` 176 crores is repayable in 11 monthly installment
of `16 crores each from 1.5.2012 to 1.3.2013. (iii) ` 28.04 crores is repayable in 4 quarterly installment
of ` 0.83 crores each from 30.4.2012 to 31.1.2013 and of 12 quarterly installments of ` 2.06 crores each from 30.4.2013 to 31.1.2016.
(iv) ` 8.84 crores is repayable in 7 quarterly installment of ` 1.09 crores each from 30.6.2012 to 31.12.2013 and 1 quarterly installment of ` 1.17 crores on 31.3.2014.
(v) ` 4.58 crores is repayable in 7 quarterly installments of ` 0.57 crores each from 30.6.2012 to 31.12.2013 and 1 quarterly installment of ` 0.59 crores on 31.3.2014.
(vi) ` 2,935.74 crores is repayable as under : - 4 quarterly installments of `18.82 crores from
30.6.2012 - 31.3.2013. - 8 quarterly installments of `75.28 crores from
30.6.2013 - 31.3.2015. - 8 quarterly installments of `188.19 crores from
30.6.2015 - 31.3.2017. - 2 quarterly installments of `250.91 crores from
30.6.2017 - 30.9.2017. - 1 quarterly installments of `250.94 crores on
31.12.2017. (vii) ` 1,250 crores is repayable as under : - 2 quarterly installments of ` 15.63 crores each
from 31.12.2012 - 31.3.2013. - 4 quarterly installments of ` 7.81 crores each
from 30.6.2013 - 31.3.2014. - 8 quarterly installments of ` 31.25 crores each
from 30.6.2014 - 31.3.2016. - 12 quarterly installments of ` 78.13 crores each
from 30.6.2016 - 31.3.2019. (viii) ` 387.38 crores is repayable as under : - 3 quarterly installments of ` 2.5 crores each
from 1.7.2012 - 1.1.2013. - 8 quarterly installments of ̀ 10 crores each from
1.4.2013 - 1.1.2015. - 8 quarterly installments of ̀ 25 crores each from
1.4.2015 - 1.1.2017. - 3 quarterly installments of `33.32 crores each
from 1.4.2017 - 1.10.2017. (ix) ` 615 crores is repayable in 19 quarterly installments
of ` 32.14 crores each from 1.1.2013 to 1.7.2017 and 1 quarterly installment of ` 4.29 crores on 1.10.2017.
(x) ` 40 crores is repayable in 1 quarterly installment of ` 27.5 crores each on 1.10.2012 and 1 quarterly installment of ` 12.5 crores on 1.1.2013.
(B) Foreign Currency Term Loan from Banks of : (i) ` 51.16 crores is repayable in 2 half yearly installments
of ` 25.58 crores each from 17.8.2012 to 17.2.2013. (ii) ` 62.66 crores is repayable in 7 half yearly installments
of ` 8.95 crores each from 16.6.2012 to 16.6.2015. (iii) ` 228.28 crores is repayable in 7 half yearly
installments of ` 32.61 crores each from 7.4.2012 to 7.4.2015.

113
Steel Limited
(iv) ` 239.79 crores is repayable in 5 half yearly installments of ` 47.96 crores each from 6.7.2012 to 6.7.2014.
(v) ` 18.21 crores is repayable in 3 half yearly installments of ` 6.07 crores each from 21.9.2012 to 23.9.2013.
(vi) ` 805.71 crores is repayable in 4 half yearly installments of ` 89.52 crores each from 29.5.2012 to 27.11.2013 and 1 half yearly installment of ` 447.62 crores on 27.5.2014.
(vii) ` 76.74 crores is repayable in 3 quarterly installments of ` 25.58 crores each from 7.6.2012 to 7.6.2013.
(viii) ` 68.69 crores is repayable in 8 half yearly installments of ` 8.59 crores each from 10.9.2012 to 9.3.2016.
(C) Rupee Term Loan from Financial Institutions of :
(i) ` 1.13 crores is repayable in 5 monthly installments of ` 0.22 crores each from 28.4.2012 to 28.8.2012.
(ii) ` 14.86 crores is repayable in 39 monthly installments of ` 0.38 crores each from 11.4.2012 to 11.6.2015.
(iii) ` 7.34 crores is repayable in 39 monthly installments of ` 0.19 crores each from 20.4.2012 to 20.6.2015.
(iv) ` 7.60 crores is repayable in 39 monthly installments of ` 0.195 crores each from 2.5.2012 to 02.7.2015.
(v) ` 6.68 crores is repayable in 39 monthly installments of ` 0.17 crores each from 15.4.2012 to 15.7.2015.
3 Terms of Repayment of Unsecured Term Loans
(A) Rupee Term Loan from Banks of `900 crores is repayable in 6 monthly installments of ` 150 crores each from 1.8.2012 to 1.1.2013.
(B) Foreign Currency Term Loan from Banks of :
(i) ` 1,432.38 crores is repayable in 5 half yearly installments of ` 286.48 crores each from 28.8.2015 to 27.8.2017.
(ii) ` 808.37 crores is repayable in 19 half yearly installments of ` 42.55 crores each from 30.5.2012 to 31.3.2021.
(iii) ` 81.67 crores is repayable in 20 half yearly installments of ` 4.08 crores each reckoned 6 months from the date of last drawdown.
(iv) ` 51.16 crores is repayable on 28.6.2012.
(v) ` 51.16 crores is repayable on 30.9.2012.
4 Long Term Advance from a Customer of ` 356.39 crores is repayable as under :
- 6 monthly installments of `18.17 crores each from 30.4.2012 to 30.9.2012.
- 6 monthly installments of `19.82 crores each from 31.10.2012 to 31.3.2013.
- 5 monthly installments of `21.47 crores each from 30.4.2013 to 31.8.2013.
- 1 monthly installment of `21.14 crores on 1.9.2013.
5 Deferred Sales tax of ̀ 111.65 crores is repayable in 101 varying monthly installments starting from 30.4.2013 to 31.8.2021.
(Repayments stated above are rounded off to the nearest crore)
Notes forming part of the fi nancial statements
` in crores
As at 31.03.2012
As at 31.03.2011
Note 5 Taxation a Current Tax comprises of
Minimum Alternative Tax (MAT) for the year 442.75 565.76 Excess provision of tax relating to earlier years (40.36) 12.58
402.39 578.34 b Deferred Tax 753.80 387.67 c MAT Credit Entitlement
includes amount in relation to earlier years 244.74 18.52
d Deferred Tax Liability comprises of timing differences on account of Depreciation 3,068.40 2,367.26 Expenses allowable on payment basis (18.63) (10.34)Provision for doubtful debts/advances (35.56) (36.56)Others (2.12) (3.32)
Total: 3,012.09 2,317.04
` in crores As at
31.3.2012 As at
31.3.2011 As at
31.3.2012 As at
31.3.2011 Non-Current Current
(Refer Note 10)Note 6
Other Long Term Liabilities Rent and other Deposits 42.54 42.81 2.28 - Retention Money for Capital Projects 38.51 31.78 173.94 224.56 Other Payables 1.67 - - - Premium payable on redemption of FCCBs - 375.31 565.36 -
Total: 82.72 449.90 741.58 224.56
Note 7
Long Term ProvisionsEmployee Benefi ts 32.90 21.82 28.56 16.80
Total: 32.90 21.82 28.56 16.80

Eighteenth Annual Report 2011-12
114
Notes forming part of the fi nancial statements
` in crores As at
31.03.2012 As at
31.03.2011 Note 8Short Term BorrowingsDebentures (Secured)7.10 % Non Convertible Debentures of ` 10 lacs each - 500.00 Working Capital Loans from Banks (Secured) 162.89 334.24 Foreign Curreny Loan from Bank
Secured 153.46 - Unsecured 457.78 1,045.19
Total: 774.13 1,879.43
Details of Security
Working capital loans of ` 162.89 crores and Foreign currency loan of ` 153.46 crores are secured by :
- pari passu fi rst charge by way of hypothecation of Stocks of Raw Materials, Finished Goods, Work-in-Process, Consumable Stores and Spares and Book Debts / Receivables of the Company, both present and future.
- pari passu second charge on movable properties and immovable properties forming part of the Fixed/Blocked assets of the company, both present and future except such properties as may be specifi cally excluded.
` in crores
As at 31.03.2012
As at 31.03.2011
Note 9
Trade Payables
Acceptances 7,321.57 4,634.08
Other than Acceptances 1,932.68 1,375.74
Total: 9,254.25 6,009.82
(For Micro, Small and Medium Enterprises Act, 2006 disclosure Refer Note 26 (17))
` in crores
As at 31.03.2012
As at 31.03.2011
Note 10
Other Current Liabilities
Current maturities of Long Term Debt (Refer Note 4) 3,627.80 1,204.01
Current dues of Other Long Term Liabilities ( Refer Note 6) 741.58 224.56
Current dues of Long term Employee Benefi ts (Refer Note 7) 28.56 16.80
Payables for Capital Projects 2,309.46 2,583.51
Advances from Customers 171.05 158.56
Interest Accrued but not due on borrowings 61.29 64.14
Other Statutory Liabilities 199.39 139.72
Other Payables 22.53 19.04
Investor Education and Protection Fund shall be credited by :
Unclaimed Debenture Redemption Instalments 1.61 1.67
Unclaimed Debenture Interest 1.43 1.30
Unclaimed Dividend 14.11 11.39
Unclaimed amount of sale proceeds of fractional shares 3.71 3.72
Total: 7,182.52 4,428.42
` in crores
As at 31.03.2012
As at 31.03.2011
Note 11
Short Term Provisions
Proposed Dividend on Preference Shares 27.90 27.90
Proposed Dividend on Equity Shares 167.34 273.32
Corporate Dividend Tax 31.68 48.87
Provision for Tax - 8.69
Total: 226.92 358.78

115
Steel Limited
Notes forming part of the fi nancial statements
No
te 1
2
Fixe
d A
sset
s
` in
cro
res
Part
icu
lars
Gro
ss B
lock
(at
co
st)
Dep
reci
atio
n a
nd
Am
ort
izat
ion
Net
Blo
ck
As
at
01.0
4.20
11 A
dd
itio
ns
Ded
uc-
tio
ns
Oth
er
Ad
just
-m
ents
As
at
31.0
3.20
12
As
at
01.0
4.20
11
For
the
year
Ded
uc-
tio
ns
As
at
31.0
3.20
12
As
at
31.0
3.20
12
As
at
31.0
3.20
11
Tan
gib
le A
sset
s
Free
ho
ld L
and
1
67.3
8 1
9.33
-
-
1
86.7
1 1
8.48
-
-
1
8.48
1
68.2
2 1
48.9
0
Leas
eho
ld L
and
8
1.25
5
3.12
-
-
1
34.3
7 0
.56
0.1
3 -
0
.69
133
.67
80.
69
Bu
ildin
gs
3,7
64.1
7 7
64.1
3 0
.07
38.
73
4,5
66.9
6 5
66.3
0 1
31.4
8 0
.01
697
.77
3,8
69.2
0 3
,197
.88
Plan
t &
Mac
hin
ery@
23,
099.
68
6,0
07.7
1 1
1.29
7
80.8
1 2
9,87
6.90
5
,623
.72
1,5
49.4
4 1
0.22
7
,162
.93
22,
713.
97
17,
475.
96
Furn
itu
re &
Fix
ture
s 8
2.21
9
.09
0.1
0 -
9
1.19
3
4.14
6
.35
0.0
3 4
0.46
5
0.74
4
8.07
Veh
icle
s &
Air
craf
ts 1
63.2
6 9
.53
6.0
8 -
1
66.7
2 3
5.87
1
1.25
2
.66
44.
46
122
.26
127
.39
Offi
ce
Equ
ipm
ents
13.
19
4.1
8 0
.07
-
17.
30
2.9
7 0
.71
0.0
1 3
.67
13.
63
10.
22
Tan
gib
le A
sset
s To
tal (
A)
27,3
71.1
4 6
,867
.09
17.
61
819
.54
35,
040.
16
6,2
82.0
4 1
,699
.36
12.
93
7,9
68.4
7 2
7,07
1.69
21
,089
.11
Inta
ng
ible
Ass
ets
Co
mp
ute
r So
ftw
are
34.
73
11.
27
-
-
46.
00
22.
42
6.8
9 -
2
9.31
1
6.69
1
2.31
Lice
nce
s 1
.48
3.3
8 -
-
4
.86
0.7
3 1
.93
-
2.6
6 2
.20
0.7
3
Inta
ng
ible
Ass
ets
Tota
l (B
) 3
6.21
1
4.65
-
-
5
0.86
2
3.15
8
.82
-
31.
97
18.
89
13.
04
TOTA
L (A
+B
) 2
7,40
7.35
6
,881
.74
17.
61
819
.54
35,
091.
02
6,3
05.2
0 1
,708
.17
12.
93
8,0
00.4
4 2
7,09
0.58
2
1,10
2.15
Prev
iou
s Y
ear
21,
795.
58
5,4
21.2
2 6
.64
197
.19
27,
407.
35
4,9
29.4
4 1
,378
.71
2.9
5 6
,305
.20
21,
102.
15
-
@ In
clu
des
pro
po
rtio
nat
e sh
are
of
asse
ts jo
intl
y o
wn
ed
Plan
t &
Mac
hin
ery
32.
71
-
-
-
32.
71
19.
12
1.7
3 -
2
0.85
1
1.86
1
3.59
(a)
‘Bu
ildin
gs’
incl
ud
e:
(i
)
Ro
ads
no
t o
wn
ed b
y th
e C
om
pan
y am
ort
ised
ove
r a
per
iod
of
fi ve
yea
rs. G
ross
Blo
ck `
3.1
3 c
rore
s (p
revi
ou
s ye
ar `
3.1
3 cr
ore
s) N
et b
lock
nil
(pre
vio
us
year
nil)
.
(i
i)
Ass
ets
giv
en o
n o
per
atin
g l
ease
fo
r w
hic
h d
ocu
men
ts a
re y
et t
o b
e ex
ecu
ted
pen
din
g a
pp
rova
ls f
rom
Len
der
s an
d K
SIID
C. G
ross
Blo
ck `
3.0
8 c
rore
s (p
revi
ou
s ye
ar `
3.0
8 cr
ore
s); n
et b
lock
` 2
.47
cro
res
(pre
vio
us
year
` 2
.52
cro
res)
.
(i
ii)
Exec
uti
on
of
Co
nve
yen
ce d
eed
in f
avo
ur
of
the
Co
mp
any
is p
end
ing
in r
esp
ect
of
a B
uild
ing
acq
uir
ed in
an
ear
lier
year
, Gro
ss b
lock
` 2
4.07
cro
res,
Net
b
lock
` 2
1.22
cro
res
(pre
vio
us
year
Gro
ss b
lock
` 2
4.07
cro
res,
Net
blo
ck `
21.
75 c
rore
s).
(b)
Oth
er a
dju
stm
ents
co
mp
rise
th
e fo
llow
ing
co
sts
cap
ital
ised
du
rin
g t
he
year
:
(i
) B
orr
ow
ing
co
sts
of
` 33
4.64
cro
res
(pre
vio
us
year
` 2
86.2
6 cr
ore
s).
(i
i)
Fore
ign
Exc
han
ge
Loss
of
` 48
4.90
cro
res
(pre
vio
us
year
Fo
reig
n E
xch
ang
e G
ain
of
` 89
.07
cro
res)
.
(c)
Free
ho
ld L
and
an
d B
uild
ing
s o
f `
158.
31 c
rore
s (p
revi
ou
s ye
ar `
147
.60
cro
res)
has
bee
n/a
gre
ed t
o b
e h
ypo
thec
ated
/mo
rtg
aged
to
len
der
s o
f g
rou
p
com
pan
ies.
(d)
F
or
det
ails
of
asse
ts g
iven
on
op
erat
ing
leas
e, r
efer
no
te 2
6 (1
3).

Eighteenth Annual Report 2011-12
116
Notes forming part of the fi nancial statements
` in crores
As at 31.03.2012
As at 31.03.2011
Note 13
Non Current Investments
LONG TERM
a Equity Instruments
Trade- Quoted
Associate
JSW Ispat Steel Limited 1,176,590,764 (Previous year 1,086,649,874) Equity Shares of ` 10 each fully paid-up (The shares are subject to lock-in for a period of fi ve years till 23.01.2016.)
2,357.11 2,157.00
Others
JSW Energy Limited 77,980,500 Equity Shares of `10 each fully paid-up 120.90 120.90
Trade- Unquoted
Associates
Jindal Praxair Oxygen Company Private Limited (JPOCPL) 29,640,000 (Previous year 39,520,000) Equity Shares of ` 10 each fully paid-up (Refer Note e) 29.64 39.52
Joint Ventures
Gourangdih Coal Limited 2,450,000 Equity shares of ` 10 each, fully paid up 2.45 2.45
JSW MI Service Centre Private Limited 6,112,960 Equity shares of ` 10 each, fully paid up 6.11 -
JSW Severfi eld Structures Limited 39,537,940 (Previous year 38,142,300), Equity Shares of ` 10 each, fully paid up 39.54 38.14
MJSJ Coal Limited 7,711,000 (Previous year 4,411,000), Equity Shares of ` 10 each, fully paid up 7.71 4.41
Rohne Coal Company Private Limited 490,000 Equity shares of ` 10 each, fully paid up 0.49 0.49
Toshiba JSW Turbine and Generator Private Limited 11,000,000 Equity Shares of ` 10 each, fully paid up 11.00 11.00
` in crores
As at 31.03.2012
As at 31.03.2011
Vijayanagar Minerals Private Limited 4,000 Equity Shares of ` 10 each fully paid-up (` 40,000) - -
Other than Trade - Unquoted
Subsidiaries
Amba River Coke Limited 67,865,020 (Previous year Nil), Equity shares of ` 10 each, fully paid up 67.87 -
JSW Bengal Steel Limited 270,123,300 (Previous Year 178,293,300) Equity Shares of ` 10 each fully paid-up 270.12 178.29
JSW Building Systems Limited 2,810,000 Equity Shares of ` 10 each fully paid-up 2.81 2.81
JSW Jharkhand Steel Limited 34,874,610 (Previous Year 19,473,910) Equity Shares of ` 10 each fully paid-up 34.87 19.47
JSW Natural Resources Limited 1,365,500 Equity Shares of USD 10 each fully paid-up
62.59 62.59
JSW Steel Processing Centres Limited 50,000,000 Equity Shares of ` 10 each fully paid-up
50.00 50.00
JSW Steel (Netherlands) B.V. 165,474,900 Equity Shares of Euro 1 each fully paid-up
1,020.02 1,020.02
JSW Steel Holding (USA) Inc. 1 Equity Share of USD 0.01 each fully paid-up
0.89 0.89
Others
SICOM Limited 600,000 Equity Shares of ` 10 each fully paid-up 4.88 4.88
Steelscape Consultancy Private Limited 50,000 Equity Shares of ` 10 each fully paid-up 0.05 0.05
Tarapur Environment Protection Society 29,116 (Previous year Nil), Equity shares of ` 100 each, fully paid up 0.29 -

117
Steel Limited
Notes forming part of the fi nancial statements
` in crores
As at 31.03.2012
As at 31.03.2011
b Preference Shares
Trade- Unquoted
Associates
Jindal Praxair Oxygen Company Private Limited (JPOCPL) 4,200,000, 10% Preference Shares of ` 10 each fully paid up (Tranche 2) 32,310,000, 0.1% Preference Shares of ` 10 each fully paid up
4.20 4.20
32.31 32.31
Joint Ventures
Rohne Coal Company Private Limited 19,822,910 (Previous Year 14,487,869) 1% Preference Shares of ` 10 each fully paid up 19.82 14.49
Others
JSW Realty & Infrastructure Private Limited (Tranche 1) 5,750,000 10% Preference Shares of ` 100 each, fully paid up 57.50 57.50
JSW Realty & Infrastructure Private Limited (Tranche 2) 7,250,000 10% Preference Shares of ` 100 each, fully paid up 72.50 72.50
c Government Securities (Unquoted)
National Savings Certifi cates (Pledged with Commercial Tax Department) 0.01 0.01
d Investment in Limited Liability Partnership Firm
Subsidiaries
Inversiones Eurosh Limitada5% Equity Interest in the capital of the Firm 0.01 0.01
4,275.69 3,893.93
Less: Provision for diminition in the value of Investments (63.49) (62.12)
Total: 4,212.20 3,831.81
` in crores
As at 31.03.2012
As at 31.03.2011
e The Company has a 26% stake in Jindal Praxair Oxygen Company Private Limited (JPOCL). Though the Company is entitled to exercise joint control in respect of certain operating and fi nancial matters in terms of theshareholders agreement, on account of certain constraints, it is unable to exercise such joint control. The Company has representation on JPOCL’s Board. JPOCL has therefore been consolidated as an associate in accordance with the requirements of Accounting Standard (AS) - 23 “Accounting for Investments in Associates in Consolidated Financial Statements”.
f SUMMARY
Quoted
Aggregate book value 2,478.01 2,277.90
Aggregate market value 1,960.52 2,992.83
Unquoted
Aggregate book value 1,734.20 1,553.91
g Mode of Valuation - Refer Note 1(4)

Eighteenth Annual Report 2011-12
118
Notes forming part of the fi nancial statements
` in Crores
As at 31.03.2012
As at 31.03.2011
As at 31.03.2012
As at 31.03.2011
Non-Current Current
Note 14
Loans and Advances
(Unsecured)
Capital Advances 763.49 547.68 - -
Less : Provision for doubtful advances (86.75) (86.69) - -
676.74 460.99 - -
Other loans and advances
Loans and Advances
To Related Parties (Refer Note 26 (12)) - 642.51 2,561.30 703.80
To Other Body Corporate 9.10 9.10 - -
Advance to Suppliers 8.54 8.54 704.46 244.75
Export benefi ts and entitlements 6.69 6.69 108.85 122.68
Amount recoverable from ESOP Trusts 231.96 83.82 - -
Deposits
Security Deposits - - 117.62 -
Others 102.04 104.71 0.71 3.51
Indirect Tax balances/recoverables/credits 27.43 15.43 770.23 600.66
Prepayments and Others 98.41 110.20 385.06 128.01
Advance Tax and Tax Deducted at Source (Net) 13.65 - - -
Minimum Alternative Tax credit entitlement 1,209.36 551.98 - -
Advance towards Equity / Preference capital 71.48 6.54 - -
Less : Provision for doubtful loans and advances (19.07) (18.50) - -
1,759.59 1,521.02 4,648.23 1,803.41
2,436.33 1,982.01 4,648.23 1,803.41
a Loans and Advances Constitute:
Capital Advances
Considered Good 676.74 460.99 - -
Considered Doubtful, Provided 86.75 86.69 - -
Other Loans and Advances
Considered Good 1,759.59 1,521.02 4,648.23 1,803.41
Considered Doubtful, Provided
Loans & advances to other Body Corporate 9.10 9.10 - -
Advance to Suppliers 8.54 8.54 - -
Prepayment and Others / Other Deposits 1.43 0.86 - -
b Details of Loans and Advances in the nature of loans to subsidiaries (including interest receivable):
Name of Company As at 31.03.2012 As at 31.03.2011Maximum amount
outstanding during the
year
Amount outstanding
Maximum amount
outstanding during the
year
Amount outstanding
JSW Steel (Netherlands) B.V. 983.65 949.93 689.85 632.09 JSW Natural Resources Limited 15.86 15.86 5.82 5.68 Inversiones Eurosh Limitada 363.56 363.56 321.57 314.89 JSW Steel Holding (USA) Inc. 1,389.61 1,223.46 432.44 391.18

119
Steel Limited
Notes forming part of the fi nancial statements
` in Crores
As at 31.03.2012
As at 31.03.2011
Note 15
Other Non Current Assets
Trade Receivables (Refer note 18) - -
Cash and Bank Balances (Refer note 19) 1.58 0.08
Total: 1.58 0.08
Note 16
Current Investments
Mutual Funds
Axis Liquid Fund - Institutional Growth 21,051 (Previous year Nil) units of ` 1000 each 2.50 -
Baroda Pioneer Liquid Fund - Institutional Growth Plan366,360 (Previous year 267,205) units of ` 1000 each 45.00 30.00
BNP Paribas Overnight- Institutional Growth 30,319,936 (Previous year Nil) units of ` 10 each 50.00 -
IDBI Liquid Fund - Growth 260,757 (Previous year Nil) units of ` 1000 each 30.00 -
JPmorgan India Liquid Fund Super Institutional Growth 21,590,656 (Previous year Nil) units of ` 10 each 30.00 -
Religare Liquid Fund - Super Institutional - Growth 54,294 (Previous year 74,260) units of ` 1000 each 8.00 10.00
SBI Premiur Liquid Fund Super Institutional-Growth 15,662 (Previous year Nil) units of ` 1000 each 2.64 -
Sundaram Money Fund Super Institutional - Growth 1,370,299 (Previous year Nil) units of ` 10 each 3.08 -
Taurus Liquid Fund - Super Institutional Growth 259,588 (Previous year Nil) units of ` 1000 each 30.00 -
` in Crores
As at 31.03.2012
As at 31.03.2011
Birla Sunlife Floating Rate Fund Long Term Institutional-Growth Nil (Previous year 184,101) units of ` 1000 each - 20.00
Canara Robeco Liquid super IP - Growth Nil (Previous year 5,873,469) units of ` 10 each - 7.00
DWS Insta Cash Plus Fund super IP - Growth Nil (Previous year 3,927,671) units of ` 100 each - 50.00
Prud.ICICI Institutional Liquid-Super IP - Growth Nil (Previous year 3,448,737) units of ` 100 each - 50.00
Reliance Liquidity Fund - Growth Nil (Previous year 33,867,996) units of ` 10 each - 50.00
SBI Premiur Liquid Fund Super IP - Growth Nil (Previous year 32,435,729) units of ` 10 each - 50.00
201.22 267.00
SUMMARY
Unquoted
Aggregate book value 201.22 267.00
Aggregate Repurchase Value 201.32 267.07
Note :
Mode of Valuation - Refer Note 1(4)
Note 17
Inventories
Raw Materials 2,379.59 1,895.59
Work-in-Progress 507.16 263.74
Semi Finished/ Finished Goods 1,465.78 1,378.77
Production Consumables and Stores & Spares 826.55 600.31
Total: 5,179.08 4,138.41
Details of stock-in-transit
Raw Materials 423.22 312.90
Semi Finished/ Finished Goods 51.66 34.81
Production Consumables and Stores & Spares 29.02 32.84
Mode of Valuation - refer note 1(6)

Eighteenth Annual Report 2011-12
120
Notes forming part of the fi nancial statements
` in Crores
As at31.03.2012
As at 31.03.2011
As at 31.03.2012
As at31.03.2011
Non -Current(Refer note 15)
Current
Note 18
Trade Receivables
(Unsecured)
Outstanding for a period exceeding six months from the date they are due for payment
Considered Good - - 12.62 2.01
Considered Doubtful 6.42 6.42 7.94 9.31
Less: Provision for Doubtful debts (6.42) (6.42) (7.94) (9.31)
- - 12.62 2.01
Other Debts
Considered Good - - 1,349.44 836.64
- - 1,362.06 838.65
` in Crores
As at31.03.2012
As at 31.03.2011
As at 31.03.2012
As at31.03.2011
Non -Current(Refer note 15)
Current
Note 19
Cash and Bank Balances
Cash and Cash Equivalents
Balances with Banks
In Current Accounts - - 198.15 135.78
In Margin Money with maturity less than 3 months at inception - - - 0.50
In Term Deposit Accounts with maturity less than 3 months at inception - - 1,060.62 1486.92
Cash on hand - - 0.70 0.48
- - 1,259.47* 1,623.68*
Others
In Margin Money with maturity more than 3 months but less than 12 months at inception - - 0.93 0.99
In Term Deposit Accounts
with maturity more than 3 months but less than 12 months at inception - - 1,695.62 262.13
with maturity more than 12 months at inception 1.58 0.08 - -
1.58 0.08 1,696.55 263.12
1.58 0.08 2,956.02 1,886.80
* Refer Cash Flow Statement
Earmarked balances
In Current Accounts - - 20.84 18.07
In Term Deposit Accounts 1.58 0.08 2,328.59 1,440.37
In Margin Money - - 0.93 1.49

121
Steel Limited
Notes forming part of the fi nancial statements
` in Crores For the
Year Ended31.03.2012
For theYear Ended31.03.2011
Note 20 Revenue from operations Sale of ProductsDomestic Turnover 28,769.60 21,429.87 Export Turnover 5,888.88 3,662.22
34,658.48 25,092.09 Less: Excise duty 2,598.01 1,967.52
32,060.47 23,124.57 Other Operating Revenues Carbon Credits 13.37 38.67 Value Added Tax Refund - 174.48 Miscellaneous Income 48.82 29.39
62.19 242.54
Total : 32,122.66 23,367.11
` in Crores
For theYear Ended31.03.2012
For theYear Ended31.03.2011
Note 21Other IncomeInterest Income 138.46 123.69Dividend Income from long-term Investments 8.67 9.92Profi t on sale of current investment 14.90 32.05Profi t on sale of Long term investment 16.45 -Net Gain on foreign currency transactions and translation (Other than considered as fi nance cost) - 67.10Provision for Doubtful Debts/Loans/Advances written back (net) 0.74 1.75Profi t on sale of fi xed assets (net) 0.08 -Total: 179.30 234.51
Note 22Changes in inventories of Finished goods, Work-in-progress and Stock in TradeOpening Stock :Semi Finished/Finished Goods 1,378.50 780.54Work-in-progress 263.74 114.20Traded goods - 0.13
1,642.24 894.87Closing Stock :Semi Finished /Finished Goods 1,465.78 1,378.50Work-in-progress 507.16 263.74
1,972.94 1,642.24 (330.70) (747.37)
Excise duty on stock of fi nished goods (net) 32.89 64.39Total: (297.81) (682.98)
` in Crores
For theYear Ended31.03.2012
For theYear Ended31.03.2011
Note 25
Other expenses
Stores and Spares consumed 1,359.86 1,058.11
Power and Fuel 1,683.84 1,133.28
Rent 9.68 9.32
Repairs & Maintenance
Plant & Machinery 609.01 402.42
Buildings 46.88 44.87
Others 14.59 8.20
Insurance 55.14 43.29
Rates and Taxes 13.94 12.38
Carriage and Freight 919.91 647.81
Jobwork and Processing Charges 81.86 74.16
Commission on Sales 39.82 49.70
Donations & Contributions 2.97 2.89
Miscellaneous Expenses 287.32 203.87
Loss on sale of fi xed assets (net) - 0.98
Provision for Diminition in Value of Investments 1.37 62.12
Total: 5,126.19 3,753.40
` in Crores For the
Year Ended31.03.2012
For theYear Ended31.03.2011
Note 23
Employee benefi ts expense
Salaries and Wages 538.68 468.40
Contribution to Provident and Other Funds 46.12 27.40
Expenses on employees stock option scheme 10.28 7.55
Staff Welfare Expenses 30.79 31.12
Total: 625.87 534.47
Note 24
Finance costs
Interest (Refer Note 26 (18) 1,107.19 773.55
Other borrowing costs 79.22 80.62
Total: 1,186.41 854.17

Eighteenth Annual Report 2011-12
122
Notes forming part of the fi nancial statements
Note 26
1. Contingent Liabilities not provided for in respect of
a) Bills Discounted ̀ 3,117.13 crores (Previous year ̀ 2,621.86 crores).
b) Guarantees provided to banks on behalf of subsidiaries ` 1,096.27 crores (Previous year ` 1,620.51 crores).
c) Disputed claims/levies (excluding interest, if any), in respect of:
(i) Excise Duty ` 200.27 crores (Previous year ` 179.70 crores);
(ii) Custom Duty ` 477.44 crores (Previous year ` 242.87 crores);
(iii) Income Tax ` 1.47 crores (Previous year ` 12.47 crores);
(iv) Sales Tax / Special Entry tax ` 170.30 crores (Previous year ` 72.36 crores);
(v) Service Tax ` 70.08 crores (Previous year ` 45.18 crores);
(vi) Miscellaneous ` 0.05 crores (Previous year ` 0.05 crores);
(vii) Levies by local authorities ̀ 3.04 crores (Previous year ` 3.04 crores); and
(viii) Claims by suppliers and other parties (including for Forest Development Tax) ` 509 crores (Previous year ` 207.41 crores).
2. Estimated amount of contracts remaining to be executed on capital account and not provided for (net of advances) ` 3,729.12 crores (Previous year ` 3,865.45 crores).
3. Other Commitments :
(a) The Company has issued an undertaking to associate bankers for non disposal of its investment of ` 2,357.11 crores (Previous year ` Nil) in an associate till that entity repays its debts.
(b) The Company from time to time provides need based support to subsidiaries and a joint venture entity towards capital and other requirements.
(c) The Company has imported capital goods under the Export Promotion Capital Goods Scheme to utilise the benefi t of a zero or concessional customs duty rate. These benefi ts are subject to future exports. Such export obligations at year end aggregate to ` 16,912.59 crores (Previous year ̀ 17,853.27 crores) by the company within the stipulated period.
4. In respect of the Company’s long term, strategic investment in one of its subsidiaries, JSW Steel (USA) Inc., the Company has reviewed and assessed its business plans and expected future cash fl ows. The company has also considered an independent valuation of a signifi cant portion of the underlying tangible assets. Whilst the subsidiary may have a longer gestation period than originally envisaged, the Company has concluded that the decline is temporary and no provision against the carrying amounts of the investment and loans of ` 1,948.41 crores is presently necessary.
In view of estimation uncertainties, assumptions will be monitored on a periodic basis by management and adjustments will be made in the event of an other than temporary adverse effect on the recoverable amounts of the assets.
5. D ue to the unusual depreciation in the value of the rupee against US dollar, the net foreign exchange loss for the year has been considered by the Company as exceptional in nature.
6. Details of utilization of funds received on preferential allotment :
(a) Issue of Convertible Warrants` in crores
Current
Year
Previous
Year
Net issue proceeds Nil 529.38
Less: Utilization
Debt Repayment/
Reduction Nil 220.00
Working Capital Nil 309.38
Balance Nil Nil
(b) Issue of Fully Convertible Debenture
` in crores
Current
Year
Previous
Year
Net issue proceeds/
Previous Year Balance 1,010.00 4,800.72
Less: Utilization
Debt Repayment/
Reduction Nil 2,864.70
Investment in JSW
Ispat Steel Limited 200.00 540.00
Working Capital 810.00 366.02
Capital Expenditure Nil 20.00
Balance held in Fixed
deposits with banks
pending utilization Nil 1,010.00
(c) Issue of Equity Shares` in crores
Current
Year
Previous
Year
Net issue proceeds Nil 146.69
Less: Utilization
Debt Repayment /
Reduction Nil 146.69
Balance Nil Nil

123
Steel Limited
Notes forming part of the fi nancial statements 7. Em ployee Share based Payment Plans:
a) The Company operates an employee share-based payments plan, which is described below:
Particulars ESOP 2010
Scheme 1 (Junior
Manager &
Above)Date of grant 1-Oct-10
Outstanding as on 01.04.2011 1,692,949
Granted during the year 137,238
Transfer arising from transfer of employees from group companies 7,462
Forfeited during the year 111,947
Transfer arising from transfer of employees to group companies 13,627
Exercised during the year -
Outstanding as on 31.03.2012 1,712,075
Vesting Period Graded vesting over 3 years
Method of settlement Cash
Exercise Price 1,100
b) Expenses arising from employee’s share- based payment plans- `10.68 crores (Previous year ` 8.12 crores).
8. Der ivatives:
a) The Company uses foreign currency forward contracts to hedge its risks associated with foreign currency fl uctuations relating to certain fi rm commitments and highly probable forecast transactions. The use of foreign currency forward contracts is governed by the Company’s strategy approved by the Board of Directors, which provide principles on the use of such forward contracts consistent with the Company’s Risk Management Policy.
The Forward Exchange Contracts entered into by the Company and outstanding are as under:
As at No. of
Contracts
Type US$
equivalent
INR
Equivalent
(crores)(Million)
31.03.2012
25 Buy 144.79 740.69
76 Sell 241.72 1,236.58
31.03.2011
79 Buy 311.66 1,391.55
22 Sell 119.95 535.58
b) The Company also uses derivative contracts other than forward contracts to hedge the interest rate and currency risk on capital account. Such transactions are governed by the strategy approved by the Board of Directors, which provide principles on the use of these instruments, consistent with the Company’s Risk Management Policy. The Company does not use these contracts for speculative purposes.
Notional value of Interest Rate Swaps (IRS) to hedge against fl uctuations in interest rate changes are as under:
As at No. of Contracts
US$ Equivalent of notional
value (Million)
MTM of IRS(INR crores)
31.03.2012 7 70 (13.90)
31.03.2011 2 50 (5.33)
Currency Swap to hedge against fl uctuations in changes in exchange rate and interest rate:
As at No. of Contracts
US$ Equivalent of notional
value (Million)
MTM of Currency
Swap(INR crores)
31.03.2012 1 25 (15.30)
31.03.2011 - - -
c) The year end foreign currency exposures that have not been hedged by a derivative instrument or otherwise are given below:
i) Amounts receivable in foreign currency on account of the following:
Current Year Previous Year
US$
equivalent
INR
Equivalent
US$
equivalent
INR
Equivalent(Million) (crores) (Million) (crores)
Debtors 2.35 12.01 9.32 41.61
Balances with
banks - in Fixed
Deposit Account 0.01 0.04 10.01 44.68
- in Current Account 0.03 0.13 0.03 0.12
Advances/
Loans to
Subsidiaries 500.13 2,558.50 300.97 1,343.83
ii) Amounts payable in foreign currency on account of the following:
Current Year Previous Year
US$
equivalent
INR
Equivalent
US$
equivalent
INR
Equivalent(Million) (crores) (Million) (crores)
Acceptances 1,529.07 7,822.17 1,225.20 5,470.53
Creditors 151.60 775.52 85.61 382.24
Loans payable 1,155.94 5,913.42 947.39 4,230.11
Redemption
premium
payable on
FCCB’s 110.52 565.36 84.06 375.31

Eighteenth Annual Report 2011-12
124
Notes forming part of the fi nancial statements
9. Research and Development Activities:
Disclosure as required under Section 35(2AB) of the Income Tax Act, 1961.
a) Fixed Assets includes the capital cost of in-house research recognised facility as under:-
` in crores
Particulars Buildings Plantand
Machinery
Others Total
Gross Block at the beginning of the year
Current Year 1.47 27.53 - 29.00 Previous Year 1.47 14.48 - 15.95
Additions during the year
Current Year 6.14 73.51 0.22 79.87 Previous Year - 13.05 - 13.05
Gross Block at the end of the year
Current Year 7.61 101.04 0.22 108.87 Previous Year 1.47 27.53 - 29.00
Capital Work in Progress
Current Year - 7.60 0.03 7.63 Previous Year 2.68 33.29 - 35.97
Capital Expenditure incurred during the year (including CWIP)
Current Year 3.46 47.82 0.25 51.53 Previous Year
2.68
39.04 - 41.72
b) The manufacturing and other expenses and depreciation include ` 9.28 crores (previous year ` 3.85 crores) and ` 3.52 crores (previous year ` 1.38 crores), respectively, in respect of Research and Development activities undertaken during the year.
10. Employee Benefi ts:
a) Defi ned Contribution Plan:
Company’s contribution to Provident Fund ` 24 crores. (Previous Year ` 17.05 crores)
b) Defi ned Benefi t Plans –(i) Gratuity:
` in crores
Current Year Previous Year
a) Liability recognized in the Balance Sheet
i) Present value of obligation
Opening Balance 49.60 36.91
Service Cost 4.59 3.75
Interest Cost 3.97 3.17
Actuarial loss on obligation 18.26 7.71
Benefi ts paid (2.77) (1.94)
Closing Balance 73.65 49.60
` in crores
Current Year Previous Year
Less: ii) Fair Value of Plan
Assets Opening Balance 38.10 33.66 Expected Return on
Plan assets less loss on investments 3.05 2.93
Actuarial (loss)/gain on Plan Assets (0.78) (0.46)
Employers’ Contribution 11.54 3.91
Benefi ts paid (1.92) (1.94) Closing Balance 49.99 38.10 Amount recognized
in Balance Sheet 23.66 11.50 b) Expenses during the year
(included in Note 24 under Contribution to Provident and Other Funds)
Service cost 4.59 3.75 Interest cost 3.97 3.17 Expected Return on Plan
assets (3.05) (2.93) Actuarial Loss 19.04 8.17 Transferred to
preoperative expenses (0.78) (0.81) Total 23.77 11.35 c) Actual Return on plan
assets 2.28 2.47 d) Break up of Plan Assets : (i) ICICI Prudential Life
Insurance Co. Ltd. Balanced Fund 3.40 3.18 Debt Fund 4.10 1.18 Short Term Debt Fund 1.52 3.82 Endowment plan 6.20 - (ii) HDFC Standard Life
Insurance Co. Ltd. Defensive Managed
Fund 1.04 0.99 Stable Managed Fund 11.46 10.55 (iii) SBI Life Insurance Co.
Ltd. – Cap Assured Fund 15.52 11.93
(iv) LIC of India – Insurer Managed Fund 6.74 6.45
e) Principal actuarial assumptions
Rate of Discounting 8.5% p.a. 8% p.a. Expected Return on Plan
Assets 8.6% p.a. 8% p.a. Rate of increase in salaries 6% p.a. 6% p.a. Attrition Rate 2% p.a. 2% p.a.

125
Steel Limited
Notes forming part of the fi nancial statements
The Company expects to contribute ` 23.66 crores (previous year ` 12.22 crores) to its Gratuity Plan for the next year.
In assessing the Company’s Post Retirement Liabilities, the Company monitors mortality assumptions and uses up-to-date mortality tables, the base being the LIC 1994-96 ultimate tables.
Expected return on plan assets is based on expectation of the average long term rate of return expected on investments of the fund during the estimated term of the obligations.
The estimates of future salary increase, considered in actuarial valuation, take account of infl ation, seniority, promotion and other relevant factors, such as supply and demand in the employment market.
Other disclosures: ` in crores
Particulars 2011-12 2010-11 2009-10 2008-09
Defi ned Benefi t Obligation 73.65 49.60 36.91 31.22
Plan Assets 49.99 38.10 33.66 26.14
Surplus / (Defi cit) (23.66) (11.50) (3.25) (5.08)
Experience Adjustments on Plan Liabilities – Loss/(Gain) 21.40 7.71 1.44 1.42
Experience Adjustments on Plan Assets – Gain/(Loss) (0.78) (0.46) 0.08 (1.22)
(ii) Provident Fund:
The company makes monthly contributions to Provident Fund managed by Trust for qualifying employees. Under the scheme, the company is required to contribute a specifi ed percentage of the payroll costs to fund the benefi ts.
In keeping with the Guidance on Implementing Accounting Standard (AS) 15 (Revised) on Employee Benefi ts notifi ed by the Companies (Accounting Standards) Rules, 2006, employer established provident fund trusts are treated as Defi ned Benefi t Plans, since the Company is obliged to meet interest shortfall, if any, with respect to covered employees. According to the actuarial Valuation, the Defi ned Benefi t Obligation of Interest rate Guarantee on exempted Provident Fund in respect of employees of the company as at 31st March, 2012 works out to ` Nil and hence no provision is required to be provided for in the books of accounts towards the guarantee given for notifi ed interest rates.
Actuarial assumptions made to determine Interest Rate Guarantee on Exempt Provident Fund Liabilities are as follows:
Particulars 31 Mar 2012
Rate of Discounting 8.50%
Rate of return on assets 9.04%
Guaranteed Rate of Return 8.25%
11. Segment Reporting:
The Company is primarily engaged in the business of manufacture and sale of Iron and Steel Products. The Company has identifi ed two primary business segments, namely Steel and Power (used mainly for captive consumption), which in the context of Accounting Standard 17 on “Segment Reporting” constitute reportable segments.
Information about Primary Business Segments ` in crores
Particulars Current Year 31.03.2012 Previous Year 31.03.2011Steel Power Elimination Total Steel Power Elimination Total
INCOMEExternal Sales 31,751.89 370.77 32,122.66 23,261.77 105.34 23,367.11Inter Segment Sales 1,820.98 2,340.11 (4,161.09) - 651.87 988.73 (1,640.60) -Total Income 33,572.87 2,710.88 (4,161.09) 32,122.66 23,913.64 1,094.07 (1,640.60) 23,367.11SEGMENT RESULTSSegment/Operating Results 2,568.26 535.60 3,103.86 3,184.90 344.26 3,529.16Un-allocated Items :(Expenses) / Income 177.11 103.54Finance Costs (1,186.41) (854.17)Provision for Taxation (468.70) (767.86)Net Profi t 1,625.86 2,010.67OTHER INFORMATIONSegment Assets 39,850.12 2,208.03 42,058.15 33,276.08 1,844.96 35,121.04Un-allocated Items 8,532.96 6,437.34Total Assets 50,591.11 41,558.38Segment Liabilities 12,622.35 179.49 12,801.84 9,569.70 33.49 9,603.19Un-alloacated Liabilities & Provisions 19,291.78 14,729.92Total Liabilities 32,093.62 24,333.11Depreciation and amortisation 1,628.43 79.74 1,708.17 1,341.00 37.71 1,378.71Total Cost incurred during the year to acquire Segment Assets 4,227.74 485.10 4,712.84 3,928.93 1,174.26 5,103.19

Eighteenth Annual Report 2011-12
126
Notes forming part of the fi nancial statements
Notes :1. Inter Segment transfer from the power segment is measured at the rate at which power is purchased / sold from / to the respective Electricity
Board.2. Inter Segment transfer from the steel segment is measured on the basis of fuel cost.
12. Related Parties disclosure as per Accounting Standard (AS)-18:
A List of Related Parties
Parties with whom the Company has entered into transactions during the period where control exists :
1 Subsidiaries
JSW Steel (Netherlands) B.V.
JSW Steel (UK) Limited
Argent Independent Steel (Holdings) Limited
JSW Steel Service Centre (UK) Limited
JSW Steel Holding (USA) Inc.
JSW Steel (USA) Inc.
Periama Holdings, LLC
Purest Energy, LLC
Meadow Creek Minerals, LLC
Hutchinson Minerals, LLC
R.C. Minerals, LLC
Keenan Minerals, LLC
Peace Leasing, LLC
Prime Coal, LLC
Planck Holdings, LLC
Rolling S Augering, LLC
Periama Handling, LLC
Lower Hutchinson Minerals, LLC
Caretta Minerals, LLC
JSW Panama Holdings Corporation
Inversiones Euroush Limitada
Santa Fe Mining
Santa Fe Puerto S.A.
JSW Natural Resources Limited
JSW Natural Resources Mozambique Limitada
JSW ADMS Carvo Lda
JSW Steel Processing Centres Limited
JSW Bengal Steel Limited
JSW Natural Resources India Limited
Barbil Benefi ciation Company Limited
JSW Jharkhand Steel Limited
JSW Building Systems Limited
JSW Steel East Africa Limited (w.e.f 13.09.2011)
Amba River Coke Limited (w.e.f 4.10.2011)
JSW Energy (Bengal) Limited (w.e.f 5.03.2012)
2 Associates
Jindal Praxair Oxygen Company Private Limited
JSW Ispat Steel Limited
JSW Energy (Bengal) Limited (upto 4.03.2012)
3 Joint Ventures
Vijayanagar Minerals Private Limited
Rohne Coal Company Private Limited
JSW Severfi eld Structures limited
Gourangdih Coal Limited
Toshiba JSW Turbine and Generator Private Limited
MJSJ Coal Limited
GEO Steel LLC
JSW Structural Metal Decking Limited
JSW MI Steel Service Center Private Limited (w.e.f 19.09.2011)
4 Key Management Personnel (KMP)
Mr. Sajjan Jindal
Mr. Seshagiri Rao M V S
Dr. Vinod Nowal
Mr. Jayant Acharya
5 Relative of Key Managerial Personnel
Mrs. Savitri Devi Jindal
6 Enterprises over which Key Management Personnel and Relatives of such personnel exercise signifi cant infl uence.
JSW Energy Limited
JSL Limited
JSW Realty & Infrastructure Private Limited
Jindal Saw Limited
Jindal Steel & Power Limited
Jindal South West Holdings Limited
JSOFT Solutions Limited
Jindal Industries Limited
JSW Cement Limited
JSW Jaigarh Port Limited
JSW Investments Private Limited
Reynold Traders Private Limited
Raj West Power Limited
JSW Power Trading Company Limited
JSW Aluminium Limited
O P Jindal Foundation
JSW Infrastructure Limited
South West Port Limited
JSW Techno Projects Management Limited
South West Mining Limited
JSL Architecture Limited
JSW Projects Limited
Sapphire Technologies Limited

127
Steel Limited
Particulars Subsidiaries Associates Joint Ventures
Key Managerial Personnel
Relatives of Key
Managerial Personnel
Enterprises over which KMP and relatives of such
personnel exercise
signifi cant infl uence
Total
B. Transactions with related parties
Party’s Name
Purchase of Goods / Power & Fuel / Services
JSW Energy Limited
- - - - - 388.58 388.58
- - - - - 430.01 430.01
Jindal Praxair Oxygen Company Private Limited
- 111.59 - - - - 111.59
- 130.77 - - - - 130.77
JSW Ispat Steel Limited
- 2,741.54 - - - - 2,741.54
- 568.90 - - - - 568.90
Others
61.00 - 14.98 - - 411.79 487.77
59.10 - 50.61 - - 151.74 261.45
Total
61.00 2,853.13 14.98 - - 800.37 3,729.48
59.10 699.67 50.61 - - 581.75 1,391.13
Reimbursement of Expenses incurred on our behalf by
Jindal South West Holdings Limited - - - - - - -
- - - - - 0.13 0.13
JSW Ispat Steel Limited
- 3.35 - - - - 3.35
- - - - - - -
JSW Energy (Bengal) Limited
15.38 - - - - - 15.38
- - - - - - -
Others
0.06 - 0.26 - - 0.03 0.35
- - - - - - -
Total
15.44 3.35 0.26 - - 0.03 19.08
- - - - - - -
Sales of Goods/Power & Fuel
JSW Steel (USA) Inc.
369.55 - - - - - 369.55
58.06 - - - - - 58.06
Jindal Saw Limited
- - - - - 337.55 337.55
- - - - - 48.84 48.84
JSW Energy Limited
- - - - - 468.30 468.30
- - - - - 771.23 771.23
Jindal Industries Limited
- - - - - 257.30 257.30
- - - - - 214.28 214.28
JSW Ispat Steel Limited
- 1,215.19 - - - - 1,215.19
- 325.85 - - - - 325.85
Others
26.47 8.28 6.42 - - 536.91 578.08
0.43 5.76 5.12 - - 264.83 276.14
Total
396.02 1,223.47 6.42 - - 1,600.06 3,225.97
58.49 331.61 5.12 - - 1,299.18 1,694.40
Notes forming part of the fi nancial statements` in crores

Eighteenth Annual Report 2011-12
128
Notes forming part of the fi nancial statements` in crores
Particulars Subsidiaries Associates Joint Ventures
Key Managerial Personnel
Relatives of Key
Managerial Personnel
Enterprises over which KMP and relatives of such
personnel exercise
signifi cant infl uence
Total
Other Income /Interest income/Dividend Income
JSW Steel (Netherlands) B.V.
41.55 - - - - - 41.55
25.78 - - - - - 25.78
JSW Energy Limited
- - - - - 8.63 8.63
- - - - - 6.01 6.01
Inversiones Eurosh Limitada
16.59 - - - - - 16.59
9.50 - - - - - 9.50
JSW Steel Holding (USA) Inc.
44.04 - - - - - 44.04
8.69 - - - - - 8.69
Others
5.69 1.92 0.42 - - 0.79 8.82
0.97 3.86 0.40 - - 2.36 7.59
Total
107.87 1.92 0.42 - - 9.42 119.63
44.94 3.86 0.40 - - 8.37 57.57
Purchase of Assets
JSW Cement Limited
- - - - - 26.62 26.62
- - - - - 3.54 3.54
Jindal Steel & Power Limited
- - - - - 128.72 128.72
- - - - - 250.01 250.01
South West Mining Limited
- - - - - 39.29 39.29
- - - - - - -
JSW Energy Limited
- - - - - 28.07 28.07
- - - - - 95.07 95.07
Jindal Saw Limited
- - - - - 0.09 0.09
- - - - - 7.47 7.47
JSW Severfi eld Structures Limited - - 36.18 - - - 36.18
- - - - - - -
Others
- 2.48 - - - 10.11 12.59
- - 6.10 - - 16.02 22.12
Total
- 2.48 36.18 - - 232.90 271.56
- - 6.10 - - 372.11 378.21
Sale of Assets
JSW Techno Project Management Limited
- - - - - - -
- - - - - 0.07 0.07
JSW Investments Private Limited
- - - - - - -
- - - - - 0.16 0.16
JSW Energy Limited
- - - - - - -
- - - - - 0.04 0.04
Total
- - - - - - -
- - - - - 0.27 0.27

129
Steel Limited
Notes forming part of the fi nancial statements` in crores
Particulars Subsidiaries Associates Joint Ventures
Key Managerial Personnel
Relatives of Key
Managerial Personnel
Enterprises over which KMP and relatives of such
personnel exercise
signifi cant infl uence
Total
Lease & Other deposits given
Jindal Saw Limited
- - - - - - -
- - - - - 2.50 2.50
JSW Projects Limited
- - - - - 1.99 1.99
- - - - - - -
Total
- - - - - 1.99 1.99- - - - - 2.50 2.50
Lease & Other deposits refunded
JSW Power Trading Company Limited - - - - - - -- - - - - 20.00 20.00
Total
- - - - - - -- - - - - 20.00 20.00
Advance given Received back JSW Aluminum Limited
- - - - - 0.16 0.16- - - - - - -
Total
- - - - - 0.16 0.16- - - - - - -
Loan given Received back JSW Steel (Netherlands) B.V
12.12 - - - - - 12.1223.30 - - - - - 23.30
JSW Steel Holding (USA) Inc.
333.30 - - - - - 333.30391.29 - - - - - 391.29
Inversiones Eurosh Limitada
11.93 - - - - - 11.9323.77 - - - - - 23.77
Total
357.35 - - - - - 357.35438.36 - - - - - 438.36
Loan givenJSW Steel (Netherlands) B.V.
217.29 - - - - - 217.2990.05 - - - - - 90.05
JSW Steel Holding (USA) Inc.
1,033.46 - - - - - 1,033.46760.18 - - - - - 760.18
Inversiones Eurosh Limitada
- - - - - - -255.44 - - - - - 255.44
JSW Natural resources Limited
8.20 - - - - - 8.203.92 - - - - - 3.92
Total
1,258.95 - - - - - 1,258.951,109.59 - - - - - 1,109.59
Donation Given O.P. Jindal Foundation
- - - - - 0.49 0.49- - - - - 0.25 0.25
Total
- - - - - 0.49 0.49- - - - - 0.25 0.25

Eighteenth Annual Report 2011-12
130
Particulars Subsidiaries Associates Joint Ventures
Key Managerial Personnel
Relatives of Key
Managerial Personnel
Enterprises over which KMP and relatives of such
personnel exercise
signifi cant infl uence
Total
Recovery of Expenses incurred by us on their behalf
JSW Cement Limited
- - - - - 0.95 0.95
- - - - - 0.18 0.18
JSW Energy Limited
- - - - - 4.06 4.06
- - - - - 1.50 1.50
JSW Ispat Steel Limited
- 6.82 - - - - 6.82
- - - - - - -
Sapphire Technologies Limited
- - - - - 0.39 0.39
- - - - - 0.41 0.41
JSOFT Solutions Limited
- - - - - 0.13 0.13
- - - - - 0.12 0.12
Others
0.07 - 0.03 - - 0.14 0.24
0.08 - 0.10 - - - 0.18
Total
0.07 6.82 0.03 - - 5.67 12.59
0.08 - 0.10 - - 2.21 2.39
Investments / Share Application Money received during the year
Sapphire Technologies Limited
- - - - - - -
- - - - - 529.38 529.38
Total
- - - - - - -
- - - - - 529.38 529.38
Investments / Share Application Money given during the year
Amba River Coke Limited
67.49 - - - - - 67.49
- - - - - - -
JSW Ispat Steel Limited
- - - - - - -
- 2,157.00 - - - - 2,157.00
JSW Bengal Steel Limited
95.23 - - - - - 95.23
54.39 - - - - - 54.39
JSW Steel (Netherlands) B.V.
62.15 - - - - - 62.15
89.71 - - - - - 89.71
Others
15.72 - 18.99 - - - 34.71
115.95 - 16.32 - - 2.50 134.77
Total
240.59 - 18.99 - - - 259.58
260.05 2,157.00 16.32 - - 2.50 2,435.87
Investments / Share Application Money refunded during the year.
JSW Bengal Steel Limited
3.40 - - - - - 3.40
- - - - - - -
JSW Steel Holding (USA) Inc.
- - - - - - -
113.18 - - - - - 113.18
Notes forming part of the fi nancial statements` in crores

131
Steel Limited
Particulars Subsidiaries Associates Joint Ventures
Key Managerial Personnel
Relatives of Key
Managerial Personnel
Enterprises over which KMP and relatives of such
personnel exercise
signifi cant infl uence
Total
JSW Severfi eld Structures Limited - - 0.36 - - - 0.36
- - 0.36 - - - 0.36
Total
3.40 - 0.36 - - - 3.76
113.18 - 0.36 - - - 113.54
Redemption of Shares
Jindal Praxair Oxygen Company Private Limited
- 26.33 - - - - 26.33
- 4.16 - - - - 4.16
Total
- 26.33 - - - - 26.33
- 4.16 - - - - 4.16
Remuneration
Mrs. Savitri Devi Jindal
- - - - 0.15 - 0.15
- - - - 0.08 - 0.08
Mr. Sajjan Jindal
- - - 18.18 - - 18.18
- - - 20.80 - - 20.80
Mr. Seshagiri Rao M V S
- - - 3.39 - - 3.39
- - - 3.26 - - 3.26
Dr. Vinod Nowal
- - - 2.52 - - 2.52
- - - 2.35 - - 2.35
Mr. Jayant Acharya
- - - 2.21 - - 2.21
- - - 2.00 - - 2.00
Total
- - - 26.30 0.15 - 26.45
- - - 28.41 0.08 - 28.49
Guarantees and collaterals provided by the Company on behalf of
JSW Steel Holding (USA) Inc.
- - - - - - -
267.90 - - - - - 267.90
JSW Steel Processing Centres Limited - - - - - - -
8.73 - - - - - 8.73
Total
- - - - - - -
276.63 - - - - - 276.63
Guarantees and collaterals released
JSW Steel Processing Centres Limited 8.73 - - - - - 8.73
- - - - - - -
JSW Steel (Netherlands) B.V.
- - - - - - -
1,963.59 - - - - - 1,963.59
JSW Steel (USA) Inc.
- - - - - - -
270.84 - - - - - 270.84
Others
- - - - - - -
- 39.52 89.85 - - 75.00 204.37
Total
8.73 - - - - - 8.73
2,234.43 39.52 89.85 - - 75.00 2,438.80
Notes forming part of the fi nancial statements` in crores

Eighteenth Annual Report 2011-12
132
Particulars Subsidiaries Associates Joint Ventures
Key Managerial Personnel
Relatives of Key
Managerial Personnel
Enterprises over which KMP and relatives of such
personnel exercise
signifi cant infl uence
Total
C. Closing balance of related partiesTrade payablesJindal Steel & Power Limited.
- - - - - - -- - - - - 8.66 8.66
Jindal Praxair Oxygen Company Private Limited
- 12.63 - - - - 12.63- 11.69 - - - - 11.69
South West Port Limited
- - - - - 14.31 14.31- - - - - 20.73 20.73
JSW Steel Processing Centres Limited 20.28 - - - - - 20.2820.37 - - - - - 20.37
JSW Energy Limited
- - - - - 42.17 42.17- - - - - - -
Vijayanagar Minerals Private Limited - - 3.50 - - - 3.50- - 12.50 - - - 12.50
JSW Energy (Bengal) Limited
15.38 - - - - - 15.38- - - - - - -
Others
1.38 - - - - 10.25 11.631.47 - 0.69 - - 6.37 8.53
Total
37.04 12.63 3.50 - - 66.73 119.9021.84 11.69 13.19 - - 35.76 82.48
Advance received from CustomersJSW Jaigarh Port Limited
- - - - - 0.08 0.08- - - - - 0.83 0.83
Jindal Saw Limited
- - - - - 0.14 0.14- - - - - - -
JSW Energy Limited
- - - - - - -- - - - - 0.97 0.97
Raj west Power Limited
- - - - - 0.87 0.87- - - - - 6.49 6.49
Total
- - - - - 1.09 1.09- - - - - 8.29 8.29
Lease & Other deposit receivedJindal Praxair Oxygen Company Private Limited
- 3.83 - - - - 3.83- 3.83 - - - - 3.83
JSW Energy Limited
- - - - - 10.19 10.19- - - - - 10.20 10.20
JSW Projects Limited
- - - - - 1.99 1.99- - - - - - -
JSW Jaigarh Port Limited
- - - - - 3.50 3.50- - - - - 3.50 3.50
Jindal Saw Limited
- - - - - 5.00 5.00- - - - - 5.00 5.00
JSW Severfi eld Structures Limited - - 13.00 - - - 13.00- - 13.00 - - - 13.00
Total
- 3.83 13.00 - - 20.68 37.51- 3.83 13.00 - - 18.70 35.53
Notes forming part of the fi nancial statements` in crores

133
Steel Limited
Particulars Subsidiaries Associates Joint Ventures
Key Managerial Personnel
Relatives of Key
Managerial Personnel
Enterprises over which KMP and relatives of such
personnel exercise
signifi cant infl uence
Total
Trade receivablesJSW Cement Limited
- - - - - 24.83 24.83- - - - - 28.07 28.07
JSW Steel (USA) Inc.
37.57 - - - - - 37.57- - - - - - -
JSW Power Trading Company Limited - - - - - 66.91 66.91- - - - - 56.64 56.64
JSW Energy Limited
- - - - - - -- - - - - 16.97 16.97
JSW Ispat Steel Limited
- 25.98 - - - - 25.98- 210.67 - - - - 210.67
Amba River Coke Limited
26.18 - - - - - 26.18- - - - - - -
Others
- - 0.44 - - 25.04 25.48- - - - - 19.63 19.63
Total
63.75 25.98 0.44 - - 116.78 206.95- 210.67 - - - 121.31 331.98
Share Application Money GivenJSW Steel ( Netherlands ) B V
62.15 - - - - - 62.150.10 - - - - - 0.10
Vijayanagar Minerals Private Limited - - 4.05 - - - 4.05- - 4.05 - - - 4.05
Rohne Coal Company Limited
- - 4.81 - - - 4.81- - 2.33 - - - 2.33
Gourangdih Coal Limited
- - 0.05 - - - 0.05- - 0.05 - - - 0.05
Others
0.42 - - - - - 0.42- - - - - - -
Total
62.57 - 8.91 - - - 71.480.10 - 6.43 - - - 6.53
Share Application Money ReceivedSapphire Technologies Limited
- - - - - - -- - - - - 529.38 529.38
Total
- - - - - - -- - - - - 529.38 529.38
Capital /Revenue Advances Jindal Steel & Power Limited
- - - - - 14.71 14.71- - - - - - -
JSW Severfi eld structures limited - - 10.85 - - - 10.85- - - - - - -
JSW Realty & Infrastructure Private Limited. (SWIPL)
- - - - - 47.63 47.63- - - - - - -
Others
- - - - - 0.17 0.17- - - - - - -
Total
- - 10.85 - - 62.51 73.36- - - - - - -
Notes forming part of the fi nancial statements` in crores

Eighteenth Annual Report 2011-12
134
Particulars Subsidiaries Associates Joint Ventures
Key Managerial Personnel
Relatives of Key
Managerial Personnel
Enterprises over which KMP and relatives of such
personnel exercise
signifi cant infl uence
Total
Loan and Advances given
JSW Steel (Netherlands) B.V.
949.93 - - - - - 949.93
632.09 - - - - - 632.09
JSW Steel Holding (USA) Inc.
1,223.46 - - - - - 1,223.46
391.18 - - - - - 391.18
Inversiones Eurosh Limitada
363.56 - - - - - 363.56
314.89 - - - - - 314.89
Others
23.96 - 0.38 - - 0.01 24.35
8.06 - 0.08 - - 0.17 8.31
Total
2,560.91 - 0.38 - - 0.01 2,561.30
1,346.22 - 0.08 - - 0.17 1,346.47
Investments held by the Company
JSW Steel (Netherlands) B.V.
1,020.02 - - - - - 1,020.02
1,020.02 - - - - - 1,020.02
JSW Ispat Steel Limited
- 2,357.11 - - - - 2,357.11
- 2,157.00 - - - - 2,157.00
Others
489.15 66.15 87.12 - - 250.90 893.32
314.03 76.03 70.98 - - 250.90 711.94
Total
1,509.17 2,423.26 87.12 - - 250.90 4,270.45
1,334.05 2,233.03 70.98 - - 250.90 3,888.96
Guarantees and collaterals provided by the Company on behalf:
JSW Steel (Netherlands) B.V. and its subsidiaries for USA and Chile acquisition
189.47 - - - - - 189.47
1,611.78 - - - - - 1,611.78
JSW Steel (USA) Inc.
906.80 - - - - - 906.80
- - - - - - -
Others
- - - - - - -
8.73 - - - - - 8.73
Total
1,096.27 - - - - - 1,096.27
1,620.51 - - - - - 1,620.51
Figures in bold represents current year numbers
Notes forming part of the fi nancial statements` in crores

135
Steel Limited
13. Operating Lease
a) As Lessor:
i. The Company has entered into lease arrangements, for renting :
- 2,279 houses (admeasuring approximately 1,410,997 square feet) at the rate of ` 100/- per house per annum, for a period of 180 months.
- 648 houses (admeasuring approximately 326,703 square feet) at the rate of ` 24/- per square feet per annum, for a period of 36 to 60 months.
- 1 house at the rate of ` 1.2 lacs per annum, for a period of 11 months.
- 9 houses (admeasuring approximately 9,027 square feet) at the rate of ` 40/- per square feet per month per house, for a period of 60 months.
- 6 houses (approximately 5,529 square feet) at the rate of ` 125 per square feet for a period of 12 months.
- Offi ce premises (part) admeasuring approximately 4,760 square feet at the rate of ` 110 per square feet for a period of 11 months.
- Offi ce premises (part) admeasuring approximately 15,392 square feet at the rate of ` 175 per square feet for a period of 11 months.
The agreements are renewable at the option of the lessee after the end of the lease term.
ii. Disclosure in respect of assets (building) given on operating lease :
` in crores Current Year Previous Year
Gross Carrying amount of
Assets 196.68 170.76 Accumulated Depreciation 20.60 18.04
Depreciation for the year 3.19 3.08
b) As Lessee:
Lease Rentals charged to revenue for right to use following assets are:
` in crores
Current Year Previous Year
Offi ce Premises, Residential
Flats etc. 9.68 8.74
Total 9.68 8.74
The agreements are executed for a period of 11 to 60 months with a renewable clause and also provide for termination at will by either party giving a prior notice period of 1 to 3 months.
Notes forming part of the fi nancial statements` in crores
14. Earnings Per Share (EPS):
Current Year Previous Year
Profi t after Tax ` in Crs 1,625.86 2,010.67
Less: Dividend on preference shares (Including corporate dividend tax) ` in Crs 32.43 32.43
Profi t after tax for Equity share holders (Numerator)- Basic / Diluted (A) ` in Crs 1,593.43 1,978.24
Weighted average number of equity shares for Basic EPS (denominator) (B) Nos. 223,117,200 203,595,864
Add: Potential Equity Shares on conversion of FCCB’s / Warrants Nos. -* 1,767,540
Weighted average number of equity shares for Diluted EPS (denominator) (C) Nos. 223,117,200 205,363,404
Earning per share – Basic (A/B) ` 71.42 97.17
Earning per share – Diluted (A/C) ` 71.42 96.33
Nominal value per share ` 10 10
* as anti dilutive
15. The Company has the following Joint venture interest in India as at 31st March 2012:
Interest as Venturer
Vijayanagar Minerals Private Limited: Percentage of holding – 40% (Previous year 40 %)
Rohne Coal Company Private Limited: Percentage of holding – 49% (Previous year 49 %)
JSW Severfi eld Structures Limited : Percentage of holding – 50 % (Previous Year 50%)
Gourangdih Coal Limited : Percentage of holding – 50 % (Previous Year 50 %)
JSW MI Steel Service Center Private Limited – 50% (Previous Year Nil )
Interest as Investor
MJSJ Coal Limited: Percentage of holding – 11% (Previous year 11 %)
Toshiba JSW Turbine and Generator Private Limited – 5% (Previous year 5 %)

Eighteenth Annual Report 2011-12
136
The proportionate share of assets, liabilities, income and expenditure of the jointly controlled entities are as under:
` in crores
Current Period (Based on fi nancial information/
estimates made by the
management)
Previous Year (Audited/Based on fi nancial
information/estimates
made by the management)
I Assets
Non-Current Fixed Assets (including CWIP and Intangible assets under development) 114.16 106.37Non-current Investments 3.60 2.22Deferred Tax Asset (net) 0.27 0.03Long-term loans and advances 1.15 0.92Current AssetsCurrent Investments 0.03 0.53Inventories 5.30 4.57Trade Receivables 19.27 11.26Cash and Cash equivalents 24.05 3.95Short-term loans and advances 16.04 14.21Other current assets 0.41 1.27Unbilled Revenue 20.62 17.11
II Liabilities
Non-current LiabilitiesLong-term borrowings 60.81 60.79Other long-term liabilities 2.50 2.50Long term provisions 0.10 0.05Current Liabilities Short-term borrowings 21.81 9.88Trade Payables 46.37 29.83Other current liabilities 21.91 12.35Short Term provisions 0.30 0.55
III Income
Revenue from operations 89.13 46.61Other Income 4.11 0.73
IV Expenses
Cost of materials consumed 7.21 19.08Cost of Construction 64.53 23.55Employee benefi t expense 11.23 3.51Finance costs 11.99 3.48Depreciation and amortisation expense 5.65 1.72Other Expenses 13.18 6.76
Notes forming part of the fi nancial statements
Current Period (Based on fi nancial information/
estimates made by the
management)
Previous Year (Audited/Based on fi nancial
information/estimates
made by the management)
Tax Expenses- Current/Deferred Tax (0.09) 0.67
V Other Matters
Contingent Liabilities 1.87 1.87Capital Commitment 0.11 1.78
16. Additional information:
A) Auditors Remuneration
` in crores
Current Year Previous Year
As Audit Fees(including limited
review) 2.41 1.88
For Tax Audit Fees 0.29 0.20
For Certifi cation & other
Services 0.65 0.90
Out of Pocket Expenses 0.04 0.04
Total: 3.39 3.02
B) Installed capacities and production:
Class of goods Installed
capacity
Production
Tonnes Tonnes
1 MS Slabs
8,300,000
(6,800,000)
5,659,244
(5,042,838)
2
Hot Rolled Coils/Steel
Plates/Sheets
6,700,000
(6,700,000)
5,268,577
(4,787,770)
3
Hot Rolled Steel Plates
320,000
(320,000)
96,210
(151,739)
4
Cold Rolled Coils/Sheets
1,825,000
(1,825,000)
1,624,572
(1,669,884)
5
Galvanised/Galvalum Coils/
Sheets
925,000
(900,000)
917,328
(908,498)
6
Colour Coating Coils /
Sheets
232,000
(232,000)
176,850
(159,583)
7
Steel Billets & Bloom
2,500,000
(2,500,000)
1,769,758
(1,384,107)
8
Long Rolled Products
2,450,000
(2,200,000)
1,521,867
(1,134,004)
As certifi ed by the management and accepted by auditors, being a technical matter.

137
Steel Limited
C) Opening Stock, Sales and Closing Stock:
i) Manufactured goods
Class of goods Opening Stock Sales Closing Stock Tonnes ` in Crores Tonnes ` in Crores Tonnes ` in Crores
MS Slabs 32,073 76.93 198,529 725.05 38,890 114.22
(64,817) (134.12) (138,177) (511.08) (32,073) (76.93)
Hot Rolled Coils/Steel Plates/Sheets
138,090 384.42 4,173,888 15,914.19 142,642 452.48
(58,351) (133.59) (2,922,933) (10,486.33) (138,090) (384.42)
Galvanized Coils/Sheets 61,489 273.28 795,997 4,006.12 49,591 231.44 (36,453) (118.72) (709,851) (3,348.04) (61,489) (273.28)
Cold Rolled Coils/Sheets 74,816 236.00 715,157 3,113.42 54,296 193.70 (50,793) (128.40) (782,543) (3,319.60) (74,816) (236.00)
Hot Rolled Steel Plates 4,855 14.39 92,543 392.23 7,169 25.58 (8,912) (23.62) (132,386) (503.29) (4,855) (14.39)
Colour Coating Coils/Sheets 10,918 60.07 171,730 1,049.16 12,972 76.03 (6,413) (25.98) (152,307) (870.41) (10,918) (60.07)
Steel Billets & Blooms 28,737 84.21 210,395 786.98 25,914 89.88 (16,914) (40.05) (205,613) (687.88) (28,737) (84.21)
Long Rolled Products 59,990 202.74 1,456,976 6,098.93 65,257 252.83
(55,030) (138.86) (1,055,236) (3,769.24) (59,990) (202.74)
Others 46.46 2,492.65 29.62
(37.20) (1,394.79) (46.46)
Total 1,378.50 34,578.73 1,465.78 (780.54) (24,890.66) (1,378.50)
ii) Traded goods
D) Consumption of Materials:
Current Year Previous Year
Description Quantity
Tonnes
` in crores
Quantity
Tonnes
` incrores
Iron ore lumps/fi nes 14,660,173 4,304.65 12,972,111 3,707.80
Coal/Coke 8,730,477 11,367.50 7,911,646 8,376.45
Hot Rolled Coils 739,483 2,630.05 158,138 563.11
M S Slabs - - 29,128 75.44
Zinc & Alloys 46,188 514.11 41,152 446.33
Others 2,422.87 2,121.87
Total: 21,239.18 15,291.00
Less: captive consumption 279.07 487.91
Total: 20,960.11 14,803.09
Notes forming part of the fi nancial statements
` in crores
Description Current Year Previous Year
Opening Stock
Hot Rolled Plates - 0.13
Others - -
Total - 0.13
Purchases
Hot Rolled Plates - -
Others 77.50 182.23
Total 77.50 182.23
Sales
Hot Rolled Plates - 0.14
Others 79.75 201.29
Total 79.75 201.43
Closing Stock
Hot Rolled Plates - -
Others - -
Total - -

Eighteenth Annual Report 2011-12
138
E) Value of Consumption of directly imported and indigenously obtained raw materials and stores and spares and the percentage of each to total consumption:
Description Current Year Previous YearValue
` in crores% of Total Value
Value` in crores
% of Total Value
RAW MATERIALSImported 12,005.00 57.28 9,424.07 63.66Indigenous 8,955.12 42.72 5,379.02 36.34Total: 20,960.11 100.00 14,803.09 100.00STORES AND SPARESImported 265.59 19.53 174.07 16.45Indigenous 1,094.27 80.47 884.04 83.55Total: 1,359.86 100.00 1,058.11 100.00
F) C.I.F. Value of Imports:` in crores
Description Current Year
Previous Year
Capital Goods 975.53 1,482.99 Raw Materials (including Power and Fuel) 12,397.05 8,874.48 Stores & Spare Parts 372.39 278.44
G) Expenditure in Foreign Currency:` in crores
Description Current Year
Previous Year
Interest and Finance charges 274.82 218.28Ocean Freight 320.24 179.41Commission on sales 10.17 36.70Legal & Professional Fees 8.57 4.08Others 17.81 21.36
H) Earnings in Foreign Currency:
` in crores
Description Current Year
Previous Year
F.O.B. Value of Exports 5,375.22 3,328.25 Sale of Carbon Credits 13.37 38.67Interest Income 107.83 45.76
Notes forming part of the fi nancial statements
In terms of our report attached
For DELOITTE HASKINS & SELLS Chartered Accountants
For and on behalf of the Board of Directors
SAJJAN JINDAL Chairman & Managing Director
P. B. PARDIWALLA Partner
Place : Mumbai, Dated : 14 May 2012
LANCY VARGHESECompany Secretary
RAJEEV PAI Chief Financial Offi cer
SESHAGIRI RAO M.V.S. Jt. Managing Director & Group CFO
I) Remittance in Foreign Currency on account of Dividend:
Dividend to Equity Shareholders :
Description Current
Year
Previous
YearYear to which the Dividend
relates 2010-11 2009-10Number of Non-resident
Shareholders 4,220 4,395Number of Equity Shares held
by them 14,213,956 14,228,602Amount remitted (` in crores) 17.41 13.52
17. Disclosure pertaining to Micro, Small and Medium Enterprises (as per information available with the Company):
` in crores
Description Current Year
Previous Year
Principal amount due outstanding as at end of period 8.19 15.92
Interest due on (1) above and unpaid as at end of period 0.12 0.56
Interest paid to the supplier - -
Payments made to the supplier beyond the appointed day during the period - -
Interest due and payable for the period of delay - -
Interest accrued and remaining unpaid as at end of period - 1.21
Amount of further interest remaining due and payable in succeeding year 0.12 1.21
18. Interest includes ` 2.5 crores (previous year ` 3.25 crores) on account of shortfall in payment of Direct Taxes.
19. Comparative fi nancial information (i.e. the amounts and other disclosure for the preceding year) presented above, is included as an integral part of the current year’s fi nancial statements, and is to be read in relation to the amounts and other disclosures relating to the current year. Figures of the previous year are regrouped and reclassifi ed wherever necessary to correspond to fi gures of the current year. (Refer note 1(1)).

139
Steel Limited
Auditor’s Report on the Consolidated Financial Statements
To The Board of Directors of JSW Steel Limited
1. We have audited the attached Consolidated Balance Sheet of JSW Steel Limited and its subsidiaries (“the Group”) as at 31 March 2012, and also the Consolidated Profi t and Loss Account and the Consolidated Cash Flow Statement of the Group for the year ended on that date, both annexed thereto. The Consolidated Financial Statements are the responsibility of JSW Steel Limited’s Management and have been prepared by the Management on the basis of separate fi nancial statements and other fi nancial information relating to the components. Our responsibility is to express an opinion on these fi nancial statements based on our audit.
2. We conducted our audit in accordance with the auditing standards generally accepted in India. Those Standards require that we plan and perform the audit to obtain reasonable assurance about whether the fi nancial statements are free of material misstatement. An audit includes examining, on a test basis, evidence supporting the amounts and disclosures in the fi nancial statements. An audit also includes assessing the accounting principles used and signifi cant estimates made by Management, as well as evaluating the overall fi nancial statement presentation. We believe that our audit provides a reasonable basis for our opinion.
3. (a) We did not audit the fi nancial statements of certain components, namely subsidiaries and joint ventures, whose fi nancial statements refl ect the Group’s share of total assets of ` 6,701.22 crores as at 31 March 2012, and the Group’s share of total revenues of ` 2,392.63 crores and net cash outfl ows of ` 92.80 crores for the year ended on that date and associates whose fi nancial statements refl ect the Group’s share of losses of ` 950.02 crores for the year ended on that date as considered in the Consolidated Financial Statements. These fi nancial statements and other fi nancial information have been audited by other auditors whose reports have been furnished to us, and our opinion, in so far as it relates to the amounts included in respect of these subsidiaries, joint ventures and associates, is based solely on the reports of the other auditors.
(b) Without qualifying our opinion, attention is invited to the following matter of emphasis included in the report of the other auditor of one of JSW Steel Limited’s associate company, namely, JSW Ispat Steel Limited:
Trade Receivables of ` 255.61 crores, which are overdue from Peddar Realty Private Limited towards sale consideration of landed property along with interest thereon have been considered good of recovery by the Management in view of the market value of the underlying assets.
(c) We did not audit the fi nancial statements of certain components namely subsidiaries, joint ventures and associates whose fi nancial statements are based on
unaudited fi nancial information/estimates as certifi ed by the Management on which we have relied for the purposes of our examination of the Consolidated Financial Statements, (reference is invited to Note no. 1(A)): Subsidiaries and Joint ventures whose fi nancial statements refl ect the Group’s share of total assets of ` 349.85 crores as at 31 March 2012, and the Group’s share of total revenues of ` 259.31 crores and net cash infl ows of ` 14.95 crores for the year ended on that date and Associates whose fi nancial statements refl ect the Group’s share of ` 13.42 crores profi ts for the year ended on that date as considered in the Consolidated Financial Statements.
4. Further to our comment in paragraph 3(b) above and subject to the matter referred to in paragraph 3 (c) above:
(a) We report that the Consolidated Financial Statements have been prepared by the Company’s Management in accordance with the requirements of Accounting Standard 21, ‘Consolidated Financial Statements’, Accounting Standard 23 ‘Accounting for Investments in Associates in Consolidated Financial Statements’ and Accounting Standard 27 ‘Financial Reporting of interests in Joint Ventures’ as notifi ed under the Companies (Accounting Standards) Rules, 2006.
(b) Based on our audit and on consideration of reports of other auditors on the separate fi nancial statements and on the other fi nancial information of the components, in our opinion and to the best of our information and according to the explanations given to us, the Consolidated Financial Statements give a true and fair view in conformity with the accounting principles generally accepted in India:
i) in the case of the Consolidated Balance Sheet, of the state of affairs of the Group as at 31 March 2012;
ii) in the case of the Consolidated Profi t and Loss account, of the profi t of the Group for the year ended on that date; and
iii) in the case of the Consolidated Cash Flow Statement, of the cash fl ows of the Group for the year ended on that date.
For Deloitte Haskins & SellsChartered Accountants
(Firm Registration No. 117366W)
P. B. PardiwallaPartner
(Membership No. 40005)Place: Mumbai Date: 14 May 2012

Eighteenth Annual Report 2011-12
140
Consolidated Balance Sheet as at 31st March, 2012` in crores
Note No
As at31.03.2012
As at31.03.2011
I. EQUITY AND LIABILITIES(1) Shareholders’ funds
2 Share capital 563.18 563.183 Reserves and surplus 16,186.39 15,436.77
Money received against share warrants - 529.3816,749.57 16,529.33
Minority Interest 217.67 221.85(2) Non-current liabilities
4 Long-term borrowings 12,889.12 11,334.855(d) Deferred Tax Liabilities (Net) 3,041.19 2,325.63
6 Other Long term liabilities 472.21 772.857 Long-term provisions 35.03 22.57
16,437.55 14,455.90(3) Current liabilities
8 Short-term borrowings 1,375.75 2,394.469 Trade payables 9,705.20 6,045.2310 Other current liabilities 9,512.94 6,157.9511 Short-term provisions 230.84 359.76
20,824.73 14,957.40TOTAL 54,229.52 46,164.48
II. ASSETS(1) Non-current assets
12 Fixed assetsTangible assets 32,529.26 25,790.76Intangible assets 38.82 19.90Capital work-in-progress 2,801.83 5,982.52Intangible assets under development 29.88 40.53
35,399.79 31,833.71Goodwill on Consolidation 1,243.98 1,093.20
13 Non-current investments 1,885.60 2,643.695(d) Deferred tax assets (net) 316.21 276.2314 Long-term loans and advances 2,602.87 1,454.5115 Other non-current assets 14.36 10.69
41,462.81 37,312.03(2) Current assets
16 Current investments 204.00 270.1417 Inventories 5,789.26 4,409.7018 Trade receivables 1,539.39 933.3519 Cash and Cash Equivalents 3,046.97 2,036.1214 Short-term loans and advances 2,187.09 1,203.14
12,766.71 8,852.45
TOTAL 54,229.52 46,164.48
1(B) Signifi cant Accounting PoliciesThe accompanying Notes 1 to 26 are an integral part of the consolidated fi nancial statements
In terms of our report attached
For DELOITTE HASKINS & SELLS Chartered Accountants
For and on behalf of the Board of Directors
SAJJAN JINDAL Chairman & Managing Director
P. B. PARDIWALLA Partner
Place : Mumbai, Dated : 14 May 2012
LANCY VARGHESECompany Secretary
RAJEEV PAI Chief Financial Offi cer
SESHAGIRI RAO M.V.S. Jt. Managing Director & Group CFO

141
Steel Limited
Consolidated Statement of Profi t and Loss for the year ended 31st March, 2012` in crores
Note No.
For theYear Ended31.03.2012
For theYear Ended31.03.2011
20 I. Revenue from operations 36,964.23 26,073.45
Less: Excise duty 2,596.18 1,967.56
34,368.05 24,105.89
21 II. Other income 76.85 189.97
III. Total Revenue (I + II) 34,444.90 24,295.86
IV. Expenses:
Cost of materials consumed 22,245.23 15,162.75
Purchases of traded goods 77.50 223.97
22 Changes in inventories of Finished goods, Work-in-progress and Stock-in-Trade (443.65) (633.38)
Cost of Construction 48.94 20.21
23 Employee benefi ts expense 846.39 640.66
24 Finance costs 1,427.30 1,060.26
12 Depreciation and amortization 1,933.15 1,559.71
25 Other expenses 5,491.75 3,823.78
Total expenses 31,626.61 21,857.96
V. Profi t before Exceptional Items and Tax 2,818.29 2,437.90
VI. Exceptional Items
26(4-a) Exchange Loss (net) 824.94 -
VII. Profi t before Tax (V-VI) 1,993.35 2,437.90
VIII. Tax expense:
5(a) Current tax 411.27 585.48
5(b) Deferred tax 773.23 396.79
5(c) Less: MAT Credit Entitlement (684.35) (203.75)
500.15 778.52
IX. Profi t after Taxation but before minority interests and share of profi ts/loss of Associates (VII-VIII) 1,493.20 1,659.38
X. Share of Profi t / (Losses) of Minority 18.92 (23.87)
XI. Share of (Losses) / Profi t from Associates (net)
Before exceptional items (226.21) 70.73
26(4-b) Exceptional items (710.39) -
XII. Profi t for the year (IX-X+XI) 537.68 1,753.98
26(12) XIII. Earnings per equity share:
(1) Basic 22.65 84.56
(2) Diluted 22.65 83.83
1(B) Signifi cant Accounting Policies
The accompanying Notes 1 to 26 are an integral part of the consolidated fi nancial statements
In terms of our report attached
For DELOITTE HASKINS & SELLS Chartered Accountants
For and on behalf of the Board of Directors
SAJJAN JINDAL Chairman & Managing Director
P. B. PARDIWALLA Partner
Place : Mumbai, Dated : 14 May 2012
LANCY VARGHESECompany Secretary
RAJEEV PAI Chief Financial Offi cer
SESHAGIRI RAO M.V.S. Jt. Managing Director & Group CFO

Eighteenth Annual Report 2011-12
142
Consolidated Cash Flow Statement for the year ended 31st March, 2012` in crores
For the year ended31.03.2012
For the year ended31.03.2011
A. CASH FLOW FROM OPERATING ACTIVITIESNET PROFIT BEFORE TAX 1,993.35 2,437.90Adjustments for :Depreciation and amortisation 1,933.15 1,559.71(Profi t)/Loss on sale of Fixed Assets (0.08) 1.21Income from Current Investments (15.00) (32.29)Interest Income (32.58) (79.30)Dividend Income (7.85) (5.88)Interest Expenses 975.35 735.78Unrealised exchange Loss/(gain) 125.00 (54.43)Amortisation of Employees Share Payments 10.35 7.62
2,988.34 2,132.42Operating profi t before working capital changes 4,981.69 4,570.32Adjustments for :Increase in Inventories (1,379.56) (1,542.96)Increase in Trade Receivables and Loans and Advances* (2,728.63) (2,210.57)Increase in Liabilities and Provisions* 3,046.02 2,439.86
(1,062.17) (1,313.67)Cash fl ow before taxation 3,919.52 3,256.65Direct Taxes Paid (407.12) (426.42)NET CASH GENERATED FROM OPERATING ACTIVITIES 3,512.40 2,830.23
B. CASH FLOW FROM INVESTING ACTIVITIESPurchase of fi xed assets and capital advances (4,079.46) (5,314.39)Investment in associates and Joint Ventures (178.21) (2,156.03)Purchase of Other Long Term Investments (Net) (0.30) (2.50)Purchase/Sale of Current Investments (Net) 81.14 (24.08)Acquisition of Subsidiaries (0.75) (203.73)Proceeds from sale of Fixed Assets 13.45 15.02Interest received 55.72 46.69Dividend received 7.85 5.88NET CASH USED IN INVESTING ACTIVITIES (4,100.56) (7,633.14)
C. CASH FLOW FROM FINANCING ACTIVITIESProceeds from Issue of Equity Share Capital / Share Warrants - 5,935.62Proceeds from Long Term Borrowings 6,024.44 4,498.30Repayment of Long Term Borrowings (2,707.28) (5,140.65)Short term borrowings (net) (1,126.27) 1,043.19Interest Paid (1,143.03) (1,000.65)Dividend Paid (including Corporate Dividend Tax) (350.09) (239.74)NET CASH GENERATED FROM FINANCING ACTIVITIES 697.77 5,096.07
NET INCREASE IN CASH AND CASH EQUIVALENTS(A+B+C) 109.61 293.16CASH AND CASH EQUIVALENTS - OPENING BALANCE 572.89 279.73CASH AND CASH EQUIVALENTS - CLOSING BALANCE# 682.50 572.89
Add : Margin Money / Fixed Deposit Balance (In Lien) 2,329.52 1,447.89Add : Balance in debenture interest / installments / dividend payment accounts 20.84 18.07Add : Translation Adjustment in Cash and Cash Equivalents 14.11 (2.73)CASH AND CASH EQUIVALENTS ( As per Note 19) 3,046.97 2,036.12* Includes current and non current# Cash and Cash Equivalents (refer note 19) 1,324.68 1,767.03Less : Earmarked balances included above 642.18 1,194.14Cash and Cash Equivalents considered for Cash Flow 682.50 572.89
In terms of our report attached
For DELOITTE HASKINS & SELLS Chartered Accountants
For and on behalf of the Board of Directors
SAJJAN JINDAL Chairman & Managing Director
P. B. PARDIWALLA Partner
Place : Mumbai, Dated : 14 May 2012
LANCY VARGHESECompany Secretary
RAJEEV PAI Chief Financial Offi cer
SESHAGIRI RAO M.V.S. Jt. Managing Director & Group CFO

143
Steel Limited
Note 1: Signifi cant Accounting Policies
A. General Information
The Consolidated Financial Statements of the Group – JSW Steel Limited (‘JSW’ or ‘the Company’) the parent Company and all its subsidiaries include fi nancial information of other components, namely, joint ventures and associate companies. The Company was incorporated on 15 March 1994. The Company is predominantly engaged in the business of production and distribution of iron and steel products.
The following components are included in the consolidation:
Subsidiary Companies:
Name of the Company
Country of incorporation
Share holding at year end
either directly or through subsidiaries
Nature of operations
(commenced / planned)
JSW Steel (Netherlands) B.V.
Netherlands 100%(100%)
Acquisition and investment in steel related and steel allied businesses and trading in steel products
JSW Steel (UK) Limited
United Kingdom
100%(100%)
Investment in steel related and steel allied businesses
Argent Independent Steel (Holdings) Limited
United Kingdom
100%(100%)
Holding company of JSW Steel Service Centre (UK) Limited
JSW Steel Service Centre (UK) Limited
United Kingdom
100%(100%)
Steel service centre
JSW Steel Holding (USA) Inc.
United States of America
100%(100%)
Holding Company of JSW Steel (USA) Inc. and Periama Holdings, LLC
JSW Steel (USA) Inc.
United States of America
90%(90%)
Manufacturing plates, pipes and double jointing.
Periama Holdings, LLC
United States of America
100%(100%)
Mining company
Purest Energy, LLC
United States of America
100%(100%)
Mining company
Meadow Creek Minerals, LLC
United States of America
100%(100%)
Mining company
Hutchinson Minerals, LLC
United States of America
100%(100%)
Mining company
R.C. Minerals, LLC
United States of America
100%(100%)
Mining company
Keenan Minerals, LLC
United States of America
100%(100%)
Mining company
Peace Leasing, LLC
United States of America
100%(100%)
Mining company
Prime Coal, LLC
United States of America
100%(100%)
Mining company
Planck Holdings, LLC
United States of America
100%(100%)
Mining company
Rolling S Augering, LLC
United States of America
100%(100%)
Mining company
Notes Forming Part of the Consolidated Financial Statements
Name of the Company
Country of incorporation
Share holding at year end
either directly or through subsidiaries
Nature of operations
(commenced / planned)
Periama Handling, LLC
United States of America
100%(100%)
Mining company
Lower Hutchinson Minerals, LLC
United States of America
100%(100%)
Mining company
Caretta Minerals, LLC
United States of America
100%(100%)
Mining company
JSW Panama Holdings Corporation
Republic of Panama
100%(100%)
Holding company for Chile based companies and trading in iron ore
Inversiones Eurosh Limitada
Chile 100%(100%)
Holding Company (LLP) of Santa Fe Mining
Santa Fe Mining
Chile 70%(70%)
Mining company
Santa Fe Puerto S.A.
Chile 70%(70%)
Port company
JSW Natural Resources Limited
Republic of Mauritius
100%(100%)
Holding company of JSW Natural Resources Mozambique Lda
JSW Natural Resources Mozambique Limitada
Mozambique 100%(100%)
Mining Company
JSW ADMS Carvo Lda
Mozambique 85 %(85%)
Mining Company
JSW East Africa Limited*(w.e.f. 13 September 2011)
Kenya 100%(-)
Mining Company
JSW Steel Processing Centres Limited
India 100%(100%)
Steel service center
JSW Bengal Steel Limited
India 97.82%(96.74%)
Steel plant
JSW Natural Resources India Limited
India 97.82%(96.74%)
Steel Plant
Barbil Benefi ciation Company Limited
India 97.82%(96.74%)
Benefi ciation plant
JSW Jharkhand Steel Limited
India 100%(100%)
Steel plant and mining
JSW Building Systems Limited
India 100%(100%)
Pre-fabricated building systems and technologies
Amba River Coke Limited(w.e.f. 4 October 2011)
India 100%(-)
Coke oven plant

Eighteenth Annual Report 2011-12
144
Name of the Company
Country of incorporation
Share holding at year end
either directly or through subsidiaries
Nature of operations
(commenced / planned)
JSW Energy (Bengal) Limited(Subsidiary w.e.f. 1 March 2012)
India 97.82%(-)
Power plant
Joint Venture Companies:Vijayanagar Minerals Private Limited
India 40%(40%)
Supply of iron ore.
Rohne Coal Company Private Limited
India 49%(49%)
Coal mining company
Geo Steel LLC*
Georgia 49%(49%)
Manufacturing of TMT Rebar
JSW Severfi eld Structures Limited (JSSL)*
India 50%(50%)
Designing, fabricating and erecting structural steel works
JSW Structural Metal Decking Limited*
India 33.33%(33.33%)
Metal deckings
Gourangdih Coal Limited*
India 50%(50%)
Coal mining company
JSW MI Steel Service Center Private Limited (w.e.f. 19 September 2011)
India 50%(-)
Steel service centre
Associate Companies:Jindal Praxair Oxygen Company Private Limited*
India 26%(26%)
Production of gaseous and liquid form of oxygen, nitrogen, argon and other products recoverable from separation of air.
JSW Energy (Bengal) Limited(Subsidiary w.e.f. 1 March 2012)
India -(26%)
Power plant
JSW Ispat Steel Limited
India 49.30%(45.53%)
Production and distribution of iron and steel products
*Consolidated based on unaudited fi nancial information /estimates as certifi ed by the management.
The Company has a 26% stake in Jindal Praxair Oxygen Company Private Limited (JPOCL). Though the Company is entitled to exercise joint control in respect of certain operating and fi nancial matters in terms of the shareholders’ agreement, on account of certain constraints, it is unable to
Notes Forming Part of the Consolidated Financial Statements
exercise such joint control. The Company has representation on JPOCL’s Board. JPOCL has therefore been accounted for as an associate in Consolidated Financial Statements using the equity method as per Accounting Standard (AS) - 23 “Accounting for Investments in Associates in Consolidated Financial Statements”.
B. Signifi cant Accounting Policies
1. Principles of consolidation
The subsidiaries are consolidated on a line-by-line basis in accordance with Accounting Standard 21 “Consolidated Financial Statements”. Interest of the minority shareholders in the subsidiaries’ profi ts or losses and net worth is displayed separately in the consolidated fi nancial statements. Inter-company transactions and balances are eliminated on consolidation.
Investments in joint ventures are accounted for using the proportionate consolidation method in accordance with Accounting Standard 27 “Financial Reporting of Interests in Joint Ventures”. Unrealized profi ts and losses resulting from transactions between the Company and the joint venture companies are eliminated to the extent of the company’s share in the joint ventures.
Investments in associates are accounted for using the equity method in accordance with Accounting Standard 23 “Accounting for Investments in Associates in Consolidated Financial Statements”. Unrealized profi ts and losses resulting from transactions between the Company and the associates are eliminated to the extent of the company’s interest in the associate.
For the purpose of consolidation, the fi nancial statements of the subsidiaries, joint venture companies and associates are drawn up to 31 March 2012 which is the reporting period of the Company.
The excess of the cost of investment in subsidiary companies, joint venture and associate companies over the parent’s share of equity is recognized in the fi nancial statements as goodwill. When the cost to the parent of its investment in subsidiary companies, joint venture and associate companies is less than the parents’ share of equity, the difference is recognized in the fi nancial statements as capital reserve.
2. Uniform accounting policies
The consolidated fi nancial statements of JSW and its subsidiary, joint venture and associate companies have been prepared using uniform accounting policies for like transactions and other events in similar circumstances.
The Ministry of Corporate Affairs revised Schedule VI to the Companies Act, 1956 (the Act) for fi nancial years commencing on or after 1 April 2011. The balance sheet and profi t and loss account and the comparative fi nancial information for the previous year, have accordingly been prepared and presented with disclosures as required under the Revised Schedule VI.

145
Steel Limited
3. Use of estimates
The preparation of fi nancial statements in conformity with Generally Accepted Accounting Principles require estimates and assumptions to be made that affect the reported amounts of assets and liabilities and disclosure of contingent liabilities on the date of fi nancial statements and the reported amounts of revenues and expenses during the reporting period. Actual results could differ from these estimates and differences between actual results and estimates are recognized in the periods in which the results are known/materialize.
4. Fixed assets and depreciation
Fixed Assets are stated at their cost of acquisition or construction less accumulated depreciation and impairment losses.
Costs of acquisition comprise all costs incurred to bring the assets to their location and working condition up to the date the assets are put to use. Costs of construction are composed of those costs that relate directly to specifi c assets and those that are attributable to the construction activity in general and can be allocated to specifi c assets up to the date the asset are put to use.
Depreciation on assets is provided, pro-rata for the period of use, using the Straight Line Method (SLM).
Leasehold land is amortized over the period of the lease, except where the lease is convertible to freehold land under lease agreements at future dates at no additional cost.
The company capitalizes software where it is reasonably estimated that the software has an enduring useful life. Software is depreciated over an estimated useful life of 3 to 5 years.
In respect of mining projects, the Company capitalizes cost of acquisition of mining concessions and all costs incurred till mining reserves are proved, such as license fees, direct exploration costs and indirect incidental costs. Once the determination of mining reserves is made, the following conditions must be met in order for these costs to remain capitalized:
i. The economic and operating viability of the project is assessed determining whether suffi cient reserves exist to justify further capitalized expenditure for commercial exploration of the reserves, and
ii. Further exploration and development activity is under way or fi rmly planned for the near future.
These are amortized by the unit of production method once the mine commences commercial production. All expenditure related to unsuccessful efforts are charged to the profi t and loss account when so established. Goodwill arising on consolidation to the extent attributable to mining concessions is also amortized on the basis described above.
The carrying values of assets /cash generating units at each balance sheet date are reviewed for impairment in accordance with Accounting Standard 28 “Impairment
Notes Forming Part of the Consolidated Financial Statements
of Assets”. If any indication of impairment exists, the recoverable amount of such assets is estimated and impairment is recognized, if the carrying amount of these assets exceeds their recoverable amount (i.e. the higher of the asset’s net selling price and value in use).
In respect of mining projects which are at different stages of prospecting and exploration, ranging from precursor activities to establishment of mining reserves, and where mining proper and other related activities to develop the property after assessment of economic and technical viability of the project have not yet commenced, related assets are carried at their original value, since impairment if any cannot be ascertained at this stage.
5. Investments
Investments are classifi ed as current or long-term in accordance with Accounting Standard 13 “Accounting for Investments”.
Current investments are stated at lower of cost and fair value. Any reduction in the carrying amount and any reversals of such reductions are charged or credited to the profi t and loss account.
Long term investments are stated at cost. Provision for diminution is made to recognize a decline, other than temporary, in the value of such investments.
6. Revenue recognition
Revenue is recognized when it is earned and no signifi cant uncertainty exists as to its realization or collection.
Revenue from sale of goods is recognized on delivery of the products, when all signifi cant contractual obligations have been satisfi ed, the property in the goods is transferred for a price, signifi cant risks and rewards of ownership are transferred to the customers and no effective ownership is retained. Sales are net of sales tax/value added tax. Export turnover includes related export benefi ts. Excise duty recovered is presented as a reduction from gross turnover.
Revenue in respect of construction contracts is calculated as that proportion of the total contract value which costs incurred to date bear to the total expected costs for that contract. Variations in contract work, claims and incentive payments are included in revenue to the extent that it is probable that they will result in revenue and can be measured reliably. Where the outcome of a construction contract cannot be estimated reliably, contract revenue is recognized to the extent of contract costs incurred of which recovery is probable. Where the outcome of a construction contract can be estimated reliably, profi t is recognized on contracts by including in the income statement revenue and related cost as contract activity progresses. When it is probable that total contract costs will exceed total contract revenue, the expected loss is recognized as an expense immediately. Profi t is recognized on contracts, if the fi nal outcome can be estimated reliably, by including in the income statement revenue and related cost as contract activity progresses.

Eighteenth Annual Report 2011-12
146
7. Inventories
Inventories are valued at the lower of cost and net realizable value. Cost of inventories comprise all costs of purchase, costs of conversion and other costs incurred in bringing the inventories to their present location and condition. Cost is determined by the weighted average cost method.
Excise duty related to fi nished goods stock is included under changes in inventories of fi nished goods, work-in-progress and stock-in-trade (Note 22).
8. Borrowing Costs
Borrowing costs attributable to the acquisition or construction of qualifying assets, as defi ned in Accounting Standard 16 “Borrowing Costs” are capitalized as part of the cost of such asset up to the date when the asset is ready for its intended use. Other borrowing costs are expensed as incurred.
9. Employee benefi ts
Employee benefi ts such as salaries, allowances, non-monetary benefi ts and employee benefi ts under defi ned contribution plans such as provident and other funds, which fall due for payment within a period of twelve months after rendering service, are charged as expense to the profi t and loss account in the period in which the service is rendered.
Employee benefi ts under defi ned benefi t plans, such as gratuity and compensated absences which fall due for payment after a period of twelve months from rendering service or after completion of employment, are measured by the projected unit credit method, on the basis of actuarial valuations carried out by third party actuaries at each balance sheet date. The company’s obligations recognized in the balance sheet represents the present value of obligations as reduced by the fair value of plan assets, where applicable.
Actuarial gains and losses are recognized immediately in the profi t and loss Account.
10. Foreign currency transactions
Foreign currency transactions are recorded at the exchange rates prevailing on the date of the transaction.
Monetary foreign currency assets and liabilities (monetary items) are reported at the exchange rate prevailing on the balance sheet date. Exchange differences relating to long term monetary items are dealt with in the following manner:
i. Exchange differences relating to long-term monetary items, arising during the year, in so far as they relate to the acquisition of a depreciable capital asset are added to / deducted from the cost of the asset and depreciated over the balance life of the asset.
ii. In other cases such differences are accumulated in a “Foreign Currency Monetary Item Translation Difference Account” and amortized to the profi t and loss account over the balance life of the long-
term monetary item, however that the period of amortization does not extend beyond 31 March 2020.
All other exchange differences are dealt with in the profi t and loss account.
Non-monetary items such as investments are carried at historical cost using the exchange rates on the date of the transaction.
In translating the fi nancial statements of subsidiary companies’ non-integral foreign operations, for incorporation in the consolidated fi nancial statements the assets and liabilities, both monetary and non-monetary, are translated at the closing rate, the income and expense items of the subsidiary company are translated at the average rate and all resulting exchange differences are accumulated in a foreign currency translation reserve until the disposal of the net investment.
11. Derivative instruments and hedge accounting
The Company enters into derivative fi nancial instruments such as foreign exchange forward contracts, interest rate swaps and currency options to manage its exposure to interest rate and foreign exchange risks.
Derivatives are initially recognized at fair value at the date a derivative contract is entered into and are subsequently re-measured to their fair value at each balance sheet date.
The Company designates certain derivatives as either hedges of the fair value of recognised assets or liabilities (fair value hedges) or hedges of highly probable forecast transactions or hedges of foreign currency risk of fi rm commitments (cash fl ow hedges). The Company does not enter into derivative contracts for trading or speculative purposes.
A derivative is presented under “Short term loans and advances” (Note 14) or “Other Current Liabilities” (Note 10).
Changes in the fair value of derivatives that are designated and qualify as fair value hedges are recorded in the profi t and loss account immediately, together with any changes in the fair value of the hedged item that are attributable to the hedged risk. The change in the fair value of the hedging instrument and the change in the hedged item attributable to the hedged risk are recognized in the same line of the profi t and loss account relating to the hedged item.
Changes in the fair value of derivatives that are designated and qualify as cash fl ow hedges are deferred in a “Hedging Reserve Account”. The gain or loss relating to the ineffective portion is recognised immediately in profi t and loss account. Amounts deferred in the Hedging Reserve Account are recycled in the profi t and loss account in the periods when the hedged item is recognized in the profi t and loss account, in the same line as the hedged item.
Notes Forming Part of the Consolidated Financial Statements

147
Steel Limited
Hedge accounting is discontinued when the Company revokes the hedging relationship, the hedging instrument expires or is sold, terminated, or exercised, or no longer qualifi es for hedge accounting. In case of fair value hedges the adjustment to the carrying amount of the hedged item arising from the hedged risk is amortized to the profi t and loss account from that date. In case of cash fl ow hedges any cumulative gain or loss deferred in the Hedging Reserve Account at that time is retained and is recognized when the forecast transaction is ultimately recognized in the profi t and loss account. When a forecast transaction is no longer expected to occur, the cumulative gain or loss that was deferred is recognized immediately in the profi t and loss account.
12. Income taxes
Income taxes are accounted for in accordance with Accounting Standard 22 “Accounting for Taxes on Income”. Taxes comprise both current and deferred tax.
Current tax is measured at the amount expected to be paid/recovered from the revenue authorities, using the applicable tax rates and tax laws. Minimum Alternate Tax (MAT) credit entitlement available under the provisions of Section 115 JAA of the Income Tax Act, 1961 is recognised to the extent that the credit will be available for discharge of future normal tax liability.
The tax effect of the timing differences that result between taxable income and accounting income and are capable of reversal in one or more subsequent periods are recorded as a deferred tax asset or deferred tax liability. They are measured using the substantively enacted tax rates and tax laws.
The carrying amount of MAT credit and deferred tax assets at each balance sheet date is reduced to the extent that it is no longer reasonably certain that suffi cient future taxable income will be available against which the assets can be realized.
Where certain expenses or credits which are otherwise required to be charged to the profi t and loss account are adjusted directly to reserves in accordance with a court order or as permitted by Law/accounting standards, the tax benefi ts or charge, arising from the admissibility or taxability of such expenses or income for tax purpose is also recognised in the reserves.
Tax on distributed profi ts payable in accordance with the provisions of section 115O of the Income Tax Act, 1961 which is accounted for in accordance with the Guidance Note on Accounting for Corporate Dividend Tax is regarded as a tax on distribution of profi ts and is not considered in determination of profi ts for the year.
13. Earnings per share
The Company reports basic and diluted Earnings per share (EPS) in accordance with Accounting Standard 20 “Earnings per Share”. Basic EPS is computed by dividing the net profi t or loss for the year attributable to equity shareholders by the weighted average number of
equity shares outstanding during the year. Diluted EPS is computed by dividing the net profi t or loss for the year attributable to equity shareholders by the weighted average number of equity shares outstanding during the year as adjusted for the effects of all dilutive potential equity shares, except where the results are anti-dilutive.
14. Leases
(i) Operating lease
Operating lease receipts and payments are recognized as income or expense in the profi t and loss account on a straight-line basis over the lease term.
(ii) Finance leases
Assets acquired under fi nance leases are recognized at the lower of the fair value of the leased assets at inception and the present value of minimum lease payments. Lease payments are apportioned between the fi nance charge and the outstanding liability. The fi nance charge is allocated to periods during the lease term at a constant periodic rate of interest on the remaining balance of the liability.
15. Cash fl ow statement
The cash fl ow statement is prepared by the “indirect method” set out in Accounting Standard 3 “Cash Flow Statements” and presents the cash fl ows by operating, investing and fi nancing activities of the Company.
Cash and cash equivalents presented in the cash fl ow statement consist of cash on hand and unencumbered, highly liquid bank balances.
16. Securities expenses
Expenses on issue of securities are adjusted against the Securities Premium Account in accordance with Section 78 of the Act.
Premium payable on redemption of bonds is provided for over the life of the bonds. The Securities Premium Account is applied in providing for premium on redemption in accordance with Section 78 of the Act. On conversion of the bonds to equity the provision for the redemption premium is reversed.
17. Stock based compensation
The compensation cost of stock options granted to employees is calculated using the intrinsic value of the stock options. The compensation expense is amortized uniformly over the vesting period of the option.
18. Contingent liabilities
Contingent liabilities as defi ned in Accounting Standard 29 “Provisions, Contingent Liabilities and Contingent Assets” are disclosed by way of notes to the accounts. Disclosure is not made if the possibility of an outfl ow of future economic benefi ts is remote. Provision is made if it is probable that an outfl ow of future economic benefi ts will be required to settle the obligation.
Notes Forming Part of the Consolidated Financial Statements

Eighteenth Annual Report 2011-12
148
` in crores
As at31.03.2012
As at31.03.2011
Note 2 Share Capital a Authorised :
2,00,00,00,000 Equity Shares of the par value of ` 10 each 2,000.00 2,000.001,00,00,00,000 Preference Shares of the par value of ` 10 each 1,000.00 1,000.00
3,000.00 3,000.00b Issued and Subscribed:
22,31,17,200 Equity Shares fully paid up 223.12 223.12Equity Shares Forfeited (Amount originally paid-up) 61.03 61.0327,90,34,907 10% Cumulative Redeemable Preference Shares fully paid up 279.03 279.03Total: 563.18 563.18
c Reconciliation of number of shares outstanding at the beginning and end of the year :
Equity (including shares represented by underlying GDRs):Outstanding at the beginning of the year 223,117,200 187,048,682Issued during the year - 36,068,518Outstanding at the end of the year 223,117,200 223,117,200Preference :Outstanding at the beginning and at the end of the year 279,034,907 279,034,907
d Rights, preferences and restrictions attached to Equity sharesThe company has a single class of equity shares. Each shareholder is eligible for one vote per share held (other than the shares represented by underlying GDR’s which do not carry a voting right). The dividend proposed by the Board of Directors is subject to the approval of the shareholders. In the event of liquidation, the equity shareholders are eligible to receive the remaining assets of the company after distribution of all preferential amounts, in proportion to their shareholding.26,00,938 (previous year 3,085,814) equity shares represent the shares underlying outstanding Global Depository Receipts (GDRs). Each GDR represents 1 underlying equity share.
e Rights, preferences and restrictions attached to Preference sharesThe company has a single class of preference shares. They are redeemable at par in four equal quarterly installments commencing from 15 December 2017. The shares carry a right to receive 10% dividend every year till redempton. In the event of liquidation, the preference shareholders are eligible to receive the outstanding amount after distribution of all other preferential amounts, in proportion to their shareholding.
f Shareholders holding more than 5% shares in the company is set out below:Equity (excluding shares represented by underlying GDRs)
JFE SteelCorporation
No of Shares%
33,467,580 15.00%
32,982,704 14.78%
Jindal South WestHoldings Limited
No of Shares%
17,284,923 7.75%
17,284,923 7.75%
JSW Energy Investments Private Limited
No of Shares%
13,764,364 6.17%
13,764,364 6.17%
PreferenceICICI Bank Limited No of Shares
% 125,707,730
45.05%125,707,730
45.05%IDBI Bank Limited No of Shares
% 69,734,847
24.99% 69,734,847
24.99%Life Insurance Corporation of India
No of Shares%
36,348,783 13.03%
36,348,783 13.03%
IFCI Limited No of Shares%
21,262,362 7.62%
21,262,362 7.62%
g Equity shares alloted as fully paid-up pursuant to contracts without payment being received in cash during the period of fi ve years immediate preceding the date of the Balance Sheet are as under:
1,50,35,712 equity shares to the shareholders of erstwhile Southern Iron and Steel Company Limited pursuant to scheme of Amalgamation
h Foreign Currency Convertible Bonds (FCCB) (refer note 4 (a))
` in crores
As at 31.03.2012
As at 31.03.2011
Note 3Reserves and Surplus a Capital Reserve:
Money received against equity share warrants forfeited, option not exercised by warrant holders 529.38 -
529.38 -b Capital Redemption Reserve:
As per last Balance Sheet 9.90 9.909.90 9.90
c Securities Premium Reserve:As per last Balance Sheet 5,667.53 368.89Add : Premium received on issue of Equity Shares / GDRs - 5,374.21
5,667.53 5,743.10Less : Preferential issue expenses - (4.04)Provision for premium on redemption of FCCBs (131.28) (71.53)
5,536.25 5,667.53
d Debenture Redemption Reserve:As per last Balance Sheet 129.04 129.04Less : Transfer to Surplus in Statement of Profi t and Loss (125.00) -
4.04 129.04
Notes Forming Part of the Consolidated Financial Statements

149
Steel Limited
As at 31.03.2012
As at 31.03.2011
e Share Options Outstanding:Share Options Outstanding 24.57 24.28Less: Deferred Compensation (6.15) (16.87)
18.42 7.41f Hedging Reserve Account:
As per last Balance Sheet (8.34) 3.88Movement during the year (6.12) (12.22)
(14.46) (8.34)g General Reserve:
As per last Balance Sheet 7,539.02 3,326.34Add : Transfer from Surplus in
Statement of Profi t and Loss 2,325.77 4,200.00
Transfer from Shares Options Outstanding - 12.68
9,864.79 7,539.02
h Foreign Currency Translation Reserve Account:As per last Balance Sheet (51.47) (60.98)Movement during the year 0.43 9.51
(51.04) (51.47)
Notes Forming Part of the Consolidated Financial Statements
As at 31.03.2012
As at 31.03.2011
i Capital Reserve on Consolidation 279.77 244.33
j Surplus in Statement of Profi t and Loss:As per last Balance Sheet 1,899.35 4,695.46Add: Profi t for the year 537.68 1,753.98 Transfer from Debenture
Redemption Reserve 125.00 -Less: Appropriations : Dividend on Preference
Shares (27.90) (27.90) Proposed Final Dividend
on Equity Shares (167.34) (273.32) Corporate Dividend Tax (31.68) (48.87) Transfer to General
Reserve (2,325.77) (4,200.00)9.34 1,899.35
Total: 16,186.39 15,436.77
` in crores As at
31.3.2012 As at
31.3.2011 As at
31.3.2012 As at
31.3.2011 Non Current Current (Refer note 10)
Note 4 Long Term Borrowings Bonds / Debentures Bonds (Unsecured) 2,744 Zero Coupon Foreign Currency Convertible Bonds (FCCB) of USD 1,00,000 each - 1,225.20 1,403.73 -Debentures (Secured)11 % Non Convertible Debentures of ` 10 lacs each 1,000.00 - - -10.25 % Non Convertible Debentures of ` 10 lacs each 500.00 500.00 - -10.60 % Non Convertible Debentures of ` 10 lacs each 350.00 350.00 - -10.10 % Non Convertible Debentures of ` 10 lacs each 1,000.00 1,000.00 - -11.82 % (Previous Year 10.20%)Non Convertible Debentures of ` 10 lacs each 14.66 23.03 8.38 8.3811.82 % (Previous Year 10.20%)Non Convertible Debentures of ` 10 lacs each 25.35 33.15 7.80 7.80
2,890.01 1,906.18 16.18 16.18Term Loans (Secured)Rupee Term Loans from Banks 5,178.67 2,941.09 414.76 225.92Foreign Currency Term Loans from Banks 2,251.08 3,648.55 2,003.62 1,570.50Rupee Term Loans from Financial Institutions 25.45 37.61 12.16 13.91(Unsecured)Rupee Term Loans from Banks - 900.00 900.00 300.00Foreign Currency Term Loans from Banks 2,237.33 133.95 647.81 401.85
9,692.53 7,661.20 3,978.35 2,512.18Long Term Advance from a Customer 128.48 356.40 227.91 203.13Others 9.16 8.44 - -Deferred Payment LiabilitiesDeferred Sales Tax Loan (Unsecured) 111.65 111.65 - -Finance Lease Obligation 57.29 65.78 18.07 15.36Total: 12,889.12 11,334.85 5,644.24 2,746.85
The FCCB’s are convertible into Equity Shares at the option of the bondholders at any time on or after 7 August 2007 and prior to the close of business on 21 June, 2012 at Rs. 40.28 = 1 USD$

Eighteenth Annual Report 2011-12
150
` in crores
As at 31.03.2012
As at 31.03.2011
Note 5Taxation
a Current Tax comprises of Current Tax for the year 451.63 572.90 Excess provision of tax relating to earlier years (40.36) 12.58
411.27 585.48b Deferred Tax 773.23 396.79c MAT Credit Entitlement includes amount in relation to earlier years 244.74 18.52d Deferred Tax Assets / Liability comprises of timing differences on account of
Depreciation 3,110.18 2,376.27 Expenses allowable on payment basis (74.63) (59.23) Provision for doubtful debts/advances (39.49) (40.14) Others (271.08) (227.50)
Total: 2,724.98 2,049.40
` in crores
As at 31.3.2012
As at 31.3.2011
As at 31.3.2012
As at 31.3.2011
Non Current Current (Refer note 10)
Note 6
Other Long Term Liabilities
Rent and other Deposits 36.04 36.31 2.29 -
Retention Money for Capital Projects 38.89 31.78 173.94 224.56
Other Payables 397.28 329.45 31.92 27.86
Premium payable on redemption of FCCBs - 375.31 565.36 -
Total: 472.21 772.85 773.51 252.42
Note 7
Long Term Provisions
Employee Benefi ts 35.03 22.57 30.47 17.68
Total: 35.03 22.57 30.47 17.68
` in crores
As at 31.03.2012
As at 31.03.2011
Note 8Short Term BorrowingsDebentures (Secured)7.10 % Non Convertible Debentures of Rs. 10 lacs each - 500.00Working Capital Loans from Banks (Secured) 749.42 836.10Foreign Curreny Loan from Bank
Secured 153.46 -Unsecured 457.78 1,045.19
Foreign Curreny Loan from Others (Unsecured) 15.09 13.17
Total: 1,375.75 2,394.46
Notes Forming Part of the Consolidated Financial Statements
` in crores
As at 31.03.2012
As at 31.03.2011
Note 9
Trade Payables
Acceptances 7,520.96 4,644.12
Other than Acceptances 2,184.24 1,401.11
Total: 9,705.20 6,045.23

151
Steel Limited
` in crores
As at 31.03.2012
As at 31.03.2011
Note 10
Other Current Liabilities
Current maturities of Long Term Debt ( Refer Note 4) 5,644.24 2,746.85
Current dues of Other Long Term Liabilities ( Refer Note 6) 773.51 252.42
Current dues of Long term Employee Benefi ts (Refer Note 7) 30.47 17.68
Payables for Capital Projects 2,421.23 2,622.83
Advances from Customers 195.56 180.12
Interest Accrued but not due on borrowings 132.01 119.87
Other Statutory Liabilities 206.56 147.75
Other Payables 88.50 52.35
Investor Education and Protection Fund shall be credited by :
Unclaimed Debenture Redemption Installments 1.61 1.67
Unclaimed Debenture Interest 1.43 1.30
Unclaimed Dividend 14.11 11.39
Unclaimed amount of sale proceeds of fractional shares 3.71 3.72
Total: 9,512.94 6,157.95
Notes Forming Part of the Consolidated Financial Statements
` in crores
As at 31.03.2012
As at 31.03.2011
Note 11
Short Term Provisions
Proposed Dividend on Preference Shares 27.90 27.90
Proposed Dividend on Equity Shares 167.34 273.32
Corporate Dividend Tax 31.68 48.87
Provision for Tax 3.92 9.67
Total: 230.84 359.76

Eighteenth Annual Report 2011-12
152
No
te 1
2
Fixe
d A
sset
s`
in c
rore
s
Part
icula
rsGr
oss B
lock
(at c
ost)
Depr
ecia
tion
and
Amor
tizat
ion
Net B
lock
As a
t 01
.04.
2011
Addi
tions
co
nseq
uent
to
acq
uisi-
tion
of
subs
idia
ries
Add
ition
s D
educ
-tio
ns
Oth
er
Adju
st-
men
ts
Tra
nsla
-tio
n Re
serv
e
As a
t 31
.03.
2012
A
s at
01.0
4.20
11
Addi
tions
co
nseq
uent
to
acq
uisi-
tion
of
subs
idia
ries
For t
he
year
Ded
uc-
tions
T
rans
latio
n Re
serv
e A
s at
31.0
3.20
12
As a
t 31
.03.
2012
As
at
31.0
3.20
11
Tang
ible
s
Free
hold
Lan
d 2
05.6
3 -
37.
57
8.6
3 -
3.3
1 2
37.8
8 1
8.48
-
- -
- 1
8.48
2
19.4
0 1
87.1
5
Leas
ehol
d La
nd
152
.28
- 6
6.85
-
- -
219
.13
2.7
3 -
0.8
6 -
0.0
1 3
.60
215
.53
149
.55
Build
ings
4,6
90.7
9 -
766
.95
0.0
7 3
8.73
1
24.0
0 5
,620
.40
662
.79
- 1
65.4
4 0
.01
15.
49
843
.71
4,7
76.6
9 4
,028
.00
Plan
t & M
achi
nery
@ 2
6,95
7.66
0
.04
6,0
76.1
5 1
1.29
7
80.8
1 5
48.0
0 3
4,35
1.37
6
,081
.22
0.0
1 1,
722.
22
10.
21
74.
17
7,8
67.4
1 2
6,48
3.96
2
0,87
6.44
Furn
iture
& F
ixtu
res
90.
28
- 9
.54
0.1
0 -
0.9
4 1
00.6
6 3
9.11
-
6.8
1 0
.03
0.6
2 4
6.51
5
4.15
5
1.17
Vehi
cles &
Airc
raft
s 1
69.1
0 -
10.
58
6.1
2 -
0.7
1 1
74.2
7 3
8.90
-
12.
48
2.6
6 0
.48
49.
20
125
.07
130
.20
Offi
ce E
quip
men
ts 1
5.56
-
5.1
7 0
.08
- 0
.20
20.
85
3.9
9 -
0.9
6 0
.01
0.1
4 5
.08
15.
77
11.
57
Min
ing
Deve
lopm
ent
and
Proj
ects
359
.36
- 2
21.3
1 -
- 6
8.92
6
49.5
9 2
.68
- 7
.34
- 0
.88
10.
90
638
.69
356
.68
Tang
ible
s Tot
al (A
)32
,640
.66
0.0
4 7
,194
.12
26.
29
819
.54
746
.08
41,3
74.1
5 6
,849
.90
0.0
1 1,
916.
11
12.
92
91.
79
8,8
44.8
9 32
,529
.26
25,7
90.7
6
Inta
ngib
les
Soft
war
e 4
0.66
-
7.2
8 -
- 0
.43
48.
37
22.
60
- 7
.28
- 0
.02
29.
90
18.
47
18.
06
Lice
nces
1.4
8 -
13.
68
- -
1.3
7 1
6.53
0
.73
- 1
.93
- -
2.6
6 1
3.87
0
.75
Min
ing
Conc
essio
n -
- 3
.55
- -
0.2
4 3
.79
- -
- -
- -
3.7
9 -
Port
Con
cess
ion
1.0
9 -
1.3
5 -
- 0
.25
2.6
9 -
- -
- -
- 2
.69
1.0
9
Inta
ngib
les T
otal
(B)
43.
23
- 2
5.86
-
- 2
.29
71.
38
23.
33
- 9
.21
- 0
.02
32.
56
38.
82
19.
90
TOTA
L (A
+B)
32,
683.
89
0.0
4 7
,219
.98
26.
29
819
.54
748
.37
41,
445.
53
6,8
73.2
3 0
.01
1,92
5.32
1
2.92
9
1.81
8
,877
.45
32,
568.
08
25,
810.
66
Prev
ious
Yea
r 2
6,79
2.05
-
5,7
72.1
0 4
0.41
2
00.2
9 (4
0.14
) 3
2,68
3.89
5
,339
.26
- 1,
563.
96
24.
18
(5.8
1) 6
,873
.23
25,
810.
66
(a)
‘Bui
ldin
gs’ i
nclu
de: (i
) Ro
ads n
ot o
wne
d by
the
Com
pany
am
ortis
ed o
ver a
per
iod
of fi
ve y
ears
. Gro
ss B
lock
` 3
.13
cror
es (p
revi
ous y
ear `
3.1
3 cr
ores
)
Ne
t blo
ck n
il (p
revi
ous y
ear n
il).
(ii)
Asse
ts g
iven
on
oper
atin
g le
ase
for w
hich
doc
umen
ts a
re y
et to
be
exec
uted
pen
ding
app
rova
ls fr
om L
ende
rs a
nd K
SIID
C.
Gr
oss B
lock
` 3
.08
cro
res (
prev
ious
yea
r ` 3
.08
cror
es);
net b
lock
` 2
.47
cror
es (p
revi
ous y
ear `
2.5
2 cr
ores
).
(iii)
Exe
cutio
n of
Con
veye
nce
deed
in fa
vour
of t
he C
ompa
ny is
pen
ding
in re
spec
t of a
Bui
ldin
g ac
quire
d in
an
earli
er y
ear,
Gros
s blo
ck `
24.
07 cr
ores
, Net
blo
ck `
21.
22 cr
ores
(pre
viou
s yea
r Gro
ss b
lock
` 2
4.07
cror
es, N
et b
lock
` 2
1.75
cror
es).
(b)
Oth
er a
djus
tmen
ts co
mpr
ise th
e fo
llow
ing
cost
s cap
italis
ed d
urin
g th
e ye
ar:
(i)
Borr
owin
g co
sts o
f ` 3
34.6
4 cr
ores
(pre
viou
s yea
r ` 2
89.3
6 cr
ores
).
(ii)
For
eign
Exc
hang
e Lo
ss o
f ` 4
84.9
0 cr
ores
(pre
viou
s yea
r For
eign
Exc
hang
e Ga
in o
f ` 8
9.07
cror
es).
(c)
Free
hold
Lan
d an
d Bu
ildin
gs o
f ` 1
58.3
1 cr
ores
(pre
viou
s yea
r ` 1
47.6
0 cr
ores
) has
bee
n/ag
reed
to b
e hy
poth
ecat
ed/m
ortg
aged
to le
nder
s of g
roup
com
pani
es.
(d)
For d
etai
ls of
ass
ets g
iven
on
oper
atin
g le
ase,
refe
r not
e 26
(10-
a).
(e)
For d
etai
ls of
ass
ets t
aken
on
fi nan
ce le
ase,
refe
r not
e 26
(9).
Not
es F
orm
ing
Part
of
the
Cons
olid
ated
Fin
anci
al S
tate
men
ts

153
Steel Limited
` in crores
As at31.03.2012
As at 31.03.2011
Note 13
Non Current Investments (Unquoted)
LONG TERM
a) In Associates
Equity Shares (at cost) (refer note b) 2,386.77 2,196.53
Add: Share of (Loss) /Profi t (net) (818.41) 135.06
Preference Shares 36.51 1,604.87 36.51 2,368.10
b) In Joint Ventures
Equity Shares 18.71 15.41
Preference Shares 5.74 24.45 4.20 19.61
c) Others
Equity Shares 126.27 125.97
Preference Shares 130.00 130.00
Government Securities 0.01 256.28 0.01 255.98
Total: 1,885.60 2,643.69
Note:
(a) Mode of Valuation - Refer Note 1(B-5)
(b) Goodwill arising at acquisition ` 2,502.99 crores (Previous year ` 2,295.34 crores)
` in crores
As at31.03.2012
As at31.03.2011
As at 31.03.2012
As at31.03.2011
Non-Current CurrentNote 14Loans and Advances (Unsecured)Capital Advances 825.36 571.42 - -Less : Provision for doubtful advances (86.75) (86.69) - -
738.61 484.73 - -Other loans and advancesLoans and Advances
To Related Parties (Refer Note 26 (8)) - - 0.21 -To Other Body Corporate 49.46 9.10 - -
Advance to Suppliers 8.54 8.54 726.97 275.15Export benefi ts and entitlements 6.69 6.69 108.85 122.68Amount recoverable from ESOP Trusts 231.96 83.82 - -Deposits
Security Deposits 3.43 2.37 117.62 -Others 106.22 106.65 2.48 4.44
Indirect Tax balances/recoverables/credits 32.95 15.61 791.46 618.68Prepayments and Others 212.70 193.41 476.14 216.09Advance Tax and Tax Deducted at Source (Net) 13.80 - 2.04 0.74Minimum Alternative Tax credit entitlement 1,212.69 558.45 - -Advance towards Equity / Preference capital 4.89 3.64 -Unbilled Revenue - - 20.62 17.11Less : Provision for doubtful loans and advances (19.07) (18.50) (59.30) (51.75)
1,864.26 969.78 2,187.09 1,203.14
Total: 2,602.87 1,454.51 2,187.09 1,203.14
Notes Forming Part of the Consolidated Financial Statements

Eighteenth Annual Report 2011-12
154
As at31.03.2012
As at31.03.2011
As at 31.03.2012
As at31.03.2011
Non-Current Current
Note:Loans and Advances Constitute:
Capital AdvancesConsidered Good 738.61 484.73 - -
Considered Doubtful, Provided 86.75 86.69 - -
Other Loans and AdvancesConsidered Good 1,864.26 969.78 2,187.09 1,203.14Considered Doubtful, Provided
Loans and advances to other Body Corporate 9.10 9.10 - -
Advance to suppliers 8.54 8.54 - -
Prepayment and Others /Other Deposits 1.43 1.43 59.30 51.75
` in crores
As at 31.03.2012
As at 31.03.2011
Note 15
Other Non Current Assets
Trade Receivables (Refer note 18) - -
Cash and Bank Balances (Refer note 19) 14.36 10.69
Total: 14.36 10.69
Note 16
Current Investments
Mutual Funds 204.00 270.14
Total: 204.00 270.14
Note:
Mode of Valuation - Refer Note 1(B-5)
` in crores
As at 31.03.2012
As at 31.03.2011
Note 17
Inventories
Raw Materials 2,597.93 1,943.82Work-in-Progress 534.72 280.38Semi Finished/ Finished Goods 1,743.17 1,521.24
Production Consumables and Stores & Spares 908.14 659.69Construction Materials 5.30 4.57Total: 5,789.26 4,409.70Details of stock-in-transit
Raw Materials 482.33 314.59Semi Finished/ Finished Goods 51.66 34.81Production Consumables and Stores & Spares 29.02 33.28Mode of Valuation - Refer note 1 (B-7)
` in crores
As at31.03.2012
As at31.03.2011
As at 31.03.2012
As at31.03.2011
Non-Current(Refer Note 15)
Current
Note 18
Trade Receivables(Unsecured)
Outstanding for a period exceeding six months from the date they are due for payment
Considered Good - - 14.23 2.01
Considered Doubtful 6.42 6.42 18.31 16.85
Less: Provision for Doubtful debts (6.42) (6.42) (18.31) (16.85)
- - 14.23 2.01
Other Debts
Considered Good - - 1,525.16 931.34
Total: - - 1,539.39 933.35
Notes Forming Part of the Consolidated Financial Statements

155
Steel Limited
` in crores
As at31.03.2012
As at31.03.2011
As at 31.03.2012
As at31.03.2011
Non-Current (Refer Note 15) Current
Note 19
Cash and Bank Balances
Cash and Cash Equivalents
Balances with Banks
In Current Accounts - - 263.10 278.86
In Margin Money with maturity less than 3 months at inception - - - 0.50
In Term Deposit Accounts with maturity less than 3 months at inception - - 1,060.83 1,487.10
Cash on hand - - 0.75 0.57
- - 1,324.68* 1,767.03*
Others
In Margin Money with maturity more than 3 months but less than 12 months at inception - - 5.47 6.92
In Term Deposit Accounts
with maturity more than 3 months but less than 12 months at inception - - 1,715.79 262.17
with maturity more than 12 months at inception 14.36 10.69 1.03 -
14.36 10.69 1,722.29 269.09
Total: 14.36 10.69 3,046.97 2,036.12
* Refer Cash Flow Statement
Earmarked balances
In Current Accounts - - 20.84 18.07
In Term Deposit Accounts 14.36 10.69 2,328.59 1,446.40
In Margin Money - - 0.93 1.49
` in crores
For theYear Ended31.03.2012
For theYear Ended31.03.2011
Note 20
Revenue from operations
Sale of Products
Domestic Turnover 30,691.11 22,190.88
Export Turnover 5,969.02 3,617.30
Contract Revenue 59.70 20.95
36,719.83 25,829.13
Less: Excise duty 2,596.18 1,967.56
34,123.65 23,861.57
Other Operating Revenues
Carbon Credits 13.37 38.67
Value Added Tax Refund - 174.48
Miscellaneous Income / Receipts 231.03 31.17
244.40 244.32
Total: 34,368.05 24,105.89
` in crores
For theYear Ended31.03.2012
For theYear Ended31.03.2011
Note 21
Other Income
Interest Income 32.58 79.30
Dividend Income
from Long-term Investments 7.85 5.88
from Current Investments 0.10 0.24
Profi t on sale of current investment 14.90 32.05
Exchange Gain - net (other than considered as fi nance cost) - 62.30
Profi t on sale of fi xed assets (net) 0.08 -
Other Income 21.34 10.20
Total: 76.85 189.97
Notes Forming Part of the Consolidated Financial Statements

Eighteenth Annual Report 2011-12
156
` in crores
For theYear Ended31.03.2012
For theYear Ended31.03.2011
Note 22Changes in inventories of Finished goods, Work-in-progress and Stock in TradeOpening Stock :
Semi Finished /Finished Goods 1,520.97 960.99Work-in-progress 280.38 142.42Traded goods - 0.13
1,801.35 1,103.54Closing Stock :
Semi Finished /Finished Goods 1,743.17 1,520.97Work-in-progress 534.72 280.38
2,277.89 1,801.35(476.54) (697.81)
Excise duty on stock of fi nished goods (net) 32.89 64.43Total: (443.65) (633.38)
Note 23Employee benefi ts expenseSalaries and Wages 754.44 568.44Contribution to Provident and Other Funds 47.63 28.74Expenses on employees stock option scheme 10.35 7.62Staff Welfare Expenses 33.97 35.86Total: 846.39 640.66
Note 24Finance costsInterest 1,294.22 940.61Other borrowing costs 133.08 119.65Total: 1,427.30 1,060.26
Note 25Other expensesStores and Spares consumed 1,428.83 1,084.30Power and Fuel 1,751.87 1,170.07Rent 15.40 13.01Repairs & Maintenance
Plant & Machinery 646.59 418.69Buildings 47.09 44.87Others 15.97 9.04
Insurance 80.03 58.35Rates and Taxes 29.18 20.54Carriage and Freight 1,038.23 646.60Jobwork and Processing Charges 26.56 20.18Commission on Sales 39.92 51.49Donations & Contributions 3.13 2.93Miscellaneous Expenses 367.85 229.41Provision for Doubtful Debts/Loans/Advances (net) 1.10 53.09Loss on sale of fi xed assets (net) - 1.21 Total: 5,491.75 3,823.78
26. Notes to Accounts:
1. Contingent Liabilities not provided for in respect of :
a) Bills Discounted ̀ 3,960.04 crores (Previous year ̀ 2,792.87 crores).
b) Guarantees provided ` 112.40 crores (Previous year ` 87.12 crores).
c) Disputed statutory claims/levies including those pending in courts (excluding interest, if any), in respect of:
(i) Excise Duty ` 202.57 crores (Previous year ` 181.58 crores);
(ii) Custom Duty ` 481.03 crores (Previous year ` 243.01 crores);
(iii) Income Tax ` 3.38 crores (Previous year ` 14.23 crores);
(iv) Sales Tax / VAT / Special Entry tax ` 171.10 crores (Previous year ` 73.10 crores);
(v) Service Tax ` 70.08 crores (Previous year ` 45.18 crores);
(vi) Miscellaneous ` 0.05 crores (Previous year ` 0.05 crores);
(vii) Levies by local authorities ̀ 5.44 crores (Previous year ` 3.04 crores);
(viii) Claims by suppliers and other parties (including for Forest Development Tax) ̀ 572.14 crores (Previous year ` 215.24 crores); and
(ix) Custom duty on import of equipments and spare parts under Export Promotion Capital Goods Scheme ` 50.07 crores (Previous year ` 82.05 crores).
d) Dividend in arrears (including tax) on Cumulative Redeemable Preference Shares ̀ 0.17 crores (Previous year ` 363.06 crores).
2. Estimated amount of contracts remaining to be executed on capital account and not provided for (net of advances) ` 4,409.46 crores (Previous year ` 3,997.60 crores).
3. Other Commitments :
a) The Company has issued an undertaking to associate bankers for non disposal of its investment of ` 2,357.11 crores (Previous year ` Nil) in an associate till that entity repays its debts.
b) The Group has imported capital goods under the Export Promotion Capital Goods Scheme to utilise the benefi t of a zero or concessional customs duty rate. These benefi ts are subject to future exports. Such export obligations at year end aggregate to ` 16,912.59 crores (Previous year 17,853.27 crores) by the Group within the stipulated period.
4. a) Due to the unusual depreciation in the value of the rupee against US dollar, the net foreign exchange loss has been considered by the Group as exceptional in nature.
Notes Forming Part of the Consolidated Financial Statements

157
Steel Limited
b) Exceptional items related to an associate entity (group’s share):
` in crores
Provision towards doubtful debts/advances and diminution in the value of investments, inventories etc 581.61Custom duty provided for 34.86Net foreign exchange fl uctuation loss on operating balances/forward exchange contracts and mark-to-market loss on derivative contracts 93.92Total 710.39
5. Derivatives:
a) The Group uses foreign currency forward contracts to hedge its risks associated with foreign currency fl uctuations relating to certain fi rm commitments and highly probable forecast transactions. The use of foreign currency forward contracts is governed by the Group’s strategy approved by the Board of Directors, which provide principles on the use of such forward contracts consistent with the Group’s Risk Management Policy.
The Forward Exchange Contracts entered into by the Group and outstanding are as under:
As at No. of Contracts
Type US$ equivalent (Million)
INR Equivalent
(crores)31.03.2012
26 Buy 145.07 742.1576 Sell 241.72 1,236.58
31.03.2011
86 Buy 314.01 1,402.0422 Sell 119.95 535.58
b) The Group also uses derivative contracts other than forward contracts to hedge the interest rate and currency risk on capital account. Such transactions are governed by the strategy approved by the Board of Directors, which provide principles on the use of these instruments, consistent with the Group’s Risk Management Policy. The Group does not use these contracts for speculative purposes.
Notional value of Interest Rate Swaps (IRS) to hedge against fl uctuations in interest rate changes are as under:
As at No. of Contracts
US$ Equivalentof notional
value (Million)
MTM of IRS(INR crores)
31.03.2012 9 74.50 (13.90)31.03.2011 4 54.50 (5.33)
Currency Swaps to hedge against fl uctuations in changes in exchange rate and interest rate:
As at No. of Contracts
US$ Equivalent of notional
value (Million)
MTM of Currency Swap
(INR crores)
31.03.2012 1 25 (15.30)
31.03.2011 - - -
Notes Forming Part of the Consolidated Financial Statements
c) The year end foreign currency exposures that have not been hedged by a derivative instrument or otherwise are given below:
i) Amounts receivable in foreign currency on account of the following:
Current Year Previous Year
US$ equivalent
INR Equivalent
US$ equivalent
INR Equivalent
(Million) (crores) (Million) (crores)
Debtors 2.35 12.01 9.32 41.61
Balances with banks - in Fixed
Deposit Account 0.01 0.04 10.01 44.68
- in Current Account 0.03 0.13 0.03 0.12
ii) Amounts payable in foreign currency on account of the following:
Current Year Previous Year
US$ equivalent
INR Equivalent
US$ equivalent
INR Equivalent
(Million) (crores) (Million) (crores)
Acceptances 1,533.39 7,844.28 1,225.25 5,470.73Creditors 152.59 780.60 88.74 396.21Loans payable 1,193.07 6,103.35 1,000.51 4,467.26Redemption premium payable on FCCB’s 110.52 565.36 84.06 375.31
6. Employee Benefi ts:
a) Defi ned Contribution Plan:
The group’s contribution to Provident Fund ` 25.86 crores (Previous year ` 17.91 crores).
b) Defi ned Benefi t Plans-
(i) Gratuity: ` in crores
Current Year Previous Year a) Liability recognized in the
Balance Sheet
i) Present value of obligation
Opening Balance 50.11 37.21
Service Cost 4.82 3.84
Interest Cost 4.01 3.20
Actuarial loss onobligation 18.99 7.82
Benefi ts paid (2.79) (1.96)
Closing Balance 75.14 50.11

Eighteenth Annual Report 2011-12
158
Current Year Previous Year Less:
ii) Fair Value of Plan Assets Opening Balance 38.15 33.66Expected Return on Plan assets less loss on investments 3.05 2.93Actuarial gain/(loss) on Plan Assets (0.78) (0.46)Employers’ Contribution 11.54 3.96Benefi ts paid (1.92) (1.94)Closing Balance 50.04 38.15Amount recognized in Balance Sheet 25.10 11.96
b) Expenses during the year Service cost 4.82 3.84Interest cost 4.01 3.20Expected Return on Plan assets (3.05) (2.87)Actuarial (Gain)/Loss 19.77 8.22Transferred to preoperative expenses (0.84) (0.81)Total 24.71 11.58
c) Actual Return on plan assets 2.28 2.47d) Break up of Plan Assets :
(i) ICICI Prudential Life Insurance Co. Ltd. Balanced Fund 3.40 3.18Debt Fund 4.10 1.18Short Term Debt Fund 1.52 3.82Endowment plan 6.20 -
(ii) HDFC Standard Life Insurance Co. Ltd. Defensive Managed Fund 1.07 1.04Stable Managed Fund 11.46 10.55Liquid Fund II 0.03 -
(iii) SBI Life Insurance Co. Ltd. – Cap Assured Fund 15.52 11.93
(iv) LIC of India – Insurer Managed Fund 6.74 6.45
e) Principal actuarial assumptions Rate of Discounting 8% to 8.75%
p.a.8% to 8.5%
p.a.Expected Return on Plan Assets 8.6% p.a. 8% p.a.Rate of increase in salaries 6% p.a. 6% p.a.Attrition Rate 2% p.a. 2% p.a.
Notes Forming Part of the Consolidated Financial Statements
The group expects to contribute ` 23.84 crores to its Gratuity Plan for the next year.
In assessing the group’s Post Retirement Liabilities the group monitors mortality assumptions and uses up-to-date mortality tables, the base being the LIC 1994-96 ultimate tables.
Expected return on plan assets is based on expectation of the average long term rate of return expected on investments of the fund during the estimated term of the obligations.
The estimates of future salary increase, considered in actuarial valuation, take account of infl ation, seniority, promotion and other relevant factors, such as supply and demand in the employment market.
Other disclosures:
` in crores
Particulars Current Year
2010-11 2009-10 2008-09 2007-08
Defi ned Benefi t Obligation 75.14 50.11 37.21 31.39 25.45
Plan Assets 50.04 38.15 33.66 26.14 21.42
Defi cit (25.10) (11.96) (3.55) (5.25) (4.03)
(ii) Provident Fund:The Group makes monthly contributions to Provident Fund managed by Trust for qualifying employees. Under the scheme, the Group is required to contribute a specifi ed percentage of the payroll costs to fund the benefi ts.In keeping with the Guidance on Implementing Accounting Standard (AS) 15 (Revised) on Employee Benefi ts notifi ed by the Companies (Accounting Standards) Rules, 2006, employer established provident fund trusts are treated as Defi ned Benefi t Plans, since the Group is obliged to meet interest shortfall, if any, with respect to covered employees. According to the actuarial Valuation, the Defi ned Benefi t Obligation of Interest rate Guarantee on exempted Provident Fund in respect of employees of the Group as at 31 March, 2012 works out to ` NIL and hence no provision is required to be provided for in the books of accounts towards the guarantee given for notifi ed interest rates.Actuarial assumptions made to determine Interest Rate Guarantee on Exempt Provident Fund Liabilities are as follows:
Particulars 31 Mar 2012
Rate of Discounting 8.50%
Rate of return on assets 9.04%
Guaranteed Rate of Return 8.25%

159
Steel Limited
7. Segment Reporting:
The group is primarily engaged in the business of manufacture and sale of iron and steel Products. The Group has identifi ed primary business segments, namely Steel, Power (used mainly for captive consumption) and others, which in the context of Accounting Standard 17 on “Segment Reporting” constitute reportable segments.
I) Information about Primary Business Segments
` in crores
Particulars Current Year 31.03.2012 Previous Year 31.03.2011Steel Power Other Eliminations Total Steel Power Other Eliminations Total
INCOMEExternal Sales 33,445.30 370.77 551.98 34,368.05 23,965.58 105.34 34.97 24,105.89Inter Segment Sales 1,820.98 2,340.11 4.97 (4.166.09) - 651.87 988.73 22.62 (1,663.22) -Total Income 35,266.28 2,710.88 556.95 (4.166.09) 34,368.05 24,617.45 1,094.07 57.59 (1,663.22) 24,105.89SEGMENT RESULTSSegment/Operating Results 1,813.99 535.60 60.11 2,409.70 3,212.19 344.26 (81.16) 3,475.29Un-allocated Items:Income 55.43 117.47Finance Costs (1,427.30) (1,060.26)Provision for Taxation (500.15) (778.52)Net Profi t 537.68 1,753.98OTHER INFORMATIONSegment Assets 42,979.81 2,257.37 1,270.85 46,508.03 36,664.71 1,844.96 1,028.71 39,538.38Un-allocated Items 7,721.49 6,626.10Total Assets 54,229.52 46,164.48Segment Liabilities 13,364.00 260.11 259.52 13,883.63 9,867.37 33.49 190.77 10,091.63Un-alloacated Liabilities & Provisions 23,378.65 19,321.67Total Liabilities 37,262.28 29,413.30Depreciation and amortisation 1,817.86 79.74 35.55 1,933.15 1,516.41 37.71 5.59 1,559.71Total Cost incurred during the year to acquire Segment Assets 4,546.61 485.10 70.41 5,102.12 3,997.04 1,174.26 352.59 5,523.89
1. Inter Segment transfer from the power segment is measured at the rate at which power is purchased from/sold to the respective Electricity Board.
2. Inter Segment transfer from the steel segment is measured on the basis of fuel cost.
3. Other business segment represents mining and construction activities.
II) Information about Secondary Segment- Geographical Segment
` in crores
Particulars Current Year 31.03.2012 Previous Year 31.03.2011
Indian Entities Foreign Entities Total Indian Entities Foreign Entities Total
SEGMENT REVENUE 31,796.35 2,571.70 34,368.05 23,325.60 780.29 24,105.89
Segment Assets 46,460.91 7,768.61 54,229.52 39,521.88 6,642.60 46,164.48
Capital Expenditure Incurred 5,000.87 101.25 5,102.12 5,377.22 146.67 5,523.89
Notes Forming Part of the Consolidated Financial Statements
8. Related Parties disclosure as per Accounting Standard (AS) – 18:
A) List of Related Parties:
Parties with whom the Group has entered into transactions during the year / where control exists :1 Associates Jindal Praxair Oxygen Company Private Limited JSW Energy (Bengal) Limited (upto 4.03.2012) JSW Ispat Steel Limited (W.e.f. 24.01.2011)2 Joint Ventures Vijayanagar Minerals Private Limited Rohne Coal Company Private Limited Gourangdih Coal Limited
Toshiba JSW Turbine and Generator Private Limited JSW Severfi eld Structures Limited Geo Steel LLC MJSJ Coal Limited
JSW Structural Metal Decking LimitedJSW MI Steel Service Center Private Limited (w.e.f 19.09.2011)
3 Key Management Personnel Mr. Sajjan Jindal Mr. Seshagiri Rao M V S Dr. Vinod Nowal Mr. Jayant Acharya

Eighteenth Annual Report 2011-12
160
4 Relatives of Key Management PersonnelMrs. Savitri Devi Jindal
5 Enterprises over which Key Management Personnel and Relatives of such personnel exercise signifi cant infl uence
JSW Energy Limited JSL Limited JSW Realty & Infrastructure Private Limited Jindal Saw Limited Jindal Saw USA Jindal Steel & Power Limited Jindal South West Holdings Limited JSOFT Solutions Limited Jindal Industries Limited JSW Cement Limited
Notes Forming Part of the Consolidated Financial Statements
JSW Jaigarh Port Limited JSW Investments Private Limited Reynold Traders Private Limited Raj West Power Limited JSW Power Trading Company Limited JSW Aluminum Limited O P Jindal Foundation JSW Infrastructure Limited South West Port Limited JSW Techno Projects Management Limited Sapphire Technologies Limited
South West Mining LimitedJSL Architecture LimitedJSW Projects Limited
St. James Investment Limited
` in crores
Particulars Associates Joint Ventures
Key Managerial Personnel
Relatives of Key
Managerial Personnel
Enterprises over which KMP and relatives of such
personnel exercise Signifi cant infl uences
Total
B. Transactions with related parties Party’s Name Purchase of Goods / Power & Fuel / Services JSW Energy Limited
- - - - 388.58 388.58 - - - - 430.01 430.01
Jindal Praxair Oxygen Company Private Limited
111.59 - - - - 111.59 130.77 - - - - 130.77
JSW Ispat Steel Limited 2,741.54 - - - - 2,741.54 568.90 - - - - 568.90
Others
- 9.38 - - 411.79 421.17 - 30.29 - - 151.74 182.03
Total
2,853.13 9.38 - - 800.37 3,662.88 699.67 30.29 - - 581.75 1,311.71
Reimbursement of Expenses incurred on our behalf by
Jindal South West Holdings Limited
- - - - - - - - - - 0.13 0.13
JSW Ispat Steel Limited
3.35 - - - - 3.35 - - - - - -
Others
- 0.13 - - 0.03 0.16 - - - - - -
Total
3.35 0.13 - - 0.03 3.51 - - - - 0.13 0.13
Interest Expenses St . James Investment Limited
- - - - 7.05 7.05 - - - - 6.66 6.66
Total
- - - - 7.05 7.05 - - - - 6.66 6.66
Sales of Goods/Power & Fuel/ Other Income JSW Energy Limited
- - - - 468.30 468.30 - - - - 771.23 771.23
Jindal Industriers Limited
- - - - 257.30 257.30 - - - - 214.28 214.28

161
Steel Limited
Notes Forming Part of the Consolidated Financial Statements` in crores
Particulars Associates Joint Ventures
Key Managerial Personnel
Relatives of Key
Managerial Personnel
Enterprises over which KMP and relatives of such
personnel exercise Signifi cant infl uences
Total
JSW Ispat Steel Limited
1,215.19 - - - - 1,215.19 325.85 - - - - 325.85
Jindal Saw Limited
- - - - 337.55 337.55 - - - - 48.84 48.84
JSW Power Trading Company Limited
- - - - 298.97 298.97 - - - - 90.52 90.52
Others
8.28 3.21 - - 237.94 249.43 5.76 2.56 - - 174.31 182.63
Total
1,223.47 3.21 - - 1,600.06 2,826.74 331.61 2.56 - - 1,299.18 1,633.35
Other Income
JSW Ispat Steel Limited
1.50 - - - - 1.50
- - - - - -
JSW Realty & Infrastructure Private Limited - - - - 0.19 0.19 - - - - 1.75 1.75
JSW Energy Limited
- - - - 8.63 8.63
- - - - 6.01 6.01
Jindal Praxair Oxygen Company Private Limited
0.42 - - - - 0.42 3.86 - - - - 3.86
Others
- 0.01 - - 0.60 0.61
- 0.10 - - 0.61 0.71
Total
1.92 0.01 - - 9.42 11.35
3.86 0.10 - - 8.37 12.33
Purchase of Assets
Jindal Steel & Power Limited
- - - - 128.72 128.72
- - - - 250.01 250.01
Jindal Saw Limited
- - - - 0.09 0.09
- - - - 7.47 7.47
JSW Energy Limited
- - - - 28.07 28.07
- - - - 95.07 95.07
JSW Cement Limited
- - - - 26.62 26.62
- - - - 3.54 3.54
South West Mining Limited
- - - - 39.29 39.29
- - - - - -
Others
2.48 18.09 - - 10.11 30.68
- 3.05 - - 16.02 19.07
Total
2.48 18.09 - - 232.90 253.47
- 3.05 - - 372.11 375.16
Sale of Assets
JSW Techno Project Management Limited - - - - - -
- - - - 0.07 0.07

Eighteenth Annual Report 2011-12
162
Particulars Associates Joint Ventures
Key Managerial Personnel
Relatives of Key
Managerial Personnel
Enterprises over which KMP and relatives of such
personnel exercise Signifi cant infl uences
Total
JSW Investments Private Limited
- - - - - -
- - - - 0.16 0.16
JSW Energy Limited
- - - - - -
- - - - 0.04 0.04
Total
- - - - - -
- - - - 0.27 0.27
Donation Given O.P. Jindal Foundation
- - - - 0.49 0.49 - - - - 0.25 0.25
Total
- - - - 0.49 0.49 - - - - 0.25 0.25
Recovery of Expenses incurred by us on their behalf
JSW Energy Limited
- - - - 4.06 4.06 - - - - 1.50 1.50
Sapphire Technologies Limited
- - - - 0.39 0.39 - - - - 0.41 0.41
JSW Cement Limited
- - - - 0.95 0.95 - - - - 0.18 0.18
Jsoft Solutions Limited
- - - - 0.13 0.13 - - - - 0.12 0.12
JSW Ispat Steel Limited
6.82 - - - - 6.82 - - - - - -
Others
- 0.02 - - 0.14 0.16 - 0.05 - - - 0.05
Total
6.82 0.02 - - 5.67 12.51 - 0.05 - - 2.21 2.26
Investments / Share Application Money given during the year
JSW Ispat Steel Limited
- - - - - - 2,157.00 - - - - 2,157.00
Rohne Coal Company Private Limited
- 1.65 - - - 1.65 - - - - - -
MJSJ Coal Limited
- 3.30 - - - 3.30 - - - - - -
Others
- - - - - - - - - - 2.50 2.50
Total
- 4.95 - - - 4.95 2,157.00 - - - 2.50 2,159.50
Lease & Other deposits given Jindal Saw Limited
- - - - - - - - - - 2.50 2.50
JSW Projects Limited
- - - - 1.99 1.99 - - - - - -
Total
- - - - 1.99 1.99 - - - - 2.50 2.50
Lease & Other deposits refunded JSW Power Trading Company Limited
- - - - - - - - - - 20.00 20.00
Total
- - - - - - - - - - 20.00 20.00
Notes Forming Part of the Consolidated Financial Statements` in crores

163
Steel Limited
Particulars Associates Joint Ventures
Key Managerial Personnel
Relatives of Key
Managerial Personnel
Enterprises over which KMP and relatives of such
personnel exercise Signifi cant infl uences
Total
Advance given Received backJSW Aluminium Limited - - - - 0.16 0.16
- - - - - - Total
- - - - 0.16 0.16 - - - - - -
Share Application Money Received Sapphire Technologies Limited
- - - - - - - - - - 529.38 529.38
Total
- - - - - - - - - - 529.38 529.38
Proceeds of Redemption of Pref Shares Jindal Praxair Oxygen Company Private Limited
26.33 - - - - 26.33 4.16 - - - - 4.16
Total
26.33 - - - - 26.33 4.16 - - - - 4.16
Remuneration to key managerial personnel Mrs. Savitri Devi Jindal
- - - 0.15 - 0.15 - - - 0.08 - 0.08
Mr. Sajjan Jindal
- - 18.18 - - 18.18 - - 20.80 - - 20.80
Mr. Seshagiri Rao M V S
- - 3.39 - - 3.39 - - 3.26 - - 3.26
Dr. Vinod Nowal
- - 2.52 - - 2.52 - - 2.35 - - 2.35
Mr. Jayant Acharya
- - 2.21 - - 2.21 - - 2.00 - - 2.00
Total
- - 26.30 0.15 - 26.45 - - 28.41 0.08 - 28.49
Guarantees and collaterals released Rohne Coal Company Private Limited
- - - - - - - 45.82 - - - 45.82
JSW Cement Limited
- - - - - - - - - - 75.00 75.00
Jindal Praxair Oxygen Company Private Limited
- - - - - - 39.52 - - - - 39.52
Total
- - - - - - 39.52 45.82 - - 75.00 160.34
C. Closing balance of related parties Trade payables Jindal Praxair Oxygen Company Private Limited
12.63 - - - - 12.63 11.69 - - - - 11.69
South West Port Limited
- - - - 14.31 14.31 - - - - 20.73 20.73
St . James Investment Limited
- - - - 29.46 29.46 - - - - 19.15 19.15
Vijayanagar Minerals Private Limited - 1.78 - - - 1.78 - 7.50 - - - 7.50
Jindal Steel & Power Limited
- - - - - - - - - - 8.66 8.66
Notes Forming Part of the Consolidated Financial Statements` in crores

Eighteenth Annual Report 2011-12
164
Particulars Associates Joint Ventures
Key Managerial Personnel
Relatives of Key
Managerial Personnel
Enterprises over which KMP and relatives of such
personnel exercise Signifi cant infl uences
Total
JSW Energy Limited
- - - - 42.17 42.17 - - - - - -
Others
- - - - 11.69 11.69 - 0.35 - - 6.36 6.71
Total
12.63 1.78 - - 97.63 112.04 11.69 7.85 - - 54.90 74.44
Notes Payable St . James Investment Limited
- - - - 219.99 219.99 - - - - 192.00 192.00
Total
- - - - 219.99 219.99 - - - - 192.00 192.00
Advance recieved from Customers Raj West Power Limited
- - - - 0.87 0.87 - - - - 6.49 6.49
JSW Jaigarh Port Limited
- - - - 0.08 0.08 - - - - 0.83 0.83
JSW Energy Limited
- - - - - - - - - - 0.97 0.97
Others
- - - - 0.14 0.14 - - - - - -
Total
- - - - 1.09 1.09 - - - - 8.29 8.29
Lease & Other deposit received Jindal Praxair Oxygen Company Private Limited
3.83 - - - - 3.83 3.83 - - - - 3.83
JSW Energy Limited
- - - - 10.19 10.19 - - - - 10.20 10.20
JSW Severfi eld Structures Limited
- 6.50 - - - 6.50 - 6.50 - - - 6.50
Jindal Saw Limited
- - - - 5.00 5.00 - - - - 5.00 5.00
JSW Jaigarh Port Limited
- - - - 3.50 3.50 - - - - 3.50 3.50
Others
- - - - 1.99 1.99 - - - - - -
Total
3.83 6.50 - - 20.68 31.01 3.83 6.50 - - 18.70 29.03
Trade receivables JSW Energy Limited
- - - - - - - - - - 16.97 16.97
JSW Cement Limited
- - - - 24.83 24.83 - - - - 28.07 28.07
JSW Ispat Steel Limited
25.98 - - - - 25.98 210.67 - - - - 210.67
Jindal Power Trading Company Limited - - - - 66.91 66.91 - - - - 56.64 56.64
Others
- 0.22 - - 25.86 26.08 - - - - 19.63 19.63
Total
25.98 0.22 - - 117.60 143.80 210.67 - - - 121.31 331.98
Notes Forming Part of the Consolidated Financial Statements` in crores

165
Steel Limited
Particulars Associates Joint Ventures
Key Managerial Personnel
Relatives of Key
Managerial Personnel
Enterprises over which KMP and relatives of such
personnel exercise Signifi cant infl uences
Total
Capital / Revenue Advances Given JSW Severfi eld structures Limited
- 5.43 - - - 5.43 - - - - - -
Jindal Steel & Power Limited
- - - - 14.71 14.71 - - - - - -
JSW Infrastructure Limited
- - - - 0.14 0.14 - - - - - -
Jindal Architecture Limited
- - - - 0.03 0.03 - - - - - -
JSW Realty & Infrastructure Pvt.Limited - - 47.63 - - 47.63 - - - - - -
Total
- 5.43 47.63 - 14.88 67.94 - - - - - -
Share Application Money Vijayanagar Minerals Private Limited
- 2.42 - - - 2.42 - 2.42 - - - 2.42
Rohne Coal Company Private Limited
- 2.45 - - - 2.45 - 1.19 - - - 1.19
Others
- 0.03 - - - 0.03 - 0.02 - - - 0.02
Total
- 4.90 - - - 4.90 - 3.63 - - - 3.63
Share Application Money Received Sapphire Technologies Limited
- - - - - - - - - - 529.38 529.38
Total
- - - - - - - - - - 529.38 529.38
Other advances given JSW Aluminium Limited
- - - - 0.01 0.01 - - - - 0.17 0.17
Gourangdih Coal Limited
- 0.19 - - - 0.19 - 0.04 - - - 0.04
Total
- 0.19 - - 0.01 0.20 - 0.04 - - 0.17 0.21
Investments held by the Company Jindal Praxair Oxygen Company Private Limited
66.15 - - - - 66.15 76.03 - - - - 76.03
JSW Energy Limited
- - - - 120.90 120.90 - - - - 120.90 120.90
JSW Realty & Infrastructure Private Limited - - - - 130.00 130.00 - - - - 130.00 130.00
JSW Ispat Steel Limited
2,357.11 - - - - 2,357.11 2,157.00 - - - - 2,157.00
Others
- 24.45 - - - 24.45 - 19.61 - - - 19.61
Total
2,423.26 24.45 - - 250.90 2,698.61 2,233.03 19.61 - - 250.90 2,503.54
Figures in bold represents current year numbers
Notes Forming Part of the Consolidated Financial Statements` in crores

Eighteenth Annual Report 2011-12
166
Notes Forming Part of the Consolidated Financial Statements
9. Finance Lease As Lessee: i. The Group has acquired equipments for ` 99.78 crores through fi nance lease. The fi nance leases are for various durations
with last lease maturing in 2016. The amount of depreciation charged to profi t and loss account till 31 March 2012 was ` 20.03 crores and the book value is ` 79.75 crores.
ii. The Minimum Lease Payments as at 31 March 2012 and the present value as at 31 March 2012 of minimum lease payments in respect of assets acquired under the fi nance leases are as follows:
` in crores
Particulars Minimum Lease Payments Present Value of MinimumLease Payments
As at 31.03.12 As at 31.03.11 As at 31.03.12 As at 31.03.11Payable not later than 1 year 22.42 20.17 18.07 15.36Payable later than 1 year and not later than 5 years
63.03 74.58 57.29 65.78
Payable later than 5 years - - - -Total 85.45 94.75 75.36 81.14Less: Future Finance Charges 10.09 13.61Present Value of Minimum Lease Payments 75.36 81.14
10. Operating Lease
a) As Lessor:
i. The Group has entered into lease arrangements, for renting :
2,279 houses (admeasuring approximately 1,410,997 square feet) at the rate of ` 100/- per house per annum, for a period of 180 months.
648 houses (admeasuring approximately 326,703 square feet) at the rate of ` 24/- per square feet per annum, for a period of 36 to 60 months.
1 house at the rate of ` 1.2 lacs per annum, for a period of 11 months.
9 houses (admeasuring approximately 9,027 square feet) at the rate of ` 40/- per square feet per month per house, for a period of 60 months.
6 houses (approximately 5,529 square feet) at the rate of ` 125 per square feet for a period of 12 months.
Offi ce premises (part) admeasuring approximately 4,760 square feet at the rate of ` 110 per square feet for a period of 11 months.
Offi ce premises (part) admeasuring approximately 15,392 square feet at the rate of ` 175 per square feet for a period of 11 months.
The agreements are renewable at the option of the lessee after the end of the lease term.
ii. Disclosure in respect of assets (building) given on operating lease :
` in crores
Current Year Previous YearGross Carrying amount of Assets 196.68 170.76Accumulated Depreciation
20.60
18.04
Depreciation for the year
3.19
3.08
b) As Lessee: Lease Rentals charged to revenue for right to use
following assets are:` in crores
Current Year Previous YearOffi ce Premises, Residential Flats etc. 15.40 13.02Total 15.40 13.02
The agreements are executed for a period of 11 to 60 months with a renewable clause and also provide for termination at will by either party giving a prior notice period of 1 to 3 months.
Minimum lease payments under non-cancellable operating lease fall due as follows:
` in crores
Current Year Previous YearDue not later than one year 3.07 1.79Due later than one year but not later than fi ve years 6.14 8.04Later than fi ve yearsTotal 9.21 9.83
Operating lease payments represent rentals payable by the Group for lease of coal loading property. The agreement is executed for a period of 5 years with a renewable clause.

167
Steel Limited
Notes Forming Part of the Consolidated Financial Statements
11. The effect of acquisition of subsidiaries on the fi nancial position and the results as included in consolidated fi nancial statements for the year ended on 31 March, 2012 are given below:
` in crores
EQUITY AND LIABILITIES
Shareholders’ funds 65.51
Non-current liabilities 80.46
Current liabilities 127.84
TOTAL 273.81
ASSETS
Non-current assets 273.10
Current assets 0.71
TOTAL 273.81
Revenue from operations -
Expenses:
Other expenses 0.98
Loss for the year (0.98)
12. Earnings Per Share (EPS):
Current Year Previous Year
Profi t after Tax ` in Crs 537.68 1,753.98
Less: Dividend on preference shares (Including corporate dividend tax) ` in Crs 32.43 32.43
Profi t after tax for Equity share holders (Numerator)- Basic / Diluted (A) ` in Crs 505.25 1,721.55
Weighted average number of equity shares for Basic EPS (denominator) (B) Nos. 223,117,200 203,595,864
Add: Potential Equity Shares on conversion of FCCB’s / Warrants Nos. -* 1,767,540
Weighted average number of equity shares for Diluted EPS (denominator) (C) Nos. 223,117,200 205,363,404
Earning per share – Basic (A/B) ` 22.65 84.56
Earning per share – Diluted (A/C) ` 22.65 83.83
Nominal value per share ` 10 10
* as anti dilutive

Eighteenth Annual Report 2011-12
168
Nam
e of
the
Su
bsid
iary
JSW
Ste
el
(Net
herl
ands
) B.
V.
JSW
St
eel
(UK
) Li
mit
ed
Arg
ent
Inde
pend
ent
Stee
l (H
oldi
ngs)
Li
mit
ed
JSW
St
eel
Serv
ice
Cent
re
(UK
) Li
mit
ed
JSW
Ste
el
Hol
ding
s (U
SA)
Inc.
JSW
St
eel
(USA
) In
c.
Peri
ama
Hol
ding
s LL
C
Prim
e Co
al
LLC
Plan
ck
Hol
ding
s LL
C
Rolli
ng S
A
uger
ing
LLC
Peri
ama
Han
dlin
g LL
C
Care
tta
Min
eral
s LL
C
Low
er
Hut
chin
son
Min
eral
s LL
C
Mea
dow
Cr
eek
Min
eral
s LL
C
Kee
nan
Min
eral
s LL
C
Hut
chin
son
Min
eral
s LL
C
Peac
e Le
asin
g LL
C
R.C.
M
iner
als
LLC
A.Sh
are
Capi
tal
1,20
6.14
58.9
4-
27.4
897
2.27
2,73
6.87
73.4
10.
5438
0.36
22.5
820
.47
414.
608.
2920
.78
2.75
26.1
3-
39.5
2
B.Re
serv
es(2
63.3
4)(5
.29)
0.29
(0.4
1)(2
47.9
4)(6
71.2
5)65
.47
(10.
71)
(1.6
4)(3
.02)
(10.
41)
(0.0
4)0.
03(1
8.84
)(0
.01)
(0.0
7)(0
.12)
-
C.To
tal
Liabi
litie
s1,
234.
150.
0711
.52
1.47
2,58
0.75
4,42
1.00
556.
6136
.82
105.
0621
.15
23.6
525
.46
6.77
30.1
73.
007.
970.
167.
27
D.To
tal A
sset
s2,
176.
9553
.72
11.8
128
.54
3,30
5.08
6,48
6.62
695.
4926
.65
483.
7840
.71
33.7
144
0.02
15.0
932
.11
5.74
34.0
30.
0446
.79
E.In
vest
men
t In
clude
d in
To
tal A
sset
s (E
xcep
t for
In
vest
men
t in
Su
bsid
iarie
s)-
--
--
--
--
--
--
--
--
-
F.Tu
rnov
er-
--
0.31
-1,
891.
43-
--
3.39
2.06
-8.
176.
93-
--
-
G.Pr
ofi ts
/ (L
osse
s) be
fore
Tax
es(5
8.72
)(1
.57)
-(0
.79)
(102
.84)
(14.
66)
(19.
97)
(3.2
8)-
(2.9
4)(5
.83)
(0.0
4)0.
14(7
.72)
(0.0
1)(0
.05)
(0.1
5)0.
03
H.Pr
ovisi
on fo
r Ta
xatio
n-
--
1.75
(35.
00)
(20.
51)
(13.
94)
--
--
--
--
--
-
I.Pr
ofi ts
/ (L
osse
s) af
ter T
axes
(58.
72)
(1.5
7)-
(2.5
4)(6
7.84
)5.
85(6
.03)
(3.2
8)-
(2.9
4)(5
.83)
(0.0
4)0.
14(7
.72)
(0.0
1)(0
.05)
(0.1
5)0.
03
J.Pr
opos
ed
Divid
end
--
--
--
--
--
--
--
--
--
13. I
nfo
rmat
ion
of
Sub
sid
iari
es a
s re
qu
ired
un
der
sec
tio
n 2
12 o
f th
e C
om
pan
ies
Act
, 195
6
`
in C
rore
s

169
Steel Limited
As
per
ou
r at
tach
ed r
epo
rt o
f ev
en d
ate
Fo
r D
ELO
ITTE
HA
SKIN
S &
SEL
LS
Ch
arte
red
Acc
ou
nta
nts
Fo
r an
d o
n b
ehal
f o
f th
e B
oar
d o
f D
irec
tors
SAJJ
AN
JIN
DA
L C
hai
rman
& M
anag
ing
Dir
ecto
r
P. B
. PA
RD
IWA
LLA
P
artn
er
Pla
ce
: Mu
mb
ai,
Dat
ed :
14
May
201
2
LAN
CY
VA
RG
HES
EC
om
pan
y Se
cret
ary
RA
JEEV
PA
I C
hie
f Fi
nan
cial
Offi
cer
SESH
AG
IRI R
AO
M.V
.S.
Jt. M
anag
ing
Dir
ecto
r &
Gro
up
CFO
Nam
e of
the
Su
bsid
iary
Pure
st
Ener
gy
LLC
JSW
Pa
nam
a ho
ldin
g Co
rpor
atio
n
Inve
rsio
nes
Euro
sh
Lim
itad
a
Sant
a Fe
Min
ing
Sant
a Fe
Puer
to
S.A
.
JSW
N
atur
al
Reso
urce
s Lt
d
JSW
Nat
ural
Re
sour
ces
Moz
ambi
que
Lda
JSW
A
DM
S Ca
rvo
Lda
JSW
Ea
st
Afr
ica
Lim
ited
JSW
Ste
el
Proc
essi
ng
Cent
res
Lim
ited
JSW
Be
ngal
St
eel
Lim
ited
Barb
il Be
nefi
ciat
ion
Com
pany
Li
mit
ed
JSW
N
atur
al
Reso
urce
s In
dia
Lim
ited
JSW
En
ergy
(B
enga
l) Li
mit
ed
Am
ba
Rive
r Co
ke
Lim
ited
JSW
Jh
arkh
and
Stee
l Li
mit
ed
JSW
Bu
ildin
g Sy
stem
Li
mit
ed
A.Sh
are
Capi
tal
63.
18
0.5
1 0
.22
10.
06
0.2
5 6
9.85
2
9.92
-
0.5
1 5
0.00
2
90.1
0 0
.05
64.
65
0.0
5 6
7.87
3
4.87
2
.81
B.Re
serv
es -
23.
35
(5.4
6) 6
5.38
0
.02
(1.4
6) (6
0.96
) (0
.01)
(0.0
4) 3
5.28
(6
.62)
(0.0
1) (0
.69)
(0.8
2) (1
.58)
(0.6
3) (0
.12)
C.To
tal
Liabi
litie
s 4
8.67
0
.01
379
.99
348
.03
0.8
4 1
5.89
5
4.39
1
0.01
0
.04
78.
79
34.
04
0.0
5 2
.00
80.
62
127
.68
0.7
0 -
D.To
tal A
sset
s 1
11.8
5 2
3.87
3
74.7
5 4
23.4
7 1
.11
84.
28
23.
35
10.
00
0.5
1 1
64.0
7 3
17.5
2 0
.09
65.
96
79.
85
193
.97
34.
94
2.6
9
E.In
vest
men
t In
clude
d in
To
tal A
sset
s (E
xcep
t for
In
vest
men
t in
Su
bsid
iarie
s) -
- -
0.1
3 -
- -
- -
- -
- -
- -
0.0
3 2
.68
F.Tu
rnov
er -
- -
478
.40
- -
- -
- 5
5.30
-
- -
- -
- -
G.Pr
ofi ts
/ (L
osse
s) be
fore
Tax
es -
1.0
1 (4
.25)
92.
10
- (0
.67)
5.0
9 (0
.01)
(0.0
4) 2
5.92
(2
.01)
- (0
.50)
(0.0
5) (0
.93)
(0.0
1) 0
.06
H.Pr
ovisi
on fo
r Ta
xatio
n -
- -
16.
70
- -
- -
- 8
.48
0.0
1 -
- -
- -
-
I.Pr
ofi ts
/ (L
osse
s) af
ter T
axes
- 1
.01
(4.2
5) 7
5.40
-
(0.6
7) 5
.09
(0.0
1) (0
.04)
17.
44
(2.0
2) -
(0.5
0) (0
.05)
(0.9
3) (0
.01)
0.0
6
J.Pr
opos
ed
Divid
end
- -
- -
- -
- -
- -
- -
- -
- -
-
Note
: Th
e fi n
ancia
l sta
tem
ents
of s
ubsid
iarie
s are
conv
erte
d in
to In
dian
Rup
ees o
n th
e ba
sis o
f exc
hang
e ra
te a
s on
closin
g da
y of t
he fi
nanc
ial y
ear.
14.
Co
mp
arat
ive
fi n
anci
al in
form
atio
n (
i.e. t
he
amo
un
ts a
nd
oth
er d
iscl
osu
re f
or
the
pre
ced
ing
yea
r) p
rese
nte
d a
bo
ve, i
s in
clu
ded
as
an in
teg
ral p
art
of
the
curr
ent
year
’s fi
nan
cial
sta
tem
ents
, an
d i
s to
be
read
in
rel
atio
n t
o t
he
amo
un
ts a
nd
oth
er d
iscl
osu
res
rela
tin
g t
o t
he
curr
ent
year
. Fi
gu
res
of
the
pre
vio
us
year
are
re
gro
up
ed a
nd
rec
lass
ifi e
d w
her
ever
nec
essa
ry t
o c
orr
esp
on
d t
o fi
gu
res
of
the
curr
ent
year
. (R
efer
no
te 1
(B)(
2)).


Steel LimitedRegd. Offi ce: Jindal Mansion, 5A, Dr. G. Deshmukh Marg, Mumbai 400 026.
E-COMMUNICATION REGISTRATION FORM
To,
Karvy Computershare Private Limited
Unit: JSW Steel Limited
Plot No. 17 to 24, Vittalrao Nagar,
Madhapur, Hyderabad - 500 081
Green Initiative in Corporate Governance
I/we hereby exercise my/our option to receive all communications from the Company such as Notice of General Meeting, Explanatory Statement, Audited Financial Statements, Balance Sheet, Profi t & Loss Account, Directors’ Report, Auditor’s Report etc. in electronic mode pursuant to the ‘Green Initiative in Corporate Governance‘ taken by the Ministry of Corporate Affairs vide circular no. 17/2011 dated 21st April, 2011. Please register my e-mail ID as given below, in your records, for sending the communications:
Folio No. / DP ID & Client ID No. : ....................................................................................................................................................................
Name of 1st Registered Holder : ....................................................................................................................................................................
Name of Joint Holder(s), if any : .....................................................................................................................................................................
Registered Address of the Sole/
1st Registered Holder : .....................................................................................................................................................................
.....................................................................................................................................................................
.....................................................................................................................................................................
No. of Shares held : ....................................................................................................................................................................
E-mail ID (to be registered) : ....................................................................................................................................................................
Date: ................................ Signature: .......................................................................
Notes:
1) On registration, all communications will be sent to the e-mail ID registered.
2) The form is also available on the website of the Company www.jsw.in under the section ‘Shareholder‘s information‘.
3) Shareholders are requested to keep the Company‘s Registrar-Karvy Computershare Private Limited informed as and when there is any change in the e-mail address.


NATIONAL ELECTRONIC CLEARING SERVICES (NECS)MANDATE FORM
To,JSW Steel LimitedC/o. Karvy Computershare Private LimitedPlot No. 17 to 24, Vittalrao Nagar,Madhapur, Hyderabad 500 081(In case of physical holding)
To,The Depository Participant concerned(In case of electronic holding)
Please fi ll in the information in CAPITAL LETTERS IN ENGLISH only.
Folio No./Client ID No.*
DP ID* I N
* Applicable only in case of Electronic holding.
Name of Sole/First holder
Bank Name
Branch Name
Branch code
(9 Digits Code number appearing on the MICR Band of the cheque supplied by the Bank).Please attach a photo copy of a cheque or a blank cheque of your bank duly cancelled forensuring accuracy of the bank‘s name, branch name and code number.
For Offi ce only
ECSRef. No.
Account type(Please Tick (�) wherever applicable)
Savings Current Cash Credit
A/c. No.(as appearing in the cheque book)
I, hereby declare that the particulars given above are correct and complete. If any transaction is delayed or not effected at all for reasons of incompleteness or incorrectness of information supplied as above, I shall not hold the Company/Karvy Computershare Private Limited, responsible. I agree to avail the NECS facility as implemented by JSW Steel Limited.
I further undertake to inform Karvy Computershare Private Limited/concerned Depository Participant of any change in the particulars given above to facilitate updation of records.
Place : ___________________
Date : ___________________
(Signature of Sole/First holder)
Notes :
1. Whenever the Shares in the given folio are entirely dematerialised, then this NECS mandate form if given to the Company will stand rescinded.
2. For shares held in dematerialised mode, NECS Mandate is required to be fi led with the concerned Depository Participant.

��

ATTENDANCE SLIPRegd. Folio No. ....................................... ** D.P. I.D. .....................................
** Client I.D. ..................................
EIGHTEENTH ANNUAL GENERAL MEETING – 25TH JULY, 2012
I certify that I am a member/ proxy for the member of the Company.
I hereby record my presence at the Eighteenth Annual General Meeting of the Company held on Wednesday, 25th July, 2012 at 11.00 a.m at Birla Matushri Sabhagar, 19, New Marine Lines, Mumbai-400 020.
________________________________________________ _______________________________________________
* Member’s / Proxy’s Name in Block Letters * Member’s / Proxy’s Signature
Note:
1. Member / Proxy must bring the Attendance Slip to the Meeting and hand it over, duly signed, at the registration counter.
2. The Copy of the Notice may please be brought to the Meeting Hall.
*Strike out whichever is not applicable.
Regd. Offi ce: Jindal Mansion, 5A, Dr. G. Deshmukh Marg, Mumbai 400 026.
PROXY FORMRegd Folio No. ............................... **D.P. I.D. ...............................
**Client I.D. ...........................
EIGHTEENTH ANNUAL GENERAL MEETING – 25TH JULY, 2012
I/We ............................................................................................................................................................................................................................
of ................................................................................................................................................................................................................................
being a member / members of JSW Steel Limited, hereby appoint ..................................................................................................................
............................................................................................................... of ................................................................................................................
or failing him / her .....................................................................................................................................................................................................
of ................................................................................................................................................................................................................................
as my/our Proxy to attend and vote for me/us on my / our behalf at the Eighteenth Annual General Meeting of the Company to be held on Wednesday, 25th July, 2012 at 11.00 a.m at Birla Matushri Sabhagar, 19, New Marine Lines, Mumbai-400 020 and at any adjournment thereof.
Signed this ............................................................................................ day of ................................................................................................ 2012
Signature ______ ________Affi x
Revenue Stamp
Note:
1. Proxy need not be a member.
2. Proxy form, complete in all respects, should reach the Company’s Registered Offi ce at Jindal Mansion, 5A, Dr. G. Deshmukh Marg, Mumbai 400 026, not less than 48 hours before the scheduled time of the meeting.
** Applicable only in case of investors holding shares in Electronic form.
�
��
Tear Here
Steel LimitedRegd. Offi ce: Jindal Mansion, 5A, Dr. G. Deshmukh Marg, Mumbai 400 026.
Steel Limited
�


177
Steel Limited
Notes

Eighteenth Annual Report 2011-12
178178
Notes

179
Steel Limited
179
Steel Limited
Notes

Eighteenth Annual Report 2011-12
180180
Notes

Standalone Consolidated
2007-08 2008-09 2009-10 2010-11 2011-12 2007-08 2008-09 2009-10 2010-11 2011-12
REVENUE ACCOUNTS (` in crores)
Gross Turnover 12,517.80 15,130.71 19396.43 25,092.09 34,658.48 13,554.45 17,064.30 20,151.12 25,829.13 36,719.83
Net Turnover 11,308.89 13,952.67 18,142.27 23,124.57 32,060.47 12,345.54 15,886.26 18,896.96 23,861.57 34,123.65
Operating EBIDTA 3,495.74 2,985.42 4,383.92 4,776.90 5,630.80 3,600.79 3,071.44 4,157.86 4,867.90 6,101.89
Depreciation and Amortization 687.18 827.66 1,123.41 1,378.71 1,708.17 741.94 987.77 1,298.66 1,559.71 1,933.15
Finance Costs 494.84 836.82 904.70 854.17 1,186.41 625.57 1,168.13 1,119.35 1,060.26 1,427.30
Profi t Before Taxes 2,483.77 677.23 2,814.71 2,778.53 2,094.56 2,423.90 314.93 2,195.06 2,437.90 1,993.35
Provision for Taxation 755.58 218.73 791.97 767.86 468.70 765.43 72.20 641.77 778.52 500.15
Profi t After Taxes 1,728.19 458.50 2,022.74 2,010.67 1,625.86 1,640.04 274.91 1,597.55 1,753.98 537.68
CAPITAL ACCOUNTS (` in crores)
Gross Fixed Asset 13,952.32 16,896.75 21,795.58 27,407.35 35,091.02 18,105.12 22,388.91 26,792.05 32,683.89 41,445.53
Net Fixed Asset 10,955.49 13,086.44 16,866.14 21,102.15 27,090.58 15,030.87 18,309.16 21,452.79 25,810.66 32,568.08
Debt 7,546.53 11,272.63 11,585.10 11,951.34 15,930.02 12,136.22 16,550.22 16,173.04 16,476.16 19,909.11
Net Debt 6,991.56 10,849.92 11,090.50 9,797.46 12,771.20 11,448.99 16,038.17 15,656.23 14,159.21 16,643.78
Equity Capital 187.05 187.05 187.05 223.12 223.12 187.05 187.05 187.05 223.12 223.12
Reserves & Surplus 7,140.24 7,422.24 9,179.23 16,132.71 17,934.31 7,351.83 7,266.94 8,730.04 15,436.77 16,186.39
Shareholders’ Funds 7,677.25 7,959.25 9,706.34 17,225.27 18,497.49 7,888.84 7,803.95 9,257.15 16,529.33 16,749.57
RATIOS
Book Value Per Share (`) 394.99 410.07 504.00 735.80 816.54 406.31 401.77 479.99 704.60 738.20
Market Price Per Share (`) 819.10 231.85 1,235.90 916.30 721.45 819.10 231.85 1,235.90 916.30 721.45
Earning Per Share (Diluted) (`) 94.18 22.70 105.94 96.33 71.42 89.26 12.88 83.29 83.83 22.65
Market Capitalisation (` crores) 15,321.15 4,336.72 23,117.35 20,444.23 16,096.79 15,321.15 4,336.72 23,117.35 20,444.23 16,096.79
Equity Dividend per Share (`) 14.00 1.00 9.50 12.25 7.50 14.00 1.00 9.50 12.25 7.50
Fixed Assets Turnover Ratio 1.03 1.07 1.08 1.10 1.18 0.82 0.87 0.88 0.92 1.05
Operating EBIDTA Margin 30.2% 21.1% 23.9% 20.4% 17.5% 28.6% 19.2% 21.8% 20.2% 17.8%
Interest Coverage 5.81 2.75 4.11 4.25 3.46 4.70 1.95 2.96 3.30 2.97
Net Debt Equity Ratio 0.91 1.36 1.14 0.57 0.69 1.42 1.99 1.65 0.84 0.98
Net Debt to EBIDTA 2.00 3.63 2.53 2.05 2.27 3.18 5.22 3.77 2.90 2.73
Financial Highlights

If undelivered please return to: Victoria House, Pandurang Budhkar Marg, Lower Parel (W), Mumbai - 400 013. Tel: +91-22-2492 7000
Steel Limited
BOOK POST
This
Ann
ual R
epor
t is
pri
nted
on
ECO
FRI
END
LY p
aper
ww
w.s
appr
ints
.com