lao social indicator survey ii 2017 mics/dhs
TRANSCRIPT
1
II
The Lao Social Indicator Survey II (LSIS II) was carried out in 2017 by Lao Statistics Bureau (LSB) in collaboration with Ministry of Health and Ministry of Education and Sport, as part of the Global Multiple Indicator Cluster Survey (MICS) Programme. Technical support was provided by the United Nations Children’s Fund (UNICEF), with government funding and financial support of UNICEF and United Nations Population Fund (UNFPA), European Union (EU), Luxembourg Government, United States Agency for International Development (USAID), Swiss Development Cooperation (SDC), World Food Programme (WFP), and United Nations Development Programmes (UNDP), World Health Organisation (WHO) and Japanese International Cooperation Agency (JICA). USAID provided technical support for the data collection and analysis on anaemia. The Global MICS Programme was developed by UNICEF in the 1990s as an international multi-purpose household survey programme to support countries in collecting internationally comparable data on a wide range of indicators on the situation of children and women. MICS surveys measure key indicators that allow countries to generate data for use in policies, programmes, and national development plans, and to monitor progress towards the Sustainable Development Goals (SDGs) and other internationally agreed upon commitments. The LSIS II presents up-to date information for assessing the situation of children, women and men as well as to provide data for monitoring progress towards existing strategies and action plans including the 8th National Socio-Economic Development Plan (NSEDP) 2016-2020, update the status of the provincial social development indicators and track the graduation of the country from the category of Least Developed Country by 2020. The objective of this report is to facilitate the timely dissemination and use of results from the LSIS II. The report contains detailed information on the methodology of the survey, and tables following MICS standard and templates. For more information on the Global MICS Programme, please go to mics.unicef.org. Suggested citation: Lao Statistics Bureau. 2018. Lao Social Indicator Survey II 2017, Survey Findings Report. Vientiane, Lao PDR: Lao Statistics Bureau and UNICEF.
P a g e | iii
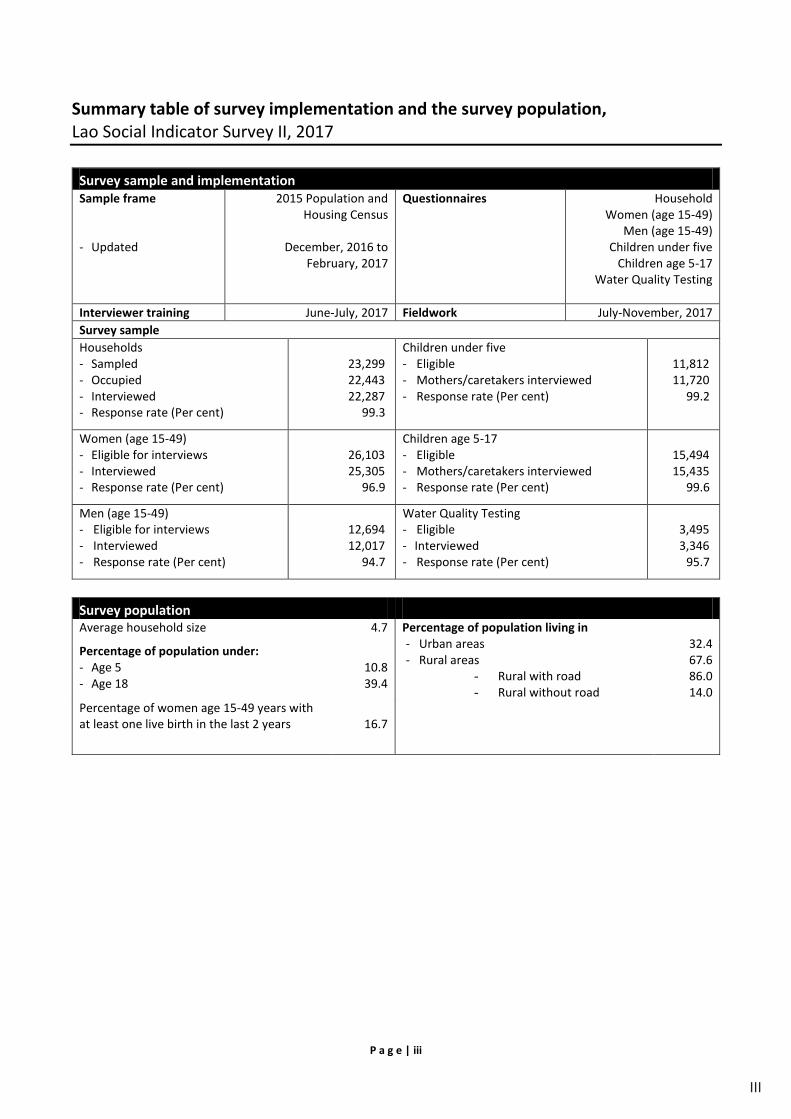
Summary table of survey implementation and the survey population, Lao Social Indicator Survey II, 2017
Survey sample and implementation Sample frame
- Updated
2015 Population and Housing Census
December, 2016 to February, 2017
Questionnaires Household Women (age 15-49)
Men (age 15-49) Children under five
Children age 5-17 Water Quality Testing
Interviewer training June-July, 2017 Fieldwork July-November, 2017 Survey sample Households - Sampled - Occupied - Interviewed - Response rate (Per cent)
23,299 22,443 22,287
99.3
Children under five - Eligible - Mothers/caretakers interviewed - Response rate (Per cent)
11,812 11,720
99.2
Women (age 15-49) - Eligible for interviews - Interviewed - Response rate (Per cent)
26,103 25,305
96.9
Children age 5-17 - Eligible - Mothers/caretakers interviewed - Response rate (Per cent)
15,494 15,435
99.6
Men (age 15-49) - Eligible for interviews - Interviewed - Response rate (Per cent)
12,694 12,017
94.7
Water Quality Testing - Eligible - Interviewed - Response rate (Per cent)
3,495 3,346
95.7
Survey population Average household size 4.7 Percentage of population living in
- Urban areas - Rural areas
- Rural with road - Rural without road
32.4 67.6 86.0 14.0
Percentage of population under: - Age 5 - Age 18
10.8 39.4
Percentage of women age 15-49 years with at least one live birth in the last 2 years 16.7
III
The Lao Social Indicator Survey II (LSIS II) was carried out in 2017 by Lao Statistics Bureau (LSB) in collaboration with Ministry of Health and Ministry of Education and Sport, as part of the Global Multiple Indicator Cluster Survey (MICS) Programme. Technical support was provided by the United Nations Children’s Fund (UNICEF), with government funding and financial support of UNICEF and United Nations Population Fund (UNFPA), European Union (EU), Luxembourg Government, United States Agency for International Development (USAID), Swiss Development Cooperation (SDC), World Food Programme (WFP), and United Nations Development Programmes (UNDP), World Health Organisation (WHO) and Japanese International Cooperation Agency (JICA). USAID provided technical support for the data collection and analysis on anaemia. The Global MICS Programme was developed by UNICEF in the 1990s as an international multi-purpose household survey programme to support countries in collecting internationally comparable data on a wide range of indicators on the situation of children and women. MICS surveys measure key indicators that allow countries to generate data for use in policies, programmes, and national development plans, and to monitor progress towards the Sustainable Development Goals (SDGs) and other internationally agreed upon commitments. The LSIS II presents up-to date information for assessing the situation of children, women and men as well as to provide data for monitoring progress towards existing strategies and action plans including the 8th National Socio-Economic Development Plan (NSEDP) 2016-2020, update the status of the provincial social development indicators and track the graduation of the country from the category of Least Developed Country by 2020. The objective of this report is to facilitate the timely dissemination and use of results from the LSIS II. The report contains detailed information on the methodology of the survey, and tables following MICS standard and templates. For more information on the Global MICS Programme, please go to mics.unicef.org. Suggested citation: Lao Statistics Bureau. 2018. Lao Social Indicator Survey II 2017, Survey Findings Report. Vientiane, Lao PDR: Lao Statistics Bureau and UNICEF.
P a g e | iii
Summary table of survey implementation and the survey population, Lao Social Indicator Survey II, 2017
Survey sample and implementation Sample frame
- Updated
2015 Population and Housing Census
December, 2016 to February, 2017
Questionnaires Household Women (age 15-49)
Men (age 15-49) Children under five
Children age 5-17 Water Quality Testing
Interviewer training June-July, 2017 Fieldwork July-November, 2017 Survey sample Households - Sampled - Occupied - Interviewed - Response rate (Per cent)
23,299 22,443 22,287
99.3
Children under five - Eligible - Mothers/caretakers interviewed - Response rate (Per cent)
11,812 11,720
99.2
Women (age 15-49) - Eligible for interviews - Interviewed - Response rate (Per cent)
26,103 25,305
96.9
Children age 5-17 - Eligible - Mothers/caretakers interviewed - Response rate (Per cent)
15,494 15,435
99.6
Men (age 15-49) - Eligible for interviews - Interviewed - Response rate (Per cent)
12,694 12,017
94.7
Water Quality Testing - Eligible - Interviewed - Response rate (Per cent)
3,495 3,346
95.7
Survey population Average household size 4.7 Percentage of population living in
- Urban areas - Rural areas
- Rural with road - Rural without road
32.4 67.6 86.0 14.0
Percentage of population under: - Age 5 - Age 18
10.8 39.4
Percentage of women age 15-49 years with at least one live birth in the last 2 years 16.7
IV
Table of contents
Summary table of survey implementation and the survey population, ............................................................... iii
Table of contents .................................................................................................................................................. iv
List of abbreviations………………………………………………………………………………………………………………………………………... xi
Foreword .............................................................................................................................................................. xiii
Acknowledgements ............................................................................................................................................. xiv
I. Introduction ....................................................................................................................................... 1 1.1 Background ............................................................................................................................ .....1 1.2 Survey objectives ........................................................................................................................ 1
II. Sample and survey methodology ................................................................................................... 32.1 Sample design ............................................................................................................................. 3 2.2 Questionnaires ............................................................................................................................ 3 2.3 Training and fieldwork ................................................................................................................. 5 2.4 Data collection method ................................................................................................................6
III. Indicators and definitions ............................................................................................................. 8
IV. Sample coverage and characteristics of respondents .................................................................. 23SR.1. Results of interviews ......................................................................................................... 23
Table SR.1.1: Results of household, women's, men's, under-5's and children age 5-17's interviews ........................................................................................................... 24
SR.2. Housing and household characteristics ............................................................................. 26 Table SR.2.1: Housing characteristics ................................................................................... 26 Table SR.2.2: Household and personal assets ...................................................................... 28 Table SR.2.3: Wealth quintiles ............................................................................................. 30
SR.3. Household composition .................................................................................................... 30 Table SR.3.1: Household composition .................................................................................. 31
SR.4. Age structure of household population ............................................................................. 32 Table SR.4.1: Age distribution of household population by sex ............................................ 32
SR.5. Respondents’ background characteristics ......................................................................... 32 Table SR.5.1W: Women's background characteristics .......................................................... 33 Table SR.5.1M: Men's background characteristics ............................................................... 34 Table SR.5.2: Children under 5's background characteristics ................................................ 35 Table SR.5.3: Children age 5-17's background characteristics .............................................. 37
SR.6. Literacy ............................................................................................................................. 38 Table SR.6.1W: Literacy (women) ....................................................................................... 39 Table SR.6.1M: Literacy (men) ............................................................................................ 40
SR.7. Migratory status ............................................................................................................... 41 Table SR.7.1W: Migratory status of women ......................................................................... 42 Table SR.7.1M: Migratory status of men .............................................................................. 46
SR.10. Mass media and ICT .......................................................................................................... 50 Table SR.9.1W: Exposure to mass media (women) .............................................................. 50 Table SR.9.1M: Exposure to mass media (men) .................................................................. 51 Table SR.9.2: Household ownership of ICT equipment and access to internet ...................... 52
V
Table of contents
Summary table of survey implementation and the survey population, ............................................................... iii
Table of contents .................................................................................................................................................. iv
List of abbreviations………………………………………………………………………………………………………………………………………... xi
Foreword .............................................................................................................................................................. xiii
Acknowledgements ............................................................................................................................................. xiv
I. Introduction ....................................................................................................................................... 1 1.1 Background ............................................................................................................................ .....1 1.2 Survey objectives ........................................................................................................................ 1
II. Sample and survey methodology ................................................................................................... 32.1 Sample design ............................................................................................................................. 3 2.2 Questionnaires ............................................................................................................................ 3 2.3 Training and fieldwork ................................................................................................................. 5 2.4 Data collection method ................................................................................................................6
III. Indicators and definitions ............................................................................................................. 8
IV. Sample coverage and characteristics of respondents .................................................................. 23SR.1. Results of interviews ......................................................................................................... 23
Table SR.1.1: Results of household, women's, men's, under-5's and children age 5-17's interviews ........................................................................................................... 24
SR.2. Housing and household characteristics ............................................................................. 26 Table SR.2.1: Housing characteristics ................................................................................... 26 Table SR.2.2: Household and personal assets ...................................................................... 28 Table SR.2.3: Wealth quintiles ............................................................................................. 30
SR.3. Household composition .................................................................................................... 30 Table SR.3.1: Household composition .................................................................................. 31
SR.4. Age structure of household population ............................................................................. 32 Table SR.4.1: Age distribution of household population by sex ............................................ 32
SR.5. Respondents’ background characteristics ......................................................................... 32 Table SR.5.1W: Women's background characteristics .......................................................... 33 Table SR.5.1M: Men's background characteristics ............................................................... 34 Table SR.5.2: Children under 5's background characteristics ................................................ 35 Table SR.5.3: Children age 5-17's background characteristics .............................................. 37
SR.6. Literacy ............................................................................................................................. 38 Table SR.6.1W: Literacy (women) ....................................................................................... 39 Table SR.6.1M: Literacy (men) ............................................................................................ 40
SR.7. Migratory status ............................................................................................................... 41 Table SR.7.1W: Migratory status of women ......................................................................... 42 Table SR.7.1M: Migratory status of men .............................................................................. 46
SR.10. Mass media and ICT .......................................................................................................... 50 Table SR.9.1W: Exposure to mass media (women) .............................................................. 50 Table SR.9.1M: Exposure to mass media (men) .................................................................. 51 Table SR.9.2: Household ownership of ICT equipment and access to internet ...................... 52
Table SR.9.3W: Use of ICT (women) .................................................................................... 53 Table SR.9.3M: Use of ICT (men) ......................................................................................... 55 Table SR.9.4W: ICT skills (women) ...................................................................................... 57 Table SR.9.4M: ICT skills (men) ........................................................................................... 59
SR.10. Tobacco and alcohol use ................................................................................................. 61 Table SR.10.1W: Current and ever use of tobacco (women) ............................................... 62 Table SR.10.1M: Current and ever use of tobacco (men) .................................................... 64 Table SR.10.2W: Age at first use of cigarettes and frequency of use (women) .................... 66 Table SR.10.2M: Age at first use of cigarettes and frequency of use (men) ......................... 67 Table SR.10.3W: Use of alcohol (women) ........................................................................... 68 Table SR.10.3M: Use of alcohol (men) ................................................................................ 69
SR.11. Children's living arrangements ........................................................................................ 70 Table SR.11.1: Children's living arrangements and orphanhood ........................................... 71 Table SR.11.2: Children's living arrangements and co-residence with parents ..................... 72 Table SR.11.3: Children not in parental care ........................................................................ 73
V. Survive ........................................................................................................................................ 76 Table CS.1: Early childhood mortality rates .......................................................................... 76 Table CS.2: Early childhood mortality rates by socioeconomic characteristics ...................... 77 Table CS.3: Early childhood mortality rates by demographic characteristics ........................ 78 Table CS.1: Children ever born, children surviving and proportion dead .............................. 76 Table CS.2: Infant and under-5 mortality rates by time since first birth groups of women.... 77 Table CS.3: Infant and under-5 mortality rates by background characteristics ..................... 78 Figure CS.1: Trend in under-5 mortality rates ...................................................................... 79
VI. Thrive – Reproductive and maternal health ................................................................................ 81TM.1. Fertility ............................................................................................................................ 81
Table TM.1.1: Fertility rates................................................................................................ .81 TM.2. Early childbearing ............................................................................................................ 82
Table TM.2.1: Adolescent birth rate and total fertility rate .................................................. 82 Table TM.2.2W: Early childbearing (young women) ............................................................ 84 Table TM.2.2M: Early fatherhood (young men) .................................................................. 85 Table TM.2.3W: Trends in early childbearing (women) ....................................................... 86 Table TM.2.3M: Trends in early fatherhood (men) .............................................................. 88
TM.3. Family planning ............................................................................................................... 90 Table TM.3.1: Use of contraception (currently married/in union) ....................................... 91 Table TM.3.2: Use of contraception (currently unmarried/not in union) ............................. 93 Table TM.3.3: Need for contraception (currently married/in union) ................................... 95 Table TM.3.4: Need for contraception (currently unmarried/not in union) ......................... 97
TM.4. Antenatal care ................................................................................................................. 99 Table TM.4.1: Antenatal care coverage ............................................................................. 100 Table TM.4.2: Number of antenatal care visits and timing of first visit ............................... 101 Table TM.4.3: Content of antenatal care ........................................................................... 103
TM.5. Neonatal tetanus ........................................................................................................... 104 Table TM.5.1: Neonatal tetanus protection ....................................................................... 105
TM.6. Delivery care ................................................................................................................. 106 Table TM.6.1: Place of delivery .......................................................................................... 106 Table TM.6.2: Assistance during delivery and caesarean section ....................................... 108
TM.7. Birthweight.................................................................................................................... 110 Table TM.7.1: Infants weighed at birth .............................................................................. 110
TM.8. Postnatal care ................................................................................................................ 112 Table TM.8.1: Post-partum stay in health facility ............................................................... 113 Table TM.8.2: Post-natal health checks for newborns ........................................................ 114
VI
Table TM.8.3: Post-natal care visits for newborns within one week of birth....................... 116 Table TM.8.4: Thermal care for newborns ......................................................................... 118 Table TM.8.5: Cord cutting and care .................................................................................. 120 Table TM.8.6: Content of postnatal care for newborns ...................................................... 122 Table TM.8.7: Post-natal health checks for mothers .......................................................... 124 Table TM.8.8: Post-natal care visits for mothers within one week of birth ......................... 126 Table TM.8.9: Post-natal health checks for mothers and newborns ................................... 127
TM.10. Sexual behaviour ......................................................................................................... 129 Table TM.10.1W: Sex with multiple partners (women) ..................................................... 129 Table TM.10.1M: Sex with multiple partners (men) .......................................................... 131 Table TM.10.2W: Key sexual behaviour indicators (young women) ................................... 132 Table TM.10.2M: Key sexual behaviour indicators (young men) ........................................ 134
TM.11. HIV .............................................................................................................................. 136 Table TM.11.1W: Knowledge about HIV transmission, misconceptions about HIV, and comprehensive knowledge about HIV transmission (women) .................................... 137 Table TM.11.1M: Knowledge about HIV transmission, misconceptions about HIV, and comprehensive knowledge about HIV transmission (men) ......................................... 139 Table TM.11.2W: Knowledge of mother-to-child HIV transmission (women) .................... 141 Table TM.11.2M: Knowledge of mother-to-child HIV transmission (men) ......................... 143 Table TM.11.3W: Attitudes towards people living with HIV (women) ............................... 145 Table TM.11.3M: Attitudes towards people living with HIV (men) .................................... 147 Table TM.11.4W: Knowledge of a place for HIV testing (women) ...................................... 149 Table TM.11.4M: Knowledge of a place for HIV testing (men) ........................................... 151 Table TM.11.5: HIV counselling and testing during antenatal care ..................................... 153 Table TM.11.6W: Key HIV and AIDS indicators (young women) ......................................... 155 Table TM.11.6M: Key HIV and AIDS indicators (young men) ............................................. 157
TM.13. Anemia ........................................................................................................................ 159 Table TM.13.1: Women's coverage of hemoglobin testing................................................. 160 Table TM.13.2: Prevalence of anemia in women ............................................................... 162
TM.14. Abortion ...................................................................................................................... 164 Table TM.14.1: Induced abortion rates ............................................................................. 164 Table TM.14.2: Pregnancy Outcomes ................................................................................ 165 Table TM.14.3: Method of Abortion, Lao PDR, 2017 .......................................................... 167
VII. Thrive – Child health, nutrition and development ................................................................... 172TC.1. Immunisation ................................................................................................................. 172
Table TC.1.1: Vaccinations in the first years of life ............................................................ 173 Table TC.1.2: Vaccinations by background characteristics ................................................. 174
TC.2. Disease episodes ............................................................................................................ 176 Table TC.2.1: Reported disease episodes .......................................................................... 177
TC.3. Diarrhoea ....................................................................................................................... 178 Table TC.3.1: Care-seeking during diarrhoea ..................................................................... 179 Table TC.3.2: Feeding practices during diarrhoea .............................................................. 180 Table TC.3.3: Oral rehydration solutions, government-recommended homemade fluid and zinc … ................................................................................................................. 182 Table TC.3.4: Oral rehydration therapy with continued feeding and other treatments ....................................................................................................... 183 Table TC.3.5: Source of ORS and zinc ................................................................................ 185
TC.4. Household energy use .................................................................................................... 186 Table TC.4.1: Primary reliance on clean fuels and technologies for cooking ...................... 187 Table TC.4.2: Primary reliance on solid fuels for cooking ................................................... 189 Table TC.4.3: Polluting fuels and technologies for cooking by type and characteristics of cookstove and place of cooking ...................................................... 191
VII
Table TM.8.3: Post-natal care visits for newborns within one week of birth....................... 116 Table TM.8.4: Thermal care for newborns ......................................................................... 118 Table TM.8.5: Cord cutting and care .................................................................................. 120 Table TM.8.6: Content of postnatal care for newborns ...................................................... 122 Table TM.8.7: Post-natal health checks for mothers .......................................................... 124 Table TM.8.8: Post-natal care visits for mothers within one week of birth ......................... 126 Table TM.8.9: Post-natal health checks for mothers and newborns ................................... 127
TM.10. Sexual behaviour ......................................................................................................... 129 Table TM.10.1W: Sex with multiple partners (women) ..................................................... 129 Table TM.10.1M: Sex with multiple partners (men) .......................................................... 131 Table TM.10.2W: Key sexual behaviour indicators (young women) ................................... 132 Table TM.10.2M: Key sexual behaviour indicators (young men) ........................................ 134
TM.11. HIV .............................................................................................................................. 136 Table TM.11.1W: Knowledge about HIV transmission, misconceptions about HIV, and comprehensive knowledge about HIV transmission (women) .................................... 137 Table TM.11.1M: Knowledge about HIV transmission, misconceptions about HIV, and comprehensive knowledge about HIV transmission (men) ......................................... 139 Table TM.11.2W: Knowledge of mother-to-child HIV transmission (women) .................... 141 Table TM.11.2M: Knowledge of mother-to-child HIV transmission (men) ......................... 143 Table TM.11.3W: Attitudes towards people living with HIV (women) ............................... 145 Table TM.11.3M: Attitudes towards people living with HIV (men) .................................... 147 Table TM.11.4W: Knowledge of a place for HIV testing (women) ...................................... 149 Table TM.11.4M: Knowledge of a place for HIV testing (men) ........................................... 151 Table TM.11.5: HIV counselling and testing during antenatal care ..................................... 153 Table TM.11.6W: Key HIV and AIDS indicators (young women) ......................................... 155 Table TM.11.6M: Key HIV and AIDS indicators (young men) ............................................. 157
TM.13. Anemia ........................................................................................................................ 159 Table TM.13.1: Women's coverage of hemoglobin testing................................................. 160 Table TM.13.2: Prevalence of anemia in women ............................................................... 162
TM.14. Abortion ...................................................................................................................... 164 Table TM.14.1: Induced abortion rates ............................................................................. 164 Table TM.14.2: Pregnancy Outcomes ................................................................................ 165 Table TM.14.3: Method of Abortion, Lao PDR, 2017 .......................................................... 167
VII. Thrive – Child health, nutrition and development ................................................................... 172TC.1. Immunisation ................................................................................................................. 172
Table TC.1.1: Vaccinations in the first years of life ............................................................ 173 Table TC.1.2: Vaccinations by background characteristics ................................................. 174
TC.2. Disease episodes ............................................................................................................ 176 Table TC.2.1: Reported disease episodes .......................................................................... 177
TC.3. Diarrhoea ....................................................................................................................... 178 Table TC.3.1: Care-seeking during diarrhoea ..................................................................... 179 Table TC.3.2: Feeding practices during diarrhoea .............................................................. 180 Table TC.3.3: Oral rehydration solutions, government-recommended homemade fluid and zinc … ................................................................................................................. 182 Table TC.3.4: Oral rehydration therapy with continued feeding and other treatments ....................................................................................................... 183 Table TC.3.5: Source of ORS and zinc ................................................................................ 185
TC.4. Household energy use .................................................................................................... 186 Table TC.4.1: Primary reliance on clean fuels and technologies for cooking ...................... 187 Table TC.4.2: Primary reliance on solid fuels for cooking ................................................... 189 Table TC.4.3: Polluting fuels and technologies for cooking by type and characteristics of cookstove and place of cooking ...................................................... 191
Table TC.4.4: Primary reliance on clean fuels and technologies for space heating ............. 193 Table TC.4.5: Type of space heater mainly used and presence of chimney ........................ 195 Table TC.4.6: Primary reliance on clean fuels and technologies for lighting ....................... 197 Table TC.4.7: Primary reliance on clean fuels and technologies for cooking, space heating, and lighting .............................................................................................. 199
TC.5. Symptoms of acute respiratory infection ........................................................................ 201 Table TC.5.1: Care-seeking for and antibiotic treatment of symptoms of acute respiratory infection (ARI) ................................................................................................ 202
TC.6. Malaria .......................................................................................................................... 203 Table TC.6.1: Household possession of mosquito nets ...................................................... 204 Table TC.6.2: Source of mosquito nets .............................................................................. 205 Table TC.6.3: Access to an insecticide-treated net (ITN) – number of household members .................................................................................................... 207 Table TC.6.4: Access to an insecticide-treated net (ITN) – background characteristics .................................................................................................................. 208 Table TC.6.5: Use of mosquito nets by the household population ..................................... 209 Table TC.6.6: Use of existing ITNs ..................................................................................... 210 Table TC.6.7: Use of mosquito nets by children ................................................................ 211 Table TC.6.8: Use of mosquito nets by pregnant women .................................................. 213 Table TC.6.9: Use of Intermittent Preventive Treatment for malaria (IPTp by women during pregnancy ........................................................................................... 215 Table TC.6.10: Care-seeking during fever .......................................................................... 216 Table TC.6.11: Treatment of children with fever ............................................................... 217 Table TC.6.12: Diagnostics and anti-malarial treatment of children .................................. 219 Table TC.6.13: Source of anti-malarial .............................................................................. 221
TC.7. Infant and young child feeding ....................................................................................... 222 Table TC.7.1: Initial breastfeeding .................................................................................... 224 Table TC.7.2: Newborn feeding ......................................................................................... 226 Table TC.7.3: Breastfeeding status .................................................................................... 229 Table TC.7.4: Duration of breastfeeding ........................................................................... 230 Table TC.7.5: Age-appropriate breastfeeding .................................................................... 231 Table TC.7.6: Introduction of solid, semi-solid, or soft foods ............................................. 232 Table TC.7.7: Infant and young child feeding (IYCF) practices ............................................ 233 Table TC.7.8: Bottle feeding .............................................................................................. 235
TC.8. Malnutrition .................................................................................................................. 236 Table TC.8.1: Nutritional status of children ....................................................................... 238
TC.9. Salt iodisation ................................................................................................................ 240 Table TC.9.1: Iodized salt consumption ............................................................................. 240
TC.10. Early childhood home environment ............................................................................. 241 Table TC.10.1: Support for learning .................................................................................. 242 Table TC.10.2: Learning materials ..................................................................................... 244 Table TC.10.3: Inadequate supervision ............................................................................. 245
TC.11. Early childhood development index ............................................................................. 247 Table TC.11.1: Early child development index ................................................................... 248
TC.12. Anemia of children ....................................................................................................... 249 Table TC.12.1: Children's coverage of hemoglobin testing ................................................. 250 Table TC.12.2: Prevalence of anemia in children ................................................................ 252
VIII
VIII. Learn ..................................................................................................................................... 255LN.1. Early childhood education .............................................................................................. 255
Table LN.1.1: Early childhood education ........................................................................... 256 Table LN.1.2: Participation rate in organised learning ....................................................... 257
LN.2. Attendance .................................................................................................................... 258 Table LN.2.1: School readiness ......................................................................................... 259 Table LN.2.2: Primary school entry ................................................................................... 260 Table LN.2.3: Primary school attendance and out of school children ................................. 261Table LN.2.4: Lower secondary school attendance and out of school adolescents ............ 263Table LN.2.5: Age for grade .............................................................................................. 265Table LN.2.6: Upper secondary school attendance and out of school youth ...................... 268Table LN.2.7: Gross intake, completion and effective transition rates ............................... 269Table LN.2.8: Parity indices ............................................................................................... 272
LN.3. Parental involvement ..................................................................................................... 274Table LN.3.1: Support for child learning at school ............................................................. 275Table LN.3.2: School-related reasons for inability to attend class ...................................... 277Table LN.3.3: Learning environment at home ................................................................... 279
IX. Protection from violence and exploitation ............................................................................... 283PR.1. Birth registration ........................................................................................................... 283
Table PR.1.1: Birth registration ......................................................................................... 284 PR.2. Child discipline ............................................................................................................... 285
Table PR.2.1: Child discipline ............................................................................................ 286Table PR.2.2: Attitudes toward physical punishment ........................................................ 287
PR.3. Child labour ................................................................................................................... 288 Table PR.3.1: Children's involvement in economic activities ............................................. 289 Table PR.3.2: Children's involvement in household chores ................................................ 291 Table PR.3.3: Child labour ................................................................................................. 292
PR.4. Child marriage ............................................................................................................... 293Table SR.4.1W: Child marriage and polygyny (women) ..................................................... 294Table SR.4.1M: Child marriage and polygyny (men) .......................................................... 296Table SR.4.2W: Trends in child marriage (women) ............................................................ 298Table SR.4.2M: Trends in child marriage (men) ................................................................. 299Table SR.4.3: Spousal age difference ................................................................................ 300
PR.8. Attitudes toward domestic violence ............................................................................... 301Table PR.8.1W: Attitudes toward domestic violence (women) .......................................... 301Table PR.8.1M: Attitudes toward domestic violence (men) ............................................... 302
X. Live in a safe and clean environment ......................................................................................... 306 WS.1 Drinking water ............................................................................................................... 306
Table WS.1.1: Use of improved and unimproved water sources ....................................... 307 Table WS.1.2: Use of basic and limited drinking water services ......................................... 309 Table WS.1.3: Person collecting water .............................................................................. 310 Table WS.1.4: Time spent collecting water ....................................................................... 312 Table WS.1.5: Availability of sufficient drinking water when needed ................................ 313 Table WS.1.6: Quality of source drinking water ................................................................ 314 Table WS.1.7: Quality of household drinking water .......................................................... 315 Table WS.1.8: Safely managed drinking water services ..................................................... 316 Table WS.1.9: Household water treatment ....................................................................... 317
WS.2 Handwashing ................................................................................................................. 318 Table WS.2.1: Handwashing facility with soap and water on premises .............................. 319
IX
VIII. Learn ..................................................................................................................................... 255LN.1. Early childhood education .............................................................................................. 255
Table LN.1.1: Early childhood education ........................................................................... 256 Table LN.1.2: Participation rate in organised learning ....................................................... 257
LN.2. Attendance .................................................................................................................... 258 Table LN.2.1: School readiness ......................................................................................... 259 Table LN.2.2: Primary school entry ................................................................................... 260 Table LN.2.3: Primary school attendance and out of school children ................................. 261Table LN.2.4: Lower secondary school attendance and out of school adolescents ............ 263Table LN.2.5: Age for grade .............................................................................................. 265Table LN.2.6: Upper secondary school attendance and out of school youth ...................... 268Table LN.2.7: Gross intake, completion and effective transition rates ............................... 269Table LN.2.8: Parity indices ............................................................................................... 272
LN.3. Parental involvement ..................................................................................................... 274Table LN.3.1: Support for child learning at school ............................................................. 275Table LN.3.2: School-related reasons for inability to attend class ...................................... 277Table LN.3.3: Learning environment at home ................................................................... 279
IX. Protection from violence and exploitation ............................................................................... 283PR.1. Birth registration ........................................................................................................... 283
Table PR.1.1: Birth registration ......................................................................................... 284 PR.2. Child discipline ............................................................................................................... 285
Table PR.2.1: Child discipline ............................................................................................ 286Table PR.2.2: Attitudes toward physical punishment ........................................................ 287
PR.3. Child labour ................................................................................................................... 288 Table PR.3.1: Children's involvement in economic activities ............................................. 289 Table PR.3.2: Children's involvement in household chores ................................................ 291 Table PR.3.3: Child labour ................................................................................................. 292
PR.4. Child marriage ............................................................................................................... 293Table SR.4.1W: Child marriage and polygyny (women) ..................................................... 294Table SR.4.1M: Child marriage and polygyny (men) .......................................................... 296Table SR.4.2W: Trends in child marriage (women) ............................................................ 298Table SR.4.2M: Trends in child marriage (men) ................................................................. 299Table SR.4.3: Spousal age difference ................................................................................ 300
PR.8. Attitudes toward domestic violence ............................................................................... 301Table PR.8.1W: Attitudes toward domestic violence (women) .......................................... 301Table PR.8.1M: Attitudes toward domestic violence (men) ............................................... 302
X. Live in a safe and clean environment ......................................................................................... 306 WS.1 Drinking water ............................................................................................................... 306
Table WS.1.1: Use of improved and unimproved water sources ....................................... 307 Table WS.1.2: Use of basic and limited drinking water services ......................................... 309 Table WS.1.3: Person collecting water .............................................................................. 310 Table WS.1.4: Time spent collecting water ....................................................................... 312 Table WS.1.5: Availability of sufficient drinking water when needed ................................ 313 Table WS.1.6: Quality of source drinking water ................................................................ 314 Table WS.1.7: Quality of household drinking water .......................................................... 315 Table WS.1.8: Safely managed drinking water services ..................................................... 316 Table WS.1.9: Household water treatment ....................................................................... 317
WS.2 Handwashing ................................................................................................................. 318 Table WS.2.1: Handwashing facility with soap and water on premises .............................. 319
WS.3 Sanitation ...................................................................................................................... 321 Table WS.3.1: Use of improved and unimproved sanitation facilities ................................ 322 Table WS.3.2: Use basic and limited sanitation services .................................................... 324 Table WS.3.3: Emptying and removal of excreta from improved pit latrines and septic tanks ...................................................................................................................... 326 Table WS.3.4: Management of excreta from household sanitation facilities ..................... 328 Table WS.3.5: Disposal of child's faeces ............................................................................ 329 Table WS.3.6: Drinking water, sanitation and handwashing ladders .................................. 330
WS.4 Menstrual hygiene ......................................................................................................... 332 Table WS.4.1: Menstrual hygiene management ................................................................ 333
XI. Equitable chance in life ............................................................................................................ 337EQ.1 Child functioning ............................................................................................................ 337
Table EQ.1.1: Child functioning (children age 2-4 years) ................................................... 338 Table EQ.1.3: Use of assistive devices (children age 2-17 years) ........................................ 340
EQ.2 Social transfers ............................................................................................................... 342 Table EQ.2.1W: Health insurance coverage (women) ....................................................... 343 Table EQ.2.1M: Health insurance coverage (men) ............................................................ 345 Table EQ.2.2: Health insurance coverage (children age 5-17 years) ................................... 347 Table EQ.2.3: Health insurance coverage (children under age 5) ....................................... 349 Table EQ.2.4: Awareness and ever use of external economic support ............................... 351 Table EQ.2.5: Coverage of social transfers and benefits: All household members ............. 352 Table EQ.2.6: Coverage of social transfers and benefits: Households in the lowest two quintiles ......................................................................................................... 354 Table EQ.2.7: Coverage of social transfers and benefits: Children in all households .......... 359 Table EQ.2.8: Coverage of school support programmes: Members age 5-24 in
all households ................................................................................................................. 360
Appendices: Appendix A. Sample design ........................................................................................................... 363
Table SD.1: Distribution of Villages and households in sampling frame .............................. 364 Table SD.2: Sample allocation............................................................................................ 366
Appendix B. List of personnel involved in the survey ..................................................................... 372
Appendix C. Estimates of sampling errors ..................................................................................... 383 Table SE.1: Sampling errors: Total sample ........................................................................ 384 Table SE.2: Sampling errors: Urban ................................................................................... 386 Table SE.3: Sampling errors: Rural .................................................................................... 388 Table SE.4: Sampling errors: Rural with road .................................................................... 390 Table SE.5: Sampling errors: Rural without road ............................................................... 392 Table SE.6: Sampling errors: North ................................................................................... 394 Table SE.7: Sampling errors: Central ................................................................................. 396 Table SE.8: Sampling errors: South ................................................................................... 398 Table SE.9: Sampling errors: Vientiane Capital .................................................................. 400 Table SE.10: Sampling errors: Phongsaly ........................................................................... 402 Table SE.11: Sampling errors: Luangnamtha ..................................................................... 404 Table SE.12: Sampling errors: Oudomxay .......................................................................... 406 Table SE.13: Sampling errors: Bokeo ................................................................................. 408 Table SE.14: Sampling errors: Luangprabang .................................................................... 410 Table SE.15: Sampling errors: Huaphanh .......................................................................... 412 Table SE.16: Sampling errors: Xayabury ............................................................................ 414 Table SE.17: Sampling errors: Xiengkhuang ...................................................................... 416
Table WS.4.2: Exclusion from activities during menstruation............................................. 334
X
Table SE.18: Sampling errors: Vientiane ............................................................................ 418 Table SE.19: Sampling errors: Borikhamxay ...................................................................... 420 Table SE.20: Sampling errors: Khammuane ....................................................................... 422 Table SE.21: Sampling errors: Savannakhet ...................................................................... 424 Table SE.22: Sampling errors: Saravane ............................................................................ 426 Table SE.23: Sampling errors: Sekong ............................................................................... 428 Table SE.24: Sampling errors: Champasack ....................................................................... 430 Table SE.25: Sampling errors: Attapeu .............................................................................. 432 Table SE.26: Sampling errors: Xaysomboun ...................................................................... 434
Appendix D. Data quality tables .................................................................................................... 436 DQ.1. Age distribution ............................................................................................................ 438
Table DQ.1.1: Age distribution of household population ................................................... 437 Table DQ.1.2W: Age distribution of eligible and interviewed women ................................ 438 Table DQ.1.2M: Age distribution of eligible and interviewed men .................................... 439 Table DQ.1.3: Age distribution of young children in households and under-5 questionnaires .................................................................................................... 439 Table DQ.1.4: Age distribution of children age 3-20 in households and 5-17 questionnaires .................................................................................................. 440
DQ.2. Birth date reporting ...................................................................................................... 441 Table DQ.2.1: Birth date reporting (household population) .............................................. 441 Table DQ.2.2W: Birth date and age reporting (women) .................................................... 442 Table DQ.2.2M: Birth date and age reporting (men) ......................................................... 443 Table DQ.2.3: Birth date reporting (first and last births) ................................................... 444 Table DQ.2.4: Birth date and age reporting (children under age 5 years) .......................... 445 Table DQ.2.5: Birth date reporting (children age 5-17 years) ............................................ 446
DQ.3 Completeness and measurements ................................................................................. 447 Table DQ.3.1: Completeness of salt iodisation testing ...................................................... 447 Table DQ.3.2: Completeness and quality of information of water quality testing .............. 448 Table DQ.3.3W: Completeness of information on dates of marriage/union and sexual intercourse (women) ...................................................................................... 448 Table DQ.3.3M: Completeness of information on dates of marriage/union and sexual intercourse (men) ........................................................................................... 449 Table DQ.3.4: Completeness of information for anthropometric indicators: Underweight .................................................................................................................... 449 Table DQ.3.5: Completeness of information for anthropometric indicators: Stunting ........................................................................................................................... 448 Table DQ.3.6: Completeness of information for anthropometric indicators: Wasting and overweight .................................................................................................. 450 Table DQ.3.7: Heaping in anthropometric measurements ................................................ 451
DQ.4. Observations ................................................................................................................. 452 Table DQ.4.1: Observation of bednets .............................................................................. 452 Table DQ.4.2: Observation of handwashing facility ........................................................... 453 Table DQ.4.3: Observation of birth certificates ................................................................. 454 Table DQ.4.4: Observation of vaccination records ............................................................ 456
DQ.5. School attendance ........................................................................................................ 457 Table DQ.5.1: School attendance by single age ................................................................. 457
DQ.6. Birth history .................................................................................................................. 458 Table DQ.6.1: Sex ratio at birth among children ever born and living ................................ 458 Table DQ.6.2: Births by periods preceding the survey ....................................................... 459 Table DQ.6.3: Reporting of age at death in days ............................................................... 460 Table DQ.6.4: Reporting of age at death in months .......................................................... 461
Appendix E. Questionnaires ........................................................................................................... 463
XI
Table SE.18: Sampling errors: Vientiane ............................................................................ 418 Table SE.19: Sampling errors: Borikhamxay ...................................................................... 420 Table SE.20: Sampling errors: Khammuane ....................................................................... 422 Table SE.21: Sampling errors: Savannakhet ...................................................................... 424 Table SE.22: Sampling errors: Saravane ............................................................................ 426 Table SE.23: Sampling errors: Sekong ............................................................................... 428 Table SE.24: Sampling errors: Champasack ....................................................................... 430 Table SE.25: Sampling errors: Attapeu .............................................................................. 432 Table SE.26: Sampling errors: Xaysomboun ...................................................................... 434
Appendix D. Data quality tables .................................................................................................... 436 DQ.1. Age distribution ............................................................................................................ 438
Table DQ.1.1: Age distribution of household population ................................................... 437 Table DQ.1.2W: Age distribution of eligible and interviewed women ................................ 438 Table DQ.1.2M: Age distribution of eligible and interviewed men .................................... 439 Table DQ.1.3: Age distribution of young children in households and under-5 questionnaires .................................................................................................... 439 Table DQ.1.4: Age distribution of children age 3-20 in households and 5-17 questionnaires .................................................................................................. 440
DQ.2. Birth date reporting ...................................................................................................... 441 Table DQ.2.1: Birth date reporting (household population) .............................................. 441 Table DQ.2.2W: Birth date and age reporting (women) .................................................... 442 Table DQ.2.2M: Birth date and age reporting (men) ......................................................... 443 Table DQ.2.3: Birth date reporting (first and last births) ................................................... 444 Table DQ.2.4: Birth date and age reporting (children under age 5 years) .......................... 445 Table DQ.2.5: Birth date reporting (children age 5-17 years) ............................................ 446
DQ.3 Completeness and measurements ................................................................................. 447 Table DQ.3.1: Completeness of salt iodisation testing ...................................................... 447 Table DQ.3.2: Completeness and quality of information of water quality testing .............. 448 Table DQ.3.3W: Completeness of information on dates of marriage/union and sexual intercourse (women) ...................................................................................... 448 Table DQ.3.3M: Completeness of information on dates of marriage/union and sexual intercourse (men) ........................................................................................... 449 Table DQ.3.4: Completeness of information for anthropometric indicators: Underweight .................................................................................................................... 449 Table DQ.3.5: Completeness of information for anthropometric indicators: Stunting ........................................................................................................................... 448 Table DQ.3.6: Completeness of information for anthropometric indicators: Wasting and overweight .................................................................................................. 450 Table DQ.3.7: Heaping in anthropometric measurements ................................................ 451
DQ.4. Observations ................................................................................................................. 452 Table DQ.4.1: Observation of bednets .............................................................................. 452 Table DQ.4.2: Observation of handwashing facility ........................................................... 453 Table DQ.4.3: Observation of birth certificates ................................................................. 454 Table DQ.4.4: Observation of vaccination records ............................................................ 456
DQ.5. School attendance ........................................................................................................ 457 Table DQ.5.1: School attendance by single age ................................................................. 457
DQ.6. Birth history .................................................................................................................. 458 Table DQ.6.1: Sex ratio at birth among children ever born and living ................................ 458 Table DQ.6.2: Births by periods preceding the survey ....................................................... 459 Table DQ.6.3: Reporting of age at death in days ............................................................... 460 Table DQ.6.4: Reporting of age at death in months .......................................................... 461
Appendix E. Questionnaires ........................................................................................................... 463
List of abbreviations ACT Artemisinin-based Combination Therapy AIDS Acquired Immune Deficiency Syndrome ARI Acute Respiratory Infection ASFR Age Specific Fertility Rates BCG Bacillus Calmette-Guérin (Tuberculosis) C-section Caesarean section CAPI Computer-Assisted Personal Interviewing CBR Crude Birth Rate CRC Convention on the Rights of the Child CSPro Census and Survey Processing System DTP Diphtheria, Tetanus, and Pertussis E. coli Escherichia coli ECDI Early Child Development Index FCT Field Check Tables GAM Global AIDS Monitoring GFR General Fertility Rate GPI Gender Parity Index Hib Haemophilus influenzae type B HIV Human Immunodeficiency Virus ICT Information and Communication Technology IDD Iodine Deficiency Disorders IFSS Internet File Streaming System IPTp Intermittent Preventive Treatment for malaria in pregnancy IPV Inactivated Polio Vaccine ITN Insecticide-Treated Net IYCF Infant and Young Child Feeding JMP WHO/UNICEF Joint Monitoring Programme for Water Supply, Sanitation and Hygiene LLECE The Latin American Laboratory for Assessment of the Quality of Education LSB Lao Statistics Bureau LSIS Lao Social Indicator Survey LPG Liquefied Petroleum Gas MDG Millennium Development Goals MICS Multiple Indicator Cluster Survey MICS6 Sixth global round of Multiple Indicator Clusters Surveys programme MMR Measles, Mumps, and Rubella NSEDP National Socio-Economic Development Plan ORS Oral Rehydration Salt Solution OPV Oral Polio Vaccine ORT Oral Rehydration Therapy PASEC The Programme for the Analysis of Education Systems PNC Post-natal Care ppm Parts Per Million SDGs Sustainable Development Goals SP Sulfadoxine-Pyrimethamine SPSS Statistical Package for Social Sciences TFR Total Fertility Rate UN United Nations UNGASS United Nations General Assembly Special Session on HIV/AIDS UNICEF United Nations Children’s Fund USAID-ICF United States Agency for International Development – Inner City Fund WASH Water, Sanitation and Hygiene WG Washington Group on Disability Statistics WHO World Health Organization
XII
Foreword
The Lao Social Indicator Survey (LSIS) II conducted in 2017 is a nation-wide household based survey with a sample size of 23,400, covering all 18 provinces. It aims to generate data at provincial level disaggregated by age, residence, sex, wealth quantile and ethnic groups.
LSIS II followed the Sixth global round of the Multiple Cluster Indicator Survey programme (MICS6) platform and modules focusing to generate the new data requirements of the SDGs. LSIS II includes 6 questionnaires: 1 for household including salt testing; 1 for women 15-49 years of age; 1 for men 15-49 years of age; 1 for children 5-17 years of age; 1 for children under five (administered to their mothers or care takers) including anthropometry; and 1 for water quality testing of source and household drinking water. The specific add-on questionnaires of abortion have been included in the women questionnaires as well as anemia testing for children 6 to 59 months and women 15-49 years.
LSIS II provides up-to-date information needed for the selection of data on key social development indicators to monitor the Sustainable Development Goals (SDGs) especially key inputs for the ongoing Voluntary National Report on SDG, 2018. This will provide a baseline for the 8th National Socio-Economic Development Plan (NSEDP) and provincial development plans including the inputs for upcoming Mid-Term Review of the 8th NSEDP, and support the country’s graduation from Least Developed Country by 2020.
On this occasion, on behalf of the Lao Government and, in particular, the Steering Committee, I would like to express my sincere thanks to all government agencies, international organizations for their valuable support to the conduct of the LSIS II. We hope this report will serve as a useful source of information and data for evidence based planning policies, decision-making and in-depth research and also hope that it will be contribution of ideas and suggestion of feedback to further improve in the next survey and to provide appropriate needs of orientations for decision making and policy planning and to serve for user’s need of using data both inside and outside of the country.
______________________
Dr. Samaychan Boupha
Vice Minister, Head of Lao Statistics Bureau
Ministry of Planning and Investment
Acknowledgements
On behalf of the Steering Committee of the survey, we would like to extend our sincere thanks to all organizations and individuals who have contributed to making this survey a success, especially the Lao Statistics Bureau, Ministry of Planning and Investment, Ministry of Health and Ministry of Education and Sports for leading and implementing the entire survey. We would also like to express our special thanks to the LSIS II Steering Committee for their leadership and guidance of the survey, the Technical Task Force for advising and supporting the survey, and the Secretariat Group for organizing and dealing with day-to-day work.
We acknowledge the great contribution of the MICS Global and Regional team and USAID – ICF for overall technical support throughout the survey.
Special thanks are extended to 175 enumerators, measurers and supervisors especially from the Provincial Statistics Centers, Provincial Health Offices in each province for being intensively involved in field data collection and monitoring. All Committees at all levels have played a very critical role in the successful achievement of the survey, and its high standard of quality.
We would like to also extend our sincere appreciation to the United Nations Children’s Fund (UNICEF), Global MICS Team, United Nations Population Fund (UNFPA) and USAID - ICF International for their support that made the survey possible. Special thanks to European Union (EU), Luxembourg Government, United States Agency for International Development (USAID), Swiss Development Cooperation (SDC), United Nations Development Programmes (UNDP), World Food Programme (WFP), World Health Organization (WHO), and Japan International Cooperation Agency (JICA).
XIII
Acknowledgements
On behalf of the Steering Committee of the survey, we would like to extend our sincere thanks to all organizations and individuals who have contributed to making this survey a success, especially the Lao Statistics Bureau, Ministry of Planning and Investment, Ministry of Health and Ministry of Education and Sports for leading and implementing the entire survey. We would also like to express our special thanks to the LSIS II Steering Committee for their leadership and guidance of the survey, the Technical Task Force for advising and supporting the survey, and the Secretariat Group for organizing and dealing with day-to-day work.
We acknowledge the great contribution of the MICS Global and Regional team and USAID – ICF for overall technical support throughout the survey.
Special thanks are extended to 175 enumerators, measurers and supervisors especially from the Provincial Statistics Centers, Provincial Health Offices in each province for being intensively involved in field data collection and monitoring. All Committees at all levels have played a very critical role in the successful achievement of the survey, and its high standard of quality.
We would like to also extend our sincere appreciation to the United Nations Children’s Fund (UNICEF), Global MICS Team, United Nations Population Fund (UNFPA) and USAID - ICF International for their support that made the survey possible. Special thanks to European Union (EU), Luxembourg Government, United States Agency for International Development (USAID), Swiss Development Cooperation (SDC), United Nations Development Programmes (UNDP), World Food Programme (WFP), World Health Organization (WHO), and Japan International Cooperation Agency (JICA).
1
1
I. Introduction
1.1 Background The Lao Social Indicator Survey (LSIS) II provides a set of single national figure on social indicators. It combines the Multiple Indicator Cluster Survey (MICS) and the Demographic and Health Survey modules to maximise government resources for a nationally representative sample survey. LSIS II follows the first LSIS I survey which was carried out in 2011-12 jointly by the Ministry of Health (MoH) and the Lao Statistics Bureau (LSB) of the Ministry of Planning and Investment in collaboration with other line ministries. The LSIS I provided baseline data for the 7th National Socio-Economic Development Plan (NSEDP) and the Millennium Development Goals.
1.2 Survey Objectives The LSISII 2017 of Lao PDR has as its primary objectives:
• To provide up-to-date information that will assist with the selection of data on key social development indicators to support the monitoring of the Sustainable Development Goals (SDGs);
• To establish a baseline for national development plans and priorities including the 8th National Socio-Economic Development Plan (NSEDP), provincial core social development indicators data, as well as supporting the data for Least Developed Country Graduation;
• To produce a range of population and social indicators that are statistically sound and based on internationally comparable methodology and best practices; and
• To continue reinforcing coordination mechanisms on supporting and strengthening social statistics in Lao PDR and making use of its findings to formulate and advocate for policies, programme formulation and monitoring.
The financial and technical support for LSIS II was provided by the Government of Lao PDR, the United Nations Children’s Fund (UNICEF), Global MICS Team, United Nations Population Fund (UNFPA), European Union (EU), Luxembourg Government, United States Agency for International Development (USAID), Swiss Development Cooperation (SDC), World Food Programme (WFP), World Health Organization (WHO) and Japan International Cooperation Agency (JICA). This report presents the results on all of the indicators and topics covered in the survey.

2
3
2 SURVEY METHODOLOGY
This chapter provides a brief description of the survey methodology. It provides information on the sample design and other steps of the survey implementation from questionnaires, ethical protocol, data processing, training, fieldwork implementation, data quality measures, analysis and data sharing.
How to read tables
The tables in this report present data collected through the LSIS II, 2017, intuitively easy to understand. However, the reader should be aware of the following:
Values in parenthesis indicate that the percentage or proportion is based on 25–49 unweighted cases and should be treated with caution. An asterisk in table cells indicate that the percentage or proportion has been suppressed because it is based on fewer than 25 unweighted cases while a dash denotes shown no unweighted cases.
2.1 SAMPLE DESIGN
The sample for the Lao Social Indicator Survey, 2017 was designed to provide estimates for a large number of indicators on the situation of children and women at the national level, for urban and rural areas, including rural with roads and rural without roads, for three regions including: North, Central and South and 18 provinces including: Vientiane Capital, Phongsaly, Luangnamtha, Oudomxay, Bokeo, Luangprabang, Huaphanh, Xayabury, Xiengkhuang, Vientinae, Borikhamxay, Khammuane, Savannakhet, Saravane, Sekong, Champasack, Attapeu and Xaysomboun . The urban and rural areas within each province were identified as the main sampling strata and the sample of households was selected in two stages. Within each stratum, a specified number of census enumeration areas were selected systematically with probability proportional to size. After a household listing was carried out within the selected enumeration areas, a systematic sample of 20 households was drawn from each sample enumeration area. Five out of the 1,170 selected enumeration areas were not visited because of the reasons listed below:
- Clusters inaccessible due to extremely poor road conditions requiring long time for travel; - After the listing exercise, households moved out due to infrastructure development project; - Merging of village to neighbouring villages during the fieldwork period.
The LSIS II sample is not self-weighting and for reporting survey results, sample weights are used. A more detailed description of the sample design and computation of sample weights can be found in Appendix A: Sample Design.
2.2 QUESTIONNAIRES
Six questionnaires were used in the survey: 1) a household questionnaire which was used to collect basic demographic information on all de jure household members (usual residents), the household, and the dwelling; 2) a water quality testing questionnaire administered in three households in each cluster of the sample; 3) a questionnaire for individual women administered in each household to all women age 15-49 years; 4) a questionnaire for individual men administered in every second household to all men age 15-49 years; 5) an under-5 questionnaire, administered to mothers (or caretakers) of all children under 5 living in the household; and 6) a questionnaire for children age 5-17 years, administered to the mother (or caretaker) of one randomly selected child age 5-17 years living in the household. Questionnaires to capture anthropometry measurements among children under 5 years and to record anaemia test results for children under 5 years and women age 15-19 years also form part of the LSIS II questionnaires. The LSIS II 2017 included the following modules:
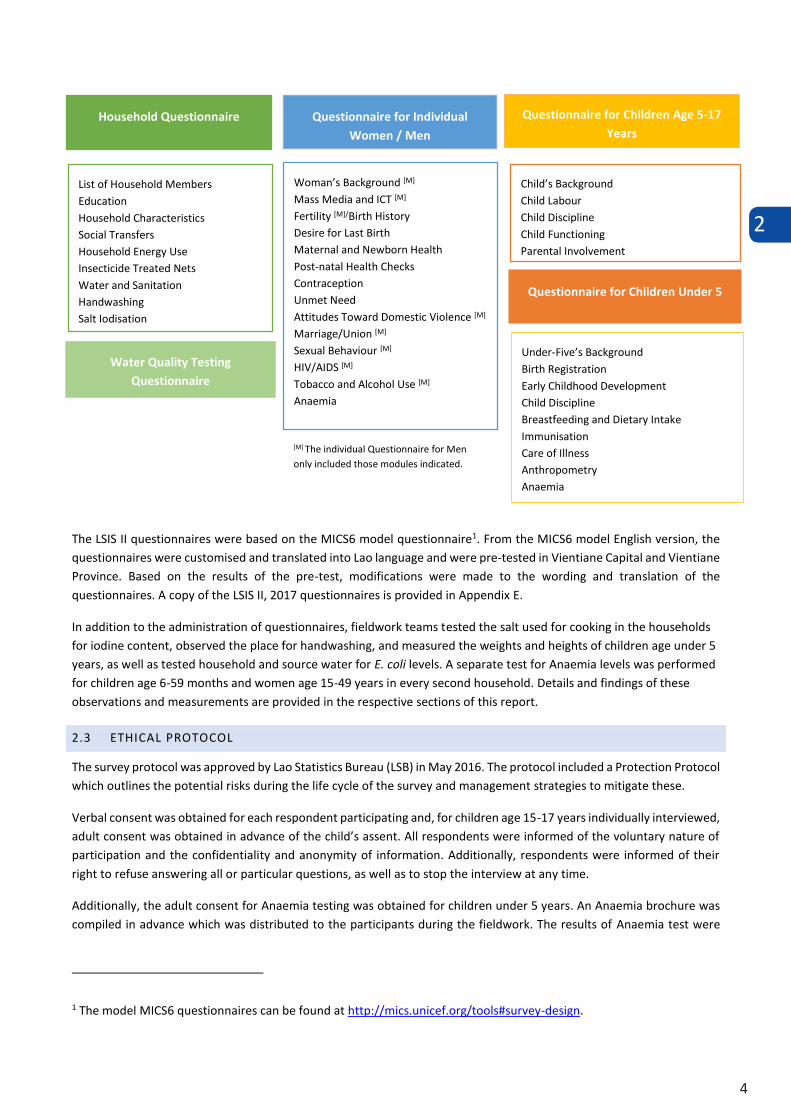
2
4
The LSIS II questionnaires were based on the MICS6 model questionnaire1. From the MICS6 model English version, the questionnaires were customised and translated into Lao language and were pre-tested in Vientiane Capital and Vientiane Province. Based on the results of the pre-test, modifications were made to the wording and translation of the questionnaires. A copy of the LSIS II, 2017 questionnaires is provided in Appendix E.
In addition to the administration of questionnaires, fieldwork teams tested the salt used for cooking in the households for iodine content, observed the place for handwashing, and measured the weights and heights of children age under 5 years, as well as tested household and source water for E. coli levels. A separate test for Anaemia levels was performed for children age 6-59 months and women age 15-49 years in every second household. Details and findings of these observations and measurements are provided in the respective sections of this report.
2.3 ETHICAL PROTOCOL
The survey protocol was approved by Lao Statistics Bureau (LSB) in May 2016. The protocol included a Protection Protocol which outlines the potential risks during the life cycle of the survey and management strategies to mitigate these.
Verbal consent was obtained for each respondent participating and, for children age 15-17 years individually interviewed, adult consent was obtained in advance of the child’s assent. All respondents were informed of the voluntary nature of participation and the confidentiality and anonymity of information. Additionally, respondents were informed of their right to refuse answering all or particular questions, as well as to stop the interview at any time.
Additionally, the adult consent for Anaemia testing was obtained for children under 5 years. An Anaemia brochure was compiled in advance which was distributed to the participants during the fieldwork. The results of Anaemia test were
1 The model MICS6 questionnaires can be found at http://mics.unicef.org/tools#survey-design.
Household Questionnaire Questionnaire for Individual Women / Men
Questionnaire for Children Under 5
List of Household Members Education Household Characteristics Social Transfers Household Energy Use Insecticide Treated Nets Water and Sanitation Handwashing Salt Iodisation
Woman’s Background [M] Mass Media and ICT [M] Fertility [M]/Birth History Desire for Last Birth Maternal and Newborn Health Post-natal Health Checks Contraception Unmet Need Attitudes Toward Domestic Violence [M] Marriage/Union [M] Sexual Behaviour [M] HIV/AIDS [M] Tobacco and Alcohol Use [M] Anaemia
Child’s Background Child Labour Child Discipline Child Functioning Parental Involvement
Questionnaire for Children Age 5-17 Years
Under-Five’s Background Birth Registration Early Childhood Development Child Discipline Breastfeeding and Dietary Intake Immunisation Care of Illness Anthropometry Anaemia
Water Quality Testing Questionnaire
[M] The individual Questionnaire for Men only included those modules indicated.
2
5
The LSIS II questionnaires were based on the MICS6 model questionnaire1. From the MICS6 model English version, the questionnaires were customised and translated into Lao language and were pre-tested in Vientiane Capital and Vientiane Province. Based on the results of the pre-test, modifications were made to the wording and translation of the questionnaires. A copy of the LSIS II, 2017 questionnaires is provided in Appendix E.
In addition to the administration of questionnaires, fieldwork teams tested the salt used for cooking in the households for iodine content, observed the place for handwashing, and measured the weights and heights of children age under 5 years, as well as tested household and source water for E. coli levels. A separate test for Anaemia levels was performed for children age 6-59 months and women age 15-49 years in every second household. Details and findings of these observations and measurements are provided in the respective sections of this report.
2.3 ETHICAL PROTOCOL
The survey protocol was approved by Lao Statistics Bureau (LSB) in May 2016. The protocol included a Protection Protocol which outlines the potential risks during the life cycle of the survey and management strategies to mitigate these.
Verbal consent was obtained for each respondent participating and, for children age 15-17 years individually interviewed, adult consent was obtained in advance of the child’s assent. All respondents were informed of the voluntary nature of participation and the confidentiality and anonymity of information. Additionally, respondents were informed of their right to refuse answering all or particular questions, as well as to stop the interview at any time.
Additionally, the adult consent for Anaemia testing was obtained for children under 5 years. An Anaemia brochure was compiled in advance which was distributed to the participants during the fieldwork. The results of Anaemia test were
1 The model MICS6 questionnaires can be found at http://mics.unicef.org/tools#survey-design.
Household Questionnaire Questionnaire for Individual Women / Men
Questionnaire for Children Under 5
List of Household Members Education Household Characteristics Social Transfers Household Energy Use Insecticide Treated Nets Water and Sanitation Handwashing Salt Iodisation
Woman’s Background [M] Mass Media and ICT [M] Fertility [M]/Birth History Desire for Last Birth Maternal and Newborn Health Post-natal Health Checks Contraception Unmet Need Attitudes Toward Domestic Violence [M] Marriage/Union [M] Sexual Behaviour [M] HIV/AIDS [M] Tobacco and Alcohol Use [M] Anaemia
Child’s Background Child Labour Child Discipline Child Functioning Parental Involvement
Questionnaire for Children Age 5-17 Years
Under-Five’s Background Birth Registration Early Childhood Development Child Discipline Breastfeeding and Dietary Intake Immunisation Care of Illness Anthropometry Anaemia
Water Quality Testing Questionnaire
[M] The individual Questionnaire for Men only included those modules indicated.
shared with respondents who were informed on their deficiency level of haemoglobin. In cases of severe levels of deficiencies identified (less than 7.0 g/dl), a letter for referral to medical facility was issued.
2.4 DATA COLLECTION METHOD
MICS surveys utilise Computer-Assisted Personal Interviewing (CAPI). The data collection application was based on the CSPro (Census and Survey Processing System) software, Version 6.3, including a MICS dedicated data management platform. Procedures and standard programs2 developed under the global MICS programme and adapted to the LSIS II, 2017 questionnaire were used throughout. The CAPI application was tested in Vientiane Capital and Vientiane Province. Based on the results of the CAPI-test, modifications were made to the questionnaires and application.
2.5 TRAINING
Training for the fieldwork was conducted for 31 days during June and July, 2017. Training included lectures on interviewing techniques and the contents of the questionnaires, and mock interviews between trainees to gain practice in asking questions. Participants were trained to collecting data using paper questionnaires as well as tablets/CAPI application. The trainees spent three days in field practise and one day on a full pilot survey in Vientiane province. The standard MICS training agenda was customized for LSIS II training.3
Measurers received dedicated training on anthropometric measurements and water quality testing for a total of 9 days, including three days in field practise and pilot survey.
Field Supervisors attended additional training on the duties of team supervision and responsibilities.
2.6 FIELDWORK
The data were collected by 25 teams; each was comprised of four interviewers, one driver, two measurers and a supervisor. Fieldwork began in July, 2017 and concluded in November, 2017.
Data was collected using tablet computers running the Windows 10 operating system, utilising a Bluetooth data transfer application for field operations, enabling transfer of assignments and completed questionnaires between supervisor’s and interviewer’s tablets.
2.7 FIELDWORK QUALITY CONTROL MEASURES
Team supervisors were responsible for daily monitoring of the fieldwork. Forced re-interviewing was implemented on one randomly selected household per cluster. Daily observations of interviewer skills and performance was conducted.
During the fieldwork period, each team was visited multiple times by survey management team members and field visits were arranged for UNICEF MICS Team members.
The Field check tables (FCTs) were being produced for analysis and action with field teams.4
2.8 DATA MANAGEMENT, EDITING AND ANALYSIS
Data were received at the LSB via Internet File Streaming System (IFSS) integrated into the management application on the supervisors’ tablets. The central office communicated application updates through this system to field teams.
2 The standard MICS6 data collection application can be found at http://mics.unicef.org/tools#data-processing. 3 The template training agenda can be found at http://mics.unicef.org/tools#survey-design. 4 The standard field check tables can be found at http://mics.unicef.org/tools#data-collection
2
6
During data collection and following completion of fieldwork, data were edited according to editing process described in detail in the Guidelines for Secondary Editing, a customised version of the standard MICS6 documentation.5
Data were analysed using the Statistical Package for Social Sciences (SPSS) software, Version 23. Model syntax and tabulation plans developed by UNICEF were customized and used for this purpose.6
2.9 DATA SHARING
Unique identifiers such as location and names collected during interviews were removed from datasets to ensure privacy. These anonymised data files are made available on the MICS website7 and can be freely downloaded for legitimate research purposes. Users are required to submit final research to entities listed in the included readme file, strictly for information purposes.
Archiving of data and survey tools was done throughout the process of implementation of the survey. Full datasets, SPSS syntaxes and other corresponding survey documentation have been archived within the LSB and shared with MICS Global team.
5 The standard guidelines can be found at http://mics.unicef.org/tools#data-processing. 6 The standard tabulation plan and syntax files can be found at http://mics.unicef.org/tools#analysis. 7 The survey datasets can be found at http://mics.unicef.org/surveys

2
7
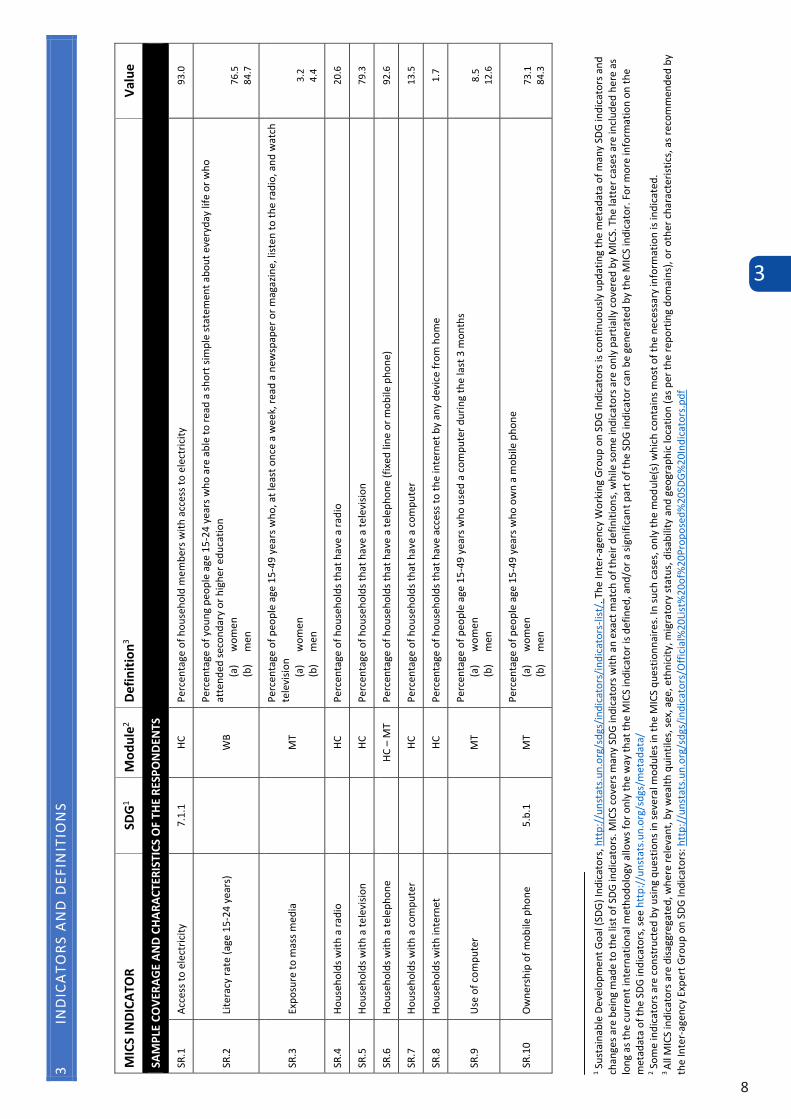
3
8
3 IN
DIC
ATO
RS A
ND
DEF
INIT
ION
S
M
ICS
INDI
CATO
R SD
G1 M
odul
e2 De
finiti
on3
Valu
e
SAM
PLE
COVE
RAGE
AND
CHA
RACT
ERIS
TICS
OF T
HE R
ESPO
NDEN
TS
SR.1
Ac
cess
to e
lect
ricity
7.
1.1
HC
Perc
enta
ge o
f hou
seho
ld m
embe
rs w
ith a
cces
s to
elec
trici
ty
93.0
SR.2
Lit
erac
y ra
te (a
ge 1
5-24
yea
rs)
W
B
Perc
enta
ge o
f you
ng p
eopl
e ag
e 15
-24
year
s who
are
abl
e to
read
a sh
ort s
impl
e st
atem
ent a
bout
eve
ryda
y lif
e or
who
at
tend
ed se
cond
ary
or h
ighe
r edu
catio
n (a
) w
omen
(b
) m
en
76.5
84
.7
SR.3
Ex
posu
re to
mas
s med
ia
M
T
Perc
enta
ge o
f peo
ple
age
15-4
9 ye
ars w
ho, a
t lea
st o
nce
a w
eek,
read
a n
ewsp
aper
or m
agaz
ine,
list
en to
the
radi
o, a
nd w
atch
te
levi
sion
(a)
wom
en
(b)
men
3.
2 4.
4
SR.4
Ho
useh
olds
with
a ra
dio
HC
Pe
rcen
tage
of h
ouse
hold
s tha
t hav
e a
radi
o 20
.6
SR.5
Ho
useh
olds
with
a te
levi
sion
HC
Pe
rcen
tage
of h
ouse
hold
s tha
t hav
e a
tele
visio
n 79
.3
SR.6
Ho
useh
olds
with
a te
leph
one
HC
– M
T Pe
rcen
tage
of h
ouse
hold
s tha
t hav
e a
tele
phon
e (fi
xed
line
or m
obile
pho
ne)
92.6
SR.7
Ho
useh
olds
with
a co
mpu
ter
HC
Pe
rcen
tage
of h
ouse
hold
s tha
t hav
e a
com
pute
r 13
.5
SR.8
Ho
useh
olds
with
inte
rnet
HC
Perc
enta
ge o
f hou
seho
lds t
hat h
ave
acce
ss to
the
inte
rnet
by
any
devi
ce fr
om h
ome
1.7
SR.9
Us
e of
com
pute
r
MT
Perc
enta
ge o
f peo
ple
age
15-4
9 ye
ars w
ho u
sed
a co
mpu
ter d
urin
g th
e la
st 3
mon
ths
(a)
wom
en
(b)
men
8.
5 12
.6
SR.1
0 Ow
ners
hip
of m
obile
pho
ne
5.b.
1 M
T Pe
rcen
tage
of p
eopl
e ag
e 15
-49
year
s who
ow
n a
mob
ile p
hone
(a
) w
omen
(b
) m
en
73.1
84
.3
1 Sus
tain
able
Dev
elop
men
t Goa
l (SD
G) In
dica
tors
, htt
p://
unst
ats.u
n.or
g/sd
gs/in
dica
tors
/indi
cato
rs-li
st/.
The
Inte
r-age
ncy
Wor
king
Gro
up o
n SD
G In
dica
tors
is co
ntin
uous
ly u
pdat
ing
the
met
adat
a of
man
y SD
G in
dica
tors
and
ch
ange
s are
bei
ng m
ade
to th
e lis
t of S
DG in
dica
tors
. MIC
S co
vers
man
y SD
G in
dica
tors
with
an
exac
t mat
ch o
f the
ir de
finiti
ons,
whi
le so
me
indi
cato
rs a
re o
nly
part
ially
cove
red
by M
ICS.
The
latt
er ca
ses a
re in
clude
d he
re a
s lo
ng a
s the
curr
ent i
nter
natio
nal m
etho
dolo
gy a
llow
s for
onl
y th
e w
ay th
at th
e M
ICS
indi
cato
r is d
efin
ed, a
nd/o
r a si
gnifi
cant
par
t of t
he S
DG in
dica
tor c
an b
e ge
nera
ted
by th
e M
ICS
indi
cato
r. Fo
r mor
e in
form
atio
n on
the
met
adat
a of
the
SDG
indi
cato
rs, s
ee h
ttp:
//un
stat
s.un.
org/
sdgs
/met
adat
a/
2 Som
e in
dica
tors
are
cons
truc
ted
by u
sing
ques
tions
in se
vera
l mod
ules
in th
e M
ICS
ques
tionn
aire
s. In
such
case
s, on
ly th
e m
odul
e(s)
whi
ch co
ntai
ns m
ost o
f the
nec
essa
ry in
form
atio
n is
indi
cate
d.
3 Al
l MIC
S in
dica
tors
are
disa
ggre
gate
d, w
here
rele
vant
, by
wea
lth q
uint
iles,
sex,
age
, eth
nicit
y, m
igra
tory
stat
us, d
isabi
lity
and
geog
raph
ic lo
catio
n (a
s per
the
repo
rtin
g do
mai
ns),
or o
ther
char
acte
ristic
s, as
reco
mm
ende
d by
th
e In
ter-a
genc
y Ex
pert
Gro
up o
n SD
G In
dica
tors
: htt
p://
unst
ats.u
n.or
g/sd
gs/in
dica
tors
/Offi
cial%
20Lis
t%20
of%
20Pr
opos
ed%
20SD
G%20
Indi
cato
rs.p
df
MIC
S IN
DICA
TOR
SDG1
Mod
ule2
Defin
ition
3 Va
lue
SR.1
1 Us
e of
mob
ile p
hone
M
T Pe
rcen
tage
of p
eopl
e ag
e 15
-49
who
use
d a
mob
ile te
leph
one
durin
g th
e la
st 3
mon
ths
(a)
wom
en
(b)
men
79
.6
87.1
SR.1
2a
Use
of in
tern
et
(dur
ing
last
3 m
onth
s)
17.8
.1
MT
Perc
enta
ge o
f peo
ple
age
15-4
9 ye
ars w
ho u
sed
the
inte
rnet
dur
ing
the
last
3 m
onth
s (a
)w
omen
(b
)m
en
27.9
28
.5
SR.1
2b
Use
of in
tern
et
(at l
east
onc
e a
wee
k du
ring
the
last
3 m
onth
s)
MT
Perc
enta
ge o
f peo
ple
age
15-4
9 ye
ars w
ho u
sed
the
inte
rnet
at l
east
onc
e a
wee
k du
ring
the
last
3 m
onth
s (a
)w
omen
(b
)m
en
26.6
26
.2
SR.1
3 IC
T sk
ills
4.4.
1 M
T Pe
rcen
tage
of p
eopl
e ag
e 15
-49
year
s who
hav
e ca
rrie
d ou
t at l
east
one
of n
ine
spec
ific c
ompu
ter r
elat
ed a
ctiv
ities
(a
)w
omen
(b
)m
en
7.3
11.9
SR.1
4 Us
e of
toba
cco
3.a.
1 TA
Perc
enta
ge o
f peo
ple
age
15-4
9 ye
ars w
ho sm
oked
ciga
rett
es o
r use
d sm
oked
or s
mok
eles
s tob
acco
pro
duct
s at a
ny ti
me
durin
g th
e la
st o
ne m
onth
(a
)w
omen
(b
)m
en
7.2
43.5
SR.1
5 Sm
okin
g be
fore
age
15
TA
Perc
enta
ge o
f peo
ple
age
15-4
9 ye
ars w
ho sm
oked
a w
hole
ciga
rett
e be
fore
age
15
(a)
wom
en
(b)
men
2.
1 12
.7
SR.1
6 Us
e of
alco
hol
TA
Perc
enta
ge o
f peo
ple
age
15-4
9 ye
ars w
ho h
ad a
t lea
st o
ne a
lcoho
lic d
rink
at a
ny ti
me
durin
g th
e la
st o
ne m
onth
(a
)w
omen
(b
)m
en
31.0
65
.4
SR.1
7 Us
e of
alco
hol b
efor
e ag
e 15
TA
Pe
rcen
tage
of p
eopl
e ag
e 15
-49
year
s who
had
at l
east
one
alco
holic
drin
k be
fore
age
15
(a)
wom
en
(b)
men
11
.6
15.6
SR.1
8 Ch
ildre
n’s l
ivin
g ar
rang
emen
ts
HL
Perc
enta
ge o
f chi
ldre
n ag
e 0-
17 y
ears
livi
ng w
ith n
eith
er b
iolo
gica
l par
ent
7.5
SR.1
9 Pr
eval
ence
of c
hild
ren
with
one
or
bot
h pa
rent
s dea
d HL
Pe
rcen
tage
of c
hild
ren
age
0-17
yea
rs w
ith o
ne o
r bot
h bi
olog
ical p
aren
ts d
ead
4.8
SR.2
0 Ch
ildre
n w
ith a
t lea
st o
ne p
aren
t liv
ing
abro
ad
HL
Perc
enta
ge o
f chi
ldre
n ag
e 0-
17 y
ears
with
at l
east
one
bio
logi
cal p
aren
t liv
ing
abro
ad
2.9
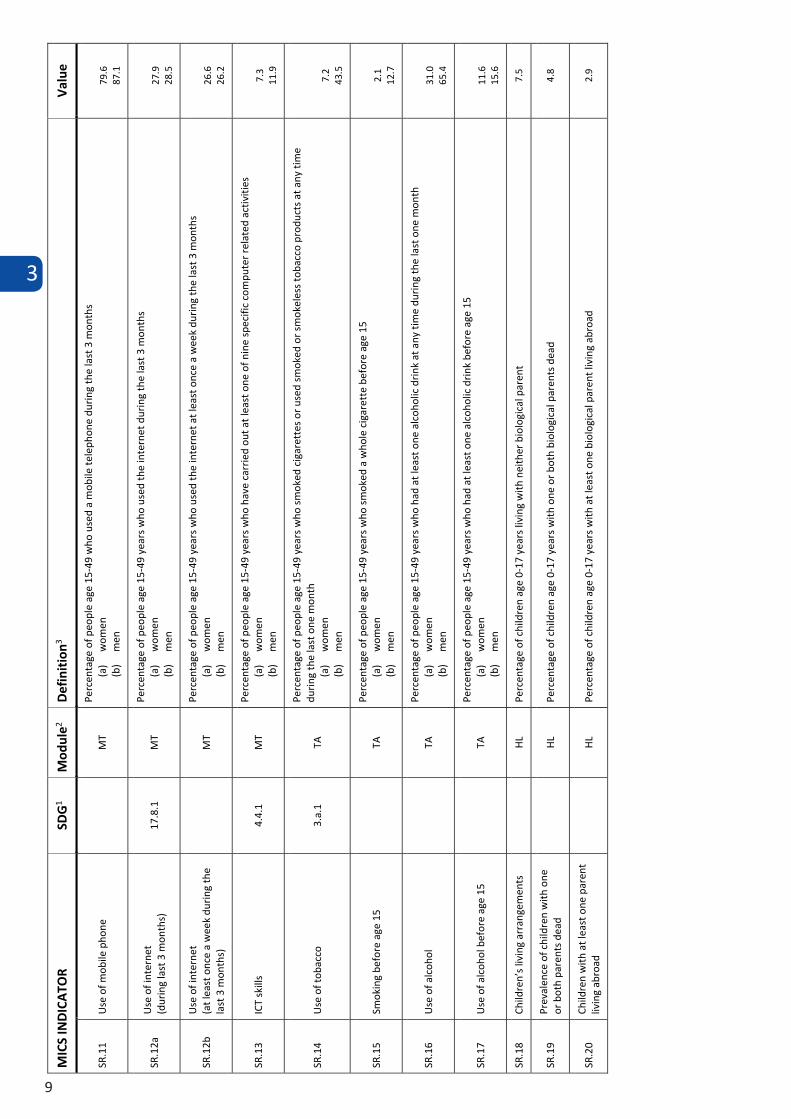
3
9
3 IN
DIC
ATO
RS A
ND
DEF
INIT
ION
S
M
ICS
INDI
CATO
R SD
G1 M
odul
e2 De
finiti
on3
Valu
e
SAM
PLE
COVE
RAGE
AND
CHA
RACT
ERIS
TICS
OF T
HE R
ESPO
NDEN
TS
SR.1
Ac
cess
to e
lect
ricity
7.
1.1
HC
Perc
enta
ge o
f hou
seho
ld m
embe
rs w
ith a
cces
s to
elec
trici
ty
93.0
SR.2
Lit
erac
y ra
te (a
ge 1
5-24
yea
rs)
W
B
Perc
enta
ge o
f you
ng p
eopl
e ag
e 15
-24
year
s who
are
abl
e to
read
a sh
ort s
impl
e st
atem
ent a
bout
eve
ryda
y lif
e or
who
at
tend
ed se
cond
ary
or h
ighe
r edu
catio
n (a
) w
omen
(b
) m
en
76.5
84
.7
SR.3
Ex
posu
re to
mas
s med
ia
M
T
Perc
enta
ge o
f peo
ple
age
15-4
9 ye
ars w
ho, a
t lea
st o
nce
a w
eek,
read
a n
ewsp
aper
or m
agaz
ine,
list
en to
the
radi
o, a
nd w
atch
te
levi
sion
(a)
wom
en
(b)
men
3.
2 4.
4
SR.4
Ho
useh
olds
with
a ra
dio
HC
Pe
rcen
tage
of h
ouse
hold
s tha
t hav
e a
radi
o 20
.6
SR.5
Ho
useh
olds
with
a te
levi
sion
HC
Pe
rcen
tage
of h
ouse
hold
s tha
t hav
e a
tele
visio
n 79
.3
SR.6
Ho
useh
olds
with
a te
leph
one
HC
– M
T Pe
rcen
tage
of h
ouse
hold
s tha
t hav
e a
tele
phon
e (fi
xed
line
or m
obile
pho
ne)
92.6
SR.7
Ho
useh
olds
with
a co
mpu
ter
HC
Pe
rcen
tage
of h
ouse
hold
s tha
t hav
e a
com
pute
r 13
.5
SR.8
Ho
useh
olds
with
inte
rnet
HC
Perc
enta
ge o
f hou
seho
lds t
hat h
ave
acce
ss to
the
inte
rnet
by
any
devi
ce fr
om h
ome
1.7
SR.9
Us
e of
com
pute
r
MT
Perc
enta
ge o
f peo
ple
age
15-4
9 ye
ars w
ho u
sed
a co
mpu
ter d
urin
g th
e la
st 3
mon
ths
(a)
wom
en
(b)
men
8.
5 12
.6
SR.1
0 Ow
ners
hip
of m
obile
pho
ne
5.b.
1 M
T Pe
rcen
tage
of p
eopl
e ag
e 15
-49
year
s who
ow
n a
mob
ile p
hone
(a
) w
omen
(b
) m
en
73.1
84
.3
1 Sus
tain
able
Dev
elop
men
t Goa
l (SD
G) In
dica
tors
, htt
p://
unst
ats.u
n.or
g/sd
gs/in
dica
tors
/indi
cato
rs-li
st/.
The
Inte
r-age
ncy
Wor
king
Gro
up o
n SD
G In
dica
tors
is co
ntin
uous
ly u
pdat
ing
the
met
adat
a of
man
y SD
G in
dica
tors
and
ch
ange
s are
bei
ng m
ade
to th
e lis
t of S
DG in
dica
tors
. MIC
S co
vers
man
y SD
G in
dica
tors
with
an
exac
t mat
ch o
f the
ir de
finiti
ons,
whi
le so
me
indi
cato
rs a
re o
nly
part
ially
cove
red
by M
ICS.
The
latt
er ca
ses a
re in
clude
d he
re a
s lo
ng a
s the
curr
ent i
nter
natio
nal m
etho
dolo
gy a
llow
s for
onl
y th
e w
ay th
at th
e M
ICS
indi
cato
r is d
efin
ed, a
nd/o
r a si
gnifi
cant
par
t of t
he S
DG in
dica
tor c
an b
e ge
nera
ted
by th
e M
ICS
indi
cato
r. Fo
r mor
e in
form
atio
n on
the
met
adat
a of
the
SDG
indi
cato
rs, s
ee h
ttp:
//un
stat
s.un.
org/
sdgs
/met
adat
a/
2 Som
e in
dica
tors
are
cons
truc
ted
by u
sing
ques
tions
in se
vera
l mod
ules
in th
e M
ICS
ques
tionn
aire
s. In
such
case
s, on
ly th
e m
odul
e(s)
whi
ch co
ntai
ns m
ost o
f the
nec
essa
ry in
form
atio
n is
indi
cate
d.
3 Al
l MIC
S in
dica
tors
are
disa
ggre
gate
d, w
here
rele
vant
, by
wea
lth q
uint
iles,
sex,
age
, eth
nicit
y, m
igra
tory
stat
us, d
isabi
lity
and
geog
raph
ic lo
catio
n (a
s per
the
repo
rtin
g do
mai
ns),
or o
ther
char
acte
ristic
s, as
reco
mm
ende
d by
th
e In
ter-a
genc
y Ex
pert
Gro
up o
n SD
G In
dica
tors
: htt
p://
unst
ats.u
n.or
g/sd
gs/in
dica
tors
/Offi
cial%
20Lis
t%20
of%
20Pr
opos
ed%
20SD
G%20
Indi
cato
rs.p
df
MIC
S IN
DICA
TOR
SDG1
Mod
ule2
Defin
ition
3 Va
lue
SR.1
1 Us
e of
mob
ile p
hone
M
T Pe
rcen
tage
of p
eopl
e ag
e 15
-49
who
use
d a
mob
ile te
leph
one
durin
g th
e la
st 3
mon
ths
(a)
wom
en
(b)
men
79
.6
87.1
SR.1
2a
Use
of in
tern
et
(dur
ing
last
3 m
onth
s)
17.8
.1
MT
Perc
enta
ge o
f peo
ple
age
15-4
9 ye
ars w
ho u
sed
the
inte
rnet
dur
ing
the
last
3 m
onth
s (a
)w
omen
(b
)m
en
27.9
28
.5
SR.1
2b
Use
of in
tern
et
(at l
east
onc
e a
wee
k du
ring
the
last
3 m
onth
s)
MT
Perc
enta
ge o
f peo
ple
age
15-4
9 ye
ars w
ho u
sed
the
inte
rnet
at l
east
onc
e a
wee
k du
ring
the
last
3 m
onth
s (a
)w
omen
(b
)m
en
26.6
26
.2
SR.1
3 IC
T sk
ills
4.4.
1 M
T Pe
rcen
tage
of p
eopl
e ag
e 15
-49
year
s who
hav
e ca
rrie
d ou
t at l
east
one
of n
ine
spec
ific c
ompu
ter r
elat
ed a
ctiv
ities
(a
)w
omen
(b
)m
en
7.3
11.9
SR.1
4 Us
e of
toba
cco
3.a.
1 TA
Perc
enta
ge o
f peo
ple
age
15-4
9 ye
ars w
ho sm
oked
ciga
rett
es o
r use
d sm
oked
or s
mok
eles
s tob
acco
pro
duct
s at a
ny ti
me
durin
g th
e la
st o
ne m
onth
(a
)w
omen
(b
)m
en
7.2
43.5
SR.1
5 Sm
okin
g be
fore
age
15
TA
Perc
enta
ge o
f peo
ple
age
15-4
9 ye
ars w
ho sm
oked
a w
hole
ciga
rett
e be
fore
age
15
(a)
wom
en
(b)
men
2.
1 12
.7
SR.1
6 Us
e of
alco
hol
TA
Perc
enta
ge o
f peo
ple
age
15-4
9 ye
ars w
ho h
ad a
t lea
st o
ne a
lcoho
lic d
rink
at a
ny ti
me
durin
g th
e la
st o
ne m
onth
(a
)w
omen
(b
)m
en
31.0
65
.4
SR.1
7 Us
e of
alco
hol b
efor
e ag
e 15
TA
Pe
rcen
tage
of p
eopl
e ag
e 15
-49
year
s who
had
at l
east
one
alco
holic
drin
k be
fore
age
15
(a)
wom
en
(b)
men
11
.6
15.6
SR.1
8 Ch
ildre
n’s l
ivin
g ar
rang
emen
ts
HL
Perc
enta
ge o
f chi
ldre
n ag
e 0-
17 y
ears
livi
ng w
ith n
eith
er b
iolo
gica
l par
ent
7.5
SR.1
9 Pr
eval
ence
of c
hild
ren
with
one
or
bot
h pa
rent
s dea
d HL
Pe
rcen
tage
of c
hild
ren
age
0-17
yea
rs w
ith o
ne o
r bot
h bi
olog
ical p
aren
ts d
ead
4.8
SR.2
0 Ch
ildre
n w
ith a
t lea
st o
ne p
aren
t liv
ing
abro
ad
HL
Perc
enta
ge o
f chi
ldre
n ag
e 0-
17 y
ears
with
at l
east
one
bio
logi
cal p
aren
t liv
ing
abro
ad
2.9
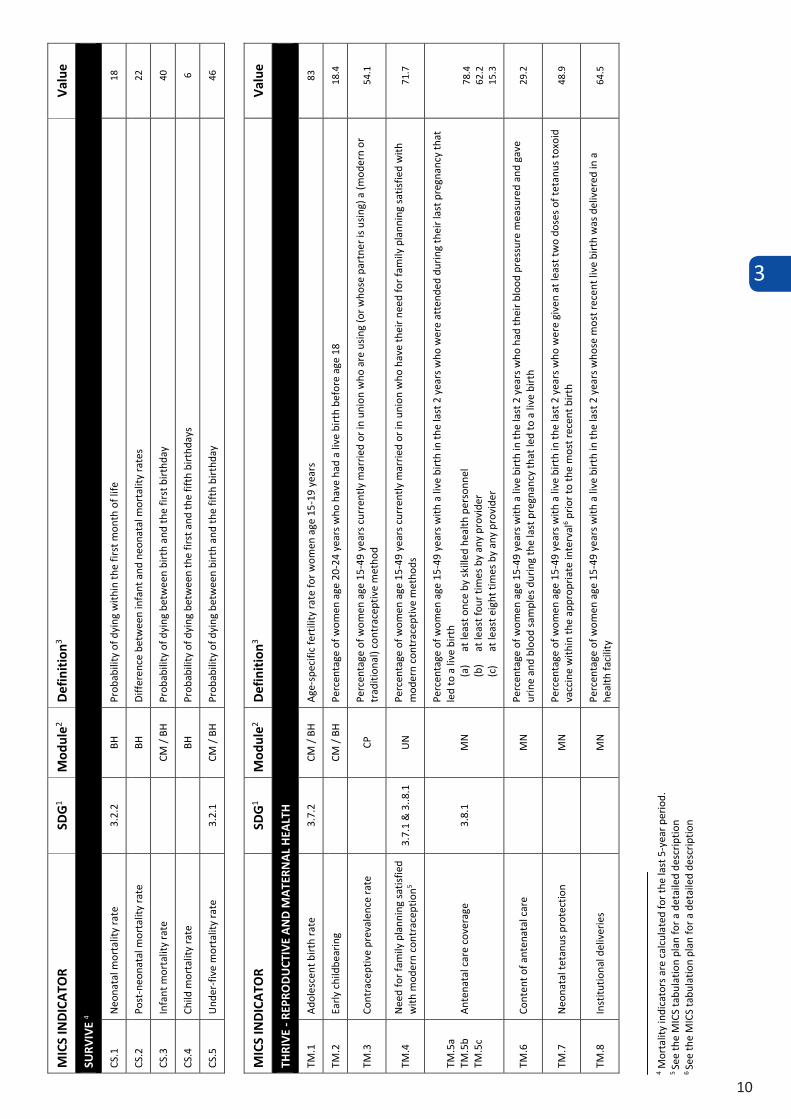
3
10
MIC
S IN
DICA
TOR
SDG1
Mod
ule2
Defin
ition
3 Va
lue
SURV
IVE
4
CS.1
Ne
onat
al m
orta
lity
rate
3.
2.2
BH
Prob
abili
ty o
f dyi
ng w
ithin
the
first
mon
th o
f life
18
CS.2
Po
st-n
eona
tal m
orta
lity
rate
BH
Diffe
renc
e be
twee
n in
fant
and
neo
nata
l mor
talit
y ra
tes
22
CS.3
In
fant
mor
talit
y ra
te
CM
/ BH
Pr
obab
ility
of d
ying
bet
wee
n bi
rth
and
the
first
birt
hday
40
CS.4
Ch
ild m
orta
lity
rate
BH
Prob
abili
ty o
f dyi
ng b
etw
een
the
first
and
the
fifth
birt
hday
s 6
CS.5
Un
der-f
ive
mor
talit
y ra
te
3.2.
1 CM
/ BH
Pr
obab
ility
of d
ying
bet
wee
n bi
rth
and
the
fifth
birt
hday
46
MIC
S IN
DICA
TOR
SDG1
Mod
ule2
Defin
ition
3 Va
lue
THRI
VE -
REPR
ODUC
TIVE
AND
MAT
ERNA
L HEA
LTH
TM.1
Ad
oles
cent
birt
h ra
te
3.7.
2 CM
/ BH
Ag
e-sp
ecifi
c fer
tility
rate
for w
omen
age
15-
19 y
ears
83
TM.2
Ea
rly ch
ildbe
arin
g
CM /
BH
Perc
enta
ge o
f wom
en a
ge 2
0-24
yea
rs w
ho h
ave
had
a liv
e bi
rth
befo
re a
ge 1
8 18
.4
TM.3
Co
ntra
cept
ive
prev
alen
ce ra
te
CP
Pe
rcen
tage
of w
omen
age
15-
49 y
ears
curr
ently
mar
ried
or in
uni
on w
ho a
re u
sing
(or w
hose
par
tner
is u
sing)
a (m
oder
n or
tr
aditi
onal
) con
trac
eptiv
e m
etho
d
54.1
TM.4
Ne
ed fo
r fam
ily p
lann
ing
satis
fied
with
mod
ern
cont
race
ptio
n5 3.
7.1
& 3
..8.1
UN
Pe
rcen
tage
of w
omen
age
15-
49 y
ears
curr
ently
mar
ried
or in
uni
on w
ho h
ave
thei
r nee
d fo
r fam
ily p
lann
ing
satis
fied
with
m
oder
n co
ntra
cept
ive
met
hods
71
.7
TM.5
a TM
.5b
TM.5
c An
tena
tal c
are
cove
rage
3.
8.1
MN
Perc
enta
ge o
f wom
en a
ge 1
5-49
yea
rs w
ith a
live
birt
h in
the
last
2 y
ears
who
wer
e at
tend
ed d
urin
g th
eir l
ast p
regn
ancy
that
le
d to
a li
ve b
irth
(a)
at le
ast o
nce
by sk
illed
hea
lth p
erso
nnel
(b
) at
leas
t fou
r tim
es b
y an
y pr
ovid
er
(c)
at le
ast e
ight
tim
es b
y an
y pr
ovid
er
78.4
62
.2
15.3
TM.6
Co
nten
t of a
nten
atal
care
MN
Perc
enta
ge o
f wom
en a
ge 1
5-49
yea
rs w
ith a
live
birt
h in
the
last
2 y
ears
who
had
thei
r blo
od p
ress
ure
mea
sure
d an
d ga
ve
urin
e an
d bl
ood
sam
ples
dur
ing
the
last
pre
gnan
cy th
at le
d to
a li
ve b
irth
29.2
TM.7
Ne
onat
al te
tanu
s pro
tect
ion
MN
Perc
enta
ge o
f wom
en a
ge 1
5-49
yea
rs w
ith a
live
birt
h in
the
last
2 y
ears
who
wer
e gi
ven
at le
ast t
wo
dose
s of t
etan
us to
xoid
va
ccin
e w
ithin
the
appr
opria
te in
terv
al6 p
rior t
o th
e m
ost r
ecen
t birt
h 48
.9
TM.8
In
stitu
tiona
l del
iver
ies
M
N Pe
rcen
tage
of w
omen
age
15-
49 y
ears
with
a li
ve b
irth
in th
e la
st 2
yea
rs w
hose
mos
t rec
ent l
ive
birt
h w
as d
eliv
ered
in a
he
alth
facil
ity
64.5
4 Mor
talit
y in
dica
tors
are
calcu
late
d fo
r the
last
5-y
ear p
erio
d.
5 Se
e th
e M
ICS
tabu
latio
n pl
an fo
r a d
etai
led
desc
riptio
n 6
See
the
MIC
S ta
bula
tion
plan
for a
det
aile
d de
scrip
tion
MIC
S IN
DICA
TOR
SDG1
Mod
ule2
Defin
ition
3 Va
lue
TM.9
Sk
illed
att
enda
nt a
t del
iver
y 3.
1.2
MN
Perc
enta
ge o
f wom
en a
ge 1
5-49
yea
rs w
ith a
live
birt
h in
the
last
2 y
ears
who
wer
e at
tend
ed b
y sk
illed
hea
lth p
erso
nnel
du
ring
thei
r mos
t rec
ent l
ive
birt
h 64
.4
TM.1
0 Ca
esar
ean
sect
ion
M
N Pe
rcen
tage
of w
omen
age
15-
49 y
ears
with
a li
ve b
irth
in th
e la
st 2
yea
rs w
hose
mos
t rec
ent l
ive
birt
h w
as d
eliv
ered
by
caes
area
n se
ctio
n 5.
8
TM.1
1 Ch
ildre
n w
eigh
ed a
t birt
h
MN
Perc
enta
ge o
f mos
t rec
ent l
ive
birt
hs in
the
last
2 y
ears
who
wer
e w
eigh
ed a
t birt
h 67
.4
TM.1
2 Po
st-p
artu
m st
ay in
hea
lth fa
cility
PN
Perc
enta
ge o
f wom
en a
ge 1
5-49
yea
rs w
ith a
live
birt
h in
the
last
2 y
ears
who
stay
ed in
the
heal
th fa
cility
for 1
2 ho
urs o
r mor
e af
ter t
he d
eliv
ery
of th
eir m
ost r
ecen
t liv
e bi
rth
72.4
TM.1
3 Po
st-n
atal
hea
lth ch
eck
for t
he
new
born
PN
Perc
enta
ge o
f las
t liv
e bi
rths
in th
e la
st 2
yea
rs w
ho re
ceiv
ed a
hea
lth ch
eck
whi
le in
facil
ity o
r at h
ome
follo
win
g de
liver
y, o
r a
post
-nat
al ca
re v
isit w
ithin
2 d
ays a
fter d
eliv
ery
47.1
TM.1
4 Ne
wbo
rns d
ried
MN
Perc
enta
ge o
f las
t liv
e bi
rths
in th
e la
st 2
yea
rs w
here
the
new
born
was
drie
d af
ter b
irth
86.1
TM.1
5 Sk
in-to
-ski
n ca
re
M
N Pe
rcen
tage
of l
ast l
ive
birt
hs in
the
last
2 y
ears
whe
re th
e ne
wbo
rn w
as p
lace
d on
the
mot
her’s
bar
e ch
est a
fter b
irth
16.8
TM.1
6 De
laye
d ba
thin
g
MN
Perc
enta
ge o
f las
t liv
e bi
rths
in th
e la
st 2
yea
rs w
here
the
new
born
was
bat
hed
mor
e th
an 2
4 ho
urs a
fter b
irth
41.3
TM.1
7 Co
rd cu
t with
clea
n in
stru
men
t
MN
Perc
enta
ge o
f las
t liv
e bi
rths
del
iver
ed o
utsid
e a
facil
ity in
the
last
2 y
ears
whe
re th
e um
bilic
al co
rd w
as cu
t with
a n
ew b
lade
or
boi
led
inst
rum
ent
22.6
TM.1
8 No
thin
g ha
rmfu
l app
lied
to co
rd
M
N Pe
rcen
tage
of l
ast l
ive
birt
hs in
the
last
2 y
ears
whe
re n
othi
ng h
arm
ful w
as a
pplie
d to
the
cord
81
.0
TM.1
9 Po
stna
tal s
igna
l car
e fu
nctio
ns7
PN
Pe
rcen
tage
of l
ast l
ive
birt
hs in
the
last
2 y
ears
whe
re th
e ne
wbo
rn re
ceiv
ed a
leas
t 2 si
gnal
pos
tnat
al ca
re fu
nctio
ns w
ithin
2
days
afte
r birt
h 16
.4
TM.2
0 Po
st-n
atal
hea
lth ch
eck
for t
he
mot
her
PN
Pe
rcen
tage
of w
omen
age
15-
49 y
ears
with
a li
ve b
irth
in th
e la
st 2
yea
rs w
ho re
ceiv
ed a
hea
lth ch
eck
whi
le in
facil
ity o
r at
hom
e fo
llow
ing
deliv
ery,
or a
pos
t-nat
al ca
re v
isit w
ithin
2 d
ays a
fter d
eliv
ery
of th
eir m
ost r
ecen
t liv
e 47
.2
TM.2
2 M
ultip
le se
xual
par
tner
ship
s
SB
Perc
enta
ge o
f peo
ple
age
15-4
9 ye
ars w
ho h
ad se
x with
mor
e th
an o
ne p
artn
er in
the
last
12
mon
ths
(a)
wom
en
(b)
men
0.
5 8.
5
TM.2
3 Co
ndom
use
at l
ast s
ex a
mon
g pe
ople
with
mul
tiple
sexu
al
part
ners
hips
SB
Perc
enta
ge o
f peo
ple
age
15-4
9 ye
ars r
epor
ted
havi
ng h
ad m
ore
than
one
sexu
al p
artn
er in
the
last
12
mon
ths w
ho a
lso
repo
rted
that
a co
ndom
was
use
d th
e la
st ti
me
they
had
sex
(a)
wom
en
(b)
men
27
.2
26.3
TM.2
4 Se
x bef
ore
age
15 a
mon
g yo
ung
peop
le
SB
Pe
rcen
tage
of y
oung
peo
ple
age
15-2
4 ye
ars w
ho h
ad se
x bef
ore
age
15
(a)
wom
en
(b)
men
5.
5 2.
8
7 Sig
nal f
unct
ions
are
1) C
heck
ing
the
cord
, 2) C
ouns
elin
g on
dan
ger s
igns
, 3) A
sses
sing
tem
pera
ture
,4) O
bser
ving
/cou
nsel
ing
on b
reas
tfeed
ing,
and
5) W
eigh
ing
the
baby
(whe
re a
pplic
able
).
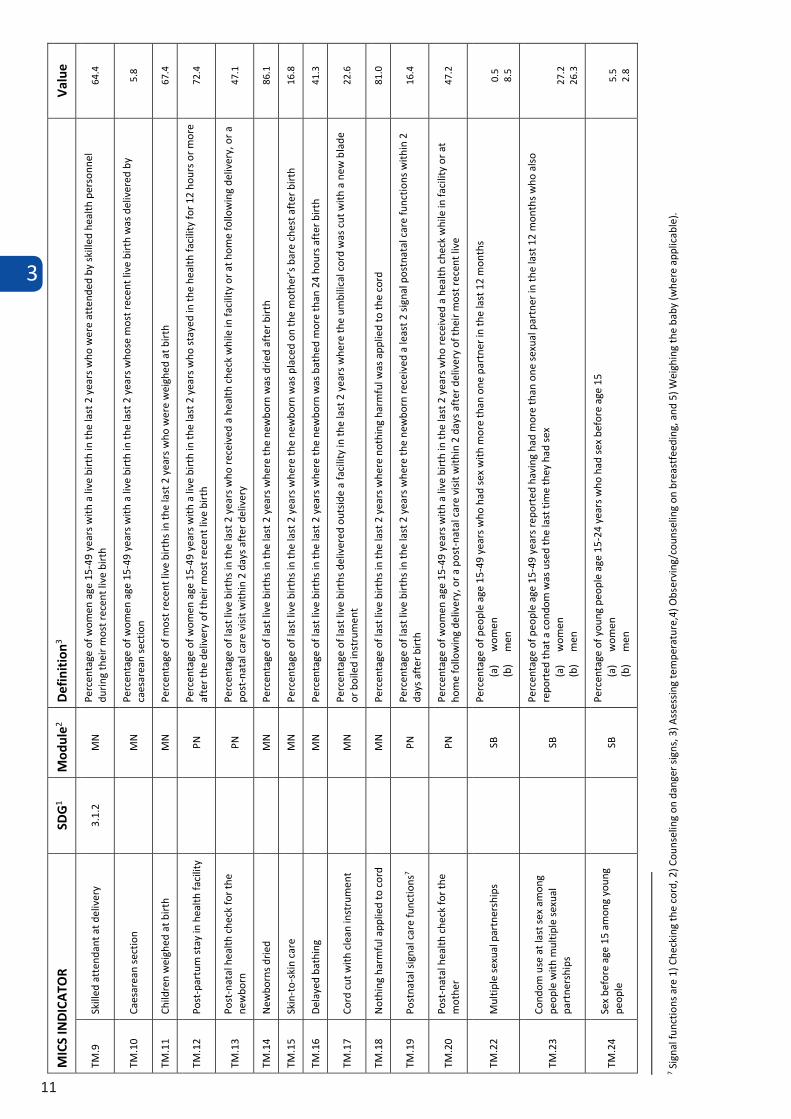
3
11
MIC
S IN
DICA
TOR
SDG1
Mod
ule2
Defin
ition
3 Va
lue
SURV
IVE
4
CS.1
Ne
onat
al m
orta
lity
rate
3.
2.2
BH
Prob
abili
ty o
f dyi
ng w
ithin
the
first
mon
th o
f life
18
CS.2
Po
st-n
eona
tal m
orta
lity
rate
BH
Diffe
renc
e be
twee
n in
fant
and
neo
nata
l mor
talit
y ra
tes
22
CS.3
In
fant
mor
talit
y ra
te
CM
/ BH
Pr
obab
ility
of d
ying
bet
wee
n bi
rth
and
the
first
birt
hday
40
CS.4
Ch
ild m
orta
lity
rate
BH
Prob
abili
ty o
f dyi
ng b
etw
een
the
first
and
the
fifth
birt
hday
s 6
CS.5
Un
der-f
ive
mor
talit
y ra
te
3.2.
1 CM
/ BH
Pr
obab
ility
of d
ying
bet
wee
n bi
rth
and
the
fifth
birt
hday
46
MIC
S IN
DICA
TOR
SDG1
Mod
ule2
Defin
ition
3 Va
lue
THRI
VE -
REPR
ODUC
TIVE
AND
MAT
ERNA
L HEA
LTH
TM.1
Ad
oles
cent
birt
h ra
te
3.7.
2 CM
/ BH
Ag
e-sp
ecifi
c fer
tility
rate
for w
omen
age
15-
19 y
ears
83
TM.2
Ea
rly ch
ildbe
arin
g
CM /
BH
Perc
enta
ge o
f wom
en a
ge 2
0-24
yea
rs w
ho h
ave
had
a liv
e bi
rth
befo
re a
ge 1
8 18
.4
TM.3
Co
ntra
cept
ive
prev
alen
ce ra
te
CP
Pe
rcen
tage
of w
omen
age
15-
49 y
ears
curr
ently
mar
ried
or in
uni
on w
ho a
re u
sing
(or w
hose
par
tner
is u
sing)
a (m
oder
n or
tr
aditi
onal
) con
trac
eptiv
e m
etho
d
54.1
TM.4
Ne
ed fo
r fam
ily p
lann
ing
satis
fied
with
mod
ern
cont
race
ptio
n5 3.
7.1
& 3
..8.1
UN
Pe
rcen
tage
of w
omen
age
15-
49 y
ears
curr
ently
mar
ried
or in
uni
on w
ho h
ave
thei
r nee
d fo
r fam
ily p
lann
ing
satis
fied
with
m
oder
n co
ntra
cept
ive
met
hods
71
.7
TM.5
a TM
.5b
TM.5
c An
tena
tal c
are
cove
rage
3.
8.1
MN
Perc
enta
ge o
f wom
en a
ge 1
5-49
yea
rs w
ith a
live
birt
h in
the
last
2 y
ears
who
wer
e at
tend
ed d
urin
g th
eir l
ast p
regn
ancy
that
le
d to
a li
ve b
irth
(a)
at le
ast o
nce
by sk
illed
hea
lth p
erso
nnel
(b
) at
leas
t fou
r tim
es b
y an
y pr
ovid
er
(c)
at le
ast e
ight
tim
es b
y an
y pr
ovid
er
78.4
62
.2
15.3
TM.6
Co
nten
t of a
nten
atal
care
MN
Perc
enta
ge o
f wom
en a
ge 1
5-49
yea
rs w
ith a
live
birt
h in
the
last
2 y
ears
who
had
thei
r blo
od p
ress
ure
mea
sure
d an
d ga
ve
urin
e an
d bl
ood
sam
ples
dur
ing
the
last
pre
gnan
cy th
at le
d to
a li
ve b
irth
29.2
TM.7
Ne
onat
al te
tanu
s pro
tect
ion
MN
Perc
enta
ge o
f wom
en a
ge 1
5-49
yea
rs w
ith a
live
birt
h in
the
last
2 y
ears
who
wer
e gi
ven
at le
ast t
wo
dose
s of t
etan
us to
xoid
va
ccin
e w
ithin
the
appr
opria
te in
terv
al6 p
rior t
o th
e m
ost r
ecen
t birt
h 48
.9
TM.8
In
stitu
tiona
l del
iver
ies
M
N Pe
rcen
tage
of w
omen
age
15-
49 y
ears
with
a li
ve b
irth
in th
e la
st 2
yea
rs w
hose
mos
t rec
ent l
ive
birt
h w
as d
eliv
ered
in a
he
alth
facil
ity
64.5
4 Mor
talit
y in
dica
tors
are
calcu
late
d fo
r the
last
5-y
ear p
erio
d.
5 Se
e th
e M
ICS
tabu
latio
n pl
an fo
r a d
etai
led
desc
riptio
n 6
See
the
MIC
S ta
bula
tion
plan
for a
det
aile
d de
scrip
tion
MIC
S IN
DICA
TOR
SDG1
Mod
ule2
Defin
ition
3 Va
lue
TM.9
Sk
illed
att
enda
nt a
t del
iver
y 3.
1.2
MN
Perc
enta
ge o
f wom
en a
ge 1
5-49
yea
rs w
ith a
live
birt
h in
the
last
2 y
ears
who
wer
e at
tend
ed b
y sk
illed
hea
lth p
erso
nnel
du
ring
thei
r mos
t rec
ent l
ive
birt
h 64
.4
TM.1
0 Ca
esar
ean
sect
ion
M
N Pe
rcen
tage
of w
omen
age
15-
49 y
ears
with
a li
ve b
irth
in th
e la
st 2
yea
rs w
hose
mos
t rec
ent l
ive
birt
h w
as d
eliv
ered
by
caes
area
n se
ctio
n 5.
8
TM.1
1 Ch
ildre
n w
eigh
ed a
t birt
h
MN
Perc
enta
ge o
f mos
t rec
ent l
ive
birt
hs in
the
last
2 y
ears
who
wer
e w
eigh
ed a
t birt
h 67
.4
TM.1
2 Po
st-p
artu
m st
ay in
hea
lth fa
cility
PN
Perc
enta
ge o
f wom
en a
ge 1
5-49
yea
rs w
ith a
live
birt
h in
the
last
2 y
ears
who
stay
ed in
the
heal
th fa
cility
for 1
2 ho
urs o
r mor
e af
ter t
he d
eliv
ery
of th
eir m
ost r
ecen
t liv
e bi
rth
72.4
TM.1
3 Po
st-n
atal
hea
lth ch
eck
for t
he
new
born
PN
Perc
enta
ge o
f las
t liv
e bi
rths
in th
e la
st 2
yea
rs w
ho re
ceiv
ed a
hea
lth ch
eck
whi
le in
facil
ity o
r at h
ome
follo
win
g de
liver
y, o
r a
post
-nat
al ca
re v
isit w
ithin
2 d
ays a
fter d
eliv
ery
47.1
TM.1
4 Ne
wbo
rns d
ried
MN
Perc
enta
ge o
f las
t liv
e bi
rths
in th
e la
st 2
yea
rs w
here
the
new
born
was
drie
d af
ter b
irth
86.1
TM.1
5 Sk
in-to
-ski
n ca
re
M
N Pe
rcen
tage
of l
ast l
ive
birt
hs in
the
last
2 y
ears
whe
re th
e ne
wbo
rn w
as p
lace
d on
the
mot
her’s
bar
e ch
est a
fter b
irth
16.8
TM.1
6 De
laye
d ba
thin
g
MN
Perc
enta
ge o
f las
t liv
e bi
rths
in th
e la
st 2
yea
rs w
here
the
new
born
was
bat
hed
mor
e th
an 2
4 ho
urs a
fter b
irth
41.3
TM.1
7 Co
rd cu
t with
clea
n in
stru
men
t
MN
Perc
enta
ge o
f las
t liv
e bi
rths
del
iver
ed o
utsid
e a
facil
ity in
the
last
2 y
ears
whe
re th
e um
bilic
al co
rd w
as cu
t with
a n
ew b
lade
or
boi
led
inst
rum
ent
22.6
TM.1
8 No
thin
g ha
rmfu
l app
lied
to co
rd
M
N Pe
rcen
tage
of l
ast l
ive
birt
hs in
the
last
2 y
ears
whe
re n
othi
ng h
arm
ful w
as a
pplie
d to
the
cord
81
.0
TM.1
9 Po
stna
tal s
igna
l car
e fu
nctio
ns7
PN
Pe
rcen
tage
of l
ast l
ive
birt
hs in
the
last
2 y
ears
whe
re th
e ne
wbo
rn re
ceiv
ed a
leas
t 2 si
gnal
pos
tnat
al ca
re fu
nctio
ns w
ithin
2
days
afte
r birt
h 16
.4
TM.2
0 Po
st-n
atal
hea
lth ch
eck
for t
he
mot
her
PN
Pe
rcen
tage
of w
omen
age
15-
49 y
ears
with
a li
ve b
irth
in th
e la
st 2
yea
rs w
ho re
ceiv
ed a
hea
lth ch
eck
whi
le in
facil
ity o
r at
hom
e fo
llow
ing
deliv
ery,
or a
pos
t-nat
al ca
re v
isit w
ithin
2 d
ays a
fter d
eliv
ery
of th
eir m
ost r
ecen
t liv
e 47
.2
TM.2
2 M
ultip
le se
xual
par
tner
ship
s
SB
Perc
enta
ge o
f peo
ple
age
15-4
9 ye
ars w
ho h
ad se
x with
mor
e th
an o
ne p
artn
er in
the
last
12
mon
ths
(a)
wom
en
(b)
men
0.
5 8.
5
TM.2
3 Co
ndom
use
at l
ast s
ex a
mon
g pe
ople
with
mul
tiple
sexu
al
part
ners
hips
SB
Perc
enta
ge o
f peo
ple
age
15-4
9 ye
ars r
epor
ted
havi
ng h
ad m
ore
than
one
sexu
al p
artn
er in
the
last
12
mon
ths w
ho a
lso
repo
rted
that
a co
ndom
was
use
d th
e la
st ti
me
they
had
sex
(a)
wom
en
(b)
men
27
.2
26.3
TM.2
4 Se
x bef
ore
age
15 a
mon
g yo
ung
peop
le
SB
Pe
rcen
tage
of y
oung
peo
ple
age
15-2
4 ye
ars w
ho h
ad se
x bef
ore
age
15
(a)
wom
en
(b)
men
5.
5 2.
8
7 Sig
nal f
unct
ions
are
1) C
heck
ing
the
cord
, 2) C
ouns
elin
g on
dan
ger s
igns
, 3) A
sses
sing
tem
pera
ture
,4) O
bser
ving
/cou
nsel
ing
on b
reas
tfeed
ing,
and
5) W
eigh
ing
the
baby
(whe
re a
pplic
able
).
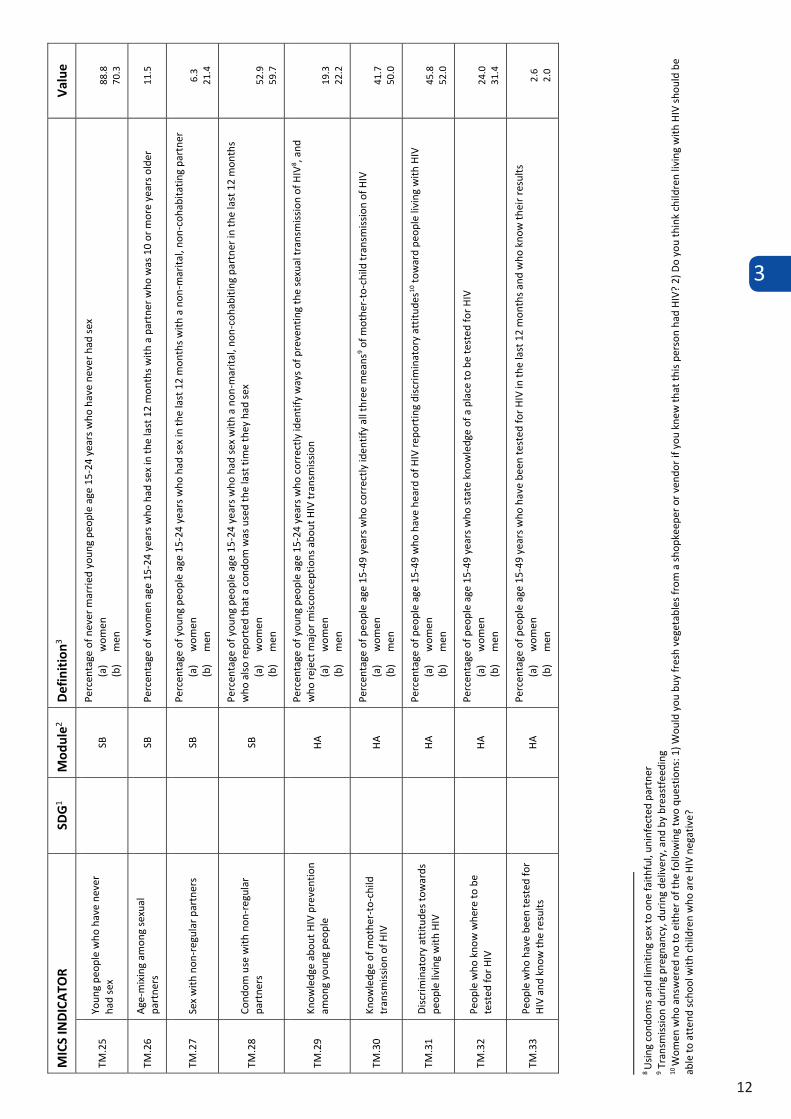
3
12
MIC
S IN
DICA
TOR
SDG1
Mod
ule2
Defin
ition
3 Va
lue
TM.2
5 Yo
ung
peop
le w
ho h
ave
neve
r ha
d se
x
SB
Perc
enta
ge o
f nev
er m
arrie
d yo
ung
peop
le a
ge 1
5-24
yea
rs w
ho h
ave
neve
r had
sex
(a)
wom
en
(b)
men
88
.8
70.3
TM.2
6 Ag
e-m
ixing
am
ong
sexu
al
part
ners
SB
Perc
enta
ge o
f wom
en a
ge 1
5-24
yea
rs w
ho h
ad se
x in
the
last
12
mon
ths w
ith a
par
tner
who
was
10
or m
ore
year
s old
er
11.5
TM.2
7 Se
x with
non
-regu
lar p
artn
ers
SB
Pe
rcen
tage
of y
oung
peo
ple
age
15-2
4 ye
ars w
ho h
ad se
x in
the
last
12
mon
ths w
ith a
non
-mar
ital,
non-
coha
bita
ting
part
ner
(a)
wom
en
(b)
men
6.
3 21
.4
TM.2
8 Co
ndom
use
with
non
-regu
lar
part
ners
SB
Perc
enta
ge o
f you
ng p
eopl
e ag
e 15
-24
year
s who
had
sex w
ith a
non
-mar
ital,
non-
coha
bitin
g pa
rtne
r in
the
last
12
mon
ths
who
also
repo
rted
that
a co
ndom
was
use
d th
e la
st ti
me
they
had
sex
(a)
wom
en
(b)
men
52
.9
59.7
TM.2
9 Kn
owle
dge
abou
t HIV
pre
vent
ion
amon
g yo
ung
peop
le
HA
Perc
enta
ge o
f you
ng p
eopl
e ag
e 15
-24
year
s who
corr
ectly
iden
tify
way
s of p
reve
ntin
g th
e se
xual
tran
smiss
ion
of H
IV8 , a
nd
who
reje
ct m
ajor
misc
once
ptio
ns a
bout
HIV
tran
smiss
ion
(a)
wom
en
(b)
men
19
.3
22.2
TM.3
0 Kn
owle
dge
of m
othe
r-to-
child
tr
ansm
issio
n of
HIV
HA
Perc
enta
ge o
f peo
ple
age
15-4
9 ye
ars w
ho co
rrec
tly id
entif
y al
l thr
ee m
eans
9 of m
othe
r-to-
child
tran
smiss
ion
of H
IV
(a)
wom
en
(b)
men
41
.7
50.0
TM.3
1 Di
scrim
inat
ory
attit
udes
tow
ards
pe
ople
livi
ng w
ith H
IV
HA
Pe
rcen
tage
of p
eopl
e ag
e 15
-49
who
hav
e he
ard
of H
IV re
port
ing
disc
rimin
ator
y at
titud
es10
tow
ard
peop
le li
ving
with
HIV
(a
) w
omen
(b
) m
en
45.8
52
.0
TM.3
2 Pe
ople
who
kno
w w
here
to b
e te
sted
for H
IV
HA
Pe
rcen
tage
of p
eopl
e ag
e 15
-49
year
s who
stat
e kn
owle
dge
of a
pla
ce to
be
test
ed fo
r HIV
(a
) w
omen
(b
) m
en
24.0
31
.4
TM.3
3 Pe
ople
who
hav
e be
en te
sted
for
HIV
and
know
the
resu
lts
HA
Pe
rcen
tage
of p
eopl
e ag
e 15
-49
year
s who
hav
e be
en te
sted
for H
IV in
the
last
12
mon
ths a
nd w
ho k
now
thei
r res
ults
(a
) w
omen
(b
) m
en
2.6
2.0
8 Us
ing
cond
oms a
nd li
miti
ng se
x to
one
faith
ful,
unin
fect
ed p
artn
er
9 Tra
nsm
issio
n du
ring
preg
nanc
y, d
urin
g de
liver
y, a
nd b
y br
east
feed
ing
10 W
omen
who
ans
wer
ed n
o to
eith
er o
f the
follo
win
g tw
o qu
estio
ns: 1
) Wou
ld y
ou b
uy fr
esh
vege
tabl
es fr
om a
shop
keep
er o
r ven
dor i
f you
kne
w th
at th
is pe
rson
had
HIV
? 2)
Do
you
thin
k ch
ildre
n liv
ing
with
HIV
shou
ld b
e ab
le to
att
end
scho
ol w
ith ch
ildre
n w
ho a
re H
IV n
egat
ive?
MIC
S IN
DICA
TOR
SDG1
Mod
ule2
Defin
ition
3 Va
lue
TM.3
4 Se
xual
ly a
ctiv
e yo
ung
peop
le w
ho
have
bee
n te
sted
for H
IV a
nd
know
the
resu
lts
HA
Perc
enta
ge o
f you
ng p
eopl
e ag
e 15
-24
year
s who
hav
e ha
d se
x in
the
last
12
mon
ths,
who
hav
e be
en te
sted
for H
IV in
the
last
12
mon
ths a
nd w
ho k
now
thei
r res
ults
(a
) w
omen
(b
) m
en
4.1
1.9
TM.3
5a
TM.3
5b
HIV
coun
selli
ng d
urin
g an
tena
tal
care
HA
Perc
enta
ge o
f wom
en a
ge 1
5-49
yea
rs w
ho h
ad a
live
birt
h in
the
last
2 y
ears
and
rece
ived
ant
enat
al ca
re d
urin
g th
e pr
egna
ncy
of th
eir m
ost r
ecen
t birt
h, re
port
ing
that
dur
ing
an A
NC v
isit t
hey
rece
ived
(a
) co
unse
lling
on
HIV
(b)
info
rmat
ion
or co
unse
lling
on
HIV
afte
r rec
eivi
ng th
e HI
V te
st re
sults
9.
9 7.
5
TM.3
6 HI
V te
stin
g du
ring
ante
nata
l car
e
HA
Perc
enta
ge o
f wom
en a
ge 1
5-49
yea
rs w
ho h
ad a
live
birt
h in
the
last
2 y
ears
and
rece
ived
ant
enat
al ca
re d
urin
g th
e pr
egna
ncy
of th
eir m
ost r
ecen
t birt
h, re
port
ing
that
they
wer
e of
fere
d an
d ac
cept
ed a
n HI
V te
st d
urin
g an
tena
tal c
are
and
rece
ived
thei
r res
ults
13
.5
MIC
S IN
DICA
TOR
SDG1
Mod
ule2
Defin
ition
3 Va
lue
THRI
VE -
CHILD
HEA
LTH,
NUT
RITI
ON A
ND D
EVEL
OPM
ENT
TC.1
Tu
berc
ulos
is im
mun
izatio
n co
vera
ge
IM
Pe
rcen
tage
of c
hild
ren
age
12-2
3 m
onth
s who
rece
ived
BCG
cont
aini
ng v
accin
e at
any
tim
e be
fore
the
surv
ey
81.5
TC.2
Po
lio im
mun
izatio
n co
vera
ge
IM
Pe
rcen
tage
of c
hild
ren
age
12-2
3 m
onth
s who
rece
ived
at l
east
one
dos
e of
Inac
tivat
ed P
olio
Vac
cine
(IPV)
and
the
third
dos
e of
eith
er IP
V or
Ora
l Pol
io V
accin
e (O
PV) v
accin
es a
t any
tim
e be
fore
the
surv
ey
69.0
TC.3
Di
phth
eria
, tet
anus
, and
per
tuss
is an
d (D
TP) i
mm
uniza
tion
cove
rage
3.
b.1
& 3
.8.1
IM
Pe
rcen
tage
of c
hild
ren
age
12-2
3 m
onth
s who
rece
ived
the
third
dos
e of
DTP
cont
aini
ng v
accin
e (D
PT3)
at a
ny ti
me
befo
re th
e su
rvey
60
.8
TC.4
He
patit
is B
imm
uniza
tion
cove
rage
IM
Perc
enta
ge o
f chi
ldre
n ag
e 12
-23
mon
ths w
ho re
ceiv
ed th
e th
ird/f
ourt
h do
se o
f Hep
atiti
s B co
ntai
ning
vac
cine
(Hep
B3) a
t any
tim
e be
fore
the
surv
ey
60.8
TC.5
Ha
emop
hilu
s inf
luen
zae
type
B
(Hib
) im
mun
izatio
n co
vera
ge
IM
Pe
rcen
tage
of c
hild
ren
age
12-2
3 m
onth
s who
rece
ived
the
third
dos
e of
Hib
cont
aini
ng v
accin
e (H
ib3)
at a
ny ti
me
befo
re th
e su
rvey
60
.8
TC.6
Pn
eum
ococ
cal (
Conj
ugat
e)
imm
uniza
tion
cove
rage
3.
b.1
IM
Perc
enta
ge o
f chi
ldre
n ag
e 12
-23
mon
ths w
ho re
ceiv
ed th
e th
ird d
ose
of P
neum
ococ
cal (
Conj
ugat
e) v
accin
e (P
CV3)
at a
ny
time
befo
re th
e su
rvey
47
.6
TC.8
Ru
bella
imm
uniza
tion
cove
rage
IM
Perc
enta
ge o
f chi
ldre
n ag
e 12
-23
mon
ths w
ho re
ceiv
ed ru
bella
cont
aini
ng v
accin
e at
any
tim
e be
fore
the
surv
ey
66.0
TC.1
0 M
easle
s im
mun
izatio
n co
vera
ge11
11
IM
Pe
rcen
tage
of c
hild
ren
age
12-2
3 m
onth
s who
rece
ived
the
first
mea
sles c
onta
inin
g va
ccin
e at
any
tim
e be
fore
the
surv
ey
66.0
11 Su
rvey
spec
ific i
ndica
tor-t
he d
ata
pres
ente
d fo
r the
MR1
as t
he p
erce
ntag
e of
child
ren
age
12-2
3 m
onth
s who
rece
ived
the
first
mea
sles c
onta
inin
g va
ccin
e at
any
tim
e be
fore
the
surv
ey. T
his i
s not
a st
anda
rd M
ICS
TC.1
0 in
dica
tor (
and
no re
fere
nce
to th
e SD
G in
dica
tor)
whi
ch m
easu
res f
or th
e se
cond
mea
sles d
ose.
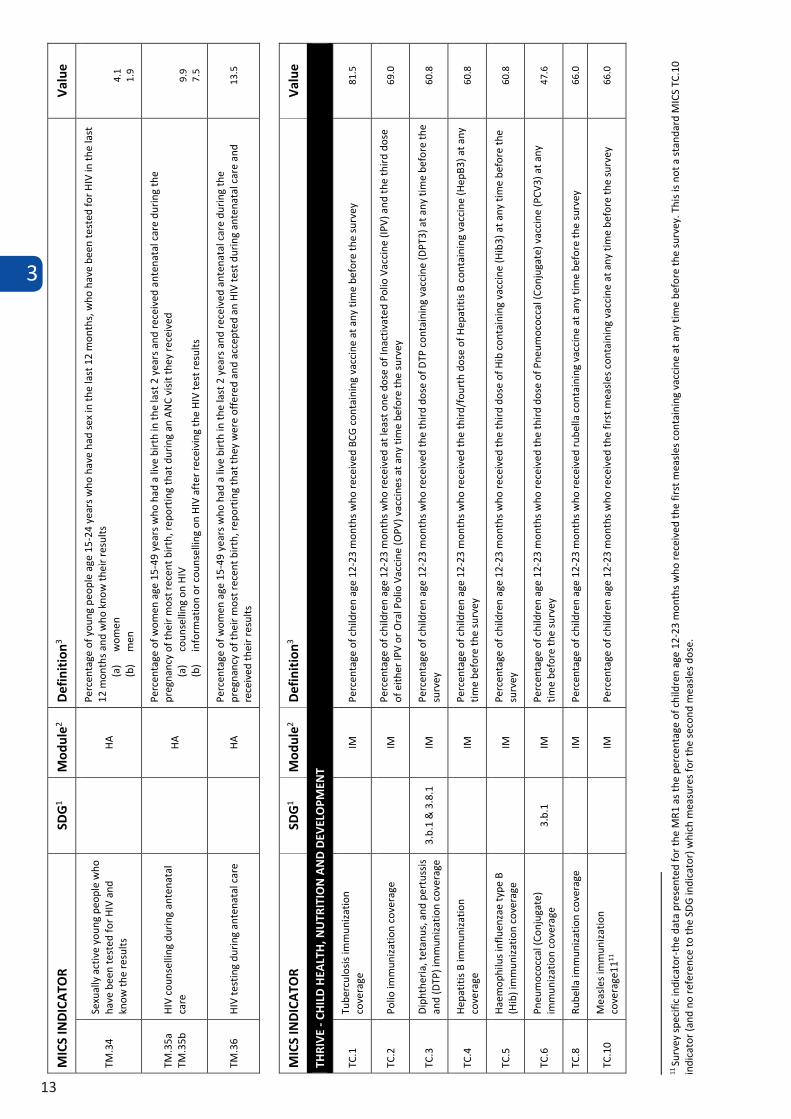
3
13
MIC
S IN
DICA
TOR
SDG1
Mod
ule2
Defin
ition
3 Va
lue
TM.2
5 Yo
ung
peop
le w
ho h
ave
neve
r ha
d se
x
SB
Perc
enta
ge o
f nev
er m
arrie
d yo
ung
peop
le a
ge 1
5-24
yea
rs w
ho h
ave
neve
r had
sex
(a)
wom
en
(b)
men
88
.8
70.3
TM.2
6 Ag
e-m
ixing
am
ong
sexu
al
part
ners
SB
Perc
enta
ge o
f wom
en a
ge 1
5-24
yea
rs w
ho h
ad se
x in
the
last
12
mon
ths w
ith a
par
tner
who
was
10
or m
ore
year
s old
er
11.5
TM.2
7 Se
x with
non
-regu
lar p
artn
ers
SB
Pe
rcen
tage
of y
oung
peo
ple
age
15-2
4 ye
ars w
ho h
ad se
x in
the
last
12
mon
ths w
ith a
non
-mar
ital,
non-
coha
bita
ting
part
ner
(a)
wom
en
(b)
men
6.
3 21
.4
TM.2
8 Co
ndom
use
with
non
-regu
lar
part
ners
SB
Perc
enta
ge o
f you
ng p
eopl
e ag
e 15
-24
year
s who
had
sex w
ith a
non
-mar
ital,
non-
coha
bitin
g pa
rtne
r in
the
last
12
mon
ths
who
also
repo
rted
that
a co
ndom
was
use
d th
e la
st ti
me
they
had
sex
(a)
wom
en
(b)
men
52
.9
59.7
TM.2
9 Kn
owle
dge
abou
t HIV
pre
vent
ion
amon
g yo
ung
peop
le
HA
Perc
enta
ge o
f you
ng p
eopl
e ag
e 15
-24
year
s who
corr
ectly
iden
tify
way
s of p
reve
ntin
g th
e se
xual
tran
smiss
ion
of H
IV8 , a
nd
who
reje
ct m
ajor
misc
once
ptio
ns a
bout
HIV
tran
smiss
ion
(a)
wom
en
(b)
men
19
.3
22.2
TM.3
0 Kn
owle
dge
of m
othe
r-to-
child
tr
ansm
issio
n of
HIV
HA
Perc
enta
ge o
f peo
ple
age
15-4
9 ye
ars w
ho co
rrec
tly id
entif
y al
l thr
ee m
eans
9 of m
othe
r-to-
child
tran
smiss
ion
of H
IV
(a)
wom
en
(b)
men
41
.7
50.0
TM.3
1 Di
scrim
inat
ory
attit
udes
tow
ards
pe
ople
livi
ng w
ith H
IV
HA
Pe
rcen
tage
of p
eopl
e ag
e 15
-49
who
hav
e he
ard
of H
IV re
port
ing
disc
rimin
ator
y at
titud
es10
tow
ard
peop
le li
ving
with
HIV
(a
) w
omen
(b
) m
en
45.8
52
.0
TM.3
2 Pe
ople
who
kno
w w
here
to b
e te
sted
for H
IV
HA
Pe
rcen
tage
of p
eopl
e ag
e 15
-49
year
s who
stat
e kn
owle
dge
of a
pla
ce to
be
test
ed fo
r HIV
(a
) w
omen
(b
) m
en
24.0
31
.4
TM.3
3 Pe
ople
who
hav
e be
en te
sted
for
HIV
and
know
the
resu
lts
HA
Pe
rcen
tage
of p
eopl
e ag
e 15
-49
year
s who
hav
e be
en te
sted
for H
IV in
the
last
12
mon
ths a
nd w
ho k
now
thei
r res
ults
(a
) w
omen
(b
) m
en
2.6
2.0
8 Us
ing
cond
oms a
nd li
miti
ng se
x to
one
faith
ful,
unin
fect
ed p
artn
er
9 Tra
nsm
issio
n du
ring
preg
nanc
y, d
urin
g de
liver
y, a
nd b
y br
east
feed
ing
10 W
omen
who
ans
wer
ed n
o to
eith
er o
f the
follo
win
g tw
o qu
estio
ns: 1
) Wou
ld y
ou b
uy fr
esh
vege
tabl
es fr
om a
shop
keep
er o
r ven
dor i
f you
kne
w th
at th
is pe
rson
had
HIV
? 2)
Do
you
thin
k ch
ildre
n liv
ing
with
HIV
shou
ld b
e ab
le to
att
end
scho
ol w
ith ch
ildre
n w
ho a
re H
IV n
egat
ive?
MIC
S IN
DICA
TOR
SDG1
Mod
ule2
Defin
ition
3 Va
lue
TM.3
4 Se
xual
ly a
ctiv
e yo
ung
peop
le w
ho
have
bee
n te
sted
for H
IV a
nd
know
the
resu
lts
HA
Perc
enta
ge o
f you
ng p
eopl
e ag
e 15
-24
year
s who
hav
e ha
d se
x in
the
last
12
mon
ths,
who
hav
e be
en te
sted
for H
IV in
the
last
12
mon
ths a
nd w
ho k
now
thei
r res
ults
(a
) w
omen
(b
) m
en
4.1
1.9
TM.3
5a
TM.3
5b
HIV
coun
selli
ng d
urin
g an
tena
tal
care
HA
Perc
enta
ge o
f wom
en a
ge 1
5-49
yea
rs w
ho h
ad a
live
birt
h in
the
last
2 y
ears
and
rece
ived
ant
enat
al ca
re d
urin
g th
e pr
egna
ncy
of th
eir m
ost r
ecen
t birt
h, re
port
ing
that
dur
ing
an A
NC v
isit t
hey
rece
ived
(a
) co
unse
lling
on
HIV
(b)
info
rmat
ion
or co
unse
lling
on
HIV
afte
r rec
eivi
ng th
e HI
V te
st re
sults
9.
9 7.
5
TM.3
6 HI
V te
stin
g du
ring
ante
nata
l car
e
HA
Perc
enta
ge o
f wom
en a
ge 1
5-49
yea
rs w
ho h
ad a
live
birt
h in
the
last
2 y
ears
and
rece
ived
ant
enat
al ca
re d
urin
g th
e pr
egna
ncy
of th
eir m
ost r
ecen
t birt
h, re
port
ing
that
they
wer
e of
fere
d an
d ac
cept
ed a
n HI
V te
st d
urin
g an
tena
tal c
are
and
rece
ived
thei
r res
ults
13
.5
MIC
S IN
DICA
TOR
SDG1
Mod
ule2
Defin
ition
3 Va
lue
THRI
VE -
CHILD
HEA
LTH,
NUT
RITI
ON A
ND D
EVEL
OPM
ENT
TC.1
Tu
berc
ulos
is im
mun
izatio
n co
vera
ge
IM
Pe
rcen
tage
of c
hild
ren
age
12-2
3 m
onth
s who
rece
ived
BCG
cont
aini
ng v
accin
e at
any
tim
e be
fore
the
surv
ey
81.5
TC.2
Po
lio im
mun
izatio
n co
vera
ge
IM
Pe
rcen
tage
of c
hild
ren
age
12-2
3 m
onth
s who
rece
ived
at l
east
one
dos
e of
Inac
tivat
ed P
olio
Vac
cine
(IPV)
and
the
third
dos
e of
eith
er IP
V or
Ora
l Pol
io V
accin
e (O
PV) v
accin
es a
t any
tim
e be
fore
the
surv
ey
69.0
TC.3
Di
phth
eria
, tet
anus
, and
per
tuss
is an
d (D
TP) i
mm
uniza
tion
cove
rage
3.
b.1
& 3
.8.1
IM
Pe
rcen
tage
of c
hild
ren
age
12-2
3 m
onth
s who
rece
ived
the
third
dos
e of
DTP
cont
aini
ng v
accin
e (D
PT3)
at a
ny ti
me
befo
re th
e su
rvey
60
.8
TC.4
He
patit
is B
imm
uniza
tion
cove
rage
IM
Perc
enta
ge o
f chi
ldre
n ag
e 12
-23
mon
ths w
ho re
ceiv
ed th
e th
ird/f
ourt
h do
se o
f Hep
atiti
s B co
ntai
ning
vac
cine
(Hep
B3) a
t any
tim
e be
fore
the
surv
ey
60.8
TC.5
Ha
emop
hilu
s inf
luen
zae
type
B
(Hib
) im
mun
izatio
n co
vera
ge
IM
Pe
rcen
tage
of c
hild
ren
age
12-2
3 m
onth
s who
rece
ived
the
third
dos
e of
Hib
cont
aini
ng v
accin
e (H
ib3)
at a
ny ti
me
befo
re th
e su
rvey
60
.8
TC.6
Pn
eum
ococ
cal (
Conj
ugat
e)
imm
uniza
tion
cove
rage
3.
b.1
IM
Perc
enta
ge o
f chi
ldre
n ag
e 12
-23
mon
ths w
ho re
ceiv
ed th
e th
ird d
ose
of P
neum
ococ
cal (
Conj
ugat
e) v
accin
e (P
CV3)
at a
ny
time
befo
re th
e su
rvey
47
.6
TC.8
Ru
bella
imm
uniza
tion
cove
rage
IM
Perc
enta
ge o
f chi
ldre
n ag
e 12
-23
mon
ths w
ho re
ceiv
ed ru
bella
cont
aini
ng v
accin
e at
any
tim
e be
fore
the
surv
ey
66.0
TC.1
0 M
easle
s im
mun
izatio
n co
vera
ge11
11
IM
Pe
rcen
tage
of c
hild
ren
age
12-2
3 m
onth
s who
rece
ived
the
first
mea
sles c
onta
inin
g va
ccin
e at
any
tim
e be
fore
the
surv
ey
66.0
11 Su
rvey
spec
ific i
ndica
tor-t
he d
ata
pres
ente
d fo
r the
MR1
as t
he p
erce
ntag
e of
child
ren
age
12-2
3 m
onth
s who
rece
ived
the
first
mea
sles c
onta
inin
g va
ccin
e at
any
tim
e be
fore
the
surv
ey. T
his i
s not
a st
anda
rd M
ICS
TC.1
0 in
dica
tor (
and
no re
fere
nce
to th
e SD
G in
dica
tor)
whi
ch m
easu
res f
or th
e se
cond
mea
sles d
ose.
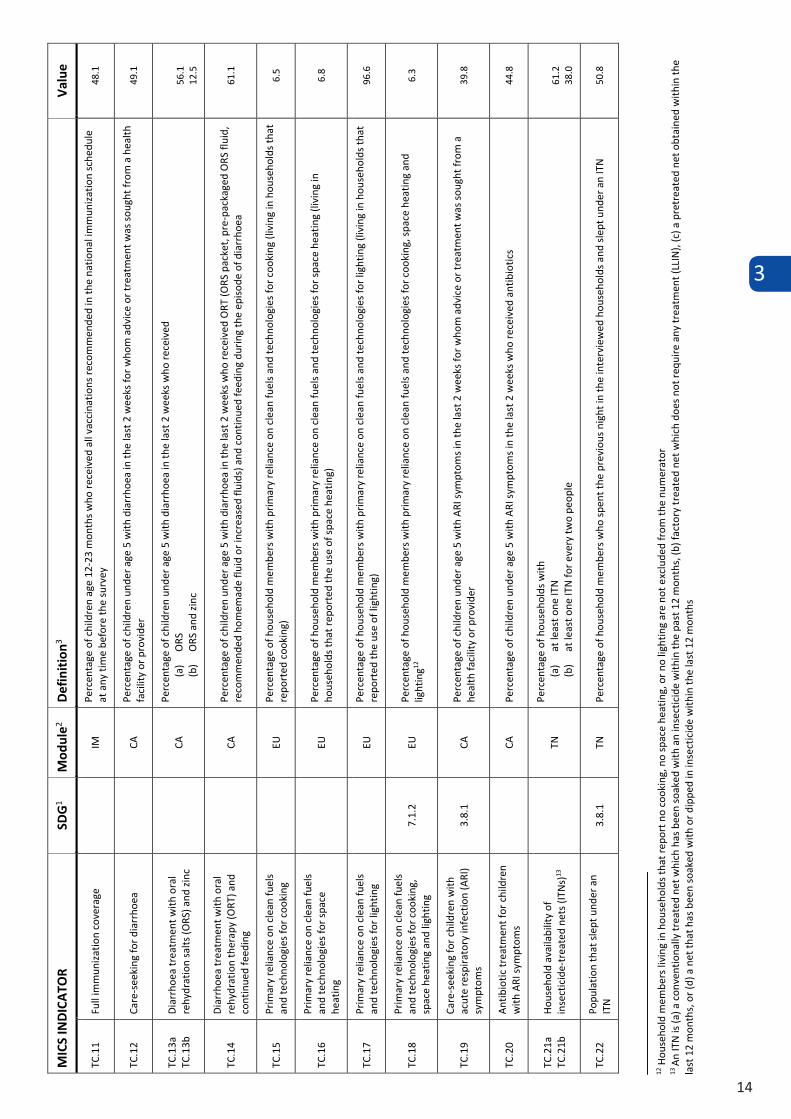
3
14
MIC
S IN
DICA
TOR
SDG1
Mod
ule2
Defin
ition
3 Va
lue
TC.1
1 Fu
ll im
mun
izatio
n co
vera
ge
IM
Pe
rcen
tage
of c
hild
ren
age
12-2
3 m
onth
s who
rece
ived
all
vacc
inat
ions
reco
mm
ende
d in
the
natio
nal i
mm
uniza
tion
sche
dule
at
any
tim
e be
fore
the
surv
ey
48.1
TC.1
2 Ca
re-s
eeki
ng fo
r dia
rrho
ea
CA
Pe
rcen
tage
of c
hild
ren
unde
r age
5 w
ith d
iarr
hoea
in th
e la
st 2
wee
ks fo
r who
m a
dvice
or t
reat
men
t was
soug
ht fr
om a
hea
lth
facil
ity o
r pro
vide
r 49
.1
TC.1
3a
TC.1
3b
Diar
rhoe
a tr
eatm
ent w
ith o
ral
rehy
drat
ion
salts
(ORS
) and
zinc
CA
Perc
enta
ge o
f chi
ldre
n un
der a
ge 5
with
dia
rrho
ea in
the
last
2 w
eeks
who
rece
ived
(a
) OR
S (b
) OR
S an
d zin
c 56
.1
12.5
TC.1
4 Di
arrh
oea
trea
tmen
t with
ora
l re
hydr
atio
n th
erap
y (O
RT) a
nd
cont
inue
d fe
edin
g
CA
Perc
enta
ge o
f chi
ldre
n un
der a
ge 5
with
dia
rrho
ea in
the
last
2 w
eeks
who
rece
ived
ORT
(ORS
pac
ket,
pre-
pack
aged
ORS
flui
d,
reco
mm
ende
d ho
mem
ade
fluid
or i
ncre
ased
flui
ds) a
nd co
ntin
ued
feed
ing
durin
g th
e ep
isode
of d
iarr
hoea
61
.1
TC.1
5 Pr
imar
y re
lianc
e on
clea
n fu
els
and
tech
nolo
gies
for c
ooki
ng
EU
Pe
rcen
tage
of h
ouse
hold
mem
bers
with
prim
ary
relia
nce
on cl
ean
fuel
s and
tech
nolo
gies
for c
ooki
ng (l
ivin
g in
hou
seho
lds t
hat
repo
rted
cook
ing)
6.
5
TC.1
6 Pr
imar
y re
lianc
e on
clea
n fu
els
and
tech
nolo
gies
for s
pace
he
atin
g
EU
Perc
enta
ge o
f hou
seho
ld m
embe
rs w
ith p
rimar
y re
lianc
e on
clea
n fu
els a
nd te
chno
logi
es fo
r spa
ce h
eatin
g (li
ving
in
hous
ehol
ds th
at re
port
ed th
e us
e of
spac
e he
atin
g)
6.8
TC.1
7 Pr
imar
y re
lianc
e on
clea
n fu
els
and
tech
nolo
gies
for l
ight
ing
EU
Pe
rcen
tage
of h
ouse
hold
mem
bers
with
prim
ary
relia
nce
on cl
ean
fuel
s and
tech
nolo
gies
for l
ight
ing
(livi
ng in
hou
seho
lds t
hat
repo
rted
the
use
of li
ghtin
g)
96.6
TC.1
8 Pr
imar
y re
lianc
e on
clea
n fu
els
and
tech
nolo
gies
for c
ooki
ng,
spac
e he
atin
g an
d lig
htin
g 7.
1.2
EU
Perc
enta
ge o
f hou
seho
ld m
embe
rs w
ith p
rimar
y re
lianc
e on
clea
n fu
els a
nd te
chno
logi
es fo
r coo
king
, spa
ce h
eatin
g an
d lig
htin
g12
6.3
TC.1
9 Ca
re-s
eeki
ng fo
r chi
ldre
n w
ith
acut
e re
spira
tory
infe
ctio
n (A
RI)
sym
ptom
s 3.
8.1
CA
Perc
enta
ge o
f chi
ldre
n un
der a
ge 5
with
ARI
sym
ptom
s in
the
last
2 w
eeks
for w
hom
adv
ice o
r tre
atm
ent w
as so
ught
from
a
heal
th fa
cility
or p
rovi
der
39.8
TC.2
0 An
tibio
tic tr
eatm
ent f
or ch
ildre
n w
ith A
RI sy
mpt
oms
CA
Pe
rcen
tage
of c
hild
ren
unde
r age
5 w
ith A
RI sy
mpt
oms i
n th
e la
st 2
wee
ks w
ho re
ceiv
ed a
ntib
iotic
s 44
.8
TC.2
1a
TC.2
1b
Hous
ehol
d av
aila
bilit
y of
in
sect
icide
-trea
ted
nets
(ITN
s)13
TN
Perc
enta
ge o
f hou
seho
lds w
ith
(a)
at le
ast o
ne IT
N (b
) at
leas
t one
ITN
for e
very
two
peop
le
61.2
38
.0
TC.2
2 Po
pula
tion
that
slep
t und
er a
n IT
N 3.
8.1
TN
Perc
enta
ge o
f hou
seho
ld m
embe
rs w
ho sp
ent t
he p
revi
ous n
ight
in th
e in
terv
iew
ed h
ouse
hold
s and
slep
t und
er a
n IT
N
50.8
12 H
ouse
hold
mem
bers
livi
ng in
hou
seho
lds t
hat r
epor
t no
cook
ing,
no
spac
e he
atin
g, o
r no
light
ing
are
not e
xclu
ded
from
the
num
erat
or
13 An
ITN
is (a
) a co
nven
tiona
lly tr
eate
d ne
t whi
ch h
as b
een
soak
ed w
ith a
n in
sect
icide
with
in th
e pa
st 1
2 m
onth
s, (b
) fac
tory
trea
ted
net w
hich
doe
s not
requ
ire a
ny tr
eatm
ent (
LLIN
), (c
) a p
retr
eate
d ne
t obt
aine
d w
ithin
the
last
12
mon
ths,
or (d
) a n
et th
at h
as b
een
soak
ed w
ith o
r dip
ped
in in
sect
icide
with
in th
e la
st 1
2 m
onth
s
MIC
S IN
DICA
TOR
SDG1
Mod
ule2
Defin
ition
3 Va
lue
TC.2
3 Ch
ildre
n un
der a
ge 5
who
slep
t un
der a
n IT
N
TN
Perc
enta
ge o
f chi
ldre
n un
der a
ge 5
who
spen
t the
pre
viou
s nig
ht in
the
inte
rvie
wed
hou
seho
lds a
nd sl
ept u
nder
an
ITN
49
.8
TC.2
4 Pr
egna
nt w
omen
who
slep
t un
der a
n IT
N
TN –
CP
Perc
enta
ge o
f pre
gnan
t wom
en w
ho sp
ent t
he p
revi
ous n
ight
in th
e in
terv
iew
ed h
ouse
hold
s and
slep
t und
er a
n IT
N
52.4
TC.2
5 In
term
itten
t pre
vent
ive
trea
tmen
t for
mal
aria
dur
ing
preg
nanc
y14
M
N Pe
rcen
tage
of w
omen
age
15-
49 y
ears
with
a li
ve b
irth
in th
e la
st 2
yea
rs w
ho to
ok th
ree
or m
ore
dose
s of S
P/Fa
nsid
ar to
pr
even
t mal
aria
dur
ing
thei
r las
t pre
gnan
cy th
at le
d to
a li
ve b
irth
1.0
TC.2
6 Ca
re-s
eeki
ng fo
r fev
er
CA
Pe
rcen
tage
of c
hild
ren
unde
r age
5 w
ith fe
ver i
n th
e la
st 2
wee
ks fo
r who
m a
dvice
or t
reat
men
t was
soug
ht fr
om a
hea
lth
facil
ity o
r pro
vide
r 58
.4
TC.2
7 M
alar
ia d
iagn
ostic
s usa
ge
CA
Pe
rcen
tage
of c
hild
ren
unde
r age
5 w
ith fe
ver i
n th
e la
st 2
wee
ks w
ho h
ad a
fing
er o
r hee
l stic
k fo
r mal
aria
test
ing
8.5
TC.2
8 An
ti-m
alar
ial t
reat
men
t of
child
ren
unde
r age
5
CA
Pe
rcen
tage
of c
hild
ren
unde
r age
5 w
ith fe
ver i
n th
e la
st 2
wee
ks w
ho re
ceiv
ed a
ny a
ntim
alar
ial t
reat
men
t 8.
2
TC.2
9
Trea
tmen
t with
Art
emisi
nin-
base
d Co
mbi
natio
n Th
erap
y (A
CT) a
mon
g ch
ildre
n w
ho
rece
ived
ant
i-mal
aria
l tre
atm
ent
CA
Pe
rcen
tage
of c
hild
ren
unde
r age
5 w
ith fe
ver i
n th
e la
st 2
wee
ks w
ho re
ceiv
ed a
nti-m
alar
ial d
rugs
and
rece
ived
ACT
(or o
ther
fir
st-li
ne tr
eatm
ent a
ccor
ding
to n
atio
nal p
olicy
) 47
.7
TC.3
0 Ch
ildre
n ev
er b
reas
tfed
M
N Pe
rcen
tage
of w
omen
with
a li
ve b
irth
in th
e la
st 2
yea
rs w
ho b
reas
tfed
thei
r las
t liv
e-bo
rn ch
ild a
t any
tim
e 97
.0
TC.3
1 Ea
rly in
itiat
ion
of b
reas
tfeed
ing
M
N Pe
rcen
tage
of w
omen
with
a li
ve b
irth
in th
e la
st 2
yea
rs w
ho p
ut th
eir l
ast n
ewbo
rn to
the
brea
st w
ithin
one
hou
r of b
irth
50.1
TC.3
2 Ex
clusiv
e br
east
feed
ing
unde
r 6
mon
ths
BD
Pe
rcen
tage
of i
nfan
ts u
nder
6 m
onth
s of a
ge w
ho a
re e
xclu
sivel
y br
east
fed15
44
.9
TC.3
3 Pr
edom
inan
t bre
astfe
edin
g un
der
6 m
onth
s
BD
Perc
enta
ge o
f inf
ants
und
er 6
mon
ths o
f age
who
rece
ived
bre
ast m
ilk a
s the
pre
dom
inan
t sou
rce
of n
ouris
hmen
t16 d
urin
g th
e pr
evio
us d
ay
59.5
TC.3
4 Co
ntin
ued
brea
stfe
edin
g at
1
year
BD
Perc
enta
ge o
f chi
ldre
n ag
e 12
-15
mon
ths w
ho re
ceiv
ed b
reas
t milk
dur
ing
the
prev
ious
day
64
.9
TC.3
5 Co
ntin
ued
brea
stfe
edin
g at
2
year
s
BD
Perc
enta
ge o
f chi
ldre
n ag
e 20
-23
mon
ths w
ho re
ceiv
ed b
reas
t milk
dur
ing
the
prev
ious
day
27
.2
TC.3
6 Du
ratio
n of
bre
astfe
edin
g
BD
The
age
in m
onth
s whe
n 50
per
cent
of c
hild
ren
age
0-35
mon
ths d
id n
ot re
ceiv
e br
east
milk
dur
ing
the
prev
ious
day
15
.7
14 O
nly
wom
en w
ho re
ceiv
ed A
NC w
ere
aske
d ab
out i
nter
mitt
ent p
reve
ntiv
e tr
eatm
ent f
or m
alar
ia d
urin
g pr
egna
ncy.
15
Infa
nts r
ecei
ving
bre
ast m
ilk, a
nd n
ot re
ceiv
ing
any
othe
r flu
ids o
r foo
ds, w
ith th
e ex
cept
ion
of o
ral r
ehyd
ratio
n so
lutio
n, v
itam
ins,
min
eral
supp
lem
ents
and
med
icin
es
16 In
fant
s who
rece
ive
brea
st m
ilk a
nd ce
rtai
n flu
ids (
wat
er a
nd w
ater
-bas
ed d
rinks
, fru
it ju
ice, r
itual
flui
ds, o
ral r
ehyd
ratio
n so
lutio
n, d
rops
, vita
min
s, m
iner
als,
and
med
icine
s), b
ut d
o no
t rec
eive
any
thin
g el
se (i
n pa
rticu
lar,
non-
hum
an m
ilk a
nd fo
od-b
ased
flui
ds)
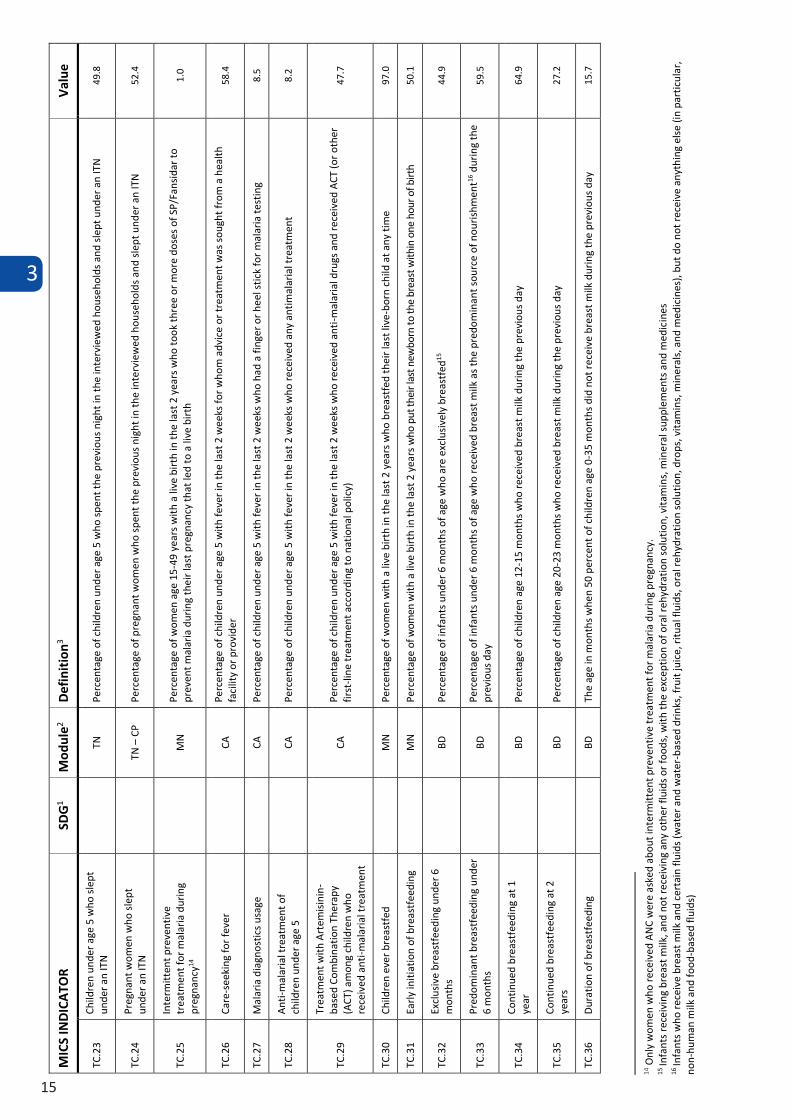
3
15
MIC
S IN
DICA
TOR
SDG1
Mod
ule2
Defin
ition
3 Va
lue
TC.1
1 Fu
ll im
mun
izatio
n co
vera
ge
IM
Pe
rcen
tage
of c
hild
ren
age
12-2
3 m
onth
s who
rece
ived
all
vacc
inat
ions
reco
mm
ende
d in
the
natio
nal i
mm
uniza
tion
sche
dule
at
any
tim
e be
fore
the
surv
ey
48.1
TC.1
2 Ca
re-s
eeki
ng fo
r dia
rrho
ea
CA
Pe
rcen
tage
of c
hild
ren
unde
r age
5 w
ith d
iarr
hoea
in th
e la
st 2
wee
ks fo
r who
m a
dvice
or t
reat
men
t was
soug
ht fr
om a
hea
lth
facil
ity o
r pro
vide
r 49
.1
TC.1
3a
TC.1
3b
Diar
rhoe
a tr
eatm
ent w
ith o
ral
rehy
drat
ion
salts
(ORS
) and
zinc
CA
Perc
enta
ge o
f chi
ldre
n un
der a
ge 5
with
dia
rrho
ea in
the
last
2 w
eeks
who
rece
ived
(a
) OR
S (b
) OR
S an
d zin
c 56
.1
12.5
TC.1
4 Di
arrh
oea
trea
tmen
t with
ora
l re
hydr
atio
n th
erap
y (O
RT) a
nd
cont
inue
d fe
edin
g
CA
Perc
enta
ge o
f chi
ldre
n un
der a
ge 5
with
dia
rrho
ea in
the
last
2 w
eeks
who
rece
ived
ORT
(ORS
pac
ket,
pre-
pack
aged
ORS
flui
d,
reco
mm
ende
d ho
mem
ade
fluid
or i
ncre
ased
flui
ds) a
nd co
ntin
ued
feed
ing
durin
g th
e ep
isode
of d
iarr
hoea
61
.1
TC.1
5 Pr
imar
y re
lianc
e on
clea
n fu
els
and
tech
nolo
gies
for c
ooki
ng
EU
Pe
rcen
tage
of h
ouse
hold
mem
bers
with
prim
ary
relia
nce
on cl
ean
fuel
s and
tech
nolo
gies
for c
ooki
ng (l
ivin
g in
hou
seho
lds t
hat
repo
rted
cook
ing)
6.
5
TC.1
6 Pr
imar
y re
lianc
e on
clea
n fu
els
and
tech
nolo
gies
for s
pace
he
atin
g
EU
Perc
enta
ge o
f hou
seho
ld m
embe
rs w
ith p
rimar
y re
lianc
e on
clea
n fu
els a
nd te
chno
logi
es fo
r spa
ce h
eatin
g (li
ving
in
hous
ehol
ds th
at re
port
ed th
e us
e of
spac
e he
atin
g)
6.8
TC.1
7 Pr
imar
y re
lianc
e on
clea
n fu
els
and
tech
nolo
gies
for l
ight
ing
EU
Pe
rcen
tage
of h
ouse
hold
mem
bers
with
prim
ary
relia
nce
on cl
ean
fuel
s and
tech
nolo
gies
for l
ight
ing
(livi
ng in
hou
seho
lds t
hat
repo
rted
the
use
of li
ghtin
g)
96.6
TC.1
8 Pr
imar
y re
lianc
e on
clea
n fu
els
and
tech
nolo
gies
for c
ooki
ng,
spac
e he
atin
g an
d lig
htin
g 7.
1.2
EU
Perc
enta
ge o
f hou
seho
ld m
embe
rs w
ith p
rimar
y re
lianc
e on
clea
n fu
els a
nd te
chno
logi
es fo
r coo
king
, spa
ce h
eatin
g an
d lig
htin
g12
6.3
TC.1
9 Ca
re-s
eeki
ng fo
r chi
ldre
n w
ith
acut
e re
spira
tory
infe
ctio
n (A
RI)
sym
ptom
s 3.
8.1
CA
Perc
enta
ge o
f chi
ldre
n un
der a
ge 5
with
ARI
sym
ptom
s in
the
last
2 w
eeks
for w
hom
adv
ice o
r tre
atm
ent w
as so
ught
from
a
heal
th fa
cility
or p
rovi
der
39.8
TC.2
0 An
tibio
tic tr
eatm
ent f
or ch
ildre
n w
ith A
RI sy
mpt
oms
CA
Pe
rcen
tage
of c
hild
ren
unde
r age
5 w
ith A
RI sy
mpt
oms i
n th
e la
st 2
wee
ks w
ho re
ceiv
ed a
ntib
iotic
s 44
.8
TC.2
1a
TC.2
1b
Hous
ehol
d av
aila
bilit
y of
in
sect
icide
-trea
ted
nets
(ITN
s)13
TN
Perc
enta
ge o
f hou
seho
lds w
ith
(a)
at le
ast o
ne IT
N (b
) at
leas
t one
ITN
for e
very
two
peop
le
61.2
38
.0
TC.2
2 Po
pula
tion
that
slep
t und
er a
n IT
N 3.
8.1
TN
Perc
enta
ge o
f hou
seho
ld m
embe
rs w
ho sp
ent t
he p
revi
ous n
ight
in th
e in
terv
iew
ed h
ouse
hold
s and
slep
t und
er a
n IT
N
50.8
12 H
ouse
hold
mem
bers
livi
ng in
hou
seho
lds t
hat r
epor
t no
cook
ing,
no
spac
e he
atin
g, o
r no
light
ing
are
not e
xclu
ded
from
the
num
erat
or
13 An
ITN
is (a
) a co
nven
tiona
lly tr
eate
d ne
t whi
ch h
as b
een
soak
ed w
ith a
n in
sect
icide
with
in th
e pa
st 1
2 m
onth
s, (b
) fac
tory
trea
ted
net w
hich
doe
s not
requ
ire a
ny tr
eatm
ent (
LLIN
), (c
) a p
retr
eate
d ne
t obt
aine
d w
ithin
the
last
12
mon
ths,
or (d
) a n
et th
at h
as b
een
soak
ed w
ith o
r dip
ped
in in
sect
icide
with
in th
e la
st 1
2 m
onth
s
MIC
S IN
DICA
TOR
SDG1
Mod
ule2
Defin
ition
3 Va
lue
TC.2
3 Ch
ildre
n un
der a
ge 5
who
slep
t un
der a
n IT
N
TN
Perc
enta
ge o
f chi
ldre
n un
der a
ge 5
who
spen
t the
pre
viou
s nig
ht in
the
inte
rvie
wed
hou
seho
lds a
nd sl
ept u
nder
an
ITN
49
.8
TC.2
4 Pr
egna
nt w
omen
who
slep
t un
der a
n IT
N
TN –
CP
Perc
enta
ge o
f pre
gnan
t wom
en w
ho sp
ent t
he p
revi
ous n
ight
in th
e in
terv
iew
ed h
ouse
hold
s and
slep
t und
er a
n IT
N
52.4
TC.2
5 In
term
itten
t pre
vent
ive
trea
tmen
t for
mal
aria
dur
ing
preg
nanc
y14
M
N Pe
rcen
tage
of w
omen
age
15-
49 y
ears
with
a li
ve b
irth
in th
e la
st 2
yea
rs w
ho to
ok th
ree
or m
ore
dose
s of S
P/Fa
nsid
ar to
pr
even
t mal
aria
dur
ing
thei
r las
t pre
gnan
cy th
at le
d to
a li
ve b
irth
1.0
TC.2
6 Ca
re-s
eeki
ng fo
r fev
er
CA
Pe
rcen
tage
of c
hild
ren
unde
r age
5 w
ith fe
ver i
n th
e la
st 2
wee
ks fo
r who
m a
dvice
or t
reat
men
t was
soug
ht fr
om a
hea
lth
facil
ity o
r pro
vide
r 58
.4
TC.2
7 M
alar
ia d
iagn
ostic
s usa
ge
CA
Pe
rcen
tage
of c
hild
ren
unde
r age
5 w
ith fe
ver i
n th
e la
st 2
wee
ks w
ho h
ad a
fing
er o
r hee
l stic
k fo
r mal
aria
test
ing
8.5
TC.2
8 An
ti-m
alar
ial t
reat
men
t of
child
ren
unde
r age
5
CA
Pe
rcen
tage
of c
hild
ren
unde
r age
5 w
ith fe
ver i
n th
e la
st 2
wee
ks w
ho re
ceiv
ed a
ny a
ntim
alar
ial t
reat
men
t 8.
2
TC.2
9
Trea
tmen
t with
Art
emisi
nin-
base
d Co
mbi
natio
n Th
erap
y (A
CT) a
mon
g ch
ildre
n w
ho
rece
ived
ant
i-mal
aria
l tre
atm
ent
CA
Pe
rcen
tage
of c
hild
ren
unde
r age
5 w
ith fe
ver i
n th
e la
st 2
wee
ks w
ho re
ceiv
ed a
nti-m
alar
ial d
rugs
and
rece
ived
ACT
(or o
ther
fir
st-li
ne tr
eatm
ent a
ccor
ding
to n
atio
nal p
olicy
) 47
.7
TC.3
0 Ch
ildre
n ev
er b
reas
tfed
M
N Pe
rcen
tage
of w
omen
with
a li
ve b
irth
in th
e la
st 2
yea
rs w
ho b
reas
tfed
thei
r las
t liv
e-bo
rn ch
ild a
t any
tim
e 97
.0
TC.3
1 Ea
rly in
itiat
ion
of b
reas
tfeed
ing
M
N Pe
rcen
tage
of w
omen
with
a li
ve b
irth
in th
e la
st 2
yea
rs w
ho p
ut th
eir l
ast n
ewbo
rn to
the
brea
st w
ithin
one
hou
r of b
irth
50.1
TC.3
2 Ex
clusiv
e br
east
feed
ing
unde
r 6
mon
ths
BD
Pe
rcen
tage
of i
nfan
ts u
nder
6 m
onth
s of a
ge w
ho a
re e
xclu
sivel
y br
east
fed15
44
.9
TC.3
3 Pr
edom
inan
t bre
astfe
edin
g un
der
6 m
onth
s
BD
Perc
enta
ge o
f inf
ants
und
er 6
mon
ths o
f age
who
rece
ived
bre
ast m
ilk a
s the
pre
dom
inan
t sou
rce
of n
ouris
hmen
t16 d
urin
g th
e pr
evio
us d
ay
59.5
TC.3
4 Co
ntin
ued
brea
stfe
edin
g at
1
year
BD
Perc
enta
ge o
f chi
ldre
n ag
e 12
-15
mon
ths w
ho re
ceiv
ed b
reas
t milk
dur
ing
the
prev
ious
day
64
.9
TC.3
5 Co
ntin
ued
brea
stfe
edin
g at
2
year
s
BD
Perc
enta
ge o
f chi
ldre
n ag
e 20
-23
mon
ths w
ho re
ceiv
ed b
reas
t milk
dur
ing
the
prev
ious
day
27
.2
TC.3
6 Du
ratio
n of
bre
astfe
edin
g
BD
The
age
in m
onth
s whe
n 50
per
cent
of c
hild
ren
age
0-35
mon
ths d
id n
ot re
ceiv
e br
east
milk
dur
ing
the
prev
ious
day
15
.7
14 O
nly
wom
en w
ho re
ceiv
ed A
NC w
ere
aske
d ab
out i
nter
mitt
ent p
reve
ntiv
e tr
eatm
ent f
or m
alar
ia d
urin
g pr
egna
ncy.
15
Infa
nts r
ecei
ving
bre
ast m
ilk, a
nd n
ot re
ceiv
ing
any
othe
r flu
ids o
r foo
ds, w
ith th
e ex
cept
ion
of o
ral r
ehyd
ratio
n so
lutio
n, v
itam
ins,
min
eral
supp
lem
ents
and
med
icin
es
16 In
fant
s who
rece
ive
brea
st m
ilk a
nd ce
rtai
n flu
ids (
wat
er a
nd w
ater
-bas
ed d
rinks
, fru
it ju
ice, r
itual
flui
ds, o
ral r
ehyd
ratio
n so
lutio
n, d
rops
, vita
min
s, m
iner
als,
and
med
icine
s), b
ut d
o no
t rec
eive
any
thin
g el
se (i
n pa
rticu
lar,
non-
hum
an m
ilk a
nd fo
od-b
ased
flui
ds)
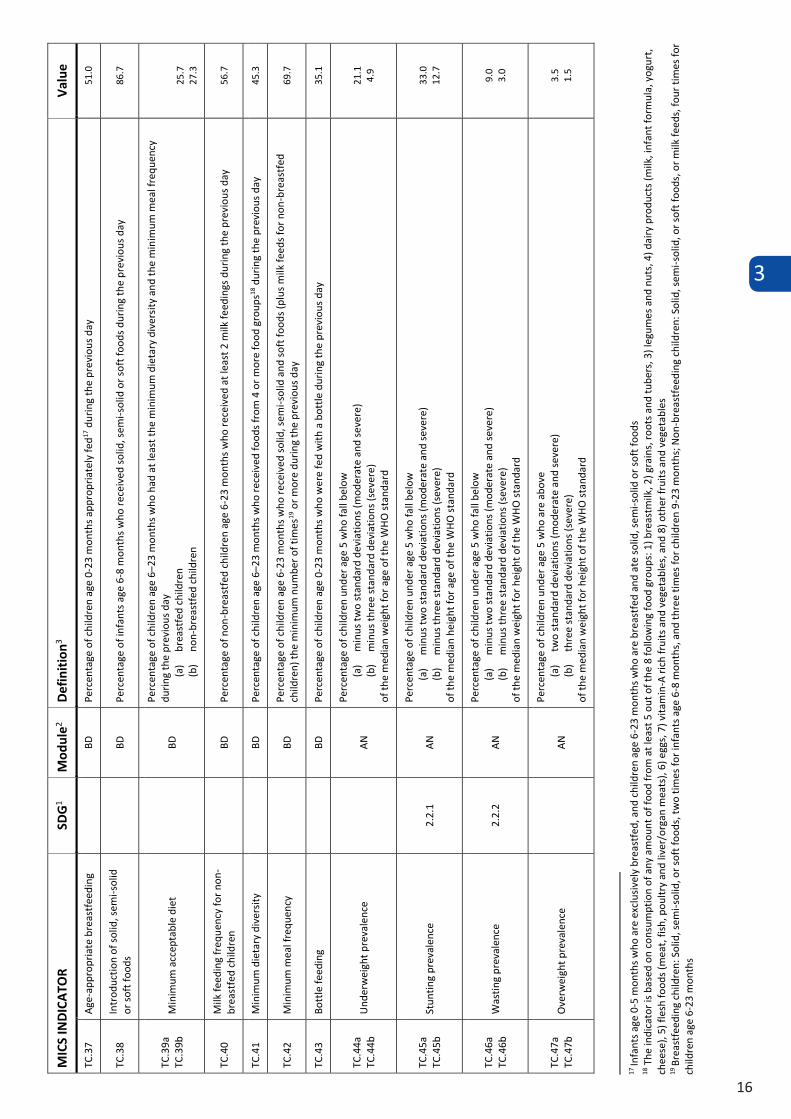
3
16
MIC
S IN
DICA
TOR
SDG1
Mod
ule2
Defin
ition
3 Va
lue
TC.3
7 Ag
e-ap
prop
riate
bre
astfe
edin
g
BD
Pe
rcen
tage
of c
hild
ren
age
0-23
mon
ths a
ppro
pria
tely
fed17
dur
ing
the
prev
ious
day
51
.0
TC.3
8 In
trod
uctio
n of
solid
, sem
i-sol
id
or so
ft fo
ods
BD
Pe
rcen
tage
of i
nfan
ts a
ge 6
-8 m
onth
s who
rece
ived
solid
, sem
i-sol
id o
r sof
t foo
ds d
urin
g th
e pr
evio
us d
ay
86.7
TC.3
9a
TC.3
9b
Min
imum
acc
epta
ble
diet
BD
Perc
enta
ge o
f chi
ldre
n ag
e 6–
23 m
onth
s who
had
at l
east
the
min
imum
die
tary
div
ersit
y an
d th
e m
inim
um m
eal f
requ
ency
du
ring
the
prev
ious
day
(a
) br
east
fed
child
ren
(b)
non-
brea
stfe
d ch
ildre
n 25
.7
27.3
TC.4
0 M
ilk fe
edin
g fre
quen
cy fo
r non
-br
east
fed
child
ren
BD
Pe
rcen
tage
of n
on-b
reas
tfed
child
ren
age
6-23
mon
ths w
ho re
ceiv
ed a
t lea
st 2
milk
feed
ings
dur
ing
the
prev
ious
day
56
.7
TC.4
1 M
inim
um d
ieta
ry d
iver
sity
BD
Pe
rcen
tage
of c
hild
ren
age
6–23
mon
ths w
ho re
ceiv
ed fo
ods f
rom
4 o
r mor
e fo
od g
roup
s18 d
urin
g th
e pr
evio
us d
ay
45.3
TC.4
2 M
inim
um m
eal f
requ
ency
BD
Perc
enta
ge o
f chi
ldre
n ag
e 6-
23 m
onth
s who
rece
ived
solid
, sem
i-sol
id a
nd so
ft fo
ods (
plus
milk
feed
s for
non
-bre
astfe
d ch
ildre
n) th
e m
inim
um n
umbe
r of t
imes
19 o
r mor
e du
ring
the
prev
ious
day
69
.7
TC.4
3 Bo
ttle
feed
ing
BD
Pe
rcen
tage
of c
hild
ren
age
0-23
mon
ths w
ho w
ere
fed
with
a b
ottle
dur
ing
the
prev
ious
day
35
.1
TC.4
4a
TC.4
4b
Unde
rwei
ght p
reva
lenc
e
AN
Perc
enta
ge o
f chi
ldre
n un
der a
ge 5
who
fall
belo
w
(a)
min
us tw
o st
anda
rd d
evia
tions
(mod
erat
e an
d se
vere
) (b
) m
inus
thre
e st
anda
rd d
evia
tions
(sev
ere)
of
the
med
ian
wei
ght f
or a
ge o
f the
WHO
stan
dard
21.1
4.
9
TC.4
5a
TC.4
5b
Stun
ting
prev
alen
ce
2.2.
1 AN
Perc
enta
ge o
f chi
ldre
n un
der a
ge 5
who
fall
belo
w
(a)
min
us tw
o st
anda
rd d
evia
tions
(mod
erat
e an
d se
vere
) (b
) m
inus
thre
e st
anda
rd d
evia
tions
(sev
ere)
of
the
med
ian
heig
ht fo
r age
of t
he W
HO st
anda
rd
33.0
12
.7
TC.4
6a
TC.4
6b
Was
ting
prev
alen
ce
2.2.
2 AN
Perc
enta
ge o
f chi
ldre
n un
der a
ge 5
who
fall
belo
w
(a)
min
us tw
o st
anda
rd d
evia
tions
(mod
erat
e an
d se
vere
) (b
) m
inus
thre
e st
anda
rd d
evia
tions
(sev
ere)
of
the
med
ian
wei
ght f
or h
eigh
t of t
he W
HO st
anda
rd
9.0
3.0
TC.4
7a
TC.4
7b
Over
wei
ght p
reva
lenc
e
AN
Perc
enta
ge o
f chi
ldre
n un
der a
ge 5
who
are
abo
ve
(a)
two
stan
dard
dev
iatio
ns (m
oder
ate
and
seve
re)
(b)
thre
e st
anda
rd d
evia
tions
(sev
ere)
of
the
med
ian
wei
ght f
or h
eigh
t of t
he W
HO st
anda
rd
3.5
1.5
17 In
fant
s age
0-5
mon
ths w
ho a
re e
xclu
sivel
y br
east
fed,
and
child
ren
age
6-23
mon
ths w
ho a
re b
reas
tfed
and
ate
solid
, sem
i-sol
id o
r sof
t foo
ds
18 T
he in
dica
tor i
s bas
ed o
n co
nsum
ptio
n of
any
am
ount
of f
ood
from
at l
east
5 o
ut o
f the
8 fo
llow
ing
food
gro
ups:
1) b
reas
tmilk
, 2) g
rain
s, ro
ots a
nd tu
bers
, 3) l
egum
es a
nd n
uts,
4) d
airy
pro
duct
s (m
ilk, i
nfan
t for
mul
a, y
ogur
t, ch
eese
), 5)
fles
h fo
ods (
mea
t, fis
h, p
oultr
y an
d liv
er/o
rgan
mea
ts),
6) e
ggs,
7) v
itam
in-A
rich
frui
ts a
nd v
eget
able
s, an
d 8)
oth
er fr
uits
and
veg
etab
les
19 Br
east
feed
ing
child
ren:
Sol
id, s
emi-s
olid
, or s
oft f
oods
, tw
o tim
es fo
r inf
ants
age
6-8
mon
ths,
and
thre
e tim
es fo
r chi
ldre
n 9-
23 m
onth
s; No
n-br
east
feed
ing
child
ren:
Sol
id, s
emi-s
olid
, or s
oft f
oods
, or m
ilk fe
eds,
four
tim
es fo
r ch
ildre
n ag
e 6-
23 m
onth
s
MIC
S IN
DICA
TOR
SDG1
Mod
ule2
Defin
ition
3 Va
lue
TC.4
8 Io
dize
d sa
lt co
nsum
ptio
n
SA
Perc
enta
ge o
f hou
seho
lds w
ith sa
lt te
stin
g po
sitiv
e fo
r any
ioda
te a
mon
g ho
useh
olds
in w
hich
salt
was
test
ed o
r whe
re th
ere
was
no
salt
93.6
TC.4
9a
TC.4
9b
TC.4
9c
Early
stim
ulat
ion
and
resp
onsiv
e ca
re
EC
Perc
enta
ge o
f chi
ldre
n ag
e 24
-59
mon
ths e
ngag
ed in
four
or m
ore
activ
ities
to p
rovi
de e
arly
stim
ulat
ion
and
resp
onsiv
e ca
re
in th
e la
st 3
day
s with
(a
) An
y ad
ult h
ouse
hold
mem
ber
(b)
Fath
er
(c)
Mot
her
29.8
7.
4 13
.5
TC.5
0 Av
aila
bilit
y of
child
ren’
s boo
ks
EC
Pe
rcen
tage
of c
hild
ren
unde
r age
5 w
ho h
ave
thre
e or
mor
e ch
ildre
n’s b
ooks
4.
2
TC.5
1 Av
aila
bilit
y of
pla
ythi
ngs
EC
Pe
rcen
tage
of c
hild
ren
unde
r age
5 w
ho p
lay
with
two
or m
ore
type
s of p
layt
hing
s 61
.2
TC.5
2 In
adeq
uate
supe
rvisi
on
EC
Pe
rcen
tage
of c
hild
ren
unde
r age
5 le
ft al
one
or u
nder
the
supe
rvisi
on o
f ano
ther
child
you
nger
than
10
year
s of a
ge fo
r mor
e th
an o
ne h
our a
t lea
st o
nce
in th
e la
st w
eek
12.4
TC.5
3 Ea
rly ch
ild d
evel
opm
ent i
ndex
4.
2.1
EC
Perc
enta
ge o
f chi
ldre
n ag
e 36
-59
mon
ths w
ho a
re d
evel
opm
enta
lly o
n tr
ack
in a
t lea
st th
ree
of th
e fo
llow
ing
four
dom
ains
: lit
erac
y-nu
mer
acy,
phy
sical
, soc
ial-e
mot
iona
l, an
d le
arni
ng
89.1
MIC
S IN
DICA
TOR
SDG1
Mod
ule2
Defin
ition
3 Va
lue
LEAR
N
LN.1
At
tend
ance
to e
arly
child
hood
ed
ucat
ion
UB
Pe
rcen
tage
of c
hild
ren
age
36-5
9 m
onth
s who
are
att
endi
ng a
n ea
rly ch
ildho
od e
duca
tion
prog
ram
me
32.1
LN.2
Pa
rtici
patio
n ra
te in
org
anise
d le
arni
ng (a
djus
ted)
4.
2.2
ED
Perc
enta
ge o
f chi
ldre
n in
the
rele
vant
age
gro
up (o
ne y
ear b
efor
e th
e of
ficia
l prim
ary
scho
ol e
ntry
age
) who
are
att
endi
ng a
n ea
rly ch
ildho
od e
duca
tion
prog
ram
me
or p
rimar
y sc
hool
73
.9
LN.3
Sc
hool
read
ines
s
ED
Perc
enta
ge o
f chi
ldre
n at
tend
ing
the
first
gra
de o
f prim
ary
scho
ol w
ho a
tten
ded
early
child
hood
edu
catio
n pr
ogra
mm
e du
ring
the
prev
ious
scho
ol y
ear
55.1
LN.4
Ne
t int
ake
rate
in p
rimar
y ed
ucat
ion
ED
Pe
rcen
tage
of c
hild
ren
of sc
hool
-ent
ry a
ge w
ho e
nter
the
first
gra
de o
f prim
ary
scho
ol
73.1
LN.5
a LN
.5b
LN.5
c Ne
t att
enda
nce
ratio
(adj
uste
d)
ED
Perc
enta
ge o
f chi
ldre
n of
(a
) pr
imar
y sc
hool
age
curr
ently
att
endi
ng p
rimar
y or
seco
ndar
y sc
hool
(b
) lo
wer
seco
ndar
y sc
hool
age
curr
ently
att
endi
ng lo
wer
seco
ndar
y sc
hool
or h
ighe
r (c
) up
per s
econ
dary
scho
ol a
ge cu
rren
tly a
tten
ding
upp
er se
cond
ary
scho
ol o
r hig
her
89.6
60
.5
38.1
LN.6
a LN
.6b
LN.6
c Ou
t-of-s
choo
l rat
e
ED
Perc
enta
ge o
f chi
ldre
n of
(a
) pr
imar
y sc
hool
age
who
are
not
att
endi
ng p
rimar
y or
low
er se
cond
ary
scho
ol
(b)
low
er se
cond
ary
scho
ol a
ge w
ho a
re n
ot a
tten
ding
prim
ary
scho
ol, l
ower
or u
pper
seco
ndar
y sc
hool
or h
ighe
r (c
) up
per s
econ
dary
scho
ol a
ge w
ho a
re n
ot a
tten
ding
prim
ary
scho
ol, l
ower
or u
pper
seco
ndar
y sc
hool
or h
ighe
r
10
.4
16.6
38
.1
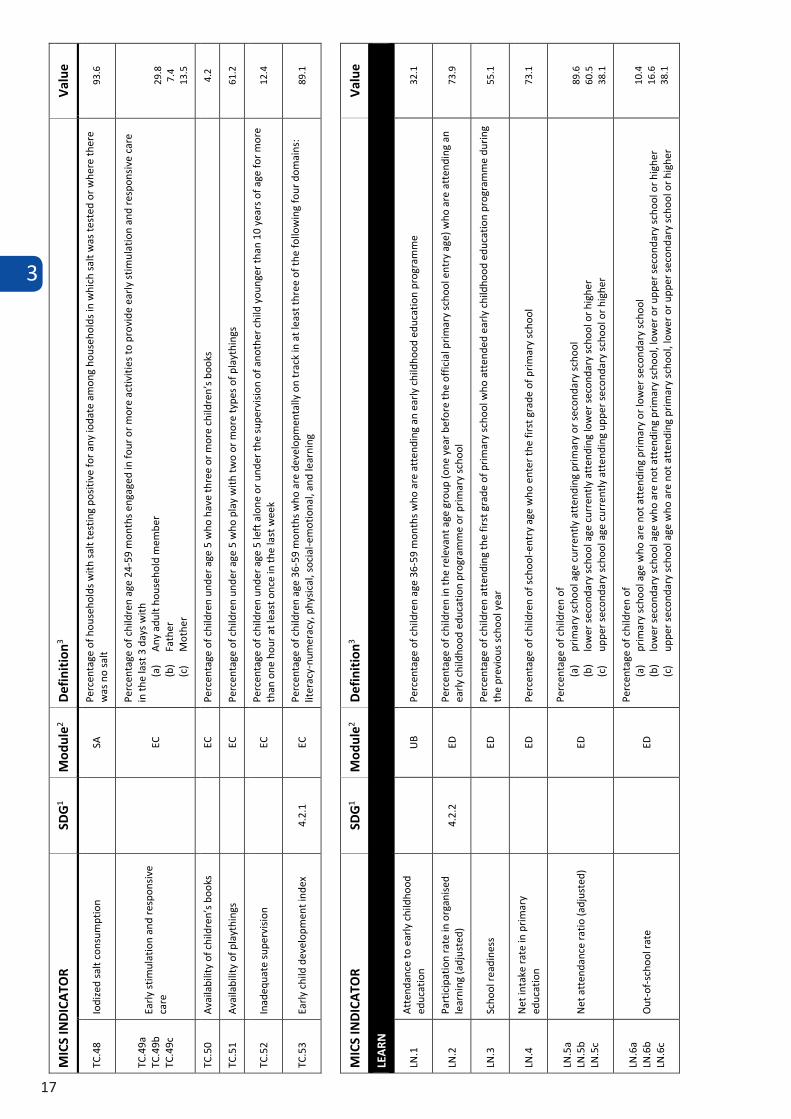
3
17
MIC
S IN
DICA
TOR
SDG1
Mod
ule2
Defin
ition
3 Va
lue
TC.3
7 Ag
e-ap
prop
riate
bre
astfe
edin
g
BD
Pe
rcen
tage
of c
hild
ren
age
0-23
mon
ths a
ppro
pria
tely
fed17
dur
ing
the
prev
ious
day
51
.0
TC.3
8 In
trod
uctio
n of
solid
, sem
i-sol
id
or so
ft fo
ods
BD
Pe
rcen
tage
of i
nfan
ts a
ge 6
-8 m
onth
s who
rece
ived
solid
, sem
i-sol
id o
r sof
t foo
ds d
urin
g th
e pr
evio
us d
ay
86.7
TC.3
9a
TC.3
9b
Min
imum
acc
epta
ble
diet
BD
Perc
enta
ge o
f chi
ldre
n ag
e 6–
23 m
onth
s who
had
at l
east
the
min
imum
die
tary
div
ersit
y an
d th
e m
inim
um m
eal f
requ
ency
du
ring
the
prev
ious
day
(a
) br
east
fed
child
ren
(b)
non-
brea
stfe
d ch
ildre
n 25
.7
27.3
TC.4
0 M
ilk fe
edin
g fre
quen
cy fo
r non
-br
east
fed
child
ren
BD
Pe
rcen
tage
of n
on-b
reas
tfed
child
ren
age
6-23
mon
ths w
ho re
ceiv
ed a
t lea
st 2
milk
feed
ings
dur
ing
the
prev
ious
day
56
.7
TC.4
1 M
inim
um d
ieta
ry d
iver
sity
BD
Pe
rcen
tage
of c
hild
ren
age
6–23
mon
ths w
ho re
ceiv
ed fo
ods f
rom
4 o
r mor
e fo
od g
roup
s18 d
urin
g th
e pr
evio
us d
ay
45.3
TC.4
2 M
inim
um m
eal f
requ
ency
BD
Perc
enta
ge o
f chi
ldre
n ag
e 6-
23 m
onth
s who
rece
ived
solid
, sem
i-sol
id a
nd so
ft fo
ods (
plus
milk
feed
s for
non
-bre
astfe
d ch
ildre
n) th
e m
inim
um n
umbe
r of t
imes
19 o
r mor
e du
ring
the
prev
ious
day
69
.7
TC.4
3 Bo
ttle
feed
ing
BD
Pe
rcen
tage
of c
hild
ren
age
0-23
mon
ths w
ho w
ere
fed
with
a b
ottle
dur
ing
the
prev
ious
day
35
.1
TC.4
4a
TC.4
4b
Unde
rwei
ght p
reva
lenc
e
AN
Perc
enta
ge o
f chi
ldre
n un
der a
ge 5
who
fall
belo
w
(a)
min
us tw
o st
anda
rd d
evia
tions
(mod
erat
e an
d se
vere
) (b
) m
inus
thre
e st
anda
rd d
evia
tions
(sev
ere)
of
the
med
ian
wei
ght f
or a
ge o
f the
WHO
stan
dard
21.1
4.
9
TC.4
5a
TC.4
5b
Stun
ting
prev
alen
ce
2.2.
1 AN
Perc
enta
ge o
f chi
ldre
n un
der a
ge 5
who
fall
belo
w
(a)
min
us tw
o st
anda
rd d
evia
tions
(mod
erat
e an
d se
vere
) (b
) m
inus
thre
e st
anda
rd d
evia
tions
(sev
ere)
of
the
med
ian
heig
ht fo
r age
of t
he W
HO st
anda
rd
33.0
12
.7
TC.4
6a
TC.4
6b
Was
ting
prev
alen
ce
2.2.
2 AN
Perc
enta
ge o
f chi
ldre
n un
der a
ge 5
who
fall
belo
w
(a)
min
us tw
o st
anda
rd d
evia
tions
(mod
erat
e an
d se
vere
) (b
) m
inus
thre
e st
anda
rd d
evia
tions
(sev
ere)
of
the
med
ian
wei
ght f
or h
eigh
t of t
he W
HO st
anda
rd
9.0
3.0
TC.4
7a
TC.4
7b
Over
wei
ght p
reva
lenc
e
AN
Perc
enta
ge o
f chi
ldre
n un
der a
ge 5
who
are
abo
ve
(a)
two
stan
dard
dev
iatio
ns (m
oder
ate
and
seve
re)
(b)
thre
e st
anda
rd d
evia
tions
(sev
ere)
of
the
med
ian
wei
ght f
or h
eigh
t of t
he W
HO st
anda
rd
3.5
1.5
17 In
fant
s age
0-5
mon
ths w
ho a
re e
xclu
sivel
y br
east
fed,
and
child
ren
age
6-23
mon
ths w
ho a
re b
reas
tfed
and
ate
solid
, sem
i-sol
id o
r sof
t foo
ds
18 T
he in
dica
tor i
s bas
ed o
n co
nsum
ptio
n of
any
am
ount
of f
ood
from
at l
east
5 o
ut o
f the
8 fo
llow
ing
food
gro
ups:
1) b
reas
tmilk
, 2) g
rain
s, ro
ots a
nd tu
bers
, 3) l
egum
es a
nd n
uts,
4) d
airy
pro
duct
s (m
ilk, i
nfan
t for
mul
a, y
ogur
t, ch
eese
), 5)
fles
h fo
ods (
mea
t, fis
h, p
oultr
y an
d liv
er/o
rgan
mea
ts),
6) e
ggs,
7) v
itam
in-A
rich
frui
ts a
nd v
eget
able
s, an
d 8)
oth
er fr
uits
and
veg
etab
les
19 Br
east
feed
ing
child
ren:
Sol
id, s
emi-s
olid
, or s
oft f
oods
, tw
o tim
es fo
r inf
ants
age
6-8
mon
ths,
and
thre
e tim
es fo
r chi
ldre
n 9-
23 m
onth
s; No
n-br
east
feed
ing
child
ren:
Sol
id, s
emi-s
olid
, or s
oft f
oods
, or m
ilk fe
eds,
four
tim
es fo
r ch
ildre
n ag
e 6-
23 m
onth
s
MIC
S IN
DICA
TOR
SDG1
Mod
ule2
Defin
ition
3 Va
lue
TC.4
8 Io
dize
d sa
lt co
nsum
ptio
n
SA
Perc
enta
ge o
f hou
seho
lds w
ith sa
lt te
stin
g po
sitiv
e fo
r any
ioda
te a
mon
g ho
useh
olds
in w
hich
salt
was
test
ed o
r whe
re th
ere
was
no
salt
93.6
TC.4
9a
TC.4
9b
TC.4
9c
Early
stim
ulat
ion
and
resp
onsiv
e ca
re
EC
Perc
enta
ge o
f chi
ldre
n ag
e 24
-59
mon
ths e
ngag
ed in
four
or m
ore
activ
ities
to p
rovi
de e
arly
stim
ulat
ion
and
resp
onsiv
e ca
re
in th
e la
st 3
day
s with
(a
) An
y ad
ult h
ouse
hold
mem
ber
(b)
Fath
er
(c)
Mot
her
29.8
7.
4 13
.5
TC.5
0 Av
aila
bilit
y of
child
ren’
s boo
ks
EC
Pe
rcen
tage
of c
hild
ren
unde
r age
5 w
ho h
ave
thre
e or
mor
e ch
ildre
n’s b
ooks
4.
2
TC.5
1 Av
aila
bilit
y of
pla
ythi
ngs
EC
Pe
rcen
tage
of c
hild
ren
unde
r age
5 w
ho p
lay
with
two
or m
ore
type
s of p
layt
hing
s 61
.2
TC.5
2 In
adeq
uate
supe
rvisi
on
EC
Pe
rcen
tage
of c
hild
ren
unde
r age
5 le
ft al
one
or u
nder
the
supe
rvisi
on o
f ano
ther
child
you
nger
than
10
year
s of a
ge fo
r mor
e th
an o
ne h
our a
t lea
st o
nce
in th
e la
st w
eek
12.4
TC.5
3 Ea
rly ch
ild d
evel
opm
ent i
ndex
4.
2.1
EC
Perc
enta
ge o
f chi
ldre
n ag
e 36
-59
mon
ths w
ho a
re d
evel
opm
enta
lly o
n tr
ack
in a
t lea
st th
ree
of th
e fo
llow
ing
four
dom
ains
: lit
erac
y-nu
mer
acy,
phy
sical
, soc
ial-e
mot
iona
l, an
d le
arni
ng
89.1
MIC
S IN
DICA
TOR
SDG1
Mod
ule2
Defin
ition
3 Va
lue
LEAR
N
LN.1
At
tend
ance
to e
arly
child
hood
ed
ucat
ion
UB
Pe
rcen
tage
of c
hild
ren
age
36-5
9 m
onth
s who
are
att
endi
ng a
n ea
rly ch
ildho
od e
duca
tion
prog
ram
me
32.1
LN.2
Pa
rtici
patio
n ra
te in
org
anise
d le
arni
ng (a
djus
ted)
4.
2.2
ED
Perc
enta
ge o
f chi
ldre
n in
the
rele
vant
age
gro
up (o
ne y
ear b
efor
e th
e of
ficia
l prim
ary
scho
ol e
ntry
age
) who
are
att
endi
ng a
n ea
rly ch
ildho
od e
duca
tion
prog
ram
me
or p
rimar
y sc
hool
73
.9
LN.3
Sc
hool
read
ines
s
ED
Perc
enta
ge o
f chi
ldre
n at
tend
ing
the
first
gra
de o
f prim
ary
scho
ol w
ho a
tten
ded
early
child
hood
edu
catio
n pr
ogra
mm
e du
ring
the
prev
ious
scho
ol y
ear
55.1
LN.4
Ne
t int
ake
rate
in p
rimar
y ed
ucat
ion
ED
Pe
rcen
tage
of c
hild
ren
of sc
hool
-ent
ry a
ge w
ho e
nter
the
first
gra
de o
f prim
ary
scho
ol
73.1
LN.5
a LN
.5b
LN.5
c Ne
t att
enda
nce
ratio
(adj
uste
d)
ED
Perc
enta
ge o
f chi
ldre
n of
(a
) pr
imar
y sc
hool
age
curr
ently
att
endi
ng p
rimar
y or
seco
ndar
y sc
hool
(b
) lo
wer
seco
ndar
y sc
hool
age
curr
ently
att
endi
ng lo
wer
seco
ndar
y sc
hool
or h
ighe
r (c
) up
per s
econ
dary
scho
ol a
ge cu
rren
tly a
tten
ding
upp
er se
cond
ary
scho
ol o
r hig
her
89.6
60
.5
38.1
LN.6
a LN
.6b
LN.6
c Ou
t-of-s
choo
l rat
e
ED
Perc
enta
ge o
f chi
ldre
n of
(a
) pr
imar
y sc
hool
age
who
are
not
att
endi
ng p
rimar
y or
low
er se
cond
ary
scho
ol
(b)
low
er se
cond
ary
scho
ol a
ge w
ho a
re n
ot a
tten
ding
prim
ary
scho
ol, l
ower
or u
pper
seco
ndar
y sc
hool
or h
ighe
r (c
) up
per s
econ
dary
scho
ol a
ge w
ho a
re n
ot a
tten
ding
prim
ary
scho
ol, l
ower
or u
pper
seco
ndar
y sc
hool
or h
ighe
r
10
.4
16.6
38
.1
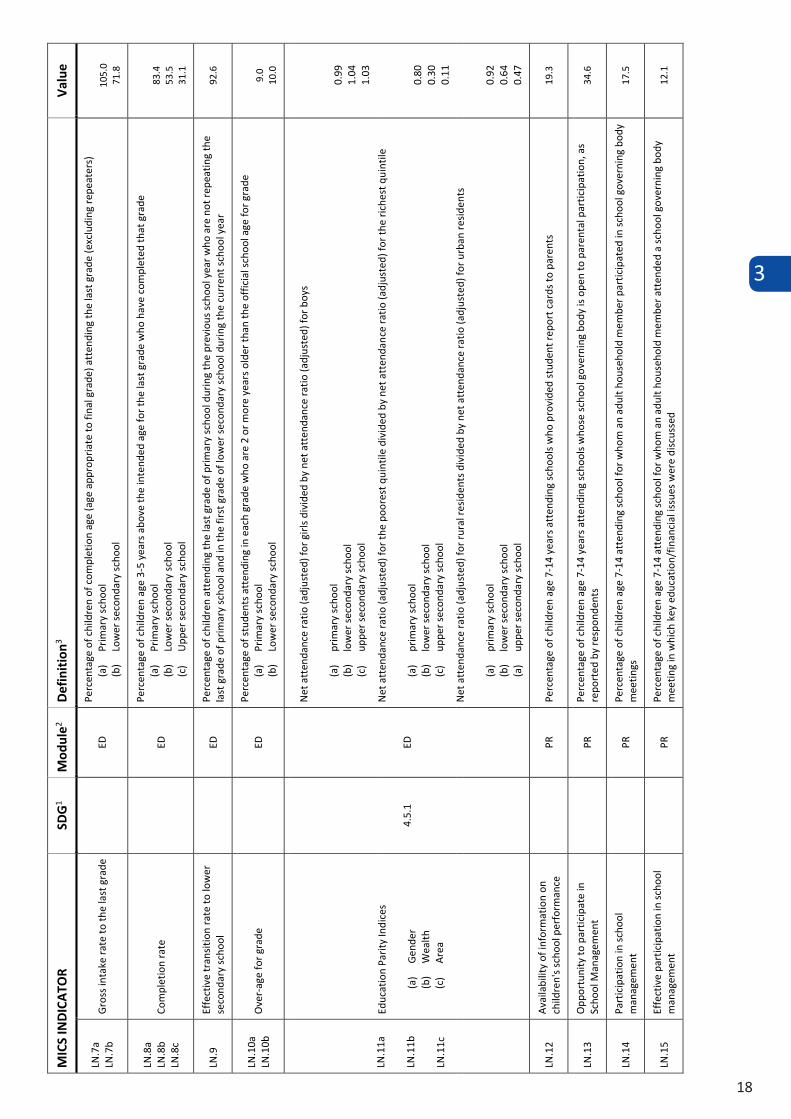
3
18
MIC
S IN
DICA
TOR
SDG1
Mod
ule2
Defin
ition
3 Va
lue
LN.7
a LN
.7b
Gros
s int
ake
rate
to th
e la
st g
rade
ED
Perc
enta
ge o
f chi
ldre
n of
com
plet
ion
age
(age
app
ropr
iate
to fi
nal g
rade
) att
endi
ng th
e la
st g
rade
(exc
ludi
ng re
peat
ers)
(a
) Pr
imar
y sc
hool
(b
) Lo
wer
seco
ndar
y sc
hool
10
5.0
71.8
LN.8
a LN
.8b
LN.8
c Co
mpl
etio
n ra
te
ED
Perc
enta
ge o
f chi
ldre
n ag
e 3-
5 ye
ars a
bove
the
inte
nded
age
for t
he la
st g
rade
who
hav
e co
mpl
eted
that
gra
de
(a)
Prim
ary
scho
ol
(b)
Low
er se
cond
ary
scho
ol
(c)
Uppe
r sec
onda
ry sc
hool
83.4
53
.5
31.1
LN.9
Ef
fect
ive
tran
sitio
n ra
te to
low
er
seco
ndar
y sc
hool
ED
Perc
enta
ge o
f chi
ldre
n at
tend
ing
the
last
gra
de o
f prim
ary
scho
ol d
urin
g th
e pr
evio
us sc
hool
yea
r who
are
not
repe
atin
g th
e la
st g
rade
of p
rimar
y sc
hool
and
in th
e fir
st g
rade
of l
ower
seco
ndar
y sc
hool
dur
ing
the
curr
ent s
choo
l yea
r 92
.6
LN.1
0a
LN.1
0b
Over
-age
for g
rade
ED
Perc
enta
ge o
f stu
dent
s att
endi
ng in
eac
h gr
ade
who
are
2 o
r mor
e ye
ars o
lder
than
the
offic
ial s
choo
l age
for g
rade
(a
) Pr
imar
y sc
hool
(b
) Lo
wer
seco
ndar
y sc
hool
9.
0 10
.0
LN.1
1a
LN.1
1b
LN.1
1c
Educ
atio
n Pa
rity
Indi
ces
(a)
Gend
er
(b)
Wea
lth
(c)
Area
4.5.
1 ED
Net a
tten
danc
e ra
tio (a
djus
ted)
for g
irls d
ivid
ed b
y ne
t att
enda
nce
ratio
(adj
uste
d) fo
r boy
s
(a)
prim
ary
scho
ol
(b)
low
er se
cond
ary
scho
ol
(c)
uppe
r sec
onda
ry sc
hool
Net a
tten
danc
e ra
tio (a
djus
ted)
for t
he p
oore
st q
uint
ile d
ivid
ed b
y ne
t att
enda
nce
ratio
(adj
uste
d) fo
r the
rich
est q
uint
ile
(a)
prim
ary
scho
ol
(b)
low
er se
cond
ary
scho
ol
(c)
uppe
r sec
onda
ry sc
hool
Net a
tten
danc
e ra
tio (a
djus
ted)
for r
ural
resid
ents
div
ided
by
net a
tten
danc
e ra
tio (a
djus
ted)
for u
rban
resid
ents
(a)
prim
ary
scho
ol
(b)
low
er se
cond
ary
scho
ol
(a)
uppe
r sec
onda
ry sc
hool
0.
99
1.04
1.
03
0.
80
0.30
0.
11
0.92
0.
64
0.47
LN.1
2 Av
aila
bilit
y of
info
rmat
ion
on
child
ren'
s sch
ool p
erfo
rman
ce
PR
Pe
rcen
tage
of c
hild
ren
age
7-14
yea
rs a
tten
ding
scho
ols w
ho p
rovi
ded
stud
ent r
epor
t car
ds to
par
ents
19
.3
LN.1
3 Op
port
unity
to p
artic
ipat
e in
Sc
hool
Man
agem
ent
PR
Pe
rcen
tage
of c
hild
ren
age
7-14
yea
rs a
tten
ding
scho
ols w
hose
scho
ol g
over
ning
bod
y is
open
to p
aren
tal p
artic
ipat
ion,
as
repo
rted
by
resp
onde
nts
34.6
LN.1
4 Pa
rtici
patio
n in
scho
ol
man
agem
ent
PR
Pe
rcen
tage
of c
hild
ren
age
7-14
att
endi
ng sc
hool
for w
hom
an
adul
t hou
seho
ld m
embe
r par
ticip
ated
in sc
hool
gov
erni
ng b
ody
mee
tings
17
.5
LN.1
5 Ef
fect
ive
part
icipa
tion
in sc
hool
m
anag
emen
t
PR
Perc
enta
ge o
f chi
ldre
n ag
e 7-
14 a
tten
ding
scho
ol fo
r who
m a
n ad
ult h
ouse
hold
mem
ber a
tten
ded
a sc
hool
gov
erni
ng b
ody
mee
ting
in w
hich
key
edu
catio
n/fin
ancia
l iss
ues w
ere
disc
usse
d 12
.1
MIC
S IN
DICA
TOR
SDG1
Mod
ule2
Defin
ition
3 Va
lue
LN.1
6 Di
scus
sion
with
teac
hers
re
gard
ing
child
ren’
s pro
gres
s
PR
Perc
enta
ge o
f chi
ldre
n ag
e 7-
14 a
tten
ding
scho
ol fo
r who
m a
n ad
ult h
ouse
hold
mem
ber d
iscus
sed
child
’s pr
ogre
ss w
ith
teac
hers
15
.9
LN.1
7 Co
ntac
t with
scho
ol co
ncer
ning
te
ache
r abs
ence
20
PR
Pe
rcen
tage
of c
hild
ren
age
7-14
att
endi
ng sc
hool
who
coul
d no
t att
end
class
due
to te
ache
r abs
ence
and
for w
hom
an
adul
t ho
useh
old
mem
ber c
onta
cted
scho
ol re
pres
enta
tives
whe
n ch
ild co
uld
not a
tten
d cla
ss
16.0
LN.1
8 Av
aila
bilit
y of
boo
ks a
t hom
e
PR
Perc
enta
ge o
f chi
ldre
n ag
e 7-
14 y
ears
who
hav
e th
ree
or m
ore
book
s to
read
at h
ome
13.1
LN.2
1 Su
ppor
t with
hom
ewor
k
PR
Pe
rcen
tage
of c
hild
ren
age
7-14
att
endi
ng sc
hool
who
hav
e ho
mew
ork
and
rece
ived
hel
p w
ith h
omew
ork
52
.7
MIC
S IN
DICA
TOR
SDG1
Mod
ule2
Defin
ition
3 Va
lue
PROT
ECTE
D FR
OM V
IOLE
NCE
AND
EXPL
OITA
TION
PR.1
Bi
rth
regi
stra
tion
16.9
.1
BR
Perc
enta
ge o
f chi
ldre
n un
der a
ge 5
who
se b
irths
are
repo
rted
regi
ster
ed w
ith a
civi
l aut
horit
y (in
cludi
ng re
gist
ratio
n in
the
fam
ily b
ook)
73
.0
PR.2
Vi
olen
t disc
iplin
e 16
.2.1
UC
D –
FCD
Perc
enta
ge o
f chi
ldre
n ag
e 1-
14 y
ears
who
exp
erie
nced
any
phy
sical
pun
ishm
ent a
nd/o
r psy
chol
ogica
l agg
ress
ion
by
care
give
rs in
the
past
one
mon
th
69.0
PR.3
Ch
ild la
bour
8.
7.1
CL
Perc
enta
ge o
f chi
ldre
n ag
e 5-
17 y
ears
who
are
invo
lved
in ch
ild la
bour
21
42.5
PR.4
a Ea
rly m
arria
ge (b
efor
e ag
e 15
) 5.
3.1
MA
Perc
enta
ge o
f you
ng p
eopl
e ag
e 20
-24
year
s who
wer
e fir
st m
arrie
d or
in u
nion
bef
ore
age
15
(a)
wom
en
(b)
men
7.
1 1.
8
PR.4
b Ea
rly m
arria
ge (b
efor
e ag
e 18
) 5.
3.1
MA
Perc
enta
ge o
f you
ng p
eopl
e ag
e 20
-24
year
s who
wer
e fir
st m
arrie
d or
in u
nion
bef
ore
age
18
(a)
wom
en
(b)
men
32
.7
10.8
PR.5
Yo
ung
peop
le a
ge 1
5-19
yea
rs
curr
ently
mar
ried
or in
uni
on
M
A Pe
rcen
tage
of y
oung
peo
ple
age
15-1
9 ye
ars w
ho a
re m
arrie
d or
in u
nion
(a
) w
omen
(b
) m
en
23.5
5.
9
PR.6
Po
lygy
ny
M
A Pe
rcen
tage
of p
eopl
e ag
e 15
-49
year
s who
are
in a
pol
ygyn
ous u
nion
(a
) w
omen
(b
) m
en
3.5
2.1
20 T
he in
dica
tor n
ame
has b
een
chan
ged
from
the
stan
dard
“MIC
S in
dica
tor L
N.17
- Co
ntac
t with
scho
ol co
ncer
ning
teac
her s
trik
e or
abs
ence
” sin
ce te
ache
r str
ike
is no
t app
licab
le fo
r Lao
PDR
.
21 C
hild
ren
invo
lved
in ch
ild la
bour
are
def
ined
as c
hild
ren
invo
lved
in e
cono
mic
activ
ities
abo
ve th
e ag
e-sp
ecifi
c thr
esho
lds,
child
ren
invo
lved
in h
ouse
hold
chor
es a
bove
the
age-
spec
ific t
hres
hold
s, an
d ch
ildre
n in
volv
ed in
ha
zard
ous w
ork.
See
the
MIC
S ta
bula
tion
plan
for m
ore
deta
iled
info
rmat
ion
on th
resh
olds
and
clas
sifica
tions
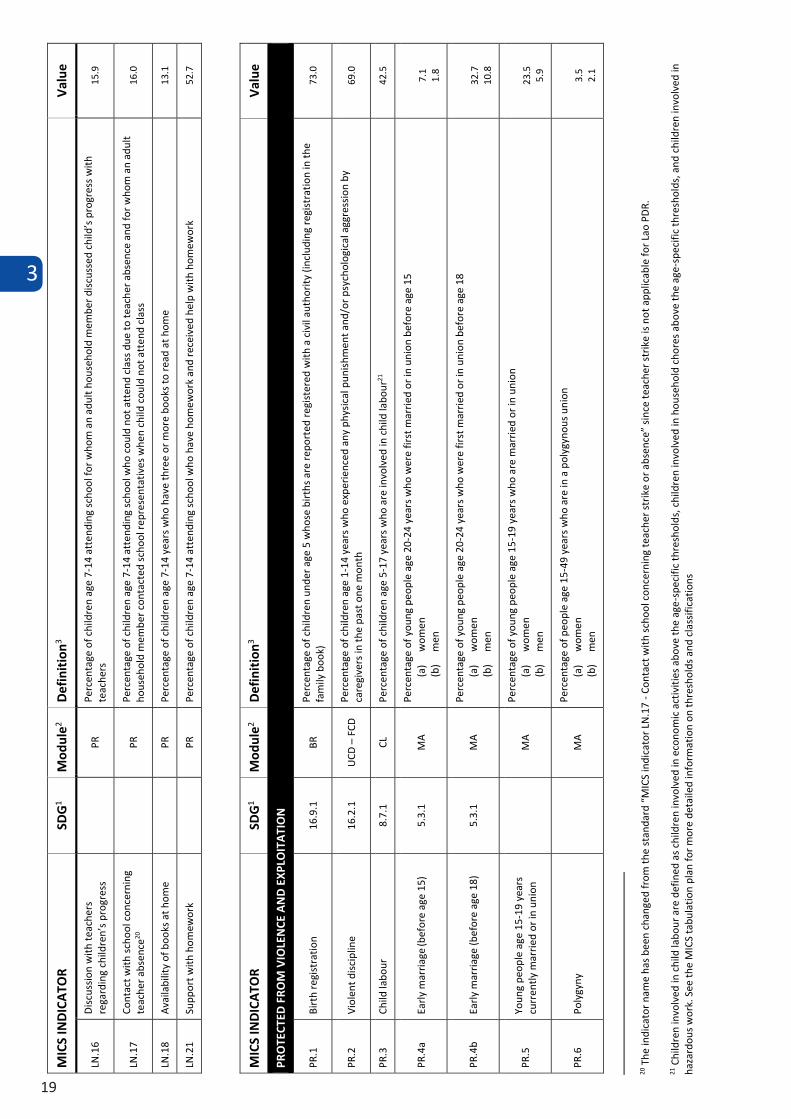
3
19
MIC
S IN
DICA
TOR
SDG1
Mod
ule2
Defin
ition
3 Va
lue
LN.7
a LN
.7b
Gros
s int
ake
rate
to th
e la
st g
rade
ED
Perc
enta
ge o
f chi
ldre
n of
com
plet
ion
age
(age
app
ropr
iate
to fi
nal g
rade
) att
endi
ng th
e la
st g
rade
(exc
ludi
ng re
peat
ers)
(a
) Pr
imar
y sc
hool
(b
) Lo
wer
seco
ndar
y sc
hool
10
5.0
71.8
LN.8
a LN
.8b
LN.8
c Co
mpl
etio
n ra
te
ED
Perc
enta
ge o
f chi
ldre
n ag
e 3-
5 ye
ars a
bove
the
inte
nded
age
for t
he la
st g
rade
who
hav
e co
mpl
eted
that
gra
de
(a)
Prim
ary
scho
ol
(b)
Low
er se
cond
ary
scho
ol
(c)
Uppe
r sec
onda
ry sc
hool
83.4
53
.5
31.1
LN.9
Ef
fect
ive
tran
sitio
n ra
te to
low
er
seco
ndar
y sc
hool
ED
Perc
enta
ge o
f chi
ldre
n at
tend
ing
the
last
gra
de o
f prim
ary
scho
ol d
urin
g th
e pr
evio
us sc
hool
yea
r who
are
not
repe
atin
g th
e la
st g
rade
of p
rimar
y sc
hool
and
in th
e fir
st g
rade
of l
ower
seco
ndar
y sc
hool
dur
ing
the
curr
ent s
choo
l yea
r 92
.6
LN.1
0a
LN.1
0b
Over
-age
for g
rade
ED
Perc
enta
ge o
f stu
dent
s att
endi
ng in
eac
h gr
ade
who
are
2 o
r mor
e ye
ars o
lder
than
the
offic
ial s
choo
l age
for g
rade
(a
) Pr
imar
y sc
hool
(b
) Lo
wer
seco
ndar
y sc
hool
9.
0 10
.0
LN.1
1a
LN.1
1b
LN.1
1c
Educ
atio
n Pa
rity
Indi
ces
(a)
Gend
er
(b)
Wea
lth
(c)
Area
4.5.
1 ED
Net a
tten
danc
e ra
tio (a
djus
ted)
for g
irls d
ivid
ed b
y ne
t att
enda
nce
ratio
(adj
uste
d) fo
r boy
s
(a)
prim
ary
scho
ol
(b)
low
er se
cond
ary
scho
ol
(c)
uppe
r sec
onda
ry sc
hool
Net a
tten
danc
e ra
tio (a
djus
ted)
for t
he p
oore
st q
uint
ile d
ivid
ed b
y ne
t att
enda
nce
ratio
(adj
uste
d) fo
r the
rich
est q
uint
ile
(a)
prim
ary
scho
ol
(b)
low
er se
cond
ary
scho
ol
(c)
uppe
r sec
onda
ry sc
hool
Net a
tten
danc
e ra
tio (a
djus
ted)
for r
ural
resid
ents
div
ided
by
net a
tten
danc
e ra
tio (a
djus
ted)
for u
rban
resid
ents
(a)
prim
ary
scho
ol
(b)
low
er se
cond
ary
scho
ol
(a)
uppe
r sec
onda
ry sc
hool
0.
99
1.04
1.
03
0.
80
0.30
0.
11
0.92
0.
64
0.47
LN.1
2 Av
aila
bilit
y of
info
rmat
ion
on
child
ren'
s sch
ool p
erfo
rman
ce
PR
Pe
rcen
tage
of c
hild
ren
age
7-14
yea
rs a
tten
ding
scho
ols w
ho p
rovi
ded
stud
ent r
epor
t car
ds to
par
ents
19
.3
LN.1
3 Op
port
unity
to p
artic
ipat
e in
Sc
hool
Man
agem
ent
PR
Pe
rcen
tage
of c
hild
ren
age
7-14
yea
rs a
tten
ding
scho
ols w
hose
scho
ol g
over
ning
bod
y is
open
to p
aren
tal p
artic
ipat
ion,
as
repo
rted
by
resp
onde
nts
34.6
LN.1
4 Pa
rtici
patio
n in
scho
ol
man
agem
ent
PR
Pe
rcen
tage
of c
hild
ren
age
7-14
att
endi
ng sc
hool
for w
hom
an
adul
t hou
seho
ld m
embe
r par
ticip
ated
in sc
hool
gov
erni
ng b
ody
mee
tings
17
.5
LN.1
5 Ef
fect
ive
part
icipa
tion
in sc
hool
m
anag
emen
t
PR
Perc
enta
ge o
f chi
ldre
n ag
e 7-
14 a
tten
ding
scho
ol fo
r who
m a
n ad
ult h
ouse
hold
mem
ber a
tten
ded
a sc
hool
gov
erni
ng b
ody
mee
ting
in w
hich
key
edu
catio
n/fin
ancia
l iss
ues w
ere
disc
usse
d 12
.1
MIC
S IN
DICA
TOR
SDG1
Mod
ule2
Defin
ition
3 Va
lue
LN.1
6 Di
scus
sion
with
teac
hers
re
gard
ing
child
ren’
s pro
gres
s
PR
Perc
enta
ge o
f chi
ldre
n ag
e 7-
14 a
tten
ding
scho
ol fo
r who
m a
n ad
ult h
ouse
hold
mem
ber d
iscus
sed
child
’s pr
ogre
ss w
ith
teac
hers
15
.9
LN.1
7 Co
ntac
t with
scho
ol co
ncer
ning
te
ache
r abs
ence
20
PR
Pe
rcen
tage
of c
hild
ren
age
7-14
att
endi
ng sc
hool
who
coul
d no
t att
end
class
due
to te
ache
r abs
ence
and
for w
hom
an
adul
t ho
useh
old
mem
ber c
onta
cted
scho
ol re
pres
enta
tives
whe
n ch
ild co
uld
not a
tten
d cla
ss
16.0
LN.1
8 Av
aila
bilit
y of
boo
ks a
t hom
e
PR
Perc
enta
ge o
f chi
ldre
n ag
e 7-
14 y
ears
who
hav
e th
ree
or m
ore
book
s to
read
at h
ome
13.1
LN.2
1 Su
ppor
t with
hom
ewor
k
PR
Pe
rcen
tage
of c
hild
ren
age
7-14
att
endi
ng sc
hool
who
hav
e ho
mew
ork
and
rece
ived
hel
p w
ith h
omew
ork
52
.7
MIC
S IN
DICA
TOR
SDG1
Mod
ule2
Defin
ition
3 Va
lue
PROT
ECTE
D FR
OM V
IOLE
NCE
AND
EXPL
OITA
TION
PR.1
Bi
rth
regi
stra
tion
16.9
.1
BR
Perc
enta
ge o
f chi
ldre
n un
der a
ge 5
who
se b
irths
are
repo
rted
regi
ster
ed w
ith a
civi
l aut
horit
y (in
cludi
ng re
gist
ratio
n in
the
fam
ily b
ook)
73
.0
PR.2
Vi
olen
t disc
iplin
e 16
.2.1
UC
D –
FCD
Perc
enta
ge o
f chi
ldre
n ag
e 1-
14 y
ears
who
exp
erie
nced
any
phy
sical
pun
ishm
ent a
nd/o
r psy
chol
ogica
l agg
ress
ion
by
care
give
rs in
the
past
one
mon
th
69.0
PR.3
Ch
ild la
bour
8.
7.1
CL
Perc
enta
ge o
f chi
ldre
n ag
e 5-
17 y
ears
who
are
invo
lved
in ch
ild la
bour
21
42.5
PR.4
a Ea
rly m
arria
ge (b
efor
e ag
e 15
) 5.
3.1
MA
Perc
enta
ge o
f you
ng p
eopl
e ag
e 20
-24
year
s who
wer
e fir
st m
arrie
d or
in u
nion
bef
ore
age
15
(a)
wom
en
(b)
men
7.
1 1.
8
PR.4
b Ea
rly m
arria
ge (b
efor
e ag
e 18
) 5.
3.1
MA
Perc
enta
ge o
f you
ng p
eopl
e ag
e 20
-24
year
s who
wer
e fir
st m
arrie
d or
in u
nion
bef
ore
age
18
(a)
wom
en
(b)
men
32
.7
10.8
PR.5
Yo
ung
peop
le a
ge 1
5-19
yea
rs
curr
ently
mar
ried
or in
uni
on
M
A Pe
rcen
tage
of y
oung
peo
ple
age
15-1
9 ye
ars w
ho a
re m
arrie
d or
in u
nion
(a
) w
omen
(b
) m
en
23.5
5.
9
PR.6
Po
lygy
ny
M
A Pe
rcen
tage
of p
eopl
e ag
e 15
-49
year
s who
are
in a
pol
ygyn
ous u
nion
(a
) w
omen
(b
) m
en
3.5
2.1
20 T
he in
dica
tor n
ame
has b
een
chan
ged
from
the
stan
dard
“MIC
S in
dica
tor L
N.17
- Co
ntac
t with
scho
ol co
ncer
ning
teac
her s
trik
e or
abs
ence
” sin
ce te
ache
r str
ike
is no
t app
licab
le fo
r Lao
PDR
.
21 C
hild
ren
invo
lved
in ch
ild la
bour
are
def
ined
as c
hild
ren
invo
lved
in e
cono
mic
activ
ities
abo
ve th
e ag
e-sp
ecifi
c thr
esho
lds,
child
ren
invo
lved
in h
ouse
hold
chor
es a
bove
the
age-
spec
ific t
hres
hold
s, an
d ch
ildre
n in
volv
ed in
ha
zard
ous w
ork.
See
the
MIC
S ta
bula
tion
plan
for m
ore
deta
iled
info
rmat
ion
on th
resh
olds
and
clas
sifica
tions
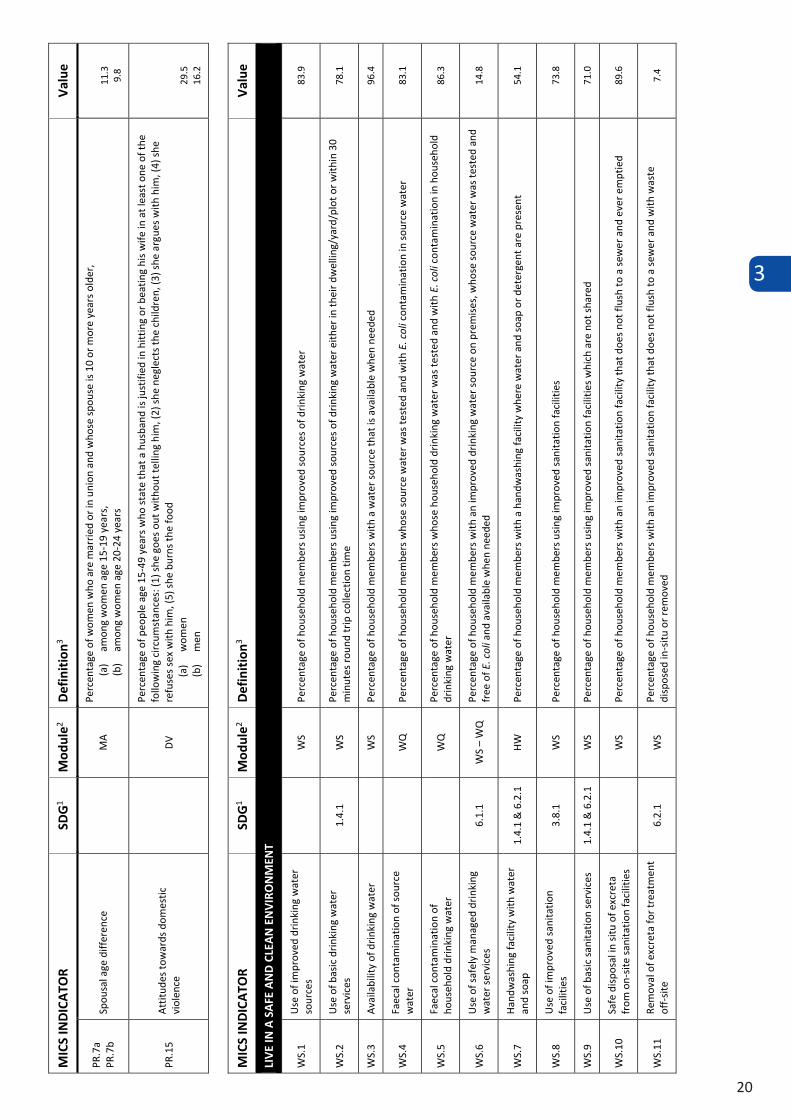
3
20
MIC
S IN
DICA
TOR
SDG1
Mod
ule2
Defin
ition
3 Va
lue
PR.7
a PR
.7b
Spou
sal a
ge d
iffer
ence
MA
Perc
enta
ge o
f wom
en w
ho a
re m
arrie
d or
in u
nion
and
who
se sp
ouse
is 1
0 or
mor
e ye
ars o
lder
, (a
) am
ong
wom
en a
ge 1
5-19
yea
rs,
(b)
amon
g w
omen
age
20-
24 y
ears
11
.3
9.8
PR.1
5 At
titud
es to
war
ds d
omes
tic
viol
ence
DV
Perc
enta
ge o
f peo
ple
age
15-4
9 ye
ars w
ho st
ate
that
a h
usba
nd is
just
ified
in h
ittin
g or
bea
ting
his w
ife in
at l
east
one
of t
he
follo
win
g cir
cum
stan
ces:
(1) s
he g
oes o
ut w
ithou
t tel
ling
him
, (2)
she
negl
ects
the
child
ren,
(3) s
he a
rgue
s with
him
, (4)
she
refu
ses s
ex w
ith h
im, (
5) sh
e bu
rns t
he fo
od
(a)
wom
en
(b)
men
29
.5
16.2
MIC
S IN
DICA
TOR
SDG1
Mod
ule2
Defin
ition
3 Va
lue
LIVE
IN A
SAF
E AN
D CL
EAN
ENVI
RONM
ENT
WS.
1 Us
e of
impr
oved
drin
king
wat
er
sour
ces
W
S Pe
rcen
tage
of h
ouse
hold
mem
bers
usin
g im
prov
ed so
urce
s of d
rinki
ng w
ater
83
.9
WS.
2 Us
e of
bas
ic dr
inki
ng w
ater
se
rvice
s 1.
4.1
WS
Perc
enta
ge o
f hou
seho
ld m
embe
rs u
sing
impr
oved
sour
ces o
f drin
king
wat
er e
ither
in th
eir d
wel
ling/
yard
/plo
t or w
ithin
30
min
utes
roun
d tr
ip co
llect
ion
time
78.1
WS.
3 Av
aila
bilit
y of
drin
king
wat
er
W
S Pe
rcen
tage
of h
ouse
hold
mem
bers
with
a w
ater
sour
ce th
at is
ava
ilabl
e w
hen
need
ed
96.4
WS.
4 Fa
ecal
cont
amin
atio
n of
sour
ce
wat
er
W
Q
Perc
enta
ge o
f hou
seho
ld m
embe
rs w
hose
sour
ce w
ater
was
test
ed a
nd w
ith E
. col
i con
tam
inat
ion
in so
urce
wat
er
83.1
WS.
5 Fa
ecal
cont
amin
atio
n of
ho
useh
old
drin
king
wat
er
W
Q
Perc
enta
ge o
f hou
seho
ld m
embe
rs w
hose
hou
seho
ld d
rinki
ng w
ater
was
test
ed a
nd w
ith E
. col
i con
tam
inat
ion
in h
ouse
hold
dr
inki
ng w
ater
86
.3
WS.
6 Us
e of
safe
ly m
anag
ed d
rinki
ng
wat
er se
rvice
s 6.
1.1
WS
– W
Q
Perc
enta
ge o
f hou
seho
ld m
embe
rs w
ith a
n im
prov
ed d
rinki
ng w
ater
sour
ce o
n pr
emise
s, w
hose
sour
ce w
ater
was
test
ed a
nd
free
of E
. col
i and
ava
ilabl
e w
hen
need
ed
14.8
WS.
7 Ha
ndw
ashi
ng fa
cility
with
wat
er
and
soap
1.
4.1
& 6
.2.1
HW
Pe
rcen
tage
of h
ouse
hold
mem
bers
with
a h
andw
ashi
ng fa
cility
whe
re w
ater
and
soap
or d
eter
gent
are
pre
sent
54
.1
WS.
8 Us
e of
impr
oved
sani
tatio
n fa
ciliti
es
3.8.
1 W
S Pe
rcen
tage
of h
ouse
hold
mem
bers
usin
g im
prov
ed sa
nita
tion
facil
ities
73
.8
WS.
9 Us
e of
bas
ic sa
nita
tion
serv
ices
1.4.
1 &
6.2
.1
WS
Perc
enta
ge o
f hou
seho
ld m
embe
rs u
sing
impr
oved
sani
tatio
n fa
ciliti
es w
hich
are
not
shar
ed
71.0
WS.
10
Safe
disp
osal
in si
tu o
f exc
reta
fro
m o
n-sit
e sa
nita
tion
facil
ities
WS
Perc
enta
ge o
f hou
seho
ld m
embe
rs w
ith a
n im
prov
ed sa
nita
tion
facil
ity th
at d
oes n
ot fl
ush
to a
sew
er a
nd e
ver e
mpt
ied
89.6
WS.
11
Rem
oval
of e
xcre
ta fo
r tre
atm
ent
off-s
ite
6.2.
1 W
S Pe
rcen
tage
of h
ouse
hold
mem
bers
with
an
impr
oved
sani
tatio
n fa
cility
that
doe
s not
flus
h to
a se
wer
and
with
was
te
disp
osed
in-s
itu o
r rem
oved
7.
4
MIC
S IN
DICA
TOR
SDG1
Mod
ule2
Defin
ition
3 Va
lue
WS.
12
Men
stru
al h
ygie
ne m
anag
emen
t
UN
Perc
enta
ge o
f wom
en a
ge 1
5-49
yea
rs re
port
ing
men
stru
atin
g in
the
last
12
mon
ths a
nd u
sing
men
stru
al h
ygie
ne m
ater
ials
with
a p
rivat
e pl
ace
to w
ash
and
chan
ge w
hile
at h
ome
72.7
WS.
13
Exclu
sion
from
act
iviti
es d
urin
g m
enst
ruat
ion
UN
Pe
rcen
tage
of w
omen
age
15-
49 y
ears
repo
rtin
g m
enst
ruat
ing
in th
e la
st 1
2 m
onth
s who
did
not
par
ticip
ate
in so
cial a
ctiv
ities
, sc
hool
or w
ork
due
to th
eir l
ast m
enst
ruat
ion
11.8
MIC
S IN
DICA
TOR
SDG1
Mod
ule2
Defin
ition
3 Va
lue
EQUI
TABL
E CH
ANCE
IN LI
FE
EQ.1
Ch
ildre
n w
ith fu
nctio
nal d
ifficu
lty
UC
F –
FCF
Perc
enta
ge o
f chi
ldre
n ag
e 2-
4 ye
ars r
epor
ted
with
func
tiona
l diff
iculty
in a
t lea
st o
ne d
omai
n 2.
0
EQ.2
a EQ
.2b
EQ.2
c He
alth
insu
ranc
e co
vera
ge [M
]
W
B CB
UB
Perc
enta
ge o
f wom
en, m
en, a
nd ch
ildre
n co
vere
d by
hea
lth in
sura
nce
(a)
wom
en a
ge 1
5-49
(b
) ch
ildre
n ag
e 5-
17
(c)
child
ren
unde
r age
5
15.4
10
.4
13.7
EQ.3
Po
pula
tion
cove
red
by so
cial
tran
sfer
s 1.
3.1
ST
Perc
enta
ge o
f hou
seho
ld m
embe
rs th
at re
ceiv
ed a
ny ty
pe o
f soc
ial t
rans
fers
and
ben
efits
in th
e la
st 3
mon
ths
12.4
EQ.4
Ex
tern
al e
cono
mic
supp
ort t
o th
e po
ores
t hou
seho
lds
ST
Pe
rcen
tage
of h
ouse
hold
s in
the
two
low
est w
ealth
qui
ntile
s tha
t rec
eive
d an
y ty
pe o
f soc
ial t
rans
fers
in th
e la
st 3
mon
ths
9.2
EQ.5
Ch
ildre
n in
the
hous
ehol
ds th
at
rece
ived
any
type
of s
ocia
l tr
ansf
ers
ST
Pe
rcen
tage
of c
hild
ren
unde
r age
18
livin
g in
the
hous
ehol
ds th
at re
ceiv
ed a
ny ty
pe o
f soc
ial t
rans
fers
in th
e la
st 3
mon
ths
12.4
EQ.6
Sc
hool
-rela
ted
supp
ort
ED
Pe
rcen
tage
of c
hild
ren
and
youn
g pe
ople
age
5-2
4 ye
ars c
urre
ntly
att
endi
ng sc
hool
that
rece
ived
any
type
of s
choo
l-rel
ated
su
ppor
t in
the
curr
ent/
mos
t rec
ent a
cade
mic
year
4.
7
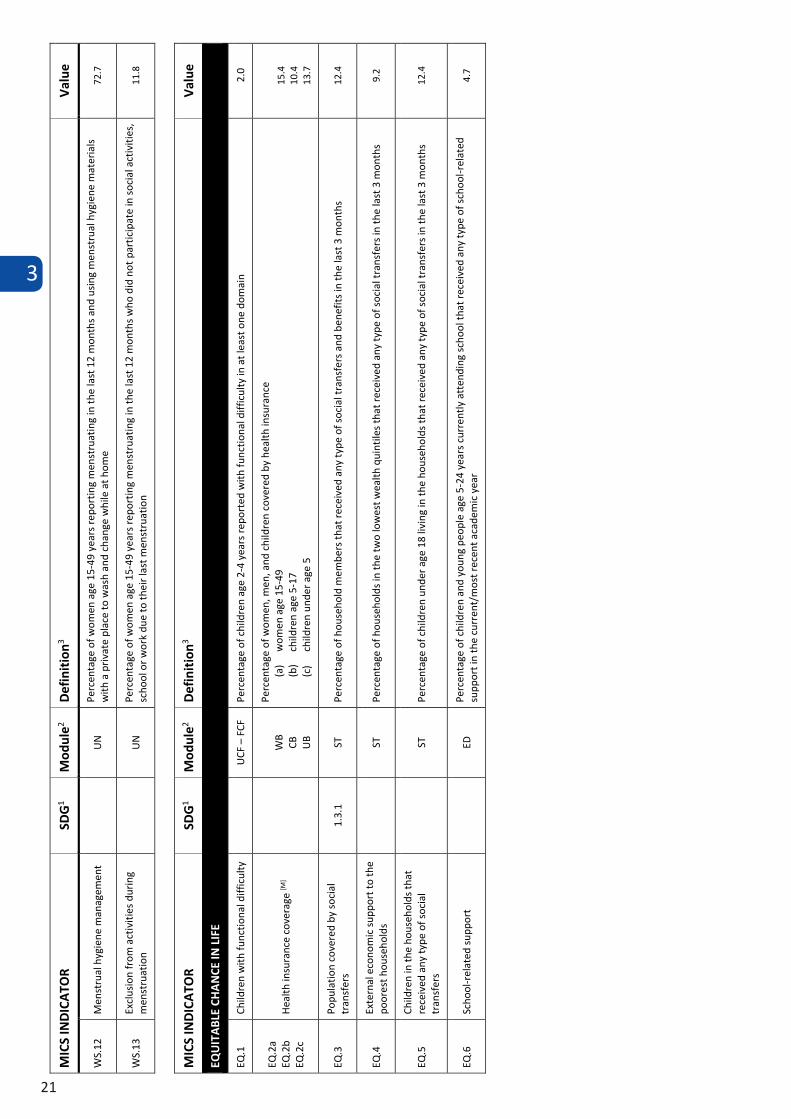
3
21
MIC
S IN
DICA
TOR
SDG1
Mod
ule2
Defin
ition
3 Va
lue
PR.7
a PR
.7b
Spou
sal a
ge d
iffer
ence
MA
Perc
enta
ge o
f wom
en w
ho a
re m
arrie
d or
in u
nion
and
who
se sp
ouse
is 1
0 or
mor
e ye
ars o
lder
, (a
) am
ong
wom
en a
ge 1
5-19
yea
rs,
(b)
amon
g w
omen
age
20-
24 y
ears
11
.3
9.8
PR.1
5 At
titud
es to
war
ds d
omes
tic
viol
ence
DV
Perc
enta
ge o
f peo
ple
age
15-4
9 ye
ars w
ho st
ate
that
a h
usba
nd is
just
ified
in h
ittin
g or
bea
ting
his w
ife in
at l
east
one
of t
he
follo
win
g cir
cum
stan
ces:
(1) s
he g
oes o
ut w
ithou
t tel
ling
him
, (2)
she
negl
ects
the
child
ren,
(3) s
he a
rgue
s with
him
, (4)
she
refu
ses s
ex w
ith h
im, (
5) sh
e bu
rns t
he fo
od
(a)
wom
en
(b)
men
29
.5
16.2
MIC
S IN
DICA
TOR
SDG1
Mod
ule2
Defin
ition
3 Va
lue
LIVE
IN A
SAF
E AN
D CL
EAN
ENVI
RONM
ENT
WS.
1 Us
e of
impr
oved
drin
king
wat
er
sour
ces
W
S Pe
rcen
tage
of h
ouse
hold
mem
bers
usin
g im
prov
ed so
urce
s of d
rinki
ng w
ater
83
.9
WS.
2 Us
e of
bas
ic dr
inki
ng w
ater
se
rvice
s 1.
4.1
WS
Perc
enta
ge o
f hou
seho
ld m
embe
rs u
sing
impr
oved
sour
ces o
f drin
king
wat
er e
ither
in th
eir d
wel
ling/
yard
/plo
t or w
ithin
30
min
utes
roun
d tr
ip co
llect
ion
time
78.1
WS.
3 Av
aila
bilit
y of
drin
king
wat
er
W
S Pe
rcen
tage
of h
ouse
hold
mem
bers
with
a w
ater
sour
ce th
at is
ava
ilabl
e w
hen
need
ed
96.4
WS.
4 Fa
ecal
cont
amin
atio
n of
sour
ce
wat
er
W
Q
Perc
enta
ge o
f hou
seho
ld m
embe
rs w
hose
sour
ce w
ater
was
test
ed a
nd w
ith E
. col
i con
tam
inat
ion
in so
urce
wat
er
83.1
WS.
5 Fa
ecal
cont
amin
atio
n of
ho
useh
old
drin
king
wat
er
W
Q
Perc
enta
ge o
f hou
seho
ld m
embe
rs w
hose
hou
seho
ld d
rinki
ng w
ater
was
test
ed a
nd w
ith E
. col
i con
tam
inat
ion
in h
ouse
hold
dr
inki
ng w
ater
86
.3
WS.
6 Us
e of
safe
ly m
anag
ed d
rinki
ng
wat
er se
rvice
s 6.
1.1
WS
– W
Q
Perc
enta
ge o
f hou
seho
ld m
embe
rs w
ith a
n im
prov
ed d
rinki
ng w
ater
sour
ce o
n pr
emise
s, w
hose
sour
ce w
ater
was
test
ed a
nd
free
of E
. col
i and
ava
ilabl
e w
hen
need
ed
14.8
WS.
7 Ha
ndw
ashi
ng fa
cility
with
wat
er
and
soap
1.
4.1
& 6
.2.1
HW
Pe
rcen
tage
of h
ouse
hold
mem
bers
with
a h
andw
ashi
ng fa
cility
whe
re w
ater
and
soap
or d
eter
gent
are
pre
sent
54
.1
WS.
8 Us
e of
impr
oved
sani
tatio
n fa
ciliti
es
3.8.
1 W
S Pe
rcen
tage
of h
ouse
hold
mem
bers
usin
g im
prov
ed sa
nita
tion
facil
ities
73
.8
WS.
9 Us
e of
bas
ic sa
nita
tion
serv
ices
1.4.
1 &
6.2
.1
WS
Perc
enta
ge o
f hou
seho
ld m
embe
rs u
sing
impr
oved
sani
tatio
n fa
ciliti
es w
hich
are
not
shar
ed
71.0
WS.
10
Safe
disp
osal
in si
tu o
f exc
reta
fro
m o
n-sit
e sa
nita
tion
facil
ities
WS
Perc
enta
ge o
f hou
seho
ld m
embe
rs w
ith a
n im
prov
ed sa
nita
tion
facil
ity th
at d
oes n
ot fl
ush
to a
sew
er a
nd e
ver e
mpt
ied
89.6
WS.
11
Rem
oval
of e
xcre
ta fo
r tre
atm
ent
off-s
ite
6.2.
1 W
S Pe
rcen
tage
of h
ouse
hold
mem
bers
with
an
impr
oved
sani
tatio
n fa
cility
that
doe
s not
flus
h to
a se
wer
and
with
was
te
disp
osed
in-s
itu o
r rem
oved
7.
4
MIC
S IN
DICA
TOR
SDG1
Mod
ule2
Defin
ition
3 Va
lue
WS.
12
Men
stru
al h
ygie
ne m
anag
emen
t
UN
Perc
enta
ge o
f wom
en a
ge 1
5-49
yea
rs re
port
ing
men
stru
atin
g in
the
last
12
mon
ths a
nd u
sing
men
stru
al h
ygie
ne m
ater
ials
with
a p
rivat
e pl
ace
to w
ash
and
chan
ge w
hile
at h
ome
72.7
WS.
13
Exclu
sion
from
act
iviti
es d
urin
g m
enst
ruat
ion
UN
Pe
rcen
tage
of w
omen
age
15-
49 y
ears
repo
rtin
g m
enst
ruat
ing
in th
e la
st 1
2 m
onth
s who
did
not
par
ticip
ate
in so
cial a
ctiv
ities
, sc
hool
or w
ork
due
to th
eir l
ast m
enst
ruat
ion
11.8
MIC
S IN
DICA
TOR
SDG1
Mod
ule2
Defin
ition
3 Va
lue
EQUI
TABL
E CH
ANCE
IN LI
FE
EQ.1
Ch
ildre
n w
ith fu
nctio
nal d
ifficu
lty
UC
F –
FCF
Perc
enta
ge o
f chi
ldre
n ag
e 2-
4 ye
ars r
epor
ted
with
func
tiona
l diff
iculty
in a
t lea
st o
ne d
omai
n 2.
0
EQ.2
a EQ
.2b
EQ.2
c He
alth
insu
ranc
e co
vera
ge [M
]
W
B CB
UB
Perc
enta
ge o
f wom
en, m
en, a
nd ch
ildre
n co
vere
d by
hea
lth in
sura
nce
(a)
wom
en a
ge 1
5-49
(b
) ch
ildre
n ag
e 5-
17
(c)
child
ren
unde
r age
5
15.4
10
.4
13.7
EQ.3
Po
pula
tion
cove
red
by so
cial
tran
sfer
s 1.
3.1
ST
Perc
enta
ge o
f hou
seho
ld m
embe
rs th
at re
ceiv
ed a
ny ty
pe o
f soc
ial t
rans
fers
and
ben
efits
in th
e la
st 3
mon
ths
12.4
EQ.4
Ex
tern
al e
cono
mic
supp
ort t
o th
e po
ores
t hou
seho
lds
ST
Pe
rcen
tage
of h
ouse
hold
s in
the
two
low
est w
ealth
qui
ntile
s tha
t rec
eive
d an
y ty
pe o
f soc
ial t
rans
fers
in th
e la
st 3
mon
ths
9.2
EQ.5
Ch
ildre
n in
the
hous
ehol
ds th
at
rece
ived
any
type
of s
ocia
l tr
ansf
ers
ST
Pe
rcen
tage
of c
hild
ren
unde
r age
18
livin
g in
the
hous
ehol
ds th
at re
ceiv
ed a
ny ty
pe o
f soc
ial t
rans
fers
in th
e la
st 3
mon
ths
12.4
EQ.6
Sc
hool
-rela
ted
supp
ort
ED
Pe
rcen
tage
of c
hild
ren
and
youn
g pe
ople
age
5-2
4 ye
ars c
urre
ntly
att
endi
ng sc
hool
that
rece
ived
any
type
of s
choo
l-rel
ated
su
ppor
t in
the
curr
ent/
mos
t rec
ent a
cade
mic
year
4.
7

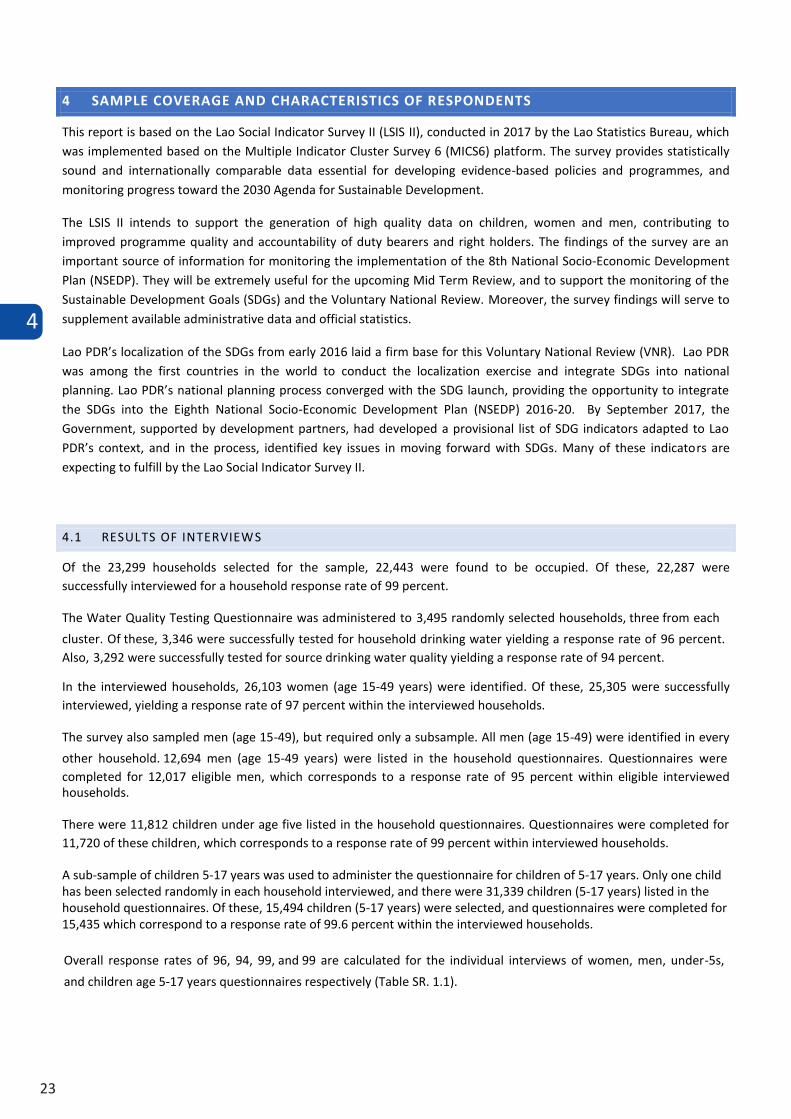
4
23
4 SAMPLE COVERAGE AND CHARACTERISTICS OF RESPONDENTS
This report is based on the Lao Social Indicator Survey II (LSIS II), conducted in 2017 by the Lao Statistics Bureau, which was implemented based on the Multiple Indicator Cluster Survey 6 (MICS6) platform. The survey provides statistically sound and internationally comparable data essential for developing evidence-based policies and programmes, and monitoring progress toward the 2030 Agenda for Sustainable Development.
The LSIS II intends to support the generation of high quality data on children, women and men, contributing to improved programme quality and accountability of duty bearers and right holders. The findings of the survey are an important source of information for monitoring the implementation of the 8th National Socio-Economic Development Plan (NSEDP). They will be extremely useful for the upcoming Mid Term Review, and to support the monitoring of the Sustainable Development Goals (SDGs) and the Voluntary National Review. Moreover, the survey findings will serve to supplement available administrative data and official statistics.
Lao PDR’s localization of the SDGs from early 2016 laid a firm base for this Voluntary National Review (VNR). Lao PDR was among the first countries in the world to conduct the localization exercise and integrate SDGs into national planning. Lao PDR’s national planning process converged with the SDG launch, providing the opportunity to integrate the SDGs into the Eighth National Socio-Economic Development Plan (NSEDP) 2016-20. By September 2017, the Government, supported by development partners, had developed a provisional list of SDG indicators adapted to Lao PDR’s context, and in the process, identified key issues in moving forward with SDGs. Many of these indicators are expecting to fulfill by the Lao Social Indicator Survey II.
4.1 RESULTS OF INTERVIEWS
Of the 23,299 households selected for the sample, 22,443 were found to be occupied. Of these, 22,287 were successfully interviewed for a household response rate of 99 percent.
The Water Quality Testing Questionnaire was administered to 3,495 randomly selected households, three from each
cluster. Of these, 3,346 were successfully tested for household drinking water yielding a response rate of 96 percent. Also, 3,292 were successfully tested for source drinking water quality yielding a response rate of 94 percent.
In the interviewed households, 26,103 women (age 15-49 years) were identified. Of these, 25,305 were successfully interviewed, yielding a response rate of 97 percent within the interviewed households.
The survey also sampled men (age 15-49), but required only a subsample. All men (age 15-49) were identified in every
other household. 12,694 men (age 15-49 years) were listed in the household questionnaires. Questionnaires were completed for 12,017 eligible men, which corresponds to a response rate of 95 percent within eligible interviewed households.
There were 11,812 children under age five listed in the household questionnaires. Questionnaires were completed for 11,720 of these children, which corresponds to a response rate of 99 percent within interviewed households. A sub-sample of children 5-17 years was used to administer the questionnaire for children of 5-17 years. Only one child has been selected randomly in each household interviewed, and there were 31,339 children (5-17 years) listed in the household questionnaires. Of these, 15,494 children (5-17 years) were selected, and questionnaires were completed for 15,435 which correspond to a response rate of 99.6 percent within the interviewed households.
Overall response rates of 96, 94, 99, and 99 are calculated for the individual interviews of women, men, under-5s,
and children age 5-17 years questionnaires respectively (Table SR. 1.1).
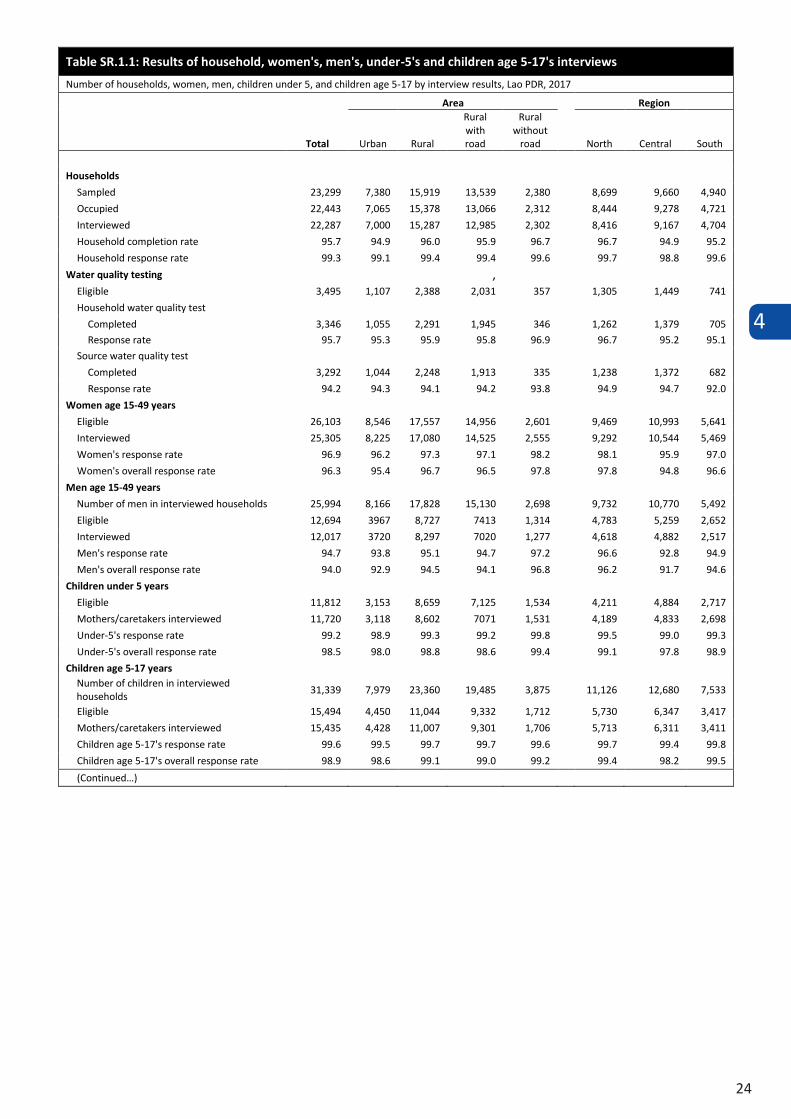
4
24
Table SR.1.1: Results of household, women's, men's, under-5's and children age 5-17's interviews
Number of households, women, men, children under 5, and children age 5-17 by interview results, Lao PDR, 2017
Total
Area Region
Urban Rural
Rural with road
Rural without
road North Central South
Households
Sampled 23,299 7,380 15,919 13,539 2,380
8,699 9,660 4,940
Occupied 22,443 7,065 15,378 13,066 2,312
8,444 9,278 4,721
Interviewed 22,287 7,000 15,287 12,985 2,302
8,416 9,167 4,704
Household completion rate 95.7 94.9 96.0 95.9 96.7
96.7 94.9 95.2
Household response rate 99.3 99.1 99.4 99.4 99.6
99.7 98.8 99.6
Water quality testing
,
Eligible 3,495 1,107 2,388 2,031 357
1,305 1,449 741
Household water quality test
Completed 3,346 1,055 2,291 1,945 346
1,262 1,379 705
Response rate 95.7 95.3 95.9 95.8 96.9
96.7 95.2 95.1
Source water quality test
Completed 3,292 1,044 2,248 1,913 335
1,238 1,372 682
Response rate 94.2 94.3 94.1 94.2 93.8
94.9 94.7 92.0
Women age 15-49 years
Eligible 26,103 8,546 17,557 14,956 2,601
9,469 10,993 5,641
Interviewed 25,305 8,225 17,080 14,525 2,555
9,292 10,544 5,469
Women's response rate 96.9 96.2 97.3 97.1 98.2
98.1 95.9 97.0
Women's overall response rate 96.3 95.4 96.7 96.5 97.8
97.8 94.8 96.6
Men age 15-49 years
Number of men in interviewed households 25,994 8,166 17,828 15,130 2,698
9,732 10,770 5,492
Eligible 12,694 3967 8,727 7413 1,314
4,783 5,259 2,652
Interviewed 12,017 3720 8,297 7020 1,277
4,618 4,882 2,517
Men's response rate 94.7 93.8 95.1 94.7 97.2
96.6 92.8 94.9
Men's overall response rate 94.0 92.9 94.5 94.1 96.8
96.2 91.7 94.6
Children under 5 years
Eligible 11,812 3,153 8,659 7,125 1,534
4,211 4,884 2,717
Mothers/caretakers interviewed 11,720 3,118 8,602 7071 1,531
4,189 4,833 2,698
Under-5's response rate 99.2 98.9 99.3 99.2 99.8
99.5 99.0 99.3
Under-5's overall response rate 98.5 98.0 98.8 98.6 99.4
99.1 97.8 98.9
Children age 5-17 years
Number of children in interviewed households
31,339 7,979 23,360 19,485 3,875
11,126 12,680 7,533
Eligible 15,494 4,450 11,044 9,332 1,712
5,730 6,347 3,417
Mothers/caretakers interviewed 15,435 4,428 11,007 9,301 1,706
5,713 6,311 3,411
Children age 5-17's response rate 99.6 99.5 99.7 99.7 99.6
99.7 99.4 99.8
Children age 5-17's overall response rate 98.9 98.6 99.1 99.0 99.2 99.4 98.2 99.5
(Continued…)
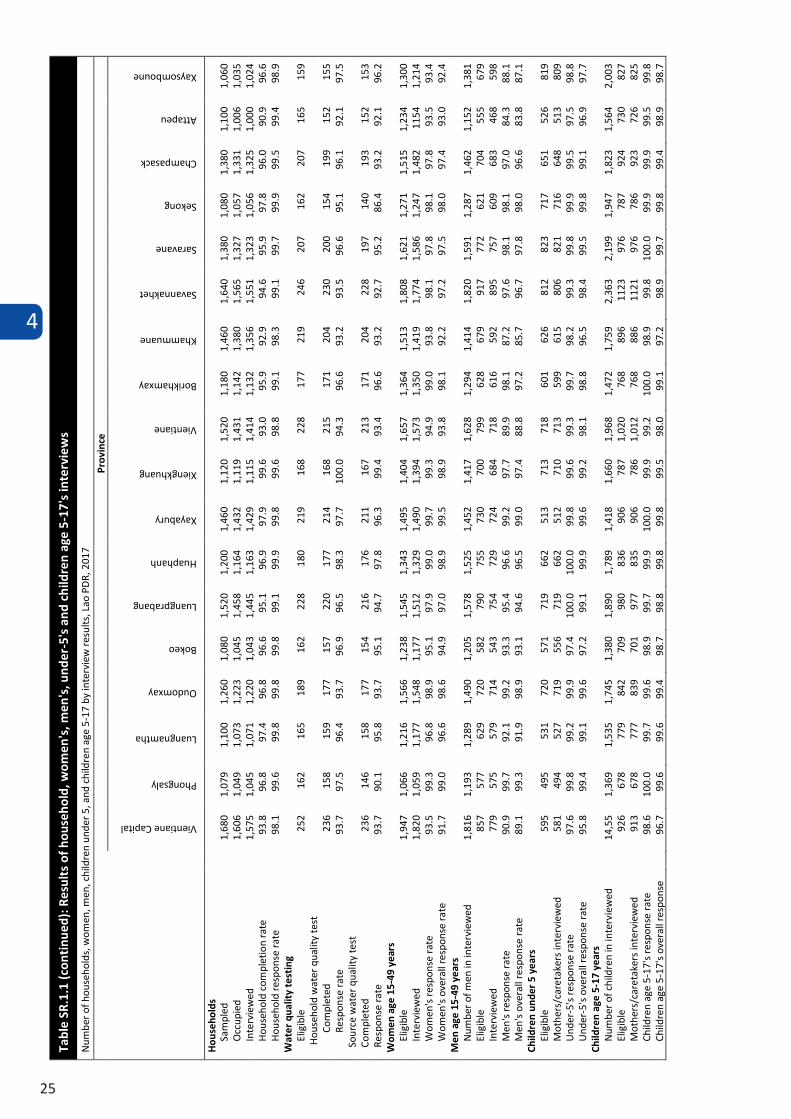
4
25
Table SR.1.1: Results of household, women's, men's, under-5's and children age 5-17's interviews
Number of households, women, men, children under 5, and children age 5-17 by interview results, Lao PDR, 2017
Total
Area Region
Urban Rural
Rural with road
Rural without
road North Central South
Households
Sampled 23,299 7,380 15,919 13,539 2,380
8,699 9,660 4,940
Occupied 22,443 7,065 15,378 13,066 2,312
8,444 9,278 4,721
Interviewed 22,287 7,000 15,287 12,985 2,302
8,416 9,167 4,704
Household completion rate 95.7 94.9 96.0 95.9 96.7
96.7 94.9 95.2
Household response rate 99.3 99.1 99.4 99.4 99.6
99.7 98.8 99.6
Water quality testing
,
Eligible 3,495 1,107 2,388 2,031 357
1,305 1,449 741
Household water quality test
Completed 3,346 1,055 2,291 1,945 346
1,262 1,379 705
Response rate 95.7 95.3 95.9 95.8 96.9
96.7 95.2 95.1
Source water quality test
Completed 3,292 1,044 2,248 1,913 335
1,238 1,372 682
Response rate 94.2 94.3 94.1 94.2 93.8
94.9 94.7 92.0
Women age 15-49 years
Eligible 26,103 8,546 17,557 14,956 2,601
9,469 10,993 5,641
Interviewed 25,305 8,225 17,080 14,525 2,555
9,292 10,544 5,469
Women's response rate 96.9 96.2 97.3 97.1 98.2
98.1 95.9 97.0
Women's overall response rate 96.3 95.4 96.7 96.5 97.8
97.8 94.8 96.6
Men age 15-49 years
Number of men in interviewed households 25,994 8,166 17,828 15,130 2,698
9,732 10,770 5,492
Eligible 12,694 3967 8,727 7413 1,314
4,783 5,259 2,652
Interviewed 12,017 3720 8,297 7020 1,277
4,618 4,882 2,517
Men's response rate 94.7 93.8 95.1 94.7 97.2
96.6 92.8 94.9
Men's overall response rate 94.0 92.9 94.5 94.1 96.8
96.2 91.7 94.6
Children under 5 years
Eligible 11,812 3,153 8,659 7,125 1,534
4,211 4,884 2,717
Mothers/caretakers interviewed 11,720 3,118 8,602 7071 1,531
4,189 4,833 2,698
Under-5's response rate 99.2 98.9 99.3 99.2 99.8
99.5 99.0 99.3
Under-5's overall response rate 98.5 98.0 98.8 98.6 99.4
99.1 97.8 98.9
Children age 5-17 years
Number of children in interviewed households
31,339 7,979 23,360 19,485 3,875
11,126 12,680 7,533
Eligible 15,494 4,450 11,044 9,332 1,712
5,730 6,347 3,417
Mothers/caretakers interviewed 15,435 4,428 11,007 9,301 1,706
5,713 6,311 3,411
Children age 5-17's response rate 99.6 99.5 99.7 99.7 99.6
99.7 99.4 99.8
Children age 5-17's overall response rate 98.9 98.6 99.1 99.0 99.2 99.4 98.2 99.5
(Continued…)
Tabl
e SR
.1.1
(con
tinu
ed):
Res
ults
of h
ouse
hold
, wom
en's
, men
's, u
nder
-5's
and
chi
ldre
n ag
e 5-
17's
inte
rvie
ws
Num
ber o
f hou
seho
lds,
wom
en, m
en, c
hild
ren
unde
r 5, a
nd c
hild
ren
age
5-17
by
inte
rvie
w re
sults
, Lao
PD
R, 2
017
Prov
ince
Vientiane Capital
Phongsaly
Luangnamtha
Oudomxay
Bokeo
Luangprabang
Huaphanh
Xayabury
Xiengkhuang
Vientiane
Borikhamxay
Khammuane
Savannakhet
Saravane
Sekong
Champasack
Attapeu
Xaysomboune
Hou
seho
lds
Sam
pled
1,
680
1,07
9 1,
100
1,26
0 1,
080
1,52
0 1,
200
1,46
0 1,
120
1,52
0 1,
180
1,46
0 1,
640
1,38
0 1,
080
1,38
0 1,
100
1,06
0 O
ccup
ied
1,60
6 1,
049
1,07
3 1,
223
1,04
5 1,
458
1,16
4 1,
432
1,11
9 1,
431
1,14
2 1,
380
1,56
5 1,
327
1,05
7 1,
331
1,00
6 1,
035
Inte
rvie
wed
1,
575
1,04
5 1,
071
1,22
0 1,
043
1,44
5 1,
163
1,42
9 1,
115
1,41
4 1,
132
1,35
6 1,
551
1,32
3 1,
056
1,32
5 1,
000
1,02
4 H
ouse
hold
com
plet
ion
rate
93
.8
96.8
97
.4
96.8
96
.6
95.1
96
.9
97.9
99
.6
93.0
95
.9
92.9
94
.6
95.9
97
.8
96.0
90
.9
96.6
H
ouse
hold
resp
onse
rate
98
.1
99.6
99
.8
99.8
99
.8
99.1
99
.9
99.8
99
.6
98.8
99
.1
98.3
99
.1
99.7
99
.9
99.5
99
.4
98.9
W
ater
qua
lity
test
ing
Elig
ible
25
2 16
2 16
5 18
9 16
2 22
8 18
0 21
9 16
8 22
8 17
7 21
9 24
6 20
7 16
2 20
7 16
5 15
9
Hou
seho
ld w
ater
qua
lity
test
Co
mpl
eted
23
6 15
8 15
9 17
7 15
7 22
0 17
7 21
4 16
8 21
5 17
1 20
4 23
0 20
0 15
4 19
9 15
2 15
5
Re
spon
se ra
te
93.7
97
.5
96.4
93
.7
96.9
96
.5
98.3
97
.7
100.
0 94
.3
96.6
93
.2
93.5
96
.6
95.1
96
.1
92.1
97
.5
Sou
rce
wat
er q
ualit
y te
st
Com
plet
ed
236
146
158
177
154
216
176
211
167
213
171
204
228
197
140
193
152
153
Res
pons
e ra
te
93.7
90
.1
95.8
93
.7
95.1
94
.7
97.8
96
.3
99.4
93
.4
96.6
93
.2
92.7
95
.2
86.4
93
.2
92.1
96
.2
Wom
en a
ge 1
5-49
yea
rs
Elig
ible
1,
947
1,06
6 1,
216
1,56
6 1,
238
1,54
5 1,
343
1,49
5 1,
404
1,65
7 1,
364
1,51
3 1,
808
1,62
1 1,
271
1,51
5 1,
234
1,30
0 In
terv
iew
ed
1,82
0 1,
059
1,17
7 1,
548
1,17
7 1,
512
1,32
9 1,
490
1,39
4 1,
573
1,35
0 1,
419
1,77
4 1,
586
1,24
7 1,
482
1154
1,
214
Wom
en's
resp
onse
rate
93
.5
99.3
96
.8
98.9
95
.1
97.9
99
.0
99.7
99
.3
94.9
99
.0
93.8
98
.1
97.8
98
.1
97.8
93
.5
93.4
W
omen
's o
vera
ll re
spon
se ra
te
91.7
99
.0
96.6
98
.6
94.9
97
.0
98.9
99
.5
98.9
93
.8
98.1
92
.2
97.2
97
.5
98.0
97
.4
93.0
92
.4
Men
age
15-
49 y
ears
N
umbe
r of m
en in
inte
rvie
wed
ho
useh
olds
1,81
6 1,
193
1,28
9 1,
490
1,20
5 1,
578
1,52
5 1,
452
1,41
7 1,
628
1,29
4 1,
414
1,82
0 1,
591
1,28
7 1,
462
1,15
2 1,
381
Elig
ible
85
7 57
7 62
9 72
0 58
2 79
0 75
5 73
0 70
0 79
9 62
8 67
9 91
7 77
2 62
1 70
4 55
5 67
9 In
terv
iew
ed
779
575
579
714
543
754
729
724
684
718
616
592
895
757
609
683
468
598
Men
's re
spon
se ra
te
90.9
99
.7
92.1
99
.2
93.3
95
.4
96.6
99
.2
97.7
89
.9
98.1
87
.2
97.6
98
.1
98.1
97
.0
84.3
88
.1
Men
's o
vera
ll re
spon
se r
ate
89.1
99
.3
91.9
98
.9
93.1
94
.6
96.5
99
.0
97.4
88
.8
97.2
85
.7
96.7
97
.8
98.0
96
.6
83.8
87
.1
Child
ren
unde
r 5
year
s El
igib
le
595
495
531
720
571
719
662
513
713
718
601
626
812
823
717
651
526
819
Mot
hers
/car
etak
ers
inte
rvie
wed
58
1 49
4 52
7 71
9 55
6 71
9 66
2 51
2 71
0 71
3 59
9 61
5 80
6 82
1 71
6 64
8 51
3 80
9 U
nder
-5's
resp
onse
rate
97
.6
99.8
99
.2
99.9
97
.4
100.
0 10
0.0
99.8
99
.6
99.3
99
.7
98.2
99
.3
99.8
99
.9
99.5
97
.5
98.8
U
nder
-5's
ove
rall
resp
onse
rate
95
.8
99.4
99
.1
99.6
97
.2
99.1
99
.9
99.6
99
.2
98.1
98
.8
96.5
98
.4
99.5
99
.8
99.1
96
.9
97.7
Ch
ildre
n ag
e 5-
17 y
ears
N
umbe
r of c
hild
ren
in in
terv
iew
ed
hous
ehol
ds14
,55
1,36
9 1,
535
1,74
5 1,
380
1,89
0 1,
789
1,41
8 1,
660
1,96
8 1,
472
1,75
9 2,
363
2,19
9 1,
947
1,82
3 1,
564
2,00
3 El
igib
le
926
678
779
842
709
980
836
906
787
1,02
0 76
8 89
6 11
23
976
787
924
730
827
Mot
hers
/car
etak
ers
inte
rvie
wed
91
3 67
8 77
7 83
9 70
1 97
7 83
5 90
6 78
6 1,
012
768
886
1121
97
6 78
6 92
3 72
6 82
5 Ch
ildre
n ag
e 5-
17's
resp
onse
rate
98
.6
100.
0 99
.7
99.6
98
.9
99.7
99
.9
100.
0 99
.9
99.2
10
0.0
98.9
99
.8
100.
0 99
.9
99.9
99
.5
99.8
Ch
ildre
n ag
e 5-
17's
ove
rall
resp
onse
ra
te96
.7
99.6
99
.6
99.4
98
.7
98.8
99
.8
99.8
99
.5
98.0
99
.1
97.2
98
.9
99.7
99
.8
99.4
98
.9
98.7
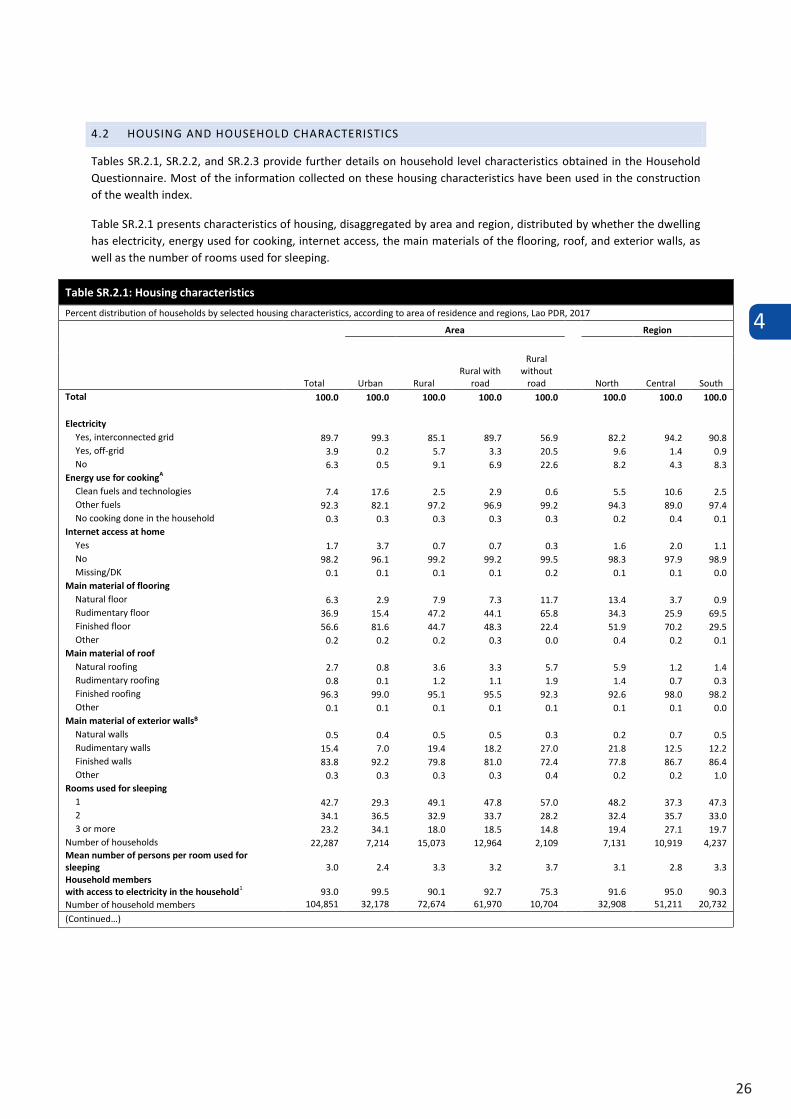
4
26
4.2 HOUSING AND HOUSEHOLD CHARACTERISTICS
Tables SR.2.1, SR.2.2, and SR.2.3 provide further details on household level characteristics obtained in the Household Questionnaire. Most of the information collected on these housing characteristics have been used in the construction of the wealth index.
Table SR.2.1 presents characteristics of housing, disaggregated by area and region, distributed by whether the dwelling has electricity, energy used for cooking, internet access, the main materials of the flooring, roof, and exterior walls, as well as the number of rooms used for sleeping.
Table SR.2.1: Housing characteristics
Percent distribution of households by selected housing characteristics, according to area of residence and regions, Lao PDR, 2017
Total
Area Region
Urban Rural Rural with
road
Rural without
road North Central South Total 100.0 100.0 100.0 100.0 100.0 100.0 100.0 100.0
Electricity Yes, interconnected grid 89.7 99.3 85.1 89.7 56.9 82.2 94.2 90.8 Yes, off-grid 3.9 0.2 5.7 3.3 20.5 9.6 1.4 0.9 No 6.3 0.5 9.1 6.9 22.6 8.2 4.3 8.3
Energy use for cookingA Clean fuels and technologies 7.4 17.6 2.5 2.9 0.6 5.5 10.6 2.5 Other fuels 92.3 82.1 97.2 96.9 99.2 94.3 89.0 97.4 No cooking done in the household 0.3 0.3 0.3 0.3 0.3 0.2 0.4 0.1
Internet access at home Yes 1.7 3.7 0.7 0.7 0.3 1.6 2.0 1.1 No 98.2 96.1 99.2 99.2 99.5 98.3 97.9 98.9 Missing/DK 0.1 0.1 0.1 0.1 0.2 0.1 0.1 0.0
Main material of flooring Natural floor 6.3 2.9 7.9 7.3 11.7 13.4 3.7 0.9 Rudimentary floor 36.9 15.4 47.2 44.1 65.8 34.3 25.9 69.5 Finished floor 56.6 81.6 44.7 48.3 22.4 51.9 70.2 29.5 Other 0.2 0.2 0.2 0.3 0.0 0.4 0.2 0.1
Main material of roof Natural roofing 2.7 0.8 3.6 3.3 5.7 5.9 1.2 1.4 Rudimentary roofing 0.8 0.1 1.2 1.1 1.9 1.4 0.7 0.3 Finished roofing 96.3 99.0 95.1 95.5 92.3 92.6 98.0 98.2 Other 0.1 0.1 0.1 0.1 0.1 0.1 0.1 0.0
Main material of exterior wallsB Natural walls 0.5 0.4 0.5 0.5 0.3 0.2 0.7 0.5 Rudimentary walls 15.4 7.0 19.4 18.2 27.0 21.8 12.5 12.2 Finished walls 83.8 92.2 79.8 81.0 72.4 77.8 86.7 86.4 Other 0.3 0.3 0.3 0.3 0.4 0.2 0.2 1.0
Rooms used for sleeping 1 42.7 29.3 49.1 47.8 57.0 48.2 37.3 47.3 2 34.1 36.5 32.9 33.7 28.2 32.4 35.7 33.0 3 or more 23.2 34.1 18.0 18.5 14.8 19.4 27.1 19.7
Number of households 22,287 7,214 15,073 12,964 2,109 7,131 10,919 4,237 Mean number of persons per room used for sleeping 3.0 2.4 3.3 3.2 3.7 3.1 2.8 3.3 Household members with access to electricity in the household1 93.0 99.5 90.1 92.7 75.3 91.6 95.0 90.3 Number of household members 104,851 32,178 72,674 61,970 10,704 32,908 51,211 20,732
(Continued…)
Tabl
e SR
.2.1
(con
tinu
ed):
Hou
sing
cha
ract
eris
tics
Perc
ent d
istr
ibut
ion
of h
ouse
hold
s by
sel
ecte
d ho
usin
g ch
arac
teris
tics,
acc
ordi
ng to
Pro
vinc
e, L
ao P
DR,
201
7 Pr
ovin
ce
Vientiane Capital
Phongsaly
Luangnamtha
Oudomxay
Bokeo
Luangprabang
Huaphanh
Xayabury
Xiengkhuang
Vientiane
Borikhamxay
Khammuane
Savannakhet
Saravane
Sekong
Champasack
Attapeu
Xaysomboune
Tota
l 10
0.0
100.
0 10
0.0
100.
0 10
0.0
100.
0 10
0.0
100.
0 10
0.0
100.
0 10
0.0
100.
0 10
0.0
100.
0 10
0.0
100.
0 10
0.0
100.
0 El
ectr
icit
y Ye
s, in
terc
onne
cted
grid
99
.6
66.1
87
.2
83.2
96
.2
77.2
65
.4
97.1
93
.6
99.2
99
.5
93.4
85
.3
80.9
81
.1
97.6
93
.7
94.9
Ye
s, o
ff-g
rid
0.2
23.5
4.
4 6.
9 0.
5 9.
6 26
.8
0.1
2.6
0.2
0.2
0.1
4.1
1.4
4.2
0.2
0.6
0.2
No
0.2
10.4
8.
4 9.
9 3.
3 13
.2
7.8
2.7
3.8
0.6
0.3
6.6
10.6
17
.8
14.7
2.
2 5.
7 4.
9 M
issi
ng/D
K 0.
0 0.
0 0.
0 0.
0 0.
0 0.
1 0.
0 0.
0 0.
0 0.
0 0.
0 0.
0 0.
0 0.
0 0.
0 0.
0 0.
0 0.
0 En
ergy
use
for
cook
ingA
Clea
n fu
els
and
tech
nolo
gies
28
.5
4.6
6.0
4.5
14.5
4.
5 4.
3 4.
4 4.
0 6.
2 8.
7 2.
9 1.
8 1.
9 1.
8 2.
7 3.
9 6.
4 O
ther
fuel
s 71
.1
95.3
93
.8
95.3
85
.2
95.1
95
.7
95.6
96
.0
93.6
91
.1
95.8
97
.8
98.1
98
.0
97.2
95
.9
93.6
N
o co
okin
g do
ne in
the
hous
ehol
d 0.
3 0.
1 0.
3 0.
2 0.
4 0.
4 0.
0 0.
0 0.
0 0.
3 0.
2 1.
3 0.
4 0.
0 0.
2 0.
1 0.
1 0.
0 In
tern
et a
cces
s at
hom
e Ye
s 4.
4 1.
1 6.
8 1.
0 0.
4 1.
7 1.
0 0.
8 0.
3 0.
8 0.
7 0.
8 0.
6 1.
0 0.
8 1.
1 1.
4 13
.2
No
95.4
98
.7
93.2
98
.8
99.2
98
.2
99.0
99
.1
99.5
99
.1
99.3
99
.2
99.3
99
.0
99.1
98
.9
98.6
86
.8
Mis
sing
/DK
0.3
0.1
0.0
0.2
0.4
0.1
0.0
0.2
0.3
0.1
0.1
0.0
0.1
0.0
0.1
0.0
0.0
0.0
Mai
n m
ater
ial o
f flo
orin
g N
atur
al fl
oor
0.5
31.8
8.
2 12
.7
8.6
10.5
23
.3
6.6
17.0
7.
1 3.
2 1.
3 0.
5 0.
9 1.
2 0.
2 4.
2 27
.4
Rudi
men
tary
floo
r 8.
8 42
.0
52.9
46
.2
27.6
29
.3
39.4
18
.8
29.4
19
.7
25.1
58
.2
30.3
75
.6
80.5
70
.0
40.8
18
.7
Fini
shed
floo
r 90
.5
26.2
38
.9
40.6
63
.6
59.2
37
.3
74.5
53
.5
73.3
70
.3
40.4
69
.3
23.4
17
.9
29.6
55
.0
53.9
O
ther
0.
1 0.
0 0.
0 0.
5 0.
2 1.
0 0.
0 0.
1 0.
1 0.
0 1.
4 0.
1 0.
0 0.
2 0.
4 0.
1 0.
0 0.
0 M
ain
mat
eria
l of r
oof
Nat
ural
roof
ing
0.4
1.3
5.7
11.7
4.
2 3.
6 8.
1 5.
5 5.
0 0.
6 2.
0 0.
4 0.
9 2.
6 3.
1 0.
5 1.
1 5.
8 Ru
dim
enta
ry ro
ofin
g 0.
0 0.
3 1.
4 1.
3 4.
1 1.
3 2.
2 0.
4 0.
6 1.
7 0.
7 1.
3 0.
4 0.
1 0.
5 0.
4 0.
1 1.
9 Fi
nish
ed ro
ofin
g 99
.5
98.4
92
.9
86.9
91
.5
94.8
89
.6
94.0
94
.4
97.2
97
.3
98.2
98
.6
97.2
96
.1
99.1
98
.9
92.3
O
ther
0.
1 0.
0 0.
0 0.
1 0.
3 0.
3 0.
1 0.
1 0.
0 0.
4 0.
0 0.
1 0.
1 0.
0 0.
3 0.
0 0.
0 0.
0 M
ain
mat
eria
l of e
xter
ior
wal
lsA
Nat
ural
wal
ls
0.2
1.1
0.1
0.1
0.0
0.1
0.3
0.1
0.0
0.0
0.0
4.0
0.3
0.4
0.1
0.5
0.6
0.2
Rudi
men
tary
wal
ls
5.4
16.8
24
.8
37.2
22
.4
25.3
16
.8
10.4
1.
4 20
.3
13.0
15
.4
15.2
17
.4
19.0
7.
1 16
.1
31.4
Fi
nish
ed w
alls
94
.0
81.4
74
.9
62.6
77
.4
74.5
82
.8
89.4
98
.6
79.6
87
.0
80.5
84
.4
80.2
80
.3
91.8
82
.9
68.4
O
ther
0.
5 0.
7 0.
2 0.
1 0.
2 0.
1 0.
1 0.
1 0.
0 0.
1 0.
0 0.
1 0.
1 2.
0 0.
6 0.
6 0.
3 0.
0 Ro
oms
used
for s
leep
ing
1 24
.2
43.6
61
.1
65.2
36
.6
54.7
42
.2
33.7
24
.6
34.8
36
.3
33.3
56
.7
53.1
53
.6
42.8
46
.8
42.4
2
38.5
37
.9
22.4
22
.9
35.3
30
.3
31.4
42
.7
32.2
41
.4
37.1
40
.8
28.1
31
.9
26.9
34
.1
35.6
34
.0
3 or
mor
e 37
.3
18.5
16
.4
12.0
28
.1
14.9
26
.3
23.5
43
.1
23.8
26
.6
25.9
15
.2
14.9
19
.5
23.0
17
.7
23.6
Num
ber o
f hou
seho
lds
2,90
6 70
6 62
4 11
22
623
1,64
0 93
0 1,
486
843
1,52
9 96
3 1,
429
2,96
9 1,
266
366
2,15
1 45
3 28
1
Mea
n nu
mbe
r of
per
sons
per
roo
m u
sed
for
slee
ping
2.
1 2.
9 3.
5 3.
8 2.
8 3.
3 3.
2 2.
5 2.
7 2.
8 2.
8 2.
5 3.
6 3.
7 3.
7 3.
0 3.
3 3.
7
Perc
enta
ge o
f hou
seho
ld m
embe
rs w
ith
acce
ss t
o el
ectr
icit
y in
the
hou
seho
ld1
wit
h ac
cess
to e
lect
rici
ty in
the
hous
ehol
d1
99.8
88
.9
92.1
89
.9
97.0
86
.6
92.6
97
.1
95.9
99
.6
99.8
92
.7
87.6
79
.4
84.8
97
.6
94.4
95
.3
Num
ber o
f hou
seho
ld m
embe
rs
12,6
33
3,16
6 2,
952
5,52
5 3,
025
7,42
7 4,
697
6,11
6 4,
314
7,25
7 4,
521
6,34
6 14
,535
6,
554
1,93
1 10
,043
2,
204
1,60
6 1
MIC
S in
dica
tor
SR.1
- A
cces
s to
ele
ctri
city
; SD
G In
dica
tor
7.1.
1 A
Plea
se re
fer t
o Ta
ble
TC.4
.1 in
Sec
tion
Thriv
e - C
hild
hea
lth, n
utri
tion
and
deve
lopm
ent
B Pl
ease
refe
r Hou
seho
ld Q
uest
ionn
aire
in A
ppen
dix
E, q
uest
ions
HC4
, HC5
and
HC6
for d
efin
ition
s of
nat
ural
, rud
imen
tary
, fin
ishe
d an
d ot
her
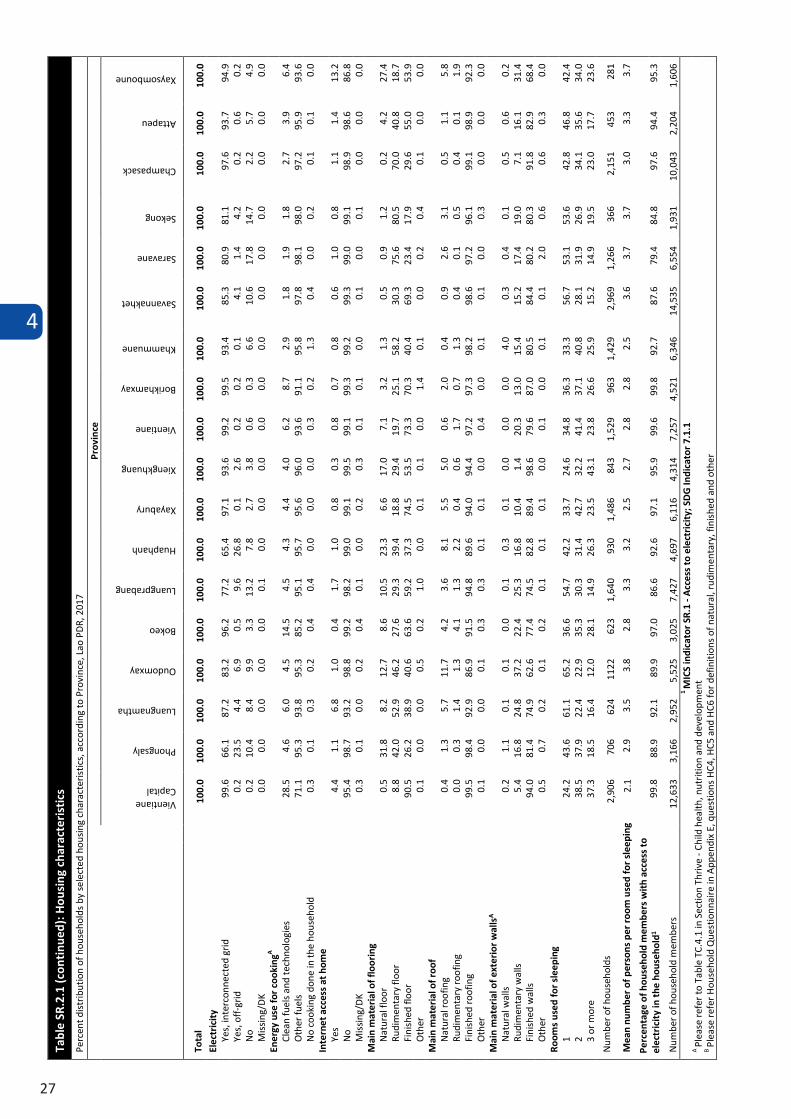
4
27
Tabl
e SR
.2.1
(con
tinu
ed):
Hou
sing
cha
ract
eris
tics
Perc
ent d
istr
ibut
ion
of h
ouse
hold
s by
sel
ecte
d ho
usin
g ch
arac
teris
tics,
acc
ordi
ng to
Pro
vinc
e, L
ao P
DR,
201
7 Pr
ovin
ce
Vientiane Capital
Phongsaly
Luangnamtha
Oudomxay
Bokeo
Luangprabang
Huaphanh
Xayabury
Xiengkhuang
Vientiane
Borikhamxay
Khammuane
Savannakhet
Saravane
Sekong
Champasack
Attapeu
Xaysomboune
Tota
l 10
0.0
100.
0 10
0.0
100.
0 10
0.0
100.
0 10
0.0
100.
0 10
0.0
100.
0 10
0.0
100.
0 10
0.0
100.
0 10
0.0
100.
0 10
0.0
100.
0 El
ectr
icit
y Ye
s, in
terc
onne
cted
grid
99
.6
66.1
87
.2
83.2
96
.2
77.2
65
.4
97.1
93
.6
99.2
99
.5
93.4
85
.3
80.9
81
.1
97.6
93
.7
94.9
Ye
s, o
ff-g
rid
0.2
23.5
4.
4 6.
9 0.
5 9.
6 26
.8
0.1
2.6
0.2
0.2
0.1
4.1
1.4
4.2
0.2
0.6
0.2
No
0.2
10.4
8.
4 9.
9 3.
3 13
.2
7.8
2.7
3.8
0.6
0.3
6.6
10.6
17
.8
14.7
2.
2 5.
7 4.
9 M
issi
ng/D
K 0.
0 0.
0 0.
0 0.
0 0.
0 0.
1 0.
0 0.
0 0.
0 0.
0 0.
0 0.
0 0.
0 0.
0 0.
0 0.
0 0.
0 0.
0 En
ergy
use
for
cook
ingA
Clea
n fu
els
and
tech
nolo
gies
28
.5
4.6
6.0
4.5
14.5
4.
5 4.
3 4.
4 4.
0 6.
2 8.
7 2.
9 1.
8 1.
9 1.
8 2.
7 3.
9 6.
4 O
ther
fuel
s 71
.1
95.3
93
.8
95.3
85
.2
95.1
95
.7
95.6
96
.0
93.6
91
.1
95.8
97
.8
98.1
98
.0
97.2
95
.9
93.6
N
o co
okin
g do
ne in
the
hous
ehol
d 0.
3 0.
1 0.
3 0.
2 0.
4 0.
4 0.
0 0.
0 0.
0 0.
3 0.
2 1.
3 0.
4 0.
0 0.
2 0.
1 0.
1 0.
0 In
tern
et a
cces
s at
hom
e Ye
s 4.
4 1.
1 6.
8 1.
0 0.
4 1.
7 1.
0 0.
8 0.
3 0.
8 0.
7 0.
8 0.
6 1.
0 0.
8 1.
1 1.
4 13
.2
No
95.4
98
.7
93.2
98
.8
99.2
98
.2
99.0
99
.1
99.5
99
.1
99.3
99
.2
99.3
99
.0
99.1
98
.9
98.6
86
.8
Mis
sing
/DK
0.3
0.1
0.0
0.2
0.4
0.1
0.0
0.2
0.3
0.1
0.1
0.0
0.1
0.0
0.1
0.0
0.0
0.0
Mai
n m
ater
ial o
f flo
orin
g N
atur
al fl
oor
0.5
31.8
8.
2 12
.7
8.6
10.5
23
.3
6.6
17.0
7.
1 3.
2 1.
3 0.
5 0.
9 1.
2 0.
2 4.
2 27
.4
Rudi
men
tary
floo
r 8.
8 42
.0
52.9
46
.2
27.6
29
.3
39.4
18
.8
29.4
19
.7
25.1
58
.2
30.3
75
.6
80.5
70
.0
40.8
18
.7
Fini
shed
floo
r 90
.5
26.2
38
.9
40.6
63
.6
59.2
37
.3
74.5
53
.5
73.3
70
.3
40.4
69
.3
23.4
17
.9
29.6
55
.0
53.9
O
ther
0.
1 0.
0 0.
0 0.
5 0.
2 1.
0 0.
0 0.
1 0.
1 0.
0 1.
4 0.
1 0.
0 0.
2 0.
4 0.
1 0.
0 0.
0 M
ain
mat
eria
l of r
oof
Nat
ural
roof
ing
0.4
1.3
5.7
11.7
4.
2 3.
6 8.
1 5.
5 5.
0 0.
6 2.
0 0.
4 0.
9 2.
6 3.
1 0.
5 1.
1 5.
8 Ru
dim
enta
ry ro
ofin
g 0.
0 0.
3 1.
4 1.
3 4.
1 1.
3 2.
2 0.
4 0.
6 1.
7 0.
7 1.
3 0.
4 0.
1 0.
5 0.
4 0.
1 1.
9 Fi
nish
ed ro
ofin
g 99
.5
98.4
92
.9
86.9
91
.5
94.8
89
.6
94.0
94
.4
97.2
97
.3
98.2
98
.6
97.2
96
.1
99.1
98
.9
92.3
O
ther
0.
1 0.
0 0.
0 0.
1 0.
3 0.
3 0.
1 0.
1 0.
0 0.
4 0.
0 0.
1 0.
1 0.
0 0.
3 0.
0 0.
0 0.
0 M
ain
mat
eria
l of e
xter
ior
wal
lsA
Nat
ural
wal
ls
0.2
1.1
0.1
0.1
0.0
0.1
0.3
0.1
0.0
0.0
0.0
4.0
0.3
0.4
0.1
0.5
0.6
0.2
Rudi
men
tary
wal
ls
5.4
16.8
24
.8
37.2
22
.4
25.3
16
.8
10.4
1.
4 20
.3
13.0
15
.4
15.2
17
.4
19.0
7.
1 16
.1
31.4
Fi
nish
ed w
alls
94
.0
81.4
74
.9
62.6
77
.4
74.5
82
.8
89.4
98
.6
79.6
87
.0
80.5
84
.4
80.2
80
.3
91.8
82
.9
68.4
O
ther
0.
5 0.
7 0.
2 0.
1 0.
2 0.
1 0.
1 0.
1 0.
0 0.
1 0.
0 0.
1 0.
1 2.
0 0.
6 0.
6 0.
3 0.
0 Ro
oms
used
for s
leep
ing
1 24
.2
43.6
61
.1
65.2
36
.6
54.7
42
.2
33.7
24
.6
34.8
36
.3
33.3
56
.7
53.1
53
.6
42.8
46
.8
42.4
2
38.5
37
.9
22.4
22
.9
35.3
30
.3
31.4
42
.7
32.2
41
.4
37.1
40
.8
28.1
31
.9
26.9
34
.1
35.6
34
.0
3 or
mor
e 37
.3
18.5
16
.4
12.0
28
.1
14.9
26
.3
23.5
43
.1
23.8
26
.6
25.9
15
.2
14.9
19
.5
23.0
17
.7
23.6
Num
ber o
f hou
seho
lds
2,90
6 70
6 62
4 11
22
623
1,64
0 93
0 1,
486
843
1,52
9 96
3 1,
429
2,96
9 1,
266
366
2,15
1 45
3 28
1
Mea
n nu
mbe
r of
per
sons
per
roo
m u
sed
for
slee
ping
2.
1 2.
9 3.
5 3.
8 2.
8 3.
3 3.
2 2.
5 2.
7 2.
8 2.
8 2.
5 3.
6 3.
7 3.
7 3.
0 3.
3 3.
7
Perc
enta
ge o
f hou
seho
ld m
embe
rs w
ith
acce
ss t
o el
ectr
icit
y in
the
hou
seho
ld1
wit
h ac
cess
to e
lect
rici
ty in
the
hous
ehol
d1
99.8
88
.9
92.1
89
.9
97.0
86
.6
92.6
97
.1
95.9
99
.6
99.8
92
.7
87.6
79
.4
84.8
97
.6
94.4
95
.3
Num
ber o
f hou
seho
ld m
embe
rs
12,6
33
3,16
6 2,
952
5,52
5 3,
025
7,42
7 4,
697
6,11
6 4,
314
7,25
7 4,
521
6,34
6 14
,535
6,
554
1,93
1 10
,043
2,
204
1,60
6 1
MIC
S in
dica
tor
SR.1
- A
cces
s to
ele
ctri
city
; SD
G In
dica
tor
7.1.
1 A
Plea
se re
fer t
o Ta
ble
TC.4
.1 in
Sec
tion
Thriv
e - C
hild
hea
lth, n
utri
tion
and
deve
lopm
ent
B Pl
ease
refe
r Hou
seho
ld Q
uest
ionn
aire
in A
ppen
dix
E, q
uest
ions
HC4
, HC5
and
HC6
for d
efin
ition
s of
nat
ural
, rud
imen
tary
, fin
ishe
d an
d ot
her
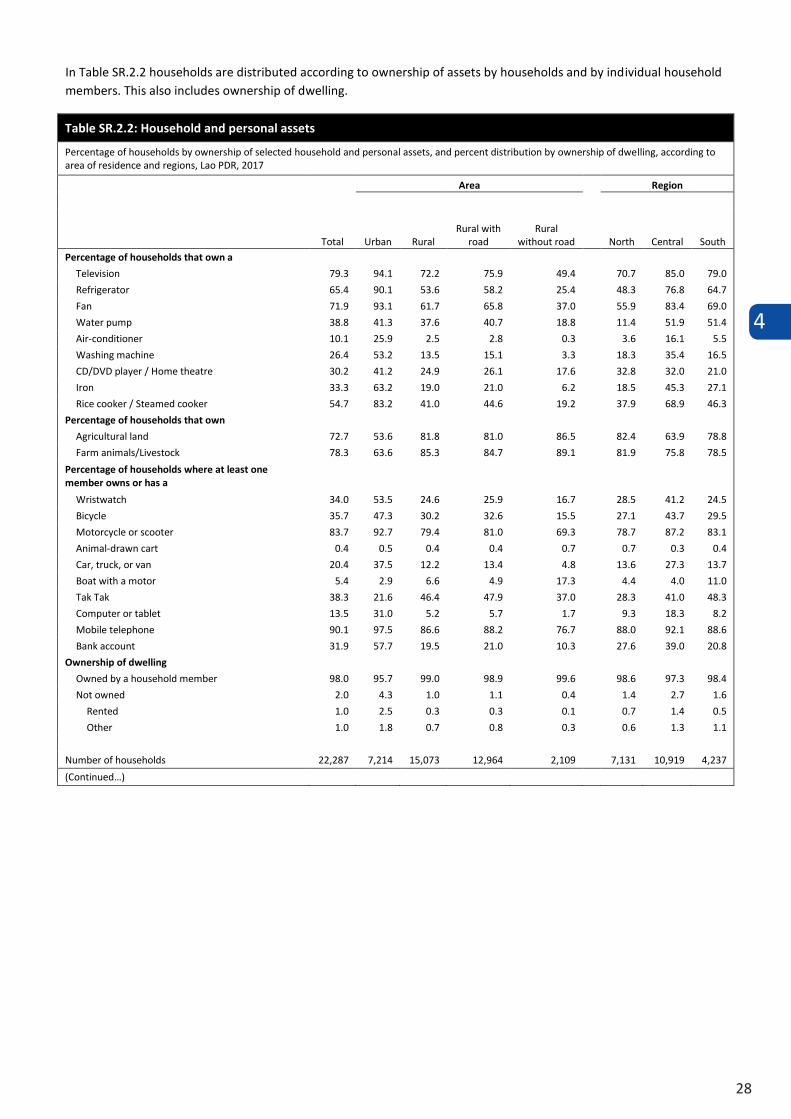
4
28
In Table SR.2.2 households are distributed according to ownership of assets by households and by individual household members. This also includes ownership of dwelling.
Table SR.2.2: Household and personal assets
Percentage of households by ownership of selected household and personal assets, and percent distribution by ownership of dwelling, according to area of residence and regions, Lao PDR, 2017
Total
Area Region
Urban Rural Rural with
road Rural
without road North Central South Percentage of households that own a
Television 79.3 94.1 72.2 75.9 49.4 70.7 85.0 79.0
Refrigerator 65.4 90.1 53.6 58.2 25.4 48.3 76.8 64.7
Fan 71.9 93.1 61.7 65.8 37.0 55.9 83.4 69.0
Water pump 38.8 41.3 37.6 40.7 18.8 11.4 51.9 51.4
Air-conditioner 10.1 25.9 2.5 2.8 0.3 3.6 16.1 5.5
Washing machine 26.4 53.2 13.5 15.1 3.3 18.3 35.4 16.5
CD/DVD player / Home theatre 30.2 41.2 24.9 26.1 17.6 32.8 32.0 21.0
Iron 33.3 63.2 19.0 21.0 6.2 18.5 45.3 27.1
Rice cooker / Steamed cooker 54.7 83.2 41.0 44.6 19.2 37.9 68.9 46.3
Percentage of households that own
Agricultural land 72.7 53.6 81.8 81.0 86.5 82.4 63.9 78.8
Farm animals/Livestock 78.3 63.6 85.3 84.7 89.1 81.9 75.8 78.5
Percentage of households where at least one member owns or has a
Wristwatch 34.0 53.5 24.6 25.9 16.7 28.5 41.2 24.5
Bicycle 35.7 47.3 30.2 32.6 15.5 27.1 43.7 29.5
Motorcycle or scooter 83.7 92.7 79.4 81.0 69.3 78.7 87.2 83.1
Animal-drawn cart 0.4 0.5 0.4 0.4 0.7 0.7 0.3 0.4
Car, truck, or van 20.4 37.5 12.2 13.4 4.8 13.6 27.3 13.7
Boat with a motor 5.4 2.9 6.6 4.9 17.3 4.4 4.0 11.0
Tak Tak 38.3 21.6 46.4 47.9 37.0 28.3 41.0 48.3
Computer or tablet 13.5 31.0 5.2 5.7 1.7 9.3 18.3 8.2
Mobile telephone 90.1 97.5 86.6 88.2 76.7 88.0 92.1 88.6
Bank account 31.9 57.7 19.5 21.0 10.3 27.6 39.0 20.8
Ownership of dwelling
Owned by a household member 98.0 95.7 99.0 98.9 99.6 98.6 97.3 98.4
Not owned 2.0 4.3 1.0 1.1 0.4 1.4 2.7 1.6
Rented 1.0 2.5 0.3 0.3 0.1 0.7 1.4 0.5
Other 1.0 1.8 0.7 0.8 0.3 0.6 1.3 1.1
Number of households 22,287 7,214 15,073 12,964 2,109 7,131 10,919 4,237
(Continued…)
Tabl
e SR
.2.2
(con
tinu
ed):
Hou
seho
ld a
nd p
erso
nal a
sset
s
Perc
enta
ge o
f hou
seho
lds
by o
wne
rshi
p of
sel
ecte
d ho
useh
old
and
pers
onal
ass
ets,
and
per
cent
dis
trib
utio
n by
ow
ners
hip
of d
wel
ling,
acc
ordi
ng to
Pro
vinc
e, L
ao P
DR,
201
7
Prov
ince
Vientiane Capital
Phongsaly
Luangnamtha
Oudomxay
Bokeo
Luangprabang
Huaphanh
Xayabury
Xiengkhuang
Vientiane
Borikhamxay
Khammuane
Savannakhet
Saravane
Sekong
Champasack
Attapeu
Xaysomboune Pe
rcen
tage
of h
ouse
hold
s th
at o
wn
a Te
levi
sion
95
.9
66.0
73
.8
68.2
78
.8
64.8
58
.6
84.5
81
.2
88.9
89
.8
83.3
74
.5
66.8
62
.2
89.2
78
.7
66.3
Re
frig
erat
or
96.3
32
.6
49.5
34
.2
67.3
46
.4
29.7
71
.7
56.2
77
.8
86.1
76
.7
61.9
46
.6
40.6
81
.2
56.6
58
.6
Fan
99.2
34
.8
50.8
46
.9
78.8
55
.7
42.0
74
.2
55.6
89
.1
91.3
82
.8
72.8
60
.0
40.0
79
.8
66.4
61
.7
Wat
er p
ump
58.4
4.
8 10
.0
7.3
35.2
6.
4 4.
0 18
.3
36.0
56
.0
66.9
52
.8
46.1
30
.8
14.9
71
.1
44.9
13
.9
Air-
cond
ition
er
40.8
1.
0 2.
5 2.
8 6.
7 4.
7 1.
2 4.
8 1.
6 8.
4 11
.3
7.8
6.8
4.5
3.0
5.7
9.1
2.4
Was
hing
mac
hine
66
.6
6.2
14.3
11
.7
37.4
12
.6
9.0
34.9
17
.3
32.2
40
.4
22.9
18
.4
10.6
12
.7
20.3
17
.9
11.6
CD
/DVD
pla
yer /
Hom
e th
eatr
e 47
.0
37.4
27
.3
36.7
33
.0
26.0
35
.6
35.7
63
.8
30.4
26
.0
24.0
15
.0
17.4
17
.0
22.6
26
.3
30.5
Ir
on
76.3
12
.6
17.2
15
.3
25.6
16
.7
10.8
28
.4
42.2
36
.0
46.6
33
.5
27.6
17
.7
18.1
34
.9
23.1
27
.3
Rice
coo
ker /
Ste
amed
coo
ker
93.9
29
.4
38.2
29
.7
58.9
37
.8
19.9
50
.8
65.7
68
.6
76.9
57
.2
49.5
31
.8
24.8
59
.7
40.7
57
.2
Perc
enta
ge o
f hou
seho
lds
that
ow
n A
gric
ultu
ral l
and
36.4
90
.6
84.5
81
.5
75.7
79
.9
81.1
84
.8
79.3
70
.9
77.5
69
.0
75.2
84
.4
83.5
73
.8
83.4
70
.9
Farm
ani
mal
s/Li
vest
ock
52.1
82
.9
82.8
79
.3
86.3
71
.6
91.4
86
.4
90.8
82
.8
86.9
82
.7
82.9
85
.7
77.2
73
.3
84.1
90
.3
Perc
enta
ge o
f hou
seho
lds
whe
re a
t lea
st
one
mem
ber
owns
or
has
a W
ristw
atch
64
.7
33.3
27
.7
25.2
43
.1
28.8
18
.5
29.0
51
.7
40.4
35
.8
25.6
25
.7
19.6
21
.4
28.8
20
.4
33.3
Bi
cycl
e 49
.1
7.9
30.3
22
.4
39.6
22
.7
12.3
47
.0
27.3
48
.9
48.1
53
.9
35.6
23
.0
13.6
35
.5
32.5
29
.3
Mot
orcy
cle
or s
coot
er
93.3
77
.7
86.3
71
.8
80.0
71
.7
88.0
82
.3
93.3
85
.4
90.5
78
.9
83.1
78
.5
74.4
87
.7
81.4
89
.0
Ani
mal
-dra
wn
cart
0.
3 0.
1 0.
4 0.
5 0.
5 0.
5 2.
3 0.
4 0.
7 0.
3 0.
3 0.
1 0.
2 1.
0 0.
7 0.
2 0.
0 0.
9 Ca
r, tr
uck,
or v
an
46.5
10
.3
16.3
14
.0
18.9
11
.6
9.2
16.6
28
.3
19.4
29
.3
16.4
18
.4
13.6
9.
3 14
.9
12.4
13
.4
Boat
with
a m
otor
3.
4 3.
4 2.
7 1.
6 7.
1 7.
9 0.
7 4.
8 2.
3 4.
6 10
.9
6.2
1.0
0.6
3.3
19.6
5.
4 7.
0 Ta
k Ta
k 15
.5
26.0
18
.5
21.2
37
.7
11.6
38
.8
46.6
42
.2
43.2
46
.8
53.6
57
.1
55.0
33
.2
48.7
40
.2
35.6
Co
mpu
ter o
r tab
let
37.5
8.
1 8.
8 13
.9
17.3
8.
3 7.
1 5.
9 14
.3
11.1
16
.9
9.5
9.6
8.1
8.8
7.3
12.4
12
.0
Mob
ile te
leph
one
99.0
91
.4
89.2
84
.2
89.9
84
.5
85.7
93
.3
96.1
94
.4
95.5
88
.4
83.6
80
.8
84.3
93
.8
88.8
92
.9
Bank
acc
ount
59
.5
25.7
37
.6
32.1
38
.3
20.6
21
.2
28.2
41
.4
29.9
42
.2
26.2
30
.1
16.3
19
.4
21.0
33
.2
18.8
O
wne
rshi
p of
dw
ellin
g O
wne
d by
a h
ouse
hold
mem
ber
93.3
98
.0
98.7
97
.6
98.2
98
.3
99.4
99
.8
99.7
98
.5
98.8
98
.2
99.1
98
.6
98.3
98
.4
98.0
98
.2
Not
ow
ned
6.7
2.0
1.3
2.4
1.8
1.7
0.6
0.2
0.3
1.5
1.2
1.8
0.9
1.4
1.7
1.6
2.0
1.8
Rent
ed
3.9
1.6
0.5
1.0
1.0
0.9
0.3
0.2
0.3
0.6
0.4
0.7
0.4
0.6
0.4
0.2
1.4
0.7
Oth
er2.
8 0.
5 0.
8 1.
4 0.
9 0.
8 0.
3 0.
0 0.
1 0.
9 0.
7 1.
1 0.
5 0.
8 1.
2 1.
4 0.
6 1.
1
Num
ber o
f hou
seho
lds
2,90
6 70
6 62
4 1,
122
623
1,64
0 93
0 1,
486
843
1,52
9 96
3 1,
429
2,96
9 1,
266
366
2,15
1 45
3 28
1
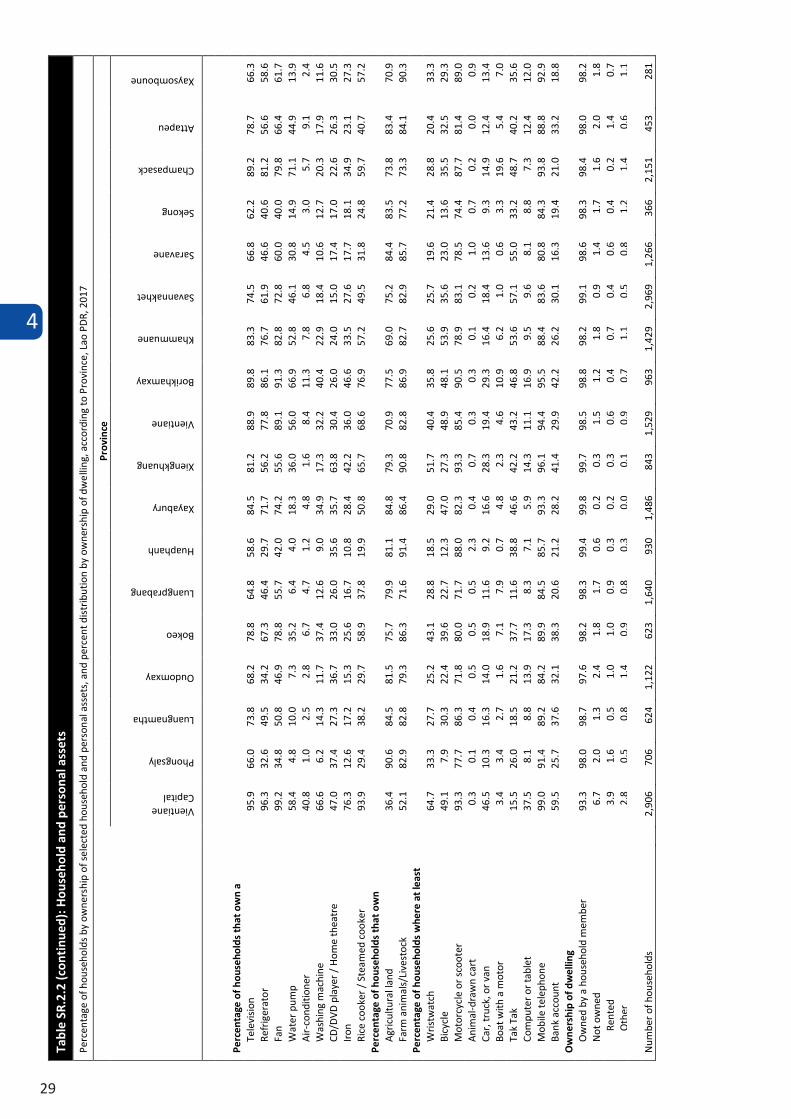
4
29
In Table SR.2.2 households are distributed according to ownership of assets by households and by individual household members. This also includes ownership of dwelling.
Table SR.2.2: Household and personal assets
Percentage of households by ownership of selected household and personal assets, and percent distribution by ownership of dwelling, according to area of residence and regions, Lao PDR, 2017
Total
Area Region
Urban Rural Rural with
road Rural
without road North Central South Percentage of households that own a
Television 79.3 94.1 72.2 75.9 49.4 70.7 85.0 79.0
Refrigerator 65.4 90.1 53.6 58.2 25.4 48.3 76.8 64.7
Fan 71.9 93.1 61.7 65.8 37.0 55.9 83.4 69.0
Water pump 38.8 41.3 37.6 40.7 18.8 11.4 51.9 51.4
Air-conditioner 10.1 25.9 2.5 2.8 0.3 3.6 16.1 5.5
Washing machine 26.4 53.2 13.5 15.1 3.3 18.3 35.4 16.5
CD/DVD player / Home theatre 30.2 41.2 24.9 26.1 17.6 32.8 32.0 21.0
Iron 33.3 63.2 19.0 21.0 6.2 18.5 45.3 27.1
Rice cooker / Steamed cooker 54.7 83.2 41.0 44.6 19.2 37.9 68.9 46.3
Percentage of households that own
Agricultural land 72.7 53.6 81.8 81.0 86.5 82.4 63.9 78.8
Farm animals/Livestock 78.3 63.6 85.3 84.7 89.1 81.9 75.8 78.5
Percentage of households where at least one member owns or has a
Wristwatch 34.0 53.5 24.6 25.9 16.7 28.5 41.2 24.5
Bicycle 35.7 47.3 30.2 32.6 15.5 27.1 43.7 29.5
Motorcycle or scooter 83.7 92.7 79.4 81.0 69.3 78.7 87.2 83.1
Animal-drawn cart 0.4 0.5 0.4 0.4 0.7 0.7 0.3 0.4
Car, truck, or van 20.4 37.5 12.2 13.4 4.8 13.6 27.3 13.7
Boat with a motor 5.4 2.9 6.6 4.9 17.3 4.4 4.0 11.0
Tak Tak 38.3 21.6 46.4 47.9 37.0 28.3 41.0 48.3
Computer or tablet 13.5 31.0 5.2 5.7 1.7 9.3 18.3 8.2
Mobile telephone 90.1 97.5 86.6 88.2 76.7 88.0 92.1 88.6
Bank account 31.9 57.7 19.5 21.0 10.3 27.6 39.0 20.8
Ownership of dwelling
Owned by a household member 98.0 95.7 99.0 98.9 99.6 98.6 97.3 98.4
Not owned 2.0 4.3 1.0 1.1 0.4 1.4 2.7 1.6
Rented 1.0 2.5 0.3 0.3 0.1 0.7 1.4 0.5
Other 1.0 1.8 0.7 0.8 0.3 0.6 1.3 1.1
Number of households 22,287 7,214 15,073 12,964 2,109 7,131 10,919 4,237
(Continued…)
Tabl
e SR
.2.2
(con
tinu
ed):
Hou
seho
ld a
nd p
erso
nal a
sset
s
Perc
enta
ge o
f hou
seho
lds
by o
wne
rshi
p of
sel
ecte
d ho
useh
old
and
pers
onal
ass
ets,
and
per
cent
dis
trib
utio
n by
ow
ners
hip
of d
wel
ling,
acc
ordi
ng to
Pro
vinc
e, L
ao P
DR,
201
7
Prov
ince
Vientiane Capital
Phongsaly
Luangnamtha
Oudomxay
Bokeo
Luangprabang
Huaphanh
Xayabury
Xiengkhuang
Vientiane
Borikhamxay
Khammuane
Savannakhet
Saravane
Sekong
Champasack
Attapeu
Xaysomboune
Perc
enta
ge o
f hou
seho
lds
that
ow
n a
Tele
visi
on
95.9
66
.0
73.8
68
.2
78.8
64
.8
58.6
84
.5
81.2
88
.9
89.8
83
.3
74.5
66
.8
62.2
89
.2
78.7
66
.3
Refr
iger
ator
96
.3
32.6
49
.5
34.2
67
.3
46.4
29
.7
71.7
56
.2
77.8
86
.1
76.7
61
.9
46.6
40
.6
81.2
56
.6
58.6
Fa
n 99
.2
34.8
50
.8
46.9
78
.8
55.7
42
.0
74.2
55
.6
89.1
91
.3
82.8
72
.8
60.0
40
.0
79.8
66
.4
61.7
W
ater
pum
p 58
.4
4.8
10.0
7.
3 35
.2
6.4
4.0
18.3
36
.0
56.0
66
.9
52.8
46
.1
30.8
14
.9
71.1
44
.9
13.9
A
ir-co
nditi
oner
40
.8
1.0
2.5
2.8
6.7
4.7
1.2
4.8
1.6
8.4
11.3
7.
8 6.
8 4.
5 3.
0 5.
7 9.
1 2.
4 W
ashi
ng m
achi
ne
66.6
6.
2 14
.3
11.7
37
.4
12.6
9.
0 34
.9
17.3
32
.2
40.4
22
.9
18.4
10
.6
12.7
20
.3
17.9
11
.6
CD/D
VD p
laye
r / H
ome
thea
tre
47.0
37
.4
27.3
36
.7
33.0
26
.0
35.6
35
.7
63.8
30
.4
26.0
24
.0
15.0
17
.4
17.0
22
.6
26.3
30
.5
Iron
76
.3
12.6
17
.2
15.3
25
.6
16.7
10
.8
28.4
42
.2
36.0
46
.6
33.5
27
.6
17.7
18
.1
34.9
23
.1
27.3
Ri
ce c
ooke
r / S
team
ed c
ooke
r 93
.9
29.4
38
.2
29.7
58
.9
37.8
19
.9
50.8
65
.7
68.6
76
.9
57.2
49
.5
31.8
24
.8
59.7
40
.7
57.2
Pe
rcen
tage
of h
ouse
hold
s th
at o
wn
Agr
icul
tura
l lan
d 36
.4
90.6
84
.5
81.5
75
.7
79.9
81
.1
84.8
79
.3
70.9
77
.5
69.0
75
.2
84.4
83
.5
73.8
83
.4
70.9
Fa
rm a
nim
als/
Live
stoc
k 52
.1
82.9
82
.8
79.3
86
.3
71.6
91
.4
86.4
90
.8
82.8
86
.9
82.7
82
.9
85.7
77
.2
73.3
84
.1
90.3
Pe
rcen
tage
of h
ouse
hold
s w
here
at l
east
on
e m
embe
r ow
ns o
r ha
s a
Wris
twat
ch
64.7
33
.3
27.7
25
.2
43.1
28
.8
18.5
29
.0
51.7
40
.4
35.8
25
.6
25.7
19
.6
21.4
28
.8
20.4
33
.3
Bicy
cle
49.1
7.
9 30
.3
22.4
39
.6
22.7
12
.3
47.0
27
.3
48.9
48
.1
53.9
35
.6
23.0
13
.6
35.5
32
.5
29.3
M
otor
cycl
e or
sco
oter
93
.3
77.7
86
.3
71.8
80
.0
71.7
88
.0
82.3
93
.3
85.4
90
.5
78.9
83
.1
78.5
74
.4
87.7
81
.4
89.0
A
nim
al-d
raw
n ca
rt
0.3
0.1
0.4
0.5
0.5
0.5
2.3
0.4
0.7
0.3
0.3
0.1
0.2
1.0
0.7
0.2
0.0
0.9
Car,
truc
k, o
r van
46
.5
10.3
16
.3
14.0
18
.9
11.6
9.
2 16
.6
28.3
19
.4
29.3
16
.4
18.4
13
.6
9.3
14.9
12
.4
13.4
Bo
at w
ith a
mot
or
3.4
3.4
2.7
1.6
7.1
7.9
0.7
4.8
2.3
4.6
10.9
6.
2 1.
0 0.
6 3.
3 19
.6
5.4
7.0
Tak
Tak
15.5
26
.0
18.5
21
.2
37.7
11
.6
38.8
46
.6
42.2
43
.2
46.8
53
.6
57.1
55
.0
33.2
48
.7
40.2
35
.6
Com
pute
r or t
able
t 37
.5
8.1
8.8
13.9
17
.3
8.3
7.1
5.9
14.3
11
.1
16.9
9.
5 9.
6 8.
1 8.
8 7.
3 12
.4
12.0
M
obile
tele
phon
e 99
.0
91.4
89
.2
84.2
89
.9
84.5
85
.7
93.3
96
.1
94.4
95
.5
88.4
83
.6
80.8
84
.3
93.8
88
.8
92.9
Ba
nk a
ccou
nt
59.5
25
.7
37.6
32
.1
38.3
20
.6
21.2
28
.2
41.4
29
.9
42.2
26
.2
30.1
16
.3
19.4
21
.0
33.2
18
.8
Ow
ners
hip
of d
wel
ling
Ow
ned
by a
hou
seho
ld m
embe
r 93
.3
98.0
98
.7
97.6
98
.2
98.3
99
.4
99.8
99
.7
98.5
98
.8
98.2
99
.1
98.6
98
.3
98.4
98
.0
98.2
N
ot o
wne
d 6.
7 2.
0 1.
3 2.
4 1.
8 1.
7 0.
6 0.
2 0.
3 1.
5 1.
2 1.
8 0.
9 1.
4 1.
7 1.
6 2.
0 1.
8 Re
nted
3.
9 1.
6 0.
5 1.
0 1.
0 0.
9 0.
3 0.
2 0.
3 0.
6 0.
4 0.
7 0.
4 0.
6 0.
4 0.
2 1.
4 0.
7 O
ther
2.8
0.5
0.8
1.4
0.9
0.8
0.3
0.0
0.1
0.9
0.7
1.1
0.5
0.8
1.2
1.4
0.6
1.1
Num
ber o
f hou
seho
lds
2,90
6 70
6 62
4 1,
122
623
1,64
0 93
0 1,
486
843
1,52
9 96
3 1,
429
2,96
9 1,
266
366
2,15
1 45
3 28
1
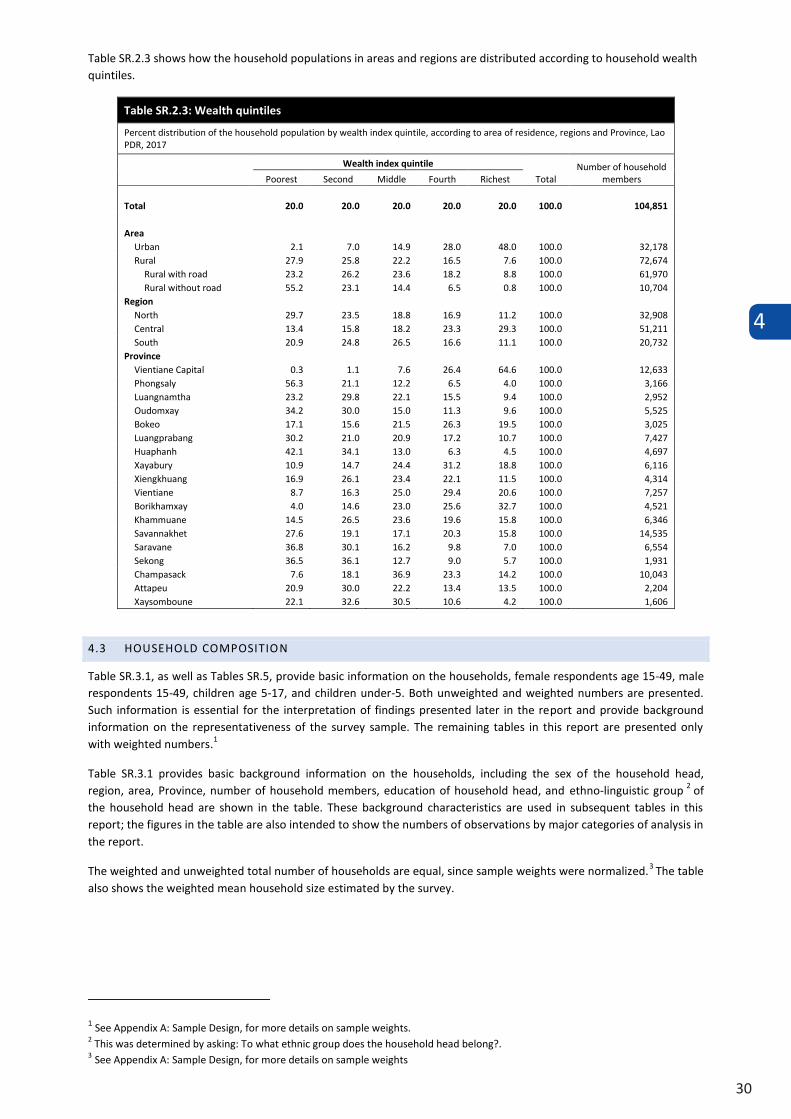
4
30
Table SR.2.3 shows how the household populations in areas and regions are distributed according to household wealth quintiles.
Table SR.2.3: Wealth quintiles
Percent distribution of the household population by wealth index quintile, according to area of residence, regions and Province, Lao PDR, 2017
Wealth index quintile
Total Number of household
members Poorest Second Middle Fourth Richest
Total 20.0 20.0 20.0 20.0 20.0 100.0 104,851
Area Urban 2.1 7.0 14.9 28.0 48.0 100.0 32,178 Rural 27.9 25.8 22.2 16.5 7.6 100.0 72,674
Rural with road 23.2 26.2 23.6 18.2 8.8 100.0 61,970 Rural without road 55.2 23.1 14.4 6.5 0.8 100.0 10,704
Region North 29.7 23.5 18.8 16.9 11.2 100.0 32,908 Central 13.4 15.8 18.2 23.3 29.3 100.0 51,211 South 20.9 24.8 26.5 16.6 11.1 100.0 20,732
Province Vientiane Capital 0.3 1.1 7.6 26.4 64.6 100.0 12,633 Phongsaly 56.3 21.1 12.2 6.5 4.0 100.0 3,166 Luangnamtha 23.2 29.8 22.1 15.5 9.4 100.0 2,952 Oudomxay 34.2 30.0 15.0 11.3 9.6 100.0 5,525 Bokeo 17.1 15.6 21.5 26.3 19.5 100.0 3,025 Luangprabang 30.2 21.0 20.9 17.2 10.7 100.0 7,427 Huaphanh 42.1 34.1 13.0 6.3 4.5 100.0 4,697 Xayabury 10.9 14.7 24.4 31.2 18.8 100.0 6,116 Xiengkhuang 16.9 26.1 23.4 22.1 11.5 100.0 4,314 Vientiane 8.7 16.3 25.0 29.4 20.6 100.0 7,257 Borikhamxay 4.0 14.6 23.0 25.6 32.7 100.0 4,521 Khammuane 14.5 26.5 23.6 19.6 15.8 100.0 6,346 Savannakhet 27.6 19.1 17.1 20.3 15.8 100.0 14,535 Saravane 36.8 30.1 16.2 9.8 7.0 100.0 6,554 Sekong 36.5 36.1 12.7 9.0 5.7 100.0 1,931 Champasack 7.6 18.1 36.9 23.3 14.2 100.0 10,043 Attapeu 20.9 30.0 22.2 13.4 13.5 100.0 2,204 Xaysomboune 22.1 32.6 30.5 10.6 4.2 100.0 1,606
4.3 HOUSEHOLD COMPOSITION
Table SR.3.1, as well as Tables SR.5, provide basic information on the households, female respondents age 15-49, male respondents 15-49, children age 5-17, and children under-5. Both unweighted and weighted numbers are presented. Such information is essential for the interpretation of findings presented later in the report and provide background information on the representativeness of the survey sample. The remaining tables in this report are presented only with weighted numbers.1
Table SR.3.1 provides basic background information on the households, including the sex of the household head, region, area, Province, number of household members, education of household head, and ethno-linguistic group 2 of the household head are shown in the table. These background characteristics are used in subsequent tables in this report; the figures in the table are also intended to show the numbers of observations by major categories of analysis in the report.
The weighted and unweighted total number of households are equal, since sample weights were normalized.3 The table
also shows the weighted mean household size estimated by the survey.
1 See Appendix A: Sample Design, for more details on sample weights. 2 This was determined by asking: To what ethnic group does the household head belong?. 3 See Appendix A: Sample Design, for more details on sample weights
Table SR.3.1: Household composition
Percent and frequency distribution of households by selected characteristics, Lao PDR 2017
Weighted percent
Number of households
Weighted Unweighted Total 100.0 22,287 22,287 Sex of household head
Male 86.1 19,183 19,506 Female 13.9 3,104 2781
Age of household headA
<18 0.1 15 14 18-34 19.4 4,321 4,786 35-64 68.9 15,356 15,099 65-84 11.1 2,472 2,275 85+ 0.6 124 113
Area
Urban 32.4 7,214 7,000 Rural 67.6 15,073 15,287
Rural with road 86.0 12,964 12,985 Rural without road 14.0 2,109 2,302
Region
North 32.0 7,131 8,416 Central 49.0 10,919 9,167 South 19.0 4,237 4,704
Province
Vientiane Capital 13.0 2,906 1,575 Phongsaly 3.2 706 1,045 Luangnamtha 2.8 624 1,071 Oudomxay 5.0 1,122 1,220 Bokeo 2.8 623 1,043 Luangprabang 7.4 1,640 1,445 Huaphanh 4.2 930 1,163 Xayabury 6.7 1,486 1,429 Xiengkhuang 3.8 843 1,115 Vientiane 6.9 1,529 1,414 Borikhamxay 4.3 963 1,132 Khammuane 6.4 1,429 1,356 Savannakhet 13.3 2,969 1,551 Saravane 5.7 1266 1,323 Sekong 1.6 366 1,056 Champasack 9.6 2,151 1,325 Attapeu 2.0 453 1,000 Xaysomboune 1.3 281 1,024
Education of household head
None or ECE 16.0 3,566 3,802 Primary 43.1 9,605 9,631 Lower secondary 19.3 4,300 4,252 Upper secondary 7.2 1,606 1,520 Post secondary / Non tertiary 6.4 1,427 1,358 Higher 7.9 1,752 1,702 DK/Missing 0.1 31 22
Number of household members
1 3.2 709 651 2 8.8 1,959 1,838 3 16.0 3,568 3,456 4 23.1 5,146 5,089 5 19.5 4,345 4,363 6 13.2 2,950 3,020 7+ 16.2 3,610 3,870
Ethno-linguistic group of household head
Lao-Tai 66.3 14,785 13,028 Mon-Khmer 22.4 4,983 5,726 Hmong-Mien 7.5 1,667 2,309 Chinese-Tibetan 2.8 624 990 Other, DK, Missing 1.0 228 234
Households withA,B
At least one child under age 5 years 38.7 8,616 8,888 At least one child age 5-17 years 68.4 15,255 15,494 At least one child age <18 years 80.0 17,819 18,058 At least one woman age 15-49 years 84.3 18,797 19,040 At least one man age 15-49 years 81.1 18,075 18,370 No member age <50 years 5.5 1,230 1,146 No adult (18+ years) member 0.1 13 11
Mean household size 4.7 22,287 22,287 A In all following household level tables, the figures for the category "<18" under "Age of household head" and the category "no adult (18+) member" under "Household with" will be suppressed because they are based on fewer than 25 unweighted cases.
B Each proportion presented below is a separate characteristic based on the total number of households.
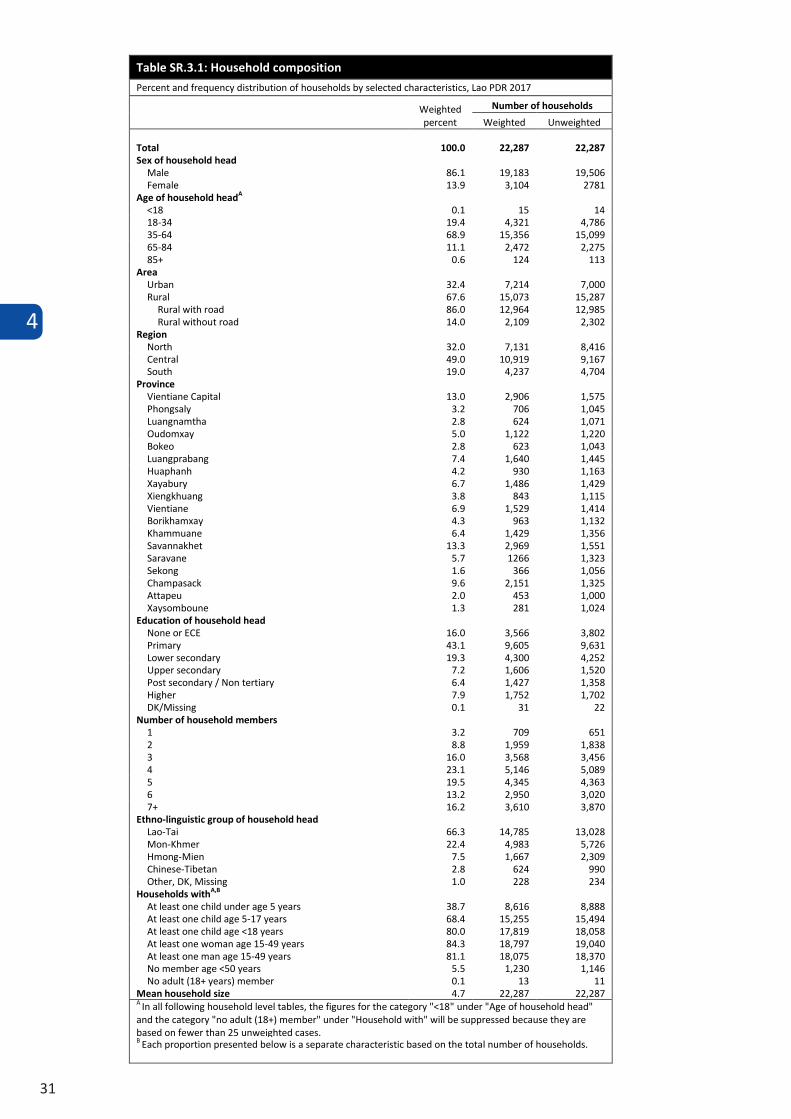
4
31
Table SR.3.1: Household composition
Percent and frequency distribution of households by selected characteristics, Lao PDR 2017
Weighted percent
Number of households
Weighted Unweighted Total 100.0 22,287 22,287 Sex of household head
Male 86.1 19,183 19,506 Female 13.9 3,104 2781
Age of household headA
<18 0.1 15 14 18-34 19.4 4,321 4,786 35-64 68.9 15,356 15,099 65-84 11.1 2,472 2,275 85+ 0.6 124 113
Area
Urban 32.4 7,214 7,000 Rural 67.6 15,073 15,287
Rural with road 86.0 12,964 12,985 Rural without road 14.0 2,109 2,302
Region
North 32.0 7,131 8,416 Central 49.0 10,919 9,167 South 19.0 4,237 4,704
Province
Vientiane Capital 13.0 2,906 1,575 Phongsaly 3.2 706 1,045 Luangnamtha 2.8 624 1,071 Oudomxay 5.0 1,122 1,220 Bokeo 2.8 623 1,043 Luangprabang 7.4 1,640 1,445 Huaphanh 4.2 930 1,163 Xayabury 6.7 1,486 1,429 Xiengkhuang 3.8 843 1,115 Vientiane 6.9 1,529 1,414 Borikhamxay 4.3 963 1,132 Khammuane 6.4 1,429 1,356 Savannakhet 13.3 2,969 1,551 Saravane 5.7 1266 1,323 Sekong 1.6 366 1,056 Champasack 9.6 2,151 1,325 Attapeu 2.0 453 1,000 Xaysomboune 1.3 281 1,024
Education of household head
None or ECE 16.0 3,566 3,802 Primary 43.1 9,605 9,631 Lower secondary 19.3 4,300 4,252 Upper secondary 7.2 1,606 1,520 Post secondary / Non tertiary 6.4 1,427 1,358 Higher 7.9 1,752 1,702 DK/Missing 0.1 31 22
Number of household members
1 3.2 709 651 2 8.8 1,959 1,838 3 16.0 3,568 3,456 4 23.1 5,146 5,089 5 19.5 4,345 4,363 6 13.2 2,950 3,020 7+ 16.2 3,610 3,870
Ethno-linguistic group of household head
Lao-Tai 66.3 14,785 13,028 Mon-Khmer 22.4 4,983 5,726 Hmong-Mien 7.5 1,667 2,309 Chinese-Tibetan 2.8 624 990 Other, DK, Missing 1.0 228 234
Households withA,B
At least one child under age 5 years 38.7 8,616 8,888 At least one child age 5-17 years 68.4 15,255 15,494 At least one child age <18 years 80.0 17,819 18,058 At least one woman age 15-49 years 84.3 18,797 19,040 At least one man age 15-49 years 81.1 18,075 18,370 No member age <50 years 5.5 1,230 1,146 No adult (18+ years) member 0.1 13 11
Mean household size 4.7 22,287 22,287 A In all following household level tables, the figures for the category "<18" under "Age of household head" and the category "no adult (18+) member" under "Household with" will be suppressed because they are based on fewer than 25 unweighted cases.
B Each proportion presented below is a separate characteristic based on the total number of households.
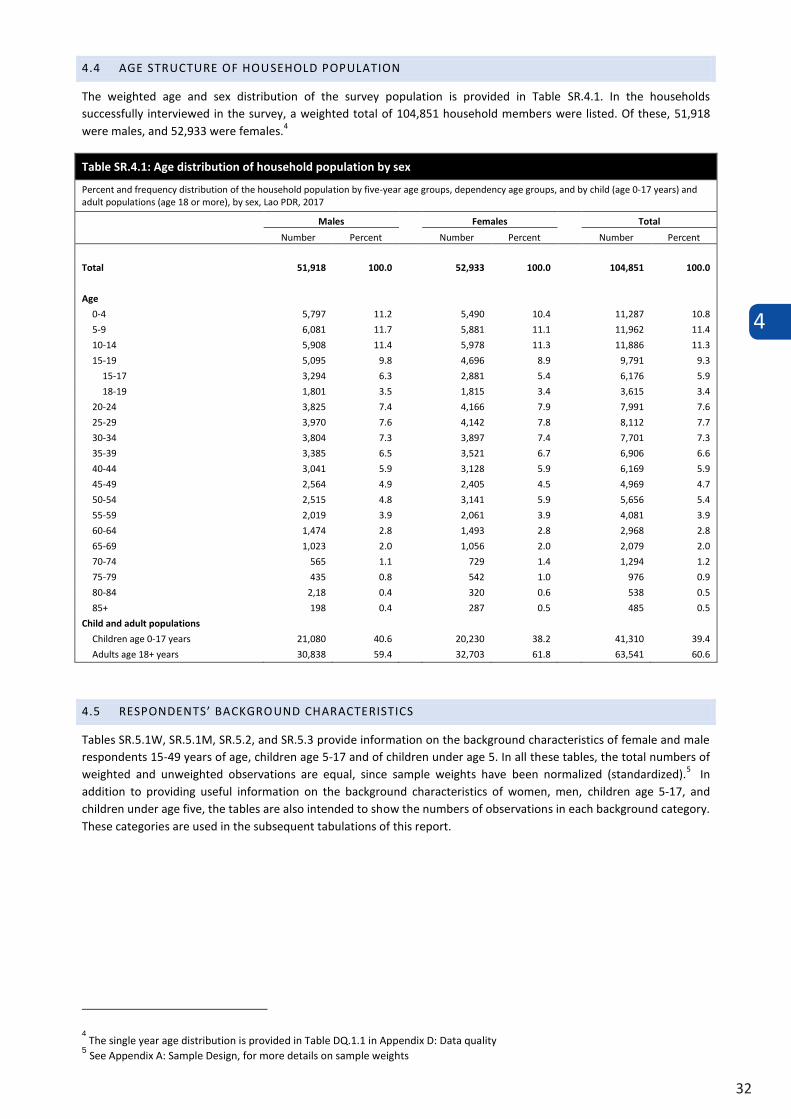
4
32
4.4 AGE STRUCTURE OF HOUSEHOLD POPULATION
The weighted age and sex distribution of the survey population is provided in Table SR.4.1. In the households successfully interviewed in the survey, a weighted total of 104,851 household members were listed. Of these, 51,918 were males, and 52,933 were females.4
Table SR.4.1: Age distribution of household population by sex
Percent and frequency distribution of the household population by five-year age groups, dependency age groups, and by child (age 0-17 years) and adult populations (age 18 or more), by sex, Lao PDR, 2017
Males Females Total
Number Percent Number Percent Number Percent
Total 51,918 100.0 52,933 100.0 104,851 100.0
Age
0-4 5,797 11.2 5,490 10.4 11,287 10.8
5-9 6,081 11.7 5,881 11.1 11,962 11.4
10-14 5,908 11.4 5,978 11.3 11,886 11.3
15-19 5,095 9.8 4,696 8.9 9,791 9.3
15-17 3,294 6.3 2,881 5.4 6,176 5.9
18-19 1,801 3.5 1,815 3.4 3,615 3.4
20-24 3,825 7.4 4,166 7.9 7,991 7.6
25-29 3,970 7.6 4,142 7.8 8,112 7.7
30-34 3,804 7.3 3,897 7.4 7,701 7.3
35-39 3,385 6.5 3,521 6.7 6,906 6.6
40-44 3,041 5.9 3,128 5.9 6,169 5.9
45-49 2,564 4.9 2,405 4.5 4,969 4.7
50-54 2,515 4.8 3,141 5.9 5,656 5.4
55-59 2,019 3.9 2,061 3.9 4,081 3.9
60-64 1,474 2.8 1,493 2.8 2,968 2.8
65-69 1,023 2.0 1,056 2.0 2,079 2.0
70-74 565 1.1 729 1.4 1,294 1.2
75-79 435 0.8 542 1.0 976 0.9
80-84 2,18 0.4 320 0.6 538 0.5
85+ 198 0.4 287 0.5 485 0.5
Child and adult populations
Children age 0-17 years 21,080 40.6 20,230 38.2 41,310 39.4
Adults age 18+ years 30,838 59.4 32,703 61.8 63,541 60.6
4.5 RESPONDENTS’ BACKGROUND CHARACTERISTICS
Tables SR.5.1W, SR.5.1M, SR.5.2, and SR.5.3 provide information on the background characteristics of female and male respondents 15-49 years of age, children age 5-17 and of children under age 5. In all these tables, the total numbers of weighted and unweighted observations are equal, since sample weights have been normalized (standardized).5 In addition to providing useful information on the background characteristics of women, men, children age 5-17, and children under age five, the tables are also intended to show the numbers of observations in each background category. These categories are used in the subsequent tabulations of this report.
4 The single year age distribution is provided in Table DQ.1.1 in Appendix D: Data quality
5 See Appendix A: Sample Design, for more details on sample weights
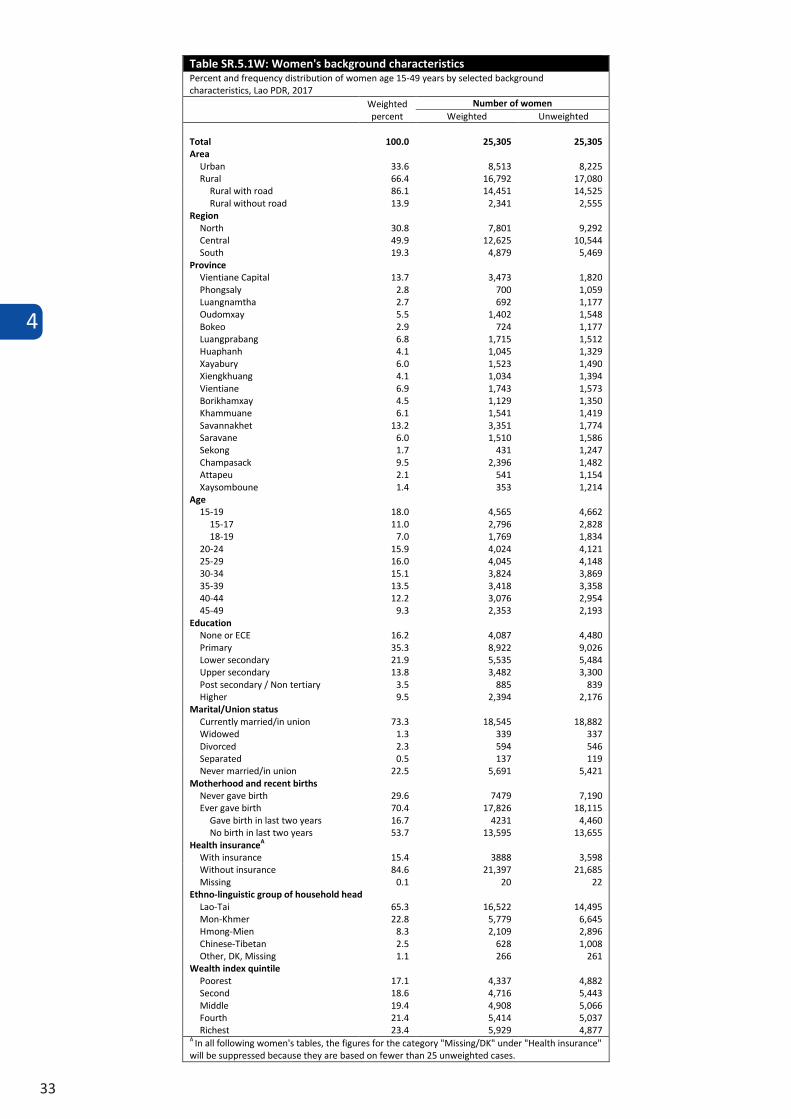
4
33
Table SR.5.1W: Women's background characteristics Percent and frequency distribution of women age 15-49 years by selected background characteristics, Lao PDR, 2017
Weighted percent
Number of women Weighted Unweighted
Total 100.0 25,305 25,305 Area
Urban 33.6 8,513 8,225 Rural 66.4 16,792 17,080
Rural with road 86.1 14,451 14,525 Rural without road 13.9 2,341 2,555
Region North 30.8 7,801 9,292 Central 49.9 12,625 10,544 South 19.3 4,879 5,469
Province Vientiane Capital 13.7 3,473 1,820 Phongsaly 2.8 700 1,059 Luangnamtha 2.7 692 1,177 Oudomxay 5.5 1,402 1,548 Bokeo 2.9 724 1,177 Luangprabang 6.8 1,715 1,512 Huaphanh 4.1 1,045 1,329 Xayabury 6.0 1,523 1,490 Xiengkhuang 4.1 1,034 1,394 Vientiane 6.9 1,743 1,573 Borikhamxay 4.5 1,129 1,350 Khammuane 6.1 1,541 1,419 Savannakhet 13.2 3,351 1,774 Saravane 6.0 1,510 1,586 Sekong 1.7 431 1,247 Champasack 9.5 2,396 1,482 Attapeu 2.1 541 1,154 Xaysomboune 1.4 353 1,214
Age 15-19 18.0 4,565 4,662
15-17 11.0 2,796 2,828 18-19 7.0 1,769 1,834
20-24 15.9 4,024 4,121 25-29 16.0 4,045 4,148 30-34 15.1 3,824 3,869 35-39 13.5 3,418 3,358 40-44 12.2 3,076 2,954 45-49 9.3 2,353 2,193
Education None or ECE 16.2 4,087 4,480 Primary 35.3 8,922 9,026 Lower secondary 21.9 5,535 5,484 Upper secondary 13.8 3,482 3,300 Post secondary / Non tertiary 3.5 885 839 Higher 9.5 2,394 2,176
Marital/Union status Currently married/in union 73.3 18,545 18,882 Widowed 1.3 339 337 Divorced 2.3 594 546 Separated 0.5 137 119 Never married/in union 22.5 5,691 5,421
Motherhood and recent births Never gave birth 29.6 7479 7,190 Ever gave birth 70.4 17,826 18,115
Gave birth in last two years 16.7 4231 4,460 No birth in last two years 53.7 13,595 13,655
Health insuranceA With insurance 15.4 3888 3,598 Without insurance 84.6 21,397 21,685 Missing 0.1 20 22
Ethno-linguistic group of household head Lao-Tai 65.3 16,522 14,495 Mon-Khmer 22.8 5,779 6,645 Hmong-Mien 8.3 2,109 2,896 Chinese-Tibetan 2.5 628 1,008 Other, DK, Missing 1.1 266 261
Wealth index quintile Poorest 17.1 4,337 4,882 Second 18.6 4,716 5,443 Middle 19.4 4,908 5,066 Fourth 21.4 5,414 5,037 Richest 23.4 5,929 4,877
A In all following women's tables, the figures for the category "Missing/DK" under "Health insurance" will be suppressed because they are based on fewer than 25 unweighted cases.
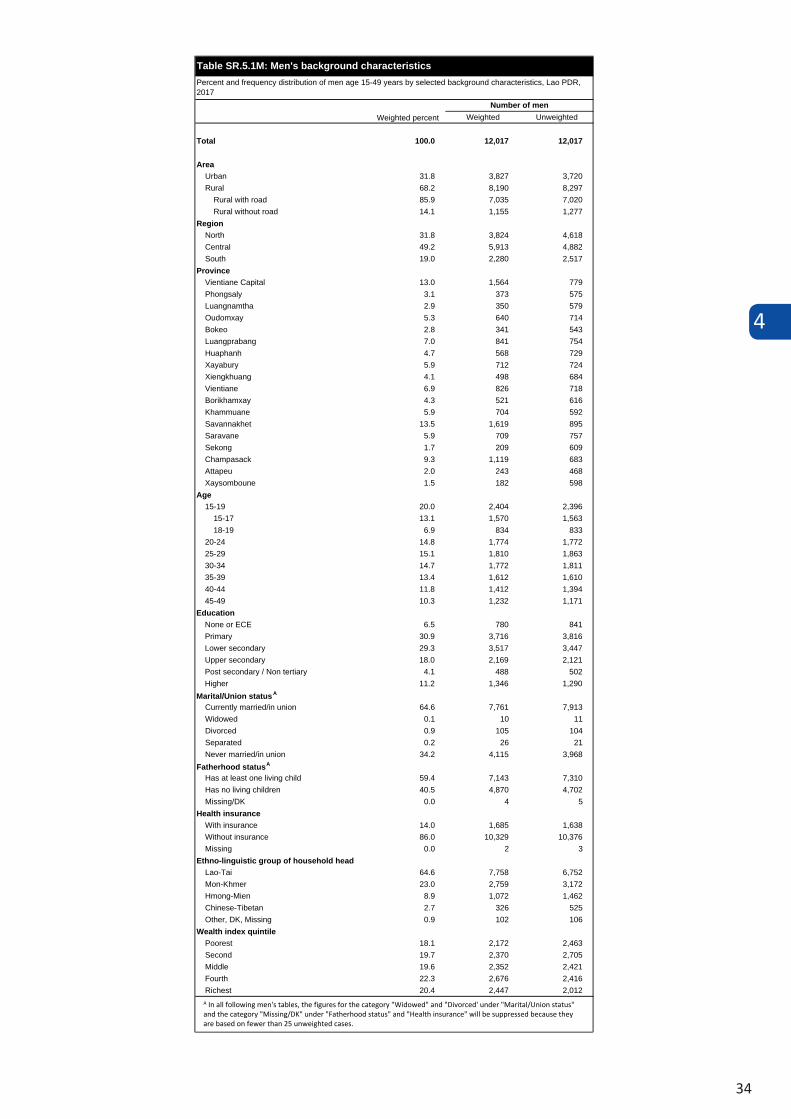
4
34
Weighted Unweighted
Total 100.0 12,017 12,017
AreaUrban 31.8 3,827 3,720Rural 68.2 8,190 8,297
Rural with road 85.9 7,035 7,020Rural without road 14.1 1,155 1,277
RegionNorth 31.8 3,824 4,618Central 49.2 5,913 4,882South 19.0 2,280 2,517
ProvinceVientiane Capital 13.0 1,564 779Phongsaly 3.1 373 575Luangnamtha 2.9 350 579Oudomxay 5.3 640 714Bokeo 2.8 341 543Luangprabang 7.0 841 754Huaphanh 4.7 568 729Xayabury 5.9 712 724Xiengkhuang 4.1 498 684Vientiane 6.9 826 718Borikhamxay 4.3 521 616Khammuane 5.9 704 592Savannakhet 13.5 1,619 895Saravane 5.9 709 757Sekong 1.7 209 609Champasack 9.3 1,119 683Attapeu 2.0 243 468Xaysomboune 1.5 182 598
Age15-19 20.0 2,404 2,396
15-17 13.1 1,570 1,56318-19 6.9 834 833
20-24 14.8 1,774 1,77225-29 15.1 1,810 1,86330-34 14.7 1,772 1,81135-39 13.4 1,612 1,61040-44 11.8 1,412 1,39445-49 10.3 1,232 1,171
EducationNone or ECE 6.5 780 841Primary 30.9 3,716 3,816Lower secondary 29.3 3,517 3,447Upper secondary 18.0 2,169 2,121Post secondary / Non tertiary 4.1 488 502Higher 11.2 1,346 1,290
Marital/Union statusA
Currently married/in union 64.6 7,761 7,913Widowed 0.1 10 11Divorced 0.9 105 104Separated 0.2 26 21Never married/in union 34.2 4,115 3,968
Fatherhood statusA
Has at least one living child 59.4 7,143 7,310Has no living children 40.5 4,870 4,702Missing/DK 0.0 4 5
Health insuranceWith insurance 14.0 1,685 1,638Without insurance 86.0 10,329 10,376Missing 0.0 2 3
Ethno-linguistic group of household headLao-Tai 64.6 7,758 6,752Mon-Khmer 23.0 2,759 3,172Hmong-Mien 8.9 1,072 1,462Chinese-Tibetan 2.7 326 525Other, DK, Missing 0.9 102 106
Wealth index quintilePoorest 18.1 2,172 2,463Second 19.7 2,370 2,705Middle 19.6 2,352 2,421Fourth 22.3 2,676 2,416Richest 20.4 2,447 2,012
Table SR.5.1M: Men's background characteristicsPercent and frequency distribution of men age 15-49 years by selected background characteristics, Lao PDR, 2017
Weighted percentNumber of men
A In all following men's tables, the figures for the category "Widowed" and "Divorced' under "Marital/Union status" and the category "Missing/DK" under "Fatherhood status" and "Health insurance" will be suppressed because they are based on fewer than 25 unweighted cases.
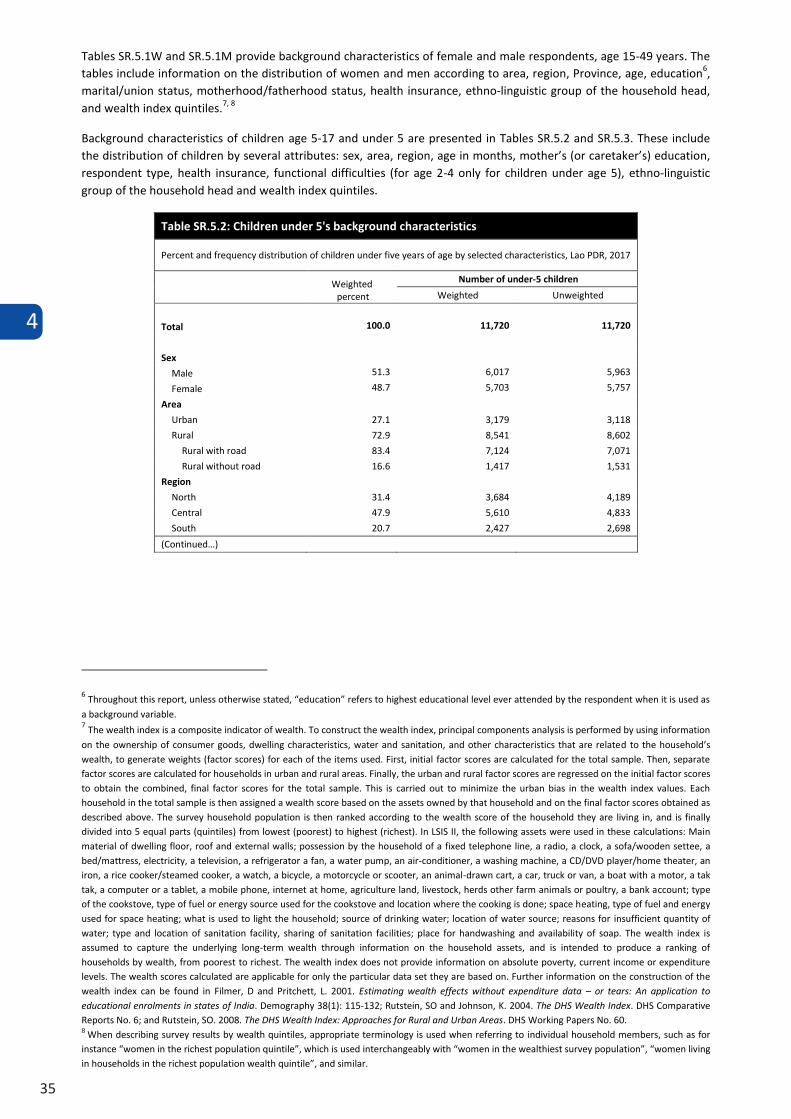
4
35
Tables SR.5.1W and SR.5.1M provide background characteristics of female and male respondents, age 15-49 years. The tables include information on the distribution of women and men according to area, region, Province, age, education6, marital/union status, motherhood/fatherhood status, health insurance, ethno-linguistic group of the household head, and wealth index quintiles.7, 8
Background characteristics of children age 5-17 and under 5 are presented in Tables SR.5.2 and SR.5.3. These include the distribution of children by several attributes: sex, area, region, age in months, mother’s (or caretaker’s) education, respondent type, health insurance, functional difficulties (for age 2-4 only for children under age 5), ethno-linguistic group of the household head and wealth index quintiles.
Table SR.5.2: Children under 5's background characteristics
Percent and frequency distribution of children under five years of age by selected characteristics, Lao PDR, 2017
Weighted percent
Number of under-5 children
Weighted Unweighted
Total 100.0 11,720 11,720
Sex
Male 51.3 6,017 5,963
Female 48.7 5,703 5,757
Area
Urban 27.1 3,179 3,118
Rural 72.9 8,541 8,602
Rural with road 83.4 7,124 7,071
Rural without road 16.6 1,417 1,531
Region
North 31.4 3,684 4,189
Central 47.9 5,610 4,833
South 20.7 2,427 2,698
(Continued…)
6 Throughout this report, unless otherwise stated, “education” refers to highest educational level ever attended by the respondent when it is used as
a background variable. 7 The wealth index is a composite indicator of wealth. To construct the wealth index, principal components analysis is performed by using information
on the ownership of consumer goods, dwelling characteristics, water and sanitation, and other characteristics that are related to the household’s wealth, to generate weights (factor scores) for each of the items used. First, initial factor scores are calculated for the total sample. Then, separate factor scores are calculated for households in urban and rural areas. Finally, the urban and rural factor scores are regressed on the initial factor scores to obtain the combined, final factor scores for the total sample. This is carried out to minimize the urban bias in the wealth index values. Each household in the total sample is then assigned a wealth score based on the assets owned by that household and on the final factor scores obtained as described above. The survey household population is then ranked according to the wealth score of the household they are living in, and is finally divided into 5 equal parts (quintiles) from lowest (poorest) to highest (richest). In LSIS II, the following assets were used in these calculations: Main material of dwelling floor, roof and external walls; possession by the household of a fixed telephone line, a radio, a clock, a sofa/wooden settee, a bed/mattress, electricity, a television, a refrigerator a fan, a water pump, an air-conditioner, a washing machine, a CD/DVD player/home theater, an iron, a rice cooker/steamed cooker, a watch, a bicycle, a motorcycle or scooter, an animal-drawn cart, a car, truck or van, a boat with a motor, a tak tak, a computer or a tablet, a mobile phone, internet at home, agriculture land, livestock, herds other farm animals or poultry, a bank account; type of the cookstove, type of fuel or energy source used for the cookstove and location where the cooking is done; space heating, type of fuel and energy used for space heating; what is used to light the household; source of drinking water; location of water source; reasons for insufficient quantity of water; type and location of sanitation facility, sharing of sanitation facilities; place for handwashing and availability of soap. The wealth index is assumed to capture the underlying long-term wealth through information on the household assets, and is intended to produce a ranking of households by wealth, from poorest to richest. The wealth index does not provide information on absolute poverty, current income or expenditure levels. The wealth scores calculated are applicable for only the particular data set they are based on. Further information on the construction of the wealth index can be found in Filmer, D and Pritchett, L. 2001. Estimating wealth effects without expenditure data – or tears: An application to educational enrolments in states of India. Demography 38(1): 115-132; Rutstein, SO and Johnson, K. 2004. The DHS Wealth Index. DHS Comparative Reports No. 6; and Rutstein, SO. 2008. The DHS Wealth Index: Approaches for Rural and Urban Areas. DHS Working Papers No. 60. 8 When describing survey results by wealth quintiles, appropriate terminology is used when referring to individual household members, such as for instance “women in the richest population quintile”, which is used interchangeably with “women in the wealthiest survey population”, “women living in households in the richest population wealth quintile”, and similar.
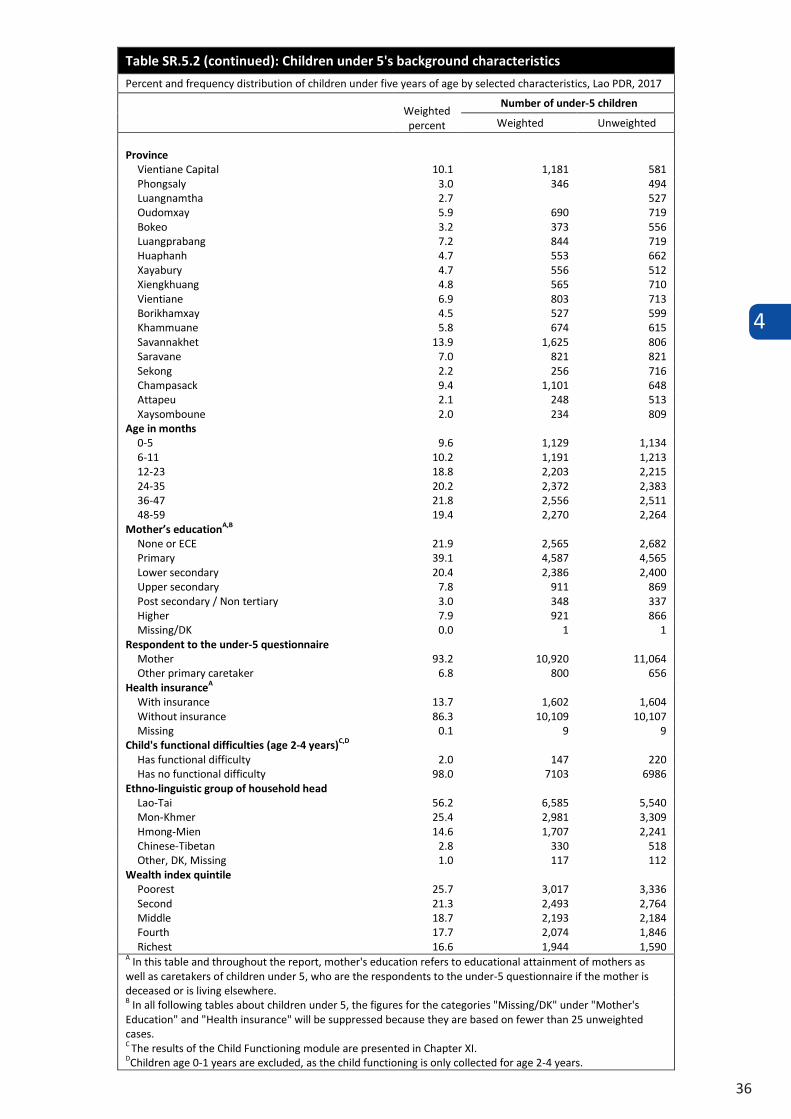
4
36
Table SR.5.2 (continued): Children under 5's background characteristics
Percent and frequency distribution of children under five years of age by selected characteristics, Lao PDR, 2017
Weighted percent
Number of under-5 children
Weighted Unweighted
Province Vientiane Capital 10.1 1,181 581 Phongsaly 3.0 346 494 Luangnamtha 2.7 321 527 Oudomxay 5.9 690 719 Bokeo 3.2 373 556 Luangprabang 7.2 844 719 Huaphanh 4.7 553 662 Xayabury 4.7 556 512 Xiengkhuang 4.8 565 710 Vientiane 6.9 803 713 Borikhamxay 4.5 527 599 Khammuane 5.8 674 615 Savannakhet 13.9 1,625 806 Saravane 7.0 821 821 Sekong 2.2 256 716 Champasack 9.4 1,101 648 Attapeu 2.1 248 513 Xaysomboune 2.0 234 809
Age in months 0-5 9.6 1,129 1,134 6-11 10.2 1,191 1,213 12-23 18.8 2,203 2,215 24-35 20.2 2,372 2,383 36-47 21.8 2,556 2,511 48-59 19.4 2,270 2,264
Mother’s educationA,B None or ECE 21.9 2,565 2,682 Primary 39.1 4,587 4,565 Lower secondary 20.4 2,386 2,400 Upper secondary 7.8 911 869 Post secondary / Non tertiary 3.0 348 337 Higher 7.9 921 866 Missing/DK 0.0 1 1
Respondent to the under-5 questionnaire Mother 93.2 10,920 11,064 Other primary caretaker 6.8 800 656
Health insuranceA With insurance 13.7 1,602 1,604 Without insurance 86.3 10,109 10,107 Missing 0.1 9 9
Child's functional difficulties (age 2-4 years)C,D Has functional difficulty 2.0 147 220 Has no functional difficulty 98.0 7103 6986
Ethno-linguistic group of household head Lao-Tai 56.2 6,585 5,540 Mon-Khmer 25.4 2,981 3,309 Hmong-Mien 14.6 1,707 2,241 Chinese-Tibetan 2.8 330 518 Other, DK, Missing 1.0 117 112
Wealth index quintile Poorest 25.7 3,017 3,336 Second 21.3 2,493 2,764 Middle 18.7 2,193 2,184 Fourth 17.7 2,074 1,846 Richest 16.6 1,944 1,590
A In this table and throughout the report, mother's education refers to educational attainment of mothers as well as caretakers of children under 5, who are the respondents to the under-5 questionnaire if the mother is deceased or is living elsewhere. B In all following tables about children under 5, the figures for the categories "Missing/DK" under "Mother's Education" and "Health insurance" will be suppressed because they are based on fewer than 25 unweighted cases. C The results of the Child Functioning module are presented in Chapter XI. DChildren age 0-1 years are excluded, as the child functioning is only collected for age 2-4 years.
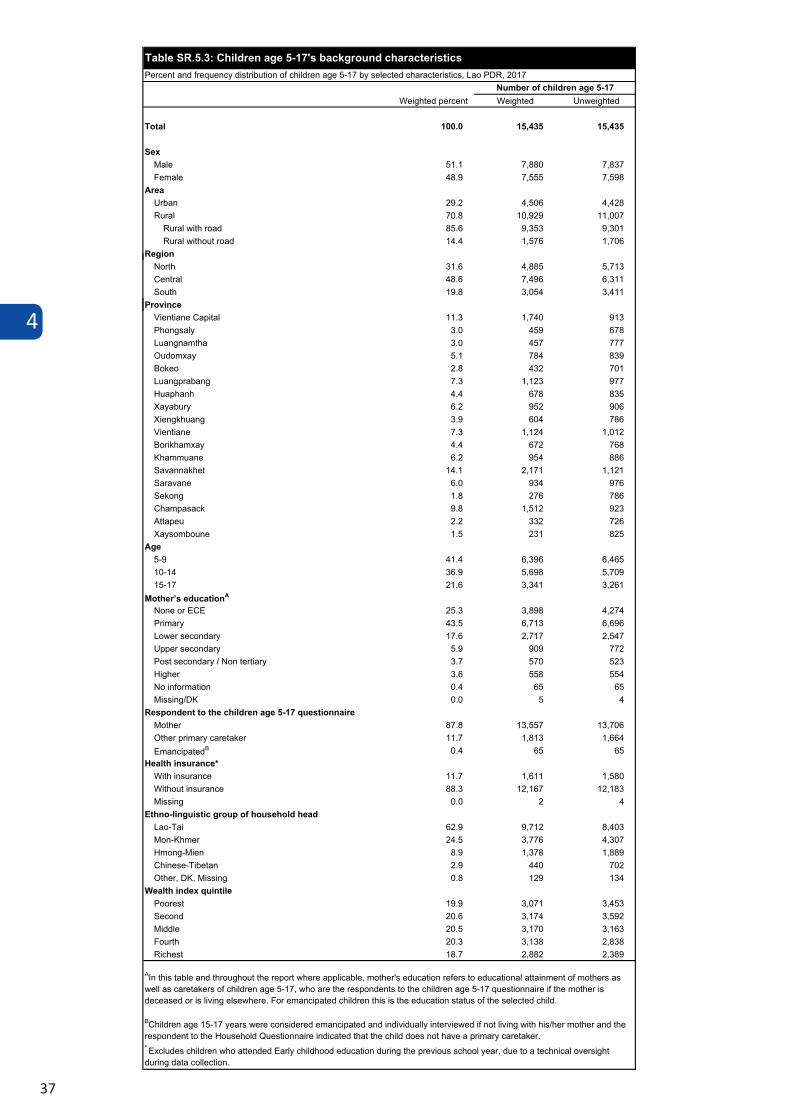
4
37
Table SR.5.2 (continued): Children under 5's background characteristics
Percent and frequency distribution of children under five years of age by selected characteristics, Lao PDR, 2017
Weighted percent
Number of under-5 children
Weighted Unweighted
Province Vientiane Capital 10.1 1,181 581 Phongsaly 3.0 346 494 Luangnamtha 2.7 321 527 Oudomxay 5.9 690 719 Bokeo 3.2 373 556 Luangprabang 7.2 844 719 Huaphanh 4.7 553 662 Xayabury 4.7 556 512 Xiengkhuang 4.8 565 710 Vientiane 6.9 803 713 Borikhamxay 4.5 527 599 Khammuane 5.8 674 615 Savannakhet 13.9 1,625 806 Saravane 7.0 821 821 Sekong 2.2 256 716 Champasack 9.4 1,101 648 Attapeu 2.1 248 513 Xaysomboune 2.0 234 809
Age in months 0-5 9.6 1,129 1,134 6-11 10.2 1,191 1,213 12-23 18.8 2,203 2,215 24-35 20.2 2,372 2,383 36-47 21.8 2,556 2,511 48-59 19.4 2,270 2,264
Mother’s educationA,B None or ECE 21.9 2,565 2,682 Primary 39.1 4,587 4,565 Lower secondary 20.4 2,386 2,400 Upper secondary 7.8 911 869 Post secondary / Non tertiary 3.0 348 337 Higher 7.9 921 866 Missing/DK 0.0 1 1
Respondent to the under-5 questionnaire Mother 93.2 10,920 11,064 Other primary caretaker 6.8 800 656
Health insuranceA With insurance 13.7 1,602 1,604 Without insurance 86.3 10,109 10,107 Missing 0.1 9 9
Child's functional difficulties (age 2-4 years)C,D Has functional difficulty 2.0 147 220 Has no functional difficulty 98.0 7103 6986
Ethno-linguistic group of household head Lao-Tai 56.2 6,585 5,540 Mon-Khmer 25.4 2,981 3,309 Hmong-Mien 14.6 1,707 2,241 Chinese-Tibetan 2.8 330 518 Other, DK, Missing 1.0 117 112
Wealth index quintile Poorest 25.7 3,017 3,336 Second 21.3 2,493 2,764 Middle 18.7 2,193 2,184 Fourth 17.7 2,074 1,846 Richest 16.6 1,944 1,590
A In this table and throughout the report, mother's education refers to educational attainment of mothers as well as caretakers of children under 5, who are the respondents to the under-5 questionnaire if the mother is deceased or is living elsewhere. B In all following tables about children under 5, the figures for the categories "Missing/DK" under "Mother's Education" and "Health insurance" will be suppressed because they are based on fewer than 25 unweighted cases. C The results of the Child Functioning module are presented in Chapter XI. DChildren age 0-1 years are excluded, as the child functioning is only collected for age 2-4 years.
Weighted Unweighted
Total 100.0 15,435 15,435
SexMale 51.1 7,880 7,837Female 48.9 7,555 7,598
AreaUrban 29.2 4,506 4,428Rural 70.8 10,929 11,007
Rural with road 85.6 9,353 9,301Rural without road 14.4 1,576 1,706
RegionNorth 31.6 4,885 5,713Central 48.6 7,496 6,311South 19.8 3,054 3,411
ProvinceVientiane Capital 11.3 1,740 913Phongsaly 3.0 459 678Luangnamtha 3.0 457 777Oudomxay 5.1 784 839Bokeo 2.8 432 701Luangprabang 7.3 1,123 977Huaphanh 4.4 678 835Xayabury 6.2 952 906Xiengkhuang 3.9 604 786Vientiane 7.3 1,124 1,012Borikhamxay 4.4 672 768Khammuane 6.2 954 886Savannakhet 14.1 2,171 1,121Saravane 6.0 934 976Sekong 1.8 276 786Champasack 9.8 1,512 923Attapeu 2.2 332 726Xaysomboune 1.5 231 825
Age5-9 41.4 6,396 6,46510-14 36.9 5,698 5,70915-17 21.6 3,341 3,261
Mother’s educationA
None or ECE 25.3 3,898 4,274Primary 43.5 6,713 6,696Lower secondary 17.6 2,717 2,547Upper secondary 5.9 909 772Post secondary / Non tertiary 3.7 570 523Higher 3.6 558 554No information 0.4 65 65Missing/DK 0.0 5 4
Respondent to the children age 5-17 questionnaireMother 87.8 13,557 13,706Other primary caretaker 11.7 1,813 1,664EmancipatedB 0.4 65 65
Health insurance*With insurance 11.7 1,611 1,580Without insurance 88.3 12,167 12,183Missing 0.0 2 4
Ethno-linguistic group of household headLao-Tai 62.9 9,712 8,403Mon-Khmer 24.5 3,776 4,307Hmong-Mien 8.9 1,378 1,889Chinese-Tibetan 2.9 440 702Other, DK, Missing 0.8 129 134
Wealth index quintilePoorest 19.9 3,071 3,453Second 20.6 3,174 3,592Middle 20.5 3,170 3,163Fourth 20.3 3,138 2,838Richest 18.7 2,882 2,389
Table SR.5.3: Children age 5-17's background characteristicsPercent and frequency distribution of children age 5-17 by selected characteristics, Lao PDR, 2017
Weighted percentNumber of children age 5-17
AIn this table and throughout the report where applicable, mother's education refers to educational attainment of mothers as well as caretakers of children age 5-17, who are the respondents to the children age 5-17 questionnaire if the mother is deceased or is living elsewhere. For emancipated children this is the education status of the selected child.
BChildren age 15-17 years were considered emancipated and individually interviewed if not living with his/her mother and the respondent to the Household Questionnaire indicated that the child does not have a primary caretaker.* Excludes children who attended Early childhood education during the previous school year, due to a technical oversight during data collection.
4
38
4.6 LITERACY
The literacy rate reflects the outcomes of primary education over the previous 30-40 years. As a measure of the effectiveness of the primary education system, it is often seen as a proxy measure of social progress and economic achievement. In LSIS II, literacy is assessed on the ability of the respondent to read a short simple statement or based on school attendance.
Tables SR.6.1W and SR.6.1M show the survey findings for the total number of interviewed women and men, respectively. The Youth Literacy Rate, MICS Indicator SR.2, is calculated for women and men age 15-24 years and presented in the Age disaggregate in the two tables.
Note that those who have ever attended lower secondary or higher education are immediately classified as literate, due to their education level and are therefore not asked to read the statement. All others who successfully read the statement are also classified as literate. The tables are designed as full distributions of the survey respondents, by level of education ever attended. The total percentage literate presented in the final column is the sum of literate individuals among those with 1) Early Childhood Education (ECE) or no education, 2) primary education.
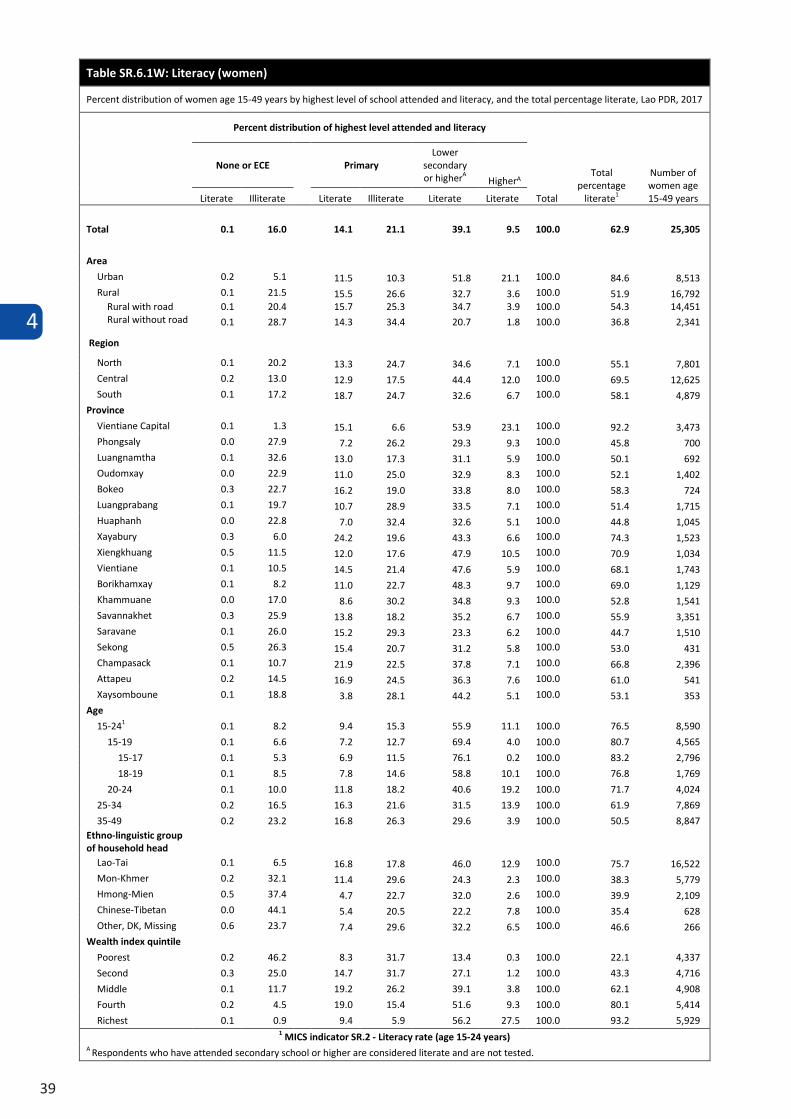
4
39
Table SR.6.1W: Literacy (women)
Percent distribution of women age 15-49 years by highest level of school attended and literacy, and the total percentage literate, Lao PDR, 2017
Percent distribution of highest level attended and literacy
Total
Total percentage
literate1
Number of women age 15-49 years
None or ECE Primary Lower
secondary or higherA HigherA
Literate Illiterate Literate Illiterate Literate Literate
Total 0.1 16.0 14.1 21.1 39.1 9.5 100.0 62.9 25,305
Area
Urban 0.2 5.1 11.5 10.3 51.8 21.1 100.0 84.6 8,513 Rural 0.1 21.5 15.5 26.6 32.7 3.6 100.0 51.9 16,792
0.1 20.4 15.7 25.3 34.7 3.9 100.0 54.3 14,451 Rural with road Rural without road 0.1 28.7 14.3 34.4 20.7 1.8 100.0 36.8 2,341
Region
North 0.1 20.2 13.3 24.7 34.6 7.1 100.0 55.1 7,801 Central 0.2 13.0 12.9 17.5 44.4 12.0 100.0 69.5 12,625 South 0.1 17.2 18.7 24.7 32.6 6.7 100.0 58.1 4,879
Province
Vientiane Capital 0.1 1.3 15.1 6.6 53.9 23.1 100.0 92.2 3,473 Phongsaly 0.0 27.9 7.2 26.2 29.3 9.3 100.0 45.8 700 Luangnamtha 0.1 32.6 13.0 17.3 31.1 5.9 100.0 50.1 692 Oudomxay 0.0 22.9 11.0 25.0 32.9 8.3 100.0 52.1 1,402 Bokeo 0.3 22.7 16.2 19.0 33.8 8.0 100.0 58.3 724 Luangprabang 0.1 19.7 10.7 28.9 33.5 7.1 100.0 51.4 1,715 Huaphanh 0.0 22.8 7.0 32.4 32.6 5.1 100.0 44.8 1,045 Xayabury 0.3 6.0 24.2 19.6 43.3 6.6 100.0 74.3 1,523 Xiengkhuang 0.5 11.5 12.0 17.6 47.9 10.5 100.0 70.9 1,034 Vientiane 0.1 10.5 14.5 21.4 47.6 5.9 100.0 68.1 1,743 Borikhamxay 0.1 8.2 11.0 22.7 48.3 9.7 100.0 69.0 1,129 Khammuane 0.0 17.0 8.6 30.2 34.8 9.3 100.0 52.8 1,541 Savannakhet 0.3 25.9 13.8 18.2 35.2 6.7 100.0 55.9 3,351 Saravane 0.1 26.0 15.2 29.3 23.3 6.2 100.0 44.7 1,510 Sekong 0.5 26.3 15.4 20.7 31.2 5.8 100.0 53.0 431 Champasack 0.1 10.7 21.9 22.5 37.8 7.1 100.0 66.8 2,396 Attapeu 0.2 14.5 16.9 24.5 36.3 7.6 100.0 61.0 541 Xaysomboune 0.1 18.8 3.8 28.1 44.2 5.1 100.0 53.1 353
Age
15-241 0.1 8.2 9.4 15.3 55.9 11.1 100.0 76.5 8,590
15-19 0.1 6.6 7.2 12.7 69.4 4.0 100.0 80.7 4,565
15-17 0.1 5.3 6.9 11.5 76.1 0.2 100.0 83.2 2,796
18-19 0.1 8.5 7.8 14.6 58.8 10.1 100.0 76.8 1,769
20-24 0.1 10.0 11.8 18.2 40.6 19.2 100.0 71.7 4,024
25-34 0.2 16.5 16.3 21.6 31.5 13.9 100.0 61.9 7,869
35-49 0.2 23.2 16.8 26.3 29.6 3.9 100.0 50.5 8,847 Ethno-linguistic group of household head
Lao-Tai 0.1 6.5 16.8 17.8 46.0 12.9 100.0 75.7 16,522 Mon-Khmer 0.2 32.1 11.4 29.6 24.3 2.3 100.0 38.3 5,779 Hmong-Mien 0.5 37.4 4.7 22.7 32.0 2.6 100.0 39.9 2,109 Chinese-Tibetan 0.0 44.1 5.4 20.5 22.2 7.8 100.0 35.4 628 Other, DK, Missing 0.6 23.7 7.4 29.6 32.2 6.5 100.0 46.6 266
Wealth index quintile
Poorest 0.2 46.2 8.3 31.7 13.4 0.3 100.0 22.1 4,337
Second 0.3 25.0 14.7 31.7 27.1 1.2 100.0 43.3 4,716
Middle 0.1 11.7 19.2 26.2 39.1 3.8 100.0 62.1 4,908
Fourth 0.2 4.5 19.0 15.4 51.6 9.3 100.0 80.1 5,414
Richest 0.1 0.9 9.4 5.9 56.2 27.5 100.0 93.2 5,929 1 MICS indicator SR.2 - Literacy rate (age 15-24 years)
A Respondents who have attended secondary school or higher are considered literate and are not tested.
4.6 LITERACY
The literacy rate reflects the outcomes of primary education over the previous 30-40 years. As a measure of theeffectiveness of the primary education system, it is often seen as a proxy measure of social progress and economicachievement. In LSIS II, literacy is assessed on the ability of the respondent to read a short simple statement or basedon school attendance.
Tables SR.6.1W and SR.6.1M show the survey findings for the total number of interviewed women and men,respectively. The Youth Literacy Rate, MICS Indicator SR.2, is calculated for women and men age 15-24 years andpresented in the Age disaggregate in the two tables.
Note that those who have ever attended lower secondary or higher education are immediately classified as literate,due to their education level and are therefore not asked to read the statement. All others who successfully read thestatement are also classified as literate. The tables are designed as full distributions of the survey respondents, by level of education ever attended. The total percentage literate presented in the final column is the sum of literate individualsamong those with 1) Early Childhood Education (ECE) or no education, 2) primary education.
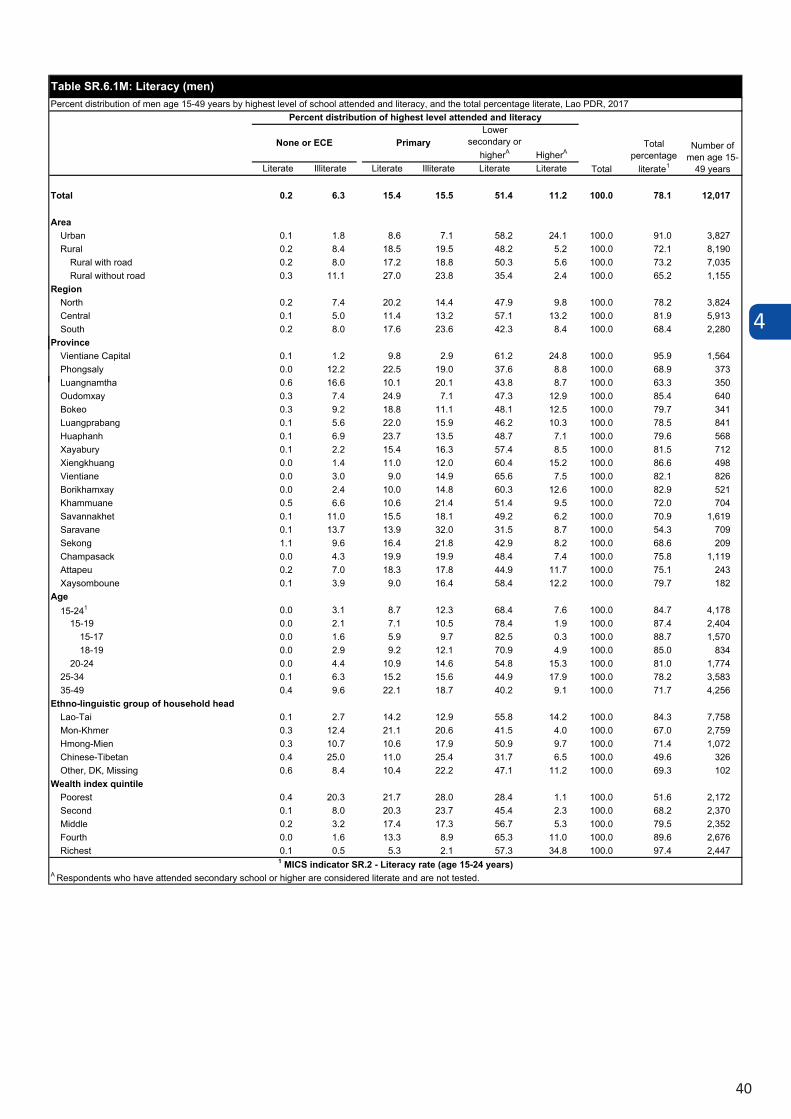
4
40
Lower secondary or
higherA HigherA
Literate Illiterate Literate Illiterate Literate Literate
Total 0.2 6.3 15.4 15.5 51.4 11.2 100.0 78.1 12,017
AreaUrban 0.1 1.8 8.6 7.1 58.2 24.1 100.0 91.0 3,827Rural 0.2 8.4 18.5 19.5 48.2 5.2 100.0 72.1 8,190
Rural with road 0.2 8.0 17.2 18.8 50.3 5.6 100.0 73.2 7,035Rural without road 0.3 11.1 27.0 23.8 35.4 2.4 100.0 65.2 1,155
RegionNorth 0.2 7.4 20.2 14.4 47.9 9.8 100.0 78.2 3,824Central 0.1 5.0 11.4 13.2 57.1 13.2 100.0 81.9 5,913South 0.2 8.0 17.6 23.6 42.3 8.4 100.0 68.4 2,280
ProvinceVientiane Capital 0.1 1.2 9.8 2.9 61.2 24.8 100.0 95.9 1,564Phongsaly 0.0 12.2 22.5 19.0 37.6 8.8 100.0 68.9 373Luangnamtha 0.6 16.6 10.1 20.1 43.8 8.7 100.0 63.3 350Oudomxay 0.3 7.4 24.9 7.1 47.3 12.9 100.0 85.4 640Bokeo 0.3 9.2 18.8 11.1 48.1 12.5 100.0 79.7 341Luangprabang 0.1 5.6 22.0 15.9 46.2 10.3 100.0 78.5 841Huaphanh 0.1 6.9 23.7 13.5 48.7 7.1 100.0 79.6 568Xayabury 0.1 2.2 15.4 16.3 57.4 8.5 100.0 81.5 712Xiengkhuang 0.0 1.4 11.0 12.0 60.4 15.2 100.0 86.6 498Vientiane 0.0 3.0 9.0 14.9 65.6 7.5 100.0 82.1 826Borikhamxay 0.0 2.4 10.0 14.8 60.3 12.6 100.0 82.9 521Khammuane 0.5 6.6 10.6 21.4 51.4 9.5 100.0 72.0 704Savannakhet 0.1 11.0 15.5 18.1 49.2 6.2 100.0 70.9 1,619Saravane 0.1 13.7 13.9 32.0 31.5 8.7 100.0 54.3 709Sekong 1.1 9.6 16.4 21.8 42.9 8.2 100.0 68.6 209Champasack 0.0 4.3 19.9 19.9 48.4 7.4 100.0 75.8 1,119Attapeu 0.2 7.0 18.3 17.8 44.9 11.7 100.0 75.1 243Xaysomboune 0.1 3.9 9.0 16.4 58.4 12.2 100.0 79.7 182
Age15-241 0.0 3.1 8.7 12.3 68.4 7.6 100.0 84.7 4,178
15-19 0.0 2.1 7.1 10.5 78.4 1.9 100.0 87.4 2,40415-17 0.0 1.6 5.9 9.7 82.5 0.3 100.0 88.7 1,57018-19 0.0 2.9 9.2 12.1 70.9 4.9 100.0 85.0 834
20-24 0.0 4.4 10.9 14.6 54.8 15.3 100.0 81.0 1,77425-34 0.1 6.3 15.2 15.6 44.9 17.9 100.0 78.2 3,58335-49 0.4 9.6 22.1 18.7 40.2 9.1 100.0 71.7 4,256
Ethno-linguistic group of household headLao-Tai 0.1 2.7 14.2 12.9 55.8 14.2 100.0 84.3 7,758Mon-Khmer 0.3 12.4 21.1 20.6 41.5 4.0 100.0 67.0 2,759Hmong-Mien 0.3 10.7 10.6 17.9 50.9 9.7 100.0 71.4 1,072Chinese-Tibetan 0.4 25.0 11.0 25.4 31.7 6.5 100.0 49.6 326Other, DK, Missing 0.6 8.4 10.4 22.2 47.1 11.2 100.0 69.3 102
Wealth index quintilePoorest 0.4 20.3 21.7 28.0 28.4 1.1 100.0 51.6 2,172Second 0.1 8.0 20.3 23.7 45.4 2.3 100.0 68.2 2,370Middle 0.2 3.2 17.4 17.3 56.7 5.3 100.0 79.5 2,352Fourth 0.0 1.6 13.3 8.9 65.3 11.0 100.0 89.6 2,676Richest 0.1 0.5 5.3 2.1 57.3 34.8 100.0 97.4 2,447
1 MICS indicator SR.2 - Literacy rate (age 15-24 years)A Respondents who have attended secondary school or higher are considered literate and are not tested.
Table SR.6.1M: Literacy (men)Percent distribution of men age 15-49 years by highest level of school attended and literacy, and the total percentage literate, Lao PDR, 2017
Total percentage
literate1
Number of men age 15-
49 years
None or ECE Primary
Total
Percent distribution of highest level attended and literacy
4
41
4.7 MIGRATORY STATUS
The Background module of the LSIS II, 2017 asked respondents to the Individual Questionnaire for Women and Men how long they have been continuously living in the current residence and, if they were not living there since birth, whether they lived in a city, town or rural area and the name of the region they lived in before moving to their current place of residence. Tables SR.7.1W and 7.1.M present the percentage of women and men who have changed residence according to the time since last move and also compares the place of residence of each individual at the time of the survey with that of the last place of residence and the type of residence.
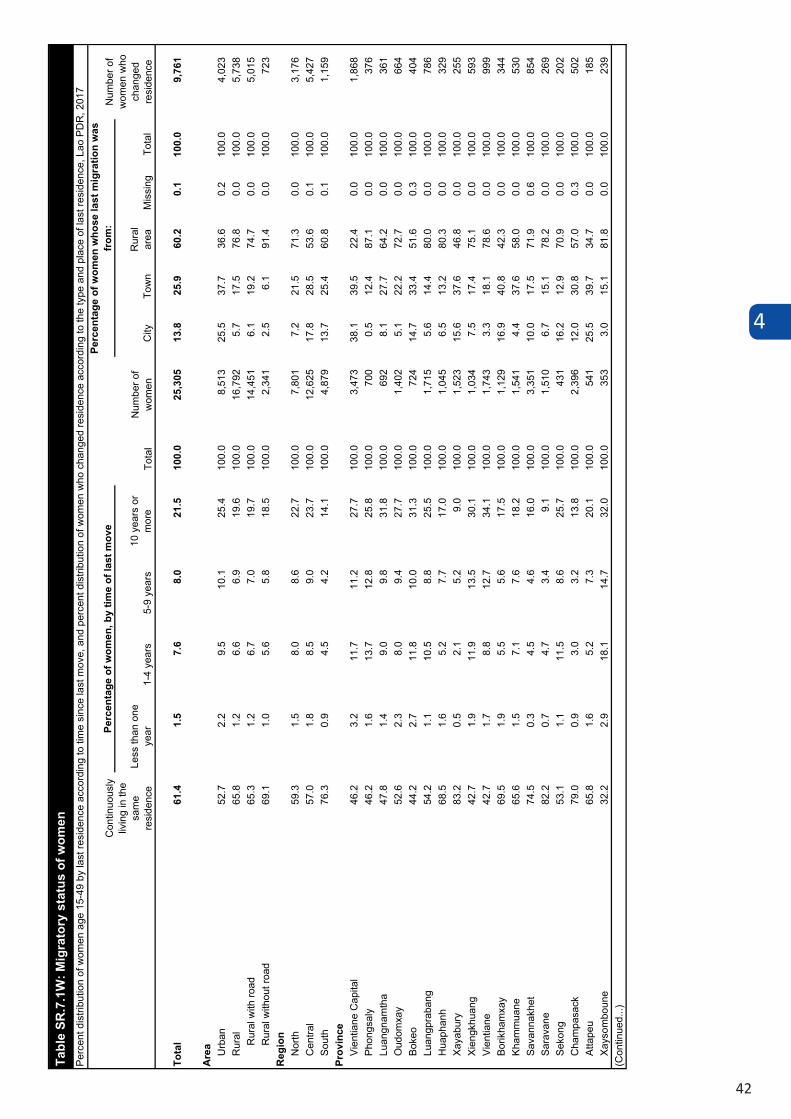
4
42
Less
than
one
ye
ar1-
4 ye
ars
5-9
year
s10
yea
rs o
r m
ore
City
Tow
nR
ural
ar
eaM
issi
ngTo
tal
Tota
l61
.41.
57.
68.
021
.510
0.0
25,3
0513
.825
.960
.20.
110
0.0
9,76
1
Are
a Urb
an52
.72.
29.
510
.125
.410
0.0
8,51
325
.537
.736
.60.
210
0.0
4,02
3R
ural
65.8
1.2
6.6
6.9
19.6
100.
016
,792
5.7
17.5
76.8
0.0
100.
05,
738
Rur
al w
ith ro
ad65
.31.
26.
77.
019
.710
0.0
14,4
516.
119
.274
.70.
010
0.0
5,01
5R
ural
with
out r
oad
69.1
1.0
5.6
5.8
18.5
100.
02,
341
2.5
6.1
91.4
0.0
100.
072
3R
egio
nN
orth
59.3
1.5
8.0
8.6
22.7
100.
07,
801
7.2
21.5
71.3
0.0
100.
03,
176
Cen
tral
57.0
1.8
8.5
9.0
23.7
100.
012
,625
17.8
28.5
53.6
0.1
100.
05,
427
Sout
h76
.30.
94.
54.
214
.110
0.0
4,87
913
.725
.460
.80.
110
0.0
1,15
9Pr
ovin
ceVi
entia
ne C
apita
l46
.23.
211
.711
.227
.710
0.0
3,47
338
.139
.522
.40.
010
0.0
1,86
8Ph
ongs
aly
46.2
1.6
13.7
12.8
25.8
100.
070
00.
512
.487
.10.
010
0.0
376
Luan
gnam
tha
47.8
1.4
9.0
9.8
31.8
100.
069
28.
127
.764
.20.
010
0.0
361
Oud
omxa
y52
.62.
38.
09.
427
.710
0.0
1,40
25.
122
.272
.70.
010
0.0
664
Boke
o44
.22.
711
.810
.031
.310
0.0
724
14.7
33.4
51.6
0.3
100.
040
4Lu
angp
raba
ng54
.21.
110
.58.
825
.510
0.0
1,71
55.
614
.480
.00.
010
0.0
786
Hua
phan
h68
.51.
65.
27.
717
.010
0.0
1,04
56.
513
.280
.30.
010
0.0
329
Xaya
bury
83.2
0.5
2.1
5.2
9.0
100.
01,
523
15.6
37.6
46.8
0.0
100.
025
5Xi
engk
huan
g42
.71.
911
.913
.530
.110
0.0
1,03
47.
517
.475
.10.
010
0.0
593
Vien
tiane
42.7
1.7
8.8
12.7
34.1
100.
01,
743
3.3
18.1
78.6
0.0
100.
099
9Bo
rikha
mxa
y69
.51.
95.
55.
617
.510
0.0
1,12
916
.940
.842
.30.
010
0.0
344
Kham
mua
ne65
.61.
57.
17.
618
.210
0.0
1,54
14.
437
.658
.00.
010
0.0
530
Sava
nnak
het
74.5
0.3
4.5
4.6
16.0
100.
03,
351
10.0
17.5
71.9
0.6
100.
085
4Sa
rava
ne82
.20.
74.
73.
49.
110
0.0
1,51
06.
715
.178
.20.
010
0.0
269
Seko
ng53
.11.
111
.58.
625
.710
0.0
431
16.2
12.9
70.9
0.0
100.
020
2C
ham
pasa
ck79
.00.
93.
03.
213
.810
0.0
2,39
612
.030
.857
.00.
310
0.0
502
Atta
peu
65.8
1.6
5.2
7.3
20.1
100.
054
125
.539
.734
.70.
010
0.0
185
Xays
ombo
une
32.2
2.9
18.1
14.7
32.0
100.
035
33.
015
.181
.80.
010
0.0
239
(Con
tinue
d...)
Tabl
e SR
.7.1
W: M
igra
tory
sta
tus
of w
omen
Perc
ent d
istri
butio
n of
wom
en a
ge 1
5-49
by
last
resi
denc
e ac
cord
ing
to ti
me
sinc
e la
st m
ove,
and
per
cent
dis
tribu
tion
of w
omen
who
cha
nged
resi
denc
e ac
cord
ing
to th
e ty
pe a
nd p
lace
of l
ast r
esid
ence
, Lao
PD
R, 2
017
Con
tinuo
usly
liv
ing
in th
e sa
me
resi
denc
e
Perc
enta
ge o
f wom
en, b
y tim
e of
last
mov
e
Tota
lN
umbe
r of
wom
en
Perc
enta
ge o
f wom
en w
hose
last
mig
ratio
n w
as
from
:N
umbe
r of
wom
en w
ho
chan
ged
resi
denc
e
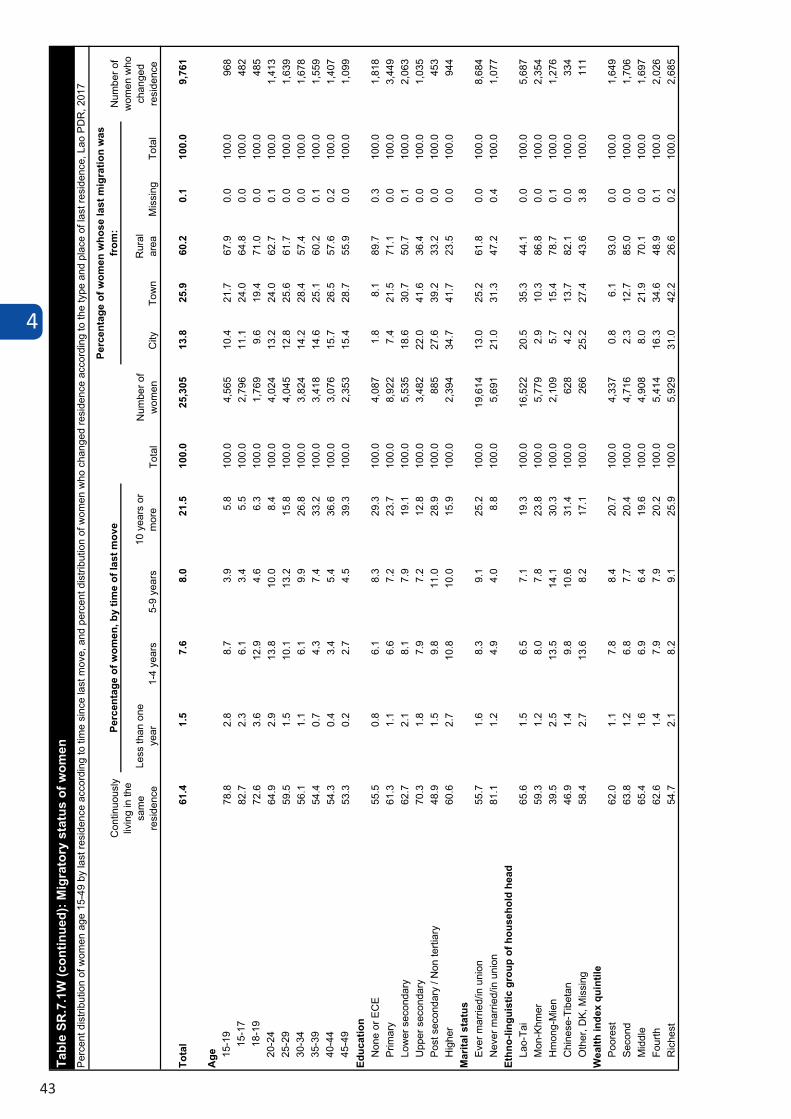
4
43
Less
than
one
ye
ar1-
4 ye
ars
5-9
year
s10
yea
rs o
r m
ore
City
Tow
nR
ural
ar
eaM
issi
ngTo
tal
Tota
l61
.41.
57.
68.
021
.510
0.0
25,3
0513
.825
.960
.20.
110
0.0
9,76
1
Age 15
-19
78.8
2.8
8.7
3.9
5.8
100.
04,
565
10.4
21.7
67.9
0.0
100.
096
815
-17
82.7
2.3
6.1
3.4
5.5
100.
02,
796
11.1
24.0
64.8
0.0
100.
048
218
-19
72.6
3.6
12.9
4.6
6.3
100.
01,
769
9.6
19.4
71.0
0.0
100.
048
520
-24
64.9
2.9
13.8
10.0
8.4
100.
04,
024
13.2
24.0
62.7
0.1
100.
01,
413
25-2
959
.51.
510
.113
.215
.810
0.0
4,04
512
.825
.661
.70.
010
0.0
1,63
930
-34
56.1
1.1
6.1
9.9
26.8
100.
03,
824
14.2
28.4
57.4
0.0
100.
01,
678
35-3
954
.40.
74.
37.
433
.210
0.0
3,41
814
.625
.160
.20.
110
0.0
1,55
940
-44
54.3
0.4
3.4
5.4
36.6
100.
03,
076
15.7
26.5
57.6
0.2
100.
01,
407
45-4
953
.30.
22.
74.
539
.310
0.0
2,35
315
.428
.755
.90.
010
0.0
1,09
9Ed
ucat
ion
Non
e or
EC
E55
.50.
86.
18.
329
.310
0.0
4,08
71.
88.
189
.70.
310
0.0
1,81
8Pr
imar
y61
.31.
16.
67.
223
.710
0.0
8,92
27.
421
.571
.10.
010
0.0
3,44
9Lo
wer
sec
onda
ry62
.72.
18.
17.
919
.110
0.0
5,53
518
.630
.750
.70.
110
0.0
2,06
3U
pper
sec
onda
ry70
.31.
87.
97.
212
.810
0.0
3,48
222
.041
.636
.40.
010
0.0
1,03
5Po
st s
econ
dary
/ N
on te
rtiar
y48
.91.
59.
811
.028
.910
0.0
885
27.6
39.2
33.2
0.0
100.
045
3H
ighe
r60
.62.
710
.810
.015
.910
0.0
2,39
434
.741
.723
.50.
010
0.0
944
Mar
ital s
tatu
sEv
er m
arrie
d/in
uni
on55
.71.
68.
39.
125
.210
0.0
19,6
1413
.025
.261
.80.
010
0.0
8,68
4N
ever
mar
ried/
in u
nion
81.1
1.2
4.9
4.0
8.8
100.
05,
691
21.0
31.3
47.2
0.4
100.
01,
077
Ethn
o-lin
guis
tic g
roup
of h
ouse
hold
hea
dLa
o-Ta
i65
.61.
56.
57.
119
.310
0.0
16,5
2220
.535
.344
.10.
010
0.0
5,68
7M
on-K
hmer
59.3
1.2
8.0
7.8
23.8
100.
05,
779
2.9
10.3
86.8
0.0
100.
02,
354
Hm
ong-
Mie
n39
.52.
513
.514
.130
.310
0.0
2,10
95.
715
.478
.70.
110
0.0
1,27
6C
hine
se-T
ibet
an46
.91.
49.
810
.631
.410
0.0
628
4.2
13.7
82.1
0.0
100.
033
4O
ther
, DK,
Mis
sing
58.4
2.7
13.6
8.2
17.1
100.
026
625
.227
.443
.63.
810
0.0
111
Wea
lth in
dex
quin
tile
Poor
est
62.0
1.1
7.8
8.4
20.7
100.
04,
337
0.8
6.1
93.0
0.0
100.
01,
649
Seco
nd63
.81.
26.
87.
720
.410
0.0
4,71
62.
312
.785
.00.
010
0.0
1,70
6M
iddl
e65
.41.
66.
96.
419
.610
0.0
4,90
88.
021
.970
.10.
010
0.0
1,69
7Fo
urth
62.6
1.4
7.9
7.9
20.2
100.
05,
414
16.3
34.6
48.9
0.1
100.
02,
026
Ric
hest
54.7
2.1
8.2
9.1
25.9
100.
05,
929
31.0
42.2
26.6
0.2
100.
02,
685
Tabl
e SR
.7.1
W (c
ontin
ued)
: Mig
rato
ry s
tatu
s of
wom
enPe
rcen
t dis
tribu
tion
of w
omen
age
15-
49 b
y la
st re
side
nce
acco
rdin
g to
tim
e si
nce
last
mov
e, a
nd p
erce
nt d
istri
butio
n of
wom
en w
ho c
hang
ed re
side
nce
acco
rdin
g to
the
type
and
pla
ce o
f las
t res
iden
ce, L
ao P
DR
, 201
7
Con
tinuo
usly
liv
ing
in th
e sa
me
resi
denc
e
Perc
enta
ge o
f wom
en, b
y tim
e of
last
mov
e
Tota
lN
umbe
r of
wom
en
Perc
enta
ge o
f wom
en w
hose
last
mig
ratio
n w
as
from
:N
umbe
r of
wom
en w
ho
chan
ged
resi
denc
e
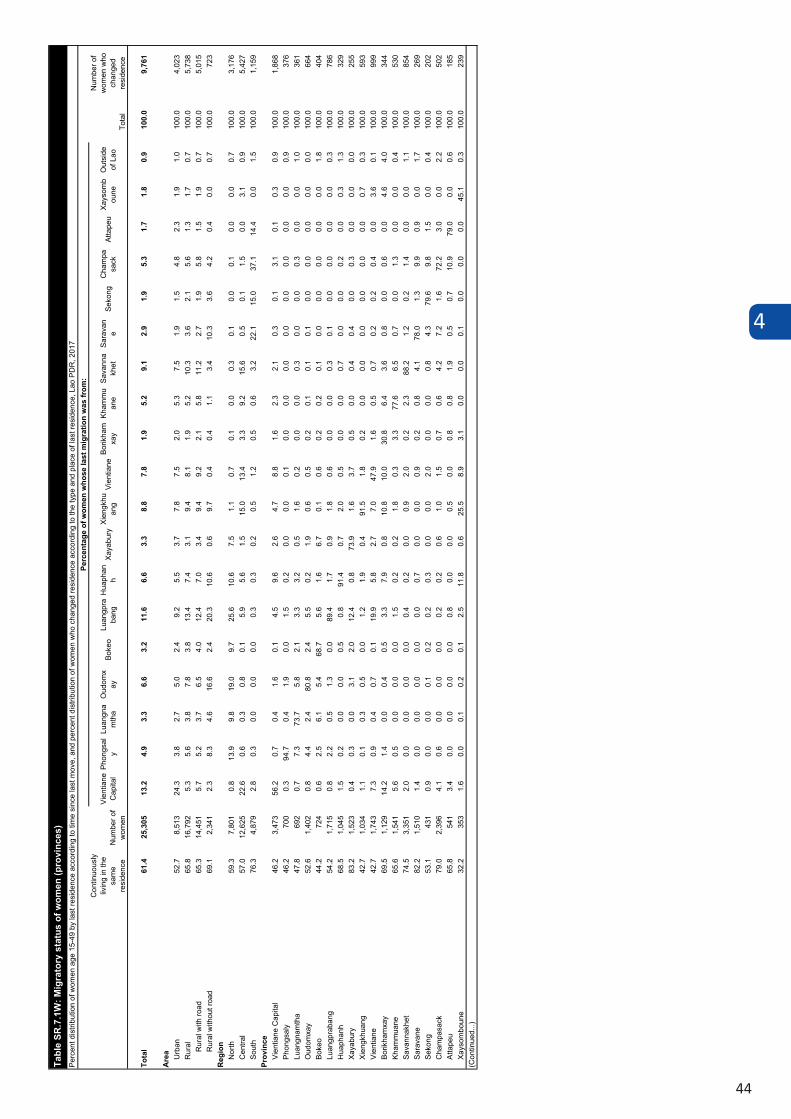
4
44
Vien
tiane
C
apita
lPh
ongs
aly
Luan
gna
mth
aO
udom
xay
Boke
oLu
angp
raba
ngH
uaph
anh
Xaya
bury
Xien
gkhu
ang
Vien
tiane
Borik
ham
xay
Kham
mu
ane
Sava
nna
khet
Sara
van
eSe
kong
Cha
mpa
sack
Atta
peu
Xays
omb
oune
Out
side
of
Lao
Tota
l61
.425
,305
13.2
4.9
3.3
6.6
3.2
11.6
6.6
3.3
8.8
7.8
1.9
5.2
9.1
2.9
1.9
5.3
1.7
1.8
0.9
100.
09,
761
Are
a Urb
an52
.78,
513
24.3
3.8
2.7
5.0
2.4
9.2
5.5
3.7
7.8
7.5
2.0
5.3
7.5
1.9
1.5
4.8
2.3
1.9
1.0
100.
04,
023
Rur
al65
.816
,792
5.3
5.6
3.8
7.8
3.8
13.4
7.4
3.1
9.4
8.1
1.9
5.2
10.3
3.6
2.1
5.6
1.3
1.7
0.7
100.
05,
738
Rur
al w
ith ro
ad65
.314
,451
5.7
5.2
3.7
6.5
4.0
12.4
7.0
3.4
9.4
9.2
2.1
5.8
11.2
2.7
1.9
5.8
1.5
1.9
0.7
100.
05,
015
Rur
al w
ithou
t roa
d69
.12,
341
2.3
8.3
4.6
16.6
2.4
20.3
10.6
0.6
9.7
0.4
0.4
1.1
3.4
10.3
3.6
4.2
0.4
0.0
0.7
100.
072
3R
egio
nN
orth
59.3
7,80
10.
813
.99.
819
.09.
725
.610
.67.
51.
10.
70.
10.
00.
30.
10.
00.
10.
00.
00.
710
0.0
3,17
6C
entra
l57
.012
,625
22.6
0.6
0.3
0.8
0.1
5.9
5.6
1.5
15.0
13.4
3.3
9.2
15.6
0.5
0.1
1.5
0.0
3.1
0.9
100.
05,
427
Sout
h76
.34,
879
2.8
0.3
0.0
0.0
0.0
0.3
0.3
0.2
0.5
1.2
0.5
0.6
3.2
22.1
15.0
37.1
14.4
0.0
1.5
100.
01,
159
Prov
ince
Vien
tiane
Cap
ital
46.2
3,47
356
.20.
70.
41.
60.
14.
59.
62.
64.
78.
81.
62.
32.
10.
30.
13.
10.
10.
30.
910
0.0
1,86
8Ph
ongs
aly
46.2
700
0.3
94.7
0.4
1.9
0.0
1.5
0.2
0.0
0.0
0.1
0.0
0.0
0.0
0.0
0.0
0.0
0.0
0.0
0.9
100.
037
6Lu
angn
amth
a47
.869
20.
77.
373
.75.
82.
13.
33.
20.
51.
60.
20.
00.
00.
30.
00.
00.
30.
00.
01.
010
0.0
361
Oud
omxa
y52
.61,
402
0.8
4.4
2.4
80.8
2.4
5.5
0.2
1.9
0.6
0.5
0.2
0.1
0.1
0.1
0.0
0.0
0.0
0.0
0.0
100.
066
4Bo
keo
44.2
724
0.6
2.5
6.1
5.4
68.7
5.6
1.6
6.7
0.1
0.6
0.2
0.2
0.1
0.0
0.0
0.0
0.0
0.0
1.8
100.
040
4Lu
angp
raba
ng54
.21,
715
0.8
2.2
0.5
1.3
0.0
89.4
1.7
0.9
1.8
0.6
0.0
0.0
0.3
0.1
0.0
0.0
0.0
0.0
0.3
100.
078
6H
uaph
anh
68.5
1,04
51.
50.
20.
00.
00.
50.
891
.40.
72.
00.
50.
00.
00.
70.
00.
00.
20.
00.
31.
310
0.0
329
Xaya
bury
83.2
1,52
30.
40.
30.
03.
12.
012
.40.
873
.91.
63.
70.
50.
00.
40.
40.
00.
30.
00.
00.
010
0.0
255
Xien
gkhu
ang
42.7
1,03
41.
10.
10.
30.
50.
01.
21.
90.
491
.51.
80.
20.
00.
00.
00.
00.
00.
00.
70.
310
0.0
593
Vien
tiane
42.7
1,74
37.
30.
90.
40.
70.
119
.95.
82.
77.
047
.91.
60.
50.
70.
20.
20.
40.
03.
60.
110
0.0
999
Borik
ham
xay
69.5
1,12
914
.21.
40.
00.
40.
53.
37.
90.
810
.810
.030
.86.
43.
60.
80.
00.
60.
04.
64.
010
0.0
344
Kham
mua
ne65
.61,
541
5.6
0.5
0.0
0.0
0.0
1.5
0.2
0.2
1.8
0.3
3.3
77.6
6.5
0.7
0.0
1.3
0.0
0.0
0.4
100.
053
0Sa
vann
akhe
t74
.53,
351
2.0
0.0
0.0
0.0
0.0
0.4
0.2
0.0
0.9
2.0
0.2
2.3
88.2
1.2
0.2
1.4
0.0
0.0
1.1
100.
085
4Sa
rava
ne82
.21,
510
1.4
0.0
0.0
0.0
0.0
0.0
0.7
0.0
0.0
0.9
0.2
0.8
4.1
78.0
1.3
9.9
0.9
0.0
1.7
100.
026
9Se
kong
53.1
431
0.9
0.0
0.0
0.1
0.2
0.2
0.3
0.0
0.0
2.0
0.0
0.0
0.8
4.3
79.6
9.8
1.5
0.0
0.4
100.
020
2C
ham
pasa
ck79
.02,
396
4.1
0.6
0.0
0.0
0.0
0.2
0.2
0.6
1.0
1.5
0.7
0.6
4.2
7.2
1.6
72.2
3.0
0.0
2.2
100.
050
2At
tape
u65
.854
13.
40.
00.
00.
00.
00.
80.
00.
00.
50.
00.
80.
81.
90.
50.
710
.979
.00.
00.
610
0.0
185
Xays
ombo
une
32.2
353
1.6
0.0
0.1
0.2
0.1
2.5
11.8
0.6
25.5
8.9
3.1
0.0
0.0
0.1
0.0
0.0
0.0
45.1
0.3
100.
023
9(C
ontin
ued.
..)
Tabl
e SR
.7.1
W: M
igra
tory
sta
tus
of w
omen
(pro
vinc
es)
Perc
ent d
istri
butio
n of
wom
en a
ge 1
5-49
by
last
resi
denc
e ac
cord
ing
to ti
me
sinc
e la
st m
ove,
and
per
cent
dis
tribu
tion
of w
omen
who
cha
nged
resi
denc
e ac
cord
ing
to th
e ty
pe a
nd p
lace
of l
ast r
esid
ence
, Lao
PD
R, 2
017
Con
tinuo
usly
liv
ing
in th
e sa
me
resi
denc
e
Perc
enta
ge o
f wom
en w
hose
last
mig
ratio
n w
as fr
om:
Tota
l
Num
ber o
f w
omen
who
ch
ange
d re
side
nce
Num
ber o
f w
omen
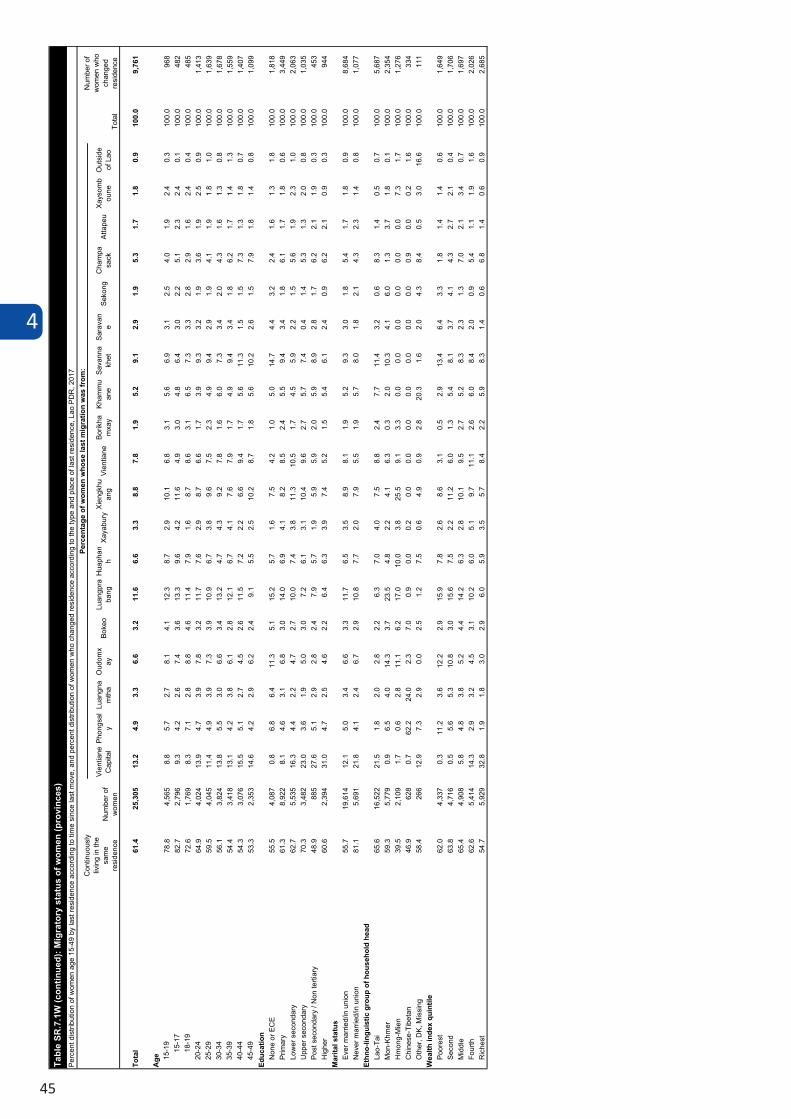
4
45
Vien
tiane
C
apita
lPh
ongs
aly
Luan
gna
mth
aO
udom
xay
Boke
oLu
angp
raba
ngH
uaph
anh
Xaya
bury
Xien
gkhu
ang
Vien
tiane
Borik
ham
xay
Kham
mu
ane
Sava
nna
khet
Sara
van
eSe
kong
Cha
mpa
sack
Atta
peu
Xays
omb
oune
Out
side
of
Lao
Tota
l61
.425
,305
13.2
4.9
3.3
6.6
3.2
11.6
6.6
3.3
8.8
7.8
1.9
5.2
9.1
2.9
1.9
5.3
1.7
1.8
0.9
100.
09,
761
Age 15
-19
78.8
4,56
58.
85.
72.
78.
14.
112
.38.
72.
910
.16.
83.
15.
66.
93.
12.
54.
01.
92.
40.
310
0.0
968
15-1
782
.72,
796
9.3
4.2
2.6
7.4
3.6
13.3
9.6
4.2
11.6
4.9
3.0
4.8
6.4
3.0
2.2
5.1
2.3
2.4
0.1
100.
048
218
-19
72.6
1,76
98.
37.
12.
88.
84.
611
.47.
91.
68.
78.
63.
16.
57.
33.
32.
82.
91.
62.
40.
410
0.0
485
20-2
464
.94,
024
13.9
4.7
3.9
7.8
3.2
11.7
7.6
2.9
8.7
6.6
1.7
3.9
9.3
3.2
1.9
3.6
1.9
2.5
0.9
100.
01,
413
25-2
959
.54,
045
11.4
4.9
3.9
7.3
3.9
10.9
6.7
3.8
9.6
7.5
2.3
4.9
9.4
2.9
1.9
4.1
1.9
1.8
1.0
100.
01,
639
30-3
456
.13,
824
13.8
5.5
3.0
6.6
3.4
13.2
4.7
4.3
9.2
7.8
1.6
6.0
7.3
3.4
2.0
4.3
1.6
1.3
0.8
100.
01,
678
35-3
954
.43,
418
13.1
4.2
3.8
6.1
2.8
12.1
6.7
4.1
7.6
7.9
1.7
4.9
9.4
3.4
1.8
6.2
1.7
1.4
1.3
100.
01,
559
40-4
454
.33,
076
15.5
5.1
2.7
4.5
2.6
11.5
7.2
2.2
6.6
9.4
1.7
5.6
11.3
1.5
1.5
7.3
1.3
1.8
0.7
100.
01,
407
45-4
953
.32,
353
14.6
4.2
2.9
6.2
2.4
9.1
5.5
2.5
10.2
8.7
1.8
5.6
10.2
2.6
1.5
7.9
1.8
1.4
0.8
100.
01,
099
Educ
atio
nN
one
or E
CE
55.5
4,08
70.
86.
86.
411
.35.
115
.25.
71.
67.
54.
21.
05.
014
.74.
43.
22.
41.
61.
31.
810
0.0
1,81
8Pr
imar
y61
.38,
922
8.1
4.6
3.1
6.8
3.0
14.0
6.9
4.1
8.2
8.5
2.4
5.5
9.4
3.4
1.8
6.1
1.7
1.8
0.6
100.
03,
449
Low
er s
econ
dary
62.7
5,53
516
.34.
42.
24.
72.
710
.07.
43.
811
.310
.51.
74.
55.
92.
21.
55.
61.
92.
31.
010
0.0
2,06
3U
pper
sec
onda
ry70
.33,
482
23.0
3.6
1.9
5.0
3.0
7.2
6.1
3.1
10.4
9.6
2.7
5.7
7.4
0.4
1.4
5.3
1.3
2.0
0.8
100.
01,
035
Post
sec
onda
ry /
Non
terti
ary
48.9
885
27.6
5.1
2.9
2.8
2.4
7.9
5.7
1.9
5.9
5.9
2.0
5.9
8.9
2.8
1.7
6.2
2.1
1.9
0.3
100.
045
3H
ighe
r60
.62,
394
31.0
4.7
2.5
4.6
2.2
6.4
6.3
3.9
7.4
5.2
1.5
5.4
6.1
2.4
0.9
6.2
2.1
0.9
0.3
100.
094
4M
arita
l sta
tus
Ever
mar
ried/
in u
nion
55.7
19,6
1412
.15.
03.
46.
63.
311
.76.
53.
58.
98.
11.
95.
29.
33.
01.
85.
41.
71.
80.
910
0.0
8,68
4N
ever
mar
ried/
in u
nion
81.1
5,69
121
.84.
12.
46.
72.
910
.87.
72.
07.
95.
51.
95.
78.
01.
82.
14.
32.
31.
40.
810
0.0
1,07
7Et
hno-
lingu
istic
gro
up o
f hou
seho
ld h
ead
Lao-
Tai
65.6
16,5
2221
.51.
82.
02.
82.
26.
37.
04.
07.
58.
82.
47.
711
.43.
20.
68.
31.
40.
50.
710
0.0
5,68
7M
on-K
hmer
59.3
5,77
90.
96.
54.
014
.33.
723
.54.
82.
24.
16.
30.
32.
010
.34.
16.
01.
33.
71.
80.
110
0.0
2,35
4H
mon
g-M
ien
39.5
2,10
91.
70.
62.
811
.16.
217
.010
.03.
825
.59.
13.
30.
00.
00.
00.
00.
00.
07.
31.
710
0.0
1,27
6C
hine
se-T
ibet
an46
.962
80.
762
.224
.02.
37.
00.
90.
00.
20.
00.
00.
00.
00.
00.
00.
00.
90.
00.
21.
610
0.0
334
Oth
er, D
K, M
issi
ng58
.426
612
.97.
32.
90.
02.
51.
27.
50.
64.
90.
92.
820
.31.
62.
04.
38.
40.
53.
016
.610
0.0
111
Wea
lth in
dex
quin
tile
Poor
est
62.0
4,33
70.
311
.23.
612
.22.
915
.97.
82.
68.
63.
10.
52.
913
.46.
43.
31.
81.
41.
40.
610
0.0
1,64
9Se
cond
63.8
4,71
60.
55.
65.
310
.83.
015
.67.
52.
211
.26.
01.
35.
48.
13.
74.
14.
32.
72.
10.
410
0.0
1,70
6M
iddl
e65
.44,
908
5.8
4.8
3.8
5.2
4.4
14.2
6.3
2.8
10.1
9.5
2.7
5.2
8.3
2.3
1.3
7.0
2.1
3.4
0.7
100.
01,
697
Four
th62
.65,
414
14.3
2.9
3.2
4.5
3.1
10.2
6.0
5.1
9.7
11.1
2.6
6.0
8.4
2.0
0.9
5.4
1.1
1.9
1.6
100.
02,
026
Ric
hest
54.7
5,92
932
.81.
91.
83.
02.
96.
05.
93.
55.
78.
42.
25.
98.
31.
40.
66.
81.
40.
60.
910
0.0
2,68
5
Tabl
e SR
.7.1
W (c
ontin
ued)
: Mig
rato
ry s
tatu
s of
wom
en (p
rovi
nces
)Pe
rcen
t dis
tribu
tion
of w
omen
age
15-
49 b
y la
st re
side
nce
acco
rdin
g to
tim
e si
nce
last
mov
e, a
nd p
erce
nt d
istri
butio
n of
wom
en w
ho c
hang
ed re
side
nce
acco
rdin
g to
the
type
and
pla
ce o
f las
t res
iden
ce, L
ao P
DR
, 201
7
Con
tinuo
usly
liv
ing
in th
e sa
me
resi
denc
e
Perc
enta
ge o
f wom
en w
hose
last
mig
ratio
n w
as fr
om:
Tota
l
Num
ber o
f w
omen
who
ch
ange
d re
side
nce
Num
ber o
f w
omen
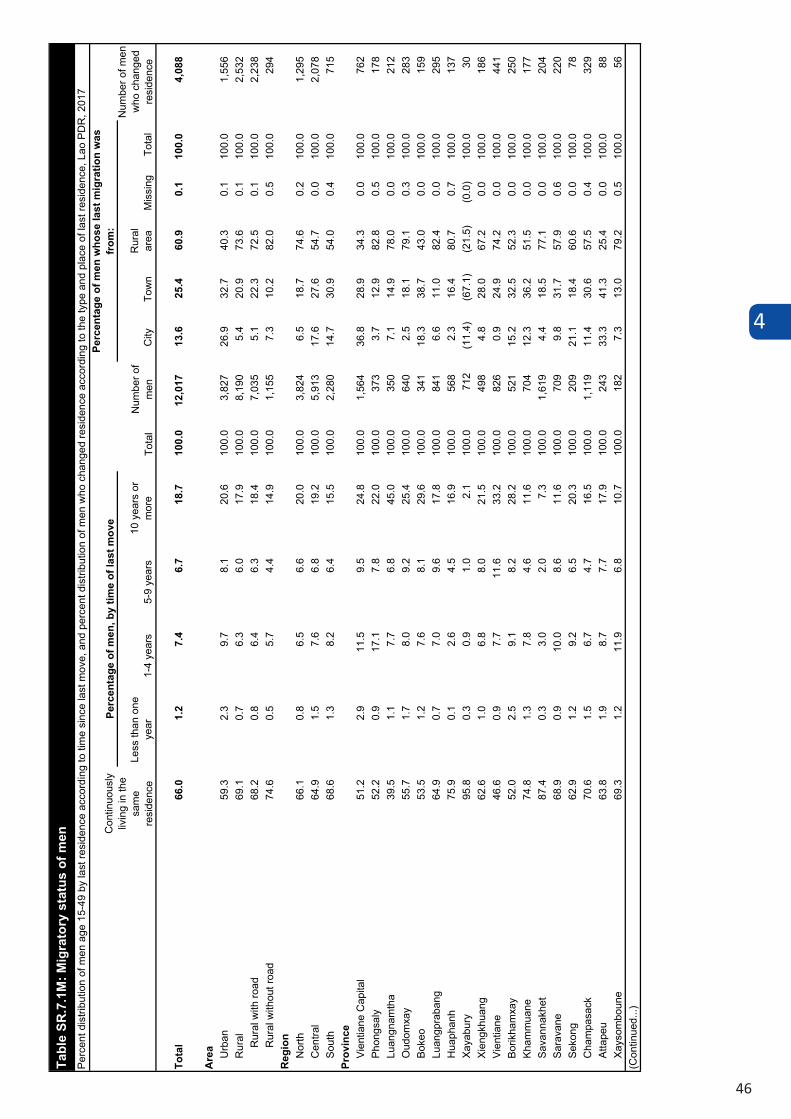
4
46
Less
than
one
ye
ar1-
4 ye
ars
5-9
year
s10
yea
rs o
r m
ore
City
Tow
nR
ural
ar
eaM
issi
ngTo
tal
Tota
l66
.01.
27.
46.
718
.710
0.0
12,0
1713
.625
.460
.90.
110
0.0
4,08
8
Are
a Urb
an59
.32.
39.
78.
120
.610
0.0
3,82
726
.932
.740
.30.
110
0.0
1,55
6R
ural
69.1
0.7
6.3
6.0
17.9
100.
08,
190
5.4
20.9
73.6
0.1
100.
02,
532
Rur
al w
ith ro
ad68
.20.
86.
46.
318
.410
0.0
7,03
55.
122
.372
.50.
110
0.0
2,23
8R
ural
with
out r
oad
74.6
0.5
5.7
4.4
14.9
100.
01,
155
7.3
10.2
82.0
0.5
100.
029
4R
egio
nN
orth
66.1
0.8
6.5
6.6
20.0
100.
03,
824
6.5
18.7
74.6
0.2
100.
01,
295
Cen
tral
64.9
1.5
7.6
6.8
19.2
100.
05,
913
17.6
27.6
54.7
0.0
100.
02,
078
Sout
h68
.61.
38.
26.
415
.510
0.0
2,28
014
.730
.954
.00.
410
0.0
715
Prov
ince
Vien
tiane
Cap
ital
51.2
2.9
11.5
9.5
24.8
100.
01,
564
36.8
28.9
34.3
0.0
100.
076
2Ph
ongs
aly
52.2
0.9
17.1
7.8
22.0
100.
037
33.
712
.982
.80.
510
0.0
178
Luan
gnam
tha
39.5
1.1
7.7
6.8
45.0
100.
035
07.
114
.978
.00.
010
0.0
212
Oud
omxa
y55
.71.
78.
09.
225
.410
0.0
640
2.5
18.1
79.1
0.3
100.
028
3Bo
keo
53.5
1.2
7.6
8.1
29.6
100.
034
118
.338
.743
.00.
010
0.0
159
Luan
gpra
bang
64.9
0.7
7.0
9.6
17.8
100.
084
16.
611
.082
.40.
010
0.0
295
Hua
phan
h75
.90.
12.
64.
516
.910
0.0
568
2.3
16.4
80.7
0.7
100.
013
7Xa
yabu
ry95
.80.
30.
91.
02.
110
0.0
712
(11.
4)
(67.
1)
(21.
5)(0
.0)
100.
030
Xien
gkhu
ang
62.6
1.0
6.8
8.0
21.5
100.
049
84.
828
.067
.20.
010
0.0
186
Vien
tiane
46.6
0.9
7.7
11.6
33.2
100.
082
60.
924
.974
.20.
010
0.0
441
Borik
ham
xay
52.0
2.5
9.1
8.2
28.2
100.
052
115
.232
.552
.30.
010
0.0
250
Kham
mua
ne74
.81.
37.
84.
611
.610
0.0
704
12.3
36.2
51.5
0.0
100.
017
7Sa
vann
akhe
t87
.40.
33.
02.
07.
310
0.0
1,61
94.
418
.577
.10.
010
0.0
204
Sara
vane
68.9
0.9
10.0
8.6
11.6
100.
070
99.
831
.757
.90.
610
0.0
220
Seko
ng62
.91.
29.
26.
520
.310
0.0
209
21.1
18.4
60.6
0.0
100.
078
Cha
mpa
sack
70.6
1.5
6.7
4.7
16.5
100.
01,
119
11.4
30.6
57.5
0.4
100.
032
9At
tape
u63
.81.
98.
77.
717
.910
0.0
243
33.3
41.3
25.4
0.0
100.
088
Xays
ombo
une
69.3
1.2
11.9
6.8
10.7
100.
018
27.
313
.079
.20.
510
0.0
56(C
ontin
ued.
..)
Num
ber o
f men
w
ho c
hang
ed
resi
denc
e
Tabl
e SR
.7.1
M: M
igra
tory
sta
tus
of m
enPe
rcen
t dis
tribu
tion
of m
en a
ge 1
5-49
by
last
resi
denc
e ac
cord
ing
to ti
me
sinc
e la
st m
ove,
and
per
cent
dis
tribu
tion
of m
en w
ho c
hang
ed re
side
nce
acco
rdin
g to
the
type
and
pla
ce o
f las
t res
iden
ce, L
ao P
DR
, 201
7
Con
tinuo
usly
liv
ing
in th
e sa
me
resi
denc
e
Perc
enta
ge o
f men
, by
time
of la
st m
ove
Tota
lN
umbe
r of
men
Perc
enta
ge o
f men
who
se la
st m
igra
tion
was
fr
om:
Less
than
one
ye
ar1-
4 ye
ars
5-9
year
s10
yea
rs o
r m
ore
City
Tow
nR
ural
ar
eaM
issi
ngTo
tal
Tota
l66
.01.
27.
46.
718
.710
0.0
12,0
1713
.625
.460
.90.
110
0.0
4,08
8
Age 15
-19
85.9
1.1
3.6
2.9
6.5
100.
02,
404
11.8
19.2
68.5
0.4
100.
034
015
-17
86.7
0.9
3.5
2.7
6.2
100.
01,
570
9.1
19.5
71.4
0.0
100.
020
918
-19
84.3
1.5
3.8
3.3
7.1
100.
083
416
.118
.864
.01.
110
0.0
131
20-2
473
.52.
710
.13.
99.
810
0.0
1,77
411
.420
.668
.00.
010
0.0
470
25-2
963
.32.
312
.610
.011
.810
0.0
1,81
013
.225
.761
.00.
010
0.0
664
30-3
459
.60.
710
.611
.217
.910
0.0
1,77
214
.428
.756
.80.
010
0.0
717
35-3
957
.70.
46.
28.
527
.210
0.0
1,61
214
.827
.557
.40.
210
0.0
683
40-4
452
.30.
54.
86.
236
.310
0.0
1,41
215
.625
.758
.30.
410
0.0
674
45-4
956
.10.
52.
94.
935
.510
0.0
1,23
211
.825
.462
.90.
010
0.0
540
Educ
atio
nN
one
or E
CE
68.6
0.3
4.0
6.1
20.9
100.
078
02.
310
.886
.90.
010
0.0
245
Prim
ary
67.1
0.9
5.6
5.6
20.8
100.
03,
716
6.2
19.1
74.3
0.4
100.
01,
222
Low
er s
econ
dary
68.4
1.3
6.8
5.6
17.9
100.
03,
517
10.1
25.6
64.3
0.0
100.
01,
113
Upp
er s
econ
dary
72.8
1.3
6.6
5.7
13.7
100.
02,
169
14.0
27.8
58.2
0.0
100.
059
0Po
st s
econ
dary
/ N
on te
rtiar
y45
.71.
114
.012
.027
.210
0.0
488
22.7
36.9
40.4
0.0
100.
026
5H
ighe
r51
.62.
514
.512
.518
.910
0.0
1,34
633
.435
.331
.10.
210
0.0
652
Mar
ital s
tatu
sEv
er m
arrie
d/in
uni
on56
.11.
39.
28.
724
.610
0.0
7,90
213
.025
.960
.80.
210
0.0
3,46
5N
ever
mar
ried/
in u
nion
84.9
1.1
3.7
2.9
7.5
100.
04,
115
16.5
22.2
61.3
0.0
100.
062
2Et
hno-
lingu
istic
gro
up o
f hou
seho
ld h
ead
Lao-
Tai
67.1
1.5
7.6
6.4
17.4
100.
07,
758
19.1
32.0
48.7
0.1
100.
02,
554
Mon
-Khm
er69
.70.
76.
96.
016
.710
0.0
2,75
94.
413
.482
.10.
110
0.0
836
Hm
ong-
Mie
n55
.60.
46.
19.
928
.010
0.0
1,07
24.
316
.179
.30.
310
0.0
476
Chi
nese
-Tib
etan
46.0
0.0
8.6
9.5
35.8
100.
032
62.
99.
188
.00.
010
0.0
176
Oth
er, D
K, M
issi
ng55
.43.
812
.25.
623
.110
0.0
102
(9.2
)(3
2.8)
(57.
9)(0
.0)
100.
046
Wea
lth in
dex
quin
tile
Poor
est
72.2
0.6
6.2
6.3
14.7
100.
02,
172
1.8
8.6
89.5
0.2
100.
060
5Se
cond
68.9
0.9
5.4
5.9
18.9
100.
02,
370
3.4
15.9
80.6
0.1
100.
073
7M
iddl
e70
.00.
86.
34.
918
.010
0.0
2,35
28.
023
.568
.20.
310
0.0
706
Four
th64
.41.
88.
37.
218
.310
0.0
2,67
612
.631
.855
.60.
010
0.0
952
Ric
hest
55.5
1.9
10.2
9.0
23.3
100.
02,
447
31.5
36.7
31.6
0.2
100.
01,
088
Num
ber o
f men
w
ho c
hang
ed
resi
denc
e
Tabl
e SR
.7.1
M (c
ontin
ued)
: Mig
rato
ry s
tatu
s of
men
Perc
ent d
istri
butio
n of
men
age
15-
49 b
y la
st re
side
nce
acco
rdin
g to
tim
e si
nce
last
mov
e, a
nd p
erce
nt d
istri
butio
n of
men
who
cha
nged
resi
denc
e ac
cord
ing
to th
e ty
pe a
nd p
lace
of l
ast r
esid
ence
, Lao
PD
R, 2
017
Con
tinuo
usly
liv
ing
in th
e sa
me
resi
denc
e
Perc
enta
ge o
f men
who
mov
ed
Tota
lN
umbe
r of
men
Am
ong
men
who
cha
nged
resi
denc
e,
perc
enta
ge li
ving
in:
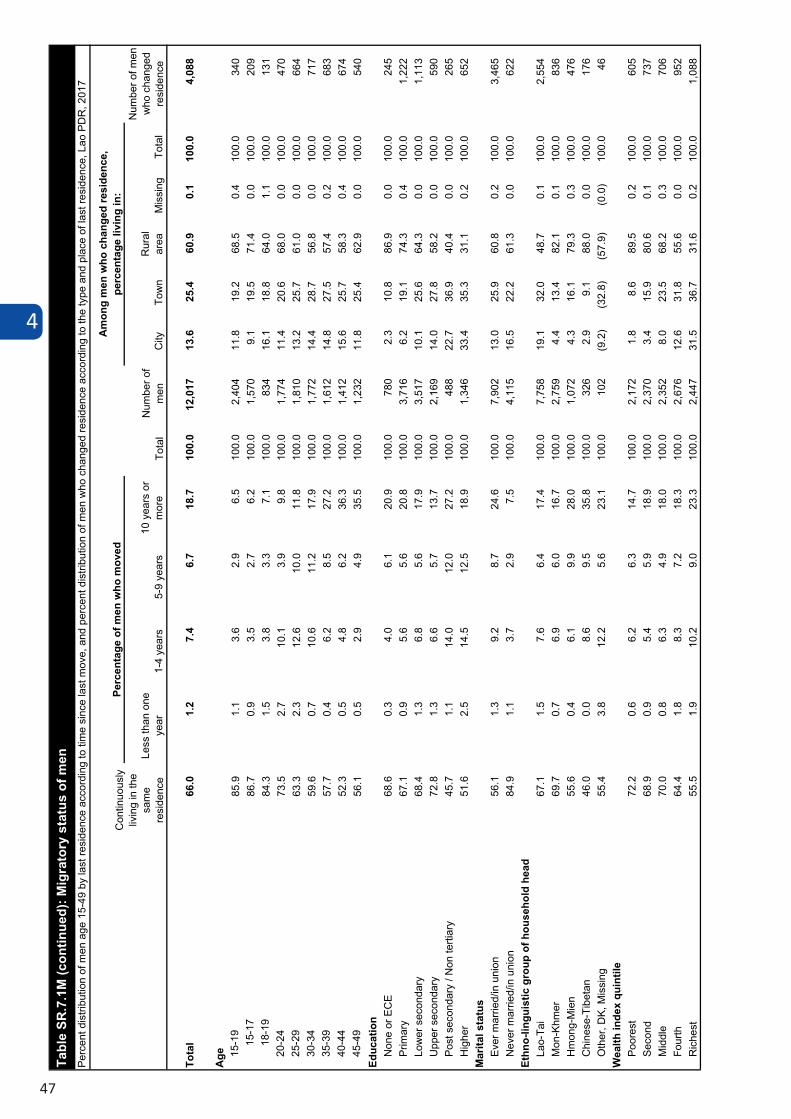
4
47
Less
than
one
ye
ar1-
4 ye
ars
5-9
year
s10
yea
rs o
r m
ore
City
Tow
nR
ural
ar
eaM
issi
ngTo
tal
Tota
l66
.01.
27.
46.
718
.710
0.0
12,0
1713
.625
.460
.90.
110
0.0
4,08
8
Age 15
-19
85.9
1.1
3.6
2.9
6.5
100.
02,
404
11.8
19.2
68.5
0.4
100.
034
015
-17
86.7
0.9
3.5
2.7
6.2
100.
01,
570
9.1
19.5
71.4
0.0
100.
020
918
-19
84.3
1.5
3.8
3.3
7.1
100.
083
416
.118
.864
.01.
110
0.0
131
20-2
473
.52.
710
.13.
99.
810
0.0
1,77
411
.420
.668
.00.
010
0.0
470
25-2
963
.32.
312
.610
.011
.810
0.0
1,81
013
.225
.761
.00.
010
0.0
664
30-3
459
.60.
710
.611
.217
.910
0.0
1,77
214
.428
.756
.80.
010
0.0
717
35-3
957
.70.
46.
28.
527
.210
0.0
1,61
214
.827
.557
.40.
210
0.0
683
40-4
452
.30.
54.
86.
236
.310
0.0
1,41
215
.625
.758
.30.
410
0.0
674
45-4
956
.10.
52.
94.
935
.510
0.0
1,23
211
.825
.462
.90.
010
0.0
540
Educ
atio
nN
one
or E
CE
68.6
0.3
4.0
6.1
20.9
100.
078
02.
310
.886
.90.
010
0.0
245
Prim
ary
67.1
0.9
5.6
5.6
20.8
100.
03,
716
6.2
19.1
74.3
0.4
100.
01,
222
Low
er s
econ
dary
68.4
1.3
6.8
5.6
17.9
100.
03,
517
10.1
25.6
64.3
0.0
100.
01,
113
Upp
er s
econ
dary
72.8
1.3
6.6
5.7
13.7
100.
02,
169
14.0
27.8
58.2
0.0
100.
059
0Po
st s
econ
dary
/ N
on te
rtiar
y45
.71.
114
.012
.027
.210
0.0
488
22.7
36.9
40.4
0.0
100.
026
5H
ighe
r51
.62.
514
.512
.518
.910
0.0
1,34
633
.435
.331
.10.
210
0.0
652
Mar
ital s
tatu
sEv
er m
arrie
d/in
uni
on56
.11.
39.
28.
724
.610
0.0
7,90
213
.025
.960
.80.
210
0.0
3,46
5N
ever
mar
ried/
in u
nion
84.9
1.1
3.7
2.9
7.5
100.
04,
115
16.5
22.2
61.3
0.0
100.
062
2Et
hno-
lingu
istic
gro
up o
f hou
seho
ld h
ead
Lao-
Tai
67.1
1.5
7.6
6.4
17.4
100.
07,
758
19.1
32.0
48.7
0.1
100.
02,
554
Mon
-Khm
er69
.70.
76.
96.
016
.710
0.0
2,75
94.
413
.482
.10.
110
0.0
836
Hm
ong-
Mie
n55
.60.
46.
19.
928
.010
0.0
1,07
24.
316
.179
.30.
310
0.0
476
Chi
nese
-Tib
etan
46.0
0.0
8.6
9.5
35.8
100.
032
62.
99.
188
.00.
010
0.0
176
Oth
er, D
K, M
issi
ng55
.43.
812
.25.
623
.110
0.0
102
(9.2
)(3
2.8)
(57.
9)(0
.0)
100.
046
Wea
lth in
dex
quin
tile
Poor
est
72.2
0.6
6.2
6.3
14.7
100.
02,
172
1.8
8.6
89.5
0.2
100.
060
5Se
cond
68.9
0.9
5.4
5.9
18.9
100.
02,
370
3.4
15.9
80.6
0.1
100.
073
7M
iddl
e70
.00.
86.
34.
918
.010
0.0
2,35
28.
023
.568
.20.
310
0.0
706
Four
th64
.41.
88.
37.
218
.310
0.0
2,67
612
.631
.855
.60.
010
0.0
952
Ric
hest
55.5
1.9
10.2
9.0
23.3
100.
02,
447
31.5
36.7
31.6
0.2
100.
01,
088
Num
ber o
f men
w
ho c
hang
ed
resi
denc
e
Tabl
e SR
.7.1
M (c
ontin
ued)
: Mig
rato
ry s
tatu
s of
men
Perc
ent d
istri
butio
n of
men
age
15-
49 b
y la
st re
side
nce
acco
rdin
g to
tim
e si
nce
last
mov
e, a
nd p
erce
nt d
istri
butio
n of
men
who
cha
nged
resi
denc
e ac
cord
ing
to th
e ty
pe a
nd p
lace
of l
ast r
esid
ence
, Lao
PD
R, 2
017
Con
tinuo
usly
liv
ing
in th
e sa
me
resi
denc
e
Perc
enta
ge o
f men
who
mov
ed
Tota
lN
umbe
r of
men
Am
ong
men
who
cha
nged
resi
denc
e,
perc
enta
ge li
ving
in:
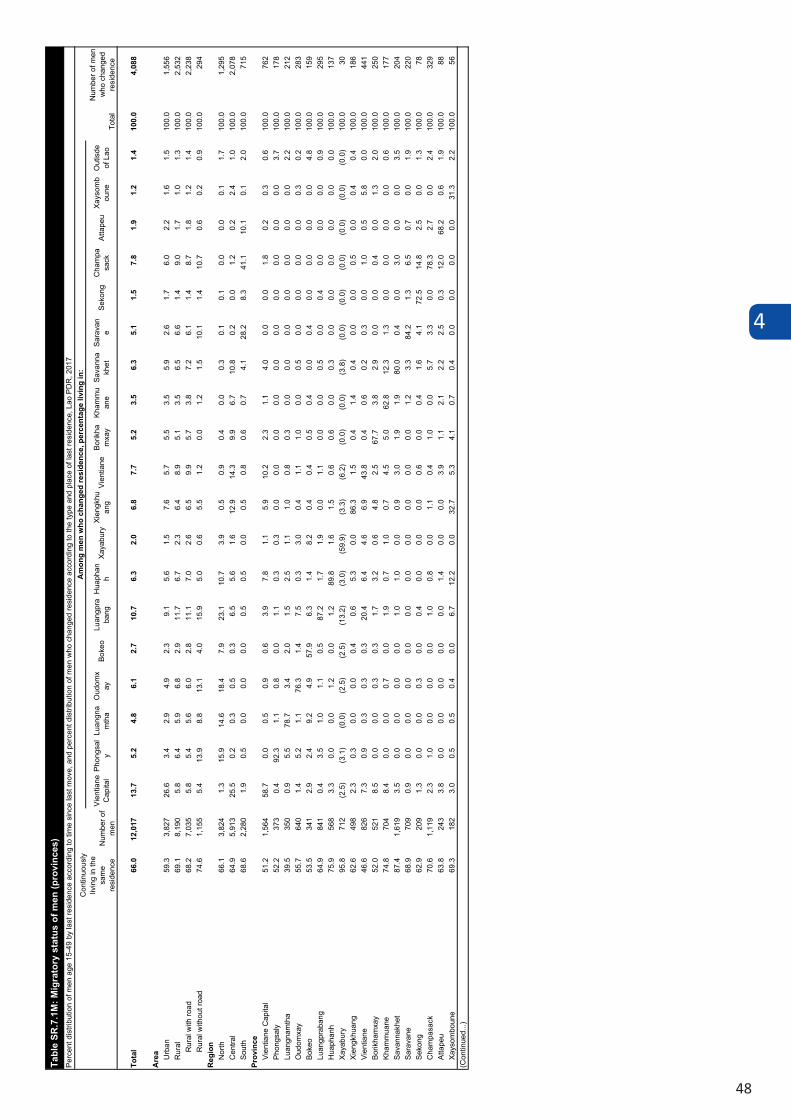
4
48
Vien
tiane
C
apita
lPh
ongs
aly
Luan
gna
mth
aO
udom
xay
Boke
oLu
angp
raba
ngH
uaph
anh
Xaya
bury
Xien
gkhu
ang
Vien
tiane
Borik
ham
xay
Kham
mu
ane
Sava
nna
khet
Sara
van
eSe
kong
Cha
mpa
sack
Atta
peu
Xays
omb
oune
Out
isde
of
Lao
Tota
l66
.012
,017
13.7
5.2
4.8
6.1
2.7
10.7
6.3
2.0
6.8
7.7
5.2
3.5
6.3
5.1
1.5
7.8
1.9
1.2
1.4
100.
04,
088
Are
a Urb
an59
.33,
827
26.6
3.4
2.9
4.9
2.3
9.1
5.6
1.5
7.6
5.7
5.5
3.5
5.9
2.6
1.7
6.0
2.2
1.6
1.5
100.
01,
556
Rur
al69
.18,
190
5.8
6.4
5.9
6.8
2.9
11.7
6.7
2.3
6.4
8.9
5.1
3.5
6.5
6.6
1.4
9.0
1.7
1.0
1.3
100.
02,
532
Rur
al w
ith ro
ad68
.27,
035
5.8
5.4
5.6
6.0
2.8
11.1
7.0
2.6
6.5
9.9
5.7
3.8
7.2
6.1
1.4
8.7
1.8
1.2
1.4
100.
02,
238
Rur
al w
ithou
t roa
d74
.61,
155
5.4
13.9
8.8
13.1
4.0
15.9
5.0
0.6
5.5
1.2
0.0
1.2
1.5
10.1
1.4
10.7
0.6
0.2
0.9
100.
029
4R
egio
nN
orth
66.1
3,82
41.
315
.914
.618
.47.
923
.110
.73.
90.
50.
90.
40.
00.
30.
10.
10.
00.
00.
11.
710
0.0
1,29
5C
entra
l64
.95,
913
25.5
0.2
0.3
0.5
0.3
6.5
5.6
1.6
12.9
14.3
9.9
6.7
10.8
0.2
0.0
1.2
0.2
2.4
1.0
100.
02,
078
Sout
h68
.62,
280
1.9
0.5
0.0
0.0
0.0
0.5
0.5
0.0
0.5
0.8
0.6
0.7
4.1
28.2
8.3
41.1
10.1
0.1
2.0
100.
071
5Pr
ovin
ceVi
entia
ne C
apita
l51
.21,
564
58.7
0.0
0.5
0.9
0.6
3.9
7.8
1.1
5.9
10.2
2.3
1.1
4.0
0.0
0.0
1.8
0.2
0.3
0.6
100.
076
2Ph
ongs
aly
52.2
373
0.4
92.3
1.1
0.8
0.0
1.1
0.3
0.3
0.0
0.0
0.0
0.0
0.0
0.0
0.0
0.0
0.0
0.0
3.7
100.
017
8Lu
angn
amth
a39
.535
00.
95.
578
.73.
42.
01.
52.
51.
11.
00.
80.
30.
00.
00.
00.
00.
00.
00.
02.
210
0.0
212
Oud
omxa
y55
.764
01.
45.
21.
176
.31.
47.
50.
33.
00.
41.
11.
00.
00.
50.
00.
00.
00.
00.
30.
210
0.0
283
Boke
o53
.534
12.
92.
49.
24.
957
.96.
31.
48.
20.
40.
40.
50.
40.
00.
40.
00.
00.
00.
04.
810
0.0
159
Luan
gpra
bang
64.9
841
0.4
3.5
1.0
1.1
0.5
87.2
1.7
1.9
0.0
1.1
0.0
0.0
0.5
0.0
0.4
0.0
0.0
0.0
0.9
100.
029
5H
uaph
anh
75.9
568
3.3
0.0
0.0
1.2
0.0
1.2
89.8
1.6
1.5
0.6
0.6
0.0
0.3
0.0
0.0
0.0
0.0
0.0
0.0
100.
013
7Xa
yabu
ry95
.871
2(2
.5)
(3.1
)(0
.0)
(2.5
)(2
.5)
(13.
2)(3
.0)
(59.
9)(3
.3)
(6.2
)(0
.0)
(0.0
)(3
.8)
(0.0
)(0
.0)
(0.0
)(0
.0)
(0.0
)(0
.0)
100.
030
Xien
gkhu
ang
62.6
498
2.3
0.3
0.0
0.0
0.4
0.6
5.3
0.0
86.3
1.5
0.4
1.4
0.4
0.0
0.0
0.5
0.0
0.4
0.4
100.
018
6Vi
entia
ne46
.682
67.
30.
90.
30.
30.
320
.46.
44.
66.
943
.80.
40.
60.
20.
30.
01.
00.
55.
80.
010
0.0
441
Borik
ham
xay
52.0
521
8.5
0.0
0.0
0.3
0.3
1.7
3.2
0.6
4.8
2.5
67.7
3.8
2.9
0.0
0.0
0.4
0.0
1.3
2.0
100.
025
0Kh
amm
uane
74.8
704
8.4
0.0
0.0
0.7
0.0
1.9
0.7
1.0
0.7
4.5
5.0
62.8
12.3
1.3
0.0
0.0
0.0
0.0
0.6
100.
017
7Sa
vann
akhe
t87
.41,
619
3.5
0.0
0.0
0.0
0.0
1.0
1.0
0.0
0.9
3.0
1.9
1.9
80.0
0.4
0.0
3.0
0.0
0.0
3.5
100.
020
4Sa
rava
ne68
.970
90.
90.
00.
00.
00.
00.
00.
00.
00.
00.
00.
01.
23.
384
.21.
36.
50.
70.
01.
910
0.0
220
Seko
ng62
.920
91.
30.
00.
00.
30.
00.
40.
00.
00.
00.
60.
00.
41.
64.
172
.514
.82.
50.
01.
310
0.0
78C
ham
pasa
ck70
.61,
119
2.3
1.0
0.0
0.0
0.0
1.0
0.8
0.0
1.1
0.4
1.0
0.0
5.7
3.3
0.0
78.3
2.7
0.0
2.4
100.
032
9At
tape
u63
.824
33.
80.
00.
00.
00.
00.
01.
40.
00.
03.
91.
12.
12.
22.
50.
312
.068
.20.
61.
910
0.0
88Xa
ysom
boun
e69
.318
23.
00.
50.
50.
40.
06.
712
.20.
032
.75.
34.
10.
70.
40.
00.
00.
00.
031
.32.
210
0.0
56(C
ontin
ued.
..)
Tabl
e SR
.7.1
M: M
igra
tory
sta
tus
of m
en (p
rovi
nces
)Pe
rcen
t dis
tribu
tion
of m
en a
ge 1
5-49
by
last
resi
denc
e ac
cord
ing
to ti
me
sinc
e la
st m
ove,
and
per
cent
dis
tribu
tion
of m
en w
ho c
hang
ed re
side
nce
acco
rdin
g to
the
type
and
pla
ce o
f las
t res
iden
ce, L
ao P
DR
, 201
7
Con
tinuo
usly
liv
ing
in th
e sa
me
resi
denc
e
Am
ong
men
who
cha
nged
resi
denc
e, p
erce
ntag
e liv
ing
in:
Tota
l
Num
ber o
f men
w
ho c
hang
ed
resi
denc
eN
umbe
r of
men
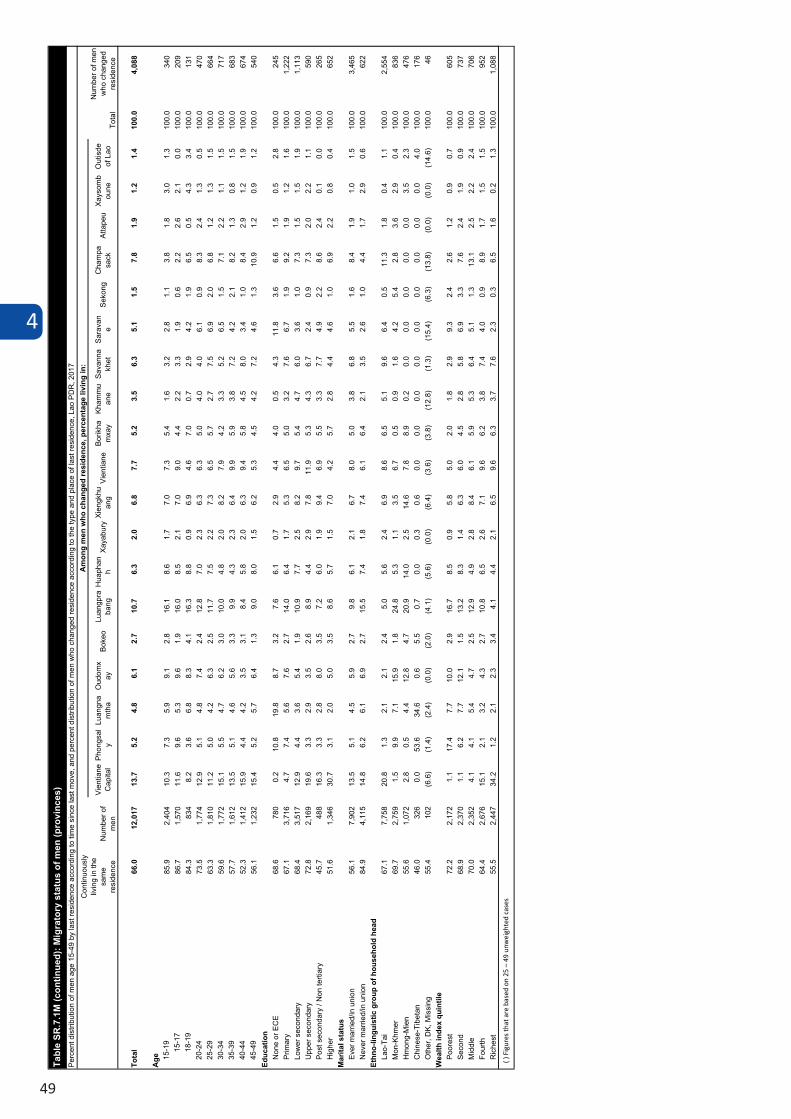
4
49
Vien
tiane
C
apita
lPh
ongs
aly
Luan
gna
mth
aO
udom
xay
Boke
oLu
angp
raba
ngH
uaph
anh
Xaya
bury
Xien
gkhu
ang
Vien
tiane
Borik
ham
xay
Kham
mu
ane
Sava
nna
khet
Sara
van
eSe
kong
Cha
mpa
sack
Atta
peu
Xays
omb
oune
Out
isde
of
Lao
Tota
l66
.012
,017
13.7
5.2
4.8
6.1
2.7
10.7
6.3
2.0
6.8
7.7
5.2
3.5
6.3
5.1
1.5
7.8
1.9
1.2
1.4
100.
04,
088
Age 15
-19
85.9
2,40
410
.37.
35.
99.
12.
816
.18.
61.
77.
07.
35.
41.
63.
22.
81.
13.
81.
83.
01.
310
0.0
340
15-1
786
.71,
570
11.6
9.6
5.3
9.6
1.9
16.0
8.5
2.1
7.0
9.0
4.4
2.2
3.3
1.9
0.6
2.2
2.6
2.1
0.0
100.
020
918
-19
84.3
834
8.2
3.6
6.8
8.3
4.1
16.3
8.8
0.9
6.9
4.6
7.0
0.7
2.9
4.2
1.9
6.5
0.5
4.3
3.4
100.
013
120
-24
73.5
1,77
412
.95.
14.
87.
42.
412
.87.
02.
36.
36.
35.
04.
04.
06.
10.
98.
32.
41.
30.
510
0.0
470
25-2
963
.31,
810
11.2
5.0
4.2
6.3
2.5
11.7
7.5
2.2
7.3
6.5
5.7
2.7
7.5
6.9
2.0
6.8
1.2
1.3
1.5
100.
066
430
-34
59.6
1,77
215
.15.
54.
76.
23.
010
.04.
82.
08.
27.
94.
23.
35.
26.
51.
57.
12.
21.
11.
510
0.0
717
35-3
957
.71,
612
13.5
5.1
4.6
5.6
3.3
9.9
4.3
2.3
6.4
9.9
5.9
3.8
7.2
4.2
2.1
8.2
1.3
0.8
1.5
100.
068
340
-44
52.3
1,41
215
.94.
44.
23.
53.
18.
45.
82.
06.
39.
45.
84.
58.
03.
41.
08.
42.
91.
21.
910
0.0
674
45-4
956
.11,
232
15.4
5.2
5.7
6.4
1.3
9.0
8.0
1.5
6.2
5.3
4.5
4.2
7.2
4.6
1.3
10.9
1.2
0.9
1.2
100.
054
0Ed
ucat
ion
Non
e or
EC
E68
.678
00.
210
.819
.88.
73.
27.
66.
10.
72.
94.
44.
00.
54.
311
.83.
66.
61.
50.
52.
810
0.0
245
Prim
ary
67.1
3,71
64.
77.
45.
67.
62.
714
.06.
41.
75.
36.
55.
03.
27.
66.
71.
99.
21.
91.
21.
610
0.0
1,22
2Lo
wer
sec
onda
ry68
.43,
517
12.9
4.4
3.6
5.4
1.9
10.9
7.7
2.5
8.2
9.7
5.4
4.7
6.0
3.6
1.0
7.3
1.5
1.5
1.9
100.
01,
113
Upp
er s
econ
dary
72.8
2,16
919
.63.
32.
93.
52.
68.
94.
42.
97.
811
.95.
34.
36.
72.
40.
97.
32.
02.
21.
110
0.0
590
Post
sec
onda
ry /
Non
terti
ary
45.7
488
16.3
3.3
2.8
8.0
3.5
7.2
6.0
1.9
9.4
6.9
5.5
3.3
7.7
4.9
2.2
8.6
2.4
0.1
0.0
100.
026
5H
ighe
r51
.61,
346
30.7
3.1
2.0
5.0
3.5
8.6
5.7
1.5
7.0
4.2
5.7
2.8
4.4
4.6
1.0
6.9
2.2
0.8
0.4
100.
065
2M
arita
l sta
tus
Ever
mar
ried/
in u
nion
56.1
7,90
213
.55.
14.
55.
92.
79.
86.
12.
16.
78.
05.
03.
86.
85.
51.
68.
41.
91.
01.
510
0.0
3,46
5N
ever
mar
ried/
in u
nion
84.9
4,11
514
.86.
26.
16.
92.
715
.57.
41.
87.
46.
16.
42.
13.
52.
61.
04.
41.
72.
90.
610
0.0
622
Ethn
o-lin
guis
tic g
roup
of h
ouse
hold
hea
dLa
o-Ta
i67
.17,
758
20.8
1.3
2.1
2.1
2.4
5.0
5.6
2.4
6.9
8.6
6.5
5.1
9.6
6.4
0.5
11.3
1.8
0.4
1.1
100.
02,
554
Mon
-Khm
er69
.72,
759
1.5
9.9
7.1
15.9
1.8
24.8
5.3
1.1
3.5
6.7
0.5
0.9
1.6
4.2
5.4
2.8
3.6
2.9
0.4
100.
083
6H
mon
g-M
ien
55.6
1,07
22.
80.
54.
412
.84.
720
.914
.02.
514
.67.
88.
90.
20.
00.
00.
00.
00.
03.
52.
310
0.0
476
Chi
nese
-Tib
etan
46.0
326
0.0
53.6
34.6
0.6
5.5
0.7
0.0
0.3
0.6
0.0
0.0
0.0
0.0
0.0
0.0
0.0
0.0
0.0
4.0
100.
017
6O
ther
, DK,
Mis
sing
55.4
102
(6.6
)(1
.4)
(2.4
)(0
.0)
(2.0
)(4
.1)
(5.6
)(0
.0)
(6.4
)(3
.6)
(3.8
)(1
2.8)
(1.3
)(1
5.4)
(6.3
)(1
3.8)
(0.0
)(0
.0)
(14.
6)10
0.0
46W
ealth
inde
x qu
intil
ePo
ores
t72
.22,
172
1.1
17.4
7.7
10.0
2.9
16.7
8.5
0.9
5.8
5.0
2.0
1.8
2.9
9.3
2.4
2.6
1.2
0.9
0.7
100.
060
5Se
cond
68.9
2,37
01.
16.
27.
712
.11.
513
.28.
31.
46.
36.
04.
52.
85.
86.
93.
37.
62.
41.
90.
910
0.0
737
Mid
dle
70.0
2,35
24.
14.
15.
44.
72.
512
.94.
92.
88.
46.
15.
95.
36.
45.
11.
313
.12.
52.
22.
410
0.0
706
Four
th64
.42,
676
15.1
2.1
3.2
4.3
2.7
10.8
6.5
2.6
7.1
9.6
6.2
3.8
7.4
4.0
0.9
8.9
1.7
1.5
1.5
100.
095
2R
iche
st55
.52,
447
34.2
1.2
2.1
2.3
3.4
4.1
4.4
2.1
6.5
9.6
6.3
3.7
7.6
2.3
0.3
6.5
1.6
0.2
1.3
100.
01,
088
Tabl
e SR
.7.1
M (c
ontin
ued)
: Mig
rato
ry s
tatu
s of
men
(pro
vinc
es)
Perc
ent d
istri
butio
n of
men
age
15-
49 b
y la
st re
side
nce
acco
rdin
g to
tim
e si
nce
last
mov
e, a
nd p
erce
nt d
istri
butio
n of
men
who
cha
nged
resi
denc
e ac
cord
ing
to th
e ty
pe a
nd p
lace
of l
ast r
esid
ence
, Lao
PD
R, 2
017
Con
tinuo
usly
liv
ing
in th
e sa
me
resi
denc
e
Am
ong
men
who
cha
nged
resi
denc
e, p
erce
ntag
e liv
ing
in:
Tota
l
Num
ber o
f men
w
ho c
hang
ed
resi
denc
eN
umbe
r of
men
( ) F
igur
es th
at a
re b
ased
on
25 –
49
unw
eigh
ted
case
s
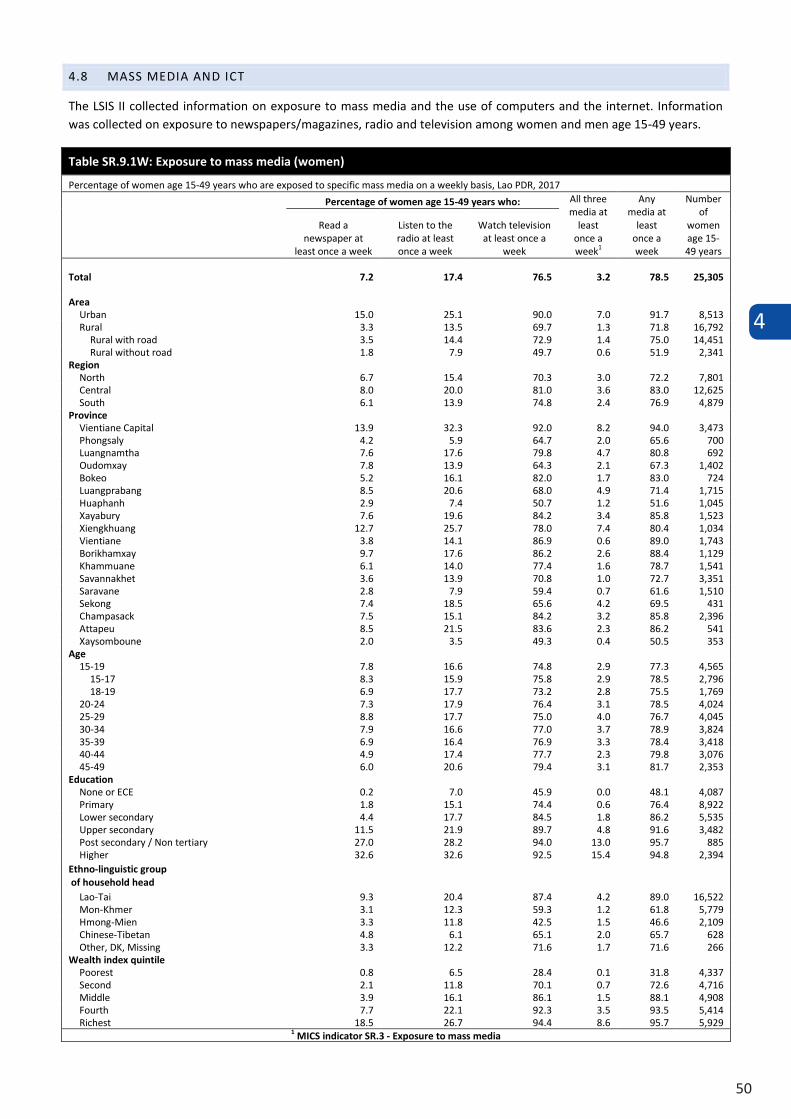
4
50
4.8 MASS MEDIA AND ICT
The LSIS II collected information on exposure to mass media and the use of computers and the internet. Information was collected on exposure to newspapers/magazines, radio and television among women and men age 15-49 years.
Table SR.9.1W: Exposure to mass media (women)
Percentage of women age 15-49 years who are exposed to specific mass media on a weekly basis, Lao PDR, 2017
Percentage of women age 15-49 years who: All three media at
least once a week1
Any media at
least once a week
Number of
women age 15-49 years
Read a newspaper at
least once a week
Listen to the radio at least once a week
Watch television at least once a
week
Total 7.2 17.4 76.5 3.2 78.5 25,305
Area Urban 15.0 25.1 90.0 7.0 91.7 8,513 Rural 3.3 13.5 69.7 1.3 71.8 16,792
Rural with road 3.5 14.4 72.9 1.4 75.0 14,451 Rural without road 1.8 7.9 49.7 0.6 51.9 2,341
Region North 6.7 15.4 70.3 3.0 72.2 7,801 Central 8.0 20.0 81.0 3.6 83.0 12,625 South 6.1 13.9 74.8 2.4 76.9 4,879
Province Vientiane Capital 13.9 32.3 92.0 8.2 94.0 3,473 Phongsaly 4.2 5.9 64.7 2.0 65.6 700 Luangnamtha 7.6 17.6 79.8 4.7 80.8 692 Oudomxay 7.8 13.9 64.3 2.1 67.3 1,402 Bokeo 5.2 16.1 82.0 1.7 83.0 724 Luangprabang 8.5 20.6 68.0 4.9 71.4 1,715 Huaphanh 2.9 7.4 50.7 1.2 51.6 1,045 Xayabury 7.6 19.6 84.2 3.4 85.8 1,523 Xiengkhuang 12.7 25.7 78.0 7.4 80.4 1,034 Vientiane 3.8 14.1 86.9 0.6 89.0 1,743 Borikhamxay 9.7 17.6 86.2 2.6 88.4 1,129 Khammuane 6.1 14.0 77.4 1.6 78.7 1,541 Savannakhet 3.6 13.9 70.8 1.0 72.7 3,351 Saravane 2.8 7.9 59.4 0.7 61.6 1,510 Sekong 7.4 18.5 65.6 4.2 69.5 431 Champasack 7.5 15.1 84.2 3.2 85.8 2,396 Attapeu 8.5 21.5 83.6 2.3 86.2 541 Xaysomboune 2.0 3.5 49.3 0.4 50.5 353
Age 15-19 7.8 16.6 74.8 2.9 77.3 4,565
15-17 8.3 15.9 75.8 2.9 78.5 2,796 18-19 6.9 17.7 73.2 2.8 75.5 1,769
20-24 7.3 17.9 76.4 3.1 78.5 4,024 25-29 8.8 17.7 75.0 4.0 76.7 4,045 30-34 7.9 16.6 77.0 3.7 78.9 3,824 35-39 6.9 16.4 76.9 3.3 78.4 3,418 40-44 4.9 17.4 77.7 2.3 79.8 3,076 45-49 6.0 20.6 79.4 3.1 81.7 2,353
Education None or ECE 0.2 7.0 45.9 0.0 48.1 4,087 Primary 1.8 15.1 74.4 0.6 76.4 8,922 Lower secondary 4.4 17.7 84.5 1.8 86.2 5,535 Upper secondary 11.5 21.9 89.7 4.8 91.6 3,482 Post secondary / Non tertiary 27.0 28.2 94.0 13.0 95.7 885 Higher 32.6 32.6 92.5 15.4 94.8 2,394
Ethno-linguistic group of household head
Lao-Tai 9.3 20.4 87.4 4.2 89.0 16,522 Mon-Khmer 3.1 12.3 59.3 1.2 61.8 5,779 Hmong-Mien 3.3 11.8 42.5 1.5 46.6 2,109 Chinese-Tibetan 4.8 6.1 65.1 2.0 65.7 628 Other, DK, Missing 3.3 12.2 71.6 1.7 71.6 266
Wealth index quintile Poorest 0.8 6.5 28.4 0.1 31.8 4,337 Second 2.1 11.8 70.1 0.7 72.6 4,716 Middle 3.9 16.1 86.1 1.5 88.1 4,908 Fourth 7.7 22.1 92.3 3.5 93.5 5,414 Richest 18.5 26.7 94.4 8.6 95.7 5,929
1 MICS indicator SR.3 - Exposure to mass media
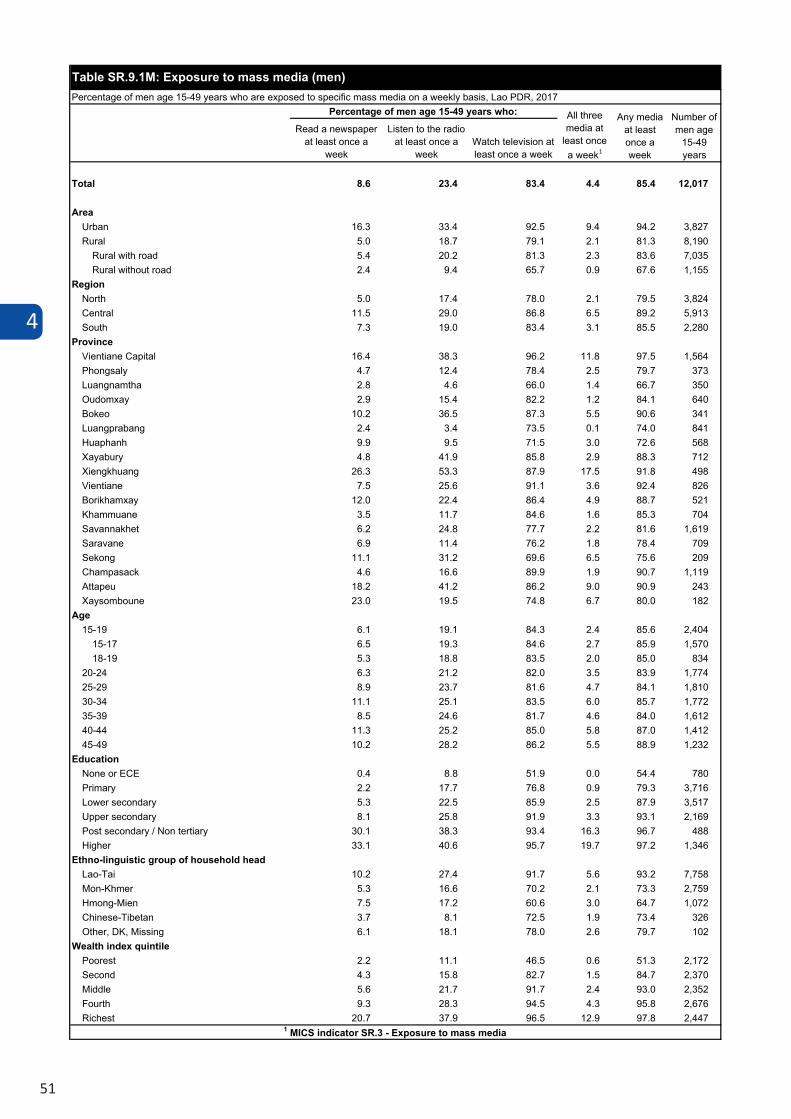
4
51
4.8 MASS MEDIA AND ICT
The LSIS II collected information on exposure to mass media and the use of computers and the internet. Information was collected on exposure to newspapers/magazines, radio and television among women and men age 15-49 years.
Table SR.9.1W: Exposure to mass media (women)
Percentage of women age 15-49 years who are exposed to specific mass media on a weekly basis, Lao PDR, 2017
Percentage of women age 15-49 years who: All three media at
least once a week1
Any media at
least once a week
Number of
women age 15-49 years
Read a newspaper at
least once a week
Listen to the radio at least once a week
Watch television at least once a
week
Total 7.2 17.4 76.5 3.2 78.5 25,305
Area Urban 15.0 25.1 90.0 7.0 91.7 8,513 Rural 3.3 13.5 69.7 1.3 71.8 16,792
Rural with road 3.5 14.4 72.9 1.4 75.0 14,451 Rural without road 1.8 7.9 49.7 0.6 51.9 2,341
Region North 6.7 15.4 70.3 3.0 72.2 7,801 Central 8.0 20.0 81.0 3.6 83.0 12,625 South 6.1 13.9 74.8 2.4 76.9 4,879
Province Vientiane Capital 13.9 32.3 92.0 8.2 94.0 3,473 Phongsaly 4.2 5.9 64.7 2.0 65.6 700 Luangnamtha 7.6 17.6 79.8 4.7 80.8 692 Oudomxay 7.8 13.9 64.3 2.1 67.3 1,402 Bokeo 5.2 16.1 82.0 1.7 83.0 724 Luangprabang 8.5 20.6 68.0 4.9 71.4 1,715 Huaphanh 2.9 7.4 50.7 1.2 51.6 1,045 Xayabury 7.6 19.6 84.2 3.4 85.8 1,523 Xiengkhuang 12.7 25.7 78.0 7.4 80.4 1,034 Vientiane 3.8 14.1 86.9 0.6 89.0 1,743 Borikhamxay 9.7 17.6 86.2 2.6 88.4 1,129 Khammuane 6.1 14.0 77.4 1.6 78.7 1,541 Savannakhet 3.6 13.9 70.8 1.0 72.7 3,351 Saravane 2.8 7.9 59.4 0.7 61.6 1,510 Sekong 7.4 18.5 65.6 4.2 69.5 431 Champasack 7.5 15.1 84.2 3.2 85.8 2,396 Attapeu 8.5 21.5 83.6 2.3 86.2 541 Xaysomboune 2.0 3.5 49.3 0.4 50.5 353
Age 15-19 7.8 16.6 74.8 2.9 77.3 4,565
15-17 8.3 15.9 75.8 2.9 78.5 2,796 18-19 6.9 17.7 73.2 2.8 75.5 1,769
20-24 7.3 17.9 76.4 3.1 78.5 4,024 25-29 8.8 17.7 75.0 4.0 76.7 4,045 30-34 7.9 16.6 77.0 3.7 78.9 3,824 35-39 6.9 16.4 76.9 3.3 78.4 3,418 40-44 4.9 17.4 77.7 2.3 79.8 3,076 45-49 6.0 20.6 79.4 3.1 81.7 2,353
Education None or ECE 0.2 7.0 45.9 0.0 48.1 4,087 Primary 1.8 15.1 74.4 0.6 76.4 8,922 Lower secondary 4.4 17.7 84.5 1.8 86.2 5,535 Upper secondary 11.5 21.9 89.7 4.8 91.6 3,482 Post secondary / Non tertiary 27.0 28.2 94.0 13.0 95.7 885 Higher 32.6 32.6 92.5 15.4 94.8 2,394
Ethno-linguistic group of household head
Lao-Tai 9.3 20.4 87.4 4.2 89.0 16,522 Mon-Khmer 3.1 12.3 59.3 1.2 61.8 5,779 Hmong-Mien 3.3 11.8 42.5 1.5 46.6 2,109 Chinese-Tibetan 4.8 6.1 65.1 2.0 65.7 628 Other, DK, Missing 3.3 12.2 71.6 1.7 71.6 266
Wealth index quintile Poorest 0.8 6.5 28.4 0.1 31.8 4,337 Second 2.1 11.8 70.1 0.7 72.6 4,716 Middle 3.9 16.1 86.1 1.5 88.1 4,908 Fourth 7.7 22.1 92.3 3.5 93.5 5,414 Richest 18.5 26.7 94.4 8.6 95.7 5,929
1 MICS indicator SR.3 - Exposure to mass media
Read a newspaper at least once a
week
Listen to the radio at least once a
weekWatch television at least once a week
Total 8.6 23.4 83.4 4.4 85.4 12,017
AreaUrban 16.3 33.4 92.5 9.4 94.2 3,827Rural 5.0 18.7 79.1 2.1 81.3 8,190
Rural with road 5.4 20.2 81.3 2.3 83.6 7,035Rural without road 2.4 9.4 65.7 0.9 67.6 1,155
RegionNorth 5.0 17.4 78.0 2.1 79.5 3,824Central 11.5 29.0 86.8 6.5 89.2 5,913South 7.3 19.0 83.4 3.1 85.5 2,280
ProvinceVientiane Capital 16.4 38.3 96.2 11.8 97.5 1,564Phongsaly 4.7 12.4 78.4 2.5 79.7 373Luangnamtha 2.8 4.6 66.0 1.4 66.7 350Oudomxay 2.9 15.4 82.2 1.2 84.1 640Bokeo 10.2 36.5 87.3 5.5 90.6 341Luangprabang 2.4 3.4 73.5 0.1 74.0 841Huaphanh 9.9 9.5 71.5 3.0 72.6 568Xayabury 4.8 41.9 85.8 2.9 88.3 712Xiengkhuang 26.3 53.3 87.9 17.5 91.8 498Vientiane 7.5 25.6 91.1 3.6 92.4 826Borikhamxay 12.0 22.4 86.4 4.9 88.7 521Khammuane 3.5 11.7 84.6 1.6 85.3 704Savannakhet 6.2 24.8 77.7 2.2 81.6 1,619Saravane 6.9 11.4 76.2 1.8 78.4 709Sekong 11.1 31.2 69.6 6.5 75.6 209Champasack 4.6 16.6 89.9 1.9 90.7 1,119Attapeu 18.2 41.2 86.2 9.0 90.9 243Xaysomboune 23.0 19.5 74.8 6.7 80.0 182
Age15-19 6.1 19.1 84.3 2.4 85.6 2,404
15-17 6.5 19.3 84.6 2.7 85.9 1,57018-19 5.3 18.8 83.5 2.0 85.0 834
20-24 6.3 21.2 82.0 3.5 83.9 1,77425-29 8.9 23.7 81.6 4.7 84.1 1,81030-34 11.1 25.1 83.5 6.0 85.7 1,77235-39 8.5 24.6 81.7 4.6 84.0 1,61240-44 11.3 25.2 85.0 5.8 87.0 1,41245-49 10.2 28.2 86.2 5.5 88.9 1,232
EducationNone or ECE 0.4 8.8 51.9 0.0 54.4 780Primary 2.2 17.7 76.8 0.9 79.3 3,716Lower secondary 5.3 22.5 85.9 2.5 87.9 3,517Upper secondary 8.1 25.8 91.9 3.3 93.1 2,169Post secondary / Non tertiary 30.1 38.3 93.4 16.3 96.7 488Higher 33.1 40.6 95.7 19.7 97.2 1,346
Ethno-linguistic group of household headLao-Tai 10.2 27.4 91.7 5.6 93.2 7,758Mon-Khmer 5.3 16.6 70.2 2.1 73.3 2,759Hmong-Mien 7.5 17.2 60.6 3.0 64.7 1,072Chinese-Tibetan 3.7 8.1 72.5 1.9 73.4 326Other, DK, Missing 6.1 18.1 78.0 2.6 79.7 102
Wealth index quintilePoorest 2.2 11.1 46.5 0.6 51.3 2,172Second 4.3 15.8 82.7 1.5 84.7 2,370Middle 5.6 21.7 91.7 2.4 93.0 2,352Fourth 9.3 28.3 94.5 4.3 95.8 2,676Richest 20.7 37.9 96.5 12.9 97.8 2,447
1 MICS indicator SR.3 - Exposure to mass media
Table SR.9.1M: Exposure to mass media (men)Percentage of men age 15-49 years who are exposed to specific mass media on a weekly basis, Lao PDR, 2017
Percentage of men age 15-49 years who: All three media at
least once a week1
Any media at least once a week
Number of men age
15-49 years
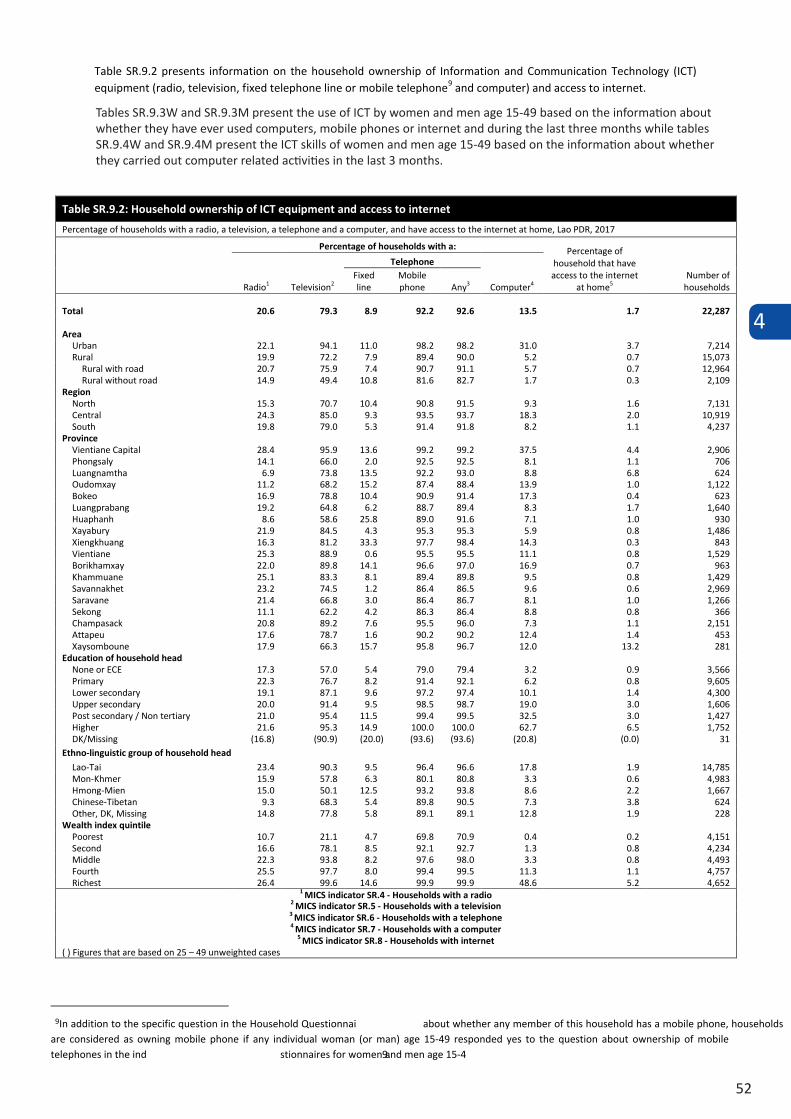
4
52
Table SR.9.2 presents information on the household ownership of Information and Communication Technology (ICT) equipment (radio, television, fixed telephone line or mobile telephone9 and computer) and access to internet.
Table SR.9.2: Household ownership of ICT equipment and access to internet
Percentage of households with a radio, a television, a telephone and a computer, and have access to the internet at home, Lao PDR, 2017
Percentage of households with a: Percentage of household that have access to the internet
at home5 Number of households Radio1 Television2
Telephone
Computer4 Fixed line
Mobile phone Any3
Total 20.6 79.3 8.9 92.2 92.6 13.5 1.7 22,287
Area Urban 22.1 94.1 11.0 98.2 98.2 31.0 3.7 7,214 Rural 19.9 72.2 7.9 89.4 90.0 5.2 0.7 15,073
Rural with road 20.7 75.9 7.4 90.7 91.1 5.7 0.7 12,964 Rural without road 14.9 49.4 10.8 81.6 82.7 1.7 0.3 2,109
Region North 15.3 70.7 10.4 90.8 91.5 9.3 1.6 7,131 Central 24.3 85.0 9.3 93.5 93.7 18.3 2.0 10,919 South 19.8 79.0 5.3 91.4 91.8 8.2 1.1 4,237
Province Vientiane Capital 28.4 95.9 13.6 99.2 99.2 37.5 4.4 2,906 Phongsaly 14.1 66.0 2.0 92.5 92.5 8.1 1.1 706 Luangnamtha 6.9 73.8 13.5 92.2 93.0 8.8 6.8 624 Oudomxay 11.2 68.2 15.2 87.4 88.4 13.9 1.0 1,122 Bokeo 16.9 78.8 10.4 90.9 91.4 17.3 0.4 623 Luangprabang 19.2 64.8 6.2 88.7 89.4 8.3 1.7 1,640 Huaphanh 8.6 58.6 25.8 89.0 91.6 7.1 1.0 930 Xayabury 21.9 84.5 4.3 95.3 95.3 5.9 0.8 1,486 Xiengkhuang 16.3 81.2 33.3 97.7 98.4 14.3 0.3 843 Vientiane 25.3 88.9 0.6 95.5 95.5 11.1 0.8 1,529 Borikhamxay 22.0 89.8 14.1 96.6 97.0 16.9 0.7 963 Khammuane 25.1 83.3 8.1 89.4 89.8 9.5 0.8 1,429 Savannakhet 23.2 74.5 1.2 86.4 86.5 9.6 0.6 2,969 Saravane 21.4 66.8 3.0 86.4 86.7 8.1 1.0 1,266 Sekong 11.1 62.2 4.2 86.3 86.4 8.8 0.8 366 Champasack 20.8 89.2 7.6 95.5 96.0 7.3 1.1 2,151 Attapeu 17.6 78.7 1.6 90.2 90.2 12.4 1.4 453 Xaysomboune 17.9 66.3 15.7 95.8 96.7 12.0 13.2 281
Education of household head None or ECE 17.3 57.0 5.4 79.0 79.4 3.2 0.9 3,566 Primary 22.3 76.7 8.2 91.4 92.1 6.2 0.8 9,605 Lower secondary 19.1 87.1 9.6 97.2 97.4 10.1 1.4 4,300 Upper secondary 20.0 91.4 9.5 98.5 98.7 19.0 3.0 1,606 Post secondary / Non tertiary 21.0 95.4 11.5 99.4 99.5 32.5 3.0 1,427 Higher 21.6 95.3 14.9 100.0 100.0 62.7 6.5 1,752 DK/Missing (16.8) (90.9) (20.0) (93.6) (93.6) (20.8) (0.0) 31
Ethno-linguistic group of household head
Lao-Tai 23.4 90.3 9.5 96.4 96.6 17.8 1.9 14,785 Mon-Khmer 15.9 57.8 6.3 80.1 80.8 3.3 0.6 4,983 Hmong-Mien 15.0 50.1 12.5 93.2 93.8 8.6 2.2 1,667 Chinese-Tibetan 9.3 68.3 5.4 89.8 90.5 7.3 3.8 624 Other, DK, Missing 14.8 77.8 5.8 89.1 89.1 12.8 1.9 228
Wealth index quintile Poorest 10.7 21.1 4.7 69.8 70.9 0.4 0.2 4,151 Second 16.6 78.1 8.5 92.1 92.7 1.3 0.8 4,234 Middle 22.3 93.8 8.2 97.6 98.0 3.3 0.8 4,493 Fourth 25.5 97.7 8.0 99.4 99.5 11.3 1.1 4,757 Richest 26.4 99.6 14.6 99.9 99.9 48.6 5.2 4,652
1 MICS indicator SR.4 - Households with a radio 2 MICS indicator SR.5 - Households with a television 3 MICS indicator SR.6 - Households with a telephone 4 MICS indicator SR.7 - Households with a computer
5 MICS indicator SR.8 - Households with internet ( ) Figures that are based on 25 – 49 unweighted cases
9In addition to the specific question in the Household Questionnaire about whether any member of this household has a mobile phone, households are considered as owning mobile phone if any individual woman (or man) age 15-49 responded yes to the question about ownership of mobile telephones in the individual questionnaires for women and men age 15-49.
Tables SR.9.3W and SR.9.3M present the use of ICT by women and men age 15-49 based on the information about whether they have ever used computers, mobile phones or internet and during the last three months while tables SR.9.4W and SR.9.4M present the ICT skills of women and men age 15-49 based on the information about whether they carried out computer related activities in the last 3 months.
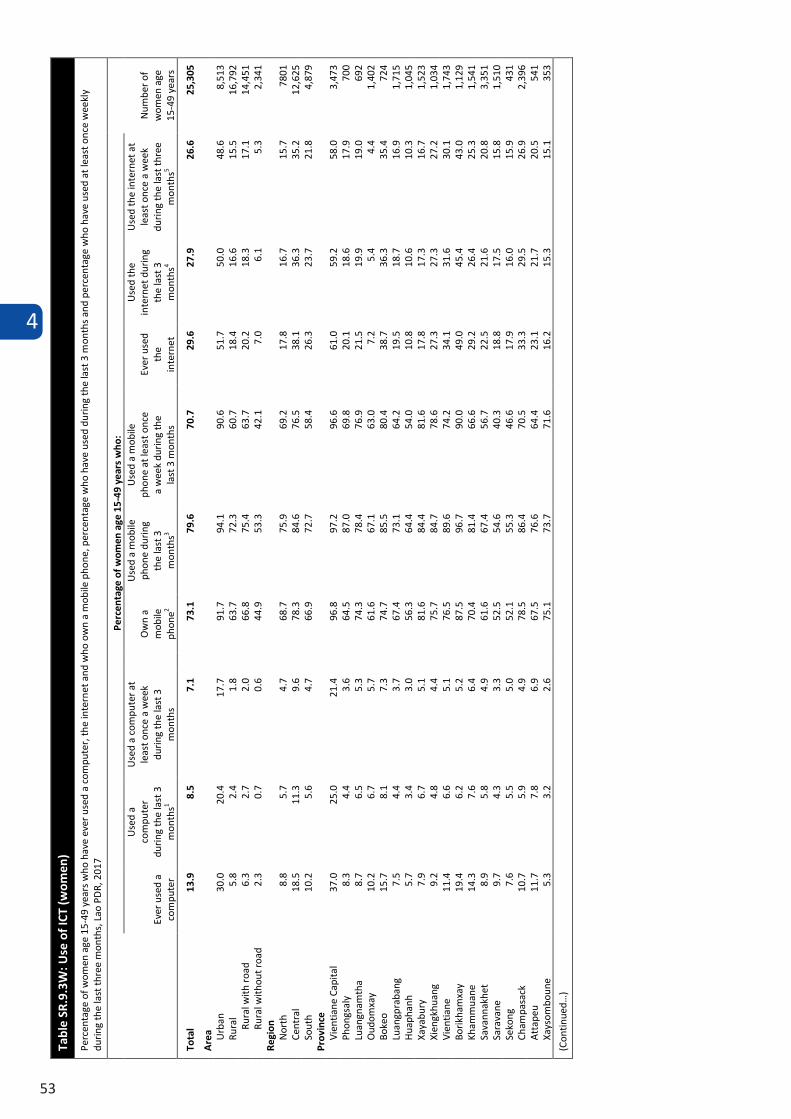
4
53
Tabl
es S
R.9.
3W a
nd S
R.9.
3M p
rese
nt t
he u
se o
f IC
T by
wom
en a
nd m
en a
ge 1
5-49
bas
ed o
n th
e in
form
atio
n ab
out
whe
ther
the
y ha
ve e
ver
used
com
pute
rs,
mob
ile p
hone
s or
in
tern
et a
nd d
urin
g th
e la
st t
hree
mon
ths
whi
le t
able
s SR
.9.4
W a
nd S
R.9.
4M p
rese
nt t
he I
CT s
kills
of
wom
en a
nd m
en a
ge 1
5-49
bas
ed o
n th
e in
form
atio
n ab
out
whe
ther
the
y ca
rrie
d ou
t com
pute
r re
late
d ac
tiviti
es in
the
last
3 m
onth
s.
Tabl
e SR
.9.3
W: U
se o
f ICT
(wom
en)
Perc
enta
ge o
f wom
en a
ge 1
5-49
yea
rs w
ho h
ave
ever
use
d a
com
pute
r, th
e in
tern
et a
nd w
ho o
wn
a m
obile
pho
ne, p
erce
ntag
e w
ho h
ave
used
dur
ing
the
last
3 m
onth
s an
d pe
rcen
tage
who
hav
e us
ed a
t lea
st o
nce
wee
kly
durin
g th
e la
st th
ree
mon
ths,
Lao
PD
R, 2
017
Perc
enta
ge o
f wom
en a
ge 1
5-49
yea
rs w
ho:
Num
ber o
f w
omen
age
15
-49
year
s Ev
er u
sed
a co
mpu
ter
Use
d a
com
pute
r du
ring
the
last
3
mon
ths1
Use
d a
com
pute
r at
leas
t onc
e a
wee
k du
ring
the
last
3
mon
ths
Ow
n a
mob
ile
phon
e2
Use
d a
mob
ile
phon
e du
ring
the
last
3
mon
ths3
Use
d a
mob
ile
phon
e at
leas
t onc
e a
wee
k du
ring
the
last
3 m
onth
s
Ever
use
d th
e in
tern
et
Use
d th
e in
tern
et d
urin
g th
e la
st 3
m
onth
s4
Use
d th
e in
tern
et a
t le
ast o
nce
a w
eek
durin
g th
e la
st th
ree
mon
ths5
Tota
l 13
.9
8.5
7.1
73.1
79
.6
70.7
29
.6
27.9
26
.6
25,3
05
Are
a Urb
an
30.0
20
.4
17.7
91
.7
94.1
90
.6
51.7
50
.0
48.6
8,
513
Rura
l 5.
8 2.
4 1.
8 63
.7
72.3
60
.7
18.4
16
.6
15.5
16
,792
Ru
ral w
ith r
oad
6.3
2.7
2.0
66.8
75
.4
63.7
20
.2
18.3
17
.1
14,4
51
Rura
l with
out r
oad
2.3
0.7
0.6
44.9
53
.3
42.1
7.
0 6.
1 5.
3 2,
341
Regi
on
Nor
th
8.8
5.7
4.7
68.7
75
.9
69.2
17
.8
16.7
15
.7
7801
Ce
ntra
l 18
.5
11.3
9.
6 78
.3
84.6
76
.5
38.1
36
.3
35.2
12
,625
So
uth
10.2
5.
6 4.
7 66
.9
72.7
58
.4
26.3
23
.7
21.8
4,
879
Prov
ince
Vi
entia
ne C
apita
l 37
.0
25.0
21
.4
96.8
97
.2
96.6
61
.0
59.2
58
.0
3,47
3 Ph
ongs
aly
8.
3 4.
4 3.
6 64
.5
87.0
69
.8
20.1
18
.6
17.9
70
0 Lu
angn
amth
a 8.
7 6.
5 5.
3 74
.3
78.4
76
.9
21.5
19
.9
19.0
69
2 O
udom
xay
10.2
6.
7 5.
7 61
.6
67.1
63
.0
7.2
5.4
4.4
1,40
2 Bo
keo
15.7
8.
1 7.
3 74
.7
85.5
80
.4
38.7
36
.3
35.4
72
4 Lu
angp
raba
ng
7.5
4.4
3.7
67.4
73
.1
64.2
19
.5
18.7
16
.9
1,71
5 H
uaph
anh
5.7
3.4
3.0
56.3
64
.4
54.0
10
.8
10.6
10
.3
1,04
5 Xa
yabu
ry
7.9
6.7
5.1
81.6
84
.4
81.6
17
.8
17.3
16
.7
1,52
3 Xi
engk
huan
g 9.
2 4.
8 4.
4 75
.7
84.7
78
.6
27.3
27
.3
27.2
1,
034
Vien
tiane
11
.4
6.6
5.1
76.5
89
.6
74.2
34
.1
31.6
30
.1
1,74
3 Bo
rikha
mxa
y 19
.4
6.2
5.2
87.5
96
.7
90.0
49
.0
45.4
43
.0
1,12
9 Kh
amm
uane
14
.3
7.6
6.4
70.4
81
.4
66.6
29
.2
26.4
25
.3
1,54
1 Sa
vann
akhe
t 8.
9 5.
8 4.
9 61
.6
67.4
56
.7
22.5
21
.6
20.8
3,
351
Sara
vane
9.
7 4.
3 3.
3 52
.5
54.6
40
.3
18.8
17
.5
15.8
1,
510
Seko
ng
7.6
5.5
5.0
52.1
55
.3
46.6
17
.9
16.0
15
.9
431
Cham
pasa
ck
10.7
5.
9 4.
9 78
.5
86.4
70
.5
33.3
29
.5
26.9
2,
396
Att
apeu
11
.7
7.8
6.9
67.5
76
.6
64.4
23
.1
21.7
20
.5
541
Xays
ombo
une
5.3
3.2
2.6
75.1
73
.7
71.6
16
.2
15.3
15
.1
353
(Con
tinue
d…)
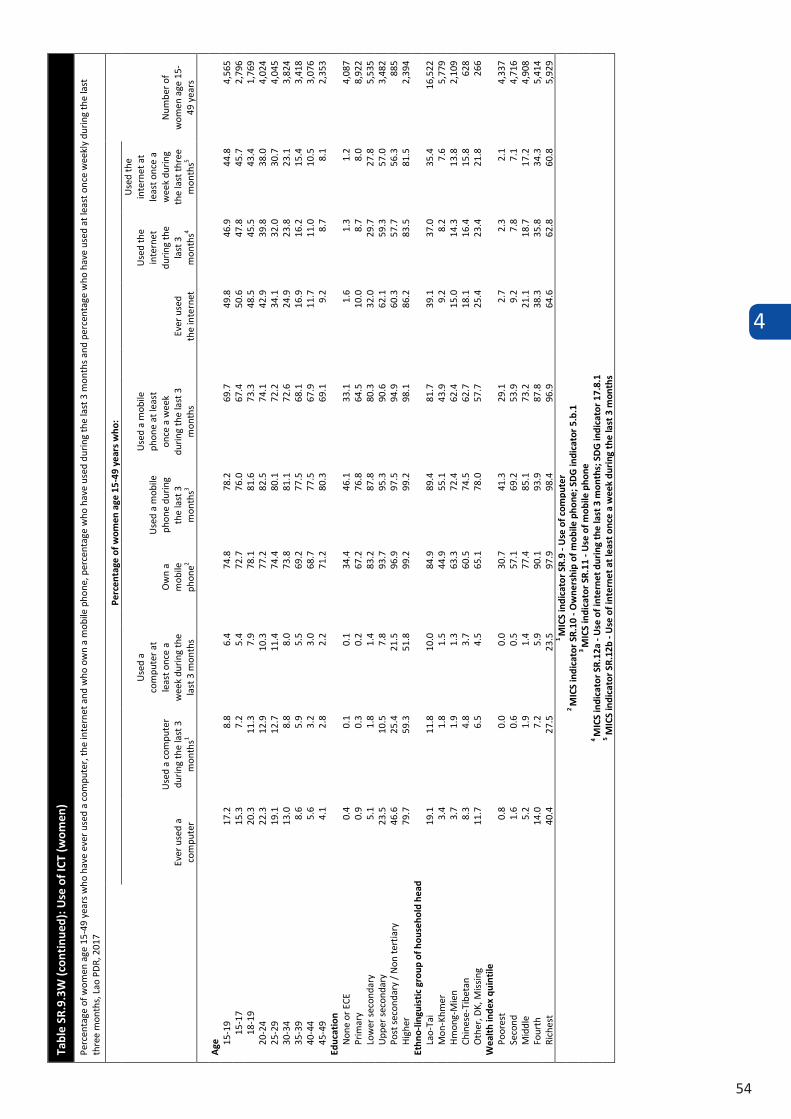
4
54
Tabl
e SR
.9.3
W (c
onti
nued
): U
se o
f ICT
(wom
en)
Perc
enta
ge o
f wom
en a
ge 1
5-49
yea
rs w
ho h
ave
ever
use
d a
com
pute
r, th
e in
tern
et a
nd w
ho o
wn
a m
obile
pho
ne, p
erce
ntag
e w
ho h
ave
used
dur
ing
the
last
3 m
onth
s an
d pe
rcen
tage
who
hav
e us
ed a
t lea
st o
nce
wee
kly
durin
g th
e la
st
thre
e m
onth
s, L
ao P
DR,
201
7
Perc
enta
ge o
f wom
en a
ge 1
5-49
yea
rs w
ho:
Num
ber o
f w
omen
age
15-
49 y
ears
Ev
er u
sed
a co
mpu
ter
Use
d a
com
pute
r du
ring
the
last
3
mon
ths1
Use
d a
com
pute
r at
leas
t onc
e a
wee
k du
ring
the
last
3 m
onth
s
Ow
n a
mob
ile
phon
e2
Use
d a
mob
ile
phon
e du
ring
the
last
3
mon
ths3
Use
d a
mob
ile
phon
e at
leas
t on
ce a
wee
k du
ring
the
last
3
mon
ths
Ever
use
d th
e in
tern
et
Use
d th
e in
tern
et
durin
g th
e la
st 3
m
onth
s4
Use
d th
e in
tern
et a
t le
ast o
nce
a w
eek
durin
g th
e la
st th
ree
mon
ths5
Age
15
-19
17.2
8.
8 6.
4 74
.8
78.2
69
.7
49.8
46
.9
44.8
4,
565
15
-17
15.3
7.
2 5.
4 72
.7
76.0
67
.4
50.6
47
.8
45.7
2,
796
18
-19
20.3
11
.3
7.9
78.1
81
.6
73.3
48
.5
45.5
43
.4
1,76
9
20-2
4 22
.3
12.9
10
.3
77.2
82
.5
74.1
42
.9
39.8
38
.0
4,02
4
25-2
9 19
.1
12.7
11
.4
74.4
80
.1
72.2
34
.1
32.0
30
.7
4,04
5
30-3
4 13
.0
8.8
8.0
73.8
81
.1
72.6
24
.9
23.8
23
.1
3,82
4
35-3
9 8.
6 5.
9 5.
5 69
.2
77.5
68
.1
16.9
16
.2
15.4
3,
418
40
-44
5.6
3.2
3.0
68.7
77
.5
67.9
11
.7
11.0
10
.5
3,07
6
45-4
9 4.
1 2.
8 2.
2 71
.2
80.3
69
.1
9.2
8.7
8.1
2,35
3
Educ
atio
n N
one
or E
CE
0.4
0.1
0.1
34.4
46
.1
33.1
1.
6 1.
3 1.
2 4,
087
Pr
imar
y 0.
9 0.
3 0.
2 67
.2
76.8
64
.5
10.0
8.
7 8.
0
8
,922
Lo
wer
sec
onda
ry
5.1
1.8
1.4
83.2
87
.8
80.3
32
.0
29.7
27
.8
5,53
5
Upp
er s
econ
dary
23
.5
10.5
7.
8 93
.7
95.3
90
.6
62.1
59
.3
57.0
3,
482
Po
st s
econ
dary
/ N
on te
rtia
ry
46.6
25
.4
21.5
96
.9
97.5
94
.9
60.3
57
.7
56.3
88
5
Hig
her
79.7
59
.3
51.8
99
.2
99.2
98
.1
86.2
83
.5
81.5
2,
394
Et
hno-
lingu
isti
c gr
oup
of h
ouse
hold
hea
d La
o-Ta
i 19
.1
11.8
10
.0
84.9
89
.4
81.7
39
.1
37.0
35
.4
16,5
22
Mon
-Khm
er
3.4
1.8
1.5
44.9
55
.1
43.9
9.
2 8.
2 7.
6 5,
779
H
mon
g-M
ien
3.7
1.9
1.3
63.3
72
.4
62.4
15
.0
14.3
13
.8
2,10
9
Chin
ese-
Tibe
tan
8.3
4.8
3.7
60.5
74
.5
62.7
18
.1
16.4
15
.8
628
O
ther
, DK,
Mis
sing
11
.7
6.5
4.5
65.1
78
.0
57.7
25
.4
23.4
21
.8
266
W
ealt
h in
dex
quin
tile
Po
ores
t 0.
8 0.
0 0.
0 30
.7
41.3
29
.1
2.7
2.3
2.1
4,33
7
Seco
nd
1.6
0.6
0.5
57.1
69
.2
53.9
9.
2 7.
8 7.
1 4,
716
M
iddl
e 5.
2 1.
9 1.
4 77
.4
85.1
73
.2
21.1
18
.7
17.2
4,
908
Fo
urth
14
.0
7.2
5.9
90.1
93
.9
87.8
38
.3
35.8
34
.3
5,41
4
Rich
est
40.4
27
.5
23.5
97
.9
98.4
96
.9
64.6
62
.8
60.8
5,
929
1
MIC
S in
dica
tor
SR.9
- U
se o
f com
pute
r 2
MIC
S in
dica
tor
SR.1
0 - O
wne
rshi
p of
mob
ile p
hone
; SD
G in
dica
tor
5.b.
1 3
MIC
S in
dica
tor
SR.1
1 - U
se o
f mob
ile p
hone
4
MIC
S in
dica
tor
SR.1
2a -
Use
of i
nter
net d
urin
g th
e la
st 3
mon
ths;
SD
G in
dica
tor
17.8
.1
5 MIC
S in
dica
tor S
R.12
b - U
se o
f int
erne
t at l
east
onc
e a
wee
k du
ring
the
last
3 m
onth
s
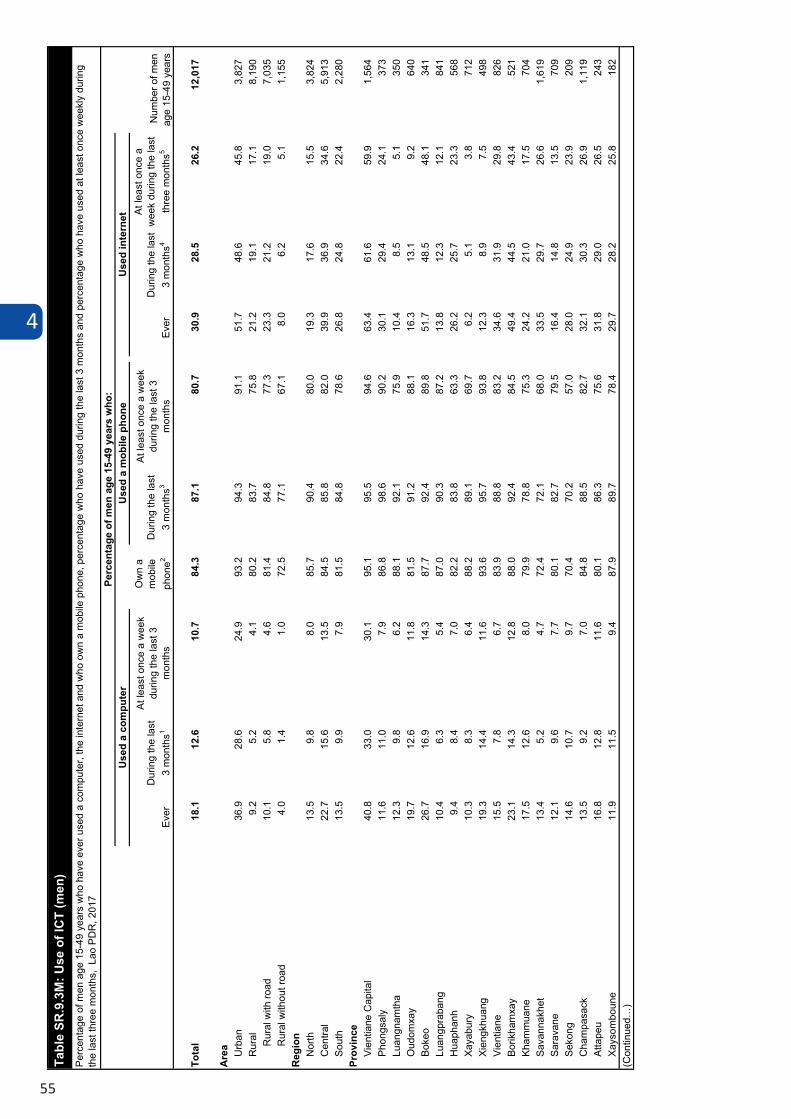
4
55
Ever
Dur
ing
the
last
3
mon
ths1
At le
ast o
nce
a w
eek
durin
g th
e la
st 3
m
onth
sD
urin
g th
e la
st
3 m
onth
s3
At le
ast o
nce
a w
eek
durin
g th
e la
st 3
m
onth
sEv
erD
urin
g th
e la
st
3 m
onth
s4
At le
ast o
nce
a w
eek
durin
g th
e la
st
thre
e m
onth
s5
Tota
l18
.112
.610
.784
.387
.180
.730
.928
.526
.212
,017
Are
a Urb
an36
.928
.624
.993
.294
.391
.151
.748
.645
.83,
827
Rur
al9.
25.
24.
180
.283
.775
.821
.219
.117
.18,
190
Rur
al w
ith ro
ad10
.15.
84.
681
.484
.877
.323
.321
.219
.07,
035
Rur
al w
ithou
t roa
d4.
01.
41.
072
.577
.167
.18.
06.
25.
11,
155
Reg
ion
Nor
th13
.59.
88.
085
.790
.480
.019
.317
.615
.53,
824
Cen
tral
22.7
15.6
13.5
84.5
85.8
82.0
39.9
36.9
34.6
5,91
3So
uth
13.5
9.9
7.9
81.5
84.8
78.6
26.8
24.8
22.4
2,28
0Pr
ovin
ceVi
entia
ne C
apita
l40
.833
.030
.195
.195
.594
.663
.461
.659
.91,
564
Phon
gsal
y 11
.611
.07.
986
.898
.690
.230
.129
.424
.137
3Lu
angn
amth
a12
.39.
86.
288
.192
.175
.910
.48.
55.
135
0O
udom
xay
19.7
12.6
11.8
81.5
91.2
88.1
16.3
13.1
9.2
640
Boke
o26
.716
.914
.387
.792
.489
.851
.748
.548
.134
1Lu
angp
raba
ng10
.46.
35.
487
.090
.387
.213
.812
.312
.184
1H
uaph
anh
9.4
8.4
7.0
82.2
83.8
63.3
26.2
25.7
23.3
568
Xaya
bury
10.3
8.3
6.4
88.2
89.1
69.7
6.2
5.1
3.8
712
Xien
gkhu
ang
19.3
14.4
11.6
93.6
95.7
93.8
12.3
8.9
7.5
498
Vien
tiane
15.5
7.8
6.7
83.9
88.8
83.2
34.6
31.9
29.8
826
Borik
ham
xay
23.1
14.3
12.8
88.0
92.4
84.5
49.4
44.5
43.4
521
Kham
mua
ne17
.512
.68.
079
.978
.875
.324
.221
.017
.570
4Sa
vann
akhe
t13
.45.
24.
772
.472
.168
.033
.529
.726
.61,
619
Sara
vane
12.1
9.6
7.7
80.1
82.7
79.5
16.4
14.8
13.5
709
Seko
ng14
.610
.79.
770
.470
.257
.028
.024
.923
.920
9C
ham
pasa
ck13
.59.
27.
084
.888
.582
.732
.130
.326
.91,
119
Atta
peu
16.8
12.8
11.6
80.1
86.3
75.6
31.8
29.0
26.5
243
Xays
ombo
une
11.9
11.5
9.4
87.9
89.7
78.4
29.7
28.2
25.8
182
(Con
tinue
d…)
Use
d a
mob
ile p
hone
Use
d in
tern
et
Tabl
e SR
.9.3
M: U
se o
f IC
T (m
en)
Perc
enta
ge o
f men
age
15-
49 y
ears
who
hav
e ev
er u
sed
a co
mpu
ter,
the
inte
rnet
and
who
ow
n a
mob
ile p
hone
, per
cent
age
who
hav
e us
ed d
urin
g th
e la
st 3
mon
ths
and
perc
enta
ge w
ho h
ave
used
at l
east
onc
e w
eekl
y du
ring
the
last
thre
e m
onth
s, L
ao P
DR
, 201
7Pe
rcen
tage
of m
en a
ge 1
5-49
yea
rs w
ho:
Num
ber o
f men
ag
e 15
-49
year
s
Use
d a
com
pute
rO
wn
a m
obile
ph
one2
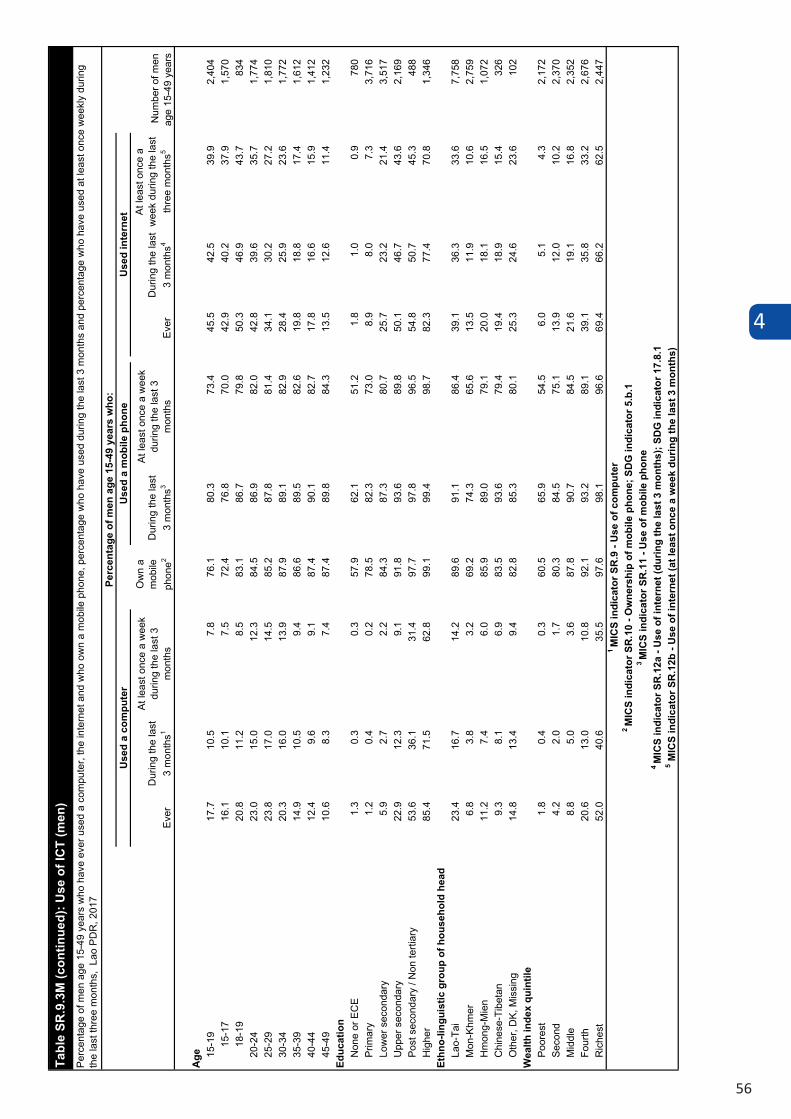
4
56
Tabl
e SR
.9.4
W: I
CT s
kills
(wom
en)
Perc
enta
ge o
f wom
en a
ge 1
5-49
yea
rs w
ho in
the
last
3 m
onth
s ha
ve c
arri
ed o
ut c
ompu
ter
rela
ted
activ
ities
, Lao
PD
R, 2
017
Perc
enta
ge o
f wom
en a
ge 1
5-49
yea
rs w
ho in
the
last
3 m
onth
s:
Num
ber o
f w
omen
age
15-
49
year
s
Copi
ed
or m
oved
a
file
or
fold
er
Use
d a
copy
an
d pa
ste
tool
to
dup
licat
e or
m
ove
info
rmat
ion
with
in a
do
cum
ent
Sent
e-m
ail
with
att
ache
d fil
e, s
uch
as a
do
cum
ent,
pi
ctur
e or
vi
deo
Use
d a
basi
c ar
ithm
etic
fo
rmul
a in
a
spre
adsh
eet
Conn
ecte
d an
d in
stal
led
a ne
w d
evic
e,
such
as
a m
odem
, ca
mer
a or
pr
inte
r
Foun
d,
dow
nloa
ded,
in
stal
led
and
conf
igur
ed
soft
war
e
Crea
ted
an
elec
tron
ic
pres
enta
tion
with
pr
esen
tatio
n so
ftw
are,
incl
udin
g te
xt, i
mag
es, s
ound
, vi
deo
or c
hart
s
Tran
sfer
red
a fil
e be
twee
n a
com
pute
r an
d ot
her
devi
ce
Wro
te a
co
mpu
ter
prog
ram
in a
ny
prog
ram
min
g la
ngua
ge
Perf
orm
ed
at le
ast o
ne
of th
e ni
ne
liste
d co
mpu
ter
rela
ted
activ
ities
1
Tota
l 5.
6 5.
7 2.
9 5.
1 1.
7 2.
5 2.
4 4.
1 0.
5 7.
3 25
,305
Are
a Urb
an
13.9
14
.1
7.6
12.5
4.
4 6.
1 5.
8 10
.1
1.4
17.8
8,
513
Rura
l 1.
5 1.
4 0.
5 1.
3 0.
3 0.
6 0.
6 1.
0 0.
1 2.
0 16
,792
Ru
ral w
ith r
oad
1.6
1.6
0.6
1.4
0.3
0.7
0.7
1.1
0.1
2.2
14,4
51
Rura
l with
out
road
0.4
0.3
0.1
0.4
0.0
0.1
0.1
0.3
0.0
0.4
2,34
1 Re
gion
N
orth
3.
6 3.
5 1.
5 3.
4 0.
9 1.
7 1.
5 2.
9 0.
4 5.
0 7,
801
Cent
ral
7.8
7.8
4.5
6.8
2.5
3.4
3.5
5.5
0.7
9.8
12,6
25
Sout
h 3.
5 3.
7 1.
1 3.
2 0.
9 1.
4 0.
9 2.
3 0.
2 4.
5 4,
879
Prov
ince
Vi
entia
ne C
apita
l 17
.8
17.7
11
.8
15.7
5.
6 8.
4 8.
6 13
.4
2.0
22.0
3,
473
Phon
gsal
y
3.5
3.4
1.4
3.1
0.0
2.0
0.8
1.1
0.0
4.0
700
Luan
gnam
tha
4.4
4.8
3.1
4.0
1.1
2.3
2.8
3.4
1.6
6.2
692
Oud
omxa
y 3.
5 3.
4 1.
3 3.
4 0.
4 0.
7 1.
0 3.
0 0.
8 5.
2 1,
402
Boke
o 4.
4 3.
8 1.
4 4.
1 3.
5 3.
8 3.
3 4.
6 0.
2 7.
3 72
4 Lu
angp
raba
ng
3.0
3.1
1.2
3.3
0.2
0.9
1.7
2.5
0.3
4.0
1,71
5 H
uaph
anh
2.8
2.3
0.9
1.5
0.4
0.7
1.0
1.1
0.0
3.1
1,04
5 Xa
yabu
ry
4.1
4.1
1.7
4.3
1.6
2.7
1.0
4.1
0.4
5.9
1,52
3 Xi
engk
huan
g 3.
2 3.
0 1.
6 3.
4 0.
4 0.
6 1.
0 2.
1 0.
4 4.
1 1,
034
Vien
tiane
3.
2 3.
0 1.
3 2.
6 1.
1 1.
8 1.
9 2.
5 0.
3 5.
1 1,
743
Borik
ham
xay
4.8
5.3
2.0
3.7
2.5
0.6
1.1
2.9
0.1
5.7
1,12
9 Kh
amm
uane
4.
6 4.
6 1.
3 4.
7 1.
6 3.
0 2.
1 2.
9 0.
0 6.
8 1,
541
Sava
nnak
het
4.2
4.4
2.2
3.4
1.2
1.2
1.5
2.6
0.4
5.0
3,35
1 Sa
rava
ne
3.3
3.4
0.9
2.7
0.2
1.7
0.5
1.4
0.4
4.2
1,51
0 Se
kong
2.
6 3.
5 1.
0 2.
8 2.
3 0.
5 0.
8 0.
5 0.
1 4.
6 43
1 Ch
ampa
sack
3.
5 3.
6 1.
4 3.
3 1.
0 1.
2 1.
1 3.
0 0.
0 4.
2 2,
396
Att
apeu
4.
5 5.
1 0.
8 4.
2 1.
1 1.
8 1.
3 2.
9 0.
3 6.
8 54
1 Xa
ysom
boun
e 1.
7 1.
8 1.
1 1.
3 0.
2 0.
6 0.
5 1.
1 0.
0 2.
3 35
3 (C
ontin
ued…
)
Ever
Dur
ing
the
last
3
mon
ths1
At le
ast o
nce
a w
eek
durin
g th
e la
st 3
m
onth
sD
urin
g th
e la
st
3 m
onth
s3
At le
ast o
nce
a w
eek
durin
g th
e la
st 3
m
onth
sEv
erD
urin
g th
e la
st
3 m
onth
s4
At le
ast o
nce
a w
eek
durin
g th
e la
st
thre
e m
onth
s5
Age 15
-19
17.7
10.5
7.8
76.1
80.3
73.4
45.5
42.5
39.9
2,40
415
-17
16.1
10.1
7.5
72.4
76.8
70.0
42.9
40.2
37.9
1,57
018
-19
20.8
11.2
8.5
83.1
86.7
79.8
50.3
46.9
43.7
834
20-2
423
.015
.012
.384
.586
.982
.042
.839
.635
.71,
774
25-2
923
.817
.014
.585
.287
.881
.434
.130
.227
.21,
810
30-3
420
.316
.013
.987
.989
.182
.928
.425
.923
.61,
772
35-3
914
.910
.59.
486
.689
.582
.619
.818
.817
.41,
612
40-4
412
.49.
69.
187
.490
.182
.717
.816
.615
.91,
412
45-4
910
.68.
37.
487
.489
.884
.313
.512
.611
.41,
232
Educ
atio
nN
one
or E
CE
1.3
0.3
0.3
57.9
62.1
51.2
1.8
1.0
0.9
780
Prim
ary
1.2
0.4
0.2
78.5
82.3
73.0
8.9
8.0
7.3
3,71
6Lo
wer
sec
onda
ry5.
92.
72.
284
.387
.380
.725
.723
.221
.43,
517
Upp
er s
econ
dary
22.9
12.3
9.1
91.8
93.6
89.8
50.1
46.7
43.6
2,16
9Po
st s
econ
dary
/ N
on te
rtiar
y53
.636
.131
.497
.797
.896
.554
.850
.745
.348
8H
ighe
r85
.471
.562
.899
.199
.498
.782
.377
.470
.81,
346
Ethn
o-lin
guis
tic g
roup
of h
ouse
hold
hea
dLa
o-Ta
i23
.416
.714
.289
.691
.186
.439
.136
.333
.67,
758
Mon
-Khm
er6.
83.
83.
269
.274
.365
.613
.511
.910
.62,
759
Hm
ong-
Mie
n11
.27.
46.
085
.989
.079
.120
.018
.116
.51,
072
Chi
nese
-Tib
etan
9.3
8.1
6.9
83.5
93.6
79.4
19.4
18.9
15.4
326
Oth
er, D
K, M
issi
ng14
.813
.49.
482
.885
.380
.125
.324
.623
.610
2W
ealth
inde
x qu
intil
ePo
ores
t1.
80.
40.
360
.565
.954
.56.
05.
14.
32,
172
Seco
nd4.
22.
01.
780
.384
.575
.113
.912
.010
.22,
370
Mid
dle
8.8
5.0
3.6
87.8
90.7
84.5
21.6
19.1
16.8
2,35
2Fo
urth
20.6
13.0
10.8
92.1
93.2
89.1
39.1
35.8
33.2
2,67
6R
iche
st52
.040
.635
.597
.698
.196
.669
.466
.262
.52,
447
4 M
ICS
indi
cato
r SR
.12a
- U
se o
f int
erne
t (du
ring
the
last
3 m
onth
s); S
DG
indi
cato
r 17.
8.1
5 MIC
S in
dica
tor S
R.1
2b -
Use
of i
nter
net (
at le
ast o
nce
a w
eek
durin
g th
e la
st 3
mon
ths)
Use
d a
mob
ile p
hone
Use
d in
tern
et
1 M
ICS
indi
cato
r SR
.9 -
Use
of c
ompu
ter
2 M
ICS
indi
cato
r SR
.10
- Ow
ners
hip
of m
obile
pho
ne; S
DG
indi
cato
r 5.b
.13
MIC
S in
dica
tor S
R.1
1 - U
se o
f mob
ile p
hone
Tabl
e SR
.9.3
M (c
ontin
ued)
: Use
of I
CT
(men
)Pe
rcen
tage
of m
en a
ge 1
5-49
yea
rs w
ho h
ave
ever
use
d a
com
pute
r, th
e in
tern
et a
nd w
ho o
wn
a m
obile
pho
ne, p
erce
ntag
e w
ho h
ave
used
dur
ing
the
last
3 m
onth
s an
d pe
rcen
tage
who
hav
e us
ed a
t lea
st o
nce
wee
kly
durin
g th
e la
st th
ree
mon
ths,
Lao
PD
R, 2
017
Perc
enta
ge o
f men
age
15-
49 y
ears
who
:
Num
ber o
f men
ag
e 15
-49
year
s
Use
d a
com
pute
rO
wn
a m
obile
ph
one2
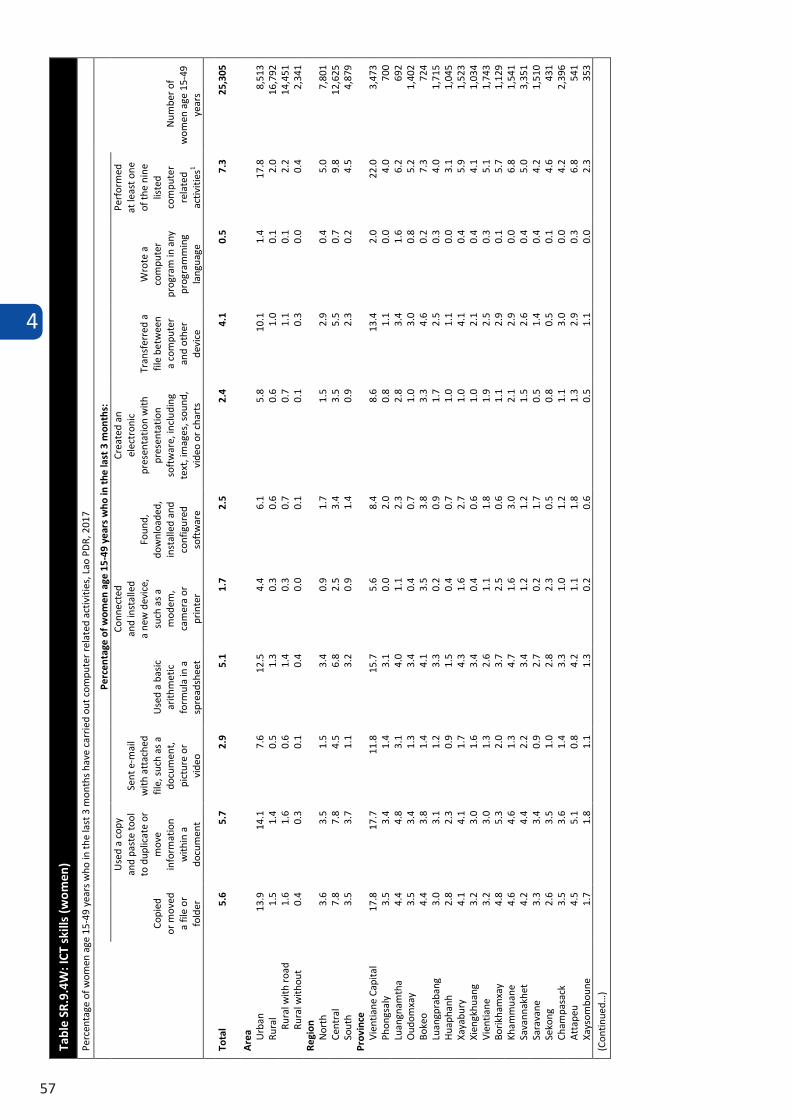
4
57
Tabl
e SR
.9.4
W: I
CT s
kills
(wom
en)
Perc
enta
ge o
f wom
en a
ge 1
5-49
yea
rs w
ho in
the
last
3 m
onth
s ha
ve c
arri
ed o
ut c
ompu
ter
rela
ted
activ
ities
, Lao
PD
R, 2
017
Perc
enta
ge o
f wom
en a
ge 1
5-49
yea
rs w
ho in
the
last
3 m
onth
s:
Num
ber o
f w
omen
age
15-
49
year
s
Copi
ed
or m
oved
a
file
or
fold
er
Use
d a
copy
an
d pa
ste
tool
to
dup
licat
e or
m
ove
info
rmat
ion
with
in a
do
cum
ent
Sent
e-m
ail
with
att
ache
d fil
e, s
uch
as a
do
cum
ent,
pi
ctur
e or
vi
deo
Use
d a
basi
c ar
ithm
etic
fo
rmul
a in
a
spre
adsh
eet
Conn
ecte
d an
d in
stal
led
a ne
w d
evic
e,
such
as
a m
odem
, ca
mer
a or
pr
inte
r
Foun
d,
dow
nloa
ded,
in
stal
led
and
conf
igur
ed
soft
war
e
Crea
ted
an
elec
tron
ic
pres
enta
tion
with
pr
esen
tatio
n so
ftw
are,
incl
udin
g te
xt, i
mag
es, s
ound
, vi
deo
or c
hart
s
Tran
sfer
red
a fil
e be
twee
n a
com
pute
r an
d ot
her
devi
ce
Wro
te a
co
mpu
ter
prog
ram
in a
ny
prog
ram
min
g la
ngua
ge
Perf
orm
ed
at le
ast o
ne
of th
e ni
ne
liste
d co
mpu
ter
rela
ted
activ
ities
1
Tota
l 5.
6 5.
7 2.
9 5.
1 1.
7 2.
5 2.
4 4.
1 0.
5 7.
3 25
,305
Are
a Urb
an
13.9
14
.1
7.6
12.5
4.
4 6.
1 5.
8 10
.1
1.4
17.8
8,
513
Rura
l 1.
5 1.
4 0.
5 1.
3 0.
3 0.
6 0.
6 1.
0 0.
1 2.
0 16
,792
Ru
ral w
ith r
oad
1.6
1.6
0.6
1.4
0.3
0.7
0.7
1.1
0.1
2.2
14,4
51
Rura
l with
out
road
0.4
0.3
0.1
0.4
0.0
0.1
0.1
0.3
0.0
0.4
2,34
1 Re
gion
N
orth
3.
6 3.
5 1.
5 3.
4 0.
9 1.
7 1.
5 2.
9 0.
4 5.
0 7,
801
Cent
ral
7.8
7.8
4.5
6.8
2.5
3.4
3.5
5.5
0.7
9.8
12,6
25
Sout
h 3.
5 3.
7 1.
1 3.
2 0.
9 1.
4 0.
9 2.
3 0.
2 4.
5 4,
879
Prov
ince
Vi
entia
ne C
apita
l 17
.8
17.7
11
.8
15.7
5.
6 8.
4 8.
6 13
.4
2.0
22.0
3,
473
Phon
gsal
y
3.5
3.4
1.4
3.1
0.0
2.0
0.8
1.1
0.0
4.0
700
Luan
gnam
tha
4.4
4.8
3.1
4.0
1.1
2.3
2.8
3.4
1.6
6.2
692
Oud
omxa
y 3.
5 3.
4 1.
3 3.
4 0.
4 0.
7 1.
0 3.
0 0.
8 5.
2 1,
402
Boke
o 4.
4 3.
8 1.
4 4.
1 3.
5 3.
8 3.
3 4.
6 0.
2 7.
3 72
4 Lu
angp
raba
ng
3.0
3.1
1.2
3.3
0.2
0.9
1.7
2.5
0.3
4.0
1,71
5 H
uaph
anh
2.8
2.3
0.9
1.5
0.4
0.7
1.0
1.1
0.0
3.1
1,04
5 Xa
yabu
ry
4.1
4.1
1.7
4.3
1.6
2.7
1.0
4.1
0.4
5.9
1,52
3 Xi
engk
huan
g 3.
2 3.
0 1.
6 3.
4 0.
4 0.
6 1.
0 2.
1 0.
4 4.
1 1,
034
Vien
tiane
3.
2 3.
0 1.
3 2.
6 1.
1 1.
8 1.
9 2.
5 0.
3 5.
1 1,
743
Borik
ham
xay
4.8
5.3
2.0
3.7
2.5
0.6
1.1
2.9
0.1
5.7
1,12
9 Kh
amm
uane
4.
6 4.
6 1.
3 4.
7 1.
6 3.
0 2.
1 2.
9 0.
0 6.
8 1,
541
Sava
nnak
het
4.2
4.4
2.2
3.4
1.2
1.2
1.5
2.6
0.4
5.0
3,35
1 Sa
rava
ne
3.3
3.4
0.9
2.7
0.2
1.7
0.5
1.4
0.4
4.2
1,51
0 Se
kong
2.
6 3.
5 1.
0 2.
8 2.
3 0.
5 0.
8 0.
5 0.
1 4.
6 43
1 Ch
ampa
sack
3.
5 3.
6 1.
4 3.
3 1.
0 1.
2 1.
1 3.
0 0.
0 4.
2 2,
396
Att
apeu
4.
5 5.
1 0.
8 4.
2 1.
1 1.
8 1.
3 2.
9 0.
3 6.
8 54
1 Xa
ysom
boun
e 1.
7 1.
8 1.
1 1.
3 0.
2 0.
6 0.
5 1.
1 0.
0 2.
3 35
3 (C
ontin
ued…
)
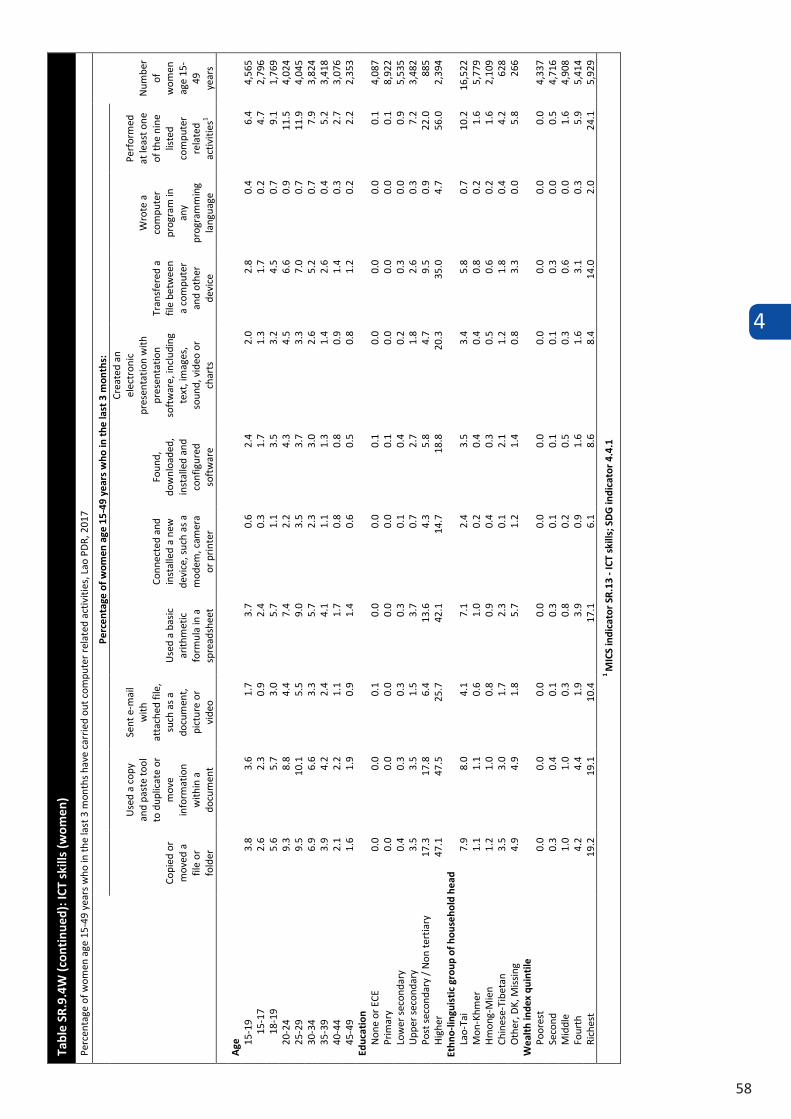
4
58
Tabl
e SR
.9.4
W (c
onti
nued
): IC
T sk
ills
(wom
en)
Perc
enta
ge o
f wom
en a
ge 1
5-49
yea
rs w
ho in
the
last
3 m
onth
s ha
ve c
arri
ed o
ut c
ompu
ter
rela
ted
activ
ities
, Lao
PD
R, 2
017
Perc
enta
ge o
f wom
en a
ge 1
5-49
yea
rs w
ho in
the
last
3 m
onth
s:
N
umbe
r of
w
omen
ag
e 15
-49
ye
ars
Copi
ed o
r m
oved
a
file
or
fold
er
Use
d a
copy
an
d pa
ste
tool
to
dup
licat
e or
m
ove
info
rmat
ion
with
in a
do
cum
ent
Sent
e-m
ail
with
at
tach
ed fi
le,
such
as
a do
cum
ent,
pi
ctur
e or
vi
deo
Use
d a
basi
c ar
ithm
etic
fo
rmul
a in
a
spre
adsh
eet
Conn
ecte
d an
d in
stal
led
a ne
w
devi
ce, s
uch
as a
m
odem
, cam
era
or p
rinte
r
Foun
d,
dow
nloa
ded,
in
stal
led
and
conf
igur
ed
soft
war
e
Crea
ted
an
elec
tron
ic
pres
enta
tion
with
pr
esen
tatio
n so
ftw
are,
incl
udin
g te
xt, i
mag
es,
soun
d, v
ideo
or
char
ts
Tran
sfer
ed a
fil
e be
twee
n a
com
pute
r an
d ot
her
devi
ce
Wro
te a
co
mpu
ter
prog
ram
in
any
prog
ram
min
g la
ngua
ge
Perf
orm
ed
at le
ast o
ne
of th
e ni
ne
liste
d co
mpu
ter
rela
ted
activ
ities
1
A
ge
15
-19
3.8
3.6
1.7
3.7
0.6
2.4
2.0
2.8
0.4
6.4
4,56
5 15
-17
2.6
2.3
0.9
2.4
0.3
1.7
1.3
1.7
0.2
4.7
2,79
6 18
-19
5.6
5.7
3.0
5.7
1.1
3.5
3.2
4.5
0.7
9.1
1,76
9 20
-24
9.3
8.8
4.4
7.4
2.2
4.3
4.5
6.6
0.9
11.5
4,
024
25-2
9 9.
5 10
.1
5.5
9.0
3.5
3.7
3.3
7.0
0.7
11.9
4,
045
30-3
4 6.
9 6.
6 3.
3 5.
7 2.
3 3.
0 2.
6 5.
2 0.
7 7.
9 3,
824
35-3
9 3.
9 4.
2 2.
4 4.
1 1.
1 1.
3 1.
4 2.
6 0.
4 5.
2 3,
418
40-4
4 2.
1 2.
2 1.
1 1.
7 0.
8 0.
8 0.
9 1.
4 0.
3 2.
7 3,
076
45-4
9 1.
6 1.
9 0.
9 1.
4 0.
6 0.
5 0.
8 1.
2 0.
2 2.
2 2,
353
Educ
atio
n
Non
e or
ECE
0.
0 0.
0 0.
1 0.
0 0.
0 0.
1 0.
0 0.
0 0.
0 0.
1 4,
087
Prim
ary
0.0
0.0
0.0
0.0
0.0
0.1
0.0
0.0
0.0
0.1
8,92
2 Lo
wer
sec
onda
ry
0.4
0.3
0.3
0.3
0.1
0.4
0.2
0.3
0.0
0.9
5,53
5 U
pper
sec
onda
ry
3.5
3.5
1.5
3.7
0.7
2.7
1.8
2.6
0.3
7.2
3,48
2 Po
st s
econ
dary
/ N
on te
rtia
ry
17.3
17
.8
6.4
13.6
4.
3 5.
8 4.
7 9.
5 0.
9 22
.0
885
Hig
her
47.1
47
.5
25.7
42
.1
14.7
18
.8
20.3
35
.0
4.7
56.0
2,
394
Ethn
o-lin
guis
tic
grou
p of
hou
seho
ld h
ead
Lao-
Tai
7.9
8.0
4.1
7.1
2.4
3.5
3.4
5.8
0.7
10.2
16
,522
M
on-K
hmer
1.
1 1.
1 0.
6 1.
0 0.
2 0.
4 0.
4 0.
8 0.
2 1.
6 5,
779
Hm
ong-
Mie
n 1.
2 1.
0 0.
8 0.
9 0.
4 0.
3 0.
5 0.
6 0.
2 1.
6 2,
109
Chin
ese-
Tibe
tan
3.5
3.0
1.7
2.3
0.1
2.1
1.2
1.8
0.4
4.2
628
Oth
er, D
K, M
issi
ng
4.9
4.9
1.8
5.7
1.2
1.4
0.8
3.3
0.0
5.8
266
Wea
lth
inde
x qu
inti
le
Po
ores
t 0.
0 0.
0 0.
0 0.
0 0.
0 0.
0 0.
0 0.
0 0.
0 0.
0 4,
337
Seco
nd
0.3
0.4
0.1
0.3
0.1
0.1
0.1
0.3
0.0
0.5
4,71
6 M
iddl
e 1.
0 1.
0 0.
3 0.
8 0.
2 0.
5 0.
3 0.
6 0.
0 1.
6 4,
908
Four
th
4.2
4.4
1.9
3.9
0.9
1.6
1.6
3.1
0.3
5.9
5,41
4 Ri
ches
t 19
.2
19.1
10
.4
17.1
6.
1 8.
6 8.
4 14
.0
2.0
24.1
5,
929
1 M
ICS
indi
cato
r SR
.13
- ICT
ski
lls; S
DG
indi
cato
r 4.
4.1
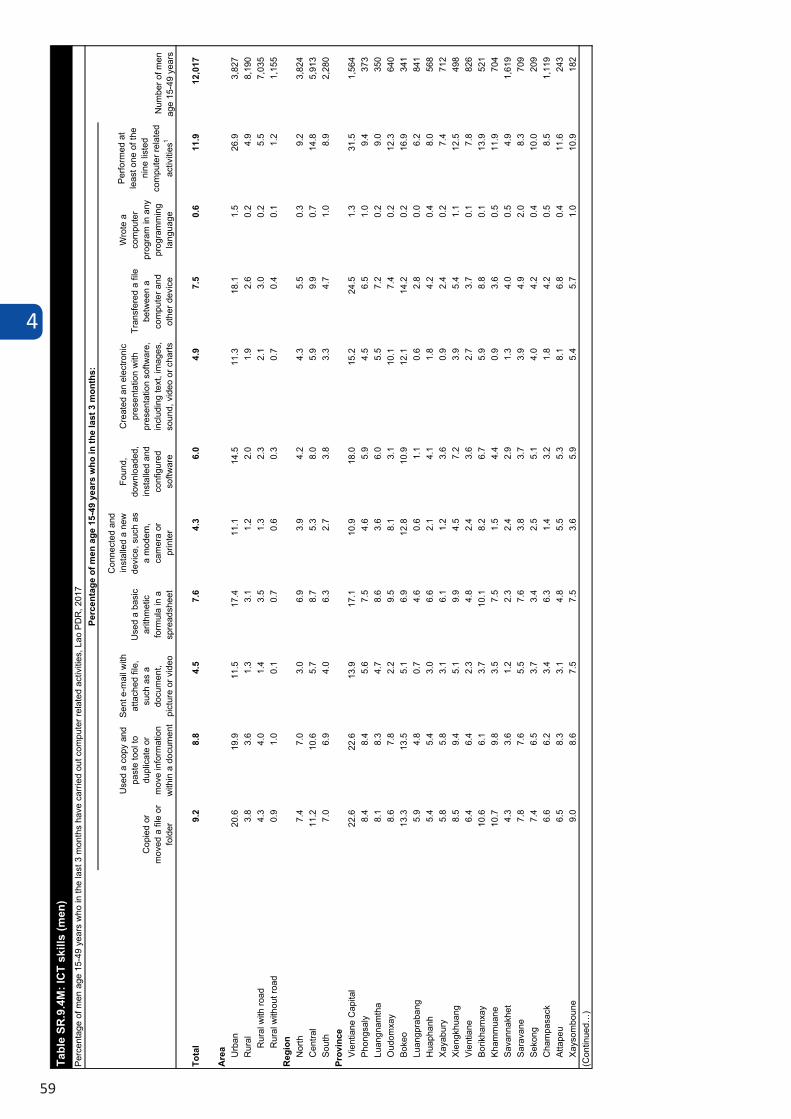
4
59
Cop
ied
or
mov
ed a
file
or
fold
er
Use
d a
copy
and
pa
ste
tool
to
dupl
icat
e or
m
ove
info
rmat
ion
with
in a
doc
umen
t
Sent
e-m
ail w
ith
atta
ched
file
, su
ch a
s a
do
cum
ent,
pict
ure
or v
ideo
Use
d a
basi
c ar
ithm
etic
fo
rmul
a in
a
spre
adsh
eet
Con
nect
ed a
nd
inst
alle
d a
new
de
vice
, suc
h as
a
mod
em,
cam
era
or
prin
ter
Foun
d,
dow
nloa
ded,
in
stal
led
and
co
nfig
ured
so
ftwar
e
Cre
ated
an
elec
troni
c pr
esen
tatio
n w
ith
pres
enta
tion
softw
are,
in
clud
ing
text
, im
ages
, so
und,
vid
eo o
r cha
rts
Tran
sfer
ed a
file
be
twee
n a
com
pute
r and
ot
her d
evic
e
Wro
te a
co
mpu
ter
prog
ram
in a
ny
prog
ram
min
g la
ngua
ge
Perfo
rmed
at
leas
t one
of t
he
nine
list
ed
com
pute
r rel
ated
ac
tiviti
es1
Tota
l9.
28.
84.
57.
64.
36.
04.
97.
50.
611
.912
,017
Are
a Urb
an20
.619
.911
.517
.411
.114
.511
.318
.11.
526
.93,
827
Rur
al3.
83.
61.
33.
11.
22.
01.
92.
60.
24.
98,
190
Rur
al w
ith ro
ad4.
34.
01.
43.
51.
32.
32.
13.
00.
25.
57,
035
Rur
al w
ithou
t roa
d0.
91.
00.
10.
70.
60.
30.
70.
40.
11.
21,
155
Reg
ion
Nor
th7.
47.
03.
06.
93.
94.
24.
35.
50.
39.
23,
824
Cen
tral
11.2
10.6
5.7
8.7
5.3
8.0
5.9
9.9
0.7
14.8
5,91
3So
uth
7.0
6.9
4.0
6.3
2.7
3.8
3.3
4.7
1.0
8.9
2,28
0Pr
ovin
ceVi
entia
ne C
apita
l22
.622
.613
.917
.110
.918
.015
.224
.51.
331
.51,
564
Phon
gsal
y 8.
48.
45.
67.
54.
65.
94.
56.
51.
09.
437
3Lu
angn
amth
a8.
18.
34.
78.
63.
66.
05.
57.
20.
29.
035
0O
udom
xay
8.6
7.8
2.2
9.5
8.1
3.1
10.1
7.4
0.2
12.3
640
Boke
o13
.313
.55.
16.
912
.810
.912
.114
.20.
216
.934
1Lu
angp
raba
ng5.
94.
80.
74.
60.
61.
10.
62.
80.
06.
284
1H
uaph
anh
5.4
5.4
3.0
6.6
2.1
4.1
1.8
4.2
0.4
8.0
568
Xaya
bury
5.8
5.8
3.1
6.1
1.2
3.6
0.9
2.4
0.2
7.4
712
Xien
gkhu
ang
8.5
9.4
5.1
9.9
4.5
7.2
3.9
5.4
1.1
12.5
498
Vien
tiane
6.4
6.4
2.3
4.8
2.4
3.6
2.7
3.7
0.1
7.8
826
Borik
ham
xay
10.6
6.1
3.7
10.1
8.2
6.7
5.9
8.8
0.1
13.9
521
Kham
mua
ne10
.79.
83.
57.
51.
54.
40.
93.
60.
511
.970
4Sa
vann
akhe
t4.
33.
61.
22.
32.
42.
91.
34.
00.
54.
91,
619
Sara
vane
7.8
7.6
5.5
7.6
3.8
3.7
3.9
4.9
2.0
8.3
709
Seko
ng7.
46.
53.
73.
42.
55.
14.
04.
20.
410
.020
9C
ham
pasa
ck6.
66.
23.
46.
31.
43.
21.
84.
20.
58.
51,
119
Atta
peu
6.5
8.3
3.1
4.8
5.5
5.3
8.1
6.8
0.4
11.6
243
Xays
ombo
une
9.0
8.6
7.5
7.5
3.6
5.9
5.4
5.7
1.0
10.9
182
(Con
tinue
d…)
Tabl
e SR
.9.4
M: I
CT
skill
s (m
en)
Perc
enta
ge o
f men
age
15-
49 y
ears
who
in th
e la
st 3
mon
ths
have
car
ried
out c
ompu
ter r
elat
ed a
ctiv
ities
, Lao
PD
R, 2
017
Perc
enta
ge o
f men
age
15-
49 y
ears
who
in th
e la
st 3
mon
ths:
Num
ber o
f men
ag
e 15
-49
year
s
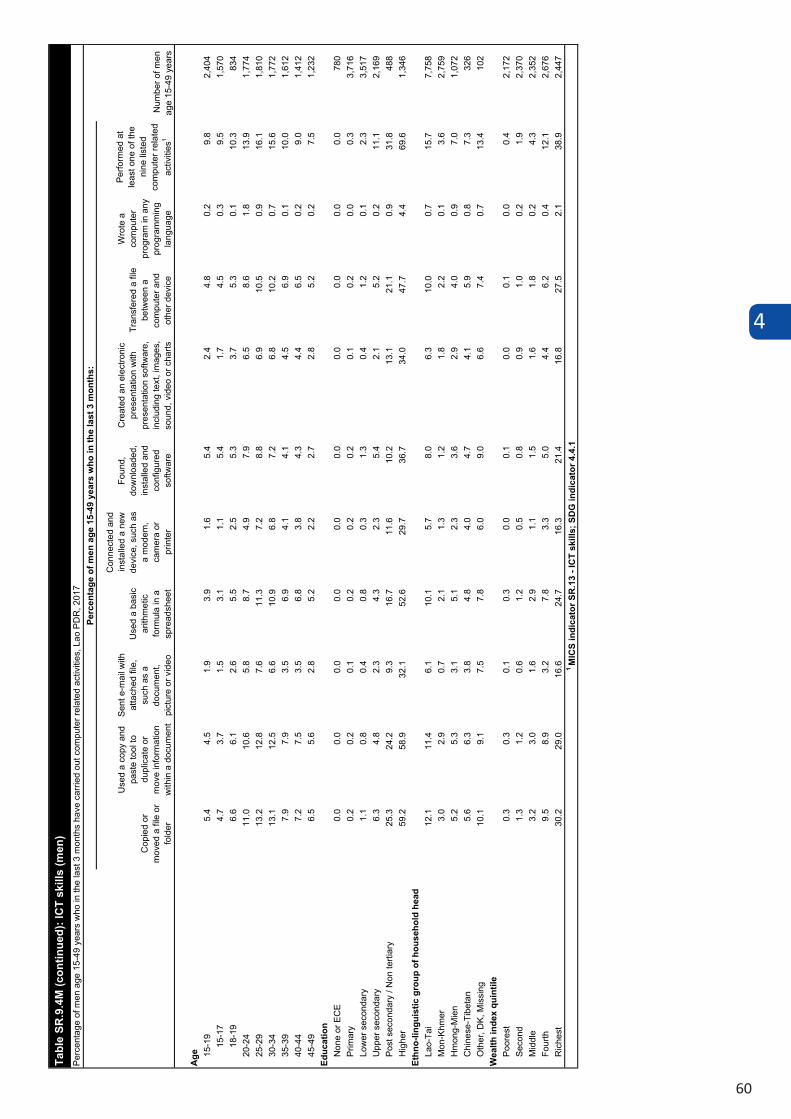
4
60
Cop
ied
or
mov
ed a
file
or
fold
er
Use
d a
copy
and
pa
ste
tool
to
dupl
icat
e or
m
ove
info
rmat
ion
with
in a
doc
umen
t
Sent
e-m
ail w
ith
atta
ched
file
, su
ch a
s a
do
cum
ent,
pict
ure
or v
ideo
Use
d a
basi
c ar
ithm
etic
fo
rmul
a in
a
spre
adsh
eet
Con
nect
ed a
nd
inst
alle
d a
new
de
vice
, suc
h as
a
mod
em,
cam
era
or
prin
ter
Foun
d,
dow
nloa
ded,
in
stal
led
and
co
nfig
ured
so
ftwar
e
Cre
ated
an
elec
troni
c pr
esen
tatio
n w
ith
pres
enta
tion
softw
are,
in
clud
ing
text
, im
ages
, so
und,
vid
eo o
r cha
rts
Tran
sfer
ed a
file
be
twee
n a
com
pute
r and
ot
her d
evic
e
Wro
te a
co
mpu
ter
prog
ram
in a
ny
prog
ram
min
g la
ngua
ge
Perfo
rmed
at
leas
t one
of t
he
nine
list
ed
com
pute
r rel
ated
ac
tiviti
es1
Age 15
-19
5.4
4.5
1.9
3.9
1.6
5.4
2.4
4.8
0.2
9.8
2,40
415
-17
4.7
3.7
1.5
3.1
1.1
5.4
1.7
4.5
0.3
9.5
1,57
018
-19
6.6
6.1
2.6
5.5
2.5
5.3
3.7
5.3
0.1
10.3
834
20-2
411
.010
.65.
88.
74.
97.
96.
58.
61.
813
.91,
774
25-2
913
.212
.87.
611
.37.
28.
86.
910
.50.
916
.11,
810
30-3
413
.112
.56.
610
.96.
87.
26.
810
.20.
715
.61,
772
35-3
97.
97.
93.
56.
94.
14.
14.
56.
90.
110
.01,
612
40-4
47.
27.
53.
56.
83.
84.
34.
46.
50.
29.
01,
412
45-4
96.
55.
62.
85.
22.
22.
72.
85.
20.
27.
51,
232
Educ
atio
nN
one
or E
CE
0.0
0.0
0.0
0.0
0.0
0.0
0.0
0.0
0.0
0.0
780
Prim
ary
0.2
0.2
0.1
0.2
0.2
0.2
0.1
0.2
0.0
0.3
3,71
6Lo
wer
sec
onda
ry1.
10.
80.
40.
80.
31.
30.
41.
20.
12.
33,
517
Upp
er s
econ
dary
6.3
4.8
2.3
4.3
2.3
5.4
2.1
5.2
0.2
11.1
2,16
9Po
st s
econ
dary
/ N
on te
rtiar
y25
.324
.29.
316
.711
.610
.213
.121
.10.
931
.848
8H
ighe
r59
.258
.932
.152
.629
.736
.734
.047
.74.
469
.61,
346
Ethn
o-lin
guis
tic g
roup
of h
ouse
hold
hea
dLa
o-Ta
i12
.111
.46.
110
.15.
78.
06.
310
.00.
715
.77,
758
Mon
-Khm
er3.
02.
90.
72.
11.
31.
21.
82.
20.
13.
62,
759
Hm
ong-
Mie
n5.
25.
33.
15.
12.
33.
62.
94.
00.
97.
01,
072
Chi
nese
-Tib
etan
5.6
6.3
3.8
4.8
4.0
4.7
4.1
5.9
0.8
7.3
326
Oth
er, D
K, M
issi
ng10
.19.
17.
57.
86.
09.
06.
67.
40.
713
.410
2W
ealth
inde
x qu
intil
ePo
ores
t0.
30.
30.
10.
30.
00.
10.
00.
10.
00.
42,
172
Seco
nd1.
31.
20.
61.
20.
50.
80.
91.
00.
21.
92,
370
Mid
dle
3.2
3.0
1.6
2.9
1.1
1.5
1.6
1.8
0.2
4.3
2,35
2Fo
urth
9.5
8.9
3.2
7.8
3.3
5.0
4.4
6.2
0.4
12.1
2,67
6R
iche
st30
.229
.016
.624
.716
.321
.416
.827
.52.
138
.92,
447
1 M
ICS
indi
cato
r SR
.13
- IC
T sk
ills;
SD
G in
dica
tor 4
.4.1
Tabl
e SR
.9.4
M (c
ontin
ued)
: IC
T sk
ills
(men
)Pe
rcen
tage
of m
en a
ge 1
5-49
yea
rs w
ho in
the
last
3 m
onth
s ha
ve c
arrie
d ou
t com
pute
r rel
ated
act
iviti
es, L
ao P
DR
, 201
7Pe
rcen
tage
of m
en a
ge 1
5-49
yea
rs w
ho in
the
last
3 m
onth
s:
Num
ber o
f men
ag
e 15
-49
year
s
4
61
4.9 TOBACCO AND ALCOHOL USE
Tobacco products are products made entirely or partly of leaf tobacco as raw material, which are intended to be
smoked, sucked, chewed, or snuffed. All contain the highly addictive psychoactive ingredient, nicotine. Tobacco use is
one of the main risk factors for a number of chronic diseases, including cancer, lung diseases, and cardiovascular
diseases.10 If mentioned, e-cigarettes are included in the other response category of smokeless tobacco product use.
The consumption of alcohol carries a risk of adverse health and social consequences related to its intoxicating, toxic and dependence-producing properties. In addition to the chronic diseases that may develop in those who drink large amounts of alcohol over a number of years, alcohol use is also associated with an increased risk of acute health conditions, such as injuries, including from traffic accidents.11 Alcohol use also causes harm far beyond the physical and psychological health of the drinker. It harms the well-being and health of people around the drinker. An intoxicated person can harm others or put them at risk of traffic accidents or violent behaviour, or negatively affect co-workers, relatives, friends or strangers. Thus, the impact of the harmful use of alcohol reaches deep into society.12
The LSIS II collected information on ever and current use of tobacco and alcohol and intensity of use among women and men age 15-49 years. This section presents the main results.
Table SR.10.1W presents the current and ever use of tobacco products by women age 15-49 years, and Table SR.10.1M presents the corresponding information for men of the same age group.
10 WHO. http://www.who.int/topics/tobacco/en/ 11 WHO. http://www.who.int/topics/alcohol_drinking/en/ 12 WHO. http://www.who.int/mediacentre/factsheets/fs349/en/
Table SR.10.3W and SR.10.3M show the use of alcohol among women and men age 15-49 years.
Tables SR.10.2W and SR.10.2M present results on age at first use of cigarettes, as well as frequency of use, for women and men respectively.
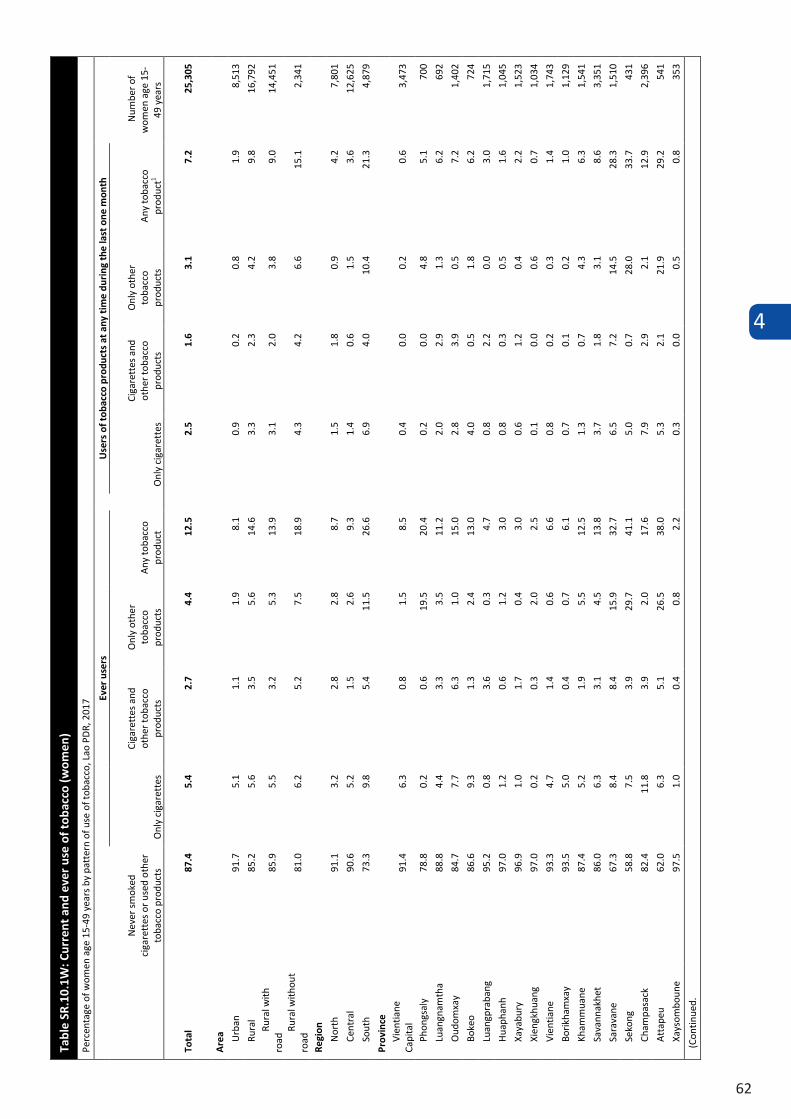
4
62
Tabl
e SR
.10.
1W: C
urre
nt a
nd e
ver
use
of to
bacc
o (w
omen
)
Perc
enta
ge o
f wom
en a
ge 1
5-49
yea
rs b
y pa
tter
n of
use
of t
obac
co, L
ao P
DR,
201
7
Nev
er s
mok
ed
ciga
rett
es o
r use
d ot
her
toba
cco
prod
ucts
Ever
use
rs
Use
rs o
f tob
acco
pro
duct
s at
any
tim
e du
ring
the
last
one
mon
th
Num
ber o
f w
omen
age
15-
49 y
ears
O
nly
ciga
rett
es
Ciga
rett
es a
nd
othe
r tob
acco
pr
oduc
ts
Onl
y ot
her
toba
cco
prod
ucts
A
ny to
bacc
o pr
oduc
t O
nly
ciga
rett
es
Ciga
rett
es a
nd
othe
r tob
acco
pr
oduc
ts
Onl
y ot
her
toba
cco
prod
ucts
A
ny to
bacc
o pr
oduc
t1
Tota
l 87
.4
5.4
2.7
4.4
12.5
2.
5 1.
6 3.
1 7.
2
25,3
05
Are
a Urb
an
91.7
5.
1 1.
1 1.
9 8.
1 0.
9 0.
2 0.
8 1.
9
8,51
3
Rura
l 85
.2
5.6
3.5
5.6
14.6
3.
3 2.
3 4.
2 9.
8
1
6,79
2
Rura
l with
ro
ad
85.9
5.
5 3.
2 5.
3 13
.9
3.1
2.0
3.8
9.0
14,
451
Rura
l with
out
road
81
.0
6.2
5.2
7.5
18.9
4.
3 4.
2 6.
6 15
.1
2,
341
Regi
on
Nor
th
91.1
3.
2 2.
8 2.
8 8.
7 1.
5 1.
8 0.
9 4.
2
7,80
1
Cent
ral
90.6
5.
2 1.
5 2.
6 9.
3 1.
4 0.
6 1.
5 3.
6
1
2,62
5
Sout
h 73
.3
9.8
5.4
11.5
26
.6
6.9
4.0
10.4
21
.3
4,8
79
Prov
ince
Vi
entia
ne
Capi
tal
91.4
6.
3 0.
8 1.
5 8.
5 0.
4 0.
0 0.
2 0.
6
3,47
3
Phon
gsal
y
78.8
0.
2 0.
6 19
.5
20.4
0.
2 0.
0 4.
8 5.
1
70
0
Luan
gnam
tha
88.8
4.
4 3.
3 3.
5 11
.2
2.0
2.9
1.3
6.2
692
Oud
omxa
y 84
.7
7.7
6.3
1.0
15.0
2.
8 3.
9 0.
5 7.
2
1,40
2
Boke
o 86
.6
9.3
1.3
2.4
13.0
4.
0 0.
5 1.
8 6.
2
72
4
Luan
gpra
bang
95
.2
0.8
3.6
0.3
4.7
0.8
2.2
0.0
3.0
1,
715
Hua
phan
h 97
.0
1.2
0.6
1.2
3.0
0.8
0.3
0.5
1.6
1,
045
Xaya
bury
96
.9
1.0
1.7
0.4
3.0
0.6
1.2
0.4
2.2
1,
523
Xien
gkhu
ang
97.0
0.
2 0.
3 2.
0 2.
5 0.
1 0.
0 0.
6 0.
7
1,03
4
Vien
tiane
93
.3
4.7
1.4
0.6
6.6
0.8
0.2
0.3
1.4
1,
743
Borik
ham
xay
93.5
5.
0 0.
4 0.
7 6.
1 0.
7 0.
1 0.
2 1.
0
1,12
9
Kham
mua
ne
87.4
5.
2 1.
9 5.
5 12
.5
1.3
0.7
4.3
6.3
1,
541
Sava
nnak
het
86.0
6.
3 3.
1 4.
5 13
.8
3.7
1.8
3.1
8.6
3,
351
Sara
vane
67
.3
8.4
8.4
15.9
32
.7
6.5
7.2
14.5
28
.3
1,
510
Seko
ng
58.8
7.
5 3.
9 29
.7
41.1
5.
0 0.
7 28
.0
33.7
431
Cham
pasa
ck
82.4
11
.8
3.9
2.0
17.6
7.
9 2.
9 2.
1 12
.9
2,
396
Att
apeu
62
.0
6.3
5.1
26.5
38
.0
5.3
2.1
21.9
29
.2
541
Xays
ombo
une
97.5
1.
0 0.
4 0.
8 2.
2 0.
3 0.
0 0.
5 0.
8
35
3
(Con
tinue
d...)
Tabl
e SR
.10.
1W (c
onti
nued
): C
urre
nt a
nd e
ver
use
of to
bacc
o (w
omen
)
Perc
enta
ge o
f wom
en a
ge 1
5-49
yea
rs b
y pa
tter
n of
use
of t
obac
co, L
ao P
DR,
201
7
Nev
er s
mok
ed
ciga
rett
es o
r use
d ot
her t
obac
co
prod
ucts
Ever
use
rs
Use
rs o
f tob
acco
pro
duct
s at
any
tim
e du
ring
the
last
one
mon
th
Num
ber o
f w
omen
age
15
-49
year
s
Onl
y ci
gare
ttes
Ciga
rett
es a
nd
othe
r tob
acco
pr
oduc
ts
Onl
y ot
her
toba
cco
prod
ucts
A
ny to
bacc
o pr
oduc
t O
nly
ciga
rett
es
Ciga
rett
es a
nd
othe
r tob
acco
pr
oduc
ts
Onl
y ot
her
toba
cco
prod
ucts
A
ny to
bacc
o pr
oduc
t1
Age
15
-19
94.0
2.
8 0.
8 2.
1 5.
8 0.
4 0.
1 1.
1 1.
6 4,
565
15-1
7 94
.7
2.5
0.7
1.9
5.1
0.3
0.0
0.7
1.0
2,79
6 18
-19
93.0
3.
3 1.
0 2.
5 6.
8 0.
5 0.
4 1.
6 2.
5 1,
769
20-2
4 91
.9
3.7
1.6
2.6
7.9
0.8
0.7
1.6
3.1
4,02
4 25
-29
88.8
5.
0 2.
0 4.
1 11
.1
1.8
1.2
2.7
5.6
4,04
5 30
-34
86.5
5.
5 3.
2 4.
6 13
.3
2.7
2.0
3.2
7.9
3,82
4 35
-39
83.9
7.
1 3.
3 5.
6 16
.0
3.9
2.3
4.0
10.1
3,
418
40-4
4 81
.2
8.1
4.3
6.3
18.7
4.
8 2.
9 5.
1 12
.8
3,07
6 45
-49
79.2
8.
1 5.
4 7.
1 20
.6
5.4
3.4
5.9
14.7
2,
353
Educ
atio
n N
one
or E
CE
74.2
8.
2 6.
5 10
.9
25.6
6.
4 4.
9 9.
2 20
.6
4,08
7 Pr
imar
y 85
.2
6.4
3.3
5.0
14.7
3.
6 2.
1 3.
6 9.
4 8,
922
Low
er s
econ
dary
92
.7
3.9
1.3
2.0
7.2
0.8
0.2
0.9
1.9
5,53
5 U
pper
sec
onda
ry
93.9
3.
8 0.
8 1.
3 6.
0 0.
1 0.
1 0.
4 0.
6 3,
482
Post
sec
onda
ry /
Non
tert
iary
94
.6
3.6
0.3
1.3
5.2
0.5
0.0
0.2
0.7
885
Hig
her
93.8
3.
5 0.
8 1.
6 5.
9 0.
0 0.
0 0.
3 0.
3 2,
394
Und
er-5
s in
the
sam
e ho
useh
old
At l
east
one
87
.3
5.1
2.6
4.9
12.5
2.
3 1.
5 3.
6 7.
5 11
,323
N
one
87.5
5.
7 2.
8 3.
9 12
.4
2.6
1.7
2.6
6.9
13,9
82
Ethn
o-lin
guis
tic
grou
p of
hou
seho
ld h
ead
Lao-
Tai
90.0
5.
4 1.
9 2.
5 9.
9 2.
1 1.
0 1.
6 4.
7 16
,522
M
on-K
hmer
76
.9
7.2
5.8
9.9
22.9
4.
5 4.
1 8.
1 16
.7
5,77
9 H
mon
g-M
ien
98.3
0.
6 0.
5 0.
4 1.
5 0.
3 0.
2 0.
1 0.
7 2,
109
Chin
ese-
Tibe
tan
84.7
2.
0 0.
6 12
.2
14.8
0.
4 0.
1 1.
7 2.
2 62
8 O
ther
, DK,
Mis
sing
75
.0
13.3
2.
6 9.
1 25
.0
8.8
1.6
8.7
19.0
26
6 W
ealt
h in
dex
quin
tile
Po
ores
t 77
.1
6.1
5.9
10.7
22
.7
5.1
4.6
8.3
18.1
4,
337
Seco
nd
82.6
6.
3 4.
2 6.
7 17
.3
3.7
2.8
5.3
11.8
4,
716
Mid
dle
88.4
6.
1 2.
3 3.
0 11
.4
3.1
1.1
2.1
6.3
4,90
8 Fo
urth
92
.6
4.5
0.9
1.9
7.3
1.2
0.3
0.8
2.3
5,41
4 Ri
ches
t 93
.1
4.5
1.0
1.2
6.7
0.3
0.1
0.3
0.6
5,92
9 1 M
ICS
indi
cato
r SR.
14; S
DG
indi
cato
r 3.
a.1
- Tob
acco
use
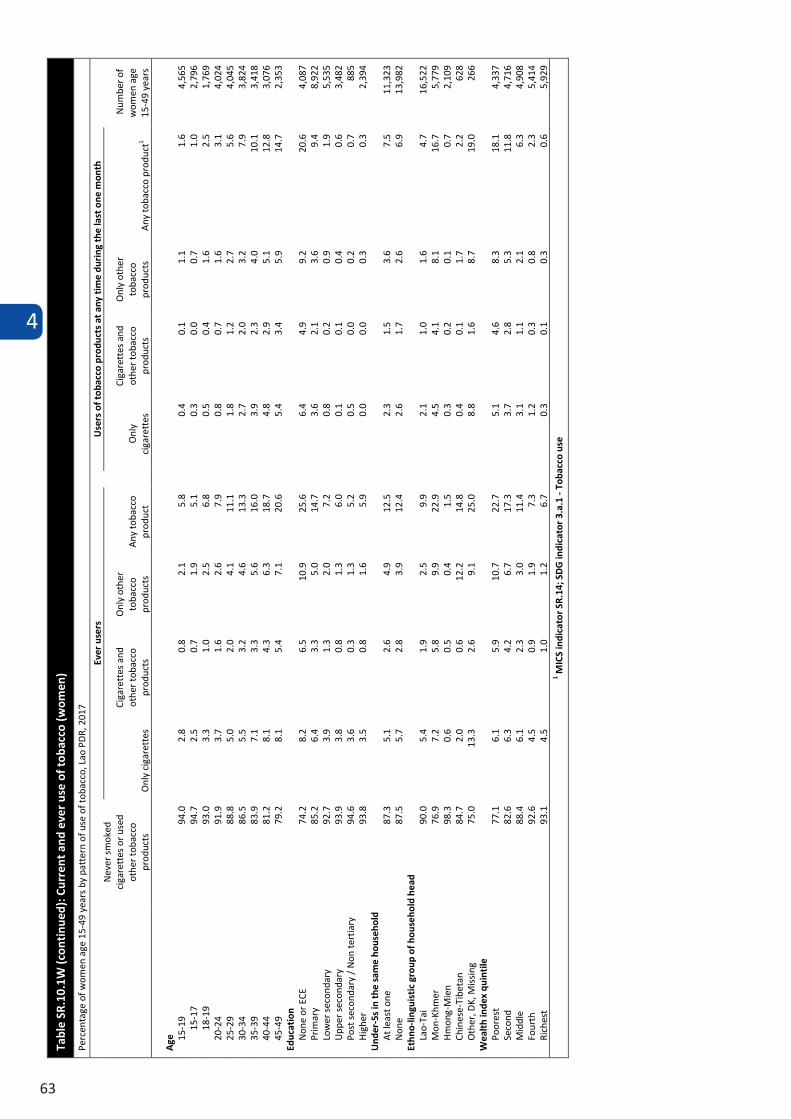
4
63
Tabl
e SR
.10.
1W (c
onti
nued
): C
urre
nt a
nd e
ver
use
of to
bacc
o (w
omen
)
Perc
enta
ge o
f wom
en a
ge 1
5-49
yea
rs b
y pa
tter
n of
use
of t
obac
co, L
ao P
DR,
201
7
Nev
er s
mok
ed
ciga
rett
es o
r use
d ot
her t
obac
co
prod
ucts
Ever
use
rs
Use
rs o
f tob
acco
pro
duct
s at
any
tim
e du
ring
the
last
one
mon
th
Num
ber o
f w
omen
age
15
-49
year
s
Onl
y ci
gare
ttes
Ciga
rett
es a
nd
othe
r tob
acco
pr
oduc
ts
Onl
y ot
her
toba
cco
prod
ucts
A
ny to
bacc
o pr
oduc
t O
nly
ciga
rett
es
Ciga
rett
es a
nd
othe
r tob
acco
pr
oduc
ts
Onl
y ot
her
toba
cco
prod
ucts
A
ny to
bacc
o pr
oduc
t1
Age
15
-19
94.0
2.
8 0.
8 2.
1 5.
8 0.
4 0.
1 1.
1 1.
6 4,
565
15-1
7 94
.7
2.5
0.7
1.9
5.1
0.3
0.0
0.7
1.0
2,79
6 18
-19
93.0
3.
3 1.
0 2.
5 6.
8 0.
5 0.
4 1.
6 2.
5 1,
769
20-2
4 91
.9
3.7
1.6
2.6
7.9
0.8
0.7
1.6
3.1
4,02
4 25
-29
88.8
5.
0 2.
0 4.
1 11
.1
1.8
1.2
2.7
5.6
4,04
5 30
-34
86.5
5.
5 3.
2 4.
6 13
.3
2.7
2.0
3.2
7.9
3,82
4 35
-39
83.9
7.
1 3.
3 5.
6 16
.0
3.9
2.3
4.0
10.1
3,
418
40-4
4 81
.2
8.1
4.3
6.3
18.7
4.
8 2.
9 5.
1 12
.8
3,07
6 45
-49
79.2
8.
1 5.
4 7.
1 20
.6
5.4
3.4
5.9
14.7
2,
353
Educ
atio
n N
one
or E
CE
74.2
8.
2 6.
5 10
.9
25.6
6.
4 4.
9 9.
2 20
.6
4,08
7 Pr
imar
y 85
.2
6.4
3.3
5.0
14.7
3.
6 2.
1 3.
6 9.
4 8,
922
Low
er s
econ
dary
92
.7
3.9
1.3
2.0
7.2
0.8
0.2
0.9
1.9
5,53
5 U
pper
sec
onda
ry
93.9
3.
8 0.
8 1.
3 6.
0 0.
1 0.
1 0.
4 0.
6 3,
482
Post
sec
onda
ry /
Non
tert
iary
94
.6
3.6
0.3
1.3
5.2
0.5
0.0
0.2
0.7
885
Hig
her
93.8
3.
5 0.
8 1.
6 5.
9 0.
0 0.
0 0.
3 0.
3 2,
394
Und
er-5
s in
the
sam
e ho
useh
old
At l
east
one
87
.3
5.1
2.6
4.9
12.5
2.
3 1.
5 3.
6 7.
5 11
,323
N
one
87.5
5.
7 2.
8 3.
9 12
.4
2.6
1.7
2.6
6.9
13,9
82
Ethn
o-lin
guis
tic
grou
p of
hou
seho
ld h
ead
Lao-
Tai
90.0
5.
4 1.
9 2.
5 9.
9 2.
1 1.
0 1.
6 4.
7 16
,522
M
on-K
hmer
76
.9
7.2
5.8
9.9
22.9
4.
5 4.
1 8.
1 16
.7
5,77
9 H
mon
g-M
ien
98.3
0.
6 0.
5 0.
4 1.
5 0.
3 0.
2 0.
1 0.
7 2,
109
Chin
ese-
Tibe
tan
84.7
2.
0 0.
6 12
.2
14.8
0.
4 0.
1 1.
7 2.
2 62
8 O
ther
, DK,
Mis
sing
75
.0
13.3
2.
6 9.
1 25
.0
8.8
1.6
8.7
19.0
26
6 W
ealt
h in
dex
quin
tile
Po
ores
t 77
.1
6.1
5.9
10.7
22
.7
5.1
4.6
8.3
18.1
4,
337
Seco
nd
82.6
6.
3 4.
2 6.
7 17
.3
3.7
2.8
5.3
11.8
4,
716
Mid
dle
88.4
6.
1 2.
3 3.
0 11
.4
3.1
1.1
2.1
6.3
4,90
8 Fo
urth
92
.6
4.5
0.9
1.9
7.3
1.2
0.3
0.8
2.3
5,41
4 Ri
ches
t 93
.1
4.5
1.0
1.2
6.7
0.3
0.1
0.3
0.6
5,92
9 1 M
ICS
indi
cato
r SR.
14; S
DG
indi
cato
r 3.
a.1
- Tob
acco
use
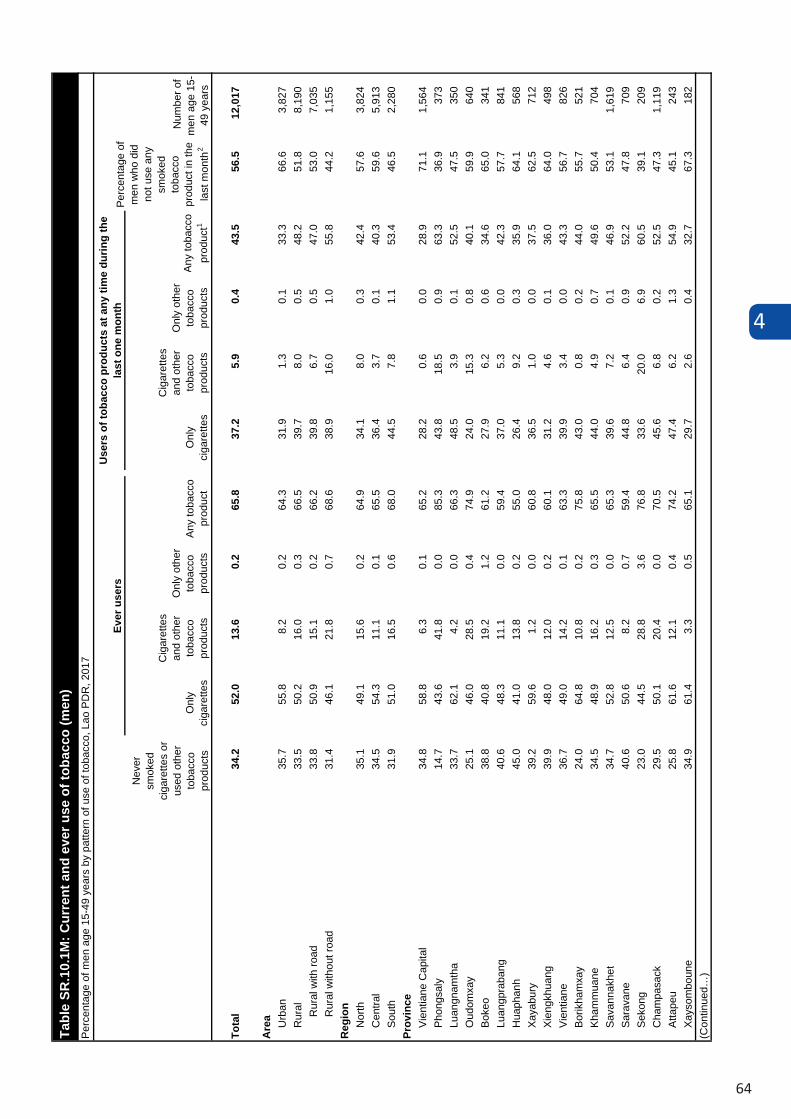
4
64
Onl
yci
gare
ttes
Cig
aret
tes
and
othe
r to
bacc
opr
oduc
ts
Onl
y ot
her
toba
cco
prod
ucts
Any
toba
cco
prod
uct
Onl
yci
gare
ttes
Cig
aret
tes
and
othe
r to
bacc
opr
oduc
ts
Onl
y ot
her
toba
cco
prod
ucts
Any
toba
cco
prod
uct1
Tota
l34
.252
.013
.60.
265
.837
.25.
90.
443
.556
.512
,017
Are
a Urb
an35
.755
.88.
20.
264
.331
.91.
30.
133
.366
.63,
827
Rur
al33
.550
.216
.00.
366
.539
.78.
00.
548
.251
.88,
190
Rur
al w
ith ro
ad33
.850
.915
.10.
266
.239
.86.
70.
547
.053
.07,
035
Rur
al w
ithou
t roa
d31
.446
.121
.80.
768
.638
.916
.01.
055
.844
.21,
155
Reg
ion
Nor
th35
.149
.115
.60.
264
.934
.18.
00.
342
.457
.63,
824
Cen
tral
34.5
54.3
11.1
0.1
65.5
36.4
3.7
0.1
40.3
59.6
5,91
3S
outh
31.9
51.0
16.5
0.6
68.0
44.5
7.8
1.1
53.4
46.5
2,28
0Pr
ovin
ceV
ient
iane
Cap
ital
34.8
58.8
6.3
0.1
65.2
28.2
0.6
0.0
28.9
71.1
1,56
4P
hong
saly
14
.743
.641
.80.
085
.343
.818
.50.
963
.336
.937
3Lu
angn
amth
a33
.762
.14.
20.
066
.348
.53.
90.
152
.547
.535
0O
udom
xay
25.1
46.0
28.5
0.4
74.9
24.0
15.3
0.8
40.1
59.9
640
Bok
eo38
.840
.819
.21.
261
.227
.96.
20.
634
.665
.034
1Lu
angp
raba
ng40
.648
.311
.10.
059
.437
.05.
30.
042
.357
.784
1H
uaph
anh
45.0
41.0
13.8
0.2
55.0
26.4
9.2
0.3
35.9
64.1
568
Xay
abur
y39
.259
.61.
20.
060
.836
.51.
00.
037
.562
.571
2X
ieng
khua
ng39
.948
.012
.00.
260
.131
.24.
60.
136
.064
.049
8V
ient
iane
36.7
49.0
14.2
0.1
63.3
39.9
3.4
0.0
43.3
56.7
826
Bor
ikha
mxa
y24
.064
.810
.80.
275
.843
.00.
80.
244
.055
.752
1K
ham
mua
ne34
.548
.916
.20.
365
.544
.04.
90.
749
.650
.470
4S
avan
nakh
et34
.752
.812
.50.
065
.339
.67.
20.
146
.953
.11,
619
Sar
avan
e40
.650
.68.
20.
759
.444
.86.
40.
952
.247
.870
9S
ekon
g23
.044
.528
.83.
676
.833
.620
.06.
960
.539
.120
9C
ham
pasa
ck29
.550
.120
.40.
070
.545
.66.
80.
252
.547
.31,
119
Atta
peu
25.8
61.6
12.1
0.4
74.2
47.4
6.2
1.3
54.9
45.1
243
Xay
som
boun
e34
.961
.43.
30.
565
.129
.72.
60.
432
.767
.318
2
Tabl
e SR
.10.
1M: C
urre
nt a
nd e
ver u
se o
f tob
acco
(men
)P
erce
ntag
e of
men
age
15-
49 y
ears
by
patte
rn o
f use
of t
obac
co, L
ao P
DR
, 201
7
Num
ber o
f m
en a
ge 1
5-49
yea
rs
(Con
tinue
d…)
Nev
ersm
oked
ciga
rette
s or
us
ed o
ther
to
bacc
opr
oduc
ts
Ever
use
rsU
sers
of t
obac
co p
rodu
cts
at a
ny ti
me
durin
g th
e la
st o
ne m
onth
Per
cent
age
of
men
who
did
no
t use
any
sm
oked
toba
cco
prod
uct i
n th
e la
st m
onth
2
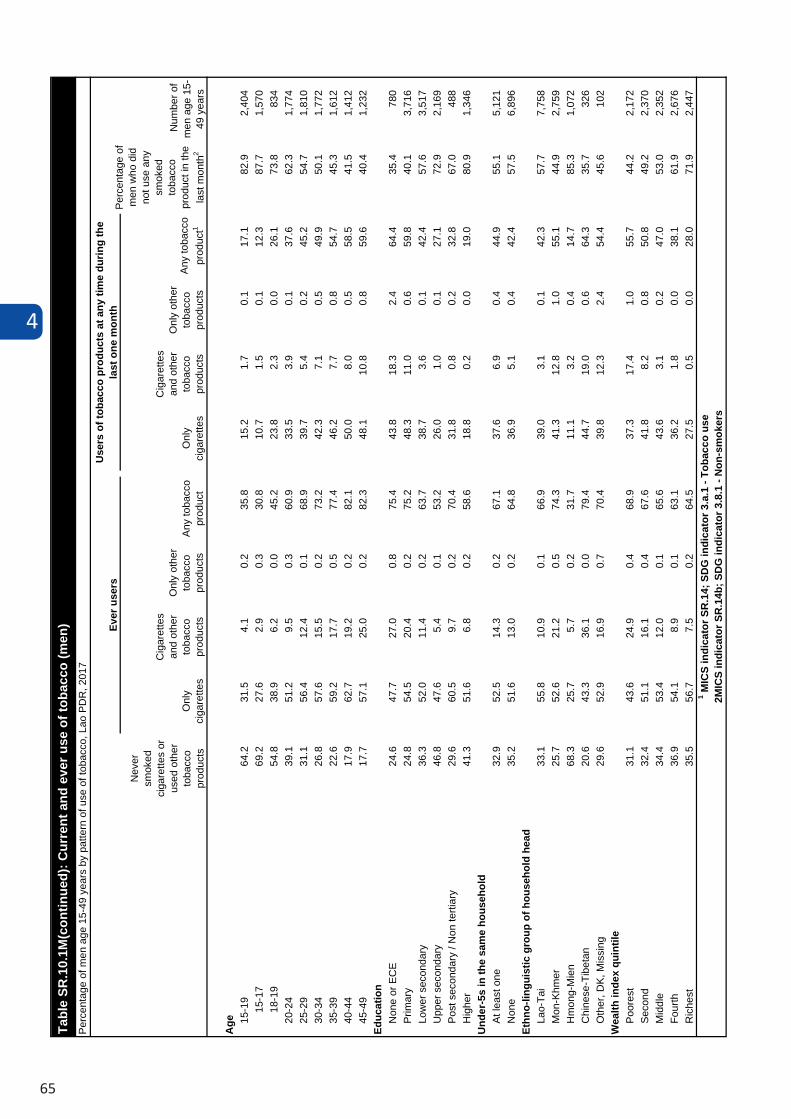
4
65
Onl
yci
gare
ttes
Cig
aret
tes
and
othe
r to
bacc
opr
oduc
ts
Onl
y ot
her
toba
cco
prod
ucts
Any
toba
cco
prod
uct
Onl
yci
gare
ttes
Cig
aret
tes
and
othe
r to
bacc
opr
oduc
ts
Onl
y ot
her
toba
cco
prod
ucts
Any
toba
cco
prod
uct1
Age 15
-19
64.2
31.5
4.1
0.2
35.8
15.2
1.7
0.1
17.1
82.9
2,40
415
-17
69.2
27.6
2.9
0.3
30.8
10.7
1.5
0.1
12.3
87.7
1,57
018
-19
54.8
38.9
6.2
0.0
45.2
23.8
2.3
0.0
26.1
73.8
834
20-2
439
.151
.29.
50.
360
.933
.53.
90.
137
.662
.31,
774
25-2
931
.156
.412
.40.
168
.939
.75.
40.
245
.254
.71,
810
30-3
426
.857
.615
.50.
273
.242
.37.
10.
549
.950
.11,
772
35-3
922
.659
.217
.70.
577
.446
.27.
70.
854
.745
.31,
612
40-4
417
.962
.719
.20.
282
.150
.08.
00.
558
.541
.51,
412
45-4
917
.757
.125
.00.
282
.348
.110
.80.
859
.640
.41,
232
Educ
atio
nN
one
or E
CE
24.6
47.7
27.0
0.8
75.4
43.8
18.3
2.4
64.4
35.4
780
Prim
ary
24.8
54.5
20.4
0.2
75.2
48.3
11.0
0.6
59.8
40.1
3,71
6Lo
wer
sec
onda
ry36
.352
.011
.40.
263
.738
.73.
60.
142
.457
.63,
517
Upp
er s
econ
dary
46.8
47.6
5.4
0.1
53.2
26.0
1.0
0.1
27.1
72.9
2,16
9P
ost s
econ
dary
/ N
on te
rtiar
y29
.660
.59.
70.
270
.431
.80.
80.
232
.867
.048
8H
ighe
r41
.351
.66.
80.
258
.618
.80.
20.
019
.080
.91,
346
Und
er-5
s in
the
sam
e ho
useh
old
At l
east
one
32.9
52.5
14.3
0.2
67.1
37.6
6.9
0.4
44.9
55.1
5,12
1N
one
35.2
51.6
13.0
0.2
64.8
36.9
5.1
0.4
42.4
57.5
6,89
6Et
hno-
lingu
istic
gro
up o
f hou
seho
ld h
ead
Lao-
Tai
33.1
55.8
10.9
0.1
66.9
39.0
3.1
0.1
42.3
57.7
7,75
8M
on-K
hmer
25.7
52.6
21.2
0.5
74.3
41.3
12.8
1.0
55.1
44.9
2,75
9H
mon
g-M
ien
68.3
25.7
5.7
0.2
31.7
11.1
3.2
0.4
14.7
85.3
1,07
2C
hine
se-T
ibet
an20
.643
.336
.10.
079
.444
.719
.00.
664
.335
.732
6O
ther
, DK
, Mis
sing
29.6
52.9
16.9
0.7
70.4
39.8
12.3
2.4
54.4
45.6
102
Wea
lth in
dex
quin
tile
Poo
rest
31.1
43.6
24.9
0.4
68.9
37.3
17.4
1.0
55.7
44.2
2,17
2S
econ
d32
.451
.116
.10.
467
.641
.88.
20.
850
.849
.22,
370
Mid
dle
34.4
53.4
12.0
0.1
65.6
43.6
3.1
0.2
47.0
53.0
2,35
2Fo
urth
36.9
54.1
8.9
0.1
63.1
36.2
1.8
0.0
38.1
61.9
2,67
6R
iche
st35
.556
.77.
50.
264
.527
.50.
50.
028
.071
.92,
447
Tabl
e SR
.10.
1M(c
ontin
ued)
: Cur
rent
and
eve
r use
of t
obac
co (m
en)
Per
cent
age
of m
en a
ge 1
5-49
yea
rs b
y pa
ttern
of u
se o
f tob
acco
, Lao
PD
R, 2
017
Num
ber o
f m
en a
ge 1
5-49
yea
rs
1 MIC
S in
dica
tor S
R.1
4; S
DG
indi
cato
r 3.a
.1 -
Toba
cco
use
2MIC
S in
dica
tor S
R.1
4b; S
DG
indi
cato
r 3.8
.1 -
Non
-sm
oker
s
Nev
ersm
oked
ciga
rette
s or
us
ed o
ther
to
bacc
opr
oduc
ts
Ever
use
rsU
sers
of t
obac
co p
rodu
cts
at a
ny ti
me
durin
g th
e la
st o
ne m
onth
Per
cent
age
of
men
who
did
no
t use
any
sm
oked
toba
cco
prod
uct i
n th
e la
st m
onth
2
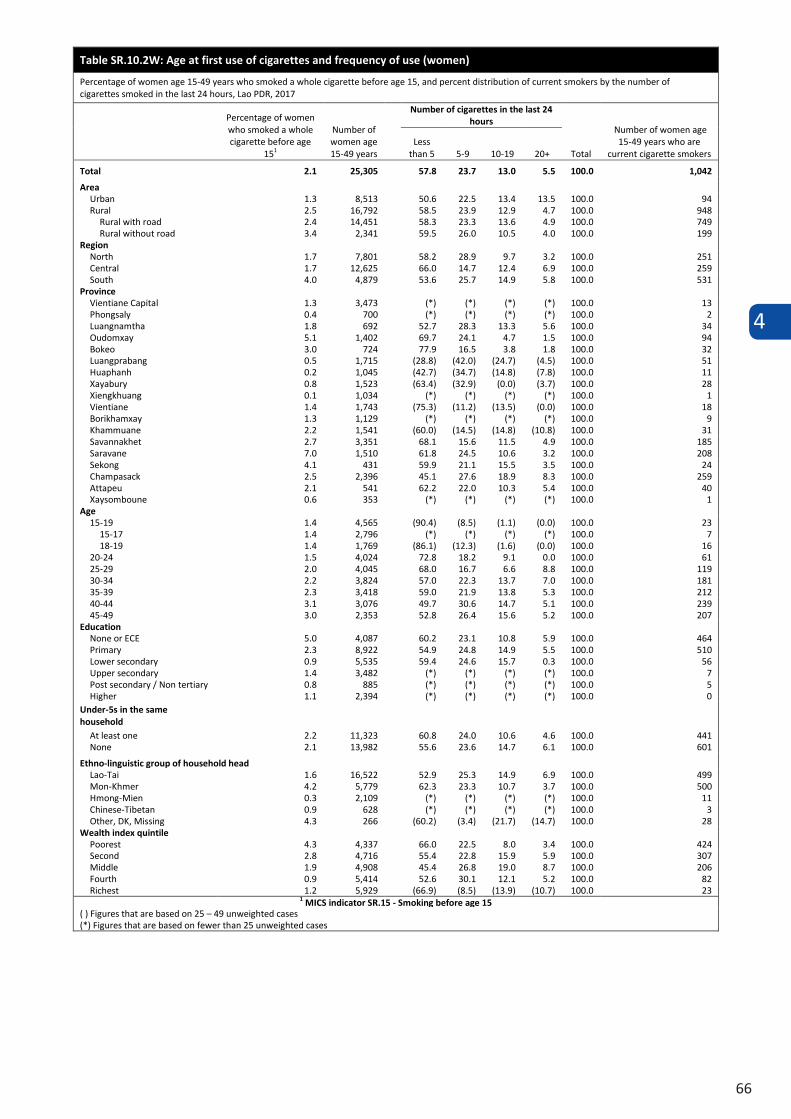
4
66
Table SR.10.2W: Age at first use of cigarettes and frequency of use (women)
Percentage of women age 15-49 years who smoked a whole cigarette before age 15, and percent distribution of current smokers by the number of cigarettes smoked in the last 24 hours, Lao PDR, 2017
Percentage of women who smoked a whole cigarette before age
151
Number of women age 15-49 years
Number of cigarettes in the last 24 hours
Total
Number of women age 15-49 years who are
current cigarette smokers Less
than 5 5-9 10-19 20+
Total 2.1 25,305 57.8 23.7 13.0 5.5 100.0 1,042
Area Urban 1.3 8,513 50.6 22.5 13.4 13.5 100.0 94 Rural 2.5 16,792 58.5 23.9 12.9 4.7 100.0 948
Rural with road 2.4 14,451 58.3 23.3 13.6 4.9 100.0 749 Rural without road 3.4 2,341 59.5 26.0 10.5 4.0 100.0 199
Region North 1.7 7,801 58.2 28.9 9.7 3.2 100.0 251 Central 1.7 12,625 66.0 14.7 12.4 6.9 100.0 259 South 4.0 4,879 53.6 25.7 14.9 5.8 100.0 531
Province Vientiane Capital 1.3 3,473 (*) (*) (*) (*) 100.0 13 Phongsaly 0.4 700 (*) (*) (*) (*) 100.0 2 Luangnamtha 1.8 692 52.7 28.3 13.3 5.6 100.0 34 Oudomxay 5.1 1,402 69.7 24.1 4.7 1.5 100.0 94 Bokeo 3.0 724 77.9 16.5 3.8 1.8 100.0 32 Luangprabang 0.5 1,715 (28.8) (42.0) (24.7) (4.5) 100.0 51 Huaphanh 0.2 1,045 (42.7) (34.7) (14.8) (7.8) 100.0 11 Xayabury 0.8 1,523 (63.4) (32.9) (0.0) (3.7) 100.0 28 Xiengkhuang 0.1 1,034 (*) (*) (*) (*) 100.0 1 Vientiane 1.4 1,743 (75.3) (11.2) (13.5) (0.0) 100.0 18 Borikhamxay 1.3 1,129 (*) (*) (*) (*) 100.0 9 Khammuane 2.2 1,541 (60.0) (14.5) (14.8) (10.8) 100.0 31 Savannakhet 2.7 3,351 68.1 15.6 11.5 4.9 100.0 185 Saravane 7.0 1,510 61.8 24.5 10.6 3.2 100.0 208 Sekong 4.1 431 59.9 21.1 15.5 3.5 100.0 24 Champasack 2.5 2,396 45.1 27.6 18.9 8.3 100.0 259 Attapeu 2.1 541 62.2 22.0 10.3 5.4 100.0 40 Xaysomboune 0.6 353 (*) (*) (*) (*) 100.0 1
Age 15-19 1.4 4,565 (90.4) (8.5) (1.1) (0.0) 100.0 23
15-17 1.4 2,796 (*) (*) (*) (*) 100.0 7 18-19 1.4 1,769 (86.1) (12.3) (1.6) (0.0) 100.0 16
20-24 1.5 4,024 72.8 18.2 9.1 0.0 100.0 61 25-29 2.0 4,045 68.0 16.7 6.6 8.8 100.0 119 30-34 2.2 3,824 57.0 22.3 13.7 7.0 100.0 181 35-39 2.3 3,418 59.0 21.9 13.8 5.3 100.0 212 40-44 3.1 3,076 49.7 30.6 14.7 5.1 100.0 239 45-49 3.0 2,353 52.8 26.4 15.6 5.2 100.0 207
Education None or ECE 5.0 4,087 60.2 23.1 10.8 5.9 100.0 464 Primary 2.3 8,922 54.9 24.8 14.9 5.5 100.0 510 Lower secondary 0.9 5,535 59.4 24.6 15.7 0.3 100.0 56 Upper secondary 1.4 3,482 (*) (*) (*) (*) 100.0 7 Post secondary / Non tertiary 0.8 885 (*) (*) (*) (*) 100.0 5 Higher 1.1 2,394 (*) (*) (*) (*) 100.0 0
Under-5s in the same household
At least one 2.2 11,323 60.8 24.0 10.6 4.6 100.0 441 None 2.1 13,982 55.6 23.6 14.7 6.1 100.0 601
Ethno-linguistic group of household head Lao-Tai 1.6 16,522 52.9 25.3 14.9 6.9 100.0 499 Mon-Khmer 4.2 5,779 62.3 23.3 10.7 3.7 100.0 500 Hmong-Mien 0.3 2,109 (*) (*) (*) (*) 100.0 11 Chinese-Tibetan 0.9 628 (*) (*) (*) (*) 100.0 3 Other, DK, Missing 4.3 266 (60.2) (3.4) (21.7) (14.7) 100.0 28
Wealth index quintile Poorest 4.3 4,337 66.0 22.5 8.0 3.4 100.0 424 Second 2.8 4,716 55.4 22.8 15.9 5.9 100.0 307 Middle 1.9 4,908 45.4 26.8 19.0 8.7 100.0 206 Fourth 0.9 5,414 52.6 30.1 12.1 5.2 100.0 82 Richest 1.2 5,929 (66.9) (8.5) (13.9) (10.7) 100.0 23
1 MICS indicator SR.15 - Smoking before age 15 ( ) Figures that are based on 25 – 49 unweighted cases (*) Figures that are based on fewer than 25 unweighted cases
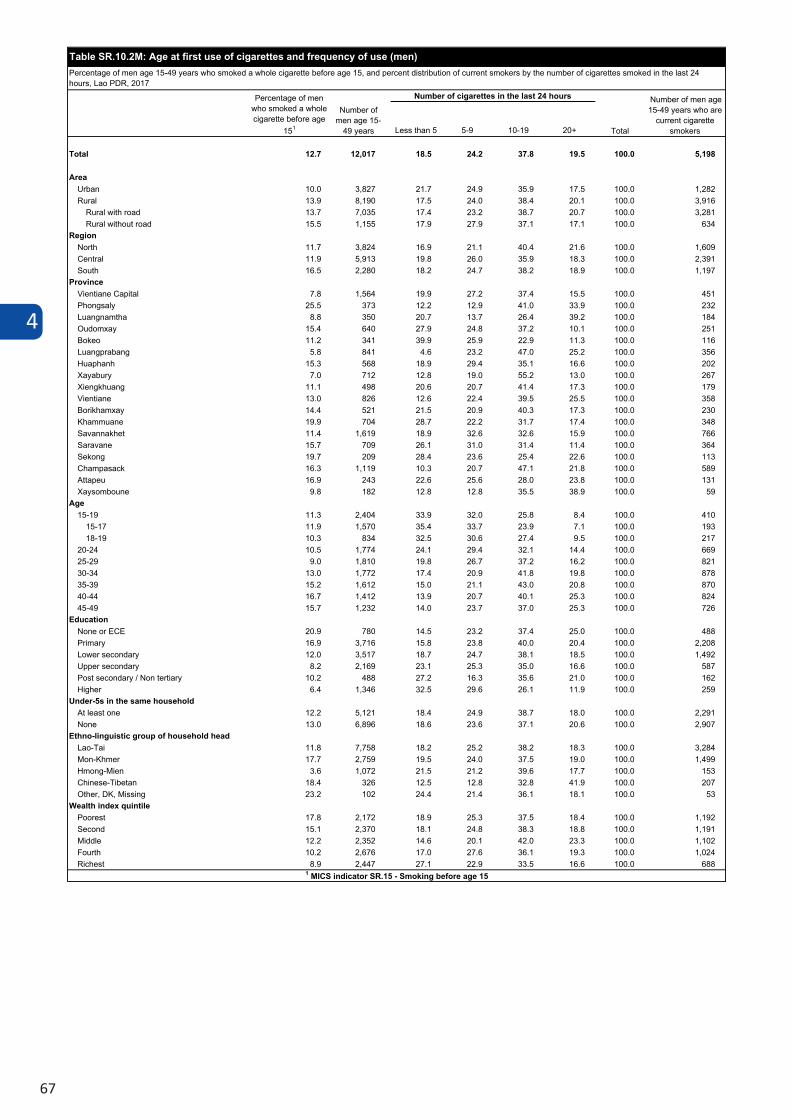
4
67
Less than 5 5-9 10-19 20+
Total 12.7 12,017 18.5 24.2 37.8 19.5 100.0 5,198
AreaUrban 10.0 3,827 21.7 24.9 35.9 17.5 100.0 1,282Rural 13.9 8,190 17.5 24.0 38.4 20.1 100.0 3,916
Rural with road 13.7 7,035 17.4 23.2 38.7 20.7 100.0 3,281Rural without road 15.5 1,155 17.9 27.9 37.1 17.1 100.0 634
RegionNorth 11.7 3,824 16.9 21.1 40.4 21.6 100.0 1,609Central 11.9 5,913 19.8 26.0 35.9 18.3 100.0 2,391South 16.5 2,280 18.2 24.7 38.2 18.9 100.0 1,197
ProvinceVientiane Capital 7.8 1,564 19.9 27.2 37.4 15.5 100.0 451Phongsaly 25.5 373 12.2 12.9 41.0 33.9 100.0 232Luangnamtha 8.8 350 20.7 13.7 26.4 39.2 100.0 184Oudomxay 15.4 640 27.9 24.8 37.2 10.1 100.0 251Bokeo 11.2 341 39.9 25.9 22.9 11.3 100.0 116Luangprabang 5.8 841 4.6 23.2 47.0 25.2 100.0 356Huaphanh 15.3 568 18.9 29.4 35.1 16.6 100.0 202Xayabury 7.0 712 12.8 19.0 55.2 13.0 100.0 267Xiengkhuang 11.1 498 20.6 20.7 41.4 17.3 100.0 179Vientiane 13.0 826 12.6 22.4 39.5 25.5 100.0 358Borikhamxay 14.4 521 21.5 20.9 40.3 17.3 100.0 230Khammuane 19.9 704 28.7 22.2 31.7 17.4 100.0 348Savannakhet 11.4 1,619 18.9 32.6 32.6 15.9 100.0 766Saravane 15.7 709 26.1 31.0 31.4 11.4 100.0 364Sekong 19.7 209 28.4 23.6 25.4 22.6 100.0 113Champasack 16.3 1,119 10.3 20.7 47.1 21.8 100.0 589Attapeu 16.9 243 22.6 25.6 28.0 23.8 100.0 131Xaysomboune 9.8 182 12.8 12.8 35.5 38.9 100.0 59
Age15-19 11.3 2,404 33.9 32.0 25.8 8.4 100.0 410
15-17 11.9 1,570 35.4 33.7 23.9 7.1 100.0 19318-19 10.3 834 32.5 30.6 27.4 9.5 100.0 217
20-24 10.5 1,774 24.1 29.4 32.1 14.4 100.0 66925-29 9.0 1,810 19.8 26.7 37.2 16.2 100.0 82130-34 13.0 1,772 17.4 20.9 41.8 19.8 100.0 87835-39 15.2 1,612 15.0 21.1 43.0 20.8 100.0 87040-44 16.7 1,412 13.9 20.7 40.1 25.3 100.0 82445-49 15.7 1,232 14.0 23.7 37.0 25.3 100.0 726
EducationNone or ECE 20.9 780 14.5 23.2 37.4 25.0 100.0 488Primary 16.9 3,716 15.8 23.8 40.0 20.4 100.0 2,208Lower secondary 12.0 3,517 18.7 24.7 38.1 18.5 100.0 1,492Upper secondary 8.2 2,169 23.1 25.3 35.0 16.6 100.0 587Post secondary / Non tertiary 10.2 488 27.2 16.3 35.6 21.0 100.0 162Higher 6.4 1,346 32.5 29.6 26.1 11.9 100.0 259
Under-5s in the same householdAt least one 12.2 5,121 18.4 24.9 38.7 18.0 100.0 2,291None 13.0 6,896 18.6 23.6 37.1 20.6 100.0 2,907
Ethno-linguistic group of household headLao-Tai 11.8 7,758 18.2 25.2 38.2 18.3 100.0 3,284Mon-Khmer 17.7 2,759 19.5 24.0 37.5 19.0 100.0 1,499Hmong-Mien 3.6 1,072 21.5 21.2 39.6 17.7 100.0 153Chinese-Tibetan 18.4 326 12.5 12.8 32.8 41.9 100.0 207Other, DK, Missing 23.2 102 24.4 21.4 36.1 18.1 100.0 53
Wealth index quintilePoorest 17.8 2,172 18.9 25.3 37.5 18.4 100.0 1,192Second 15.1 2,370 18.1 24.8 38.3 18.8 100.0 1,191Middle 12.2 2,352 14.6 20.1 42.0 23.3 100.0 1,102Fourth 10.2 2,676 17.0 27.6 36.1 19.3 100.0 1,024Richest 8.9 2,447 27.1 22.9 33.5 16.6 100.0 688
1 MICS indicator SR.15 - Smoking before age 15
Table SR.10.2M: Age at first use of cigarettes and frequency of use (men)Percentage of men age 15-49 years who smoked a whole cigarette before age 15, and percent distribution of current smokers by the number of cigarettes smoked in the last 24 hours, Lao PDR, 2017
Percentage of men who smoked a whole cigarette before age
151
Number of men age 15-
49 years
Number of men age 15-49 years who are
current cigarette smokers
Number of cigarettes in the last 24 hours
Total
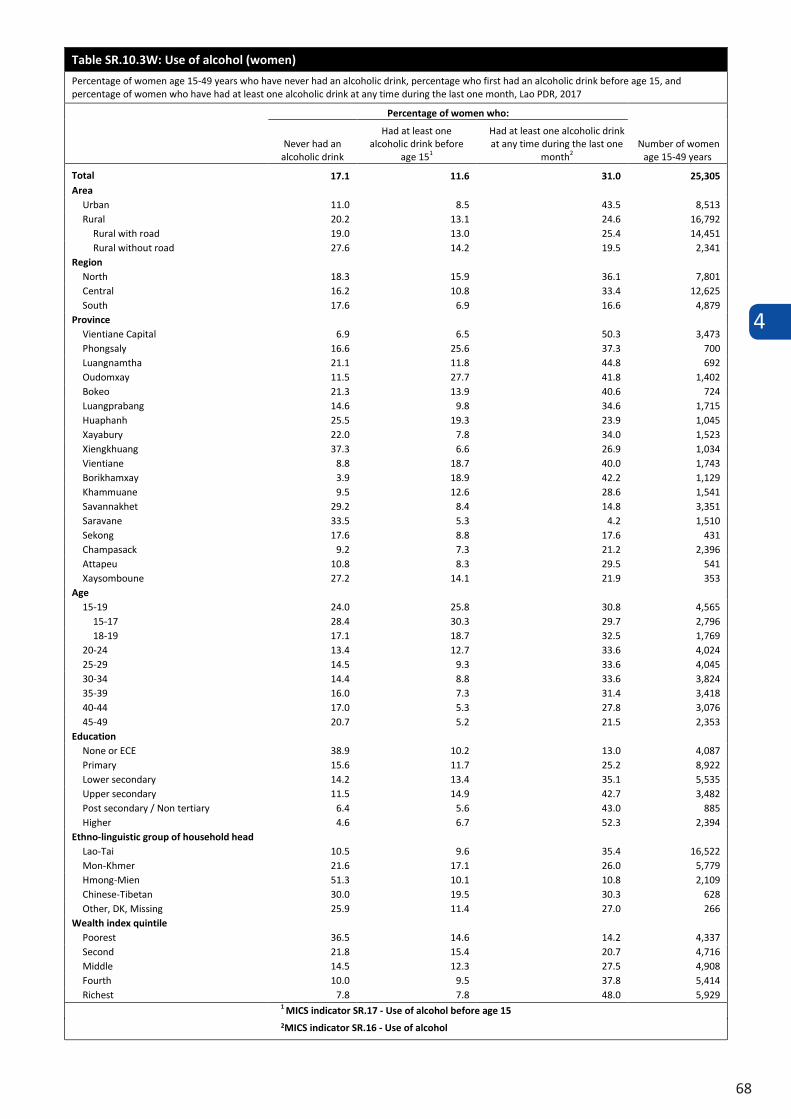
4
68
Table SR.10.3W: Use of alcohol (women)
Percentage of women age 15-49 years who have never had an alcoholic drink, percentage who first had an alcoholic drink before age 15, and percentage of women who have had at least one alcoholic drink at any time during the last one month, Lao PDR, 2017
Percentage of women who:
Number of women age 15-49 years
Never had an alcoholic drink
Had at least one alcoholic drink before
age 151
Had at least one alcoholic drink at any time during the last one
month2
Total 17.1 11.6 31.0 25,305 Area
Urban 11.0 8.5 43.5 8,513 Rural 20.2 13.1 24.6 16,792
Rural with road 19.0 13.0 25.4 14,451 Rural without road 27.6 14.2 19.5 2,341
Region North 18.3 15.9 36.1 7,801 Central 16.2 10.8 33.4 12,625 South 17.6 6.9 16.6 4,879
Province Vientiane Capital 6.9 6.5 50.3 3,473 Phongsaly 16.6 25.6 37.3 700 Luangnamtha 21.1 11.8 44.8 692 Oudomxay 11.5 27.7 41.8 1,402 Bokeo 21.3 13.9 40.6 724 Luangprabang 14.6 9.8 34.6 1,715 Huaphanh 25.5 19.3 23.9 1,045 Xayabury 22.0 7.8 34.0 1,523 Xiengkhuang 37.3 6.6 26.9 1,034 Vientiane 8.8 18.7 40.0 1,743 Borikhamxay 3.9 18.9 42.2 1,129 Khammuane 9.5 12.6 28.6 1,541 Savannakhet 29.2 8.4 14.8 3,351 Saravane 33.5 5.3 4.2 1,510 Sekong 17.6 8.8 17.6 431 Champasack 9.2 7.3 21.2 2,396 Attapeu 10.8 8.3 29.5 541 Xaysomboune 27.2 14.1 21.9 353
Age 15-19 24.0 25.8 30.8 4,565
15-17 28.4 30.3 29.7 2,796 18-19 17.1 18.7 32.5 1,769
20-24 13.4 12.7 33.6 4,024 25-29 14.5 9.3 33.6 4,045 30-34 14.4 8.8 33.6 3,824 35-39 16.0 7.3 31.4 3,418 40-44 17.0 5.3 27.8 3,076 45-49 20.7 5.2 21.5 2,353
Education None or ECE 38.9 10.2 13.0 4,087 Primary 15.6 11.7 25.2 8,922 Lower secondary 14.2 13.4 35.1 5,535 Upper secondary 11.5 14.9 42.7 3,482 Post secondary / Non tertiary 6.4 5.6 43.0 885 Higher 4.6 6.7 52.3 2,394
Ethno-linguistic group of household head Lao-Tai 10.5 9.6 35.4 16,522 Mon-Khmer 21.6 17.1 26.0 5,779 Hmong-Mien 51.3 10.1 10.8 2,109 Chinese-Tibetan 30.0 19.5 30.3 628 Other, DK, Missing 25.9 11.4 27.0 266
Wealth index quintile Poorest 36.5 14.6 14.2 4,337 Second 21.8 15.4 20.7 4,716 Middle 14.5 12.3 27.5 4,908 Fourth 10.0 9.5 37.8 5,414 Richest 7.8 7.8 48.0 5,929
1 MICS indicator SR.17 - Use of alcohol before age 152MICS indicator SR.16 - Use of alcohol
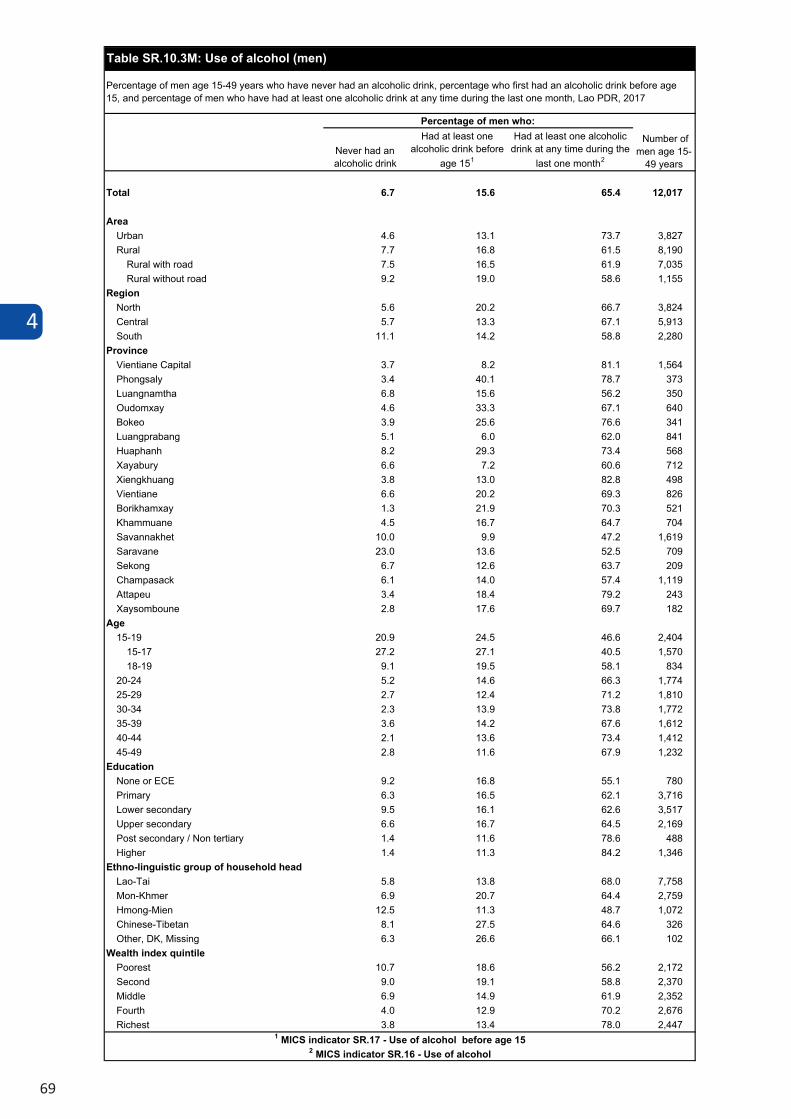
4
69
Table SR.10.3W: Use of alcohol (women)
Percentage of women age 15-49 years who have never had an alcoholic drink, percentage who first had an alcoholic drink before age 15, and percentage of women who have had at least one alcoholic drink at any time during the last one month, Lao PDR, 2017
Percentage of women who:
Number of women age 15-49 years
Never had an alcoholic drink
Had at least one alcoholic drink before
age 151
Had at least one alcoholic drink at any time during the last one
month2
Total 17.1 11.6 31.0 25,305 Area
Urban 11.0 8.5 43.5 8,513 Rural 20.2 13.1 24.6 16,792
Rural with road 19.0 13.0 25.4 14,451 Rural without road 27.6 14.2 19.5 2,341
Region North 18.3 15.9 36.1 7,801 Central 16.2 10.8 33.4 12,625 South 17.6 6.9 16.6 4,879
Province Vientiane Capital 6.9 6.5 50.3 3,473 Phongsaly 16.6 25.6 37.3 700 Luangnamtha 21.1 11.8 44.8 692 Oudomxay 11.5 27.7 41.8 1,402 Bokeo 21.3 13.9 40.6 724 Luangprabang 14.6 9.8 34.6 1,715 Huaphanh 25.5 19.3 23.9 1,045 Xayabury 22.0 7.8 34.0 1,523 Xiengkhuang 37.3 6.6 26.9 1,034 Vientiane 8.8 18.7 40.0 1,743 Borikhamxay 3.9 18.9 42.2 1,129 Khammuane 9.5 12.6 28.6 1,541 Savannakhet 29.2 8.4 14.8 3,351 Saravane 33.5 5.3 4.2 1,510 Sekong 17.6 8.8 17.6 431 Champasack 9.2 7.3 21.2 2,396 Attapeu 10.8 8.3 29.5 541 Xaysomboune 27.2 14.1 21.9 353
Age 15-19 24.0 25.8 30.8 4,565
15-17 28.4 30.3 29.7 2,796 18-19 17.1 18.7 32.5 1,769
20-24 13.4 12.7 33.6 4,024 25-29 14.5 9.3 33.6 4,045 30-34 14.4 8.8 33.6 3,824 35-39 16.0 7.3 31.4 3,418 40-44 17.0 5.3 27.8 3,076 45-49 20.7 5.2 21.5 2,353
Education None or ECE 38.9 10.2 13.0 4,087 Primary 15.6 11.7 25.2 8,922 Lower secondary 14.2 13.4 35.1 5,535 Upper secondary 11.5 14.9 42.7 3,482 Post secondary / Non tertiary 6.4 5.6 43.0 885 Higher 4.6 6.7 52.3 2,394
Ethno-linguistic group of household head Lao-Tai 10.5 9.6 35.4 16,522 Mon-Khmer 21.6 17.1 26.0 5,779 Hmong-Mien 51.3 10.1 10.8 2,109 Chinese-Tibetan 30.0 19.5 30.3 628 Other, DK, Missing 25.9 11.4 27.0 266
Wealth index quintile Poorest 36.5 14.6 14.2 4,337 Second 21.8 15.4 20.7 4,716 Middle 14.5 12.3 27.5 4,908 Fourth 10.0 9.5 37.8 5,414 Richest 7.8 7.8 48.0 5,929
1 MICS indicator SR.17 - Use of alcohol before age 152MICS indicator SR.16 - Use of alcohol
Never had an alcoholic drink
Had at least one alcoholic drink before
age 151
Had at least one alcoholic drink at any time during the
last one month2
Total 6.7 15.6 65.4 12,017
AreaUrban 4.6 13.1 73.7 3,827Rural 7.7 16.8 61.5 8,190
Rural with road 7.5 16.5 61.9 7,035Rural without road 9.2 19.0 58.6 1,155
RegionNorth 5.6 20.2 66.7 3,824Central 5.7 13.3 67.1 5,913South 11.1 14.2 58.8 2,280
ProvinceVientiane Capital 3.7 8.2 81.1 1,564Phongsaly 3.4 40.1 78.7 373Luangnamtha 6.8 15.6 56.2 350Oudomxay 4.6 33.3 67.1 640Bokeo 3.9 25.6 76.6 341Luangprabang 5.1 6.0 62.0 841Huaphanh 8.2 29.3 73.4 568Xayabury 6.6 7.2 60.6 712Xiengkhuang 3.8 13.0 82.8 498Vientiane 6.6 20.2 69.3 826Borikhamxay 1.3 21.9 70.3 521Khammuane 4.5 16.7 64.7 704Savannakhet 10.0 9.9 47.2 1,619Saravane 23.0 13.6 52.5 709Sekong 6.7 12.6 63.7 209Champasack 6.1 14.0 57.4 1,119Attapeu 3.4 18.4 79.2 243Xaysomboune 2.8 17.6 69.7 182
Age15-19 20.9 24.5 46.6 2,404
15-17 27.2 27.1 40.5 1,57018-19 9.1 19.5 58.1 834
20-24 5.2 14.6 66.3 1,77425-29 2.7 12.4 71.2 1,81030-34 2.3 13.9 73.8 1,77235-39 3.6 14.2 67.6 1,61240-44 2.1 13.6 73.4 1,41245-49 2.8 11.6 67.9 1,232
EducationNone or ECE 9.2 16.8 55.1 780Primary 6.3 16.5 62.1 3,716Lower secondary 9.5 16.1 62.6 3,517Upper secondary 6.6 16.7 64.5 2,169Post secondary / Non tertiary 1.4 11.6 78.6 488Higher 1.4 11.3 84.2 1,346
Ethno-linguistic group of household headLao-Tai 5.8 13.8 68.0 7,758Mon-Khmer 6.9 20.7 64.4 2,759Hmong-Mien 12.5 11.3 48.7 1,072Chinese-Tibetan 8.1 27.5 64.6 326Other, DK, Missing 6.3 26.6 66.1 102
Wealth index quintilePoorest 10.7 18.6 56.2 2,172Second 9.0 19.1 58.8 2,370Middle 6.9 14.9 61.9 2,352Fourth 4.0 12.9 70.2 2,676Richest 3.8 13.4 78.0 2,447
2 MICS indicator SR.16 - Use of alcohol
Table SR.10.3M: Use of alcohol (men)
Percentage of men age 15-49 years who have never had an alcoholic drink, percentage who first had an alcoholic drink before age 15, and percentage of men who have had at least one alcoholic drink at any time during the last one month, Lao PDR, 2017
Percentage of men who: Number of
men age 15-49 years
1 MICS indicator SR.17 - Use of alcohol before age 15
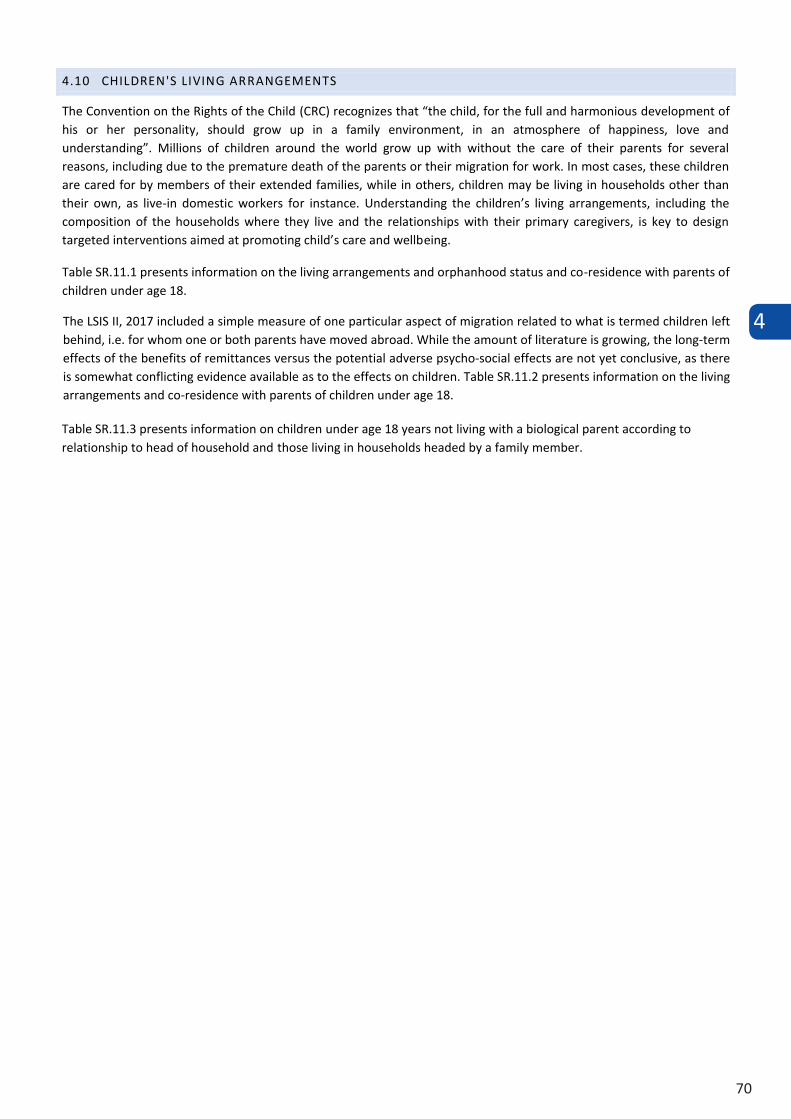
4
70
4.10 CHILDREN'S LIVING ARRANGEMENTS
The Convention on the Rights of the Child (CRC) recognizes that “the child, for the full and harmonious development of his or her personality, should grow up in a family environment, in an atmosphere of happiness, love and understanding”. Millions of children around the world grow up with without the care of their parents for several reasons, including due to the premature death of the parents or their migration for work. In most cases, these children are cared for by members of their extended families, while in others, children may be living in households other than their own, as live-in domestic workers for instance. Understanding the children’s living arrangements, including the composition of the households where they live and the relationships with their primary caregivers, is key to design targeted interventions aimed at promoting child’s care and wellbeing.
Table SR.11.1 presents information on the living arrangements and orphanhood status and co-residence with parents of children under age 18.
The LSIS II, 2017 included a simple measure of one particular aspect of migration related to what is termed children left behind, i.e. for whom one or both parents have moved abroad. While the amount of literature is growing, the long-term effects of the benefits of remittances versus the potential adverse psycho-social effects are not yet conclusive, as there is somewhat conflicting evidence available as to the effects on children. Table SR.11.2 presents information on the living arrangements and co-residence with parents of children under age 18.
Table SR.11.3 presents information on children under age 18 years not living with a biological parent according to relationship to head of household and those living in households headed by a family member.
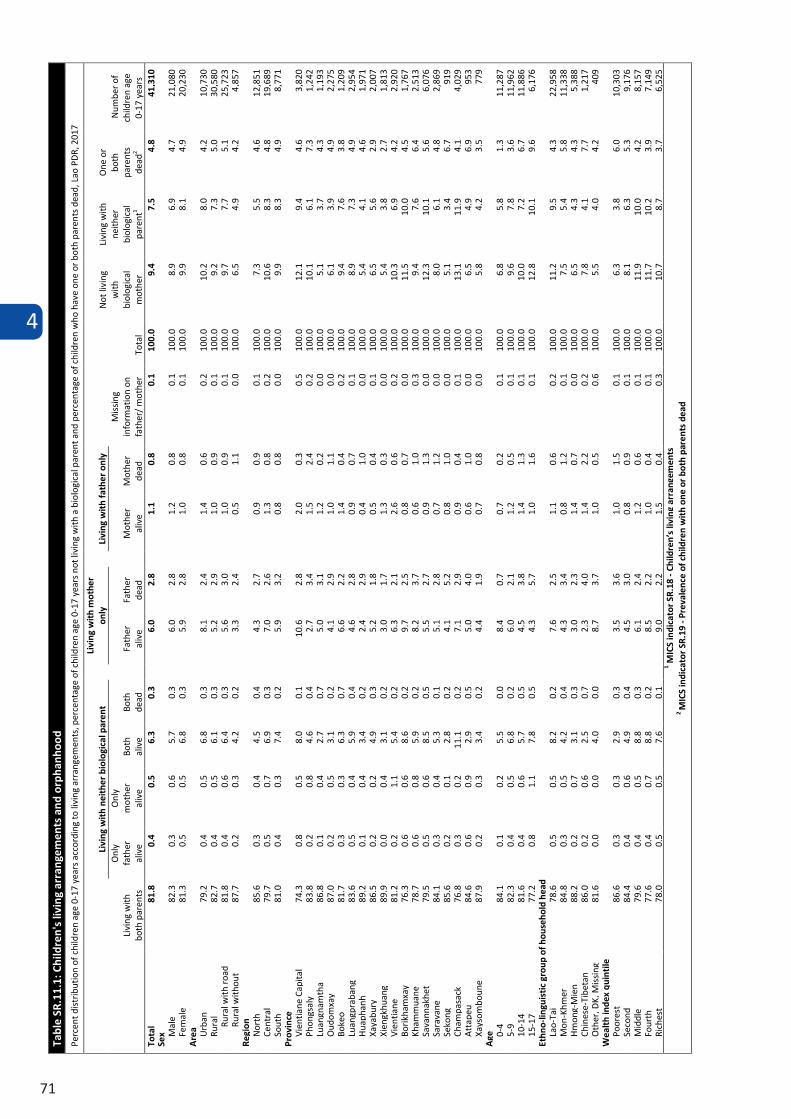
4
71
4.10 CHILDREN'S LIVING ARRANGEMENTS
The Convention on the Rights of the Child (CRC) recognizes that “the child, for the full and harmonious development of his or her personality, should grow up in a family environment, in an atmosphere of happiness, love and understanding”. Millions of children around the world grow up with without the care of their parents for several reasons, including due to the premature death of the parents or their migration for work. In most cases, these children are cared for by members of their extended families, while in others, children may be living in households other than their own, as live-in domestic workers for instance. Understanding the children’s living arrangements, including the composition of the households where they live and the relationships with their primary caregivers, is key to design targeted interventions aimed at promoting child’s care and wellbeing.
Table SR.11.1 presents information on the living arrangements and orphanhood status and co-residence with parents of children under age 18.
The LSIS II, 2017 included a simple measure of one particular aspect of migration related to what is termed children left behind, i.e. for whom one or both parents have moved abroad. While the amount of literature is growing, the long-term effects of the benefits of remittances versus the potential adverse psycho-social effects are not yet conclusive, as there is somewhat conflicting evidence available as to the effects on children. Table SR.11.2 presents information on the living arrangements and co-residence with parents of children under age 18.
Table SR.11.3 presents information on children under age 18 years not living with a biological parent according to relationship to head of household and those living in households headed by a family member.
Tabl
e SR
.11.
1: C
hild
ren'
s liv
ing
arra
ngem
ents
and
orp
hanh
ood
Perc
ent d
istr
ibut
ion
of c
hild
ren
age
0-17
yea
rs a
ccor
ding
to li
ving
arr
ange
men
ts, p
erce
ntag
e of
chi
ldre
n ag
e 0-
17 y
ears
not
livi
ng w
ith a
bio
logi
cal p
aren
t and
per
cent
age
of c
hild
ren
who
hav
e on
e or
bot
h pa
rent
s de
ad, L
ao P
DR,
201
7
Livi
ng w
ith
both
par
ents
Livi
ng w
ith
neit
her
biol
ogic
al p
aren
t Li
ving
wit
h m
othe
r on
ly
Livi
ng w
ith
fath
er o
nly
Mis
sing
in
form
atio
n on
fa
ther
/ m
othe
r To
tal
Not
livi
ng
with
bi
olog
ical
m
othe
r
Livi
ng w
ith
neith
er
biol
ogic
al
pare
nt1
One
or
both
pa
rent
s de
ad2
Num
ber o
f ch
ildre
n ag
e 0-
17 y
ears
Onl
y fa
ther
al
ive
Onl
y m
othe
r al
ive
Both
al
ive
Both
de
ad
Fath
er
aliv
e Fa
ther
de
ad
Mot
her
aliv
e M
othe
r de
ad
Tota
l 81
.8
0.4
0.5
6.3
0.3
6.0
2.8
1.1
0.8
0.1
100.
0 9.
4 7.
5 4.
8 41
,310
Se
x Mal
e 82
.3
0.3
0.6
5.7
0.3
6.0
2.8
1.2
0.8
0.1
100.
0 8.
9 6.
9 4.
7 21
,080
Fe
mal
e 81
.3
0.5
0.5
6.8
0.3
5.9
2.8
1.0
0.8
0.1
100.
0 9.
9 8.
1 4.
9 20
,230
A
rea Urb
an
79.2
0.
4 0.
5 6.
8 0.
3 8.
1 2.
4 1.
4 0.
6 0.
2 10
0.0
10.2
8.
0 4.
2 10
,730
Ru
ral
82.7
0.
4 0.
5 6.
1 0.
3 5.
2 2.
9 1.
0 0.
9 0.
1 10
0.0
9.2
7.3
5.0
30,5
80
Rura
l with
roa
d 81
.8
0.4
0.6
6.4
0.3
5.6
3.0
1.0
0.9
0.1
100.
0 9.
7 7.
7 5.
1 25
,723
Ru
ral w
ithou
t ro
ad87
.7
0.2
0.3
4.2
0.2
3.3
2.4
0.5
1.1
0.0
100.
0 6.
5 4.
9 4.
2 4,
857
Regi
on
Nor
th
85.6
0.
3 0.
4 4.
5 0.
4 4.
3 2.
7 0.
9 0.
9 0.
1 10
0.0
7.3
5.5
4.6
12,8
51
Cent
ral
79.7
0.
5 0.
7 6.
9 0.
3 7.
0 2.
6 1.
3 0.
8 0.
2 10
0.0
10.6
8.
3 4.
8 19
,689
So
uth
81.0
0.
4 0.
3 7.
4 0.
2 5.
9 3.
2 0.
8 0.
8 0.
0 10
0.0
9.9
8.3
4.9
8,77
1 Pr
ovin
ce
Vien
tiane
Cap
ital
74.3
0.
8 0.
5 8.
0 0.
1 10
.6
2.8
2.0
0.3
0.5
100.
0 12
.1
9.4
4.6
3,82
0 Ph
ongs
aly
83
.8
0.2
0.8
4.6
0.4
2.7
3.4
1.5
2.4
0.2
100.
0 10
.1
6.1
7.3
1,24
2 Lu
angn
amth
a 86
.8
0.1
0.4
2.7
0.7
5.0
3.1
1.2
0.2
0.0
100.
0 5.
1 3.
7 4.
3 1,
193
Oud
omxa
y 87
.0
0.2
0.5
3.1
0.2
4.1
2.9
1.0
1.1
0.0
100.
0 6.
1 3.
9 4.
9 2,
275
Boke
o 81
.7
0.3
0.3
6.3
0.7
6.6
2.2
1.4
0.4
0.2
100.
0 9.
4 7.
6 3.
8 1,
209
Luan
gpra
bang
83
.6
0.5
0.4
5.9
0.4
4.6
2.8
0.9
0.7
0.1
100.
0 8.
9 7.
3 4.
9 2,
954
Hua
phan
h 89
.2
0.1
0.4
3.4
0.2
2.4
2.9
0.4
1.0
0.0
100.
0 5.
4 4.
1 4.
6 1,
971
Xaya
bury
86
.5
0.2
0.2
4.9
0.3
5.2
1.8
0.5
0.4
0.1
100.
0 6.
5 5.
6 2.
9 2,
007
Xien
gkhu
ang
89.9
0.
0 0.
4 3.
1 0.
2 3.
0 1.
7 1.
3 0.
3 0.
0 10
0.0
5.4
3.8
2.7
1,81
3 Vi
entia
ne
81.2
0.
2 1.
1 5.
4 0.
2 6.
3 2.
1 2.
6 0.
6 0.
2 10
0.0
10.3
6.
9 4.
2 2,
920
Borik
ham
xay
76.3
0.
6 0.
6 8.
6 0.
2 9.
7 2.
5 0.
8 0.
7 0.
0 10
0.0
11.5
10
.0
4.5
1,76
7 Kh
amm
uane
78
.7
0.6
0.8
5.9
0.2
8.2
3.7
0.6
1.0
0.3
100.
0 9.
4 7.
6 6.
4 2,
513
Sava
nnak
het
79.5
0.
5 0.
6 8.
5 0.
5 5.
5 2.
7 0.
9 1.
3 0.
0 10
0.0
12.3
10
.1
5.6
6,07
6 Sa
rava
ne
84.1
0.
3 0.
4 5.
3 0.
1 5.
1 2.
8 0.
7 1.
2 0.
0 10
0.0
8.0
6.1
4.8
2,86
9 Se
kong
85
.6
0.2
0.1
2.8
0.2
4.1
5.2
0.8
1.0
0.0
100.
0 5.
1 3.
4 6.
7 91
9 Ch
ampa
sack
76
.8
0.3
0.2
11.1
0.
2 7.
1 2.
9 0.
9 0.
4 0.
1 10
0.0
13.1
11
.9
4.1
4,02
9 A
ttap
eu
84.6
0.
6 0.
9 2.
9 0.
5 5.
0 4.
0 0.
6 1.
0 0.
0 10
0.0
6.5
4.9
6.9
953
Xays
ombo
une
87.9
0.
2 0.
3 3.
4 0.
2 4.
4 1.
9 0.
7 0.
8 0.
0 10
0.0
5.8
4.2
3.5
779
Age
0-
4 84
.1
0.1
0.2
5.5
0.0
8.4
0.7
0.7
0.2
0.1
100.
0 6.
8 5.
8 1.
3 11
,287
5-
9 82
.3
0.4
0.5
6.8
0.2
6.0
2.1
1.2
0.5
0.1
100.
0 9.
6 7.
8 3.
6 11
,962
10
-14
81.6
0.
4 0.
6 5.
7 0.
5 4.
5 3.
8 1.
4 1.
3 0.
1 10
0.0
10.0
7.
2 6.
7 11
,886
15
-17
77.2
0.
8 1.
1 7.
8 0.
5 4.
3 5.
7 1.
0 1.
6 0.
1 10
0.0
12.8
10
.1
9.6
6,17
6 Et
hno-
lingu
isti
c gr
oup
of h
ouse
hold
hea
d La
o-Ta
i 78
.6
0.5
0.5
8.2
0.2
7.6
2.5
1.1
0.6
0.2
100.
0 11
.2
9.5
4.3
22,9
58
Mon
-Khm
er
84.8
0.
3 0.
5 4.
2 0.
4 4.
3 3.
4 0.
8 1.
2 0.
1 10
0.0
7.5
5.4
5.8
11,3
38
Hm
ong-
Mie
n 88
.2
0.2
0.7
3.1
0.3
3.0
2.3
1.4
0.7
0.0
100.
0 6.
5 4.
3 4.
3 5,
388
Chin
ese-
Tibe
tan
86.0
0.
2 0.
6 2.
5 0.
7 2.
3 4.
0 1.
4 2.
2 0.
2 10
0.0
7.8
4.1
7.7
1,21
7 O
ther
, DK,
Mis
sing
81
.6
0.0
0.0
4.0
0.0
8.7
3.7
1.0
0.5
0.6
100.
0 5.
5 4.
0 4.
2 40
9 W
ealt
h in
dex
quin
tile
Po
ores
t 86
.6
0.3
0.3
2.9
0.3
3.5
3.6
1.0
1.5
0.1
100.
0 6.
3 3.
8 6.
0 10
,303
Se
cond
84
.4
0.4
0.6
4.9
0.4
4.5
3.0
0.8
0.9
0.1
100.
0 8.
1 6.
3 5.
3 9,
176
Mid
dle
79.6
0.
4 0.
5 8.
8 0.
3 6.
1 2.
4 1.
2 0.
6 0.
1 10
0.0
11.9
10
.0
4.2
8,15
7 Fo
urth
77
.6
0.4
0.7
8.8
0.2
8.5
2.2
1.0
0.4
0.1
100.
0 11
.7
10.2
3.
9 7,
149
Rich
est
78.0
0.
5 0.
5 7.
6 0.
1 9.
0 2.
2 1.
5 0.
4 0.
3 10
0.0
10.7
8.
7 3.
7 6,
525
1 MIC
S in
dica
tor S
R.18
- Ch
ildre
n’s
livin
g ar
rang
emen
ts
2 M
ICS
indi
cato
r SR
.19
- Pre
vale
nce
of c
hild
ren
wit
h on
e or
bot
h pa
rent
s de
ad
4
72
Table SR.11.2: Children's living arrangements and co-residence with parents Percentage of children age 0-17 years by coresidence of parents, Lao PDR, 2017
Percentage of children age 0-17 years with:
Number of children age 0-17 years
Only mother is living
elsewhereA
Only father is living
elsewhereA
Both mother and father are
living elsewhereA
At least one parent living elsewhereA
Only mother living
abroad
Only father living
abroad
Both mother and
father living
abroad
At least one
parent living
abroad1
Total 1.1 5.8 6.2 13.1 0.2 0.9 1.9 2.9 41,310
Sex Male 1.2 5.9 5.7 12.8 0.2 0.9 1.9 2.9 21,080 Female 1.0 5.7 6.8 13.5 0.2 0.8 1.8 2.9 20,230
Area Urban 1.4 7.8 6.8 16.0 0.3 0.9 1.2 2.4 10,730 Rural 0.9 5.1 6.0 12.1 0.2 0.8 2.1 3.1 30,580
Rural with road 1.0 5.5 6.4 12.9 0.2 0.9 2.2 3.2 25,723 Rural without road 0.5 3.1 4.2 7.8 0.1 0.5 1.6 2.2 4,857
Region North 0.9 4.2 4.5 9.6 0.1 0.3 0.5 0.8 12,851 Central 1.3 6.9 6.8 15.0 0.2 1.0 1.9 3.2 19,689 South 0.8 5.8 7.4 13.9 0.2 1.3 3.9 5.4 8,771
Province Vientiane Capital 2.0 10.0 7.8 19.8 0.6 1.7 1.2 3.4 3,820 Phongsaly 1.4 2.6 4.6 8.6 0.0 0.1 0.0 0.1 1,242 Luangnamtha 1.2 4.9 2.7 8.8 0.3 0.1 0.0 0.4 1,193 Oudomxay 1.0 4.1 3.1 8.1 0.0 0.0 0.0 0.1 2,275 Bokeo 1.3 6.6 6.3 14.2 0.0 0.2 0.0 0.2 1,209 Luangprabang 0.9 4.6 5.9 11.3 0.0 0.4 0.7 1.1 2,954 Huaphanh 0.4 2.3 3.4 6.1 0.0 0.1 0.0 0.1 1,971 Xayabury 0.5 5.0 4.9 10.3 0.2 0.8 2.0 3.0 2,007 Xiengkhuang 1.3 3.0 3.1 7.4 0.0 0.0 0.0 0.1 1,813 Vientiane 2.6 6.3 5.4 14.2 0.3 0.5 0.8 1.6 2,920 Borikhamxay 0.8 9.7 8.6 19.1 0.1 0.5 0.6 1.2 1,767 Khammuane 0.6 7.8 5.8 14.2 0.2 1.1 1.0 2.3 2,513 Savannakhet 0.9 5.4 8.5 14.7 0.2 1.5 4.4 6.0 6,076 Saravane 0.7 4.9 5.2 10.8 0.2 0.5 2.2 2.9 2,869 Sekong 0.8 4.0 2.8 7.6 0.2 0.0 0.1 0.3 919 Champasack 0.9 7.0 11.1 18.9 0.3 2.4 6.9 9.6 4,029 Attapeu 0.6 5.0 2.9 8.5 0.0 0.3 0.2 0.4 953 Xaysomboune 0.7 4.4 3.4 8.5 0.0 0.1 0.0 0.1 779
Age 0-4 0.7 8.2 5.4 14.3 0.1 1.4 2.2 3.7 11,287 5-9 1.2 5.8 6.7 13.7 0.2 0.9 2.4 3.5 11,962 10-14 1.4 4.4 5.7 11.5 0.2 0.5 1.5 2.2 11,886 15-17 1.0 4.1 7.8 12.9 0.2 0.5 0.8 1.5 6,176
Orphanhood status Both parents alive 1.1 6.1 6.5 13.8 0.2 0.9 2.0 3.1 39,289 Only mother alive 0.0 0.0 0.0 0.0 0.0 0.0 0.0 0.0 1,356 Only father alive 0.0 0.0 0.0 0.0 0.0 0.0 0.0 0.0 494 Both parents deceased 0.0 0.0 0.0 0.0 0.0 0.0 0.0 0.0 123 Unknown (0.0) (0.0) (0.0) (0.0) (0.0) (0.0) (0.0) (0.0) 48
Ethno-linguistic group of household headLao-Tai 1.1 7.4 8.2 16.7 0.3 1.4 3.1 4.8 22,958
Mon-Khmer 0.8 4.1 4.2 9.2 0.0 0.2 0.5 0.7 11,338 Hmong-Mien 1.4 2.9 3.1 7.4 0.0 0.0 0.0 0.0 5,388 Chinese-Tibetan 1.4 2.3 2.5 6.1 0.3 0.2 0.0 0.4 1,217 Other, DK, Missing 1.0 8.4 4.0 13.4 0.0 1.2 0.0 1.2 409
Wealth index quintile Poorest 1.0 3.3 2.9 7.2 0.1 0.3 0.4 0.8 10,303 Second 0.8 4.4 4.9 10.2 0.1 0.5 1.2 1.8 9,176 Middle 1.2 6.0 8.7 15.9 0.3 1.2 3.6 5.1 8,157 Fourth 1.0 8.3 8.8 18.1 0.3 1.6 3.2 5.0 7,149 Richest 1.5 8.7 7.5 17.7 0.4 1.0 1.4 2.8 6,525
1 MICS indicator SR.20 - Children with at least one parent living abroad A Includes parents living abroad as well as those living elsewhere in the country ( ) Figures that are based on 25 – 49 unweighted cases
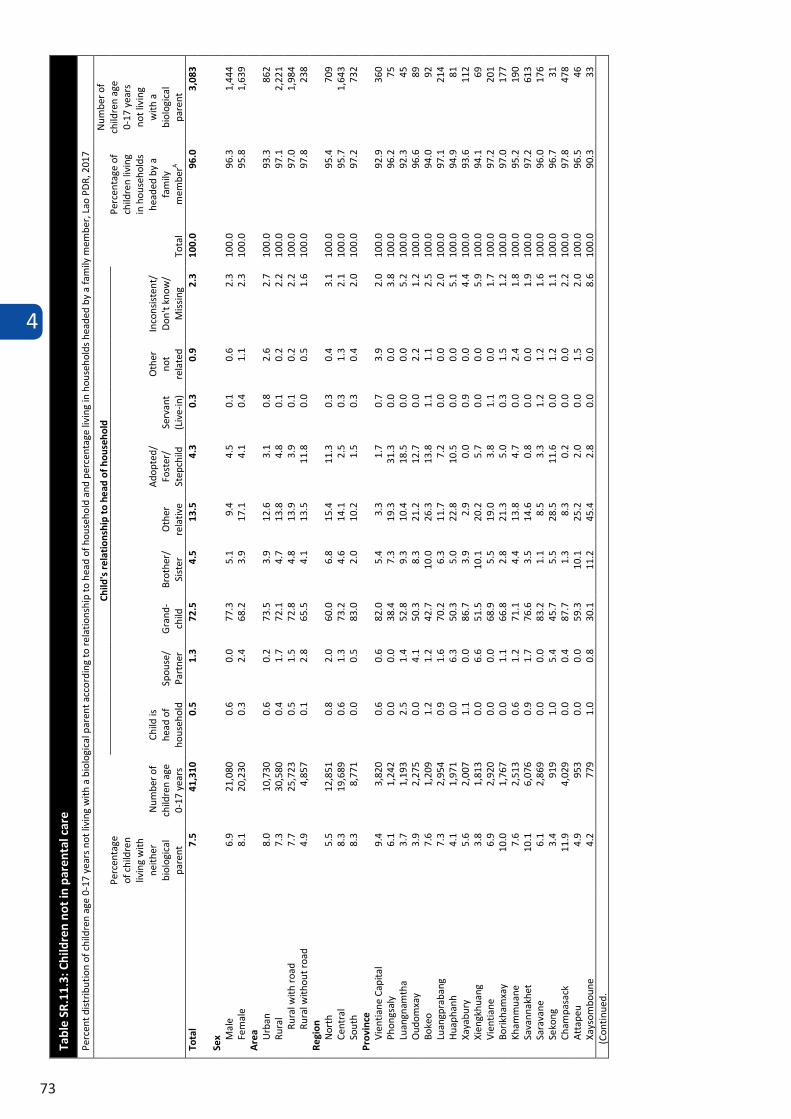
4
73
Tabl
e SR
.11.
3: C
hild
ren
not
in p
aren
tal c
are
Perc
ent d
istr
ibut
ion
of c
hild
ren
age
0-17
yea
rs n
ot li
ving
with
a b
iolo
gica
l par
ent a
ccor
ding
to re
latio
nshi
p to
hea
d of
hou
seho
ld a
nd p
erce
ntag
e liv
ing
in h
ouse
hold
s he
aded
by
a fa
mily
mem
ber,
Lao
PD
R, 2
017
Perc
enta
ge
of c
hild
ren
livin
g w
ith
neith
er
biol
ogic
al
pare
nt
Num
ber o
f ch
ildre
n ag
e 0-
17 y
ears
Child
's r
elat
ions
hip
to h
ead
of h
ouse
hold
Tota
l
Perc
enta
ge o
f ch
ildre
n liv
ing
in h
ouse
hold
s he
aded
by
a fa
mily
m
embe
rA
Num
ber o
f ch
ildre
n ag
e 0-
17 y
ears
no
t liv
ing
with
a
biol
ogic
al
pare
nt
Child
is
head
of
hous
ehol
d Sp
ouse
/ Pa
rtne
r G
rand
-ch
ild
Brot
her/
Si
ster
O
ther
re
lativ
e
Ado
pted
/ Fo
ster
/ St
epch
ild
Serv
ant
(Liv
e-in
)
Oth
er
not
rela
ted
Inco
nsis
tent
/ D
on't
know
/ M
issi
ng
Tota
l 7.
5 41
,310
0.
5 1.
3 72
.5
4.5
13.5
4.
3 0.
3 0.
9 2.
3 10
0.0
96.0
3,
083
Sex M
ale
6.9
21,0
80
0.6
0.0
77.3
5.
1 9.
4 4.
5 0.
1 0.
6 2.
3 10
0.0
96.3
1,
444
Fem
ale
8.1
20,2
30
0.3
2.4
68.2
3.
9 17
.1
4.1
0.4
1.1
2.3
100.
0 95
.8
1,63
9 A
rea Urb
an
8.0
10,7
30
0.6
0.2
73.5
3.
9 12
.6
3.1
0.8
2.6
2.7
100.
0 93
.3
862
Rura
l 7.
3 30
,580
0.
4 1.
7 72
.1
4.7
13.8
4.
8 0.
1 0.
2 2.
2 10
0.0
97.1
2,
221
Rura
l with
roa
d 7.
7 25
,723
0.
5 1.
5 72
.8
4.8
13.9
3.
9 0.
1 0.
2 2.
2 10
0.0
97.0
1,
984
Rura
l with
out r
oad
4.9
4,85
7 0.
1 2.
8 65
.5
4.1
13.5
11
.8
0.0
0.5
1.6
100.
0 97
.8
238
Regi
on
Nor
th
5.5
12,8
51
0.8
2.0
60.0
6.
8 15
.4
11.3
0.
3 0.
4 3.
1 10
0.0
95.4
70
9 Ce
ntra
l 8.
3 19
,689
0.
6 1.
3 73
.2
4.6
14.1
2.
5 0.
3 1.
3 2.
1 10
0.0
95.7
1,
643
Sout
h 8.
3 8,
771
0.0
0.5
83.0
2.
0 10
.2
1.5
0.3
0.4
2.0
100.
0 97
.2
732
Prov
ince
Vi
entia
ne C
apita
l 9.
4 3,
820
0.6
0.6
82.0
5.
4 3.
3 1.
7 0.
7 3.
9 2.
0 10
0.0
92.9
36
0 Ph
ongs
aly
6.
1 1,
242
0.0
0.0
38.4
7.
3 19
.3
31.3
0.
0 0.
0 3.
8 10
0.0
96.2
75
Lu
angn
amth
a 3.
7 1,
193
2.5
1.4
52.8
9.
3 10
.4
18.5
0.
0 0.
0 5.
2 10
0.0
92.3
45
O
udom
xay
3.9
2,27
5 0.
0 4.
1 50
.3
8.3
21.2
12
.7
0.0
2.2
1.2
100.
0 96
.6
89
Boke
o 7.
6 1,
209
1.2
1.2
42.7
10
.0
26.3
13
.8
1.1
1.1
2.5
100.
0 94
.0
92
Luan
gpra
bang
7.
3 2,
954
0.9
1.6
70.2
6.
3 11
.7
7.2
0.0
0.0
2.0
100.
0 97
.1
214
Hua
phan
h 4.
1 1,
971
0.0
6.3
50.3
5.
0 22
.8
10.5
0.
0 0.
0 5.
1 10
0.0
94.9
81
Xa
yabu
ry
5.6
2,00
7 1.
1 0.
0 86
.7
3.9
2.9
0.0
0.9
0.0
4.4
100.
0 93
.6
112
Xien
gkhu
ang
3.8
1,81
3 0.
0 6.
6 51
.5
10.1
20
.2
5.7
0.0
0.0
5.9
100.
0 94
.1
69
Vien
tiane
6.
9 2,
920
0.0
0.0
68.9
5.
5 19
.0
3.8
1.1
0.0
1.7
100.
0 97
.2
201
Borik
ham
xay
10.0
1,
767
0.0
1.1
66.8
2.
8 21
.3
5.0
0.3
1.5
1.2
100.
0 97
.0
177
Kham
mua
ne
7.6
2,51
3 0.
6 1.
2 71
.1
4.4
13.8
4.
7 0.
0 2.
4 1.
8 10
0.0
95.2
19
0 Sa
vann
akhe
t 10
.1
6,07
6 0.
9 1.
7 76
.6
3.5
14.6
0.
8 0.
0 0.
0 1.
9 10
0.0
97.2
61
3 Sa
rava
ne
6.1
2,86
9 0.
0 0.
0 83
.2
1.1
8.5
3.3
1.2
1.2
1.6
100.
0 96
.0
176
Seko
ng
3.4
919
1.0
5.4
45.7
5.
5 28
.5
11.6
0.
0 1.
2 1.
1 10
0.0
96.7
31
Ch
ampa
sack
11
.9
4,02
9 0.
0 0.
4 87
.7
1.3
8.3
0.2
0.0
0.0
2.2
100.
0 97
.8
478
Att
apeu
4.
9 95
3 0.
0 0.
0 59
.3
10.1
25
.2
2.0
0.0
1.5
2.0
100.
0 96
.5
46
Xays
ombo
une
4.2
779
1.0
0.8
30.1
11
.2
45.4
2.
8 0.
0 0.
0 8.
6 10
0.0
90.3
33
(C
ontin
ued.
..)
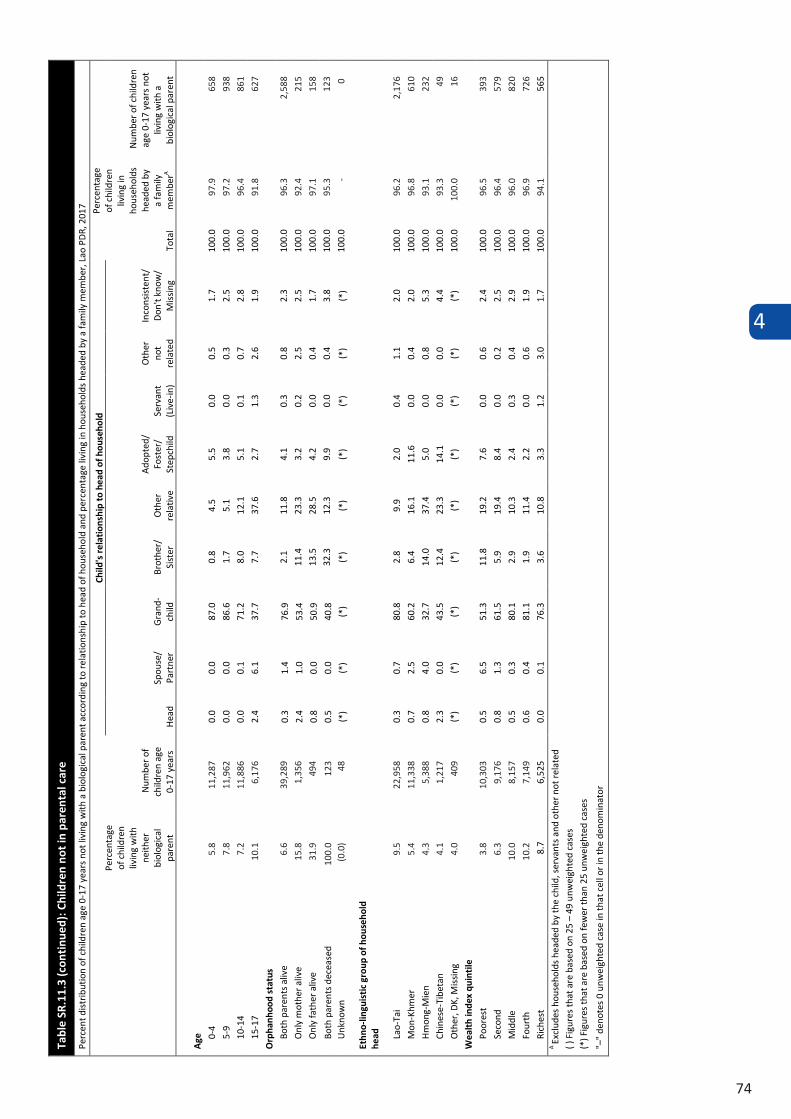
4
74
Tabl
e SR
.11.
3 (c
onti
nued
): C
hild
ren
not
in p
aren
tal c
are
Perc
ent d
istr
ibut
ion
of c
hild
ren
age
0-17
yea
rs n
ot li
ving
with
a b
iolo
gica
l par
ent a
ccor
ding
to re
latio
nshi
p to
hea
d of
hou
seho
ld a
nd p
erce
ntag
e liv
ing
in h
ouse
hold
s he
aded
by
a fa
mily
mem
ber,
Lao
PD
R, 2
017
Perc
enta
ge
of c
hild
ren
livin
g w
ith
neith
er
biol
ogic
al
pare
nt
Num
ber o
f ch
ildre
n ag
e 0-
17 y
ears
Child
's r
elat
ions
hip
to h
ead
of h
ouse
hold
Tota
l
Perc
enta
ge
of c
hild
ren
livin
g in
ho
useh
olds
he
aded
by
a fa
mily
m
embe
rA
Num
ber o
f chi
ldre
n ag
e 0-
17 y
ears
not
liv
ing
with
a
biol
ogic
al p
aren
t H
ead
Spou
se/
Part
ner
Gra
nd-
child
Br
othe
r/
Sist
er
Oth
er
rela
tive
Ado
pted
/ Fo
ster
/ St
epch
ild
Serv
ant
(Liv
e-in
)
Oth
er
not
rela
ted
Inco
nsis
tent
/ D
on't
know
/ M
issi
ng
Age
0-4
5.8
7.8
7.2
10.1
6.6
15.8
31.9
9.5
5.4
4.3
4.1
4.0
3.8
6.3
10.0
10
.2
100.
0 (0
.0)
11,2
8797
.9
658
11,9
6297
.2
938
11,8
8696
.4
861
6,17
691
.8
627
39,2
8996
.3
2,58
8
1,35
692
.4
215
494
97.1
15
8
123
123
48
0
22,9
5896
.2
2,17
6
11,3
3896
.8
610
5,38
893
.1
232
1,21
793
.3
49
409
100.
0 16
10,3
0396
.5
393
9,17
696
.4
579
8,15
796
.0
820
7,14
996
.9
726
94.1
95.3
-
0.0
0.0
87.0
0.
8 4.
5 5.
5 0.
0 0.
5 1.
7 10
0.0
5-9
0.0
0.0
86.6
1.
7 5.
1 3.
8 0.
0 0.
3 2.
5 10
0.0
10-1
4 0.
0 0.
1 71
.2
8.0
12.1
5.
1 0.
1 0.
7 2.
8 10
0.0
15-1
7 2.
4 6.
1 37
.7
7.7
37.6
2.
7 1.
3 2.
6 1.
9 10
0.0
Orp
hanh
ood
stat
us
Both
par
ents
aliv
e 0.
3 1.
4 76
.9
2.1
11.8
4.
1 0.
3 0.
8 2.
3 10
0.0
Onl
y m
othe
r aliv
e 2.
4 1.
0 53
.4
11.4
23
.3
3.2
0.2
2.5
2.5
100.
0
Onl
y fa
ther
aliv
e 0.
8 0.
0 50
.9
13.5
28
.5
4.2
0.0
0.4
1.7
100.
0
Both
par
ents
dec
ease
d 0.
5 0.
0 40
.8
32.3
12
.3
9.9
0.0
0.4
3.8
100.
0
Unk
now
n (*
) (*
) (*
) (*
) (*
) (*
) (*
) (*
) (*
) 10
0.0
Ethn
o-lin
guis
tic
grou
p of
hou
seho
ld
head
Lao-
Tai
0.3
0.7
80.8
2.
8 9.
9 2.
0 0.
4 1.
1 2.
0 10
0.0
Mon
-Khm
er
0.7
2.5
60.2
6.
4 16
.1
11.6
0.
0 0.
4 2.
0 10
0.0
Hm
ong-
Mie
n 0.
8 4.
0 32
.7
14.0
37
.4
5.0
0.0
0.8
5.3
100.
0 Ch
ines
e-Ti
beta
n 2.
3 0.
0 43
.5
12.4
23
.3
14.1
0.
0 0.
0 4.
4 10
0.0
Oth
er, D
K, M
issi
ng
(*)
(*)
(*)
(*)
(*)
(*)
(*)
(*)
(*)
100.
0
Wea
lth
inde
x qu
inti
le
Poor
est
0.5
6.5
51.3
11
.8
19.2
7.
6 0.
0 0.
6 2.
4 10
0.0
Seco
nd
0.8
1.3
61.5
5.
9 19
.4
8.4
0.0
0.2
2.5
100.
0
Mid
dle
0.5
0.3
80.1
2.
9 10
.3
2.4
0.3
0.4
2.9
100.
0 Fo
urth
0.
6 0.
4 81
.1
1.9
11.4
2.
2 0.
0 0.
6 1.
9 10
0.0
Rich
est
8.7
6,52
5 0.
0 0.
1 76
.3
3.6
10.8
3.
3 1.
2 3.
0 1.
7 10
0.0
565
A Ex
clud
es h
ouse
hold
s he
aded
by
the
child
, ser
vant
s an
d ot
her n
ot r
elat
ed
( ) F
igur
es th
at a
re b
ased
on
25 –
49
unw
eigh
ted
case
s
(*) F
igur
es th
at a
re b
ased
on
few
er th
an 2
5 un
wei
ghte
d ca
ses
"–"
deno
tes
0 un
wei
ghte
d ca
se in
that
cel
l or i
n th
e de
nom
inat
or
4
76
5 SURVIVE (CS)
With the SDG target (3.2) for child mortality, on ending preventable deaths of newborns and children under 5 years of age, the international community has retained the overarching goal of reducing child mortality. While the global target calls for reducing neonatal mortality to at least as low as 12 deaths per 1,000 live births and under-five mortality to at least as low as 25 deaths per 1,000 live births, reduction of child mortality continues to be one of the most important objectives in national plans and programmes in each and every country.
Mortality rates presented in this chapter are calculated from information collected in the birth histories of the Women’s Questionnaires. All interviewed women were asked whether they had ever given birth, and those who had were asked to report the number of sons and daughters who live with them, the number who live elsewhere, and the number who have died. In addition, women were asked to provide detailed information on their live births, starting with the firstborn, in chronological order. This information included whether births were single or multiple, and for each live birth, sex, date of birth (month and year), and survival status. Further, for children alive at the time of survey, women were asked the current age of the child; for deceased children, the age at death was obtained. Childhood mortality rates are expressed by conventional age categories and are defined as follows:
• Neonatal mortality (NN): probability of dying within the first month of life1
• Post-neonatal mortality (PNN): difference between infant and neonatal mortality rates• Infant mortality (1q0): probability of dying between birth and the first birthday• Child mortality (4q1): probability of dying between the first and the fifth birthdays• Under-five mortality (5q0): the probability of dying between birth and the fifth birthday
Neonatal, infant and under-five mortality rates are expressed as deaths per 1,000 live births. Child mortality is expressed as deaths per 1,000 children surviving to age one. Post-neonatal mortality is calculated as the difference between infant and neonatal mortality rates.
Table CS.1: Early childhood mortality rates
Neonatal, post-neonatal, infant, child and under-five mortality rates for five year periods preceding the survey, Lao PDR, 2017
Neonatal mortality rate1
Post-neonatal mortality rate2,A
Infant mortality rate3
Child mortality rate4
Under-five mortality rate5
Years preceding the survey
0-4 18 22 40 6 46
5-9 23 25 48 5 53
10-14 24 32 57 10 67 1 MICS indicator CS.1 - Neonatal mortality rate; SDG indicator 3.2.2
2 MICS indicator CS.2 - Post-neonatal mortality rate 3 MICS indicator CS.3 - Infant mortality rate 4 MICS indicator CS.4 - Child mortality rate
5 MICS indicator CS.5 - Under-five mortality rate; SDG indicator 3.2.1 A Post-neonatal mortality rates are computed as the difference between the infant and neonatal mortality rates
1The neonatal mortality rate is the probability that a child born in a specific year or period will die during the first 28 days of life if subject to age-specific mortality rates of the reference period, expressed per 1,000 live births (SDG Indicator 3.2.2). However, the standard calculation and reporting period used in MICS and other household surveys is death within one month (30 days).
Table CS.1 presents neonatal, post-neonatal, infant, child, and under-five mortality rates for the three most recent five-year periods before the survey (corresponding roughly to the period of 2012-2017). For each mortality rate in the table, it is possible to assess changes over time, during the last 15 years preceding the survey.
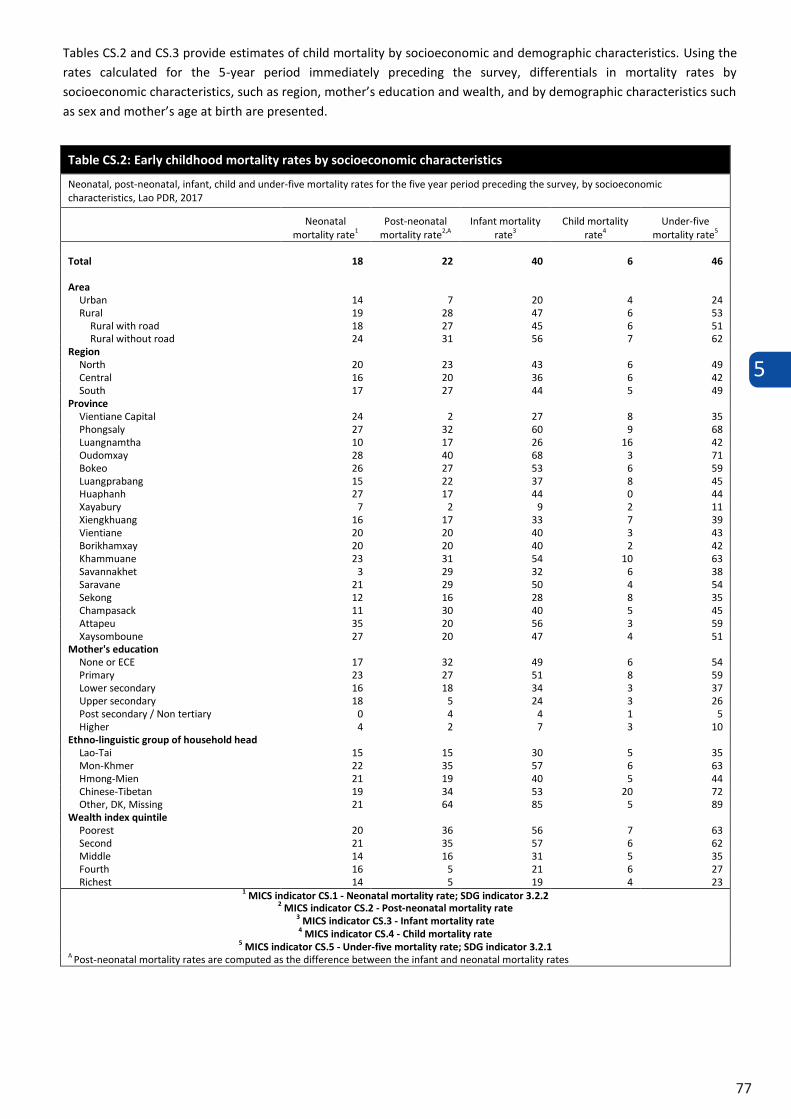
5
77
Table CS.2: Early childhood mortality rates by socioeconomic characteristics
Neonatal, post-neonatal, infant, child and under-five mortality rates for the five year period preceding the survey, by socioeconomic characteristics, Lao PDR, 2017
Neonatal mortality rate1
Post-neonatal mortality rate2,A
Infant mortality rate3
Child mortality rate4
Under-five mortality rate5
Total 18 22 40 6 46
Area Urban 14 7 20 4 24 Rural 19 28 47 6 53
Rural with road 18 27 45 6 51 Rural without road 24 31 56 7 62
Region North 20 23 43 6 49 Central 16 20 36 6 42 South 17 27 44 5 49
Province Vientiane Capital 24 2 27 8 35 Phongsaly 27 32 60 9 68 Luangnamtha 10 17 26 16 42 Oudomxay 28 40 68 3 71 Bokeo 26 27 53 6 59 Luangprabang 15 22 37 8 45 Huaphanh 27 17 44 0 44 Xayabury 7 2 9 2 11 Xiengkhuang 16 17 33 7 39 Vientiane 20 20 40 3 43 Borikhamxay 20 20 40 2 42 Khammuane 23 31 54 10 63 Savannakhet 3 29 32 6 38 Saravane 21 29 50 4 54 Sekong 12 16 28 8 35 Champasack 11 30 40 5 45 Attapeu 35 20 56 3 59 Xaysomboune 27 20 47 4 51
Mother's education None or ECE 17 32 49 6 54 Primary 23 27 51 8 59 Lower secondary 16 18 34 3 37 Upper secondary 18 5 24 3 26 Post secondary / Non tertiary 0 4 4 1 5 Higher 4 2 7 3 10
Ethno-linguistic group of household head Lao-Tai 15 15 30 5 35 Mon-Khmer 22 35 57 6 63 Hmong-Mien 21 19 40 5 44 Chinese-Tibetan 19 34 53 20 72 Other, DK, Missing 21 64 85 5 89
Wealth index quintile Poorest 20 36 56 7 63 Second 21 35 57 6 62 Middle 14 16 31 5 35 Fourth 16 5 21 6 27 Richest 14 5 19 4 23
1 MICS indicator CS.1 - Neonatal mortality rate; SDG indicator 3.2.2 2 MICS indicator CS.2 - Post-neonatal mortality rate
3 MICS indicator CS.3 - Infant mortality rate 4 MICS indicator CS.4 - Child mortality rate
5 MICS indicator CS.5 - Under-five mortality rate; SDG indicator 3.2.1 A Post-neonatal mortality rates are computed as the difference between the infant and neonatal mortality rates
Tables CS.2 and CS.3 provide estimates of child mortality by socioeconomic and demographic characteristics. Using the rates calculated for the 5-year period immediately preceding the survey, differentials in mortality rates by socioeconomic characteristics, such as region, mother’s education and wealth, and by demographic characteristics such as sex and mother’s age at birth are presented.
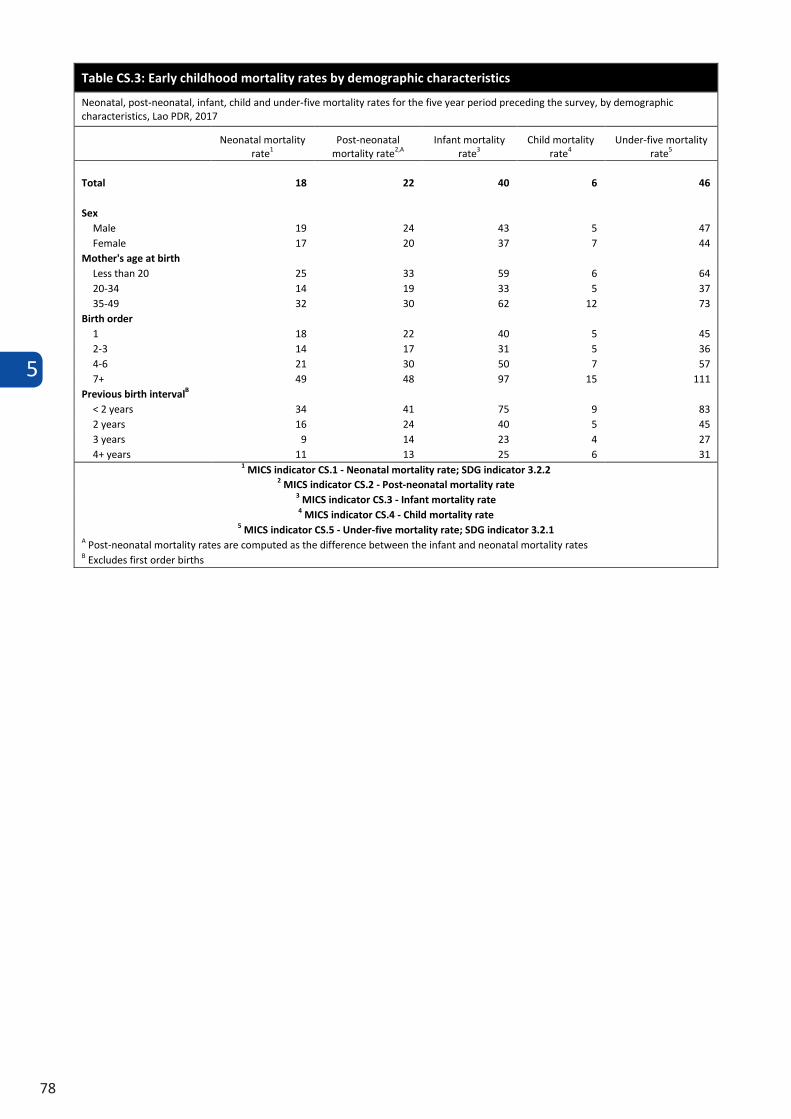
5
78
Table CS.3: Early childhood mortality rates by demographic characteristics
Neonatal, post-neonatal, infant, child and under-five mortality rates for the five year period preceding the survey, by demographic characteristics, Lao PDR, 2017
Neonatal mortality rate1
Post-neonatal mortality rate2,A
Infant mortality rate3
Child mortality rate4
Under-five mortality rate5
Total 18 22 40 6 46
Sex Male 19 24 43 5 47 Female 17 20 37 7 44
Mother's age at birth Less than 20 25 33 59 6 64 20-34 14 19 33 5 37 35-49 32 30 62 12 73
Birth order 1 18 22 40 5 45 2-3 14 17 31 5 36 4-6 21 30 50 7 57 7+ 49 48 97 15 111
Previous birth intervalB < 2 years 34 41 75 9 83 2 years 16 24 40 5 45 3 years 9 14 23 4 27 4+ years 11 13 25 6 31
1 MICS indicator CS.1 - Neonatal mortality rate; SDG indicator 3.2.2 2 MICS indicator CS.2 - Post-neonatal mortality rate
3 MICS indicator CS.3 - Infant mortality rate 4 MICS indicator CS.4 - Child mortality rate
5 MICS indicator CS.5 - Under-five mortality rate; SDG indicator 3.2.1 A Post-neonatal mortality rates are computed as the difference between the infant and neonatal mortality rates B Excludes first order births
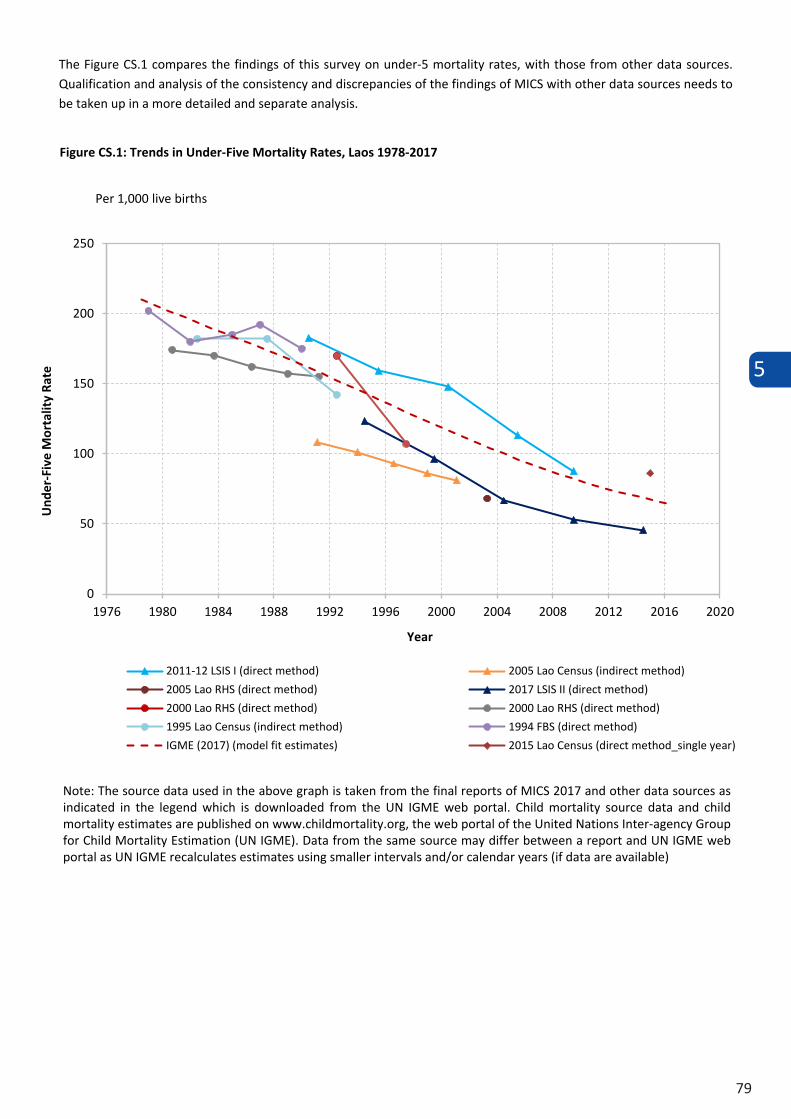
5
79
The Figure CS.1 compares the findings of this survey on under-5 mortality rates, with those from other data sources. Qualification and analysis of the consistency and discrepancies of the findings of MICS with other data sources needs to be taken up in a more detailed and separate analysis.
0
50
100
150
200
250
1976 1980 1984 1988 1992 1996 2000 2004 2008 2012 2016 2020
Per 1,000 live births
Year
2011-12 LSIS I (direct method) 2005 Lao Census (indirect method)
2005 Lao RHS (direct method) 2017 LSIS II (direct method)
2000 Lao RHS (direct method) 2000 Lao RHS (direct method)
1994 FBS (direct method)1995 Lao Census (indirect method)
IGME (2017) (model fit estimates) 2015 Lao Census (direct method_single year)
Figure CS.1: Trends in Under-Five Mortality Rates, Laos 1978-2017
Und
er-F
ive
Mor
talit
y Ra
te
Note: The source data used in the above graph is taken from the final reports of MICS 2017 and other data sources as indicated in the legend which is downloaded from the UN IGME web portal. Child mortality source data and child mortality estimates are published on www.childmortality.org, the web portal of the United Nations Inter-agency Group for Child Mortality Estimation (UN IGME). Data from the same source may differ between a report and UN IGME web portal as UN IGME recalculates estimates using smaller intervals and/or calendar years (if data are available)
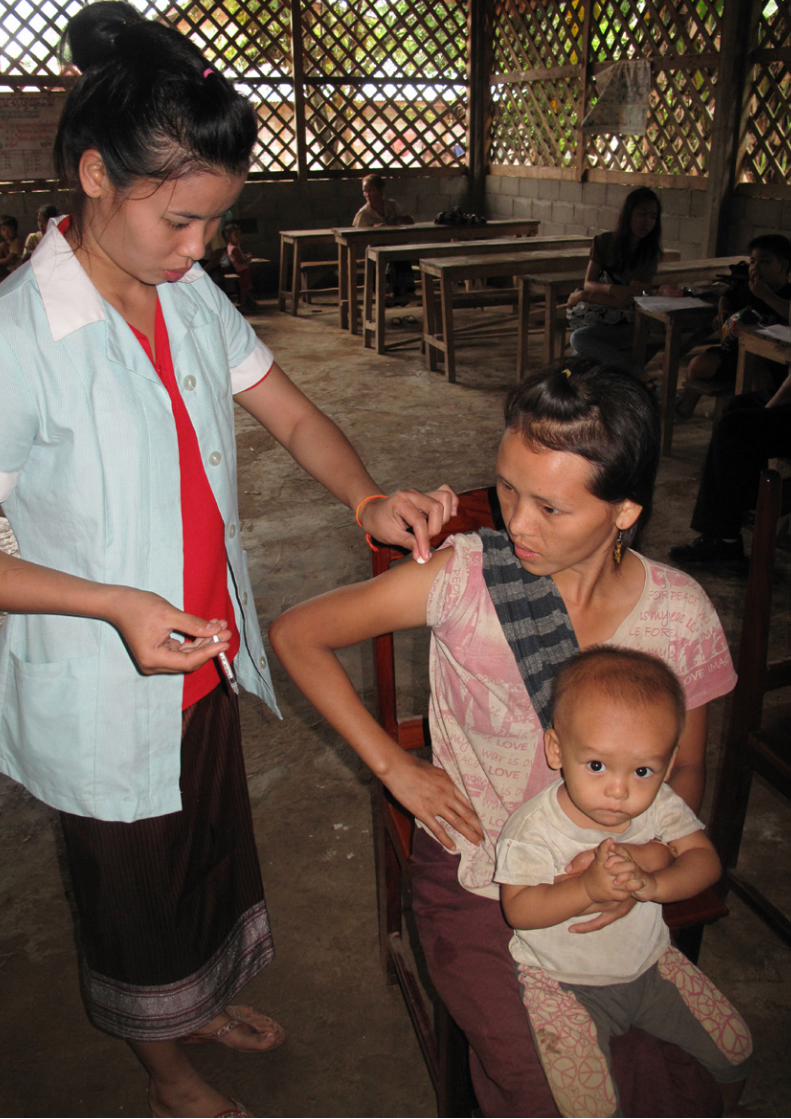
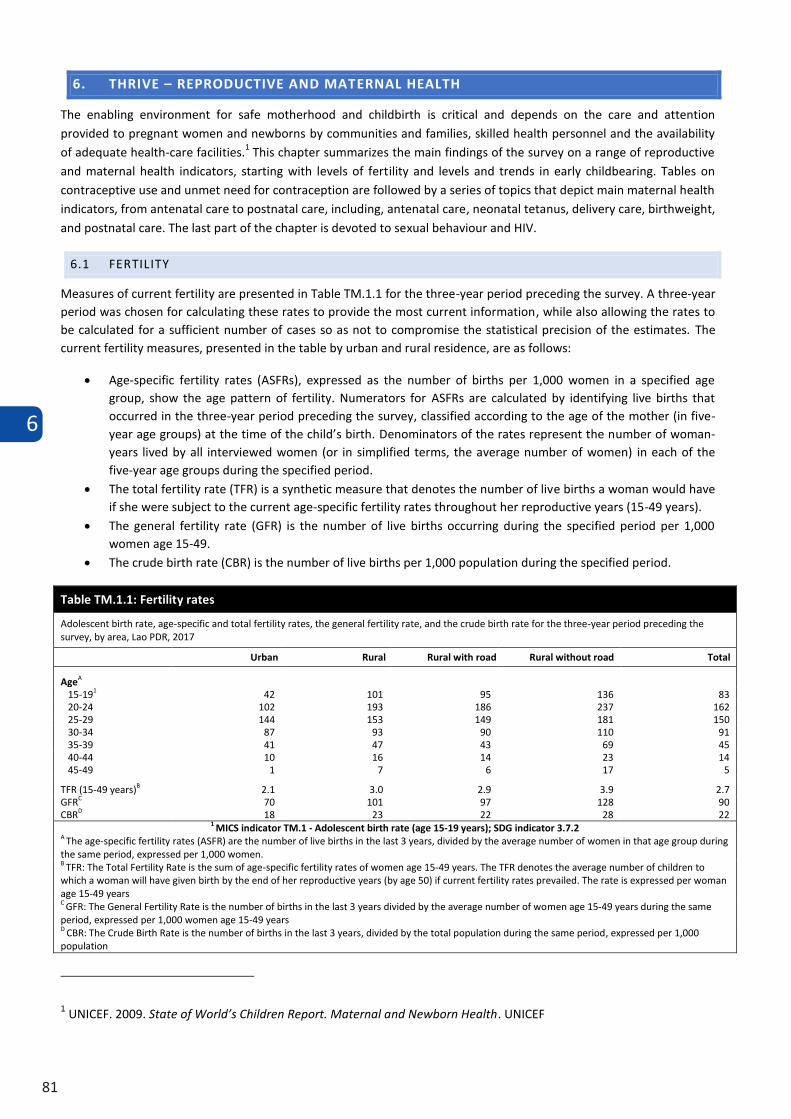
6
81
6. THRIVE – REPRODUCTIVE AND MATERNAL HEALTH
The enabling environment for safe motherhood and childbirth is critical and depends on the care and attention provided to pregnant women and newborns by communities and families, skilled health personnel and the availability of adequate health-care facilities.1 This chapter summarizes the main findings of the survey on a range of reproductive and maternal health indicators, starting with levels of fertility and levels and trends in early childbearing. Tables on contraceptive use and unmet need for contraception are followed by a series of topics that depict main maternal health indicators, from antenatal care to postnatal care, including, antenatal care, neonatal tetanus, delivery care, birthweight, and postnatal care. The last part of the chapter is devoted to sexual behaviour and HIV.
6.1 FERTILITY
Measures of current fertility are presented in Table TM.1.1 for the three-year period preceding the survey. A three-year period was chosen for calculating these rates to provide the most current information, while also allowing the rates to be calculated for a sufficient number of cases so as not to compromise the statistical precision of the estimates. The current fertility measures, presented in the table by urban and rural residence, are as follows:
Age-specific fertility rates (ASFRs), expressed as the number of births per 1,000 women in a specified agegroup, show the age pattern of fertility. Numerators for ASFRs are calculated by identifying live births thatoccurred in the three-year period preceding the survey, classified according to the age of the mother (in five-year age groups) at the time of the child’s birth. Denominators of the rates represent the number of woman-years lived by all interviewed women (or in simplified terms, the average number of women) in each of thefive-year age groups during the specified period.
The total fertility rate (TFR) is a synthetic measure that denotes the number of live births a woman would haveif she were subject to the current age-specific fertility rates throughout her reproductive years (15-49 years).
The general fertility rate (GFR) is the number of live births occurring during the specified period per 1,000women age 15-49.
The crude birth rate (CBR) is the number of live births per 1,000 population during the specified period.
Table TM.1.1: Fertility rates
Adolescent birth rate, age-specific and total fertility rates, the general fertility rate, and the crude birth rate for the three-year period preceding the survey, by area, Lao PDR, 2017
Urban Rural Rural with road Rural without road Total
AgeA 15-191 42 101 95 136 83 20-24 102 193 186 237 162 25-29 144 153 149 181 150 30-34 87 93 90 110 91 35-39 41 47 43 69 45 40-44 10 16 14 23 14 45-49 1 7 6 17 5 TFR (15-49 years)B 2.1 3.0 2.9 3.9 2.7 GFRC 70 101 97 128 90 CBRD 18 23 22 28 22
1 MICS indicator TM.1 - Adolescent birth rate (age 15-19 years); SDG indicator 3.7.2 A The age-specific fertility rates (ASFR) are the number of live births in the last 3 years, divided by the average number of women in that age group during the same period, expressed per 1,000 women. B TFR: The Total Fertility Rate is the sum of age-specific fertility rates of women age 15-49 years. The TFR denotes the average number of children to which a woman will have given birth by the end of her reproductive years (by age 50) if current fertility rates prevailed. The rate is expressed per woman age 15-49 years C GFR: The General Fertility Rate is the number of births in the last 3 years divided by the average number of women age 15-49 years during the same period, expressed per 1,000 women age 15-49 years D CBR: The Crude Birth Rate is the number of births in the last 3 years, divided by the total population during the same period, expressed per 1,000 population
1 UNICEF. 2009. State of World’s Children Report. Maternal and Newborn Health. UNICEF
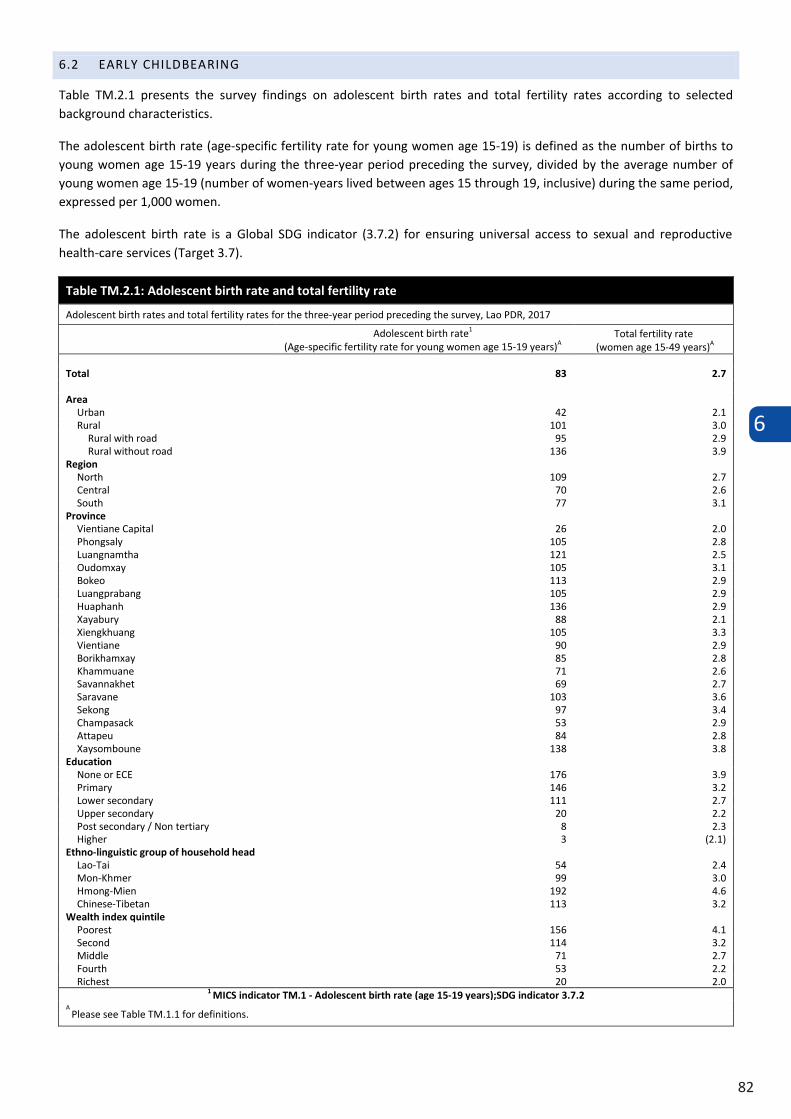
6
82
6.2 EARLY CHILDBEARING
Table TM.2.1 presents the survey findings on adolescent birth rates and total fertility rates according to selected background characteristics.
The adolescent birth rate (age-specific fertility rate for young women age 15-19) is defined as the number of births to young women age 15-19 years during the three-year period preceding the survey, divided by the average number of young women age 15-19 (number of women-years lived between ages 15 through 19, inclusive) during the same period, expressed per 1,000 women.
The adolescent birth rate is a Global SDG indicator (3.7.2) for ensuring universal access to sexual and reproductive health-care services (Target 3.7).
Table TM.2.1: Adolescent birth rate and total fertility rate
Adolescent birth rates and total fertility rates for the three-year period preceding the survey, Lao PDR, 2017
Adolescent birth rate1
(Age-specific fertility rate for young women age 15-19 years)A Total fertility rate
(women age 15-49 years)A
Total 83 2.7
Area Urban 42 2.1 Rural 101 3.0
Rural with road 95 2.9 Rural without road 136 3.9
Region North 109 2.7 Central 70 2.6 South 77 3.1
Province Vientiane Capital 26 2.0 Phongsaly 105 2.8 Luangnamtha 121 2.5 Oudomxay 105 3.1 Bokeo 113 2.9 Luangprabang 105 2.9 Huaphanh 136 2.9 Xayabury 88 2.1 Xiengkhuang 105 3.3 Vientiane 90 2.9 Borikhamxay 85 2.8 Khammuane 71 2.6 Savannakhet 69 2.7 Saravane 103 3.6 Sekong 97 3.4 Champasack 53 2.9 Attapeu 84 2.8 Xaysomboune 138 3.8
Education None or ECE 176 3.9 Primary 146 3.2 Lower secondary 111 2.7 Upper secondary 20 2.2 Post secondary / Non tertiary 8 2.3 Higher 3 (2.1)
Ethno-linguistic group of household head Lao-Tai 54 2.4 Mon-Khmer 99 3.0 Hmong-Mien 192 4.6 Chinese-Tibetan 113 3.2
Wealth index quintile Poorest 156 4.1 Second 114 3.2 Middle 71 2.7 Fourth 53 2.2 Richest 20 2.0
1 MICS indicator TM.1 - Adolescent birth rate (age 15-19 years);SDG indicator 3.7.2 A
Please see Table TM.1.1 for definitions.
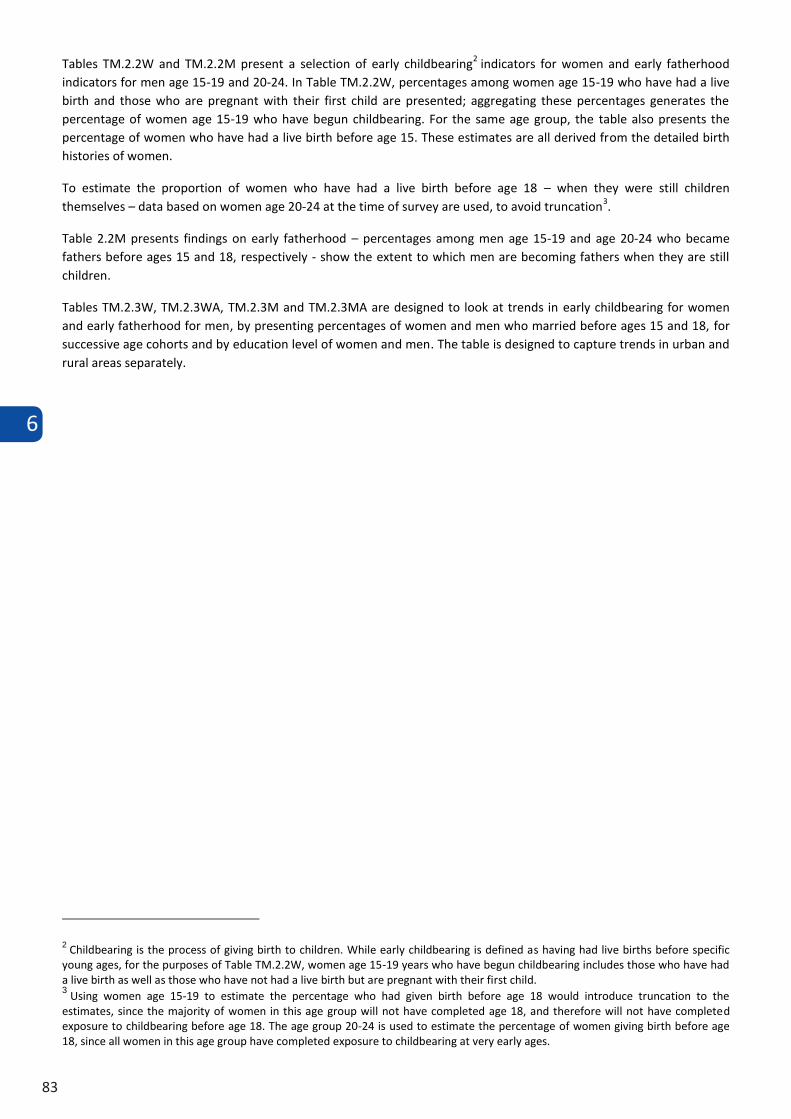
6
83
6.2 EARLY CHILDBEARING
Table TM.2.1 presents the survey findings on adolescent birth rates and total fertility rates according to selected background characteristics.
The adolescent birth rate (age-specific fertility rate for young women age 15-19) is defined as the number of births to young women age 15-19 years during the three-year period preceding the survey, divided by the average number of young women age 15-19 (number of women-years lived between ages 15 through 19, inclusive) during the same period, expressed per 1,000 women.
The adolescent birth rate is a Global SDG indicator (3.7.2) for ensuring universal access to sexual and reproductive health-care services (Target 3.7).
Table TM.2.1: Adolescent birth rate and total fertility rate
Adolescent birth rates and total fertility rates for the three-year period preceding the survey, Lao PDR, 2017
Adolescent birth rate1
(Age-specific fertility rate for young women age 15-19 years)A Total fertility rate
(women age 15-49 years)A
Total 83 2.7
Area Urban 42 2.1 Rural 101 3.0
Rural with road 95 2.9 Rural without road 136 3.9
Region North 109 2.7 Central 70 2.6 South 77 3.1
Province Vientiane Capital 26 2.0 Phongsaly 105 2.8 Luangnamtha 121 2.5 Oudomxay 105 3.1 Bokeo 113 2.9 Luangprabang 105 2.9 Huaphanh 136 2.9 Xayabury 88 2.1 Xiengkhuang 105 3.3 Vientiane 90 2.9 Borikhamxay 85 2.8 Khammuane 71 2.6 Savannakhet 69 2.7 Saravane 103 3.6 Sekong 97 3.4 Champasack 53 2.9 Attapeu 84 2.8 Xaysomboune 138 3.8
Education None or ECE 176 3.9 Primary 146 3.2 Lower secondary 111 2.7 Upper secondary 20 2.2 Post secondary / Non tertiary 8 2.3 Higher 3 (2.1)
Ethno-linguistic group of household head Lao-Tai 54 2.4 Mon-Khmer 99 3.0 Hmong-Mien 192 4.6 Chinese-Tibetan 113 3.2
Wealth index quintile Poorest 156 4.1 Second 114 3.2 Middle 71 2.7 Fourth 53 2.2 Richest 20 2.0
1 MICS indicator TM.1 - Adolescent birth rate (age 15-19 years);SDG indicator 3.7.2 A
Please see Table TM.1.1 for definitions.
Tables TM.2.2W and TM.2.2M present a selection of early childbearing2 indicators for women and early fatherhood indicators for men age 15-19 and 20-24. In Table TM.2.2W, percentages among women age 15-19 who have had a live birth and those who are pregnant with their first child are presented; aggregating these percentages generates the percentage of women age 15-19 who have begun childbearing. For the same age group, the table also presents the percentage of women who have had a live birth before age 15. These estimates are all derived from the detailed birth histories of women.
To estimate the proportion of women who have had a live birth before age 18 – when they were still children themselves – data based on women age 20-24 at the time of survey are used, to avoid truncation3.
Table 2.2M presents findings on early fatherhood – percentages among men age 15-19 and age 20-24 who became fathers before ages 15 and 18, respectively - show the extent to which men are becoming fathers when they are still children.
Tables TM.2.3W, TM.2.3WA, TM.2.3M and TM.2.3MA are designed to look at trends in early childbearing for women and early fatherhood for men, by presenting percentages of women and men who married before ages 15 and 18, for successive age cohorts and by education level of women and men. The table is designed to capture trends in urban and rural areas separately.
2 Childbearing is the process of giving birth to children. While early childbearing is defined as having had live births before specific young ages, for the purposes of Table TM.2.2W, women age 15-19 years who have begun childbearing includes those who have had a live birth as well as those who have not had a live birth but are pregnant with their first child. 3 Using women age 15-19 to estimate the percentage who had given birth before age 18 would introduce truncation to the estimates, since the majority of women in this age group will not have completed age 18, and therefore will not have completed exposure to childbearing before age 18. The age group 20-24 is used to estimate the percentage of women giving birth before age 18, since all women in this age group have completed exposure to childbearing at very early ages.
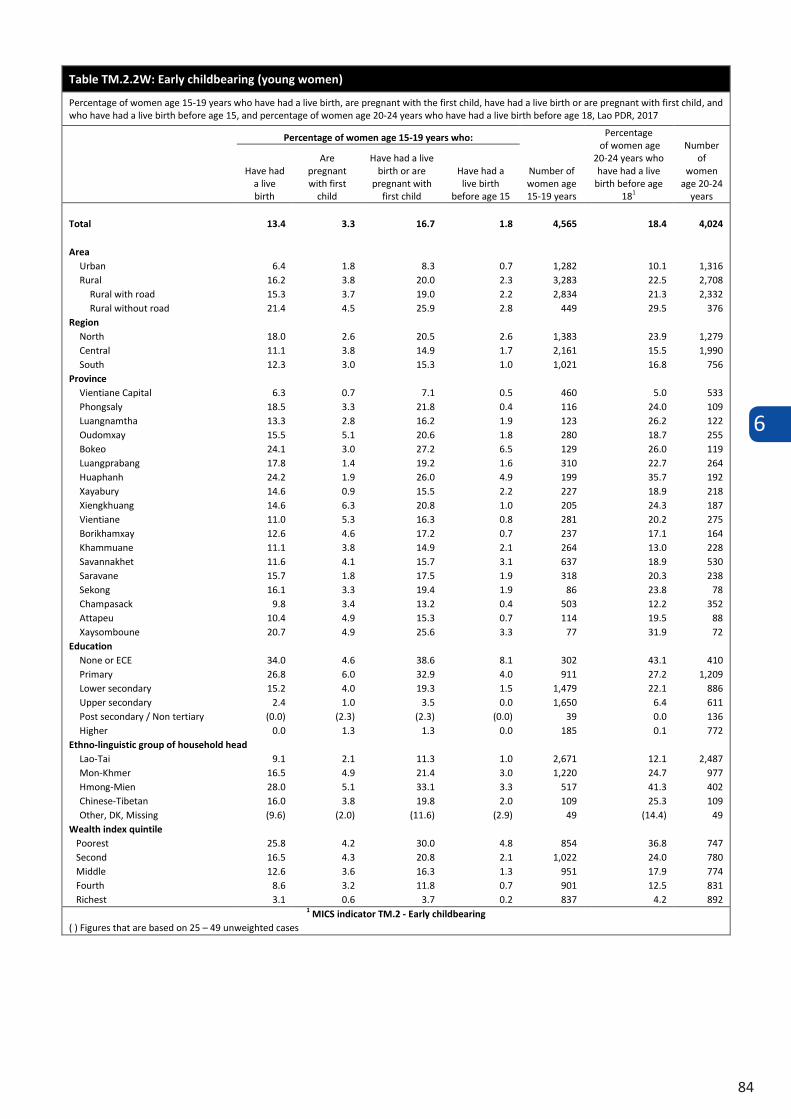
6
84
Table TM.2.2W: Early childbearing (young women)
Percentage of women age 15-19 years who have had a live birth, are pregnant with the first child, have had a live birth or are pregnant with first child, and who have had a live birth before age 15, and percentage of women age 20-24 years who have had a live birth before age 18, Lao PDR, 2017
Percentage of women age 15-19 years who:
Number of women age 15-19 years
Percentage of women age
20-24 years who have had a live
birth before age 181
Number of
women age 20-24
years
Have had a live birth
Are pregnant with first
child
Have had a live birth or are
pregnant with first child
Have had a live birth
before age 15
Total 13.4 3.3 16.7 1.8 4,565 18.4 4,024
Area Urban 6.4 1.8 8.3 0.7 1,282 10.1 1,316 Rural 16.2 3.8 20.0 2.3 3,283 22.5 2,708
Rural with road 15.3 3.7 19.0 2.2 2,834 21.3 2,332 Rural without road 21.4 4.5 25.9 2.8 449 29.5 376
Region North 18.0 2.6 20.5 2.6 1,383 23.9 1,279 Central 11.1 3.8 14.9 1.7 2,161 15.5 1,990 South 12.3 3.0 15.3 1.0 1,021 16.8 756
Province Vientiane Capital 6.3 0.7 7.1 0.5 460 5.0 533 Phongsaly 18.5 3.3 21.8 0.4 116 24.0 109 Luangnamtha 13.3 2.8 16.2 1.9 123 26.2 122 Oudomxay 15.5 5.1 20.6 1.8 280 18.7 255 Bokeo 24.1 3.0 27.2 6.5 129 26.0 119 Luangprabang 17.8 1.4 19.2 1.6 310 22.7 264 Huaphanh 24.2 1.9 26.0 4.9 199 35.7 192 Xayabury 14.6 0.9 15.5 2.2 227 18.9 218 Xiengkhuang 14.6 6.3 20.8 1.0 205 24.3 187 Vientiane 11.0 5.3 16.3 0.8 281 20.2 275 Borikhamxay 12.6 4.6 17.2 0.7 237 17.1 164 Khammuane 11.1 3.8 14.9 2.1 264 13.0 228 Savannakhet 11.6 4.1 15.7 3.1 637 18.9 530 Saravane 15.7 1.8 17.5 1.9 318 20.3 238 Sekong 16.1 3.3 19.4 1.9 86 23.8 78 Champasack 9.8 3.4 13.2 0.4 503 12.2 352 Attapeu 10.4 4.9 15.3 0.7 114 19.5 88 Xaysomboune 20.7 4.9 25.6 3.3 77 31.9 72
Education None or ECE 34.0 4.6 38.6 8.1 302 43.1 410 Primary 26.8 6.0 32.9 4.0 911 27.2 1,209 Lower secondary 15.2 4.0 19.3 1.5 1,479 22.1 886 Upper secondary 2.4 1.0 3.5 0.0 1,650 6.4 611 Post secondary / Non tertiary (0.0) (2.3) (2.3) (0.0) 39 0.0 136 Higher 0.0 1.3 1.3 0.0 185 0.1 772
Ethno-linguistic group of household head Lao-Tai 9.1 2.1 11.3 1.0 2,671 12.1 2,487 Mon-Khmer 16.5 4.9 21.4 3.0 1,220 24.7 977 Hmong-Mien 28.0 5.1 33.1 3.3 517 41.3 402 Chinese-Tibetan 16.0 3.8 19.8 2.0 109 25.3 109 Other, DK, Missing (9.6) (2.0) (11.6) (2.9) 49 (14.4) 49
Wealth index quintile Poorest 25.8 4.2 30.0 4.8 854 36.8 747 Second 16.5 4.3 20.8 2.1 1,022 24.0 780 Middle 12.6 3.6 16.3 1.3 951 17.9 774 Fourth 8.6 3.2 11.8 0.7 901 12.5 831 Richest 3.1 0.6 3.7 0.2 837 4.2 892
1 MICS indicator TM.2 - Early childbearing ( ) Figures that are based on 25 – 49 unweighted cases
6
85
Fathered a live birth
Fathered a live birth before age 15
Total 2.7 0.3 2,404 3.0 1,774
AreaUrban 1.1 0.0 725 0.6 529Rural 3.3 0.4 1,679 4.1 1,245
Rural with road 3.2 0.4 1,456 3.7 1,081Rural without road 4.4 0.4 224 6.4 163
RegionNorth 4.3 0.5 697 3.9 579Central 1.9 0.3 1,236 2.3 847South 2.3 0.0 471 3.3 348
ProvinceVientiane Capital 0.7 0.0 298 2.3 218Phongslay 5.3 0.0 56 5.6 55Luangnamtha 4.5 0.0 65 1.2 52Oudomxay 2.4 0.0 123 2.7 107Bokeo 5.8 0.0 57 2.4 53Luangprabang 3.2 0.0 159 1.7 123Huaphanh 8.7 2.8 125 8.9 95Xayabury 1.6 0.0 112 4.5 93Xiengkhuang 3.2 0.0 104 3.4 70Vientiane 2.5 0.8 185 3.1 102Borikhamxay 1.6 0.0 114 0.0 72Khammua 1.5 0.0 127 1.8 130Savannakhet 2.5 0.5 363 2.5 229Saravane 3.7 0.0 150 8.0 109Sekong 2.0 0.0 48 1.0 30Champasack 1.5 0.0 224 1.1 172Attapeu 1.5 0.0 49 1.6 37Xaysomboune 1.2 0.0 44 4.9 27
EducationNone or ECE (18.4) (0.0) 50 13.7 78Primary 3.9 1.1 423 4.2 453Lower secondary 3.5 0.2 968 2.5 532Upper secondary 0.5 0.0 908 2.5 394Post secondary / Non tertiary (*) (*) 10 (1.8) 46Higher (0.0) (0.0) 45 0.1 271
Ethno-linguistic group of household headLao-Tai 1.2 0.0 1,470 1.6 1,067Mon-Khmer 3.5 0.7 590 3.3 448Hmong-Mien 7.9 0.9 275 9.7 186Chinese-Tibetan 8.0 0.0 50 6.6 56Other, DK, Missing (*) (*) 19 (*) 16
Wealth index quintile Poorest 6.4 0.9 416 7.3 366 Second 3.0 0.4 543 4.6 365 Middle 2.4 0.2 495 0.5 327 Fourth 1.2 0.0 531 1.6 391 Richest 0.7 0.0 419 0.8 326
Table TM.2.2M: Early fatherhood (young men)
Percentage of men age 15-19 years who have fathered a live birth and who have fathered a live birth before age 15, and percentage of men age 20-24 years who have fathered a live birth before age 18, Lao PDR, 2017
Percentage of men age 15-19 years who have: Number of
men age 15-19 years
Percentage of men age 20-24 years who have fathered a live birth before age 18
Number of men age
20-24 years
( ) Figures that are based on 25 – 49 unweighted cases(*) Figures that are based on fewer than 25 unweighted cases
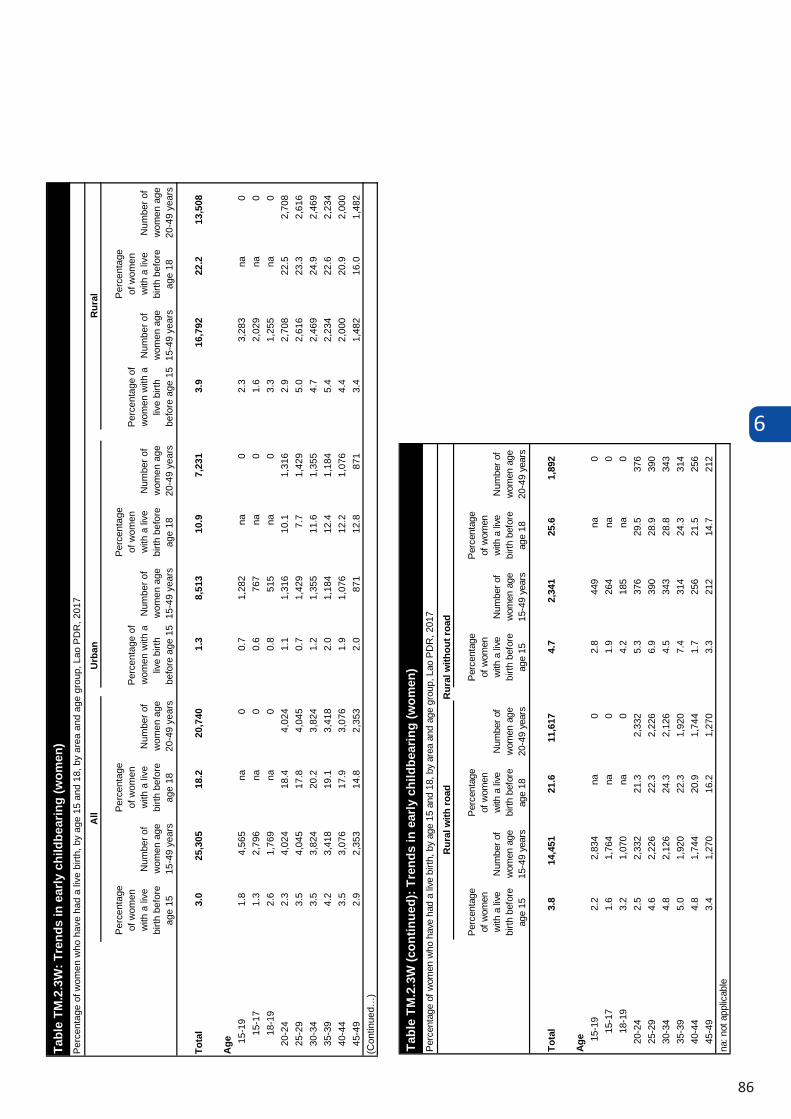
6
86
Tabl
e TM
.2.3
W: T
rend
s in
ear
ly c
hild
bear
ing
(wom
en)
Urb
an
Per
cent
age
of w
omen
w
ith a
live
bi
rth b
efor
e ag
e 15
Num
ber o
f w
omen
age
15
-49
year
s
Per
cent
age
of w
omen
w
ith a
live
bi
rth b
efor
e ag
e 18
Num
ber o
f w
omen
age
20
-49
year
s
Per
cent
age
ofw
omen
with
aliv
e bi
rth
befo
re a
ge 1
5
Num
ber o
f w
omen
age
15
-49
year
s
Per
cent
age
of w
omen
w
ith a
live
bi
rth b
efor
e ag
e 18
Num
ber o
f w
omen
age
20
-49
year
s
Per
cent
age
ofw
omen
with
aliv
e bi
rth
befo
re a
ge 1
5
Num
ber o
f w
omen
age
15
-49
year
s
Per
cent
age
of w
omen
w
ith a
live
bi
rth b
efor
e ag
e 18
Num
ber o
f w
omen
age
20
-49
year
s
Tota
l3.
025
,305
18.2
20,7
401.
38,
513
10.9
7,23
13.
916
,792
22.2
13,5
08
Age 15
-19
1.8
4,56
5na
00.
71,
282
na0
2.3
3,28
3na
0
15-1
71.
32,
796
na0
0.6
767
na0
1.6
2,02
9na
0
18-1
92.
61,
769
na0
0.8
515
na0
3.3
1,25
5na
0
20-2
42.
34,
024
18.4
4,02
41.
11,
316
10.1
1,31
62.
92,
708
22.5
2,70
8
25-2
93.
54,
045
17.8
4,04
50.
71,
429
7.7
1,42
95.
02,
616
23.3
2,61
6
30-3
43.
53,
824
20.2
3,82
41.
21,
355
11.6
1,35
54.
72,
469
24.9
2,46
9
35-3
94.
23,
418
19.1
3,41
82.
01,
184
12.4
1,18
45.
42,
234
22.6
2,23
4
40-4
43.
53,
076
17.9
3,07
61.
91,
076
12.2
1,07
64.
42,
000
20.9
2,00
0
45-4
92.
92,
353
14.8
2,35
32.
087
112
.887
13.
41,
482
16.0
1,48
2(C
ontin
ued…
)
Rur
al
Per
cent
age
of w
omen
who
hav
e ha
d a
live
birth
, by
age
15 a
nd 1
8, b
y ar
ea a
nd a
ge g
roup
, Lao
PD
R, 2
017
All
Tabl
e TM
.2.3
W (c
ontin
ued)
: Tre
nds
in e
arly
chi
ldbe
arin
g (w
omen
)
Rur
al w
ithou
t roa
d
Perc
enta
ge
of w
omen
w
ith a
live
bi
rth b
efor
e ag
e 15
Num
ber o
f w
omen
age
15
-49
year
s
Perc
enta
ge
of w
omen
w
ith a
live
bi
rth b
efor
e ag
e 18
Num
ber o
f w
omen
age
20
-49
year
s
Perc
enta
ge
of w
omen
w
ith a
live
bi
rth b
efor
e ag
e 15
Num
ber o
f w
omen
age
15
-49
year
s
Perc
enta
ge
of w
omen
w
ith a
live
bi
rth b
efor
e ag
e 18
Num
ber o
f w
omen
age
20
-49
year
s
Tota
l3.
814
,451
21.6
11,6
174.
72,
341
25.6
1,89
2
Age 15
-19
2.2
2,83
4na
02.
844
9na
0
15-1
71.
61,
764
na0
1.9
264
na0
18
-19
3.2
1,07
0na
04.
218
5na
0
20-2
42.
52,
332
21.3
2,33
25.
337
629
.537
6
25-2
94.
62,
226
22.3
2,22
66.
939
028
.939
0
30-3
44.
82,
126
24.3
2,12
64.
534
328
.834
3
35-3
95.
01,
920
22.3
1,92
07.
431
424
.331
4
40-4
44.
81,
744
20.9
1,74
41.
725
621
.525
6
45-4
93.
41,
270
16.2
1,27
03.
321
214
.721
2na
: not
app
licab
le
Per
cent
age
of w
omen
who
hav
e ha
d a
live
birth
, by
age
15 a
nd 1
8, b
y ar
ea a
nd a
ge g
roup
, Lao
PD
R, 2
017
Rur
al w
ith ro
ad
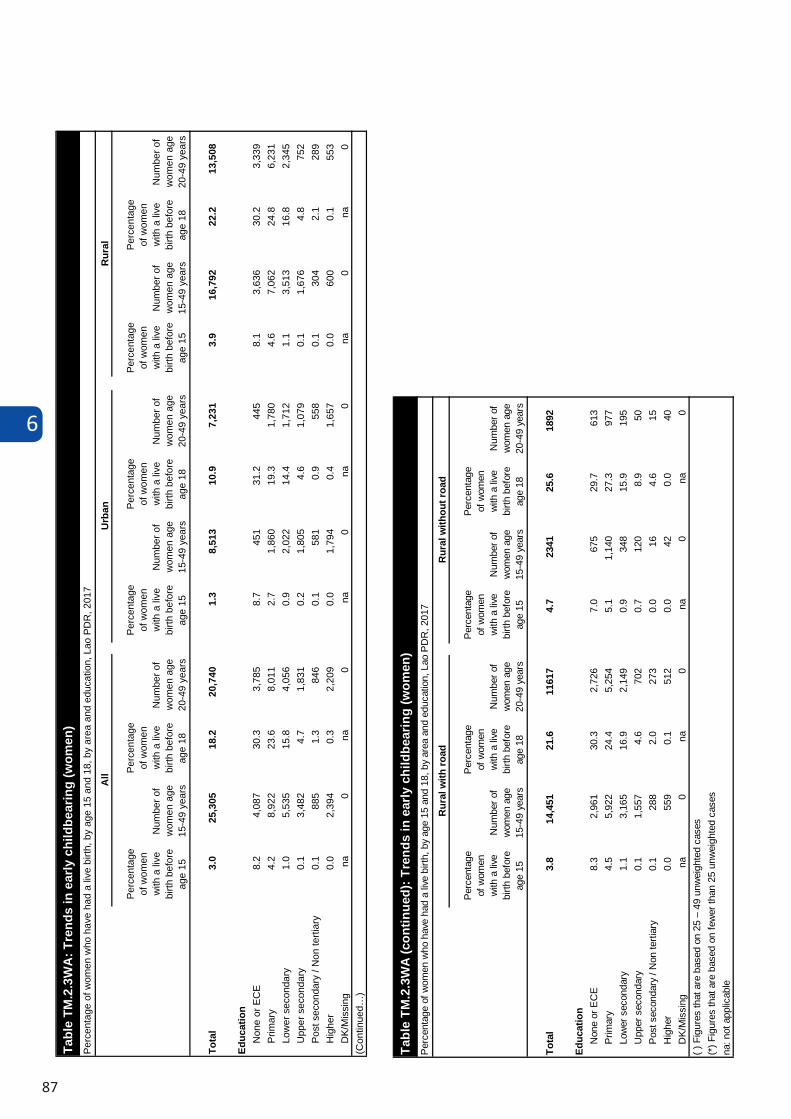
6
87
Tabl
e TM
.2.3
WA
: Tre
nds
in e
arly
chi
ldbe
arin
g (w
omen
)
Per
cent
age
of w
omen
w
ith a
live
bi
rth b
efor
e ag
e 15
Num
ber o
f w
omen
age
15
-49
year
s
Per
cent
age
of w
omen
w
ith a
live
bi
rth b
efor
e ag
e 18
Num
ber o
f w
omen
age
20
-49
year
s
Per
cent
age
of w
omen
w
ith a
live
bi
rth b
efor
e ag
e 15
Num
ber o
f w
omen
age
15
-49
year
s
Per
cent
age
of w
omen
w
ith a
live
bi
rth b
efor
e ag
e 18
Num
ber o
f w
omen
age
20
-49
year
s
Per
cent
age
of w
omen
w
ith a
live
bi
rth b
efor
e ag
e 15
Num
ber o
f w
omen
age
15
-49
year
s
Per
cent
age
of w
omen
w
ith a
live
bi
rth b
efor
e ag
e 18
Num
ber o
f w
omen
age
20
-49
year
s
Tota
l3.
025
,305
18.2
20,7
401.
38,
513
10.9
7,23
13.
916
,792
22.2
13,5
08
Educ
atio
nN
one
or E
CE
8.2
4,08
730
.33,
785
8.7
451
31.2
445
8.1
3,63
630
.23,
339
Prim
ary
4.2
8,92
223
.68,
011
2.7
1,86
019
.31,
780
4.6
7,06
224
.86,
231
Low
er s
econ
dary
1.0
5,53
515
.84,
056
0.9
2,02
214
.41,
712
1.1
3,51
316
.82,
345
Upp
er s
econ
dary
0.1
3,48
24.
71,
831
0.2
1,80
54.
61,
079
0.1
1,67
64.
875
2P
ost s
econ
dary
/ N
on te
rtiar
y0.
188
51.
384
60.
158
10.
955
80.
130
42.
128
9H
ighe
r0.
02,
394
0.3
2,20
90.
01,
794
0.4
1,65
70.
060
00.
155
3D
K/M
issi
ngna
0na
0na
0na
0na
0na
0(C
ontin
ued…
)
Per
cent
age
of w
omen
who
hav
e ha
d a
live
birth
, by
age
15 a
nd 1
8, b
y ar
ea a
nd e
duca
tion,
Lao
PD
R, 2
017
All
Urb
anR
ural
Tabl
e TM
.2.3
WA
(con
tinue
d): T
rend
s in
ear
ly c
hild
bear
ing
(wom
en)
Perc
enta
ge
of w
omen
w
ith a
live
bi
rth b
efor
e ag
e 15
Num
ber o
f w
omen
age
15
-49
year
s
Perc
enta
ge
of w
omen
w
ith a
live
bi
rth b
efor
e ag
e 18
Num
ber o
f w
omen
age
20
-49
year
s
Perc
enta
ge
of w
omen
w
ith a
live
bi
rth b
efor
e ag
e 15
Num
ber o
f w
omen
age
15
-49
year
s
Perc
enta
ge
of w
omen
w
ith a
live
bi
rth b
efor
e ag
e 18
Num
ber o
f w
omen
age
20
-49
year
s
Tota
l3.
814
,451
21.6
1161
74.
723
4125
.618
92
Educ
atio
nN
one
or E
CE
8.3
2,96
130
.32,
726
7.0
675
29.7
613
Prim
ary
4.5
5,92
224
.45,
254
5.1
1,14
027
.397
7Lo
wer
sec
onda
ry1.
13,
165
16.9
2,14
90.
934
815
.919
5U
pper
sec
onda
ry0.
11,
557
4.6
702
0.7
120
8.9
50P
ost s
econ
dary
/ N
on te
rtiar
y0.
128
82.
027
30.
016
4.6
15H
ighe
r0.
055
90.
151
20.
042
0.0
40D
K/M
issi
ngna
0na
0na
0na
0( )
Fig
ures
that
are
bas
ed o
n 25
– 4
9 un
wei
ghte
d ca
ses
(*) F
igur
es th
at a
re b
ased
on
few
er th
an 2
5 un
wei
ghte
d ca
ses
na: n
ot a
pplic
able
Rur
al w
ith ro
adR
ural
with
out r
oad
Per
cent
age
of w
omen
who
hav
e ha
d a
live
birth
, by
age
15 a
nd 1
8, b
y ar
ea a
nd e
duca
tion,
Lao
PD
R, 2
017
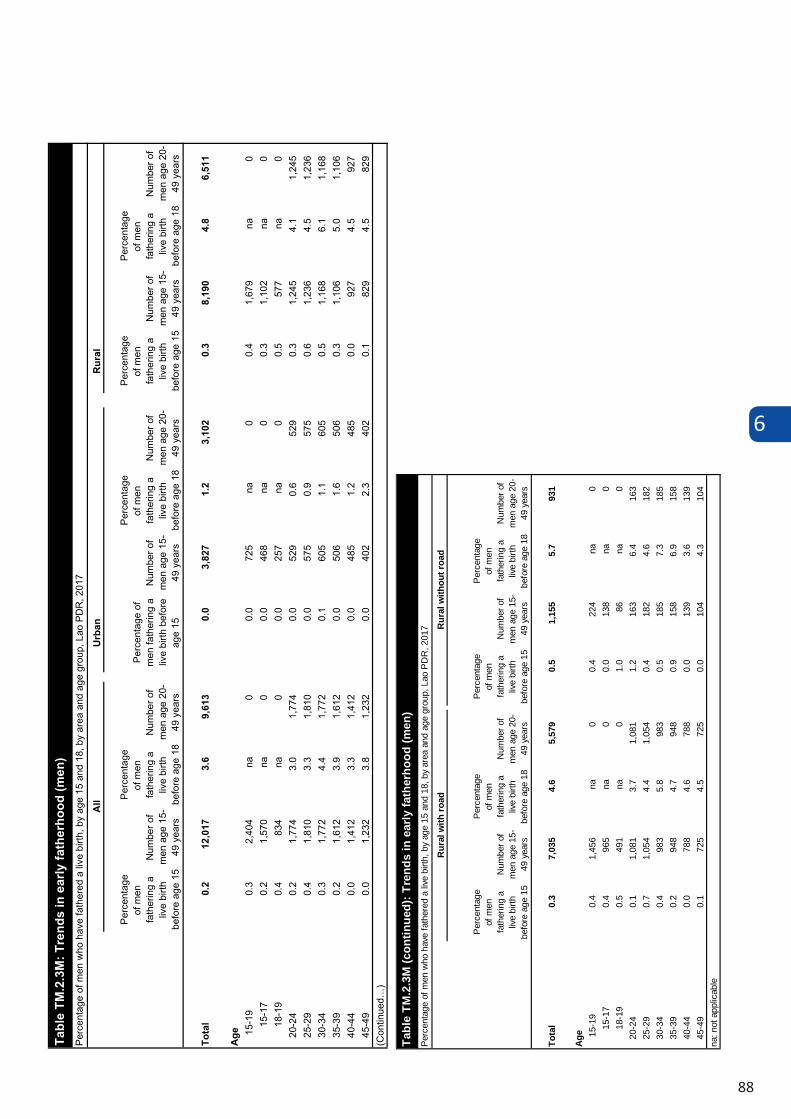
6
88
Urb
anR
ural
Perc
enta
ge
of m
en
fath
erin
g a
live
birth
be
fore
age
15
Num
ber o
f m
en a
ge 1
5-49
yea
rs
Perc
enta
ge
of m
en
fath
erin
g a
live
birth
be
fore
age
18
Num
ber o
f m
en a
ge 2
0-49
yea
rs
Perc
enta
ge o
f m
en fa
ther
ing
a liv
e bi
rth b
efor
e ag
e 15
Num
ber o
f m
en a
ge 1
5-49
yea
rs
Perc
enta
ge
of m
en
fath
erin
g a
live
birth
be
fore
age
18
Num
ber o
f m
en a
ge 2
0-49
yea
rs
Perc
enta
ge
of m
en
fath
erin
g a
live
birth
be
fore
age
15
Num
ber o
f m
en a
ge 1
5-49
yea
rs
Perc
enta
ge
of m
en
fath
erin
g a
live
birth
be
fore
age
18
Num
ber o
f m
en a
ge 2
0-49
yea
rs
Tota
l0.
212
,017
3.6
9,61
30.
03,
827
1.2
3,10
20.
38,
190
4.8
6,51
1
Age 15
-19
0.3
2,40
4na
00.
072
5na
00.
41,
679
na0
15
-17
0.2
1,57
0na
00.
046
8na
00.
31,
102
na0
18
-19
0.4
834
na0
0.0
257
na0
0.5
577
na0
20
-24
0.2
1,77
43.
01,
774
0.0
529
0.6
529
0.3
1,24
54.
11,
245
25
-29
0.4
1,81
03.
31,
810
0.0
575
0.9
575
0.6
1,23
64.
51,
236
30
-34
0.3
1,77
24.
41,
772
0.1
605
1.1
605
0.5
1,16
86.
11,
168
35
-39
0.2
1,61
23.
91,
612
0.0
506
1.6
506
0.3
1,10
65.
01,
106
40
-44
0.0
1,41
23.
31,
412
0.0
485
1.2
485
0.0
927
4.5
927
45
-49
0.0
1,23
23.
81,
232
0.0
402
2.3
402
0.1
829
4.5
829
(Con
tinue
d…)
All
Tabl
e TM
.2.3
M: T
rend
s in
ear
ly fa
ther
hood
(men
)Pe
rcen
tage
of m
en w
ho h
ave
fath
ered
a li
ve b
irth,
by
age
15 a
nd 1
8, b
y ar
ea a
nd a
ge g
roup
, Lao
PD
R, 2
017
Perc
enta
ge
of m
en
fath
erin
g a
live
birth
be
fore
age
15
Num
ber o
f m
en a
ge 1
5-49
yea
rs
Perc
enta
ge
of m
en
fath
erin
g a
live
birth
be
fore
age
18
Num
ber o
f m
en a
ge 2
0-49
yea
rs
Perc
enta
ge
of m
en
fath
erin
g a
live
birth
be
fore
age
15
Num
ber o
f m
en a
ge 1
5-49
yea
rs
Perc
enta
ge
of m
en
fath
erin
g a
live
birth
be
fore
age
18
Num
ber o
f m
en a
ge 2
0-49
yea
rs
Tota
l0.
37,
035
4.6
5,57
90.
51,
155
5.7
931
Age 15
-19
0.4
1,45
6na
00.
422
4na
0
15-1
70.
496
5na
00.
013
8na
0
18-1
90.
549
1na
01.
086
na0
20
-24
0.1
1,08
13.
71,
081
1.2
163
6.4
163
25
-29
0.7
1,05
44.
41,
054
0.4
182
4.6
182
30
-34
0.4
983
5.8
983
0.5
185
7.3
185
35
-39
0.2
948
4.7
948
0.9
158
6.9
158
40
-44
0.0
788
4.6
788
0.0
139
3.6
139
45
-49
0.1
725
4.5
725
0.0
104
4.3
104
na: n
ot a
pplic
able
Tabl
e TM
.2.3
M (c
ontin
ued)
: Tre
nds
in e
arly
fath
erho
od (m
en)
Rur
al w
ith ro
adR
ural
with
out r
oad
Per
cent
age
of m
en w
ho h
ave
fath
ered
a li
ve b
irth,
by
age
15 a
nd 1
8, b
y ar
ea a
nd a
ge g
roup
, Lao
PD
R, 2
017
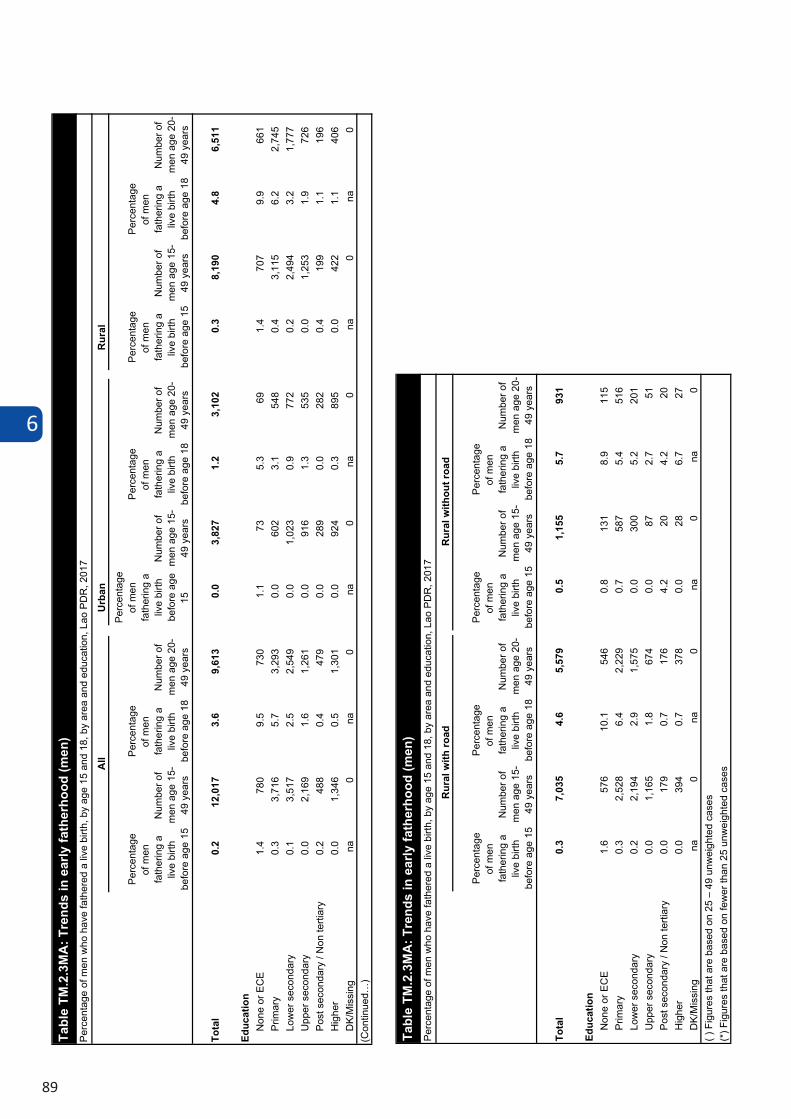
6
89
Urb
anR
ural
Perc
enta
ge
of m
en
fath
erin
g a
live
birth
be
fore
age
15
Num
ber o
f m
en a
ge 1
5-49
yea
rs
Perc
enta
ge
of m
en
fath
erin
g a
live
birth
be
fore
age
18
Num
ber o
f m
en a
ge 2
0-49
yea
rs
Perc
enta
geof
men
fa
ther
ing
a liv
e bi
rth
befo
re a
ge
15
Num
ber o
f m
en a
ge 1
5-49
yea
rs
Perc
enta
ge
of m
en
fath
erin
g a
live
birth
be
fore
age
18
Num
ber o
f m
en a
ge 2
0-49
yea
rs
Perc
enta
ge
of m
en
fath
erin
g a
live
birth
be
fore
age
15
Num
ber o
f m
en a
ge 1
5-49
yea
rs
Perc
enta
ge
of m
en
fath
erin
g a
live
birth
be
fore
age
18
Num
ber o
f m
en a
ge 2
0-49
yea
rs
Tota
l0.
212
,017
3.6
9,61
30.
03,
827
1.2
3,10
20.
38,
190
4.8
6,51
1
Educ
atio
nN
one
or E
CE
1.4
780
9.5
730
1.1
735.
369
1.4
707
9.9
661
Prim
ary
0.3
3,71
65.
73,
293
0.0
602
3.1
548
0.4
3,11
56.
22,
745
Low
er s
econ
dary
0.1
3,51
72.
52,
549
0.0
1,02
30.
977
20.
22,
494
3.2
1,77
7U
pper
sec
onda
ry0.
02,
169
1.6
1,26
10.
091
61.
353
50.
01,
253
1.9
726
Post
sec
onda
ry /
Non
terti
ary
0.2
488
0.4
479
0.0
289
0.0
282
0.4
199
1.1
196
Hig
her
0.0
1,34
60.
51,
301
0.0
924
0.3
895
0.0
422
1.1
406
DK/
Mis
sing
na0
na0
na0
na0
na0
na0
(Con
tinue
d…)
All
Perc
enta
ge o
f men
who
hav
e fa
ther
ed a
live
birt
h, b
y ag
e 15
and
18,
by
area
and
edu
catio
n, L
ao P
DR
, 201
7
Tabl
e TM
.2.3
MA
: Tre
nds
in e
arly
fath
erho
od (m
en)
Perc
enta
ge
of m
en
fath
erin
g a
live
birth
be
fore
age
15
Num
ber o
f m
en a
ge 1
5-49
yea
rs
Perc
enta
ge
of m
en
fath
erin
g a
live
birth
be
fore
age
18
Num
ber o
f m
en a
ge 2
0-49
yea
rs
Perc
enta
ge
of m
en
fath
erin
g a
live
birth
be
fore
age
15
Num
ber o
f m
en a
ge 1
5-49
yea
rs
Perc
enta
ge
of m
en
fath
erin
g a
live
birth
be
fore
age
18
Num
ber o
f m
en a
ge 2
0-49
yea
rs
Tota
l0.
37,
035
4.6
5,57
90.
51,
155
5.7
931
Educ
atio
nN
one
or E
CE
1.6
576
10.1
546
0.8
131
8.9
115
Prim
ary
0.3
2,52
86.
42,
229
0.7
587
5.4
516
Low
er s
econ
dary
0.2
2,19
42.
91,
575
0.0
300
5.2
201
Upp
er s
econ
dary
0.0
1,16
51.
867
40.
087
2.7
51Po
st s
econ
dary
/ N
on te
rtiar
y0.
017
90.
717
64.
220
4.2
20H
ighe
r0.
039
40.
737
80.
028
6.7
27D
K/M
issi
ngna
0na
0na
0na
0( )
Fig
ures
that
are
bas
ed o
n 25
– 4
9 un
wei
ghte
d ca
ses
(*) F
igur
es th
at a
re b
ased
on
few
er th
an 2
5 un
wei
ghte
d ca
ses
Tabl
e TM
.2.3
MA
: Tre
nds
in e
arly
fath
erho
od (m
en)
Rur
al w
ith ro
adR
ural
with
out r
oad
Perc
enta
ge o
f men
who
hav
e fa
ther
ed a
live
birt
h, b
y ag
e 15
and
18,
by
area
and
edu
catio
n, L
ao P
DR
, 201
7
6
90
6.3 CONTRACEPTION
Appropriate contraceptive use is important to the health of women and children by: 1) preventing pregnancies that are too early; 2) extending the period between births; and 3) limiting the total number of children4.
Table TM.3.1 presents the current use of contraception for women who are currently married or in union while table TM.3.2 presents the same information for women who are not currently married or in union. In Table TM.3.1, use of specific methods of contraception are first presented; specific methods are then grouped into modern and traditional methods and presented as such. For women who are not currently married or in union, in Table TM.3.2, contraceptive use is only presented by modern and traditional method categories.
4 PATH and United Nations Population Fund. 2006. Meeting the Need: Strengthening Family Planning Programs. Seattle,
2006. Download
Tabl
e TM
.3.1
: Use
of c
ontr
acep
tion
(cur
rent
ly m
arri
ed/i
n un
ion)
Perc
enta
ge o
f wom
en a
ge 1
5-49
yea
rs c
urre
ntly
mar
ried
or in
uni
on w
ho a
re u
sing
(or w
hose
par
tner
is u
sing
) a c
ontr
acep
tive
met
hod,
Lao
PD
R, 2
017
Perc
enta
ge o
f wom
en c
urre
ntly
mar
ried
or
in u
nion
who
are
usi
ng (o
r w
hose
par
tner
is u
sing
):
Num
ber
of
wom
en
age
15-
49 y
ears
cu
rren
tly
mar
ried
or in
un
ion
No
met
hod
Mod
ern
met
hod
Trad
itio
nal m
etho
d
Any
m
oder
n m
etho
d
Any
tr
adi-
tiona
l m
etho
d A
ny
met
hod1
Fem
ale
ster
ili-
zatio
n
Mal
e st
erili
- za
tion
IUD
In
ject
able
s Im
plan
ts
Pill
Mal
e co
ndom
Fe
mal
e co
ndom
D
iaph
ragm
/ Fo
am/J
elly
Pe
riodi
c ab
stin
ence
W
ithdr
awal
O
ther
M
issi
ng
Tota
l 45
.9
4.4
0.0
2.1
12.6
1.
4 27
.3
1.1
0.1
0.0
3.8
0.9
0.3
0.0
49.0
5.
0 54
.1
19,6
14
Are
a Urb
an
45.9
5.
9 0.
0 3.
2 6.
7 1.
7 25
.8
2.3
0.1
0.0
6.1
1.6
0.6
0.0
45.8
8.
3 54
.1
6,20
6 Ru
ral
45.9
3.
8 0.
0 1.
5 15
.3
1.2
28.0
0.
6 0.
1 0.
0 2.
8 0.
6 0.
1 0.
0 50
.5
3.5
54.1
13
,408
Ru
ral w
ith r
oad
45.1
4.
0 0.
0 1.
6 15
.1
1.3
28.4
0.
6 0.
1 0.
0 2.
9 0.
6 0.
1 0.
0 51
.2
3.7
54.9
11
,499
Ru
ral w
ithou
t roa
d 51
.3
2.2
0.0
0.9
16.5
0.
6 25
.9
0.1
0.0
0.0
1.7
0.5
0.2
0.0
46.3
2.
4 48
.7
1,90
9 Re
gion
N
orth
41
.9
4.7
0.0
1.3
12.4
1.
5 35
.5
0.4
0.0
0.0
1.7
0.4
0.2
0.0
55.8
2.
3 58
.1
6,31
2 Ce
ntra
l 47
.4
3.9
0.0
2.2
11.9
1.
3 24
.9
1.7
0.1
0.0
4.9
1.2
0.4
0.0
46.2
6.
5 52
.6
9,60
5 So
uth
49.1
5.
5 0.
0 3.
0 14
.7
1.3
19.8
0.
6 0.
0 0.
0 4.
5 1.
2 0.
2 0.
0 45
.0
5.9
50.9
3,
697
Prov
ince
Vi
entia
ne C
apita
l 49
.4
2.6
0.0
3.6
3.9
1.5
26.6
3.
7 0.
3 0.
0 5.
1 2.
1 1.
1 0.
0 42
.2
8.4
50.6
2,
488
Phon
gsal
y
43.2
12
.6
0.0
2.7
14.0
1.
7 21
.2
0.6
0.0
0.0
2.0
1.9
0.1
0.0
52.8
4.
0 56
.8
585
Luan
gnam
tha
36.9
6.
1 0.
0 1.
1 13
.2
3.1
37.5
0.
4 0.
0 0.
0 0.
6 0.
9 0.
1 0.
0 61
.5
1.6
63.1
56
5 O
udom
xay
46.4
4.
4 0.
0 1.
1 15
.4
1.8
26.0
0.
2 0.
0 0.
0 4.
3 0.
2 0.
2 0.
0 48
.9
4.7
53.6
1,
099
Boke
o 38
.2
14.8
0.
3 0.
1 17
.0
0.7
26.1
0.
5 0.
0 0.
0 1.
6 0.
2 0.
4 0.
0 59
.5
2.3
61.8
59
5 Lu
angp
raba
ng
50.1
0.
9 0.
0 1.
4 9.
1 1.
9 34
.3
0.7
0.0
0.0
1.1
0.3
0.2
0.0
48.3
1.
6 49
.9
1,37
4 H
uaph
anh
49.8
0.
7 0.
0 1.
6 8.
0 0.
5 37
.1
0.3
0.0
0.0
1.8
0.3
0.0
0.0
48.1
2.
1 50
.2
858
Xaya
bury
26
.7
2.7
0.0
1.1
13.2
1.
1 54
.6
0.2
0.0
0.0
0.5
0.0
0.0
0.0
72.9
0.
5 73
.3
1,23
7 Xi
engk
huan
g 45
.6
1.1
0.1
4.2
10.5
1.
9 19
.4
1.3
0.2
0.0
14.9
0.
5 0.
3 0.
0 38
.7
15.6
54
.4
810
Vien
tiane
42
.7
1.8
0.1
3.0
7.7
1.3
36.5
0.
8 0.
0 0.
1 5.
4 0.
5 0.
2 0.
0 51
.2
6.0
57.3
1,
426
Borik
ham
xay
32.8
4.
5 0.
0 0.
8 13
.9
1.9
30.5
3.
3 0.
0 0.
0 7.
4 4.
8 0.
1 0.
0 54
.9
12.3
67
.2
929
Kham
mua
ne
44.5
5.
7 0.
0 1.
1 23
.7
0.8
19.2
0.
9 0.
2 0.
0 3.
2 0.
6 0.
0 0.
0 51
.7
3.8
55.5
1,
191
Sava
nnak
het
52.9
6.
4 0.
0 0.
9 16
.8
1.1
19.5
0.
6 0.
1 0.
0 1.
6 0.
0 0.
1 0.
0 45
.4
1.7
47.1
2,
477
Sara
vane
45
.8
5.0
0.0
2.7
20.7
1.
4 21
.7
0.0
0.0
0.0
1.6
1.1
0.0
0.0
51.5
2.
7 54
.2
1,17
0 Se
kong
59
.9
3.6
0.1
5.4
14.6
0.
2 12
.2
0.4
0.0
0.0
2.7
0.8
0.1
0.0
36.6
3.
5 40
.1
335
Cham
pasa
ck
49.2
6.
1 0.
0 2.
5 11
.4
1.4
19.6
1.
0 0.
0 0.
0 7.
2 1.
3 0.
4 0.
0 41
.9
8.9
50.8
1,
780
Att
apeu
49
.8
6.1
0.0
4.2
12.2
1.
4 21
.4
1.1
0.0
0.0
2.9
0.7
0.4
0.0
46.3
3.
9 50
.2
412
Xays
ombo
une
68.6
0.
8 0.
1 1.
2 9.
4 1.
2 18
.5
0.0
0.0
0.0
0.0
0.1
0.1
0.0
31.2
0.
2 31
.4
284
(Con
tinue
d…)
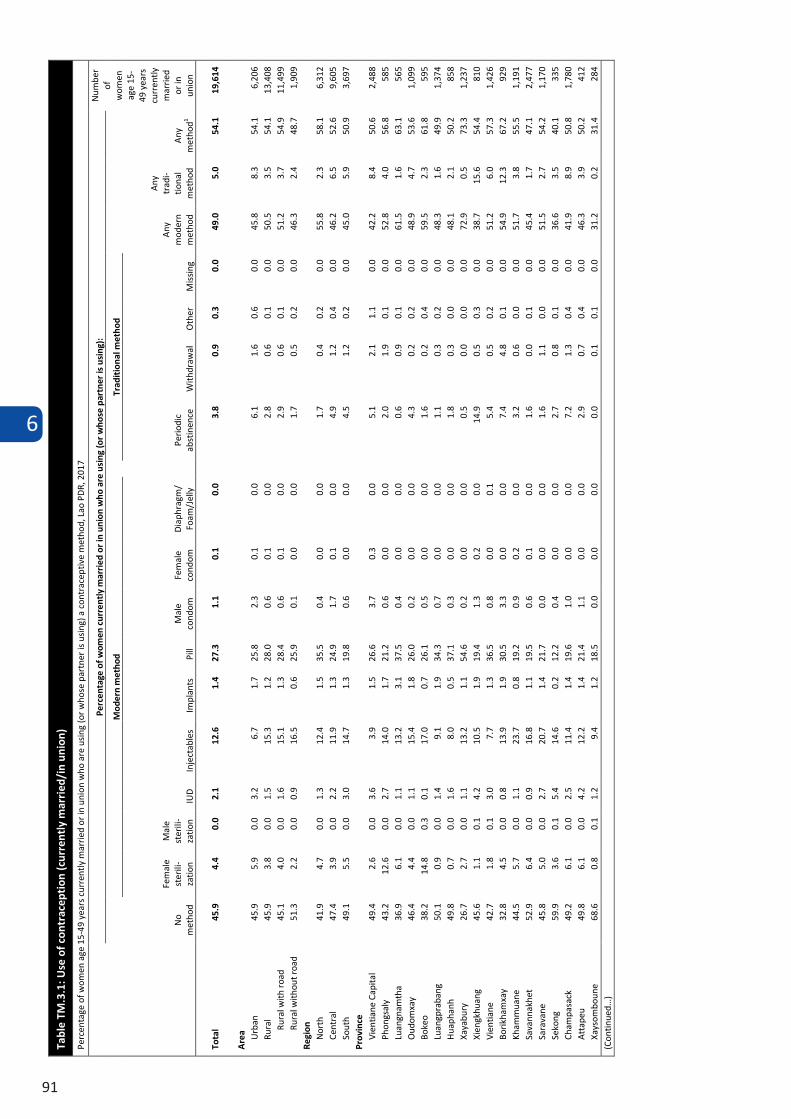
6
91
6.3 CONTRACEPTION
Appropriate contraceptive use is important to the health of women and children by: 1) preventing pregnancies that are too early; 2) extending the period between births; and 3) limiting the total number of children4.
Table TM.3.1 presents the current use of contraception for women who are currently married or in union while table TM.3.2 presents the same information for women who are not currently married or in union. In Table TM.3.1, use of specific methods of contraception are first presented; specific methods are then grouped into modern and traditional methods and presented as such. For women who are not currently married or in union, in Table TM.3.2, contraceptive use is only presented by modern and traditional method categories.
4 PATH and United Nations Population Fund. 2006. Meeting the Need: Strengthening Family Planning Programs. Seattle,
2006. Download
Tabl
e TM
.3.1
: Use
of c
ontr
acep
tion
(cur
rent
ly m
arri
ed/i
n un
ion)
Perc
enta
ge o
f wom
en a
ge 1
5-49
yea
rs c
urre
ntly
mar
ried
or in
uni
on w
ho a
re u
sing
(or w
hose
par
tner
is u
sing
) a c
ontr
acep
tive
met
hod,
Lao
PD
R, 2
017
Perc
enta
ge o
f wom
en c
urre
ntly
mar
ried
or
in u
nion
who
are
usi
ng (o
r w
hose
par
tner
is u
sing
):
Num
ber
of
wom
en
age
15-
49 y
ears
cu
rren
tly
mar
ried
or in
un
ion
No
met
hod
Mod
ern
met
hod
Trad
itio
nal m
etho
d
Any
m
oder
n m
etho
d
Any
tr
adi-
tiona
l m
etho
d A
ny
met
hod1
Fem
ale
ster
ili-
zatio
n
Mal
e st
erili
- za
tion
IUD
In
ject
able
s Im
plan
ts
Pill
Mal
e co
ndom
Fe
mal
e co
ndom
D
iaph
ragm
/ Fo
am/J
elly
Pe
riodi
c ab
stin
ence
W
ithdr
awal
O
ther
M
issi
ng
Tota
l 45
.9
4.4
0.0
2.1
12.6
1.
4 27
.3
1.1
0.1
0.0
3.8
0.9
0.3
0.0
49.0
5.
0 54
.1
19,6
14
Are
a Urb
an
45.9
5.
9 0.
0 3.
2 6.
7 1.
7 25
.8
2.3
0.1
0.0
6.1
1.6
0.6
0.0
45.8
8.
3 54
.1
6,20
6 Ru
ral
45.9
3.
8 0.
0 1.
5 15
.3
1.2
28.0
0.
6 0.
1 0.
0 2.
8 0.
6 0.
1 0.
0 50
.5
3.5
54.1
13
,408
Ru
ral w
ith r
oad
45.1
4.
0 0.
0 1.
6 15
.1
1.3
28.4
0.
6 0.
1 0.
0 2.
9 0.
6 0.
1 0.
0 51
.2
3.7
54.9
11
,499
Ru
ral w
ithou
t roa
d 51
.3
2.2
0.0
0.9
16.5
0.
6 25
.9
0.1
0.0
0.0
1.7
0.5
0.2
0.0
46.3
2.
4 48
.7
1,90
9 Re
gion
N
orth
41
.9
4.7
0.0
1.3
12.4
1.
5 35
.5
0.4
0.0
0.0
1.7
0.4
0.2
0.0
55.8
2.
3 58
.1
6,31
2 Ce
ntra
l 47
.4
3.9
0.0
2.2
11.9
1.
3 24
.9
1.7
0.1
0.0
4.9
1.2
0.4
0.0
46.2
6.
5 52
.6
9,60
5 So
uth
49.1
5.
5 0.
0 3.
0 14
.7
1.3
19.8
0.
6 0.
0 0.
0 4.
5 1.
2 0.
2 0.
0 45
.0
5.9
50.9
3,
697
Prov
ince
Vi
entia
ne C
apita
l 49
.4
2.6
0.0
3.6
3.9
1.5
26.6
3.
7 0.
3 0.
0 5.
1 2.
1 1.
1 0.
0 42
.2
8.4
50.6
2,
488
Phon
gsal
y
43.2
12
.6
0.0
2.7
14.0
1.
7 21
.2
0.6
0.0
0.0
2.0
1.9
0.1
0.0
52.8
4.
0 56
.8
585
Luan
gnam
tha
36.9
6.
1 0.
0 1.
1 13
.2
3.1
37.5
0.
4 0.
0 0.
0 0.
6 0.
9 0.
1 0.
0 61
.5
1.6
63.1
56
5 O
udom
xay
46.4
4.
4 0.
0 1.
1 15
.4
1.8
26.0
0.
2 0.
0 0.
0 4.
3 0.
2 0.
2 0.
0 48
.9
4.7
53.6
1,
099
Boke
o 38
.2
14.8
0.
3 0.
1 17
.0
0.7
26.1
0.
5 0.
0 0.
0 1.
6 0.
2 0.
4 0.
0 59
.5
2.3
61.8
59
5 Lu
angp
raba
ng
50.1
0.
9 0.
0 1.
4 9.
1 1.
9 34
.3
0.7
0.0
0.0
1.1
0.3
0.2
0.0
48.3
1.
6 49
.9
1,37
4 H
uaph
anh
49.8
0.
7 0.
0 1.
6 8.
0 0.
5 37
.1
0.3
0.0
0.0
1.8
0.3
0.0
0.0
48.1
2.
1 50
.2
858
Xaya
bury
26
.7
2.7
0.0
1.1
13.2
1.
1 54
.6
0.2
0.0
0.0
0.5
0.0
0.0
0.0
72.9
0.
5 73
.3
1,23
7 Xi
engk
huan
g 45
.6
1.1
0.1
4.2
10.5
1.
9 19
.4
1.3
0.2
0.0
14.9
0.
5 0.
3 0.
0 38
.7
15.6
54
.4
810
Vien
tiane
42
.7
1.8
0.1
3.0
7.7
1.3
36.5
0.
8 0.
0 0.
1 5.
4 0.
5 0.
2 0.
0 51
.2
6.0
57.3
1,
426
Borik
ham
xay
32.8
4.
5 0.
0 0.
8 13
.9
1.9
30.5
3.
3 0.
0 0.
0 7.
4 4.
8 0.
1 0.
0 54
.9
12.3
67
.2
929
Kham
mua
ne
44.5
5.
7 0.
0 1.
1 23
.7
0.8
19.2
0.
9 0.
2 0.
0 3.
2 0.
6 0.
0 0.
0 51
.7
3.8
55.5
1,
191
Sava
nnak
het
52.9
6.
4 0.
0 0.
9 16
.8
1.1
19.5
0.
6 0.
1 0.
0 1.
6 0.
0 0.
1 0.
0 45
.4
1.7
47.1
2,
477
Sara
vane
45
.8
5.0
0.0
2.7
20.7
1.
4 21
.7
0.0
0.0
0.0
1.6
1.1
0.0
0.0
51.5
2.
7 54
.2
1,17
0 Se
kong
59
.9
3.6
0.1
5.4
14.6
0.
2 12
.2
0.4
0.0
0.0
2.7
0.8
0.1
0.0
36.6
3.
5 40
.1
335
Cham
pasa
ck
49.2
6.
1 0.
0 2.
5 11
.4
1.4
19.6
1.
0 0.
0 0.
0 7.
2 1.
3 0.
4 0.
0 41
.9
8.9
50.8
1,
780
Att
apeu
49
.8
6.1
0.0
4.2
12.2
1.
4 21
.4
1.1
0.0
0.0
2.9
0.7
0.4
0.0
46.3
3.
9 50
.2
412
Xays
ombo
une
68.6
0.
8 0.
1 1.
2 9.
4 1.
2 18
.5
0.0
0.0
0.0
0.0
0.1
0.1
0.0
31.2
0.
2 31
.4
284
(Con
tinue
d…)
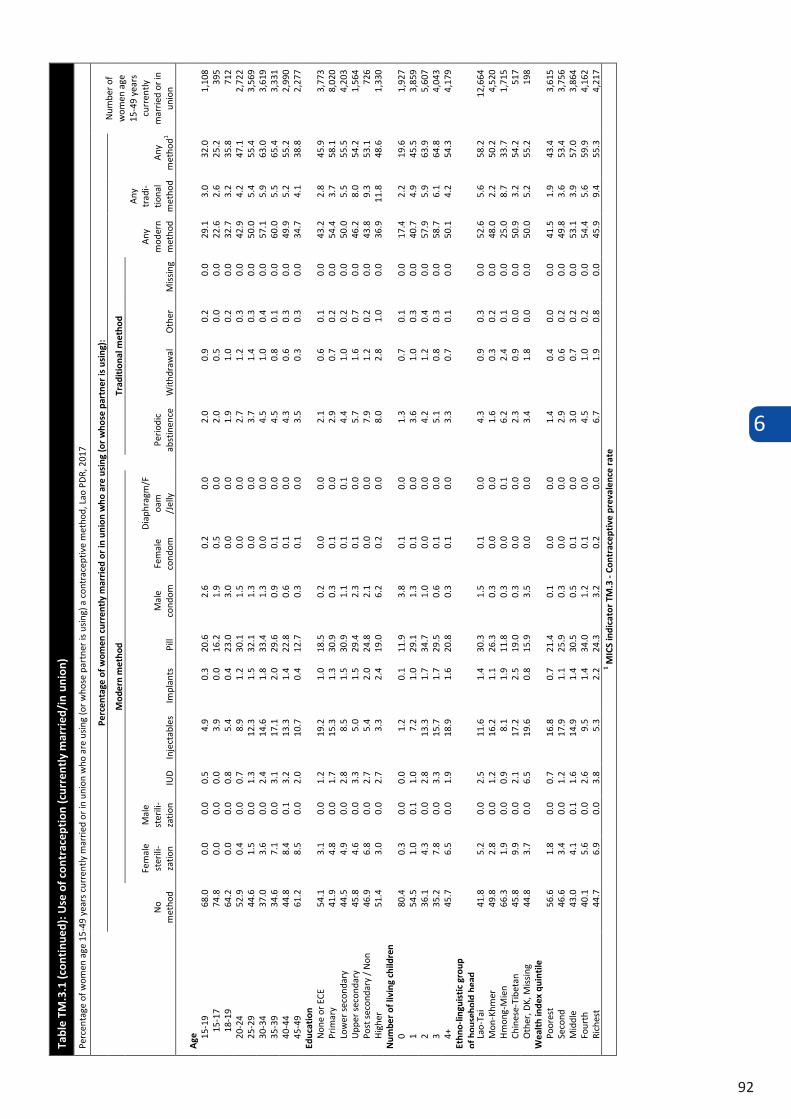
6
92
Tabl
e TM
.3.1
(con
tinu
ed):
Use
of c
ontr
acep
tion
(cur
rent
ly m
arri
ed/i
n un
ion)
Perc
enta
ge o
f wom
en a
ge 1
5-49
yea
rs c
urre
ntly
mar
ried
or in
uni
on w
ho a
re u
sing
(or w
hose
par
tner
is u
sing
) a c
ontr
acep
tive
met
hod,
Lao
PD
R, 2
017
Perc
enta
ge o
f wom
en c
urre
ntly
mar
ried
or
in u
nion
who
are
usi
ng (o
r w
hose
par
tner
is u
sing
):
Num
ber o
f w
omen
age
15
-49
year
s
curr
ently
m
arrie
d or
in
unio
n N
o m
etho
d
Mod
ern
met
hod
Trad
itio
nal m
etho
d
Any
m
oder
n m
etho
d
Any
tr
adi-
tiona
l m
etho
d A
ny
met
hod1
Fem
ale
ster
ili-
zatio
n
Mal
e st
erili
- za
tion
IUD
In
ject
able
s Im
plan
ts
Pill
Mal
e co
ndom
Fe
mal
e co
ndom
Dia
phra
gm/F
oam
/J
elly
Pe
riodi
c ab
stin
ence
W
ithdr
awal
O
ther
M
issi
ng
Age
15
-19
68.0
0.
0 0.
0 0.
5 4.
9 0.
3 20
.6
2.6
0.2
0.0
2.0
0.9
0.2
0.0
29.1
3.
0 32
.0
1,10
8
15-1
7 74
.8
0.0
0.0
0.0
3.9
0.0
16.2
1.
9 0.
5 0.
0 2.
0 0.
5 0.
0 0.
0 22
.6
2.6
25.2
39
5
18-1
9 64
.2
0.0
0.0
0.8
5.4
0.4
23.0
3.
0 0.
0 0.
0 1.
9 1.
0 0.
2 0.
0 32
.7
3.2
35.8
71
2 20
-24
52.9
0.
4 0.
0 0.
7 8.
9 1.
2 30
.1
1.5
0.0
0.0
2.7
1.2
0.3
0.0
42.9
4.
2 47
.1
2,72
2 25
-29
44.6
1.
5 0.
0 1.
3 12
.3
1.5
32.1
1.
3 0.
0 0.
0 3.
7 1.
4 0.
3 0.
0 50
.0
5.4
55.4
3,
569
30-3
4 37
.0
3.6
0.0
2.4
14.6
1.
8 33
.4
1.3
0.0
0.0
4.5
1.0
0.4
0.0
57.1
5.
9 63
.0
3,61
9 35
-39
34.6
7.
1 0.
0 3.
1 17
.1
2.0
29.6
0.
9 0.
1 0.
0 4.
5 0.
8 0.
1 0.
0 60
.0
5.5
65.4
3,
331
40-4
4 44
.8
8.4
0.1
3.2
13.3
1.
4 22
.8
0.6
0.1
0.0
4.3
0.6
0.3
0.0
49.9
5.
2 55
.2
2,99
0 45
-49
61.2
8.
5 0.
0 2.
0 10
.7
0.4
12.7
0.
3 0.
1 0.
0 3.
5 0.
3 0.
3 0.
0 34
.7
4.1
38.8
2,
277
Educ
atio
n N
one
or E
CE
54.1
3.
1 0.
0 1.
2 19
.2
1.0
18.5
0.
2 0.
0 0.
0 2.
1 0.
6 0.
1 0.
0 43
.2
2.8
45.9
3,
773
Prim
ary
41.9
4.
8 0.
0 1.
7 15
.3
1.3
30.9
0.
3 0.
1 0.
0 2.
9 0.
7 0.
2 0.
0 54
.4
3.7
58.1
8,
020
Low
er s
econ
dary
44
.5
4.9
0.0
2.8
8.5
1.5
30.9
1.
1 0.
1 0.
1 4.
4 1.
0 0.
2 0.
0 50
.0
5.5
55.5
4,
203
Upp
er s
econ
dary
45
.8
4.6
0.0
3.3
5.0
1.5
29.4
2.
3 0.
1 0.
0 5.
7 1.
6 0.
7 0.
0 46
.2
8.0
54.2
1,
564
Post
sec
onda
ry /
Non
te
rtia
ry46
.9
6.8
0.0
2.7
5.4
2.0
24.8
2.
1 0.
0 0.
0 7.
9 1.
2 0.
2 0.
0 43
.8
9.3
53.1
72
6 H
ighe
r 51
.4
3.0
0.0
2.7
3.3
2.4
19.0
6.
2 0.
2 0.
0 8.
0 2.
8 1.
0 0.
0 36
.9
11.8
48
.6
1,33
0 N
umbe
r of
livi
ng c
hild
ren
0 80
.4
0.3
0.0
0.0
1.2
0.1
11.9
3.
8 0.
1 0.
0 1.
3 0.
7 0.
1 0.
0 17
.4
2.2
19.6
1,
927
1 54
.5
1.0
0.1
1.0
7.2
1.0
29.1
1.
3 0.
1 0.
0 3.
6 1.
0 0.
3 0.
0 40
.7
4.9
45.5
3,
859
2 36
.1
4.3
0.0
2.8
13.3
1.
7 34
.7
1.0
0.0
0.0
4.2
1.2
0.4
0.0
57.9
5.
9 63
.9
5,60
7 3
35.2
7.
8 0.
0 3.
3 15
.7
1.7
29.5
0.
6 0.
1 0.
0 5.
1 0.
8 0.
3 0.
0 58
.7
6.1
64.8
4,
043
4+
45.7
6.
5 0.
0 1.
9 18
.9
1.6
20.8
0.
3 0.
1 0.
0 3.
3 0.
7 0.
1 0.
0 50
.1
4.2
54.3
4,
179
Ethn
o-lin
guis
tic
grou
p
of h
ouse
hold
hea
d La
o-Ta
i 41
.8
5.2
0.0
2.5
11.6
1.
4 30
.3
1.5
0.1
0.0
4.3
0.9
0.3
0.0
52.6
5.
6 58
.2
12,6
64
Mon
-Khm
er
49.8
2.
8 0.
0 1.
2 16
.2
1.1
26.3
0.
3 0.
0 0.
0 1.
6 0.
3 0.
2 0.
0 48
.0
2.2
50.2
4,
520
Hm
ong-
Mie
n 66
.3
1.9
0.0
0.9
8.1
1.9
11.8
0.
3 0.
0 0.
1 6.
2 2.
4 0.
1 0.
0 25
.0
8.7
33.7
1,
715
Chin
ese-
Tibe
tan
45.8
9.
9 0.
0 2.
1 17
.2
2.5
19.0
0.
3 0.
0 0.
0 2.
3 0.
9 0.
0 0.
0 50
.9
3.2
54.2
51
7 O
ther
, DK,
Mis
sing
44
.8
3.7
0.0
6.5
19.6
0.
8 15
.9
3.5
0.0
0.0
3.4
1.8
0.0
0.0
50.0
5.
2 55
.2
198
Wea
lth
inde
x qu
inti
le
Poor
est
56.6
1.
8 0.
0 0.
7 16
.8
0.7
21.4
0.
1 0.
0 0.
0 1.
4 0.
4 0.
0 0.
0 41
.5
1.9
43.4
3,
615
Seco
nd
46.6
3.
4 0.
0 1.
2 17
.9
1.1
25.9
0.
3 0.
0 0.
0 2.
9 0.
6 0.
2 0.
0 49
.8
3.6
53.4
3,
756
Mid
dle
43.0
4.
1 0.
1 1.
6 14
.9
1.4
30.5
0.
5 0.
1 0.
0 3.
0 0.
7 0.
2 0.
0 53
.1
3.9
57.0
3,
864
Four
th
40.1
5.
6 0.
0 2.
6 9.
5 1.
4 34
.0
1.2
0.1
0.0
4.5
1.0
0.2
0.0
54.4
5.
6 59
.9
4,16
2 Ri
ches
t 44
.7
6.9
0.0
3.8
5.3
2.2
24.3
3.
2 0.
2 0.
0 6.
7 1.
9 0.
8 0.
0 45
.9
9.4
55.3
4,
217
1 MIC
S in
dica
tor
TM.3
- Co
ntra
cept
ive
prev
alen
ce r
ate
Table TM.3.2: Use of contraception (currently unmarried/not in union)
Percentage of sexually active women age 15-49 years currently unmarried or not in union who are using (or whose partner is using) a contraceptive method, Lao PDR, 2017
Percentage of sexually activeA women currently unmarried or not in union who are using (or whose partner is using):
Number of sexually activeA women age 15-49 years
currently unmarried or not in union Any modern method
Any traditional method Any method
Total 14.5 0.3 14.8 275
Area Urban 14.0 0.0 14.0 136 Rural 15.0 0.7 15.6 139
Rural with road 16.7 0.7 17.4 124 Rural without road (*) (*) (*) 15
Region North 10.7 0.0 10.7 103 Central 15.5 0.6 16.0 158 South (*) (*) (*) 15
Age 15-19 14.1 0.0 14.1 112 15-17 14.7 0.0 14.7 62 18-19 13.3 0.0 13.3 50 20-24 16.4 0.0 16.4 104 25-29 (15.0) (1.9) (16.9) 46 30-34 (*) (*) (*) 3 35-39 (*) (*) (*) 3 40-44 (*) (*) (*) 5
Education None or ECE (*) (*) (*) 6 Primary (20.0) (0.0) (20.0) 36 Lower secondary 10.4 0.0 10.4 58 Upper secondary 17.5 0.0 17.5 73 Post secondary / Non tertiary (*) (*) (*) 16 Higher 15.4 1.1 16.4 86
Number of living children 0 14.6 0.3 14.9 273 1 (*) (*) (*) 2
Ethno-linguistic group of household head Lao-Tai 18.5 0.0 18.5 175 Mon-Khmer 4.2 0.0 4.2 55 Hmong-Mien (12.2) (0.0) (12.2) 21 Chinese-Tibetan (3.5) (0.0) (3.5) 18 Other, DK, Missing (*) (*) (*) 6
Wealth index quintile Poorest (9.3) (0.0) (9.3) 27 Second 4.6 0.0 4.6 40 Middle (12.4) (0.0) (12.4) 37 Fourth 22.7 0.0 22.7 64 Richest 15.2 0.8 16.1 108
A "Sexually active" is defined as having had sex within the last 30 days. ( ) Figures that are based on 25 – 49 unweighted cases (*) Figures are not shown, based on fewer than 25 unweighted cases Note: Province level figures are not shown separately, fewer than 25 unweighted cases for most of the provinces
Unmet need for contraception refers to fecund women who are married or in union and are not using any method of contraception, but who wish to postpone the next birth (spacing) or who wish to stop childbearing altogether (limiting). Unmet need is identified in LSIS II by using a set of questions eliciting current behaviours and preferences pertaining to contraceptive use, fecundity, and fertility preferences.
Table TM.3.3 shows the levels of unmet need and met need for contraception, and the demand for contraception satisfied for women who are currently married or in union. The same table is reproduced in Table 3.4 for women who are not currently married or in union.
Unmet need for spacing is defined as the percentage of women who are married or in union and are not using a method of contraception AND
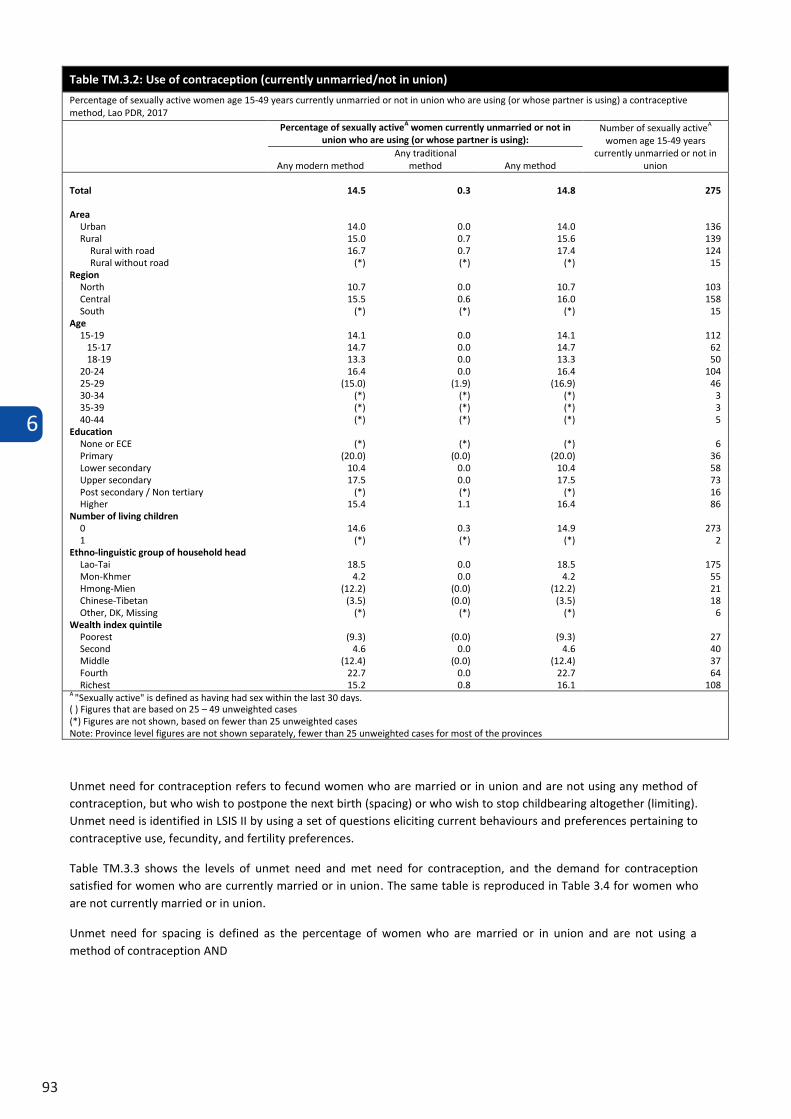
6
93
Table TM.3.2: Use of contraception (currently unmarried/not in union)
Percentage of sexually active women age 15-49 years currently unmarried or not in union who are using (or whose partner is using) a contraceptive method, Lao PDR, 2017
Percentage of sexually activeA women currently unmarried or not in union who are using (or whose partner is using):
Number of sexually activeA women age 15-49 years
currently unmarried or not in union Any modern method
Any traditional method Any method
Total 14.5 0.3 14.8 275
Area Urban 14.0 0.0 14.0 136 Rural 15.0 0.7 15.6 139
Rural with road 16.7 0.7 17.4 124 Rural without road (*) (*) (*) 15
Region North 10.7 0.0 10.7 103 Central 15.5 0.6 16.0 158 South (*) (*) (*) 15
Age 15-19 14.1 0.0 14.1 112 15-17 14.7 0.0 14.7 62 18-19 13.3 0.0 13.3 50 20-24 16.4 0.0 16.4 104 25-29 (15.0) (1.9) (16.9) 46 30-34 (*) (*) (*) 3 35-39 (*) (*) (*) 3 40-44 (*) (*) (*) 5
Education None or ECE (*) (*) (*) 6 Primary (20.0) (0.0) (20.0) 36 Lower secondary 10.4 0.0 10.4 58 Upper secondary 17.5 0.0 17.5 73 Post secondary / Non tertiary (*) (*) (*) 16 Higher 15.4 1.1 16.4 86
Number of living children 0 14.6 0.3 14.9 273 1 (*) (*) (*) 2
Ethno-linguistic group of household head Lao-Tai 18.5 0.0 18.5 175 Mon-Khmer 4.2 0.0 4.2 55 Hmong-Mien (12.2) (0.0) (12.2) 21 Chinese-Tibetan (3.5) (0.0) (3.5) 18 Other, DK, Missing (*) (*) (*) 6
Wealth index quintile Poorest (9.3) (0.0) (9.3) 27 Second 4.6 0.0 4.6 40 Middle (12.4) (0.0) (12.4) 37 Fourth 22.7 0.0 22.7 64 Richest 15.2 0.8 16.1 108
A "Sexually active" is defined as having had sex within the last 30 days. ( ) Figures that are based on 25 – 49 unweighted cases (*) Figures are not shown, based on fewer than 25 unweighted cases Note: Province level figures are not shown separately, fewer than 25 unweighted cases for most of the provinces
Unmet need for contraception refers to fecund women who are married or in union and are not using any method of contraception, but who wish to postpone the next birth (spacing) or who wish to stop childbearing altogether (limiting). Unmet need is identified in LSIS II by using a set of questions eliciting current behaviours and preferences pertaining to contraceptive use, fecundity, and fertility preferences.
Table TM.3.3 shows the levels of unmet need and met need for contraception, and the demand for contraception satisfied for women who are currently married or in union. The same table is reproduced in Table 3.4 for women who are not currently married or in union.
Unmet need for spacing is defined as the percentage of women who are married or in union and are not using a method of contraception AND
6
94
are not pregnant, and not postpartum amenorrheic5, and are fecund6, and say they want to wait two or more years for their next birth OR
are not pregnant, and not postpartum amenorrheic, and are fecund, and unsure whether they want anotherchild OR
are pregnant, and say that pregnancy was mistimed: would have wanted to wait OR are postpartum amenorrheic, and say that the birth was mistimed: would have wanted to wait.
Unmet need for limiting is defined as percentage of women who are married or in union and are not using a method of contraception AND
are not pregnant, and not postpartum amenorrheic, and are fecund, and say they do not want any morechildren OR
are pregnant, and say they did not want to have a child OR are postpartum amenorrheic, and say that they did not want the birth.
Total unmet need for contraception is the sum of unmet need for spacing and unmet need for limiting.
Met need for limiting includes women married or in union who are using (or whose partner is using) a contraceptive method7, and who want no more children, are using male or female sterilization, or declare themselves as infecund. Met need for spacing includes women who are using (or whose partner is using) a contraceptive method, and who want to have another child, or are undecided whether to have another child. Summing the met need for spacing and limiting results in the total met need for contraception.
Using information on contraception and unmet need, the percentage of demand for contraception satisfied is also estimated from the LSIS II data. The percentage of demand satisfied is defined as the proportion of women currently married or in union who are currently using contraception, over the total demand for contraception. The total demand for contraception includes women who currently have an unmet need (for spacing or limiting), plus those who are currently using contraception.
Percentage of demand for family planning satisfied with modern methods is one of the indicators used to track progress toward the Sustainable Development Goal, Target 3.7, on ensuring universal access to sexual and reproductive health-care services, including for family planning, information and education, and the integration of reproductive health into national strategies and programmes.
5 A woman is postpartum amenorrheic if she had a birth in last two years and is not currently pregnant, and her menstrual period has not returned since the birth of the last child 6 A woman is considered infecund if she is neither pregnant nor postpartum amenorrheic, and
(1a) has not had menstruation for at least six months, or (1b) never menstruated, or (1c) her last menstruation occurred before her last birth, or (1d) in menopause/has had hysterectomy OR (2) She declares that she has had hysterectomy, or that she has never menstruated, or that she is menopausal, or that she has been trying to get pregnant for 2 or more years without result in response to questions on why she thinks she is not physically able to get pregnant at the time of survey OR (3) She declares she cannot get pregnant when asked about desire for future birth OR (4) She has not had a birth in the preceding 5 years, is currently not using contraception and is currently married and was continuously married during the last 5 years preceding the survey.
7 In this chapter, whenever reference is made to the use of a contraceptive by a woman, this may refer to her partner using a contraceptive method (such as male condom).
Tabl
e TM
.3.3
: Nee
d fo
r co
ntra
cept
ion
(cur
rent
ly m
arri
ed/i
n un
ion)
Perc
enta
ge o
f wom
en a
ge 1
5-49
yea
rs w
ho a
re c
urre
ntly
mar
ried
or in
uni
on w
ith m
et a
nd u
nmet
nee
d fo
r con
trac
eptio
n, to
tal d
eman
d fo
r con
trac
eptio
n an
d pe
rcen
tage
of w
omen
cur
rent
ly m
arrie
d or
in u
nion
with
nee
d fo
r con
trac
eptio
n w
ho
are
usin
g a
mod
ern
met
hod,
Lao
PD
R, 2
017
Unm
et n
eed
for
fam
ily
plan
ning
Met
nee
d fo
r fa
mily
pla
nnin
g (c
urre
ntly
usi
ng c
ontr
acep
tion
) To
tal d
eman
d fo
r fa
mily
pl
anni
ng
Num
ber o
f w
omen
cu
rren
tly
mar
ried
or in
un
ion
Perc
enta
ge o
f dem
and
for
fam
ily
plan
ning
sat
isfie
d w
ith:
N
umbe
r of w
omen
cu
rren
tly m
arrie
d or
in
uni
on w
ith n
eed
for
fam
ily p
lann
ing
For
spac
ing
birt
hs
For
limiti
ng
birt
hs
Tota
l
For
spac
ing
birt
hs
For
limiti
ng
birt
hs
Tota
l
For
spac
ing
birt
hs
For
limiti
ng
birt
hs
Tota
l A
ny m
etho
d
Mod
ern
met
hods
1
Tota
l 5.
4 8.
9 14
.3
15.2
38
.8
54.1
20
.7
47.7
68
.4
19,6
14
79.0
71
.7
13,4
17
Are
a Urb
an
5.6
9.1
14.7
15
.5
38.6
54
.1
21.1
47
.6
68.8
6,
206
78.7
66
.6
4,26
8 Ru
ral
5.3
8.8
14.2
15
.1
39.0
54
.1
20.4
47
.8
68.2
13
,408
79
.2
74.1
9,
149
Rura
l with
roa
d 5.
2 8.
6 13
.8
15.4
39
.5
54.9
20
.6
48.1
68
.8
11,4
99
79.9
74
.5
7,91
0 Ru
ral w
ithou
t roa
d 6.
0 10
.1
16.2
13
.2
35.5
48
.7
19.2
45
.7
64.9
1,
909
75.1
71
.4
1,23
9 Re
gion
N
orth
4.
2 7.
1 11
.4
14.5
43
.6
58.1
18
.7
50.7
69
.5
6,31
2 83
.7
80.4
4,
385
Cent
ral
5.9
9.0
14.9
15
.6
37.0
52
.6
21.5
46
.0
67.5
9,
605
78.0
68
.4
6,48
5 So
uth
6.3
11.7
18
.0
15.4
35
.4
50.9
21
.8
47.1
68
.9
3,69
7 73
.8
65.3
2,
547
Prov
ince
Vi
entia
ne C
apita
l 4.
9 8.
7 13
.6
13.6
37
.0
50.6
18
.5
45.7
64
.2
2,48
8 78
.8
65.8
1,
597
Phon
gsal
y
2.8
2.6
5.4
8.4
48.3
56
.8
11.3
50
.9
62.2
58
5 91
.3
84.9
36
4 Lu
angn
amth
a 2.
5 6.
6 9.
1 12
.1
51.0
63
.1
14.6
57
.7
72.3
56
5 87
.4
85.1
40
8 O
udom
xay
5.9
8.2
14.1
10
.8
42.8
53
.6
16.7
51
.0
67.7
1,
099
79.2
72
.2
744
Boke
o 4.
0 4.
9 8.
9 18
.1
43.7
61
.8
22.1
48
.6
70.7
59
5 87
.4
84.2
42
0 Lu
angp
raba
ng
4.9
10.9
15
.9
14.8
35
.1
49.9
19
.7
46.1
65
.8
1,37
4 75
.9
73.4
90
3 H
uaph
anh
5.3
8.3
13.6
11
.0
39.1
50
.2
16.4
47
.5
63.8
85
8 78
.6
75.4
54
7 Xa
yabu
ry
2.7
4.6
7.3
22.2
51
.1
73.3
24
.9
55.8
80
.7
1,23
7 90
.9
90.3
99
8 Xi
engk
huan
g 5.
2 5.
7 10
.8
15.2
39
.2
54.4
20
.4
44.8
65
.2
810
83.4
59
.4
528
Vien
tiane
5.
8 11
.3
17.1
14
.3
43.0
57
.3
20.1
54
.2
74.4
1,
426
77.0
68
.9
1,06
0 Bo
rikha
mxa
y 4.
1 5.
2 9.
3 25
.4
41.8
67
.2
29.5
47
.0
76.5
92
9 87
.8
71.7
71
0 Kh
amm
uane
4.
8 7.
4 12
.3
18.8
36
.7
55.5
23
.7
44.1
67
.8
1,19
1 81
.9
76.3
80
7 Sa
vann
akhe
t 7.
7 10
.9
18.6
14
.3
32.8
47
.1
22.0
43
.7
65.6
2,
477
71.7
69
.1
1,62
6 Sa
rava
ne
7.2
10.8
18
.0
16.6
37
.7
54.2
23
.7
48.5
72
.2
1,17
0 75
.1
71.3
84
5 Se
kong
8.
4 16
.6
25.0
8.
9 31
.2
40.1
17
.3
47.8
65
.1
335
61.6
56
.2
218
Cham
pasa
ck
5.2
10.9
16
.2
16.5
34
.3
50.8
21
.8
45.2
67
.0
1,78
0 75
.8
62.6
1,
192
Att
apeu
7.
2 13
.2
20.4
12
.9
37.4
50
.2
20.1
50
.6
70.7
41
2 71
.1
65.5
29
1 Xa
ysom
boun
e 10
.0
13.3
23
.3
7.7
23.8
31
.4
17.7
37
.0
54.7
28
4 57
.4
57.0
15
5 (C
ontin
ued…
)
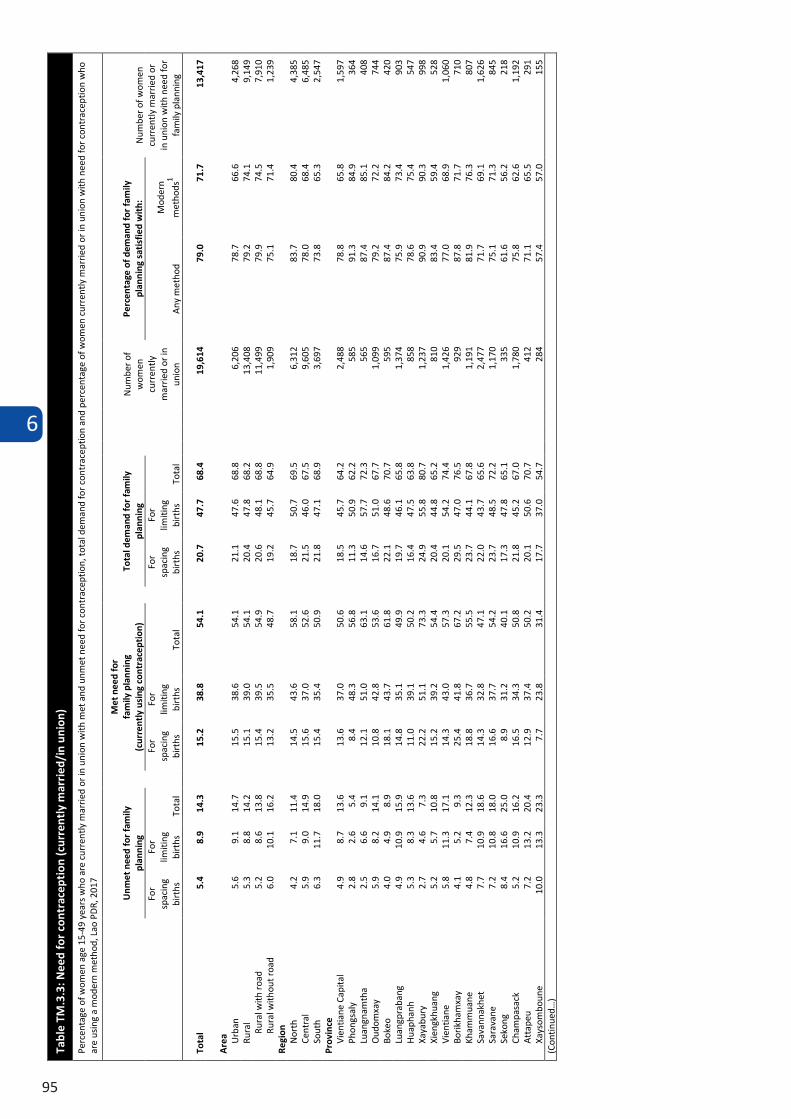
6
95
Tabl
e TM
.3.3
: Nee
d fo
r co
ntra
cept
ion
(cur
rent
ly m
arri
ed/i
n un
ion)
Perc
enta
ge o
f wom
en a
ge 1
5-49
yea
rs w
ho a
re c
urre
ntly
mar
ried
or in
uni
on w
ith m
et a
nd u
nmet
nee
d fo
r con
trac
eptio
n, to
tal d
eman
d fo
r con
trac
eptio
n an
d pe
rcen
tage
of w
omen
cur
rent
ly m
arrie
d or
in u
nion
with
nee
d fo
r con
trac
eptio
n w
ho
are
usin
g a
mod
ern
met
hod,
Lao
PD
R, 2
017
Unm
et n
eed
for
fam
ily
plan
ning
Met
nee
d fo
r fa
mily
pla
nnin
g (c
urre
ntly
usi
ng c
ontr
acep
tion
) To
tal d
eman
d fo
r fa
mily
pl
anni
ng
Num
ber o
f w
omen
cu
rren
tly
mar
ried
or in
un
ion
Perc
enta
ge o
f dem
and
for
fam
ily
plan
ning
sat
isfie
d w
ith:
N
umbe
r of w
omen
cu
rren
tly m
arrie
d or
in
uni
on w
ith n
eed
for
fam
ily p
lann
ing
For
spac
ing
birt
hs
For
limiti
ng
birt
hs
Tota
l
For
spac
ing
birt
hs
For
limiti
ng
birt
hs
Tota
l
For
spac
ing
birt
hs
For
limiti
ng
birt
hs
Tota
l A
ny m
etho
d
Mod
ern
met
hods
1
Tota
l 5.
4 8.
9 14
.3
15.2
38
.8
54.1
20
.7
47.7
68
.4
19,6
14
79.0
71
.7
13,4
17
Are
a Urb
an
5.6
9.1
14.7
15
.5
38.6
54
.1
21.1
47
.6
68.8
6,
206
78.7
66
.6
4,26
8 Ru
ral
5.3
8.8
14.2
15
.1
39.0
54
.1
20.4
47
.8
68.2
13
,408
79
.2
74.1
9,
149
Rura
l with
roa
d 5.
2 8.
6 13
.8
15.4
39
.5
54.9
20
.6
48.1
68
.8
11,4
99
79.9
74
.5
7,91
0 Ru
ral w
ithou
t roa
d 6.
0 10
.1
16.2
13
.2
35.5
48
.7
19.2
45
.7
64.9
1,
909
75.1
71
.4
1,23
9 Re
gion
N
orth
4.
2 7.
1 11
.4
14.5
43
.6
58.1
18
.7
50.7
69
.5
6,31
2 83
.7
80.4
4,
385
Cent
ral
5.9
9.0
14.9
15
.6
37.0
52
.6
21.5
46
.0
67.5
9,
605
78.0
68
.4
6,48
5 So
uth
6.3
11.7
18
.0
15.4
35
.4
50.9
21
.8
47.1
68
.9
3,69
7 73
.8
65.3
2,
547
Prov
ince
Vi
entia
ne C
apita
l 4.
9 8.
7 13
.6
13.6
37
.0
50.6
18
.5
45.7
64
.2
2,48
8 78
.8
65.8
1,
597
Phon
gsal
y
2.8
2.6
5.4
8.4
48.3
56
.8
11.3
50
.9
62.2
58
5 91
.3
84.9
36
4 Lu
angn
amth
a 2.
5 6.
6 9.
1 12
.1
51.0
63
.1
14.6
57
.7
72.3
56
5 87
.4
85.1
40
8 O
udom
xay
5.9
8.2
14.1
10
.8
42.8
53
.6
16.7
51
.0
67.7
1,
099
79.2
72
.2
744
Boke
o 4.
0 4.
9 8.
9 18
.1
43.7
61
.8
22.1
48
.6
70.7
59
5 87
.4
84.2
42
0 Lu
angp
raba
ng
4.9
10.9
15
.9
14.8
35
.1
49.9
19
.7
46.1
65
.8
1,37
4 75
.9
73.4
90
3 H
uaph
anh
5.3
8.3
13.6
11
.0
39.1
50
.2
16.4
47
.5
63.8
85
8 78
.6
75.4
54
7 Xa
yabu
ry
2.7
4.6
7.3
22.2
51
.1
73.3
24
.9
55.8
80
.7
1,23
7 90
.9
90.3
99
8 Xi
engk
huan
g 5.
2 5.
7 10
.8
15.2
39
.2
54.4
20
.4
44.8
65
.2
810
83.4
59
.4
528
Vien
tiane
5.
8 11
.3
17.1
14
.3
43.0
57
.3
20.1
54
.2
74.4
1,
426
77.0
68
.9
1,06
0 Bo
rikha
mxa
y 4.
1 5.
2 9.
3 25
.4
41.8
67
.2
29.5
47
.0
76.5
92
9 87
.8
71.7
71
0 Kh
amm
uane
4.
8 7.
4 12
.3
18.8
36
.7
55.5
23
.7
44.1
67
.8
1,19
1 81
.9
76.3
80
7 Sa
vann
akhe
t 7.
7 10
.9
18.6
14
.3
32.8
47
.1
22.0
43
.7
65.6
2,
477
71.7
69
.1
1,62
6 Sa
rava
ne
7.2
10.8
18
.0
16.6
37
.7
54.2
23
.7
48.5
72
.2
1,17
0 75
.1
71.3
84
5 Se
kong
8.
4 16
.6
25.0
8.
9 31
.2
40.1
17
.3
47.8
65
.1
335
61.6
56
.2
218
Cham
pasa
ck
5.2
10.9
16
.2
16.5
34
.3
50.8
21
.8
45.2
67
.0
1,78
0 75
.8
62.6
1,
192
Att
apeu
7.
2 13
.2
20.4
12
.9
37.4
50
.2
20.1
50
.6
70.7
41
2 71
.1
65.5
29
1 Xa
ysom
boun
e 10
.0
13.3
23
.3
7.7
23.8
31
.4
17.7
37
.0
54.7
28
4 57
.4
57.0
15
5 (C
ontin
ued…
)
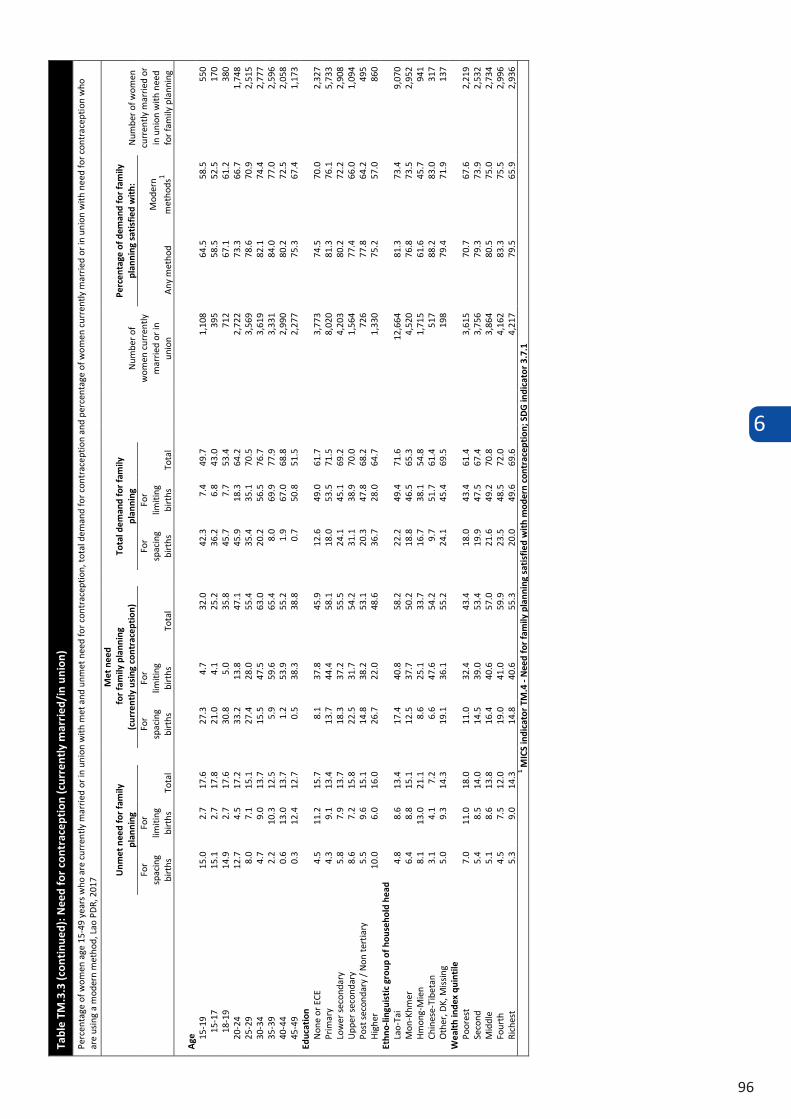
6
96
Tabl
e TM
.3.3
(con
tinu
ed):
Nee
d fo
r co
ntra
cept
ion
(cur
rent
ly m
arri
ed/i
n un
ion)
Perc
enta
ge o
f wom
en a
ge 1
5-49
yea
rs w
ho a
re c
urre
ntly
mar
ried
or in
uni
on w
ith m
et a
nd u
nmet
nee
d fo
r co
ntra
cept
ion,
tota
l dem
and
for c
ontr
acep
tion
and
perc
enta
ge o
f wom
en c
urre
ntly
mar
ried
or in
uni
on w
ith n
eed
for c
ontr
acep
tion
who
ar
e us
ing
a m
oder
n m
etho
d, L
ao P
DR,
201
7
Unm
et n
eed
for
fam
ily
plan
ning
Met
nee
d fo
r fa
mily
pla
nnin
g (c
urre
ntly
usi
ng c
ontr
acep
tion
) To
tal d
eman
d fo
r fa
mily
pl
anni
ng
Num
ber o
f w
omen
cur
rent
ly
mar
ried
or in
un
ion
Perc
enta
ge o
f dem
and
for
fam
ily
plan
ning
sat
isfie
d w
ith:
N
umbe
r of w
omen
cu
rren
tly m
arrie
d or
in
uni
on w
ith n
eed
for f
amily
pla
nnin
g
For
spac
ing
birt
hs
For
limiti
ng
birt
hs
Tota
l
For
spac
ing
birt
hs
For
limiti
ng
birt
hs
Tota
l
For
spac
ing
birt
hs
For
limiti
ng
birt
hs
Tota
l A
ny m
etho
d
Mod
ern
met
hods
1
Age
15
-19
15.0
2.
7 17
.6
27.3
4.
7 32
.0
42.3
7.
4 49
.7
1,10
8 64
.5
58.5
55
0
15-1
7 15
.1
2.7
17.8
21
.0
4.1
25.2
36
.2
6.8
43.0
39
5 58
.5
52.5
17
0
18-1
9 14
.9
2.7
17.6
30
.8
5.0
35.8
45
.7
7.7
53.4
71
2 67
.1
61.2
38
0 20
-24
12.7
4.
5 17
.2
33.2
13
.8
47.1
45
.9
18.3
64
.2
2,72
2 73
.3
66.7
1,
748
25-2
9 8.
0 7.
1 15
.1
27.4
28
.0
55.4
35
.4
35.1
70
.5
3,56
9 78
.6
70.9
2,
515
30-3
4 4.
7 9.
0 13
.7
15.5
47
.5
63.0
20
.2
56.5
76
.7
3,61
9 82
.1
74.4
2,
777
35-3
9 2.
2 10
.3
12.5
5.
9 59
.6
65.4
8.
0 69
.9
77.9
3,
331
84.0
77
.0
2,59
6 40
-44
0.6
13.0
13
.7
1.2
53.9
55
.2
1.9
67.0
68
.8
2,99
0 80
.2
72.5
2,
058
45-4
9 0.
3 12
.4
12.7
0.
5 38
.3
38.8
0.
7 50
.8
51.5
2,
277
75.3
67
.4
1,17
3 Ed
ucat
ion
Non
e or
ECE
4.
5 11
.2
15.7
8.
1 37
.8
45.9
12
.6
49.0
61
.7
3,77
3 74
.5
70.0
2,
327
Prim
ary
4.3
9.1
13.4
13
.7
44.4
58
.1
18.0
53
.5
71.5
8,
020
81.3
76
.1
5,73
3 Lo
wer
sec
onda
ry
5.8
7.9
13.7
18
.3
37.2
55
.5
24.1
45
.1
69.2
4,
203
80.2
72
.2
2,90
8 U
pper
sec
onda
ry
8.6
7.2
15.8
22
.5
31.7
54
.2
31.1
38
.9
70.0
1,
564
77.4
66
.0
1,09
4 Po
st s
econ
dary
/ N
on te
rtia
ry
5.5
9.6
15.1
14
.8
38.2
53
.1
20.3
47
.8
68.2
72
6 77
.8
64.2
49
5 H
ighe
r 10
.0
6.0
16.0
26
.7
22.0
48
.6
36.7
28
.0
64.7
1,
330
75.2
57
.0
860
Ethn
o-lin
guis
tic
grou
p of
hou
seho
ld h
ead
Lao-
Tai
4.8
8.6
13.4
17
.4
40.8
58
.2
22.2
49
.4
71.6
12
,664
81
.3
73.4
9,
070
Mon
-Khm
er
6.4
8.8
15.1
12
.5
37.7
50
.2
18.8
46
.5
65.3
4,
520
76.8
73
.5
2,95
2 H
mon
g-M
ien
8.1
13.0
21
.1
8.6
25.1
33
.7
16.7
38
.1
54.8
1,
715
61.6
45
.7
941
Chin
ese-
Tibe
tan
3.1
4.1
7.2
6.6
47.6
54
.2
9.7
51.7
61
.4
517
88.2
83
.0
317
Oth
er, D
K, M
issi
ng
5.0
9.3
14.3
19
.1
36.1
55
.2
24.1
45
.4
69.5
19
8 79
.4
71.9
13
7 W
ealt
h in
dex
quin
tile
Po
ores
t 7.
0 11
.0
18.0
11
.0
32.4
43
.4
18.0
43
.4
61.4
3,
615
70.7
67
.6
2,21
9 Se
cond
5.
4 8.
5 14
.0
14.5
39
.0
53.4
19
.9
47.5
67
.4
3,75
6 79
.3
73.9
2,
532
Mid
dle
5.1
8.6
13.8
16
.4
40.6
57
.0
21.6
49
.2
70.8
3,
864
80.5
75
.0
2,73
4 Fo
urth
4.
5 7.
5 12
.0
19.0
41
.0
59.9
23
.5
48.5
72
.0
4,16
2 83
.3
75.5
2,
996
Rich
est
5.3
9.0
14.3
14
.8
40.6
55
.3
20.0
49
.6
69.6
4,
217
79.5
65
.9
2,93
6 1 M
ICS
indi
cato
r TM
.4 -
Nee
d fo
r fa
mily
pla
nnin
g sa
tisf
ied
wit
h m
oder
n co
ntra
cept
ion;
SD
G in
dica
tor
3.7.
1
Tabl
e TM
.3.4
: Nee
d fo
r co
ntra
cept
ion
(cur
rent
ly u
nmar
ried
/not
in u
nion
)
Perc
enta
ge o
f sex
ually
act
ive
wom
en a
ge 1
5-49
yea
rs w
ho a
re c
urre
ntly
unm
arrie
d or
not
in u
nion
with
met
and
unm
et n
eed
for c
ontr
acep
tion,
tota
l dem
and
for c
ontr
acep
tion
and
perc
enta
ge w
ith n
eed
for c
ontr
acep
tion
who
are
usi
ng a
m
oder
n m
etho
d, L
ao P
DR,
201
7 Unm
et n
eed
for
fam
ily
plan
ning
Met
nee
d
for
fam
ily p
lann
ing
(c
urre
ntly
usi
ng c
ontr
acep
tion
) To
tal d
eman
d fo
r fa
mily
pl
anni
ng
Num
ber o
f se
xual
ly a
ctiv
eA w
omen
cur
rent
ly
unm
arrie
d or
not
in
uni
on
Perc
enta
ge o
f dem
and
for
fam
ily
plan
ning
sat
isfie
d w
ith:
Num
ber o
f sex
ually
ac
tiveA w
omen
cu
rren
tly u
nmar
ried
or n
ot in
uni
on w
ith
need
for
fam
ily
plan
ning
For
spac
ing
birt
hs
For
limiti
ng
birt
hs
Tota
l
For
spac
ing
birt
hs
For
limiti
ng
birt
hs
Tota
l
For
spac
ing
birt
hs
For
limiti
ng
birt
hs
Tota
l A
ny m
etho
d M
oder
n m
etho
ds
Tota
l 71
.1
4.3
75.4
14
.5
0.4
14.8
85
.6
4.7
90.3
27
5 16
.4
16.0
24
8
Are
a Urb
an
74.3
3.
9 78
.3
13.3
0.
7 14
.0
87.6
4.
6 92
.3
136
15.2
15
.2
126
Rura
l 67
.9
4.7
72.7
15
.6
0.0
15.6
83
.5
4.7
88.3
13
9 17
.7
16.9
12
2 Ru
ral w
ith r
oad
66.5
5.
3 71
.8
17.4
0.
0 17
.4
83.9
5.
3 89
.2
124
19.5
18
.7
111
Rura
l with
out r
oad
(*)
(*)
(*)
(*)
(*)
(*)
(*)
(*)
(*)
15
(*)
(*)
12
Regi
on
Nor
th
72.1
3.
3 75
.4
9.8
0.9
10.7
81
.9
4.2
86.1
10
3 12
.4
12.4
88
Ce
ntra
l 70
.6
5.4
76.0
16
.0
0.0
16.0
86
.6
5.4
92.0
15
8 17
.4
16.8
14
5 So
uth
(*)
(*)
(*)
(*)
(*)
(*)
(*)
(*)
(*)
15
(*)
(*)
15
(Con
tinue
d…)
Not
e: P
rovi
nce
leve
l fig
ures
are
not
sho
wn
sepa
rate
ly, f
ewer
than
25
unw
eigh
ted
case
s fo
r mos
t of t
he p
rovi
nces
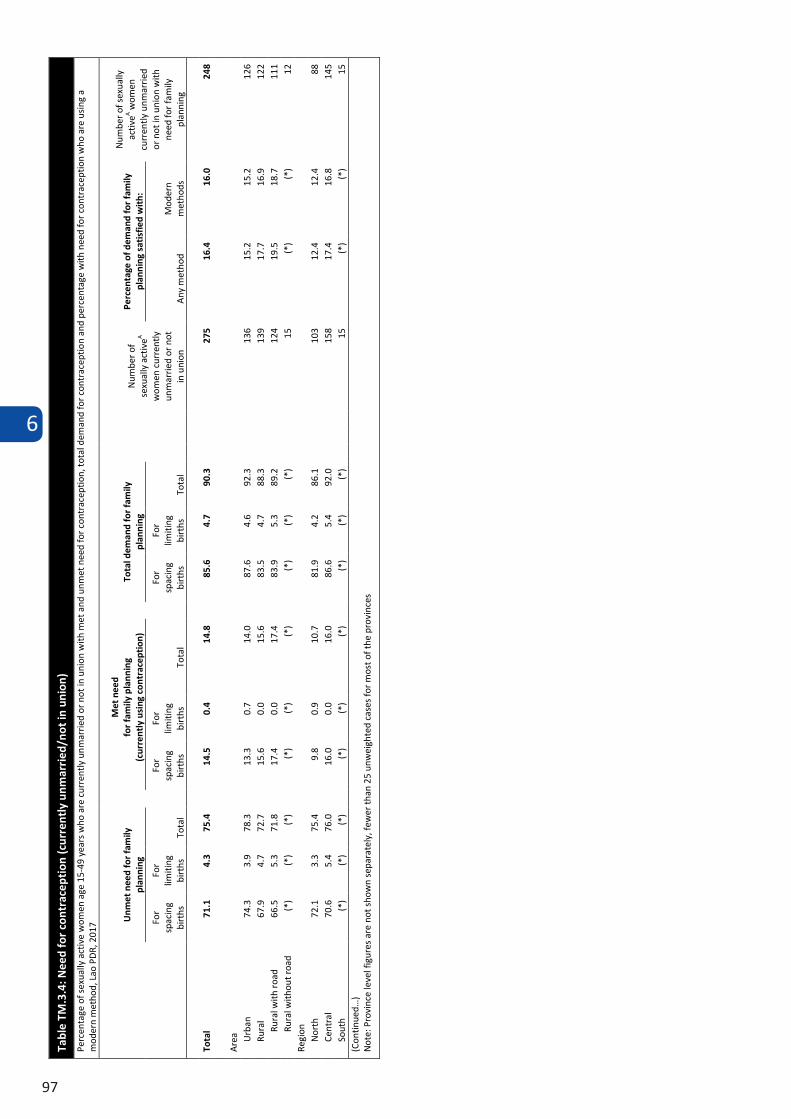
6
97
Tabl
e TM
.3.4
: Nee
d fo
r co
ntra
cept
ion
(cur
rent
ly u
nmar
ried
/not
in u
nion
)
Perc
enta
ge o
f sex
ually
act
ive
wom
en a
ge 1
5-49
yea
rs w
ho a
re c
urre
ntly
unm
arrie
d or
not
in u
nion
with
met
and
unm
et n
eed
for c
ontr
acep
tion,
tota
l dem
and
for c
ontr
acep
tion
and
perc
enta
ge w
ith n
eed
for c
ontr
acep
tion
who
are
usi
ng a
m
oder
n m
etho
d, L
ao P
DR,
201
7 Unm
et n
eed
for
fam
ily
plan
ning
Met
nee
d
for
fam
ily p
lann
ing
(c
urre
ntly
usi
ng c
ontr
acep
tion
) To
tal d
eman
d fo
r fa
mily
pl
anni
ng
Num
ber o
f se
xual
ly a
ctiv
eA w
omen
cur
rent
ly
unm
arrie
d or
not
in
uni
on
Perc
enta
ge o
f dem
and
for
fam
ily
plan
ning
sat
isfie
d w
ith:
Num
ber o
f sex
ually
ac
tiveA w
omen
cu
rren
tly u
nmar
ried
or n
ot in
uni
on w
ith
need
for
fam
ily
plan
ning
For
spac
ing
birt
hs
For
limiti
ng
birt
hs
Tota
l
For
spac
ing
birt
hs
For
limiti
ng
birt
hs
Tota
l
For
spac
ing
birt
hs
For
limiti
ng
birt
hs
Tota
l A
ny m
etho
d M
oder
n m
etho
ds
Tota
l 71
.1
4.3
75.4
14
.5
0.4
14.8
85
.6
4.7
90.3
27
5 16
.4
16.0
24
8
Are
a Urb
an
74.3
3.
9 78
.3
13.3
0.
7 14
.0
87.6
4.
6 92
.3
136
15.2
15
.2
126
Rura
l 67
.9
4.7
72.7
15
.6
0.0
15.6
83
.5
4.7
88.3
13
9 17
.7
16.9
12
2 Ru
ral w
ith r
oad
66.5
5.
3 71
.8
17.4
0.
0 17
.4
83.9
5.
3 89
.2
124
19.5
18
.7
111
Rura
l with
out r
oad
(*)
(*)
(*)
(*)
(*)
(*)
(*)
(*)
(*)
15
(*)
(*)
12
Regi
on
Nor
th
72.1
3.
3 75
.4
9.8
0.9
10.7
81
.9
4.2
86.1
10
3 12
.4
12.4
88
Ce
ntra
l 70
.6
5.4
76.0
16
.0
0.0
16.0
86
.6
5.4
92.0
15
8 17
.4
16.8
14
5 So
uth
(*)
(*)
(*)
(*)
(*)
(*)
(*)
(*)
(*)
15
(*)
(*)
15
(Con
tinue
d…)
Not
e: P
rovi
nce
leve
l fig
ures
are
not
sho
wn
sepa
rate
ly, f
ewer
than
25
unw
eigh
ted
case
s fo
r mos
t of t
he p
rovi
nces
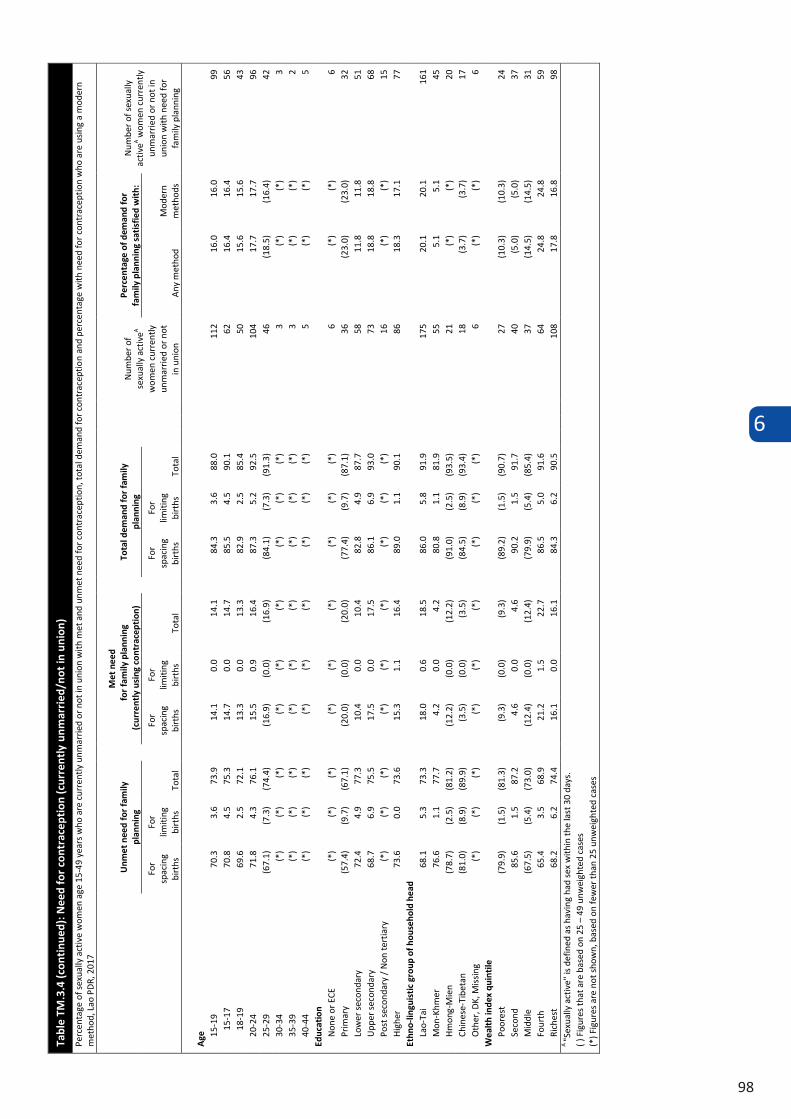
6
98
Tabl
e TM
.3.4
(con
tinu
ed):
Nee
d fo
r co
ntra
cept
ion
(cur
rent
ly u
nmar
ried
/not
in u
nion
)
Perc
enta
ge o
f sex
ually
act
ive
wom
en a
ge 1
5-49
yea
rs w
ho a
re c
urre
ntly
unm
arrie
d or
not
in u
nion
with
met
and
unm
et n
eed
for c
ontr
acep
tion,
tota
l dem
and
for c
ontr
acep
tion
and
perc
enta
ge w
ith n
eed
for c
ontr
acep
tion
who
are
usi
ng a
mod
ern
met
hod,
Lao
PD
R, 2
017
Unm
et n
eed
for
fam
ily
plan
ning
Met
nee
d
for
fam
ily p
lann
ing
(cur
rent
ly u
sing
con
trac
epti
on)
Tota
l dem
and
for
fam
ily
plan
ning
N
umbe
r of
sexu
ally
act
iveA
wom
en c
urre
ntly
un
mar
ried
or n
ot
in u
nion
Perc
enta
ge o
f dem
and
for
fam
ily p
lann
ing
sati
sfie
d w
ith:
N
umbe
r of s
exua
lly
activ
eA wom
en c
urre
ntly
un
mar
ried
or n
ot in
un
ion
with
nee
d fo
r fa
mily
pla
nnin
g
For
spac
ing
birt
hs
For
limiti
ng
birt
hs
Tota
l
For
spac
ing
birt
hs
For
limiti
ng
birt
hs
Tota
l
For
spac
ing
birt
hs
For
limiti
ng
birt
hs
Tota
l A
ny m
etho
d M
oder
n m
etho
ds
Age
15
-19
70.3
3.
6 73
.9
14.1
0.
0 14
.1
84.3
3.
6 88
.0
112
16.0
16
.0
99
15
-17
70.8
4.
5 75
.3
14.7
0.
0 14
.7
85.5
4.
5 90
.1
62
16.4
16
.4
56
18
-19
69.6
2.
5 72
.1
13.3
0.
0 13
.3
82.9
2.
5 85
.4
50
15.6
15
.6
43
20-2
4 71
.8
4.3
76.1
15
.5
0.9
16.4
87
.3
5.2
92.5
10
4 17
.7
17.7
96
25
-29
(67.
1)
(7.3
) (7
4.4)
(1
6.9)
(0
.0)
(16.
9)
(84.
1)
(7.3
) (9
1.3)
46
(1
8.5)
(1
6.4)
42
30
-34
(*)
(*)
(*)
(*)
(*)
(*)
(*)
(*)
(*)
3 (*
) (*
) 3
35-3
9 (*
) (*
) (*
) (*
) (*
) (*
) (*
) (*
) (*
) 3
(*)
(*)
2 40
-44
(*)
(*)
(*)
(*)
(*)
(*)
(*)
(*)
(*)
5 (*
) (*
) 5
Educ
atio
n N
one
or E
CE
(*)
(*)
(*)
(*)
(*)
(*)
(*)
(*)
(*)
6 (*
) (*
) 6
Prim
ary
(57.
4)
(9.7
) (6
7.1)
(2
0.0)
(0
.0)
(20.
0)
(77.
4)
(9.7
) (8
7.1)
36
(2
3.0)
(2
3.0)
32
Lo
wer
sec
onda
ry
72.4
4.
9 77
.3
10.4
0.
0 10
.4
82.8
4.
9 87
.7
58
11.8
11
.8
51
Upp
er s
econ
dary
68
.7
6.9
75.5
17
.5
0.0
17.5
86
.1
6.9
93.0
73
18
.8
18.8
68
Po
st s
econ
dary
/ N
on te
rtia
ry
(*)
(*)
(*)
(*)
(*)
(*)
(*)
(*)
(*)
16
(*)
(*)
15
Hig
her
73.6
0.
0 73
.6
15.3
1.
1 16
.4
89.0
1.
1 90
.1
86
18.3
17
.1
77
Ethn
o-lin
guis
tic
grou
p of
hou
seho
ld h
ead
Lao-
Tai
68.1
5.
3 73
.3
18.0
0.
6 18
.5
86.0
5.
8 91
.9
175
20.1
20
.1
161
Mon
-Khm
er
76.6
1.
1 77
.7
4.2
0.0
4.2
80.8
1.
1 81
.9
55
5.1
5.1
45
Hm
ong-
Mie
n (7
8.7)
(2
.5)
(81.
2)
(12.
2)
(0.0
) (1
2.2)
(9
1.0)
(2
.5)
(93.
5)
21
(*)
(*)
20
Chin
ese-
Tibe
tan
(81.
0)
(8.9
) (8
9.9)
(3
.5)
(0.0
) (3
.5)
(84.
5)
(8.9
) (9
3.4)
18
(3
.7)
(3.7
) 17
O
ther
, DK,
Mis
sing
(*
) (*
) (*
) (*
) (*
) (*
) (*
) (*
) (*
) 6
(*)
(*)
6 W
ealt
h in
dex
quin
tile
Po
ores
t (7
9.9)
(1
.5)
(81.
3)
(9.3
) (0
.0)
(9.3
) (8
9.2)
(1
.5)
(90.
7)
27
(10.
3)
(10.
3)
24
Seco
nd
85.6
1.
5 87
.2
4.6
0.0
4.6
90.2
1.
5 91
.7
40
(5.0
) (5
.0)
37
Mid
dle
(67.
5)
(5.4
) (7
3.0)
(1
2.4)
(0
.0)
(12.
4)
(79.
9)
(5.4
) (8
5.4)
37
(1
4.5)
(1
4.5)
31
Fo
urth
65
.4
3.5
68.9
21
.2
1.5
22.7
86
.5
5.0
91.6
64
24
.8
24.8
59
Ri
ches
t 68
.2
6.2
74.4
16
.1
0.0
16.1
84
.3
6.2
90.5
10
8 17
.8
16.8
98
A
"Sex
ually
act
ive"
is d
efin
ed a
s ha
ving
had
sex
with
in th
e la
st 3
0 da
ys.
( ) F
igur
es th
at a
re b
ased
on
25 –
49
unw
eigh
ted
case
s (*
) Fig
ures
are
not
sho
wn,
bas
ed o
n fe
wer
than
25
unw
eigh
ted
case
s

6
99
6.4 ANTENATAL CARE
The antenatal period presents important opportunities for reaching pregnant women with a number of interventions that may be vital to their health and well-being and that of their infants. For example, antenatal care can be used to inform women and families about risks and symptoms in pregnancy and about the risks of labour and delivery, and therefore it may provide the route for ensuring that pregnant women do, in practice, deliver with the assistance of a skilled health care provider. Antenatal visits also provide an opportunity to supply information on birth spacing, which is recognized as an important factor in improving infant survival.
WHO recommends a minimum of eight antenatal visits based on a review of the effectiveness of different models of antenatal care. WHO guidelines are specific on the content on antenatal care visits, which include:
Blood pressure measurement Urine testing for bacteriuria and proteinuria Blood testing to detect syphilis and severe anaemia Weight/height measurement (optional).
It is of crucial importance for pregnant women to start attending antenatal care visits as early in pregnancy as possible and ideally have the first visit during the first trimester in order to prevent and detect pregnancy conditions that could affect both the woman and her baby. Antenatal care should continue throughout the entire pregnancy8.
Antenatal care is a tracer indicator of the Reproductive and Maternal Health Dimension of SDG 3.8 Universal Health Coverage. The type of personnel providing antenatal care to women age 15-49 years who gave birth in the two years preceding the survey is presented in Table TM.4.1.
8WHO 2016. WHO recommendations on antenatal care for a positive pregnancy experience. Geneva 2016.
Table TM.4.2 shows the number of antenatal care visits during the latest pregnancy that took place within the two years preceding the survey, regardless of provider, by selected characteristics. Table TM.4.2 also provides information about the timing of the first antenatal care visit.
The coverage of key services that pregnant women are expected to receive during antenatal care are shown in Table TM.4.3.
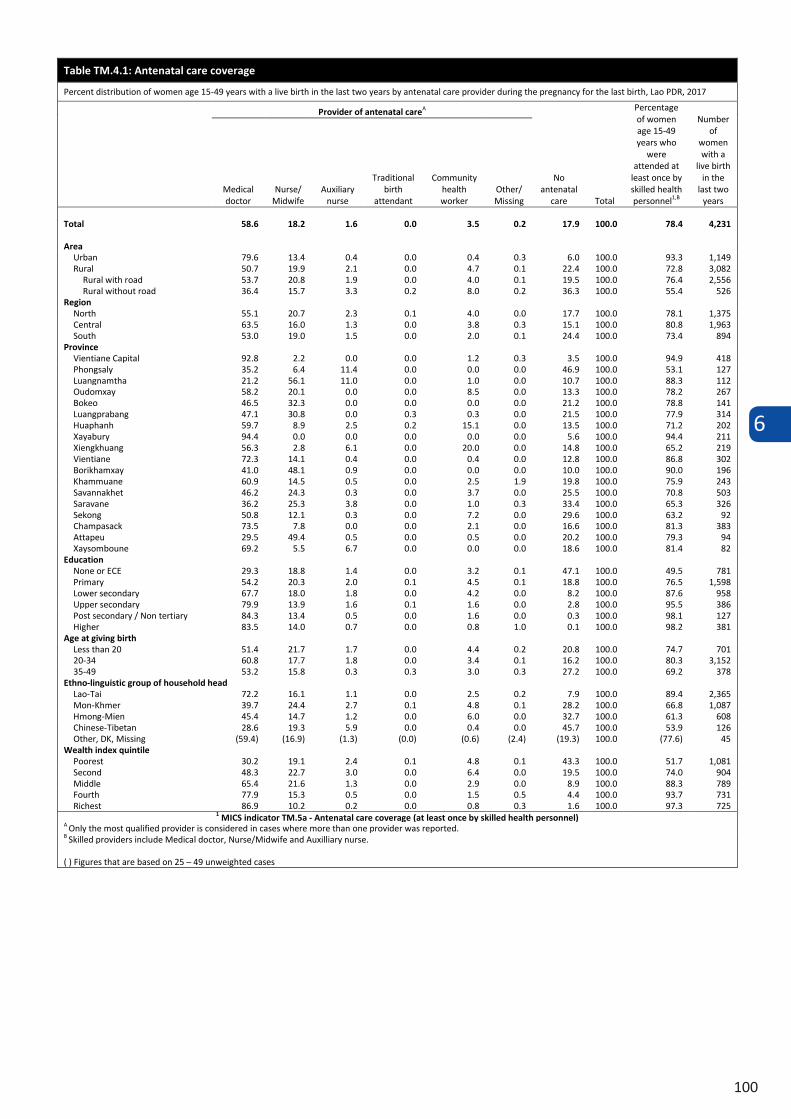
6
100
Table TM.4.1: Antenatal care coverage
Percent distribution of women age 15-49 years with a live birth in the last two years by antenatal care provider during the pregnancy for the last birth, Lao PDR, 2017
Provider of antenatal careA
No antenatal
care Total
Percentage of women age 15-49 years who
were attended at
least once by skilled health personnel1,B
Number of
women with a
live birth in the
last two years
Medical doctor
Nurse/ Midwife
Auxiliary nurse
Traditional birth
attendant
Community health worker
Other/ Missing
Total 58.6 18.2 1.6 0.0 3.5 0.2 17.9 100.0 78.4 4,231
Area Urban 79.6 13.4 0.4 0.0 0.4 0.3 6.0 100.0 93.3 1,149 Rural 50.7 19.9 2.1 0.0 4.7 0.1 22.4 100.0 72.8 3,082
Rural with road 53.7 20.8 1.9 0.0 4.0 0.1 19.5 100.0 76.4 2,556 Rural without road 36.4 15.7 3.3 0.2 8.0 0.2 36.3 100.0 55.4 526
Region North 55.1 20.7 2.3 0.1 4.0 0.0 17.7 100.0 78.1 1,375 Central 63.5 16.0 1.3 0.0 3.8 0.3 15.1 100.0 80.8 1,963 South 53.0 19.0 1.5 0.0 2.0 0.1 24.4 100.0 73.4 894
Province Vientiane Capital 92.8 2.2 0.0 0.0 1.2 0.3 3.5 100.0 94.9 418 Phongsaly 35.2 6.4 11.4 0.0 0.0 0.0 46.9 100.0 53.1 127 Luangnamtha 21.2 56.1 11.0 0.0 1.0 0.0 10.7 100.0 88.3 112 Oudomxay 58.2 20.1 0.0 0.0 8.5 0.0 13.3 100.0 78.2 267 Bokeo 46.5 32.3 0.0 0.0 0.0 0.0 21.2 100.0 78.8 141 Luangprabang 47.1 30.8 0.0 0.3 0.3 0.0 21.5 100.0 77.9 314 Huaphanh 59.7 8.9 2.5 0.2 15.1 0.0 13.5 100.0 71.2 202 Xayabury 94.4 0.0 0.0 0.0 0.0 0.0 5.6 100.0 94.4 211 Xiengkhuang 56.3 2.8 6.1 0.0 20.0 0.0 14.8 100.0 65.2 219 Vientiane 72.3 14.1 0.4 0.0 0.4 0.0 12.8 100.0 86.8 302 Borikhamxay 41.0 48.1 0.9 0.0 0.0 0.0 10.0 100.0 90.0 196 Khammuane 60.9 14.5 0.5 0.0 2.5 1.9 19.8 100.0 75.9 243 Savannakhet 46.2 24.3 0.3 0.0 3.7 0.0 25.5 100.0 70.8 503 Saravane 36.2 25.3 3.8 0.0 1.0 0.3 33.4 100.0 65.3 326 Sekong 50.8 12.1 0.3 0.0 7.2 0.0 29.6 100.0 63.2 92 Champasack 73.5 7.8 0.0 0.0 2.1 0.0 16.6 100.0 81.3 383 Attapeu 29.5 49.4 0.5 0.0 0.5 0.0 20.2 100.0 79.3 94 Xaysomboune 69.2 5.5 6.7 0.0 0.0 0.0 18.6 100.0 81.4 82
Education None or ECE 29.3 18.8 1.4 0.0 3.2 0.1 47.1 100.0 49.5 781 Primary 54.2 20.3 2.0 0.1 4.5 0.1 18.8 100.0 76.5 1,598 Lower secondary 67.7 18.0 1.8 0.0 4.2 0.0 8.2 100.0 87.6 958 Upper secondary 79.9 13.9 1.6 0.1 1.6 0.0 2.8 100.0 95.5 386 Post secondary / Non tertiary 84.3 13.4 0.5 0.0 1.6 0.0 0.3 100.0 98.1 127 Higher 83.5 14.0 0.7 0.0 0.8 1.0 0.1 100.0 98.2 381
Age at giving birth Less than 20 51.4 21.7 1.7 0.0 4.4 0.2 20.8 100.0 74.7 701 20-34 60.8 17.7 1.8 0.0 3.4 0.1 16.2 100.0 80.3 3,152 35-49 53.2 15.8 0.3 0.3 3.0 0.3 27.2 100.0 69.2 378
Ethno-linguistic group of household head Lao-Tai 72.2 16.1 1.1 0.0 2.5 0.2 7.9 100.0 89.4 2,365 Mon-Khmer 39.7 24.4 2.7 0.1 4.8 0.1 28.2 100.0 66.8 1,087 Hmong-Mien 45.4 14.7 1.2 0.0 6.0 0.0 32.7 100.0 61.3 608 Chinese-Tibetan 28.6 19.3 5.9 0.0 0.4 0.0 45.7 100.0 53.9 126 Other, DK, Missing (59.4) (16.9) (1.3) (0.0) (0.6) (2.4) (19.3) 100.0 (77.6) 45
Wealth index quintile Poorest 30.2 19.1 2.4 0.1 4.8 0.1 43.3 100.0 51.7 1,081 Second 48.3 22.7 3.0 0.0 6.4 0.0 19.5 100.0 74.0 904 Middle 65.4 21.6 1.3 0.0 2.9 0.0 8.9 100.0 88.3 789 Fourth 77.9 15.3 0.5 0.0 1.5 0.5 4.4 100.0 93.7 731 Richest 86.9 10.2 0.2 0.0 0.8 0.3 1.6 100.0 97.3 725
1 MICS indicator TM.5a - Antenatal care coverage (at least once by skilled health personnel) A Only the most qualified provider is considered in cases where more than one provider was reported. B Skilled providers include Medical doctor, Nurse/Midwife and Auxilliary nurse.
( ) Figures that are based on 25 – 49 unweighted cases Ta
ble
TM.4
.2: N
umbe
r of
ant
enat
al c
are
visi
ts a
nd t
imin
g of
firs
t vi
sit
Perc
enta
ge o
f wom
en a
ge 1
5-49
yea
rs w
ith a
live
birt
h in
the
last
two
year
s by
num
ber o
f ant
enat
al c
are
visi
ts b
y an
y pr
ovid
er a
nd b
y th
e tim
ing
of fi
rst a
nten
atal
car
e vi
sits
, Lao
PD
R, 2
017
Perc
enta
ge o
f wom
en b
y nu
mbe
r of
ant
enat
al c
are
visi
ts:
Perc
ent d
istr
ibut
ion
of w
omen
by
num
ber
of m
onth
s pr
egna
nt a
t the
ti
me
of fi
rst a
nten
atal
car
e vi
sit
Tota
l
Num
ber o
f w
omen
with
a
live
birt
h in
th
e la
st tw
o ye
ars
Med
ian
mon
ths
preg
nant
at
first
AN
C vi
sit
Num
ber o
f w
omen
with
a
live
birt
h in
the
last
two
year
s w
ho h
ad a
t lea
st
one
AN
C vi
sit
No
visi
ts
1-3
visi
ts
to a
ny
prov
ider
4 or
mor
e vi
sits
to
any
prov
ider
1
8 or
mor
e vi
sits
to a
ny
prov
ider
2 M
issi
ng/
DK
No
ante
nata
l ca
re v
isits
Less
th
an 4
m
onth
s 4-
5 m
onth
s 6-
7 m
onth
s 8+
m
onth
s D
K/M
issi
ng
Tota
l 17
.9
19.3
62
.2
15.3
0.
6 17
.9
43.9
30
.5
6.4
1.2
0.0
100.
0 4,
231
3.0
3,47
2
Are
a Urb
an
6.0
11.9
81
.4
29.1
0.
7 6.
0 59
.2
29.2
4.
8 0.
8 0.
0 10
0.0
1,14
9 3.
0 1,
080
Rura
l 22
.4
22.0
55
.1
10.1
0.
5 22
.4
38.2
31
.0
7.0
1.4
0.0
100.
0 3,
082
4.0
2,39
2 Ru
ral w
ith r
oad
19.5
21
.5
58.3
10
.9
0.7
19.5
39
.8
31.9
7.
3 1.
4 0.
0 10
0.0
2,55
6 3.
7 2,
057
Rura
l with
out r
oad
36.3
24
.2
39.5
6.
6 0.
0 36
.3
30.5
26
.4
5.7
1.2
0.0
100.
0 52
6 4.
0 33
5 Re
gion
N
orth
17
.7
20.0
62
.0
12.6
0.
3 17
.7
47.3
29
.0
4.7
1.2
0.0
100.
0 1,
375
3.0
1,13
1 Ce
ntra
l 15
.1
16.8
67
.1
20.8
1.
0 15
.1
44.7
31
.4
7.5
1.3
0.0
100.
0 1,
963
3.0
1,66
5 So
uth
24.4
23
.5
51.8
7.
5 0.
2 24
.4
37.0
30
.9
6.6
1.1
0.0
100.
0 89
4 4.
0 67
5 Pr
ovin
ce
Vien
tiane
Cap
ital
3.5
9.6
86.0
48
.9
0.9
3.5
70.8
21
.4
2.7
1.6
0.0
100.
0 41
8 3.
0 40
4 Ph
ongs
aly
46
.9
12.0
41
.0
6.5
0.0
46.9
32
.4
17.2
2.
9 0.
5 0.
0 10
0.0
127
3.0
67
Luan
gnam
tha
10.7
20
.7
68.6
5.
6 0.
0 10
.7
34.9
47
.1
6.2
1.0
0.0
100.
0 11
2 4.
0 10
0 O
udom
xay
13.3
26
.4
60.3
7.
5 0.
0 13
.3
34.1
45
.3
5.8
1.5
0.0
100.
0 26
7 4.
0 23
2 Bo
keo
21.2
22
.9
53.3
22
.5
2.7
21.2
37
.6
29.7
8.
4 3.
1 0.
0 10
0.0
141
4.0
111
Luan
gpra
bang
21
.5
23.2
55
.3
17.1
0.
0 21
.5
57.8
16
.3
4.1
0.3
0.0
100.
0 31
4 3.
0 24
7 H
uaph
anh
13.5
23
.2
63.4
10
.7
0.0
13.5
49
.5
30.7
3.
8 2.
5 0.
0 10
0.0
202
3.0
174
Xaya
bury
5.
6 6.
8 87
.6
14.8
0.
0 5.
6 67
.9
23.1
3.
1 0.
4 0.
0 10
0.0
211
3.0
199
Xien
gkhu
ang
14.8
15
.3
69.9
20
.8
0.0
14.8
51
.8
27.7
5.
0 0.
7 0.
0 10
0.0
219
3.0
187
Vien
tiane
12
.8
17.2
69
.7
11.3
0.
4 12
.8
48.3
33
.3
5.2
0.4
0.0
100.
0 30
2 3.
0 26
3 Bo
rikha
mxa
y 10
.0
21.7
68
.3
15.1
0.
0 10
.0
41.8
33
.9
12.1
2.
2 0.
0 10
0.0
196
3.7
176
Kham
mua
ne
19.8
21
.6
58.2
8.
6 0.
4 19
.8
35.9
36
.0
6.7
1.5
0.0
100.
0 24
3 4.
0 19
5 Sa
vann
akhe
t 25
.5
18.3
53
.4
13.4
2.
8 25
.5
24.4
36
.7
12.1
1.
4 0.
0 10
0.0
503
4.0
375
Sara
vane
33
.4
30.7
35
.9
6.3
0.0
33.4
32
.9
25.5
6.
5 1.
6 0.
0 10
0.0
326
4.0
217
Seko
ng
29.6
17
.6
52.8
11
.4
0.0
29.6
31
.4
29.7
8.
3 1.
1 0.
0 10
0.0
92
4.0
64
Cham
pasa
ck
16.6
16
.1
66.8
7.
2 0.
5 16
.6
39.6
37
.2
6.4
0.3
0.0
100.
0 38
3 4.
0 31
9 A
ttap
eu
20.2
34
.7
45.1
8.
8 0.
0 20
.2
46.2
24
.7
6.5
2.4
0.0
100.
0 94
3.
0 75
Xa
ysom
boun
e 18
.6
20.7
60
.7
6.7
0.0
18.6
36
.0
32.1
10
.5
2.0
0.8
100.
0 82
4.
0 66
(C
ontin
ued…
)
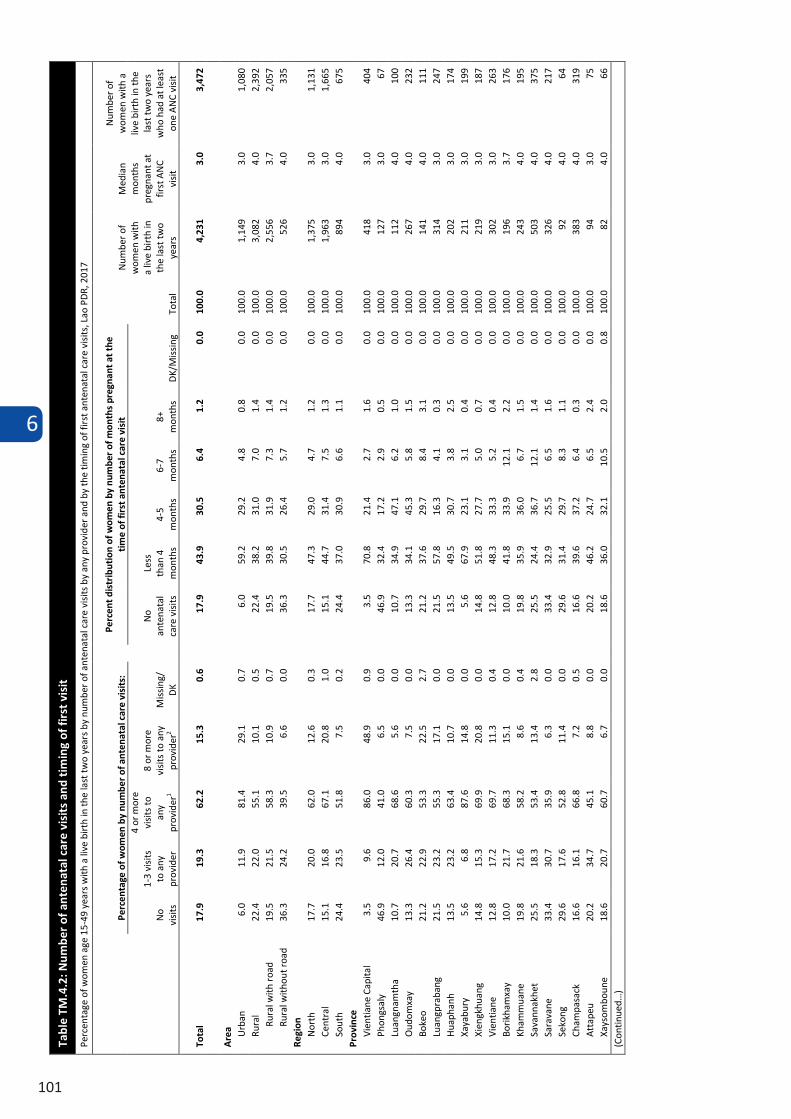
6
101
Tabl
e TM
.4.2
: Num
ber
of a
nten
atal
car
e vi
sits
and
tim
ing
of fi
rst
visi
t
Perc
enta
ge o
f wom
en a
ge 1
5-49
yea
rs w
ith a
live
birt
h in
the
last
two
year
s by
num
ber o
f ant
enat
al c
are
visi
ts b
y an
y pr
ovid
er a
nd b
y th
e tim
ing
of fi
rst a
nten
atal
car
e vi
sits
, Lao
PD
R, 2
017
Perc
enta
ge o
f wom
en b
y nu
mbe
r of
ant
enat
al c
are
visi
ts:
Perc
ent d
istr
ibut
ion
of w
omen
by
num
ber
of m
onth
s pr
egna
nt a
t the
ti
me
of fi
rst a
nten
atal
car
e vi
sit
Tota
l
Num
ber o
f w
omen
with
a
live
birt
h in
th
e la
st tw
o ye
ars
Med
ian
mon
ths
preg
nant
at
first
AN
C vi
sit
Num
ber o
f w
omen
with
a
live
birt
h in
the
last
two
year
s w
ho h
ad a
t lea
st
one
AN
C vi
sit
No
visi
ts
1-3
visi
ts
to a
ny
prov
ider
4 or
mor
e vi
sits
to
any
prov
ider
1
8 or
mor
e vi
sits
to a
ny
prov
ider
2 M
issi
ng/
DK
No
ante
nata
l ca
re v
isits
Less
th
an 4
m
onth
s 4-
5 m
onth
s 6-
7 m
onth
s 8+
m
onth
s D
K/M
issi
ng
Tota
l 17
.9
19.3
62
.2
15.3
0.
6 17
.9
43.9
30
.5
6.4
1.2
0.0
100.
0 4,
231
3.0
3,47
2
Are
a Urb
an
6.0
11.9
81
.4
29.1
0.
7 6.
0 59
.2
29.2
4.
8 0.
8 0.
0 10
0.0
1,14
9 3.
0 1,
080
Rura
l 22
.4
22.0
55
.1
10.1
0.
5 22
.4
38.2
31
.0
7.0
1.4
0.0
100.
0 3,
082
4.0
2,39
2 Ru
ral w
ith r
oad
19.5
21
.5
58.3
10
.9
0.7
19.5
39
.8
31.9
7.
3 1.
4 0.
0 10
0.0
2,55
6 3.
7 2,
057
Rura
l with
out r
oad
36.3
24
.2
39.5
6.
6 0.
0 36
.3
30.5
26
.4
5.7
1.2
0.0
100.
0 52
6 4.
0 33
5 Re
gion
N
orth
17
.7
20.0
62
.0
12.6
0.
3 17
.7
47.3
29
.0
4.7
1.2
0.0
100.
0 1,
375
3.0
1,13
1 Ce
ntra
l 15
.1
16.8
67
.1
20.8
1.
0 15
.1
44.7
31
.4
7.5
1.3
0.0
100.
0 1,
963
3.0
1,66
5 So
uth
24.4
23
.5
51.8
7.
5 0.
2 24
.4
37.0
30
.9
6.6
1.1
0.0
100.
0 89
4 4.
0 67
5 Pr
ovin
ce
Vien
tiane
Cap
ital
3.5
9.6
86.0
48
.9
0.9
3.5
70.8
21
.4
2.7
1.6
0.0
100.
0 41
8 3.
0 40
4 Ph
ongs
aly
46
.9
12.0
41
.0
6.5
0.0
46.9
32
.4
17.2
2.
9 0.
5 0.
0 10
0.0
127
3.0
67
Luan
gnam
tha
10.7
20
.7
68.6
5.
6 0.
0 10
.7
34.9
47
.1
6.2
1.0
0.0
100.
0 11
2 4.
0 10
0 O
udom
xay
13.3
26
.4
60.3
7.
5 0.
0 13
.3
34.1
45
.3
5.8
1.5
0.0
100.
0 26
7 4.
0 23
2 Bo
keo
21.2
22
.9
53.3
22
.5
2.7
21.2
37
.6
29.7
8.
4 3.
1 0.
0 10
0.0
141
4.0
111
Luan
gpra
bang
21
.5
23.2
55
.3
17.1
0.
0 21
.5
57.8
16
.3
4.1
0.3
0.0
100.
0 31
4 3.
0 24
7 H
uaph
anh
13.5
23
.2
63.4
10
.7
0.0
13.5
49
.5
30.7
3.
8 2.
5 0.
0 10
0.0
202
3.0
174
Xaya
bury
5.
6 6.
8 87
.6
14.8
0.
0 5.
6 67
.9
23.1
3.
1 0.
4 0.
0 10
0.0
211
3.0
199
Xien
gkhu
ang
14.8
15
.3
69.9
20
.8
0.0
14.8
51
.8
27.7
5.
0 0.
7 0.
0 10
0.0
219
3.0
187
Vien
tiane
12
.8
17.2
69
.7
11.3
0.
4 12
.8
48.3
33
.3
5.2
0.4
0.0
100.
0 30
2 3.
0 26
3 Bo
rikha
mxa
y 10
.0
21.7
68
.3
15.1
0.
0 10
.0
41.8
33
.9
12.1
2.
2 0.
0 10
0.0
196
3.7
176
Kham
mua
ne
19.8
21
.6
58.2
8.
6 0.
4 19
.8
35.9
36
.0
6.7
1.5
0.0
100.
0 24
3 4.
0 19
5 Sa
vann
akhe
t 25
.5
18.3
53
.4
13.4
2.
8 25
.5
24.4
36
.7
12.1
1.
4 0.
0 10
0.0
503
4.0
375
Sara
vane
33
.4
30.7
35
.9
6.3
0.0
33.4
32
.9
25.5
6.
5 1.
6 0.
0 10
0.0
326
4.0
217
Seko
ng
29.6
17
.6
52.8
11
.4
0.0
29.6
31
.4
29.7
8.
3 1.
1 0.
0 10
0.0
92
4.0
64
Cham
pasa
ck
16.6
16
.1
66.8
7.
2 0.
5 16
.6
39.6
37
.2
6.4
0.3
0.0
100.
0 38
3 4.
0 31
9 A
ttap
eu
20.2
34
.7
45.1
8.
8 0.
0 20
.2
46.2
24
.7
6.5
2.4
0.0
100.
0 94
3.
0 75
Xa
ysom
boun
e 18
.6
20.7
60
.7
6.7
0.0
18.6
36
.0
32.1
10
.5
2.0
0.8
100.
0 82
4.
0 66
(C
ontin
ued…
)
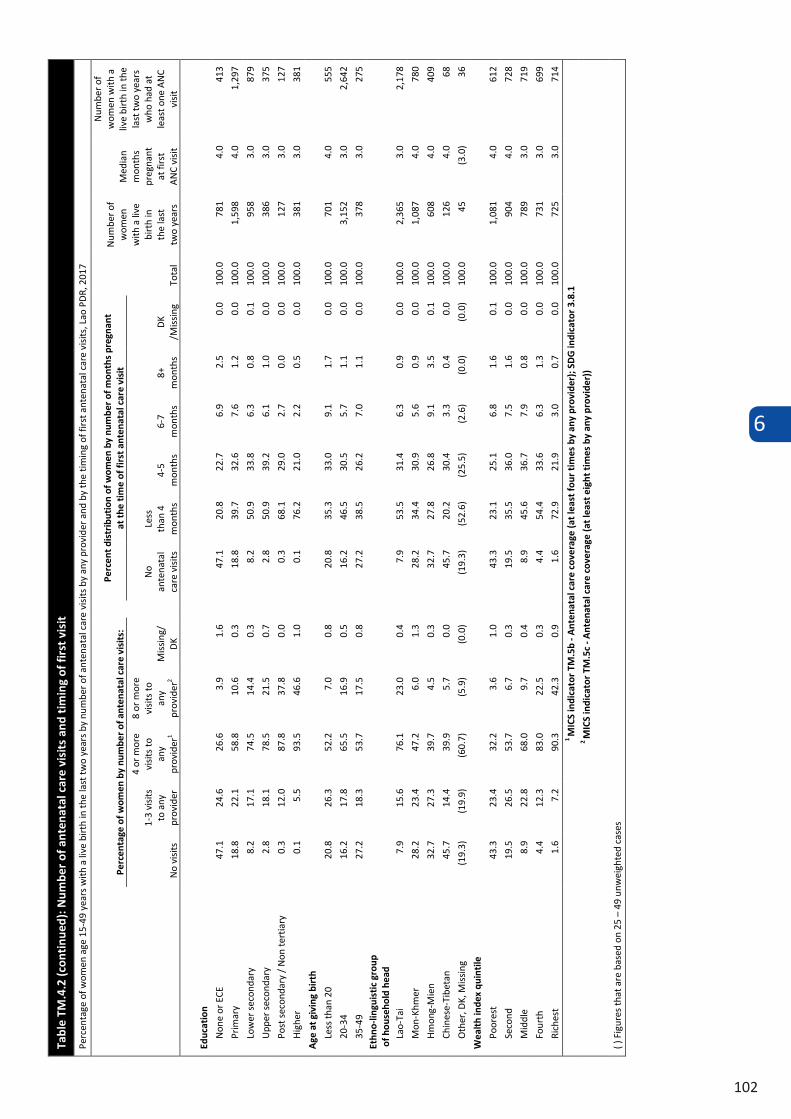
6
102
Tabl
e TM
.4.2
(con
tinu
ed):
Num
ber
of a
nten
atal
car
e vi
sits
and
tim
ing
of fi
rst
visi
t
Perc
enta
ge o
f wom
en a
ge 1
5-49
yea
rs w
ith a
live
birt
h in
the
last
two
year
s by
num
ber o
f ant
enat
al c
are
visi
ts b
y an
y pr
ovid
er a
nd b
y th
e tim
ing
of fi
rst a
nten
atal
car
e vi
sits
, Lao
PD
R, 2
017
Perc
enta
ge o
f wom
en b
y nu
mbe
r of
ant
enat
al c
are
visi
ts:
Perc
ent d
istr
ibut
ion
of w
omen
by
num
ber
of m
onth
s pr
egna
nt
at th
e ti
me
of fi
rst a
nten
atal
car
e vi
sit
Tota
l
Num
ber o
f w
omen
w
ith a
live
bi
rth
in
the
last
tw
o ye
ars
Med
ian
mon
ths
preg
nant
at
firs
t A
NC
visi
t
Num
ber o
f w
omen
with
a
live
birt
h in
the
last
two
year
s w
ho h
ad a
t le
ast o
ne A
NC
visi
t N
o vi
sits
1-3
visi
ts
to a
ny
prov
ider
4 or
mor
e vi
sits
to
any
prov
ider
1
8 or
mor
e vi
sits
to
any
prov
ider
2 M
issi
ng/
DK
No
ante
nata
l ca
re v
isits
Less
th
an 4
m
onth
s 4-
5 m
onth
s 6-
7 m
onth
s 8+
m
onth
s D
K /M
issi
ng
Educ
atio
n
Non
e or
ECE
47
.1
24.6
26
.6
3.9
1.6
47.1
20
.8
22.7
6.
9 2.
5 0.
0 10
0.0
781
4.0
413
Prim
ary
18.8
22
.1
58.8
10
.6
0.3
18.8
39
.7
32.6
7.
6 1.
2 0.
0 10
0.0
1,59
8 4.
0 1,
297
Low
er s
econ
dary
8.
2 17
.1
74.5
14
.4
0.3
8.2
50.9
33
.8
6.3
0.8
0.1
100.
0 95
8 3.
0 87
9
Upp
er s
econ
dary
2.
8 18
.1
78.5
21
.5
0.7
2.8
50.9
39
.2
6.1
1.0
0.0
100.
0 38
6 3.
0 37
5
Post
sec
onda
ry /
Non
tert
iary
0.
3 12
.0
87.8
37
.8
0.0
0.3
68.1
29
.0
2.7
0.0
0.0
100.
0 12
7 3.
0 12
7
Hig
her
0.1
5.5
93.5
46
.6
1.0
0.1
76.2
21
.0
2.2
0.5
0.0
100.
0 38
1 3.
0 38
1
Age
at g
ivin
g bi
rth
Less
than
20
20.8
26
.3
52.2
7.
0 0.
8 20
.8
35.3
33
.0
9.1
1.7
0.0
100.
0 70
1 4.
0 55
5
20-3
4 16
.2
17.8
65
.5
16.9
0.
5 16
.2
46.5
30
.5
5.7
1.1
0.0
100.
0 3,
152
3.0
2,64
2
35-4
9 27
.2
18.3
53
.7
17.5
0.
8 27
.2
38.5
26
.2
7.0
1.1
0.0
100.
0 37
8 3.
0 27
5 Et
hno-
lingu
isti
c gr
oup
of h
ouse
hold
hea
d La
o-Ta
i 7.
9 15
.6
76.1
23
.0
0.4
7.9
53.5
31
.4
6.3
0.9
0.0
100.
0 2,
365
3.0
2,17
8
Mon
-Khm
er
28.2
23
.4
47.2
6.
0 1.
3 28
.2
34.4
30
.9
5.6
0.9
0.0
100.
0 1,
087
4.0
780
Hm
ong-
Mie
n 32
.7
27.3
39
.7
4.5
0.3
32.7
27
.8
26.8
9.
1 3.
5 0.
1 10
0.0
608
4.0
409
Chin
ese-
Tibe
tan
45.7
14
.4
39.9
5.
7 0.
0 45
.7
20.2
30
.4
3.3
0.4
0.0
100.
0 12
6 4.
0 68
Oth
er, D
K, M
issi
ng
(19.
3)
(19.
9)
(60.
7)
(5.9
) (0
.0)
(19.
3)
(52.
6)
(25.
5)
(2.6
) (0
.0)
(0.0
) 10
0.0
45
(3.0
) 36
Wea
lth
inde
x qu
inti
le
Poor
est
43.3
23
.4
32.2
3.
6 1.
0 43
.3
23.1
25
.1
6.8
1.6
0.1
100.
0 1,
081
4.0
612
Seco
nd
19.5
26
.5
53.7
6.
7 0.
3 19
.5
35.5
36
.0
7.5
1.6
0.0
100.
0 90
4 4.
0 72
8
Mid
dle
8.9
22.8
68
.0
9.7
0.4
8.9
45.6
36
.7
7.9
0.8
0.0
100.
0 78
9 3.
0 71
9
Four
th
4.4
12.3
83
.0
22.5
0.
3 4.
4 54
.4
33.6
6.
3 1.
3 0.
0 10
0.0
731
3.0
699
Rich
est
1.6
7.2
90.3
42
.3
0.9
1.6
72.9
21
.9
3.0
0.7
0.0
100.
0 72
5 3.
0 71
4 1 2
MIC
S in
dica
tor
TM.5
b - A
nten
atal
car
e co
vera
ge (a
t lea
st fo
ur ti
mes
by
any
prov
ider
); S
DG
indi
cato
r 3.
8.1
MIC
S in
dica
tor
TM.5
c - A
nten
atal
car
e co
vera
ge (a
t lea
st e
ight
tim
es b
y an
y pr
ovid
er))
( ) F
igur
es th
at a
re b
ased
on
25 –
49
unw
eigh
ted
case
s
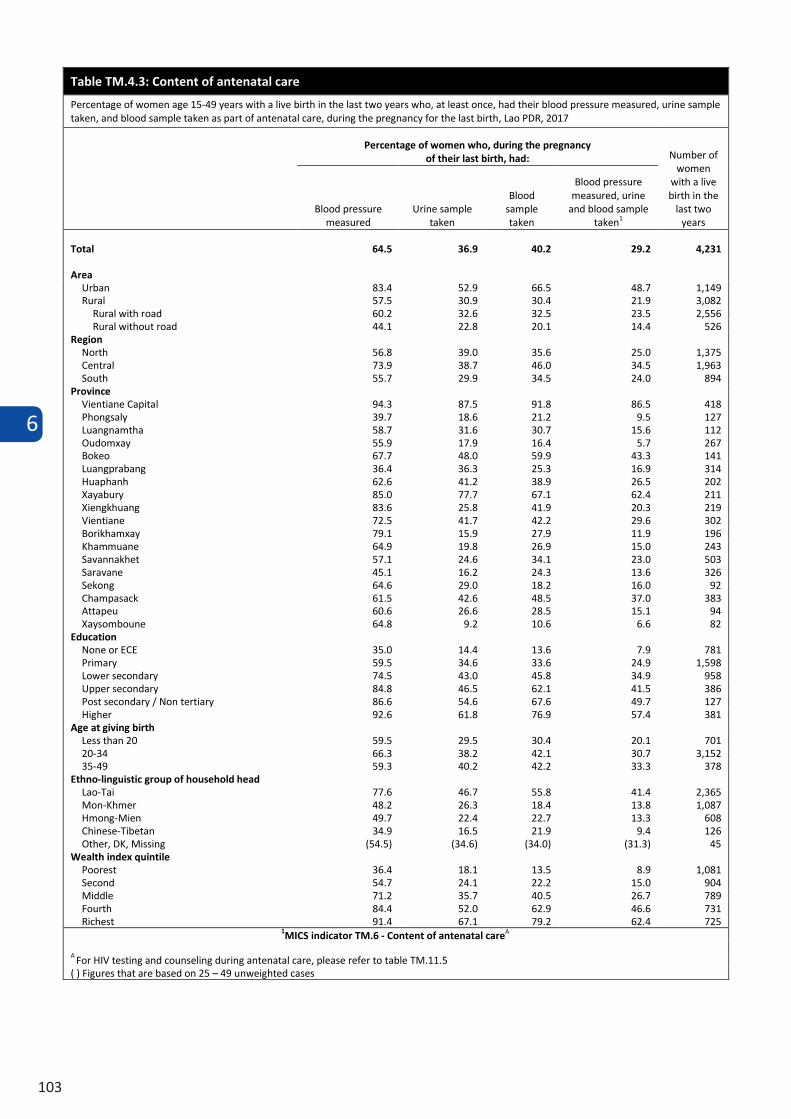
6
103
Table TM.4.3: Content of antenatal care
Percentage of women age 15-49 years with a live birth in the last two years who, at least once, had their blood pressure measured, urine sample taken, and blood sample taken as part of antenatal care, during the pregnancy for the last birth, Lao PDR, 2017
Percentage of women who, during the pregnancy of their last birth, had: Number of
women with a live birth in the
last two years
Blood pressure measured
Urine sample taken
Blood sample taken
Blood pressure measured, urine
and blood sample taken1
Total 64.5 36.9 40.2 29.2 4,231
Area Urban 83.4 52.9 66.5 48.7 1,149 Rural 57.5 30.9 30.4 21.9 3,082
Rural with road 60.2 32.6 32.5 23.5 2,556 Rural without road 44.1 22.8 20.1 14.4 526
Region North 56.8 39.0 35.6 25.0 1,375 Central 73.9 38.7 46.0 34.5 1,963 South 55.7 29.9 34.5 24.0 894
Province Vientiane Capital 94.3 87.5 91.8 86.5 418 Phongsaly 39.7 18.6 21.2 9.5 127 Luangnamtha 58.7 31.6 30.7 15.6 112 Oudomxay 55.9 17.9 16.4 5.7 267 Bokeo 67.7 48.0 59.9 43.3 141 Luangprabang 36.4 36.3 25.3 16.9 314 Huaphanh 62.6 41.2 38.9 26.5 202 Xayabury 85.0 77.7 67.1 62.4 211 Xiengkhuang 83.6 25.8 41.9 20.3 219 Vientiane 72.5 41.7 42.2 29.6 302 Borikhamxay 79.1 15.9 27.9 11.9 196 Khammuane 64.9 19.8 26.9 15.0 243 Savannakhet 57.1 24.6 34.1 23.0 503 Saravane 45.1 16.2 24.3 13.6 326 Sekong 64.6 29.0 18.2 16.0 92 Champasack 61.5 42.6 48.5 37.0 383 Attapeu 60.6 26.6 28.5 15.1 94 Xaysomboune 64.8 9.2 10.6 6.6 82
Education None or ECE 35.0 14.4 13.6 7.9 781 Primary 59.5 34.6 33.6 24.9 1,598 Lower secondary 74.5 43.0 45.8 34.9 958 Upper secondary 84.8 46.5 62.1 41.5 386 Post secondary / Non tertiary 86.6 54.6 67.6 49.7 127 Higher 92.6 61.8 76.9 57.4 381
Age at giving birth Less than 20 59.5 29.5 30.4 20.1 701 20-34 66.3 38.2 42.1 30.7 3,152 35-49 59.3 40.2 42.2 33.3 378
Ethno-linguistic group of household head Lao-Tai 77.6 46.7 55.8 41.4 2,365 Mon-Khmer 48.2 26.3 18.4 13.8 1,087 Hmong-Mien 49.7 22.4 22.7 13.3 608 Chinese-Tibetan 34.9 16.5 21.9 9.4 126 Other, DK, Missing (54.5) (34.6) (34.0) (31.3) 45
Wealth index quintile Poorest 36.4 18.1 13.5 8.9 1,081 Second 54.7 24.1 22.2 15.0 904 Middle 71.2 35.7 40.5 26.7 789 Fourth 84.4 52.0 62.9 46.6 731 Richest 91.4 67.1 79.2 62.4 725
1 MICS indicator TM.6 - Content of antenatal careA
AFor HIV testing and counseling during antenatal care, please refer to table TM.11.5 ( ) Figures that are based on 25 – 49 unweighted cases
6
104
6.5 NEONATAL TETANUS
Tetanus immunization during pregnancy can be life-saving for both the mother and the infant9. WHO estimated that neonatal tetanus killed more than 31,000 newborn children in 2016 within their first month of life10. SDG 3.1 aims at reducing by 2030 the global maternal mortality ratio to less than 70 per 100,000 live births. Eliminating maternal tetanus is one of the strategies used to achieve SDG target 3.1.
The strategy for preventing maternal and neonatal tetanus is to ensure that all pregnant women receive at least two doses of tetanus toxoid vaccine. If a woman has not received at least two doses of tetanus toxoid during a particular pregnancy, she (and her newborn) are also considered to be protected against tetanus if the woman: Received at least two doses of tetanus toxoid vaccine, the last within the previous 3 years; Received at least 3 doses, the last within the previous 5 years; Received at least 4 doses, the last within the previous 10 years; Received 5 or more doses anytime during her life11.
To assess the status of tetanus vaccination coverage, women who had a live birth during the two years before the survey were asked if they had received tetanus toxoid injections during the pregnancy for their most recent birth, and if so, how many. Women who did not receive two or more tetanus toxoid vaccinations during this recent pregnancy were then asked about tetanus toxoid vaccinations they may have previously received. Interviewers also asked women to present their vaccination card on which dates of tetanus toxoid are recorded and referred to information from the cards when available.
Table TM.5.1 shows the protection status from tetanus of women who have had a live birth within the last 2 years.
9 Hoper et al 2007. Maternal and neonatal tetanus. Lancet 2007.10 WHO-MCEE (Maternal Child Epidemiology Estimation) estimates for child causes of death 2000–2016: http://www.who.int/healthinfo/global_burden_disease.11 Deming, M.S. et al. 2002. Tetanus toxoid coverage as an indicator of serological protection against neonatal tetanus. Bulletin of the World Health Organization 80(9):696-703
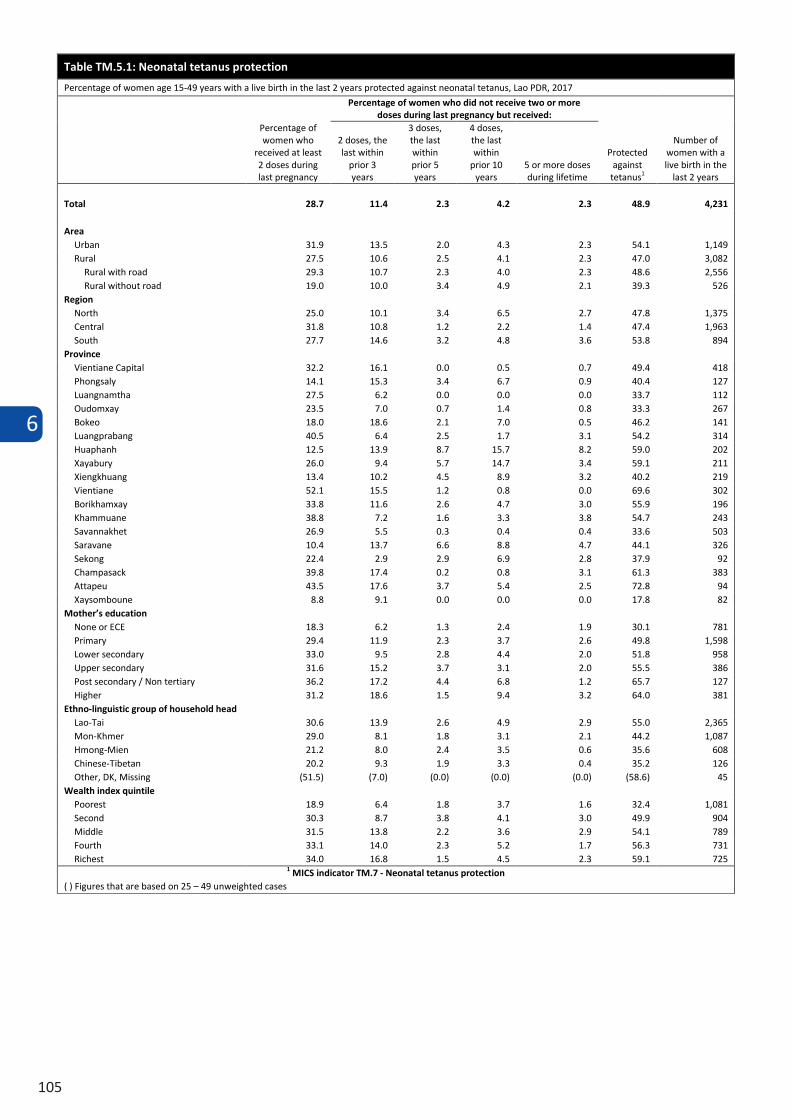
6
105
6.5 NEONATAL TETANUS
Tetanus immunization during pregnancy can be life-saving for both the mother and the infant9. WHO estimated that neonatal tetanus killed more than 31,000 newborn children in 2016 within their first month of life10. SDG 3.1 aims at reducing by 2030 the global maternal mortality ratio to less than 70 per 100,000 live births. Eliminating maternal tetanus is one of the strategies used to achieve SDG target 3.1.
The strategy for preventing maternal and neonatal tetanus is to ensure that all pregnant women receive at least two doses of tetanus toxoid vaccine. If a woman has not received at least two doses of tetanus toxoid during a particular pregnancy, she (and her newborn) are also considered to be protected against tetanus if the woman: Received at least two doses of tetanus toxoid vaccine, the last within the previous 3 years; Received at least 3 doses, the last within the previous 5 years; Received at least 4 doses, the last within the previous 10 years; Received 5 or more doses anytime during her life11.
To assess the status of tetanus vaccination coverage, women who had a live birth during the two years before the survey were asked if they had received tetanus toxoid injections during the pregnancy for their most recent birth, and if so, how many. Women who did not receive two or more tetanus toxoid vaccinations during this recent pregnancy were then asked about tetanus toxoid vaccinations they may have previously received. Interviewers also asked women to present their vaccination card on which dates of tetanus toxoid are recorded and referred to information from the cards when available.
Table TM.5.1 shows the protection status from tetanus of women who have had a live birth within the last 2 years.
9 Hoper et al 2007. Maternal and neonatal tetanus. Lancet 2007.10 WHO-MCEE (Maternal Child Epidemiology Estimation) estimates for child causes of death 2000–2016: http://www.who.int/healthinfo/global_burden_disease.11 Deming, M.S. et al. 2002. Tetanus toxoid coverage as an indicator of serological protection against neonatal tetanus. Bulletin of the World Health Organization 80(9):696-703
Table TM.5.1: Neonatal tetanus protection
Percentage of women age 15-49 years with a live birth in the last 2 years protected against neonatal tetanus, Lao PDR, 2017
Percentage of women who
received at least 2 doses during last pregnancy
Percentage of women who did not receive two or more doses during last pregnancy but received:
Protected against
tetanus1
Number of women with a live birth in the
last 2 years
2 doses, the last within
prior 3 years
3 doses, the last within prior 5 years
4 doses, the last within
prior 10 years
5 or more doses during lifetime
Total 28.7 11.4 2.3 4.2 2.3 48.9 4,231
Area Urban 31.9 13.5 2.0 4.3 2.3 54.1 1,149 Rural 27.5 10.6 2.5 4.1 2.3 47.0 3,082
Rural with road 29.3 10.7 2.3 4.0 2.3 48.6 2,556 Rural without road 19.0 10.0 3.4 4.9 2.1 39.3 526
Region North 25.0 10.1 3.4 6.5 2.7 47.8 1,375 Central 31.8 10.8 1.2 2.2 1.4 47.4 1,963 South 27.7 14.6 3.2 4.8 3.6 53.8 894
Province Vientiane Capital 32.2 16.1 0.0 0.5 0.7 49.4 418 Phongsaly 14.1 15.3 3.4 6.7 0.9 40.4 127 Luangnamtha 27.5 6.2 0.0 0.0 0.0 33.7 112 Oudomxay 23.5 7.0 0.7 1.4 0.8 33.3 267 Bokeo 18.0 18.6 2.1 7.0 0.5 46.2 141 Luangprabang 40.5 6.4 2.5 1.7 3.1 54.2 314 Huaphanh 12.5 13.9 8.7 15.7 8.2 59.0 202 Xayabury 26.0 9.4 5.7 14.7 3.4 59.1 211 Xiengkhuang 13.4 10.2 4.5 8.9 3.2 40.2 219 Vientiane 52.1 15.5 1.2 0.8 0.0 69.6 302 Borikhamxay 33.8 11.6 2.6 4.7 3.0 55.9 196 Khammuane 38.8 7.2 1.6 3.3 3.8 54.7 243 Savannakhet 26.9 5.5 0.3 0.4 0.4 33.6 503 Saravane 10.4 13.7 6.6 8.8 4.7 44.1 326 Sekong 22.4 2.9 2.9 6.9 2.8 37.9 92 Champasack 39.8 17.4 0.2 0.8 3.1 61.3 383 Attapeu 43.5 17.6 3.7 5.4 2.5 72.8 94 Xaysomboune 8.8 9.1 0.0 0.0 0.0 17.8 82
Mother’s education None or ECE 18.3 6.2 1.3 2.4 1.9 30.1 781 Primary 29.4 11.9 2.3 3.7 2.6 49.8 1,598 Lower secondary 33.0 9.5 2.8 4.4 2.0 51.8 958 Upper secondary 31.6 15.2 3.7 3.1 2.0 55.5 386 Post secondary / Non tertiary 36.2 17.2 4.4 6.8 1.2 65.7 127 Higher 31.2 18.6 1.5 9.4 3.2 64.0 381
Ethno-linguistic group of household head Lao-Tai 30.6 13.9 2.6 4.9 2.9 55.0 2,365 Mon-Khmer 29.0 8.1 1.8 3.1 2.1 44.2 1,087 Hmong-Mien 21.2 8.0 2.4 3.5 0.6 35.6 608 Chinese-Tibetan 20.2 9.3 1.9 3.3 0.4 35.2 126 Other, DK, Missing (51.5) (7.0) (0.0) (0.0) (0.0) (58.6) 45
Wealth index quintile Poorest 18.9 6.4 1.8 3.7 1.6 32.4 1,081 Second 30.3 8.7 3.8 4.1 3.0 49.9 904 Middle 31.5 13.8 2.2 3.6 2.9 54.1 789 Fourth 33.1 14.0 2.3 5.2 1.7 56.3 731 Richest 34.0 16.8 1.5 4.5 2.3 59.1 725
1 MICS indicator TM.7 - Neonatal tetanus protection ( ) Figures that are based on 25 – 49 unweighted cases
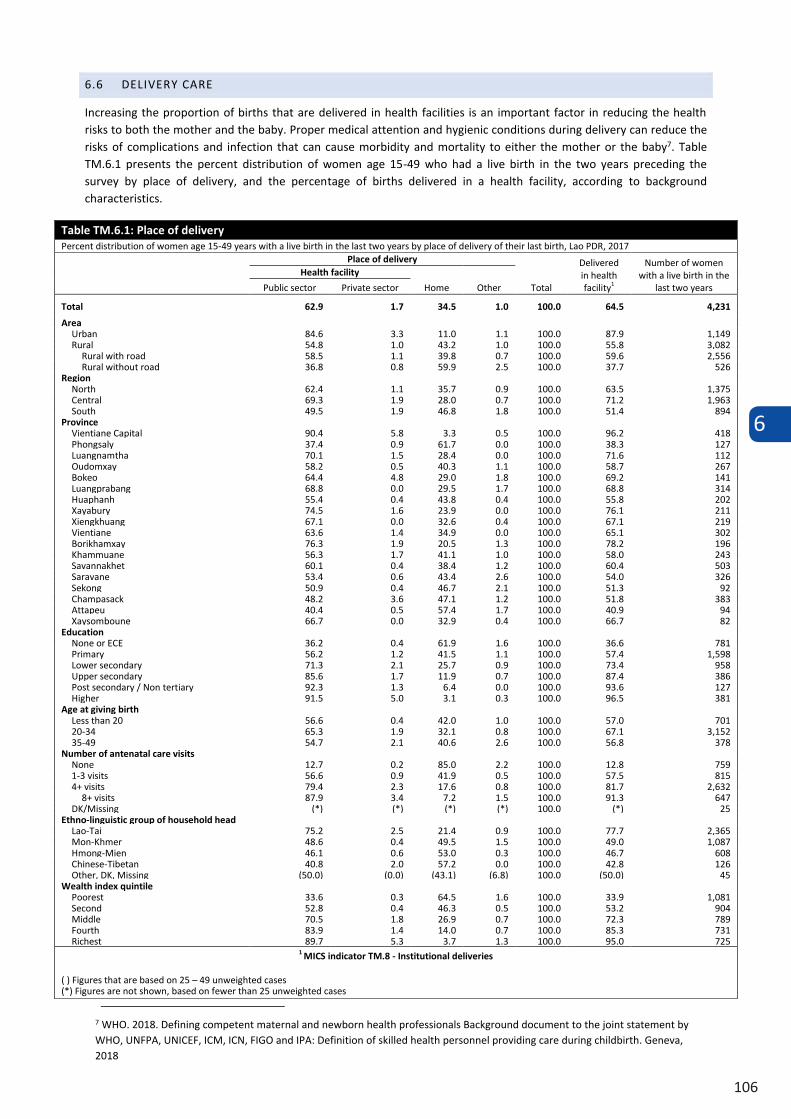
6
106
6.6 DELIVERY CARE
Increasing the proportion of births that are delivered in health facilities is an important factor in reducing the health risks to both the mother and the baby. Proper medical attention and hygienic conditions during delivery can reduce the risks of complications and infection that can cause morbidity and mortality to either the mother or the baby7. Table TM.6.1 presents the percent distribution of women age 15-49 who had a live birth in the two years preceding the survey by place of delivery, and the percentage of births delivered in a health facility, according to background characteristics.
Table TM.6.1: Place of delivery Percent distribution of women age 15-49 years with a live birth in the last two years by place of delivery of their last birth, Lao PDR, 2017
Place of delivery
Total
Delivered in health facility1
Number of women with a live birth in the
last two years
Health facility
Home Other Public sector Private sector
Total 62.9 1.7 34.5 1.0 100.0 64.5 4,231
Area Urban 84.6 3.3 11.0 1.1 100.0 87.9 1,149 Rural 54.8 1.0 43.2 1.0 100.0 55.8 3,082
Rural with road 58.5 1.1 39.8 0.7 100.0 59.6 2,556 Rural without road 36.8 0.8 59.9 2.5 100.0 37.7 526
Region North 62.4 1.1 35.7 0.9 100.0 63.5 1,375 Central 69.3 1.9 28.0 0.7 100.0 71.2 1,963 South 49.5 1.9 46.8 1.8 100.0 51.4 894
Province Vientiane Capital 90.4 5.8 3.3 0.5 100.0 96.2 418 Phongsaly 37.4 0.9 61.7 0.0 100.0 38.3 127 Luangnamtha 70.1 1.5 28.4 0.0 100.0 71.6 112 Oudomxay 58.2 0.5 40.3 1.1 100.0 58.7 267 Bokeo 64.4 4.8 29.0 1.8 100.0 69.2 141 Luangprabang 68.8 0.0 29.5 1.7 100.0 68.8 314 Huaphanh 55.4 0.4 43.8 0.4 100.0 55.8 202 Xayabury 74.5 1.6 23.9 0.0 100.0 76.1 211 Xiengkhuang 67.1 0.0 32.6 0.4 100.0 67.1 219 Vientiane 63.6 1.4 34.9 0.0 100.0 65.1 302 Borikhamxay 76.3 1.9 20.5 1.3 100.0 78.2 196 Khammuane 56.3 1.7 41.1 1.0 100.0 58.0 243 Savannakhet 60.1 0.4 38.4 1.2 100.0 60.4 503 Saravane 53.4 0.6 43.4 2.6 100.0 54.0 326 Sekong 50.9 0.4 46.7 2.1 100.0 51.3 92 Champasack 48.2 3.6 47.1 1.2 100.0 51.8 383 Attapeu 40.4 0.5 57.4 1.7 100.0 40.9 94 Xaysomboune 66.7 0.0 32.9 0.4 100.0 66.7 82
Education None or ECE 36.2 0.4 61.9 1.6 100.0 36.6 781 Primary 56.2 1.2 41.5 1.1 100.0 57.4 1,598 Lower secondary 71.3 2.1 25.7 0.9 100.0 73.4 958 Upper secondary 85.6 1.7 11.9 0.7 100.0 87.4 386 Post secondary / Non tertiary 92.3 1.3 6.4 0.0 100.0 93.6 127 Higher 91.5 5.0 3.1 0.3 100.0 96.5 381
Age at giving birth Less than 20 56.6 0.4 42.0 1.0 100.0 57.0 701 20-34 65.3 1.9 32.1 0.8 100.0 67.1 3,152 35-49 54.7 2.1 40.6 2.6 100.0 56.8 378
Number of antenatal care visits None 12.7 0.2 85.0 2.2 100.0 12.8 759 1-3 visits 56.6 0.9 41.9 0.5 100.0 57.5 815 4+ visits 79.4 2.3 17.6 0.8 100.0 81.7 2,632
8+ visits 87.9 3.4 7.2 1.5 100.0 91.3 647 DK/Missing (*) (*) (*) (*) 100.0 (*) 25
Ethno-linguistic group of household head Lao-Tai 75.2 2.5 21.4 0.9 100.0 77.7 2,365 Mon-Khmer 48.6 0.4 49.5 1.5 100.0 49.0 1,087 Hmong-Mien 46.1 0.6 53.0 0.3 100.0 46.7 608 Chinese-Tibetan 40.8 2.0 57.2 0.0 100.0 42.8 126 Other, DK, Missing (50.0) (0.0) (43.1) (6.8) 100.0 (50.0) 45
Wealth index quintile Poorest 33.6 0.3 64.5 1.6 100.0 33.9 1,081 Second 52.8 0.4 46.3 0.5 100.0 53.2 904 Middle 70.5 1.8 26.9 0.7 100.0 72.3 789 Fourth 83.9 1.4 14.0 0.7 100.0 85.3 731 Richest 89.7 5.3 3.7 1.3 100.0 95.0 725
1 MICS indicator TM.8 - Institutional deliveries
( ) Figures that are based on 25 – 49 unweighted cases (*) Figures are not shown, based on fewer than 25 unweighted cases
7 WHO. 2018. Defining competent maternal and newborn health professionals Background document to the joint statement by WHO, UNFPA, UNICEF, ICM, ICN, FIGO and IPA: Definition of skilled health personnel providing care during childbirth. Geneva, 2018
6
107
About three quarters of all maternal deaths occur due to direct obstetric causes.12 The single most critical intervention for safe motherhood is to ensure that a competent health worker with midwifery skills is present at every birth, and in case of emergency that transport is available to a referral facility for obstetric care. The skilled attendant at delivery indicator is used to track progress toward the Sustainable Development Goal 3.1 of reducing maternal mortality and it is SDG indicator 3.1.2.
The LSIS II included a number of questions to assess the proportion of births attended by a skilled attendant. According to the revised definition13, skilled health personnel, as referenced by SDG indicator 3.1.2, are competent maternal and newborn health professionals educated, trained and regulated to national and international standards. They are competent to: (i) provide and promote evidence-based, human-rights-based, quality, socio-culturally sensitive and dignified care to women and their newborns; (ii) facilitate physiological processes during labour to ensure clean and safe birth; and (iii) identify and manage or refer women and/or newborns with complications. In addition, as part of an integrated team of maternal and newborn health professionals (including midwives, nurses, obstetricians, paediatricians and anaesthesiologists), they perform all signal functions of emergency maternal and newborn care to optimize the health and well-being of mothers and newborns. Within an enabling environment, midwives trained to International Confederation of Midwives standards can provide almost all of the essential care needed for women and newborns. A skilled attendant in Lao PDR includes a doctor, nurse, midwife and auxiliary midwife.
Table TM.6.2 presents information on assistance during delivery. This table also shows information on women who delivered by caesarean section (C-section) and provides additional information on the timing of the decision to conduct a C-section (before labour pains began or after) in order to better assess if such decisions are mostly driven by medical or non–medical reasons.
12 Say, L et al. 2014. Global causes of maternal death: a WHO systematic analysis. The Lancet Global Health 2(6): e323-33. DOI: 10.1016/S2214-109X(14)70227-X 13 Defining competent maternal and newborn health professionals. Background document to the joint statement by WHO, UNFPA, UNICEF, ICM, ICN, FIGO and IPA: Definition of skilled health personnel providing care during childbirth. 2018
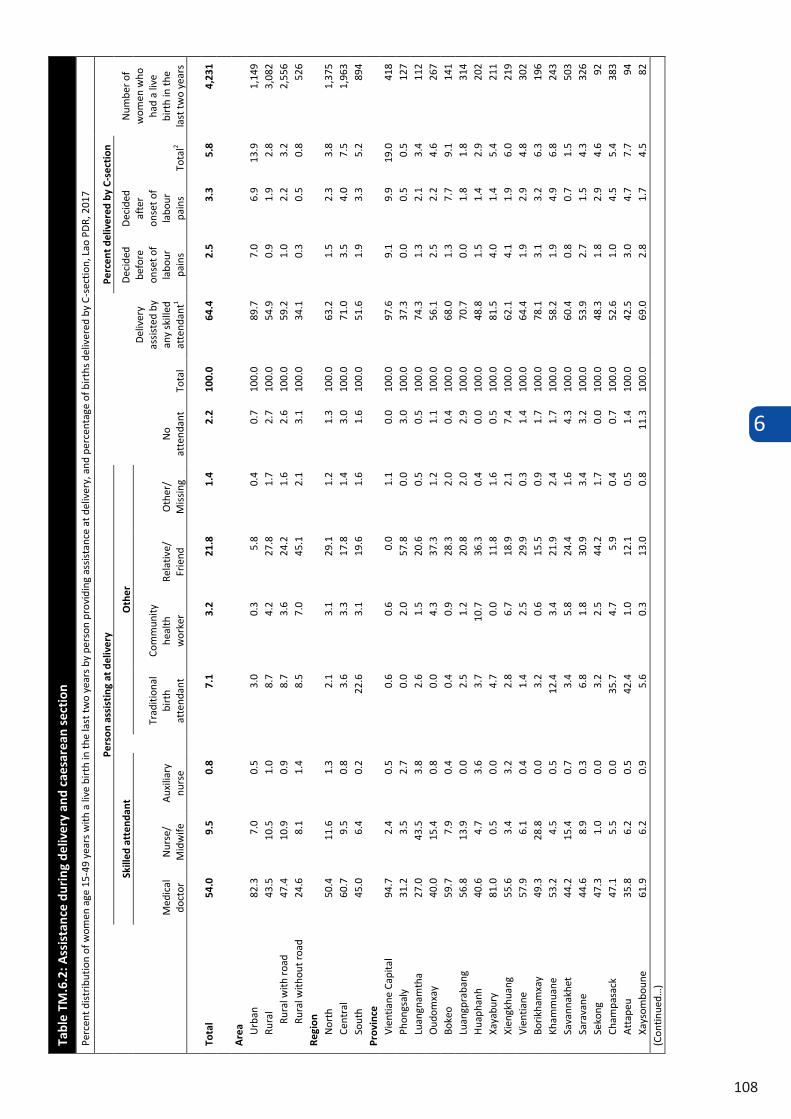
6
108
Tabl
e TM
.6.2
: Ass
ista
nce
duri
ng d
eliv
ery
and
caes
area
n se
ctio
n
Perc
ent d
istr
ibut
ion
of w
omen
age
15-
49 y
ears
with
a li
ve b
irth
in th
e la
st tw
o ye
ars
by p
erso
n pr
ovid
ing
assi
stan
ce a
t del
iver
y, a
nd p
erce
ntag
e of
bir
ths
deliv
ered
by
C-se
ctio
n, L
ao P
DR,
201
7
Pers
on a
ssis
ting
at d
eliv
ery
No
atte
ndan
t To
tal
Del
iver
y as
sist
ed b
y an
y sk
illed
at
tend
ant1
Perc
ent d
eliv
ered
by
C-se
ctio
n
Num
ber o
f w
omen
who
ha
d a
live
birt
h in
the
last
two
year
s
Skill
ed a
tten
dant
O
ther
D
ecid
ed
befo
re
onse
t of
labo
ur
pain
s
Dec
ided
af
ter
onse
t of
labo
ur
pain
s To
tal2
Med
ical
do
ctor
N
urse
/ M
idw
ife
Aux
iliar
y nu
rse
Trad
ition
al
birt
h at
tend
ant
Com
mun
ity
heal
th
wor
ker
Rela
tive/
Fr
iend
O
ther
/ M
issi
ng
Tota
l 54
.0
9.5
0.8
7.1
3.2
21.8
1.
4 2.
2 10
0.0
64.4
2.
5 3.
3 5.
8 4,
231
Are
a Urb
an
82.3
7.
0 0.
5 3.
0 0.
3 5.
8 0.
4 0.
7 10
0.0
89.7
7.
0 6.
9 13
.9
1,14
9 Ru
ral
43.5
10
.5
1.0
8.7
4.2
27.8
1.
7 2.
7 10
0.0
54.9
0.
9 1.
9 2.
8 3,
082
Rura
l with
roa
d 47
.4
10.9
0.
9 8.
7 3.
6 24
.2
1.6
2.6
100.
0 59
.2
1.0
2.2
3.2
2,55
6 Ru
ral w
ithou
t roa
d 24
.6
8.1
1.4
8.5
7.0
45.1
2.
1 3.
1 10
0.0
34.1
0.
3 0.
5 0.
8 52
6 Re
gion
N
orth
50
.4
11.6
1.
3 2.
1 3.
1 29
.1
1.2
1.3
100.
0 63
.2
1.5
2.3
3.8
1,37
5 Ce
ntra
l 60
.7
9.5
0.8
3.6
3.3
17.8
1.
4 3.
0 10
0.0
71.0
3.
5 4.
0 7.
5 1,
963
Sout
h 45
.0
6.4
0.2
22.6
3.
1 19
.6
1.6
1.6
100.
0 51
.6
1.9
3.3
5.2
894
Prov
ince
Vi
entia
ne C
apita
l 94
.7
2.4
0.5
0.6
0.6
0.0
1.1
0.0
100.
0 97
.6
9.1
9.9
19.0
41
8 Ph
ongs
aly
31
.2
3.5
2.7
0.0
2.0
57.8
0.
0 3.
0 10
0.0
37.3
0.
0 0.
5 0.
5 12
7 Lu
angn
amth
a 27
.0
43.5
3.
8 2.
6 1.
5 20
.6
0.5
0.5
100.
0 74
.3
1.3
2.1
3.4
112
Oud
omxa
y 40
.0
15.4
0.
8 0.
0 4.
3 37
.3
1.2
1.1
100.
0 56
.1
2.5
2.2
4.6
267
Boke
o 59
.7
7.9
0.4
0.4
0.9
28.3
2.
0 0.
4 10
0.0
68.0
1.
3 7.
7 9.
1 14
1 Lu
angp
raba
ng
56.8
13
.9
0.0
2.5
1.2
20.8
2.
0 2.
9 10
0.0
70.7
0.
0 1.
8 1.
8 31
4 H
uaph
anh
40.6
4.
7 3.
6 3.
7 10
.7
36.3
0.
4 0.
0 10
0.0
48.8
1.
5 1.
4 2.
9 20
2 Xa
yabu
ry
81.0
0.
5 0.
0 4.
7 0.
0 11
.8
1.6
0.5
100.
0 81
.5
4.0
1.4
5.4
211
Xien
gkhu
ang
55.6
3.
4 3.
2 2.
8 6.
7 18
.9
2.1
7.4
100.
0 62
.1
4.1
1.9
6.0
219
Vien
tiane
57
.9
6.1
0.4
1.4
2.5
29.9
0.
3 1.
4 10
0.0
64.4
1.
9 2.
9 4.
8 30
2 Bo
rikha
mxa
y 49
.3
28.8
0.
0 3.
2 0.
6 15
.5
0.9
1.7
100.
0 78
.1
3.1
3.2
6.3
196
Kham
mua
ne
53.2
4.
5 0.
5 12
.4
3.4
21.9
2.
4 1.
7 10
0.0
58.2
1.
9 4.
9 6.
8 24
3 Sa
vann
akhe
t 44
.2
15.4
0.
7 3.
4 5.
8 24
.4
1.6
4.3
100.
0 60
.4
0.8
0.7
1.5
503
Sara
vane
44
.6
8.9
0.3
6.8
1.8
30.9
3.
4 3.
2 10
0.0
53.9
2.
7 1.
5 4.
3 32
6 Se
kong
47
.3
1.0
0.0
3.2
2.5
44.2
1.
7 0.
0 10
0.0
48.3
1.
8 2.
9 4.
6 92
Ch
ampa
sack
47
.1
5.5
0.0
35.7
4.
7 5.
9 0.
4 0.
7 10
0.0
52.6
1.
0 4.
5 5.
4 38
3 A
ttap
eu
35.8
6.
2 0.
5 42
.4
1.0
12.1
0.
5 1.
4 10
0.0
42.5
3.
0 4.
7 7.
7 94
Xa
ysom
boun
e 61
.9
6.2
0.9
5.6
0.3
13.0
0.
8 11
.3
100.
0 69
.0
2.8
1.7
4.5
82
(Con
tinue
d…)
Tabl
e TM
.6.2
(con
tinu
ed):
Ass
ista
nce
duri
ng d
eliv
ery
and
caes
area
n se
ctio
n
Perc
ent d
istr
ibut
ion
of w
omen
age
15-
49 y
ears
with
a li
ve b
irth
in th
e la
st tw
o ye
ars
by p
erso
n pr
ovid
ing
assi
stan
ce a
t del
iver
y, a
nd p
erce
ntag
e of
bir
ths
deliv
ered
by
C-se
ctio
n, L
ao P
DR,
201
7
Pers
on a
ssis
ting
at d
eliv
ery
No
atte
ndan
t To
tal
Del
iver
y as
sist
ed
by a
ny
skill
ed
atte
ndan
t1
Perc
ent d
eliv
ered
by
C-se
ctio
n
Num
ber o
f w
omen
who
ha
d a
live
birt
h in
the
last
two
year
s
Skill
ed a
tten
dant
O
ther
D
ecid
ed
befo
re
onse
t of
labo
ur
pain
s
Dec
ided
af
ter
onse
t of
labo
ur
pain
s To
tal2
Med
ical
do
ctor
N
urse
/ M
idw
ife
Aux
illia
ry
nurs
e
Trad
ition
al
birt
h at
tend
ant
Com
mun
ity
heal
th
wor
ker
Rela
tive/
Fr
iend
O
ther
/ M
issi
ng
Educ
atio
n N
one
or E
CE
23.8
11
.7
0.5
8.9
2.8
44.4
3.
1 4.
8 10
0.0
36.0
0.
2 0.
4 0.
6 78
1 Pr
imar
y 46
.4
9.3
0.8
9.9
4.6
25.4
1.
3 2.
3 10
0.0
56.5
1.
4 2.
2 3.
5 1,
598
Low
er s
econ
dary
63
.9
9.6
1.1
5.6
2.8
14.5
1.
1 1.
3 10
0.0
74.6
2.
5 3.
5 6.
0 95
8 U
pper
sec
onda
ry
77.9
8.
3 0.
9 4.
2 1.
4 5.
5 0.
3 1.
5 10
0.0
87.0
4.
3 4.
3 8.
6 38
6 Po
st s
econ
dary
/ N
on te
rtia
ry
80.6
9.
7 0.
8 2.
6 1.
4 4.
8 0.
0 0.
0 10
0.0
91.2
5.
0 8.
6 13
.6
127
Hig
her
90.2
6.
7 0.
8 0.
1 0.
8 1.
1 0.
2 0.
1 10
0.0
97.7
9.
5 10
.5
19.9
38
1 A
ge a
t giv
ing
birt
h Le
ss th
an 2
0 46
.5
9.3
0.6
7.3
4.2
28.7
1.
2 2.
2 10
0.0
56.4
0.
7 1.
5 2.
2 70
1 20
-34
56.4
9.
7 0.
9 6.
8 3.
0 19
.8
1.3
2.1
100.
0 67
.0
2.6
3.4
6.0
3,15
2 35
-49
48.0
8.
8 0.
5 9.
8 2.
7 25
.7
2.2
2.3
100.
0 57
.3
5.6
5.1
10.7
37
8 N
umbe
r of
ant
enat
al c
are
visi
ts
Non
e 9.
7 3.
6 0.
0 13
.8
3.1
60.3
3.
2 6.
2 10
0.0
13.3
0.
4 0.
7 1.
1 75
9 1-
3 vi
sits
44
.3
11.2
0.
7 9.
9 3.
9 25
.3
1.7
2.9
100.
0 56
.2
0.7
1.8
2.5
815
4+ v
isits
70
.0
10.5
1.
1 4.
3 3.
0 9.
6 0.
8 0.
7 10
0.0
81.6
3.
8 4.
5 8.
2 2,
632
8+ v
isits
82
.8
7.2
0.8
1.6
2.4
4.5
0.4
0.3
100.
0 90
.8
7.6
7.1
14.7
64
7 D
K/M
issi
ng
(*)
(*)
(*)
(*)
(*)
(*)
(*)
(*)
100.
0 (*
) (*
) (*
) (*
) 25
Pl
ace
of d
eliv
ery
Hom
e 2.
7 0.
9 0.
3 20
.3
5.2
61.8
3.
3 5.
6 10
0.0
3.8
0.0
0.0
0.0
1,45
9 H
ealth
faci
lity
81.8
14
.2
1.1
0.1
2.1
0.4
0.2
0.1
100.
0 97
.1
3.9
5.1
9.0
2,73
0 Pu
blic
81
.5
14.5
1.
2 0.
1 2.
2 0.
4 0.
1 0.
1 10
0.0
97.2
3.
4 4.
7 8.
0 2,
660
Priv
ate
94.2
2.
5 0.
0 0.
0 0.
0 0.
0 3.
3 0.
0 10
0.0
96.7
26
.3
20.3
46
.6
70
Oth
er/D
K/M
issi
ng
(33.
7)
(2.6
) (0
.0)
(5.3
) (0
.0)
(29.
1)
(11.
2)
(18.
0)
100.
0 (3
6.3)
(0
.0)
(0.0
) (0
.0)
43
Ethn
o-lin
guis
tic
grou
p of
hou
seho
ld h
ead
Lao-
Tai
69.2
8.
4 0.
6 8.
4 3.
0 8.
5 1.
1 0.
8 10
0.0
78.2
3.
8 4.
8 8.
7 2,
365
Mon
-Khm
er
34.3
12
.2
1.2
7.3
3.8
35.7
1.
9 3.
6 10
0.0
47.7
0.
8 1.
3 2.
0 1,
087
Hm
ong-
Mie
n 36
.7
8.0
1.0
2.9
2.6
42.3
1.
6 4.
9 10
0.0
45.7
0.
7 1.
3 2.
0 60
8 Ch
ines
e-Ti
beta
n 26
.8
14.2
1.
4 1.
9 2.
0 50
.1
1.4
2.2
100.
0 42
.5
1.4
1.0
2.4
126
Oth
er, D
K, M
issi
ng
(43.
8)
(9.5
) (0
.0)
(6.5
) (5
.8)
(32.
0)
(2.4
) (0
.0)
100.
0 (5
3.3)
(3
.8)
(3.3
) (7
.1)
45
Wea
lth
inde
x qu
inti
le
Poor
est
20.9
10
.9
0.8
9.1
3.6
47.3
2.
3 5.
1 10
0.0
32.6
0.
3 0.
8 1.
1 1,
081
Seco
nd
39.1
10
.1
1.7
8.3
5.9
30.6
1.
9 2.
3 10
0.0
50.9
0.
8 1.
2 2.
0 90
4 M
iddl
e 61
.2
10.3
0.
7 12
.0
2.8
10.3
1.
3 1.
4 10
0.0
72.2
1.
7 2.
9 4.
7 78
9 Fo
urth
77
.8
9.3
0.3
3.4
2.0
6.3
0.2
0.6
100.
0 87
.4
2.9
3.3
6.1
731
Rich
est
90.3
6.
1 0.
4 1.
1 0.
6 1.
0 0.
6 0.
0 10
0.0
96.8
8.
7 9.
8 18
.5
725
1 MIC
S in
dica
tor
TM.9
- Sk
illed
att
enda
nt a
t del
iver
y; S
DG
indi
cato
r 3.1
.2
2 MIC
S in
dica
tor
TM.1
0 - C
aesa
rean
sec
tion
( ) F
igur
es th
at a
re b
ased
on
25 –
49
unw
eigh
ted
case
s (*
) Fig
ures
are
not
sho
wn,
bas
ed o
n fe
wer
than
25
unw
eigh
ted
case
s
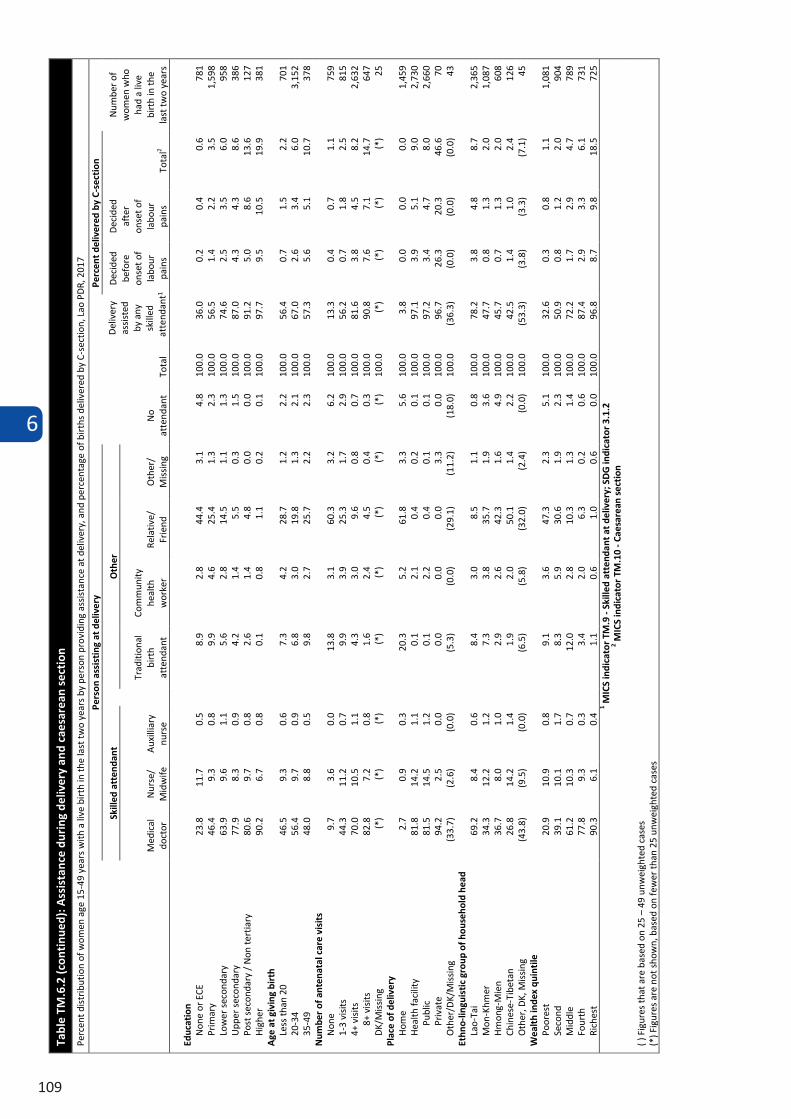
6
109
Tabl
e TM
.6.2
(con
tinu
ed):
Ass
ista
nce
duri
ng d
eliv
ery
and
caes
area
n se
ctio
n
Perc
ent d
istr
ibut
ion
of w
omen
age
15-
49 y
ears
with
a li
ve b
irth
in th
e la
st tw
o ye
ars
by p
erso
n pr
ovid
ing
assi
stan
ce a
t del
iver
y, a
nd p
erce
ntag
e of
bir
ths
deliv
ered
by
C-se
ctio
n, L
ao P
DR,
201
7
Pers
on a
ssis
ting
at d
eliv
ery
No
atte
ndan
t To
tal
Del
iver
y as
sist
ed
by a
ny
skill
ed
atte
ndan
t1
Perc
ent d
eliv
ered
by
C-se
ctio
n
Num
ber o
f w
omen
who
ha
d a
live
birt
h in
the
last
two
year
s
Skill
ed a
tten
dant
O
ther
D
ecid
ed
befo
re
onse
t of
labo
ur
pain
s
Dec
ided
af
ter
onse
t of
labo
ur
pain
s To
tal2
Med
ical
do
ctor
N
urse
/ M
idw
ife
Aux
illia
ry
nurs
e
Trad
ition
al
birt
h at
tend
ant
Com
mun
ity
heal
th
wor
ker
Rela
tive/
Fr
iend
O
ther
/ M
issi
ng
Educ
atio
n N
one
or E
CE
23.8
11
.7
0.5
8.9
2.8
44.4
3.
1 4.
8 10
0.0
36.0
0.
2 0.
4 0.
6 78
1 Pr
imar
y 46
.4
9.3
0.8
9.9
4.6
25.4
1.
3 2.
3 10
0.0
56.5
1.
4 2.
2 3.
5 1,
598
Low
er s
econ
dary
63
.9
9.6
1.1
5.6
2.8
14.5
1.
1 1.
3 10
0.0
74.6
2.
5 3.
5 6.
0 95
8 U
pper
sec
onda
ry
77.9
8.
3 0.
9 4.
2 1.
4 5.
5 0.
3 1.
5 10
0.0
87.0
4.
3 4.
3 8.
6 38
6 Po
st s
econ
dary
/ N
on te
rtia
ry
80.6
9.
7 0.
8 2.
6 1.
4 4.
8 0.
0 0.
0 10
0.0
91.2
5.
0 8.
6 13
.6
127
Hig
her
90.2
6.
7 0.
8 0.
1 0.
8 1.
1 0.
2 0.
1 10
0.0
97.7
9.
5 10
.5
19.9
38
1 A
ge a
t giv
ing
birt
h Le
ss th
an 2
0 46
.5
9.3
0.6
7.3
4.2
28.7
1.
2 2.
2 10
0.0
56.4
0.
7 1.
5 2.
2 70
1 20
-34
56.4
9.
7 0.
9 6.
8 3.
0 19
.8
1.3
2.1
100.
0 67
.0
2.6
3.4
6.0
3,15
2 35
-49
48.0
8.
8 0.
5 9.
8 2.
7 25
.7
2.2
2.3
100.
0 57
.3
5.6
5.1
10.7
37
8 N
umbe
r of
ant
enat
al c
are
visi
ts
Non
e 9.
7 3.
6 0.
0 13
.8
3.1
60.3
3.
2 6.
2 10
0.0
13.3
0.
4 0.
7 1.
1 75
9 1-
3 vi
sits
44
.3
11.2
0.
7 9.
9 3.
9 25
.3
1.7
2.9
100.
0 56
.2
0.7
1.8
2.5
815
4+ v
isits
70
.0
10.5
1.
1 4.
3 3.
0 9.
6 0.
8 0.
7 10
0.0
81.6
3.
8 4.
5 8.
2 2,
632
8+ v
isits
82
.8
7.2
0.8
1.6
2.4
4.5
0.4
0.3
100.
0 90
.8
7.6
7.1
14.7
64
7 D
K/M
issi
ng
(*)
(*)
(*)
(*)
(*)
(*)
(*)
(*)
100.
0 (*
) (*
) (*
) (*
) 25
Pl
ace
of d
eliv
ery
Hom
e 2.
7 0.
9 0.
3 20
.3
5.2
61.8
3.
3 5.
6 10
0.0
3.8
0.0
0.0
0.0
1,45
9 H
ealth
faci
lity
81.8
14
.2
1.1
0.1
2.1
0.4
0.2
0.1
100.
0 97
.1
3.9
5.1
9.0
2,73
0 Pu
blic
81
.5
14.5
1.
2 0.
1 2.
2 0.
4 0.
1 0.
1 10
0.0
97.2
3.
4 4.
7 8.
0 2,
660
Priv
ate
94.2
2.
5 0.
0 0.
0 0.
0 0.
0 3.
3 0.
0 10
0.0
96.7
26
.3
20.3
46
.6
70
Oth
er/D
K/M
issi
ng
(33.
7)
(2.6
) (0
.0)
(5.3
) (0
.0)
(29.
1)
(11.
2)
(18.
0)
100.
0 (3
6.3)
(0
.0)
(0.0
) (0
.0)
43
Ethn
o-lin
guis
tic
grou
p of
hou
seho
ld h
ead
Lao-
Tai
69.2
8.
4 0.
6 8.
4 3.
0 8.
5 1.
1 0.
8 10
0.0
78.2
3.
8 4.
8 8.
7 2,
365
Mon
-Khm
er
34.3
12
.2
1.2
7.3
3.8
35.7
1.
9 3.
6 10
0.0
47.7
0.
8 1.
3 2.
0 1,
087
Hm
ong-
Mie
n 36
.7
8.0
1.0
2.9
2.6
42.3
1.
6 4.
9 10
0.0
45.7
0.
7 1.
3 2.
0 60
8 Ch
ines
e-Ti
beta
n 26
.8
14.2
1.
4 1.
9 2.
0 50
.1
1.4
2.2
100.
0 42
.5
1.4
1.0
2.4
126
Oth
er, D
K, M
issi
ng
(43.
8)
(9.5
) (0
.0)
(6.5
) (5
.8)
(32.
0)
(2.4
) (0
.0)
100.
0 (5
3.3)
(3
.8)
(3.3
) (7
.1)
45
Wea
lth
inde
x qu
inti
le
Poor
est
20.9
10
.9
0.8
9.1
3.6
47.3
2.
3 5.
1 10
0.0
32.6
0.
3 0.
8 1.
1 1,
081
Seco
nd
39.1
10
.1
1.7
8.3
5.9
30.6
1.
9 2.
3 10
0.0
50.9
0.
8 1.
2 2.
0 90
4 M
iddl
e 61
.2
10.3
0.
7 12
.0
2.8
10.3
1.
3 1.
4 10
0.0
72.2
1.
7 2.
9 4.
7 78
9 Fo
urth
77
.8
9.3
0.3
3.4
2.0
6.3
0.2
0.6
100.
0 87
.4
2.9
3.3
6.1
731
Rich
est
90.3
6.
1 0.
4 1.
1 0.
6 1.
0 0.
6 0.
0 10
0.0
96.8
8.
7 9.
8 18
.5
725
1 MIC
S in
dica
tor
TM.9
- Sk
illed
att
enda
nt a
t del
iver
y; S
DG
indi
cato
r 3.1
.2
2 MIC
S in
dica
tor
TM.1
0 - C
aesa
rean
sec
tion
( ) F
igur
es th
at a
re b
ased
on
25 –
49
unw
eigh
ted
case
s (*
) Fig
ures
are
not
sho
wn,
bas
ed o
n fe
wer
than
25
unw
eigh
ted
case
s
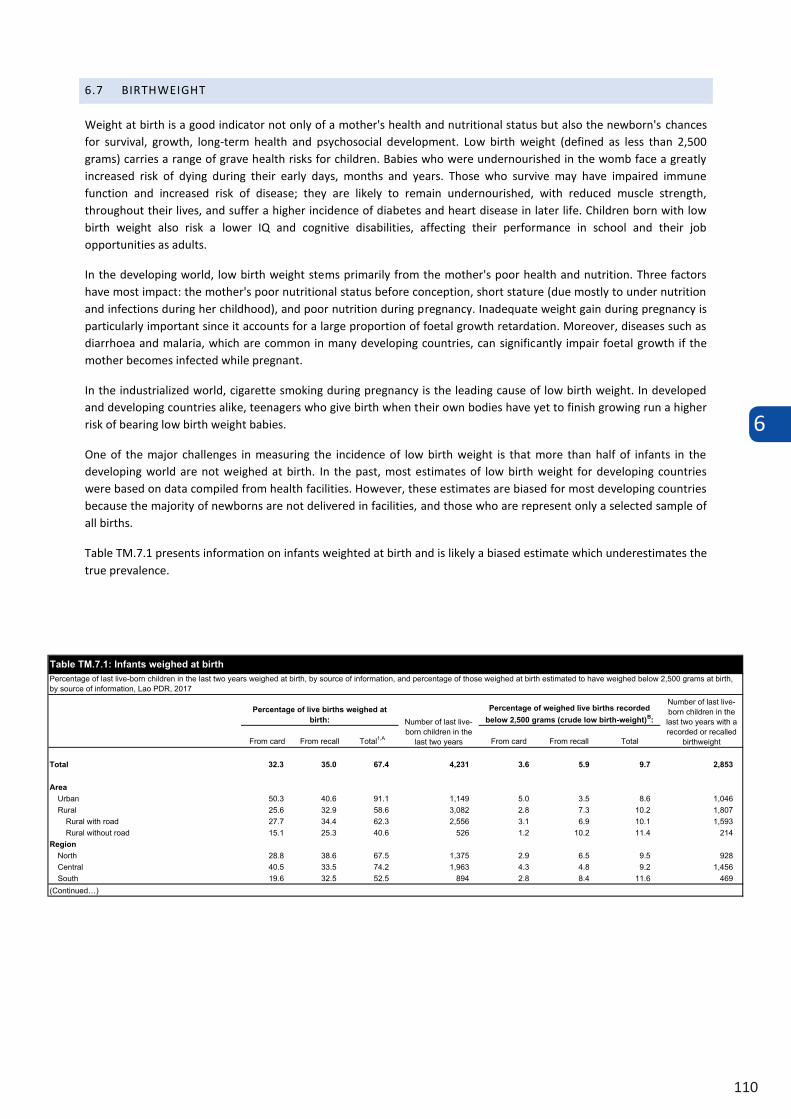
6
110
6.7 BIRTHWEIGHT
Weight at birth is a good indicator not only of a mother's health and nutritional status but also the newborn's chances for survival, growth, long-term health and psychosocial development. Low birth weight (defined as less than 2,500 grams) carries a range of grave health risks for children. Babies who were undernourished in the womb face a greatly increased risk of dying during their early days, months and years. Those who survive may have impaired immune function and increased risk of disease; they are likely to remain undernourished, with reduced muscle strength, throughout their lives, and suffer a higher incidence of diabetes and heart disease in later life. Children born with low birth weight also risk a lower IQ and cognitive disabilities, affecting their performance in school and their job opportunities as adults.
In the developing world, low birth weight stems primarily from the mother's poor health and nutrition. Three factors have most impact: the mother's poor nutritional status before conception, short stature (due mostly to under nutrition and infections during her childhood), and poor nutrition during pregnancy. Inadequate weight gain during pregnancy is particularly important since it accounts for a large proportion of foetal growth retardation. Moreover, diseases such as diarrhoea and malaria, which are common in many developing countries, can significantly impair foetal growth if the mother becomes infected while pregnant.
In the industrialized world, cigarette smoking during pregnancy is the leading cause of low birth weight. In developed and developing countries alike, teenagers who give birth when their own bodies have yet to finish growing run a higher risk of bearing low birth weight babies.
One of the major challenges in measuring the incidence of low birth weight is that more than half of infants in the developing world are not weighed at birth. In the past, most estimates of low birth weight for developing countries were based on data compiled from health facilities. However, these estimates are biased for most developing countries because the majority of newborns are not delivered in facilities, and those who are represent only a selected sample of all births.
Table TM.7.1 presents information on infants weighted at birth and is likely a biased estimate which underestimates the true prevalence.
Table TM.7.1: Infants weighed at birth
Percentage of last live-born children in the last two years weighed at birth, by source of information, and percentage of those weighed at birth estimated to have weighed below 2,500 grams at birth, by source of information, Lao PDR, 2017
Percentage of live births weighed at birth:
Number of last live-born children
in the last two years
Percentage of weighed live births recorded below 2,500 grams
(crude low birth-weight)B: Number of last live-born children in the last two
years with a recorded or recalled birthweight
From card
From recall Total1,A From card From recall Total
Total 32.3 35.0 67.4 4,231 2.4 4.0 6.5 2,853
Area Urban 50.3 40.6 91.1 1,149 4.5 3.2 7.9 1,046 Rural 25.6 32.9 58.6 3,082 1.7 4.3 6.0 1,807
Rural with road 27.7 34.4 62.3 2,556 1.9 4.3 6.3 1,593 Rural without road 15.1 25.3 40.6 526 0.5 4.2 4.6 214
Region North 28.8 38.6 67.5 1,375 2.0 4.4 6.4 928 Central 40.5 33.5 74.2 1,963 3.2 3.5 6.8 1,456 South 19.6 32.5 52.5 894 1.5 4.4 6.1 469
(Continued…)
From card From recall Total1,A From card From recall Total
Total 32.3 35.0 67.4 4,231 3.6 5.9 9.7 2,853
AreaUrban 50.3 40.6 91.1 1,149 5.0 3.5 8.6 1,046Rural 25.6 32.9 58.6 3,082 2.8 7.3 10.2 1,807
Rural with road 27.7 34.4 62.3 2,556 3.1 6.9 10.1 1,593Rural without road 15.1 25.3 40.6 526 1.2 10.2 11.4 214
RegionNorth 28.8 38.6 67.5 1,375 2.9 6.5 9.5 928Central 40.5 33.5 74.2 1,963 4.3 4.8 9.2 1,456South 19.6 32.5 52.5 894 2.8 8.4 11.6 469
(Continued…)
Table TM.7.1: Infants weighed at birthPercentage of last live-born children in the last two years weighed at birth, by source of information, and percentage of those weighed at birth estimated to have weighed below 2,500 grams at birth, by source of information, Lao PDR, 2017
Percentage of live births weighed at birth: Number of last live-
born children in the last two years
Percentage of weighed live births recorded below 2,500 grams (crude low birth-weight)B:
Number of last live-born children in the last two years with a recorded or recalled
birthweight
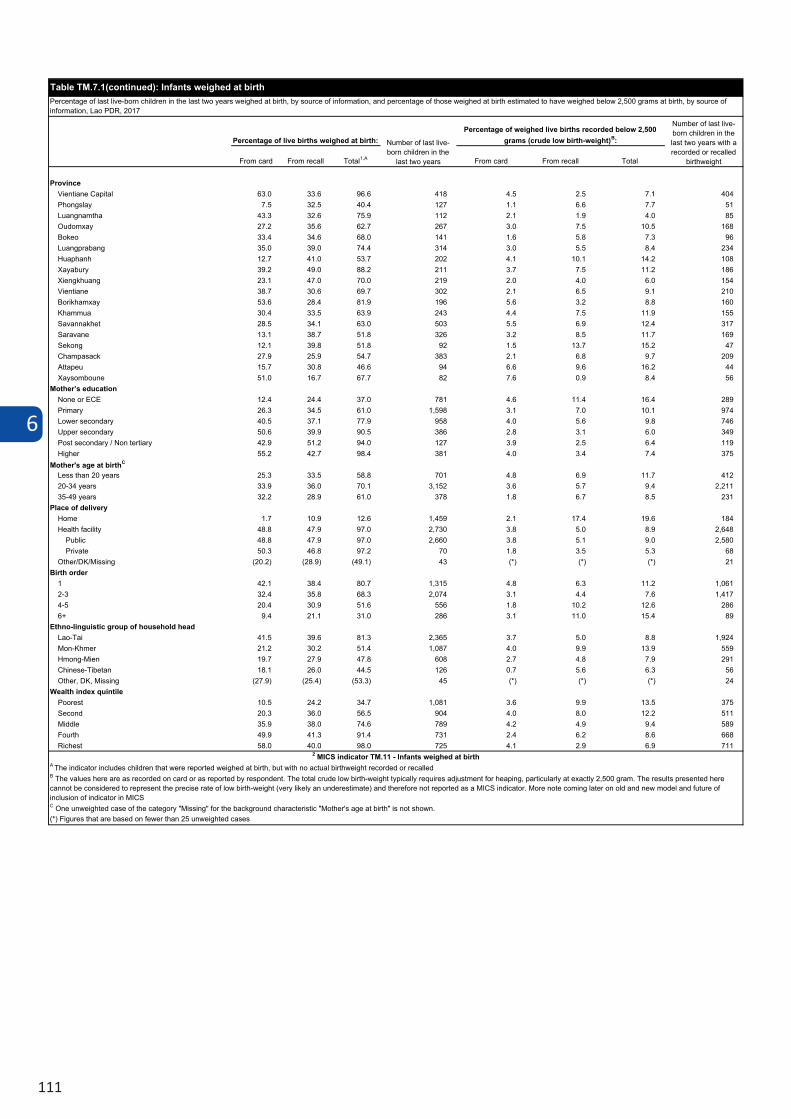
6
111
From card From recall Total1,A From card From recall Total
ProvinceVientiane Capital 63.0 33.6 96.6 418 4.5 2.5 7.1 404Phongslay 7.5 32.5 40.4 127 1.1 6.6 7.7 51Luangnamtha 43.3 32.6 75.9 112 2.1 1.9 4.0 85Oudomxay 27.2 35.6 62.7 267 3.0 7.5 10.5 168Bokeo 33.4 34.6 68.0 141 1.6 5.8 7.3 96Luangprabang 35.0 39.0 74.4 314 3.0 5.5 8.4 234Huaphanh 12.7 41.0 53.7 202 4.1 10.1 14.2 108Xayabury 39.2 49.0 88.2 211 3.7 7.5 11.2 186Xiengkhuang 23.1 47.0 70.0 219 2.0 4.0 6.0 154Vientiane 38.7 30.6 69.7 302 2.1 6.5 9.1 210Borikhamxay 53.6 28.4 81.9 196 5.6 3.2 8.8 160Khammua 30.4 33.5 63.9 243 4.4 7.5 11.9 155Savannakhet 28.5 34.1 63.0 503 5.5 6.9 12.4 317Saravane 13.1 38.7 51.8 326 3.2 8.5 11.7 169Sekong 12.1 39.8 51.8 92 1.5 13.7 15.2 47Champasack 27.9 25.9 54.7 383 2.1 6.8 9.7 209Attapeu 15.7 30.8 46.6 94 6.6 9.6 16.2 44Xaysomboune 51.0 16.7 67.7 82 7.6 0.9 8.4 56
Mother’s educationNone or ECE 12.4 24.4 37.0 781 4.6 11.4 16.4 289Primary 26.3 34.5 61.0 1,598 3.1 7.0 10.1 974Lower secondary 40.5 37.1 77.9 958 4.0 5.6 9.8 746Upper secondary 50.6 39.9 90.5 386 2.8 3.1 6.0 349Post secondary / Non tertiary 42.9 51.2 94.0 127 3.9 2.5 6.4 119Higher 55.2 42.7 98.4 381 4.0 3.4 7.4 375
Mother's age at birthC
Less than 20 years 25.3 33.5 58.8 701 4.8 6.9 11.7 41220-34 years 33.9 36.0 70.1 3,152 3.6 5.7 9.4 2,21135-49 years 32.2 28.9 61.0 378 1.8 6.7 8.5 231
Place of deliveryHome 1.7 10.9 12.6 1,459 2.1 17.4 19.6 184Health facility 48.8 47.9 97.0 2,730 3.8 5.0 8.9 2,648
Public 48.8 47.9 97.0 2,660 3.8 5.1 9.0 2,580Private 50.3 46.8 97.2 70 1.8 3.5 5.3 68
Other/DK/Missing (20.2) (28.9) (49.1) 43 (*) (*) (*) 21Birth order
1 42.1 38.4 80.7 1,315 4.8 6.3 11.2 1,0612-3 32.4 35.8 68.3 2,074 3.1 4.4 7.6 1,4174-5 20.4 30.9 51.6 556 1.8 10.2 12.6 2866+ 9.4 21.1 31.0 286 3.1 11.0 15.4 89
Ethno-linguistic group of household headLao-Tai 41.5 39.6 81.3 2,365 3.7 5.0 8.8 1,924Mon-Khmer 21.2 30.2 51.4 1,087 4.0 9.9 13.9 559Hmong-Mien 19.7 27.9 47.8 608 2.7 4.8 7.9 291Chinese-Tibetan 18.1 26.0 44.5 126 0.7 5.6 6.3 56Other, DK, Missing (27.9) (25.4) (53.3) 45 (*) (*) (*) 24
Wealth index quintilePoorest 10.5 24.2 34.7 1,081 3.6 9.9 13.5 375Second 20.3 36.0 56.5 904 4.0 8.0 12.2 511Middle 35.9 38.0 74.6 789 4.2 4.9 9.4 589Fourth 49.9 41.3 91.4 731 2.4 6.2 8.6 668Richest 58.0 40.0 98.0 725 4.1 2.9 6.9 711
2 MICS indicator TM.11 - Infants weighed at birthA The indicator includes children that were reported weighed at birth, but with no actual birthweight recorded or recalledB The values here are as recorded on card or as reported by respondent. The total crude low birth-weight typically requires adjustment for heaping, particularly at exactly 2,500 gram. The results presented here cannot be considered to represent the precise rate of low birth-weight (very likely an underestimate) and therefore not reported as a MICS indicator. More note coming later on old and new model and future of inclusion of indicator in MICSC One unweighted case of the category "Missing" for the background characteristic "Mother's age at birth" is not shown.(*) Figures that are based on fewer than 25 unweighted cases
Table TM.7.1(continued): Infants weighed at birthPercentage of last live-born children in the last two years weighed at birth, by source of information, and percentage of those weighed at birth estimated to have weighed below 2,500 grams at birth, by source of information, Lao PDR, 2017
Percentage of live births weighed at birth: Number of last live-born children in the
last two years
Percentage of weighed live births recorded below 2,500 grams (crude low birth-weight)B:
Number of last live-born children in the last two years with a recorded or recalled
birthweight
6
112
6.8 POSTNATAL CARE
The time of birth and immediately after is a critical window of opportunity to deliver lifesaving interventions for both the mother and newborn. Across the world, approximately 3 million newborns annually die in the first month of life12 andthe majority of these deaths occur within a day or two of birth13, which is also the time when the majority of maternaldeaths occur14.
The Post-natal Health Checks (PNC) module includes information on newborns’ and mothers’ contact with a provider, and specific questions on content of care. Measuring contact alone is important as PNC programmes scale up, it is important to measure the coverage of that scale up and ensure that the platform for providing essential services is in place. Content is considered more difficult to measure, particularly because the respondent is asked to recall services delivered up to two years preceding the interview.
The post-natal period begins immediately after birth and extends for about six weeks. It is a time when the mother’s body returns to how it was before pregnancy. A large proportion of maternal and neonatal deaths occur during the 48 hours after delivery, and these first two days following delivery are critical for monitoring complications arising from the delivery. Thus, post-natal care (PNC) is important for both the mother and the child, not only to treat complications arising from the delivery, but also to provide the mother with important information on how to care for herself and her child.
Table TM.8.1 presents the percent distribution of women age 15-49 who gave birth in a health facility in the two years preceding the survey by duration of stay in the facility following the delivery, according to background characteristics.
14 UN Interagency Group for Child Mortality Estimation. 2013. Levels and Trends in Child Mortality: Report 2013 15 Lawn, JE et al. 2005. 4 million neonatal deaths: When? Where? Why? Lancet 2005; 365:891–900. 16 WHO, UNICEF, UNFPA, The World Bank. 2012. Trends in Maternal Mortality: 1990-2010. World Health Organization.
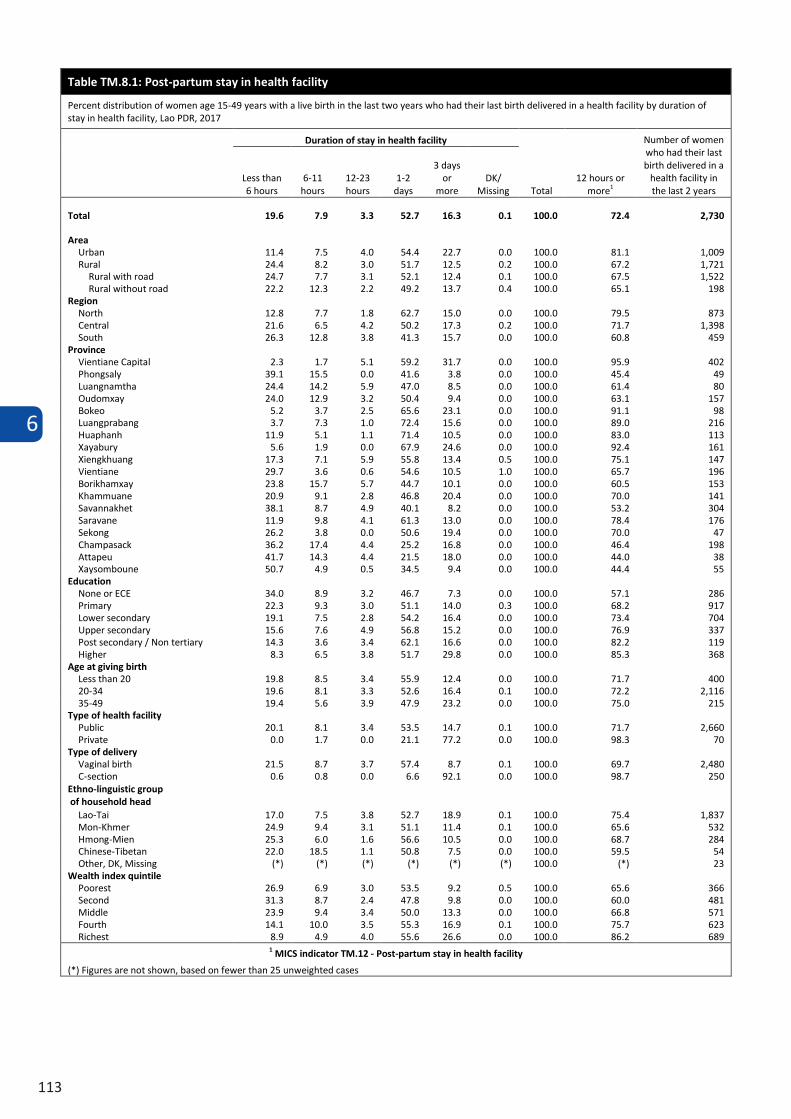
6
113
6.8 POSTNATAL CARE
The time of birth and immediately after is a critical window of opportunity to deliver lifesaving interventions for both the mother and newborn. Across the world, approximately 3 million newborns annually die in the first month of life12 andthe majority of these deaths occur within a day or two of birth13, which is also the time when the majority of maternaldeaths occur14.
The Post-natal Health Checks (PNC) module includes information on newborns’ and mothers’ contact with a provider, and specific questions on content of care. Measuring contact alone is important as PNC programmes scale up, it is important to measure the coverage of that scale up and ensure that the platform for providing essential services is in place. Content is considered more difficult to measure, particularly because the respondent is asked to recall services delivered up to two years preceding the interview.
The post-natal period begins immediately after birth and extends for about six weeks. It is a time when the mother’s body returns to how it was before pregnancy. A large proportion of maternal and neonatal deaths occur during the 48 hours after delivery, and these first two days following delivery are critical for monitoring complications arising from the delivery. Thus, post-natal care (PNC) is important for both the mother and the child, not only to treat complications arising from the delivery, but also to provide the mother with important information on how to care for herself and her child.
Table TM.8.1 presents the percent distribution of women age 15-49 who gave birth in a health facility in the two years preceding the survey by duration of stay in the facility following the delivery, according to background characteristics.
14 UN Interagency Group for Child Mortality Estimation. 2013. Levels and Trends in Child Mortality: Report 2013 15 Lawn, JE et al. 2005. 4 million neonatal deaths: When? Where? Why? Lancet 2005; 365:891–900. 16 WHO, UNICEF, UNFPA, The World Bank. 2012. Trends in Maternal Mortality: 1990-2010. World Health Organization.
Table TM.8.1: Post-partum stay in health facility
Percent distribution of women age 15-49 years with a live birth in the last two years who had their last birth delivered in a health facility by duration of stay in health facility, Lao PDR, 2017
Duration of stay in health facility
Total 12 hours or
more1
Number of women who had their last birth delivered in a
health facility in the last 2 years
Less than 6 hours
6-11 hours
12-23 hours
1-2 days
3 days or
more DK/
Missing
Total 19.6 7.9 3.3 52.7 16.3 0.1 100.0 72.4 2,730
Area Urban 11.4 7.5 4.0 54.4 22.7 0.0 100.0 81.1 1,009 Rural 24.4 8.2 3.0 51.7 12.5 0.2 100.0 67.2 1,721
Rural with road 24.7 7.7 3.1 52.1 12.4 0.1 100.0 67.5 1,522 Rural without road 22.2 12.3 2.2 49.2 13.7 0.4 100.0 65.1 198
Region North 12.8 7.7 1.8 62.7 15.0 0.0 100.0 79.5 873 Central 21.6 6.5 4.2 50.2 17.3 0.2 100.0 71.7 1,398 South 26.3 12.8 3.8 41.3 15.7 0.0 100.0 60.8 459
Province Vientiane Capital 2.3 1.7 5.1 59.2 31.7 0.0 100.0 95.9 402 Phongsaly 39.1 15.5 0.0 41.6 3.8 0.0 100.0 45.4 49 Luangnamtha 24.4 14.2 5.9 47.0 8.5 0.0 100.0 61.4 80 Oudomxay 24.0 12.9 3.2 50.4 9.4 0.0 100.0 63.1 157 Bokeo 5.2 3.7 2.5 65.6 23.1 0.0 100.0 91.1 98 Luangprabang 3.7 7.3 1.0 72.4 15.6 0.0 100.0 89.0 216 Huaphanh 11.9 5.1 1.1 71.4 10.5 0.0 100.0 83.0 113 Xayabury 5.6 1.9 0.0 67.9 24.6 0.0 100.0 92.4 161 Xiengkhuang 17.3 7.1 5.9 55.8 13.4 0.5 100.0 75.1 147 Vientiane 29.7 3.6 0.6 54.6 10.5 1.0 100.0 65.7 196 Borikhamxay 23.8 15.7 5.7 44.7 10.1 0.0 100.0 60.5 153 Khammuane 20.9 9.1 2.8 46.8 20.4 0.0 100.0 70.0 141 Savannakhet 38.1 8.7 4.9 40.1 8.2 0.0 100.0 53.2 304 Saravane 11.9 9.8 4.1 61.3 13.0 0.0 100.0 78.4 176 Sekong 26.2 3.8 0.0 50.6 19.4 0.0 100.0 70.0 47 Champasack 36.2 17.4 4.4 25.2 16.8 0.0 100.0 46.4 198 Attapeu 41.7 14.3 4.4 21.5 18.0 0.0 100.0 44.0 38 Xaysomboune 50.7 4.9 0.5 34.5 9.4 0.0 100.0 44.4 55
Education None or ECE 34.0 8.9 3.2 46.7 7.3 0.0 100.0 57.1 286 Primary 22.3 9.3 3.0 51.1 14.0 0.3 100.0 68.2 917 Lower secondary 19.1 7.5 2.8 54.2 16.4 0.0 100.0 73.4 704 Upper secondary 15.6 7.6 4.9 56.8 15.2 0.0 100.0 76.9 337 Post secondary / Non tertiary 14.3 3.6 3.4 62.1 16.6 0.0 100.0 82.2 119 Higher 8.3 6.5 3.8 51.7 29.8 0.0 100.0 85.3 368
Age at giving birth Less than 20 19.8 8.5 3.4 55.9 12.4 0.0 100.0 71.7 400 20-34 19.6 8.1 3.3 52.6 16.4 0.1 100.0 72.2 2,116 35-49 19.4 5.6 3.9 47.9 23.2 0.0 100.0 75.0 215
Type of health facility Public 20.1 8.1 3.4 53.5 14.7 0.1 100.0 71.7 2,660 Private 0.0 1.7 0.0 21.1 77.2 0.0 100.0 98.3 70
Type of delivery Vaginal birth 21.5 8.7 3.7 57.4 8.7 0.1 100.0 69.7 2,480 C-section 0.6 0.8 0.0 6.6 92.1 0.0 100.0 98.7 250
Ethno-linguistic group of household head
Lao-Tai 17.0 7.5 3.8 52.7 18.9 0.1 100.0 75.4 1,837 Mon-Khmer 24.9 9.4 3.1 51.1 11.4 0.1 100.0 65.6 532 Hmong-Mien 25.3 6.0 1.6 56.6 10.5 0.0 100.0 68.7 284 Chinese-Tibetan 22.0 18.5 1.1 50.8 7.5 0.0 100.0 59.5 54 Other, DK, Missing (*) (*) (*) (*) (*) (*) 100.0 (*) 23
Wealth index quintile Poorest 26.9 6.9 3.0 53.5 9.2 0.5 100.0 65.6 366 Second 31.3 8.7 2.4 47.8 9.8 0.0 100.0 60.0 481 Middle 23.9 9.4 3.4 50.0 13.3 0.0 100.0 66.8 571 Fourth 14.1 10.0 3.5 55.3 16.9 0.1 100.0 75.7 623 Richest 8.9 4.9 4.0 55.6 26.6 0.0 100.0 86.2 689
1 MICS indicator TM.12 - Post-partum stay in health facility
(*) Figures are not shown, based on fewer than 25 unweighted cases
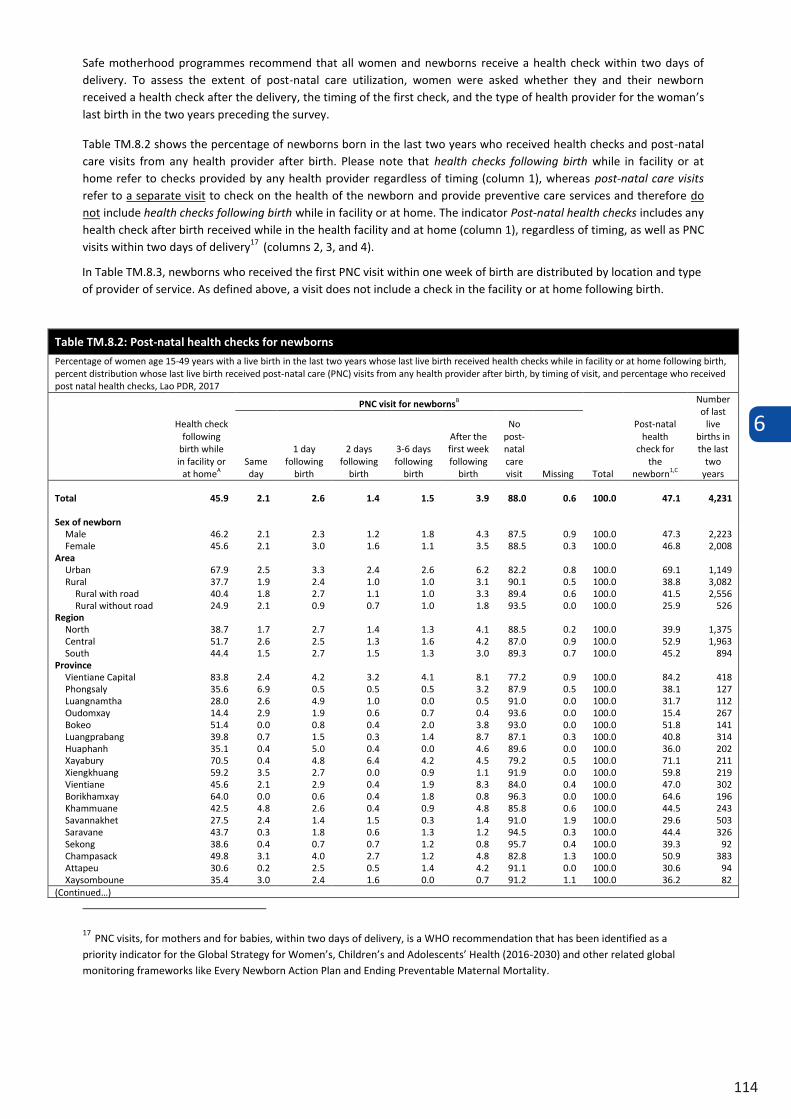
6
114
Safe motherhood programmes recommend that all women and newborns receive a health check within two days of delivery. To assess the extent of post-natal care utilization, women were asked whether they and their newborn received a health check after the delivery, the timing of the first check, and the type of health provider for the woman’s last birth in the two years preceding the survey.
Table TM.8.2 shows the percentage of newborns born in the last two years who received health checks and post-natal care visits from any health provider after birth. Please note that health checks following birth while in facility or at home refer to checks provided by any health provider regardless of timing (column 1), whereas post-natal care visits refer to a separate visit to check on the health of the newborn and provide preventive care services and therefore do not include health checks following birth while in facility or at home. The indicator Post-natal health checks includes any health check after birth received while in the health facility and at home (column 1), regardless of timing, as well as PNC visits within two days of delivery17 (columns 2, 3, and 4).
Table TM.8.2: Post-natal health checks for newborns
Percentage of women age 15-49 years with a live birth in the last two years whose last live birth received health checks while in facility or at home following birth, percent distribution whose last live birth received post-natal care (PNC) visits from any health provider after birth, by timing of visit, and percentage who received post natal health checks, Lao PDR, 2017
Health check following
birth while in facility or
at homeA
PNC visit for newbornsB
Total
Post-natal health
check for the
newborn1,C
Number of last
live births in the last
two years
Same day
1 day following
birth
2 days following
birth
3-6 days following
birth
After the first week following
birth
No post-natal care visit Missing
Total 45.9 2.1 2.6 1.4 1.5 3.9 88.0 0.6 100.0 47.1 4,231
Sex of newborn Male 46.2 2.1 2.3 1.2 1.8 4.3 87.5 0.9 100.0 47.3 2,223 Female 45.6 2.1 3.0 1.6 1.1 3.5 88.5 0.3 100.0 46.8 2,008
Area Urban 67.9 2.5 3.3 2.4 2.6 6.2 82.2 0.8 100.0 69.1 1,149 Rural 37.7 1.9 2.4 1.0 1.0 3.1 90.1 0.5 100.0 38.8 3,082
Rural with road 40.4 1.8 2.7 1.1 1.0 3.3 89.4 0.6 100.0 41.5 2,556 Rural without road 24.9 2.1 0.9 0.7 1.0 1.8 93.5 0.0 100.0 25.9 526
Region North 38.7 1.7 2.7 1.4 1.3 4.1 88.5 0.2 100.0 39.9 1,375 Central 51.7 2.6 2.5 1.3 1.6 4.2 87.0 0.9 100.0 52.9 1,963 South 44.4 1.5 2.7 1.5 1.3 3.0 89.3 0.7 100.0 45.2 894
Province Vientiane Capital 83.8 2.4 4.2 3.2 4.1 8.1 77.2 0.9 100.0 84.2 418 Phongsaly 35.6 6.9 0.5 0.5 0.5 3.2 87.9 0.5 100.0 38.1 127 Luangnamtha 28.0 2.6 4.9 1.0 0.0 0.5 91.0 0.0 100.0 31.7 112 Oudomxay 14.4 2.9 1.9 0.6 0.7 0.4 93.6 0.0 100.0 15.4 267 Bokeo 51.4 0.0 0.8 0.4 2.0 3.8 93.0 0.0 100.0 51.8 141 Luangprabang 39.8 0.7 1.5 0.3 1.4 8.7 87.1 0.3 100.0 40.8 314 Huaphanh 35.1 0.4 5.0 0.4 0.0 4.6 89.6 0.0 100.0 36.0 202 Xayabury 70.5 0.4 4.8 6.4 4.2 4.5 79.2 0.5 100.0 71.1 211 Xiengkhuang 59.2 3.5 2.7 0.0 0.9 1.1 91.9 0.0 100.0 59.8 219 Vientiane 45.6 2.1 2.9 0.4 1.9 8.3 84.0 0.4 100.0 47.0 302 Borikhamxay 64.0 0.0 0.6 0.4 1.8 0.8 96.3 0.0 100.0 64.6 196 Khammuane 42.5 4.8 2.6 0.4 0.9 4.8 85.8 0.6 100.0 44.5 243 Savannakhet 27.5 2.4 1.4 1.5 0.3 1.4 91.0 1.9 100.0 29.6 503 Saravane 43.7 0.3 1.8 0.6 1.3 1.2 94.5 0.3 100.0 44.4 326 Sekong 38.6 0.4 0.7 0.7 1.2 0.8 95.7 0.4 100.0 39.3 92 Champasack 49.8 3.1 4.0 2.7 1.2 4.8 82.8 1.3 100.0 50.9 383 Attapeu 30.6 0.2 2.5 0.5 1.4 4.2 91.1 0.0 100.0 30.6 94 Xaysomboune 35.4 3.0 2.4 1.6 0.0 0.7 91.2 1.1 100.0 36.2 82
(Continued…)
17 PNC visits, for mothers and for babies, within two days of delivery, is a WHO recommendation that has been identified as a priority indicator for the Global Strategy for Women’s, Children’s and Adolescents’ Health (2016-2030) and other related global monitoring frameworks like Every Newborn Action Plan and Ending Preventable Maternal Mortality.
In Table TM.8.3, newborns who received the first PNC visit within one week of birth are distributed by location and type of provider of service. As defined above, a visit does not include a check in the facility or at home following birth.
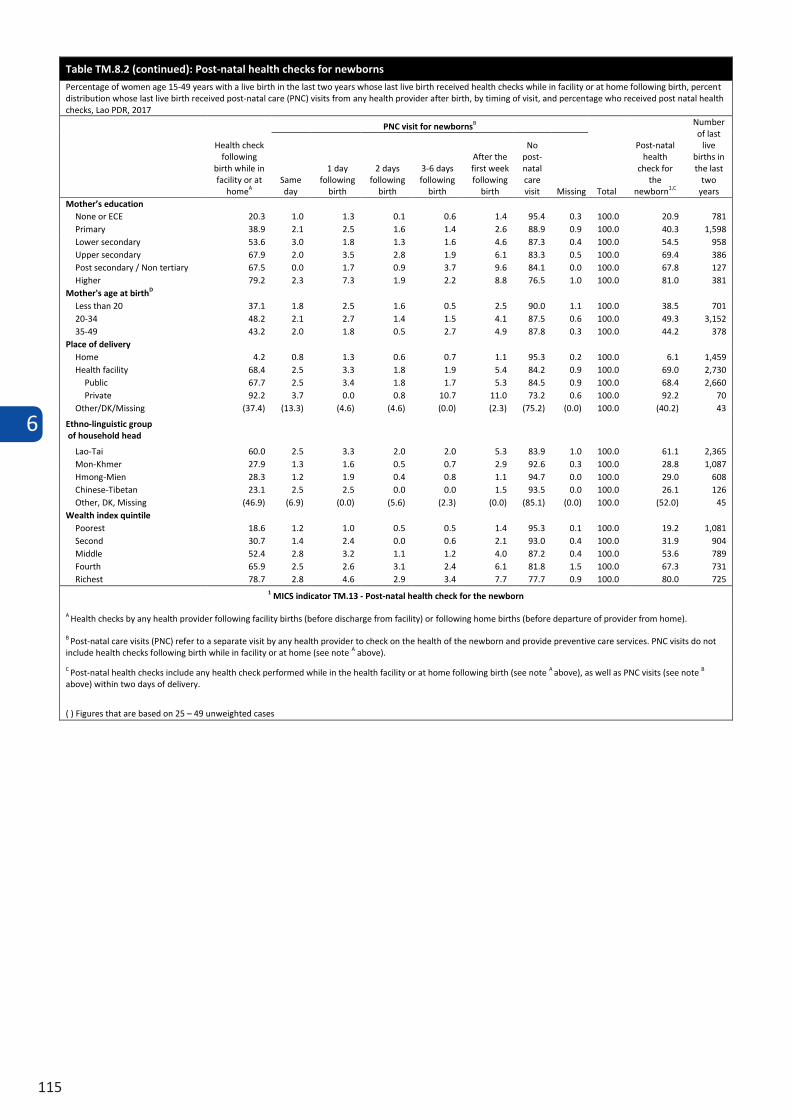
6
115
Table TM.8.2 (continued): Post-natal health checks for newborns
Percentage of women age 15-49 years with a live birth in the last two years whose last live birth received health checks while in facility or at home following birth, percent distribution whose last live birth received post-natal care (PNC) visits from any health provider after birth, by timing of visit, and percentage who received post natal health checks, Lao PDR, 2017
Health check following
birth while in facility or at
homeA
PNC visit for newbornsB
Total
Post-natal health
check for the
newborn1,C
Number of last
live births in the last
two years
Same day
1 day following
birth
2 days following
birth
3-6 days following
birth
After the first week following
birth
No post-natal care visit Missing
Mother’s education None or ECE 20.3 1.0 1.3 0.1 0.6 1.4 95.4 0.3 100.0 20.9 781 Primary 38.9 2.1 2.5 1.6 1.4 2.6 88.9 0.9 100.0 40.3 1,598 Lower secondary 53.6 3.0 1.8 1.3 1.6 4.6 87.3 0.4 100.0 54.5 958 Upper secondary 67.9 2.0 3.5 2.8 1.9 6.1 83.3 0.5 100.0 69.4 386 Post secondary / Non tertiary 67.5 0.0 1.7 0.9 3.7 9.6 84.1 0.0 100.0 67.8 127 Higher 79.2 2.3 7.3 1.9 2.2 8.8 76.5 1.0 100.0 81.0 381
Mother's age at birthD Less than 20 37.1 1.8 2.5 1.6 0.5 2.5 90.0 1.1 100.0 38.5 701 20-34 48.2 2.1 2.7 1.4 1.5 4.1 87.5 0.6 100.0 49.3 3,152 35-49 43.2 2.0 1.8 0.5 2.7 4.9 87.8 0.3 100.0 44.2 378
Place of delivery Home 4.2 0.8 1.3 0.6 0.7 1.1 95.3 0.2 100.0 6.1 1,459 Health facility 68.4 2.5 3.3 1.8 1.9 5.4 84.2 0.9 100.0 69.0 2,730
Public 67.7 2.5 3.4 1.8 1.7 5.3 84.5 0.9 100.0 68.4 2,660 Private 92.2 3.7 0.0 0.8 10.7 11.0 73.2 0.6 100.0 92.2 70
Other/DK/Missing (37.4) (13.3) (4.6) (4.6) (0.0) (2.3) (75.2) (0.0) 100.0 (40.2) 43
Ethno-linguistic group of household head
Lao-Tai 60.0 2.5 3.3 2.0 2.0 5.3 83.9 1.0 100.0 61.1 2,365 Mon-Khmer 27.9 1.3 1.6 0.5 0.7 2.9 92.6 0.3 100.0 28.8 1,087 Hmong-Mien 28.3 1.2 1.9 0.4 0.8 1.1 94.7 0.0 100.0 29.0 608 Chinese-Tibetan 23.1 2.5 2.5 0.0 0.0 1.5 93.5 0.0 100.0 26.1 126 Other, DK, Missing (46.9) (6.9) (0.0) (5.6) (2.3) (0.0) (85.1) (0.0) 100.0 (52.0) 45
Wealth index quintile Poorest 18.6 1.2 1.0 0.5 0.5 1.4 95.3 0.1 100.0 19.2 1,081 Second 30.7 1.4 2.4 0.0 0.6 2.1 93.0 0.4 100.0 31.9 904 Middle 52.4 2.8 3.2 1.1 1.2 4.0 87.2 0.4 100.0 53.6 789 Fourth 65.9 2.5 2.6 3.1 2.4 6.1 81.8 1.5 100.0 67.3 731 Richest 78.7 2.8 4.6 2.9 3.4 7.7 77.7 0.9 100.0 80.0 725
1 MICS indicator TM.13 - Post-natal health check for the newborn
A Health checks by any health provider following facility births (before discharge from facility) or following home births (before departure of provider from home).
B Post-natal care visits (PNC) refer to a separate visit by any health provider to check on the health of the newborn and provide preventive care services. PNC visits do not include health checks following birth while in facility or at home (see note A above).
C Post-natal health checks include any health check performed while in the health facility or at home following birth (see note A above), as well as PNC visits (see note B above) within two days of delivery.
( ) Figures that are based on 25 – 49 unweighted cases
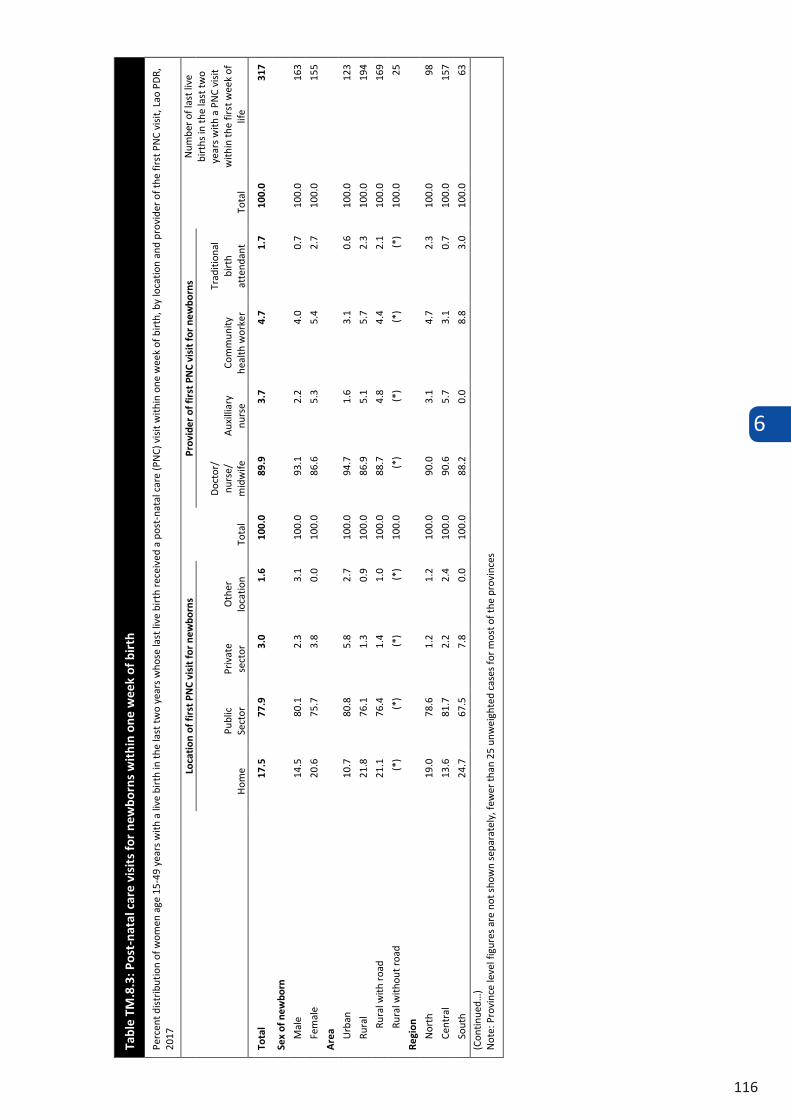
6
116
Tabl
e TM
.8.3
: Pos
t-na
tal c
are
visi
ts fo
r ne
wbo
rns
wit
hin
one
wee
k of
bir
th
Perc
ent d
istr
ibut
ion
of w
omen
age
15-
49 y
ears
with
a li
ve b
irth
in th
e la
st tw
o ye
ars
who
se la
st li
ve b
irth
rece
ived
a p
ost-
nata
l car
e (P
NC)
vis
it w
ithin
one
wee
k of
birt
h, b
y lo
catio
n an
d pr
ovid
er o
f the
firs
t PN
C vi
sit,
Lao
PD
R,
2017
Loca
tion
of f
irst
PN
C vi
sit f
or n
ewbo
rns
Tota
l
Prov
ider
of f
irst
PN
C vi
sit f
or n
ewbo
rns
Tota
l
Num
ber o
f las
t liv
e bi
rths
in th
e la
st tw
o ye
ars
with
a P
NC
visi
t w
ithin
the
first
wee
k of
lif
e H
ome
Publ
ic
Sect
or
Priv
ate
sect
or
Oth
er
loca
tion
Doc
tor/
nu
rse/
m
idw
ife
Aux
illia
ry
nurs
e Co
mm
unity
he
alth
wor
ker
Trad
ition
al
birt
h at
tend
ant
Tota
l 17
.5
77.9
3.
0 1.
6 10
0.0
89.9
3.
7 4.
7 1.
7 10
0.0
317
Sex
of n
ewbo
rn
Mal
e 14
.5
80.1
2.
3 3.
1 10
0.0
93.1
2.
2 4.
0 0.
7 10
0.0
163
Fem
ale
20.6
75
.7
3.8
0.0
100.
0 86
.6
5.3
5.4
2.7
100.
0 15
5
Are
a Urb
an
10.7
80
.8
5.8
2.7
100.
0 94
.7
1.6
3.1
0.6
100.
0 12
3
Rura
l 21
.8
76.1
1.
3 0.
9 10
0.0
86.9
5.
1 5.
7 2.
3 10
0.0
194
Rura
l with
roa
d 21
.1
76.4
1.
4 1.
0 10
0.0
88.7
4.
8 4.
4 2.
1 10
0.0
169
Rura
l with
out r
oad
(*)
(*)
(*)
(*)
100.
0 (*
) (*
) (*
) (*
) 10
0.0
25
Regi
on
Nor
th
19.0
78
.6
1.2
1.2
100.
0 90
.0
3.1
4.7
2.3
100.
0 98
Cent
ral
13.6
81
.7
2.2
2.4
100.
0 90
.6
5.7
3.1
0.7
100.
0 15
7
Sout
h 24
.7
67.5
7.
8 0.
0 10
0.0
88.2
0.
0 8.
8 3.
0 10
0.0
63
(Con
tinue
d…)
Not
e: P
rovi
nce
leve
l fig
ures
are
not
sho
wn
sepa
rate
ly, f
ewer
than
25
unw
eigh
ted
case
s fo
r mos
t of t
he p
rovi
nces
Tabl
e TM
.8.3
(con
tinu
ed):
Pos
t-na
tal c
are
visi
ts fo
r ne
wbo
rns
wit
hin
one
wee
k of
bir
th
Perc
ent d
istr
ibut
ion
of w
omen
age
15-
49 y
ears
with
a li
ve b
irth
in th
e la
st tw
o ye
ars
who
se la
st li
ve b
irth
rece
ived
a p
ost-
nata
l car
e (P
NC)
vis
it w
ithin
one
wee
k of
birt
h, b
y lo
catio
n an
d pr
ovid
er o
f the
firs
t PN
C vi
sit,
Lao
PD
R,
2017
Loca
tion
of f
irst
PN
C vi
sit f
or n
ewbo
rns
Tota
l
Prov
ider
of f
irst
PN
C vi
sit f
or n
ewbo
rns
Tota
l
Num
ber o
f las
t liv
e bi
rths
in th
e la
st tw
o ye
ars
with
a P
NC
visi
t w
ithin
the
first
w
eek
of li
fe
Hom
e Pu
blic
Se
ctor
Pr
ivat
e se
ctor
O
ther
lo
catio
n
Doc
tor/
nu
rse/
m
idw
ife
Aux
illia
ry
nurs
e Co
mm
unity
he
alth
wor
ker
Trad
ition
al
birt
h at
tend
ant
Mot
her’
s ed
ucat
ion
Non
e or
ECE
(3
6.4)
(6
1.1)
(2
.5)
(0.0
) 10
0.0
(75.
1)
(9.4
) (8
.8)
(6.8
) 10
0.0
23
Prim
ary
22.4
75
.1
2.0
0.4
100.
0 82
.5
6.2
8.8
2.5
100.
0 12
2 Lo
wer
sec
onda
ry
9.9
84.4
2.
1 3.
6 10
0.0
98.8
0.
0 1.
2 0.
0 10
0.0
73
Upp
er s
econ
dary
(9
.9)
(81.
5)
(8.6
) (0
.0)
100.
0 (9
6.5)
(3
.5)
(0.0
) (0
.0)
100.
0 39
Po
st s
econ
dary
/ N
on te
rtia
ry
(*)
(*)
(*)
(*)
100.
0 (*
) (*
) (*
) (*
) 10
0.0
8 H
ighe
r 13
.1
83.5
0.
0 3.
4 10
0.0
94.7
1.
6 2.
4 1.
3 10
0.0
52
Mot
her'
s ag
e at
bir
th
Less
than
20
(17.
0)
(83.
0)
(0.0
) (0
.0)
100.
0 (8
4.9)
(9
.4)
(5.7
) (0
.0)
100.
0 45
20
-34
16.0
80
.2
1.8
2.0
100.
0 91
.5
3.1
3.2
2.1
100.
0 24
6 35
-49
(32.
5)
(48.
3)
(19.
2)
(0.0
) 10
0.0
(83.
6)
(0.0
) (1
6.4)
(0
.0)
100.
0 26
Pl
ace
of d
eliv
ery
Hom
e 67
.3
31.5
1.
2 0.
0 10
0.0
62.1
9.
7 17
.6
10.6
10
0.0
49
Hea
lth fa
cilit
y 8.
4 87
.8
2.9
0.9
100.
0 94
.9
2.7
2.4
0.0
100.
0 25
8 Pu
blic
8.
5 90
.5
0.0
0.9
100.
0 94
.6
2.9
2.5
0.0
100.
0 24
8 Pr
ivat
e (*
) (*
) (*
) (*
) 10
0.0
(*)
(*)
(*)
(*)
100.
0 11
O
ther
/DK/
Mis
sing
(*
) (*
) (*
) (*
) 10
0.0
(*)
(*)
(*)
(*)
100.
0 10
Et
hno-
lingu
isti
c gr
oup
of h
ouse
hold
hea
d La
o-Ta
i 15
.7
79.7
3.
0 1.
6 10
0.0
92.5
2.
3 4.
5 0.
8 10
0.0
234
Mon
-Khm
er
27.6
69
.7
1.3
1.4
100.
0 80
.1
8.7
6.5
4.7
100.
0 45
H
mon
g-M
ien
(6.8
) (8
8.9)
(2
.3)
(2.1
) 10
0.0
(86.
1)
(10.
6)
(3.3
) (0
.0)
100.
0 26
Ch
ines
e-Ti
beta
n (*
) (*
) (*
) (*
) 10
0.0
(*)
(*)
(*)
(*)
100.
0 6
Oth
er, D
K, M
issi
ng
(*)
(*)
(*)
(*)
100.
0 (*
) (*
) (*
) (*
) 10
0.0
7 W
ealt
h in
dex
quin
tile
Po
ores
t (2
7.1)
(7
2.9)
(0
.0)
(0.0
) 10
0.0
(76.
6)
(7.6
) (1
0.0)
(5
.9)
100.
0 34
Se
cond
(3
4.9)
(6
5.1)
(0
.0)
(0.0
) 10
0.0
(71.
2)
(7.1
) (1
7.1)
(4
.6)
100.
0 40
M
iddl
e 21
.4
75.0
2.
8 0.
8 10
0.0
92.7
2.
6 2.
5 2.
1 10
0.0
66
Four
th
12.5
83
.2
2.8
1.5
100.
0 92
.4
5.4
2.2
0.0
100.
0 78
Ri
ches
t 8.
4 82
.6
5.6
3.3
100.
0 98
.3
0.5
1.3
0.0
100.
0 99
( )
Fig
ures
that
are
bas
ed o
n 25
– 4
9 un
wei
ghte
d ca
ses
(*) F
igur
es a
re n
ot s
how
n, b
ased
on
few
er th
an 2
5 un
wei
ghte
d ca
ses
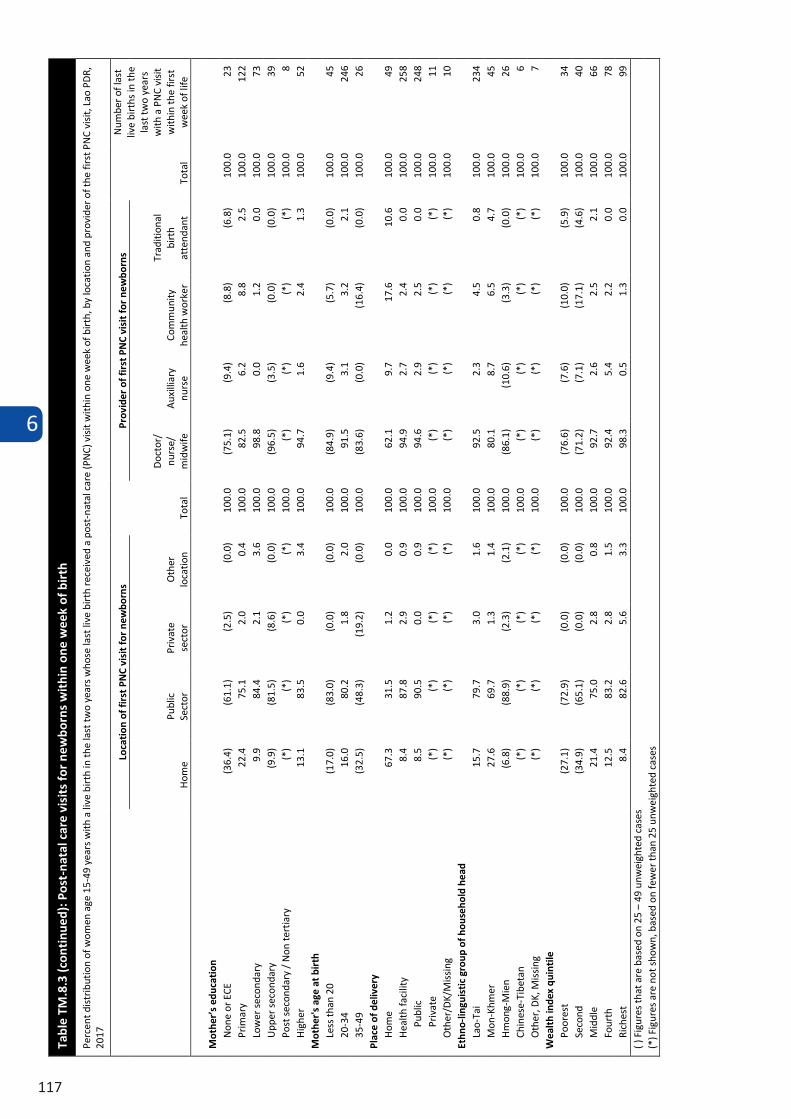
6
117
Tabl
e TM
.8.3
(con
tinu
ed):
Pos
t-na
tal c
are
visi
ts fo
r ne
wbo
rns
wit
hin
one
wee
k of
bir
th
Perc
ent d
istr
ibut
ion
of w
omen
age
15-
49 y
ears
with
a li
ve b
irth
in th
e la
st tw
o ye
ars
who
se la
st li
ve b
irth
rece
ived
a p
ost-
nata
l car
e (P
NC)
vis
it w
ithin
one
wee
k of
birt
h, b
y lo
catio
n an
d pr
ovid
er o
f the
firs
t PN
C vi
sit,
Lao
PD
R,
2017
Loca
tion
of f
irst
PN
C vi
sit f
or n
ewbo
rns
Tota
l
Prov
ider
of f
irst
PN
C vi
sit f
or n
ewbo
rns
Tota
l
Num
ber o
f las
t liv
e bi
rths
in th
e la
st tw
o ye
ars
with
a P
NC
visi
t w
ithin
the
first
w
eek
of li
fe
Hom
e Pu
blic
Se
ctor
Pr
ivat
e se
ctor
O
ther
lo
catio
n
Doc
tor/
nu
rse/
m
idw
ife
Aux
illia
ry
nurs
e Co
mm
unity
he
alth
wor
ker
Trad
ition
al
birt
h at
tend
ant
Mot
her’
s ed
ucat
ion
Non
e or
ECE
(3
6.4)
(6
1.1)
(2
.5)
(0.0
) 10
0.0
(75.
1)
(9.4
) (8
.8)
(6.8
) 10
0.0
23
Prim
ary
22.4
75
.1
2.0
0.4
100.
0 82
.5
6.2
8.8
2.5
100.
0 12
2 Lo
wer
sec
onda
ry
9.9
84.4
2.
1 3.
6 10
0.0
98.8
0.
0 1.
2 0.
0 10
0.0
73
Upp
er s
econ
dary
(9
.9)
(81.
5)
(8.6
) (0
.0)
100.
0 (9
6.5)
(3
.5)
(0.0
) (0
.0)
100.
0 39
Po
st s
econ
dary
/ N
on te
rtia
ry
(*)
(*)
(*)
(*)
100.
0 (*
) (*
) (*
) (*
) 10
0.0
8 H
ighe
r 13
.1
83.5
0.
0 3.
4 10
0.0
94.7
1.
6 2.
4 1.
3 10
0.0
52
Mot
her'
s ag
e at
bir
th
Less
than
20
(17.
0)
(83.
0)
(0.0
) (0
.0)
100.
0 (8
4.9)
(9
.4)
(5.7
) (0
.0)
100.
0 45
20
-34
16.0
80
.2
1.8
2.0
100.
0 91
.5
3.1
3.2
2.1
100.
0 24
6 35
-49
(32.
5)
(48.
3)
(19.
2)
(0.0
) 10
0.0
(83.
6)
(0.0
) (1
6.4)
(0
.0)
100.
0 26
Pl
ace
of d
eliv
ery
Hom
e 67
.3
31.5
1.
2 0.
0 10
0.0
62.1
9.
7 17
.6
10.6
10
0.0
49
Hea
lth fa
cilit
y 8.
4 87
.8
2.9
0.9
100.
0 94
.9
2.7
2.4
0.0
100.
0 25
8 Pu
blic
8.
5 90
.5
0.0
0.9
100.
0 94
.6
2.9
2.5
0.0
100.
0 24
8 Pr
ivat
e (*
) (*
) (*
) (*
) 10
0.0
(*)
(*)
(*)
(*)
100.
0 11
O
ther
/DK/
Mis
sing
(*
) (*
) (*
) (*
) 10
0.0
(*)
(*)
(*)
(*)
100.
0 10
Et
hno-
lingu
isti
c gr
oup
of h
ouse
hold
hea
d La
o-Ta
i 15
.7
79.7
3.
0 1.
6 10
0.0
92.5
2.
3 4.
5 0.
8 10
0.0
234
Mon
-Khm
er
27.6
69
.7
1.3
1.4
100.
0 80
.1
8.7
6.5
4.7
100.
0 45
H
mon
g-M
ien
(6.8
) (8
8.9)
(2
.3)
(2.1
) 10
0.0
(86.
1)
(10.
6)
(3.3
) (0
.0)
100.
0 26
Ch
ines
e-Ti
beta
n (*
) (*
) (*
) (*
) 10
0.0
(*)
(*)
(*)
(*)
100.
0 6
Oth
er, D
K, M
issi
ng
(*)
(*)
(*)
(*)
100.
0 (*
) (*
) (*
) (*
) 10
0.0
7 W
ealt
h in
dex
quin
tile
Po
ores
t (2
7.1)
(7
2.9)
(0
.0)
(0.0
) 10
0.0
(76.
6)
(7.6
) (1
0.0)
(5
.9)
100.
0 34
Se
cond
(3
4.9)
(6
5.1)
(0
.0)
(0.0
) 10
0.0
(71.
2)
(7.1
) (1
7.1)
(4
.6)
100.
0 40
M
iddl
e 21
.4
75.0
2.
8 0.
8 10
0.0
92.7
2.
6 2.
5 2.
1 10
0.0
66
Four
th
12.5
83
.2
2.8
1.5
100.
0 92
.4
5.4
2.2
0.0
100.
0 78
Ri
ches
t 8.
4 82
.6
5.6
3.3
100.
0 98
.3
0.5
1.3
0.0
100.
0 99
( )
Fig
ures
that
are
bas
ed o
n 25
– 4
9 un
wei
ghte
d ca
ses
(*) F
igur
es a
re n
ot s
how
n, b
ased
on
few
er th
an 2
5 un
wei
ghte
d ca
ses
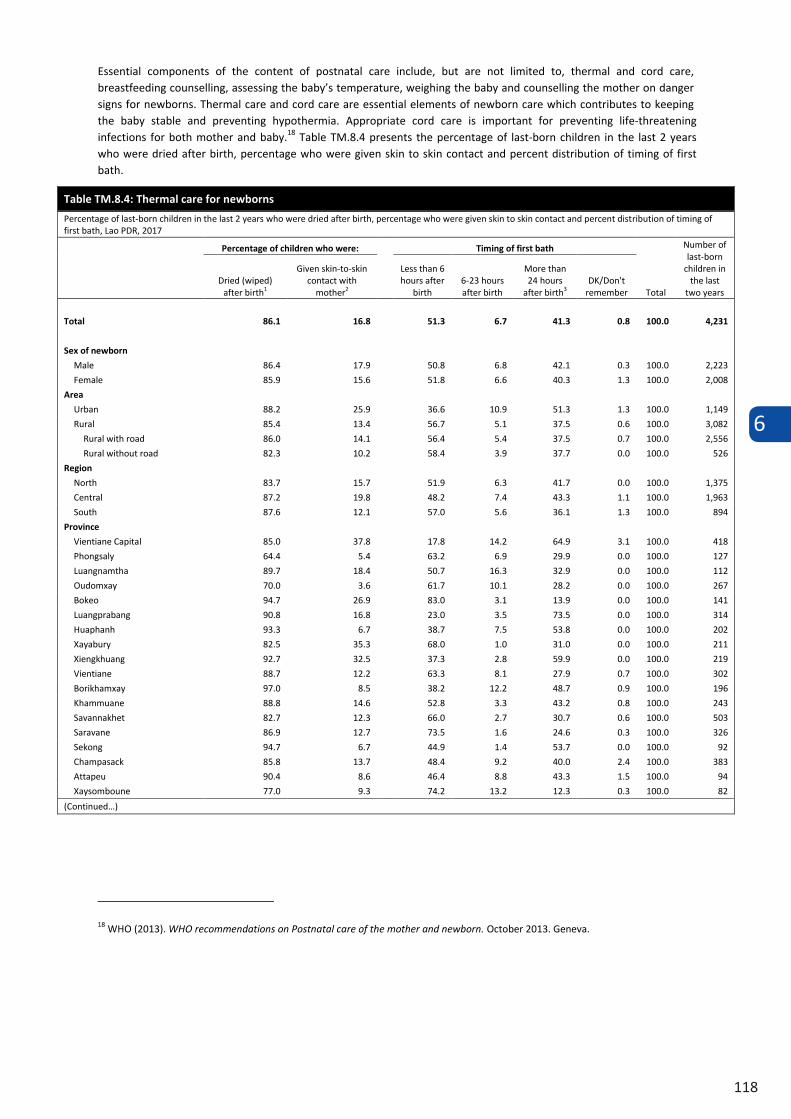
6
118
Essential components of the content of postnatal care include, but are not limited to, thermal and cord care, breastfeeding counselling, assessing the baby’s temperature, weighing the baby and counselling the mother on danger signs for newborns. Thermal care and cord care are essential elements of newborn care which contributes to keeping the baby stable and preventing hypothermia. Appropriate cord care is important for preventing life-threatening infections for both mother and baby.18 Table TM.8.4 presents the percentage of last-born children in the last 2 years who were dried after birth, percentage who were given skin to skin contact and percent distribution of timing of first bath.
Table TM.8.4: Thermal care for newborns
Percentage of last-born children in the last 2 years who were dried after birth, percentage who were given skin to skin contact and percent distribution of timing of first bath, Lao PDR, 2017
Percentage of children who were: Timing of first bath
Total
Number of last-born
children in the last
two years Dried (wiped)
after birth1
Given skin-to-skin contact with
mother2
Less than 6 hours after
birth 6-23 hours after birth
More than 24 hours
after birth3 DK/Don't
remember
Total 86.1 16.8 51.3 6.7 41.3 0.8 100.0 4,231
Sex of newborn
Male 86.4 17.9 50.8 6.8 42.1 0.3 100.0 2,223
Female 85.9 15.6 51.8 6.6 40.3 1.3 100.0 2,008
Area
Urban 88.2 25.9 36.6 10.9 51.3 1.3 100.0 1,149
Rural 85.4 13.4 56.7 5.1 37.5 0.6 100.0 3,082
Rural with road 86.0 14.1 56.4 5.4 37.5 0.7 100.0 2,556
Rural without road 82.3 10.2 58.4 3.9 37.7 0.0 100.0 526
Region
North 83.7 15.7 51.9 6.3 41.7 0.0 100.0 1,375
Central 87.2 19.8 48.2 7.4 43.3 1.1 100.0 1,963
South 87.6 12.1 57.0 5.6 36.1 1.3 100.0 894
Province
Vientiane Capital 85.0 37.8 17.8 14.2 64.9 3.1 100.0 418
Phongsaly 64.4 5.4 63.2 6.9 29.9 0.0 100.0 127
Luangnamtha 89.7 18.4 50.7 16.3 32.9 0.0 100.0 112
Oudomxay 70.0 3.6 61.7 10.1 28.2 0.0 100.0 267
Bokeo 94.7 26.9 83.0 3.1 13.9 0.0 100.0 141
Luangprabang 90.8 16.8 23.0 3.5 73.5 0.0 100.0 314
Huaphanh 93.3 6.7 38.7 7.5 53.8 0.0 100.0 202
Xayabury 82.5 35.3 68.0 1.0 31.0 0.0 100.0 211
Xiengkhuang 92.7 32.5 37.3 2.8 59.9 0.0 100.0 219
Vientiane 88.7 12.2 63.3 8.1 27.9 0.7 100.0 302
Borikhamxay 97.0 8.5 38.2 12.2 48.7 0.9 100.0 196
Khammuane 88.8 14.6 52.8 3.3 43.2 0.8 100.0 243
Savannakhet 82.7 12.3 66.0 2.7 30.7 0.6 100.0 503
Saravane 86.9 12.7 73.5 1.6 24.6 0.3 100.0 326
Sekong 94.7 6.7 44.9 1.4 53.7 0.0 100.0 92
Champasack 85.8 13.7 48.4 9.2 40.0 2.4 100.0 383
Attapeu 90.4 8.6 46.4 8.8 43.3 1.5 100.0 94
Xaysomboune 77.0 9.3 74.2 13.2 12.3 0.3 100.0 82
(Continued…)
18 WHO (2013). WHO recommendations on Postnatal care of the mother and newborn. October 2013. Geneva.
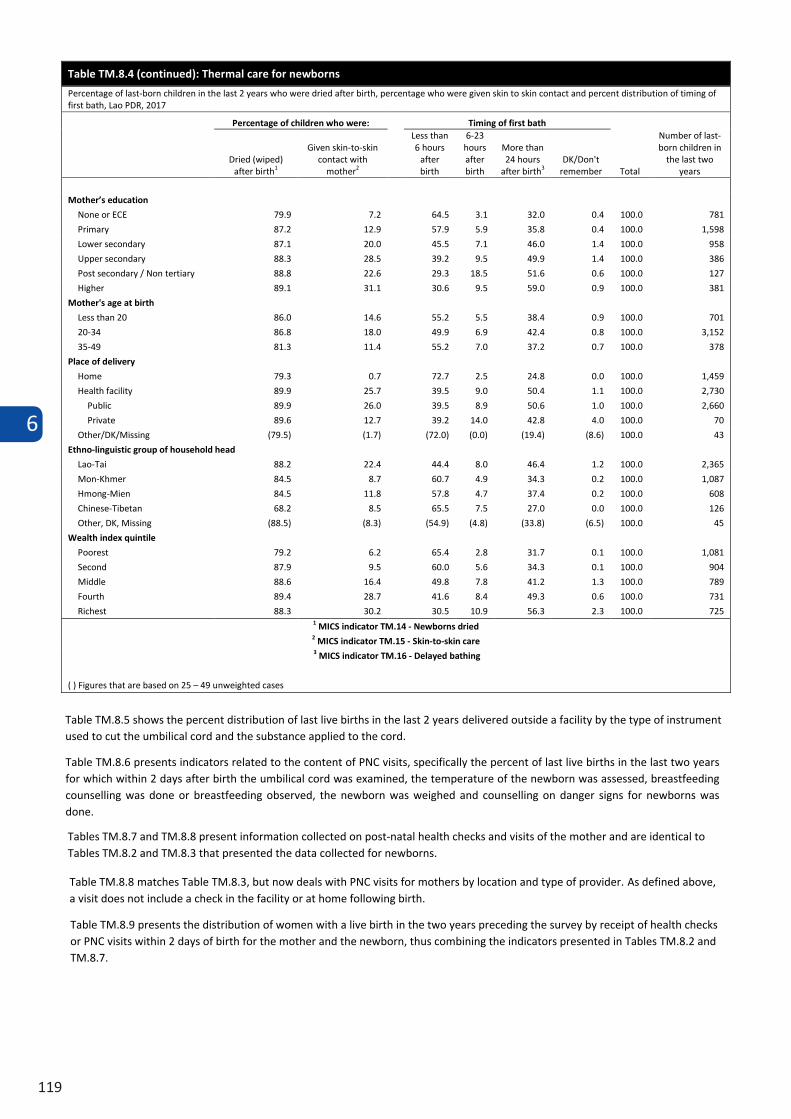
6
119
Table TM.8.4 (continued): Thermal care for newborns
Percentage of last-born children in the last 2 years who were dried after birth, percentage who were given skin to skin contact and percent distribution of timing of first bath, Lao PDR, 2017
Percentage of children who were: Timing of first bath
Total
Number of last-born children in
the last two years
Dried (wiped) after birth1
Given skin-to-skin contact with
mother2
Less than 6 hours
after birth
6-23 hours after birth
More than 24 hours
after birth3 DK/Don't
remember
Mother’s education
None or ECE 79.9 7.2 64.5 3.1 32.0 0.4 100.0 781
Primary 87.2 12.9 57.9 5.9 35.8 0.4 100.0 1,598
Lower secondary 87.1 20.0 45.5 7.1 46.0 1.4 100.0 958
Upper secondary 88.3 28.5 39.2 9.5 49.9 1.4 100.0 386
Post secondary / Non tertiary 88.8 22.6 29.3 18.5 51.6 0.6 100.0 127
Higher 89.1 31.1 30.6 9.5 59.0 0.9 100.0 381
Mother's age at birth
Less than 20 86.0 14.6 55.2 5.5 38.4 0.9 100.0 701
20-34 86.8 18.0 49.9 6.9 42.4 0.8 100.0 3,152
35-49 81.3 11.4 55.2 7.0 37.2 0.7 100.0 378
Place of delivery
Home 79.3 0.7 72.7 2.5 24.8 0.0 100.0 1,459
Health facility 89.9 25.7 39.5 9.0 50.4 1.1 100.0 2,730
Public 89.9 26.0 39.5 8.9 50.6 1.0 100.0 2,660
Private 89.6 12.7 39.2 14.0 42.8 4.0 100.0 70
Other/DK/Missing (79.5) (1.7) (72.0) (0.0) (19.4) (8.6) 100.0 43
Ethno-linguistic group of household head
Lao-Tai 88.2 22.4 44.4 8.0 46.4 1.2 100.0 2,365
Mon-Khmer 84.5 8.7 60.7 4.9 34.3 0.2 100.0 1,087
Hmong-Mien 84.5 11.8 57.8 4.7 37.4 0.2 100.0 608
Chinese-Tibetan 68.2 8.5 65.5 7.5 27.0 0.0 100.0 126
Other, DK, Missing (88.5) (8.3) (54.9) (4.8) (33.8) (6.5) 100.0 45
Wealth index quintile
Poorest 79.2 6.2 65.4 2.8 31.7 0.1 100.0 1,081
Second 87.9 9.5 60.0 5.6 34.3 0.1 100.0 904
Middle 88.6 16.4 49.8 7.8 41.2 1.3 100.0 789
Fourth 89.4 28.7 41.6 8.4 49.3 0.6 100.0 731
Richest 88.3 30.2 30.5 10.9 56.3 2.3 100.0 725 1 MICS indicator TM.14 - Newborns dried 2 MICS indicator TM.15 - Skin-to-skin care 3 MICS indicator TM.16 - Delayed bathing
( ) Figures that are based on 25 – 49 unweighted cases
Table TM.8.5 shows the percent distribution of last live births in the last 2 years delivered outside a facility by the type of instrument used to cut the umbilical cord and the substance applied to the cord.
Table TM.8.6 presents indicators related to the content of PNC visits, specifically the percent of last live births in the last two years for which within 2 days after birth the umbilical cord was examined, the temperature of the newborn was assessed, breastfeeding counselling was done or breastfeeding observed, the newborn was weighed and counselling on danger signs for newborns was done.
Tables TM.8.7 and TM.8.8 present information collected on post-natal health checks and visits of the mother and are identical to Tables TM.8.2 and TM.8.3 that presented the data collected for newborns.
Table TM.8.8 matches Table TM.8.3, but now deals with PNC visits for mothers by location and type of provider. As defined above, a visit does not include a check in the facility or at home following birth.
Table TM.8.9 presents the distribution of women with a live birth in the two years preceding the survey by receipt of health checks or PNC visits within 2 days of birth for the mother and the newborn, thus combining the indicators presented in Tables TM.8.2 and TM.8.7.
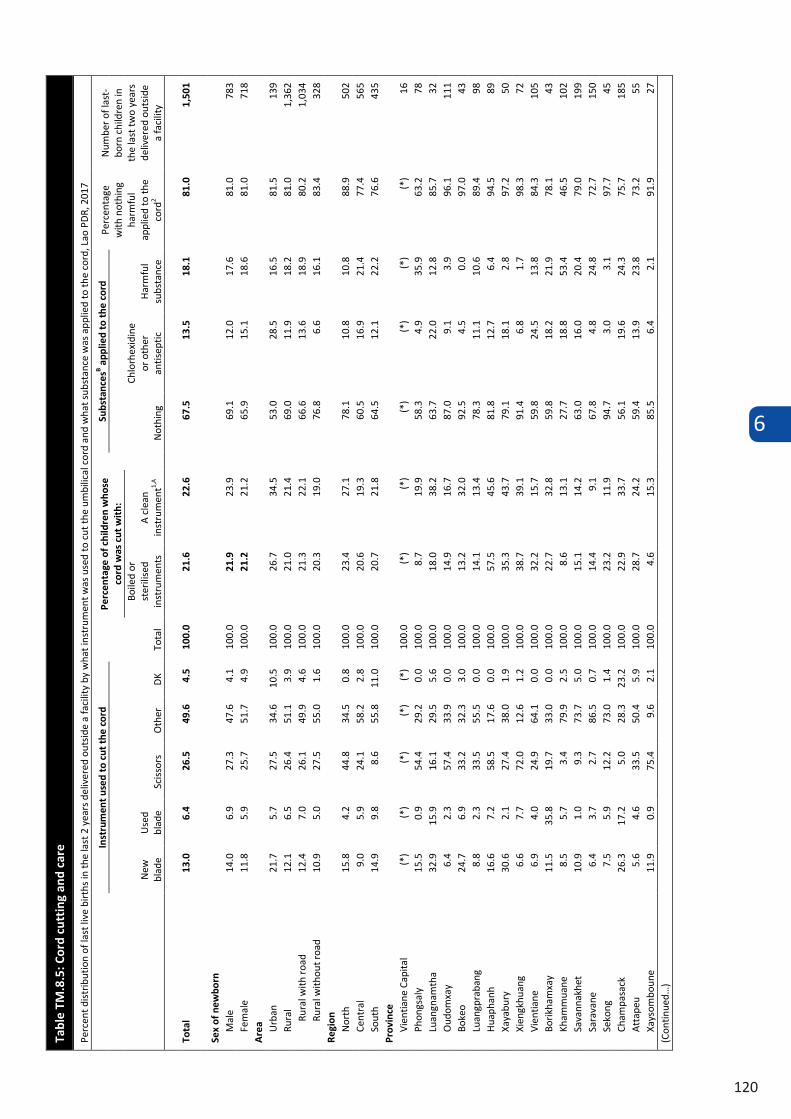
6
120
Tabl
e TM
.8.5
: Cor
d cu
ttin
g an
d ca
re
Perc
ent d
istr
ibut
ion
of la
st li
ve b
irth
s in
the
last
2 y
ears
del
iver
ed o
utsi
de a
faci
lity
by w
hat i
nstr
umen
t was
use
d to
cut
the
umbi
lical
cor
d an
d w
hat s
ubst
ance
was
app
lied
to th
e co
rd, L
ao P
DR,
201
7
Inst
rum
ent u
sed
to c
ut th
e co
rd
Tota
l
Perc
enta
ge o
f chi
ldre
n w
hose
co
rd w
as c
ut w
ith:
Su
bsta
nces
B app
lied
to th
e co
rd
Perc
enta
ge
with
not
hing
ha
rmfu
l ap
plie
d to
the
cord
2
Num
ber o
f las
t-bo
rn c
hild
ren
in
the
last
two
year
s de
liver
ed o
utsi
de
a fa
cilit
y N
ew
blad
e U
sed
blad
e Sc
isso
rs
Oth
er
DK
Not
hing
Chlo
rhex
idin
e or
oth
er
antis
eptic
H
arm
ful
subs
tanc
e
Boile
d or
st
erili
sed
inst
rum
ents
A
cle
an
inst
rum
ent1,
A
Tota
l 13
.0
6.4
26.5
49
.6
4.5
100.
0 21
.6
22.6
67
.5
13.5
18
.1
81.0
1,
501
Sex
of n
ewbo
rn
Mal
e 14
.0
6.9
27.3
47
.6
4.1
100.
0 21
.9
23.9
69
.1
12.0
17
.6
81.0
78
3 Fe
mal
e 11
.8
5.9
25.7
51
.7
4.9
100.
0 21
.2
21.2
65
.9
15.1
18
.6
81.0
71
8 A
rea Urb
an
21.7
5.
7 27
.5
34.6
10
.5
100.
0 26
.7
34.5
53
.0
28.5
16
.5
81.5
13
9 Ru
ral
12.1
6.
5 26
.4
51.1
3.
9 10
0.0
21.0
21
.4
69.0
11
.9
18.2
81
.0
1,36
2 Ru
ral w
ith r
oad
12.4
7.
0 26
.1
49.9
4.
6 10
0.0
21.3
22
.1
66.6
13
.6
18.9
80
.2
1,03
4 Ru
ral w
ithou
t roa
d 10
.9
5.0
27.5
55
.0
1.6
100.
0 20
.3
19.0
76
.8
6.6
16.1
83
.4
328
Regi
on
Nor
th
15.8
4.
2 44
.8
34.5
0.
8 10
0.0
23.4
27
.1
78.1
10
.8
10.8
88
.9
502
Cent
ral
9.0
5.9
24.1
58
.2
2.8
100.
0 20
.6
19.3
60
.5
16.9
21
.4
77.4
56
5 So
uth
14.9
9.
8 8.
6 55
.8
11.0
10
0.0
20.7
21
.8
64.5
12
.1
22.2
76
.6
435
Prov
ince
Vi
entia
ne C
apita
l (*
) (*
) (*
) (*
) (*
) 10
0.0
(*)
(*)
(*)
(*)
(*)
(*)
16
Phon
gsal
y
15.5
0.
9 54
.4
29.2
0.
0 10
0.0
8.7
19.9
58
.3
4.9
35.9
63
.2
78
Luan
gnam
tha
32.9
15
.9
16.1
29
.5
5.6
100.
0 18
.0
38.2
63
.7
22.0
12
.8
85.7
32
O
udom
xay
6.4
2.3
57.4
33
.9
0.0
100.
0 14
.9
16.7
87
.0
9.1
3.9
96.1
11
1 Bo
keo
24.7
6.
9 33
.2
32.3
3.
0 10
0.0
13.2
32
.0
92.5
4.
5 0.
0 97
.0
43
Luan
gpra
bang
8.
8 2.
3 33
.5
55.5
0.
0 10
0.0
14.1
13
.4
78.3
11
.1
10.6
89
.4
98
Hua
phan
h 16
.6
7.2
58.5
17
.6
0.0
100.
0 57
.5
45.6
81
.8
12.7
6.
4 94
.5
89
Xaya
bury
30
.6
2.1
27.4
38
.0
1.9
100.
0 35
.3
43.7
79
.1
18.1
2.
8 97
.2
50
Xien
gkhu
ang
6.6
7.7
72.0
12
.6
1.2
100.
0 38
.7
39.1
91
.4
6.8
1.7
98.3
72
Vi
entia
ne
6.9
4.0
24.9
64
.1
0.0
100.
0 32
.2
15.7
59
.8
24.5
13
.8
84.3
10
5 Bo
rikha
mxa
y 11
.5
35.8
19
.7
33.0
0.
0 10
0.0
22.7
32
.8
59.8
18
.2
21.9
78
.1
43
Kham
mua
ne
8.5
5.7
3.4
79.9
2.
5 10
0.0
8.6
13.1
27
.7
18.8
53
.4
46.5
10
2 Sa
vann
akhe
t 10
.9
1.0
9.3
73.7
5.
0 10
0.0
15.1
14
.2
63.0
16
.0
20.4
79
.0
199
Sara
vane
6.
4 3.
7 2.
7 86
.5
0.7
100.
0 14
.4
9.1
67.8
4.
8 24
.8
72.7
15
0 Se
kong
7.
5 5.
9 12
.2
73.0
1.
4 10
0.0
23.2
11
.9
94.7
3.
0 3.
1 97
.7
45
Cham
pasa
ck
26.3
17
.2
5.0
28.3
23
.2
100.
0 22
.9
33.7
56
.1
19.6
24
.3
75.7
18
5 A
ttap
eu
5.6
4.6
33.5
50
.4
5.9
100.
0 28
.7
24.2
59
.4
13.9
23
.8
73.2
55
Xa
ysom
boun
e 11
.9
0.9
75.4
9.
6 2.
1 10
0.0
4.6
15.3
85
.5
6.4
2.1
91.9
27
(C
ontin
ued…
)
Tabl
e TM
.8.5
(con
tinu
ed):
Cor
d cu
ttin
g an
d ca
re
Perc
ent d
istr
ibut
ion
of la
st li
ve b
irth
s in
the
last
2 y
ears
del
iver
ed o
utsi
de a
faci
lity
by w
hat i
nstr
umen
t was
use
d to
cut
the
um
bilic
al c
ord
and
wha
t sub
stan
ce w
as a
pplie
d to
the
cord
, Lao
PD
R, 2
017
Inst
rum
ent u
sed
to c
ut th
e co
rd
Tota
l
Perc
enta
ge o
f chi
ldre
n w
hose
co
rd w
as c
ut w
ith:
Su
bsta
nces
B app
lied
to th
e co
rd
Perc
enta
ge
with
not
hing
ha
rmfu
l ap
plie
d to
the
cord
2
Num
ber o
f las
t-bo
rn
child
ren
in th
e la
st
two
year
s de
liver
ed
outs
ide
a fa
cilit
y N
ew
blad
e U
sed
blad
e Sc
isso
rs
Oth
er
DK
Not
hing
Chlo
rhex
idin
e or
oth
er
antis
eptic
H
arm
ful
subs
tanc
e
Boile
d or
st
erili
sed
inst
rum
ents
A
cle
an
inst
rum
ent1,
A
Mot
her’
s ed
ucat
ion
Non
e or
ECE
9.
0 7.
6 24
.5
56.0
2.
9 10
0.0
13.3
14
.6
75.1
7.
3 17
.2
82.4
49
6 Pr
imar
y 12
.6
5.9
24.5
53
.1
3.9
100.
0 22
.4
22.2
66
.1
12.7
20
.5
78.9
68
1 Lo
wer
sec
onda
ry
19.0
4.
4 34
.1
34.4
8.
1 10
0.0
33.3
35
.3
60.5
23
.7
14.4
84
.2
255
Upp
er s
econ
dary
14
.8
14.0
35
.4
24.5
11
.3
100.
0 29
.8
30.2
54
.6
28.6
10
.8
83.2
49
Po
st s
econ
dary
/ N
on te
rtia
ry
(*)
(*)
(*)
(*)
(*)
100.
0 (*
) (*
) (*
) (*
) (*
) (*
) 8
Hig
her
(*)
(*)
(*)
(*)
(*)
100.
0 (*
) (*
) (*
) (*
) (*
) (*
) 13
M
othe
r's
age
at b
irth
Le
ss th
an 2
0 10
.0
6.4
33.7
46
.2
3.7
100.
0 19
.3
21.4
70
.2
8.8
17.7
79
.0
301
20-3
4 13
.7
6.0
25.0
50
.3
5.1
100.
0 22
.0
22.8
67
.1
14.4
17
.7
81.5
1,
036
35-4
9 14
.0
9.4
22.8
51
.3
2.5
100.
0 22
.9
24.1
64
.8
16.6
21
.5
81.4
16
3 Pl
ace
of d
eliv
ery
Hom
e 13
.0
6.4
26.6
49
.8
4.1
100.
0 21
.3
22.4
67
.9
12.8
18
.3
80.7
1,
459
Oth
er/D
K/M
issi
ng
(12.
7)
(6.5
) (2
2.4)
(4
1.4)
(1
7.0)
10
0.0
(31.
3)
(30.
7)
(54.
9)
(35.
6)
(10.
6)
(90.
5)
43
Att
enda
nt to
del
iver
y Sk
illed
pro
vide
r 29
.1
1.5
34.1
19
.2
16.2
10
0.0
50.8
54
.0
42.8
45
.1
6.9
87.9
71
Tr
aditi
onal
bir
th a
tten
dant
20
.3
10.9
15
.6
42.1
11
.1
100.
0 23
.4
30.2
55
.9
15.5
27
.3
71.4
29
8 O
ther
/No
atte
ndan
t/M
issi
ng
10.0
5.
6 28
.9
53.5
2.
0 10
0.0
19.2
18
.6
72.2
11
.0
16.4
83
.1
1,13
1 Et
hno-
lingu
isti
c gr
oup
of h
ouse
hold
hea
d La
o-Ta
i 19
.0
6.3
13.8
52
.1
8.8
100.
0 25
.9
28.6
51
.5
23.0
25
.4
74.4
52
8 M
on-K
hmer
7.
3 5.
2 18
.7
66.4
2.
5 10
0.0
16.3
13
.3
72.8
8.
6 16
.2
81.5
55
4 H
mon
g-M
ien
12.4
8.
5 57
.5
20.6
0.
9 10
0.0
28.0
30
.3
87.5
7.
0 4.
6 94
.5
324
Chin
ese-
Tibe
tan
12.5
3.
9 48
.7
33.3
1.
6 10
0.0
7.3
16.4
58
.6
9.1
34.0
67
.7
72
Oth
er, D
K, M
issi
ng
(*)
(*)
(*)
(*)
(*)
100.
0 (*
) (*
) (*
) (*
) (*
) (*
) 23
W
ealt
h in
dex
quin
tile
Po
ores
t 7.
8 6.
2 29
.1
54.3
2.
6 10
0.0
16.6
14
.8
76.3
5.
7 17
.4
82.0
71
5 Se
cond
13
.4
5.3
23.6
53
.5
4.2
100.
0 19
.9
22.3
66
.2
14.2
17
.9
80.4
42
3 M
iddl
e 25
.2
9.9
22.0
38
.1
4.8
100.
0 32
.4
39.7
58
.6
21.8
22
.9
80.4
21
8 Fo
urth
20
.1
6.4
29.2
32
.7
11.6
10
0.0
34.1
37
.3
44.8
32
.0
15.1
76
.8
108
Rich
est
(15.
1)
(2.9
) (2
8.6)
(3
1.6)
(2
1.8)
10
0.0
(37.
8)
(33.
6)
(32.
0)
(52.
9)
(13.
2)
(84.
9)
36
1 MIC
S in
dica
tor
TM.1
7 - C
ord
cut w
ith
clea
n in
stru
men
t 2
MIC
S in
dica
tor
TM.1
8 - N
othi
ng h
arm
ful a
pplie
d to
cor
d A
Clea
n in
stru
men
ts a
re a
ll ne
w b
lade
s an
d bo
iled
or s
teril
ised
use
d bl
ades
or s
ciss
ors
B Su
bsta
nces
incl
ude:
Chl
orhe
xidi
ne, o
ther
ant
isep
tic (s
uch
as a
lcoh
ol, s
pirit
, gen
tian
viol
et),
mus
tard
oil,
ash
, ani
mal
dun
g an
d ot
hers
. Mus
tard
oil,
ash
and
ani
mal
dun
g ar
e co
nsid
ered
har
mfu
l.
( ) F
igur
es th
at a
re b
ased
on
25 –
49
unw
eigh
ted
case
s (*
) Fig
ures
are
not
sho
wn,
bas
ed o
n fe
wer
than
25
unw
eigh
ted
case
s
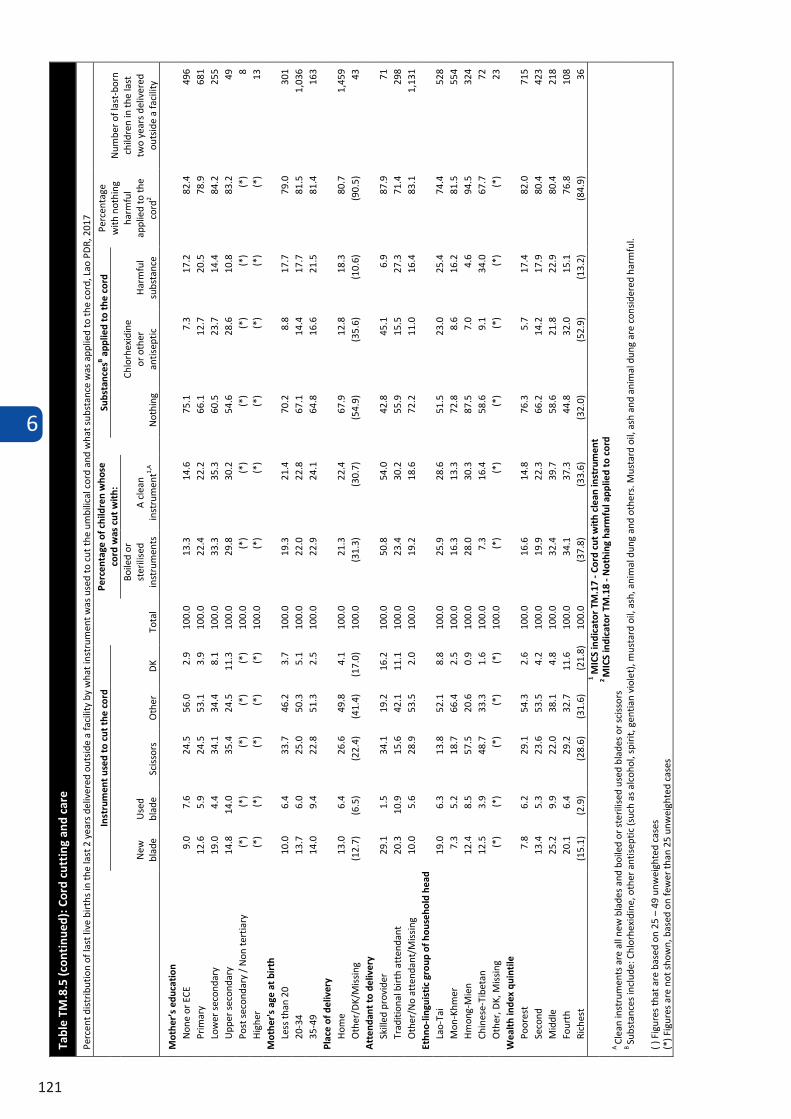
6
121
Tabl
e TM
.8.5
(con
tinu
ed):
Cor
d cu
ttin
g an
d ca
re
Perc
ent d
istr
ibut
ion
of la
st li
ve b
irth
s in
the
last
2 y
ears
del
iver
ed o
utsi
de a
faci
lity
by w
hat i
nstr
umen
t was
use
d to
cut
the
um
bilic
al c
ord
and
wha
t sub
stan
ce w
as a
pplie
d to
the
cord
, Lao
PD
R, 2
017
Inst
rum
ent u
sed
to c
ut th
e co
rd
Tota
l
Perc
enta
ge o
f chi
ldre
n w
hose
co
rd w
as c
ut w
ith:
Su
bsta
nces
B app
lied
to th
e co
rd
Perc
enta
ge
with
not
hing
ha
rmfu
l ap
plie
d to
the
cord
2
Num
ber o
f las
t-bo
rn
child
ren
in th
e la
st
two
year
s de
liver
ed
outs
ide
a fa
cilit
y N
ew
blad
e U
sed
blad
e Sc
isso
rs
Oth
er
DK
Not
hing
Chlo
rhex
idin
e or
oth
er
antis
eptic
H
arm
ful
subs
tanc
e
Boile
d or
st
erili
sed
inst
rum
ents
A
cle
an
inst
rum
ent1,
A
Mot
her’
s ed
ucat
ion
Non
e or
ECE
9.
0 7.
6 24
.5
56.0
2.
9 10
0.0
13.3
14
.6
75.1
7.
3 17
.2
82.4
49
6 Pr
imar
y 12
.6
5.9
24.5
53
.1
3.9
100.
0 22
.4
22.2
66
.1
12.7
20
.5
78.9
68
1 Lo
wer
sec
onda
ry
19.0
4.
4 34
.1
34.4
8.
1 10
0.0
33.3
35
.3
60.5
23
.7
14.4
84
.2
255
Upp
er s
econ
dary
14
.8
14.0
35
.4
24.5
11
.3
100.
0 29
.8
30.2
54
.6
28.6
10
.8
83.2
49
Po
st s
econ
dary
/ N
on te
rtia
ry
(*)
(*)
(*)
(*)
(*)
100.
0 (*
) (*
) (*
) (*
) (*
) (*
) 8
Hig
her
(*)
(*)
(*)
(*)
(*)
100.
0 (*
) (*
) (*
) (*
) (*
) (*
) 13
M
othe
r's
age
at b
irth
Le
ss th
an 2
0 10
.0
6.4
33.7
46
.2
3.7
100.
0 19
.3
21.4
70
.2
8.8
17.7
79
.0
301
20-3
4 13
.7
6.0
25.0
50
.3
5.1
100.
0 22
.0
22.8
67
.1
14.4
17
.7
81.5
1,
036
35-4
9 14
.0
9.4
22.8
51
.3
2.5
100.
0 22
.9
24.1
64
.8
16.6
21
.5
81.4
16
3 Pl
ace
of d
eliv
ery
Hom
e 13
.0
6.4
26.6
49
.8
4.1
100.
0 21
.3
22.4
67
.9
12.8
18
.3
80.7
1,
459
Oth
er/D
K/M
issi
ng
(12.
7)
(6.5
) (2
2.4)
(4
1.4)
(1
7.0)
10
0.0
(31.
3)
(30.
7)
(54.
9)
(35.
6)
(10.
6)
(90.
5)
43
Att
enda
nt to
del
iver
y Sk
illed
pro
vide
r 29
.1
1.5
34.1
19
.2
16.2
10
0.0
50.8
54
.0
42.8
45
.1
6.9
87.9
71
Tr
aditi
onal
bir
th a
tten
dant
20
.3
10.9
15
.6
42.1
11
.1
100.
0 23
.4
30.2
55
.9
15.5
27
.3
71.4
29
8 O
ther
/No
atte
ndan
t/M
issi
ng
10.0
5.
6 28
.9
53.5
2.
0 10
0.0
19.2
18
.6
72.2
11
.0
16.4
83
.1
1,13
1 Et
hno-
lingu
isti
c gr
oup
of h
ouse
hold
hea
d La
o-Ta
i 19
.0
6.3
13.8
52
.1
8.8
100.
0 25
.9
28.6
51
.5
23.0
25
.4
74.4
52
8 M
on-K
hmer
7.
3 5.
2 18
.7
66.4
2.
5 10
0.0
16.3
13
.3
72.8
8.
6 16
.2
81.5
55
4 H
mon
g-M
ien
12.4
8.
5 57
.5
20.6
0.
9 10
0.0
28.0
30
.3
87.5
7.
0 4.
6 94
.5
324
Chin
ese-
Tibe
tan
12.5
3.
9 48
.7
33.3
1.
6 10
0.0
7.3
16.4
58
.6
9.1
34.0
67
.7
72
Oth
er, D
K, M
issi
ng
(*)
(*)
(*)
(*)
(*)
100.
0 (*
) (*
) (*
) (*
) (*
) (*
) 23
W
ealt
h in
dex
quin
tile
Po
ores
t 7.
8 6.
2 29
.1
54.3
2.
6 10
0.0
16.6
14
.8
76.3
5.
7 17
.4
82.0
71
5 Se
cond
13
.4
5.3
23.6
53
.5
4.2
100.
0 19
.9
22.3
66
.2
14.2
17
.9
80.4
42
3 M
iddl
e 25
.2
9.9
22.0
38
.1
4.8
100.
0 32
.4
39.7
58
.6
21.8
22
.9
80.4
21
8 Fo
urth
20
.1
6.4
29.2
32
.7
11.6
10
0.0
34.1
37
.3
44.8
32
.0
15.1
76
.8
108
Rich
est
(15.
1)
(2.9
) (2
8.6)
(3
1.6)
(2
1.8)
10
0.0
(37.
8)
(33.
6)
(32.
0)
(52.
9)
(13.
2)
(84.
9)
36
1 MIC
S in
dica
tor
TM.1
7 - C
ord
cut w
ith
clea
n in
stru
men
t 2
MIC
S in
dica
tor
TM.1
8 - N
othi
ng h
arm
ful a
pplie
d to
cor
d A
Clea
n in
stru
men
ts a
re a
ll ne
w b
lade
s an
d bo
iled
or s
teril
ised
use
d bl
ades
or s
ciss
ors
B Su
bsta
nces
incl
ude:
Chl
orhe
xidi
ne, o
ther
ant
isep
tic (s
uch
as a
lcoh
ol, s
pirit
, gen
tian
viol
et),
mus
tard
oil,
ash
, ani
mal
dun
g an
d ot
hers
. Mus
tard
oil,
ash
and
ani
mal
dun
g ar
e co
nsid
ered
har
mfu
l.
( ) F
igur
es th
at a
re b
ased
on
25 –
49
unw
eigh
ted
case
s (*
) Fig
ures
are
not
sho
wn,
bas
ed o
n fe
wer
than
25
unw
eigh
ted
case
s
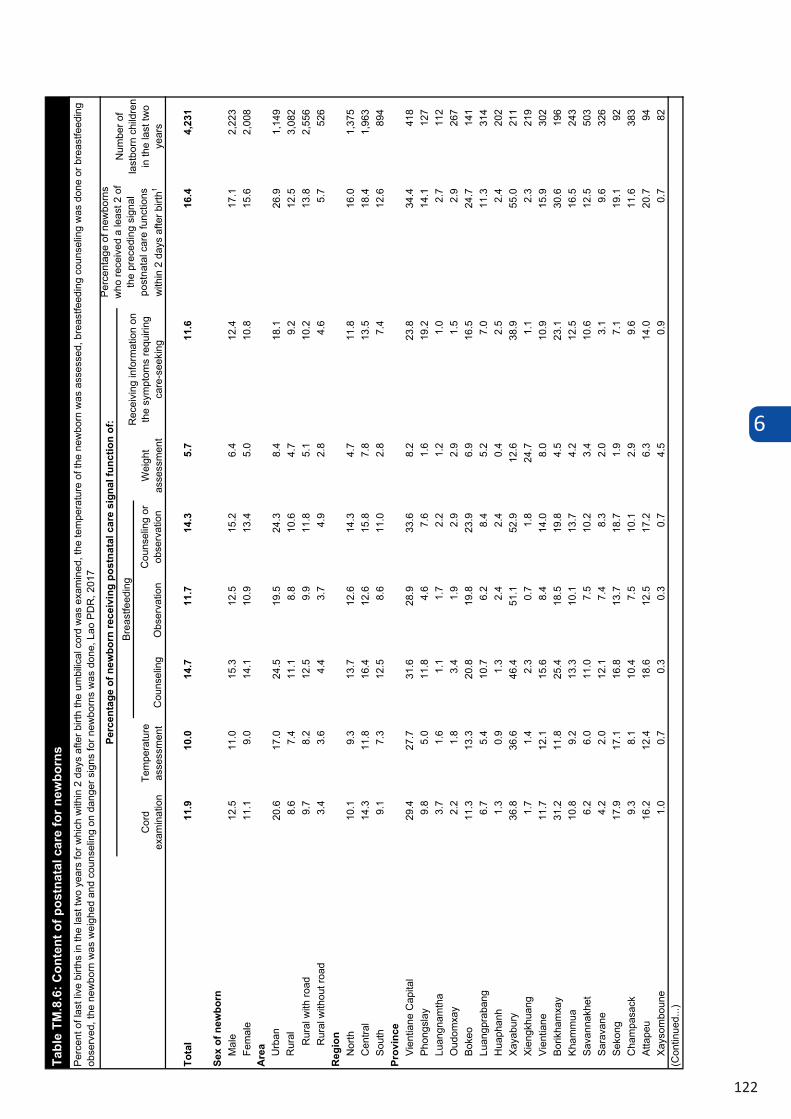
6
122
Cou
nsel
ing
Obs
erva
tion
Cou
nsel
ing
or
obse
rvat
ion
Tota
l11
.910
.014
.711
.714
.35.
711
.616
.44,
231
Sex
of n
ewbo
rnM
ale
12.5
11.0
15.3
12.5
15.2
6.4
12.4
17.1
2,22
3Fe
mal
e11
.19.
014
.110
.913
.45.
010
.815
.62,
008
Are
a Urb
an20
.617
.024
.519
.524
.38.
418
.126
.91,
149
Rur
al8.
67.
411
.18.
810
.64.
79.
212
.53,
082
Rur
al w
ith ro
ad9.
78.
212
.59.
911
.85.
110
.213
.82,
556
Rur
al w
ithou
t roa
d3.
43.
64.
43.
74.
92.
84.
65.
752
6R
egio
nN
orth
10.1
9.3
13.7
12.6
14.3
4.7
11.8
16.0
1,37
5C
entra
l14
.311
.816
.412
.615
.87.
813
.518
.41,
963
Sout
h9.
17.
312
.58.
611
.02.
87.
412
.689
4Pr
ovin
ceVi
entia
ne C
apita
l29
.427
.731
.628
.933
.68.
223
.834
.441
8Ph
ongs
lay
9.8
5.0
11.8
4.6
7.6
1.6
19.2
14.1
127
Luan
gnam
tha
3.7
1.6
1.1
1.7
2.2
1.2
1.0
2.7
112
Oud
omxa
y2.
21.
83.
41.
92.
92.
91.
52.
926
7Bo
keo
11.3
13.3
20.8
19.8
23.9
6.9
16.5
24.7
141
Luan
gpra
bang
6.7
5.4
10.7
6.2
8.4
5.2
7.0
11.3
314
Hua
phan
h1.
30.
91.
32.
42.
40.
42.
52.
420
2Xa
yabu
ry36
.836
.646
.451
.152
.912
.638
.955
.021
1Xi
engk
huan
g1.
71.
42.
30.
71.
824
.71.
12.
321
9Vi
entia
ne11
.712
.115
.68.
414
.08.
010
.915
.930
2Bo
rikha
mxa
y31
.211
.825
.418
.519
.84.
523
.130
.619
6Kh
amm
ua10
.89.
213
.310
.113
.74.
212
.516
.524
3Sa
vann
akhe
t6.
26.
011
.07.
510
.23.
410
.612
.550
3Sa
rava
ne4.
22.
012
.17.
48.
32.
03.
19.
632
6Se
kong
17.9
17.1
16.8
13.7
18.7
1.9
7.1
19.1
92C
ham
pasa
ck9.
38.
110
.47.
510
.12.
99.
611
.638
3At
tape
u16
.212
.418
.612
.517
.26.
314
.020
.794
Xays
ombo
une
1.0
0.7
0.3
0.3
0.7
4.5
0.9
0.7
82(C
ontin
ued.
..)
Rec
eivi
ng in
form
atio
n on
th
e sy
mpt
oms
requ
iring
ca
re-s
eeki
ng
Tabl
e TM
.8.6
: Con
tent
of p
ostn
atal
car
e fo
r new
born
sPe
rcen
t of l
ast l
ive
birth
s in
the
last
two
year
s fo
r whi
ch w
ithin
2 d
ays
afte
r birt
h th
e um
bilic
al c
ord
was
exa
min
ed, t
he te
mpe
ratu
re o
f the
new
born
was
ass
esse
d, b
reas
tfeed
ing
coun
selin
g w
as d
one
or b
reas
tfeed
ing
obse
rved
, the
new
born
was
wei
ghed
and
cou
nsel
ing
on d
ange
r sig
ns fo
r new
born
s w
as d
one,
Lao
PD
R, 2
017
Perc
enta
ge o
f new
born
rece
ivin
g po
stna
tal c
are
sign
al fu
nctio
n of
:Pe
rcen
tage
of n
ewbo
rns
who
rece
ived
a le
ast 2
of
the
prec
edin
g si
gnal
po
stna
tal c
are
func
tions
w
ithin
2 d
ays
afte
r birt
h1
Num
ber o
f la
stbo
rn c
hild
ren
in th
e la
st tw
o ye
ars
Cor
d ex
amin
atio
nTe
mpe
ratu
re
asse
ssm
ent
Brea
stfe
edin
g
Wei
ght
asse
ssm
ent
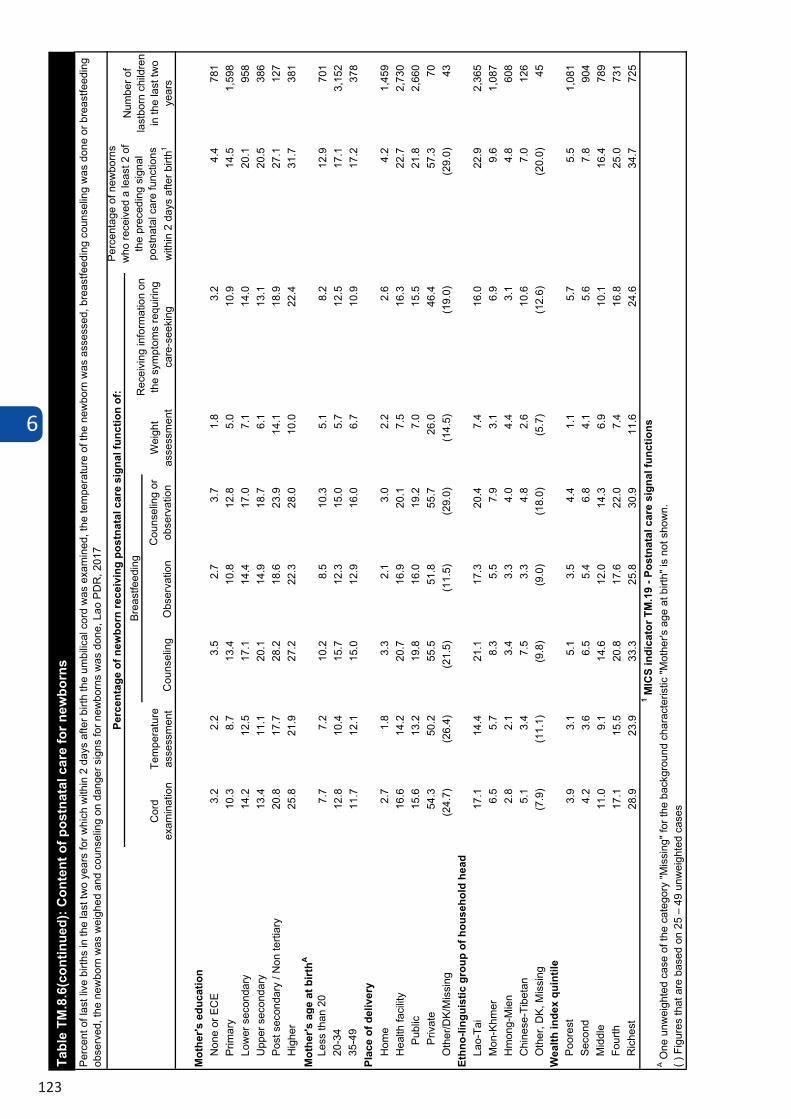
6
123
Cou
nsel
ing
Obs
erva
tion
Cou
nsel
ing
or
obse
rvat
ion
Mot
her's
edu
catio
nN
one
or E
CE
3.2
2.2
3.5
2.7
3.7
1.8
3.2
4.4
781
Prim
ary
10.3
8.7
13.4
10.8
12.8
5.0
10.9
14.5
1,59
8Lo
wer
sec
onda
ry14
.212
.517
.114
.417
.07.
114
.020
.195
8U
pper
sec
onda
ry13
.411
.120
.114
.918
.76.
113
.120
.538
6Po
st s
econ
dary
/ N
on te
rtiar
y20
.817
.728
.218
.623
.914
.118
.927
.112
7H
ighe
r25
.821
.927
.222
.328
.010
.022
.431
.738
1M
othe
r's a
ge a
t birt
hA
Less
than
20
7.7
7.2
10.2
8.5
10.3
5.1
8.2
12.9
701
20-3
412
.810
.415
.712
.315
.05.
712
.517
.13,
152
35-4
911
.712
.115
.012
.916
.06.
710
.917
.237
8Pl
ace
of d
eliv
ery
Hom
e2.
71.
83.
32.
13.
02.
22.
64.
21,
459
Hea
lth fa
cilit
y16
.614
.220
.716
.920
.17.
516
.322
.72,
730
Publ
ic15
.613
.219
.816
.019
.27.
015
.521
.82,
660
Priv
ate
54.3
50.2
55.5
51.8
55.7
26.0
46.4
57.3
70O
ther
/DK/
Mis
sing
(24.
7)(2
6.4)
(21.
5)(1
1.5)
(29.
0)(1
4.5)
(19.
0)(2
9.0)
43Et
hno-
lingu
istic
gro
up o
f hou
seho
ld h
ead
Lao-
Tai
17.1
14.4
21.1
17.3
20.4
7.4
16.0
22.9
2,36
5M
on-K
hmer
6.5
5.7
8.3
5.5
7.9
3.1
6.9
9.6
1,08
7H
mon
g-M
ien
2.8
2.1
3.4
3.3
4.0
4.4
3.1
4.8
608
Chi
nese
-Tib
etan
5.1
3.4
7.5
3.3
4.8
2.6
10.6
7.0
126
Oth
er, D
K, M
issi
ng(7
.9)
(11.
1)(9
.8)
(9.0
)(1
8.0)
(5.7
)(1
2.6)
(20.
0)45
Wea
lth in
dex
quin
tile
Poor
est
3.9
3.1
5.1
3.5
4.4
1.1
5.7
5.5
1,08
1Se
cond
4.2
3.6
6.5
5.4
6.8
4.1
5.6
7.8
904
Mid
dle
11.0
9.1
14.6
12.0
14.3
6.9
10.1
16.4
789
Four
th
17.1
15.5
20.8
17.6
22.0
7.4
16.8
25.0
731
Ric
hest
28.9
23.9
33.3
25.8
30.9
11.6
24.6
34.7
725
1 MIC
S in
dica
tor T
M.1
9 - P
ostn
atal
car
e si
gnal
func
tions
A One
unw
eigh
ted
case
of t
he c
ateg
ory
"Mis
sing
" for
the
back
grou
nd c
hara
cter
istic
"Mot
her's
age
at b
irth"
is n
ot s
how
n.( )
Fig
ures
that
are
bas
ed o
n 25
– 4
9 un
wei
ghte
d ca
ses
Tabl
e TM
.8.6
(con
tinue
d): C
onte
nt o
f pos
tnat
al c
are
for n
ewbo
rns
Perc
ent o
f las
t liv
e bi
rths
in th
e la
st tw
o ye
ars
for w
hich
with
in 2
day
s af
ter b
irth
the
umbi
lical
cor
d w
as e
xam
ined
, the
tem
pera
ture
of t
he n
ewbo
rn w
as a
sses
sed,
bre
astfe
edin
g co
unse
ling
was
don
e or
bre
astfe
edin
g ob
serv
ed, t
he n
ewbo
rn w
as w
eigh
ed a
nd c
ouns
elin
g on
dan
ger s
igns
for n
ewbo
rns
was
don
e, L
ao P
DR
, 201
7
Perc
enta
ge o
f new
born
rece
ivin
g po
stna
tal c
are
sign
al fu
nctio
n of
:Pe
rcen
tage
of n
ewbo
rns
who
rece
ived
a le
ast 2
of
the
prec
edin
g si
gnal
po
stna
tal c
are
func
tions
w
ithin
2 d
ays
afte
r birt
h1
Num
ber o
f la
stbo
rn c
hild
ren
in th
e la
st tw
o ye
ars
Cor
d ex
amin
atio
nTe
mpe
ratu
re
asse
ssm
ent
Brea
stfe
edin
g
Wei
ght
asse
ssm
ent
Rec
eivi
ng in
form
atio
n on
th
e sy
mpt
oms
requ
iring
ca
re-s
eeki
ng
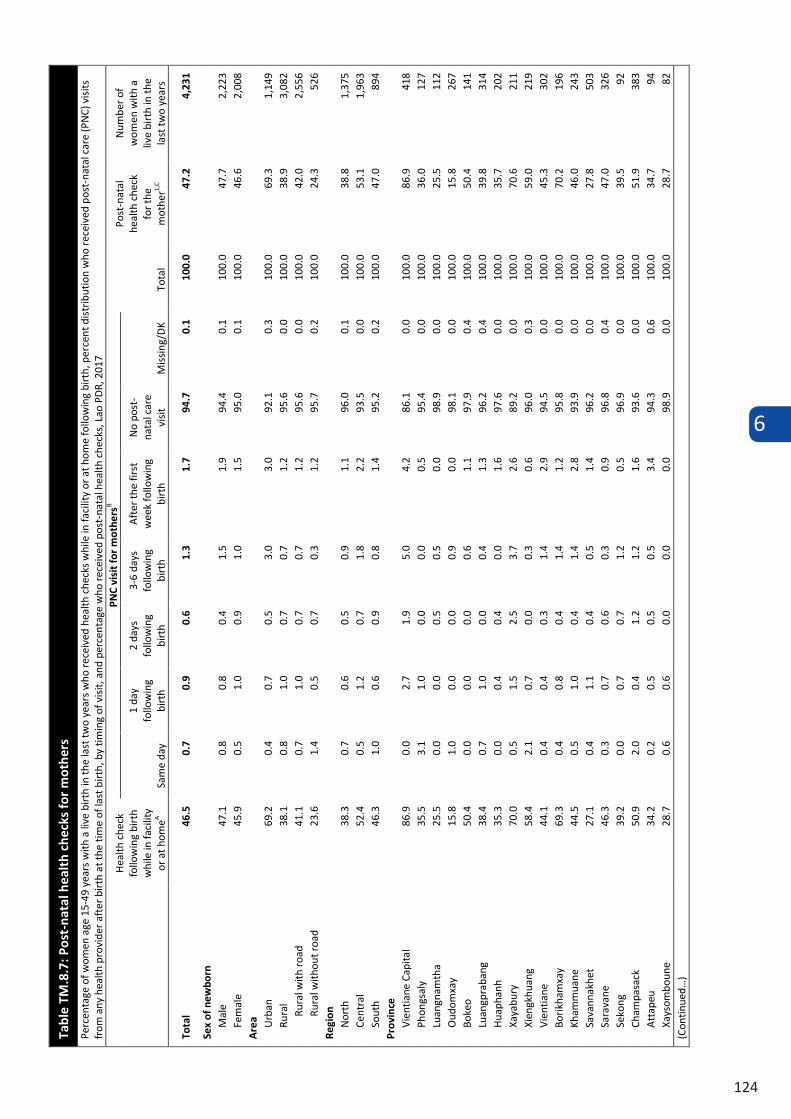
6
124
Tabl
e TM
.8.7
: Pos
t-na
tal h
ealt
h ch
ecks
for
mot
hers
Perc
enta
ge o
f wom
en a
ge 1
5-49
yea
rs w
ith a
live
birt
h in
the
last
two
year
s w
ho re
ceiv
ed h
ealth
che
cks
whi
le in
faci
lity
or a
t hom
e fo
llow
ing
birt
h, p
erce
nt d
istr
ibut
ion
who
rec
eive
d po
st-n
atal
car
e (P
NC)
vis
its
from
any
hea
lth p
rovi
der
afte
r bir
th a
t the
tim
e of
last
birt
h, b
y tim
ing
of v
isit,
and
per
cent
age
who
rece
ived
pos
t-na
tal h
ealth
che
cks,
Lao
PD
R, 2
017
Hea
lth c
heck
fo
llow
ing
birt
h w
hile
in fa
cilit
y or
at h
omeA
PNC
visi
t for
mot
hers
B
Tota
l
Post
-nat
al
heal
th c
heck
fo
r the
m
othe
r1,C
Num
ber o
f w
omen
with
a
live
birt
h in
the
last
two
year
s Sa
me
day
1 da
y fo
llow
ing
birt
h
2 da
ys
follo
win
g bi
rth
3-6
days
fo
llow
ing
birt
h
Aft
er th
e fir
st
wee
k fo
llow
ing
birt
h
No
post
-na
tal c
are
visi
t M
issi
ng/D
K
Tota
l 46
.5
0.7
0.9
0.6
1.3
1.7
94.7
0.
1 10
0.0
47.2
4,
231
Sex
of n
ewbo
rn
Mal
e 47
.1
0.8
0.8
0.4
1.5
1.9
94.4
0.
1 10
0.0
47.7
2,
223
Fem
ale
45.9
0.
5 1.
0 0.
9 1.
0 1.
5 95
.0
0.1
100.
0 46
.6
2,00
8 A
rea Urb
an
69.2
0.
4 0.
7 0.
5 3.
0 3.
0 92
.1
0.3
100.
0 69
.3
1,14
9 Ru
ral
38.1
0.
8 1.
0 0.
7 0.
7 1.
2 95
.6
0.0
100.
0 38
.9
3,08
2 Ru
ral w
ith r
oad
41.1
0.
7 1.
0 0.
7 0.
7 1.
2 95
.6
0.0
100.
0 42
.0
2,55
6 Ru
ral w
ithou
t roa
d 23
.6
1.4
0.5
0.7
0.3
1.2
95.7
0.
2 10
0.0
24.3
52
6 Re
gion
N
orth
38
.3
0.7
0.6
0.5
0.9
1.1
96.0
0.
1 10
0.0
38.8
1,
375
Cent
ral
52.4
0.
5 1.
2 0.
7 1.
8 2.
2 93
.5
0.0
100.
0 53
.1
1,96
3 So
uth
46.3
1.
0 0.
6 0.
9 0.
8 1.
4 95
.2
0.2
100.
0 47
.0
894
Prov
ince
Vi
entia
ne C
apita
l 86
.9
0.0
2.7
1.9
5.0
4.2
86.1
0.
0 10
0.0
86.9
41
8 Ph
ongs
aly
35
.5
3.1
1.0
0.0
0.0
0.5
95.4
0.
0 10
0.0
36.0
12
7 Lu
angn
amth
a 25
.5
0.0
0.0
0.5
0.5
0.0
98.9
0.
0 10
0.0
25.5
11
2 O
udom
xay
15.8
1.
0 0.
0 0.
0 0.
9 0.
0 98
.1
0.0
100.
0 15
.8
267
Boke
o 50
.4
0.0
0.0
0.0
0.6
1.1
97.9
0.
4 10
0.0
50.4
14
1 Lu
angp
raba
ng
38.4
0.
7 1.
0 0.
0 0.
4 1.
3 96
.2
0.4
100.
0 39
.8
314
Hua
phan
h 35
.3
0.0
0.4
0.4
0.0
1.6
97.6
0.
0 10
0.0
35.7
20
2 Xa
yabu
ry
70.0
0.
5 1.
5 2.
5 3.
7 2.
6 89
.2
0.0
100.
0 70
.6
211
Xien
gkhu
ang
58.4
2.
1 0.
7 0.
0 0.
3 0.
6 96
.0
0.3
100.
0 59
.0
219
Vien
tiane
44
.1
0.4
0.4
0.3
1.4
2.9
94.5
0.
0 10
0.0
45.3
30
2 Bo
rikha
mxa
y 69
.3
0.4
0.8
0.4
1.4
1.2
95.8
0.
0 10
0.0
70.2
19
6 Kh
amm
uane
44
.5
0.5
1.0
0.4
1.4
2.8
93.9
0.
0 10
0.0
46.0
24
3 Sa
vann
akhe
t 27
.1
0.4
1.1
0.4
0.5
1.4
96.2
0.
0 10
0.0
27.8
50
3 Sa
rava
ne
46.3
0.
3 0.
7 0.
6 0.
3 0.
9 96
.8
0.4
100.
0 47
.0
326
Seko
ng
39.2
0.
0 0.
7 0.
7 1.
2 0.
5 96
.9
0.0
100.
0 39
.5
92
Cham
pasa
ck
50.9
2.
0 0.
4 1.
2 1.
2 1.
6 93
.6
0.0
100.
0 51
.9
383
Att
apeu
34
.2
0.2
0.5
0.5
0.5
3.4
94.3
0.
6 10
0.0
34.7
94
Xa
ysom
boun
e 28
.7
0.6
0.6
0.0
0.0
0.0
98.9
0.
0 10
0.0
28.7
82
(C
ontin
ued…
)
Tabl
e TM
.8.7
(con
tinu
ed):
Pos
t-na
tal h
ealt
h ch
ecks
for
mot
hers
Perc
enta
ge o
f wom
en a
ge 1
5-49
yea
rs w
ith a
live
birt
h in
the
last
two
year
s w
ho re
ceiv
ed h
ealth
che
cks
whi
le in
faci
lity
or a
t hom
e fo
llow
ing
birt
h, p
erce
nt d
istr
ibut
ion
who
rec
eive
d po
st-n
atal
car
e (P
NC)
vis
its fr
om a
ny
heal
th p
rovi
der a
fter
birt
h at
the
time
of la
st b
irth,
by
timin
g of
vis
it, a
nd p
erce
ntag
e w
ho re
ceiv
ed p
ost n
atal
hea
lth c
heck
s, L
ao P
DR,
201
7 H
ealth
che
ck
follo
win
g bi
rth
whi
le in
faci
lity
or
at h
omeA
PNC
visi
t for
mot
hers
B
Tota
l
Post
-nat
al h
ealth
ch
eck
for t
he
mot
her1,
C
Num
ber o
f w
omen
with
a
live
birt
h in
the
last
two
year
s Sa
me
day
1 da
y fo
llow
ing
birt
h
2 da
ys
follo
win
g bi
rth
3-6
days
fo
llow
ing
birt
h
Aft
er th
e fir
st
wee
k fo
llow
ing
birt
h
No
post
-na
tal c
are
visi
t M
issi
ng/D
K Ed
ucat
ion
Non
e or
ECE
20
.0
0.7
0.0
0.0
0.3
0.6
98.5
0.
0 10
0.0
20.7
78
1 Pr
imar
y 39
.3
0.7
1.1
1.0
1.0
1.4
94.9
0.
0 10
0.0
40.1
1,
598
Low
er s
econ
dary
54
.3
0.9
0.8
0.3
1.5
1.0
95.4
0.
2 10
0.0
54.8
95
8 U
pper
sec
onda
ry
68.6
0.
9 1.
4 1.
5 1.
3 3.
2 91
.7
0.0
100.
0 69
.9
386
Post
sec
onda
ry /
Non
tert
iary
69
.9
0.0
0.3
0.0
3.7
2.8
93.3
0.
0 10
0.0
70.1
12
7 H
ighe
r 81
.6
0.5
1.9
0.7
3.3
5.2
87.9
0.
4 10
0.0
81.6
38
1 A
ge a
t bir
th
Less
than
20
37.0
0.
7 0.
8 0.
6 0.
7 1.
1 95
.9
0.2
100.
0 37
.9
701
20-3
4 49
.1
0.8
1.0
0.7
1.3
1.8
94.4
0.
1 10
0.0
49.8
3,
152
35-4
9 42
.6
0.1
0.1
0.0
2.5
2.2
95.1
0.
0 10
0.0
42.6
37
8 Pl
ace
of d
eliv
ery
Hom
e 3.
6 0.
8 0.
7 0.
3 0.
5 0.
6 97
.1
0.1
100.
0 5.
2 1,
459
Hea
lth fa
cilit
y 69
.6
0.6
1.0
0.8
1.7
2.3
93.5
0.
1 10
0.0
69.8
2,
730
Publ
ic
68.9
0.
6 0.
9 0.
9 1.
5 2.
2 93
.8
0.1
100.
0 69
.1
2,66
0 Pr
ivat
e 95
.6
0.0
2.4
0.0
11.7
5.
9 79
.9
0.0
100.
0 95
.6
70
Oth
er/D
K/M
issi
ng
(37.
4)
(3.5
) (2
.6)
(1.1
) (0
.0)
(2.4
) (9
0.4)
(0
.0)
100.
0 (3
7.4)
43
Ty
pe o
f del
iver
y Va
gina
l birt
h 43
.9
0.7
0.9
0.7
0.9
1.3
95.4
0.
1 10
0.0
44.6
3,
981
C-se
ctio
n 88
.9
0.6
1.0
0.0
7.6
7.7
82.7
0.
5 10
0.0
88.9
25
0 Et
hno-
lingu
isti
c gr
oup
of h
ouse
hold
hea
d La
o-Ta
i 61
.6
0.6
1.2
1.0
2.0
2.5
92.6
0.
1 10
0.0
62.0
2,
365
Mon
-Khm
er
27.2
1.
0 0.
6 0.
1 0.
4 0.
9 96
.8
0.2
100.
0 28
.4
1,08
7 H
mon
g-M
ien
27.2
0.
4 0.
3 0.
1 0.
4 0.
2 98
.7
0.0
100.
0 27
.4
608
Chin
ese-
Tibe
tan
23.7
0.
5 0.
5 0.
0 1.
4 0.
9 96
.7
0.0
100.
0 24
.2
126
Oth
er, D
K, M
issi
ng
(47.
5)
(1.9
) (0
.0)
(2.4
) (0
.0)
(0.0
) (9
5.7)
(0
.0)
100.
0 (5
1.8)
45
W
ealt
h in
dex
quin
tile
Po
ores
t 17
.9
0.7
0.2
0.3
0.3
0.7
97.7
0.
1 10
0.0
18.5
1,
081
Seco
nd
30.3
0.
9 0.
7 0.
0 0.
3 0.
9 96
.9
0.2
100.
0 31
.4
904
Mid
dle
53.7
1.
2 0.
8 0.
9 0.
9 1.
4 94
.8
0.0
100.
0 54
.6
789
Four
th
65.9
0.
3 1.
4 0.
7 1.
1 2.
5 93
.9
0.2
100.
0 66
.0
731
Rich
est
82.3
0.
3 1.
7 1.
5 4.
5 3.
8 88
.1
0.1
100.
0 82
.7
725
1 MIC
S in
dica
tor
TM.2
0 - P
ost-
nata
l hea
lth
chec
k fo
r th
e m
othe
r A
Hea
lth c
heck
s by
any
hea
lth p
rovi
der f
ollo
win
g fa
cilit
y bi
rths
(bef
ore
disc
harg
e fr
om fa
cilit
y) o
r fo
llow
ing
hom
e bi
rths
(bef
ore
depa
rtur
e of
pro
vide
r fro
m h
ome)
. B
Post
-nat
al c
are
visi
ts (P
NC)
refe
r to
a se
para
te v
isit
by a
ny h
ealth
pro
vide
r to
chec
k on
the
heal
th o
f the
mot
her a
nd p
rovi
de p
reve
ntiv
e ca
re s
ervi
ces.
PN
C vi
sits
do
not i
nclu
de h
ealth
che
cks
follo
win
g bi
rth
whi
le in
faci
lity
or a
t hom
e (s
ee n
ote
a abo
ve).
C Po
st-n
atal
hea
lth c
heck
s in
clud
e an
y he
alth
che
ck p
erfo
rmed
whi
le in
the
heal
th fa
cilit
y or
at h
ome
follo
win
g bi
rth
(see
not
e a
abov
e), a
s w
ell a
s PN
C vi
sits
(see
not
e b
abov
e) w
ithin
two
days
of d
eliv
ery.
( ) F
igur
es th
at a
re b
ased
on
25 –
49
unw
eigh
ted
case
s
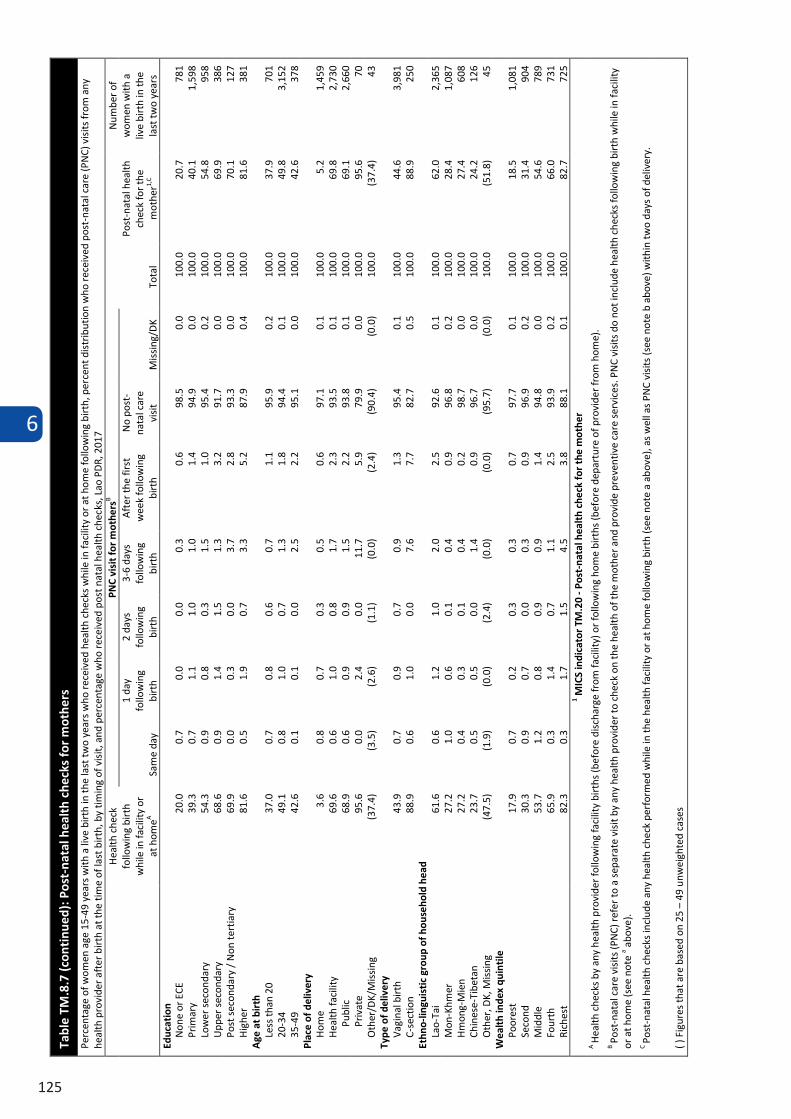
6
125
Tabl
e TM
.8.7
(con
tinu
ed):
Pos
t-na
tal h
ealt
h ch
ecks
for
mot
hers
Perc
enta
ge o
f wom
en a
ge 1
5-49
yea
rs w
ith a
live
birt
h in
the
last
two
year
s w
ho re
ceiv
ed h
ealth
che
cks
whi
le in
faci
lity
or a
t hom
e fo
llow
ing
birt
h, p
erce
nt d
istr
ibut
ion
who
rec
eive
d po
st-n
atal
car
e (P
NC)
vis
its fr
om a
ny
heal
th p
rovi
der a
fter
birt
h at
the
time
of la
st b
irth,
by
timin
g of
vis
it, a
nd p
erce
ntag
e w
ho re
ceiv
ed p
ost n
atal
hea
lth c
heck
s, L
ao P
DR,
201
7 H
ealth
che
ck
follo
win
g bi
rth
whi
le in
faci
lity
or
at h
omeA
PNC
visi
t for
mot
hers
B
Tota
l
Post
-nat
al h
ealth
ch
eck
for t
he
mot
her1,
C
Num
ber o
f w
omen
with
a
live
birt
h in
the
last
two
year
s Sa
me
day
1 da
y fo
llow
ing
birt
h
2 da
ys
follo
win
g bi
rth
3-6
days
fo
llow
ing
birt
h
Aft
er th
e fir
st
wee
k fo
llow
ing
birt
h
No
post
-na
tal c
are
visi
t M
issi
ng/D
K Ed
ucat
ion
Non
e or
ECE
20
.0
0.7
0.0
0.0
0.3
0.6
98.5
0.
0 10
0.0
20.7
78
1 Pr
imar
y 39
.3
0.7
1.1
1.0
1.0
1.4
94.9
0.
0 10
0.0
40.1
1,
598
Low
er s
econ
dary
54
.3
0.9
0.8
0.3
1.5
1.0
95.4
0.
2 10
0.0
54.8
95
8 U
pper
sec
onda
ry
68.6
0.
9 1.
4 1.
5 1.
3 3.
2 91
.7
0.0
100.
0 69
.9
386
Post
sec
onda
ry /
Non
tert
iary
69
.9
0.0
0.3
0.0
3.7
2.8
93.3
0.
0 10
0.0
70.1
12
7 H
ighe
r 81
.6
0.5
1.9
0.7
3.3
5.2
87.9
0.
4 10
0.0
81.6
38
1 A
ge a
t bir
th
Less
than
20
37.0
0.
7 0.
8 0.
6 0.
7 1.
1 95
.9
0.2
100.
0 37
.9
701
20-3
4 49
.1
0.8
1.0
0.7
1.3
1.8
94.4
0.
1 10
0.0
49.8
3,
152
35-4
9 42
.6
0.1
0.1
0.0
2.5
2.2
95.1
0.
0 10
0.0
42.6
37
8 Pl
ace
of d
eliv
ery
Hom
e 3.
6 0.
8 0.
7 0.
3 0.
5 0.
6 97
.1
0.1
100.
0 5.
2 1,
459
Hea
lth fa
cilit
y 69
.6
0.6
1.0
0.8
1.7
2.3
93.5
0.
1 10
0.0
69.8
2,
730
Publ
ic
68.9
0.
6 0.
9 0.
9 1.
5 2.
2 93
.8
0.1
100.
0 69
.1
2,66
0 Pr
ivat
e 95
.6
0.0
2.4
0.0
11.7
5.
9 79
.9
0.0
100.
0 95
.6
70
Oth
er/D
K/M
issi
ng
(37.
4)
(3.5
) (2
.6)
(1.1
) (0
.0)
(2.4
) (9
0.4)
(0
.0)
100.
0 (3
7.4)
43
Ty
pe o
f del
iver
y Va
gina
l birt
h 43
.9
0.7
0.9
0.7
0.9
1.3
95.4
0.
1 10
0.0
44.6
3,
981
C-se
ctio
n 88
.9
0.6
1.0
0.0
7.6
7.7
82.7
0.
5 10
0.0
88.9
25
0 Et
hno-
lingu
isti
c gr
oup
of h
ouse
hold
hea
d La
o-Ta
i 61
.6
0.6
1.2
1.0
2.0
2.5
92.6
0.
1 10
0.0
62.0
2,
365
Mon
-Khm
er
27.2
1.
0 0.
6 0.
1 0.
4 0.
9 96
.8
0.2
100.
0 28
.4
1,08
7 H
mon
g-M
ien
27.2
0.
4 0.
3 0.
1 0.
4 0.
2 98
.7
0.0
100.
0 27
.4
608
Chin
ese-
Tibe
tan
23.7
0.
5 0.
5 0.
0 1.
4 0.
9 96
.7
0.0
100.
0 24
.2
126
Oth
er, D
K, M
issi
ng
(47.
5)
(1.9
) (0
.0)
(2.4
) (0
.0)
(0.0
) (9
5.7)
(0
.0)
100.
0 (5
1.8)
45
W
ealt
h in
dex
quin
tile
Po
ores
t 17
.9
0.7
0.2
0.3
0.3
0.7
97.7
0.
1 10
0.0
18.5
1,
081
Seco
nd
30.3
0.
9 0.
7 0.
0 0.
3 0.
9 96
.9
0.2
100.
0 31
.4
904
Mid
dle
53.7
1.
2 0.
8 0.
9 0.
9 1.
4 94
.8
0.0
100.
0 54
.6
789
Four
th
65.9
0.
3 1.
4 0.
7 1.
1 2.
5 93
.9
0.2
100.
0 66
.0
731
Rich
est
82.3
0.
3 1.
7 1.
5 4.
5 3.
8 88
.1
0.1
100.
0 82
.7
725
1 MIC
S in
dica
tor
TM.2
0 - P
ost-
nata
l hea
lth
chec
k fo
r th
e m
othe
r A
Hea
lth c
heck
s by
any
hea
lth p
rovi
der f
ollo
win
g fa
cilit
y bi
rths
(bef
ore
disc
harg
e fr
om fa
cilit
y) o
r fo
llow
ing
hom
e bi
rths
(bef
ore
depa
rtur
e of
pro
vide
r fro
m h
ome)
. B
Post
-nat
al c
are
visi
ts (P
NC)
refe
r to
a se
para
te v
isit
by a
ny h
ealth
pro
vide
r to
chec
k on
the
heal
th o
f the
mot
her a
nd p
rovi
de p
reve
ntiv
e ca
re s
ervi
ces.
PN
C vi
sits
do
not i
nclu
de h
ealth
che
cks
follo
win
g bi
rth
whi
le in
faci
lity
or a
t hom
e (s
ee n
ote
a abo
ve).
C Po
st-n
atal
hea
lth c
heck
s in
clud
e an
y he
alth
che
ck p
erfo
rmed
whi
le in
the
heal
th fa
cilit
y or
at h
ome
follo
win
g bi
rth
(see
not
e a
abov
e), a
s w
ell a
s PN
C vi
sits
(see
not
e b
abov
e) w
ithin
two
days
of d
eliv
ery.
( ) F
igur
es th
at a
re b
ased
on
25 –
49
unw
eigh
ted
case
s
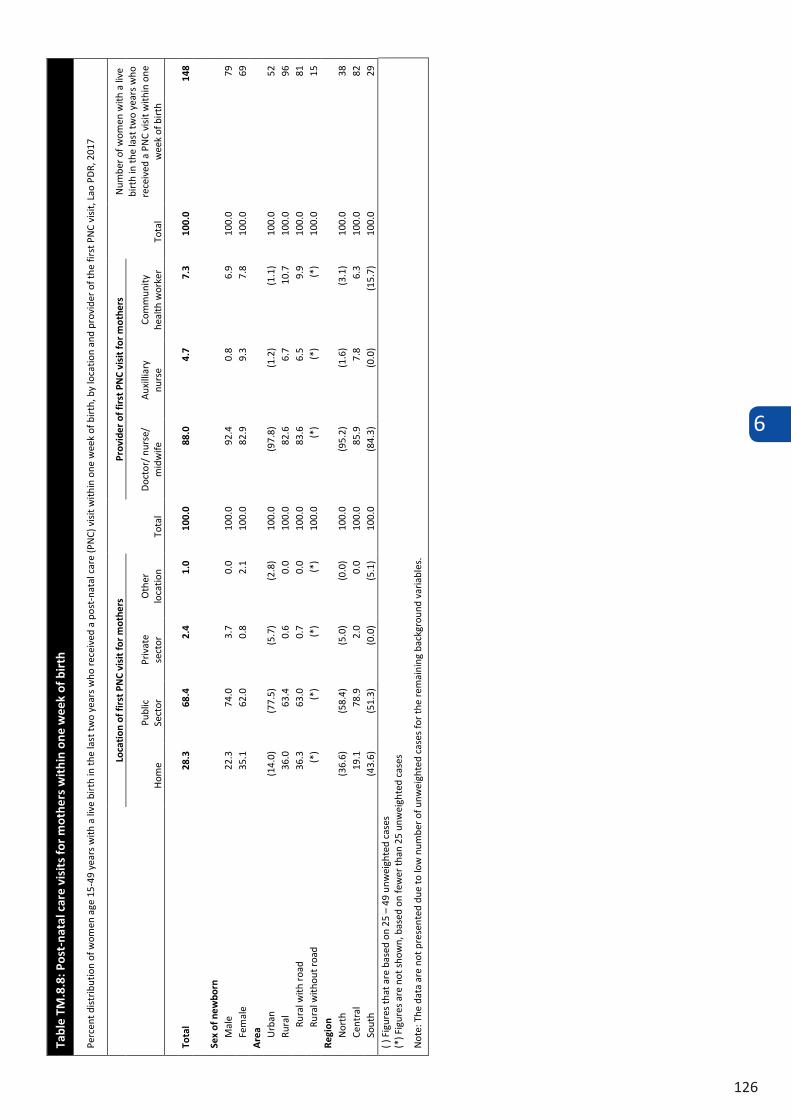
6
126
Tabl
e TM
.8.8
: Pos
t-na
tal c
are
visi
ts fo
r m
othe
rs w
ithi
n on
e w
eek
of b
irth
Perc
ent d
istr
ibut
ion
of w
omen
age
15-
49 y
ears
with
a li
ve b
irth
in th
e la
st tw
o ye
ars
who
rece
ived
a p
ost-
nata
l car
e (P
NC)
vis
it w
ithin
one
wee
k of
bir
th, b
y lo
catio
n an
d pr
ovid
er o
f the
firs
t PN
C vi
sit,
Lao
PD
R, 2
017
Loca
tion
of f
irst
PN
C vi
sit f
or m
othe
rs
Tota
l
Prov
ider
of f
irst
PN
C vi
sit f
or m
othe
rs
Tota
l
Num
ber o
f wom
en w
ith a
live
bi
rth
in th
e la
st tw
o ye
ars
who
re
ceiv
ed a
PN
C vi
sit w
ithin
one
w
eek
of b
irth
H
ome
Publ
ic
Sect
or
Priv
ate
sect
or
Oth
er
loca
tion
Doc
tor/
nur
se/
mid
wife
A
uxill
iary
nu
rse
Com
mun
ity
heal
th w
orke
r
Tota
l 28
.3
68.4
2.
4 1.
0 10
0.0
88.0
4.
7 7.
3 10
0.0
148
Sex
of n
ewbo
rn
Mal
e 22
.3
74.0
3.
7 0.
0 10
0.0
92.4
0.
8 6.
9 10
0.0
79
Fem
ale
35.1
62
.0
0.8
2.1
100.
0 82
.9
9.3
7.8
100.
0 69
A
rea Urb
an
(14.
0)
(77.
5)
(5.7
) (2
.8)
100.
0 (9
7.8)
(1
.2)
(1.1
) 10
0.0
52
Rura
l 36
.0
63.4
0.
6 0.
0 10
0.0
82.6
6.
7 10
.7
100.
0 96
Ru
ral w
ith r
oad
36.3
63
.0
0.7
0.0
100.
0 83
.6
6.5
9.9
100.
0 81
Ru
ral w
ithou
t roa
d (*
) (*
) (*
) (*
) 10
0.0
(*)
(*)
(*)
100.
0 15
Re
gion
N
orth
(3
6.6)
(5
8.4)
(5
.0)
(0.0
) 10
0.0
(95.
2)
(1.6
) (3
.1)
100.
0 38
Ce
ntra
l 19
.1
78.9
2.
0 0.
0 10
0.0
85.9
7.
8 6.
3 10
0.0
82
Sout
h (4
3.6)
(5
1.3)
(0
.0)
(5.1
) 10
0.0
(84.
3)
(0.0
) (1
5.7)
10
0.0
29
( ) F
igur
es th
at a
re b
ased
on
25 –
49
unw
eigh
ted
case
s (*
) Fig
ures
are
not
sho
wn,
bas
ed o
n fe
wer
than
25
unw
eigh
ted
case
s
Not
e: T
he d
ata
are
not p
rese
nted
due
to lo
w n
umbe
r of u
nwei
ghte
d ca
ses
for t
he re
mai
ning
bac
kgro
und
varia
bles
.
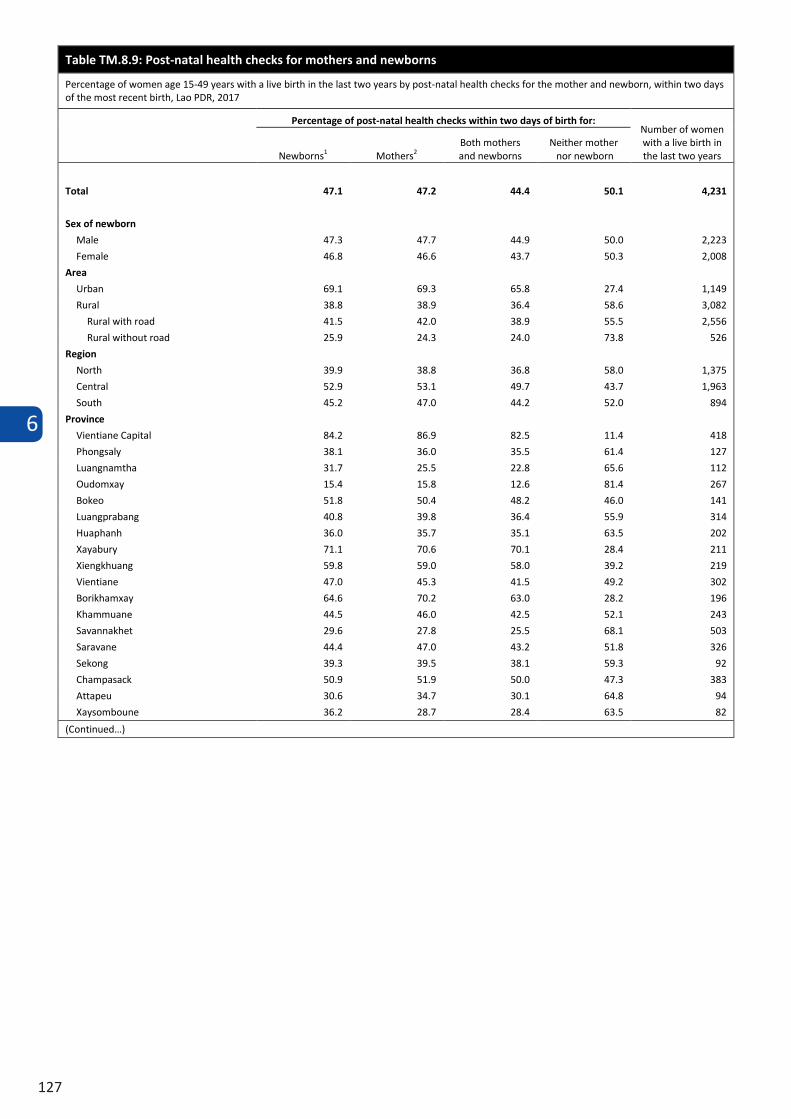
6
127
Table TM.8.9: Post-natal health checks for mothers and newborns
Percentage of women age 15-49 years with a live birth in the last two years by post-natal health checks for the mother and newborn, within two days of the most recent birth, Lao PDR, 2017
Percentage of post-natal health checks within two days of birth for: Number of women with a live birth in the last two years Newborns1 Mothers2
Both mothers and newborns
Neither mother nor newborn
Total 47.1 47.2 44.4 50.1 4,231
Sex of newborn
Male 47.3 47.7 44.9 50.0 2,223
Female 46.8 46.6 43.7 50.3 2,008
Area
Urban 69.1 69.3 65.8 27.4 1,149
Rural 38.8 38.9 36.4 58.6 3,082
Rural with road 41.5 42.0 38.9 55.5 2,556
Rural without road 25.9 24.3 24.0 73.8 526
Region
North 39.9 38.8 36.8 58.0 1,375
Central 52.9 53.1 49.7 43.7 1,963
South 45.2 47.0 44.2 52.0 894
Province
Vientiane Capital 84.2 86.9 82.5 11.4 418
Phongsaly 38.1 36.0 35.5 61.4 127
Luangnamtha 31.7 25.5 22.8 65.6 112
Oudomxay 15.4 15.8 12.6 81.4 267
Bokeo 51.8 50.4 48.2 46.0 141
Luangprabang 40.8 39.8 36.4 55.9 314
Huaphanh 36.0 35.7 35.1 63.5 202
Xayabury 71.1 70.6 70.1 28.4 211
Xiengkhuang 59.8 59.0 58.0 39.2 219
Vientiane 47.0 45.3 41.5 49.2 302
Borikhamxay 64.6 70.2 63.0 28.2 196
Khammuane 44.5 46.0 42.5 52.1 243
Savannakhet 29.6 27.8 25.5 68.1 503
Saravane 44.4 47.0 43.2 51.8 326
Sekong 39.3 39.5 38.1 59.3 92
Champasack 50.9 51.9 50.0 47.3 383
Attapeu 30.6 34.7 30.1 64.8 94
Xaysomboune 36.2 28.7 28.4 63.5 82
(Continued…)
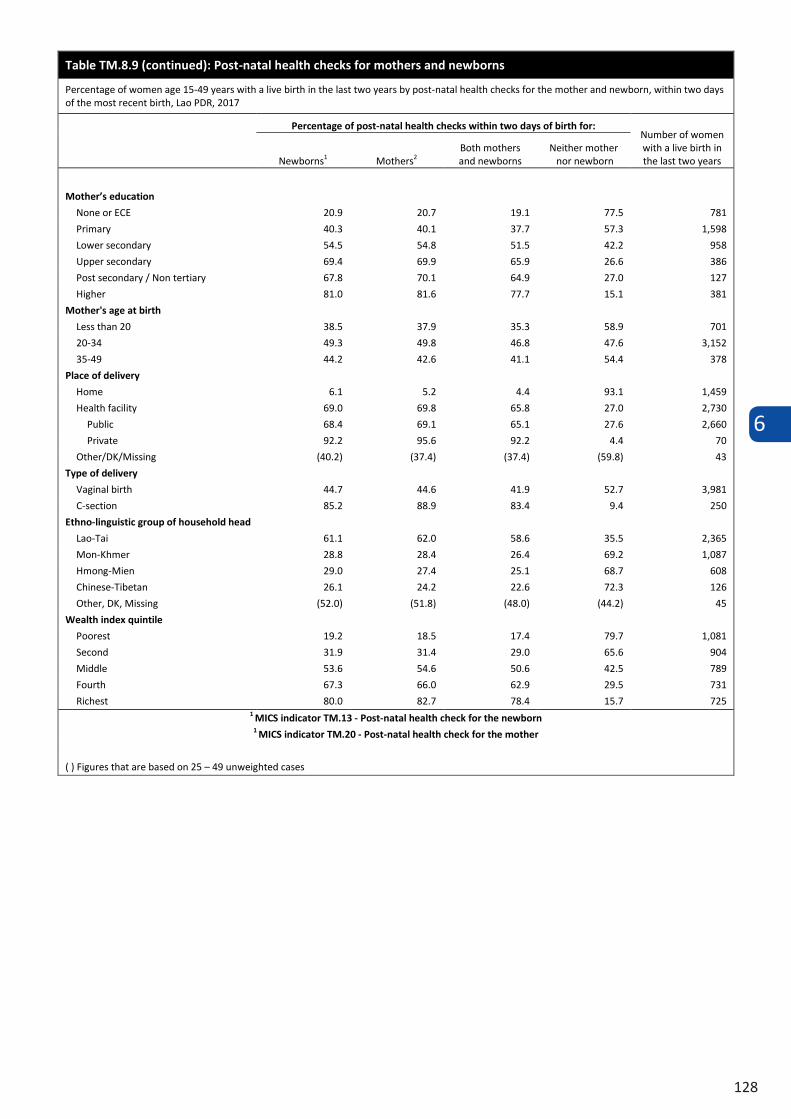
6
128
Table TM.8.9 (continued): Post-natal health checks for mothers and newborns
Percentage of women age 15-49 years with a live birth in the last two years by post-natal health checks for the mother and newborn, within two days of the most recent birth, Lao PDR, 2017
Percentage of post-natal health checks within two days of birth for: Number of women with a live birth in the last two years Newborns1 Mothers2
Both mothers and newborns
Neither mother nor newborn
Mother’s education
None or ECE 20.9 20.7 19.1 77.5 781
Primary 40.3 40.1 37.7 57.3 1,598
Lower secondary 54.5 54.8 51.5 42.2 958
Upper secondary 69.4 69.9 65.9 26.6 386
Post secondary / Non tertiary 67.8 70.1 64.9 27.0 127
Higher 81.0 81.6 77.7 15.1 381
Mother's age at birth
Less than 20 38.5 37.9 35.3 58.9 701
20-34 49.3 49.8 46.8 47.6 3,152
35-49 44.2 42.6 41.1 54.4 378
Place of delivery
Home 6.1 5.2 4.4 93.1 1,459
Health facility 69.0 69.8 65.8 27.0 2,730
Public 68.4 69.1 65.1 27.6 2,660
Private 92.2 95.6 92.2 4.4 70
Other/DK/Missing (40.2) (37.4) (37.4) (59.8) 43
Type of delivery
Vaginal birth 44.7 44.6 41.9 52.7 3,981
C-section 85.2 88.9 83.4 9.4 250
Ethno-linguistic group of household head
Lao-Tai 61.1 62.0 58.6 35.5 2,365
Mon-Khmer 28.8 28.4 26.4 69.2 1,087
Hmong-Mien 29.0 27.4 25.1 68.7 608
Chinese-Tibetan 26.1 24.2 22.6 72.3 126
Other, DK, Missing (52.0) (51.8) (48.0) (44.2) 45
Wealth index quintile
Poorest 19.2 18.5 17.4 79.7 1,081
Second 31.9 31.4 29.0 65.6 904
Middle 53.6 54.6 50.6 42.5 789
Fourth 67.3 66.0 62.9 29.5 731
Richest 80.0 82.7 78.4 15.7 725 1 MICS indicator TM.13 - Post-natal health check for the newborn
1 MICS indicator TM.20 - Post-natal health check for the mother
( ) Figures that are based on 25 – 49 unweighted cases
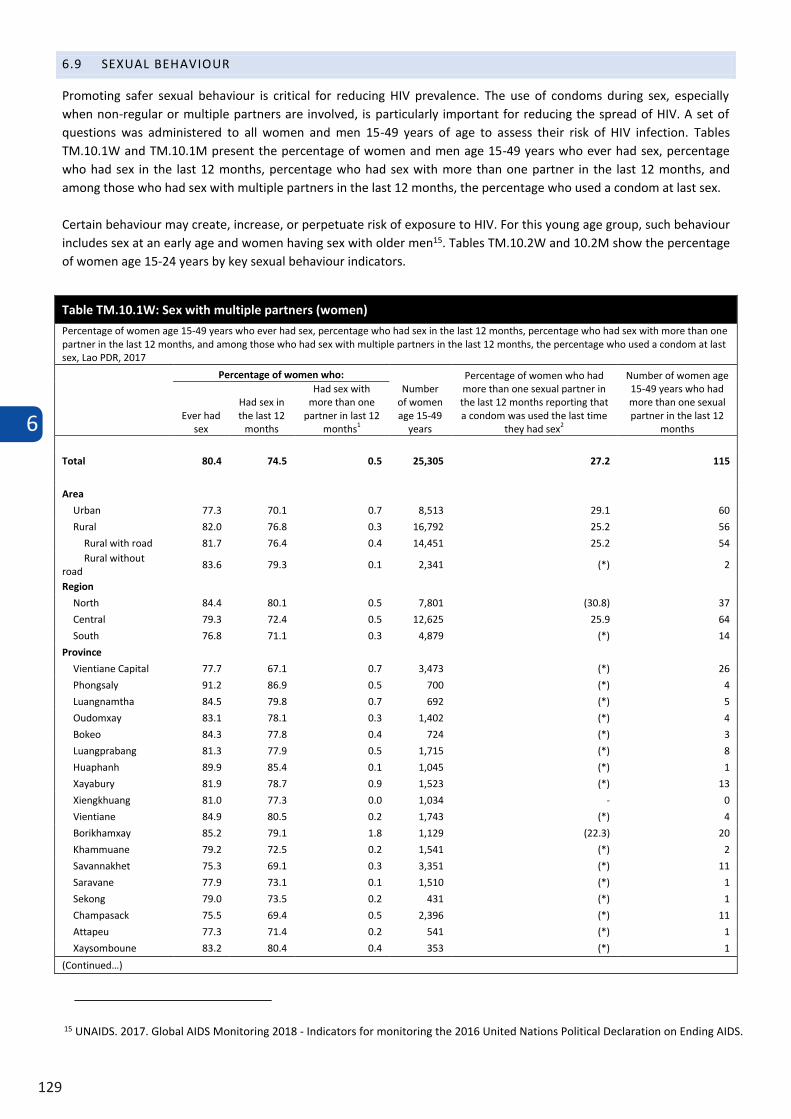
6
129
Table TM.8.9 (continued): Post-natal health checks for mothers and newborns
Percentage of women age 15-49 years with a live birth in the last two years by post-natal health checks for the mother and newborn, within two days of the most recent birth, Lao PDR, 2017
Percentage of post-natal health checks within two days of birth for: Number of women with a live birth in the last two years Newborns1 Mothers2
Both mothers and newborns
Neither mother nor newborn
Mother’s education
None or ECE 20.9 20.7 19.1 77.5 781
Primary 40.3 40.1 37.7 57.3 1,598
Lower secondary 54.5 54.8 51.5 42.2 958
Upper secondary 69.4 69.9 65.9 26.6 386
Post secondary / Non tertiary 67.8 70.1 64.9 27.0 127
Higher 81.0 81.6 77.7 15.1 381
Mother's age at birth
Less than 20 38.5 37.9 35.3 58.9 701
20-34 49.3 49.8 46.8 47.6 3,152
35-49 44.2 42.6 41.1 54.4 378
Place of delivery
Home 6.1 5.2 4.4 93.1 1,459
Health facility 69.0 69.8 65.8 27.0 2,730
Public 68.4 69.1 65.1 27.6 2,660
Private 92.2 95.6 92.2 4.4 70
Other/DK/Missing (40.2) (37.4) (37.4) (59.8) 43
Type of delivery
Vaginal birth 44.7 44.6 41.9 52.7 3,981
C-section 85.2 88.9 83.4 9.4 250
Ethno-linguistic group of household head
Lao-Tai 61.1 62.0 58.6 35.5 2,365
Mon-Khmer 28.8 28.4 26.4 69.2 1,087
Hmong-Mien 29.0 27.4 25.1 68.7 608
Chinese-Tibetan 26.1 24.2 22.6 72.3 126
Other, DK, Missing (52.0) (51.8) (48.0) (44.2) 45
Wealth index quintile
Poorest 19.2 18.5 17.4 79.7 1,081
Second 31.9 31.4 29.0 65.6 904
Middle 53.6 54.6 50.6 42.5 789
Fourth 67.3 66.0 62.9 29.5 731
Richest 80.0 82.7 78.4 15.7 725 1 MICS indicator TM.13 - Post-natal health check for the newborn
1 MICS indicator TM.20 - Post-natal health check for the mother
( ) Figures that are based on 25 – 49 unweighted cases
6.9 SEXUAL BEHAVIOUR
Promoting safer sexual behaviour is critical for reducing HIV prevalence. The use of condoms during sex, especially when non-regular or multiple partners are involved, is particularly important for reducing the spread of HIV. A set of questions was administered to all women and men 15-49 years of age to assess their risk of HIV infection. Tables TM.10.1W and TM.10.1M present the percentage of women and men age 15-49 years who ever had sex, percentage who had sex in the last 12 months, percentage who had sex with more than one partner in the last 12 months, and among those who had sex with multiple partners in the last 12 months, the percentage who used a condom at last sex.
Certain behaviour may create, increase, or perpetuate risk of exposure to HIV. For this young age group, such behaviour includes sex at an early age and women having sex with older men15. Tables TM.10.2W and 10.2M show the percentage of women age 15-24 years by key sexual behaviour indicators.
Table TM.10.1W: Sex with multiple partners (women)
Percentage of women age 15-49 years who ever had sex, percentage who had sex in the last 12 months, percentage who had sex with more than one partner in the last 12 months, and among those who had sex with multiple partners in the last 12 months, the percentage who used a condom at last sex, Lao PDR, 2017
Percentage of women who: Number
of women age 15-49
years
Percentage of women who had more than one sexual partner in the last 12 months reporting that a condom was used the last time
they had sex2
Number of women age 15-49 years who had more than one sexual partner in the last 12
months Ever had
sex
Had sex in the last 12
months
Had sex with more than one
partner in last 12 months1
Total 80.4 74.5 0.5 25,305 27.2 115
Area
Urban 77.3 70.1 0.7 8,513 29.1 60
Rural 82.0 76.8 0.3 16,792 25.2 56
Rural with road 81.7 76.4 0.4 14,451 25.2 54 Rural without
road 83.6 79.3 0.1 2,341 (*) 2
Region
North 84.4 80.1 0.5 7,801 (30.8) 37
Central 79.3 72.4 0.5 12,625 25.9 64
South 76.8 71.1 0.3 4,879 (*) 14
Province
Vientiane Capital 77.7 67.1 0.7 3,473 (*) 26
Phongsaly 91.2 86.9 0.5 700 (*) 4
Luangnamtha 84.5 79.8 0.7 692 (*) 5
Oudomxay 83.1 78.1 0.3 1,402 (*) 4
Bokeo 84.3 77.8 0.4 724 (*) 3
Luangprabang 81.3 77.9 0.5 1,715 (*) 8
Huaphanh 89.9 85.4 0.1 1,045 (*) 1
Xayabury 81.9 78.7 0.9 1,523 (*) 13
Xiengkhuang 81.0 77.3 0.0 1,034 - 0
Vientiane 84.9 80.5 0.2 1,743 (*) 4
Borikhamxay 85.2 79.1 1.8 1,129 (22.3) 20
Khammuane 79.2 72.5 0.2 1,541 (*) 2
Savannakhet 75.3 69.1 0.3 3,351 (*) 11
Saravane 77.9 73.1 0.1 1,510 (*) 1
Sekong 79.0 73.5 0.2 431 (*) 1
Champasack 75.5 69.4 0.5 2,396 (*) 11
Attapeu 77.3 71.4 0.2 541 (*) 1
Xaysomboune 83.2 80.4 0.4 353 (*) 1
(Continued…)
15 UNAIDS. 2017. Global AIDS Monitoring 2018 - Indicators for monitoring the 2016 United Nations Political Declaration on Ending AIDS.
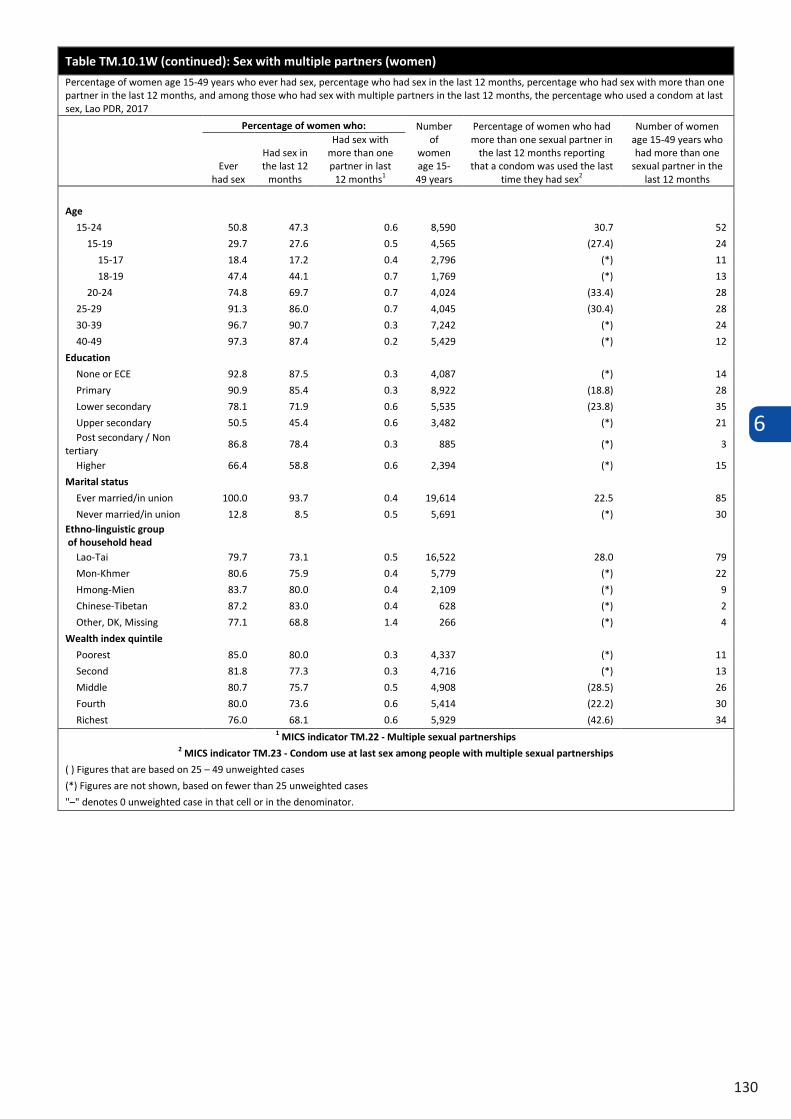
6
130
Table TM.10.1W (continued): Sex with multiple partners (women)
Percentage of women age 15-49 years who ever had sex, percentage who had sex in the last 12 months, percentage who had sex with more than one partner in the last 12 months, and among those who had sex with multiple partners in the last 12 months, the percentage who used a condom at last sex, Lao PDR, 2017
Percentage of women who: Number of
women age 15-49 years
Percentage of women who had more than one sexual partner in
the last 12 months reporting that a condom was used the last
time they had sex2
Number of women age 15-49 years who had more than one
sexual partner in the last 12 months
Ever had sex
Had sex in the last 12
months
Had sex with more than one partner in last
12 months1
Age
15-24 50.8 47.3 0.6 8,590 30.7 52
15-19 29.7 27.6 0.5 4,565 (27.4) 24
15-17 18.4 17.2 0.4 2,796 (*) 11
18-19 47.4 44.1 0.7 1,769 (*) 13
20-24 74.8 69.7 0.7 4,024 (33.4) 28
25-29 91.3 86.0 0.7 4,045 (30.4) 28
30-39 96.7 90.7 0.3 7,242 (*) 24
40-49 97.3 87.4 0.2 5,429 (*) 12
Education
None or ECE 92.8 87.5 0.3 4,087 (*) 14
Primary 90.9 85.4 0.3 8,922 (18.8) 28
Lower secondary 78.1 71.9 0.6 5,535 (23.8) 35
Upper secondary 50.5 45.4 0.6 3,482 (*) 21 Post secondary / Non
tertiary 86.8 78.4 0.3 885 (*) 3
Higher 66.4 58.8 0.6 2,394 (*) 15
Marital status
Ever married/in union 100.0 93.7 0.4 19,614 22.5 85
Never married/in union 12.8 8.5 0.5 5,691 (*) 30 Ethno-linguistic group of household head
Lao-Tai 79.7 73.1 0.5 16,522 28.0 79
Mon-Khmer 80.6 75.9 0.4 5,779 (*) 22
Hmong-Mien 83.7 80.0 0.4 2,109 (*) 9
Chinese-Tibetan 87.2 83.0 0.4 628 (*) 2
Other, DK, Missing 77.1 68.8 1.4 266 (*) 4
Wealth index quintile
Poorest 85.0 80.0 0.3 4,337 (*) 11
Second 81.8 77.3 0.3 4,716 (*) 13
Middle 80.7 75.7 0.5 4,908 (28.5) 26
Fourth 80.0 73.6 0.6 5,414 (22.2) 30
Richest 76.0 68.1 0.6 5,929 (42.6) 34 1 MICS indicator TM.22 - Multiple sexual partnerships
2 MICS indicator TM.23 - Condom use at last sex among people with multiple sexual partnerships
( ) Figures that are based on 25 – 49 unweighted cases
(*) Figures are not shown, based on fewer than 25 unweighted cases
"–" denotes 0 unweighted case in that cell or in the denominator.
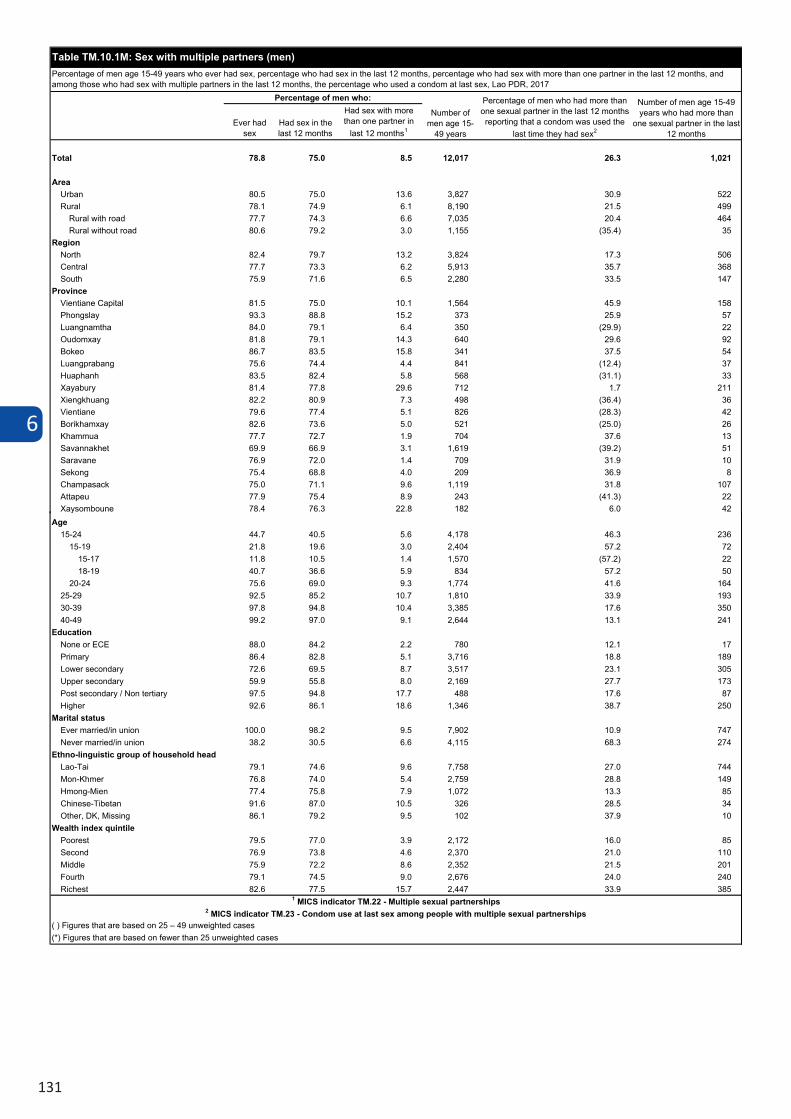
6
131
Table TM.10.1W (continued): Sex with multiple partners (women)
Percentage of women age 15-49 years who ever had sex, percentage who had sex in the last 12 months, percentage who had sex with more than one partner in the last 12 months, and among those who had sex with multiple partners in the last 12 months, the percentage who used a condom at last sex, Lao PDR, 2017
Percentage of women who: Number of
women age 15-49 years
Percentage of women who had more than one sexual partner in
the last 12 months reporting that a condom was used the last
time they had sex2
Number of women age 15-49 years who had more than one
sexual partner in the last 12 months
Ever had sex
Had sex in the last 12
months
Had sex with more than one partner in last
12 months1
Age
15-24 50.8 47.3 0.6 8,590 30.7 52
15-19 29.7 27.6 0.5 4,565 (27.4) 24
15-17 18.4 17.2 0.4 2,796 (*) 11
18-19 47.4 44.1 0.7 1,769 (*) 13
20-24 74.8 69.7 0.7 4,024 (33.4) 28
25-29 91.3 86.0 0.7 4,045 (30.4) 28
30-39 96.7 90.7 0.3 7,242 (*) 24
40-49 97.3 87.4 0.2 5,429 (*) 12
Education
None or ECE 92.8 87.5 0.3 4,087 (*) 14
Primary 90.9 85.4 0.3 8,922 (18.8) 28
Lower secondary 78.1 71.9 0.6 5,535 (23.8) 35
Upper secondary 50.5 45.4 0.6 3,482 (*) 21 Post secondary / Non
tertiary 86.8 78.4 0.3 885 (*) 3
Higher 66.4 58.8 0.6 2,394 (*) 15
Marital status
Ever married/in union 100.0 93.7 0.4 19,614 22.5 85
Never married/in union 12.8 8.5 0.5 5,691 (*) 30 Ethno-linguistic group of household head
Lao-Tai 79.7 73.1 0.5 16,522 28.0 79
Mon-Khmer 80.6 75.9 0.4 5,779 (*) 22
Hmong-Mien 83.7 80.0 0.4 2,109 (*) 9
Chinese-Tibetan 87.2 83.0 0.4 628 (*) 2
Other, DK, Missing 77.1 68.8 1.4 266 (*) 4
Wealth index quintile
Poorest 85.0 80.0 0.3 4,337 (*) 11
Second 81.8 77.3 0.3 4,716 (*) 13
Middle 80.7 75.7 0.5 4,908 (28.5) 26
Fourth 80.0 73.6 0.6 5,414 (22.2) 30
Richest 76.0 68.1 0.6 5,929 (42.6) 34 1 MICS indicator TM.22 - Multiple sexual partnerships
2 MICS indicator TM.23 - Condom use at last sex among people with multiple sexual partnerships
( ) Figures that are based on 25 – 49 unweighted cases
(*) Figures are not shown, based on fewer than 25 unweighted cases
"–" denotes 0 unweighted case in that cell or in the denominator.
Ever had sex
Had sex in the last 12 months
Had sex with more than one partner in
last 12 months1
Total 78.8 75.0 8.5 12,017 26.3 1,021
AreaUrban 80.5 75.0 13.6 3,827 30.9 522Rural 78.1 74.9 6.1 8,190 21.5 499
Rural with road 77.7 74.3 6.6 7,035 20.4 464Rural without road 80.6 79.2 3.0 1,155 (35.4) 35
RegionNorth 82.4 79.7 13.2 3,824 17.3 506Central 77.7 73.3 6.2 5,913 35.7 368South 75.9 71.6 6.5 2,280 33.5 147
ProvinceVientiane Capital 81.5 75.0 10.1 1,564 45.9 158Phongslay 93.3 88.8 15.2 373 25.9 57Luangnamtha 84.0 79.1 6.4 350 (29.9) 22Oudomxay 81.8 79.1 14.3 640 29.6 92Bokeo 86.7 83.5 15.8 341 37.5 54Luangprabang 75.6 74.4 4.4 841 (12.4) 37Huaphanh 83.5 82.4 5.8 568 (31.1) 33Xayabury 81.4 77.8 29.6 712 1.7 211Xiengkhuang 82.2 80.9 7.3 498 (36.4) 36Vientiane 79.6 77.4 5.1 826 (28.3) 42Borikhamxay 82.6 73.6 5.0 521 (25.0) 26Khammua 77.7 72.7 1.9 704 37.6 13Savannakhet 69.9 66.9 3.1 1,619 (39.2) 51Saravane 76.9 72.0 1.4 709 31.9 10Sekong 75.4 68.8 4.0 209 36.9 8Champasack 75.0 71.1 9.6 1,119 31.8 107Attapeu 77.9 75.4 8.9 243 (41.3) 22Xaysomboune 78.4 76.3 22.8 182 6.0 42
(Continued…)
Table TM.10.1M: Sex with multiple partners (men)Percentage of men age 15-49 years who ever had sex, percentage who had sex in the last 12 months, percentage who had sex with more than one partner in the last 12 months, and among those who had sex with multiple partners in the last 12 months, the percentage who used a condom at last sex, Lao PDR, 2017
Percentage of men who:
Number of men age 15-
49 years
Percentage of men who had more than one sexual partner in the last 12 months reporting that a condom was used the
last time they had sex2
Number of men age 15-49 years who had more than
one sexual partner in the last 12 months
Ever had sexHad sex in the last 12 months
Had sex with more than one partner in
last 12 months1
Age15-24 44.7 40.5 5.6 4,178 46.3 236
15-19 21.8 19.6 3.0 2,404 57.2 7215-17 11.8 10.5 1.4 1,570 (57.2) 2218-19 40.7 36.6 5.9 834 57.2 50
20-24 75.6 69.0 9.3 1,774 41.6 16425-29 92.5 85.2 10.7 1,810 33.9 19330-39 97.8 94.8 10.4 3,385 17.6 35040-49 99.2 97.0 9.1 2,644 13.1 241
EducationNone or ECE 88.0 84.2 2.2 780 12.1 17Primary 86.4 82.8 5.1 3,716 18.8 189Lower secondary 72.6 69.5 8.7 3,517 23.1 305Upper secondary 59.9 55.8 8.0 2,169 27.7 173Post secondary / Non tertiary 97.5 94.8 17.7 488 17.6 87Higher 92.6 86.1 18.6 1,346 38.7 250
Marital statusEver married/in union 100.0 98.2 9.5 7,902 10.9 747Never married/in union 38.2 30.5 6.6 4,115 68.3 274
Ethno-linguistic group of household headLao-Tai 79.1 74.6 9.6 7,758 27.0 744Mon-Khmer 76.8 74.0 5.4 2,759 28.8 149Hmong-Mien 77.4 75.8 7.9 1,072 13.3 85Chinese-Tibetan 91.6 87.0 10.5 326 28.5 34Other, DK, Missing 86.1 79.2 9.5 102 37.9 10
Wealth index quintilePoorest 79.5 77.0 3.9 2,172 16.0 85Second 76.9 73.8 4.6 2,370 21.0 110Middle 75.9 72.2 8.6 2,352 21.5 201Fourth 79.1 74.5 9.0 2,676 24.0 240Richest 82.6 77.5 15.7 2,447 33.9 385
1 MICS indicator TM.22 - Multiple sexual partnerships2 MICS indicator TM.23 - Condom use at last sex among people with multiple sexual partnerships
( ) Figures that are based on 25 – 49 unweighted cases(*) Figures that are based on fewer than 25 unweighted cases
Table TM.10.1M (continued): Sex with multiple partners (men)Percentage of men age 15-49 years who ever had sex, percentage who had sex in the last 12 months, percentage who had sex with more than one partner in the last 12 months, and among those who had sex with multiple partners in the last 12 months, the percentage who used a condom at last sex, Lao PDR, 2017
Percentage of men who:
Number of men age 15-
49 years
Percentage of men who had more than one sexual partner in the last 12 months reporting that a condom was used the
last time they had sex2
Number of men age 15-49 years who had more than
one sexual partner in the last 12 months
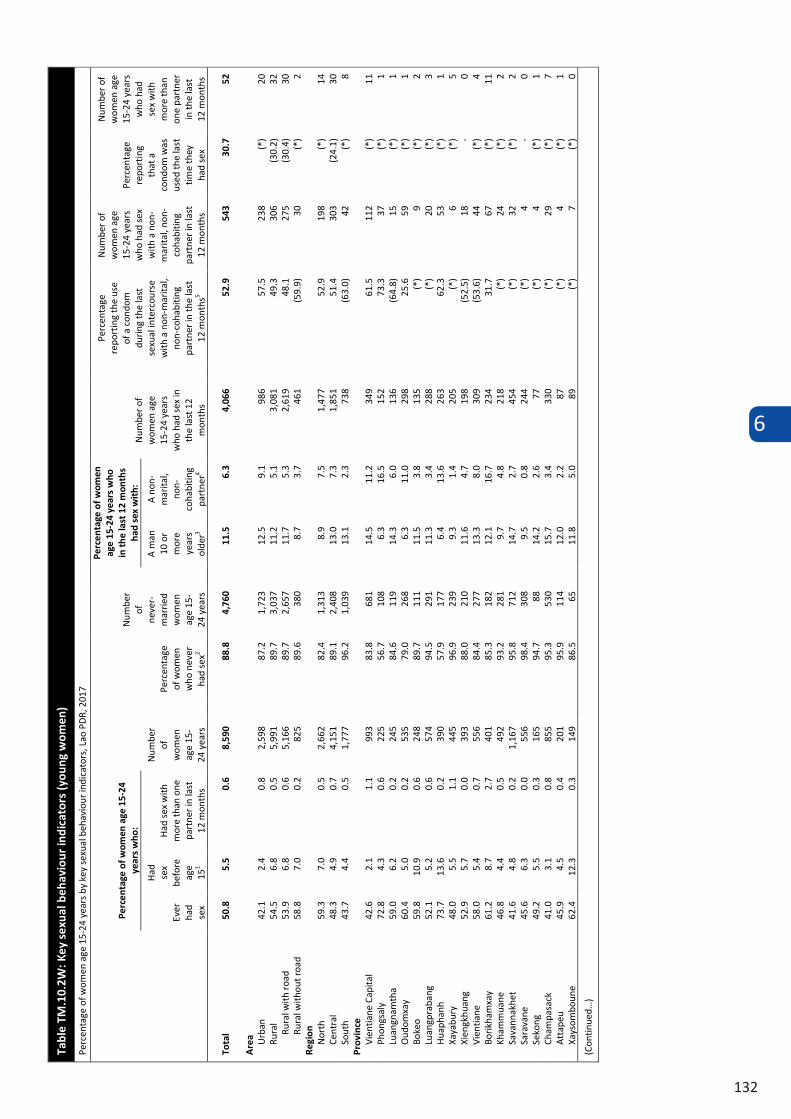
6
132
Tabl
e TM
.10.
2W: K
ey s
exua
l beh
avio
ur in
dica
tors
(you
ng w
omen
)
Perc
enta
ge o
f wom
en a
ge 1
5-24
yea
rs b
y ke
y se
xual
beh
avio
ur in
dica
tors
, Lao
PD
R, 2
017
Perc
enta
ge o
f wom
en a
ge 1
5-24
ye
ars
who
:
Num
ber
of
wom
en
age
15-
24 y
ears
Perc
enta
ge
of w
omen
w
ho n
ever
ha
d se
x2
Num
ber
of
neve
r-m
arrie
d w
omen
ag
e 15
-24
yea
rs
Perc
enta
ge o
f wom
en
age
15-2
4 ye
ars
who
in
the
last
12
mon
ths
had
sex
wit
h:
Num
ber o
f w
omen
age
15
-24
year
s w
ho h
ad s
ex in
th
e la
st 1
2 m
onth
s
Perc
enta
ge
repo
rtin
g th
e us
e of
a c
ondo
m
durin
g th
e la
st
sexu
al in
terc
ours
e w
ith a
non
-mar
ital,
non-
coha
bitin
g pa
rtne
r in
the
last
12
mon
ths5
Num
ber o
f w
omen
age
15
-24
year
s w
ho h
ad s
ex
with
a n
on-
mar
ital,
non-
coha
bitin
g pa
rtne
r in
last
12
mon
ths
Perc
enta
ge
repo
rtin
g th
at a
co
ndom
was
us
ed th
e la
st
time
they
ha
d se
x
Num
ber o
f w
omen
age
15
-24
year
s w
ho h
ad
sex
with
m
ore
than
on
e pa
rtne
r in
the
last
12
mon
ths
Ever
ha
d se
x
Had
se
x be
fore
ag
e 15
1
Had
sex
with
m
ore
than
one
pa
rtne
r in
last
12
mon
ths
A m
an
10 o
r m
ore
year
s ol
der3
A n
on-
mar
ital,
non-
coha
bitin
g pa
rtne
r4
Tota
l 50
.8
5.5
0.6
8,59
0 88
.8
4,76
0 11
.5
6.3
4,06
6 52
.9
543
30.7
52
Are
a Urb
an
42.1
2.
4 0.
8 2,
598
87.2
1,
723
12.5
9.
1 98
6 57
.5
238
(*)
20
Rura
l 54
.5
6.8
0.5
5,99
1 89
.7
3,03
7 11
.2
5.1
3,08
1 49
.3
306
(30.
2)
32
Rura
l with
roa
d 53
.9
6.8
0.6
5,16
6 89
.7
2,65
7 11
.7
5.3
2,61
9 48
.1
275
(30.
4)
30
Rura
l with
out r
oad
58.8
7.
0 0.
2 82
5 89
.6
380
8.7
3.7
461
(59.
9)
30
(*)
2 Re
gion
N
orth
59
.3
7.0
0.5
2,66
2 82
.4
1,31
3 8.
9 7.
5 1,
477
52.9
19
8 (*
) 14
Ce
ntra
l 48
.3
4.9
0.7
4,15
1 89
.1
2,40
8 13
.0
7.3
1,85
1 51
.4
303
(24.
1)
30
Sout
h 43
.7
4.4
0.5
1,77
7 96
.2
1,03
9 13
.1
2.3
738
(63.
0)
42
(*)
8 Pr
ovin
ce
Vien
tiane
Cap
ital
42.6
2.
1 1.
1 99
3 83
.8
681
14.5
11
.2
349
61.5
11
2 (*
) 11
Ph
ongs
aly
72
.8
4.3
0.6
225
56.7
10
8 6.
3 16
.5
152
73.3
37
(*
) 1
Luan
gnam
tha
59.0
6.
2 0.
2 24
5 84
.6
119
14.3
6.
0 13
6 (6
4.8)
15
(*
) 1
Oud
omxa
y 60
.4
5.0
0.2
535
79.0
26
8 6.
3 11
.0
298
25.6
59
(*
) 1
Boke
o 59
.8
10.9
0.
6 24
8 89
.7
111
11.5
3.
8 13
5 (*
) 9
(*)
2 Lu
angp
raba
ng
52.1
5.
2 0.
6 57
4 94
.5
291
11.3
3.
4 28
8 (*
) 20
(*
) 3
Hua
phan
h 73
.7
13.6
0.
2 39
0 57
.9
177
6.4
13.6
26
3 62
.3
53
(*)
1 Xa
yabu
ry
48.0
5.
5 1.
1 44
5 96
.9
239
9.3
1.4
205
(*)
6 (*
) 5
Xien
gkhu
ang
52.9
5.
7 0.
0 39
3 88
.0
210
11.6
4.
7 19
8 (5
2.5)
18
-
0 Vi
entia
ne
58.0
5.
4 0.
7 55
6 84
.4
277
13.3
8.
0 30
9 (5
3.6)
44
(*
) 4
Borik
ham
xay
61.2
8.
7 2.
7 40
1 85
.3
182
12.1
16
.7
234
31.7
67
(*
) 11
Kh
amm
uane
46
.8
4.4
0.5
492
93.2
28
1 9.
7 4.
8 21
8 (*
) 24
(*
) 2
Sava
nnak
het
41.6
4.
8 0.
2 1,
167
95.8
71
2 14
.7
2.7
454
(*)
32
(*)
2 Sa
rava
ne
45.6
6.
3 0.
0 55
6 98
.4
308
9.5
0.8
244
(*)
4 -
0 Se
kong
49
.2
5.5
0.3
165
94.7
88
14
.2
2.6
77
(*)
4 (*
) 1
Cham
pasa
ck
41.0
3.
1 0.
8 85
5 95
.3
530
15.7
3.
4 33
0 (*
) 29
(*
) 7
Att
apeu
45
.9
4.5
0.4
201
95.9
11
4 12
.0
2.2
87
(*)
4 (*
) 1
Xays
ombo
une
62.4
12
.3
0.3
149
86.5
65
11
.8
5.0
89
(*)
7 (*
) 0
(Con
tinue
d…)
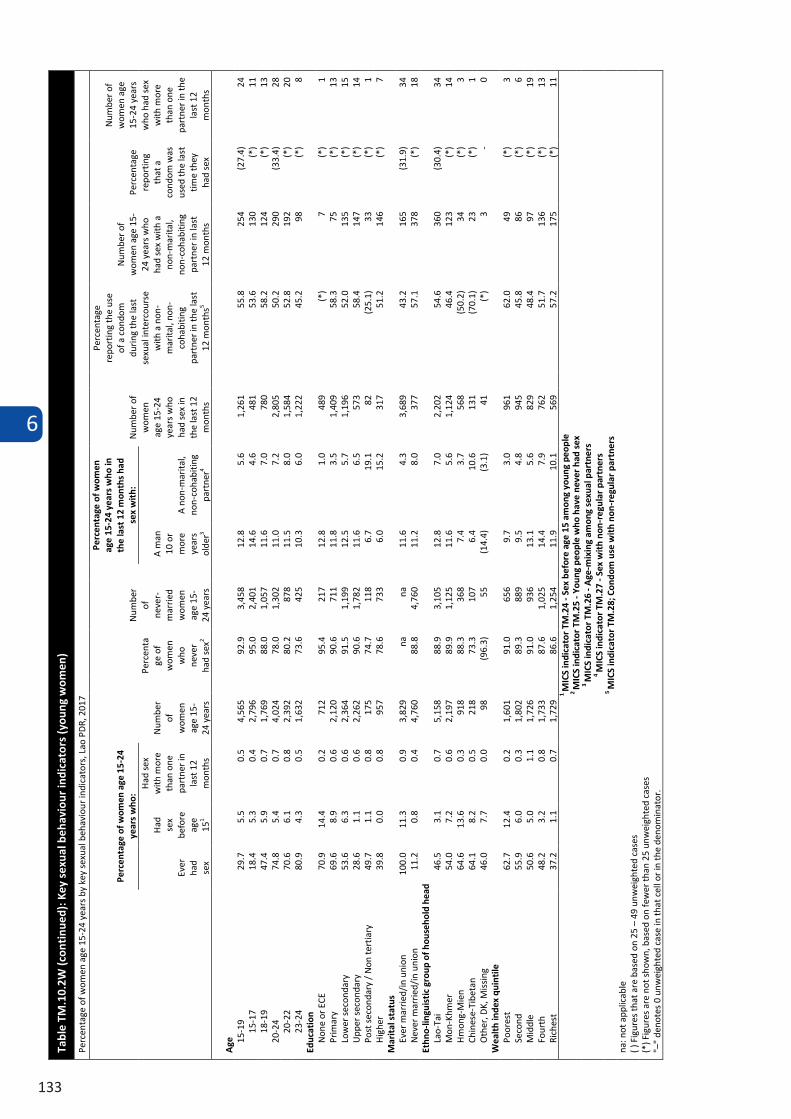
6
133
Tabl
e TM
.10.
2W (c
onti
nued
): K
ey s
exua
l beh
avio
ur in
dica
tors
(you
ng w
omen
)
Perc
enta
ge o
f wom
en a
ge 1
5-24
yea
rs b
y ke
y se
xual
beh
avio
ur in
dica
tors
, Lao
PD
R, 2
017
Perc
enta
ge o
f wom
en a
ge 1
5-24
ye
ars
who
:
Num
ber
of
wom
en
age
15-
24 y
ears
Perc
enta
ge o
f w
omen
w
ho
neve
r ha
d se
x2
Num
ber
of
neve
r-m
arrie
d w
omen
ag
e 15
-24
yea
rs
Perc
enta
ge o
f wom
en
age
15-2
4 ye
ars
who
in
the
last
12
mon
ths
had
sex
wit
h:
Num
ber o
f w
omen
ag
e 15
-24
year
s w
ho
had
sex
in
the
last
12
mon
ths
Perc
enta
ge
repo
rtin
g th
e us
e of
a c
ondo
m
durin
g th
e la
st
sexu
al in
terc
ours
e w
ith a
non
-m
arita
l, no
n-co
habi
ting
part
ner i
n th
e la
st
12 m
onth
s5
Num
ber o
f w
omen
age
15-
24 y
ears
who
ha
d se
x w
ith a
no
n-m
arita
l, no
n-co
habi
ting
part
ner i
n la
st
12 m
onth
s
Perc
enta
ge
repo
rtin
g th
at a
co
ndom
was
us
ed th
e la
st
time
they
ha
d se
x
Num
ber o
f w
omen
age
15
-24
year
s w
ho h
ad s
ex
with
mor
e th
an o
ne
part
ner i
n th
e la
st 1
2 m
onth
s
Ever
ha
d se
x
Had
se
x be
fore
ag
e 15
1
Had
sex
w
ith m
ore
than
one
pa
rtne
r in
last
12
mon
ths
A m
an
10 o
r m
ore
year
s ol
der3
A n
on-m
arita
l, no
n-co
habi
ting
part
ner4
Age
15
-19
29.7
5.
5 0.
5 4,
565
92.9
3,
458
12.8
5.
6 1,
261
55.8
25
4 (2
7.4)
24
15
-17
18.4
5.
3 0.
4 2,
796
95.0
2,
401
14.6
4.
6 48
1 53
.6
130
(*)
11
18-1
9 47
.4
5.9
0.7
1,76
9 88
.0
1,05
7 11
.6
7.0
780
58.2
12
4 (*
) 13
20
-24
74.8
5.
4 0.
7 4,
024
78.0
1,
302
11.0
7.
2 2,
805
50.2
29
0 (3
3.4)
28
20
-22
70.6
6.
1 0.
8 2,
392
80.2
87
8 11
.5
8.0
1,58
4 52
.8
192
(*)
20
23-2
4 80
.9
4.3
0.5
1,63
2 73
.6
425
10.3
6.
0 1,
222
45.2
98
(*
) 8
Educ
atio
n N
one
or E
CE
70.9
14
.4
0.2
712
95.4
21
7 12
.8
1.0
489
(*)
7 (*
) 1
Prim
ary
69.6
8.
9 0.
6 2,
120
90.6
71
1 11
.8
3.5
1,40
9 58
.3
75
(*)
13
Low
er s
econ
dary
53
.6
6.3
0.6
2,36
4 91
.5
1,19
9 12
.5
5.7
1,19
6 52
.0
135
(*)
15
Upp
er s
econ
dary
28
.6
1.1
0.6
2,26
2 90
.6
1,78
2 11
.6
6.5
573
58.4
14
7 (*
) 14
Po
st s
econ
dary
/ N
on te
rtia
ry
49.7
1.
1 0.
8 17
5 74
.7
118
6.7
19.1
82
(2
5.1)
33
(*
) 1
Hig
her
39.8
0.
0 0.
8 95
7 78
.6
733
6.0
15.2
31
7 51
.2
146
(*)
7 M
arit
al s
tatu
s Ev
er m
arrie
d/in
uni
on
100.
0 11
.3
0.9
3,82
9 na
na
11
.6
4.3
3,68
9 43
.2
165
(31.
9)
34
Nev
er m
arrie
d/in
uni
on
11.2
0.
8 0.
4 4,
760
88.8
4,
760
11.2
8.
0 37
7 57
.1
378
(*)
18
Ethn
o-lin
guis
tic
grou
p of
hou
seho
ld h
ead
Lao-
Tai
46.5
3.
1 0.
7 5,
158
88.9
3,
105
12.8
7.
0 2,
202
54.6
36
0 (3
0.4)
34
M
on-K
hmer
54
.0
7.2
0.6
2,19
7 89
.9
1,12
5 11
.6
5.6
1,12
4 46
.4
123
(*)
14
Hm
ong-
Mie
n 64
.6
13.6
0.
3 91
8 88
.3
368
7.4
3.7
568
(50.
2)
34
(*)
3 Ch
ines
e-Ti
beta
n 64
.1
8.2
0.5
218
73.3
10
7 6.
4 10
.6
131
(70.
1)
23
(*)
1 O
ther
, DK,
Mis
sing
46
.0
7.7
0.0
98
(96.
3)
55
(14.
4)
(3.1
) 41
(*
) 3
- 0
Wea
lth
inde
x qu
inti
le
Poor
est
62.7
12
.4
0.2
1,60
1 91
.0
656
9.7
3.0
961
62.0
49
(*
) 3
Seco
nd
55.9
6.
0 0.
3 1,
802
89.3
88
9 9.
5 4.
8 94
5 45
.8
86
(*)
6 M
iddl
e 50
.6
5.0
1.1
1,72
6 91
.0
936
13.1
5.
6 82
9 48
.4
97
(*)
19
Four
th
48.2
3.
2 0.
8 1,
733
87.6
1,
025
14.4
7.
9 76
2 51
.7
136
(*)
13
Rich
est
37.2
1.
1 0.
7 1,
729
86.6
1,
254
11.9
10
.1
569
57.2
17
5 (*
) 11
1
MIC
S in
dica
tor
TM.2
4 - S
ex b
efor
e ag
e 15
am
ong
youn
g pe
ople
2
MIC
S in
dica
tor
TM.2
5 - Y
oung
peo
ple
who
hav
e ne
ver
had
sex
3 M
ICS
indi
cato
r TM
.26
- Age
-mix
ing
amon
g se
xual
par
tner
s 4
MIC
S in
dica
tor
TM.2
7 - S
ex w
ith
non-
regu
lar
part
ners
5
MIC
S in
dica
tor
TM.2
8; C
ondo
m u
se w
ith
non-
regu
lar
part
ners
na
: not
app
licab
le
( ) F
igur
es th
at a
re b
ased
on
25 –
49
unw
eigh
ted
case
s (*
) Fig
ures
are
not
sho
wn,
bas
ed o
n fe
wer
than
25
unw
eigh
ted
case
s "–
" de
note
s 0
unw
eigh
ted
case
in th
at c
ell o
r in
the
deno
min
ator
.
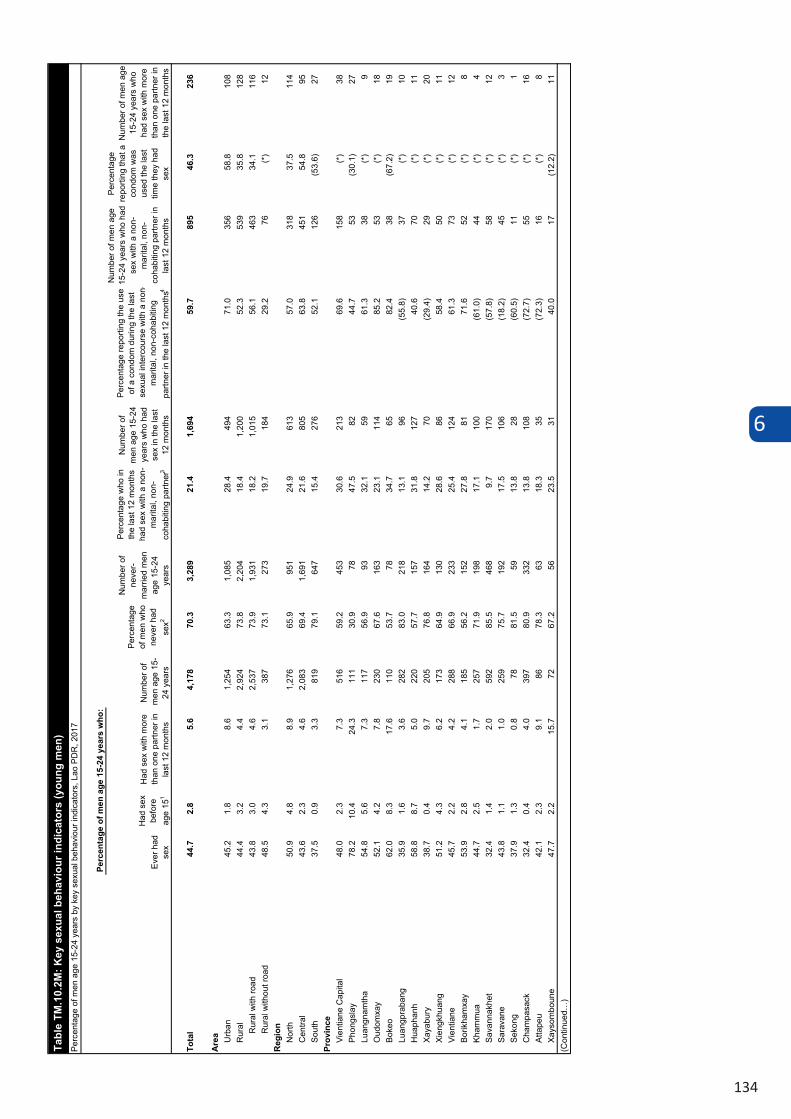
6
134
Tota
l44
.72.
85.
64,
178
70.3
3,28
921
.41,
694
59.7
895
46.3
236
Are
a Urb
an45
.21.
88.
61,
254
63.3
1,08
528
.449
471
.035
658
.810
8R
ural
44.4
3.2
4.4
2,92
473
.82,
204
18.4
1,20
052
.353
935
.812
8R
ural
with
road
43.8
3.0
4.6
2,53
773
.91,
931
18.2
1,01
556
.146
334
.111
6R
ural
with
out r
oad
48.5
4.3
3.1
387
73.1
273
19.7
184
29.2
76(*
)12
Reg
ion
Nor
th50
.94.
88.
91,
276
65.9
951
24.9
613
57.0
318
37.5
114
Cen
tral
43.6
2.3
4.6
2,08
369
.41,
691
21.6
805
63.8
451
54.8
95So
uth
37.5
0.9
3.3
819
79.1
647
15.4
276
52.1
126
(53.
6)27
Prov
ince
Vien
tiane
Cap
ital
48.0
2.3
7.3
516
59.2
453
30.6
213
69.6
158
(*)
38Ph
ongs
lay
78.2
10.4
24.3
111
30.9
7847
.582
44.7
53(3
0.1)
27Lu
angn
amth
a54
.85.
67.
311
756
.993
32.1
5961
.338
(*)
9O
udom
xay
52.1
4.2
7.8
230
67.6
163
23.1
114
85.2
53(*
)18
Boke
o62
.08.
317
.611
053
.778
34.7
6582
.438
(67.
2)19
Luan
gpra
bang
35.9
1.6
3.6
282
83.0
218
13.1
96(5
5.8)
37(*
)10
Hua
phan
h58
.88.
75.
022
057
.715
731
.812
740
.670
(*)
11Xa
yabu
ry38
.70.
49.
720
576
.816
414
.270
(29.
4)29
(*)
20Xi
engk
huan
g51
.24.
36.
217
364
.913
028
.686
58.4
50(*
)11
Vien
tiane
45.7
2.2
4.2
288
66.9
233
25.4
124
61.3
73(*
)12
Borik
ham
xay
53.9
2.8
4.1
185
56.2
152
27.8
8171
.652
(*)
8Kh
amm
ua44
.72.
51.
725
771
.919
817
.110
0(6
1.0)
44(*
)4
Sava
nnak
het
32.4
1.4
2.0
592
85.5
468
9.7
170
(57.
8)58
(*)
12Sa
rava
ne43
.81.
11.
025
975
.719
217
.510
6(1
8.2)
45(*
)3
Seko
ng37
.91.
30.
878
81.5
5913
.828
(60.
5)11
(*)
1C
ham
pasa
ck32
.40.
44.
039
780
.933
213
.810
8(7
2.7)
55(*
)16
Atta
peu
42.1
2.3
9.1
8678
.363
18.3
35(7
2.3)
16(*
)8
Xays
ombo
une
47.7
2.2
15.7
7267
.256
23.5
3140
.017
(12.
2)11
(Con
tinue
d…)
Tabl
e TM
.10.
2M: K
ey s
exua
l beh
avio
ur in
dica
tors
(you
ng m
en)
Perc
enta
ge o
f men
age
15-
24 y
ears
by
key
sexu
al b
ehav
iour
indi
cato
rs, L
ao P
DR
, 201
7
Perc
enta
ge w
ho in
th
e la
st 1
2 m
onth
s ha
d se
x w
ith a
non
-m
arita
l, no
n-co
habi
ting
partn
er3
Num
ber o
f m
en a
ge 1
5-24
ye
ars
who
had
se
x in
the
last
12
mon
ths
Perc
enta
ge re
porti
ng th
e us
e of
a c
ondo
m d
urin
g th
e la
st
sexu
al in
terc
ours
e w
ith a
non
-m
arita
l, no
n-co
habi
ting
partn
er in
the
last
12
mon
ths4
Num
ber o
f men
age
15
-24
year
s w
ho h
ad
sex
with
a n
on-
mar
ital,
non-
coha
bitin
g pa
rtner
in
last
12
mon
ths
Perc
enta
ge
repo
rting
that
a
cond
om w
as
used
the
last
tim
e th
ey h
ad
sex
Num
ber o
f men
age
15
-24
year
s w
ho
had
sex
with
mor
e th
an o
ne p
artn
er in
th
e la
st 1
2 m
onth
sEv
er h
ad
sex
Had
sex
be
fore
ag
e 15
1
Had
sex
with
mor
e th
an o
ne p
artn
er in
la
st 1
2 m
onth
s
Perc
enta
ge o
f men
age
15-
24 y
ears
who
:
Num
ber o
f m
en a
ge 1
5 -24
yea
rs
Perc
enta
ge
of m
en w
ho
neve
r had
se
x2
Num
ber o
f ne
ver-
mar
ried
men
ag
e 15
-24
year
s
Age 15
-19
21.8
1.7
3.0
2,40
483
.22,
259
14.3
470
57.2
344
57.2
7215
-17
11.8
1.7
1.4
1,57
089
.81,
541
8.9
165
58.8
140
(57.
2)22
18-1
940
.71.
75.
983
468
.971
824
.430
556
.120
357
.250
20-2
475
.64.
29.
31,
774
42.1
1,03
031
.11,
224
61.3
551
41.6
164
20-2
269
.24.
88.
91,
060
47.9
683
30.4
661
58.8
322
45.8
9423
-24
85.1
3.3
9.9
714
30.7
347
32.0
562
64.9
229
36.1
71Ed
ucat
ion
Non
e or
EC
E54
.36.
71.
412
880
.373
9.2
65(*
)12
(*)
2Pr
imar
y51
.94.
54.
387
772
.458
317
.341
949
.015
2(3
7.5)
38Lo
wer
sec
onda
ry39
.92.
74.
61,
500
77.5
1,16
417
.155
352
.225
732
.169
Upp
er s
econ
dary
35.3
1.7
5.1
1,30
272
.61,
159
21.7
412
59.8
282
43.7
67Po
st s
econ
dary
/ N
on te
rtiar
y87
.10.
024
.156
(16.
4)44
(60.
2)45
(65.
5)34
(*)
13H
ighe
r74
.51.
714
.931
630
.326
650
.220
182
.615
9(6
9.0)
47M
arita
l sta
tus
Ever
mar
ried/
in u
nion
100.
06.
88.
888
9na
08.
787
660
.477
15.2
78N
ever
mar
ried/
in u
nion
29.7
1.7
4.8
3,28
970
.33,
289
24.9
818
59.7
818
61.7
158
Ethn
o-lin
guis
tic g
roup
of h
ouse
hold
hea
dLa
o-Ta
i42
.71.
65.
42,
537
68.8
2,11
523
.095
163
.858
452
.713
6M
on-K
hmer
43.7
3.2
4.9
1,03
875
.377
617
.742
857
.118
345
.051
Hm
ong-
Mie
n48
.95.
85.
846
176
.630
816
.421
848
.076
(31.
0)27
Chi
nese
-Tib
etan
75.8
12.9
14.3
106
38.1
6739
.876
36.0
42(*
)15
Oth
er, D
K, M
issi
ng(6
5.3)
(3.3
)(2
0.7)
35(5
4.1)
23(*
)22
(*)
10(*
)7
Wea
lth in
dex
quin
tile
Poor
est
48.9
4.8
4.4
782
76.0
526
15.6
362
29.5
122
(27.
5)34
Seco
nd43
.83.
33.
690
875
.267
918
.437
652
.016
7(3
6.6)
33M
iddl
e38
.42.
26.
082
276
.566
218
.128
462
.214
929
.449
Four
th
44.3
1.7
4.6
921
66.9
766
23.1
355
67.7
213
(49.
6)42
Ric
hest
48.7
2.0
10.4
745
58.4
655
32.7
317
71.7
244
67.7
77
Tabl
e TM
.10.
2M (c
ontin
ued)
: Key
sex
ual b
ehav
iour
indi
cato
rs (y
oung
men
)Pe
rcen
tage
of m
en a
ge 1
5-24
yea
rs b
y ke
y se
xual
beh
avio
ur in
dica
tors
, Lao
PD
R, 2
017
Perc
enta
ge o
f men
age
15-
24 y
ears
who
:
Num
ber o
f m
en a
ge 1
5-24
yea
rs
Perc
enta
ge
of m
en w
ho
neve
r had
se
x2
Num
ber o
f ne
ver-
mar
ried
men
ag
e 15
-24
year
s
Perc
enta
ge
repo
rting
that
a
cond
om w
as
used
the
last
tim
e th
ey h
ad
sex
Num
ber o
f men
age
15
-24
year
s w
ho
had
sex
with
mor
e th
an o
ne p
artn
er in
th
e la
st 1
2 m
onth
sEv
er h
ad
sex
Had
sex
be
fore
ag
e 15
1
Had
sex
with
mor
e th
an o
ne p
artn
er in
la
st 1
2 m
onth
s
Perc
enta
ge w
ho in
th
e la
st 1
2 m
onth
s ha
d se
x w
ith a
non
-m
arita
l, no
n-co
habi
ting
partn
er3
Num
ber o
f m
en a
ge 1
5-24
ye
ars
who
had
se
x in
the
last
12
mon
ths
Perc
enta
ge re
porti
ng th
e us
e of
a c
ondo
m d
urin
g th
e la
st
sexu
al in
terc
ours
e w
ith a
non
-m
arita
l, no
n-co
habi
ting
partn
er in
the
last
12
mon
ths4
Num
ber o
f men
age
15
-24
year
s w
ho h
ad
sex
with
a n
on-
mar
ital,
non-
coha
bitin
g pa
rtner
in
last
12
mon
ths
( ) F
igur
es th
at a
re b
ased
on
25 –
49
unw
eigh
ted
case
s(*
) Fig
ures
that
are
bas
ed o
n fe
wer
than
25
unw
eigh
ted
case
s
1 M
ICS
indi
cato
r TM
.24
- Sex
bef
ore
age
15 a
mon
g yo
ung
peop
le2 M
ICS
indi
cato
r TM
.25
- You
ng p
eopl
e w
ho h
ave
neve
r had
sex
3 M
ICS
indi
cato
r TM
.27
- Sex
with
non
-reg
ular
par
tner
s4 M
ICS
indi
cato
r TM
.28
- Con
dom
use
with
non
-reg
ular
par
tner
sna
: not
app
licab
le
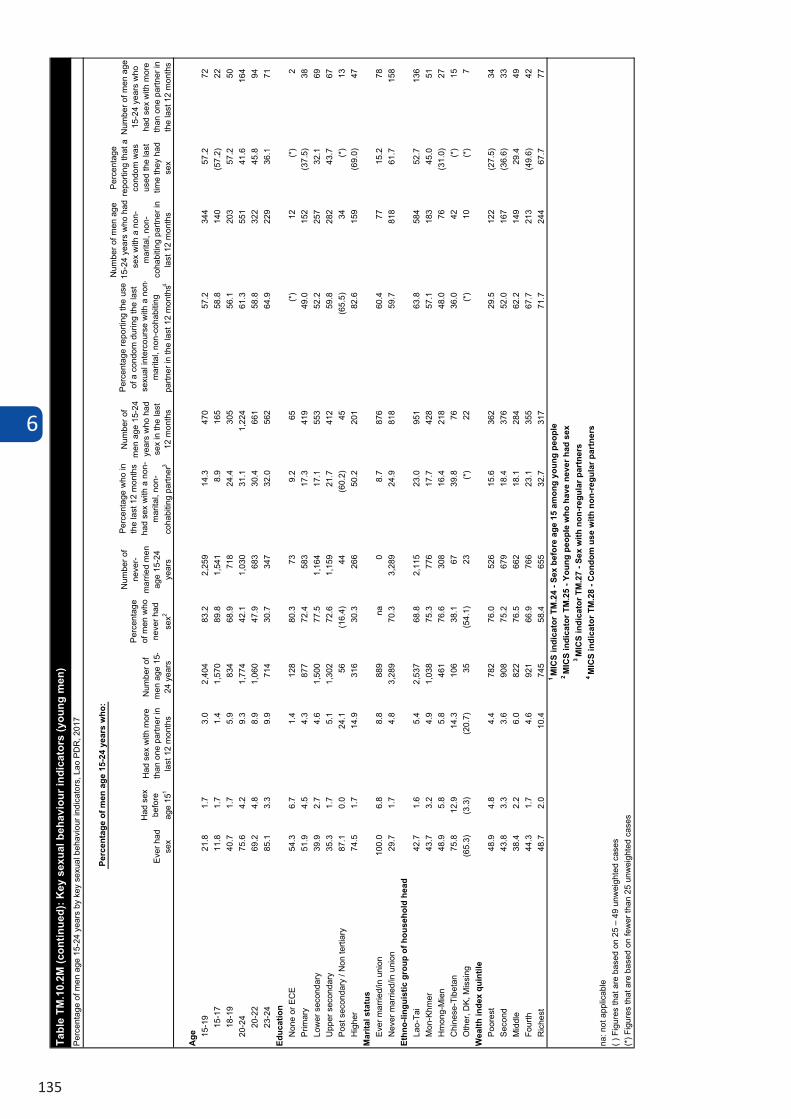
6
135
Age 15
-19
21.8
1.7
3.0
2,40
483
.22,
259
14.3
470
57.2
344
57.2
7215
-17
11.8
1.7
1.4
1,57
089
.81,
541
8.9
165
58.8
140
(57.
2)22
18-1
940
.71.
75.
983
468
.971
824
.430
556
.120
357
.250
20-2
475
.64.
29.
31,
774
42.1
1,03
031
.11,
224
61.3
551
41.6
164
20-2
269
.24.
88.
91,
060
47.9
683
30.4
661
58.8
322
45.8
9423
-24
85.1
3.3
9.9
714
30.7
347
32.0
562
64.9
229
36.1
71Ed
ucat
ion
Non
e or
EC
E54
.36.
71.
412
880
.373
9.2
65(*
)12
(*)
2Pr
imar
y51
.94.
54.
387
772
.458
317
.341
949
.015
2(3
7.5)
38Lo
wer
sec
onda
ry39
.92.
74.
61,
500
77.5
1,16
417
.155
352
.225
732
.169
Upp
er s
econ
dary
35.3
1.7
5.1
1,30
272
.61,
159
21.7
412
59.8
282
43.7
67Po
st s
econ
dary
/ N
on te
rtiar
y87
.10.
024
.156
(16.
4)44
(60.
2)45
(65.
5)34
(*)
13H
ighe
r74
.51.
714
.931
630
.326
650
.220
182
.615
9(6
9.0)
47M
arita
l sta
tus
Ever
mar
ried/
in u
nion
100.
06.
88.
888
9na
08.
787
660
.477
15.2
78N
ever
mar
ried/
in u
nion
29.7
1.7
4.8
3,28
970
.33,
289
24.9
818
59.7
818
61.7
158
Ethn
o-lin
guis
tic g
roup
of h
ouse
hold
hea
dLa
o-Ta
i42
.71.
65.
42,
537
68.8
2,11
523
.095
163
.858
452
.713
6M
on-K
hmer
43.7
3.2
4.9
1,03
875
.377
617
.742
857
.118
345
.051
Hm
ong-
Mie
n48
.95.
85.
846
176
.630
816
.421
848
.076
(31.
0)27
Chi
nese
-Tib
etan
75.8
12.9
14.3
106
38.1
6739
.876
36.0
42(*
)15
Oth
er, D
K, M
issi
ng(6
5.3)
(3.3
)(2
0.7)
35(5
4.1)
23(*
)22
(*)
10(*
)7
Wea
lth in
dex
quin
tile
Poor
est
48.9
4.8
4.4
782
76.0
526
15.6
362
29.5
122
(27.
5)34
Seco
nd43
.83.
33.
690
875
.267
918
.437
652
.016
7(3
6.6)
33M
iddl
e38
.42.
26.
082
276
.566
218
.128
462
.214
929
.449
Four
th
44.3
1.7
4.6
921
66.9
766
23.1
355
67.7
213
(49.
6)42
Ric
hest
48.7
2.0
10.4
745
58.4
655
32.7
317
71.7
244
67.7
77
Tabl
e TM
.10.
2M (c
ontin
ued)
: Key
sex
ual b
ehav
iour
indi
cato
rs (y
oung
men
)Pe
rcen
tage
of m
en a
ge 1
5-24
yea
rs b
y ke
y se
xual
beh
avio
ur in
dica
tors
, Lao
PD
R, 2
017
Perc
enta
ge o
f men
age
15-
24 y
ears
who
:
Num
ber o
f m
en a
ge 1
5-24
yea
rs
Perc
enta
ge
of m
en w
ho
neve
r had
se
x2
Num
ber o
f ne
ver-
mar
ried
men
ag
e 15
-24
year
s
Perc
enta
ge
repo
rting
that
a
cond
om w
as
used
the
last
tim
e th
ey h
ad
sex
Num
ber o
f men
age
15
-24
year
s w
ho
had
sex
with
mor
e th
an o
ne p
artn
er in
th
e la
st 1
2 m
onth
sEv
er h
ad
sex
Had
sex
be
fore
ag
e 15
1
Had
sex
with
mor
e th
an o
ne p
artn
er in
la
st 1
2 m
onth
s
Perc
enta
ge w
ho in
th
e la
st 1
2 m
onth
s ha
d se
x w
ith a
non
-m
arita
l, no
n-co
habi
ting
partn
er3
Num
ber o
f m
en a
ge 1
5-24
ye
ars
who
had
se
x in
the
last
12
mon
ths
Perc
enta
ge re
porti
ng th
e us
e of
a c
ondo
m d
urin
g th
e la
st
sexu
al in
terc
ours
e w
ith a
non
-m
arita
l, no
n-co
habi
ting
partn
er in
the
last
12
mon
ths4
Num
ber o
f men
age
15
-24
year
s w
ho h
ad
sex
with
a n
on-
mar
ital,
non-
coha
bitin
g pa
rtner
in
last
12
mon
ths
( ) F
igur
es th
at a
re b
ased
on
25 –
49
unw
eigh
ted
case
s(*
) Fig
ures
that
are
bas
ed o
n fe
wer
than
25
unw
eigh
ted
case
s
1 M
ICS
indi
cato
r TM
.24
- Sex
bef
ore
age
15 a
mon
g yo
ung
peop
le2 M
ICS
indi
cato
r TM
.25
- You
ng p
eopl
e w
ho h
ave
neve
r had
sex
3 M
ICS
indi
cato
r TM
.27
- Sex
with
non
-reg
ular
par
tner
s4 M
ICS
indi
cato
r TM
.28
- Con
dom
use
with
non
-reg
ular
par
tner
sna
: not
app
licab
le
6
136
6.10 HIV
Some of the most important prerequisites for reducing the rate of HIV infection is accurate knowledge of how HIV is transmitted and strategies for preventing transmission15. Correct information is the first step towards raising awareness and giving adolescents and young people the tools to protect themselves from infection. Misconceptions about HIV are common and can confuse adolescents and young people and hinder prevention efforts16. The UN General Assembly Special Session on HIV/AIDS (UNGASS) called on governments to improve the knowledge and skills of young people to protect themselves from HIV. HIV/AIDS modules administered to women and men 15-49 years of age addresses part of this call.
The Global AIDS Monitoring (GAM) Reporting indicator, the percentage of young people who have comprehensive and correct knowledge of HIV prevention and transmission, is defined as 1) knowing that consistent use of a condom during sexual intercourse and having just one uninfected faithful partner can reduce the chance of getting HIV, 2) knowing that a healthy-looking person can have HIV, and 3) rejecting the two most common local misconceptions about transmission/prevention of HIV. In the LSIS II, 2017 all women and men who have heard of AIDS were asked questions on all three components and the results are detailed in Tables TM.11.1W and TM.11.1M.
Tables TM.11.1W and TM.11.1M also present the percentage of women and men who can correctly identify misconceptions concerning HIV. The indicator is based on the two most common and relevant misconceptions in Lao PDR, that HIV can be transmitted by mosquito bites and sharing food with someone with HIV. The tables also provide information on whether women and men know that HIV cannot be transmitted by supernatural means.
Some of the most important prerequisites for reducing the rate of HIV infection is accurate knowledge of how HIV is trans-mitted and strategies for preventing transmission15. Correct information is the first step towards raising awareness and giving adolescents and young people the tools to protect themselves from infection. Misconceptions about HIV are common and can confuse adolescents and young people and hinder prevention efforts16. The UN General Assembly Special Session on HIV/AIDS (UNGASS) called on governments to improve the knowledge and skills of young people to protect themselves from HIV. HIV/AIDS modules administered to women and men 15-49 years of age addresses part of this call.
The Global AIDS Monitoring (GAM) Reporting indicator, the percentage of young people who have comprehensive and correct knowledge of HIV prevention and transmission, is defined as 1) knowing that consistent use of a condom during sexual intercourse and having just one uninfected faithful partner can reduce the chance of getting HIV, 2) knowing that a healthy-looking person can have HIV, and 3) rejecting the two most common local misconceptions about transmission/prevention of HIV. In the LSIS II, 2017 all women and men who have heard of AIDS were asked questions on all three compo-nents and the results are detailed in Tables TM.11.1W and TM.11.1M.
Tables TM.11.1W and TM.11.1M also present the percentage of women and men who can correctly identify misconceptions concerning HIV. The indicator is based on the two most common and relevant misconceptions in Lao PDR, that HIV can be transmitted by mosquito bites and sharing food with someone with HIV. The tables also provide information on whether women and men know that HIV cannot be transmitted by supernatural means.
Knowledge of mother-to-child transmission of HIV is also an important first step for women to seek HIV testing when they are pregnant to avoid infection in the baby. Women and men should know that HIV can be transmitted during pregnancy, during delivery, and through breastfeeding. The level of knowledge among women and men age 15-49 years concerning mother-to-child transmission is presented in Tables TM.11.2W and TM.11.2M.
The following questions were asked in LSIS II, 2017 to measure stigma and discrimination in the community: whether the respondent 1) would buy fresh vegetables from a shopkeeper or vendor who has HIV; 2) thinks that children living with HIV should be allowed to attend school with children who do not have HIV; 3) thinks people hesitate to take an HIV test because they are afraid of how other people will react if the test result is positive for HIV; 4) thinks people talk badly about those liv-ing with HIV, or who are thought to be living with HIV; 5) thinks people living with HIV, or thought to be living with HIV, lose the respect of other people; 6) agrees or disagrees with the statement ‘I would be ashamed if someone in my family had HIV’; and 7) fears that she/he could get HIV if she/he comes into contact with the saliva of a person living with HIV. Tables TM.11.3W and TM.11.3M present the attitudes of women and men towards people living with HIV.
Another important indicator is the knowledge of where to be tested for HIV and use of such services. In order to protect themselves and to prevent infecting others, it is important for individuals to know their HIV status. Knowledge of own status is also a critical factor in the decision to seek treatment. Questions related to knowledge of a facility for HIV testing and whether a person has ever been tested are presented in Tables TM.11.4W and TM.11.4M.
Among women who had given birth within the two years preceding the survey, the percentage who received counselling and HIV testing during antenatal care is presented in Table TM.11.5.
In many countries, over half of new adult HIV infections are among young people age 15-24 years thus a change in behaviour among members of this age group is especially important to reduce new infections. The next tables present specific informa-tion on this age group. Tables TM.11.6W and TM.11.6M summarize information on key HIV indicators for young women and young men.
16 UNAIDS. 2015. Fast-Tracking Combination Prevention - Towards reducing new HIV infections to fewer than 500 000 by 2020.
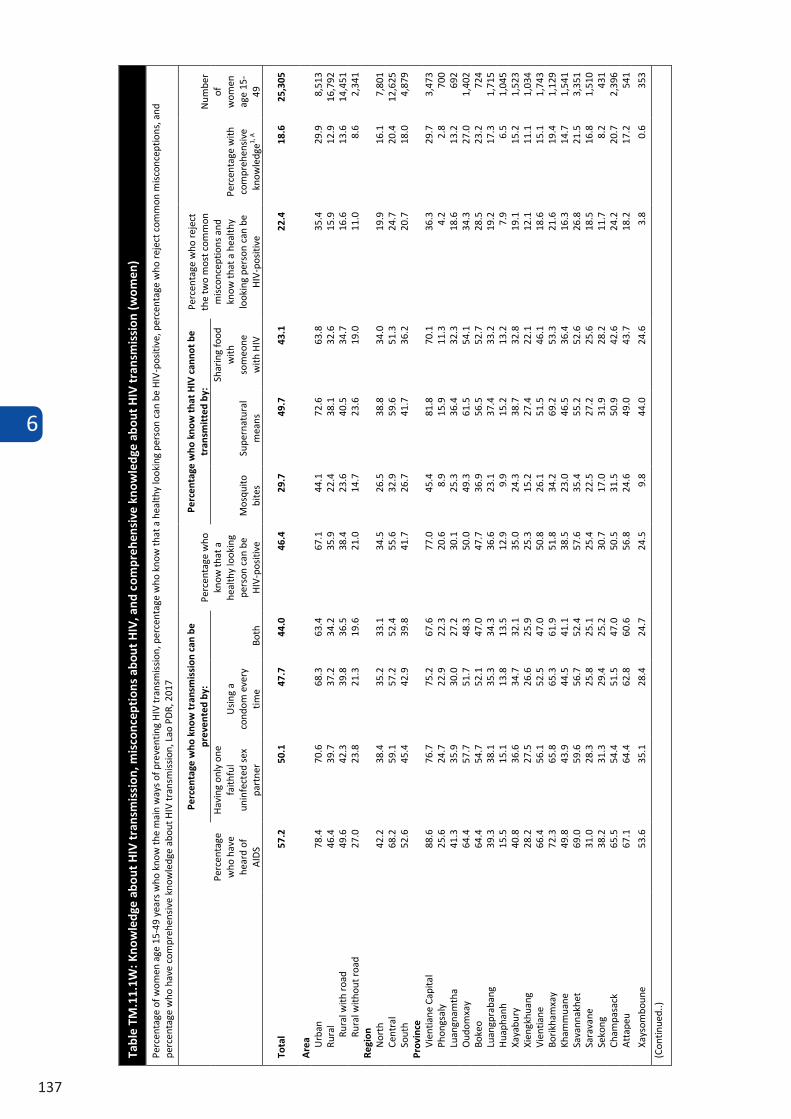
6
137
Tabl
e TM
.11.
1W: K
now
ledg
e ab
out
HIV
tran
smis
sion
, mis
conc
epti
ons
abou
t H
IV, a
nd c
ompr
ehen
sive
kno
wle
dge
abou
t H
IV tr
ansm
issi
on (w
omen
)
Perc
enta
ge o
f wom
en a
ge 1
5-49
yea
rs w
ho k
now
the
mai
n w
ays
of p
reve
ntin
g H
IV tr
ansm
issi
on, p
erce
ntag
e w
ho k
now
that
a h
ealth
y lo
okin
g pe
rson
can
be
HIV
-pos
itive
, per
cent
age
who
rej
ect c
omm
on m
isco
ncep
tions
, and
pe
rcen
tage
who
hav
e co
mpr
ehen
sive
kno
wle
dge
abou
t HIV
tran
smis
sion
, Lao
PD
R, 2
017
Perc
enta
ge
who
hav
e he
ard
of
AID
S
Perc
enta
ge w
ho k
now
tran
smis
sion
can
be
prev
ente
d by
: Pe
rcen
tage
who
kn
ow th
at a
he
alth
y lo
okin
g pe
rson
can
be
HIV
-pos
itive
Perc
enta
ge w
ho k
now
that
HIV
can
not b
e tr
ansm
itte
d by
: Pe
rcen
tage
who
reje
ct
the
two
mos
t com
mon
m
isco
ncep
tions
and
kn
ow th
at a
hea
lthy
look
ing
pers
on c
an b
e H
IV-p
ositi
ve
Perc
enta
ge w
ith
com
preh
ensi
ve
know
ledg
e1, A
Num
ber
of
wom
en
age
15-
49
Hav
ing
only
one
fa
ithfu
l un
infe
cted
sex
pa
rtne
r
Usi
ng a
co
ndom
eve
ry
time
Both
M
osqu
ito
bite
s Su
pern
atur
al
mea
ns
Shar
ing
food
w
ith
som
eone
w
ith H
IV
Tota
l 57
.2
50.1
47
.7
44.0
46
.4
29.7
49
.7
43.1
22
.4
18.6
25
,305
Are
a Urb
an
78.4
70
.6
68.3
63
.4
67.1
44
.1
72.6
63
.8
35.4
29
.9
8,51
3 Ru
ral
46.4
39
.7
37.2
34
.2
35.9
22
.4
38.1
32
.6
15.9
12
.9
16,7
92
Rura
l with
roa
d 49
.6
42.3
39
.8
36.5
38
.4
23.6
40
.5
34.7
16
.6
13.6
14
,451
Ru
ral w
ithou
t roa
d 27
.0
23.8
21
.3
19.6
21
.0
14.7
23
.6
19.0
11
.0
8.6
2,34
1 Re
gion
N
orth
42
.2
38.4
35
.2
33.1
34
.5
26.5
38
.8
34.0
19
.9
16.1
7,
801
Cent
ral
68.2
59
.1
57.2
52
.4
55.6
32
.9
59.6
51
.3
24.7
20
.4
12,6
25
Sout
h 52
.6
45.4
42
.9
39.8
41
.7
26.7
41
.7
36.2
20
.7
18.0
4,
879
Prov
ince
Vi
entia
ne C
apita
l 88
.6
76.7
75
.2
67.6
77
.0
45.4
81
.8
70.1
36
.3
29.7
3,
473
Phon
gsal
y
25.6
24
.7
22.9
22
.3
20.6
8.
9 15
.9
11.3
4.
2 2.
8 70
0 Lu
angn
amth
a 41
.3
35.9
30
.0
27.2
30
.1
25.3
36
.4
32.3
18
.6
13.2
69
2 O
udom
xay
64.4
57
.7
51.7
48
.3
50.0
49
.3
61.5
54
.1
34.3
27
.0
1,40
2 Bo
keo
64.4
54
.7
52.1
47
.0
47.7
36
.9
56.5
52
.7
28.5
23
.2
724
Luan
gpra
bang
39
.3
38.1
35
.3
34.3
36
.6
23.1
37
.4
33.2
19
.2
17.3
1,
715
Hua
phan
h 15
.5
15.1
13
.8
13.5
12
.9
9.9
15.2
13
.2
7.9
6.5
1,04
5 Xa
yabu
ry
40.8
36
.6
34.7
32
.1
35.0
24
.3
38.7
32
.8
19.1
15
.2
1,52
3 Xi
engk
huan
g 28
.2
27.5
26
.6
25.9
25
.3
15.2
27
.4
22.1
12
.1
11.1
1,
034
Vien
tiane
66
.4
56.1
52
.5
47.0
50
.8
26.1
51
.5
46.1
18
.6
15.1
1,
743
Borik
ham
xay
72.3
65
.8
65.3
61
.9
51.8
34
.2
69.2
53
.3
21.6
19
.4
1,12
9 Kh
amm
uane
49
.8
43.9
44
.5
41.1
38
.5
23.0
46
.5
36.4
16
.3
14.7
1,
541
Sava
nnak
het
69.0
59
.6
56.7
52
.4
57.6
35
.4
55.2
52
.6
26.8
21
.5
3,35
1 Sa
rava
ne
31.0
28
.3
25.8
25
.1
25.4
22
.5
27.2
25
.6
18.5
16
.8
1,51
0 Se
kong
38
.2
31.3
29
.4
25.2
30
.7
17.0
31
.9
28.2
11
.7
8.2
431
Cham
pasa
ck
65.5
54
.4
51.5
47
.0
50.5
31
.5
50.9
42
.6
24.2
20
.7
2,39
6 A
ttap
eu
67.1
64
.4
62.8
60
.6
56.8
24
.6
49.0
43
.7
18.2
17
.2
541
Xays
ombo
une
53.6
35
.1
28.4
24
.7
24.5
9.
8 44
.0
24.6
3.
8 0.
6 35
3
(Con
tinue
d..)
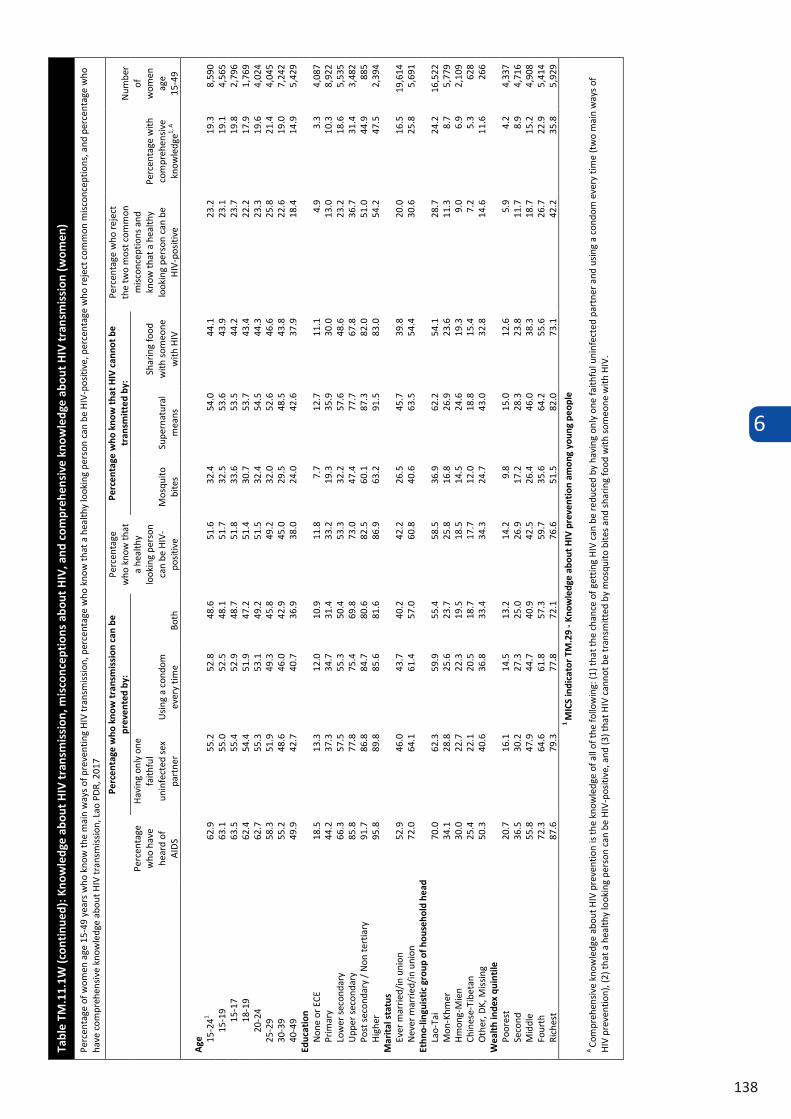
6
138
Tabl
e TM
.11.
1W (c
onti
nued
): K
now
ledg
e ab
out
HIV
tran
smis
sion
, mis
conc
epti
ons
abou
t H
IV, a
nd c
ompr
ehen
sive
kno
wle
dge
abou
t H
IV t
rans
mis
sion
(wom
en)
Perc
enta
ge o
f wom
en a
ge 1
5-49
yea
rs w
ho k
now
the
mai
n w
ays
of p
reve
ntin
g H
IV tr
ansm
issi
on, p
erce
ntag
e w
ho k
now
that
a h
ealth
y lo
okin
g pe
rson
can
be
HIV
-pos
itive
, per
cent
age
who
rej
ect c
omm
on m
isco
ncep
tions
, and
per
cent
age
who
ha
ve c
ompr
ehen
sive
kno
wle
dge
abou
t HIV
tran
smis
sion
, Lao
PD
R, 2
017
Perc
enta
ge
who
hav
e he
ard
of
AID
S
Perc
enta
ge w
ho k
now
tran
smis
sion
can
be
prev
ente
d by
: Pe
rcen
tage
w
ho k
now
that
a
heal
thy
look
ing
pers
on
can
be H
IV-
posi
tive
Perc
enta
ge w
ho k
now
that
HIV
can
not b
e tr
ansm
itte
d by
: Pe
rcen
tage
who
reje
ct
the
two
mos
t com
mon
m
isco
ncep
tions
and
kn
ow th
at a
hea
lthy
look
ing
pers
on c
an b
e H
IV-p
ositi
ve
Perc
enta
ge w
ith
com
preh
ensi
ve
know
ledg
e1, A
Num
ber
of
wom
en
age
15
-49
Hav
ing
only
one
fa
ithfu
l un
infe
cted
sex
pa
rtne
r U
sing
a c
ondo
m
ever
y tim
e Bo
th
Mos
quito
bi
tes
Supe
rnat
ural
m
eans
Shar
ing
food
w
ith s
omeo
ne
with
HIV
A
ge
15
-241
62.9
55
.2
52.8
48
.6
51.6
32
.4
54.0
44
.1
23.2
19
.3
8,59
0 15
-19
63.1
55
.0
52.5
48
.1
51.7
32
.5
53.6
43
.9
23.1
19
.1
4,56
5 15
-17
63.5
55
.4
52.9
48
.7
51.8
33
.6
53.5
44
.2
23.7
19
.8
2,79
6 18
-19
62.4
54
.4
51.9
47
.2
51.4
30
.7
53.7
43
.4
22.2
17
.9
1,76
9 20
-24
62.7
55
.3
53.1
49
.2
51.5
32
.4
54.5
44
.3
23.3
19
.6
4,02
4 25
-29
58.3
51
.9
49.3
45
.8
49.2
32
.0
52.6
46
.6
25.8
21
.4
4,04
5 30
-39
55.2
48
.6
46.0
42
.9
45.0
29
.5
48.5
43
.8
22.6
19
.0
7,24
2 40
-49
49.9
42
.7
40.7
36
.9
38.0
24
.0
42.6
37
.9
18.4
14
.9
5,42
9 Ed
ucat
ion
N
one
or E
CE
18.5
13
.3
12.0
10
.9
11.8
7.
7 12
.7
11.1
4.
9 3.
3 4,
087
Prim
ary
44.2
37
.3
34.7
31
.4
33.2
19
.3
35.9
30
.0
13.0
10
.3
8,92
2 Lo
wer
sec
onda
ry
66.3
57
.5
55.3
50
.4
53.3
32
.2
57.6
48
.6
23.2
18
.6
5,53
5 U
pper
sec
onda
ry
85.8
77
.8
75.4
69
.8
73.0
47
.4
77.7
67
.8
36.7
31
.4
3,48
2 Po
st s
econ
dary
/ N
on te
rtia
ry
91.7
86
.8
84.7
80
.6
82.5
60
.1
87.3
82
.0
51.0
44
.9
885
Hig
her
95.8
89
.8
85.6
81
.6
86.9
63
.2
91.5
83
.0
54.2
47
.5
2,39
4 M
arit
al s
tatu
s
Ever
mar
ried/
in u
nion
52
.9
46.0
43
.7
40.2
42
.2
26.5
45
.7
39.8
20
.0
16.5
19
,614
N
ever
mar
ried/
in u
nion
72
.0
64.1
61
.4
57.0
60
.8
40.6
63
.5
54.4
30
.6
25.8
5,
691
Ethn
o-lin
guis
tic
grou
p of
hou
seho
ld h
ead
Lao-
Tai
70.0
62
.3
59.9
55
.4
58.5
36
.9
62.2
54
.1
28.7
24
.2
16,5
22
Mon
-Khm
er
34.1
28
.8
25.6
23
.7
25.8
16
.8
26.9
23
.6
11.3
8.
7 5,
779
Hm
ong-
Mie
n 30
.0
22.7
22
.3
19.5
18
.5
14.5
24
.6
19.3
9.
0 6.
9 2,
109
Chin
ese-
Tibe
tan
25.4
22
.1
20.5
18
.7
17.7
12
.0
18.8
15
.4
7.2
5.3
628
Oth
er, D
K, M
issi
ng
50.3
40
.6
36.8
33
.4
34.3
24
.7
43.0
32
.8
14.6
11
.6
266
Wea
lth
inde
x qu
inti
le
Po
ores
t 20
.7
16.1
14
.5
13.2
14
.2
9.8
15.0
12
.6
5.9
4.2
4,33
7 Se
cond
36
.5
30.2
27
.3
25.0
26
.9
17.2
28
.3
23.8
11
.7
8.9
4,71
6 M
iddl
e 55
.8
47.9
44
.7
40.9
42
.5
26.4
46
.0
38.3
18
.7
15.2
4,
908
Four
th
72
.3
64.6
61
.8
57.3
59
.7
35.6
64
.2
55.6
26
.7
22.9
5,
414
Rich
est
87.6
79
.3
77.8
72
.1
76.6
51
.5
82.0
73
.1
42.2
35
.8
5,92
9 1
MIC
S in
dica
tor
TM.2
9 - K
now
ledg
e ab
out H
IV p
reve
ntio
n am
ong
youn
g pe
ople
A Co
mpr
ehen
sive
kno
wle
dge
abou
t HIV
pre
vent
ion
is th
e kn
owle
dge
of a
ll of
the
follo
win
g: (1
) tha
t the
cha
nce
of g
ettin
g H
IV c
an b
e re
duce
d by
hav
ing
only
one
faith
ful u
ninf
ecte
d pa
rtne
r and
usi
ng a
con
dom
eve
ry ti
me
(tw
o m
ain
way
s of
H
IV p
reve
ntio
n), (
2) th
at a
hea
lthy
look
ing
pers
on c
an b
e H
IV-p
ositi
ve, a
nd (3
) tha
t HIV
can
not b
e tr
ansm
itted
by
mos
quito
bite
s an
d sh
arin
g fo
od w
ith s
omeo
ne w
ith H
IV.
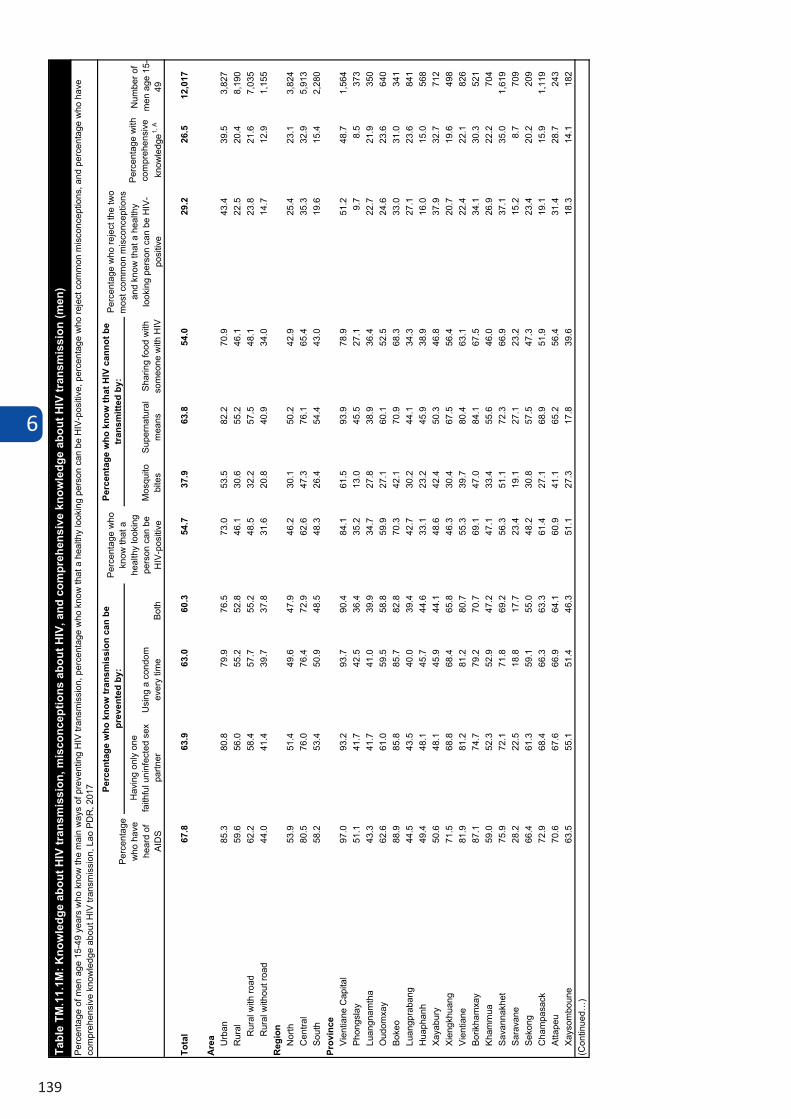
6
139
Hav
ing
only
one
fa
ithfu
l uni
nfec
ted
sex
partn
erU
sing
a c
ondo
m
ever
y tim
eBo
thM
osqu
ito
bite
sSu
pern
atur
al
mea
nsSh
arin
g fo
od w
ith
som
eone
with
HIV
Tota
l67
.863
.963
.060
.354
.737
.963
.854
.029
.226
.512
,017
Are
a Urb
an85
.380
.879
.976
.573
.053
.582
.270
.943
.439
.53,
827
Rur
al59
.656
.055
.252
.846
.130
.655
.246
.122
.520
.48,
190
Rur
al w
ith ro
ad62
.258
.457
.755
.248
.532
.257
.548
.123
.821
.67,
035
Rur
al w
ithou
t roa
d44
.041
.439
.737
.831
.620
.840
.934
.014
.712
.91,
155
Reg
ion
Nor
th53
.951
.449
.647
.946
.230
.150
.242
.925
.423
.13,
824
Cen
tral
80.5
76.0
76.4
72.9
62.6
47.3
76.1
65.4
35.3
32.9
5,91
3So
uth
58.2
53.4
50.9
48.5
48.3
26.4
54.4
43.0
19.6
15.4
2,28
0Pr
ovin
ceVi
entia
ne C
apita
l97
.093
.293
.790
.484
.161
.593
.978
.951
.248
.71,
564
Phon
gsla
y 51
.141
.742
.536
.435
.213
.045
.527
.19.
78.
537
3Lu
angn
amth
a43
.341
.741
.039
.934
.727
.838
.936
.422
.721
.935
0O
udom
xay
62.6
61.0
59.5
58.8
59.9
27.1
60.1
52.5
24.6
23.6
640
Boke
o88
.985
.885
.782
.870
.342
.170
.968
.333
.031
.034
1Lu
angp
raba
ng44
.543
.540
.039
.442
.730
.244
.134
.327
.123
.684
1H
uaph
anh
49.4
48.1
45.7
44.6
33.1
23.2
45.9
38.9
16.0
15.0
568
Xaya
bury
50.6
48.1
45.9
44.1
48.6
42.4
50.3
46.8
37.9
32.7
712
Xien
gkhu
ang
71.5
68.8
68.4
65.8
46.3
30.4
67.5
56.4
20.7
19.6
498
Vien
tiane
81.9
81.2
81.2
80.7
55.3
39.7
80.4
63.1
22.4
22.1
826
Borik
ham
xay
87.1
74.7
79.2
70.7
69.1
47.0
84.1
67.5
34.1
30.3
521
Kham
mua
59.0
52.3
52.9
47.2
47.1
33.4
55.6
46.0
26.9
22.2
704
Sava
nnak
het
75.9
72.1
71.8
69.2
56.3
51.1
72.3
66.9
37.1
35.0
1,61
9Sa
rava
ne28
.222
.518
.817
.723
.419
.127
.123
.215
.28.
770
9Se
kong
66.4
61.3
59.1
55.0
48.2
30.8
57.5
47.3
23.4
20.2
209
Cha
mpa
sack
72.9
68.4
66.3
63.3
61.4
27.1
68.9
51.9
19.1
15.9
1,11
9At
tape
u70
.667
.666
.964
.160
.941
.165
.256
.431
.428
.724
3Xa
ysom
boun
e63
.555
.151
.446
.351
.127
.317
.839
.618
.314
.118
2(C
ontin
ued…
)
Tabl
e TM
.11.
1M: K
now
ledg
e ab
out H
IV tr
ansm
issi
on, m
isco
ncep
tions
abo
ut H
IV, a
nd c
ompr
ehen
sive
kno
wle
dge
abou
t HIV
tran
smis
sion
(men
)Pe
rcen
tage
of m
en a
ge 1
5-49
yea
rs w
ho k
now
the
mai
n w
ays
of p
reve
ntin
g H
IV tr
ansm
issi
on, p
erce
ntag
e w
ho k
now
that
a h
ealth
y lo
okin
g pe
rson
can
be
HIV
-pos
itive
, per
cent
age
who
reje
ct c
omm
on m
isco
ncep
tions
, and
per
cent
age
who
hav
e co
mpr
ehen
sive
kno
wle
dge
abou
t HIV
tran
smis
sion
, Lao
PD
R, 2
017
Perc
enta
ge
who
hav
e he
ard
of
AID
S
Perc
enta
ge w
ho k
now
tran
smis
sion
can
be
prev
ente
d by
:Pe
rcen
tage
who
kn
ow th
at a
he
alth
y lo
okin
g pe
rson
can
be
HIV
-pos
itive
Perc
enta
ge w
ho k
now
that
HIV
can
not b
e tr
ansm
itted
by:
Perc
enta
ge w
ho re
ject
the
two
mos
t com
mon
mis
conc
eptio
ns
and
know
that
a h
ealth
y lo
okin
g pe
rson
can
be
HIV
-po
sitiv
e
Perc
enta
ge w
ith
com
preh
ensi
ve
know
ledg
e1, A
Num
ber o
f m
en a
ge 1
5-49
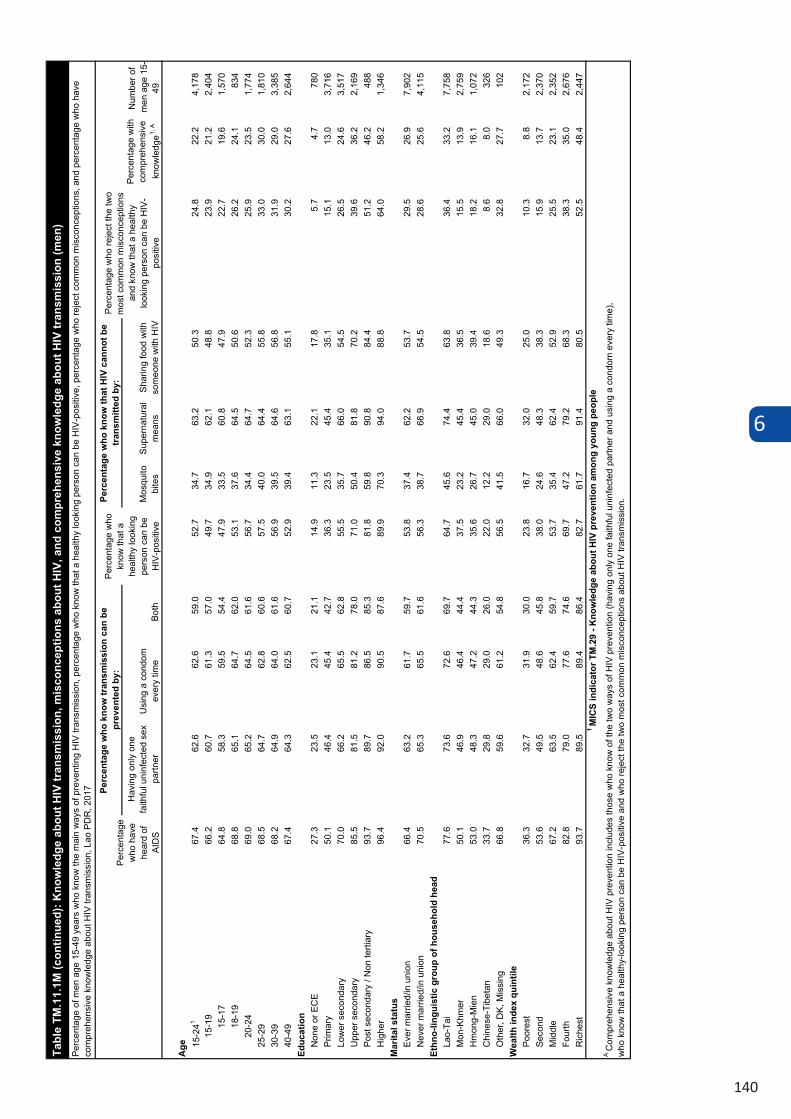
6
140
Hav
ing
only
one
fa
ithfu
l uni
nfec
ted
sex
partn
erU
sing
a c
ondo
m
ever
y tim
eBo
thM
osqu
ito
bite
sSu
pern
atur
al
mea
nsSh
arin
g fo
od w
ith
som
eone
with
HIV
Age 15
-241
67.4
62.6
62.6
59.0
52.7
34.7
63.2
50.3
24.8
22.2
4,17
815
-19
66.2
60.7
61.3
57.0
49.7
34.9
62.1
48.8
23.9
21.2
2,40
415
-17
64.8
58.3
59.5
54.4
47.9
33.5
60.8
47.9
22.7
19.6
1,57
018
-19
68.8
65.1
64.7
62.0
53.1
37.6
64.5
50.6
26.2
24.1
834
20-2
469
.065
.264
.561
.656
.734
.464
.752
.325
.923
.51,
774
25-2
968
.564
.762
.860
.657
.540
.064
.455
.833
.030
.01,
810
30-3
968
.264
.964
.061
.656
.939
.564
.656
.831
.929
.03,
385
40-4
967
.464
.362
.560
.752
.939
.463
.155
.130
.227
.62,
644
Educ
atio
nN
one
or E
CE
27.3
23.5
23.1
21.1
14.9
11.3
22.1
17.8
5.7
4.7
780
Prim
ary
50.1
46.4
45.4
42.7
36.3
23.5
45.4
35.1
15.1
13.0
3,71
6Lo
wer
sec
onda
ry70
.066
.265
.562
.855
.535
.766
.054
.526
.524
.63,
517
Upp
er s
econ
dary
85.5
81.5
81.2
78.0
71.0
50.4
81.8
70.2
39.6
36.2
2,16
9Po
st s
econ
dary
/ N
on te
rtiar
y93
.789
.786
.585
.381
.859
.890
.884
.451
.246
.248
8H
ighe
r96
.492
.090
.587
.689
.970
.394
.088
.864
.058
.21,
346
Mar
ital s
tatu
sEv
er m
arrie
d/in
uni
on66
.463
.261
.759
.753
.837
.462
.253
.729
.526
.97,
902
Nev
er m
arrie
d/in
uni
on70
.565
.365
.561
.656
.338
.766
.954
.528
.625
.64,
115
Ethn
o-lin
guis
tic g
roup
of h
ouse
hold
hea
dLa
o-Ta
i77
.673
.672
.669
.764
.745
.674
.463
.836
.433
.27,
758
Mon
-Khm
er50
.146
.946
.444
.437
.523
.245
.436
.515
.513
.92,
759
Hm
ong-
Mie
n53
.048
.347
.244
.335
.626
.745
.039
.418
.216
.11,
072
Chi
nese
-Tib
etan
33.7
29.8
29.0
26.0
22.0
12.2
29.0
18.6
8.6
8.0
326
Oth
er, D
K, M
issi
ng66
.859
.661
.254
.856
.541
.566
.049
.332
.827
.710
2W
ealth
inde
x qu
intil
ePo
ores
t36
.332
.731
.930
.023
.816
.732
.025
.010
.38.
82,
172
Seco
nd53
.649
.548
.645
.838
.024
.648
.338
.315
.913
.72,
370
Mid
dle
67.2
63.5
62.4
59.7
53.7
35.4
62.4
52.9
25.5
23.1
2,35
2Fo
urth
82
.879
.077
.674
.669
.747
.279
.268
.338
.335
.02,
676
Ric
hest
93.7
89.5
89.4
86.4
82.7
61.7
91.4
80.5
52.5
48.4
2,44
71
MIC
S in
dica
tor T
M.2
9 - K
now
ledg
e ab
out H
IV p
reve
ntio
n am
ong
youn
g pe
ople
A C
ompr
ehen
sive
kno
wle
dge
abou
t HIV
pre
vent
ion
incl
udes
thos
e w
ho k
now
of t
he tw
o w
ays
of H
IV p
reve
ntio
n (h
avin
g on
ly o
ne fa
ithfu
l uni
nfec
ted
partn
er a
nd u
sing
a c
ondo
m e
very
tim
e),
who
kno
w th
at a
hea
lthy-
look
ing
pers
on c
an b
e H
IV-p
ositi
ve a
nd w
ho re
ject
the
two
mos
t com
mon
mis
conc
eptio
ns a
bout
HIV
tran
smis
sion
.
Tabl
e TM
.11.
1M (c
ontin
ued)
: Kno
wle
dge
abou
t HIV
tran
smis
sion
, mis
conc
eptio
ns a
bout
HIV
, and
com
preh
ensi
ve k
now
ledg
e ab
out H
IV tr
ansm
issi
on (m
en)
Perc
enta
ge o
f men
age
15-
49 y
ears
who
kno
w th
e m
ain
way
s of
pre
vent
ing
HIV
tran
smis
sion
, per
cent
age
who
kno
w th
at a
hea
lthy
look
ing
pers
on c
an b
e H
IV-p
ositi
ve, p
erce
ntag
e w
ho re
ject
com
mon
mis
conc
eptio
ns, a
nd p
erce
ntag
e w
ho h
ave
com
preh
ensi
ve k
now
ledg
e ab
out H
IV tr
ansm
issi
on, L
ao P
DR
, 201
7
Perc
enta
ge
who
hav
e he
ard
of
AID
S
Perc
enta
ge w
ho k
now
tran
smis
sion
can
be
prev
ente
d by
:Pe
rcen
tage
who
kn
ow th
at a
he
alth
y lo
okin
g pe
rson
can
be
HIV
-pos
itive
Perc
enta
ge w
ho k
now
that
HIV
can
not b
e tr
ansm
itted
by:
Perc
enta
ge w
ho re
ject
the
two
mos
t com
mon
mis
conc
eptio
ns
and
know
that
a h
ealth
y lo
okin
g pe
rson
can
be
HIV
-po
sitiv
e
Perc
enta
ge w
ith
com
preh
ensi
ve
know
ledg
e1, A
Num
ber o
f m
en a
ge 1
5-49
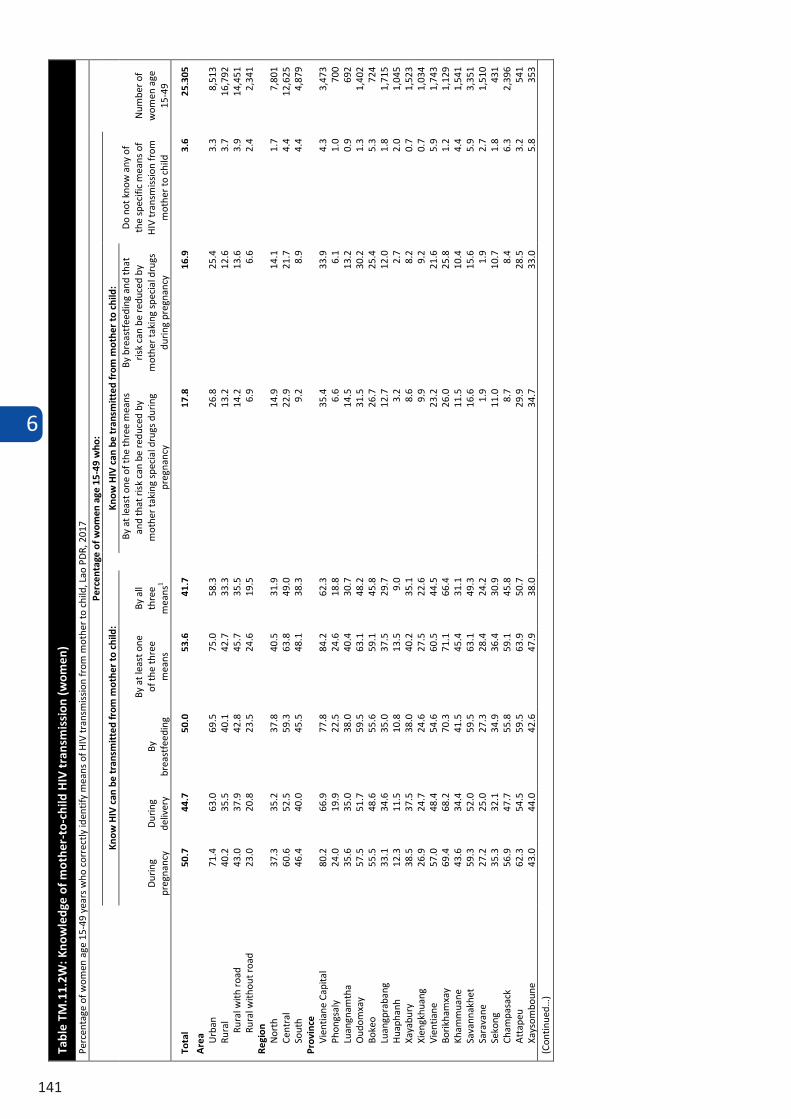
6
141
Tabl
e TM
.11.
2W: K
now
ledg
e of
mot
her-
to-c
hild
HIV
tra
nsm
issi
on (w
omen
)
Perc
enta
ge o
f wom
en a
ge 1
5-49
yea
rs w
ho c
orre
ctly
iden
tify
mea
ns o
f HIV
tran
smis
sion
from
mot
her t
o ch
ild, L
ao P
DR,
201
7 Pe
rcen
tage
of w
omen
age
15-
49 w
ho:
Num
ber o
f w
omen
age
15
-49
Know
HIV
can
be
tran
smit
ted
from
mot
her
to c
hild
: Kn
ow H
IV c
an b
e tr
ansm
itte
d fr
om m
othe
r to
chi
ld:
Do
not k
now
any
of
the
spec
ific
mea
ns o
f H
IV tr
ansm
issi
on fr
om
mot
her t
o ch
ild
Dur
ing
preg
nanc
y
Dur
ing
deliv
ery
By
brea
stfe
edin
g
By a
t lea
st o
ne
of th
e th
ree
mea
ns
By a
ll th
ree
mea
ns1
By
at le
ast o
ne o
f the
thre
e m
eans
an
d th
at ri
sk c
an b
e re
duce
d by
m
othe
r tak
ing
spec
ial d
rugs
dur
ing
preg
nanc
y
By b
reas
tfee
ding
and
that
ris
k ca
n be
redu
ced
by
mot
her t
akin
g sp
ecia
l dru
gs
durin
g pr
egna
ncy
Tota
l 50
.7
44.7
50
.0
53.6
41
.7
17.8
16
.9
3.6
25,3
05
Are
a Urb
an
71.4
63
.0
69.5
75
.0
58.3
26
.8
25.4
3.
3 8,
513
Rura
l 40
.2
35.5
40
.1
42.7
33
.3
13.2
12
.6
3.7
16,7
92
Rura
l with
roa
d 43
.0
37.9
42
.8
45.7
35
.5
14.2
13
.6
3.9
14,4
51
Rura
l with
out r
oad
23.0
20
.8
23.5
24
.6
19.5
6.
9 6.
6 2.
4 2,
341
Regi
on
Nor
th
37.3
35
.2
37.8
40
.5
31.9
14
.9
14.1
1.
7 7,
801
Cent
ral
60.6
52
.5
59.3
63
.8
49.0
22
.9
21.7
4.
4 12
,625
So
uth
46.4
40
.0
45.5
48
.1
38.3
9.
2 8.
9 4.
4 4,
879
Prov
ince
Vi
entia
ne C
apita
l 80
.2
66.9
77
.8
84.2
62
.3
35.4
33
.9
4.3
3,47
3 Ph
ongs
aly
24
.0
19.9
22
.5
24.6
18
.8
6.6
6.1
1.0
700
Luan
gnam
tha
35.6
35
.0
38.0
40
.4
30.7
14
.5
13.2
0.
9 69
2 O
udom
xay
57.5
51
.7
59.5
63
.1
48.2
31
.5
30.2
1.
3 1,
402
Boke
o 55
.5
48.6
55
.6
59.1
45
.8
26.7
25
.4
5.3
724
Luan
gpra
bang
33
.1
34.6
35
.0
37.5
29
.7
12.7
12
.0
1.8
1,71
5 H
uaph
anh
12.3
11
.5
10.8
13
.5
9.0
3.2
2.7
2.0
1,04
5 Xa
yabu
ry
38.5
37
.5
38.0
40
.2
35.1
8.
6 8.
2 0.
7 1,
523
Xien
gkhu
ang
26.9
24
.7
24.6
27
.5
22.6
9.
9 9.
2 0.
7 1,
034
Vien
tiane
57
.0
48.4
54
.6
60.5
44
.5
23.2
21
.6
5.9
1,74
3 Bo
rikha
mxa
y 69
.4
68.2
70
.3
71.1
66
.4
26.0
25
.8
1.2
1,12
9 Kh
amm
uane
43
.6
34.4
41
.5
45.4
31
.1
11.5
10
.4
4.4
1,54
1 Sa
vann
akhe
t 59
.3
52.0
59
.5
63.1
49
.3
16.6
15
.6
5.9
3,35
1 Sa
rava
ne
27.2
25
.0
27.3
28
.4
24.2
1.
9 1.
9 2.
7 1,
510
Seko
ng
35.3
32
.1
34.9
36
.4
30.9
11
.0
10.7
1.
8 43
1 Ch
ampa
sack
56
.9
47.7
55
.8
59.1
45
.8
8.7
8.4
6.3
2,39
6 A
ttap
eu
62.3
54
.5
59.5
63
.9
50.7
29
.9
28.5
3.
2 54
1 Xa
ysom
boun
e 43
.0
44.0
42
.6
47.9
38
.0
34.7
33
.0
5.8
353
(Con
tinue
d…)
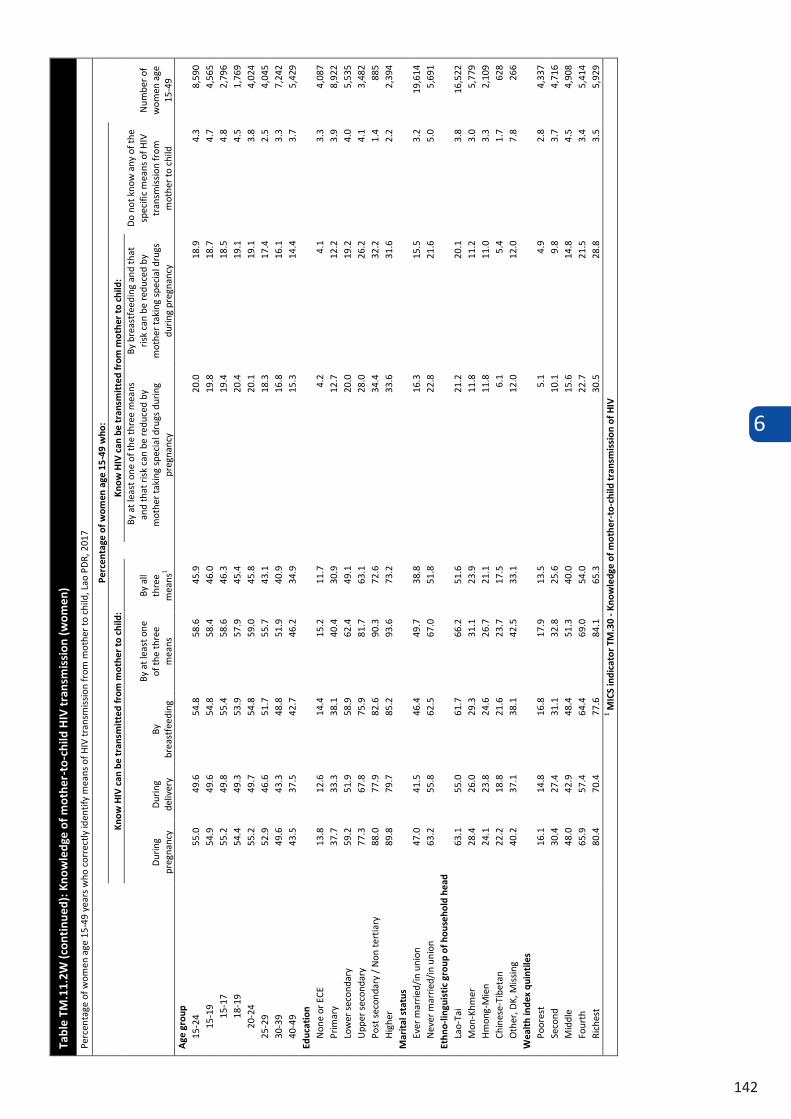
6
142
Tabl
e TM
.11.
2W (c
onti
nued
): K
now
ledg
e of
mot
her-
to-c
hild
HIV
tra
nsm
issi
on (w
omen
)
Perc
enta
ge o
f wom
en a
ge 1
5-49
yea
rs w
ho c
orre
ctly
iden
tify
mea
ns o
f HIV
tran
smis
sion
from
mot
her t
o ch
ild, L
ao P
DR,
201
7
Perc
enta
ge o
f wom
en a
ge 1
5-49
who
:
Num
ber o
f w
omen
age
15
-49
Know
HIV
can
be
tran
smit
ted
from
mot
her
to c
hild
: Kn
ow H
IV c
an b
e tr
ansm
itte
d fr
om m
othe
r to
chi
ld:
Do
not k
now
any
of t
he
spec
ific
mea
ns o
f HIV
tr
ansm
issi
on fr
om
mot
her t
o ch
ild
Dur
ing
preg
nanc
y
Dur
ing
deliv
ery
By
brea
stfe
edin
g
By a
t lea
st o
ne
of th
e th
ree
mea
ns
By a
ll th
ree
mea
ns1
By
at le
ast o
ne o
f the
thre
e m
eans
an
d th
at ri
sk c
an b
e re
duce
d by
m
othe
r tak
ing
spec
ial d
rugs
dur
ing
preg
nanc
y
By b
reas
tfee
ding
and
that
ris
k ca
n be
redu
ced
by
mot
her t
akin
g sp
ecia
l dru
gs
durin
g pr
egna
ncy
Age
gro
up
15-2
4 55
.0
49.6
54
.8
58.6
45
.9
20.0
18
.9
4.3
8,59
0 15
-19
54.9
49
.6
54.8
58
.4
46.0
19
.8
18.7
4.
7 4,
565
15-1
7 55
.2
49.8
55
.4
58.6
46
.3
19.4
18
.5
4.8
2,79
6 18
-19
54.4
49
.3
53.9
57
.9
45.4
20
.4
19.1
4.
5 1,
769
20-2
4 55
.2
49.7
54
.8
59.0
45
.8
20.1
19
.1
3.8
4,02
4 25
-29
52.9
46
.6
51.7
55
.7
43.1
18
.3
17.4
2.
5 4,
045
30-3
9 49
.6
43.3
48
.8
51.9
40
.9
16.8
16
.1
3.3
7,24
2 40
-49
43.5
37
.5
42.7
46
.2
34.9
15
.3
14.4
3.
7 5,
429
Educ
atio
n N
one
or E
CE
13.8
12
.6
14.4
15
.2
11.7
4.
2 4.
1 3.
3 4,
087
Prim
ary
37.7
33
.3
38.1
40
.4
30.9
12
.7
12.2
3.
9 8,
922
Low
er s
econ
dary
59
.2
51.9
58
.9
62.4
49
.1
20.0
19
.2
4.0
5,53
5 U
pper
sec
onda
ry
77.3
67
.8
75.9
81
.7
63.1
28
.0
26.2
4.
1 3,
482
Post
sec
onda
ry /
Non
tert
iary
88
.0
77.9
82
.6
90.3
72
.6
34.4
32
.2
1.4
885
Hig
her
89.8
79
.7
85.2
93
.6
73.2
33
.6
31.6
2.
2 2,
394
Mar
ital
sta
tus
Ever
mar
ried/
in u
nion
47
.0
41.5
46
.4
49.7
38
.8
16.3
15
.5
3.2
19,6
14
Nev
er m
arrie
d/in
uni
on
63.2
55
.8
62.5
67
.0
51.8
22
.8
21.6
5.
0 5,
691
Ethn
o-lin
guis
tic
grou
p of
hou
seho
ld h
ead
Lao-
Tai
63.1
55
.0
61.7
66
.2
51.6
21
.2
20.1
3.
8 16
,522
M
on-K
hmer
28
.4
26.0
29
.3
31.1
23
.9
11.8
11
.2
3.0
5,77
9 H
mon
g-M
ien
24.1
23
.8
24.6
26
.7
21.1
11
.8
11.0
3.
3 2,
109
Chin
ese-
Tibe
tan
22.2
18
.8
21.6
23
.7
17.5
6.
1 5.
4 1.
7 62
8 O
ther
, DK,
Mis
sing
40
.2
37.1
38
.1
42.5
33
.1
12.0
12
.0
7.8
266
Wea
lth
inde
x qu
inti
les
Poor
est
16.1
14
.8
16.8
17
.9
13.5
5.
1 4.
9 2.
8 4,
337
Seco
nd
30.4
27
.4
31.1
32
.8
25.6
10
.1
9.8
3.7
4,71
6 M
iddl
e 48
.0
42.9
48
.4
51.3
40
.0
15.6
14
.8
4.5
4,90
8 Fo
urth
65
.9
57.4
64
.4
69.0
54
.0
22.7
21
.5
3.4
5,41
4 Ri
ches
t 80
.4
70.4
77
.6
84.1
65
.3
30.5
28
.8
3.5
5,92
9 1 M
ICS
indi
cato
r TM
.30
- Kno
wle
dge
of m
othe
r-to
-chi
ld tr
ansm
issi
on o
f HIV
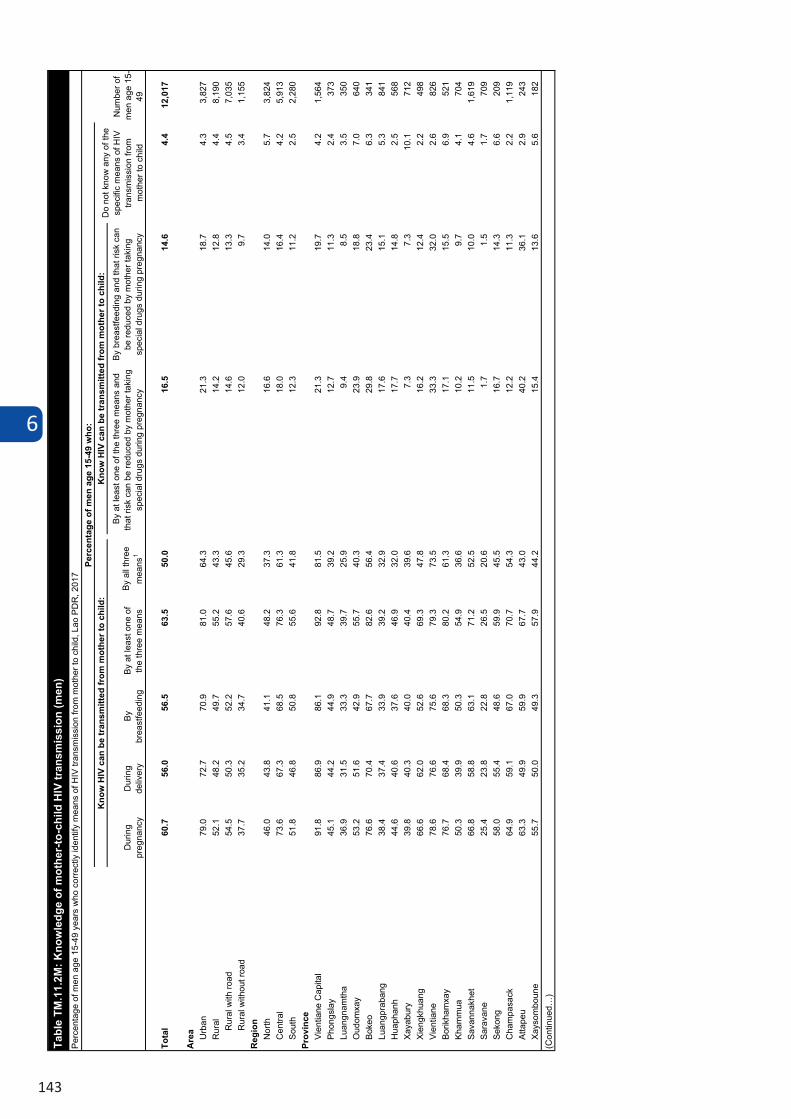
6
143
Dur
ing
preg
nanc
y D
urin
g de
liver
yBy
br
east
feed
ing
By a
t lea
st o
ne o
f th
e th
ree
mea
nsBy
all
thre
e m
eans
1
By
at le
ast o
ne o
f the
thre
e m
eans
and
th
at ri
sk c
an b
e re
duce
d by
mot
her t
akin
g sp
ecia
l dru
gs d
urin
g pr
egna
ncy
By b
reas
tfeed
ing
and
that
risk
can
be
redu
ced
by m
othe
r tak
ing
spec
ial d
rugs
dur
ing
preg
nanc
y
Tota
l60
.756
.056
.563
.550
.016
.514
.64.
412
,017
Are
a Urb
an79
.072
.770
.981
.064
.321
.318
.74.
33,
827
Rur
al52
.148
.249
.755
.243
.314
.212
.84.
48,
190
Rur
al w
ith ro
ad54
.550
.352
.257
.645
.614
.613
.34.
57,
035
Rur
al w
ithou
t roa
d37
.735
.234
.740
.629
.312
.09.
73.
41,
155
Reg
ion
Nor
th46
.043
.841
.148
.237
.316
.614
.05.
73,
824
Cen
tral
73.6
67.3
68.5
76.3
61.3
18.0
16.4
4.2
5,91
3So
uth
51.8
46.8
50.8
55.6
41.8
12.3
11.2
2.5
2,28
0Pr
ovin
ceVi
entia
ne C
apita
l91
.886
.986
.192
.881
.521
.319
.74.
21,
564
Phon
gsla
y 45
.144
.244
.948
.739
.212
.711
.32.
437
3Lu
angn
amth
a36
.931
.533
.339
.725
.99.
48.
53.
535
0O
udom
xay
53.2
51.6
42.9
55.7
40.3
23.9
18.8
7.0
640
Boke
o76
.670
.467
.782
.656
.429
.823
.46.
334
1Lu
angp
raba
ng38
.437
.433
.939
.232
.917
.615
.15.
384
1H
uaph
anh
44.6
40.6
37.6
46.9
32.0
17.7
14.8
2.5
568
Xaya
bury
39.8
40.3
40.0
40.4
39.6
7.3
7.3
10.1
712
Xien
gkhu
ang
66.6
62.0
52.6
69.3
47.8
16.2
12.4
2.2
498
Vien
tiane
78.6
76.6
75.6
79.3
73.5
33.3
32.0
2.6
826
Borik
ham
xay
76.7
68.4
68.3
80.2
61.3
17.1
15.5
6.9
521
Kham
mua
50.3
39.9
50.3
54.9
36.6
10.2
9.7
4.1
704
Sava
nnak
het
66.8
58.8
63.1
71.2
52.5
11.5
10.0
4.6
1,61
9Sa
rava
ne25
.423
.822
.826
.520
.61.
71.
51.
770
9Se
kong
58.0
55.4
48.6
59.9
45.5
16.7
14.3
6.6
209
Cha
mpa
sack
64.9
59.1
67.0
70.7
54.3
12.2
11.3
2.2
1,11
9At
tape
u63
.349
.959
.967
.743
.040
.236
.12.
924
3Xa
ysom
boun
e55
.750
.049
.357
.944
.215
.413
.65.
618
2(C
ontin
ued…
)
Tabl
e TM
.11.
2M: K
now
ledg
e of
mot
her-
to-c
hild
HIV
tran
smis
sion
(men
)Pe
rcen
tage
of m
en a
ge 1
5-49
yea
rs w
ho c
orre
ctly
iden
tify
mea
ns o
f HIV
tran
smis
sion
from
mot
her t
o ch
ild, L
ao P
DR
, 201
7Pe
rcen
tage
of m
en a
ge 1
5-49
who
:
Num
ber o
f m
en a
ge 1
5-49
Kno
w H
IV c
an b
e tr
ansm
itted
from
mot
her t
o ch
ild:
Kno
w H
IV c
an b
e tr
ansm
itted
from
mot
her t
o ch
ild:
Do
not k
now
any
of t
he
spec
ific
mea
ns o
f HIV
tra
nsm
issi
on fr
om
mot
her t
o ch
ild
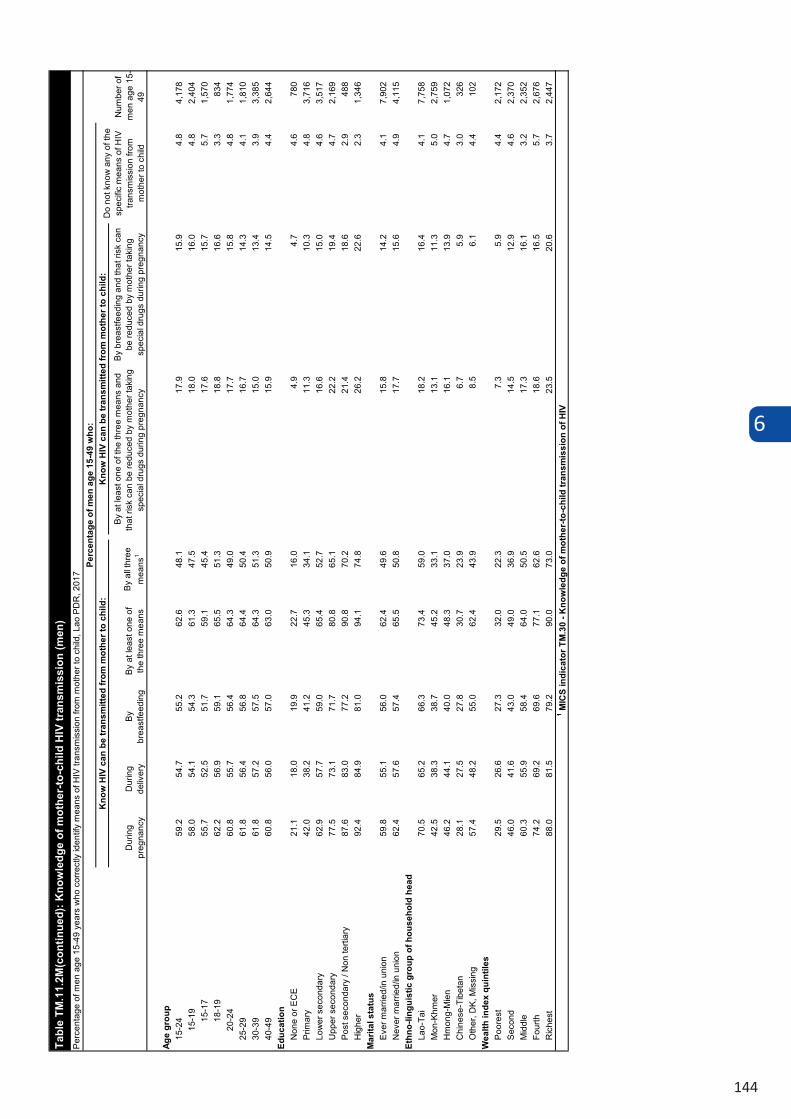
6
144
Dur
ing
preg
nanc
y D
urin
g de
liver
yBy
br
east
feed
ing
By a
t lea
st o
ne o
f th
e th
ree
mea
nsBy
all t
hree
m
eans
1
By
at le
ast o
ne o
f the
thre
e m
eans
and
th
at ri
sk c
an b
e re
duce
d by
mot
her t
akin
g sp
ecia
l dru
gs d
urin
g pr
egna
ncy
By b
reas
tfeed
ing
and
that
risk
can
be
redu
ced
by m
othe
r tak
ing
spec
ial d
rugs
dur
ing
preg
nanc
y
Age
grou
p15
-24
59.2
54.7
55.2
62.6
48.1
17.9
15.9
4.8
4,17
815
-19
58.0
54.1
54.3
61.3
47.5
18.0
16.0
4.8
2,40
415
-17
55.7
52.5
51.7
59.1
45.4
17.6
15.7
5.7
1,57
018
-19
62.2
56.9
59.1
65.5
51.3
18.8
16.6
3.3
834
20-2
460
.855
.756
.464
.349
.017
.715
.84.
81,
774
25-2
961
.856
.456
.864
.450
.416
.714
.34.
11,
810
30-3
961
.857
.257
.564
.351
.315
.013
.43.
93,
385
40-4
960
.856
.057
.063
.050
.915
.914
.54.
42,
644
Educ
atio
nN
one
or E
CE
21.1
18.0
19.9
22.7
16.0
4.9
4.7
4.6
780
Prim
ary
42.0
38.2
41.2
45.3
34.1
11.3
10.3
4.8
3,71
6Lo
wer
sec
onda
ry62
.957
.759
.065
.452
.716
.615
.04.
63,
517
Upp
er s
econ
dary
77.5
73.1
71.7
80.8
65.1
22.2
19.4
4.7
2,16
9Po
st s
econ
dary
/ N
on te
rtiar
y87
.683
.077
.290
.870
.221
.418
.62.
948
8H
ighe
r92
.484
.981
.094
.174
.826
.222
.62.
31,
346
Mar
ital s
tatu
sEv
er m
arrie
d/in
uni
on59
.855
.156
.062
.449
.615
.814
.24.
17,
902
Nev
er m
arrie
d/in
uni
on62
.457
.657
.465
.550
.817
.715
.64.
94,
115
Ethn
o-lin
guis
tic g
roup
of h
ouse
hold
hea
dLa
o-Ta
i70
.565
.266
.373
.459
.018
.216
.44.
17,
758
Mon
-Khm
er42
.538
.338
.745
.233
.113
.111
.35.
02,
759
Hm
ong-
Mie
n46
.244
.140
.048
.337
.016
.113
.94.
71,
072
Chi
nese
-Tib
etan
28.1
27.5
27.8
30.7
23.9
6.7
5.9
3.0
326
Oth
er, D
K, M
issi
ng57
.448
.255
.062
.443
.98.
56.
14.
410
2W
ealth
inde
x qu
intil
esPo
ores
t29
.526
.627
.332
.022
.37.
35.
94.
42,
172
Seco
nd46
.041
.643
.049
.036
.914
.512
.94.
62,
370
Mid
dle
60.3
55.9
58.4
64.0
50.5
17.3
16.1
3.2
2,35
2Fo
urth
74
.269
.269
.677
.162
.618
.616
.55.
72,
676
Ric
hest
88.0
81.5
79.2
90.0
73.0
23.5
20.6
3.7
2,44
71 M
ICS
indi
cato
r TM
.30
- Kno
wle
dge
of m
othe
r-to-
child
tran
smis
sion
of H
IV
Tabl
e TM
.11.
2M(c
ontin
ued)
: Kno
wle
dge
of m
othe
r-to
-chi
ld H
IV tr
ansm
issi
on (m
en)
Perc
enta
ge o
f men
age
15-
49 y
ears
who
cor
rect
ly id
entif
y m
eans
of H
IV tr
ansm
issi
on fr
om m
othe
r to
child
, Lao
PD
R, 2
017
Perc
enta
ge o
f men
age
15-
49 w
ho:
Num
ber o
f m
en a
ge 1
5 -49
Kno
w H
IV c
an b
e tra
nsm
itted
from
mot
her t
o ch
ild:
Kno
w H
IV c
an b
e tra
nsm
itted
from
mot
her t
o ch
ild:
Do
not k
now
any
of t
he
spec
ific m
eans
of H
IV
trans
mis
sion
from
m
othe
r to
child
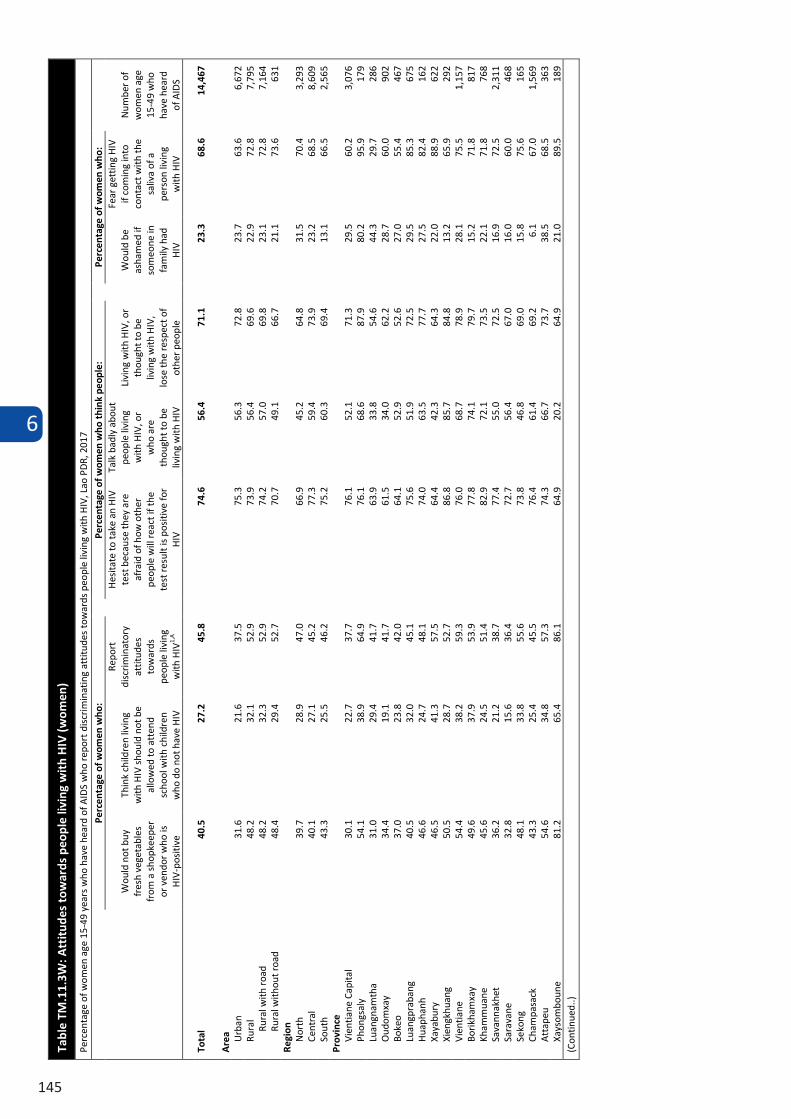
6
145
Tabl
e TM
.11.
3W: A
ttit
udes
tow
ards
peo
ple
livin
g w
ith
HIV
(wom
en)
Perc
enta
ge o
f wom
en a
ge 1
5-49
yea
rs w
ho h
ave
hear
d of
AID
S w
ho re
port
dis
crim
inat
ing
attit
udes
tow
ards
peo
ple
livin
g w
ith H
IV, L
ao P
DR,
201
7 Pe
rcen
tage
of w
omen
who
: Pe
rcen
tage
of w
omen
who
thin
k pe
ople
: Pe
rcen
tage
of w
omen
who
:
Num
ber o
f w
omen
age
15
-49
who
ha
ve h
eard
of
AID
S
Wou
ld n
ot b
uy
fres
h ve
geta
bles
fr
om a
sho
pkee
per
or v
endo
r who
is
HIV
-pos
itive
Thin
k ch
ildre
n liv
ing
with
HIV
sho
uld
not b
e al
low
ed to
att
end
scho
ol w
ith c
hild
ren
who
do
not h
ave
HIV
Repo
rt
disc
rimin
ator
y at
titud
es
tow
ards
pe
ople
livi
ng
with
HIV
1,A
Hes
itate
to ta
ke a
n H
IV
test
bec
ause
they
are
af
raid
of h
ow o
ther
pe
ople
will
reac
t if t
he
test
resu
lt is
pos
itive
for
HIV
Talk
bad
ly a
bout
pe
ople
livi
ng
with
HIV
, or
who
are
th
ough
t to
be
livin
g w
ith H
IV
Livi
ng w
ith H
IV, o
r th
ough
t to
be
livin
g w
ith H
IV,
lose
the
resp
ect o
f ot
her p
eopl
e
Wou
ld b
e as
ham
ed if
so
meo
ne in
fa
mily
had
H
IV
Fear
get
ting
HIV
if
com
ing
into
co
ntac
t with
the
saliv
a of
a
pers
on li
ving
w
ith H
IV
Tota
l 40
.5
27.2
45
.8
74.6
56
.4
71.1
23
.3
68.6
14
,467
Are
a Urb
an
31.6
21
.6
37.5
75
.3
56.3
72
.8
23.7
63
.6
6,67
2 Ru
ral
48.2
32
.1
52.9
73
.9
56.4
69
.6
22.9
72
.8
7,79
5 Ru
ral w
ith r
oad
48.2
32
.3
52.9
74
.2
57.0
69
.8
23.1
72
.8
7,16
4 Ru
ral w
ithou
t roa
d 48
.4
29.4
52
.7
70.7
49
.1
66.7
21
.1
73.6
63
1 Re
gion
N
orth
39
.7
28.9
47
.0
66.9
45
.2
64.8
31
.5
70.4
3,
293
Cent
ral
40.1
27
.1
45.2
77
.3
59.4
73
.9
23.2
68
.5
8,60
9 So
uth
43.3
25
.5
46.2
75
.2
60.3
69
.4
13.1
66
.5
2,56
5 Pr
ovin
ce
Vien
tiane
Cap
ital
30.1
22
.7
37.7
76
.1
52.1
71
.3
29.5
60
.2
3,07
6 Ph
ongs
aly
54
.1
38.9
64
.9
76.1
68
.6
87.9
80
.2
95.9
17
9 Lu
angn
amth
a 31
.0
29.4
41
.7
63.9
33
.8
54.6
44
.3
29.7
28
6 O
udom
xay
34.4
19
.1
41.7
61
.5
34.0
62
.2
28.7
60
.0
902
Boke
o 37
.0
23.8
42
.0
64.1
52
.9
52.6
27
.0
55.4
46
7 Lu
angp
raba
ng
40.5
32
.0
45.1
75
.6
51.9
72
.5
29.5
85
.3
675
Hua
phan
h 46
.6
24.7
48
.1
74.0
63
.5
77.7
27
.5
82.4
16
2 Xa
yabu
ry
46.5
41
.3
57.5
64
.4
42.3
64
.3
22.0
88
.9
622
Xien
gkhu
ang
50.5
28
.7
52.7
86
.8
85.7
84
.8
13.2
65
.9
292
Vien
tiane
54
.4
38.2
59
.3
76.0
68
.7
78.9
28
.1
75.5
1,
157
Borik
ham
xay
49.6
37
.9
53.9
77
.8
74.1
79
.7
15.2
71
.8
817
Kham
mua
ne
45.6
24
.5
51.4
82
.9
72.1
73
.5
22.1
71
.8
768
Sava
nnak
het
36.2
21
.2
38.7
77
.4
55.0
72
.5
16.9
72
.5
2,31
1 Sa
rava
ne
32.8
15
.6
36.4
72
.7
56.4
67
.0
16.0
60
.0
468
Seko
ng
48.1
33
.8
55.6
73
.8
46.8
69
.0
15.8
75
.6
165
Cham
pasa
ck
43.3
25
.4
45.5
76
.4
61.4
69
.2
6.1
67.0
1,
569
Att
apeu
54
.6
34.8
57
.3
74.3
66
.7
73.7
38
.5
68.5
36
3 Xa
ysom
boun
e 81
.2
65.4
86
.1
64.9
20
.2
64.9
21
.0
89.5
18
9 (C
ontin
ued.
.)
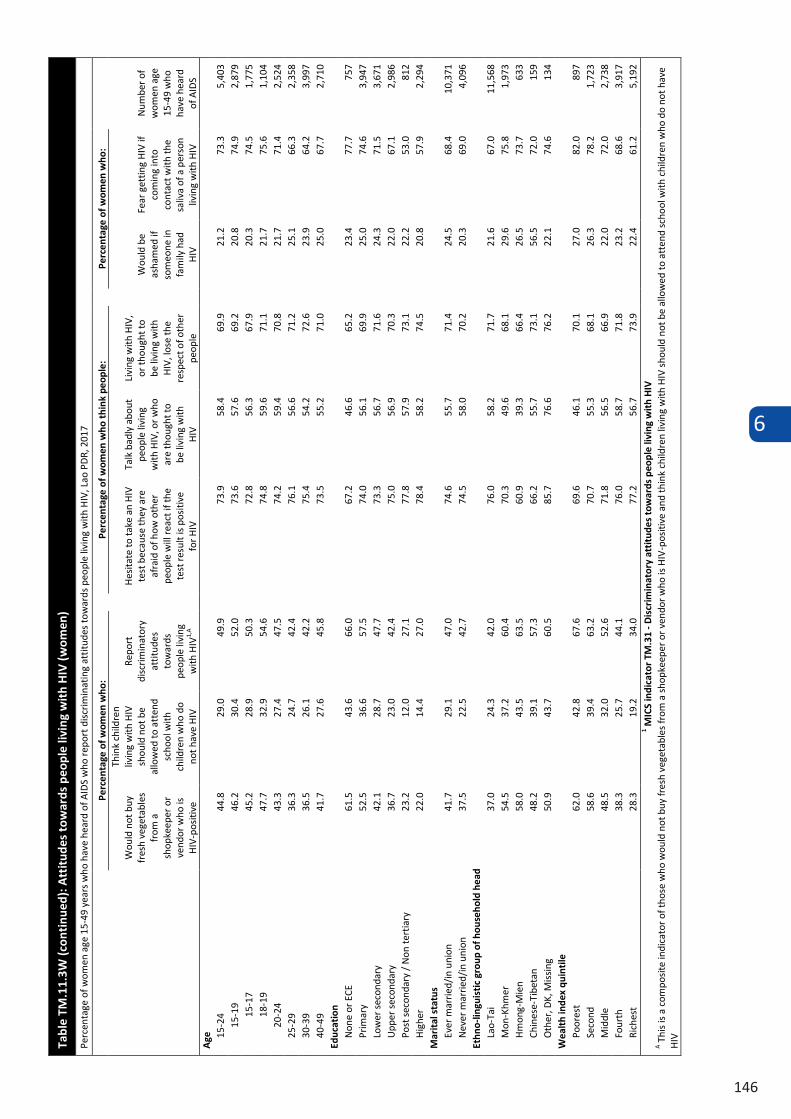
6
146
Tabl
e TM
.11.
3W (c
onti
nued
): A
ttit
udes
tow
ards
peo
ple
livin
g w
ith
HIV
(wom
en)
Perc
enta
ge o
f wom
en a
ge 1
5-49
yea
rs w
ho h
ave
hear
d of
AID
S w
ho re
port
dis
crim
inat
ing
attit
udes
tow
ards
peo
ple
livin
g w
ith H
IV, L
ao P
DR,
201
7
Perc
enta
ge o
f wom
en w
ho:
Pe
rcen
tage
of w
omen
who
thin
k pe
ople
:
Perc
enta
ge o
f wom
en w
ho:
Num
ber o
f w
omen
age
15
-49
who
ha
ve h
eard
of
AID
S
Wou
ld n
ot b
uy
fres
h ve
geta
bles
fr
om a
sh
opke
eper
or
vend
or w
ho is
H
IV-p
ositi
ve
Thin
k ch
ildre
n liv
ing
with
HIV
sh
ould
not
be
allo
wed
to a
tten
d sc
hool
with
ch
ildre
n w
ho d
o no
t hav
e H
IV
Repo
rt
disc
rimin
ator
y at
titud
es
tow
ards
pe
ople
livi
ng
with
HIV
1,A
Hes
itate
to ta
ke a
n H
IV
test
bec
ause
they
are
af
raid
of h
ow o
ther
pe
ople
will
reac
t if t
he
test
resu
lt is
pos
itive
fo
r HIV
Talk
bad
ly a
bout
pe
ople
livi
ng
with
HIV
, or w
ho
are
thou
ght t
o be
livi
ng w
ith
HIV
Livi
ng w
ith H
IV,
or th
ough
t to
be li
ving
with
H
IV, l
ose
the
resp
ect o
f oth
er
peop
le
Wou
ld b
e as
ham
ed if
so
meo
ne in
fa
mily
had
H
IV
Fear
get
ting
HIV
if
com
ing
into
co
ntac
t with
the
saliv
a of
a p
erso
n liv
ing
with
HIV
A
ge
15
-24
44.8
29
.0
49.9
73.9
58
.4
69.9
21.2
73
.3
5,40
3 15
-19
46.2
30
.4
52.0
73.6
57
.6
69.2
20.8
74
.9
2,87
9 15
-17
45.2
28
.9
50.3
72.8
56
.3
67.9
20.3
74
.5
1,77
5 18
-19
47.7
32
.9
54.6
74.8
59
.6
71.1
21.7
75
.6
1,10
4 20
-24
43.3
27
.4
47.5
74.2
59
.4
70.8
21.7
71
.4
2,52
4 25
-29
36.3
24
.7
42.4
76.1
56
.6
71.2
25.1
66
.3
2,35
8 30
-39
36.5
26
.1
42.2
75.4
54
.2
72.6
23.9
64
.2
3,99
7 40
-49
41.7
27
.6
45.8
73.5
55
.2
71.0
25.0
67
.7
2,71
0 Ed
ucat
ion
N
one
or E
CE
61.5
43
.6
66.0
67.2
46
.6
65.2
23.4
77
.7
757
Prim
ary
52.5
36
.6
57.5
74.0
56
.1
69.9
25.0
74
.6
3,94
7 Lo
wer
sec
onda
ry
42.1
28
.7
47.7
73.3
56
.7
71.6
24.3
71
.5
3,67
1 U
pper
sec
onda
ry
36.7
23
.0
42.4
75.0
56
.9
70.3
22.0
67
.1
2,98
6 Po
st s
econ
dary
/ N
on te
rtia
ry
23.2
12
.0
27.1
77.8
57
.9
73.1
22.2
53
.0
812
Hig
her
22.0
14
.4
27.0
78.4
58
.2
74.5
20.8
57
.9
2,29
4 M
arit
al s
tatu
s
Ever
mar
ried/
in u
nion
41
.7
29.1
47
.0
74
.6
55.7
71
.4
24
.5
68.4
10
,371
N
ever
mar
ried/
in u
nion
37
.5
22.5
42
.7
74
.5
58.0
70
.2
20
.3
69.0
4,
096
Ethn
o-lin
guis
tic
grou
p of
hou
seho
ld h
ead
Lao-
Tai
37.0
24
.3
42.0
76.0
58
.2
71.7
21.6
67
.0
11,5
68
Mon
-Khm
er
54.5
37
.2
60.4
70.3
49
.6
68.1
29.6
75
.8
1,97
3 H
mon
g-M
ien
58.0
43
.5
63.5
60.9
39
.3
66.4
26.5
73
.7
633
Chin
ese-
Tibe
tan
48.2
39
.1
57.3
66.2
55
.7
73.1
56.5
72
.0
159
Oth
er, D
K, M
issi
ng
50.9
43
.7
60.5
85.7
76
.6
76.2
22.1
74
.6
134
Wea
lth
inde
x qu
inti
le
Po
ores
t 62
.0
42.8
67
.6
69
.6
46.1
70
.1
27
.0
82.0
89
7 Se
cond
58
.6
39.4
63
.2
70
.7
55.3
68
.1
26
.3
78.2
1,
723
Mid
dle
48.5
32
.0
52.6
71.8
56
.5
66.9
22.0
72
.0
2,73
8 Fo
urth
38.3
25
.7
44.1
76.0
58
.7
71.8
23.2
68
.6
3,91
7 Ri
ches
t 28
.3
19.2
34
.0
77
.2
56.7
73
.9
22
.4
61.2
5,
192
1 MIC
S in
dica
tor
TM.3
1 - D
iscr
imin
ator
y at
titu
des
tow
ards
peo
ple
livin
g w
ith
HIV
A T
his
is a
com
posi
te in
dica
tor o
f tho
se w
ho w
ould
not
buy
fres
h ve
geta
bles
from
a s
hopk
eepe
r or v
endo
r who
is H
IV-p
ositi
ve a
nd th
ink
child
ren
livin
g w
ith H
IV s
houl
d no
t be
allo
wed
to a
tten
d sc
hool
with
chi
ldre
n w
ho d
o no
t hav
e H
IV
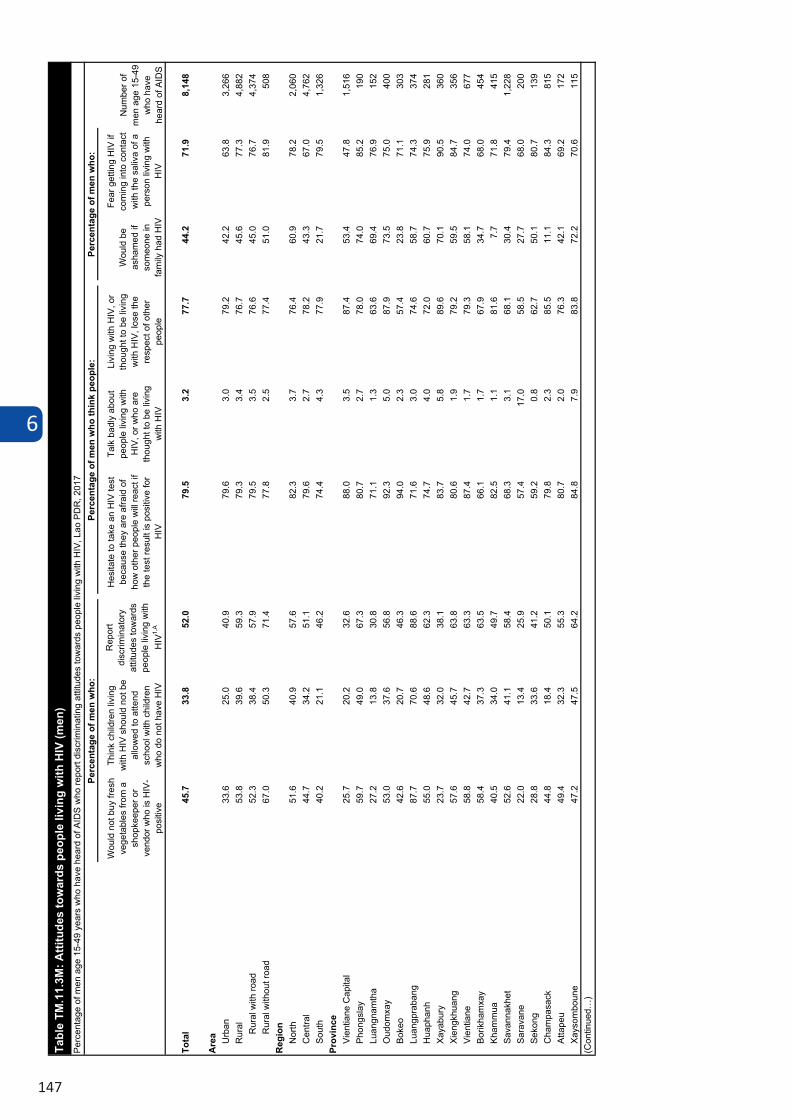
6
147
Wou
ld n
ot b
uy fr
esh
vege
tabl
es fr
om a
sh
opke
eper
or
vend
or w
ho is
HIV
-po
sitiv
e
Thin
k ch
ildre
n liv
ing
with
HIV
sho
uld
not b
e al
low
ed to
atte
nd
scho
ol w
ith c
hild
ren
who
do
not h
ave
HIV
Rep
ort
disc
rimin
ator
y at
titud
es to
war
ds
peop
le li
ving
with
H
IV1,
A
Hes
itate
to ta
ke a
n H
IV te
st
beca
use
they
are
afra
id o
f ho
w o
ther
peo
ple
will
reac
t if
the
test
resu
lt is
pos
itive
for
HIV
Talk
bad
ly a
bout
pe
ople
livi
ng w
ith
HIV
, or w
ho a
re
thou
ght t
o be
livi
ng
with
HIV
Livi
ng w
ith H
IV, o
r th
ough
t to
be li
ving
w
ith H
IV, l
ose
the
resp
ect o
f oth
er
peop
le
Wou
ld b
e as
ham
ed if
so
meo
ne in
fa
mily
had
HIV
Fear
get
ting
HIV
if
com
ing
into
con
tact
w
ith th
e sa
liva
of a
pe
rson
livi
ng w
ith
HIV
Tota
l45
.733
.852
.079
.53.
277
.744
.271
.98,
148
Are
a Urb
an33
.625
.040
.979
.63.
079
.242
.263
.83,
266
Rur
al53
.839
.659
.379
.33.
476
.745
.677
.34,
882
Rur
al w
ith ro
ad52
.338
.457
.979
.53.
576
.645
.076
.74,
374
Rur
al w
ithou
t roa
d67
.050
.371
.477
.82.
577
.451
.081
.950
8R
egio
nN
orth
51.6
40.9
57.6
82.3
3.7
76.4
60.9
78.2
2,06
0C
entra
l44
.734
.251
.179
.62.
778
.243
.367
.04,
762
Sout
h40
.221
.146
.274
.44.
377
.921
.779
.51,
326
Prov
ince
Vien
tiane
Cap
ital
25.7
20.2
32.6
88.0
3.5
87.4
53.4
47.8
1,51
6Ph
ongs
lay
59.7
49.0
67.3
80.7
2.7
78.0
74.0
85.2
190
Luan
gnam
tha
27.2
13.8
30.8
71.1
1.3
63.6
69.4
76.9
152
Oud
omxa
y53
.037
.656
.892
.35.
087
.973
.575
.040
0Bo
keo
42.6
20.7
46.3
94.0
2.3
57.4
23.8
71.1
303
Luan
gpra
bang
87.7
70.6
88.6
71.6
3.0
74.6
58.7
74.3
374
Hua
phan
h55
.048
.662
.374
.74.
072
.060
.775
.928
1Xa
yabu
ry23
.732
.038
.183
.75.
889
.670
.190
.536
0Xi
engk
huan
g57
.645
.763
.880
.61.
979
.259
.584
.735
6Vi
entia
ne58
.842
.763
.387
.41.
779
.358
.174
.067
7Bo
rikha
mxa
y58
.437
.363
.566
.11.
767
.934
.768
.045
4Kh
amm
ua40
.534
.049
.782
.51.
181
.67.
771
.841
5Sa
vann
akhe
t52
.641
.158
.468
.33.
168
.130
.479
.41,
228
Sara
vane
22.0
13.4
25.9
57.4
17.0
58.5
27.7
68.0
200
Seko
ng28
.833
.641
.259
.20.
862
.750
.180
.713
9C
ham
pasa
ck44
.818
.450
.179
.82.
385
.511
.184
.381
5At
tape
u49
.432
.355
.380
.72.
076
.342
.169
.217
2Xa
ysom
boun
e47
.247
.564
.284
.87.
983
.872
.270
.611
5(C
ontin
ued…
)
Tabl
e TM
.11.
3M: A
ttitu
des
tow
ards
peo
ple
livin
g w
ith H
IV (m
en)
Perc
enta
ge o
f men
age
15-
49 y
ears
who
hav
e he
ard
of A
IDS
who
repo
rt di
scrim
inat
ing
attit
udes
tow
ards
peo
ple
livin
g w
ith H
IV, L
ao P
DR
, 201
7Pe
rcen
tage
of m
en w
ho:
Perc
enta
ge o
f men
who
thin
k pe
ople
:Pe
rcen
tage
of m
en w
ho:
Num
ber o
f m
en a
ge 1
5-49
w
ho h
ave
hear
d of
AID
S
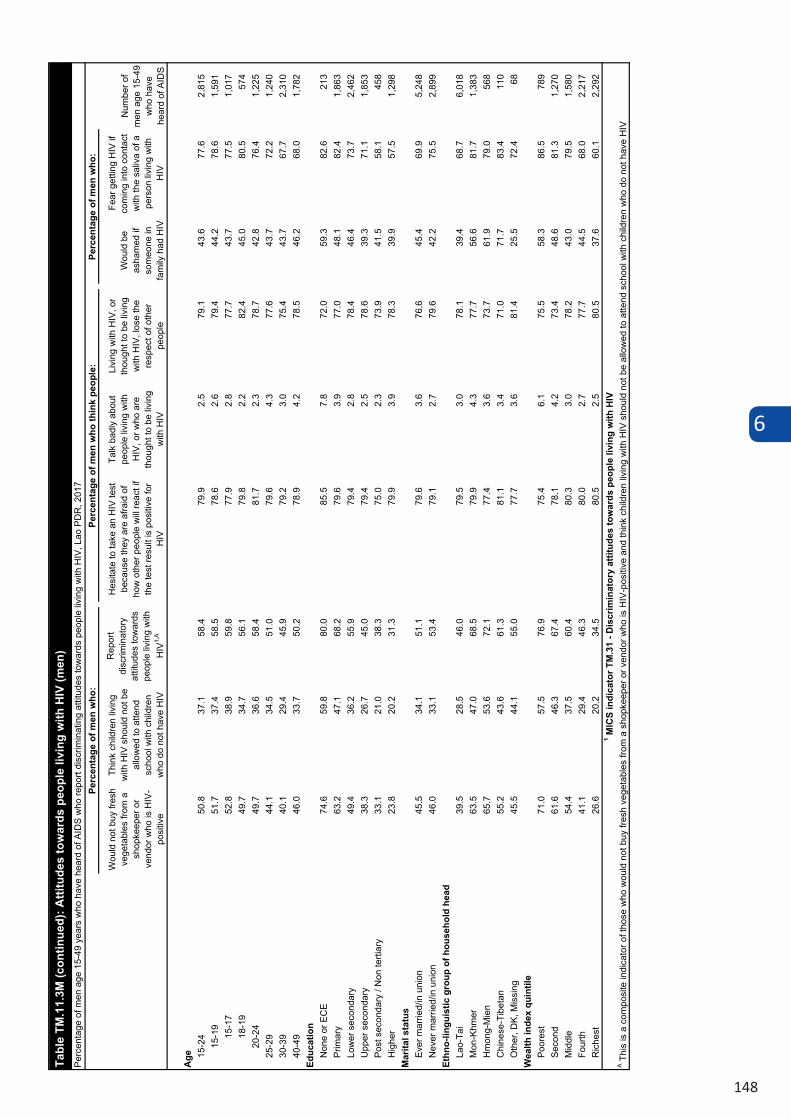
6
148
Wou
ld n
ot b
uy fr
esh
vege
tabl
es fr
om a
sh
opke
eper
or
vend
or w
ho is
HIV
-po
sitiv
e
Thin
k ch
ildre
n liv
ing
with
HIV
sho
uld
not b
e al
low
ed to
atte
nd
scho
ol w
ith c
hild
ren
who
do
not h
ave
HIV
Rep
ort
disc
rimin
ator
y at
titud
es to
war
ds
peop
le li
ving
with
H
IV1,
A
Hes
itate
to ta
ke a
n H
IV te
st
beca
use
they
are
afra
id o
f ho
w o
ther
peo
ple
will
reac
t if
the
test
resu
lt is
pos
itive
for
HIV
Talk
bad
ly a
bout
pe
ople
livi
ng w
ith
HIV
, or w
ho a
re
thou
ght t
o be
livi
ng
with
HIV
Livi
ng w
ith H
IV, o
r th
ough
t to
be li
ving
w
ith H
IV, l
ose
the
resp
ect o
f oth
er
peop
le
Wou
ld b
e as
ham
ed if
so
meo
ne in
fa
mily
had
HIV
Fear
get
ting
HIV
if
com
ing
into
con
tact
w
ith th
e sa
liva
of a
pe
rson
livi
ng w
ith
HIV
Age 15
-24
50.8
37.1
58.4
79.9
2.5
79.1
43.6
77.6
2,81
515
-19
51.7
37.4
58.5
78.6
2.6
79.4
44.2
78.6
1,59
115
-17
52.8
38.9
59.8
77.9
2.8
77.7
43.7
77.5
1,01
718
-19
49.7
34.7
56.1
79.8
2.2
82.4
45.0
80.5
574
20-2
449
.736
.658
.481
.72.
378
.742
.876
.41,
225
25-2
944
.134
.551
.079
.64.
377
.643
.772
.21,
240
30-3
940
.129
.445
.979
.23.
075
.443
.767
.72,
310
40-4
946
.033
.750
.278
.94.
278
.546
.268
.01,
782
Educ
atio
nN
one
or E
CE
74.6
59.8
80.0
85.5
7.8
72.0
59.3
82.6
213
Prim
ary
63.2
47.1
68.2
79.6
3.9
77.0
48.1
82.4
1,86
3Lo
wer
sec
onda
ry49
.436
.255
.979
.42.
878
.446
.473
.72,
462
Upp
er s
econ
dary
38.3
26.7
45.0
79.4
2.5
78.6
39.3
71.1
1,85
3Po
st s
econ
dary
/ N
on te
rtiar
y33
.121
.038
.375
.02.
373
.941
.558
.145
8H
ighe
r23
.820
.231
.379
.93.
978
.339
.957
.51,
298
Mar
ital s
tatu
sEv
er m
arrie
d/in
uni
on45
.534
.151
.179
.63.
676
.645
.469
.95,
248
Nev
er m
arrie
d/in
uni
on46
.033
.153
.479
.12.
779
.642
.275
.52,
899
Ethn
o-lin
guis
tic g
roup
of h
ouse
hold
hea
dLa
o-Ta
i39
.528
.546
.079
.53.
078
.139
.468
.76,
018
Mon
-Khm
er63
.547
.068
.579
.94.
377
.756
.681
.71,
383
Hm
ong-
Mie
n65
.753
.672
.177
.43.
673
.761
.979
.056
8C
hine
se-T
ibet
an55
.243
.661
.381
.13.
471
.071
.783
.411
0O
ther
, DK,
Mis
sing
45.5
44.1
55.0
77.7
3.6
81.4
25.5
72.4
68W
ealth
inde
x qu
intil
ePo
ores
t71
.057
.576
.975
.46.
175
.558
.386
.578
9Se
cond
61.6
46.3
67.4
78.1
4.2
73.4
48.6
81.3
1,27
0M
iddl
e54
.437
.560
.480
.33.
078
.243
.079
.51,
580
Four
th
41.1
29.4
46.3
80.0
2.7
77.7
44.5
68.0
2,21
7R
iche
st26
.620
.234
.580
.52.
580
.537
.660
.12,
292
1 MIC
S in
dica
tor T
M.3
1 - D
iscr
imin
ator
y at
titud
es to
war
ds p
eopl
e liv
ing
with
HIV
A Thi
s is
a c
ompo
site
indi
cato
r of t
hose
who
wou
ld n
ot b
uy fr
esh
vege
tabl
es fr
om a
sho
pkee
per o
r ven
dor w
ho is
HIV
-pos
itive
and
thin
k ch
ildre
n liv
ing
with
HIV
sho
uld
not b
e al
low
ed to
atte
nd s
choo
l with
chi
ldre
n w
ho d
o no
t hav
e H
IV
Tabl
e TM
.11.
3M (c
ontin
ued)
: Atti
tude
s to
war
ds p
eopl
e liv
ing
with
HIV
(men
)Pe
rcen
tage
of m
en a
ge 1
5-49
yea
rs w
ho h
ave
hear
d of
AID
S w
ho re
port
disc
rimin
atin
g at
titud
es to
war
ds p
eopl
e liv
ing
with
HIV
, Lao
PD
R, 2
017
Perc
enta
ge o
f men
who
:Pe
rcen
tage
of m
en w
ho th
ink
peop
le:
Perc
enta
ge o
f men
who
:
Num
ber o
f m
en a
ge 1
5-49
w
ho h
ave
hear
d of
AID
S
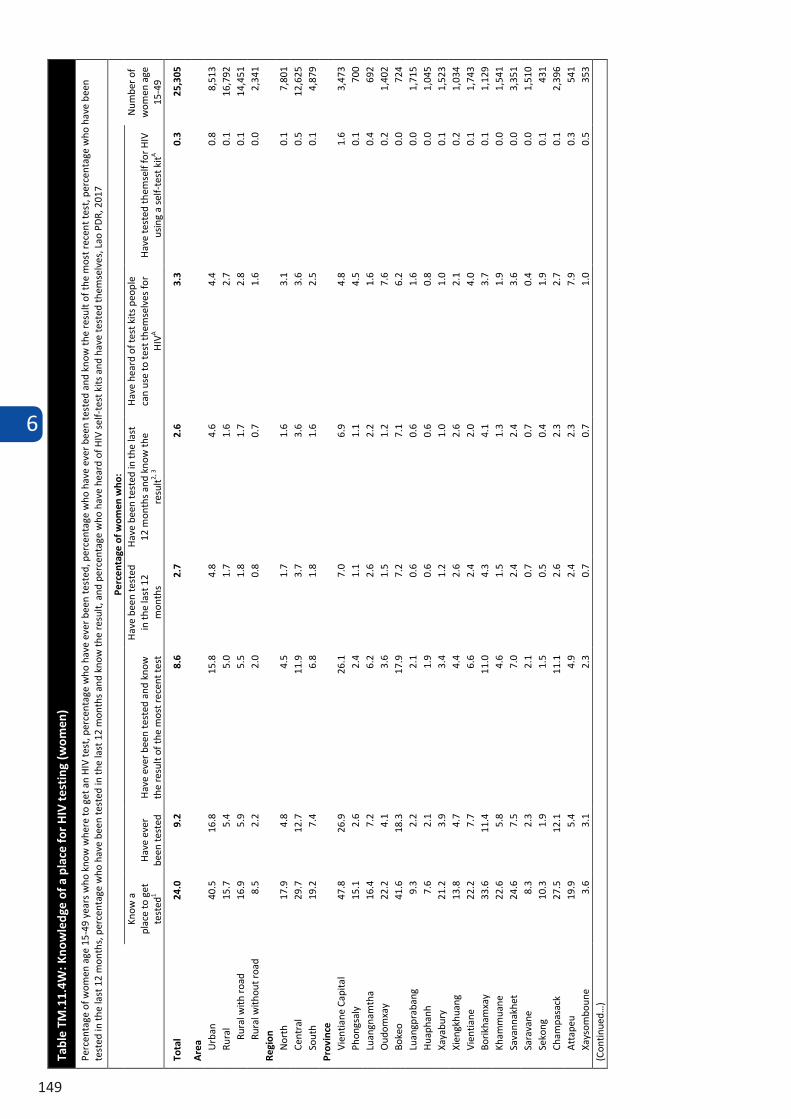
6
149
Wou
ld n
ot b
uy fr
esh
vege
tabl
es fr
om a
sh
opke
eper
or
vend
or w
ho is
HIV
-po
sitiv
e
Thin
k ch
ildre
n liv
ing
with
HIV
sho
uld
not b
e al
low
ed to
atte
nd
scho
ol w
ith c
hild
ren
who
do
not h
ave
HIV
Rep
ort
disc
rimin
ator
y at
titud
es to
war
ds
peop
le li
ving
with
H
IV1,
A
Hes
itate
to ta
ke a
n H
IV te
st
beca
use
they
are
afra
id o
f ho
w o
ther
peo
ple
will
reac
t if
the
test
resu
lt is
pos
itive
for
HIV
Talk
bad
ly a
bout
pe
ople
livi
ng w
ith
HIV
, or w
ho a
re
thou
ght t
o be
livi
ng
with
HIV
Livi
ng w
ith H
IV, o
r th
ough
t to
be li
ving
w
ith H
IV, l
ose
the
resp
ect o
f oth
er
peop
le
Wou
ld b
e as
ham
ed if
so
meo
ne in
fa
mily
had
HIV
Fear
get
ting
HIV
if
com
ing
into
con
tact
w
ith th
e sa
liva
of a
pe
rson
livi
ng w
ith
HIV
Age 15
-24
50.8
37.1
58.4
79.9
2.5
79.1
43.6
77.6
2,81
515
-19
51.7
37.4
58.5
78.6
2.6
79.4
44.2
78.6
1,59
115
-17
52.8
38.9
59.8
77.9
2.8
77.7
43.7
77.5
1,01
718
-19
49.7
34.7
56.1
79.8
2.2
82.4
45.0
80.5
574
20-2
449
.736
.658
.481
.72.
378
.742
.876
.41,
225
25-2
944
.134
.551
.079
.64.
377
.643
.772
.21,
240
30-3
940
.129
.445
.979
.23.
075
.443
.767
.72,
310
40-4
946
.033
.750
.278
.94.
278
.546
.268
.01,
782
Educ
atio
nN
one
or E
CE
74.6
59.8
80.0
85.5
7.8
72.0
59.3
82.6
213
Prim
ary
63.2
47.1
68.2
79.6
3.9
77.0
48.1
82.4
1,86
3Lo
wer
sec
onda
ry49
.436
.255
.979
.42.
878
.446
.473
.72,
462
Upp
er s
econ
dary
38.3
26.7
45.0
79.4
2.5
78.6
39.3
71.1
1,85
3Po
st s
econ
dary
/ N
on te
rtiar
y33
.121
.038
.375
.02.
373
.941
.558
.145
8H
ighe
r23
.820
.231
.379
.93.
978
.339
.957
.51,
298
Mar
ital s
tatu
sEv
er m
arrie
d/in
uni
on45
.534
.151
.179
.63.
676
.645
.469
.95,
248
Nev
er m
arrie
d/in
uni
on46
.033
.153
.479
.12.
779
.642
.275
.52,
899
Ethn
o-lin
guis
tic g
roup
of h
ouse
hold
hea
dLa
o-Ta
i39
.528
.546
.079
.53.
078
.139
.468
.76,
018
Mon
-Khm
er63
.547
.068
.579
.94.
377
.756
.681
.71,
383
Hm
ong-
Mie
n65
.753
.672
.177
.43.
673
.761
.979
.056
8C
hine
se-T
ibet
an55
.243
.661
.381
.13.
471
.071
.783
.411
0O
ther
, DK,
Mis
sing
45.5
44.1
55.0
77.7
3.6
81.4
25.5
72.4
68W
ealth
inde
x qu
intil
ePo
ores
t71
.057
.576
.975
.46.
175
.558
.386
.578
9Se
cond
61.6
46.3
67.4
78.1
4.2
73.4
48.6
81.3
1,27
0M
iddl
e54
.437
.560
.480
.33.
078
.243
.079
.51,
580
Four
th
41.1
29.4
46.3
80.0
2.7
77.7
44.5
68.0
2,21
7R
iche
st26
.620
.234
.580
.52.
580
.537
.660
.12,
292
1 MIC
S in
dica
tor T
M.3
1 - D
iscr
imin
ator
y at
titud
es to
war
ds p
eopl
e liv
ing
with
HIV
A Thi
s is
a c
ompo
site
indi
cato
r of t
hose
who
wou
ld n
ot b
uy fr
esh
vege
tabl
es fr
om a
sho
pkee
per o
r ven
dor w
ho is
HIV
-pos
itive
and
thin
k ch
ildre
n liv
ing
with
HIV
sho
uld
not b
e al
low
ed to
atte
nd s
choo
l with
chi
ldre
n w
ho d
o no
t hav
e H
IV
Tabl
e TM
.11.
3M (c
ontin
ued)
: Atti
tude
s to
war
ds p
eopl
e liv
ing
with
HIV
(men
)Pe
rcen
tage
of m
en a
ge 1
5-49
yea
rs w
ho h
ave
hear
d of
AID
S w
ho re
port
disc
rimin
atin
g at
titud
es to
war
ds p
eopl
e liv
ing
with
HIV
, Lao
PD
R, 2
017
Perc
enta
ge o
f men
who
:Pe
rcen
tage
of m
en w
ho th
ink
peop
le:
Perc
enta
ge o
f men
who
:
Num
ber o
f m
en a
ge 1
5-49
w
ho h
ave
hear
d of
AID
S
Tabl
e TM
.11.
4W: K
now
ledg
e of
a p
lace
for
HIV
tes
ting
(wom
en)
Perc
enta
ge o
f wom
en a
ge 1
5-49
yea
rs w
ho k
now
whe
re to
get
an
HIV
test
, per
cent
age
who
hav
e ev
er b
een
test
ed, p
erce
ntag
e w
ho h
ave
ever
bee
n te
sted
and
kno
w th
e re
sult
of th
e m
ost r
ecen
t tes
t, p
erce
ntag
e w
ho h
ave
been
te
sted
in th
e la
st 1
2 m
onth
s, p
erce
ntag
e w
ho h
ave
been
test
ed in
the
last
12
mon
ths
and
know
the
resu
lt, a
nd p
erce
ntag
e w
ho h
ave
hear
d of
HIV
sel
f-te
st k
its a
nd h
ave
test
ed th
emse
lves
, Lao
PD
R, 2
017
Perc
enta
ge o
f wom
en w
ho:
Num
ber o
f w
omen
age
15
-49
Know
a
plac
e to
get
te
sted
1 H
ave
ever
be
en te
sted
H
ave
ever
bee
n te
sted
and
kno
w
the
resu
lt of
the
mos
t rec
ent t
est
Hav
e be
en te
sted
in
the
last
12
mon
ths
Hav
e be
en te
sted
in th
e la
st
12 m
onth
s an
d kn
ow th
e re
sult2,
3
Hav
e he
ard
of te
st k
its p
eopl
e ca
n us
e to
test
them
selv
es fo
r H
IVA
Hav
e te
sted
them
self
for H
IV
usin
g a
self-
test
kitA
Tota
l 24
.0
9.2
8.6
2.7
2.6
3.3
0.3
25,3
05
Are
a Urb
an
40.5
16
.8
15.8
4.
8 4.
6 4.
4 0.
8 8,
513
Rura
l 15
.7
5.4
5.0
1.7
1.6
2.7
0.1
16,7
92
Rura
l with
roa
d 16
.9
5.9
5.5
1.8
1.7
2.8
0.1
14,4
51
Rura
l with
out r
oad
8.5
2.2
2.0
0.8
0.7
1.6
0.0
2,34
1 Re
gion
N
orth
17
.9
4.8
4.5
1.7
1.6
3.1
0.1
7,80
1 Ce
ntra
l 29
.7
12.7
11
.9
3.7
3.6
3.6
0.5
12,6
25
Sout
h 19
.2
7.4
6.8
1.8
1.6
2.5
0.1
4,87
9 Pr
ovin
ce
Vien
tiane
Cap
ital
47.8
26
.9
26.1
7.
0 6.
9 4.
8 1.
6 3,
473
Phon
gsal
y
15.1
2.
6 2.
4 1.
1 1.
1 4.
5 0.
1 70
0 Lu
angn
amth
a 16
.4
7.2
6.2
2.6
2.2
1.6
0.4
692
Oud
omxa
y 22
.2
4.1
3.6
1.5
1.2
7.6
0.2
1,40
2 Bo
keo
41.6
18
.3
17.9
7.
2 7.
1 6.
2 0.
0 72
4 Lu
angp
raba
ng
9.3
2.2
2.1
0.6
0.6
1.6
0.0
1,71
5 H
uaph
anh
7.6
2.1
1.9
0.6
0.6
0.8
0.0
1,04
5 Xa
yabu
ry
21.2
3.
9 3.
4 1.
2 1.
0 1.
0 0.
1 1,
523
Xien
gkhu
ang
13.8
4.
7 4.
4 2.
6 2.
6 2.
1 0.
2 1,
034
Vien
tiane
22
.2
7.7
6.6
2.4
2.0
4.0
0.1
1,74
3 Bo
rikha
mxa
y 33
.6
11.4
11
.0
4.3
4.1
3.7
0.1
1,12
9 Kh
amm
uane
22
.6
5.8
4.6
1.5
1.3
1.9
0.0
1,54
1 Sa
vann
akhe
t 24
.6
7.5
7.0
2.4
2.4
3.6
0.0
3,35
1 Sa
rava
ne
8.3
2.3
2.1
0.7
0.7
0.4
0.0
1,51
0 Se
kong
10
.3
1.9
1.5
0.5
0.4
1.9
0.1
431
Cham
pasa
ck
27.5
12
.1
11.1
2.
6 2.
3 2.
7 0.
1 2,
396
Att
apeu
19
.9
5.4
4.9
2.4
2.3
7.9
0.3
541
Xays
ombo
une
3.6
3.1
2.3
0.7
0.7
1.0
0.5
353
(Con
tinue
d…)
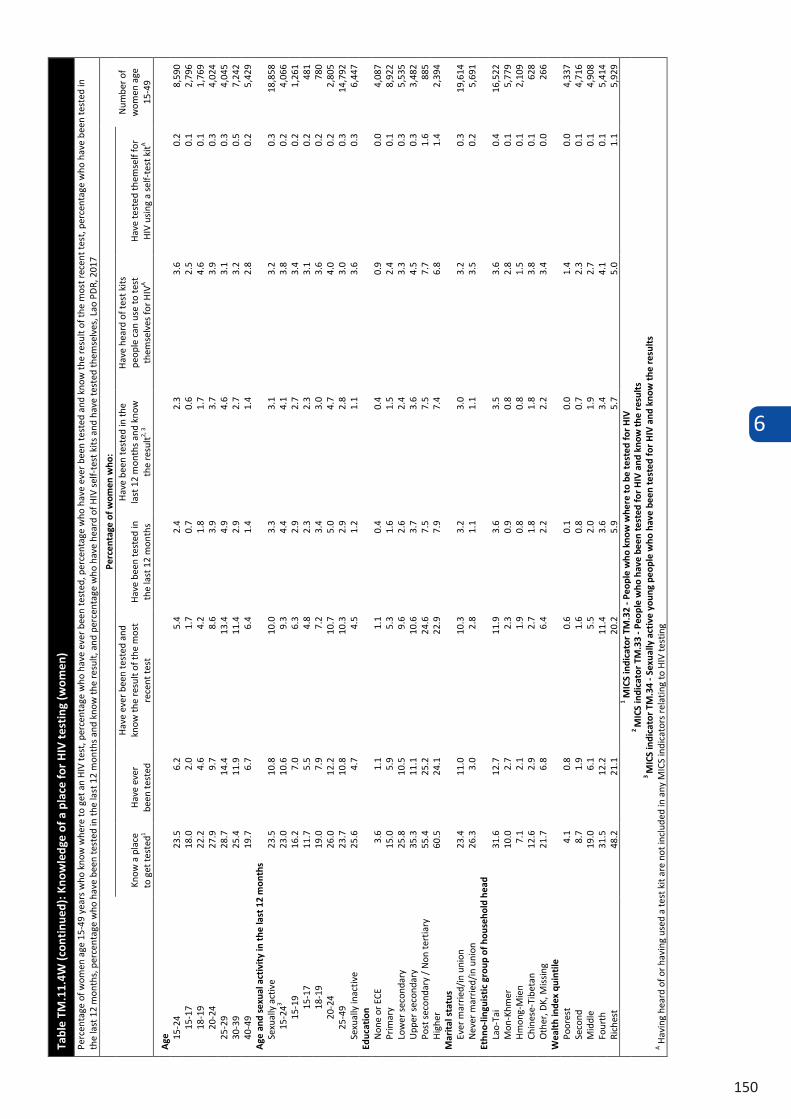
6
150
Tabl
e TM
.11.
4W (c
onti
nued
): K
now
ledg
e of
a p
lace
for
HIV
tes
ting
(wom
en)
Perc
enta
ge o
f wom
en a
ge 1
5-49
yea
rs w
ho k
now
whe
re to
get
an
HIV
test
, per
cent
age
who
hav
e ev
er b
een
test
ed, p
erce
ntag
e w
ho h
ave
ever
bee
n te
sted
and
kno
w th
e re
sult
of th
e m
ost r
ecen
t tes
t, p
erce
ntag
e w
ho h
ave
been
test
ed in
th
e la
st 1
2 m
onth
s, p
erce
ntag
e w
ho h
ave
been
test
ed in
the
last
12
mon
ths
and
know
the
resu
lt, a
nd p
erce
ntag
e w
ho h
ave
hear
d of
HIV
sel
f-te
st k
its a
nd h
ave
test
ed th
emse
lves
, Lao
PD
R, 2
017
Perc
enta
ge o
f wom
en w
ho:
Num
ber o
f w
omen
age
15
-49
Know
a p
lace
to
get
test
ed1
Hav
e ev
er
been
test
ed
Hav
e ev
er b
een
test
ed a
nd
know
the
resu
lt of
the
mos
t re
cent
test
H
ave
been
test
ed in
th
e la
st 1
2 m
onth
s
Hav
e be
en te
sted
in th
e la
st 1
2 m
onth
s an
d kn
ow
the
resu
lt2, 3
Hav
e he
ard
of te
st k
its
peop
le c
an u
se to
test
th
emse
lves
for H
IVA
Hav
e te
sted
them
self
for
HIV
usi
ng a
sel
f-te
st k
itA
Age
15
-24
23.5
6.
2 5.
4 2.
4 2.
3 3.
6 0.
2 8,
590
15-1
7 18
.0
2.0
1.7
0.7
0.6
2.5
0.1
2,79
6 18
-19
22.2
4.
6 4.
2 1.
8 1.
7 4.
6 0.
1 1,
769
20-2
4 27
.9
9.7
8.6
3.9
3.7
3.9
0.3
4,02
4 25
-29
28.7
14
.4
13.4
4.
9 4.
6 3.
1 0.
3 4,
045
30-3
9 25
.4
11.9
11
.4
2.9
2.7
3.2
0.5
7,24
2 40
-49
19.7
6.
7 6.
4 1.
4 1.
4 2.
8 0.
2 5,
429
Age
and
sex
ual a
ctiv
ity
in th
e la
st 1
2 m
onth
s Se
xual
ly a
ctiv
e 23
.5
10.8
10
.0
3.3
3.1
3.2
0.3
18,8
58
15-2
43 23
.0
10.6
9.
3 4.
4 4.
1 3.
8 0.
2 4,
066
15-1
9 16
.2
7.0
6.3
2.9
2.7
3.4
0.2
1,26
1 15
-17
11.7
5.
5 4.
8 2.
3 2.
3 3.
1 0.
2 48
1 18
-19
19.0
7.
9 7.
2 3.
4 3.
0 3.
6 0.
2 78
0 20
-24
26.0
12
.2
10.7
5.
0 4.
7 4.
0 0.
2 2,
805
25-4
9 23
.7
10.8
10
.3
2.9
2.8
3.0
0.3
14,7
92
Sexu
ally
inac
tive
25.6
4.
7 4.
5 1.
2 1.
1 3.
6 0.
3 6,
447
Educ
atio
n N
one
or E
CE
3.6
1.1
1.1
0.4
0.4
0.9
0.0
4,08
7 Pr
imar
y 15
.0
5.9
5.3
1.6
1.5
2.4
0.1
8,92
2 Lo
wer
sec
onda
ry
25.8
10
.5
9.6
2.6
2.4
3.3
0.3
5,53
5 U
pper
sec
onda
ry
35.3
11
.1
10.6
3.
7 3.
6 4.
5 0.
3 3,
482
Post
sec
onda
ry /
Non
tert
iary
55
.4
25.2
24
.6
7.5
7.5
7.7
1.6
885
Hig
her
60.5
24
.1
22.9
7.
9 7.
4 6.
8 1.
4 2,
394
Mar
ital
sta
tus
Ever
mar
ried/
in u
nion
23
.4
11.0
10
.3
3.2
3.0
3.2
0.3
19,6
14
Nev
er m
arrie
d/in
uni
on
26.3
3.
0 2.
8 1.
1 1.
1 3.
5 0.
2 5,
691
Ethn
o-lin
guis
tic
grou
p of
hou
seho
ld h
ead
Lao-
Tai
31.6
12
.7
11.9
3.
6 3.
5 3.
6 0.
4 16
,522
M
on-K
hmer
10
.0
2.7
2.3
0.9
0.8
2.8
0.1
5,77
9 H
mon
g-M
ien
7.1
2.1
1.9
0.8
0.8
1.5
0.1
2,10
9 Ch
ines
e-Ti
beta
n 12
.6
2.9
2.7
1.8
1.8
3.8
0.1
628
Oth
er, D
K, M
issi
ng
21.7
6.
8 6.
4 2.
2 2.
2 3.
4 0.
0 26
6 W
ealt
h in
dex
quin
tile
Po
ores
t 4.
1 0.
8 0.
6 0.
1 0.
0 1.
4 0.
0 4,
337
Seco
nd
8.7
1.9
1.6
0.8
0.7
2.3
0.1
4,71
6 M
iddl
e 19
.0
6.1
5.5
2.0
1.9
2.7
0.1
4,90
8 Fo
urth
31
.5
12.2
11
.4
3.6
3.4
4.1
0.1
5,41
4 Ri
ches
t 48
.2
21.1
20
.2
5.9
5.7
5.0
1.1
5,92
9 1 M
ICS
indi
cato
r TM
.32
- Peo
ple
who
kno
w w
here
to b
e te
sted
for
HIV
2
MIC
S in
dica
tor
TM.3
3 - P
eopl
e w
ho h
ave
been
test
ed fo
r H
IV a
nd k
now
the
resu
lts
3
MIC
S in
dica
tor
TM.3
4 - S
exua
lly a
ctiv
e yo
ung
peop
le w
ho h
ave
been
test
ed fo
r H
IV a
nd k
now
the
resu
lts
A H
avin
g he
ard
of o
r hav
ing
used
a te
st k
it ar
e no
t inc
lude
d in
any
MIC
S in
dica
tors
rel
atin
g to
HIV
test
ing
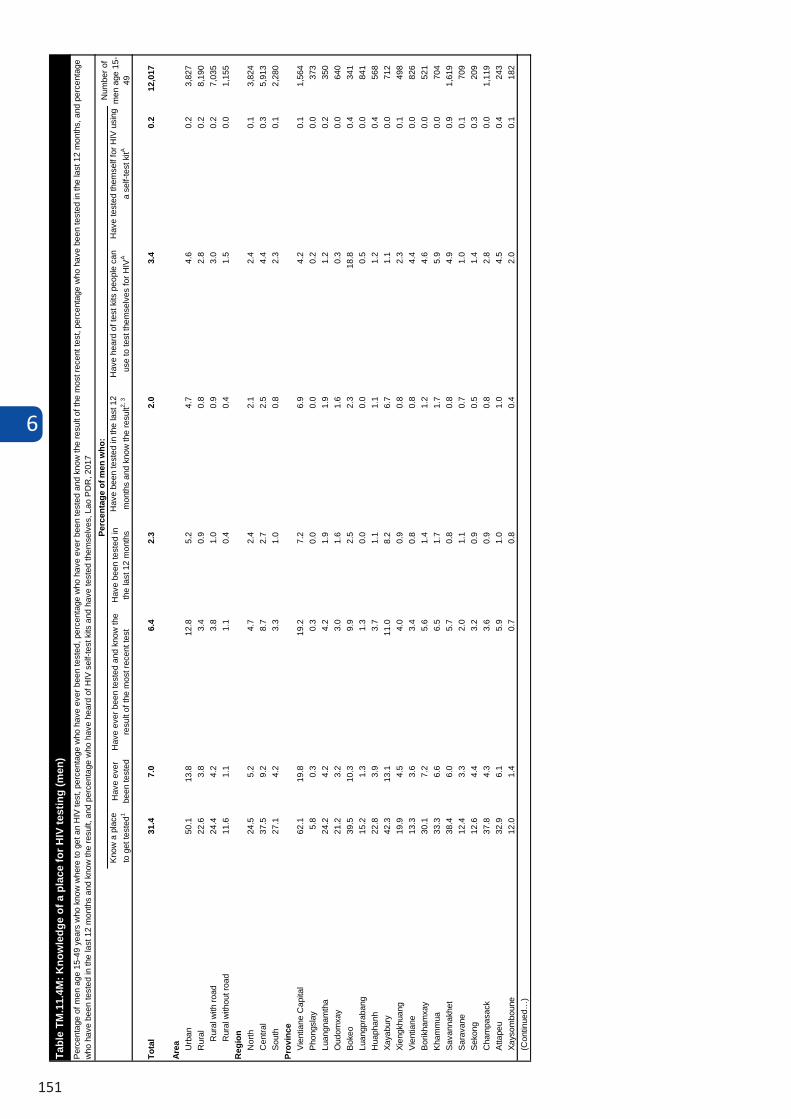
6
151
Kno
w a
pla
ce
to g
et te
sted
1H
ave
ever
be
en te
sted
Hav
e ev
er b
een
test
ed a
nd k
now
the
resu
lt of
the
mos
t rec
ent t
est
Hav
e be
en te
sted
in
the
last
12
mon
ths
Hav
e be
en te
sted
in th
e la
st 1
2 m
onth
s an
d kn
ow th
e re
sult2,
3H
ave
hear
d of
test
kits
peo
ple
can
use
to te
st th
emse
lves
for H
IVA
Hav
e te
sted
them
self
for H
IV u
sing
a
self-
test
kitA
Tota
l31
.47.
06.
42.
32.
03.
40.
212
,017
Area U
rban
50.1
13.8
12.8
5.2
4.7
4.6
0.2
3,82
7R
ural
22.6
3.8
3.4
0.9
0.8
2.8
0.2
8,19
0R
ural
with
road
24.4
4.2
3.8
1.0
0.9
3.0
0.2
7,03
5R
ural
with
out r
oad
11.6
1.1
1.1
0.4
0.4
1.5
0.0
1,15
5R
egio
nN
orth
24.5
5.2
4.7
2.4
2.1
2.4
0.1
3,82
4C
entra
l37
.59.
28.
72.
72.
54.
40.
35,
913
Sou
th27
.14.
23.
31.
00.
82.
30.
12,
280
Prov
ince
Vie
ntia
ne C
apita
l62
.119
.819
.27.
26.
94.
20.
11,
564
Pho
ngsl
ay
5.8
0.3
0.3
0.0
0.0
0.2
0.0
373
Luan
gnam
tha
24.2
4.2
4.2
1.9
1.9
1.2
0.2
350
Oud
omxa
y21
.23.
23.
01.
61.
60.
30.
064
0B
okeo
39.5
10.3
9.9
2.5
2.3
18.8
0.4
341
Luan
gpra
bang
15.2
1.3
1.3
0.0
0.0
0.5
0.0
841
Hua
phan
h22
.83.
93.
71.
11.
11.
20.
456
8Xa
yabu
ry42
.313
.111
.08.
26.
71.
10.
071
2Xi
engk
huan
g19
.94.
54.
00.
90.
82.
30.
149
8V
ient
iane
13.3
3.6
3.4
0.8
0.8
4.4
0.0
826
Bor
ikha
mxa
y30
.17.
25.
61.
41.
24.
60.
052
1K
ham
mua
33.3
6.6
6.5
1.7
1.7
5.9
0.0
704
Sav
anna
khet
38.4
6.0
5.7
0.8
0.8
4.9
0.9
1,61
9S
arav
ane
12.4
3.3
2.0
1.1
0.7
1.0
0.1
709
Sek
ong
12.6
4.4
3.2
0.9
0.5
1.4
0.3
209
Cha
mpa
sack
37.8
4.3
3.6
0.9
0.8
2.8
0.0
1,11
9A
ttape
u32
.96.
15.
91.
01.
04.
50.
424
3Xa
ysom
boun
e12
.01.
40.
70.
80.
42.
00.
118
2(C
ontin
ued…
)
Tabl
e TM
.11.
4M: K
now
ledg
e of
a p
lace
for H
IV te
stin
g (m
en)
Per
cent
age
of m
en a
ge 1
5-49
yea
rs w
ho k
now
whe
re to
get
an
HIV
test
, per
cent
age
who
hav
e ev
er b
een
test
ed, p
erce
ntag
e w
ho h
ave
ever
bee
n te
sted
and
kno
w th
e re
sult
of th
e m
ost r
ecen
t tes
t, pe
rcen
tage
who
hav
e be
en te
sted
in th
e la
st 1
2 m
onth
s, a
nd p
erce
ntag
e w
ho h
ave
been
test
ed in
the
last
12
mon
ths
and
know
the
resu
lt, a
nd p
erce
ntag
e w
ho h
ave
hear
d of
HIV
sel
f-tes
t kits
and
hav
e te
sted
them
selv
es, L
ao P
DR
, 201
7Pe
rcen
tage
of m
en w
ho:
Num
ber o
f m
en a
ge 1
5-49
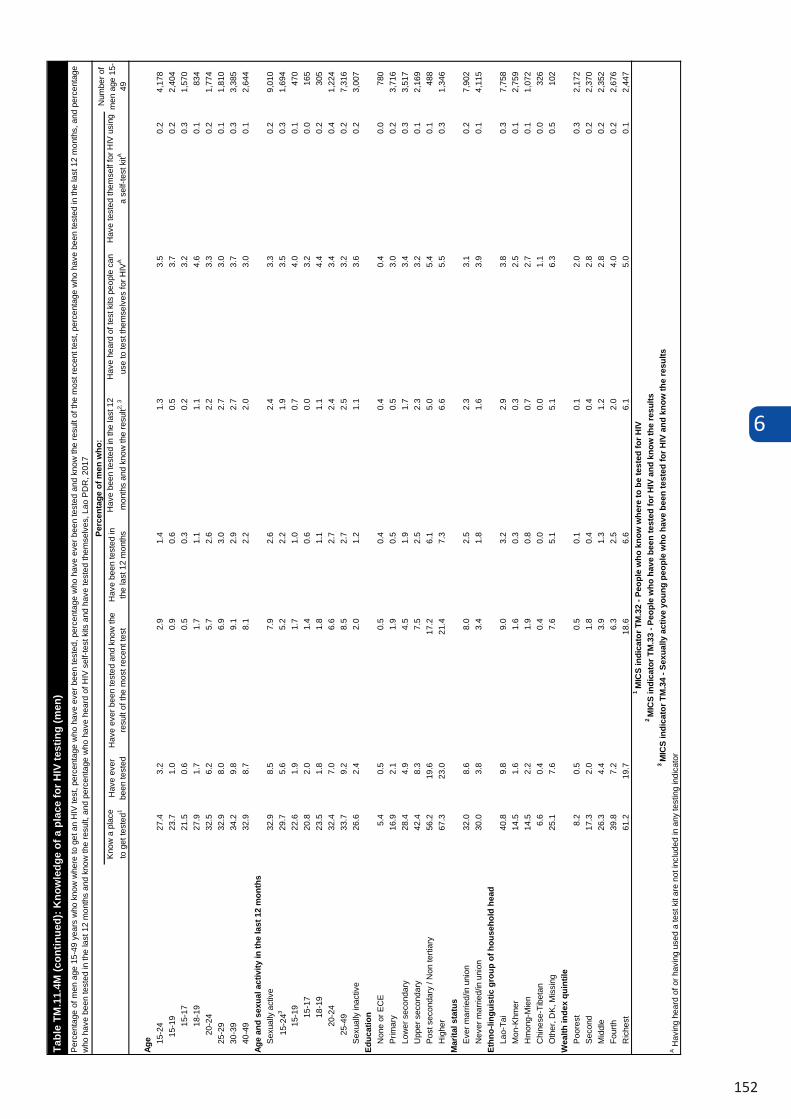
6
152
Kno
w a
pla
ce
to g
et te
sted
1H
ave
ever
be
en te
sted
Hav
e ev
er b
een
test
ed a
nd k
now
the
resu
lt of
the
mos
t rec
ent t
est
Hav
e be
en te
sted
in
the
last
12
mon
ths
Hav
e be
en te
sted
in th
e la
st 1
2 m
onth
s an
d kn
ow th
e re
sult2,
3H
ave
hear
d of
test
kits
peo
ple
can
use
to te
st th
emse
lves
for H
IVA
Hav
e te
sted
them
self
for H
IV u
sing
a
self-
test
kitA
Age 15
-24
27.4
3.2
2.9
1.4
1.3
3.5
0.2
4,17
8
15-1
923
.71.
00.
90.
60.
53.
70.
22,
404
15-1
721
.50.
60.
50.
30.
23.
20.
31,
570
18-1
927
.91.
71.
71.
11.
14.
60.
183
420
-24
32.5
6.2
5.7
2.6
2.2
3.3
0.2
1,77
425
-29
32.9
8.0
6.9
3.0
2.7
3.0
0.1
1,81
030
-39
34.2
9.8
9.1
2.9
2.7
3.7
0.3
3,38
540
-49
32.9
8.7
8.1
2.2
2.0
3.0
0.1
2,64
4Ag
e an
d se
xual
act
ivity
in th
e la
st 1
2 m
onth
sS
exua
lly a
ctiv
e32
.98.
57.
92.
62.
43.
30.
29,
010
15-2
4329
.75.
65.
22.
21.
93.
50.
31,
694
15-1
922
.61.
91.
71.
00.
74.
00.
147
015
-17
20.8
2.0
1.4
0.6
0.0
3.2
0.0
165
18-1
923
.51.
81.
81.
11.
14.
40.
230
520
-24
32.4
7.0
6.6
2.7
2.4
3.4
0.4
1,22
425
-49
33.7
9.2
8.5
2.7
2.5
3.2
0.2
7,31
6S
exua
lly in
activ
e26
.62.
42.
01.
21.
13.
60.
23,
007
Educ
atio
nN
one
or E
CE
5.4
0.5
0.5
0.4
0.4
0.4
0.0
780
Prim
ary
16.9
2.1
1.9
0.5
0.5
3.0
0.2
3,71
6Lo
wer
sec
onda
ry28
.44.
94.
51.
91.
73.
40.
33,
517
Upp
er s
econ
dary
42.4
8.3
7.5
2.5
2.3
3.2
0.1
2,16
9P
ost s
econ
dary
/ N
on te
rtiar
y56
.219
.617
.26.
15.
05.
40.
148
8H
ighe
r67
.323
.021
.47.
36.
65.
50.
31,
346
Mar
ital s
tatu
sE
ver m
arrie
d/in
uni
on32
.08.
68.
02.
52.
33.
10.
27,
902
Nev
er m
arrie
d/in
uni
on30
.03.
83.
41.
81.
63.
90.
14,
115
Ethn
o-lin
guis
tic g
roup
of h
ouse
hold
hea
dLa
o-Ta
i40
.89.
89.
03.
22.
93.
80.
37,
758
Mon
-Khm
er14
.51.
61.
60.
30.
32.
50.
12,
759
Hm
ong-
Mie
n14
.52.
21.
90.
80.
72.
70.
11,
072
Chi
nese
-Tib
etan
6.6
0.4
0.4
0.0
0.0
1.1
0.0
326
Oth
er, D
K, M
issi
ng25
.17.
67.
65.
15.
16.
30.
510
2W
ealth
inde
x qu
intil
eP
oore
st8.
20.
50.
50.
10.
12.
00.
32,
172
Sec
ond
17.3
2.0
1.8
0.4
0.4
2.8
0.2
2,37
0M
iddl
e26
.34.
43.
91.
31.
22.
80.
22,
352
Four
th
39.8
7.2
6.3
2.5
2.0
4.0
0.2
2,67
6R
iche
st61
.219
.718
.66.
66.
15.
00.
12,
447
Tabl
e TM
.11.
4M (c
ontin
ued)
: Kno
wle
dge
of a
pla
ce fo
r HIV
test
ing
(men
)P
erce
ntag
e of
men
age
15-
49 y
ears
who
kno
w w
here
to g
et a
n H
IV te
st, p
erce
ntag
e w
ho h
ave
ever
bee
n te
sted
, per
cent
age
who
hav
e ev
er b
een
test
ed a
nd k
now
the
resu
lt of
the
mos
t rec
ent t
est,
perc
enta
ge w
ho h
ave
been
test
ed in
the
last
12
mon
ths,
and
per
cent
age
who
hav
e be
en te
sted
in th
e la
st 1
2 m
onth
s an
d kn
ow th
e re
sult,
and
per
cent
age
who
hav
e he
ard
of H
IV s
elf-t
est k
its a
nd h
ave
test
ed th
emse
lves
, Lao
PD
R, 2
017
Perc
enta
ge o
f men
who
:N
umbe
r of
men
age
15-
49
1 MIC
S in
dica
tor T
M.3
2 - P
eopl
e w
ho k
now
whe
re to
be
test
ed fo
r HIV
2 M
ICS
indi
cato
r TM
.33
- Peo
ple
who
hav
e be
en te
sted
for H
IV a
nd k
now
the
resu
lts3
MIC
S in
dica
tor T
M.3
4 - S
exua
lly a
ctiv
e yo
ung
peop
le w
ho h
ave
been
test
ed fo
r HIV
and
kno
w th
e re
sults
A Hav
ing
hear
d of
or h
avin
g us
ed a
test
kit
are
not i
nclu
ded
in a
ny te
stin
g in
dica
tor
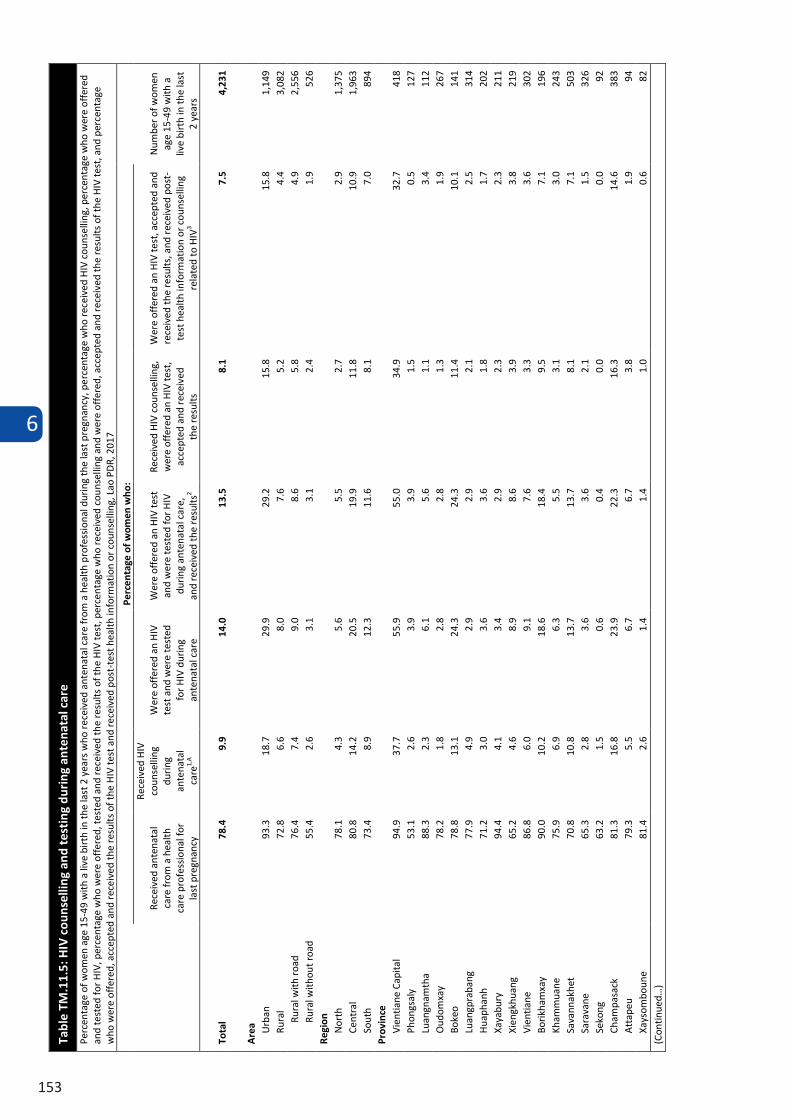
6
153
Tabl
e TM
.11.
5: H
IV c
ouns
ellin
g an
d te
stin
g du
ring
ant
enat
al c
are
Perc
enta
ge o
f wom
en a
ge 1
5-49
with
a li
ve b
irth
in th
e la
st 2
yea
rs w
ho r
ecei
ved
ante
nata
l car
e fr
om a
hea
lth p
rofe
ssio
nal d
urin
g th
e la
st p
regn
ancy
, per
cent
age
who
rece
ived
HIV
cou
nsel
ling,
per
cent
age
who
wer
e of
fere
d an
d te
sted
for H
IV, p
erce
ntag
e w
ho w
ere
offe
red,
test
ed a
nd re
ceiv
ed th
e re
sults
of t
he H
IV te
st, p
erce
ntag
e w
ho re
ceiv
ed c
ouns
ellin
g an
d w
ere
offe
red,
acc
epte
d an
d re
ceiv
ed th
e re
sults
of t
he H
IV te
st, a
nd p
erce
ntag
e w
ho w
ere
offe
red,
acc
epte
d an
d re
ceiv
ed th
e re
sults
of t
he H
IV te
st a
nd re
ceiv
ed p
ost-
test
hea
lth in
form
atio
n or
cou
nsel
ling,
Lao
PD
R, 2
017
Perc
enta
ge o
f wom
en w
ho:
Num
ber o
f wom
en
age
15-4
9 w
ith a
liv
e bi
rth
in th
e la
st
2 ye
ars
Rece
ived
ant
enat
al
care
from
a h
ealth
ca
re p
rofe
ssio
nal f
or
last
pre
gnan
cy
Rece
ived
HIV
co
unse
lling
du
ring
ante
nata
l ca
re1,
A
Wer
e of
fere
d an
HIV
te
st a
nd w
ere
test
ed
for H
IV d
urin
g an
tena
tal c
are
Wer
e of
fere
d an
HIV
test
an
d w
ere
test
ed fo
r HIV
du
ring
ante
nata
l car
e,
and
rece
ived
the
resu
lts2
Rece
ived
HIV
cou
nsel
ling,
w
ere
offe
red
an H
IV te
st,
acce
pted
and
rec
eive
d th
e re
sults
Wer
e of
fere
d an
HIV
test
, acc
epte
d an
d re
ceiv
ed th
e re
sults
, and
rec
eive
d po
st-
test
hea
lth in
form
atio
n or
cou
nsel
ling
rela
ted
to H
IV3
Tota
l 78
.4
9.9
14.0
13
.5
8.1
7.5
4,23
1
Are
a Urb
an
93.3
18
.7
29.9
29
.2
15.8
15
.8
1,14
9 Ru
ral
72.8
6.
6 8.
0 7.
6 5.
2 4.
4 3,
082
Rura
l with
roa
d 76
.4
7.4
9.0
8.6
5.8
4.9
2,55
6 Ru
ral w
ithou
t roa
d 55
.4
2.6
3.1
3.1
2.4
1.9
526
Regi
on
Nor
th
78.1
4.
3 5.
6 5.
5 2.
7 2.
9 1,
375
Cent
ral
80.8
14
.2
20.5
19
.9
11.8
10
.9
1,96
3 So
uth
73.4
8.
9 12
.3
11.6
8.
1 7.
0 89
4 Pr
ovin
ce
Vien
tiane
Cap
ital
94.9
37
.7
55.9
55
.0
34.9
32
.7
418
Phon
gsal
y
53.1
2.
6 3.
9 3.
9 1.
5 0.
5 12
7 Lu
angn
amth
a 88
.3
2.3
6.1
5.6
1.1
3.4
112
Oud
omxa
y 78
.2
1.8
2.8
2.8
1.3
1.9
267
Boke
o 78
.8
13.1
24
.3
24.3
11
.4
10.1
14
1 Lu
angp
raba
ng
77.9
4.
9 2.
9 2.
9 2.
1 2.
5 31
4 H
uaph
anh
71.2
3.
0 3.
6 3.
6 1.
8 1.
7 20
2 Xa
yabu
ry
94.4
4.
1 3.
4 2.
9 2.
3 2.
3 21
1 Xi
engk
huan
g 65
.2
4.6
8.9
8.6
3.9
3.8
219
Vien
tiane
86
.8
6.0
9.1
7.6
3.3
3.6
302
Borik
ham
xay
90.0
10
.2
18.6
18
.4
9.5
7.1
196
Kham
mua
ne
75.9
6.
9 6.
3 5.
5 3.
1 3.
0 24
3 Sa
vann
akhe
t 70
.8
10.8
13
.7
13.7
8.
1 7.
1 50
3 Sa
rava
ne
65.3
2.
8 3.
6 3.
6 2.
1 1.
5 32
6 Se
kong
63
.2
1.5
0.6
0.4
0.0
0.0
92
Cham
pasa
ck
81.3
16
.8
23.9
22
.3
16.3
14
.6
383
Att
apeu
79
.3
5.5
6.7
6.7
3.8
1.9
94
Xays
ombo
une
81.4
2.
6 1.
4 1.
4 1.
0 0.
6 82
(C
ontin
ued…
)
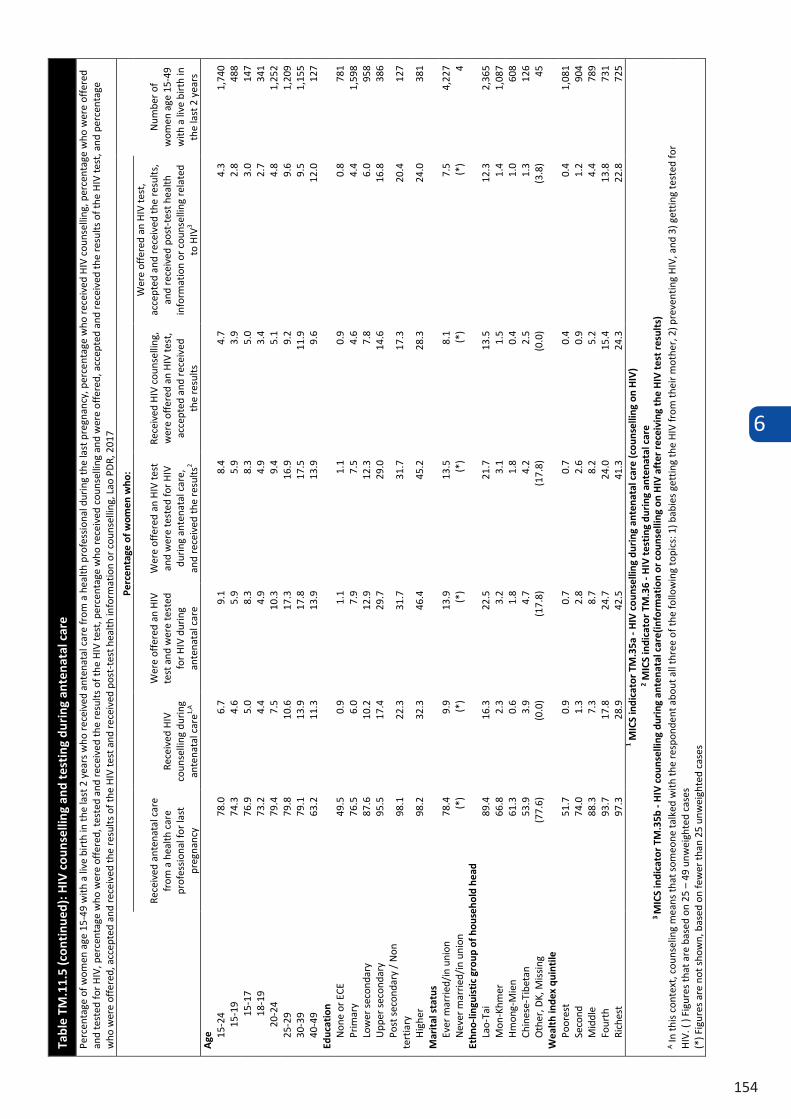
6
154
Tabl
e TM
.11.
5 (c
onti
nued
): H
IV c
ouns
ellin
g an
d te
stin
g du
ring
ant
enat
al c
are
Perc
enta
ge o
f wom
en a
ge 1
5-49
with
a li
ve b
irth
in th
e la
st 2
yea
rs w
ho r
ecei
ved
ante
nata
l car
e fr
om a
hea
lth p
rofe
ssio
nal d
urin
g th
e la
st p
regn
ancy
, per
cent
age
who
rece
ived
HIV
cou
nsel
ling,
per
cent
age
who
wer
e of
fere
d an
d te
sted
for H
IV, p
erce
ntag
e w
ho w
ere
offe
red,
test
ed a
nd re
ceiv
ed th
e re
sults
of t
he H
IV te
st, p
erce
ntag
e w
ho re
ceiv
ed c
ouns
ellin
g an
d w
ere
offe
red,
acc
epte
d an
d re
ceiv
ed th
e re
sults
of t
he H
IV te
st, a
nd p
erce
ntag
e w
ho w
ere
offe
red,
acc
epte
d an
d re
ceiv
ed th
e re
sults
of t
he H
IV te
st a
nd re
ceiv
ed p
ost-
test
hea
lth in
form
atio
n or
cou
nsel
ling,
Lao
PD
R, 2
017
Perc
enta
ge o
f wom
en w
ho:
Num
ber o
f w
omen
age
15-
49
with
a li
ve b
irth
in
the
last
2 y
ears
Rece
ived
ant
enat
al c
are
from
a h
ealth
car
e pr
ofes
sion
al fo
r las
t pr
egna
ncy
Rece
ived
HIV
co
unse
lling
dur
ing
ante
nata
l car
e1,A
Wer
e of
fere
d an
HIV
te
st a
nd w
ere
test
ed
for H
IV d
urin
g an
tena
tal c
are
Wer
e of
fere
d an
HIV
test
an
d w
ere
test
ed fo
r HIV
du
ring
ante
nata
l car
e,
and
rece
ived
the
resu
lts2
Rece
ived
HIV
cou
nsel
ling,
w
ere
offe
red
an H
IV te
st,
acce
pted
and
rec
eive
d th
e re
sults
Wer
e of
fere
d an
HIV
test
, ac
cept
ed a
nd r
ecei
ved
the
resu
lts,
and
rece
ived
pos
t-te
st h
ealth
in
form
atio
n or
cou
nsel
ling
rela
ted
to H
IV3
Age
15
-24
78.0
6.
7 9.
1 8.
4 4.
7 4.
3 1,
740
15-1
9 74
.3
4.6
5.9
5.9
3.9
2.8
488
15-1
7 76
.9
5.0
8.3
8.3
5.0
3.0
147
18-1
9 73
.2
4.4
4.9
4.9
3.4
2.7
341
20-2
4 79
.4
7.5
10.3
9.
4 5.
1 4.
8 1,
252
25-2
9 79
.8
10.6
17
.3
16.9
9.
2 9.
6 1,
209
30-3
9 79
.1
13.9
17
.8
17.5
11
.9
9.5
1,15
5 40
-49
63.2
11
.3
13.9
13
.9
9.6
12.0
12
7 Ed
ucat
ion
Non
e or
ECE
49
.5
0.9
1.1
1.1
0.9
0.8
781
Prim
ary
76.5
6.
0 7.
9 7.
5 4.
6 4.
4 1,
598
Low
er s
econ
dary
87
.6
10.2
12
.9
12.3
7.
8 6.
0 95
8 U
pper
sec
onda
ry
95.5
17
.4
29.7
29
.0
14.6
16
.8
386
Post
sec
onda
ry /
Non
te
rtia
ry
98.1
22
.3
31.7
31
.7
17.3
20
.4
127
Hig
her
98.2
32
.3
46.4
45
.2
28.3
24
.0
381
Mar
ital
sta
tus
Ever
mar
ried/
in u
nion
78
.4
9.9
13.9
13
.5
8.1
7.5
4,22
7 N
ever
mar
ried/
in u
nion
(*
) (*
) (*
) (*
) (*
) (*
) 4
Ethn
o-lin
guis
tic
grou
p of
hou
seho
ld h
ead
Lao-
Tai
89.4
16
.3
22.5
21
.7
13.5
12
.3
2,36
5 M
on-K
hmer
66
.8
2.3
3.2
3.1
1.5
1.4
1,08
7 H
mon
g-M
ien
61.3
0.
6 1.
8 1.
8 0.
4 1.
0 60
8 Ch
ines
e-Ti
beta
n 53
.9
3.9
4.7
4.2
2.5
1.3
126
Oth
er, D
K, M
issi
ng
(77.
6)
(0.0
) (1
7.8)
(1
7.8)
(0
.0)
(3.8
) 45
W
ealt
h in
dex
quin
tile
Po
ores
t 51
.7
0.9
0.7
0.7
0.4
0.4
1,08
1 Se
cond
74
.0
1.3
2.8
2.6
0.9
1.2
904
Mid
dle
88.3
7.
3 8.
7 8.
2 5.
2 4.
4 78
9 Fo
urth
93
.7
17.8
24
.7
24.0
15
.4
13.8
73
1 Ri
ches
t 97
.3
28.9
42
.5
41.3
24
.3
22.8
72
5 1 M
ICS
indi
cato
r TM
.35a
- H
IV c
ouns
ellin
g du
ring
ant
enat
al c
are
(cou
nsel
ling
on H
IV)
2 MIC
S in
dica
tor
TM.3
6 - H
IV t
esti
ng d
urin
g an
tena
tal c
are
3
MIC
S in
dica
tor
TM.3
5b -
HIV
cou
nsel
ling
duri
ng a
nten
atal
car
e(in
form
atio
n or
cou
nsel
ling
on H
IV a
fter
rec
eivi
ng t
he H
IV t
est
resu
lts)
A In
this
con
text
, cou
nsel
ing
mea
ns th
at s
omeo
ne ta
lked
with
the
resp
onde
nt a
bout
all
thre
e of
the
follo
win
g to
pics
: 1) b
abie
s ge
ttin
g th
e H
IV fr
om t
heir
mot
her,
2) p
reve
ntin
g H
IV, a
nd 3
) get
ting
test
ed fo
r H
IV. (
) Fi
gure
s th
at a
re b
ased
on
25 –
49
unw
eigh
ted
case
s (*
) Fig
ures
are
not
sho
wn,
bas
ed o
n fe
wer
than
25
unw
eigh
ted
case
s
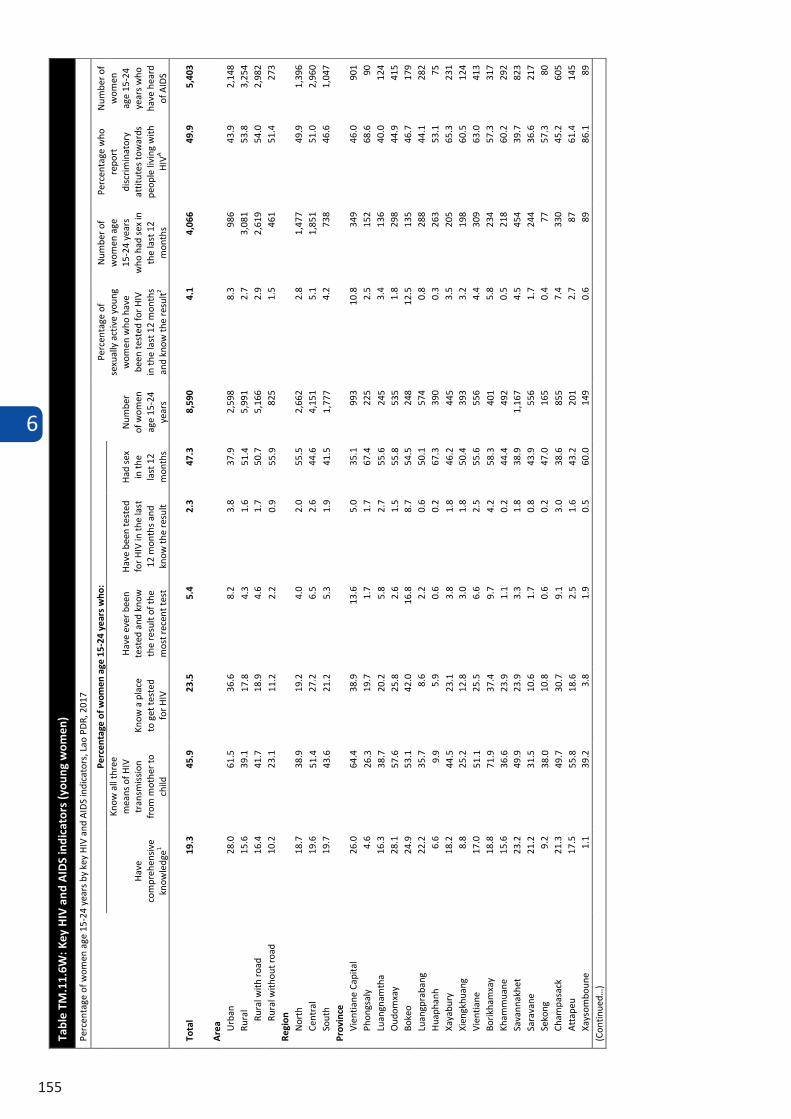
6
155
Tabl
e TM
.11.
6W: K
ey H
IV a
nd A
IDS
indi
cato
rs (y
oung
wom
en)
Perc
enta
ge o
f wom
en a
ge 1
5-24
yea
rs b
y ke
y H
IV a
nd A
IDS
indi
cato
rs, L
ao P
DR,
201
7
Perc
enta
ge o
f wom
en a
ge 1
5-24
yea
rs w
ho:
Num
ber
of w
omen
ag
e 15
-24
year
s
Perc
enta
ge o
f se
xual
ly a
ctiv
e yo
ung
wom
en w
ho h
ave
been
test
ed fo
r HIV
in
the
last
12
mon
ths
and
know
the
resu
lt2
Num
ber o
f w
omen
age
15
-24
year
s w
ho h
ad s
ex in
th
e la
st 1
2 m
onth
s
Perc
enta
ge w
ho
repo
rt
disc
rimin
ator
y at
titut
es to
war
ds
peop
le li
ving
with
H
IVA
Num
ber o
f w
omen
ag
e 15
-24
year
s w
ho
have
hea
rd
of A
IDS
Hav
e co
mpr
ehen
sive
kn
owle
dge1
Know
all
thre
e m
eans
of H
IV
tran
smis
sion
fr
om m
othe
r to
child
Know
a p
lace
to
get
test
ed
for H
IV
Hav
e ev
er b
een
test
ed a
nd k
now
th
e re
sult
of th
e m
ost r
ecen
t tes
t
Hav
e be
en te
sted
fo
r HIV
in th
e la
st
12 m
onth
s an
d kn
ow th
e re
sult
Had
sex
in
the
last
12
mon
ths
Tota
l 19
.3
45.9
23
.5
5.4
2.3
47.3
8,
590
4.1
4,06
6 49
.9
5,40
3
Are
a Urb
an
28.0
61
.5
36.6
8.
2 3.
8 37
.9
2,59
8 8.
3 98
6 43
.9
2,14
8 Ru
ral
15.6
39
.1
17.8
4.
3 1.
6 51
.4
5,99
1 2.
7 3,
081
53.8
3,
254
Rura
l with
roa
d 16
.4
41.7
18
.9
4.6
1.7
50.7
5,
166
2.9
2,61
9 54
.0
2,98
2 Ru
ral w
ithou
t roa
d 10
.2
23.1
11
.2
2.2
0.9
55.9
82
5 1.
5 46
1 51
.4
273
Regi
on
Nor
th
18.7
38
.9
19.2
4.
0 2.
0 55
.5
2,66
2 2.
8 1,
477
49.9
1,
396
Cent
ral
19.6
51
.4
27.2
6.
5 2.
6 44
.6
4,15
1 5.
1 1,
851
51.0
2,
960
Sout
h 19
.7
43.6
21
.2
5.3
1.9
41.5
1,
777
4.2
738
46.6
1,
047
Prov
ince
Vi
entia
ne C
apita
l 26
.0
64.4
38
.9
13.6
5.
0 35
.1
993
10.8
34
9 46
.0
901
Phon
gsal
y
4.6
26.3
19
.7
1.7
1.7
67.4
22
5 2.
5 15
2 68
.6
90
Luan
gnam
tha
16.3
38
.7
20.2
5.
8 2.
7 55
.6
245
3.4
136
40.0
12
4 O
udom
xay
28.1
57
.6
25.8
2.
6 1.
5 55
.8
535
1.8
298
44.9
41
5 Bo
keo
24.9
53
.1
42.0
16
.8
8.7
54.5
24
8 12
.5
135
46.7
17
9 Lu
angp
raba
ng
22.2
35
.7
8.6
2.2
0.6
50.1
57
4 0.
8 28
8 44
.1
282
Hua
phan
h 6.
6 9.
9 5.
9 0.
6 0.
2 67
.3
390
0.3
263
53.1
75
Xa
yabu
ry
18.2
44
.5
23.1
3.
8 1.
8 46
.2
445
3.5
205
65.3
23
1 Xi
engk
huan
g 8.
8 25
.2
12.8
3.
0 1.
8 50
.4
393
3.2
198
60.5
12
4 Vi
entia
ne
17.0
51
.1
25.5
6.
6 2.
5 55
.6
556
4.4
309
63.0
41
3 Bo
rikha
mxa
y 18
.8
71.9
37
.4
9.7
4.2
58.3
40
1 5.
8 23
4 57
.3
317
Kham
mua
ne
15.6
36
.6
23.9
1.
1 0.
2 44
.4
492
0.5
218
60.2
29
2 Sa
vann
akhe
t 23
.2
49.9
23
.9
3.3
1.8
38.9
1,
167
4.5
454
39.7
82
3 Sa
rava
ne
21.2
31
.5
10.6
1.
7 0.
8 43
.9
556
1.7
244
36.6
21
7 Se
kong
9.
2 38
.0
10.8
0.
6 0.
2 47
.0
165
0.4
77
57.3
80
Ch
ampa
sack
21
.3
49.7
30
.7
9.1
3.0
38.6
85
5 7.
4 33
0 45
.2
605
Att
apeu
17
.5
55.8
18
.6
2.5
1.6
43.2
20
1 2.
7 87
61
.4
145
Xays
ombo
une
1.1
39.2
3.
8 1.
9 0.
5 60
.0
149
0.6
89
86.1
89
(C
ontin
ued…
)
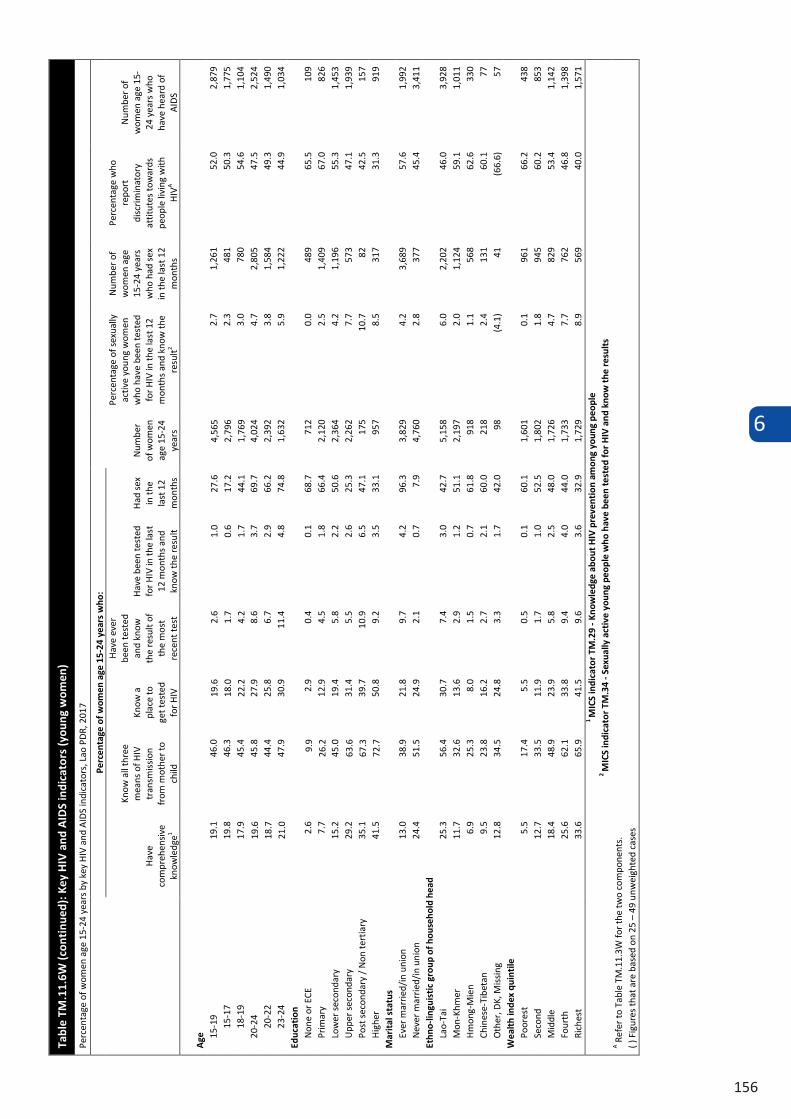
6
156
Tabl
e TM
.11.
6W (c
onti
nued
): K
ey H
IV a
nd A
IDS
indi
cato
rs (y
oung
wom
en)
Perc
enta
ge o
f wom
en a
ge 1
5-24
yea
rs b
y ke
y H
IV a
nd A
IDS
indi
cato
rs, L
ao P
DR,
201
7
Perc
enta
ge o
f wom
en a
ge 1
5-24
yea
rs w
ho:
Num
ber
of w
omen
ag
e 15
-24
year
s
Perc
enta
ge o
f sex
ually
ac
tive
youn
g w
omen
w
ho h
ave
been
test
ed
for H
IV in
the
last
12
mon
ths
and
know
the
resu
lt2
Num
ber o
f w
omen
age
15
-24
year
s w
ho h
ad s
ex
in th
e la
st 1
2 m
onth
s
Perc
enta
ge w
ho
repo
rt
disc
rimin
ator
y at
titut
es to
war
ds
peop
le li
ving
with
H
IVA
Num
ber o
f w
omen
age
15-
24 y
ears
who
ha
ve h
eard
of
AID
S
Hav
e co
mpr
ehen
sive
kn
owle
dge1
Know
all
thre
e m
eans
of H
IV
tran
smis
sion
fr
om m
othe
r to
child
Know
a
plac
e to
ge
t tes
ted
for H
IV
Hav
e ev
er
been
test
ed
and
know
th
e re
sult
of
the
mos
t re
cent
test
Hav
e be
en te
sted
fo
r HIV
in th
e la
st
12 m
onth
s an
d kn
ow th
e re
sult
Had
sex
in
the
last
12
mon
ths
Age
15
-19
19.1
46
.0
19.6
2.
6 1.
0 27
.6
4,56
5 2.
7 1,
261
52.0
2,
879
15-1
7 19
.8
46.3
18
.0
1.7
0.6
17.2
2,
796
2.3
481
50.3
1,
775
18-1
9 17
.9
45.4
22
.2
4.2
1.7
44.1
1,
769
3.0
780
54.6
1,
104
20-2
4 19
.6
45.8
27
.9
8.6
3.7
69.7
4,
024
4.7
2,80
5 47
.5
2,52
4 20
-22
18.7
44
.4
25.8
6.
7 2.
9 66
.2
2,39
2 3.
8 1,
584
49.3
1,
490
23-2
4 21
.0
47.9
30
.9
11.4
4.
8 74
.8
1,63
2 5.
9 1,
222
44.9
1,
034
Educ
atio
n N
one
or E
CE
2.6
9.9
2.9
0.4
0.1
68.7
71
2 0.
0 48
9 65
.5
109
Prim
ary
7.7
26.2
12
.9
4.5
1.8
66.4
2,
120
2.5
1,40
9 67
.0
826
Low
er s
econ
dary
15
.2
45.0
19
.4
5.8
2.2
50.6
2,
364
4.2
1,19
6 55
.3
1,45
3 U
pper
sec
onda
ry
29.2
63
.6
31.4
5.
5 2.
6 25
.3
2,26
2 7.
7 57
3 47
.1
1,93
9 Po
st s
econ
dary
/ N
on te
rtia
ry
35.1
67
.3
39.7
10
.9
6.5
47.1
17
5 10
.7
82
42.5
15
7 H
ighe
r 41
.5
72.7
50
.8
9.2
3.5
33.1
95
7 8.
5 31
7 31
.3
919
Mar
ital
sta
tus
Ever
mar
ried/
in u
nion
13
.0
38.9
21
.8
9.7
4.2
96.3
3,
829
4.2
3,68
9 57
.6
1,99
2 N
ever
mar
ried/
in u
nion
24
.4
51.5
24
.9
2.1
0.7
7.9
4,76
0 2.
8 37
7 45
.4
3,41
1 Et
hno-
lingu
isti
c gr
oup
of h
ouse
hold
hea
d La
o-Ta
i 25
.3
56.4
30
.7
7.4
3.0
42.7
5,
158
6.0
2,20
2 46
.0
3,92
8 M
on-K
hmer
11
.7
32.6
13
.6
2.9
1.2
51.1
2,
197
2.0
1,12
4 59
.1
1,01
1 H
mon
g-M
ien
6.9
25.3
8.
0 1.
5 0.
7 61
.8
918
1.1
568
62.6
33
0 Ch
ines
e-Ti
beta
n 9.
5 23
.8
16.2
2.
7 2.
1 60
.0
218
2.4
131
60.1
77
O
ther
, DK,
Mis
sing
12
.8
34.5
24
.8
3.3
1.7
42.0
98
(4
.1)
41
(66.
6)
57
Wea
lth
inde
x qu
inti
le
Poor
est
5.5
17.4
5.
5 0.
5 0.
1 60
.1
1,60
1 0.
1 96
1 66
.2
438
Seco
nd
12.7
33
.5
11.9
1.
7 1.
0 52
.5
1,80
2 1.
8 94
5 60
.2
853
Mid
dle
18.4
48
.9
23.9
5.
8 2.
5 48
.0
1,72
6 4.
7 82
9 53
.4
1,14
2 Fo
urth
25
.6
62.1
33
.8
9.4
4.0
44.0
1,
733
7.7
762
46.8
1,
398
Rich
est
33.6
65
.9
41.5
9.
6 3.
6 32
.9
1,72
9 8.
9 56
9 40
.0
1,57
1 1
MIC
S in
dica
tor
TM.2
9 - K
now
ledg
e ab
out H
IV p
reve
ntio
n am
ong
youn
g pe
ople
2
MIC
S in
dica
tor
TM.3
4 - S
exua
lly a
ctiv
e yo
ung
peop
le w
ho h
ave
been
test
ed fo
r H
IV a
nd k
now
the
resu
lts
A Ref
er to
Tab
le T
M.1
1.3W
for t
he tw
o co
mpo
nent
s.
( ) F
igur
es th
at a
re b
ased
on
25 –
49
unw
eigh
ted
case
s
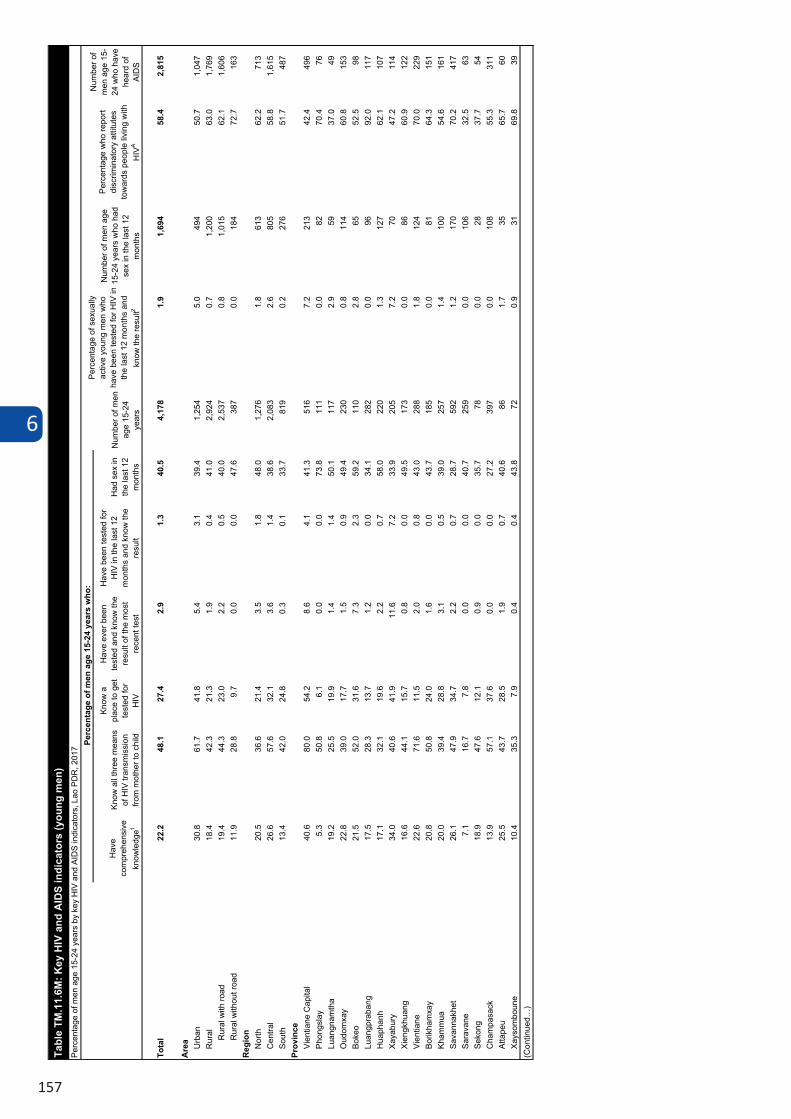
6
157
Hav
e co
mpr
ehen
sive
kn
owle
dge1
Know
all
thre
e m
eans
of
HIV
tran
smis
sion
fro
m m
othe
r to
child
Know
a
plac
e to
get
te
sted
for
HIV
Hav
e ev
er b
een
test
ed a
nd k
now
the
resu
lt of
the
mos
t re
cent
test
Hav
e be
en te
sted
for
HIV
in th
e la
st 1
2 m
onth
s an
d kn
ow th
e re
sult
Had
sex
in
the
last
12
mon
ths
Tota
l22
.248
.127
.42.
91.
340
.54,
178
1.9
1,69
458
.42,
815
Are
a Urb
an30
.861
.741
.85.
43.
139
.41,
254
5.0
494
50.7
1,04
7R
ural
18.4
42.3
21.3
1.9
0.4
41.0
2,92
40.
71,
200
63.0
1,76
9R
ural
with
road
19.4
44.3
23.0
2.2
0.5
40.0
2,53
70.
81,
015
62.1
1,60
6R
ural
with
out r
oad
11.9
28.8
9.7
0.0
0.0
47.6
387
0.0
184
72.7
163
Reg
ion
Nor
th20
.536
.621
.43.
51.
848
.01,
276
1.8
613
62.2
713
Cen
tral
26.6
57.6
32.1
3.6
1.4
38.6
2,08
32.
680
558
.81,
615
Sout
h13
.442
.024
.80.
30.
133
.781
90.
227
651
.748
7Pr
ovin
ceVi
entia
ne C
apita
l40
.680
.054
.28.
64.
141
.351
67.
221
342
.449
6Ph
ongs
lay
5.3
50.8
6.1
0.0
0.0
73.8
111
0.0
8270
.476
Luan
gnam
tha
19.2
25.5
19.9
1.4
1.4
50.1
117
2.9
5937
.049
Oud
omxa
y22
.839
.017
.71.
50.
949
.423
00.
811
460
.815
3Bo
keo
21.5
52.0
31.6
7.3
2.3
59.2
110
2.8
6552
.598
Luan
gpra
bang
17.5
28.3
13.7
1.2
0.0
34.1
282
0.0
9692
.011
7H
uaph
anh
17.1
32.1
19.6
2.2
0.7
58.0
220
1.3
127
62.1
107
Xaya
bury
34.0
40.6
41.9
11.6
7.2
33.9
205
7.2
7047
.211
4Xi
engk
huan
g16
.644
.115
.70.
80.
049
.517
30.
086
60.9
122
Vien
tiane
22.6
71.6
11.5
2.0
0.8
43.0
288
1.8
124
70.0
229
Borik
ham
xay
20.8
50.8
24.0
1.6
0.0
43.7
185
0.0
8164
.315
1Kh
amm
ua20
.039
.428
.83.
10.
539
.025
71.
410
054
.616
1Sa
vann
akhe
t26
.147
.934
.72.
20.
728
.759
21.
217
070
.241
7Sa
rava
ne7.
116
.77.
80.
00.
040
.725
90.
010
632
.563
Seko
ng18
.947
.612
.10.
90.
035
.778
0.0
2837
.754
Cha
mpa
sack
13.9
57.1
37.6
0.0
0.0
27.2
397
0.0
108
55.3
311
Atta
peu
25.5
43.7
28.5
1.9
0.7
40.6
861.
735
65.7
60Xa
ysom
boun
e10
.435
.37.
90.
40.
443
.872
0.9
3169
.839
(Con
tinue
d…)
Tabl
e TM
.11.
6M: K
ey H
IV a
nd A
IDS
indi
cato
rs (y
oung
men
)Pe
rcen
tage
of m
en a
ge 1
5-24
yea
rs b
y ke
y H
IV a
nd A
IDS
indi
cato
rs, L
ao P
DR
, 201
7Pe
rcen
tage
of m
en a
ge 1
5-24
yea
rs w
ho:
Num
ber o
f men
ag
e 15
-24
year
s
Perc
enta
ge o
f sex
ually
ac
tive
youn
g m
en w
ho
have
bee
n te
sted
for H
IV in
th
e la
st 1
2 m
onth
s an
d kn
ow th
e re
sult2
Num
ber o
f men
age
15
-24
year
s w
ho h
ad
sex
in th
e la
st 1
2 m
onth
s
Perc
enta
ge w
ho re
port
disc
rimin
ator
y at
titut
es
tow
ards
peo
ple
livin
g w
ith
HIV
A
Num
ber o
f m
en a
ge 1
5-24
who
hav
e he
ard
of
AID
S
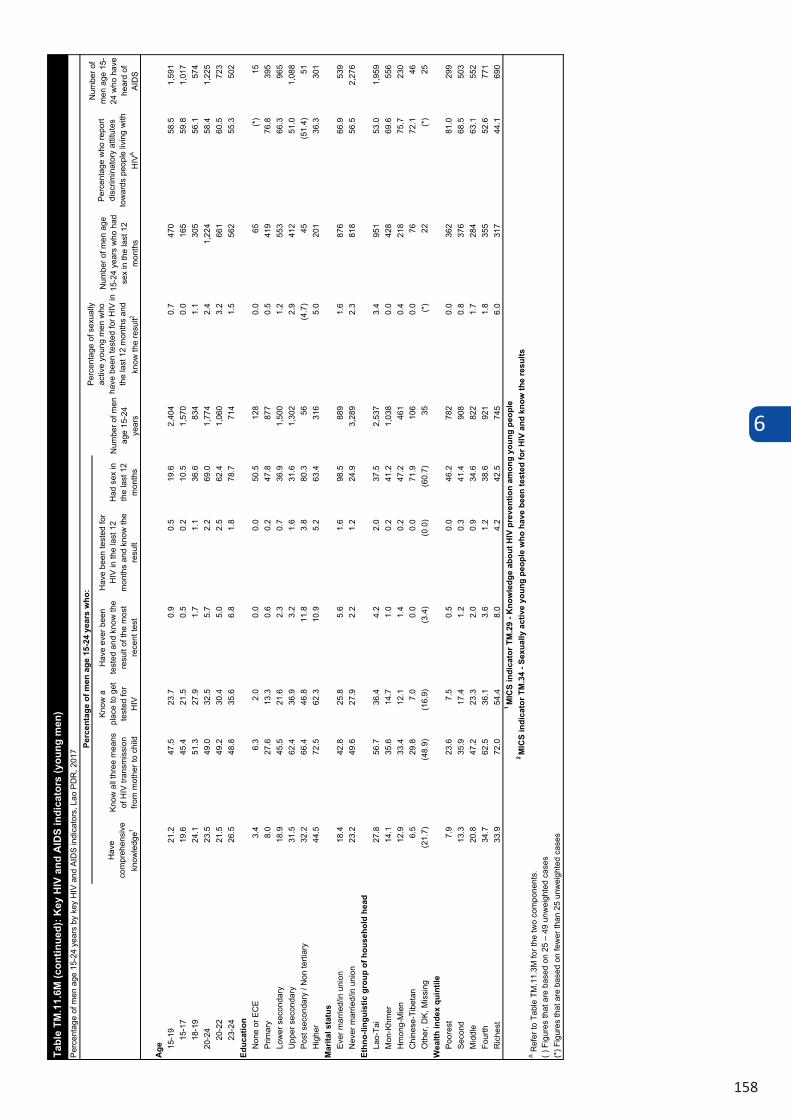
6
158
Hav
e co
mpr
ehen
sive
kn
owle
dge1
Know
all
thre
e m
eans
of
HIV
tran
smis
sion
fro
m m
othe
r to
child
Know
a
plac
e to
get
te
sted
for
HIV
Hav
e ev
er b
een
test
ed a
nd k
now
the
resu
lt of
the
mos
t re
cent
test
Hav
e be
en te
sted
for
HIV
in th
e la
st 1
2 m
onth
s an
d kn
ow th
e re
sult
Had
sex
in
the
last
12
mon
ths
Age 15
-19
21.2
47.5
23.7
0.9
0.5
19.6
2,40
40.
747
058
.51,
591
15-1
719
.645
.421
.50.
50.
210
.51,
570
0.0
165
59.8
1,01
718
-19
24.1
51.3
27.9
1.7
1.1
36.6
834
1.1
305
56.1
574
20-2
423
.549
.032
.55.
72.
269
.01,
774
2.4
1,22
458
.41,
225
20-2
221
.549
.230
.45.
02.
562
.41,
060
3.2
661
60.5
723
23-2
426
.548
.835
.66.
81.
878
.771
41.
556
255
.350
2Ed
ucat
ion
Non
e or
EC
E3.
46.
32.
00.
00.
050
.512
80.
065
(*)
15Pr
imar
y8.
027
.613
.30.
60.
247
.887
70.
541
976
.839
5Lo
wer
sec
onda
ry18
.945
.521
.62.
30.
736
.91,
500
1.2
553
66.3
965
Upp
er s
econ
dary
31.5
62.4
36.9
3.2
1.6
31.6
1,30
22.
941
251
.01,
088
Post
sec
onda
ry /
Non
terti
ary
32.2
66.4
46.8
11.8
3.8
80.3
56(4
.7)
45(5
1.4)
51H
ighe
r44
.572
.562
.310
.95.
263
.431
65.
020
136
.330
1M
arita
l sta
tus
Ever
mar
ried/
in u
nion
18.4
42.8
25.8
5.6
1.6
98.5
889
1.6
876
66.9
539
Nev
er m
arrie
d/in
uni
on23
.249
.627
.92.
21.
224
.93,
289
2.3
818
56.5
2,27
6Et
hno-
lingu
istic
gro
up o
f hou
seho
ld h
ead
Lao-
Tai
27.8
56.7
36.4
4.2
2.0
37.5
2,53
73.
495
153
.01,
959
Mon
-Khm
er14
.135
.614
.71.
00.
241
.21,
038
0.0
428
69.6
556
Hm
ong-
Mie
n12
.933
.412
.11.
40.
247
.246
10.
421
875
.723
0C
hine
se-T
ibet
an6.
529
.87.
00.
00.
071
.910
60.
076
72.1
46O
ther
, DK,
Mis
sing
(21.
7)(4
8.9)
(16.
9)(3
.4)
(0.0
)(6
0.7)
35(*
)22
(*)
25W
ealth
inde
x qu
intil
ePo
ores
t7.
923
.67.
50.
50.
046
.278
20.
036
281
.029
9Se
cond
13.3
35.9
17.4
1.2
0.3
41.4
908
0.8
376
68.5
503
Mid
dle
20.8
47.2
23.3
2.0
0.9
34.6
822
1.7
284
63.1
552
Four
th
34.7
62.5
36.1
3.6
1.2
38.6
921
1.8
355
52.6
771
Ric
hest
33.9
72.0
54.4
8.0
4.2
42.5
745
6.0
317
44.1
690
Tabl
e TM
.11.
6M (c
ontin
ued)
: Key
HIV
and
AID
S in
dica
tors
(you
ng m
en)
Perc
enta
ge o
f men
age
15-
24 y
ears
by
key
HIV
and
AID
S in
dica
tors
, Lao
PD
R, 2
017
Perc
enta
ge o
f men
age
15-
24 y
ears
who
:
Num
ber o
f men
ag
e 15
-24
year
s
Perc
enta
ge o
f sex
ually
ac
tive
youn
g m
en w
ho
have
bee
n te
sted
for H
IV in
th
e la
st 1
2 m
onth
s an
d kn
ow th
e re
sult2
Num
ber o
f men
age
15
-24
year
s w
ho h
ad
sex
in th
e la
st 1
2 m
onth
s
Perc
enta
ge w
ho re
port
disc
rimin
ator
y at
titut
es
tow
ards
peo
ple
livin
g w
ith
HIV
A
Num
ber o
f m
en a
ge 1
5-24
who
hav
e he
ard
of
AID
S
1 M
ICS
indi
cato
r TM
.29
- Kno
wle
dge
abou
t HIV
pre
vent
ion
amon
g yo
ung
peop
le2 M
ICS
indi
cato
r TM
.34
- Sex
ually
act
ive
youn
g pe
ople
who
hav
e be
en te
sted
for H
IV a
nd k
now
the
resu
ltsA R
efer
to T
able
TM
.11.
3M fo
r the
two
com
pone
nts.
( ) F
igur
es th
at a
re b
ased
on
25 –
49
unw
eigh
ted
case
s(*
) Fig
ures
that
are
bas
ed o
n fe
wer
than
25
unw
eigh
ted
case
s
6
159
6.11 ANEMIA
Anemia is a condition that is marked by low levels of hemoglobin in the blood. Iron is a key component of hemoglobin, and iron deficiency is estimated to be responsible for half of all anemia globally. Other causes of anemia include malaria, hookworm, and other helminths, other nutritional deficiencies, chronic infections, and genetic conditions. Anemia is a serious concern for children because it can impair cognitive development, stunt growth, and increase morbidity from infectious diseases. In addition to causing weakness, frequent tiredness, and lowered resistance to disease, anemia can be a particularly serious problem for pregnant women, leading to premature delivery and low birth weight.
As part of the LSISII, hemoglobin testing was carried out among women age 15-49 in 50% of sample households (12,701 eligible women). Blood specimens for hemoglobin testing were collected from eligible women who voluntarily consented to be tested. Blood samples were obtained from a drop of blood taken from a finger prick. A drop of blood from the prick site was drawn into a microcuvette, and hemoglobin analysis was carried out on site with a battery-operated portable HemoCue analyzer. Results were provided verbally and in writing. Adults with hemoglobin levels below certain cut-off points (8 g/dl for non-pregnant women, and 7 g/dl for pregnant women) were referred for follow-up care. All households in which anemia testing was conducted were given a brochure that explained the causes and prevention of anemia.
Tables TM.13.1 and TM.13.2 present the women’s coverage of haemoglobin testing and the prevalence of anemia in women age 15-49 years.
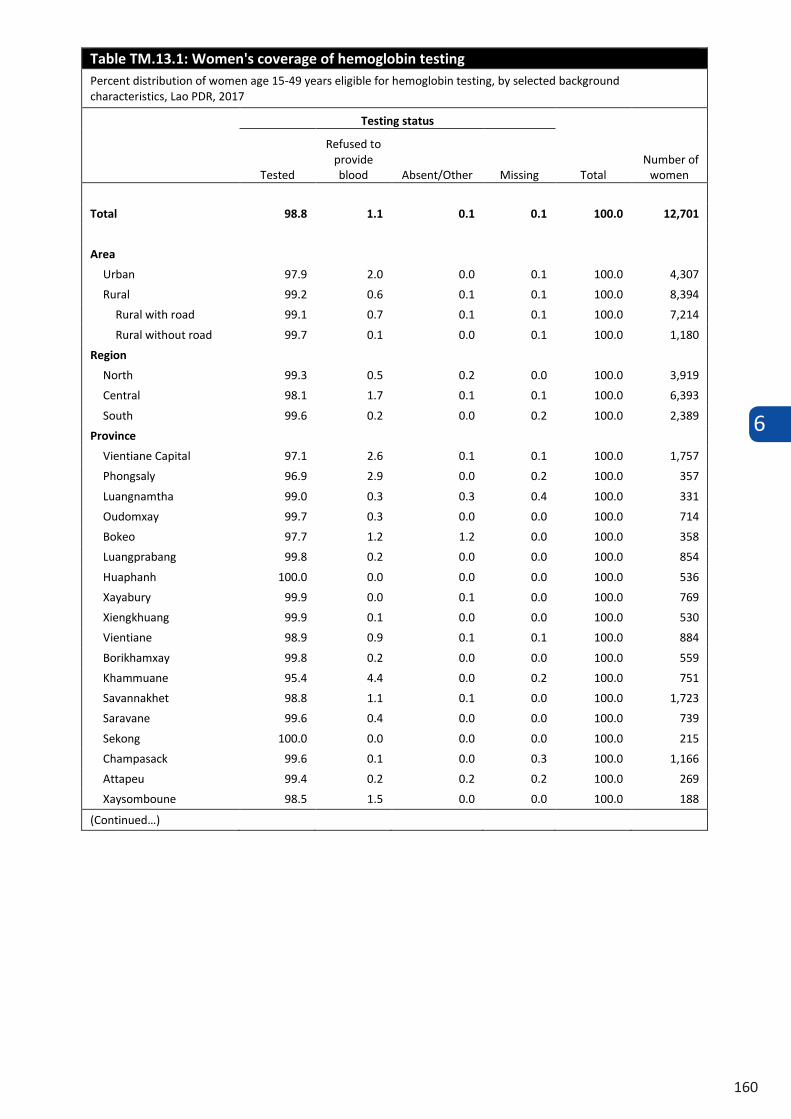
6
160
Table TM.13.1: Women's coverage of hemoglobin testing Percent distribution of women age 15-49 years eligible for hemoglobin testing, by selected background characteristics, Lao PDR, 2017
Testing status
Total Number of
women Tested
Refused to provide blood Absent/Other Missing
Total 98.8 1.1 0.1 0.1 100.0 12,701
Area
Urban 97.9 2.0 0.0 0.1 100.0 4,307
Rural 99.2 0.6 0.1 0.1 100.0 8,394
Rural with road 99.1 0.7 0.1 0.1 100.0 7,214
Rural without road 99.7 0.1 0.0 0.1 100.0 1,180
Region
North 99.3 0.5 0.2 0.0 100.0 3,919
Central 98.1 1.7 0.1 0.1 100.0 6,393
South 99.6 0.2 0.0 0.2 100.0 2,389
Province
Vientiane Capital 97.1 2.6 0.1 0.1 100.0 1,757
Phongsaly 96.9 2.9 0.0 0.2 100.0 357
Luangnamtha 99.0 0.3 0.3 0.4 100.0 331
Oudomxay 99.7 0.3 0.0 0.0 100.0 714
Bokeo 97.7 1.2 1.2 0.0 100.0 358
Luangprabang 99.8 0.2 0.0 0.0 100.0 854
Huaphanh 100.0 0.0 0.0 0.0 100.0 536
Xayabury 99.9 0.0 0.1 0.0 100.0 769
Xiengkhuang 99.9 0.1 0.0 0.0 100.0 530
Vientiane 98.9 0.9 0.1 0.1 100.0 884
Borikhamxay 99.8 0.2 0.0 0.0 100.0 559
Khammuane 95.4 4.4 0.0 0.2 100.0 751
Savannakhet 98.8 1.1 0.1 0.0 100.0 1,723
Saravane 99.6 0.4 0.0 0.0 100.0 739
Sekong 100.0 0.0 0.0 0.0 100.0 215
Champasack 99.6 0.1 0.0 0.3 100.0 1,166
Attapeu 99.4 0.2 0.2 0.2 100.0 269
Xaysomboune 98.5 1.5 0.0 0.0 100.0 188
(Continued…)
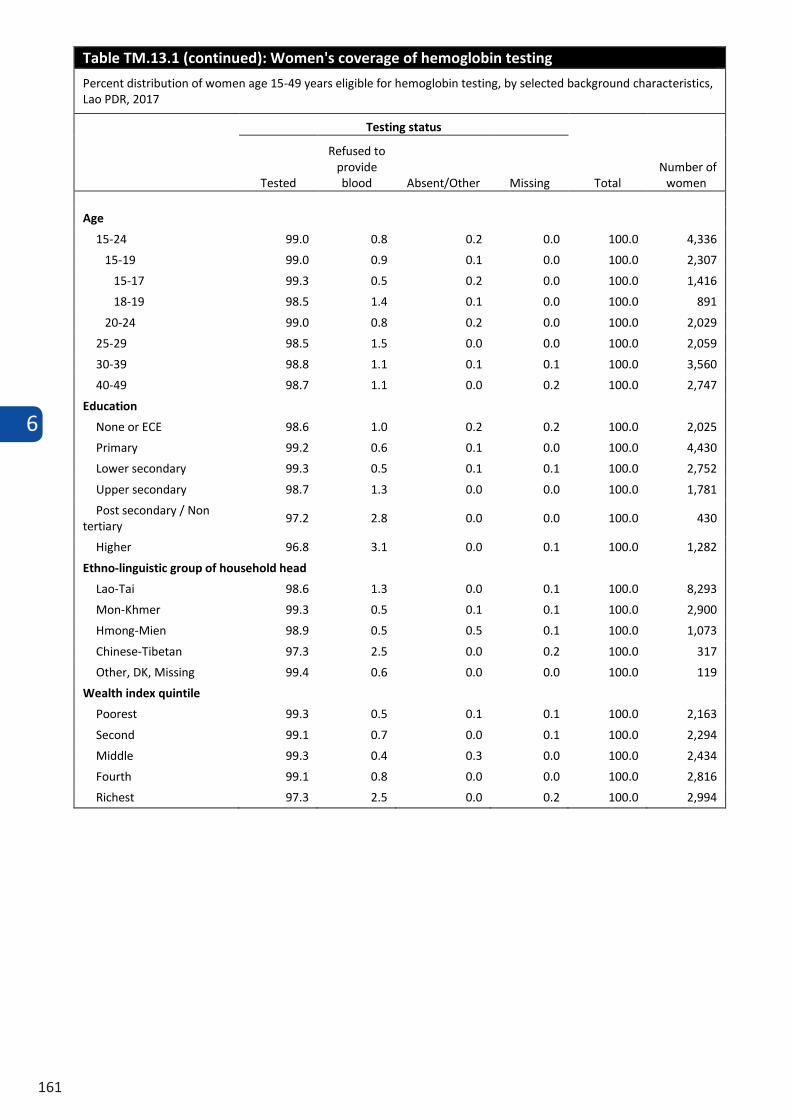
6
161
Table TM.13.1: Women's coverage of hemoglobin testing Percent distribution of women age 15-49 years eligible for hemoglobin testing, by selected background characteristics, Lao PDR, 2017
Testing status
Total Number of
women Tested
Refused to provide blood Absent/Other Missing
Total 98.8 1.1 0.1 0.1 100.0 12,701
Area
Urban 97.9 2.0 0.0 0.1 100.0 4,307
Rural 99.2 0.6 0.1 0.1 100.0 8,394
Rural with road 99.1 0.7 0.1 0.1 100.0 7,214
Rural without road 99.7 0.1 0.0 0.1 100.0 1,180
Region
North 99.3 0.5 0.2 0.0 100.0 3,919
Central 98.1 1.7 0.1 0.1 100.0 6,393
South 99.6 0.2 0.0 0.2 100.0 2,389
Province
Vientiane Capital 97.1 2.6 0.1 0.1 100.0 1,757
Phongsaly 96.9 2.9 0.0 0.2 100.0 357
Luangnamtha 99.0 0.3 0.3 0.4 100.0 331
Oudomxay 99.7 0.3 0.0 0.0 100.0 714
Bokeo 97.7 1.2 1.2 0.0 100.0 358
Luangprabang 99.8 0.2 0.0 0.0 100.0 854
Huaphanh 100.0 0.0 0.0 0.0 100.0 536
Xayabury 99.9 0.0 0.1 0.0 100.0 769
Xiengkhuang 99.9 0.1 0.0 0.0 100.0 530
Vientiane 98.9 0.9 0.1 0.1 100.0 884
Borikhamxay 99.8 0.2 0.0 0.0 100.0 559
Khammuane 95.4 4.4 0.0 0.2 100.0 751
Savannakhet 98.8 1.1 0.1 0.0 100.0 1,723
Saravane 99.6 0.4 0.0 0.0 100.0 739
Sekong 100.0 0.0 0.0 0.0 100.0 215
Champasack 99.6 0.1 0.0 0.3 100.0 1,166
Attapeu 99.4 0.2 0.2 0.2 100.0 269
Xaysomboune 98.5 1.5 0.0 0.0 100.0 188
(Continued…)
Table TM.13.1 (continued): Women's coverage of hemoglobin testing
Percent distribution of women age 15-49 years eligible for hemoglobin testing, by selected background characteristics, Lao PDR, 2017
Testing status
Total Number of
women Tested
Refused to provide blood Absent/Other Missing
Age
15-24 99.0 0.8 0.2 0.0 100.0 4,336
15-19 99.0 0.9 0.1 0.0 100.0 2,307
15-17 99.3 0.5 0.2 0.0 100.0 1,416
18-19 98.5 1.4 0.1 0.0 100.0 891
20-24 99.0 0.8 0.2 0.0 100.0 2,029
25-29 98.5 1.5 0.0 0.0 100.0 2,059
30-39 98.8 1.1 0.1 0.1 100.0 3,560
40-49 98.7 1.1 0.0 0.2 100.0 2,747
Education
None or ECE 98.6 1.0 0.2 0.2 100.0 2,025
Primary 99.2 0.6 0.1 0.0 100.0 4,430
Lower secondary 99.3 0.5 0.1 0.1 100.0 2,752
Upper secondary 98.7 1.3 0.0 0.0 100.0 1,781
Post secondary / Non tertiary
97.2 2.8 0.0 0.0 100.0 430
Higher 96.8 3.1 0.0 0.1 100.0 1,282
Ethno-linguistic group of household head
Lao-Tai 98.6 1.3 0.0 0.1 100.0 8,293
Mon-Khmer 99.3 0.5 0.1 0.1 100.0 2,900
Hmong-Mien 98.9 0.5 0.5 0.1 100.0 1,073
Chinese-Tibetan 97.3 2.5 0.0 0.2 100.0 317
Other, DK, Missing 99.4 0.6 0.0 0.0 100.0 119
Wealth index quintile
Poorest 99.3 0.5 0.1 0.1 100.0 2,163
Second 99.1 0.7 0.0 0.1 100.0 2,294
Middle 99.3 0.4 0.3 0.0 100.0 2,434
Fourth 99.1 0.8 0.0 0.0 100.0 2,816
Richest 97.3 2.5 0.0 0.2 100.0 2,994
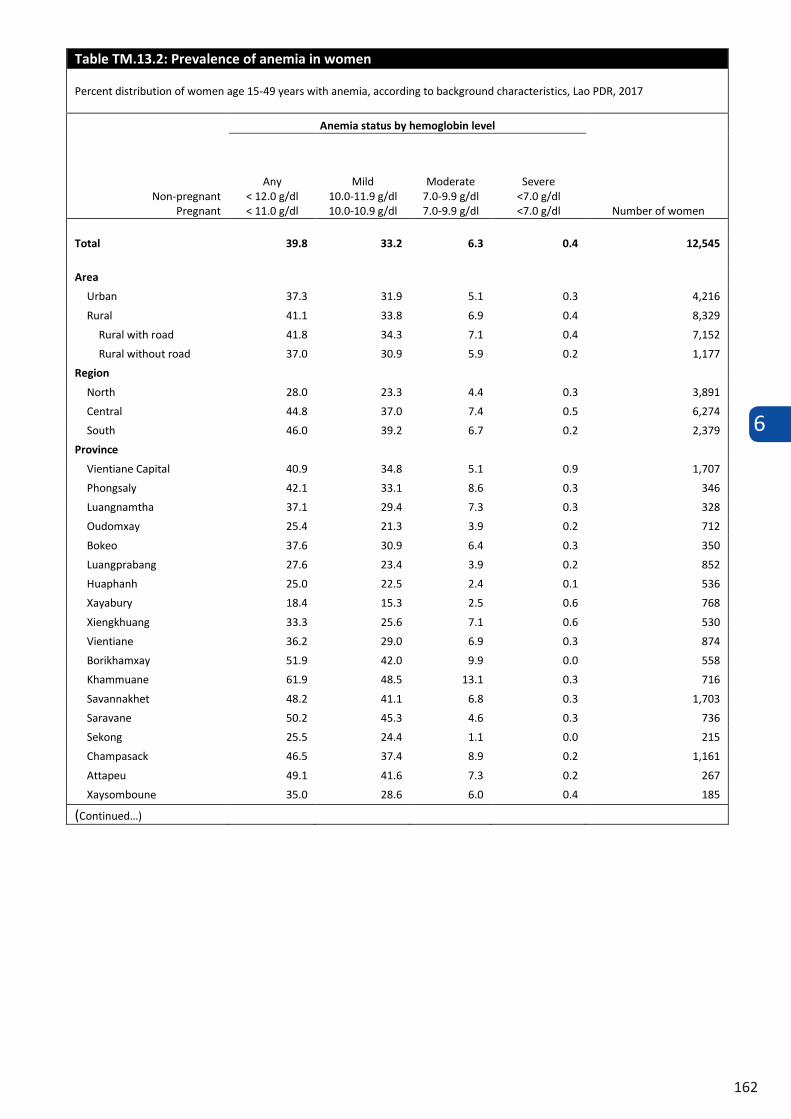
6
162
Table TM.13.2: Prevalence of anemia in women
Percent distribution of women age 15-49 years with anemia, according to background characteristics, Lao PDR, 2017
Non-pregnant Pregnant
Anemia status by hemoglobin level
Number of women
Any < 12.0 g/dl < 11.0 g/dl
Mild 10.0-11.9 g/dl 10.0-10.9 g/dl
Moderate 7.0-9.9 g/dl 7.0-9.9 g/dl
Severe <7.0 g/dl <7.0 g/dl
Total 39.8 33.2 6.3 0.4 12,545
Area
Urban 37.3 31.9 5.1 0.3 4,216
Rural 41.1 33.8 6.9 0.4 8,329
Rural with road 41.8 34.3 7.1 0.4 7,152
Rural without road 37.0 30.9 5.9 0.2 1,177
Region
North 28.0 23.3 4.4 0.3 3,891
Central 44.8 37.0 7.4 0.5 6,274
South 46.0 39.2 6.7 0.2 2,379
Province
Vientiane Capital 40.9 34.8 5.1 0.9 1,707
Phongsaly 42.1 33.1 8.6 0.3 346
Luangnamtha 37.1 29.4 7.3 0.3 328
Oudomxay 25.4 21.3 3.9 0.2 712
Bokeo 37.6 30.9 6.4 0.3 350
Luangprabang 27.6 23.4 3.9 0.2 852
Huaphanh 25.0 22.5 2.4 0.1 536
Xayabury 18.4 15.3 2.5 0.6 768
Xiengkhuang 33.3 25.6 7.1 0.6 530
Vientiane 36.2 29.0 6.9 0.3 874
Borikhamxay 51.9 42.0 9.9 0.0 558
Khammuane 61.9 48.5 13.1 0.3 716
Savannakhet 48.2 41.1 6.8 0.3 1,703
Saravane 50.2 45.3 4.6 0.3 736
Sekong 25.5 24.4 1.1 0.0 215
Champasack 46.5 37.4 8.9 0.2 1,161
Attapeu 49.1 41.6 7.3 0.2 267
Xaysomboune 35.0 28.6 6.0 0.4 185
(Continued…)
Table TM.13.2 (continued): Prevalence of anemia in women
Percent distribution of women age 15-49 years with anemia, according to background characteristics, Lao PDR, 2017
Non-pregnant Pregnant
Anemia status by hemoglobin level
Number of women
Any < 12.0 g/dl < 11.0 g/dl
Mild 10.0-11.9 g/dl 10.0-10.9 g/dl
Moderate 7.0-9.9 g/dl 7.0-9.9 g/dl
Severe <7.0 g/dl <7.0 g/dl
Age
15-24 41.5 34.9 6.3 0.3 4,291
15-19 42.6 36.5 6.0 0.1 2,283
15-17 42.8 36.5 6.2 0.1 1,406
18-19 42.3 36.5 5.7 0.1 877
20-24 40.1 33.1 6.6 0.4 2,008
25-29 37.2 30.2 6.4 0.6 2,027
30-39 36.7 31.1 5.3 0.3 3,515
40-49 43.2 35.2 7.5 0.5 2,711
Education
None or ECE 43.7 35.6 7.5 0.6 1,997
Primary 39.2 31.7 6.9 0.6 4,397
Lower secondary 39.5 33.4 5.8 0.3 2,734
Upper secondary 39.5 33.2 6.2 0.1 1,757
Post secondary / Non tertiary 35.4 29.7 5.7 0.0 418
Higher 38.5 34.9 3.6 0.1 1,241
Ethno-linguistic group of household head
Lao-Tai 40.9 34.5 6.1 0.4 8,178
Mon-Khmer 40.5 33.0 7.1 0.5 2,879
Hmong-Mien 29.0 23.2 5.4 0.3 1,061
Chinese-Tibetan 38.8 30.3 8.1 0.3 309
Other, DK, Missing 47.5 40.1 7.3 0.0 118
Wealth index quintile
Poorest 42.9 34.7 7.5 0.7 2,149
Second 40.1 32.8 7.0 0.3 2,274
Middle 39.3 32.2 7.0 0.1 2,416
Fourth 38.0 32.0 5.5 0.5 2,792
Richest 39.5 34.1 5.1 0.2 2,914
Note: Prevalence is adjusted for altitude and for smoking status, if known, using formulas in CDC, 1998.
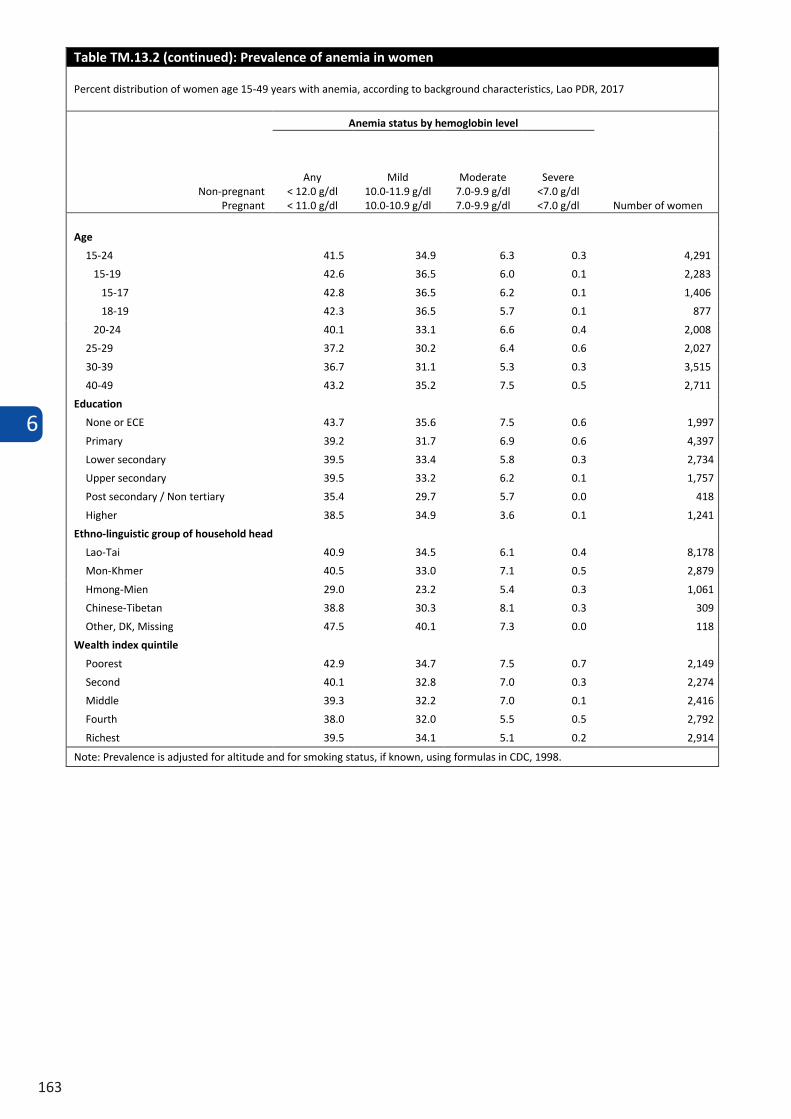
6
163
Table TM.13.2: Prevalence of anemia in women
Percent distribution of women age 15-49 years with anemia, according to background characteristics, Lao PDR, 2017
Non-pregnant Pregnant
Anemia status by hemoglobin level
Number of women
Any < 12.0 g/dl < 11.0 g/dl
Mild 10.0-11.9 g/dl 10.0-10.9 g/dl
Moderate 7.0-9.9 g/dl 7.0-9.9 g/dl
Severe <7.0 g/dl <7.0 g/dl
Total 39.8 33.2 6.3 0.4 12,545
Area
Urban 37.3 31.9 5.1 0.3 4,216
Rural 41.1 33.8 6.9 0.4 8,329
Rural with road 41.8 34.3 7.1 0.4 7,152
Rural without road 37.0 30.9 5.9 0.2 1,177
Region
North 28.0 23.3 4.4 0.3 3,891
Central 44.8 37.0 7.4 0.5 6,274
South 46.0 39.2 6.7 0.2 2,379
Province
Vientiane Capital 40.9 34.8 5.1 0.9 1,707
Phongsaly 42.1 33.1 8.6 0.3 346
Luangnamtha 37.1 29.4 7.3 0.3 328
Oudomxay 25.4 21.3 3.9 0.2 712
Bokeo 37.6 30.9 6.4 0.3 350
Luangprabang 27.6 23.4 3.9 0.2 852
Huaphanh 25.0 22.5 2.4 0.1 536
Xayabury 18.4 15.3 2.5 0.6 768
Xiengkhuang 33.3 25.6 7.1 0.6 530
Vientiane 36.2 29.0 6.9 0.3 874
Borikhamxay 51.9 42.0 9.9 0.0 558
Khammuane 61.9 48.5 13.1 0.3 716
Savannakhet 48.2 41.1 6.8 0.3 1,703
Saravane 50.2 45.3 4.6 0.3 736
Sekong 25.5 24.4 1.1 0.0 215
Champasack 46.5 37.4 8.9 0.2 1,161
Attapeu 49.1 41.6 7.3 0.2 267
Xaysomboune 35.0 28.6 6.0 0.4 185
(Continued…)
Table TM.13.2 (continued): Prevalence of anemia in women
Percent distribution of women age 15-49 years with anemia, according to background characteristics, Lao PDR, 2017
Non-pregnant Pregnant
Anemia status by hemoglobin level
Number of women
Any < 12.0 g/dl < 11.0 g/dl
Mild 10.0-11.9 g/dl 10.0-10.9 g/dl
Moderate 7.0-9.9 g/dl 7.0-9.9 g/dl
Severe <7.0 g/dl <7.0 g/dl
Age
15-24 41.5 34.9 6.3 0.3 4,291
15-19 42.6 36.5 6.0 0.1 2,283
15-17 42.8 36.5 6.2 0.1 1,406
18-19 42.3 36.5 5.7 0.1 877
20-24 40.1 33.1 6.6 0.4 2,008
25-29 37.2 30.2 6.4 0.6 2,027
30-39 36.7 31.1 5.3 0.3 3,515
40-49 43.2 35.2 7.5 0.5 2,711
Education
None or ECE 43.7 35.6 7.5 0.6 1,997
Primary 39.2 31.7 6.9 0.6 4,397
Lower secondary 39.5 33.4 5.8 0.3 2,734
Upper secondary 39.5 33.2 6.2 0.1 1,757
Post secondary / Non tertiary 35.4 29.7 5.7 0.0 418
Higher 38.5 34.9 3.6 0.1 1,241
Ethno-linguistic group of household head
Lao-Tai 40.9 34.5 6.1 0.4 8,178
Mon-Khmer 40.5 33.0 7.1 0.5 2,879
Hmong-Mien 29.0 23.2 5.4 0.3 1,061
Chinese-Tibetan 38.8 30.3 8.1 0.3 309
Other, DK, Missing 47.5 40.1 7.3 0.0 118
Wealth index quintile
Poorest 42.9 34.7 7.5 0.7 2,149
Second 40.1 32.8 7.0 0.3 2,274
Middle 39.3 32.2 7.0 0.1 2,416
Fourth 38.0 32.0 5.5 0.5 2,792
Richest 39.5 34.1 5.1 0.2 2,914
Note: Prevalence is adjusted for altitude and for smoking status, if known, using formulas in CDC, 1998.
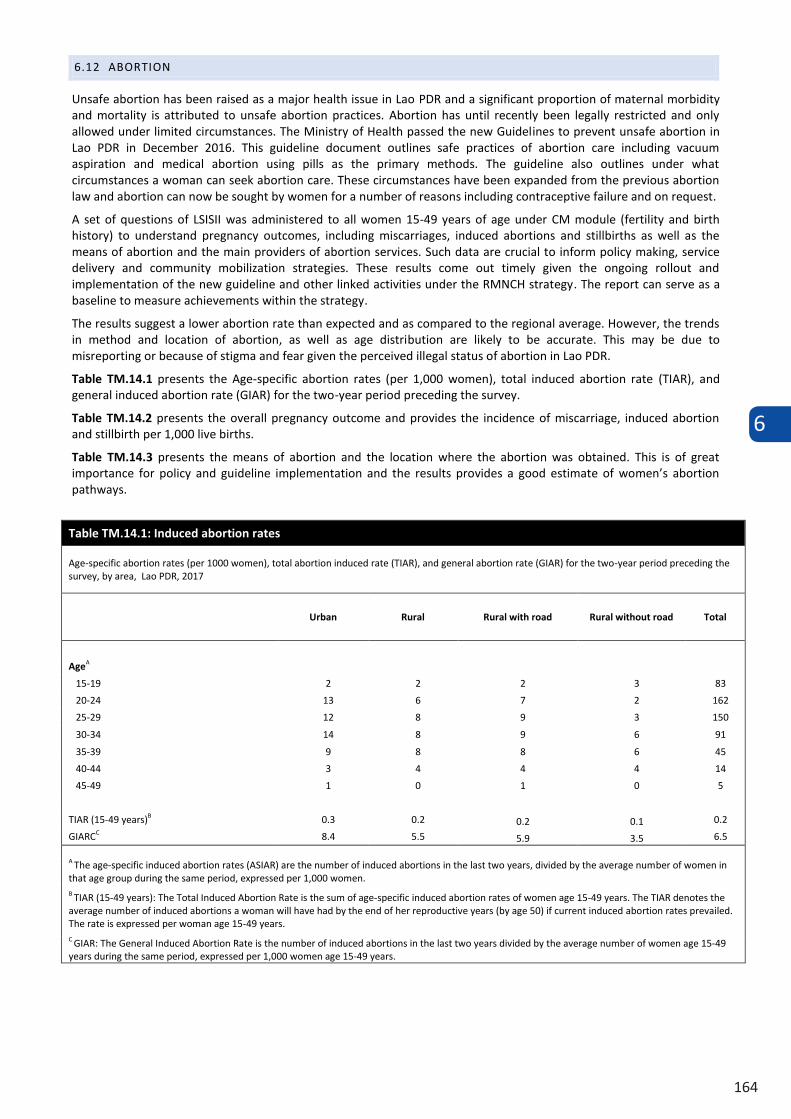
6
164
6.12 ABORTION
Unsafe abortion has been raised as a major health issue in Lao PDR and a significant proportion of maternal morbidity and mortality is attributed to unsafe abortion practices. Abortion has until recently been legally restricted and only allowed under limited circumstances. The Ministry of Health passed the new Guidelines to prevent unsafe abortion in Lao PDR in December 2016. This guideline document outlines safe practices of abortion care including vacuum aspiration and medical abortion using pills as the primary methods. The guideline also outlines under what circumstances a woman can seek abortion care. These circumstances have been expanded from the previous abortion law and abortion can now be sought by women for a number of reasons including contraceptive failure and on request.
A set of questions of LSISII was administered to all women 15-49 years of age under CM module (fertility and birth history) to understand pregnancy outcomes, including miscarriages, induced abortions and stillbirths as well as the means of abortion and the main providers of abortion services. Such data are crucial to inform policy making, service delivery and community mobilization strategies. These results come out timely given the ongoing rollout and implementation of the new guideline and other linked activities under the RMNCH strategy. The report can serve as a baseline to measure achievements within the strategy.
The results suggest a lower abortion rate than expected and as compared to the regional average. However, the trends in method and location of abortion, as well as age distribution are likely to be accurate. This may be due to misreporting or because of stigma and fear given the perceived illegal status of abortion in Lao PDR.
Table TM.14.1 presents the Age-specific abortion rates (per 1,000 women), total induced abortion rate (TIAR), and general induced abortion rate (GIAR) for the two-year period preceding the survey.
Table TM.14.2 presents the overall pregnancy outcome and provides the incidence of miscarriage, induced abortion and stillbirth per 1,000 live births.
Table TM.14.3 presents the means of abortion and the location where the abortion was obtained. This is of great importance for policy and guideline implementation and the results provides a good estimate of women’s abortion pathways.
Table TM.14.1: Induced abortion rates
Age-specific abortion rates (per 1000 women), total abortion induced rate (TIAR), and general abortion rate (GIAR) for the two-year period preceding the survey, by area, Lao PDR, 2017
Urban Rural Rural with road Rural without road Total
AgeA
15-19 2 2 2 3 83
20-24 13 6 7 2 162
25-29 12 8 9 3 150
30-34 14 8 9 6 91
35-39 9 8 8 6 45
40-44 3 4 4 4 14
45-49 1 0 1 0 5
TIAR (15-49 years)B 0.3 0.2 0.2 0.1 0.2
GIARCC 8.4 5.5 5.9 3.5 6.5
A The age-specific induced abortion rates (ASIAR) are the number of induced abortions in the last two years, divided by the average number of women in that age group during the same period, expressed per 1,000 women. B TIAR (15-49 years): The Total Induced Abortion Rate is the sum of age-specific induced abortion rates of women age 15-49 years. The TIAR denotes the average number of induced abortions a woman will have had by the end of her reproductive years (by age 50) if current induced abortion rates prevailed. The rate is expressed per woman age 15-49 years. C GIAR: The General Induced Abortion Rate is the number of induced abortions in the last two years divided by the average number of women age 15-49 years during the same period, expressed per 1,000 women age 15-49 years.
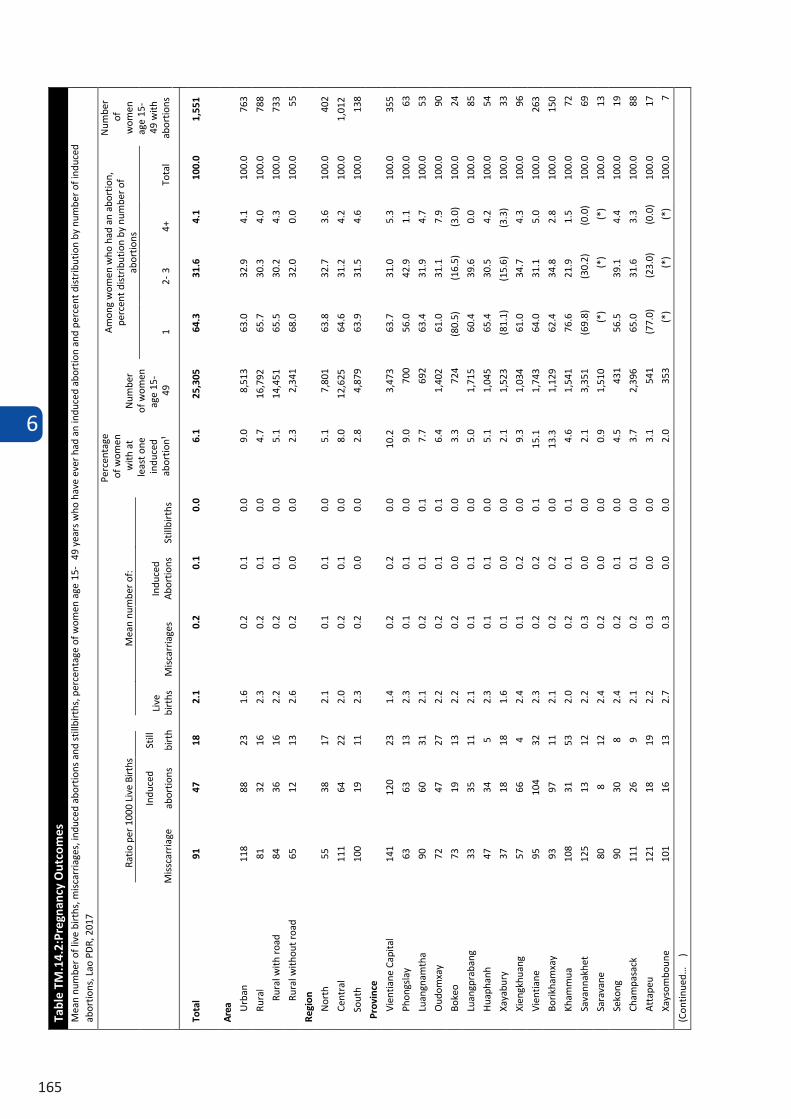
6
165
6.12 ABORTION
Unsafe abortion has been raised as a major health issue in Lao PDR and a significant proportion of maternal morbidity and mortality is attributed to unsafe abortion practices. Abortion has until recently been legally restricted and only allowed under limited circumstances. The Ministry of Health passed the new Guidelines to prevent unsafe abortion in Lao PDR in December 2016. This guideline document outlines safe practices of abortion care including vacuum aspiration and medical abortion using pills as the primary methods. The guideline also outlines under what circumstances a woman can seek abortion care. These circumstances have been expanded from the previous abortion law and abortion can now be sought by women for a number of reasons including contraceptive failure and on request.
A set of questions of LSISII was administered to all women 15-49 years of age under CM module (fertility and birth history) to understand pregnancy outcomes, including miscarriages, induced abortions and stillbirths as well as the means of abortion and the main providers of abortion services. Such data are crucial to inform policy making, service delivery and community mobilization strategies. These results come out timely given the ongoing rollout and implementation of the new guideline and other linked activities under the RMNCH strategy. The report can serve as a baseline to measure achievements within the strategy.
The results suggest a lower abortion rate than expected and as compared to the regional average. However, the trends in method and location of abortion, as well as age distribution are likely to be accurate. This may be due to misreporting or because of stigma and fear given the perceived illegal status of abortion in Lao PDR.
Table TM.14.1 presents the Age-specific abortion rates (per 1,000 women), total induced abortion rate (TIAR), and general induced abortion rate (GIAR) for the two-year period preceding the survey.
Table TM.14.2 presents the overall pregnancy outcome and provides the incidence of miscarriage, induced abortion and stillbirth per 1,000 live births.
Table TM.14.3 presents the means of abortion and the location where the abortion was obtained. This is of great importance for policy and guideline implementation and the results provides a good estimate of women’s abortion pathways.
Table TM.14.1: Induced abortion rates
Age-specific abortion rates (per 1000 women), total abortion induced rate (TIAR), and general abortion rate (GIAR) for the two-year period preceding the survey, by area, Lao PDR, 2017
Urban Rural Rural with road Rural without road Total
AgeA
15-19 2 2 2 3 83
20-24 13 6 7 2 162
25-29 12 8 9 3 150
30-34 14 8 9 6 91
35-39 9 8 8 6 45
40-44 3 4 4 4 14
45-49 1 0 1 0 5
TIAR (15-49 years)B 0.3 0.2 0.2 0.1 0.2
GIARCC 8.4 5.5 5.9 3.5 6.5
A The age-specific induced abortion rates (ASIAR) are the number of induced abortions in the last two years, divided by the average number of women in that age group during the same period, expressed per 1,000 women. B TIAR (15-49 years): The Total Induced Abortion Rate is the sum of age-specific induced abortion rates of women age 15-49 years. The TIAR denotes the average number of induced abortions a woman will have had by the end of her reproductive years (by age 50) if current induced abortion rates prevailed. The rate is expressed per woman age 15-49 years. C GIAR: The General Induced Abortion Rate is the number of induced abortions in the last two years divided by the average number of women age 15-49 years during the same period, expressed per 1,000 women age 15-49 years.
Tabl
e TM
.14.
2:Pr
egna
ncy
Out
com
es
Mea
n nu
mbe
r of
live
birt
hs, m
isca
rria
ges,
indu
ced
abor
tions
and
stil
lbirt
hs, p
erce
ntag
e of
wom
en a
ge 1
5-
49 y
ears
who
hav
e ev
er h
ad a
n in
duce
d ab
ortio
n an
d pe
rcen
t di
strib
utio
n by
num
ber
of in
duce
d ab
ortio
ns, L
ao P
DR,
201
7
Ratio
per
100
0 Li
ve B
irths
M
ean
num
ber
of:
Perc
enta
ge
of w
omen
w
ith a
t le
ast o
ne
indu
ced
abor
tion¹
Num
ber
of w
omen
ag
e 15
-49
Am
ong
wom
en w
ho h
ad a
n ab
ortio
n,
perc
ent d
istr
ibut
ion
by n
umbe
r of
abor
tions
Num
ber
of
wom
en
age
15-
49 w
ith
abor
tions
M
issc
arria
ge
Indu
ced
abor
tions
Still
birt
h Li
ve
birt
hs
Mis
carr
iage
s In
duce
d A
bort
ions
St
illbi
rths
1
2- 3
4+
To
tal
Tota
l 91
47
18
2.
1 0.
2 0.
1 0.
0 6.
1 25
,305
64
.3
31.6
4.
1 10
0.0
1,55
1
Area
Urb
an
118
88
23
1.6
0.2
0.1
0.0
9.0
8,51
3 63
.0
32.9
4.
1 10
0.0
763
Rura
l 81
32
16
2.
3 0.
2 0.
1 0.
0 4.
7 16
,792
65
.7
30.3
4.
0 10
0.0
788
Rura
l with
roa
d 84
36
16
2.
2 0.
2 0.
1 0.
0 5.
1 14
,451
65
.5
30.2
4.
3 10
0.0
733
65
12
13
2.6
0.2
0.0
0.0
2.3
2,34
1 68
.0
32.0
0.
0 10
0.0
55
Rura
l with
out r
oad
Regi
on
Nor
th
55
38
17
2.1
0.1
0.1
0.0
5.1
7,80
1 63
.8
32.7
3.
6 10
0.0
402
Cent
ral
111
64
22
2.0
0.2
0.1
0.0
8.0
12,6
25
64.6
31
.2
4.2
100.
0 1,
012
100
19
11
2.3
0.2
0.0
0.0
2.8
4,87
9 63
.9
31.5
4.
6 10
0.0
138
Sout
h
Prov
ince
141
120
23
1.4
0.2
0.2
0.0
10.2
3,
473
63.7
31
.0
5.3
100.
0 35
5
63
63
13
2.3
0.1
0.1
0.0
9.0
700
56.0
42
.9
1.1
100.
0 63
90
60
31
2.1
0.2
0.1
0.1
7.7
692
63.4
31
.9
4.7
100.
0 53
72
47
27
2.2
0.2
0.1
0.1
6.4
1,40
2 61
.0
31.1
7.
9 10
0.0
90
73
19
13
2.2
0.2
0.0
0.0
3.3
724
(80
.5)
(16
.5)
(3.0
) 10
0.0
24
33
35
11
2.1
0.1
0.1
0.0
5.0
1,71
5 60
.4
39.6
0.
0 10
0.0
85
47
34
5 2.
3 0.
1 0.
1 0.
0 5.
1 1,
045
65.4
30
.5
4.2
100.
0 54
37
18
18
1.6
0.1
0.0
0.0
2.1
1,52
3
(81.
1)
(15.
6)
(3.3
) 10
0.0
33
57
66
4 2.
4 0.
1 0.
2 0.
0 9.
3 1,
034
61.0
34
.7
4.3
100.
0 96
95
104
32
2.3
0.2
0.2
0.1
15.1
1,
743
64.0
31
.1
5.0
100.
0 26
3
93
97
11
2.1
0.2
0.2
0.0
13.3
1,
129
62.4
34
.8
2.8
100.
0 15
0
108
31
53
2.0
0.2
0.1
0.1
4.6
1,54
1 76
.6
21.9
1.
5 10
0.0
72
125
13
12
2.2
0.3
0.0
0.0
2.1
3,35
1
(69.
8)
(30
.2)
(0.0
) 10
0.0
69
80
8 12
2.
4 0.
2 0.
0 0.
0 0.
9 1,
510
(*)
(*)
(*)
100.
0 13
90
30
8 2.
4 0.
2 0.
1 0.
0 4.
5 43
1 56
.5
39.1
4.
4 10
0.0
19
111
26
9 2.
1 0.
2 0.
1 0.
0 3.
7 2,
396
65.0
31
.6
3.3
100.
0 88
121
18
19
2.2
0.3
0.0
0.0
3.1
541
(7
7.0)
(
23.0
) (0
.0)
100.
0 17
Vien
tiane
Cap
ital
Phon
gsla
y
Luan
gnam
tha
Oud
omxa
y
Boke
o
Luan
gpra
bang
Hua
phan
h
Xaya
bury
Xien
gkhu
ang
Vien
tiane
Borik
ham
xay
Kham
mua
Sava
nnak
het
Sara
vane
Seko
ng
Cham
pasa
ck
Att
apeu
Xays
ombo
une
101
16
13
2.7
0.3
0.0
0.0
2.0
353
(*)
(*)
(*)
100.
0 7
(Con
tinue
d…
)
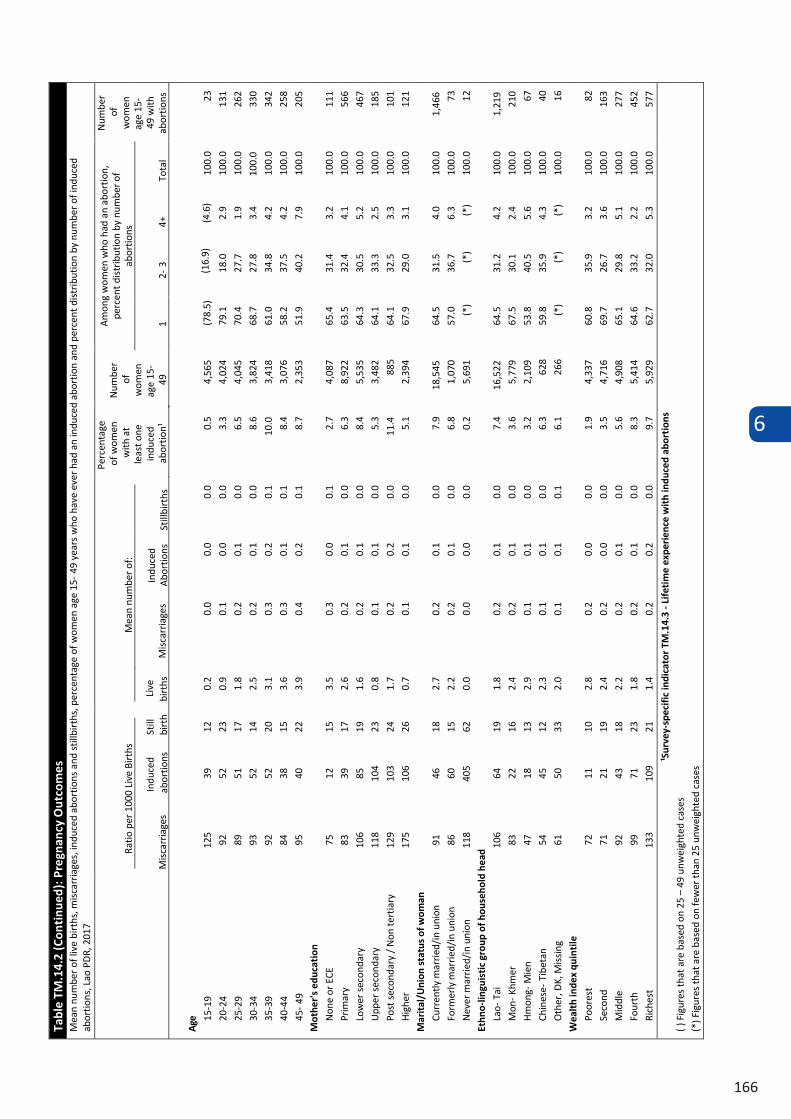
6
166
Tabl
e TM
.14.
2 (C
onti
nued
): P
regn
ancy
Out
com
es
Mea
n nu
mbe
r of
live
birt
hs, m
isca
rria
ges,
indu
ced
abor
tions
and
stil
lbirt
hs, p
erce
ntag
e of
wom
en a
ge 1
5- 4
9 ye
ars
who
hav
e ev
er h
ad a
n in
duce
d ab
ortio
n an
d pe
rcen
t di
strib
utio
n by
num
ber
of in
duce
d ab
ortio
ns, L
ao P
DR,
201
7
Ratio
per
100
0 Li
ve B
irths
M
ean
num
ber
of:
Perc
enta
ge
of w
omen
w
ith a
t le
ast o
ne
indu
ced
abor
tion¹
Num
ber
of
wom
en
age
15-
49
Am
ong
wom
en w
ho h
ad a
n ab
ortio
n,
perc
ent d
istr
ibut
ion
by n
umbe
r of
abor
tions
Num
ber
of
wom
en
age
15-
49 w
ith
abor
tions
M
isca
rria
ges
Indu
ced
abor
tions
St
ill
birt
h bi
rths
Indu
ced
Abo
rtio
ns
Still
birt
hs
1 2-
3
4+
Tota
l
Age
125
39
12
0.2
0.0
0.0
0.0
0.5
4,56
510
0.0
23
92
52
23
0.9
0.1
0.0
0.0
3.3
4,02
4 79
.1
18.0
2.
9 10
0.0
131
89
51
17
1.8
0.2
0.1
0.0
6.5
4,04
5 70
.4
27.7
1.
9 10
0.0
262
93
52
14
2.5
0.2
0.1
0.0
8.6
3,82
4 68
.7
27.8
3.
4 10
0.0
330
92
52
20
3.1
0.3
0.2
0.1
10.0
3,
418
61.0
34
.8
4.2
100.
0 34
2 84
38
15
3.
6 0.
3 0.
1 0.
1 8.
4 3,
076
58.2
37
.5
4.2
100.
0 25
8
15-1
9 20
-24
25-2
9 30
-34
35-3
9 40
-44
45-
49
95
40
22
3.9
0.4
0.2
0.1
8.7
2,35
3 51
.9
40.2
7.
9 10
0.0
205
Mot
her'
s ed
ucat
ion
75
12
15
3.5
0.3
0.0
0.1
2.7
4,08
7 65
.4
31.4
3.
2 10
0.0
111
83
39
17
2.6
0.2
0.1
0.0
6.3
8,92
2 63
.5
32.4
4.
1 10
0.0
566
106
85
19
1.6
0.2
0.1
0.0
8.4
5,53
5 64
.3
30.5
5.
2 10
0.0
467
118
104
23
0.8
0.1
0.1
0.0
5.3
3,48
2 64
.1
33.3
2.
5 10
0.0
185
129
103
24
1.7
0.2
0.2
0.0
11.4
88
5 64
.1
32.5
3.
3 10
0.0
101
Non
e or
ECE
Pr
imar
y Lo
wer
sec
onda
ry
Upp
er s
econ
dary
Po
st s
econ
dary
/ N
on te
rtia
ry
Hig
her
175
106
26
0.7
0.1
0.1
0.0
5.1
2,39
4 67
.9
29.0
3.
1 10
0.0
121
Mar
ital
/Uni
on s
tatu
s of
wom
an
Curr
ently
mar
ried/
in u
nion
91
46
18
2.
7 0.
2 0.
1 0.
0 7.
9 18
,545
64
.5
31.5
4.
0 10
0.0
1,46
6 Fo
rmer
ly m
arrie
d/in
uni
on
86
60
15
2.2
0.2
0.1
0.0
6.8
1,07
0 57
.0
36.7
6.
3 10
0.0
73
Nev
er m
arrie
d/in
uni
on
118
405
62
0.0
0.0
0.0
0.0
0.2
5,69
1 (*
) (*
) (*
) 10
0.0
12
Ethn
o-lin
guis
tic
grou
p of
hou
seho
ld h
ead
106
64
19
1.8
0.2
0.1
0.0
7.4
16,5
22
64.5
31
.2
4.2
100.
0 1,
219
83
22
16
2.4
0.2
0.1
0.0
3.6
5,77
9 67
.5
30.1
2.
4 10
0.0
210
47
18
13
2.9
0.1
0.1
0.0
3.2
2,10
9 53
.8
40.5
5.
6 10
0.0
67
54
45
12
2.3
0.1
0.1
0.0
6.3
628
59.8
35
.9
4.3
100.
0 40
Lao-
Tai
M
on-
Khm
er
Hm
ong-
Mie
n Ch
ines
e- T
ibet
an
Oth
er, D
K, M
issi
ng
61
50
33
2.0
0.1
0.1
0.1
6.1
266
(*)
(*)
(*)
100.
0 16
W
ealt
h in
dex
quin
tile
Poor
est
72
11
10
2.8
0.2
0.0
0.0
1.9
4,33
7 60
.8
35.9
3.
2 10
0.0
82
Seco
nd
71
21
19
2.4
0.2
0.0
0.0
3.5
4,71
6 69
.7
26.7
3.
6 10
0.0
163
Mid
dle
92
43
18
2.2
0.2
0.1
0.0
5.6
4,90
8 65
.1
29.8
5.
1 10
0.0
277
Four
th
99
71
23
1.8
0.2
0.1
0.0
8.3
5,41
4 64
.6
33.2
2.
2 10
0.0
452
Rich
est
133
109
21
1.4
0.2
0.2
0.0
9.7
5,92
9 62
.7
32.0
5.
3 10
0.0
577
¹Sur
vey-
spec
ific
indi
cato
r TM
.14.
3 - L
ifeti
me
expe
rien
ce w
ith
indu
ced
abor
tion
s ( )
Fig
ures
that
are
bas
ed o
n 25
– 4
9 un
wei
ghte
d ca
ses
(*) F
igur
es th
at a
re b
ased
on
few
er th
an 2
5 un
wei
ghte
d ca
ses
(78.
5)
(16.
9)
(4.6
)
Mis
carr
iage
sLi
ve
TM.1
4.3:
Met
hod
of A
bort
ion,
Lao
PD
R, 2
017
Perc
enta
ge o
f wom
en a
ge 1
5- 4
9 w
ho h
ad a
n in
duce
d ab
ortio
n in
the
last
five
yea
rs b
y ab
ortio
n m
etho
d La
o PD
R, 2
017
Met
hod
used
for a
bort
ion
Num
ber
of
wom
en
age
15-
49
with
at
leas
t one
in
duce
d ab
ortio
n in
th
e la
st
five
year
s
Plac
e of
med
ical
Abo
rtio
n Pi
lls
Num
ber
of
wom
en
age
15-
49 w
ith a
t le
ast o
ne
med
ical
ab
ortio
n in
the
last
fiv
e ye
ars
Plac
e of
sur
gica
l abo
rtio
n N
umbe
r of
w
omen
age
15
- 49
with
at
leas
t one
su
rgic
al
abor
tion
in
the
last
five
ye
ars
Med
ical
m
etho
d us
ing
pills
Surg
ical
/
Inva
sive
m
etho
d N
o Re
spon
se
Gov
ernm
ent/
Pu
blic
Fa
cilit
y Pr
ivat
e Fa
cilit
y A
t ho
me
Oth
er
No
Resp
onse
Gov
ernm
ent/
Pu
blic
Fa
cilit
y Pr
ivat
e Fa
cilit
y O
ther
N
o Re
spon
se
Tota
l 54
.2
45.1
0.
8 68
0 9
17
68.1
5.
6 0.
0 36
8 32
.0
66.2
1.
4 0.
4 30
7
Area
U
rban
51.5
47.3
1.2
333
422
68.9
5.7
0.0
172
34.2
64.0
1.1
0.7
158
Rura
l56
.743
.00.
334
614
1367
.45.
50.
019
729
.768
.51.
80.
014
9Ru
ral w
ith r
oad
55.8
43.9
0.3
319
1213
69.9
4.7
0.0
178
29.8
68.2
1.9
0.0
140
(32.
2)(0
.0)
28(*
)(*
)(*
) (*
)(*
)19
(*)
(*)
(*)
(*)
9Ru
ral w
ithou
t roa
d
(67.
8)
Regi
on
Nor
th58
.341
.70.
018
516
1760
.95.
70.
010
835
.065
.00.
00.
077
Cent
ral
53.5
45.4
1.1
444
617
72.0
4.2
0.0
238
32.8
64.5
2.2
0.5
202
Sout
h45
.454
.60.
051
(2.5
) (1
6.5)
(6
1.0)
(2
0.1)
(0.0
)23
(17.
9)
(82.
1)
(0.
0)(0
.0)
28Pr
ovin
ce
50.1
48
.6
1.4
140
(5.3
) (2
3.6)
(
62.9
) (8
.2)
(0.0
) 70
(3
2.1)
(6
7.9)
(0
.0)
(0.0
) 68
(59.
7)(4
0.3)
(0.0
)23
(*)
(*)
(*)
(*)
(*)
14(*
)(*
)(*
)(*
)9
(50.
7)(4
9.3)
(0.0
)26
(*)
(*)
(*)
(*)
(*)
13(*
)(*
)(*
)(*
)13
(69.
9)(3
0.1)
(0.0
)40
(10.
8)
(10.
0)
(75.
8)
(3.5
)(0
.0)
28(*
)(*
)(*
)(*
)12
(*)
(*)
(*)
10(*
)(*
)(*
) (*
)(*
)6
(*)
(*)
(*)
(*)
4(4
6.4)
(53.
6)(0
.0)
49(*
)(*
)(*
) (*
)(*
)23
(*)
(*)
(*)
(*)
26(6
3.6)
(36.
4)(0
.0)
21(*
)(*
)(*
) (*
)(*
)13
(*)
(*)
(*)
(*)
8(*
)(*
)(*
)15
(*)
(*)
(*)
(*)
(*)
10(*
)(*
)(*
)(*
)5
50.9
49.1
0.0
41(2
2.7)
(7
.1)
(62.
6)
(7.
6)(0
.0)
21(0
.0)
2041
.758
.30.
011
95
489
.71.
80.
050
(33.
0)
(67
.0)
(0.0
)(3
2.9)
(
63.9
) (3
.2)
(0.0
)70
75.1
24.9
0.0
684
1679
.11.
20.
051
(*)
(*)
(*)
(*)
17(6
0.0)
(37.
0)(3
.0)
37(*
)(*
)(*
) (*
)(*
)22
(*)
(*)
(*)
14(*
)(*
)(*
)36
(*)
(*)
(*)
(*)
(*)
23(*
)(*
)(*
)13
(*)
(*)
(*)
6(*
)(*
)(*
) (*
)(*
)3
(*)
(*)
(*)
3(*
)(*
)(*
)7
(*)
(*)
(*)
(*)
(*)
1(*
)(*
)(*
)6
(*)
(*)
(*)
30(*
)(*
)(*
) (*
)(*
)13
(*)
(*)
(*)
17(*
)(*
)(*
)8
(*)
(*)
(*)
(*)
(*)
6(*
)(*
)(*
)1
Vien
tiane
Cap
ital
Phon
gsal
y Lu
angn
amth
a O
udom
xay
Boke
o Lu
angp
raba
ng
Hua
phan
h Xa
yabu
ry
Xien
gkhu
ang
Vien
tiane
Bo
rikha
mxa
y Kh
amm
uane
Sa
vann
akhe
t Sa
rava
ne
Seko
ng
Cham
pasa
ck
Att
apeu
Xa
ysom
boun
e(*
)(*
)(*
)3
(*)
(*)
(*)
(*)
(*)
1
(*)
(*)
(*)
(*)
(*)
(*)
(*)
(*)
(*)
(*)
0(C
ontin
ued…
)
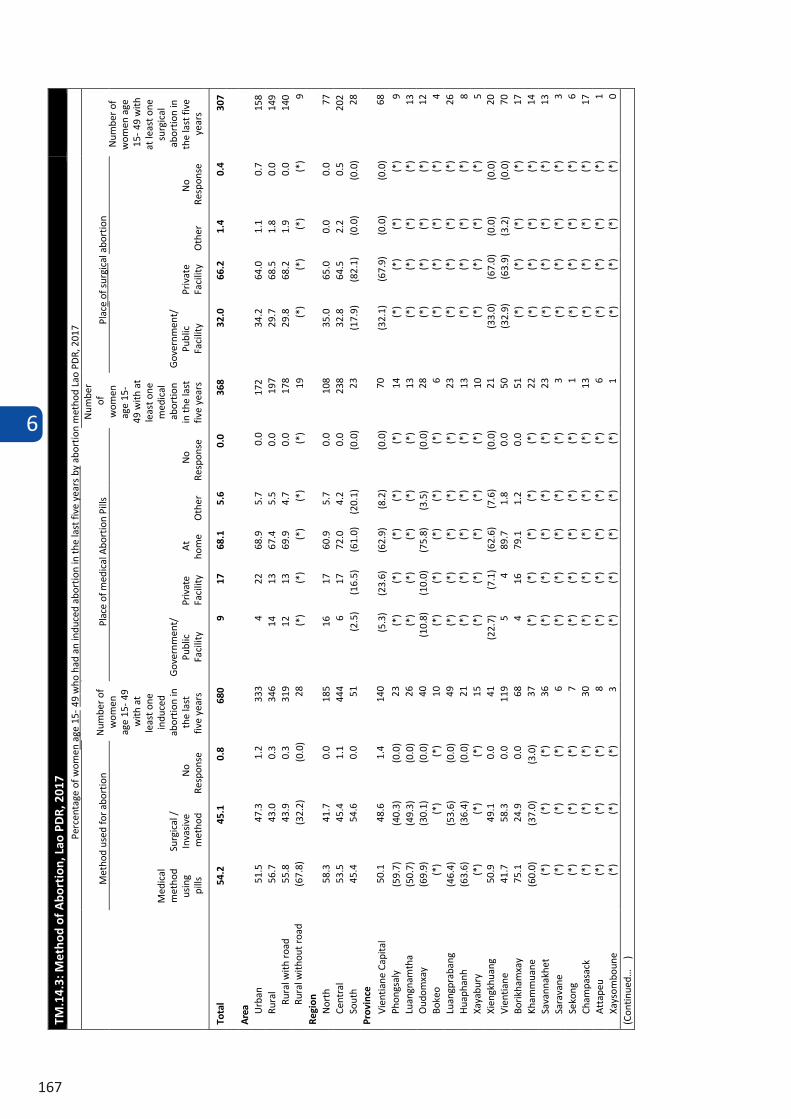
6
167
TM.1
4.3:
Met
hod
of A
bort
ion,
Lao
PD
R, 2
017
Perc
enta
ge o
f wom
en a
ge 1
5- 4
9 w
ho h
ad a
n in
duce
d ab
ortio
n in
the
last
five
yea
rs b
y ab
ortio
n m
etho
d La
o PD
R, 2
017
Met
hod
used
for a
bort
ion
Num
ber
of
wom
en
age
15-
49
with
at
leas
t one
in
duce
d ab
ortio
n in
th
e la
st
five
year
s
Plac
e of
med
ical
Abo
rtio
n Pi
lls
Num
ber
of
wom
en
age
15-
49 w
ith a
t le
ast o
ne
med
ical
ab
ortio
n in
the
last
fiv
e ye
ars
Plac
e of
sur
gica
l abo
rtio
n N
umbe
r of
w
omen
age
15
- 49
with
at
leas
t one
su
rgic
al
abor
tion
in
the
last
five
ye
ars
Med
ical
m
etho
d us
ing
pills
Surg
ical
/
Inva
sive
m
etho
d N
o Re
spon
se
Gov
ernm
ent/
Pu
blic
Fa
cilit
y Pr
ivat
e Fa
cilit
y A
t ho
me
Oth
er
No
Resp
onse
Gov
ernm
ent/
Pu
blic
Fa
cilit
y Pr
ivat
e Fa
cilit
y O
ther
N
o Re
spon
se
Tota
l 54
.2
45.1
0.
8 68
0 9
17
68.1
5.
6 0.
0 36
8 32
.0
66.2
1.
4 0.
4 30
7
Area
U
rban
51.5
47.3
1.2
333
422
68.9
5.7
0.0
172
34.2
64.0
1.1
0.7
158
Rura
l56
.743
.00.
334
614
1367
.45.
50.
019
729
.768
.51.
80.
014
9Ru
ral w
ith r
oad
55.8
43.9
0.3
319
1213
69.9
4.7
0.0
178
29.8
68.2
1.9
0.0
140
(32.
2)(0
.0)
28(*
)(*
)(*
) (*
)(*
)19
(*)
(*)
(*)
(*)
9Ru
ral w
ithou
t roa
d
(67.
8)
Regi
on
Nor
th58
.341
.70.
018
516
1760
.95.
70.
010
835
.065
.00.
00.
077
Cent
ral
53.5
45.4
1.1
444
617
72.0
4.2
0.0
238
32.8
64.5
2.2
0.5
202
Sout
h45
.454
.60.
051
(2.5
) (1
6.5)
(6
1.0)
(2
0.1)
(0.0
)23
(17.
9)
(82.
1)
(0.
0)(0
.0)
28Pr
ovin
ce
50.1
48
.6
1.4
140
(5.3
) (2
3.6)
(
62.9
) (8
.2)
(0.0
) 70
(3
2.1)
(6
7.9)
(0
.0)
(0.0
) 68
(59.
7)(4
0.3)
(0.0
)23
(*)
(*)
(*)
(*)
(*)
14(*
)(*
)(*
)(*
)9
(50.
7)(4
9.3)
(0.0
)26
(*)
(*)
(*)
(*)
(*)
13(*
)(*
)(*
)(*
)13
(69.
9)(3
0.1)
(0.0
)40
(10.
8)
(10.
0)
(75.
8)
(3.5
)(0
.0)
28(*
)(*
)(*
)(*
)12
(*)
(*)
(*)
10(*
)(*
)(*
) (*
)(*
)6
(*)
(*)
(*)
(*)
4(4
6.4)
(53.
6)(0
.0)
49(*
)(*
)(*
) (*
)(*
)23
(*)
(*)
(*)
(*)
26(6
3.6)
(36.
4)(0
.0)
21(*
)(*
)(*
) (*
)(*
)13
(*)
(*)
(*)
(*)
8(*
)(*
)(*
)15
(*)
(*)
(*)
(*)
(*)
10(*
)(*
)(*
)(*
)5
50.9
49.1
0.0
41(2
2.7)
(7
.1)
(62.
6)
(7.
6)(0
.0)
21(0
.0)
2041
.758
.30.
011
95
489
.71.
80.
050
(33.
0)
(67
.0)
(0.0
)(3
2.9)
(
63.9
) (3
.2)
(0.0
)70
75.1
24.9
0.0
684
1679
.11.
20.
051
(*)
(*)
(*)
(*)
17(6
0.0)
(37.
0)(3
.0)
37(*
)(*
)(*
) (*
)(*
)22
(*)
(*)
(*)
14(*
)(*
)(*
)36
(*)
(*)
(*)
(*)
(*)
23(*
)(*
)(*
)13
(*)
(*)
(*)
6(*
)(*
)(*
) (*
)(*
)3
(*)
(*)
(*)
3(*
)(*
)(*
)7
(*)
(*)
(*)
(*)
(*)
1(*
)(*
)(*
)6
(*)
(*)
(*)
30(*
)(*
)(*
) (*
)(*
)13
(*)
(*)
(*)
17(*
)(*
)(*
)8
(*)
(*)
(*)
(*)
(*)
6(*
)(*
)(*
)1
Vien
tiane
Cap
ital
Phon
gsal
y Lu
angn
amth
a O
udom
xay
Boke
o Lu
angp
raba
ng
Hua
phan
h Xa
yabu
ry
Xien
gkhu
ang
Vien
tiane
Bo
rikha
mxa
y Kh
amm
uane
Sa
vann
akhe
t Sa
rava
ne
Seko
ng
Cham
pasa
ck
Att
apeu
Xa
ysom
boun
e(*
)(*
)(*
)3
(*)
(*)
(*)
(*)
(*)
1
(*)
(*)
(*)
(*)
(*)
(*)
(*)
(*)
(*)
(*)
0(C
ontin
ued…
)
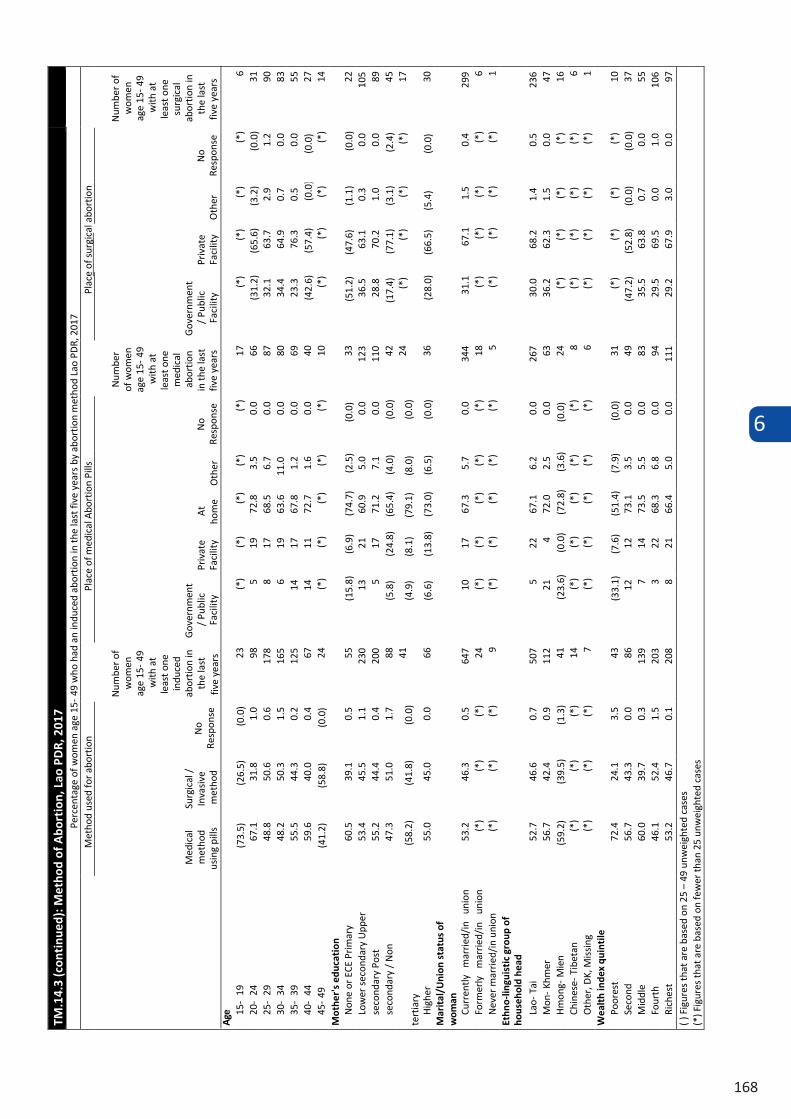
6
168
TM.1
4.3
(con
tinu
ed):
Met
hod
of A
bort
ion,
Lao
PD
R, 2
017
Perc
enta
ge o
f wom
en a
ge 1
5- 4
9 w
ho h
ad a
n in
duce
d ab
ortio
n in
the
last
five
yea
rs b
y ab
ortio
n m
etho
d La
o PD
R, 2
017
Met
hod
used
for a
bort
ion
Num
ber
of
wom
en
age
15-
49
with
at
leas
t one
in
duce
d ab
ortio
n in
th
e la
st
five
year
s
Plac
e of
med
ical
Abo
rtio
n Pi
lls
Num
ber
of w
omen
ag
e 15
- 49
w
ith a
t le
ast o
ne
med
ical
ab
ortio
n in
the
last
fiv
e ye
ars
Plac
e of
sur
gica
l abo
rtio
n
Num
ber
of
wom
en
age
15-
49
with
at
leas
t one
su
rgic
al
abor
tion
in
the
last
fiv
e ye
ars
Med
ical
m
etho
d us
ing
pills
Surg
ical
/
Inva
sive
m
etho
d N
o Re
spon
se
Gov
ernm
ent
/ Pu
blic
Fa
cilit
y Pr
ivat
e Fa
cilit
y A
t ho
me
Oth
er
No
Resp
onse
Gov
ernm
ent
/ Pu
blic
Fa
cilit
y Pr
ivat
e Fa
cilit
y O
ther
N
o Re
spon
seAg
e (7
3.5)
(26.
5)(0
.0)
23(*
)(*
)(*
) (*
)(*
)17
(*)
667
.131
.81.
098
519
72.8
3.5
0.0
66(*
) (*
) (*
) (3
1.2)
(6
5.6)
(3
.2)
(0.0
)31
48.8
50.6
0.6
178
817
68.5
6.7
0.0
8732
.163
.72.
91.
290
48.2
50.3
1.5
165
619
63.6
11.0
0.0
8034
.464
.90.
70.
083
55.5
44.3
0.2
125
1417
67.8
1.2
0.0
6923
.376
.30.
50.
055
59.6
40.0
0.4
6714
1172
.71.
60.
040
(42.
6)
(5
7.4)
(0
.0)
(0.0
)27
15-
19
20-
24
25-
29
30-
34
35-
39
40-
44
45-
49(4
1.2)
(58.
8)(0
.0)
24(*
)(*
)(*
) (*
)(*
)10
(*)
(*)
(*)
(*)
14M
othe
r's
educ
atio
n 60
.539
.10.
555
(15.
8)
(6.9
) (7
4.7)
(2
.5)
(0.0
)33
(51.
2)
(47.
6)
(1.
1)(0
.0)
2253
.445
.51.
123
013
2160
.95.
00.
012
336
.563
.10.
30.
010
555
.244
.40.
420
05
1771
.27.
10.
011
028
.870
.21.
00.
089
47.3
51.0
1.7
88(0
.0)
42(1
7.4)
(
77.1
)
(3
.1)
(2.4
)45
Non
e or
ECE
Prim
ary
Low
er s
econ
dary
Upp
er
seco
ndar
y Po
st
seco
ndar
y /
Non
tert
iary
(5
8.2)
(4
1.8)
(0
.0)
41
(0.0
) 24
(*
) (*
) (*
) (*
) 17
55.0
45.0
0.0
66
(5.8
)
(
24.8
)
(65.
4)
(4
.0)
(4.9
)
(
8.1)
(79
.1)
(
8.0)
(6.6
)
(
13.8
)
(73.
0)
(6
.5)
(0.0
)36
(28.
0)
(66.
5)
(5.4
)(0
.0)
30H
ighe
rM
arit
al/U
nion
sta
tus
of
wom
an
53.2
46.3
0.5
647
1017
67.3
5.7
0.0
344
31.1
67.1
1.5
0.4
299
(*)
(*)
(*)
24(*
)(*
)(*
) (*
)(*
)18
(*)
(*)
(*)
(*)
6Cu
rren
tly
mar
ried/
in
unio
n Fo
rmer
ly
mar
ried/
in
unio
n N
ever
mar
ried/
in u
nion
(*)
(*)
(*)
9(*
)(*
)(*
) (*
)(*
)5
(*)
(*)
(*)
(*)
1Et
hno-
lingu
isti
c gr
oup
of
hous
ehol
d he
ad
52.7
46.6
0.7
507
522
67.1
6.2
0.0
267
30.0
68.2
1.4
0.5
236
56.7
42.4
0.9
112
214
72.0
2.5
0.0
6336
.262
.31.
50.
047
(59.
2)(3
9.5)
(1.3
)41
(23.
6)
(0.0
) (7
2.8)
(3
.6)
(0.0
)24
(*)
(*)
(*)
(*)
16(*
)(*
)(*
)14
(*)
(*)
(*)
(*)
(*)
8(*
)(*
)(*
)(*
)6
Lao-
Tai
Mon
- Kh
mer
H
mon
g- M
ien
Chin
ese-
Tib
etan
O
ther
, DK,
Mis
sing
(*)
(*)
(*)
7(*
)(*
)(*
) (*
)(*
)6
(*)
(*)
(*)
(*)
1W
ealt
h in
dex
quin
tile
Po
ores
t72
.424
.13.
543
(33.
1)
(7.6
) (5
1.4)
(7
.9)
(0.0
)31
(*)
(*)
(*)
(*)
10Se
cond
56.7
43.3
0.0
8612
1273
.13.
50.
049
(47.
2)
(52.
8)
(0.
0)(0
.0)
37M
iddl
e60
.039
.70.
313
97
1473
.55.
50.
083
35.5
63.8
0.7
0.0
55Fo
urth
46.1
52.4
1.5
203
322
68.3
6.8
0.0
9429
.569
.50.
01.
010
6Ri
ches
t53
.246
.70.
120
88
2166
.45.
00.
011
129
.267
.93.
00.
097
( ) F
igur
es th
at a
re b
ased
on
25 –
49
unw
eigh
ted
case
s(*
) Fig
ures
that
are
bas
ed o
n fe
wer
than
25
unw
eigh
ted
case
s
7
172
7 THRIVE – CHILD HEALTH, NUTRITION AND DEVELOPMENT
In order to survive and develop to their full potential, children need health care, appropriate nutrition, education that nurtures their minds and equips them with useful knowledge and skills and the time and space to play.1 This chapter summarizes the main findings of the survey on a range of child health, nutrition and development indicators. Tables on immunisation coverage are followed by a series of topics related to children’s health presenting indicators related to disease episodes including diarrhoea, acute respiratory infection and malaria. A number of nutrition indicators are presented under Infant and Young Child Feeding section that depict main findings on breastfeeding and other feeding practices, as well as, malnutrition which highlights the main findings on underweight, stunting, wasting and overweight. Findings of salt iodisation are also presented in this chapter. The last part of the chapter presents the findings related to child development and early childhood development.
7.1 IMMUNISATION
Immunisation is a proven tool for controlling and eliminating life-threatening infectious diseases and is estimated to avert between 2 and 3 million deaths each year. It is one of the most cost-effective health investments, with proven strategies that make it accessible to even the most hard-to-reach and vulnerable populations.
The WHO Recommended Routine Immunisations for Children2 recommends all children to be vaccinated against tuberculosis, diphtheria, pertussis, tetanus, polio, measles, hepatitis B, haemophilus influenzae type b, pneumococcal bacteria/disease, rotavirus, and rubella3.
At the global level, SDG indicator 3.b.1 is used to monitor the progress of the vaccination of children at the national level. The proportion of the target population covered by all vaccines included in their national programme is presented in Table TC.1.1.
All doses in the primary series are recommended to be completed before the child’s first birthday, although depending on the epidemiology of disease in a country, the first doses of measles and rubella containing vaccines may be recommended at 12 months or later. The recommended number and timing of most other doses also vary slightly with local epidemiology and may include booster doses later in childhood.
The vaccination schedule followed by the Lao PDR National Immunisation Programme provides all the above mentioned vaccinations with the exception of rotavirus vaccine which will be included in 2019. The National Immunisation Programme for Lao PDR includes the following vaccination of children: birth doses of BCG and Hepatitis B vaccines (both within seven days of life); three doses of the Pentavalent vaccine containing DTP, Hepatitis B, and Haemophilus influenzae type b (Hib) antigens; four doses of Polio vaccine – three doses of OPV and one dose of IPV; three doses of Pneumococcal (conjugate) vaccine; two doses of MR vaccine containing measles and rubella antigens; one dose of Japanese Encephalitis vaccine; one dose of Vitamin A and one dose of Deworming vaccine. All vaccinations should be received during the first year of life except the second dose of MR2 at 12 and 18 months. Taking into consideration this vaccination schedule, the estimates for full immunisation coverage from the Lao PDR, 2017 LSIS II are based on children age 12-23 months. Given that, HepB0, Polio0, IPV, Pneumococcal, Japanese Encephalitis vaccine; have not been universally administrated across country, these vaccines therefore excluded in the full immunisation calculation.
1 UNICEF. 2014. The State of Children’s Report in Numbers. Every Child Counts. UNICEF 2 WHO Recommendations for Routine Immunization - Summary Tables." World Health Organization. August 22, 2018. Accessed August 23, 2018. http://www.who.int/immunization/policy/immunization_tables/en/ 3 Additionally, vaccination against the human papillomavirus (HPV) is recommended for girls from 9 to 14 years of age, but coverage of this vaccine is not yet included in MICS, as methodology is under development.
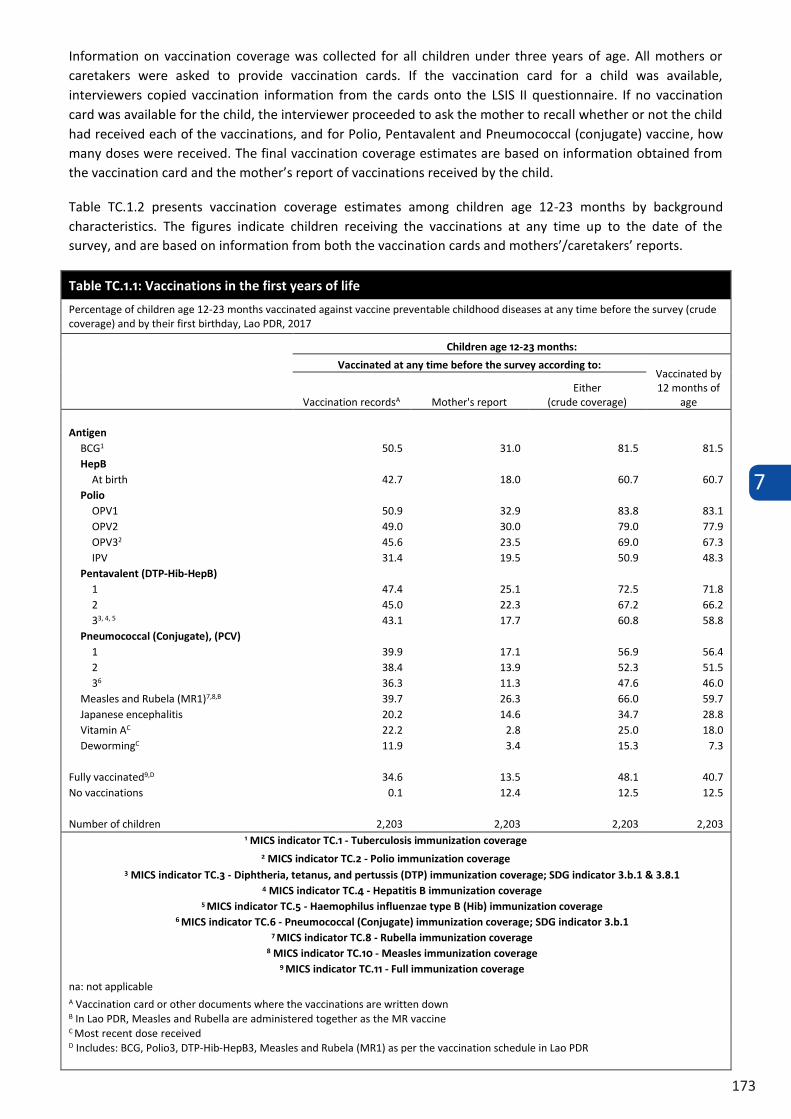
7
173
Information on vaccination coverage was collected for all children under three years of age. All mothers or caretakers were asked to provide vaccination cards. If the vaccination card for a child was available, interviewers copied vaccination information from the cards onto the LSIS II questionnaire. If no vaccination card was available for the child, the interviewer proceeded to ask the mother to recall whether or not the child had received each of the vaccinations, and for Polio, Pentavalent and Pneumococcal (conjugate) vaccine, how many doses were received. The final vaccination coverage estimates are based on information obtained from the vaccination card and the mother’s report of vaccinations received by the child.
Table TC.1.2 presents vaccination coverage estimates among children age 12-23 months by background characteristics. The figures indicate children receiving the vaccinations at any time up to the date of the survey, and are based on information from both the vaccination cards and mothers’/caretakers’ reports.
Table TC.1.1: Vaccinations in the first years of life
Percentage of children age 12-23 months vaccinated against vaccine preventable childhood diseases at any time before the survey (crude coverage) and by their first birthday, Lao PDR, 2017
Children age 12-23 months:
Vaccinated at any time before the survey according to: Vaccinated by 12 months of
age Vaccination recordsA Mother's report Either
(crude coverage)
Antigen BCG1 50.5 31.0 81.5 81.5 HepB
At birth 42.7 18.0 60.7 60.7 Polio
OPV1 50.9 32.9 83.8 83.1 OPV2 49.0 30.0 79.0 77.9 OPV32 45.6 23.5 69.0 67.3 IPV 31.4 19.5 50.9 48.3
Pentavalent (DTP-Hib-HepB) 1 47.4 25.1 72.5 71.8 2 45.0 22.3 67.2 66.2 33, 4, 5 43.1 17.7 60.8 58.8
Pneumococcal (Conjugate), (PCV) 1 39.9 17.1 56.9 56.4 2 38.4 13.9 52.3 51.5 36 36.3 11.3 47.6 46.0
Measles and Rubela (MR1)7,8,B 39.7 26.3 66.0 59.7 Japanese encephalitis 20.2 14.6 34.7 28.8 Vitamin AC 22.2 2.8 25.0 18.0 DewormingC 11.9 3.4 15.3 7.3
Fully vaccinated9,D 34.6 13.5 48.1 40.7 No vaccinations 0.1 12.4 12.5 12.5
Number of children 2,203 2,203 2,203 2,203 1 MICS indicator TC.1 - Tuberculosis immunization coverage
2 MICS indicator TC.2 - Polio immunization coverage 3 MICS indicator TC.3 - Diphtheria, tetanus, and pertussis (DTP) immunization coverage; SDG indicator 3.b.1 & 3.8.1
4 MICS indicator TC.4 - Hepatitis B immunization coverage 5 MICS indicator TC.5 - Haemophilus influenzae type B (Hib) immunization coverage
6 MICS indicator TC.6 - Pneumococcal (Conjugate) immunization coverage; SDG indicator 3.b.17 MICS indicator TC.8 - Rubella immunization coverage
8 MICS indicator TC.10 - Measles immunization coverage 9 MICS indicator TC.11 - Full immunization coverage
na: not applicable A Vaccination card or other documents where the vaccinations are written down B In Lao PDR, Measles and Rubella are administered together as the MR vaccineC Most recent dose received D Includes: BCG, Polio3, DTP-Hib-HepB3, Measles and Rubela (MR1) as per the vaccination schedule in Lao PDR
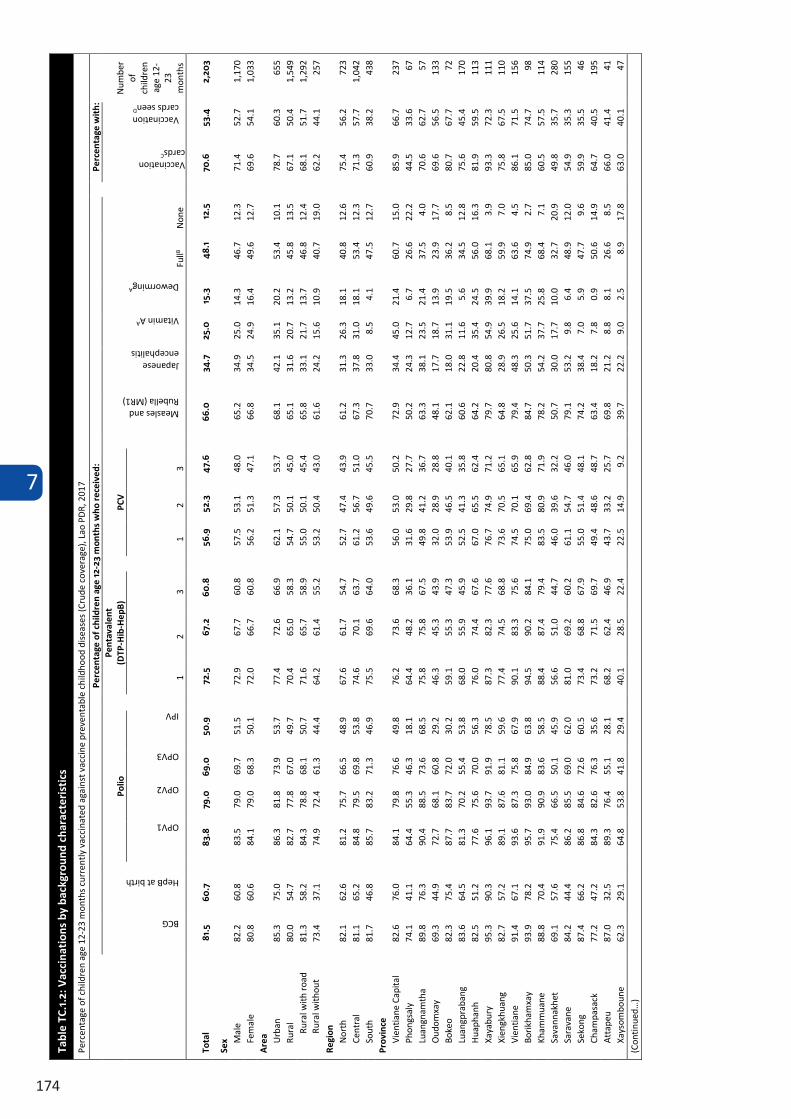
7
174
Information on vaccination coverage was collected for all children under three years of age. All mothers or caretakers were asked to provide vaccination cards. If the vaccination card for a child was available, interviewers copied vaccination information from the cards onto the LSIS II questionnaire. If no vaccination card was available for the child, the interviewer proceeded to ask the mother to recall whether or not the child had received each of the vaccinations, and for Polio, Pentavalent and Pneumococcal (conjugate) vaccine, how many doses were received. The final vaccination coverage estimates are based on information obtained from the vaccination card and the mother’s report of vaccinations received by the child.
Table TC.1.2 presents vaccination coverage estimates among children age 12-23 months by background characteristics. The figures indicate children receiving the vaccinations at any time up to the date of the survey, and are based on information from both the vaccination cards and mothers’/caretakers’ reports.
Table TC.1.1: Vaccinations in the first years of life
Percentage of children age 12-23 months vaccinated against vaccine preventable childhood diseases at any time before the survey (crude coverage) and by their first birthday, Lao PDR, 2017
Children age 12-23 months:
Vaccinated at any time before the survey according to: Vaccinated by 12 months of
age Vaccination recordsA Mother's report Either
(crude coverage)
Antigen BCG1 50.5 31.0 81.5 81.5 HepB
At birth 42.7 18.0 60.7 60.7 Polio
OPV1 50.9 32.9 83.8 83.1 OPV2 49.0 30.0 79.0 77.9 OPV32 45.6 23.5 69.0 67.3 IPV 31.4 19.5 50.9 48.3
Pentavalent (DTP-Hib-HepB) 1 47.4 25.1 72.5 71.8 2 45.0 22.3 67.2 66.2 33, 4, 5 43.1 17.7 60.8 58.8
Pneumococcal (Conjugate), (PCV) 1 39.9 17.1 56.9 56.4 2 38.4 13.9 52.3 51.5 36 36.3 11.3 47.6 46.0
Measles and Rubela (MR1)7,8,B 39.7 26.3 66.0 59.7 Japanese encephalitis 20.2 14.6 34.7 28.8 Vitamin AC 22.2 2.8 25.0 18.0 DewormingC 11.9 3.4 15.3 7.3
Fully vaccinated9,D 34.6 13.5 48.1 40.7 No vaccinations 0.1 12.4 12.5 12.5
Number of children 2,203 2,203 2,203 2,203 1 MICS indicator TC.1 - Tuberculosis immunization coverage
2 MICS indicator TC.2 - Polio immunization coverage 3 MICS indicator TC.3 - Diphtheria, tetanus, and pertussis (DTP) immunization coverage; SDG indicator 3.b.1 & 3.8.1
4 MICS indicator TC.4 - Hepatitis B immunization coverage 5 MICS indicator TC.5 - Haemophilus influenzae type B (Hib) immunization coverage
6 MICS indicator TC.6 - Pneumococcal (Conjugate) immunization coverage; SDG indicator 3.b.17 MICS indicator TC.8 - Rubella immunization coverage
8 MICS indicator TC.10 - Measles immunization coverage 9 MICS indicator TC.11 - Full immunization coverage
na: not applicable A Vaccination card or other documents where the vaccinations are written down B In Lao PDR, Measles and Rubella are administered together as the MR vaccineC Most recent dose received D Includes: BCG, Polio3, DTP-Hib-HepB3, Measles and Rubela (MR1) as per the vaccination schedule in Lao PDR Ta
ble
TC.1
.2: V
acci
nati
ons
by b
ackg
roun
d ch
arac
teri
stic
s
Perc
enta
ge o
f chi
ldre
n ag
e 12
-23
mon
ths c
urre
ntly
vac
cinat
ed a
gain
st v
accin
e pr
even
tabl
e ch
ildho
od d
iseas
es (C
rude
cove
rage
), La
o PD
R, 2
017
Perc
enta
ge o
f chi
ldre
n ag
e 12
-23
mon
ths
who
rece
ived
: Pe
rcen
tage
wit
h:
Num
ber
of
child
ren
age
12-
23
mon
ths
BCG
HepB at birth
Polio
Pe
ntav
alen
t (D
TP-H
ib-H
epB)
PC
V
Measles and Rubella (MR1)
Japanese encephalitis
Vitamin AA
DewormingA
FullB
None
Vaccination cardsC
Vaccination cards seenD
OPV1
OPV2
OPV3
IPV
1 2
3 1
2 3
Tota
l 81
.5
60.7
83
.8
79.0
69
.0
50.9
72
.5
67.2
60
.8
56.9
52
.3
47.6
66
.0
34.7
25
.0
15.3
48
.1
12.5
70
.6
53.4
2,
203
Sex M
ale
82.2
60
.8
83.5
79
.0
69.7
51
.5
72.9
67
.7
60.8
57
.5
53.1
48
.0
65.2
34
.9
25.0
14
.3
46.7
12
.3
71.4
52
.7
1,17
0 Fe
mal
e 80
.8
60.6
84
.1
79.0
68
.3
50.1
72
.0
66.7
60
.8
56.2
51
.3
47.1
66
.8
34.5
24
.9
16.4
49
.6
12.7
69
.6
54.1
1,
033
Are
a Urba
n 85
.3
75.0
86
.3
81.8
73
.9
53.7
77
.4
72.6
66
.9
62.1
57
.3
53.7
68
.1
42.1
35
.1
20.2
53
.4
10.1
78
.7
60.3
65
5 Ru
ral
80.0
54
.7
82.7
77
.8
67.0
49
.7
70.4
65
.0
58.3
54
.7
50.1
45
.0
65.1
31
.6
20.7
13
.2
45.8
13
.5
67.1
50
.4
1,54
9 Ru
ral w
ith ro
ad
81.3
58
.2
84.3
78
.8
68.1
50
.7
71.6
65
.7
58.9
55
.0
50.1
45
.4
65.8
33
.1
21.7
13
.7
46.8
12
.4
68.1
51
.7
1,29
2 Ru
ral w
ithou
t ro
ad
73.4
37
.1
74.9
72
.4
61.3
44
.4
64.2
61
.4
55.2
53
.2
50.4
43
.0
61.6
24
.2
15.6
10
.9
40.7
19
.0
62.2
44
.1
257
Regi
on
Nort
h 82
.1
62.6
81
.2
75.7
66
.5
48.9
67
.6
61.7
54
.7
52.7
47
.4
43.9
61
.2
31.3
26
.3
18.1
40
.8
12.6
75
.4
56.2
72
3 Ce
ntra
l 81
.1
65.2
84
.8
79.5
69
.8
53.8
74
.6
70.1
63
.7
61.2
56
.7
51.0
67
.3
37.8
31
.0
18.1
53
.4
12.3
71
.3
57.7
1,
042
Sout
h 81
.7
46.8
85
.7
83.2
71
.3
46.9
75
.5
69.6
64
.0
53.6
49
.6
45.5
70
.7
33.0
8.
5 4.
1 47
.5
12.7
60
.9
38.2
43
8 Pr
ovin
ce
Vien
tiane
Cap
ital
82.6
76
.0
84.1
79
.8
76.6
49
.8
76.2
73
.6
68.3
56
.0
53.0
50
.2
72.9
34
.4
45.0
21
.4
60.7
15
.0
85.9
66
.7
237
Phon
gsal
y
74.1
41
.1
64.4
55
.3
46.3
18
.1
64.4
48
.2
36.1
31
.6
29.8
27
.7
50.2
24
.3
12.7
6.
7 26
.6
22.2
44
.5
33.6
67
Lu
angn
amth
a 89
.8
76.3
90
.4
88.5
73
.6
68.5
75
.8
75.8
67
.5
49.8
41
.2
36.7
63
.3
38.1
23
.5
21.4
37
.5
4.0
70.6
62
.7
57
Oudo
mxa
y 69
.3
44.9
72
.7
68.1
60
.8
29.2
46
.3
45.3
43
.9
32.0
28
.9
28.8
48
.1
17.7
18
.7
13.9
23
.9
17.7
69
.6
56.5
13
3 Bo
keo
82.3
75
.4
87.7
83
.7
72.0
30
.2
59.1
55
.3
47.3
53
.9
46.5
40
.1
62.1
18
.0
31.1
19
.5
36.2
8.
5 80
.7
67.7
72
Lu
angp
raba
ng
83.6
64
.5
81.3
70
.2
55.4
53
.8
68.0
55
.9
45.9
52
.5
41.3
35
.8
60.6
22
.8
11.6
5.
6 34
.5
12.8
75
.6
45.4
17
0 Hu
apha
nh
82.5
51
.2
77.6
75
.6
70.0
56
.3
76.0
74
.4
67.6
67
.0
65.5
62
.4
64.2
20
.4
35.4
24
.5
56.0
16
.3
81.9
59
.5
113
Xaya
bury
95
.3
90.3
96
.1
93.7
91
.9
78.5
87
.3
82.3
77
.6
76.7
74
.9
71.2
79
.7
80.8
54
.9
39.9
68
.1
3.9
93.3
72
.3
111
Xien
gkhu
ang
82.7
57
.2
89.1
87
.6
81.1
59
.6
77.4
74
.5
68.8
73
.6
70.5
65
.1
64.8
28
.9
26.5
18
.2
59.9
7.
0 75
.8
67.5
11
0 Vi
entia
ne
91.4
67
.1
93.6
87
.3
75.8
67
.9
90.1
83
.3
75.6
74
.5
70.1
65
.9
79.4
48
.3
25.6
14
.1
63.6
4.
5 86
.1
71.5
15
6 Bo
rikha
mxa
y 93
.9
78.2
95
.7
93.0
84
.9
63.8
94
.5
90.2
84
.1
75.0
69
.4
62.8
84
.7
50.3
51
.7
37.5
74
.9
2.7
85.0
74
.7
98
Kham
mua
ne
88.8
70
.4
91.9
90
.9
83.6
58
.5
88.4
87
.4
79.4
83
.5
80.9
71
.9
78.2
54
.2
37.7
25
.8
68.4
7.
1 60
.5
57.5
11
4 Sa
vann
akhe
t 69
.1
57.6
75
.4
66.5
50
.1
45.9
56
.6
51.0
44
.7
46.0
39
.6
32.2
50
.7
30.0
17
.7
10.0
32
.7
20.9
49
.8
35.7
28
0 Sa
rava
ne
84.2
44
.4
86.2
85
.5
69.0
62
.0
81.0
69
.2
60.2
61
.1
54.7
46
.0
79.1
53
.2
9.8
6.4
48.9
12
.0
54.9
35
.3
155
Seko
ng
87.4
66
.2
86.8
84
.6
72.6
60
.5
73.4
68
.8
67.9
55
.0
51.4
48
.1
74.2
38
.4
7.0
5.9
47.7
9.
6 59
.9
35.5
46
Ch
ampa
sack
77
.2
47.2
84
.3
82.6
76
.3
35.6
73
.2
71.5
69
.7
49.4
48
.6
48.7
63
.4
18.2
7.
8 0.
9 50
.6
14.9
64
.7
40.5
19
5 At
tape
u 87
.0
32.5
89
.3
76.4
55
.1
28.1
68
.2
62.4
46
.9
43.7
33
.2
25.7
69
.8
21.2
8.
8 8.
1 26
.6
8.5
66.0
41
.4
41
Xays
ombo
une
62.3
29
.1
64.8
53
.8
41.8
29
.4
40.1
28
.5
22.4
22
.5
14.9
9.
2 39
.7
22.2
9.
0 2.
5 8.
9 17
.8
63.0
40
.1
47
(Con
tinue
d…)
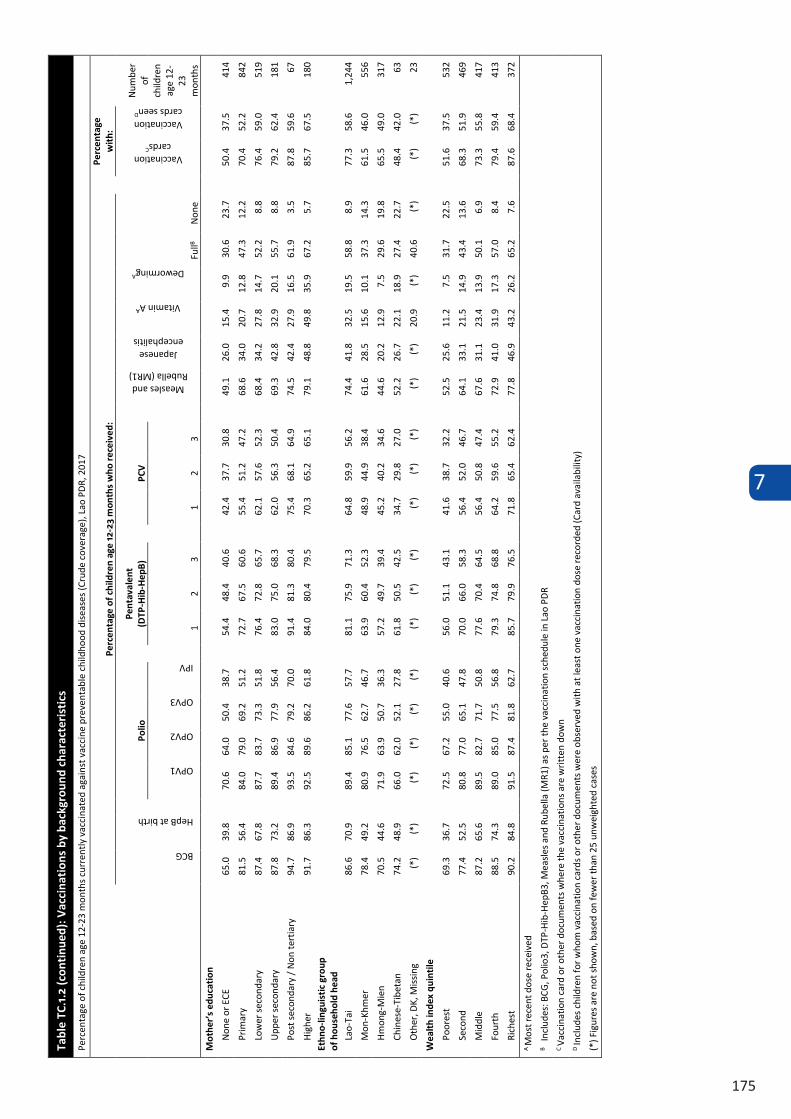
7
175
Tabl
e TC
.1.2
(con
tinu
ed):
Vac
cina
tion
s by
bac
kgro
und
char
acte
rist
ics
Perc
enta
ge o
f chi
ldre
n ag
e 12
-23
mon
ths c
urre
ntly
vac
cinat
ed a
gain
st v
accin
e pr
even
tabl
e ch
ildho
od d
iseas
es (C
rude
cove
rage
), La
o PD
R, 2
017
Perc
enta
ge o
f chi
ldre
n ag
e 12
-23
mon
ths
who
rece
ived
: Pe
rcen
tage
w
ith:
Num
ber
of
child
ren
age
12-
23
mon
ths
BCG
HepB at birth
Polio
Pe
ntav
alen
t (D
TP-H
ib-H
epB)
PC
V
Measles and Rubella (MR1)
Japanese encephalitis
Vitamin AA
DewormingA
FullB
None
Vaccination cardsC
Vaccination cards seenD
OPV1
OPV2
OPV3
IPV
1 2
3 1
2 3
Mot
her’
s ed
ucat
ion
None
or E
CE
65.0
39
.8
70.6
64
.0
50.4
38
.7
54.4
48
.4
40.6
42
.4
37.7
30
.8
49.1
26
.0
15.4
9.
9 30
.6
23.7
50
.4
37.5
41
4 Pr
imar
y 81
.5
56.4
84
.0
79.0
69
.2
51.2
72
.7
67.5
60
.6
55.4
51
.2
47.2
68
.6
34.0
20
.7
12.8
47
.3
12.2
70
.4
52.2
84
2 Lo
wer
seco
ndar
y 87
.4
67.8
87
.7
83.7
73
.3
51.8
76
.4
72.8
65
.7
62.1
57
.6
52.3
68
.4
34.2
27
.8
14.7
52
.2
8.8
76.4
59
.0
519
Uppe
r sec
onda
ry
87.8
73
.2
89.4
86
.9
77.9
56
.4
83.0
75
.0
68.3
62
.0
56.3
50
.4
69.3
42
.8
32.9
20
.1
55.7
8.
8 79
.2
62.4
18
1 Po
st se
cond
ary
/ Non
tert
iary
94
.7
86.9
93
.5
84.6
79
.2
70.0
91
.4
81.3
80
.4
75.4
68
.1
64.9
74
.5
42.4
27
.9
16.5
61
.9
3.5
87.8
59
.6
67
High
er
91.7
86
.3
92.5
89
.6
86.2
61
.8
84.0
80
.4
79.5
70
.3
65.2
65
.1
79.1
48
.8
49.8
35
.9
67.2
5.
7 85
.7
67.5
18
0 Et
hno-
lingu
isti
c gr
oup
of
hou
seho
ld h
ead
Lao-
Tai
86.6
70
.9
89.4
85
.1
77.6
57
.7
81.1
75
.9
71.3
64
.8
59.9
56
.2
74.4
41
.8
32.5
19
.5
58.8
8.
9 77
.3
58.6
1,
244
Mon
-Khm
er
78.4
49
.2
80.9
76
.5
62.7
46
.7
63.9
60
.4
52.3
48
.9
44.9
38
.4
61.6
28
.5
15.6
10
.1
37.3
14
.3
61.5
46
.0
556
Hmon
g-M
ien
70.5
44
.6
71.9
63
.9
50.7
36
.3
57.2
49
.7
39.4
45
.2
40.2
34
.6
44.6
20
.2
12.9
7.
5 29
.6
19.8
65
.5
49.0
31
7 Ch
ines
e-Ti
beta
n 74
.2
48.9
66
.0
62.0
52
.1
27.8
61
.8
50.5
42
.5
34.7
29
.8
27.0
52
.2
26.7
22
.1
18.9
27
.4
22.7
48
.4
42.0
63
Ot
her,
DK, M
issin
g (*
) (*
) (*
) (*
) (*
) (*
) (*
) (*
) (*
) (*
) (*
) (*
) (*
) (*
) 20
.9
(*)
40.6
(*
) (*
) (*
) 23
W
ealt
h in
dex
quin
tile
Poor
est
69.3
36
.7
72.5
67
.2
55.0
40
.6
56.0
51
.1
43.1
41
.6
38.7
32
.2
52.5
25
.6
11.2
7.
5 31
.7
22.5
51
.6
37.5
53
2 Se
cond
77
.4
52.5
80
.8
77.0
65
.1
47.8
70
.0
66.0
58
.3
56.4
52
.0
46.7
64
.1
33.1
21
.5
14.9
43
.4
13.6
68
.3
51.9
46
9 M
iddl
e 87
.2
65.6
89
.5
82.7
71
.7
50.8
77
.6
70.4
64
.5
56.4
50
.8
47.4
67
.6
31.1
23
.4
13.9
50
.1
6.9
73.3
55
.8
417
Four
th
88.5
74
.3
89.0
85
.0
77.5
56
.8
79.3
74
.8
68.8
64
.2
59.6
55
.2
72.9
41
.0
31.9
17
.3
57.0
8.
4 79
.4
59.4
41
3 Ri
ches
t 90
.2
84.8
91
.5
87.4
81
.8
62.7
85
.7
79.9
76
.5
71.8
65
.4
62.4
77
.8
46.9
43
.2
26.2
65
.2
7.6
87.6
68
.4
372
A M
ost r
ecen
t dos
e re
ceiv
ed
B I
nclu
des:
BCG,
Pol
io3,
DTP
-Hib
-Hep
B3, M
easle
s and
Rub
ella
(MR1
) as p
er th
e va
ccin
atio
n sc
hedu
le in
Lao
PDR
C Va
ccin
atio
n ca
rd o
r oth
er d
ocum
ents
whe
re th
e va
ccin
atio
ns a
re w
ritte
n do
wn
D In
clude
s chi
ldre
n fo
r who
m v
accin
atio
n ca
rds o
r oth
er d
ocum
ents
wer
e ob
serv
ed w
ith a
t lea
st o
ne v
accin
atio
n do
se re
cord
ed (C
ard
avai
labi
lity)
(*
) Fig
ures
are
not
show
n, b
ased
on
few
er th
an 2
5 un
wei
ghte
d ca
ses
7
176
7.2 DISEASE EPISODES
A key strategy for achieving progress toward SDG 3.2: By 2030, end preventable deaths of newborns and children under 5 years of age, with all countries aiming to reduce neonatal mortality to at least as low as 12 per 1,000 live births and under-5 mortality to at least as low as 25 per 1,000 live births, is to tackle the diseases such as diarrhoea, pneumonia, and malaria that are the leading killers of children under 5.4 Target 3.3 of the SDGs on ending the epidemics on malaria by 2030 along with other diseases is interpreted as the attainment of the Global Technical Strategy for malaria 2016–2030 and the Roll Back Malaria advocacy plan, Action and Investment to defeat Malaria 2016–2030 targets which aim at reducing malaria mortality rates globally by 90 percent compared with 2015.
Table TC.2.1 presents the percentage of children under 5 years of age who were reported to have had an episode of diarrhoea, symptoms of acute respiratory infection (ARI), or fever during the 2 weeks preceding the survey. These results are not measures of true prevalence, and should not be used as such, but rather the period-prevalence of those illnesses over a two-week time window.
The definition of a case of diarrhoea or fever, in this survey, was the mother’s (or caretaker’s) report that the child had such symptoms over the specified period; no other evidence were sought beside the opinion of the mother. A child was considered to have had an episode of ARI if the mother or caretaker reported that the child had, over the specified period, an illness with a cough with rapid or difficult breathing, and whose symptoms were perceived to be due to a problem in the chest or both a problem in the chest and a blocked or runny nose. While this approach is reasonable in the context of a LSIS II, these basically simple case definitions must be kept in mind when interpreting the results, as well as the potential for reporting and recall biases. Further, diarrhoea, fever and ARI are not only seasonal but are also characterized by the often rapid spread of localized outbreaks from one area to another at different points in time. The timing of the survey and the location of the teams might thus considerably affect the results, which must consequently be interpreted with caution. For these reasons, although the period-prevalence over a two-week time window is reported, these data should not be used to assess the epidemiological characteristics of these diseases but rather to obtain denominators for the indicators related to use of health services and treatment.
4 The main killers of children under age 5 in 2016 included preterm birth complications (18 per cent), pneumonia (16 per cent), intrapartum related events (12 per cent), diarrhoea (8 per cent), neonatal sepsis (7 per cent) and malaria (5 per cent). UNICEF, WHO, World Bank Group, and United Nations. Levels and Trends in Child Mortality Report 2017. New York: UNICEF, 2017. https://www.unicef.org/publications/index_101071.html
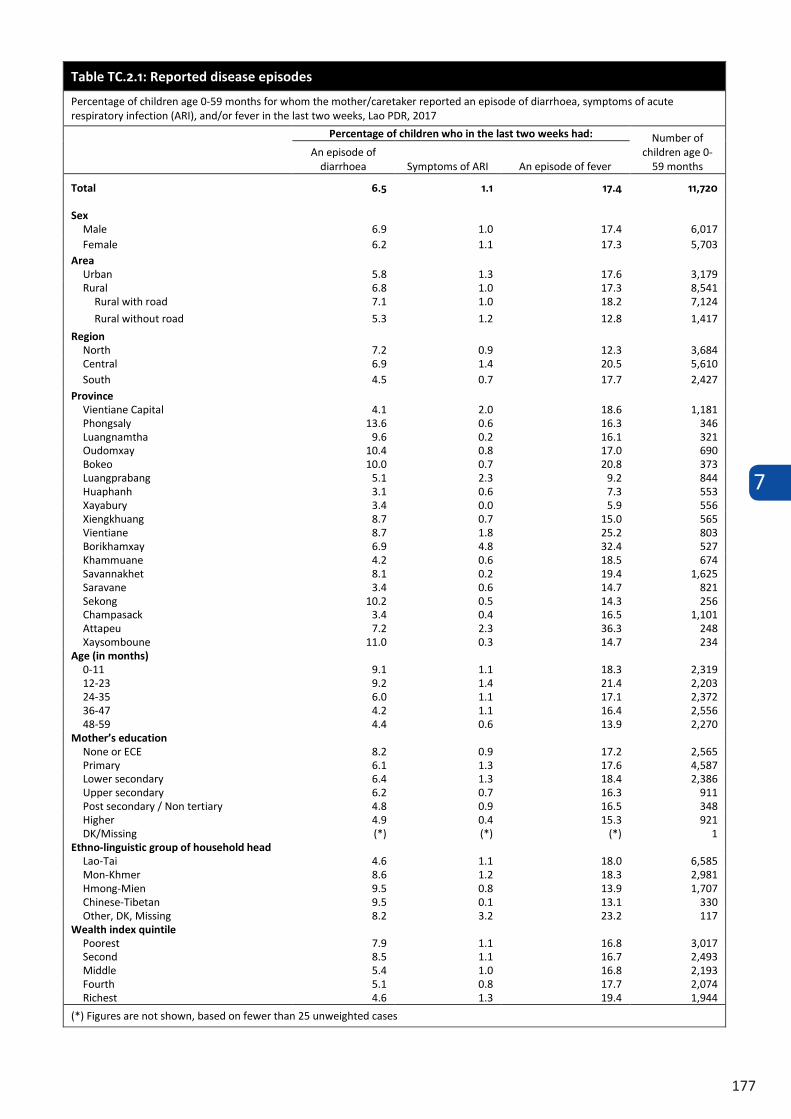
7
177
Table TC.2.1: Reported disease episodes
Percentage of children age 0-59 months for whom the mother/caretaker reported an episode of diarrhoea, symptoms of acute respiratory infection (ARI), and/or fever in the last two weeks, Lao PDR, 2017
Percentage of children who in the last two weeks had: Number of children age 0-
59 months An episode of
diarrhoea Symptoms of ARI An episode of fever
Total 6.5 1.1 17.4 11,720
Sex Male 6.9 1.0 17.4 6,017 Female 6.2 1.1 17.3 5,703
Area Urban 5.8 1.3 17.6 3,179 Rural 6.8 1.0 17.3 8,541
Rural with road 7.1 1.0 18.2 7,124 Rural without road 5.3 1.2 12.8 1,417
Region North 7.2 0.9 12.3 3,684 Central 6.9 1.4 20.5 5,610 South 4.5 0.7 17.7 2,427
Province Vientiane Capital 4.1 2.0 18.6 1,181 Phongsaly 13.6 0.6 16.3 346 Luangnamtha 9.6 0.2 16.1 321 Oudomxay 10.4 0.8 17.0 690 Bokeo 10.0 0.7 20.8 373 Luangprabang 5.1 2.3 9.2 844 Huaphanh 3.1 0.6 7.3 553 Xayabury 3.4 0.0 5.9 556 Xiengkhuang 8.7 0.7 15.0 565 Vientiane 8.7 1.8 25.2 803 Borikhamxay 6.9 4.8 32.4 527 Khammuane 4.2 0.6 18.5 674 Savannakhet 8.1 0.2 19.4 1,625 Saravane 3.4 0.6 14.7 821 Sekong 10.2 0.5 14.3 256 Champasack 3.4 0.4 16.5 1,101 Attapeu 7.2 2.3 36.3 248 Xaysomboune 11.0 0.3 14.7 234
Age (in months) 0-11 9.1 1.1 18.3 2,319 12-23 9.2 1.4 21.4 2,203 24-35 6.0 1.1 17.1 2,372 36-47 4.2 1.1 16.4 2,556 48-59 4.4 0.6 13.9 2,270
Mother’s education None or ECE 8.2 0.9 17.2 2,565 Primary 6.1 1.3 17.6 4,587 Lower secondary 6.4 1.3 18.4 2,386 Upper secondary 6.2 0.7 16.3 911 Post secondary / Non tertiary 4.8 0.9 16.5 348 Higher 4.9 0.4 15.3 921 DK/Missing (*) (*) (*) 1
Ethno-linguistic group of household head Lao-Tai 4.6 1.1 18.0 6,585 Mon-Khmer 8.6 1.2 18.3 2,981 Hmong-Mien 9.5 0.8 13.9 1,707 Chinese-Tibetan 9.5 0.1 13.1 330 Other, DK, Missing 8.2 3.2 23.2 117
Wealth index quintile Poorest 7.9 1.1 16.8 3,017 Second 8.5 1.1 16.7 2,493 Middle 5.4 1.0 16.8 2,193 Fourth 5.1 0.8 17.7 2,074 Richest 4.6 1.3 19.4 1,944
(*) Figures are not shown, based on fewer than 25 unweighted cases
7
178
Table TC.2.1: Reported disease episodes
Percentage of children age 0-59 months for whom the mother/caretaker reported an episode of diarrhoea, symptoms of acute respiratory infection (ARI), and/or fever in the last two weeks, Lao PDR, 2017
Percentage of children who in the last two weeks had: Number of children age 0-
59 months An episode of
diarrhoea Symptoms of ARI An episode of fever
Total 6.5 1.1 17.4 11,720
Sex Male 6.9 1.0 17.4 6,017 Female 6.2 1.1 17.3 5,703
Area Urban 5.8 1.3 17.6 3,179 Rural 6.8 1.0 17.3 8,541
Rural with road 7.1 1.0 18.2 7,124 Rural without road 5.3 1.2 12.8 1,417
Region North 7.2 0.9 12.3 3,684 Central 6.9 1.4 20.5 5,610 South 4.5 0.7 17.7 2,427
Province Vientiane Capital 4.1 2.0 18.6 1,181 Phongsaly 13.6 0.6 16.3 346 Luangnamtha 9.6 0.2 16.1 321 Oudomxay 10.4 0.8 17.0 690 Bokeo 10.0 0.7 20.8 373 Luangprabang 5.1 2.3 9.2 844 Huaphanh 3.1 0.6 7.3 553 Xayabury 3.4 0.0 5.9 556 Xiengkhuang 8.7 0.7 15.0 565 Vientiane 8.7 1.8 25.2 803 Borikhamxay 6.9 4.8 32.4 527 Khammuane 4.2 0.6 18.5 674 Savannakhet 8.1 0.2 19.4 1,625 Saravane 3.4 0.6 14.7 821 Sekong 10.2 0.5 14.3 256 Champasack 3.4 0.4 16.5 1,101 Attapeu 7.2 2.3 36.3 248 Xaysomboune 11.0 0.3 14.7 234
Age (in months) 0-11 9.1 1.1 18.3 2,319 12-23 9.2 1.4 21.4 2,203 24-35 6.0 1.1 17.1 2,372 36-47 4.2 1.1 16.4 2,556 48-59 4.4 0.6 13.9 2,270
Mother’s education None or ECE 8.2 0.9 17.2 2,565 Primary 6.1 1.3 17.6 4,587 Lower secondary 6.4 1.3 18.4 2,386 Upper secondary 6.2 0.7 16.3 911 Post secondary / Non tertiary 4.8 0.9 16.5 348 Higher 4.9 0.4 15.3 921 DK/Missing (*) (*) (*) 1
Ethno-linguistic group of household head Lao-Tai 4.6 1.1 18.0 6,585 Mon-Khmer 8.6 1.2 18.3 2,981 Hmong-Mien 9.5 0.8 13.9 1,707 Chinese-Tibetan 9.5 0.1 13.1 330 Other, DK, Missing 8.2 3.2 23.2 117
Wealth index quintile Poorest 7.9 1.1 16.8 3,017 Second 8.5 1.1 16.7 2,493 Middle 5.4 1.0 16.8 2,193 Fourth 5.1 0.8 17.7 2,074 Richest 4.6 1.3 19.4 1,944
(*) Figures are not shown, based on fewer than 25 unweighted cases
7.3 DIARRHOEA
Diarrhoea is one of the leading cause of death among children under five worldwide.5 Most diarrhoea-related deaths in children are due to dehydration from loss of large quantities of water and electrolytes from the body in liquid stools. Management of diarrhoea – either through oral rehydration salt solution (ORS) or a recommended home fluid (RHF) – can prevent many of these deaths. In addition, provision of zinc supplements has been shown to reduce the duration and severity of the illness as well as the risk of future episodes within the next two or three months. While provision of safe water and sanitation facilities is an important strategy for the prevention of diarrhoea, preventing dehydration and malnutrition by increasing fluid intake and continuing to feed the child are also important strategies for managing diarrhoea.
In the LSIS 2017, mothers or caretakers were asked whether their child under age five years had an episode of diarrhoea in the two weeks prior to the survey. In cases where mothers reported that the child had diarrhoea, a series of questions were asked about the treatment of the illness, including what the child had been given to drink and eat during the episode and whether this was more or less than what was usually given to the child.
Table TC.3.1 shows the percentage of children age 0-59 months with diarrhoea in the two weeks preceding the survey for whom advice or treatment was sought and where.
Table TC.3.2 shows patterns on drinking and feeding practices during diarrhoea among children age 0-59 months.
Table TC.3.3 shows the percentage of children age 0-59 months receiving ORS, various types of recommended homemade fluids and zinc during the episode of diarrhoea. Since children may have been given more than one type of liquid, the percentages do not necessarily add to 100.
Table TC3.4 provides the proportion of children age 0-59 months with diarrhoea in the last two weeks who received oral rehydration therapy with continued feeding, and the percentage of children with diarrhoea who received other treatments.
Table TC.3.5 provides information on the source of ORS and zinc for children age 0-59 months who benefitted from these treatments.
5 United Nations Children’s Fund. One is Too Many: Ending Child Deaths from Pneumonia and Diarrhoea. New York: UNICEF, 2016. https://data.unicef.org/wp-content/uploads/2016/11/UNICEF-Pneumonia-Diarrhoea-report2016-web-version.pdf.
Almost 60 per cent of deaths due to diarrhoea worldwide are attributable to unsafe drinking water and poor hygiene and sanitation. Hand washing with soap alone can cut the risk of diarrhoea by at least 40 per cent and significantly lower the risk of respiratory infections. Clean home environments and good hygiene are important for preventing the spread of both pneumonia and diarrhoea, and safe drinking water and proper disposal of human waste, including child faeces, are vital to stopping the spread of diarrhoeal disease among children and adults.
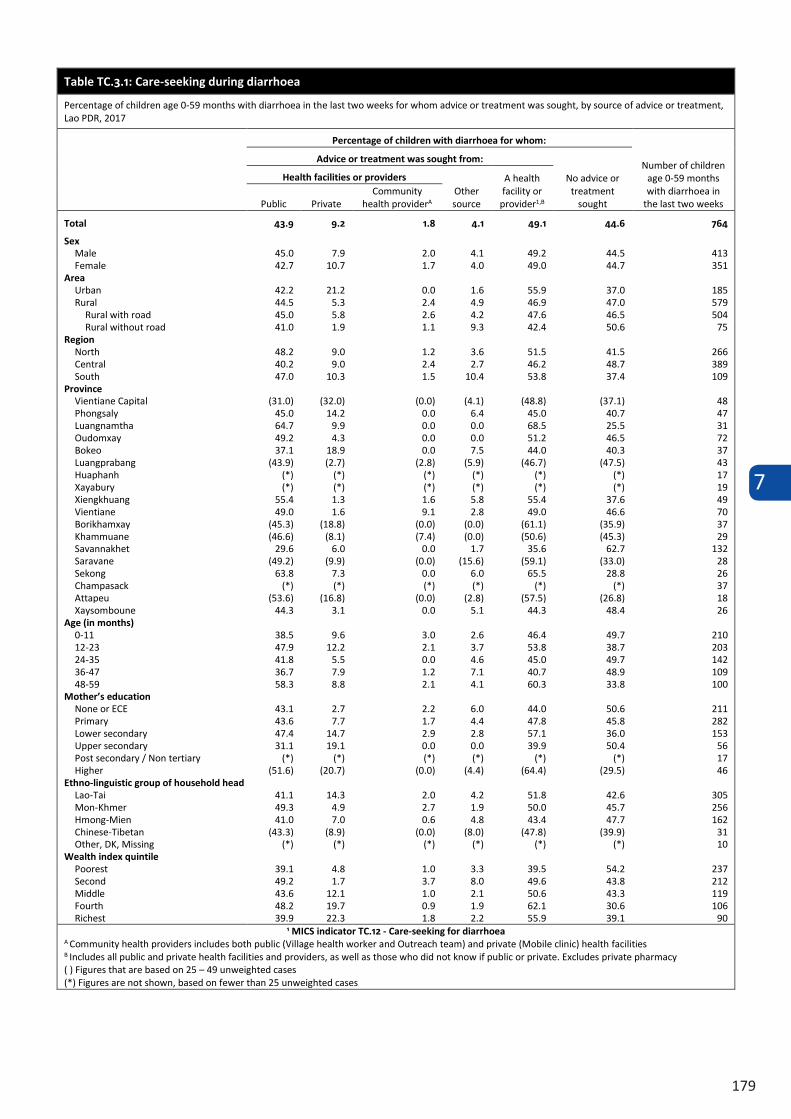
7
179
Table TC.3.1: Care-seeking during diarrhoea
Percentage of children age 0-59 months with diarrhoea in the last two weeks for whom advice or treatment was sought, by source of advice or treatment, Lao PDR, 2017
Percentage of children with diarrhoea for whom:
Number of children age 0-59 months with diarrhoea in
the last two weeks
Advice or treatment was sought from:
No advice or treatment
sought
Health facilities or providers Other source
A health facility or
provider1,B Public Private Community
health providerA
Total 43.9 9.2 1.8 4.1 49.1 44.6 764
Sex Male 45.0 7.9 2.0 4.1 49.2 44.5 413 Female 42.7 10.7 1.7 4.0 49.0 44.7 351
Area Urban 42.2 21.2 0.0 1.6 55.9 37.0 185 Rural 44.5 5.3 2.4 4.9 46.9 47.0 579
Rural with road 45.0 5.8 2.6 4.2 47.6 46.5 504 Rural without road 41.0 1.9 1.1 9.3 42.4 50.6 75
Region North 48.2 9.0 1.2 3.6 51.5 41.5 266 Central 40.2 9.0 2.4 2.7 46.2 48.7 389 South 47.0 10.3 1.5 10.4 53.8 37.4 109
Province Vientiane Capital (31.0) (32.0) (0.0) (4.1) (48.8) (37.1) 48 Phongsaly 45.0 14.2 0.0 6.4 45.0 40.7 47 Luangnamtha 64.7 9.9 0.0 0.0 68.5 25.5 31 Oudomxay 49.2 4.3 0.0 0.0 51.2 46.5 72 Bokeo 37.1 18.9 0.0 7.5 44.0 40.3 37 Luangprabang (43.9) (2.7) (2.8) (5.9) (46.7) (47.5) 43 Huaphanh (*) (*) (*) (*) (*) (*) 17 Xayabury (*) (*) (*) (*) (*) (*) 19 Xiengkhuang 55.4 1.3 1.6 5.8 55.4 37.6 49 Vientiane 49.0 1.6 9.1 2.8 49.0 46.6 70 Borikhamxay (45.3) (18.8) (0.0) (0.0) (61.1) (35.9) 37 Khammuane (46.6) (8.1) (7.4) (0.0) (50.6) (45.3) 29 Savannakhet 29.6 6.0 0.0 1.7 35.6 62.7 132 Saravane (49.2) (9.9) (0.0) (15.6) (59.1) (33.0) 28 Sekong 63.8 7.3 0.0 6.0 65.5 28.8 26 Champasack (*) (*) (*) (*) (*) (*) 37 Attapeu (53.6) (16.8) (0.0) (2.8) (57.5) (26.8) 18 Xaysomboune 44.3 3.1 0.0 5.1 44.3 48.4 26
Age (in months) 0-11 38.5 9.6 3.0 2.6 46.4 49.7 210 12-23 47.9 12.2 2.1 3.7 53.8 38.7 203 24-35 41.8 5.5 0.0 4.6 45.0 49.7 142 36-47 36.7 7.9 1.2 7.1 40.7 48.9 109 48-59 58.3 8.8 2.1 4.1 60.3 33.8 100
Mother’s education None or ECE 43.1 2.7 2.2 6.0 44.0 50.6 211 Primary 43.6 7.7 1.7 4.4 47.8 45.8 282 Lower secondary 47.4 14.7 2.9 2.8 57.1 36.0 153 Upper secondary 31.1 19.1 0.0 0.0 39.9 50.4 56 Post secondary / Non tertiary (*) (*) (*) (*) (*) (*) 17 Higher (51.6) (20.7) (0.0) (4.4) (64.4) (29.5) 46
Ethno-linguistic group of household head Lao-Tai 41.1 14.3 2.0 4.2 51.8 42.6 305 Mon-Khmer 49.3 4.9 2.7 1.9 50.0 45.7 256 Hmong-Mien 41.0 7.0 0.6 4.8 43.4 47.7 162 Chinese-Tibetan (43.3) (8.9) (0.0) (8.0) (47.8) (39.9) 31 Other, DK, Missing (*) (*) (*) (*) (*) (*) 10
Wealth index quintile Poorest 39.1 4.8 1.0 3.3 39.5 54.2 237 Second 49.2 1.7 3.7 8.0 49.6 43.8 212 Middle 43.6 12.1 1.0 2.1 50.6 43.3 119 Fourth 48.2 19.7 0.9 1.9 62.1 30.6 106 Richest 39.9 22.3 1.8 2.2 55.9 39.1 90
1 MICS indicator TC.12 - Care-seeking for diarrhoea A Community health providers includes both public (Village health worker and Outreach team) and private (Mobile clinic) health facilities B Includes all public and private health facilities and providers, as well as those who did not know if public or private. Excludes private pharmacy ( ) Figures that are based on 25 – 49 unweighted cases (*) Figures are not shown, based on fewer than 25 unweighted cases
Tabl
e TC
.3.2
: Fee
ding
pra
ctic
es d
urin
g di
arrh
oea
Perc
ent d
istrib
utio
n of
child
ren
age
0-59
mon
ths w
ith d
iarr
hoea
in th
e la
st tw
o w
eeks
by
amou
nt o
f liq
uids
and
food
giv
en d
urin
g ep
isode
of d
iarr
hoea
, Lao
PDR
, 201
7
Dri
nkin
g pr
acti
ces
duri
ng d
iarr
hoea
Ea
ting
pra
ctic
es d
urin
g di
arrh
oea
Num
ber
of ch
ildre
n ag
e 0-
59 m
onth
s w
ith d
iarr
hoea
in
the
last
two
wee
ks
Child
was
giv
en to
dri
nk:
Tota
l
Child
was
giv
en to
eat
:
Tota
l M
uch
less
So
mew
hat
less
Abou
t th
e sa
me
Mor
e No
thin
g M
issin
g/
DK
Muc
h le
ss
Som
ewha
t le
ss
Abou
t th
e sa
me
Mor
e No
thin
g M
issin
g/
DK
Tota
l 4.
1 26
.7
40.7
19
.9
8.4
0.2
10
0.0
3.
8 33
.9
45.9
14
.1
2.1
0.2
10
0.0
76
4
Sex M
ale
4.0
26.5
37
.4
21.7
10
.1
0.3
100.
0 4.
3 33
.7
44.4
15
.1
2.2
0.3
100.
0 41
3 Fe
mal
e 4.
3 27
.1
44.5
17
.9
6.3
0.0
100.
0 3.
3 34
.1
47.7
13
.0
1.9
0.0
100.
0 35
1 A
rea Ur
ban
4.5
28.0
34
.2
27.3
5.
3 0.
7 10
0.0
2.7
33.5
43
.3
18.9
1.
6 0.
0 10
0.0
185
Rura
l 4.
0 26
.3
42.7
17
.6
9.3
0.0
100.
0 4.
2 34
.0
46.7
12
.6
2.2
0.2
100.
0 57
9 Ru
ral w
ith ro
ad
4.5
24.4
43
.9
17.8
9.
4 0.
0 10
0.0
4.7
31.9
48
.2
13.0
1.
9 0.
2 10
0.0
504
Rura
l with
out r
oad
1.1
39.4
34
.7
15.8
9.
0 0.
0 10
0.0
0.7
48.0
36
.5
10.2
4.
5 0.
0 10
0.0
75
Regi
on
Nort
h 5.
2 33
.7
33.2
19
.0
8.4
0.5
100.
0 4.
8 42
.1
33.7
15
.8
3.1
0.4
100.
0 26
6 Ce
ntra
l 4.
2 23
.8
45.4
17
.1
9.5
0.0
100.
0 4.
2 30
.4
52.1
12
.2
1.1
0.0
100.
0 38
9 So
uth
1.2
20.1
42
.2
32.5
4.
1 0.
0 10
0.0
0.2
26.1
53
.5
17.0
3.
1 0.
0 10
0.0
109
Prov
ince
Vi
entia
ne C
apita
l (4
.2)
(28.
7)
(29.
9)
(30.
2)
(7.1
) (0
.0)
100.
0 (0
.0)
(22.
2)
(52.
1)
(21.
4)
(4.3
) (0
.0)
100.
0 48
Ph
ongs
aly
0.
0 47
.0
25.1
12
.4
15.5
0.
0 10
0.0
0.0
64.3
25
.4
4.5
5.8
0.0
100.
0 47
Lu
angn
amth
a 0.
0 39
.9
47.8
6.
4 5.
9 0.
0 10
0.0
0.0
54.2
41
.9
3.9
0.0
0.0
100.
0 31
Ou
dom
xay
1.4
45.5
40
.5
11.1
1.
5 0.
0 10
0.0
1.4
48.0
39
.5
8.5
2.6
0.0
100.
0 72
Bo
keo
6.3
20.4
30
.6
28.6
14
.1
0.0
100.
0 9.
8 31
.5
35.4
19
.7
3.6
0.0
100.
0 37
Lu
angp
raba
ng
(11.
8)
(22.
9)
(32.
4)
(21.
2)
(8.8
) (2
.9)
100.
0 (1
1.8)
(3
0.5)
(3
3.4)
(1
8.8)
(5
.5)
(0.0
) 10
0.0
43
Huap
hanh
(*
) (*
) (*
) (*
) (*
) (*
) 10
0.0
(*)
(*)
(*)
(*)
(*)
(*)
100.
0 17
Xa
yabu
ry
(*)
(*)
(*)
(*)
(*)
(*)
100.
0 (*
) (*
) (*
) (*
) (*
) (*
) 10
0.0
19
Xien
gkhu
ang
3.2
27.3
64
.5
1.7
3.2
0.0
100.
0 0.
0 26
.4
66.8
6.
8 0.
0 0.
0 10
0.0
49
Vien
tiane
1.
3 25
.5
42.2
19
.2
11.8
0.
0 10
0.0
8.0
44.9
35
.9
11.2
0.
0 0.
0 10
0.0
70
Borik
ham
xay
(8.2
) (1
5.0)
(2
6.7)
(2
6.8)
(2
3.3)
(0
.0)
100.
0 (8
.3)
(26.
4)
(41.
3)
(18.
9)
(5.1
) (0
.0)
100.
0 37
Kh
amm
uane
(7
.8)
(7.2
) (3
1.8)
(4
0.6)
(1
2.6)
(0
.0)
100.
0 (3
.3)
(14.
7)
(48.
2)
(33.
9)
(0.0
) (0
.0)
100.
0 29
Sa
vann
akhe
t 4.
9 23
.1
57.6
6.
3 8.
0 0.
0 10
0.0
4.8
31.3
63
.8
0.0
0.0
0.0
100.
0 13
2 Sa
rava
ne
(3.4
) (1
5.1)
(2
3.4)
(4
7.2)
(1
0.8)
(0
.0)
100.
0 (0
.0)
(21.
1)
(42.
2)
(25.
7)
(11.
0)
(0.0
) 10
0.0
28
Seko
ng
1.3
15.6
55
.5
23.1
4.
5 0.
0 10
0.0
0.0
20.0
68
.9
9.8
1.3
0.0
100.
0 26
Ch
ampa
sack
(*
) (*
) (*
) (*
) (*
) (*
) 10
0.0
(*)
(*)
(*)
(*)
(*)
(*)
100.
0 37
At
tape
u (0
.0)
(30.
5)
(47.
7)
(20.
1)
(1.6
) (0
.0)
100.
0 (1
.4)
(41.
0)
(49.
7)
(7.9
) (0
.0)
(0.0
) 10
0.0
18
Xays
ombo
une
1.5
37.9
25
.3
31.5
3.
9 0.
0 10
0.0
1.5
32.8
28
.0
36.8
1.
0 0.
0 10
0.0
26
(Con
tinue
d…)
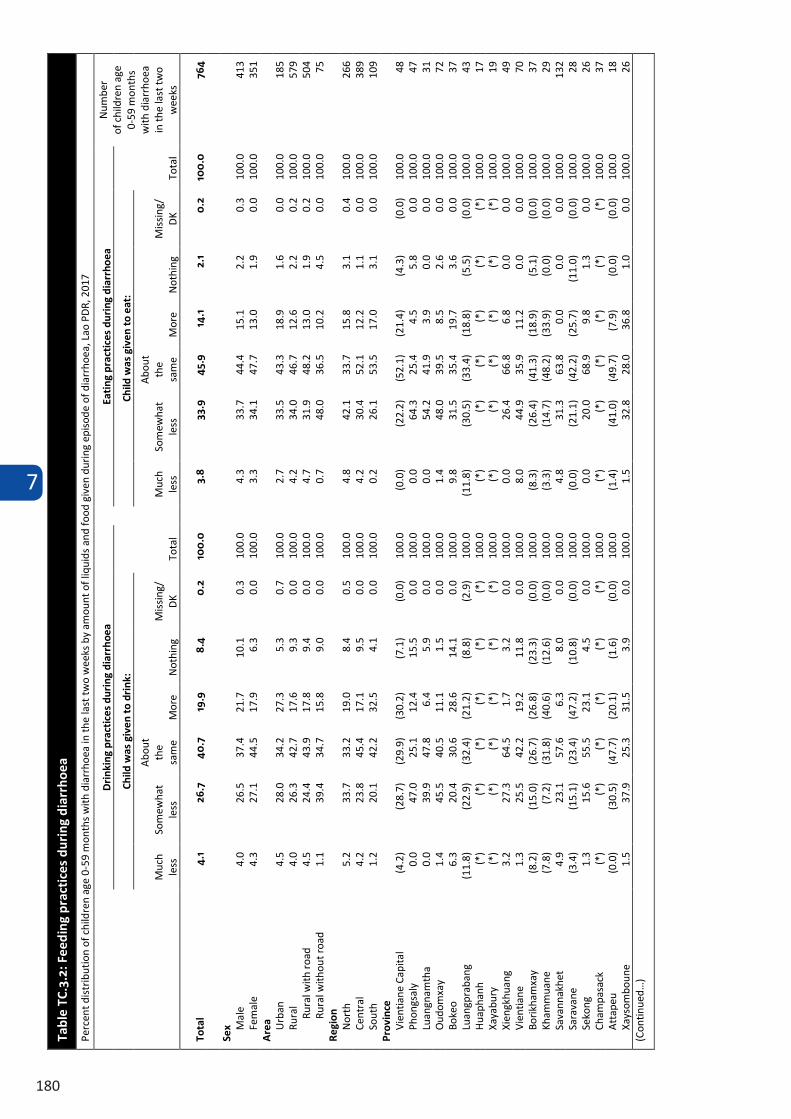
7
180
Tabl
e TC
.3.2
: Fee
ding
pra
ctic
es d
urin
g di
arrh
oea
Perc
ent d
istrib
utio
n of
child
ren
age
0-59
mon
ths w
ith d
iarr
hoea
in th
e la
st tw
o w
eeks
by
amou
nt o
f liq
uids
and
food
giv
en d
urin
g ep
isode
of d
iarr
hoea
, Lao
PDR
, 201
7
Dri
nkin
g pr
acti
ces
duri
ng d
iarr
hoea
Ea
ting
pra
ctic
es d
urin
g di
arrh
oea
Num
ber
of ch
ildre
n ag
e 0-
59 m
onth
s w
ith d
iarr
hoea
in
the
last
two
wee
ks
Child
was
giv
en to
dri
nk:
Tota
l
Child
was
giv
en to
eat
:
Tota
l M
uch
less
So
mew
hat
less
Abou
t th
e sa
me
Mor
e No
thin
g M
issin
g/
DK
Muc
h le
ss
Som
ewha
t le
ss
Abou
t th
e sa
me
Mor
e No
thin
g M
issin
g/
DK
Tota
l 4.
1 26
.7
40.7
19
.9
8.4
0.2
10
0.0
3.
8 33
.9
45.9
14
.1
2.1
0.2
10
0.0
76
4
Sex M
ale
4.0
26.5
37
.4
21.7
10
.1
0.3
100.
0 4.
3 33
.7
44.4
15
.1
2.2
0.3
100.
0 41
3 Fe
mal
e 4.
3 27
.1
44.5
17
.9
6.3
0.0
100.
0 3.
3 34
.1
47.7
13
.0
1.9
0.0
100.
0 35
1 A
rea Ur
ban
4.5
28.0
34
.2
27.3
5.
3 0.
7 10
0.0
2.7
33.5
43
.3
18.9
1.
6 0.
0 10
0.0
185
Rura
l 4.
0 26
.3
42.7
17
.6
9.3
0.0
100.
0 4.
2 34
.0
46.7
12
.6
2.2
0.2
100.
0 57
9 Ru
ral w
ith ro
ad
4.5
24.4
43
.9
17.8
9.
4 0.
0 10
0.0
4.7
31.9
48
.2
13.0
1.
9 0.
2 10
0.0
504
Rura
l with
out r
oad
1.1
39.4
34
.7
15.8
9.
0 0.
0 10
0.0
0.7
48.0
36
.5
10.2
4.
5 0.
0 10
0.0
75
Regi
on
Nort
h 5.
2 33
.7
33.2
19
.0
8.4
0.5
100.
0 4.
8 42
.1
33.7
15
.8
3.1
0.4
100.
0 26
6 Ce
ntra
l 4.
2 23
.8
45.4
17
.1
9.5
0.0
100.
0 4.
2 30
.4
52.1
12
.2
1.1
0.0
100.
0 38
9 So
uth
1.2
20.1
42
.2
32.5
4.
1 0.
0 10
0.0
0.2
26.1
53
.5
17.0
3.
1 0.
0 10
0.0
109
Prov
ince
Vi
entia
ne C
apita
l (4
.2)
(28.
7)
(29.
9)
(30.
2)
(7.1
) (0
.0)
100.
0 (0
.0)
(22.
2)
(52.
1)
(21.
4)
(4.3
) (0
.0)
100.
0 48
Ph
ongs
aly
0.
0 47
.0
25.1
12
.4
15.5
0.
0 10
0.0
0.0
64.3
25
.4
4.5
5.8
0.0
100.
0 47
Lu
angn
amth
a 0.
0 39
.9
47.8
6.
4 5.
9 0.
0 10
0.0
0.0
54.2
41
.9
3.9
0.0
0.0
100.
0 31
Ou
dom
xay
1.4
45.5
40
.5
11.1
1.
5 0.
0 10
0.0
1.4
48.0
39
.5
8.5
2.6
0.0
100.
0 72
Bo
keo
6.3
20.4
30
.6
28.6
14
.1
0.0
100.
0 9.
8 31
.5
35.4
19
.7
3.6
0.0
100.
0 37
Lu
angp
raba
ng
(11.
8)
(22.
9)
(32.
4)
(21.
2)
(8.8
) (2
.9)
100.
0 (1
1.8)
(3
0.5)
(3
3.4)
(1
8.8)
(5
.5)
(0.0
) 10
0.0
43
Huap
hanh
(*
) (*
) (*
) (*
) (*
) (*
) 10
0.0
(*)
(*)
(*)
(*)
(*)
(*)
100.
0 17
Xa
yabu
ry
(*)
(*)
(*)
(*)
(*)
(*)
100.
0 (*
) (*
) (*
) (*
) (*
) (*
) 10
0.0
19
Xien
gkhu
ang
3.2
27.3
64
.5
1.7
3.2
0.0
100.
0 0.
0 26
.4
66.8
6.
8 0.
0 0.
0 10
0.0
49
Vien
tiane
1.
3 25
.5
42.2
19
.2
11.8
0.
0 10
0.0
8.0
44.9
35
.9
11.2
0.
0 0.
0 10
0.0
70
Borik
ham
xay
(8.2
) (1
5.0)
(2
6.7)
(2
6.8)
(2
3.3)
(0
.0)
100.
0 (8
.3)
(26.
4)
(41.
3)
(18.
9)
(5.1
) (0
.0)
100.
0 37
Kh
amm
uane
(7
.8)
(7.2
) (3
1.8)
(4
0.6)
(1
2.6)
(0
.0)
100.
0 (3
.3)
(14.
7)
(48.
2)
(33.
9)
(0.0
) (0
.0)
100.
0 29
Sa
vann
akhe
t 4.
9 23
.1
57.6
6.
3 8.
0 0.
0 10
0.0
4.8
31.3
63
.8
0.0
0.0
0.0
100.
0 13
2 Sa
rava
ne
(3.4
) (1
5.1)
(2
3.4)
(4
7.2)
(1
0.8)
(0
.0)
100.
0 (0
.0)
(21.
1)
(42.
2)
(25.
7)
(11.
0)
(0.0
) 10
0.0
28
Seko
ng
1.3
15.6
55
.5
23.1
4.
5 0.
0 10
0.0
0.0
20.0
68
.9
9.8
1.3
0.0
100.
0 26
Ch
ampa
sack
(*
) (*
) (*
) (*
) (*
) (*
) 10
0.0
(*)
(*)
(*)
(*)
(*)
(*)
100.
0 37
At
tape
u (0
.0)
(30.
5)
(47.
7)
(20.
1)
(1.6
) (0
.0)
100.
0 (1
.4)
(41.
0)
(49.
7)
(7.9
) (0
.0)
(0.0
) 10
0.0
18
Xays
ombo
une
1.5
37.9
25
.3
31.5
3.
9 0.
0 10
0.0
1.5
32.8
28
.0
36.8
1.
0 0.
0 10
0.0
26
(Con
tinue
d…)
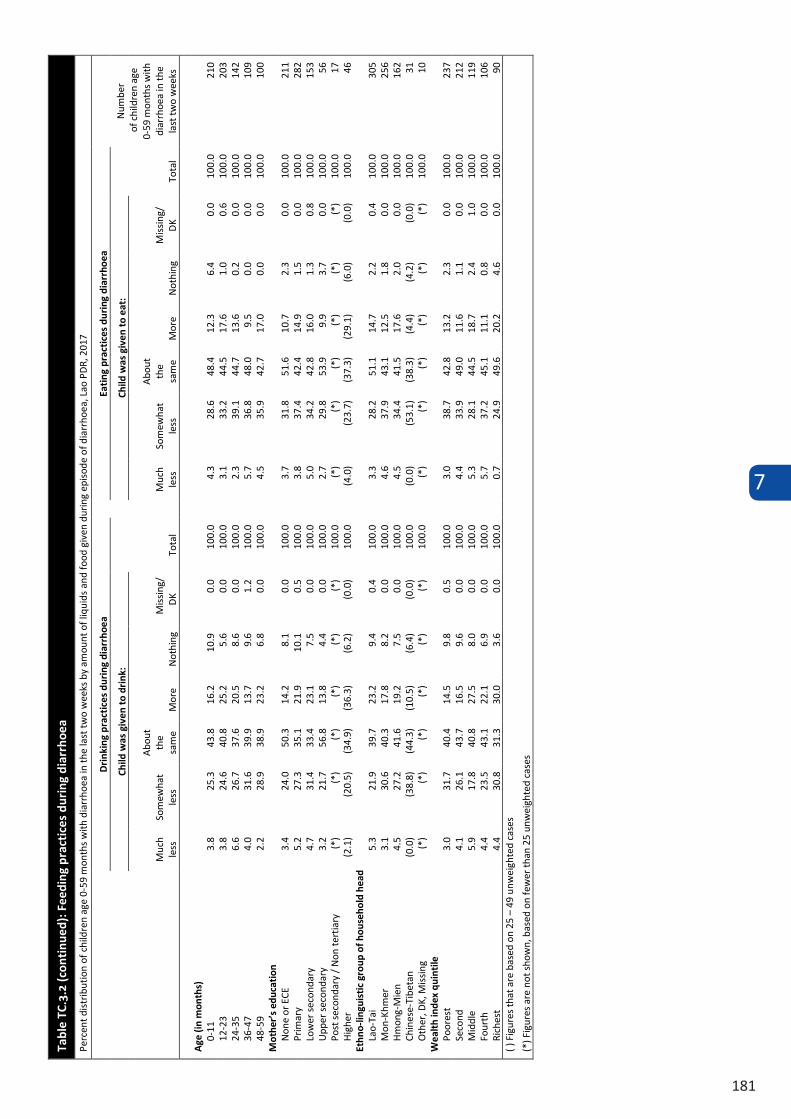
7
181
Tabl
e TC
.3.2
(con
tinu
ed):
Fee
ding
pra
ctic
es d
urin
g di
arrh
oea
Perc
ent d
istrib
utio
n of
child
ren
age
0-59
mon
ths w
ith d
iarr
hoea
in th
e la
st tw
o w
eeks
by
amou
nt o
f liq
uids
and
food
giv
en d
urin
g ep
isode
of d
iarr
hoea
, Lao
PDR
, 201
7
Dri
nkin
g pr
acti
ces
duri
ng d
iarr
hoea
Ea
ting
pra
ctic
es d
urin
g di
arrh
oea
Num
ber
of c
hild
ren
age
0-59
mon
ths w
ith
diar
rhoe
a in
the
last
two
wee
ks
Child
was
giv
en to
dri
nk:
Tota
l
Child
was
giv
en to
eat
:
Tota
l M
uch
less
So
mew
hat
less
Abou
t th
e sa
me
Mor
e No
thin
g M
issin
g/
DK
Muc
h le
ss
Som
ewha
t le
ss
Abou
t th
e sa
me
Mor
e No
thin
g M
issin
g/
DK
Age
(in
mon
ths)
0-
11
3.8
25.3
43
.8
16.2
10
.9
0.0
100.
0 4.
3 28
.6
48.4
12
.3
6.4
0.0
100.
0 21
0 12
-23
3.8
24.6
40
.8
25.2
5.
6 0.
0 10
0.0
3.1
33.2
44
.5
17.6
1.
0 0.
6 10
0.0
203
24-3
5 6.
6 26
.7
37.6
20
.5
8.6
0.0
100.
0 2.
3 39
.1
44.7
13
.6
0.2
0.0
100.
0 14
2 36
-47
4.0
31.6
39
.9
13.7
9.
6 1.
2 10
0.0
5.7
36.8
48
.0
9.5
0.0
0.0
100.
0 10
9 48
-59
2.2
28.9
38
.9
23.2
6.
8 0.
0 10
0.0
4.5
35.9
42
.7
17.0
0.
0 0.
0 10
0.0
100
Mot
her’
s ed
ucat
ion
None
or E
CE
3.4
24.0
50
.3
14.2
8.
1 0.
0 10
0.0
3.7
31.8
51
.6
10.7
2.
3 0.
0 10
0.0
211
Prim
ary
5.2
27.3
35
.1
21.9
10
.1
0.5
100.
0 3.
8 37
.4
42.4
14
.9
1.5
0.0
100.
0 28
2 Lo
wer
seco
ndar
y 4.
7 31
.4
33.4
23
.1
7.5
0.0
100.
0 5.
0 34
.2
42.8
16
.0
1.3
0.8
100.
0 15
3 Up
per s
econ
dary
3.
2 21
.7
56.8
13
.8
4.4
0.0
100.
0 2.
7 29
.8
53.9
9.
9 3.
7 0.
0 10
0.0
56
Post
seco
ndar
y / N
on te
rtia
ry
(*)
(*)
(*)
(*)
(*)
(*)
100.
0 (*
) (*
) (*
) (*
) (*
) (*
) 10
0.0
17
High
er
(2.1
) (2
0.5)
(3
4.9)
(3
6.3)
(6
.2)
(0.0
) 10
0.0
(4.0
) (2
3.7)
(3
7.3)
(2
9.1)
(6
.0)
(0.0
) 10
0.0
46
Ethn
o-lin
guis
tic
grou
p of
hou
seho
ld h
ead
Lao-
Tai
5.3
21.9
39
.7
23.2
9.
4 0.
4 10
0.0
3.3
28.2
51
.1
14.7
2.
2 0.
4 10
0.0
305
Mon
-Khm
er
3.1
30.6
40
.3
17.8
8.
2 0.
0 10
0.0
4.6
37.9
43
.1
12.5
1.
8 0.
0 10
0.0
256
Hmon
g-M
ien
4.5
27.2
41
.6
19.2
7.
5 0.
0 10
0.0
4.5
34.4
41
.5
17.6
2.
0 0.
0 10
0.0
162
Chin
ese-
Tibe
tan
(0.0
) (3
8.8)
(4
4.3)
(1
0.5)
(6
.4)
(0.0
) 10
0.0
(0.0
) (5
3.1)
(3
8.3)
(4
.4)
(4.2
) (0
.0)
100.
0 31
Ot
her,
DK, M
issin
g (*
) (*
) (*
) (*
) (*
) (*
) 10
0.0
(*)
(*)
(*)
(*)
(*)
(*)
100.
0 10
W
ealt
h in
dex
quin
tile
Po
ores
t 3.
0 31
.7
40.4
14
.5
9.8
0.5
100.
0 3.
0 38
.7
42.8
13
.2
2.3
0.0
100.
0 23
7 Se
cond
4.
1 26
.1
43.7
16
.5
9.6
0.0
100.
0 4.
4 33
.9
49.0
11
.6
1.1
0.0
100.
0 21
2 M
iddl
e 5.
9 17
.8
40.8
27
.5
8.0
0.0
100.
0 5.
3 28
.1
44.5
18
.7
2.4
1.0
100.
0 11
9 Fo
urth
4.
4 23
.5
43.1
22
.1
6.9
0.0
100.
0 5.
7 37
.2
45.1
11
.1
0.8
0.0
100.
0 10
6 Ri
ches
t 4.
4 30
.8
31.3
30
.0
3.6
0.0
100.
0 0.
7 24
.9
49.6
20
.2
4.6
0.0
100.
0 90
( )
Fig
ures
that
are
bas
ed o
n 25
– 4
9 un
wei
ghte
d ca
ses
(*) F
igur
es a
re n
ot sh
own,
bas
ed o
n fe
wer
than
25
unw
eigh
ted
case
s
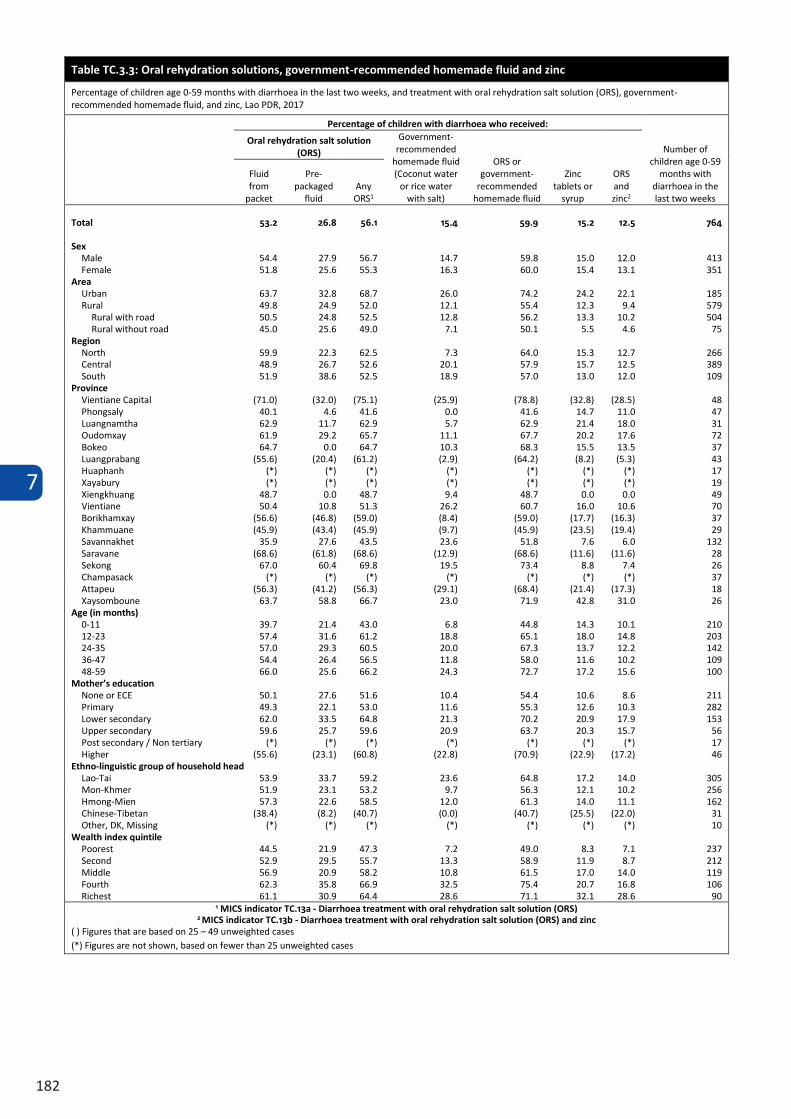
7
182
Table TC.3.3: Oral rehydration solutions, government-recommended homemade fluid and zinc
Percentage of children age 0-59 months with diarrhoea in the last two weeks, and treatment with oral rehydration salt solution (ORS), government-recommended homemade fluid, and zinc, Lao PDR, 2017
Percentage of children with diarrhoea who received:
Number of children age 0-59
months with diarrhoea in the last two weeks
Oral rehydration salt solution (ORS)
Government-recommended
homemade fluid (Coconut water
or rice water with salt)
ORS or government-
recommended homemade fluid
Zinc tablets or
syrup
ORS and zinc2
Fluid from
packet
Pre-packaged
fluid Any ORS1
Total 53.2 26.8 56.1 15.4 59.9 15.2 12.5 764
Sex Male 54.4 27.9 56.7 14.7 59.8 15.0 12.0 413 Female 51.8 25.6 55.3 16.3 60.0 15.4 13.1 351
Area Urban 63.7 32.8 68.7 26.0 74.2 24.2 22.1 185 Rural 49.8 24.9 52.0 12.1 55.4 12.3 9.4 579
Rural with road 50.5 24.8 52.5 12.8 56.2 13.3 10.2 504 Rural without road 45.0 25.6 49.0 7.1 50.1 5.5 4.6 75
Region North 59.9 22.3 62.5 7.3 64.0 15.3 12.7 266 Central 48.9 26.7 52.6 20.1 57.9 15.7 12.5 389 South 51.9 38.6 52.5 18.9 57.0 13.0 12.0 109
Province Vientiane Capital (71.0) (32.0) (75.1) (25.9) (78.8) (32.8) (28.5) 48 Phongsaly 40.1 4.6 41.6 0.0 41.6 14.7 11.0 47 Luangnamtha 62.9 11.7 62.9 5.7 62.9 21.4 18.0 31 Oudomxay 61.9 29.2 65.7 11.1 67.7 20.2 17.6 72 Bokeo 64.7 0.0 64.7 10.3 68.3 15.5 13.5 37 Luangprabang (55.6) (20.4) (61.2) (2.9) (64.2) (8.2) (5.3) 43 Huaphanh (*) (*) (*) (*) (*) (*) (*) 17 Xayabury (*) (*) (*) (*) (*) (*) (*) 19 Xiengkhuang 48.7 0.0 48.7 9.4 48.7 0.0 0.0 49 Vientiane 50.4 10.8 51.3 26.2 60.7 16.0 10.6 70 Borikhamxay (56.6) (46.8) (59.0) (8.4) (59.0) (17.7) (16.3) 37 Khammuane (45.9) (43.4) (45.9) (9.7) (45.9) (23.5) (19.4) 29 Savannakhet 35.9 27.6 43.5 23.6 51.8 7.6 6.0 132 Saravane (68.6) (61.8) (68.6) (12.9) (68.6) (11.6) (11.6) 28 Sekong 67.0 60.4 69.8 19.5 73.4 8.8 7.4 26 Champasack (*) (*) (*) (*) (*) (*) (*) 37 Attapeu (56.3) (41.2) (56.3) (29.1) (68.4) (21.4) (17.3) 18 Xaysomboune 63.7 58.8 66.7 23.0 71.9 42.8 31.0 26
Age (in months) 0-11 39.7 21.4 43.0 6.8 44.8 14.3 10.1 210 12-23 57.4 31.6 61.2 18.8 65.1 18.0 14.8 203 24-35 57.0 29.3 60.5 20.0 67.3 13.7 12.2 142 36-47 54.4 26.4 56.5 11.8 58.0 11.6 10.2 109 48-59 66.0 25.6 66.2 24.3 72.7 17.2 15.6 100
Mother’s education None or ECE 50.1 27.6 51.6 10.4 54.4 10.6 8.6 211 Primary 49.3 22.1 53.0 11.6 55.3 12.6 10.3 282 Lower secondary 62.0 33.5 64.8 21.3 70.2 20.9 17.9 153 Upper secondary 59.6 25.7 59.6 20.9 63.7 20.3 15.7 56 Post secondary / Non tertiary (*) (*) (*) (*) (*) (*) (*) 17 Higher (55.6) (23.1) (60.8) (22.8) (70.9) (22.9) (17.2) 46
Ethno-linguistic group of household head Lao-Tai 53.9 33.7 59.2 23.6 64.8 17.2 14.0 305 Mon-Khmer 51.9 23.1 53.2 9.7 56.3 12.1 10.2 256 Hmong-Mien 57.3 22.6 58.5 12.0 61.3 14.0 11.1 162 Chinese-Tibetan (38.4) (8.2) (40.7) (0.0) (40.7) (25.5) (22.0) 31 Other, DK, Missing (*) (*) (*) (*) (*) (*) (*) 10
Wealth index quintile Poorest 44.5 21.9 47.3 7.2 49.0 8.3 7.1 237 Second 52.9 29.5 55.7 13.3 58.9 11.9 8.7 212 Middle 56.9 20.9 58.2 10.8 61.5 17.0 14.0 119 Fourth 62.3 35.8 66.9 32.5 75.4 20.7 16.8 106 Richest 61.1 30.9 64.4 28.6 71.1 32.1 28.6 90
1 MICS indicator TC.13a - Diarrhoea treatment with oral rehydration salt solution (ORS) 2 MICS indicator TC.13b - Diarrhoea treatment with oral rehydration salt solution (ORS) and zinc
( ) Figures that are based on 25 – 49 unweighted cases (*) Figures are not shown, based on fewer than 25 unweighted cases
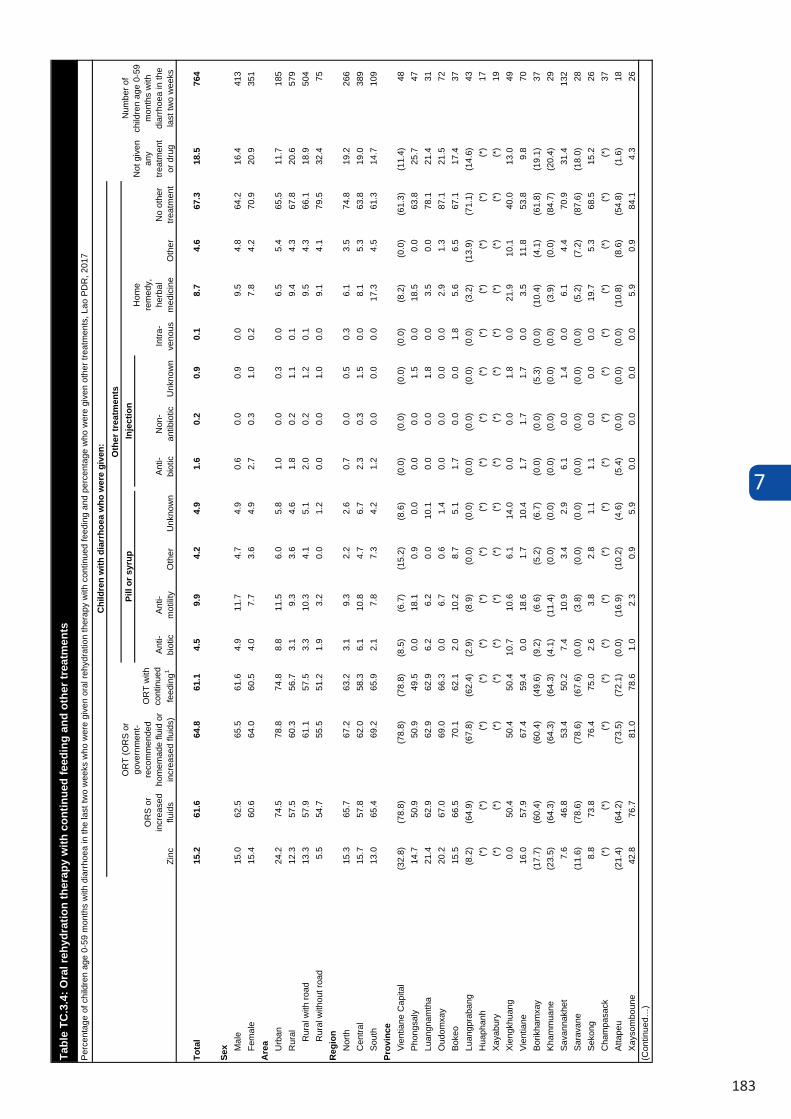
7
183
Tabl
e TC
.3.4
(con
tinu
ed) :
Ora
l reh
ydra
tion
the
rapy
wit
h co
ntin
ued
feed
ing
and
othe
r tr
eatm
ents
Perc
enta
ge o
f chi
ldre
n ag
e 0-
59 m
onth
s with
dia
rrho
ea in
the
last
two
wee
ks w
ho w
ere
give
n or
al re
hydr
atio
n th
erap
y w
ith co
ntin
ued
feed
ing
and
perc
enta
ge w
ho w
ere
give
n ot
her t
reat
men
ts, L
ao P
DR, 2
017
Child
ren
wit
h di
arrh
oea
who
wer
e gi
ven:
Not
give
n an
y tr
eatm
ent
or
drug
Num
ber o
f ch
ildre
n ag
e 0-
59
mon
ths
with
di
arrh
oea
in th
e la
st
two
wee
ks
Zinc
ORS
or
incr
ease
d flu
ids
ORT
(ORS
or
gove
rnm
ent-
reco
mm
ende
d ho
mem
ade
fluid
or
incr
ease
d flu
ids)
ORT
with
co
ntin
ued
feed
ing1
Oth
er tr
eatm
ents
Pill
or s
yrup
In
ject
ion
Intr
a-ve
nous
Hom
e re
med
y,
herb
al
med
icine
Ot
her
No
othe
r tr
eatm
ent
Anti-
bi
otic
Anti-
mot
ility
Ot
her
Unkn
own
Anti-
bi
otic
Non-
antib
iotic
Un
know
n
Age
(in
mon
ths)
0-
11
14.3
52
.2
52.9
47
.9
4.5
9.5
7.4
5.2
1.1
0.6
0.9
0.0
7.3
5.0
65.1
26
.4
210
12-2
3 18
.0
67.2
70
.9
67.0
7.
3 10
.5
3.7
6.1
1.5
0.0
0.8
0.0
9.1
4.7
65.9
13
.7
203
24-3
5 13
.7
64.1
69
.5
67.9
3.
4 9.
5 1.
0 2.
2 2.
8 0.
0 0.
6 0.
5 10
.5
6.5
69.2
16
.4
142
36-4
7 11
.6
59.9
61
.2
57.3
4.
5 8.
6 2.
9 4.
7 1.
0 0.
0 0.
8 0.
0 9.
4 2.
2 70
.2
19.6
10
9 48
-59
17.2
68
.2
74.6
71
.1
0.7
11.3
4.
3 6.
1 1.
6 0.
0 1.
9 0.
0 7.
8 3.
2 68
.7
13.2
10
0 M
othe
r’s
educ
atio
n No
ne o
r ECE
10
.6
55.8
57
.6
54.8
2.
5 11
.3
2.9
3.2
1.5
0.0
1.6
0.3
9.1
3.3
70.5
24
.7
211
Prim
ary
12.6
59
.4
61.5
58
.1
3.1
10.4
4.
3 5.
3 1.
9 0.
4 1.
0 0.
0 8.
1 5.
3 66
.0
18.6
28
2 Lo
wer
seco
ndar
y 20
.9
72.0
77
.0
71.8
6.
1 7.
6 3.
6 4.
6 1.
1 0.
0 0.
0 0.
0 10
.6
5.9
67.3
12
.0
153
Uppe
r sec
onda
ry
20.3
60
.9
64.9
62
.3
8.4
2.0
6.8
12.0
0.
0 0.
0 2.
0 0.
0 4.
9 6.
0 62
.7
20.6
56
Po
st se
cond
ary
/ Non
te
rtia
ry(*
) (*
) (*
) (*
) (*
) (*
) (*
) (*
) (*
) (*
) (*
) (*
) (*
) (*
) (*
) (*
) 17
Hi
gher
(2
2.9)
(6
8.5)
(7
4.7)
(6
6.2)
(1
.6)
(8.9
) (6
.1)
(4.5
) (0
.0)
(0.0
) (0
.0)
(0.0
) (1
2.5)
(1
.0)
(71.
4)
(11.
5)
46
Ethn
o-lin
guis
tic
grou
p of
hou
seho
ld h
ead
Lao-
Tai
17.2
65
.4
69.6
66
.2
7.3
10.7
5.
7 6.
0 2.
5 0.
0 0.
0 0.
0 5.
2 4.
7 67
.9
17.0
30
5 M
on-K
hmer
12
.1
58.2
61
.1
56.5
2.
1 8.
6 3.
3 3.
5 1.
7 0.
5 1.
5 0.
0 9.
7 4.
7 69
.0
21.6
25
6 Hm
ong-
Mie
n 14
.0
62.8
65
.4
61.8
3.
8 9.
2 3.
5 4.
5 0.
0 0.
0 2.
1 0.
4 11
.2
5.2
65.1
14
.5
162
Chin
ese-
Tibe
tan
(25.
5)
(47.
0)
(47.
0)
(44.
8)
(1.9
) (1
4.7)
(1
.3)
(3.8
) (0
.0)
(0.0
) (0
.0)
(0.0
) (1
3.7)
(0
.0)
(68.
3)
(26.
3)
31
Othe
r, DK
, Miss
ing
(*)
(*)
(*)
(*)
(*)
(*)
(*)
(*)
(*)
(*)
(*)
(*)
(*)
(*)
(*)
(*)
10
Wea
lth
inde
x qu
inti
le
Poor
est
8.3
52.6
53
.9
51.0
1.
3 11
.7
2.6
4.4
1.6
0.0
1.3
0.0
12.3
5.
4 64
.4
24.4
23
7 Se
cond
11
.9
61.2
63
.2
59.2
3.
6 7.
5 3.
1 1.
8 1.
2 0.
0 0.
0 0.
3 9.
2 3.
1 74
.2
19.0
21
2 M
iddl
e 17
.0
65.5
68
.9
64.7
5.
4 9.
2 6.
7 9.
2 1.
0 1.
0 3.
5 0.
0 6.
2 4.
3 63
.6
15.8
11
9 Fo
urth
20
.7
70.0
78
.5
73.4
11
.9
12.5
6.
1 7.
5 4.
3 0.
0 0.
0 0.
0 6.
3 7.
2 58
.2
8.1
106
Rich
est
32.1
71
.3
76.0
73
.0
5.4
8.2
5.4
4.8
0.0
0.0
0.0
0.0
4.6
2.9
74.1
17
.1
90
1 M
ICS
indi
cato
r TC
.14
- Dia
rrho
ea tr
eatm
ent w
ith
oral
reh
ydra
tion
ther
apy
(ORT
) and
con
tinu
ed fe
edin
g ( )
Fig
ures
that
are
bas
ed o
n 25
– 4
9 un
wei
ghte
d ca
ses
(*) F
igur
es a
re n
ot sh
own,
bas
ed o
n fe
wer
than
25
unw
eigh
ted
case
s
Tota
l15
.261
.664
.861
.14.
59.
94.
24.
91.
60.
20.
90.
18.
74.
667
.318
.576
4
Sex M
ale
15.0
62.5
65.5
61.6
4.9
11.7
4.7
4.9
0.6
0.0
0.9
0.0
9.5
4.8
64.2
16.4
413
Fem
ale
15.4
60.6
64.0
60.5
4.0
7.7
3.6
4.9
2.7
0.3
1.0
0.2
7.8
4.2
70.9
20.9
351
Are
a Urb
an24
.274
.578
.874
.88.
811
.56.
05.
81.
00.
00.
30.
06.
55.
465
.511
.718
5R
ural
12.3
57.5
60.3
56.7
3.1
9.3
3.6
4.6
1.8
0.2
1.1
0.1
9.4
4.3
67.8
20.6
579
Rur
al w
ith ro
ad13
.357
.961
.157
.53.
310
.34.
15.
12.
00.
21.
20.
19.
54.
366
.118
.950
4R
ural
with
out r
oad
5.5
54.7
55.5
51.2
1.9
3.2
0.0
1.2
0.0
0.0
1.0
0.0
9.1
4.1
79.5
32.4
75R
egio
nN
orth
15.3
65.7
67.2
63.2
3.1
9.3
2.2
2.6
0.7
0.0
0.5
0.3
6.1
3.5
74.8
19.2
266
Cen
tral
15.7
57.8
62.0
58.3
6.1
10.8
4.7
6.7
2.3
0.3
1.5
0.0
8.1
5.3
63.8
19.0
389
Sou
th13
.065
.469
.265
.92.
17.
87.
34.
21.
20.
00.
00.
017
.34.
561
.314
.710
9Pr
ovin
ceV
ient
iane
Cap
ital
(32.
8)(7
8.8)
(78.
8)(7
8.8)
(8.5
)(6
.7)
(15.
2)(8
.6)
(0.0
)(0
.0)
(0.0
)(0
.0)
(8.2
)(0
.0)
(61.
3)(1
1.4)
48P
hong
saly
14
.750
.950
.949
.50.
018
.10.
90.
00.
00.
01.
50.
018
.50.
063
.825
.747
Luan
gnam
tha
21.4
62.9
62.9
62.9
6.2
6.2
0.0
10.1
0.0
0.0
1.8
0.0
3.5
0.0
78.1
21.4
31O
udom
xay
20.2
67.0
69.0
66.3
0.0
6.7
0.6
1.4
0.0
0.0
0.0
0.0
2.9
1.3
87.1
21.5
72B
okeo
15.5
66.5
70.1
62.1
2.0
10.2
8.7
5.1
1.7
0.0
0.0
1.8
5.6
6.5
67.1
17.4
37Lu
angp
raba
ng(8
.2)
(64.
9)(6
7.8)
(62.
4)(2
.9)
(8.9
)(0
.0)
(0.0
)(0
.0)
(0.0
)(0
.0)
(0.0
)(3
.2)
(13.
9)(7
1.1)
(14.
6)43
Hua
phan
h(*
)(*
)(*
)(*
)(*
)(*
)(*
)(*
)(*
)(*
)(*
)(*
)(*
)(*
)(*
)(*
)17
Xay
abur
y(*
)(*
)(*
)(*
)(*
)(*
)(*
)(*
)(*
)(*
)(*
)(*
)(*
)(*
)(*
)(*
)19
Xie
ngkh
uang
0.0
50.4
50.4
50.4
10.7
10.6
6.1
14.0
0.0
0.0
1.8
0.0
21.9
10.1
40.0
13.0
49V
ient
iane
16.0
57.9
67.4
59.4
0.0
18.6
1.7
10.4
1.7
1.7
1.7
0.0
3.5
11.8
53.8
9.8
70B
orik
ham
xay
(17.
7)(6
0.4)
(60.
4)(4
9.6)
(9.2
)(6
.6)
(5.2
)(6
.7)
(0.0
)(0
.0)
(5.3
)(0
.0)
(10.
4)(4
.1)
(61.
8)(1
9.1)
37K
ham
mua
ne(2
3.5)
(64.
3)(6
4.3)
(64.
3)(4
.1)
(11.
4)(0
.0)
(0.0
)(0
.0)
(0.0
)(0
.0)
(0.0
)(3
.9)
(0.0
)(8
4.7)
(20.
4)29
Sav
anna
khet
7.6
46.8
53.4
50.2
7.4
10.9
3.4
2.9
6.1
0.0
1.4
0.0
6.1
4.4
70.9
31.4
132
Sar
avan
e(1
1.6)
(78.
6)(7
8.6)
(67.
6)(0
.0)
(3.8
)(0
.0)
(0.0
)(0
.0)
(0.0
)(0
.0)
(0.0
)(5
.2)
(7.2
)(8
7.6)
(18.
0)28
Sek
ong
8.8
73.8
76.4
75.0
2.6
3.8
2.8
1.1
1.1
0.0
0.0
0.0
19.7
5.3
68.5
15.2
26C
ham
pasa
ck(*
)(*
)(*
)(*
)(*
)(*
)(*
)(*
)(*
)(*
)(*
)(*
)(*
)(*
)(*
)(*
)37
Atta
peu
(21.
4)(6
4.2)
(73.
5)(7
2.1)
(0.0
)(1
6.9)
(10.
2)(4
.6)
(5.4
)(0
.0)
(0.0
)(0
.0)
(10.
8)(8
.6)
(54.
8)(1
.6)
18X
ayso
mbo
une
42.8
76.7
81.0
78.6
1.0
2.3
0.9
5.9
0.0
0.0
0.0
0.0
5.9
0.9
84.1
4.3
26
Unk
now
nA
nti-
biot
icN
on-
antib
iotic
Unk
now
nN
o ot
her
treat
men
tA
nti-
biot
icA
nti-
mot
ility
Oth
er
(Con
tinue
d…)
Tabl
e TC
.3.4
: Ora
l reh
ydra
tion
ther
apy
with
con
tinue
d fe
edin
g an
d ot
her t
reat
men
ts
Per
cent
age
of c
hild
ren
age
0-59
mon
ths
with
dia
rrho
ea in
the
last
two
wee
ks w
ho w
ere
give
n or
al re
hydr
atio
n th
erap
y w
ith c
ontin
ued
feed
ing
and
perc
enta
ge w
ho w
ere
give
n ot
her t
reat
men
ts, L
ao P
DR
, 201
7
Chi
ldre
n w
ith d
iarr
hoea
who
wer
e gi
ven:
Not
giv
en
any
treat
men
tor
dru
g
Num
ber o
f ch
ildre
n ag
e 0-
59
mon
ths
with
di
arrh
oea
in th
e la
st tw
o w
eeks
Zinc
OR
S o
r in
crea
sed
fluid
s
OR
T (O
RS
or
gove
rnm
ent-
reco
mm
ende
dho
mem
ade
fluid
or
incr
ease
d flu
ids)
OR
T w
ith
cont
inue
dfe
edin
g1
Oth
er tr
eatm
ents
Pill
or s
yrup
Inje
ctio
n
Intra
-ve
nous
Hom
ere
med
y,he
rbal
med
icin
eO
ther
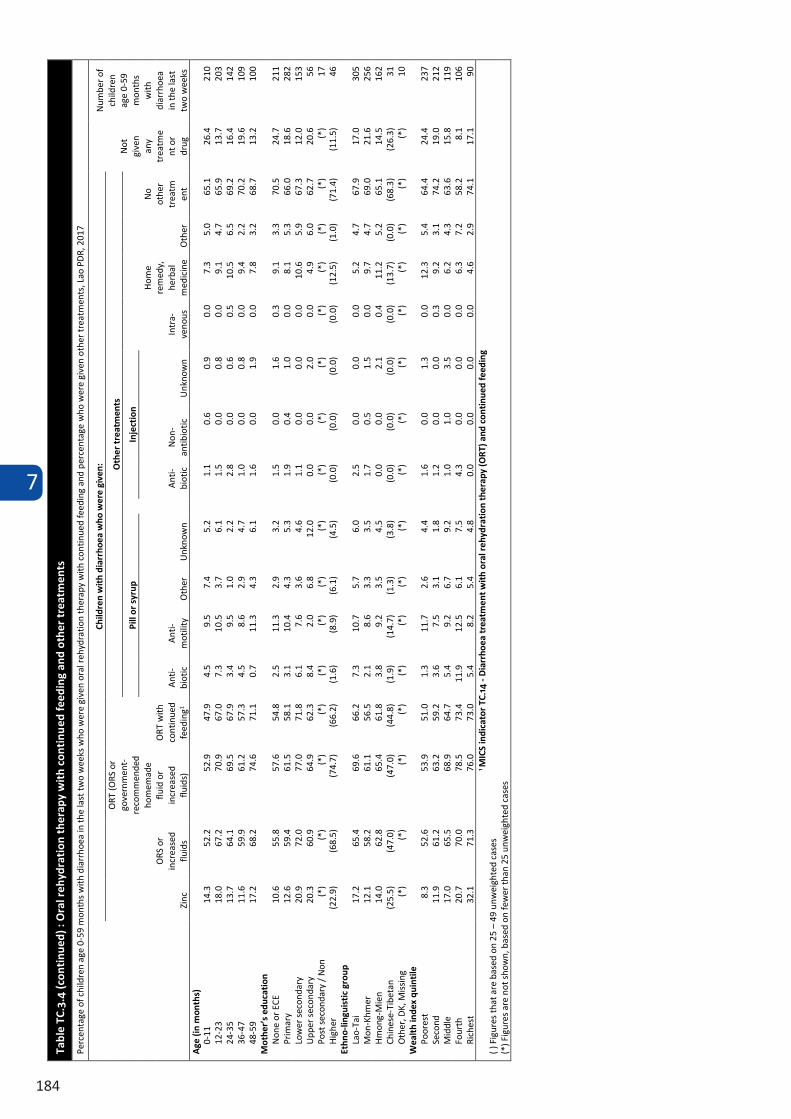
7
184
Tabl
e TC
.3.4
(con
tinu
ed) :
Ora
l reh
ydra
tion
the
rapy
wit
h co
ntin
ued
feed
ing
and
othe
r tr
eatm
ents
Perc
enta
ge o
f chi
ldre
n ag
e 0-
59 m
onth
s with
dia
rrho
ea in
the
last
two
wee
ks w
ho w
ere
give
n or
al re
hydr
atio
n th
erap
y w
ith co
ntin
ued
feed
ing
and
perc
enta
ge w
ho w
ere
give
n ot
her t
reat
men
ts, L
ao P
DR, 2
017
Child
ren
wit
h di
arrh
oea
who
wer
e gi
ven:
Not
give
n an
y tr
eatm
ent
or
drug
Num
ber o
f ch
ildre
n ag
e 0-
59
mon
ths
with
di
arrh
oea
in th
e la
st
two
wee
ks
Zinc
ORS
or
incr
ease
d flu
ids
ORT
(ORS
or
gove
rnm
ent-
reco
mm
ende
d ho
mem
ade
fluid
or
incr
ease
d flu
ids)
ORT
with
co
ntin
ued
feed
ing1
Oth
er tr
eatm
ents
Pill
or s
yrup
In
ject
ion
Intr
a-ve
nous
Hom
e re
med
y,
herb
al
med
icine
Ot
her
No
othe
r tr
eatm
ent
Anti-
bi
otic
Anti-
mot
ility
Ot
her
Unkn
own
Anti-
bi
otic
Non-
antib
iotic
Un
know
n
Age
(in
mon
ths)
0-
11
14.3
52
.2
52.9
47
.9
4.5
9.5
7.4
5.2
1.1
0.6
0.9
0.0
7.3
5.0
65.1
26
.4
210
12-2
3 18
.0
67.2
70
.9
67.0
7.
3 10
.5
3.7
6.1
1.5
0.0
0.8
0.0
9.1
4.7
65.9
13
.7
203
24-3
5 13
.7
64.1
69
.5
67.9
3.
4 9.
5 1.
0 2.
2 2.
8 0.
0 0.
6 0.
5 10
.5
6.5
69.2
16
.4
142
36-4
7 11
.6
59.9
61
.2
57.3
4.
5 8.
6 2.
9 4.
7 1.
0 0.
0 0.
8 0.
0 9.
4 2.
2 70
.2
19.6
10
9 48
-59
17.2
68
.2
74.6
71
.1
0.7
11.3
4.
3 6.
1 1.
6 0.
0 1.
9 0.
0 7.
8 3.
2 68
.7
13.2
10
0 M
othe
r’s
educ
atio
n No
ne o
r ECE
10
.6
55.8
57
.6
54.8
2.
5 11
.3
2.9
3.2
1.5
0.0
1.6
0.3
9.1
3.3
70.5
24
.7
211
Prim
ary
12.6
59
.4
61.5
58
.1
3.1
10.4
4.
3 5.
3 1.
9 0.
4 1.
0 0.
0 8.
1 5.
3 66
.0
18.6
28
2 Lo
wer
seco
ndar
y 20
.9
72.0
77
.0
71.8
6.
1 7.
6 3.
6 4.
6 1.
1 0.
0 0.
0 0.
0 10
.6
5.9
67.3
12
.0
153
Uppe
r sec
onda
ry
20.3
60
.9
64.9
62
.3
8.4
2.0
6.8
12.0
0.
0 0.
0 2.
0 0.
0 4.
9 6.
0 62
.7
20.6
56
Po
st se
cond
ary
/ Non
te
rtia
ry(*
) (*
) (*
) (*
) (*
) (*
) (*
) (*
) (*
) (*
) (*
) (*
) (*
) (*
) (*
) (*
) 17
Hi
gher
(2
2.9)
(6
8.5)
(7
4.7)
(6
6.2)
(1
.6)
(8.9
) (6
.1)
(4.5
) (0
.0)
(0.0
) (0
.0)
(0.0
) (1
2.5)
(1
.0)
(71.
4)
(11.
5)
46
Ethn
o-lin
guis
tic
grou
p of
hou
seho
ld h
ead
Lao-
Tai
17.2
65
.4
69.6
66
.2
7.3
10.7
5.
7 6.
0 2.
5 0.
0 0.
0 0.
0 5.
2 4.
7 67
.9
17.0
30
5 M
on-K
hmer
12
.1
58.2
61
.1
56.5
2.
1 8.
6 3.
3 3.
5 1.
7 0.
5 1.
5 0.
0 9.
7 4.
7 69
.0
21.6
25
6 Hm
ong-
Mie
n 14
.0
62.8
65
.4
61.8
3.
8 9.
2 3.
5 4.
5 0.
0 0.
0 2.
1 0.
4 11
.2
5.2
65.1
14
.5
162
Chin
ese-
Tibe
tan
(25.
5)
(47.
0)
(47.
0)
(44.
8)
(1.9
) (1
4.7)
(1
.3)
(3.8
) (0
.0)
(0.0
) (0
.0)
(0.0
) (1
3.7)
(0
.0)
(68.
3)
(26.
3)
31
Othe
r, DK
, Miss
ing
(*)
(*)
(*)
(*)
(*)
(*)
(*)
(*)
(*)
(*)
(*)
(*)
(*)
(*)
(*)
(*)
10
Wea
lth
inde
x qu
inti
le
Poor
est
8.3
52.6
53
.9
51.0
1.
3 11
.7
2.6
4.4
1.6
0.0
1.3
0.0
12.3
5.
4 64
.4
24.4
23
7 Se
cond
11
.9
61.2
63
.2
59.2
3.
6 7.
5 3.
1 1.
8 1.
2 0.
0 0.
0 0.
3 9.
2 3.
1 74
.2
19.0
21
2 M
iddl
e 17
.0
65.5
68
.9
64.7
5.
4 9.
2 6.
7 9.
2 1.
0 1.
0 3.
5 0.
0 6.
2 4.
3 63
.6
15.8
11
9 Fo
urth
20
.7
70.0
78
.5
73.4
11
.9
12.5
6.
1 7.
5 4.
3 0.
0 0.
0 0.
0 6.
3 7.
2 58
.2
8.1
106
Rich
est
32.1
71
.3
76.0
73
.0
5.4
8.2
5.4
4.8
0.0
0.0
0.0
0.0
4.6
2.9
74.1
17
.1
90
1 M
ICS
indi
cato
r TC
.14
- Dia
rrho
ea tr
eatm
ent w
ith
oral
reh
ydra
tion
ther
apy
(ORT
) and
con
tinu
ed fe
edin
g ( )
Fig
ures
that
are
bas
ed o
n 25
– 4
9 un
wei
ghte
d ca
ses
(*) F
igur
es a
re n
ot sh
own,
bas
ed o
n fe
wer
than
25
unw
eigh
ted
case
s
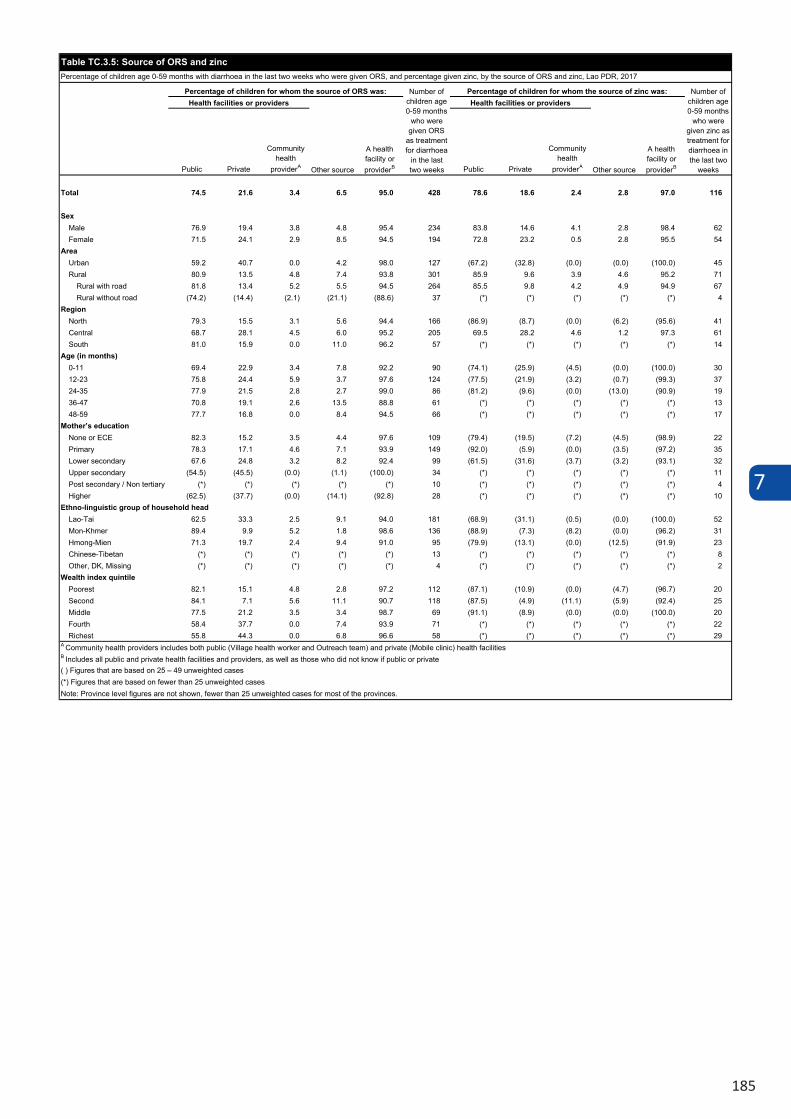
7
185
7.4 HOUSEHOLD ENERGY USE
There is a global consensus and an ever-growing body of evidence that expanding access to clean household energy for cooking, heating, and lighting is key to achieving a range of global priorities such as improving health, gender equality, equitable economic development and environmental protection. Goal 7 of the Sustainable Development Goals seeks to ensure access to affordable, reliable sustainable and modern energy for all by 2030 and would be measured as the percentage of the population relying on clean fuels and technology. 6
The Lao DPR, 2017 LSIS II included a module with questions to assess the main technologies and fuels used for cooking, heating, and lighting. Information was also collected about the use of technologies with chimneys or other venting mechanisms which can improve indoor air quality through moving a fraction of the pollutants outdoors.
Households that use clean fuels and technologies for cooking are those mainly using electric stove, solar cooker, LPG (Liquefied Petroleum Gas)/cooking gas stove, biogas stove, or a liquid fuel stove burning ethanol/alcohol only. Table TC.4.1 presents the percent distribution of household members according to type of cookstove mainly used by the household and percentage of household members living in households using clean fuels and technologies for cooking.
6 WHO. 2016. Burning Opportunity: Clean Household Energy for Health, Sustainable Development, and Wellbeing
of Women and Children. Geneva: WHO Press, 2016. http://apps.who.int/iris/bitstream/handle/10665/204717/
9789241565233_eng.pdf;jsessionid=63CEC48ED96098D4256007A76FEB8907?sequence=1
Table TC.4.2 further presents the percent distribution of household members using polluting fuels and technologies for cooking according to type of cooking fuel mainly used by the household, and percentage of household members living in households using polluting fuels and technologies for cooking while Table TC.4.3 presents the percent distribution of household members in households using polluted fuels for cooking by type and characteristics of cookstove and by place of cooking.
Households that use clean fuels and technologies for space heating are those mainly relying on central heating or using solar air heater, electricity, piped natural gas, LPG/cooking gas, biogas, or alcohol/ethanol. Table TC.4.4 presents the percent distribution of household members according to type of fuel mainly used for space heating by the household, and percentage of household members living in households using clean fuels and technologies for space heating. Table TC.4.5 presents the percent distribution of household members by the type of space heating mainly used in the household and presence of chimney.
Households that use clean fuels and technologies for lighting are those mainly using electricity, solar lantern, rechargeable or battery powered flashlight, torch or lantern, or biogas lamp. Table TC.4.6 presents the percent distribution of household members according to type of lighting fuel mainly used for lighting by the household, and percentageof household members living in households using clean fuels and technologies for lighting.
The questions asked about cooking, space heating and lighting help to monitor SDG indicator 7.1.2, “Proportion of population with primary reliance on clean fuels and technology” for cooking, space heating and lighting. Table TC.4.7 presents the percentage of household members living in households using clean fuels and technologies for cooking, space heating, and lighting.
Public Private
Community health
providerA Public Private
Community health
providerA
Total 74.5 21.6 3.4 6.5 95.0 428 78.6 18.6 2.4 2.8 97.0 116
SexMale 76.9 19.4 3.8 4.8 95.4 234 83.8 14.6 4.1 2.8 98.4 62Female 71.5 24.1 2.9 8.5 94.5 194 72.8 23.2 0.5 2.8 95.5 54
AreaUrban 59.2 40.7 0.0 4.2 98.0 127 (67.2) (32.8) (0.0) (0.0) (100.0) 45Rural 80.9 13.5 4.8 7.4 93.8 301 85.9 9.6 3.9 4.6 95.2 71
Rural with road 81.8 13.4 5.2 5.5 94.5 264 85.5 9.8 4.2 4.9 94.9 67Rural without road (74.2) (14.4) (2.1) (21.1) (88.6) 37 (*) (*) (*) (*) (*) 4
RegionNorth 79.3 15.5 3.1 5.6 94.4 166 (86.9) (8.7) (0.0) (6.2) (95.6) 41Central 68.7 28.1 4.5 6.0 95.2 205 69.5 28.2 4.6 1.2 97.3 61South 81.0 15.9 0.0 11.0 96.2 57 (*) (*) (*) (*) (*) 14
Age (in months)0-11 69.4 22.9 3.4 7.8 92.2 90 (74.1) (25.9) (4.5) (0.0) (100.0) 3012-23 75.8 24.4 5.9 3.7 97.6 124 (77.5) (21.9) (3.2) (0.7) (99.3) 3724-35 77.9 21.5 2.8 2.7 99.0 86 (81.2) (9.6) (0.0) (13.0) (90.9) 1936-47 70.8 19.1 2.6 13.5 88.8 61 (*) (*) (*) (*) (*) 1348-59 77.7 16.8 0.0 8.4 94.5 66 (*) (*) (*) (*) (*) 17
Mother’s educationNone or ECE 82.3 15.2 3.5 4.4 97.6 109 (79.4) (19.5) (7.2) (4.5) (98.9) 22Primary 78.3 17.1 4.6 7.1 93.9 149 (92.0) (5.9) (0.0) (3.5) (97.2) 35Lower secondary 67.6 24.8 3.2 8.2 92.4 99 (61.5) (31.6) (3.7) (3.2) (93.1) 32Upper secondary (54.5) (45.5) (0.0) (1.1) (100.0) 34 (*) (*) (*) (*) (*) 11Post secondary / Non tertiary (*) (*) (*) (*) (*) 10 (*) (*) (*) (*) (*) 4Higher (62.5) (37.7) (0.0) (14.1) (92.8) 28 (*) (*) (*) (*) (*) 10
Ethno-linguistic group of household headLao-Tai 62.5 33.3 2.5 9.1 94.0 181 (68.9) (31.1) (0.5) (0.0) (100.0) 52Mon-Khmer 89.4 9.9 5.2 1.8 98.6 136 (88.9) (7.3) (8.2) (0.0) (96.2) 31Hmong-Mien 71.3 19.7 2.4 9.4 91.0 95 (79.9) (13.1) (0.0) (12.5) (91.9) 23Chinese-Tibetan (*) (*) (*) (*) (*) 13 (*) (*) (*) (*) (*) 8Other, DK, Missing (*) (*) (*) (*) (*) 4 (*) (*) (*) (*) (*) 2
Wealth index quintilePoorest 82.1 15.1 4.8 2.8 97.2 112 (87.1) (10.9) (0.0) (4.7) (96.7) 20Second 84.1 7.1 5.6 11.1 90.7 118 (87.5) (4.9) (11.1) (5.9) (92.4) 25Middle 77.5 21.2 3.5 3.4 98.7 69 (91.1) (8.9) (0.0) (0.0) (100.0) 20Fourth 58.4 37.7 0.0 7.4 93.9 71 (*) (*) (*) (*) (*) 22Richest 55.8 44.3 0.0 6.8 96.6 58 (*) (*) (*) (*) (*) 29
A Community health providers includes both public (Village health worker and Outreach team) and private (Mobile clinic) health facilitiesB Includes all public and private health facilities and providers, as well as those who did not know if public or private( ) Figures that are based on 25 – 49 unweighted cases(*) Figures that are based on fewer than 25 unweighted casesNote: Province level figures are not shown, fewer than 25 unweighted cases for most of the provinces.
Health facilities or providers
Other source
A health facility or providerB
Table TC.3.5: Source of ORS and zincPercentage of children age 0-59 months with diarrhoea in the last two weeks who were given ORS, and percentage given zinc, by the source of ORS and zinc, Lao PDR, 2017
Percentage of children for whom the source of ORS was: Number of children age 0-59 months
who were given ORS
as treatment for diarrhoea
in the last two weeks
Percentage of children for whom the source of zinc was: Number of children age 0-59 months
who were given zinc as treatment for diarrhoea in the last two
weeks
Health facilities or providers
Other source
A health facility or providerB
7
186
7.4 HOUSEHOLD ENERGY USE
There is a global consensus and an ever-growing body of evidence that expanding access to clean household energy for cooking, heating, and lighting is key to achieving a range of global priorities such as improving health, gender equality, equitable economic development and environmental protection. Goal 7 of the Sustainable Development Goals seeks to ensure access to affordable, reliable sustainable and modern energy for all by 2030 and would be measured as the percentage of the population relying on clean fuels and technology. 6
The Lao DPR, 2017 LSIS II included a module with questions to assess the main technologies and fuels used for cooking, heating, and lighting. Information was also collected about the use of technologies with chimneys or other venting mechanisms which can improve indoor air quality through moving a fraction of the pollutants outdoors.
Households that use clean fuels and technologies for cooking are those mainly using electric stove, solar cooker, LPG (Liquefied Petroleum Gas)/cooking gas stove, biogas stove, or a liquid fuel stove burning ethanol/alcohol only. Table TC.4.1 presents the percent distribution of household members according to type of cookstove mainly used by the household and percentage of household members living in households using clean fuels and technologies for cooking.
6 WHO. 2016. Burning Opportunity: Clean Household Energy for Health, Sustainable Development, and Wellbeing
of Women and Children. Geneva: WHO Press, 2016. http://apps.who.int/iris/bitstream/handle/10665/204717/
9789241565233_eng.pdf;jsessionid=63CEC48ED96098D4256007A76FEB8907?sequence=1
Table TC.4.2 further presents the percent distribution of household members using polluting fuels and technologies for cooking according to type of cooking fuel mainly used by the household, and percentage of household members living in households using polluting fuels and technologies for cooking while Table TC.4.3 presents the percent distribution of household members in households using polluted fuels for cooking by type and characteristics of cookstove and by place of cooking.
Households that use clean fuels and technologies for space heating are those mainly relying on central heating or using solar air heater, electricity, piped natural gas, LPG/cooking gas, biogas, or alcohol/ethanol. Table TC.4.4 presents the percent distribution of household members according to type of fuel mainly used for space heating by the household, and percentage of household members living in households using clean fuels and technologies for space heating. Table TC.4.5 presents the percent distribution of household members by the type of space heating mainly used in the household and presence of chimney.
Households that use clean fuels and technologies for lighting are those mainly using electricity, solar lantern, rechargeable or battery powered flashlight, torch or lantern, or biogas lamp. Table TC.4.6 presents the percent distribution of household members according to type of lighting fuel mainly used for lighting by the household, and percentageof household members living in households using clean fuels and technologies for lighting.
The questions asked about cooking, space heating and lighting help to monitor SDG indicator 7.1.2, “Proportion of population with primary reliance on clean fuels and technology” for cooking, space heating and lighting. Table TC.4.7 presents the percentage of household members living in households using clean fuels and technologies for cooking, space heating, and lighting.
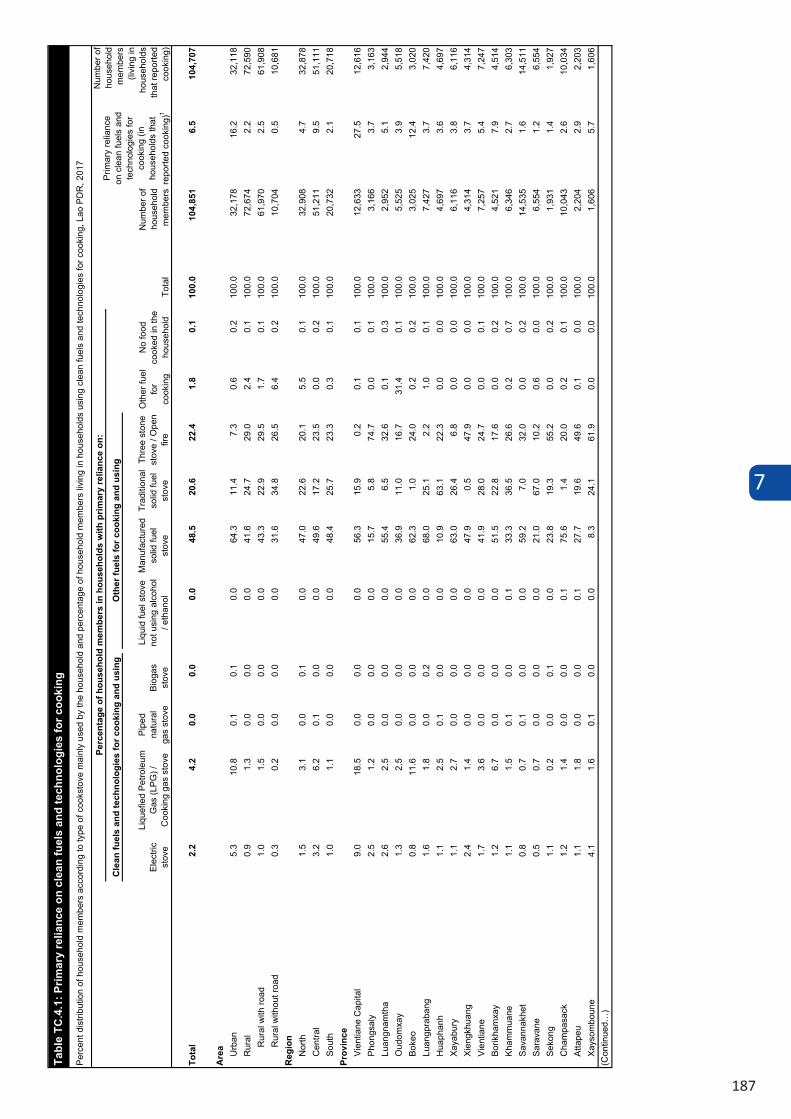
7
187
Elec
tric
stov
e
Liqu
efie
d Pe
trole
um
Gas
(LPG
) /
Coo
king
gas
sto
ve
Pipe
d na
tura
l ga
s st
ove
Biog
as
stov
e
Liqu
id fu
el s
tove
no
t usi
ng a
lcoh
ol
/ eth
anol
Man
ufac
ture
d so
lid fu
el
stov
e
Trad
ition
al
solid
fuel
st
ove
Thre
e st
one
stov
e / O
pen
fire
Tota
l2.
24.
20.
00.
00.
048
.520
.622
.41.
80.
110
0.0
104,
851
6.5
104,
707
Are
a Urb
an5.
310
.80.
10.
10.
064
.311
.47.
30.
60.
210
0.0
32,1
7816
.232
,118
Rur
al0.
91.
30.
00.
00.
041
.624
.729
.02.
40.
110
0.0
72,6
742.
272
,590
Rur
al w
ith ro
ad1.
01.
50.
00.
00.
043
.322
.929
.51.
70.
110
0.0
61,9
702.
56 1
,908
Rur
al w
ithou
t roa
d0.
30.
20.
00.
00.
031
.634
.826
.56.
40.
210
0.0
10,7
040.
510
,681
Reg
ion
Nor
th1.
53.
10.
00.
10.
047
.022
.620
.15.
50.
110
0.0
32,9
084.
732
,878
Cen
tral
3.2
6.2
0.1
0.0
0.0
49.6
17.2
23.5
0.0
0.2
100.
051
,211
9.5
51,1
11So
uth
1.0
1.1
0.0
0.0
0.0
48.4
25.7
23.3
0.3
0.1
100.
020
,732
2.1
20,7
18Pr
ovin
ceVi
entia
ne C
apita
l9.
018
.50.
00.
00.
056
.315
.90.
20.
10.
110
0.0
12,6
3327
.512
,616
Phon
gsal
y 2.
51.
20.
00.
00.
015
.75.
874
.70.
00.
110
0.0
3,16
63.
73,
163
Luan
gnam
tha
2.6
2.5
0.0
0.0
0.0
55.4
6.5
32.6
0.1
0.3
100.
02,
952
5.1
2,94
4O
udom
xay
1.3
2.5
0.0
0.0
0.0
36.9
11.0
16.7
31.4
0.1
100.
05,
525
3.9
5,51
8Bo
keo
0.8
11.6
0.0
0.0
0.0
62.3
1.0
24.0
0.2
0.2
100.
03,
025
12.4
3,02
0Lu
angp
raba
ng1.
61.
80.
00.
20.
068
.025
.12.
21.
00.
110
0.0
7,42
73.
77,
420
Hua
phan
h1.
12.
50.
10.
00.
010
.963
.122
.30.
00.
010
0.0
4,69
73.
64,
697
Xaya
bury
1.1
2.7
0.0
0.0
0.0
63.0
26.4
6.8
0.0
0.0
100.
06,
116
3.8
6,11
6Xi
engk
huan
g2.
41.
40.
00.
00.
047
.90.
547
.90.
00.
010
0.0
4,31
43.
74,
314
Vien
tiane
1.7
3.6
0.0
0.0
0.0
41.9
28.0
24.7
0.0
0.1
100.
07,
257
5.4
7,24
7Bo
rikha
mxa
y1.
26.
70.
00.
00.
051
.522
.817
.60.
00.
210
0.0
4,52
17.
94,
514
Kham
mua
ne1.
11.
50.
10.
00.
133
.336
.526
.60.
20.
710
0.0
6,34
62.
76,
303
Sava
nnak
het
0.8
0.7
0.1
0.0
0.0
59.2
7.0
32.0
0.0
0.2
100.
014
,535
1.6
14,5
11Sa
rava
ne0.
50.
70.
00.
00.
021
.067
.010
.20.
60.
010
0.0
6,55
41.
26,
554
Seko
ng1.
10.
20.
00.
10.
023
.819
.355
.20.
00.
210
0.0
1,93
11.
41,
927
Cha
mpa
sack
1.2
1.4
0.0
0.0
0.1
75.6
1.4
20.0
0.2
0.1
100.
010
,043
2.6
10,0
34At
tape
u1.
11.
80.
00.
00.
127
.719
.649
.60.
10.
010
0.0
2,20
42.
92,
203
Xays
ombo
une
4.1
1.6
0.1
0.0
0.0
8.3
24.1
61.9
0.0
0.0
100.
01,
606
5.7
1,60
6
Tabl
e TC
.4.1
: Prim
ary
relia
nce
on c
lean
fuel
s an
d te
chno
logi
es fo
r coo
king
Perc
ent d
istri
butio
n of
hou
seho
ld m
embe
rs a
ccor
ding
to ty
pe o
f coo
ksto
ve m
ainl
y us
ed b
y th
e ho
useh
old
and
perc
enta
ge o
f hou
seho
ld m
embe
rs li
ving
in h
ouse
hold
s us
ing
clea
n fu
els
and
tech
nolo
gies
for c
ooki
ng, L
ao P
DR
, 201
7
Num
ber o
f ho
useh
old
mem
bers
(li
ving
in
hous
ehol
ds
that
repo
rted
cook
ing)
(Con
tinue
d…)
No
food
co
oked
in th
e ho
useh
old
Perc
enta
ge o
f hou
seho
ld m
embe
rs in
hou
seho
lds
with
prim
ary
relia
nce
on:
Tota
l
Num
ber o
f ho
useh
old
mem
bers
Prim
ary
relia
nce
on c
lean
fuel
s an
d te
chno
logi
es fo
r co
okin
g (in
ho
useh
olds
that
re
porte
d co
okin
g)1
Cle
an fu
els
and
tech
nolo
gies
for c
ooki
ng a
nd u
sing
Oth
er fu
els
for c
ooki
ng a
nd u
sing
Oth
er fu
el
for
cook
ing
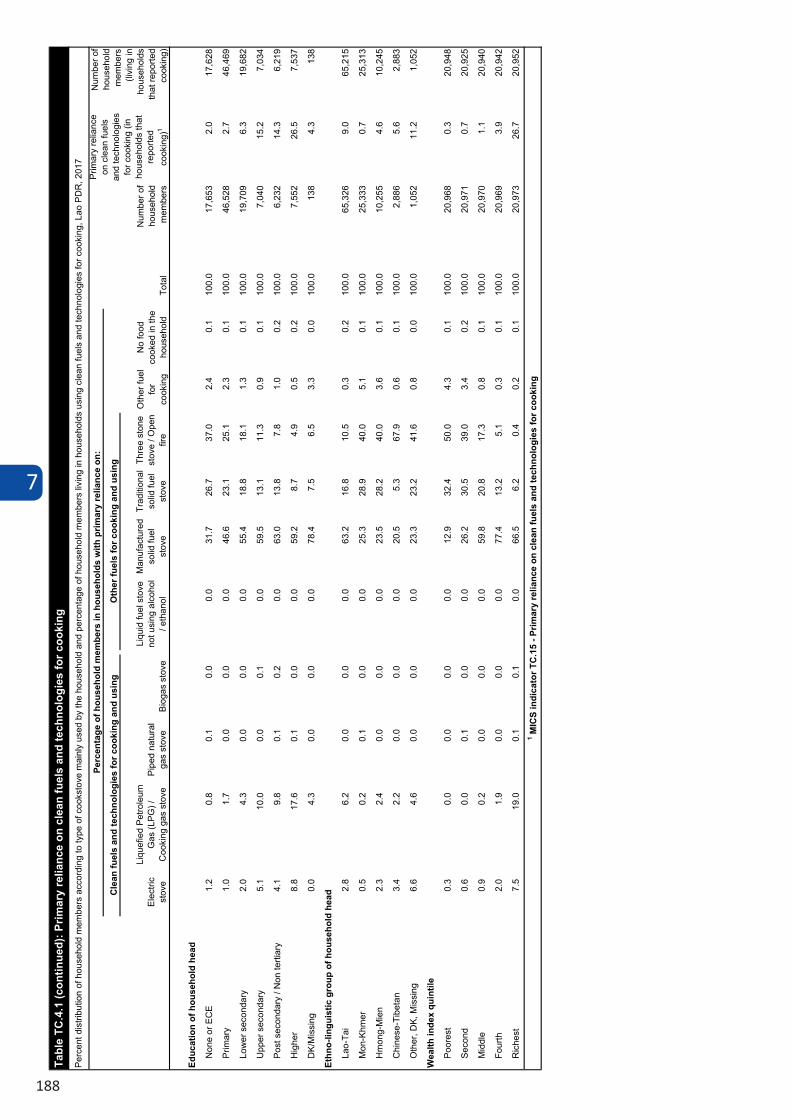
7
188
Elec
tric
stov
e
Liqu
efie
d Pe
trole
um
Gas
(LPG
) /
Coo
king
gas
sto
vePi
ped
natu
ral
gas
stov
eBi
ogas
sto
ve
Liqu
id fu
el s
tove
no
t usi
ng a
lcoh
ol
/ eth
anol
Man
ufac
ture
d so
lid fu
el
stov
e
Trad
ition
al
solid
fuel
st
ove
Thre
e st
one
stov
e / O
pen
fire
Educ
atio
n of
hou
seho
ld h
ead
Non
e or
EC
E1.
20.
80.
10.
00.
031
.726
.737
.02.
40.
110
0.0
17,6
532.
017
,62 8
Prim
ary
1.0
1.7
0.0
0.0
0.0
46.6
23.1
25.1
2.3
0.1
100.
046
,528
2.7
46,4
69
Low
er s
econ
dary
2.0
4.3
0.0
0.0
0.0
55.4
18.8
18.1
1.3
0.1
100.
019
,709
6.3
1 9,6
82
Upp
er s
econ
dary
5.1
10.0
0.0
0.1
0.0
59.5
13.1
11.3
0.9
0.1
100.
07,
040
15.2
7,03
4
Post
sec
onda
ry /
Non
terti
ary
4.1
9.8
0.1
0.2
0.0
63.0
13.8
7.8
1.0
0.2
100.
06,
232
14.3
6,21
9
Hig
her
8.8
17.6
0.1
0.0
0.0
59.2
8.7
4.9
0.5
0.2
100.
07,
552
26.5
7,53
7
DK/
Mis
sing
0.0
4.3
0.0
0.0
0.0
78.4
7.5
6.5
3.3
0.0
100.
013
84.
313
8
Ethn
o-lin
guis
tic g
roup
of h
ouse
hold
hea
d
Lao-
Tai
2.8
6.2
0.0
0.0
0.0
63.2
16.8
10.5
0.3
0.2
100.
065
,326
9.0
65,2
15
Mon
-Khm
er0.
50.
20.
10.
00.
025
.328
.940
.05.
10.
110
0.0
25,3
330.
725
,313
Hm
ong-
Mie
n2.
32.
40.
00.
00.
023
.528
.240
.03.
60.
110
0.0
10,2
554.
610
,245
Chi
nese
-Tib
etan
3.4
2.2
0.0
0.0
0.0
20.5
5.3
67.9
0.6
0.1
100.
02,
886
5.6
2,8 8
3
Oth
er, D
K, M
issi
ng6.
64.
60.
00.
00.
023
.323
.241
.60.
80.
010
0.0
1,05
211
.21,
052
Wea
lth in
dex
quin
tile
Poor
est
0.3
0.0
0.0
0.0
0.0
12.9
32.4
50.0
4.3
0.1
100.
020
,968
0.3
20,9
48
Seco
nd0.
60.
00.
10.
00.
026
.230
.539
.03.
40.
210
0.0
20,9
710.
720
,925
Mid
dle
0.9
0.2
0.0
0.0
0.0
59.8
20.8
17.3
0.8
0.1
100.
020
,970
1.1
20,9
40
Four
th2.
01.
90.
00.
00.
077
.413
.25.
10.
30.
110
0.0
20,9
693.
920
,942
Ric
hest
7.5
19.0
0.1
0.1
0.0
66.5
6.2
0.4
0.2
0.1
100.
020
,973
26.7
20,9
52
Tabl
e TC
.4.1
(con
tinue
d): P
rimar
y re
lianc
e on
cle
an fu
els
and
tech
nolo
gies
for c
ooki
ngPe
rcen
t dis
tribu
tion
of h
ouse
hold
mem
bers
acc
ordi
ng to
type
of c
ooks
tove
mai
nly
used
by
the
hous
ehol
d an
d pe
rcen
tage
of h
ouse
hold
mem
bers
livi
ng in
hou
seho
lds
usin
g cl
ean
fuel
s an
d te
chno
logi
es fo
r coo
king
, Lao
PD
R, 2
017
Num
ber o
f ho
useh
old
mem
bers
(li
ving
in
hous
ehol
ds
that
repo
rted
cook
ing)
1 MIC
S in
dica
tor T
C.1
5 - P
rimar
y re
lianc
e on
cle
an fu
els
and
tech
nolo
gies
for c
ooki
ng
No
food
co
oked
in th
e ho
useh
old
Perc
enta
ge o
f hou
seho
ld m
embe
rs in
hou
seho
lds
with
prim
ary
relia
nce
on:
Tota
l
Num
ber o
f ho
useh
old
mem
bers
Prim
ary
relia
nce
on c
lean
fuel
s an
d te
chno
logi
es
for c
ooki
ng (i
n ho
useh
olds
that
re
porte
d co
okin
g)1
Cle
an fu
els
and
tech
nolo
gies
for c
ooki
ng a
nd u
sing
Oth
er fu
els
for c
ooki
ng a
nd u
sing
Oth
er fu
el
for
cook
ing
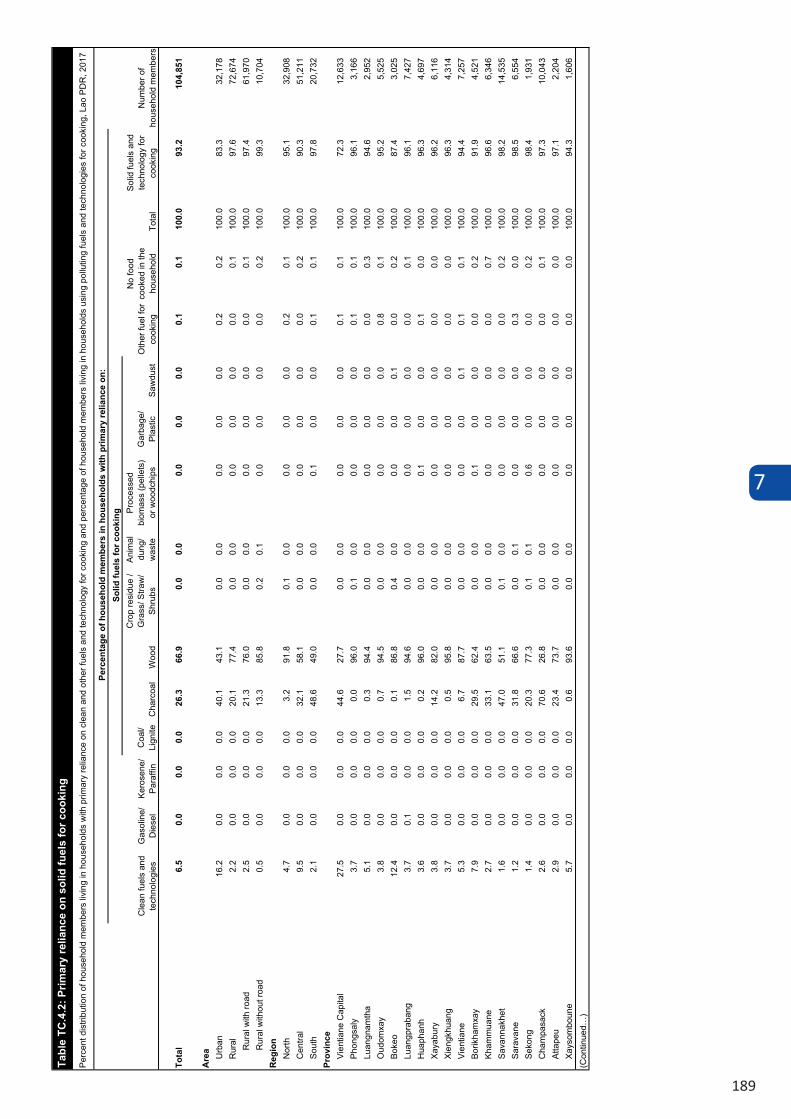
7
189
Coa
l/ Li
gnite
Cha
rcoa
lW
ood
Cro
p re
sidu
e /
Gra
ss/ S
traw
/ Sh
rubs
Anim
al
dung
/ w
aste
Proc
esse
d bi
omas
s (p
elle
ts)
or w
oodc
hips
Gar
bage
/ Pl
astic
Saw
dust
Tota
l6.
50.
00.
00.
026
.366
.90.
00.
00.
00.
00.
00.
10.
110
0.0
93.2
104,
851
Are
a Urb
an16
.20.
00.
00.
040
.143
.10.
00.
00.
00.
00.
00.
20.
210
0.0
83.3
32,1
78R
ural
2.2
0.0
0.0
0.0
20.1
77.4
0.0
0.0
0.0
0.0
0.0
0.0
0.1
100.
097
.672
,674
Rur
al w
ith ro
ad2.
50.
00.
00.
021
.376
.00.
00.
00.
00.
00.
00.
00.
110
0.0
97.4
61,9
70R
ural
with
out r
oad
0.5
0.0
0.0
0.0
13.3
85.8
0.2
0.1
0.0
0.0
0.0
0.0
0.2
100.
099
.310
,704
Reg
ion
Nor
th4.
70.
00.
00.
03.
291
.80.
10.
00.
00.
00.
00.
20.
110
0.0
95.1
32,9
08C
entra
l9.
50.
00.
00.
032
.158
.10.
00.
00.
00.
00.
00.
00.
210
0.0
90.3
51,2
11So
uth
2.1
0.0
0.0
0.0
48.6
49.0
0.0
0.0
0.1
0.0
0.0
0.1
0.1
100.
097
.820
,732
Prov
ince
Vien
tiane
Cap
ital
27.5
0.0
0.0
0.0
44.6
27.7
0.0
0.0
0.0
0.0
0.0
0.1
0.1
100.
072
.312
,633
Phon
gsal
y 3.
70.
00.
00.
00.
096
.00.
10.
00.
00.
00.
00.
10.
110
0.0
96.1
3,16
6Lu
angn
amth
a5.
10.
00.
00.
00.
394
.40.
00.
00.
00.
00.
00.
00.
310
0.0
94.6
2,95
2O
udom
xay
3.8
0.0
0.0
0.0
0.7
94.5
0.0
0.0
0.0
0.0
0.0
0.8
0.1
100.
095
.25,
525
Boke
o12
.40.
00.
00.
00.
186
.80.
40.
00.
00.
00.
10.
00.
210
0.0
87.4
3,02
5Lu
angp
raba
ng3.
70.
10.
00.
01.
594
.60.
00.
00.
00.
00.
00.
00.
110
0.0
96.1
7,42
7H
uaph
anh
3.6
0.0
0.0
0.0
0.2
96.0
0.0
0.0
0.1
0.0
0.0
0.1
0.0
100.
096
.34,
697
Xaya
bury
3.8
0.0
0.0
0.0
14.2
82.0
0.0
0.0
0.0
0.0
0.0
0.0
0.0
100.
096
.26,
116
Xien
gkhu
ang
3.7
0.0
0.0
0.0
0.5
95.8
0.0
0.0
0.0
0.0
0.0
0.0
0.0
100.
096
.34,
3 14
Vien
tiane
5.3
0.0
0.0
0.0
6.7
87.7
0.0
0.0
0.0
0.0
0.1
0.1
0.1
100.
094
.47,
257
Borik
ham
xay
7.9
0.0
0.0
0.0
29.5
62.4
0.0
0.0
0.1
0.0
0.0
0.0
0.2
100.
091
.94,
521
Kham
mua
ne2.
70.
00.
00.
033
.163
.50.
00.
00.
00.
00.
00.
00.
710
0.0
96.6
6,34
6Sa
vann
akhe
t1.
60.
00.
00.
047
.051
.10.
10.
00.
00.
00.
00.
00.
210
0.0
98.2
14,5
35Sa
rava
ne1.
20.
00.
00.
031
.866
.60.
00.
10.
00.
00.
00.
30.
010
0.0
98.5
6,55
4Se
kong
1.4
0.0
0.0
0.0
20.3
77.3
0.1
0.1
0.6
0.0
0.0
0.0
0.2
100.
098
.41,
931
Cha
mpa
sack
2.6
0.0
0.0
0.0
70.6
26.8
0.0
0.0
0.0
0.0
0.0
0.0
0.1
100.
097
.310
, 043
Atta
peu
2.9
0.0
0.0
0.0
23.4
73.7
0.0
0.0
0.0
0.0
0.0
0.0
0.0
100.
097
.12,
204
Xays
ombo
une
5.7
0.0
0.0
0.0
0.6
93.6
0.0
0.0
0.0
0.0
0.0
0.0
0.0
100.
094
.31,
6 06
(Con
tinue
d…)
Cle
an fu
els
and
tech
nolo
gies
Gas
olin
e/
Die
sel
Tabl
e TC
.4.2
: Prim
ary
relia
nce
on s
olid
fuel
s fo
r coo
king
Perc
ent d
istri
butio
n of
hou
seho
ld m
embe
rs li
ving
in h
ouse
hold
s w
ith p
rimar
y re
lianc
e on
cle
an a
nd o
ther
fuel
s an
d te
chno
logy
for c
ooki
ng a
nd p
erce
ntag
e of
hou
seho
ld m
embe
rs li
ving
in h
ouse
hold
s us
ing
pollu
ting
fuel
s an
d te
chno
logi
es fo
r coo
king
, Lao
PD
R, 2
017
Perc
enta
ge o
f hou
seho
ld m
embe
rs in
hou
seho
lds
with
prim
ary
relia
nce
on:
Num
ber o
f ho
useh
old
mem
bers
Kero
sene
/ Pa
raffi
n
Solid
fuel
s fo
r coo
king
Solid
fuel
s an
d te
chno
logy
for
cook
ing
Tota
lO
ther
fuel
for
cook
ing
No
food
co
oked
in th
e ho
useh
old
Coa
l/ Li
gnite
Cha
rcoa
lW
ood
Cro
p re
sidu
e /
Gra
ss/ S
traw
/ Sh
rubs
Anim
al
dung
/ w
aste
Proc
esse
d bi
omas
s (p
elle
ts)
or w
oodc
hips
Gar
bage
/ Pl
astic
Saw
dust
Educ
atio
n of
hou
seho
ld h
ead
Non
e or
EC
E2.
00.
00.
00.
013
.384
.20.
20.
00.
00.
00.
00.
10.
110
0.0
97.8
17,6
53Pr
imar
y2.
70.
00.
00.
023
.473
.70.
00.
00.
00.
00.
00.
00.
110
0.0
97.1
46,5
28Lo
wer
sec
onda
ry6.
30.
00.
00.
030
.063
.40.
00.
00.
00.
00.
00.
10.
110
0.0
93.4
19,7
09U
pper
sec
onda
ry15
.20.
00.
00.
039
.844
.60.
00.
00.
00.
00.
10.
20.
110
0.0
84.6
7,04
0Po
st s
econ
dary
/ N
on te
rtiar
y14
.20.
00.
00.
039
.345
.90.
00.
00.
10.
00.
00.
20.
210
0.0
85.3
6,23
2H
ighe
r26
.50.
00.
00.
040
.432
.60.
00.
00.
10.
00.
00.
30.
210
0.0
73.0
7,55
2D
K/M
issi
ng4.
30.
00.
00.
056
.838
.80.
00.
00.
00.
00.
00.
00.
010
0.0
95.7
138
Ethn
o-lin
guis
tic g
roup
of h
ouse
hold
hea
dLa
o-Ta
i9.
00.
00.
00.
040
.450
.30.
00.
00.
00.
00.
00.
10.
210
0.0
90.7
65,3
26M
on-K
hmer
0.7
0.0
0.0
0.0
3.5
95.5
0.1
0.0
0.0
0.0
0.0
0.0
0.1
100.
099
.125
,333
Hm
ong-
Mie
n4.
60.
00.
00.
00.
994
.20.
10.
00.
00.
00.
00.
20.
110
0.0
95.1
10,2
55C
hine
se-T
ibet
an5.
60.
00.
00.
01.
192
.20.
10.
00.
00.
00.
00.
90.
110
0.0
93.4
2,88
6O
ther
, DK,
Mis
sing
11.2
0.0
0.0
0.0
12.4
76.4
0.1
0.0
0.0
0.0
0.0
0.0
0.0
100.
088
.81,
052
Wea
lth in
dex
quin
tile
Poor
est
0.3
0.0
0.0
0.0
1.5
98.0
0.1
0.0
0.0
0.0
0.0
0.0
0.1
100.
099
.720
,968
Seco
nd0.
70.
00.
00.
08.
590
.50.
00.
00.
00.
00.
00.
10.
210
0.0
99.1
20,9
71M
iddl
e1.
10.
00.
00.
028
.969
.80.
00.
00.
00.
00.
00.
00.
110
0.0
98.8
20,9
70Fo
urth
3.9
0.0
0.0
0.0
41.6
54.2
0.0
0.0
0.0
0.0
0.0
0.1
0.1
100.
095
.920
,969
Ric
hest
26.7
0.0
0.0
0.0
50.8
22.1
0.0
0.0
0.0
0.0
0.0
0.3
0.1
100.
072
.920
,973
Cle
an fu
els
and
tech
nolo
gies
Gas
olin
e/
Die
sel
Tabl
e TC
.4.2
(con
tinue
d): P
rimar
y re
lianc
e on
sol
id fu
els
for c
ooki
ng
Perc
ent d
istri
butio
n of
hou
seho
ld m
embe
rs li
ving
in h
ouse
hold
s w
ith p
rimar
y re
lianc
e on
cle
an a
nd o
ther
fuel
s an
d te
chno
logy
for c
ooki
ng a
nd p
erce
ntag
e of
hou
seho
ld m
embe
rs li
ving
in h
ouse
hold
s us
ing
pollu
ting
fuel
s an
d te
chno
logi
es fo
r coo
king
, Lao
PD
R, 2
017
Perc
enta
ge o
f hou
seho
ld m
embe
rs in
hou
seho
lds
with
prim
ary
relia
nce
on:
Num
ber o
f ho
useh
old
mem
bers
Kero
sene
/ Pa
raffi
n
Solid
fuel
s fo
r coo
king
Solid
fuel
s an
d te
chno
logy
for
cook
ing
Oth
er fu
el
for c
ooki
ng
No
food
co
oked
in th
e ho
useh
old
Tota
l
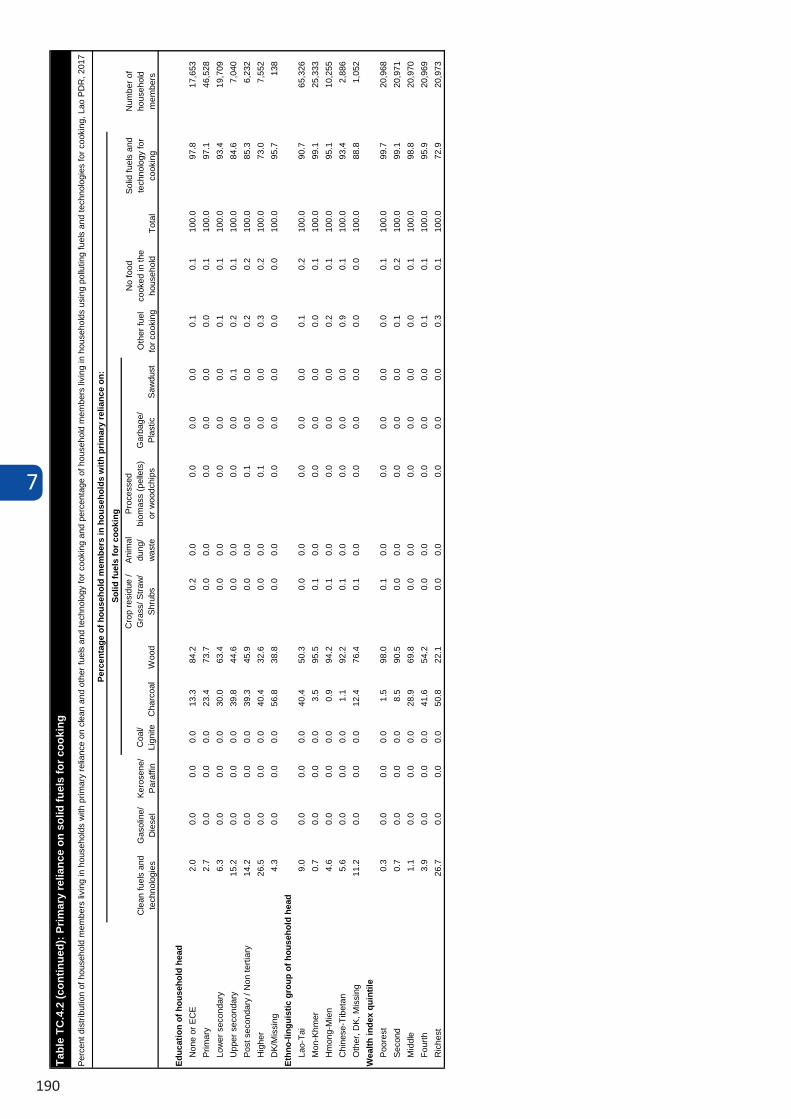
7
190
Coa
l/ Li
gnite
Cha
rcoa
lW
ood
Cro
p re
sidu
e /
Gra
ss/ S
traw
/ Sh
rubs
Anim
al
dung
/ w
aste
Proc
esse
d bi
omas
s (p
elle
ts)
or w
oodc
hips
Gar
bage
/ Pl
astic
Saw
dust
Educ
atio
n of
hou
seho
ld h
ead
Non
e or
EC
E2.
00.
00.
00.
013
.384
.20.
20.
00.
00.
00.
00.
10.
110
0.0
97.8
17,6
53Pr
imar
y2.
70.
00.
00.
023
.473
.70.
00.
00.
00.
00.
00.
00.
110
0.0
97.1
46,5
28Lo
wer
sec
onda
ry6.
30.
00.
00.
030
.063
.40.
00.
00.
00.
00.
00.
10.
110
0.0
93.4
19,7
09U
pper
sec
onda
ry15
.20.
00.
00.
039
.844
.60.
00.
00.
00.
00.
10.
20.
110
0.0
84.6
7,04
0Po
st s
econ
dary
/ N
on te
rtiar
y14
.20.
00.
00.
039
.345
.90.
00.
00.
10.
00.
00.
20.
210
0.0
85.3
6,23
2H
ighe
r26
.50.
00.
00.
040
.432
.60.
00.
00.
10.
00.
00.
30.
210
0.0
73.0
7,55
2D
K/M
issi
ng4.
30.
00.
00.
056
.838
.80.
00.
00.
00.
00.
00.
00.
010
0.0
95.7
138
Ethn
o-lin
guis
tic g
roup
of h
ouse
hold
hea
dLa
o-Ta
i9.
00.
00.
00.
040
.450
.30.
00.
00.
00.
00.
00.
10.
210
0.0
90.7
65,3
26M
on-K
hmer
0.7
0.0
0.0
0.0
3.5
95.5
0.1
0.0
0.0
0.0
0.0
0.0
0.1
100.
099
.125
,333
Hm
ong-
Mie
n4.
60.
00.
00.
00.
994
.20.
10.
00.
00.
00.
00.
20.
110
0.0
95.1
10,2
55C
hine
se-T
ibet
an5.
60.
00.
00.
01.
192
.20.
10.
00.
00.
00.
00.
90.
110
0.0
93.4
2,88
6O
ther
, DK,
Mis
sing
11.2
0.0
0.0
0.0
12.4
76.4
0.1
0.0
0.0
0.0
0.0
0.0
0.0
100.
088
.81,
052
Wea
lth in
dex
quin
tile
Poor
est
0.3
0.0
0.0
0.0
1.5
98.0
0.1
0.0
0.0
0.0
0.0
0.0
0.1
100.
099
.720
,968
Seco
nd0.
70.
00.
00.
08.
590
.50.
00.
00.
00.
00.
00.
10.
210
0.0
99.1
20,9
71M
iddl
e1.
10.
00.
00.
028
.969
.80.
00.
00.
00.
00.
00.
00.
110
0.0
98.8
20,9
70Fo
urth
3.9
0.0
0.0
0.0
41.6
54.2
0.0
0.0
0.0
0.0
0.0
0.1
0.1
100.
095
.920
,969
Ric
hest
26.7
0.0
0.0
0.0
50.8
22.1
0.0
0.0
0.0
0.0
0.0
0.3
0.1
100.
072
.920
,973
Cle
an fu
els
and
tech
nolo
gies
Gas
olin
e/
Die
sel
Tabl
e TC
.4.2
(con
tinue
d): P
rimar
y re
lianc
e on
sol
id fu
els
for c
ooki
ng
Perc
ent d
istri
butio
n of
hou
seho
ld m
embe
rs li
ving
in h
ouse
hold
s w
ith p
rimar
y re
lianc
e on
cle
an a
nd o
ther
fuel
s an
d te
chno
logy
for c
ooki
ng a
nd p
erce
ntag
e of
hou
seho
ld m
embe
rs li
ving
in h
ouse
hold
s us
ing
pollu
ting
fuel
s an
d te
chno
logi
es fo
r coo
king
, Lao
PD
R, 2
017
Perc
enta
ge o
f hou
seho
ld m
embe
rs in
hou
seho
lds
with
prim
ary
relia
nce
on:
Num
ber o
f ho
useh
old
mem
bers
Kero
sene
/ Pa
raffi
n
Solid
fuel
s fo
r coo
king
Solid
fuel
s an
d te
chno
logy
for
cook
ing
Oth
er fu
el
for c
ooki
ng
No
food
co
oked
in th
e ho
useh
old
Tota
l
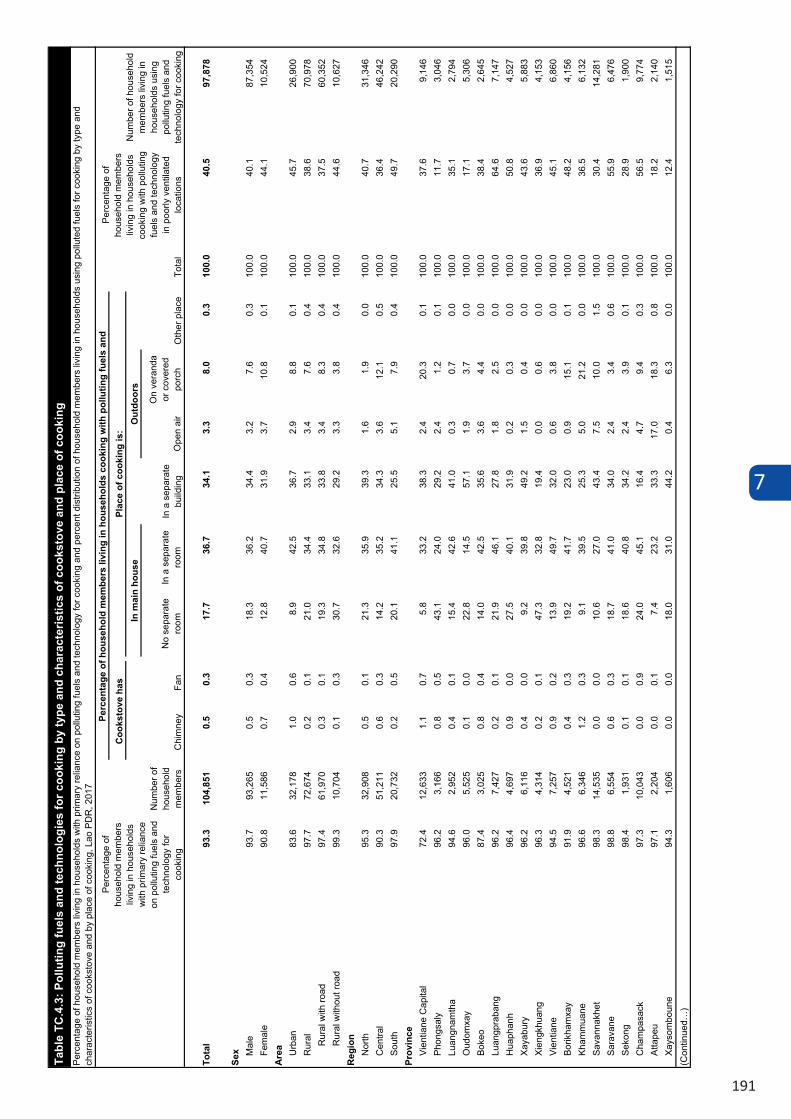
7
191
No
sepa
rate
ro
omIn
a s
epar
ate
room
Ope
n ai
r
On
vera
nda
or c
over
ed
porc
h
Tota
l93
.310
4,85
10.
50.
317
.736
.734
.13.
38.
00.
310
0.0
40.5
97,8
78
Sex M
ale
93.7
93,2
650.
50.
318
.336
.234
.43.
27.
60.
310
0.0
40.1
87,3
54Fe
mal
e90
.811
,586
0.7
0.4
12.8
40.7
31.9
3.7
10.8
0.1
100.
044
.110
,524
Are
a Urb
an83
.632
,178
1.0
0.6
8.9
42.5
36.7
2.9
8.8
0.1
100.
045
.726
,900
Rur
al97
.772
,674
0.2
0.1
21.0
34.4
33.1
3.4
7.6
0.4
100.
038
.670
,978
Rur
al w
ith ro
ad97
.461
,970
0.3
0.1
19.3
34.8
33.8
3.4
8.3
0.4
100.
037
.560
,352
Rur
al w
ithou
t roa
d99
.310
,704
0.1
0.3
30.7
32.6
29.2
3.3
3.8
0.4
100.
044
.610
,627
Reg
ion
Nor
th95
.332
,908
0.5
0.1
21.3
35.9
39.3
1.6
1.9
0.0
100.
040
.731
,346
Cen
tral
90.3
51,2
110.
60.
314
.235
.234
.33.
612
.10.
510
0.0
36.4
46,2
42So
uth
97.9
20,7
320.
20.
520
.141
.125
.55.
17.
90.
410
0.0
49.7
20,2
90Pr
ovin
ceVi
entia
ne C
apita
l72
.412
,633
1.1
0.7
5.8
33.2
38.3
2.4
20.3
0.1
100.
037
.69,
146
Phon
gsal
y 96
.23,
166
0.8
0.5
43.1
24.0
29.2
2.4
1.2
0.1
100.
011
.73,
046
Luan
gnam
tha
94.6
2,95
20.
40.
115
.442
.641
.00.
30.
70.
010
0.0
35.1
2,79
4O
udom
xay
96.0
5,52
50.
10.
022
.814
.557
.11.
93.
70.
010
0.0
17.1
5,30
6Bo
keo
87.4
3,02
50.
80.
414
.042
.535
.63.
64.
40.
010
0.0
38.4
2,64
5Lu
angp
raba
ng96
.27,
427
0.2
0.1
21.9
46.1
27.8
1.8
2.5
0.0
100.
064
.67,
147
Hua
phan
h96
.44,
697
0.9
0.0
27.5
40.1
31.9
0.2
0.3
0.0
100.
050
.84,
527
Xaya
bury
96.2
6,11
60.
40.
09.
239
.849
.21.
50.
40.
010
0.0
43.6
5,88
3Xi
engk
huan
g96
.34,
314
0.2
0.1
47.3
32.8
19.4
0.0
0.6
0.0
100.
036
.94,
153
Vien
tiane
94.5
7,25
70.
90.
213
.949
.732
.00.
63.
80.
010
0.0
45.1
6,86
0Bo
rikha
mxa
y91
.94,
521
0.4
0.3
19.2
41.7
23.0
0.9
15.1
0.1
100.
048
.24,
156
Kham
mua
ne96
.66,
346
1.2
0.3
9.1
39.5
25.3
5.0
21.2
0.0
100.
036
.56,
132
Sava
nnak
het
98.3
14,5
350.
00.
010
.627
.043
.47.
510
.01.
510
0.0
30.4
14,2
8 1Sa
rava
ne98
.86,
554
0.6
0.3
18.7
41.0
34.0
2.4
3.4
0.6
100.
055
.96,
476
Seko
ng98
.41,
931
0.1
0.1
18.6
40.8
34.2
2.4
3.9
0.1
100.
028
.91,
900
Cha
mpa
sack
97.3
10,0
430.
00.
924
.045
.116
.44.
79.
40.
310
0.0
56.5
9,77
4At
tape
u97
.12,
204
0.0
0.1
7.4
23.2
33.3
17.0
18.3
0.8
100.
018
.22,
140
Xays
ombo
une
94.3
1,60
60.
00.
018
.031
.044
.20.
46.
30.
010
0.0
12.4
1,51
5
In m
ain
hous
e
In a
sep
arat
e bu
ildin
g
Out
door
s
Oth
er p
lace
(Con
tinue
d…)
Tabl
e TC
.4.3
: Pol
lutin
g fu
els
and
tech
nolo
gies
for c
ooki
ng b
y ty
pe a
nd c
hara
cter
istic
s of
coo
ksto
ve a
nd p
lace
of c
ooki
ngPe
rcen
tage
of h
ouse
hold
mem
bers
livi
ng in
hou
seho
lds
with
prim
ary
relia
nce
on p
ollu
ting
fuel
s an
d te
chno
logy
for c
ooki
ng a
nd p
erce
nt d
istri
butio
n of
hou
seho
ld m
embe
rs li
ving
in h
ouse
hold
s us
ing
pollu
ted
fuel
s fo
r coo
king
by
type
and
ch
arac
teris
tics
of c
ooks
tove
and
by
plac
e of
coo
king
, Lao
PD
R, 2
017
Perc
enta
ge o
f ho
useh
old
mem
bers
liv
ing
in h
ouse
hold
s w
ith p
rimar
y re
lianc
e on
pol
lutin
g fu
els
and
tech
nolo
gy fo
r co
okin
g
Num
ber o
f ho
useh
old
mem
bers
Perc
enta
ge o
f hou
seho
ld m
embe
rs li
ving
in h
ouse
hold
s co
okin
g w
ith p
ollu
ting
fuel
s an
d
Tota
l
Perc
enta
ge o
f ho
useh
old
mem
bers
liv
ing
in h
ouse
hold
s co
okin
g w
ith p
ollu
ting
fuel
s an
d te
chno
logy
in
poo
rly v
entil
ated
lo
catio
ns
Num
ber o
f hou
seho
ld
mem
bers
livi
ng in
ho
useh
olds
usi
ng
pollu
ting
fuel
s an
d te
chno
logy
for c
ooki
ng
Coo
ksto
ve h
as
Plac
e of
coo
king
is:
Chi
mne
yFa
n
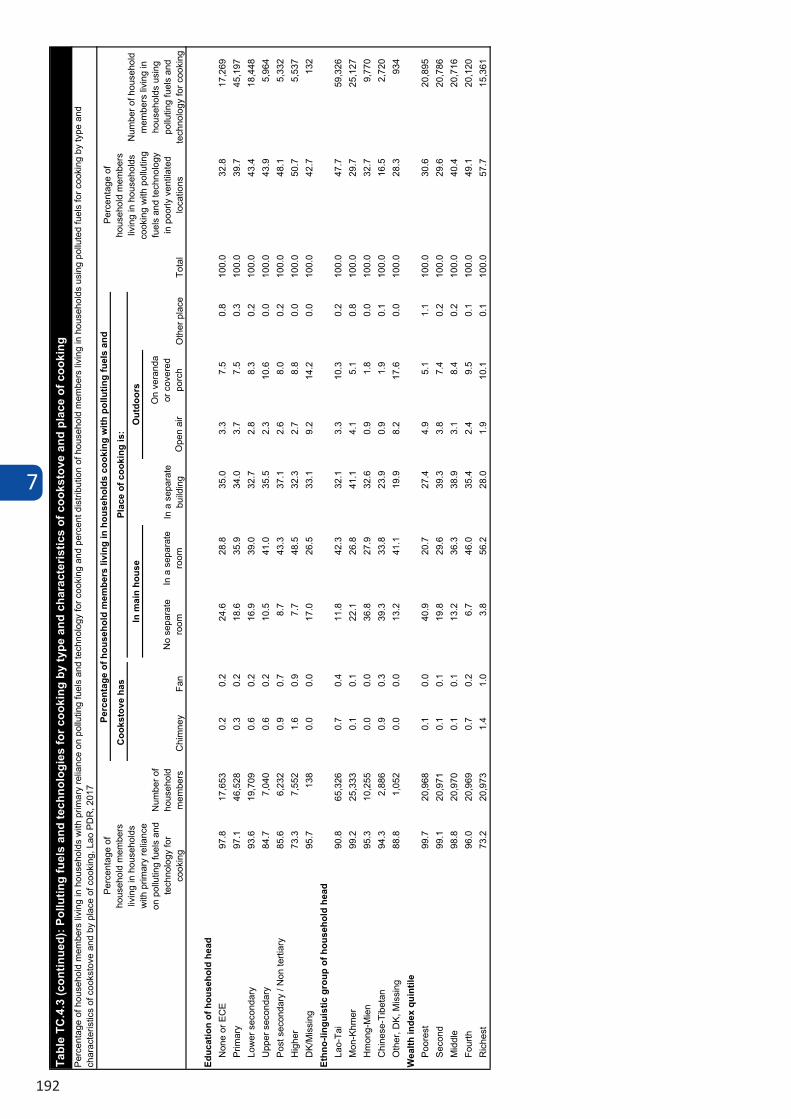
7
192
No
sepa
rate
ro
omIn
a s
epar
ate
room
Ope
n ai
r
On
vera
nda
or c
over
ed
porc
h
Educ
atio
n of
hou
seho
ld h
ead
Non
e or
EC
E97
.817
,653
0.2
0.2
24.6
28.8
35.0
3.3
7.5
0.8
100.
032
.817
,269
Prim
ary
97.1
46,5
280.
30.
218
.635
.934
.03.
77.
50.
310
0.0
39.7
45,1
97Lo
wer
sec
onda
ry93
.619
,709
0.6
0.2
16.9
39.0
32.7
2.8
8.3
0.2
100.
043
.418
,448
Upp
er s
econ
dary
84.7
7,04
00.
60.
210
.541
.035
.52.
310
.60.
010
0.0
43.9
5,96
4Po
st s
econ
dary
/ N
on te
rtiar
y85
.66,
232
0.9
0.7
8.7
43.3
37.1
2.6
8.0
0.2
100.
048
.15,
332
Hig
her
73.3
7,55
21.
60.
97.
748
.532
.32.
78.
80.
010
0.0
50.7
5,53
7D
K/M
issi
ng95
.713
80.
00.
017
.026
.533
.19.
214
.20.
010
0.0
42.7
132
Ethn
o-lin
guis
tic g
roup
of h
ouse
hold
hea
dLa
o-Ta
i90
.865
,326
0.7
0.4
11.8
42.3
32.1
3.3
10.3
0.2
100.
047
.759
,326
Mon
-Khm
er99
.225
,333
0.1
0.1
22.1
26.8
41.1
4.1
5.1
0.8
100.
029
.725
,127
Hm
ong-
Mie
n95
.310
,255
0.0
0.0
36.8
27.9
32.6
0.9
1.8
0.0
100.
032
.79,
770
Chi
nese
-Tib
etan
94.3
2,88
60.
90.
339
.333
.823
.90.
91.
90.
110
0.0
16.5
2,7 2
0O
ther
, DK,
Mis
sing
88.8
1,05
20.
00.
013
.241
.119
.98.
217
.60.
010
0.0
28.3
934
Wea
lth in
dex
quin
tile
Poor
est
99.7
20,9
680.
10.
040
.920
.727
.44.
95.
11.
110
0.0
30.6
20,8
95Se
cond
99.1
20,9
710.
10.
119
.829
.639
.33.
87.
40.
210
0.0
29.6
20,7
86M
iddl
e98
.820
,970
0.1
0.1
13.2
36.3
38.9
3.1
8.4
0.2
100.
040
.420
,716
Four
th96
.020
,969
0.7
0.2
6.7
46.0
35.4
2.4
9.5
0.1
100.
049
.120
,120
Ric
hest
73.2
20,9
731.
41.
03.
856
.228
.01.
910
.10.
110
0.0
57.7
15,3
61
Out
door
s
Oth
er p
lace
Tabl
e TC
.4.3
(con
tinue
d): P
ollu
ting
fuel
s an
d te
chno
logi
es fo
r coo
king
by
type
and
cha
ract
eris
tics
of c
ooks
tove
and
pla
ce o
f coo
king
Perc
enta
ge o
f hou
seho
ld m
embe
rs li
ving
in h
ouse
hold
s w
ith p
rimar
y re
lianc
e on
pol
lutin
g fu
els
and
tech
nolo
gy fo
r coo
king
and
per
cent
dis
tribu
tion
of h
ouse
hold
mem
bers
livi
ng in
hou
seho
lds
usin
g po
llute
d fu
els
for c
ooki
ng b
y ty
pe a
nd
char
acte
ristic
s of
coo
ksto
ve a
nd b
y pl
ace
of c
ooki
ng, L
ao P
DR
, 201
7
Perc
enta
ge o
f ho
useh
old
mem
bers
liv
ing
in h
ouse
hold
s w
ith p
rimar
y re
lianc
e on
pol
lutin
g fu
els
and
tech
nolo
gy fo
r co
okin
g
Num
ber o
f ho
useh
old
mem
bers
Perc
enta
ge o
f hou
seho
ld m
embe
rs li
ving
in h
ouse
hold
s co
okin
g w
ith p
ollu
ting
fuel
s an
d
Tota
l
Perc
enta
ge o
f ho
useh
old
mem
bers
liv
ing
in h
ouse
hold
s co
okin
g w
ith p
ollu
ting
fuel
s an
d te
chno
logy
in
poo
rly v
entil
ated
lo
catio
ns
Num
ber o
f hou
seho
ld
mem
bers
livi
ng in
ho
useh
olds
usi
ng
pollu
ting
fuel
s an
d te
chno
logy
for c
ooki
ng
Coo
ksto
ve h
as
Plac
e of
coo
king
is:
Chi
mne
yFa
n
In m
ain
hous
e
In a
sep
arat
e bu
ildin
g
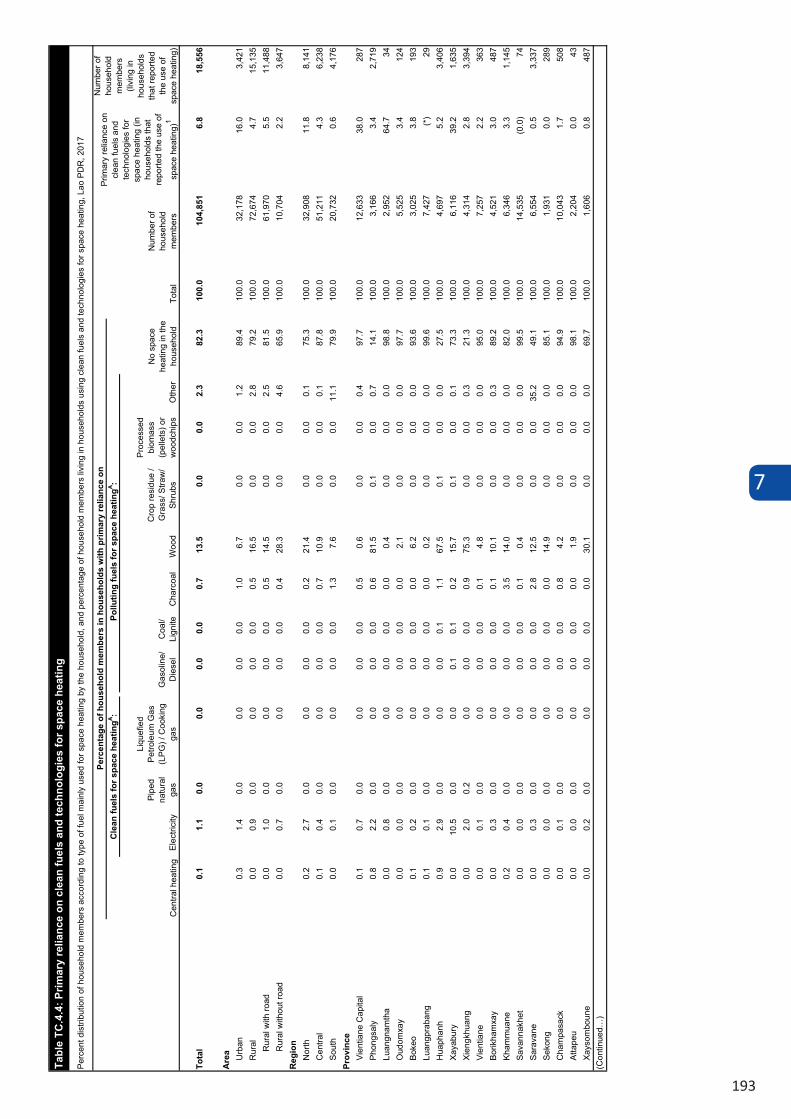
7
193
Elec
trici
ty
Pipe
d na
tura
l ga
s
Liqu
efie
d Pe
trole
um G
as
(LPG
) / C
ooki
ng
gas
Gas
olin
e/
Die
sel
Coa
l/ Li
gnite
Cha
rcoa
lW
ood
Cro
p re
sidu
e /
Gra
ss/ S
traw
/ Sh
rubs
Proc
esse
d bi
omas
s (p
elle
ts) o
r w
oodc
hips
Oth
er
Tota
l0.
11.
10.
00.
00.
00.
00.
713
.50.
00.
02.
382
.310
0.0
104,
851
6.8
18,5
56
Are
a Urb
an0.
31.
40.
00.
00.
00.
01.
06.
70.
00.
01.
289
.410
0.0
32,1
7816
.03,
421
Rur
al0.
00.
90.
00.
00.
00.
00.
516
.50.
00.
02.
879
.210
0.0
72,6
744.
715
,135
Rur
al w
ith ro
ad0.
01.
00.
00.
00.
00.
00.
514
.50.
00.
02.
581
.510
0.0
61,9
705.
511
,488
Rur
al w
ithou
t roa
d0.
00.
70.
00.
00.
00.
00.
428
.30.
00.
04.
665
.910
0.0
10,7
042.
23,
647
Reg
ion
Nor
th0.
22.
70.
00.
00.
00.
00.
221
.40.
00.
00.
175
.310
0.0
32,9
0811
.88,
141
Cen
tral
0.1
0.4
0.0
0.0
0.0
0.0
0.7
10.9
0.0
0.0
0.1
87.8
100.
051
,211
4.3
6,23
8So
uth
0.0
0.1
0.0
0.0
0.0
0.0
1.3
7.6
0.0
0.0
11.1
79.9
100.
020
,732
0.6
4,17
6Pr
ovin
ceVi
entia
ne C
apita
l0.
10.
70.
00.
00.
00.
00.
50.
60.
00.
00.
497
.710
0.0
12,6
3338
.028
7Ph
ongs
aly
0.8
2.2
0.0
0.0
0.0
0.0
0.6
81.5
0.1
0.0
0.7
14.1
100.
03,
166
3.4
2,71
9Lu
angn
amth
a0.
00.
80.
00.
00.
00.
00.
00.
40.
00.
00.
098
.810
0.0
2,95
264
.734
Oud
omxa
y0.
00.
00.
00.
00.
00.
00.
02.
10.
00.
00.
097
.710
0.0
5,52
53.
412
4Bo
keo
0.1
0.2
0.0
0.0
0.0
0.0
0.0
6.2
0.0
0.0
0.0
93.6
100.
03,
025
3.8
193
Luan
gpra
bang
0.1
0.1
0.0
0.0
0.0
0.0
0.0
0.2
0.0
0.0
0.0
99.6
100.
07,
427
(*)
29H
uaph
anh
0.9
2.9
0.0
0.0
0.0
0.1
1.1
67.5
0.1
0.0
0.0
27.5
100.
04,
697
5.2
3,40
6Xa
yabu
ry0.
010
.50.
00.
00.
10.
10.
215
.70.
10.
00.
173
.310
0.0
6,11
639
.21,
635
Xien
gkhu
ang
0.0
2.0
0.2
0.0
0.0
0.0
0.9
75.3
0.0
0.0
0.3
21.3
100.
04,
314
2.8
3,39
4Vi
entia
ne0.
00.
10.
00.
00.
00.
00.
14.
80.
00.
00.
095
.010
0.0
7,25
72.
236
3Bo
rikha
mxa
y0.
00.
30.
00.
00.
00.
00.
110
.10.
00.
00.
389
.210
0.0
4,52
13.
048
7Kh
amm
uane
0.2
0.4
0.0
0.0
0.0
0.0
3.5
14.0
0.0
0.0
0.0
82.0
100.
06,
346
3.3
1,14
5Sa
vann
akhe
t0.
00.
00.
00.
00.
00.
00.
10.
40.
00.
00.
099
.510
0.0
14,5
35(0
.0)
74Sa
rava
ne0.
00.
30.
00.
00.
00.
02.
812
.50.
00.
035
.249
.110
0.0
6,55
40.
53,
337
Seko
ng0.
00.
00.
00.
00.
00.
00.
014
.90.
00.
00.
085
.110
0.0
1,93
10.
028
9C
ham
pasa
ck0.
00.
10.
00.
00.
00.
00.
84.
20.
00.
00.
094
.910
0.0
10,0
431.
750
8At
tape
u0.
00.
00.
00.
00.
00.
00.
01.
90.
00.
00.
098
.110
0.0
2,20
40.
043
Xays
ombo
une
0.0
0.2
0.0
0.0
0.0
0.0
0.0
30.1
0.0
0.0
0.0
69.7
100.
01,
606
0.8
487
Tabl
e TC
.4.4
: Prim
ary
relia
nce
on c
lean
fuel
s an
d te
chno
logi
es fo
r spa
ce h
eatin
g
Perc
ent d
istri
butio
n of
hou
seho
ld m
embe
rs a
ccor
ding
to ty
pe o
f fue
l mai
nly
used
for s
pace
hea
ting
by th
e ho
useh
old,
and
per
cent
age
of h
ouse
hold
mem
bers
livi
ng in
hou
seho
lds
usin
g cl
ean
fuel
s an
d te
chno
logi
es fo
r spa
ce h
eatin
g, L
ao P
DR
, 201
7
Num
ber o
f ho
useh
old
mem
bers
(li
ving
in
hous
ehol
ds
that
repo
rted
the
use
of
spac
e he
atin
g)
(Con
tinue
d…)
No
spac
e he
atin
g in
the
hous
ehol
d
Perc
enta
ge o
f hou
seho
ld m
embe
rs in
hou
seho
lds
with
prim
ary
relia
nce
on
Tota
l
Num
ber o
f ho
useh
old
mem
bers
Prim
ary
relia
nce
on
clea
n fu
els
and
tech
nolo
gies
for
spac
e he
atin
g (in
ho
useh
olds
that
re
porte
d th
e us
e of
spac
e he
atin
g)1
Cen
tral h
eatin
g
Cle
an fu
els
for s
pace
hea
tingA :
Pollu
ting
fuel
s fo
r spa
ce h
eatin
gA :
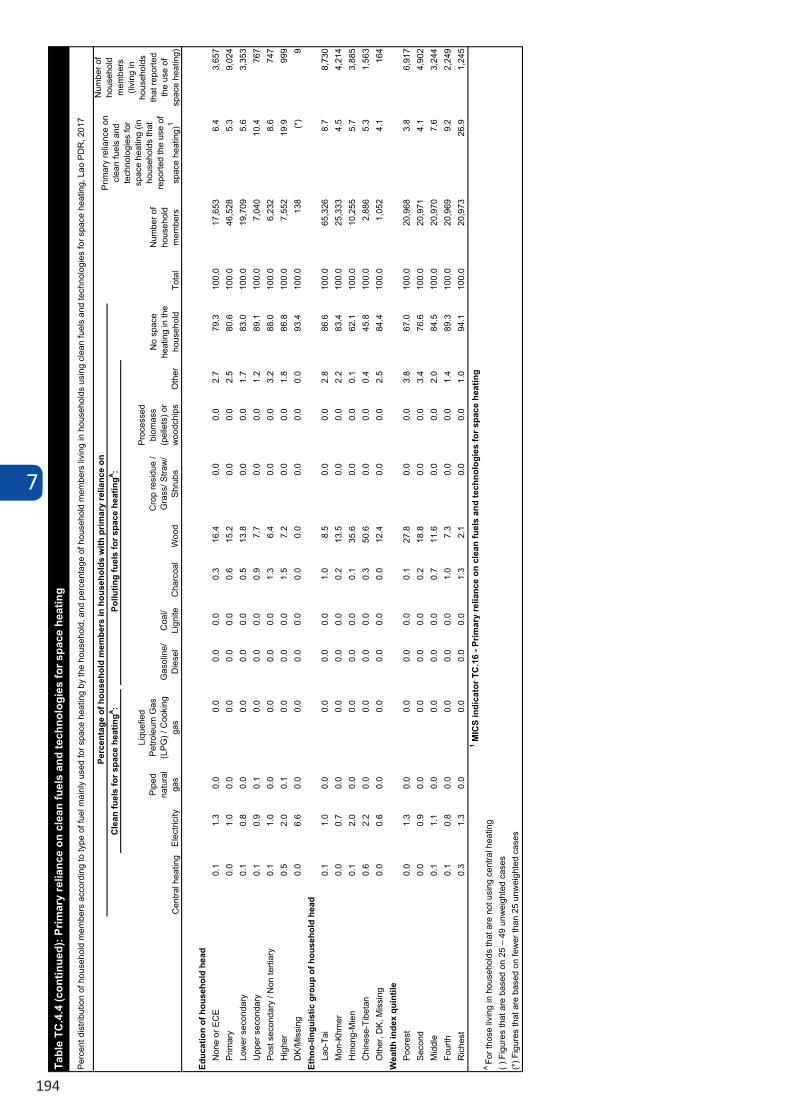
7
194
Elec
trici
ty
Pipe
d na
tura
l ga
s
Liqu
efie
d Pe
trole
um G
as
(LPG
) / C
ooki
ng
gas
Gas
olin
e/
Die
sel
Coa
l/ Li
gnite
Cha
rcoa
lW
ood
Cro
p re
sidu
e /
Gra
ss/ S
traw
/ Sh
rubs
Proc
esse
d bi
omas
s (p
elle
ts) o
r w
oodc
hips
Oth
er
Educ
atio
n of
hou
seho
ld h
ead
Non
e or
EC
E0.
11.
30.
00.
00.
00.
00.
316
.40.
00.
02.
779
.310
0.0
17,6
536.
43,
657
Prim
ary
0.0
1.0
0.0
0.0
0.0
0.0
0.6
15.2
0.0
0.0
2.5
80.6
100.
046
,528
5.3
9,02
4Lo
wer
sec
onda
ry0.
10.
80.
00.
00.
00.
00.
513
.80.
00.
01.
783
.010
0.0
19,7
095.
63,
353
Upp
er s
econ
dary
0.1
0.9
0.1
0.0
0.0
0.0
0.9
7.7
0.0
0.0
1.2
89.1
100.
07,
040
10.4
767
Post
sec
onda
ry /
Non
terti
ary
0.1
1.0
0.0
0.0
0.0
0.0
1.3
6.4
0.0
0.0
3.2
88.0
100.
06,
232
8.6
747
Hig
her
0.5
2.0
0.1
0.0
0.0
0.0
1.5
7.2
0.0
0.0
1.8
86.8
100.
07,
552
19.9
999
DK/
Mis
sing
0.0
6.6
0.0
0.0
0.0
0.0
0.0
0.0
0.0
0.0
0.0
93.4
100.
013
8(*
)9
Ethn
o-lin
guis
tic g
roup
of h
ouse
hold
hea
dLa
o-Ta
i0.
11.
00.
00.
00.
00.
01.
08.
50.
00.
02.
886
.610
0.0
65,3
268.
78,
730
Mon
-Khm
er0.
00.
70.
00.
00.
00.
00.
213
.50.
00.
02.
283
.410
0.0
25,3
334.
54,
214
Hm
ong-
Mie
n0.
12.
00.
00.
00.
00.
00.
135
.60.
00.
00.
162
.110
0.0
10,2
555.
73,
885
Chi
nese
-Tib
etan
0.6
2.2
0.0
0.0
0.0
0.0
0.3
50.6
0.0
0.0
0.4
45.8
100.
02,
886
5.3
1,56
3O
ther
, DK,
Mis
sing
0.0
0.6
0.0
0.0
0.0
0.0
0.0
12.4
0.0
0.0
2.5
84.4
100.
01,
052
4.1
164
Wea
lth in
dex
quin
tile
Poor
est
0.0
1.3
0.0
0.0
0.0
0.0
0.1
27.8
0.0
0.0
3.8
67.0
100.
020
,968
3.8
6,91
7Se
cond
0.0
0.9
0.0
0.0
0.0
0.0
0.2
18.8
0.0
0.0
3.4
76.6
100.
020
,971
4.1
4,90
2M
iddl
e0.
11.
10.
00.
00.
00.
00.
711
.60.
00.
02.
084
.510
0.0
20,9
707.
63,
244
Four
th0.
10.
80.
00.
00.
00.
01.
07.
30.
00.
01.
489
.310
0.0
20,9
699.
22,
249
Ric
hest
0.3
1.3
0.0
0.0
0.0
0.0
1.3
2.1
0.0
0.0
1.0
94.1
100.
020
,973
26.9
1,24
5
( ) F
igur
es th
at a
re b
ased
on
25 –
49
unw
eigh
ted
case
s
Tabl
e TC
.4.4
(con
tinue
d): P
rimar
y re
lianc
e on
cle
an fu
els
and
tech
nolo
gies
for s
pace
hea
ting
Perc
ent d
istri
butio
n of
hou
seho
ld m
embe
rs a
ccor
ding
to ty
pe o
f fue
l mai
nly
used
for s
pace
hea
ting
by th
e ho
useh
old,
and
per
cent
age
of h
ouse
hold
mem
bers
livi
ng in
hou
seho
lds
usin
g cl
ean
fuel
s an
d te
chno
logi
es fo
r spa
ce h
eatin
g, L
ao P
DR
, 201
7
Num
ber o
f ho
useh
old
mem
bers
(li
ving
in
hous
ehol
ds
that
repo
rted
the
use
of
spac
e he
atin
g)
1 MIC
S in
dica
tor T
C.1
6 - P
rimar
y re
lianc
e on
cle
an fu
els
and
tech
nolo
gies
for s
pace
hea
ting
(*) F
igur
es th
at a
re b
ased
on
few
er th
an 2
5 un
wei
ghte
d ca
ses
A Fo
r tho
se li
ving
in h
ouse
hold
s th
at a
re n
ot u
sing
cen
tral h
eatin
g
No
spac
e he
atin
g in
the
hous
ehol
d
Perc
enta
ge o
f hou
seho
ld m
embe
rs in
hou
seho
lds
with
prim
ary
relia
nce
on
Tota
l
Num
ber o
f ho
useh
old
mem
bers
Prim
ary
relia
nce
on
clea
n fu
els
and
tech
nolo
gies
for
spac
e he
atin
g (in
ho
useh
olds
that
re
porte
d th
e us
e of
spac
e he
atin
g)1
Cen
tral h
eatin
g
Cle
an fu
els
for s
pace
hea
tingA :
Pollu
ting
fuel
s fo
r spa
ce h
eatin
gA :
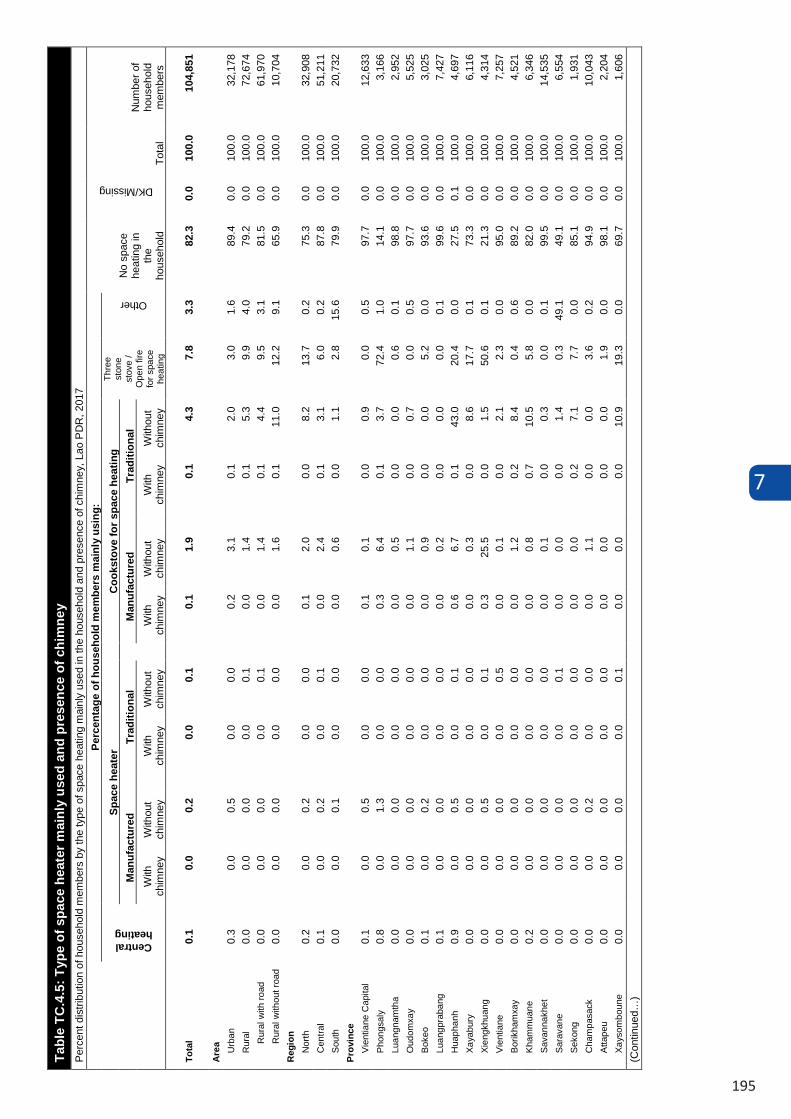
7
195
Tabl
e TC
.4.5
:Typ
e of
spa
ce h
eate
r mai
nly
used
and
pre
senc
e of
chi
mne
yP
erce
nt d
istri
butio
n of
hou
seho
ld m
embe
rs b
y th
e ty
pe o
f spa
ce h
eatin
g m
ainl
y us
ed in
the
hous
ehol
d an
d pr
esen
ce o
f chi
mne
y, L
ao P
DR
, 201
7Pe
rcen
tage
of h
ouse
hold
mem
bers
mai
nly
usin
g:
No
spac
e he
atin
g in
th
e ho
useh
old
DK/Missing
Tota
l
Num
ber o
f ho
useh
old
mem
bers
Central heating
Spac
e he
ater
Coo
ksto
ve fo
r spa
ce h
eatin
gTh
ree
ston
e st
ove
/ O
pen
fire
for s
pace
he
atin
g
Other
Man
ufac
ture
dTr
aditi
onal
Man
ufac
ture
dTr
aditi
onal
With
ch
imne
yW
ithou
t ch
imne
yW
ith
chim
ney
With
out
chim
ney
With
ch
imne
yW
ithou
t ch
imne
yW
ith
chim
ney
With
out
chim
ney
Tota
l0.
10.
00.
20.
00.
10.
11.
90.
14.
37.
83.
382
.30.
010
0.0
104,
851
Are
aU
rban
0.3
0.0
0.5
0.0
0.0
0.2
3.1
0.1
2.0
3.0
1.6
89.4
0.0
100.
032
,178
R
ural
0.0
0.0
0.0
0.0
0.1
0.0
1.4
0.1
5.3
9.9
4.0
79.2
0.0
100.
072
,674
R
ural
with
road
0.0
0.0
0.0
0.0
0.1
0.0
1.4
0.1
4.4
9.5
3.1
81.5
0.0
100.
061
,970
R
ural
with
out r
oad
0.0
0.0
0.0
0.0
0.0
0.0
1.6
0.1
11.0
12.2
9.1
65.9
0.0
100.
010
,704
R
egio
nN
orth
0.2
0.0
0.2
0.0
0.0
0.1
2.0
0.0
8.2
13.7
0.2
75.3
0.0
100.
032
,908
C
entra
l0.
10.
00.
20.
00.
10.
02.
40.
13.
16.
00.
287
.80.
010
0.0
51,2
11
Sou
th0.
00.
00.
10.
00.
00.
00.
60.
01.
12.
815
.679
.90.
010
0.0
20,7
32
Prov
ince
Vie
ntia
ne C
apita
l0.
10.
00.
50.
00.
00.
10.
10.
00.
90.
00.
597
.70.
010
0.0
12,6
33
Pho
ngsa
ly0.
80.
01.
30.
00.
00.
36.
40.
13.
772
.41.
014
.10.
010
0.0
3,16
6 Lu
angn
amth
a0.
00.
00.
00.
00.
00.
00.
50.
00.
00.
60.
198
.80.
010
0.0
2,95
2 O
udom
xay
0.0
0.0
0.0
0.0
0.0
0.0
1.1
0.0
0.7
0.0
0.5
97.7
0.0
100.
05,
525
Bok
eo0.
10.
00.
20.
00.
00.
00.
90.
00.
05.
20.
093
.60.
010
0.0
3,02
5 Lu
angp
raba
ng0.
10.
00.
00.
00.
00.
00.
20.
00.
00.
00.
199
.60.
010
0.0
7,42
7 H
uaph
anh
0.9
0.0
0.5
0.0
0.1
0.6
6.7
0.1
43.0
20.4
0.0
27.5
0.1
100.
04,
697
Xaya
bury
0.0
0.0
0.0
0.0
0.0
0.0
0.3
0.0
8.6
17.7
0.1
73.3
0.0
100.
06,
116
Xien
gkhu
ang
0.0
0.0
0.5
0.0
0.1
0.3
25.5
0.0
1.5
50.6
0.1
21.3
0.0
100.
04,
314
Vie
ntia
ne0.
00.
00.
00.
00.
50.
00.
10.
02.
12.
30.
095
.00.
010
0.0
7,25
7 B
orik
ham
xay
0.0
0.0
0.0
0.0
0.0
0.0
1.2
0.2
8.4
0.4
0.6
89.2
0.0
100.
04,
521
Kha
mm
uane
0.2
0.0
0.0
0.0
0.0
0.0
0.8
0.7
10.5
5.8
0.0
82.0
0.0
100.
06,
346
Sav
anna
khet
0.0
0.0
0.0
0.0
0.0
0.0
0.1
0.0
0.3
0.0
0.1
99.5
0.0
100.
014
,535
S
arav
ane
0.0
0.0
0.0
0.0
0.1
0.0
0.0
0.0
1.4
0.3
49.1
49.1
0.0
100.
06,
554
Sek
ong
0.0
0.0
0.0
0.0
0.0
0.0
0.0
0.2
7.1
7.7
0.0
85.1
0.0
100.
01,
931
Cha
mpa
sack
0.0
0.0
0.2
0.0
0.0
0.0
1.1
0.0
0.0
3.6
0.2
94.9
0.0
100.
010
,043
A
ttape
u0.
00.
00.
00.
00.
00.
00.
00.
00.
01.
90.
098
.10.
010
0.0
2,20
4 Xa
ysom
boun
e0.
00.
00.
00.
00.
10.
00.
00.
010
.919
.30.
069
.70.
010
0.0
1,60
6 (C
ontin
ued…
)
Hou
seho
lds
that
use
cle
an fu
els
and
tech
nolo
gies
for
light
ing
are
thos
e m
ainl
y us
ing
elec
tric
ity, s
olar
lant
ern,
rec
harg
eabl
e or
bat
tery
pow
ered
flas
hlig
ht, t
orch
or
lant
ern,
or
biog
as la
mp.
Tab
le T
C.4.
6 pr
esen
ts th
e pe
rcen
t dis
trib
utio
n of
hou
seho
ld m
embe
rs a
ccor
ding
to ty
pe o
f lig
htin
g fu
el m
ainl
y us
ed fo
r lig
htin
g by
the
hous
ehol
d, a
nd p
erce
ntag
e of
hou
seho
ld m
embe
rs li
ving
in h
ouse
hold
s us
ing
clea
n fu
els
and
tech
nolo
gies
for
light
ing.
Tabl
e TC
.4.5
(Con
tinue
d): T
ype
of s
pace
hea
ter m
ainl
y us
ed a
nd p
rese
nce
of c
him
ney
Per
cent
dis
tribu
tion
of h
ouse
hold
mem
bers
by
the
type
of s
pace
hea
ting
mai
nly
used
in th
e ho
useh
old
and
pres
ence
of c
him
ney,
Lao
PD
R, 2
017
Perc
enta
ge o
f hou
seho
ld m
embe
rs m
ainl
y us
ing:
No
spac
e he
atin
g in
th
e ho
useh
old
DK
/Mis
sing
Tota
l
Num
ber o
f ho
useh
old
mem
bers
Central heating
Spac
e he
ater
Coo
ksto
ve fo
r spa
ce h
eatin
gTh
ree
ston
e st
ove
/ O
pen
fire
for
spac
e he
atin
gO
ther
Man
ufac
ture
dTr
aditi
onal
Man
ufac
ture
dTr
aditi
onal
With
ch
imne
yW
ithou
t ch
imne
yW
ith
chim
ney
With
out
chim
ney
With
ch
imne
yW
ithou
t ch
imne
yW
ith
chim
ney
With
out
chim
ney
Educ
atio
n of
ho
useh
old
head
Non
e or
EC
E0.
10.
00.
00.
00.
00.
00.
90.
14.
710
.64.
479
.30.
010
0.0
17,6
53
Prim
ary
0.0
0.0
0.1
0.0
0.1
0.0
1.4
0.0
5.2
8.9
3.6
80.6
0.0
100.
046
,528
Lo
wer
sec
onda
ry0.
10.
00.
10.
00.
00.
02.
60.
04.
27.
72.
183
.00.
010
0.0
19,7
09
Upp
er s
econ
dary
0.1
0.0
0.1
0.0
0.0
0.0
2.1
0.3
2.7
3.9
1.7
89.1
0.0
100.
07,
040
Pos
t sec
onda
ry /
Non
te
rtiar
y0.
10.
00.
30.
00.
10.
24.
30.
01.
22.
13.
788
.00.
010
0.0
6,23
2
Hig
her
0.5
0.0
1.1
0.0
0.1
0.3
3.7
0.1
2.5
2.4
2.5
86.8
0.0
100.
07,
552
DK
/Mis
sing
0.0
0.0
0.0
0.0
0.0
0.0
0.0
0.0
0.0
6.6
0.0
93.4
0.0
100.
013
8 Et
hno-
lingu
istic
gro
up o
f ho
useh
old
head
Lao-
Tai
0.1
0.0
0.1
0.0
0.0
0.1
2.3
0.1
3.4
3.5
3.8
86.6
0.0
100.
065
,326
M
on-K
hmer
0.0
0.0
0.1
0.0
0.1
0.0
0.7
0.0
4.3
7.8
3.6
83.4
0.0
100.
025
,333
H
mon
g-M
ien
0.1
0.0
0.1
0.0
0.2
0.0
2.8
0.0
11.5
23.1
0.1
62.1
0.0
100.
010
,255
C
hine
se-T
ibet
an0.
60.
01.
10.
00.
00.
12.
00.
11.
248
.40.
745
.80.
010
0.0
2,88
6 O
ther
, DK
, Mis
sing
0.0
0.0
0.0
0.0
0.0
0.0
1.5
0.0
4.0
7.6
2.5
84.4
0.0
100.
01,
052
Wea
lth in
dex
quin
tile
Poo
rest
0.0
0.0
0.0
0.0
0.1
0.0
0.5
0.0
7.4
18.9
6.1
67.0
0.0
100.
020
,968
S
econ
d0.
00.
00.
00.
00.
10.
01.
10.
06.
810
.84.
676
.60.
010
0.0
20,9
71
Mid
dle
0.1
0.0
0.1
0.0
0.1
0.0
2.4
0.1
4.1
6.2
2.5
84.5
0.0
100.
020
,970
Fo
urth
0.1
0.0
0.1
0.0
0.0
0.2
3.5
0.2
2.4
2.5
1.7
89.3
0.0
100.
020
,969
R
iche
st0.
30.
00.
70.
00.
00.
12.
00.
10.
90.
41.
594
.10.
010
0.0
20,9
73
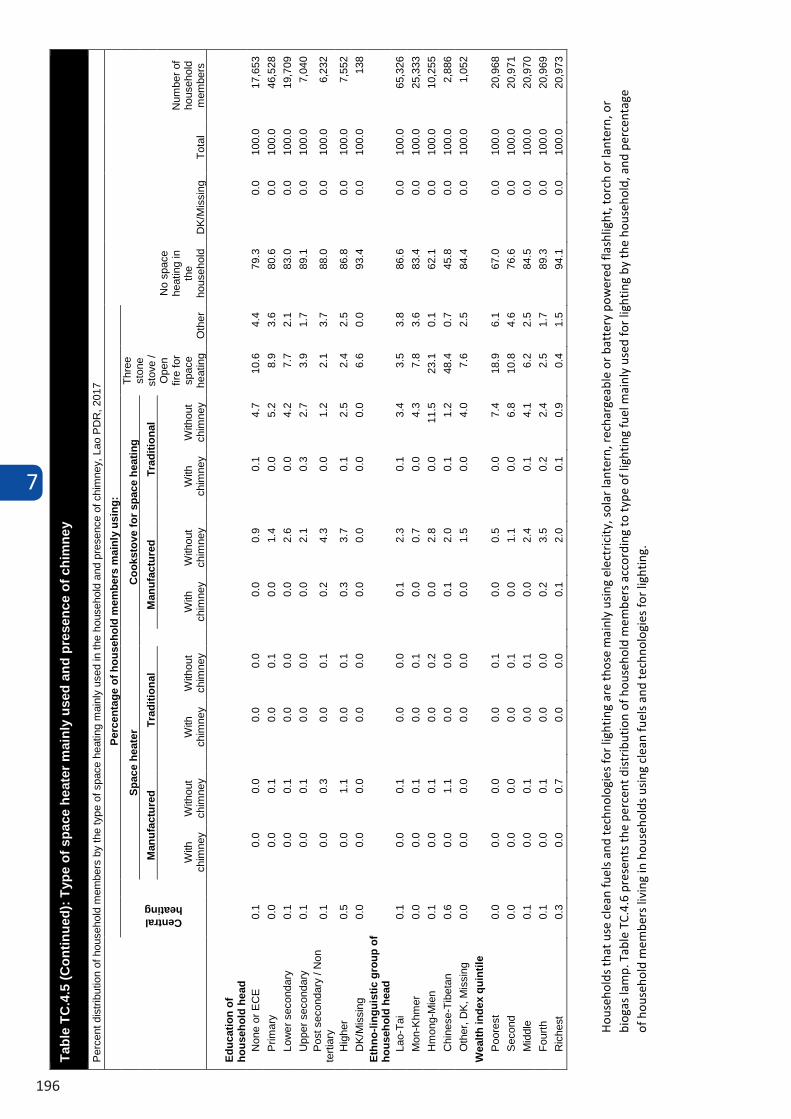
7
196
Hou
seho
lds
that
use
cle
an fu
els
and
tech
nolo
gies
for
light
ing
are
thos
e m
ainl
y us
ing
elec
tric
ity, s
olar
lant
ern,
rec
harg
eabl
e or
bat
tery
pow
ered
flas
hlig
ht, t
orch
or
lant
ern,
or
biog
as la
mp.
Tab
le T
C.4.
6 pr
esen
ts th
e pe
rcen
t dis
trib
utio
n of
hou
seho
ld m
embe
rs a
ccor
ding
to ty
pe o
f lig
htin
g fu
el m
ainl
y us
ed fo
r lig
htin
g by
the
hous
ehol
d, a
nd p
erce
ntag
e of
hou
seho
ld m
embe
rs li
ving
in h
ouse
hold
s us
ing
clea
n fu
els
and
tech
nolo
gies
for
light
ing.
Tabl
e TC
.4.5
(Con
tinue
d): T
ype
of s
pace
hea
ter m
ainl
y us
ed a
nd p
rese
nce
of c
him
ney
Per
cent
dis
tribu
tion
of h
ouse
hold
mem
bers
by
the
type
of s
pace
hea
ting
mai
nly
used
in th
e ho
useh
old
and
pres
ence
of c
him
ney,
Lao
PD
R, 2
017
Perc
enta
ge o
f hou
seho
ld m
embe
rs m
ainl
y us
ing:
No
spac
e he
atin
g in
th
e ho
useh
old
DK
/Mis
sing
Tota
l
Num
ber o
f ho
useh
old
mem
bers
Central heating
Spac
e he
ater
Coo
ksto
ve fo
r spa
ce h
eatin
gTh
ree
ston
e st
ove
/ O
pen
fire
for
spac
e he
atin
gO
ther
Man
ufac
ture
dTr
aditi
onal
Man
ufac
ture
dTr
aditi
onal
With
ch
imne
yW
ithou
t ch
imne
yW
ith
chim
ney
With
out
chim
ney
With
ch
imne
yW
ithou
t ch
imne
yW
ith
chim
ney
With
out
chim
ney
Educ
atio
n of
ho
useh
old
head
Non
e or
EC
E0.
10.
00.
00.
00.
00.
00.
90.
14.
710
.64.
479
.30.
010
0.0
17,6
53
Prim
ary
0.0
0.0
0.1
0.0
0.1
0.0
1.4
0.0
5.2
8.9
3.6
80.6
0.0
100.
046
,528
Lo
wer
sec
onda
ry0.
10.
00.
10.
00.
00.
02.
60.
04.
27.
72.
183
.00.
010
0.0
19,7
09
Upp
er s
econ
dary
0.1
0.0
0.1
0.0
0.0
0.0
2.1
0.3
2.7
3.9
1.7
89.1
0.0
100.
07,
040
Pos
t sec
onda
ry /
Non
te
rtiar
y0.
10.
00.
30.
00.
10.
24.
30.
01.
22.
13.
788
.00.
010
0.0
6,23
2
Hig
her
0.5
0.0
1.1
0.0
0.1
0.3
3.7
0.1
2.5
2.4
2.5
86.8
0.0
100.
07,
552
DK
/Mis
sing
0.0
0.0
0.0
0.0
0.0
0.0
0.0
0.0
0.0
6.6
0.0
93.4
0.0
100.
013
8 Et
hno-
lingu
istic
gro
up o
f ho
useh
old
head
Lao-
Tai
0.1
0.0
0.1
0.0
0.0
0.1
2.3
0.1
3.4
3.5
3.8
86.6
0.0
100.
065
,326
M
on-K
hmer
0.0
0.0
0.1
0.0
0.1
0.0
0.7
0.0
4.3
7.8
3.6
83.4
0.0
100.
025
,333
H
mon
g-M
ien
0.1
0.0
0.1
0.0
0.2
0.0
2.8
0.0
11.5
23.1
0.1
62.1
0.0
100.
010
,255
C
hine
se-T
ibet
an0.
60.
01.
10.
00.
00.
12.
00.
11.
248
.40.
745
.80.
010
0.0
2,88
6 O
ther
, DK
, Mis
sing
0.0
0.0
0.0
0.0
0.0
0.0
1.5
0.0
4.0
7.6
2.5
84.4
0.0
100.
01,
052
Wea
lth in
dex
quin
tile
Poo
rest
0.0
0.0
0.0
0.0
0.1
0.0
0.5
0.0
7.4
18.9
6.1
67.0
0.0
100.
020
,968
S
econ
d0.
00.
00.
00.
00.
10.
01.
10.
06.
810
.84.
676
.60.
010
0.0
20,9
71
Mid
dle
0.1
0.0
0.1
0.0
0.1
0.0
2.4
0.1
4.1
6.2
2.5
84.5
0.0
100.
020
,970
Fo
urth
0.1
0.0
0.1
0.0
0.0
0.2
3.5
0.2
2.4
2.5
1.7
89.3
0.0
100.
020
,969
R
iche
st0.
30.
00.
70.
00.
00.
12.
00.
10.
90.
41.
594
.10.
010
0.0
20,9
73
Hou
seho
lds
that
use
cle
an fu
els
and
tech
nolo
gies
for
light
ing
are
thos
e m
ainl
y us
ing
elec
tric
ity, s
olar
lant
ern,
rec
harg
eabl
e or
bat
tery
pow
ered
flas
hlig
ht, t
orch
or
lant
ern,
or
biog
as la
mp.
Tab
le T
C.4.
6 pr
esen
ts th
e pe
rcen
t dis
trib
utio
n of
hou
seho
ld m
embe
rs a
ccor
ding
to ty
pe o
f lig
htin
g fu
el m
ainl
y us
ed fo
r lig
htin
g by
the
hous
ehol
d, a
nd p
erce
ntag
e of
hou
seho
ld m
embe
rs li
ving
in h
ouse
hold
s us
ing
clea
n fu
els
and
tech
nolo
gies
for
light
ing .
Tabl
e TC
.4.5
(Con
tinue
d): T
ype
of s
pace
hea
ter m
ainl
y us
ed a
nd p
rese
nce
of c
him
ney
Per
cent
dis
tribu
tion
of h
ouse
hold
mem
bers
by
the
type
of s
pace
hea
ting
mai
nly
used
in th
e ho
useh
old
and
pres
ence
of c
him
ney,
Lao
PD
R, 2
017
Perc
enta
ge o
f hou
seho
ld m
embe
rs m
ainl
y us
ing:
No
spac
e he
atin
g in
th
e ho
useh
old
DK
/Mis
sing
Tota
l
Num
ber o
f ho
useh
old
mem
bers
Central heating
Spac
e he
ater
Coo
ksto
ve fo
r spa
ce h
eatin
gTh
ree
ston
e st
ove
/ O
pen
fire
for
spac
e he
atin
gO
ther
Man
ufac
ture
dTr
aditi
onal
Man
ufac
ture
dTr
aditi
onal
With
ch
imne
yW
ithou
t ch
imne
yW
ith
chim
ney
With
out
chim
ney
With
ch
imne
yW
ithou
t ch
imne
yW
ith
chim
ney
With
out
chim
ney
Educ
atio
n of
ho
useh
old
head
Non
e or
EC
E0.
10.
00.
00.
00.
00.
00.
90.
14.
710
.64.
479
.30.
010
0.0
17,6
53
Prim
ary
0.0
0.0
0.1
0.0
0.1
0.0
1.4
0.0
5.2
8.9
3.6
80.6
0.0
100.
046
,528
Lo
wer
sec
onda
ry0.
10.
00.
10.
00.
00.
02.
60.
04.
27.
72.
183
.00.
010
0.0
19,7
09
Upp
er s
econ
dary
0.1
0.0
0.1
0.0
0.0
0.0
2.1
0.3
2.7
3.9
1.7
89.1
0.0
100.
07,
040
Pos
t sec
onda
ry /
Non
te
rtiar
y0.
10.
00.
30.
00.
10.
24.
30.
01.
22.
13.
788
.00.
010
0.0
6,23
2
Hig
her
0.5
0.0
1.1
0.0
0.1
0.3
3.7
0.1
2.5
2.4
2.5
86.8
0.0
100.
07,
552
DK
/Mis
sing
0.0
0.0
0.0
0.0
0.0
0.0
0.0
0.0
0.0
6.6
0.0
93.4
0.0
100.
013
8 Et
hno-
lingu
istic
gro
up o
f ho
useh
old
head
Lao-
Tai
0.1
0.0
0.1
0.0
0.0
0.1
2.3
0.1
3.4
3.5
3.8
86.6
0.0
100.
065
,326
M
on-K
hmer
0.0
0.0
0.1
0.0
0.1
0.0
0.7
0.0
4.3
7.8
3.6
83.4
0.0
100.
025
,333
H
mon
g-M
ien
0.1
0.0
0.1
0.0
0.2
0.0
2.8
0.0
11.5
23.1
0.1
62.1
0.0
100.
010
,255
C
hine
se-T
ibet
an0.
60.
01.
10.
00.
00.
12.
00.
11.
248
.40.
745
.80.
010
0.0
2,88
6 O
ther
, DK
, Mis
sing
0.0
0.0
0.0
0.0
0.0
0.0
1.5
0.0
4.0
7.6
2.5
84.4
0.0
100.
01,
052
Wea
lth in
dex
quin
tile
Poo
rest
0.0
0.0
0.0
0.0
0.1
0.0
0.5
0.0
7.4
18.9
6.1
67.0
0.0
100.
020
,968
S
econ
d0.
00.
00.
00.
00.
10.
01.
10.
06.
810
.84.
676
.60.
010
0.0
20,9
71
Mid
dle
0.1
0.0
0.1
0.0
0.1
0.0
2.4
0.1
4.1
6.2
2.5
84.5
0.0
100.
020
,970
Fo
urth
0.1
0.0
0.1
0.0
0.0
0.2
3.5
0.2
2.4
2.5
1.7
89.3
0.0
100.
020
,969
R
iche
st0.
30.
00.
70.
00.
00.
12.
00.
10.
90.
41.
594
.10.
010
0.0
20,9
73
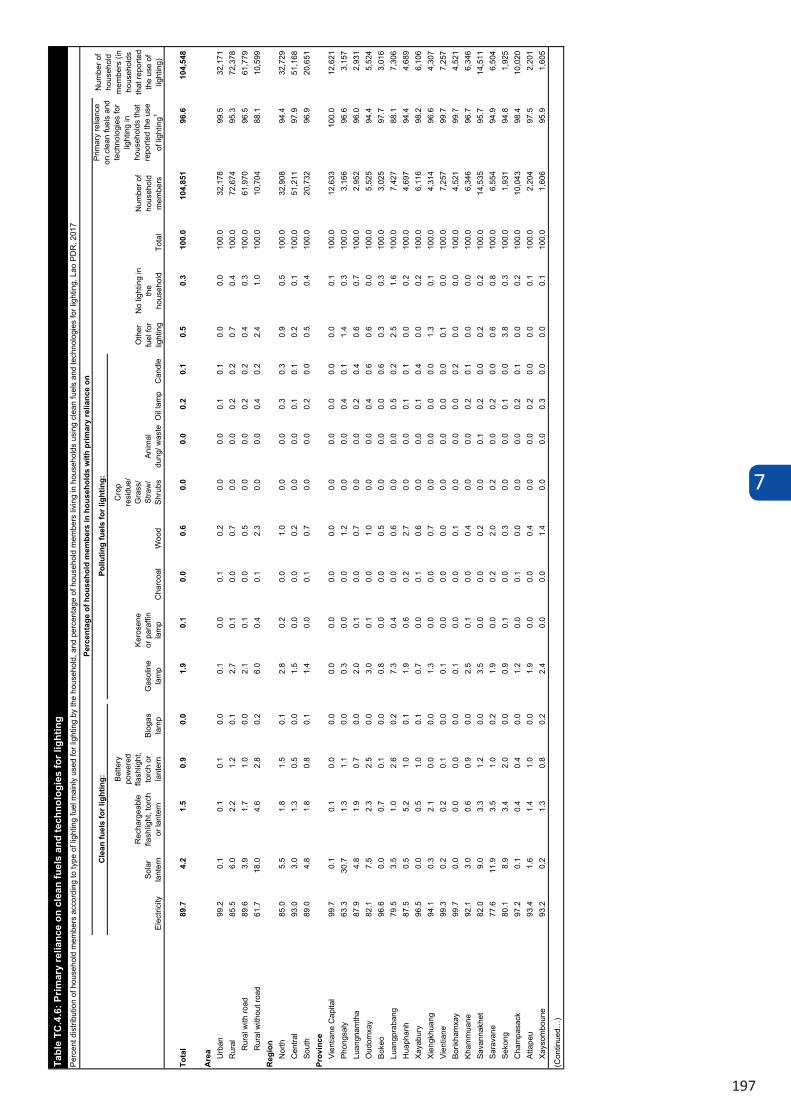
7
197
Elec
trici
tySo
lar
lant
ern
Rec
harg
eabl
e fla
shlig
ht, t
orch
or
lant
ern
Batte
ry
pow
ered
fla
shlig
ht,
torc
h or
la
nter
nBi
ogas
la
mp
Gas
olin
e la
mp
Kero
sene
or
par
affin
la
mp
Cha
rcoa
lW
ood
Cro
p re
sidu
e/
Gra
ss/
Stra
w/
Shru
bsAn
imal
du
ng/ w
aste
Oil
lam
pC
andl
e
Tota
l89
.74.
21.
50.
90.
01.
90.
10.
00.
60.
00.
00.
20.
10.
50.
310
0.0
104,
851
96.6
104,
548
Are
a Urb
an99
.20.
10.
10.
10.
00.
10.
00.
10.
20.
00.
00.
10.
10.
00.
010
0.0
32,1
78
99
.532
,171
R
ural
85.5
6.0
2.2
1.2
0.1
2.7
0.1
0.0
0.7
0.0
0.0
0.2
0.2
0.7
0.4
100.
072
,674
95.3
72,3
78
Rur
al w
ith ro
ad89
.63.
91.
71.
00.
02.
10.
10.
00.
50.
00.
00.
20.
20.
40.
310
0.0
61,9
70
96
.561
,779
R
ural
with
out r
oad
61.7
18.0
4.6
2.8
0.2
6.0
0.4
0.1
2.3
0.0
0.0
0.4
0.2
2.4
1.0
100.
010
,704
88.1
10,5
99
Reg
ion
Nor
th85
.05.
51.
81.
50.
12.
80.
20.
01.
00.
00.
00.
30.
30.
90.
510
0.0
32,9
08
94
.432
,729
C
entra
l93
.03.
01.
30.
50.
01.
50.
00.
00.
20.
00.
00.
10.
10.
20.
110
0.0
51,2
11
97
.951
,168
So
uth
89.0
4.8
1.8
0.8
0.1
1.4
0.0
0.1
0.7
0.0
0.0
0.2
0.0
0.5
0.4
100.
020
,732
96.9
20,6
51
Prov
ince
Vien
tiane
Cap
ital
99.7
0.1
0.1
0.0
0.0
0.0
0.0
0.0
0.0
0.0
0.0
0.0
0.0
0.0
0.1
100.
012
,633
100.
012
,621
Ph
ongs
aly
63.3
30.7
1.3
1.1
0.0
0.3
0.0
0.0
1.2
0.0
0.0
0.4
0.1
1.4
0.3
100.
03,
166
96
.63,
157
Luan
gnam
tha
87.9
4.8
1.9
0.7
0.0
2.0
0.1
0.0
0.7
0.0
0.0
0.2
0.4
0.6
0.7
100.
02,
952
96
.02,
931
Oud
omxa
y82
.17.
52.
32.
50.
03.
00.
10.
01.
00.
00.
00.
40.
60.
60.
010
0.0
5,52
5
94.4
5,52
4
Bo
keo
96.6
0.0
0.7
0.1
0.0
0.8
0.0
0.0
0.5
0.0
0.0
0.0
0.6
0.3
0.3
100.
03,
025
97
.73,
016
Luan
gpra
bang
79.5
3.5
1.0
2.6
0.2
7.3
0.4
0.0
0.6
0.0
0.0
0.5
0.2
2.5
1.6
100.
07,
427
88
.17,
306
Hua
phan
h87
.50.
55.
21.
00.
11.
90.
60.
22.
70.
00.
00.
10.
10.
00.
210
0.0
4,69
7
94.4
4,68
9
Xa
yabu
ry96
.50.
00.
51.
00.
10.
70.
00.
10.
60.
00.
00.
10.
40.
00.
210
0.0
6,11
6
98.2
6,10
6
Xi
engk
huan
g94
.10.
32.
10.
00.
01.
30.
00.
00.
70.
00.
00.
00.
01.
30.
110
0.0
4,31
4
96.6
4,30
7
Vi
entia
ne99
.30.
20.
20.
10.
00.
10.
00.
00.
00.
00.
00.
00.
00.
10.
010
0.0
7,25
7
99.7
7,25
7
Bo
rikha
mxa
y99
.70.
00.
00.
00.
00.
10.
00.
00.
10.
00.
00.
00.
20.
00.
010
0.0
4,52
1
99.7
4,52
1
Kh
amm
uane
92.1
3.0
0.6
0.9
0.0
2.5
0.1
0.0
0.4
0.0
0.0
0.2
0.1
0.0
0.0
100.
06,
346
96
.76,
346
Sava
nnak
het
82.0
9.0
3.3
1.2
0.0
3.5
0.0
0.0
0.2
0.0
0.1
0.2
0.0
0.2
0.2
100.
014
,535
95.7
14,5
11
Sara
vane
77.6
11.9
3.5
1.0
0.2
1.9
0.0
0.2
2.0
0.2
0.0
0.2
0.0
0.6
0.8
100.
06,
554
94
.96,
504
Seko
ng80
.18.
93.
42.
00.
00.
90.
10.
00.
30.
00.
00.
10.
03.
80.
310
0.0
1,93
1
94.8
1,92
5
C
ham
pasa
ck97
.20.
10.
40.
40.
01.
20.
00.
10.
00.
00.
00.
20.
10.
00.
210
0.0
10,0
43
98
.410
,020
At
tape
u93
.41.
61.
41.
00.
01.
90.
00.
00.
40.
00.
00.
20.
00.
00.
110
0.0
2,20
4
97.5
2,20
1
Xa
ysom
boun
e93
.20.
21.
30.
80.
22.
40.
00.
01.
40.
00.
00.
30.
00.
00.
110
0.0
1,60
6
95.9
1,60
5
(Con
tinue
d…)
Cle
an fu
els
for l
ight
ing:
Pollu
ting
fuel
s fo
r lig
htin
g:
Oth
er
fuel
for
light
ing
No
light
ing
in
the
hous
ehol
dTo
tal
Num
ber o
f ho
useh
old
mem
bers
Tabl
e TC
.4.6
: Prim
ary
relia
nce
on c
lean
fuel
s an
d te
chno
logi
es fo
r lig
htin
gPe
rcen
t dis
tribu
tion
of h
ouse
hold
mem
bers
acc
ordi
ng to
type
of l
ight
ing
fuel
mai
nly
used
for l
ight
ing
by th
e ho
useh
old,
and
per
cent
age
of h
ouse
hold
mem
bers
livi
ng in
hou
seho
lds
usin
g cl
ean
fuel
s an
d te
chno
logi
es fo
r lig
htin
g, L
ao P
DR
, 201
7Pe
rcen
tage
of h
ouse
hold
mem
bers
in h
ouse
hold
s w
ith p
rimar
y re
lianc
e on
Num
ber o
f ho
useh
old
mem
bers
(in
hous
ehol
ds
that
repo
rted
the
use
of
light
ing)
Prim
ary
relia
nce
on c
lean
fuel
s an
d te
chno
logi
es fo
r lig
htin
g in
ho
useh
olds
that
re
porte
d th
e us
e of
ligh
ting1
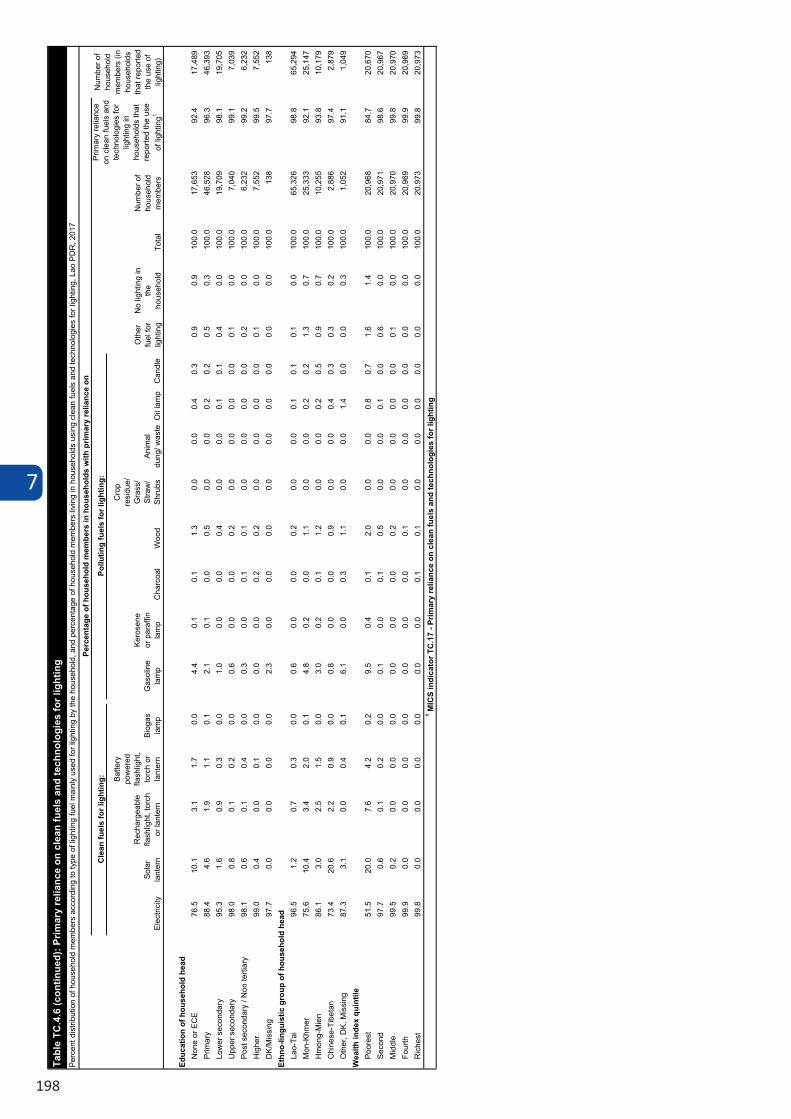
7
198
Elec
trici
tySo
lar
lant
ern
Rec
harg
eabl
e fla
shlig
ht, t
orch
or
lant
ern
Batte
ry
pow
ered
fla
shlig
ht,
torc
h or
la
nter
nBi
ogas
la
mp
Gas
olin
e la
mp
Kero
sene
or
par
affin
la
mp
Cha
rcoa
lW
ood
Cro
p re
sidu
e/
Gra
ss/
Stra
w/
Shru
bsAn
imal
du
ng/ w
aste
Oil
lam
pC
andl
e
Educ
atio
n of
hou
seho
ld h
ead
Non
e or
EC
E76
.510
.13.
11.
70.
04.
40.
10.
11.
30.
00.
00.
40.
30.
90.
910
0.0
17,6
53
92
.417
,489
Pr
imar
y88
.44.
61.
91.
10.
12.
10.
10.
00.
50.
00.
00.
20.
20.
50.
310
0.0
46,5
28
96
.346
,393
Lo
wer
sec
onda
ry95
.31.
60.
90.
30.
01.
00.
00.
00.
40.
00.
00.
10.
10.
40.
010
0.0
19,7
09
98
.119
,705
U
pper
sec
onda
ry98
.00.
80.
10.
20.
00.
60.
00.
00.
20.
00.
00.
00.
00.
10.
010
0.0
7,04
0
99.1
7,03
9
Po
st s
econ
dary
/ N
on te
rtiar
y98
.10.
60.
10.
40.
00.
30.
00.
10.
10.
00.
00.
00.
00.
20.
010
0.0
6,23
2
99.2
6,23
2
H
ighe
r99
.00.
40.
00.
10.
00.
00.
00.
20.
20.
00.
00.
00.
00.
10.
010
0.0
7,55
2
99.5
7,55
2
D
K/M
issi
ng97
.70.
00.
00.
00.
02.
30.
00.
00.
00.
00.
00.
00.
00.
00.
010
0.0
138
97.7
138
Et
hno-
lingu
istic
gro
up o
f hou
seho
ld h
ead
Lao-
Tai
96.5
1.2
0.7
0.3
0.0
0.6
0.0
0.0
0.2
0.0
0.0
0.1
0.1
0.1
0.0
100.
065
,326
98.8
65,2
94
Mon
-Khm
er75
.610
.43.
42.
00.
14.
80.
20.
01.
10.
00.
00.
20.
21.
30.
710
0.0
25,3
33
92
.125
,147
H
mon
g-M
ien
86.1
3.0
2.5
1.5
0.0
3.0
0.2
0.1
1.2
0.0
0.0
0.2
0.5
0.9
0.7
100.
010
,255
93.8
10,1
79
Chi
nese
-Tib
etan
73.4
20.6
2.2
0.9
0.0
0.8
0.0
0.0
0.9
0.0
0.0
0.4
0.3
0.3
0.2
100.
02,
886
97
.42,
879
Oth
er, D
K, M
issi
ng87
.33.
10.
00.
40.
16.
10.
00.
31.
10.
00.
01.
40.
00.
00.
310
0.0
1,05
2
91.1
1,04
9
W
ealth
inde
x qu
intil
ePo
ores
t51
.520
.07.
64.
20.
29.
50.
40.
12.
00.
00.
00.
80.
71.
61.
410
0.0
20,9
68
84
.720
,670
Se
cond
97.7
0.6
0.1
0.2
0.0
0.1
0.0
0.1
0.5
0.0
0.0
0.1
0.0
0.6
0.0
100.
020
,971
98.6
20,9
67
Mid
dle
99.5
0.2
0.0
0.0
0.0
0.0
0.0
0.0
0.2
0.0
0.0
0.0
0.0
0.1
0.0
100.
020
,970
99.8
20,9
70
Four
th99
.90.
00.
00.
00.
00.
00.
00.
00.
10.
00.
00.
00.
00.
00.
010
0.0
20,9
69
99
.920
,969
R
iche
st99
.80.
00.
00.
00.
00.
00.
00.
10.
10.
00.
00.
00.
00.
00.
010
0.0
20,9
73
99
.820
,973
1 M
ICS
indi
cato
r TC
.17
- Prim
ary
relia
nce
on c
lean
fuel
s an
d te
chno
logi
es fo
r lig
htin
g
Num
ber o
f ho
useh
old
mem
bers
Cle
an fu
els
for l
ight
ing:
Pollu
ting
fuel
s fo
r lig
htin
g:
Oth
er
fuel
for
light
ing
No
light
ing
in
the
hous
ehol
dTo
tal
Tabl
e TC
.4.6
(con
tinue
d): P
rimar
y re
lianc
e on
cle
an fu
els
and
tech
nolo
gies
for l
ight
ing
Perc
ent d
istri
butio
n of
hou
seho
ld m
embe
rs a
ccor
ding
to ty
pe o
f lig
htin
g fu
el m
ainl
y us
ed fo
r lig
htin
g by
the
hous
ehol
d, a
nd p
erce
ntag
e of
hou
seho
ld m
embe
rs li
ving
in h
ouse
hold
s us
ing
clea
n fu
els
and
tech
nolo
gies
for l
ight
ing,
Lao
PD
R, 2
017
Perc
enta
ge o
f hou
seho
ld m
embe
rs in
hou
seho
lds
with
prim
ary
relia
nce
onN
umbe
r of
hous
ehol
d m
embe
rs (i
n ho
useh
olds
th
at re
porte
d th
e us
e of
lig
htin
g)
Prim
ary
relia
nce
on c
lean
fuel
s an
d te
chno
logi
es fo
r lig
htin
g in
ho
useh
olds
that
re
porte
d th
e us
e of
ligh
ting1
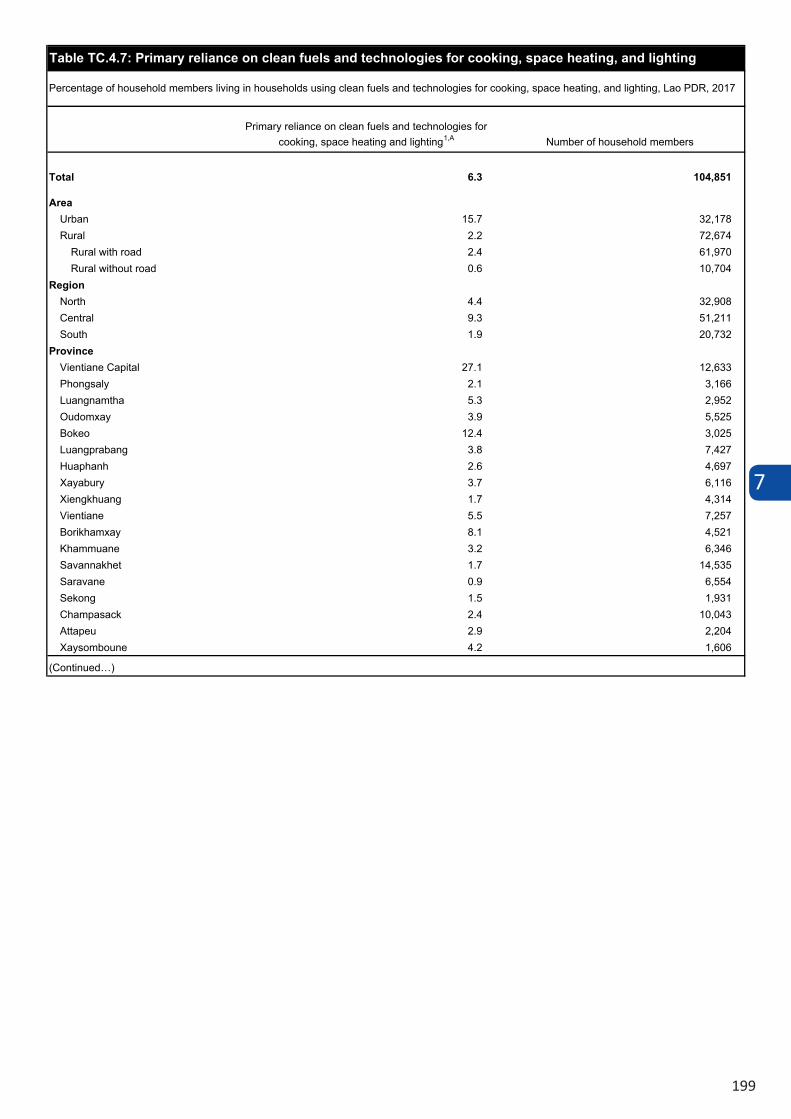
7
199
Primary reliance on clean fuels and technologies for cooking, space heating and lighting1,A Number of household members
Total 6.3 104,851
AreaUrban 15.7 32,178 Rural 2.2 72,674
Rural with road 2.4 61,970 Rural without road 0.6 10,704
RegionNorth 4.4 32,908 Central 9.3 51,211 South 1.9 20,732
ProvinceVientiane Capital 27.1 12,633 Phongsaly 2.1 3,166 Luangnamtha 5.3 2,952 Oudomxay 3.9 5,525 Bokeo 12.4 3,025 Luangprabang 3.8 7,427 Huaphanh 2.6 4,697 Xayabury 3.7 6,116 Xiengkhuang 1.7 4,314 Vientiane 5.5 7,257 Borikhamxay 8.1 4,521 Khammuane 3.2 6,346 Savannakhet 1.7 14,535 Saravane 0.9 6,554 Sekong 1.5 1,931 Champasack 2.4 10,043 Attapeu 2.9 2,204 Xaysomboune 4.2 1,606
(Continued…)
Table TC.4.7: Primary reliance on clean fuels and technologies for cooking, space heating, and lighting
Percentage of household members living in households using clean fuels and technologies for cooking, space heating, and lighting, Lao PDR, 2017
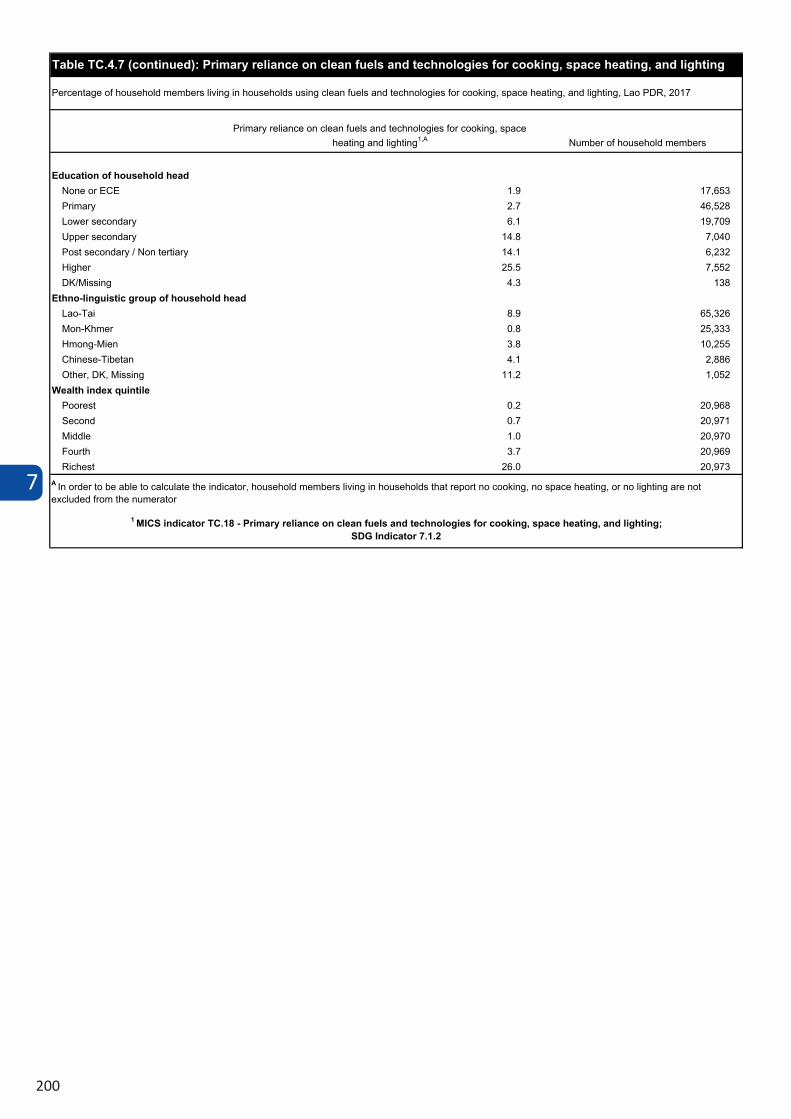
7
200
Primary reliance on clean fuels and technologies for cooking, space heating and lighting1,A Number of household members
Education of household headNone or ECE 1.9 17,653 Primary 2.7 46,528 Lower secondary 6.1 19,709 Upper secondary 14.8 7,040 Post secondary / Non tertiary 14.1 6,232 Higher 25.5 7,552 DK/Missing 4.3 138
Ethno-linguistic group of household headLao-Tai 8.9 65,326 Mon-Khmer 0.8 25,333 Hmong-Mien 3.8 10,255 Chinese-Tibetan 4.1 2,886 Other, DK, Missing 11.2 1,052
Wealth index quintilePoorest 0.2 20,968 Second 0.7 20,971 Middle 1.0 20,970 Fourth 3.7 20,969 Richest 26.0 20,973
A In order to be able to calculate the indicator, household members living in households that report no cooking, no space heating, or no lighting are not excluded from the numerator
1 MICS indicator TC.18 - Primary reliance on clean fuels and technologies for cooking, space heating, and lighting; SDG Indicator 7.1.2
Table TC.4.7 (continued): Primary reliance on clean fuels and technologies for cooking, space heating, and lighting
Percentage of household members living in households using clean fuels and technologies for cooking, space heating, and lighting, Lao PDR, 2017
7
201
Tabl
e TC
.5.1
: Car
e-se
ekin
g fo
r an
d an
tibi
otic
tre
atm
ent
of s
ympt
oms
of a
cute
res
pira
tory
infe
ctio
n (A
RI)
Perc
enta
ge o
f chi
ldre
n ag
e 0-
59 m
onth
s with
sym
ptom
s of A
RI in
the
last
two
wee
ks fo
r who
m a
dvice
or t
reat
men
t was
soug
ht, b
y so
urce
of a
dvice
or t
reat
men
t, an
d pe
rcen
tage
of c
hild
ren
with
sym
ptom
s who
wer
e gi
ven
antib
iotic
s, La
o PD
R, 2
017
Perc
enta
ge o
f chi
ldre
n w
ith
sym
ptom
s of
ARI
for
who
m:
Perc
enta
ge o
f ch
ildre
n w
ith
sym
ptom
s of A
RI in
th
e la
st tw
o w
eeks
w
ho w
ere
give
n an
tibio
tics2
Num
ber o
f ch
ildre
n ag
e 0-
59 m
onth
s w
ith
sym
ptom
s of
ARI i
n th
e la
st
two
wee
ks
Perc
enta
ge o
f chi
ldre
n w
ith
sym
ptom
s of
ARI
for
who
m
the
sour
ce o
f ant
ibio
tics
was
:
Num
ber o
f ch
ildre
n w
ith
sym
ptom
s of
ARI i
n th
e la
st
two
wee
ks w
ho
wer
e gi
ven
antib
iotic
s
Adv
ice
or tr
eatm
ent w
as s
ough
t fro
m:
No a
dvice
or
tr
eatm
ent
soug
ht
Hea
lth
faci
litie
s or
pro
vide
rs
Othe
r so
urce
A he
alth
fa
cility
or
prov
ider
1,B
Hea
lth
faci
litie
s or
pro
vide
rs
Othe
r so
urce
A he
alth
fa
cility
or
prov
ider
C Pu
blic
Priv
ate
Com
mun
ity
heal
th
prov
ider
A Pu
blic
Priv
ate
Com
mun
ity
heal
th
prov
ider
A
Tota
l 32
.5
9.5
0.8
0
.9
39.8
31
.1
44.8
12
6 65
.0
35.0
5.
8 0
.0
100
.0
56
Sex M
ale
38.4
12
.0
1.7
0.0
47.3
25
.2
52.1
60
(6
0.2)
(3
9.8)
(3
.2)
(0.0
) 10
0.0
31
Fem
ale
27.1
7.
3 0.
0 1.
8 32
.8
36.5
38
.2
65
(*)
(*)
(*)
(*)
100.
0 25
A
rea Ur
ban
(42.
0)
(18.
8)
(0.0
) (0
.0)
(59.
6)
(22.
2)
(51.
3)
40
(*)
(*)
(*)
(*)
100.
0 20
Ru
ral
28.1
5.
2 1.
2 1.
4 30
.5
35.3
41
.8
86
(74.
8)
(25.
2)
(9.1
) (0
.0)
100.
0 36
Ru
ral w
ith ro
ad
31.3
5.
2 1.
4 0.
0 33
.0
34.9
47
.5
69
(75.
0)
(25.
0)
(10.
0)
(0.0
) 10
0.0
33
Rura
l with
out r
oad
(*)
(*)
(*)
(*)
(*)
(*)
(*)
17
(*)
(*)
(*)
(*)
100.
0 3
1 MIC
S in
dica
tor
TC.1
9 - C
are-
seek
ing
for
child
ren
wit
h ac
ute
resp
irat
ory
infe
ctio
n (A
RI) s
ympt
oms;
SD
G in
dica
tor
3.8.
1 2 M
ICS
indi
cato
r TC
.20
- A
ntib
ioti
c tr
eatm
ent f
or c
hild
ren
wit
h A
RI s
ympt
oms
A Co
mm
unity
hea
lth p
rovi
ders
inclu
des b
oth
publ
ic (V
illag
e he
alth
wor
ker a
nd O
utre
ach
team
) and
priv
ate
(Mob
ile cl
inic)
hea
lth fa
ciliti
es
B In
clude
s all
publ
ic an
d pr
ivat
e he
alth
facil
ities
and
pro
vide
rs, a
s wel
l as t
hose
who
did
not
kno
w if
pub
lic o
r priv
ate.
Exc
lude
s priv
ate
phar
mac
y C
Inclu
des a
ll pu
blic
and
priv
ate
heal
th fa
ciliti
es a
nd p
rovi
ders
, as w
ell a
s tho
se w
ho d
id n
ot k
now
if p
ublic
or p
rivat
e ( )
Fig
ures
that
are
bas
ed o
n 25
– 4
9 un
wei
ghte
d ca
ses
(*) F
igur
es th
at a
re b
ased
on
few
er th
an 2
5 un
wei
ghte
d ca
ses
Not
e: O
ther
bac
kgro
und
char
acte
rist
ics
are
not s
how
n, a
s m
ost c
ateg
orie
s ha
ve fe
wer
than
25
unw
eigh
ted
case
s.
7.5 SYMPTOMS OF ACUTE RESPIRATORY INFECTION
Symptoms of ARI are collected during the LSIS II, 2017 to capture symptoms related to pneumonia, the leading cause of death in children under five. Once diagnosed, pneumonia is treated effectively with antibiotics. Studies have shown a limitation in the survey approach of measuring pneumonia because many of the cases reported in surveys by the mothers or caretakers with symptoms of pneumonia are in fact, not true pneumonia.4 While this limitation does not affect the level and patterns of care-seeking for symptoms of pneumonia, it limits the validity of the level of treatment of pneumonia with antibiotics, as reported through household surveys. The treatment indicator described in this report must therefore be taken with caution.
Table TC.5.1 presents the percentage of children with symptoms of ARI, which is also generally referred to as symptoms of pneumonia, in the two weeks preceding the survey for whom care was sought, by source of care and the percentage who received antibiotics. Information is also presented by sex, age, region, province, area, age, and socioeconomic factors and the point of treatment among children with symptoms of ARI who were treated with antibiotics.
4 Campbell, H. et al. 2013. Measuring Coverage in MNCH: Challenges in Monitoring the Proportion of Young Children with Pneumonia Who Receive Antibiotic Treatment. PLoS Med 10(5): e1001421. doi:10.1371/journal.pmed.1001421
Symptoms of ARI are collected during the LSIS II, 2017 to capture symptoms related to pneumonia, a leading cause of death in children under five.7 Once diagnosed, pneumonia is treated effectively with antibiotics. Studies have shown a limitation in the survey approach of measuring pneumonia because many of the cases reported in surveys by the mothers or caretakers with symptoms of pneumonia are in fact, not true pneumonia.8 While this limitation does not affect the level and patterns of care-seeking for symptoms of pneumonia, it limits the validity of the level of treatment of pneumonia with antibiotics, as reported through household surveys. The treatment indicator described in this report must therefore be taken with caution.
Table TC.5.1 presents the percentage of children with symptoms of ARI, which is also generally referred to as symptoms of pneumonia, in the two weeks preceding the survey for whom care was sought, by source of care and the percentage who received antibiotics. Information is also presented by sex, age, region, province, area, age, and socioeconomic factors and the point of treatment among children with symptoms of ARI who were treated with antibiotics.
7 The main killers of children under age 5 in 2016 included preterm birth complications (18 per cent), pneumonia (16 per cent), intrapartum
related events (12 per cent), diarrhoea (8 per cent), neonatal sepsis (7 per cent) and malaria (5 per cent). UNICEF, WHO, World Bank Group,
and United Nations. Levels and Trends in Child Mortality Report 2017. New York: UNICEF, 2017. https://www.unicef.org/publications/in-
dex_101071.html8 Campbell, H. et al. 2013. Measuring Coverage in MNCH: Challenges in Monitoring the Proportion of Young Children with Pneumonia Who Receive Antibiotic Treatment. PLoS Med 10(5): e1001421. doi:10.1371/journal.pmed.1001421
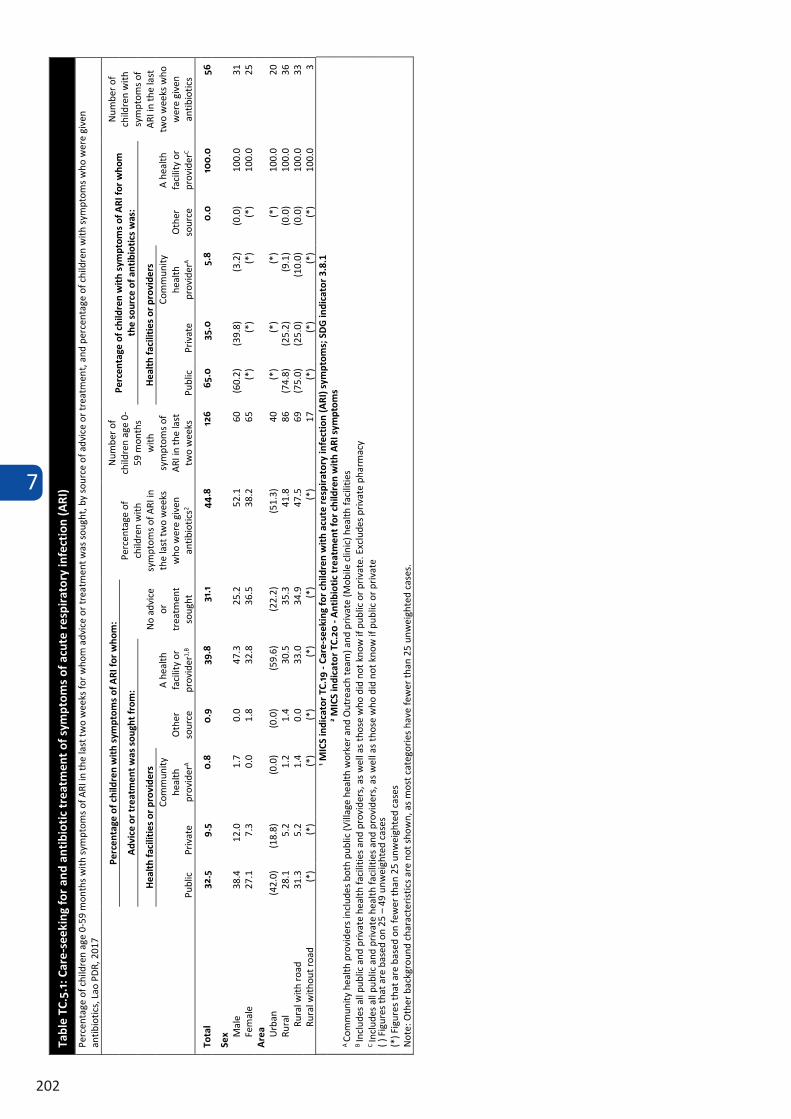
7
202
Tabl
e TC
.5.1
: Car
e-se
ekin
g fo
r an
d an
tibi
otic
tre
atm
ent
of s
ympt
oms
of a
cute
res
pira
tory
infe
ctio
n (A
RI)
Perc
enta
ge o
f chi
ldre
n ag
e 0-
59 m
onth
s with
sym
ptom
s of A
RI in
the
last
two
wee
ks fo
r who
m a
dvice
or t
reat
men
t was
soug
ht, b
y so
urce
of a
dvice
or t
reat
men
t, an
d pe
rcen
tage
of c
hild
ren
with
sym
ptom
s who
wer
e gi
ven
antib
iotic
s, La
o PD
R, 2
017
Perc
enta
ge o
f chi
ldre
n w
ith
sym
ptom
s of
ARI
for
who
m:
Perc
enta
ge o
f ch
ildre
n w
ith
sym
ptom
s of A
RI in
th
e la
st tw
o w
eeks
w
ho w
ere
give
n an
tibio
tics2
Num
ber o
f ch
ildre
n ag
e 0-
59 m
onth
s w
ith
sym
ptom
s of
ARI i
n th
e la
st
two
wee
ks
Perc
enta
ge o
f chi
ldre
n w
ith
sym
ptom
s of
ARI
for
who
m
the
sour
ce o
f ant
ibio
tics
was
:
Num
ber o
f ch
ildre
n w
ith
sym
ptom
s of
ARI i
n th
e la
st
two
wee
ks w
ho
wer
e gi
ven
antib
iotic
s
Adv
ice
or tr
eatm
ent w
as s
ough
t fro
m:
No a
dvice
or
tr
eatm
ent
soug
ht
Hea
lth
faci
litie
s or
pro
vide
rs
Othe
r so
urce
A he
alth
fa
cility
or
prov
ider
1,B
Hea
lth
faci
litie
s or
pro
vide
rs
Othe
r so
urce
A he
alth
fa
cility
or
prov
ider
C Pu
blic
Priv
ate
Com
mun
ity
heal
th
prov
ider
A Pu
blic
Priv
ate
Com
mun
ity
heal
th
prov
ider
A
Tota
l 32
.5
9.5
0.8
0
.9
39.8
31
.1
44.8
12
6 65
.0
35.0
5.
8 0
.0
100
.0
56
Sex M
ale
38.4
12
.0
1.7
0.0
47.3
25
.2
52.1
60
(6
0.2)
(3
9.8)
(3
.2)
(0.0
) 10
0.0
31
Fem
ale
27.1
7.
3 0.
0 1.
8 32
.8
36.5
38
.2
65
(*)
(*)
(*)
(*)
100.
0 25
A
rea Ur
ban
(42.
0)
(18.
8)
(0.0
) (0
.0)
(59.
6)
(22.
2)
(51.
3)
40
(*)
(*)
(*)
(*)
100.
0 20
Ru
ral
28.1
5.
2 1.
2 1.
4 30
.5
35.3
41
.8
86
(74.
8)
(25.
2)
(9.1
) (0
.0)
100.
0 36
Ru
ral w
ith ro
ad
31.3
5.
2 1.
4 0.
0 33
.0
34.9
47
.5
69
(75.
0)
(25.
0)
(10.
0)
(0.0
) 10
0.0
33
Rura
l with
out r
oad
(*)
(*)
(*)
(*)
(*)
(*)
(*)
17
(*)
(*)
(*)
(*)
100.
0 3
1 MIC
S in
dica
tor
TC.1
9 - C
are-
seek
ing
for
child
ren
wit
h ac
ute
resp
irat
ory
infe
ctio
n (A
RI) s
ympt
oms;
SD
G in
dica
tor
3.8.
1 2 M
ICS
indi
cato
r TC
.20
- A
ntib
ioti
c tr
eatm
ent f
or c
hild
ren
wit
h A
RI s
ympt
oms
A Co
mm
unity
hea
lth p
rovi
ders
inclu
des b
oth
publ
ic (V
illag
e he
alth
wor
ker a
nd O
utre
ach
team
) and
priv
ate
(Mob
ile cl
inic)
hea
lth fa
ciliti
es
B In
clude
s all
publ
ic an
d pr
ivat
e he
alth
facil
ities
and
pro
vide
rs, a
s wel
l as t
hose
who
did
not
kno
w if
pub
lic o
r priv
ate.
Exc
lude
s priv
ate
phar
mac
y C
Inclu
des a
ll pu
blic
and
priv
ate
heal
th fa
ciliti
es a
nd p
rovi
ders
, as w
ell a
s tho
se w
ho d
id n
ot k
now
if p
ublic
or p
rivat
e ( )
Fig
ures
that
are
bas
ed o
n 25
– 4
9 un
wei
ghte
d ca
ses
(*) F
igur
es th
at a
re b
ased
on
few
er th
an 2
5 un
wei
ghte
d ca
ses
Not
e: O
ther
bac
kgro
und
char
acte
rist
ics
are
not s
how
n, a
s m
ost c
ateg
orie
s ha
ve fe
wer
than
25
unw
eigh
ted
case
s.
7
203
7.6 MALARIA
Malaria is a major cause of death of children under age five worldwide. Preventive measures and treatment with an effective antimalarial can dramatically reduce malaria mortality rates among children. 9
In areas where malaria is common, WHO recommends indoor residual spraying (IRS)10, use of insecticide treated mosquito nets (ITNs)11 and prompt treatment of cases with recommended anti-malarial drugs.9
In 2010 the World Health Organization issued a recommendation for universal use of diagnostic testing to confirm malaria infection and apply appropriate treatment based on the results. According to the guidelines, treatment solely on the basis of clinical suspicion should only be considered when a parasitological diagnosis is not accessible. This recommendation was based on studies that showed substantial reduction in the proportion of fever that are associated with malaria to a low level.12 This recommendation implies that the indicator on proportion of children with fever that received antimalarial treatment is no longer an acceptable indicator of the level of treatment of malaria in the population of children under age five. However, for purposes of comparisons, as well assessment of patterns across socio-demographic characteristics, the indicator remains a standard MICS indicator.
Children with severe malaria symptoms, such as fever and convulsions, should be taken to a health facility. Further, children recovering from malaria should be given extra liquids and food, and younger children should continue breastfeeding.
Insecticide-treated mosquito nets, or ITNs, if used properly, are very effective in offering protection against mosquitos and other insects. The use of ITNs is one of the main health interventions implemented to reduce malaria transmission in Lao PDR. The questionnaire incorporates questions on the availability and use of insecticide treated mosquito nets, both at household level and among children under five years of age and pregnant women.
In the Lao People’s Democratic Republic, the malaria control programme is implemented under the leadership of the Communicable Disease Control Department of the Ministry of Health, with strong technical support from the Center of Malariology, Parasitology and Entomology (CMPE). The programme focuses on strengthening the surveillance system for both humans and vectors, promoting the ban of counterfeit and substandard antimalarial drugs, and ensuring the engagement of people in the community and mobile/migrant populations. Key interventions to control malaria include: prompt and effective diagnosis and treatment with ACTs; use of long-lasting insecticidal nets by people at risk; and indoor residual spraying with insecticide to control the vector mosquitoes.
Table TC.6.1 presents the household possession of mosquito nets while Table TC.6.2 presents the source of mosquito nets.
9 WHO. Guidelines for the treatment of malaria. Third Edition. Geneva: WHO Press, 2015. http://apps.who.int/iris/bitstream/handle/10665/162441/9789241549127_eng.pdf?sequence=110 WHO. Indoor Residual Spraying. An operational manual for indoor residual spraying (IRS) for malaria transmission control and elimination. Second edition. Geneva: WHO Press, 2015. http://apps.who.int/iris/bitstream/handle/10665/177242/9789241508940_eng.pdf?sequence=111 WHO. Achieving and maintaining universal coverage with long-lasting insecticidal nets for malaria control. Geneva: WHO Press, 2017. http://apps.who.int/iris/bitstream/handle/10665/259478/WHO-HTM-GMP-2017.20-eng.pdfsequence=112 D'Acremont, V et al. 2010. Reduction in the proportion of fevers associated with Plasmodium falciparum parasitaemia in Africa: a systematic review. Malaria Journal 9(240).
Tables TC.6.3 and TC.6.4 present the number of ITNs owned by the household and the percentage of household population with access to an ITN in the household.
Table TC.6.5 presents the use of mosquito nets by the household population while Table TC.6.6 presents the use of existing ITNs.
Table TC.6.7 and Table TC.6.8 present the percentage of children under age five and of pregnant women age 15-49 years who slept under a mosquito net last night by type of net.
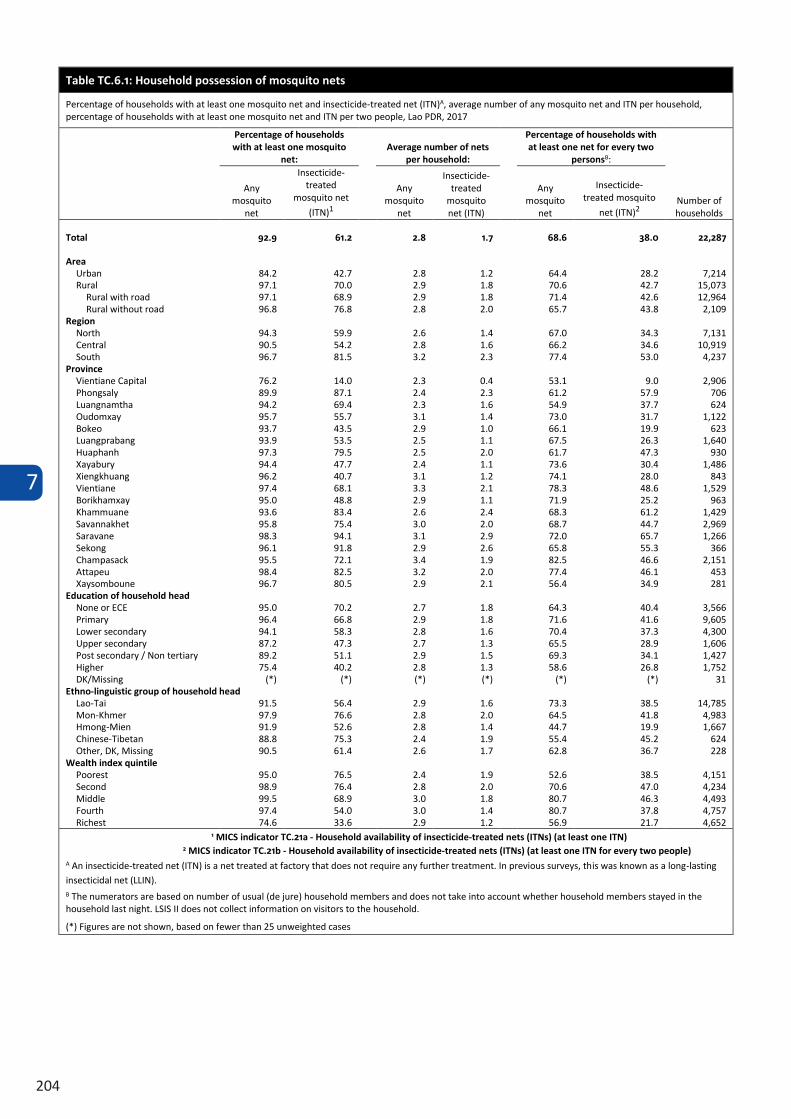
7
204
7.6 MALARIA
Malaria is a major cause of death of children under age five worldwide. Preventive measures and treatment with an effective antimalarial can dramatically reduce malaria mortality rates among children. 9
In areas where malaria is common, WHO recommends indoor residual spraying (IRS)10, use of insecticide treated mosquito nets (ITNs)11 and prompt treatment of cases with recommended anti-malarial drugs.9
In 2010 the World Health Organization issued a recommendation for universal use of diagnostic testing to confirm malaria infection and apply appropriate treatment based on the results. According to the guidelines, treatment solely on the basis of clinical suspicion should only be considered when a parasitological diagnosis is not accessible. This recommendation was based on studies that showed substantial reduction in the proportion of fever that are associated with malaria to a low level.12 This recommendation implies that the indicator on proportion of children with fever that received antimalarial treatment is no longer an acceptable indicator of the level of treatment of malaria in the population of children under age five. However, for purposes of comparisons, as well assessment of patterns across socio-demographic characteristics, the indicator remains a standard MICS indicator.
Children with severe malaria symptoms, such as fever and convulsions, should be taken to a health facility. Further, children recovering from malaria should be given extra liquids and food, and younger children should continue breastfeeding.
Insecticide-treated mosquito nets, or ITNs, if used properly, are very effective in offering protection against mosquitos and other insects. The use of ITNs is one of the main health interventions implemented to reduce malaria transmission in Lao PDR. The questionnaire incorporates questions on the availability and use of insecticide treated mosquito nets, both at household level and among children under five years of age and pregnant women.
In the Lao People’s Democratic Republic, the malaria control programme is implemented under the leadership of the Communicable Disease Control Department of the Ministry of Health, with strong technical support from the Center of Malariology, Parasitology and Entomology (CMPE). The programme focuses on strengthening the surveillance system for both humans and vectors, promoting the ban of counterfeit and substandard antimalarial drugs, and ensuring the engagement of people in the community and mobile/migrant populations. Key interventions to control malaria include: prompt and effective diagnosis and treatment with ACTs; use of long-lasting insecticidal nets by people at risk; and indoor residual spraying with insecticide to control the vector mosquitoes.
Table TC.6.1 presents the household possession of mosquito nets while Table TC.6.2 presents the source of mosquito nets.
9 WHO. Guidelines for the treatment of malaria. Third Edition. Geneva: WHO Press, 2015. http://apps.who.int/iris/bitstream/handle/10665/162441/9789241549127_eng.pdf?sequence=110 WHO. Indoor Residual Spraying. An operational manual for indoor residual spraying (IRS) for malaria transmission control and elimination. Second edition. Geneva: WHO Press, 2015. http://apps.who.int/iris/bitstream/handle/10665/177242/9789241508940_eng.pdf?sequence=111 WHO. Achieving and maintaining universal coverage with long-lasting insecticidal nets for malaria control. Geneva: WHO Press, 2017. http://apps.who.int/iris/bitstream/handle/10665/259478/WHO-HTM-GMP-2017.20-eng.pdfsequence=112 D'Acremont, V et al. 2010. Reduction in the proportion of fevers associated with Plasmodium falciparum parasitaemia in Africa: a systematic review. Malaria Journal 9(240).
Tables TC.6.3 and TC.6.4 present the number of ITNs owned by the household and the percentage of household population with access to an ITN in the household.
Table TC.6.5 presents the use of mosquito nets by the household population while Table TC.6.6 presents the use of existing ITNs.
Table TC.6.7 and Table TC.6.8 present the percentage of children under age five and of pregnant women age 15-49 years who slept under a mosquito net last night by type of net.
Table TC.6.1: Household possession of mosquito nets
Percentage of households with at least one mosquito net and insecticide-treated net (ITN)A, average number of any mosquito net and ITN per household, percentage of households with at least one mosquito net and ITN per two people, Lao PDR, 2017
Percentage of households with at least one mosquito
net: Average number of nets
per household:
Percentage of households with at least one net for every two
personsB:
Number of households
Any mosquito
net
Insecticide-treated
mosquito net (ITN)1
Any mosquito
net
Insecticide-treated
mosquito net (ITN)
Any mosquito
net
Insecticide-treated mosquito
net (ITN)2
Total 92.9 61.2 2.8 1.7 68.6 38.0 22,287
Area Urban 84.2 42.7 2.8 1.2 64.4 28.2 7,214 Rural 97.1 70.0 2.9 1.8 70.6 42.7 15,073
Rural with road 97.1 68.9 2.9 1.8 71.4 42.6 12,964 Rural without road 96.8 76.8 2.8 2.0 65.7 43.8 2,109
Region North 94.3 59.9 2.6 1.4 67.0 34.3 7,131 Central 90.5 54.2 2.8 1.6 66.2 34.6 10,919 South 96.7 81.5 3.2 2.3 77.4 53.0 4,237
Province Vientiane Capital 76.2 14.0 2.3 0.4 53.1 9.0 2,906 Phongsaly 89.9 87.1 2.4 2.3 61.2 57.9 706 Luangnamtha 94.2 69.4 2.3 1.6 54.9 37.7 624 Oudomxay 95.7 55.7 3.1 1.4 73.0 31.7 1,122 Bokeo 93.7 43.5 2.9 1.0 66.1 19.9 623 Luangprabang 93.9 53.5 2.5 1.1 67.5 26.3 1,640 Huaphanh 97.3 79.5 2.5 2.0 61.7 47.3 930 Xayabury 94.4 47.7 2.4 1.1 73.6 30.4 1,486 Xiengkhuang 96.2 40.7 3.1 1.2 74.1 28.0 843 Vientiane 97.4 68.1 3.3 2.1 78.3 48.6 1,529 Borikhamxay 95.0 48.8 2.9 1.1 71.9 25.2 963 Khammuane 93.6 83.4 2.6 2.4 68.3 61.2 1,429 Savannakhet 95.8 75.4 3.0 2.0 68.7 44.7 2,969 Saravane 98.3 94.1 3.1 2.9 72.0 65.7 1,266 Sekong 96.1 91.8 2.9 2.6 65.8 55.3 366 Champasack 95.5 72.1 3.4 1.9 82.5 46.6 2,151 Attapeu 98.4 82.5 3.2 2.0 77.4 46.1 453 Xaysomboune 96.7 80.5 2.9 2.1 56.4 34.9 281
Education of household head None or ECE 95.0 70.2 2.7 1.8 64.3 40.4 3,566 Primary 96.4 66.8 2.9 1.8 71.6 41.6 9,605 Lower secondary 94.1 58.3 2.8 1.6 70.4 37.3 4,300 Upper secondary 87.2 47.3 2.7 1.3 65.5 28.9 1,606 Post secondary / Non tertiary 89.2 51.1 2.9 1.5 69.3 34.1 1,427 Higher 75.4 40.2 2.8 1.3 58.6 26.8 1,752 DK/Missing (*) (*) (*) (*) (*) (*) 31
Ethno-linguistic group of household head Lao-Tai 91.5 56.4 2.9 1.6 73.3 38.5 14,785 Mon-Khmer 97.9 76.6 2.8 2.0 64.5 41.8 4,983 Hmong-Mien 91.9 52.6 2.8 1.4 44.7 19.9 1,667 Chinese-Tibetan 88.8 75.3 2.4 1.9 55.4 45.2 624 Other, DK, Missing 90.5 61.4 2.6 1.7 62.8 36.7 228
Wealth index quintile Poorest 95.0 76.5 2.4 1.9 52.6 38.5 4,151 Second 98.9 76.4 2.8 2.0 70.6 47.0 4,234 Middle 99.5 68.9 3.0 1.8 80.7 46.3 4,493 Fourth 97.4 54.0 3.0 1.4 80.7 37.8 4,757 Richest 74.6 33.6 2.9 1.2 56.9 21.7 4,652
1 MICS indicator TC.21a - Household availability of insecticide-treated nets (ITNs) (at least one ITN) 2 MICS indicator TC.21b - Household availability of insecticide-treated nets (ITNs) (at least one ITN for every two people)
A An insecticide-treated net (ITN) is a net treated at factory that does not require any further treatment. In previous surveys, this was known as a long-lasting insecticidal net (LLIN). B The numerators are based on number of usual (de jure) household members and does not take into account whether household members stayed in the household last night. LSIS II does not collect information on visitors to the household.
(*) Figures are not shown, based on fewer than 25 unweighted cases
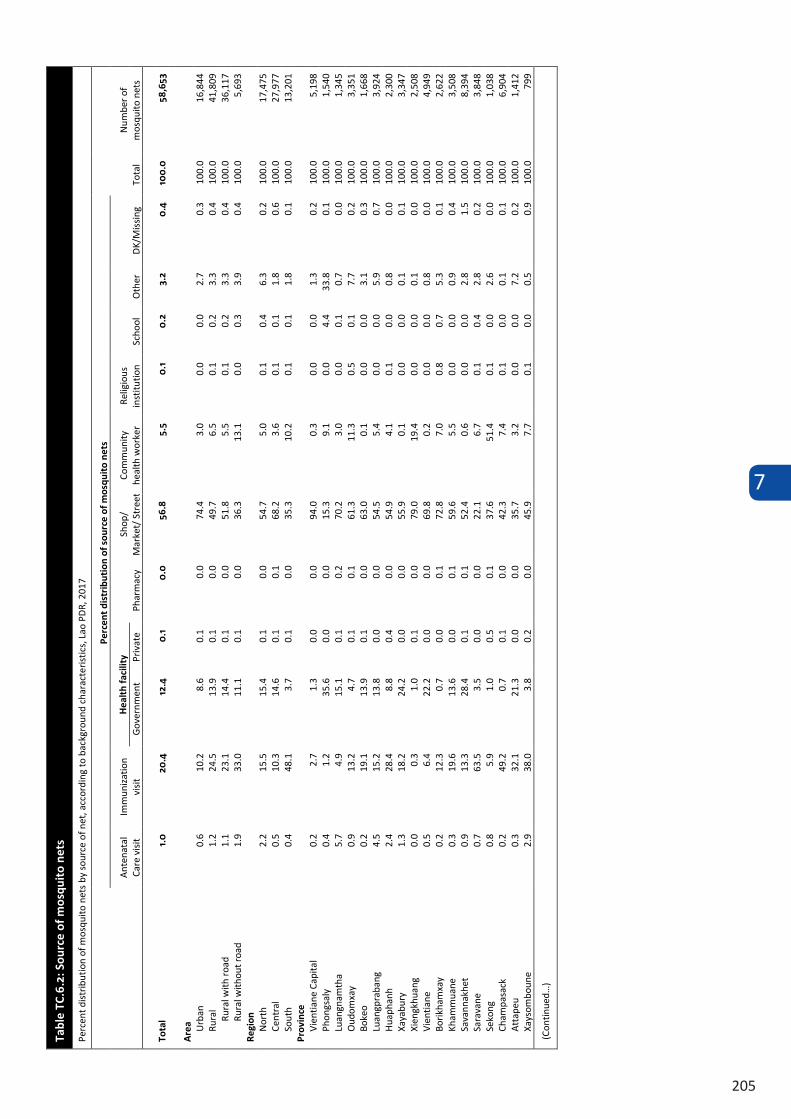
7
205
Tabl
e TC
.6.2
: Sou
rce
of m
osqu
ito
nets
Perc
ent d
istrib
utio
n of
mos
quito
net
s by
sour
ce o
f net
, acc
ordi
ng to
bac
kgro
und
char
acte
ristic
s, La
o PD
R, 2
017
Perc
ent d
istr
ibut
ion
of s
ourc
e of
mos
quit
o ne
ts
Tota
l Nu
mbe
r of
mos
quito
net
s An
tena
tal
Care
visi
t Im
mun
izatio
n vi
sit
Hea
lth
faci
lity
Phar
mac
y Sh
op/
Mar
ket/
Str
eet
Com
mun
ity
heal
th w
orke
r Re
ligio
us
inst
itutio
n Sc
hool
Ot
her
DK/M
issin
g Go
vern
men
t Pr
ivat
e
Tota
l 1.
0
20.4
12
.4
0.1
0
.0
56.8
5.
5 0
.1
0.2
3.
2 0
.4
100
.0
58,6
53
Are
a Urba
n 0.
6 10
.2
8.6
0.1
0.0
74.4
3.
0 0.
0 0.
0 2.
7 0.
3 10
0.0
16,8
44
Rura
l 1.
2 24
.5
13.9
0.
1 0.
0 49
.7
6.5
0.1
0.2
3.3
0.4
100.
0 41
,809
Ru
ral w
ith ro
ad
1.1
23.1
14
.4
0.1
0.0
51.8
5.
5 0.
1 0.
2 3.
3 0.
4 10
0.0
36,1
17
Rura
l with
out r
oad
1.9
33.0
11
.1
0.1
0.0
36.3
13
.1
0.0
0.3
3.9
0.4
100.
0 5,
693
Regi
on
Nort
h 2.
2 15
.5
15.4
0.
1 0.
0 54
.7
5.0
0.1
0.4
6.3
0.2
100.
0 17
,475
Ce
ntra
l 0.
5 10
.3
14.6
0.
1 0.
1 68
.2
3.6
0.1
0.1
1.8
0.6
100.
0 27
,977
So
uth
0.4
48.1
3.
7 0.
1 0.
0 35
.3
10.2
0.
1 0.
1 1.
8 0.
1 10
0.0
13,2
01
Prov
ince
Vi
entia
ne C
apita
l 0.
2 2.
7 1.
3 0.
0 0.
0 94
.0
0.3
0.0
0.0
1.3
0.2
100.
0 5,
198
Phon
gsal
y
0.4
1.2
35.6
0.
0 0.
0 15
.3
9.1
0.0
4.4
33.8
0.
1 10
0.0
1,54
0 Lu
angn
amth
a 5.
7 4.
9 15
.1
0.1
0.2
70.2
3.
0 0.
0 0.
1 0.
7 0.
0 10
0.0
1,34
5 Ou
dom
xay
0.9
13.2
4.
7 0.
1 0.
1 61
.3
11.3
0.
5 0.
1 7.
7 0.
2 10
0.0
3,35
1 Bo
keo
0.2
19.1
13
.9
0.1
0.0
63.0
0.
1 0.
0 0.
0 3.
1 0.
3 10
0.0
1,66
8 Lu
angp
raba
ng
4.5
15.2
13
.8
0.0
0.0
54.5
5.
4 0.
0 0.
0 5.
9 0.
7 10
0.0
3,92
4 Hu
apha
nh
2.4
28.4
8.
8 0.
4 0.
0 54
.9
4.1
0.1
0.0
0.8
0.0
100.
0 2,
300
Xaya
bury
1.
3 18
.2
24.2
0.
0 0.
0 55
.9
0.1
0.0
0.0
0.1
0.1
100.
0 3,
347
Xien
gkhu
ang
0.0
0.3
1.0
0.1
0.0
79.0
19
.4
0.0
0.0
0.1
0.0
100.
0 2,
508
Vien
tiane
0.
5 6.
4 22
.2
0.0
0.0
69.8
0.
2 0.
0 0.
0 0.
8 0.
0 10
0.0
4,94
9 Bo
rikha
mxa
y 0.
2 12
.3
0.7
0.0
0.1
72.8
7.
0 0.
8 0.
7 5.
3 0.
1 10
0.0
2,62
2 Kh
amm
uane
0.
3 19
.6
13.6
0.
0 0.
1 59
.6
5.5
0.0
0.0
0.9
0.4
100.
0 3,
508
Sava
nnak
het
0.9
13.3
28
.4
0.1
0.1
52.4
0.
6 0.
0 0.
0 2.
8 1.
5 10
0.0
8,39
4 Sa
rava
ne
0.7
63.5
3.
5 0.
0 0.
0 22
.1
6.7
0.1
0.4
2.8
0.2
100.
0 3,
848
Seko
ng
0.8
5.9
1.0
0.5
0.1
37.6
51
.4
0.1
0.0
2.6
0.0
100.
0 1,
038
Cham
pasa
ck
0.2
49.2
0.
7 0.
1 0.
0 42
.3
7.4
0.1
0.0
0.1
0.1
100.
0 6,
904
Atta
peu
0.3
32.1
21
.3
0.0
0.0
35.7
3.
2 0.
0 0.
0 7.
2 0.
2 10
0.0
1,41
2 Xa
ysom
boun
e 2.
9 38
.0
3.8
0.2
0.0
45.9
7.
7 0.
1 0.
0 0.
5 0.
9 10
0.0
799
(Con
tinue
d…)
Tabl
e TC
.6.2
(con
tinu
ed):
Sou
rce
of m
osqu
ito
nets
Perc
ent d
istrib
utio
n of
mos
quito
net
s by
sour
ce o
f net
, acc
ordi
ng to
bac
kgro
und
char
acte
ristic
s, La
o PD
R, 2
017
Perc
ent d
istr
ibut
ion
of s
ourc
e of
mos
quit
o ne
ts
Tota
l
Num
ber o
f m
osqu
ito
nets
An
tena
tal
Care
visi
t Im
mun
izatio
n vi
sit
Hea
lth
faci
lity
Phar
mac
y
Shop
/ M
arke
t/
Stre
et
Com
mun
ity
heal
th
wor
ker
Relig
ious
in
stitu
tion
Scho
ol
Othe
r DK
/Miss
ing
Gove
rnm
ent
Priv
ate
Educ
atio
n of
hou
seho
ld h
ead
None
or E
CE
1.4
22.6
17
.7
0.1
0.0
46.4
6.
5 0.
1 0.
3 4.
1 0.
7 10
0.0
9,08
9 Pr
imar
y 1.
0 23
.9
12.5
0.
1 0.
0 52
.9
5.8
0.1
0.2
3.2
0.4
100.
0 26
,808
Lo
wer
seco
ndar
y 0.
8 18
.1
10.7
0.
1 0.
0 61
.7
5.8
0.1
0.1
2.4
0.2
100.
0 11
,494
Up
per s
econ
dary
1.
4 12
.2
9.2
0.1
0.0
70.8
3.
2 0.
2 0.
0 2.
3 0.
6 10
0.0
3,80
1 Po
st se
cond
ary
/ Non
tert
iary
0.
5 16
.1
10.8
0.
1 0.
0 64
.4
4.6
0.1
0.0
3.3
0.1
100.
0 3,
693
High
er
0.7
9.5
8.6
0.0
0.2
73.5
3.
1 0.
0 0.
1 4.
0 0.
2 10
0.0
3,68
8 DK
/Miss
ing
0.0
13.4
23
.2
0.0
0.0
58.0
5.
4 0.
0 0.
0 0.
0 0.
0 10
0.0
79
Type
of n
et
ITNA
1.7
33.6
20
.4
0.1
0.1
29.4
9.
1 0.
1 0.
3 4.
7 0.
5 10
0.0
34,4
23
Othe
r 0.
1 1.
6 1.
0 0.
0 0.
0 95
.7
0.4
0.0
0.0
0.9
0.1
100.
0 24
,230
Et
hno-
lingu
isti
c gr
oup
of
hou
seho
ld h
ead
Lao-
Tai
0.7
20.3
9.
7 0.
1 0.
1 62
.3
4.3
0.1
0.1
2.1
0.2
100.
0 38
,925
M
on-K
hmer
1.
7 23
.0
20.5
0.
1 0.
0 40
.1
9.0
0.2
0.1
4.6
0.8
100.
0 13
,623
Hm
ong-
Mie
n 1.
5 15
.7
8.0
0.1
0.0
67.2
5.
0 0.
1 0.
1 2.
2 0.
2 10
0.0
4,27
4 Ch
ines
e-Ti
beta
n 1.
4 5.
4 24
.9
0.0
0.0
35.7
5.
5 0.
0 3.
7 23
.3
0.1
100.
0 1,
303
Othe
r, DK
, Miss
ing
0.9
32.9
7.
6 0.
0 0.
2 48
.3
7.6
0.5
0.0
1.9
0.0
100.
0 52
9 W
ealt
h in
dex
quin
tile
Po
ores
t 1.
3 28
.5
21.9
0.
0 0.
0 31
.9
9.1
0.2
0.7
5.6
0.8
100.
0 9,
526
Seco
nd
1.4
27.1
15
.1
0.1
0.0
43.6
8.
0 0.
1 0.
2 4.
0 0.
4 10
0.0
11,8
47
Mid
dle
1.2
23.7
11
.1
0.1
0.0
55.4
5.
4 0.
0 0.
1 2.
6 0.
3 10
0.0
13,4
86
Four
th
0.6
14.1
9.
0 0.
1 0.
1 70
.4
3.6
0.0
0.0
1.9
0.2
100.
0 13
,831
Ri
ches
t 0.
6 8.
9 6.
6 0.
0 0.
1 79
.2
2.0
0.1
0.0
2.4
0.1
100.
0 9,
963
A An
inse
ctici
de-tr
eate
d ne
t (IT
N) is
a n
et tr
eate
d at
fact
ory
that
doe
s not
requ
ire a
ny fu
rthe
r tre
atm
ent.
In p
revi
ous s
urve
ys, t
his w
as k
now
n as
a lo
ng-la
stin
g in
sect
icida
l net
(LLI
N). A
n "o
ther
" net
is a
ny n
et th
at is
not
an
ITN.
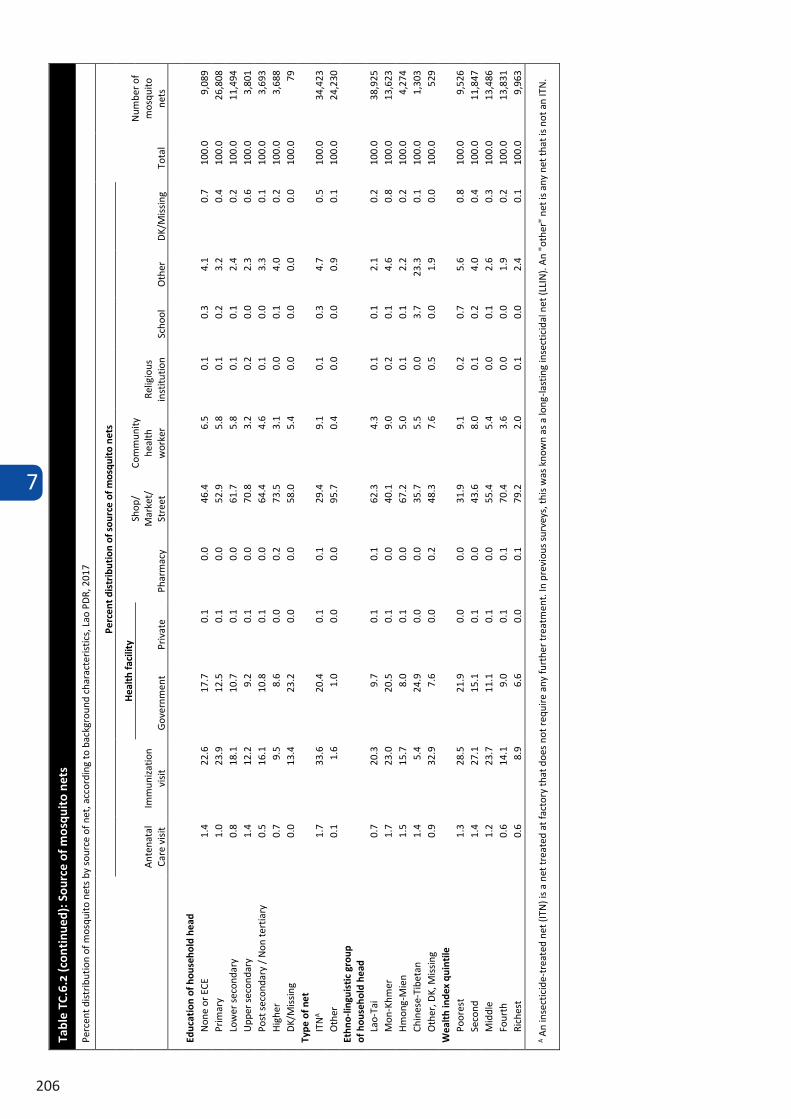
7
206
Tabl
e TC
.6.2
(con
tinu
ed):
Sou
rce
of m
osqu
ito
nets
Perc
ent d
istrib
utio
n of
mos
quito
net
s by
sour
ce o
f net
, acc
ordi
ng to
bac
kgro
und
char
acte
ristic
s, La
o PD
R, 2
017
Perc
ent d
istr
ibut
ion
of s
ourc
e of
mos
quit
o ne
ts
Tota
l
Num
ber o
f m
osqu
ito
nets
An
tena
tal
Care
visi
t Im
mun
izatio
n vi
sit
Hea
lth
faci
lity
Phar
mac
y
Shop
/ M
arke
t/
Stre
et
Com
mun
ity
heal
th
wor
ker
Relig
ious
in
stitu
tion
Scho
ol
Othe
r DK
/Miss
ing
Gove
rnm
ent
Priv
ate
Educ
atio
n of
hou
seho
ld h
ead
None
or E
CE
1.4
22.6
17
.7
0.1
0.0
46.4
6.
5 0.
1 0.
3 4.
1 0.
7 10
0.0
9,08
9 Pr
imar
y 1.
0 23
.9
12.5
0.
1 0.
0 52
.9
5.8
0.1
0.2
3.2
0.4
100.
0 26
,808
Lo
wer
seco
ndar
y 0.
8 18
.1
10.7
0.
1 0.
0 61
.7
5.8
0.1
0.1
2.4
0.2
100.
0 11
,494
Up
per s
econ
dary
1.
4 12
.2
9.2
0.1
0.0
70.8
3.
2 0.
2 0.
0 2.
3 0.
6 10
0.0
3,80
1 Po
st se
cond
ary
/ Non
tert
iary
0.
5 16
.1
10.8
0.
1 0.
0 64
.4
4.6
0.1
0.0
3.3
0.1
100.
0 3,
693
High
er
0.7
9.5
8.6
0.0
0.2
73.5
3.
1 0.
0 0.
1 4.
0 0.
2 10
0.0
3,68
8 DK
/Miss
ing
0.0
13.4
23
.2
0.0
0.0
58.0
5.
4 0.
0 0.
0 0.
0 0.
0 10
0.0
79
Type
of n
et
ITNA
1.7
33.6
20
.4
0.1
0.1
29.4
9.
1 0.
1 0.
3 4.
7 0.
5 10
0.0
34,4
23
Othe
r 0.
1 1.
6 1.
0 0.
0 0.
0 95
.7
0.4
0.0
0.0
0.9
0.1
100.
0 24
,230
Et
hno-
lingu
isti
c gr
oup
of
hou
seho
ld h
ead
Lao-
Tai
0.7
20.3
9.
7 0.
1 0.
1 62
.3
4.3
0.1
0.1
2.1
0.2
100.
0 38
,925
M
on-K
hmer
1.
7 23
.0
20.5
0.
1 0.
0 40
.1
9.0
0.2
0.1
4.6
0.8
100.
0 13
,623
Hm
ong-
Mie
n 1.
5 15
.7
8.0
0.1
0.0
67.2
5.
0 0.
1 0.
1 2.
2 0.
2 10
0.0
4,27
4 Ch
ines
e-Ti
beta
n 1.
4 5.
4 24
.9
0.0
0.0
35.7
5.
5 0.
0 3.
7 23
.3
0.1
100.
0 1,
303
Othe
r, DK
, Miss
ing
0.9
32.9
7.
6 0.
0 0.
2 48
.3
7.6
0.5
0.0
1.9
0.0
100.
0 52
9 W
ealt
h in
dex
quin
tile
Po
ores
t 1.
3 28
.5
21.9
0.
0 0.
0 31
.9
9.1
0.2
0.7
5.6
0.8
100.
0 9,
526
Seco
nd
1.4
27.1
15
.1
0.1
0.0
43.6
8.
0 0.
1 0.
2 4.
0 0.
4 10
0.0
11,8
47
Mid
dle
1.2
23.7
11
.1
0.1
0.0
55.4
5.
4 0.
0 0.
1 2.
6 0.
3 10
0.0
13,4
86
Four
th
0.6
14.1
9.
0 0.
1 0.
1 70
.4
3.6
0.0
0.0
1.9
0.2
100.
0 13
,831
Ri
ches
t 0.
6 8.
9 6.
6 0.
0 0.
1 79
.2
2.0
0.1
0.0
2.4
0.1
100.
0 9,
963
A An
inse
ctici
de-tr
eate
d ne
t (IT
N) is
a n
et tr
eate
d at
fact
ory
that
doe
s not
requ
ire a
ny fu
rthe
r tre
atm
ent.
In p
revi
ous s
urve
ys, t
his w
as k
now
n as
a lo
ng-la
stin
g in
sect
icida
l net
(LLI
N). A
n "o
ther
" net
is a
ny n
et th
at is
not
an
ITN.
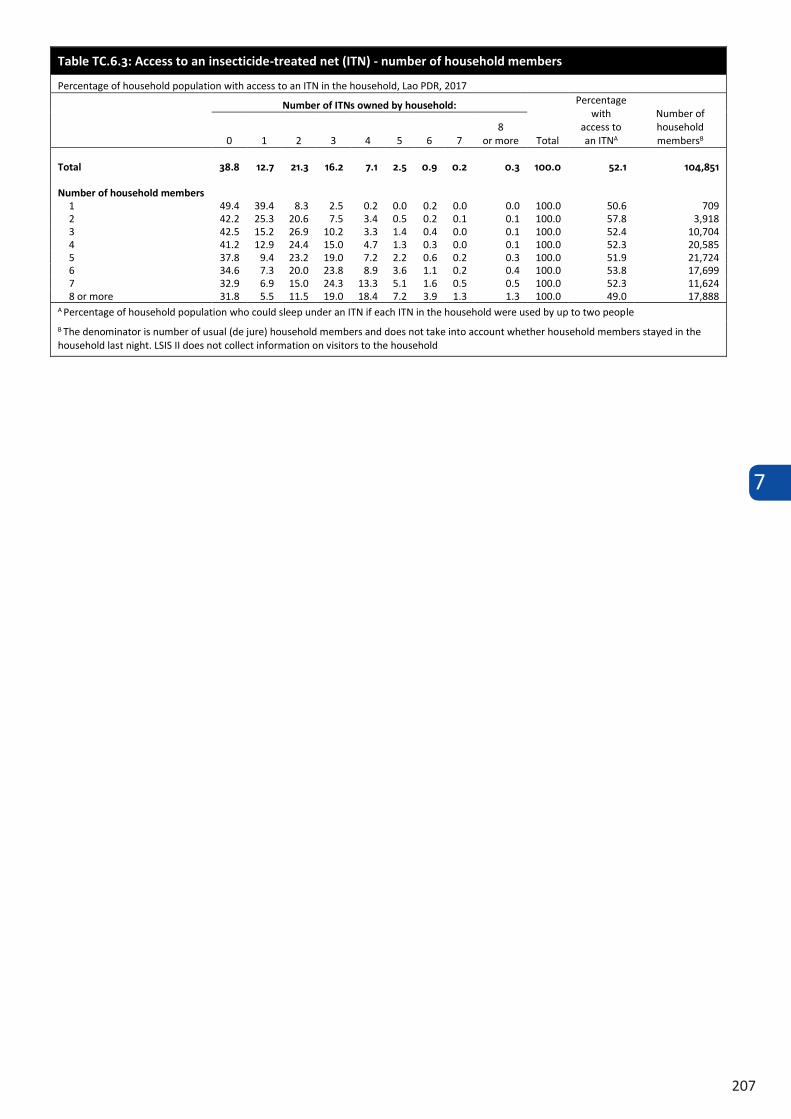
7
207
Table TC.6.3: Access to an insecticide-treated net (ITN) - number of household members
Percentage of household population with access to an ITN in the household, Lao PDR, 2017
Number of ITNs owned by household:
Total
Percentage with
access to an ITNA
Number of household membersB 0 1 2 3 4 5 6 7
8 or more
Total 38.8 12.7 21.3 16.2 7.1 2.5 0.9 0.2 0.3 100.0 52.1 104,851
Number of household members 1 49.4 39.4 8.3 2.5 0.2 0.0 0.2 0.0 0.0 100.0 50.6 709 2 42.2 25.3 20.6 7.5 3.4 0.5 0.2 0.1 0.1 100.0 57.8 3,918 3 42.5 15.2 26.9 10.2 3.3 1.4 0.4 0.0 0.1 100.0 52.4 10,704 4 41.2 12.9 24.4 15.0 4.7 1.3 0.3 0.0 0.1 100.0 52.3 20,585 5 37.8 9.4 23.2 19.0 7.2 2.2 0.6 0.2 0.3 100.0 51.9 21,724 6 34.6 7.3 20.0 23.8 8.9 3.6 1.1 0.2 0.4 100.0 53.8 17,699 7 32.9 6.9 15.0 24.3 13.3 5.1 1.6 0.5 0.5 100.0 52.3 11,624 8 or more 31.8 5.5 11.5 19.0 18.4 7.2 3.9 1.3 1.3 100.0 49.0 17,888
A Percentage of household population who could sleep under an ITN if each ITN in the household were used by up to two people B The denominator is number of usual (de jure) household members and does not take into account whether household members stayed in the household last night. LSIS II does not collect information on visitors to the household
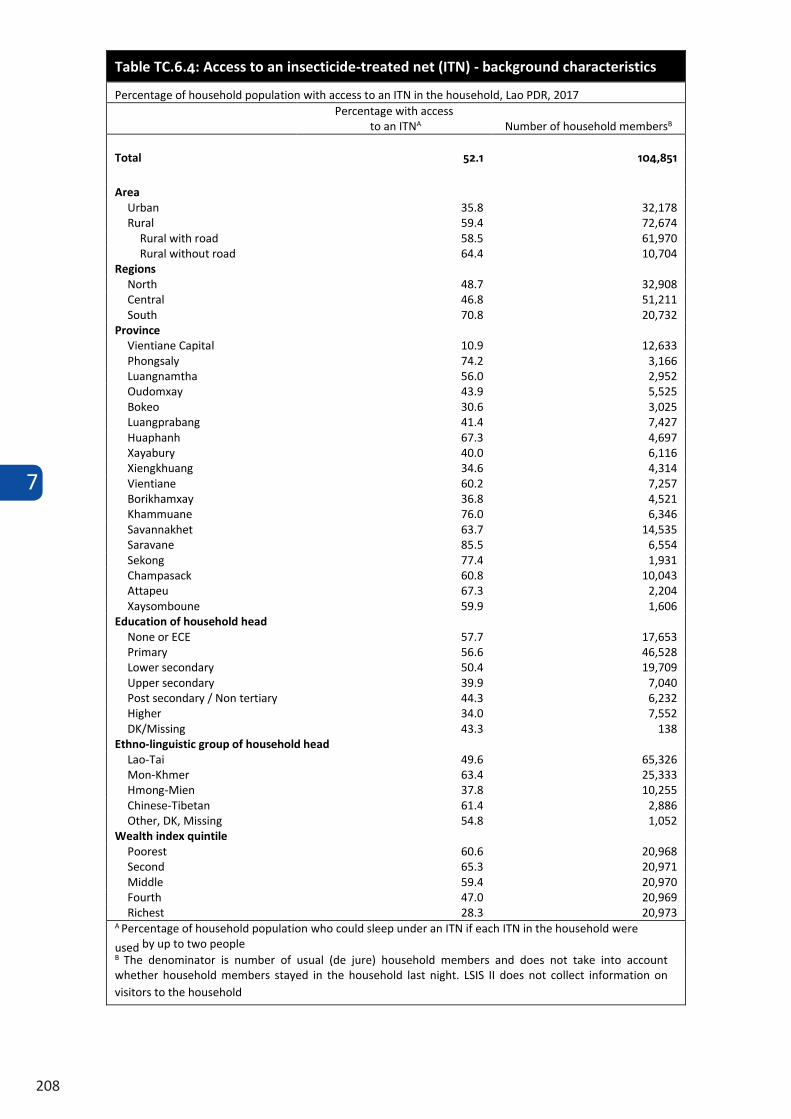
7
208
Table TC.6.4: Access to an insecticide-treated net (ITN) - background characteristics
Percentage of household population with access to an ITN in the household, Lao PDR, 2017 Percentage with access
to an ITNA Number of household membersB
Total 52.1 104,851
Area Urban 35.8 32,178 Rural 59.4 72,674
Rural with road 58.5 61,970 Rural without road 64.4 10,704
Regions North 48.7 32,908 Central 46.8 51,211 South 70.8 20,732
Province Vientiane Capital 10.9 12,633 Phongsaly 74.2 3,166 Luangnamtha 56.0 2,952 Oudomxay 43.9 5,525 Bokeo 30.6 3,025 Luangprabang 41.4 7,427 Huaphanh 67.3 4,697 Xayabury 40.0 6,116 Xiengkhuang 34.6 4,314 Vientiane 60.2 7,257 Borikhamxay 36.8 4,521 Khammuane 76.0 6,346 Savannakhet 63.7 14,535 Saravane 85.5 6,554 Sekong 77.4 1,931 Champasack 60.8 10,043 Attapeu 67.3 2,204 Xaysomboune 59.9 1,606
Education of household head None or ECE 57.7 17,653 Primary 56.6 46,528 Lower secondary 50.4 19,709 Upper secondary 39.9 7,040 Post secondary / Non tertiary 44.3 6,232 Higher 34.0 7,552 DK/Missing 43.3 138
Ethno-linguistic group of household head Lao-Tai 49.6 65,326 Mon-Khmer 63.4 25,333 Hmong-Mien 37.8 10,255 Chinese-Tibetan 61.4 2,886 Other, DK, Missing 54.8 1,052
Wealth index quintile Poorest 60.6 20,968 Second 65.3 20,971 Middle 59.4 20,970 Fourth 47.0 20,969 Richest 28.3 20,973
A Percentage of household population who could sleep under an ITN if each ITN in the household were used by up to two people B The denominator is number of usual (de jure) household members and does not take into account whether household members stayed in the household last night. LSIS II does not collect information on visitors to the household
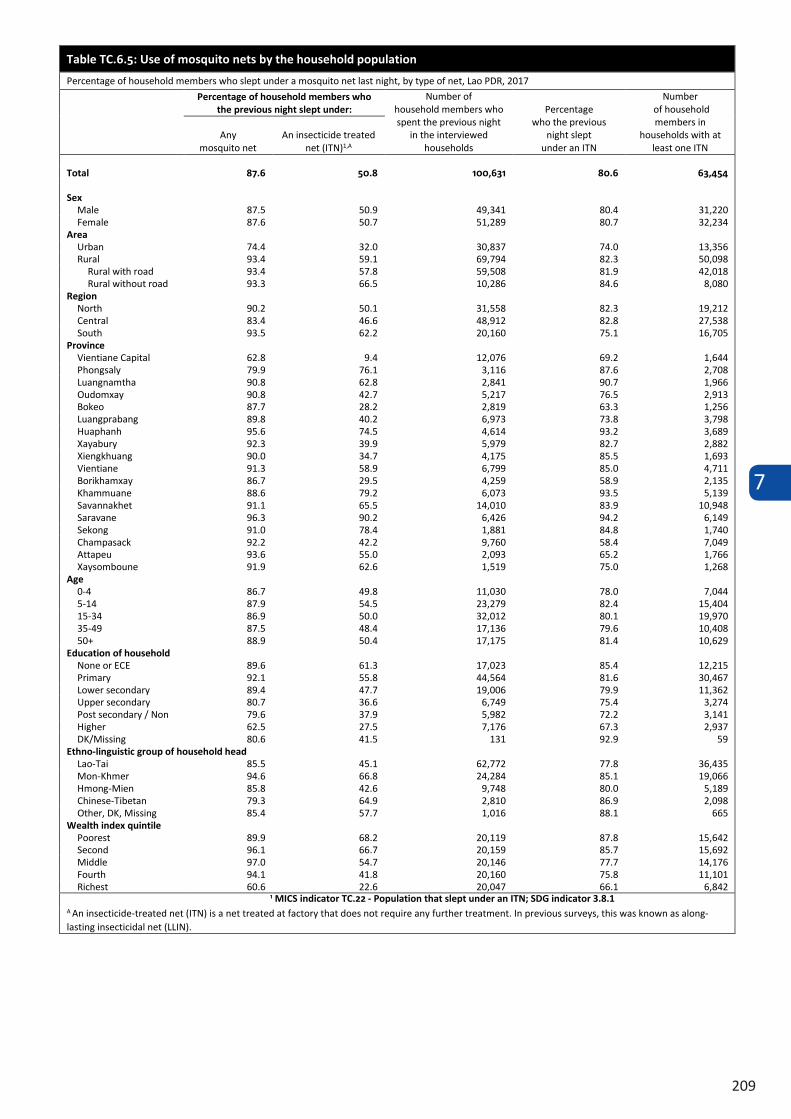
7
209
Table TC.6.5: Use of mosquito nets by the household population
Percentage of household members who slept under a mosquito net last night, by type of net, Lao PDR, 2017 Percentage of household members who
the previous night slept under: Number of
household members who spent the previous night
in the interviewed households
Percentage who the previous
night slept under an ITN
Number of household members in
households with at least one ITN
Any mosquito net
An insecticide treated net (ITN)1,A
Total 87.6 50.8 100,631 80.6 63,454
Sex Male 87.5 50.9 49,341 80.4 31,220 Female 87.6 50.7 51,289 80.7 32,234
Area Urban 74.4 32.0 30,837 74.0 13,356 Rural 93.4 59.1 69,794 82.3 50,098
Rural with road 93.4 57.8 59,508 81.9 42,018 Rural without road 93.3 66.5 10,286 84.6 8,080
Region North 90.2 50.1 31,558 82.3 19,212 Central 83.4 46.6 48,912 82.8 27,538 South 93.5 62.2 20,160 75.1 16,705
Province Vientiane Capital 62.8 9.4 12,076 69.2 1,644 Phongsaly 79.9 76.1 3,116 87.6 2,708 Luangnamtha 90.8 62.8 2,841 90.7 1,966 Oudomxay 90.8 42.7 5,217 76.5 2,913 Bokeo 87.7 28.2 2,819 63.3 1,256 Luangprabang 89.8 40.2 6,973 73.8 3,798 Huaphanh 95.6 74.5 4,614 93.2 3,689 Xayabury 92.3 39.9 5,979 82.7 2,882 Xiengkhuang 90.0 34.7 4,175 85.5 1,693 Vientiane 91.3 58.9 6,799 85.0 4,711 Borikhamxay 86.7 29.5 4,259 58.9 2,135 Khammuane 88.6 79.2 6,073 93.5 5,139 Savannakhet 91.1 65.5 14,010 83.9 10,948 Saravane 96.3 90.2 6,426 94.2 6,149 Sekong 91.0 78.4 1,881 84.8 1,740 Champasack 92.2 42.2 9,760 58.4 7,049 Attapeu 93.6 55.0 2,093 65.2 1,766 Xaysomboune 91.9 62.6 1,519 75.0 1,268
Age 0-4 86.7 49.8 11,030 78.0 7,044 5-14 87.9 54.5 23,279 82.4 15,404 15-34 86.9 50.0 32,012 80.1 19,970 35-49 87.5 48.4 17,136 79.6 10,408 50+ 88.9 50.4 17,175 81.4 10,629
Education of household headNone or ECE 89.6 61.3 17,023 85.4 12,215
Primary 92.1 55.8 44,564 81.6 30,467 Lower secondary 89.4 47.7 19,006 79.9 11,362 Upper secondary 80.7 36.6 6,749 75.4 3,274 Post secondary / Non
tertiary79.6 37.9 5,982 72.2 3,141
Higher 62.5 27.5 7,176 67.3 2,937 DK/Missing 80.6 41.5 131 92.9 59
Ethno-linguistic group of household head Lao-Tai 85.5 45.1 62,772 77.8 36,435 Mon-Khmer 94.6 66.8 24,284 85.1 19,066 Hmong-Mien 85.8 42.6 9,748 80.0 5,189 Chinese-Tibetan 79.3 64.9 2,810 86.9 2,098 Other, DK, Missing 85.4 57.7 1,016 88.1 665
Wealth index quintile Poorest 89.9 68.2 20,119 87.8 15,642 Second 96.1 66.7 20,159 85.7 15,692 Middle 97.0 54.7 20,146 77.7 14,176 Fourth 94.1 41.8 20,160 75.8 11,101 Richest 60.6 22.6 20,047 66.1 6,842
1 MICS indicator TC.22 - Population that slept under an ITN; SDG indicator 3.8.1A An insecticide-treated net (ITN) is a net treated at factory that does not require any further treatment. In previous surveys, this was known as along-lasting insecticidal net (LLIN).
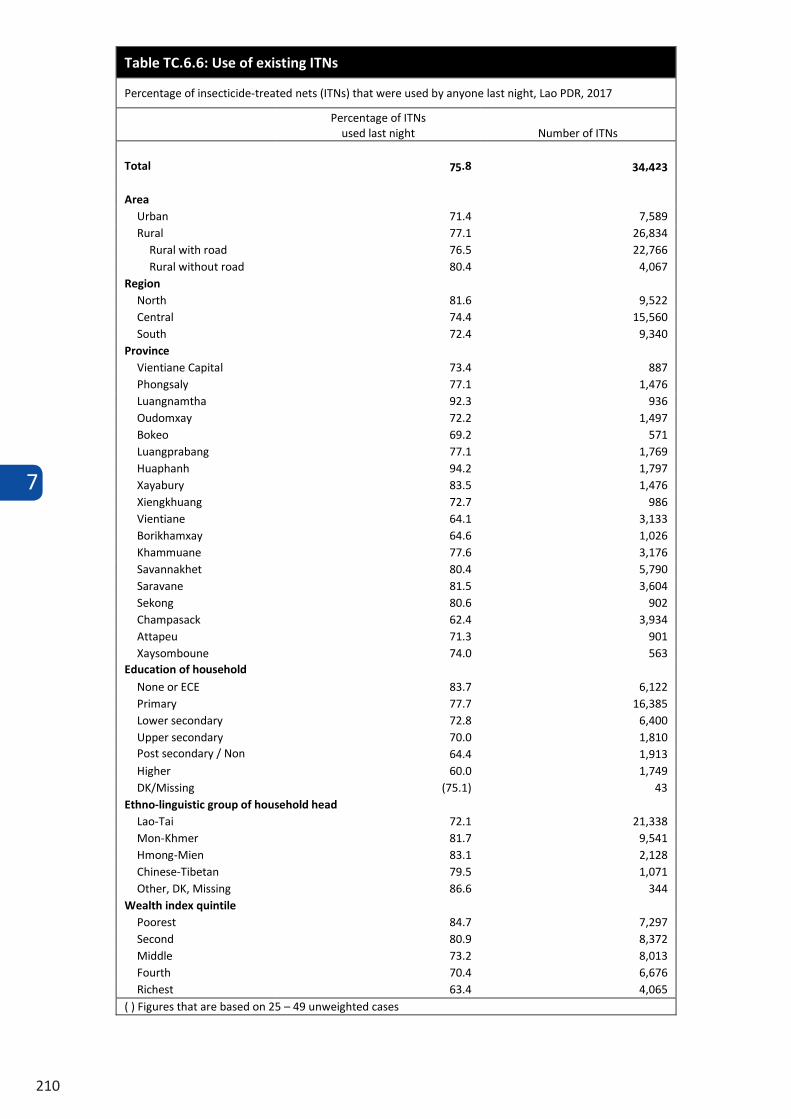
7
210
Table TC.6.6: Use of existing ITNs
Percentage of insecticide-treated nets (ITNs) that were used by anyone last night, Lao PDR, 2017
Percentage of ITNs used last night Number of ITNs
Total 75.8 34,423
Area Urban 71.4 7,589 Rural 77.1 26,834
Rural with road 76.5 22,766 Rural without road 80.4 4,067
Region North 81.6 9,522 Central 74.4 15,560 South 72.4 9,340
Province Vientiane Capital 73.4 887 Phongsaly 77.1 1,476 Luangnamtha 92.3 936 Oudomxay 72.2 1,497 Bokeo 69.2 571 Luangprabang 77.1 1,769 Huaphanh 94.2 1,797 Xayabury 83.5 1,476 Xiengkhuang 72.7 986 Vientiane 64.1 3,133 Borikhamxay 64.6 1,026 Khammuane 77.6 3,176 Savannakhet 80.4 5,790 Saravane 81.5 3,604 Sekong 80.6 902 Champasack 62.4 3,934 Attapeu 71.3 901 Xaysomboune 74.0 563
Education of household head None or ECE 83.7 6,122
Primary 77.7 16,385 Lower secondary 72.8 6,400 Upper secondary 70.0 1,810 Post secondary / Non
tertiary 64.4 1,913
Higher 60.0 1,749 DK/Missing (75.1) 43
Ethno-linguistic group of household head Lao-Tai 72.1 21,338 Mon-Khmer 81.7 9,541 Hmong-Mien 83.1 2,128 Chinese-Tibetan 79.5 1,071 Other, DK, Missing 86.6 344
Wealth index quintile Poorest 84.7 7,297 Second 80.9 8,372 Middle 73.2 8,013 Fourth 70.4 6,676 Richest 63.4 4,065
( ) Figures that are based on 25 – 49 unweighted cases
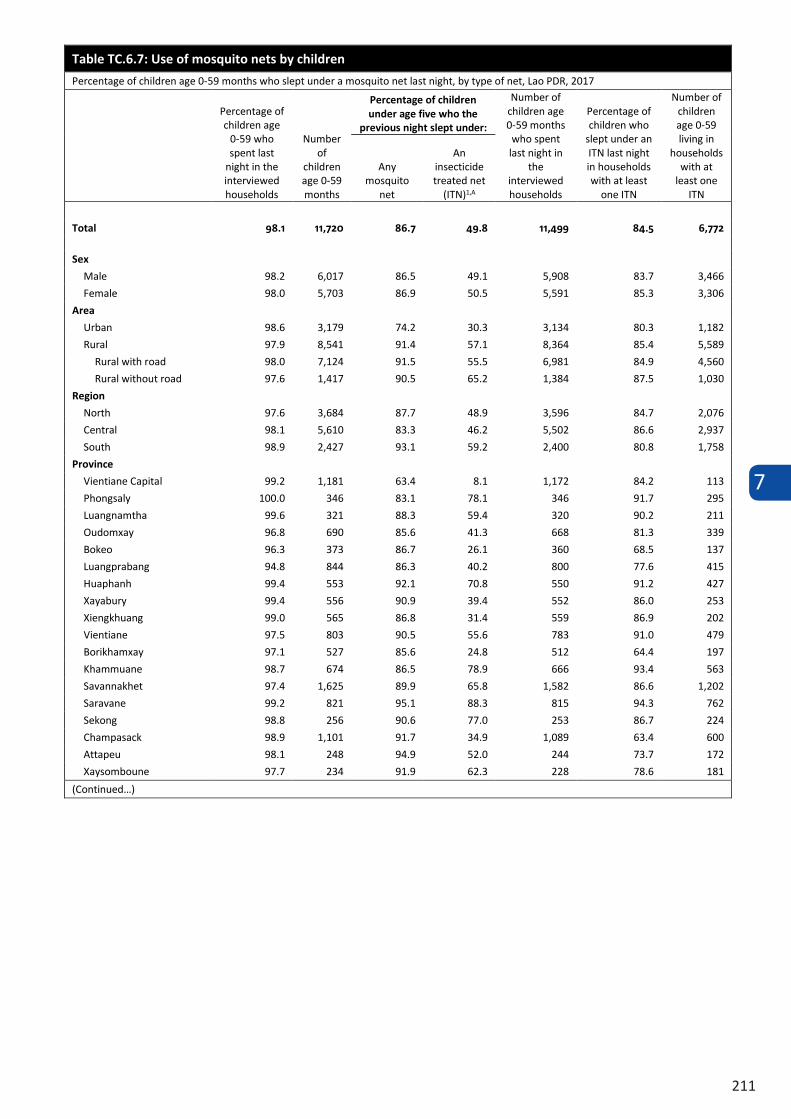
7
211
Table TC.6.7: Use of mosquito nets by children
Percentage of children age 0-59 months who slept under a mosquito net last night, by type of net, Lao PDR, 2017
Percentage of children age
0-59 who spent last
night in the interviewed households
Number of
children age 0-59 months
Percentage of children under age five who the
previous night slept under:
Number of children age 0-59 months who spent last night in
the interviewed households
Percentage of children who
slept under an ITN last night in households with at least
one ITN
Number of children age 0-59 living in
households with at
least one ITN
Any mosquito
net
An insecticide treated net
(ITN)1,A
Total 98.1 11,720 86.7 49.8 11,499 84.5 6,772
Sex
Male 98.2 6,017 86.5 49.1 5,908 83.7 3,466 Female 98.0 5,703 86.9 50.5 5,591 85.3 3,306
Area
Urban 98.6 3,179 74.2 30.3 3,134 80.3 1,182 Rural 97.9 8,541 91.4 57.1 8,364 85.4 5,589
Rural with road 98.0 7,124 91.5 55.5 6,981 84.9 4,560 Rural without road 97.6 1,417 90.5 65.2 1,384 87.5 1,030
Region
North 97.6 3,684 87.7 48.9 3,596 84.7 2,076 Central 98.1 5,610 83.3 46.2 5,502 86.6 2,937 South 98.9 2,427 93.1 59.2 2,400 80.8 1,758
Province
Vientiane Capital 99.2 1,181 63.4 8.1 1,172 84.2 113 Phongsaly 100.0 346 83.1 78.1 346 91.7 295 Luangnamtha 99.6 321 88.3 59.4 320 90.2 211 Oudomxay 96.8 690 85.6 41.3 668 81.3 339 Bokeo 96.3 373 86.7 26.1 360 68.5 137 Luangprabang 94.8 844 86.3 40.2 800 77.6 415 Huaphanh 99.4 553 92.1 70.8 550 91.2 427 Xayabury 99.4 556 90.9 39.4 552 86.0 253 Xiengkhuang 99.0 565 86.8 31.4 559 86.9 202 Vientiane 97.5 803 90.5 55.6 783 91.0 479 Borikhamxay 97.1 527 85.6 24.8 512 64.4 197 Khammuane 98.7 674 86.5 78.9 666 93.4 563 Savannakhet 97.4 1,625 89.9 65.8 1,582 86.6 1,202 Saravane 99.2 821 95.1 88.3 815 94.3 762 Sekong 98.8 256 90.6 77.0 253 86.7 224 Champasack 98.9 1,101 91.7 34.9 1,089 63.4 600 Attapeu 98.1 248 94.9 52.0 244 73.7 172 Xaysomboune 97.7 234 91.9 62.3 228 78.6 181
(Continued…)
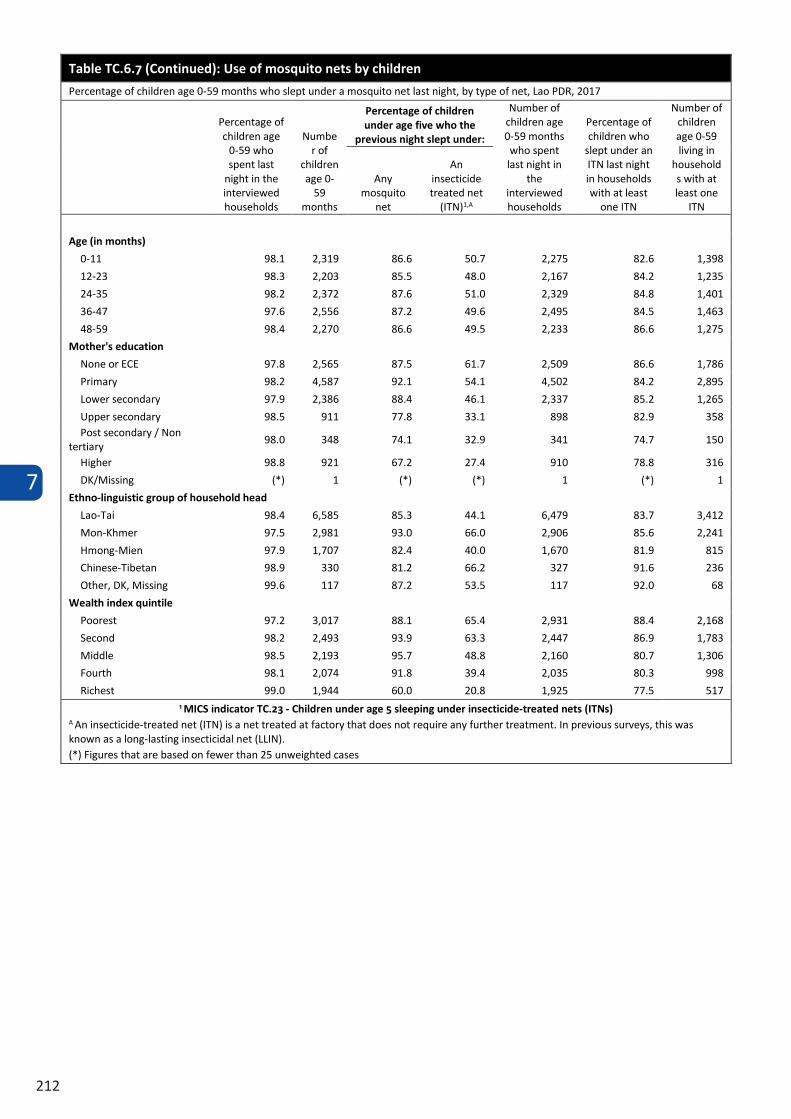
7
212
Table TC.6.7: Use of mosquito nets by children
Percentage of children age 0-59 months who slept under a mosquito net last night, by type of net, Lao PDR, 2017
Percentage of children age
0-59 who spent last
night in the interviewed households
Number of
children age 0-59 months
Percentage of children under age five who the
previous night slept under:
Number of children age 0-59 months who spent last night in
the interviewed households
Percentage of children who
slept under an ITN last night in households with at least
one ITN
Number of children age 0-59 living in
households with at
least one ITN
Any mosquito
net
An insecticide treated net
(ITN)1,A
Total 98.1 11,720 86.7 49.8 11,499 84.5 6,772
Sex
Male 98.2 6,017 86.5 49.1 5,908 83.7 3,466 Female 98.0 5,703 86.9 50.5 5,591 85.3 3,306
Area
Urban 98.6 3,179 74.2 30.3 3,134 80.3 1,182 Rural 97.9 8,541 91.4 57.1 8,364 85.4 5,589
Rural with road 98.0 7,124 91.5 55.5 6,981 84.9 4,560 Rural without road 97.6 1,417 90.5 65.2 1,384 87.5 1,030
Region
North 97.6 3,684 87.7 48.9 3,596 84.7 2,076 Central 98.1 5,610 83.3 46.2 5,502 86.6 2,937 South 98.9 2,427 93.1 59.2 2,400 80.8 1,758
Province
Vientiane Capital 99.2 1,181 63.4 8.1 1,172 84.2 113 Phongsaly 100.0 346 83.1 78.1 346 91.7 295 Luangnamtha 99.6 321 88.3 59.4 320 90.2 211 Oudomxay 96.8 690 85.6 41.3 668 81.3 339 Bokeo 96.3 373 86.7 26.1 360 68.5 137 Luangprabang 94.8 844 86.3 40.2 800 77.6 415 Huaphanh 99.4 553 92.1 70.8 550 91.2 427 Xayabury 99.4 556 90.9 39.4 552 86.0 253 Xiengkhuang 99.0 565 86.8 31.4 559 86.9 202 Vientiane 97.5 803 90.5 55.6 783 91.0 479 Borikhamxay 97.1 527 85.6 24.8 512 64.4 197 Khammuane 98.7 674 86.5 78.9 666 93.4 563 Savannakhet 97.4 1,625 89.9 65.8 1,582 86.6 1,202 Saravane 99.2 821 95.1 88.3 815 94.3 762 Sekong 98.8 256 90.6 77.0 253 86.7 224 Champasack 98.9 1,101 91.7 34.9 1,089 63.4 600 Attapeu 98.1 248 94.9 52.0 244 73.7 172 Xaysomboune 97.7 234 91.9 62.3 228 78.6 181
(Continued…)
Table TC.6.7 (Continued): Use of mosquito nets by children
Percentage of children age 0-59 months who slept under a mosquito net last night, by type of net, Lao PDR, 2017
Percentage of children age
0-59 who spent last
night in the interviewed households
Number of
children age 0-
59 months
Percentage of children under age five who the
previous night slept under:
Number of children age 0-59 months who spent last night in
the interviewed households
Percentage of children who
slept under an ITN last night in households with at least
one ITN
Number of children age 0-59 living in
households with at least one
ITN
Any mosquito
net
An insecticide treated net
(ITN)1,A
Age (in months)
0-11 98.1 2,319 86.6 50.7 2,275 82.6 1,398 12-23 98.3 2,203 85.5 48.0 2,167 84.2 1,235 24-35 98.2 2,372 87.6 51.0 2,329 84.8 1,401 36-47 97.6 2,556 87.2 49.6 2,495 84.5 1,463 48-59 98.4 2,270 86.6 49.5 2,233 86.6 1,275
Mother's education
None or ECE 97.8 2,565 87.5 61.7 2,509 86.6 1,786 Primary 98.2 4,587 92.1 54.1 4,502 84.2 2,895 Lower secondary 97.9 2,386 88.4 46.1 2,337 85.2 1,265 Upper secondary 98.5 911 77.8 33.1 898 82.9 358 Post secondary / Non
tertiary 98.0 348 74.1 32.9 341 74.7 150
Higher 98.8 921 67.2 27.4 910 78.8 316 DK/Missing (*) 1 (*) (*) 1 (*) 1
Ethno-linguistic group of household head
Lao-Tai 98.4 6,585 85.3 44.1 6,479 83.7 3,412 Mon-Khmer 97.5 2,981 93.0 66.0 2,906 85.6 2,241 Hmong-Mien 97.9 1,707 82.4 40.0 1,670 81.9 815 Chinese-Tibetan 98.9 330 81.2 66.2 327 91.6 236 Other, DK, Missing 99.6 117 87.2 53.5 117 92.0 68
Wealth index quintile
Poorest 97.2 3,017 88.1 65.4 2,931 88.4 2,168 Second 98.2 2,493 93.9 63.3 2,447 86.9 1,783 Middle 98.5 2,193 95.7 48.8 2,160 80.7 1,306 Fourth 98.1 2,074 91.8 39.4 2,035 80.3 998 Richest 99.0 1,944 60.0 20.8 1,925 77.5 517
1 MICS indicator TC.23 - Children under age 5 sleeping under insecticide-treated nets (ITNs) A An insecticide-treated net (ITN) is a net treated at factory that does not require any further treatment. In previous surveys, this was known as a long-lasting insecticidal net (LLIN). (*) Figures that are based on fewer than 25 unweighted cases
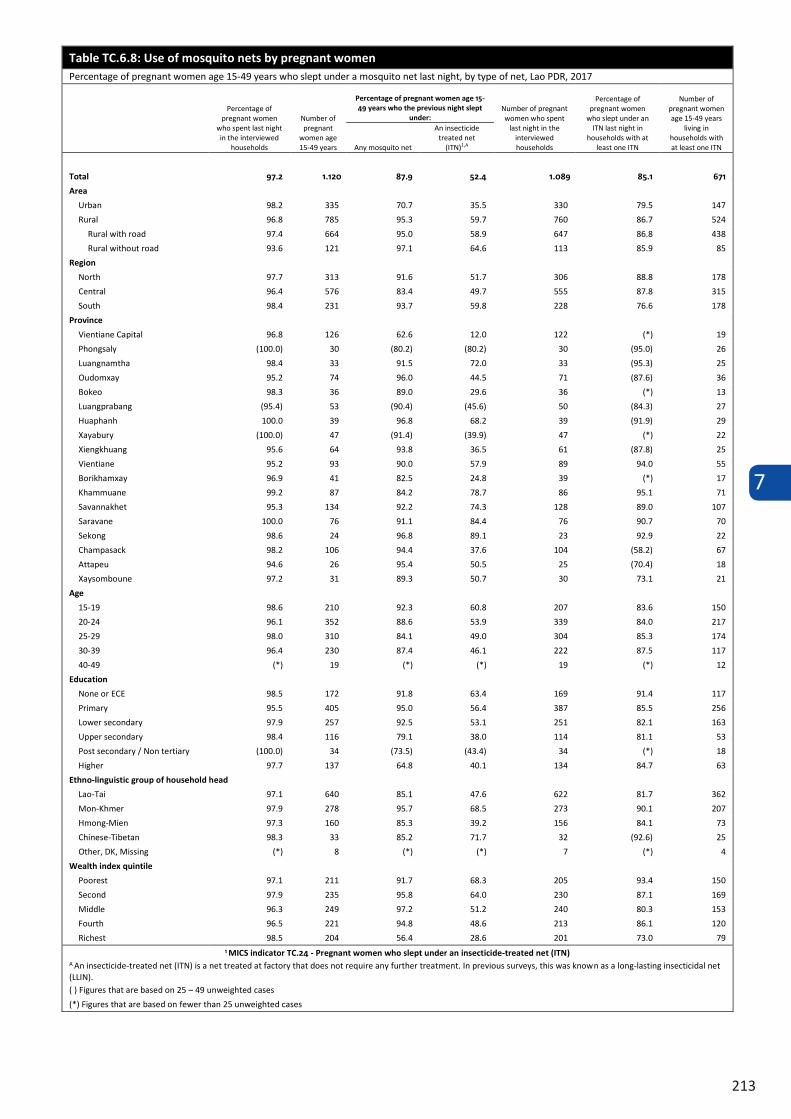
7
213
Table TC.6.8: Use of mosquito nets by pregnant women Percentage of pregnant women age 15-49 years who slept under a mosquito net last night, by type of net, Lao PDR, 2017
Percentage of pregnant women
who spent last night in the interviewed
households
Number of pregnant
women age 15-49 years
Percentage of pregnant women age 15-49 years who the previous night slept
under: Number of pregnant women who spent
last night in the interviewed households
Percentage of pregnant women
who slept under an ITN last night in
households with at least one ITN
Number of pregnant women age 15-49 years
living in households with at least one ITN Any mosquito net
An insecticide treated net
(ITN)1,A
Total 97.2 1.120 87.9 52.4 1.089 85.1 671
Area
Urban 98.2 335 70.7 35.5 330 79.5 147 Rural 96.8 785 95.3 59.7 760 86.7 524
Rural with road 97.4 664 95.0 58.9 647 86.8 438 Rural without road 93.6 121 97.1 64.6 113 85.9 85
Region
North 97.7 313 91.6 51.7 306 88.8 178 Central 96.4 576 83.4 49.7 555 87.8 315 South 98.4 231 93.7 59.8 228 76.6 178
Province
Vientiane Capital 96.8 126 62.6 12.0 122 (*) 19 Phongsaly (100.0) 30 (80.2) (80.2) 30 (95.0) 26 Luangnamtha 98.4 33 91.5 72.0 33 (95.3) 25 Oudomxay 95.2 74 96.0 44.5 71 (87.6) 36 Bokeo 98.3 36 89.0 29.6 36 (*) 13 Luangprabang (95.4) 53 (90.4) (45.6) 50 (84.3) 27 Huaphanh 100.0 39 96.8 68.2 39 (91.9) 29 Xayabury (100.0) 47 (91.4) (39.9) 47 (*) 22 Xiengkhuang 95.6 64 93.8 36.5 61 (87.8) 25 Vientiane 95.2 93 90.0 57.9 89 94.0 55 Borikhamxay 96.9 41 82.5 24.8 39 (*) 17 Khammuane 99.2 87 84.2 78.7 86 95.1 71 Savannakhet 95.3 134 92.2 74.3 128 89.0 107 Saravane 100.0 76 91.1 84.4 76 90.7 70 Sekong 98.6 24 96.8 89.1 23 92.9 22 Champasack 98.2 106 94.4 37.6 104 (58.2) 67 Attapeu 94.6 26 95.4 50.5 25 (70.4) 18 Xaysomboune 97.2 31 89.3 50.7 30 73.1 21
Age
15-19 98.6 210 92.3 60.8 207 83.6 150 20-24 96.1 352 88.6 53.9 339 84.0 217 25-29 98.0 310 84.1 49.0 304 85.3 174 30-39 96.4 230 87.4 46.1 222 87.5 117 40-49 (*) 19 (*) (*) 19 (*) 12
Education
None or ECE 98.5 172 91.8 63.4 169 91.4 117 Primary 95.5 405 95.0 56.4 387 85.5 256 Lower secondary 97.9 257 92.5 53.1 251 82.1 163 Upper secondary 98.4 116 79.1 38.0 114 81.1 53 Post secondary / Non tertiary (100.0) 34 (73.5) (43.4) 34 (*) 18 Higher 97.7 137 64.8 40.1 134 84.7 63
Ethno-linguistic group of household head
Lao-Tai 97.1 640 85.1 47.6 622 81.7 362 Mon-Khmer 97.9 278 95.7 68.5 273 90.1 207 Hmong-Mien 97.3 160 85.3 39.2 156 84.1 73 Chinese-Tibetan 98.3 33 85.2 71.7 32 (92.6) 25 Other, DK, Missing (*) 8 (*) (*) 7 (*) 4
Wealth index quintile
Poorest 97.1 211 91.7 68.3 205 93.4 150 Second 97.9 235 95.8 64.0 230 87.1 169 Middle 96.3 249 97.2 51.2 240 80.3 153 Fourth 96.5 221 94.8 48.6 213 86.1 120 Richest 98.5 204 56.4 28.6 201 73.0 79
1 MICS indicator TC.24 - Pregnant women who slept under an insecticide-treated net (ITN) A An insecticide-treated net (ITN) is a net treated at factory that does not require any further treatment. In previous surveys, this was known as a long-lasting insecticidal net (LLIN). ( ) Figures that are based on 25 – 49 unweighted cases (*) Figures that are based on fewer than 25 unweighted cases
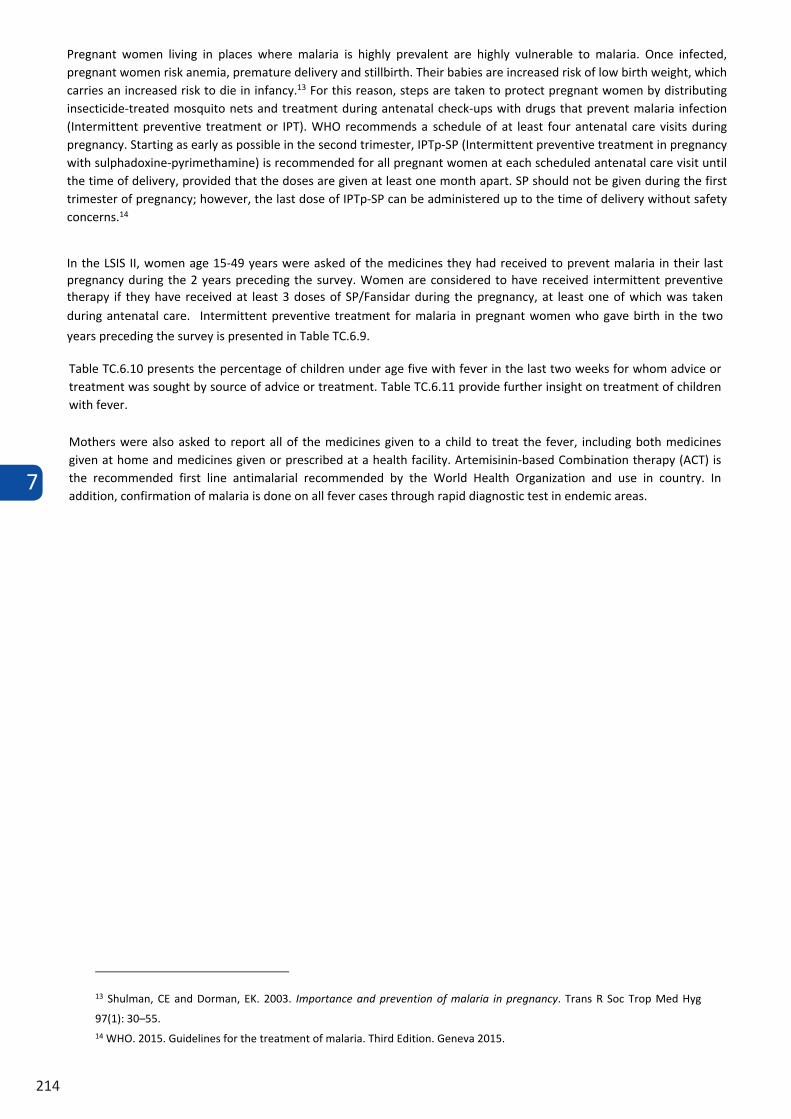
7
214
Pregnant women living in places where malaria is highly prevalent are highly vulnerable to malaria. Once infected, pregnant women risk anemia, premature delivery and stillbirth. Their babies are increased risk of low birth weight, which carries an increased risk to die in infancy.13 For this reason, steps are taken to protect pregnant women by distributing insecticide-treated mosquito nets and treatment during antenatal check-ups with drugs that prevent malaria infection (Intermittent preventive treatment or IPT). WHO recommends a schedule of at least four antenatal care visits during pregnancy. Starting as early as possible in the second trimester, IPTp-SP (Intermittent preventive treatment in pregnancy with sulphadoxine-pyrimethamine) is recommended for all pregnant women at each scheduled antenatal care visit until the time of delivery, provided that the doses are given at least one month apart. SP should not be given during the first trimester of pregnancy; however, the last dose of IPTp-SP can be administered up to the time of delivery without safety concerns.14
In the LSIS II, women age 15-49 years were asked of the medicines they had received to prevent malaria in their last pregnancy during the 2 years preceding the survey. Women are considered to have received intermittent preventive therapy if they have received at least 3 doses of SP/Fansidar during the pregnancy, at least one of which was taken during antenatal care. Intermittent preventive treatment for malaria in pregnant women who gave birth in the two years preceding the survey is presented in Table TC.6.9.
13 Shulman, CE and Dorman, EK. 2003. Importance and prevention of malaria in pregnancy. Trans R Soc Trop Med Hyg 97(1): 30–55. 14 WHO. 2015. Guidelines for the treatment of malaria. Third Edition. Geneva 2015.
Table TC.6.10 presents the percentage of children under age five with fever in the last two weeks for whom advice or treatment was sought by source of advice or treatment. Table TC.6.11 provide further insight on treatment of children with fever.
Mothers were also asked to report all of the medicines given to a child to treat the fever, including both medicines given at home and medicines given or prescribed at a health facility. Artemisinin-based Combination therapy (ACT) is the recommended first line antimalarial recommended by the World Health Organization and use in country. In addition, confirmation of malaria is done on all fever cases through rapid diagnostic test in endemic areas.
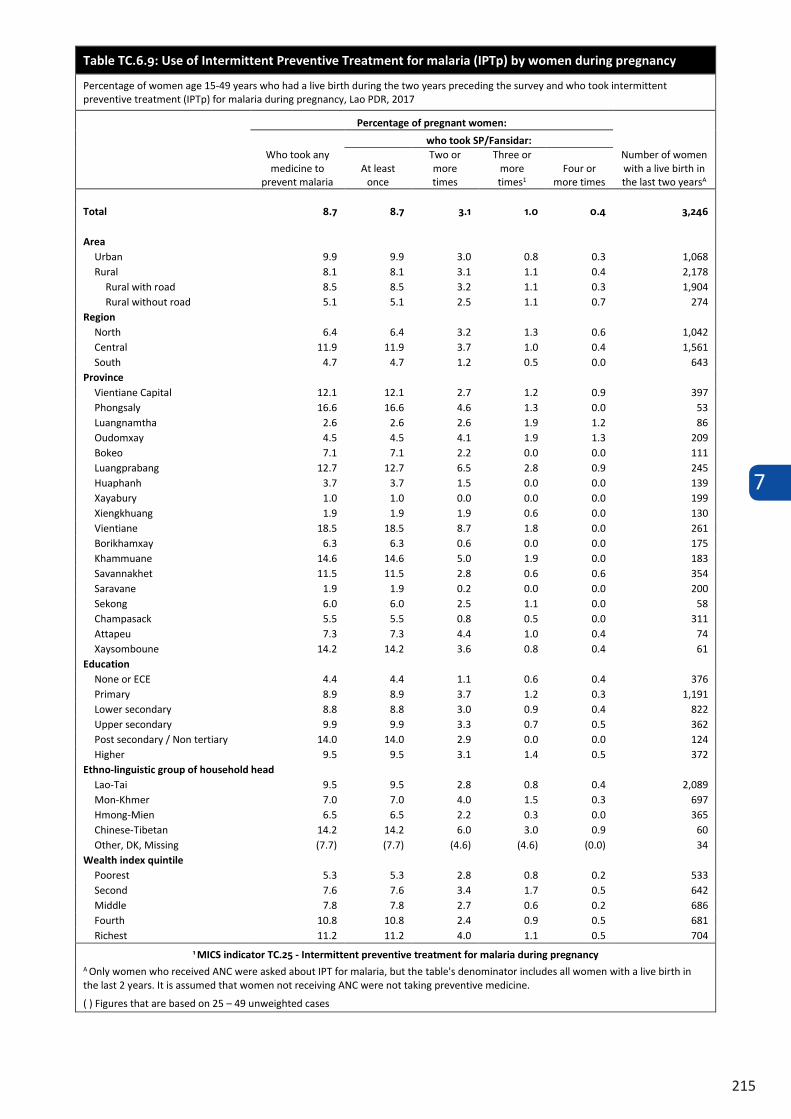
7
215
Table TC.6.9: Use of Intermittent Preventive Treatment for malaria (IPTp) by women during pregnancy
Percentage of women age 15-49 years who had a live birth during the two years preceding the survey and who took intermittent preventive treatment (IPTp) for malaria during pregnancy, Lao PDR, 2017
Percentage of pregnant women:
Number of women with a live birth in the last two yearsA
Who took any medicine to
prevent malaria
who took SP/Fansidar:
At least once
Two or more times
Three or more times1
Four or more times
Total 8.7 8.7 3.1 1.0 0.4 3,246
Area Urban 9.9 9.9 3.0 0.8 0.3 1,068 Rural 8.1 8.1 3.1 1.1 0.4 2,178
Rural with road 8.5 8.5 3.2 1.1 0.3 1,904 Rural without road 5.1 5.1 2.5 1.1 0.7 274
Region North 6.4 6.4 3.2 1.3 0.6 1,042 Central 11.9 11.9 3.7 1.0 0.4 1,561 South 4.7 4.7 1.2 0.5 0.0 643
Province Vientiane Capital 12.1 12.1 2.7 1.2 0.9 397 Phongsaly 16.6 16.6 4.6 1.3 0.0 53 Luangnamtha 2.6 2.6 2.6 1.9 1.2 86 Oudomxay 4.5 4.5 4.1 1.9 1.3 209 Bokeo 7.1 7.1 2.2 0.0 0.0 111 Luangprabang 12.7 12.7 6.5 2.8 0.9 245 Huaphanh 3.7 3.7 1.5 0.0 0.0 139 Xayabury 1.0 1.0 0.0 0.0 0.0 199 Xiengkhuang 1.9 1.9 1.9 0.6 0.0 130 Vientiane 18.5 18.5 8.7 1.8 0.0 261 Borikhamxay 6.3 6.3 0.6 0.0 0.0 175 Khammuane 14.6 14.6 5.0 1.9 0.0 183 Savannakhet 11.5 11.5 2.8 0.6 0.6 354 Saravane 1.9 1.9 0.2 0.0 0.0 200 Sekong 6.0 6.0 2.5 1.1 0.0 58 Champasack 5.5 5.5 0.8 0.5 0.0 311 Attapeu 7.3 7.3 4.4 1.0 0.4 74 Xaysomboune 14.2 14.2 3.6 0.8 0.4 61
Education None or ECE 4.4 4.4 1.1 0.6 0.4 376 Primary 8.9 8.9 3.7 1.2 0.3 1,191 Lower secondary 8.8 8.8 3.0 0.9 0.4 822 Upper secondary 9.9 9.9 3.3 0.7 0.5 362 Post secondary / Non tertiary 14.0 14.0 2.9 0.0 0.0 124 Higher 9.5 9.5 3.1 1.4 0.5 372
Ethno-linguistic group of household head Lao-Tai 9.5 9.5 2.8 0.8 0.4 2,089 Mon-Khmer 7.0 7.0 4.0 1.5 0.3 697 Hmong-Mien 6.5 6.5 2.2 0.3 0.0 365 Chinese-Tibetan 14.2 14.2 6.0 3.0 0.9 60 Other, DK, Missing (7.7) (7.7) (4.6) (4.6) (0.0) 34
Wealth index quintile Poorest 5.3 5.3 2.8 0.8 0.2 533 Second 7.6 7.6 3.4 1.7 0.5 642 Middle 7.8 7.8 2.7 0.6 0.2 686 Fourth 10.8 10.8 2.4 0.9 0.5 681 Richest 11.2 11.2 4.0 1.1 0.5 704
1 MICS indicator TC.25 - Intermittent preventive treatment for malaria during pregnancy A Only women who received ANC were asked about IPT for malaria, but the table's denominator includes all women with a live birth in the last 2 years. It is assumed that women not receiving ANC were not taking preventive medicine. ( ) Figures that are based on 25 – 49 unweighted cases
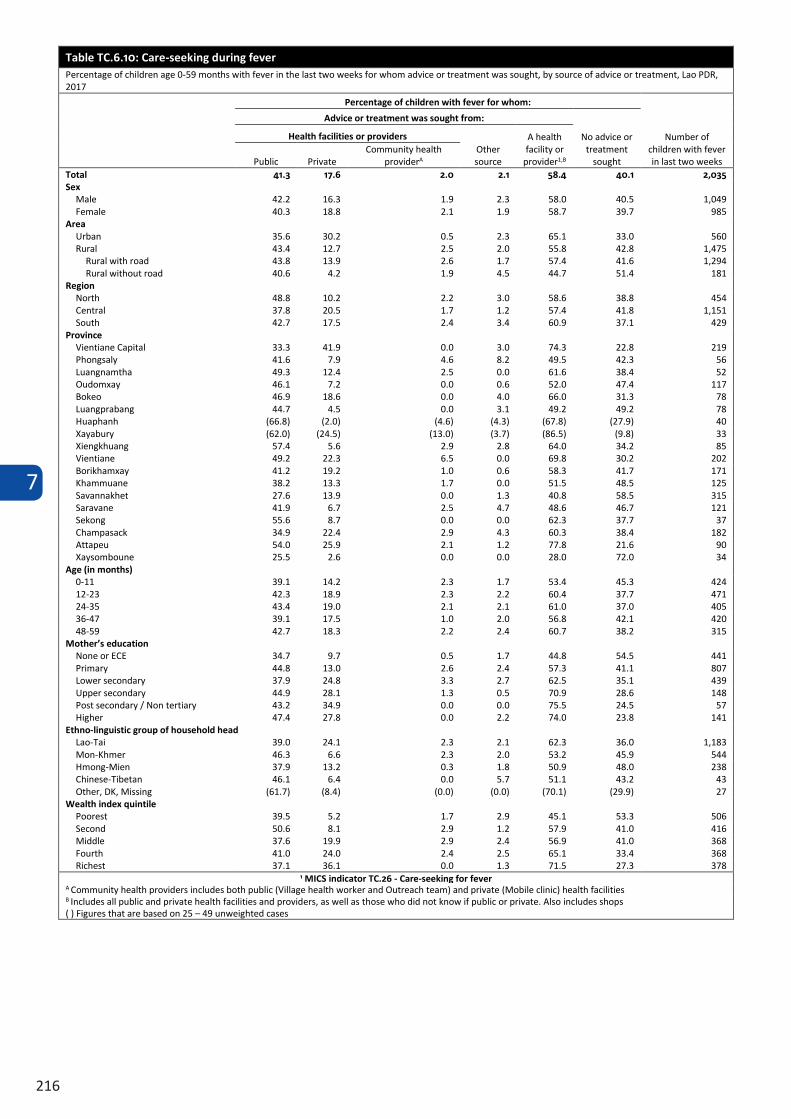
7
216
Table TC.6.10: Care-seeking during fever Percentage of children age 0-59 months with fever in the last two weeks for whom advice or treatment was sought, by source of advice or treatment, Lao PDR, 2017
Percentage of children with fever for whom:
Number of children with fever in last two weeks
Advice or treatment was sought from:
No advice or treatment
sought
Health facilities or providers Other source
A health facility or
provider1,B Public Private Community health
providerA Total 41.3 17.6 2.0 2.1 58.4 40.1 2,035 Sex
Male 42.2 16.3 1.9 2.3 58.0 40.5 1,049 Female 40.3 18.8 2.1 1.9 58.7 39.7 985
Area Urban 35.6 30.2 0.5 2.3 65.1 33.0 560 Rural 43.4 12.7 2.5 2.0 55.8 42.8 1,475
Rural with road 43.8 13.9 2.6 1.7 57.4 41.6 1,294 Rural without road 40.6 4.2 1.9 4.5 44.7 51.4 181
Region North 48.8 10.2 2.2 3.0 58.6 38.8 454 Central 37.8 20.5 1.7 1.2 57.4 41.8 1,151 South 42.7 17.5 2.4 3.4 60.9 37.1 429
Province Vientiane Capital 33.3 41.9 0.0 3.0 74.3 22.8 219 Phongsaly 41.6 7.9 4.6 8.2 49.5 42.3 56 Luangnamtha 49.3 12.4 2.5 0.0 61.6 38.4 52 Oudomxay 46.1 7.2 0.0 0.6 52.0 47.4 117 Bokeo 46.9 18.6 0.0 4.0 66.0 31.3 78 Luangprabang 44.7 4.5 0.0 3.1 49.2 49.2 78 Huaphanh (66.8) (2.0) (4.6) (4.3) (67.8) (27.9) 40 Xayabury (62.0) (24.5) (13.0) (3.7) (86.5) (9.8) 33 Xiengkhuang 57.4 5.6 2.9 2.8 64.0 34.2 85 Vientiane 49.2 22.3 6.5 0.0 69.8 30.2 202 Borikhamxay 41.2 19.2 1.0 0.6 58.3 41.7 171 Khammuane 38.2 13.3 1.7 0.0 51.5 48.5 125 Savannakhet 27.6 13.9 0.0 1.3 40.8 58.5 315 Saravane 41.9 6.7 2.5 4.7 48.6 46.7 121 Sekong 55.6 8.7 0.0 0.0 62.3 37.7 37 Champasack 34.9 22.4 2.9 4.3 60.3 38.4 182 Attapeu 54.0 25.9 2.1 1.2 77.8 21.6 90 Xaysomboune 25.5 2.6 0.0 0.0 28.0 72.0 34
Age (in months) 0-11 39.1 14.2 2.3 1.7 53.4 45.3 424 12-23 42.3 18.9 2.3 2.2 60.4 37.7 471 24-35 43.4 19.0 2.1 2.1 61.0 37.0 405 36-47 39.1 17.5 1.0 2.0 56.8 42.1 420 48-59 42.7 18.3 2.2 2.4 60.7 38.2 315
Mother’s education None or ECE 34.7 9.7 0.5 1.7 44.8 54.5 441 Primary 44.8 13.0 2.6 2.4 57.3 41.1 807 Lower secondary 37.9 24.8 3.3 2.7 62.5 35.1 439 Upper secondary 44.9 28.1 1.3 0.5 70.9 28.6 148 Post secondary / Non tertiary 43.2 34.9 0.0 0.0 75.5 24.5 57 Higher 47.4 27.8 0.0 2.2 74.0 23.8 141
Ethno-linguistic group of household head Lao-Tai 39.0 24.1 2.3 2.1 62.3 36.0 1,183 Mon-Khmer 46.3 6.6 2.3 2.0 53.2 45.9 544 Hmong-Mien 37.9 13.2 0.3 1.8 50.9 48.0 238 Chinese-Tibetan 46.1 6.4 0.0 5.7 51.1 43.2 43 Other, DK, Missing (61.7) (8.4) (0.0) (0.0) (70.1) (29.9) 27
Wealth index quintile Poorest 39.5 5.2 1.7 2.9 45.1 53.3 506 Second 50.6 8.1 2.9 1.2 57.9 41.0 416 Middle 37.6 19.9 2.9 2.4 56.9 41.0 368 Fourth 41.0 24.0 2.4 2.5 65.1 33.4 368 Richest 37.1 36.1 0.0 1.3 71.5 27.3 378
1 MICS indicator TC.26 - Care-seeking for fever A Community health providers includes both public (Village health worker and Outreach team) and private (Mobile clinic) health facilities B Includes all public and private health facilities and providers, as well as those who did not know if public or private. Also includes shops ( ) Figures that are based on 25 – 49 unweighted cases
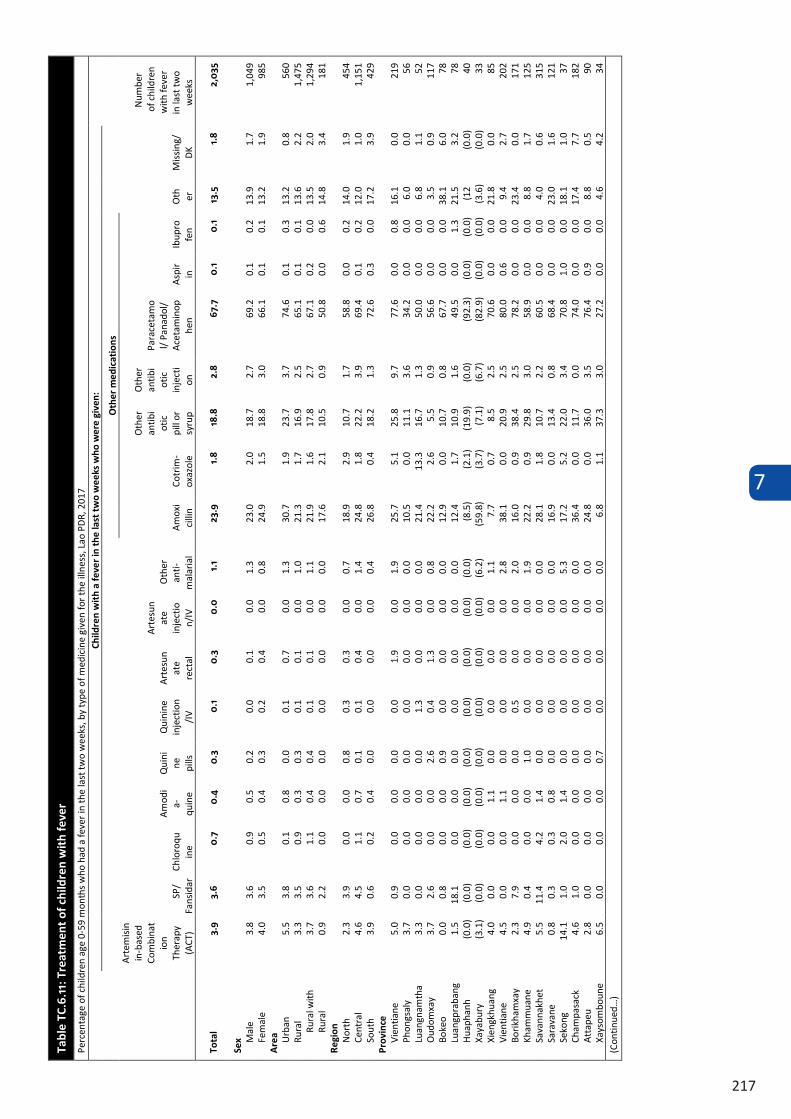
7
217
Tabl
e TC
.6.1
1: T
reat
men
t of
chi
ldre
n w
ith
feve
r
Perc
enta
ge o
f chi
ldre
n ag
e 0-
59 m
onth
s who
had
a fe
ver i
n th
e la
st tw
o w
eeks
, by
type
of m
edici
ne g
iven
for t
he il
lnes
s, La
o PD
R, 2
017
Child
ren
wit
h a
feve
r in
the
last
two
wee
ks w
ho w
ere
give
n:
Num
ber
of c
hild
ren
with
feve
r in
last
two
wee
ks
Oth
er m
edic
atio
ns
Oth er
Miss
ing/
DK
Arte
misi
nin
-bas
ed
Com
bina
tio
n Th
erap
y (A
CT)
SP/
Fans
idar
Ch
loro
quin
e
Amod
ia-
quin
e
Qui
nine
pi
lls
Qui
nine
in
ject
ion
/IV
Arte
sun
ate
rect
al
Arte
sun
ate
inje
ctio
n/IV
Othe
r an
ti-m
alar
ial
Amox
icil
lin
Cotr
im-
oxaz
ole
Othe
r an
tibi
otic
pill
or
syru
p
Othe
r an
tibi
otic
inje
cti
on
Para
ceta
mo
l/ Pa
nado
l/ Ac
etam
inop
hen
Aspi
rin
Ib
upro
fen
Tota
l 3.
9 3.
6 0
.7
0.4
0
.3
0.1
0
.3
0.0
1.
1 23
.9
1.8
18.8
2.
8 67
.7
0.1
0
.1
13.5
1.
8 2,
035
Sex M
ale
3.8
3.6
0.9
0.5
0.2
0.0
0.1
0.0
1.3
23.0
2.
0 18
.7
2.7
69.2
0.
1 0.
2 13
.9
1.7
1,04
9 Fe
mal
e 4.
0 3.
5 0.
5 0.
4 0.
3 0.
2 0.
4 0.
0 0.
8 24
.9
1.5
18.8
3.
0 66
.1
0.1
0.1
13.2
1.
9 98
5 A
rea Ur
ban
5.5
3.8
0.1
0.8
0.0
0.1
0.7
0.0
1.3
30.7
1.
9 23
.7
3.7
74.6
0.
1 0.
3 13
.2
0.8
560
Rura
l 3.
3 3.
5 0.
9 0.
3 0.
3 0.
1 0.
1 0.
0 1.
0 21
.3
1.7
16.9
2.
5 65
.1
0.1
0.1
13.6
2.
2 1,
475
Rura
l with
ro
ad3.
7 3.
6 1.
1 0.
4 0.
4 0.
1 0.
1 0.
0 1.
1 21
.9
1.6
17.8
2.
7 67
.1
0.2
0.0
13.5
2.
0 1,
294
Rura
l w
ithou
t roa
d0.
9 2.
2 0.
0 0.
0 0.
0 0.
0 0.
0 0.
0 0.
0 17
.6
2.1
10.5
0.
9 50
.8
0.0
0.6
14.8
3.
4 18
1 Re
gion
No
rth
2.3
3.9
0.0
0.0
0.8
0.3
0.3
0.0
0.7
18.9
2.
9 10
.7
1.7
58.8
0.
0 0.
2 14
.0
1.9
454
Cent
ral
4.6
4.5
1.1
0.7
0.1
0.1
0.4
0.0
1.4
24.8
1.
8 22
.2
3.9
69.4
0.
1 0.
2 12
.0
1.0
1,15
1 So
uth
3.9
0.6
0.2
0.4
0.0
0.0
0.0
0.0
0.4
26.8
0.
4 18
.2
1.3
72.6
0.
3 0.
0 17
.2
3.9
429
Prov
ince
Vi
entia
ne
Capi
tal
5.0
0.9
0.0
0.0
0.0
0.0
1.9
0.0
1.9
25.7
5.
1 25
.8
9.7
77.6
0.
0 0.
8 16
.1
0.0
219
Phon
gsal
y
3.7
0.0
0.0
0.0
0.0
0.0
0.0
0.0
0.0
10.5
0.
0 11
.1
3.6
34.2
0.
0 0.
0 6.
0 0.
0 56
Lu
angn
amth
a 3.
3 0.
0 0.
0 0.
0 0.
0 1.
3 0.
0 0.
0 0.
0 21
.4
13.3
16
.7
1.3
50.0
0.
0 0.
0 6.
8 1.
1 52
Ou
dom
xay
3.7
2.6
0.0
0.0
2.6
0.4
1.3
0.0
0.8
22.2
2.
6 5.
5 0.
9 56
.6
0.0
0.0
3.5
0.9
117
Boke
o 0.
0 0.
8 0.
0 0.
0 0.
9 0.
0 0.
0 0.
0 0.
0 12
.9
0.0
10.7
0.
8 67
.7
0.0
0.0
38.1
6.
0 78
Lu
angp
raba
ng
1.5
18.1
0.
0 0.
0 0.
0 0.
0 0.
0 0.
0 0.
0 12
.4
1.7
10.9
1.
6 49
.5
0.0
1.3
21.5
3.
2 78
Hu
apha
nh
(0.0
) (0
.0)
(0.0
) (0
.0)
(0.0
) (0
.0)
(0.0
) (0
.0)
(0.0
) (8
.5)
(2.1
) (1
9.9)
(0
.0)
(92.
3)
(0.0
) (0
.0)
(12 8)
(0.0
) 40
Xa
yabu
ry
(3.1
) (0
.0)
(0.0
) (0
.0)
(0.0
) (0
.0)
(0.0
) (0
.0)
(6.2
) (5
9.8)
(3
.7)
(7.1
) (6
.7)
(82.
9)
(0.0
) (0
.0)
(3.6
) (0
.0)
33
Xien
gkhu
ang
4.0
0.0
0.0
1.1
0.0
0.0
0.0
0.0
1.1
7.7
0.7
8.5
2.5
70.6
0.
0 0.
0 21
.8
0.0
85
Vien
tiane
4.
5 0.
0 0.
0 1.
1 0.
0 0.
0 0.
0 0.
0 2.
8 38
.1
0.0
20.9
2.
5 80
.0
0.6
0.0
9.4
2.7
202
Borik
ham
xay
2.3
7.9
0.0
0.0
0.0
0.5
0.0
0.0
2.0
16.0
0.
9 38
.4
2.5
78.2
0.
0 0.
0 23
.4
0.0
171
Kham
mua
ne
4.9
0.4
0.0
0.0
1.0
0.0
0.0
0.0
1.9
22.2
0.
9 29
.8
3.0
58.9
0.
0 0.
0 8.
8 1.
7 12
5 Sa
vann
akhe
t 5.
5 11
.4
4.2
1.4
0.0
0.0
0.0
0.0
0.0
28.1
1.
8 10
.7
2.2
60.5
0.
0 0.
0 4.
0 0.
6 31
5 Sa
rava
ne
0.8
0.3
0.3
0.8
0.0
0.0
0.0
0.0
0.0
16.9
0.
0 13
.4
0.8
68.4
0.
0 0.
0 23
.0
1.6
121
Seko
ng
14.1
1.
0 2.
0 1.
4 0.
0 0.
0 0.
0 0.
0 5.
3 17
.2
5.2
22.0
3.
4 70
.8
1.0
0.0
18.1
1.
0 37
Ch
ampa
sack
4.
6 1.
0 0.
0 0.
0 0.
0 0.
0 0.
0 0.
0 0.
0 36
.4
0.0
11.7
0.
0 74
.0
0.0
0.0
17.4
7.
7 18
2 At
tape
u 2.
8 0.
0 0.
0 0.
0 0.
0 0.
0 0.
0 0.
0 0.
0 24
.8
0.0
36.0
3.
5 76
.4
0.9
0.0
8.8
0.5
90
Xays
ombo
une
6.5
0.0
0.0
0.0
0.7
0.0
0.0
0.0
0.0
6.8
1.1
37.3
3.
0 27
.2
0.0
0.0
4.6
4.2
34
(Con
tinue
d…)
Tabl
e TC
.6.1
1 (c
onti
nued
): T
reat
men
t of
chi
ldre
n w
ith
feve
r
Perc
enta
ge o
f chi
ldre
n ag
e 0-
59 m
onth
s who
had
a fe
ver i
n th
e la
st tw
o w
eeks
, by
type
of m
edici
ne g
iven
for t
he il
lnes
s, La
o PD
R, 2
017
Child
ren
wit
h a
feve
r in
the
last
two
wee
ks w
ho w
ere
give
n:
Num
ber o
f ch
ildre
n w
ith fe
ver
in la
st tw
o w
eeks
Oth
er m
edic
atio
ns
Othe
r M
issin
g /D
K
Arte
misi
nin-
base
d Co
mbi
natio
n Th
erap
y (A
CT)
SP/
Fans
idar
Ch
loro
qui
ne
Amod
ia-
quin
e Q
uini
ne
pills
Qui
nine
in
ject
ion
/IV
Arte
sun
ate
rect
al
Arte
suna
te
inje
cti
on/IV
Othe
r an
ti-m
alar
ial
Am
oxi
-cill
in
Cotr
imo-
xazo
le
Othe
r an
tibio
tic
pill
or
syru
p
Othe
r an
tibio
tic
inje
ctio
n
Para
ceta
mol
/ Pa
nado
l/ Ac
etam
inop
hen
Aspi
rin
Ibup
-ro
fen
Age
(in
mon
ths)
0-
11
4.3
4.3
0.6
0.7
0.2
0.0
0.5
0.0
0.9
20.9
0.
6 15
.0
2.6
61.8
0.
0 0.
0 14
.8
1.8
424
12-2
3 3.
7 4.
7 1.
5 0.
2 0.
2 0.
0 0.
4 0.
0 0.
9 21
.2
1.4
19.1
2.
5 70
.9
0.1
0.0
16.2
1.
3 47
1 24
-35
2.9
1.9
0.0
0.0
0.3
0.4
0.3
0.0
1.0
27.0
1.
3 19
.6
3.3
68.4
0.
0 0.
7 12
.8
1.0
405
36-4
7 4.
0 2.
3 0.
6 0.
5 0.
2 0.
1 0.
1 0.
0 1.
4 25
.9
2.6
21.3
3.
0 71
.4
0.1
0.0
10.5
2.
7 42
0 48
-59
5.0
4.5
0.7
0.9
0.4
0.0
0.0
0.0
1.2
25.6
3.
3 18
.9
2.9
65.1
0.
4 0.
0 12
.7
2.4
315
Mot
her’
s ed
ucat
ion
None
or E
CE
1.9
4.0
1.6
0.2
0.5
0.0
0.0
0.0
0.6
19.2
1.
4 12
.8
1.0
56.0
0.
1 0.
0 7.
7 1.
9 44
1 Pr
imar
y 4.
6 4.
0 0.
8 0.
4 0.
1 0.
1 0.
2 0.
0 0.
9 23
.5
1.7
19.4
1.
8 67
.9
0.0
0.1
14.7
2.
9 80
7 Lo
wer
seco
ndar
y 3.
6 3.
5 0.
1 0.
7 0.
5 0.
4 0.
5 0.
0 1.
7 26
.2
1.3
23.0
4.
8 74
.8
0.2
0.0
15.2
0.
7 43
9 Up
per s
econ
dary
5.
2 1.
2 0.
0 0.
0 0.
0 0.
0 1.
4 0.
0 0.
6 27
.3
2.7
23.6
5.
3 70
.3
0.0
0.0
12.7
1.
0 14
8 Po
st se
cond
ary
/ No
n te
rtia
ry
3.3
3.3
0.0
0.0
0.0
0.0
0.0
0.0
5.1
18.3
5.
6 18
.8
7.0
69.5
2.
0 3.
2 16
.1
0.0
57
High
er
6.8
2.4
0.0
1.5
0.0
0.0
0.0
0.0
0.3
32.9
2.
2 15
.2
4.2
77.5
0.
0 0.
0 19
.9
0.3
141
Ethn
o-lin
guis
tic
grou
p of
hou
seho
ld
head
La
o-Ta
i 4.
3 3.
6 0.
6 0.
4 0.
1 0.
1 0.
4 0.
0 1.
2 28
.0
2.0
21.7
3.
5 73
.6
0.2
0.2
14.1
1.
5 1,
183
Mon
-Khm
er
4.2
4.4
1.4
0.5
0.3
0.1
0.1
0.0
0.7
20.4
2.
0 14
.2
1.8
60.2
0.
1 0.
2 10
.3
1.9
544
Hmon
g-M
ien
2.0
2.2
0.0
0.4
1.0
0.0
0.0
0.0
1.5
15.2
0.
6 13
.2
2.1
62.9
0.
0 0.
0 16
.2
1.5
238
Chin
ese-
Tibe
tan
1.5
0.0
0.0
0.0
0.0
0.0
0.0
0.0
0.0
12.0
0.
0 13
.0
3.2
37.3
0.
0 0.
0 10
.6
6.1
43
Othe
r, DK
, Miss
ing
(4.2
) (0
.0)
(0.0
) (0
.0)
(0.0
) (0
.0)
(0.0
) (0
.0)
(0.0
) (1
3.8)
(0
.0)
(38.
3)
(0.0
) (5
0.2)
(0
.0)
(0.0
) (3
4.4)
(6
.2)
27
Wea
lth
inde
x qu
inti
le
Poor
est
2.9
4.2
1.5
0.6
0.3
0.1
0.1
0.0
0.6
15.8
1.
0 13
.2
1.0
54.9
0.
1 0.
2 8.
3 0.
7 50
6 Se
cond
2.
4 3.
1 0.
7 0.
3 0.
5 0.
0 0.
3 0.
0 0.
7 22
.0
2.0
17.0
1.
9 66
.1
0.1
0.0
16.6
2.
5 41
6 M
iddl
e 2.
7 2.
4 0.
5 0.
3 0.
0 0.
3 0.
0 0.
0 1.
2 24
.1
1.7
20.0
2.
2 66
.9
0.1
0.0
13.0
3.
8 36
8 Fo
urth
6.
8 3.
2 0.
0 0.
0 0.
3 0.
0 0.
0 0.
0 2.
5 30
.3
1.3
19.6
2.
7 76
.1
0.3
0.0
17.2
2.
0 36
8 Ri
ches
t 5.
4 4.
6 0.
5 1.
1 0.
0 0.
2 1.
1 0.
0 0.
5 30
.6
3.1
26.1
7.
1 79
.2
0.0
0.5
14.1
0.
3 37
8 ( )
Fig
ures
that
are
bas
ed o
n 25
– 4
9 un
wei
ghte
d ca
ses
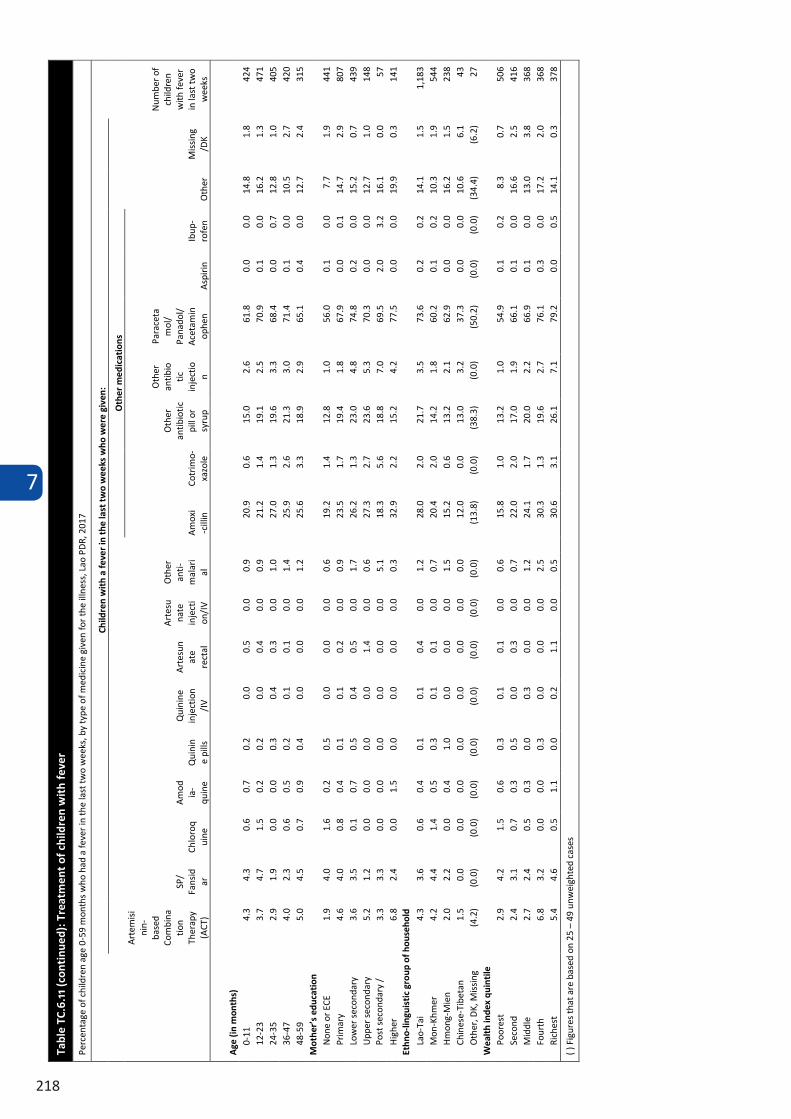
7
218
Tabl
e TC
.6.1
1 (c
onti
nued
): T
reat
men
t of
chi
ldre
n w
ith
feve
r
Perc
enta
ge o
f chi
ldre
n ag
e 0-
59 m
onth
s who
had
a fe
ver i
n th
e la
st tw
o w
eeks
, by
type
of m
edici
ne g
iven
for t
he il
lnes
s, La
o PD
R, 2
017
Child
ren
wit
h a
feve
r in
the
last
two
wee
ks w
ho w
ere
give
n:
Num
ber o
f ch
ildre
n w
ith fe
ver
in la
st tw
o w
eeks
Oth
er m
edic
atio
ns
Othe
r M
issin
g /D
K
Arte
misi
nin-
base
d Co
mbi
natio
n Th
erap
y (A
CT)
SP/
Fans
idar
Ch
loro
qui
ne
Amod
ia-
quin
e Q
uini
ne
pills
Qui
nine
in
ject
ion
/IV
Arte
sun
ate
rect
al
Arte
suna
te
inje
cti
on/IV
Othe
r an
ti-m
alar
ial
Am
oxi
-cill
in
Cotr
imo-
xazo
le
Othe
r an
tibio
tic
pill
or
syru
p
Othe
r an
tibio
tic
inje
ctio
n
Para
ceta
mol
/ Pa
nado
l/ Ac
etam
inop
hen
Aspi
rin
Ibup
-ro
fen
Age
(in
mon
ths)
0-
11
4.3
4.3
0.6
0.7
0.2
0.0
0.5
0.0
0.9
20.9
0.
6 15
.0
2.6
61.8
0.
0 0.
0 14
.8
1.8
424
12-2
3 3.
7 4.
7 1.
5 0.
2 0.
2 0.
0 0.
4 0.
0 0.
9 21
.2
1.4
19.1
2.
5 70
.9
0.1
0.0
16.2
1.
3 47
1 24
-35
2.9
1.9
0.0
0.0
0.3
0.4
0.3
0.0
1.0
27.0
1.
3 19
.6
3.3
68.4
0.
0 0.
7 12
.8
1.0
405
36-4
7 4.
0 2.
3 0.
6 0.
5 0.
2 0.
1 0.
1 0.
0 1.
4 25
.9
2.6
21.3
3.
0 71
.4
0.1
0.0
10.5
2.
7 42
0 48
-59
5.0
4.5
0.7
0.9
0.4
0.0
0.0
0.0
1.2
25.6
3.
3 18
.9
2.9
65.1
0.
4 0.
0 12
.7
2.4
315
Mot
her’
s ed
ucat
ion
None
or E
CE
1.9
4.0
1.6
0.2
0.5
0.0
0.0
0.0
0.6
19.2
1.
4 12
.8
1.0
56.0
0.
1 0.
0 7.
7 1.
9 44
1 Pr
imar
y 4.
6 4.
0 0.
8 0.
4 0.
1 0.
1 0.
2 0.
0 0.
9 23
.5
1.7
19.4
1.
8 67
.9
0.0
0.1
14.7
2.
9 80
7 Lo
wer
seco
ndar
y 3.
6 3.
5 0.
1 0.
7 0.
5 0.
4 0.
5 0.
0 1.
7 26
.2
1.3
23.0
4.
8 74
.8
0.2
0.0
15.2
0.
7 43
9 Up
per s
econ
dary
5.
2 1.
2 0.
0 0.
0 0.
0 0.
0 1.
4 0.
0 0.
6 27
.3
2.7
23.6
5.
3 70
.3
0.0
0.0
12.7
1.
0 14
8 Po
st se
cond
ary
/ No
n te
rtia
ry
3.3
3.3
0.0
0.0
0.0
0.0
0.0
0.0
5.1
18.3
5.
6 18
.8
7.0
69.5
2.
0 3.
2 16
.1
0.0
57
High
er
6.8
2.4
0.0
1.5
0.0
0.0
0.0
0.0
0.3
32.9
2.
2 15
.2
4.2
77.5
0.
0 0.
0 19
.9
0.3
141
Ethn
o-lin
guis
tic
grou
p of
hou
seho
ld
head
La
o-Ta
i 4.
3 3.
6 0.
6 0.
4 0.
1 0.
1 0.
4 0.
0 1.
2 28
.0
2.0
21.7
3.
5 73
.6
0.2
0.2
14.1
1.
5 1,
183
Mon
-Khm
er
4.2
4.4
1.4
0.5
0.3
0.1
0.1
0.0
0.7
20.4
2.
0 14
.2
1.8
60.2
0.
1 0.
2 10
.3
1.9
544
Hmon
g-M
ien
2.0
2.2
0.0
0.4
1.0
0.0
0.0
0.0
1.5
15.2
0.
6 13
.2
2.1
62.9
0.
0 0.
0 16
.2
1.5
238
Chin
ese-
Tibe
tan
1.5
0.0
0.0
0.0
0.0
0.0
0.0
0.0
0.0
12.0
0.
0 13
.0
3.2
37.3
0.
0 0.
0 10
.6
6.1
43
Othe
r, DK
, Miss
ing
(4.2
) (0
.0)
(0.0
) (0
.0)
(0.0
) (0
.0)
(0.0
) (0
.0)
(0.0
) (1
3.8)
(0
.0)
(38.
3)
(0.0
) (5
0.2)
(0
.0)
(0.0
) (3
4.4)
(6
.2)
27
Wea
lth
inde
x qu
inti
le
Poor
est
2.9
4.2
1.5
0.6
0.3
0.1
0.1
0.0
0.6
15.8
1.
0 13
.2
1.0
54.9
0.
1 0.
2 8.
3 0.
7 50
6 Se
cond
2.
4 3.
1 0.
7 0.
3 0.
5 0.
0 0.
3 0.
0 0.
7 22
.0
2.0
17.0
1.
9 66
.1
0.1
0.0
16.6
2.
5 41
6 M
iddl
e 2.
7 2.
4 0.
5 0.
3 0.
0 0.
3 0.
0 0.
0 1.
2 24
.1
1.7
20.0
2.
2 66
.9
0.1
0.0
13.0
3.
8 36
8 Fo
urth
6.
8 3.
2 0.
0 0.
0 0.
3 0.
0 0.
0 0.
0 2.
5 30
.3
1.3
19.6
2.
7 76
.1
0.3
0.0
17.2
2.
0 36
8 Ri
ches
t 5.
4 4.
6 0.
5 1.
1 0.
0 0.
2 1.
1 0.
0 0.
5 30
.6
3.1
26.1
7.
1 79
.2
0.0
0.5
14.1
0.
3 37
8 ( )
Fig
ures
that
are
bas
ed o
n 25
– 4
9 un
wei
ghte
d ca
ses
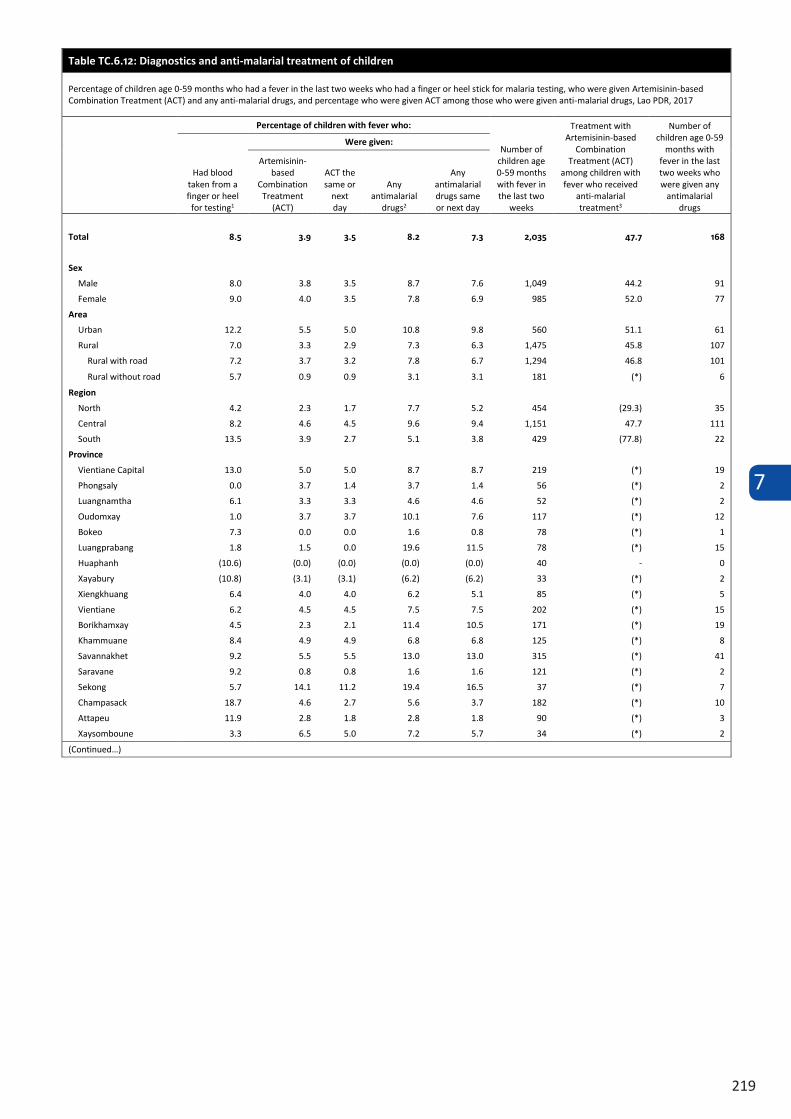
7
219
Table TC.6.12: Diagnostics and anti-malarial treatment of children
Percentage of children age 0-59 months who had a fever in the last two weeks who had a finger or heel stick for malaria testing, who were given Artemisinin-based Combination Treatment (ACT) and any anti-malarial drugs, and percentage who were given ACT among those who were given anti-malarial drugs, Lao PDR, 2017
Percentage of children with fever who:
Number of children age 0-59 months with fever in the last two
weeks
Treatment with Artemisinin-based
Combination Treatment (ACT)
among children with fever who received
anti-malarial treatment3
Number of children age 0-59
months with fever in the last two weeks who were given any
antimalarial drugs
Had blood taken from a finger or heel
for testing1
Were given:
Artemisinin-based
Combination Treatment
(ACT)
ACT the same or
next day
Any antimalarial
drugs2
Any antimalarial drugs same or next day
Total 8.5 3.9 3.5 8.2 7.3 2,035 47.7 168
Sex
Male 8.0 3.8 3.5 8.7 7.6 1,049 44.2 91 Female 9.0 4.0 3.5 7.8 6.9 985 52.0 77
Area
Urban 12.2 5.5 5.0 10.8 9.8 560 51.1 61 Rural 7.0 3.3 2.9 7.3 6.3 1,475 45.8 107
Rural with road 7.2 3.7 3.2 7.8 6.7 1,294 46.8 101 Rural without road 5.7 0.9 0.9 3.1 3.1 181 (*) 6
Region
North 4.2 2.3 1.7 7.7 5.2 454 (29.3) 35 Central 8.2 4.6 4.5 9.6 9.4 1,151 47.7 111 South 13.5 3.9 2.7 5.1 3.8 429 (77.8) 22
Province
Vientiane Capital 13.0 5.0 5.0 8.7 8.7 219 (*) 19 Phongsaly 0.0 3.7 1.4 3.7 1.4 56 (*) 2 Luangnamtha 6.1 3.3 3.3 4.6 4.6 52 (*) 2 Oudomxay 1.0 3.7 3.7 10.1 7.6 117 (*) 12 Bokeo 7.3 0.0 0.0 1.6 0.8 78 (*) 1 Luangprabang 1.8 1.5 0.0 19.6 11.5 78 (*) 15 Huaphanh (10.6) (0.0) (0.0) (0.0) (0.0) 40 - 0 Xayabury (10.8) (3.1) (3.1) (6.2) (6.2) 33 (*) 2 Xiengkhuang 6.4 4.0 4.0 6.2 5.1 85 (*) 5 Vientiane 6.2 4.5 4.5 7.5 7.5 202 (*) 15 Borikhamxay 4.5 2.3 2.1 11.4 10.5 171 (*) 19 Khammuane 8.4 4.9 4.9 6.8 6.8 125 (*) 8 Savannakhet 9.2 5.5 5.5 13.0 13.0 315 (*) 41 Saravane 9.2 0.8 0.8 1.6 1.6 121 (*) 2 Sekong 5.7 14.1 11.2 19.4 16.5 37 (*) 7 Champasack 18.7 4.6 2.7 5.6 3.7 182 (*) 10 Attapeu 11.9 2.8 1.8 2.8 1.8 90 (*) 3 Xaysomboune 3.3 6.5 5.0 7.2 5.7 34 (*) 2
(Continued…)
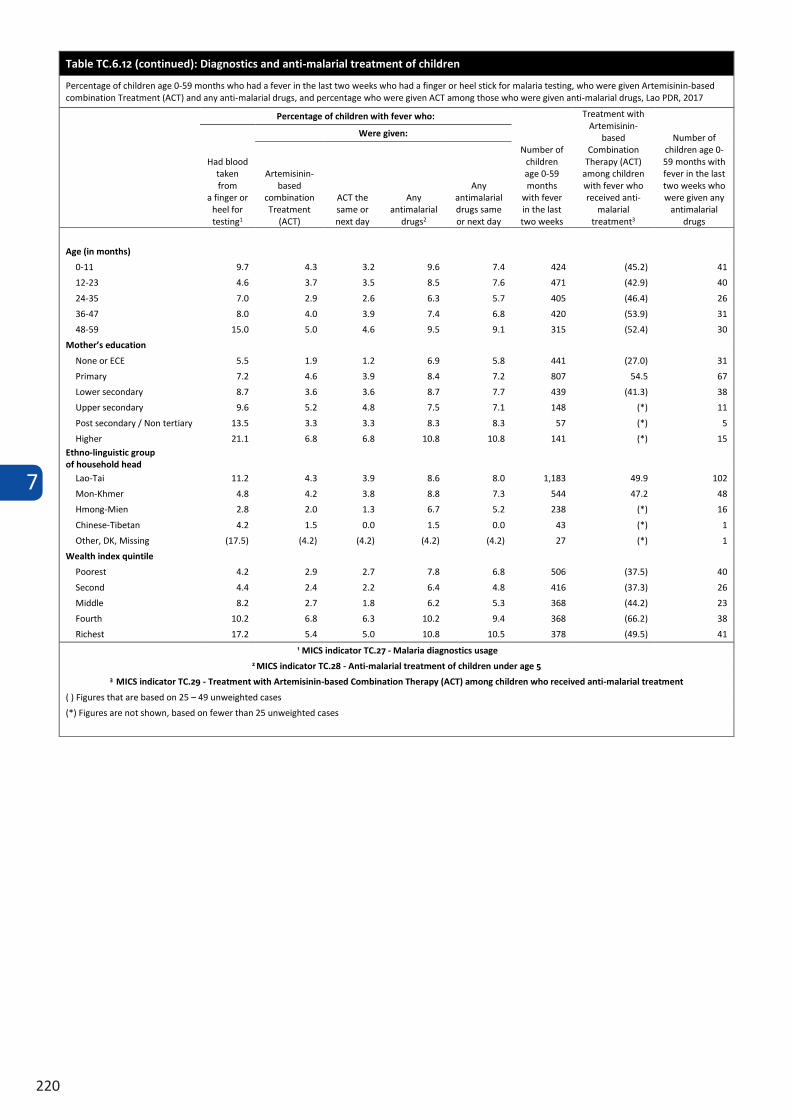
7
220
Table TC.6.12 (continued): Diagnostics and anti-malarial treatment of children
Percentage of children age 0-59 months who had a fever in the last two weeks who had a finger or heel stick for malaria testing, who were given Artemisinin-based combination Treatment (ACT) and any anti-malarial drugs, and percentage who were given ACT among those who were given anti-malarial drugs, Lao PDR, 2017
Percentage of children with fever who:
Number of children age 0-59 months
with fever in the last two weeks
Treatment with Artemisinin-
based Combination
Therapy (ACT) among children with fever who received anti-
malarial treatment3
Number of children age 0-59 months with fever in the last two weeks who were given any
antimalarial drugs
Had blood taken from
a finger or heel for testing1
Were given:
Artemisinin-based
combination Treatment
(ACT)
ACT the same or next day
Any antimalarial
drugs2
Any antimalarial drugs same or next day
Age (in months)
0-11 9.7 4.3 3.2 9.6 7.4 424 (45.2) 41 12-23 4.6 3.7 3.5 8.5 7.6 471 (42.9) 40 24-35 7.0 2.9 2.6 6.3 5.7 405 (46.4) 26 36-47 8.0 4.0 3.9 7.4 6.8 420 (53.9) 31 48-59 15.0 5.0 4.6 9.5 9.1 315 (52.4) 30
Mother’s education
None or ECE 5.5 1.9 1.2 6.9 5.8 441 (27.0) 31 Primary 7.2 4.6 3.9 8.4 7.2 807 54.5 67 Lower secondary 8.7 3.6 3.6 8.7 7.7 439 (41.3) 38 Upper secondary 9.6 5.2 4.8 7.5 7.1 148 (*) 11 Post secondary / Non tertiary 13.5 3.3 3.3 8.3 8.3 57 (*) 5 Higher 21.1 6.8 6.8 10.8 10.8 141 (*) 15
Ethno-linguistic group of household head
Lao-Tai 11.2 4.3 3.9 8.6 8.0 1,183 49.9 102 Mon-Khmer 4.8 4.2 3.8 8.8 7.3 544 47.2 48 Hmong-Mien 2.8 2.0 1.3 6.7 5.2 238 (*) 16 Chinese-Tibetan 4.2 1.5 0.0 1.5 0.0 43 (*) 1 Other, DK, Missing (17.5) (4.2) (4.2) (4.2) (4.2) 27 (*) 1
Wealth index quintile
Poorest 4.2 2.9 2.7 7.8 6.8 506 (37.5) 40 Second 4.4 2.4 2.2 6.4 4.8 416 (37.3) 26 Middle 8.2 2.7 1.8 6.2 5.3 368 (44.2) 23 Fourth 10.2 6.8 6.3 10.2 9.4 368 (66.2) 38 Richest 17.2 5.4 5.0 10.8 10.5 378 (49.5) 41
1 MICS indicator TC.27 - Malaria diagnostics usage 2 MICS indicator TC.28 - Anti-malarial treatment of children under age 5
3 MICS indicator TC.29 - Treatment with Artemisinin-based Combination Therapy (ACT) among children who received anti-malarial treatment
( ) Figures that are based on 25 – 49 unweighted cases (*) Figures are not shown, based on fewer than 25 unweighted cases
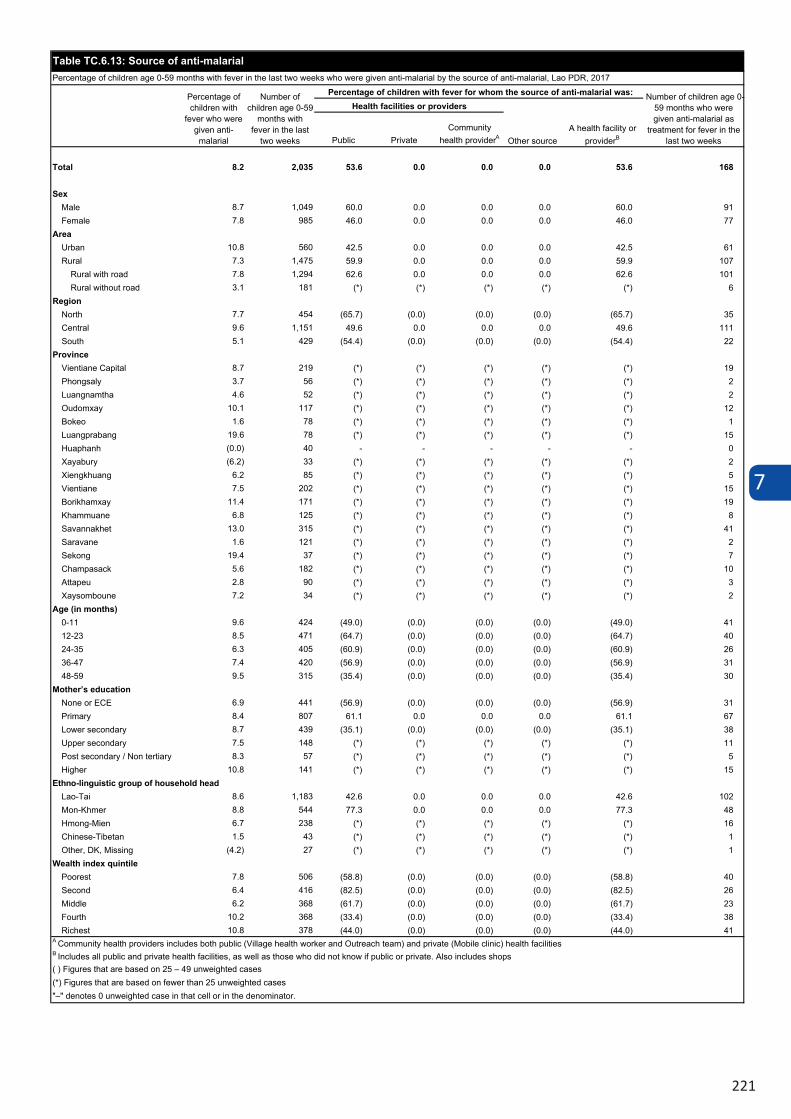
7
221
Public PrivateCommunity
health providerA
Total 8.2 2,035 53.6 0.0 0.0 0.0 53.6 168
SexMale 8.7 1,049 60.0 0.0 0.0 0.0 60.0 91Female 7.8 985 46.0 0.0 0.0 0.0 46.0 77
AreaUrban 10.8 560 42.5 0.0 0.0 0.0 42.5 61Rural 7.3 1,475 59.9 0.0 0.0 0.0 59.9 107
Rural with road 7.8 1,294 62.6 0.0 0.0 0.0 62.6 101Rural without road 3.1 181 (*) (*) (*) (*) (*) 6
RegionNorth 7.7 454 (65.7) (0.0) (0.0) (0.0) (65.7) 35Central 9.6 1,151 49.6 0.0 0.0 0.0 49.6 111South 5.1 429 (54.4) (0.0) (0.0) (0.0) (54.4) 22
ProvinceVientiane Capital 8.7 219 (*) (*) (*) (*) (*) 19Phongsaly 3.7 56 (*) (*) (*) (*) (*) 2Luangnamtha 4.6 52 (*) (*) (*) (*) (*) 2Oudomxay 10.1 117 (*) (*) (*) (*) (*) 12Bokeo 1.6 78 (*) (*) (*) (*) (*) 1Luangprabang 19.6 78 (*) (*) (*) (*) (*) 15Huaphanh (0.0) 40 - - - - - 0Xayabury (6.2) 33 (*) (*) (*) (*) (*) 2Xiengkhuang 6.2 85 (*) (*) (*) (*) (*) 5Vientiane 7.5 202 (*) (*) (*) (*) (*) 15Borikhamxay 11.4 171 (*) (*) (*) (*) (*) 19Khammuane 6.8 125 (*) (*) (*) (*) (*) 8Savannakhet 13.0 315 (*) (*) (*) (*) (*) 41Saravane 1.6 121 (*) (*) (*) (*) (*) 2Sekong 19.4 37 (*) (*) (*) (*) (*) 7Champasack 5.6 182 (*) (*) (*) (*) (*) 10Attapeu 2.8 90 (*) (*) (*) (*) (*) 3Xaysomboune 7.2 34 (*) (*) (*) (*) (*) 2
Age (in months)0-11 9.6 424 (49.0) (0.0) (0.0) (0.0) (49.0) 4112-23 8.5 471 (64.7) (0.0) (0.0) (0.0) (64.7) 4024-35 6.3 405 (60.9) (0.0) (0.0) (0.0) (60.9) 2636-47 7.4 420 (56.9) (0.0) (0.0) (0.0) (56.9) 3148-59 9.5 315 (35.4) (0.0) (0.0) (0.0) (35.4) 30
Mother’s educationNone or ECE 6.9 441 (56.9) (0.0) (0.0) (0.0) (56.9) 31Primary 8.4 807 61.1 0.0 0.0 0.0 61.1 67Lower secondary 8.7 439 (35.1) (0.0) (0.0) (0.0) (35.1) 38Upper secondary 7.5 148 (*) (*) (*) (*) (*) 11Post secondary / Non tertiary 8.3 57 (*) (*) (*) (*) (*) 5Higher 10.8 141 (*) (*) (*) (*) (*) 15
Ethno-linguistic group of household headLao-Tai 8.6 1,183 42.6 0.0 0.0 0.0 42.6 102Mon-Khmer 8.8 544 77.3 0.0 0.0 0.0 77.3 48Hmong-Mien 6.7 238 (*) (*) (*) (*) (*) 16Chinese-Tibetan 1.5 43 (*) (*) (*) (*) (*) 1Other, DK, Missing (4.2) 27 (*) (*) (*) (*) (*) 1
Wealth index quintilePoorest 7.8 506 (58.8) (0.0) (0.0) (0.0) (58.8) 40Second 6.4 416 (82.5) (0.0) (0.0) (0.0) (82.5) 26Middle 6.2 368 (61.7) (0.0) (0.0) (0.0) (61.7) 23Fourth 10.2 368 (33.4) (0.0) (0.0) (0.0) (33.4) 38Richest 10.8 378 (44.0) (0.0) (0.0) (0.0) (44.0) 41
Table TC.6.13: Source of anti-malarialPercentage of children age 0-59 months with fever in the last two weeks who were given anti-malarial by the source of anti-malarial, Lao PDR, 2017
Number of children age 0-59
months with fever in the last
two weeks
Percentage of children with fever for whom the source of anti-malarial was: Number of children age 0-59 months who were given anti-malarial as
treatment for fever in the last two weeks
Health facilities or providers
A Community health providers includes both public (Village health worker and Outreach team) and private (Mobile clinic) health facilities
"–" denotes 0 unweighted case in that cell or in the denominator.
Percentage of children with
fever who were given anti-malarial Other source
A health facility or providerB
B Includes all public and private health facilities, as well as those who did not know if public or private. Also includes shops
(*) Figures that are based on fewer than 25 unweighted cases( ) Figures that are based on 25 – 49 unweighted cases
7
222
7.7 INFANT AND YOUNG CHILD FEEDING
Proper feeding of infants and young children can increase their chances of survival; it can also promote optimal growth and development, especially in the critical window from birth to 2 years of age. Breastfeeding for the first few years of life protects children from infection, provides an ideal source of nutrients, and is economical and safe15. However, many mothers don’t start to breastfeed early enough, do not breastfeed exclusively for the recommended 6 months or stop breastfeeding too soon16. There are often pressures to switch to infant formula, which can contribute to growth faltering and micronutrient malnutrition and can be unsafe if hygienic conditions, including safe drinking water are not readily available. In some cases it can be unsafe even with proper and hygienic preparation in the home due to food adulteration or other contamination that can affect unaware consumers.17 Studies have shown that, in addition to continued breastfeeding, consumption of appropriate, adequate and safe solid, semi-solid and soft foods from the age of 6 months onwards leads to better health and growth outcomes, with potential to reduce stunting during the first two years of life.18
UNICEF and WHO recommend that infants be breastfed within one hour of birth, breastfed exclusively for the first six months of life and continue to be breastfed up to 2 years of age and beyond.19 Starting at 6 months,breastfeeding should be combined with safe, age-appropriate feeding of solid, semi-solid and soft foods.20 Asummary of key guiding principles21, 22 for feeding 6-23 month olds is provided in the table below along withproximate measures for these guidelines collected in this survey.
The guiding principles for which proximate measures and indicators exist are:
(i) continued breastfeeding; (ii) appropriate frequency of meals (but not energy density); and (iii) appropriate nutrient content of food.
Feeding frequency is used as proxy for energy intake, requiring children to receive a minimum number of meals/snacks (and milk feeds for non-breastfed children) for their age. Dietary diversity is used to ascertain the adequacy of the nutrient content of the food (not including iron) consumed. For dietary diversity, eight food groups were created for which a child consuming at least five of these is considered to have a better quality diet.23 In most populations, consumption of at least five food groups means that the child has a high likelihood of consuming at least one animal-source food and at least one fruit or vegetable, in addition to a staple food (grain, root or tuber).
15 Victora et al. 2016. Breastfeeding in the 21st century: epidemiology, mechanisms, and lifelong effect. Lancet 2016; 387: 475–90. 16 UNICEF. 2016. From the first hour of life. Making the case for improved infant and young child feeding everywhere.Accessed online 17 January 2018: url: https://data.unicef.org/wp-content/uploads/2016/10/From-the-first-hour-of-life.pdf 17 Gossner, CME et al. The Melamine incident: Implications for international food and feed safety. Environ HealthPerspective. 2009 Dec; 117(12): 1803–1808 18 Bhuta, Z. et al. 2013. Evidence-based interventions for improvement of maternal and child nutrition: what can be done and at what cost? The Lancet June 6, 2013. 19 WHO. 2003. Implementing the Global Strategy for Infant and Young Child Feeding. Meeting Report Geneva, 3-5 February, 2003. 20 WHO. 2003. Global Strategy for Infant and Young Child Feeding. 21 PAHO. 2003. Guiding principles for complementary feeding of the breastfed child. 22 WHO. 2005. Guiding principles for feeding non-breastfed children 6-24 months of age. 23 UNICEF, FANTA, USAID, WHO. 2017. Meeting report on reconsidering, refining and extending the WHO IYCF Indicators.Accessed online on 17 Jan 2017, URL: https://data.unicef.org/resources/meeting-report-infant-young-child-feeding-indicators/
Public PrivateCommunity
health providerA
Total 8.2 2,035 53.6 0.0 0.0 0.0 53.6 168
SexMale 8.7 1,049 60.0 0.0 0.0 0.0 60.0 91Female 7.8 985 46.0 0.0 0.0 0.0 46.0 77
AreaUrban 10.8 560 42.5 0.0 0.0 0.0 42.5 61Rural 7.3 1,475 59.9 0.0 0.0 0.0 59.9 107
Rural with road 7.8 1,294 62.6 0.0 0.0 0.0 62.6 101Rural without road 3.1 181 (*) (*) (*) (*) (*) 6
RegionNorth 7.7 454 (65.7) (0.0) (0.0) (0.0) (65.7) 35Central 9.6 1,151 49.6 0.0 0.0 0.0 49.6 111South 5.1 429 (54.4) (0.0) (0.0) (0.0) (54.4) 22
ProvinceVientiane Capital 8.7 219 (*) (*) (*) (*) (*) 19Phongsaly 3.7 56 (*) (*) (*) (*) (*) 2Luangnamtha 4.6 52 (*) (*) (*) (*) (*) 2Oudomxay 10.1 117 (*) (*) (*) (*) (*) 12Bokeo 1.6 78 (*) (*) (*) (*) (*) 1Luangprabang 19.6 78 (*) (*) (*) (*) (*) 15Huaphanh (0.0) 40 - - - - - 0Xayabury (6.2) 33 (*) (*) (*) (*) (*) 2Xiengkhuang 6.2 85 (*) (*) (*) (*) (*) 5Vientiane 7.5 202 (*) (*) (*) (*) (*) 15Borikhamxay 11.4 171 (*) (*) (*) (*) (*) 19Khammuane 6.8 125 (*) (*) (*) (*) (*) 8Savannakhet 13.0 315 (*) (*) (*) (*) (*) 41Saravane 1.6 121 (*) (*) (*) (*) (*) 2Sekong 19.4 37 (*) (*) (*) (*) (*) 7Champasack 5.6 182 (*) (*) (*) (*) (*) 10Attapeu 2.8 90 (*) (*) (*) (*) (*) 3Xaysomboune 7.2 34 (*) (*) (*) (*) (*) 2
Age (in months)0-11 9.6 424 (49.0) (0.0) (0.0) (0.0) (49.0) 4112-23 8.5 471 (64.7) (0.0) (0.0) (0.0) (64.7) 4024-35 6.3 405 (60.9) (0.0) (0.0) (0.0) (60.9) 2636-47 7.4 420 (56.9) (0.0) (0.0) (0.0) (56.9) 3148-59 9.5 315 (35.4) (0.0) (0.0) (0.0) (35.4) 30
Mother’s educationNone or ECE 6.9 441 (56.9) (0.0) (0.0) (0.0) (56.9) 31Primary 8.4 807 61.1 0.0 0.0 0.0 61.1 67Lower secondary 8.7 439 (35.1) (0.0) (0.0) (0.0) (35.1) 38Upper secondary 7.5 148 (*) (*) (*) (*) (*) 11Post secondary / Non tertiary 8.3 57 (*) (*) (*) (*) (*) 5Higher 10.8 141 (*) (*) (*) (*) (*) 15
Ethno-linguistic group of household headLao-Tai 8.6 1,183 42.6 0.0 0.0 0.0 42.6 102Mon-Khmer 8.8 544 77.3 0.0 0.0 0.0 77.3 48Hmong-Mien 6.7 238 (*) (*) (*) (*) (*) 16Chinese-Tibetan 1.5 43 (*) (*) (*) (*) (*) 1Other, DK, Missing (4.2) 27 (*) (*) (*) (*) (*) 1
Wealth index quintilePoorest 7.8 506 (58.8) (0.0) (0.0) (0.0) (58.8) 40Second 6.4 416 (82.5) (0.0) (0.0) (0.0) (82.5) 26Middle 6.2 368 (61.7) (0.0) (0.0) (0.0) (61.7) 23Fourth 10.2 368 (33.4) (0.0) (0.0) (0.0) (33.4) 38Richest 10.8 378 (44.0) (0.0) (0.0) (0.0) (44.0) 41
Table TC.6.13: Source of anti-malarialPercentage of children age 0-59 months with fever in the last two weeks who were given anti-malarial by the source of anti-malarial, Lao PDR, 2017
Number of children age 0-59
months with fever in the last
two weeks
Percentage of children with fever for whom the source of anti-malarial was: Number of children age 0-59 months who were given anti-malarial as
treatment for fever in the last two weeks
Health facilities or providers
A Community health providers includes both public (Village health worker and Outreach team) and private (Mobile clinic) health facilities
"–" denotes 0 unweighted case in that cell or in the denominator.
Percentage of children with
fever who were given anti-malarial Other source
A health facility or providerB
B Includes all public and private health facilities, as well as those who did not know if public or private. Also includes shops
(*) Figures that are based on fewer than 25 unweighted cases( ) Figures that are based on 25 – 49 unweighted cases
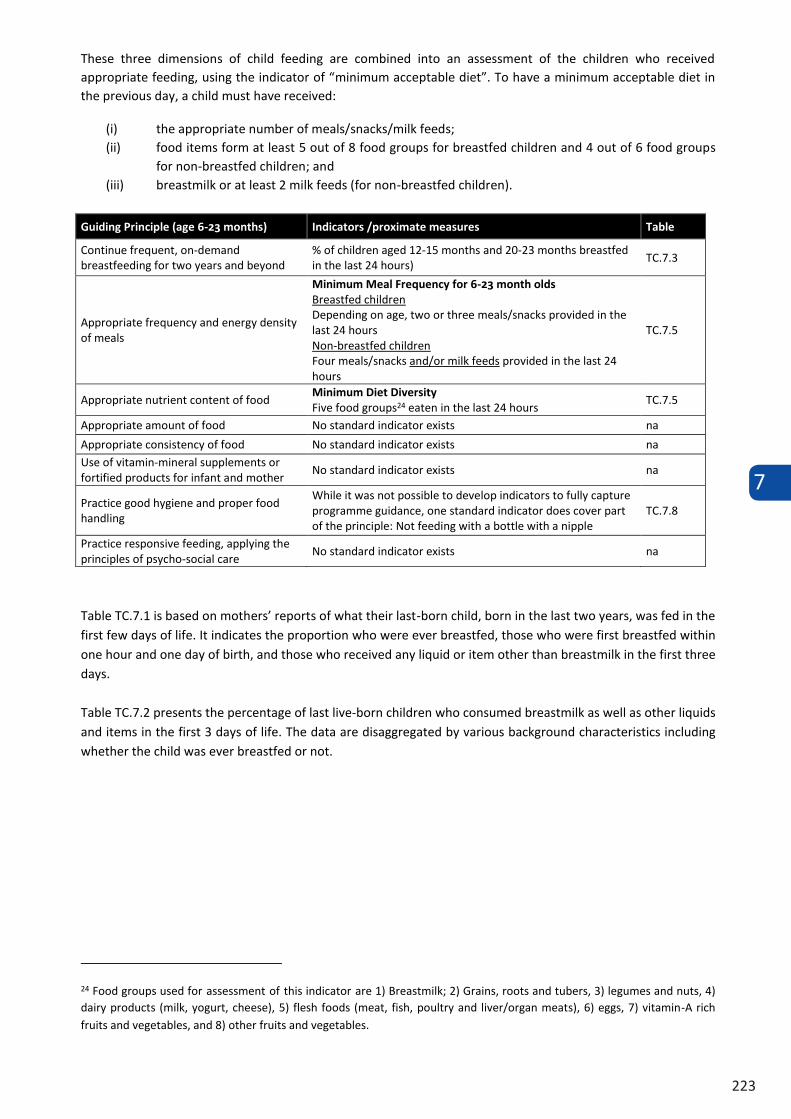
7
223
These three dimensions of child feeding are combined into an assessment of the children who received appropriate feeding, using the indicator of “minimum acceptable diet”. To have a minimum acceptable diet in the previous day, a child must have received:
(i) the appropriate number of meals/snacks/milk feeds; (ii) food items form at least 5 out of 8 food groups for breastfed children and 4 out of 6 food groups
for non-breastfed children; and (iii) breastmilk or at least 2 milk feeds (for non-breastfed children).
Guiding Principle (age 6-23 months) Indicators /proximate measures Table
Continue frequent, on-demand breastfeeding for two years and beyond
% of children aged 12-15 months and 20-23 months breastfed in the last 24 hours) TC.7.3
Appropriate frequency and energy density of meals
Minimum Meal Frequency for 6-23 month olds Breastfed children Depending on age, two or three meals/snacks provided in the last 24 hours Non-breastfed children Four meals/snacks and/or milk feeds provided in the last 24 hours
TC.7.5
Appropriate nutrient content of food Minimum Diet Diversity Five food groups24 eaten in the last 24 hours TC.7.5
Appropriate amount of food No standard indicator exists na Appropriate consistency of food No standard indicator exists na Use of vitamin-mineral supplements or fortified products for infant and mother No standard indicator exists na
Practice good hygiene and proper food handling
While it was not possible to develop indicators to fully capture programme guidance, one standard indicator does cover part of the principle: Not feeding with a bottle with a nipple
TC.7.8
Practice responsive feeding, applying the principles of psycho-social care No standard indicator exists na
Table TC.7.1 is based on mothers’ reports of what their last-born child, born in the last two years, was fed in the first few days of life. It indicates the proportion who were ever breastfed, those who were first breastfed within one hour and one day of birth, and those who received any liquid or item other than breastmilk in the first three days.
Table TC.7.2 presents the percentage of last live-born children who consumed breastmilk as well as other liquids and items in the first 3 days of life. The data are disaggregated by various background characteristics including whether the child was ever breastfed or not.
24 Food groups used for assessment of this indicator are 1) Breastmilk; 2) Grains, roots and tubers, 3) legumes and nuts, 4) dairy products (milk, yogurt, cheese), 5) flesh foods (meat, fish, poultry and liver/organ meats), 6) eggs, 7) vitamin-A rich fruits and vegetables, and 8) other fruits and vegetables.
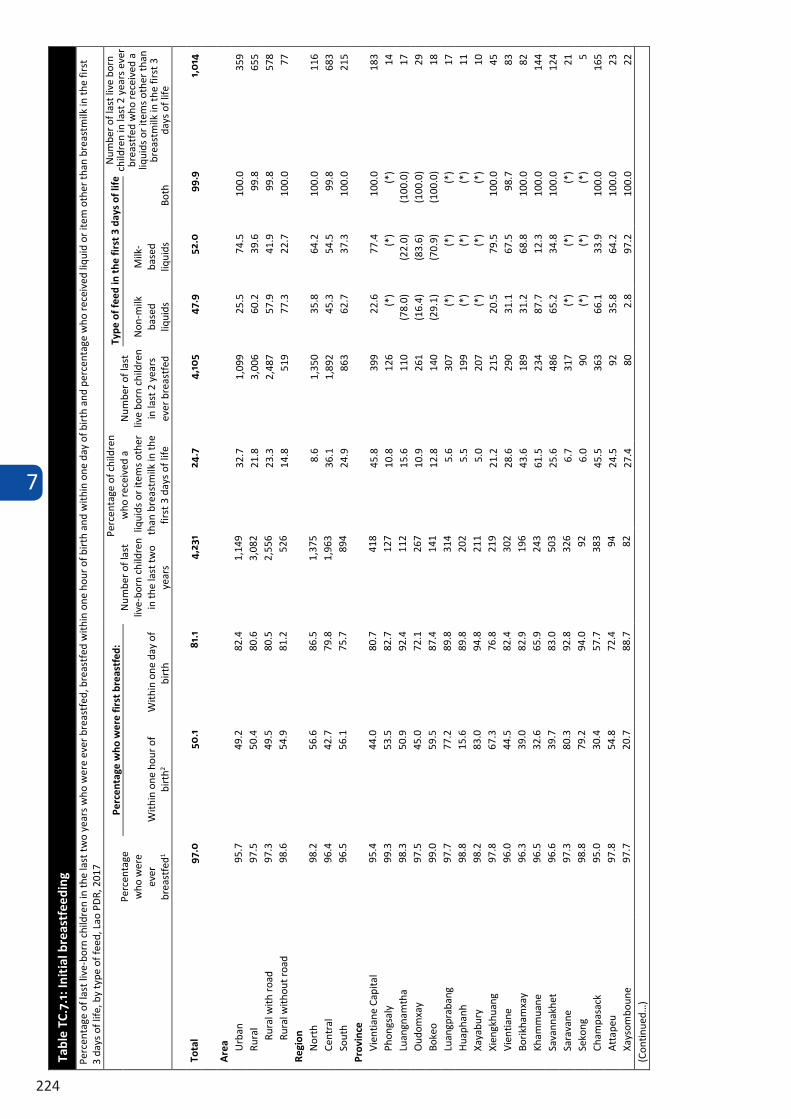
7
224
These three dimensions of child feeding are combined into an assessment of the children who received appropriate feeding, using the indicator of “minimum acceptable diet”. To have a minimum acceptable diet in the previous day, a child must have received:
(i) the appropriate number of meals/snacks/milk feeds; (ii) food items form at least 5 out of 8 food groups for breastfed children and 4 out of 6 food groups
for non-breastfed children; and (iii) breastmilk or at least 2 milk feeds (for non-breastfed children).
Guiding Principle (age 6-23 months) Indicators /proximate measures Table
Continue frequent, on-demand breastfeeding for two years and beyond
% of children aged 12-15 months and 20-23 months breastfed in the last 24 hours) TC.7.3
Appropriate frequency and energy density of meals
Minimum Meal Frequency for 6-23 month olds Breastfed children Depending on age, two or three meals/snacks provided in the last 24 hours Non-breastfed children Four meals/snacks and/or milk feeds provided in the last 24 hours
TC.7.5
Appropriate nutrient content of food Minimum Diet Diversity Five food groups24 eaten in the last 24 hours TC.7.5
Appropriate amount of food No standard indicator exists na Appropriate consistency of food No standard indicator exists na Use of vitamin-mineral supplements or fortified products for infant and mother No standard indicator exists na
Practice good hygiene and proper food handling
While it was not possible to develop indicators to fully capture programme guidance, one standard indicator does cover part of the principle: Not feeding with a bottle with a nipple
TC.7.8
Practice responsive feeding, applying the principles of psycho-social care No standard indicator exists na
Table TC.7.1 is based on mothers’ reports of what their last-born child, born in the last two years, was fed in the first few days of life. It indicates the proportion who were ever breastfed, those who were first breastfed within one hour and one day of birth, and those who received any liquid or item other than breastmilk in the first three days.
Table TC.7.2 presents the percentage of last live-born children who consumed breastmilk as well as other liquids and items in the first 3 days of life. The data are disaggregated by various background characteristics including whether the child was ever breastfed or not.
24 Food groups used for assessment of this indicator are 1) Breastmilk; 2) Grains, roots and tubers, 3) legumes and nuts, 4) dairy products (milk, yogurt, cheese), 5) flesh foods (meat, fish, poultry and liver/organ meats), 6) eggs, 7) vitamin-A rich fruits and vegetables, and 8) other fruits and vegetables.
Tabl
e TC
.7.1
: Ini
tial
bre
astf
eedi
ng
Perc
enta
ge o
f las
t liv
e-bo
rn ch
ildre
n in
the
last
two
year
s who
wer
e ev
er b
reas
tfed,
bre
astfe
d w
ithin
one
hou
r of b
irth
and
with
in o
ne d
ay o
f birt
h an
d pe
rcen
tage
who
rece
ived
liqu
id o
r ite
m o
ther
than
bre
astm
ilk in
the
first
3
days
of l
ife, b
y ty
pe o
f fee
d, La
o PD
R, 2
017
Perc
enta
ge
who
wer
e ev
er
brea
stfe
d1
Perc
enta
ge w
ho w
ere
first
bre
astf
ed:
Num
ber o
f las
t liv
e-bo
rn ch
ildre
n in
the
last
two
year
s
Perc
enta
ge o
f chi
ldre
n w
ho re
ceiv
ed a
li
quid
s or
item
s ot
her
than
bre
astm
ilk in
the
first
3 d
ays
of li
fe
Num
ber o
f las
t liv
e bo
rn ch
ildre
n in
last
2 y
ears
ev
er b
reas
tfed
Type
of f
eed
in t
he fi
rst
3 da
ys o
f life
Nu
mbe
r of l
ast l
ive
born
ch
ildre
n in
last
2 y
ears
eve
r br
east
fed
who
rece
ived
a
liqui
ds o
r ite
ms
othe
r th
an
brea
stm
ilk in
the
first
3
days
of l
ife
With
in o
ne h
our o
f bi
rth2
With
in o
ne d
ay o
f bi
rth
Non-
milk
ba
sed
liqui
ds
Milk
-ba
sed
liqui
ds
Both
Tota
l 97
.0
50.1
81
.1
4,23
1 24
.7
4,10
5 47
.9
52.0
99
.9
1,0
14
Are
a Urba
n 95
.7
49.2
82
.4
1,14
9 32
.7
1,09
9 25
.5
74.5
10
0.0
359
Rura
l 97
.5
50.4
80
.6
3,08
2 21
.8
3,00
6 60
.2
39.6
99
.8
655
Rura
l with
road
97
.3
49.5
80
.5
2,55
6 23
.3
2,48
7 57
.9
41.9
99
.8
578
Rura
l with
out r
oad
98.6
54
.9
81.2
52
6 14
.8
519
77.3
22
.7
100.
0 77
Re
gion
No
rth
98.2
56
.6
86.5
1,
375
8.6
1,35
0 35
.8
64.2
10
0.0
116
Cent
ral
96.4
42
.7
79.8
1,
963
36.1
1,
892
45.3
54
.5
99.8
68
3 So
uth
96.5
56
.1
75.7
89
4 24
.9
863
62.7
37
.3
100.
0 21
5 Pr
ovin
ce
Vien
tiane
Cap
ital
95.4
44
.0
80.7
41
8 45
.8
399
22.6
77
.4
100.
0 18
3 Ph
ongs
aly
99
.3
53.5
82
.7
127
10.8
12
6 (*
) (*
) (*
) 14
Lu
angn
amth
a 98
.3
50.9
92
.4
112
15.6
11
0 (7
8.0)
(2
2.0)
(1
00.0
) 17
Ou
dom
xay
97.5
45
.0
72.1
26
7 10
.9
261
(16.
4)
(83.
6)
(100
.0)
29
Boke
o 99
.0
59.5
87
.4
141
12.8
14
0 (2
9.1)
(7
0.9)
(1
00.0
) 18
Lu
angp
raba
ng
97.7
77
.2
89.8
31
4 5.
6 30
7 (*
) (*
) (*
) 17
Hu
apha
nh
98.8
15
.6
89.8
20
2 5.
5 19
9 (*
) (*
) (*
) 11
Xa
yabu
ry
98.2
83
.0
94.8
21
1 5.
0 20
7 (*
) (*
) (*
) 10
Xi
engk
huan
g 97
.8
67.3
76
.8
219
21.2
21
5 20
.5
79.5
10
0.0
45
Vien
tiane
96
.0
44.5
82
.4
302
28.6
29
0 31
.1
67.5
98
.7
83
Borik
ham
xay
96.3
39
.0
82.9
19
6 43
.6
189
31.2
68
.8
100.
0 82
Kh
amm
uane
96
.5
32.6
65
.9
243
61.5
23
4 87
.7
12.3
10
0.0
144
Sava
nnak
het
96.6
39
.7
83.0
50
3 25
.6
486
65.2
34
.8
100.
0 12
4 Sa
rava
ne
97.3
80
.3
92.8
32
6 6.
7 31
7 (*
) (*
) (*
) 21
Se
kong
98
.8
79.2
94
.0
92
6.0
90
(*)
(*)
(*)
5 Ch
ampa
sack
95
.0
30.4
57
.7
383
45.5
36
3 66
.1
33.9
10
0.0
165
Atta
peu
97.8
54
.8
72.4
94
24
.5
92
35.8
64
.2
100.
0 23
Xa
ysom
boun
e 97
.7
20.7
88
.7
82
27.4
80
2.
8 97
.2
100.
0 22
(C
ontin
ued…
)
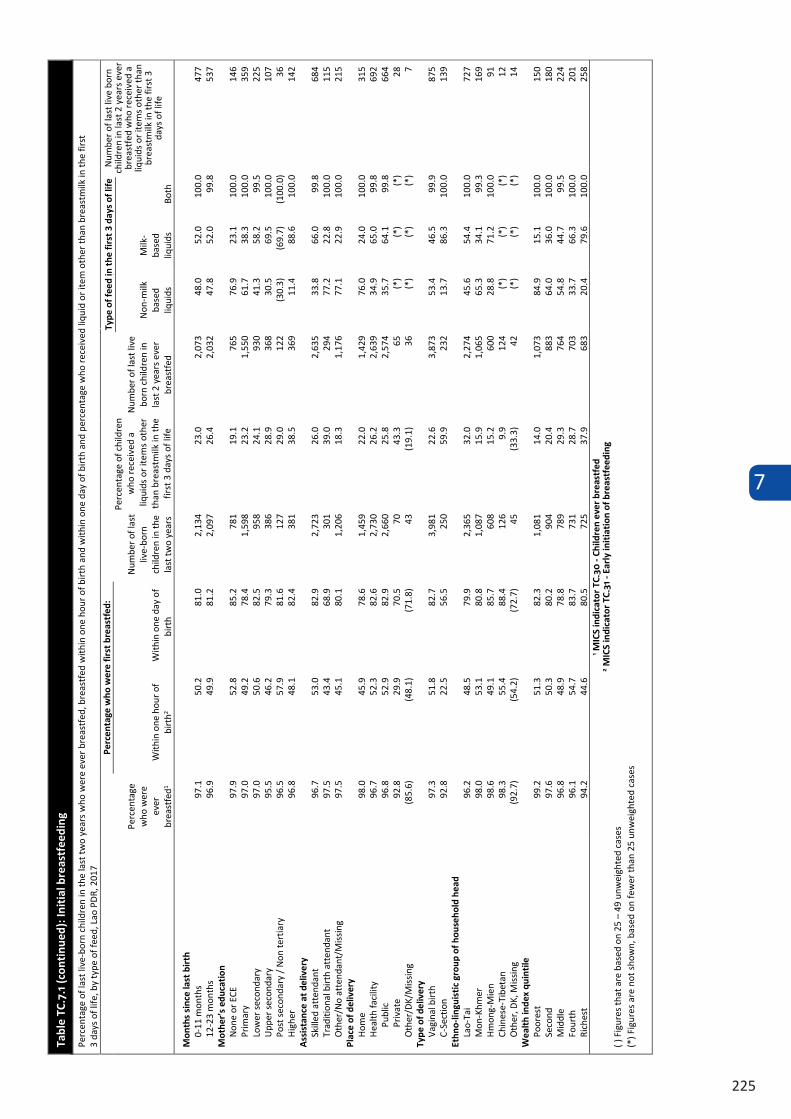
7
225
Tabl
e TC
.7.1
(con
tinu
ed):
Init
ial b
reas
tfee
ding
Perc
enta
ge o
f las
t liv
e-bo
rn c
hild
ren
in th
e la
st tw
o ye
ars
who
wer
e ev
er b
reas
tfed
, bre
astf
ed w
ithin
one
hou
r of
bir
th a
nd w
ithin
one
day
of b
irth
and
per
cent
age
who
rec
eive
d liq
uid
or it
em o
ther
than
bre
astm
ilk in
the
first
3
days
of l
ife, b
y ty
pe o
f fee
d, L
ao P
DR,
201
7
Perc
enta
ge
who
wer
e ev
er
brea
stfe
d1
Perc
enta
ge w
ho w
ere
first
bre
astf
ed:
Num
ber o
f las
t liv
e-bo
rn
child
ren
in th
e la
st tw
o ye
ars
Num
ber o
f las
t liv
e bo
rn ch
ildre
n in
la
st 2
yea
rs e
ver
brea
stfe
d
Type
of f
eed
in th
e fir
st 3
day
s of
life
With
in o
ne h
our o
f bi
rth2
With
in o
ne d
ay o
f bi
rth
Non-
milk
ba
sed
liqui
ds
Milk
-ba
sed
liqui
ds
Both
Mon
ths
sinc
e la
st b
irth
0-
11 m
onth
s 97
.1
50.2
81
.0
2,13
4 23
.0
2,07
3 48
.0
52.0
10
0.0
477
12-2
3 m
onth
s 96
.9
49.9
81
.2
2,09
7 26
.4
2,03
2 47
.8
52.0
99
.8
537
Mot
her’
s ed
ucat
ion
None
or E
CE
97.9
52
.8
85.2
78
1 19
.1
765
76.9
23
.1
100.
0 14
6 Pr
imar
y 97
.0
49.2
78
.4
1,59
8 23
.2
1,55
0 61
.7
38.3
10
0.0
359
Low
er se
cond
ary
97.0
50
.6
82.5
95
8 24
.1
930
41.3
58
.2
99.5
22
5 Up
per s
econ
dary
95
.5
46.2
79
.3
386
28.9
36
8 30
.5
69.5
10
0.0
107
Post
seco
ndar
y / N
on te
rtia
ry
96.5
57
.9
81.6
12
7 29
.0
122
(30.
3)
(69.
7)
(100
.0)
36
High
er
96.8
48
.1
82.4
38
1 38
.5
369
11.4
88
.6
100.
0 14
2 A
ssis
tanc
e at
del
iver
y Sk
illed
att
enda
nt
96.7
53
.0
82.9
2,
723
26.0
2,
635
33.8
66
.0
99.8
68
4 Tr
aditi
onal
birt
h at
tend
ant
97.5
43
.4
68.9
30
1 39
.0
294
77.2
22
.8
100.
0 11
5 Ot
her/
No a
tten
dant
/Miss
ing
97.5
45
.1
80.1
1,
206
18.3
1,
176
77.1
22
.9
100.
0 21
5 Pl
ace
of d
eliv
ery
Hom
e 98
.0
45.9
78
.6
1,45
9 22
.0
1,42
9 76
.0
24.0
10
0.0
315
Heal
th fa
cility
96
.7
52.3
82
.6
2,73
0 26
.2
2,63
9 34
.9
65.0
99
.8
692
Publ
ic 96
.8
52.9
82
.9
2,66
0 25
.8
2,57
4 35
.7
64.1
99
.8
664
Priv
ate
92.8
29
.9
70.5
70
43
.3
65
(*)
(*)
(*)
28
Othe
r/DK
/Miss
ing
(85.
6)
(48.
1)
(71.
8)
43
(19.
1)
36
(*)
(*)
(*)
7 Ty
pe o
f del
iver
y Va
gina
l birt
h 97
.3
51.8
82
.7
3,98
1 22
.6
3,87
3 53
.4
46.5
99
.9
875
C-Se
ctio
n 92
.8
22.5
56
.5
250
59.9
23
2 13
.7
86.3
10
0.0
139
Ethn
o-lin
guis
tic
grou
p of
hou
seho
ld h
ead
Lao-
Tai
96.2
48
.5
79.9
2,
365
32.0
2,
274
45.6
54
.4
100.
0 72
7 M
on-K
hmer
98
.0
53.1
80
.8
1,08
7 15
.9
1,06
5 65
.3
34.1
99
.3
169
Hmon
g-M
ien
98.6
49
.1
85.7
60
8 15
.2
600
28.8
71
.2
100.
0 91
Ch
ines
e-Ti
beta
n 98
.3
55.4
88
.4
126
9.9
124
(*)
(*)
(*)
12
Othe
r, DK
, Miss
ing
(92.
7)
(54.
2)
(72.
7)
45
(33.
3)
42
(*)
(*)
(*)
14
Wea
lth
inde
x qu
inti
le
Poor
est
99.2
51
.3
82.3
1,
081
14.0
1,
073
84.9
15
.1
100.
0 15
0 Se
cond
97
.6
50.3
80
.2
904
20.4
88
3 64
.0
36.0
10
0.0
180
Mid
dle
96.8
48
.9
78.8
78
9 29
.3
764
54.8
44
.7
99.5
22
4 Fo
urth
96
.1
54.7
83
.7
731
28.7
70
3 33
.7
66.3
10
0.0
201
Rich
est
94.2
44
.6
80.5
72
5 37
.9
683
20.4
79
.6
100.
0 25
8 1 M
ICS
indi
cato
r TC
.30
- Ch
ildre
n ev
er b
reas
tfed
2 M
ICS
indi
cato
r TC
.31
- Ear
ly in
itia
tion
of b
reas
tfee
ding
( )
Fig
ures
that
are
bas
ed o
n 25
– 4
9 un
wei
ghte
d ca
ses
(*) F
igur
es a
re n
ot s
how
n, b
ased
on
few
er th
an 2
5 un
wei
ghte
d ca
ses
Perc
enta
ge o
f chi
ldre
n w
ho re
ceiv
ed a
li
quid
s or
item
s ot
her
than
bre
astm
ilk in
the
first
3 d
ays
of li
fe
Num
ber o
f las
t liv
e bo
rn
child
ren
in la
st 2
yea
rs e
ver
brea
stfe
d w
ho re
ceiv
ed a
liq
uids
or
item
s ot
her
than
br
east
milk
in th
e fir
st 3
da
ys o
f life
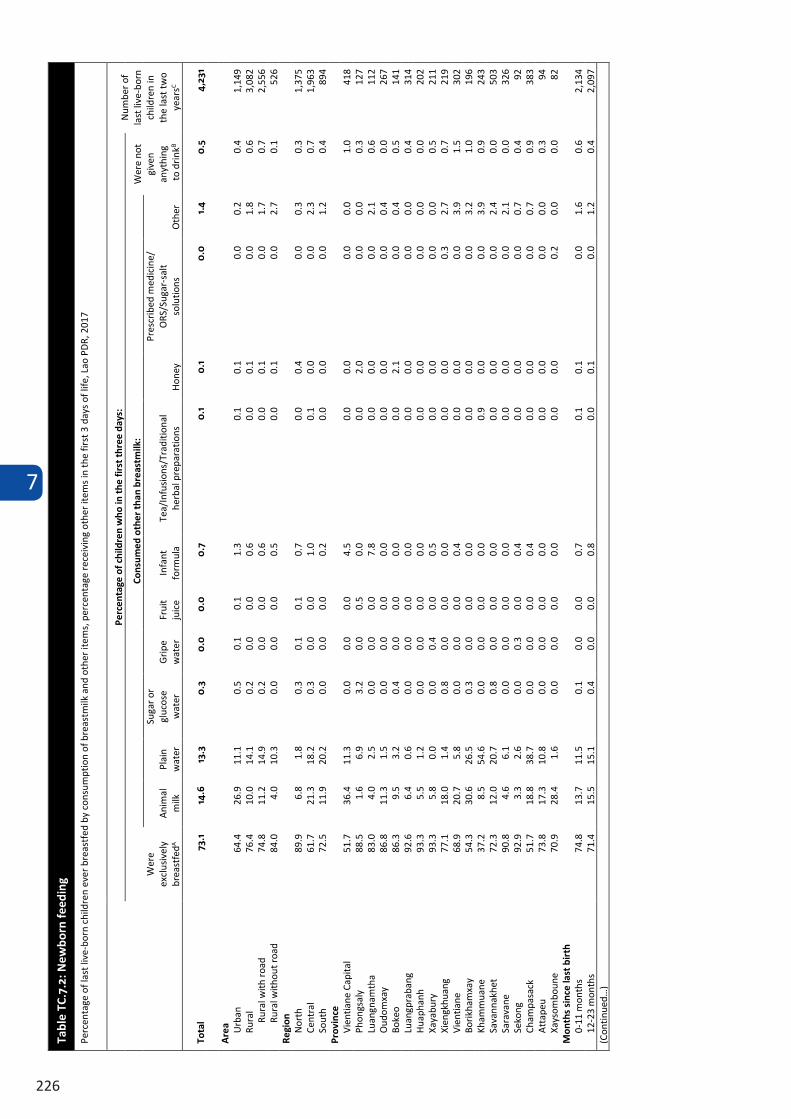
7
226
Tabl
e TC
.7.2
: New
born
feed
ing
Perc
enta
ge o
f las
t liv
e-bo
rn ch
ildre
n ev
er b
reas
tfed
by co
nsum
ptio
n of
bre
astm
ilk a
nd o
ther
item
s, pe
rcen
tage
rece
ivin
g ot
her i
tem
s in
the
first
3 d
ays o
f life
, Lao
PDR
, 201
7
Perc
enta
ge o
f chi
ldre
n w
ho in
the
first
thre
e da
ys:
Num
ber o
f la
st li
ve-b
orn
child
ren
in
the
last
two
year
sC
Wer
e ex
clusiv
ely
brea
stfe
dA
Cons
umed
oth
er th
an b
reas
tmilk
: W
ere
not
give
n an
ythi
ng
to d
rinkB
Anim
al
milk
Pl
ain
wat
er
Suga
r or
gluc
ose
wat
er
Grip
e w
ater
Fr
uit
juice
In
fant
fo
rmul
a Te
a/In
fusio
ns/T
radi
tiona
l he
rbal
pre
para
tions
Ho
ney
Pres
crib
ed m
edici
ne/
ORS/
Suga
r-sal
t so
lutio
ns
Othe
r
Tota
l 73
.1
14.6
13
.3
0.3
0
.0
0.0
0
.7
0.1
0
.1
0.0
1.
4 0
.5
4,23
1
Are
a Urba
n 64
.4
26.9
11
.1
0.5
0.1
0.1
1.3
0.1
0.1
0.0
0.2
0.4
1,14
9 Ru
ral
76.4
10
.0
14.1
0.
2 0.
0 0.
0 0.
6 0.
0 0.
1 0.
0 1.
8 0.
6 3,
082
Rura
l with
road
74
.8
11.2
14
.9
0.2
0.0
0.0
0.6
0.0
0.1
0.0
1.7
0.7
2,55
6 Ru
ral w
ithou
t roa
d 84
.0
4.0
10.3
0.
0 0.
0 0.
0 0.
5 0.
0 0.
1 0.
0 2.
7 0.
1 52
6 Re
gion
No
rth
89.9
6.
8 1.
8 0.
3 0.
1 0.
1 0.
7 0.
0 0.
4 0.
0 0.
3 0.
3 1,
375
Cent
ral
61.7
21
.3
18.2
0.
3 0.
0 0.
0 1.
0 0.
1 0.
0 0.
0 2.
3 0.
7 1,
963
Sout
h 72
.5
11.9
20
.2
0.0
0.0
0.0
0.2
0.0
0.0
0.0
1.2
0.4
894
Prov
ince
Vi
entia
ne C
apita
l 51
.7
36.4
11
.3
0.0
0.0
0.0
4.5
0.0
0.0
0.0
0.0
1.0
418
Phon
gsal
y
88.5
1.
6 6.
9 3.
2 0.
0 0.
5 0.
0 0.
0 2.
0 0.
0 0.
0 0.
3 12
7 Lu
angn
amth
a 83
.0
4.0
2.5
0.0
0.0
0.0
7.8
0.0
0.0
0.0
2.1
0.6
112
Oudo
mxa
y 86
.8
11.3
1.
5 0.
0 0.
0 0.
0 0.
0 0.
0 0.
0 0.
0 0.
4 0.
0 26
7 Bo
keo
86.3
9.
5 3.
2 0.
4 0.
0 0.
0 0.
0 0.
0 2.
1 0.
0 0.
4 0.
5 14
1 Lu
angp
raba
ng
92.6
6.
4 0.
6 0.
0 0.
0 0.
0 0.
0 0.
0 0.
0 0.
0 0.
0 0.
4 31
4 Hu
apha
nh
93.3
5.
5 1.
2 0.
0 0.
0 0.
0 0.
0 0.
0 0.
0 0.
0 0.
0 0.
0 20
2 Xa
yabu
ry
93.3
5.
8 0.
0 0.
0 0.
4 0.
0 0.
5 0.
0 0.
0 0.
0 0.
0 0.
5 21
1 Xi
engk
huan
g 77
.1
18.0
1.
4 0.
8 0.
0 0.
0 0.
0 0.
0 0.
0 0.
3 2.
7 0.
7 21
9 Vi
entia
ne
68.9
20
.7
5.8
0.0
0.0
0.0
0.4
0.0
0.0
0.0
3.9
1.5
302
Borik
ham
xay
54.3
30
.6
26.5
0.
3 0.
0 0.
0 0.
0 0.
0 0.
0 0.
0 3.
2 1.
0 19
6 Kh
amm
uane
37
.2
8.5
54.6
0.
0 0.
0 0.
0 0.
0 0.
9 0.
0 0.
0 3.
9 0.
9 24
3 Sa
vann
akhe
t 72
.3
12.0
20
.7
0.8
0.0
0.0
0.0
0.0
0.0
0.0
2.4
0.0
503
Sara
vane
90
.8
4.6
6.1
0.0
0.0
0.0
0.0
0.0
0.0
0.0
2.1
0.0
326
Seko
ng
92.9
3.
3 2.
6 0.
0 0.
3 0.
0 0.
4 0.
0 0.
0 0.
0 0.
7 0.
4 92
Ch
ampa
sack
51
.7
18.8
38
.7
0.0
0.0
0.0
0.4
0.0
0.0
0.0
0.7
0.9
383
Atta
peu
73.8
17
.3
10.8
0.
0 0.
0 0.
0 0.
0 0.
0 0.
0 0.
0 0.
0 0.
3 94
Xa
ysom
boun
e 70
.9
28.4
1.
6 0.
0 0.
0 0.
0 0.
0 0.
0 0.
0 0.
2 0.
0 0.
0 82
M
onth
s si
nce
last
bir
th
0-11
mon
ths
74.8
13
.7
11.5
0.
1 0.
0 0.
0 0.
7 0.
1 0.
1 0.
0 1.
6 0.
6 2,
134
12-2
3 m
onth
s 71
.4
15.5
15
.1
0.4
0.0
0.0
0.8
0.0
0.1
0.0
1.2
0.4
2,09
7 (C
ontin
ued…
)
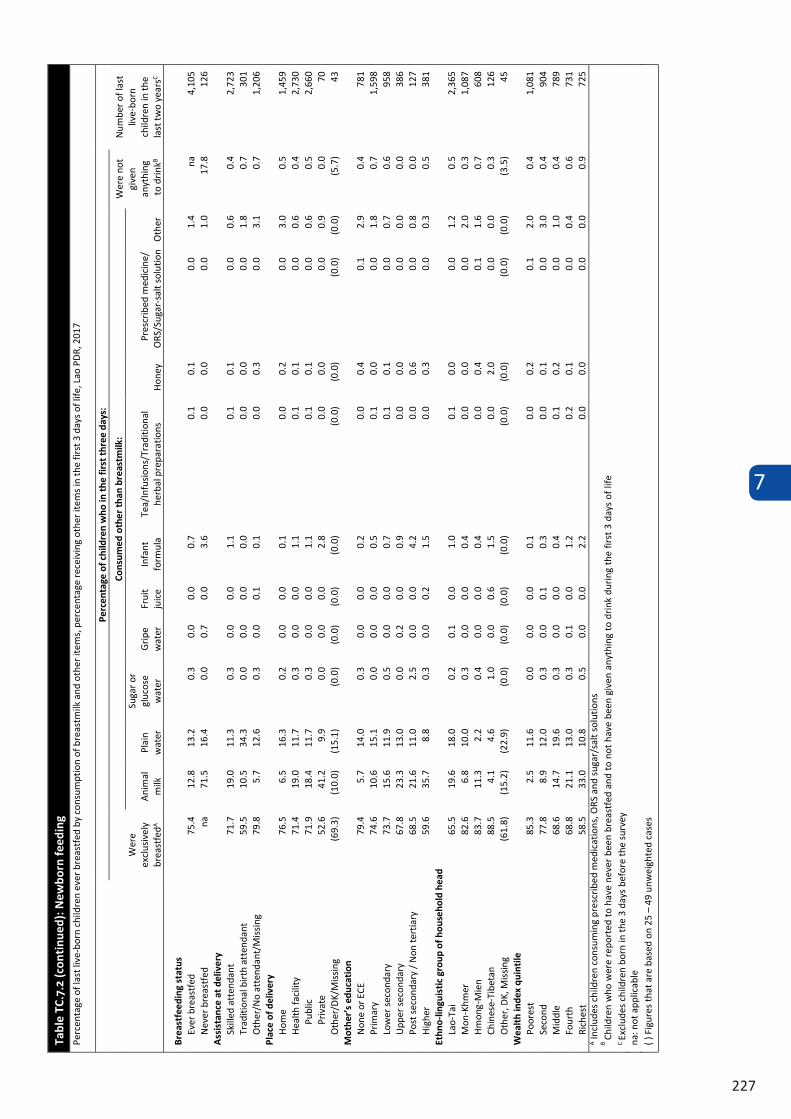
7
227
Tabl
e TC
.7.2
(con
tinu
ed):
New
born
feed
ing
Perc
enta
ge o
f las
t liv
e-bo
rn c
hild
ren
ever
bre
astf
ed b
y co
nsum
ptio
n of
bre
astm
ilk a
nd o
ther
item
s, p
erce
ntag
e re
ceiv
ing
othe
r ite
ms
in th
e fir
st 3
day
s of
life
, Lao
PD
R, 2
017
Perc
enta
ge o
f chi
ldre
n w
ho in
the
first
thre
e da
ys:
Num
ber o
f las
t liv
e-bo
rn
child
ren
in th
e la
st tw
o ye
arsC
Wer
e ex
clusiv
ely
brea
stfe
dA
Cons
umed
oth
er th
an b
reas
tmilk
: W
ere
not
give
n an
ythi
ng
to d
rinkB
Anim
al
milk
Pl
ain
wat
er
Suga
r or
gluc
ose
wat
er
Grip
e w
ater
Fr
uit
juice
In
fant
fo
rmul
a Te
a/In
fusio
ns/T
radi
tiona
l he
rbal
pre
para
tions
Ho
ney
Pres
crib
ed m
edici
ne/
ORS/
Suga
r-sal
t sol
utio
nsOt
her
Brea
stfe
edin
g st
atus
Ev
er b
reas
tfed
75.4
12
.8
13.2
0.
3 0.
0 0.
0 0.
7 0.
1 0.
1 0.
0 1.
4 na
4,
105
Neve
r bre
astfe
d na
71
.5
16.4
0.
0 0.
7 0.
0 3.
6 0.
0 0.
0 0.
0 1.
0 17
.8
126
Ass
ista
nce
at d
eliv
ery
Skill
ed a
tten
dant
71
.7
19.0
11
.3
0.3
0.0
0.0
1.1
0.1
0.1
0.0
0.6
0.4
2,72
3 Tr
aditi
onal
birt
h at
tend
ant
59.5
10
.5
34.3
0.
0 0.
0 0.
0 0.
0 0.
0 0.
0 0.
0 1.
8 0.
7 30
1 Ot
her/
No a
tten
dant
/Miss
ing
79.8
5.
7 12
.6
0.3
0.0
0.1
0.1
0.0
0.3
0.0
3.1
0.7
1,20
6 Pl
ace
of d
eliv
ery
Hom
e 76
.5
6.5
16.3
0.
2 0.
0 0.
0 0.
1 0.
0 0.
2 0.
0 3.
0 0.
5 1,
459
Heal
th fa
cility
71
.4
19.0
11
.7
0.3
0.0
0.0
1.1
0.1
0.1
0.0
0.6
0.4
2,73
0 Pu
blic
71.9
18
.4
11.7
0.
3 0.
0 0.
0 1.
1 0.
1 0.
1 0.
0 0.
6 0.
5 2,
660
Priv
ate
52.6
41
.2
9.9
0.0
0.0
0.0
2.8
0.0
0.0
0.0
0.9
0.0
70
Othe
r/DK
/Miss
ing
(69.
3)
(10.
0)
(15.
1)
(0.0
) (0
.0)
(0.0
) (0
.0)
(0.0
) (0
.0)
(0.0
) (0
.0)
(5.7
) 43
M
othe
r’s
educ
atio
n No
ne o
r ECE
79
.4
5.7
14.0
0.
3 0.
0 0.
0 0.
2 0.
0 0.
4 0.
1 2.
9 0.
4 78
1 Pr
imar
y 74
.6
10.6
15
.1
0.0
0.0
0.0
0.5
0.1
0.0
0.0
1.8
0.7
1,59
8 Lo
wer
seco
ndar
y 73
.7
15.6
11
.9
0.5
0.0
0.0
0.7
0.1
0.1
0.0
0.7
0.6
958
Uppe
r sec
onda
ry
67.8
23
.3
13.0
0.
0 0.
2 0.
0 0.
9 0.
0 0.
0 0.
0 0.
0 0.
0 38
6 Po
st se
cond
ary
/ Non
tert
iary
68
.5
21.6
11
.0
2.5
0.0
0.0
4.2
0.0
0.6
0.0
0.8
0.0
127
High
er
59.6
35
.7
8.8
0.3
0.0
0.2
1.5
0.0
0.3
0.0
0.3
0.5
381
Ethn
o-lin
guis
tic
grou
p of
hou
seho
ld h
ead
Lao-
Tai
65.5
19
.6
18.0
0.
2 0.
1 0.
0 1.
0 0.
1 0.
0 0.
0 1.
2 0.
5 2,
365
Mon
-Khm
er
82.6
6.
8 10
.0
0.3
0.0
0.0
0.4
0.0
0.0
0.0
2.0
0.3
1,08
7 Hm
ong-
Mie
n 83
.7
11.3
2.
2 0.
4 0.
0 0.
0 0.
4 0.
0 0.
4 0.
1 1.
6 0.
7 60
8 Ch
ines
e-Ti
beta
n 88
.5
4.1
4.6
1.0
0.0
0.6
1.5
0.0
2.0
0.0
0.0
0.3
126
Othe
r, DK
, Miss
ing
(61.
8)
(15.
2)
(22.
9)
(0.0
) (0
.0)
(0.0
) (0
.0)
(0.0
) (0
.0)
(0.0
) (0
.0)
(3.5
) 45
W
ealt
h in
dex
quin
tile
Po
ores
t 85
.3
2.5
11.6
0.
0 0.
0 0.
0 0.
1 0.
0 0.
2 0.
1 2.
0 0.
4 1,
081
Seco
nd
77.8
8.
9 12
.0
0.3
0.0
0.1
0.3
0.0
0.1
0.0
3.0
0.4
904
Mid
dle
68.6
14
.7
19.6
0.
3 0.
0 0.
0 0.
4 0.
1 0.
2 0.
0 1.
0 0.
4 78
9 Fo
urth
68
.8
21.1
13
.0
0.3
0.1
0.0
1.2
0.2
0.1
0.0
0.4
0.6
731
Rich
est
58.5
33
.0
10.8
0.
5 0.
0 0.
0 2.
2 0.
0 0.
0 0.
0 0.
0 0.
9 72
5 A I
nclu
des c
hild
ren
cons
umin
g pr
escr
ibed
med
icatio
ns, O
RS a
nd su
gar/
salt
solu
tions
B
Child
ren
who
wer
e re
port
ed t
o ha
ve n
ever
bee
n br
east
fed
and
to n
ot h
ave
been
giv
en a
nyth
ing
to d
rink
dur
ing
the
first
3 d
ays
of li
feC
Exclu
des c
hild
ren
born
in th
e 3
days
bef
ore
the
surv
ey
na: n
ot a
pplic
able
( )
Fig
ures
that
are
bas
ed o
n 25
– 4
9 un
wei
ghte
d ca
ses
7
228
The set of Infant and Young Child Feeding indicators reported in tables TC.7.3 through TC.7.6 are based on the mother’s report of consumption of food and fluids during the day or night prior to being interviewed. Data are subject to a number of limitations, some related to the respondent’s ability to provide a full report on the child’s liquid and food intake due to recall errors as well as lack of knowledge in cases where the child was fed by other individuals.
In Table TC.7.3, breastfeeding status is presented for both Exclusively breastfed and Predominantly breastfed; referring to infants age less than 6 months who are breastfed, distinguished by the former only allowing vitamins, mineral supplements, and medicine and the latter allowing also plain water and non-milk liquids. The table also shows continued breastfeeding of children at 12-15 and 20-23 months of age.
Table TC.7.4 shows the median duration of any breastfeeding characteristics among children age 0-35 months and the median duration of exclusive breastfeeding and predominant breastfeeding among children age 0-23 months.
The age-appropriateness of breastfeeding of children under age 24 months is provided in Table TC.7.5. Different criteria of feeding are used depending on the age of the child. For infants age 0-5 months, exclusive breastfeeding is considered as age-appropriate feeding, while children age 6-23 months are considered to be appropriately fed if they are receiving breastmilk and solid, semi-solid or soft food.
Table TC.7.6 further looks into the introduction of solid, semi-solid, or soft foods for infants age 6-8 months while Table TC.7.7 presents the percentage of children age 6-23 months who received the minimum number of meals/snacks, referring to solid, semi-solid, or soft food, but also milk feeds for non-breastfed children, during the previous day, by breastfeeding status.
The continued practice of bottle-feeding is a concern because of the possible contamination if the bottle and/or nipple are not properly cleaned or sterilized but also due to possible interference with breastfeeding, especially at the youngest ages due to nipple confusion25. Table TC.7.8 presents the percentage of children age 0-23 months who were fed with a bottle with a nipple during the previous day.
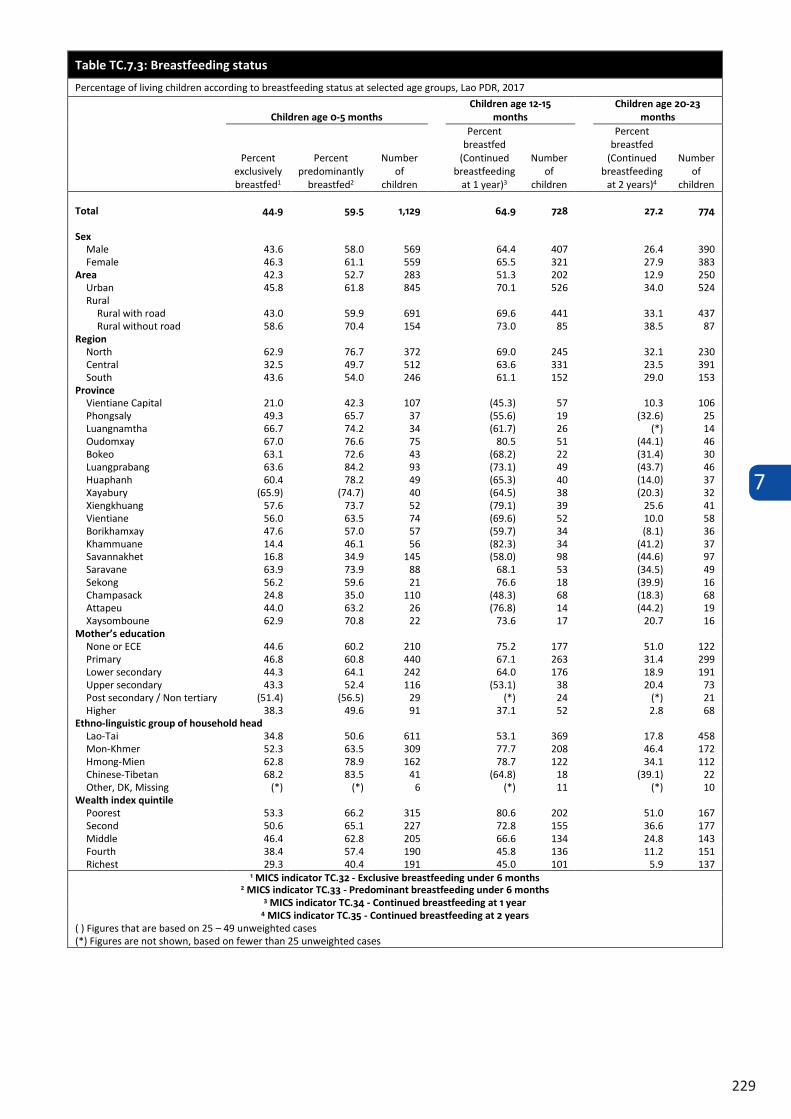
7
229
Table TC.7.3: Breastfeeding status
Percentage of living children according to breastfeeding status at selected age groups, Lao PDR, 2017
Children age 0-5 months Children age 12-15
months Children age 20-23
months
Percent exclusively breastfed1
Percent predominantly
breastfed2
Number of
children
Percent breastfed
(Continued breastfeeding
at 1 year)3
Number of
children
Percent breastfed
(Continued breastfeeding
at 2 years)4
Number of
children
Total 44.9 59.5 1,129 64.9 728 27.2 774
Sex Male 43.6 58.0 569 64.4 407 26.4 390 Female 46.3 61.1 559 65.5 321 27.9 383
Area 42.3 52.7 283 51.3 202 12.9 250 Urban 45.8 61.8 845 70.1 526 34.0 524 Rural
Rural with road 43.0 59.9 691 69.6 441 33.1 437 Rural without road 58.6 70.4 154 73.0 85 38.5 87
Region North 62.9 76.7 372 69.0 245 32.1 230 Central 32.5 49.7 512 63.6 331 23.5 391 South 43.6 54.0 246 61.1 152 29.0 153
Province Vientiane Capital 21.0 42.3 107 (45.3) 57 10.3 106 Phongsaly 49.3 65.7 37 (55.6) 19 (32.6) 25 Luangnamtha 66.7 74.2 34 (61.7) 26 (*) 14 Oudomxay 67.0 76.6 75 80.5 51 (44.1) 46 Bokeo 63.1 72.6 43 (68.2) 22 (31.4) 30 Luangprabang 63.6 84.2 93 (73.1) 49 (43.7) 46 Huaphanh 60.4 78.2 49 (65.3) 40 (14.0) 37 Xayabury (65.9) (74.7) 40 (64.5) 38 (20.3) 32 Xiengkhuang 57.6 73.7 52 (79.1) 39 25.6 41 Vientiane 56.0 63.5 74 (69.6) 52 10.0 58 Borikhamxay 47.6 57.0 57 (59.7) 34 (8.1) 36 Khammuane 14.4 46.1 56 (82.3) 34 (41.2) 37 Savannakhet 16.8 34.9 145 (58.0) 98 (44.6) 97 Saravane 63.9 73.9 88 68.1 53 (34.5) 49 Sekong 56.2 59.6 21 76.6 18 (39.9) 16 Champasack 24.8 35.0 110 (48.3) 68 (18.3) 68 Attapeu 44.0 63.2 26 (76.8) 14 (44.2) 19 Xaysomboune 62.9 70.8 22 73.6 17 20.7 16
Mother’s education None or ECE 44.6 60.2 210 75.2 177 51.0 122 Primary 46.8 60.8 440 67.1 263 31.4 299 Lower secondary 44.3 64.1 242 64.0 176 18.9 191 Upper secondary 43.3 52.4 116 (53.1) 38 20.4 73 Post secondary / Non tertiary (51.4) (56.5) 29 (*) 24 (*) 21 Higher 38.3 49.6 91 37.1 52 2.8 68
Ethno-linguistic group of household head Lao-Tai 34.8 50.6 611 53.1 369 17.8 458 Mon-Khmer 52.3 63.5 309 77.7 208 46.4 172 Hmong-Mien 62.8 78.9 162 78.7 122 34.1 112 Chinese-Tibetan 68.2 83.5 41 (64.8) 18 (39.1) 22 Other, DK, Missing (*) (*) 6 (*) 11 (*) 10
Wealth index quintile Poorest 53.3 66.2 315 80.6 202 51.0 167 Second 50.6 65.1 227 72.8 155 36.6 177 Middle 46.4 62.8 205 66.6 134 24.8 143 Fourth 38.4 57.4 190 45.8 136 11.2 151 Richest 29.3 40.4 191 45.0 101 5.9 137
1 MICS indicator TC.32 - Exclusive breastfeeding under 6 months 2 MICS indicator TC.33 - Predominant breastfeeding under 6 months
3 MICS indicator TC.34 - Continued breastfeeding at 1 year 4 MICS indicator TC.35 - Continued breastfeeding at 2 years
( ) Figures that are based on 25 – 49 unweighted cases (*) Figures are not shown, based on fewer than 25 unweighted cases
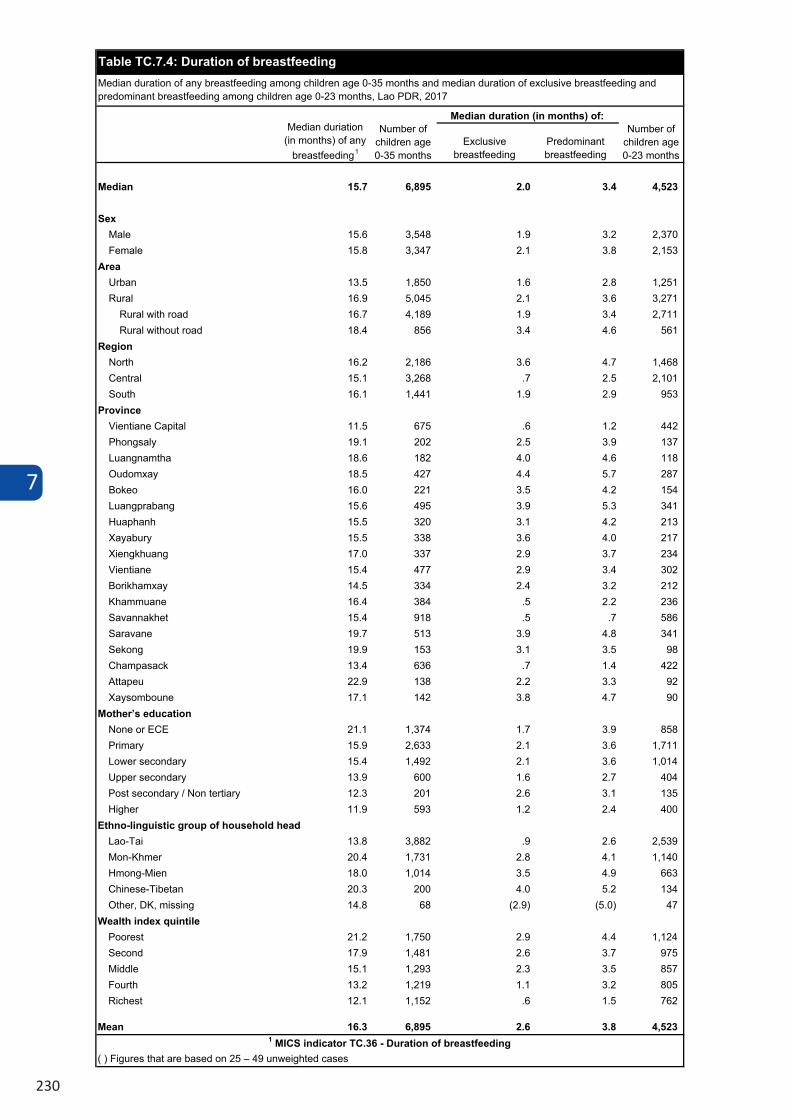
7
230
Table TC.7.3: Breastfeeding status
Percentage of living children according to breastfeeding status at selected age groups, Lao PDR, 2017
Children age 0-5 months Children age 12-15
months Children age 20-23
months
Percent exclusively breastfed1
Percent predominantly
breastfed2
Number of
children
Percent breastfed
(Continued breastfeeding
at 1 year)3
Number of
children
Percent breastfed
(Continued breastfeeding
at 2 years)4
Number of
children
Total 44.9 59.5 1,129 64.9 728 27.2 774
Sex Male 43.6 58.0 569 64.4 407 26.4 390 Female 46.3 61.1 559 65.5 321 27.9 383
Area 42.3 52.7 283 51.3 202 12.9 250 Urban 45.8 61.8 845 70.1 526 34.0 524 Rural
Rural with road 43.0 59.9 691 69.6 441 33.1 437 Rural without road 58.6 70.4 154 73.0 85 38.5 87
Region North 62.9 76.7 372 69.0 245 32.1 230 Central 32.5 49.7 512 63.6 331 23.5 391 South 43.6 54.0 246 61.1 152 29.0 153
Province Vientiane Capital 21.0 42.3 107 (45.3) 57 10.3 106 Phongsaly 49.3 65.7 37 (55.6) 19 (32.6) 25 Luangnamtha 66.7 74.2 34 (61.7) 26 (*) 14 Oudomxay 67.0 76.6 75 80.5 51 (44.1) 46 Bokeo 63.1 72.6 43 (68.2) 22 (31.4) 30 Luangprabang 63.6 84.2 93 (73.1) 49 (43.7) 46 Huaphanh 60.4 78.2 49 (65.3) 40 (14.0) 37 Xayabury (65.9) (74.7) 40 (64.5) 38 (20.3) 32 Xiengkhuang 57.6 73.7 52 (79.1) 39 25.6 41 Vientiane 56.0 63.5 74 (69.6) 52 10.0 58 Borikhamxay 47.6 57.0 57 (59.7) 34 (8.1) 36 Khammuane 14.4 46.1 56 (82.3) 34 (41.2) 37 Savannakhet 16.8 34.9 145 (58.0) 98 (44.6) 97 Saravane 63.9 73.9 88 68.1 53 (34.5) 49 Sekong 56.2 59.6 21 76.6 18 (39.9) 16 Champasack 24.8 35.0 110 (48.3) 68 (18.3) 68 Attapeu 44.0 63.2 26 (76.8) 14 (44.2) 19 Xaysomboune 62.9 70.8 22 73.6 17 20.7 16
Mother’s education None or ECE 44.6 60.2 210 75.2 177 51.0 122 Primary 46.8 60.8 440 67.1 263 31.4 299 Lower secondary 44.3 64.1 242 64.0 176 18.9 191 Upper secondary 43.3 52.4 116 (53.1) 38 20.4 73 Post secondary / Non tertiary (51.4) (56.5) 29 (*) 24 (*) 21 Higher 38.3 49.6 91 37.1 52 2.8 68
Ethno-linguistic group of household head Lao-Tai 34.8 50.6 611 53.1 369 17.8 458 Mon-Khmer 52.3 63.5 309 77.7 208 46.4 172 Hmong-Mien 62.8 78.9 162 78.7 122 34.1 112 Chinese-Tibetan 68.2 83.5 41 (64.8) 18 (39.1) 22 Other, DK, Missing (*) (*) 6 (*) 11 (*) 10
Wealth index quintile Poorest 53.3 66.2 315 80.6 202 51.0 167 Second 50.6 65.1 227 72.8 155 36.6 177 Middle 46.4 62.8 205 66.6 134 24.8 143 Fourth 38.4 57.4 190 45.8 136 11.2 151 Richest 29.3 40.4 191 45.0 101 5.9 137
1 MICS indicator TC.32 - Exclusive breastfeeding under 6 months 2 MICS indicator TC.33 - Predominant breastfeeding under 6 months
3 MICS indicator TC.34 - Continued breastfeeding at 1 year 4 MICS indicator TC.35 - Continued breastfeeding at 2 years
( ) Figures that are based on 25 – 49 unweighted cases (*) Figures are not shown, based on fewer than 25 unweighted cases
Exclusive breastfeeding
Predominant breastfeeding
Median 15.7 6,895 2.0 3.4 4,523
SexMale 15.6 3,548 1.9 3.2 2,370 Female 15.8 3,347 2.1 3.8 2,153
AreaUrban 13.5 1,850 1.6 2.8 1,251 Rural 16.9 5,045 2.1 3.6 3,271
Rural with road 16.7 4,189 1.9 3.4 2,711 Rural without road 18.4 856 3.4 4.6 561
RegionNorth 16.2 2,186 3.6 4.7 1,468 Central 15.1 3,268 .7 2.5 2,101 South 16.1 1,441 1.9 2.9 953
ProvinceVientiane Capital 11.5 675 .6 1.2 442 Phongsaly 19.1 202 2.5 3.9 137 Luangnamtha 18.6 182 4.0 4.6 118 Oudomxay 18.5 427 4.4 5.7 287 Bokeo 16.0 221 3.5 4.2 154 Luangprabang 15.6 495 3.9 5.3 341 Huaphanh 15.5 320 3.1 4.2 213 Xayabury 15.5 338 3.6 4.0 217 Xiengkhuang 17.0 337 2.9 3.7 234 Vientiane 15.4 477 2.9 3.4 302 Borikhamxay 14.5 334 2.4 3.2 212 Khammuane 16.4 384 .5 2.2 236 Savannakhet 15.4 918 .5 .7 586 Saravane 19.7 513 3.9 4.8 341 Sekong 19.9 153 3.1 3.5 98 Champasack 13.4 636 .7 1.4 422 Attapeu 22.9 138 2.2 3.3 92 Xaysomboune 17.1 142 3.8 4.7 90
Mother’s educationNone or ECE 21.1 1,374 1.7 3.9 858 Primary 15.9 2,633 2.1 3.6 1,711 Lower secondary 15.4 1,492 2.1 3.6 1,014 Upper secondary 13.9 600 1.6 2.7 404 Post secondary / Non tertiary 12.3 201 2.6 3.1 135 Higher 11.9 593 1.2 2.4 400
Ethno-linguistic group of household headLao-Tai 13.8 3,882 .9 2.6 2,539 Mon-Khmer 20.4 1,731 2.8 4.1 1,140 Hmong-Mien 18.0 1,014 3.5 4.9 663 Chinese-Tibetan 20.3 200 4.0 5.2 134 Other, DK, missing 14.8 68 (2.9) (5.0) 47
Wealth index quintilePoorest 21.2 1,750 2.9 4.4 1,124 Second 17.9 1,481 2.6 3.7 975 Middle 15.1 1,293 2.3 3.5 857 Fourth 13.2 1,219 1.1 3.2 805 Richest 12.1 1,152 .6 1.5 762
Mean 16.3 6,895 2.6 3.8 4,523
( ) Figures that are based on 25 – 49 unweighted cases
1 MICS indicator TC.36 - Duration of breastfeeding
Table TC.7.4: Duration of breastfeeding
Number of children age 0-23 months
Median duration of any breastfeeding among children age 0-35 months and median duration of exclusive breastfeeding and predominant breastfeeding among children age 0-23 months, Lao PDR, 2017
Median duriation (in months) of any
breastfeeding1
Number of children age 0-35 months
Median duration (in months) of:
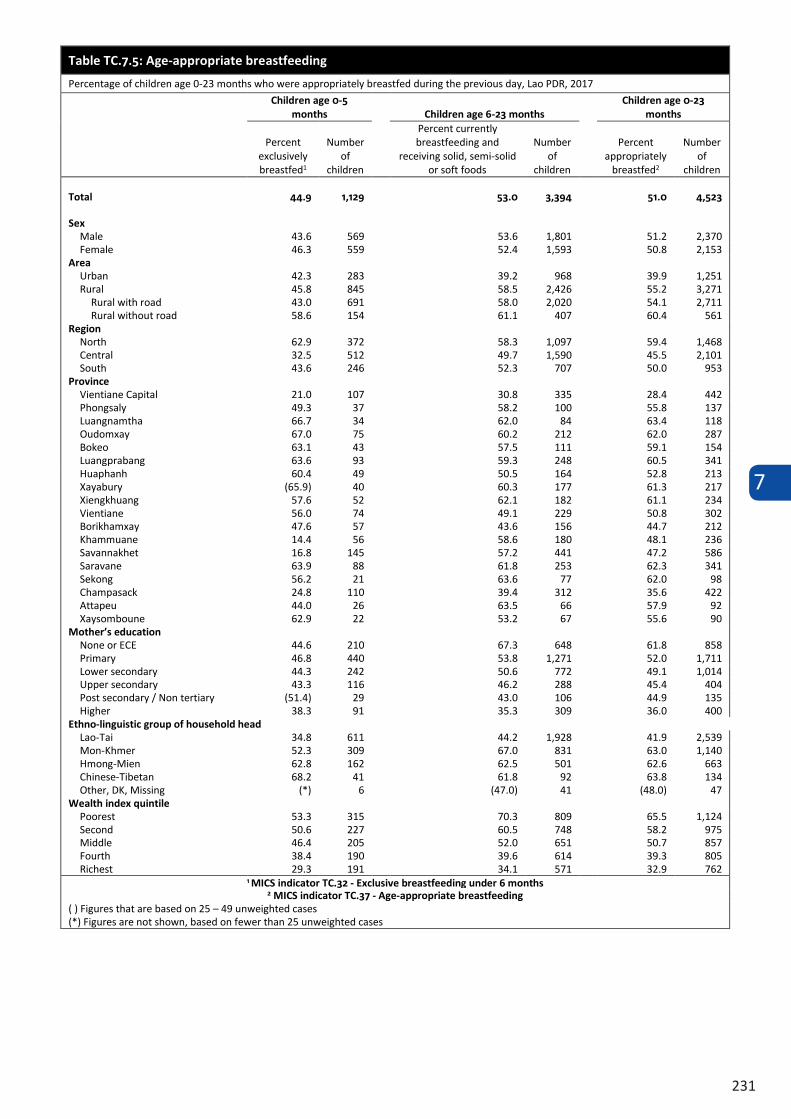
7
231
Table TC.7.5: Age-appropriate breastfeeding
Percentage of children age 0-23 months who were appropriately breastfed during the previous day, Lao PDR, 2017 Children age 0-5
months Children age 6-23 months Children age 0-23
months
Percent exclusively breastfed1
Number of
children
Percent currently breastfeeding and
receiving solid, semi-solid or soft foods
Number of
children
Percent appropriately
breastfed2
Number of
children
Total 44.9 1,129 53.0 3,394 51.0 4,523
Sex Male 43.6 569 53.6 1,801 51.2 2,370 Female 46.3 559 52.4 1,593 50.8 2,153
Area Urban 42.3 283 39.2 968 39.9 1,251 Rural 45.8 845 58.5 2,426 55.2 3,271
Rural with road 43.0 691 58.0 2,020 54.1 2,711 Rural without road 58.6 154 61.1 407 60.4 561
Region North 62.9 372 58.3 1,097 59.4 1,468 Central 32.5 512 49.7 1,590 45.5 2,101 South 43.6 246 52.3 707 50.0 953
Province Vientiane Capital 21.0 107 30.8 335 28.4 442 Phongsaly 49.3 37 58.2 100 55.8 137 Luangnamtha 66.7 34 62.0 84 63.4 118 Oudomxay 67.0 75 60.2 212 62.0 287 Bokeo 63.1 43 57.5 111 59.1 154 Luangprabang 63.6 93 59.3 248 60.5 341 Huaphanh 60.4 49 50.5 164 52.8 213 Xayabury (65.9) 40 60.3 177 61.3 217 Xiengkhuang 57.6 52 62.1 182 61.1 234 Vientiane 56.0 74 49.1 229 50.8 302 Borikhamxay 47.6 57 43.6 156 44.7 212 Khammuane 14.4 56 58.6 180 48.1 236 Savannakhet 16.8 145 57.2 441 47.2 586 Saravane 63.9 88 61.8 253 62.3 341 Sekong 56.2 21 63.6 77 62.0 98 Champasack 24.8 110 39.4 312 35.6 422 Attapeu 44.0 26 63.5 66 57.9 92 Xaysomboune 62.9 22 53.2 67 55.6 90
Mother’s education None or ECE 44.6 210 67.3 648 61.8 858 Primary 46.8 440 53.8 1,271 52.0 1,711 Lower secondary 44.3 242 50.6 772 49.1 1,014 Upper secondary 43.3 116 46.2 288 45.4 404 Post secondary / Non tertiary (51.4) 29 43.0 106 44.9 135 Higher 38.3 91 35.3 309 36.0 400
Ethno-linguistic group of household head Lao-Tai 34.8 611 44.2 1,928 41.9 2,539 Mon-Khmer 52.3 309 67.0 831 63.0 1,140 Hmong-Mien 62.8 162 62.5 501 62.6 663 Chinese-Tibetan 68.2 41 61.8 92 63.8 134 Other, DK, Missing (*) 6 (47.0) 41 (48.0) 47
Wealth index quintile Poorest 53.3 315 70.3 809 65.5 1,124 Second 50.6 227 60.5 748 58.2 975 Middle 46.4 205 52.0 651 50.7 857 Fourth 38.4 190 39.6 614 39.3 805 Richest 29.3 191 34.1 571 32.9 762
1 MICS indicator TC.32 - Exclusive breastfeeding under 6 months 2 MICS indicator TC.37 - Age-appropriate breastfeeding
( ) Figures that are based on 25 – 49 unweighted cases (*) Figures are not shown, based on fewer than 25 unweighted cases
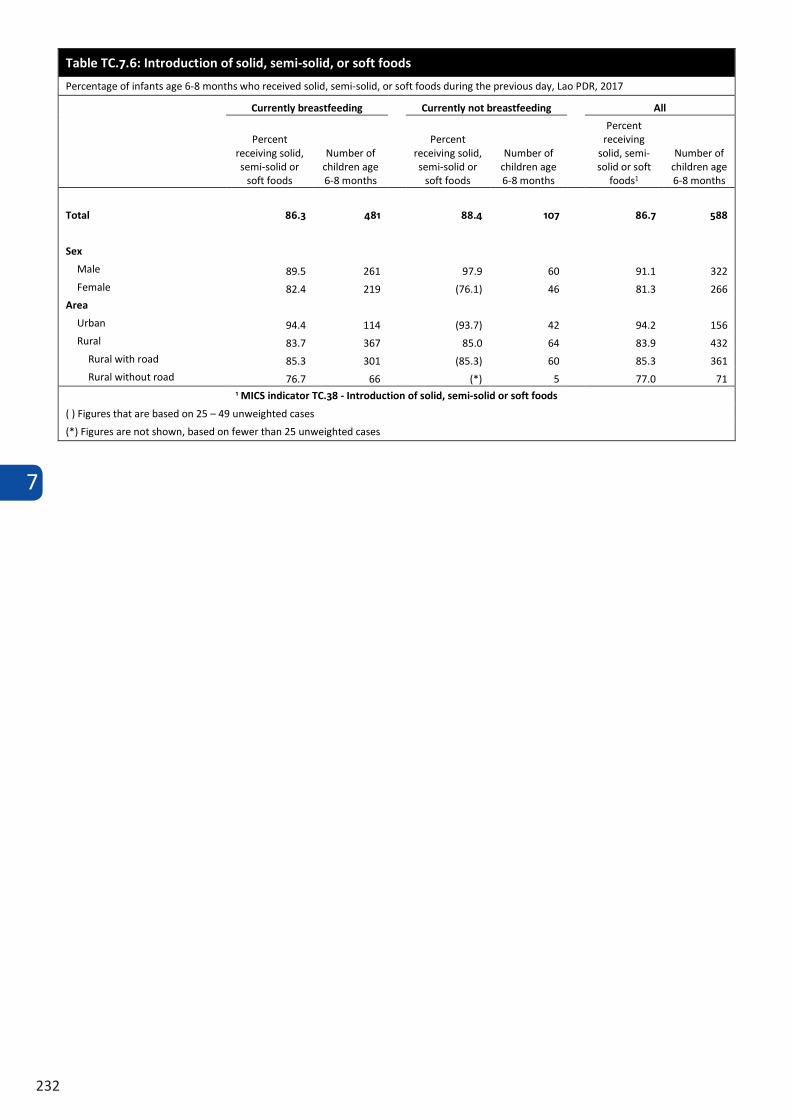
7
232
Table TC.7.5: Age-appropriate breastfeeding
Percentage of children age 0-23 months who were appropriately breastfed during the previous day, Lao PDR, 2017 Children age 0-5
months Children age 6-23 months Children age 0-23
months
Percent exclusively breastfed1
Number of
children
Percent currently breastfeeding and
receiving solid, semi-solid or soft foods
Number of
children
Percent appropriately
breastfed2
Number of
children
Total 44.9 1,129 53.0 3,394 51.0 4,523
Sex Male 43.6 569 53.6 1,801 51.2 2,370 Female 46.3 559 52.4 1,593 50.8 2,153
Area Urban 42.3 283 39.2 968 39.9 1,251 Rural 45.8 845 58.5 2,426 55.2 3,271
Rural with road 43.0 691 58.0 2,020 54.1 2,711 Rural without road 58.6 154 61.1 407 60.4 561
Region North 62.9 372 58.3 1,097 59.4 1,468 Central 32.5 512 49.7 1,590 45.5 2,101 South 43.6 246 52.3 707 50.0 953
Province Vientiane Capital 21.0 107 30.8 335 28.4 442 Phongsaly 49.3 37 58.2 100 55.8 137 Luangnamtha 66.7 34 62.0 84 63.4 118 Oudomxay 67.0 75 60.2 212 62.0 287 Bokeo 63.1 43 57.5 111 59.1 154 Luangprabang 63.6 93 59.3 248 60.5 341 Huaphanh 60.4 49 50.5 164 52.8 213 Xayabury (65.9) 40 60.3 177 61.3 217 Xiengkhuang 57.6 52 62.1 182 61.1 234 Vientiane 56.0 74 49.1 229 50.8 302 Borikhamxay 47.6 57 43.6 156 44.7 212 Khammuane 14.4 56 58.6 180 48.1 236 Savannakhet 16.8 145 57.2 441 47.2 586 Saravane 63.9 88 61.8 253 62.3 341 Sekong 56.2 21 63.6 77 62.0 98 Champasack 24.8 110 39.4 312 35.6 422 Attapeu 44.0 26 63.5 66 57.9 92 Xaysomboune 62.9 22 53.2 67 55.6 90
Mother’s education None or ECE 44.6 210 67.3 648 61.8 858 Primary 46.8 440 53.8 1,271 52.0 1,711 Lower secondary 44.3 242 50.6 772 49.1 1,014 Upper secondary 43.3 116 46.2 288 45.4 404 Post secondary / Non tertiary (51.4) 29 43.0 106 44.9 135 Higher 38.3 91 35.3 309 36.0 400
Ethno-linguistic group of household head Lao-Tai 34.8 611 44.2 1,928 41.9 2,539 Mon-Khmer 52.3 309 67.0 831 63.0 1,140 Hmong-Mien 62.8 162 62.5 501 62.6 663 Chinese-Tibetan 68.2 41 61.8 92 63.8 134 Other, DK, Missing (*) 6 (47.0) 41 (48.0) 47
Wealth index quintile Poorest 53.3 315 70.3 809 65.5 1,124 Second 50.6 227 60.5 748 58.2 975 Middle 46.4 205 52.0 651 50.7 857 Fourth 38.4 190 39.6 614 39.3 805 Richest 29.3 191 34.1 571 32.9 762
1 MICS indicator TC.32 - Exclusive breastfeeding under 6 months 2 MICS indicator TC.37 - Age-appropriate breastfeeding
( ) Figures that are based on 25 – 49 unweighted cases (*) Figures are not shown, based on fewer than 25 unweighted cases
Table TC.7.6: Introduction of solid, semi-solid, or soft foods
Percentage of infants age 6-8 months who received solid, semi-solid, or soft foods during the previous day, Lao PDR, 2017
Currently breastfeeding Currently not breastfeeding All
Percent receiving solid, semi-solid or
soft foods
Number of children age 6-8 months
Percent receiving solid, semi-solid or
soft foods
Number of children age 6-8 months
Percent receiving
solid, semi-solid or soft
foods1
Number of children age 6-8 months
Total 86.3 481 88.4 107 86.7 588
Sex
Male 89.5 261 97.9 60 91.1 322 Female 82.4 219 (76.1) 46 81.3 266
Area
Urban 94.4 114 (93.7) 42 94.2 156 Rural 83.7 367 85.0 64 83.9 432
Rural with road 85.3 301 (85.3) 60 85.3 361 Rural without road 76.7 66 (*) 5 77.0 71
1 MICS indicator TC.38 - Introduction of solid, semi-solid or soft foods
( ) Figures that are based on 25 – 49 unweighted cases (*) Figures are not shown, based on fewer than 25 unweighted cases
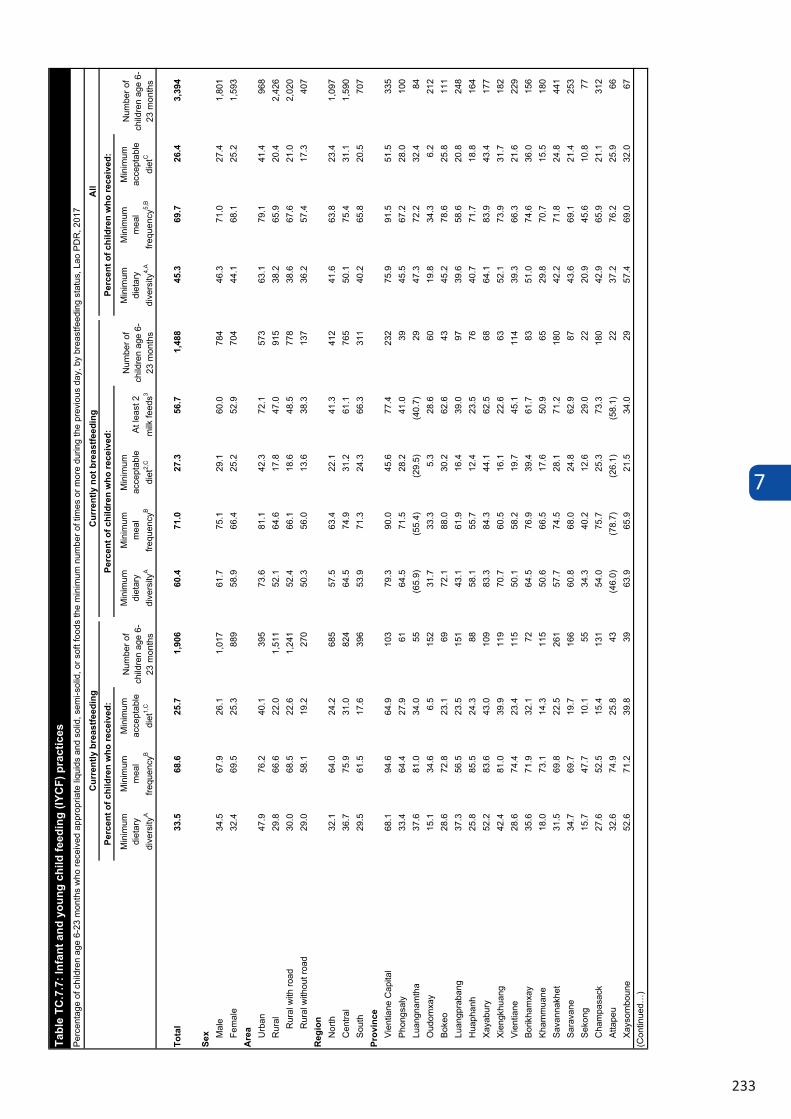
7
233
Min
imum
di
etar
y di
vers
ityA
Min
imum
m
eal
frequ
ency
B
Min
imum
ac
cept
able
di
et1,
C
Min
imum
di
etar
y di
vers
ityA
Min
imum
m
eal
frequ
ency
B
Min
imum
ac
cept
able
di
et2,
CAt
leas
t 2
milk
feed
s3
Min
imum
di
etar
y di
vers
ity4,
A
Min
imum
m
eal
frequ
ency
5,B
Min
imum
ac
cept
able
di
etC
Tota
l33
.568
.625
.71,
906
60.4
71.0
27.3
56.7
1,48
845
.369
.726
.43,
394
Sex M
ale
34.5
67.9
26.1
1,01
761
.775
.129
.160
.078
446
.371
.027
.41,
801
Fem
ale
32.4
69.5
25.3
889
58.9
66.4
25.2
52.9
704
44.1
68.1
25.2
1,59
3A
rea Urb
an47
.976
.240
.139
573
.681
.142
.372
.157
363
.179
.141
.496
8R
ural
29.8
66.6
22.0
1,51
152
.164
.617
.847
.091
538
.265
.920
.42,
426
Rur
al w
ith ro
ad30
.068
.522
.61,
241
52.4
66.1
18.6
48.5
778
38.6
67.6
21.0
2,02
0R
ural
with
out r
oad
29.0
58.1
19.2
270
50.3
56.0
13.6
38.3
137
36.2
57.4
17.3
407
Reg
ion
Nor
th32
.164
.024
.268
557
.563
.422
.141
.341
241
.663
.823
.41,
097
Cen
tral
36.7
75.9
31.0
824
64.5
74.9
31.2
61.1
765
50.1
75.4
31.1
1,59
0So
uth
29.5
61.5
17.6
396
53.9
71.3
24.3
66.3
311
40.2
65.8
20.5
707
Prov
ince
Vien
tiane
Cap
ital
68.1
94.6
64.9
103
79.3
90.0
45.6
77.4
232
75.9
91.5
51.5
335
Phon
gsal
y 33
.464
.427
.961
64.5
71.5
28.2
41.0
3945
.567
.228
.010
0Lu
angn
amth
a37
.681
.034
.055
(65.
9)(5
5.4)
(29.
5)(4
0.7)
2947
.372
.232
.484
Oud
omxa
y15
.134
.66.
515
231
.733
.35.
328
.660
19.8
34.3
6.2
212
Boke
o28
.672
.823
.169
72.1
88.0
30.2
62.6
4345
.278
.625
.811
1Lu
angp
raba
ng37
.356
.523
.515
143
.161
.916
.439
.097
39.6
58.6
20.8
248
Hua
phan
h25
.885
.524
.388
58.1
55.7
12.4
23.5
7640
.771
.718
.816
4Xa
yabu
ry52
.283
.643
.010
983
.384
.344
.162
.568
64.1
83.9
43.4
177
Xien
gkhu
ang
42.4
81.0
39.9
119
70.7
60.5
16.1
22.6
6352
.173
.931
.718
2Vi
entia
ne28
.674
.423
.411
550
.158
.219
.745
.111
439
.366
.321
.622
9Bo
rikha
mxa
y35
.671
.932
.172
64.5
76.9
39.4
61.7
8351
.074
.636
.015
6Kh
amm
uane
18.0
73.1
14.3
115
50.6
66.5
17.6
50.9
6529
.870
.715
.518
0Sa
vann
akhe
t31
.569
.822
.526
157
.774
.528
.171
.218
042
.271
.824
.844
1Sa
rava
ne34
.769
.719
.716
660
.868
.024
.862
.987
43.6
69.1
21.4
253
Seko
ng15
.747
.710
.155
34.3
40.2
12.6
29.0
2220
.945
.610
.877
Cha
mpa
sack
27.6
52.5
15.4
131
54.0
75.7
25.3
73.3
180
42.9
65.9
21.1
312
Atta
peu
32.6
74.9
25.8
43(4
6.0)
(78.
7)(2
6.1)
(58.
1)22
37.2
76.2
25.9
66Xa
ysom
boun
e52
.671
.239
.839
63.9
65.9
21.5
34.0
2957
.469
.032
.067
(Con
tinue
d…)
Tabl
e TC
.7.7
: Inf
ant a
nd y
oung
chi
ld fe
edin
g (IY
CF)
pra
ctic
es
Num
ber o
f ch
ildre
n ag
e 6-
23 m
onth
s
Num
ber o
f ch
ildre
n ag
e 6-
23 m
onth
s
Perc
enta
ge o
f chi
ldre
n ag
e 6-
23 m
onth
s w
ho re
ceiv
ed a
ppro
pria
te li
quid
s an
d so
lid, s
emi-s
olid
, or s
oft f
oods
the
min
imum
num
ber o
f tim
es o
r mor
e du
ring
the
prev
ious
day
, by
brea
stfe
edin
g st
atus
, Lao
PD
R, 2
017
Num
ber o
f ch
ildre
n ag
e 6-
23 m
onth
s
Cur
rent
ly n
ot b
reas
tfeed
ing
Cur
rent
ly b
reas
tfeed
ing
All
Perc
ent o
f chi
ldre
n w
ho re
ceiv
ed:
Perc
ent o
f chi
ldre
n w
ho re
ceiv
ed:
Perc
ent o
f chi
ldre
n w
ho re
ceiv
ed:
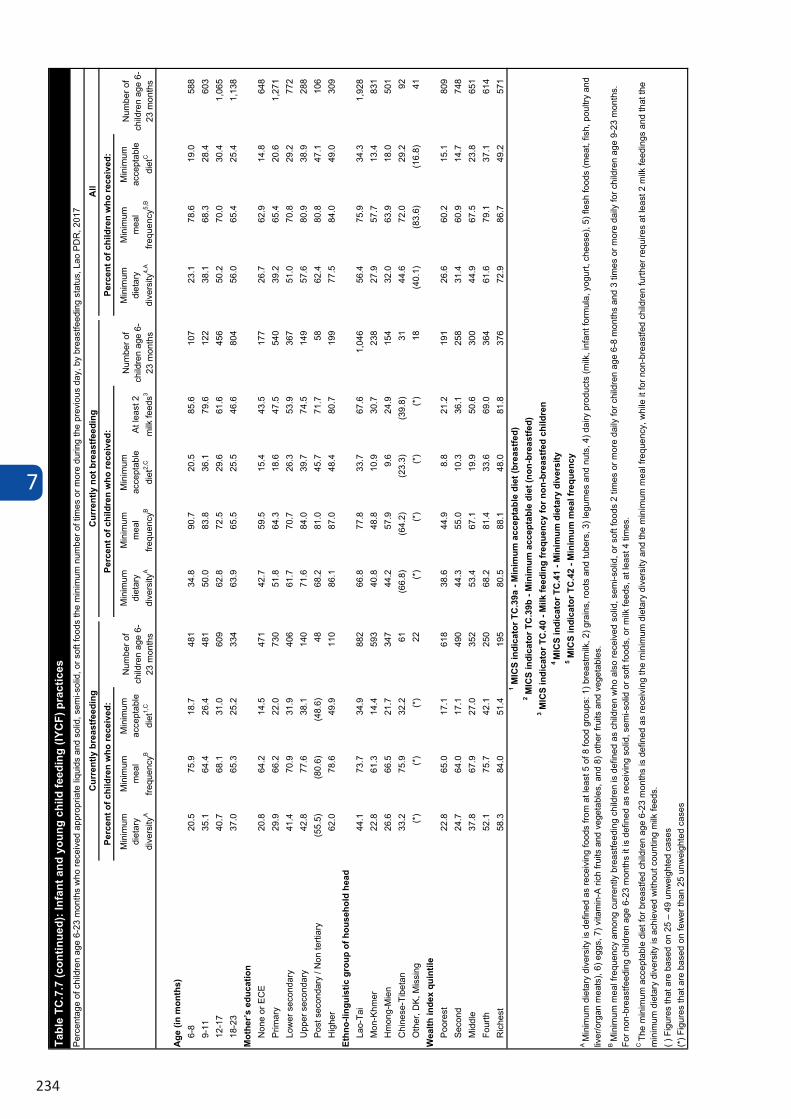
7
234
Min
imum
di
etar
y di
vers
ityA
Min
imum
m
eal
frequ
ency
B
Min
imum
ac
cept
able
di
et1,
C
Min
imum
di
etar
y di
vers
ityA
Min
imum
m
eal
frequ
ency
B
Min
imum
ac
cept
able
di
et2,
CAt
leas
t 2
milk
feed
s3
Min
imum
di
etar
y di
vers
ity4,
A
Min
imum
m
eal
frequ
ency
5,B
Min
imum
ac
cept
able
di
etC
Age
(in
mon
ths)
6-8
20.5
75.9
18.7
481
34.8
90.7
20.5
85.6
107
23.1
78.6
19.0
588
9-11
35.1
64.4
26.4
481
50.0
83.8
36.1
79.6
122
38.1
68.3
28.4
603
12-1
740
.768
.131
.060
962
.872
.529
.661
.645
650
.270
.030
.41,
065
18-2
337
.065
.325
.233
463
.965
.525
.546
.680
456
.065
.425
.41,
138
Mot
her’s
edu
catio
nN
one
or E
CE
20.8
64.2
14.5
471
42.7
59.5
15.4
43.5
177
26.7
62.9
14.8
648
Prim
ary
29.9
66.2
22.0
730
51.8
64.3
18.6
47.5
540
39.2
65.4
20.6
1,27
1Lo
wer
sec
onda
ry41
.470
.931
.940
661
.770
.726
.353
.936
751
.070
.829
.277
2U
pper
sec
onda
ry42
.877
.638
.114
071
.684
.039
.774
.514
957
.680
.938
.928
8Po
st s
econ
dary
/ N
on te
rtiar
y(5
5.5)
(80.
6)(4
8.6)
4868
.281
.045
.771
.758
62.4
80.8
47.1
106
Hig
her
62.0
78.6
49.9
110
86.1
87.0
48.4
80.7
199
77.5
84.0
49.0
309
Ethn
o-lin
guis
tic g
roup
of h
ouse
hold
hea
dLa
o-Ta
i44
.173
.734
.988
266
.877
.833
.767
.61,
046
56.4
75.9
34.3
1,92
8M
on-K
hmer
22.8
61.3
14.4
593
40.8
48.8
10.9
30.7
238
27.9
57.7
13.4
831
Hm
ong-
Mie
n26
.666
.521
.734
744
.257
.99.
624
.915
432
.063
.918
.050
1C
hine
se-T
ibet
an33
.275
.932
.261
(66.
8)(6
4.2)
(23.
3)(3
9.8)
3144
.672
.029
.292
Oth
er, D
K, M
issi
ng(*
)(*
)(*
)22
(*)
(*)
(*)
(*)
18(4
0.1)
(83.
6)(1
6.8)
41W
ealth
inde
x qu
intil
ePo
ores
t22
.865
.017
.161
838
.644
.98.
821
.219
126
.660
.215
.180
9Se
cond
24.7
64.0
17.1
490
44.3
55.0
10.3
36.1
258
31.4
60.9
14.7
748
Mid
dle
37.8
67.9
27.0
352
53.4
67.1
19.9
50.6
300
44.9
67.5
23.8
651
Four
th
52.1
75.7
42.1
250
68.2
81.4
33.6
69.0
364
61.6
79.1
37.1
614
Ric
hest
58.3
84.0
51.4
195
80.5
88.1
48.0
81.8
376
72.9
86.7
49.2
571
3 MIC
S in
dica
tor T
C.4
0 - M
ilk fe
edin
g fr
eque
ncy
for n
on-b
reas
tfed
child
ren
(*) F
igur
es th
at a
re b
ased
on
few
er th
an 2
5 un
wei
ghte
d ca
ses
4 M
ICS
indi
cato
r TC
.41
- Min
imum
die
tary
div
ersi
ty
Tabl
e TC
.7.7
(con
tinue
d): I
nfan
t and
you
ng c
hild
feed
ing
(IYC
F) p
ract
ices
Perc
enta
ge o
f chi
ldre
n ag
e 6-
23 m
onth
s w
ho re
ceiv
ed a
ppro
pria
te li
quid
s an
d so
lid, s
emi-s
olid
, or s
oft f
oods
the
min
imum
num
ber o
f tim
es o
r mor
e du
ring
the
prev
ious
day
, by
brea
stfe
edin
g st
atus
, Lao
PD
R, 2
017
Cur
rent
ly b
reas
tfeed
ing
Cur
rent
ly n
ot b
reas
tfeed
ing
All
Perc
ent o
f chi
ldre
n w
ho re
ceiv
ed:
Num
ber o
f ch
ildre
n ag
e 6-
23 m
onth
s
Perc
ent o
f chi
ldre
n w
ho re
ceiv
ed:
Num
ber o
f ch
ildre
n ag
e 6-
23 m
onth
s
Perc
ent o
f chi
ldre
n w
ho re
ceiv
ed:
Num
ber o
f ch
ildre
n ag
e 6-
23 m
onth
s
1 MIC
S in
dica
tor T
C.3
9a -
Min
imum
acc
epta
ble
diet
(bre
astfe
d)2 M
ICS
indi
cato
r TC
.39b
- M
inim
um a
ccep
tabl
e di
et (n
on-b
reas
tfed)
5 MIC
S in
dica
tor T
C.4
2 - M
inim
um m
eal f
requ
ency
A M
inim
um d
ieta
ry d
iver
sity
is d
efin
ed a
s re
ceiv
ing
food
s fro
m a
t lea
st 5
of 8
food
gro
ups:
1) b
reas
tmilk
, 2) g
rain
s, ro
ots
and
tube
rs, 3
) leg
umes
and
nut
s, 4
) dai
ry p
rodu
cts
(milk
, inf
ant f
orm
ula,
yog
urt,
chee
se),
5) fl
esh
food
s (m
eat,
fish,
pou
ltry
and
liver
/org
an m
eats
), 6)
egg
s, 7
) vita
min
-A ri
ch fr
uits
and
veg
etab
les,
and
8) o
ther
frui
ts a
nd v
eget
able
s.B
Min
imum
mea
l fre
quen
cy a
mon
g cu
rrent
ly b
reas
tfeed
ing
child
ren
is d
efin
ed a
s ch
ildre
n w
ho a
lso
rece
ived
sol
id, s
emi-s
olid
, or s
oft f
oods
2 ti
mes
or m
ore
daily
for c
hild
ren
age
6-8
mon
ths
and
3 tim
es o
r mor
e da
ily fo
r chi
ldre
n ag
e 9-
23 m
onth
s.
For n
on-b
reas
tfeed
ing
child
ren
age
6-23
mon
ths
it is
def
ined
as
rece
ivin
g so
lid, s
emi-s
olid
or s
oft f
oods
, or m
ilk fe
eds,
at l
east
4 ti
mes
.C
The
min
imum
acc
epta
ble
diet
for b
reas
tfed
child
ren
age
6-23
mon
ths
is d
efin
ed a
s re
ceiv
ing
the
min
imum
die
tary
div
ersi
ty a
nd th
e m
inim
um m
eal f
requ
ency
, whi
le it
for n
on-b
reas
tfed
child
ren
furth
er re
quire
s at
leas
t 2 m
ilk fe
edin
gs a
nd th
at th
e m
inim
um d
ieta
ry d
iver
sity
is a
chie
ved
with
out c
ount
ing
milk
feed
s.( )
Fig
ures
that
are
bas
ed o
n 25
– 4
9 un
wei
ghte
d ca
ses
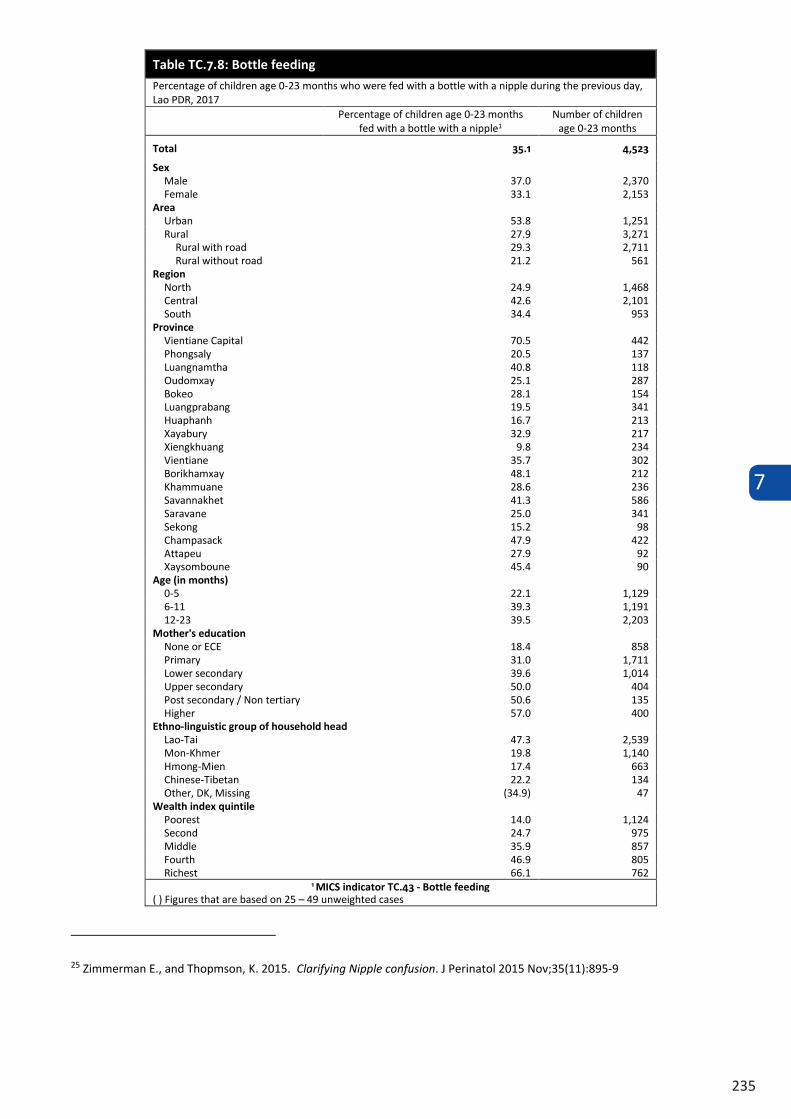
7
235
Table TC.7.8: Bottle feeding
Percentage of children age 0-23 months who were fed with a bottle with a nipple during the previous day, Lao PDR, 2017
Percentage of children age 0-23 months fed with a bottle with a nipple1
Number of children age 0-23 months
Total 35.1 4,523
Sex Male 37.0 2,370 Female 33.1 2,153
Area Urban 53.8 1,251 Rural 27.9 3,271
Rural with road 29.3 2,711 Rural without road 21.2 561
Region North 24.9 1,468 Central 42.6 2,101 South 34.4 953
Province Vientiane Capital 70.5 442 Phongsaly 20.5 137 Luangnamtha 40.8 118 Oudomxay 25.1 287 Bokeo 28.1 154 Luangprabang 19.5 341 Huaphanh 16.7 213 Xayabury 32.9 217 Xiengkhuang 9.8 234 Vientiane 35.7 302 Borikhamxay 48.1 212 Khammuane 28.6 236 Savannakhet 41.3 586 Saravane 25.0 341 Sekong 15.2 98 Champasack 47.9 422 Attapeu 27.9 92 Xaysomboune 45.4 90
Age (in months) 0-5 22.1 1,129 6-11 39.3 1,191 12-23 39.5 2,203
Mother's education None or ECE 18.4 858 Primary 31.0 1,711 Lower secondary 39.6 1,014 Upper secondary 50.0 404 Post secondary / Non tertiary 50.6 135 Higher 57.0 400
Ethno-linguistic group of household head Lao-Tai 47.3 2,539 Mon-Khmer 19.8 1,140 Hmong-Mien 17.4 663 Chinese-Tibetan 22.2 134 Other, DK, Missing (34.9) 47
Wealth index quintile Poorest 14.0 1,124 Second 24.7 975 Middle 35.9 857 Fourth 46.9 805 Richest 66.1 762
1 MICS indicator TC.43 - Bottle feeding ( ) Figures that are based on 25 – 49 unweighted cases
25 Zimmerman E., and Thopmson, K. 2015. Clarifying Nipple confusion. J Perinatol 2015 Nov;35(11):895-9
7
236
Table TC.7.8: Bottle feeding
Percentage of children age 0-23 months who were fed with a bottle with a nipple during the previous day, Lao PDR, 2017
Percentage of children age 0-23 months fed with a bottle with a nipple1
Number of children age 0-23 months
Total 35.1 4,523
Sex Male 37.0 2,370 Female 33.1 2,153
Area Urban 53.8 1,251 Rural 27.9 3,271
Rural with road 29.3 2,711 Rural without road 21.2 561
Region North 24.9 1,468 Central 42.6 2,101 South 34.4 953
Province Vientiane Capital 70.5 442 Phongsaly 20.5 137 Luangnamtha 40.8 118 Oudomxay 25.1 287 Bokeo 28.1 154 Luangprabang 19.5 341 Huaphanh 16.7 213 Xayabury 32.9 217 Xiengkhuang 9.8 234 Vientiane 35.7 302 Borikhamxay 48.1 212 Khammuane 28.6 236 Savannakhet 41.3 586 Saravane 25.0 341 Sekong 15.2 98 Champasack 47.9 422 Attapeu 27.9 92 Xaysomboune 45.4 90
Age (in months) 0-5 22.1 1,129 6-11 39.3 1,191 12-23 39.5 2,203
Mother's education None or ECE 18.4 858 Primary 31.0 1,711 Lower secondary 39.6 1,014 Upper secondary 50.0 404 Post secondary / Non tertiary 50.6 135 Higher 57.0 400
Ethno-linguistic group of household head Lao-Tai 47.3 2,539 Mon-Khmer 19.8 1,140 Hmong-Mien 17.4 663 Chinese-Tibetan 22.2 134 Other, DK, Missing (34.9) 47
Wealth index quintile Poorest 14.0 1,124 Second 24.7 975 Middle 35.9 857 Fourth 46.9 805 Richest 66.1 762
1 MICS indicator TC.43 - Bottle feeding ( ) Figures that are based on 25 – 49 unweighted cases
25 Zimmerman E., and Thopmson, K. 2015. Clarifying Nipple confusion. J Perinatol 2015 Nov;35(11):895-9
7.8 MALNUTRITION
Children’s nutritional status is a reflection of their overall health. When children have access to an adequate food supply, are not exposed to repeated illness, and are well cared for, they reach their growth potential and are considered well nourished.
Undernutrition is associated with nearly half of all child deaths worldwide.26 Undernourished children are more likely to die from common childhood ailments, and for those who survive, have recurring sicknesses and faltering growth. Three-quarters of children who die from causes related to malnutrition were only mildly or moderately malnourished – showing no outward sign of their vulnerability. The Sustainable Development Goal target is to reduce by 40 per cent the prevalence of stunting among under five year olds between 2012 and 2025 as well as to reduce wasting to <5 per cent and have no increase in overweight over the same time period. A reduction in the prevalence of malnutrition will also assist in the goal to reduce child mortality as well as a number of other goals.
In a well-nourished population, there is a reference distribution of height and weight for how children under age five years should grow. Under-nutrition in a population can be gauged by comparing children to this reference population. The reference population used in this report is based on the WHO growth standards27. Each of thethree nutritional status indicators – weight-for-age, height-for-age, and weight-for-height - can be expressed in standard deviation units (z-scores) from the median of the reference population.
Weight-for-age is a measure of both acute and chronic malnutrition. Children whose weight-for-age is more than two standard deviations below the median of the reference population are considered moderately or severely underweight while those whose weight-for-age is more than three standard deviations below the median are classified as severely underweight.
Height-for-age is a measure of linear growth. Children whose height-for-age is more than two standard deviations below the median of the reference population are considered short for their age and are classified as moderately or severely stunted. Those whose height-for-age is more than three standard deviations below the median are classified as severely stunted. Stunting is a reflection of chronic malnutrition as a result of failure to receive adequate nutrition over a long period and recurrent or chronic illness.
Weight-for-height can be used to assess wasting and overweight status. Children whose weight-for-height is more than two standard deviations below the median of the reference population are classified as moderately or severely wasted, while those who fall more than three standard deviations below the median are classified as severely wasted. Wasting is usually the result of a recent nutritional deficiency. The indicator of wasting may exhibit significant seasonal shifts associated with changes in the availability of food and/or disease prevalence.
Children whose weight-for-height is more than two standard deviations above the median reference population are classified as moderately or severely overweight.
In LSISII, weights and heights of all children under 5 years of age were measured using the anthropometric equipment recommended by UNICEF.28 Findings in this section are based on the results of these measurements in conjunction with the age in months data based on birth dates collected during the survey interview.
Table TC8.1 shows percentage of children classified into each of the above described catergories, based on the anthropometric measurements that were taken during the fieldwork. Additionally, the table includes mean z-scores for all three anthropometric indicators.
26 Black, R.E., et al. “Maternal and Child Undernutrition and Overweight in Low-income and Middle-income Countries.” The Lancet 382, no. 9890 (2013): 427–451. doi:10.1016/s0140-6736(13)60937-x27 http://www.who.int/childgrowth/standards/technical_report 28 See MICS Supply Procurement Instructions: "MICS6 TOOLS." Home - UNICEF MICS. Accessed August 23, 2018. http://mics.unicef.org/tools#survey-design
7
237
Children whose measurements were not taken due to absence from the home during interviews or other reasons, or whose measurements are outside a plausible range are excluded from Table TC.8.1. Children are excluded from one or more of the anthropometric indicators when their weights and heights have not been measured, or their age is not available, whichever applicable. For example, if a child has been weighed but his/her height has not been measured, the child is included in underweight calculations, but not in the calculations for stunting and wasting. Percentages of children by age and reasons for exclusion are shown in the data quality tables DQ.3.4, DQ.3.5, and DQ.3.6 in Appendix D. The tables show that due to implausible measurements, and/or missing weight and/or height, one percent of children have been excluded from calculations of the weight-for-age indicator, three percent each from the height-for-age indicator and the weight-for-height indicator. Table DQ.2.4 shows that completeness of reporting of date of birth and age was 100 percent. There is some evidence of out-transference of children under-5 that would affect to some extent the representativeness of the anthropometric results (Table DQ.1.3), and Table DQ.3.7 shows some evidence that measurers had a tendency to round height/length measurements to decimal digits 0 and 5, indicating 24 and 17 percent respectively, which are within acceptable level of 20 percent.
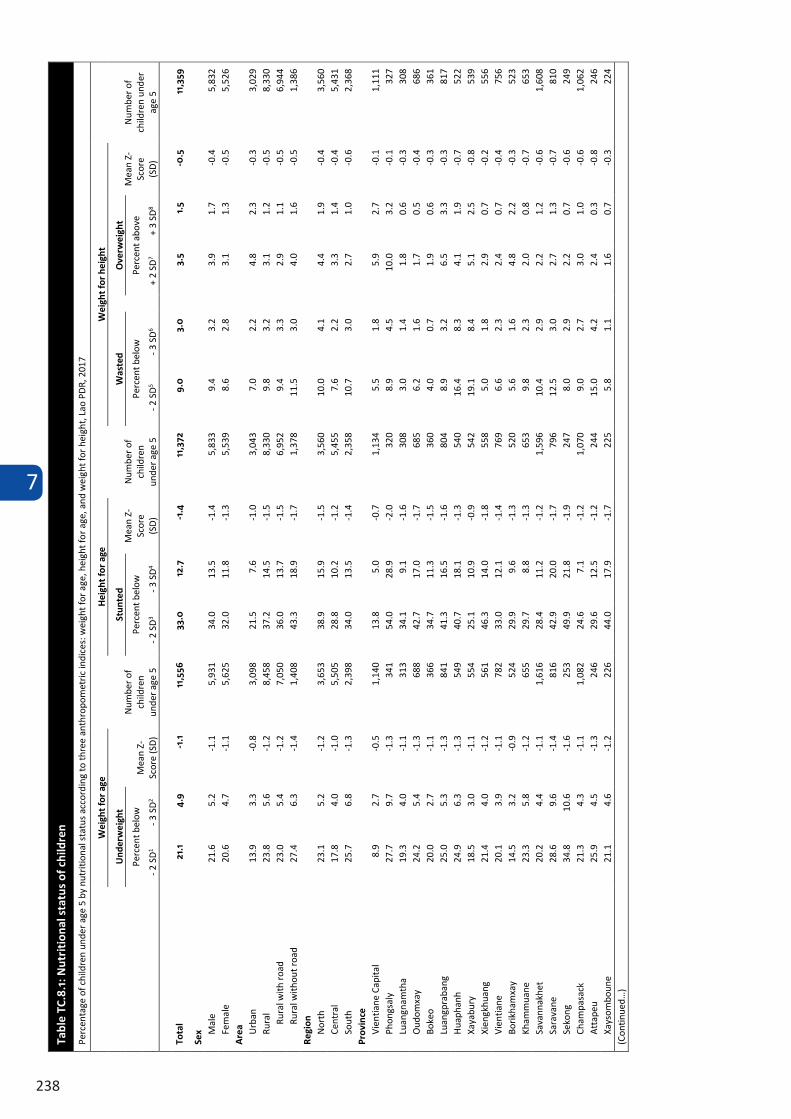
7
238
Tabl
e TC
.8.1
: Nut
riti
onal
sta
tus
of c
hild
ren
Perc
enta
ge o
f chi
ldre
n un
der a
ge 5
by
nutr
ition
al st
atus
acc
ordi
ng to
thre
e an
thro
pom
etric
indi
ces:
wei
ght f
or a
ge, h
eigh
t for
age
, and
wei
ght f
or h
eigh
t, La
o PD
R, 2
017
Wei
ght f
or a
ge
Num
ber o
f ch
ildre
n un
der a
ge 5
Hei
ght f
or a
ge
Num
ber o
f ch
ildre
n un
der a
ge 5
Wei
ght f
or h
eigh
t
Num
ber o
f ch
ildre
n un
der
age
5
Und
erw
eigh
t
Mea
n Z-
Scor
e (S
D)
Stun
ted
Mea
n Z-
Scor
e (S
D)
Was
ted
Ove
rwei
ght
Mea
n Z-
Scor
e (S
D)
Perc
ent b
elow
Pe
rcen
t bel
ow
Perc
ent b
elow
Pe
rcen
t abo
ve
- 2 S
D1 - 3
SD2
- 2 S
D3 - 3
SD4
- 2
SD5
- 3 S
D6 +
2 SD
7 +
3 SD
8
Tota
l 21
.1
4.9
-1.1
11
,556
33
.0
12.7
-1
.4
11,3
72
9.0
3.0
3.5
1.5
-0.5
11
,359
Sex M
ale
21.6
5.
2 -1
.1
5,93
1 34
.0
13.5
-1
.4
5,83
3 9.
4 3.
2 3.
9 1.
7 -0
.4
5,83
2 Fe
mal
e 20
.6
4.7
-1.1
5,
625
32.0
11
.8
-1.3
5,
539
8.6
2.8
3.1
1.3
-0.5
5,
526
Are
a Urba
n 13
.9
3.3
-0.8
3,
098
21.5
7.
6 -1
.0
3,04
3 7.
0 2.
2 4.
8 2.
3 -0
.3
3,02
9 Ru
ral
23.8
5.
6 -1
.2
8,45
8 37
.2
14.5
-1
.5
8,33
0 9.
8 3.
2 3.
1 1.
2 -0
.5
8,33
0 Ru
ral w
ith ro
ad
23.0
5.
4 -1
.2
7,05
0 36
.0
13.7
-1
.5
6,95
2 9.
4 3.
3 2.
9 1.
1 -0
.5
6,94
4 Ru
ral w
ithou
t roa
d 27
.4
6.3
-1.4
1,
408
43.3
18
.9
-1.7
1,
378
11.5
3.
0 4.
0 1.
6 -0
.5
1,38
6 Re
gion
No
rth
23.1
5.
2 -1
.2
3,65
3 38
.9
15.9
-1
.5
3,56
0 10
.0
4.1
4.4
1.9
-0.4
3,
560
Cent
ral
17.8
4.
0 -1
.0
5,50
5 28
.8
10.2
-1
.2
5,45
5 7.
6 2.
2 3.
3 1.
4 -0
.4
5,43
1 So
uth
25.7
6.
8 -1
.3
2,39
8 34
.0
13.5
-1
.4
2,35
8 10
.7
3.0
2.7
1.0
-0.6
2,
368
Prov
ince
Vi
entia
ne C
apita
l 8.
9 2.
7 -0
.5
1,14
0 13
.8
5.0
-0.7
1,
134
5.5
1.8
5.9
2.7
-0.1
1,
111
Phon
gsal
y
27.7
9.
7 -1
.3
341
54.0
28
.9
-2.0
32
0 8.
9 4.
5 10
.0
3.2
-0.1
32
7 Lu
angn
amth
a 19
.3
4.0
-1.1
31
3 34
.1
9.1
-1.6
30
8 3.
0 1.
4 1.
8 0.
6 -0
.3
308
Oudo
mxa
y 24
.2
5.4
-1.3
68
8 42
.7
17.0
-1
.7
685
6.2
1.6
1.7
0.5
-0.4
68
6 Bo
keo
20.0
2.
7 -1
.1
366
34.7
11
.3
-1.5
36
0 4.
0 0.
7 1.
9 0.
6 -0
.3
361
Luan
gpra
bang
25
.0
5.3
-1.3
84
1 41
.3
16.5
-1
.6
804
8.9
3.2
6.5
3.3
-0.3
81
7 Hu
apha
nh
24.9
6.
3 -1
.3
549
40.7
18
.1
-1.3
54
0 16
.4
8.3
4.1
1.9
-0.7
52
2 Xa
yabu
ry
18.5
3.
0 -1
.1
554
25.1
10
.9
-0.9
54
2 19
.1
8.4
5.1
2.5
-0.8
53
9 Xi
engk
huan
g 21
.4
4.0
-1.2
56
1 46
.3
14.0
-1
.8
558
5.0
1.8
2.9
0.7
-0.2
55
6 Vi
entia
ne
20.1
3.
9 -1
.1
782
33.0
12
.1
-1.4
76
9 6.
6 2.
3 2.
4 0.
7 -0
.4
756
Borik
ham
xay
14.5
3.
2 -0
.9
524
29.9
9.
6 -1
.3
520
5.6
1.6
4.8
2.2
-0.3
52
3 Kh
amm
uane
23
.3
5.8
-1.2
65
5 29
.7
8.8
-1.3
65
3 9.
8 2.
3 2.
0 0.
8 -0
.7
653
Sava
nnak
het
20.2
4.
4 -1
.1
1,61
6 28
.4
11.2
-1
.2
1,59
6 10
.4
2.9
2.2
1.2
-0.6
1,
608
Sara
vane
28
.6
9.6
-1.4
81
6 42
.9
20.0
-1
.7
796
12.5
3.
0 2.
7 1.
3 -0
.7
810
Seko
ng
34.8
10
.6
-1.6
25
3 49
.9
21.8
-1
.9
247
8.0
2.9
2.2
0.7
-0.6
24
9 Ch
ampa
sack
21
.3
4.3
-1.1
1,
082
24.6
7.
1 -1
.2
1,07
0 9.
0 2.
7 3.
0 1.
0 -0
.6
1,06
2 At
tape
u 25
.9
4.5
-1.3
24
6 29
.6
12.5
-1
.2
244
15.0
4.
2 2.
4 0.
3 -0
.8
246
Xays
ombo
une
21.1
4.
6 -1
.2
226
44.0
17
.9
-1.7
22
5 5.
8 1.
1 1.
6 0.
7 -0
.3
224
(Con
tinue
d…)
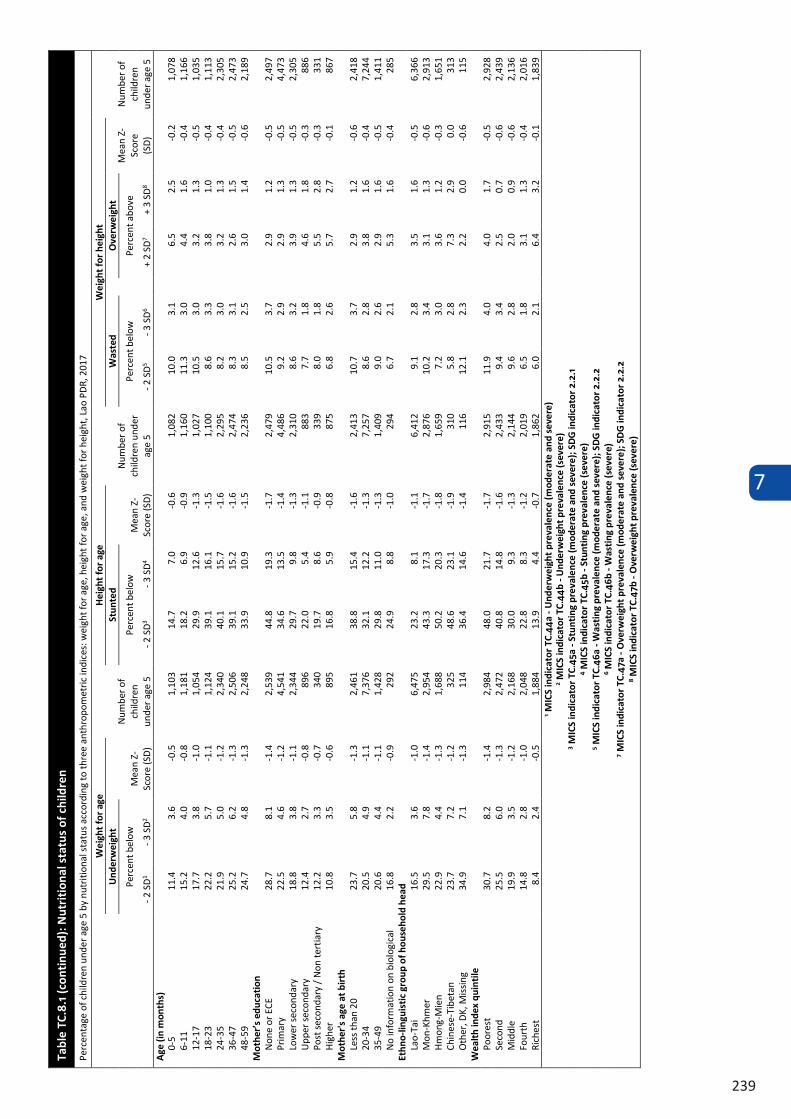
7
239
Tabl
e TC
.8.1
(con
tinu
ed):
Nut
riti
onal
sta
tus
of c
hild
ren
Perc
enta
ge o
f chi
ldre
n un
der a
ge 5
by
nutr
ition
al st
atus
acc
ordi
ng to
thre
e an
thro
pom
etric
indi
ces:
wei
ght f
or a
ge, h
eigh
t for
age
, and
wei
ght f
or h
eigh
t, La
o PD
R, 2
017
Wei
ght f
or a
ge
Num
ber o
f ch
ildre
n un
der a
ge 5
Hei
ght f
or a
ge
Num
ber o
f ch
ildre
n un
der
age
5
Wei
ght f
or h
eigh
t
Num
ber o
f ch
ildre
n un
der a
ge 5
Und
erw
eigh
t
Mea
n Z-
Scor
e (S
D)
Stun
ted
Mea
n Z-
Scor
e (S
D)
Was
ted
Ove
rwei
ght
Mea
n Z-
Scor
e (S
D)
Perc
ent b
elow
Pe
rcen
t bel
ow
Perc
ent b
elow
Pe
rcen
t abo
ve
- 2 S
D1 - 3
SD2
- 2 S
D3 - 3
SD4
- 2
SD5
- 3 S
D6 +
2 SD
7 +
3 SD
8 A
ge (i
n m
onth
s)
0-5
11.4
3.
6 -0
.5
1,10
3 14
.7
7.0
-0.6
1,
082
10.0
3.
1 6.
5 2.
5 -0
.2
1,07
8 6-
11
15.2
4.
0 -0
.8
1,18
1 18
.2
6.9
-0.9
1,
160
11.3
3.
0 4.
4 1.
6 -0
.4
1,16
6 12
-17
17.7
3.
8 -1
.0
1,05
4 29
.9
12.6
-1
.3
1,02
7 10
.5
3.0
3.2
1.3
-0.5
1,
035
18-2
3 22
.2
5.7
-1.1
1,
124
39.1
16
.1
-1.5
1,
100
8.6
3.3
3.8
1.0
-0.4
1,
113
24-3
5 21
.9
5.0
-1.2
2,
340
40.1
15
.7
-1.6
2,
295
8.2
3.0
3.2
1.3
-0.4
2,
305
36-4
7 25
.2
6.2
-1.3
2,
506
39.1
15
.2
-1.6
2,
474
8.3
3.1
2.6
1.5
-0.5
2,
473
48-5
9 24
.7
4.8
-1.3
2,
248
33.9
10
.9
-1.5
2,
236
8.5
2.5
3.0
1.4
-0.6
2,
189
Mot
her’
s ed
ucat
ion
None
or E
CE
28.7
8.
1 -1
.4
2,53
9 44
.8
19.3
-1
.7
2,47
9 10
.5
3.7
2.9
1.2
-0.5
2,
497
Prim
ary
22.5
4.
6 -1
.2
4,54
1 34
.6
13.5
-1
.4
4,48
6 9.
2 2.
9 2.
9 1.
3 -0
.5
4,47
3 Lo
wer
seco
ndar
y 18
.8
3.8
-1.1
2,
344
29.7
9.
8 -1
.3
2,31
0 8.
6 3.
2 3.
9 1.
3 -0
.5
2,30
5 Up
per s
econ
dary
12
.4
2.7
-0.8
89
6 22
.0
5.4
-1.1
88
3 7.
7 1.
8 4.
6 1.
8 -0
.3
886
Post
seco
ndar
y / N
on te
rtia
ry
12.2
3.
3 -0
.7
340
19.7
8.
6 -0
.9
339
8.0
1.8
5.5
2.8
-0.3
33
1 Hi
gher
10
.8
3.5
-0.6
89
5 16
.8
5.9
-0.8
87
5 6.
8 2.
6 5.
7 2.
7 -0
.1
867
Mot
her'
s ag
e at
bir
th
Less
than
20
23.7
5.
8 -1
.3
2,46
1 38
.8
15.4
-1
.6
2,41
3 10
.7
3.7
2.9
1.2
-0.6
2,
418
20-3
4 20
.5
4.9
-1.1
7,
376
32.1
12
.2
-1.3
7,
257
8.6
2.8
3.8
1.6
-0.4
7,
244
35-4
9 20
.6
4.4
-1.1
1,
428
29.8
11
.0
-1.3
1,
409
9.0
2.6
2.9
1.6
-0.5
1,
411
No in
form
atio
n on
bio
logi
cal
mot
her
16.8
2.
2 -0
.9
292
24.9
8.
8 -1
.0
294
6.7
2.1
5.3
1.6
-0.4
28
5 Et
hno-
lingu
isti
c gr
oup
of h
ouse
hold
hea
d La
o-Ta
i 16
.5
3.6
-1.0
6,
475
23.2
8.
1 -1
.1
6,41
2 9.
1 2.
8 3.
5 1.
6 -0
.5
6,36
6 M
on-K
hmer
29
.5
7.8
-1.4
2,
954
43.3
17
.3
-1.7
2,
876
10.2
3.
4 3.
1 1.
3 -0
.6
2,91
3 Hm
ong-
Mie
n 22
.9
4.4
-1.3
1,
688
50.2
20
.3
-1.8
1,
659
7.2
3.0
3.6
1.2
-0.3
1,
651
Chin
ese-
Tibe
tan
23.7
7.
2 -1
.2
325
48.6
23
.1
-1.9
31
0 5.
8 2.
8 7.
3 2.
9 0.
0 31
3 Ot
her,
DK, M
issin
g 34
.9
7.1
-1.3
11
4 36
.4
14.6
-1
.4
116
12.1
2.
3 2.
2 0.
0 -0
.6
115
Wea
lth
inde
x qu
inti
le
Poor
est
30.7
8.
2 -1
.4
2,98
4 48
.0
21.7
-1
.7
2,91
5 11
.9
4.0
4.0
1.7
-0.5
2,
928
Seco
nd
25.5
6.
0 -1
.3
2,47
2 40
.8
14.8
-1
.6
2,43
3 9.
4 3.
4 2.
5 0.
7 -0
.6
2,43
9 M
iddl
e 19
.9
3.5
-1.2
2,
168
30.0
9.
3 -1
.3
2,14
4 9.
6 2.
8 2.
0 0.
9 -0
.6
2,13
6 Fo
urth
14
.8
2.8
-1.0
2,
048
22.8
8.
3 -1
.2
2,01
9 6.
5 1.
8 3.
1 1.
3 -0
.4
2,01
6 Ri
ches
t 8.
4 2.
4 -0
.5
1,88
4 13
.9
4.4
-0.7
1,
862
6.0
2.1
6.4
3.2
-0.1
1,
839
1 MIC
S in
dica
tor
TC.4
4a -
Und
erw
eigh
t pre
vale
nce
(mod
erat
e an
d se
vere
) 2 M
ICS
indi
cato
r TC
.44b
- U
nder
wei
ght p
reva
lenc
e (s
ever
e)
3 MIC
S in
dica
tor
TC.4
5a -
Stun
ting
pre
vale
nce
(mod
erat
e an
d se
vere
); S
DG
indi
cato
r 2.
2.1
4 MIC
S in
dica
tor
TC.4
5b -
Stun
ting
pre
vale
nce
(sev
ere)
5 M
ICS
indi
cato
r TC
.46a
- W
asti
ng p
reva
lenc
e (m
oder
ate
and
seve
re);
SD
G in
dica
tor
2.2.
2 6 M
ICS
indi
cato
r TC
.46b
- W
asti
ng p
reva
lenc
e (s
ever
e)
7 MIC
S in
dica
tor
TC.4
7a -
Ove
rwei
ght p
reva
lenc
e (m
oder
ate
and
seve
re);
SD
G in
dica
tor
2.2.
2 8 M
ICS
indi
cato
r TC
.47b
- O
verw
eigh
t pre
vale
nce
(sev
ere)
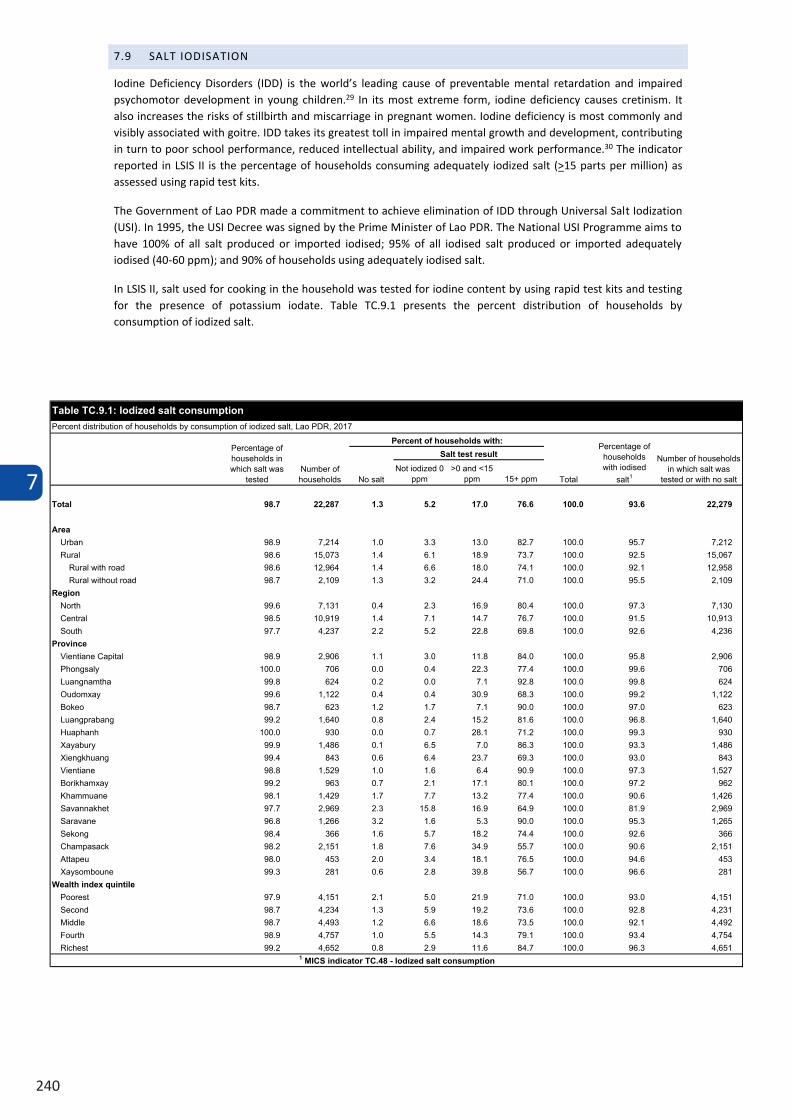
7
240
7.9 SALT IODISATION
Iodine Deficiency Disorders (IDD) is the world’s leading cause of preventable mental retardation and impaired psychomotor development in young children.29 In its most extreme form, iodine deficiency causes cretinism. It also increases the risks of stillbirth and miscarriage in pregnant women. Iodine deficiency is most commonly and visibly associated with goitre. IDD takes its greatest toll in impaired mental growth and development, contributing in turn to poor school performance, reduced intellectual ability, and impaired work performance.30 The indicator reported in LSIS II is the percentage of households consuming adequately iodized salt (>15 parts per million) as assessed using rapid test kits.
The Government of Lao PDR made a commitment to achieve elimination of IDD through Universal Salt Iodization (USI). In 1995, the USI Decree was signed by the Prime Minister of Lao PDR. The National USI Programme aims to have 100% of all salt produced or imported iodised; 95% of all iodised salt produced or imported adequately iodised (40-60 ppm); and 90% of households using adequately iodised salt.
In LSIS II, salt used for cooking in the household was tested for iodine content by using rapid test kits and testing for the presence of potassium iodate. Table TC.9.1 presents the percent distribution of households by consumption of iodized salt.
Table TC.9.1: Iodized salt consumption
Percent distribution of households by consumption of iodized salt, Lao PDR, 2017
Percentage of households in
which salt was tested
Number of households
Percent of households with:
Total
Percentage of households with
iodised salt1
Number of households in which salt was tested or with no
salt No salt
Salt test result
Not iodized 0 ppm
>0 and <15 ppm
15+ ppm
Total 98.7 22,287 1.3 9.6 14.1 75.1 100.0 89.2 22,279
Area Urban 98.9 7,214 1.0 6.7 11.0 81.2 100.0 92.2 7,212 Rural 98.6 15,073 1.4 10.9 15.6 72.1 100.0 87.7 15,067
Rural with road 98.6 12,964 1.4 10.8 15.3 72.6 100.0 87.9 12,958 Rural without road 98.7 2,109 1.3 11.8 17.7 69.1 100.0 86.8 2,109
Region North 99.6 7,131 0.4 9.0 12.4 78.2 100.0 90.6 7,130 Central 98.5 10,919 1.4 10.3 12.7 75.5 100.0 88.3 10,913 South 97.7 4,237 2.2 8.5 20.6 68.6 100.0 89.3 4,236
Province Vientiane Capital 98.9 2,906 1.1 6.4 9.8 82.7 100.0 92.5 2,906 Phongsaly 100.0 706 0.0 1.7 21.1 77.2 100.0 98.3 706 Luangnamtha 99.8 624 0.2 0.6 6.7 92.5 100.0 99.2 624 Oudomxay 99.6 1,122 0.4 4.8 27.2 67.6 100.0 94.9 1,122 Bokeo 98.7 623 1.2 9.6 5.4 83.8 100.0 89.2 623 Luangprabang 99.2 1,640 0.8 7.3 12.5 79.3 100.0 91.8 1,640 Huaphanh 100.0 930 0.0 27.6 7.7 64.7 100.0 72.4 930 Xayabury 99.9 1,486 0.1 9.3 5.1 85.5 100.0 90.5 1,486 Xiengkhuang 99.4 843 0.6 11.8 18.8 68.8 100.0 87.6 843 Vientiane 98.8 1,529 1.0 2.9 6.1 89.9 100.0 96.1 1,527 Borikhamxay 99.2 963 0.7 6.7 13.8 78.7 100.0 92.5 962 Khammuane 98.1 1,429 1.7 10.0 11.5 76.8 100.0 88.3 1,426 Savannakhet 97.7 2,969 2.3 19.3 15.1 63.2 100.0 78.3 2,969 Saravane 96.8 1,266 3.2 5.2 3.6 88.0 100.0 91.6 1,265 Sekong 98.4 366 1.6 11.4 16.6 70.3 100.0 87.0 366 Champasack 98.2 2,151 1.8 10.9 32.0 55.3 100.0 87.3 2,151 Attapeu 98.0 453 2.0 4.3 17.5 76.3 100.0 93.8 453 Xaysomboune 99.3 281 0.6 5.0 38.3 56.0 100.0 94.3 281
Wealth index quintile Poorest 97.9 4,151 2.1 10.9 18.3 68.8 100.0 87.0 4,151 Second 98.7 4,234 1.3 10.9 15.7 72.2 100.0 87.9 4,231 Middle 98.7 4,493 1.2 10.0 16.0 72.7 100.0 88.7 4,492 Fourth 98.9 4,757 1.0 9.7 11.7 77.6 100.0 89.3 4,754 Richest 99.2 4,652 0.8 6.6 9.6 83.0 100.0 92.6 4,651
1 MICS indicator TC.48 - Iodized salt consumption
29 ICCIDD, UNICEF, WHO. Assessment of iodine deficiency disorders and monitoring their elimination: a guide for programme managers. Geneva: WHO Press (2007). http://apps.who.int/iris/bitstream/handle/10665/43781/9789241595827_eng.pdf?sequence=130 Zimmermann M.B. “The role of iodine in human growth and development.” Seminars in Cell & Developmental Biology 22, (2011): 645-652. doi: 10.1016/j.semcdb.2011.07.009
Not iodized 0 ppm
>0 and <15 ppm 15+ ppm
Total 98.7 22,287 1.3 5.2 17.0 76.6 100.0 93.6 22,279
AreaUrban 98.9 7,214 1.0 3.3 13.0 82.7 100.0 95.7 7,212Rural 98.6 15,073 1.4 6.1 18.9 73.7 100.0 92.5 15,067
Rural with road 98.6 12,964 1.4 6.6 18.0 74.1 100.0 92.1 12,958Rural without road 98.7 2,109 1.3 3.2 24.4 71.0 100.0 95.5 2,109
RegionNorth 99.6 7,131 0.4 2.3 16.9 80.4 100.0 97.3 7,130Central 98.5 10,919 1.4 7.1 14.7 76.7 100.0 91.5 10,913South 97.7 4,237 2.2 5.2 22.8 69.8 100.0 92.6 4,236
ProvinceVientiane Capital 98.9 2,906 1.1 3.0 11.8 84.0 100.0 95.8 2,906Phongsaly 100.0 706 0.0 0.4 22.3 77.4 100.0 99.6 706Luangnamtha 99.8 624 0.2 0.0 7.1 92.8 100.0 99.8 624Oudomxay 99.6 1,122 0.4 0.4 30.9 68.3 100.0 99.2 1,122Bokeo 98.7 623 1.2 1.7 7.1 90.0 100.0 97.0 623Luangprabang 99.2 1,640 0.8 2.4 15.2 81.6 100.0 96.8 1,640Huaphanh 100.0 930 0.0 0.7 28.1 71.2 100.0 99.3 930Xayabury 99.9 1,486 0.1 6.5 7.0 86.3 100.0 93.3 1,486Xiengkhuang 99.4 843 0.6 6.4 23.7 69.3 100.0 93.0 843Vientiane 98.8 1,529 1.0 1.6 6.4 90.9 100.0 97.3 1,527Borikhamxay 99.2 963 0.7 2.1 17.1 80.1 100.0 97.2 962Khammuane 98.1 1,429 1.7 7.7 13.2 77.4 100.0 90.6 1,426Savannakhet 97.7 2,969 2.3 15.8 16.9 64.9 100.0 81.9 2,969Saravane 96.8 1,266 3.2 1.6 5.3 90.0 100.0 95.3 1,265Sekong 98.4 366 1.6 5.7 18.2 74.4 100.0 92.6 366Champasack 98.2 2,151 1.8 7.6 34.9 55.7 100.0 90.6 2,151Attapeu 98.0 453 2.0 3.4 18.1 76.5 100.0 94.6 453Xaysomboune 99.3 281 0.6 2.8 39.8 56.7 100.0 96.6 281
Wealth index quintilePoorest 97.9 4,151 2.1 5.0 21.9 71.0 100.0 93.0 4,151Second 98.7 4,234 1.3 5.9 19.2 73.6 100.0 92.8 4,231Middle 98.7 4,493 1.2 6.6 18.6 73.5 100.0 92.1 4,492Fourth 98.9 4,757 1.0 5.5 14.3 79.1 100.0 93.4 4,754Richest 99.2 4,652 0.8 2.9 11.6 84.7 100.0 96.3 4,651
Percent distribution of households by consumption of iodized salt, Lao PDR, 2017
Percentage of households with iodised
salt1
Table TC.9.1: Iodized salt consumption
Salt test result Number of households in which salt was
tested or with no salt
Percentage of households in which salt was
testedNumber of households
1 MICS indicator TC.48 - Iodized salt consumption
Percent of households with:
No salt Total
7
241
7.10 EARLY CHILDHOOD DEVELOPMENT
It is well recognized that a period of rapid brain development occurs in the first years of life, and the quality of children’s home environment and their interactions with caregivers is a major determinant of their development during this period. 31 Children’s early experiences with responsive caregiving serves an important neurological function and these interactions can boost cognitive, physical, social and emotional development.32 In this context, engagement of adults in activities with children, presence of books and playthings in the home for the child, and the conditions of care are important indicators.
Information on a number of activities that provide children with early stimulation and responsive care was collected in the survey. These included the involvement of adults in the household with children in the following activities: reading books or looking at picture books, telling stories, singing songs, taking children outside the home, compound or yard, playing with children, and spending time with children naming, counting, or drawing things.
31 Black, Maureen M., et al., Early Childhood Development Coming of Age: Science through the life course, The Lancet, series 0140-6736, no. 16, 4 October 2016; Shonkoff, Jack P., et al., The Lifelong Effects of Early Childhood Adversity and Toxic Stress, Pediatrics, vol. 129, no. 1, January 2012, pp. 232–246. 32 Britto, Pia R., et al., Nurturing Care: Promoting early childhood development, The Lancet, vol. 389, no. 10064, January 2017, pp. 91–102; Milteer, Regina M., et al., The Importance of Play in Promoting Healthy Child Development and Maintaining Strong
Parent-Child Bond: Focus on children in poverty’ American Academy of Pediatrics, vol. 1129, no. 1, January 2012, pp. 183–191,
Exposure to books in early years not only provides children with greater understanding of the nature of print, but may also give them opportunities to see others reading, such as older siblings doing school work. Presence of books is important for later school performance. The mothers/caretakers of all children under 5 were asked about the number of children’s books or picture books they have for the child, and the types of playthings that are available at home.
Some research has found that leaving children without adequate supervision is a risk factor for unintentional injuries.33 In LSIS II, two questions were asked to find out whether children age 0-59 months were left alone during the week preceding the interview, and whether children were left in the care of other children under 10 years of age.
33 L. D. Howe, S. R. A. Huttly and T. Abramsky, Risk Factors for Injuries in Young Children in Four Developing Countries: The
Young Lives Study, Tropical Medicine and International Health, vol. 11, No. 10, October 2006, pp. 1557-1566; Morrongiello Barbara A., Michael Corbett, Meghan McCourt, and Natalie Johnston, Understanding Unintentional Injury Risk in Young
Children II. The Contribution of Caregiver Supervision, Child Attributes, and Parent Attributes, Journal of Pediatric Psychology, vol. 31, No. 6, 2006, pp. 540-551.
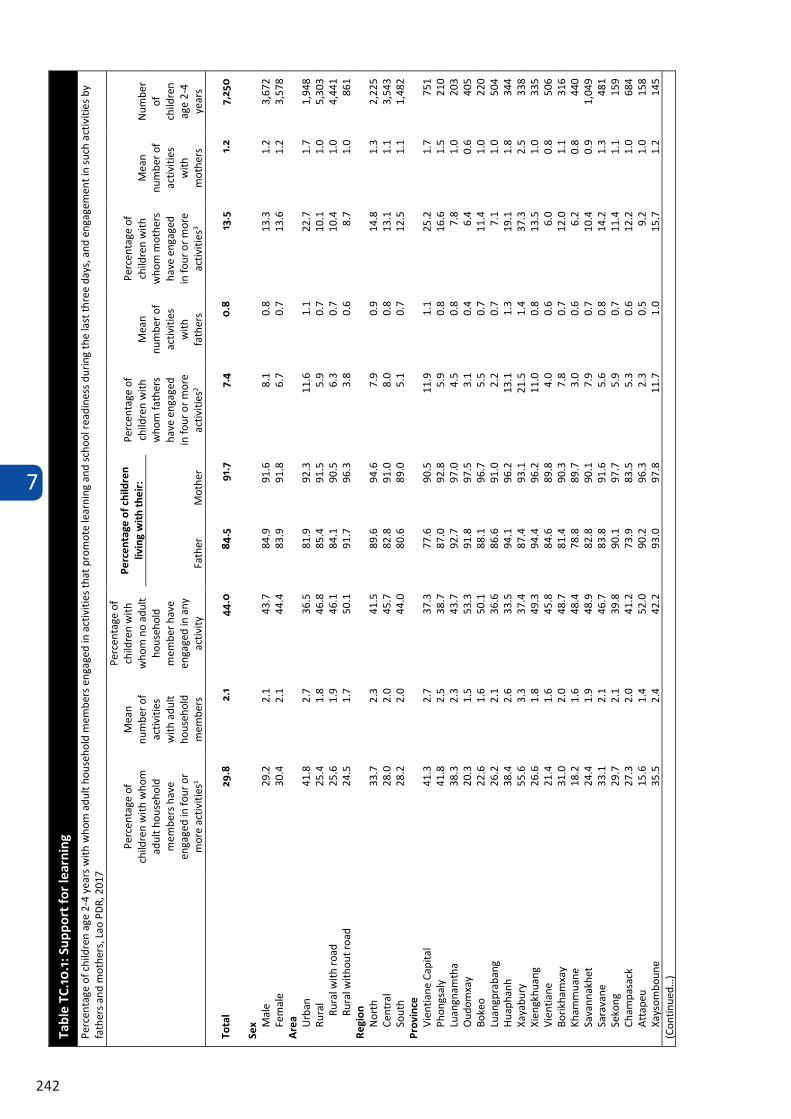
7
242
7.10 EARLY CHILDHOOD DEVELOPMENT
It is well recognized that a period of rapid brain development occurs in the first years of life, and the quality of children’s home environment and their interactions with caregivers is a major determinant of their development during this period. 31 Children’s early experiences with responsive caregiving serves an important neurological function and these interactions can boost cognitive, physical, social and emotional development.32 In this context, engagement of adults in activities with children, presence of books and playthings in the home for the child, and the conditions of care are important indicators.
Information on a number of activities that provide children with early stimulation and responsive care was collected in the survey. These included the involvement of adults in the household with children in the following activities: reading books or looking at picture books, telling stories, singing songs, taking children outside the home, compound or yard, playing with children, and spending time with children naming, counting, or drawing things.
31 Black, Maureen M., et al., Early Childhood Development Coming of Age: Science through the life course, The Lancet, series 0140-6736, no. 16, 4 October 2016; Shonkoff, Jack P., et al., The Lifelong Effects of Early Childhood Adversity and Toxic Stress, Pediatrics, vol. 129, no. 1, January 2012, pp. 232–246. 32 Britto, Pia R., et al., Nurturing Care: Promoting early childhood development, The Lancet, vol. 389, no. 10064, January 2017, pp. 91–102; Milteer, Regina M., et al., The Importance of Play in Promoting Healthy Child Development and Maintaining Strong
Parent-Child Bond: Focus on children in poverty’ American Academy of Pediatrics, vol. 1129, no. 1, January 2012, pp. 183–191,
Exposure to books in early years not only provides children with greater understanding of the nature of print, but may also give them opportunities to see others reading, such as older siblings doing school work. Presence of books is important for later school performance. The mothers/caretakers of all children under 5 were asked about the number of children’s books or picture books they have for the child, and the types of playthings that are available at home.
Some research has found that leaving children without adequate supervision is a risk factor for unintentional injuries.33 In LSIS II, two questions were asked to find out whether children age 0-59 months were left alone during the week preceding the interview, and whether children were left in the care of other children under 10 years of age.
33 L. D. Howe, S. R. A. Huttly and T. Abramsky, Risk Factors for Injuries in Young Children in Four Developing Countries: The
Young Lives Study, Tropical Medicine and International Health, vol. 11, No. 10, October 2006, pp. 1557-1566; Morrongiello Barbara A., Michael Corbett, Meghan McCourt, and Natalie Johnston, Understanding Unintentional Injury Risk in Young
Children II. The Contribution of Caregiver Supervision, Child Attributes, and Parent Attributes, Journal of Pediatric Psychology, vol. 31, No. 6, 2006, pp. 540-551.
Tabl
e TC
.10
.1: S
uppo
rt fo
r le
arni
ng
Perc
enta
ge o
f chi
ldre
n ag
e 2-
4 ye
ars w
ith w
hom
adu
lt ho
useh
old
mem
bers
eng
aged
in a
ctiv
ities
that
pro
mot
e le
arni
ng a
nd sc
hool
read
ines
s dur
ing
the
last
thre
e da
ys, a
nd e
ngag
emen
t in
such
act
iviti
es b
y fa
ther
s and
mot
hers
, Lao
PDR
, 201
7
Perc
enta
ge o
f ch
ildre
n w
ith w
hom
ad
ult h
ouse
hold
m
embe
rs h
ave
enga
ged
in fo
ur o
r m
ore
activ
ities
1
Mea
n nu
mbe
r of
activ
ities
w
ith a
dult
hous
ehol
d m
embe
rs
Perc
enta
ge o
f ch
ildre
n w
ith
who
m n
o ad
ult
hous
ehol
d m
embe
r hav
e en
gage
d in
any
ac
tivity
Perc
enta
ge o
f chi
ldre
n liv
ing
wit
h th
eir:
Pe
rcen
tage
of
child
ren
with
w
hom
fath
ers
have
eng
aged
in
four
or m
ore
activ
ities
2
Mea
n nu
mbe
r of
activ
ities
w
ith
fath
ers
Perc
enta
ge o
f ch
ildre
n w
ith
who
m m
othe
rs
have
eng
aged
in
four
or m
ore
activ
ities
3
Mea
n nu
mbe
r of
activ
ities
w
ith
mot
hers
Num
ber
of
child
ren
age
2-4
year
s Fa
ther
M
othe
r
Tota
l 29
.8
2.1
44.0
84
.5
91.7
7.
4 0
.8
13.5
1.
2 7,
250
Sex M
ale
29.2
2.
1 43
.7
84.9
91
.6
8.1
0.8
13.3
1.
2 3,
672
Fem
ale
30.4
2.
1 44
.4
83.9
91
.8
6.7
0.7
13.6
1.
2 3,
578
Are
a Urba
n 41
.8
2.7
36.5
81
.9
92.3
11
.6
1.1
22.7
1.
7 1,
948
Rura
l 25
.4
1.8
46.8
85
.4
91.5
5.
9 0.
7 10
.1
1.0
5,30
3 Ru
ral w
ith ro
ad
25.6
1.
9 46
.1
84.1
90
.5
6.3
0.7
10.4
1.
0 4,
441
Rura
l with
out r
oad
24.5
1.
7 50
.1
91.7
96
.3
3.8
0.6
8.7
1.0
861
Regi
on
Nort
h 33
.7
2.3
41.5
89
.6
94.6
7.
9 0.
9 14
.8
1.3
2,22
5 Ce
ntra
l 28
.0
2.0
45.7
82
.8
91.0
8.
0 0.
8 13
.1
1.1
3,54
3 So
uth
28.2
2.
0 44
.0
80.6
89
.0
5.1
0.7
12.5
1.
1 1,
482
Prov
ince
Vi
entia
ne C
apita
l 41
.3
2.7
37.3
77
.6
90.5
11
.9
1.1
25.2
1.
7 75
1 Ph
ongs
aly
41
.8
2.5
38.7
87
.0
92.8
5.
9 0.
8 16
.6
1.5
210
Luan
gnam
tha
38.3
2.
3 43
.7
92.7
97
.0
4.5
0.8
7.8
1.0
203
Oudo
mxa
y 20
.3
1.5
53.3
91
.8
97.5
3.
1 0.
4 6.
4 0.
6 40
5 Bo
keo
22.6
1.
6 50
.1
88.1
96
.7
5.5
0.7
11.4
1.
0 22
0 Lu
angp
raba
ng
26.2
2.
1 36
.6
86.6
91
.0
2.2
0.7
7.1
1.0
504
Huap
hanh
38
.4
2.6
33.5
94
.1
96.2
13
.1
1.3
19.1
1.
8 34
4 Xa
yabu
ry
55.6
3.
3 37
.4
87.4
93
.1
21.5
1.
4 37
.3
2.5
338
Xien
gkhu
ang
26.6
1.
8 49
.3
94.4
96
.2
11.0
0.
8 13
.5
1.0
335
Vien
tiane
21
.4
1.6
45.8
84
.6
89.8
4.
0 0.
6 6.
0 0.
8 50
6 Bo
rikha
mxa
y 31
.0
2.0
48.7
81
.4
90.3
7.
8 0.
7 12
.0
1.1
316
Kham
mua
ne
18.2
1.
6 48
.4
78.8
89
.7
3.0
0.6
6.2
0.8
440
Sava
nnak
het
24.4
1.
9 48
.9
82.8
90
.1
7.9
0.7
10.4
0.
9 1,
049
Sara
vane
33
.1
2.1
46.7
83
.8
91.6
5.
6 0.
8 14
.2
1.3
481
Seko
ng
29.7
2.
1 39
.8
90.1
97
.7
5.9
0.7
11.4
1.
1 15
9 Ch
ampa
sack
27
.3
2.0
41.2
73
.9
83.5
5.
3 0.
6 12
.2
1.0
684
Atta
peu
15.6
1.
4 52
.0
90.2
96
.3
2.3
0.5
9.2
1.0
158
Xays
ombo
une
35.5
2.
4 42
.2
93.0
97
.8
11.7
1.
0 15
.7
1.2
145
(Con
tinue
d…)
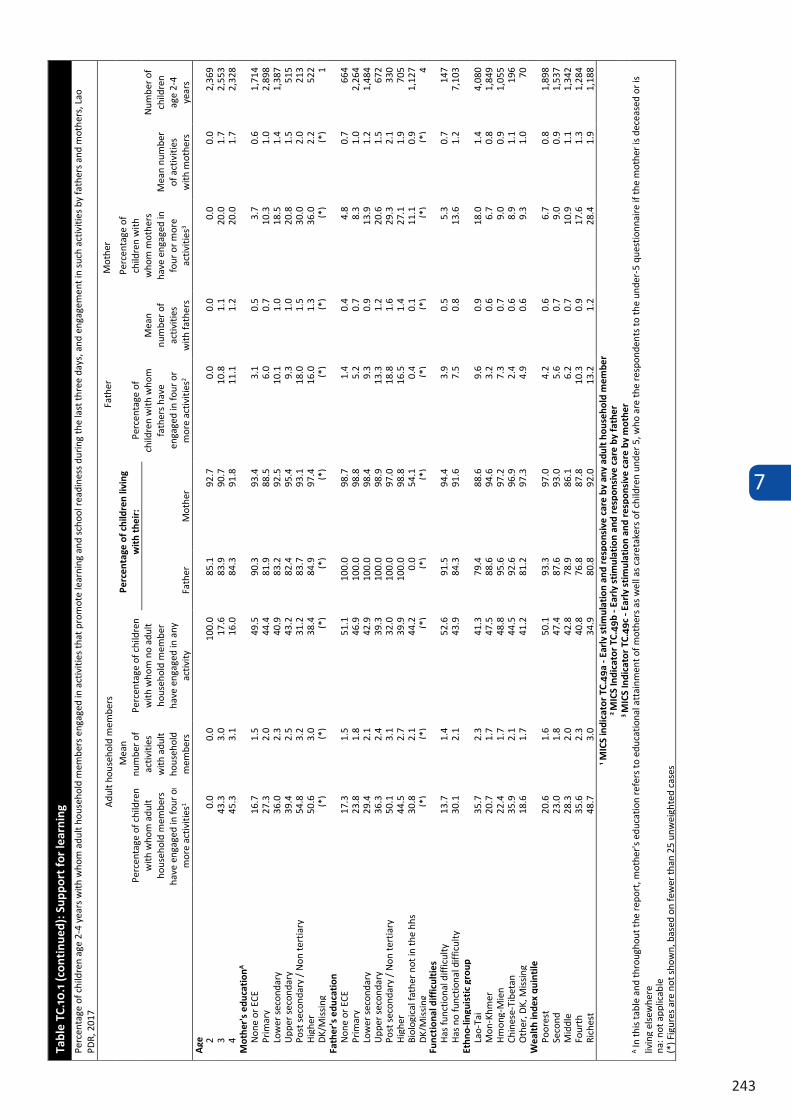
7
243
Adul
t hou
seho
ld m
embe
rs
Fath
er
Mot
her
Tabl
e TC
.10
.1 (c
onti
nued
): S
uppo
rt fo
r le
arni
ng
Perc
enta
ge o
f chi
ldre
n ag
e 2-
4 ye
ars w
ith w
hom
adu
lt ho
useh
old
mem
bers
eng
aged
in a
ctiv
ities
that
pro
mot
e le
arni
ng a
nd sc
hool
read
ines
s dur
ing
the
last
thre
e da
ys, a
nd e
ngag
emen
t in
such
act
iviti
es b
y fa
ther
s and
mot
hers
, Lao
PD
R, 2
017
Perc
enta
ge o
f chi
ldre
n w
ith w
hom
adu
lt ho
useh
old
mem
bers
ha
ve e
ngag
ed in
four
or
mor
e ac
tiviti
es1
Mea
n nu
mbe
r of
activ
ities
w
ith a
dult
hous
ehol
d m
embe
rs
Perc
enta
ge o
f chi
ldre
n w
ith w
hom
no
adul
t ho
useh
old
mem
ber
have
eng
aged
in a
ny
activ
ity
Perc
enta
ge o
f chi
ldre
n liv
ing
wit
h th
eir:
Pe
rcen
tage
of
child
ren
with
who
m
fath
ers h
ave
enga
ged
in fo
ur o
r m
ore
activ
ities
2
Mea
n nu
mbe
r of
activ
ities
w
ith fa
ther
s
Perc
enta
ge o
f ch
ildre
n w
ith
who
m m
othe
rs
have
eng
aged
in
four
or m
ore
activ
ities
3
Mea
n nu
mbe
r of
act
iviti
es
with
mot
hers
Num
ber o
f ch
ildre
n ag
e 2-
4 ye
ars
Fath
er
Mot
her
Age
2 0.
0 0.
0 10
0.0
85.1
92
.7
0.0
0.0
0.0
0.0
2,36
9 3
43.3
3.
0 17
.6
83.9
90
.7
10.8
1.
1 20
.0
1.7
2,55
3 4
45.3
3.
1 16
.0
84.3
91
.8
11.1
1.
2 20
.0
1.7
2,32
8 M
othe
r's
educ
atio
nA
None
or E
CE
16.7
1.
5 49
.5
90.3
93
.4
3.1
0.5
3.7
0.6
1,71
4 Pr
imar
y 27
.3
2.0
44.4
81
.9
88.5
6.
0 0.
7 10
.3
1.0
2,89
8 Lo
wer
seco
ndar
y 36
.0
2.3
40.9
83
.2
92.5
10
.1
1.0
18.5
1.
4 1,
387
Uppe
r sec
onda
ry
39.4
2.
5 43
.2
82.4
95
.4
9.3
1.0
20.8
1.
5 51
5 Po
st se
cond
ary
/ Non
tert
iary
54
.8
3.2
31.2
83
.7
93.1
18
.0
1.5
30.0
2.
0 21
3 Hi
gher
50
.6
3.0
38.4
84
.9
97.4
16
.0
1.3
36.0
2.
2 52
2 DK
/Miss
ing
(*)
(*)
(*)
(*)
(*)
(*)
(*)
(*)
(*)
1 Fa
ther
's e
duca
tion
No
ne o
r ECE
17
.3
1.5
51.1
10
0.0
98.7
1.
4 0.
4 4.
8 0.
7 66
4 Pr
imar
y 23
.8
1.8
46.9
10
0.0
98.8
5.
2 0.
7 8.
3 1.
0 2,
264
Low
er se
cond
ary
29.4
2.
1 42
.9
100.
0 98
.4
9.3
0.9
13.9
1.
2 1,
484
Uppe
r sec
onda
ry
36.3
2.
4 39
.3
100.
0 98
.9
13.3
1.
2 20
.6
1.5
672
Post
seco
ndar
y / N
on te
rtia
ry
50.1
3.
1 32
.0
100.
0 97
.0
18.8
1.
6 29
.3
2.1
330
High
er
44.5
2.
7 39
.9
100.
0 98
.8
16.5
1.
4 27
.1
1.9
705
Biol
ogica
l fat
her n
ot in
the
hhs
hous
eho
useh
old
30.8
2.
1 44
.2
0.0
54.1
0.
4 0.
1 11
.1
0.9
1,12
7 DK
/Miss
ing
(*)
(*)
(*)
(*)
(*)
(*)
(*)
(*)
(*)
4Fu
ncti
onal
diff
icul
ties
Ha
s fun
ctio
nal d
ifficu
lty
13.7
1.
4 52
.6
91.5
94
.4
3.9
0.5
5.3
0.7
147
Has n
o fu
nctio
nal d
ifficu
lty
30.1
2.
1 43
.9
84.3
91
.6
7.5
0.8
13.6
1.
2 7,
103
Ethn
o-lin
guis
tic
grou
p
of h
ouse
hold
hea
dLa
o-Ta
i 35
.7
2.3
41.3
79
.4
88.6
9.
6 0.
9 18
.0
1.4
4,08
0 M
on-K
hmer
20
.7
1.7
47.5
88
.6
94.6
3.
2 0.
6 6.
7 0.
8 1,
849
Hmon
g-M
ien
22.4
1.
7 48
.8
95.6
97
.2
7.3
0.7
9.0
0.9
1,05
5 Ch
ines
e-Ti
beta
n 35
.9
2.1
44.5
92
.6
96.9
2.
4 0.
6 8.
9 1.
1 19
6 Ot
her,
DK, M
issin
g 18
.6
1.7
41.2
81
.2
97.3
4.
9 0.
6 9.
3 1.
0 70
W
ealt
h in
dex
quin
tile
Po
ores
t 20
.6
1.6
50.1
93
.3
97.0
4.
2 0.
6 6.
7 0.
8 1,
898
Seco
nd
23.0
1.
8 47
.4
87.6
93
.0
5.6
0.7
9.0
0.9
1,53
7 M
iddl
e 28
.3
2.0
42.8
78
.9
86.1
6.
2 0.
7 10
.9
1.1
1,34
2 Fo
urth
35
.6
2.3
40.8
76
.8
87.8
10
.3
0.9
17.6
1.
3 1,
284
Rich
est
48.7
3.
0 34
.9
80.8
92
.0
13.2
1.
2 28
.4
1.9
1,18
8 1 M
ICS
indi
cato
r TC
.49a
- Ea
rly
stim
ulat
ion
and
resp
onsi
ve c
are
by a
ny a
dult
hou
seho
ld m
embe
r 2 M
ICS
Indi
cato
r TC
.49b
- Ea
rly
stim
ulat
ion
and
resp
onsi
ve c
are
by fa
ther
3 M
ICS
Indi
cato
r TC
.49c
- Ea
rly
stim
ulat
ion
and
resp
onsi
ve c
are
by m
othe
r A I
n th
is ta
ble
and
thro
ugho
ut th
e re
port
, mot
her's
edu
catio
n re
fers
to e
duca
tiona
l atta
inm
ent o
f mot
hers
as w
ell a
s car
etak
ers o
f chi
ldre
n un
der 5
, who
are
the
resp
onde
nts t
o th
e un
der-
5 qu
estio
nnai
re if
the
mot
her i
s dec
ease
d or
is
livin
g el
sew
here
na
: not
app
licab
le
(*) F
igur
es a
re n
ot sh
own,
bas
ed o
n fe
wer
than
25
unw
eigh
ted
case
s
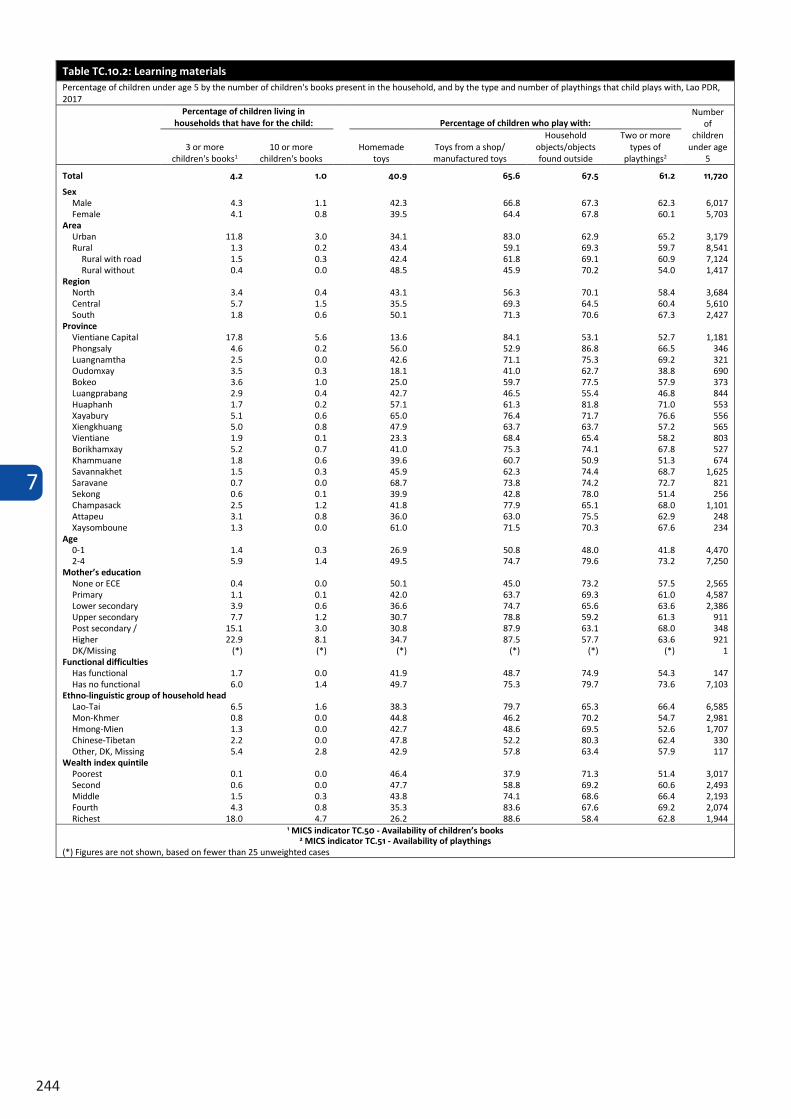
7
244
Table TC.10.2: Learning materials Percentage of children under age 5 by the number of children's books present in the household, and by the type and number of playthings that child plays with, Lao PDR, 2017
Percentage of children living in households that have for the child: Percentage of children who play with:
Number of
children under age
5 3 or more
children's books1 10 or more
children's books Homemade
toys Toys from a shop/ manufactured toys
Household objects/objects found outside
Two or more types of
playthings2
Total 4.2 1.0 40.9 65.6 67.5 61.2 11,720
Sex Male 4.3 1.1 42.3 66.8 67.3 62.3 6,017 Female 4.1 0.8 39.5 64.4 67.8 60.1 5,703
Area Urban 11.8 3.0 34.1 83.0 62.9 65.2 3,179 Rural 1.3 0.2 43.4 59.1 69.3 59.7 8,541
Rural with road 1.5 0.3 42.4 61.8 69.1 60.9 7,124 Rural without
road0.4 0.0 48.5 45.9 70.2 54.0 1,417
Region North 3.4 0.4 43.1 56.3 70.1 58.4 3,684 Central 5.7 1.5 35.5 69.3 64.5 60.4 5,610 South 1.8 0.6 50.1 71.3 70.6 67.3 2,427
Province Vientiane Capital 17.8 5.6 13.6 84.1 53.1 52.7 1,181 Phongsaly 4.6 0.2 56.0 52.9 86.8 66.5 346 Luangnamtha 2.5 0.0 42.6 71.1 75.3 69.2 321 Oudomxay 3.5 0.3 18.1 41.0 62.7 38.8 690 Bokeo 3.6 1.0 25.0 59.7 77.5 57.9 373 Luangprabang 2.9 0.4 42.7 46.5 55.4 46.8 844 Huaphanh 1.7 0.2 57.1 61.3 81.8 71.0 553 Xayabury 5.1 0.6 65.0 76.4 71.7 76.6 556 Xiengkhuang 5.0 0.8 47.9 63.7 63.7 57.2 565 Vientiane 1.9 0.1 23.3 68.4 65.4 58.2 803 Borikhamxay 5.2 0.7 41.0 75.3 74.1 67.8 527 Khammuane 1.8 0.6 39.6 60.7 50.9 51.3 674 Savannakhet 1.5 0.3 45.9 62.3 74.4 68.7 1,625 Saravane 0.7 0.0 68.7 73.8 74.2 72.7 821 Sekong 0.6 0.1 39.9 42.8 78.0 51.4 256 Champasack 2.5 1.2 41.8 77.9 65.1 68.0 1,101 Attapeu 3.1 0.8 36.0 63.0 75.5 62.9 248 Xaysomboune 1.3 0.0 61.0 71.5 70.3 67.6 234
Age 0-1 1.4 0.3 26.9 50.8 48.0 41.8 4,470 2-4 5.9 1.4 49.5 74.7 79.6 73.2 7,250
Mother’s education None or ECE 0.4 0.0 50.1 45.0 73.2 57.5 2,565 Primary 1.1 0.1 42.0 63.7 69.3 61.0 4,587 Lower secondary 3.9 0.6 36.6 74.7 65.6 63.6 2,386 Upper secondary 7.7 1.2 30.7 78.8 59.2 61.3 911 Post secondary /
Non tertiary15.1 3.0 30.8 87.9 63.1 68.0 348
Higher 22.9 8.1 34.7 87.5 57.7 63.6 921 DK/Missing (*) (*) (*) (*) (*) (*) 1
Functional difficulties (age 2-4 years)Has functional difficulty
1.7 0.0 41.9 48.7 74.9 54.3 147 Has no functional
difficulty6.0 1.4 49.7 75.3 79.7 73.6 7,103
Ethno-linguistic group of household head Lao-Tai 6.5 1.6 38.3 79.7 65.3 66.4 6,585 Mon-Khmer 0.8 0.0 44.8 46.2 70.2 54.7 2,981 Hmong-Mien 1.3 0.0 42.7 48.6 69.5 52.6 1,707 Chinese-Tibetan 2.2 0.0 47.8 52.2 80.3 62.4 330 Other, DK, Missing 5.4 2.8 42.9 57.8 63.4 57.9 117
Wealth index quintile Poorest 0.1 0.0 46.4 37.9 71.3 51.4 3,017 Second 0.6 0.0 47.7 58.8 69.2 60.6 2,493 Middle 1.5 0.3 43.8 74.1 68.6 66.4 2,193 Fourth 4.3 0.8 35.3 83.6 67.6 69.2 2,074 Richest 18.0 4.7 26.2 88.6 58.4 62.8 1,944
1 MICS indicator TC.50 - Availability of children’s books 2 MICS indicator TC.51 - Availability of playthings
(*) Figures are not shown, based on fewer than 25 unweighted cases
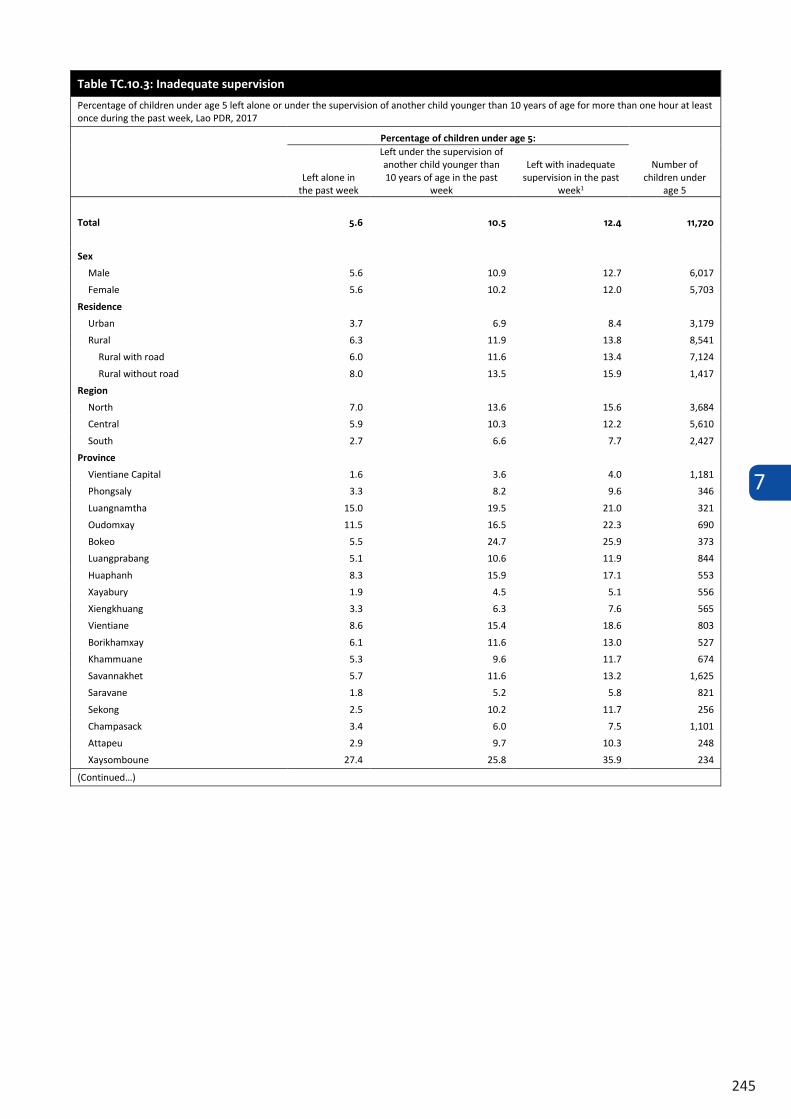
7
245
Table TC.10.3: Inadequate supervision
Percentage of children under age 5 left alone or under the supervision of another child younger than 10 years of age for more than one hour at least once during the past week, Lao PDR, 2017
Percentage of children under age 5:
Number of children under
age 5 Left alone in
the past week
Left under the supervision of another child younger than 10 years of age in the past
week
Left with inadequate supervision in the past
week1
Total 5.6 10.5 12.4 11,720
Sex
Male 5.6 10.9 12.7 6,017 Female 5.6 10.2 12.0 5,703
Residence
Urban 3.7 6.9 8.4 3,179 Rural 6.3 11.9 13.8 8,541
Rural with road 6.0 11.6 13.4 7,124 Rural without road 8.0 13.5 15.9 1,417
Region
North 7.0 13.6 15.6 3,684 Central 5.9 10.3 12.2 5,610 South 2.7 6.6 7.7 2,427
Province
Vientiane Capital 1.6 3.6 4.0 1,181 Phongsaly 3.3 8.2 9.6 346 Luangnamtha 15.0 19.5 21.0 321 Oudomxay 11.5 16.5 22.3 690 Bokeo 5.5 24.7 25.9 373 Luangprabang 5.1 10.6 11.9 844 Huaphanh 8.3 15.9 17.1 553 Xayabury 1.9 4.5 5.1 556 Xiengkhuang 3.3 6.3 7.6 565 Vientiane 8.6 15.4 18.6 803 Borikhamxay 6.1 11.6 13.0 527 Khammuane 5.3 9.6 11.7 674 Savannakhet 5.7 11.6 13.2 1,625 Saravane 1.8 5.2 5.8 821 Sekong 2.5 10.2 11.7 256 Champasack 3.4 6.0 7.5 1,101 Attapeu 2.9 9.7 10.3 248 Xaysomboune 27.4 25.8 35.9 234
(Continued…)
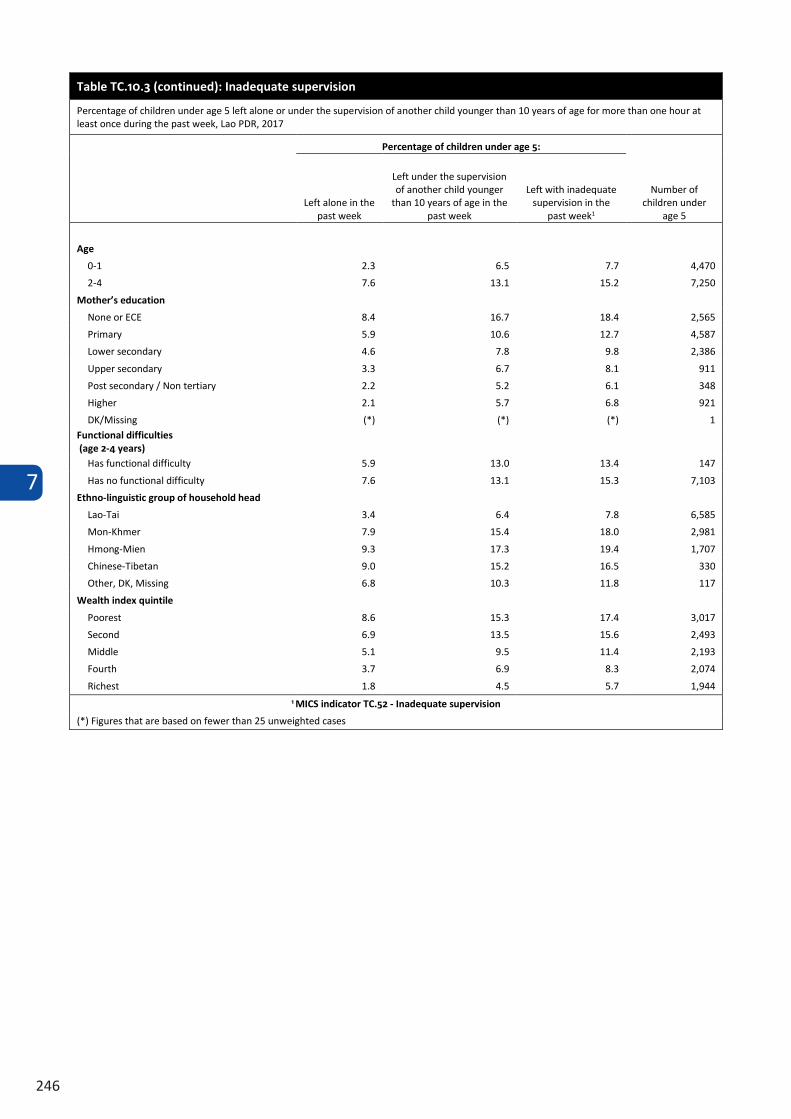
7
246
Table TC.10.3 (continued): Inadequate supervision
Percentage of children under age 5 left alone or under the supervision of another child younger than 10 years of age for more than one hour at least once during the past week, Lao PDR, 2017
Percentage of children under age 5:
Number of children under
age 5 Left alone in the
past week
Left under the supervision of another child younger
than 10 years of age in the past week
Left with inadequate supervision in the
past week1
Age
0-1 2.3 6.5 7.7 4,470 2-4 7.6 13.1 15.2 7,250
Mother’s education
None or ECE 8.4 16.7 18.4 2,565 Primary 5.9 10.6 12.7 4,587 Lower secondary 4.6 7.8 9.8 2,386 Upper secondary 3.3 6.7 8.1 911 Post secondary / Non tertiary 2.2 5.2 6.1 348 Higher 2.1 5.7 6.8 921 DK/Missing (*) (*) (*) 1
Functional difficulties (age 2-4 years)
Has functional difficulty 5.9 13.0 13.4 147 Has no functional difficulty 7.6 13.1 15.3 7,103
Ethno-linguistic group of household head
Lao-Tai 3.4 6.4 7.8 6,585 Mon-Khmer 7.9 15.4 18.0 2,981 Hmong-Mien 9.3 17.3 19.4 1,707 Chinese-Tibetan 9.0 15.2 16.5 330 Other, DK, Missing 6.8 10.3 11.8 117
Wealth index quintile
Poorest 8.6 15.3 17.4 3,017 Second 6.9 13.5 15.6 2,493 Middle 5.1 9.5 11.4 2,193 Fourth 3.7 6.9 8.3 2,074 Richest 1.8 4.5 5.7 1,944
1 MICS indicator TC.52 - Inadequate supervision
(*) Figures that are based on fewer than 25 unweighted cases
7
247
7.11 EARLY CHILDHOOD DEVELOPMENT INDEX
Early childhood development is multidimensional and involves an ordered progression of motor, cognitive, language, socio-emotional and regulatory skills and capacities across the first few years of life.34. Physical growth, literacy and numeracy skills, socio-emotional development and readiness to learn are vital domains of a child’s overall development, which build the foundation for later life and set the trajectory for health, learning and well-being. 35
A 10-item module was used to calculate the Early Child Development Index (ECDI). The primary purpose of the ECDI is to inform public policy regarding the developmental status of children in Lao PDR. The index is based on selected milestones that children are expected to achieve by ages 3 and 4. The 10 items are used to determine if children are developmentally on track in four domains:
• Literacy-numeracy: Children are identified as being developmentally on track based on whether they canidentify/name at least ten letters of the alphabet, whether they can read at least four simple, popularwords, and whether they know the name and recognize the symbols of all numbers from 1 to 10. If atleast two of these are true, then the child is considered developmentally on track.
• Physical: If the child can pick up a small object with two fingers, like a stick or a rock from the groundand/or the mother/caretaker does not indicate that the child is sometimes too sick to play, then thechild is regarded as being developmentally on track in the physical domain.
• Social-emotional: Children are considered to be developmentally on track if two of the following aretrue: If the child gets along well with other children, if the child does not kick, bite, or hit other childrenand if the child does not get distracted easily.
• Learning: If the child follows simple directions on how to do something correctly and/or when givensomething to do, is able to do it independently, then the child is considered to be developmentally ontrack in this domain.
ECDI is then calculated as the percentage of children who are developmentally on track in at least three of these four domains.
34 The Lancet, Advancing Early Childhood Development: From Science to Scale. Executive Summary, The Lancet, October 2016.
35 Shonkoff, J and Phillips, D (eds). 2000. From neurons to neighborhoods: the science of early childhood development. Committee on Integrating the Science of Early Childhood Development, National Research Council, 2000; United Nations Children’s Fund, Early Moments Matter, UNICEF, New York, September 2017.
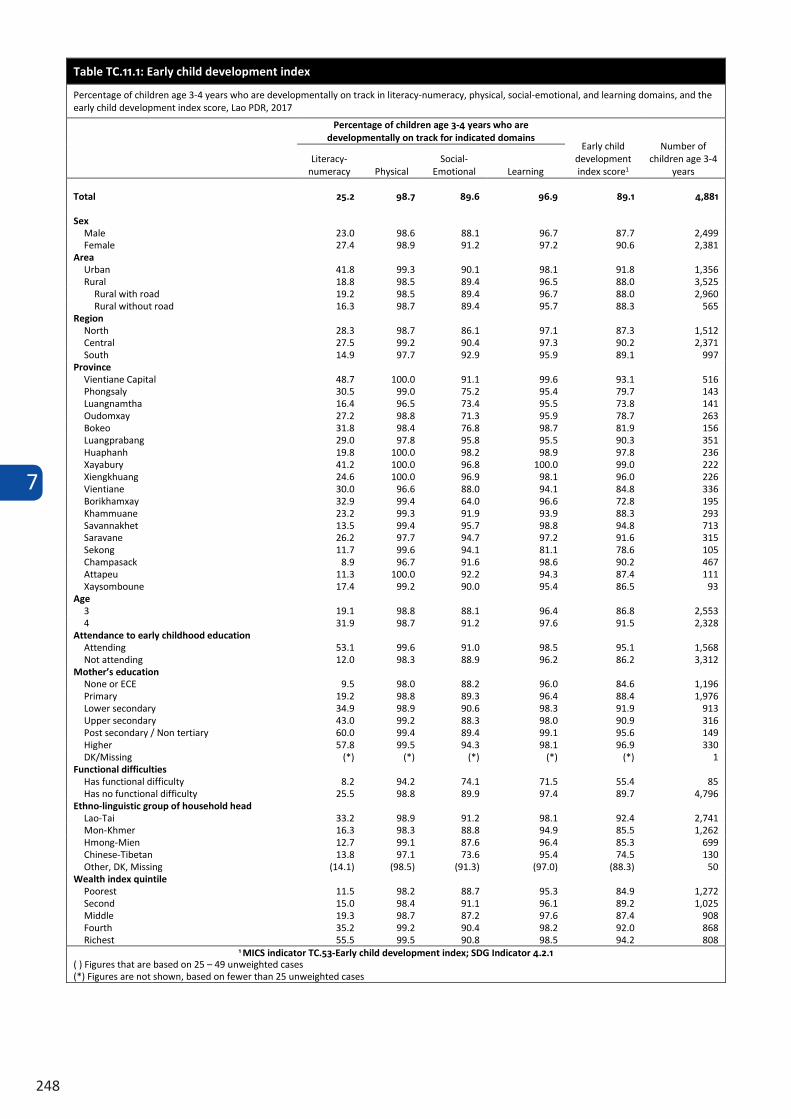
7
248
7.11 EARLY CHILDHOOD DEVELOPMENT INDEX
Early childhood development is multidimensional and involves an ordered progression of motor, cognitive, language, socio-emotional and regulatory skills and capacities across the first few years of life.34. Physical growth, literacy and numeracy skills, socio-emotional development and readiness to learn are vital domains of a child’s overall development, which build the foundation for later life and set the trajectory for health, learning and well-being. 35
A 10-item module was used to calculate the Early Child Development Index (ECDI). The primary purpose of the ECDI is to inform public policy regarding the developmental status of children in Lao PDR. The index is based on selected milestones that children are expected to achieve by ages 3 and 4. The 10 items are used to determine if children are developmentally on track in four domains:
• Literacy-numeracy: Children are identified as being developmentally on track based on whether they canidentify/name at least ten letters of the alphabet, whether they can read at least four simple, popularwords, and whether they know the name and recognize the symbols of all numbers from 1 to 10. If atleast two of these are true, then the child is considered developmentally on track.
• Physical: If the child can pick up a small object with two fingers, like a stick or a rock from the groundand/or the mother/caretaker does not indicate that the child is sometimes too sick to play, then thechild is regarded as being developmentally on track in the physical domain.
• Social-emotional: Children are considered to be developmentally on track if two of the following aretrue: If the child gets along well with other children, if the child does not kick, bite, or hit other childrenand if the child does not get distracted easily.
• Learning: If the child follows simple directions on how to do something correctly and/or when givensomething to do, is able to do it independently, then the child is considered to be developmentally ontrack in this domain.
ECDI is then calculated as the percentage of children who are developmentally on track in at least three of these four domains.
34 The Lancet, Advancing Early Childhood Development: From Science to Scale. Executive Summary, The Lancet, October 2016.
35 Shonkoff, J and Phillips, D (eds). 2000. From neurons to neighborhoods: the science of early childhood development. Committee on Integrating the Science of Early Childhood Development, National Research Council, 2000; United Nations Children’s Fund, Early Moments Matter, UNICEF, New York, September 2017.
Table TC.11.1: Early child development index
Percentage of children age 3-4 years who are developmentally on track in literacy-numeracy, physical, social-emotional, and learning domains, and the early child development index score, Lao PDR, 2017
Percentage of children age 3-4 years who are developmentally on track for indicated domains
Early child development index score1
Number of children age 3-4
years Literacy-
numeracy Physical Social-
Emotional Learning
Total 25.2 98.7 89.6 96.9 89.1 4,881
Sex Male 23.0 98.6 88.1 96.7 87.7 2,499 Female 27.4 98.9 91.2 97.2 90.6 2,381
Area Urban 41.8 99.3 90.1 98.1 91.8 1,356 Rural 18.8 98.5 89.4 96.5 88.0 3,525
Rural with road 19.2 98.5 89.4 96.7 88.0 2,960 Rural without road 16.3 98.7 89.4 95.7 88.3 565
Region North 28.3 98.7 86.1 97.1 87.3 1,512 Central 27.5 99.2 90.4 97.3 90.2 2,371 South 14.9 97.7 92.9 95.9 89.1 997
Province Vientiane Capital 48.7 100.0 91.1 99.6 93.1 516 Phongsaly 30.5 99.0 75.2 95.4 79.7 143 Luangnamtha 16.4 96.5 73.4 95.5 73.8 141 Oudomxay 27.2 98.8 71.3 95.9 78.7 263 Bokeo 31.8 98.4 76.8 98.7 81.9 156 Luangprabang 29.0 97.8 95.8 95.5 90.3 351 Huaphanh 19.8 100.0 98.2 98.9 97.8 236 Xayabury 41.2 100.0 96.8 100.0 99.0 222 Xiengkhuang 24.6 100.0 96.9 98.1 96.0 226 Vientiane 30.0 96.6 88.0 94.1 84.8 336 Borikhamxay 32.9 99.4 64.0 96.6 72.8 195 Khammuane 23.2 99.3 91.9 93.9 88.3 293 Savannakhet 13.5 99.4 95.7 98.8 94.8 713 Saravane 26.2 97.7 94.7 97.2 91.6 315 Sekong 11.7 99.6 94.1 81.1 78.6 105 Champasack 8.9 96.7 91.6 98.6 90.2 467 Attapeu 11.3 100.0 92.2 94.3 87.4 111 Xaysomboune 17.4 99.2 90.0 95.4 86.5 93
Age 3 19.1 98.8 88.1 96.4 86.8 2,553 4 31.9 98.7 91.2 97.6 91.5 2,328
Attendance to early childhood education Attending 53.1 99.6 91.0 98.5 95.1 1,568 Not attending 12.0 98.3 88.9 96.2 86.2 3,312
Mother’s education None or ECE 9.5 98.0 88.2 96.0 84.6 1,196 Primary 19.2 98.8 89.3 96.4 88.4 1,976 Lower secondary 34.9 98.9 90.6 98.3 91.9 913 Upper secondary 43.0 99.2 88.3 98.0 90.9 316 Post secondary / Non tertiary 60.0 99.4 89.4 99.1 95.6 149 Higher 57.8 99.5 94.3 98.1 96.9 330 DK/Missing (*) (*) (*) (*) (*) 1
Functional difficulties Has functional difficulty 8.2 94.2 74.1 71.5 55.4 85 Has no functional difficulty 25.5 98.8 89.9 97.4 89.7 4,796
Ethno-linguistic group of household head Lao-Tai 33.2 98.9 91.2 98.1 92.4 2,741 Mon-Khmer 16.3 98.3 88.8 94.9 85.5 1,262 Hmong-Mien 12.7 99.1 87.6 96.4 85.3 699 Chinese-Tibetan 13.8 97.1 73.6 95.4 74.5 130 Other, DK, Missing (14.1) (98.5) (91.3) (97.0) (88.3) 50
Wealth index quintile Poorest 11.5 98.2 88.7 95.3 84.9 1,272 Second 15.0 98.4 91.1 96.1 89.2 1,025 Middle 19.3 98.7 87.2 97.6 87.4 908 Fourth 35.2 99.2 90.4 98.2 92.0 868 Richest 55.5 99.5 90.8 98.5 94.2 808
1 MICS indicator TC.53-Early child development index; SDG Indicator 4.2.1 ( ) Figures that are based on 25 – 49 unweighted cases (*) Figures are not shown, based on fewer than 25 unweighted cases
7
249
7.12 ANEMIA IN CHILDREN
Anemia is a condition that is marked by low levels of hemoglobin in the blood. Iron is a key component of hemoglobin, and iron deficiency is estimated to be responsible for half of all anemia globally. Other causes of anemia include malaria, hookworm, and other helminths, other nutritional deficiencies, chronic infections, and genetic conditions. Anemia is a serious concern for children because it can impair cognitive development, stunt growth, and increase morbidity from infectious diseases. In addition to causing weakness, frequent tiredness, and lowered resistance to disease, anemia can be a particularly serious problem for pregnant women, leading to premature delivery and low birth weight.
As part of the Lao PDR MICS, hemoglobin testing was carried out among children age 6-59 months in 50% of sample households (5,360 eligible children). Blood specimens for hemoglobin testing were collected from from all children age 6-59 months for whom consent was obtained from their parents or the adult responsible for the children. Blood samples were obtained from a drop of blood taken from a finger prick (or a heel prick in the case of children age 6-11 months). A drop of blood from the prick site was drawn into a microcuvette, and hemoglobin analysis was carried out on site with a battery-operated portable HemoCue analyzer. Results were provided verbally and in writing. Parents of children with a hemoglobin level below 8 g/dl were instructed to take the child to a health facility for follow-up care. All households in which anemia testing was conducted were given a brochure that explained the causes and prevention of anemia.
Tables TM.12.1 and TM.12.2 present the children’s coverage of haemoglobin testing and the prevalence of anemia in children age 6-59 months.
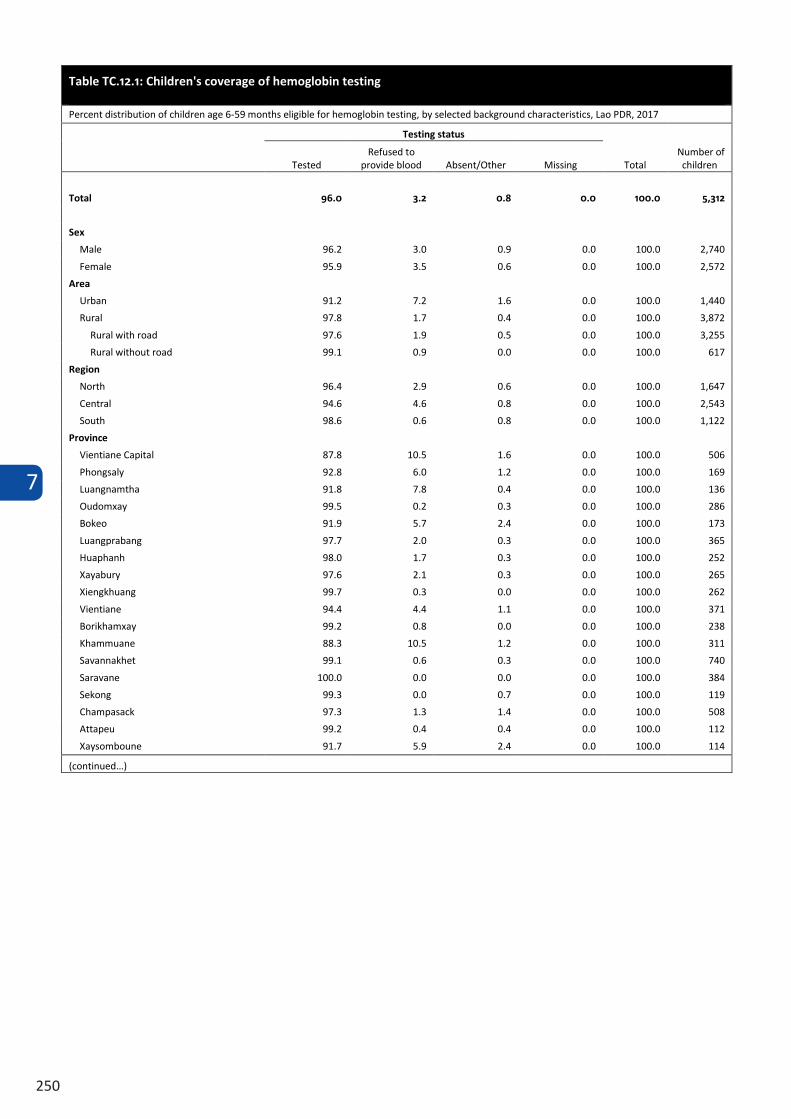
7
250
7.12 ANEMIA IN CHILDREN
Anemia is a condition that is marked by low levels of hemoglobin in the blood. Iron is a key component of hemoglobin, and iron deficiency is estimated to be responsible for half of all anemia globally. Other causes of anemia include malaria, hookworm, and other helminths, other nutritional deficiencies, chronic infections, and genetic conditions. Anemia is a serious concern for children because it can impair cognitive development, stunt growth, and increase morbidity from infectious diseases. In addition to causing weakness, frequent tiredness, and lowered resistance to disease, anemia can be a particularly serious problem for pregnant women, leading to premature delivery and low birth weight.
As part of the Lao PDR MICS, hemoglobin testing was carried out among children age 6-59 months in 50% of sample households (5,360 eligible children). Blood specimens for hemoglobin testing were collected from from all children age 6-59 months for whom consent was obtained from their parents or the adult responsible for the children. Blood samples were obtained from a drop of blood taken from a finger prick (or a heel prick in the case of children age 6-11 months). A drop of blood from the prick site was drawn into a microcuvette, and hemoglobin analysis was carried out on site with a battery-operated portable HemoCue analyzer. Results were provided verbally and in writing. Parents of children with a hemoglobin level below 8 g/dl were instructed to take the child to a health facility for follow-up care. All households in which anemia testing was conducted were given a brochure that explained the causes and prevention of anemia.
Tables TM.12.1 and TM.12.2 present the children’s coverage of haemoglobin testing and the prevalence of anemia in children age 6-59 months.
Table TC.12.1: Children's coverage of hemoglobin testing
Percent distribution of children age 6-59 months eligible for hemoglobin testing, by selected background characteristics, Lao PDR, 2017
Testing status
Total Number of
children Tested Refused to
provide blood Absent/Other Missing
Total 96.0 3.2 0.8 0.0 100.0 5,312
Sex
Male 96.2 3.0 0.9 0.0 100.0 2,740 Female 95.9 3.5 0.6 0.0 100.0 2,572
Area
Urban 91.2 7.2 1.6 0.0 100.0 1,440 Rural 97.8 1.7 0.4 0.0 100.0 3,872
Rural with road 97.6 1.9 0.5 0.0 100.0 3,255 Rural without road 99.1 0.9 0.0 0.0 100.0 617
Region
North 96.4 2.9 0.6 0.0 100.0 1,647 Central 94.6 4.6 0.8 0.0 100.0 2,543 South 98.6 0.6 0.8 0.0 100.0 1,122
Province
Vientiane Capital 87.8 10.5 1.6 0.0 100.0 506 Phongsaly 92.8 6.0 1.2 0.0 100.0 169 Luangnamtha 91.8 7.8 0.4 0.0 100.0 136 Oudomxay 99.5 0.2 0.3 0.0 100.0 286 Bokeo 91.9 5.7 2.4 0.0 100.0 173 Luangprabang 97.7 2.0 0.3 0.0 100.0 365 Huaphanh 98.0 1.7 0.3 0.0 100.0 252 Xayabury 97.6 2.1 0.3 0.0 100.0 265 Xiengkhuang 99.7 0.3 0.0 0.0 100.0 262 Vientiane 94.4 4.4 1.1 0.0 100.0 371 Borikhamxay 99.2 0.8 0.0 0.0 100.0 238 Khammuane 88.3 10.5 1.2 0.0 100.0 311 Savannakhet 99.1 0.6 0.3 0.0 100.0 740 Saravane 100.0 0.0 0.0 0.0 100.0 384 Sekong 99.3 0.0 0.7 0.0 100.0 119 Champasack 97.3 1.3 1.4 0.0 100.0 508 Attapeu 99.2 0.4 0.4 0.0 100.0 112 Xaysomboune 91.7 5.9 2.4 0.0 100.0 114
(continued…)
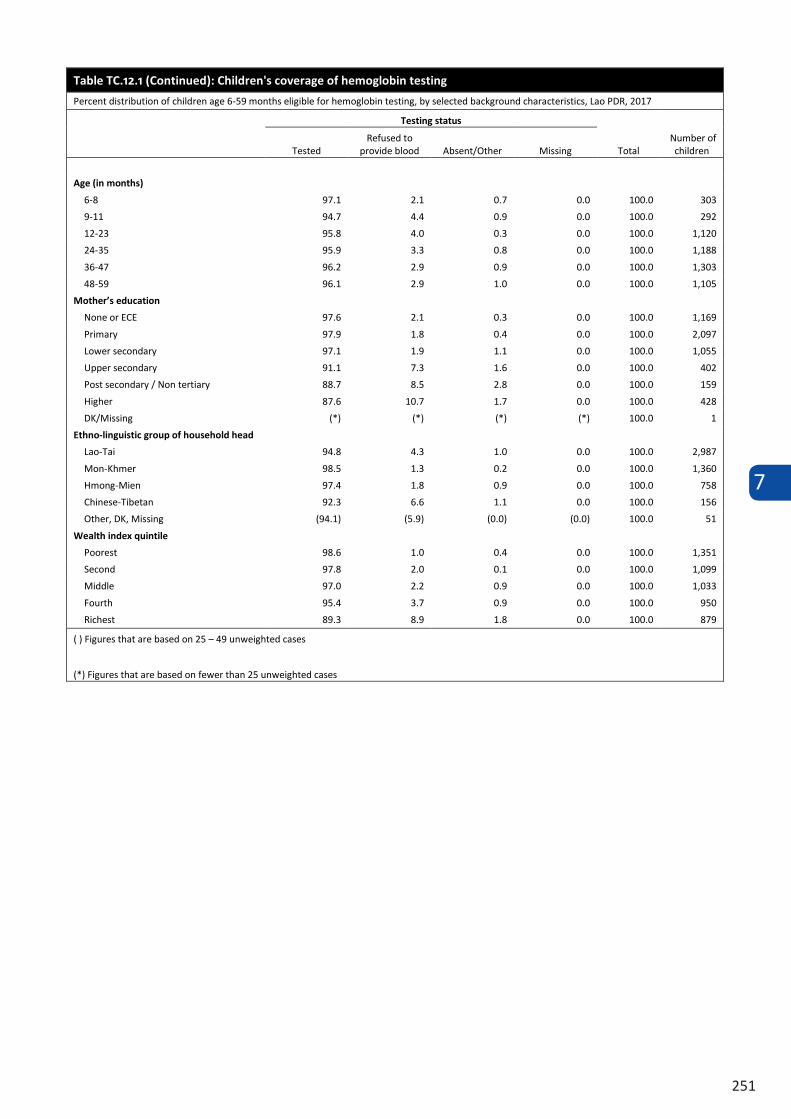
7
251
Table TC.12.1 (Continued): Children's coverage of hemoglobin testing
Percent distribution of children age 6-59 months eligible for hemoglobin testing, by selected background characteristics, Lao PDR, 2017
Testing status
Total Number of
children Tested Refused to
provide blood Absent/Other Missing
Age (in months)
6-8 97.1 2.1 0.7 0.0 100.0 303 9-11 94.7 4.4 0.9 0.0 100.0 292 12-23 95.8 4.0 0.3 0.0 100.0 1,120 24-35 95.9 3.3 0.8 0.0 100.0 1,188 36-47 96.2 2.9 0.9 0.0 100.0 1,303 48-59 96.1 2.9 1.0 0.0 100.0 1,105
Mother’s education
None or ECE 97.6 2.1 0.3 0.0 100.0 1,169 Primary 97.9 1.8 0.4 0.0 100.0 2,097 Lower secondary 97.1 1.9 1.1 0.0 100.0 1,055 Upper secondary 91.1 7.3 1.6 0.0 100.0 402 Post secondary / Non tertiary 88.7 8.5 2.8 0.0 100.0 159 Higher 87.6 10.7 1.7 0.0 100.0 428 DK/Missing (*) (*) (*) (*) 100.0 1
Ethno-linguistic group of household head
Lao-Tai 94.8 4.3 1.0 0.0 100.0 2,987 Mon-Khmer 98.5 1.3 0.2 0.0 100.0 1,360 Hmong-Mien 97.4 1.8 0.9 0.0 100.0 758 Chinese-Tibetan 92.3 6.6 1.1 0.0 100.0 156 Other, DK, Missing (94.1) (5.9) (0.0) (0.0) 100.0 51
Wealth index quintile
Poorest 98.6 1.0 0.4 0.0 100.0 1,351 Second 97.8 2.0 0.1 0.0 100.0 1,099 Middle 97.0 2.2 0.9 0.0 100.0 1,033 Fourth 95.4 3.7 0.9 0.0 100.0 950 Richest 89.3 8.9 1.8 0.0 100.0 879
( ) Figures that are based on 25 – 49 unweighted cases
(*) Figures that are based on fewer than 25 unweighted cases
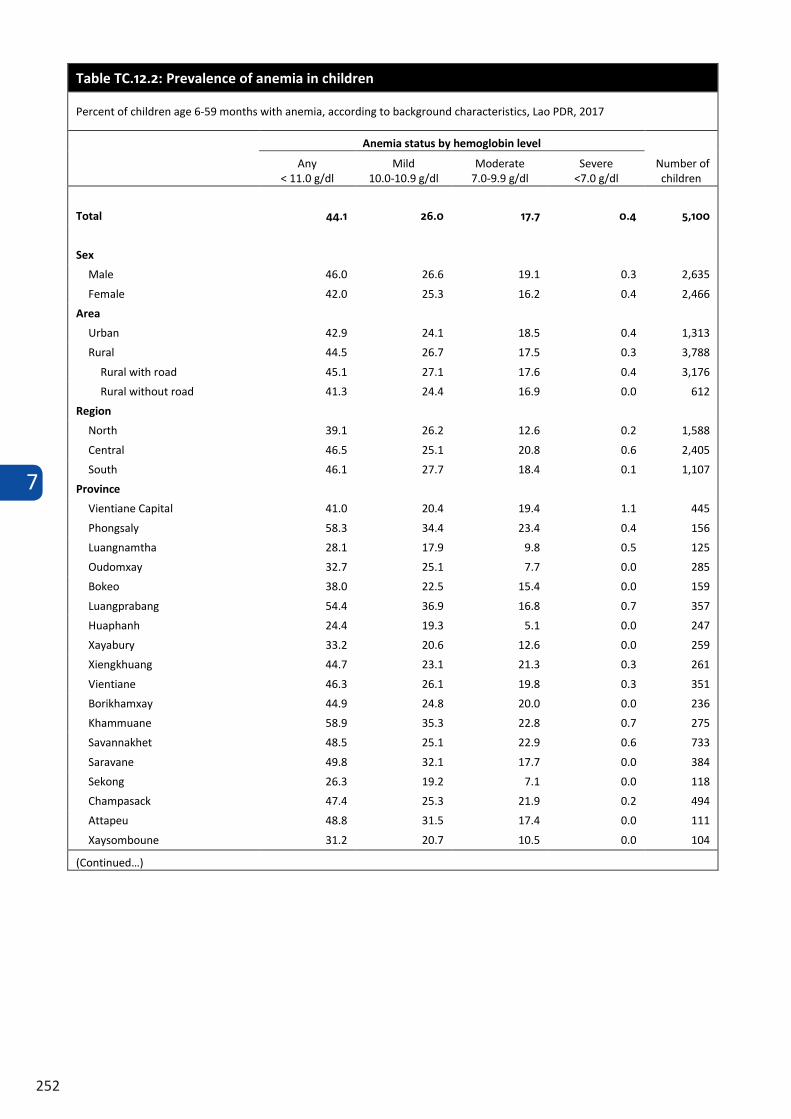
7
252
Table TC.12.2: Prevalence of anemia in children
Percent of children age 6-59 months with anemia, according to background characteristics, Lao PDR, 2017
Anemia status by hemoglobin level
Number of children
Any < 11.0 g/dl
Mild 10.0-10.9 g/dl
Moderate 7.0-9.9 g/dl
Severe <7.0 g/dl
Total 44.1 26.0 17.7 0.4 5,100
Sex
Male 46.0 26.6 19.1 0.3 2,635 Female 42.0 25.3 16.2 0.4 2,466
Area
Urban 42.9 24.1 18.5 0.4 1,313 Rural 44.5 26.7 17.5 0.3 3,788
Rural with road 45.1 27.1 17.6 0.4 3,176 Rural without road 41.3 24.4 16.9 0.0 612
Region
North 39.1 26.2 12.6 0.2 1,588 Central 46.5 25.1 20.8 0.6 2,405 South 46.1 27.7 18.4 0.1 1,107
Province
Vientiane Capital 41.0 20.4 19.4 1.1 445 Phongsaly 58.3 34.4 23.4 0.4 156 Luangnamtha 28.1 17.9 9.8 0.5 125 Oudomxay 32.7 25.1 7.7 0.0 285 Bokeo 38.0 22.5 15.4 0.0 159 Luangprabang 54.4 36.9 16.8 0.7 357 Huaphanh 24.4 19.3 5.1 0.0 247 Xayabury 33.2 20.6 12.6 0.0 259 Xiengkhuang 44.7 23.1 21.3 0.3 261 Vientiane 46.3 26.1 19.8 0.3 351 Borikhamxay 44.9 24.8 20.0 0.0 236 Khammuane 58.9 35.3 22.8 0.7 275 Savannakhet 48.5 25.1 22.9 0.6 733 Saravane 49.8 32.1 17.7 0.0 384 Sekong 26.3 19.2 7.1 0.0 118 Champasack 47.4 25.3 21.9 0.2 494 Attapeu 48.8 31.5 17.4 0.0 111 Xaysomboune 31.2 20.7 10.5 0.0 104
(Continued…)
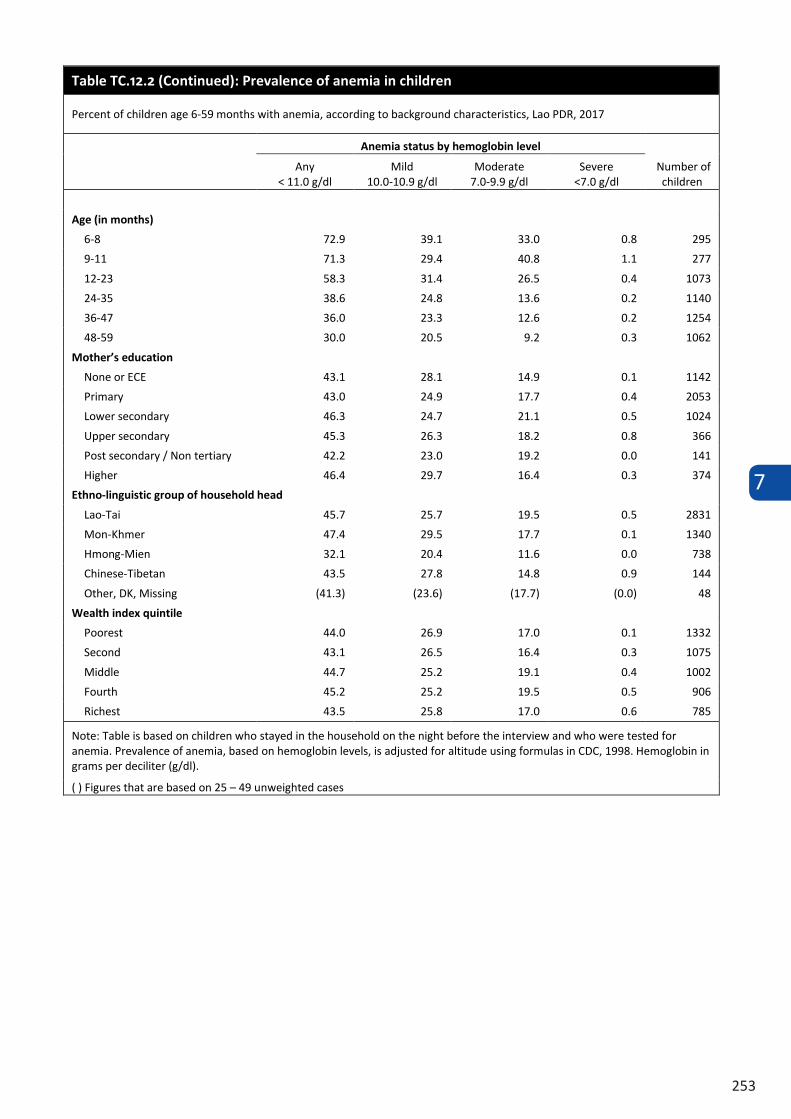
7
253
Table TC.12.2 (Continued): Prevalence of anemia in children
Percent of children age 6-59 months with anemia, according to background characteristics, Lao PDR, 2017
Anemia status by hemoglobin level
Number of children
Any < 11.0 g/dl
Mild 10.0-10.9 g/dl
Moderate 7.0-9.9 g/dl
Severe <7.0 g/dl
Age (in months)
6-8 72.9 39.1 33.0 0.8 295 9-11 71.3 29.4 40.8 1.1 277 12-23 58.3 31.4 26.5 0.4 1073 24-35 38.6 24.8 13.6 0.2 1140 36-47 36.0 23.3 12.6 0.2 1254 48-59 30.0 20.5 9.2 0.3 1062
Mother’s education
None or ECE 43.1 28.1 14.9 0.1 1142 Primary 43.0 24.9 17.7 0.4 2053 Lower secondary 46.3 24.7 21.1 0.5 1024 Upper secondary 45.3 26.3 18.2 0.8 366 Post secondary / Non tertiary 42.2 23.0 19.2 0.0 141 Higher 46.4 29.7 16.4 0.3 374
Ethno-linguistic group of household head
Lao-Tai 45.7 25.7 19.5 0.5 2831 Mon-Khmer 47.4 29.5 17.7 0.1 1340 Hmong-Mien 32.1 20.4 11.6 0.0 738 Chinese-Tibetan 43.5 27.8 14.8 0.9 144 Other, DK, Missing (41.3) (23.6) (17.7) (0.0) 48
Wealth index quintile
Poorest 44.0 26.9 17.0 0.1 1332 Second 43.1 26.5 16.4 0.3 1075 Middle 44.7 25.2 19.1 0.4 1002 Fourth 45.2 25.2 19.5 0.5 906 Richest 43.5 25.8 17.0 0.6 785
Note: Table is based on children who stayed in the household on the night before the interview and who were tested for anemia. Prevalence of anemia, based on hemoglobin levels, is adjusted for altitude using formulas in CDC, 1998. Hemoglobin in grams per deciliter (g/dl).
( ) Figures that are based on 25 – 49 unweighted cases
8
255
8 LEARN (LN)
Every child has a right to education. Education is more than just a fundamental right; it helps pave the way to a successful and productive future. Evidence suggests that quality education is a driver of economic growth – contributing to higher income, decreased poverty levels, and individual empowerment. While it is crucial to expand the education system, there is a need for dual focus on improving the quality of learning and reaching the most vulnerable.1
Despite remarkable progress made over the past years, the world missed the target for universal primary education by 2015. The new 2030 emerging agenda for Sustainable Development sets a higher level ambition, focusing on maximizing equity, quality and learning outcomes of education at all levels.2
This chapter summarizes the main findings of the survey on a range of education indicators, including early childhood education, school attendance and parental involvement in children’s education.
8.1 EARLY CHILDHOOD EDUCATION
Readiness of children for primary school can be improved through attendance to early childhood education programmes or through pre-school. Early childhood education programmes include programmes for children that have organised learning components as opposed to baby-sitting and day-care which do not typically have organised education and learning.
The Early Child Education (ECE) in Lao PDR has significantly improved and resulted in increased numbers of pupils, teachers and classrooms under the policy of expanding access to education through pre-primary and community-based school readiness programmes with support of Development Partners in recent years. In addition to the expansion of ECE school networks, the Ministry of Education and Sports (MoES) also has paid attention to developing preschool curricula and providing teaching and learning materials. The Government has set a clear goal, targets and strategy in the Education and Sports Sector Development Plan 2016-2020 in providing the opportunity for children to learn Lao language and have readiness to study in primary education focusing on reducing drop-out and repetition of primary education. Table LN.1.1 shows the percent of children age 3 and 4 currently attending early childhood education among children who are 36-59 months old: MICS indicator LN.1. This is based on question UB8 in the Questionnaire for Children under 5. If the child was currently on a school break, but regularly attends, the interviewer is asked to record this as currently attending.
Table LN.1.2 is similar to Table LN.1.1, but looks only at children who were 5 years old at the beginning of the school year. In Lao PDR, the school year begins in September.
Specifically, the table presents the percent distribution of children age one year younger than the official primary school entry age at the beginning of the school year, by attendance to education. This table utilises question UB7 for attendance. The indicator captured is the adjust net attendance ratio, which corresponds to SDG indicator 4.2.2: Participation rate in organised learning (adjusted3). The official primary school entry age in Lao PDR is age 6 years.
1 UNICEF. 2015. The Investment Case for Education and Equity, UNICEF 2 UNICEF. 2016. Is every child counted? Status of data for children in the SDGs. UNICEF 3 The ratio is termed "adjusted" since it includes children in primary education. All children age one year before official primary school entry age (at the beginning of the school year) are included in the denominator.
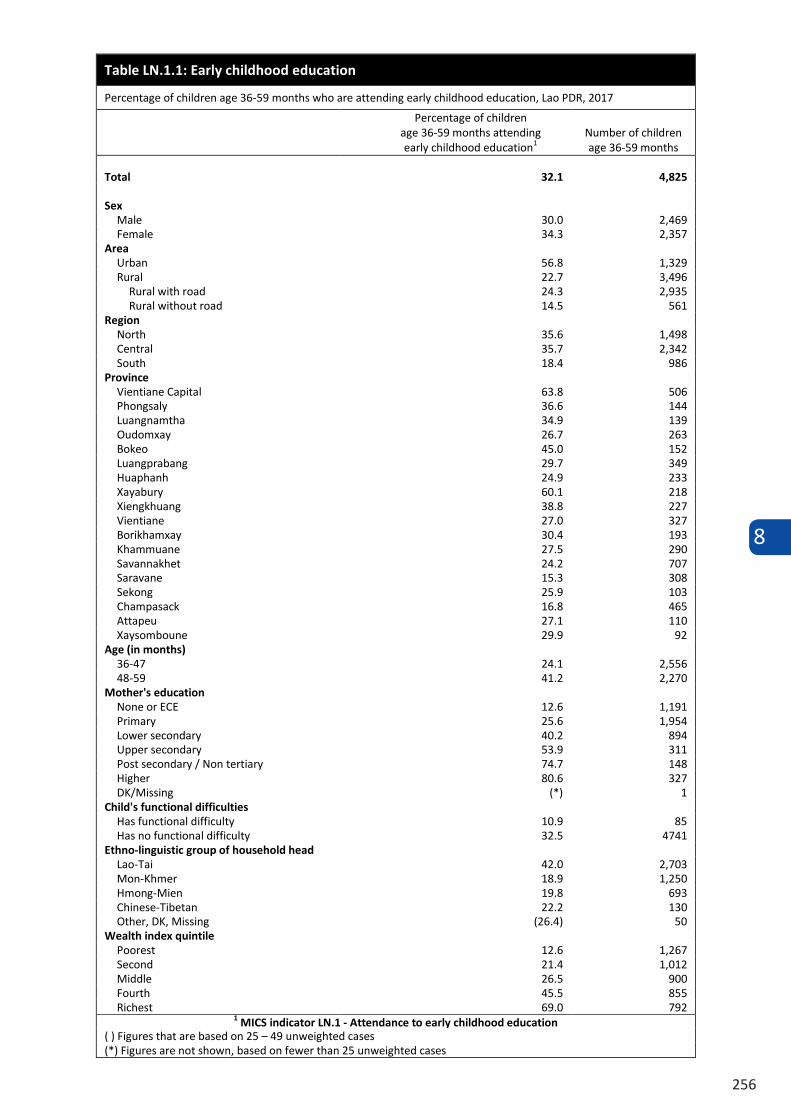
8
256
Table LN.1.1: Early childhood education
Percentage of children age 36-59 months who are attending early childhood education, Lao PDR, 2017
Percentage of children age 36-59 months attending early childhood education1
Number of children age 36-59 months
Total 32.1 4,825
Sex Male 30.0 2,469 Female 34.3 2,357
Area Urban 56.8 1,329 Rural 22.7 3,496
Rural with road 24.3 2,935 Rural without road 14.5 561
Region North 35.6 1,498 Central 35.7 2,342 South 18.4 986
Province Vientiane Capital 63.8 506 Phongsaly 36.6 144 Luangnamtha 34.9 139 Oudomxay 26.7 263 Bokeo 45.0 152 Luangprabang 29.7 349 Huaphanh 24.9 233 Xayabury 60.1 218 Xiengkhuang 38.8 227 Vientiane 27.0 327 Borikhamxay 30.4 193 Khammuane 27.5 290 Savannakhet 24.2 707 Saravane 15.3 308 Sekong 25.9 103 Champasack 16.8 465 Attapeu 27.1 110 Xaysomboune 29.9 92
Age (in months) 36-47 24.1 2,556 48-59 41.2 2,270
Mother's education None or ECE 12.6 1,191 Primary 25.6 1,954 Lower secondary 40.2 894 Upper secondary 53.9 311 Post secondary / Non tertiary 74.7 148 Higher 80.6 327 DK/Missing (*) 1
Child's functional difficulties Has functional difficulty 10.9 85 Has no functional difficulty 32.5 4741
Ethno-linguistic group of household head Lao-Tai 42.0 2,703 Mon-Khmer 18.9 1,250 Hmong-Mien 19.8 693 Chinese-Tibetan 22.2 130 Other, DK, Missing (26.4) 50
Wealth index quintile Poorest 12.6 1,267 Second 21.4 1,012 Middle 26.5 900 Fourth 45.5 855 Richest 69.0 792
1 MICS indicator LN.1 - Attendance to early childhood education ( ) Figures that are based on 25 – 49 unweighted cases (*) Figures are not shown, based on fewer than 25 unweighted cases
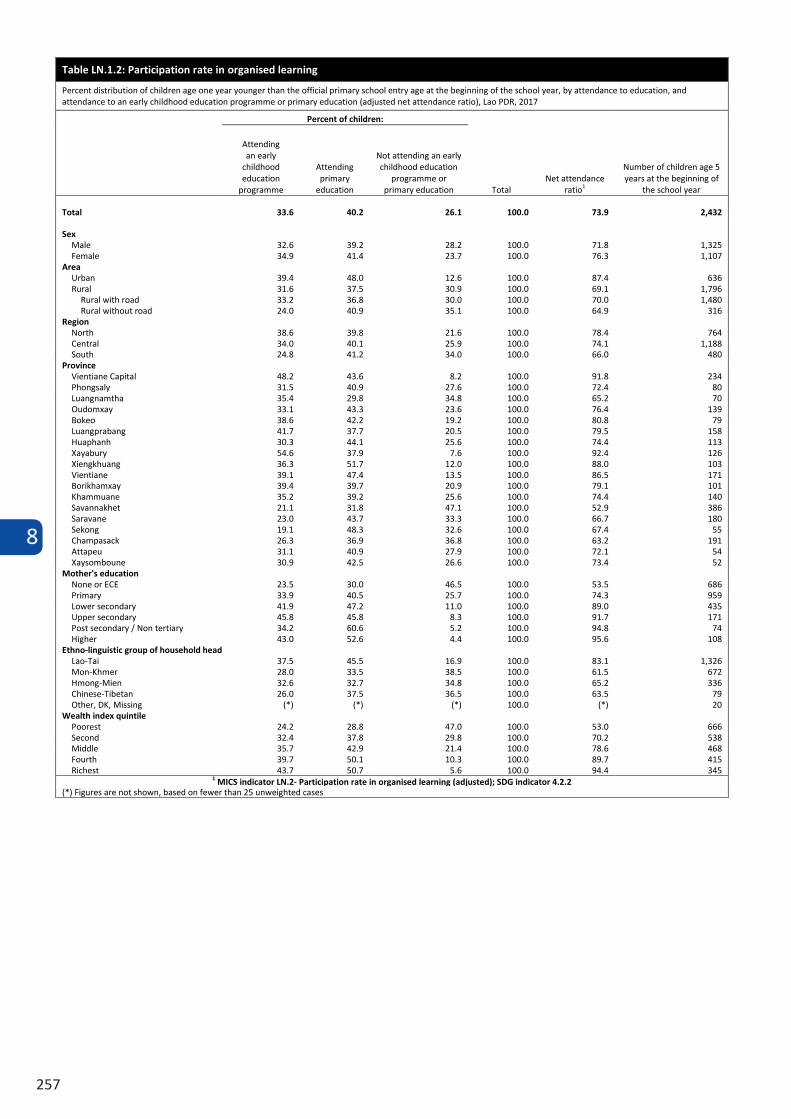
8
257
Table LN.1.2: Participation rate in organised learning
Percent distribution of children age one year younger than the official primary school entry age at the beginning of the school year, by attendance to education, and attendance to an early childhood education programme or primary education (adjusted net attendance ratio), Lao PDR, 2017
Percent of children:
Total Net attendance
ratio1
Number of children age 5 years at the beginning of
the school year
Attending an early
childhood education
programme
Attending primary
education
Not attending an early childhood education
programme or primary education
Total 33.6 40.2 26.1 100.0 73.9 2,432
Sex
Male 32.6 39.2 28.2 100.0 71.8 1,325 Female 34.9 41.4 23.7 100.0 76.3 1,107
Area
Urban 39.4 48.0 12.6 100.0 87.4 636 Rural 31.6 37.5 30.9 100.0 69.1 1,796
Rural with road 33.2 36.8 30.0 100.0 70.0 1,480 Rural without road 24.0 40.9 35.1 100.0 64.9 316
Region
North 38.6 39.8 21.6 100.0 78.4 764 Central 34.0 40.1 25.9 100.0 74.1 1,188 South 24.8 41.2 34.0 100.0 66.0 480
Province
Vientiane Capital 48.2 43.6 8.2 100.0 91.8 234 Phongsaly 31.5 40.9 27.6 100.0 72.4 80 Luangnamtha 35.4 29.8 34.8 100.0 65.2 70 Oudomxay 33.1 43.3 23.6 100.0 76.4 139 Bokeo 38.6 42.2 19.2 100.0 80.8 79 Luangprabang 41.7 37.7 20.5 100.0 79.5 158 Huaphanh 30.3 44.1 25.6 100.0 74.4 113 Xayabury 54.6 37.9 7.6 100.0 92.4 126 Xiengkhuang 36.3 51.7 12.0 100.0 88.0 103 Vientiane 39.1 47.4 13.5 100.0 86.5 171 Borikhamxay 39.4 39.7 20.9 100.0 79.1 101 Khammuane 35.2 39.2 25.6 100.0 74.4 140 Savannakhet 21.1 31.8 47.1 100.0 52.9 386 Saravane 23.0 43.7 33.3 100.0 66.7 180 Sekong 19.1 48.3 32.6 100.0 67.4 55 Champasack 26.3 36.9 36.8 100.0 63.2 191 Attapeu 31.1 40.9 27.9 100.0 72.1 54 Xaysomboune 30.9 42.5 26.6 100.0 73.4 52
Mother's education
None or ECE 23.5 30.0 46.5 100.0 53.5 686 Primary 33.9 40.5 25.7 100.0 74.3 959 Lower secondary 41.9 47.2 11.0 100.0 89.0 435 Upper secondary 45.8 45.8 8.3 100.0 91.7 171 Post secondary / Non tertiary 34.2 60.6 5.2 100.0 94.8 74 Higher 43.0 52.6 4.4 100.0 95.6 108
Ethno-linguistic group of household head
Lao-Tai 37.5 45.5 16.9 100.0 83.1 1,326 Mon-Khmer 28.0 33.5 38.5 100.0 61.5 672 Hmong-Mien 32.6 32.7 34.8 100.0 65.2 336 Chinese-Tibetan 26.0 37.5 36.5 100.0 63.5 79 Other, DK, Missing (*) (*) (*) 100.0 (*) 20
Wealth index quintile
Poorest 24.2 28.8 47.0 100.0 53.0 666 Second 32.4 37.8 29.8 100.0 70.2 538 Middle 35.7 42.9 21.4 100.0 78.6 468 Fourth 39.7 50.1 10.3 100.0 89.7 415 Richest 43.7 50.7 5.6 100.0 94.4 345
1 MICS indicator LN.2- Participation rate in organised learning (adjusted); SDG indicator 4.2.2 (*) Figures are not shown, based on fewer than 25 unweighted cases
8
258
8.2 ATTENDANCE
Attendance to pre-primary education is important for the readiness of children to school. Table LN.2.1 shows the proportion of children in the first grade of primary school (regardless of age) who attended any early childhood education the previous year4.
Ensuring that all girls and boys complete primary and secondary education is a target of the of the 2030 Agenda for Sustainable Development. Education is a vital prerequisite for combating poverty, empowering women, economic growth, protecting children from hazardous and exploitative labour and sexual exploitation, promoting human rights and democracy, protecting the environment, and influencing population growth.
In Lao PDR, children enter primary school at age 6, lower secondary at age 11 and enter upper secondary school at age 15. There are 5 grades in primary school and 4 + 3 grades in secondary school. In primary school, grades are referred toas grade 1 to grade 5. For lower secondary school, grades are referred to as grade 6 to grade 9 and in upper secondary to grade 10 to grade 12 The school year typically runs from September of one year to June of the following year.
Table LN.2.2 presents the percentage of children of primary school entry age entering year 1.
4 The computation of the indicator does not exclude repeaters, and therefore is inclusive of both children who are attending primary school for the first time, as well as those who were in the first grade of primary school the previous school year and are repeating. Children repeating may have attended pre-primary education prior to the school year during which they attended the first grade of primary school for the first time; these children are not captured in the numerator of the indicator.
LN.2.3 provides the percentage of children of primary school age 6 to 10 years who are attending primary or secondary school5, and those who are out of school. Similarly, the lower secondary school adjusted net attendance ratio is presented in Table LN.2.46 for children age 11 to 14 years.
In Table LN.2.5, children are distributed according to their age against current grade of attendance (age-for-grade), e.g. a child age 8 years (at the beginning of the school year) currently attending year 1 was to be year 3, the official age-for-grade. This child will be classified age over-age by 2 or more years. The table includes both primary and lower secondary levels.
5 Ratios presented in this table are "adjusted" since they include not only primary school attendance, but also secondary school attendance in the numerator. 6 Ratios presented in this table are "adjusted" since they include not only lower secondary school attendance, but also attendance to higher levels in the numerator.
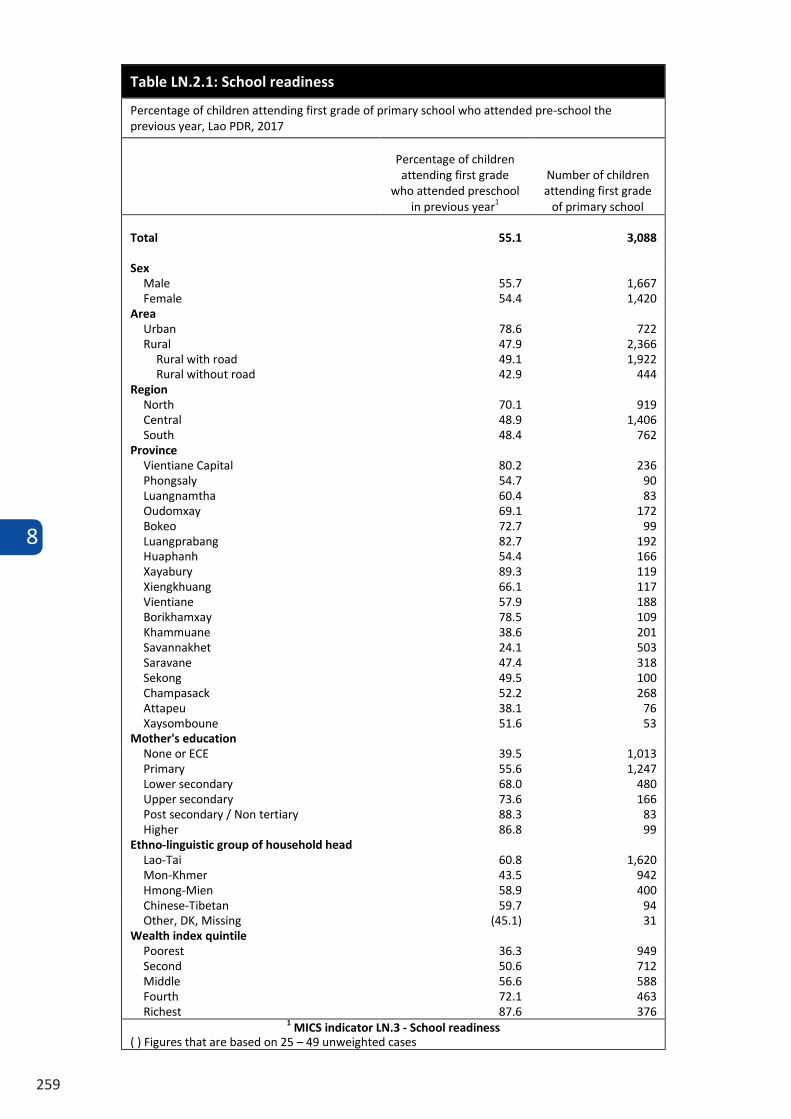
8
259
8.2 ATTENDANCE
Attendance to pre-primary education is important for the readiness of children to school. Table LN.2.1 shows the proportion of children in the first grade of primary school (regardless of age) who attended any early childhood education the previous year4.
Ensuring that all girls and boys complete primary and secondary education is a target of the of the 2030 Agenda for Sustainable Development. Education is a vital prerequisite for combating poverty, empowering women, economic growth, protecting children from hazardous and exploitative labour and sexual exploitation, promoting human rights and democracy, protecting the environment, and influencing population growth.
In Lao PDR, children enter primary school at age 6, lower secondary at age 11 and enter upper secondary school at age 15. There are 5 grades in primary school and 4 + 3 grades in secondary school. In primary school, grades are referred toas grade 1 to grade 5. For lower secondary school, grades are referred to as grade 6 to grade 9 and in upper secondary to grade 10 to grade 12 The school year typically runs from September of one year to June of the following year.
Table LN.2.2 presents the percentage of children of primary school entry age entering year 1.
4 The computation of the indicator does not exclude repeaters, and therefore is inclusive of both children who are attending primary school for the first time, as well as those who were in the first grade of primary school the previous school year and are repeating. Children repeating may have attended pre-primary education prior to the school year during which they attended the first grade of primary school for the first time; these children are not captured in the numerator of the indicator.
LN.2.3 provides the percentage of children of primary school age 6 to 10 years who are attending primary or secondary school5, and those who are out of school. Similarly, the lower secondary school adjusted net attendance ratio is presented in Table LN.2.46 for children age 11 to 14 years.
In Table LN.2.5, children are distributed according to their age against current grade of attendance (age-for-grade), e.g. a child age 8 years (at the beginning of the school year) currently attending year 1 was to be year 3, the official age-for-grade. This child will be classified age over-age by 2 or more years. The table includes both primary and lower secondary levels.
5 Ratios presented in this table are "adjusted" since they include not only primary school attendance, but also secondary school attendance in the numerator. 6 Ratios presented in this table are "adjusted" since they include not only lower secondary school attendance, but also attendance to higher levels in the numerator.
Table LN.2.1: School readiness
Percentage of children attending first grade of primary school who attended pre-school the previous year, Lao PDR, 2017
Percentage of children attending first grade
who attended preschool in previous year1
Number of children attending first grade
of primary school
Total 55.1 3,088
Sex Male 55.7 1,667 Female 54.4 1,420
Area Urban 78.6 722 Rural 47.9 2,366
Rural with road 49.1 1,922 Rural without road 42.9 444
Region North 70.1 919 Central 48.9 1,406 South 48.4 762
Province Vientiane Capital 80.2 236 Phongsaly 54.7 90 Luangnamtha 60.4 83 Oudomxay 69.1 172 Bokeo 72.7 99 Luangprabang 82.7 192 Huaphanh 54.4 166 Xayabury 89.3 119 Xiengkhuang 66.1 117 Vientiane 57.9 188 Borikhamxay 78.5 109 Khammuane 38.6 201 Savannakhet 24.1 503 Saravane 47.4 318 Sekong 49.5 100 Champasack 52.2 268 Attapeu 38.1 76 Xaysomboune 51.6 53
Mother's education None or ECE 39.5 1,013 Primary 55.6 1,247 Lower secondary 68.0 480 Upper secondary 73.6 166 Post secondary / Non tertiary 88.3 83 Higher 86.8 99
Ethno-linguistic group of household head Lao-Tai 60.8 1,620 Mon-Khmer 43.5 942 Hmong-Mien 58.9 400 Chinese-Tibetan 59.7 94 Other, DK, Missing (45.1) 31
Wealth index quintile Poorest 36.3 949 Second 50.6 712 Middle 56.6 588 Fourth 72.1 463 Richest 87.6 376
1 MICS indicator LN.3 - School readiness ( ) Figures that are based on 25 – 49 unweighted cases
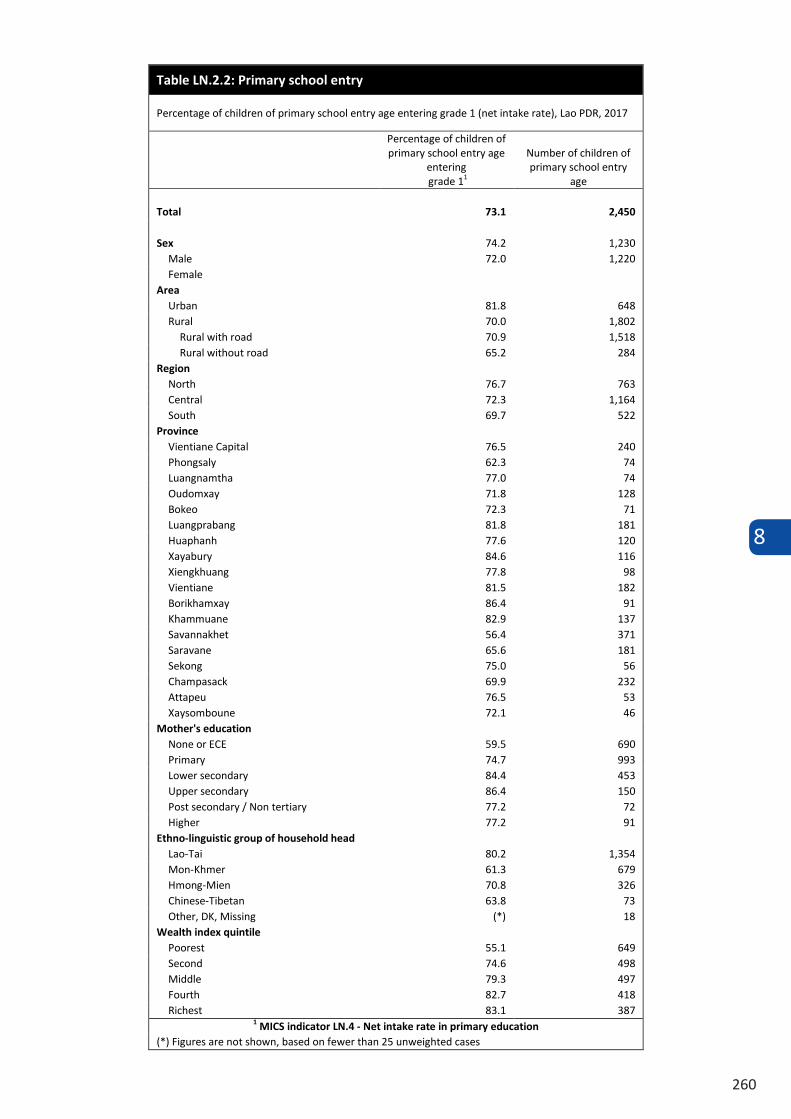
8
260
Table LN.2.2: Primary school entry
Percentage of children of primary school entry age entering grade 1 (net intake rate), Lao PDR, 2017
Percentage of children of primary school entry age
entering grade 11
Number of children of primary school entry
age
Total 73.1 2,450
Sex 74.2 1,230 Male 72.0 1,220 Female
Area Urban 81.8 648 Rural 70.0 1,802
Rural with road 70.9 1,518 Rural without road 65.2 284
Region North 76.7 763 Central 72.3 1,164 South 69.7 522
Province Vientiane Capital 76.5 240 Phongsaly 62.3 74 Luangnamtha 77.0 74 Oudomxay 71.8 128 Bokeo 72.3 71 Luangprabang 81.8 181 Huaphanh 77.6 120 Xayabury 84.6 116 Xiengkhuang 77.8 98 Vientiane 81.5 182 Borikhamxay 86.4 91 Khammuane 82.9 137 Savannakhet 56.4 371 Saravane 65.6 181 Sekong 75.0 56 Champasack 69.9 232 Attapeu 76.5 53 Xaysomboune 72.1 46
Mother's education None or ECE 59.5 690 Primary 74.7 993 Lower secondary 84.4 453 Upper secondary 86.4 150 Post secondary / Non tertiary 77.2 72 Higher 77.2 91
Ethno-linguistic group of household head Lao-Tai 80.2 1,354 Mon-Khmer 61.3 679 Hmong-Mien 70.8 326 Chinese-Tibetan 63.8 73 Other, DK, Missing (*) 18
Wealth index quintile Poorest 55.1 649 Second 74.6 498 Middle 79.3 497 Fourth 82.7 418 Richest 83.1 387
1 MICS indicator LN.4 - Net intake rate in primary education (*) Figures are not shown, based on fewer than 25 unweighted cases Ta
ble
LN.2
.3: P
rim
ary
scho
ol a
tten
danc
e an
d ou
t of s
choo
l chi
ldre
n
Perc
enta
ge o
f chi
ldre
n of
prim
ary
scho
ol a
ge a
tten
ding
prim
ary
or lo
wer
sec
onda
ry s
choo
l (ad
just
ed n
et a
tten
danc
e ra
tio),
perc
enta
ge a
tten
ding
ear
ly c
hild
hood
edu
catio
n, a
nd p
erce
ntag
e ou
t of s
choo
l, La
o PD
R, 2
017
Mal
e Fe
mal
e
Tota
l
Net
at
tend
ance
ra
tio
(adj
uste
d)
Perc
enta
ge o
f chi
ldre
n:
Num
ber
of
child
ren
Net
at
tend
ance
ra
tio
(adj
uste
d)
Perc
enta
ge o
f chi
ldre
n:
Num
ber
of
child
ren
Net
at
tend
ance
ra
tio
(adj
uste
d)1
Perc
enta
ge o
f chi
ldre
n:
Num
ber
of
child
ren
Not
at
tend
ing
scho
ol o
r ea
rly
child
hood
ed
ucat
ion
Att
endi
ng
early
ch
ildho
od
educ
atio
n O
ut o
f sc
hool
A
Not
at
tend
ing
scho
ol o
r ea
rly
child
hood
ed
ucat
ion
Att
endi
ng
early
ch
ildho
od
educ
atio
n O
ut o
f sc
hool
A
Not
at
tend
ing
scho
ol o
r ea
rly
child
hood
ed
ucat
ion
Att
endi
ng
early
ch
ildho
od
educ
atio
n O
ut o
f sc
hool
2,A
Tota
l 89
.9
8.0
2.1
10.1
5,
814
89.4
8.
3 2.
3 10
.6
5,97
1 89
.6
8.2
2.2
10.4
11
,785
Are
a Urb
an
95.7
3.
1 1.
2 4.
3 1,
413
95.3
2.
5 2.
1 4.
6 1,
511
95.5
2.
8 1.
7 4.
5 2,
924
Rura
l 88
.0
9.6
2.4
12.0
4,
401
87.3
10
.3
2.3
12.6
4,
460
87.7
10
.0
2.3
12.3
8,
862
Rura
l with
roa
d 88
.1
9.4
2.5
11.8
3,
685
88.5
9.
2 2.
3 11
.5
3,69
2 88
.3
9.3
2.4
11.7
7,
377
Rura
l with
out
road
87.2
10
.8
1.9
12.7
71
7 81
.8
15.8
2.
3 18
.1
768
84.4
13
.4
2.1
15.5
1,
485
Regi
on
Nor
th
93.1
5.
0 1.
8 6.
9 1,
834
92.4
5.
5 2.
1 7.
6 1,
879
92.7
5.
3 2.
0 7.
2 3,
713
Cent
ral
89.6
8.
2 2.
1 10
.3
2,69
1 88
.6
9.0
2.5
11.4
2,
824
89.1
8.
6 2.
3 10
.9
5,51
6 So
uth
85.7
11
.9
2.3
14.3
1,
289
86.7
11
.2
2.1
13.3
1,
268
86.2
11
.6
2.2
13.8
2,
557
Prov
ince
Vi
entia
ne C
apita
l 96
.5
2.0
1.5
3.5
492
93.5
2.
8 3.
6 6.
5 53
2 95
.0
2.4
2.6
5.0
1,02
5 Ph
ongs
aly
87
.7
7.0
5.3
12.3
18
0 88
.3
8.8
2.9
11.7
17
6 88
.0
7.9
4.1
12.0
35
6 Lu
angn
amth
a 90
.1
8.6
0.9
9.5
182
90.8
8.
9 0.
3 9.
2 19
6 90
.5
8.7
0.6
9.3
378
Oud
omxa
y 92
.9
6.2
0.8
7.1
327
90.1
8.
7 0.
9 9.
6 30
7 91
.6
7.4
0.9
8.3
634
Boke
o 89
.7
6.8
3.5
10.3
17
4 87
.4
8.7
3.9
12.6
18
7 88
.5
7.8
3.7
11.5
36
1 Lu
angp
raba
ng
95.7
2.
5 1.
8 4.
3 42
0 95
.9
2.0
2.0
4.0
456
95.8
2.
2 1.
9 4.
1 87
6 H
uaph
anh
93.8
5.
1 1.
2 6.
2 28
0 91
.2
5.3
3.5
8.8
277
92.5
5.
2 2.
3 7.
5 55
7 Xa
yabu
ry
96.3
2.
6 1.
1 3.
7 27
1 97
.3
1.2
1.5
2.7
279
96.8
1.
9 1.
3 3.
2 55
0 Xi
engk
huan
g 94
.5
3.8
1.7
5.5
236
94.2
2.
7 3.
1 5.
8 25
4 94
.3
3.2
2.4
5.7
490
Vien
tiane
95
.6
3.9
0.5
4.4
438
95.0
3.
5 1.
5 5.
0 43
9 95
.3
3.7
1.0
4.7
877
Borik
ham
xay
96.6
2.
5 0.
9 3.
4 21
8 94
.9
3.5
1.6
5.1
227
95.8
3.
0 1.
2 4.
2 44
5 Kh
amm
uane
93
.6
4.1
1.9
6.1
332
93.0
5.
8 1.
2 7.
0 36
5 93
.3
5.0
1.5
6.6
697
Sava
nnak
het
77.9
18
.2
3.9
22.1
86
8 77
.1
19.9
3.
0 22
.9
901
77.5
19
.0
3.5
22.5
1,
769
Sara
vane
85
.2
12.2
2.
6 14
.8
400
81.3
17
.4
1.3
18.7
44
7 83
.1
14.9
1.
9 16
.9
847
Seko
ng
85.5
11
.6
2.9
14.5
14
1 89
.8
7.9
2.4
10.2
13
1 87
.6
9.8
2.6
12.4
27
3 Ch
ampa
sack
84
.8
12.9
2.
4 15
.2
603
89.0
8.
3 2.
7 11
.0
555
86.8
10
.7
2.5
13.2
1,
157
Att
apeu
91
.5
7.7
0.8
8.5
145
92.0
5.
8 1.
9 7.
7 13
5 91
.8
6.7
1.4
8.1
281
Xays
ombo
une
91.2
7.
4 1.
4 8.
8 10
7 91
.7
7.0
1.4
8.3
106
91.4
7.
2 1.
4 8.
6 21
3 (C
ontu
nied
…)
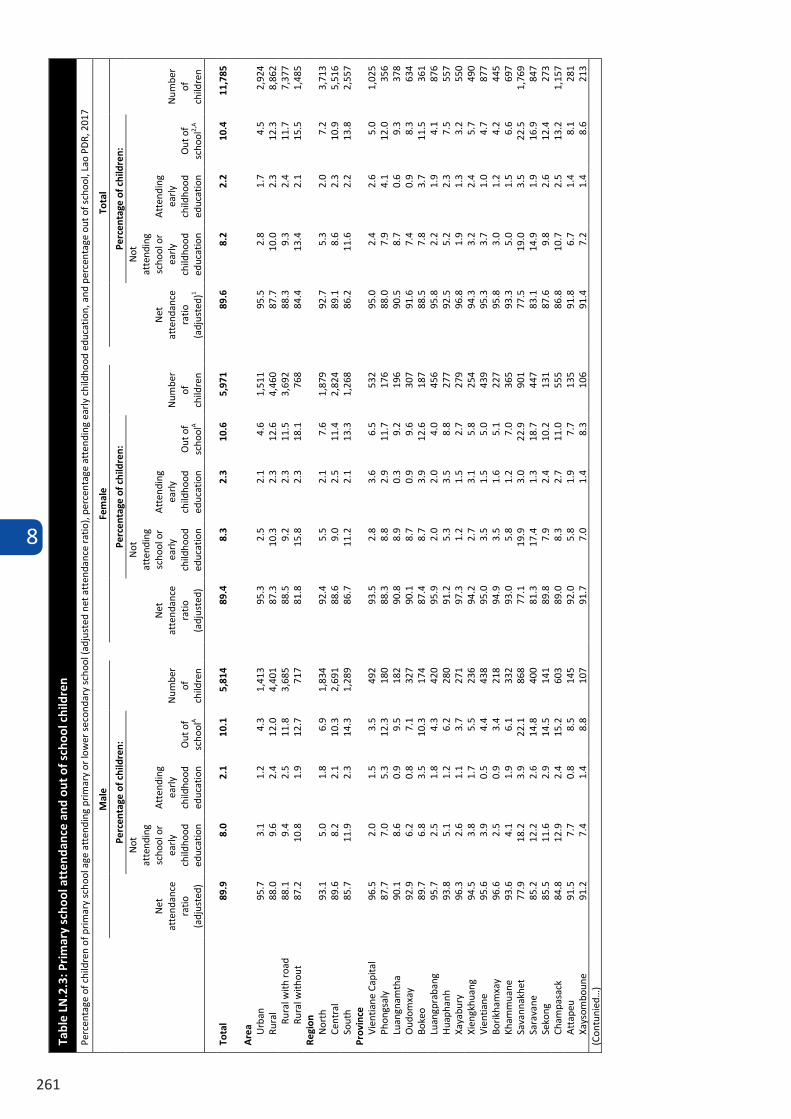
8
261
Table LN.2.2: Primary school entry
Percentage of children of primary school entry age entering grade 1 (net intake rate), Lao PDR, 2017
Percentage of children of primary school entry age
entering grade 11
Number of children of primary school entry
age
Total 73.1 2,450
Sex 74.2 1,230 Male 72.0 1,220 Female
Area Urban 81.8 648 Rural 70.0 1,802
Rural with road 70.9 1,518 Rural without road 65.2 284
Region North 76.7 763 Central 72.3 1,164 South 69.7 522
Province Vientiane Capital 76.5 240 Phongsaly 62.3 74 Luangnamtha 77.0 74 Oudomxay 71.8 128 Bokeo 72.3 71 Luangprabang 81.8 181 Huaphanh 77.6 120 Xayabury 84.6 116 Xiengkhuang 77.8 98 Vientiane 81.5 182 Borikhamxay 86.4 91 Khammuane 82.9 137 Savannakhet 56.4 371 Saravane 65.6 181 Sekong 75.0 56 Champasack 69.9 232 Attapeu 76.5 53 Xaysomboune 72.1 46
Mother's education None or ECE 59.5 690 Primary 74.7 993 Lower secondary 84.4 453 Upper secondary 86.4 150 Post secondary / Non tertiary 77.2 72 Higher 77.2 91
Ethno-linguistic group of household head Lao-Tai 80.2 1,354 Mon-Khmer 61.3 679 Hmong-Mien 70.8 326 Chinese-Tibetan 63.8 73 Other, DK, Missing (*) 18
Wealth index quintile Poorest 55.1 649 Second 74.6 498 Middle 79.3 497 Fourth 82.7 418 Richest 83.1 387
1 MICS indicator LN.4 - Net intake rate in primary education (*) Figures are not shown, based on fewer than 25 unweighted cases Ta
ble
LN.2
.3: P
rim
ary
scho
ol a
tten
danc
e an
d ou
t of s
choo
l chi
ldre
n
Perc
enta
ge o
f chi
ldre
n of
prim
ary
scho
ol a
ge a
tten
ding
prim
ary
or lo
wer
sec
onda
ry s
choo
l (ad
just
ed n
et a
tten
danc
e ra
tio),
perc
enta
ge a
tten
ding
ear
ly c
hild
hood
edu
catio
n, a
nd p
erce
ntag
e ou
t of s
choo
l, La
o PD
R, 2
017
Mal
e Fe
mal
e
Tota
l
Net
at
tend
ance
ra
tio
(adj
uste
d)
Perc
enta
ge o
f chi
ldre
n:
Num
ber
of
child
ren
Net
at
tend
ance
ra
tio
(adj
uste
d)
Perc
enta
ge o
f chi
ldre
n:
Num
ber
of
child
ren
Net
at
tend
ance
ra
tio
(adj
uste
d)1
Perc
enta
ge o
f chi
ldre
n:
Num
ber
of
child
ren
Not
at
tend
ing
scho
ol o
r ea
rly
child
hood
ed
ucat
ion
Att
endi
ng
early
ch
ildho
od
educ
atio
n O
ut o
f sc
hool
A
Not
at
tend
ing
scho
ol o
r ea
rly
child
hood
ed
ucat
ion
Att
endi
ng
early
ch
ildho
od
educ
atio
n O
ut o
f sc
hool
A
Not
at
tend
ing
scho
ol o
r ea
rly
child
hood
ed
ucat
ion
Att
endi
ng
early
ch
ildho
od
educ
atio
n O
ut o
f sc
hool
2,A
Tota
l 89
.9
8.0
2.1
10.1
5,
814
89.4
8.
3 2.
3 10
.6
5,97
1 89
.6
8.2
2.2
10.4
11
,785
Are
a Urb
an
95.7
3.
1 1.
2 4.
3 1,
413
95.3
2.
5 2.
1 4.
6 1,
511
95.5
2.
8 1.
7 4.
5 2,
924
Rura
l 88
.0
9.6
2.4
12.0
4,
401
87.3
10
.3
2.3
12.6
4,
460
87.7
10
.0
2.3
12.3
8,
862
Rura
l with
roa
d 88
.1
9.4
2.5
11.8
3,
685
88.5
9.
2 2.
3 11
.5
3,69
2 88
.3
9.3
2.4
11.7
7,
377
Rura
l with
out
road
87.2
10
.8
1.9
12.7
71
7 81
.8
15.8
2.
3 18
.1
768
84.4
13
.4
2.1
15.5
1,
485
Regi
on
Nor
th
93.1
5.
0 1.
8 6.
9 1,
834
92.4
5.
5 2.
1 7.
6 1,
879
92.7
5.
3 2.
0 7.
2 3,
713
Cent
ral
89.6
8.
2 2.
1 10
.3
2,69
1 88
.6
9.0
2.5
11.4
2,
824
89.1
8.
6 2.
3 10
.9
5,51
6 So
uth
85.7
11
.9
2.3
14.3
1,
289
86.7
11
.2
2.1
13.3
1,
268
86.2
11
.6
2.2
13.8
2,
557
Prov
ince
Vi
entia
ne C
apita
l 96
.5
2.0
1.5
3.5
492
93.5
2.
8 3.
6 6.
5 53
2 95
.0
2.4
2.6
5.0
1,02
5 Ph
ongs
aly
87
.7
7.0
5.3
12.3
18
0 88
.3
8.8
2.9
11.7
17
6 88
.0
7.9
4.1
12.0
35
6 Lu
angn
amth
a 90
.1
8.6
0.9
9.5
182
90.8
8.
9 0.
3 9.
2 19
6 90
.5
8.7
0.6
9.3
378
Oud
omxa
y 92
.9
6.2
0.8
7.1
327
90.1
8.
7 0.
9 9.
6 30
7 91
.6
7.4
0.9
8.3
634
Boke
o 89
.7
6.8
3.5
10.3
17
4 87
.4
8.7
3.9
12.6
18
7 88
.5
7.8
3.7
11.5
36
1 Lu
angp
raba
ng
95.7
2.
5 1.
8 4.
3 42
0 95
.9
2.0
2.0
4.0
456
95.8
2.
2 1.
9 4.
1 87
6 H
uaph
anh
93.8
5.
1 1.
2 6.
2 28
0 91
.2
5.3
3.5
8.8
277
92.5
5.
2 2.
3 7.
5 55
7 Xa
yabu
ry
96.3
2.
6 1.
1 3.
7 27
1 97
.3
1.2
1.5
2.7
279
96.8
1.
9 1.
3 3.
2 55
0 Xi
engk
huan
g 94
.5
3.8
1.7
5.5
236
94.2
2.
7 3.
1 5.
8 25
4 94
.3
3.2
2.4
5.7
490
Vien
tiane
95
.6
3.9
0.5
4.4
438
95.0
3.
5 1.
5 5.
0 43
9 95
.3
3.7
1.0
4.7
877
Borik
ham
xay
96.6
2.
5 0.
9 3.
4 21
8 94
.9
3.5
1.6
5.1
227
95.8
3.
0 1.
2 4.
2 44
5 Kh
amm
uane
93
.6
4.1
1.9
6.1
332
93.0
5.
8 1.
2 7.
0 36
5 93
.3
5.0
1.5
6.6
697
Sava
nnak
het
77.9
18
.2
3.9
22.1
86
8 77
.1
19.9
3.
0 22
.9
901
77.5
19
.0
3.5
22.5
1,
769
Sara
vane
85
.2
12.2
2.
6 14
.8
400
81.3
17
.4
1.3
18.7
44
7 83
.1
14.9
1.
9 16
.9
847
Seko
ng
85.5
11
.6
2.9
14.5
14
1 89
.8
7.9
2.4
10.2
13
1 87
.6
9.8
2.6
12.4
27
3 Ch
ampa
sack
84
.8
12.9
2.
4 15
.2
603
89.0
8.
3 2.
7 11
.0
555
86.8
10
.7
2.5
13.2
1,
157
Att
apeu
91
.5
7.7
0.8
8.5
145
92.0
5.
8 1.
9 7.
7 13
5 91
.8
6.7
1.4
8.1
281
Xays
ombo
une
91.2
7.
4 1.
4 8.
8 10
7 91
.7
7.0
1.4
8.3
106
91.4
7.
2 1.
4 8.
6 21
3 (C
ontu
nied
…)
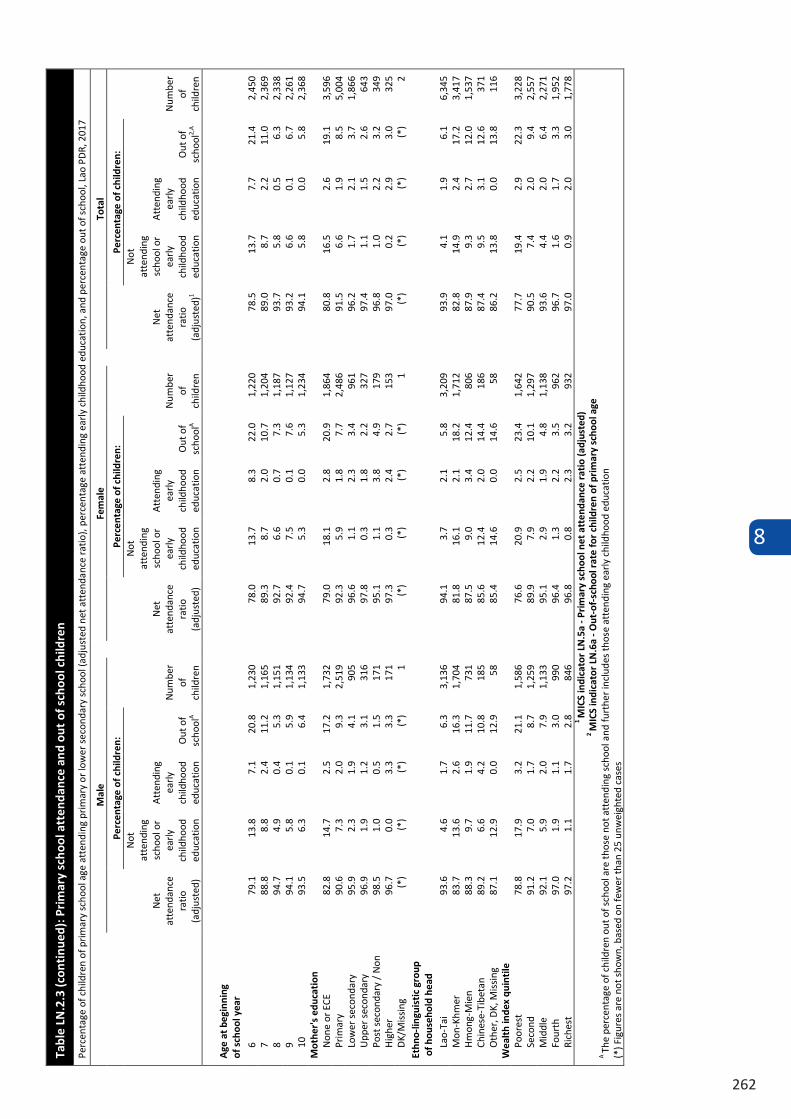
8
262
Tabl
e LN
.2.3
(con
tinu
ed):
Pri
mar
y sc
hool
att
enda
nce
and
out
of s
choo
l chi
ldre
n
Perc
enta
ge o
f chi
ldre
n of
prim
ary
scho
ol a
ge a
tten
ding
prim
ary
or lo
wer
sec
onda
ry s
choo
l (ad
just
ed n
et a
tten
danc
e ra
tio),
perc
enta
ge a
tten
ding
ear
ly c
hild
hood
edu
catio
n, a
nd p
erce
ntag
e ou
t of s
choo
l, La
o PD
R, 2
017
Mal
e
Fem
ale
Tota
l
Net
at
tend
ance
ra
tio
(adj
uste
d)
Perc
enta
ge o
f chi
ldre
n:
Num
ber
of
child
ren
Net
at
tend
ance
ra
tio
(adj
uste
d)
Perc
enta
ge o
f chi
ldre
n:
Num
ber
of
child
ren
Net
at
tend
ance
ra
tio
(adj
uste
d)1
Perc
enta
ge o
f chi
ldre
n:
Num
ber
of
child
ren
Not
at
tend
ing
scho
ol o
r ea
rly
child
hood
ed
ucat
ion
At t
endi
ng
early
ch
ildho
od
educ
atio
n O
ut o
f sc
hool
A
Not
at
tend
ing
scho
ol o
r ea
rly
child
hood
ed
ucat
ion
Att
endi
ng
early
ch
ildho
od
educ
atio
n O
ut o
f sc
hool
A
Not
at
tend
ing
scho
ol o
r ea
rly
child
hood
ed
ucat
ion
Att
endi
ng
early
ch
ildho
od
educ
atio
n O
ut o
f sc
hool
2,A
Age
at b
egin
ning
of
sch
ool y
ear
6 79
.1
13.8
7.
1 20
.8
1,23
0
78.0
13
.7
8.3
22.0
1,
220
78
.5
13.7
7.
7 21
.4
2,45
0 7
88.8
8.
8 2.
4 11
.2
1,16
5
89.3
8.
7 2.
0 10
.7
1,20
4
89.0
8.
7 2.
2 11
.0
2,36
9 8
94.7
4.
9 0.
4 5.
3 1,
151
92
.7
6.6
0.7
7.3
1,18
7
93.7
5.
8 0.
5 6.
3 2,
338
9 94
.1
5.8
0.1
5.9
1,13
4
92.4
7.
5 0.
1 7.
6 1,
127
93
.2
6.6
0.1
6.7
2,26
1 10
93
.5
6.3
0.1
6.4
1,13
3
94.7
5.
3 0.
0 5.
3 1,
234
94
.1
5.8
0.0
5.8
2,36
8 M
othe
r's
educ
atio
n
Non
e or
ECE
82
.8
14.7
2.
5 17
.2
1,73
2
79.0
18
.1
2.8
20.9
1,
864
80
.8
16.5
2.
6 19
.1
3,59
6 Pr
imar
y 90
.6
7.3
2.0
9.3
2,51
9
92.3
5.
9 1.
8 7.
7 2,
486
91
.5
6.6
1.9
8.5
5,00
4 Lo
wer
sec
onda
ry
95.9
2.
3 1.
9 4.
1 90
5
96.6
1.
1 2.
3 3.
4 96
1
96.2
1.
7 2.
1 3.
7 1,
866
Upp
er s
econ
dary
96
.9
1.9
1.2
3.1
316
97
.8
0.3
1.8
2.2
327
97
.4
1.1
1.5
2.6
643
Post
sec
onda
ry /
Non
te
rtia
ry
98.5
1.
0 0.
5 1.
5 17
1
95.1
1.
1 3.
8 4.
9 17
9
96.8
1.
0 2.
2 3.
2 34
9 H
ighe
r 96
.7
0.0
3.3
3.3
171
97
.3
0.3
2.4
2.7
153
97
.0
0.2
2.9
3.0
325
DK/
Mis
sing
(*
) (*
) (*
) (*
) 1
(*
) (*
) (*
) (*
) 1
(*
) (*
) (*
) (*
) 2
Ethn
o-lin
guis
tic
grou
p o
f hou
seho
ld h
ead
Lao-
Tai
93.6
4.
6 1.
7 6.
3 3,
136
94
.1
3.7
2.1
5.8
3,20
9
93.9
4.
1 1.
9 6.
1 6,
345
Mon
-Khm
er
83.7
13
.6
2.6
16.3
1,
704
81
.8
16.1
2.
1 18
.2
1,71
2
82.8
14
.9
2.4
17.2
3,
417
Hm
ong-
Mie
n 88
.3
9.7
1.9
11.7
73
1
87.5
9.
0 3.
4 12
.4
806
87
.9
9.3
2.7
12.0
1,
537
Chin
ese-
Tibe
tan
89.2
6.
6 4.
2 10
.8
185
85
.6
12.4
2.
0 14
.4
186
87
.4
9.5
3.1
12.6
37
1 O
ther
, DK,
Mis
sing
87
.1
12.9
0.
0 12
.9
58
85
.4
14.6
0.
0 14
.6
58
86
.2
13.8
0.
0 13
.8
116
Wea
lth
inde
x qu
inti
le
Po
ores
t 78
.8
17.9
3.
2 21
.1
1,58
6
76.6
20
.9
2.5
23.4
1,
642
77
.7
19.4
2.
9 22
.3
3,22
8 Se
cond
91
.2
7.0
1.7
8.7
1,25
9
89.9
7.
9 2.
2 10
.1
1,29
7
90.5
7.
4 2.
0 9.
4 2,
557
Mid
dle
92.1
5.
9 2.
0 7.
9 1,
133
95
.1
2.9
1.9
4.8
1,13
8
93.6
4.
4 2.
0 6.
4 2,
271
Four
th
97
.0
1.9
1.1
3.0
990
96
.4
1.3
2.2
3.5
962
96
.7
1.6
1.7
3.3
1,95
2 Ri
ches
t 97
.2
1.1
1.7
2.8
846
96
.8
0.8
2.3
3.2
932
97
.0
0.9
2.0
3.0
1,77
8 1
MIC
S in
dica
tor
LN.5
a - P
rim
ary
scho
ol n
et a
tten
danc
e ra
tio
(adj
uste
d)
2 M
ICS
indi
cato
r LN
.6a
- Out
-of-
scho
ol r
ate
for
child
ren
of p
rim
ary
scho
ol a
ge
A Th
e pe
rcen
tage
of c
hild
ren
out o
f sch
ool a
re th
ose
not a
tten
ding
sch
ool a
nd fu
rthe
r inc
lude
s th
ose
atte
ndin
g ea
rly c
hild
hood
edu
catio
n (*
) Fig
ures
are
not
sho
wn,
bas
ed o
n fe
wer
than
25
unw
eigh
ted
case
s
Tabl
e LN
.2.4
: Low
er s
econ
dary
sch
ool a
tten
danc
e an
d ou
t of s
choo
l ado
lesc
ents
Perc
enta
ge o
f chi
ldre
n of
low
er s
econ
dary
sch
ool a
ge a
tten
ding
low
er s
econ
dary
sch
ool o
r hig
her
(adj
uste
d ne
t att
enda
nce
ratio
), pe
rcen
tage
att
endi
ng p
rimar
y sc
hool
, and
per
cent
age
out o
f sch
ool,
Lao
PDR,
201
7
M
ale
Fem
ale
Tota
l
Net
at
tend
ance
ra
tio
(adj
uste
d)
Perc
enta
ge o
f chi
ldre
n:
Num
ber
of
child
ren
Net
at
tend
ance
ra
tio
(adj
uste
d)
Perc
enta
ge o
f chi
ldre
n:
Num
ber
of
child
ren
Net
at
tend
ance
ra
tio
(adj
uste
d)1
Perc
enta
ge o
f chi
ldre
n:
Num
ber
of
child
ren
Att
endi
ng
prim
ary
scho
ol
Out
of
scho
olA
Att
endi
ng
prim
ary
scho
ol
Out
of
scho
olA
Att
endi
ng
prim
ary
scho
ol
Out
of
scho
ol2,
A
To
tal
59.4
25
.3
15.2
4,
790
61
.5
20.5
18
.0
4,68
5
60.5
22
.9
16.6
9,
474
A
rea
Urb
an
80.4
11
.8
7.8
1,15
6
85.2
7.
7 7.
2 1,
157
82
.8
9.7
7.5
2,31
3 Ru
ral
52.7
29
.6
17.6
3,
633
53
.8
24.7
21
.6
3,52
8
53.3
27
.2
19.6
7,
161
Rura
l with
roa
d 54
.7
28.1
17
.2
3,07
7
56.1
23
.2
20.8
2,
989
55
.4
25.7
19
.0
6,06
6 Ru
ral w
ithou
t roa
d 42
.1
38.2
19
.7
556
40
.9
33.0
26
.1
538
41
.5
35.7
22
.8
1,09
5 Re
gion
N
orth
63
.8
24.8
11
.4
1,51
1
63.9
20
.9
15.1
1,
462
63
.9
22.9
13
.2
2,97
3 Ce
ntra
l 63
.0
22.1
15
.0
2,29
5
67.1
16
.5
16.3
2,
221
65
.0
19.3
15
.6
4,51
6 So
uth
44.4
33
.8
21.8
98
4
45.6
28
.4
26.0
1,
001
45
.0
31.1
23
.9
1,98
5 Pr
ovin
ce
Vien
tiane
Cap
ital
79.0
8.
6 12
.4
408
86
.9
5.5
7.6
400
82
.9
7.0
10.0
80
8 Ph
ongs
aly
53
.5
34.8
11
.8
154
51
.8
27.5
20
.7
161
52
.6
31.1
16
.3
315
Luan
gnam
tha
60.5
26
.4
13.1
13
5
58.2
24
.4
17.4
13
8
59.4
25
.4
15.3
27
3 O
udom
xay
59.8
27
.9
12.3
25
1
60.6
26
.3
13.2
24
2
60.2
27
.1
12.7
49
3 Bo
keo
57.8
28
.8
13.5
12
4
59.7
18
.7
21.5
12
2
58.7
23
.8
17.5
24
6 Lu
angp
raba
ng
68.6
19
.7
11.6
35
6
66.9
18
.4
14.7
32
3
67.8
19
.1
13.1
67
8 H
uaph
anh
57.6
31
.2
11.1
25
6
60.9
23
.3
15.8
23
5
59.2
27
.4
13.4
49
2 Xa
yabu
ry
79.5
12
.4
8.2
235
79
.8
11.4
8.
8 24
1
79.6
11
.9
8.5
477
Xien
gkhu
ang
78.0
18
.4
3.7
192
76
.5
11.5
12
.0
205
77
.2
14.8
8.
0 39
7 Vi
entia
ne
72.3
17
.0
10.6
35
8
72.3
14
.6
13.0
28
1
72.3
16
.0
11.7
63
8 Bo
rikha
mxa
y 80
.5
10.3
9.
2 18
5
80.6
11
.0
8.4
212
80
.6
10.6
8.
8 39
7 Kh
amm
uane
51
.3
30.0
18
.7
342
59
.5
23.7
16
.8
327
55
.3
26.9
17
.8
668
Sava
nnak
het
45.0
32
.5
22.5
72
3
50.0
23
.1
26.9
70
3
47.5
27
.9
24.7
1,
426
Sara
vane
31
.8
42.4
25
.9
307
29
.9
35.5
34
.6
305
30
.8
39.0
30
.2
612
Seko
ng
40.1
46
.4
13.5
10
3
51.8
30
.3
17.9
11
3
46.2
38
.0
15.8
21
7 Ch
ampa
sack
52
.5
24.7
22
.8
466
51
.6
22.9
25
.5
472
52
.0
23.8
24
.2
938
Att
apeu
49
.6
37.1
13
.2
107
56
.6
30.7
12
.7
111
53
.2
33.9
13
.0
218
Xays
ombo
une
73.6
21
.0
5.4
87
71
.8
19.0
9.
1 94
72.7
20
.0
7.3
182
(Con
tinue
d…)
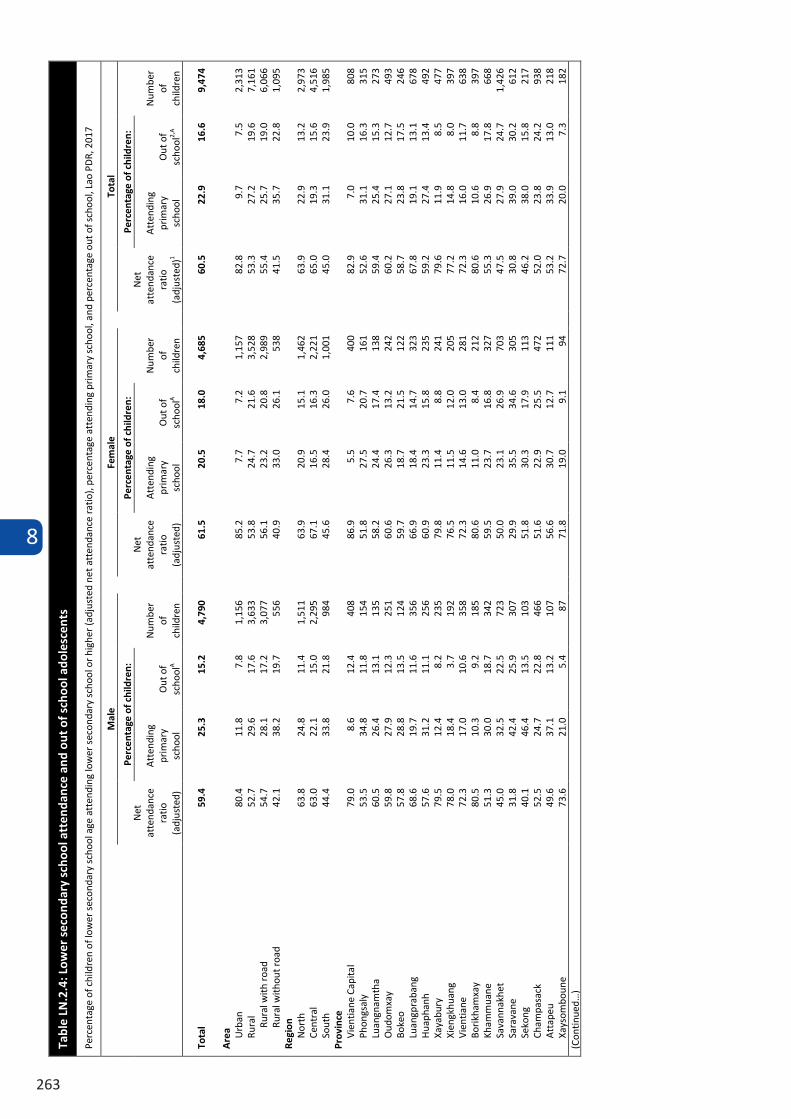
8
263
Tabl
e LN
.2.4
: Low
er s
econ
dary
sch
ool a
tten
danc
e an
d ou
t of s
choo
l ado
lesc
ents
Perc
enta
ge o
f chi
ldre
n of
low
er s
econ
dary
sch
ool a
ge a
tten
ding
low
er s
econ
dary
sch
ool o
r hig
her
(adj
uste
d ne
t att
enda
nce
ratio
), pe
rcen
tage
att
endi
ng p
rimar
y sc
hool
, and
per
cent
age
out o
f sch
ool,
Lao
PDR,
201
7
M
ale
Fem
ale
Tota
l
Net
at
tend
ance
ra
tio
(adj
uste
d)
Perc
enta
ge o
f chi
ldre
n:
Num
ber
of
child
ren
Net
at
tend
ance
ra
tio
(adj
uste
d)
Perc
enta
ge o
f chi
ldre
n:
Num
ber
of
child
ren
Net
at
tend
ance
ra
tio
(adj
uste
d)1
Perc
enta
ge o
f chi
ldre
n:
Num
ber
of
child
ren
Att
endi
ng
prim
ary
scho
ol
Out
of
scho
olA
Att
endi
ng
prim
ary
scho
ol
Out
of
scho
olA
Att
endi
ng
prim
ary
scho
ol
Out
of
scho
ol2,
A
To
tal
59.4
25
.3
15.2
4,
790
61
.5
20.5
18
.0
4,68
5
60.5
22
.9
16.6
9,
474
A
rea
Urb
an
80.4
11
.8
7.8
1,15
6
85.2
7.
7 7.
2 1,
157
82
.8
9.7
7.5
2,31
3 Ru
ral
52.7
29
.6
17.6
3,
633
53
.8
24.7
21
.6
3,52
8
53.3
27
.2
19.6
7,
161
Rura
l with
roa
d 54
.7
28.1
17
.2
3,07
7
56.1
23
.2
20.8
2,
989
55
.4
25.7
19
.0
6,06
6 Ru
ral w
ithou
t roa
d 42
.1
38.2
19
.7
556
40
.9
33.0
26
.1
538
41
.5
35.7
22
.8
1,09
5 Re
gion
N
orth
63
.8
24.8
11
.4
1,51
1
63.9
20
.9
15.1
1,
462
63
.9
22.9
13
.2
2,97
3 Ce
ntra
l 63
.0
22.1
15
.0
2,29
5
67.1
16
.5
16.3
2,
221
65
.0
19.3
15
.6
4,51
6 So
uth
44.4
33
.8
21.8
98
4
45.6
28
.4
26.0
1,
001
45
.0
31.1
23
.9
1,98
5 Pr
ovin
ce
Vien
tiane
Cap
ital
79.0
8.
6 12
.4
408
86
.9
5.5
7.6
400
82
.9
7.0
10.0
80
8 Ph
ongs
aly
53
.5
34.8
11
.8
154
51
.8
27.5
20
.7
161
52
.6
31.1
16
.3
315
Luan
gnam
tha
60.5
26
.4
13.1
13
5
58.2
24
.4
17.4
13
8
59.4
25
.4
15.3
27
3 O
udom
xay
59.8
27
.9
12.3
25
1
60.6
26
.3
13.2
24
2
60.2
27
.1
12.7
49
3 Bo
keo
57.8
28
.8
13.5
12
4
59.7
18
.7
21.5
12
2
58.7
23
.8
17.5
24
6 Lu
angp
raba
ng
68.6
19
.7
11.6
35
6
66.9
18
.4
14.7
32
3
67.8
19
.1
13.1
67
8 H
uaph
anh
57.6
31
.2
11.1
25
6
60.9
23
.3
15.8
23
5
59.2
27
.4
13.4
49
2 Xa
yabu
ry
79.5
12
.4
8.2
235
79
.8
11.4
8.
8 24
1
79.6
11
.9
8.5
477
Xien
gkhu
ang
78.0
18
.4
3.7
192
76
.5
11.5
12
.0
205
77
.2
14.8
8.
0 39
7 Vi
entia
ne
72.3
17
.0
10.6
35
8
72.3
14
.6
13.0
28
1
72.3
16
.0
11.7
63
8 Bo
rikha
mxa
y 80
.5
10.3
9.
2 18
5
80.6
11
.0
8.4
212
80
.6
10.6
8.
8 39
7 Kh
amm
uane
51
.3
30.0
18
.7
342
59
.5
23.7
16
.8
327
55
.3
26.9
17
.8
668
Sava
nnak
het
45.0
32
.5
22.5
72
3
50.0
23
.1
26.9
70
3
47.5
27
.9
24.7
1,
426
Sara
vane
31
.8
42.4
25
.9
307
29
.9
35.5
34
.6
305
30
.8
39.0
30
.2
612
Seko
ng
40.1
46
.4
13.5
10
3
51.8
30
.3
17.9
11
3
46.2
38
.0
15.8
21
7 Ch
ampa
sack
52
.5
24.7
22
.8
466
51
.6
22.9
25
.5
472
52
.0
23.8
24
.2
938
Att
apeu
49
.6
37.1
13
.2
107
56
.6
30.7
12
.7
111
53
.2
33.9
13
.0
218
Xays
ombo
une
73.6
21
.0
5.4
87
71
.8
19.0
9.
1 94
72.7
20
.0
7.3
182
(Con
tinue
d…)
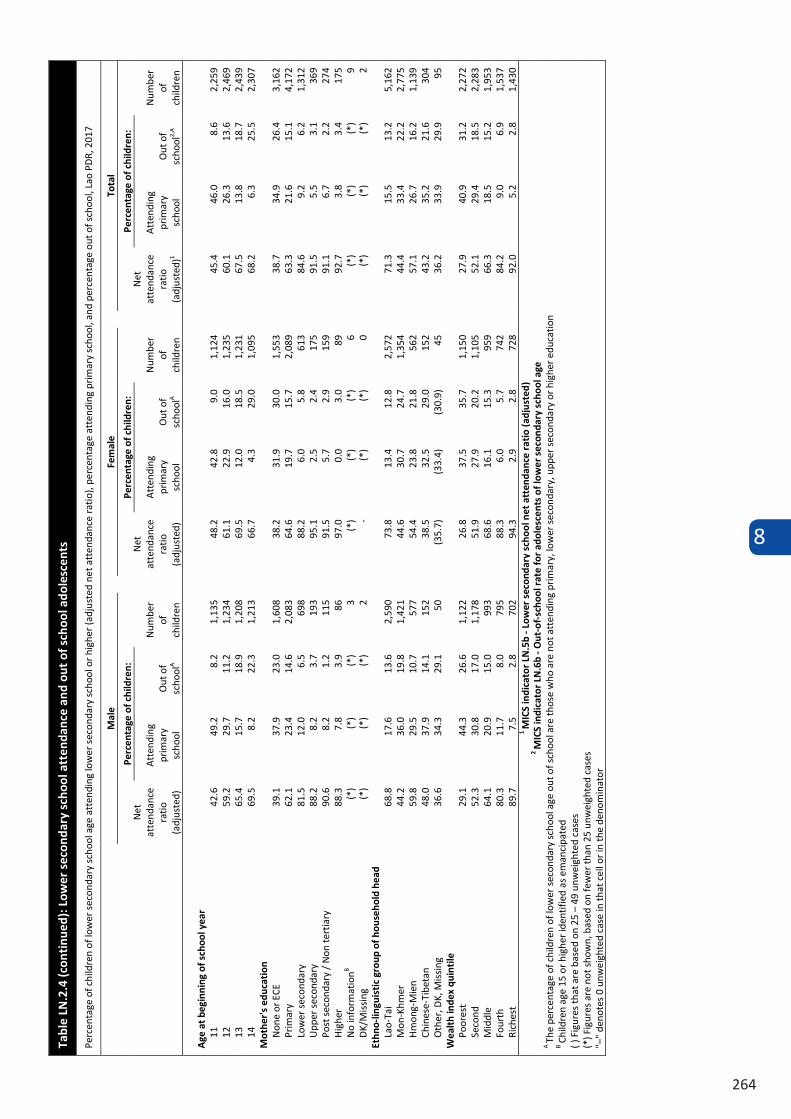
8
264
Tabl
e LN
.2.4
(con
tinu
ed):
Low
er s
econ
dary
sch
ool a
tten
danc
e an
d ou
t of
sch
ool a
dole
scen
ts
Perc
enta
ge o
f chi
ldre
n of
low
er s
econ
dary
sch
ool a
ge a
tten
ding
low
er s
econ
dary
sch
ool o
r hig
her
(adj
uste
d ne
t att
enda
nce
rati
o), p
erce
ntag
e at
tend
ing
prim
ary
scho
ol, a
nd p
erce
ntag
e ou
t of s
choo
l, La
o PD
R, 2
017
Mal
e
Fem
ale
To
tal
Net
at
tend
ance
ra
tio
(adj
uste
d)
Perc
enta
ge o
f chi
ldre
n:
Num
ber
of
child
ren
Net
at
tend
ance
ra
tio
(adj
uste
d)
Perc
enta
ge o
f chi
ldre
n:
Num
ber
of
child
ren
Net
at
tend
ance
ra
tio
(adj
uste
d)1
Perc
enta
ge o
f chi
ldre
n:
Num
ber
of
child
ren
Att
endi
ng
prim
ary
scho
ol
Out
of
scho
olA
Att
endi
ng
prim
ary
scho
ol
Out
of
scho
olA
Att
endi
ng
prim
ary
scho
ol
Out
of
scho
ol2,
A
Age
at b
egin
ning
of s
choo
l yea
r 11
42
.6
49.2
8.
2 1,
135
48.2
42
.8
9.0
1,12
4 45
.4
46.0
8.
6 2,
259
12
59.2
29
.7
11.2
1,
234
61.1
22
.9
16.0
1,
235
60.1
26
.3
13.6
2,
469
13
65.4
15
.7
18.9
1,
208
69.5
12
.0
18.5
1,
231
67.5
13
.8
18.7
2,
439
14
69.5
8.
2 22
.3
1,21
3 66
.7
4.3
29.0
1,
095
68.2
6.
3 25
.5
2,30
7 M
othe
r's
educ
atio
n N
one
or E
CE
39.1
37
.9
23.0
1,
608
38.2
31
.9
30.0
1,
553
38.7
34
.9
26.4
3,
162
Prim
ary
62.1
23
.4
14.6
2,
083
64.6
19
.7
15.7
2,
089
63.3
21
.6
15.1
4,
172
Low
er s
econ
dary
81
.5
12.0
6.
5 69
8 88
.2
6.0
5.8
613
84.6
9.
2 6.
2 1,
312
Upp
er s
econ
dary
88
.2
8.2
3.7
193
95.1
2.
5 2.
4 17
5 91
.5
5.5
3.1
369
Post
sec
onda
ry /
Non
tert
iary
90
.6
8.2
1.2
115
91.5
5.
7 2.
9 15
9 91
.1
6.7
2.2
274
Hig
her
88.3
7.
8 3.
9 86
97
.0
0.0
3.0
89
92.7
3.
8 3.
4 17
5 N
o in
form
atio
nB (*
) (*
) (*
) 3
(*)
(*)
(*)
6 (*
) (*
) (*
) 9
DK/
Mis
sing
(*
) (*
) (*
) 2
- (*
) (*
) 0
(*)
(*)
(*)
2 Et
hno-
lingu
isti
c gr
oup
of h
ouse
hold
hea
d La
o-Ta
i 68
.8
17.6
13
.6
2,59
0 73
.8
13.4
12
.8
2,57
2 71
.3
15.5
13
.2
5,16
2 M
on-K
hmer
44
.2
36.0
19
.8
1,42
1 44
.6
30.7
24
.7
1,35
4 44
.4
33.4
22
.2
2,77
5 H
mon
g-M
ien
59.8
29
.5
10.7
57
7 54
.4
23.8
21
.8
562
57.1
26
.7
16.2
1,
139
Chin
ese-
Tibe
tan
48.0
37
.9
14.1
15
2 38
.5
32.5
29
.0
152
43.2
35
.2
21.6
30
4 O
ther
, DK,
Mis
sing
36
.6
34.3
29
.1
50
(35.
7)
(33.
4)
(30.
9)
45
36.2
33
.9
29.9
95
W
ealt
h in
dex
quin
tile
Po
ores
t 29
.1
44.3
26
.6
1,12
2 26
.8
37.5
35
.7
1,15
0 27
.9
40.9
31
.2
2,27
2 Se
cond
52
.3
30.8
17
.0
1,17
8 51
.9
27.9
20
.2
1,10
5 52
.1
29.4
18
.5
2,28
3 M
iddl
e 64
.1
20.9
15
.0
993
68.6
16
.1
15.3
95
9 66
.3
18.5
15
.2
1,95
3 Fo
urth
80
.3
11.7
8.
0 79
5 88
.3
6.0
5.7
742
84.2
9.
0 6.
9 1,
537
Rich
est
89.7
7.
5 2.
8 70
2 94
.3
2.9
2.8
728
92.0
5.
2 2.
8 1,
430
1 M
ICS
indi
cato
r LN
.5b
- Low
er s
econ
dary
sch
ool n
et a
tten
danc
e ra
tio
(adj
uste
d)
2 M
ICS
indi
cato
r LN
.6b
- Out
-of-
scho
ol r
ate
for
adol
esce
nts
of lo
wer
sec
onda
ry s
choo
l age
A
The
perc
enta
ge o
f chi
ldre
n of
low
er s
econ
dary
sch
ool a
ge o
ut o
f sch
ool a
re th
ose
who
are
not
att
endi
ng p
rimar
y, lo
wer
sec
onda
ry, u
pper
sec
onda
ry o
r hig
her e
duca
tion
B Ch
ildre
n ag
e 15
or h
ighe
r ide
ntifi
ed a
s em
anci
pate
d ( )
Fig
ures
that
are
bas
ed o
n 25
– 4
9 un
wei
ghte
d ca
ses
(*) F
igur
es a
re n
ot s
how
n, b
ased
on
few
er th
an 2
5 un
wei
ghte
d ca
ses
"–"
deno
tes
0 un
wei
ghte
d ca
se in
that
cel
l or i
n th
e de
nom
inat
or
Tabl
e LN
.2.5
: Age
for
grad
e
Perc
enta
ge o
f chi
ldre
n at
tend
ing
prim
ary
and
low
er s
econ
dary
sch
ool w
ho a
re u
nder
age,
at a
ge a
nd o
vera
ge fo
r gra
de, L
ao P
DR,
201
7
Prim
ary
scho
ol
Low
er s
econ
dary
sch
ool
Perc
ent o
f chi
ldre
n by
gra
de o
f att
enda
nce:
Tota
l
Num
ber o
f ch
ildre
n at
tend
ing
prim
ary
scho
ol
Perc
ent o
f chi
ldre
n by
gra
de o
f att
enda
nce:
Tota
l
Num
ber o
f ch
ildre
n at
tend
ing
low
er
seco
ndar
y sc
hool
U
nder
-ag
e
At
offic
ial
age
Ove
r-ag
e by
1
year
O
ver-
age
by 2
or
mor
e ye
ars1
Und
er-
age
At o
ffic
ial
age
Ove
r-ag
e by
1 y
ear
Ove
r-ag
e by
2
or m
ore
year
s2
To
tal
8.8
74.4
7.
8 9.
0 10
0.0
13,3
56
8.
1 72
.4
9.5
10.0
10
0.0
7,46
7
Se
x
Mal
e 9.
0 72
.6
8.2
10.3
10
0.0
6,82
0
6.9
69.7
11
.0
12.4
10
0.0
3,90
5 Fe
mal
e 8.
7 76
.2
7.4
7.7
100.
0 6,
536
9.
5 75
.3
7.9
7.2
100.
0 3,
562
Are
a
Urb
an
11.5
81
.1
4.3
3.0
100.
0 3,
139
10
.6
75.6
7.
5 6.
3 10
0.0
2,30
1 Ru
ral
8.0
72.3
8.
8 10
.9
100.
0 10
,217
7.0
70.9
10
.4
11.6
10
0.0
5,16
6 Ru
ral w
ith r
oad
7.8
73.2
8.
6 10
.4
100.
0 8,
428
7.
3 71
.2
10.3
11
.2
100.
0 4,
515
Rura
l with
out r
oad
8.9
68.0
9.
9 13
.2
100.
0 1,
789
5.
3 69
.3
11.2
14
.2
100.
0 65
1 Re
gion
Nor
th
8.6
75.1
7.
8 8.
5 10
0.0
4,31
9
7.9
72.3
9.
1 10
.7
100.
0 2,
485
Cent
ral
9.2
75.9
7.
1 7.
8 10
0.0
6,03
6
8.7
73.5
8.
5 9.
2 10
0.0
3,74
3 So
uth
8.3
70.2
9.
2 12
.2
100.
0 3,
001
6.
9 68
.9
13.4
10
.8
100.
0 1,
240
Prov
ince
Vien
tiane
Cap
ital
11.0
83
.5
2.6
2.8
100.
0 1,
086
8.
8 81
.2
5.2
4.8
100.
0 75
3 Ph
ongs
aly
8.
5 68
.6
10.5
12
.4
100.
0 43
4
7.5
71.9
10
.1
10.5
10
0.0
205
Luan
gnam
tha
5.8
77.0
9.
0 8.
2 10
0.0
419
8.
6 67
.5
10.4
13
.5
100.
0 22
7 O
udom
xay
10.3
72
.0
8.4
9.3
100.
0 77
3
5.7
68.1
11
.5
14.7
10
0.0
408
Boke
o 10
.3
74.8
7.
8 7.
0 10
0.0
399
11
.0
72.4
7.
1 9.
4 10
0.0
192
Luan
gpra
bang
7.
7 78
.7
6.6
7.0
100.
0 99
3
9.5
74.6
8.
8 7.
1 10
0.0
587
Hua
phan
h 8.
7 71
.3
9.6
10.4
10
0.0
698
4.
1 68
.8
10.2
16
.9
100.
0 41
4 Xa
yabu
ry
8.9
80.8
3.
8 6.
5 10
0.0
603
9.
8 78
.8
6.3
5.1
100.
0 45
3 Xi
engk
huan
g 11
.1
77.8
5.
4 5.
7 10
0.0
539
10
.7
71.4
9.
8 8.
1 10
0.0
410
Vien
tiane
9.
8 79
.0
6.7
4.5
100.
0 94
6
14.4
70
.5
9.2
5.9
100.
0 60
1 Bo
rikha
mxa
y 9.
0 81
.6
4.9
4.6
100.
0 47
2
10.4
78
.8
6.3
4.5
100.
0 37
1 Kh
amm
uane
7.
7 71
.5
8.6
12.2
10
0.0
882
4.
3 76
.3
9.0
10.5
10
0.0
458
Sava
nnak
het
7.9
70.4
10
.0
11.7
10
0.0
1,86
6
5.7
67.3
10
.9
16.1
10
0.0
984
Sara
vane
10
.2
65.3
9.
1 15
.4
100.
0 1,
034
8.
7 61
.6
14.9
14
.8
100.
0 29
8 Se
kong
9.
8 65
.9
10.2
14
.1
100.
0 34
7
6.6
63.8
13
.2
16.4
10
0.0
155
Cham
pasa
ck
6.7
75.4
9.
2 8.
8 10
0.0
1,26
1
7.4
74.7
12
.4
5.5
100.
0 61
6 A
ttap
eu
7.2
70.4
9.
0 13
.4
100.
0 35
9
2.2
65.6
14
.5
17.6
10
0.0
171
Xays
ombo
une
11.2
73
.2
7.8
7.8
100.
0 24
5
9.1
72.8
8.
1 10
.1
100.
0 16
6 (C
ontin
ued…
)
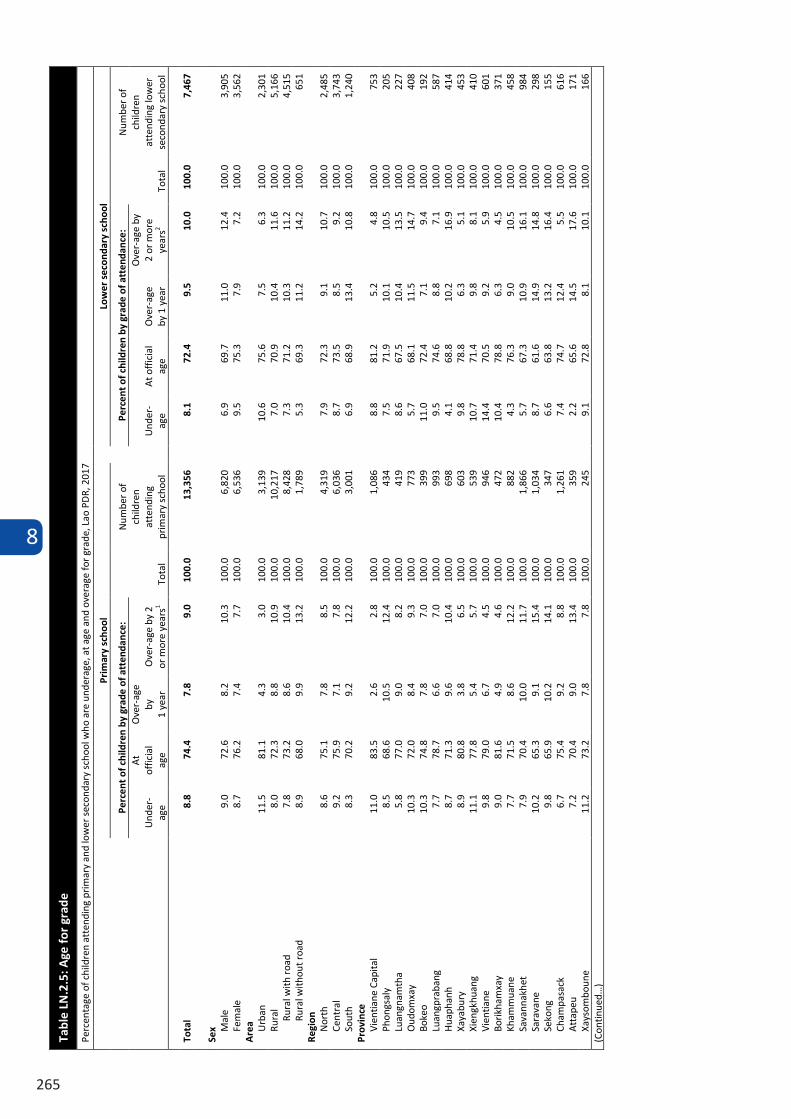
8
265
Tabl
e LN
.2.5
: Age
for
grad
e
Perc
enta
ge o
f chi
ldre
n at
tend
ing
prim
ary
and
low
er s
econ
dary
sch
ool w
ho a
re u
nder
age,
at a
ge a
nd o
vera
ge fo
r gra
de, L
ao P
DR,
201
7
Prim
ary
scho
ol
Low
er s
econ
dary
sch
ool
Perc
ent o
f chi
ldre
n by
gra
de o
f att
enda
nce:
Tota
l
Num
ber o
f ch
ildre
n at
tend
ing
prim
ary
scho
ol
Perc
ent o
f chi
ldre
n by
gra
de o
f att
enda
nce:
Tota
l
Num
ber o
f ch
ildre
n at
tend
ing
low
er
seco
ndar
y sc
hool
U
nder
-ag
e
At
offic
ial
age
Ove
r-ag
e by
1
year
O
ver-
age
by 2
or
mor
e ye
ars1
Und
er-
age
At o
ffic
ial
age
Ove
r-ag
e by
1 y
ear
Ove
r-ag
e by
2
or m
ore
year
s2
To
tal
8.8
74.4
7.
8 9.
0 10
0.0
13,3
56
8.
1 72
.4
9.5
10.0
10
0.0
7,46
7
Se
x
Mal
e 9.
0 72
.6
8.2
10.3
10
0.0
6,82
0
6.9
69.7
11
.0
12.4
10
0.0
3,90
5 Fe
mal
e 8.
7 76
.2
7.4
7.7
100.
0 6,
536
9.
5 75
.3
7.9
7.2
100.
0 3,
562
Are
a
Urb
an
11.5
81
.1
4.3
3.0
100.
0 3,
139
10
.6
75.6
7.
5 6.
3 10
0.0
2,30
1 Ru
ral
8.0
72.3
8.
8 10
.9
100.
0 10
,217
7.0
70.9
10
.4
11.6
10
0.0
5,16
6 Ru
ral w
ith r
oad
7.8
73.2
8.
6 10
.4
100.
0 8,
428
7.
3 71
.2
10.3
11
.2
100.
0 4,
515
Rura
l with
out r
oad
8.9
68.0
9.
9 13
.2
100.
0 1,
789
5.
3 69
.3
11.2
14
.2
100.
0 65
1 Re
gion
Nor
th
8.6
75.1
7.
8 8.
5 10
0.0
4,31
9
7.9
72.3
9.
1 10
.7
100.
0 2,
485
Cent
ral
9.2
75.9
7.
1 7.
8 10
0.0
6,03
6
8.7
73.5
8.
5 9.
2 10
0.0
3,74
3 So
uth
8.3
70.2
9.
2 12
.2
100.
0 3,
001
6.
9 68
.9
13.4
10
.8
100.
0 1,
240
Prov
ince
Vien
tiane
Cap
ital
11.0
83
.5
2.6
2.8
100.
0 1,
086
8.
8 81
.2
5.2
4.8
100.
0 75
3 Ph
ongs
aly
8.
5 68
.6
10.5
12
.4
100.
0 43
4
7.5
71.9
10
.1
10.5
10
0.0
205
Luan
gnam
tha
5.8
77.0
9.
0 8.
2 10
0.0
419
8.
6 67
.5
10.4
13
.5
100.
0 22
7 O
udom
xay
10.3
72
.0
8.4
9.3
100.
0 77
3
5.7
68.1
11
.5
14.7
10
0.0
408
Boke
o 10
.3
74.8
7.
8 7.
0 10
0.0
399
11
.0
72.4
7.
1 9.
4 10
0.0
192
Luan
gpra
bang
7.
7 78
.7
6.6
7.0
100.
0 99
3
9.5
74.6
8.
8 7.
1 10
0.0
587
Hua
phan
h 8.
7 71
.3
9.6
10.4
10
0.0
698
4.
1 68
.8
10.2
16
.9
100.
0 41
4 Xa
yabu
ry
8.9
80.8
3.
8 6.
5 10
0.0
603
9.
8 78
.8
6.3
5.1
100.
0 45
3 Xi
engk
huan
g 11
.1
77.8
5.
4 5.
7 10
0.0
539
10
.7
71.4
9.
8 8.
1 10
0.0
410
Vien
tiane
9.
8 79
.0
6.7
4.5
100.
0 94
6
14.4
70
.5
9.2
5.9
100.
0 60
1 Bo
rikha
mxa
y 9.
0 81
.6
4.9
4.6
100.
0 47
2
10.4
78
.8
6.3
4.5
100.
0 37
1 Kh
amm
uane
7.
7 71
.5
8.6
12.2
10
0.0
882
4.
3 76
.3
9.0
10.5
10
0.0
458
Sava
nnak
het
7.9
70.4
10
.0
11.7
10
0.0
1,86
6
5.7
67.3
10
.9
16.1
10
0.0
984
Sara
vane
10
.2
65.3
9.
1 15
.4
100.
0 1,
034
8.
7 61
.6
14.9
14
.8
100.
0 29
8 Se
kong
9.
8 65
.9
10.2
14
.1
100.
0 34
7
6.6
63.8
13
.2
16.4
10
0.0
155
Cham
pasa
ck
6.7
75.4
9.
2 8.
8 10
0.0
1,26
1
7.4
74.7
12
.4
5.5
100.
0 61
6 A
ttap
eu
7.2
70.4
9.
0 13
.4
100.
0 35
9
2.2
65.6
14
.5
17.6
10
0.0
171
Xays
ombo
une
11.2
73
.2
7.8
7.8
100.
0 24
5
9.1
72.8
8.
1 10
.1
100.
0 16
6 (C
ontin
ued…
)
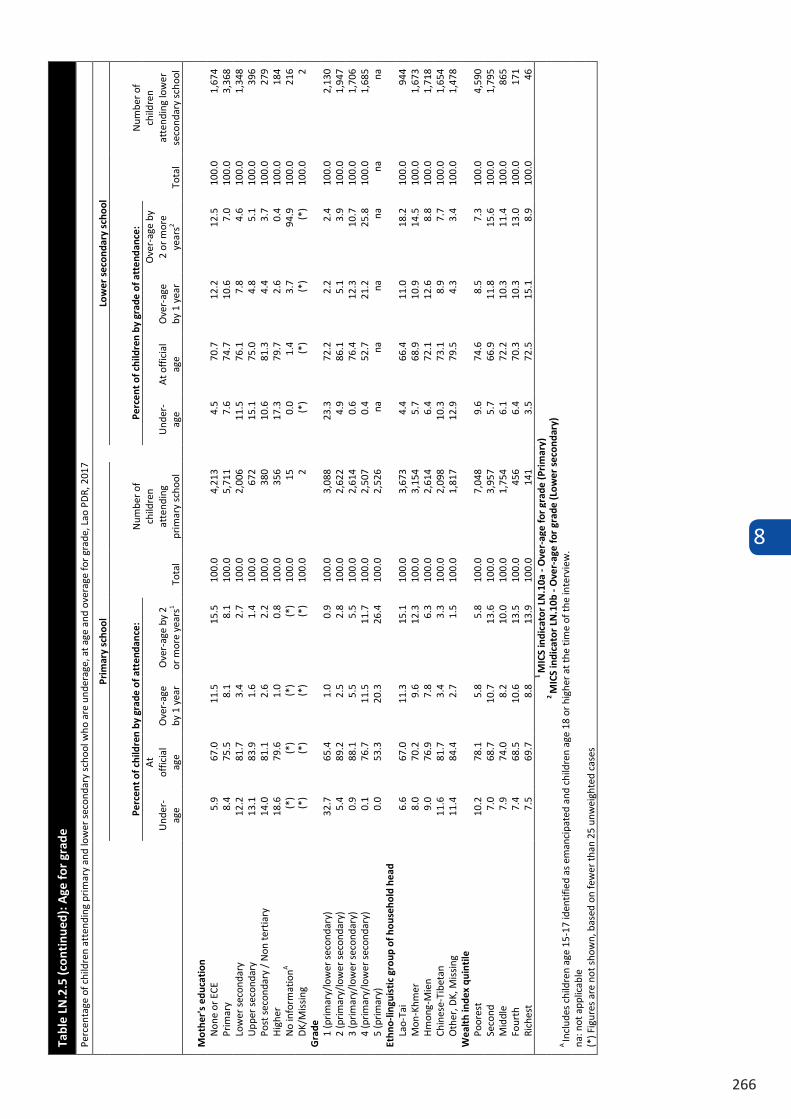
8
266
Tabl
e LN
.2.5
(con
tinu
ed):
Age
for
grad
e
Perc
enta
ge o
f chi
ldre
n at
tend
ing
prim
ary
and
low
er s
econ
dary
sch
ool w
ho a
re u
nder
age,
at a
ge a
nd o
vera
ge fo
r gra
de, L
ao P
DR,
201
7
Prim
ary
scho
ol
Low
er s
econ
dary
sch
ool
Perc
ent o
f chi
ldre
n by
gra
de o
f att
enda
nce:
Tota
l
Num
ber o
f ch
ildre
n at
tend
ing
prim
ary
scho
ol
Perc
ent o
f chi
ldre
n by
gra
de o
f att
enda
nce:
Tota
l
Num
ber o
f ch
ildre
n at
tend
ing
low
er
seco
ndar
y sc
hool
U
nder
-ag
e
At
offic
ial
age
Ove
r-ag
e by
1 y
ear
Ove
r-ag
e by
2
or m
ore
year
s1 U
nder
-ag
e A
t off
icia
l ag
e O
ver-
age
by 1
yea
r
Ove
r-ag
e by
2
or m
ore
year
s2
M
othe
r's
educ
atio
n
Non
e or
ECE
5.
9 67
.0
11.5
15
.5
100.
0 4,
213
4.
5 70
.7
12.2
12
.5
100.
0 1,
674
Prim
ary
8.4
75.5
8.
1 8.
1 10
0.0
5,71
1
7.6
74.7
10
.6
7.0
100.
0 3,
368
Low
er s
econ
dary
12
.2
81.7
3.
4 2.
7 10
0.0
2,00
6
11.5
76
.1
7.8
4.6
100.
0 1,
348
Upp
er s
econ
dary
13
.1
83.9
1.
6 1.
4 10
0.0
672
15
.1
75.0
4.
8 5.
1 10
0.0
396
Post
sec
onda
ry /
Non
tert
iary
14
.0
81.1
2.
6 2.
2 10
0.0
380
10
.6
81.3
4.
4 3.
7 10
0.0
279
Hig
her
18.6
79
.6
1.0
0.8
100.
0 35
6
17.3
79
.7
2.6
0.4
100.
0 18
4 N
o in
form
atio
nA
(*)
(*)
(*)
(*)
100.
0 15
0.0
1.4
3.7
94.9
10
0.0
216
DK/
Mis
sing
(*
) (*
) (*
) (*
) 10
0.0
2
(*)
(*)
(*)
(*)
100.
0 2
Gra
de
1
(prim
ary/
low
er s
econ
dary
) 32
.7
65.4
1.
0 0.
9 10
0.0
3,08
8
23.3
72
.2
2.2
2.4
100.
0 2,
130
2 (p
rimar
y/lo
wer
sec
onda
ry)
5.4
89.2
2.
5 2.
8 10
0.0
2,62
2
4.9
86.1
5.
1 3.
9 10
0.0
1,94
7 3
(prim
ary/
low
er s
econ
dary
) 0.
9 88
.1
5.5
5.5
100.
0 2,
614
0.
6 76
.4
12.3
10
.7
100.
0 1,
706
4 (p
rimar
y/lo
wer
sec
onda
ry)
0.1
76.7
11
.5
11.7
10
0.0
2,50
7
0.4
52.7
21
.2
25.8
10
0.0
1,68
5 5
(prim
ary)
0.
0 53
.3
20.3
26
.4
100.
0 2,
526
na
na
na
na
na
na
Et
hno-
lingu
isti
c gr
oup
of h
ouse
hold
hea
d
La
o-Ta
i 6.
6 67
.0
11.3
15
.1
100.
0 3,
673
4.
4 66
.4
11.0
18
.2
100.
0 94
4 M
on-K
hmer
8.
0 70
.2
9.6
12.3
10
0.0
3,15
4
5.7
68.9
10
.9
14.5
10
0.0
1,67
3 H
mon
g-M
ien
9.0
76.9
7.
8 6.
3 10
0.0
2,61
4
6.4
72.1
12
.6
8.8
100.
0 1,
718
Chin
ese-
Tibe
tan
11.6
81
.7
3.4
3.3
100.
0 2,
098
10
.3
73.1
8.
9 7.
7 10
0.0
1,65
4 O
ther
, DK,
Mis
sing
11
.4
84.4
2.
7 1.
5 10
0.0
1,81
7
12.9
79
.5
4.3
3.4
100.
0 1,
478
Wea
lth
inde
x qu
inti
le
Po
ores
t 10
.2
78.1
5.
8 5.
8 10
0.0
7,04
8
9.6
74.6
8.
5 7.
3 10
0.0
4,59
0 Se
cond
7.
0 68
.7
10.7
13
.6
100.
0 3,
957
5.
7 66
.9
11.8
15
.6
100.
0 1,
795
Mid
dle
7.9
74.0
8.
2 10
.0
100.
0 1,
754
6.
1 72
.2
10.3
11
.4
100.
0 86
5 Fo
urth
7.4
68.5
10
.6
13.5
10
0.0
456
6.
4 70
.3
10.3
13
.0
100.
0 17
1 Ri
ches
t 7.
5 69
.7
8.8
13.9
10
0.0
141
3.
5 72
.5
15.1
8.
9 10
0.0
46
1 M
ICS
indi
cato
r LN
.10a
- O
ver-
age
for
grad
e (P
rim
ary)
2
MIC
S in
dica
tor
LN.1
0b -
Ove
r-ag
e fo
r gr
ade
(Low
er s
econ
dary
) A
Incl
udes
chi
ldre
n ag
e 15
-17
iden
tifie
d as
em
anci
pate
d an
d ch
ildre
n ag
e 18
or h
ighe
r at t
he ti
me
of th
e in
terv
iew
. na
: not
app
licab
le
(*) F
igur
es a
re n
ot s
how
n, b
ased
on
few
er th
an 2
5 un
wei
ghte
d ca
ses
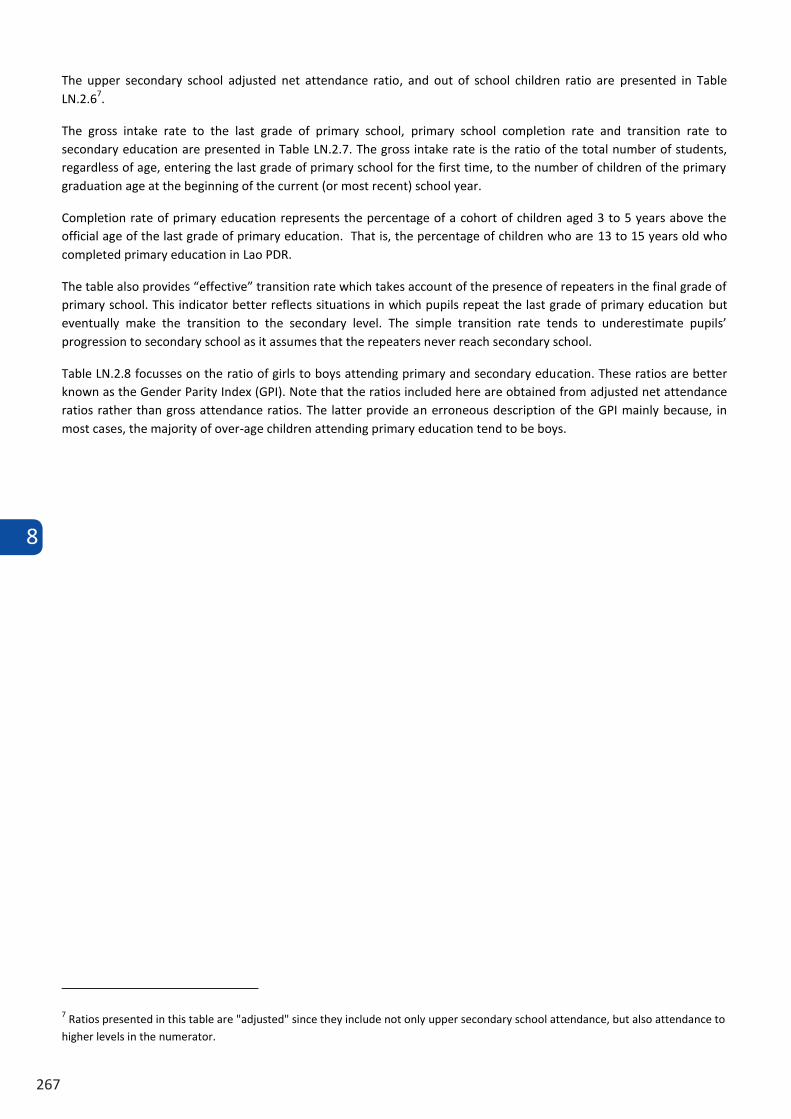
8
267
The upper secondary school adjusted net attendance ratio, and out of school children ratio are presented in Table LN.2.67.
The gross intake rate to the last grade of primary school, primary school completion rate and transition rate to secondary education are presented in Table LN.2.7. The gross intake rate is the ratio of the total number of students, regardless of age, entering the last grade of primary school for the first time, to the number of children of the primary graduation age at the beginning of the current (or most recent) school year.
Completion rate of primary education represents the percentage of a cohort of children aged 3 to 5 years above the official age of the last grade of primary education. That is, the percentage of children who are 13 to 15 years old who completed primary education in Lao PDR.
The table also provides “effective” transition rate which takes account of the presence of repeaters in the final grade of primary school. This indicator better reflects situations in which pupils repeat the last grade of primary education but eventually make the transition to the secondary level. The simple transition rate tends to underestimate pupils’ progression to secondary school as it assumes that the repeaters never reach secondary school.
Table LN.2.8 focusses on the ratio of girls to boys attending primary and secondary education. These ratios are better known as the Gender Parity Index (GPI). Note that the ratios included here are obtained from adjusted net attendance ratios rather than gross attendance ratios. The latter provide an erroneous description of the GPI mainly because, in most cases, the majority of over-age children attending primary education tend to be boys.
7 Ratios presented in this table are "adjusted" since they include not only upper secondary school attendance, but also attendance to higher levels in the numerator.
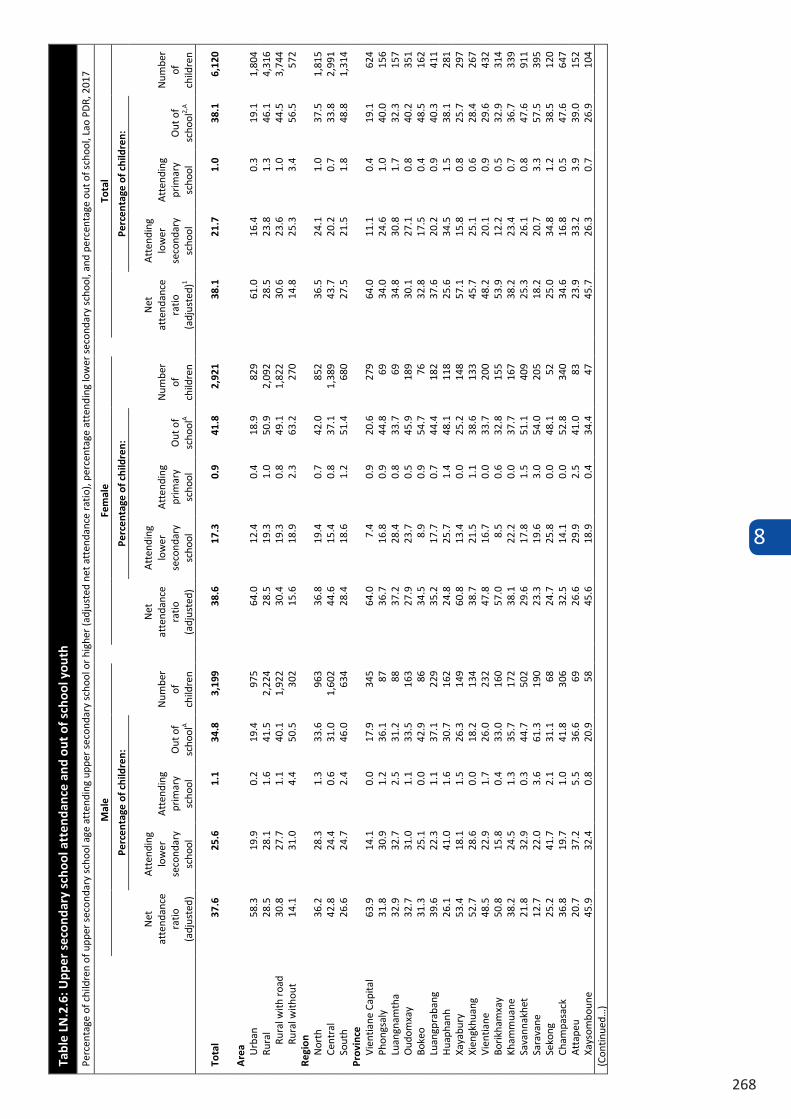
8
268
Tabl
e LN
.2.6
: Upp
er s
econ
dary
sch
ool a
tten
danc
e an
d ou
t of s
choo
l you
th
Perc
enta
ge o
f chi
ldre
n of
upp
er s
econ
dary
sch
ool a
ge a
tten
ding
upp
er s
econ
dary
sch
ool o
r hig
her
(adj
uste
d ne
t att
enda
nce
rati
o), p
erce
ntag
e at
tend
ing
low
er s
econ
dary
sch
ool,
and
perc
enta
ge o
ut o
f sch
ool,
Lao
PDR,
201
7
Mal
e
Fem
ale
Tota
l
Net
at
tend
ance
ra
tio
(adj
uste
d)
Perc
enta
ge o
f chi
ldre
n:
Num
ber
of
child
ren
Net
at
tend
ance
ra
tio
(adj
uste
d)
Perc
enta
ge o
f chi
ldre
n:
Num
ber
of
child
ren
Net
at
tend
ance
ra
tio
(adj
uste
d)1
Perc
enta
ge o
f chi
ldre
n:
Num
ber
of
child
ren
Att
endi
ng
low
er
seco
ndar
y sc
hool
Att
endi
ng
prim
ary
scho
ol
Out
of
scho
olA
Att
endi
ng
low
er
seco
ndar
y sc
hool
Att
endi
ng
prim
ary
scho
ol
Out
of
scho
olA
Att
endi
ng
low
er
seco
ndar
y sc
hool
Att
endi
ng
prim
ary
scho
ol
Out
of
scho
ol2,
A
Tota
l 37
.6
25.6
1.
1 34
.8
3,19
9
38.6
17
.3
0.9
41.8
2,
921
38
.1
21.7
1.
0 38
.1
6,12
0
A
rea
U
rban
58
.3
19.9
0.
2 19
.4
975
64
.0
12.4
0.
4 18
.9
829
61
.0
16.4
0.
3 19
.1
1,80
4 Ru
ral
28.5
28
.1
1.6
41.5
2,
224
28
.5
19.3
1.
0 50
.9
2,09
2
28.5
23
.8
1.3
46.1
4,
316
Rura
l with
roa
d 30
.8
27.7
1.
1 40
.1
1,92
2
30.4
19
.3
0.8
49.1
1,
822
30
.6
23.6
1.
0 44
.5
3,74
4 Ru
ral w
ithou
t ro
ad
14.1
31
.0
4.4
50.5
30
2
15.6
18
.9
2.3
63.2
27
0
14.8
25
.3
3.4
56.5
57
2 Re
gion
Nor
th
36.2
28
.3
1.3
33.6
96
3
36.8
19
.4
0.7
42.0
85
2
36.5
24
.1
1.0
37.5
1,
815
Cent
ral
42.8
24
.4
0.6
31.0
1,
602
44
.6
15.4
0.
8 37
.1
1,38
9
43.7
20
.2
0.7
33.8
2,
991
Sout
h 26
.6
24.7
2.
4 46
.0
634
28
.4
18.6
1.
2 51
.4
680
27
.5
21.5
1.
8 48
.8
1,31
4 Pr
ovin
ce
Vi
entia
ne C
apita
l 63
.9
14.1
0.
0 17
.9
345
64
.0
7.4
0.9
20.6
27
9
64.0
11
.1
0.4
19.1
62
4 Ph
ongs
aly
31
.8
30.9
1.
2 36
.1
87
36
.7
16.8
0.
9 44
.8
69
34
.0
24.6
1.
0 40
.0
156
Luan
gnam
tha
32.9
32
.7
2.5
31.2
88
37.2
28
.4
0.8
33.7
69
34.8
30
.8
1.7
32.3
15
7 O
udom
xay
32.7
31
.0
1.1
33.5
16
3
27.9
23
.7
0.5
45.9
18
9
30.1
27
.1
0.8
40.2
35
1 Bo
keo
31.3
25
.1
0.0
42.9
86
34.5
8.
9 0.
9 54
.7
76
32
.8
17.5
0.
4 48
.5
162
Luan
gpra
bang
39
.6
22.3
1.
1 37
.1
229
35
.2
17.7
0.
7 44
.4
182
37
.6
20.2
0.
9 40
.3
411
Hua
phan
h 26
.1
41.0
1.
6 30
.7
162
24
.8
25.7
1.
4 48
.1
118
25
.6
34.5
1.
5 38
.1
281
Xaya
bury
53
.4
18.1
1.
5 26
.3
149
60
.8
13.4
0.
0 25
.2
148
57
.1
15.8
0.
8 25
.7
297
Xien
gkhu
ang
52.7
28
.6
0.0
18.2
13
4
38.7
21
.5
1.1
38.6
13
3
45.7
25
.1
0.6
28.4
26
7 Vi
entia
ne
48.5
22
.9
1.7
26.0
23
2
47.8
16
.7
0.0
33.7
20
0
48.2
20
.1
0.9
29.6
43
2 Bo
rikha
mxa
y 50
.8
15.8
0.
4 33
.0
160
57
.0
8.5
0.6
32.8
15
5
53.9
12
.2
0.5
32.9
31
4 Kh
amm
uane
38
.2
24.5
1.
3 35
.7
172
38
.1
22.2
0.
0 37
.7
167
38
.2
23.4
0.
7 36
.7
339
Sava
nnak
het
21.8
32
.9
0.3
44.7
50
2
29.6
17
.8
1.5
51.1
40
9
25.3
26
.1
0.8
47.6
91
1 Sa
rava
ne
12.7
22
.0
3.6
61.3
19
0
23.3
19
.6
3.0
54.0
20
5
18.2
20
.7
3.3
57.5
39
5 Se
kong
25
.2
41.7
2.
1 31
.1
68
24
.7
25.8
0.
0 48
.1
52
25
.0
34.8
1.
2 38
.5
120
Cham
pasa
ck
36.8
19
.7
1.0
41.8
30
6
32.5
14
.1
0.0
52.8
34
0
34.6
16
.8
0.5
47.6
64
7 A
ttap
eu
20.7
37
.2
5.5
36.6
69
26.6
29
.9
2.5
41.0
83
23.9
33
.2
3.9
39.0
15
2 Xa
ysom
boun
e 45
.9
32.4
0.
8 20
.9
58
45
.6
18.9
0.
4 34
.4
47
45
.7
26.3
0.
7 26
.9
104
(Con
tinue
d…)
Tabl
e LN
.2.6
(con
tinu
ed):
Upp
er s
econ
dary
sch
ool a
tten
danc
e an
d ou
t of
sch
ool y
outh
Perc
enta
ge o
f chi
ldre
n of
upp
er s
econ
dary
sch
ool a
ge a
tten
ding
upp
er s
econ
dary
sch
ool o
r hig
her
(adj
uste
d ne
t att
enda
nce
ratio
), pe
rcen
tage
att
endi
ng lo
wer
sec
onda
ry s
choo
l, an
d pe
rcen
tage
out
of s
choo
l, La
o PD
R, 2
017
M
ale
Fem
ale
Tota
l
Net
at
tend
ance
ra
tio
(adj
uste
d)
Perc
enta
ge o
f chi
ldre
n:
Num
ber
of
child
ren
Net
at
tend
ance
ra
tio
(adj
uste
d)
Perc
enta
ge o
f chi
ldre
n:
Num
ber
of
child
ren
Net
at
tend
ance
ra
tio
(adj
uste
d)1
Perc
enta
ge o
f chi
ldre
n:
Num
ber
of
child
ren
Att
endi
ng
low
er
seco
ndar
y sc
hool
Att
endi
ng
prim
ary
scho
ol
Out
of
scho
olA
Att
endi
ng
low
er
seco
ndar
y sc
hool
Att
endi
ng
prim
ary
scho
ol
Out
of
scho
olA
Att
endi
ng
low
er
seco
ndar
y sc
hool
Att
endi
ng
prim
ary
scho
ol
Out
of
scho
ol2,
A
Age
at b
egin
ning
of
sch
ool y
ear
15
27.9
40
.7
2.4
29.0
1,
059
32
.8
30.9
1.
9 34
.5
913
30
.1
36.1
2.
2 31
.6
1,97
2 16
42
.2
25.0
0.
8 31
.8
1,09
2
43.5
15
.5
0.6
40.4
98
8
42.8
20
.5
0.7
35.8
2,
080
17
42.7
11
.0
0.3
43.7
1,
048
39
.0
7.0
0.2
49.8
1,
021
40
.9
9.0
0.2
46.7
2,
068
Mot
her'
s ed
ucat
ion
N
one
or E
CE
18.4
31
.0
2.1
48.3
85
8
16.4
19
.7
2.2
61.7
75
5
17.5
25
.7
2.1
54.5
1,
614
Prim
ary
35.6
28
.9
1.3
34.1
1,
196
39
.0
23.0
0.
8 37
.2
1,08
1
37.2
26
.1
1.0
35.6
2,
277
Low
er s
econ
dary
56
.4
27.8
0.
2 15
.2
421
69
.2
14.3
0.
0 16
.1
347
62
.2
21.7
0.
1 15
.6
768
Upp
er s
econ
dary
59
.8
25.8
0.
0 12
.7
104
76
.8
12.0
0.
0 11
.2
103
68
.3
18.9
0.
0 11
.9
207
Post
sec
onda
ry /
N
on te
rtia
ry
74.2
16
.9
0.0
8.9
91
72
.6
10.3
0.
0 17
.2
71
73
.5
14.0
0.
0 12
.5
162
Hig
her
91.7
5.
3 0.
0 3.
0 68
77.9
3.
9 0.
0 13
.2
51
85
.8
4.7
0.0
7.4
119
No
info
rmat
ionB
41.2
9.
8 0.
5 43
.8
459
33
.3
7.3
0.0
52.3
51
3
37.0
8.
5 0.
2 48
.3
972
DK/
Mis
sing
(*
) (*
) (*
) (*
) 1
-
- -
- 0
(*
) (*
) (*
) (*
) 1
Ethn
o-lin
guis
tic
grou
p o
f hou
seho
ld h
ead
Lao-
Tai
47.0
21
.8
0.4
29.6
1,
941
50
.0
14.8
0.
4 32
.6
1,73
0
48.4
18
.5
0.4
31.0
3,
671
Mon
-Khm
er
20.4
32
.6
2.4
44.5
78
8
18.3
22
.8
1.7
57.2
77
9
19.3
27
.7
2.0
50.8
1,
566
Hm
ong-
Mie
n 29
.3
30.8
2.
0 37
.7
360
27
.6
18.2
1.
4 52
.2
313
28
.5
24.9
1.
7 44
.5
673
Chin
ese-
Tibe
tan
25.1
29
.9
2.7
41.5
77
31.9
16
.0
0.9
50.3
69
28.3
23
.3
1.9
45.7
14
6 O
ther
, DK,
Mis
sing
(2
1.1)
(1
7.8)
(0
.0)
(61.
1)
33
(3
6.9)
(1
5.9)
(0
.0)
(47.
2)
30
28
.6
16.9
0.
0 54
.5
63
Wea
lth
inde
x qu
inti
le
Po
ores
t 9.
8 25
.5
3.5
60.9
60
0
5.7
14.5
3.
4 76
.4
511
7.
9 20
.4
3.4
68.1
1,
111
Seco
nd
21.5
32
.6
1.6
44.2
70
0
17.8
24
.8
0.7
56.7
64
9
19.7
28
.9
1.2
50.2
1,
349
Mid
dle
36.3
28
.8
0.7
34.1
69
8
35.4
22
.6
0.0
41.5
63
2
35.9
25
.8
0.3
37.6
1,
331
Four
th
51
.4
25.6
0.
0 22
.4
646
60
.2
15.9
0.
1 23
.0
605
55
.6
20.9
0.
1 22
.7
1,25
1 Ri
ches
t 73
.8
12.9
0.
0 9.
6 55
4
75.1
6.
1 0.
5 12
.0
524
74
.4
9.6
0.2
10.8
1,
078
1 M
ICS
indi
cato
r LN
.5c
- Upp
er s
econ
dary
sch
ool n
et a
tten
danc
e ra
tio
(adj
uste
d)
2 M
ICS
indi
cato
r LN
.6c
- Out
-of-
scho
ol r
ate
for
yout
h of
upp
er s
econ
dary
sch
ool a
ge
A Th
e pe
rcen
tage
of c
hild
ren
of u
pper
sec
onda
ry s
choo
l age
out
of s
choo
l are
thos
e w
ho a
re n
ot a
tten
ding
prim
ary,
low
er s
econ
dary
, upp
er s
econ
dary
or h
ighe
r edu
cati
on
B Incl
udes
chi
ldre
n ag
e 15
-17
iden
tifie
d as
em
anci
pate
d an
d ch
ildre
n ag
e 18
or h
ighe
r at t
he ti
me
of th
e in
terv
iew
.
( ) F
igur
es th
at a
re b
ased
on
25 –
49
unw
eigh
ted
case
s (*
) Fig
ures
that
are
bas
ed o
n fe
wer
than
25
unw
eigh
ted
case
s "–
" de
note
s 0
unw
eigh
ted
case
in th
at c
ell o
r in
the
deno
min
ator
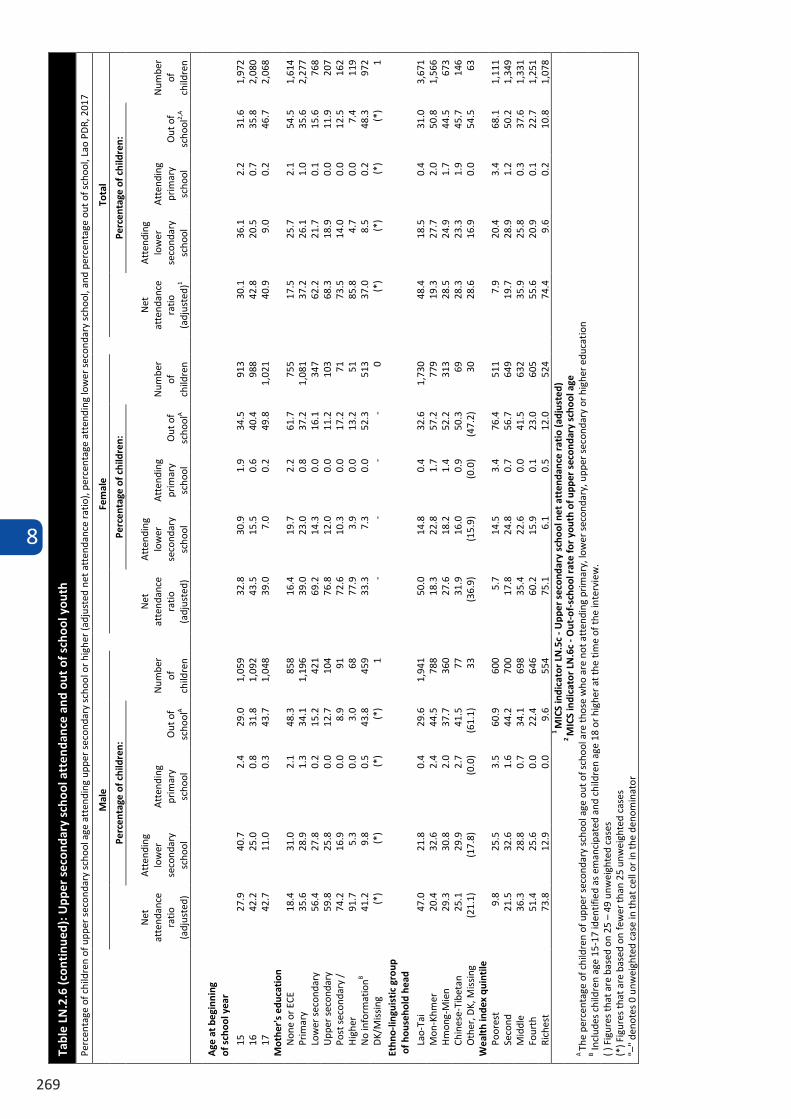
8
269
Tabl
e LN
.2.6
(con
tinu
ed):
Upp
er s
econ
dary
sch
ool a
tten
danc
e an
d ou
t of
sch
ool y
outh
Perc
enta
ge o
f chi
ldre
n of
upp
er s
econ
dary
sch
ool a
ge a
tten
ding
upp
er s
econ
dary
sch
ool o
r hig
her
(adj
uste
d ne
t att
enda
nce
ratio
), pe
rcen
tage
att
endi
ng lo
wer
sec
onda
ry s
choo
l, an
d pe
rcen
tage
out
of s
choo
l, La
o PD
R, 2
017
M
ale
Fem
ale
Tota
l
Net
at
tend
ance
ra
tio
(adj
uste
d)
Perc
enta
ge o
f chi
ldre
n:
Num
ber
of
child
ren
Net
at
tend
ance
ra
tio
(adj
uste
d)
Perc
enta
ge o
f chi
ldre
n:
Num
ber
of
child
ren
Net
at
tend
ance
ra
tio
(adj
uste
d)1
Perc
enta
ge o
f chi
ldre
n:
Num
ber
of
child
ren
Att
endi
ng
low
er
seco
ndar
y sc
hool
Att
endi
ng
prim
ary
scho
ol
Out
of
scho
olA
Att
endi
ng
low
er
seco
ndar
y sc
hool
Att
endi
ng
prim
ary
scho
ol
Out
of
scho
olA
Att
endi
ng
low
er
seco
ndar
y sc
hool
Att
endi
ng
prim
ary
scho
ol
Out
of
scho
ol2,
A
Age
at b
egin
ning
of
sch
ool y
ear
15
27.9
40
.7
2.4
29.0
1,
059
32
.8
30.9
1.
9 34
.5
913
30
.1
36.1
2.
2 31
.6
1,97
2 16
42
.2
25.0
0.
8 31
.8
1,09
2
43.5
15
.5
0.6
40.4
98
8
42.8
20
.5
0.7
35.8
2,
080
17
42.7
11
.0
0.3
43.7
1,
048
39
.0
7.0
0.2
49.8
1,
021
40
.9
9.0
0.2
46.7
2,
068
Mot
her'
s ed
ucat
ion
N
one
or E
CE
18.4
31
.0
2.1
48.3
85
8
16.4
19
.7
2.2
61.7
75
5
17.5
25
.7
2.1
54.5
1,
614
Prim
ary
35.6
28
.9
1.3
34.1
1,
196
39
.0
23.0
0.
8 37
.2
1,08
1
37.2
26
.1
1.0
35.6
2,
277
Low
er s
econ
dary
56
.4
27.8
0.
2 15
.2
421
69
.2
14.3
0.
0 16
.1
347
62
.2
21.7
0.
1 15
.6
768
Upp
er s
econ
dary
59
.8
25.8
0.
0 12
.7
104
76
.8
12.0
0.
0 11
.2
103
68
.3
18.9
0.
0 11
.9
207
Post
sec
onda
ry /
N
on te
rtia
ry
74.2
16
.9
0.0
8.9
91
72
.6
10.3
0.
0 17
.2
71
73
.5
14.0
0.
0 12
.5
162
Hig
her
91.7
5.
3 0.
0 3.
0 68
77.9
3.
9 0.
0 13
.2
51
85
.8
4.7
0.0
7.4
119
No
info
rmat
ionB
41.2
9.
8 0.
5 43
.8
459
33
.3
7.3
0.0
52.3
51
3
37.0
8.
5 0.
2 48
.3
972
DK/
Mis
sing
(*
) (*
) (*
) (*
) 1
-
- -
- 0
(*
) (*
) (*
) (*
) 1
Ethn
o-lin
guis
tic
grou
p o
f hou
seho
ld h
ead
Lao-
Tai
47.0
21
.8
0.4
29.6
1,
941
50
.0
14.8
0.
4 32
.6
1,73
0
48.4
18
.5
0.4
31.0
3,
671
Mon
-Khm
er
20.4
32
.6
2.4
44.5
78
8
18.3
22
.8
1.7
57.2
77
9
19.3
27
.7
2.0
50.8
1,
566
Hm
ong-
Mie
n 29
.3
30.8
2.
0 37
.7
360
27
.6
18.2
1.
4 52
.2
313
28
.5
24.9
1.
7 44
.5
673
Chin
ese-
Tibe
tan
25.1
29
.9
2.7
41.5
77
31.9
16
.0
0.9
50.3
69
28.3
23
.3
1.9
45.7
14
6 O
ther
, DK,
Mis
sing
(2
1.1)
(1
7.8)
(0
.0)
(61.
1)
33
(3
6.9)
(1
5.9)
(0
.0)
(47.
2)
30
28
.6
16.9
0.
0 54
.5
63
Wea
lth
inde
x qu
inti
le
Po
ores
t 9.
8 25
.5
3.5
60.9
60
0
5.7
14.5
3.
4 76
.4
511
7.
9 20
.4
3.4
68.1
1,
111
Seco
nd
21.5
32
.6
1.6
44.2
70
0
17.8
24
.8
0.7
56.7
64
9
19.7
28
.9
1.2
50.2
1,
349
Mid
dle
36.3
28
.8
0.7
34.1
69
8
35.4
22
.6
0.0
41.5
63
2
35.9
25
.8
0.3
37.6
1,
331
Four
th
51
.4
25.6
0.
0 22
.4
646
60
.2
15.9
0.
1 23
.0
605
55
.6
20.9
0.
1 22
.7
1,25
1 Ri
ches
t 73
.8
12.9
0.
0 9.
6 55
4
75.1
6.
1 0.
5 12
.0
524
74
.4
9.6
0.2
10.8
1,
078
1 M
ICS
indi
cato
r LN
.5c
- Upp
er s
econ
dary
sch
ool n
et a
tten
danc
e ra
tio
(adj
uste
d)
2 M
ICS
indi
cato
r LN
.6c
- Out
-of-
scho
ol r
ate
for
yout
h of
upp
er s
econ
dary
sch
ool a
ge
A Th
e pe
rcen
tage
of c
hild
ren
of u
pper
sec
onda
ry s
choo
l age
out
of s
choo
l are
thos
e w
ho a
re n
ot a
tten
ding
prim
ary,
low
er s
econ
dary
, upp
er s
econ
dary
or h
ighe
r edu
cati
on
B Incl
udes
chi
ldre
n ag
e 15
-17
iden
tifie
d as
em
anci
pate
d an
d ch
ildre
n ag
e 18
or h
ighe
r at t
he ti
me
of th
e in
terv
iew
.
( ) F
igur
es th
at a
re b
ased
on
25 –
49
unw
eigh
ted
case
s (*
) Fig
ures
that
are
bas
ed o
n fe
wer
than
25
unw
eigh
ted
case
s "–
" de
note
s 0
unw
eigh
ted
case
in th
at c
ell o
r in
the
deno
min
ator
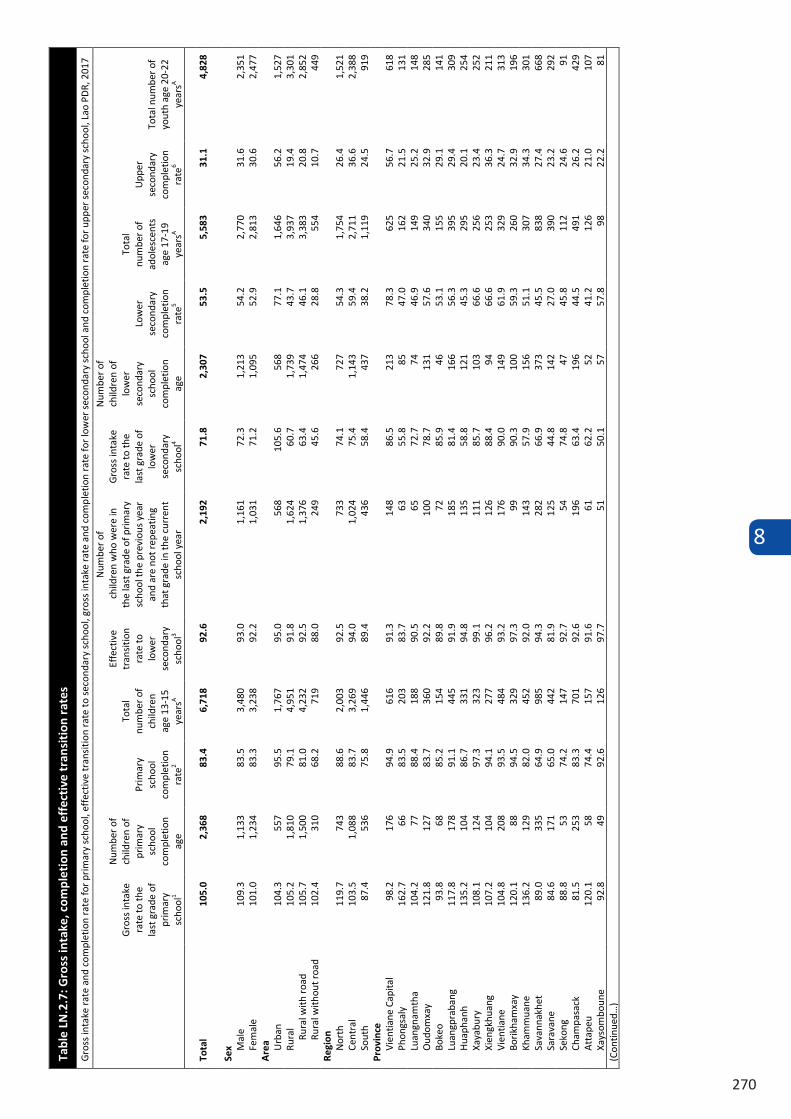
8
270
Tabl
e LN
.2.7
: Gro
ss in
take
, com
plet
ion
and
effe
ctiv
e tr
ansi
tion
rat
es
Gro
ss in
take
rate
and
com
plet
ion
rate
for p
rim
ary
scho
ol, e
ffec
tive
tran
siti
on ra
te to
sec
onda
ry s
choo
l, gr
oss
inta
ke ra
te a
nd c
ompl
etio
n ra
te fo
r low
er s
econ
dary
sch
ool a
nd c
ompl
etio
n ra
te fo
r upp
er s
econ
dary
sch
ool,
Lao
PDR,
201
7
Gro
ss in
take
ra
te to
the
last
gra
de o
f pr
imar
y sc
hool
1
Num
ber o
f ch
ildre
n of
pr
imar
y sc
hool
co
mpl
etio
n ag
e
Prim
ary
scho
ol
com
plet
ion
rate
2
Tota
l nu
mbe
r of
child
ren
age
13-1
5 ye
arsA
Effe
ctiv
e tr
ansi
tion
rate
to
low
er
seco
ndar
y sc
hool
3
Num
ber o
f c
hild
ren
who
wer
e in
th
e la
st g
rade
of p
rimar
y sc
hool
the
prev
ious
yea
r an
d ar
e no
t rep
eatin
g th
at g
rade
in th
e cu
rren
t sc
hool
yea
r
Gro
ss in
take
ra
te to
the
last
gra
de o
f lo
wer
se
cond
ary
scho
ol4
Num
ber o
f ch
ildre
n of
lo
wer
se
cond
ary
scho
ol
com
plet
ion
age
Low
er
seco
ndar
y co
mpl
etio
n ra
te5
Tota
l nu
mbe
r of
adol
esce
nts
age
17-1
9 ye
arsA
Upp
er
seco
ndar
y co
mpl
etio
n ra
te6
Tota
l num
ber o
f yo
uth
age
20-2
2 ye
arsA
Tota
l 10
5.0
2,36
8 83
.4
6,71
8 92
.6
2,19
2 71
.8
2,30
7 53
.5
5,58
3 31
.1
4,82
8
Sex
Mal
e 10
9.3
1,13
3 83
.5
3,48
0 93
.0
1,16
1 72
.3
1,21
3 54
.2
2,77
0 31
.6
2,35
1 Fe
mal
e 10
1.0
1,23
4 83
.3
3,23
8 92
.2
1,03
1 71
.2
1,09
5 52
.9
2,81
3 30
.6
2,47
7 A
rea
Urb
an
104.
3 55
7 95
.5
1,76
7 95
.0
568
105.
6 56
8 77
.1
1,64
6 56
.2
1,52
7 Ru
ral
105.
2 1,
810
79.1
4,
951
91.8
1,
624
60.7
1,
739
43.7
3,
937
19.4
3,
301
Rura
l with
roa
d 10
5.7
1,50
0 81
.0
4,23
2 92
.5
1,37
6 63
.4
1,47
4 46
.1
3,38
3 20
.8
2,85
2 Ru
ral w
ithou
t roa
d 10
2.4
310
68.2
71
9 88
.0
249
45.6
26
6 28
.8
554
10.7
44
9 Re
gion
N
orth
11
9.7
743
88.6
2,
003
92.5
73
3 74
.1
727
54.3
1,
754
26.4
1,
521
Cent
ral
103.
5 1,
088
83.7
3,
269
94.0
1,
024
75.4
1,
143
59.4
2,
711
36.6
2,
388
Sout
h 87
.4
536
75.8
1,
446
89.4
43
6 58
.4
437
38.2
1,
119
24.5
91
9 Pr
ovin
ce
Vien
tiane
Cap
ital
98.2
17
6 94
.9
616
91.3
14
8 86
.5
213
78.3
62
5 56
.7
618
Phon
gsal
y
162.
7 66
83
.5
203
83.7
63
55
.8
85
47.0
16
2 21
.5
131
Luan
gnam
tha
104.
2 77
88
.4
188
90.5
65
72
.7
74
46.9
14
9 25
.2
148
Oud
omxa
y 12
1.8
127
83.7
36
0 92
.2
100
78.7
13
1 57
.6
340
32.9
28
5 Bo
keo
93.8
68
85
.2
154
89.8
72
85
.9
46
53.1
15
5 29
.1
141
Luan
gpra
bang
11
7.8
178
91.1
44
5 91
.9
185
81.4
16
6 56
.3
395
29.4
30
9 H
uaph
anh
135.
2 10
4 86
.7
331
94.8
13
5 58
.8
121
45.3
29
5 20
.1
254
Xaya
bury
10
8.1
124
97.3
32
3 99
.1
111
85.7
10
3 66
.6
256
23.4
25
2 Xi
engk
huan
g 10
7.2
104
94.1
27
7 96
.2
126
88.4
94
66
.6
253
36.3
21
1 Vi
entia
ne
104.
8 20
8 93
.5
484
93.2
17
6 90
.0
149
61.9
32
9 24
.7
313
Borik
ham
xay
120.
1 88
94
.5
329
97.3
99
90
.3
100
59.3
26
0 32
.9
196
Kham
mua
ne
136.
2 12
9 82
.0
452
92.0
14
3 57
.9
156
51.1
30
7 34
.3
301
Sava
nnak
het
89.0
33
5 64
.9
985
94.3
28
2 66
.9
373
45.5
83
8 27
.4
668
Sara
vane
84
.6
171
65.0
44
2 81
.9
125
44.8
14
2 27
.0
390
23.2
29
2 Se
kong
88
.8
53
74.2
14
7 92
.7
54
74.8
47
45
.8
112
24.6
91
Ch
ampa
sack
81
.5
253
83.3
70
1 92
.6
196
63.4
19
6 44
.5
491
26.2
42
9 A
ttap
eu
120.
1 58
74
.4
157
91.6
61
62
.2
52
41.2
12
6 21
.0
107
Xays
ombo
une
92.8
49
92
.6
126
97.7
51
50
.1
57
57.8
98
22
.2
81
(Con
tinue
d…)
Tabl
e LN
.2.7
(con
tinu
ed):
Gro
ss in
take
, com
plet
ion
and
effe
ctiv
e tr
ansi
tion
rat
es
Gro
ss in
take
rate
and
com
plet
ion
rate
for p
rim
ary
scho
ol, e
ffec
tive
tran
siti
on ra
te to
sec
onda
ry s
choo
l, gr
oss
inta
ke ra
te a
nd c
ompl
etio
n ra
te fo
r low
er s
econ
dary
sch
ool a
nd c
ompl
etio
n ra
te fo
r upp
er s
econ
dary
sch
ool,
Lao
PDR,
201
7
Gro
ss in
take
ra
te to
the
last
gra
de o
f pr
imar
y sc
hool
1
Num
ber o
f ch
ildre
n of
pr
imar
y sc
hool
co
mpl
etio
n ag
e
Prim
ary
scho
ol
com
plet
ion
rate
2
Tota
l nu
mbe
r of
child
ren
age
13-1
5 ye
arsA
Effe
ctiv
e tr
ansi
tion
rate
to
low
er
seco
ndar
y sc
hool
3
Num
ber o
f chi
ldre
n w
ho
wer
e in
the
last
gra
de o
f pr
imar
y sc
hool
the
prev
ious
ye
ar a
nd a
re n
ot re
peat
ing
that
gra
de in
the
curr
ent
scho
ol y
ear
Gro
ss in
take
ra
te to
the
last
gr
ade
of lo
wer
se
cond
ary
scho
ol4
Num
ber o
f ch
ildre
n of
low
er
seco
ndar
y sc
hool
co
mpl
etio
n ag
e
Low
er
seco
ndar
y co
mpl
etio
n ra
te5
Tota
l nu
mbe
r of
adol
esce
nts
age
17-1
9 ye
arsA
Upp
er
seco
ndar
y co
mpl
etio
n ra
te6
Tota
l nu
mbe
r of
yout
h ag
e 20
-22
year
sA
M
othe
r's
educ
atio
n
N
one
or E
CE
98.7
78
2 68
.5
2,13
4 88
.3
602
34.4
80
8 na
na
na
na
Pr
imar
y 11
1.0
1,01
5 87
.0
2,96
4 93
.8
1,02
8 71
.2
949
na
na
na
na
Low
er s
econ
dary
96
.0
357
95.9
96
1 97
.2
368
98.6
33
3 na
na
na
na
U
pper
sec
onda
ry
91.1
11
2 98
.4
272
97.9
88
11
9.3
93
na
na
na
na
Post
sec
onda
ry /
Non
tert
iary
12
9.4
61
97.5
21
5 (1
00.0
) 45
11
7.3
74
na
na
na
na
Hig
her
(132
.3)
41
98.0
13
6 (9
3.3)
38
(1
18.1
) 39
na
na
na
na
N
o in
form
atio
nB na
na
na
na
na
na
na
na
na
na
31
.1
4,82
8 D
K/M
issi
ng
- 0
(*)
2 -
0 (*
) 2
(*)
1 -
0 Et
hno-
lingu
isti
c gr
oup
of h
ouse
hold
hea
d
Lao-
Tai
97.2
63
5 57
.8
1,44
5 82
.1
421
25.5
54
6 16
.4
1,09
1 4.
4 95
4 M
on-K
hmer
11
9.6
534
79.7
1,
569
93.0
54
9 57
.2
557
39.3
1,
268
16.0
1,
013
Hm
ong-
Mie
n 11
1.9
453
91.3
1,
422
93.9
49
1 81
.6
461
54.6
1,
143
26.3
95
8 Ch
ines
e-Ti
beta
n 90
.7
416
96.5
1,
201
96.4
40
5 10
6.0
386
73.4
1,
083
39.9
93
4 O
ther
, DK,
Mis
sing
10
4.7
329
98.1
1,
082
99.0
32
6 11
5.6
357
89.5
99
8 69
.2
968
Wea
lth
inde
x qu
inti
le
Poor
est
103.
2 1,
269
90.5
3,
821
93.9
1,
231
86.2
1,
258
63.7
3,
254
40.5
2,
891
Seco
nd
103.
2 69
3 70
.2
1,85
2 91
.5
595
56.5
68
8 37
.6
1,48
7 15
.8
1,19
3 M
iddl
e 10
6.4
313
83.4
77
8 92
.8
293
53.3
26
3 43
.9
645
18.5
54
5 Fo
urth
149.
7 66
76
.5
193
74.7
61
45
.6
75
34.6
14
5 17
.5
141
Rich
est
(104
.9)
27
68.5
73
(*
) 12
(3
6.9)
24
46
.6
53
27.6
57
1
MIC
S in
dica
tor
LN.7
a - G
ross
inta
ke ra
te to
the
last
gra
de (P
rim
ary)
2
MIC
S in
dica
tor
LN.8
a - C
ompl
etio
n ra
te (P
rim
ary)
3
MIC
S in
dica
tor
LN.9
- Ef
fect
ive
tran
siti
on r
ate
to lo
wer
sec
onda
ry s
choo
l 4
MIC
S in
dica
tor
LN.7
b - G
ross
inta
ke ra
te t
o th
e la
st g
rade
(Low
er s
econ
dary
) 5
MIC
S in
dica
tor
LN.8
b - C
ompl
etio
n ra
te (L
ower
sec
onda
ry)
6 M
ICS
indi
cato
r LN
.8c
- Com
plet
ion
rate
(Upp
er s
econ
dary
) A T
otal
num
ber o
f chi
ldre
n ag
e 3-
5 ye
ars
abov
e th
e in
tend
ed a
ge fo
r the
last
gra
de, f
or p
rimar
y, lo
wer
and
upp
er s
econ
dary
, res
pect
ivel
y B In
clud
es e
man
cipa
ted
child
ren
age
15-1
7 ye
ars
and
child
ren
age
18 o
r hig
her a
t the
tim
e of
the
inte
rvie
w
na: n
ot a
pplic
able
( )
Fig
ures
that
are
bas
ed o
n 25
– 4
9 un
wei
ghte
d ca
ses
(*) F
igur
es a
re n
ot s
how
n, b
ased
on
few
er th
an 2
5 un
wei
ghte
d ca
ses
"–"
deno
tes
0 un
wei
ghte
d ca
se in
that
cel
l or i
n th
e de
nom
inat
or
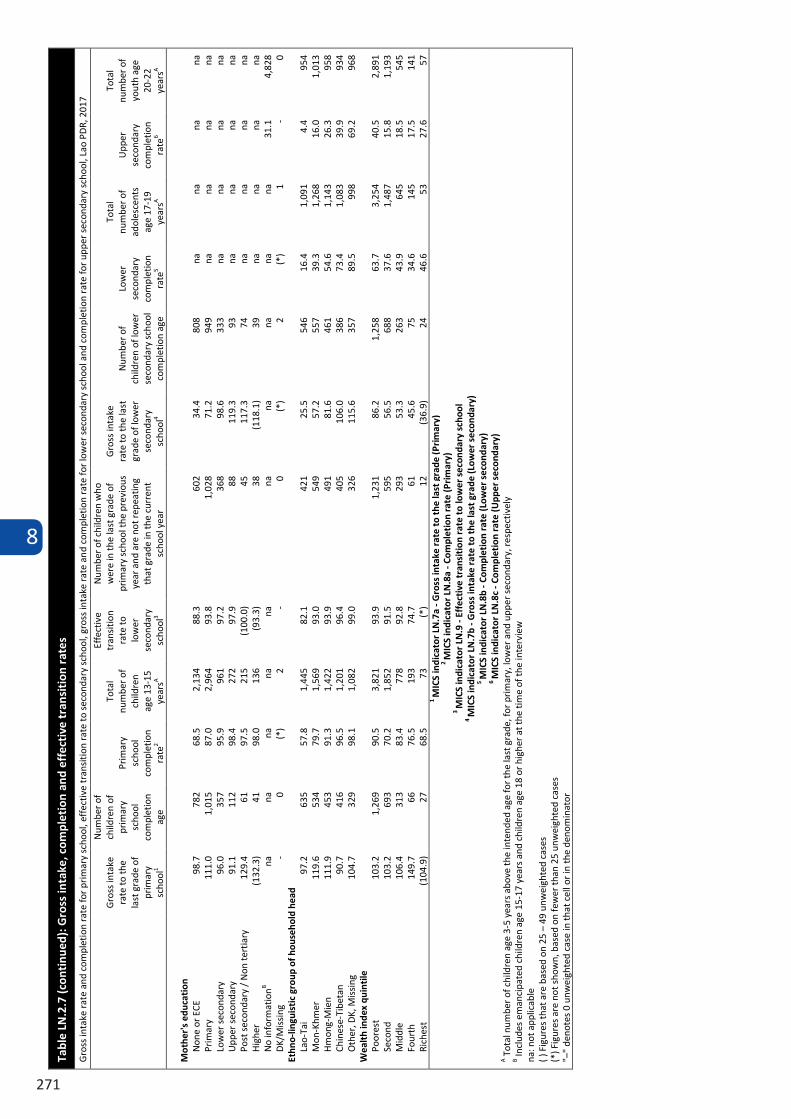
8
271
Tabl
e LN
.2.7
(con
tinu
ed):
Gro
ss in
take
, com
plet
ion
and
effe
ctiv
e tr
ansi
tion
rat
es
Gro
ss in
take
rate
and
com
plet
ion
rate
for p
rim
ary
scho
ol, e
ffec
tive
tran
siti
on ra
te to
sec
onda
ry s
choo
l, gr
oss
inta
ke ra
te a
nd c
ompl
etio
n ra
te fo
r lo
wer
sec
onda
ry s
choo
l and
com
plet
ion
rate
for u
pper
sec
onda
ry s
choo
l, La
o PD
R, 2
017
Gro
ss in
take
ra
te to
the
last
gra
de o
f pr
imar
y sc
hool
1
Num
ber o
f ch
ildre
n of
pr
imar
y sc
hool
co
mpl
etio
n ag
e
Prim
ary
scho
ol
com
plet
ion
rate
2
Tota
l nu
mbe
r of
child
ren
age
13-1
5 ye
arsA
Effe
ctiv
e tr
ansi
tion
rate
to
low
er
seco
ndar
y sc
hool
3
Num
ber o
f chi
ldre
n w
ho
wer
e in
the
last
gra
de o
f pr
imar
y sc
hool
the
prev
ious
ye
ar a
nd a
re n
ot re
peat
ing
that
gra
de in
the
curr
ent
scho
ol y
ear
Gro
ss in
take
ra
te to
the
last
gr
ade
of lo
wer
se
cond
ary
scho
ol4
Num
ber o
f ch
ildre
n of
low
er
seco
ndar
y sc
hool
co
mpl
etio
n ag
e
Low
er
seco
ndar
y co
mpl
etio
n ra
te5
Tota
l nu
mbe
r of
adol
esce
nts
age
17-1
9 ye
arsA
Upp
er
seco
ndar
y co
mpl
etio
n ra
te6
Tota
l nu
mbe
r of
yout
h ag
e 20
-22
year
sA
M
othe
r's
educ
atio
n
N
one
or E
CE
98.7
78
2 68
.5
2,13
4 88
.3
602
34.4
80
8 na
na
na
na
Pr
imar
y 11
1.0
1,01
5 87
.0
2,96
4 93
.8
1,02
8 71
.2
949
na
na
na
na
Low
er s
econ
dary
96
.0
357
95.9
96
1 97
.2
368
98.6
33
3 na
na
na
na
U
pper
sec
onda
ry
91.1
11
2 98
.4
272
97.9
88
11
9.3
93
na
na
na
na
Post
sec
onda
ry /
Non
tert
iary
12
9.4
61
97.5
21
5 (1
00.0
) 45
11
7.3
74
na
na
na
na
Hig
her
(132
.3)
41
98.0
13
6 (9
3.3)
38
(1
18.1
) 39
na
na
na
na
N
o in
form
atio
nB na
na
na
na
na
na
na
na
na
na
31
.1
4,82
8 D
K/M
issi
ng
- 0
(*)
2 -
0 (*
) 2
(*)
1 -
0 Et
hno-
lingu
isti
c gr
oup
of h
ouse
hold
hea
d
Lao-
Tai
97.2
63
5 57
.8
1,44
5 82
.1
421
25.5
54
6 16
.4
1,09
1 4.
4 95
4 M
on-K
hmer
11
9.6
534
79.7
1,
569
93.0
54
9 57
.2
557
39.3
1,
268
16.0
1,
013
Hm
ong-
Mie
n 11
1.9
453
91.3
1,
422
93.9
49
1 81
.6
461
54.6
1,
143
26.3
95
8 Ch
ines
e-Ti
beta
n 90
.7
416
96.5
1,
201
96.4
40
5 10
6.0
386
73.4
1,
083
39.9
93
4 O
ther
, DK,
Mis
sing
10
4.7
329
98.1
1,
082
99.0
32
6 11
5.6
357
89.5
99
8 69
.2
968
Wea
lth
inde
x qu
inti
le
Poor
est
103.
2 1,
269
90.5
3,
821
93.9
1,
231
86.2
1,
258
63.7
3,
254
40.5
2,
891
Seco
nd
103.
2 69
3 70
.2
1,85
2 91
.5
595
56.5
68
8 37
.6
1,48
7 15
.8
1,19
3 M
iddl
e 10
6.4
313
83.4
77
8 92
.8
293
53.3
26
3 43
.9
645
18.5
54
5 Fo
urth
149.
7 66
76
.5
193
74.7
61
45
.6
75
34.6
14
5 17
.5
141
Rich
est
(104
.9)
27
68.5
73
(*
) 12
(3
6.9)
24
46
.6
53
27.6
57
1
MIC
S in
dica
tor
LN.7
a - G
ross
inta
ke ra
te to
the
last
gra
de (P
rim
ary)
2
MIC
S in
dica
tor
LN.8
a - C
ompl
etio
n ra
te (P
rim
ary)
3
MIC
S in
dica
tor
LN.9
- Ef
fect
ive
tran
siti
on r
ate
to lo
wer
sec
onda
ry s
choo
l 4
MIC
S in
dica
tor
LN.7
b - G
ross
inta
ke ra
te t
o th
e la
st g
rade
(Low
er s
econ
dary
) 5
MIC
S in
dica
tor
LN.8
b - C
ompl
etio
n ra
te (L
ower
sec
onda
ry)
6 M
ICS
indi
cato
r LN
.8c
- Com
plet
ion
rate
(Upp
er s
econ
dary
) A T
otal
num
ber o
f chi
ldre
n ag
e 3-
5 ye
ars
abov
e th
e in
tend
ed a
ge fo
r the
last
gra
de, f
or p
rimar
y, lo
wer
and
upp
er s
econ
dary
, res
pect
ivel
y B In
clud
es e
man
cipa
ted
child
ren
age
15-1
7 ye
ars
and
child
ren
age
18 o
r hig
her a
t the
tim
e of
the
inte
rvie
w
na: n
ot a
pplic
able
( )
Fig
ures
that
are
bas
ed o
n 25
– 4
9 un
wei
ghte
d ca
ses
(*) F
igur
es a
re n
ot s
how
n, b
ased
on
few
er th
an 2
5 un
wei
ghte
d ca
ses
"–"
deno
tes
0 un
wei
ghte
d ca
se in
that
cel
l or i
n th
e de
nom
inat
or
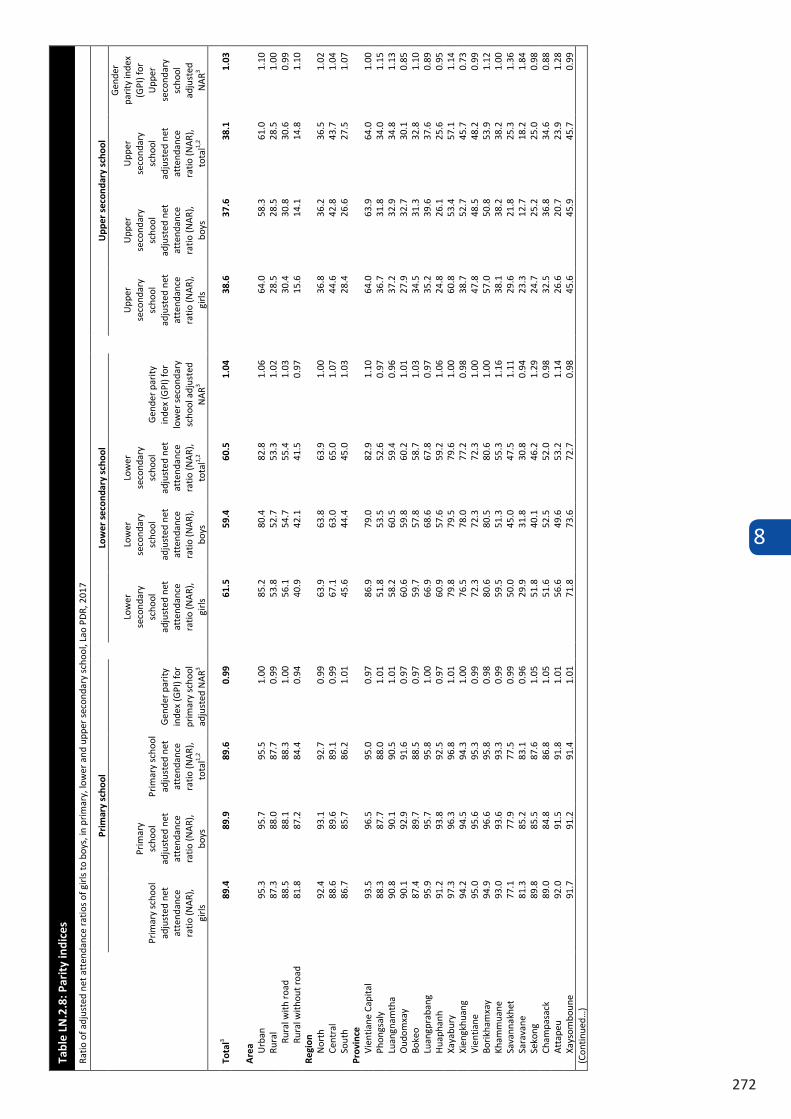
8
272
Tabl
e LN
.2.8
: Par
ity
indi
ces
Ratio
of a
djus
ted
net a
tten
danc
e ra
tios
of g
irls
to b
oys,
in p
rimar
y, lo
wer
and
upp
er s
econ
dary
sch
ool,
Lao
PDR,
201
7
Prim
ary
scho
ol
Low
er s
econ
dary
sch
ool
Upp
er s
econ
dary
sch
ool
Prim
ary
scho
ol
adju
sted
net
at
tend
ance
ra
tio (N
AR)
, gi
rls
Prim
ary
scho
ol
adju
sted
net
at
tend
ance
ra
tio (N
AR)
, bo
ys
Prim
ary
scho
ol
adju
sted
net
at
tend
ance
ra
tio (N
AR)
, to
tal1,
2
Gen
der p
arity
in
dex
(GPI
) for
pr
imar
y sc
hool
ad
just
ed N
AR3
Low
er
seco
ndar
y sc
hool
ad
just
ed n
et
atte
ndan
ce
ratio
(NA
R),
girls
Low
er
seco
ndar
y sc
hool
ad
just
ed n
et
atte
ndan
ce
ratio
(NA
R),
boys
Low
er
seco
ndar
y sc
hool
ad
just
ed n
et
atte
ndan
ce
ratio
(NA
R),
tota
l1,2
Gen
der p
arity
in
dex
(GPI
) for
lo
wer
sec
onda
ry
scho
ol a
djus
ted
NA
R3
Upp
er
seco
ndar
y sc
hool
ad
just
ed n
et
atte
ndan
ce
ratio
(NA
R),
girls
Upp
er
seco
ndar
y sc
hool
ad
just
ed n
et
atte
ndan
ce
ratio
(NA
R),
boys
Upp
er
seco
ndar
y sc
hool
ad
just
ed n
et
atte
ndan
ce
ratio
(NA
R),
tota
l1,2
Gen
der
parit
y in
dex
(GPI
) for
U
pper
se
cond
ary
scho
ol
adju
sted
N
AR3
To
tal3
89.4
89
.9
89.6
0.
99
61
.5
59.4
60
.5
1.04
38.6
37
.6
38.1
1.
03
A
rea
Urb
an
95.3
95
.7
95.5
1.
00
85
.2
80.4
82
.8
1.06
64.0
58
.3
61.0
1.
10
Rura
l 87
.3
88.0
87
.7
0.99
53.8
52
.7
53.3
1.
02
28
.5
28.5
28
.5
1.00
Ru
ral w
ith r
oad
88.5
88
.1
88.3
1.
00
56
.1
54.7
55
.4
1.03
30.4
30
.8
30.6
0.
99
Rura
l with
out r
oad
81.8
87
.2
84.4
0.
94
40
.9
42.1
41
.5
0.97
15.6
14
.1
14.8
1.
10
Regi
on
Nor
th
92.4
93
.1
92.7
0.
99
63
.9
63.8
63
.9
1.00
36.8
36
.2
36.5
1.
02
Cent
ral
88.6
89
.6
89.1
0.
99
67
.1
63.0
65
.0
1.07
44.6
42
.8
43.7
1.
04
Sout
h 86
.7
85.7
86
.2
1.01
45.6
44
.4
45.0
1.
03
28
.4
26.6
27
.5
1.07
Pr
ovin
ce
Vien
tiane
Cap
ital
93.5
96
.5
95.0
0.
97
86
.9
79.0
82
.9
1.10
64.0
63
.9
64.0
1.
00
Phon
gsal
y
88.3
87
.7
88.0
1.
01
51
.8
53.5
52
.6
0.97
36.7
31
.8
34.0
1.
15
Luan
gnam
tha
90.8
90
.1
90.5
1.
01
58
.2
60.5
59
.4
0.96
37.2
32
.9
34.8
1.
13
Oud
omxa
y 90
.1
92.9
91
.6
0.97
60.6
59
.8
60.2
1.
01
27
.9
32.7
30
.1
0.85
Bo
keo
87.4
89
.7
88.5
0.
97
59
.7
57.8
58
.7
1.03
34.5
31
.3
32.8
1.
10
Luan
gpra
bang
95
.9
95.7
95
.8
1.00
66.9
68
.6
67.8
0.
97
35
.2
39.6
37
.6
0.89
H
uaph
anh
91.2
93
.8
92.5
0.
97
60
.9
57.6
59
.2
1.06
24.8
26
.1
25.6
0.
95
Xaya
bury
97
.3
96.3
96
.8
1.01
79.8
79
.5
79.6
1.
00
60
.8
53.4
57
.1
1.14
Xi
engk
huan
g 94
.2
94.5
94
.3
1.00
76.5
78
.0
77.2
0.
98
38
.7
52.7
45
.7
0.73
Vi
entia
ne
95.0
95
.6
95.3
0.
99
72
.3
72.3
72
.3
1.00
47.8
48
.5
48.2
0.
99
Borik
ham
xay
94.9
96
.6
95.8
0.
98
80
.6
80.5
80
.6
1.00
57.0
50
.8
53.9
1.
12
Kham
mua
ne
93.0
93
.6
93.3
0.
99
59
.5
51.3
55
.3
1.16
38.1
38
.2
38.2
1.
00
Sava
nnak
het
77.1
77
.9
77.5
0.
99
50
.0
45.0
47
.5
1.11
29.6
21
.8
25.3
1.
36
Sara
vane
81
.3
85.2
83
.1
0.96
29.9
31
.8
30.8
0.
94
23
.3
12.7
18
.2
1.84
Se
kong
89
.8
85.5
87
.6
1.05
51.8
40
.1
46.2
1.
29
24
.7
25.2
25
.0
0.98
Ch
ampa
sack
89
.0
84.8
86
.8
1.05
51.6
52
.5
52.0
0.
98
32
.5
36.8
34
.6
0.88
A
ttap
eu
92.0
91
.5
91.8
1.
01
56
.6
49.6
53
.2
1.14
26.6
20
.7
23.9
1.
28
Xays
ombo
une
91.7
91
.2
91.4
1.
01
71
.8
73.6
72
.7
0.98
45.6
45
.9
45.7
0.
99
(Con
tinue
d…)
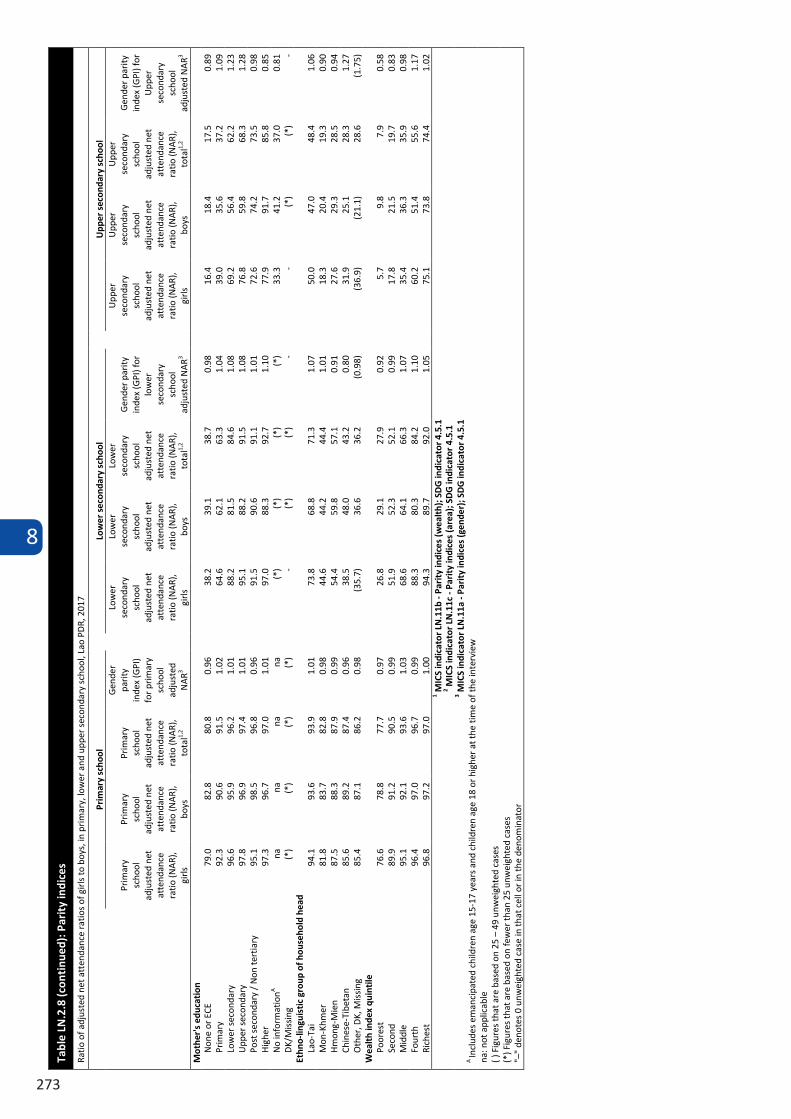
8
273
Tabl
e LN
.2.8
(con
tinu
ed):
Par
ity
indi
ces
Ratio
of a
djus
ted
net a
tten
danc
e ra
tios
of g
irls
to b
oys,
in p
rimar
y, lo
wer
and
upp
er s
econ
dary
sch
ool,
Lao
PDR,
201
7
Prim
ary
scho
ol
Low
er s
econ
dary
sch
ool
Upp
er s
econ
dary
sch
ool
Prim
ary
scho
ol
adju
sted
net
at
tend
ance
ra
tio (N
AR)
, gi
rls
Prim
ary
scho
ol
adju
sted
net
at
tend
ance
ra
tio (N
AR)
, bo
ys
Prim
ary
scho
ol
adju
sted
net
at
tend
ance
ra
tio (N
AR)
, to
tal1,
2
Gen
der
parit
y in
dex
(GPI
) fo
r prim
ary
scho
ol
adju
sted
N
AR3
Low
er
seco
ndar
y sc
hool
ad
just
ed n
et
atte
ndan
ce
ratio
(NA
R),
girls
Low
er
seco
ndar
y sc
hool
ad
just
ed n
et
atte
ndan
ce
ratio
(NA
R),
boys
Low
er
seco
ndar
y sc
hool
ad
just
ed n
et
atte
ndan
ce
ratio
(NA
R),
tota
l1,2
Gen
der p
arity
in
dex
(GPI
) for
lo
wer
se
cond
ary
scho
ol
adju
sted
NA
R3
Upp
er
seco
ndar
y sc
hool
ad
just
ed n
et
atte
ndan
ce
ratio
(NA
R),
girls
Upp
er
seco
ndar
y sc
hool
ad
just
ed n
et
atte
ndan
ce
ratio
(NA
R),
boys
Upp
er
seco
ndar
y sc
hool
ad
just
ed n
et
atte
ndan
ce
ratio
(NA
R),
tota
l1,2
Gen
der p
arity
in
dex
(GPI
) for
U
pper
se
cond
ary
scho
ol
adju
sted
NA
R3 M
othe
r's
educ
atio
n N
one
or E
CE
79.0
82
.8
80.8
0.
96
38.2
39
.1
38.7
0.
98
16.4
18
.4
17.5
0.
89
Prim
ary
92.3
90
.6
91.5
1.
02
64.6
62
.1
63.3
1.
04
39.0
35
.6
37.2
1.
09
Low
er s
econ
dary
96
.6
95.9
96
.2
1.01
88
.2
81.5
84
.6
1.08
69
.2
56.4
62
.2
1.23
U
pper
sec
onda
ry
97.8
96
.9
97.4
1.
01
95.1
88
.2
91.5
1.
08
76.8
59
.8
68.3
1.
28
Post
sec
onda
ry /
Non
tert
iary
95
.1
98.5
96
.8
0.96
91
.5
90.6
91
.1
1.01
72
.6
74.2
73
.5
0.98
H
ighe
r 97
.3
96.7
97
.0
1.01
97
.0
88.3
92
.7
1.10
77
.9
91.7
85
.8
0.85
N
o in
form
atio
nA
na
na
na
na
(*)
(*)
(*)
(*)
33.3
41
.2
37.0
0.
81
DK/
Mis
sing
(*
) (*
) (*
) (*
) -
(*)
(*)
- -
(*)
(*)
- Et
hno-
lingu
isti
c gr
oup
of h
ouse
hold
hea
d La
o-Ta
i 94
.1
93.6
93
.9
1.01
73
.8
68.8
71
.3
1.07
50
.0
47.0
48
.4
1.06
M
on-K
hmer
81
.8
83.7
82
.8
0.98
44
.6
44.2
44
.4
1.01
18
.3
20.4
19
.3
0.90
H
mon
g-M
ien
87.5
88
.3
87.9
0.
99
54.4
59
.8
57.1
0.
91
27.6
29
.3
28.5
0.
94
Chin
ese-
Tibe
tan
85.6
89
.2
87.4
0.
96
38.5
48
.0
43.2
0.
80
31.9
25
.1
28.3
1.
27
Oth
er, D
K, M
issi
ng
85.4
87
.1
86.2
0.
98
(35.
7)
36.6
36
.2
(0.9
8)
(36.
9)
(21.
1)
28.6
(1
.75)
W
ealt
h in
dex
quin
tile
Po
ores
t 76
.6
78.8
77
.7
0.97
26
.8
29.1
27
.9
0.92
5.
7 9.
8 7.
9 0.
58
Seco
nd
89.9
91
.2
90.5
0.
99
51.9
52
.3
52.1
0.
99
17.8
21
.5
19.7
0.
83
Mid
dle
95.1
92
.1
93.6
1.
03
68.6
64
.1
66.3
1.
07
35.4
36
.3
35.9
0.
98
Four
th
96.4
97
.0
96.7
0.
99
88.3
80
.3
84.2
1.
10
60.2
51
.4
55.6
1.
17
Rich
est
96.8
97
.2
97.0
1.
00
94.3
89
.7
92.0
1.
05
75.1
73
.8
74.4
1.
02
1 MIC
S in
dica
tor
LN.1
1b -
Pari
ty in
dice
s (w
ealt
h); S
DG
indi
cato
r 4.5
.1
2 MIC
S in
dica
tor
LN.1
1c -
Pari
ty in
dice
s (a
rea)
; SD
G in
dica
tor
4.5.
1 3 M
ICS
indi
cato
r LN
.11a
- Pa
rity
indi
ces
(gen
der)
; SD
G in
dica
tor
4.5.
1 A
Incl
udes
em
anci
pate
d ch
ildre
n ag
e 15
-17
year
s an
d ch
ildre
n ag
e 18
or h
ighe
r at t
he ti
me
of th
e in
terv
iew
na
: not
app
licab
le
( ) F
igur
es th
at a
re b
ased
on
25 –
49
unw
eigh
ted
case
s (*
) Fig
ures
that
are
bas
ed o
n fe
wer
than
25
unw
eigh
ted
case
s "–
" de
note
s 0
unw
eigh
ted
case
in th
at c
ell o
r in
the
deno
min
ator
8
274
8.3 PARENTAL INVOLVEMENT
Parental involvement in their children’s education is widely accepted to have a positive effect on their child’s learning performance. For instance, reading activities at home have significant positive influences on reading achievement, language comprehension and expressive language skills.8 Research also shows that parental involvement in their child’s literacy practices is a positive long-term predictor of later educational attainment.9
Beyond learning activities at home, parental involvement that occurs in school (like participating in school meetings, talking with teachers, attending school meetings and volunteering in schools) can also benefit a student’s performance.10 Research studies have shown that, in the primary school age range, the impact of parental involvement in school activities can even be much bigger than differences associated with variations in the quality of schools, regardless of social class and ethnic group.11
The PR module included in the Questionnaire for children age 5-17 years was developed and tested for inclusion in MICS6. The work is described in detail in MICS Methodological Papers (Paper No. 5).12
Table LN.3.1 represents percentages of children aged between 7 and 14, whose household adult member received a report card, involvement of adult (parent) in school management such as if a school has a governing body, if a parent attended a meeting called by the governing body, and parental involvement in school activities such as school celebration, sports event, and discussion with teachers on children’s progress.
In Table LN.3.2, reasons for children who are aged between 7 and 14 who are unable to attend class due to a school-related reasons are presented including natural and man-made disaster, teacher strike and teacher absenteeism.
Lastly, Table LN.3.3 shows learning environment at home among children aged between 7 and 14 i.e., percentage of children with 3 or more books to read, percentage of children who have homework, percentage whose teachers use the language also spoken at home, and percentage of children who receive help with homework.
8 Gest SD, Freeman NR, Domitrovich CE, Welsh JA. Shared book reading and children’s language comprehension skills: the moderating role of parental discipline practices. Early Child Res Q. 2004;19: 319–336. doi:10.1016/j.ecresq.2004.04.007 9 Flouri E, Buchanan A. Early father’s and mother’s involvement and child’s later educational outcomes. Br J Educ Psychol. 2004;74: 141–153. doi:10.1348/000709904773839806 10 Pomerantz EM, Moorman EA, Litwack SD. The How, Whom, and Why of Parents’ Involvement in Children’s Academic Lives: More Is Not Always Better. Rev Educ Res. 2007;77: 373–410. doi:10.3102/003465430305567 11 Desforges C, Abouchaar A. The Impact of Parental Involvement, Parental Support and Family Education on Pupil Achievements and Adjustment: A Literature Review. [Internet]. 2003. Report No.: 433. 12 Hattori H., Cardoso M., and Ledoux B. (2017). Collecting data on foundational learning skills and parental involvement in education. MICS Methodological Papers, No. 5, Data and Analytics Section, Division of Data, Research and Policy, UNICEF New York.
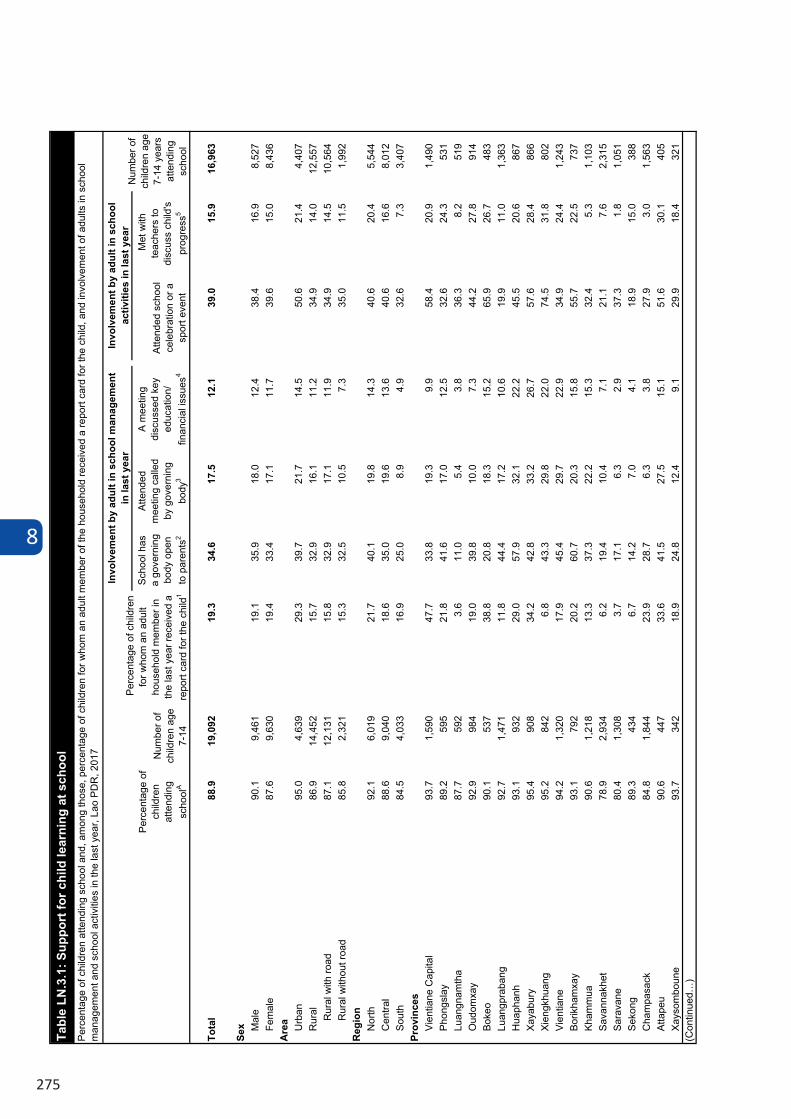
8
275
Scho
ol h
as
a go
vern
ing
body
ope
n to
par
ents
2
Atte
nded
m
eetin
g ca
lled
by g
over
ning
bo
dy3
A m
eetin
g di
scus
sed
key
educ
atio
n/
finan
cial
issu
es4
Atte
nded
sch
ool
cele
brat
ion
or a
sp
ort e
vent
Met
with
te
ache
rs to
di
scus
s ch
ild's
pr
ogre
ss5
Tota
l88
.919
,092
19.3
34.6
17.5
12.1
39.0
15.9
16,9
63
Sex M
ale
90.1
9,46
119
.135
.918
.012
.438
.416
.98,
527
Fem
ale
87.6
9,63
019
.433
.417
.111
.739
.615
.08,
436
Are
a Urb
an95
.04,
639
29.3
39.7
21.7
14.5
50.6
21.4
4,40
7R
ural
86.9
14,4
5215
.732
.916
.111
.234
.914
.012
,557
Rur
al w
ith ro
ad87
.112
,131
15.8
32.9
17.1
11.9
34.9
14.5
10,5
64R
ural
with
out r
oad
85.8
2,32
115
.332
.510
.57.
335
.011
.51,
992
Reg
ion
Nor
th92
.16,
019
21.7
40.1
19.8
14.3
40.6
20.4
5,54
4C
entra
l88
.69,
040
18.6
35.0
19.6
13.6
40.6
16.6
8,01
2So
uth
84.5
4,03
316
.925
.08.
94.
932
.67.
33,
407
Prov
ince
sVi
entia
ne C
apita
l93
.71,
590
47.7
33.8
19.3
9.9
58.4
20.9
1,49
0Ph
ongs
lay
89.2
595
21.8
41.6
17.0
12.5
32.6
24.3
531
Luan
gnam
tha
87.7
592
3.6
11.0
5.4
3.8
36.3
8.2
519
Oud
omxa
y92
.998
419
.039
.810
.07.
344
.227
.891
4Bo
keo
90.1
537
38.8
20.8
18.3
15.2
65.9
26.7
483
Luan
gpra
bang
92.7
1,47
111
.844
.417
.210
.619
.911
.01,
363
Hua
phan
h93
.193
229
.057
.932
.122
.245
.520
.686
7Xa
yabu
ry95
.490
834
.242
.833
.226
.757
.628
.486
6Xi
engk
huan
g95
.284
26.
843
.329
.822
.074
.531
.880
2Vi
entia
ne94
.21,
320
17.9
45.4
29.7
22.9
34.9
24.4
1,24
3Bo
rikha
mxa
y93
.179
220
.260
.720
.315
.855
.722
.573
7Kh
amm
ua90
.61,
218
13.3
37.3
22.2
15.3
32.4
5.3
1,10
3Sa
vann
akhe
t78
.92,
934
6.2
19.4
10.4
7.1
21.1
7.6
2,31
5Sa
rava
ne80
.41,
308
3.7
17.1
6.3
2.9
37.3
1.8
1,05
1Se
kong
89.3
434
6.7
14.2
7.0
4.1
18.9
15.0
388
Cha
mpa
sack
84.8
1,84
423
.928
.76.
33.
827
.93.
01,
563
Atta
peu
90.6
447
33.6
41.5
27.5
15.1
51.6
30.1
405
Xays
ombo
une
93.7
342
18.9
24.8
12.4
9.1
29.9
18.4
321
(Con
tinue
d…)
Tabl
e LN
.3.1
: Sup
port
for c
hild
lear
ning
at s
choo
lPe
rcen
tage
of c
hild
ren
atte
ndin
g sc
hool
and
, am
ong
thos
e, p
erce
ntag
e of
chi
ldre
n fo
r who
m a
n ad
ult m
embe
r of t
he h
ouse
hold
rece
ived
a re
port
card
for t
he c
hild
, and
invo
lvem
ent o
f adu
lts in
sch
ool
man
agem
ent a
nd s
choo
l act
iviti
es in
the
last
yea
r, La
o PD
R, 2
017
Perc
enta
ge o
f ch
ildre
n at
tend
ing
scho
olA
Num
ber o
f ch
ildre
n ag
e 7-
14
Per
cent
age
of c
hild
ren
for w
hom
an
adul
t ho
useh
old
mem
ber i
n th
e la
st y
ear r
ecei
ved
a re
port
card
for t
he c
hild
1
Invo
lvem
ent b
y ad
ult i
n sc
hool
man
agem
ent
in la
st y
ear
Invo
lvem
ent b
y ad
ult i
n sc
hool
ac
tiviti
es in
last
yea
rN
umbe
r of
child
ren
age
7-14
yea
rs
atte
ndin
g sc
hool
8.3 PARENTAL INVOLVEMENT
Parental involvement in their children’s education is widely accepted to have a positive effect on their child’s learning performance. For instance, reading activities at home have significant positive influences on reading achievement, language comprehension and expressive language skills.8 Research also shows that parental involvement in their child’s literacy practices is a positive long-term predictor of later educational attainment.9
Beyond learning activities at home, parental involvement that occurs in school (like participating in school meetings, talking with teachers, attending school meetings and volunteering in schools) can also benefit a student’s performance.10 Research studies have shown that, in the primary school age range, the impact of parental involvement in school activities can even be much bigger than differences associated with variations in the quality of schools, regardless of social class and ethnic group.11
The PR module included in the Questionnaire for children age 5-17 years was developed and tested for inclusion in MICS6. The work is described in detail in MICS Methodological Papers (Paper No. 5).12
Table LN.3.1 represents percentages of children aged between 7 and 14, whose household adult member received a report card, involvement of adult (parent) in school management such as if a school has a governing body, if a parent attended a meeting called by the governing body, and parental involvement in school activities such as school celebration, sports event, and discussion with teachers on children’s progress.
In Table LN.3.2, reasons for children who are aged between 7 and 14 who are unable to attend class due to a school-related reasons are presented including natural and man-made disaster, teacher strike and teacher absenteeism.
Lastly, Table LN.3.3 shows learning environment at home among children aged between 7 and 14 i.e., percentage of children with 3 or more books to read, percentage of children who have homework, percentage whose teachers use the language also spoken at home, and percentage of children who receive help with homework.
8 Gest SD, Freeman NR, Domitrovich CE, Welsh JA. Shared book reading and children’s language comprehension skills: the moderating role of parental discipline practices. Early Child Res Q. 2004;19: 319–336. doi:10.1016/j.ecresq.2004.04.007 9 Flouri E, Buchanan A. Early father’s and mother’s involvement and child’s later educational outcomes. Br J Educ Psychol. 2004;74: 141–153. doi:10.1348/000709904773839806 10 Pomerantz EM, Moorman EA, Litwack SD. The How, Whom, and Why of Parents’ Involvement in Children’s Academic Lives: More Is Not Always Better. Rev Educ Res. 2007;77: 373–410. doi:10.3102/003465430305567 11 Desforges C, Abouchaar A. The Impact of Parental Involvement, Parental Support and Family Education on Pupil Achievements and Adjustment: A Literature Review. [Internet]. 2003. Report No.: 433. 12 Hattori H., Cardoso M., and Ledoux B. (2017). Collecting data on foundational learning skills and parental involvement in education. MICS Methodological Papers, No. 5, Data and Analytics Section, Division of Data, Research and Policy, UNICEF New York.
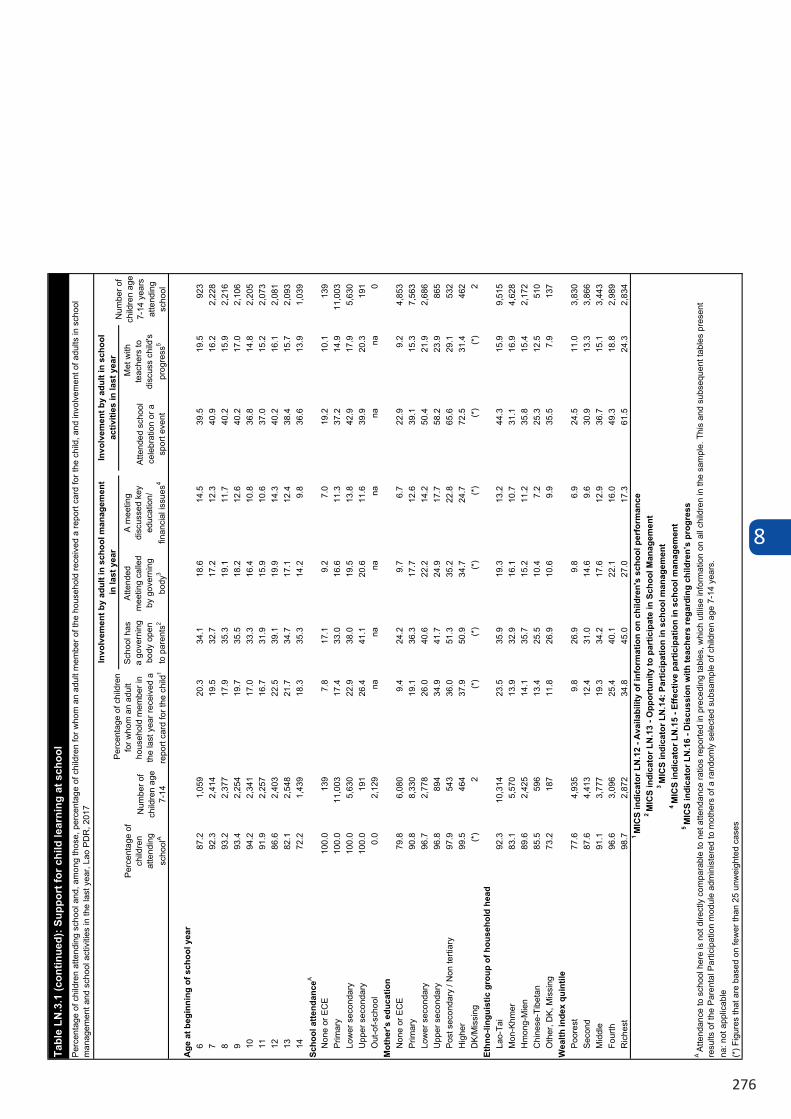
8
276
Scho
ol h
as
a go
vern
ing
body
ope
n to
par
ents
2
Atte
nded
m
eetin
g ca
lled
by g
over
ning
bo
dy3
A m
eetin
g di
scus
sed
key
educ
atio
n/
finan
cial
issu
es4
Atte
nded
sch
ool
cele
brat
ion
or a
sp
ort e
vent
Met
with
te
ache
rs to
di
scus
s ch
ild's
pr
ogre
ss5
Age
at b
egin
ning
of s
choo
l yea
r6
87.2
1,05
920
.334
.118
.614
.539
.519
.592
37
92.3
2,41
419
.532
.717
.212
.340
.916
.22,
228
893
.22,
377
17.9
35.3
19.1
11.7
40.2
15.9
2,21
69
93.4
2,25
419
.735
.518
.212
.640
.217
.02,
106
1094
.22,
341
17.0
33.3
16.4
10.8
36.8
14.8
2,20
511
91.9
2,25
716
.731
.915
.910
.637
.015
.22,
073
1286
.62,
403
22.5
39.1
19.9
14.3
40.2
16.1
2,08
113
82.1
2,54
821
.734
.717
.112
.438
.415
.72,
093
1472
.21,
439
18.3
35.3
14.2
9.8
36.6
13.9
1,03
9Sc
hool
atte
ndan
ceA
Non
e or
EC
E10
0.0
139
7.8
17.1
9.2
7.0
19.2
10.1
139
Prim
ary
100.
011
,003
17.4
33.0
16.6
11.3
37.2
14.9
11,0
03Lo
wer
sec
onda
ry10
0.0
5,63
022
.938
.019
.513
.842
.917
.95,
630
Upp
er s
econ
dary
100.
019
126
.441
.120
.611
.639
.920
.319
1O
ut-o
f-sch
ool
0.0
2,12
9na
nana
nana
na0
Mot
her's
edu
catio
nN
one
or E
CE
79.8
6,08
09.
424
.29.
76.
722
.99.
24,
853
Prim
ary
90.8
8,33
019
.136
.317
.712
.639
.115
.37,
563
Low
er s
econ
dary
96.7
2,77
826
.040
.622
.214
.250
.421
.92,
686
Upp
er s
econ
dary
96.8
894
34.9
41.7
24.9
17.7
58.2
23.9
865
Post
sec
onda
ry /
Non
terti
ary
97.9
543
36.0
51.3
35.2
22.8
65.6
29.1
532
Hig
her
99.5
464
37.9
50.9
34.7
24.7
72.5
31.4
462
DK/
Mis
sing
(*)
2(*
)(*
)(*
)(*
)(*
)(*
)2
Ethn
o-lin
guis
tic g
roup
of h
ouse
hold
hea
dLa
o-Ta
i92
.310
,314
23.5
35.9
19.3
13.2
44.3
15.9
9,51
5M
on-K
hmer
83.1
5,57
013
.932
.916
.110
.731
.116
.94,
628
Hm
ong-
Mie
n89
.62,
425
14.1
35.7
15.2
11.2
35.8
15.4
2,17
2C
hine
se-T
ibet
an85
.559
613
.425
.510
.47.
225
.312
.551
0O
ther
, DK,
Mis
sing
73.2
187
11.8
26.9
10.6
9.9
35.5
7.9
137
Wea
lth in
dex
quin
tile
Poor
est
77.6
4,93
59.
826
.99.
86.
924
.511
.03,
830
Seco
nd87
.64,
413
12.4
31.0
14.6
9.6
30.9
13.3
3,86
6M
iddl
e91
.13,
777
19.3
34.2
17.6
12.9
36.7
15.1
3,44
3Fo
urth
96.6
3,09
625
.440
.122
.116
.049
.318
.82,
989
Ric
hest
98.7
2,87
234
.845
.027
.017
.361
.524
.32,
834
Tabl
e LN
.3.1
(con
tinue
d): S
uppo
rt fo
r chi
ld le
arni
ng a
t sch
ool
Perc
enta
ge o
f chi
ldre
n at
tend
ing
scho
ol a
nd, a
mon
g th
ose,
per
cent
age
of c
hild
ren
for w
hom
an
adul
t mem
ber o
f the
hou
seho
ld re
ceiv
ed a
repo
rt ca
rd fo
r the
chi
ld, a
nd in
volv
emen
t of a
dults
in s
choo
l m
anag
emen
t and
sch
ool a
ctiv
ities
in th
e la
st y
ear,
Lao
PDR
, 201
7
Perc
enta
ge o
f ch
ildre
n at
tend
ing
scho
olA
Num
ber o
f ch
ildre
n ag
e 7-
14
Per
cent
age
of c
hild
ren
for w
hom
an
adul
t ho
useh
old
mem
ber i
n th
e la
st y
ear r
ecei
ved
a re
port
card
for t
he c
hild
1
Invo
lvem
ent b
y ad
ult i
n sc
hool
man
agem
ent
in la
st y
ear
Invo
lvem
ent b
y ad
ult i
n sc
hool
ac
tiviti
es in
last
yea
rN
umbe
r of
child
ren
age
7-14
yea
rs
atte
ndin
g sc
hool
A At
tend
ance
to s
choo
l her
e is
not
dire
ctly
com
para
ble
to n
et a
ttend
ance
ratio
s re
porte
d in
pre
cedi
ng ta
bles
, whi
ch u
tilis
e in
form
atio
n on
all
child
ren
in th
e sa
mpl
e. T
his
and
subs
eque
nt ta
bles
pre
sent
re
sults
of t
he P
aren
tal P
artic
ipat
ion
mod
ule
adm
inis
tere
d to
mot
hers
of a
rand
omly
sel
ecte
d su
bsam
ple
of c
hild
ren
age
7-14
yea
rs.
na: n
ot a
pplic
able
(*) F
igur
es th
at a
re b
ased
on
few
er th
an 2
5 un
wei
ghte
d ca
ses
1 M
ICS
indi
cato
r LN
.12
- Ava
ilabi
lity
of in
form
atio
n on
chi
ldre
n's
scho
ol p
erfo
rman
ce
2 M
ICS
indi
cato
r LN
.13
- Opp
ortu
nity
to p
artic
ipat
e in
Sch
ool M
anag
emen
t3
MIC
S in
dica
tor L
N.1
4: P
artic
ipat
ion
in s
choo
l man
agem
ent
4 M
ICS
indi
cato
r LN
.15
- Effe
ctiv
e pa
rtic
ipat
ion
in s
choo
l man
agem
ent
5 M
ICS
indi
cato
r LN
.16
- Dis
cuss
ion
with
teac
hers
rega
rdin
g ch
ildre
n’s
prog
ress
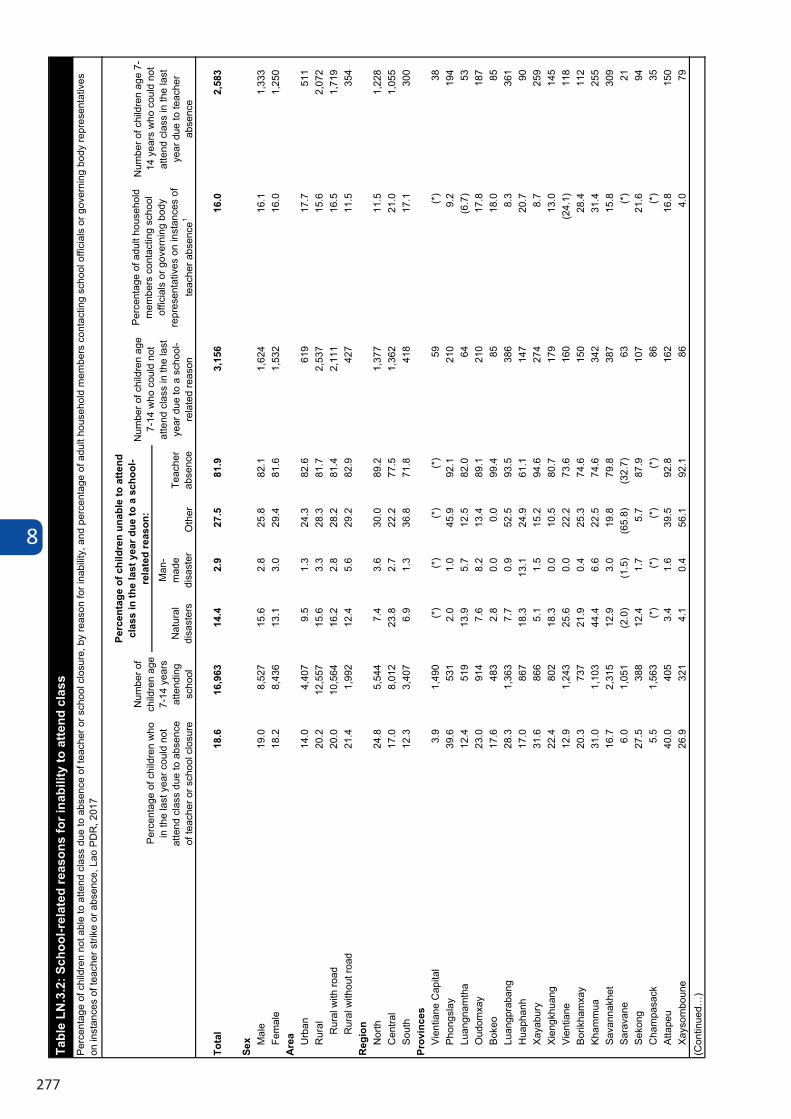
8
277
Nat
ural
di
sast
ers
Man
-m
ade
disa
ster
Oth
erTe
ache
r ab
senc
e
Tota
l18
.616
,963
14.4
2.9
27.5
81.9
3,15
616
.02,
583
Sex M
ale
19.0
8,52
715
.62.
825
.882
.11,
624
16.1
1,33
3Fe
mal
e18
.28,
436
13.1
3.0
29.4
81.6
1,53
216
.01,
250
Are
a Urb
an14
.04,
407
9.5
1.3
24.3
82.6
619
17.7
511
Rur
al20
.212
,557
15.6
3.3
28.3
81.7
2,53
715
.62,
072
Rur
al w
ith ro
ad20
.010
,564
16.2
2.8
28.2
81.4
2,11
116
.51,
719
Rur
al w
ithou
t roa
d21
.41,
992
12.4
5.6
29.2
82.9
427
11.5
354
Reg
ion
Nor
th24
.85,
544
7.4
3.6
30.0
89.2
1,37
711
.51,
228
Cen
tral
17.0
8,01
223
.82.
722
.277
.51,
362
21.0
1,05
5So
uth
12.3
3,40
76.
91.
336
.871
.841
817
.130
0Pr
ovin
ces
Vien
tiane
Cap
ital
3.9
1,49
0(*
)(*
)(*
)(*
)59
(*)
38Ph
ongs
lay
39.6
531
2.0
1.0
45.9
92.1
210
9.2
194
Luan
gnam
tha
12.4
519
13.9
5.7
12.5
82.0
64(6
.7)
53O
udom
xay
23.0
914
7.6
8.2
13.4
89.1
210
17.8
187
Boke
o17
.648
32.
80.
00.
099
.485
18.0
85Lu
angp
raba
ng28
.31,
363
7.7
0.9
52.5
93.5
386
8.3
361
Hua
phan
h17
.086
718
.313
.124
.961
.114
720
.790
Xaya
bury
31.6
866
5.1
1.5
15.2
94.6
274
8.7
259
Xien
gkhu
ang
22.4
802
18.3
0.0
10.5
80.7
179
13.0
145
Vien
tiane
12.9
1,24
325
.60.
022
.273
.616
0(2
4.1)
118
Borik
ham
xay
20.3
737
21.9
0.4
25.3
74.6
150
28.4
112
Kham
mua
31.0
1,10
344
.46.
622
.574
.634
231
.425
5Sa
vann
akhe
t16
.72,
315
12.9
3.0
19.8
79.8
387
15.8
309
Sara
vane
6.0
1,05
1(2
.0)
(1.5
)(6
5.8)
(32.
7)63
(*)
21Se
kong
27.5
388
12.4
1.7
5.7
87.9
107
21.6
94C
ham
pasa
ck5.
51,
563
(*)
(*)
(*)
(*)
86(*
)35
Atta
peu
40.0
405
3.4
1.6
39.5
92.8
162
16.8
150
Xays
ombo
une
26.9
321
4.1
0.4
56.1
92.1
864.
079
(Con
tinue
d…)
Tabl
e LN
.3.2
: Sch
ool-r
elat
ed re
ason
s fo
r ina
bilit
y to
atte
nd c
lass
Perc
enta
ge o
f chi
ldre
n no
t abl
e to
atte
nd c
lass
due
to a
bsen
ce o
f tea
cher
or s
choo
l clo
sure
, by
reas
on fo
r ina
bilit
y, a
nd p
erce
ntag
e of
adu
lt ho
useh
old
mem
bers
con
tact
ing
scho
ol o
ffici
als
or g
over
ning
bod
y re
pres
enta
tives
on
inst
ance
s of
teac
her s
trike
or a
bsen
ce, L
ao P
DR
, 201
7
Perc
enta
ge o
f chi
ldre
n w
ho
in th
e la
st y
ear c
ould
not
at
tend
cla
ss d
ue to
abs
ence
of
teac
her o
r sch
ool c
losu
re
Num
ber o
f ch
ildre
n ag
e 7-
14 y
ears
at
tend
ing
scho
ol
Perc
enta
ge o
f chi
ldre
n un
able
to a
ttend
cl
ass
in th
e la
st y
ear d
ue to
a s
choo
l-re
late
d re
ason
:N
umbe
r of c
hild
ren
age
7-14
who
cou
ld n
ot
atte
nd c
lass
in th
e la
st
year
due
to a
sch
ool-
rela
ted
reas
on
Perc
enta
ge o
f adu
lt ho
useh
old
mem
bers
con
tact
ing
scho
ol
offic
ials
or g
over
ning
bod
y re
pres
enta
tives
on
inst
ance
s of
te
ache
r abs
ence
1
Num
ber o
f chi
ldre
n ag
e 7-
14 y
ears
who
cou
ld n
ot
atte
nd c
lass
in th
e la
st
year
due
to te
ache
r ab
senc
e
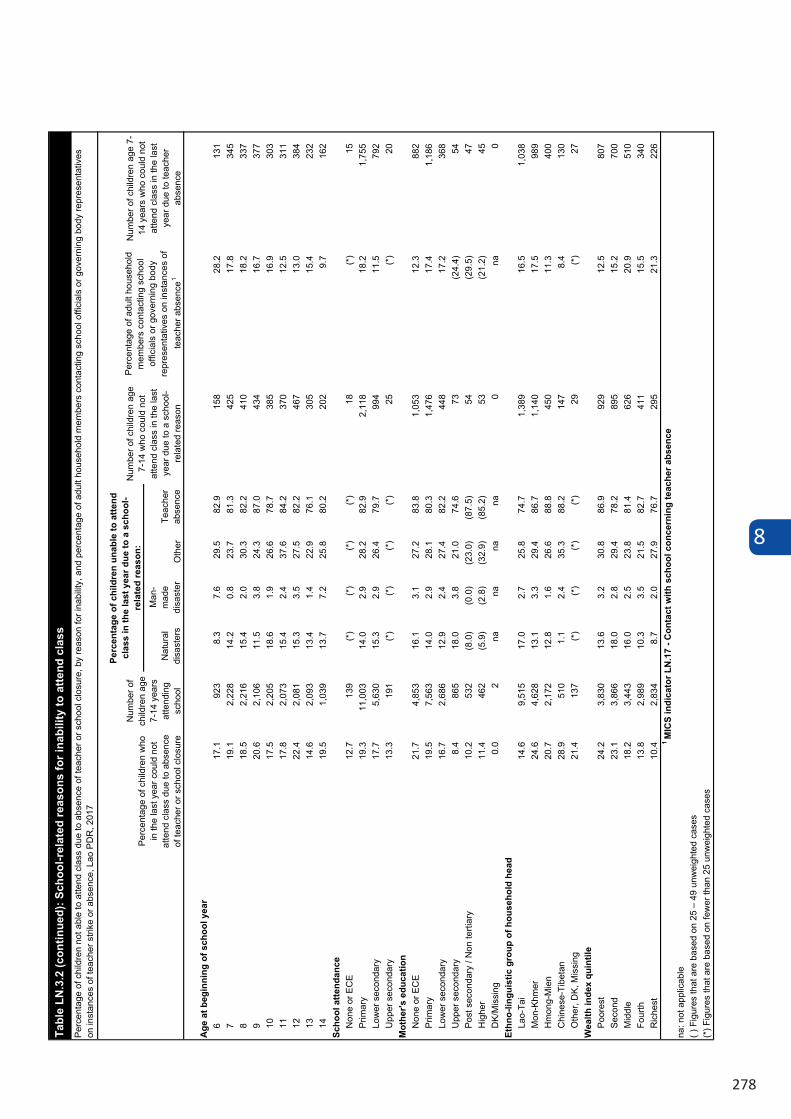
8
278
Nat
ural
di
sast
ers
Man
-m
ade
disa
ster
Oth
erTe
ache
r ab
senc
e
Age
at b
egin
ning
of s
choo
l yea
r6
17.1
923
8.3
7.6
29.5
82.9
158
28.2
131
719
.12,
228
14.2
0.8
23.7
81.3
425
17.8
345
818
.52,
216
15.4
2.0
30.3
82.2
410
18.2
337
920
.62,
106
11.5
3.8
24.3
87.0
434
16.7
377
1017
.52,
205
18.6
1.9
26.6
78.7
385
16.9
303
1117
.82,
073
15.4
2.4
37.6
84.2
370
12.5
311
1222
.42,
081
15.3
3.5
27.5
82.2
467
13.0
384
1314
.62,
093
13.4
1.4
22.9
76.1
305
15.4
232
1419
.51,
039
13.7
7.2
25.8
80.2
202
9.7
162
Scho
ol a
ttend
ance
Non
e or
EC
E12
.713
9(*
)(*
)(*
)(*
)18
(*)
15Pr
imar
y19
.311
,003
14.0
2.9
28.2
82.9
2,11
818
.21,
755
Low
er s
econ
dary
17.7
5,63
015
.32.
926
.479
.799
411
.579
2U
pper
sec
onda
ry13
.319
1(*
)(*
)(*
)(*
)25
(*)
20M
othe
r's e
duca
tion
Non
e or
EC
E21
.74,
853
16.1
3.1
27.2
83.8
1,05
312
.388
2Pr
imar
y19
.57,
563
14.0
2.9
28.1
80.3
1,47
617
.41,
186
Low
er s
econ
dary
16.7
2,68
612
.92.
427
.482
.244
817
.236
8U
pper
sec
onda
ry8.
486
518
.03.
821
.074
.673
(24.
4)54
Post
sec
onda
ry /
Non
terti
ary
10.2
532
(8.0
)(0
.0)
(23.
0)(8
7.5)
54(2
9.5)
47H
ighe
r11
.446
2(5
.9)
(2.8
)(3
2.9)
(85.
2)53
(21.
2)45
DK/
Mis
sing
0.0
2na
nana
na0
na0
Ethn
o-lin
guis
tic g
roup
of h
ouse
hold
hea
dLa
o-Ta
i14
.69,
515
17.0
2.7
25.8
74.7
1,38
916
.51,
038
Mon
-Khm
er24
.64,
628
13.1
3.3
29.4
86.7
1,14
017
.598
9H
mon
g-M
ien
20.7
2,17
212
.81.
626
.688
.845
011
.340
0C
hine
se-T
ibet
an28
.951
01.
12.
435
.388
.214
78.
413
0O
ther
, DK,
Mis
sing
21.4
137
(*)
(*)
(*)
(*)
29(*
)27
Wea
lth in
dex
quin
tile
Poor
est
24.2
3,83
013
.63.
230
.886
.992
912
.580
7Se
cond
23.1
3,86
618
.02.
829
.478
.289
515
.270
0M
iddl
e18
.23,
443
16.0
2.5
23.8
81.4
626
20.9
510
Four
th13
.82,
989
10.3
3.5
21.5
82.7
411
15.5
340
Ric
hest
10.4
2,83
48.
72.
027
.976
.729
521
.322
6
na: n
ot a
pplic
able
1 M
ICS
indi
cato
r LN
.17
- Con
tact
with
sch
ool c
once
rnin
g te
ache
r abs
ence
( ) F
igur
es th
at a
re b
ased
on
25 –
49
unw
eigh
ted
case
s(*
) Fig
ures
that
are
bas
ed o
n fe
wer
than
25
unw
eigh
ted
case
s
Tabl
e LN
.3.2
(con
tinue
d): S
choo
l-rel
ated
reas
ons
for i
nabi
lity
to a
ttend
cla
ssPe
rcen
tage
of c
hild
ren
not a
ble
to a
ttend
cla
ss d
ue to
abs
ence
of t
each
er o
r sch
ool c
losu
re, b
y re
ason
for i
nabi
lity,
and
per
cent
age
of a
dult
hous
ehol
d m
embe
rs c
onta
ctin
g sc
hool
offi
cial
s or
gov
erni
ng b
ody
repr
esen
tativ
es
on in
stan
ces
of te
ache
r stri
ke o
r abs
ence
, Lao
PD
R, 2
017
Perc
enta
ge o
f chi
ldre
n w
ho
in th
e la
st y
ear c
ould
not
at
tend
cla
ss d
ue to
abs
ence
of
teac
her o
r sch
ool c
losu
re
Num
ber o
f ch
ildre
n ag
e 7-
14 y
ears
at
tend
ing
scho
ol
Perc
enta
ge o
f chi
ldre
n un
able
to a
ttend
cl
ass
in th
e la
st y
ear d
ue to
a s
choo
l-re
late
d re
ason
:N
umbe
r of c
hild
ren
age
7-14
who
cou
ld n
ot
atte
nd c
lass
in th
e la
st
year
due
to a
sch
ool-
rela
ted
reas
on
Perc
enta
ge o
f adu
lt ho
useh
old
mem
bers
con
tact
ing
scho
ol
offic
ials
or g
over
ning
bod
y re
pres
enta
tives
on
inst
ance
s of
te
ache
r abs
ence
1
Num
ber o
f chi
ldre
n ag
e 7-
14 y
ears
who
cou
ld n
ot
atte
nd c
lass
in th
e la
st
year
due
to te
ache
r ab
senc
e
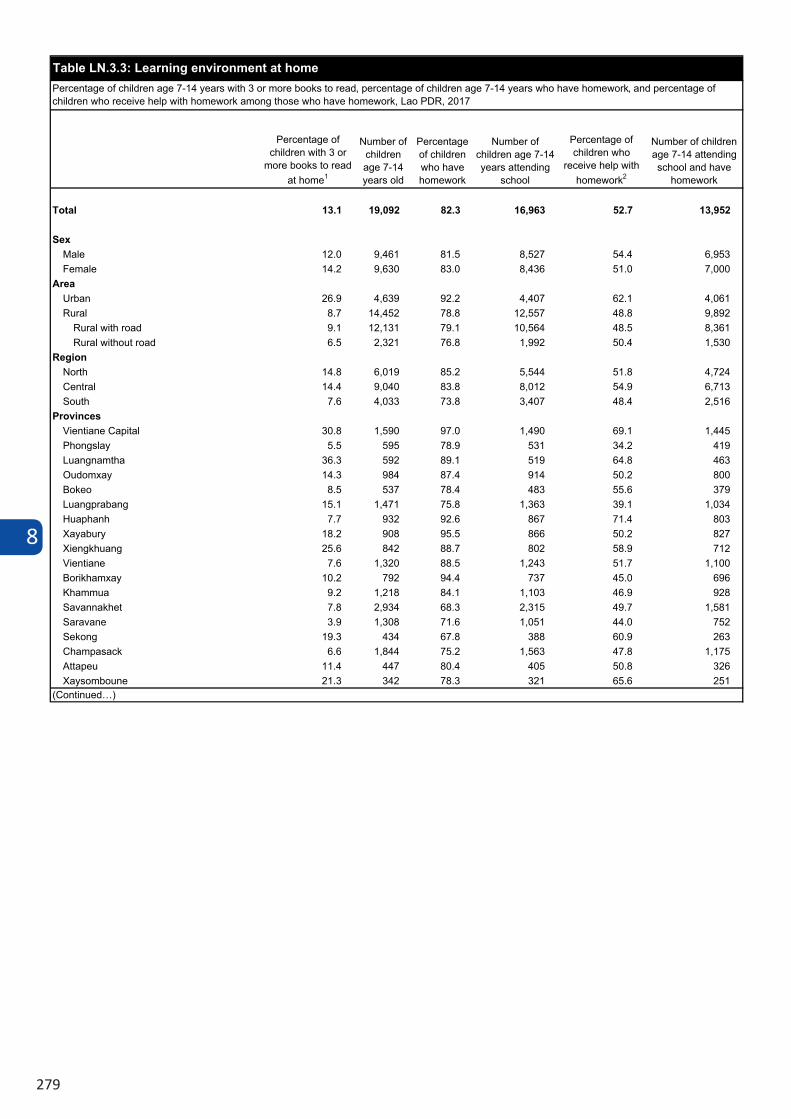
8
279
Percentage of children with 3 or
more books to read at home1
Number of children age 7-14 years old
Percentage of children who have homework
Number of children age 7-14 years attending
school
Percentage of children who
receive help with homework2
Number of children age 7-14 attending school and have
homework
Total 13.1 19,092 82.3 16,963 52.7 13,952
SexMale 12.0 9,461 81.5 8,527 54.4 6,953Female 14.2 9,630 83.0 8,436 51.0 7,000
AreaUrban 26.9 4,639 92.2 4,407 62.1 4,061Rural 8.7 14,452 78.8 12,557 48.8 9,892
Rural with road 9.1 12,131 79.1 10,564 48.5 8,361Rural without road 6.5 2,321 76.8 1,992 50.4 1,530
RegionNorth 14.8 6,019 85.2 5,544 51.8 4,724Central 14.4 9,040 83.8 8,012 54.9 6,713South 7.6 4,033 73.8 3,407 48.4 2,516
ProvincesVientiane Capital 30.8 1,590 97.0 1,490 69.1 1,445Phongslay 5.5 595 78.9 531 34.2 419Luangnamtha 36.3 592 89.1 519 64.8 463Oudomxay 14.3 984 87.4 914 50.2 800Bokeo 8.5 537 78.4 483 55.6 379Luangprabang 15.1 1,471 75.8 1,363 39.1 1,034Huaphanh 7.7 932 92.6 867 71.4 803Xayabury 18.2 908 95.5 866 50.2 827Xiengkhuang 25.6 842 88.7 802 58.9 712Vientiane 7.6 1,320 88.5 1,243 51.7 1,100Borikhamxay 10.2 792 94.4 737 45.0 696Khammua 9.2 1,218 84.1 1,103 46.9 928Savannakhet 7.8 2,934 68.3 2,315 49.7 1,581Saravane 3.9 1,308 71.6 1,051 44.0 752Sekong 19.3 434 67.8 388 60.9 263Champasack 6.6 1,844 75.2 1,563 47.8 1,175Attapeu 11.4 447 80.4 405 50.8 326Xaysomboune 21.3 342 78.3 321 65.6 251
(Continued…)
Table LN.3.3: Learning environment at homePercentage of children age 7-14 years with 3 or more books to read, percentage of children age 7-14 years who have homework, and percentage of children who receive help with homework among those who have homework, Lao PDR, 2017
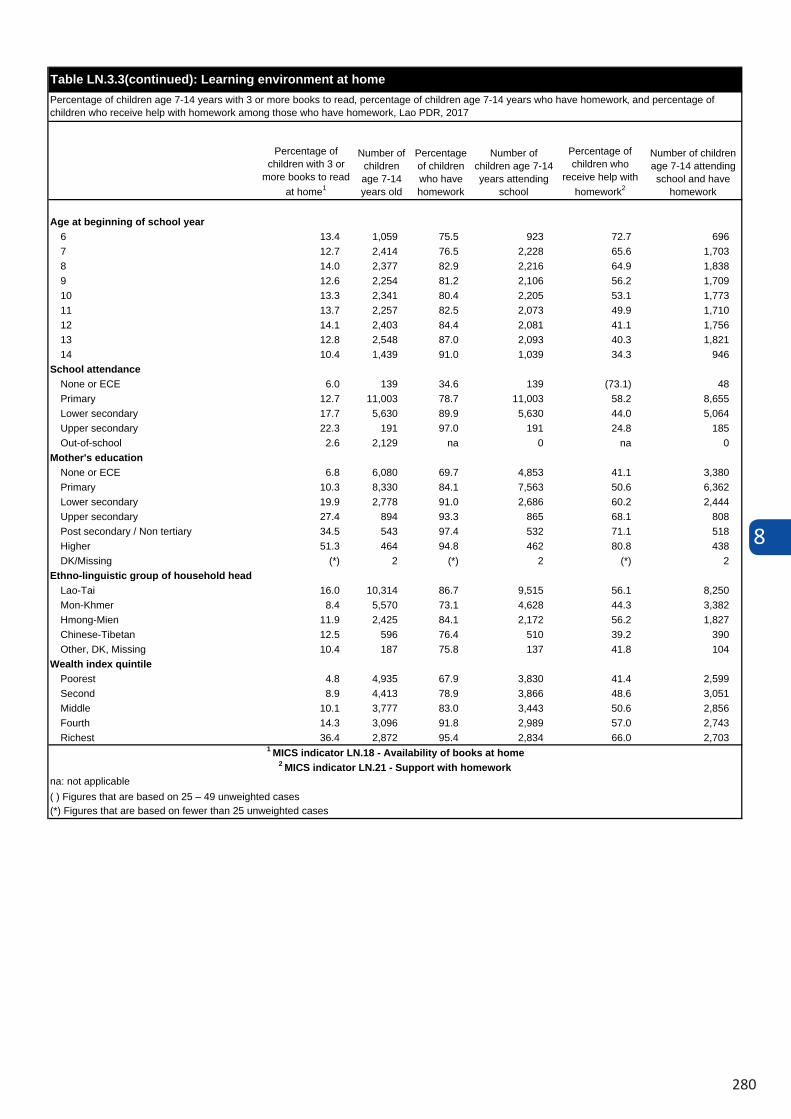
8
280
Percentage of children with 3 or
more books to read at home1
Number of childrenage 7-14 years old
Percentageof children who have homework
Number of children age 7-14 years attending
school
Percentage of children who
receive help with homework2
Number of children age 7-14 attending school and have
homework
Age at beginning of school year6 13.4 1,059 75.5 923 72.7 6967 12.7 2,414 76.5 2,228 65.6 1,7038 14.0 2,377 82.9 2,216 64.9 1,8389 12.6 2,254 81.2 2,106 56.2 1,70910 13.3 2,341 80.4 2,205 53.1 1,77311 13.7 2,257 82.5 2,073 49.9 1,71012 14.1 2,403 84.4 2,081 41.1 1,75613 12.8 2,548 87.0 2,093 40.3 1,82114 10.4 1,439 91.0 1,039 34.3 946
School attendanceNone or ECE 6.0 139 34.6 139 (73.1) 48Primary 12.7 11,003 78.7 11,003 58.2 8,655Lower secondary 17.7 5,630 89.9 5,630 44.0 5,064Upper secondary 22.3 191 97.0 191 24.8 185Out-of-school 2.6 2,129 na 0 na 0
Mother's educationNone or ECE 6.8 6,080 69.7 4,853 41.1 3,380Primary 10.3 8,330 84.1 7,563 50.6 6,362Lower secondary 19.9 2,778 91.0 2,686 60.2 2,444Upper secondary 27.4 894 93.3 865 68.1 808Post secondary / Non tertiary 34.5 543 97.4 532 71.1 518Higher 51.3 464 94.8 462 80.8 438DK/Missing (*) 2 (*) 2 (*) 2
Ethno-linguistic group of household headLao-Tai 16.0 10,314 86.7 9,515 56.1 8,250Mon-Khmer 8.4 5,570 73.1 4,628 44.3 3,382Hmong-Mien 11.9 2,425 84.1 2,172 56.2 1,827Chinese-Tibetan 12.5 596 76.4 510 39.2 390Other, DK, Missing 10.4 187 75.8 137 41.8 104
Wealth index quintilePoorest 4.8 4,935 67.9 3,830 41.4 2,599Second 8.9 4,413 78.9 3,866 48.6 3,051Middle 10.1 3,777 83.0 3,443 50.6 2,856Fourth 14.3 3,096 91.8 2,989 57.0 2,743Richest 36.4 2,872 95.4 2,834 66.0 2,703
( ) Figures that are based on 25 – 49 unweighted cases
1 MICS indicator LN.18 - Availability of books at home2 MICS indicator LN.21 - Support with homework
na: not applicable
(*) Figures that are based on fewer than 25 unweighted cases
Table LN.3.3(continued): Learning environment at homePercentage of children age 7-14 years with 3 or more books to read, percentage of children age 7-14 years who have homework, and percentage of children who receive help with homework among those who have homework, Lao PDR, 2017
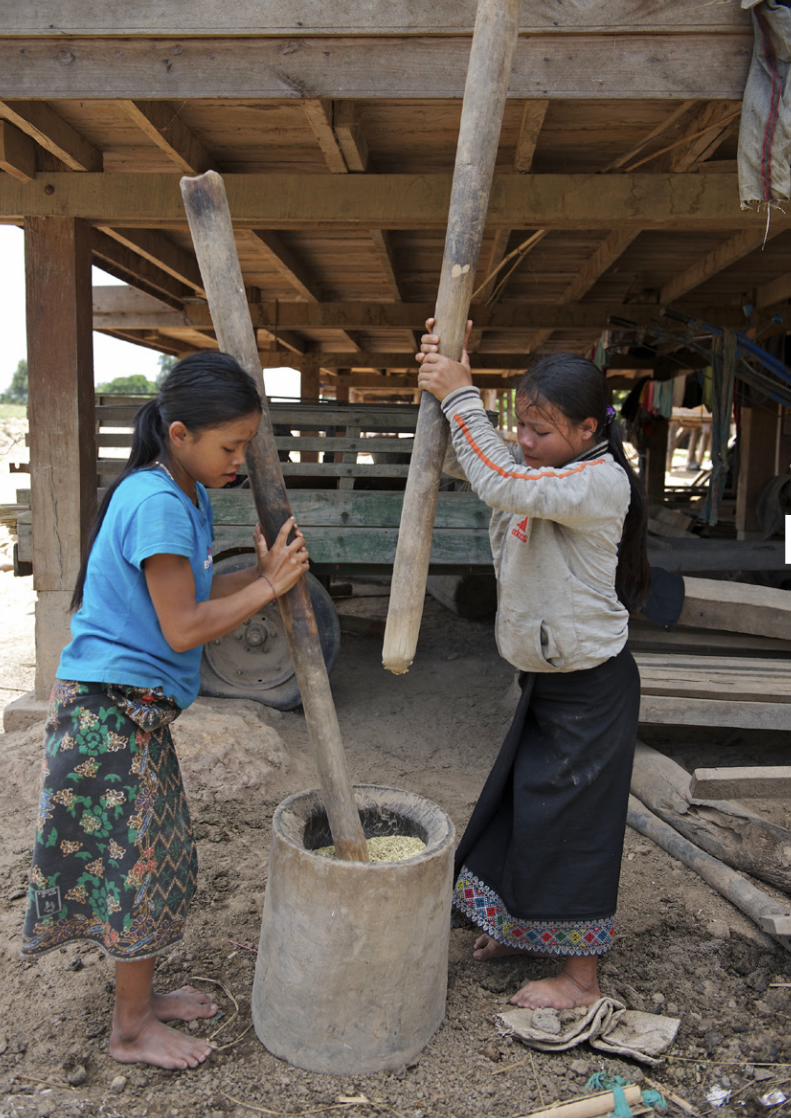
8
282
9
283
9 PROTECTION FROM VIOLENCE AND EXPLOITATION
The protection of children from all forms of violence is a fundamental right enshrined in the UN Convention on the Rights of the Child (CRC). Evidence suggests that exposure to violence at an early age in life can impair brain development and has serious and long lasting consequences for its victims with major impact on the health, development and school performance of children.1 It also slows social progress by generating huge economic costs, hindering sustainable development and eroding human capital.
The inclusion of a specific target within the 2030 Agenda for Sustainable Development provides a unique opportunity to place the protection of children at the heart of policy actions and to ensure all children have their rights realised and gives renewed impetus towards the realization of the rights of children to live free from violence, abuse and exploitation. Several other SDG targets address specific forms of protection and violence towards children, including child marriage, the eradication of child labour and registration of children at birth.
This chapter summarizes the main findings of the survey on a range of child protection indicators, including birth registration, child discipline, child labour, early marriage and attitudes toward domestic violence.
9.1 BIRTH REGISTRATION
A name and nationality is every child’s right, enshrined in the CRC and other international treaties. Registering children at birth is the first step in securing their recognition before the law, safeguarding their rights, and ensuring that any violation of these rights does not go unnoticed. 2 Birth certificates are proof of registration and the first form of legal identity and are often required to access health care or education. Having legal identification can also be one form of protection from entering into marriage or the labour market, or being conscripted into the armed forces, before the legal age. Birth registration and certification is also legal proof of one’s place of birth and family ties and thus necessary to obtain a passport. In adulthood, birth certificates may be required to obtain social assistance or a job in the formal sector, to buy or inherit property and to vote.
In Lao PDR ‘registration’ is usually understood as registration in the ‘family book’ and not necessarily possession of a birth certificate. Since 2011, the Ministry of Home Affairs has roles and responsibilities to oversee the civil registration system in the country. In the LSISII, child is registered with civil authorities if he/she has birth certificate or registered in the family book.
Reference to family registration law, a family book registration refers to a record that certifies the domicile of the members of a family household of Lao citizen, foreigner and stateless person [who is authorized to reside in the Lao PDR] in accordance with the laws and regulations. A person is willing to register [any of family registration] must submit an application for family to the concerning family registration organization via the chief of village where he/she is residing. After receiving the application for family registration, the concerning family registration organization must consider such application upon the nature of the request no later then thirty official working days from the date of reciept.
Birth Registration: When a child is born at home, or health center or hospital, the head or representative of that household must inform verbally to the chief of village where they reside or by presenting document regarding such birth from health center or hospital as evidence of the birth. A village chief must then issue the birth notification within five working days from the date of receipt of information. The applicant must further get in-touch with the family registration office at district to issue a birth certificate within thirty working days from the date of reciept the birth notification.
1 UNICEF. 2014. Ending Violence Against Children: Six strategies for action. UNICEF
2 UNICEF. 2013. Every Child’s Birth Right: Inequities and trends in birth registration. UNICEF.
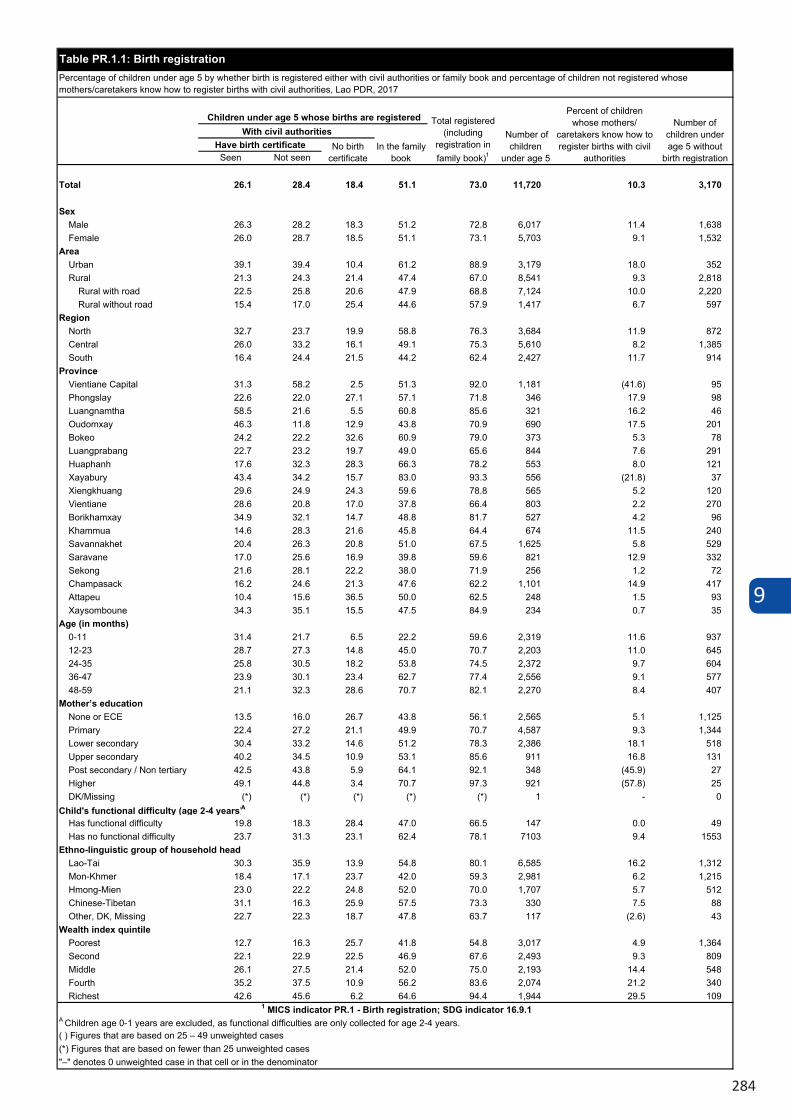
9
284
Seen Not seen
Total 26.1 28.4 18.4 51.1 73.0 11,720 10.3 3,170
SexMale 26.3 28.2 18.3 51.2 72.8 6,017 11.4 1,638Female 26.0 28.7 18.5 51.1 73.1 5,703 9.1 1,532
AreaUrban 39.1 39.4 10.4 61.2 88.9 3,179 18.0 352Rural 21.3 24.3 21.4 47.4 67.0 8,541 9.3 2,818
Rural with road 22.5 25.8 20.6 47.9 68.8 7,124 10.0 2,220Rural without road 15.4 17.0 25.4 44.6 57.9 1,417 6.7 597
RegionNorth 32.7 23.7 19.9 58.8 76.3 3,684 11.9 872Central 26.0 33.2 16.1 49.1 75.3 5,610 8.2 1,385South 16.4 24.4 21.5 44.2 62.4 2,427 11.7 914
ProvinceVientiane Capital 31.3 58.2 2.5 51.3 92.0 1,181 (41.6) 95Phongslay 22.6 22.0 27.1 57.1 71.8 346 17.9 98Luangnamtha 58.5 21.6 5.5 60.8 85.6 321 16.2 46Oudomxay 46.3 11.8 12.9 43.8 70.9 690 17.5 201Bokeo 24.2 22.2 32.6 60.9 79.0 373 5.3 78Luangprabang 22.7 23.2 19.7 49.0 65.6 844 7.6 291Huaphanh 17.6 32.3 28.3 66.3 78.2 553 8.0 121Xayabury 43.4 34.2 15.7 83.0 93.3 556 (21.8) 37Xiengkhuang 29.6 24.9 24.3 59.6 78.8 565 5.2 120Vientiane 28.6 20.8 17.0 37.8 66.4 803 2.2 270Borikhamxay 34.9 32.1 14.7 48.8 81.7 527 4.2 96Khammua 14.6 28.3 21.6 45.8 64.4 674 11.5 240Savannakhet 20.4 26.3 20.8 51.0 67.5 1,625 5.8 529Saravane 17.0 25.6 16.9 39.8 59.6 821 12.9 332Sekong 21.6 28.1 22.2 38.0 71.9 256 1.2 72Champasack 16.2 24.6 21.3 47.6 62.2 1,101 14.9 417Attapeu 10.4 15.6 36.5 50.0 62.5 248 1.5 93Xaysomboune 34.3 35.1 15.5 47.5 84.9 234 0.7 35
Age (in months)0-11 31.4 21.7 6.5 22.2 59.6 2,319 11.6 93712-23 28.7 27.3 14.8 45.0 70.7 2,203 11.0 64524-35 25.8 30.5 18.2 53.8 74.5 2,372 9.7 60436-47 23.9 30.1 23.4 62.7 77.4 2,556 9.1 57748-59 21.1 32.3 28.6 70.7 82.1 2,270 8.4 407
Mother’s educationNone or ECE 13.5 16.0 26.7 43.8 56.1 2,565 5.1 1,125Primary 22.4 27.2 21.1 49.9 70.7 4,587 9.3 1,344Lower secondary 30.4 33.2 14.6 51.2 78.3 2,386 18.1 518Upper secondary 40.2 34.5 10.9 53.1 85.6 911 16.8 131Post secondary / Non tertiary 42.5 43.8 5.9 64.1 92.1 348 (45.9) 27Higher 49.1 44.8 3.4 70.7 97.3 921 (57.8) 25DK/Missing (*) (*) (*) (*) (*) 1 - 0
Child's functional difficulty (age 2-4 years)A
Has functional difficulty 19.8 18.3 28.4 47.0 66.5 147 0.0 49Has no functional difficulty 23.7 31.3 23.1 62.4 78.1 7103 9.4 1553
Ethno-linguistic group of household headLao-Tai 30.3 35.9 13.9 54.8 80.1 6,585 16.2 1,312Mon-Khmer 18.4 17.1 23.7 42.0 59.3 2,981 6.2 1,215Hmong-Mien 23.0 22.2 24.8 52.0 70.0 1,707 5.7 512Chinese-Tibetan 31.1 16.3 25.9 57.5 73.3 330 7.5 88Other, DK, Missing 22.7 22.3 18.7 47.8 63.7 117 (2.6) 43
Wealth index quintilePoorest 12.7 16.3 25.7 41.8 54.8 3,017 4.9 1,364Second 22.1 22.9 22.5 46.9 67.6 2,493 9.3 809Middle 26.1 27.5 21.4 52.0 75.0 2,193 14.4 548Fourth 35.2 37.5 10.9 56.2 83.6 2,074 21.2 340Richest 42.6 45.6 6.2 64.6 94.4 1,944 29.5 109
Table PR.1.1: Birth registration
1 MICS indicator PR.1 - Birth registration; SDG indicator 16.9.1
Percentage of children under age 5 by whether birth is registered either with civil authorities or family book and percentage of children not registered whose mothers/caretakers know how to register births with civil authorities, Lao PDR, 2017
No birth certificate
Have birth certificate Number of
children under age 5
"–" denotes 0 unweighted case in that cell or in the denominator
Percent of children whose mothers/
caretakers know how to register births with civil
authorities
Number of children under age 5 without
birth registration
With civil authoritiesIn the family
book
Children under age 5 whose births are registered Total registered (including
registration in family book)1
A Children age 0-1 years are excluded, as functional difficulties are only collected for age 2-4 years.( ) Figures that are based on 25 – 49 unweighted cases(*) Figures that are based on fewer than 25 unweighted cases
9
285
9.2 CHILD DISCIPLINE
Teaching children self-control and acceptable behavior is an integral part of child discipline in all cultures. Positive parenting practices involve providing guidance on how to handle emotions or conflicts in manners that encourage judgment and responsibility and preserve children's self-esteem, physical and psychological integrity and dignity. Too often however, children are raised through the use of punitive methods that rely on the use of physical force or verbal intimidation to obtain desired behaviors. Studies3 have found that exposing children to violent discipline has harmful consequences, which range from immediate impacts to long-term harm that children carry forward into adult life. Violence hampers children’s development, learning abilities and school performance; it inhibits positive relationships, provokes low self-esteem, emotional distress and depression; and, at times, it leads to risk taking and self-harm.
In the LSIS II, mothers or caretakers of children under age five and those of one randomly selected child aged 5-17 for individual interview were asked a series of questions on the methods adults in the household used to discipline the child during the past month and if the respondent believes that physical punishment is a necessary part of child-rearing. Tables PR.2.1 and PR.2.2 present the results.
3 Straus, MA and Paschall MJ. 2009. Corporal Punishment by Mothers and Development of Children’s Cognitive Ability: A longitudinal study of two nationally representative age cohorts. Journal of Aggression, Maltreatment & Trauma 18(5): 459-83. Erickson, MF and Egeland, B. 1987. A Developmental View of the Psychological Consequences of Maltreatment. School Psychology Review 16: 156-68. Schneider, MW et al. 2005. Do Allegations of Emotional Maltreatment Predict Developmental Outcomes Beyond that of Other Forms of Maltreatment?. Child Abuse & Neglect 29(5): 513–32.
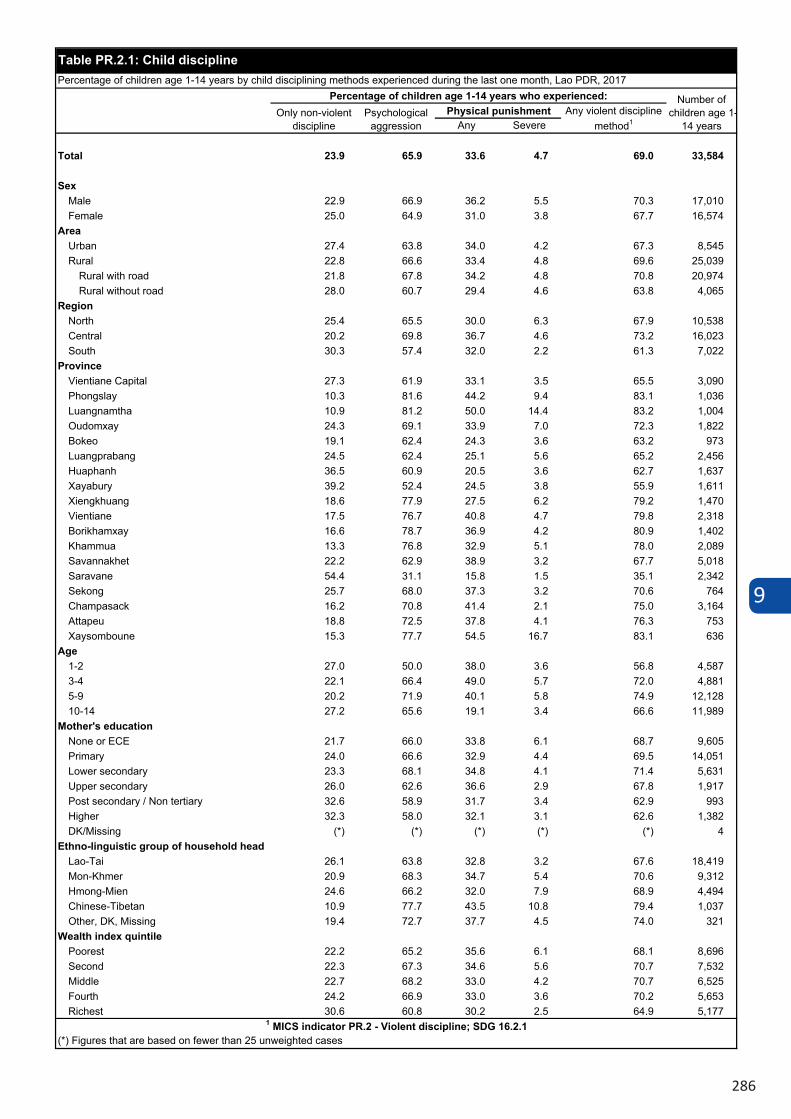
9
286
Any Severe
Total 23.9 65.9 33.6 4.7 69.0 33,584
SexMale 22.9 66.9 36.2 5.5 70.3 17,010Female 25.0 64.9 31.0 3.8 67.7 16,574
AreaUrban 27.4 63.8 34.0 4.2 67.3 8,545Rural 22.8 66.6 33.4 4.8 69.6 25,039
Rural with road 21.8 67.8 34.2 4.8 70.8 20,974Rural without road 28.0 60.7 29.4 4.6 63.8 4,065
RegionNorth 25.4 65.5 30.0 6.3 67.9 10,538Central 20.2 69.8 36.7 4.6 73.2 16,023South 30.3 57.4 32.0 2.2 61.3 7,022
ProvinceVientiane Capital 27.3 61.9 33.1 3.5 65.5 3,090Phongslay 10.3 81.6 44.2 9.4 83.1 1,036Luangnamtha 10.9 81.2 50.0 14.4 83.2 1,004Oudomxay 24.3 69.1 33.9 7.0 72.3 1,822Bokeo 19.1 62.4 24.3 3.6 63.2 973Luangprabang 24.5 62.4 25.1 5.6 65.2 2,456Huaphanh 36.5 60.9 20.5 3.6 62.7 1,637Xayabury 39.2 52.4 24.5 3.8 55.9 1,611Xiengkhuang 18.6 77.9 27.5 6.2 79.2 1,470Vientiane 17.5 76.7 40.8 4.7 79.8 2,318Borikhamxay 16.6 78.7 36.9 4.2 80.9 1,402Khammua 13.3 76.8 32.9 5.1 78.0 2,089Savannakhet 22.2 62.9 38.9 3.2 67.7 5,018Saravane 54.4 31.1 15.8 1.5 35.1 2,342Sekong 25.7 68.0 37.3 3.2 70.6 764Champasack 16.2 70.8 41.4 2.1 75.0 3,164Attapeu 18.8 72.5 37.8 4.1 76.3 753Xaysomboune 15.3 77.7 54.5 16.7 83.1 636
Age1-2 27.0 50.0 38.0 3.6 56.8 4,5873-4 22.1 66.4 49.0 5.7 72.0 4,8815-9 20.2 71.9 40.1 5.8 74.9 12,12810-14 27.2 65.6 19.1 3.4 66.6 11,989
Mother's educationNone or ECE 21.7 66.0 33.8 6.1 68.7 9,605Primary 24.0 66.6 32.9 4.4 69.5 14,051Lower secondary 23.3 68.1 34.8 4.1 71.4 5,631Upper secondary 26.0 62.6 36.6 2.9 67.8 1,917Post secondary / Non tertiary 32.6 58.9 31.7 3.4 62.9 993Higher 32.3 58.0 32.1 3.1 62.6 1,382DK/Missing (*) (*) (*) (*) (*) 4
Ethno-linguistic group of household headLao-Tai 26.1 63.8 32.8 3.2 67.6 18,419Mon-Khmer 20.9 68.3 34.7 5.4 70.6 9,312Hmong-Mien 24.6 66.2 32.0 7.9 68.9 4,494Chinese-Tibetan 10.9 77.7 43.5 10.8 79.4 1,037Other, DK, Missing 19.4 72.7 37.7 4.5 74.0 321
Wealth index quintilePoorest 22.2 65.2 35.6 6.1 68.1 8,696Second 22.3 67.3 34.6 5.6 70.7 7,532Middle 22.7 68.2 33.0 4.2 70.7 6,525Fourth 24.2 66.9 33.0 3.6 70.2 5,653Richest 30.6 60.8 30.2 2.5 64.9 5,177
Table PR.2.1: Child discipline
1 MICS indicator PR.2 - Violent discipline; SDG 16.2.1
Number of children age 1-
14 years
Percentage of children age 1-14 years who experienced:Percentage of children age 1-14 years by child disciplining methods experienced during the last one month, Lao PDR, 2017
Only non-violent discipline
Psychological aggression
Any violent discipline method1
Physical punishment
(*) Figures that are based on fewer than 25 unweighted cases
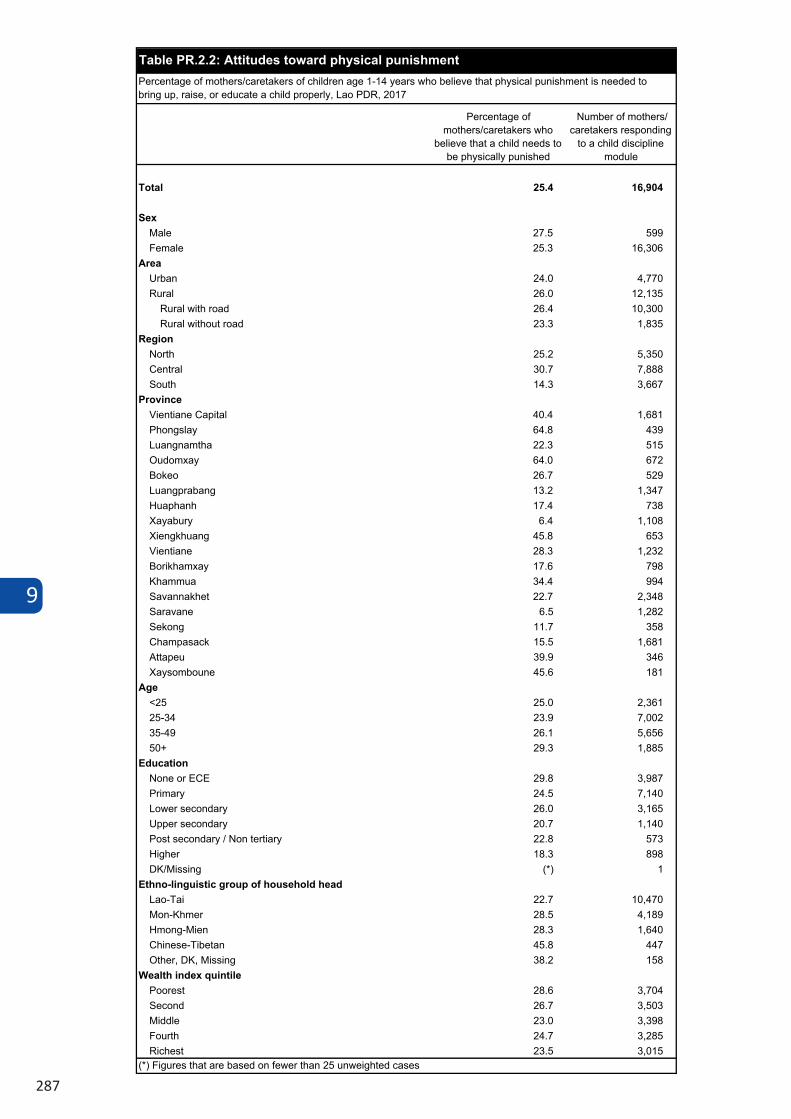
9
287
Percentage of mothers/caretakers who
believe that a child needs to be physically punished
Number of mothers/ caretakers responding
to a child discipline module
Total 25.4 16,904
SexMale 27.5 599Female 25.3 16,306
AreaUrban 24.0 4,770Rural 26.0 12,135
Rural with road 26.4 10,300Rural without road 23.3 1,835
RegionNorth 25.2 5,350Central 30.7 7,888South 14.3 3,667
ProvinceVientiane Capital 40.4 1,681Phongslay 64.8 439Luangnamtha 22.3 515Oudomxay 64.0 672Bokeo 26.7 529Luangprabang 13.2 1,347Huaphanh 17.4 738Xayabury 6.4 1,108Xiengkhuang 45.8 653Vientiane 28.3 1,232Borikhamxay 17.6 798Khammua 34.4 994Savannakhet 22.7 2,348Saravane 6.5 1,282Sekong 11.7 358Champasack 15.5 1,681Attapeu 39.9 346Xaysomboune 45.6 181
Age<25 25.0 2,36125-34 23.9 7,00235-49 26.1 5,65650+ 29.3 1,885
EducationNone or ECE 29.8 3,987Primary 24.5 7,140Lower secondary 26.0 3,165Upper secondary 20.7 1,140Post secondary / Non tertiary 22.8 573Higher 18.3 898DK/Missing (*) 1
Ethno-linguistic group of household headLao-Tai 22.7 10,470Mon-Khmer 28.5 4,189Hmong-Mien 28.3 1,640Chinese-Tibetan 45.8 447Other, DK, Missing 38.2 158
Wealth index quintilePoorest 28.6 3,704Second 26.7 3,503Middle 23.0 3,398Fourth 24.7 3,285Richest 23.5 3,015
Table PR.2.2: Attitudes toward physical punishment Percentage of mothers/caretakers of children age 1-14 years who believe that physical punishment is needed to bring up, raise, or educate a child properly, Lao PDR, 2017
(*) Figures that are based on fewer than 25 unweighted cases
9
288
9.3 CHILD LABOUR
Children around the world are routinely engaged in paid and unpaid forms of work that are not harmful to them. However, they are classified as child labourers when they are either too young to work or are involved in hazardous activities that may compromise their physical, mental, social or educational development. Article 32 (1) of the Convention on the Rights of the Child states: "States Parties recognize the right of the child to be protected from economic exploitation and from performing any work that is likely to be hazardous or to interfere with the child's education, or to be harmful to the child's health or physical, mental, spiritual, moral or social development".
The child labour module was administered for children age 5-17 and includes questions on the type of work a child does and the number of hours he or she is engaged in it. Data are collected on both economic activities (paid or unpaid work for someone who is not a member of the household, work for a family farm or business) and domestic work (household chores such as cooking, cleaning or caring for children, as well as collecting firewood or fetching water). The module also collects information on hazardous working conditions.4, 5
Table PR.3.1 presents children’s involvement in economic activities. The methodology of the MICS Indicator on Child Labour uses three age-specific thresholds for the number of hours children can perform economic activity without being classified as child labourers. A child that performed economic activities during the last week for more than the age-specific number of hours is classified as in child labour:
i. age 5-11: 1 hour or moreii. age 12-14: 14 hours or more
iii. age 15-17: 43 hours or more
4 UNICEF. 2012. How Sensitive Are Estimates of Child Labour to Definitions? MICS Methodological Paper No. 1. UNICEF. 5 The Child Labour module was administered in the Questionnaire for Children Age 5-17 (See Appendix E: Questionnaires). In households with at least one child age 5-17, one child was randomly selected. To account for the random selection, the household sample weight is multiplied by the total number of children age 5-17 in each household; this weight is used when producing the relevant tables.
Table PR.3.2 presents children’s involvement in household chores. As for economic activity above, the methodology also uses age-specific thresholds for the number of hours children can perform household chores without being classified as child labourers. A child that performed household chores during the last week for more than the age-specific number of hours is classified as in child labour:
i. age 5-11 and age 12-14: 28 hours or moreii. age 15-17: 43 hours or more
SDG Target 8.7 aims to “take immediate and effective measures to eradicate forced labour, end modern slavery and human trafficking and secure the prohibition and elimination of the worst forms of child labour, including recruitment and use of child soldiers, and by 2025 end child labour in all its forms.” The SDG indicator 8.7.1 provides the proportion of children aged 5-17 years who are engaged in child labour. Table PR.3.3 combines the children working and performing economic activities and household chores at or above and below the age-specific thresholds as detailed in the previous tables, as well as those children reported working under hazardous conditions, into the total child labour indicator.6
6 Note that the definition of child labour, hence the MICS indicator PR.3 presented in this report, also includes working in activities
that are hazardous in nature. However, to ensure comparability of estimates, it has been decided by UNICEF and ILO to exclude engagement in hazardous occupations or under hazardous working conditions from the estimates of child labour for the purpose of reporting on SDG 8.7.1 in 2018. Another reason for exclusion of hazardous conditions in the reporting is the further methodological work needed to validate questions aimed at identifying children engaged in hazardous activities.
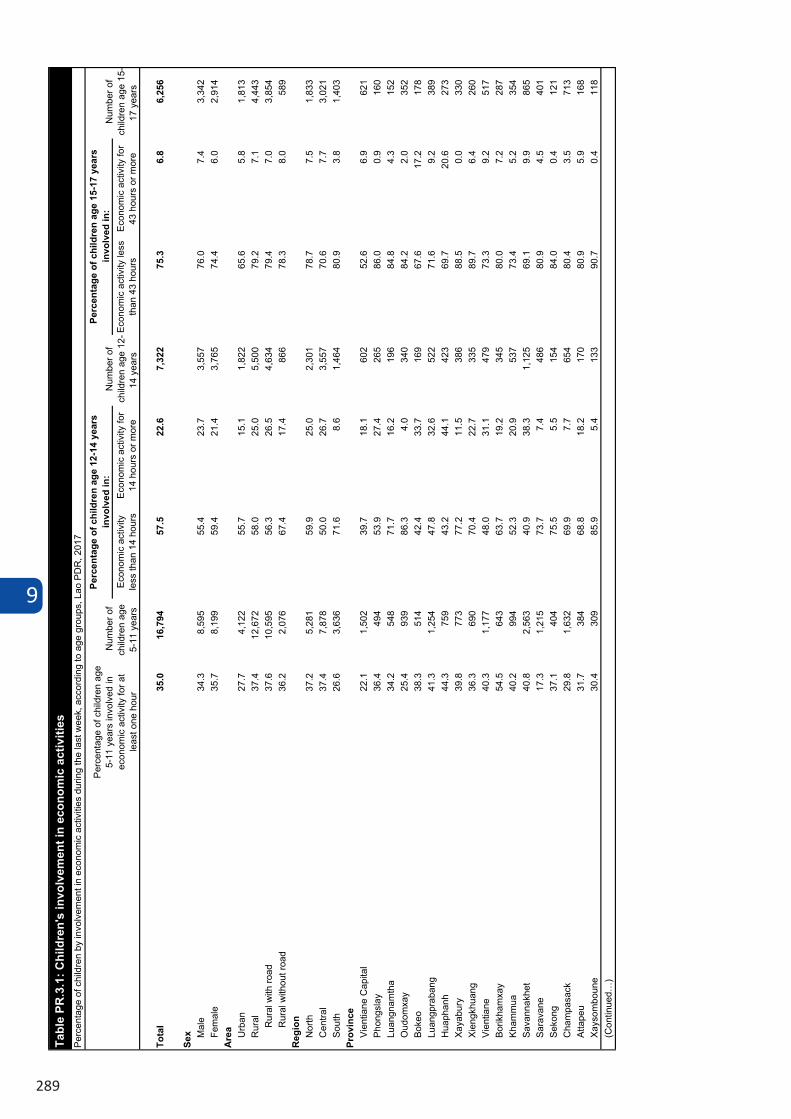
9
289
Econ
omic
act
ivity
le
ss th
an 1
4 ho
urs
Econ
omic
act
ivity
for
14 h
ours
or m
ore
Econ
omic
act
ivity
less
th
an 4
3 ho
urs
Econ
omic
act
ivity
for
43 h
ours
or m
ore
Tota
l35
.016
,794
57.5
22.6
7,32
275
.36.
86,
256
Sex M
ale
34.3
8,59
555
.423
.73,
557
76.0
7.4
3,34
2Fe
mal
e35
.78,
199
59.4
21.4
3,76
574
.46.
02,
914
Are
a Urb
an
27.7
4,12
255
.715
.11,
822
65.6
5.8
1,81
3R
ural
37.4
12,6
7258
.025
.05,
500
79.2
7.1
4,44
3R
ural
with
road
37.6
10,5
9556
.326
.54,
634
79.4
7.0
3,85
4R
ural
with
out r
oad
36.2
2,07
667
.417
.486
678
.38.
058
9R
egio
nN
orth
37.2
5,28
159
.925
.02,
301
78.7
7.5
1,83
3C
entra
l37
.47,
878
50.0
26.7
3,55
770
.67.
73,
021
Sout
h26
.63,
636
71.6
8.6
1,46
480
.93.
81,
403
Prov
ince
Vien
tiane
Cap
ital
22.1
1,50
239
.718
.160
252
.66.
962
1Ph
ongs
lay
36.4
494
53.9
27.4
265
86.0
0.9
160
Luan
gnam
tha
34.2
548
71.7
16.2
196
84.8
4.3
152
Oud
omxa
y25
.493
986
.34.
034
084
.22.
035
2Bo
keo
38.3
514
42.4
33.7
169
67.6
17.2
178
Luan
gpra
bang
41.3
1,25
447
.832
.652
271
.69.
238
9H
uaph
anh
44.3
759
43.2
44.1
423
69.7
20.6
273
Xaya
bury
39.8
773
77.2
11.5
386
88.5
0.0
330
Xien
gkhu
ang
36.3
690
70.4
22.7
335
89.7
6.4
260
Vien
tiane
40.3
1,17
748
.031
.147
973
.39.
251
7Bo
rikha
mxa
y54
.564
363
.719
.234
580
.07.
228
7Kh
amm
ua40
.299
452
.320
.953
773
.45.
235
4Sa
vann
akhe
t40
.82,
563
40.9
38.3
1,12
569
.19.
986
5Sa
rava
ne17
.31,
215
73.7
7.4
486
80.9
4.5
401
Seko
ng37
.140
475
.55.
515
484
.00.
412
1C
ham
pasa
ck29
.81,
632
69.9
7.7
654
80.4
3.5
713
Atta
peu
31.7
384
68.8
18.2
170
80.9
5.9
168
Xays
ombo
une
30.4
309
85.9
5.4
133
90.7
0.4
118
(Con
tinue
d…)
Tabl
e PR
.3.1
: Chi
ldre
n's
invo
lvem
ent i
n ec
onom
ic a
ctiv
ities
Perc
enta
ge o
f chi
ldre
n by
invo
lvem
ent i
n ec
onom
ic a
ctiv
ities
dur
ing
the
last
wee
k, a
ccor
ding
to a
ge g
roup
s, L
ao P
DR
, 201
7
Perc
enta
ge o
f chi
ldre
n ag
e 5-
11 y
ears
invo
lved
in
econ
omic
act
ivity
for a
t le
ast o
ne h
our
Num
ber o
f ch
ildre
n ag
e 5-
11 y
ears
Perc
enta
ge o
f chi
ldre
n ag
e 12
-14
year
s in
volv
ed in
: N
umbe
r of
child
ren
age
12-
14 y
ears
Perc
enta
ge o
f chi
ldre
n ag
e 15
-17
year
s in
volv
ed in
: N
umbe
r of
child
ren
age
15-
17 y
ears
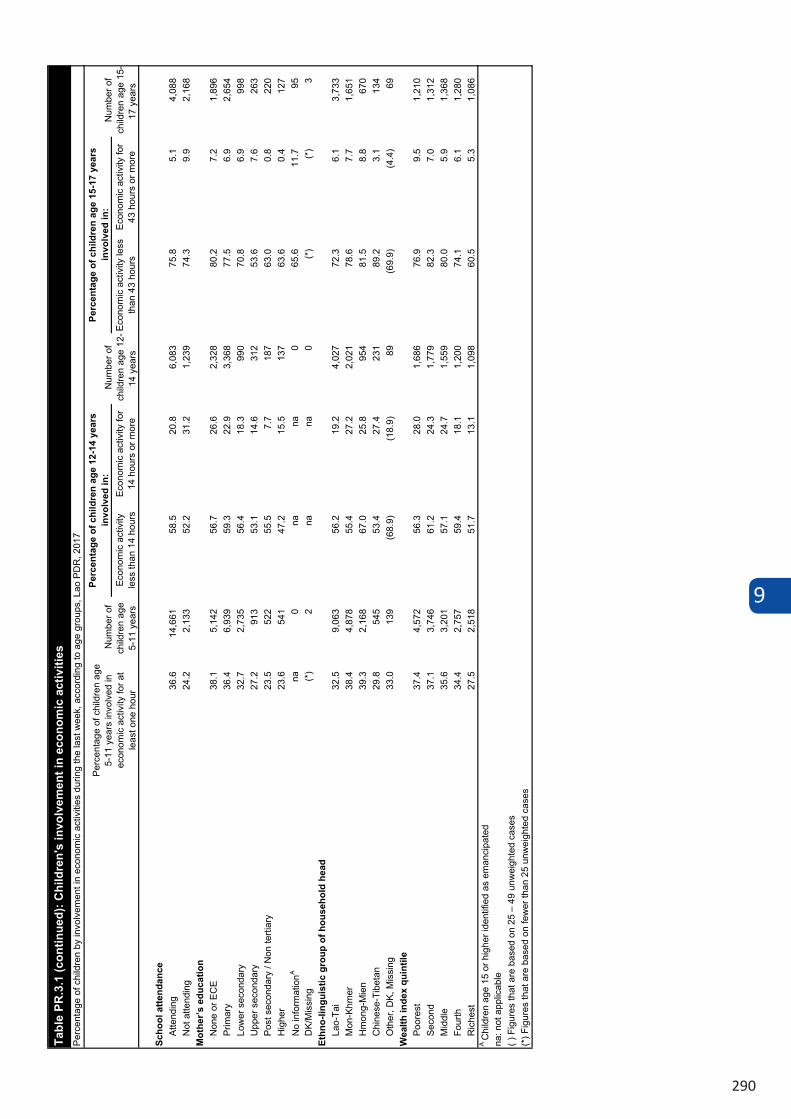
9
290
Econ
omic
act
ivity
le
ss th
an 1
4 ho
urs
Econ
omic
act
ivity
for
14 h
ours
or m
ore
Econ
omic
act
ivity
less
th
an 4
3 ho
urs
Econ
omic
act
ivity
for
43 h
ours
or m
ore
Scho
ol a
ttend
ance
Atte
ndin
g36
.614
,661
58.5
20.8
6,08
375
.85.
14,
088
Not
atte
ndin
g24
.22,
133
52.2
31.2
1,23
974
.39.
92,
168
Mot
her’s
edu
catio
nN
one
or E
CE
38.1
5,14
256
.726
.62,
328
80.2
7.2
1,89
6Pr
imar
y36
.46,
939
59.3
22.9
3,36
877
.56.
92,
654
Low
er s
econ
dary
32.7
2,73
556
.418
.399
070
.86.
999
8U
pper
sec
onda
ry27
.291
353
.114
.631
253
.67.
626
3Po
st s
econ
dary
/ N
on te
rtiar
y23
.552
255
.57.
718
763
.00.
822
0H
ighe
r23
.654
147
.215
.513
763
.60.
412
7N
o in
form
atio
nAna
0na
na0
65.6
11.7
95D
K/M
issi
ng(*
)2
nana
0(*
)(*
)3
Ethn
o-lin
guis
tic g
roup
of h
ouse
hold
hea
dLa
o-Ta
i32
.59,
063
56.2
19.2
4,02
772
.36.
13,
733
Mon
-Khm
er38
.44,
878
55.4
27.2
2,02
178
.67.
71,
651
Hm
ong-
Mie
n39
.32,
168
67.0
25.8
954
81.5
8.8
670
Chi
nese
-Tib
etan
29.8
545
53.4
27.4
231
89.2
3.1
134
Oth
er, D
K, M
issi
ng33
.013
9(6
8.9)
(18.
9)89
(69.
9)(4
.4)
69W
ealth
inde
x qu
intil
ePo
ores
t37
.44,
572
56.3
28.0
1,68
676
.99.
51,
210
Seco
nd37
.13,
746
61.2
24.3
1,77
982
.37.
01,
312
Mid
dle
35.6
3,20
157
.124
.71,
559
80.0
5.9
1,36
8Fo
urth
34.4
2,75
759
.418
.11,
200
74.1
6.1
1,28
0R
iche
st27
.52,
518
51.7
13.1
1,09
860
.55.
31,
086
A C
hild
ren
age
15 o
r hig
her i
dent
ified
as
eman
cipa
ted
na: n
ot a
pplic
able
( ) F
igur
es th
at a
re b
ased
on
25 –
49
unw
eigh
ted
case
s(*
) Fig
ures
that
are
bas
ed o
n fe
wer
than
25
unw
eigh
ted
case
s
Tabl
e PR
.3.1
(con
tinue
d): C
hild
ren'
s in
volv
emen
t in
econ
omic
act
iviti
esPe
rcen
tage
of c
hild
ren
by in
volv
emen
t in
econ
omic
act
iviti
es d
urin
g th
e la
st w
eek,
acc
ordi
ng to
age
gro
ups,
Lao
PD
R, 2
017
Perc
enta
ge o
f chi
ldre
n ag
e 5-
11 y
ears
invo
lved
in
econ
omic
act
ivity
for a
t le
ast o
ne h
our
Num
ber o
f ch
ildre
n ag
e 5-
11 y
ears
Perc
enta
ge o
f chi
ldre
n ag
e 12
-14
year
s in
volv
ed in
: N
umbe
r of
child
ren
age
12-
14 y
ears
Perc
enta
ge o
f chi
ldre
n ag
e 15
-17
year
s in
volv
ed in
: N
umbe
r of
child
ren
age
15-
17 y
ears
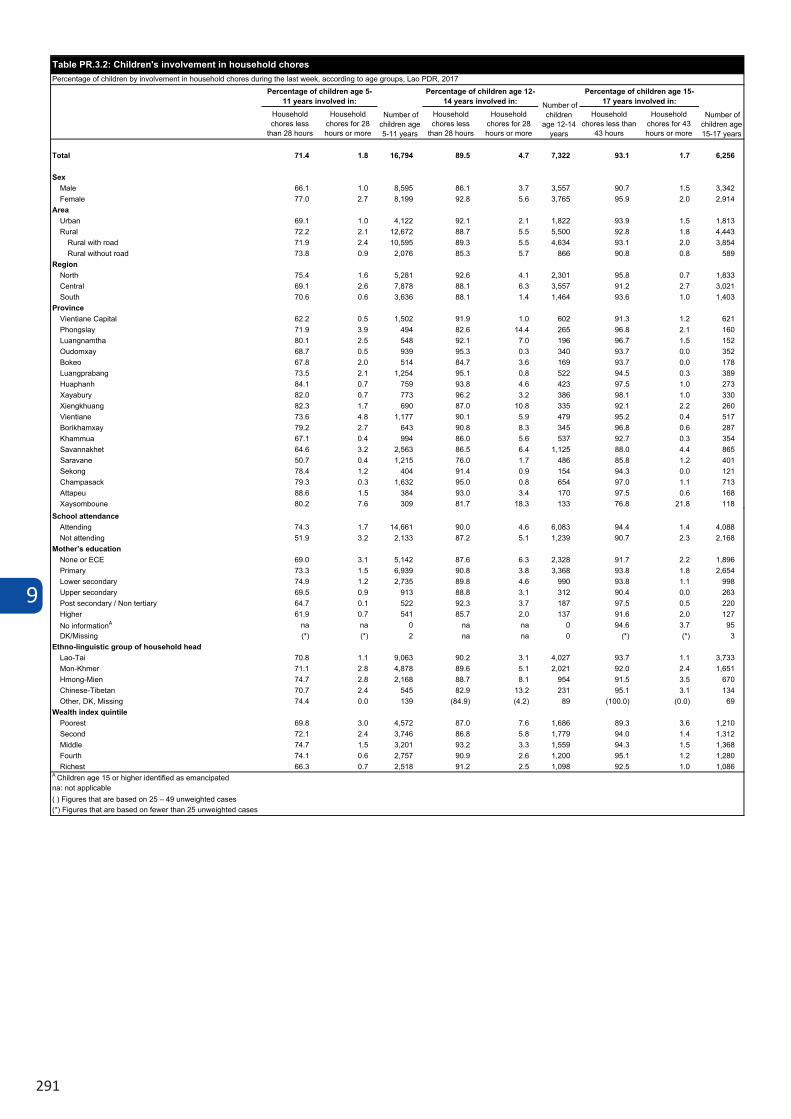
9
291
Household chores less
than 28 hours
Household chores for 28 hours or more
Household chores less
than 28 hours
Household chores for 28 hours or more
Household chores less than
43 hours
Household chores for 43 hours or more
Total 71.4 1.8 16,794 89.5 4.7 7,322 93.1 1.7 6,256
SexMale 66.1 1.0 8,595 86.1 3.7 3,557 90.7 1.5 3,342Female 77.0 2.7 8,199 92.8 5.6 3,765 95.9 2.0 2,914
AreaUrban 69.1 1.0 4,122 92.1 2.1 1,822 93.9 1.5 1,813Rural 72.2 2.1 12,672 88.7 5.5 5,500 92.8 1.8 4,443
Rural with road 71.9 2.4 10,595 89.3 5.5 4,634 93.1 2.0 3,854Rural without road 73.8 0.9 2,076 85.3 5.7 866 90.8 0.8 589
RegionNorth 75.4 1.6 5,281 92.6 4.1 2,301 95.8 0.7 1,833Central 69.1 2.6 7,878 88.1 6.3 3,557 91.2 2.7 3,021South 70.6 0.6 3,636 88.1 1.4 1,464 93.6 1.0 1,403
ProvinceVientiane Capital 62.2 0.5 1,502 91.9 1.0 602 91.3 1.2 621Phongslay 71.9 3.9 494 82.6 14.4 265 96.8 2.1 160Luangnamtha 80.1 2.5 548 92.1 7.0 196 96.7 1.5 152Oudomxay 68.7 0.5 939 95.3 0.3 340 93.7 0.0 352Bokeo 67.8 2.0 514 84.7 3.6 169 93.7 0.0 178Luangprabang 73.5 2.1 1,254 95.1 0.8 522 94.5 0.3 389Huaphanh 84.1 0.7 759 93.8 4.6 423 97.5 1.0 273Xayabury 82.0 0.7 773 96.2 3.2 386 98.1 1.0 330Xiengkhuang 82.3 1.7 690 87.0 10.8 335 92.1 2.2 260Vientiane 73.6 4.8 1,177 90.1 5.9 479 95.2 0.4 517Borikhamxay 79.2 2.7 643 90.8 8.3 345 96.8 0.6 287Khammua 67.1 0.4 994 86.0 5.6 537 92.7 0.3 354Savannakhet 64.6 3.2 2,563 86.5 6.4 1,125 88.0 4.4 865Saravane 50.7 0.4 1,215 76.0 1.7 486 85.8 1.2 401Sekong 78.4 1.2 404 91.4 0.9 154 94.3 0.0 121Champasack 79.3 0.3 1,632 95.0 0.8 654 97.0 1.1 713Attapeu 88.6 1.5 384 93.0 3.4 170 97.5 0.6 168Xaysomboune 80.2 7.6 309 81.7 18.3 133 76.8 21.8 118(Continued…)
Table PR.3.2: Children's involvement in household choresPercentage of children by involvement in household chores during the last week, according to age groups, Lao PDR, 2017
Percentage of children age 5-11 years involved in:
Number of children age 5-11 years
Percentage of children age 12-14 years involved in: Number of
children age 12-14
years
Percentage of children age 15-17 years involved in:
Number of children age 15-17 years
Household chores less
than 28 hours
Household chores for 28 hours or more
Household chores less
than 28 hours
Household chores for 28 hours or more
Household chores less than
43 hours
Household chores for 43 hours or more
School attendanceAttending 74.3 1.7 14,661 90.0 4.6 6,083 94.4 1.4 4,088Not attending 51.9 3.2 2,133 87.2 5.1 1,239 90.7 2.3 2,168
Mother’s educationNone or ECE 69.0 3.1 5,142 87.6 6.3 2,328 91.7 2.2 1,896Primary 73.3 1.5 6,939 90.8 3.8 3,368 93.8 1.8 2,654Lower secondary 74.9 1.2 2,735 89.8 4.6 990 93.8 1.1 998Upper secondary 69.5 0.9 913 88.8 3.1 312 90.4 0.0 263Post secondary / Non tertiary 64.7 0.1 522 92.3 3.7 187 97.5 0.5 220Higher 61.9 0.7 541 85.7 2.0 137 91.6 2.0 127No informationA na na 0 na na 0 94.6 3.7 95DK/Missing (*) (*) 2 na na 0 (*) (*) 3
Ethno-linguistic group of household headLao-Tai 70.8 1.1 9,063 90.2 3.1 4,027 93.7 1.1 3,733Mon-Khmer 71.1 2.8 4,878 89.6 5.1 2,021 92.0 2.4 1,651Hmong-Mien 74.7 2.8 2,168 88.7 8.1 954 91.5 3.5 670Chinese-Tibetan 70.7 2.4 545 82.9 13.2 231 95.1 3.1 134Other, DK, Missing 74.4 0.0 139 (84.9) (4.2) 89 (100.0) (0.0) 69
Wealth index quintilePoorest 69.8 3.0 4,572 87.0 7.6 1,686 89.3 3.6 1,210Second 72.1 2.4 3,746 86.8 5.8 1,779 94.0 1.4 1,312Middle 74.7 1.5 3,201 93.2 3.3 1,559 94.3 1.5 1,368Fourth 74.1 0.6 2,757 90.9 2.6 1,200 95.1 1.2 1,280Richest 66.3 0.7 2,518 91.2 2.5 1,098 92.5 1.0 1,086
( ) Figures that are based on 25 – 49 unweighted cases
A Children age 15 or higher identified as emancipatedna: not applicable
(*) Figures that are based on fewer than 25 unweighted cases
Table PR.3.2 (continued): Children's involvement in household choresPercentage of children by involvement in household chores during the last week, according to age groups, Lao PDR, 2017
Percentage of children age 5-11 years involved in:
Number of children age 5-11 years
Percentage of children age 12-14 years involved in: Number of
children age 12-14
years
Percentage of children age 15-17 years involved in:
Number of children age 15-17 years
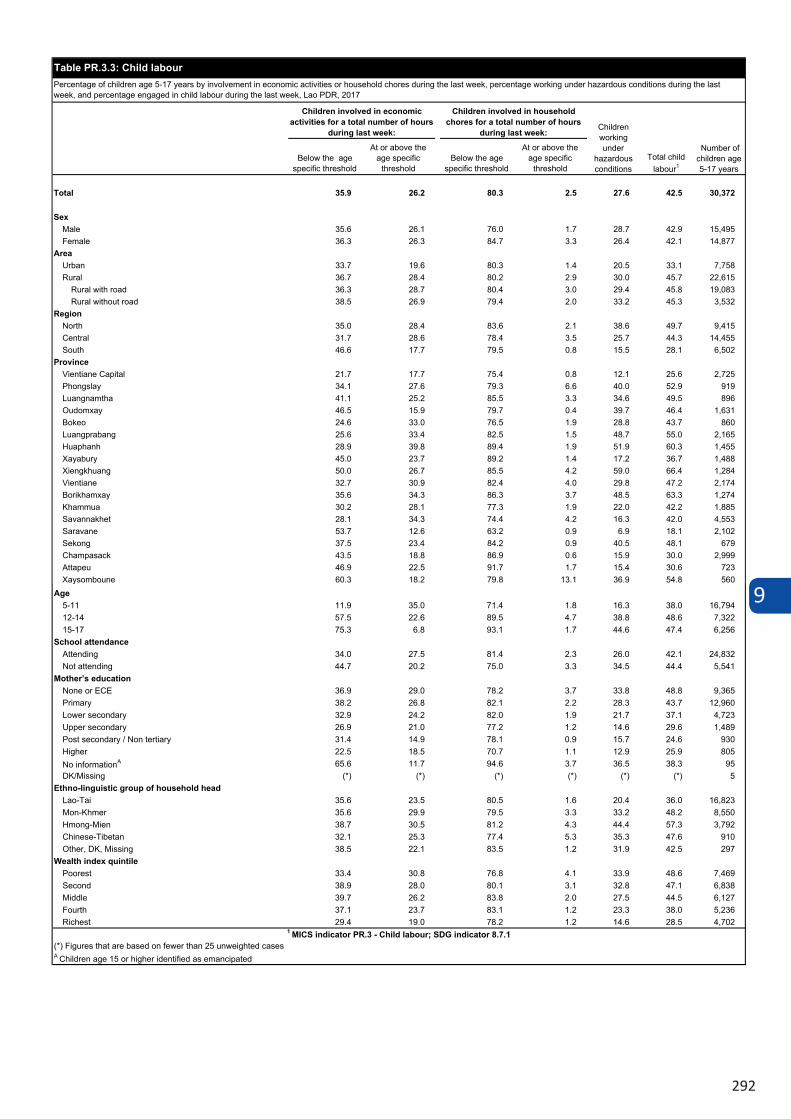
9
292
Below the age specific threshold
At or above the age specific
thresholdBelow the age
specific threshold
At or above the age specific
threshold
Total 35.9 26.2 80.3 2.5 27.6 42.5 30,372
SexMale 35.6 26.1 76.0 1.7 28.7 42.9 15,495Female 36.3 26.3 84.7 3.3 26.4 42.1 14,877
AreaUrban 33.7 19.6 80.3 1.4 20.5 33.1 7,758Rural 36.7 28.4 80.2 2.9 30.0 45.7 22,615
Rural with road 36.3 28.7 80.4 3.0 29.4 45.8 19,083Rural without road 38.5 26.9 79.4 2.0 33.2 45.3 3,532
RegionNorth 35.0 28.4 83.6 2.1 38.6 49.7 9,415Central 31.7 28.6 78.4 3.5 25.7 44.3 14,455South 46.6 17.7 79.5 0.8 15.5 28.1 6,502
ProvinceVientiane Capital 21.7 17.7 75.4 0.8 12.1 25.6 2,725Phongslay 34.1 27.6 79.3 6.6 40.0 52.9 919Luangnamtha 41.1 25.2 85.5 3.3 34.6 49.5 896Oudomxay 46.5 15.9 79.7 0.4 39.7 46.4 1,631Bokeo 24.6 33.0 76.5 1.9 28.8 43.7 860Luangprabang 25.6 33.4 82.5 1.5 48.7 55.0 2,165Huaphanh 28.9 39.8 89.4 1.9 51.9 60.3 1,455Xayabury 45.0 23.7 89.2 1.4 17.2 36.7 1,488Xiengkhuang 50.0 26.7 85.5 4.2 59.0 66.4 1,284Vientiane 32.7 30.9 82.4 4.0 29.8 47.2 2,174Borikhamxay 35.6 34.3 86.3 3.7 48.5 63.3 1,274Khammua 30.2 28.1 77.3 1.9 22.0 42.2 1,885Savannakhet 28.1 34.3 74.4 4.2 16.3 42.0 4,553Saravane 53.7 12.6 63.2 0.9 6.9 18.1 2,102Sekong 37.5 23.4 84.2 0.9 40.5 48.1 679Champasack 43.5 18.8 86.9 0.6 15.9 30.0 2,999Attapeu 46.9 22.5 91.7 1.7 15.4 30.6 723Xaysomboune 60.3 18.2 79.8 13.1 36.9 54.8 560(Continued…)
Table PR.3.3: Child labourPercentage of children age 5-17 years by involvement in economic activities or household chores during the last week, percentage working under hazardous conditions during the last week, and percentage engaged in child labour during the last week, Lao PDR, 2017
Children involved in economic activities for a total number of hours
during last week:
Children involved in household chores for a total number of hours
during last week: Children working under
hazardous conditions
Total child labour1
Number of children age 5-17 years
Below the age specific threshold
At or above the age specific
thresholdBelow the age
specific threshold
At or above the age specific
threshold
Age5-11 11.9 35.0 71.4 1.8 16.3 38.0 16,79412-14 57.5 22.6 89.5 4.7 38.8 48.6 7,32215-17 75.3 6.8 93.1 1.7 44.6 47.4 6,256
School attendanceAttending 34.0 27.5 81.4 2.3 26.0 42.1 24,832Not attending 44.7 20.2 75.0 3.3 34.5 44.4 5,541
Mother’s educationNone or ECE 36.9 29.0 78.2 3.7 33.8 48.8 9,365Primary 38.2 26.8 82.1 2.2 28.3 43.7 12,960Lower secondary 32.9 24.2 82.0 1.9 21.7 37.1 4,723Upper secondary 26.9 21.0 77.2 1.2 14.6 29.6 1,489Post secondary / Non tertiary 31.4 14.9 78.1 0.9 15.7 24.6 930Higher 22.5 18.5 70.7 1.1 12.9 25.9 805No informationA 65.6 11.7 94.6 3.7 36.5 38.3 95DK/Missing (*) (*) (*) (*) (*) (*) 5
Ethno-linguistic group of household headLao-Tai 35.6 23.5 80.5 1.6 20.4 36.0 16,823Mon-Khmer 35.6 29.9 79.5 3.3 33.2 48.2 8,550Hmong-Mien 38.7 30.5 81.2 4.3 44.4 57.3 3,792Chinese-Tibetan 32.1 25.3 77.4 5.3 35.3 47.6 910Other, DK, Missing 38.5 22.1 83.5 1.2 31.9 42.5 297
Wealth index quintilePoorest 33.4 30.8 76.8 4.1 33.9 48.6 7,469Second 38.9 28.0 80.1 3.1 32.8 47.1 6,838Middle 39.7 26.2 83.8 2.0 27.5 44.5 6,127Fourth 37.1 23.7 83.1 1.2 23.3 38.0 5,236Richest 29.4 19.0 78.2 1.2 14.6 28.5 4,702
1 MICS indicator PR.3 - Child labour; SDG indicator 8.7.1(*) Figures that are based on fewer than 25 unweighted casesA Children age 15 or higher identified as emancipated
Table PR.3.3(continued): Child labourPercentage of children age 5-17 years by involvement in economic activities or household chores during the last week, percentage working under hazardous conditions during the last week, and percentage engaged in child labour during the last week, Lao PDR, 2017
Children involved in economic activities for a total number of
hours during last week:
Children involved in household chores for a total number of hours
during last week:Children working under
hazardous conditions
Total child labour1
Number of children age 5-17 years
9
293
9.4 CHILD MARRIAGE
Marriage7 before the age of 18 is violation of human rights, yet remains a reality for many children. The right to 'free and full' consent to a marriage is recognized in the Universal Declaration of Human Rights - with the recognition that consent cannot be 'free and full' when one of the parties involved is not sufficiently mature to make an informed decision about a life partner. In the Sustainable Development Goals, child marriage has been identified as a harmful practice which the world should aim to eliminate by 2030.
Child marriage is more common among girls than boys, but does occur around the world among children of both sexes. The impacts specific to boys married in childhood are not yet well understood, but marriage does place boys in an adult role accompanied by responsibilities for which they may not be prepared.
In many parts of the world parents encourage the marriage of their daughters while they are still children in hopes that the marriage will benefit them both financially and socially, while also relieving financial burdens on the family. In actual fact, child marriage is compromises the development of girls and often results in early pregnancy and social isolation, with little education and poor vocational training reinforcing the gendered nature of poverty.8
Closely related to the issue of child marriage is the age at which sexual activity – and for females, childbearing – may begin. Women who were married before the age of 18 tend to have more children than those who marry later in life, and are less likely to receive maternal health care services.9,10 In addition, pregnancy related deaths are known to be a leading cause of mortality for both married and unmarried girls between the ages of 15 and 19.
Tables PR.4.1W and PR.4.1M present the percentage of women and men married before ages 15 and 18 years, the percentage of adolescent girls aged 15-19 who are currently married, and the percentage of women age 15-49 in a polygynous union.
7 All references to marriage in this chapter include cohabiting unions as well. 8 Bajracharya, A ND Amin, S. 2010. Poverty, marriage timing, and transitions to adulthood in Nepal: A longitudinal analysis using the Nepal living standards survey. Poverty, Gender, and Youth Working Paper No. 19. Population Council. Godha, D et al. 2011. The influence of child marriage on fertility, fertility-control, and maternal health care utilization. MEASURE/Evaluation PRH Project Working paper 11-124. 9 Godha, D., Hotchkiss, D. R., & Gage, A. J. (2013). Association between child marriage and reproductive health outcomes and service
utilization: A multi-country study from South Asia. Journal of Adolescent Health, 552-558. 10 Nour, N. M. (2006). Health Consequences of Child Marriage in Africa. Emerging Infectious Diseases, 1644-1649.
Tables PR.4.2W and PR.4.2M present respectively the proportion of women and men who were first married or entered into a marital union before age 15 and 18 by area and age groups. Examining the percentages married before ages 15 and 18 across different age groups allow for trends to be observed in child marriage over time.
Another component is the spousal age difference with the indicator being the percentage of married/in union women 10 or more years younger than their current spouse. Table PR.4.3 presents the results of the age difference between women and their husband or partner
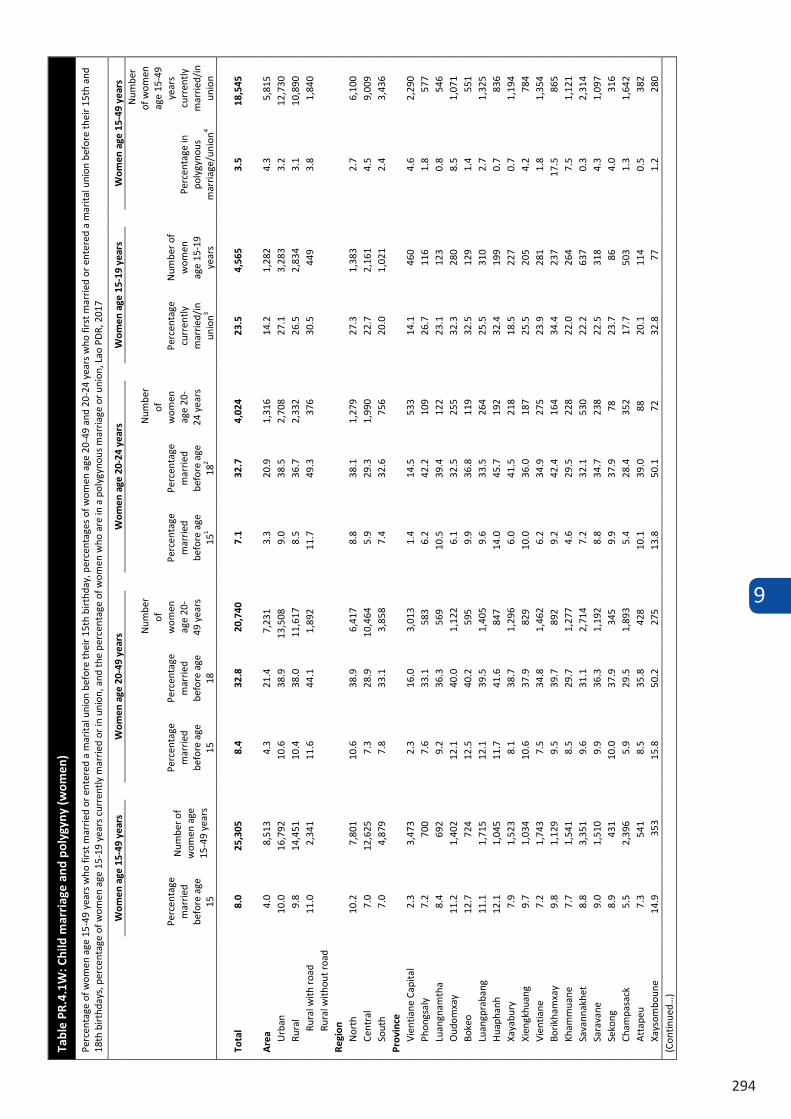
9
294
Tabl
e PR
.4.1
W: C
hild
mar
riag
e an
d po
lygy
ny (w
omen
)
Perc
enta
ge o
f wom
en a
ge 1
5-49
yea
rs w
ho fi
rst m
arri
ed o
r ent
ered
a m
arita
l uni
on b
efor
e th
eir 1
5th
birt
hday
, per
cent
ages
of w
omen
age
20-
49 a
nd 2
0-24
yea
rs w
ho fi
rst m
arrie
d or
ent
ered
a m
arita
l uni
on b
efor
e th
eir 1
5th
and
18th
birt
hday
s, p
erce
ntag
e of
wom
en a
ge 1
5-19
yea
rs c
urre
ntly
mar
ried
or in
uni
on, a
nd th
e pe
rcen
tage
of w
omen
who
are
in a
pol
ygyn
ous
mar
riage
or u
nion
, Lao
PD
R, 2
017
Wom
en a
ge 1
5-49
yea
rs
Wom
en a
ge 2
0-49
yea
rs
Wom
en a
ge 2
0-24
yea
rs
Wom
en a
ge 1
5-19
yea
rs
Wom
en a
ge 1
5-49
yea
rs
Perc
enta
ge
mar
ried
befo
re a
ge
15
Num
ber o
f w
omen
age
15
-49
year
s
Perc
enta
ge
mar
ried
befo
re a
ge
15
Perc
enta
ge
mar
ried
befo
re a
ge
18
Num
ber
of
wom
en
age
20-
49 y
ears
Perc
enta
ge
mar
ried
befo
re a
ge
151
Perc
enta
ge
mar
ried
befo
re a
ge
182
Num
ber
of
wom
en
age
20-
24 y
ears
Perc
enta
ge
curr
ently
m
arrie
d/in
un
ion3
Num
ber o
f w
omen
ag
e 15
-19
year
s
Perc
enta
ge in
po
lygy
nous
m
arria
ge/u
nion
4
Num
ber
of w
omen
ag
e 15
-49
year
s cu
rren
tly
mar
ried/
in
unio
n
Tota
l 8.
0 25
,305
8.
4 32
.8
20,7
40
7.1
32.7
4,
024
23.5
4,
565
3.5
18,5
45
Are
a 4.
0 8,
513
4.3
21.4
7,
231
3.3
20.9
1,
316
14.2
1,
282
4.3
5,81
5 U
rban
10
.0
16,7
92
10.6
38
.9
13,5
08
9.0
38.5
2,
708
27.1
3,
283
3.2
12,7
30
Rura
l 9.
8 14
,451
10
.4
38.0
11
,617
8.
5 36
.7
2,33
2 26
.5
2,83
4 3.
1 10
,890
Ru
ral w
ith r
oad
11.0
2,
341
11.6
44
.1
1,89
2 11
.7
49.3
37
6 30
.5
449
3.8
1,84
0 Ru
ral w
ithou
t roa
d Re
gion
N
orth
10
.2
7,80
1 10
.6
38.9
6,
417
8.8
38.1
1,
279
27.3
1,
383
2.7
6,10
0 Ce
ntra
l 7.
0 12
,625
7.
3 28
.9
10,4
64
5.9
29.3
1,
990
22.7
2,
161
4.5
9,00
9 So
uth
7.0
4,87
9 7.
8 33
.1
3,85
8 7.
4 32
.6
756
20.0
1,
021
2.4
3,43
6 Pr
ovin
ce
Vien
tiane
Cap
ital
2.3
3,47
3 2.
3 16
.0
3,01
3 1.
4 14
.5
533
14.1
46
0 4.
6 2,
290
Phon
gsal
y
7.2
700
7.6
33.1
58
3 6.
2 42
.2
109
26.7
11
6 1.
8 57
7 Lu
angn
amth
a 8.
4 69
2 9.
2 36
.3
569
10.5
39
.4
122
23.1
12
3 0.
8 54
6 O
udom
xay
11.2
1,
402
12.1
40
.0
1,12
2 6.
1 32
.5
255
32.3
28
0 8.
5 1,
071
Boke
o 12
.7
724
12.5
40
.2
595
9.9
36.8
11
9 32
.5
129
1.4
551
Luan
gpra
bang
11
.1
1,71
5 12
.1
39.5
1,
405
9.6
33.5
26
4 25
.5
310
2.7
1,32
5 H
uaph
anh
12.1
1,
045
11.7
41
.6
847
14.0
45
.7
192
32.4
19
9 0.
7 83
6 Xa
yabu
ry
7.9
1,52
3 8.
1 38
.7
1,29
6 6.
0 41
.5
218
18.5
22
7 0.
7 1,
194
Xien
gkhu
ang
9.7
1,03
4 10
.6
37.9
82
9 10
.0
36.0
18
7 25
.5
205
4.2
784
Vien
tiane
7.
2 1,
743
7.5
34.8
1,
462
6.2
34.9
27
5 23
.9
281
1.8
1,35
4 Bo
rikha
mxa
y 9.
8 1,
129
9.5
39.7
89
2 9.
2 42
.4
164
34.4
23
7 17
.5
865
Kham
mua
ne
7.7
1,54
1 8.
5 29
.7
1,27
7 4.
6 29
.5
228
22.0
26
4 7.
5 1,
121
Sava
nnak
het
8.8
3,35
1 9.
6 31
.1
2,71
4 7.
2 32
.1
530
22.2
63
7 0.
3 2,
314
Sara
vane
9.
0 1,
510
9.9
36.3
1,
192
8.8
34.7
23
8 22
.5
318
4.3
1,09
7 Se
kong
8.
9 43
1 10
.0
37.9
34
5 9.
9 37
.9
78
23.7
86
4.
0 31
6 Ch
ampa
sack
5.
5 2,
396
5.9
29.5
1,
893
5.4
28.4
35
2 17
.7
503
1.3
1,64
2 A
ttap
eu
7.3
541
8.5
35.8
42
8 10
.1
39.0
88
20
.1
114
0.5
382
Xays
ombo
une
14.9
35
3 15
.8
50.2
27
5 13
.8
50.1
72
32
.8
77
1.2
280
(Con
tinue
d…)
Tabl
e PR
.4.1
W (c
onti
nued
): C
hild
mar
riag
e an
d po
lygy
ny (w
omen
)
Perc
enta
ge o
f wom
en a
ge 1
5-49
yea
rs w
ho fi
rst m
arri
ed o
r ent
ered
a m
arita
l uni
on b
efor
e th
eir 1
5th
birt
hday
, per
cent
ages
of w
omen
age
20-
49 a
nd 2
0-24
yea
rs w
ho fi
rst m
arrie
d or
ent
ered
a m
arita
l uni
on b
efor
e th
eir 1
5th
and
18th
birt
hday
s,
perc
enta
ge o
f wom
en a
ge 1
5-19
yea
rs c
urre
ntly
mar
ried
or in
uni
on, a
nd th
e pe
rcen
tage
of w
omen
who
are
in a
pol
ygyn
ous
mar
riage
or u
nion
, Lao
PD
R, 2
017
Wom
en a
ge 1
5-49
yea
rs
Wom
en a
ge 2
0-49
yea
rs
Wom
en a
ge 2
0-24
yea
rs
Wom
en a
ge 1
5-19
yea
rs
Wom
en a
ge 1
5-49
yea
rs
Perc
enta
ge
mar
ried
befo
re a
ge
15
Num
ber o
f w
omen
age
15
-49
year
s
Perc
enta
ge
mar
ried
befo
re a
ge
15
Perc
enta
ge
mar
ried
befo
re a
ge
18
Num
ber
of
wom
en
age
20-
49 y
ears
Perc
enta
ge
mar
ried
befo
re a
ge
151
Perc
enta
ge
mar
ried
befo
re a
ge
182
Num
ber
of
wom
en
age
20-
24 y
ears
Perc
enta
ge
curr
ently
m
arrie
d/in
un
ion3
Num
ber o
f w
omen
age
15
-19
year
s
Perc
enta
ge in
po
lygy
nous
m
arria
ge/u
nion
4
Num
ber o
f w
omen
age
15
-49
year
s cu
rren
tly
mar
ried/
in
unio
n
Age
15
-19
6.1
4,56
5 na
na
na
na
na
na
23
.5
4,56
5 3.
1 1,
071
15-1
7 5.
2 2,
796
na
na
na
na
na
na
13.6
2,
796
2.7
379
18-1
9 7.
5 1,
769
na
na
na
na
na
na
39.1
1,
769
3.4
692
20-2
4 7.
1 4,
024
7.1
32.7
4,
024
7.1
32.7
4,
024
na
na
2.7
2,59
0 25
-29
9.8
4,04
5 9.
8 31
.9
4,04
5 na
na
na
na
na
3.
1 3,
387
30-3
4 8.
8 3,
824
8.8
35.6
3,
824
na
na
na
na
na
3.3
3,43
6 35
-39
9.0
3,41
8 9.
0 34
.8
3,41
8 na
na
na
na
na
3.
9 3,
166
40-4
4 8.
5 3,
076
8.5
32.6
3,
076
na
na
na
na
na
4.6
2,80
3 45
-49
6.7
2,35
3 6.
7 26
.9
2,35
3 na
na
na
na
na
3.
8 2,
090
Educ
atio
n N
one
or E
CE
16.8
4,
087
17.0
46
.4
3,78
5 19
.7
58.8
41
0 47
.6
302
5.2
3,60
0 Pr
imar
y 11
.0
8,92
2 10
.8
41.9
8,
011
11.0
46
.2
1,20
9 40
.3
911
2.9
7,61
7 Lo
wer
sec
onda
ry
5.7
5,53
5 4.
9 33
.8
4,05
6 6.
7 44
.4
886
28.4
1,
479
3.2
3,92
1 U
pper
sec
onda
ry
0.9
3,48
2 1.
3 13
.0
1,83
1 1.
8 15
.8
611
7.4
1,65
0 3.
8 1,
464
Post
sec
onda
ry /
Non
tert
iary
0.
4 88
5 0.
4 4.
5 84
6 0.
0 7.
3 13
6 (1
0.2)
39
4.
0 67
9 H
ighe
r 0.
2 2,
394
0.2
1.5
2,20
9 0.
1 2.
3 77
2 7.
5 18
5 2.
9 1,
264
Ethn
o-lin
guis
tic
grou
p of
hou
seho
ld h
ead
Lao-
Tai
5.3
16,5
22
5.5
27.3
13
,851
4.
1 26
.2
2,48
7 18
.0
2,67
1 3.
4 11
,888
M
on-K
hmer
11
.7
5,77
9 13
.0
42.0
4,
560
9.6
38.9
97
7 27
.8
1,22
0 3.
5 4,
306
Hm
ong-
Mie
n 18
.4
2,10
9 19
.7
54.9
1,
593
18.3
56
.9
402
41.3
51
7 4.
9 1,
667
Chin
ese-
Tibe
tan
9.2
628
9.8
31.6
51
9 11
.6
36.8
10
9 23
.3
109
2.5
507
Oth
er, D
K, M
issi
ng
9.6
266
9.4
30.7
21
7 9.
0 (3
2.8)
49
(2
5.6)
49
4.
4 17
7 W
ealt
h in
dex
quin
tile
Po
ores
t 16
.4
4,33
7 17
.1
47.1
3,
483
15.9
55
.6
747
36.1
85
4 4.
0 3,
442
Seco
nd
10.6
4,
716
11.8
41
.8
3,69
4 9.
7 40
.4
780
29.1
1,
022
3.0
3,59
5 M
iddl
e 8.
2 4,
908
8.9
36.2
3,
957
6.6
33.2
77
4 23
.6
951
3.3
3,68
2 Fo
urth
5.
3 5,
414
5.6
30.0
4,
513
3.4
25.8
83
1 19
.2
901
3.2
3,90
7 Ri
ches
t 2.
0 5,
929
2.1
16.3
5,
093
1.4
12.9
89
2 8.
1 83
7 4.
2 3,
918
1 MIC
S in
dica
tor P
R.4a
- Ch
ild m
arri
age
(bef
ore
15);
SD
G 5
.3.1
2 M
ICS
indi
cato
r PR.
4b -
Child
mar
riag
e (b
efor
e 18
); S
DG
5.3
.1
3 M
ICS
indi
cato
r PR
.5 -
Youn
g w
omen
age
15-
19 y
ears
cur
rent
ly m
arri
ed o
r in
uni
on
4 M
ICS
indi
cato
r PR
.6 -
Poly
gyny
n
a: n
ot a
pplic
able
(
) Fig
ures
that
are
bas
ed o
n 25
– 4
9 un
wei
ghte
d ca
ses
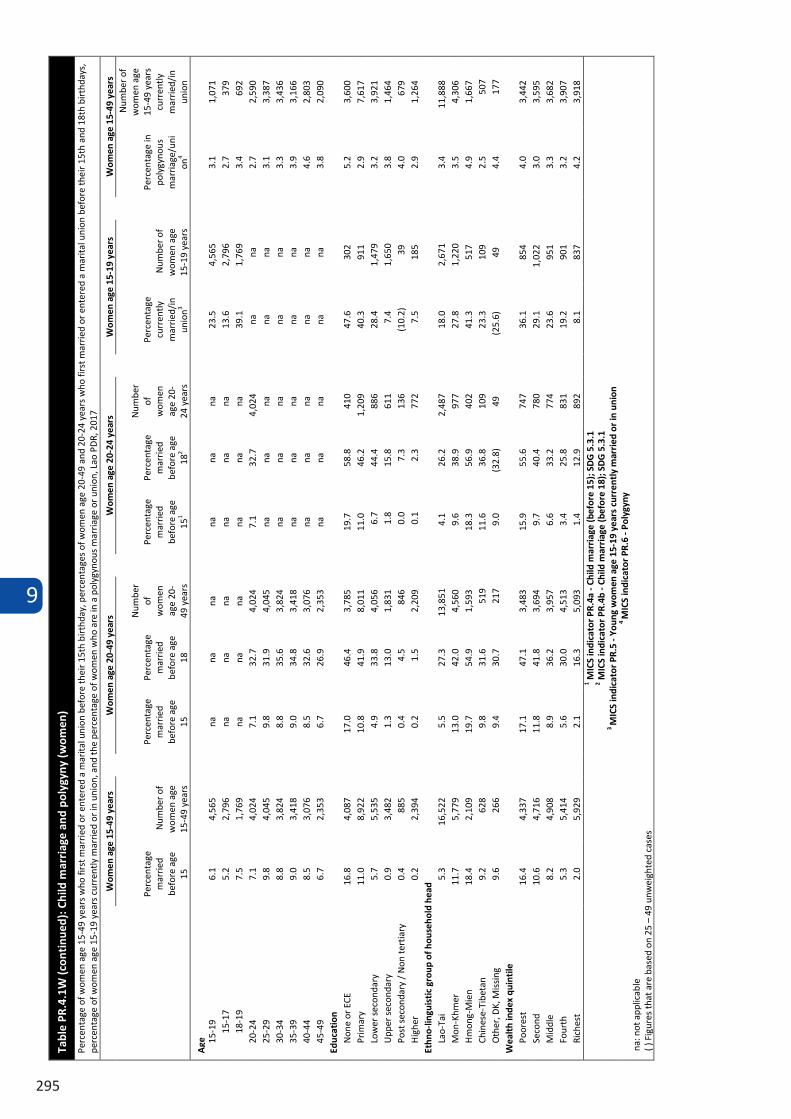
9
295
Tabl
e PR
.4.1
W (c
onti
nued
): C
hild
mar
riag
e an
d po
lygy
ny (w
omen
)
Perc
enta
ge o
f wom
en a
ge 1
5-49
yea
rs w
ho fi
rst m
arri
ed o
r ent
ered
a m
arita
l uni
on b
efor
e th
eir 1
5th
birt
hday
, per
cent
ages
of w
omen
age
20-
49 a
nd 2
0-24
yea
rs w
ho fi
rst m
arrie
d or
ent
ered
a m
arita
l uni
on b
efor
e th
eir 1
5th
and
18th
birt
hday
s,
perc
enta
ge o
f wom
en a
ge 1
5-19
yea
rs c
urre
ntly
mar
ried
or in
uni
on, a
nd th
e pe
rcen
tage
of w
omen
who
are
in a
pol
ygyn
ous
mar
riage
or u
nion
, Lao
PD
R, 2
017
Wom
en a
ge 1
5-49
yea
rs
Wom
en a
ge 2
0-49
yea
rs
Wom
en a
ge 2
0-24
yea
rs
Wom
en a
ge 1
5-19
yea
rs
Wom
en a
ge 1
5-49
yea
rs
Perc
enta
ge
mar
ried
befo
re a
ge
15
Num
ber o
f w
omen
age
15
-49
year
s
Perc
enta
ge
mar
ried
befo
re a
ge
15
Perc
enta
ge
mar
ried
befo
re a
ge
18
Num
ber
of
wom
en
age
20-
49 y
ears
Perc
enta
ge
mar
ried
befo
re a
ge
151
Perc
enta
ge
mar
ried
befo
re a
ge
182
Num
ber
of
wom
en
age
20-
24 y
ears
Perc
enta
ge
curr
ently
m
arrie
d/in
un
ion3
Num
ber o
f w
omen
age
15
-19
year
s
Perc
enta
ge in
po
lygy
nous
m
arria
ge/u
nion
4
Num
ber o
f w
omen
age
15
-49
year
s cu
rren
tly
mar
ried/
in
unio
n
Age
15
-19
6.1
4,56
5 na
na
na
na
na
na
23
.5
4,56
5 3.
1 1,
071
15-1
7 5.
2 2,
796
na
na
na
na
na
na
13.6
2,
796
2.7
379
18-1
9 7.
5 1,
769
na
na
na
na
na
na
39.1
1,
769
3.4
692
20-2
4 7.
1 4,
024
7.1
32.7
4,
024
7.1
32.7
4,
024
na
na
2.7
2,59
0 25
-29
9.8
4,04
5 9.
8 31
.9
4,04
5 na
na
na
na
na
3.
1 3,
387
30-3
4 8.
8 3,
824
8.8
35.6
3,
824
na
na
na
na
na
3.3
3,43
6 35
-39
9.0
3,41
8 9.
0 34
.8
3,41
8 na
na
na
na
na
3.
9 3,
166
40-4
4 8.
5 3,
076
8.5
32.6
3,
076
na
na
na
na
na
4.6
2,80
3 45
-49
6.7
2,35
3 6.
7 26
.9
2,35
3 na
na
na
na
na
3.
8 2,
090
Educ
atio
n N
one
or E
CE
16.8
4,
087
17.0
46
.4
3,78
5 19
.7
58.8
41
0 47
.6
302
5.2
3,60
0 Pr
imar
y 11
.0
8,92
2 10
.8
41.9
8,
011
11.0
46
.2
1,20
9 40
.3
911
2.9
7,61
7 Lo
wer
sec
onda
ry
5.7
5,53
5 4.
9 33
.8
4,05
6 6.
7 44
.4
886
28.4
1,
479
3.2
3,92
1 U
pper
sec
onda
ry
0.9
3,48
2 1.
3 13
.0
1,83
1 1.
8 15
.8
611
7.4
1,65
0 3.
8 1,
464
Post
sec
onda
ry /
Non
tert
iary
0.
4 88
5 0.
4 4.
5 84
6 0.
0 7.
3 13
6 (1
0.2)
39
4.
0 67
9 H
ighe
r 0.
2 2,
394
0.2
1.5
2,20
9 0.
1 2.
3 77
2 7.
5 18
5 2.
9 1,
264
Ethn
o-lin
guis
tic
grou
p of
hou
seho
ld h
ead
Lao-
Tai
5.3
16,5
22
5.5
27.3
13
,851
4.
1 26
.2
2,48
7 18
.0
2,67
1 3.
4 11
,888
M
on-K
hmer
11
.7
5,77
9 13
.0
42.0
4,
560
9.6
38.9
97
7 27
.8
1,22
0 3.
5 4,
306
Hm
ong-
Mie
n 18
.4
2,10
9 19
.7
54.9
1,
593
18.3
56
.9
402
41.3
51
7 4.
9 1,
667
Chin
ese-
Tibe
tan
9.2
628
9.8
31.6
51
9 11
.6
36.8
10
9 23
.3
109
2.5
507
Oth
er, D
K, M
issi
ng
9.6
266
9.4
30.7
21
7 9.
0 (3
2.8)
49
(2
5.6)
49
4.
4 17
7 W
ealt
h in
dex
quin
tile
Po
ores
t 16
.4
4,33
7 17
.1
47.1
3,
483
15.9
55
.6
747
36.1
85
4 4.
0 3,
442
Seco
nd
10.6
4,
716
11.8
41
.8
3,69
4 9.
7 40
.4
780
29.1
1,
022
3.0
3,59
5 M
iddl
e 8.
2 4,
908
8.9
36.2
3,
957
6.6
33.2
77
4 23
.6
951
3.3
3,68
2 Fo
urth
5.
3 5,
414
5.6
30.0
4,
513
3.4
25.8
83
1 19
.2
901
3.2
3,90
7 Ri
ches
t 2.
0 5,
929
2.1
16.3
5,
093
1.4
12.9
89
2 8.
1 83
7 4.
2 3,
918
1 MIC
S in
dica
tor P
R.4a
- Ch
ild m
arri
age
(bef
ore
15);
SD
G 5
.3.1
2 M
ICS
indi
cato
r PR.
4b -
Child
mar
riag
e (b
efor
e 18
); S
DG
5.3
.1
3 M
ICS
indi
cato
r PR
.5 -
Youn
g w
omen
age
15-
19 y
ears
cur
rent
ly m
arri
ed o
r in
uni
on
4 M
ICS
indi
cato
r PR
.6 -
Poly
gyny
n
a: n
ot a
pplic
able
(
) Fig
ures
that
are
bas
ed o
n 25
– 4
9 un
wei
ghte
d ca
ses
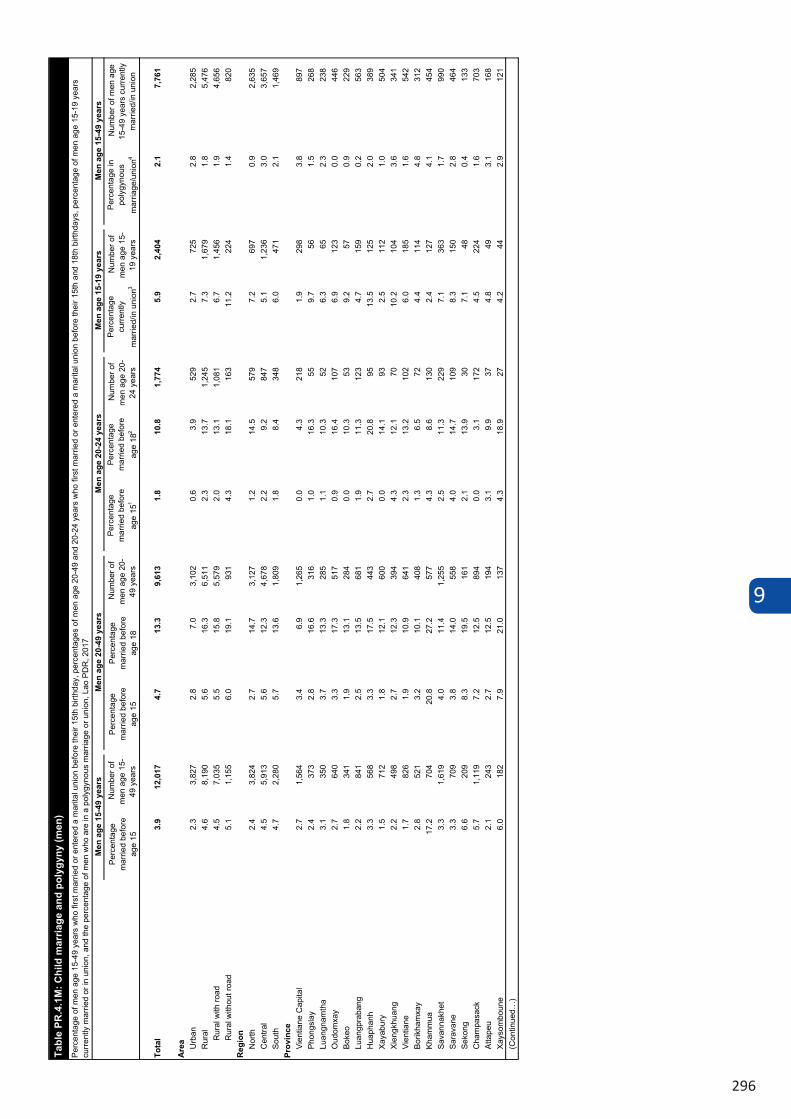
9
296
Perc
enta
ge
mar
ried
befo
re
age
15
Num
ber o
f m
en a
ge 1
5-49
yea
rs
Perc
enta
ge
mar
ried
befo
re
age
15
Perc
enta
ge
mar
ried
befo
re
age
18
Num
ber o
f m
en a
ge 2
0-49
yea
rs
Perc
enta
ge
mar
ried
befo
re
age
151
Perc
enta
ge
mar
ried
befo
re
age
182
Num
ber o
f m
en a
ge 2
0-24
yea
rs
Perc
enta
ge
curre
ntly
m
arrie
d/in
uni
on3
Num
ber o
f m
en a
ge 1
5-19
yea
rs
Perc
enta
ge in
po
lygy
nous
m
arria
ge/u
nion
4
Num
ber o
f men
age
15
-49
year
s cu
rrent
ly
mar
ried/
in u
nion
Tota
l3.
912
,017
4.7
13.3
9,61
31.
810
.81,
774
5.9
2,40
42.
17,
761
Are
a Urb
an
2.3
3,82
72.
87.
03,
102
0.6
3.9
529
2.7
725
2.8
2,28
5R
ural
4.6
8,19
05.
616
.36,
511
2.3
13.7
1,24
57.
31,
679
1.8
5,47
6R
ural
with
road
4.5
7,03
55.
515
.85,
579
2.0
13.1
1,08
16.
71,
456
1.9
4,65
6R
ural
with
out r
oad
5.1
1,15
56.
019
.193
14.
318
.116
311
.222
41.
482
0R
egio
nN
orth
2.4
3,82
42.
714
.73,
127
1.2
14.5
579
7.2
697
0.9
2,63
5C
entra
l4.
55,
913
5.6
12.3
4,67
82.
29.
284
75.
11,
236
3.0
3,65
7So
uth
4.7
2,28
05.
713
.61,
809
1.8
8.4
348
6.0
471
2.1
1,46
9Pr
ovin
ceVi
entia
ne C
apita
l2.
71,
564
3.4
6.9
1,26
50.
04.
321
81.
929
83.
889
7Ph
ongs
lay
2.4
373
2.8
16.6
316
1.0
16.3
559.
756
1.5
268
Luan
gnam
tha
3.1
350
3.7
13.3
285
1.1
10.3
526.
365
2.3
238
Oud
omxa
y2.
764
03.
317
.351
70.
916
.410
76.
912
30.
044
6Bo
keo
1.8
341
1.9
13.1
284
0.0
10.3
539.
257
0.9
229
Luan
gpra
bang
2.2
841
2.5
13.5
681
1.9
11.3
123
4.7
159
0.2
563
Hua
phan
h3.
356
83.
317
.544
32.
720
.895
13.5
125
2.0
389
Xaya
bury
1.5
712
1.8
12.1
600
0.0
14.1
932.
511
21.
050
4Xi
engk
huan
g2.
249
82.
712
.339
44.
312
.170
10.2
104
3.6
341
Vien
tiane
1.7
826
1.9
10.9
641
2.3
13.2
102
6.0
185
1.6
542
Borik
ham
xay
2.8
521
3.2
10.1
408
1.3
6.5
724.
411
44.
831
2Kh
amm
ua17
.270
420
.827
.257
74.
38.
613
02.
412
74.
145
4Sa
vann
akhe
t3.
31,
619
4.0
11.4
1,25
52.
511
.322
97.
136
31.
799
0Sa
rava
ne3.
370
93.
814
.055
84.
014
.710
98.
315
02.
846
4Se
kong
6.6
209
8.3
19.5
161
2.1
13.9
307.
148
0.4
133
Cha
mpa
sack
5.7
1,11
97.
212
.589
40.
03.
117
24.
522
41.
670
3At
tape
u2.
124
32.
712
.519
43.
19.
937
4.8
493.
116
8Xa
ysom
boun
e6.
018
27.
921
.013
74.
318
.927
4.2
442.
912
1(C
ontin
ued…
)
Tabl
e PR
.4.1
M: C
hild
mar
riage
and
pol
ygyn
y (m
en)
Perc
enta
ge o
f men
age
15-
49 y
ears
who
firs
t mar
ried
or e
nter
ed a
mar
ital u
nion
bef
ore
thei
r 15t
h bi
rthda
y, p
erce
ntag
es o
f men
age
20-
49 a
nd 2
0-24
yea
rs w
ho fi
rst m
arrie
d or
ent
ered
a m
arita
l uni
on b
efor
e th
eir 1
5th
and
18th
birt
hday
s, p
erce
ntag
e of
men
age
15-
19 y
ears
cu
rrent
ly m
arrie
d or
in u
nion
, and
the
perc
enta
ge o
f men
who
are
in a
pol
ygyn
ous
mar
riage
or u
nion
, Lao
PD
R, 2
017
Men
age
15-
49 y
ears
Men
age
20-
49 y
ears
Men
age
20-
24 y
ears
Men
age
15-
19 y
ears
Men
age
15-
49 y
ears
Perc
enta
ge
mar
ried
befo
re
age
15
Num
ber o
f m
en a
ge 1
5-49
yea
rs
Perc
enta
ge
mar
ried
befo
re
age
15
Perc
enta
ge
mar
ried
befo
re
age
18
Num
ber o
f m
en a
ge 2
0-49
yea
rs
Perc
enta
ge
mar
ried
befo
re
age
151
Perc
enta
ge
mar
ried
befo
re
age
182
Num
ber o
f m
en a
ge 2
0-24
yea
rs
Perc
enta
ge
curre
ntly
m
arrie
d/in
uni
on3
Num
ber o
f m
en a
ge 1
5-19
yea
rs
Perc
enta
ge in
po
lygy
nous
m
arria
ge/u
nion
4
Num
ber o
f men
age
15
-49
year
s cu
rrent
ly
mar
ried/
in u
nion
Age 15
-19
0.7
2,40
4na
na0
nana
05.
92,
404
2.9
142
15-1
70.
41,
570
nana
0na
na0
1.8
1,57
0(5
.4)
2918
-19
1.2
834
nana
0na
na0
13.6
834
2.2
113
20-2
41.
81,
774
1.8
10.8
1,77
41.
810
.81,
774
na0
1.8
720
25-2
93.
91,
810
3.9
11.8
1,81
0na
na0
na0
1.5
1,25
730
-34
6.3
1,77
26.
316
.01,
772
nana
0na
01.
81,
558
35-3
95.
51,
612
5.5
14.8
1,61
2na
na0
na0
2.1
1,51
940
-44
5.4
1,41
25.
413
.81,
412
nana
0na
02.
61,
353
45-4
95.
51,
232
5.5
12.9
1,23
2na
na0
na0
2.7
1,21
1Ed
ucat
ion
Non
e or
EC
E8.
178
08.
526
.073
06.
431
.678
(23.
7)50
1.0
638
Prim
ary
6.0
3,71
66.
518
.13,
293
2.8
14.9
453
11.7
423
2.1
2,87
2Lo
wer
sec
onda
ry3.
43,
517
4.5
14.9
2,54
91.
714
.653
26.
896
82.
02,
088
Upp
er s
econ
dary
1.7
2,16
92.
95.
71,
261
1.1
4.4
394
1.7
908
2.1
887
Post
sec
onda
ry /
Non
terti
ary
1.8
488
1.9
3.9
479
(1.8
)(2
.7)
46(*
)10
2.8
410
Hig
her
0.9
1,34
60.
91.
91,
301
0.0
1.0
271
(0.0
)45
3.1
865
Ethn
o-lin
guis
tic g
roup
of h
ouse
hold
hea
dLa
o-Ta
i3.
67,
758
4.4
10.4
6,28
81.
06.
51,
067
3.2
1,47
02.
34,
887
Mon
-Khm
er4.
02,
759
4.7
16.0
2,16
92.
913
.044
87.
959
01.
71,
836
Hm
ong-
Mie
n4.
51,
072
5.5
25.6
797
3.8
28.0
186
14.1
275
1.5
727
Chi
nese
-Tib
etan
3.5
326
4.2
19.2
276
2.0
21.6
5611
.650
1.3
239
Oth
er, D
K, M
issi
ng14
.310
217
.522
.683
(*)
(*)
16(*
)19
4.4
72W
ealth
inde
x qu
intil
ePo
ores
t5.
82,
172
6.7
21.8
1,75
64.
823
.336
611
.541
61.
61,
540
Seco
nd4.
42,
370
5.4
17.3
1,82
72.
213
.736
57.
654
32.
31,
558
Mid
dle
5.0
2,35
26.
215
.51,
857
1.1
8.7
327
4.4
495
2.1
1,49
7Fo
urth
3.0
2,67
63.
79.
22,
146
0.8
4.7
391
4.6
531
1.8
1,66
3R
iche
st1.
52,
447
1.8
4.8
2,02
70.
02.
732
61.
741
92.
61,
503
( ) F
igur
es th
at a
re b
ased
on
25 –
49
unw
eigh
ted
case
s(*
) Fig
ures
that
are
bas
ed o
n fe
wer
than
25
unw
eigh
ted
case
s
1 MIC
S in
dica
tor P
R.4
a - C
hild
mar
riage
; SD
G 5
.3.1
2 MIC
S in
dica
tor P
R.4
b - C
hild
mar
riage
; SD
G 5
.3.1
3 M
ICS
indi
cato
r PR
.5 -
Youn
g m
en a
ge 1
5-19
yea
rs c
urre
ntly
mar
ried
or in
uni
on4 M
ICS
indi
cato
r PR
.6 -
Poly
gyny
na: n
ot a
pplic
able
Tabl
e PR
.4.1
M(c
ontin
ued)
: Chi
ld m
arria
ge a
nd p
olyg
yny
(men
)Pe
rcen
tage
of m
en a
ge 1
5-49
yea
rs w
ho fi
rst m
arrie
d or
ent
ered
a m
arita
l uni
on b
efor
e th
eir 1
5th
birth
day,
per
cent
ages
of m
en a
ge 2
0-49
and
20-
24 y
ears
who
firs
t mar
ried
or e
nter
ed a
mar
ital u
nion
bef
ore
thei
r 15t
h an
d 18
th b
irthd
ays,
per
cent
age
of m
en a
ge 1
5-19
yea
rs
curre
ntly
mar
ried
or in
uni
on, a
nd th
e pe
rcen
tage
of m
en w
ho a
re in
a p
olyg
ynou
s m
arria
ge o
r uni
on, L
ao P
DR
, 201
7M
en a
ge 1
5-49
yea
rsM
en a
ge 2
0-49
yea
rsM
en a
ge 2
0-24
yea
rsM
en a
ge 1
5-19
yea
rsM
en a
ge 1
5-49
yea
rs
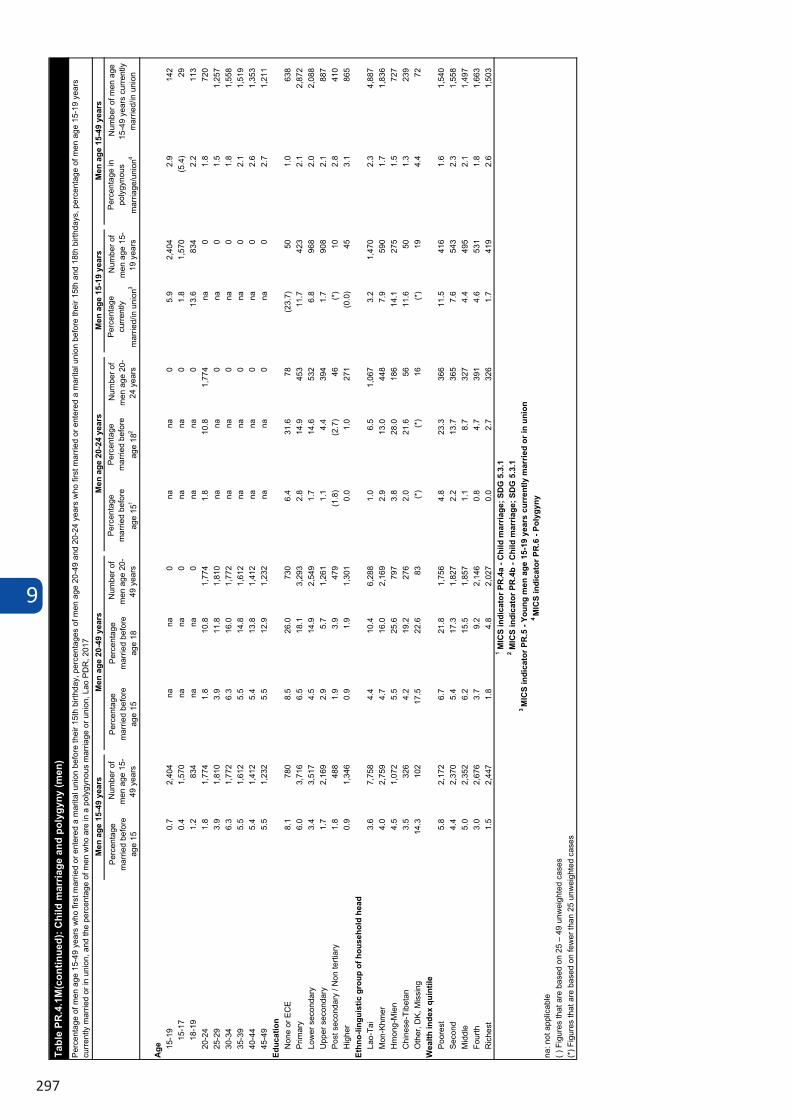
9
297
Perc
enta
ge
mar
ried
befo
re
age
15
Num
ber o
f m
en a
ge 1
5-49
yea
rs
Perc
enta
ge
mar
ried
befo
re
age
15
Perc
enta
ge
mar
ried
befo
re
age
18
Num
ber o
f m
en a
ge 2
0-49
yea
rs
Perc
enta
ge
mar
ried
befo
re
age
151
Perc
enta
ge
mar
ried
befo
re
age
182
Num
ber o
f m
en a
ge 2
0-24
yea
rs
Perc
enta
ge
curre
ntly
m
arrie
d/in
uni
on3
Num
ber o
f m
en a
ge 1
5-19
yea
rs
Perc
enta
ge in
po
lygy
nous
m
arria
ge/u
nion
4
Num
ber o
f men
age
15
-49
year
s cu
rrent
ly
mar
ried/
in u
nion
Age 15
-19
0.7
2,40
4na
na0
nana
05.
92,
404
2.9
142
15-1
70.
41,
570
nana
0na
na0
1.8
1,57
0(5
.4)
2918
-19
1.2
834
nana
0na
na0
13.6
834
2.2
113
20-2
41.
81,
774
1.8
10.8
1,77
41.
810
.81,
774
na0
1.8
720
25-2
93.
91,
810
3.9
11.8
1,81
0na
na0
na0
1.5
1,25
730
-34
6.3
1,77
26.
316
.01,
772
nana
0na
01.
81,
558
35-3
95.
51,
612
5.5
14.8
1,61
2na
na0
na0
2.1
1,51
940
-44
5.4
1,41
25.
413
.81,
412
nana
0na
02.
61,
353
45-4
95.
51,
232
5.5
12.9
1,23
2na
na0
na0
2.7
1,21
1Ed
ucat
ion
Non
e or
EC
E8.
178
08.
526
.073
06.
431
.678
(23.
7)50
1.0
638
Prim
ary
6.0
3,71
66.
518
.13,
293
2.8
14.9
453
11.7
423
2.1
2,87
2Lo
wer
sec
onda
ry3.
43,
517
4.5
14.9
2,54
91.
714
.653
26.
896
82.
02,
088
Upp
er s
econ
dary
1.7
2,16
92.
95.
71,
261
1.1
4.4
394
1.7
908
2.1
887
Post
sec
onda
ry /
Non
terti
ary
1.8
488
1.9
3.9
479
(1.8
)(2
.7)
46(*
)10
2.8
410
Hig
her
0.9
1,34
60.
91.
91,
301
0.0
1.0
271
(0.0
)45
3.1
865
Ethn
o-lin
guis
tic g
roup
of h
ouse
hold
hea
dLa
o-Ta
i3.
67,
758
4.4
10.4
6,28
81.
06.
51,
067
3.2
1,47
02.
34,
887
Mon
-Khm
er4.
02,
759
4.7
16.0
2,16
92.
913
.044
87.
959
01.
71,
836
Hm
ong-
Mie
n4.
51,
072
5.5
25.6
797
3.8
28.0
186
14.1
275
1.5
727
Chi
nese
-Tib
etan
3.5
326
4.2
19.2
276
2.0
21.6
5611
.650
1.3
239
Oth
er, D
K, M
issi
ng14
.310
217
.522
.683
(*)
(*)
16(*
)19
4.4
72W
ealth
inde
x qu
intil
ePo
ores
t5.
82,
172
6.7
21.8
1,75
64.
823
.336
611
.541
61.
61,
540
Seco
nd4.
42,
370
5.4
17.3
1,82
72.
213
.736
57.
654
32.
31,
558
Mid
dle
5.0
2,35
26.
215
.51,
857
1.1
8.7
327
4.4
495
2.1
1,49
7Fo
urth
3.0
2,67
63.
79.
22,
146
0.8
4.7
391
4.6
531
1.8
1,66
3R
iche
st1.
52,
447
1.8
4.8
2,02
70.
02.
732
61.
741
92.
61,
503
( ) F
igur
es th
at a
re b
ased
on
25 –
49
unw
eigh
ted
case
s(*
) Fig
ures
that
are
bas
ed o
n fe
wer
than
25
unw
eigh
ted
case
s
1 MIC
S in
dica
tor P
R.4
a - C
hild
mar
riage
; SD
G 5
.3.1
2 MIC
S in
dica
tor P
R.4
b - C
hild
mar
riage
; SD
G 5
.3.1
3 M
ICS
indi
cato
r PR
.5 -
Youn
g m
en a
ge 1
5-19
yea
rs c
urre
ntly
mar
ried
or in
uni
on4 M
ICS
indi
cato
r PR
.6 -
Poly
gyny
na: n
ot a
pplic
able
Tabl
e PR
.4.1
M(c
ontin
ued)
: Chi
ld m
arria
ge a
nd p
olyg
yny
(men
)Pe
rcen
tage
of m
en a
ge 1
5-49
yea
rs w
ho fi
rst m
arrie
d or
ent
ered
a m
arita
l uni
on b
efor
e th
eir 1
5th
birth
day,
per
cent
ages
of m
en a
ge 2
0-49
and
20-
24 y
ears
who
firs
t mar
ried
or e
nter
ed a
mar
ital u
nion
bef
ore
thei
r 15t
h an
d 18
th b
irthd
ays,
per
cent
age
of m
en a
ge 1
5-19
yea
rs
curre
ntly
mar
ried
or in
uni
on, a
nd th
e pe
rcen
tage
of m
en w
ho a
re in
a p
olyg
ynou
s m
arria
ge o
r uni
on, L
ao P
DR
, 201
7M
en a
ge 1
5-49
yea
rsM
en a
ge 2
0-49
yea
rsM
en a
ge 2
0-24
yea
rsM
en a
ge 1
5-19
yea
rsM
en a
ge 1
5-49
yea
rs
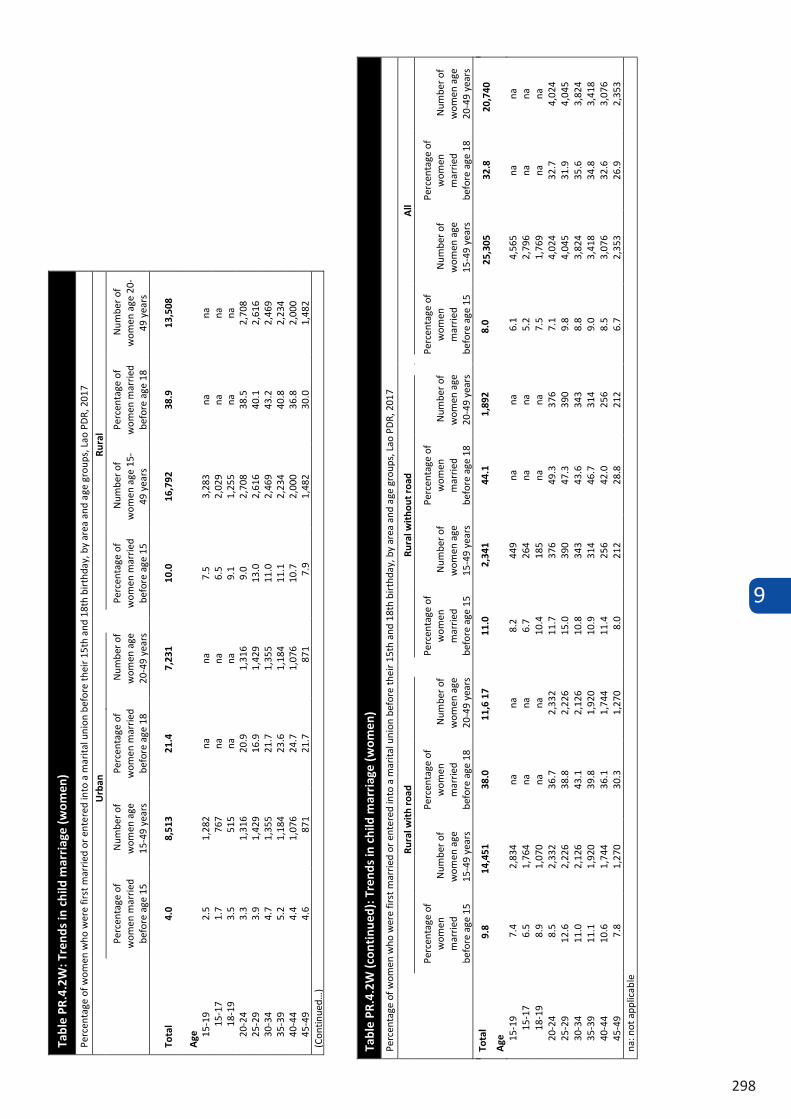
9
298
Tabl
e PR
.4.2
W: T
rend
s in
chi
ld m
arri
age
(wom
en)
Perc
enta
ge o
f wom
en w
ho w
ere
first
mar
ried
or e
nter
ed in
to a
mar
ital u
nion
bef
ore
thei
r 15t
h an
d 18
th b
irth
day,
by
area
and
age
gro
ups,
Lao
PD
R, 2
017
Urb
an
Rura
l
Perc
enta
ge o
f w
omen
mar
ried
befo
re a
ge 1
5
Num
ber o
f w
omen
age
15
-49
year
s
Perc
enta
ge o
f w
omen
mar
ried
befo
re a
ge 1
8
Num
ber o
f w
omen
age
20
-49
year
s
Perc
enta
ge o
f w
omen
mar
ried
befo
re a
ge 1
5
Num
ber o
f w
omen
age
15-
49 y
ears
Perc
enta
ge o
f w
omen
mar
ried
befo
re a
ge 1
8
Num
ber o
f w
omen
age
20-
49 y
ears
Tota
l 4.
0 8,
513
21.4
7,
231
10.0
16
,792
38
.9
13,5
08
Age
15
-19
2.5
1,28
2 na
na
7.
5 3,
283
na
na
15-1
7 1.
7 76
7 na
na
6.
5 2,
029
na
na
18-1
9 3.
5 51
5 na
na
9.
1 1,
255
na
na
20-2
4 3.
3 1,
316
20.9
1,
316
9.0
2,70
8 38
.5
2,70
8 25
-29
3.9
1,42
9 16
.9
1,42
9 13
.0
2,61
6 40
.1
2,61
6 30
-34
4.7
1,35
5 21
.7
1,35
5 11
.0
2,46
9 43
.2
2,46
9 35
-39
5.2
1,18
4 23
.6
1,18
4 11
.1
2,23
4 40
.8
2,23
4 40
-44
4.4
1,07
6 24
.7
1,07
6 10
.7
2,00
0 36
.8
2,00
0 45
-49
4.6
871
21.7
87
1 7.
9 1,
482
30.0
1,
482
(Con
tinue
d…)
Tabl
e PR
.4.2
W (c
onti
nued
): T
rend
s in
chi
ld m
arri
age
(wom
en)
Perc
enta
ge o
f wom
en w
ho w
ere
first
mar
ried
or e
nter
ed in
to a
mar
ital u
nion
bef
ore
thei
r 15t
h an
d 18
th b
irth
day,
by
area
and
age
gro
ups,
Lao
PD
R, 2
017
Rura
l wit
h ro
ad
Rura
l wit
hout
roa
d A
ll
Perc
enta
ge o
f w
omen
m
arrie
d be
fore
age
15
Num
ber o
f w
omen
age
15
-49
year
s
Perc
enta
ge o
f w
omen
m
arrie
d be
fore
age
18
Num
ber o
f w
omen
age
20
-49
year
s
Perc
enta
ge o
f w
omen
m
arrie
d be
fore
age
15
Num
ber o
f w
omen
age
15
-49
year
s
Perc
enta
ge o
f w
omen
m
arrie
d be
fore
age
18
Num
ber o
f w
omen
age
20
-49
year
s
Perc
enta
ge o
f w
omen
m
arrie
d be
fore
age
15
Num
ber o
f w
omen
age
15
-49
year
s
Perc
enta
ge o
f w
omen
m
arrie
d be
fore
age
18
Num
ber o
f w
omen
age
20
-49
year
s
Age
15
-19
7.4
2,83
4 na
na
8.
2 44
9 na
na
6.
1 4,
565
na
na
15-1
7 6.
5 1,
764
na
na
6.7
264
na
na
5.2
2,79
6 na
na
18
-19
8.9
1,07
0 na
na
10
.4
185
na
na
7.5
1,76
9 na
na
20
-24
8.5
2,33
2 36
.7
2,33
2 11
.7
376
49.3
37
6 7.
1 4,
024
32.7
4,
024
25-2
9 12
.6
2,22
6 38
.8
2,22
6 15
.0
390
47.3
39
0 9.
8 4,
045
31.9
4,
045
30-3
4 11
.0
2,12
6 43
.1
2,12
6 10
.8
343
43.6
34
3 8.
8 3,
824
35.6
3,
824
35-3
9 11
.1
1,92
0 39
.8
1,92
0 10
.9
314
46.7
31
4 9.
0 3,
418
34.8
3,
418
40-4
4 10
.6
1,74
4 36
.1
1,74
4 11
.4
256
42.0
25
6 8.
5 3,
076
32.6
3,
076
45-4
9 7.
8 1,
270
30.3
1,
270
8.0
212
28.8
21
2 6.
7 2,
353
26.9
2,
353
na: n
ot a
pplic
able
Tota
l 9.
814
,451
38.0
11
,6 1
711
.02,
341
44.1
1,
892
8.0
25,3
0532
.820
,740
Tabl
e PR
.4.2
M: T
rend
s in
chi
ld m
arri
age
(men
)
Perc
enta
ge o
f men
who
wer
e fir
st m
arrie
d or
ent
ered
into
a m
arita
l uni
on b
efor
e th
eir 1
5th
and
18th
birt
hday
, by
area
and
age
gro
ups,
Lao
PD
R, 2
017
Urb
an
Rura
l
Perc
enta
ge o
f m
en m
arrie
d be
fore
age
15
Num
ber
of m
en
age
15-4
9 ye
ars
Perc
enta
ge o
f m
en m
arrie
d be
fore
age
18
Num
ber
of m
en
age
20-4
9 ye
ars
Perc
enta
ge o
f m
en m
arrie
d be
fore
age
15
Num
ber
of m
en
age
15-4
9 ye
ars
Perc
enta
ge o
f m
en m
arrie
d be
fore
age
18
Num
ber
of m
en
age
20-4
9 ye
ars
Tota
l 2.
2 3,
808
7.1
3,08
8 4.
6 8,
209
16.3
6,
524
Age
15
-19
0.0
721
na
na
1.0
1,68
5 na
na
15
-17
0.0
465
na
na
0.6
1,10
6 na
na
18
-19
0.1
256
na
na
1.6
579
na
na
20-2
4 0.
6 52
7 3.
9 52
7 2.
3 1,
246
13.8
1,
246
25-2
9 1.
9 57
2 5.
1 57
2 4.
8 1,
240
14.9
1,
240
30-3
4 3.
0 60
2 8.
7 60
2 8.
0 1,
171
19.7
1,
171
35-3
9 4.
6 50
3 8.
6 50
3 5.
8 1,
109
17.6
1,
109
40-4
4 3.
4 48
2 8.
5 48
2 6.
4 92
8 16
.5
928
45-4
9 3.
4 40
1 7.
9 40
1 6.
4 83
0 15
.4
830
(Con
tinue
d…)
Tabl
e PR
.4.2
M: T
rend
s in
chi
ld m
arri
age
(men
)
Perc
enta
ge o
f men
who
wer
e fir
st m
arrie
d or
ent
ered
into
a m
arita
l uni
on b
efor
e th
eir 1
5th
and
18th
birt
hday
, by
area
and
age
gro
ups,
Lao
PD
R, 2
017
Rura
l wit
h ro
ad
Rura
l wit
hout
roa
d A
ll
Perc
enta
ge o
f m
en m
arrie
d be
fore
age
15
Num
ber o
f m
en a
ge 1
5-49
yea
rs
Perc
enta
ge o
f m
en m
arrie
d be
fore
age
18
Num
ber o
f m
en a
ge 2
0-49
yea
rs
Perc
enta
ge o
f m
en m
arrie
d be
fore
age
15
Num
ber o
f m
en a
ge 1
5-49
yea
rs
Perc
enta
ge o
f m
en m
arrie
d be
fore
age
18
Num
ber o
f m
en a
ge 2
0-49
yea
rs
Perc
enta
ge o
f m
en m
arrie
d be
fore
age
15
Num
ber o
f m
en a
ge 1
5-49
yea
rs
Perc
enta
ge o
f m
en m
arrie
d be
fore
age
18
Num
ber o
f m
en a
ge 2
0-49
yea
rs
Age
15
-19
190.
9 1,
460
na
na
1.2
224
na
na
0.7
2,40
5 na
na
15
-17
5-17
0.6
968
na
na
0.6
138
na
na
0.5
1,57
1 na
na
18
-19
8-19
1.5
493
na
na
2.2
86
na
na
1.2
835
na
na
20-24
242.
0 1,
082
13.1
1,
082
4.3
165
18.1
16
5 1.
8 1,
773
10.8
1,
773
25-29
294.
9 1,
057
14.4
1,
057
4.7
182
17.9
18
2 3.
9 1,
812
11.8
1,
812
30-34
348.
4 98
6 19
.3
986
6.4
185
22.0
18
5 6.
3 1,
773
16.0
1,
773
35-39
395.
6 95
1 17
.5
951
7.1
158
18.6
15
8 5.
5 1,
612
14.8
1,
612
40-44
446.
3 78
9 15
.8
789
7.0
139
20.5
13
9 5.
3 1,
410
13.8
1,
410
45-49
496.
3 72
6 15
.2
726
7.3
104
16.5
10
4 5.
4 1,
231
12.9
1,
231
na: n
ot a
pplic
able
Tota
l 4.
5 7,
051
15.8
5,
591
5.1
1,15
8 19
.1
933
3.8
12,0
1713
.39,
612
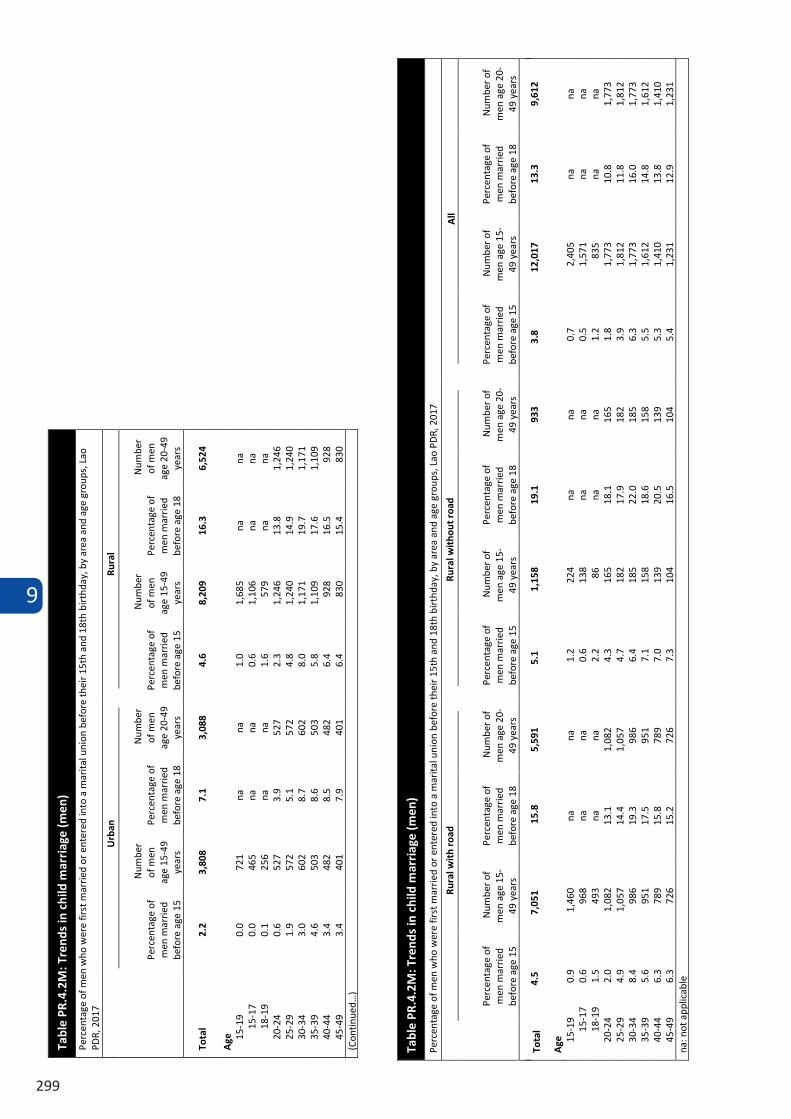
9
299
Tabl
e PR
.4.2
M: T
rend
s in
chi
ld m
arri
age
(men
)
Perc
enta
ge o
f men
who
wer
e fir
st m
arrie
d or
ent
ered
into
a m
arita
l uni
on b
efor
e th
eir 1
5th
and
18th
birt
hday
, by
area
and
age
gro
ups,
Lao
PD
R, 2
017
Urb
an
Rura
l
Perc
enta
ge o
f m
en m
arrie
d be
fore
age
15
Num
ber
of m
en
age
15-4
9 ye
ars
Perc
enta
ge o
f m
en m
arrie
d be
fore
age
18
Num
ber
of m
en
age
20-4
9 ye
ars
Perc
enta
ge o
f m
en m
arrie
d be
fore
age
15
Num
ber
of m
en
age
15-4
9 ye
ars
Perc
enta
ge o
f m
en m
arrie
d be
fore
age
18
Num
ber
of m
en
age
20-4
9 ye
ars
Tota
l 2.
2 3,
808
7.1
3,08
8 4.
6 8,
209
16.3
6,
524
Age
15
-19
0.0
721
na
na
1.0
1,68
5 na
na
15
-17
0.0
465
na
na
0.6
1,10
6 na
na
18
-19
0.1
256
na
na
1.6
579
na
na
20-2
4 0.
6 52
7 3.
9 52
7 2.
3 1,
246
13.8
1,
246
25-2
9 1.
9 57
2 5.
1 57
2 4.
8 1,
240
14.9
1,
240
30-3
4 3.
0 60
2 8.
7 60
2 8.
0 1,
171
19.7
1,
171
35-3
9 4.
6 50
3 8.
6 50
3 5.
8 1,
109
17.6
1,
109
40-4
4 3.
4 48
2 8.
5 48
2 6.
4 92
8 16
.5
928
45-4
9 3.
4 40
1 7.
9 40
1 6.
4 83
0 15
.4
830
(Con
tinue
d…)
Tabl
e PR
.4.2
M: T
rend
s in
chi
ld m
arri
age
(men
)
Perc
enta
ge o
f men
who
wer
e fir
st m
arrie
d or
ent
ered
into
a m
arita
l uni
on b
efor
e th
eir 1
5th
and
18th
birt
hday
, by
area
and
age
gro
ups,
Lao
PD
R, 2
017
Rura
l wit
h ro
ad
Rura
l wit
hout
roa
d A
ll
Perc
enta
ge o
f m
en m
arrie
d be
fore
age
15
Num
ber o
f m
en a
ge 1
5-49
yea
rs
Perc
enta
ge o
f m
en m
arrie
d be
fore
age
18
Num
ber o
f m
en a
ge 2
0-49
yea
rs
Perc
enta
ge o
f m
en m
arrie
d be
fore
age
15
Num
ber o
f m
en a
ge 1
5-49
yea
rs
Perc
enta
ge o
f m
en m
arrie
d be
fore
age
18
Num
ber o
f m
en a
ge 2
0-49
yea
rs
Perc
enta
ge o
f m
en m
arrie
d be
fore
age
15
Num
ber o
f m
en a
ge 1
5-49
yea
rs
Perc
enta
ge o
f m
en m
arrie
d be
fore
age
18
Num
ber o
f m
en a
ge 2
0-49
yea
rs
Age
15
-19
190.
9 1,
460
na
na
1.2
224
na
na
0.7
2,40
5 na
na
15
-17
5-17
0.6
968
na
na
0.6
138
na
na
0.5
1,57
1 na
na
18
-19
8-19
1.5
493
na
na
2.2
86
na
na
1.2
835
na
na
20-24
242.
0 1,
082
13.1
1,
082
4.3
165
18.1
16
5 1.
8 1,
773
10.8
1,
773
25-29
294.
9 1,
057
14.4
1,
057
4.7
182
17.9
18
2 3.
9 1,
812
11.8
1,
812
30-34
348.
4 98
6 19
.3
986
6.4
185
22.0
18
5 6.
3 1,
773
16.0
1,
773
35-39
395.
6 95
1 17
.5
951
7.1
158
18.6
15
8 5.
5 1,
612
14.8
1,
612
40-44
446.
3 78
9 15
.8
789
7.0
139
20.5
13
9 5.
3 1,
410
13.8
1,
410
45-49
496.
3 72
6 15
.2
726
7.3
104
16.5
10
4 5.
4 1,
231
12.9
1,
231
na: n
ot a
pplic
able
Tota
l 4.
5 7,
051
15.8
5,
591
5.1
1,15
8 19
.1
933
3.8
12,0
1713
.39,
612
Tabl
e PR
.4.2
M: T
rend
s in
chi
ld m
arri
age
(men
)
Perc
enta
ge o
f men
who
wer
e fir
st m
arrie
d or
ent
ered
into
a m
arita
l uni
on b
efor
e th
eir 1
5th
and
18th
birt
hday
, by
area
and
age
gro
ups,
Lao
PD
R, 2
017
Urb
an
Rura
l
Perc
enta
ge o
f m
en m
arrie
d be
fore
age
15
Num
ber
of m
en
age
15-4
9 ye
ars
Perc
enta
ge o
f m
en m
arrie
d be
fore
age
18
Num
ber
of m
en
age
20-4
9 ye
ars
Perc
enta
ge o
f m
en m
arrie
d be
fore
age
15
Num
ber
of m
en
age
15-4
9 ye
ars
Perc
enta
ge o
f m
en m
arrie
d be
fore
age
18
Num
ber
of m
en
age
20-4
9 ye
ars
Tota
l 2.
2 3,
808
7.1
3,08
8 4.
6 8,
209
16.3
6,
524
Age
15
-19
0.0
721
na
na
1.0
1,68
5 na
na
15
-17
0.0
465
na
na
0.6
1,10
6 na
na
18
-19
0.1
256
na
na
1.6
579
na
na
20-2
4 0.
6 52
7 3.
9 52
7 2.
3 1,
246
13.8
1,
246
25-2
9 1.
9 57
2 5.
1 57
2 4.
8 1,
240
14.9
1,
240
30-3
4 3.
0 60
2 8.
7 60
2 8.
0 1,
171
19.7
1,
171
35-3
9 4.
6 50
3 8.
6 50
3 5.
8 1,
109
17.6
1,
109
40-4
4 3.
4 48
2 8.
5 48
2 6.
4 92
8 16
.5
928
45-4
9 3.
4 40
1 7.
9 40
1 6.
4 83
0 15
.4
830
(Con
tinue
d…)
Tabl
e PR
.4.2
M: T
rend
s in
chi
ld m
arri
age
(men
)
Perc
enta
ge o
f men
who
wer
e fir
st m
arrie
d or
ent
ered
into
a m
arita
l uni
on b
efor
e th
eir 1
5th
and
18th
birt
hday
, by
area
and
age
gro
ups,
Lao
PD
R, 2
017
Rura
l wit
h ro
ad
Rura
l wit
hout
roa
d A
ll
Perc
enta
ge o
f m
en m
arrie
d be
fore
age
15
Num
ber o
f m
en a
ge 1
5-49
yea
rs
Perc
enta
ge o
f m
en m
arrie
d be
fore
age
18
Num
ber o
f m
en a
ge 2
0-49
yea
rs
Perc
enta
ge o
f m
en m
arrie
d be
fore
age
15
Num
ber o
f m
en a
ge 1
5-49
yea
rs
Perc
enta
ge o
f m
en m
arrie
d be
fore
age
18
Num
ber o
f m
en a
ge 2
0-49
yea
rs
Perc
enta
ge o
f m
en m
arrie
d be
fore
age
15
Num
ber o
f m
en a
ge 1
5-49
yea
rs
Perc
enta
ge o
f m
en m
arrie
d be
fore
age
18
Num
ber o
f m
en a
ge 2
0-49
yea
rs
Age
15
-19
190.
9 1,
460
na
na
1.2
224
na
na
0.7
2,40
5 na
na
15
-17
5-17
0.6
968
na
na
0.6
138
na
na
0.5
1,57
1 na
na
18
-19
8-19
1.5
493
na
na
2.2
86
na
na
1.2
835
na
na
20-24
242.
0 1,
082
13.1
1,
082
4.3
165
18.1
16
5 1.
8 1,
773
10.8
1,
773
25-29
294.
9 1,
057
14.4
1,
057
4.7
182
17.9
18
2 3.
9 1,
812
11.8
1,
812
30-34
348.
4 98
6 19
.3
986
6.4
185
22.0
18
5 6.
3 1,
773
16.0
1,
773
35-39
395.
6 95
1 17
.5
951
7.1
158
18.6
15
8 5.
5 1,
612
14.8
1,
612
40-44
446.
3 78
9 15
.8
789
7.0
139
20.5
13
9 5.
3 1,
410
13.8
1,
410
45-49
496.
3 72
6 15
.2
726
7.3
104
16.5
10
4 5.
4 1,
231
12.9
1,
231
na: n
ot a
pplic
able
Tota
l 4.
5 7,
051
15.8
5,
591
5.1
1,15
8 19
.1
933
3.8
12,0
1713
.39,
612
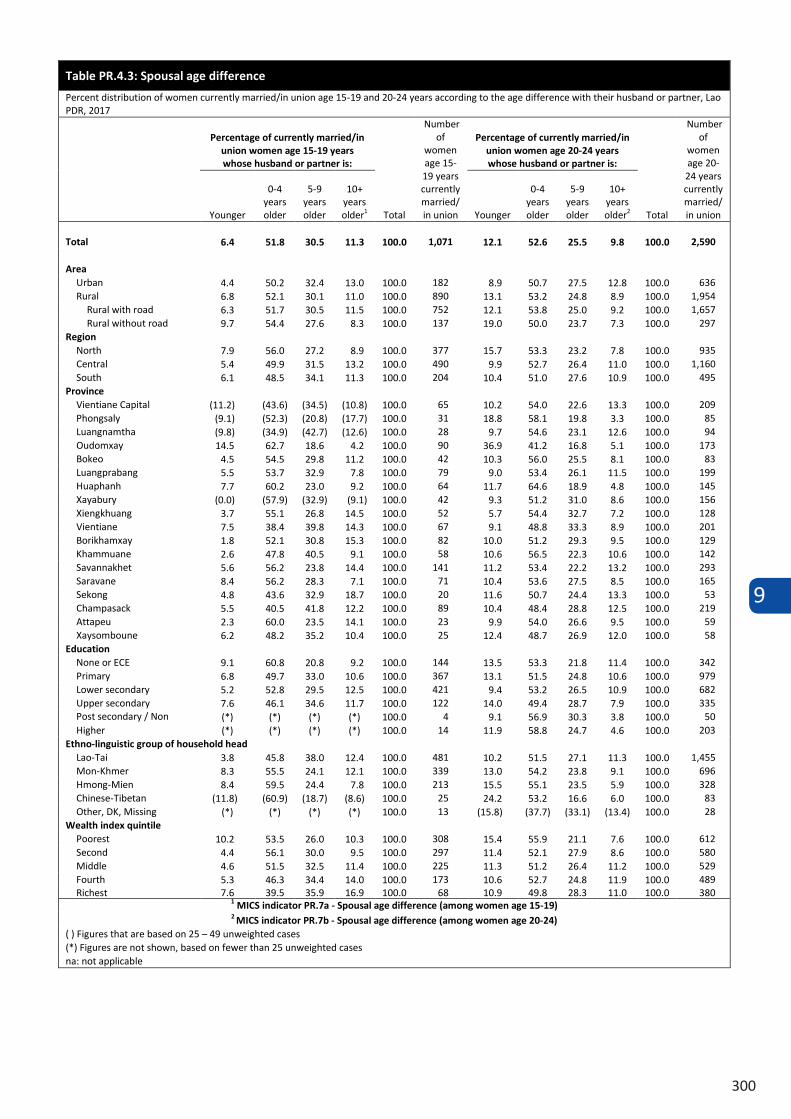
9
300
Table PR.4.3: Spousal age difference
Percent distribution of women currently married/in union age 15-19 and 20-24 years according to the age difference with their husband or partner, Lao PDR, 2017
Percentage of currently married/in union women age 15-19 years whose husband or partner is:
Total
Number of
women age 15-19 years currently married/ in union
Percentage of currently married/in union women age 20-24 years whose husband or partner is:
Total
Number of
women age 20-24 years currently married/ in union Younger
0-4 years older
5-9 years older
10+ years older1 Younger
0-4 years older
5-9 years older
10+ years older2
Total 6.4 51.8 30.5 11.3 100.0 1,071 12.1 52.6 25.5 9.8 100.0 2,590
Area Urban 4.4 50.2 32.4 13.0 100.0 182 8.9 50.7 27.5 12.8 100.0 636 Rural 6.8 52.1 30.1 11.0 100.0 890 13.1 53.2 24.8 8.9 100.0 1,954
Rural with road 6.3 51.7 30.5 11.5 100.0 752 12.1 53.8 25.0 9.2 100.0 1,657 Rural without road 9.7 54.4 27.6 8.3 100.0 137 19.0 50.0 23.7 7.3 100.0 297
Region North 7.9 56.0 27.2 8.9 100.0 377 15.7 53.3 23.2 7.8 100.0 935 Central 5.4 49.9 31.5 13.2 100.0 490 9.9 52.7 26.4 11.0 100.0 1,160 South 6.1 48.5 34.1 11.3 100.0 204 10.4 51.0 27.6 10.9 100.0 495
Province Vientiane Capital (11.2) (43.6) (34.5) (10.8) 100.0 65 10.2 54.0 22.6 13.3 100.0 209 Phongsaly (9.1) (52.3) (20.8) (17.7) 100.0 31 18.8 58.1 19.8 3.3 100.0 85 Luangnamtha (9.8) (34.9) (42.7) (12.6) 100.0 28 9.7 54.6 23.1 12.6 100.0 94 Oudomxay 14.5 62.7 18.6 4.2 100.0 90 36.9 41.2 16.8 5.1 100.0 173 Bokeo 4.5 54.5 29.8 11.2 100.0 42 10.3 56.0 25.5 8.1 100.0 83 Luangprabang 5.5 53.7 32.9 7.8 100.0 79 9.0 53.4 26.1 11.5 100.0 199 Huaphanh 7.7 60.2 23.0 9.2 100.0 64 11.7 64.6 18.9 4.8 100.0 145 Xayabury (0.0) (57.9) (32.9) (9.1) 100.0 42 9.3 51.2 31.0 8.6 100.0 156 Xiengkhuang 3.7 55.1 26.8 14.5 100.0 52 5.7 54.4 32.7 7.2 100.0 128 Vientiane 7.5 38.4 39.8 14.3 100.0 67 9.1 48.8 33.3 8.9 100.0 201 Borikhamxay 1.8 52.1 30.8 15.3 100.0 82 10.0 51.2 29.3 9.5 100.0 129 Khammuane 2.6 47.8 40.5 9.1 100.0 58 10.6 56.5 22.3 10.6 100.0 142 Savannakhet 5.6 56.2 23.8 14.4 100.0 141 11.2 53.4 22.2 13.2 100.0 293 Saravane 8.4 56.2 28.3 7.1 100.0 71 10.4 53.6 27.5 8.5 100.0 165 Sekong 4.8 43.6 32.9 18.7 100.0 20 11.6 50.7 24.4 13.3 100.0 53 Champasack 5.5 40.5 41.8 12.2 100.0 89 10.4 48.4 28.8 12.5 100.0 219 Attapeu 2.3 60.0 23.5 14.1 100.0 23 9.9 54.0 26.6 9.5 100.0 59 Xaysomboune 6.2 48.2 35.2 10.4 100.0 25 12.4 48.7 26.9 12.0 100.0 58
Education None or ECE 9.1 60.8 20.8 9.2 100.0 144 13.5 53.3 21.8 11.4 100.0 342 Primary 6.8 49.7 33.0 10.6 100.0 367 13.1 51.5 24.8 10.6 100.0 979 Lower secondary 5.2 52.8 29.5 12.5 100.0 421 9.4 53.2 26.5 10.9 100.0 682 Upper secondary 7.6 46.1 34.6 11.7 100.0 122 14.0 49.4 28.7 7.9 100.0 335 Post secondary / Non
tertiary (*) (*) (*) (*) 100.0 4 9.1 56.9 30.3 3.8 100.0 50
Higher (*) (*) (*) (*) 100.0 14 11.9 58.8 24.7 4.6 100.0 203 Ethno-linguistic group of household head
Lao-Tai 3.8 45.8 38.0 12.4 100.0 481 10.2 51.5 27.1 11.3 100.0 1,455 Mon-Khmer 8.3 55.5 24.1 12.1 100.0 339 13.0 54.2 23.8 9.1 100.0 696 Hmong-Mien 8.4 59.5 24.4 7.8 100.0 213 15.5 55.1 23.5 5.9 100.0 328 Chinese-Tibetan (11.8) (60.9) (18.7) (8.6) 100.0 25 24.2 53.2 16.6 6.0 100.0 83 Other, DK, Missing (*) (*) (*) (*) 100.0 13 (15.8) (37.7) (33.1) (13.4) 100.0 28
Wealth index quintile Poorest 10.2 53.5 26.0 10.3 100.0 308 15.4 55.9 21.1 7.6 100.0 612 Second 4.4 56.1 30.0 9.5 100.0 297 11.4 52.1 27.9 8.6 100.0 580 Middle 4.6 51.5 32.5 11.4 100.0 225 11.3 51.2 26.4 11.2 100.0 529 Fourth 5.3 46.3 34.4 14.0 100.0 173 10.6 52.7 24.8 11.9 100.0 489 Richest 7.6 39.5 35.9 16.9 100.0 68 10.9 49.8 28.3 11.0 100.0 380
1 MICS indicator PR.7a - Spousal age difference (among women age 15-19) 2 MICS indicator PR.7b - Spousal age difference (among women age 20-24)
( ) Figures that are based on 25 – 49 unweighted cases(*) Figures are not shown, based on fewer than 25 unweighted casesna: not applicable
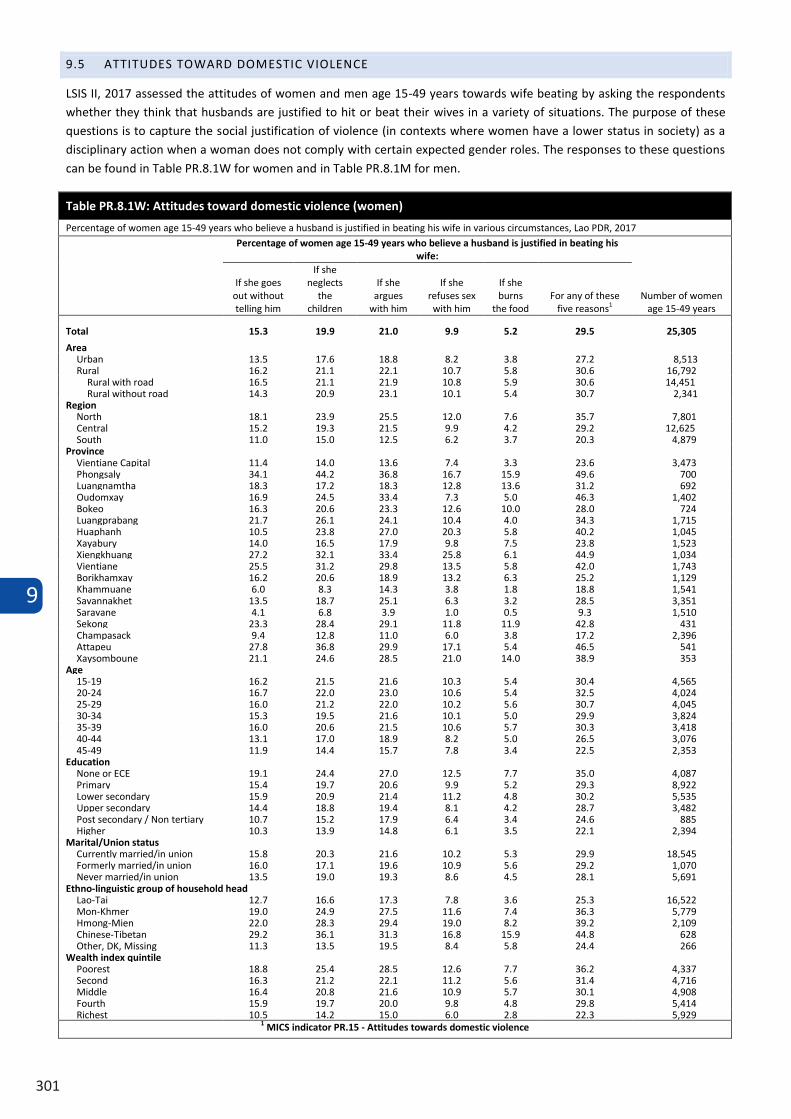
9
301
Table PR.4.3: Spousal age difference
Percent distribution of women currently married/in union age 15-19 and 20-24 years according to the age difference with their husband or partner, Lao PDR, 2017
Percentage of currently married/in union women age 15-19 years whose husband or partner is:
Total
Number of
women age 15-19 years currently married/ in union
Percentage of currently married/in union women age 20-24 years whose husband or partner is:
Total
Number of
women age 20-24 years currently married/ in union Younger
0-4 years older
5-9 years older
10+ years older1 Younger
0-4 years older
5-9 years older
10+ years older2
Total 6.4 51.8 30.5 11.3 100.0 1,071 12.1 52.6 25.5 9.8 100.0 2,590
Area Urban 4.4 50.2 32.4 13.0 100.0 182 8.9 50.7 27.5 12.8 100.0 636 Rural 6.8 52.1 30.1 11.0 100.0 890 13.1 53.2 24.8 8.9 100.0 1,954
Rural with road 6.3 51.7 30.5 11.5 100.0 752 12.1 53.8 25.0 9.2 100.0 1,657 Rural without road 9.7 54.4 27.6 8.3 100.0 137 19.0 50.0 23.7 7.3 100.0 297
Region North 7.9 56.0 27.2 8.9 100.0 377 15.7 53.3 23.2 7.8 100.0 935 Central 5.4 49.9 31.5 13.2 100.0 490 9.9 52.7 26.4 11.0 100.0 1,160 South 6.1 48.5 34.1 11.3 100.0 204 10.4 51.0 27.6 10.9 100.0 495
Province Vientiane Capital (11.2) (43.6) (34.5) (10.8) 100.0 65 10.2 54.0 22.6 13.3 100.0 209 Phongsaly (9.1) (52.3) (20.8) (17.7) 100.0 31 18.8 58.1 19.8 3.3 100.0 85 Luangnamtha (9.8) (34.9) (42.7) (12.6) 100.0 28 9.7 54.6 23.1 12.6 100.0 94 Oudomxay 14.5 62.7 18.6 4.2 100.0 90 36.9 41.2 16.8 5.1 100.0 173 Bokeo 4.5 54.5 29.8 11.2 100.0 42 10.3 56.0 25.5 8.1 100.0 83 Luangprabang 5.5 53.7 32.9 7.8 100.0 79 9.0 53.4 26.1 11.5 100.0 199 Huaphanh 7.7 60.2 23.0 9.2 100.0 64 11.7 64.6 18.9 4.8 100.0 145 Xayabury (0.0) (57.9) (32.9) (9.1) 100.0 42 9.3 51.2 31.0 8.6 100.0 156 Xiengkhuang 3.7 55.1 26.8 14.5 100.0 52 5.7 54.4 32.7 7.2 100.0 128 Vientiane 7.5 38.4 39.8 14.3 100.0 67 9.1 48.8 33.3 8.9 100.0 201 Borikhamxay 1.8 52.1 30.8 15.3 100.0 82 10.0 51.2 29.3 9.5 100.0 129 Khammuane 2.6 47.8 40.5 9.1 100.0 58 10.6 56.5 22.3 10.6 100.0 142 Savannakhet 5.6 56.2 23.8 14.4 100.0 141 11.2 53.4 22.2 13.2 100.0 293 Saravane 8.4 56.2 28.3 7.1 100.0 71 10.4 53.6 27.5 8.5 100.0 165 Sekong 4.8 43.6 32.9 18.7 100.0 20 11.6 50.7 24.4 13.3 100.0 53 Champasack 5.5 40.5 41.8 12.2 100.0 89 10.4 48.4 28.8 12.5 100.0 219 Attapeu 2.3 60.0 23.5 14.1 100.0 23 9.9 54.0 26.6 9.5 100.0 59 Xaysomboune 6.2 48.2 35.2 10.4 100.0 25 12.4 48.7 26.9 12.0 100.0 58
Education None or ECE 9.1 60.8 20.8 9.2 100.0 144 13.5 53.3 21.8 11.4 100.0 342 Primary 6.8 49.7 33.0 10.6 100.0 367 13.1 51.5 24.8 10.6 100.0 979 Lower secondary 5.2 52.8 29.5 12.5 100.0 421 9.4 53.2 26.5 10.9 100.0 682 Upper secondary 7.6 46.1 34.6 11.7 100.0 122 14.0 49.4 28.7 7.9 100.0 335 Post secondary / Non
tertiary (*) (*) (*) (*) 100.0 4 9.1 56.9 30.3 3.8 100.0 50
Higher (*) (*) (*) (*) 100.0 14 11.9 58.8 24.7 4.6 100.0 203 Ethno-linguistic group of household head
Lao-Tai 3.8 45.8 38.0 12.4 100.0 481 10.2 51.5 27.1 11.3 100.0 1,455 Mon-Khmer 8.3 55.5 24.1 12.1 100.0 339 13.0 54.2 23.8 9.1 100.0 696 Hmong-Mien 8.4 59.5 24.4 7.8 100.0 213 15.5 55.1 23.5 5.9 100.0 328 Chinese-Tibetan (11.8) (60.9) (18.7) (8.6) 100.0 25 24.2 53.2 16.6 6.0 100.0 83 Other, DK, Missing (*) (*) (*) (*) 100.0 13 (15.8) (37.7) (33.1) (13.4) 100.0 28
Wealth index quintile Poorest 10.2 53.5 26.0 10.3 100.0 308 15.4 55.9 21.1 7.6 100.0 612 Second 4.4 56.1 30.0 9.5 100.0 297 11.4 52.1 27.9 8.6 100.0 580 Middle 4.6 51.5 32.5 11.4 100.0 225 11.3 51.2 26.4 11.2 100.0 529 Fourth 5.3 46.3 34.4 14.0 100.0 173 10.6 52.7 24.8 11.9 100.0 489 Richest 7.6 39.5 35.9 16.9 100.0 68 10.9 49.8 28.3 11.0 100.0 380
1 MICS indicator PR.7a - Spousal age difference (among women age 15-19) 2 MICS indicator PR.7b - Spousal age difference (among women age 20-24)
( ) Figures that are based on 25 – 49 unweighted cases(*) Figures are not shown, based on fewer than 25 unweighted casesna: not applicable
9.5 ATTITUDES TOWARD DOMESTIC VIOLENCE
LSIS II, 2017 assessed the attitudes of women and men age 15-49 years towards wife beating by asking the respondents whether they think that husbands are justified to hit or beat their wives in a variety of situations. The purpose of these questions is to capture the social justification of violence (in contexts where women have a lower status in society) as a disciplinary action when a woman does not comply with certain expected gender roles. The responses to these questions can be found in Table PR.8.1W for women and in Table PR.8.1M for men.
Table PR.8.1W: Attitudes toward domestic violence (women)
Percentage of women age 15-49 years who believe a husband is justified in beating his wife in various circumstances, Lao PDR, 2017 Percentage of women age 15-49 years who believe a husband is justified in beating his
wife:
Number of women age 15-49 years
If she goes out without telling him
If she neglects
the children
If she argues
with him
If she refuses sex with him
If she burns
the food For any of these
five reasons1
Total 15.3 19.9 21.0 9.9 5.2 29.5 25,305
Area Urban 13.5 17.6 18.8 8.2 3.8 27.2 8,513 Rural 16.2 21.1 22.1 10.7 5.8 30.6 16,792
Rural with road 16.5 21.1 21.9 10.8 5.9 30.6 14,451 Rural without road 14.3 20.9 23.1 10.1 5.4 30.7 2,341
Region North 18.1 23.9 25.5 12.0 7.6 35.7 7,801 Central 15.2 19.3 21.5 9.9 4.2 29.2 12,625 South 11.0 15.0 12.5 6.2 3.7 20.3 4,879
Province Vientiane Capital 11.4 14.0 13.6 7.4 3.3 23.6 3,473 Phongsaly 34.1 44.2 36.8 16.7 15.9 49.6 700 Luangnamtha 18.3 17.2 18.3 12.8 13.6 31.2 692 Oudomxay 16.9 24.5 33.4 7.3 5.0 46.3 1,402 Bokeo 16.3 20.6 23.3 12.6 10.0 28.0 724 Luangprabang 21.7 26.1 24.1 10.4 4.0 34.3 1,715 Huaphanh 10.5 23.8 27.0 20.3 5.8 40.2 1,045 Xayabury 14.0 16.5 17.9 9.8 7.5 23.8 1,523 Xiengkhuang 27.2 32.1 33.4 25.8 6.1 44.9 1,034 Vientiane 25.5 31.2 29.8 13.5 5.8 42.0 1,743 Borikhamxay 16.2 20.6 18.9 13.2 6.3 25.2 1,129 Khammuane 6.0 8.3 14.3 3.8 1.8 18.8 1,541 Savannakhet 13.5 18.7 25.1 6.3 3.2 28.5 3,351 Saravane 4.1 6.8 3.9 1.0 0.5 9.3 1,510 Sekong 23.3 28.4 29.1 11.8 11.9 42.8 431 Champasack 9.4 12.8 11.0 6.0 3.8 17.2 2,396 Attapeu 27.8 36.8 29.9 17.1 5.4 46.5 541 Xaysomboune 21.1 24.6 28.5 21.0 14.0 38.9 353
Age 15-19 16.2 21.5 21.6 10.3 5.4 30.4 4,565 20-24 16.7 22.0 23.0 10.6 5.4 32.5 4,024 25-29 16.0 21.2 22.0 10.2 5.6 30.7 4,045 30-34 15.3 19.5 21.6 10.1 5.0 29.9 3,824 35-39 16.0 20.6 21.5 10.6 5.7 30.3 3,418 40-44 13.1 17.0 18.9 8.2 5.0 26.5 3,076 45-49 11.9 14.4 15.7 7.8 3.4 22.5 2,353
Education None or ECE 19.1 24.4 27.0 12.5 7.7 35.0 4,087 Primary 15.4 19.7 20.6 9.9 5.2 29.3 8,922 Lower secondary 15.9 20.9 21.4 11.2 4.8 30.2 5,535 Upper secondary 14.4 18.8 19.4 8.1 4.2 28.7 3,482 Post secondary / Non tertiary 10.7 15.2 17.9 6.4 3.4 24.6 885 Higher 10.3 13.9 14.8 6.1 3.5 22.1 2,394
Marital/Union status Currently married/in union 15.8 20.3 21.6 10.2 5.3 29.9 18,545 Formerly married/in union 16.0 17.1 19.6 10.9 5.6 29.2 1,070 Never married/in union 13.5 19.0 19.3 8.6 4.5 28.1 5,691
Ethno-linguistic group of household head Lao-Tai 12.7 16.6 17.3 7.8 3.6 25.3 16,522 Mon-Khmer 19.0 24.9 27.5 11.6 7.4 36.3 5,779 Hmong-Mien 22.0 28.3 29.4 19.0 8.2 39.2 2,109 Chinese-Tibetan 29.2 36.1 31.3 16.8 15.9 44.8 628 Other, DK, Missing 11.3 13.5 19.5 8.4 5.8 24.4 266
Wealth index quintile Poorest 18.8 25.4 28.5 12.6 7.7 36.2 4,337 Second 16.3 21.2 22.1 11.2 5.6 31.4 4,716 Middle 16.4 20.8 21.6 10.9 5.7 30.1 4,908 Fourth 15.9 19.7 20.0 9.8 4.8 29.8 5,414 Richest 10.5 14.2 15.0 6.0 2.8 22.3 5,929
1 MICS indicator PR.15 - Attitudes towards domestic violence
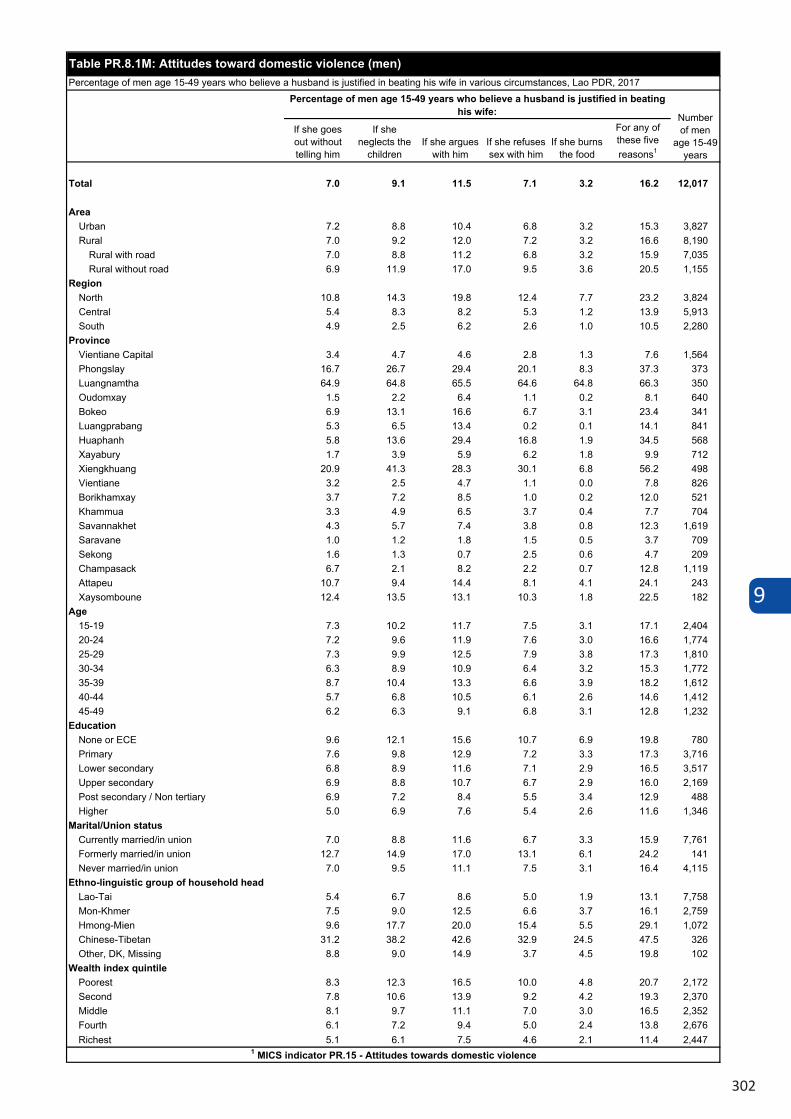
9
302
If she goes out without telling him
If she neglects the
childrenIf she argues
with himIf she refuses sex with him
If she burns the food
For any of these five reasons1
Total 7.0 9.1 11.5 7.1 3.2 16.2 12,017
AreaUrban 7.2 8.8 10.4 6.8 3.2 15.3 3,827Rural 7.0 9.2 12.0 7.2 3.2 16.6 8,190
Rural with road 7.0 8.8 11.2 6.8 3.2 15.9 7,035Rural without road 6.9 11.9 17.0 9.5 3.6 20.5 1,155
RegionNorth 10.8 14.3 19.8 12.4 7.7 23.2 3,824Central 5.4 8.3 8.2 5.3 1.2 13.9 5,913South 4.9 2.5 6.2 2.6 1.0 10.5 2,280
ProvinceVientiane Capital 3.4 4.7 4.6 2.8 1.3 7.6 1,564Phongslay 16.7 26.7 29.4 20.1 8.3 37.3 373Luangnamtha 64.9 64.8 65.5 64.6 64.8 66.3 350Oudomxay 1.5 2.2 6.4 1.1 0.2 8.1 640Bokeo 6.9 13.1 16.6 6.7 3.1 23.4 341Luangprabang 5.3 6.5 13.4 0.2 0.1 14.1 841Huaphanh 5.8 13.6 29.4 16.8 1.9 34.5 568Xayabury 1.7 3.9 5.9 6.2 1.8 9.9 712Xiengkhuang 20.9 41.3 28.3 30.1 6.8 56.2 498Vientiane 3.2 2.5 4.7 1.1 0.0 7.8 826Borikhamxay 3.7 7.2 8.5 1.0 0.2 12.0 521Khammua 3.3 4.9 6.5 3.7 0.4 7.7 704Savannakhet 4.3 5.7 7.4 3.8 0.8 12.3 1,619Saravane 1.0 1.2 1.8 1.5 0.5 3.7 709Sekong 1.6 1.3 0.7 2.5 0.6 4.7 209Champasack 6.7 2.1 8.2 2.2 0.7 12.8 1,119Attapeu 10.7 9.4 14.4 8.1 4.1 24.1 243Xaysomboune 12.4 13.5 13.1 10.3 1.8 22.5 182
Age15-19 7.3 10.2 11.7 7.5 3.1 17.1 2,40420-24 7.2 9.6 11.9 7.6 3.0 16.6 1,77425-29 7.3 9.9 12.5 7.9 3.8 17.3 1,81030-34 6.3 8.9 10.9 6.4 3.2 15.3 1,77235-39 8.7 10.4 13.3 6.6 3.9 18.2 1,61240-44 5.7 6.8 10.5 6.1 2.6 14.6 1,41245-49 6.2 6.3 9.1 6.8 3.1 12.8 1,232
EducationNone or ECE 9.6 12.1 15.6 10.7 6.9 19.8 780Primary 7.6 9.8 12.9 7.2 3.3 17.3 3,716Lower secondary 6.8 8.9 11.6 7.1 2.9 16.5 3,517Upper secondary 6.9 8.8 10.7 6.7 2.9 16.0 2,169Post secondary / Non tertiary 6.9 7.2 8.4 5.5 3.4 12.9 488Higher 5.0 6.9 7.6 5.4 2.6 11.6 1,346
Marital/Union statusCurrently married/in union 7.0 8.8 11.6 6.7 3.3 15.9 7,761Formerly married/in union 12.7 14.9 17.0 13.1 6.1 24.2 141Never married/in union 7.0 9.5 11.1 7.5 3.1 16.4 4,115
Ethno-linguistic group of household headLao-Tai 5.4 6.7 8.6 5.0 1.9 13.1 7,758Mon-Khmer 7.5 9.0 12.5 6.6 3.7 16.1 2,759Hmong-Mien 9.6 17.7 20.0 15.4 5.5 29.1 1,072Chinese-Tibetan 31.2 38.2 42.6 32.9 24.5 47.5 326Other, DK, Missing 8.8 9.0 14.9 3.7 4.5 19.8 102
Wealth index quintilePoorest 8.3 12.3 16.5 10.0 4.8 20.7 2,172Second 7.8 10.6 13.9 9.2 4.2 19.3 2,370Middle 8.1 9.7 11.1 7.0 3.0 16.5 2,352Fourth 6.1 7.2 9.4 5.0 2.4 13.8 2,676Richest 5.1 6.1 7.5 4.6 2.1 11.4 2,447
Table PR.8.1M: Attitudes toward domestic violence (men)Percentage of men age 15-49 years who believe a husband is justified in beating his wife in various circumstances, Lao PDR, 2017
Percentage of men age 15-49 years who believe a husband is justified in beating his wife: Number
of men age 15-49
years
1 MICS indicator PR.15 - Attitudes towards domestic violence
10 LIVE IN A SAFE AND CLEAN ENVIRONMENT
Access to safe drinking water, sanitation and hygiene (WASH) is essential for good health, welfare and productivity and is widely recognised as a human right.1 Inadequate WASH is primarily responsible for the transmission of diseases such as cholera, diarrhoea, dysentery, hepatitis A, typhoid and polio. Diarrhoeal diseases exacerbate malnutrition and remain a leading global cause of child deaths.
Drinking water may be contaminated with human or animal faeces containing pathogens, or with chemical and physical contaminants with harmful effects on child health and development. While improving water quality is critical to prevent disease, improving the accessibility and availability of drinking water is equally important, particularly for women and girls who usually bear the primary responsibility for carrying water, often for long distances.2
Unsafe management of human excreta and poor personal hygiene are closely associated with diarrhoea as well as parasitic infections, such as soil transmitted helminths (worms). Improved sanitation and hygiene can reduce diarrhoeal disease by more than a third3, and can substantially reduce the health impact of soil-transmitted helminth infection and a range of other neglected tropical diseases which affect over 1 billion people worldwide4.
The SDG targets relating to drinking water, sanitation and hygiene are much more ambitious than the MDGs and variously aim to end open defecation (SDG 6.2), to achieve universal access to basic services (SDG 1.4), and to achieve universal access to safely managed services (SDG 6.1 and 6.2).
For more details on drinking water, sanitation and hygiene, please visit data.unicef.org5 or the website of the WHO/UNICEF Joint Monitoring Programme for Water Supply, Sanitation and Hygiene6.
10.1 DRINKING WATER
The distribution of the population by main source of drinking water is shown in Table WS.1.1. The population using improved sources of drinking water are those using any of the following types of supply: piped water (into dwelling, compound, yard or plot, to neighbour, public tap/standpipe), tube well/borehole, protected dug well, protected spring, rainwater collection, and packaged or delivered water7.
1 The human rights to water and sanitation were explicitly recognised by the UN General Assembly and Human Rights Council in 2010 and in 2015. 2 WHO/UNICEF. 2017. Safely Managed Drinking Water: thematic report on drinking water. 2017. 3 Cairncross, S et al. 2010. Water, sanitation and hygiene for the prevention of diarrhoea. International Journal of Epidemiology 39: i193-i205. 4 WHO. 2015. Water, sanitation and hygiene for accelerating and sustaining progress on Neglected Tropical Diseases. A Global Strategy 2015-2020. 5 http://data.unicef.org/water-sanitation 6 https://washdata.org/ 7 Packaged water (bottled water and sachet water) and delivered water (tanker truck and cart with small drum/tank) are treated as improved based in new SDG definition.
Table WS 1.2 shows the amount of time taken per round trip to collect water for users of improved and unimproved sources. Household members using improved water sources located on premises or requiring up to and including 30 minutes per trip for water collection meet the SDG criteria for a ‘basic’ drinking water service.
Table WS.1.3 shows the sex and age of the household member usually responsible for water collection among household members without water sources on premises. Table WS 1.4 shows the average time spent each day by the household member mainly responsible for collecting drinking water.
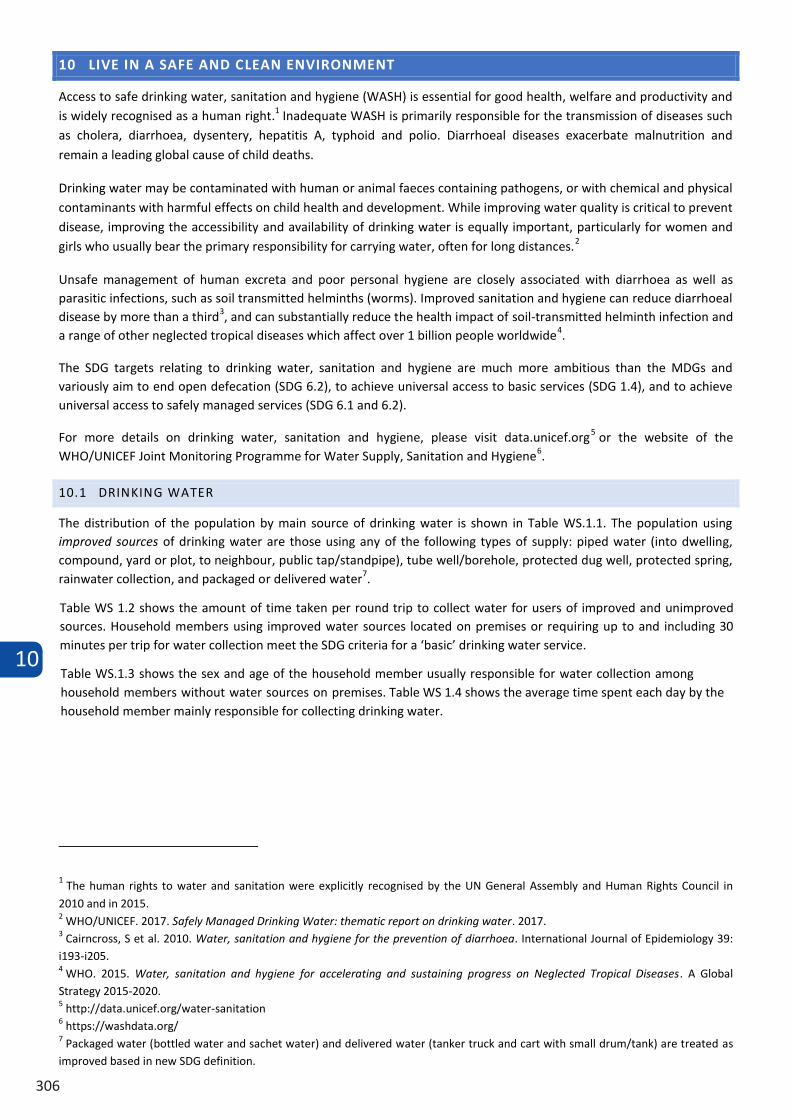
10
306
10 LIVE IN A SAFE AND CLEAN ENVIRONMENT
Access to safe drinking water, sanitation and hygiene (WASH) is essential for good health, welfare and productivity and is widely recognised as a human right.1 Inadequate WASH is primarily responsible for the transmission of diseases such as cholera, diarrhoea, dysentery, hepatitis A, typhoid and polio. Diarrhoeal diseases exacerbate malnutrition and remain a leading global cause of child deaths.
Drinking water may be contaminated with human or animal faeces containing pathogens, or with chemical and physical contaminants with harmful effects on child health and development. While improving water quality is critical to prevent disease, improving the accessibility and availability of drinking water is equally important, particularly for women and girls who usually bear the primary responsibility for carrying water, often for long distances.2
Unsafe management of human excreta and poor personal hygiene are closely associated with diarrhoea as well as parasitic infections, such as soil transmitted helminths (worms). Improved sanitation and hygiene can reduce diarrhoeal disease by more than a third3, and can substantially reduce the health impact of soil-transmitted helminth infection and a range of other neglected tropical diseases which affect over 1 billion people worldwide4.
The SDG targets relating to drinking water, sanitation and hygiene are much more ambitious than the MDGs and variously aim to end open defecation (SDG 6.2), to achieve universal access to basic services (SDG 1.4), and to achieve universal access to safely managed services (SDG 6.1 and 6.2).
For more details on drinking water, sanitation and hygiene, please visit data.unicef.org5 or the website of the WHO/UNICEF Joint Monitoring Programme for Water Supply, Sanitation and Hygiene6.
10.1 DRINKING WATER
The distribution of the population by main source of drinking water is shown in Table WS.1.1. The population using improved sources of drinking water are those using any of the following types of supply: piped water (into dwelling, compound, yard or plot, to neighbour, public tap/standpipe), tube well/borehole, protected dug well, protected spring, rainwater collection, and packaged or delivered water7.
1 The human rights to water and sanitation were explicitly recognised by the UN General Assembly and Human Rights Council in 2010 and in 2015. 2 WHO/UNICEF. 2017. Safely Managed Drinking Water: thematic report on drinking water. 2017. 3 Cairncross, S et al. 2010. Water, sanitation and hygiene for the prevention of diarrhoea. International Journal of Epidemiology 39: i193-i205. 4 WHO. 2015. Water, sanitation and hygiene for accelerating and sustaining progress on Neglected Tropical Diseases. A Global Strategy 2015-2020. 5 http://data.unicef.org/water-sanitation 6 https://washdata.org/ 7 Packaged water (bottled water and sachet water) and delivered water (tanker truck and cart with small drum/tank) are treated as improved based in new SDG definition.
Table WS 1.2 shows the amount of time taken per round trip to collect water for users of improved and unimproved sources. Household members using improved water sources located on premises or requiring up to and including 30 minutes per trip for water collection meet the SDG criteria for a ‘basic’ drinking water service.
Table WS.1.3 shows the sex and age of the household member usually responsible for water collection among household members without water sources on premises. Table WS 1.4 shows the average time spent each day by the household member mainly responsible for collecting drinking water.
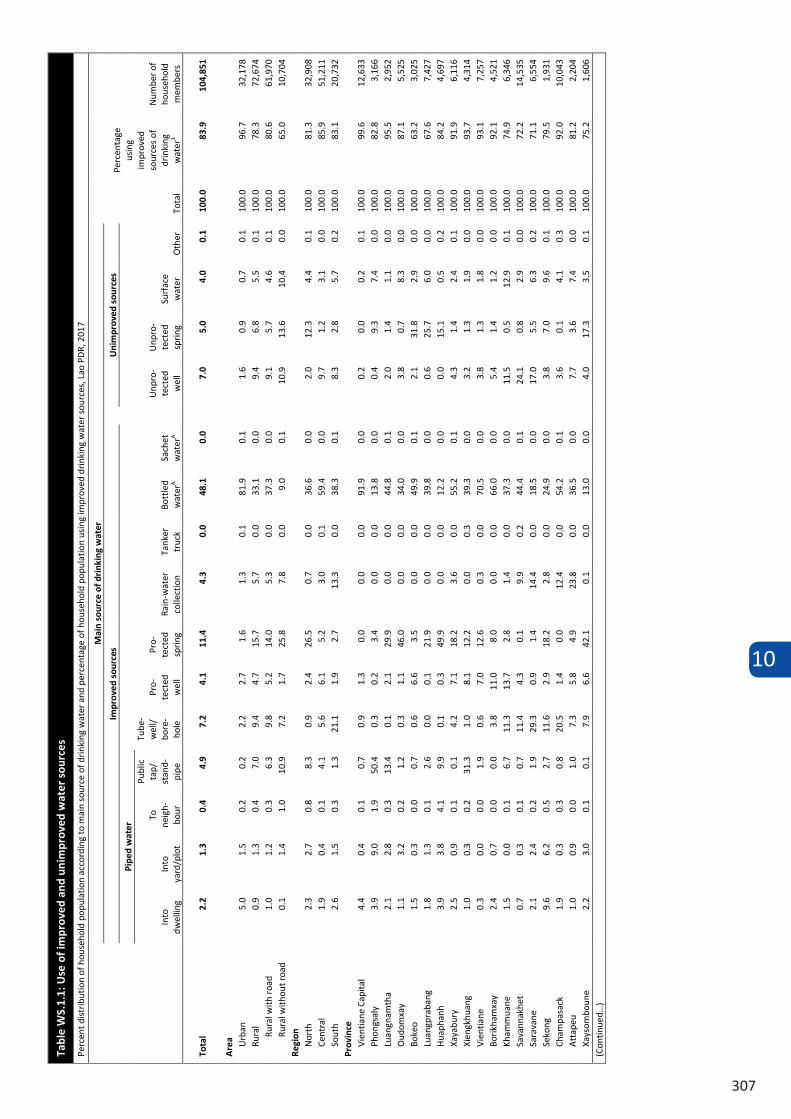
10
307
Tabl
e W
S.1.
1: U
se o
f im
prov
ed a
nd u
nim
prov
ed w
ater
sou
rces
Perc
ent d
istr
ibut
ion
of h
ouse
hold
pop
ulat
ion
acco
rdin
g to
mai
n so
urce
of d
rinki
ng w
ater
and
per
cent
age
of h
ouse
hold
pop
ulat
ion
usin
g im
prov
ed d
rinki
ng w
ater
sou
rces
, Lao
PD
R, 2
017
Mai
n so
urce
of d
rink
ing
wat
er
Tota
l
Perc
enta
ge
usin
g im
prov
ed
sour
ces
of
drin
king
w
ater
1
Num
ber o
f ho
useh
old
mem
bers
Impr
oved
sou
rces
U
nim
prov
ed s
ourc
es
Pipe
d w
ater
Tu
be-
wel
l/
bore
-ho
le
Pro-
tect
ed
wel
l
Pro-
tect
ed
sprin
g Ra
in-w
ater
co
llect
ion
Tank
er
truc
k Bo
ttle
d w
ater
A Sa
chet
w
ater
A
Unp
ro-
tect
ed
wel
l
Unp
ro-
tect
ed
sprin
g Su
rfac
e w
ater
O
ther
In
to
dwel
ling
Into
ya
rd/p
lot
To
neig
h-bo
ur
Publ
ic
tap/
st
and-
pipe
Tota
l 2.
2 1.
3 0.
4 4.
9 7.
2 4.
1 11
.4
4.3
0.0
48.1
0.
0 7.
0 5.
0 4.
0 0.
1 10
0.0
83.9
10
4,85
1
Are
a Urb
an
5.0
1.5
0.2
0.2
2.2
2.7
1.6
1.3
0.1
81.9
0.
1 1.
6 0.
9 0.
7 0.
1 10
0.0
96.7
32
,178
Ru
ral
0.9
1.3
0.4
7.0
9.4
4.7
15.7
5.
7 0.
0 33
.1
0.0
9.4
6.8
5.5
0.1
100.
0 78
.3
72,6
74
Rura
l with
roa
d 1.
0 1.
2 0.
3 6.
3 9.
8 5.
2 14
.0
5.3
0.0
37.3
0.
0 9.
1 5.
7 4.
6 0.
1 10
0.0
80.6
61
,970
Ru
ral w
ithou
t roa
d 0.
1 1.
4 1.
0 10
.9
7.2
1.7
25.8
7.
8 0.
0 9.
0 0.
1 10
.9
13.6
10
.4
0.0
100.
0 65
.0
10,7
04
Regi
on
Nor
th
2.3
2.7
0.8
8.3
0.9
2.4
26.5
0.
7 0.
0 36
.6
0.0
2.0
12.3
4.
4 0.
1 10
0.0
81.3
32
,908
Ce
ntra
l 1.
9 0.
4 0.
1 4.
1 5.
6 6.
1 5.
2 3.
0 0.
1 59
.4
0.0
9.7
1.2
3.1
0.0
100.
0 85
.9
51,2
11
Sout
h 2.
6 1.
5 0.
3 1.
3 21
.1
1.9
2.7
13.3
0.
0 38
.3
0.1
8.3
2.8
5.7
0.2
100.
0 83
.1
20,7
32
Prov
ince
Vi
entia
ne C
apita
l 4.
4 0.
4 0.
1 0.
7 0.
9 1.
3 0.
0 0.
0 0.
0 91
.9
0.0
0.2
0.0
0.2
0.1
100.
0 99
.6
12,6
33
Phon
gsal
y 3.
9 9.
0 1.
9 50
.4
0.3
0.2
3.4
0.0
0.0
13.8
0.
0 0.
4 9.
3 7.
4 0.
0 10
0.0
82.8
3,
166
Luan
gnam
tha
2.1
2.8
0.3
13.4
0.
1 2.
1 29
.9
0.0
0.0
44.8
0.
1 2.
0 1.
4 1.
1 0.
0 10
0.0
95.5
2,
952
Oud
omxa
y 1.
1 3.
2 0.
2 1.
2 0.
3 1.
1 46
.0
0.0
0.0
34.0
0.
0 3.
8 0.
7 8.
3 0.
0 10
0.0
87.1
5,
525
Boke
o 1.
5 0.
3 0.
0 0.
7 0.
6 6.
6 3.
5 0.
0 0.
0 49
.9
0.1
2.1
31.8
2.
9 0.
0 10
0.0
63.2
3,
025
Luan
gpra
bang
1.
8 1.
3 0.
1 2.
6 0.
0 0.
1 21
.9
0.0
0.0
39.8
0.
0 0.
6 25
.7
6.0
0.0
100.
0 67
.6
7,42
7 H
uaph
anh
3.9
3.8
4.1
9.9
0.1
0.3
49.9
0.
0 0.
0 12
.2
0.0
0.0
15.1
0.
5 0.
2 10
0.0
84.2
4,
697
Xaya
bury
2.
5 0.
9 0.
1 0.
1 4.
2 7.
1 18
.2
3.6
0.0
55.2
0.
1 4.
3 1.
4 2.
4 0.
1 10
0.0
91.9
6,
116
Xien
gkhu
ang
1.0
0.3
0.2
31.3
1.
0 8.
1 12
.2
0.0
0.3
39.3
0.
0 3.
2 1.
3 1.
9 0.
0 10
0.0
93.7
4,
314
Vien
tiane
0.
3 0.
0 0.
0 1.
9 0.
6 7.
0 12
.6
0.3
0.0
70.5
0.
0 3.
8 1.
3 1.
8 0.
0 10
0.0
93.1
7,
257
Borik
ham
xay
2.4
0.7
0.0
0.0
3.8
11.0
8.
0 0.
0 0.
0 66
.0
0.0
5.4
1.4
1.2
0.0
100.
0 92
.1
4,52
1 Kh
amm
uane
1.
5 0.
0 0.
1 6.
7 11
.3
13.7
2.
8 1.
4 0.
0 37
.3
0.0
11.5
0.
5 12
.9
0.1
100.
0 74
.9
6,34
6 Sa
vann
akhe
t 0.
7 0.
3 0.
1 0.
7 11
.4
4.3
0.1
9.9
0.2
44.4
0.
1 24
.1
0.8
2.9
0.0
100.
0 72
.2
14,5
35
Sara
vane
2.
1 2.
4 0.
2 1.
9 29
.3
0.9
1.4
14.4
0.
0 18
.5
0.0
17.0
5.
5 6.
3 0.
2 10
0.0
71.1
6,
554
Seko
ng
9.6
6.2
0.5
2.7
11.6
2.
9 18
.2
2.8
0.0
24.9
0.
0 3.
8 7.
0 9.
6 0.
1 10
0.0
79.5
1,
931
Cham
pasa
ck
1.9
0.3
0.3
0.8
20.5
1.
4 0.
0 12
.4
0.0
54.2
0.
1 3.
6 0.
1 4.
1 0.
3 10
0.0
92.0
10
,043
A
ttap
eu
1.0
0.9
0.0
1.0
7.3
5.8
4.9
23.8
0.
0 36
.5
0.0
7.7
3.6
7.4
0.0
100.
0 81
.2
2,20
4 Xa
ysom
boun
e 2.
2 3.
0 0.
1 0.
1 7.
9 6.
6 42
.1
0.1
0.0
13.0
0.
0 4.
0 17
.3
3.5
0.1
100.
0 75
.2
1,60
6 (C
ontin
ued…
)
Tabl
e W
S.1.
1 (c
onti
nued
): U
se o
f im
prov
ed a
nd u
nim
prov
ed w
ater
sou
rces
Perc
ent d
istr
ibut
ion
of h
ouse
hold
pop
ulat
ion
acco
rdin
g to
mai
n so
urce
of d
rinki
ng w
ater
and
per
cent
age
of h
ouse
hold
pop
ulat
ion
usin
g im
prov
ed d
rinki
ng w
ater
sou
rces
, Lao
PD
R, 2
017
Mai
n so
urce
of d
rink
ing
wat
er
Tota
l
Perc
enta
ge
usin
g im
prov
ed
sour
ces
of
drin
king
w
ater
1
Num
ber
of
hous
ehol
d m
embe
rs
Impr
oved
sou
rces
U
nim
prov
ed s
ourc
es
Pipe
d w
ater
Tu
be-
wel
l/
bore
-ho
le
Pro-
tect
ed
wel
l
Pro-
tect
ed
sprin
g
Rain
-w
ater
co
llect
ion
Tank
er
truc
k Bo
ttle
d w
ater
A Sa
chet
w
ater
A
Unp
ro-
tect
ed
wel
l
Unp
ro-
tect
ed
sprin
g Su
rfac
e w
ater
O
ther
In
to
dwel
ling
Into
ya
rd/p
lot
To
neig
h-bo
ur
Publ
ic
tap/
st
and-
pipe
Ed
ucat
ion
of h
ouse
hold
hea
d
Non
e or
ECE
1.
5 1.
7 0.
2 7.
3 9.
8 5.
1 15
.4
5.1
0.1
23.5
0.
0 14
.1
8.8
7.3
0.0
100.
0 69
.7
17,6
53
Prim
ary
1.5
1.5
0.5
5.7
8.6
4.5
14.2
5.
5 0.
0 39
.5
0.1
8.1
5.6
4.7
0.1
100.
0 81
.5
46,5
28
Low
er s
econ
dary
2.
4 1.
1 0.
4 4.
7 6.
0 3.
8 9.
6 3.
8 0.
1 57
.3
0.0
4.3
4.0
2.5
0.0
100.
0 89
.2
19,7
09
Upp
er s
econ
dary
2.
5 0.
9 0.
3 1.
9 4.
5 3.
9 4.
1 1.
5 0.
0 75
.7
0.2
1.7
1.6
1.3
0.0
100.
0 95
.4
7,04
0 Po
st s
econ
dary
/ N
on
tert
iary
3.
8 0.
6 0.
1 1.
2 3.
6 2.
2 3.
9 2.
7 0.
1 77
.0
0.0
1.5
1.9
1.3
0.2
100.
0 95
.1
6,23
2
Hig
her
5.6
0.8
0.1
0.9
1.1
1.8
2.2
0.8
0.0
84.7
0.
0 0.
5 0.
9 0.
5 0.
1 10
0.0
98.0
7,
552
DK/
Mis
sing
5.
7 0.
0 3.
3 0.
0 0.
0 9.
1 4.
8 7.
8 0.
0 65
.0
0.0
0.0
0.8
3.4
0.0
100.
0 95
.7
138
Ethn
o-lin
guis
tic
grou
p
of h
ouse
hold
hea
d La
o-Ta
i 2.
4 0.
7 0.
1 2.
1 7.
4 3.
6 4.
0 5.
6 0.
1 65
.4
0.1
4.9
1.8
1.7
0.1
100.
0 91
.5
65,3
26
Mon
-Khm
er
1.2
1.8
0.8
6.5
9.3
4.1
22.7
3.
2 0.
0 17
.9
0.0
14.0
10
.3
8.1
0.1
100.
0 67
.5
25,3
33
Hm
ong-
Mie
n 2.
4 2.
8 0.
5 10
.8
2.3
8.2
30.7
0.
2 0.
0 20
.2
0.0
5.0
10.8
6.
1 0.
0 10
0.0
78.1
10
,255
Chin
ese-
Tibe
tan
3.2
5.6
1.1
33.0
0.
2 0.
7 12
.5
0.0
0.0
23.9
0.
0 0.
4 11
.0
8.5
0.0
100.
0 80
.2
2,88
6
Oth
er, D
K, M
issi
ng
5.0
0.8
0.8
7.2
14.3
4.
2 4.
5 2.
0 0.
0 37
.7
0.0
7.3
2.2
13.8
0.
0 10
0.0
76.6
1,
052
Wea
lth
inde
x qu
inti
le
Poor
est
0.4
1.4
0.6
12.9
9.
8 3.
2 24
.7
3.5
0.0
1.8
0.0
18.3
11
.5
11.8
0.
0 10
0.0
58.4
20
,968
Seco
nd
2.0
2.8
0.9
7.2
12.6
6.
2 21
.6
7.5
0.1
14.2
0.
0 11
.1
7.9
5.7
0.1
100.
0 75
.1
20,9
71
Mid
dle
1.9
1.6
0.2
3.5
8.7
6.9
8.8
8.1
0.1
49.0
0.
1 4.
3 4.
5 2.
2 0.
0 10
0.0
89.0
20
,970
Four
th
1.9
0.7
0.0
0.8
3.7
3.6
1.6
2.4
0.0
82.4
0.
1 1.
1 1.
1 0.
3 0.
1 10
0.0
97.4
20
,969
Rich
est
4.4
0.1
0.0
0.0
1.1
0.7
0.2
0.2
0.0
93.1
0.
0 0.
1 0.
1 0.
0 0.
1 10
0.0
99.8
20
,973
1
MIC
S in
dica
tor
WS.
1 - U
se o
f im
prov
ed d
rink
ing
wat
er s
ourc
es
A D
eliv
ered
and
pac
kage
d w
ater
con
side
red
impr
oved
sou
rces
of d
rinki
ng w
ater
bas
ed o
n ne
w S
DG
def
initi
on.
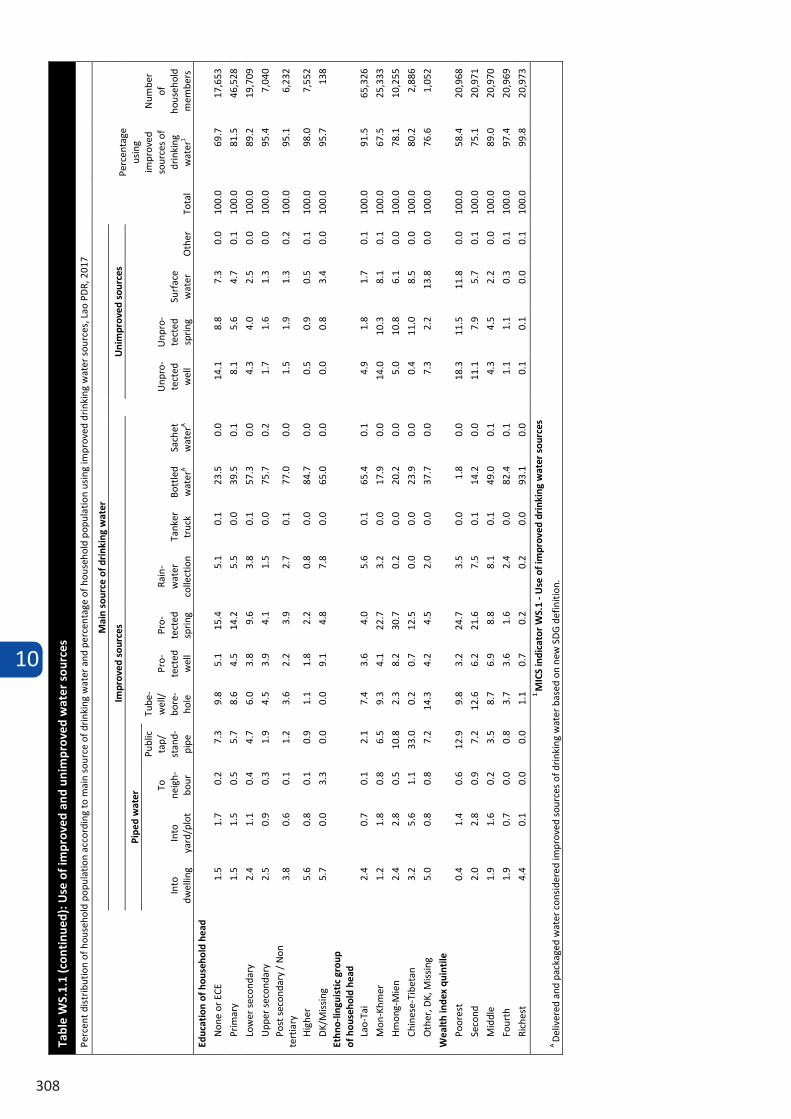
10
308
Tabl
e W
S.1.
1 (c
onti
nued
): U
se o
f im
prov
ed a
nd u
nim
prov
ed w
ater
sou
rces
Perc
ent d
istr
ibut
ion
of h
ouse
hold
pop
ulat
ion
acco
rdin
g to
mai
n so
urce
of d
rinki
ng w
ater
and
per
cent
age
of h
ouse
hold
pop
ulat
ion
usin
g im
prov
ed d
rinki
ng w
ater
sou
rces
, Lao
PD
R, 2
017
Mai
n so
urce
of d
rink
ing
wat
er
Tota
l
Perc
enta
ge
usin
g im
prov
ed
sour
ces
of
drin
king
w
ater
1
Num
ber
of
hous
ehol
d m
embe
rs
Impr
oved
sou
rces
U
nim
prov
ed s
ourc
es
Pipe
d w
ater
Tu
be-
wel
l/
bore
-ho
le
Pro-
tect
ed
wel
l
Pro-
tect
ed
sprin
g
Rain
-w
ater
co
llect
ion
Tank
er
truc
k Bo
ttle
d w
ater
A Sa
chet
w
ater
A
Unp
ro-
tect
ed
wel
l
Unp
ro-
tect
ed
sprin
g Su
rfac
e w
ater
O
ther
In
to
dwel
ling
Into
ya
rd/p
lot
To
neig
h-bo
ur
Publ
ic
tap/
st
and-
pipe
Ed
ucat
ion
of h
ouse
hold
hea
d
Non
e or
ECE
1.
5 1.
7 0.
2 7.
3 9.
8 5.
1 15
.4
5.1
0.1
23.5
0.
0 14
.1
8.8
7.3
0.0
100.
0 69
.7
17,6
53
Prim
ary
1.5
1.5
0.5
5.7
8.6
4.5
14.2
5.
5 0.
0 39
.5
0.1
8.1
5.6
4.7
0.1
100.
0 81
.5
46,5
28
Low
er s
econ
dary
2.
4 1.
1 0.
4 4.
7 6.
0 3.
8 9.
6 3.
8 0.
1 57
.3
0.0
4.3
4.0
2.5
0.0
100.
0 89
.2
19,7
09
Upp
er s
econ
dary
2.
5 0.
9 0.
3 1.
9 4.
5 3.
9 4.
1 1.
5 0.
0 75
.7
0.2
1.7
1.6
1.3
0.0
100.
0 95
.4
7,04
0 Po
st s
econ
dary
/ N
on
tert
iary
3.
8 0.
6 0.
1 1.
2 3.
6 2.
2 3.
9 2.
7 0.
1 77
.0
0.0
1.5
1.9
1.3
0.2
100.
0 95
.1
6,23
2
Hig
her
5.6
0.8
0.1
0.9
1.1
1.8
2.2
0.8
0.0
84.7
0.
0 0.
5 0.
9 0.
5 0.
1 10
0.0
98.0
7,
552
DK/
Mis
sing
5.
7 0.
0 3.
3 0.
0 0.
0 9.
1 4.
8 7.
8 0.
0 65
.0
0.0
0.0
0.8
3.4
0.0
100.
0 95
.7
138
Ethn
o-lin
guis
tic
grou
p
of h
ouse
hold
hea
d La
o-Ta
i 2.
4 0.
7 0.
1 2.
1 7.
4 3.
6 4.
0 5.
6 0.
1 65
.4
0.1
4.9
1.8
1.7
0.1
100.
0 91
.5
65,3
26
Mon
-Khm
er
1.2
1.8
0.8
6.5
9.3
4.1
22.7
3.
2 0.
0 17
.9
0.0
14.0
10
.3
8.1
0.1
100.
0 67
.5
25,3
33
Hm
ong-
Mie
n 2.
4 2.
8 0.
5 10
.8
2.3
8.2
30.7
0.
2 0.
0 20
.2
0.0
5.0
10.8
6.
1 0.
0 10
0.0
78.1
10
,255
Chin
ese-
Tibe
tan
3.2
5.6
1.1
33.0
0.
2 0.
7 12
.5
0.0
0.0
23.9
0.
0 0.
4 11
.0
8.5
0.0
100.
0 80
.2
2,88
6
Oth
er, D
K, M
issi
ng
5.0
0.8
0.8
7.2
14.3
4.
2 4.
5 2.
0 0.
0 37
.7
0.0
7.3
2.2
13.8
0.
0 10
0.0
76.6
1,
052
Wea
lth
inde
x qu
inti
le
Poor
est
0.4
1.4
0.6
12.9
9.
8 3.
2 24
.7
3.5
0.0
1.8
0.0
18.3
11
.5
11.8
0.
0 10
0.0
58.4
20
,968
Seco
nd
2.0
2.8
0.9
7.2
12.6
6.
2 21
.6
7.5
0.1
14.2
0.
0 11
.1
7.9
5.7
0.1
100.
0 75
.1
20,9
71
Mid
dle
1.9
1.6
0.2
3.5
8.7
6.9
8.8
8.1
0.1
49.0
0.
1 4.
3 4.
5 2.
2 0.
0 10
0.0
89.0
20
,970
Four
th
1.9
0.7
0.0
0.8
3.7
3.6
1.6
2.4
0.0
82.4
0.
1 1.
1 1.
1 0.
3 0.
1 10
0.0
97.4
20
,969
Rich
est
4.4
0.1
0.0
0.0
1.1
0.7
0.2
0.2
0.0
93.1
0.
0 0.
1 0.
1 0.
0 0.
1 10
0.0
99.8
20
,973
1
MIC
S in
dica
tor
WS.
1 - U
se o
f im
prov
ed d
rink
ing
wat
er s
ourc
es
A D
eliv
ered
and
pac
kage
d w
ater
con
side
red
impr
oved
sou
rces
of d
rinki
ng w
ater
bas
ed o
n ne
w S
DG
def
initi
on.
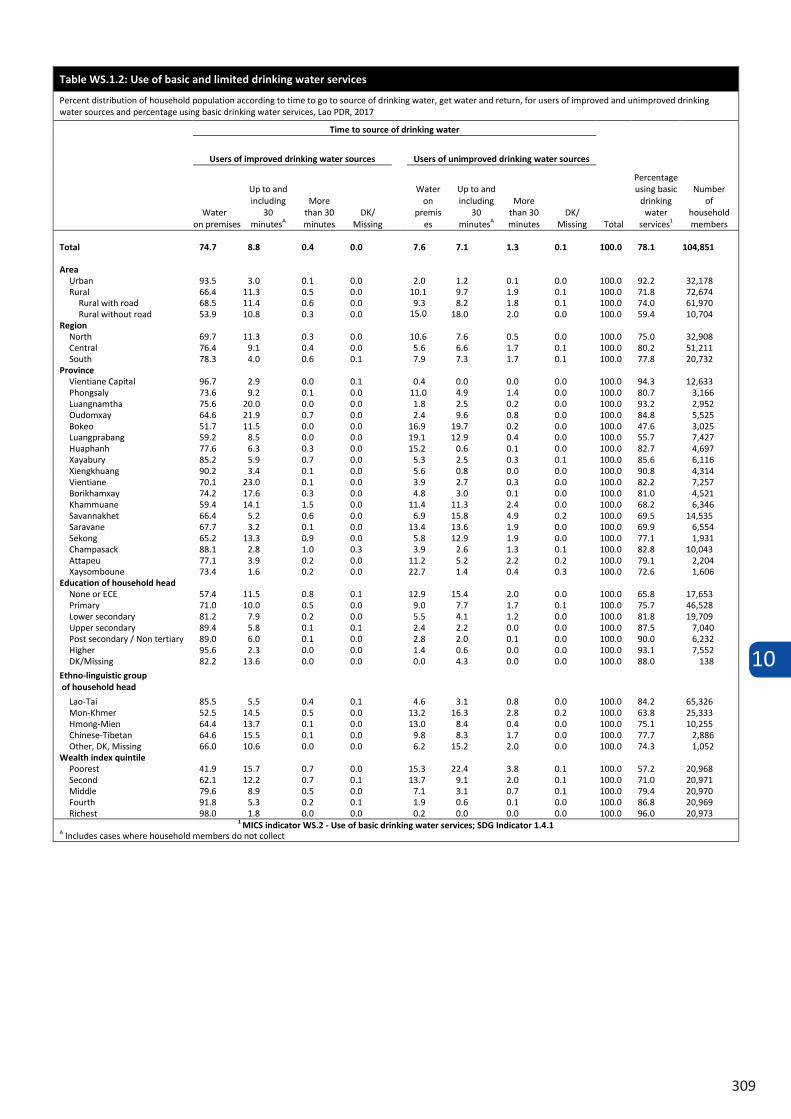
10
309
Table WS.1.2: Use of basic and limited drinking water services
Percent distribution of household population according to time to go to source of drinking water, get water and return, for users of improved and unimproved drinking water sources and percentage using basic drinking water services, Lao PDR, 2017
Time to source of drinking water
Total
Percentage using basic
drinking water
services1
Number of
household members
Users of improved drinking water sources Users of unimproved drinking water sources
Water on premises
Up to and including
30 minutesA
More than 30 minutes
DK/ Missing
Water on
premises
Up to and including
30 minutesA
More than 30 minutes
DK/ Missing
Total 74.7 8.8 0.4 0.0 7.6 7.1 1.3 0.1 100.0 78.1 104,851
Area Urban 93.5 3.0 0.1 0.0 2.0 1.2 0.1 0.0 100.0 92.2 32,178 Rural 66.4 11.3 0.5 0.0 10.1 9.7 1.9 0.1 100.0 71.8 72,674
Rural with road 68.5 11.4 0.6 0.0 9.3 8.2 1.8 0.1 100.0 74.0 61,970 Rural without road 53.9 10.8 0.3 0.0 15.0 18.0 2.0 0.0 100.0 59.4 10,704
Region North 69.7 11.3 0.3 0.0 10.6 7.6 0.5 0.0 100.0 75.0 32,908 Central 76.4 9.1 0.4 0.0 5.6 6.6 1.7 0.1 100.0 80.2 51,211 South 78.3 4.0 0.6 0.1 7.9 7.3 1.7 0.1 100.0 77.8 20,732
Province Vientiane Capital 96.7 2.9 0.0 0.1 0.4 0.0 0.0 0.0 100.0 94.3 12,633 Phongsaly 73.6 9.2 0.1 0.0 11.0 4.9 1.4 0.0 100.0 80.7 3,166 Luangnamtha 75.6 20.0 0.0 0.0 1.8 2.5 0.2 0.0 100.0 93.2 2,952 Oudomxay 64.6 21.9 0.7 0.0 2.4 9.6 0.8 0.0 100.0 84.8 5,525 Bokeo 51.7 11.5 0.0 0.0 16.9 19.7 0.2 0.0 100.0 47.6 3,025 Luangprabang 59.2 8.5 0.0 0.0 19.1 12.9 0.4 0.0 100.0 55.7 7,427 Huaphanh 77.6 6.3 0.3 0.0 15.2 0.6 0.1 0.0 100.0 82.7 4,697 Xayabury 85.2 5.9 0.7 0.0 5.3 2.5 0.3 0.1 100.0 85.6 6,116 Xiengkhuang 90.2 3.4 0.1 0.0 5.6 0.8 0.0 0.0 100.0 90.8 4,314 Vientiane 70.1 23.0 0.1 0.0 3.9 2.7 0.3 0.0 100.0 82.2 7,257 Borikhamxay 74.2 17.6 0.3 0.0 4.8 3.0 0.1 0.0 100.0 81.0 4,521 Khammuane 59.4 14.1 1.5 0.0 11.4 11.3 2.4 0.0 100.0 68.2 6,346 Savannakhet 66.4 5.2 0.6 0.0 6.9 15.8 4.9 0.2 100.0 69.5 14,535 Saravane 67.7 3.2 0.1 0.0 13.4 13.6 1.9 0.0 100.0 69.9 6,554 Sekong 65.2 13.3 0.9 0.0 5.8 12.9 1.9 0.0 100.0 77.1 1,931 Champasack 88.1 2.8 1.0 0.3 3.9 2.6 1.3 0.1 100.0 82.8 10,043 Attapeu 77.1 3.9 0.2 0.0 11.2 5.2 2.2 0.2 100.0 79.1 2,204 Xaysomboune 73.4 1.6 0.2 0.0 22.7 1.4 0.4 0.3 100.0 72.6 1,606
Education of household head None or ECE 57.4 11.5 0.8 0.1 12.9 15.4 2.0 0.0 100.0 65.8 17,653 Primary 71.0 10.0 0.5 0.0 9.0 7.7 1.7 0.1 100.0 75.7 46,528 Lower secondary 81.2 7.9 0.2 0.0 5.5 4.1 1.2 0.0 100.0 81.8 19,709 Upper secondary 89.4 5.8 0.1 0.1 2.4 2.2 0.0 0.0 100.0 87.5 7,040 Post secondary / Non tertiary 89.0 6.0 0.1 0.0 2.8 2.0 0.1 0.0 100.0 90.0 6,232 Higher 95.6 2.3 0.0 0.0 1.4 0.6 0.0 0.0 100.0 93.1 7,552 DK/Missing 82.2 13.6 0.0 0.0 0.0 4.3 0.0 0.0 100.0 88.0 138
Ethno-linguistic group of household head
Lao-Tai 85.5 5.5 0.4 0.1 4.6 3.1 0.8 0.0 100.0 84.2 65,326 Mon-Khmer 52.5 14.5 0.5 0.0 13.2 16.3 2.8 0.2 100.0 63.8 25,333 Hmong-Mien 64.4 13.7 0.1 0.0 13.0 8.4 0.4 0.0 100.0 75.1 10,255 Chinese-Tibetan 64.6 15.5 0.1 0.0 9.8 8.3 1.7 0.0 100.0 77.7 2,886 Other, DK, Missing 66.0 10.6 0.0 0.0 6.2 15.2 2.0 0.0 100.0 74.3 1,052
Wealth index quintile Poorest 41.9 15.7 0.7 0.0 15.3 22.4 3.8 0.1 100.0 57.2 20,968 Second 62.1 12.2 0.7 0.1 13.7 9.1 2.0 0.1 100.0 71.0 20,971 Middle 79.6 8.9 0.5 0.0 7.1 3.1 0.7 0.1 100.0 79.4 20,970 Fourth 91.8 5.3 0.2 0.1 1.9 0.6 0.1 0.0 100.0 86.8 20,969 Richest 98.0 1.8 0.0 0.0 0.2 0.0 0.0 0.0 100.0 96.0 20,973
1 MICS indicator WS.2 - Use of basic drinking water services; SDG Indicator 1.4.1 A Includes cases where household members do not collect
Tabl
e W
S.1.
3: P
erso
n co
llect
ing
wat
er
Perc
enta
ge o
f hou
seho
ld m
embe
rs w
ithou
t drin
king
wat
er o
n pr
emis
es, a
nd p
erce
nt d
istr
ibut
ion
of h
ouse
hold
mem
bers
with
out d
rink
ing
wat
er o
n pr
emis
es a
ccor
ding
to th
e pe
rson
usu
ally
col
lect
ing
drin
king
wat
er
used
in th
e ho
useh
old,
Lao
PD
R, 2
017
Perc
enta
ge o
f ho
useh
old
mem
bers
w
ithou
t dri
nkin
g w
ater
on
prem
ises
Num
ber o
f ho
useh
old
mem
bers
Pers
on u
sual
ly c
olle
ctin
g dr
inki
ng w
ater
Tota
l
Num
ber o
f hou
seho
ld m
embe
rs
with
out d
rink
ing
wat
er o
n pr
emis
es
Wom
an (1
5+)
Man
(15+
) Fe
mal
e ch
ild
unde
r age
15
Mal
e ch
ild
unde
r age
15
DK/
Mis
sing
/ M
embe
rs d
o no
t co
llect
Tota
l 17
.7
104,
851
48.7
19
.8
9.4
2.9
19.2
10
0.0
18,5
27
Are
a Urb
an
4.5
32,1
78
29.1
28
.2
3.8
1.8
37.0
10
0.0
1,45
4 Ru
ral
23.5
72
,674
50
.3
19.1
9.
9 2.
9 17
.7
100.
0 17
,072
Ru
ral w
ith r
oad
22.2
61
,970
47
.2
19.9
9.
9 3.
1 19
.8
100.
0 13
,748
Ru
ral w
ithou
t roa
d 31
.1
10,7
04
63.3
15
.8
9.6
2.2
9.1
100.
0 3,
324
Regi
on
Nor
th
19.7
32
,908
60
.4
12.5
11
.4
3.2
12.5
10
0.0
6,47
2 Ce
ntra
l 17
.9
51,2
11
39.4
22
.4
8.9
2.9
26.4
10
0.0
9,19
2 So
uth
13.8
20
,732
52
.1
28.2
6.
3 2.
1 11
.3
100.
0 2,
863
Prov
ince
Vi
entia
ne C
apita
l 3.
0 12
,633
8.
5 35
.1
0.0
1.1
55.3
10
0.0
373
Phon
gsal
y 15
.5
3,16
6 71
.1
5.3
15.7
4.
3 3.
7 10
0.0
491
Luan
gnam
tha
22.6
2,
952
66.6
11
.4
15.9
3.
7 2.
4 10
0.0
668
Oud
omxa
y 33
.0
5,52
5 77
.6
7.6
11.1
3.
7 0.
0 10
0.0
1,82
1 Bo
keo
31.5
3,
025
34.6
7.
3 5.
6 2.
2 50
.4
100.
0 95
2 Lu
angp
raba
ng
21.8
7,
427
51.8
11
.1
15.6
3.
4 18
.2
100.
0 1,
619
Hua
phan
h 7.
2 4,
697
75.6
10
.6
10.7
3.
2 0.
0 10
0.0
340
Xaya
bury
9.
5 6,
116
47.2
48
.7
2.3
1.1
0.7
100.
0 58
1 Xi
engk
huan
g 4.
3 4,
314
27.5
48
.8
4.1
0.0
19.5
10
0.0
184
Vien
tiane
26
.0
7,25
7 33
.8
13.9
10
.0
4.0
38.3
10
0.0
1,88
9 Bo
rikha
mxa
y 21
.0
4,52
1 10
.2
9.0
1.3
0.8
78.7
10
0.0
951
Kham
mua
ne
29.2
6,
346
33.3
23
.9
8.2
1.9
32.7
10
0.0
1,85
1 Sa
vann
akhe
t 26
.7
14,5
35
56.0
26
.3
11.9
3.
5 2.
3 10
0.0
3,88
1 Sa
rava
ne
18.9
6,
554
77.2
12
.6
7.6
0.8
1.7
100.
0 1,
236
Seko
ng
29.0
1,
931
42.3
26
.5
9.5
3.8
17.8
10
0.0
560
Cham
pasa
ck
8.1
10,0
43
19.7
54
.3
3.0
2.8
20.2
10
0.0
809
Att
apeu
11
.7
2,20
4 54
.3
24.4
3.
4 2.
5 15
.5
100.
0 25
9 Xa
ysom
boun
e 3.
9 1,
606
19.2
47
.7
1.5
8.1
23.5
10
0.0
63
(Con
tinue
d…)
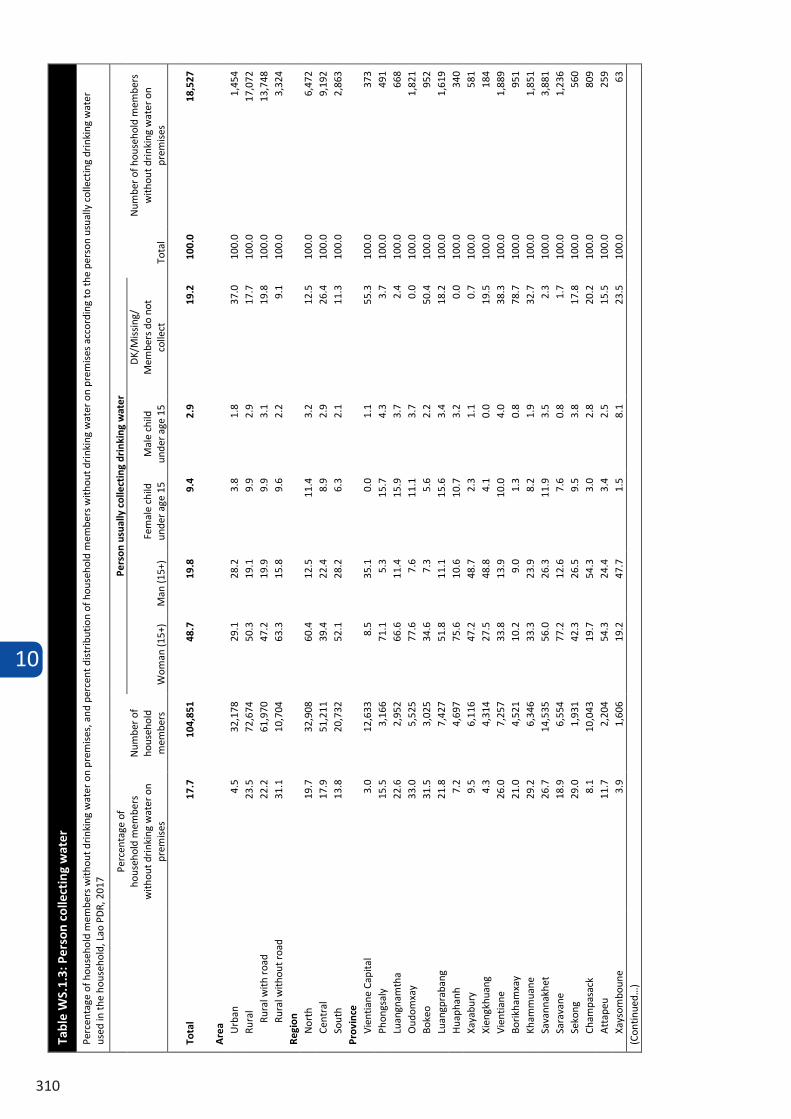
10
310
Tabl
e W
S.1.
3: P
erso
n co
llect
ing
wat
er
Perc
enta
ge o
f hou
seho
ld m
embe
rs w
ithou
t drin
king
wat
er o
n pr
emis
es, a
nd p
erce
nt d
istr
ibut
ion
of h
ouse
hold
mem
bers
with
out d
rink
ing
wat
er o
n pr
emis
es a
ccor
ding
to th
e pe
rson
usu
ally
col
lect
ing
drin
king
wat
er
used
in th
e ho
useh
old,
Lao
PD
R, 2
017
Perc
enta
ge o
f ho
useh
old
mem
bers
w
ithou
t dri
nkin
g w
ater
on
prem
ises
Num
ber o
f ho
useh
old
mem
bers
Pers
on u
sual
ly c
olle
ctin
g dr
inki
ng w
ater
Tota
l
Num
ber o
f hou
seho
ld m
embe
rs
with
out d
rink
ing
wat
er o
n pr
emis
es
Wom
an (1
5+)
Man
(15+
) Fe
mal
e ch
ild
unde
r age
15
Mal
e ch
ild
unde
r age
15
DK/
Mis
sing
/ M
embe
rs d
o no
t co
llect
Tota
l 17
.7
104,
851
48.7
19
.8
9.4
2.9
19.2
10
0.0
18,5
27
Are
a Urb
an
4.5
32,1
78
29.1
28
.2
3.8
1.8
37.0
10
0.0
1,45
4 Ru
ral
23.5
72
,674
50
.3
19.1
9.
9 2.
9 17
.7
100.
0 17
,072
Ru
ral w
ith r
oad
22.2
61
,970
47
.2
19.9
9.
9 3.
1 19
.8
100.
0 13
,748
Ru
ral w
ithou
t roa
d 31
.1
10,7
04
63.3
15
.8
9.6
2.2
9.1
100.
0 3,
324
Regi
on
Nor
th
19.7
32
,908
60
.4
12.5
11
.4
3.2
12.5
10
0.0
6,47
2 Ce
ntra
l 17
.9
51,2
11
39.4
22
.4
8.9
2.9
26.4
10
0.0
9,19
2 So
uth
13.8
20
,732
52
.1
28.2
6.
3 2.
1 11
.3
100.
0 2,
863
Prov
ince
Vi
entia
ne C
apita
l 3.
0 12
,633
8.
5 35
.1
0.0
1.1
55.3
10
0.0
373
Phon
gsal
y 15
.5
3,16
6 71
.1
5.3
15.7
4.
3 3.
7 10
0.0
491
Luan
gnam
tha
22.6
2,
952
66.6
11
.4
15.9
3.
7 2.
4 10
0.0
668
Oud
omxa
y 33
.0
5,52
5 77
.6
7.6
11.1
3.
7 0.
0 10
0.0
1,82
1 Bo
keo
31.5
3,
025
34.6
7.
3 5.
6 2.
2 50
.4
100.
0 95
2 Lu
angp
raba
ng
21.8
7,
427
51.8
11
.1
15.6
3.
4 18
.2
100.
0 1,
619
Hua
phan
h 7.
2 4,
697
75.6
10
.6
10.7
3.
2 0.
0 10
0.0
340
Xaya
bury
9.
5 6,
116
47.2
48
.7
2.3
1.1
0.7
100.
0 58
1 Xi
engk
huan
g 4.
3 4,
314
27.5
48
.8
4.1
0.0
19.5
10
0.0
184
Vien
tiane
26
.0
7,25
7 33
.8
13.9
10
.0
4.0
38.3
10
0.0
1,88
9 Bo
rikha
mxa
y 21
.0
4,52
1 10
.2
9.0
1.3
0.8
78.7
10
0.0
951
Kham
mua
ne
29.2
6,
346
33.3
23
.9
8.2
1.9
32.7
10
0.0
1,85
1 Sa
vann
akhe
t 26
.7
14,5
35
56.0
26
.3
11.9
3.
5 2.
3 10
0.0
3,88
1 Sa
rava
ne
18.9
6,
554
77.2
12
.6
7.6
0.8
1.7
100.
0 1,
236
Seko
ng
29.0
1,
931
42.3
26
.5
9.5
3.8
17.8
10
0.0
560
Cham
pasa
ck
8.1
10,0
43
19.7
54
.3
3.0
2.8
20.2
10
0.0
809
Att
apeu
11
.7
2,20
4 54
.3
24.4
3.
4 2.
5 15
.5
100.
0 25
9 Xa
ysom
boun
e 3.
9 1,
606
19.2
47
.7
1.5
8.1
23.5
10
0.0
63
(Con
tinue
d…)
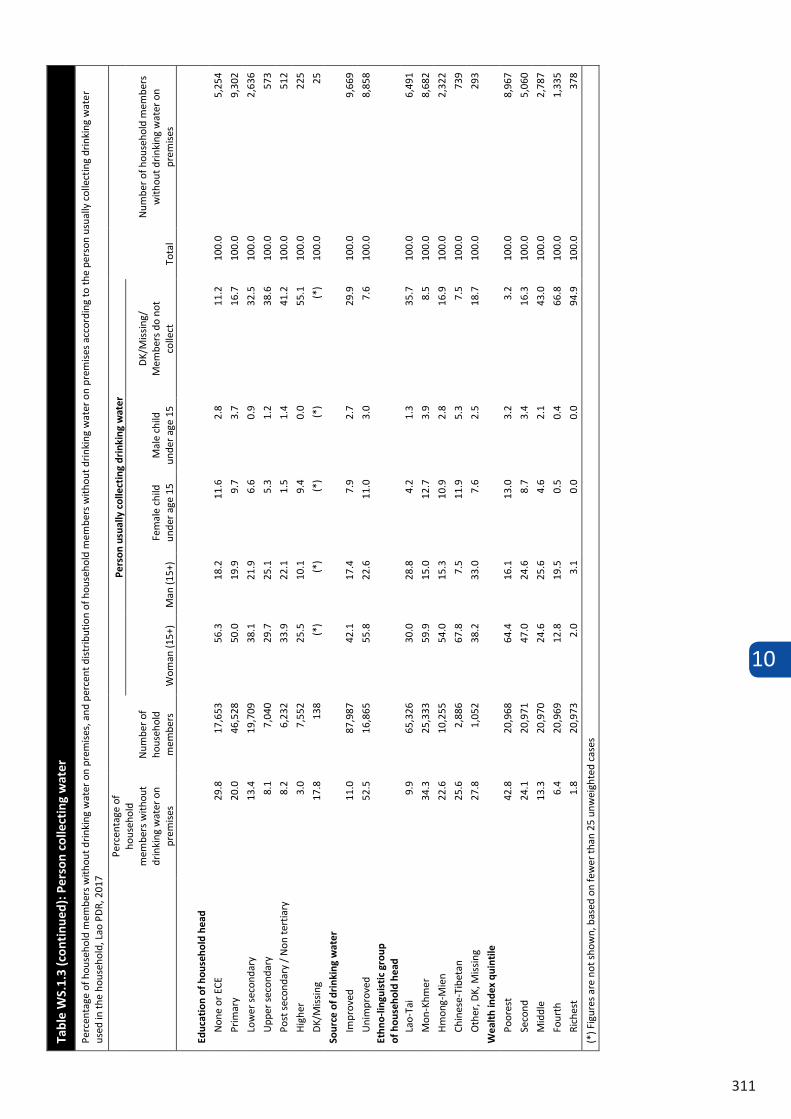
10
311
Tabl
e W
S.1.
3 (c
onti
nued
): P
erso
n co
llect
ing
wat
er
Perc
enta
ge o
f hou
seho
ld m
embe
rs w
ithou
t drin
king
wat
er o
n pr
emis
es, a
nd p
erce
nt d
istr
ibut
ion
of h
ouse
hold
mem
bers
with
out d
rinki
ng w
ater
on
prem
ises
acc
ordi
ng to
the
pers
on u
sual
ly c
olle
ctin
g dr
inki
ng w
ater
us
ed in
the
hous
ehol
d, L
ao P
DR,
201
7
Perc
enta
ge o
f ho
useh
old
mem
bers
with
out
drin
king
wat
er o
n pr
emis
es
Num
ber o
f ho
useh
old
mem
bers
Pers
on u
sual
ly c
olle
ctin
g dr
inki
ng w
ater
Tota
l
Num
ber o
f hou
seho
ld m
embe
rs
with
out d
rink
ing
wat
er o
n pr
emis
es
Wom
an (1
5+)
Man
(15+
) Fe
mal
e ch
ild
unde
r age
15
Mal
e ch
ild
unde
r age
15
DK/
Mis
sing
/ M
embe
rs d
o no
t co
llect
Educ
atio
n of
hou
seho
ld h
ead
Non
e or
ECE
29
.8
17,6
53
56.3
18
.2
11.6
2.
8 11
.2
100.
0 5,
254
Prim
ary
20.0
46
,528
50
.0
19.9
9.
7 3.
7 16
.7
100.
0 9,
302
Low
er s
econ
dary
13
.4
19,7
09
38.1
21
.9
6.6
0.9
32.5
10
0.0
2,63
6
Upp
er s
econ
dary
8.
1 7,
040
29.7
25
.1
5.3
1.2
38.6
10
0.0
573
Post
sec
onda
ry /
Non
tert
iary
8.
2 6,
232
33.9
22
.1
1.5
1.4
41.2
10
0.0
512
Hig
her
3.0
7,55
2 25
.5
10.1
9.
4 0.
0 55
.1
100.
0 22
5
DK/
Mis
sing
17
.8
138
(*)
(*)
(*)
(*)
(*)
100.
0 25
Sour
ce o
f dri
nkin
g w
ater
Impr
oved
11
.0
87,9
87
42.1
17
.4
7.9
2.7
29.9
10
0.0
9,66
9
Uni
mpr
oved
52
.5
16,8
65
55.8
22
.6
11.0
3.
0 7.
6 10
0.0
8,85
8 Et
hno-
lingu
isti
c gr
oup
of
hou
seho
ld h
ead
Lao-
Tai
9.9
65,3
26
30.0
28
.8
4.2
1.3
35.7
10
0.0
6,49
1
Mon
-Khm
er
34.3
25
,333
59
.9
15.0
12
.7
3.9
8.5
100.
0 8,
682
Hm
ong-
Mie
n 22
.6
10,2
55
54.0
15
.3
10.9
2.
8 16
.9
100.
0 2,
322
Chin
ese-
Tibe
tan
25.6
2,
886
67.8
7.
5 11
.9
5.3
7.5
100.
0 73
9
Oth
er, D
K, M
issi
ng
27.8
1,
052
38.2
33
.0
7.6
2.5
18.7
10
0.0
293
Wea
lth
inde
x qu
inti
le
Poor
est
42.8
20
,968
64
.4
16.1
13
.0
3.2
3.2
100.
0 8,
967
Seco
nd
24.1
20
,971
47
.0
24.6
8.
7 3.
4 16
.3
100.
0 5,
060
Mid
dle
13.3
20
,970
24
.6
25.6
4.
6 2.
1 43
.0
100.
0 2,
787
Four
th
6.4
20,9
69
12.8
19
.5
0.5
0.4
66.8
10
0.0
1,33
5
Rich
est
1.8
20,9
73
2.0
3.1
0.0
0.0
94.9
10
0.0
378
(*) F
igur
es a
re n
ot s
how
n, b
ased
on
few
er th
an 2
5 un
wei
ghte
d ca
ses
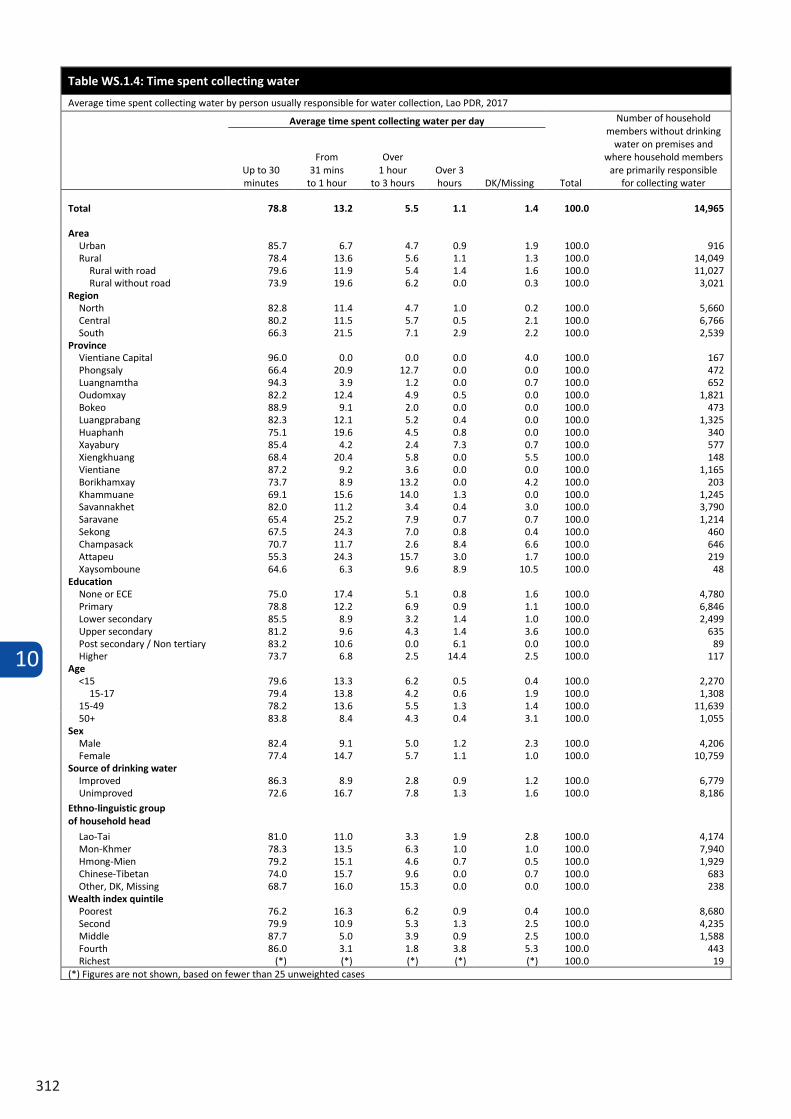
10
312
Table WS.1.4: Time spent collecting water
Average time spent collecting water by person usually responsible for water collection, Lao PDR, 2017
Average time spent collecting water per day
Total
Number of household members without drinking
water on premises and where household members
are primarily responsible for collecting water
Up to 30 minutes
From 31 mins
to 1 hour
Over 1 hour
to 3 hours Over 3 hours DK/Missing
Total 78.8 13.2 5.5 1.1 1.4 100.0 14,965
Area Urban 85.7 6.7 4.7 0.9 1.9 100.0 916 Rural 78.4 13.6 5.6 1.1 1.3 100.0 14,049
Rural with road 79.6 11.9 5.4 1.4 1.6 100.0 11,027 Rural without road 73.9 19.6 6.2 0.0 0.3 100.0 3,021
Region North 82.8 11.4 4.7 1.0 0.2 100.0 5,660 Central 80.2 11.5 5.7 0.5 2.1 100.0 6,766 South 66.3 21.5 7.1 2.9 2.2 100.0 2,539
Province Vientiane Capital 96.0 0.0 0.0 0.0 4.0 100.0 167 Phongsaly 66.4 20.9 12.7 0.0 0.0 100.0 472 Luangnamtha 94.3 3.9 1.2 0.0 0.7 100.0 652 Oudomxay 82.2 12.4 4.9 0.5 0.0 100.0 1,821 Bokeo 88.9 9.1 2.0 0.0 0.0 100.0 473 Luangprabang 82.3 12.1 5.2 0.4 0.0 100.0 1,325 Huaphanh 75.1 19.6 4.5 0.8 0.0 100.0 340 Xayabury 85.4 4.2 2.4 7.3 0.7 100.0 577 Xiengkhuang 68.4 20.4 5.8 0.0 5.5 100.0 148 Vientiane 87.2 9.2 3.6 0.0 0.0 100.0 1,165 Borikhamxay 73.7 8.9 13.2 0.0 4.2 100.0 203 Khammuane 69.1 15.6 14.0 1.3 0.0 100.0 1,245 Savannakhet 82.0 11.2 3.4 0.4 3.0 100.0 3,790 Saravane 65.4 25.2 7.9 0.7 0.7 100.0 1,214 Sekong 67.5 24.3 7.0 0.8 0.4 100.0 460 Champasack 70.7 11.7 2.6 8.4 6.6 100.0 646 Attapeu 55.3 24.3 15.7 3.0 1.7 100.0 219 Xaysomboune 64.6 6.3 9.6 8.9 10.5 100.0 48
Education None or ECE 75.0 17.4 5.1 0.8 1.6 100.0 4,780 Primary 78.8 12.2 6.9 0.9 1.1 100.0 6,846 Lower secondary 85.5 8.9 3.2 1.4 1.0 100.0 2,499 Upper secondary 81.2 9.6 4.3 1.4 3.6 100.0 635 Post secondary / Non tertiary 83.2 10.6 0.0 6.1 0.0 100.0 89 Higher 73.7 6.8 2.5 14.4 2.5 100.0 117
Age <15 79.6 13.3 6.2 0.5 0.4 100.0 2,270
15-17 79.4 13.8 4.2 0.6 1.9 100.0 1,308 15-49 78.2 13.6 5.5 1.3 1.4 100.0 11,639 50+ 83.8 8.4 4.3 0.4 3.1 100.0 1,055
Sex Male 82.4 9.1 5.0 1.2 2.3 100.0 4,206 Female 77.4 14.7 5.7 1.1 1.0 100.0 10,759
Source of drinking water Improved 86.3 8.9 2.8 0.9 1.2 100.0 6,779 Unimproved 72.6 16.7 7.8 1.3 1.6 100.0 8,186
Ethno-linguistic group of household head
Lao-Tai 81.0 11.0 3.3 1.9 2.8 100.0 4,174 Mon-Khmer 78.3 13.5 6.3 1.0 1.0 100.0 7,940 Hmong-Mien 79.2 15.1 4.6 0.7 0.5 100.0 1,929 Chinese-Tibetan 74.0 15.7 9.6 0.0 0.7 100.0 683 Other, DK, Missing 68.7 16.0 15.3 0.0 0.0 100.0 238
Wealth index quintile Poorest 76.2 16.3 6.2 0.9 0.4 100.0 8,680 Second 79.9 10.9 5.3 1.3 2.5 100.0 4,235 Middle 87.7 5.0 3.9 0.9 2.5 100.0 1,588 Fourth 86.0 3.1 1.8 3.8 5.3 100.0 443 Richest (*) (*) (*) (*) (*) 100.0 19
(*) Figures are not shown, based on fewer than 25 unweighted cases
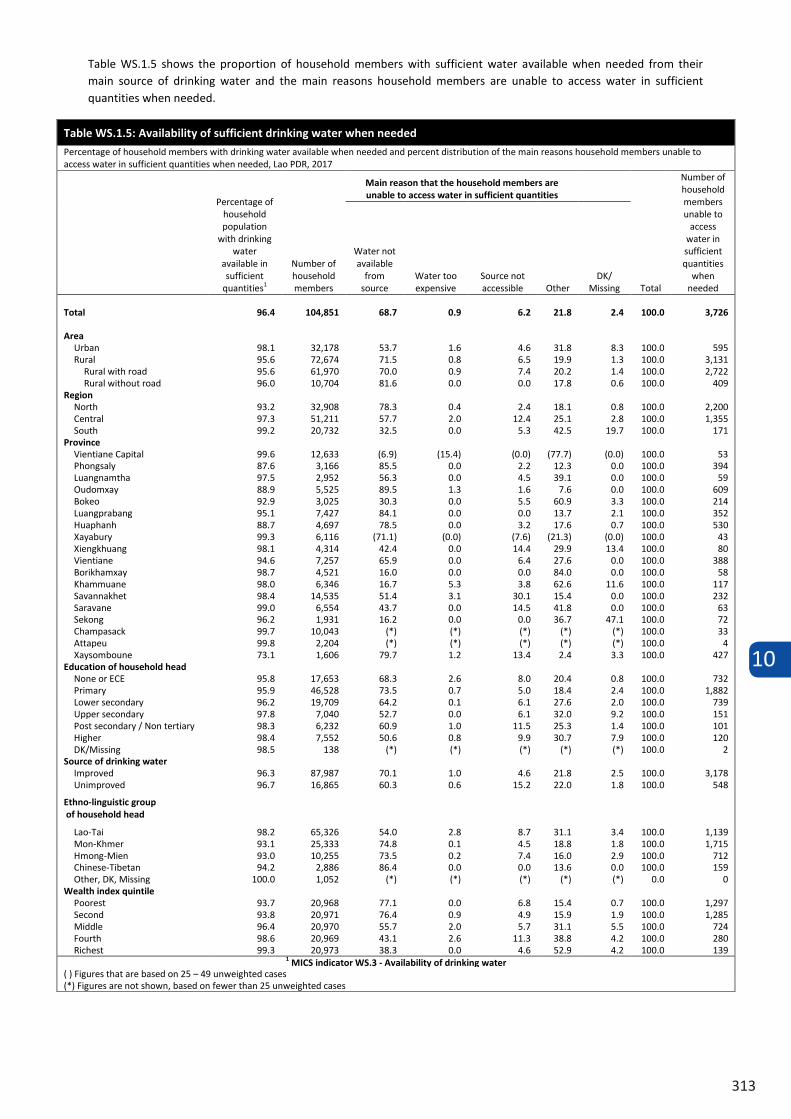
10
313
Table WS.1.5 shows the proportion of household members with sufficient water available when needed from their main source of drinking water and the main reasons household members are unable to access water in sufficient quantities when needed.
Table WS.1.5: Availability of sufficient drinking water when needed
Percentage of household members with drinking water available when needed and percent distribution of the main reasons household members unable to access water in sufficient quantities when needed, Lao PDR, 2017
Percentage of household population
with drinking water
available in sufficient
quantities1
Number of household members
Main reason that the household members are unable to access water in sufficient quantities
Total
Number of household members unable to
access water in sufficient quantities
when needed
Water not available
from source
Water too expensive
Source not accessible Other
DK/ Missing
Total 96.4 104,851 68.7 0.9 6.2 21.8 2.4 100.0 3,726
Area Urban 98.1 32,178 53.7 1.6 4.6 31.8 8.3 100.0 595 Rural 95.6 72,674 71.5 0.8 6.5 19.9 1.3 100.0 3,131
Rural with road 95.6 61,970 70.0 0.9 7.4 20.2 1.4 100.0 2,722 Rural without road 96.0 10,704 81.6 0.0 0.0 17.8 0.6 100.0 409
Region North 93.2 32,908 78.3 0.4 2.4 18.1 0.8 100.0 2,200 Central 97.3 51,211 57.7 2.0 12.4 25.1 2.8 100.0 1,355 South 99.2 20,732 32.5 0.0 5.3 42.5 19.7 100.0 171
Province Vientiane Capital 99.6 12,633 (6.9) (15.4) (0.0) (77.7) (0.0) 100.0 53 Phongsaly 87.6 3,166 85.5 0.0 2.2 12.3 0.0 100.0 394 Luangnamtha 97.5 2,952 56.3 0.0 4.5 39.1 0.0 100.0 59 Oudomxay 88.9 5,525 89.5 1.3 1.6 7.6 0.0 100.0 609 Bokeo 92.9 3,025 30.3 0.0 5.5 60.9 3.3 100.0 214 Luangprabang 95.1 7,427 84.1 0.0 0.0 13.7 2.1 100.0 352 Huaphanh 88.7 4,697 78.5 0.0 3.2 17.6 0.7 100.0 530 Xayabury 99.3 6,116 (71.1) (0.0) (7.6) (21.3) (0.0) 100.0 43 Xiengkhuang 98.1 4,314 42.4 0.0 14.4 29.9 13.4 100.0 80 Vientiane 94.6 7,257 65.9 0.0 6.4 27.6 0.0 100.0 388 Borikhamxay 98.7 4,521 16.0 0.0 0.0 84.0 0.0 100.0 58 Khammuane 98.0 6,346 16.7 5.3 3.8 62.6 11.6 100.0 117 Savannakhet 98.4 14,535 51.4 3.1 30.1 15.4 0.0 100.0 232 Saravane 99.0 6,554 43.7 0.0 14.5 41.8 0.0 100.0 63 Sekong 96.2 1,931 16.2 0.0 0.0 36.7 47.1 100.0 72 Champasack 99.7 10,043 (*) (*) (*) (*) (*) 100.0 33 Attapeu 99.8 2,204 (*) (*) (*) (*) (*) 100.0 4 Xaysomboune 73.1 1,606 79.7 1.2 13.4 2.4 3.3 100.0 427
Education of household head None or ECE 95.8 17,653 68.3 2.6 8.0 20.4 0.8 100.0 732 Primary 95.9 46,528 73.5 0.7 5.0 18.4 2.4 100.0 1,882 Lower secondary 96.2 19,709 64.2 0.1 6.1 27.6 2.0 100.0 739 Upper secondary 97.8 7,040 52.7 0.0 6.1 32.0 9.2 100.0 151 Post secondary / Non tertiary 98.3 6,232 60.9 1.0 11.5 25.3 1.4 100.0 101 Higher 98.4 7,552 50.6 0.8 9.9 30.7 7.9 100.0 120 DK/Missing 98.5 138 (*) (*) (*) (*) (*) 100.0 2
Source of drinking water Improved 96.3 87,987 70.1 1.0 4.6 21.8 2.5 100.0 3,178 Unimproved 96.7 16,865 60.3 0.6 15.2 22.0 1.8 100.0 548
Ethno-linguistic group of household head
Lao-Tai 98.2 65,326 54.0 2.8 8.7 31.1 3.4 100.0 1,139 Mon-Khmer 93.1 25,333 74.8 0.1 4.5 18.8 1.8 100.0 1,715 Hmong-Mien 93.0 10,255 73.5 0.2 7.4 16.0 2.9 100.0 712 Chinese-Tibetan 94.2 2,886 86.4 0.0 0.0 13.6 0.0 100.0 159 Other, DK, Missing 100.0 1,052 (*) (*) (*) (*) (*) 0.0 0
Wealth index quintile Poorest 93.7 20,968 77.1 0.0 6.8 15.4 0.7 100.0 1,297 Second 93.8 20,971 76.4 0.9 4.9 15.9 1.9 100.0 1,285 Middle 96.4 20,970 55.7 2.0 5.7 31.1 5.5 100.0 724 Fourth 98.6 20,969 43.1 2.6 11.3 38.8 4.2 100.0 280 Richest 99.3 20,973 38.3 0.0 4.6 52.9 4.2 100.0 139
1 MICS indicator WS.3 - Availability of drinking water ( ) Figures that are based on 25 – 49 unweighted cases (*) Figures are not shown, based on fewer than 25 unweighted cases
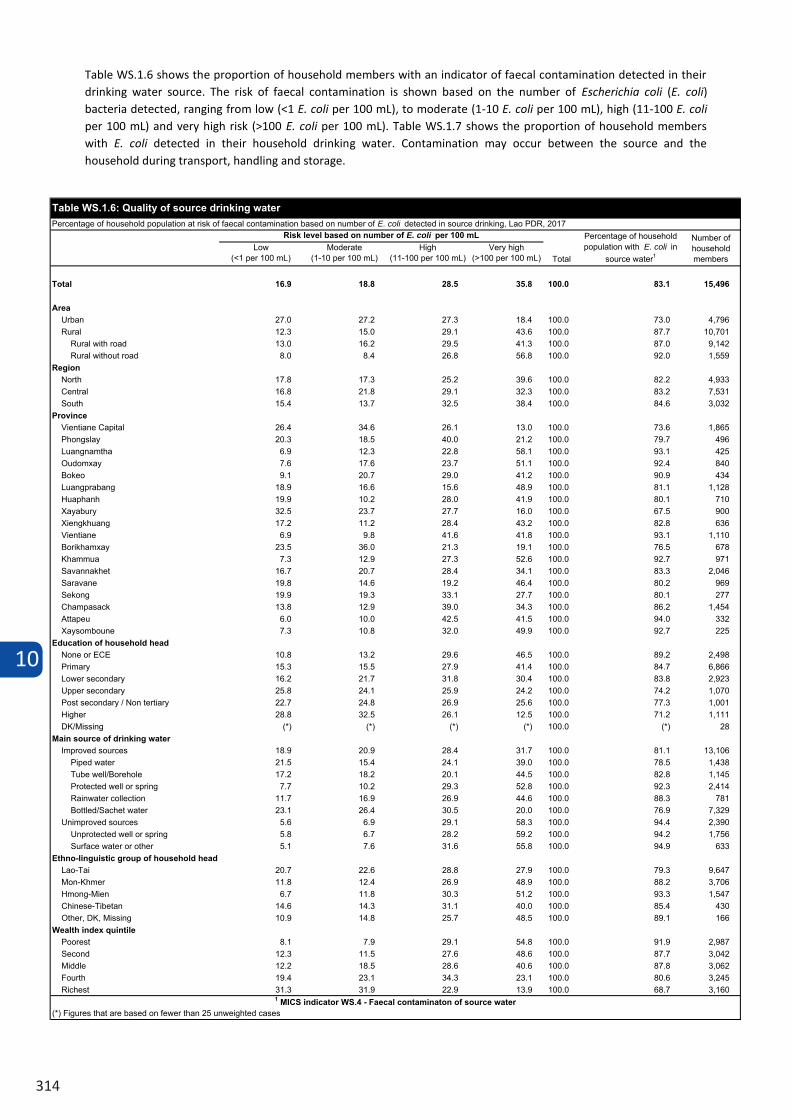
10
314
Table WS.1.6 shows the proportion of household members with an indicator of faecal contamination detected in their drinking water source. The risk of faecal contamination is shown based on the number of Escherichia coli (E. coli) bacteria detected, ranging from low (<1 E. coli per 100 mL), to moderate (1-10 E. coli per 100 mL), high (11-100 E. coli per 100 mL) and very high risk (>100 E. coli per 100 mL). Table WS.1.7 shows the proportion of household members with E. coli detected in their household drinking water. Contamination may occur between the source and the household during transport, handling and storage.
Table WS.1.6: Quality of source drinking water Percentage of household population at risk of faecal contamination based on number of E. coli detected in source drinking, Lao PDR, 2017
Risk level based on number of E. coli per 100 mL
Total
Percentage of household
population with E. coli in source
water1
Number of household members
Low (<1 per 100
mL)
Moderate (1-10 per 100 mL)
High (11-100 per
100 mL)
Very high (>100 per 100 mL)
Total 16.9 18.8 28.5 35.8 100.0 83.1 15,498 Area
Urban 27.0 27.2 27.3 18.4 100.0 73.0 4,783 Rural 12.3 15.0 29.1 43.6 100.0 87.7 10,715
Rural with road 13.1 16.2 29.5 41.3 100.0 86.9 9,154 Rural without road 8.0 8.4 26.7 56.8 100.0 92.0 1,561
Region North 17.9 17.3 25.2 39.6 100.0 82.1 4,956 Central 16.8 21.7 29.1 32.3 100.0 83.2 7,524 South 15.4 13.7 32.5 38.4 100.0 84.6 3,018
Province Vientiane Capital 26.4 34.6 26.1 13.0 100.0 73.6 1,842 Phongsaly 20.3 18.5 40.0 21.2 100.0 79.7 501 Luangnamtha 6.9 12.3 22.8 58.1 100.0 93.1 426 Oudomxay 7.6 17.6 23.7 51.1 100.0 92.4 842 Bokeo 9.1 20.7 29.0 41.2 100.0 90.9 435 Luangprabang 18.9 16.6 15.6 48.9 100.0 81.1 1,127 Huaphanh 19.9 10.2 28.0 41.9 100.0 80.1 716 Xayabury 32.5 23.7 27.7 16.0 100.0 67.5 908 Xiengkhuang 17.2 11.2 28.4 43.2 100.0 82.8 642 Vientiane 6.9 9.8 41.6 41.8 100.0 93.1 1,115 Borikhamxay 23.5 36.0 21.3 19.1 100.0 76.5 676 Khammuane 7.3 12.9 27.3 52.6 100.0 92.7 960 Savannakhet 16.7 20.7 28.4 34.1 100.0 83.3 2,064 Saravane 19.8 14.6 19.2 46.4 100.0 80.2 973 Sekong 19.9 19.3 33.1 27.7 100.0 80.1 269 Champasack 13.8 12.9 39.0 34.3 100.0 86.2 1,452 Attapeu 6.0 10.0 42.5 41.5 100.0 94.0 325 Xaysomboune 7.3 10.8 32.0 49.9 100.0 92.7 225
Education of household head None or ECE 10.8 13.2 29.6 46.5 100.0 89.2 2,501 Primary 15.3 15.5 27.9 41.4 100.0 84.7 6,874 Lower secondary 16.2 21.6 31.8 30.4 100.0 83.8 2,923 Upper secondary 25.7 24.1 25.9 24.3 100.0 74.3 1,068 Post secondary / Non tertiary 22.8 24.8 26.8 25.7 100.0 77.2 997 Higher 28.8 32.5 26.1 12.6 100.0 71.2 1,108 DK/Missing (*) (*) (*) (*) 100.0 (*) 28
Improved sources of drinking water Piped water 21.4 15.4 24.2 39.0 100.0 78.6 1,441 Tube well/Borehole 17.2 18.2 20.1 44.5 100.0 82.8 1,145 Protected well or spring 7.7 10.2 29.2 52.8 100.0 92.3 2,419 Rainwater collection 11.7 16.9 26.8 44.6 100.0 88.3 781 Bottled/Sachet water 23.2 26.4 30.5 20.0 100.0 76.8 7,321
Unimproved sources of drinking water Unprotected well or spring 5.9 6.7 28.2 59.2 100.0 94.1 1,759 Surface water or other 5.0 7.6 31.7 55.7 100.0 95.0 632
Ethno-linguistic group of household head Lao-Tai 20.7 22.6 28.8 27.9 100.0 79.3 9,640 Mon-Khmer 11.8 12.4 26.9 48.9 100.0 88.2 3,707 Hmong-Mien 6.7 11.8 30.3 51.2 100.0 93.3 1,553 Chinese-Tibetan 14.6 14.3 31.1 39.9 100.0 85.4 433 Other, DK, Missing 11.0 14.9 25.7 48.4 100.0 89.0 165
Wealth index quintile Poorest 8.1 8.0 29.1 54.8 100.0 91.9 2,995 Second 12.4 11.5 27.6 48.6 100.0 87.6 3,045 Middle 12.2 18.5 28.6 40.6 100.0 87.8 3,064 Fourth 19.4 23.1 34.3 23.1 100.0 80.6 3,245 Richest 31.4 31.8 22.9 13.9 100.0 68.6 3,150
1 MICS indicator WS.4 - Faecal contaminaton of source water (*) Figures are not shown, based on fewer than 25 unweighted cases
Low(<1 per 100 mL)
Moderate(1-10 per 100 mL)
High(11-100 per 100 mL)
Very high(>100 per 100 mL)
Total 16.9 18.8 28.5 35.8 100.0 83.1 15,496
AreaUrban 27.0 27.2 27.3 18.4 100.0 73.0 4,796Rural 12.3 15.0 29.1 43.6 100.0 87.7 10,701
Rural with road 13.0 16.2 29.5 41.3 100.0 87.0 9,142Rural without road 8.0 8.4 26.8 56.8 100.0 92.0 1,559
RegionNorth 17.8 17.3 25.2 39.6 100.0 82.2 4,933Central 16.8 21.8 29.1 32.3 100.0 83.2 7,531South 15.4 13.7 32.5 38.4 100.0 84.6 3,032
ProvinceVientiane Capital 26.4 34.6 26.1 13.0 100.0 73.6 1,865Phongslay 20.3 18.5 40.0 21.2 100.0 79.7 496Luangnamtha 6.9 12.3 22.8 58.1 100.0 93.1 425Oudomxay 7.6 17.6 23.7 51.1 100.0 92.4 840Bokeo 9.1 20.7 29.0 41.2 100.0 90.9 434Luangprabang 18.9 16.6 15.6 48.9 100.0 81.1 1,128Huaphanh 19.9 10.2 28.0 41.9 100.0 80.1 710Xayabury 32.5 23.7 27.7 16.0 100.0 67.5 900Xiengkhuang 17.2 11.2 28.4 43.2 100.0 82.8 636Vientiane 6.9 9.8 41.6 41.8 100.0 93.1 1,110Borikhamxay 23.5 36.0 21.3 19.1 100.0 76.5 678Khammua 7.3 12.9 27.3 52.6 100.0 92.7 971Savannakhet 16.7 20.7 28.4 34.1 100.0 83.3 2,046Saravane 19.8 14.6 19.2 46.4 100.0 80.2 969Sekong 19.9 19.3 33.1 27.7 100.0 80.1 277Champasack 13.8 12.9 39.0 34.3 100.0 86.2 1,454Attapeu 6.0 10.0 42.5 41.5 100.0 94.0 332Xaysomboune 7.3 10.8 32.0 49.9 100.0 92.7 225
Education of household headNone or ECE 10.8 13.2 29.6 46.5 100.0 89.2 2,498Primary 15.3 15.5 27.9 41.4 100.0 84.7 6,866Lower secondary 16.2 21.7 31.8 30.4 100.0 83.8 2,923Upper secondary 25.8 24.1 25.9 24.2 100.0 74.2 1,070Post secondary / Non tertiary 22.7 24.8 26.9 25.6 100.0 77.3 1,001Higher 28.8 32.5 26.1 12.5 100.0 71.2 1,111DK/Missing (*) (*) (*) (*) 100.0 (*) 28
Main source of drinking waterImproved sources 18.9 20.9 28.4 31.7 100.0 81.1 13,106
Piped water 21.5 15.4 24.1 39.0 100.0 78.5 1,438Tube well/Borehole 17.2 18.2 20.1 44.5 100.0 82.8 1,145Protected well or spring 7.7 10.2 29.3 52.8 100.0 92.3 2,414Rainwater collection 11.7 16.9 26.9 44.6 100.0 88.3 781Bottled/Sachet water 23.1 26.4 30.5 20.0 100.0 76.9 7,329
Unimproved sources 5.6 6.9 29.1 58.3 100.0 94.4 2,390Unprotected well or spring 5.8 6.7 28.2 59.2 100.0 94.2 1,756Surface water or other 5.1 7.6 31.6 55.8 100.0 94.9 633
Ethno-linguistic group of household headLao-Tai 20.7 22.6 28.8 27.9 100.0 79.3 9,647Mon-Khmer 11.8 12.4 26.9 48.9 100.0 88.2 3,706Hmong-Mien 6.7 11.8 30.3 51.2 100.0 93.3 1,547Chinese-Tibetan 14.6 14.3 31.1 40.0 100.0 85.4 430Other, DK, Missing 10.9 14.8 25.7 48.5 100.0 89.1 166
Wealth index quintilePoorest 8.1 7.9 29.1 54.8 100.0 91.9 2,987Second 12.3 11.5 27.6 48.6 100.0 87.7 3,042Middle 12.2 18.5 28.6 40.6 100.0 87.8 3,062Fourth 19.4 23.1 34.3 23.1 100.0 80.6 3,245Richest 31.3 31.9 22.9 13.9 100.0 68.7 3,160
(*) Figures that are based on fewer than 25 unweighted cases
Table WS.1.6: Quality of source drinking waterPercentage of household population at risk of faecal contamination based on number of E. coli detected in source drinking, Lao PDR, 2017
Risk level based on number of E. coli per 100 mL
Total
Percentage of household population with E. coli in
source water1
Number of household members
1 MICS indicator WS.4 - Faecal contaminaton of source water
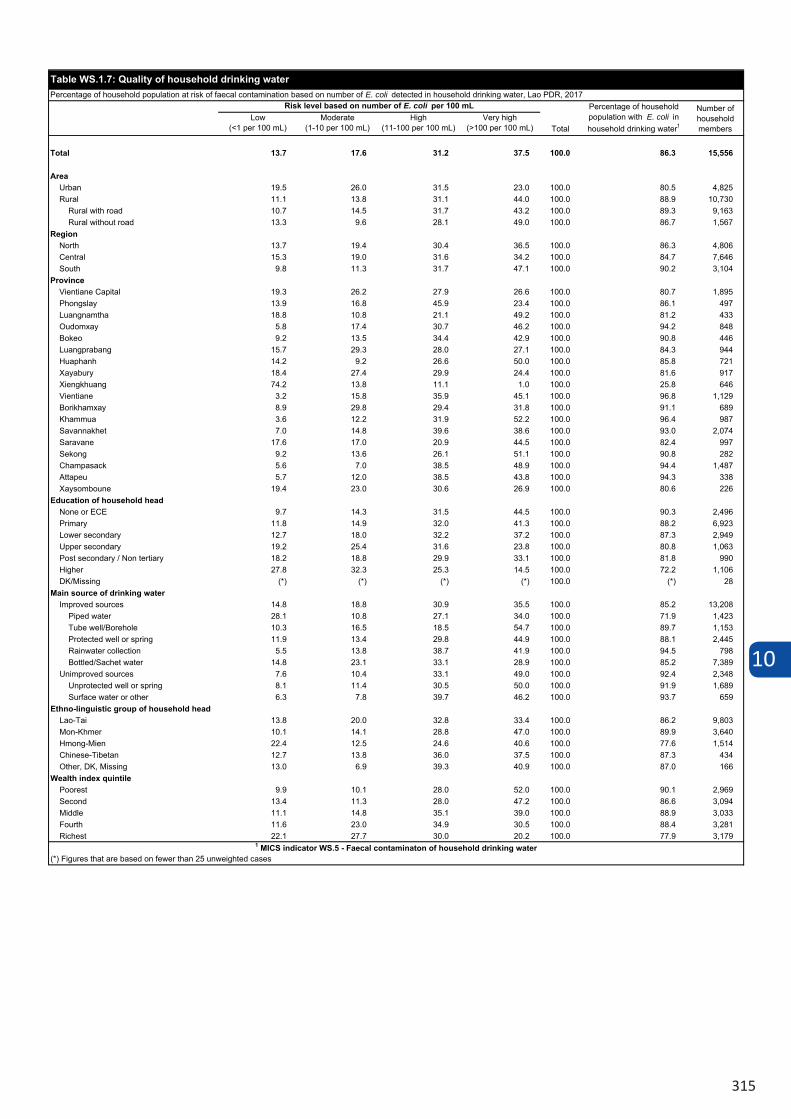
10
315
Low(<1 per 100 mL)
Moderate(1-10 per 100 mL)
High(11-100 per 100 mL)
Very high(>100 per 100 mL)
Total 13.7 17.6 31.2 37.5 100.0 86.3 15,556
AreaUrban 19.5 26.0 31.5 23.0 100.0 80.5 4,825Rural 11.1 13.8 31.1 44.0 100.0 88.9 10,730
Rural with road 10.7 14.5 31.7 43.2 100.0 89.3 9,163Rural without road 13.3 9.6 28.1 49.0 100.0 86.7 1,567
RegionNorth 13.7 19.4 30.4 36.5 100.0 86.3 4,806Central 15.3 19.0 31.6 34.2 100.0 84.7 7,646South 9.8 11.3 31.7 47.1 100.0 90.2 3,104
ProvinceVientiane Capital 19.3 26.2 27.9 26.6 100.0 80.7 1,895Phongslay 13.9 16.8 45.9 23.4 100.0 86.1 497Luangnamtha 18.8 10.8 21.1 49.2 100.0 81.2 433Oudomxay 5.8 17.4 30.7 46.2 100.0 94.2 848Bokeo 9.2 13.5 34.4 42.9 100.0 90.8 446Luangprabang 15.7 29.3 28.0 27.1 100.0 84.3 944Huaphanh 14.2 9.2 26.6 50.0 100.0 85.8 721Xayabury 18.4 27.4 29.9 24.4 100.0 81.6 917Xiengkhuang 74.2 13.8 11.1 1.0 100.0 25.8 646Vientiane 3.2 15.8 35.9 45.1 100.0 96.8 1,129Borikhamxay 8.9 29.8 29.4 31.8 100.0 91.1 689Khammua 3.6 12.2 31.9 52.2 100.0 96.4 987Savannakhet 7.0 14.8 39.6 38.6 100.0 93.0 2,074Saravane 17.6 17.0 20.9 44.5 100.0 82.4 997Sekong 9.2 13.6 26.1 51.1 100.0 90.8 282Champasack 5.6 7.0 38.5 48.9 100.0 94.4 1,487Attapeu 5.7 12.0 38.5 43.8 100.0 94.3 338Xaysomboune 19.4 23.0 30.6 26.9 100.0 80.6 226
Education of household headNone or ECE 9.7 14.3 31.5 44.5 100.0 90.3 2,496Primary 11.8 14.9 32.0 41.3 100.0 88.2 6,923Lower secondary 12.7 18.0 32.2 37.2 100.0 87.3 2,949Upper secondary 19.2 25.4 31.6 23.8 100.0 80.8 1,063Post secondary / Non tertiary 18.2 18.8 29.9 33.1 100.0 81.8 990Higher 27.8 32.3 25.3 14.5 100.0 72.2 1,106DK/Missing (*) (*) (*) (*) 100.0 (*) 28
Main source of drinking waterImproved sources 14.8 18.8 30.9 35.5 100.0 85.2 13,208
Piped water 28.1 10.8 27.1 34.0 100.0 71.9 1,423Tube well/Borehole 10.3 16.5 18.5 54.7 100.0 89.7 1,153Protected well or spring 11.9 13.4 29.8 44.9 100.0 88.1 2,445Rainwater collection 5.5 13.8 38.7 41.9 100.0 94.5 798Bottled/Sachet water 14.8 23.1 33.1 28.9 100.0 85.2 7,389
Unimproved sources 7.6 10.4 33.1 49.0 100.0 92.4 2,348Unprotected well or spring 8.1 11.4 30.5 50.0 100.0 91.9 1,689Surface water or other 6.3 7.8 39.7 46.2 100.0 93.7 659
Ethno-linguistic group of household headLao-Tai 13.8 20.0 32.8 33.4 100.0 86.2 9,803Mon-Khmer 10.1 14.1 28.8 47.0 100.0 89.9 3,640Hmong-Mien 22.4 12.5 24.6 40.6 100.0 77.6 1,514Chinese-Tibetan 12.7 13.8 36.0 37.5 100.0 87.3 434Other, DK, Missing 13.0 6.9 39.3 40.9 100.0 87.0 166
Wealth index quintilePoorest 9.9 10.1 28.0 52.0 100.0 90.1 2,969Second 13.4 11.3 28.0 47.2 100.0 86.6 3,094Middle 11.1 14.8 35.1 39.0 100.0 88.9 3,033Fourth 11.6 23.0 34.9 30.5 100.0 88.4 3,281Richest 22.1 27.7 30.0 20.2 100.0 77.9 3,179
(*) Figures that are based on fewer than 25 unweighted cases
Number of household members
Table WS.1.7: Quality of household drinking waterPercentage of household population at risk of faecal contamination based on number of E. coli detected in household drinking water, Lao PDR, 2017
Percentage of household population with E. coli in household drinking water1Total
Risk level based on number of E. coli per 100 mL
1 MICS indicator WS.5 - Faecal contaminaton of household drinking water
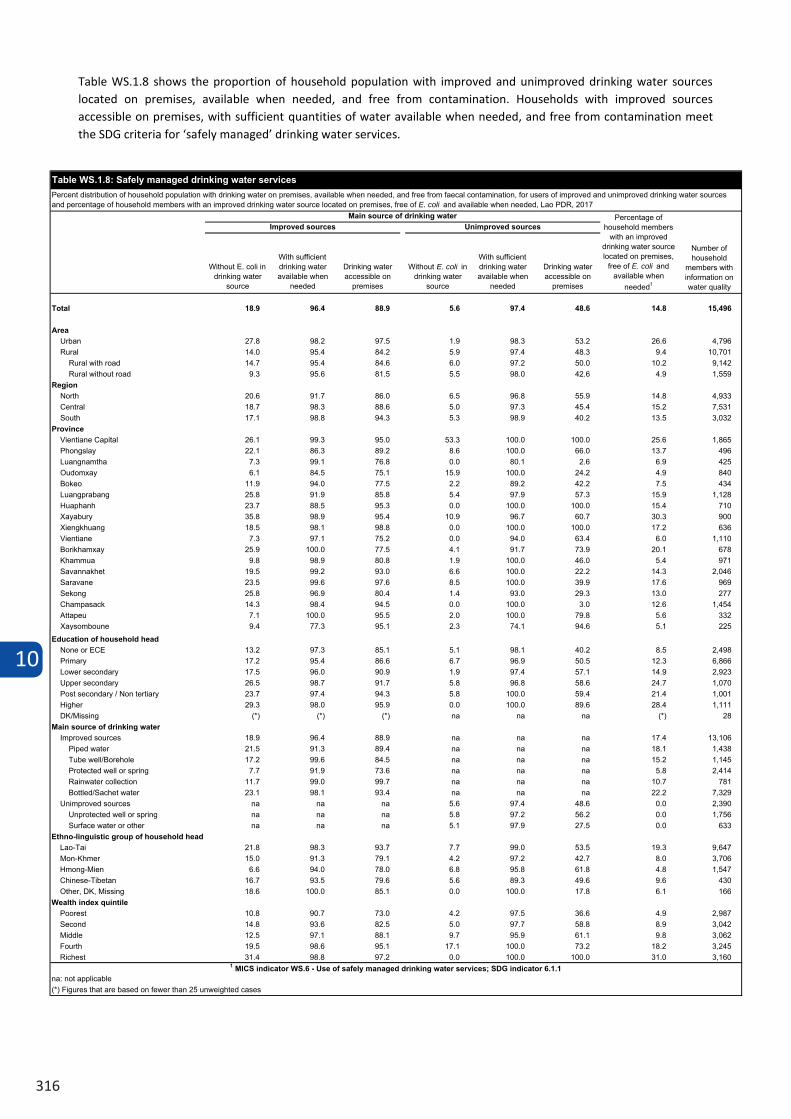
10
316
Table WS.1.8 shows the proportion of household population with improved and unimproved drinking water sources located on premises, available when needed, and free from contamination. Households with improved sources accessible on premises, with sufficient quantities of water available when needed, and free from contamination meet the SDG criteria for ‘safely managed’ drinking water services.
Table WS.1.8: Safely managed drinking water services
Percent distribution of household population with drinking water on premises, available when needed, and free from faecal contamination, for users of improved and unimproved drinking water sources and percentage of household members with an improved drinking water source located on premises, free of E. coli and available when needed, Lao PDR, 2017
Main source of drinking water Percentage of household
members with an improved drinking
water source located on
premises, free of E. coli and
available when needed1
Number of household members
with information
on water quality
Improved sources Unimproved sources
Without E. coli in drinking
water source
With sufficient drinking
water available
when needed
Drinking water
accessible on
premises
Without E. coli in drinking
water source
With sufficient drinking
water available
when needed
Drinking water
accessible on
premises
Total 18.9 96.4 88.9 5.6 97.4 48.6 14.8 15,498
Area
Urban 27.8 98.2 97.5 2.0 98.3 53.0 26.7 4,783
Rural 14.0 95.4 84.3 5.9 97.4 48.3 9.4 10,715
Rural with road 14.7 95.3 84.6 6.0 97.2 50.0 10.2 9,154
Rural without road 9.3 95.6 81.5 5.5 98.0 42.6 5.0 1,561
Region
North 20.6 91.7 86.0 6.5 96.8 55.9 14.8 4,956
Central 18.6 98.3 88.6 5.0 97.3 45.3 15.2 7,524
South 17.1 98.8 94.4 5.4 98.9 40.1 13.5 3,018
Province
Vientiane Capital 26.1 99.3 95.0 53.3 100.0 100.0 25.6 1,842
Phongsaly 22.1 86.3 89.2 8.6 100.0 66.0 13.7 501
Luangnamtha 7.3 99.1 76.8 0.0 80.1 2.6 6.9 426
Oudomxay 6.1 84.5 75.1 15.9 100.0 24.2 4.9 842
Bokeo 11.9 94.0 77.5 2.2 89.2 42.2 7.5 435
Luangprabang 25.8 91.9 85.8 5.4 97.9 57.3 15.9 1,127
Huaphanh 23.7 88.5 95.3 0.0 100.0 100.0 15.4 716
Xayabury 35.8 98.9 95.4 10.9 96.7 60.7 30.3 908
Xiengkhuang 18.5 98.1 98.8 0.0 100.0 100.0 17.2 642
Vientiane 7.3 97.1 75.2 0.0 94.0 63.4 6.0 1,115
Borikhamxay 25.9 100.0 77.5 4.1 91.7 73.9 20.1 676
Khammuane 9.8 98.9 80.8 1.9 100.0 46.0 5.4 960
Savannakhet 19.5 99.2 93.0 6.6 100.0 22.2 14.3 2,064
Saravane 23.5 99.6 97.6 8.5 100.0 39.9 17.6 973
Sekong 25.8 96.9 80.4 1.4 93.0 29.3 13.0 269
Champasack 14.3 98.4 94.5 0.0 100.0 3.0 12.6 1,452
Attapeu 7.1 100.0 95.5 2.0 100.0 79.8 5.6 325
Xaysomboune 9.4 77.3 95.1 2.3 74.1 94.6 5.1 225
(Continued…)
Without E. coli in drinking water
source
With sufficient drinking water available when
needed
Drinking water accessible on
premises
Without E. coli in drinking water
source
With sufficient drinking water available when
needed
Drinking water accessible on
premises
Total 18.9 96.4 88.9 5.6 97.4 48.6 14.8 15,496
AreaUrban 27.8 98.2 97.5 1.9 98.3 53.2 26.6 4,796Rural 14.0 95.4 84.2 5.9 97.4 48.3 9.4 10,701
Rural with road 14.7 95.4 84.6 6.0 97.2 50.0 10.2 9,142Rural without road 9.3 95.6 81.5 5.5 98.0 42.6 4.9 1,559
RegionNorth 20.6 91.7 86.0 6.5 96.8 55.9 14.8 4,933Central 18.7 98.3 88.6 5.0 97.3 45.4 15.2 7,531South 17.1 98.8 94.3 5.3 98.9 40.2 13.5 3,032
ProvinceVientiane Capital 26.1 99.3 95.0 53.3 100.0 100.0 25.6 1,865Phongslay 22.1 86.3 89.2 8.6 100.0 66.0 13.7 496Luangnamtha 7.3 99.1 76.8 0.0 80.1 2.6 6.9 425Oudomxay 6.1 84.5 75.1 15.9 100.0 24.2 4.9 840Bokeo 11.9 94.0 77.5 2.2 89.2 42.2 7.5 434Luangprabang 25.8 91.9 85.8 5.4 97.9 57.3 15.9 1,128Huaphanh 23.7 88.5 95.3 0.0 100.0 100.0 15.4 710Xayabury 35.8 98.9 95.4 10.9 96.7 60.7 30.3 900Xiengkhuang 18.5 98.1 98.8 0.0 100.0 100.0 17.2 636Vientiane 7.3 97.1 75.2 0.0 94.0 63.4 6.0 1,110Borikhamxay 25.9 100.0 77.5 4.1 91.7 73.9 20.1 678Khammua 9.8 98.9 80.8 1.9 100.0 46.0 5.4 971Savannakhet 19.5 99.2 93.0 6.6 100.0 22.2 14.3 2,046Saravane 23.5 99.6 97.6 8.5 100.0 39.9 17.6 969Sekong 25.8 96.9 80.4 1.4 93.0 29.3 13.0 277Champasack 14.3 98.4 94.5 0.0 100.0 3.0 12.6 1,454Attapeu 7.1 100.0 95.5 2.0 100.0 79.8 5.6 332Xaysomboune 9.4 77.3 95.1 2.3 74.1 94.6 5.1 225(Continued…)
Table WS.1.8: Safely managed drinking water servicesPercent distribution of household population with drinking water on premises, available when needed, and free from faecal contamination, for users of improved and unimproved drinking water sources and percentage of household members with an improved drinking water source located on premises, free of E. coli and available when needed, Lao PDR, 2017
Main source of drinking water Percentage of household members
with an improved drinking water source located on premises,
free of E. coli and available when
needed1
Number of household
members with information on water quality
Improved sources Unimproved sources
Without E. coli in drinking water
source
With sufficient drinking water available when
needed
Drinking water accessible on
premises
Without E. coli in drinking water
source
With sufficient drinking water available when
needed
Drinking water accessible on
premises
Education of household headNone or ECE 13.2 97.3 85.1 5.1 98.1 40.2 8.5 2,498Primary 17.2 95.4 86.6 6.7 96.9 50.5 12.3 6,866Lower secondary 17.5 96.0 90.9 1.9 97.4 57.1 14.9 2,923Upper secondary 26.5 98.7 91.7 5.8 96.8 58.6 24.7 1,070Post secondary / Non tertiary 23.7 97.4 94.3 5.8 100.0 59.4 21.4 1,001Higher 29.3 98.0 95.9 0.0 100.0 89.6 28.4 1,111DK/Missing (*) (*) (*) na na na (*) 28
Main source of drinking waterImproved sources 18.9 96.4 88.9 na na na 17.4 13,106
Piped water 21.5 91.3 89.4 na na na 18.1 1,438Tube well/Borehole 17.2 99.6 84.5 na na na 15.2 1,145Protected well or spring 7.7 91.9 73.6 na na na 5.8 2,414Rainwater collection 11.7 99.0 99.7 na na na 10.7 781Bottled/Sachet water 23.1 98.1 93.4 na na na 22.2 7,329
Unimproved sources na na na 5.6 97.4 48.6 0.0 2,390Unprotected well or spring na na na 5.8 97.2 56.2 0.0 1,756Surface water or other na na na 5.1 97.9 27.5 0.0 633
Ethno-linguistic group of household headLao-Tai 21.8 98.3 93.7 7.7 99.0 53.5 19.3 9,647Mon-Khmer 15.0 91.3 79.1 4.2 97.2 42.7 8.0 3,706Hmong-Mien 6.6 94.0 78.0 6.8 95.8 61.8 4.8 1,547Chinese-Tibetan 16.7 93.5 79.6 5.6 89.3 49.6 9.6 430Other, DK, Missing 18.6 100.0 85.1 0.0 100.0 17.8 6.1 166
Wealth index quintilePoorest 10.8 90.7 73.0 4.2 97.5 36.6 4.9 2,987Second 14.8 93.6 82.5 5.0 97.7 58.8 8.9 3,042Middle 12.5 97.1 88.1 9.7 95.9 61.1 9.8 3,062Fourth 19.5 98.6 95.1 17.1 100.0 73.2 18.2 3,245Richest 31.4 98.8 97.2 0.0 100.0 100.0 31.0 3,160
1 MICS indicator WS.6 - Use of safely managed drinking water services; SDG indicator 6.1.1na: not applicable(*) Figures that are based on fewer than 25 unweighted cases
Table WS.1.8 (continued): Safely managed drinking water servicesPercent distribution of household population with drinking water on premises, available when needed, and free from faecal contamination, for users of improved and unimproved drinking water sources and percentage of household members with an improved drinking water source located on premises, free of E. coli and available when needed, Lao PDR, 2017
Main source of drinking water Percentage of household members
with an improved drinking water source located on premises,
free of E. coli and available when
needed1
Number of household
members with information on water quality
Improved sources Unimproved sources
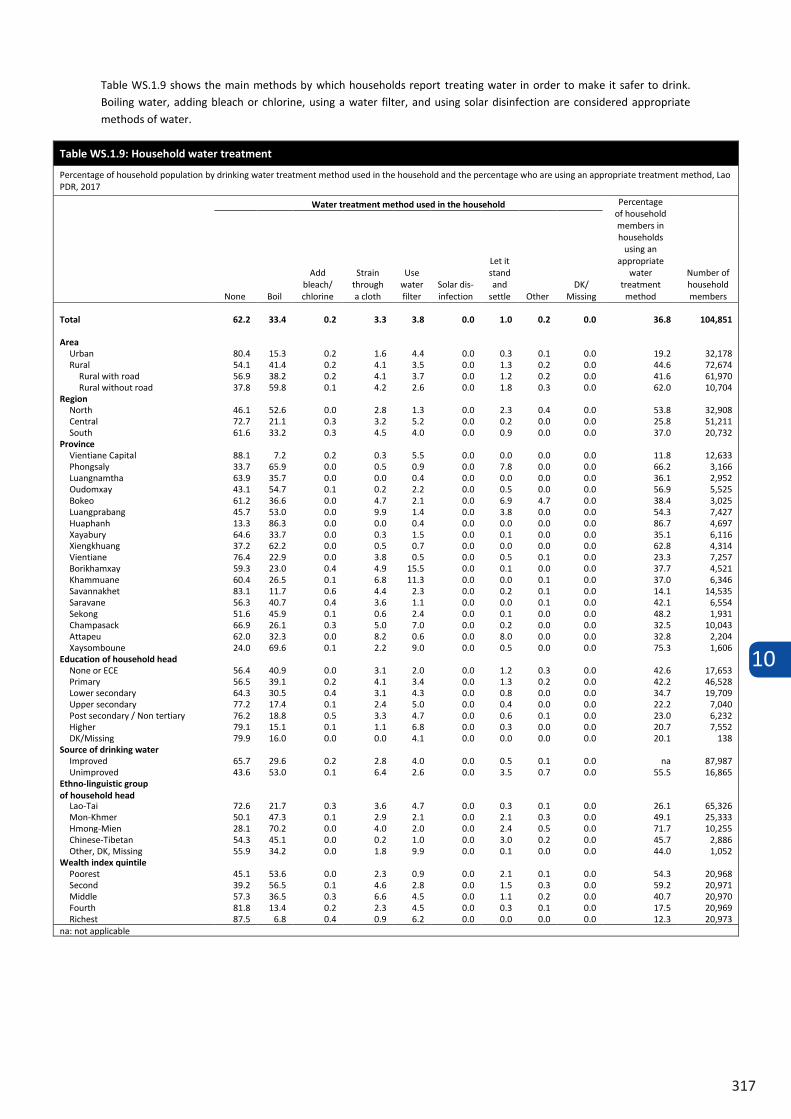
10
317
Table WS.1.9 shows the main methods by which households report treating water in order to make it safer to drink. Boiling water, adding bleach or chlorine, using a water filter, and using solar disinfection are considered appropriate methods of water.
Table WS.1.9: Household water treatment
Percentage of household population by drinking water treatment method used in the household and the percentage who are using an appropriate treatment method, Lao PDR, 2017
Water treatment method used in the household Percentage of household members in households
using an appropriate
water treatment
method
Number of household members None Boil
Add bleach/ chlorine
Strain through a cloth
Use water filter
Solar dis-infection
Let it stand and
settle Other DK/
Missing
Total 62.2 33.4 0.2 3.3 3.8 0.0 1.0 0.2 0.0 36.8 104,851
Area Urban 80.4 15.3 0.2 1.6 4.4 0.0 0.3 0.1 0.0 19.2 32,178 Rural 54.1 41.4 0.2 4.1 3.5 0.0 1.3 0.2 0.0 44.6 72,674
Rural with road 56.9 38.2 0.2 4.1 3.7 0.0 1.2 0.2 0.0 41.6 61,970 Rural without road 37.8 59.8 0.1 4.2 2.6 0.0 1.8 0.3 0.0 62.0 10,704
Region North 46.1 52.6 0.0 2.8 1.3 0.0 2.3 0.4 0.0 53.8 32,908 Central 72.7 21.1 0.3 3.2 5.2 0.0 0.2 0.0 0.0 25.8 51,211 South 61.6 33.2 0.3 4.5 4.0 0.0 0.9 0.0 0.0 37.0 20,732
Province Vientiane Capital 88.1 7.2 0.2 0.3 5.5 0.0 0.0 0.0 0.0 11.8 12,633 Phongsaly 33.7 65.9 0.0 0.5 0.9 0.0 7.8 0.0 0.0 66.2 3,166 Luangnamtha 63.9 35.7 0.0 0.0 0.4 0.0 0.0 0.0 0.0 36.1 2,952 Oudomxay 43.1 54.7 0.1 0.2 2.2 0.0 0.5 0.0 0.0 56.9 5,525 Bokeo 61.2 36.6 0.0 4.7 2.1 0.0 6.9 4.7 0.0 38.4 3,025 Luangprabang 45.7 53.0 0.0 9.9 1.4 0.0 3.8 0.0 0.0 54.3 7,427 Huaphanh 13.3 86.3 0.0 0.0 0.4 0.0 0.0 0.0 0.0 86.7 4,697 Xayabury 64.6 33.7 0.0 0.3 1.5 0.0 0.1 0.0 0.0 35.1 6,116 Xiengkhuang 37.2 62.2 0.0 0.5 0.7 0.0 0.0 0.0 0.0 62.8 4,314 Vientiane 76.4 22.9 0.0 3.8 0.5 0.0 0.5 0.1 0.0 23.3 7,257 Borikhamxay 59.3 23.0 0.4 4.9 15.5 0.0 0.1 0.0 0.0 37.7 4,521 Khammuane 60.4 26.5 0.1 6.8 11.3 0.0 0.0 0.1 0.0 37.0 6,346 Savannakhet 83.1 11.7 0.6 4.4 2.3 0.0 0.2 0.1 0.0 14.1 14,535 Saravane 56.3 40.7 0.4 3.6 1.1 0.0 0.0 0.1 0.0 42.1 6,554 Sekong 51.6 45.9 0.1 0.6 2.4 0.0 0.1 0.0 0.0 48.2 1,931 Champasack 66.9 26.1 0.3 5.0 7.0 0.0 0.2 0.0 0.0 32.5 10,043 Attapeu 62.0 32.3 0.0 8.2 0.6 0.0 8.0 0.0 0.0 32.8 2,204 Xaysomboune 24.0 69.6 0.1 2.2 9.0 0.0 0.5 0.0 0.0 75.3 1,606
Education of household head None or ECE 56.4 40.9 0.0 3.1 2.0 0.0 1.2 0.3 0.0 42.6 17,653 Primary 56.5 39.1 0.2 4.1 3.4 0.0 1.3 0.2 0.0 42.2 46,528 Lower secondary 64.3 30.5 0.4 3.1 4.3 0.0 0.8 0.0 0.0 34.7 19,709 Upper secondary 77.2 17.4 0.1 2.4 5.0 0.0 0.4 0.0 0.0 22.2 7,040 Post secondary / Non tertiary 76.2 18.8 0.5 3.3 4.7 0.0 0.6 0.1 0.0 23.0 6,232 Higher 79.1 15.1 0.1 1.1 6.8 0.0 0.3 0.0 0.0 20.7 7,552 DK/Missing 79.9 16.0 0.0 0.0 4.1 0.0 0.0 0.0 0.0 20.1 138
Source of drinking water Improved 65.7 29.6 0.2 2.8 4.0 0.0 0.5 0.1 0.0 na 87,987 Unimproved 43.6 53.0 0.1 6.4 2.6 0.0 3.5 0.7 0.0 55.5 16,865
Ethno-linguistic group of household head
Lao-Tai 72.6 21.7 0.3 3.6 4.7 0.0 0.3 0.1 0.0 26.1 65,326 Mon-Khmer 50.1 47.3 0.1 2.9 2.1 0.0 2.1 0.3 0.0 49.1 25,333 Hmong-Mien 28.1 70.2 0.0 4.0 2.0 0.0 2.4 0.5 0.0 71.7 10,255 Chinese-Tibetan 54.3 45.1 0.0 0.2 1.0 0.0 3.0 0.2 0.0 45.7 2,886 Other, DK, Missing 55.9 34.2 0.0 1.8 9.9 0.0 0.1 0.0 0.0 44.0 1,052
Wealth index quintile Poorest 45.1 53.6 0.0 2.3 0.9 0.0 2.1 0.1 0.0 54.3 20,968 Second 39.2 56.5 0.1 4.6 2.8 0.0 1.5 0.3 0.0 59.2 20,971 Middle 57.3 36.5 0.3 6.6 4.5 0.0 1.1 0.2 0.0 40.7 20,970 Fourth 81.8 13.4 0.2 2.3 4.5 0.0 0.3 0.1 0.0 17.5 20,969 Richest 87.5 6.8 0.4 0.9 6.2 0.0 0.0 0.0 0.0 12.3 20,973
na: not applicable
10
318
10.2 HANDWASHING
Handwashing with water and soap is the most cost effective health intervention to reduce both the incidence of diarrhoea and pneumonia in children under five8. It is most effective when done using water and soap after visiting a toilet or cleaning a child, before eating or handling food and, before feeding a child. Direct observation of handwashing behaviour at these critical times is challenging. A reliable alternative to observations is assessing the likelihood that correct handwashing behaviour takes place by asking to see the place where people wash their hands and observing whether water and soap (or other local cleansing materials) are available at this place9 10.
Table WS.2.1 shows the proportion of household members with fixed or mobile handwashing facilities observed on premises (in the dwelling, yard or plot). It also shows the proportion of handwashing facilities where water and soap were observed. Household members with a handwashing facility on premises with soap and water available meet the SDG criteria for a ‘basic’ handwashing facility.
8 Cairncross, S and Valdmanis, V. 2006. Water supply, sanitation and hygiene promotion Chapter 41 in Disease Control Priorities in Developing Countries. 2nd Edition, Edt. Jameson et al. The World Bank.9 Ram, P et al. editors. 2008. Use of a novel method to detect reactivity to structured observation for measurement of handwashing behavior. American Society of Tropical Medicine and Hygiene. 10 Handwashing place or facilities may be fixed or mobile and include a sink with tap water, buckets with taps, tippy-taps, and jugs or
basins designated for handwashing. Soap includes bar soap, liquid soap, powder detergent, and soapy water but does not include ash, soil, sand or other handwashing agents.
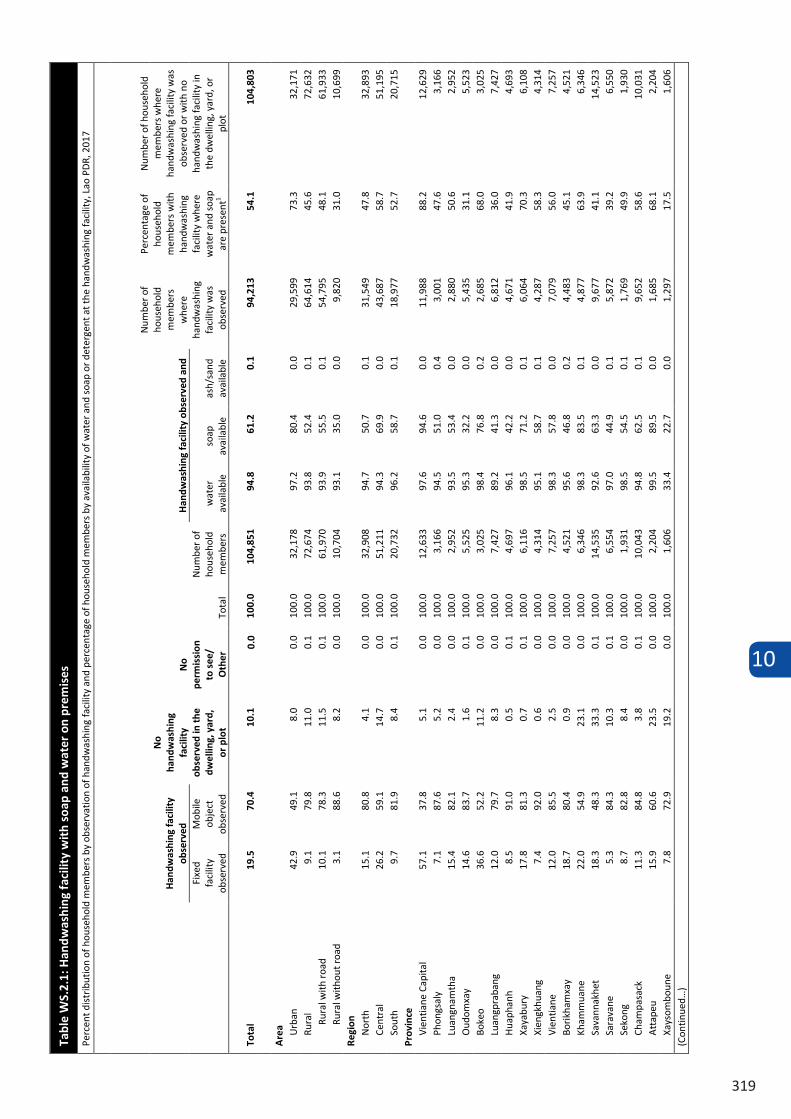
10
319
Tabl
e W
S.2.
1: H
andw
ashi
ng fa
cilit
y w
ith
soap
and
wat
er o
n pr
emis
es
Perc
ent d
istr
ibut
ion
of h
ouse
hold
mem
bers
by
obse
rvat
ion
of h
andw
ashi
ng fa
cilit
y an
d pe
rcen
tage
of h
ouse
hold
mem
bers
by
avai
labi
lity
of w
ater
and
soa
p or
det
erge
nt a
t the
han
dwas
hing
faci
lity,
Lao
PD
R, 2
017
Han
dwas
hing
faci
lity
obse
rved
No
hand
was
hing
fa
cilit
y ob
serv
ed in
the
dwel
ling,
yar
d,
or p
lot
No
perm
issi
on
to s
ee/
Oth
er
Tota
l
Num
ber o
f ho
useh
old
mem
bers
Han
dwas
hing
faci
lity
obse
rved
and
Num
ber o
f ho
useh
old
mem
bers
w
here
ha
ndw
ashi
ng
faci
lity
was
ob
serv
ed
Perc
enta
ge o
f ho
useh
old
mem
bers
with
ha
ndw
ashi
ng
faci
lity
whe
re
wat
er a
nd s
oap
are
pres
ent1
Num
ber o
f hou
seho
ld
mem
bers
whe
re
hand
was
hing
faci
lity
was
ob
serv
ed o
r w
ith n
o ha
ndw
ashi
ng fa
cilit
y in
th
e dw
ellin
g, y
ard,
or
plot
Fixe
d fa
cilit
y ob
serv
ed
Mob
ile
obje
ct
obse
rved
w
ater
av
aila
ble
soap
av
aila
ble
ash/
sand
av
aila
ble
Tota
l 19
.5
70.4
10
.1
0.0
100.
0 10
4,85
1 94
.8
61.2
0.
1 94
,213
54
.1
104,
803
Are
a Urb
an
42.9
49
.1
8.0
0.0
100.
0 32
,178
97
.2
80.4
0.
0 29
,599
73
.3
32,1
71
Rura
l 9.
1 79
.8
11.0
0.
1 10
0.0
72,6
74
93.8
52
.4
0.1
64,6
14
45.6
72
,632
Ru
ral w
ith r
oad
10.1
78
.3
11.5
0.
1 10
0.0
61,9
70
93.9
55
.5
0.1
54,7
95
48.1
61
,933
Ru
ral w
ithou
t roa
d 3.
1 88
.6
8.2
0.0
100.
0 10
,704
93
.1
35.0
0.
0 9,
820
31.0
10
,699
Re
gion
N
orth
15
.1
80.8
4.
1 0.
0 10
0.0
32,9
08
94.7
50
.7
0.1
31,5
49
47.8
32
,893
Ce
ntra
l 26
.2
59.1
14
.7
0.0
100.
0 51
,211
94
.3
69.9
0.
0 43
,687
58
.7
51,1
95
Sout
h 9.
7 81
.9
8.4
0.1
100.
0 20
,732
96
.2
58.7
0.
1 18
,977
52
.7
20,7
15
Prov
ince
Vi
entia
ne C
apita
l 57
.1
37.8
5.
1 0.
0 10
0.0
12,6
33
97.6
94
.6
0.0
11,9
88
88.2
12
,629
Ph
ongs
aly
7.1
87.6
5.
2 0.
0 10
0.0
3,16
6 94
.5
51.0
0.
4 3,
001
47.6
3,
166
Luan
gnam
tha
15.4
82
.1
2.4
0.0
100.
0 2,
952
93.5
53
.4
0.0
2,88
0 50
.6
2,95
2 O
udom
xay
14.6
83
.7
1.6
0.1
100.
0 5,
525
95.3
32
.2
0.0
5,43
5 31
.1
5,52
3 Bo
keo
36.6
52
.2
11.2
0.
0 10
0.0
3,02
5 98
.4
76.8
0.
2 2,
685
68.0
3,
025
Luan
gpra
bang
12
.0
79.7
8.
3 0.
0 10
0.0
7,42
7 89
.2
41.3
0.
0 6,
812
36.0
7,
427
Hua
phan
h 8.
5 91
.0
0.5
0.1
100.
0 4,
697
96.1
42
.2
0.0
4,67
1 41
.9
4,69
3 Xa
yabu
ry
17.8
81
.3
0.7
0.1
100.
0 6,
116
98.5
71
.2
0.1
6,06
4 70
.3
6,10
8 Xi
engk
huan
g 7.
4 92
.0
0.6
0.0
100.
0 4,
314
95.1
58
.7
0.1
4,28
7 58
.3
4,31
4 Vi
entia
ne
12.0
85
.5
2.5
0.0
100.
0 7,
257
98.3
57
.8
0.0
7,07
9 56
.0
7,25
7 Bo
rikha
mxa
y 18
.7
80.4
0.
9 0.
0 10
0.0
4,52
1 95
.6
46.8
0.
2 4,
483
45.1
4,
521
Kham
mua
ne
22.0
54
.9
23.1
0.
0 10
0.0
6,34
6 98
.3
83.5
0.
1 4,
877
63.9
6,
346
Sava
nnak
het
18.3
48
.3
33.3
0.
1 10
0.0
14,5
35
92.6
63
.3
0.0
9,67
7 41
.1
14,5
23
Sara
vane
5.
3 84
.3
10.3
0.
1 10
0.0
6,55
4 97
.0
44.9
0.
1 5,
872
39.2
6,
550
Seko
ng
8.7
82.8
8.
4 0.
0 10
0.0
1,93
1 98
.5
54.5
0.
1 1,
769
49.9
1,
930
Cham
pasa
ck
11.3
84
.8
3.8
0.1
100.
0 10
,043
94
.8
62.5
0.
1 9,
652
58.6
10
,031
A
ttap
eu
15.9
60
.6
23.5
0.
0 10
0.0
2,20
4 99
.5
89.5
0.
0 1,
685
68.1
2,
204
Xays
ombo
une
7.8
72.9
19
.2
0.0
100.
0 1,
606
33.4
22
.7
0.0
1,29
7 17
.5
1,60
6 (C
ontin
ued…
)
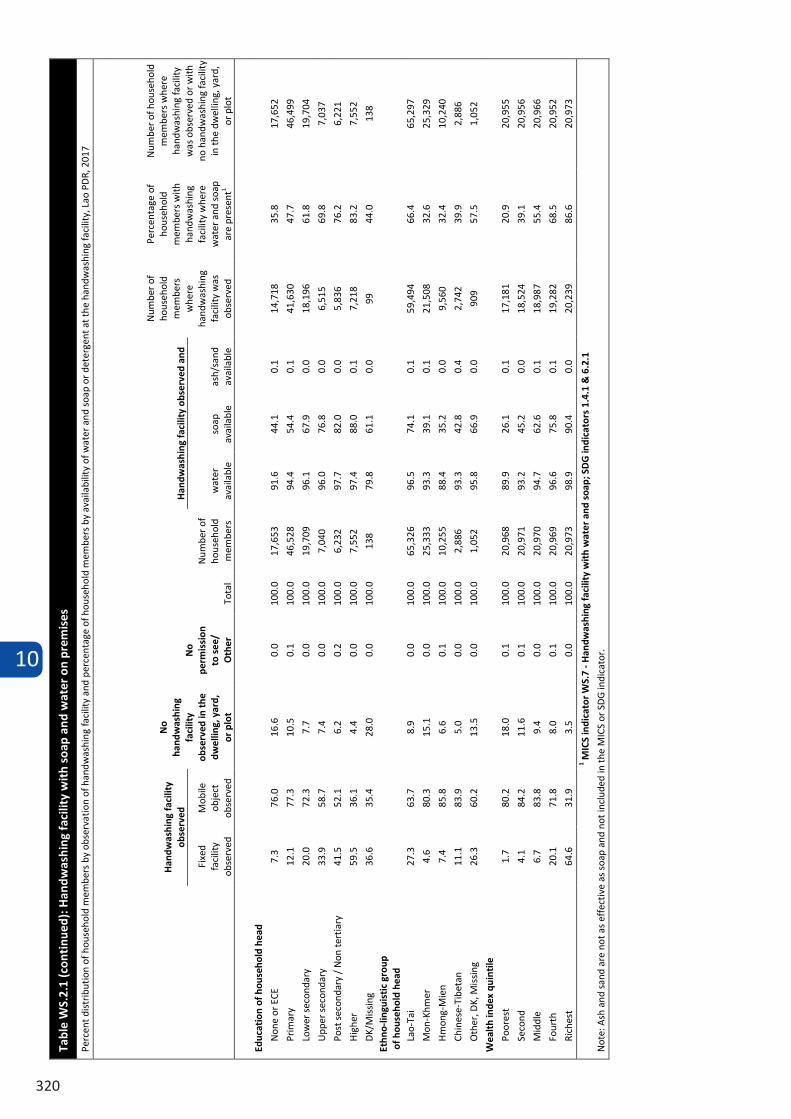
10
320
Tabl
e W
S.2.
1 (c
onti
nued
): H
andw
ashi
ng fa
cilit
y w
ith
soap
and
wat
er o
n pr
emis
es
Perc
ent d
istr
ibut
ion
of h
ouse
hold
mem
bers
by
obse
rvat
ion
of h
andw
ashi
ng fa
cilit
y an
d pe
rcen
tage
of h
ouse
hold
mem
bers
by
avai
labi
lity
of w
ater
and
soa
p or
det
erge
nt a
t the
han
dwas
hing
faci
lity,
Lao
PD
R, 2
017
Han
dwas
hing
faci
lity
obse
rved
No
hand
was
hing
fa
cilit
y ob
serv
ed in
the
dwel
ling,
yar
d,
or p
lot
No
perm
issi
on
to s
ee/
Oth
er
Tota
l
Num
ber o
f ho
useh
old
mem
bers
Han
dwas
hing
faci
lity
obse
rved
and
Num
ber o
f ho
useh
old
mem
bers
w
here
ha
ndw
ashi
ng
faci
lity
was
ob
serv
ed
Perc
enta
ge o
f ho
useh
old
mem
bers
with
ha
ndw
ashi
ng
faci
lity
whe
re
wat
er a
nd s
oap
are
pres
ent1
Num
ber o
f hou
seho
ld
mem
bers
whe
re
hand
was
hing
faci
lity
was
obs
erve
d or
with
no
han
dwas
hing
faci
lity
in th
e dw
ellin
g, y
ard,
or
plo
t
Fixe
d fa
cilit
y ob
serv
ed
Mob
ile
obje
ct
obse
rved
w
ater
av
aila
ble
soap
av
aila
ble
ash/
sand
av
aila
ble
Educ
atio
n of
hou
seho
ld h
ead
Non
e or
ECE
7.
3 76
.0
16.6
0.
0 10
0.0
17,6
53
91.6
44
.1
0.1
14,7
18
35.8
17
,652
Prim
ary
12.1
77
.3
10.5
0.
1 10
0.0
46,5
28
94.4
54
.4
0.1
41,6
30
47.7
46
,499
Low
er s
econ
dary
20
.0
72.3
7.
7 0.
0 10
0.0
19,7
09
96.1
67
.9
0.0
18,1
96
61.8
19
,704
Upp
er s
econ
dary
33
.9
58.7
7.
4 0.
0 10
0.0
7,04
0 96
.0
76.8
0.
0 6,
515
69.8
7,
037
Post
sec
onda
ry /
Non
tert
iary
41
.5
52.1
6.
2 0.
2 10
0.0
6,23
2 97
.7
82.0
0.
0 5,
836
76.2
6,
221
Hig
her
59.5
36
.1
4.4
0.0
100.
0 7,
552
97.4
88
.0
0.1
7,21
8 83
.2
7,55
2
DK/
Mis
sing
36
.6
35.4
28
.0
0.0
100.
0 13
8 79
.8
61.1
0.
0 99
44
.0
138
Ethn
o-lin
guis
tic
grou
p o
f hou
seho
ld h
ead
Lao-
Tai
27.3
63
.7
8.9
0.0
100.
0 65
,326
96
.5
74.1
0.
1 59
,494
66
.4
65,2
97
Mon
-Khm
er
4.6
80.3
15
.1
0.0
100.
0 25
,333
93
.3
39.1
0.
1 21
,508
32
.6
25,3
29
Hm
ong-
Mie
n 7.
4 85
.8
6.6
0.1
100.
0 10
,255
88
.4
35.2
0.
0 9,
560
32.4
10
,240
Chin
ese-
Tibe
tan
11.1
83
.9
5.0
0.0
100.
0 2,
886
93.3
42
.8
0.4
2,74
2 39
.9
2,88
6
Oth
er, D
K, M
issi
ng
26.3
60
.2
13.5
0.
0 10
0.0
1,05
2 95
.8
66.9
0.
0 90
9 57
.5
1,05
2
Wea
lth
inde
x qu
inti
le
Poor
est
1.7
80.2
18
.0
0.1
100.
0 20
,968
89
.9
26.1
0.
1 17
,181
20
.9
20,9
55
Seco
nd
4.1
84.2
11
.6
0.1
100.
0 20
,971
93
.2
45.2
0.
0 18
,524
39
.1
20,9
56
Mid
dle
6.7
83.8
9.
4 0.
0 10
0.0
20,9
70
94.7
62
.6
0.1
18,9
87
55.4
20
,966
Four
th
20.1
71
.8
8.0
0.1
100.
0 20
,969
96
.6
75.8
0.
1 19
,282
68
.5
20,9
52
Rich
est
64.6
31
.9
3.5
0.0
100.
0 20
,973
98
.9
90.4
0.
0 20
,239
86
.6
20,9
73
1 MIC
S in
dica
tor W
S.7
- Han
dwas
hing
faci
lity
wit
h w
ater
and
soa
p; S
DG
indi
cato
rs 1
.4.1
& 6
.2.1
Not
e: A
sh a
nd s
and
are
not a
s ef
fect
ive
as s
oap
and
not i
nclu
ded
in th
e M
ICS
or S
DG
indi
cato
r.
10
321
An improved sanitation facility is defined as one that hygienically separates human excreta from human contact. Improved sanitation facilities include flush or pour flush to a piped sewer systems, septic tanks, or pit latrines; ventilated improved pit latrines, pit latrines with slabs, and composting toilets. Table WS.3.1 shows the population using improved and unimproved sanitation facilities. It also shows the proportion who dispose of faeces in fields, forests, bushes, open water bodies of water, beaches or other open spaces, or with solid waste, a practice known as ‘open defecation’.
10.3 SANITATION
Table WS. 3.2 shows the distribution of household population using improved and unimproved sanitation facilities which are private, shared with other households or public facilities. Those using shared or public improved sanitation facilities are classed as having a ‘limited’ service for the purpose of SDG monitoring. Households using improved sanitation facilities that are not shared with other households meet the SDG criteria for a ‘basic’ sanitation service, and may be considered ‘safely managed’ depending on how excreta are managed.
Table WS.3.3 shows the methods used for emptying and removal of excreta from improved pit latrines and septic tanks. Excreta from improved pit latrines and septic tanks that is never emptied (or don’t know if ever emptied) or is emptied and buried in a covered pit is classed as ‘safely disposed in situ’ and meets the SDG criteria for a ‘safely managed’ sanitation service. Excreta from improved pit latrines and septic tanks that is removed by a service provider to treatment may also be safely managed, depending on the type of treatment received. Other methods of emptying and removal are not considered ‘safely managed’.
Table WS.3.4 summarises the main ways in which excreta is managed from households with improved on-site sanitation systems (improved pit latrines and septic tanks) and compares these with the proportion with sewer connections, unimproved sanitation or practicing open defecation.
Table WS.3.5 shows the main methods used for disposal of child faeces among households with children aged 0-2 years. Appropriate methods for disposing of the stool include the child using a toilet or latrine and putting or rinsing the stool into a toilet or latrine. Putting disposable diapers with solid waste, a very common practice throughout the world, is only considered an appropriate means of disposal if there is also a system in place for hygienic collection and disposal of the solid waste itself. This classification is currently under review.
The WHO/UNICEF Joint Monitoring Programme for Water Supply, Sanitation and Hygiene (JMP) has produced regular estimates of national, regional and global progress on drinking water, sanitation and hygiene (WASH) since 1990. The JMP service ‘ladders’ enable benchmarking and comparison of progress across countries at different stages of development. As of 2015, updated water and sanitation ladders have been introduced which build on established indicators and establish new rungs with additional criteria relating to service levels. A third ladder has also been introduced for handwashing hygiene11. Table WS.3.6 summarises the percentages of household population meeting the SDG criteria for ‘basic’ drinking water, sanitation and handwashing services.
11 WHO, UNICEF and JMP. 2017. Progress on Drinking Water, Sanitation and Hygiene.
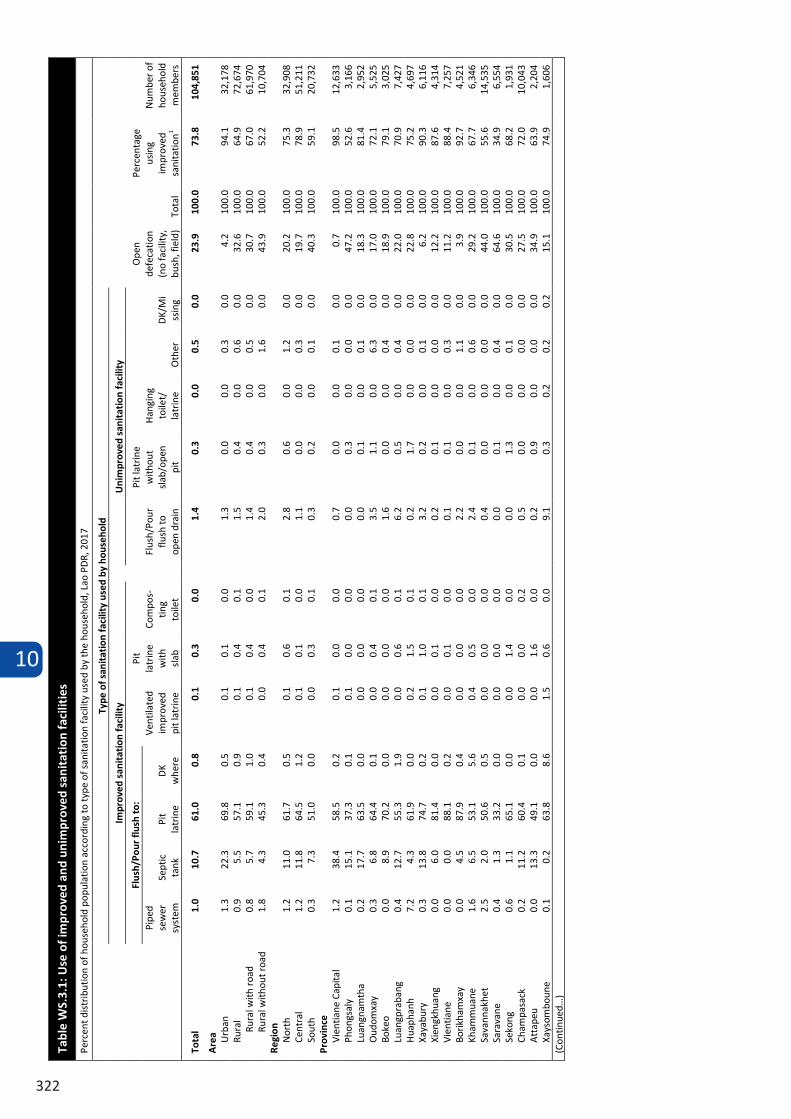
10
322
An improved sanitation facility is defined as one that hygienically separates human excreta from human contact. Improved sanitation facilities include flush or pour flush to a piped sewer systems, septic tanks, or pit latrines; ventilated improved pit latrines, pit latrines with slabs, and composting toilets. Table WS.3.1 shows the population using improved and unimproved sanitation facilities. It also shows the proportion who dispose of faeces in fields, forests, bushes, open water bodies of water, beaches or other open spaces, or with solid waste, a practice known as ‘open defecation’.
10.3 SANITATION
Table WS. 3.2 shows the distribution of household population using improved and unimproved sanitation facilities which are private, shared with other households or public facilities. Those using shared or public improved sanitation facilities are classed as having a ‘limited’ service for the purpose of SDG monitoring. Households using improved sanitation facilities that are not shared with other households meet the SDG criteria for a ‘basic’ sanitation service, and may be considered ‘safely managed’ depending on how excreta are managed.
Table WS.3.3 shows the methods used for emptying and removal of excreta from improved pit latrines and septic tanks. Excreta from improved pit latrines and septic tanks that is never emptied (or don’t know if ever emptied) or is emptied and buried in a covered pit is classed as ‘safely disposed in situ’ and meets the SDG criteria for a ‘safely managed’ sanitation service. Excreta from improved pit latrines and septic tanks that is removed by a service provider to treatment may also be safely managed, depending on the type of treatment received. Other methods of emptying and removal are not considered ‘safely managed’.
Table WS.3.4 summarises the main ways in which excreta is managed from households with improved on-site sanitation systems (improved pit latrines and septic tanks) and compares these with the proportion with sewer connections, unimproved sanitation or practicing open defecation.
Table WS.3.5 shows the main methods used for disposal of child faeces among households with children aged 0-2 years. Appropriate methods for disposing of the stool include the child using a toilet or latrine and putting or rinsing the stool into a toilet or latrine. Putting disposable diapers with solid waste, a very common practice throughout the world, is only considered an appropriate means of disposal if there is also a system in place for hygienic collection and disposal of the solid waste itself. This classification is currently under review.
The WHO/UNICEF Joint Monitoring Programme for Water Supply, Sanitation and Hygiene (JMP) has produced regular estimates of national, regional and global progress on drinking water, sanitation and hygiene (WASH) since 1990. The JMP service ‘ladders’ enable benchmarking and comparison of progress across countries at different stages of development. As of 2015, updated water and sanitation ladders have been introduced which build on established indicators and establish new rungs with additional criteria relating to service levels. A third ladder has also been introduced for handwashing hygiene11. Table WS.3.6 summarises the percentages of household population meeting the SDG criteria for ‘basic’ drinking water, sanitation and handwashing services.
11 WHO, UNICEF and JMP. 2017. Progress on Drinking Water, Sanitation and Hygiene. Tabl
e W
S.3.
1: U
se o
f im
prov
ed a
nd u
nim
prov
ed s
anit
atio
n fa
cilit
ies
Perc
ent d
istr
ibut
ion
of h
ouse
hold
pop
ulat
ion
acco
rdin
g to
type
of s
anita
tion
faci
lity
used
by
the
hous
ehol
d, L
ao P
DR,
201
7
Type
of s
anit
atio
n fa
cilit
y us
ed b
y ho
useh
old
Ope
n de
feca
tion
(no
faci
lity,
bu
sh, f
ield
) To
tal
Perc
enta
ge
usin
g im
prov
ed
sani
tatio
n1
Num
ber o
f ho
useh
old
mem
bers
Impr
oved
san
itat
ion
faci
lity
Uni
mpr
oved
san
itat
ion
faci
lity
Flus
h/Po
ur fl
ush
to:
Vent
ilate
d im
prov
ed
pit l
atrin
e
Pit
latr
ine
with
sl
ab
Com
pos-
ting
toile
t
Flus
h/Po
ur
flush
to
open
dra
in
Pit l
atrin
e w
ithou
t sl
ab/o
pen
pit
Han
ging
to
ilet/
la
trin
e O
ther
D
K/M
iss
ing
Pipe
d se
wer
sy
stem
Se
ptic
ta
nk
Pit
latr
ine
DK
whe
re
Tota
l 1.
0 10
.7
61.0
0.
8 0.
1 0.
3 0.
0 1.
4 0.
3 0.
0 0.
5 0.
0 23
.9
100.
0 73
.8
104,
851
Are
a Urb
an
1.3
22.3
69
.8
0.5
0.1
0.1
0.0
1.3
0.0
0.0
0.3
0.0
4.2
100.
0 94
.1
32,1
78
Rura
l 0.
9 5.
5 57
.1
0.9
0.1
0.4
0.1
1.5
0.4
0.0
0.6
0.0
32.6
10
0.0
64.9
72
,674
Ru
ral w
ith r
oad
0.8
5.7
59.1
1.
0 0.
1 0.
4 0.
0 1.
4 0.
4 0.
0 0.
5 0.
0 30
.7
100.
0 67
.0
61,9
70
Rura
l with
out r
oad
1.8
4.3
45.3
0.
4 0.
0 0.
4 0.
1 2.
0 0.
3 0.
0 1.
6 0.
0 43
.9
100.
0 52
.2
10,7
04
Regi
on
Nor
th
1.2
11.0
61
.7
0.5
0.1
0.6
0.1
2.8
0.6
0.0
1.2
0.0
20.2
10
0.0
75.3
32
,908
Ce
ntra
l 1.
2 11
.8
64.5
1.
2 0.
1 0.
1 0.
0 1.
1 0.
0 0.
0 0.
3 0.
0 19
.7
100.
0 78
.9
51,2
11
Sout
h 0.
3 7.
3 51
.0
0.0
0.0
0.3
0.1
0.3
0.2
0.0
0.1
0.0
40.3
10
0.0
59.1
20
,732
Pr
ovin
ce
Vien
tiane
Cap
ital
1.2
38.4
58
.5
0.2
0.1
0.0
0.0
0.7
0.0
0.0
0.1
0.0
0.7
100.
0 98
.5
12,6
33
Phon
gsal
y 0.
1 15
.1
37.3
0.
1 0.
1 0.
0 0.
0 0.
0 0.
3 0.
0 0.
0 0.
0 47
.2
100.
0 52
.6
3,16
6 Lu
angn
amth
a 0.
2 17
.7
63.5
0.
0 0.
0 0.
0 0.
0 0.
0 0.
1 0.
0 0.
1 0.
0 18
.3
100.
0 81
.4
2,95
2 O
udom
xay
0.3
6.8
64.4
0.
1 0.
0 0.
4 0.
1 3.
5 1.
1 0.
0 6.
3 0.
0 17
.0
100.
0 72
.1
5,52
5 Bo
keo
0.0
8.9
70.2
0.
0 0.
0 0.
0 0.
0 1.
6 0.
0 0.
0 0.
4 0.
0 18
.9
100.
0 79
.1
3,02
5 Lu
angp
raba
ng
0.4
12.7
55
.3
1.9
0.0
0.6
0.1
6.2
0.5
0.0
0.4
0.0
22.0
10
0.0
70.9
7,
427
Hua
phan
h 7.
2 4.
3 61
.9
0.0
0.2
1.5
0.1
0.2
1.7
0.0
0.0
0.0
22.8
10
0.0
75.2
4,
697
Xaya
bury
0.
3 13
.8
74.7
0.
2 0.
1 1.
0 0.
1 3.
2 0.
2 0.
0 0.
1 0.
0 6.
2 10
0.0
90.3
6,
116
Xien
gkhu
ang
0.0
6.0
81.4
0.
0 0.
0 0.
1 0.
0 0.
2 0.
1 0.
0 0.
0 0.
0 12
.2
100.
0 87
.6
4,31
4 Vi
entia
ne
0.0
0.0
88.1
0.
2 0.
0 0.
1 0.
0 0.
1 0.
1 0.
0 0.
3 0.
0 11
.2
100.
0 88
.4
7,25
7 Bo
rikha
mxa
y 0.
0 4.
5 87
.9
0.4
0.0
0.0
0.0
2.2
0.0
0.0
1.1
0.0
3.9
100.
0 92
.7
4,52
1 Kh
amm
uane
1.
6 6.
5 53
.1
5.6
0.4
0.5
0.0
2.4
0.1
0.0
0.6
0.0
29.2
10
0.0
67.7
6,
346
Sava
nnak
het
2.5
2.0
50.6
0.
5 0.
0 0.
0 0.
0 0.
4 0.
0 0.
0 0.
0 0.
0 44
.0
100.
0 55
.6
14,5
35
Sara
vane
0.
4 1.
3 33
.2
0.0
0.0
0.0
0.0
0.0
0.1
0.0
0.4
0.0
64.6
10
0.0
34.9
6,
554
Seko
ng
0.6
1.1
65.1
0.
0 0.
0 1.
4 0.
0 0.
0 1.
3 0.
0 0.
1 0.
0 30
.5
100.
0 68
.2
1,93
1 Ch
ampa
sack
0.
2 11
.2
60.4
0.
1 0.
0 0.
0 0.
2 0.
5 0.
0 0.
0 0.
0 0.
0 27
.5
100.
0 72
.0
10,0
43
Att
apeu
0.
0 13
.3
49.1
0.
0 0.
0 1.
6 0.
0 0.
2 0.
9 0.
0 0.
0 0.
0 34
.9
100.
0 63
.9
2,20
4 Xa
ysom
boun
e 0.
1 0.
2 63
.8
8.6
1.5
0.6
0.0
9.1
0.3
0.2
0.2
0.2
15.1
10
0.0
74.9
1,
606
(Con
tinue
d…)
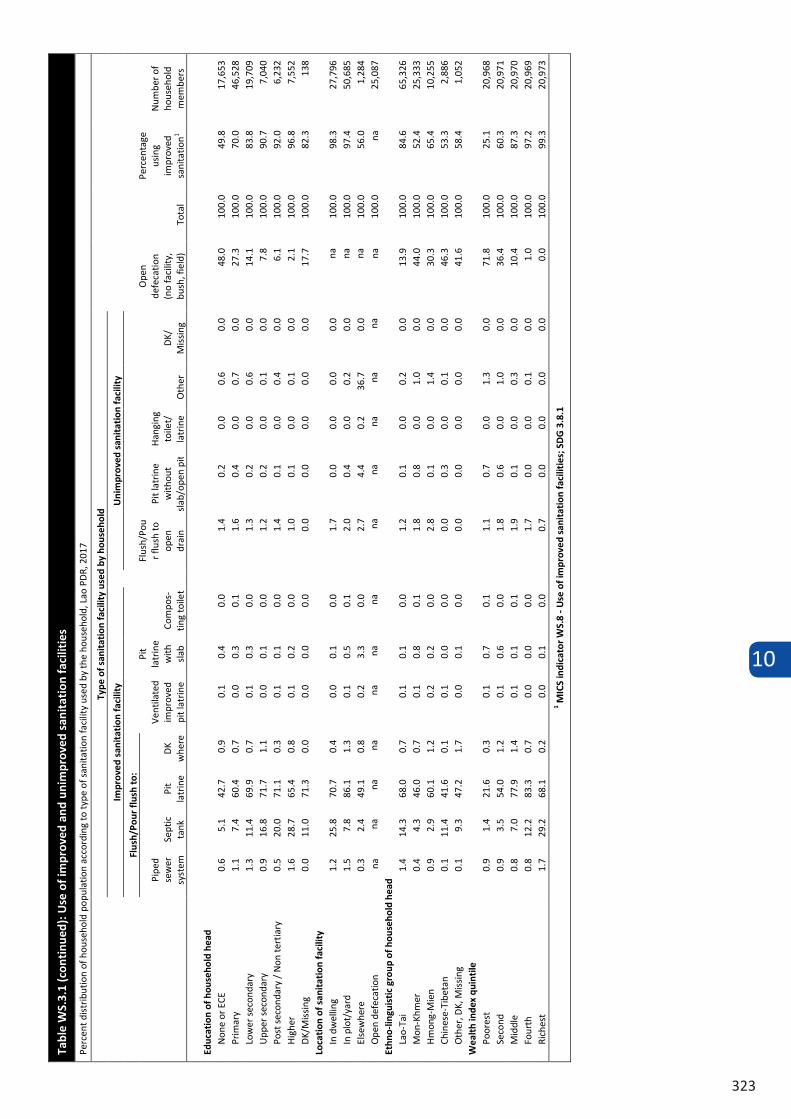
10
323
Tabl
e W
S.3.
1 (c
onti
nued
): U
se o
f im
prov
ed a
nd u
nim
prov
ed s
anit
atio
n fa
cilit
ies
Perc
ent d
istr
ibut
ion
of h
ouse
hold
pop
ulat
ion
acco
rdin
g to
type
of s
anita
tion
faci
lity
used
by
the
hous
ehol
d, L
ao P
DR,
201
7
Type
of s
anit
atio
n fa
cilit
y us
ed b
y ho
useh
old
Ope
n de
feca
tion
(no
faci
lity,
bu
sh, f
ield
) To
tal
Perc
enta
ge
usin
g im
prov
ed
sani
tatio
n1
Num
ber o
f ho
useh
old
mem
bers
Impr
oved
san
itat
ion
faci
lity
Uni
mpr
oved
san
itat
ion
faci
lity
Flus
h/Po
ur fl
ush
to:
Vent
ilate
d im
prov
ed
pit l
atrin
e
Pit
latr
ine
with
sl
ab
Com
pos-
ting
toile
t
Flus
h/Po
ur f
lush
to
open
dr
ain
Pit l
atrin
e w
ithou
t sl
ab/o
pen
pit
Han
ging
to
ilet/
la
trin
e O
ther
D
K/
Mis
sing
Pipe
d se
wer
sy
stem
Se
ptic
ta
nk
Pit
latr
ine
DK
whe
re
Educ
atio
n of
hou
seho
ld h
ead
Non
e or
ECE
0.
6 5.
1 42
.7
0.9
0.1
0.4
0.0
1.4
0.2
0.0
0.6
0.0
48.0
10
0.0
49.8
17
,653
Pr
imar
y 1.
1 7.
4 60
.4
0.7
0.0
0.3
0.1
1.6
0.4
0.0
0.7
0.0
27.3
10
0.0
70.0
46
,528
Lo
wer
sec
onda
ry
1.3
11.4
69
.9
0.7
0.1
0.3
0.0
1.3
0.2
0.0
0.6
0.0
14.1
10
0.0
83.8
19
,709
U
pper
sec
onda
ry
0.9
16.8
71
.7
1.1
0.0
0.1
0.0
1.2
0.2
0.0
0.1
0.0
7.8
100.
0 90
.7
7,04
0 Po
st s
econ
dary
/ N
on te
rtia
ry
0.5
20.0
71
.1
0.3
0.1
0.1
0.0
1.4
0.1
0.0
0.4
0.0
6.1
100.
0 92
.0
6,23
2 H
ighe
r 1.
6 28
.7
65.4
0.
8 0.
1 0.
2 0.
0 1.
0 0.
1 0.
0 0.
1 0.
0 2.
1 10
0.0
96.8
7,
552
DK/
Mis
sing
0.
0 11
.0
71.3
0.
0 0.
0 0.
0 0.
0 0.
0 0.
0 0.
0 0.
0 0.
0 17
.7
100.
0 82
.3
138
Loca
tion
of s
anit
atio
n fa
cilit
y In
dw
ellin
g 1.
2 25
.8
70.7
0.
4 0.
0 0.
1 0.
0 1.
7 0.
0 0.
0 0.
0 0.
0 na
10
0.0
98.3
27
,796
In
plo
t/ya
rd
1.5
7.8
86.1
1.
3 0.
1 0.
5 0.
1 2.
0 0.
4 0.
0 0.
2 0.
0 na
10
0.0
97.4
50
,685
El
sew
here
0.
3 2.
4 49
.1
0.8
0.2
3.3
0.0
2.7
4.4
0.2
36.7
0.
0 na
10
0.0
56.0
1,
284
Ope
n de
feca
tion
na
na
na
na
na
na
na
na
na
na
na
na
na
100.
0 na
25
,087
Et
hno-
lingu
isti
c gr
oup
of h
ouse
hold
hea
d La
o-Ta
i 1.
4 14
.3
68.0
0.
7 0.
1 0.
1 0.
0 1.
2 0.
1 0.
0 0.
2 0.
0 13
.9
100.
0 84
.6
65,3
26
Mon
-Khm
er
0.4
4.3
46.0
0.
7 0.
1 0.
8 0.
1 1.
8 0.
8 0.
0 1.
0 0.
0 44
.0
100.
0 52
.4
25,3
33
Hm
ong-
Mie
n 0.
9 2.
9 60
.1
1.2
0.2
0.2
0.0
2.8
0.1
0.0
1.4
0.0
30.3
10
0.0
65.4
10
,255
Ch
ines
e-Ti
beta
n 0.
1 11
.4
41.6
0.
1 0.
1 0.
0 0.
0 0.
0 0.
3 0.
0 0.
1 0.
0 46
.3
100.
0 53
.3
2,88
6 O
ther
, DK,
Mis
sing
0.
1 9.
3 47
.2
1.7
0.0
0.1
0.0
0.0
0.0
0.0
0.0
0.0
41.6
10
0.0
58.4
1,
052
Wea
lth
inde
x qu
inti
le
Poor
est
0.9
1.4
21.6
0.
3 0.
1 0.
7 0.
1 1.
1 0.
7 0.
0 1.
3 0.
0 71
.8
100.
0 25
.1
20,9
68
Seco
nd
0.9
3.5
54.0
1.
2 0.
1 0.
6 0.
0 1.
8 0.
6 0.
0 1.
0 0.
0 36
.4
100.
0 60
.3
20,9
71
Mid
dle
0.8
7.0
77.9
1.
4 0.
1 0.
1 0.
1 1.
9 0.
1 0.
0 0.
3 0.
0 10
.4
100.
0 87
.3
20,9
70
Four
th
0.8
12.2
83
.3
0.7
0.0
0.0
0.0
1.7
0.0
0.0
0.1
0.0
1.0
100.
0 97
.2
20,9
69
Rich
est
1.7
29.2
68
.1
0.2
0.0
0.1
0.0
0.7
0.0
0.0
0.0
0.0
0.0
100.
0 99
.3
20,9
73
1 MIC
S in
dica
tor W
S.8
- Use
of i
mpr
oved
san
itat
ion
faci
litie
s; S
DG
3.8
.1
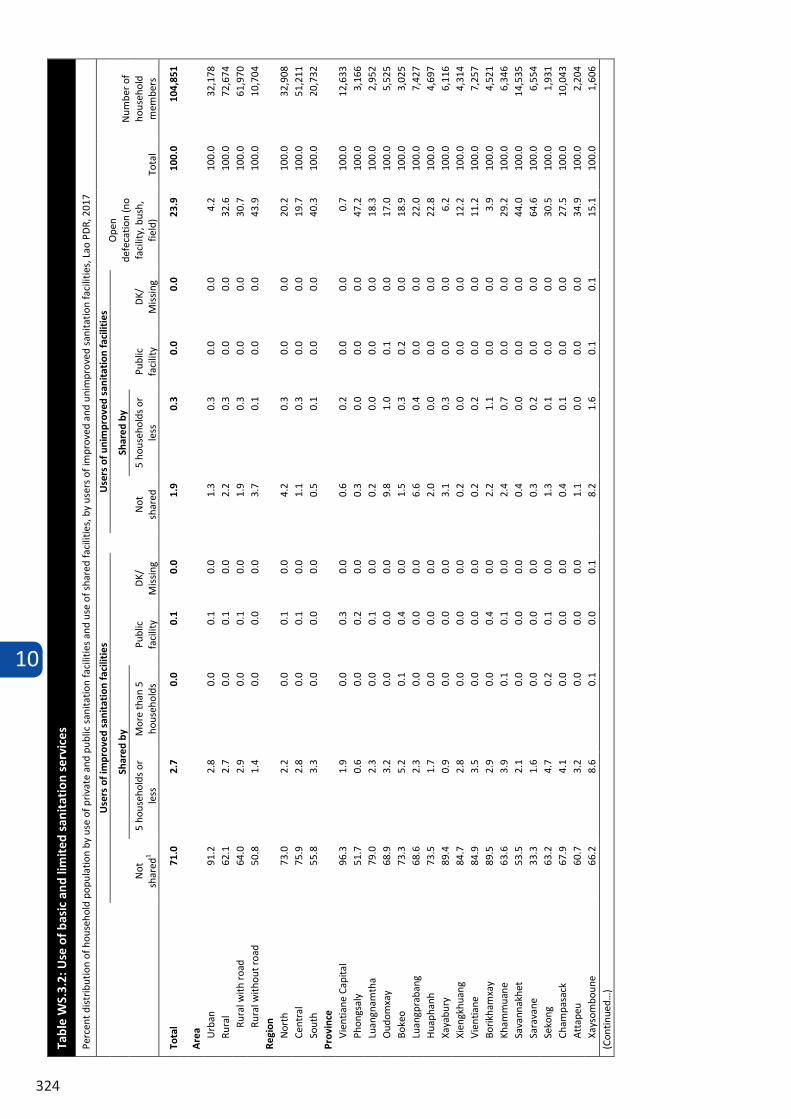
10
324
Tabl
e W
S.3.
2: U
se o
f bas
ic a
nd li
mit
ed s
anit
atio
n se
rvic
es
Perc
ent d
istr
ibut
ion
of h
ouse
hold
pop
ulat
ion
by u
se o
f priv
ate
and
publ
ic s
anita
tion
faci
litie
s an
d us
e of
sha
red
faci
litie
s, b
y us
ers
of im
prov
ed a
nd u
nim
prov
ed s
anita
tion
faci
litie
s, L
ao P
DR,
201
7
Use
rs o
f im
prov
ed s
anit
atio
n fa
cilit
ies
Use
rs o
f uni
mpr
oved
san
itat
ion
faci
litie
s O
pen
defe
catio
n (n
o fa
cilit
y, b
ush,
fie
ld)
Tota
l
Num
ber o
f ho
useh
old
mem
bers
N
ot
shar
ed1
Shar
ed b
y
Publ
ic
faci
lity
DK/
M
issi
ng
Not
sh
ared
Shar
ed b
y
Publ
ic
faci
lity
DK/
M
issi
ng
5 ho
useh
olds
or
less
M
ore
than
5
hous
ehol
ds
5 ho
useh
olds
or
less
Tota
l 71
.0
2.7
0.0
0.1
0.0
1.9
0.3
0.0
0.0
23.9
10
0.0
104,
851
Are
a Urb
an
91.2
2.
8 0.
0 0.
1 0.
0 1.
3 0.
3 0.
0 0.
0 4.
2 10
0.0
32,1
78
Rura
l 62
.1
2.7
0.0
0.1
0.0
2.2
0.3
0.0
0.0
32.6
10
0.0
72,6
74
Rura
l with
roa
d 64
.0
2.9
0.0
0.1
0.0
1.9
0.3
0.0
0.0
30.7
10
0.0
61,9
70
Rura
l with
out r
oad
50.8
1.
4 0.
0 0.
0 0.
0 3.
7 0.
1 0.
0 0.
0 43
.9
100.
0 10
,704
Re
gion
N
orth
73
.0
2.2
0.0
0.1
0.0
4.2
0.3
0.0
0.0
20.2
10
0.0
32,9
08
Cent
ral
75.9
2.
8 0.
0 0.
1 0.
0 1.
1 0.
3 0.
0 0.
0 19
.7
100.
0 51
,211
So
uth
55.8
3.
3 0.
0 0.
0 0.
0 0.
5 0.
1 0.
0 0.
0 40
.3
100.
0 20
,732
Pr
ovin
ce
Vien
tiane
Cap
ital
96.3
1.
9 0.
0 0.
3 0.
0 0.
6 0.
2 0.
0 0.
0 0.
7 10
0.0
12,6
33
Phon
gsal
y 51
.7
0.6
0.0
0.2
0.0
0.3
0.0
0.0
0.0
47.2
10
0.0
3,16
6 Lu
angn
amth
a 79
.0
2.3
0.0
0.1
0.0
0.2
0.0
0.0
0.0
18.3
10
0.0
2,95
2 O
udom
xay
68.9
3.
2 0.
0 0.
0 0.
0 9.
8 1.
0 0.
1 0.
0 17
.0
100.
0 5,
525
Boke
o 73
.3
5.2
0.1
0.4
0.0
1.5
0.3
0.2
0.0
18.9
10
0.0
3,02
5 Lu
angp
raba
ng
68.6
2.
3 0.
0 0.
0 0.
0 6.
6 0.
4 0.
0 0.
0 22
.0
100.
0 7,
427
Hua
phan
h 73
.5
1.7
0.0
0.0
0.0
2.0
0.0
0.0
0.0
22.8
10
0.0
4,69
7 Xa
yabu
ry
89.4
0.
9 0.
0 0.
0 0.
0 3.
1 0.
3 0.
0 0.
0 6.
2 10
0.0
6,11
6 Xi
engk
huan
g 84
.7
2.8
0.0
0.0
0.0
0.2
0.0
0.0
0.0
12.2
10
0.0
4,31
4 Vi
entia
ne
84.9
3.
5 0.
0 0.
0 0.
0 0.
2 0.
2 0.
0 0.
0 11
.2
100.
0 7,
257
Borik
ham
xay
89.5
2.
9 0.
0 0.
4 0.
0 2.
2 1.
1 0.
0 0.
0 3.
9 10
0.0
4,52
1 Kh
amm
uane
63
.6
3.9
0.1
0.1
0.0
2.4
0.7
0.0
0.0
29.2
10
0.0
6,34
6 Sa
vann
akhe
t 53
.5
2.1
0.0
0.0
0.0
0.4
0.0
0.0
0.0
44.0
10
0.0
14,5
35
Sara
vane
33
.3
1.6
0.0
0.0
0.0
0.3
0.2
0.0
0.0
64.6
10
0.0
6,55
4 Se
kong
63
.2
4.7
0.2
0.1
0.0
1.3
0.1
0.0
0.0
30.5
10
0.0
1,93
1 Ch
ampa
sack
67
.9
4.1
0.0
0.0
0.0
0.4
0.1
0.0
0.0
27.5
10
0.0
10,0
43
Att
apeu
60
.7
3.2
0.0
0.0
0.0
1.1
0.0
0.0
0.0
34.9
10
0.0
2,20
4 Xa
ysom
boun
e 66
.2
8.6
0.1
0.0
0.1
8.2
1.6
0.1
0.1
15.1
10
0.0
1,60
6 (C
ontin
ued…
)
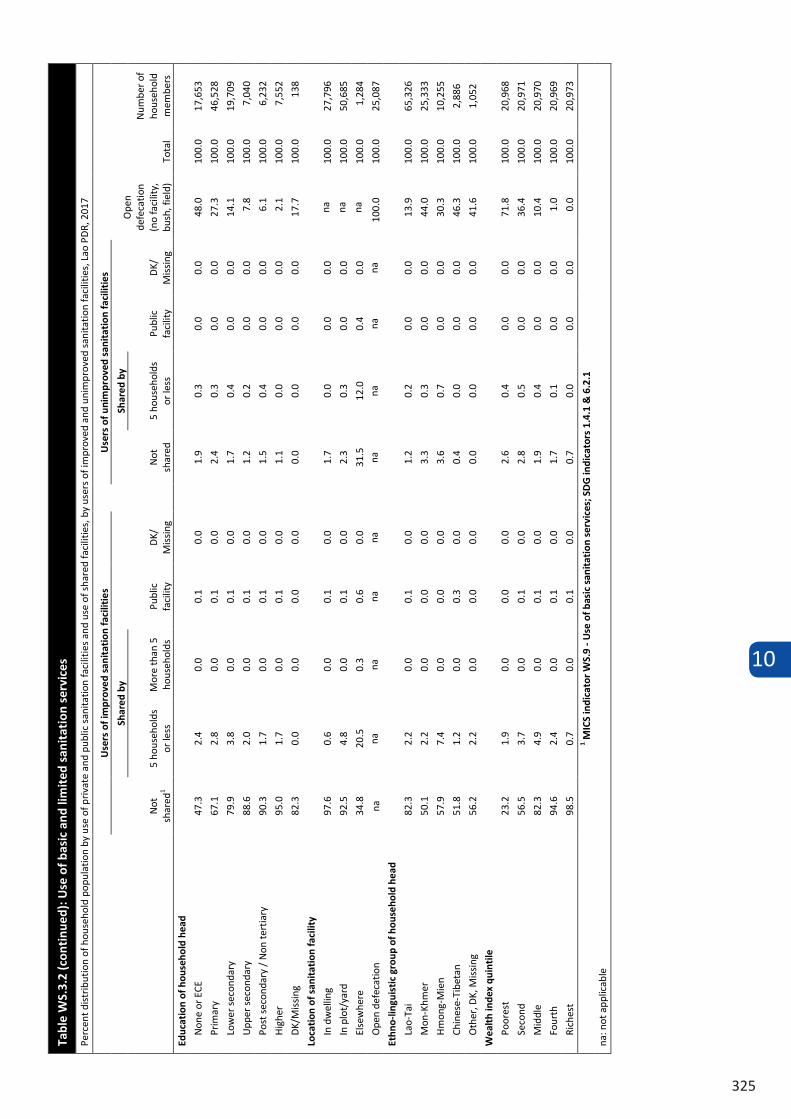
10
325
Tabl
e W
S.3.
2 (c
onti
nued
): U
se o
f bas
ic a
nd li
mit
ed s
anit
atio
n se
rvic
es
Perc
ent d
istr
ibut
ion
of h
ouse
hold
pop
ulat
ion
by u
se o
f priv
ate
and
publ
ic s
anita
tion
faci
litie
s an
d us
e of
sha
red
faci
litie
s, b
y us
ers
of im
prov
ed a
nd u
nim
prov
ed s
anita
tion
faci
litie
s, L
ao P
DR,
201
7
Use
rs o
f im
prov
ed s
anit
atio
n fa
cilit
ies
Use
rs o
f uni
mpr
oved
san
itat
ion
faci
litie
s
Ope
n de
feca
tion
(no
faci
lity,
bu
sh, f
ield
) To
tal
Num
ber o
f ho
useh
old
mem
bers
N
ot
shar
ed1
Shar
ed b
y
Publ
ic
faci
lity
DK/
M
issi
ng
Not
sh
ared
Shar
ed b
y
Publ
ic
faci
lity
DK/
M
issi
ng
5 ho
useh
olds
or
less
M
ore
than
5
hous
ehol
ds
5 ho
useh
olds
or
less
Ed
ucat
ion
of h
ouse
hold
hea
d
Non
e or
ECE
47
.3
2.4
0.0
0.1
0.0
1.9
0.3
0.0
0.0
48.0
10
0.0
17,6
53
Prim
ary
67.1
2.
8 0.
0 0.
1 0.
0 2.
4 0.
3 0.
0 0.
0 27
.3
100.
0 46
,528
Low
er s
econ
dary
79
.9
3.8
0.0
0.1
0.0
1.7
0.4
0.0
0.0
14.1
10
0.0
19,7
09
Upp
er s
econ
dary
88
.6
2.0
0.0
0.1
0.0
1.2
0.2
0.0
0.0
7.8
100.
0 7,
040
Post
sec
onda
ry /
Non
tert
iary
90
.3
1.7
0.0
0.1
0.0
1.5
0.4
0.0
0.0
6.1
100.
0 6,
232
Hig
her
95.0
1.
7 0.
0 0.
1 0.
0 1.
1 0.
0 0.
0 0.
0 2.
1 10
0.0
7,55
2
DK/
Mis
sing
82
.3
0.0
0.0
0.0
0.0
0.0
0.0
0.0
0.0
17.7
10
0.0
138
Loca
tion
of s
anit
atio
n fa
cilit
y
In d
wel
ling
97.6
0.
6 0.
0 0.
1 0.
0 1.
7 0.
0 0.
0 0.
0 na
10
0.0
27,7
96
In p
lot/
yard
92
.5
4.8
0.0
0.1
0.0
2.3
0.3
0.0
0.0
na
100.
0 50
,685
Else
whe
re
34.8
20
.5
0.3
0.6
0.0
31.5
12
.0
0.4
0.0
na
100.
0 1,
284
Ope
n de
feca
tion
na
na
na
na
na
na
na
na
na
100.
0 10
0.0
25,0
87
Ethn
o-lin
guis
tic
grou
p of
hou
seho
ld h
ead
Lao-
Tai
82.3
2.
2 0.
0 0.
1 0.
0 1.
2 0.
2 0.
0 0.
0 13
.9
100.
0 65
,326
Mon
-Khm
er
50.1
2.
2 0.
0 0.
0 0.
0 3.
3 0.
3 0.
0 0.
0 44
.0
100.
0 25
,333
Hm
ong-
Mie
n 57
.9
7.4
0.0
0.0
0.0
3.6
0.7
0.0
0.0
30.3
10
0.0
10,2
55
Chin
ese-
Tibe
tan
51.8
1.
2 0.
0 0.
3 0.
0 0.
4 0.
0 0.
0 0.
0 46
.3
100.
0 2,
886
Oth
er, D
K, M
issi
ng
56.2
2.
2 0.
0 0.
0 0.
0 0.
0 0.
0 0.
0 0.
0 41
.6
100.
0 1,
052
Wea
lth
inde
x qu
inti
le
Poor
est
23.2
1.
9 0.
0 0.
0 0.
0 2.
6 0.
4 0.
0 0.
0 71
.8
100.
0 20
,968
Seco
nd
56.5
3.
7 0.
0 0.
1 0.
0 2.
8 0.
5 0.
0 0.
0 36
.4
100.
0 20
,971
Mid
dle
82.3
4.
9 0.
0 0.
1 0.
0 1.
9 0.
4 0.
0 0.
0 10
.4
100.
0 20
,970
Four
th
94.6
2.
4 0.
0 0.
1 0.
0 1.
7 0.
1 0.
0 0.
0 1.
0 10
0.0
20,9
69
Rich
est
98.5
0.
7 0.
0 0.
1 0.
0 0.
7 0.
0 0.
0 0.
0 0.
0 10
0.0
20,9
73
1 MIC
S in
dica
tor W
S.9
- Use
of b
asic
san
itat
ion
serv
ices
; SD
G in
dica
tors
1.4
.1 &
6.2
.1
na: n
ot a
pplic
able
Tabl
e W
S.3.
3: E
mpt
ying
and
rem
oval
of e
xcre
ta fr
om im
prov
ed p
it la
trin
es a
nd s
epti
c ta
nks
Perc
ent d
istr
ibut
ion
of h
ouse
hold
mem
bers
in h
ouse
hold
s w
ith im
prov
ed p
it la
trin
es a
nd s
eptic
tank
s by
met
hod
of e
mpt
ying
, Lao
PD
R, 2
017
Empt
ying
of s
epti
c ta
nks
Empt
ying
of o
ther
impr
oved
on-
site
san
itat
ion
faci
litie
s
Tota
l
Safe
di
spos
al in
si
tu o
f ex
cret
a fr
om o
n-si
te
sani
tatio
n fa
cilit
ies1
Uns
afe
disp
osal
of
excr
eta
from
on-
site
sa
nita
tion
faci
litie
s
Rem
oval
o
f exc
reta
fo
r tr
eatm
ent
from
o
n-si
te
sani
tatio
n fa
cilit
ies
Num
ber o
f ho
useh
old
mem
bers
in
hous
ehol
ds
with
im
prov
ed
on-s
ite
sani
tatio
n fa
cilit
ies
Whe
re w
ere
the
cont
ents
em
ptie
d to
?
Nev
er
empt
ied
DK
if
ever
em
ptie
d
Whe
re w
ere
the
cont
ents
em
ptie
d to
?
Nev
er
empt
ied
DK
if ev
er
empt
ied/
M
issi
ng
Rem
oved
by
a
serv
ice
prov
ider
to
tr
eatm
ent Re
mov
ed b
y a
serv
ice
prov
ider
to
DK
Burie
d
in a
cov
ered
pit
To
unc
over
ed p
it,op
en g
roun
d,
wat
er b
ody
or e
lsew
here
O
ther
Don
't kn
ow
whe
re
was
tes
wer
e ta
ken
Rem
oved
by
a
serv
ice
prov
ider
to
trea
tmen
t
Rem
oved
b
y a
se
rvic
e pr
ovid
er
to D
K
Burie
d in
a
cove
red
pit
To
unco
vere
d pi
t, op
en
grou
nd, w
ater
body
or
else
whe
re
Oth
er
Don
't kn
ow
whe
re
was
tes
wer
e ta
ken
Tota
l 0.
0 2.
6 0.
0 0.
0 0.
1 0.
4 11
.7
0.0
0.1
5.1
0.1
0.1
0.1
2.0
77.6
0.
1 10
0.0
89.6
0.
2 10
.2
75,5
42
Are
a Urb
an
0.0
5.7
0.0
0.0
0.2
0.8
17.3
0.
1 0.
2 8.
1 0.
1 0.
1 0.
1 4.
0 63
.0
0.2
100.
0 80
.7
0.4
18.9
29
,710
Ru
ral
0.0
0.5
0.0
0.0
0.0
0.1
8.1
0.0
0.1
3.1
0.1
0.0
0.1
0.7
87.0
0.
1 10
0.0
95.3
0.
1 4.
6 45
,831
Ru
ral w
ith ro
ad
0.0
0.6
0.0
0.0
0.0
0.1
8.0
0.0
0.1
3.6
0.1
0.1
0.1
0.8
86.5
0.
1 10
0.0
94.7
0.
1 5.
2 40
,474
Ru
ral w
ithou
t roa
d 0.
0 0.
0 0.
0 0.
0 0.
0 0.
0 8.
6 0.
0 0.
1 0.
0 0.
3 0.
0 0.
0 0.
0 90
.9
0.0
100.
0 99
.9
0.0
0.1
5,35
7 Re
gion
N
orth
0.
0 1.
0 0.
0 0.
0 0.
0 0.
3 13
.7
0.0
0.1
1.7
0.0
0.1
0.1
1.7
81.1
0.
0 10
0.0
94.9
0.
2 4.
9 24
,200
Ce
ntra
l 0.
0 4.
3 0.
0 0.
0 0.
1 0.
5 10
.3
0.1
0.1
8.4
0.2
0.0
0.1
2.5
73.2
0.
2 10
0.0
83.9
0.
3 15
.8
39,1
65
Sout
h 0.
1 0.
1 0.
0 0.
0 0.
1 0.
0 12
.2
0.0
0.2
1.4
0.0
0.0
0.0
1.1
84.6
0.
2 10
0.0
97.0
0.
1 2.
9 12
,177
Pr
ovin
ce
Vien
tiane
Cap
ital
0.0
12.5
0.
0 0.
0 0.
2 1.
3 25
.3
0.3
0.1
14.4
0.
1 0.
0 0.
1 5.
1 40
.3
0.3
100.
0 66
.2
0.4
33.4
12
,262
Ph
ongs
aly
0.0
0.2
0.0
0.0
0.0
0.0
28.5
0.
0 0.
1 0.
2 0.
2 0.
1 0.
0 0.
0 70
.7
0.0
100.
0 99
.4
0.1
0.5
1,65
9 Lu
angn
amth
a 0.
0 0.
7 0.
0 0.
0 0.
0 0.
8 20
.3
0.0
0.0
1.8
0.1
0.5
0.0
0.6
75.1
0.
0 10
0.0
95.5
0.
5 4.
0 2,
399
Oud
omxa
y 0.
0 1.
4 0.
0 0.
0 0.
0 0.
0 8.
1 0.
0 0.
3 2.
5 0.
0 0.
0 0.
2 0.
4 87
.0
0.0
100.
0 95
.1
0.2
4.7
3,96
6 Bo
keo
0.0
1.0
0.0
0.0
0.0
0.0
10.2
0.
0 0.
1 2.
2 0.
0 0.
3 0.
1 0.
1 85
.6
0.4
100.
0 96
.2
0.4
3.4
2,39
2 Lu
angp
raba
ng
0.0
0.9
0.0
0.0
0.0
0.9
16.6
0.
0 0.
1 1.
0 0.
1 0.
0 0.
0 1.
8 78
.7
0.0
100.
0 95
.4
0.0
4.6
5,09
6 H
uaph
anh
0.0
0.3
0.0
0.0
0.0
0.1
5.9
0.0
0.0
0.2
0.0
0.3
0.2
0.4
92.5
0.
0 10
0.0
98.4
0.
5 1.
1 3,
194
Xaya
bury
0.
0 1.
6 0.
0 0.
0 0.
0 0.
0 13
.8
0.0
0.2
2.9
0.0
0.1
0.1
5.0
76.3
0.
0 10
0.0
90.1
0.
1 9.
7 5,
494
Xien
gkhu
ang
0.1
0.5
0.2
0.0
0.0
0.2
5.8
0.0
0.2
1.0
1.4
0.0
0.1
0.2
90.2
0.
0 10
0.0
97.6
0.
1 2.
2 3,
775
Vien
tiane
0.
0 0.
0 0.
0 0.
0 0.
0 0.
0 0.
0 0.
0 0.
1 5.
6 0.
0 0.
0 0.
0 1.
1 93
.2
0.1
100.
0 93
.2
0.0
6.8
6,40
1 Bo
rikha
mxa
y 0.
0 0.
6 0.
0 0.
0 0.
0 0.
0 4.
3 0.
0 0.
0 3.
5 0.
0 0.
0 0.
0 0.
0 91
.6
0.0
100.
0 95
.9
0.0
4.1
4,17
7 Kh
amm
uane
0.
1 2.
1 0.
2 0.
0 0.
0 0.
0 8.
3 0.
0 0.
2 11
.0
0.2
0.2
0.0
0.3
77.0
0.
4 10
0.0
86.0
0.
2 13
.8
3,84
1 Sa
vann
akhe
t 0.
1 0.
2 0.
0 0.
0 0.
3 0.
4 2.
8 0.
0 0.
3 7.
1 0.
0 0.
0 0.
2 3.
4 85
.1
0.1
100.
0 88
.0
0.6
11.5
7,
647
Sara
vane
0.
0 0.
0 0.
0 0.
0 0.
0 0.
1 3.
7 0.
0 0.
3 3.
4 0.
1 0.
0 0.
0 0.
1 92
.2
0.1
100.
0 96
.1
0.0
3.9
2,26
1 Se
kong
0.
0 0.
0 0.
0 0.
0 0.
0 0.
0 1.
7 0.
0 0.
0 1.
1 0.
1 0.
0 0.
0 0.
4 96
.8
0.0
100.
0 98
.6
0.0
1.4
1,30
5 Ch
ampa
sack
0.
1 0.
1 0.
0 0.
0 0.
1 0.
0 15
.3
0.0
0.2
0.7
0.0
0.0
0.0
1.3
81.9
0.
3 10
0.0
97.5
0.
1 2.
4 7,
202
Atta
peu
0.0
0.7
0.0
0.0
0.0
0.0
20.1
0.
0 0.
2 1.
9 0.
0 0.
1 0.
2 2.
1 74
.8
0.0
100.
0 94
.8
0.3
4.9
1,40
9 Xa
ysom
boun
e 0.
0 0.
0 0.
0 0.
0 0.
0 0.
0 0.
3 0.
0 0.
0 0.
0 0.
0 0.
0 0.
0 0.
0 99
.7
0.0
100.
0 10
0.0
0.0
0.0
1,06
2 (C
ontin
ued…
)
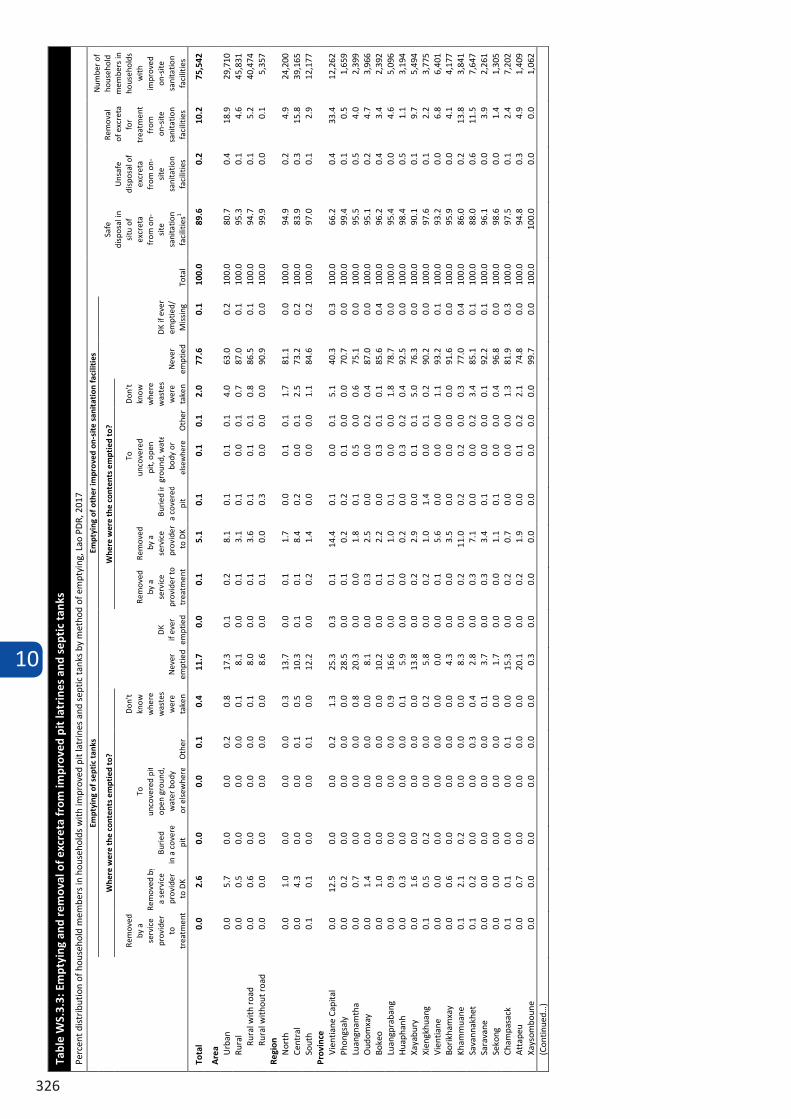
10
326
Tabl
e W
S.3.
3: E
mpt
ying
and
rem
oval
of e
xcre
ta fr
om im
prov
ed p
it la
trin
es a
nd s
epti
c ta
nks
Perc
ent d
istr
ibut
ion
of h
ouse
hold
mem
bers
in h
ouse
hold
s w
ith im
prov
ed p
it la
trin
es a
nd s
eptic
tank
s by
met
hod
of e
mpt
ying
, Lao
PD
R, 2
017
Empt
ying
of s
epti
c ta
nks
Empt
ying
of o
ther
impr
oved
on-
site
san
itat
ion
faci
litie
s
Tota
l
Safe
di
spos
al in
si
tu o
f ex
cret
a fr
om o
n-si
te
sani
tatio
n fa
cilit
ies1
Uns
afe
disp
osal
of
excr
eta
from
on-
site
sa
nita
tion
faci
litie
s
Rem
oval
o
f exc
reta
fo
r tr
eatm
ent
from
o
n-si
te
sani
tatio
n fa
cilit
ies
Num
ber o
f ho
useh
old
mem
bers
in
hous
ehol
ds
with
im
prov
ed
on-s
ite
sani
tatio
n fa
cilit
ies
Whe
re w
ere
the
cont
ents
em
ptie
d to
?
Nev
er
empt
ied
DK
if
ever
em
ptie
d
Whe
re w
ere
the
cont
ents
em
ptie
d to
?
Nev
er
empt
ied
DK
if ev
er
empt
ied/
M
issi
ng
Rem
oved
by
a
serv
ice
prov
ider
to
tr
eatm
ent Re
mov
ed b
y a
serv
ice
prov
ider
to
DK
Burie
d
in a
cov
ered
pit
To
unc
over
ed p
it,op
en g
roun
d,
wat
er b
ody
or e
lsew
here
O
ther
Don
't kn
ow
whe
re
was
tes
wer
e ta
ken
Rem
oved
by
a
serv
ice
prov
ider
to
trea
tmen
t
Rem
oved
b
y a
se
rvic
e pr
ovid
er
to D
K
Burie
d in
a
cove
red
pit
To
unco
vere
d pi
t, op
en
grou
nd, w
ater
body
or
else
whe
re
Oth
er
Don
't kn
ow
whe
re
was
tes
wer
e ta
ken
Tota
l 0.
0 2.
6 0.
0 0.
0 0.
1 0.
4 11
.7
0.0
0.1
5.1
0.1
0.1
0.1
2.0
77.6
0.
1 10
0.0
89.6
0.
2 10
.2
75,5
42
Are
a Urb
an
0.0
5.7
0.0
0.0
0.2
0.8
17.3
0.
1 0.
2 8.
1 0.
1 0.
1 0.
1 4.
0 63
.0
0.2
100.
0 80
.7
0.4
18.9
29
,710
Ru
ral
0.0
0.5
0.0
0.0
0.0
0.1
8.1
0.0
0.1
3.1
0.1
0.0
0.1
0.7
87.0
0.
1 10
0.0
95.3
0.
1 4.
6 45
,831
Ru
ral w
ith ro
ad
0.0
0.6
0.0
0.0
0.0
0.1
8.0
0.0
0.1
3.6
0.1
0.1
0.1
0.8
86.5
0.
1 10
0.0
94.7
0.
1 5.
2 40
,474
Ru
ral w
ithou
t roa
d 0.
0 0.
0 0.
0 0.
0 0.
0 0.
0 8.
6 0.
0 0.
1 0.
0 0.
3 0.
0 0.
0 0.
0 90
.9
0.0
100.
0 99
.9
0.0
0.1
5,35
7 Re
gion
N
orth
0.
0 1.
0 0.
0 0.
0 0.
0 0.
3 13
.7
0.0
0.1
1.7
0.0
0.1
0.1
1.7
81.1
0.
0 10
0.0
94.9
0.
2 4.
9 24
,200
Ce
ntra
l 0.
0 4.
3 0.
0 0.
0 0.
1 0.
5 10
.3
0.1
0.1
8.4
0.2
0.0
0.1
2.5
73.2
0.
2 10
0.0
83.9
0.
3 15
.8
39,1
65
Sout
h 0.
1 0.
1 0.
0 0.
0 0.
1 0.
0 12
.2
0.0
0.2
1.4
0.0
0.0
0.0
1.1
84.6
0.
2 10
0.0
97.0
0.
1 2.
9 12
,177
Pr
ovin
ce
Vien
tiane
Cap
ital
0.0
12.5
0.
0 0.
0 0.
2 1.
3 25
.3
0.3
0.1
14.4
0.
1 0.
0 0.
1 5.
1 40
.3
0.3
100.
0 66
.2
0.4
33.4
12
,262
Ph
ongs
aly
0.0
0.2
0.0
0.0
0.0
0.0
28.5
0.
0 0.
1 0.
2 0.
2 0.
1 0.
0 0.
0 70
.7
0.0
100.
0 99
.4
0.1
0.5
1,65
9 Lu
angn
amth
a 0.
0 0.
7 0.
0 0.
0 0.
0 0.
8 20
.3
0.0
0.0
1.8
0.1
0.5
0.0
0.6
75.1
0.
0 10
0.0
95.5
0.
5 4.
0 2,
399
Oud
omxa
y 0.
0 1.
4 0.
0 0.
0 0.
0 0.
0 8.
1 0.
0 0.
3 2.
5 0.
0 0.
0 0.
2 0.
4 87
.0
0.0
100.
0 95
.1
0.2
4.7
3,96
6 Bo
keo
0.0
1.0
0.0
0.0
0.0
0.0
10.2
0.
0 0.
1 2.
2 0.
0 0.
3 0.
1 0.
1 85
.6
0.4
100.
0 96
.2
0.4
3.4
2,39
2 Lu
angp
raba
ng
0.0
0.9
0.0
0.0
0.0
0.9
16.6
0.
0 0.
1 1.
0 0.
1 0.
0 0.
0 1.
8 78
.7
0.0
100.
0 95
.4
0.0
4.6
5,09
6 H
uaph
anh
0.0
0.3
0.0
0.0
0.0
0.1
5.9
0.0
0.0
0.2
0.0
0.3
0.2
0.4
92.5
0.
0 10
0.0
98.4
0.
5 1.
1 3,
194
Xaya
bury
0.
0 1.
6 0.
0 0.
0 0.
0 0.
0 13
.8
0.0
0.2
2.9
0.0
0.1
0.1
5.0
76.3
0.
0 10
0.0
90.1
0.
1 9.
7 5,
494
Xien
gkhu
ang
0.1
0.5
0.2
0.0
0.0
0.2
5.8
0.0
0.2
1.0
1.4
0.0
0.1
0.2
90.2
0.
0 10
0.0
97.6
0.
1 2.
2 3,
775
Vien
tiane
0.
0 0.
0 0.
0 0.
0 0.
0 0.
0 0.
0 0.
0 0.
1 5.
6 0.
0 0.
0 0.
0 1.
1 93
.2
0.1
100.
0 93
.2
0.0
6.8
6,40
1 Bo
rikha
mxa
y 0.
0 0.
6 0.
0 0.
0 0.
0 0.
0 4.
3 0.
0 0.
0 3.
5 0.
0 0.
0 0.
0 0.
0 91
.6
0.0
100.
0 95
.9
0.0
4.1
4,17
7 Kh
amm
uane
0.
1 2.
1 0.
2 0.
0 0.
0 0.
0 8.
3 0.
0 0.
2 11
.0
0.2
0.2
0.0
0.3
77.0
0.
4 10
0.0
86.0
0.
2 13
.8
3,84
1 Sa
vann
akhe
t 0.
1 0.
2 0.
0 0.
0 0.
3 0.
4 2.
8 0.
0 0.
3 7.
1 0.
0 0.
0 0.
2 3.
4 85
.1
0.1
100.
0 88
.0
0.6
11.5
7,
647
Sara
vane
0.
0 0.
0 0.
0 0.
0 0.
0 0.
1 3.
7 0.
0 0.
3 3.
4 0.
1 0.
0 0.
0 0.
1 92
.2
0.1
100.
0 96
.1
0.0
3.9
2,26
1 Se
kong
0.
0 0.
0 0.
0 0.
0 0.
0 0.
0 1.
7 0.
0 0.
0 1.
1 0.
1 0.
0 0.
0 0.
4 96
.8
0.0
100.
0 98
.6
0.0
1.4
1,30
5 Ch
ampa
sack
0.
1 0.
1 0.
0 0.
0 0.
1 0.
0 15
.3
0.0
0.2
0.7
0.0
0.0
0.0
1.3
81.9
0.
3 10
0.0
97.5
0.
1 2.
4 7,
202
Atta
peu
0.0
0.7
0.0
0.0
0.0
0.0
20.1
0.
0 0.
2 1.
9 0.
0 0.
1 0.
2 2.
1 74
.8
0.0
100.
0 94
.8
0.3
4.9
1,40
9 Xa
ysom
boun
e 0.
0 0.
0 0.
0 0.
0 0.
0 0.
0 0.
3 0.
0 0.
0 0.
0 0.
0 0.
0 0.
0 0.
0 99
.7
0.0
100.
0 10
0.0
0.0
0.0
1,06
2 (C
ontin
ued…
)
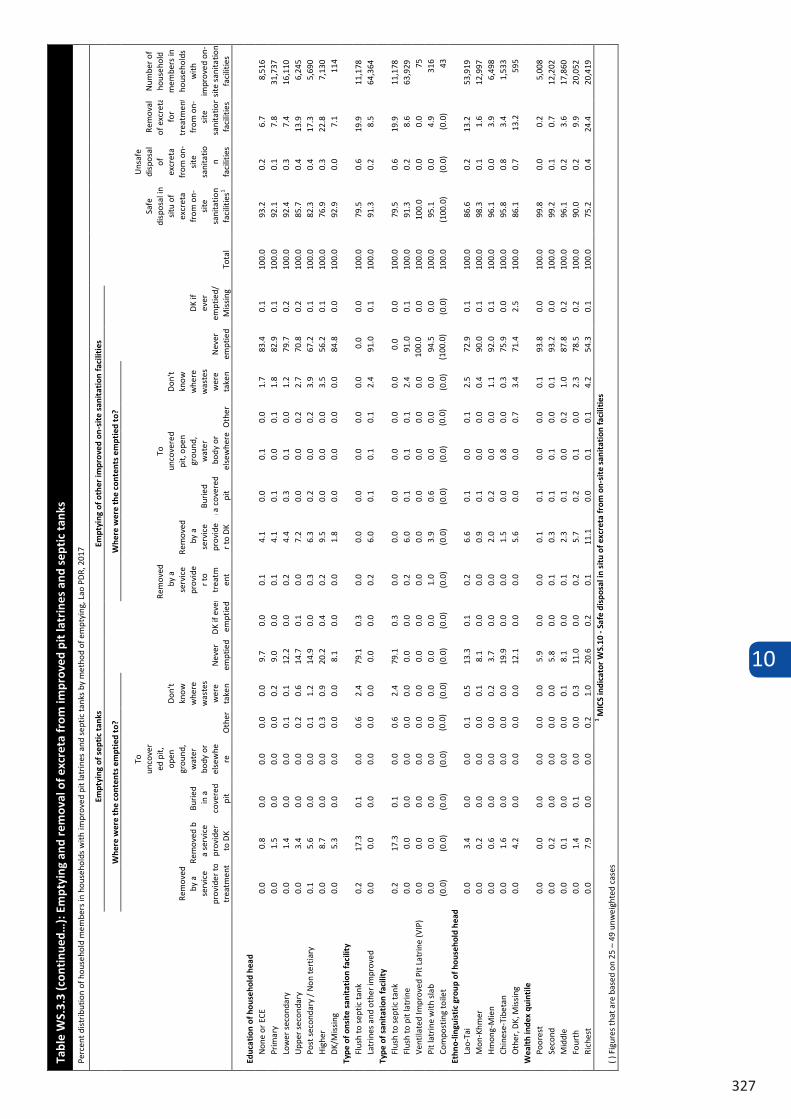
10
327
Tabl
e W
S.3.
3 (c
onti
nued
…):
Em
ptyi
ng a
nd r
emov
al o
f exc
reta
from
impr
oved
pit
latr
ines
and
sep
tic
tank
s
Perc
ent d
istr
ibut
ion
of h
ouse
hold
mem
bers
in h
ouse
hold
s w
ith im
prov
ed p
it la
trin
es a
nd s
eptic
tank
s by
met
hod
of e
mpt
ying
, Lao
PD
R, 2
017
Empt
ying
of s
epti
c ta
nks
Empt
ying
of o
ther
impr
oved
on-
site
san
itat
ion
faci
litie
s
Tota
l
Safe
di
spos
al in
si
tu o
f ex
cret
a fr
om o
n-si
te
sani
tatio
n fa
cilit
ies1
Uns
afe
disp
osal
of
ex
cret
a fr
om o
n-si
te
sani
tatio
n fa
cilit
ies
Rem
oval
of
exc
reta
fo
r tr
eatm
ent
from
on-
site
sa
nita
tion
faci
litie
s
Num
ber o
f ho
useh
old
mem
bers
in
hous
ehol
ds
with
im
prov
ed o
n-si
te s
anita
tion
faci
litie
s
Whe
re w
ere
the
cont
ents
em
ptie
d to
?
N
ever
em
ptie
d D
K if
ever
em
ptie
d
Whe
re w
ere
the
cont
ents
em
ptie
d to
?
Nev
er
empt
ied
DK
if ev
er
empt
ied/
M
issi
ng
Rem
oved
by
a
serv
ice
prov
ider
to
trea
tmen
t Rem
oved
by
a se
rvic
e pr
ovid
er
to D
K
Burie
d in
a
cove
red
pit
To
unco
ver
ed p
it,
open
gr
ound
, w
ater
bo
dy o
r el
sew
here
O
ther
Don
't kn
ow
whe
re
was
tes
wer
e ta
ken
Rem
oved
b
y a
serv
ice
prov
ide
r to
trea
tmen
t
Rem
oved
b
y a
serv
ice
prov
ide
r to
DK
Burie
d in
a c
over
ed
pit
To
unco
vere
d pi
t, op
en
grou
nd,
wat
er
bod
y or
el
sew
here
Oth
er
Don
't kn
ow
whe
re
was
tes
wer
e ta
ken
Educ
atio
n of
hou
seho
ld h
ead
Non
e or
ECE
0.
0 0.
8 0.
0 0.
0 0.
0 0.
0 9.
7 0.
0 0.
1 4.
1 0.
0 0.
1 0.
0 1.
7 83
.4
0.1
100.
0 93
.2
0.2
6.7
8,51
6 Pr
imar
y 0.
0 1.
5 0.
0 0.
0 0.
0 0.
2 9.
0 0.
0 0.
1 4.
1 0.
1 0.
0 0.
1 1.
8 82
.9
0.1
100.
0 92
.1
0.1
7.8
31,7
37
Low
er s
econ
dary
0.
0 1.
4 0.
0 0.
0 0.
1 0.
1 12
.2
0.0
0.2
4.4
0.3
0.1
0.0
1.2
79.7
0.
2 10
0.0
92.4
0.
3 7.
4 16
,110
U
pper
sec
onda
ry
0.0
3.4
0.0
0.0
0.2
0.6
14.7
0.
1 0.
0 7.
2 0.
0 0.
0 0.
2 2.
7 70
.8
0.2
100.
0 85
.7
0.4
13.9
6,
245
Post
sec
onda
ry /
Non
tert
iary
0.
1 5.
6 0.
0 0.
0 0.
1 1.
2 14
.9
0.0
0.3
6.3
0.2
0.0
0.2
3.9
67.2
0.
1 10
0.0
82.3
0.
4 17
.3
5,69
0 H
ighe
r 0.
0 8.
7 0.
0 0.
0 0.
3 0.
9 20
.2
0.4
0.2
9.5
0.0
0.0
0.0
3.5
56.2
0.
1 10
0.0
76.9
0.
3 22
.8
7,13
0 D
K/M
issi
ng
0.0
5.3
0.0
0.0
0.0
0.0
8.1
0.0
0.0
1.8
0.0
0.0
0.0
0.0
84.8
0.
0 10
0.0
92.9
0.
0 7.
1 11
4 Ty
pe o
f ons
ite
sani
tati
on fa
cilit
y Fl
ush
to s
eptic
tank
0.
2 17
.3
0.1
0.0
0.6
2.4
79.1
0.
3 0.
0 0.
0 0.
0 0.
0 0.
0 0.
0 0.
0 0.
0 10
0.0
79.5
0.
6 19
.9
11,1
78
Latr
ines
and
oth
er im
prov
ed
0.0
0.0
0.0
0.0
0.0
0.0
0.0
0.0
0.2
6.0
0.1
0.1
0.1
2.4
91.0
0.
1 10
0.0
91.3
0.
2 8.
5 64
,364
Ty
pe o
f san
itat
ion
faci
lity
Flus
h to
sep
tic ta
nk
0.2
17.3
0.
1 0.
0 0.
6 2.
4 79
.1
0.3
0.0
0.0
0.0
0.0
0.0
0.0
0.0
0.0
100.
0 79
.5
0.6
19.9
11
,178
Fl
ush
to p
it la
trin
e 0.
0 0.
0 0.
0 0.
0 0.
0 0.
0 0.
0 0.
0 0.
2 6.
0 0.
1 0.
1 0.
1 2.
4 91
.0
0.1
100.
0 91
.3
0.2
8.6
63,9
29
Vent
ilate
d Im
prov
ed P
it La
trin
e (V
IP)
0.0
0.0
0.0
0.0
0.0
0.0
0.0
0.0
0.0
0.0
0.0
0.0
0.0
0.0
100.0
0 0.
0 10
0.0
100.
0 0.
0 0.
0 75
Pi
t lat
rine
with
sla
b 0.
0 0.
0 0.
0 0.
0 0.
0 0.
0 0.
0 0.
0 1.
0 3.
9 0.
6 0.
0 0.
0 0.
0 94
.5
0.0
100.
0 95
.1
0.0
4.9
316
Com
post
ing
toile
t (0
.0)
(0.0
) (0
.0)
(0.0
) (0
.0)
0)
(0.0
) (0
.0)
(0.0
) (0
.0)
(0.0
) (0
.0)
(0.0
) (0
.0)
0)
(0.0
) (1
00.0)
0)
(0.0
) 10
0.0
(100
.0)
(0.0
) (0
.0)
43
Ethn
o-lin
guis
tic
grou
p of
hou
seho
ld h
ead
Lao-
Tai
0.0
3.4
0.0
0.0
0.1
0.5
13.3
0.
1 0.
2 6.
6 0.
1 0.
0 0.
1 2.
5 72
.9
0.1
100.
0 86
.6
0.2
13.2
53
,919
M
on-K
hmer
0.
0 0.
2 0.
0 0.
0 0.
0 0.
1 8.
1 0.
0 0.
0 0.
9 0.
1 0.
0 0.
0 0.
4 90
.0
0.1
100.
0 98
.3
0.1
1.6
12,9
97
Hm
ong-
Mie
n 0.
0 0.
6 0.
0 0.
0 0.
0 0.
2 3.
7 0.
0 0.
0 2.
0 0.
2 0.
0 0.
0 1.
1 92
.0
0.1
100.
0 96
.1
0.0
3.9
6,49
8 Ch
ines
e-Ti
beta
n 0.
0 1.
6 0.
0 0.
0 0.
0 0.
0 19
.9
0.0
0.0
1.5
0.0
0.8
0.0
0.3
75.9
0.
0 10
0.0
95.8
0.
8 3.
4 1,
533
Oth
er, D
K, M
issi
ng
0.0
4.2
0.0
0.0
0.0
0.0
12.1
0.
0 0.
0 5.
6 0.
0 0.
0 0.
7 3.
4 71
.4
2.5
100.
0 86
.1
0.7
13.2
59
5 W
ealt
h in
dex
quin
tile
Po
ores
t 0.
0 0.
0 0.
0 0.
0 0.
0 0.
0 5.
9 0.
0 0.
0 0.
1 0.
1 0.
0 0.
0 0.
1 93
.8
0.0
100.
0 99
.8
0.0
0.2
5,00
8 Se
cond
0.
0 0.
2 0.
0 0.
0 0.
0 0.
0 5.
8 0.
0 0.
1 0.
3 0.
1 0.
1 0.
0 0.
1 93
.2
0.0
100.
0 99
.2
0.1
0.7
12,2
02
Mid
dle
0.0
0.1
0.0
0.0
0.0
0.1
8.1
0.0
0.1
2.3
0.1
0.0
0.2
1.0
87.8
0.
2 10
0.0
96.1
0.
2 3.
6 17
,860
Fo
urth
0.
0 1.
4 0.
1 0.
0 0.
0 0.
3 11
.0
0.0
0.2
5.7
0.2
0.1
0.0
2.3
78.5
0.
2 10
0.0
90.0
0.
2 9.
9 20
,052
Ri
ches
t 0.
0 7.
9 0.
0 0.
0 0.
2 1.
0 20
.6
0.2
0.1
11.1
0.
0 0.
1 0.
1 4.
2 54
.3
0.1
100.
0 75
.2
0.4
24.4
20
,419
1 M
ICS
indi
cato
r W
S.10
- Sa
fe d
ispo
sal i
n si
tu o
f exc
reta
from
on-
site
san
itat
ion
faci
litie
s ( )
Fig
ures
tha
t are
bas
ed o
n 25
– 4
9 un
wei
ghte
d ca
ses
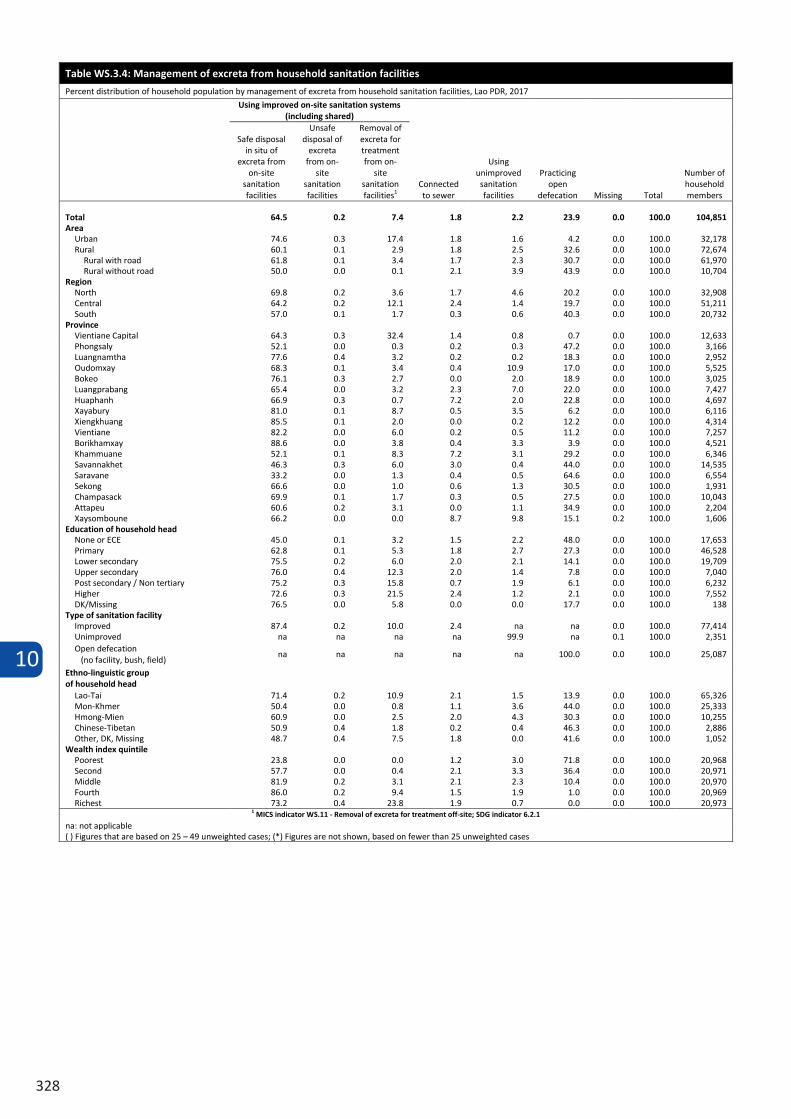
10
328
Table WS.3.4: Management of excreta from household sanitation facilities
Percent distribution of household population by management of excreta from household sanitation facilities, Lao PDR, 2017
Using improved on-site sanitation systems (including shared)
Connected to sewer
Using unimproved sanitation facilities
Practicing open
defecation Missing Total
Number of household members
Safe disposal in situ of
excreta from on-site
sanitation facilities
Unsafe disposal of
excreta from on-
site sanitation facilities
Removal of excreta for treatment from on-
site sanitation facilities1
Total 64.5 0.2 7.4 1.8 2.2 23.9 0.0 100.0 104,851 Area
Urban 74.6 0.3 17.4 1.8 1.6 4.2 0.0 100.0 32,178 Rural 60.1 0.1 2.9 1.8 2.5 32.6 0.0 100.0 72,674
Rural with road 61.8 0.1 3.4 1.7 2.3 30.7 0.0 100.0 61,970 Rural without road 50.0 0.0 0.1 2.1 3.9 43.9 0.0 100.0 10,704
Region North 69.8 0.2 3.6 1.7 4.6 20.2 0.0 100.0 32,908 Central 64.2 0.2 12.1 2.4 1.4 19.7 0.0 100.0 51,211 South 57.0 0.1 1.7 0.3 0.6 40.3 0.0 100.0 20,732
Province Vientiane Capital 64.3 0.3 32.4 1.4 0.8 0.7 0.0 100.0 12,633 Phongsaly 52.1 0.0 0.3 0.2 0.3 47.2 0.0 100.0 3,166 Luangnamtha 77.6 0.4 3.2 0.2 0.2 18.3 0.0 100.0 2,952 Oudomxay 68.3 0.1 3.4 0.4 10.9 17.0 0.0 100.0 5,525 Bokeo 76.1 0.3 2.7 0.0 2.0 18.9 0.0 100.0 3,025 Luangprabang 65.4 0.0 3.2 2.3 7.0 22.0 0.0 100.0 7,427 Huaphanh 66.9 0.3 0.7 7.2 2.0 22.8 0.0 100.0 4,697 Xayabury 81.0 0.1 8.7 0.5 3.5 6.2 0.0 100.0 6,116 Xiengkhuang 85.5 0.1 2.0 0.0 0.2 12.2 0.0 100.0 4,314 Vientiane 82.2 0.0 6.0 0.2 0.5 11.2 0.0 100.0 7,257 Borikhamxay 88.6 0.0 3.8 0.4 3.3 3.9 0.0 100.0 4,521 Khammuane 52.1 0.1 8.3 7.2 3.1 29.2 0.0 100.0 6,346 Savannakhet 46.3 0.3 6.0 3.0 0.4 44.0 0.0 100.0 14,535 Saravane 33.2 0.0 1.3 0.4 0.5 64.6 0.0 100.0 6,554 Sekong 66.6 0.0 1.0 0.6 1.3 30.5 0.0 100.0 1,931 Champasack 69.9 0.1 1.7 0.3 0.5 27.5 0.0 100.0 10,043 Attapeu 60.6 0.2 3.1 0.0 1.1 34.9 0.0 100.0 2,204 Xaysomboune 66.2 0.0 0.0 8.7 9.8 15.1 0.2 100.0 1,606
Education of household head None or ECE 45.0 0.1 3.2 1.5 2.2 48.0 0.0 100.0 17,653 Primary 62.8 0.1 5.3 1.8 2.7 27.3 0.0 100.0 46,528 Lower secondary 75.5 0.2 6.0 2.0 2.1 14.1 0.0 100.0 19,709 Upper secondary 76.0 0.4 12.3 2.0 1.4 7.8 0.0 100.0 7,040 Post secondary / Non tertiary 75.2 0.3 15.8 0.7 1.9 6.1 0.0 100.0 6,232 Higher 72.6 0.3 21.5 2.4 1.2 2.1 0.0 100.0 7,552 DK/Missing 76.5 0.0 5.8 0.0 0.0 17.7 0.0 100.0 138
Type of sanitation facility Improved 87.4 0.2 10.0 2.4 na na 0.0 100.0 77,414 Unimproved na na na na 99.9 na 0.1 100.0 2,351 Open defecation (no facility, bush, field)
na na na na na 100.0 0.0 100.0 25,087
Ethno-linguistic group of household head
Lao-Tai 71.4 0.2 10.9 2.1 1.5 13.9 0.0 100.0 65,326 Mon-Khmer 50.4 0.0 0.8 1.1 3.6 44.0 0.0 100.0 25,333 Hmong-Mien 60.9 0.0 2.5 2.0 4.3 30.3 0.0 100.0 10,255 Chinese-Tibetan 50.9 0.4 1.8 0.2 0.4 46.3 0.0 100.0 2,886 Other, DK, Missing 48.7 0.4 7.5 1.8 0.0 41.6 0.0 100.0 1,052
Wealth index quintile Poorest 23.8 0.0 0.0 1.2 3.0 71.8 0.0 100.0 20,968 Second 57.7 0.0 0.4 2.1 3.3 36.4 0.0 100.0 20,971 Middle 81.9 0.2 3.1 2.1 2.3 10.4 0.0 100.0 20,970 Fourth 86.0 0.2 9.4 1.5 1.9 1.0 0.0 100.0 20,969 Richest 73.2 0.4 23.8 1.9 0.7 0.0 0.0 100.0 20,973
1 MICS indicator WS.11 - Removal of excreta for treatment off-site; SDG indicator 6.2.1 na: not applicable ( ) Figures that are based on 25 – 49 unweighted cases; (*) Figures are not shown, based on fewer than 25 unweighted cases
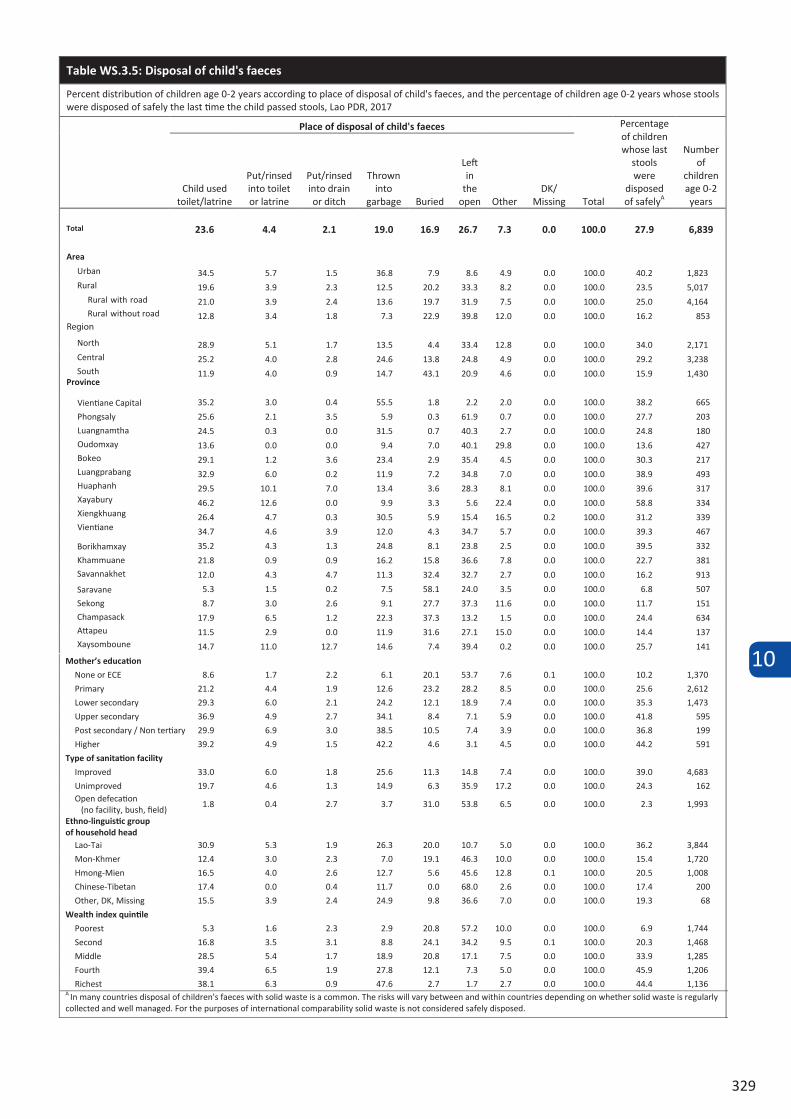
10
329
Table WS.3.5: Disposal of child's faeces
Total
Place of disposal of child's faeces Percentage of children whose last
stools were
disposed of safelyA
Number of
children age 0-2 years
Child used
Percent distribution of children age 0-2 years according to place of disposal of child's faeces, and the percentage of children age 0-2 years whose stools were disposed of safely the last time the child passed stools, Lao PDR, 2017
toilet/latrine
Put/rinsed into toilet or latrine
Put/rinsed into drain or ditch
Thrown into
Left in
garbage Buried the DK/
open Other Missing
Total 23.6 4.4 2.1 19.0 16.9 26.7 7.3 0.0 100.0 27.9 6,839
Area
Urban 34.5 5.7 1.5 36.8 7.9 8.6 4.9 0.0 100.0 40.2 1,823 Rural 19.6 3.9 2.3 12.5 20.2 33.3 8.2 0.0 100.0 23.5 5,017
Rural with road 21.0 3.9 2.4 13.6 19.7 31.9 7.5 0.0 100.0 25.0 4,164
12.8 3.4 1.8 7.3 22.9 39.8 12.0 0.0 100.0 16.2 853 Rural without road
North 28.9 5.1 1.7 13.5 4.4 33.4 12.8 0.0 100.0 34.0 2,171 Central 25.2 4.0 2.8 24.6 13.8 24.8 4.9 0.0 100.0 29.2 3,238
11.9 4.0 0.9 14.7 43.1 20.9 4.6 0.0 100.0 15.9 1,430 South Province
35.2 3.0 0.4 55.5 1.8 2.2 2.0 0.0 100.0 38.2 665
25.6 2.1 3.5 5.9 0.3 61.9 0.7 0.0 100.0 27.7 203
24.5 0.3 0.0 31.5 0.7 40.3 2.7 0.0 100.0 24.8 180
13.6 0.0 0.0 9.4 7.0 40.1 29.8 0.0 100.0 13.6 427
29.1 1.2 3.6 23.4 2.9 35.4 4.5 0.0 100.0 30.3 217
32.9 6.0 0.2 11.9 7.2 34.8 7.0 0.0 100.0 38.9 493
29.5 10.1 7.0 13.4 3.6 28.3 8.1 0.0 100.0 39.6 317
46.2 12.6 0.0 9.9 3.3 5.6 22.4 0.0 100.0 58.8 334
26.4 4.7 0.3 30.5 5.9 15.4 16.5 0.2 100.0 31.2 339
34.7 4.6
Vientiane Capital
Phongsaly
Luangnamtha
Oudomxay
Bokeo
Luangprabang
Huaphanh
Xayabury
Xiengkhuang
Vientiane 3.9 12.0 4.3 34.7 5.7 0.0 100.0 39.3 467
35.2 4.3 1.3 24.8 8.1 23.8 2.5 0.0 100.0 39.5 332
21.8 0.9 0.9 16.2 15.8 36.6 7.8 0.0 100.0 22.7 381
Borikhamxay
Khammuane
Savannakhet 12.0 4.3 4.7 11.3 32.4 32.7 2.7 0.0 100.0 16.2 913
5.3 1.5 0.2 7.5 58.1 24.0 3.5 0.0 100.0 6.8 507
8.7 3.0 2.6 9.1 27.7 37.3 11.6 0.0 100.0 11.7 151
17.9 6.5 1.2 22.3 37.3 13.2 1.5 0.0 100.0 24.4 634
11.5 2.9 0.0 11.9 31.6 27.1 15.0 0.0 100.0 14.4 137
Saravane
Sekong
Champasack
Attapeu
Xaysomboune 14.7 11.0 12.7 14.6 7.4 39.4 0.2 0.0 100.0 25.7 141
8.6 1.7 2.2
Mother’s education
6.1 20.1 53.7 7.6 0.1 100.0 10.2 1,370
21.2 4.4 1.9 12.6 23.2 28.2 8.5 0.0 100.0 25.6 2,612
29.3 6.0 2.1 24.2 12.1 18.9 7.4 0.0 100.0 35.3 1,473
36.9 4.9 2.7 34.1 8.4 7.1 5.9 0.0 100.0 41.8 595
29.9 6.9 3.0 38.5 10.5 7.4 3.9 0.0 100.0 36.8 199
39.2 4.9 1.5 42.2 4.6 3.1 4.5 0.0 100.0 44.2 591
33.0 6.0 1.8 25.6 11.3
Type of sanitation facility
14.8 7.4 0.0 100.0
None or ECE
Primary
Lower secondary
Upper secondary
Post secondary / Non tertiary
Higher
39.0 4,683
19.7 4.6 1.3 14.9 6.3 35.9 17.2 0.0 100.0 24.3 162
1.8 0.4 2.7 3.7 31.0 53.8 6.5 0.0 100.0 2.3 1,993
Improved
Unimproved Open defecation
30.9 5.3 1.9 26.3 20.0 10.7 5.0 0.0 100.0 36.2 3,844
12.4 3.0 2.3 7.0 19.1
(no facility, bush, field) Ethno-linguistic group of household head
46.3 10.0 0.0 100.0 15.4 1,720
16.5 4.0 2.6 12.7 5.6 45.6 12.8 0.1 100.0 20.5 1,008
17.4 0.0 0.4 11.7 0.0 68.0 2.6 0.0 100.0 17.4 200
15.5 3.9 2.4 24.9 9.8 36.6 7.0 0.0 100.0 19.3 68
5.3
Lao-Tai
Mon-Khmer
Hmong-Mien
Chinese-Tibetan
Other, DK, Missing
1.6 2.3 2.9
Wealth index quintile
20.8 57.2 10.0 0.0 100.0 6.9 1,744
16.8 3.5 3.1 8.8 24.1 34.2 9.5 0.1 100.0 20.3 1,468
28.5 5.4 1.7 18.9 20.8 17.1 7.5 0.0 100.0 33.9 1,285
39.4 6.5 1.9 27.8 12.1 7.3 5.0 0.0 100.0 45.9 1,206
38.1 6.3 0.9 47.6 2.7 1.7 2.7 0.0 100.0 44.4 1,136 A
Poorest
Second
Middle
Fourth
Richest In many countries disposal of children's faeces with solid waste is a common. The risks will vary between and within countries depending on whether solid waste is regularly
Region
collected and well managed. For the purposes of international comparability solid waste is not considered safely disposed.
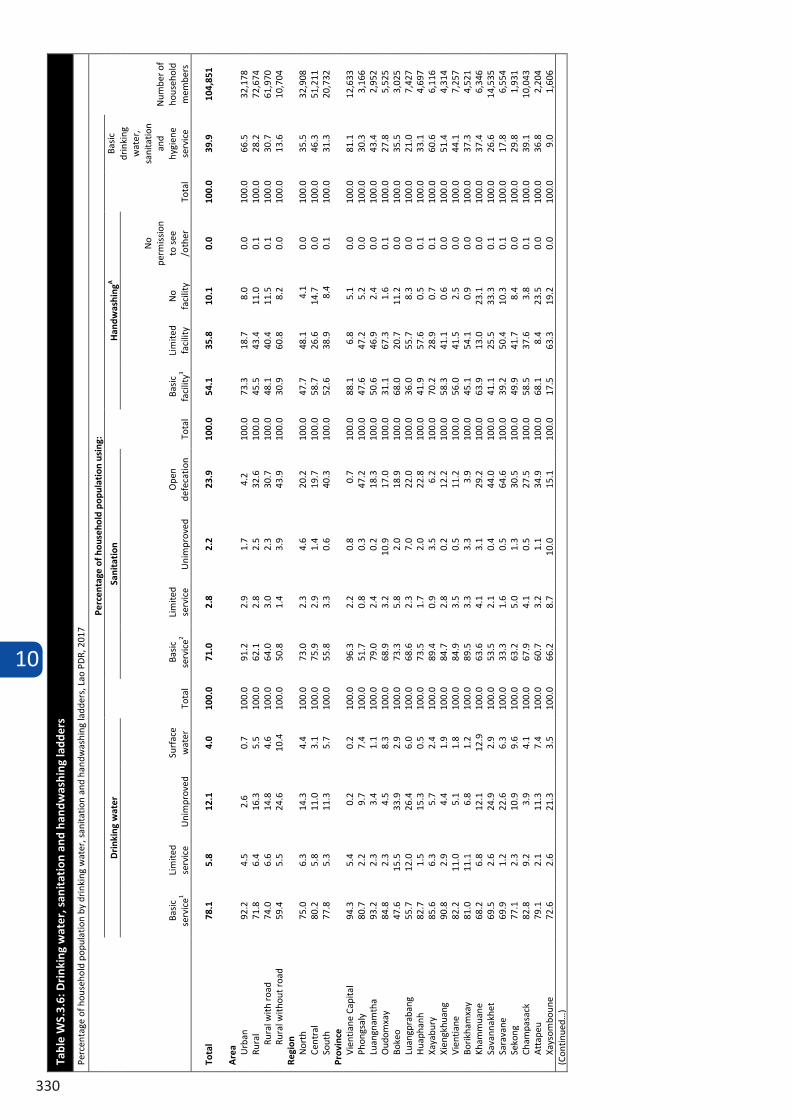
10
330
Tabl
e W
S.3.
6: D
rink
ing
wat
er, s
anit
atio
n an
d ha
ndw
ashi
ng la
dder
s
Perc
enta
ge o
f hou
seho
ld p
opul
atio
n by
drin
king
wat
er, s
anita
tion
and
hand
was
hing
ladd
ers,
Lao
PD
R, 2
017
Perc
enta
ge o
f hou
seho
ld p
opul
atio
n us
ing:
Num
ber o
f ho
useh
old
mem
bers
Dri
nkin
g w
ater
Tota
l
Sani
tati
on
Tota
l
Han
dwas
hing
A
Tota
l
Basi
c dr
inki
ng
wat
er,
sani
tatio
n an
d hy
gien
e se
rvic
e Ba
sic
serv
ice1
Lim
ited
serv
ice
Uni
mpr
oved
Su
rfac
e w
ater
Ba
sic
serv
ice2
Lim
ited
serv
ice
Uni
mpr
oved
O
pen
defe
catio
n Ba
sic
faci
lity3
Lim
ited
faci
lity
No
faci
lity
No
perm
issi
on
to s
ee
/oth
er
Tota
l 78
.1
5.8
12.1
4.
0 10
0.0
71.0
2.
8 2.
2 23
.9
100.
0 54
.1
35.8
10
.1
0.0
100.
0 39
.9
104,
851
Are
a Urb
an
92.2
4.
5 2.
6 0.
7 10
0.0
91.2
2.
9 1.
7 4.
2 10
0.0
73.3
18
.7
8.0
0.0
100.
0 66
.5
32,1
78
Rura
l 71
.8
6.4
16.3
5.
5 10
0.0
62.1
2.
8 2.
5 32
.6
100.
0 45
.5
43.4
11
.0
0.1
100.
0 28
.2
72,6
74
Rura
l with
roa
d 74
.0
6.6
14.8
4.
6 10
0.0
64.0
3.
0 2.
3 30
.7
100.
0 48
.1
40.4
11
.5
0.1
100.
0 30
.7
61,9
70
Rura
l with
out r
oad
59.4
5.
5 24
.6
10.4
10
0.0
50.8
1.
4 3.
9 43
.9
100.
0 30
.9
60.8
8.
2 0.
0 10
0.0
13.6
10
,704
Re
gion
N
orth
75
.0
6.3
14.3
4.
4 10
0.0
73.0
2.
3 4.
6 20
.2
100.
0 47
.7
48.1
4.
1 0.
0 10
0.0
35.5
32
,908
Ce
ntra
l 80
.2
5.8
11.0
3.
1 10
0.0
75.9
2.
9 1.
4 19
.7
100.
0 58
.7
26.6
14
.7
0.0
100.
0 46
.3
51,2
11
Sout
h 77
.8
5.3
11.3
5.
7 10
0.0
55.8
3.
3 0.
6 40
.3
100.
0 52
.6
38.9
8.
4 0.
1 10
0.0
31.3
20
,732
Pr
ovin
ce
Vien
tiane
Cap
ital
94.3
5.
4 0.
2 0.
2 10
0.0
96.3
2.
2 0.
8 0.
7 10
0.0
88.1
6.
8 5.
1 0.
0 10
0.0
81.1
12
,633
Ph
ongs
aly
80.7
2.
2 9.
7 7.
4 10
0.0
51.7
0.
8 0.
3 47
.2
100.
0 47
.6
47.2
5.
2 0.
0 10
0.0
30.3
3,
166
Luan
gnam
tha
93.2
2.
3 3.
4 1.
1 10
0.0
79.0
2.
4 0.
2 18
.3
100.
0 50
.6
46.9
2.
4 0.
0 10
0.0
43.4
2,
952
Oud
omxa
y 84
.8
2.3
4.5
8.3
100.
0 68
.9
3.2
10.9
17
.0
100.
0 31
.1
67.3
1.
6 0.
1 10
0.0
27.8
5,
525
Boke
o 47
.6
15.5
33
.9
2.9
100.
0 73
.3
5.8
2.0
18.9
10
0.0
68.0
20
.7
11.2
0.
0 10
0.0
35.5
3,
025
Luan
gpra
bang
55
.7
12.0
26
.4
6.0
100.
0 68
.6
2.3
7.0
22.0
10
0.0
36.0
55
.7
8.3
0.0
100.
0 21
.0
7,42
7 H
uaph
anh
82.7
1.
5 15
.3
0.5
100.
0 73
.5
1.7
2.0
22.8
10
0.0
41.9
57
.6
0.5
0.1
100.
0 33
.1
4,69
7 Xa
yabu
ry
85.6
6.
3 5.
7 2.
4 10
0.0
89.4
0.
9 3.
5 6.
2 10
0.0
70.2
28
.9
0.7
0.1
100.
0 60
.6
6,11
6 Xi
engk
huan
g 90
.8
2.9
4.4
1.9
100.
0 84
.7
2.8
0.2
12.2
10
0.0
58.3
41
.1
0.6
0.0
100.
0 51
.4
4,31
4 Vi
entia
ne
82.2
11
.0
5.1
1.8
100.
0 84
.9
3.5
0.5
11.2
10
0.0
56.0
41
.5
2.5
0.0
100.
0 44
.1
7,25
7 Bo
rikha
mxa
y 81
.0
11.1
6.
8 1.
2 10
0.0
89.5
3.
3 3.
3 3.
9 10
0.0
45.1
54
.1
0.9
0.0
100.
0 37
.3
4,52
1 Kh
amm
uane
68
.2
6.8
12.1
12
.9
100.
0 63
.6
4.1
3.1
29.2
10
0.0
63.9
13
.0
23.1
0.
0 10
0.0
37.4
6,
346
Sava
nnak
het
69.5
2.
6 24
.9
2.9
100.
0 53
.5
2.1
0.4
44.0
10
0.0
41.1
25
.5
33.3
0.
1 10
0.0
26.6
14
,535
Sa
rava
ne
69.9
1.
2 22
.6
6.3
100.
0 33
.3
1.6
0.5
64.6
10
0.0
39.2
50
.4
10.3
0.
1 10
0.0
17.8
6,
554
Seko
ng
77.1
2.
3 10
.9
9.6
100.
0 63
.2
5.0
1.3
30.5
10
0.0
49.9
41
.7
8.4
0.0
100.
0 29
.8
1,93
1 Ch
ampa
sack
82
.8
9.2
3.9
4.1
100.
0 67
.9
4.1
0.5
27.5
10
0.0
58.5
37
.6
3.8
0.1
100.
0 39
.1
10,0
43
Att
apeu
79
.1
2.1
11.3
7.
4 10
0.0
60.7
3.
2 1.
1 34
.9
100.
0 68
.1
8.4
23.5
0.
0 10
0.0
36.8
2,
204
Xays
ombo
une
72.6
2.
6 21
.3
3.5
100.
0 66
.2
8.7
10.0
15
.1
100.
0 17
.5
63.3
19
.2
0.0
100.
0 9.
0 1,
606
(Con
tinue
d…)
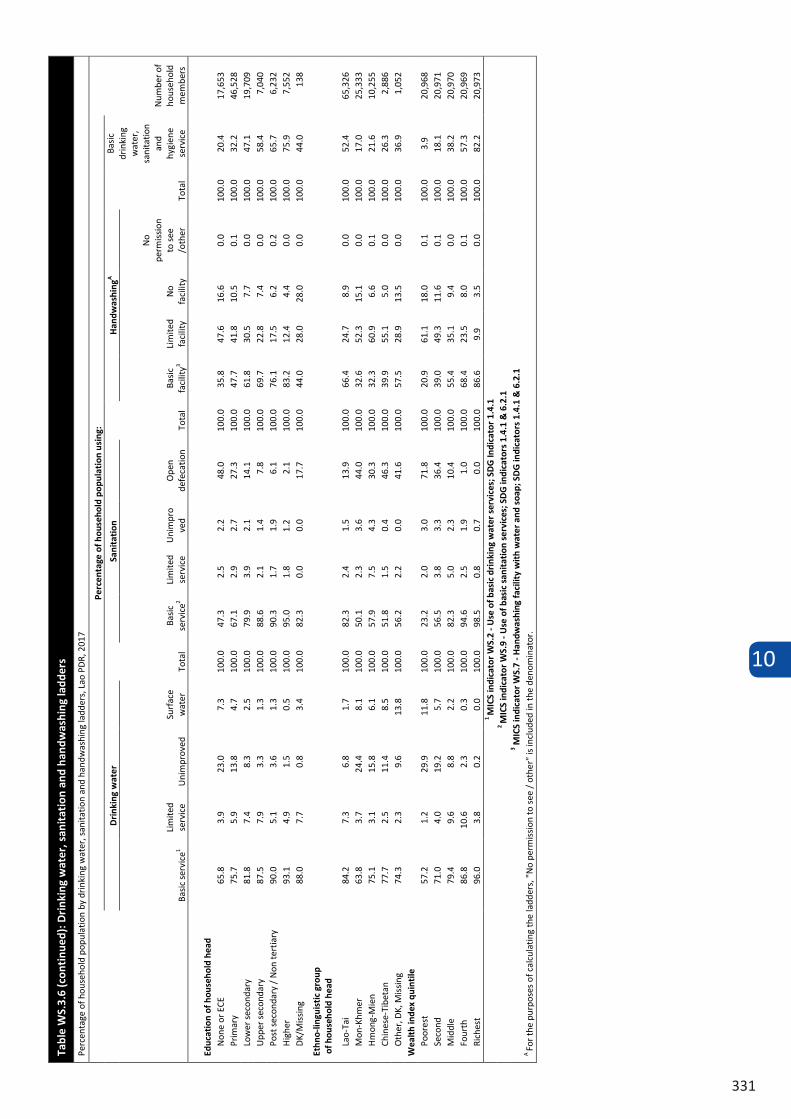
10
331
Tabl
e W
S.3.
6 (c
onti
nued
): D
rink
ing
wat
er, s
anit
atio
n an
d ha
ndw
ashi
ng la
dder
s
Perc
enta
ge o
f hou
seho
ld p
opul
atio
n by
drin
king
wat
er, s
anita
tion
and
hand
was
hing
ladd
ers,
Lao
PD
R, 2
017
Perc
enta
ge o
f hou
seho
ld p
opul
atio
n us
ing:
Num
ber o
f ho
useh
old
mem
bers
Dri
nkin
g w
ater
Tota
l
Sani
tati
on
Tota
l
Han
dwas
hing
A
Tota
l
Basi
c dr
inki
ng
wat
er,
sani
tatio
n an
d hy
gien
e se
rvic
e Ba
sic
serv
ice1
Lim
ited
serv
ice
Uni
mpr
oved
Su
rfac
e w
ater
Ba
sic
serv
ice2
Lim
ited
serv
ice
Uni
mpr
ove
d O
pen
defe
catio
n Ba
sic
faci
lity3
Lim
ited
faci
lity
No
faci
lity
No
perm
issi
on
to s
ee
/oth
er
Educ
atio
n of
hou
seho
ld h
ead
Non
e or
ECE
65
.8
3.9
23.0
7.
3 10
0.0
47.3
2.
5 2.
2 48
.0
100.
0 35
.8
47.6
16
.6
0.0
100.
0 20
.4
17,6
53
Prim
ary
75.7
5.
9 13
.8
4.7
100.
0 67
.1
2.9
2.7
27.3
10
0.0
47.7
41
.8
10.5
0.
1 10
0.0
32.2
46
,528
Lo
wer
sec
onda
ry
81.8
7.
4 8.
3 2.
5 10
0.0
79.9
3.
9 2.
1 14
.1
100.
0 61
.8
30.5
7.
7 0.
0 10
0.0
47.1
19
,709
U
pper
sec
onda
ry
87.5
7.
9 3.
3 1.
3 10
0.0
88.6
2.
1 1.
4 7.
8 10
0.0
69.7
22
.8
7.4
0.0
100.
0 58
.4
7,04
0 Po
st s
econ
dary
/ N
on te
rtia
ry
90.0
5.
1 3.
6 1.
3 10
0.0
90.3
1.
7 1.
9 6.
1 10
0.0
76.1
17
.5
6.2
0.2
100.
0 65
.7
6,23
2 H
ighe
r 93
.1
4.9
1.5
0.5
100.
0 95
.0
1.8
1.2
2.1
100.
0 83
.2
12.4
4.
4 0.
0 10
0.0
75.9
7,
552
DK/
Mis
sing
88
.0
7.7
0.8
3.4
100.
0 82
.3
0.0
0.0
17.7
10
0.0
44.0
28
.0
28.0
0.
0 10
0.0
44.0
13
8
Ethn
o-lin
guis
tic
grou
p o
f hou
seho
ld h
ead
Lao-
Tai
84.2
7.
3 6.
8 1.
7 10
0.0
82.3
2.
4 1.
5 13
.9
100.
0 66
.4
24.7
8.
9 0.
0 10
0.0
52.4
65
,326
M
on-K
hmer
63
.8
3.7
24.4
8.
1 10
0.0
50.1
2.
3 3.
6 44
.0
100.
0 32
.6
52.3
15
.1
0.0
100.
0 17
.0
25,3
33
Hm
ong-
Mie
n 75
.1
3.1
15.8
6.
1 10
0.0
57.9
7.
5 4.
3 30
.3
100.
0 32
.3
60.9
6.
6 0.
1 10
0.0
21.6
10
,255
Ch
ines
e-Ti
beta
n 77
.7
2.5
11.4
8.
5 10
0.0
51.8
1.
5 0.
4 46
.3
100.
0 39
.9
55.1
5.
0 0.
0 10
0.0
26.3
2,
886
Oth
er, D
K, M
issi
ng
74.3
2.
3 9.
6 13
.8
100.
0 56
.2
2.2
0.0
41.6
10
0.0
57.5
28
.9
13.5
0.
0 10
0.0
36.9
1,
052
Wea
lth
inde
x qu
inti
le
Poor
est
57.2
1.
2 29
.9
11.8
10
0.0
23.2
2.
0 3.
0 71
.8
100.
0 20
.9
61.1
18
.0
0.1
100.
0 3.
9 20
,968
Se
cond
71
.0
4.0
19.2
5.
7 10
0.0
56.5
3.
8 3.
3 36
.4
100.
0 39
.0
49.3
11
.6
0.1
100.
0 18
.1
20,9
71
Mid
dle
79.4
9.
6 8.
8 2.
2 10
0.0
82.3
5.
0 2.
3 10
.4
100.
0 55
.4
35.1
9.
4 0.
0 10
0.0
38.2
20
,970
Fo
urth
86
.8
10.6
2.
3 0.
3 10
0.0
94.6
2.
5 1.
9 1.
0 10
0.0
68.4
23
.5
8.0
0.1
100.
0 57
.3
20,9
69
Rich
est
96.0
3.
8 0.
2 0.
0 10
0.0
98.5
0.
8 0.
7 0.
0 10
0.0
86.6
9.
9 3.
5 0.
0 10
0.0
82.2
20
,973
1
MIC
S in
dica
tor
WS.
2 - U
se o
f bas
ic d
rink
ing
wat
er s
ervi
ces;
SD
G In
dica
tor
1.4.
1 2
MIC
S in
dica
tor
WS.
9 - U
se o
f bas
ic s
anit
atio
n se
rvic
es; S
DG
indi
cato
rs 1
.4.1
& 6
.2.1
3 M
ICS
indi
cato
r WS.
7 - H
andw
ashi
ng fa
cilit
y w
ith
wat
er a
nd s
oap;
SD
G in
dica
tors
1.4
.1 &
6.2
.1
A Fo
r the
pur
pose
s of
cal
cula
ting
the
ladd
ers,
"N
o pe
rmis
sion
to s
ee /
oth
er"
is in
clud
ed in
the
deno
min
ator
.
10
332
10.4 MENSTRUAL HYGIENE
The ability of women and adolescent girls to safely manage their monthly menstrual cycle in privacy and with dignity is fundamental to their health, psychosocial well-being and mobility. Women and girls who lack access to adequate menstrual hygiene management facilities and supplies experience stigma and social exclusion while also forgoing important educational, social and economic opportunities.4
Table WS.4.1 shows the percentage of women and girls aged 15-49 who menstruated in the last 12 months reporting having a private place to wash and change while at home. It also records whether they used appropriate materials including reusable and non-reusable materials during last menstruation. Table WS.4.2 shows the percentage of women who reported not being able to participate in social activities, school or work during their last menstruation.
12Sommer M, Sutherland C, Chandra-Mouli V. Putting menarche and girls into the global population health agenda. Reproductive health 2015; 12(1): 24.
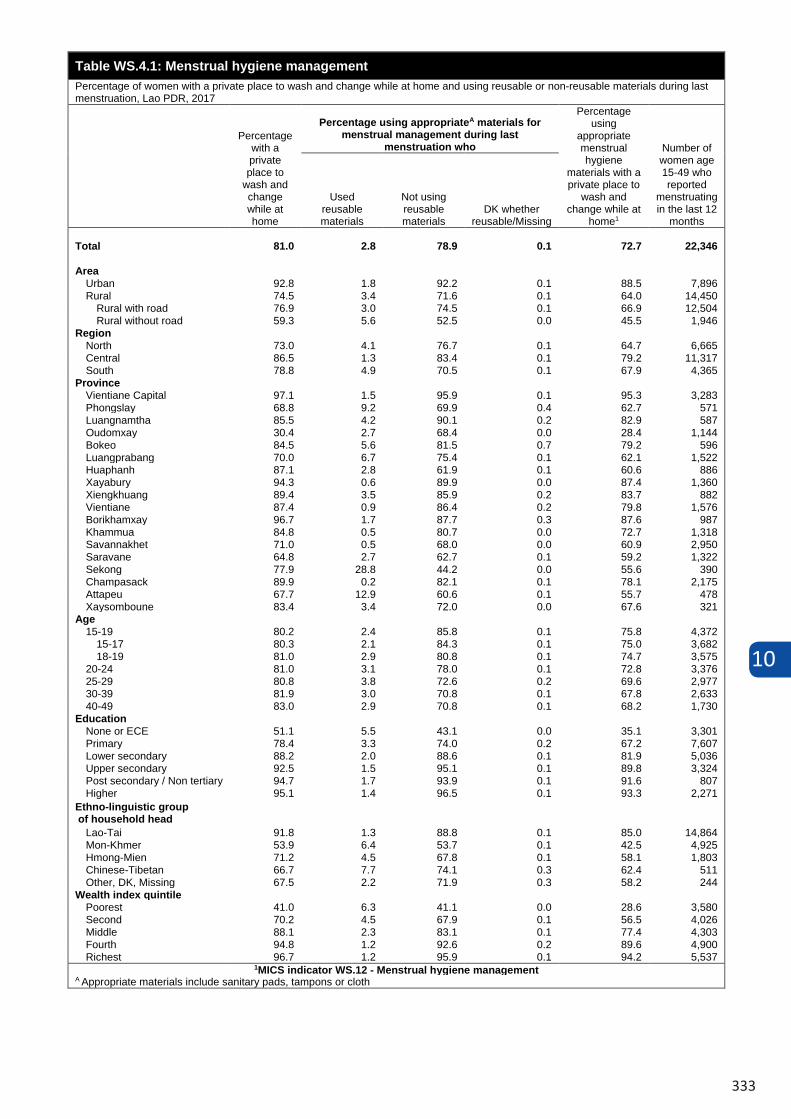
10
333
Table WS.4.1: Menstrual hygiene managementPercentage of women with a private place to wash and change while at home and using reusable or non-reusable materials during last menstruation, Lao PDR, 2017
Percentage with a private place to
wash and change while at home
Percentage using appropriateA materials for menstrual management during last
menstruation who
Percentage using
appropriate menstrual hygiene
materials with a private place to
wash and change while at
home1
Number of women age 15-49 who reported
menstruating in the last 12
months
Used reusable materials
Not using reusable materials
DK whether reusable/Missing
Total 81.0 2.8 78.9 0.1 72.7 22,346
AreaUrban 92.8 1.8 92.2 0.1 88.5 7,896Rural 74.5 3.4 71.6 0.1 64.0 14,450
Rural with road 76.9 3.0 74.5 0.1 66.9 12,504Rural without road 59.3 5.6 52.5 0.0 45.5 1,946
RegionNorth 73.0 4.1 76.7 0.1 64.7 6,665Central 86.5 1.3 83.4 0.1 79.2 11,317South 78.8 4.9 70.5 0.1 67.9 4,365
ProvinceVientiane Capital 97.1 1.5 95.9 0.1 95.3 3,283Phongslay 68.8 9.2 69.9 0.4 62.7 571Luangnamtha 85.5 4.2 90.1 0.2 82.9 587Oudomxay 30.4 2.7 68.4 0.0 28.4 1,144Bokeo 84.5 5.6 81.5 0.7 79.2 596Luangprabang 70.0 6.7 75.4 0.1 62.1 1,522Huaphanh 87.1 2.8 61.9 0.1 60.6 886Xayabury 94.3 0.6 89.9 0.0 87.4 1,360Xiengkhuang 89.4 3.5 85.9 0.2 83.7 882Vientiane 87.4 0.9 86.4 0.2 79.8 1,576Borikhamxay 96.7 1.7 87.7 0.3 87.6 987Khammua 84.8 0.5 80.7 0.0 72.7 1,318Savannakhet 71.0 0.5 68.0 0.0 60.9 2,950Saravane 64.8 2.7 62.7 0.1 59.2 1,322Sekong 77.9 28.8 44.2 0.0 55.6 390Champasack 89.9 0.2 82.1 0.1 78.1 2,175Attapeu 67.7 12.9 60.6 0.1 55.7 478Xaysomboune 83.4 3.4 72.0 0.0 67.6 321
Age15-19 80.2 2.4 85.8 0.1 75.8 4,372
15-17 80.3 2.1 84.3 0.1 75.0 3,68218-19 81.0 2.9 80.8 0.1 74.7 3,575
20-24 81.0 3.1 78.0 0.1 72.8 3,37625-29 80.8 3.8 72.6 0.2 69.6 2,97730-39 81.9 3.0 70.8 0.1 67.8 2,63340-49 83.0 2.9 70.8 0.1 68.2 1,730
EducationNone or ECE 51.1 5.5 43.1 0.0 35.1 3,301Primary 78.4 3.3 74.0 0.2 67.2 7,607Lower secondary 88.2 2.0 88.6 0.1 81.9 5,036Upper secondary 92.5 1.5 95.1 0.1 89.8 3,324Post secondary / Non tertiary 94.7 1.7 93.9 0.1 91.6 807Higher 95.1 1.4 96.5 0.1 93.3 2,271
Ethno-linguistic groupof household head
Lao-Tai 91.8 1.3 88.8 0.1 85.0 14,864Mon-Khmer 53.9 6.4 53.7 0.1 42.5 4,925Hmong-Mien 71.2 4.5 67.8 0.1 58.1 1,803Chinese-Tibetan 66.7 7.7 74.1 0.3 62.4 511Other, DK, Missing 67.5 2.2 71.9 0.3 58.2 244
Wealth index quintilePoorest 41.0 6.3 41.1 0.0 28.6 3,580Second 70.2 4.5 67.9 0.1 56.5 4,026Middle 88.1 2.3 83.1 0.1 77.4 4,303Fourth 94.8 1.2 92.6 0.2 89.6 4,900Richest 96.7 1.2 95.9 0.1 94.2 5,537
1MICS indicator WS.12 - Menstrual hygiene management A Appropriate materials include sanitary pads, tampons or cloth
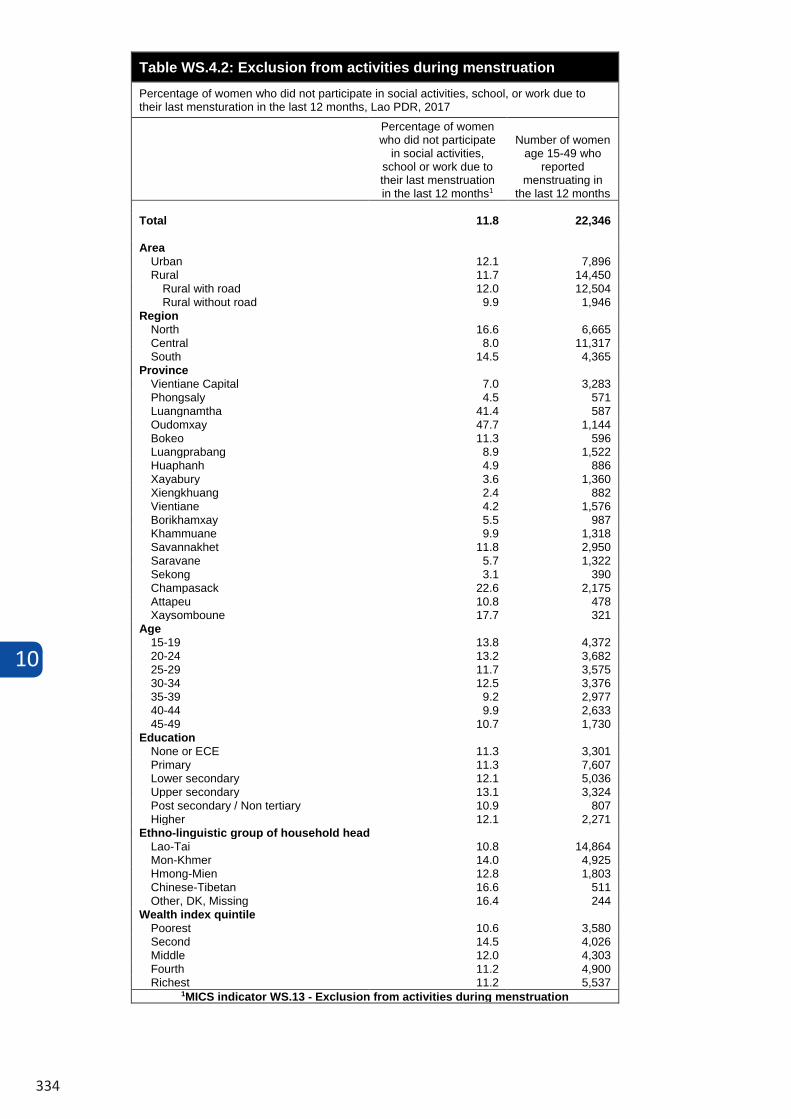
10
334
Table WS.4.2: Exclusion from activities during menstruationPercentage of women who did not participate in social activities, school, or work due to their last mensturation in the last 12 months, Lao PDR, 2017
Percentage of women who did not participate
in social activities, school or work due to their last menstruation in the last 12 months1
Number of women age 15-49 who
reported menstruating in
the last 12 months
Total 11.8 22,346
AreaUrban 12.1 7,896Rural 11.7 14,450
Rural with road 12.0 12,504Rural without road 9.9 1,946
RegionNorth 16.6 6,665Central 8.0 11,317South 14.5 4,365
ProvinceVientiane Capital 7.0 3,283Phongsaly 4.5 571Luangnamtha 41.4 587Oudomxay 47.7 1,144Bokeo 11.3 596Luangprabang 8.9 1,522Huaphanh 4.9 886Xayabury 3.6 1,360Xiengkhuang 2.4 882Vientiane 4.2 1,576Borikhamxay 5.5 987Khammuane 9.9 1,318Savannakhet 11.8 2,950Saravane 5.7 1,322Sekong 3.1 390Champasack 22.6 2,175Attapeu 10.8 478Xaysomboune 17.7 321
Age15-19 13.8 4,37220-24 13.2 3,68225-29 11.7 3,57530-34 12.5 3,37635-39 9.2 2,97740-44 9.9 2,63345-49 10.7 1,730
EducationNone or ECE 11.3 3,301Primary 11.3 7,607Lower secondary 12.1 5,036Upper secondary 13.1 3,324Post secondary / Non tertiary 10.9 807Higher 12.1 2,271
Ethno-linguistic group of household headLao-Tai 10.8 14,864Mon-Khmer 14.0 4,925Hmong-Mien 12.8 1,803Chinese-Tibetan 16.6 511Other, DK, Missing 16.4 244
Wealth index quintilePoorest 10.6 3,580Second 14.5 4,026Middle 12.0 4,303Fourth 11.2 4,900Richest 11.2 5,537
1MICS indicator WS.13 - Exclusion from activities during menstruation
11
335
11
337
11 EQUITABLE CHANCE IN LIFE
Fifteen years of concerted effort towards the Millennium Development Goals (MDG) have yielded tremendous progresses in tackling some of the world’s greatest development challenges. However, despite the overall progress, achievements have been uneven and advances did not always lead to greater opportunities for all.
Inequitable opportunities are leaving children at the margins of society and undermine the realisation of their rights, with certain groups of children being left behind. Recently, unequal development outcomes have rightfully captured the world’s attention with equity placing the central role within the 2030 Agenda for Sustainable Development.1
11.1 CHILD FUNCTIONING
The Convention on the Rights of Persons with Disabilities (UN, 2006) outlines States Parties’ obligations to ensure the
full realization of rights for children with disabilities on an equal basis with other children. The presence of functional
difficulties may place children at risk of experiencing limited participation in an unaccommodating environment, and
limit the fulfilment of their rights.
LSIS II, 2017 included child functioning modules intended to provide an estimate of the number/proportion of children
with functional difficulties as reported by their mothers or primary caregivers. The module included in the
Questionnaire for Children Under Five covered children between 2 and 4 years of age.
Functional domains covered in Questionnaire for Children Under Five are as follows: Seeing, hearing, walking, fine
motor, communication, learning, playing, and controlling behaviour.
Tables EQ.1.1 present the percentage of children by age group with functional difficulty by domain.
Table EQ.1.3 presents the percentage of children age 2-4 who use assistive devices and still have difficulty within the
relevant functional domains.
1 UNICEF. 2015. A Fair Chance for Every Child. UNICEF
Investing in children, particularly the poorest and most disadvantaged, is the right thing to do. Increasingly, we understand that it is also the smart thing to do. Evidence shows that it is cost-effective and brings not only multiple benefits to children, but also to their families, communities and economies. Development agencies, researchers and economists across the world are finding evidence that more equitable societies have better growth prospects and are more prosperous and stable. To become more equitable, however, societies have to address the underlying drivers of inequity that often appear even before a child is born.
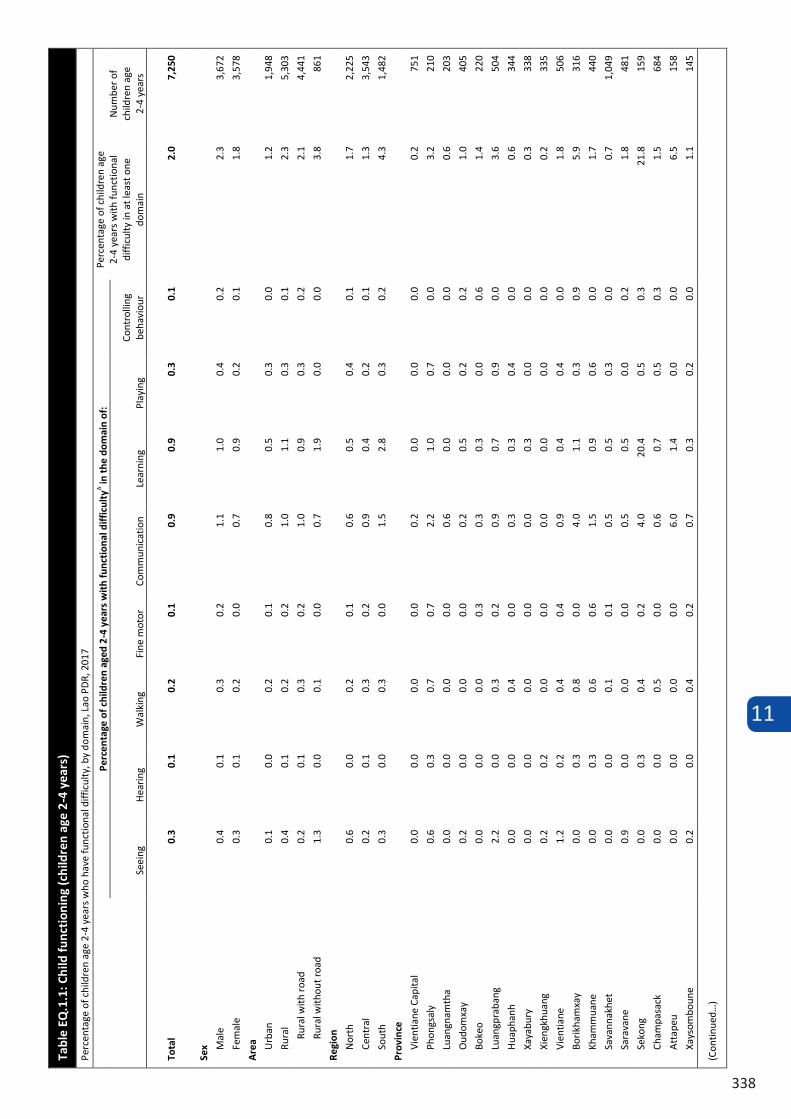
11
338
Tabl
e EQ
.1.1
: Chi
ld fu
ncti
onin
g (c
hild
ren
age
2-4
year
s)
Perc
enta
ge o
f chi
ldre
n ag
e 2-
4 ye
ars
who
hav
e fu
nctio
nal d
iffic
ulty
, by
dom
ain,
Lao
PD
R, 2
017
Perc
enta
ge o
f chi
ldre
n ag
ed 2
-4 y
ears
wit
h fu
ncti
onal
diff
icul
tyA in
the
dom
ain
of:
Perc
enta
ge o
f chi
ldre
n ag
e 2-
4 ye
ars
with
func
tiona
l di
ffic
ulty
in a
t lea
st o
ne
dom
ain
Num
ber o
f ch
ildre
n ag
e
2-4
year
s Se
eing
H
earin
g W
alki
ng
Fine
mot
or
Com
mun
icat
ion
Lear
ning
Pl
ayin
g
Cont
rolli
ng
beha
viou
r
Tota
l 0.
3 0.
1 0.
2 0.
1 0.
9 0.
9 0.
3 0.
1 2.
0 7,
250
Sex M
ale
0.4
0.1
0.3
0.2
1.1
1.0
0.4
0.2
2.3
3,67
2
Fem
ale
0.3
0.1
0.2
0.0
0.7
0.9
0.2
0.1
1.8
3,57
8
Are
a Urb
an
0.1
0.0
0.2
0.1
0.8
0.5
0.3
0.0
1.2
1,94
8
Rura
l 0.
4 0.
1 0.
2 0.
2 1.
0 1.
1 0.
3 0.
1 2.
3 5,
303
Rura
l with
roa
d 0.
2 0.
1 0.
3 0.
2 1.
0 0.
9 0.
3 0.
2 2.
1 4,
441
Rura
l with
out r
oad
1.3
0.0
0.1
0.0
0.7
1.9
0.0
0.0
3.8
861
Regi
on
Nor
th
0.6
0.0
0.2
0.1
0.6
0.5
0.4
0.1
1.7
2,22
5
Cent
ral
0.2
0.1
0.3
0.2
0.9
0.4
0.2
0.1
1.3
3,54
3
Sout
h 0.
3 0.
0 0.
3 0.
0 1.
5 2.
8 0.
3 0.
2 4.
3 1,
482
Prov
ince
Vien
tiane
Cap
ital
0.0
0.0
0.0
0.0
0.2
0.0
0.0
0.0
0.2
751
Phon
gsal
y 0.
6 0.
3 0.
7 0.
7 2.
2 1.
0 0.
7 0.
0 3.
2 21
0
Luan
gnam
tha
0.0
0.0
0.0
0.0
0.6
0.0
0.0
0.0
0.6
203
Oud
omxa
y 0.
2 0.
0 0.
0 0.
0 0.
2 0.
5 0.
2 0.
2 1.
0 40
5
Boke
o 0.
0 0.
0 0.
0 0.
3 0.
3 0.
3 0.
0 0.
6 1.
4 22
0
Luan
gpra
bang
2.
2 0.
0 0.
3 0.
2 0.
9 0.
7 0.
9 0.
0 3.
6 50
4
Hua
phan
h 0.
0 0.
0 0.
4 0.
0 0.
3 0.
3 0.
4 0.
0 0.
6 34
4
Xaya
bury
0.
0 0.
0 0.
0 0.
0 0.
0 0.
3 0.
0 0.
0 0.
3 33
8
Xien
gkhu
ang
0.2
0.2
0.0
0.0
0.0
0.0
0.0
0.0
0.2
335
Vien
tiane
1.
2 0.
2 0.
4 0.
4 0.
9 0.
4 0.
4 0.
0 1.
8 50
6
Borik
ham
xay
0.0
0.3
0.8
0.0
4.0
1.1
0.3
0.9
5.9
316
Kham
mua
ne
0.0
0.3
0.6
0.6
1.5
0.9
0.6
0.0
1.7
440
Sava
nnak
het
0.0
0.0
0.1
0.1
0.5
0.5
0.3
0.0
0.7
1,04
9
Sara
vane
0.
9 0.
0 0.
0 0.
0 0.
5 0.
5 0.
0 0.
2 1.
8 48
1
Seko
ng
0.0
0.3
0.4
0.2
4.0
20.4
0.
5 0.
3 21
.8
159
Cham
pasa
ck
0.0
0.0
0.5
0.0
0.6
0.7
0.5
0.3
1.5
684
Att
apeu
0.
0 0.
0 0.
0 0.
0 6.
0 1.
4 0.
0 0.
0 6.
5 15
8
Xays
ombo
une
0.2
0.0
0.4
0.2
0.7
0.3
0.2
0.0
1.1
145
(Con
tinue
d…)
Tabl
e EQ
.1.1
(con
tinu
ed):
Chi
ld fu
ncti
onin
g (c
hild
ren
age
2-4
year
s)
Perc
enta
ge o
f chi
ldre
n ag
e 2-
4 ye
ars
who
hav
e fu
nctio
nal d
iffic
ulty
, by
dom
ain,
Lao
PD
R, 2
017
Perc
enta
ge o
f chi
ldre
n ag
ed 2
-4 y
ears
wit
h fu
ncti
onal
diff
icul
tyA in
the
dom
ain
of:
Perc
enta
ge o
f chi
ldre
n ag
e 2-
4 ye
ars
with
func
tiona
l di
ffic
ulty
in a
t lea
st o
ne
dom
ain
Num
ber o
f chi
ldre
n ag
e 2
-4 y
ears
Se
eing
H
earin
g W
alki
ng
Fine
mot
or
Com
mun
icat
ion
Lear
ning
Pl
ayin
g
Cont
rolli
ng
beha
viou
r
Tota
l 0.
3 0.
1 0.
2 0.
1 0.
9 0.
9 0.
3 0.
1 2.
0 7,
250
Age
2 0.
5 0.
1 0.
3 0.
2 1.
6 1.
1 0.
4 0.
1 2.
6 2,
369
3 0.
2 0.
1 0.
3 0.
1 0.
7 0.
8 0.
2 0.
2 1.
9 2,
553
4 0.
3 0.
0 0.
1 0.
1 0.
4 0.
9 0.
3 0.
1 1.
6 2,
328
Earl
y ch
ildho
od e
duca
tion
at
tend
ance
B A
tten
ding
0.
1 0.
0 0.
0 0.
0 0.
2 0.
3 0.
1 0.
1 0.
6 1,
568
Not
att
endi
ng
0.4
0.1
0.3
0.1
0.8
1.1
0.3
0.2
2.3
3,31
2
Mot
her'
s ed
ucat
ion
Non
e or
ECE
0.
8 0.
1 0.
5 0.
2 0.
7 1.
4 0.
5 0.
1 3.
0 1,
714
Prim
ary
0.3
0.0
0.1
0.1
1.2
1.1
0.2
0.1
2.3
2,89
8
Low
er s
econ
dary
0.
1 0.
2 0.
2 0.
2 0.
9 0.
7 0.
3 0.
1 1.
4 1,
387
Upp
er s
econ
dary
0.
1 0.
1 0.
2 0.
2 0.
7 0.
2 0.
2 0.
4 1.
3 51
5
Post
sec
onda
ry /
Non
tert
iary
0.
0 0.
0 0.
0 0.
0 1.
1 0.
6 0.
0 0.
0 1.
1 21
3
Hig
her
0.0
0.0
0.0
0.0
0.2
0.0
0.0
0.0
0.2
522
DK/
Mis
sing
(*
) (*
) (*
) (*
) (*
) (*
) (*
) (*
) (*
) 1
Ethn
o-lin
guis
tic
grou
p
of h
ouse
hold
hea
d La
o-Ta
i 0.
1 0.
1 0.
3 0.
1 0.
8 0.
4 0.
3 0.
2 1.
2 4,
080
Mon
-Khm
er
0.8
0.0
0.1
0.1
1.1
2.3
0.3
0.1
3.9
1,84
9
Hm
ong-
Mie
n 0.
4 0.
0 0.
3 0.
0 0.
8 0.
5 0.
3 0.
1 1.
7 1,
055
Chin
ese-
Tibe
tan
0.7
0.3
0.7
0.7
2.1
1.1
0.7
0.0
3.1
196
Oth
er, D
K, M
issi
ng
0.0
0.0
0.0
0.0
0.0
0.0
0.0
0.0
0.0
70
Wea
lth
inde
x qu
inti
le
Poor
est
0.7
0.1
0.2
0.2
1.1
2.2
0.4
0.0
3.6
1,89
8
Seco
nd
0.5
0.0
0.4
0.1
1.1
0.9
0.3
0.1
2.3
1,53
7
Mid
dle
0.1
0.0
0.1
0.0
0.5
0.1
0.1
0.4
1.3
1,34
2
Four
th
0.2
0.3
0.3
0.3
0.9
0.6
0.4
0.1
1.2
1,28
4
Rich
est
0.0
0.0
0.1
0.1
0.8
0.2
0.2
0.1
0.8
1,18
8 A
Func
tiona
l diff
icul
ty fo
r chi
ldre
n ag
e 2-
4 ye
ars
are
defin
ed a
s ha
ving
resp
onde
d "A
lot o
f diff
icul
ty"
or "
Cann
ot a
t all"
to q
uest
ions
with
in a
ll lis
ted
dom
ains
, exc
ept t
he la
st d
omai
n of
con
trol
ling
beha
viou
r, fo
r whi
ch th
e re
spon
se
cate
gory
"A
lot m
ore"
is c
onsi
dere
d a
func
tiona
l diff
icul
ty.
B Ch
ildre
n ag
e 2
are
excl
uded
, as
early
chi
ldho
od e
duca
tion
atte
ndan
ce is
onl
y co
llect
ed fo
r age
3-4
yea
rs.
(*) F
igur
es a
re n
ot s
how
n, b
ased
on
few
er th
an 2
5 un
wei
ghte
d ca
ses
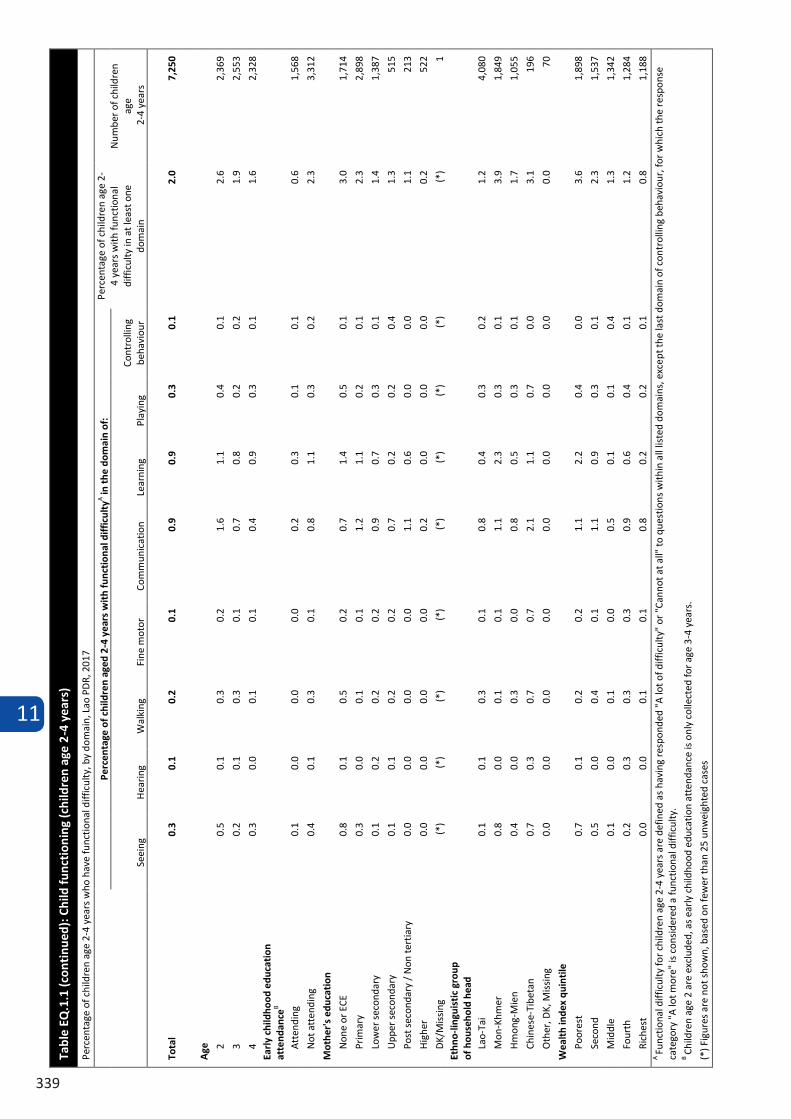
11
339
Tabl
e EQ
.1.1
(con
tinu
ed):
Chi
ld fu
ncti
onin
g (c
hild
ren
age
2-4
year
s)
Perc
enta
ge o
f chi
ldre
n ag
e 2-
4 ye
ars
who
hav
e fu
nctio
nal d
iffic
ulty
, by
dom
ain,
Lao
PD
R, 2
017
Perc
enta
ge o
f chi
ldre
n ag
ed 2
-4 y
ears
wit
h fu
ncti
onal
diff
icul
tyA in
the
dom
ain
of:
Perc
enta
ge o
f chi
ldre
n ag
e 2-
4 ye
ars
with
func
tiona
l di
ffic
ulty
in a
t lea
st o
ne
dom
ain
Num
ber o
f chi
ldre
n ag
e 2
-4 y
ears
Se
eing
H
earin
g W
alki
ng
Fine
mot
or
Com
mun
icat
ion
Lear
ning
Pl
ayin
g
Cont
rolli
ng
beha
viou
r
Tota
l 0.
3 0.
1 0.
2 0.
1 0.
9 0.
9 0.
3 0.
1 2.
0 7,
250
Age
2 0.
5 0.
1 0.
3 0.
2 1.
6 1.
1 0.
4 0.
1 2.
6 2,
369
3 0.
2 0.
1 0.
3 0.
1 0.
7 0.
8 0.
2 0.
2 1.
9 2,
553
4 0.
3 0.
0 0.
1 0.
1 0.
4 0.
9 0.
3 0.
1 1.
6 2,
328
Earl
y ch
ildho
od e
duca
tion
at
tend
ance
B A
tten
ding
0.
1 0.
0 0.
0 0.
0 0.
2 0.
3 0.
1 0.
1 0.
6 1,
568
Not
att
endi
ng
0.4
0.1
0.3
0.1
0.8
1.1
0.3
0.2
2.3
3,31
2
Mot
her'
s ed
ucat
ion
Non
e or
ECE
0.
8 0.
1 0.
5 0.
2 0.
7 1.
4 0.
5 0.
1 3.
0 1,
714
Prim
ary
0.3
0.0
0.1
0.1
1.2
1.1
0.2
0.1
2.3
2,89
8
Low
er s
econ
dary
0.
1 0.
2 0.
2 0.
2 0.
9 0.
7 0.
3 0.
1 1.
4 1,
387
Upp
er s
econ
dary
0.
1 0.
1 0.
2 0.
2 0.
7 0.
2 0.
2 0.
4 1.
3 51
5
Post
sec
onda
ry /
Non
tert
iary
0.
0 0.
0 0.
0 0.
0 1.
1 0.
6 0.
0 0.
0 1.
1 21
3
Hig
her
0.0
0.0
0.0
0.0
0.2
0.0
0.0
0.0
0.2
522
DK/
Mis
sing
(*
) (*
) (*
) (*
) (*
) (*
) (*
) (*
) (*
) 1
Ethn
o-lin
guis
tic
grou
p
of h
ouse
hold
hea
d La
o-Ta
i 0.
1 0.
1 0.
3 0.
1 0.
8 0.
4 0.
3 0.
2 1.
2 4,
080
Mon
-Khm
er
0.8
0.0
0.1
0.1
1.1
2.3
0.3
0.1
3.9
1,84
9
Hm
ong-
Mie
n 0.
4 0.
0 0.
3 0.
0 0.
8 0.
5 0.
3 0.
1 1.
7 1,
055
Chin
ese-
Tibe
tan
0.7
0.3
0.7
0.7
2.1
1.1
0.7
0.0
3.1
196
Oth
er, D
K, M
issi
ng
0.0
0.0
0.0
0.0
0.0
0.0
0.0
0.0
0.0
70
Wea
lth
inde
x qu
inti
le
Poor
est
0.7
0.1
0.2
0.2
1.1
2.2
0.4
0.0
3.6
1,89
8
Seco
nd
0.5
0.0
0.4
0.1
1.1
0.9
0.3
0.1
2.3
1,53
7
Mid
dle
0.1
0.0
0.1
0.0
0.5
0.1
0.1
0.4
1.3
1,34
2
Four
th
0.2
0.3
0.3
0.3
0.9
0.6
0.4
0.1
1.2
1,28
4
Rich
est
0.0
0.0
0.1
0.1
0.8
0.2
0.2
0.1
0.8
1,18
8 A
Func
tiona
l diff
icul
ty fo
r chi
ldre
n ag
e 2-
4 ye
ars
are
defin
ed a
s ha
ving
resp
onde
d "A
lot o
f diff
icul
ty"
or "
Cann
ot a
t all"
to q
uest
ions
with
in a
ll lis
ted
dom
ains
, exc
ept t
he la
st d
omai
n of
con
trol
ling
beha
viou
r, fo
r whi
ch th
e re
spon
se
cate
gory
"A
lot m
ore"
is c
onsi
dere
d a
func
tiona
l diff
icul
ty.
B Ch
ildre
n ag
e 2
are
excl
uded
, as
early
chi
ldho
od e
duca
tion
atte
ndan
ce is
onl
y co
llect
ed fo
r age
3-4
yea
rs.
(*) F
igur
es a
re n
ot s
how
n, b
ased
on
few
er th
an 2
5 un
wei
ghte
d ca
ses
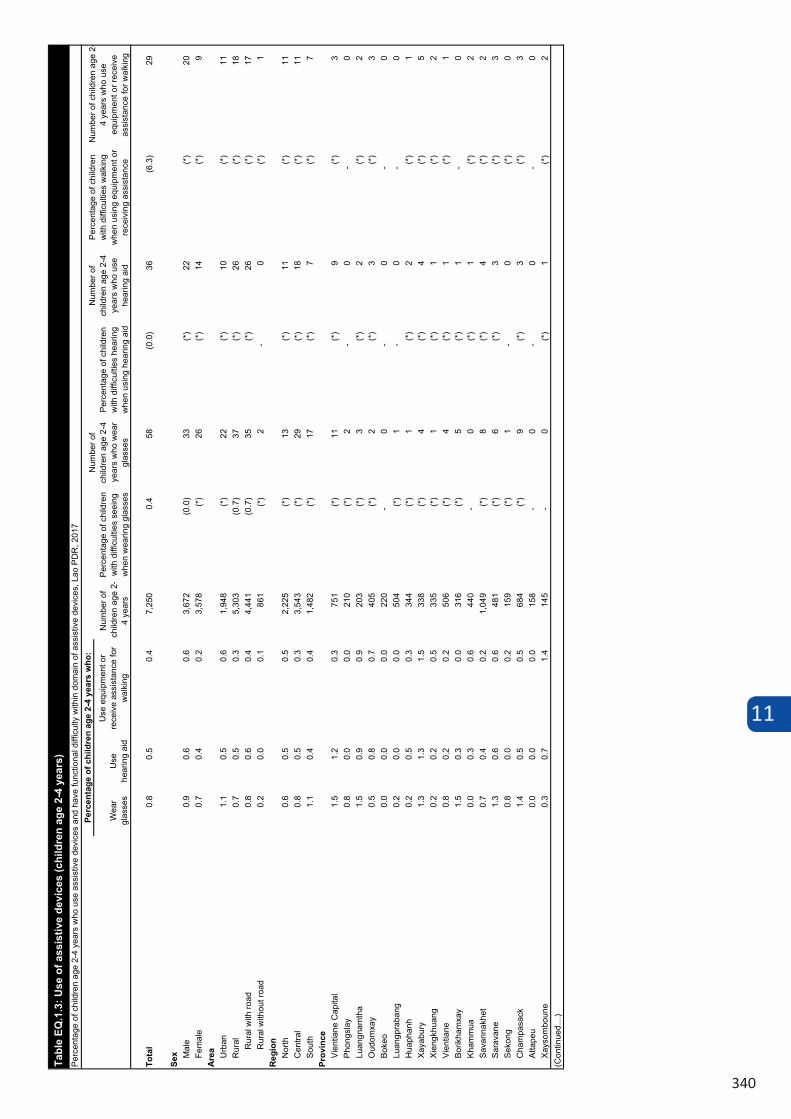
11
340
Wea
r gl
asse
sU
se
hear
ing
aid
Use
equ
ipm
ent o
r re
ceiv
e as
sist
ance
for
wal
king
Tota
l0.
80.
50.
47,
250
0.4
58(0
.0)
36(6
.3)
29
Sex M
ale
0.9
0.6
0.6
3,67
2(0
.0)
33(*
)22
(*)
20Fe
mal
e0.
70.
40.
23,
578
(*)
26(*
)14
(*)
9A
rea Urb
an
1.1
0.5
0.6
1,94
8(*
)22
(*)
10(*
)11
Rur
al0.
70.
50.
35,
303
(0.7
)37
(*)
26(*
)18
Rur
al w
ith ro
ad0.
80.
60.
44,
441
(0.7
)35
(*)
26(*
)17
Rur
al w
ithou
t roa
d0.
20.
00.
186
1(*
)2
-0
(*)
1R
egio
nN
orth
0.6
0.5
0.5
2,22
5(*
)13
(*)
11(*
)11
Cen
tral
0.8
0.5
0.3
3,54
3(*
)29
(*)
18(*
)11
Sout
h1.
10.
40.
41,
482
(*)
17(*
)7
(*)
7Pr
ovin
ceVi
entia
ne C
apita
l1.
51.
20.
375
1(*
)11
(*)
9(*
)3
Phon
gsla
y 0.
80.
00.
021
0(*
)2
-0
-0
Luan
gnam
tha
1.5
0.9
0.9
203
(*)
3(*
)2
(*)
2O
udom
xay
0.5
0.8
0.7
405
(*)
2(*
)3
(*)
3Bo
keo
0.0
0.0
0.0
220
-0
-0
-0
Luan
gpra
bang
0.2
0.0
0.0
504
(*)
1-
0-
0H
uaph
anh
0.2
0.5
0.3
344
(*)
1(*
)2
(*)
1Xa
yabu
ry1.
31.
31.
533
8(*
)4
(*)
4(*
)5
Xien
gkhu
ang
0.2
0.2
0.5
335
(*)
1(*
)1
(*)
2Vi
entia
ne0.
80.
20.
250
6(*
)4
(*)
1(*
)1
Borik
ham
xay
1.5
0.3
0.0
316
(*)
5(*
)1
-0
Kham
mua
0.0
0.3
0.6
440
-0
(*)
1(*
)2
Sava
nnak
het
0.7
0.4
0.2
1,04
9(*
)8
(*)
4(*
)2
Sara
vane
1.3
0.6
0.6
481
(*)
6(*
)3
(*)
3Se
kong
0.8
0.0
0.2
159
(*)
1-
0(*
)0
Cha
mpa
sack
1.4
0.5
0.5
684
(*)
9(*
)3
(*)
3At
tape
u0.
00.
00.
015
8-
0-
0-
0Xa
ysom
boun
e0.
30.
71.
414
5-
0(*
)1
(*)
2(C
ontin
ued…
)
Tabl
e EQ
.1.3
: Use
of a
ssis
tive
devi
ces
(chi
ldre
n ag
e 2-
4 ye
ars)
Perc
enta
ge o
f chi
ldre
n ag
e 2-
4 ye
ars
who
use
ass
istiv
e de
vice
s an
d ha
ve fu
nctio
nal d
iffic
ulty
with
in d
omai
n of
ass
istiv
e de
vice
s, L
ao P
DR
, 201
7Pe
rcen
tage
of c
hild
ren
age
2-4
year
s w
ho:
Num
ber o
f ch
ildre
n ag
e 2 -
4 ye
ars
Perc
enta
ge o
f chi
ldre
n w
ith d
iffic
ultie
s se
eing
w
hen
wea
ring
glas
ses
Num
ber o
f ch
ildre
n ag
e 2-
4 ye
ars
who
wea
r gl
asse
s
Perc
enta
ge o
f chi
ldre
n w
ith d
iffic
ultie
s he
arin
g w
hen
usin
g he
arin
g ai
d
Num
ber o
f ch
ildre
n ag
e 2-
4 ye
ars
who
use
he
arin
g ai
d
Perc
enta
ge o
f chi
ldre
n w
ith d
iffic
ultie
s w
alki
ng
whe
n us
ing
equi
pmen
t or
rece
ivin
g as
sist
ance
Num
ber o
f chi
ldre
n ag
e 2-
4 ye
ars
who
use
eq
uipm
ent o
r rec
eive
as
sist
ance
for w
alki
ng
Wea
r gl
asse
sU
se
hear
ing
aid
Use
equ
ipm
ent o
r re
ceiv
e as
sist
ance
for
wal
king
Age 2
0.7
0.2
0.3
2,36
9(*
)16
(*)
4(*
)7
30.
30.
40.
42,
553
(*)
9(*
)11
(*)
114
1.4
0.9
0.5
2,32
8(0
.0)
33(*
)21
(*)
11Ea
rly c
hild
hood
edu
catio
n/sc
hool
atte
ndan
ceA
Atte
ndin
g1.
51.
20.
51,
568
(*)
24(*
)19
(*)
8N
ot a
ttend
ing
0.6
0.4
0.4
3,31
2(*
)18
(*)
13(*
)13
Mot
her's
edu
catio
nN
one
or E
CE
0.7
0.4
0.3
1,71
4(*
)12
(*)
6(*
)5
Prim
ary
0.8
0.5
0.4
2,89
8(*
)24
(*)
15(*
)13
Low
er s
econ
dary
0.8
0.3
0.2
1,38
7(*
)11
(*)
4(*
)3
Upp
er s
econ
dary
1.2
1.4
0.8
515
(*)
6(*
)7
(*)
4Po
st s
econ
dary
/ N
on te
rtiar
y0.
80.
50.
521
3(*
)2
(*)
1(*
)1
Hig
her
0.7
0.5
0.5
522
(*)
3(*
)3
(*)
3D
K/M
issi
ng(*
)(*
)(*
)1
-0
-0
-0
Ethn
o-lin
guis
tic g
roup
of h
ouse
hold
hea
dLa
o-Ta
i1.
00.
60.
44,
080
(0.0
)39
(*)
23(*
)16
Mon
-Khm
er0.
60.
30.
21,
849
(*)
12(*
)6
(*)
3H
mon
g-M
ien
0.5
0.5
0.8
1,05
5(*
)5
(*)
5(*
)8
Chi
nese
-Tib
etan
0.0
0.0
0.0
196
-0
-0
-0
Oth
er, D
K, M
issi
ng2.
82.
82.
870
(*)
2(*
)2
(*)
2W
ealth
inde
x qu
intil
ePo
ores
t0.
80.
60.
51,
898
(*)
16(*
)11
(*)
9Se
cond
0.6
0.3
0.4
1,53
7(*
)9
(*)
4(*
)6
Mid
dle
0.6
0.5
0.3
1,34
2(*
)8
(*)
6(*
)4
Four
th1.
00.
60.
31,
284
(*)
13(*
)8
(*)
4R
iche
st1.
10.
60.
51,
188
(*)
13(*
)7
(*)
5A C
hild
ren
age
2 ar
e ex
clud
ed, a
s ea
rly c
hild
hood
edu
catio
n at
tend
ance
is o
nly
colle
cted
for a
ge 3
-4 y
ears
.( )
Fig
ures
that
are
bas
ed o
n 25
– 4
9 un
wei
ghte
d ca
ses
(*) F
igur
es th
at a
re b
ased
on
few
er th
an 2
5 un
wei
ghte
d ca
ses
"–" d
enot
es 0
unw
eigh
ted
case
in th
at c
ell o
r in
the
deno
min
ator
.
Tabl
e EQ
.1.3
(con
tinue
d): U
se o
f ass
istiv
e de
vice
s (c
hild
ren
age
2-4
year
s)Pe
rcen
tage
of c
hild
ren
age
2-4
year
s w
ho u
se a
ssis
tive
devi
ces
and
have
func
tiona
l diff
icul
ty w
ithin
dom
ain
of a
ssis
tive
devi
ces,
Lao
PD
R, 2
017
Perc
enta
ge o
f chi
ldre
n ag
e 2-
4 ye
ars
who
:
Num
ber o
f ch
ildre
n ag
e 2 -
4 ye
ars
Perc
enta
ge o
f chi
ldre
n w
ith d
iffic
ultie
s se
eing
w
hen
wea
ring
glas
ses
Num
ber o
f ch
ildre
n ag
e 2-
4 ye
ars
who
wea
r gl
asse
s
Perc
enta
ge o
f chi
ldre
n w
ith d
iffic
ultie
s he
arin
g w
hen
usin
g he
arin
g ai
d
Num
ber o
f ch
ildre
n ag
e 2-
4 ye
ars
who
use
he
arin
g ai
d
Perc
enta
ge o
f chi
ldre
n w
ith d
iffic
ultie
s w
alki
ng
whe
n us
ing
equi
pmen
t or
rece
ivin
g as
sist
ance
Num
ber o
f chi
ldre
n ag
e 2-
4 ye
ars
who
use
eq
uipm
ent o
r rec
eive
as
sist
ance
for w
alki
ng
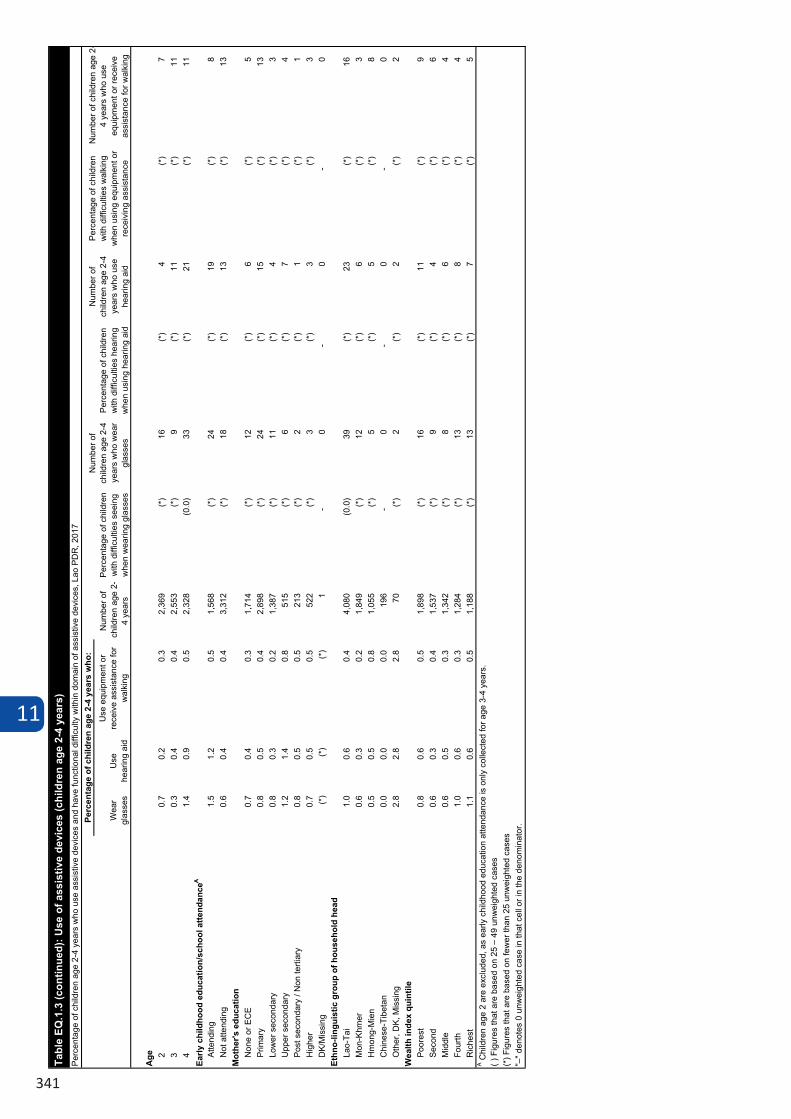
11
341
Wea
r gl
asse
sU
se
hear
ing
aid
Use
equ
ipm
ent o
r re
ceiv
e as
sist
ance
for
wal
king
Age 2
0.7
0.2
0.3
2,36
9(*
)16
(*)
4(*
)7
30.
30.
40.
42,
553
(*)
9(*
)11
(*)
114
1.4
0.9
0.5
2,32
8(0
.0)
33(*
)21
(*)
11Ea
rly c
hild
hood
edu
catio
n/sc
hool
atte
ndan
ceA
Atte
ndin
g1.
51.
20.
51,
568
(*)
24(*
)19
(*)
8N
ot a
ttend
ing
0.6
0.4
0.4
3,31
2(*
)18
(*)
13(*
)13
Mot
her's
edu
catio
nN
one
or E
CE
0.7
0.4
0.3
1,71
4(*
)12
(*)
6(*
)5
Prim
ary
0.8
0.5
0.4
2,89
8(*
)24
(*)
15(*
)13
Low
er s
econ
dary
0.8
0.3
0.2
1,38
7(*
)11
(*)
4(*
)3
Upp
er s
econ
dary
1.2
1.4
0.8
515
(*)
6(*
)7
(*)
4Po
st s
econ
dary
/ N
on te
rtiar
y0.
80.
50.
521
3(*
)2
(*)
1(*
)1
Hig
her
0.7
0.5
0.5
522
(*)
3(*
)3
(*)
3D
K/M
issi
ng(*
)(*
)(*
)1
-0
-0
-0
Ethn
o-lin
guis
tic g
roup
of h
ouse
hold
hea
dLa
o-Ta
i1.
00.
60.
44,
080
(0.0
)39
(*)
23(*
)16
Mon
-Khm
er0.
60.
30.
21,
849
(*)
12(*
)6
(*)
3H
mon
g-M
ien
0.5
0.5
0.8
1,05
5(*
)5
(*)
5(*
)8
Chi
nese
-Tib
etan
0.0
0.0
0.0
196
-0
-0
-0
Oth
er, D
K, M
issi
ng2.
82.
82.
870
(*)
2(*
)2
(*)
2W
ealth
inde
x qu
intil
ePo
ores
t0.
80.
60.
51,
898
(*)
16(*
)11
(*)
9Se
cond
0.6
0.3
0.4
1,53
7(*
)9
(*)
4(*
)6
Mid
dle
0.6
0.5
0.3
1,34
2(*
)8
(*)
6(*
)4
Four
th1.
00.
60.
31,
284
(*)
13(*
)8
(*)
4R
iche
st1.
10.
60.
51,
188
(*)
13(*
)7
(*)
5A C
hild
ren
age
2 ar
e ex
clud
ed, a
s ea
rly c
hild
hood
edu
catio
n at
tend
ance
is o
nly
colle
cted
for a
ge 3
-4 y
ears
.( )
Fig
ures
that
are
bas
ed o
n 25
– 4
9 un
wei
ghte
d ca
ses
(*) F
igur
es th
at a
re b
ased
on
few
er th
an 2
5 un
wei
ghte
d ca
ses
"–" d
enot
es 0
unw
eigh
ted
case
in th
at c
ell o
r in
the
deno
min
ator
.
Tabl
e EQ
.1.3
(con
tinue
d): U
se o
f ass
istiv
e de
vice
s (c
hild
ren
age
2-4
year
s)Pe
rcen
tage
of c
hild
ren
age
2-4
year
s w
ho u
se a
ssis
tive
devi
ces
and
have
func
tiona
l diff
icul
ty w
ithin
dom
ain
of a
ssis
tive
devi
ces,
Lao
PD
R, 2
017
Perc
enta
ge o
f chi
ldre
n ag
e 2-
4 ye
ars
who
:
Num
ber o
f ch
ildre
n ag
e 2 -
4 ye
ars
Perc
enta
ge o
f chi
ldre
n w
ith d
iffic
ultie
s se
eing
w
hen
wea
ring
glas
ses
Num
ber o
f ch
ildre
n ag
e 2-
4 ye
ars
who
wea
r gl
asse
s
Perc
enta
ge o
f chi
ldre
n w
ith d
iffic
ultie
s he
arin
g w
hen
usin
g he
arin
g ai
d
Num
ber o
f ch
ildre
n ag
e 2-
4 ye
ars
who
use
he
arin
g ai
d
Perc
enta
ge o
f chi
ldre
n w
ith d
iffic
ultie
s w
alki
ng
whe
n us
ing
equi
pmen
t or
rece
ivin
g as
sist
ance
Num
ber o
f chi
ldre
n ag
e 2-
4 ye
ars
who
use
eq
uipm
ent o
r rec
eive
as
sist
ance
for w
alki
ng
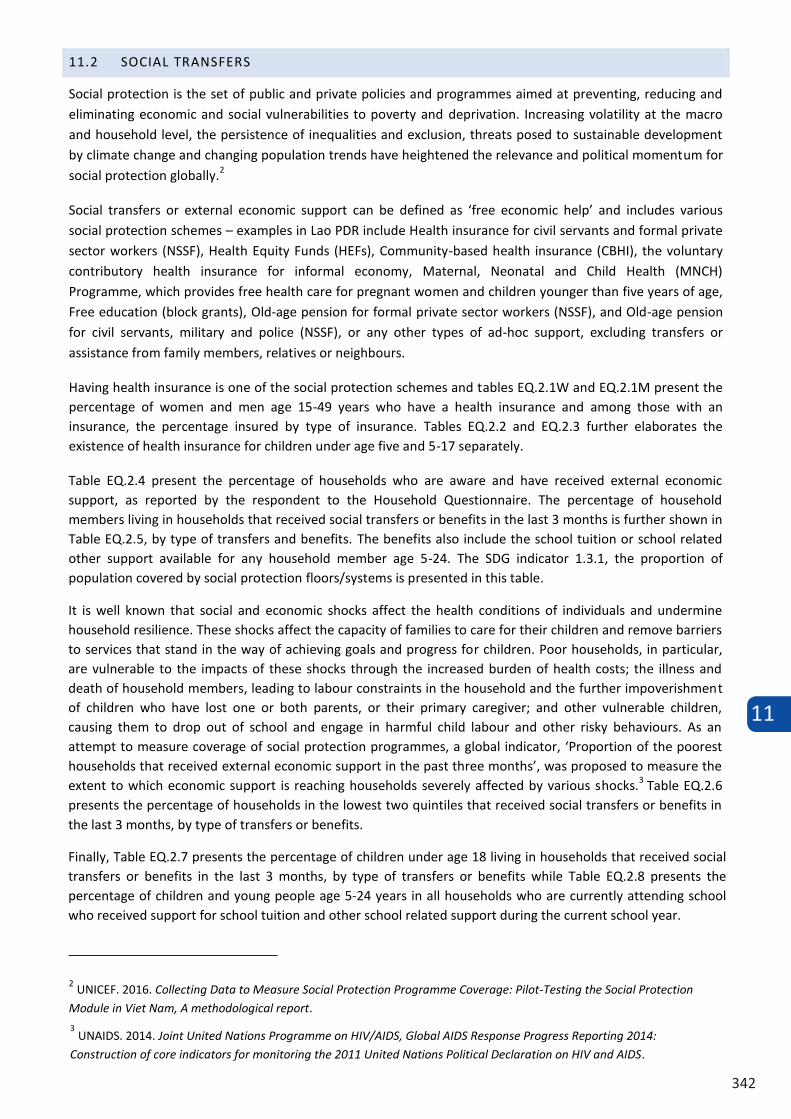
11
342
11.2 SOCIAL TRANSFERS
Social protection is the set of public and private policies and programmes aimed at preventing, reducing and eliminating economic and social vulnerabilities to poverty and deprivation. Increasing volatility at the macro and household level, the persistence of inequalities and exclusion, threats posed to sustainable development by climate change and changing population trends have heightened the relevance and political momentum for social protection globally.2
Social transfers or external economic support can be defined as ‘free economic help’ and includes various social protection schemes – examples in Lao PDR include Health insurance for civil servants and formal private sector workers (NSSF), Health Equity Funds (HEFs), Community-based health insurance (CBHI), the voluntary contributory health insurance for informal economy, Maternal, Neonatal and Child Health (MNCH) Programme, which provides free health care for pregnant women and children younger than five years of age, Free education (block grants), Old-age pension for formal private sector workers (NSSF), and Old-age pension for civil servants, military and police (NSSF), or any other types of ad-hoc support, excluding transfers or assistance from family members, relatives or neighbours.
Having health insurance is one of the social protection schemes and tables EQ.2.1W and EQ.2.1M present the percentage of women and men age 15-49 years who have a health insurance and among those with an insurance, the percentage insured by type of insurance. Tables EQ.2.2 and EQ.2.3 further elaborates the existence of health insurance for children under age five and 5-17 separately.
2 UNICEF. 2016. Collecting Data to Measure Social Protection Programme Coverage: Pilot-Testing the Social Protection Module in Viet Nam, A methodological report.
Table EQ.2.4 present the percentage of households who are aware and have received external economic support, as reported by the respondent to the Household Questionnaire. The percentage of household members living in households that received social transfers or benefits in the last 3 months is further shown in Table EQ.2.5, by type of transfers and benefits. The benefits also include the school tuition or school related other support available for any household member age 5-24. The SDG indicator 1.3.1, the proportion of population covered by social protection floors/systems is presented in this table.
It is well known that social and economic shocks affect the health conditions of individuals and undermine household resilience. These shocks affect the capacity of families to care for their children and remove barriers to services that stand in the way of achieving goals and progress for children. Poor households, in particular, are vulnerable to the impacts of these shocks through the increased burden of health costs; the illness and death of household members, leading to labour constraints in the household and the further impoverishment of children who have lost one or both parents, or their primary caregiver; and other vulnerable children, causing them to drop out of school and engage in harmful child labour and other risky behaviours. As an attempt to measure coverage of social protection programmes, a global indicator, ‘Proportion of the poorest households that received external economic support in the past three months’, was proposed to measure the extent to which economic support is reaching households severely affected by various shocks.3 Table EQ.2.6 presents the percentage of households in the lowest two quintiles that received social transfers or benefits in the last 3 months, by type of transfers or benefits.
3 UNAIDS. 2014. Joint United Nations Programme on HIV/AIDS, Global AIDS Response Progress Reporting 2014:
Construction of core indicators for monitoring the 2011 United Nations Political Declaration on HIV and AIDS.
Finally, Table EQ.2.7 presents the percentage of children under age 18 living in households that received social transfers or benefits in the last 3 months, by type of transfers or benefits while Table EQ.2.8 presents the percentage of children and young people age 5-24 years in all households who are currently attending school who received support for school tuition and other school related support during the current school year.
Tabl
e EQ
.2.1
W: H
ealt
h in
sura
nce
cove
rage
(wom
en)
Perc
enta
ge o
f wom
en a
ge 1
5-49
with
hea
lth in
sura
nce,
and
, am
ong
thos
e w
ith h
ealth
insu
ranc
e, p
erce
ntag
e co
vere
d by
var
ious
hea
lth in
sura
nce
plan
s, L
ao P
DR,
201
7
Perc
enta
ge
cove
red
by
any
heal
th
insu
ranc
e1
Num
ber
of
wom
en
Am
ong
wom
en h
avin
g he
alth
insu
ranc
e, p
erce
ntag
e re
port
ing
they
wer
e in
sure
d by
N
umbe
r of
wom
en
with
he
alth
in
sura
nce
Civi
l ser
vant
sch
eme
Soci
al
secu
rity
offic
e
Com
mun
ity-
base
d he
alth
in
sura
nce
(CBH
I)
Hea
lth
equi
ty
fund
(H
EF)
Free
mot
her a
nd
child
hea
lth
insu
ranc
e (M
CH)
Priv
ate
heal
th
insu
ranc
e O
ther
Tota
l 15
.4
25,3
05
64.0
13
.5
14.0
3.
7 0.
7 3.
6 2.
4 3,
888
Are
a Urb
an
29.2
8,
513
67.9
15
.2
10.0
1.
4 0.
5 4.
8 2.
1 2,
487
Rura
l 8.
3 16
,792
56
.9
10.3
21
.1
7.8
1.1
1.4
3.1
1,40
2
Rura
l with
roa
d 9.
1 14
,451
57
.0
10.6
22
.3
6.1
1.2
1.3
3.3
1,30
9
Rura
l with
out r
oad
3.9
2,34
1 55
.6
5.8
4.4
31.8
0.
3 2.
1 0.
0 92
Regi
on
Nor
th
12.1
7,
801
69.8
5.
6 8.
9 10
.3
2.4
0.9
3.0
944
Cent
ral
19.7
12
,625
59
.3
17.1
18
.3
1.1
0.1
5.0
1.5
2,49
2
Sout
h 9.
3 4,
879
77.2
9.
8 1.
4 4.
2 0.
7 1.
0 6.
6 45
2
Prov
ince
Vien
tiane
Cap
ital
30.3
3,
473
56.4
25
.8
9.0
0.5
0.0
9.5
1.4
1,05
2
Phon
gsal
y 10
.5
700
100.
0 0.
0 0.
0 0.
0 0.
0 0.
0 0.
0 74
Luan
gnam
tha
8.6
692
98.0
1.
1 0.
9 1.
0 0.
0 0.
0 0.
0 60
Oud
omxa
y 16
.8
1,40
2 52
.8
1.5
6.2
39.5
0.
0 1.
4 0.
0 23
6
Boke
o 12
.3
724
83.3
7.
0 4.
6 1.
9 0.
7 1.
9 0.
7 89
Luan
gpra
bang
12
.9
1,71
5 58
.6
10.6
20
.1
0.5
0.0
0.0
11.5
22
2
Hua
phan
h 5.
7 1,
045
92.0
2.
6 5.
3 1.
4 0.
0 0.
0 0.
0 60
Xaya
bury
13
.4
1,52
3 70
.1
8.5
8.3
0.0
10.7
1.
9 1.
0 20
4
Xien
gkhu
ang
13.5
1,
034
97.6
3.
9 0.
0 0.
0 0.
0 0.
0 0.
5 14
0
Vien
tiane
13
.0
1,74
3 72
.0
14.7
5.
0 2.
6 0.
5 3.
5 2.
7 22
7
Borik
ham
xay
15.2
1,
129
74.9
6.
2 17
.9
0.0
0.0
1.0
0.0
172
Kham
mua
ne
17.1
1,
541
66.3
9.
1 23
.5
0.0
0.0
0.3
3.4
264
Sava
nnak
het
17.3
3,
351
42.5
13
.5
41.7
2.
3 0.
3 2.
6 1.
0 58
1
Sara
vane
6.
9 1,
510
97.5
0.
0 1.
0 0.
0 0.
0 1.
5 0.
0 10
4
Seko
ng
12.9
43
1 76
.9
1.7
3.4
13.7
5.
6 0.
6 2.
1 56
Cham
pasa
ck
8.1
2,39
6 72
.3
12.3
0.
0 5.
1 0.
0 1.
0 9.
3 19
3
Att
apeu
18
.4
541
65.6
19
.5
3.7
1.5
0.0
0.5
10.9
99
Xays
ombo
une
15.6
35
3 61
.7
4.1
26.7
7.
6 0.
0 0.
8 0.
0 55
(Con
tinue
d…)
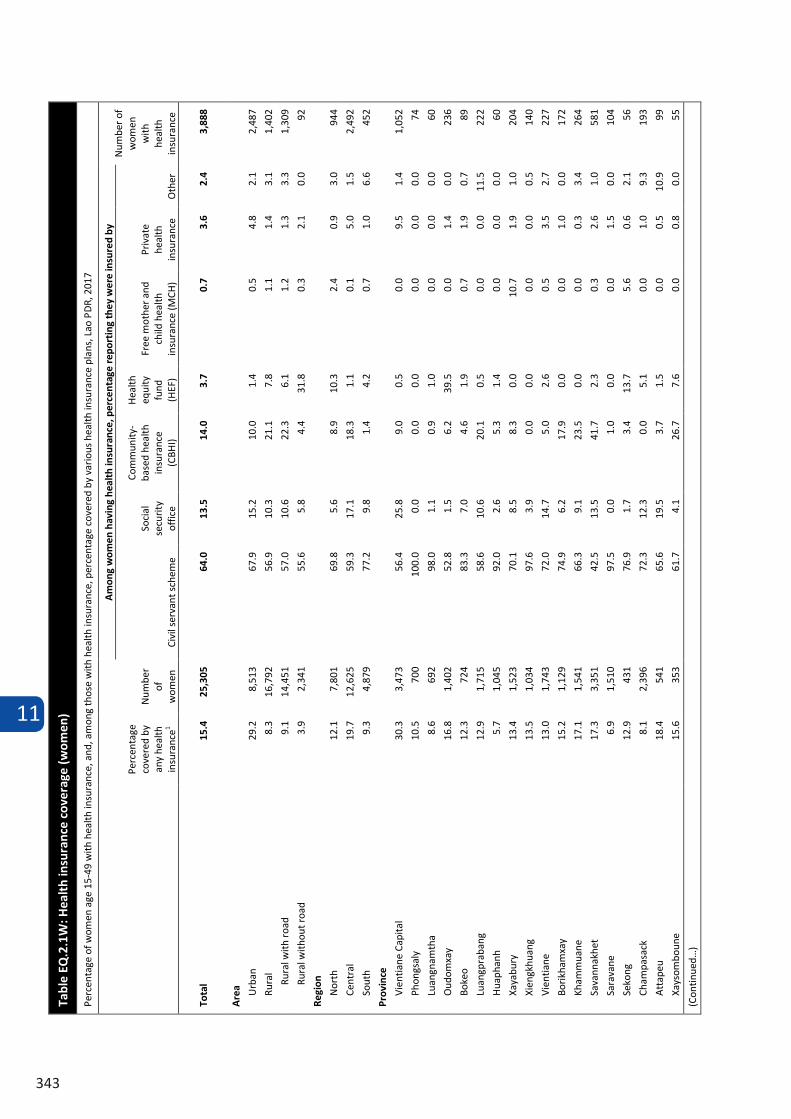
11
343
11.2 SOCIAL TRANSFERS
Social protection is the set of public and private policies and programmes aimed at preventing, reducing and eliminating economic and social vulnerabilities to poverty and deprivation. Increasing volatility at the macro and household level, the persistence of inequalities and exclusion, threats posed to sustainable development by climate change and changing population trends have heightened the relevance and political momentum for social protection globally.2
Social transfers or external economic support can be defined as ‘free economic help’ and includes various social protection schemes – examples in Lao PDR include Health insurance for civil servants and formal private sector workers (NSSF), Health Equity Funds (HEFs), Community-based health insurance (CBHI), the voluntary contributory health insurance for informal economy, Maternal, Neonatal and Child Health (MNCH) Programme, which provides free health care for pregnant women and children younger than five years of age, Free education (block grants), Old-age pension for formal private sector workers (NSSF), and Old-age pension for civil servants, military and police (NSSF), or any other types of ad-hoc support, excluding transfers or assistance from family members, relatives or neighbours.
Having health insurance is one of the social protection schemes and tables EQ.2.1W and EQ.2.1M present the percentage of women and men age 15-49 years who have a health insurance and among those with an insurance, the percentage insured by type of insurance. Tables EQ.2.2 and EQ.2.3 further elaborates the existence of health insurance for children under age five and 5-17 separately.
2 UNICEF. 2016. Collecting Data to Measure Social Protection Programme Coverage: Pilot-Testing the Social Protection Module in Viet Nam, A methodological report.
Table EQ.2.4 present the percentage of households who are aware and have received external economic support, as reported by the respondent to the Household Questionnaire. The percentage of household members living in households that received social transfers or benefits in the last 3 months is further shown in Table EQ.2.5, by type of transfers and benefits. The benefits also include the school tuition or school related other support available for any household member age 5-24. The SDG indicator 1.3.1, the proportion of population covered by social protection floors/systems is presented in this table.
It is well known that social and economic shocks affect the health conditions of individuals and undermine household resilience. These shocks affect the capacity of families to care for their children and remove barriers to services that stand in the way of achieving goals and progress for children. Poor households, in particular, are vulnerable to the impacts of these shocks through the increased burden of health costs; the illness and death of household members, leading to labour constraints in the household and the further impoverishment of children who have lost one or both parents, or their primary caregiver; and other vulnerable children, causing them to drop out of school and engage in harmful child labour and other risky behaviours. As an attempt to measure coverage of social protection programmes, a global indicator, ‘Proportion of the poorest households that received external economic support in the past three months’, was proposed to measure the extent to which economic support is reaching households severely affected by various shocks.3 Table EQ.2.6 presents the percentage of households in the lowest two quintiles that received social transfers or benefits in the last 3 months, by type of transfers or benefits.
3 UNAIDS. 2014. Joint United Nations Programme on HIV/AIDS, Global AIDS Response Progress Reporting 2014:
Construction of core indicators for monitoring the 2011 United Nations Political Declaration on HIV and AIDS.
Finally, Table EQ.2.7 presents the percentage of children under age 18 living in households that received social transfers or benefits in the last 3 months, by type of transfers or benefits while Table EQ.2.8 presents the percentage of children and young people age 5-24 years in all households who are currently attending school who received support for school tuition and other school related support during the current school year.
Tabl
e EQ
.2.1
W: H
ealt
h in
sura
nce
cove
rage
(wom
en)
Perc
enta
ge o
f wom
en a
ge 1
5-49
with
hea
lth in
sura
nce,
and
, am
ong
thos
e w
ith h
ealth
insu
ranc
e, p
erce
ntag
e co
vere
d by
var
ious
hea
lth in
sura
nce
plan
s, L
ao P
DR,
201
7
Perc
enta
ge
cove
red
by
any
heal
th
insu
ranc
e1
Num
ber
of
wom
en
Am
ong
wom
en h
avin
g he
alth
insu
ranc
e, p
erce
ntag
e re
port
ing
they
wer
e in
sure
d by
N
umbe
r of
wom
en
with
he
alth
in
sura
nce
Civi
l ser
vant
sch
eme
Soci
al
secu
rity
offic
e
Com
mun
ity-
base
d he
alth
in
sura
nce
(CBH
I)
Hea
lth
equi
ty
fund
(H
EF)
Free
mot
her a
nd
child
hea
lth
insu
ranc
e (M
CH)
Priv
ate
heal
th
insu
ranc
e O
ther
Tota
l 15
.4
25,3
05
64.0
13
.5
14.0
3.
7 0.
7 3.
6 2.
4 3,
888
Are
a Urb
an
29.2
8,
513
67.9
15
.2
10.0
1.
4 0.
5 4.
8 2.
1 2,
487
Rura
l 8.
3 16
,792
56
.9
10.3
21
.1
7.8
1.1
1.4
3.1
1,40
2
Rura
l with
roa
d 9.
1 14
,451
57
.0
10.6
22
.3
6.1
1.2
1.3
3.3
1,30
9
Rura
l with
out r
oad
3.9
2,34
1 55
.6
5.8
4.4
31.8
0.
3 2.
1 0.
0 92
Regi
on
Nor
th
12.1
7,
801
69.8
5.
6 8.
9 10
.3
2.4
0.9
3.0
944
Cent
ral
19.7
12
,625
59
.3
17.1
18
.3
1.1
0.1
5.0
1.5
2,49
2
Sout
h 9.
3 4,
879
77.2
9.
8 1.
4 4.
2 0.
7 1.
0 6.
6 45
2
Prov
ince
Vien
tiane
Cap
ital
30.3
3,
473
56.4
25
.8
9.0
0.5
0.0
9.5
1.4
1,05
2
Phon
gsal
y 10
.5
700
100.
0 0.
0 0.
0 0.
0 0.
0 0.
0 0.
0 74
Luan
gnam
tha
8.6
692
98.0
1.
1 0.
9 1.
0 0.
0 0.
0 0.
0 60
Oud
omxa
y 16
.8
1,40
2 52
.8
1.5
6.2
39.5
0.
0 1.
4 0.
0 23
6
Boke
o 12
.3
724
83.3
7.
0 4.
6 1.
9 0.
7 1.
9 0.
7 89
Luan
gpra
bang
12
.9
1,71
5 58
.6
10.6
20
.1
0.5
0.0
0.0
11.5
22
2
Hua
phan
h 5.
7 1,
045
92.0
2.
6 5.
3 1.
4 0.
0 0.
0 0.
0 60
Xaya
bury
13
.4
1,52
3 70
.1
8.5
8.3
0.0
10.7
1.
9 1.
0 20
4
Xien
gkhu
ang
13.5
1,
034
97.6
3.
9 0.
0 0.
0 0.
0 0.
0 0.
5 14
0
Vien
tiane
13
.0
1,74
3 72
.0
14.7
5.
0 2.
6 0.
5 3.
5 2.
7 22
7
Borik
ham
xay
15.2
1,
129
74.9
6.
2 17
.9
0.0
0.0
1.0
0.0
172
Kham
mua
ne
17.1
1,
541
66.3
9.
1 23
.5
0.0
0.0
0.3
3.4
264
Sava
nnak
het
17.3
3,
351
42.5
13
.5
41.7
2.
3 0.
3 2.
6 1.
0 58
1
Sara
vane
6.
9 1,
510
97.5
0.
0 1.
0 0.
0 0.
0 1.
5 0.
0 10
4
Seko
ng
12.9
43
1 76
.9
1.7
3.4
13.7
5.
6 0.
6 2.
1 56
Cham
pasa
ck
8.1
2,39
6 72
.3
12.3
0.
0 5.
1 0.
0 1.
0 9.
3 19
3
Att
apeu
18
.4
541
65.6
19
.5
3.7
1.5
0.0
0.5
10.9
99
Xays
ombo
une
15.6
35
3 61
.7
4.1
26.7
7.
6 0.
0 0.
8 0.
0 55
(Con
tinue
d…)
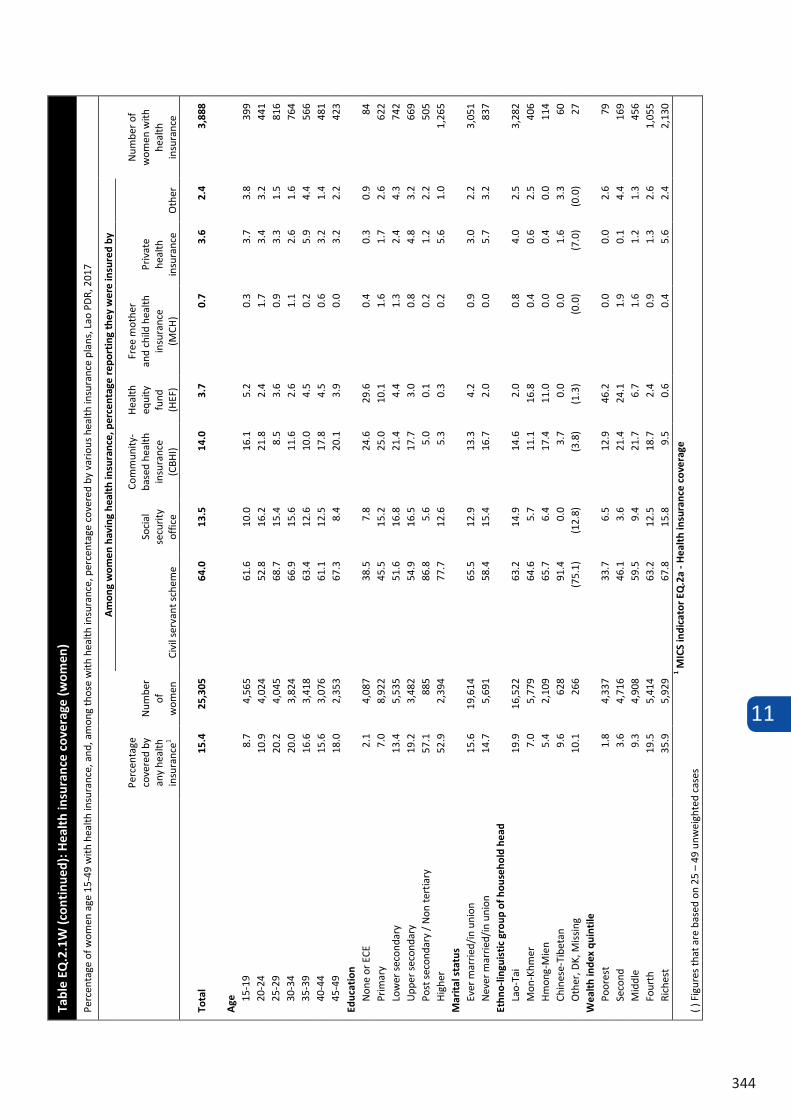
11
344
Tabl
e EQ
.2.1
W (c
onti
nued
): H
ealt
h in
sura
nce
cove
rage
(wom
en)
Perc
enta
ge o
f wom
en a
ge 1
5-49
with
hea
lth in
sura
nce,
and
, am
ong
thos
e w
ith h
ealth
insu
ranc
e, p
erce
ntag
e co
vere
d by
var
ious
hea
lth in
sura
nce
plan
s, L
ao P
DR,
201
7
Perc
enta
ge
cove
red
by
any
heal
th
insu
ranc
e1
Num
ber
of
wom
en
Am
ong
wom
en h
avin
g he
alth
insu
ranc
e, p
erce
ntag
e re
port
ing
they
wer
e in
sure
d by
Num
ber o
f w
omen
with
he
alth
in
sura
nce
Civi
l ser
vant
sch
eme
Soci
al
secu
rity
offic
e
Com
mun
ity-
base
d he
alth
in
sura
nce
(CBH
I)
Hea
lth
equi
ty
fund
(H
EF)
Free
mot
her
and
child
hea
lth
insu
ranc
e (M
CH)
Priv
ate
heal
th
insu
ranc
e O
ther
Tota
l 15
.4
25,3
05
64.0
13
.5
14.0
3.
7 0.
7 3.
6 2.
4 3,
888
Age
15
-19
8.7
4,56
5 61
.6
10.0
16
.1
5.2
0.3
3.7
3.8
399
20-2
4 10
.9
4,02
4 52
.8
16.2
21
.8
2.4
1.7
3.4
3.2
441
25-2
9 20
.2
4,04
5 68
.7
15.4
8.
5 3.
6 0.
9 3.
3 1.
5 81
6 30
-34
20.0
3,
824
66.9
15
.6
11.6
2.
6 1.
1 2.
6 1.
6 76
4 35
-39
16.6
3,
418
63.4
12
.6
10.0
4.
5 0.
2 5.
9 4.
4 56
6 40
-44
15.6
3,
076
61.1
12
.5
17.8
4.
5 0.
6 3.
2 1.
4 48
1 45
-49
18.0
2,
353
67.3
8.
4 20
.1
3.9
0.0
3.2
2.2
423
Educ
atio
n N
one
or E
CE
2.1
4,08
7 38
.5
7.8
24.6
29
.6
0.4
0.3
0.9
84
Prim
ary
7.0
8,92
2 45
.5
15.2
25
.0
10.1
1.
6 1.
7 2.
6 62
2 Lo
wer
sec
onda
ry
13.4
5,
535
51.6
16
.8
21.4
4.
4 1.
3 2.
4 4.
3 74
2 U
pper
sec
onda
ry
19.2
3,
482
54.9
16
.5
17.7
3.
0 0.
8 4.
8 3.
2 66
9 Po
st s
econ
dary
/ N
on te
rtia
ry
57.1
88
5 86
.8
5.6
5.0
0.1
0.2
1.2
2.2
505
Hig
her
52.9
2,
394
77.7
12
.6
5.3
0.3
0.2
5.6
1.0
1,26
5 M
arit
al s
tatu
s Ev
er m
arrie
d/in
uni
on
15.6
19
,614
65
.5
12.9
13
.3
4.2
0.9
3.0
2.2
3,05
1 N
ever
mar
ried/
in u
nion
14
.7
5,69
1 58
.4
15.4
16
.7
2.0
0.0
5.7
3.2
837
Ethn
o-lin
guis
tic
grou
p of
hou
seho
ld h
ead
Lao-
Tai
19.9
16
,522
63
.2
14.9
14
.6
2.0
0.8
4.0
2.5
3,28
2 M
on-K
hmer
7.
0 5,
779
64.6
5.
7 11
.1
16.8
0.
4 0.
6 2.
5 40
6 H
mon
g-M
ien
5.4
2,10
9 65
.7
6.4
17.4
11
.0
0.0
0.4
0.0
114
Chin
ese-
Tibe
tan
9.6
628
91.4
0.
0 3.
7 0.
0 0.
0 1.
6 3.
3 60
O
ther
, DK,
Mis
sing
10
.1
266
(75.
1)
(12.
8)
(3.8
) (1
.3)
(0.0
) (7
.0)
(0.0
) 27
W
ealt
h in
dex
quin
tile
Po
ores
t 1.
8 4,
337
33.7
6.
5 12
.9
46.2
0.
0 0.
0 2.
6 79
Se
cond
3.
6 4,
716
46.1
3.
6 21
.4
24.1
1.
9 0.
1 4.
4 16
9 M
iddl
e 9.
3 4,
908
59.5
9.
4 21
.7
6.7
1.6
1.2
1.3
456
Four
th
19.5
5,
414
63.2
12
.5
18.7
2.
4 0.
9 1.
3 2.
6 1,
055
Rich
est
35.9
5,
929
67.8
15
.8
9.5
0.6
0.4
5.6
2.4
2,13
0 1 M
ICS
indi
cato
r EQ
.2a
- Hea
lth
insu
ranc
e co
vera
ge
( ) F
igur
es th
at a
re b
ased
on
25 –
49
unw
eigh
ted
case
s
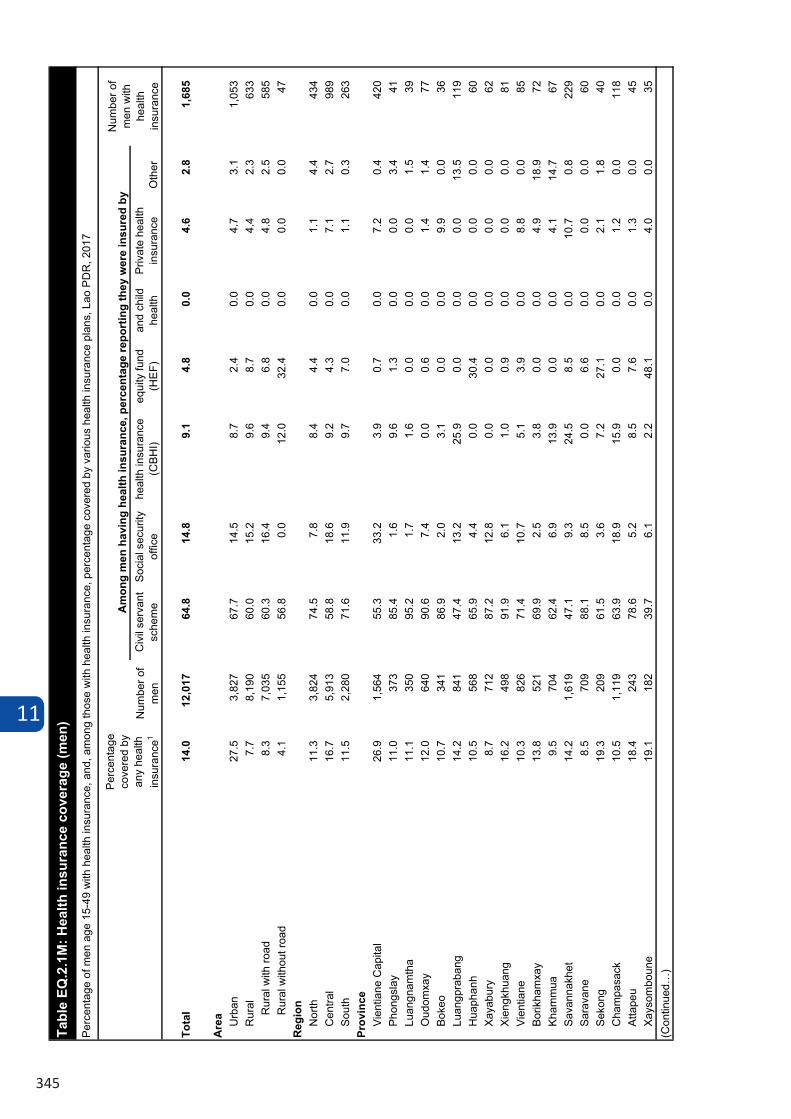
11
345
Civ
il se
rvan
t sc
hem
eSo
cial
sec
urity
of
fice
yhe
alth
insu
ranc
e (C
BHI)
equi
ty fu
nd
(HEF
)an
d ch
ild
heal
th
Priv
ate
heal
th
insu
ranc
eO
ther
Tota
l14
.012
,017
64.8
14.8
9.1
4.8
0.0
4.6
2.8
1,68
5
Are
a Urb
an
27.5
3,82
767
.714
.58.
72.
40.
04.
73.
11,
053
Rur
al7.
78,
190
60.0
15.2
9.6
8.7
0.0
4.4
2.3
633
Rur
al w
ith ro
ad8.
37,
035
60.3
16.4
9.4
6.8
0.0
4.8
2.5
585
Rur
al w
ithou
t roa
d4.
11,
155
56.8
0.0
12.0
32.4
0.0
0.0
0.0
47R
egio
nN
orth
11.3
3,82
474
.57.
88.
44.
40.
01.
14.
443
4C
entra
l16
.75,
913
58.8
18.6
9.2
4.3
0.0
7.1
2.7
989
Sout
h11
.52,
280
71.6
11.9
9.7
7.0
0.0
1.1
0.3
263
Prov
ince
Vien
tiane
Cap
ital
26.9
1,56
455
.333
.23.
90.
70.
07.
20.
442
0Ph
ongs
lay
11.0
373
85.4
1.6
9.6
1.3
0.0
0.0
3.4
41Lu
angn
amth
a11
.135
095
.21.
71.
60.
00.
00.
01.
539
Oud
omxa
y12
.064
090
.67.
40.
00.
60.
01.
41.
477
Boke
o10
.734
186
.92.
03.
10.
00.
09.
90.
036
Luan
gpra
bang
14.2
841
47.4
13.2
25.9
0.0
0.0
0.0
13.5
119
Hua
phan
h10
.556
865
.94.
40.
030
.40.
00.
00.
060
Xaya
bury
8.7
712
87.2
12.8
0.0
0.0
0.0
0.0
0.0
62Xi
engk
huan
g16
.249
891
.96.
11.
00.
90.
00.
00.
081
Vien
tiane
10.3
826
71.4
10.7
5.1
3.9
0.0
8.8
0.0
85Bo
rikha
mxa
y13
.852
169
.92.
53.
80.
00.
04.
918
.972
Kham
mua
9.5
704
62.4
6.9
13.9
0.0
0.0
4.1
14.7
67Sa
vann
akhe
t14
.21,
619
47.1
9.3
24.5
8.5
0.0
10.7
0.8
229
Sara
vane
8.5
709
88.1
8.5
0.0
6.6
0.0
0.0
0.0
60Se
kong
19.3
209
61.5
3.6
7.2
27.1
0.0
2.1
1.8
40C
ham
pasa
ck10
.51,
119
63.9
18.9
15.9
0.0
0.0
1.2
0.0
118
Atta
peu
18.4
243
78.6
5.2
8.5
7.6
0.0
1.3
0.0
45Xa
ysom
boun
e19
.118
239
.76.
12.
248
.10.
04.
00.
035
(Con
tinue
d…)
Tabl
e EQ
.2.1
M: H
ealth
insu
ranc
e co
vera
ge (m
en)
Perc
enta
ge o
f men
age
15-
49 w
ith h
ealth
insu
ranc
e, a
nd, a
mon
g th
ose
with
hea
lth in
sura
nce,
per
cent
age
cove
red
by v
ario
us h
ealth
insu
ranc
e pl
ans,
Lao
PD
R, 2
017
Perc
enta
ge
cove
red
by
any
heal
th
insu
ranc
e1N
umbe
r of
men
Am
ong
men
hav
ing
heal
th in
sura
nce,
per
cent
age
repo
rtin
g th
ey w
ere
insu
red
byN
umbe
r of
men
with
he
alth
in
sura
nce
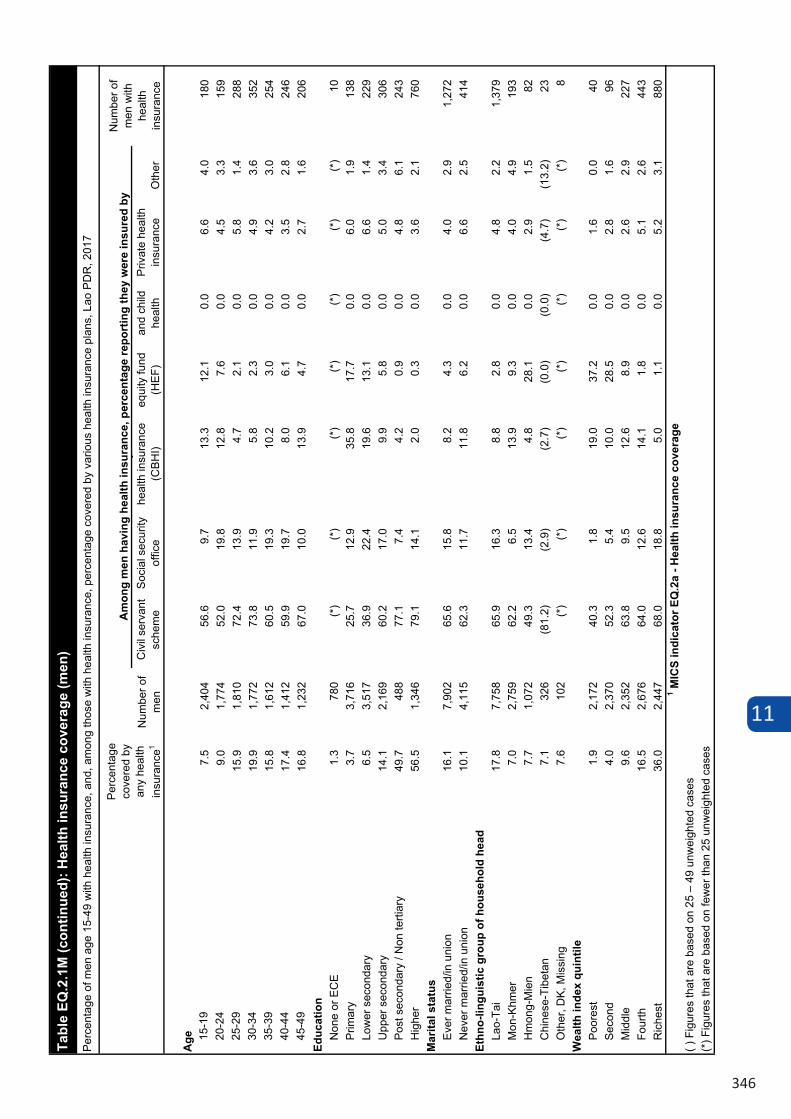
11
346
Civ
il se
rvan
t sc
hem
eSo
cial
sec
urity
of
fice
yhe
alth
insu
ranc
e (C
BHI)
equi
ty fu
nd
(HEF
)an
d ch
ild
heal
th
Priv
ate
heal
th
insu
ranc
eO
ther
Age 15
-19
7.5
2,40
456
.69.
713
.312
.10.
06.
64.
018
020
-24
9.0
1,77
452
.019
.812
.87.
60.
04.
53.
315
925
-29
15.9
1,81
072
.413
.94.
72.
10.
05.
81.
428
830
-34
19.9
1,77
273
.811
.95.
82.
30.
04.
93.
635
235
-39
15.8
1,61
260
.519
.310
.23.
00.
04.
23.
025
440
-44
17.4
1,41
259
.919
.78.
06.
10.
03.
52.
824
645
-49
16.8
1,23
267
.010
.013
.94.
70.
02.
71.
620
6Ed
ucat
ion
Non
e or
EC
E1.
378
0(*
)(*
)(*
)(*
)(*
)(*
)(*
)10
Prim
ary
3.7
3,71
625
.712
.935
.817
.70.
06.
01.
913
8Lo
wer
sec
onda
ry6.
53,
517
36.9
22.4
19.6
13.1
0.0
6.6
1.4
229
Upp
er s
econ
dary
14.1
2,16
960
.217
.09.
95.
80.
05.
03.
430
6Po
st s
econ
dary
/ N
on te
rtiar
y49
.748
877
.17.
44.
20.
90.
04.
86.
124
3H
ighe
r56
.51,
346
79.1
14.1
2.0
0.3
0.0
3.6
2.1
760
Mar
ital s
tatu
sEv
er m
arrie
d/in
uni
on16
.17,
902
65.6
15.8
8.2
4.3
0.0
4.0
2.9
1,27
2N
ever
mar
ried/
in u
nion
10.1
4,11
562
.311
.711
.86.
20.
06.
62.
541
4Et
hno-
lingu
istic
gro
up o
f hou
seho
ld h
ead
Lao-
Tai
17.8
7,75
865
.916
.38.
82.
80.
04.
82.
21,
379
Mon
-Khm
er7.
02,
759
62.2
6.5
13.9
9.3
0.0
4.0
4.9
193
Hm
ong-
Mie
n7.
71,
072
49.3
13.4
4.8
28.1
0.0
2.9
1.5
82C
hine
se-T
ibet
an7.
132
6(8
1.2)
(2.9
)(2
.7)
(0.0
)(0
.0)
(4.7
)(1
3.2)
23O
ther
, DK,
Mis
sing
7.6
102
(*)
(*)
(*)
(*)
(*)
(*)
(*)
8W
ealth
inde
x qu
intil
ePo
ores
t1.
92,
172
40.3
1.8
19.0
37.2
0.0
1.6
0.0
40Se
cond
4.0
2,37
052
.35.
410
.028
.50.
02.
81.
696
Mid
dle
9.6
2,35
263
.89.
512
.68.
90.
02.
62.
922
7Fo
urth
16.5
2,67
664
.012
.614
.11.
80.
05.
12.
644
3R
iche
st36
.02,
447
68.0
18.8
5.0
1.1
0.0
5.2
3.1
880
1 MIC
S in
dica
tor E
Q.2
a - H
ealth
insu
ranc
e co
vera
ge( )
Fig
ures
that
are
bas
ed o
n 25
– 4
9 un
wei
ghte
d ca
ses
(*) F
igur
es th
at a
re b
ased
on
few
er th
an 2
5 un
wei
ghte
d ca
ses
Tabl
e EQ
.2.1
M (c
ontin
ued)
: Hea
lth in
sura
nce
cove
rage
(men
)Pe
rcen
tage
of m
en a
ge 1
5-49
with
hea
lth in
sura
nce,
and
, am
ong
thos
e w
ith h
ealth
insu
ranc
e, p
erce
ntag
e co
vere
d by
var
ious
hea
lth in
sura
nce
plan
s, L
ao P
DR
, 201
7
Perc
enta
ge
cove
red
by
any
heal
th
insu
ranc
e1N
umbe
r of
men
Am
ong
men
hav
ing
heal
th in
sura
nce,
per
cent
age
repo
rtin
g th
ey w
ere
insu
red
byN
umbe
r of
men
with
he
alth
in
sura
nce
Civ
il se
rvan
t sc
hem
eSo
cial
sec
urity
of
fice
Com
mun
ity b
ased
he
alth
insu
ranc
e (C
BHI)
Hea
lth
equi
ty fu
nd
(HEF
)
and
child
he
alth
in
sura
nce
Priv
ate
heal
th
insu
ranc
eO
ther
Tota
l10
.415
,435
66.0
10.9
14.4
4.1
0.2
2.4
2.8
1,61
1
Are
a Urb
an
21.7
4,50
670
.912
.010
.81.
60.
03.
42.
598
0R
ural
5.8
10,9
2958
.59.
220
.08.
10.
61.
03.
263
1R
ural
with
road
6.2
9,35
358
.79.
920
.96.
30.
61.
13.
258
4R
ural
with
out r
oad
3.0
1,57
656
.50.
08.
630
.60.
00.
04.
247
Reg
ion
Nor
th7.
24,
885
72.7
3.8
12.7
6.9
0.3
0.5
3.0
354
Cen
tral
13.7
7,49
661
.614
.616
.82.
60.
13.
52.
31,
029
Sout
h7.
53,
054
75.6
5.1
6.3
6.7
0.8
0.7
4.9
228
Prov
ince
Vien
tiane
Cap
ital
19.9
1,74
067
.225
.05.
20.
00.
05.
10.
634
6Ph
ongs
lay
6.6
459
(100
.0)
(0.0
)(0
.0)
(0.0
)(0
.0)
(0.0
)(0
.0)
30Lu
angn
amth
a5.
145
7(1
00.0
)(0
.0)
(0.0
)(0
.0)
(0.0
)(0
.0)
(0.0
)23
Oud
omxa
y7.
478
461
.20.
813
.923
.00.
00.
01.
158
Boke
o7.
943
291
.63.
43.
21.
80.
00.
00.
034
Luan
gpra
bang
9.3
1,12
356
.57.
725
.70.
00.
00.
79.
510
4H
uaph
anh
5.6
678
67.0
1.0
4.4
27.6
0.0
0.0
0.0
38Xa
yabu
ry6.
995
280
.25.
111
.20.
01.
81.
70.
066
Xien
gkhu
ang
11.8
604
96.8
4.2
0.0
0.0
0.0
0.0
0.0
71Vi
entia
ne9.
81,
124
64.2
20.1
7.9
2.7
0.0
2.2
3.9
110
Borik
ham
xay
10.7
672
72.6
6.4
4.3
0.0
1.4
3.9
12.9
72Kh
amm
ua13
.395
460
.410
.321
.20.
00.
02.
95.
212
7Sa
vann
akhe
t12
.12,
171
45.2
7.7
42.2
1.6
0.0
3.5
0.6
263
Sara
vane
5.0
934
(94.
8)(0
.0)
(0.0
)(2
.9)
(2.2
)(0
.0)
(0.0
)46
Seko
ng13
.427
669
.70.
90.
027
.32.
00.
00.
037
Cha
mpa
sack
6.3
1,51
271
.78.
56.
91.
60.
01.
69.
695
Atta
peu
14.8
332
69.3
6.4
15.8
4.5
0.0
0.0
4.0
49Xa
ysom
boun
e17
.123
135
.82.
212
.150
.10.
00.
90.
039
(Con
tinue
d…)
Tabl
e EQ
.2.2
: Hea
lth in
sura
nce
cove
rage
(chi
ldre
n ag
e 5-
17 y
ears
)Pe
rcen
tage
of c
hild
ren
age
5-17
with
hea
lth in
sura
nce,
and
, am
ong
thos
e w
ith h
ealth
insu
ranc
e, p
erce
ntag
e co
vere
d by
var
ious
hea
lth in
sura
nce
plan
s, L
ao P
DR
, 201
7
Perc
enta
ge
cove
red
by
any
heal
th
insu
ranc
e1, A
Num
ber o
f ch
ildre
n ag
e 5-
17
Am
ong
child
ren
age
5-17
hav
ing
heal
th in
sura
nce,
per
cent
age
repo
rted
they
wer
e in
sure
d by
Num
ber o
f ch
ildre
n ag
e 5-
17 w
ith h
ealth
in
sura
nce
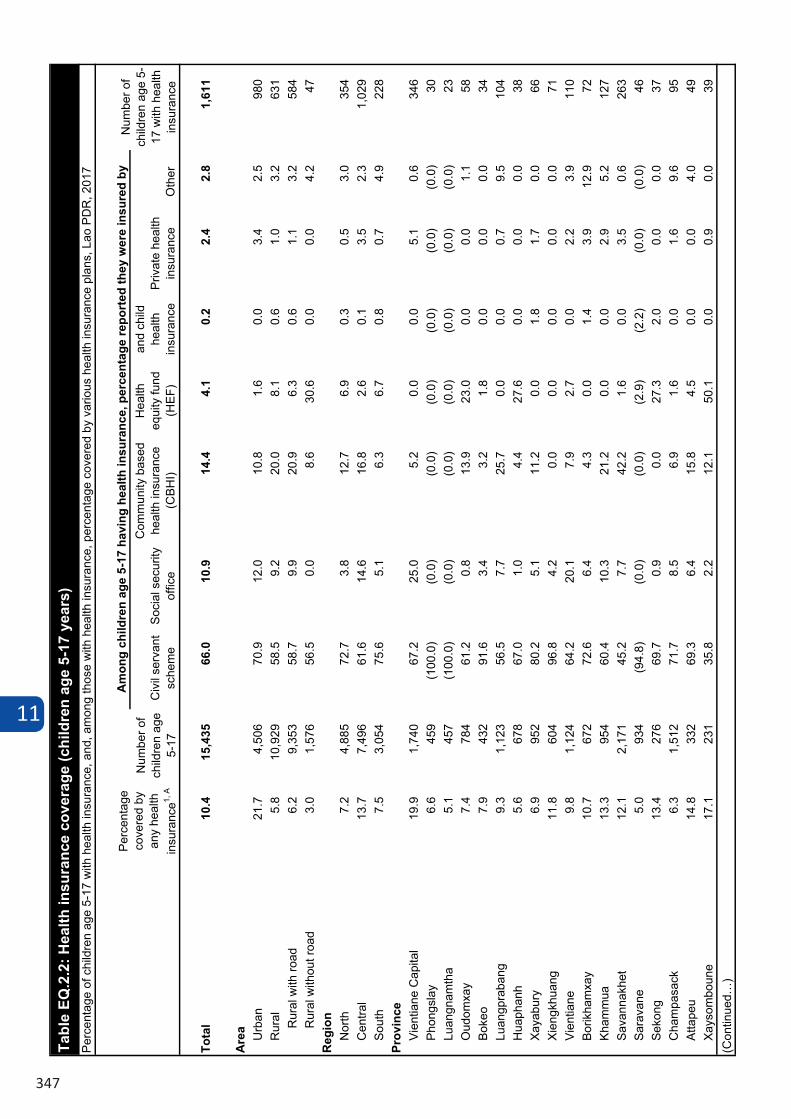
11
347
Civ
il se
rvan
t sc
hem
eSo
cial
sec
urity
of
fice
Com
mun
ity b
ased
he
alth
insu
ranc
e (C
BHI)
Hea
lth
equi
ty fu
nd
(HEF
)
and
child
he
alth
in
sura
nce
Priv
ate
heal
th
insu
ranc
eO
ther
Tota
l10
.415
,435
66.0
10.9
14.4
4.1
0.2
2.4
2.8
1,61
1
Are
a Urb
an
21.7
4,50
670
.912
.010
.81.
60.
03.
42.
598
0R
ural
5.8
10,9
2958
.59.
220
.08.
10.
61.
03.
263
1R
ural
with
road
6.2
9,35
358
.79.
920
.96.
30.
61.
13.
258
4R
ural
with
out r
oad
3.0
1,57
656
.50.
08.
630
.60.
00.
04.
247
Reg
ion
Nor
th7.
24,
885
72.7
3.8
12.7
6.9
0.3
0.5
3.0
354
Cen
tral
13.7
7,49
661
.614
.616
.82.
60.
13.
52.
31,
029
Sout
h7.
53,
054
75.6
5.1
6.3
6.7
0.8
0.7
4.9
228
Prov
ince
Vien
tiane
Cap
ital
19.9
1,74
067
.225
.05.
20.
00.
05.
10.
634
6Ph
ongs
lay
6.6
459
(100
.0)
(0.0
)(0
.0)
(0.0
)(0
.0)
(0.0
)(0
.0)
30Lu
angn
amth
a5.
145
7(1
00.0
)(0
.0)
(0.0
)(0
.0)
(0.0
)(0
.0)
(0.0
)23
Oud
omxa
y7.
478
461
.20.
813
.923
.00.
00.
01.
158
Boke
o7.
943
291
.63.
43.
21.
80.
00.
00.
034
Luan
gpra
bang
9.3
1,12
356
.57.
725
.70.
00.
00.
79.
510
4H
uaph
anh
5.6
678
67.0
1.0
4.4
27.6
0.0
0.0
0.0
38Xa
yabu
ry6.
995
280
.25.
111
.20.
01.
81.
70.
066
Xien
gkhu
ang
11.8
604
96.8
4.2
0.0
0.0
0.0
0.0
0.0
71Vi
entia
ne9.
81,
124
64.2
20.1
7.9
2.7
0.0
2.2
3.9
110
Borik
ham
xay
10.7
672
72.6
6.4
4.3
0.0
1.4
3.9
12.9
72Kh
amm
ua13
.395
460
.410
.321
.20.
00.
02.
95.
212
7Sa
vann
akhe
t12
.12,
171
45.2
7.7
42.2
1.6
0.0
3.5
0.6
263
Sara
vane
5.0
934
(94.
8)(0
.0)
(0.0
)(2
.9)
(2.2
)(0
.0)
(0.0
)46
Seko
ng13
.427
669
.70.
90.
027
.32.
00.
00.
037
Cha
mpa
sack
6.3
1,51
271
.78.
56.
91.
60.
01.
69.
695
Atta
peu
14.8
332
69.3
6.4
15.8
4.5
0.0
0.0
4.0
49Xa
ysom
boun
e17
.123
135
.82.
212
.150
.10.
00.
90.
039
(Con
tinue
d…)
Tabl
e EQ
.2.2
: Hea
lth in
sura
nce
cove
rage
(chi
ldre
n ag
e 5-
17 y
ears
)Pe
rcen
tage
of c
hild
ren
age
5-17
with
hea
lth in
sura
nce,
and
, am
ong
thos
e w
ith h
ealth
insu
ranc
e, p
erce
ntag
e co
vere
d by
var
ious
hea
lth in
sura
nce
plan
s, L
ao P
DR
, 201
7
Perc
enta
ge
cove
red
by
any
heal
th
insu
ranc
e1, A
Num
ber o
f ch
ildre
n ag
e 5-
17
Am
ong
child
ren
age
5-17
hav
ing
heal
th in
sura
nce,
per
cent
age
repo
rted
they
wer
e in
sure
d by
Num
ber o
f ch
ildre
n ag
e 5-
17 w
ith h
ealth
in
sura
nce
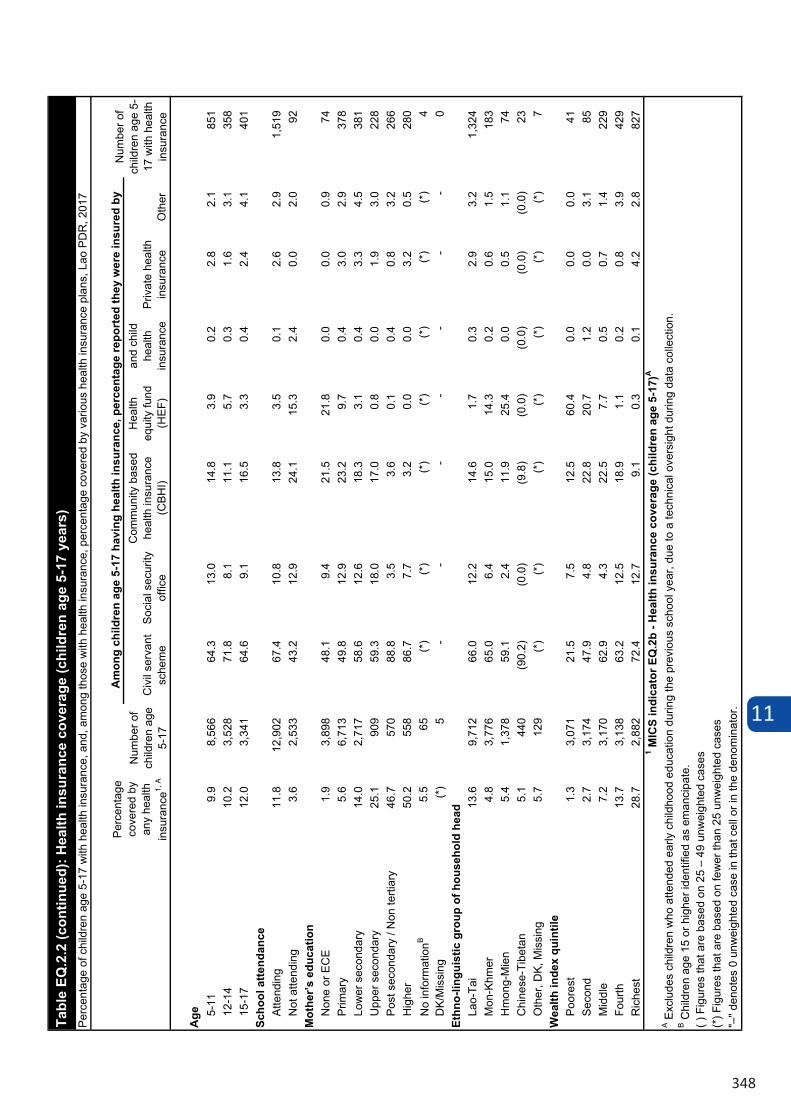
11
348
Civ
il se
rvan
t sc
hem
eSo
cial
sec
urity
of
fice
Com
mun
ity b
ased
he
alth
insu
ranc
e (C
BHI)
Hea
lth
equi
ty fu
nd
(HEF
)
and
child
he
alth
in
sura
nce
Priv
ate
heal
th
insu
ranc
eO
ther
Age 5-
119.
98,
566
64.3
13.0
14.8
3.9
0.2
2.8
2.1
851
12-1
410
.23,
528
71.8
8.1
11.1
5.7
0.3
1.6
3.1
358
15-1
712
.03,
341
64.6
9.1
16.5
3.3
0.4
2.4
4.1
401
Scho
ol a
ttend
ance
Atte
ndin
g11
.812
,902
67.4
10.8
13.8
3.5
0.1
2.6
2.9
1,51
9N
ot a
ttend
ing
3.6
2,53
343
.212
.924
.115
.32.
40.
02.
092
Mot
her’s
edu
catio
nN
one
or E
CE
1.9
3,89
848
.19.
421
.521
.80.
00.
00.
974
Prim
ary
5.6
6,71
349
.812
.923
.29.
70.
43.
02.
937
8Lo
wer
sec
onda
ry14
.02,
717
58.6
12.6
18.3
3.1
0.4
3.3
4.5
381
Upp
er s
econ
dary
25.1
909
59.3
18.0
17.0
0.8
0.0
1.9
3.0
228
Post
sec
onda
ry /
Non
terti
ary
46.7
570
88.8
3.5
3.6
0.1
0.4
0.8
3.2
266
Hig
her
50.2
558
86.7
7.7
3.2
0.0
0.0
3.2
0.5
280
No
info
rmat
ionB
5.5
65(*
)(*
)(*
)(*
)(*
)(*
)(*
)4
DK/
Mis
sing
(*)
5-
--
--
--
0Et
hno-
lingu
istic
gro
up o
f hou
seho
ld h
ead
Lao-
Tai
13.6
9,71
266
.012
.214
.61.
70.
32.
93.
21,
324
Mon
-Khm
er4.
83,
776
65.0
6.4
15.0
14.3
0.2
0.6
1.5
183
Hm
ong-
Mie
n5.
41,
378
59.1
2.4
11.9
25.4
0.0
0.5
1.1
74C
hine
se-T
ibet
an5.
144
0(9
0.2)
(0.0
)(9
.8)
(0.0
)(0
.0)
(0.0
)(0
.0)
23O
ther
, DK,
Mis
sing
5.7
129
(*)
(*)
(*)
(*)
(*)
(*)
(*)
7W
ealth
inde
x qu
intil
ePo
ores
t1.
33,
071
21.5
7.5
12.5
60.4
0.0
0.0
0.0
41Se
cond
2.7
3,17
447
.94.
822
.820
.71.
20.
03.
185
Mid
dle
7.2
3,17
062
.94.
322
.57.
70.
50.
71.
422
9Fo
urth
13.7
3,13
863
.212
.518
.91.
10.
20.
83.
942
9R
iche
st28
.72,
882
72.4
12.7
9.1
0.3
0.1
4.2
2.8
827
Tabl
e EQ
.2.2
(con
tinue
d): H
ealth
insu
ranc
e co
vera
ge (c
hild
ren
age
5-17
yea
rs)
Perc
enta
ge o
f chi
ldre
n ag
e 5-
17 w
ith h
ealth
insu
ranc
e, a
nd, a
mon
g th
ose
with
hea
lth in
sura
nce,
per
cent
age
cove
red
by v
ario
us h
ealth
insu
ranc
e pl
ans,
Lao
PD
R, 2
017
Perc
enta
ge
cove
red
by
any
heal
th
insu
ranc
e1, A
Num
ber o
f ch
ildre
n ag
e 5-
17
Am
ong
child
ren
age
5-17
hav
ing
heal
th in
sura
nce,
per
cent
age
repo
rted
they
wer
e in
sure
d by
Num
ber o
f ch
ildre
n ag
e 5-
17 w
ith h
ealth
in
sura
nce
"–" d
enot
es 0
unw
eigh
ted
case
in th
at c
ell o
r in
the
deno
min
ator
.
1 MIC
S in
dica
tor E
Q.2
b - H
ealth
insu
ranc
e co
vera
ge (c
hild
ren
age
5-17
)A
A Exc
lude
s ch
ildre
n w
ho a
ttend
ed e
arly
chi
ldho
od e
duca
tion
durin
g th
e pr
evio
us s
choo
l yea
r, du
e to
a te
chni
cal o
vers
ight
dur
ing
data
col
lect
ion.
B Chi
ldre
n ag
e 15
or h
ighe
r ide
ntifi
ed a
s em
anci
pate
.( )
Fig
ures
that
are
bas
ed o
n 25
– 4
9 un
wei
ghte
d ca
ses
(*) F
igur
es th
at a
re b
ased
on
few
er th
an 2
5 un
wei
ghte
d ca
ses
Tabl
e EQ
.2.3
: Hea
lth
insu
ranc
e co
vera
ge (c
hild
ren
unde
r ag
e 5)
Perc
enta
ge o
f chi
ldre
n un
der a
ge 5
with
hea
lth in
sura
nce,
and
, am
ong
thos
e w
ith h
ealth
insu
ranc
e, p
erce
ntag
e co
vere
d by
var
ious
hea
lth in
sura
nce
plan
s, L
ao P
DR,
201
7
Perc
enta
ge
cove
red
by
any
heal
th
insu
ranc
e1
Num
ber
of
child
ren
unde
r age
5
Am
ong
child
ren
unde
r ag
e 5
havi
ng h
ealt
h in
sura
nce,
per
cent
age
repo
rted
they
wer
e in
sure
d by
N
umbe
r of
child
ren
unde
r age
5
with
hea
lth
insu
ranc
e Ci
vil s
erva
nt
sche
me
Soci
al
secu
rity
offic
e
Com
mun
ity
base
d he
alth
in
sura
nce
(CBH
I)
Hea
lth
equi
ty
fund
(H
EF)
Free
mot
her a
nd
child
hea
lth
insu
ranc
e (M
CH)
Priv
ate
heal
th
insu
ranc
e O
ther
Tota
l 13
.7
11,7
20
64.4
13
.0
9.2
2.3
9.3
2.2
1.8
1,60
2
Are
a
U
rban
29
.3
3,17
9 68
.8
16.4
6.
9 1.
4 3.
9 3.
5 2.
0 93
2 Ru
ral
7.8
8,54
1 58
.2
8.3
12.4
3.
5 16
.9
0.4
1.6
670
Rura
l with
roa
d 8.
5 7,
124
58.6
9.
2 13
.2
3.1
14.9
0.
5 1.
8 60
6 Ru
ral w
ithou
t roa
d 4.
5 1,
417
54.1
0.
0 4.
9 7.
7 35
.7
0.0
0.0
64
Regi
on
Nor
th
11.0
3,
684
73.4
6.
4 4.
7 1.
8 11
.6
0.3
2.3
407
Cent
ral
17.2
5,
610
62.3
17
.4
12.5
2.
6 3.
0 3.
5 1.
7 96
5 So
uth
9.5
2,42
7 56
.9
6.5
3.0
1.6
31.6
0.
2 1.
6 23
1 Pr
ovin
ce
Vien
tiane
Cap
ital
31.0
1,
181
64.5
31
.2
2.8
0.0
0.5
6.5
0.0
366
Phon
gsal
y 11
.9
346
92.5
0.
0 0.
0 1.
7 7.
5 0.
0 0.
0 41
Lu
angn
amth
a 8.
1 32
1 (9
7.5)
(2
.5)
(2.1
) (0
.0)
(0.0
) (0
.0)
(0.0
) 26
O
udom
xay
10.2
69
0 91
.1
0.0
4.8
4.1
0.0
0.0
0.0
70
Boke
o 11
.5
373
85.4
8.
8 0.
0 0.
0 1.
5 3.
0 1.
2 43
Lu
angp
raba
ng
10.3
84
4 62
.2
14.9
12
.5
0.0
0.0
0.0
10.3
87
H
uaph
anh
9.1
553
78.7
0.
0 0.
0 7.
1 14
.2
0.0
0.0
50
Xaya
bury
16
.1
556
46.0
9.
8 4.
9 0.
0 40
.5
0.0
0.0
89
Xien
gkhu
ang
12.4
56
5 95
.8
5.3
0.0
0.0
0.0
0.0
0.0
70
Vien
tiane
9.
3 80
3 77
.6
12.4
5.
5 0.
0 0.
0 3.
1 1.
4 75
Bo
rikha
mxa
y 14
.9
527
75.7
4.
5 9.
4 0.
0 0.
0 0.
9 10
.1
78
Kham
mua
ne
15.1
67
4 62
.8
8.0
26.1
0.
0 0.
0 1.
2 3.
0 10
2 Sa
vann
akhe
t 13
.6
1,62
5 45
.3
12.1
31
.3
0.9
9.0
1.8
1.9
221
Sara
vane
9.
9 82
1 50
.7
0.0
0.0
0.0
50.0
0.
6 0.
0 81
Se
kong
18
.7
256
30.0
1.
3 0.
0 6.
6 64
.5
0.0
0.0
48
Cham
pasa
ck
5.7
1,10
1 (7
5.0)
(1
6.2)
(5
.8)
(0.0
) (0
.0)
(0.0
) (3
.0)
62
Att
apeu
15
.9
248
73.8
10
.6
8.7
1.3
3.9
0.0
4.4
39
Xays
ombo
une
22.4
23
4 31
.3
3.3
6.2
44.9
14
.8
3.2
0.0
52
(Con
tinue
d…)
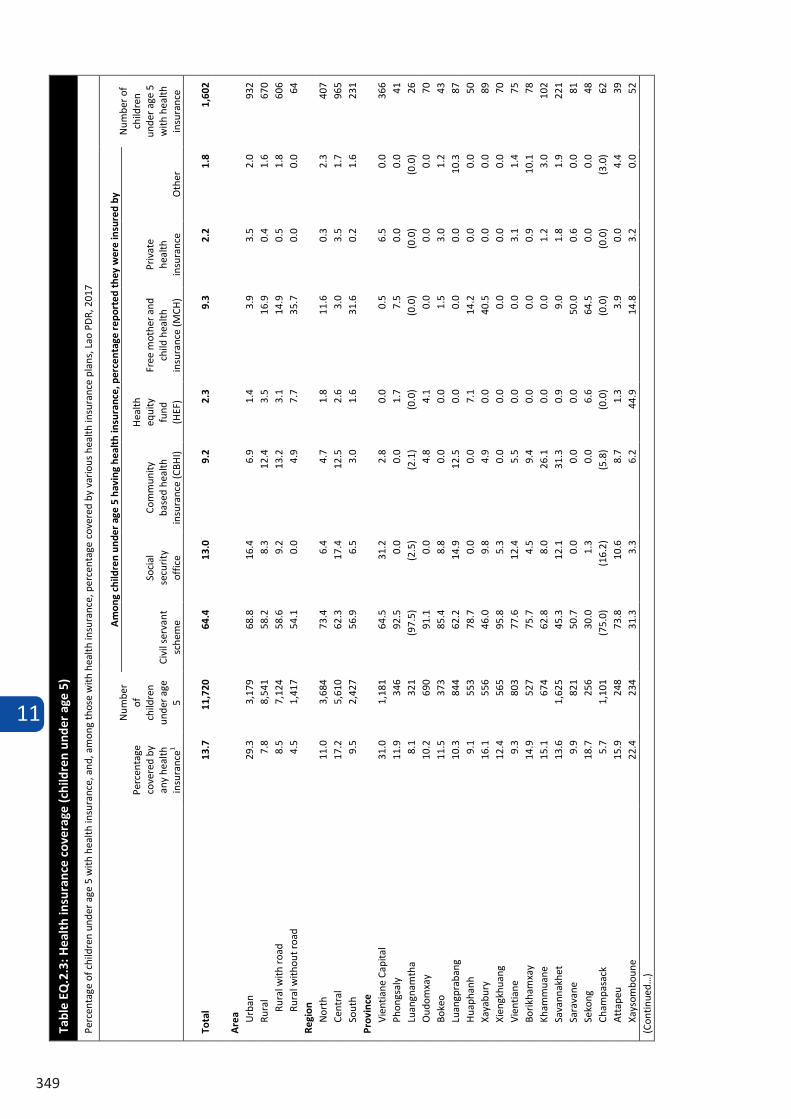
11
349
Civ
il se
rvan
t sc
hem
eSo
cial
sec
urity
of
fice
Com
mun
ity b
ased
he
alth
insu
ranc
e (C
BHI)
Hea
lth
equi
ty fu
nd
(HEF
)
and
child
he
alth
in
sura
nce
Priv
ate
heal
th
insu
ranc
eO
ther
Age 5-
119.
98,
566
64.3
13.0
14.8
3.9
0.2
2.8
2.1
851
12-1
410
.23,
528
71.8
8.1
11.1
5.7
0.3
1.6
3.1
358
15-1
712
.03,
341
64.6
9.1
16.5
3.3
0.4
2.4
4.1
401
Scho
ol a
ttend
ance
Atte
ndin
g11
.812
,902
67.4
10.8
13.8
3.5
0.1
2.6
2.9
1,51
9N
ot a
ttend
ing
3.6
2,53
343
.212
.924
.115
.32.
40.
02.
092
Mot
her’s
edu
catio
nN
one
or E
CE
1.9
3,89
848
.19.
421
.521
.80.
00.
00.
974
Prim
ary
5.6
6,71
349
.812
.923
.29.
70.
43.
02.
937
8Lo
wer
sec
onda
ry14
.02,
717
58.6
12.6
18.3
3.1
0.4
3.3
4.5
381
Upp
er s
econ
dary
25.1
909
59.3
18.0
17.0
0.8
0.0
1.9
3.0
228
Post
sec
onda
ry /
Non
terti
ary
46.7
570
88.8
3.5
3.6
0.1
0.4
0.8
3.2
266
Hig
her
50.2
558
86.7
7.7
3.2
0.0
0.0
3.2
0.5
280
No
info
rmat
ionB
5.5
65(*
)(*
)(*
)(*
)(*
)(*
)(*
)4
DK/
Mis
sing
(*)
5-
--
--
--
0Et
hno-
lingu
istic
gro
up o
f hou
seho
ld h
ead
Lao-
Tai
13.6
9,71
266
.012
.214
.61.
70.
32.
93.
21,
324
Mon
-Khm
er4.
83,
776
65.0
6.4
15.0
14.3
0.2
0.6
1.5
183
Hm
ong-
Mie
n5.
41,
378
59.1
2.4
11.9
25.4
0.0
0.5
1.1
74C
hine
se-T
ibet
an5.
144
0(9
0.2)
(0.0
)(9
.8)
(0.0
)(0
.0)
(0.0
)(0
.0)
23O
ther
, DK,
Mis
sing
5.7
129
(*)
(*)
(*)
(*)
(*)
(*)
(*)
7W
ealth
inde
x qu
intil
ePo
ores
t1.
33,
071
21.5
7.5
12.5
60.4
0.0
0.0
0.0
41Se
cond
2.7
3,17
447
.94.
822
.820
.71.
20.
03.
185
Mid
dle
7.2
3,17
062
.94.
322
.57.
70.
50.
71.
422
9Fo
urth
13.7
3,13
863
.212
.518
.91.
10.
20.
83.
942
9R
iche
st28
.72,
882
72.4
12.7
9.1
0.3
0.1
4.2
2.8
827
Tabl
e EQ
.2.2
(con
tinue
d): H
ealth
insu
ranc
e co
vera
ge (c
hild
ren
age
5-17
yea
rs)
Perc
enta
ge o
f chi
ldre
n ag
e 5-
17 w
ith h
ealth
insu
ranc
e, a
nd, a
mon
g th
ose
with
hea
lth in
sura
nce,
per
cent
age
cove
red
by v
ario
us h
ealth
insu
ranc
e pl
ans,
Lao
PD
R, 2
017
Perc
enta
ge
cove
red
by
any
heal
th
insu
ranc
e1, A
Num
ber o
f ch
ildre
n ag
e 5-
17
Am
ong
child
ren
age
5-17
hav
ing
heal
th in
sura
nce,
per
cent
age
repo
rted
they
wer
e in
sure
d by
Num
ber o
f ch
ildre
n ag
e 5-
17 w
ith h
ealth
in
sura
nce
"–" d
enot
es 0
unw
eigh
ted
case
in th
at c
ell o
r in
the
deno
min
ator
.
1 MIC
S in
dica
tor E
Q.2
b - H
ealth
insu
ranc
e co
vera
ge (c
hild
ren
age
5-17
)A
A Exc
lude
s ch
ildre
n w
ho a
ttend
ed e
arly
chi
ldho
od e
duca
tion
durin
g th
e pr
evio
us s
choo
l yea
r, du
e to
a te
chni
cal o
vers
ight
dur
ing
data
col
lect
ion.
B Chi
ldre
n ag
e 15
or h
ighe
r ide
ntifi
ed a
s em
anci
pate
.( )
Fig
ures
that
are
bas
ed o
n 25
– 4
9 un
wei
ghte
d ca
ses
(*) F
igur
es th
at a
re b
ased
on
few
er th
an 2
5 un
wei
ghte
d ca
ses
Tabl
e EQ
.2.3
: Hea
lth
insu
ranc
e co
vera
ge (c
hild
ren
unde
r ag
e 5)
Perc
enta
ge o
f chi
ldre
n un
der a
ge 5
with
hea
lth in
sura
nce,
and
, am
ong
thos
e w
ith h
ealth
insu
ranc
e, p
erce
ntag
e co
vere
d by
var
ious
hea
lth in
sura
nce
plan
s, L
ao P
DR,
201
7
Perc
enta
ge
cove
red
by
any
heal
th
insu
ranc
e1
Num
ber
of
child
ren
unde
r age
5
Am
ong
child
ren
unde
r ag
e 5
havi
ng h
ealt
h in
sura
nce,
per
cent
age
repo
rted
they
wer
e in
sure
d by
N
umbe
r of
child
ren
unde
r age
5
with
hea
lth
insu
ranc
e Ci
vil s
erva
nt
sche
me
Soci
al
secu
rity
offic
e
Com
mun
ity
base
d he
alth
in
sura
nce
(CBH
I)
Hea
lth
equi
ty
fund
(H
EF)
Free
mot
her a
nd
child
hea
lth
insu
ranc
e (M
CH)
Priv
ate
heal
th
insu
ranc
e O
ther
Tota
l 13
.7
11,7
20
64.4
13
.0
9.2
2.3
9.3
2.2
1.8
1,60
2
Are
a
U
rban
29
.3
3,17
9 68
.8
16.4
6.
9 1.
4 3.
9 3.
5 2.
0 93
2 Ru
ral
7.8
8,54
1 58
.2
8.3
12.4
3.
5 16
.9
0.4
1.6
670
Rura
l with
roa
d 8.
5 7,
124
58.6
9.
2 13
.2
3.1
14.9
0.
5 1.
8 60
6 Ru
ral w
ithou
t roa
d 4.
5 1,
417
54.1
0.
0 4.
9 7.
7 35
.7
0.0
0.0
64
Regi
on
Nor
th
11.0
3,
684
73.4
6.
4 4.
7 1.
8 11
.6
0.3
2.3
407
Cent
ral
17.2
5,
610
62.3
17
.4
12.5
2.
6 3.
0 3.
5 1.
7 96
5 So
uth
9.5
2,42
7 56
.9
6.5
3.0
1.6
31.6
0.
2 1.
6 23
1 Pr
ovin
ce
Vien
tiane
Cap
ital
31.0
1,
181
64.5
31
.2
2.8
0.0
0.5
6.5
0.0
366
Phon
gsal
y 11
.9
346
92.5
0.
0 0.
0 1.
7 7.
5 0.
0 0.
0 41
Lu
angn
amth
a 8.
1 32
1 (9
7.5)
(2
.5)
(2.1
) (0
.0)
(0.0
) (0
.0)
(0.0
) 26
O
udom
xay
10.2
69
0 91
.1
0.0
4.8
4.1
0.0
0.0
0.0
70
Boke
o 11
.5
373
85.4
8.
8 0.
0 0.
0 1.
5 3.
0 1.
2 43
Lu
angp
raba
ng
10.3
84
4 62
.2
14.9
12
.5
0.0
0.0
0.0
10.3
87
H
uaph
anh
9.1
553
78.7
0.
0 0.
0 7.
1 14
.2
0.0
0.0
50
Xaya
bury
16
.1
556
46.0
9.
8 4.
9 0.
0 40
.5
0.0
0.0
89
Xien
gkhu
ang
12.4
56
5 95
.8
5.3
0.0
0.0
0.0
0.0
0.0
70
Vien
tiane
9.
3 80
3 77
.6
12.4
5.
5 0.
0 0.
0 3.
1 1.
4 75
Bo
rikha
mxa
y 14
.9
527
75.7
4.
5 9.
4 0.
0 0.
0 0.
9 10
.1
78
Kham
mua
ne
15.1
67
4 62
.8
8.0
26.1
0.
0 0.
0 1.
2 3.
0 10
2 Sa
vann
akhe
t 13
.6
1,62
5 45
.3
12.1
31
.3
0.9
9.0
1.8
1.9
221
Sara
vane
9.
9 82
1 50
.7
0.0
0.0
0.0
50.0
0.
6 0.
0 81
Se
kong
18
.7
256
30.0
1.
3 0.
0 6.
6 64
.5
0.0
0.0
48
Cham
pasa
ck
5.7
1,10
1 (7
5.0)
(1
6.2)
(5
.8)
(0.0
) (0
.0)
(0.0
) (3
.0)
62
Att
apeu
15
.9
248
73.8
10
.6
8.7
1.3
3.9
0.0
4.4
39
Xays
ombo
une
22.4
23
4 31
.3
3.3
6.2
44.9
14
.8
3.2
0.0
52
(Con
tinue
d…)
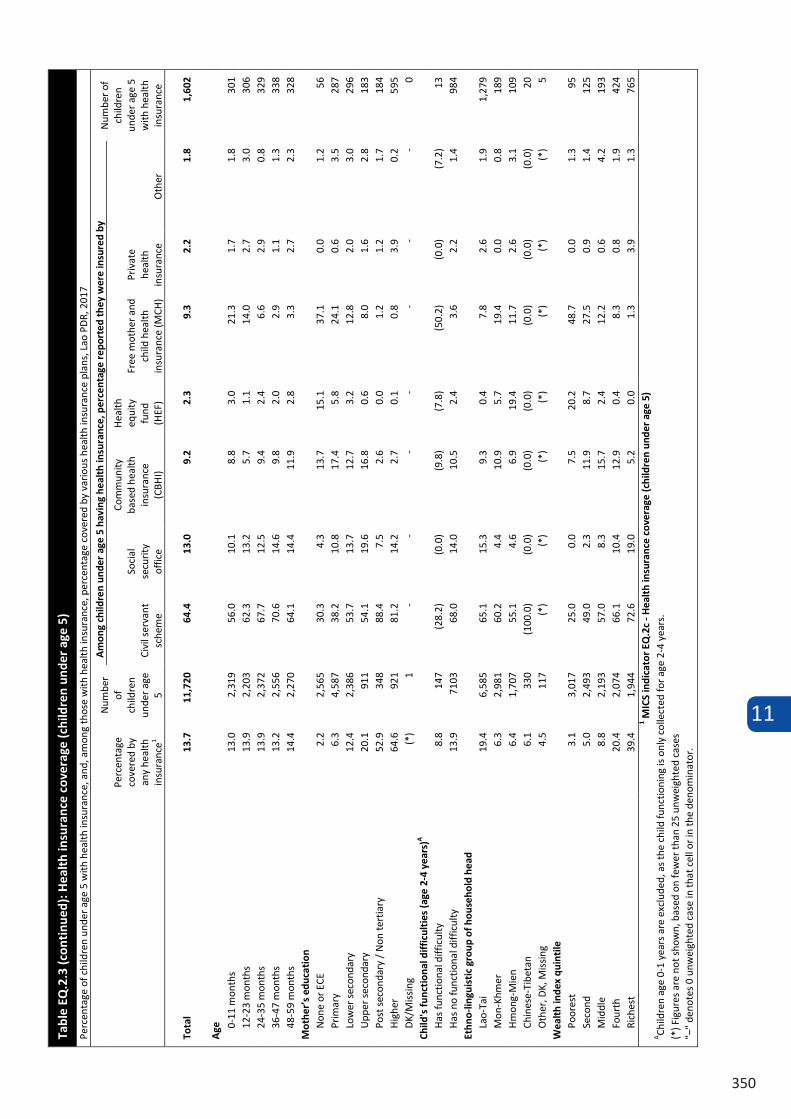
11
350
Tabl
e EQ
.2.3
(con
tinu
ed):
Hea
lth
insu
ranc
e co
vera
ge (c
hild
ren
unde
r ag
e 5)
Perc
enta
ge o
f chi
ldre
n un
der a
ge 5
with
hea
lth in
sura
nce,
and
, am
ong
thos
e w
ith h
ealth
insu
ranc
e, p
erce
ntag
e co
vere
d by
var
ious
hea
lth in
sura
nce
plan
s, L
ao P
DR,
201
7
Perc
enta
ge
cove
red
by
any
heal
th
insu
ranc
e1
Num
ber
of
child
ren
unde
r age
5
Am
ong
child
ren
unde
r ag
e 5
havi
ng h
ealt
h in
sura
nce,
per
cent
age
repo
rted
they
wer
e in
sure
d by
N
umbe
r of
child
ren
unde
r age
5
with
hea
lth
insu
ranc
e Ci
vil s
erva
nt
sche
me
Soci
al
secu
rity
offic
e
Com
mun
ity
base
d he
alth
in
sura
nce
(CBH
I)
Hea
lth
equi
ty
fund
(H
EF)
Free
mot
her a
nd
child
hea
lth
insu
ranc
e (M
CH)
Priv
ate
heal
th
insu
ranc
e O
ther
Tota
l 13
.7
11,7
20
64.4
13
.0
9.2
2.3
9.3
2.2
1.8
1,60
2
Age
0-
11 m
onth
s 13
.0
2,31
9 56
.0
10.1
8.
8 3.
0 21
.3
1.7
1.8
301
12-2
3 m
onth
s 13
.9
2,20
3 62
.3
13.2
5.
7 1.
1 14
.0
2.7
3.0
306
24-3
5 m
onth
s 13
.9
2,37
2 67
.7
12.5
9.
4 2.
4 6.
6 2.
9 0.
8 32
9 36
-47
mon
ths
13.2
2,
556
70.6
14
.6
9.8
2.0
2.9
1.1
1.3
338
48-5
9 m
onth
s 14
.4
2,27
0 64
.1
14.4
11
.9
2.8
3.3
2.7
2.3
328
Mot
her’
s ed
ucat
ion
Non
e or
ECE
2.
2 2,
565
30.3
4.
3 13
.7
15.1
37
.1
0.0
1.2
56
Prim
ary
6.3
4,58
7 38
.2
10.8
17
.4
5.8
24.1
0.
6 3.
5 28
7 Lo
wer
sec
onda
ry
12.4
2,
386
53.7
13
.7
12.7
3.
2 12
.8
2.0
3.0
296
Upp
er s
econ
dary
20
.1
911
54.1
19
.6
16.8
0.
6 8.
0 1.
6 2.
8 18
3 Po
st s
econ
dary
/ N
on te
rtia
ry
52.9
34
8 88
.4
7.5
2.6
0.0
1.2
1.2
1.7
184
Hig
her
64.6
92
1 81
.2
14.2
2.
7 0.
1 0.
8 3.
9 0.
2 59
5 D
K/M
issi
ng
(*)
1 -
- -
- -
- -
0 Ch
ild's
func
tion
al d
iffic
ulti
es (a
ge 2
-4 y
ears
)A H
as fu
nctio
nal d
iffic
ulty
8.
8 14
7 (2
8.2)
(0
.0)
(9.8
) (7
.8)
(50.
2)
(0.0
) (7
.2)
13
Has
no
func
tiona
l diff
icul
ty
13.9
71
03
68.0
14
.0
10.5
2.
4 3.
6 2.
2 1.
4 98
4 Et
hno-
lingu
isti
c gr
oup
of h
ouse
hold
hea
d La
o-Ta
i 19
.4
6,58
5 65
.1
15.3
9.
3 0.
4 7.
8 2.
6 1.
9 1,
279
Mon
-Khm
er
6.3
2,98
1 60
.2
4.4
10.9
5.
7 19
.4
0.0
0.8
189
Hm
ong-
Mie
n 6.
4 1,
707
55.1
4.
6 6.
9 19
.4
11.7
2.
6 3.
1 10
9 Ch
ines
e-Ti
beta
n 6.
1 33
0 (1
00.0
) (0
.0)
(0.0
) (0
.0)
(0.0
) (0
.0)
(0.0
) 20
O
ther
, DK,
Mis
sing
4.
5 11
7 (*
) (*
) (*
) (*
) (*
) (*
) (*
) 5
Wea
lth
inde
x qu
inti
le
Poor
est
3.1
3,01
7 25
.0
0.0
7.5
20.2
48
.7
0.0
1.3
95
Seco
nd
5.0
2,49
3 49
.0
2.3
11.9
8.
7 27
.5
0.9
1.4
125
Mid
dle
8.8
2,19
3 57
.0
8.3
15.7
2.
4 12
.2
0.6
4.2
193
Four
th
20.4
2,
074
66.1
10
.4
12.9
0.
4 8.
3 0.
8 1.
9 42
4 Ri
ches
t 39
.4
1,94
4 72
.6
19.0
5.
2 0.
0 1.
3 3.
9 1.
3 76
5 1 M
ICS
indi
cato
r EQ
.2c
- Hea
lth
insu
ranc
e co
vera
ge (c
hild
ren
unde
r ag
e 5)
A Ch
ildre
n ag
e 0-
1 ye
ars
are
excl
uded
, as
the
child
func
tioni
ng is
onl
y co
llect
ed fo
r age
2-4
yea
rs.
(*) F
igur
es a
re n
ot s
how
n, b
ased
on
few
er th
an 2
5 un
wei
ghte
d ca
ses
"–"
deno
tes
0 un
wei
ghte
d ca
se in
that
cel
l or i
n th
e de
nom
inat
or.
Table EQ.2.4: Awareness and ever use of external economic support
Percentage of households who are aware and have received external economic support, Lao PDR, 2017
Percentage of households who are aware of economic assistance
programme
Percentage of households who are aware and have ever
received assistance Number of households
Total 51.8 21.0 22,287
Sex of household head Male 52.9 21.8 19,183 Female 45.4 16.4 3,104
Area Urban 64.9 27.4 7,214 Rural 45.6 18.0 15,073
Rural with road 45.5 17.7 12,964 Rural without road 46.0 19.8 2,109
Region North 50.3 21.9 7,131 Central 54.6 19.9 10,919 South 47.3 22.4 4,237
Province Vientiane Capital 72.2 22.9 2,906 Phongsaly 63.6 16.1 706 Luangnamtha 31.5 7.1 624 Oudomxay 88.0 52.7 1,122 Bokeo 50.1 28.3 623 Luangprabang 41.1 12.1 1,640 Huaphanh 44.7 26.8 930 Xayabury 37.0 12.5 1,486 Xiengkhuang 73.3 35.5 843 Vientiane 53.6 22.2 1,529 Borikhamxay 80.7 41.9 963 Khammuane 44.8 16.0 1,429 Savannakhet 32.0 7.4 2,969 Saravane 53.1 27.5 1,266 Sekong 48.6 18.5 366 Champasack 35.5 9.5 2,151 Attapeu 85.5 72.3 453 Xaysomboune 22.9 7.6 281
Age of household head 15-19 41.1 16.3 73 20-24 42.4 19.7 450 25-49 52.1 20.9 12,248 50+ 52.0 21.3 9,516
Household with orphans With at least one orphan 44.4 20.2 1,197 With no orphans 52.3 21.1 21,090
Ethno-linguistic group of household head Lao-Tai 56.0 21.2 14,785 Mon-Khmer 43.9 21.7 4,983 Hmong-Mien 43.7 20.6 1,667 Chinese-Tibetan 43.5 13.6 624 Other, DK, Missing 38.3 15.9 228
Wealth index quintiles Poorest 32.2 14.0 4,151 Second 42.9 19.0 4,234 Middle 46.3 18.3 4,493 Fourth 58.8 21.1 4,757 Richest 75.7 31.6 4,652
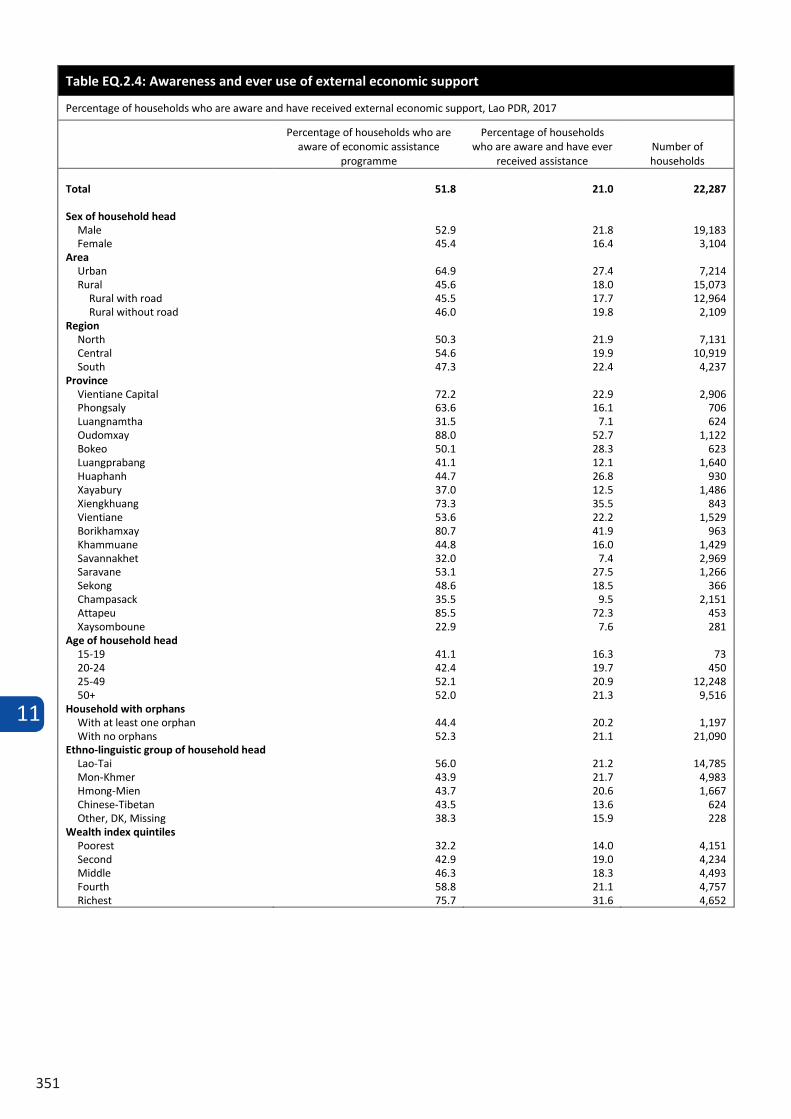
11
351
Table EQ.2.4: Awareness and ever use of external economic support
Percentage of households who are aware and have received external economic support, Lao PDR, 2017
Percentage of households who are aware of economic assistance
programme
Percentage of households who are aware and have ever
received assistance Number of households
Total 51.8 21.0 22,287
Sex of household head Male 52.9 21.8 19,183 Female 45.4 16.4 3,104
Area Urban 64.9 27.4 7,214 Rural 45.6 18.0 15,073
Rural with road 45.5 17.7 12,964 Rural without road 46.0 19.8 2,109
Region North 50.3 21.9 7,131 Central 54.6 19.9 10,919 South 47.3 22.4 4,237
Province Vientiane Capital 72.2 22.9 2,906 Phongsaly 63.6 16.1 706 Luangnamtha 31.5 7.1 624 Oudomxay 88.0 52.7 1,122 Bokeo 50.1 28.3 623 Luangprabang 41.1 12.1 1,640 Huaphanh 44.7 26.8 930 Xayabury 37.0 12.5 1,486 Xiengkhuang 73.3 35.5 843 Vientiane 53.6 22.2 1,529 Borikhamxay 80.7 41.9 963 Khammuane 44.8 16.0 1,429 Savannakhet 32.0 7.4 2,969 Saravane 53.1 27.5 1,266 Sekong 48.6 18.5 366 Champasack 35.5 9.5 2,151 Attapeu 85.5 72.3 453 Xaysomboune 22.9 7.6 281
Age of household head 15-19 41.1 16.3 73 20-24 42.4 19.7 450 25-49 52.1 20.9 12,248 50+ 52.0 21.3 9,516
Household with orphans With at least one orphan 44.4 20.2 1,197 With no orphans 52.3 21.1 21,090
Ethno-linguistic group of household head Lao-Tai 56.0 21.2 14,785 Mon-Khmer 43.9 21.7 4,983 Hmong-Mien 43.7 20.6 1,667 Chinese-Tibetan 43.5 13.6 624 Other, DK, Missing 38.3 15.9 228
Wealth index quintiles Poorest 32.2 14.0 4,151 Second 42.9 19.0 4,234 Middle 46.3 18.3 4,493 Fourth 58.8 21.1 4,757 Richest 75.7 31.6 4,652
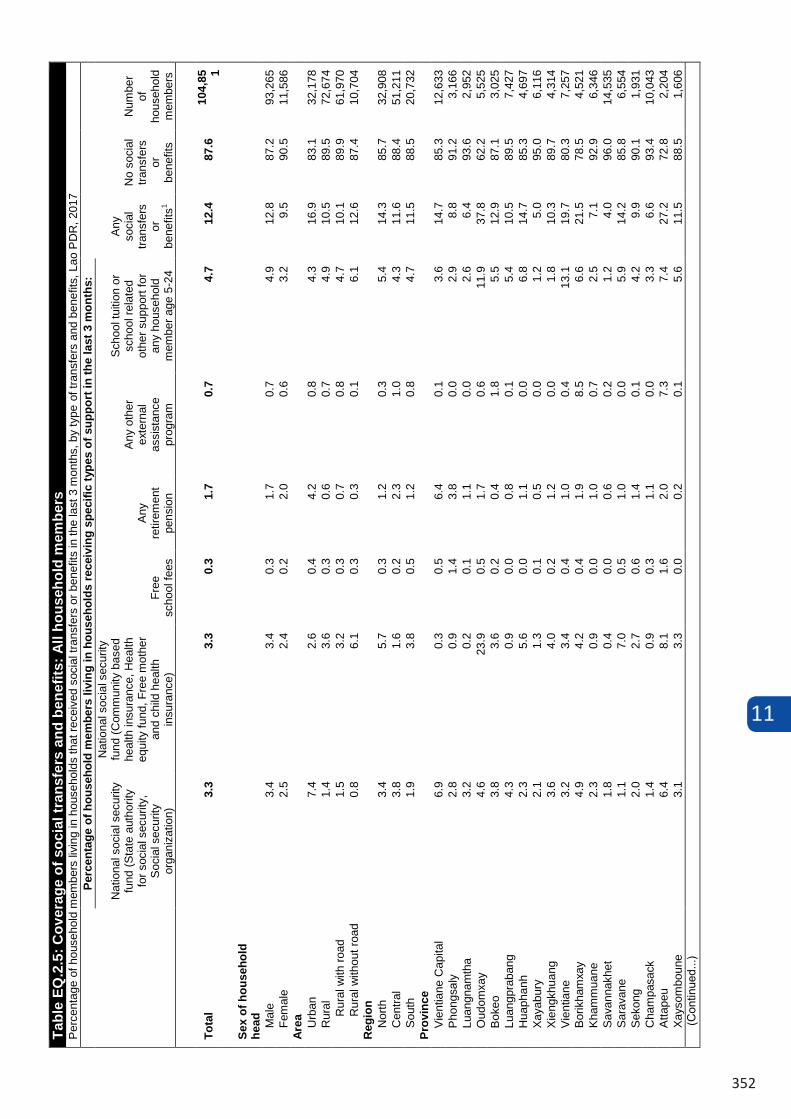
11
352
Tabl
e EQ
.2.5
: Cov
erag
e of
soc
ial t
rans
fers
and
ben
efits
: All
hous
ehol
d m
embe
rsP
erce
ntag
e of
hou
seho
ld m
embe
rs li
ving
in h
ouse
hold
s th
at re
ceiv
ed s
ocia
l tra
nsfe
rs o
r ben
efits
in th
e la
st 3
mon
ths,
by
type
of tr
ansf
ers
and
bene
fits,
Lao
PD
R, 2
017
Perc
enta
ge o
f hou
seho
ld m
embe
rs li
ving
in h
ouse
hold
s re
ceiv
ing
spec
ific
type
s of
sup
port
in th
e la
st 3
mon
ths:
Any
so
cial
tra
nsfe
rs
orbe
nefit
s1
No
soci
al
trans
fers
or
bene
fits
Num
ber
of
hous
ehol
d m
embe
rs
Nat
iona
l soc
ial s
ecur
ity
fund
(Sta
te a
utho
rity
for s
ocia
l sec
urity
, S
ocia
l sec
urity
or
gani
zatio
n)
Nat
iona
l soc
ial s
ecur
ity
fund
(Com
mun
ity b
ased
he
alth
insu
ranc
e, H
ealth
eq
uity
fund
, Fre
e m
othe
r an
d ch
ild h
ealth
in
sura
nce)
Free
sc
hool
fees
Any
re
tirem
ent
pens
ion
Any
oth
er
exte
rnal
as
sist
ance
pr
ogra
m
Sch
ool t
uitio
n or
sc
hool
rela
ted
othe
r sup
port
for
any
hous
ehol
d m
embe
r age
5-2
4
Tota
l3.
33.
30.
31.
70.
74.
712
.487
.610
4,85 1
Sex
of h
ouse
hold
he
ad Mal
e3.
43.
40.
31.
70.
74.
912
.887
.293
,265
Fem
ale
2.5
2.4
0.2
2.0
0.6
3.2
9.5
90.5
11,5
86Ar
ea Urb
an
7.4
2.6
0.4
4.2
0.8
4.3
16.9
83.1
32,1
78R
ural
1.4
3.6
0.3
0.6
0.7
4.9
10.5
89.5
72,6
74R
ural
with
road
1.5
3.2
0.3
0.7
0.8
4.7
10.1
89.9
61,9
70R
ural
with
out r
oad
0.8
6.1
0.3
0.3
0.1
6.1
12.6
87.4
10,7
04R
egio
nN
orth
3.4
5.7
0.3
1.2
0.3
5.4
14.3
85.7
32,9
08C
entra
l3.
81.
60.
22.
31.
04.
311
.688
.451
,211
Sou
th1.
93.
80.
51.
20.
84.
711
.588
.520
,732
Prov
ince
6.9
0.3
0.5
6.4
0.1
3.6
14.7
85.3
12,6
332.
80.
91.
43.
80.
02.
98.
891
.23,
166
3.2
0.2
0.1
1.1
0.0
2.6
6.4
93.6
2,95
24.
623
.90.
51.
70.
611
.937
.862
.25,
525
3.8
3.6
0.2
0.4
1.8
5.5
12.9
87.1
3,02
54.
30.
90.
00.
80.
15.
410
.589
.57,
427
2.3
5.6
0.0
1.1
0.0
6.8
14.7
85.3
4,69
72.
11.
30.
10.
50.
01.
25.
095
.06,
116
3.6
4.0
0.2
1.2
0.0
1.8
10.3
89.7
4,31
4
Vie
ntia
ne C
apita
l P
hong
saly
Luan
gnam
tha
Oud
omxa
yB
okeo
Luan
gpra
bang
Hua
phan
hX
ayab
ury
Xie
ngkh
uang
Vie
ntia
ne3.
23.
40.
41.
00.
413
.119
.780
.37,
257
Bor
ikha
mxa
y4.
94.
20.
41.
98.
56.
621
.578
.54,
521
Kha
mm
uane
2.3
0.9
0.0
1.0
0.7
2.5
7.1
92.9
6,34
6S
avan
nakh
et1.
80.
40.
00.
60.
21.
24.
096
.014
,535
Sar
avan
e1.
17.
00.
51.
00.
05.
914
.285
.86,
554
Sek
ong
2.0
2.7
0.6
1.4
0.1
4.2
9.9
90.1
1,93
1C
ham
pasa
ck1.
40.
90.
31.
10.
03.
36.
693
.410
,043
Atta
peu
6.4
8.1
1.6
2.0
7.3
7.4
27.2
72.8
2,20
4Xa
ysom
boun
e3.
13.
30.
00.
20.
15.
611
.588
.51,
606
(Continued...)
Tabl
e EQ
.2.5
(con
tinue
d): C
over
age
of s
ocia
l tra
nsfe
rs a
nd b
enef
its: A
ll ho
useh
old
mem
bers
Per
cent
age
of h
ouse
hold
mem
bers
livi
ng in
hou
seho
lds
that
rece
ived
soc
ial t
rans
fers
or b
enef
its in
the
last
3 m
onth
s, b
y ty
pe o
f tra
nsfe
rs a
nd b
enef
its, L
ao P
DR
, 201
7
Perc
enta
ge o
f hou
seho
ld m
embe
rs li
ving
in h
ouse
hold
s re
ceiv
ing
spec
ific
type
s of
sup
port
in th
e la
st 3
m
onth
s:
Any
so
cial
tra
nsfe
rs
or
bene
fits1
No
soci
al
trans
fers
or
be
nefit
s
Num
ber
of
hous
ehol
d m
embe
rs
Nat
iona
l soc
ial
secu
rity
fund
(Sta
te
auth
ority
for s
ocia
l se
curit
y, S
ocia
l se
curit
y or
gani
zatio
n)
Nat
iona
l soc
ial s
ecur
ity
fund
(Com
mun
ity b
ased
he
alth
insu
ranc
e, H
ealth
eq
uity
fund
, Fre
e m
othe
r an
d ch
ild h
ealth
in
sura
nce)
Free
sc
hool
fe
es
Any
re
tirem
ent
pens
ion
Any
oth
er
exte
rnal
as
sist
ance
pr
ogra
m
Sch
ool t
uitio
n or
sc
hool
rela
ted
othe
r sup
port
for
any
hous
ehol
d m
embe
r age
5-2
4
Ag
e of
hou
seho
ld h
ead
15
-19
0.0
5.1
0.0
0.0
1.1
0.0
6.2
93.8
21
5 20
-24
0.0
2.9
0.0
0.0
0.3
1.5
4.7
95.3
1,
678
25-2
9 2.
0 4.
7 0.
4 0.
0 0.
6 4.
3 11
.1
88.9
5,
885
30-3
4 3.
3 4.
1 0.
1 0.
1 0.
8 5.
5 12
.6
87.4
11
,134
35
-39
2.1
3.1
0.3
0.3
0.8
5.3
10.9
89
.1
13,8
02
40-4
4 3.
6 3.
3 0.
4 0.
2 0.
7 5.
4 12
.1
87.9
14
,468
45
-49
3.0
2.5
0.4
0.4
0.8
5.4
11.0
89
.0
12,7
68
50-5
9 3.
6 3.
2 0.
5 1.
2 0.
8 4.
7 12
.5
87.5
24
,889
60
-69
4.3
3.4
0.0
6.4
0.5
3.6
15.2
84
.8
13,6
58
70+
4.3
3.0
0.1
8.0
0.7
3.1
16.4
83
.6
6,35
5 Ed
ucat
ion
hous
ehol
d he
ad
N
one
or E
CE
0.8
2.8
0.2
0.4
0.6
4.5
8.5
91.5
17
,653
P
rimar
y 0.
9 3.
7 0.
2 0.
7 0.
8 4.
8 10
.0
90.0
46
,528
Lo
wer
sec
onda
ry
2.3
3.4
0.4
1.6
0.7
4.5
11.1
88
.9
19,7
09
Upp
er s
econ
dary
3.
2 2.
6 0.
0 1.
3 0.
7 5.
1 11
.9
88.1
7,
040
Pos
t sec
onda
ry /
Non
terti
ary
12.7
3.
7 0.
5 7.
6 1.
1 4.
7 25
.3
74.7
6,
232
Hig
her
18.6
1.
9 1.
3 7.
3 0.
5 5.
2 29
.8
70.2
7,
552
DK
/Mis
sing
0.
0 7.
2 0.
0 0.
0 0.
0 3.
3 7.
2 92
.8
138
Ethn
o-lin
guis
tic g
roup
of
hous
ehol
d he
ad
Lao-
Tai
4.2
2.4
0.3
2.2
0.7
3.9
12.1
87
.9
65,3
26
Mon
-Khm
er
1.7
5.4
0.4
1.2
0.8
6.5
14.1
85
.9
25,3
33
Hm
ong-
Mie
n 1.
7 5.
0 0.
1 0.
2 0.
4 5.
9 12
.2
87.8
10
,255
C
hine
se-T
ibet
an
2.1
1.1
1.0
1.8
1.1
4.8
9.0
91.0
2,
886
Oth
er, D
K, M
issi
ng
3.7
1.1
1.4
1.3
0.1
3.0
6.1
93.9
1,
052
Wea
lth q
uint
ile
P
oore
st
0.3
3.3
0.2
0.1
0.4
4.8
8.4
91.6
20
,968
S
econ
d 0.
7 4.
8 0.
2 0.
4 0.
8 5.
6 11
.3
88.7
20
,971
M
iddl
e 1.
7 4.
1 0.
1 1.
1 0.
9 5.
0 11
.7
88.3
20
,970
Fo
urth
3.
8 2.
5 0.
2 1.
7 0.
9 3.
8 11
.7
88.3
20
,969
R
iche
st
9.8
1.8
0.7
5.4
0.6
4.5
19.1
80
.9
20,9
73
1 MIC
S in
dica
tor E
Q.3
- Po
pula
tion
cove
red
by s
ocia
l tra
nsfe
rs; S
DG
indi
cato
r 1.3
.1
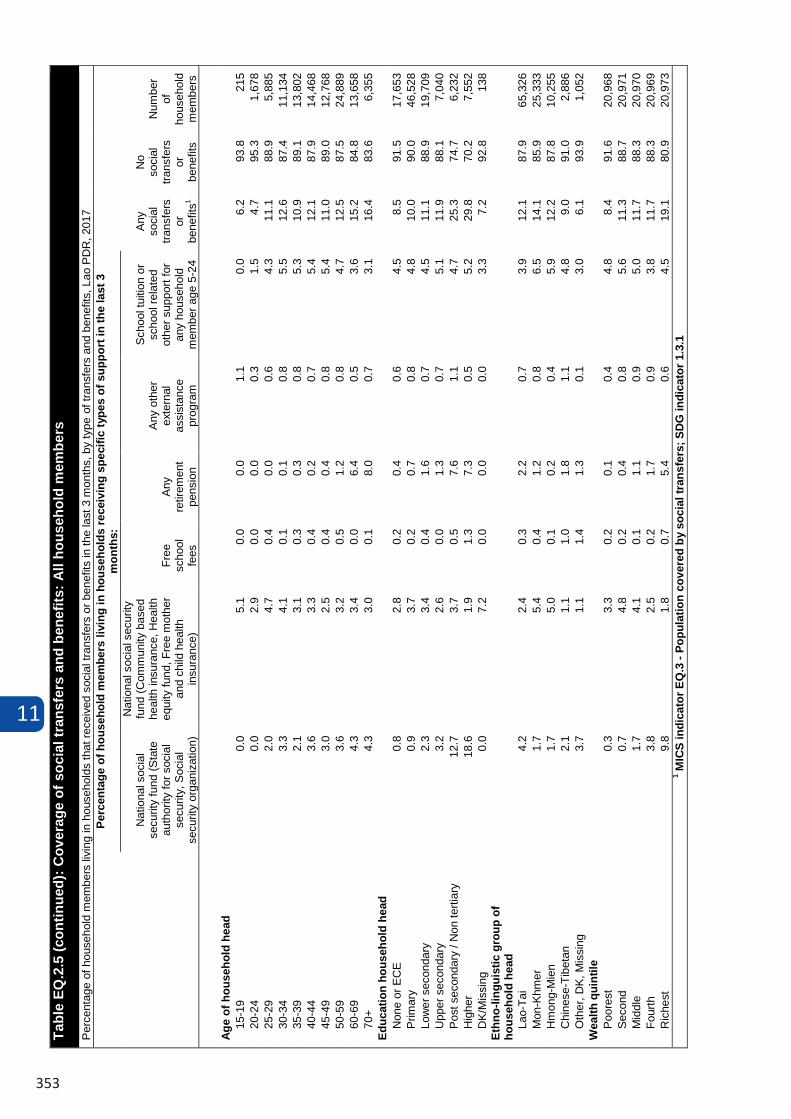
11
353
Tabl
e EQ
.2.5
(con
tinue
d): C
over
age
of s
ocia
l tra
nsfe
rs a
nd b
enef
its: A
ll ho
useh
old
mem
bers
Per
cent
age
of h
ouse
hold
mem
bers
livi
ng in
hou
seho
lds
that
rece
ived
soc
ial t
rans
fers
or b
enef
its in
the
last
3 m
onth
s, b
y ty
pe o
f tra
nsfe
rs a
nd b
enef
its, L
ao P
DR
, 201
7
Perc
enta
ge o
f hou
seho
ld m
embe
rs li
ving
in h
ouse
hold
s re
ceiv
ing
spec
ific
type
s of
sup
port
in th
e la
st 3
m
onth
s:
Any
so
cial
tra
nsfe
rs
or
bene
fits1
No
soci
al
trans
fers
or
be
nefit
s
Num
ber
of
hous
ehol
d m
embe
rs
Nat
iona
l soc
ial
secu
rity
fund
(Sta
te
auth
ority
for s
ocia
l se
curit
y, S
ocia
l se
curit
y or
gani
zatio
n)
Nat
iona
l soc
ial s
ecur
ity
fund
(Com
mun
ity b
ased
he
alth
insu
ranc
e, H
ealth
eq
uity
fund
, Fre
e m
othe
r an
d ch
ild h
ealth
in
sura
nce)
Free
sc
hool
fe
es
Any
re
tirem
ent
pens
ion
Any
oth
er
exte
rnal
as
sist
ance
pr
ogra
m
Sch
ool t
uitio
n or
sc
hool
rela
ted
othe
r sup
port
for
any
hous
ehol
d m
embe
r age
5-2
4
Ag
e of
hou
seho
ld h
ead
15
-19
0.0
5.1
0.0
0.0
1.1
0.0
6.2
93.8
21
5 20
-24
0.0
2.9
0.0
0.0
0.3
1.5
4.7
95.3
1,
678
25-2
9 2.
0 4.
7 0.
4 0.
0 0.
6 4.
3 11
.1
88.9
5,
885
30-3
4 3.
3 4.
1 0.
1 0.
1 0.
8 5.
5 12
.6
87.4
11
,134
35
-39
2.1
3.1
0.3
0.3
0.8
5.3
10.9
89
.1
13,8
02
40-4
4 3.
6 3.
3 0.
4 0.
2 0.
7 5.
4 12
.1
87.9
14
,468
45
-49
3.0
2.5
0.4
0.4
0.8
5.4
11.0
89
.0
12,7
68
50-5
9 3.
6 3.
2 0.
5 1.
2 0.
8 4.
7 12
.5
87.5
24
,889
60
-69
4.3
3.4
0.0
6.4
0.5
3.6
15.2
84
.8
13,6
58
70+
4.3
3.0
0.1
8.0
0.7
3.1
16.4
83
.6
6,35
5 Ed
ucat
ion
hous
ehol
d he
ad
N
one
or E
CE
0.8
2.8
0.2
0.4
0.6
4.5
8.5
91.5
17
,653
P
rimar
y 0.
9 3.
7 0.
2 0.
7 0.
8 4.
8 10
.0
90.0
46
,528
Lo
wer
sec
onda
ry
2.3
3.4
0.4
1.6
0.7
4.5
11.1
88
.9
19,7
09
Upp
er s
econ
dary
3.
2 2.
6 0.
0 1.
3 0.
7 5.
1 11
.9
88.1
7,
040
Pos
t sec
onda
ry /
Non
terti
ary
12.7
3.
7 0.
5 7.
6 1.
1 4.
7 25
.3
74.7
6,
232
Hig
her
18.6
1.
9 1.
3 7.
3 0.
5 5.
2 29
.8
70.2
7,
552
DK
/Mis
sing
0.
0 7.
2 0.
0 0.
0 0.
0 3.
3 7.
2 92
.8
138
Ethn
o-lin
guis
tic g
roup
of
hous
ehol
d he
ad
Lao-
Tai
4.2
2.4
0.3
2.2
0.7
3.9
12.1
87
.9
65,3
26
Mon
-Khm
er
1.7
5.4
0.4
1.2
0.8
6.5
14.1
85
.9
25,3
33
Hm
ong-
Mie
n 1.
7 5.
0 0.
1 0.
2 0.
4 5.
9 12
.2
87.8
10
,255
C
hine
se-T
ibet
an
2.1
1.1
1.0
1.8
1.1
4.8
9.0
91.0
2,
886
Oth
er, D
K, M
issi
ng
3.7
1.1
1.4
1.3
0.1
3.0
6.1
93.9
1,
052
Wea
lth q
uint
ile
P
oore
st
0.3
3.3
0.2
0.1
0.4
4.8
8.4
91.6
20
,968
S
econ
d 0.
7 4.
8 0.
2 0.
4 0.
8 5.
6 11
.3
88.7
20
,971
M
iddl
e 1.
7 4.
1 0.
1 1.
1 0.
9 5.
0 11
.7
88.3
20
,970
Fo
urth
3.
8 2.
5 0.
2 1.
7 0.
9 3.
8 11
.7
88.3
20
,969
R
iche
st
9.8
1.8
0.7
5.4
0.6
4.5
19.1
80
.9
20,9
73
1 MIC
S in
dica
tor E
Q.3
- Po
pula
tion
cove
red
by s
ocia
l tra
nsfe
rs; S
DG
indi
cato
r 1.3
.1

11
354
Tabl
e EQ
.2.6
: Cov
erag
e of
soc
ial t
rans
fers
and
ben
efit
s: H
ouse
hold
s in
the
low
est
two
quin
tile
s
Perc
enta
ge o
f hou
seho
lds
in th
e lo
wes
t tw
o qu
intil
es th
at re
ceiv
ed s
ocia
l tra
nsfe
rs o
r ben
efits
in th
e la
st 3
mon
ths,
by
type
of t
rans
fers
or b
enef
its, L
ao P
DR,
201
7
Perc
enta
ge o
f hou
seho
lds
rece
ivin
g sp
ecifi
c ty
pes
of s
uppo
rt in
the
last
3 m
onth
s:
Any
soc
ial
tran
sfer
s or
be
nefit
s1
No
soci
al
tran
sfer
s or
be
nefit
s
Num
ber o
f ho
useh
olds
in th
e tw
o lo
wes
t qu
intil
es
Nat
iona
l soc
ial s
ecur
ity
fund
(Sta
te a
utho
rity
for
soci
al s
ecur
ity, S
ocia
l se
curit
y or
gani
zatio
n)
Nat
iona
l soc
ial s
ecur
ity fu
nd
(Com
mun
ity b
ased
hea
lth in
sura
nce,
H
ealth
equ
ity fu
nd, F
ree
mot
her a
nd
child
hea
lth in
sura
nce)
Fr
ee s
choo
l fe
es
Any
retir
emen
t pe
nsio
n
Any
oth
er
exte
rnal
as
sist
ance
pr
ogra
m
Scho
ol tu
ition
or
scho
ol re
late
d ot
her s
uppo
rt fo
r an
y ho
useh
old
mem
ber a
ge 5
-24
Tota
l 0.
5 3.
8 0.
2 0.
2 0.
7 4.
6 9.
2 90
.8
8,38
5
Sex
of h
ouse
hold
hea
d M
ale
0.5
3.9
0.2
0.2
0.7
4.8
9.5
90.5
7,
446
Fem
ale
0.3
3.0
0.3
0.1
0.7
3.2
6.9
93.1
93
9 A
rea Urb
an
2.2
4.7
0.3
0.8
1.0
3.9
10.4
89
.6
593
Rura
l 0.
4 3.
8 0.
2 0.
2 0.
6 4.
7 9.
1 90
.9
7,79
2 Ru
ral w
ith r
oad
0.3
3.0
0.2
0.2
0.8
4.3
8.1
91.9
6,
181
Rura
l with
out r
oad
0.7
6.8
0.3
0.1
0.1
6.1
13.0
87
.0
1,61
1 Re
gion
N
orth
0.
6 5.
8 0.
2 0.
3 0.
3 5.
7 11
.6
88.4
3,
643
Cent
ral
0.2
1.2
0.0
0.1
1.1
3.6
5.9
94.1
2,
914
Sout
h 0.
8 4.
1 0.
4 0.
2 0.
8 4.
2 9.
5 90
.5
1,82
8 Pr
ovin
ce
Vien
tiane
Cap
ital
(*)
(*)
(*)
(*)
(*)
(*)
(*)
(*)
57
Phon
gsal
y 0.
4 0.
6 0.
8 1.
2 0.
0 1.
7 3.
4 96
.6
534
Luan
gnam
tha
0.0
0.0
0.0
0.0
0.0
1.9
1.9
98.1
32
5 O
udom
xay
1.4
23.4
0.
7 0.
3 0.
6 11
.3
33.1
66
.9
710
Boke
o 0.
3 2.
1 0.
0 0.
0 2.
8 9.
0 11
.8
88.2
19
1 Lu
angp
raba
ng
1.2
0.6
0.0
0.3
0.0
5.4
7.3
92.7
81
9 H
uaph
anh
0.0
4.7
0.0
0.1
0.0
6.4
10.6
89
.4
683
Xaya
bury
0.
2 0.
3 0.
0 0.
0 0.
0 1.
7 2.
2 97
.8
380
Xien
gkhu
ang
0.3
3.0
0.0
0.1
0.0
0.9
4.3
95.7
33
8 Vi
entia
ne
0.0
3.7
0.0
0.3
1.3
17.8
22
.2
77.8
35
5 Bo
rikha
mxa
y 0.
0 2.
1 0.
0 0.
0 7.
6 4.
5 13
.4
86.6
16
9 Kh
amm
uane
0.
2 0.
2 0.
0 0.
2 2.
0 2.
2 4.
8 95
.2
565
Sava
nnak
het
0.2
0.1
0.0
0.0
0.2
0.6
1.0
99.0
1,
277
Sara
vane
0.
8 6.
2 0.
3 0.
3 0.
0 5.
2 11
.6
88.4
80
5 Se
kong
0.
1 2.
4 0.
5 0.
4 0.
1 3.
1 6.
3 93
.7
252
Cham
pasa
ck
0.0
0.3
0.0
0.0
0.0
2.2
2.5
97.5
54
6 A
ttap
eu
3.6
7.7
1.9
0.4
6.2
6.6
22.6
77
.4
225
Xays
ombo
une
1.2
3.1
0.0
0.0
0.2
6.8
10.9
89
.1
153
(Con
tinue
d…)
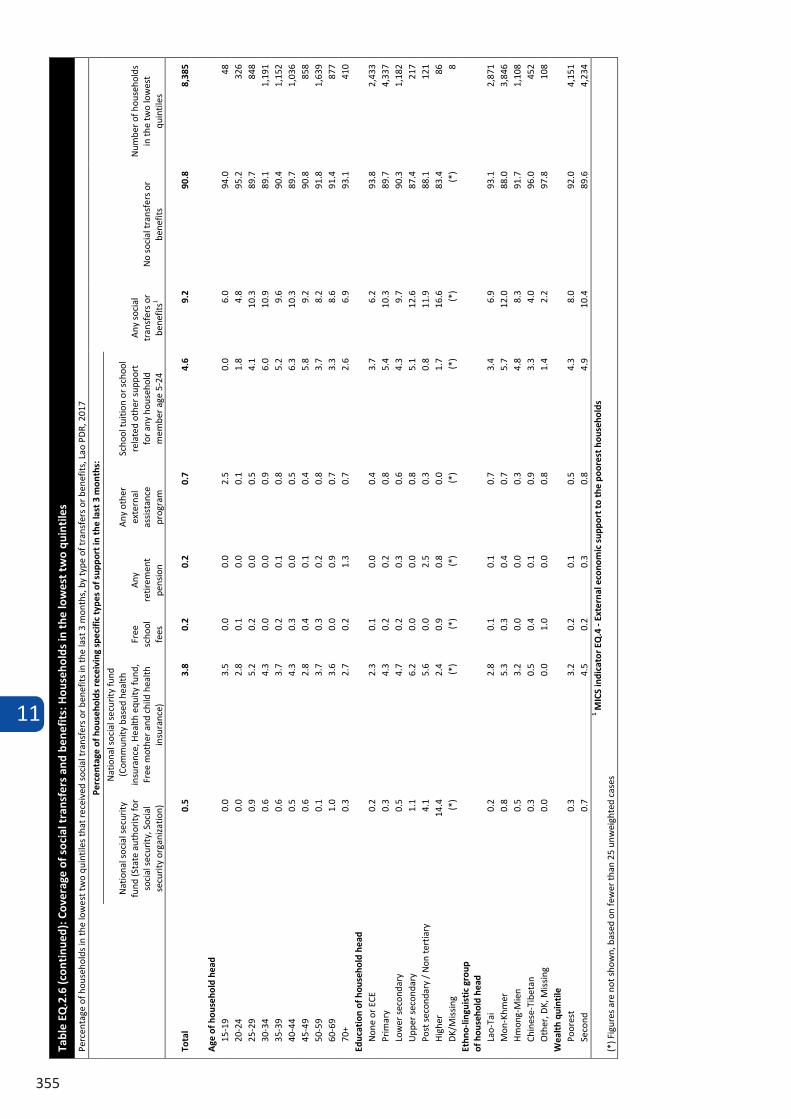
11
355
Tabl
e EQ
.2.6
(con
tinu
ed):
Cov
erag
e of
soc
ial t
rans
fers
and
ben
efit
s: H
ouse
hold
s in
the
low
est
two
quin
tile
s
Perc
enta
ge o
f hou
seho
lds
in th
e lo
wes
t tw
o qu
intil
es th
at re
ceiv
ed s
ocia
l tra
nsfe
rs o
r ben
efits
in th
e la
st 3
mon
ths,
by
type
of t
rans
fers
or b
enef
its, L
ao P
DR,
201
7
Perc
enta
ge o
f hou
seho
lds
rece
ivin
g sp
ecifi
c ty
pes
of s
uppo
rt in
the
last
3 m
onth
s:
Any
soc
ial
tran
sfer
s or
be
nefit
s1 N
o so
cial
tran
sfer
s or
be
nefit
s
Num
ber o
f hou
seho
lds
in th
e tw
o lo
wes
t qu
intil
es
Nat
iona
l soc
ial s
ecur
ity
fund
(Sta
te a
utho
rity
for
soci
al s
ecur
ity, S
ocia
l se
curit
y or
gani
zatio
n)
Nat
iona
l soc
ial s
ecur
ity fu
nd
(Com
mun
ity b
ased
hea
lth
insu
ranc
e, H
ealth
equ
ity fu
nd,
Free
mot
her a
nd c
hild
hea
lth
insu
ranc
e)
Free
sc
hool
fe
es
Any
re
tirem
ent
pens
ion
Any
oth
er
exte
rnal
as
sist
ance
pr
ogra
m
Scho
ol tu
ition
or s
choo
l re
late
d ot
her s
uppo
rt
for a
ny h
ouse
hold
m
embe
r age
5-2
4
Tota
l 0.
5 3.
8 0.
2 0.
2 0.
7 4.
6 9.
2 90
.8
8,38
5
Age
of h
ouse
hold
hea
d 0.
0 3.
5 0.
0 0.
0 2.
5 0.
0 6.
0 94
.0
48
0.0
2.8
0.1
0.0
0.1
1.8
4.8
95.2
32
6 0.
9 5.
2 0.
2 0.
0 0.
5 4.
1 10
.3
89.7
84
8 0.
6 4.
3 0.
0 0.
0 0.
9 6.
0 10
.9
89.1
1,
191
0.6
3.7
0.2
0.1
0.8
5.2
9.6
90.4
1,
152
0.5
4.3
0.3
0.0
0.5
6.3
10.3
89
.7
1,03
6 0.
6 2.
8 0.
4 0.
1 0.
4 5.
8 9.
2 90
.8
858
0.1
3.7
0.3
0.2
0.8
3.7
8.2
91.8
1,
639
15-1
9
20-24
25-2
9
30-3
4
35-3
9
40-4
4
45-4
9
50-5
9 60
-69
1.0
3.6
0.0
0.9
0.7
3.3
8.6
91.4
87
7 70
+ 0.
3 2.
7 0.
2 1.
3 0.
7 2.
6 6.
9 93
.1
410
Educ
atio
n of
hou
seho
ld h
ead
Non
e or
ECE
0.
2 2.
3 0.
1 0.
0 0.
4 3.
7 6.
2 93
.8
2,43
3 Pr
imar
y 0.
3 4.
3 0.
2 0.
2 0.
8 5.
4 10
.3
89.7
4,
337
Low
er s
econ
dary
0.
5 4.
7 0.
2 0.
3 0.
6 4.
3 9.
7 90
.3
1,18
2 U
pper
sec
onda
ry
1.1
6.2
0.0
0.0
0.8
5.1
12.6
87
.4
217
Post
sec
onda
ry /
Non
tert
iary
4.
1 5.
6 0.
0 2.
5 0.
3 0.
8 11
.9
88.1
12
1 H
ighe
r 14
.4
2.4
0.9
0.8
0.0
1.7
16.6
83
.4
86
DK/
Mis
sing
(*
) (*
) (*
) (*
) (*
) (*
) (*
) (*
) 8
Ethn
o-lin
guis
tic
grou
p
of h
ouse
hold
hea
d La
o-Ta
i 0.
2 2.
8 0.
1 0.
1 0.
7 3.
4 6.
9 93
.1
2,87
1 M
on-K
hmer
0.
8 5.
3 0.
3 0.
4 0.
7 5.
7 12
.0
88.0
3,
846
Hm
ong-
Mie
n 0.
5 3.
2 0.
0 0.
0 0.
3 4.
8 8.
3 91
.7
1,10
8 Ch
ines
e-Ti
beta
n 0.
3 0.
5 0.
4 0.
1 0.
9 3.
3 4.
0 96
.0
452
Oth
er, D
K, M
issi
ng
0.0
0.0
1.0
0.0
0.8
1.4
2.2
97.8
10
8 W
ealt
h qu
inti
le
Poor
est
0.3
3.2
0.2
0.1
0.5
4.3
8.0
92.0
4,
151
Seco
nd
0.7
4.5
0.2
0.3
0.8
4.9
10.4
89
.6
4,23
4 1 M
ICS
indi
cato
r EQ
.4 -
Exte
rnal
eco
nom
ic s
uppo
rt to
the
poor
est h
ouse
hold
s (*
) Fig
ures
are
not
sho
wn,
bas
ed o
n fe
wer
than
25
unw
eigh
ted
case
s
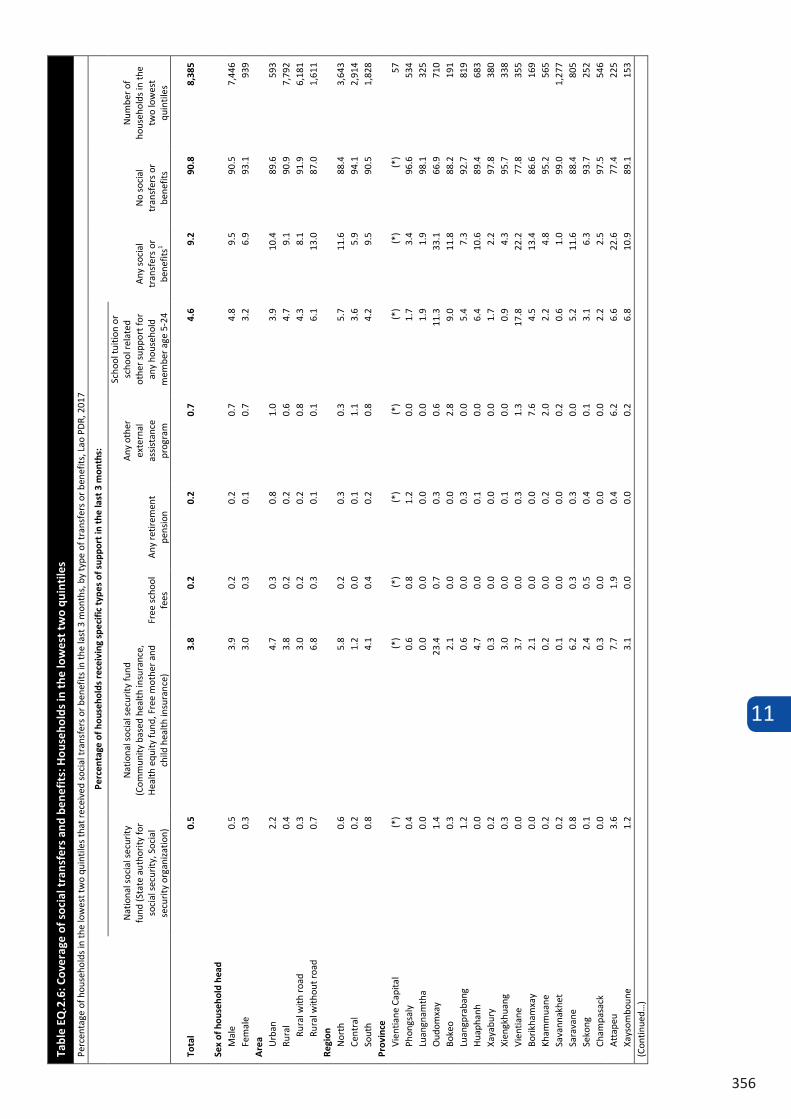
11
356
Tabl
e EQ
.2.6
: Cov
erag
e of
soc
ial t
rans
fers
and
ben
efit
s: H
ouse
hold
s in
the
low
est
two
quin
tile
s
Perc
enta
ge o
f hou
seho
lds
in th
e lo
wes
t tw
o qu
intil
es th
at re
ceiv
ed s
ocia
l tra
nsfe
rs o
r ben
efits
in th
e la
st 3
mon
ths,
by
type
of t
rans
fers
or b
enef
its, L
ao P
DR,
201
7
Perc
enta
ge o
f hou
seho
lds
rece
ivin
g sp
ecifi
c ty
pes
of s
uppo
rt in
the
last
3 m
onth
s:
Any
soc
ial
tran
sfer
s or
be
nefit
s1
No
soci
al
tran
sfer
s or
be
nefit
s
Num
ber o
f ho
useh
olds
in th
e tw
o lo
wes
t qu
intil
es
Nat
iona
l soc
ial s
ecur
ity
fund
(Sta
te a
utho
rity
for
soci
al s
ecur
ity, S
ocia
l se
curit
y or
gani
zatio
n)
Nat
iona
l soc
ial s
ecur
ity fu
nd
(Com
mun
ity b
ased
hea
lth in
sura
nce,
H
ealth
equ
ity fu
nd, F
ree
mot
her a
nd
child
hea
lth in
sura
nce)
Fr
ee s
choo
l fe
es
Any
retir
emen
t pe
nsio
n
Any
oth
er
exte
rnal
as
sist
ance
pr
ogra
m
Scho
ol tu
ition
or
scho
ol re
late
d ot
her s
uppo
rt fo
r an
y ho
useh
old
mem
ber a
ge 5
-24
Tota
l 0.
5 3.
8 0.
2 0.
2 0.
7 4.
6 9.
2 90
.8
8,38
5
Sex
of h
ouse
hold
hea
d M
ale
0.5
3.9
0.2
0.2
0.7
4.8
9.5
90.5
7,
446
Fem
ale
0.3
3.0
0.3
0.1
0.7
3.2
6.9
93.1
93
9 A
rea Urb
an
2.2
4.7
0.3
0.8
1.0
3.9
10.4
89
.6
593
Rura
l 0.
4 3.
8 0.
2 0.
2 0.
6 4.
7 9.
1 90
.9
7,79
2 Ru
ral w
ith r
oad
0.3
3.0
0.2
0.2
0.8
4.3
8.1
91.9
6,
181
Rura
l with
out r
oad
0.7
6.8
0.3
0.1
0.1
6.1
13.0
87
.0
1,61
1 Re
gion
N
orth
0.
6 5.
8 0.
2 0.
3 0.
3 5.
7 11
.6
88.4
3,
643
Cent
ral
0.2
1.2
0.0
0.1
1.1
3.6
5.9
94.1
2,
914
Sout
h 0.
8 4.
1 0.
4 0.
2 0.
8 4.
2 9.
5 90
.5
1,82
8 Pr
ovin
ce
Vien
tiane
Cap
ital
(*)
(*)
(*)
(*)
(*)
(*)
(*)
(*)
57
Phon
gsal
y 0.
4 0.
6 0.
8 1.
2 0.
0 1.
7 3.
4 96
.6
534
Luan
gnam
tha
0.0
0.0
0.0
0.0
0.0
1.9
1.9
98.1
32
5 O
udom
xay
1.4
23.4
0.
7 0.
3 0.
6 11
.3
33.1
66
.9
710
Boke
o 0.
3 2.
1 0.
0 0.
0 2.
8 9.
0 11
.8
88.2
19
1 Lu
angp
raba
ng
1.2
0.6
0.0
0.3
0.0
5.4
7.3
92.7
81
9 H
uaph
anh
0.0
4.7
0.0
0.1
0.0
6.4
10.6
89
.4
683
Xaya
bury
0.
2 0.
3 0.
0 0.
0 0.
0 1.
7 2.
2 97
.8
380
Xien
gkhu
ang
0.3
3.0
0.0
0.1
0.0
0.9
4.3
95.7
33
8 Vi
entia
ne
0.0
3.7
0.0
0.3
1.3
17.8
22
.2
77.8
35
5 Bo
rikha
mxa
y 0.
0 2.
1 0.
0 0.
0 7.
6 4.
5 13
.4
86.6
16
9 Kh
amm
uane
0.
2 0.
2 0.
0 0.
2 2.
0 2.
2 4.
8 95
.2
565
Sava
nnak
het
0.2
0.1
0.0
0.0
0.2
0.6
1.0
99.0
1,
277
Sara
vane
0.
8 6.
2 0.
3 0.
3 0.
0 5.
2 11
.6
88.4
80
5 Se
kong
0.
1 2.
4 0.
5 0.
4 0.
1 3.
1 6.
3 93
.7
252
Cham
pasa
ck
0.0
0.3
0.0
0.0
0.0
2.2
2.5
97.5
54
6 A
ttap
eu
3.6
7.7
1.9
0.4
6.2
6.6
22.6
77
.4
225
Xays
ombo
une
1.2
3.1
0.0
0.0
0.2
6.8
10.9
89
.1
153
(Con
tinue
d…)

11
357
Tabl
e EQ
.2.6
(con
tinu
ed):
Cov
erag
e of
soc
ial t
rans
fers
and
ben
efit
s: H
ouse
hold
s in
the
low
est
two
quin
tile
s
Perc
enta
ge o
f hou
seho
lds
in th
e lo
wes
t tw
o qu
intil
es th
at re
ceiv
ed s
ocia
l tra
nsfe
rs o
r ben
efits
in th
e la
st 3
mon
ths,
by
type
of t
rans
fers
or b
enef
its, L
ao P
DR,
201
7
Perc
enta
ge o
f hou
seho
lds
rece
ivin
g sp
ecifi
c ty
pes
of s
uppo
rt in
the
last
3 m
onth
s:
Any
soc
ial
tran
sfer
s or
be
nefit
s1 N
o so
cial
tran
sfer
s or
be
nefit
s
Num
ber o
f hou
seho
lds
in th
e tw
o lo
wes
t qu
intil
es
Nat
iona
l soc
ial s
ecur
ity
fund
(Sta
te a
utho
rity
for
soci
al s
ecur
ity, S
ocia
l se
curit
y or
gani
zatio
n)
Nat
iona
l soc
ial s
ecur
ity fu
nd
(Com
mun
ity b
ased
hea
lth
insu
ranc
e, H
ealth
equ
ity fu
nd,
Free
mot
her a
nd c
hild
hea
lth
insu
ranc
e)
Free
sc
hool
fe
es
Any
re
tirem
ent
pens
ion
Any
oth
er
exte
rnal
as
sist
ance
pr
ogra
m
Scho
ol tu
ition
or s
choo
l re
late
d ot
her s
uppo
rt
for a
ny h
ouse
hold
m
embe
r age
5-2
4
To
tal
0.5
3.8
0.2
0.2
0.7
4.6
9.2
90.8
8,
385
Age
of h
ouse
hold
hea
d
15-1
9
0.0
3.5
0.0
0.0
2.5
0.0
6.0
94.0
48
20
-2
0.0
2.8
0.1
0.0
0.1
1.8
4.8
95.2
32
6 25
-29
0.
9 5.
2 0.
2 0.
0 0.
5 4.
1 10
.3
89.7
84
8 30
-34
0.
6 4.
3 0.
0 0.
0 0.
9 6.
0 10
.9
89.1
1,
191
35-3
9
0.6
3.7
0.2
0.1
0.8
5.2
9.6
90.4
1,
152
40-4
4
0.5
4.3
0.3
0.0
0.5
6.3
10.3
89
.7
1,03
6 45
-49
0.
6 2.
8 0.
4 0.
1 0.
4 5.
8 9.
2 90
.8
858
50-5
9 0.
1 3.
7 0.
3 0.
2 0.
8 3.
7 8.
2 91
.8
1,63
9 60
-69
1.0
3.6
0.0
0.9
0.7
3.3
8.6
91.4
87
7 70
+ 0.
3 2.
7 0.
2 1.
3 0.
7 2.
6 6.
9 93
.1
410
Educ
atio
n of
hou
seho
ld h
ead
N
one
or E
CE
0.2
2.3
0.1
0.0
0.4
3.7
6.2
93.8
2,
433
Prim
ary
0.3
4.3
0.2
0.2
0.8
5.4
10.3
89
.7
4,33
7 Lo
wer
sec
onda
ry
0.5
4.7
0.2
0.3
0.6
4.3
9.7
90.3
1,
182
Upp
er s
econ
dary
1.
1 6.
2 0.
0 0.
0 0.
8 5.
1 12
.6
87.4
21
7 Po
st s
econ
dary
/ N
on te
rtia
ry
4.1
5.6
0.0
2.5
0.3
0.8
11.9
88
.1
121
Hig
her
14.4
2.
4 0.
9 0.
8 0.
0 1.
7 16
.6
83.4
86
D
K/M
issi
ng
(*)
(*)
(*)
(*)
(*)
(*)
(*)
(*)
8 Et
hno-
lingu
isti
c gr
oup
of
hou
seho
ld h
ead
Lao-
Tai
0.2
2.8
0.1
0.1
0.7
3.4
6.9
93.1
2,
871
Mon
-Khm
er
0.8
5.3
0.3
0.4
0.7
5.7
12.0
88
.0
3,84
6 H
mon
g-M
ien
0.5
3.2
0.0
0.0
0.3
4.8
8.3
91.7
1,
108
Chin
ese-
Tibe
tan
0.3
0.5
0.4
0.1
0.9
3.3
4.0
96.0
45
2 O
ther
, DK,
Mis
sing
0.
0 0.
0 1.
0 0.
0 0.
8 1.
4 2.
2 97
.8
108
Wea
lth
quin
tile
Poor
est
0.3
3.2
0.2
0.1
0.5
4.3
8.0
92.0
4,
151
Seco
nd
0.7
4.5
0.2
0.3
0.8
4.9
10.4
89
.6
4,23
4 1 M
ICS
indi
cato
r EQ
.4 -
Exte
rnal
eco
nom
ic s
uppo
rt to
the
poor
est h
ouse
hold
s (*
) Fig
ures
are
not
sho
wn,
bas
ed o
n fe
wer
than
25
unw
eigh
ted
case
s
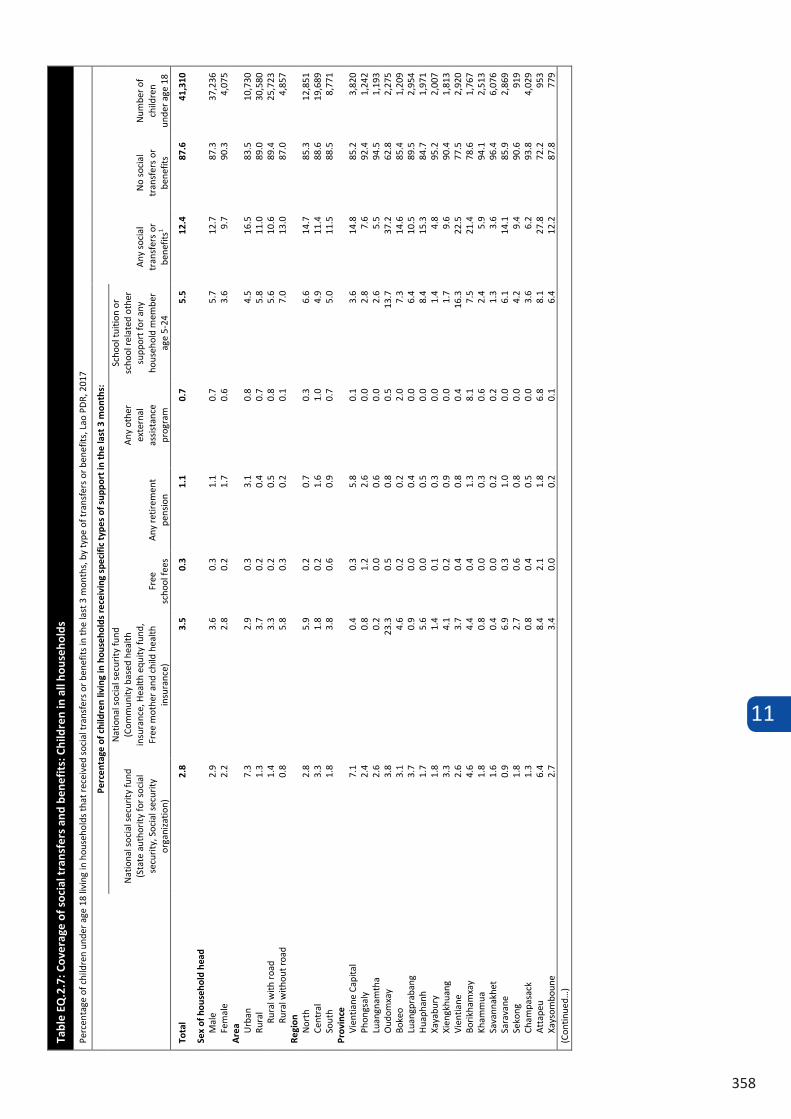
11
358
Tabl
e EQ
.2.7
: Cov
erag
e of
soc
ial t
rans
fers
and
ben
efit
s: C
hild
ren
in a
ll ho
useh
olds
Perc
enta
ge o
f chi
ldre
n un
der a
ge 1
8 liv
ing
in h
ouse
hold
s th
at r
ecei
ved
soci
al tr
ansf
ers
or b
enef
its in
the
last
3 m
onth
s, b
y ty
pe o
f tra
nsfe
rs o
r ben
efits
, Lao
PD
R, 2
017
Perc
enta
ge o
f chi
ldre
n liv
ing
in h
ouse
hold
s re
ceiv
ing
spec
ific
type
s of
sup
port
in th
e la
st 3
mon
ths:
Any
soc
ial
tran
sfer
s or
be
nefit
s1
No
soci
al
tran
sfer
s or
be
nefit
s
Num
ber o
f ch
ildre
n un
der a
ge 1
8
Nat
iona
l soc
ial s
ecur
ity fu
nd
(Sta
te a
utho
rity
for s
ocia
l se
curit
y, S
ocia
l sec
urity
or
gani
zatio
n)
Nat
iona
l soc
ial s
ecur
ity fu
nd
(Com
mun
ity b
ased
hea
lth
insu
ranc
e, H
ealth
equ
ity fu
nd,
Free
mot
her a
nd c
hild
hea
lth
insu
ranc
e)
Free
sc
hool
fees
A
ny re
tirem
ent
pens
ion
Any
oth
er
exte
rnal
as
sist
ance
pr
ogra
m
Scho
ol tu
ition
or
scho
ol re
late
d ot
her
supp
ort f
or a
ny
hous
ehol
d m
embe
r ag
e 5-
24
Tota
l 2.
8 3.
5 0.
3 1.
1 0.
7 5.
5 12
.4
87.6
41
,310
Sex
of h
ouse
hold
hea
d M
ale
2.9
3.6
0.3
1.1
0.7
5.7
12.7
87
.3
37,2
36
Fem
ale
2.2
2.8
0.2
1.7
0.6
3.6
9.7
90.3
4,
075
Are
a Urb
an
7.3
2.9
0.3
3.1
0.8
4.5
16.5
83
.5
10,7
30
Rura
l 1.
3 3.
7 0.
2 0.
4 0.
7 5.
8 11
.0
89.0
30
,580
Ru
ral w
ith r
oad
1.4
3.3
0.2
0.5
0.8
5.6
10.6
89
.4
25,7
23
Rura
l with
out r
oad
0.8
5.8
0.3
0.2
0.1
7.0
13.0
87
.0
4,85
7 Re
gion
N
orth
2.
8 5.
9 0.
2 0.
7 0.
3 6.
6 14
.7
85.3
12
,851
Ce
ntra
l 3.
3 1.
8 0.
2 1.
6 1.
0 4.
9 11
.4
88.6
19
,689
So
uth
1.8
3.8
0.6
0.9
0.7
5.0
11.5
88
.5
8,77
1 Pr
ovin
ce
Vien
tiane
Cap
ital
7.1
0.4
0.3
5.8
0.1
3.6
14.8
85
.2
3,82
0 Ph
ongs
aly
2.4
0.8
1.2
2.6
0.0
2.8
7.6
92.4
1,
242
Luan
gnam
tha
2.6
0.2
0.0
0.6
0.0
2.6
5.5
94.5
1,
193
Oud
omxa
y 3.
8 23
.3
0.5
0.8
0.5
13.7
37
.2
62.8
2,
275
Boke
o 3.
1 4.
6 0.
2 0.
2 2.
0 7.
3 14
.6
85.4
1,
209
Luan
gpra
bang
3.
7 0.
9 0.
0 0.
4 0.
0 6.
4 10
.5
89.5
2,
954
Hua
phan
h 1.
7 5.
6 0.
0 0.
5 0.
0 8.
4 15
.3
84.7
1,
971
Xaya
bury
1.
8 1.
4 0.
1 0.
3 0.
0 1.
4 4.
8 95
.2
2,00
7 Xi
engk
huan
g 3.
3 4.
1 0.
2 0.
9 0.
0 1.
7 9.
6 90
.4
1,81
3 Vi
entia
ne
2.6
3.7
0.4
0.8
0.4
16.3
22
.5
77.5
2,
920
Borik
ham
xay
4.6
4.4
0.4
1.3
8.1
7.5
21.4
78
.6
1,76
7 Kh
amm
ua
1.8
0.8
0.0
0.3
0.6
2.4
5.9
94.1
2,
513
Sava
nnak
het
1.6
0.4
0.0
0.2
0.2
1.3
3.6
96.4
6,
076
Sara
vane
0.
9 6.
9 0.
3 1.
0 0.
0 6.
1 14
.1
85.9
2,
869
Seko
ng
1.8
2.7
0.6
0.8
0.0
4.2
9.4
90.6
91
9 Ch
ampa
sack
1.
3 0.
8 0.
4 0.
5 0.
0 3.
6 6.
2 93
.8
4,02
9 A
ttap
eu
6.4
8.4
2.1
1.8
6.8
8.1
27.8
72
.2
953
Xays
ombo
une
2.7
3.4
0.0
0.2
0.1
6.4
12.2
87
.8
779
(Con
tinue
d…)
Tabl
e EQ
.2.7
(con
tinu
ed):
Cov
erag
e of
soc
ial t
rans
fers
and
ben
efit
s: C
hild
ren
in a
ll ho
useh
olds
Perc
enta
ge o
f chi
ldre
n un
der a
ge 1
8 liv
ing
in h
ouse
hold
s th
at r
ecei
ved
soci
al tr
ansf
ers
or b
enef
its in
the
last
3 m
onth
s, b
y ty
pe o
f tra
nsfe
rs o
r ben
efits
, Lao
PD
R, 2
017
Perc
enta
ge o
f chi
ldre
n liv
ing
in h
ouse
hold
s re
ceiv
ing
spec
ific
type
s of
sup
port
in th
e la
st 3
mon
ths:
Any
soc
ial
tran
sfer
s or
be
nefit
s1
No
soci
al
tran
sfer
s or
be
nefit
s N
umbe
r of c
hild
ren
unde
r age
18
Nat
iona
l soc
ial s
ecur
ity fu
nd
(Sta
te a
utho
rity
for s
ocia
l se
curit
y, S
ocia
l sec
urity
or
gani
zatio
n)
Nat
iona
l soc
ial s
ecur
ity fu
nd
(Com
mun
ity b
ased
hea
lth
insu
ranc
e, H
ealth
equ
ity fu
nd,
Free
mot
her a
nd c
hild
hea
lth
insu
ranc
e)
Free
sc
hool
fe
es
Any
re
tirem
ent
pens
ion
Any
oth
er
exte
rnal
as
sist
ance
pr
ogra
m
Scho
ol tu
ition
or
scho
ol re
late
d ot
her
supp
ort f
or a
ny
hous
ehol
d m
embe
r ag
e 5-
24
Tota
l 2.
8 3.
5 0.
3 1.
1 0.
7 5.
5 12
.4
87.6
41
,310
A
ge o
f hou
seho
ld h
ead
15
-19
0.
0 3.
7 0.
0 0.
0 1.
2 0.
0 4.
9 95
.1
103
20-2
4
0.0
2.6
0.0
0.0
0.2
1.9
4.8
95.2
70
5 25
-29
1.
6 5.
0 0.
4 0.
0 0.
6 5.
0 11
.7
88.3
2,
734
30-3
4
2.7
4.1
0.1
0.1
0.8
6.0
12.5
87
.5
5,71
1 35
-39
2.
0 3.
1 0.
3 0.
2 0.
8 5.
5 10
.9
89.1
7,
184
40-4
4
3.6
3.2
0.4
0.2
0.7
5.7
12.3
87
.7
6,65
8 45
-49
2.
4 2.
5 0.
2 0.
2 0.
7 5.
8 10
.7
89.3
4,
787
50-5
9 3.
1 3.
6 0.
5 0.
8 0.
7 5.
8 12
.9
87.1
7,
620
60-6
9 3.
9 4.
0 0.
0 5.
6 0.
4 4.
9 15
.9
84.1
3,
979
70+
4.7
4.0
0.0
7.8
0.5
4.0
18.2
81
.8
1,83
0 Ed
ucat
ion
of h
ouse
hold
hea
d
Non
e or
ECE
0.
7 2.
9 0.
2 0.
3 0.
5 5.
7 9.
5 90
.5
7,44
2 Pr
imar
y 0.
7 3.
9 0.
2 0.
5 0.
8 5.
6 10
.5
89.5
18
,559
Lo
wer
sec
onda
ry
2.0
3.5
0.3
1.1
0.8
5.2
11.2
88
.8
7,90
3 U
pper
sec
onda
ry
3.0
3.1
0.0
0.8
0.7
5.9
12.7
87
.3
2,75
1 Po
st s
econ
dary
/ N
on te
rtia
ry
12.9
3.
7 0.
4 5.
0 0.
9 4.
7 23
.6
76.4
2,
043
Hig
her
19.1
2.
3 1.
2 5.
9 0.
6 4.
9 29
.5
70.5
2,
571
DK/
Mis
sing
(0
.0)
(13.
1)
(0.0
) (0
.0)
(0.0
) (6
.6)
(13.
1)
(86.
9)
42
Ethn
o-lin
guis
tic
grou
p of
hou
seho
ld h
ead
Lao-
Tai
3.9
2.5
0.2
1.6
0.7
4.4
12.1
87
.9
22,9
58
Mon
-Khm
er
1.3
5.2
0.4
0.7
0.7
7.1
13.8
86
.2
11,3
38
Hm
ong-
Mie
n 1.
6 5.
1 0.
0 0.
2 0.
4 6.
5 12
.5
87.5
5,
388
Chin
ese-
Tibe
tan
1.9
1.0
0.8
1.0
1.1
5.2
8.4
91.6
1,
217
Oth
er, D
K, M
issi
ng
3.2
0.8
0.5
1.1
0.0
2.3
4.8
95.2
40
9 W
ealt
h qu
inti
le
Po
ores
t 0.
2 3.
3 0.
2 0.
1 0.
4 5.
3 8.
8 91
.2
10,3
03
Seco
nd
0.8
4.7
0.2
0.3
0.8
6.4
11.9
88
.1
9,17
6 M
iddl
e 1.
7 4.
4 0.
1 0.
8 0.
8 6.
0 12
.5
87.5
8,
157
Four
th
3.8
2.8
0.2
1.4
1.0
4.5
12.3
87
.7
7,14
9 Ri
ches
t 10
.3
1.8
0.6
4.2
0.6
4.6
18.9
81
.1
6,52
5 1 M
ICS
indi
cato
r EQ
.5 -
Child
ren
in th
e ho
useh
olds
that
rec
eive
d an
y ty
pe o
f soc
ial t
rans
fers
( )
Fig
ures
that
are
bas
ed o
n 25
– 4
9 un
wei
ghte
d ca
ses
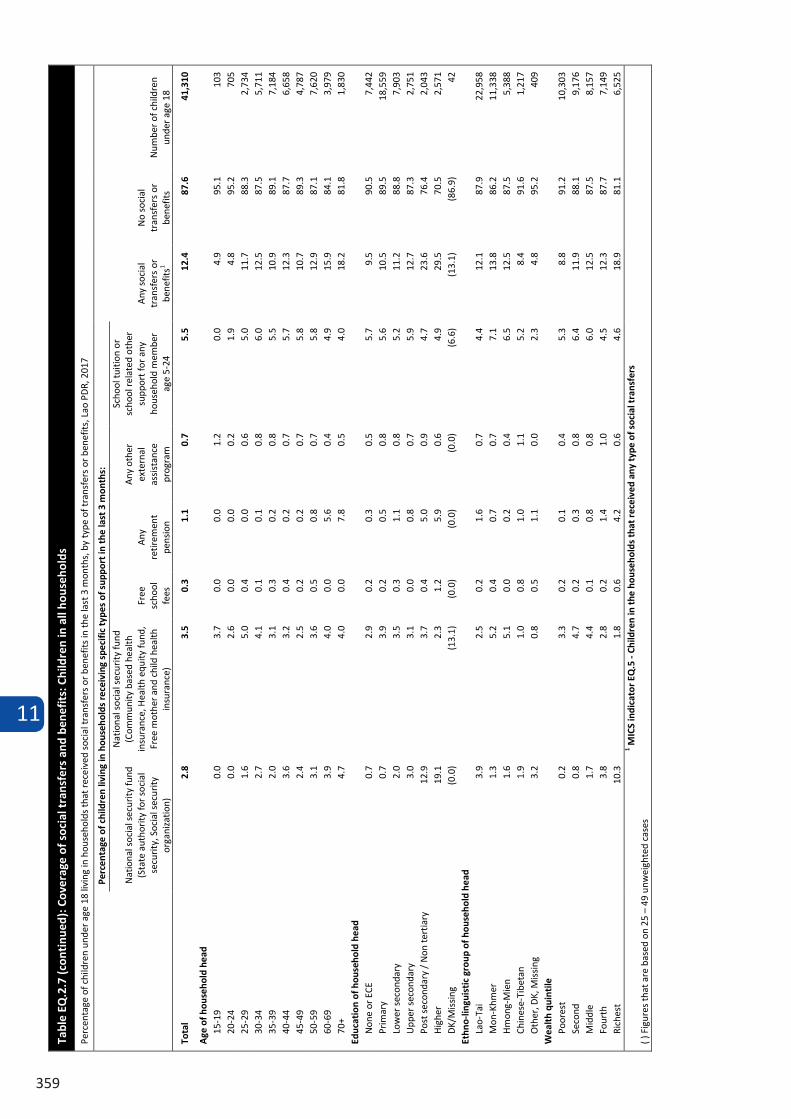
11
359
Tabl
e EQ
.2.7
(con
tinu
ed):
Cov
erag
e of
soc
ial t
rans
fers
and
ben
efit
s: C
hild
ren
in a
ll ho
useh
olds
Perc
enta
ge o
f chi
ldre
n un
der a
ge 1
8 liv
ing
in h
ouse
hold
s th
at r
ecei
ved
soci
al tr
ansf
ers
or b
enef
its in
the
last
3 m
onth
s, b
y ty
pe o
f tra
nsfe
rs o
r ben
efits
, Lao
PD
R, 2
017
Perc
enta
ge o
f chi
ldre
n liv
ing
in h
ouse
hold
s re
ceiv
ing
spec
ific
type
s of
sup
port
in th
e la
st 3
mon
ths:
Any
soc
ial
tran
sfer
s or
be
nefit
s1
No
soci
al
tran
sfer
s or
be
nefit
s N
umbe
r of c
hild
ren
unde
r age
18
Nat
iona
l soc
ial s
ecur
ity fu
nd
(Sta
te a
utho
rity
for s
ocia
l se
curit
y, S
ocia
l sec
urity
or
gani
zatio
n)
Nat
iona
l soc
ial s
ecur
ity fu
nd
(Com
mun
ity b
ased
hea
lth
insu
ranc
e, H
ealth
equ
ity fu
nd,
Free
mot
her a
nd c
hild
hea
lth
insu
ranc
e)
Free
sc
hool
fe
es
Any
re
tirem
ent
pens
ion
Any
oth
er
exte
rnal
as
sist
ance
pr
ogra
m
Scho
ol tu
ition
or
scho
ol re
late
d ot
her
supp
ort f
or a
ny
hous
ehol
d m
embe
r ag
e 5-
24
Tota
l 2.
8 3.
5 0.
3 1.
1 0.
7 5.
5 12
.4
87.6
41
,310
A
ge o
f hou
seho
ld h
ead
15
-19
0.
0 3.
7 0.
0 0.
0 1.
2 0.
0 4.
9 95
.1
103
20-2
4
0.0
2.6
0.0
0.0
0.2
1.9
4.8
95.2
70
5 25
-29
1.
6 5.
0 0.
4 0.
0 0.
6 5.
0 11
.7
88.3
2,
734
30-3
4
2.7
4.1
0.1
0.1
0.8
6.0
12.5
87
.5
5,71
1 35
-39
2.
0 3.
1 0.
3 0.
2 0.
8 5.
5 10
.9
89.1
7,
184
40-4
4
3.6
3.2
0.4
0.2
0.7
5.7
12.3
87
.7
6,65
8 45
-49
2.
4 2.
5 0.
2 0.
2 0.
7 5.
8 10
.7
89.3
4,
787
50-5
9 3.
1 3.
6 0.
5 0.
8 0.
7 5.
8 12
.9
87.1
7,
620
60-6
9 3.
9 4.
0 0.
0 5.
6 0.
4 4.
9 15
.9
84.1
3,
979
70+
4.7
4.0
0.0
7.8
0.5
4.0
18.2
81
.8
1,83
0 Ed
ucat
ion
of h
ouse
hold
hea
d
Non
e or
ECE
0.
7 2.
9 0.
2 0.
3 0.
5 5.
7 9.
5 90
.5
7,44
2 Pr
imar
y 0.
7 3.
9 0.
2 0.
5 0.
8 5.
6 10
.5
89.5
18
,559
Lo
wer
sec
onda
ry
2.0
3.5
0.3
1.1
0.8
5.2
11.2
88
.8
7,90
3 U
pper
sec
onda
ry
3.0
3.1
0.0
0.8
0.7
5.9
12.7
87
.3
2,75
1 Po
st s
econ
dary
/ N
on te
rtia
ry
12.9
3.
7 0.
4 5.
0 0.
9 4.
7 23
.6
76.4
2,
043
Hig
her
19.1
2.
3 1.
2 5.
9 0.
6 4.
9 29
.5
70.5
2,
571
DK/
Mis
sing
(0
.0)
(13.
1)
(0.0
) (0
.0)
(0.0
) (6
.6)
(13.
1)
(86.
9)
42
Ethn
o-lin
guis
tic
grou
p of
hou
seho
ld h
ead
Lao-
Tai
3.9
2.5
0.2
1.6
0.7
4.4
12.1
87
.9
22,9
58
Mon
-Khm
er
1.3
5.2
0.4
0.7
0.7
7.1
13.8
86
.2
11,3
38
Hm
ong-
Mie
n 1.
6 5.
1 0.
0 0.
2 0.
4 6.
5 12
.5
87.5
5,
388
Chin
ese-
Tibe
tan
1.9
1.0
0.8
1.0
1.1
5.2
8.4
91.6
1,
217
Oth
er, D
K, M
issi
ng
3.2
0.8
0.5
1.1
0.0
2.3
4.8
95.2
40
9 W
ealt
h qu
inti
le
Po
ores
t 0.
2 3.
3 0.
2 0.
1 0.
4 5.
3 8.
8 91
.2
10,3
03
Seco
nd
0.8
4.7
0.2
0.3
0.8
6.4
11.9
88
.1
9,17
6 M
iddl
e 1.
7 4.
4 0.
1 0.
8 0.
8 6.
0 12
.5
87.5
8,
157
Four
th
3.8
2.8
0.2
1.4
1.0
4.5
12.3
87
.7
7,14
9 Ri
ches
t 10
.3
1.8
0.6
4.2
0.6
4.6
18.9
81
.1
6,52
5 1 M
ICS
indi
cato
r EQ
.5 -
Child
ren
in th
e ho
useh
olds
that
rec
eive
d an
y ty
pe o
f soc
ial t
rans
fers
( )
Fig
ures
that
are
bas
ed o
n 25
– 4
9 un
wei
ghte
d ca
ses
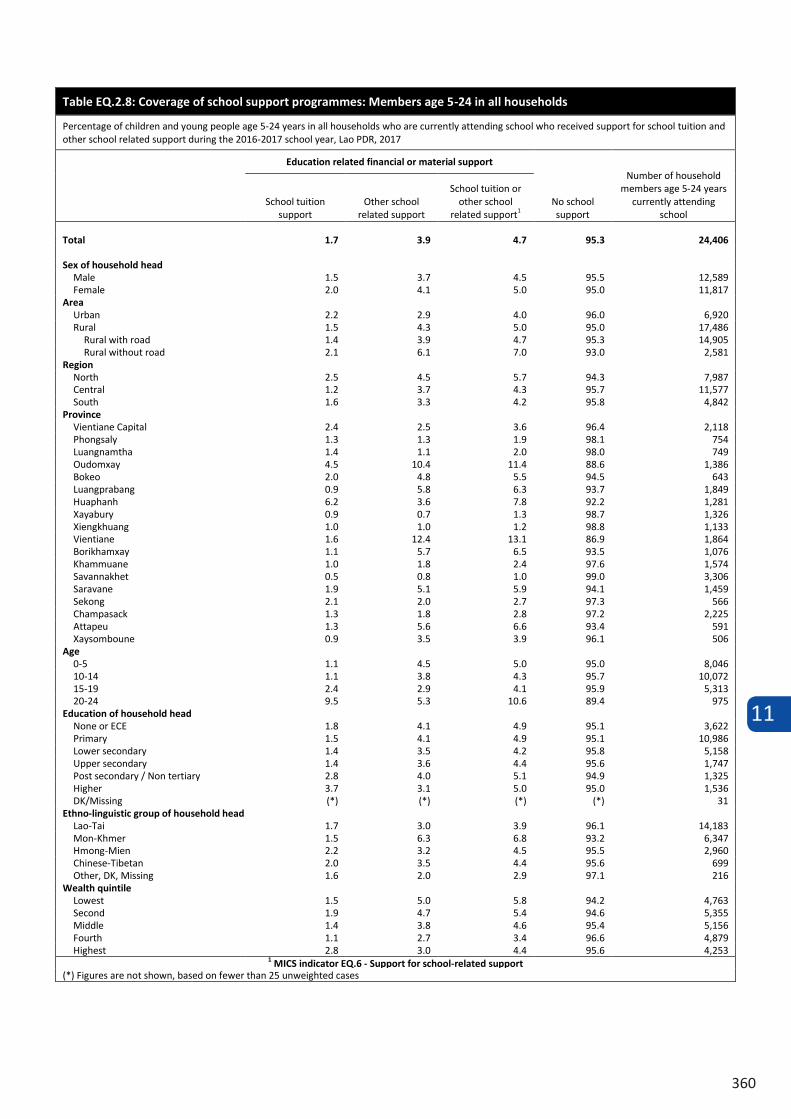
11
360
Table EQ.2.8: Coverage of school support programmes: Members age 5-24 in all households
Percentage of children and young people age 5-24 years in all households who are currently attending school who received support for school tuition and other school related support during the 2016-2017 school year, Lao PDR, 2017
Education related financial or material support
No school support
Number of household members age 5-24 years
currently attending school
School tuition support
Other school related support
School tuition or other school
related support1
Total 1.7 3.9 4.7 95.3 24,406
Sex of household head
Male 1.5 3.7 4.5 95.5 12,589 Female 2.0 4.1 5.0 95.0 11,817
Area
Urban 2.2 2.9 4.0 96.0 6,920 Rural 1.5 4.3 5.0 95.0 17,486
Rural with road 1.4 3.9 4.7 95.3 14,905 Rural without road 2.1 6.1 7.0 93.0 2,581
Region
North 2.5 4.5 5.7 94.3 7,987 Central 1.2 3.7 4.3 95.7 11,577 South 1.6 3.3 4.2 95.8 4,842
Province
Vientiane Capital 2.4 2.5 3.6 96.4 2,118 Phongsaly 1.3 1.3 1.9 98.1 754 Luangnamtha 1.4 1.1 2.0 98.0 749 Oudomxay 4.5 10.4 11.4 88.6 1,386 Bokeo 2.0 4.8 5.5 94.5 643 Luangprabang 0.9 5.8 6.3 93.7 1,849 Huaphanh 6.2 3.6 7.8 92.2 1,281 Xayabury 0.9 0.7 1.3 98.7 1,326 Xiengkhuang 1.0 1.0 1.2 98.8 1,133 Vientiane 1.6 12.4 13.1 86.9 1,864 Borikhamxay 1.1 5.7 6.5 93.5 1,076 Khammuane 1.0 1.8 2.4 97.6 1,574 Savannakhet 0.5 0.8 1.0 99.0 3,306 Saravane 1.9 5.1 5.9 94.1 1,459 Sekong 2.1 2.0 2.7 97.3 566 Champasack 1.3 1.8 2.8 97.2 2,225 Attapeu 1.3 5.6 6.6 93.4 591 Xaysomboune 0.9 3.5 3.9 96.1 506
Age
0-5 1.1 4.5 5.0 95.0 8,046 10-14 1.1 3.8 4.3 95.7 10,072 15-19 2.4 2.9 4.1 95.9 5,313 20-24 9.5 5.3 10.6 89.4 975
Education of household head
None or ECE 1.8 4.1 4.9 95.1 3,622 Primary 1.5 4.1 4.9 95.1 10,986 Lower secondary 1.4 3.5 4.2 95.8 5,158 Upper secondary 1.4 3.6 4.4 95.6 1,747 Post secondary / Non tertiary 2.8 4.0 5.1 94.9 1,325 Higher 3.7 3.1 5.0 95.0 1,536 DK/Missing (*) (*) (*) (*) 31
Ethno-linguistic group of household head
Lao-Tai 1.7 3.0 3.9 96.1 14,183 Mon-Khmer 1.5 6.3 6.8 93.2 6,347 Hmong-Mien 2.2 3.2 4.5 95.5 2,960 Chinese-Tibetan 2.0 3.5 4.4 95.6 699 Other, DK, Missing 1.6 2.0 2.9 97.1 216
Wealth quintile
Lowest 1.5 5.0 5.8 94.2 4,763 Second 1.9 4.7 5.4 94.6 5,355 Middle 1.4 3.8 4.6 95.4 5,156 Fourth 1.1 2.7 3.4 96.6 4,879 Highest 2.8 3.0 4.4 95.6 4,253
1 MICS indicator EQ.6 - Support for school-related support (*) Figures are not shown, based on fewer than 25 unweighted cases

362
363
APPENDIX A. SAMPLE DESIGN
The major features of the sample design are described in this appendix. Sample design features include defining the sampling frame, target sample size, sample allocation, listing in sample clusters, choice of domains, sampling stages, stratification, and the calculation of sample weights.
The primary objective of the sample design for the 2017 Lao Social Indicator Survey (LSIS 2017) was to produce statistically reliable estimates of most indicators, at the national level, for urban and rural areas, and for the 18 provinces of the country. In designing the sample for LSIS 2017, it was useful to review the sample design and results of the Lao Social Indicator Survey conducted in 2011-12 (LSIS 2011-12), documented in the Final Report of that survey.
A multi-stage, stratified cluster sampling approach was used for the selection of the survey sample. The primary sampling units (PSUs) selected at the first stage were villages (PSU and Village are used interchangeably in this Chapter). A listing of households was conducted in each sample village, and a sample of households was selected at the second stage.
A.1 SAMPLING FRAME AND STRATIFICATION
The sampling frame for this survey consisted of a list of all villages in the country, arranged by province, with appropriate size estimates (number of households) and other relevant information about each village. The village register is maintained by Lao Statistics Bureau (LSB). It is updated in December each year. The version used as sampling frame was the village register of December 2015. Table SD.1 shows the distribution of villages and households by province, according to whether the village is classified as urban, rural with road, or rural without road (village category).
The 18 provinces were defined as the sampling strata. Within provinces a further, implicit, stratification - on village category - was achieved by systematic sampling from a list of villages ordered by village category.
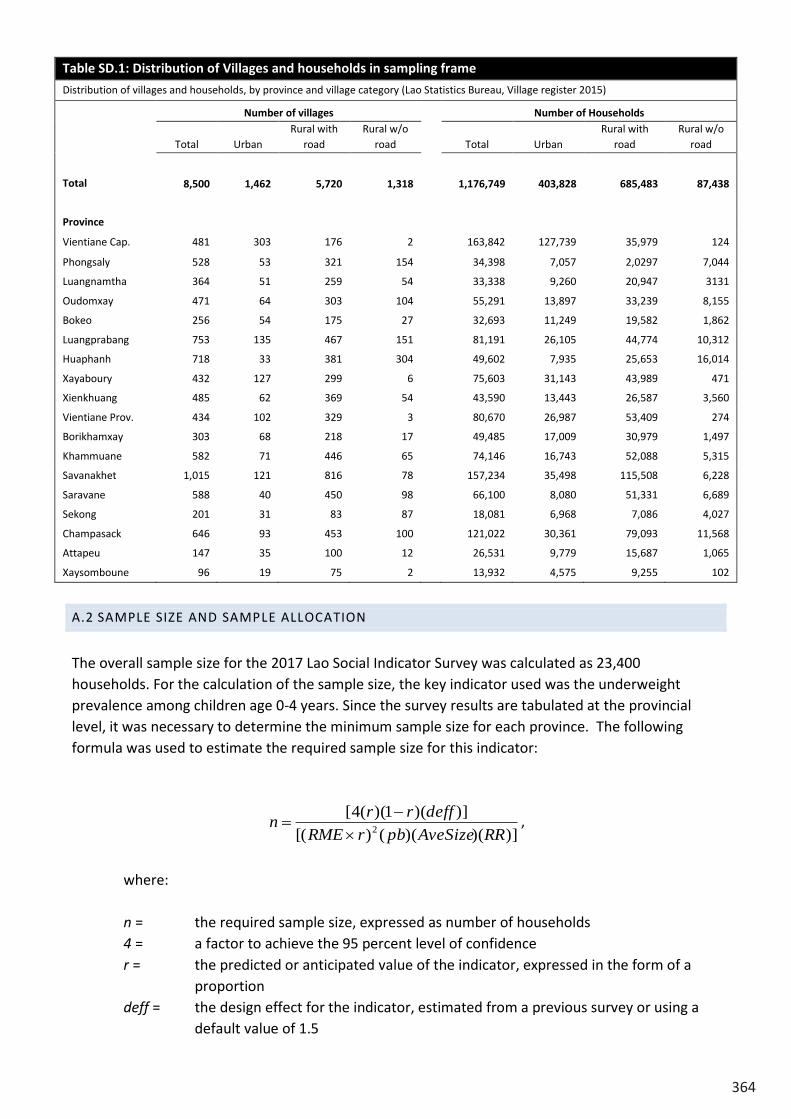
364
Table SD.1: Distribution of Villages and households in sampling frame
Distribution of villages and households, by province and village category (Lao Statistics Bureau, Village register 2015)
Number of villages Number of Households
Total Urban Rural with
road Rural w/o
road Total Urban Rural with
road Rural w/o
road
Total 8,500 1,462 5,720 1,318 1,176,749 403,828 685,483 87,438
Province
Vientiane Cap. 481 303 176 2 163,842 127,739 35,979 124
Phongsaly 528 53 321 154 34,398 7,057 2,0297 7,044
Luangnamtha 364 51 259 54 33,338 9,260 20,947 3131
Oudomxay 471 64 303 104 55,291 13,897 33,239 8,155
Bokeo 256 54 175 27 32,693 11,249 19,582 1,862
Luangprabang 753 135 467 151 81,191 26,105 44,774 10,312
Huaphanh 718 33 381 304 49,602 7,935 25,653 16,014
Xayaboury 432 127 299 6 75,603 31,143 43,989 471
Xienkhuang 485 62 369 54 43,590 13,443 26,587 3,560
Vientiane Prov. 434 102 329 3 80,670 26,987 53,409 274
Borikhamxay 303 68 218 17 49,485 17,009 30,979 1,497
Khammuane 582 71 446 65 74,146 16,743 52,088 5,315
Savanakhet 1,015 121 816 78 157,234 35,498 115,508 6,228
Saravane 588 40 450 98 66,100 8,080 51,331 6,689
Sekong 201 31 83 87 18,081 6,968 7,086 4,027
Champasack 646 93 453 100 121,022 30,361 79,093 11,568
Attapeu 147 35 100 12 26,531 9,779 15,687 1,065
Xaysomboune 96 19 75 2 13,932 4,575 9,255 102
A.2 SAMPLE SIZE AND SAMPLE ALLOCATION
The overall sample size for the 2017 Lao Social Indicator Survey was calculated as 23,400 households. For the calculation of the sample size, the key indicator used was the underweight prevalence among children age 0-4 years. Since the survey results are tabulated at the provincial level, it was necessary to determine the minimum sample size for each province. The following formula was used to estimate the required sample size for this indicator:
)])()(()[()])(1)((4[
2 RRAveSizepbrRMEdeffrrn
,
where:
n = the required sample size, expressed as number of households 4 = a factor to achieve the 95 percent level of confidence r = the predicted or anticipated value of the indicator, expressed in the form of a
proportion deff = the design effect for the indicator, estimated from a previous survey or using a
default value of 1.5
RME = the relative margin of error of r to be tolerated at the 95 percent level of confidence; it is generally not more than 0.12 (12 percent) for national-level estimates
pb = the proportion of the total population upon which the indicator, r, is based AveSize = the average household size (mean number of persons per household) RR = the predicted response rate
For the calculation, r (underweight prevalence) was assumed to be 26.3 percent based on the national estimate from LSIS 2011-12. The value of deff (design effect) was taken as 1.4 based on the estimate from LSIS 2011-12, pb (percentage of children age 0-4 years in the total population) was taken as 12.4 percent, AveSize (mean household size) was taken as 5.3 households, and the response rate was assumed to be 97 percent, based on experience from LSIS 2011-12. Although an RME of 12% is needed for the national-level estimates, for the provincial-level estimates it was sufficient to use an RME of 15% (that is, a margin of error of 0.15 r). The resulting number of sample households from this exercise was 1,094, rounded to 1,100.
For the final decision on the sample size it was necessary to address the demands on the design to provide data for the analysis of change in nutrition status over time. The problem was stated as follows: given that the true change (in the population) of underweight prevalence was six percentage points between 2012 and 2017, what sample size is needed to conclude from the sample results that there has been a statistically significant change? Calculations (of statistical test power) showed that a sample of 1,350 households would give a fair chance (probability= 0.8) of concluding that a statistically significant change has taken place (when the true change in the population is six percentage points). With a sample of 1,100 households the chance is somewhat smaller (probability=0.73). Based on these calculations and other considerations it was decided to set the total sample size to 18 x 1,300 = 23,400 households.
The number of households selected per cluster for the survey was determined as 20 households, based on a number of considerations, including the design effect, the budget available, and the time that would be needed per team to complete one cluster. Dividing the total number of households by the number of sample households per cluster, it was calculated that 1,170 sample clusters would need to be selected for the survey.
The sample allocation over provinces was determined by a procedure where the sample at first was allocated proportionally to the square root of the number of households in each province. This allocation was further adjusted so that provinces getting less than 1,100 households in the preliminary allocation were given additional households up to 1,100. These additional households were taken from the three provinces that had the largest samples according to the preliminary allocation. The sample sizes for provinces vary between 1,100 and 1,680 households. The justification for using different sample sizes is that the standard errors for national estimates will be lower than the standard errors that would have been achieved with equal sample sizes over the provinces.
365
Table SD.1: Distribution of Villages and households in sampling frame
Distribution of villages and households, by province and village category (Lao Statistics Bureau, Village register 2015)
Number of villages Number of Households
Total Urban Rural with
road Rural w/o
road Total Urban Rural with
road Rural w/o
road
Total 8,500 1,462 5,720 1,318 1,176,749 403,828 685,483 87,438
Province
Vientiane Cap. 481 303 176 2 163,842 127,739 35,979 124
Phongsaly 528 53 321 154 34,398 7,057 2,0297 7,044
Luangnamtha 364 51 259 54 33,338 9,260 20,947 3131
Oudomxay 471 64 303 104 55,291 13,897 33,239 8,155
Bokeo 256 54 175 27 32,693 11,249 19,582 1,862
Luangprabang 753 135 467 151 81,191 26,105 44,774 10,312
Huaphanh 718 33 381 304 49,602 7,935 25,653 16,014
Xayaboury 432 127 299 6 75,603 31,143 43,989 471
Xienkhuang 485 62 369 54 43,590 13,443 26,587 3,560
Vientiane Prov. 434 102 329 3 80,670 26,987 53,409 274
Borikhamxay 303 68 218 17 49,485 17,009 30,979 1,497
Khammuane 582 71 446 65 74,146 16,743 52,088 5,315
Savanakhet 1,015 121 816 78 157,234 35,498 115,508 6,228
Saravane 588 40 450 98 66,100 8,080 51,331 6,689
Sekong 201 31 83 87 18,081 6,968 7,086 4,027
Champasack 646 93 453 100 121,022 30,361 79,093 11,568
Attapeu 147 35 100 12 26,531 9,779 15,687 1,065
Xaysomboune 96 19 75 2 13,932 4,575 9,255 102
A.2 SAMPLE SIZE AND SAMPLE ALLOCATION
The overall sample size for the 2017 Lao Social Indicator Survey was calculated as 23,400 households. For the calculation of the sample size, the key indicator used was the underweight prevalence among children age 0-4 years. Since the survey results are tabulated at the provincial level, it was necessary to determine the minimum sample size for each province. The following formula was used to estimate the required sample size for this indicator:
)])()(()[()])(1)((4[
2 RRAveSizepbrRMEdeffrrn
,
where:
n = the required sample size, expressed as number of households 4 = a factor to achieve the 95 percent level of confidence r = the predicted or anticipated value of the indicator, expressed in the form of a
proportion deff = the design effect for the indicator, estimated from a previous survey or using a
default value of 1.5
RME = the relative margin of error of r to be tolerated at the 95 percent level of confidence; it is generally not more than 0.12 (12 percent) for national-level estimates
pb = the proportion of the total population upon which the indicator, r, is based AveSize = the average household size (mean number of persons per household) RR = the predicted response rate
For the calculation, r (underweight prevalence) was assumed to be 26.3 percent based on the national estimate from LSIS 2011-12. The value of deff (design effect) was taken as 1.4 based on the estimate from LSIS 2011-12, pb (percentage of children age 0-4 years in the total population) was taken as 12.4 percent, AveSize (mean household size) was taken as 5.3 households, and the response rate was assumed to be 97 percent, based on experience from LSIS 2011-12. Although an RME of 12% is needed for the national-level estimates, for the provincial-level estimates it was sufficient to use an RME of 15% (that is, a margin of error of 0.15 r). The resulting number of sample households from this exercise was 1,094, rounded to 1,100.
For the final decision on the sample size it was necessary to address the demands on the design to provide data for the analysis of change in nutrition status over time. The problem was stated as follows: given that the true change (in the population) of underweight prevalence was six percentage points between 2012 and 2017, what sample size is needed to conclude from the sample results that there has been a statistically significant change? Calculations (of statistical test power) showed that a sample of 1,350 households would give a fair chance (probability= 0.8) of concluding that a statistically significant change has taken place (when the true change in the population is six percentage points). With a sample of 1,100 households the chance is somewhat smaller (probability=0.73). Based on these calculations and other considerations it was decided to set the total sample size to 18 x 1,300 = 23,400 households.
The number of households selected per cluster for the survey was determined as 20 households, based on a number of considerations, including the design effect, the budget available, and the time that would be needed per team to complete one cluster. Dividing the total number of households by the number of sample households per cluster, it was calculated that 1,170 sample clusters would need to be selected for the survey.
The sample allocation over provinces was determined by a procedure where the sample at first was allocated proportionally to the square root of the number of households in each province. This allocation was further adjusted so that provinces getting less than 1,100 households in the preliminary allocation were given additional households up to 1,100. These additional households were taken from the three provinces that had the largest samples according to the preliminary allocation. The sample sizes for provinces vary between 1,100 and 1,680 households. The justification for using different sample sizes is that the standard errors for national estimates will be lower than the standard errors that would have been achieved with equal sample sizes over the provinces.
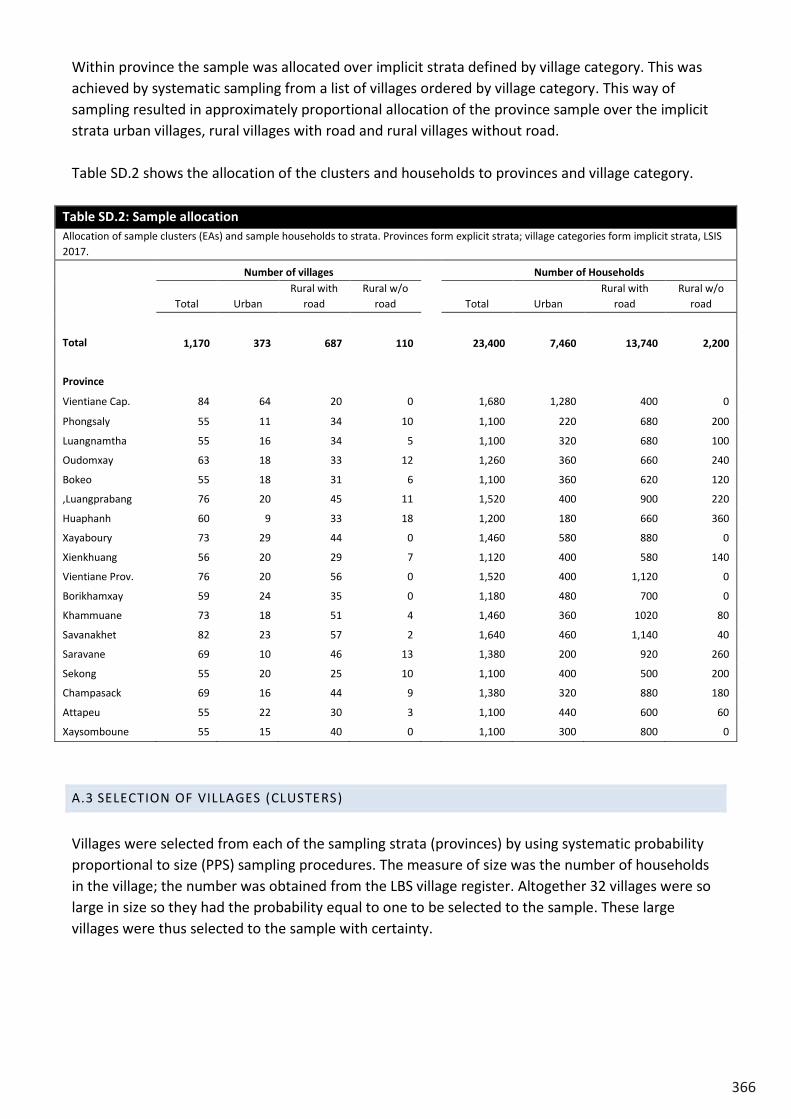
366
Within province the sample was allocated over implicit strata defined by village category. This was achieved by systematic sampling from a list of villages ordered by village category. This way of sampling resulted in approximately proportional allocation of the province sample over the implicit strata urban villages, rural villages with road and rural villages without road.
Table SD.2 shows the allocation of the clusters and households to provinces and village category.
Table SD.2: Sample allocation Allocation of sample clusters (EAs) and sample households to strata. Provinces form explicit strata; village categories form implicit strata, LSIS 2017.
Number of villages Number of Households
Total Urban Rural with
road Rural w/o
road Total Urban Rural with
road Rural w/o
road
Total 1,170 373 687 110 23,400 7,460 13,740 2,200
Province
Vientiane Cap. 84 64 20 0 1,680 1,280 400 0
Phongsaly 55 11 34 10 1,100 220 680 200
Luangnamtha 55 16 34 5 1,100 320 680 100
Oudomxay 63 18 33 12 1,260 360 660 240
Bokeo 55 18 31 6 1,100 360 620 120
,Luangprabang 76 20 45 11 1,520 400 900 220
Huaphanh 60 9 33 18 1,200 180 660 360
Xayaboury 73 29 44 0 1,460 580 880 0
Xienkhuang 56 20 29 7 1,120 400 580 140
Vientiane Prov. 76 20 56 0 1,520 400 1,120 0
Borikhamxay 59 24 35 0 1,180 480 700 0
Khammuane 73 18 51 4 1,460 360 1020 80
Savanakhet 82 23 57 2 1,640 460 1,140 40
Saravane 69 10 46 13 1,380 200 920 260
Sekong 55 20 25 10 1,100 400 500 200
Champasack 69 16 44 9 1,380 320 880 180
Attapeu 55 22 30 3 1,100 440 600 60
Xaysomboune 55 15 40 0 1,100 300 800 0
A.3 SELECTION OF VILLAGES (CLUSTERS)
Villages were selected from each of the sampling strata (provinces) by using systematic probability proportional to size (PPS) sampling procedures. The measure of size was the number of households in the village; the number was obtained from the LBS village register. Altogether 32 villages were so large in size so they had the probability equal to one to be selected to the sample. These large villages were thus selected to the sample with certainty.
367
A.4 LISTING ACTIVITIES
A new listing of households was conducted in all the sample villages prior to the selection of households. For this purpose, listing teams were trained to visit all the sampled villages and list all households in the village. The listing operation took place from December 2016 to February 2017 with 70 listing team members. In each Province, there were two teams each consisting of a lister and a mapper, except in Champasack, where three teams were assigned.
Listing could not be done in four villages. In two of the villages the area had been completely cleared of dwellings due to preparations for dam construction. One village was not accessible by car or motorcycle due to poor roads and one village could not be properly identified due to village mergers.
Large villages, where the number of households exceeded 300 households, were divided into two or more segments, and one segment was picked randomly before listing. Segmentation was done in 216 villages.
A.5 SELECTION OF HOUSEHOLDS
Lists of households were prepared by the listing teams in the field for each village. The households were then sequentially numbered from 1 to Mhi (the total number of households in each village or segment) at the Lao Bureau of Statistics, where the selection of 20 households in each village was carried out using random systematic selection procedures. The MICS6 spreadsheet template for systematic random selection of households was adapted for this purpose. 1
The survey also included a questionnaire for individual men that was to be administered in half of the sample of households. The MICS household selection template includes an option to specify the proportion of households to be selected for administering the individual questionnaire for men, and the spreadsheet automatically selected the corresponding subsample of households.1 All men age 15 to 49 years in the selected households were eligible for interview.
LSIS 2017 also included water quality testing for a subsample of households within each sample cluster. A subsample of 3 of the 20 selected households was selected in each sample cluster using random systematic sampling for conducting water quality testing, for both water in the household and at the source. The MICS household selection template includes an option to specify the number of households to be selected for the water quality testing, and the spreadsheet automatically selected the corresponding subsample of households.1
A.6 CALCULATION OF SAMPLE WEIGHTS
The LSIS 2017 sample is not self-weighting. For this reason, sample weights were calculated and these were used in the subsequent analyses of the survey data.
1 Available here: http://mics.unicef.org/tools#survey-design
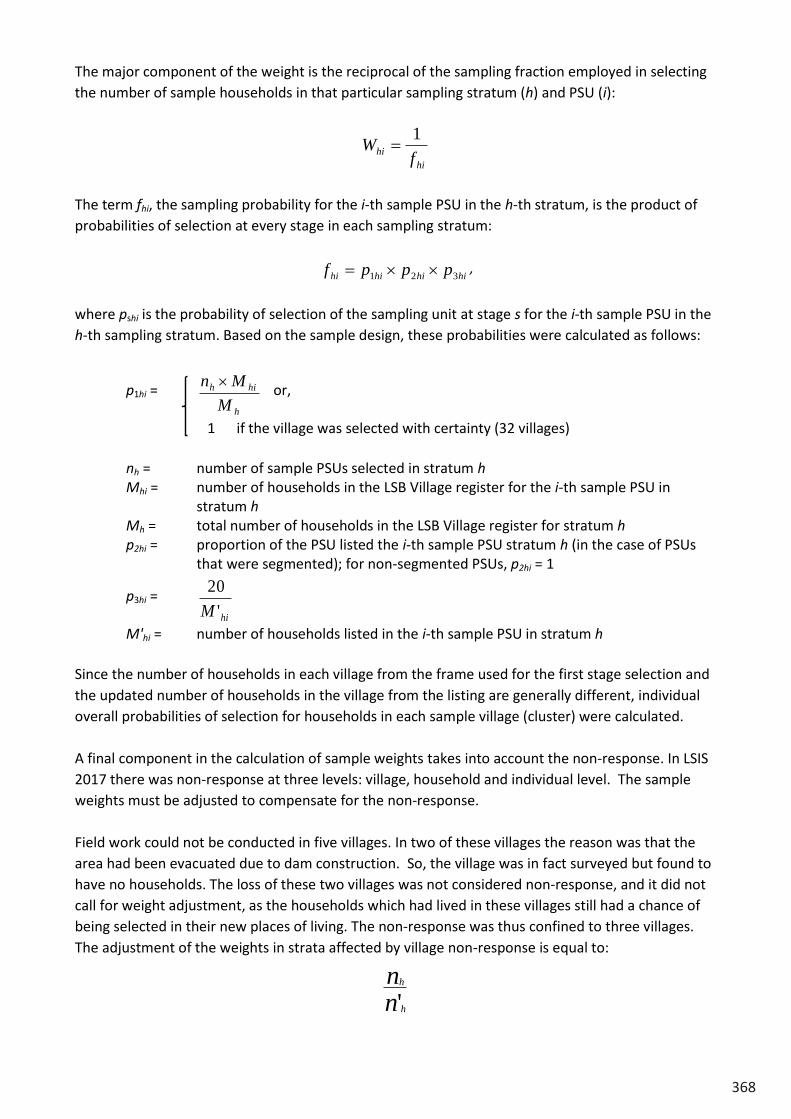
368
The major component of the weight is the reciprocal of the sampling fraction employed in selecting the number of sample households in that particular sampling stratum (h) and PSU (i):
hihi f
W 1
The term fhi, the sampling probability for the i-th sample PSU in the h-th stratum, is the product of probabilities of selection at every stage in each sampling stratum:
hihihihi pppf 321 ,
where pshi is the probability of selection of the sampling unit at stage s for the i-th sample PSU in the h-th sampling stratum. Based on the sample design, these probabilities were calculated as follows:
p1hi = h
hih
MMn or,
1 if the village was selected with certainty (32 villages)
nh = number of sample PSUs selected in stratum h Mhi = number of households in the LSB Village register for the i-th sample PSU in
stratum h Mh = total number of households in the LSB Village register for stratum h p2hi = proportion of the PSU listed the i-th sample PSU stratum h (in the case of PSUs
that were segmented); for non-segmented PSUs, p2hi = 1
p3hi = hiM '
20
M'hi = number of households listed in the i-th sample PSU in stratum h
Since the number of households in each village from the frame used for the first stage selection and the updated number of households in the village from the listing are generally different, individual overall probabilities of selection for households in each sample village (cluster) were calculated.
A final component in the calculation of sample weights takes into account the non-response. In LSIS 2017 there was non-response at three levels: village, household and individual level. The sample weights must be adjusted to compensate for the non-response.
Field work could not be conducted in five villages. In two of these villages the reason was that the area had been evacuated due to dam construction. So, the village was in fact surveyed but found to have no households. The loss of these two villages was not considered non-response, and it did not call for weight adjustment, as the households which had lived in these villages still had a chance of being selected in their new places of living. The non-response was thus confined to three villages. The adjustment of the weights in strata affected by village non-response is equal to:
'nn
h
h
369
The major component of the weight is the reciprocal of the sampling fraction employed in selecting the number of sample households in that particular sampling stratum (h) and PSU (i):
hihi f
W 1
The term fhi, the sampling probability for the i-th sample PSU in the h-th stratum, is the product of probabilities of selection at every stage in each sampling stratum:
hihihihi pppf 321 ,
where pshi is the probability of selection of the sampling unit at stage s for the i-th sample PSU in the h-th sampling stratum. Based on the sample design, these probabilities were calculated as follows:
p1hi = h
hih
MMn or,
1 if the village was selected with certainty (32 villages)
nh = number of sample PSUs selected in stratum h Mhi = number of households in the LSB Village register for the i-th sample PSU in
stratum h Mh = total number of households in the LSB Village register for stratum h p2hi = proportion of the PSU listed the i-th sample PSU stratum h (in the case of PSUs
that were segmented); for non-segmented PSUs, p2hi = 1
p3hi = hiM '
20
M'hi = number of households listed in the i-th sample PSU in stratum h
Since the number of households in each village from the frame used for the first stage selection and the updated number of households in the village from the listing are generally different, individual overall probabilities of selection for households in each sample village (cluster) were calculated.
A final component in the calculation of sample weights takes into account the non-response. In LSIS 2017 there was non-response at three levels: village, household and individual level. The sample weights must be adjusted to compensate for the non-response.
Field work could not be conducted in five villages. In two of these villages the reason was that the area had been evacuated due to dam construction. So, the village was in fact surveyed but found to have no households. The loss of these two villages was not considered non-response, and it did not call for weight adjustment, as the households which had lived in these villages still had a chance of being selected in their new places of living. The non-response was thus confined to three villages. The adjustment of the weights in strata affected by village non-response is equal to:
'nn
h
h
where n’h is the number of surveyed villages in stratum h (including the villages that turned out to be “empty” due to dam construction)
The adjustment for household non-response in each stratum is equal to:
hRR1
where RRh is the response rate for the sample households in stratum h, defined as the proportion of the number of interviewed households in stratum h out of the number of selected households found to be occupied during the fieldwork in stratum h.
Similarly, adjustment for non-response at the individual level (women, men, and under-5 children) for each stratum is equal to:
qhRR1
where RRqh is the response rate for the individual questionnaires in stratum h, defined as the proportion of eligible individuals (women, men, and under-5 children) in the sample households in stratum h who were successfully interviewed.
After the completion of fieldwork, response rates were calculated for each sampling stratum. These were used to adjust the sample weights calculated for each cluster. Response rates in LSIS 2017 are shown in Table SR.1.1 in this report.
The non-response adjustment factors for the individual women and under-5 questionnaires were applied to the adjusted household weights. Numbers of eligible women and under-5 children were obtained from the list of household members in the Household Questionnaire for households where interviews were completed.
The weights for the questionnaire for individual men were calculated in a similar way. In this case the number of eligible men in the list of household members in all the LSIS sample households in the stratum was used as the numerator of the non-response adjustment factor, while the number of completed questionnaires for men in the stratum was obtained from the 50% subsample of households. Therefore, this adjustment factor includes an implicit subsampling weighting factor of 2 in addition to the adjustment for the non-response to the individual questionnaire for men.
In the case of the questionnaire for children age 5 to 17 years, one child was selected from all the children in this age group recorded in the list of household members. The weight for the corresponding data will be equal to the adjusted household weight multiplied by the number of children age 5 to 17 years recorded in the list of household members. Therefore, the weights for the children age 5 to 17 years will vary by sample household. This weighting is implemented in the tabulation programs for the corresponding tables. However, an additional household weight adjustment factor is applied at the stratum level to account for any nonresponse for the module of children age 5 to 17 years.
For the water quality testing (both in household and at source) a subsample of 3 households was selected from the 20 LSIS sample households in each sample cluster. Therefore the basic
370
(unadjusted) household weight would be multiplied by the inverse of this subsampling rate as follows:
,f
f
= Whihi
wqhi67.6
3201
where:
Wwqhi = basic weight for the subsample of households selected for the water quality testing in the i-th sample EA in stratum h
Since the response rate may be different for the water quality testing for home consumption and at the source, the basic weights for each were adjusted separately for non-response at the stratum level as follows:
,mm
W = Wwqh
wqhwqhiwqhi ''
where:
W’wqhi = adjusted weight for the subsample of households selected for the water quality testing in the i-th sample EA in stratum h (separately for water quality testing in the household and at the source)
mwqh = number of valid (occupied) sample households selected for water quality testing in stratum h
m’wqh = number of sample households with completed water quality testing in stratum h (separately for water quality testing in the household and at the source)
The full (raw) weights for the households were calculated by multiplying the inverse of the probabilities of selection by the non-response adjustment factor for each stratum. These weights were then standardized (or normalized), one purpose of which is to make the weighted sum of the interviewed sample units equal to the total sample size at the national level. Normalization is achieved by dividing the full sample weights (adjusted for nonresponse) by the average of these weights across all households at the national level. This is performed by multiplying the sample weights by a constant factor equal to the unweighted number of households at the national level divided by the weighted total number of households (using the full sample weights adjusted for non-response). Standardised (normalized) household weights varied between 0.1733 and 3.6787 in the 1,165 surveyed sample villages.
A similar standardization procedure was followed in obtaining standardized weights for individuals (women, men, children 5-17 and under-5) and water quality tests.
Sample weights were appended to all data sets and analyses were performed by weighting survey data with these sample weights.

372
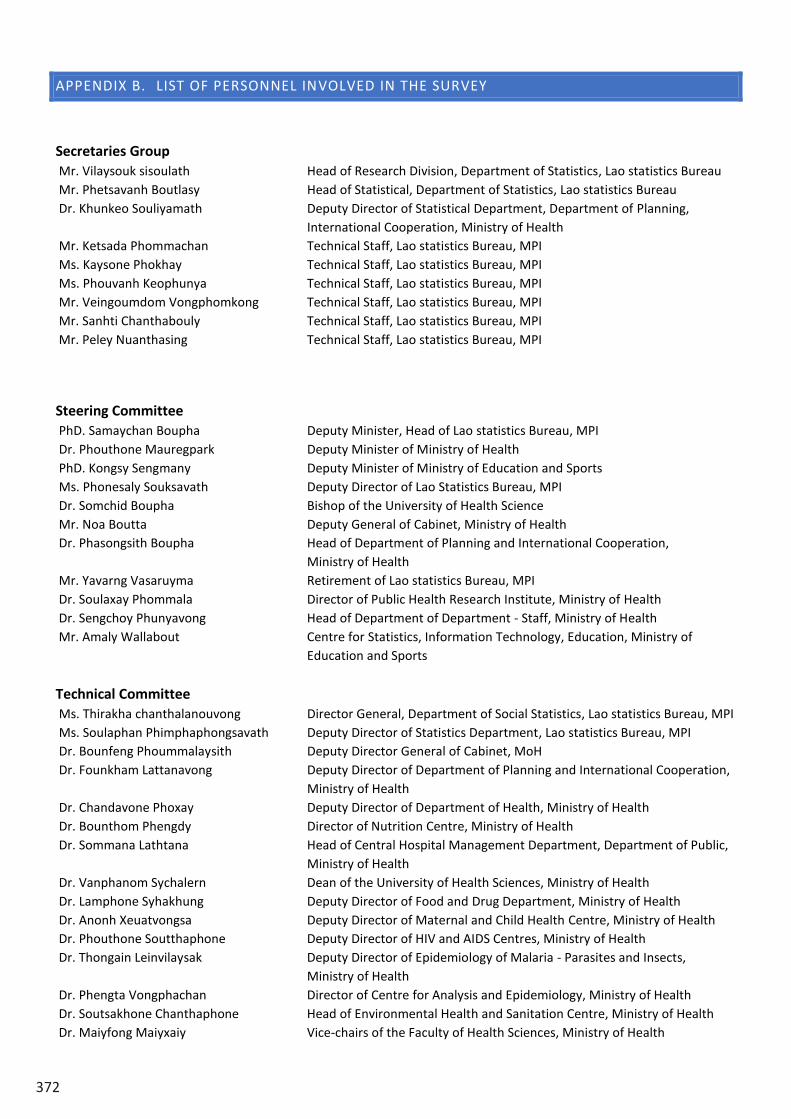
372
APPENDIX B. LIST OF PERSONNEL INVOLVED IN THE SURVEY
Secretaries Group Mr. Vilaysouk sisoulath Head of Research Division, Department of Statistics, Lao statistics Bureau Mr. Phetsavanh Boutlasy Head of Statistical, Department of Statistics, Lao statistics Bureau Dr. Khunkeo Souliyamath Deputy Director of Statistical Department, Department of Planning,
International Cooperation, Ministry of Health Mr. Ketsada Phommachan Technical Staff, Lao statistics Bureau, MPI Ms. Kaysone Phokhay Technical Staff, Lao statistics Bureau, MPI Ms. Phouvanh Keophunya Technical Staff, Lao statistics Bureau, MPI Mr. Veingoumdom Vongphomkong Technical Staff, Lao statistics Bureau, MPI Mr. Sanhti Chanthabouly Technical Staff, Lao statistics Bureau, MPI Mr. Peley Nuanthasing Technical Staff, Lao statistics Bureau, MPI
Steering Committee PhD. Samaychan Boupha Deputy Minister, Head of Lao statistics Bureau, MPI Dr. Phouthone Mauregpark Deputy Minister of Ministry of Health PhD. Kongsy Sengmany Deputy Minister of Ministry of Education and Sports Ms. Phonesaly Souksavath Deputy Director of Lao Statistics Bureau, MPI Dr. Somchid Boupha Bishop of the University of Health Science Mr. Noa Boutta Deputy General of Cabinet, Ministry of Health Dr. Phasongsith Boupha Head of Department of Planning and International Cooperation,
Ministry of Health Mr. Yavarng Vasaruyma Retirement of Lao statistics Bureau, MPI Dr. Soulaxay Phommala Director of Public Health Research Institute, Ministry of Health Dr. Sengchoy Phunyavong Head of Department of Department - Staff, Ministry of Health Mr. Amaly Wallabout Centre for Statistics, Information Technology, Education, Ministry of
Education and Sports Technical Committee Ms. Thirakha chanthalanouvong Director General, Department of Social Statistics, Lao statistics Bureau, MPI Ms. Soulaphan Phimphaphongsavath Deputy Director of Statistics Department, Lao statistics Bureau, MPI Dr. Bounfeng Phoummalaysith Deputy Director General of Cabinet, MoH Dr. Founkham Lattanavong Deputy Director of Department of Planning and International Cooperation,
Ministry of Health Dr. Chandavone Phoxay Deputy Director of Department of Health, Ministry of Health Dr. Bounthom Phengdy Director of Nutrition Centre, Ministry of Health Dr. Sommana Lathtana Head of Central Hospital Management Department, Department of Public,
Ministry of Health Dr. Vanphanom Sychalern Dean of the University of Health Sciences, Ministry of Health Dr. Lamphone Syhakhung Deputy Director of Food and Drug Department, Ministry of Health Dr. Anonh Xeuatvongsa Deputy Director of Maternal and Child Health Centre, Ministry of Health Dr. Phouthone Soutthaphone Deputy Director of HIV and AIDS Centres, Ministry of Health Dr. Thongain Leinvilaysak Deputy Director of Epidemiology of Malaria - Parasites and Insects,
Ministry of Health Dr. Phengta Vongphachan Director of Centre for Analysis and Epidemiology, Ministry of Health Dr. Soutsakhone Chanthaphone Head of Environmental Health and Sanitation Centre, Ministry of Health Dr. Maiyfong Maiyxaiy Vice-chairs of the Faculty of Health Sciences, Ministry of Health
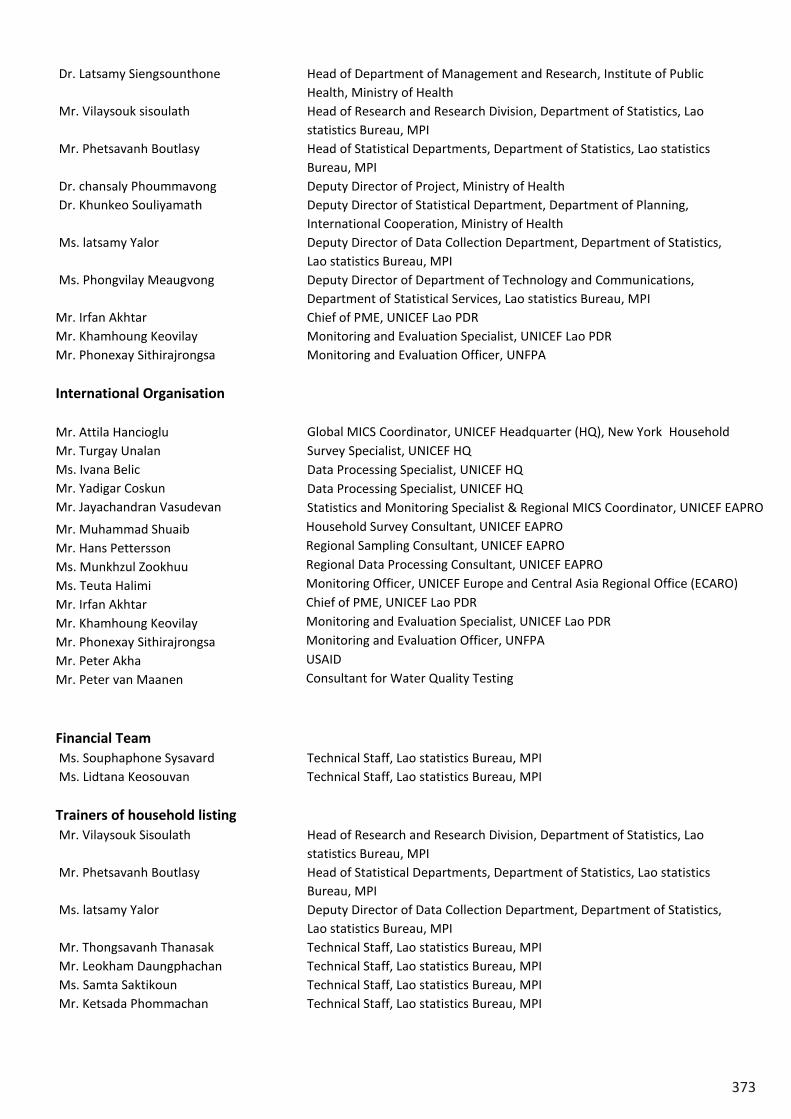
373
Dr. Latsamy Siengsounthone
Mr. Vilaysouk sisoulath
Mr. Phetsavanh Boutlasy
Dr. chansaly Phoummavong Dr. Khunkeo Souliyamath
Ms. latsamy Yalor
Ms. Phongvilay Meaugvong
Mr. Irfan Akhtar Mr. Khamhoung Keovilay Mr. Phonexay Sithirajrongsa
Head of Department of Management and Research, Institute of Public Health, Ministry of Health Head of Research and Research Division, Department of Statistics, Lao statistics Bureau, MPI Head of Statistical Departments, Department of Statistics, Lao statistics Bureau, MPI Deputy Director of Project, Ministry of Health Deputy Director of Statistical Department, Department of Planning, International Cooperation, Ministry of Health Deputy Director of Data Collection Department, Department of Statistics, Lao statistics Bureau, MPI Deputy Director of Department of Technology and Communications, Department of Statistical Services, Lao statistics Bureau, MPI Chief of PME, UNICEF Lao PDR Monitoring and Evaluation Specialist, UNICEF Lao PDR Monitoring and Evaluation Officer, UNFPA
International Organisation
Mr. Attila Hancioglu Mr. Turgay Unalan Ms. Ivana Belic Mr. Yadigar Coskun Mr. Jayachandran Vasudevan Mr. Muhammad ShuaibMr. Hans Pettersson Ms. Munkhzul Zookhuu Ms. Teuta Halimi Mr. Irfan Akhtar Mr. Khamhoung Keovilay Mr. Phonexay Sithirajrongsa Mr. Peter Akha Mr. Peter van Maanen
Global MICS Coordinator, UNICEF Headquarter (HQ), New York Household Survey Specialist, UNICEF HQ Data Processing Specialist, UNICEF HQ Data Processing Specialist, UNICEF HQ Statistics and Monitoring Specialist & Regional MICS Coordinator, UNICEF EAPRO Household Survey Consultant, UNICEF EAPRO Regional Sampling Consultant, UNICEF EAPRO Regional Data Processing Consultant, UNICEF EAPRO Monitoring Officer, UNICEF Europe and Central Asia Regional Office (ECARO) Chief of PME, UNICEF Lao PDR Monitoring and Evaluation Specialist, UNICEF Lao PDR Monitoring and Evaluation Officer, UNFPA USAID Consultant for Water Quality Testing
Financial Team Ms. Souphaphone Sysavard Technical Staff, Lao statistics Bureau, MPI Ms. Lidtana Keosouvan Technical Staff, Lao statistics Bureau, MPI
Trainers of household listing Mr. Vilaysouk Sisoulath Head of Research and Research Division, Department of Statistics, Lao
statistics Bureau, MPI Mr. Phetsavanh Boutlasy Head of Statistical Departments, Department of Statistics, Lao statistics
Bureau, MPI Ms. latsamy Yalor Deputy Director of Data Collection Department, Department of Statistics,
Lao statistics Bureau, MPI Mr. Thongsavanh Thanasak Technical Staff, Lao statistics Bureau, MPI Mr. Leokham Daungphachan Technical Staff, Lao statistics Bureau, MPI Ms. Samta Saktikoun Technical Staff, Lao statistics Bureau, MPI Mr. Ketsada Phommachan Technical Staff, Lao statistics Bureau, MPI
374
Dr. Latsamy Siengsounthone
Mr. Vilaysouk sisoulath
Mr. Phetsavanh Boutlasy
Dr. chansaly Phoummavong Dr. Khunkeo Souliyamath
Ms. latsamy Yalor
Ms. Phongvilay Meaugvong
Mr. Irfan Akhtar Mr. Khamhoung Keovilay Mr. Phonexay Sithirajrongsa
Head of Department of Management and Research, Institute of Public Health, Ministry of Health Head of Research and Research Division, Department of Statistics, Lao statistics Bureau, MPI Head of Statistical Departments, Department of Statistics, Lao statistics Bureau, MPI Deputy Director of Project, Ministry of Health Deputy Director of Statistical Department, Department of Planning, International Cooperation, Ministry of Health Deputy Director of Data Collection Department, Department of Statistics, Lao statistics Bureau, MPI Deputy Director of Department of Technology and Communications, Department of Statistical Services, Lao statistics Bureau, MPI Chief of PME, UNICEF Lao PDR Monitoring and Evaluation Specialist, UNICEF Lao PDR Monitoring and Evaluation Officer, UNFPA
International Organisation
Mr. Attila Hancioglu Mr. Turgay Unalan Ms. Ivana Belic Mr. Yadigar Coskun Mr. Jayachandran Vasudevan Mr. Muhammad ShuaibMr. Hans Pettersson Ms. Munkhzul Zookhuu Ms. Teuta Halimi Mr. Irfan Akhtar Mr. Khamhoung Keovilay Mr. Phonexay Sithirajrongsa Mr. Peter Akha Mr. Peter van Maanen
Global MICS Coordinator, UNICEF Headquarter (HQ), New York Household Survey Specialist, UNICEF HQ Data Processing Specialist, UNICEF HQ Data Processing Specialist, UNICEF HQ Statistics and Monitoring Specialist & Regional MICS Coordinator, UNICEF EAPRO Household Survey Consultant, UNICEF EAPRO Regional Sampling Consultant, UNICEF EAPRO Regional Data Processing Consultant, UNICEF EAPRO Monitoring Officer, UNICEF Europe and Central Asia Regional Office (ECARO) Chief of PME, UNICEF Lao PDR Monitoring and Evaluation Specialist, UNICEF Lao PDR Monitoring and Evaluation Officer, UNFPA USAID Consultant for Water Quality Testing
Financial Team Ms. Souphaphone Sysavard Technical Staff, Lao statistics Bureau, MPI Ms. Lidtana Keosouvan Technical Staff, Lao statistics Bureau, MPI
Trainers of household listing Mr. Vilaysouk Sisoulath Head of Research and Research Division, Department of Statistics, Lao
statistics Bureau, MPI Mr. Phetsavanh Boutlasy Head of Statistical Departments, Department of Statistics, Lao statistics
Bureau, MPI Ms. latsamy Yalor Deputy Director of Data Collection Department, Department of Statistics,
Lao statistics Bureau, MPI Mr. Thongsavanh Thanasak Technical Staff, Lao statistics Bureau, MPI Mr. Leokham Daungphachan Technical Staff, Lao statistics Bureau, MPI Ms. Samta Saktikoun Technical Staff, Lao statistics Bureau, MPI Mr. Ketsada Phommachan Technical Staff, Lao statistics Bureau, MPI
Trainers for field data collection Mr. Vilaysouk Sisoulath Head of Research and Research Division, Department of Statistics, Lao
statistics Bureau, MPI Mr. Phetsavanh Boutlasy Head of Statistical Departments, Department of Statistics, Lao statistics
Bureau, MPI Ms. latsamy Yalor Deputy Director of Data Collection Department, Department of Statistics,
Lao statistics Bureau, MPI Mr. Parngkham Thikeo Technical Staff, Lao statistics Bureau, MPI Dr. Phanom Maternal and Child Health Centre, Ministry of Health Dr. Chanthasouk Centre for HIV / AIDS, Ministry of Health Dr. Manythong Institute of Public Health, Ministry of Health Dr. Veingkhun Maternal and Child Health Centre, Ministry of Health Dr. Khunkeo Souliyamath Deputy Director of Statistical Department, Department of Planning,
International Cooperation, Ministry of Health Dr. Latsamy Siengsounthone Head of Department of Management and Research, Institute of Public
Health, Ministry of Health Nutrition Centre, Ministry of Health Nutrition Centre, Ministry of Health Institute of Public Health, Ministry of Health Environmental Health Centre and Clean Water Supply, Ministry of Health
Mr. Vilasith Dr. Latthiphone Dr. Daovieng Mr. Phisoudsak Mr. Phousavanh Mysavath Environmental Health Centre and Clean Water Supply, Ministry of Health
Mr. Chuntha Vongkavady Environmental Health Centre and Clean Water Supply, Ministry of Health Mr. Phankham Aunyamany Environmental Health Centre and Clean Water Supply, Ministry of Health Ms. Sengphet Thammavong Environmental Health Centre and Clean Water Supply, Ministry of Health Ms. Veomany Syhalath Mahosod hospital, Ministry of Health Ms. Aongyarng Bounthun Setthatilard hospital, Ministry of Health Mr. Sonephat Thongain Maternal and Child Hospital, Ministry of Health
Household listing Teams
Vientiane Capital Mr. Phimpha Chandaungsavanh Deputy Statistics Division Social Statistics of the Statistical of Vientian
Capital Ms. Sonephet Bunnalath Technical Staff, District Statistics Xaythany Ms. Thanomechit Porlavong Technical Staff, District Statistics Chanthabury Ms. Aallathai Sysoutham Technical Staff, District Statistics Sykhod Mr. Anousin Technical Staff, District Statistics Hardxaifong Mr. Thavathxay Chantala Technical Staff, District Statistics Pharkngeau Mr. Daoheaung Meaungviengkham Technical Staff, of the Statistical of Vientiane Capital Ms. Phimchai Baulavong Technical Staff, of the Statistical of Vientiane Capital
Phongsaly Province Mr. Fhachit Sengsomcheary Technical Staff, District Statistics Samphun Mr. Khou Ms.eng Vilayvone Technical Staff, District Statistics Bounneau Mr. Mysay Dongdala Technical Staff, District Statistics Khau Mr. Veingoudom Vongphomkhong Technical Staff, Lao statistics Bureau, MPI
Luangnamtha Province Mr. Syvone Xaymetnga Technical Staff, Statistical of Luangnamtha Province Mr. Souladet Keodaungchan Technical Staff, Statistical of Luangnamtha Province
375
Mr. Soubin Kouthonglar Technical Staff, District Luangnamtha Mr. Phonevilay Markponesouk Technical Staff, Lao statistics Bureau, MPI
Oudomxay Province Mr. Sengealoun Thammasan Maintain the head of the social statistics sector, Statistical of Oudomxay
Province Mr. Kongthin Soulakharm Technical Staff, Statistical of Oudomxay Province Mr. Somxay Ainthavixay Technical Staff, Statistical of Oudomxay Province Mr. Xaiphone Xayyavong Technical Staff, District Statistics Namort Mr. Bounyong Vungchiatou Technical Staff, District Statistics Baeng Mr. Xaykhone Keosomphan Technical Staff, District Statistics Houn Mr. Kitsana Latdavong Technical Staff, District Statistics Ngar Mr. Leokham Daungphachan Technical Staff, Lao statistics Bureau, MPI
Bokeo Province Mr. Soulisack Keobundith Technical Staff, Statistical Office of Bokeo Province Mr. Thonglein Keosysomh Technical Staff, Statistical Office of Bokeo Province Ms. Chansaiy Xayyavong Technical Staff, Statistical Office of Bokeo Province Ms. hongkham Xayyavong Technical Staff, Ministry of Health
Luangprabang Province Mr. Khankham Technical Staff, District Statistics Luangprabang Mr. Souk Oudomphon Technical Staff, District Statistics Luangprabang Mr. Bounphone Phonesavanh Technical Staff, District Statistics Narn Mr. Sengthong Technical Staff, District Statistics Nambark Mr. Chayaeng Sengxay Technical Staff, District Statistics Phoxay Mr. Xayyaphet Technical Staff, District Statistics Parkxeng Mr. Soulidet Phommala Technical Staff, District Statistics Chomphet Mr. Thongsavanh Thanasack Technical Staff, Lao statistics Bureau, MPI
Huaphanh Province Mr. Xaysanith Phoudthapunya Secondary social statistical sector, Statistical of Huaphanh Province Mr. Khounsouk Thipphavongxay Technical Staff, Statistical Office of Huaphanh Province Mr. Maymon Vongkha Ms.om Technical Staff, Statistical Office of Huaphanh Province Mr. So Ms.avanh Phimmachan Technical Staff, Statistical Office of Huaphanh Province
Xayabury Province Mr. Bounkhen Voudtisack Technical Staff, Statistical of Xayabury Province Mr. Chittakone Xayyasith Technical Staff, Statistical of Xayabury Province Mr. Sengthong Soukphaly Technical Staff, District Statistics Xayabury Mr. Bounlerd Chalernphon Technical Staff, District Statistics Pheing Mr. Visoun Bounyavong Technical Staff, District Statistics Pharklaiy Mr. Serdxai Phongsavanh Technical Staff, District Statistics khenthao Mr. Phonesavanh Xaythong Technical Staff, Statistical of Xayabury Province Mr. Somphet Keoeaphone Technical Staff, Ministry of Health
Xiengkhuang Province Mr. Saoyasith Xayyasith Technical Staff, Statistical of Xiengkhuang Province Mr. Phetsavanh Syvongxay Technical Staff, Statistical of Xiengkhuang Province Ms. Phounsamay Vongphothong Technical Staff, Statistical of Xiengkhuang Province Mr. Ketsada Phommachan Technical Staff, Lao statistics Bureau, MPI
376
Mr. Soubin Kouthonglar Technical Staff, District Luangnamtha Mr. Phonevilay Markponesouk Technical Staff, Lao statistics Bureau, MPI
Oudomxay Province Mr. Sengealoun Thammasan Maintain the head of the social statistics sector, Statistical of Oudomxay
Province Mr. Kongthin Soulakharm Technical Staff, Statistical of Oudomxay Province Mr. Somxay Ainthavixay Technical Staff, Statistical of Oudomxay Province Mr. Xaiphone Xayyavong Technical Staff, District Statistics Namort Mr. Bounyong Vungchiatou Technical Staff, District Statistics Baeng Mr. Xaykhone Keosomphan Technical Staff, District Statistics Houn Mr. Kitsana Latdavong Technical Staff, District Statistics Ngar Mr. Leokham Daungphachan Technical Staff, Lao statistics Bureau, MPI
Bokeo Province Mr. Soulisack Keobundith Technical Staff, Statistical Office of Bokeo Province Mr. Thonglein Keosysomh Technical Staff, Statistical Office of Bokeo Province Ms. Chansaiy Xayyavong Technical Staff, Statistical Office of Bokeo Province Ms. hongkham Xayyavong Technical Staff, Ministry of Health
Luangprabang Province Mr. Khankham Technical Staff, District Statistics Luangprabang Mr. Souk Oudomphon Technical Staff, District Statistics Luangprabang Mr. Bounphone Phonesavanh Technical Staff, District Statistics Narn Mr. Sengthong Technical Staff, District Statistics Nambark Mr. Chayaeng Sengxay Technical Staff, District Statistics Phoxay Mr. Xayyaphet Technical Staff, District Statistics Parkxeng Mr. Soulidet Phommala Technical Staff, District Statistics Chomphet Mr. Thongsavanh Thanasack Technical Staff, Lao statistics Bureau, MPI
Huaphanh Province Mr. Xaysanith Phoudthapunya Secondary social statistical sector, Statistical of Huaphanh Province Mr. Khounsouk Thipphavongxay Technical Staff, Statistical Office of Huaphanh Province Mr. Maymon Vongkha Ms.om Technical Staff, Statistical Office of Huaphanh Province Mr. So Ms.avanh Phimmachan Technical Staff, Statistical Office of Huaphanh Province
Xayabury Province Mr. Bounkhen Voudtisack Technical Staff, Statistical of Xayabury Province Mr. Chittakone Xayyasith Technical Staff, Statistical of Xayabury Province Mr. Sengthong Soukphaly Technical Staff, District Statistics Xayabury Mr. Bounlerd Chalernphon Technical Staff, District Statistics Pheing Mr. Visoun Bounyavong Technical Staff, District Statistics Pharklaiy Mr. Serdxai Phongsavanh Technical Staff, District Statistics khenthao Mr. Phonesavanh Xaythong Technical Staff, Statistical of Xayabury Province Mr. Somphet Keoeaphone Technical Staff, Ministry of Health
Xiengkhuang Province Mr. Saoyasith Xayyasith Technical Staff, Statistical of Xiengkhuang Province Mr. Phetsavanh Syvongxay Technical Staff, Statistical of Xiengkhuang Province Ms. Phounsamay Vongphothong Technical Staff, Statistical of Xiengkhuang Province Mr. Ketsada Phommachan Technical Staff, Lao statistics Bureau, MPI
Vientiane Province Ms. Veingkham Vongphachan Deputy Director Service, Statistical of Vientiane Province Ms. Thipphachan Philom Technical Staff, Statistical of Vientiane Province Mr. Veingnakhone Khongboupha Technical Staff, District Statistics Keooudom Ms. khamphouy Sengdara Technical Staff, District Statistics Vungvieng Mr. Keo Sykhai Technical Staff, District Statistics Kasy Ms. Sysouphan Phimpunhuk Technical Staff, Statistical of Vientiane Province Mr. Khammanh Pukvilay Technical Staff, District Statistics Maed Ms. Thatsavone Philom Technical Staff, Ministry of Health
Borikhamxay Province Mr. Thanongsak Keovongsa Head of Statistics Center District Parkkading Mr. Kong Xayyarng Deputy Director of Borikhun District Statistical Center; Mr. Phunthalard Soulivong Technical Staff, District Statistics Sun Dr. Bounyot Mounthalak Deputy Head of Department of Ministry of Health
Khammuane Province Mr. Sungkhom Philompun Deputy Head of Social Statistics Division, Statistics of khammuane Province Ms. phanxay Xayyalard Deputy Head of Office, Statistics of khammuane Province; Mr. Sathaphone Khodtavong Technical Staff, District Statistics Thakheak Mr. Saamart Manypakone Technical Staff, District Statistics Xebungfai Mr. Teingkham Technical Staff, District Statistics Nakaiy Ms. Thingthong Vongxay Technical Staff, Statistics of khammuane Province; Ms. Phaliya Sengealoun Technical Staff, Statistics of khammuane Province; Dr. Khunpaserth Sengngam Deputy Head of Department of Ministry of Health
Savannakhet Province Mr. Anisong Pho Ms.oupha Technical Staff, Statistical Office of Savannakhet Province Mr. Keooudone Thouchaimany Technical Staff, Statistical Office of Savannakhet Province Mr. Phetdavone Phoudthavong Technical Staff, Statistical Office of Savannakhet Province Mr. Phonephasith Technical Staff, District Statistics Kaysone Mr. Somphai Vongkha Ms.ao Technical Staff, District Statistics Songkhone Mr. Kikeo Ainthavong Technical Staff, District Statistics Xonnaburry Mr. Bounlone Phommachan Technical Staff, District Statistics Sephon Ms. Kaysone Pfokhay Technical Staff, Lao statistics Bureau, MPI
Saravane Province Mr. Bounmy Aindavong Technical Staff, Statistical Office of Saravane Province Mr. Khamlar Phommany Technical Staff, Statistical Office of Saravane Province Ms. Manyda Phommavongsa Technical Staff, Statistical Office of Saravane Province Mr. Done Phaphimpha Technical Staff, District Statistics Laongam Mr. Ketkeo Kayasith Technical Staff, Statistical Office of Saravane Province Mr. Khauntha Keoheaungsy Technical Staff, District Statistics Khongxedon Ms. Phaikham Phengboupha Technical Staff, District Statistics Samarung Ms. Monthalack Bunphasith Deputy Director of Advertising and Publishing, Lao statistics Bureau, MPI
Sekong Province Mr. Phaivan Phommasean Secondary social statistical sector, Statistical of Sekhong Province Dr. Khamlai Suntiphoum Secondary Economic statistical sectors, Statistical of Sekhong Province Mr. Phonesouk Technical Staff, District Statistics Mr. sanhti Chanthabury Technical Staff, Lao statistics Bureau, MPI
377
Champasack Province Mr. Manysack Vongsavath Technical Staff, Statistical of Champasack Province Ms. Souksamay Keokhoumaueng Technical Staff, Statistical of Champasack Province Ms. Khaikham Phavixay Technical Staff, Statistical of Champasack Province Ms. Sysouphun Vongphouxay Technical Staff, District Statistics Pharkse Ms. Soukthavy Savalath Technical Staff, District Statistics Sanasomboun Mr. soudsakhone Phapasouk Technical Staff, District Statistics Champasack Mr. xayyasith Sysouvan Technical Staff, District Statistics Mounlapamok Mr. Soneeamphai Phetvilaysone Technical Staff, Lao statistics Bureau, MPI
Attapeu Province Mr. Khamphaung Laungking Secondary social statistical sector, Statistical of Attapeu Province Mr. Sorlisack Veosy Secondary Economic statistical sectors, Statistical of Attapue Province Mr. Kheakvilay Xayyaseng Technical Staff, Statistical of Attapeu Province Mr. Peley Nuanthasing Technical Staff, Lao statistics Bureau, MPI Xaysomboun Province Mr. Lyvone Thousong Technical Staff, Statistical Office of Xaysomboun Province Mr. Mauvarng Xaydau Technical Staff, District Statistics Homh Mr. Thorvue Noryachattheng Technical Staff, District Statistics Longsarn Mr. Salunyou Xayyasarn Technical Staff, Lao statistics Bureau, MPI
Field collection Teams
Teams 1 Vientiane Capital Mr. phimpha Changduangsavanh Technical Staff, Statistical of Province Dr. bounyod Moonkalak Ministry of Health Ms. Sonephet Bannalath Technical Staff, District Statistics Ms. Orlathai Sysuthum Technical Staff, District Statistics Ms. Phonesavanh Vilaivan Technical Staff, Statistical of Province Dr. visanu Phermphoth Department of Public Health Ms. Phinmany phommavy Department of Public Health
Teams 2 Vientiane Capital Ms. Thanhomchid Porlavong Technical Staff, District Statistics Dr. Orlanat Phandinvaih Technical Staff, Ministry of Health Ms. Sommala Sukhaphom Technical Staff, Statistical of Province Ms. Phimchai Bualavong Technical Staff, District Statistics Mr. Thavatxai chantala Technical Staff, District Statistics Mr. Saosamhon sintavong Department of Public Health Dr. Pheng Vongpanya Department of Public Health
Teams 3 Phongsaly Province Mr. Kou Ms.ang Vilaiphone Technical Staff, District Statistics Mr. Fachit so Ms.angchuery Technical Staff, District Statistics Ms. Chanmaly Xaiyating Technical Staff, District Statistics Ms. Saoboun Nam Technical Staff, District Statistics Mr. Viengoudom vongphomkong Technical Staff, Lao statistics Bureau, MPI Mr. Kamyin Sina Department of Public Health Mr. Chanthala Inthalart Department of Public Health
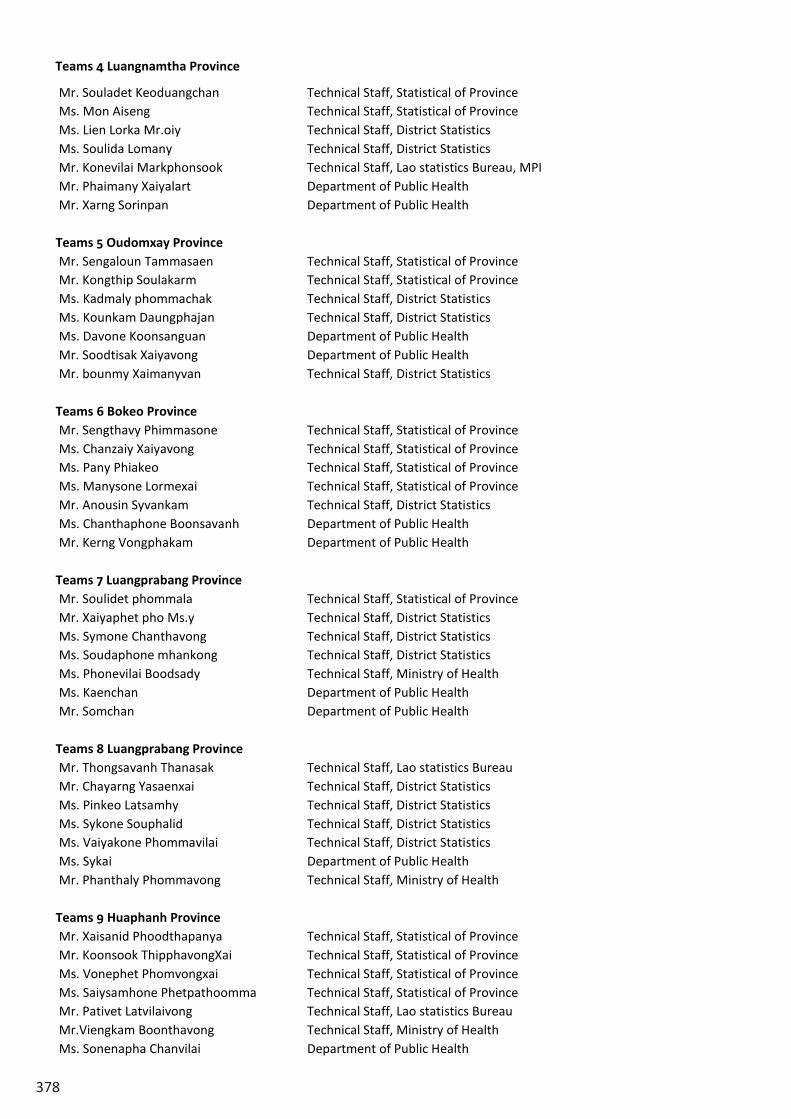
378
Champasack Province Mr. Manysack Vongsavath Technical Staff, Statistical of Champasack Province Ms. Souksamay Keokhoumaueng Technical Staff, Statistical of Champasack Province Ms. Khaikham Phavixay Technical Staff, Statistical of Champasack Province Ms. Sysouphun Vongphouxay Technical Staff, District Statistics Pharkse Ms. Soukthavy Savalath Technical Staff, District Statistics Sanasomboun Mr. soudsakhone Phapasouk Technical Staff, District Statistics Champasack Mr. xayyasith Sysouvan Technical Staff, District Statistics Mounlapamok Mr. Soneeamphai Phetvilaysone Technical Staff, Lao statistics Bureau, MPI
Attapeu Province Mr. Khamphaung Laungking Secondary social statistical sector, Statistical of Attapeu Province Mr. Sorlisack Veosy Secondary Economic statistical sectors, Statistical of Attapue Province Mr. Kheakvilay Xayyaseng Technical Staff, Statistical of Attapeu Province Mr. Peley Nuanthasing Technical Staff, Lao statistics Bureau, MPI Xaysomboun Province Mr. Lyvone Thousong Technical Staff, Statistical Office of Xaysomboun Province Mr. Mauvarng Xaydau Technical Staff, District Statistics Homh Mr. Thorvue Noryachattheng Technical Staff, District Statistics Longsarn Mr. Salunyou Xayyasarn Technical Staff, Lao statistics Bureau, MPI
Field collection Teams
Teams 1 Vientiane Capital Mr. phimpha Changduangsavanh Technical Staff, Statistical of Province Dr. bounyod Moonkalak Ministry of Health Ms. Sonephet Bannalath Technical Staff, District Statistics Ms. Orlathai Sysuthum Technical Staff, District Statistics Ms. Phonesavanh Vilaivan Technical Staff, Statistical of Province Dr. visanu Phermphoth Department of Public Health Ms. Phinmany phommavy Department of Public Health
Teams 2 Vientiane Capital Ms. Thanhomchid Porlavong Technical Staff, District Statistics Dr. Orlanat Phandinvaih Technical Staff, Ministry of Health Ms. Sommala Sukhaphom Technical Staff, Statistical of Province Ms. Phimchai Bualavong Technical Staff, District Statistics Mr. Thavatxai chantala Technical Staff, District Statistics Mr. Saosamhon sintavong Department of Public Health Dr. Pheng Vongpanya Department of Public Health
Teams 3 Phongsaly Province Mr. Kou Ms.ang Vilaiphone Technical Staff, District Statistics Mr. Fachit so Ms.angchuery Technical Staff, District Statistics Ms. Chanmaly Xaiyating Technical Staff, District Statistics Ms. Saoboun Nam Technical Staff, District Statistics Mr. Viengoudom vongphomkong Technical Staff, Lao statistics Bureau, MPI Mr. Kamyin Sina Department of Public Health Mr. Chanthala Inthalart Department of Public Health
Mr. Souladet Keoduangchan Technical Staff, Statistical of Province Ms. Mon Aiseng Technical Staff, Statistical of Province Ms. Lien Lorka Mr.oiy Technical Staff, District Statistics Ms. Soulida Lomany Technical Staff, District Statistics Mr. Konevilai Markphonsook Technical Staff, Lao statistics Bureau, MPI Mr. Phaimany Xaiyalart Department of Public Health Mr. Xarng Sorinpan Department of Public Health
Teams 5 Oudomxay Province Mr. Sengaloun Tammasaen Technical Staff, Statistical of Province Mr. Kongthip Soulakarm Technical Staff, Statistical of Province Ms. Kadmaly phommachak Technical Staff, District Statistics Ms. Kounkam Daungphajan Technical Staff, District Statistics Ms. Davone Koonsanguan Department of Public Health Mr. Soodtisak Xaiyavong Department of Public Health Mr. bounmy Xaimanyvan Technical Staff, District Statistics
Teams 6 Bokeo Province Mr. Sengthavy Phimmasone Technical Staff, Statistical of Province Ms. Chanzaiy Xaiyavong Technical Staff, Statistical of Province Ms. Pany Phiakeo Technical Staff, Statistical of Province Ms. Manysone Lormexai Technical Staff, Statistical of Province Mr. Anousin Syvankam Technical Staff, District Statistics Ms. Chanthaphone Boonsavanh Department of Public Health Mr. Kerng Vongphakam Department of Public Health
Teams 7 Luangprabang Province Mr. Soulidet phommala Technical Staff, Statistical of Province Mr. Xaiyaphet pho Ms.y Technical Staff, District Statistics Ms. Symone Chanthavong Technical Staff, District Statistics Ms. Soudaphone mhankong Technical Staff, District Statistics Ms. Phonevilai Boodsady Technical Staff, Ministry of Health Ms. Kaenchan Department of Public Health Mr. Somchan Department of Public Health
Teams 8 Luangprabang Province Mr. Thongsavanh Thanasak Technical Staff, Lao statistics Bureau Mr. Chayarng Yasaenxai Technical Staff, District Statistics Ms. Pinkeo Latsamhy Technical Staff, District Statistics Ms. Sykone Souphalid Technical Staff, District Statistics Ms. Vaiyakone Phommavilai Technical Staff, District Statistics Ms. Sykai Department of Public Health Mr. Phanthaly Phommavong Technical Staff, Ministry of Health
Teams 9 Huaphanh Province Mr. Xaisanid Phoodthapanya Technical Staff, Statistical of Province Mr. Koonsook ThipphavongXai Technical Staff, Statistical of Province Ms. Vonephet Phomvongxai Technical Staff, Statistical of Province Ms. Saiysamhone Phetpathoomma Technical Staff, Statistical of Province Mr. Pativet Latvilaivong Technical Staff, Lao statistics Bureau Mr.Viengkam Boonthavong Technical Staff, Ministry of Health Ms. Sonenapha Chanvilai Department of Public Health
Teams 4 Luangnamtha Province
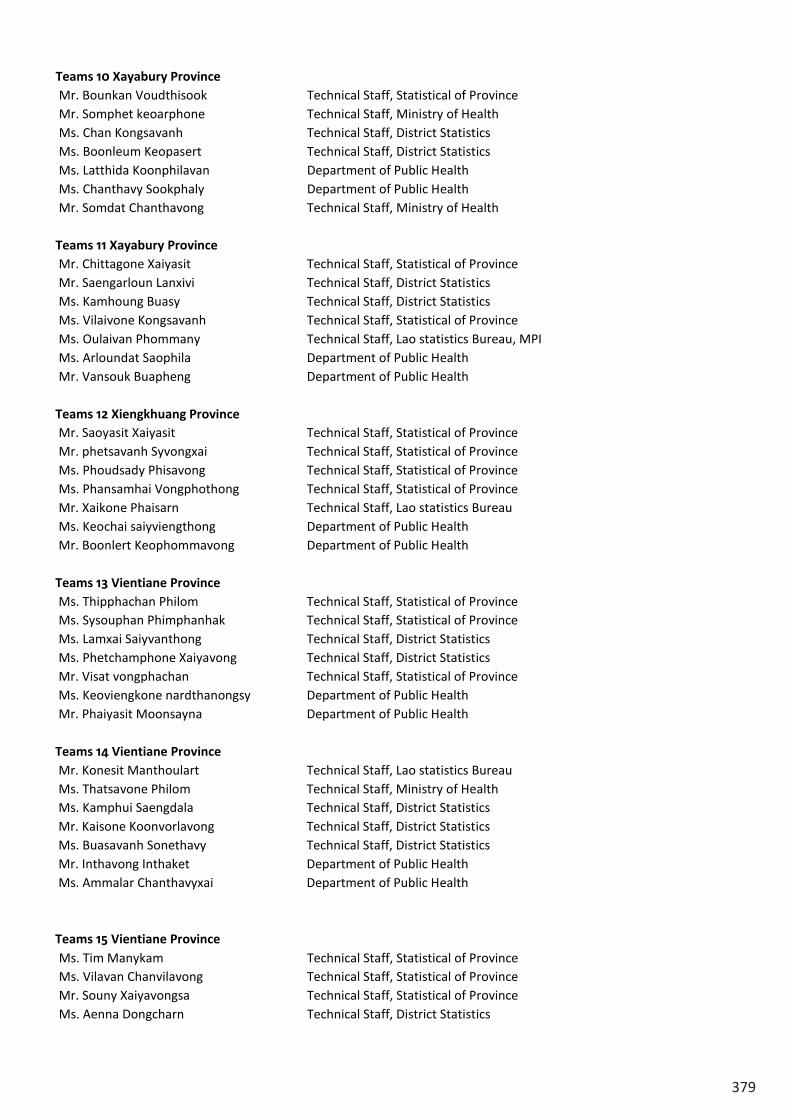
379
Teams 10 Xayabury Province Mr. Bounkan Voudthisook Technical Staff, Statistical of Province Mr. Somphet keoarphone Technical Staff, Ministry of Health Ms. Chan Kongsavanh Technical Staff, District Statistics Ms. Boonleum Keopasert Technical Staff, District Statistics Ms. Latthida Koonphilavan Department of Public Health Ms. Chanthavy Sookphaly Department of Public Health Mr. Somdat Chanthavong Technical Staff, Ministry of Health Teams 11 Xayabury Province Mr. Chittagone Xaiyasit Technical Staff, Statistical of Province Mr. Saengarloun Lanxivi Technical Staff, District Statistics Ms. Kamhoung Buasy Technical Staff, District Statistics Ms. Vilaivone Kongsavanh Technical Staff, Statistical of Province Ms. Oulaivan Phommany Technical Staff, Lao statistics Bureau, MPI Ms. Arloundat Saophila Department of Public Health Mr. Vansouk Buapheng Department of Public Health Teams 12 Xiengkhuang Province Mr. Saoyasit Xaiyasit Technical Staff, Statistical of Province Mr. phetsavanh Syvongxai Technical Staff, Statistical of Province Ms. Phoudsady Phisavong Technical Staff, Statistical of Province Ms. Phansamhai Vongphothong Technical Staff, Statistical of Province Mr. Xaikone Phaisarn Technical Staff, Lao statistics Bureau Ms. Keochai saiyviengthong Department of Public Health Mr. Boonlert Keophommavong Department of Public Health Teams 13 Vientiane Province Ms. Thipphachan Philom Technical Staff, Statistical of Province Ms. Sysouphan Phimphanhak Technical Staff, Statistical of Province Ms. Lamxai Saiyvanthong Technical Staff, District Statistics Ms. Phetchamphone Xaiyavong Technical Staff, District Statistics Mr. Visat vongphachan Technical Staff, Statistical of Province Ms. Keoviengkone nardthanongsy Department of Public Health Mr. Phaiyasit Moonsayna Department of Public Health Teams 14 Vientiane Province Mr. Konesit Manthoulart Technical Staff, Lao statistics Bureau Ms. Thatsavone Philom Technical Staff, Ministry of Health Ms. Kamphui Saengdala Technical Staff, District Statistics Mr. Kaisone Koonvorlavong Technical Staff, District Statistics Ms. Buasavanh Sonethavy Technical Staff, District Statistics Mr. Inthavong Inthaket Department of Public Health Ms. Ammalar Chanthavyxai Department of Public Health Teams 15 Vientiane Province Ms. Tim Manykam Technical Staff, Statistical of Province Ms. Vilavan Chanvilavong Technical Staff, Statistical of Province Mr. Souny Xaiyavongsa Technical Staff, Statistical of Province Ms. Aenna Dongcharn Technical Staff, District Statistics
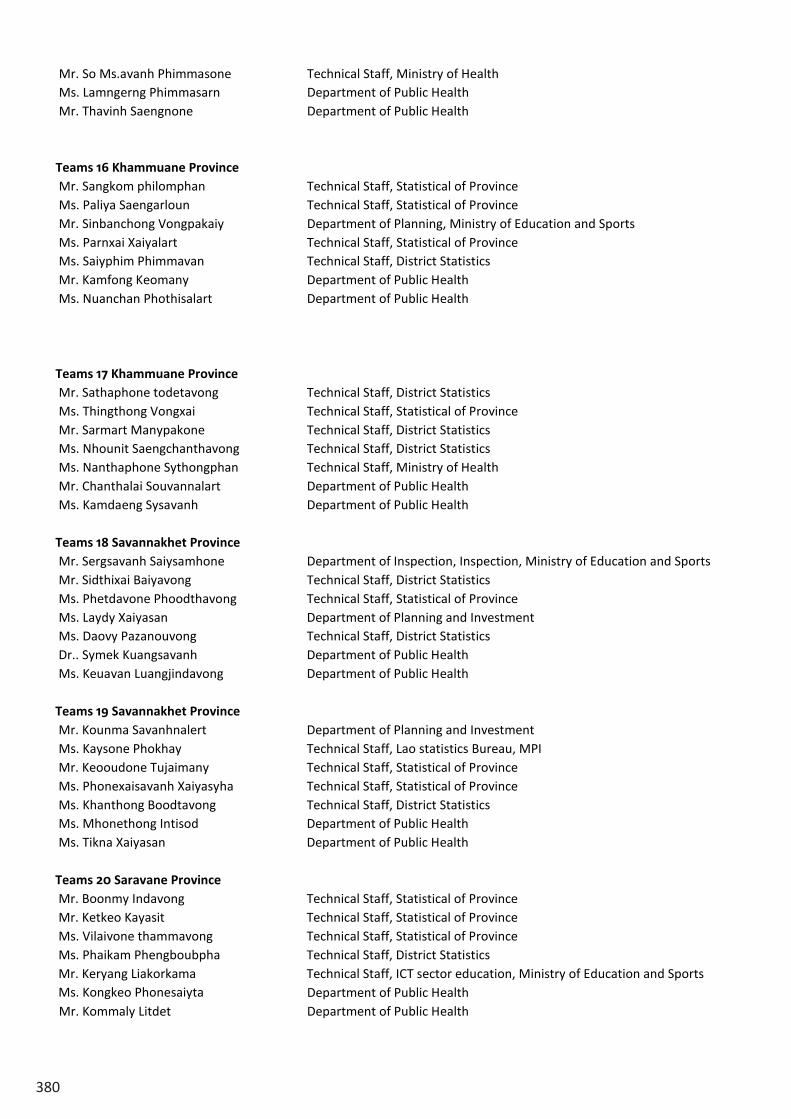
380
Teams 10 Xayabury Province Mr. Bounkan Voudthisook Technical Staff, Statistical of Province Mr. Somphet keoarphone Technical Staff, Ministry of Health Ms. Chan Kongsavanh Technical Staff, District Statistics Ms. Boonleum Keopasert Technical Staff, District Statistics Ms. Latthida Koonphilavan Department of Public Health Ms. Chanthavy Sookphaly Department of Public Health Mr. Somdat Chanthavong Technical Staff, Ministry of Health Teams 11 Xayabury Province Mr. Chittagone Xaiyasit Technical Staff, Statistical of Province Mr. Saengarloun Lanxivi Technical Staff, District Statistics Ms. Kamhoung Buasy Technical Staff, District Statistics Ms. Vilaivone Kongsavanh Technical Staff, Statistical of Province Ms. Oulaivan Phommany Technical Staff, Lao statistics Bureau, MPI Ms. Arloundat Saophila Department of Public Health Mr. Vansouk Buapheng Department of Public Health Teams 12 Xiengkhuang Province Mr. Saoyasit Xaiyasit Technical Staff, Statistical of Province Mr. phetsavanh Syvongxai Technical Staff, Statistical of Province Ms. Phoudsady Phisavong Technical Staff, Statistical of Province Ms. Phansamhai Vongphothong Technical Staff, Statistical of Province Mr. Xaikone Phaisarn Technical Staff, Lao statistics Bureau Ms. Keochai saiyviengthong Department of Public Health Mr. Boonlert Keophommavong Department of Public Health Teams 13 Vientiane Province Ms. Thipphachan Philom Technical Staff, Statistical of Province Ms. Sysouphan Phimphanhak Technical Staff, Statistical of Province Ms. Lamxai Saiyvanthong Technical Staff, District Statistics Ms. Phetchamphone Xaiyavong Technical Staff, District Statistics Mr. Visat vongphachan Technical Staff, Statistical of Province Ms. Keoviengkone nardthanongsy Department of Public Health Mr. Phaiyasit Moonsayna Department of Public Health Teams 14 Vientiane Province Mr. Konesit Manthoulart Technical Staff, Lao statistics Bureau Ms. Thatsavone Philom Technical Staff, Ministry of Health Ms. Kamphui Saengdala Technical Staff, District Statistics Mr. Kaisone Koonvorlavong Technical Staff, District Statistics Ms. Buasavanh Sonethavy Technical Staff, District Statistics Mr. Inthavong Inthaket Department of Public Health Ms. Ammalar Chanthavyxai Department of Public Health Teams 15 Vientiane Province Ms. Tim Manykam Technical Staff, Statistical of Province Ms. Vilavan Chanvilavong Technical Staff, Statistical of Province Mr. Souny Xaiyavongsa Technical Staff, Statistical of Province Ms. Aenna Dongcharn Technical Staff, District Statistics
Mr. So Ms.avanh Phimmasone Technical Staff, Ministry of Health Ms. Lamngerng Phimmasarn Department of Public Health Mr. Thavinh Saengnone Department of Public Health Teams 16 Khammuane Province Mr. Sangkom philomphan Technical Staff, Statistical of Province Ms. Paliya Saengarloun Technical Staff, Statistical of Province Mr. Sinbanchong Vongpakaiy Department of Planning, Ministry of Education and Sports Ms. Parnxai Xaiyalart Technical Staff, Statistical of Province Ms. Saiyphim Phimmavan Technical Staff, District Statistics Mr. Kamfong Keomany Department of Public Health Ms. Nuanchan Phothisalart Department of Public Health Teams 17 Khammuane Province Mr. Sathaphone todetavong Technical Staff, District Statistics Ms. Thingthong Vongxai Technical Staff, Statistical of Province Mr. Sarmart Manypakone Technical Staff, District Statistics Ms. Nhounit Saengchanthavong Technical Staff, District Statistics Ms. Nanthaphone Sythongphan Technical Staff, Ministry of Health Mr. Chanthalai Souvannalart Department of Public Health Ms. Kamdaeng Sysavanh Department of Public Health Teams 18 Savannakhet Province Mr. Sergsavanh Saiysamhone Department of Inspection, Inspection, Ministry of Education and Sports Mr. Sidthixai Baiyavong Technical Staff, District Statistics Ms. Phetdavone Phoodthavong Technical Staff, Statistical of Province Ms. Laydy Xaiyasan Department of Planning and Investment Ms. Daovy Pazanouvong Technical Staff, District Statistics Dr.. Symek Kuangsavanh Department of Public Health Ms. Keuavan Luangjindavong Department of Public Health Teams 19 Savannakhet Province Mr. Kounma Savanhnalert Department of Planning and Investment Ms. Kaysone Phokhay Technical Staff, Lao statistics Bureau, MPI Mr. Keooudone Tujaimany Technical Staff, Statistical of Province Ms. Phonexaisavanh Xaiyasyha Technical Staff, Statistical of Province Ms. Khanthong Boodtavong Technical Staff, District Statistics Ms. Mhonethong Intisod Department of Public Health Ms. Tikna Xaiyasan Department of Public Health Teams 20 Saravane Province Mr. Boonmy Indavong Technical Staff, Statistical of Province Mr. Ketkeo Kayasit Technical Staff, Statistical of Province Ms. Vilaivone thammavong Technical Staff, Statistical of Province Ms. Phaikam Phengboubpha Technical Staff, District Statistics Mr. Keryang Liakorkama Technical Staff, ICT sector education, Ministry of Education and Sports Ms. Kongkeo Phonesaiyta Department of Public Health Mr. Kommaly Litdet Department of Public Health
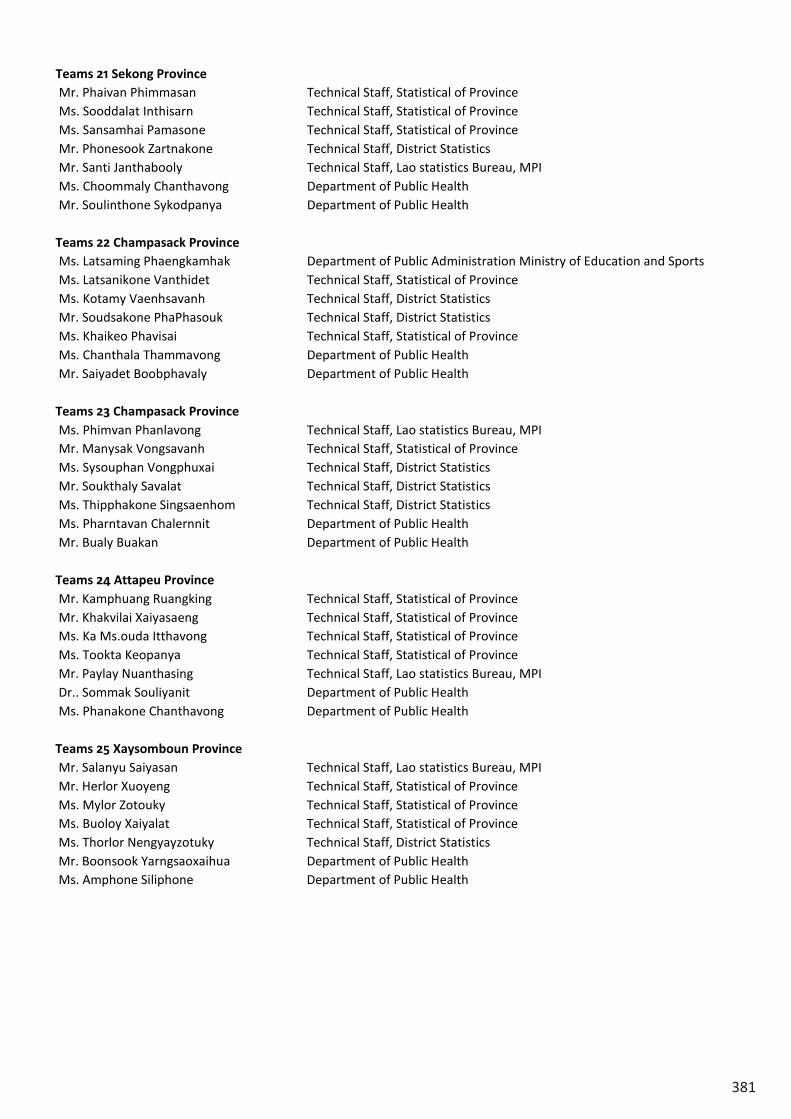
381
Teams 21 Sekong Province Mr. Phaivan Phimmasan Technical Staff, Statistical of Province Ms. Sooddalat Inthisarn Technical Staff, Statistical of Province Ms. Sansamhai Pamasone Technical Staff, Statistical of Province Mr. Phonesook Zartnakone Technical Staff, District Statistics Mr. Santi Janthabooly Technical Staff, Lao statistics Bureau, MPI Ms. Choommaly Chanthavong Department of Public Health Mr. Soulinthone Sykodpanya Department of Public Health Teams 22 Champasack Province Ms. Latsaming Phaengkamhak Department of Public Administration Ministry of Education and Sports Ms. Latsanikone Vanthidet Technical Staff, Statistical of Province Ms. Kotamy Vaenhsavanh Technical Staff, District Statistics Mr. Soudsakone PhaPhasouk Technical Staff, District Statistics Ms. Khaikeo Phavisai Technical Staff, Statistical of Province Ms. Chanthala Thammavong Department of Public Health Mr. Saiyadet Boobphavaly Department of Public Health Teams 23 Champasack Province Ms. Phimvan Phanlavong Technical Staff, Lao statistics Bureau, MPI Mr. Manysak Vongsavanh Technical Staff, Statistical of Province Ms. Sysouphan Vongphuxai Technical Staff, District Statistics Mr. Soukthaly Savalat Technical Staff, District Statistics Ms. Thipphakone Singsaenhom Technical Staff, District Statistics Ms. Pharntavan Chalernnit Department of Public Health Mr. Bualy Buakan Department of Public Health Teams 24 Attapeu Province Mr. Kamphuang Ruangking Technical Staff, Statistical of Province Mr. Khakvilai Xaiyasaeng Technical Staff, Statistical of Province Ms. Ka Ms.ouda Itthavong Technical Staff, Statistical of Province Ms. Tookta Keopanya Technical Staff, Statistical of Province Mr. Paylay Nuanthasing Technical Staff, Lao statistics Bureau, MPI Dr.. Sommak Souliyanit Department of Public Health Ms. Phanakone Chanthavong Department of Public Health Teams 25 Xaysomboun Province Mr. Salanyu Saiyasan Technical Staff, Lao statistics Bureau, MPI Mr. Herlor Xuoyeng Technical Staff, Statistical of Province Ms. Mylor Zotouky Technical Staff, Statistical of Province Ms. Buoloy Xaiyalat Technical Staff, Statistical of Province Ms. Thorlor Nengyayzotuky Technical Staff, District Statistics Mr. Boonsook Yarngsaoxaihua Department of Public Health Ms. Amphone Siliphone Department of Public Health

383
383
APPENDIX C. ESTIMATES OF SAMPLING ERRORS
The sample of respondents selected in the LSISII is only one of the samples that could have been selected from the same population, using the same design and size. Each of these samples would yield results that differ somewhat from the results based on the actual sample selected. Sampling errors are a measure of the variability between the estimates from all possible samples. The extent of variability is not known exactly, but can be estimated statistically from the survey data.
The following sampling error measures are presented in this appendix for each of the selected indicators:
▪ Standard error (se): Standard error is the square root of the variance of the estimate. For survey indicators that are means, proportions or ratios, the Taylor series linearization method is used for the estimation of standard errors. For more complex statistics, such as fertility and mortality rates, the Jackknife repeated replication method is used for standard error estimation.
▪ Coefficient of variation (se/r) is the ratio of the standard error to the value (r) of the indicator, and is a measure of the relative sampling error.
▪ Design effect (deff) is the ratio of the actual variance of an indicator, under the sampling method used in the survey, to the variance calculated under the assumption of simple random sampling based on the same sample size. The square root of the design effect (deft) is used to show the efficiency of the sample design in relation to the precision. A deft value of 1.0 indicates that the sample design of the survey is as efficient as a simple random sample for a particular indicator, while a deft value above 1.0 indicates an increase in the standard error due to the use of a more complex sample design.
▪ Confidence limits are calculated to show the interval which contains the true value of the indicator for the population, with a specified level of confidence. For MICS results 95% confidence intervals are used, which is the standard for this type of survey. The concept of the 95% confidence interval can be understood in this way: if many repeated samples of identical size and design were taken and the confidence interval computed for each sample, then 95% of these intervals would contain the true value of the indicator.
For the calculation of sampling errors from MICS data, programs developed in CSPro Version 5.0 and SPSS Version 23 Complex Samples module have been used.
The results are shown in the tables that follow. Sampling errors are calculated for SDG indicators for which SEs can be calculated, and several other MICS indicators. Definitions, numerators and denominators of each of these indicators are provided in Chapter III. Results are presented for the national level (Table SE.1), for urban and rural areas (Tables SE.2 and SE.3), for all regions, and for all provinces (Tables SE.4 to SE.8).
In addition to the sampling error measures described above, the tables also include weighted and unweighted counts of denominators for each indicator. Given the use of normalized weights, by comparing the weighted and unweighted counts it is possible to determine whether a particular domain has been under-sampled or over-sampled compared to the average sampling rate. If the weighted count is smaller than the unweighted count, this means that the domain had been over-sampled.
For several indicators, however, the unweighted count represents the number of sample households, and the weighted counts reflect the total population living in these households.
• Access to electricity • Primary reliance on clean fuels and technologies for cooking, space heating and lighting • Use of basic drinking water services • Use of safely managed drinking water services • Handwashing facility with water and soap • Use of basic sanitation services • Safe disposal in situ of excreta from on-site sanitation facilities • Population covered by social transfers
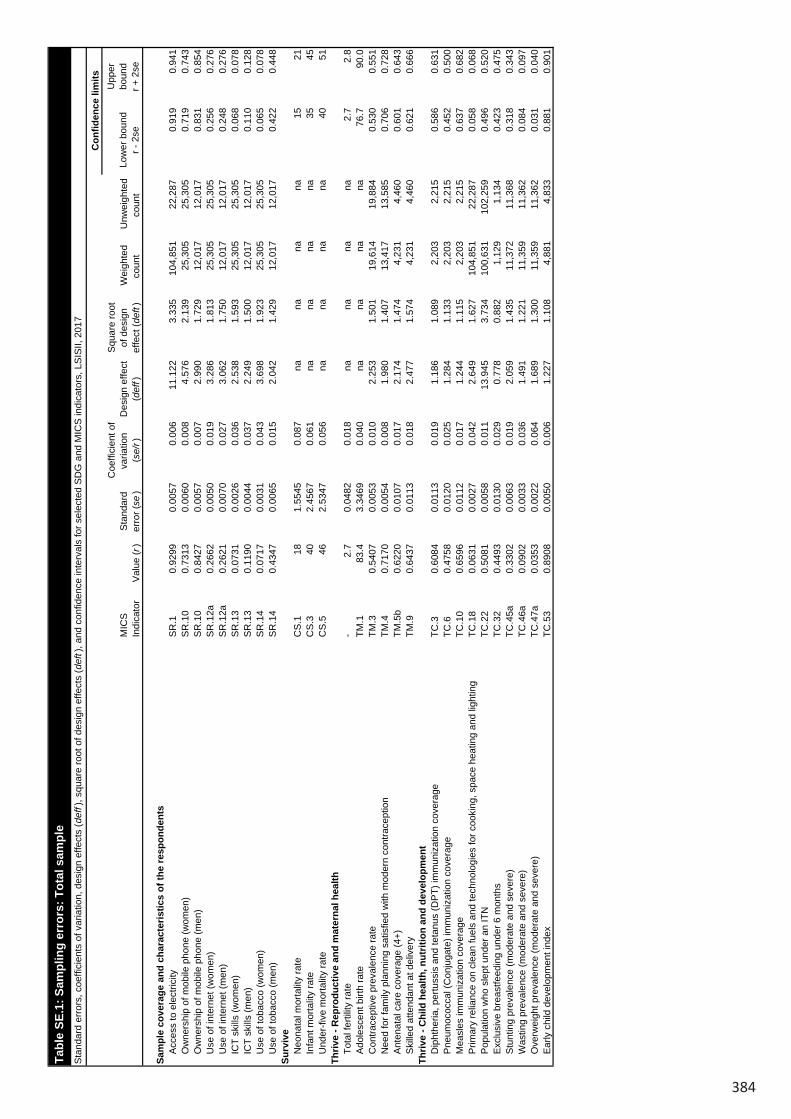
384
Low
er b
ound
r - 2
se
Upp
erbo
und
r + 2
se
Sam
ple
cove
rage
and
cha
ract
eris
tics
of th
e re
spon
dent
sA
cces
s to
ele
ctric
ityS
R.1
0.92
990.
0057
0.00
611
.122
3.33
510
4,85
1
22,2
87
0.91
90.
941
Ow
ners
hip
of m
obile
pho
ne (w
omen
)S
R.1
00.
7313
0.00
600.
008
4.57
62.
139
25,3
05
25,3
05
0.71
90.
743
Ow
ners
hip
of m
obile
pho
ne (m
en)
SR
.10
0.84
270.
0057
0.00
72.
990
1.72
912
,017
12
,017
0.
831
0.85
4U
se o
f int
erne
t (w
omen
)S
R.1
2a0.
2662
0.00
500.
019
3.28
61.
813
25,3
05
25,3
05
0.25
60.
276
Use
of i
nter
net (
men
)S
R.1
2a0.
2621
0.00
700.
027
3.06
21.
750
12,0
17
12,0
17
0.24
80.
276
ICT
skill
s (w
omen
)S
R.1
30.
0731
0.00
260.
036
2.53
81.
593
25,3
05
25,3
05
0.06
80.
078
ICT
skill
s (m
en)
SR
.13
0.11
900.
0044
0.03
72.
249
1.50
012
,017
12
,017
0.
110
0.12
8U
se o
f tob
acco
(wom
en)
SR
.14
0.07
170.
0031
0.04
33.
698
1.92
325
,305
25
,305
0.
065
0.07
8U
se o
f tob
acco
(men
)S
R.1
40.
4347
0.00
650.
015
2.04
21.
429
12,0
17
12,0
17
0.42
20.
448
Surv
ive
Neo
nata
l mor
talit
y ra
teC
S.1
181.
5545
0.08
7na
nana
na15
21In
fant
mor
talit
y ra
teC
S.3
402.
4567
0.06
1na
nana
na35
45U
nder
-five
mor
talit
y ra
teC
S.5
462.
5347
0.05
6na
nana
na40
51Th
rive
- Rep
rodu
ctiv
e an
d m
ater
nal h
ealth
Tota
l fer
tility
rate
-2.
70.
0482
0.01
8na
nana
na2.
72.
8A
dole
scen
t birt
h ra
teTM
.183
.43.
3469
0.04
0na
nana
na76
.790
.0C
ontra
cept
ive
prev
alen
ce ra
teTM
.30.
5407
0.00
530.
010
2.25
31.
501
19,6
14
19,8
84
0.53
00.
551
Nee
d fo
r fam
ily p
lann
ing
satis
fied
with
mod
ern
cont
race
ptio
nTM
.40.
7170
0.00
540.
008
1.98
01.
407
13,4
17
13,5
85
0.70
60.
728
Ant
enat
al c
are
cove
rage
(4+)
TM.5
b0.
6220
0.01
070.
017
2.17
41.
474
4,23
1
4,
460
0.60
10.
643
Ski
lled
atte
ndan
t at d
eliv
ery
TM.9
0.64
370.
0113
0.01
82.
477
1.57
44,
231
4,46
0
0.
621
0.66
6Th
rive
- Chi
ld h
ealth
, nut
ritio
n an
d de
velo
pmen
tD
ipht
heria
, per
tuss
is a
nd te
tanu
s (D
PT)
imm
uniz
atio
n co
vera
geTC
.30.
6084
0.01
130.
019
1.18
61.
089
2,20
3
2,
215
0.58
60.
631
Pne
umoc
occa
l (C
onju
gate
) im
mun
izat
ion
cove
rage
TC.6
0.47
580.
0120
0.02
51.
284
1.13
32,
203
2,21
5
0.
452
0.50
0M
easl
es im
mun
izat
ion
cove
rage
TC.1
00.
6596
0.01
120.
017
1.24
41.
115
2,20
3
2,
215
0.63
70.
682
Prim
ary
relia
nce
on c
lean
fuel
s an
d te
chno
logi
es fo
r coo
king
, spa
ce h
eatin
g an
d lig
htin
gTC
.18
0.06
310.
0027
0.04
22.
649
1.62
710
4,85
1
22,2
87
0.05
80.
068
Pop
ulat
ion
who
sle
pt u
nder
an
ITN
TC.2
20.
5081
0.00
580.
011
13.9
453.
734
100,
631
10
2,25
9
0.49
60.
520
Exc
lusi
ve b
reas
tfeed
ing
unde
r 6 m
onth
sTC
.32
0.44
930.
0130
0.02
90.
778
0.88
21,
129
1,13
4
0.
423
0.47
5S
tunt
ing
prev
alen
ce (m
oder
ate
and
seve
re)
TC.4
5a0.
3302
0.00
630.
019
2.05
91.
435
11,3
72
11,3
68
0.31
80.
343
Was
ting
prev
alen
ce (m
oder
ate
and
seve
re)
TC.4
6a0.
0902
0.00
330.
036
1.49
11.
221
11,3
59
11,3
62
0.08
40.
097
Ove
rwei
ght p
reva
lenc
e (m
oder
ate
and
seve
re)
TC.4
7a0.
0353
0.00
220.
064
1.68
91.
300
11,3
59
11,3
62
0.03
10.
040
Ear
ly c
hild
dev
elop
men
t ind
exTC
.53
0.89
080.
0050
0.00
61.
227
1.10
84,
881
4,83
3
0.
881
0.90
1
Low
er b
ound
r - 2
se
Upp
erbo
und
r + 2
seLe
arn
Par
ticip
atio
n ra
te in
org
anis
ed le
arni
ng (a
djus
ted)
LN.2
0.73
860.
0108
0.01
51.
542
1.24
22,
432
2,57
3
0.
717
0.76
0Pr
otec
ted
from
vio
lenc
e an
d ex
ploi
tatio
nB
irth
regi
stra
tion
PR
.10.
7295
0.00
730.
010
3.19
71.
788
11,7
20
11,7
20
0.71
50.
744
Vio
lent
dis
cipl
ine
PR
.20.
6905
0.00
510.
007
2.67
41.
635
33,5
84
21,6
15
0.68
00.
701
Chi
ld la
bour
PR
.30.
4249
0.00
620.
015
2.42
51.
557
30,3
72
15,4
35
0.41
30.
437
Chi
ld m
arria
ge (b
efor
e ag
e 15
)P
R.4
a0.
0710
0.00
440.
063
1.23
61.
112
4,02
4
4,
121
0.06
20.
080
Chi
ld m
arria
ge (b
efor
e ag
e 18
)P
R.4
b0.
3273
0.00
870.
027
1.42
01.
192
4,02
4
4,
121
0.31
00.
345
Live
in a
saf
e an
d cl
ean
envi
ronm
ent
Use
of b
asic
drin
king
wat
er s
ervi
ces
WS
.20.
7808
0.00
770.
010
7.69
62.
774
104,
851
22
,287
0.
765
0.79
6U
se o
f saf
ely
man
aged
drin
king
wat
er s
ervi
ces
WS
.60.
1475
0.00
720.
049
1.34
71.
161
15,4
96
3,29
0
0.
133
0.16
2H
andw
ashi
ng fa
cilit
y w
ith w
ater
and
soa
pW
S.7
0.54
080.
0074
0.01
44.
954
2.22
610
4,80
3
22,2
77
0.52
60.
556
Use
of b
asic
san
itatio
n se
rvic
esW
S.9
0.71
020.
0075
0.01
16.
076
2.46
510
4,85
1
22,2
87
0.69
50.
725
Saf
e di
spos
al in
situ
of e
xcre
ta fr
om o
n-si
te s
anita
tion
faci
litie
sW
S.1
00.
8957
0.00
430.
005
3.19
01.
786
75,5
42
16,2
67
0.88
70.
904
Equi
tabl
e ch
ance
in li
feC
hild
ren
with
func
tiona
l difi
culty
E
Q.1
0.02
030.
0018
0.08
81.
166
1.08
07,
250
7,20
6
0.
017
0.02
4P
opul
atio
n co
vere
d by
soc
ial t
rans
fers
EQ
.30.
1243
0.00
320.
026
2.07
51.
441
104,
851
22
,287
0.
118
0.13
1
Des
ign
effe
ct
(def
f)
Squ
are
root
of
des
ign
effe
ct (d
eft)
Wei
ghte
d co
unt
Unw
eigh
ted
coun
t
Con
fiden
ce li
mits
MIC
SIn
dica
tor
Val
ue (r
)S
tand
ard
erro
r (se
)
Coe
ffici
ent o
f va
riatio
n(s
e/r)
na: n
ot a
pplic
able
Tabl
e SE
.1: S
ampl
ing
erro
rs: T
otal
sam
ple
Sta
ndar
d er
rors
, coe
ffici
ents
of v
aria
tion,
des
ign
effe
cts
(def
f), s
quar
e ro
ot o
f des
ign
effe
cts
(def
t), a
nd c
onfid
ence
inte
rval
s fo
r sel
ecte
d S
DG
and
MIC
S in
dica
tors
, LS
ISII,
201
7
MIC
SIn
dica
tor
Val
ue (r
)S
tand
ard
erro
r (se
)
Coe
ffici
ent o
f va
riatio
n(s
e/r)
Des
ign
effe
ct
(def
f)
Squ
are
root
of
des
ign
effe
ct (d
eft)
Wei
ghte
d co
unt
Unw
eigh
ted
coun
t
Con
fiden
ce li
mits
Tabl
e SE
.1: S
ampl
ing
erro
rs: T
otal
sam
ple
Sta
ndar
d er
rors
, coe
ffici
ents
of v
aria
tion,
des
ign
effe
cts
(def
f), s
quar
e ro
ot o
f des
ign
effe
cts
(def
t), a
nd c
onfid
ence
inte
rval
s fo
r sel
ecte
d S
DG
and
MIC
S in
dica
tors
, LS
ISII,
201
7
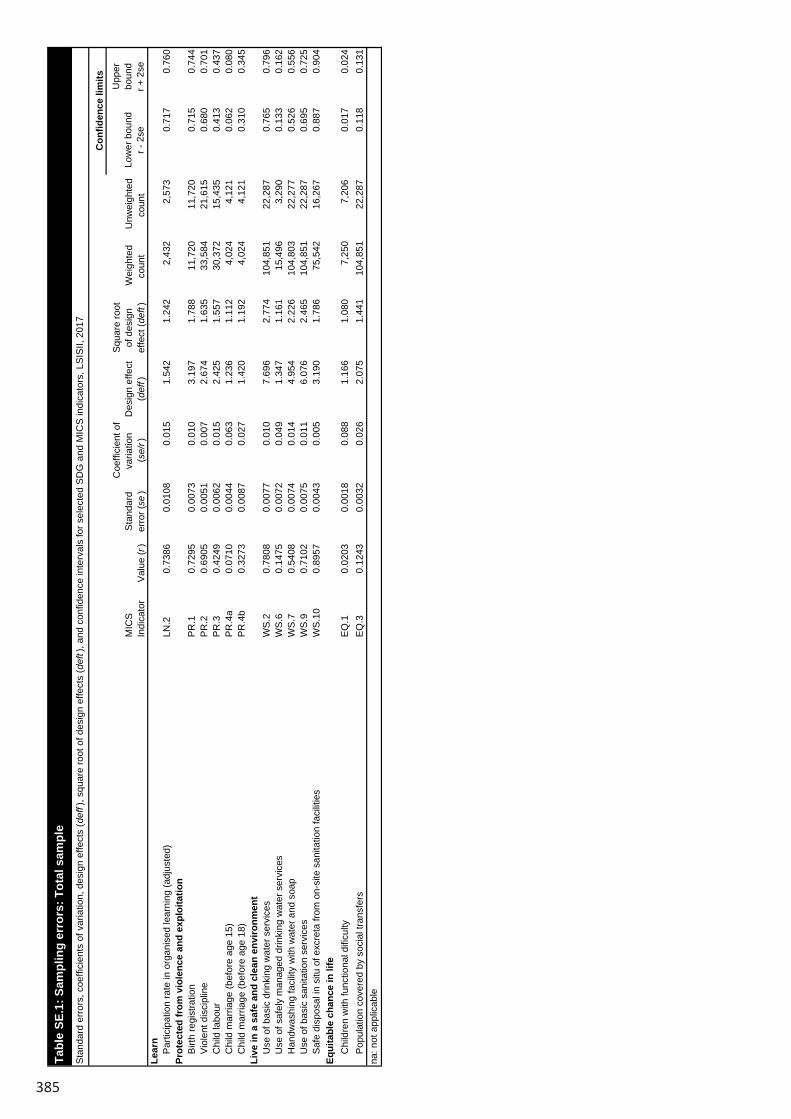
385
Low
er b
ound
r - 2
se
Upp
erbo
und
r + 2
se
Sam
ple
cove
rage
and
cha
ract
eris
tics
of th
e re
spon
dent
sA
cces
s to
ele
ctric
ityS
R.1
0.92
990.
0057
0.00
611
.122
3.33
510
4,85
1
22,2
87
0.91
90.
941
Ow
ners
hip
of m
obile
pho
ne (w
omen
)S
R.1
00.
7313
0.00
600.
008
4.57
62.
139
25,3
05
25,3
05
0.71
90.
743
Ow
ners
hip
of m
obile
pho
ne (m
en)
SR
.10
0.84
270.
0057
0.00
72.
990
1.72
912
,017
12
,017
0.
831
0.85
4U
se o
f int
erne
t (w
omen
)S
R.1
2a0.
2662
0.00
500.
019
3.28
61.
813
25,3
05
25,3
05
0.25
60.
276
Use
of i
nter
net (
men
)S
R.1
2a0.
2621
0.00
700.
027
3.06
21.
750
12,0
17
12,0
17
0.24
80.
276
ICT
skill
s (w
omen
)S
R.1
30.
0731
0.00
260.
036
2.53
81.
593
25,3
05
25,3
05
0.06
80.
078
ICT
skill
s (m
en)
SR
.13
0.11
900.
0044
0.03
72.
249
1.50
012
,017
12
,017
0.
110
0.12
8U
se o
f tob
acco
(wom
en)
SR
.14
0.07
170.
0031
0.04
33.
698
1.92
325
,305
25
,305
0.
065
0.07
8U
se o
f tob
acco
(men
)S
R.1
40.
4347
0.00
650.
015
2.04
21.
429
12,0
17
12,0
17
0.42
20.
448
Surv
ive
Neo
nata
l mor
talit
y ra
teC
S.1
181.
5545
0.08
7na
nana
na15
21In
fant
mor
talit
y ra
teC
S.3
402.
4567
0.06
1na
nana
na35
45U
nder
-five
mor
talit
y ra
teC
S.5
462.
5347
0.05
6na
nana
na40
51Th
rive
- Rep
rodu
ctiv
e an
d m
ater
nal h
ealth
Tota
l fer
tility
rate
-2.
70.
0482
0.01
8na
nana
na2.
72.
8A
dole
scen
t birt
h ra
teTM
.183
.43.
3469
0.04
0na
nana
na76
.790
.0C
ontra
cept
ive
prev
alen
ce ra
teTM
.30.
5407
0.00
530.
010
2.25
31.
501
19,6
14
19,8
84
0.53
00.
551
Nee
d fo
r fam
ily p
lann
ing
satis
fied
with
mod
ern
cont
race
ptio
nTM
.40.
7170
0.00
540.
008
1.98
01.
407
13,4
17
13,5
85
0.70
60.
728
Ant
enat
al c
are
cove
rage
(4+)
TM.5
b0.
6220
0.01
070.
017
2.17
41.
474
4,23
1
4,
460
0.60
10.
643
Ski
lled
atte
ndan
t at d
eliv
ery
TM.9
0.64
370.
0113
0.01
82.
477
1.57
44,
231
4,46
0
0.
621
0.66
6Th
rive
- Chi
ld h
ealth
, nut
ritio
n an
d de
velo
pmen
tD
ipht
heria
, per
tuss
is a
nd te
tanu
s (D
PT)
imm
uniz
atio
n co
vera
geTC
.30.
6084
0.01
130.
019
1.18
61.
089
2,20
3
2,
215
0.58
60.
631
Pne
umoc
occa
l (C
onju
gate
) im
mun
izat
ion
cove
rage
TC.6
0.47
580.
0120
0.02
51.
284
1.13
32,
203
2,21
5
0.
452
0.50
0M
easl
es im
mun
izat
ion
cove
rage
TC.1
00.
6596
0.01
120.
017
1.24
41.
115
2,20
3
2,
215
0.63
70.
682
Prim
ary
relia
nce
on c
lean
fuel
s an
d te
chno
logi
es fo
r coo
king
, spa
ce h
eatin
g an
d lig
htin
gTC
.18
0.06
310.
0027
0.04
22.
649
1.62
710
4,85
1
22,2
87
0.05
80.
068
Pop
ulat
ion
who
sle
pt u
nder
an
ITN
TC.2
20.
5081
0.00
580.
011
13.9
453.
734
100,
631
10
2,25
9
0.49
60.
520
Exc
lusi
ve b
reas
tfeed
ing
unde
r 6 m
onth
sTC
.32
0.44
930.
0130
0.02
90.
778
0.88
21,
129
1,13
4
0.
423
0.47
5S
tunt
ing
prev
alen
ce (m
oder
ate
and
seve
re)
TC.4
5a0.
3302
0.00
630.
019
2.05
91.
435
11,3
72
11,3
68
0.31
80.
343
Was
ting
prev
alen
ce (m
oder
ate
and
seve
re)
TC.4
6a0.
0902
0.00
330.
036
1.49
11.
221
11,3
59
11,3
62
0.08
40.
097
Ove
rwei
ght p
reva
lenc
e (m
oder
ate
and
seve
re)
TC.4
7a0.
0353
0.00
220.
064
1.68
91.
300
11,3
59
11,3
62
0.03
10.
040
Ear
ly c
hild
dev
elop
men
t ind
exTC
.53
0.89
080.
0050
0.00
61.
227
1.10
84,
881
4,83
3
0.
881
0.90
1
Low
er b
ound
r - 2
se
Upp
erbo
und
r + 2
seLe
arn
Par
ticip
atio
n ra
te in
org
anis
ed le
arni
ng (a
djus
ted)
LN.2
0.73
860.
0108
0.01
51.
542
1.24
22,
432
2,57
3
0.
717
0.76
0Pr
otec
ted
from
vio
lenc
e an
d ex
ploi
tatio
nB
irth
regi
stra
tion
PR
.10.
7295
0.00
730.
010
3.19
71.
788
11,7
20
11,7
20
0.71
50.
744
Vio
lent
dis
cipl
ine
PR
.20.
6905
0.00
510.
007
2.67
41.
635
33,5
84
21,6
15
0.68
00.
701
Chi
ld la
bour
PR
.30.
4249
0.00
620.
015
2.42
51.
557
30,3
72
15,4
35
0.41
30.
437
Chi
ld m
arria
ge (b
efor
e ag
e 15
)P
R.4
a0.
0710
0.00
440.
063
1.23
61.
112
4,02
4
4,
121
0.06
20.
080
Chi
ld m
arria
ge (b
efor
e ag
e 18
)P
R.4
b0.
3273
0.00
870.
027
1.42
01.
192
4,02
4
4,
121
0.31
00.
345
Live
in a
saf
e an
d cl
ean
envi
ronm
ent
Use
of b
asic
drin
king
wat
er s
ervi
ces
WS
.20.
7808
0.00
770.
010
7.69
62.
774
104,
851
22
,287
0.
765
0.79
6U
se o
f saf
ely
man
aged
drin
king
wat
er s
ervi
ces
WS
.60.
1475
0.00
720.
049
1.34
71.
161
15,4
96
3,29
0
0.
133
0.16
2H
andw
ashi
ng fa
cilit
y w
ith w
ater
and
soa
pW
S.7
0.54
080.
0074
0.01
44.
954
2.22
610
4,80
3
22,2
77
0.52
60.
556
Use
of b
asic
san
itatio
n se
rvic
esW
S.9
0.71
020.
0075
0.01
16.
076
2.46
510
4,85
1
22,2
87
0.69
50.
725
Saf
e di
spos
al in
situ
of e
xcre
ta fr
om o
n-si
te s
anita
tion
faci
litie
sW
S.1
00.
8957
0.00
430.
005
3.19
01.
786
75,5
42
16,2
67
0.88
70.
904
Equi
tabl
e ch
ance
in li
feC
hild
ren
with
func
tiona
l difi
culty
E
Q.1
0.02
030.
0018
0.08
81.
166
1.08
07,
250
7,20
6
0.
017
0.02
4P
opul
atio
n co
vere
d by
soc
ial t
rans
fers
EQ
.30.
1243
0.00
320.
026
2.07
51.
441
104,
851
22
,287
0.
118
0.13
1
Des
ign
effe
ct
(def
f)
Squ
are
root
of
des
ign
effe
ct (d
eft)
Wei
ghte
d co
unt
Unw
eigh
ted
coun
t
Con
fiden
ce li
mits
MIC
SIn
dica
tor
Val
ue (r
)S
tand
ard
erro
r (se
)
Coe
ffici
ent o
f va
riatio
n(s
e/r)
na: n
ot a
pplic
able
Tabl
e SE
.1: S
ampl
ing
erro
rs: T
otal
sam
ple
Sta
ndar
d er
rors
, coe
ffici
ents
of v
aria
tion,
des
ign
effe
cts
(def
f), s
quar
e ro
ot o
f des
ign
effe
cts
(def
t), a
nd c
onfid
ence
inte
rval
s fo
r sel
ecte
d S
DG
and
MIC
S in
dica
tors
, LS
ISII,
201
7
MIC
SIn
dica
tor
Val
ue (r
)S
tand
ard
erro
r (se
)
Coe
ffici
ent o
f va
riatio
n(s
e/r)
Des
ign
effe
ct
(def
f)
Squ
are
root
of
des
ign
effe
ct (d
eft)
Wei
ghte
d co
unt
Unw
eigh
ted
coun
t
Con
fiden
ce li
mits
Tabl
e SE
.1: S
ampl
ing
erro
rs: T
otal
sam
ple
Sta
ndar
d er
rors
, coe
ffici
ents
of v
aria
tion,
des
ign
effe
cts
(def
f), s
quar
e ro
ot o
f des
ign
effe
cts
(def
t), a
nd c
onfid
ence
inte
rval
s fo
r sel
ecte
d S
DG
and
MIC
S in
dica
tors
, LS
ISII,
201
7
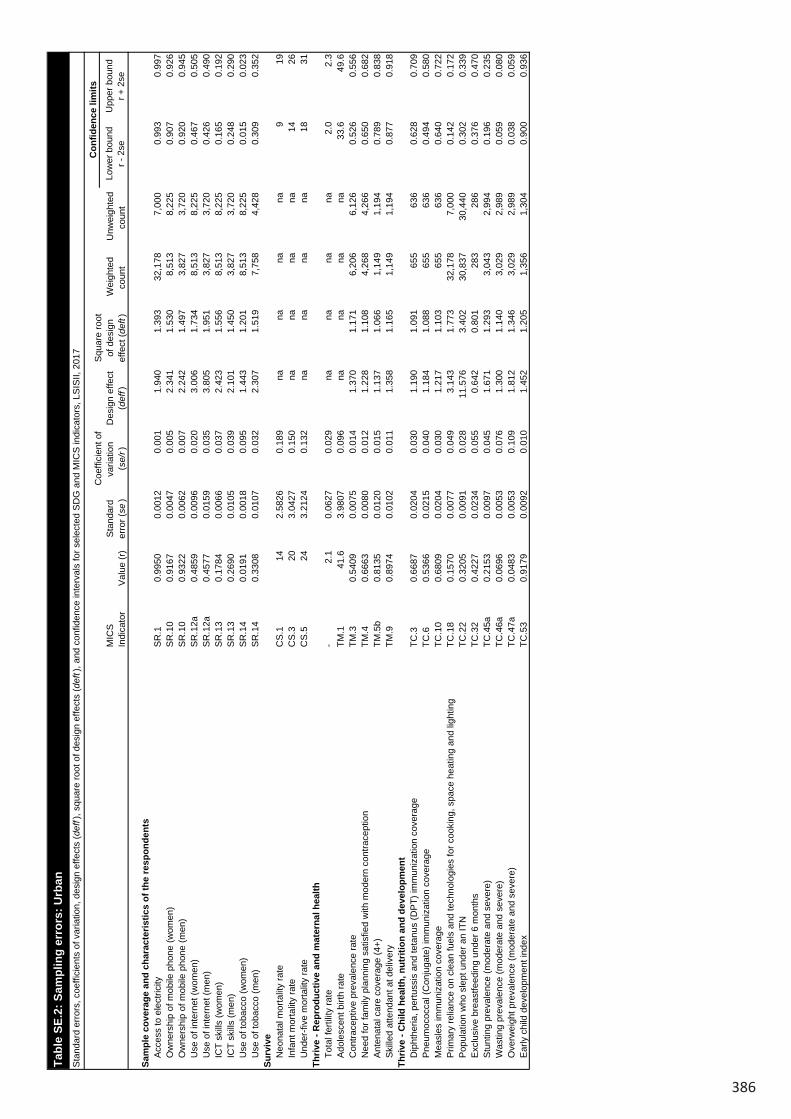
386
Low
er b
ound
r - 2
seU
pper
bou
ndr +
2se
Sam
ple
cove
rage
and
cha
ract
eris
tics
of th
e re
spon
dent
sA
cces
s to
ele
ctric
ityS
R.1
0.99
50
0.
0012
0.00
11.
940
1.39
332
,178
7,
000
0.99
30.
997
Ow
ners
hip
of m
obile
pho
ne (w
omen
)S
R.1
00.
9167
0.00
470.
005
2.34
11.
530
8,51
3
8,
225
0.90
70.
926
Ow
ners
hip
of m
obile
pho
ne (m
en)
SR
.10
0.93
22
0.
0062
0.00
72.
242
1.49
73,
827
3,72
0
0.
920
0.94
5U
se o
f int
erne
t (w
omen
)S
R.1
2a0.
4859
0.00
960.
020
3.00
61.
734
8,51
3
8,
225
0.46
70.
505
Use
of i
nter
net (
men
)S
R.1
2a0.
4577
0.01
590.
035
3.80
51.
951
3,82
7
3,
720
0.42
60.
490
ICT
skill
s (w
omen
)S
R.1
30.
1784
0.00
660.
037
2.42
31.
556
8,51
3
8,
225
0.16
50.
192
ICT
skill
s (m
en)
SR
.13
0.26
90
0.
0105
0.03
92.
101
1.45
03,
827
3,72
0
0.
248
0.29
0U
se o
f tob
acco
(wom
en)
SR
.14
0.01
91
0.
0018
0.09
51.
443
1.20
18,
513
8,22
5
0.
015
0.02
3U
se o
f tob
acco
(men
)S
R.1
40.
3308
0.01
070.
032
2.30
71.
519
7,75
8
4,
428
0.30
90.
352
Surv
ive
Neo
nata
l mor
talit
y ra
teC
S.1
142.
5826
0.18
9na
nana
na9
19In
fant
mor
talit
y ra
teC
S.3
203.
0427
0.15
0na
nana
na14
26U
nder
-five
mor
talit
y ra
teC
S.5
243.
2124
0.13
2na
nana
na18
31Th
rive
- Rep
rodu
ctiv
e an
d m
ater
nal h
ealth
Tota
l fer
tility
rate
-2.
10.
0627
0.02
9na
nana
na2.
02.
3A
dole
scen
t birt
h ra
teTM
.141
.63.
9807
0.09
6na
nana
na33
.649
.6…
Con
trace
ptiv
e pr
eval
ence
rate
TM.3
0.54
09
0.
0075
0.01
41.
370
1.17
16,
206
6,12
6
0.
526
0.55
6N
eed
for f
amily
pla
nnin
g sa
tisfie
d w
ith m
oder
n co
ntra
cept
ion
TM.4
0.66
63
0.
0080
0.01
21.
228
1.10
84,
268
4,26
6
0.
650
0.68
2A
nten
atal
car
e co
vera
ge (4
+)TM
.5b
0.81
35
0.
0120
0.01
51.
137
1.06
61,
149
1,19
4
0.
789
0.83
8S
kille
d at
tend
ant a
t del
iver
yTM
.90.
8974
0.01
020.
011
1.35
81.
165
1,14
9
1,
194
0.87
70.
918
Thriv
e - C
hild
hea
lth, n
utrit
ion
and
deve
lopm
ent
Dip
hthe
ria, p
ertu
ssis
and
teta
nus
(DP
T) im
mun
izat
ion
cove
rage
TC.3
0.66
87
0.
0204
0.03
01.
190
1.09
165
5
636
0.
628
0.70
9P
neum
ococ
cal (
Con
juga
te) i
mm
uniz
atio
n co
vera
geTC
.60.
5366
0.02
150.
040
1.18
41.
088
655
63
6
0.49
40.
580
Mea
sles
imm
uniz
atio
n co
vera
geTC
.10
0.68
09
0.
0204
0.03
01.
217
1.10
365
5
636
0.
640
0.72
2P
rimar
y re
lianc
e on
cle
an fu
els
and
tech
nolo
gies
for c
ooki
ng, s
pace
hea
ting
and
light
ing
TC.1
80.
1570
0.00
770.
049
3.14
31.
773
32,1
78
7,00
0
0.
142
0.17
2P
opul
atio
n w
ho s
lept
und
er a
n IT
NTC
.22
0.32
05
0.
0091
0.02
811
.576
3.40
230
,837
30
,440
0.
302
0.33
9E
xclu
sive
bre
astfe
edin
g un
der 6
mon
ths
TC.3
20.
4227
0.02
340.
055
0.64
20.
801
283
28
6
0.37
60.
470
Stu
ntin
g pr
eval
ence
(mod
erat
e an
d se
vere
)TC
.45a
0.21
53
0.
0097
0.04
51.
671
1.29
33,
043
2,99
4
0.
196
0.23
5W
astin
g pr
eval
ence
(mod
erat
e an
d se
vere
)TC
.46a
0.06
96
0.
0053
0.07
61.
300
1.14
03,
029
2,98
9
0.
059
0.08
0O
verw
eigh
t pre
vale
nce
(mod
erat
e an
d se
vere
)TC
.47a
0.04
83
0.
0053
0.10
91.
812
1.34
63,
029
2,98
9
0.
038
0.05
9E
arly
chi
ld d
evel
opm
ent i
ndex
TC.5
30.
9179
0.00
920.
010
1.45
21.
205
1,35
6
1,
304
0.90
00.
936
Low
er b
ound
r - 2
seU
pper
bou
ndr +
2se
Lear
nP
artic
ipat
ion
rate
in o
rgan
ised
lear
ning
(adj
uste
d)LN
.20.
8739
0.01
470.
017
1.30
41.
142
636
66
7
0.84
50.
903
Prot
ecte
d fr
om v
iole
nce
and
expl
oita
tion
Birt
h re
gist
ratio
nP
R.1
0.88
92
0.
0078
0.00
91.
927
1.38
83,
179
3,11
8
0.
874
0.90
5V
iole
nt d
isci
plin
eP
R.2
0.67
30
0.
0085
0.01
31.
958
1.39
98,
545
5,92
4
0.
656
0.69
0C
hild
labo
urP
R.3
0.33
48
0.
0107
0.03
22.
278
1.50
97,
536
4,42
8
0.
313
0.35
6C
hild
mar
riage
(bef
ore
age
15)
PR
.4a
0.03
26
0.
0048
0.14
80.
919
0.95
91,
316
1,24
3
0.
023
0.04
2C
hild
mar
riage
(bef
ore
age
18)
PR
.4b
0.20
92
0.
0132
0.06
31.
309
1.14
41,
316
1,24
3
0.
183
0.23
6Li
ve in
a s
afe
and
clea
n en
viro
nmen
tU
se o
f bas
ic d
rinki
ng w
ater
ser
vice
sW
S.2
0.92
18
0.
0075
0.00
85.
413
2.32
732
,178
7,
000
0.90
70.
937
Use
of s
afel
y m
anag
ed d
rinki
ng w
ater
ser
vice
sW
S.6
0.26
64
0.
0167
0.06
31.
490
1.22
14,
796
1,04
2
0.
233
0.30
0H
andw
ashi
ng fa
cilit
y w
ith w
ater
and
soa
pW
S.7
0.73
32
0.
0097
0.01
33.
341
1.82
832
,171
6,
998
0.71
40.
753
Use
of b
asic
san
itatio
n se
rvic
esW
S.9
0.91
18
0.
0065
0.00
73.
716
1.92
832
,178
7,
000
0.89
90.
925
Saf
e di
spos
al in
situ
of e
xcre
ta fr
om o
n-si
te s
anita
tion
faci
litie
sW
S.1
00.
8074
0.00
910.
011
3.42
01.
849
29,7
10
6,39
9
0.
789
0.82
6Eq
uita
ble
chan
ce in
life
Chi
ldre
n w
ith fu
nctio
nal d
ificu
lty
EQ
.10.
0122
0.00
260.
211
1.04
11.
021
1,94
8
1,
898
0.00
70.
017
Pop
ulat
ion
cove
red
by s
ocia
l tra
nsfe
rsE
Q.3
0.16
88
0.
0065
0.03
82.
102
1.45
032
,178
7,
000
0.15
60.
182
Des
ign
effe
ct
(def
f)
Squ
are
root
of
des
ign
effe
ct (d
eft)
Wei
ghte
d co
unt
Unw
eigh
ted
coun
t
Con
fiden
ce li
mits
MIC
SIn
dica
tor
Val
ue (r
) S
tand
ard
erro
r (se
)
Coe
ffici
ent o
f va
riatio
n(s
e/r)
na: n
ot a
pplic
able
Tabl
e SE
.2: S
ampl
ing
erro
rs: U
rban
Sta
ndar
d er
rors
, coe
ffici
ents
of v
aria
tion,
des
ign
effe
cts
(def
f), s
quar
e ro
ot o
f des
ign
effe
cts
(def
t), a
nd c
onfid
ence
inte
rval
s fo
r sel
ecte
d S
DG
and
MIC
S in
dica
tors
, LS
ISII,
201
7
MIC
SIn
dica
tor
Val
ue (r
) S
tand
ard
erro
r (se
)
Coe
ffici
ent o
f va
riatio
n(s
e/r)
Des
ign
effe
ct
(def
f)
Squ
are
root
of
des
ign
effe
ct (d
eft)
Wei
ghte
d co
unt
Unw
eigh
ted
coun
t
Con
fiden
ce li
mits
Tabl
e SE
.2: S
ampl
ing
erro
rs: U
rban
Sta
ndar
d er
rors
, coe
ffici
ents
of v
aria
tion,
des
ign
effe
cts
(def
f), s
quar
e ro
ot o
f des
ign
effe
cts
(def
t), a
nd c
onfid
ence
inte
rval
s fo
r sel
ecte
d S
DG
and
MIC
S in
dica
tors
, LS
ISII,
201
7

387
Low
er b
ound
r - 2
seU
pper
bou
ndr +
2se
Sam
ple
cove
rage
and
cha
ract
eris
tics
of th
e re
spon
dent
sA
cces
s to
ele
ctric
ityS
R.1
0.99
50
0.
0012
0.00
11.
940
1.39
332
,178
7,
000
0.99
30.
997
Ow
ners
hip
of m
obile
pho
ne (w
omen
)S
R.1
00.
9167
0.00
470.
005
2.34
11.
530
8,51
3
8,
225
0.90
70.
926
Ow
ners
hip
of m
obile
pho
ne (m
en)
SR
.10
0.93
22
0.
0062
0.00
72.
242
1.49
73,
827
3,72
0
0.
920
0.94
5U
se o
f int
erne
t (w
omen
)S
R.1
2a0.
4859
0.00
960.
020
3.00
61.
734
8,51
3
8,
225
0.46
70.
505
Use
of i
nter
net (
men
)S
R.1
2a0.
4577
0.01
590.
035
3.80
51.
951
3,82
7
3,
720
0.42
60.
490
ICT
skill
s (w
omen
)S
R.1
30.
1784
0.00
660.
037
2.42
31.
556
8,51
3
8,
225
0.16
50.
192
ICT
skill
s (m
en)
SR
.13
0.26
90
0.
0105
0.03
92.
101
1.45
03,
827
3,72
0
0.
248
0.29
0U
se o
f tob
acco
(wom
en)
SR
.14
0.01
91
0.
0018
0.09
51.
443
1.20
18,
513
8,22
5
0.
015
0.02
3U
se o
f tob
acco
(men
)S
R.1
40.
3308
0.01
070.
032
2.30
71.
519
7,75
8
4,
428
0.30
90.
352
Surv
ive
Neo
nata
l mor
talit
y ra
teC
S.1
142.
5826
0.18
9na
nana
na9
19In
fant
mor
talit
y ra
teC
S.3
203.
0427
0.15
0na
nana
na14
26U
nder
-five
mor
talit
y ra
teC
S.5
243.
2124
0.13
2na
nana
na18
31Th
rive
- Rep
rodu
ctiv
e an
d m
ater
nal h
ealth
Tota
l fer
tility
rate
-2.
10.
0627
0.02
9na
nana
na2.
02.
3A
dole
scen
t birt
h ra
teTM
.141
.63.
9807
0.09
6na
nana
na33
.649
.6…
Con
trace
ptiv
e pr
eval
ence
rate
TM.3
0.54
09
0.
0075
0.01
41.
370
1.17
16,
206
6,12
6
0.
526
0.55
6N
eed
for f
amily
pla
nnin
g sa
tisfie
d w
ith m
oder
n co
ntra
cept
ion
TM.4
0.66
63
0.
0080
0.01
21.
228
1.10
84,
268
4,26
6
0.
650
0.68
2A
nten
atal
car
e co
vera
ge (4
+)TM
.5b
0.81
35
0.
0120
0.01
51.
137
1.06
61,
149
1,19
4
0.
789
0.83
8S
kille
d at
tend
ant a
t del
iver
yTM
.90.
8974
0.01
020.
011
1.35
81.
165
1,14
9
1,
194
0.87
70.
918
Thriv
e - C
hild
hea
lth, n
utrit
ion
and
deve
lopm
ent
Dip
hthe
ria, p
ertu
ssis
and
teta
nus
(DP
T) im
mun
izat
ion
cove
rage
TC.3
0.66
87
0.
0204
0.03
01.
190
1.09
165
5
636
0.
628
0.70
9P
neum
ococ
cal (
Con
juga
te) i
mm
uniz
atio
n co
vera
geTC
.60.
5366
0.02
150.
040
1.18
41.
088
655
63
6
0.49
40.
580
Mea
sles
imm
uniz
atio
n co
vera
geTC
.10
0.68
09
0.
0204
0.03
01.
217
1.10
365
5
636
0.
640
0.72
2P
rimar
y re
lianc
e on
cle
an fu
els
and
tech
nolo
gies
for c
ooki
ng, s
pace
hea
ting
and
light
ing
TC.1
80.
1570
0.00
770.
049
3.14
31.
773
32,1
78
7,00
0
0.
142
0.17
2P
opul
atio
n w
ho s
lept
und
er a
n IT
NTC
.22
0.32
05
0.
0091
0.02
811
.576
3.40
230
,837
30
,440
0.
302
0.33
9E
xclu
sive
bre
astfe
edin
g un
der 6
mon
ths
TC.3
20.
4227
0.02
340.
055
0.64
20.
801
283
28
6
0.37
60.
470
Stu
ntin
g pr
eval
ence
(mod
erat
e an
d se
vere
)TC
.45a
0.21
53
0.
0097
0.04
51.
671
1.29
33,
043
2,99
4
0.
196
0.23
5W
astin
g pr
eval
ence
(mod
erat
e an
d se
vere
)TC
.46a
0.06
96
0.
0053
0.07
61.
300
1.14
03,
029
2,98
9
0.
059
0.08
0O
verw
eigh
t pre
vale
nce
(mod
erat
e an
d se
vere
)TC
.47a
0.04
83
0.
0053
0.10
91.
812
1.34
63,
029
2,98
9
0.
038
0.05
9E
arly
chi
ld d
evel
opm
ent i
ndex
TC.5
30.
9179
0.00
920.
010
1.45
21.
205
1,35
6
1,
304
0.90
00.
936
Low
er b
ound
r - 2
seU
pper
bou
ndr +
2se
Lear
nP
artic
ipat
ion
rate
in o
rgan
ised
lear
ning
(adj
uste
d)LN
.20.
8739
0.01
470.
017
1.30
41.
142
636
66
7
0.84
50.
903
Prot
ecte
d fr
om v
iole
nce
and
expl
oita
tion
Birt
h re
gist
ratio
nP
R.1
0.88
92
0.
0078
0.00
91.
927
1.38
83,
179
3,11
8
0.
874
0.90
5V
iole
nt d
isci
plin
eP
R.2
0.67
30
0.
0085
0.01
31.
958
1.39
98,
545
5,92
4
0.
656
0.69
0C
hild
labo
urP
R.3
0.33
48
0.
0107
0.03
22.
278
1.50
97,
536
4,42
8
0.
313
0.35
6C
hild
mar
riage
(bef
ore
age
15)
PR
.4a
0.03
26
0.
0048
0.14
80.
919
0.95
91,
316
1,24
3
0.
023
0.04
2C
hild
mar
riage
(bef
ore
age
18)
PR
.4b
0.20
92
0.
0132
0.06
31.
309
1.14
41,
316
1,24
3
0.
183
0.23
6Li
ve in
a s
afe
and
clea
n en
viro
nmen
tU
se o
f bas
ic d
rinki
ng w
ater
ser
vice
sW
S.2
0.92
18
0.
0075
0.00
85.
413
2.32
732
,178
7,
000
0.90
70.
937
Use
of s
afel
y m
anag
ed d
rinki
ng w
ater
ser
vice
sW
S.6
0.26
64
0.
0167
0.06
31.
490
1.22
14,
796
1,04
2
0.
233
0.30
0H
andw
ashi
ng fa
cilit
y w
ith w
ater
and
soa
pW
S.7
0.73
32
0.
0097
0.01
33.
341
1.82
832
,171
6,
998
0.71
40.
753
Use
of b
asic
san
itatio
n se
rvic
esW
S.9
0.91
18
0.
0065
0.00
73.
716
1.92
832
,178
7,
000
0.89
90.
925
Saf
e di
spos
al in
situ
of e
xcre
ta fr
om o
n-si
te s
anita
tion
faci
litie
sW
S.1
00.
8074
0.00
910.
011
3.42
01.
849
29,7
10
6,39
9
0.
789
0.82
6Eq
uita
ble
chan
ce in
life
Chi
ldre
n w
ith fu
nctio
nal d
ificu
lty
EQ
.10.
0122
0.00
260.
211
1.04
11.
021
1,94
8
1,
898
0.00
70.
017
Pop
ulat
ion
cove
red
by s
ocia
l tra
nsfe
rsE
Q.3
0.16
88
0.
0065
0.03
82.
102
1.45
032
,178
7,
000
0.15
60.
182
Des
ign
effe
ct
(def
f)
Squ
are
root
of
des
ign
effe
ct (d
eft)
Wei
ghte
d co
unt
Unw
eigh
ted
coun
t
Con
fiden
ce li
mits
MIC
SIn
dica
tor
Val
ue (r
) S
tand
ard
erro
r (se
)
Coe
ffici
ent o
f va
riatio
n(s
e/r)
na: n
ot a
pplic
able
Tabl
e SE
.2: S
ampl
ing
erro
rs: U
rban
Sta
ndar
d er
rors
, coe
ffici
ents
of v
aria
tion,
des
ign
effe
cts
(def
f), s
quar
e ro
ot o
f des
ign
effe
cts
(def
t), a
nd c
onfid
ence
inte
rval
s fo
r sel
ecte
d S
DG
and
MIC
S in
dica
tors
, LS
ISII,
201
7
MIC
SIn
dica
tor
Val
ue (r
) S
tand
ard
erro
r (se
)
Coe
ffici
ent o
f va
riatio
n(s
e/r)
Des
ign
effe
ct
(def
f)
Squ
are
root
of
des
ign
effe
ct (d
eft)
Wei
ghte
d co
unt
Unw
eigh
ted
coun
t
Con
fiden
ce li
mits
Tabl
e SE
.2: S
ampl
ing
erro
rs: U
rban
Sta
ndar
d er
rors
, coe
ffici
ents
of v
aria
tion,
des
ign
effe
cts
(def
f), s
quar
e ro
ot o
f des
ign
effe
cts
(def
t), a
nd c
onfid
ence
inte
rval
s fo
r sel
ecte
d S
DG
and
MIC
S in
dica
tors
, LS
ISII,
201
7

388
Low
er b
ound
r - 2
seU
pper
bou
ndr +
2se
Sam
ple
cove
rage
and
cha
ract
eris
tics
of th
e re
spon
dent
sA
cces
s to
ele
ctric
ityS
R.1
0.90
110.
0081
0.00
911
.384
3.37
472
,674
15
,287
0.
885
0.91
7O
wne
rshi
p of
mob
ile p
hone
(wom
en)
SR
.10
0.63
720.
0083
0.01
35.
147
2.26
916
,792
17
,080
0.
621
0.65
4O
wne
rshi
p of
mob
ile p
hone
(men
)S
R.1
00.
8019
0.00
780.
010
3.14
21.
773
8,19
0
8,
297
0.78
60.
817
Use
of i
nter
net (
wom
en)
SR
.12a
0.15
480.
0049
0.03
23.
112
1.76
416
,792
17
,080
0.
145
0.16
5U
se o
f int
erne
t (m
en)
SR
.12a
0.17
080.
0066
0.03
92.
569
1.60
38,
190
8,29
7
0.
158
0.18
4IC
T sk
ills
(wom
en)
SR
.13
0.01
970.
0015
0.07
51.
906
1.38
116
,792
17
,080
0.
017
0.02
3IC
T sk
ills
(men
)S
R.1
30.
0489
0.00
360.
073
2.29
11.
514
8,19
0
8,
297
0.04
20.
056
Use
of t
obac
co (w
omen
)S
R.1
40.
0984
0.00
460.
046
4.00
42.
001
16,7
92
17,0
80
0.08
90.
108
Use
of t
obac
co (m
en)
SR
.14
0.48
220.
0083
0.01
72.
295
1.51
58,
190
8,29
7
0.
466
0.49
9Su
rviv
eN
eona
tal m
orta
lity
rate
CS
.119
1.90
000.
100
nana
nana
1623
Infa
nt m
orta
lity
rate
CS
.347
3.10
000.
070
nana
nana
4153
Und
er-fi
ve m
orta
lity
rate
CS
.553
3.20
000.
060
nana
nana
4760
Thriv
e - R
epro
duct
ive
and
mat
erna
l hea
lthTo
tal f
ertil
ity ra
te-
3.0
0.06
090.
020
nana
nana
2.9
3.2
Ado
lesc
ent b
irth
rate
TM.1
100.
64.
2145
0.04
2na
nana
na92
.110
9.0
Con
trace
ptiv
e pr
eval
ence
rate
TM.3
0.54
050.
0069
0.01
32.
649
1.62
813
,408
13
,758
0.
527
0.55
4N
eed
for f
amily
pla
nnin
g sa
tisfie
d w
ith m
oder
n co
ntra
cept
ion
TM.4
0.74
060.
0070
0.00
92.
362
1.53
79,
149
9,31
9
0.
727
0.75
5A
nten
atal
car
e co
vera
ge (4
+)TM
.5b
0.55
060.
0131
0.02
42.
261
1.50
43,
082
3,26
6
0.
524
0.57
7S
kille
d at
tend
ant a
t del
iver
yTM
.90.
5491
0.01
420.
026
2.64
41.
626
3,08
2
3,
266
0.52
10.
577
Thriv
e - C
hild
hea
lth, n
utrit
ion
and
deve
lopm
ent
Dip
hthe
ria, p
ertu
ssis
and
teta
nus
(DP
T) im
mun
izat
ion
cove
rage
TC.3
0.58
290.
0132
0.02
31.
127
1.06
11,
549
1,57
9
0.
557
0.60
9P
neum
ococ
cal (
Con
juga
te) i
mm
uniz
atio
n co
vera
geTC
.60.
4501
0.01
410.
031
1.26
11.
123
1,54
9
1,
579
0.42
20.
478
Mea
sles
imm
uniz
atio
n co
vera
geTC
.10
0.65
060.
0132
0.02
01.
213
1.10
11,
549
1,57
9
0.
624
0.67
7P
rimar
y re
lianc
e on
cle
an fu
els
and
tech
nolo
gies
for c
ooki
ng, s
pace
hea
ting
and
light
ing
TC.1
80.
0215
0.00
150.
070
1.63
51.
279
72,6
74
15,2
87
0.01
90.
025
Pop
ulat
ion
who
sle
pt u
nder
an
ITN
TC.2
20.
5910
0.00
700.
012
14.5
673.
817
69,7
94
71,8
19
0.57
70.
605
Exc
lusi
ve b
reas
tfeed
ing
unde
r 6 m
onth
sTC
.32
0.45
820.
0155
0.03
40.
823
0.90
784
5
848
0.
427
0.48
9S
tunt
ing
prev
alen
ce (m
oder
ate
and
seve
re)
TC.4
5a0.
3722
0.00
760.
021
2.09
21.
446
8,33
0
8,
374
0.35
70.
387
Was
ting
prev
alen
ce (m
oder
ate
and
seve
re)
TC.4
6a0.
0977
0.00
400.
041
1.50
51.
227
8,33
0
8,
373
0.09
00.
106
Ove
rwei
ght p
reva
lenc
e (m
oder
ate
and
seve
re)
TC.4
7a0.
0305
0.00
240.
078
1.59
61.
263
8,33
0
8,
373
0.02
60.
035
Ear
ly c
hild
dev
elop
men
t ind
exTC
.53
0.88
030.
0059
0.00
71.
150
1.07
23,
525
3,52
9
0.
869
0.89
2
Low
er b
ound
r - 2
seU
pper
bou
ndr +
2se
Lear
nP
artic
ipat
ion
rate
in o
rgan
ised
lear
ning
(adj
uste
d)LN
.20.
6907
0.01
350.
020
1.62
61.
275
1,79
6
1,
906
0.66
40.
718
Prot
ecte
d fr
om v
iole
nce
and
expl
oita
tion
Birt
h re
gist
ratio
nP
R.1
0.67
010.
0094
0.01
43.
425
1.85
18,
541
8,60
2
0.
651
0.68
9V
iole
nt d
isci
plin
eP
R.2
0.69
640.
0062
0.00
92.
856
1.69
025
,039
15
,691
0.
684
0.70
9C
hild
labo
urP
R.3
0.45
720.
0073
0.01
62.
357
1.53
522
,615
11
,007
0.
443
0.47
2C
hild
mar
riage
(bef
ore
age
15)
PR
.4a
0.08
970.
0060
0.06
71.
287
1.13
42,
708
2,87
8
0.
078
0.10
2C
hild
mar
riage
(bef
ore
age
18)
PR
.4b
0.38
480.
0109
0.02
81.
456
1.20
72,
708
2,87
8
0.
363
0.40
7Li
ve in
a s
afe
and
clea
n en
viro
nmen
tU
se o
f bas
ic d
rinki
ng w
ater
ser
vice
sW
S.2
0.71
830.
0103
0.01
47.
974
2.82
472
,674
15
,287
0.
698
0.73
9U
se o
f saf
ely
man
aged
drin
king
wat
er s
ervi
ces
WS
.60.
0943
0.00
710.
075
1.32
71.
152
10,7
01
2,24
8
0.
080
0.10
8H
andw
ashi
ng fa
cilit
y w
ith w
ater
and
soa
pW
S.7
0.45
560.
0095
0.02
15.
527
2.35
172
,632
15
,279
0.
437
0.47
5U
se o
f bas
ic s
anita
tion
serv
ices
WS
.90.
6209
0.01
000.
016
6.45
82.
541
72,6
74
15,2
87
0.60
10.
641
Saf
e di
spos
al in
situ
of e
xcre
ta fr
om o
n-si
te s
anita
tion
faci
litie
sW
S.1
00.
9530
0.00
360.
004
2.92
01.
709
45,8
31
9,86
8
0.
946
0.96
0Eq
uita
ble
chan
ce in
life
Chi
ldre
n w
ith fu
nctio
nal d
ificu
lty
EQ
.10.
0233
0.00
230.
097
1.19
81.
095
5,30
3
5,
308
0.01
90.
028
Pop
ulat
ion
cove
red
by s
ocia
l tra
nsfe
rsE
Q.3
0.10
470.
0035
0.03
42.
013
1.41
972
,674
15
,287
0.
098
0.11
2
Des
ign
effe
ct
(def
f)
Squ
are
root
of
des
ign
effe
ct (d
eft)
Wei
ghte
d co
unt
Unw
eigh
ted
coun
t
Con
fiden
ce li
mits
MIC
SIn
dica
tor
Val
ue (r
)S
tand
ard
erro
r (se
)
Coe
ffici
ent o
f va
riatio
n(s
e/r)
na: n
ot a
pplic
able
Tabl
e SE
.3: S
ampl
ing
erro
rs: R
ural
Sta
ndar
d er
rors
, coe
ffici
ents
of v
aria
tion,
des
ign
effe
cts
(def
f), s
quar
e ro
ot o
f des
ign
effe
cts
(def
t), a
nd c
onfid
ence
inte
rval
s fo
r sel
ecte
d S
DG
and
MIC
S in
dica
tors
, LS
ISII,
201
7
MIC
SIn
dica
tor
Val
ue (r
)S
tand
ard
erro
r (se
)
Coe
ffici
ent o
f va
riatio
n(s
e/r)
Des
ign
effe
ct
(def
f)
Squ
are
root
of
des
ign
effe
ct (d
eft)
Wei
ghte
d co
unt
Unw
eigh
ted
coun
t
Con
fiden
ce li
mits
Tabl
e SE
.3: S
ampl
ing
erro
rs: R
ural
Sta
ndar
d er
rors
, coe
ffici
ents
of v
aria
tion,
des
ign
effe
cts
(def
f), s
quar
e ro
ot o
f des
ign
effe
cts
(def
t), a
nd c
onfid
ence
inte
rval
s fo
r sel
ecte
d S
DG
and
MIC
S in
dica
tors
, LS
ISII,
201
7

389
Low
er b
ound
r - 2
seU
pper
bou
ndr +
2se
Sam
ple
cove
rage
and
cha
ract
eris
tics
of th
e re
spon
dent
sA
cces
s to
ele
ctric
ityS
R.1
0.90
110.
0081
0.00
911
.384
3.37
472
,674
15
,287
0.
885
0.91
7O
wne
rshi
p of
mob
ile p
hone
(wom
en)
SR
.10
0.63
720.
0083
0.01
35.
147
2.26
916
,792
17
,080
0.
621
0.65
4O
wne
rshi
p of
mob
ile p
hone
(men
)S
R.1
00.
8019
0.00
780.
010
3.14
21.
773
8,19
0
8,
297
0.78
60.
817
Use
of i
nter
net (
wom
en)
SR
.12a
0.15
480.
0049
0.03
23.
112
1.76
416
,792
17
,080
0.
145
0.16
5U
se o
f int
erne
t (m
en)
SR
.12a
0.17
080.
0066
0.03
92.
569
1.60
38,
190
8,29
7
0.
158
0.18
4IC
T sk
ills
(wom
en)
SR
.13
0.01
970.
0015
0.07
51.
906
1.38
116
,792
17
,080
0.
017
0.02
3IC
T sk
ills
(men
)S
R.1
30.
0489
0.00
360.
073
2.29
11.
514
8,19
0
8,
297
0.04
20.
056
Use
of t
obac
co (w
omen
)S
R.1
40.
0984
0.00
460.
046
4.00
42.
001
16,7
92
17,0
80
0.08
90.
108
Use
of t
obac
co (m
en)
SR
.14
0.48
220.
0083
0.01
72.
295
1.51
58,
190
8,29
7
0.
466
0.49
9Su
rviv
eN
eona
tal m
orta
lity
rate
CS
.119
1.90
000.
100
nana
nana
1623
Infa
nt m
orta
lity
rate
CS
.347
3.10
000.
070
nana
nana
4153
Und
er-fi
ve m
orta
lity
rate
CS
.553
3.20
000.
060
nana
nana
4760
Thriv
e - R
epro
duct
ive
and
mat
erna
l hea
lthTo
tal f
ertil
ity ra
te-
3.0
0.06
090.
020
nana
nana
2.9
3.2
Ado
lesc
ent b
irth
rate
TM.1
100.
64.
2145
0.04
2na
nana
na92
.110
9.0
Con
trace
ptiv
e pr
eval
ence
rate
TM.3
0.54
050.
0069
0.01
32.
649
1.62
813
,408
13
,758
0.
527
0.55
4N
eed
for f
amily
pla
nnin
g sa
tisfie
d w
ith m
oder
n co
ntra
cept
ion
TM.4
0.74
060.
0070
0.00
92.
362
1.53
79,
149
9,31
9
0.
727
0.75
5A
nten
atal
car
e co
vera
ge (4
+)TM
.5b
0.55
060.
0131
0.02
42.
261
1.50
43,
082
3,26
6
0.
524
0.57
7S
kille
d at
tend
ant a
t del
iver
yTM
.90.
5491
0.01
420.
026
2.64
41.
626
3,08
2
3,
266
0.52
10.
577
Thriv
e - C
hild
hea
lth, n
utrit
ion
and
deve
lopm
ent
Dip
hthe
ria, p
ertu
ssis
and
teta
nus
(DP
T) im
mun
izat
ion
cove
rage
TC.3
0.58
290.
0132
0.02
31.
127
1.06
11,
549
1,57
9
0.
557
0.60
9P
neum
ococ
cal (
Con
juga
te) i
mm
uniz
atio
n co
vera
geTC
.60.
4501
0.01
410.
031
1.26
11.
123
1,54
9
1,
579
0.42
20.
478
Mea
sles
imm
uniz
atio
n co
vera
geTC
.10
0.65
060.
0132
0.02
01.
213
1.10
11,
549
1,57
9
0.
624
0.67
7P
rimar
y re
lianc
e on
cle
an fu
els
and
tech
nolo
gies
for c
ooki
ng, s
pace
hea
ting
and
light
ing
TC.1
80.
0215
0.00
150.
070
1.63
51.
279
72,6
74
15,2
87
0.01
90.
025
Pop
ulat
ion
who
sle
pt u
nder
an
ITN
TC.2
20.
5910
0.00
700.
012
14.5
673.
817
69,7
94
71,8
19
0.57
70.
605
Exc
lusi
ve b
reas
tfeed
ing
unde
r 6 m
onth
sTC
.32
0.45
820.
0155
0.03
40.
823
0.90
784
5
848
0.
427
0.48
9S
tunt
ing
prev
alen
ce (m
oder
ate
and
seve
re)
TC.4
5a0.
3722
0.00
760.
021
2.09
21.
446
8,33
0
8,
374
0.35
70.
387
Was
ting
prev
alen
ce (m
oder
ate
and
seve
re)
TC.4
6a0.
0977
0.00
400.
041
1.50
51.
227
8,33
0
8,
373
0.09
00.
106
Ove
rwei
ght p
reva
lenc
e (m
oder
ate
and
seve
re)
TC.4
7a0.
0305
0.00
240.
078
1.59
61.
263
8,33
0
8,
373
0.02
60.
035
Ear
ly c
hild
dev
elop
men
t ind
exTC
.53
0.88
030.
0059
0.00
71.
150
1.07
23,
525
3,52
9
0.
869
0.89
2
Low
er b
ound
r - 2
seU
pper
bou
ndr +
2se
Lear
nP
artic
ipat
ion
rate
in o
rgan
ised
lear
ning
(adj
uste
d)LN
.20.
6907
0.01
350.
020
1.62
61.
275
1,79
6
1,
906
0.66
40.
718
Prot
ecte
d fr
om v
iole
nce
and
expl
oita
tion
Birt
h re
gist
ratio
nP
R.1
0.67
010.
0094
0.01
43.
425
1.85
18,
541
8,60
2
0.
651
0.68
9V
iole
nt d
isci
plin
eP
R.2
0.69
640.
0062
0.00
92.
856
1.69
025
,039
15
,691
0.
684
0.70
9C
hild
labo
urP
R.3
0.45
720.
0073
0.01
62.
357
1.53
522
,615
11
,007
0.
443
0.47
2C
hild
mar
riage
(bef
ore
age
15)
PR
.4a
0.08
970.
0060
0.06
71.
287
1.13
42,
708
2,87
8
0.
078
0.10
2C
hild
mar
riage
(bef
ore
age
18)
PR
.4b
0.38
480.
0109
0.02
81.
456
1.20
72,
708
2,87
8
0.
363
0.40
7Li
ve in
a s
afe
and
clea
n en
viro
nmen
tU
se o
f bas
ic d
rinki
ng w
ater
ser
vice
sW
S.2
0.71
830.
0103
0.01
47.
974
2.82
472
,674
15
,287
0.
698
0.73
9U
se o
f saf
ely
man
aged
drin
king
wat
er s
ervi
ces
WS
.60.
0943
0.00
710.
075
1.32
71.
152
10,7
01
2,24
8
0.
080
0.10
8H
andw
ashi
ng fa
cilit
y w
ith w
ater
and
soa
pW
S.7
0.45
560.
0095
0.02
15.
527
2.35
172
,632
15
,279
0.
437
0.47
5U
se o
f bas
ic s
anita
tion
serv
ices
WS
.90.
6209
0.01
000.
016
6.45
82.
541
72,6
74
15,2
87
0.60
10.
641
Saf
e di
spos
al in
situ
of e
xcre
ta fr
om o
n-si
te s
anita
tion
faci
litie
sW
S.1
00.
9530
0.00
360.
004
2.92
01.
709
45,8
31
9,86
8
0.
946
0.96
0Eq
uita
ble
chan
ce in
life
Chi
ldre
n w
ith fu
nctio
nal d
ificu
lty
EQ
.10.
0233
0.00
230.
097
1.19
81.
095
5,30
3
5,
308
0.01
90.
028
Pop
ulat
ion
cove
red
by s
ocia
l tra
nsfe
rsE
Q.3
0.10
470.
0035
0.03
42.
013
1.41
972
,674
15
,287
0.
098
0.11
2
Des
ign
effe
ct
(def
f)
Squ
are
root
of
des
ign
effe
ct (d
eft)
Wei
ghte
d co
unt
Unw
eigh
ted
coun
t
Con
fiden
ce li
mits
MIC
SIn
dica
tor
Val
ue (r
)S
tand
ard
erro
r (se
)
Coe
ffici
ent o
f va
riatio
n(s
e/r)
na: n
ot a
pplic
able
Tabl
e SE
.3: S
ampl
ing
erro
rs: R
ural
Sta
ndar
d er
rors
, coe
ffici
ents
of v
aria
tion,
des
ign
effe
cts
(def
f), s
quar
e ro
ot o
f des
ign
effe
cts
(def
t), a
nd c
onfid
ence
inte
rval
s fo
r sel
ecte
d S
DG
and
MIC
S in
dica
tors
, LS
ISII,
201
7
MIC
SIn
dica
tor
Val
ue (r
)S
tand
ard
erro
r (se
)
Coe
ffici
ent o
f va
riatio
n(s
e/r)
Des
ign
effe
ct
(def
f)
Squ
are
root
of
des
ign
effe
ct (d
eft)
Wei
ghte
d co
unt
Unw
eigh
ted
coun
t
Con
fiden
ce li
mits
Tabl
e SE
.3: S
ampl
ing
erro
rs: R
ural
Sta
ndar
d er
rors
, coe
ffici
ents
of v
aria
tion,
des
ign
effe
cts
(def
f), s
quar
e ro
ot o
f des
ign
effe
cts
(def
t), a
nd c
onfid
ence
inte
rval
s fo
r sel
ecte
d S
DG
and
MIC
S in
dica
tors
, LS
ISII,
201
7
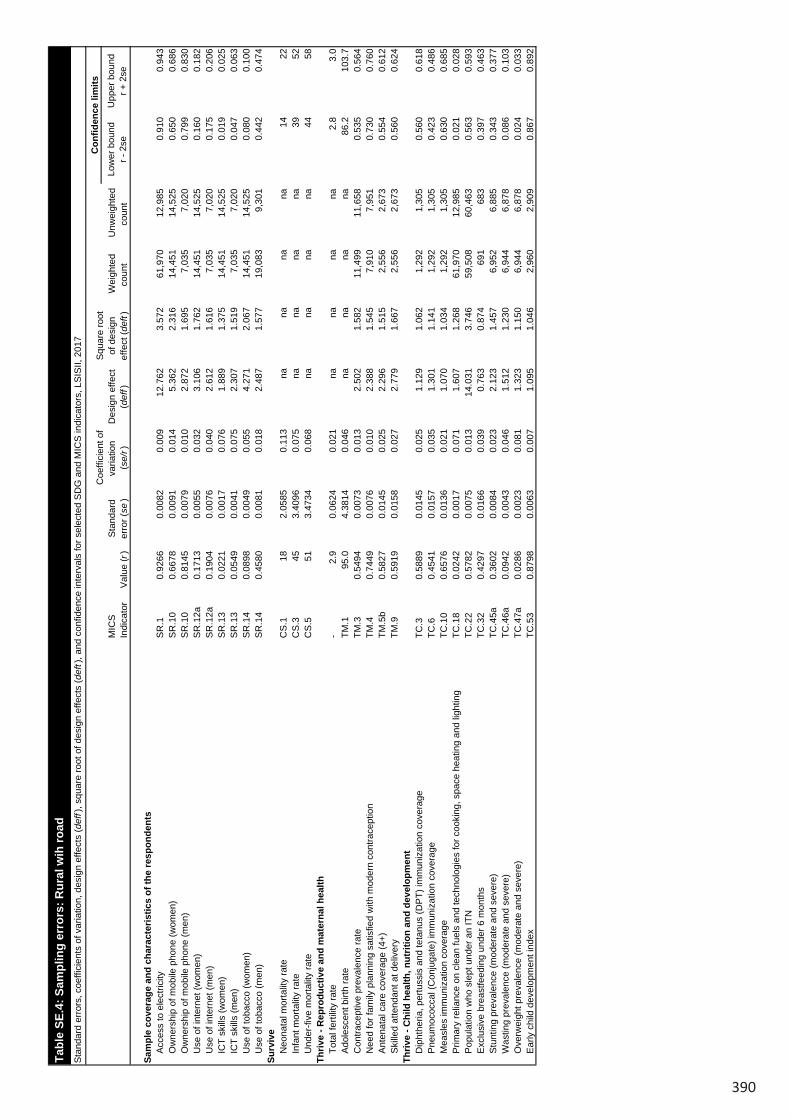
390
Low
er b
ound
r - 2
seU
pper
bou
ndr +
2se
Sam
ple
cove
rage
and
cha
ract
eris
tics
of th
e re
spon
dent
sA
cces
s to
ele
ctric
ityS
R.1
0.92
660.
0082
0.00
912
.762
3.57
261
,970
12
,985
0.
910
0.94
3O
wne
rshi
p of
mob
ile p
hone
(wom
en)
SR
.10
0.66
780.
0091
0.01
45.
362
2.31
614
,451
14
,525
0.
650
0.68
6O
wne
rshi
p of
mob
ile p
hone
(men
)S
R.1
00.
8145
0.00
790.
010
2.87
21.
695
7,03
5
7,
020
0.79
90.
830
Use
of i
nter
net (
wom
en)
SR
.12a
0.17
130.
0055
0.03
23.
106
1.76
214
,451
14
,525
0.
160
0.18
2U
se o
f int
erne
t (m
en)
SR
.12a
0.19
040.
0076
0.04
02.
612
1.61
67,
035
7,02
0
0.
175
0.20
6IC
T sk
ills
(wom
en)
SR
.13
0.02
210.
0017
0.07
61.
889
1.37
514
,451
14
,525
0.
019
0.02
5IC
T sk
ills
(men
)S
R.1
30.
0549
0.00
410.
075
2.30
71.
519
7,03
5
7,
020
0.04
70.
063
Use
of t
obac
co (w
omen
)S
R.1
40.
0898
0.00
490.
055
4.27
12.
067
14,4
51
14,5
25
0.08
00.
100
Use
of t
obac
co (m
en)
SR
.14
0.45
800.
0081
0.01
82.
487
1.57
719
,083
9,
301
0.44
20.
474
Surv
ive
Neo
nata
l mor
talit
y ra
teC
S.1
182.
0585
0.11
3na
nana
na14
22In
fant
mor
talit
y ra
teC
S.3
453.
4096
0.07
5na
nana
na39
52U
nder
-five
mor
talit
y ra
teC
S.5
513.
4734
0.06
8na
nana
na44
58Th
rive
- Rep
rodu
ctiv
e an
d m
ater
nal h
ealth
Tota
l fer
tility
rate
-2.
90.
0624
0.02
1na
nana
na2.
83.
0A
dole
scen
t birt
h ra
teTM
.195
.04.
3814
0.04
6na
nana
na86
.210
3.7
…C
ontra
cept
ive
prev
alen
ce ra
teTM
.30.
5494
0.00
730.
013
2.50
21.
582
11,4
99
11,6
58
0.53
50.
564
Nee
d fo
r fam
ily p
lann
ing
satis
fied
with
mod
ern
cont
race
ptio
nTM
.40.
7449
0.00
760.
010
2.38
81.
545
7,91
0
7,
951
0.73
00.
760
Ant
enat
al c
are
cove
rage
(4+)
TM.5
b0.
5827
0.01
450.
025
2.29
61.
515
2,55
6
2,
673
0.55
40.
612
Ski
lled
atte
ndan
t at d
eliv
ery
TM.9
0.59
190.
0158
0.02
72.
779
1.66
72,
556
2,67
3
0.
560
0.62
4Th
rive
- Chi
ld h
ealth
, nut
ritio
n an
d de
velo
pmen
tD
ipht
heria
, per
tuss
is a
nd te
tanu
s (D
PT)
imm
uniz
atio
n co
vera
geTC
.30.
5889
0.01
450.
025
1.12
91.
062
1,29
2
1,
305
0.56
00.
618
Pne
umoc
occa
l (C
onju
gate
) im
mun
izat
ion
cove
rage
TC.6
0.45
410.
0157
0.03
51.
301
1.14
11,
292
1,30
5
0.
423
0.48
6M
easl
es im
mun
izat
ion
cove
rage
TC.1
00.
6576
0.01
360.
021
1.07
01.
034
1,29
2
1,
305
0.63
00.
685
Prim
ary
relia
nce
on c
lean
fuel
s an
d te
chno
logi
es fo
r coo
king
, spa
ce h
eatin
g an
d lig
htin
gTC
.18
0.02
420.
0017
0.07
11.
607
1.26
861
,970
12
,985
0.
021
0.02
8P
opul
atio
n w
ho s
lept
und
er a
n IT
NTC
.22
0.57
820.
0075
0.01
314
.031
3.74
659
,508
60
,463
0.
563
0.59
3E
xclu
sive
bre
astfe
edin
g un
der 6
mon
ths
TC.3
20.
4297
0.01
660.
039
0.76
30.
874
691
68
3
0.39
70.
463
Stu
ntin
g pr
eval
ence
(mod
erat
e an
d se
vere
)TC
.45a
0.36
020.
0084
0.02
32.
123
1.45
76,
952
6,88
5
0.
343
0.37
7W
astin
g pr
eval
ence
(mod
erat
e an
d se
vere
)TC
.46a
0.09
420.
0043
0.04
61.
512
1.23
06,
944
6,87
8
0.
086
0.10
3O
verw
eigh
t pre
vale
nce
(mod
erat
e an
d se
vere
)TC
.47a
0.02
860.
0023
0.08
11.
323
1.15
06,
944
6,87
8
0.
024
0.03
3E
arly
chi
ld d
evel
opm
ent i
ndex
TC.5
30.
8798
0.00
630.
007
1.09
51.
046
2,96
0
2,
909
0.86
70.
892
Low
er b
ound
r - 2
seU
pper
bou
ndr +
2se
Lear
nP
artic
ipat
ion
rate
in o
rgan
ised
lear
ning
(adj
uste
d)LN
.20.
6997
0.01
430.
020
1.53
51.
239
1,48
0
1,
568
0.67
10.
728
Prot
ecte
d fr
om v
iole
nce
and
expl
oita
tion
Birt
h re
gist
ratio
nP
R.1
0.68
830.
0098
0.01
43.
151
1.77
57,
124
7,07
1
0.
669
0.70
8V
iole
nt d
isci
plin
eP
R.2
0.70
770.
0068
0.01
02.
909
1.70
520
,974
13
,058
0.
694
0.72
1C
hild
labo
urP
R.3
0.45
930.
0081
0.01
82.
467
1.57
119
,463
9,
301
0.44
30.
476
Chi
ld m
arria
ge (b
efor
e ag
e 15
)P
R.4
a0.
0853
0.00
630.
074
1.26
31.
124
2,33
2
2,
453
0.07
30.
098
Chi
ld m
arria
ge (b
efor
e ag
e 18
)P
R.4
b0.
3674
0.01
160.
032
1.42
41.
193
2,33
2
2,
453
0.34
40.
391
Live
in a
saf
e an
d cl
ean
envi
ronm
ent
Use
of b
asic
drin
king
wat
er s
ervi
ces
WS
.20.
7397
0.01
050.
014
7.44
62.
729
61,9
70
12,9
85
0.71
90.
761
Use
of s
afel
y m
anag
ed d
rinki
ng w
ater
ser
vice
sW
S.6
0.10
190.
0079
0.07
81.
314
1.14
69,
142
1,91
3
0.
086
0.11
8H
andw
ashi
ng fa
cilit
y w
ith w
ater
and
soa
pW
S.7
0.48
090.
0103
0.02
15.
556
2.35
761
,933
12
,979
0.
460
0.50
2U
se o
f bas
ic s
anita
tion
serv
ices
WS
.90.
6404
0.01
080.
017
6.61
02.
571
61,9
70
12,9
85
0.61
90.
662
Saf
e di
spos
al in
situ
of e
xcre
ta fr
om o
n-si
te s
anita
tion
faci
litie
sW
S.1
00.
9469
0.00
410.
004
2.83
51.
684
40,4
74
8,66
3
0.
939
0.95
5Eq
uita
ble
chan
ce in
life
Chi
ldre
n w
ith fu
nctio
nal d
ificu
lty
EQ
.10.
0205
0.00
220.
106
1.02
41.
012
4,44
1
4,
375
0.01
60.
025
Pop
ulat
ion
cove
red
by s
ocia
l tra
nsfe
rsE
Q.3
0.10
100.
0037
0.03
71.
944
1.39
461
,970
12
,985
0.
094
0.10
8
Des
ign
effe
ct
(def
f)
Squ
are
root
of
des
ign
effe
ct (d
eft)
Wei
ghte
d co
unt
Unw
eigh
ted
coun
t
Con
fiden
ce li
mits
MIC
SIn
dica
tor
Val
ue (r
)S
tand
ard
erro
r (se
)
Coe
ffici
ent o
f va
riatio
n(s
e/r)
na: n
ot a
pplic
able
Tabl
e SE
.4: S
ampl
ing
erro
rs: R
ural
wih
road
Sta
ndar
d er
rors
, coe
ffici
ents
of v
aria
tion,
des
ign
effe
cts
(def
f), s
quar
e ro
ot o
f des
ign
effe
cts
(def
t), a
nd c
onfid
ence
inte
rval
s fo
r sel
ecte
d S
DG
and
MIC
S in
dica
tors
, LS
ISII,
201
7
MIC
SIn
dica
tor
Val
ue (r
)S
tand
ard
erro
r (se
)
Coe
ffici
ent o
f va
riatio
n(s
e/r)
Des
ign
effe
ct
(def
f)
Squ
are
root
of
des
ign
effe
ct (d
eft)
Wei
ghte
d co
unt
Unw
eigh
ted
coun
t
Con
fiden
ce li
mits
Tabl
e SE
.4: S
ampl
ing
erro
rs: R
ural
wih
road
Sta
ndar
d er
rors
, coe
ffici
ents
of v
aria
tion,
des
ign
effe
cts
(def
f), s
quar
e ro
ot o
f des
ign
effe
cts
(def
t), a
nd c
onfid
ence
inte
rval
s fo
r sel
ecte
d S
DG
and
MIC
S in
dica
tors
, LS
ISII,
201
7
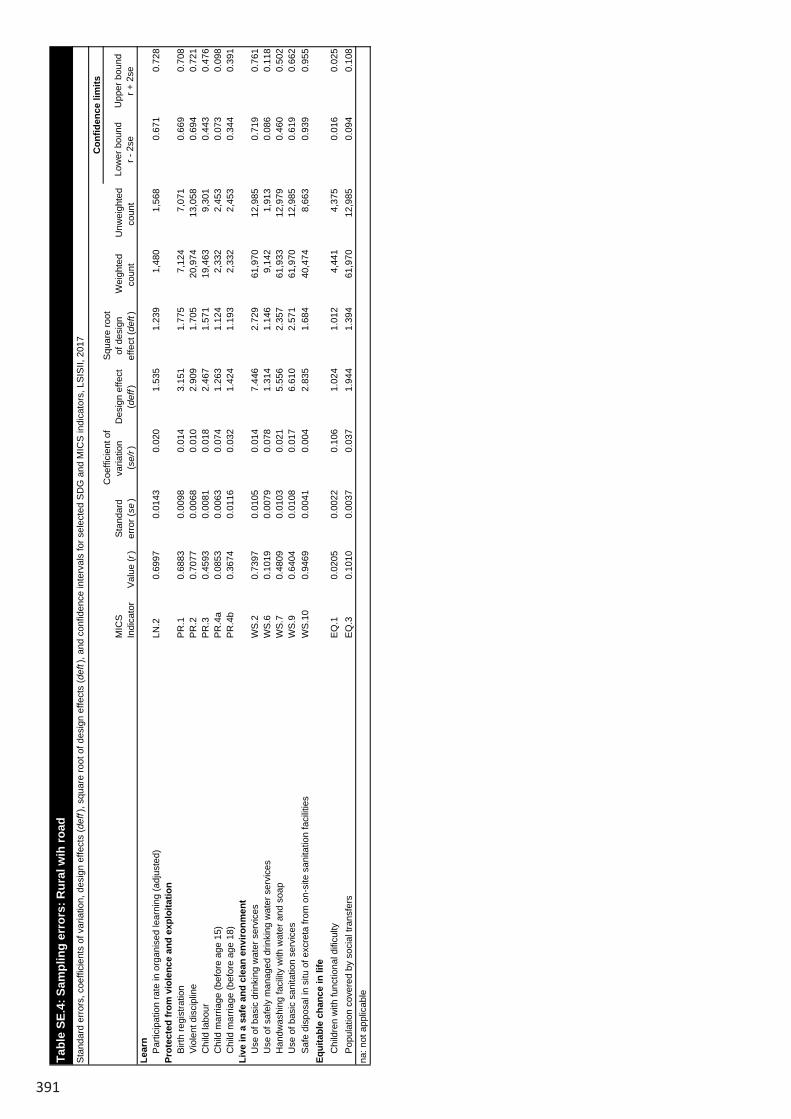
391
Low
er b
ound
r - 2
seU
pper
bou
ndr +
2se
Sam
ple
cove
rage
and
cha
ract
eris
tics
of th
e re
spon
dent
sA
cces
s to
ele
ctric
ityS
R.1
0.92
660.
0082
0.00
912
.762
3.57
261
,970
12
,985
0.
910
0.94
3O
wne
rshi
p of
mob
ile p
hone
(wom
en)
SR
.10
0.66
780.
0091
0.01
45.
362
2.31
614
,451
14
,525
0.
650
0.68
6O
wne
rshi
p of
mob
ile p
hone
(men
)S
R.1
00.
8145
0.00
790.
010
2.87
21.
695
7,03
5
7,
020
0.79
90.
830
Use
of i
nter
net (
wom
en)
SR
.12a
0.17
130.
0055
0.03
23.
106
1.76
214
,451
14
,525
0.
160
0.18
2U
se o
f int
erne
t (m
en)
SR
.12a
0.19
040.
0076
0.04
02.
612
1.61
67,
035
7,02
0
0.
175
0.20
6IC
T sk
ills
(wom
en)
SR
.13
0.02
210.
0017
0.07
61.
889
1.37
514
,451
14
,525
0.
019
0.02
5IC
T sk
ills
(men
)S
R.1
30.
0549
0.00
410.
075
2.30
71.
519
7,03
5
7,
020
0.04
70.
063
Use
of t
obac
co (w
omen
)S
R.1
40.
0898
0.00
490.
055
4.27
12.
067
14,4
51
14,5
25
0.08
00.
100
Use
of t
obac
co (m
en)
SR
.14
0.45
800.
0081
0.01
82.
487
1.57
719
,083
9,
301
0.44
20.
474
Surv
ive
Neo
nata
l mor
talit
y ra
teC
S.1
182.
0585
0.11
3na
nana
na14
22In
fant
mor
talit
y ra
teC
S.3
453.
4096
0.07
5na
nana
na39
52U
nder
-five
mor
talit
y ra
teC
S.5
513.
4734
0.06
8na
nana
na44
58Th
rive
- Rep
rodu
ctiv
e an
d m
ater
nal h
ealth
Tota
l fer
tility
rate
-2.
90.
0624
0.02
1na
nana
na2.
83.
0A
dole
scen
t birt
h ra
teTM
.195
.04.
3814
0.04
6na
nana
na86
.210
3.7
…C
ontra
cept
ive
prev
alen
ce ra
teTM
.30.
5494
0.00
730.
013
2.50
21.
582
11,4
99
11,6
58
0.53
50.
564
Nee
d fo
r fam
ily p
lann
ing
satis
fied
with
mod
ern
cont
race
ptio
nTM
.40.
7449
0.00
760.
010
2.38
81.
545
7,91
0
7,
951
0.73
00.
760
Ant
enat
al c
are
cove
rage
(4+)
TM.5
b0.
5827
0.01
450.
025
2.29
61.
515
2,55
6
2,
673
0.55
40.
612
Ski
lled
atte
ndan
t at d
eliv
ery
TM.9
0.59
190.
0158
0.02
72.
779
1.66
72,
556
2,67
3
0.
560
0.62
4Th
rive
- Chi
ld h
ealth
, nut
ritio
n an
d de
velo
pmen
tD
ipht
heria
, per
tuss
is a
nd te
tanu
s (D
PT)
imm
uniz
atio
n co
vera
geTC
.30.
5889
0.01
450.
025
1.12
91.
062
1,29
2
1,
305
0.56
00.
618
Pne
umoc
occa
l (C
onju
gate
) im
mun
izat
ion
cove
rage
TC.6
0.45
410.
0157
0.03
51.
301
1.14
11,
292
1,30
5
0.
423
0.48
6M
easl
es im
mun
izat
ion
cove
rage
TC.1
00.
6576
0.01
360.
021
1.07
01.
034
1,29
2
1,
305
0.63
00.
685
Prim
ary
relia
nce
on c
lean
fuel
s an
d te
chno
logi
es fo
r coo
king
, spa
ce h
eatin
g an
d lig
htin
gTC
.18
0.02
420.
0017
0.07
11.
607
1.26
861
,970
12
,985
0.
021
0.02
8P
opul
atio
n w
ho s
lept
und
er a
n IT
NTC
.22
0.57
820.
0075
0.01
314
.031
3.74
659
,508
60
,463
0.
563
0.59
3E
xclu
sive
bre
astfe
edin
g un
der 6
mon
ths
TC.3
20.
4297
0.01
660.
039
0.76
30.
874
691
68
3
0.39
70.
463
Stu
ntin
g pr
eval
ence
(mod
erat
e an
d se
vere
)TC
.45a
0.36
020.
0084
0.02
32.
123
1.45
76,
952
6,88
5
0.
343
0.37
7W
astin
g pr
eval
ence
(mod
erat
e an
d se
vere
)TC
.46a
0.09
420.
0043
0.04
61.
512
1.23
06,
944
6,87
8
0.
086
0.10
3O
verw
eigh
t pre
vale
nce
(mod
erat
e an
d se
vere
)TC
.47a
0.02
860.
0023
0.08
11.
323
1.15
06,
944
6,87
8
0.
024
0.03
3E
arly
chi
ld d
evel
opm
ent i
ndex
TC.5
30.
8798
0.00
630.
007
1.09
51.
046
2,96
0
2,
909
0.86
70.
892
Low
er b
ound
r - 2
seU
pper
bou
ndr +
2se
Lear
nP
artic
ipat
ion
rate
in o
rgan
ised
lear
ning
(adj
uste
d)LN
.20.
6997
0.01
430.
020
1.53
51.
239
1,48
0
1,
568
0.67
10.
728
Prot
ecte
d fr
om v
iole
nce
and
expl
oita
tion
Birt
h re
gist
ratio
nP
R.1
0.68
830.
0098
0.01
43.
151
1.77
57,
124
7,07
1
0.
669
0.70
8V
iole
nt d
isci
plin
eP
R.2
0.70
770.
0068
0.01
02.
909
1.70
520
,974
13
,058
0.
694
0.72
1C
hild
labo
urP
R.3
0.45
930.
0081
0.01
82.
467
1.57
119
,463
9,
301
0.44
30.
476
Chi
ld m
arria
ge (b
efor
e ag
e 15
)P
R.4
a0.
0853
0.00
630.
074
1.26
31.
124
2,33
2
2,
453
0.07
30.
098
Chi
ld m
arria
ge (b
efor
e ag
e 18
)P
R.4
b0.
3674
0.01
160.
032
1.42
41.
193
2,33
2
2,
453
0.34
40.
391
Live
in a
saf
e an
d cl
ean
envi
ronm
ent
Use
of b
asic
drin
king
wat
er s
ervi
ces
WS
.20.
7397
0.01
050.
014
7.44
62.
729
61,9
70
12,9
85
0.71
90.
761
Use
of s
afel
y m
anag
ed d
rinki
ng w
ater
ser
vice
sW
S.6
0.10
190.
0079
0.07
81.
314
1.14
69,
142
1,91
3
0.
086
0.11
8H
andw
ashi
ng fa
cilit
y w
ith w
ater
and
soa
pW
S.7
0.48
090.
0103
0.02
15.
556
2.35
761
,933
12
,979
0.
460
0.50
2U
se o
f bas
ic s
anita
tion
serv
ices
WS
.90.
6404
0.01
080.
017
6.61
02.
571
61,9
70
12,9
85
0.61
90.
662
Saf
e di
spos
al in
situ
of e
xcre
ta fr
om o
n-si
te s
anita
tion
faci
litie
sW
S.1
00.
9469
0.00
410.
004
2.83
51.
684
40,4
74
8,66
3
0.
939
0.95
5Eq
uita
ble
chan
ce in
life
Chi
ldre
n w
ith fu
nctio
nal d
ificu
lty
EQ
.10.
0205
0.00
220.
106
1.02
41.
012
4,44
1
4,
375
0.01
60.
025
Pop
ulat
ion
cove
red
by s
ocia
l tra
nsfe
rsE
Q.3
0.10
100.
0037
0.03
71.
944
1.39
461
,970
12
,985
0.
094
0.10
8
Des
ign
effe
ct
(def
f)
Squ
are
root
of
des
ign
effe
ct (d
eft)
Wei
ghte
d co
unt
Unw
eigh
ted
coun
t
Con
fiden
ce li
mits
MIC
SIn
dica
tor
Val
ue (r
)S
tand
ard
erro
r (se
)
Coe
ffici
ent o
f va
riatio
n(s
e/r)
na: n
ot a
pplic
able
Tabl
e SE
.4: S
ampl
ing
erro
rs: R
ural
wih
road
Sta
ndar
d er
rors
, coe
ffici
ents
of v
aria
tion,
des
ign
effe
cts
(def
f), s
quar
e ro
ot o
f des
ign
effe
cts
(def
t), a
nd c
onfid
ence
inte
rval
s fo
r sel
ecte
d S
DG
and
MIC
S in
dica
tors
, LS
ISII,
201
7
MIC
SIn
dica
tor
Val
ue (r
)S
tand
ard
erro
r (se
)
Coe
ffici
ent o
f va
riatio
n(s
e/r)
Des
ign
effe
ct
(def
f)
Squ
are
root
of
des
ign
effe
ct (d
eft)
Wei
ghte
d co
unt
Unw
eigh
ted
coun
t
Con
fiden
ce li
mits
Tabl
e SE
.4: S
ampl
ing
erro
rs: R
ural
wih
road
Sta
ndar
d er
rors
, coe
ffici
ents
of v
aria
tion,
des
ign
effe
cts
(def
f), s
quar
e ro
ot o
f des
ign
effe
cts
(def
t), a
nd c
onfid
ence
inte
rval
s fo
r sel
ecte
d S
DG
and
MIC
S in
dica
tors
, LS
ISII,
201
7
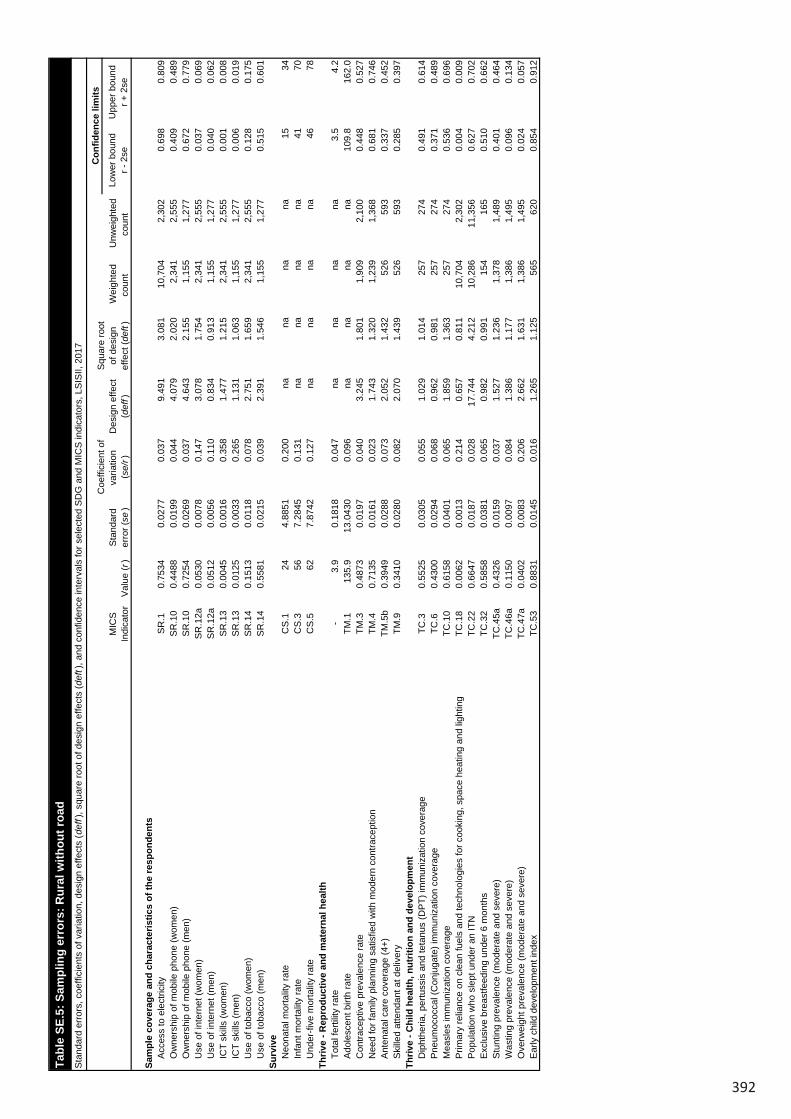
392
Low
er b
ound
r - 2
seU
pper
bou
ndr +
2se
Sam
ple
cove
rage
and
cha
ract
eris
tics
of th
e re
spon
dent
sA
cces
s to
ele
ctric
ityS
R.1
0.75
340.
0277
0.03
79.
491
3.08
110
,704
2,
302
0.69
80.
809
Ow
ners
hip
of m
obile
pho
ne (w
omen
)S
R.1
00.
4488
0.01
990.
044
4.07
92.
020
2,34
1
2,
555
0.40
90.
489
Ow
ners
hip
of m
obile
pho
ne (m
en)
SR
.10
0.72
540.
0269
0.03
74.
643
2.15
51,
155
1,27
7
0.
672
0.77
9U
se o
f int
erne
t (w
omen
)S
R.1
2a0.
0530
0.00
780.
147
3.07
81.
754
2,34
1
2,
555
0.03
70.
069
Use
of i
nter
net (
men
)S
R.1
2a0.
0512
0.00
560.
110
0.83
40.
913
1,15
5
1,
277
0.04
00.
062
ICT
skill
s (w
omen
)S
R.1
30.
0045
0.00
160.
358
1.47
71.
215
2,34
1
2,
555
0.00
10.
008
ICT
skill
s (m
en)
SR
.13
0.01
250.
0033
0.26
51.
131
1.06
31,
155
1,27
7
0.
006
0.01
9U
se o
f tob
acco
(wom
en)
SR
.14
0.15
130.
0118
0.07
82.
751
1.65
92,
341
2,55
5
0.
128
0.17
5U
se o
f tob
acco
(men
)S
R.1
40.
5581
0.02
150.
039
2.39
11.
546
1,15
5
1,
277
0.51
50.
601
Surv
ive
Neo
nata
l mor
talit
y ra
teC
S.1
244.
8851
0.20
0na
nana
na15
34In
fant
mor
talit
y ra
teC
S.3
567.
2845
0.13
1na
nana
na41
70U
nder
-five
mor
talit
y ra
teC
S.5
627.
8742
0.12
7na
nana
na46
78Th
rive
- Rep
rodu
ctiv
e an
d m
ater
nal h
ealth
Tota
l fer
tility
rate
-3.
90.
1818
0.04
7na
nana
na3.
54.
2A
dole
scen
t birt
h ra
teTM
.113
5.9
13.0
430
0.09
6na
nana
na10
9.8
162.
0…
Con
trace
ptiv
e pr
eval
ence
rate
TM.3
0.48
730.
0197
0.04
03.
245
1.80
11,
909
2,10
0
0.
448
0.52
7N
eed
for f
amily
pla
nnin
g sa
tisfie
d w
ith m
oder
n co
ntra
cept
ion
TM.4
0.71
350.
0161
0.02
31.
743
1.32
01,
239
1,36
8
0.
681
0.74
6A
nten
atal
car
e co
vera
ge (4
+)TM
.5b
0.39
490.
0288
0.07
32.
052
1.43
252
6
593
0.
337
0.45
2S
kille
d at
tend
ant a
t del
iver
yTM
.90.
3410
0.02
800.
082
2.07
01.
439
526
59
3
0.28
50.
397
Thriv
e - C
hild
hea
lth, n
utrit
ion
and
deve
lopm
ent
Dip
hthe
ria, p
ertu
ssis
and
teta
nus
(DP
T) im
mun
izat
ion
cove
rage
TC.3
0.55
250.
0305
0.05
51.
029
1.01
425
7
274
0.
491
0.61
4P
neum
ococ
cal (
Con
juga
te) i
mm
uniz
atio
n co
vera
geTC
.60.
4300
0.02
940.
068
0.96
20.
981
257
27
4
0.37
10.
489
Mea
sles
imm
uniz
atio
n co
vera
geTC
.10
0.61
580.
0401
0.06
51.
859
1.36
325
7
274
0.
536
0.69
6P
rimar
y re
lianc
e on
cle
an fu
els
and
tech
nolo
gies
for c
ooki
ng, s
pace
hea
ting
and
light
ing
TC.1
80.
0062
0.00
130.
214
0.65
70.
811
10,7
04
2,30
2
0.
004
0.00
9P
opul
atio
n w
ho s
lept
und
er a
n IT
NTC
.22
0.66
470.
0187
0.02
817
.744
4.21
210
,286
11
,356
0.
627
0.70
2E
xclu
sive
bre
astfe
edin
g un
der 6
mon
ths
TC.3
20.
5858
0.03
810.
065
0.98
20.
991
154
16
5
0.51
00.
662
Stu
ntin
g pr
eval
ence
(mod
erat
e an
d se
vere
)TC
.45a
0.43
260.
0159
0.03
71.
527
1.23
61,
378
1,48
9
0.
401
0.46
4W
astin
g pr
eval
ence
(mod
erat
e an
d se
vere
)TC
.46a
0.11
500.
0097
0.08
41.
386
1.17
71,
386
1,49
5
0.
096
0.13
4O
verw
eigh
t pre
vale
nce
(mod
erat
e an
d se
vere
)TC
.47a
0.04
020.
0083
0.20
62.
662
1.63
11,
386
1,49
5
0.
024
0.05
7E
arly
chi
ld d
evel
opm
ent i
ndex
TC.5
30.
8831
0.01
450.
016
1.26
51.
125
565
62
0
0.85
40.
912
Low
er b
ound
r - 2
seU
pper
bou
ndr +
2se
Lear
nP
artic
ipat
ion
rate
in o
rgan
ised
lear
ning
(adj
uste
d)LN
.20.
6487
0.03
670.
057
1.98
91.
410
316
33
8
0.57
50.
722
Prot
ecte
d fr
om v
iole
nce
and
expl
oita
tion
Birt
h re
gist
ratio
nP
R.1
0.57
860.
0248
0.04
33.
855
1.96
31,
417
1,53
1
0.
529
0.62
8V
iole
nt d
isci
plin
eP
R.2
0.63
810.
0145
0.02
32.
381
1.54
34,
065
2,63
3
0.
609
0.66
7C
hild
labo
urP
R.3
0.45
280.
0148
0.03
31.
506
1.22
73,
532
1,70
6
0.
423
0.48
2C
hild
mar
riage
(bef
ore
age
15)
PR
.4a
0.11
720.
0174
0.14
91.
242
1.11
537
6
425
0.
082
0.15
2C
hild
mar
riage
(bef
ore
age
18)
PR
.4b
0.49
270.
0258
0.05
21.
129
1.06
337
6
425
0.
441
0.54
4Li
ve in
a s
afe
and
clea
n en
viro
nmen
tU
se o
f bas
ic d
rinki
ng w
ater
ser
vice
sW
S.2
0.59
420.
0277
0.04
77.
300
2.70
210
,704
2,
302
0.53
90.
650
Use
of s
afel
y m
anag
ed d
rinki
ng w
ater
ser
vice
sW
S.6
0.04
950.
0143
0.28
91.
452
1.20
51,
559
335
0.
021
0.07
8H
andw
ashi
ng fa
cilit
y w
ith w
ater
and
soa
pW
S.7
0.30
960.
0208
0.06
74.
648
2.15
610
,699
2,
300
0.26
80.
351
Use
of b
asic
san
itatio
n se
rvic
esW
S.9
0.50
800.
0247
0.04
95.
603
2.36
710
,704
2,
302
0.45
90.
557
Saf
e di
spos
al in
situ
of e
xcre
ta fr
om o
n-si
te s
anita
tion
faci
litie
sW
S.1
00.
9985
0.00
020.
000
0.04
00.
201
5,35
7
1,
205
0.99
80.
999
Equi
tabl
e ch
ance
in li
feC
hild
ren
with
func
tiona
l difi
culty
E
Q.1
0.03
750.
0081
0.21
71.
704
1.30
586
1
933
0.
021
0.05
4P
opul
atio
n co
vere
d by
soc
ial t
rans
fers
EQ
.30.
1261
0.01
060.
084
2.35
41.
534
10,7
04
2,30
2
0.
105
0.14
7na
: not
app
licab
le
Tabl
e SE
.5: S
ampl
ing
erro
rs: R
ural
with
out r
oad
Sta
ndar
d er
rors
, coe
ffici
ents
of v
aria
tion,
des
ign
effe
cts
(def
f), s
quar
e ro
ot o
f des
ign
effe
cts
(def
t), a
nd c
onfid
ence
inte
rval
s fo
r sel
ecte
d S
DG
and
MIC
S in
dica
tors
, LS
ISII,
201
7
MIC
SIn
dica
tor
Val
ue (r
)S
tand
ard
erro
r (se
)
Coe
ffici
ent o
f va
riatio
n(s
e/r)
Des
ign
effe
ct
(def
f)
Squ
are
root
of
des
ign
effe
ct (d
eft)
Wei
ghte
d co
unt
Unw
eigh
ted
coun
t
Con
fiden
ce li
mits
Tabl
e SE
.5: S
ampl
ing
erro
rs: R
ural
with
out r
oad
Sta
ndar
d er
rors
, coe
ffici
ents
of v
aria
tion,
des
ign
effe
cts
(def
f), s
quar
e ro
ot o
f des
ign
effe
cts
(def
t), a
nd c
onfid
ence
inte
rval
s fo
r sel
ecte
d S
DG
and
MIC
S in
dica
tors
, LS
ISII,
201
7
MIC
SIn
dica
tor
Val
ue (r
)S
tand
ard
erro
r (se
)
Coe
ffici
ent o
f va
riatio
n(s
e/r)
Des
ign
effe
ct
(def
f)
Squ
are
root
of
des
ign
effe
ct (d
eft)
Wei
ghte
d co
unt
Unw
eigh
ted
coun
t
Con
fiden
ce li
mits

393
Low
er b
ound
r - 2
seU
pper
bou
ndr +
2se
Sam
ple
cove
rage
and
cha
ract
eris
tics
of th
e re
spon
dent
sA
cces
s to
ele
ctric
ityS
R.1
0.75
340.
0277
0.03
79.
491
3.08
110
,704
2,
302
0.69
80.
809
Ow
ners
hip
of m
obile
pho
ne (w
omen
)S
R.1
00.
4488
0.01
990.
044
4.07
92.
020
2,34
1
2,
555
0.40
90.
489
Ow
ners
hip
of m
obile
pho
ne (m
en)
SR
.10
0.72
540.
0269
0.03
74.
643
2.15
51,
155
1,27
7
0.
672
0.77
9U
se o
f int
erne
t (w
omen
)S
R.1
2a0.
0530
0.00
780.
147
3.07
81.
754
2,34
1
2,
555
0.03
70.
069
Use
of i
nter
net (
men
)S
R.1
2a0.
0512
0.00
560.
110
0.83
40.
913
1,15
5
1,
277
0.04
00.
062
ICT
skill
s (w
omen
)S
R.1
30.
0045
0.00
160.
358
1.47
71.
215
2,34
1
2,
555
0.00
10.
008
ICT
skill
s (m
en)
SR
.13
0.01
250.
0033
0.26
51.
131
1.06
31,
155
1,27
7
0.
006
0.01
9U
se o
f tob
acco
(wom
en)
SR
.14
0.15
130.
0118
0.07
82.
751
1.65
92,
341
2,55
5
0.
128
0.17
5U
se o
f tob
acco
(men
)S
R.1
40.
5581
0.02
150.
039
2.39
11.
546
1,15
5
1,
277
0.51
50.
601
Surv
ive
Neo
nata
l mor
talit
y ra
teC
S.1
244.
8851
0.20
0na
nana
na15
34In
fant
mor
talit
y ra
teC
S.3
567.
2845
0.13
1na
nana
na41
70U
nder
-five
mor
talit
y ra
teC
S.5
627.
8742
0.12
7na
nana
na46
78Th
rive
- Rep
rodu
ctiv
e an
d m
ater
nal h
ealth
Tota
l fer
tility
rate
-3.
90.
1818
0.04
7na
nana
na3.
54.
2A
dole
scen
t birt
h ra
teTM
.113
5.9
13.0
430
0.09
6na
nana
na10
9.8
162.
0…
Con
trace
ptiv
e pr
eval
ence
rate
TM.3
0.48
730.
0197
0.04
03.
245
1.80
11,
909
2,10
0
0.
448
0.52
7N
eed
for f
amily
pla
nnin
g sa
tisfie
d w
ith m
oder
n co
ntra
cept
ion
TM.4
0.71
350.
0161
0.02
31.
743
1.32
01,
239
1,36
8
0.
681
0.74
6A
nten
atal
car
e co
vera
ge (4
+)TM
.5b
0.39
490.
0288
0.07
32.
052
1.43
252
6
593
0.
337
0.45
2S
kille
d at
tend
ant a
t del
iver
yTM
.90.
3410
0.02
800.
082
2.07
01.
439
526
59
3
0.28
50.
397
Thriv
e - C
hild
hea
lth, n
utrit
ion
and
deve
lopm
ent
Dip
hthe
ria, p
ertu
ssis
and
teta
nus
(DP
T) im
mun
izat
ion
cove
rage
TC.3
0.55
250.
0305
0.05
51.
029
1.01
425
7
274
0.
491
0.61
4P
neum
ococ
cal (
Con
juga
te) i
mm
uniz
atio
n co
vera
geTC
.60.
4300
0.02
940.
068
0.96
20.
981
257
27
4
0.37
10.
489
Mea
sles
imm
uniz
atio
n co
vera
geTC
.10
0.61
580.
0401
0.06
51.
859
1.36
325
7
274
0.
536
0.69
6P
rimar
y re
lianc
e on
cle
an fu
els
and
tech
nolo
gies
for c
ooki
ng, s
pace
hea
ting
and
light
ing
TC.1
80.
0062
0.00
130.
214
0.65
70.
811
10,7
04
2,30
2
0.
004
0.00
9P
opul
atio
n w
ho s
lept
und
er a
n IT
NTC
.22
0.66
470.
0187
0.02
817
.744
4.21
210
,286
11
,356
0.
627
0.70
2E
xclu
sive
bre
astfe
edin
g un
der 6
mon
ths
TC.3
20.
5858
0.03
810.
065
0.98
20.
991
154
16
5
0.51
00.
662
Stu
ntin
g pr
eval
ence
(mod
erat
e an
d se
vere
)TC
.45a
0.43
260.
0159
0.03
71.
527
1.23
61,
378
1,48
9
0.
401
0.46
4W
astin
g pr
eval
ence
(mod
erat
e an
d se
vere
)TC
.46a
0.11
500.
0097
0.08
41.
386
1.17
71,
386
1,49
5
0.
096
0.13
4O
verw
eigh
t pre
vale
nce
(mod
erat
e an
d se
vere
)TC
.47a
0.04
020.
0083
0.20
62.
662
1.63
11,
386
1,49
5
0.
024
0.05
7E
arly
chi
ld d
evel
opm
ent i
ndex
TC.5
30.
8831
0.01
450.
016
1.26
51.
125
565
62
0
0.85
40.
912
Low
er b
ound
r - 2
seU
pper
bou
ndr +
2se
Lear
nP
artic
ipat
ion
rate
in o
rgan
ised
lear
ning
(adj
uste
d)LN
.20.
6487
0.03
670.
057
1.98
91.
410
316
33
8
0.57
50.
722
Prot
ecte
d fr
om v
iole
nce
and
expl
oita
tion
Birt
h re
gist
ratio
nP
R.1
0.57
860.
0248
0.04
33.
855
1.96
31,
417
1,53
1
0.
529
0.62
8V
iole
nt d
isci
plin
eP
R.2
0.63
810.
0145
0.02
32.
381
1.54
34,
065
2,63
3
0.
609
0.66
7C
hild
labo
urP
R.3
0.45
280.
0148
0.03
31.
506
1.22
73,
532
1,70
6
0.
423
0.48
2C
hild
mar
riage
(bef
ore
age
15)
PR
.4a
0.11
720.
0174
0.14
91.
242
1.11
537
6
425
0.
082
0.15
2C
hild
mar
riage
(bef
ore
age
18)
PR
.4b
0.49
270.
0258
0.05
21.
129
1.06
337
6
425
0.
441
0.54
4Li
ve in
a s
afe
and
clea
n en
viro
nmen
tU
se o
f bas
ic d
rinki
ng w
ater
ser
vice
sW
S.2
0.59
420.
0277
0.04
77.
300
2.70
210
,704
2,
302
0.53
90.
650
Use
of s
afel
y m
anag
ed d
rinki
ng w
ater
ser
vice
sW
S.6
0.04
950.
0143
0.28
91.
452
1.20
51,
559
335
0.
021
0.07
8H
andw
ashi
ng fa
cilit
y w
ith w
ater
and
soa
pW
S.7
0.30
960.
0208
0.06
74.
648
2.15
610
,699
2,
300
0.26
80.
351
Use
of b
asic
san
itatio
n se
rvic
esW
S.9
0.50
800.
0247
0.04
95.
603
2.36
710
,704
2,
302
0.45
90.
557
Saf
e di
spos
al in
situ
of e
xcre
ta fr
om o
n-si
te s
anita
tion
faci
litie
sW
S.1
00.
9985
0.00
020.
000
0.04
00.
201
5,35
7
1,
205
0.99
80.
999
Equi
tabl
e ch
ance
in li
feC
hild
ren
with
func
tiona
l difi
culty
E
Q.1
0.03
750.
0081
0.21
71.
704
1.30
586
1
933
0.
021
0.05
4P
opul
atio
n co
vere
d by
soc
ial t
rans
fers
EQ
.30.
1261
0.01
060.
084
2.35
41.
534
10,7
04
2,30
2
0.
105
0.14
7na
: not
app
licab
le
Tabl
e SE
.5: S
ampl
ing
erro
rs: R
ural
with
out r
oad
Sta
ndar
d er
rors
, coe
ffici
ents
of v
aria
tion,
des
ign
effe
cts
(def
f), s
quar
e ro
ot o
f des
ign
effe
cts
(def
t), a
nd c
onfid
ence
inte
rval
s fo
r sel
ecte
d S
DG
and
MIC
S in
dica
tors
, LS
ISII,
201
7
MIC
SIn
dica
tor
Val
ue (r
)S
tand
ard
erro
r (se
)
Coe
ffici
ent o
f va
riatio
n(s
e/r)
Des
ign
effe
ct
(def
f)
Squ
are
root
of
des
ign
effe
ct (d
eft)
Wei
ghte
d co
unt
Unw
eigh
ted
coun
t
Con
fiden
ce li
mits
Tabl
e SE
.5: S
ampl
ing
erro
rs: R
ural
with
out r
oad
Sta
ndar
d er
rors
, coe
ffici
ents
of v
aria
tion,
des
ign
effe
cts
(def
f), s
quar
e ro
ot o
f des
ign
effe
cts
(def
t), a
nd c
onfid
ence
inte
rval
s fo
r sel
ecte
d S
DG
and
MIC
S in
dica
tors
, LS
ISII,
201
7
MIC
SIn
dica
tor
Val
ue (r
)S
tand
ard
erro
r (se
)
Coe
ffici
ent o
f va
riatio
n(s
e/r)
Des
ign
effe
ct
(def
f)
Squ
are
root
of
des
ign
effe
ct (d
eft)
Wei
ghte
d co
unt
Unw
eigh
ted
coun
t
Con
fiden
ce li
mits
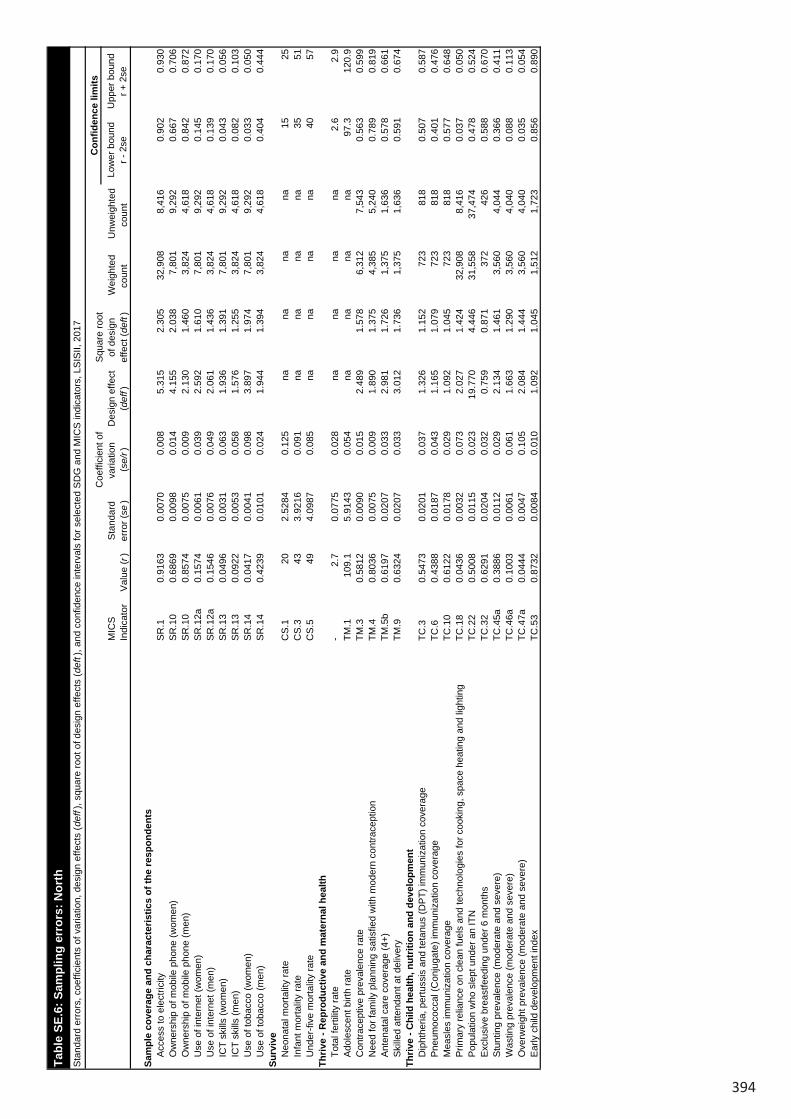
394
Low
er b
ound
r - 2
seU
pper
bou
ndr +
2se
Sam
ple
cove
rage
and
cha
ract
eris
tics
of th
e re
spon
dent
sA
cces
s to
ele
ctric
ityS
R.1
0.91
630.
0070
0.00
85.
315
2.30
532
,908
8,
416
0.90
20.
930
Ow
ners
hip
of m
obile
pho
ne (w
omen
)S
R.1
00.
6869
0.00
980.
014
4.15
52.
038
7,80
1
9,
292
0.66
70.
706
Ow
ners
hip
of m
obile
pho
ne (m
en)
SR
.10
0.85
740.
0075
0.00
92.
130
1.46
03,
824
4,61
8
0.
842
0.87
2U
se o
f int
erne
t (w
omen
)S
R.1
2a0.
1574
0.00
610.
039
2.59
21.
610
7,80
1
9,
292
0.14
50.
170
Use
of i
nter
net (
men
)S
R.1
2a0.
1546
0.00
760.
049
2.06
11.
436
3,82
4
4,
618
0.13
90.
170
ICT
skill
s (w
omen
)S
R.1
30.
0496
0.00
310.
063
1.93
61.
391
7,80
1
9,
292
0.04
30.
056
ICT
skill
s (m
en)
SR
.13
0.09
220.
0053
0.05
81.
576
1.25
53,
824
4,61
8
0.
082
0.10
3U
se o
f tob
acco
(wom
en)
SR
.14
0.04
170.
0041
0.09
83.
897
1.97
47,
801
9,29
2
0.
033
0.05
0U
se o
f tob
acco
(men
)S
R.1
40.
4239
0.01
010.
024
1.94
41.
394
3,82
4
4,
618
0.40
40.
444
Surv
ive
Neo
nata
l mor
talit
y ra
teC
S.1
202.
5284
0.12
5na
nana
na15
25In
fant
mor
talit
y ra
teC
S.3
433.
9216
0.09
1na
nana
na35
51U
nder
-five
mor
talit
y ra
teC
S.5
494.
0987
0.08
5na
nana
na40
57Th
rive
- Rep
rodu
ctiv
e an
d m
ater
nal h
ealth
Tota
l fer
tility
rate
-2.
70.
0775
0.02
8na
nana
na2.
62.
9A
dole
scen
t birt
h ra
teTM
.110
9.1
5.91
430.
054
nana
nana
97.3
120.
9…
Con
trace
ptiv
e pr
eval
ence
rate
TM.3
0.58
120.
0090
0.01
52.
489
1.57
86,
312
7,54
3
0.
563
0.59
9N
eed
for f
amily
pla
nnin
g sa
tisfie
d w
ith m
oder
n co
ntra
cept
ion
TM.4
0.80
360.
0075
0.00
91.
890
1.37
54,
385
5,24
0
0.
789
0.81
9A
nten
atal
car
e co
vera
ge (4
+)TM
.5b
0.61
970.
0207
0.03
32.
981
1.72
61,
375
1,63
6
0.
578
0.66
1S
kille
d at
tend
ant a
t del
iver
yTM
.90.
6324
0.02
070.
033
3.01
21.
736
1,37
5
1,
636
0.59
10.
674
Thriv
e - C
hild
hea
lth, n
utrit
ion
and
deve
lopm
ent
Dip
hthe
ria, p
ertu
ssis
and
teta
nus
(DP
T) im
mun
izat
ion
cove
rage
TC.3
0.54
730.
0201
0.03
71.
326
1.15
272
3
818
0.
507
0.58
7P
neum
ococ
cal (
Con
juga
te) i
mm
uniz
atio
n co
vera
geTC
.60.
4388
0.01
870.
043
1.16
51.
079
723
81
8
0.40
10.
476
Mea
sles
imm
uniz
atio
n co
vera
geTC
.10
0.61
220.
0178
0.02
91.
092
1.04
572
3
818
0.
577
0.64
8P
rimar
y re
lianc
e on
cle
an fu
els
and
tech
nolo
gies
for c
ooki
ng, s
pace
hea
ting
and
light
ing
TC.1
80.
0436
0.00
320.
073
2.02
71.
424
32,9
08
8,41
6
0.
037
0.05
0P
opul
atio
n w
ho s
lept
und
er a
n IT
NTC
.22
0.50
080.
0115
0.02
319
.770
4.44
631
,558
37
,474
0.
478
0.52
4E
xclu
sive
bre
astfe
edin
g un
der 6
mon
ths
TC.3
20.
6291
0.02
040.
032
0.75
90.
871
372
42
6
0.58
80.
670
Stu
ntin
g pr
eval
ence
(mod
erat
e an
d se
vere
)TC
.45a
0.38
860.
0112
0.02
92.
134
1.46
13,
560
4,04
4
0.
366
0.41
1W
astin
g pr
eval
ence
(mod
erat
e an
d se
vere
)TC
.46a
0.10
030.
0061
0.06
11.
663
1.29
03,
560
4,04
0
0.
088
0.11
3O
verw
eigh
t pre
vale
nce
(mod
erat
e an
d se
vere
)TC
.47a
0.04
440.
0047
0.10
52.
084
1.44
43,
560
4,04
0
0.
035
0.05
4E
arly
chi
ld d
evel
opm
ent i
ndex
TC.5
30.
8732
0.00
840.
010
1.09
21.
045
1,51
2
1,
723
0.85
60.
890
Low
er b
ound
r - 2
seU
pper
bou
ndr +
2se
Lear
nP
artic
ipat
ion
rate
in o
rgan
ised
lear
ning
(adj
uste
d)LN
.20.
7840
0.01
360.
017
1.01
61.
008
764
92
9
0.75
70.
811
Prot
ecte
d fr
om v
iole
nce
and
expl
oita
tion
Birt
h re
gist
ratio
nP
R.1
0.76
340.
0126
0.01
63.
678
1.91
83,
684
4,18
9
0.
738
0.78
9V
iole
nt d
isci
plin
eP
R.2
0.67
890.
0083
0.01
22.
523
1.58
810
,538
7,
935
0.66
20.
696
Chi
ld la
bour
PR
.30.
4966
0.00
980.
020
2.20
61.
485
9,41
5
5,
713
0.47
70.
516
Chi
ld m
arria
ge (b
efor
e ag
e 15
)P
R.4
a0.
0879
0.00
830.
094
1.31
11.
145
1,27
9
1,
532
0.07
10.
104
Chi
ld m
arria
ge (b
efor
e ag
e 18
)P
R.4
b0.
3812
0.01
480.
039
1.41
61.
190
1,27
9
1,
532
0.35
20.
411
Live
in a
saf
e an
d cl
ean
envi
ronm
ent
Use
of b
asic
drin
king
wat
er s
ervi
ces
WS
.20.
7502
0.01
470.
020
9.65
53.
107
32,9
08
8,41
6
0.
721
0.78
0U
se o
f saf
ely
man
aged
drin
king
wat
er s
ervi
ces
WS
.60.
1483
0.01
120.
075
1.21
91.
104
4,93
3
1,
236
0.12
60.
171
Han
dwas
hing
faci
lity
with
wat
er a
nd s
oap
WS
.70.
4777
0.01
010.
021
3.41
81.
849
32,8
93
8,41
3
0.
458
0.49
8U
se o
f bas
ic s
anita
tion
serv
ices
WS
.90.
7296
0.01
420.
019
8.54
52.
923
32,9
08
8,41
6
0.
701
0.75
8S
afe
disp
osal
in s
itu o
f exc
reta
from
on-
site
san
itatio
n fa
cilit
ies
WS
.10
0.94
920.
0046
0.00
52.
770
1.66
424
,200
6,
280
0.94
00.
958
Equi
tabl
e ch
ance
in li
feC
hild
ren
with
func
tiona
l difi
culty
E
Q.1
0.01
650.
0033
0.20
21.
737
1.31
82,
225
2,53
5
0.
010
0.02
3P
opul
atio
n co
vere
d by
soc
ial t
rans
fers
EQ
.30.
1434
0.00
560.
039
2.14
91.
466
32,9
08
8,41
6
0.
132
0.15
5na
: not
app
licab
le
Tabl
e SE
.6: S
ampl
ing
erro
rs: N
orth
Sta
ndar
d er
rors
, coe
ffici
ents
of v
aria
tion,
des
ign
effe
cts
(def
f), s
quar
e ro
ot o
f des
ign
effe
cts
(def
t), a
nd c
onfid
ence
inte
rval
s fo
r sel
ecte
d S
DG
and
MIC
S in
dica
tors
, LS
ISII,
201
7
MIC
SIn
dica
tor
Val
ue (r
)S
tand
ard
erro
r (se
)
Coe
ffici
ent o
f va
riatio
n(s
e/r)
Des
ign
effe
ct
(def
f)
Squ
are
root
of
des
ign
effe
ct (d
eft)
Wei
ghte
d co
unt
Unw
eigh
ted
coun
t
Con
fiden
ce li
mits
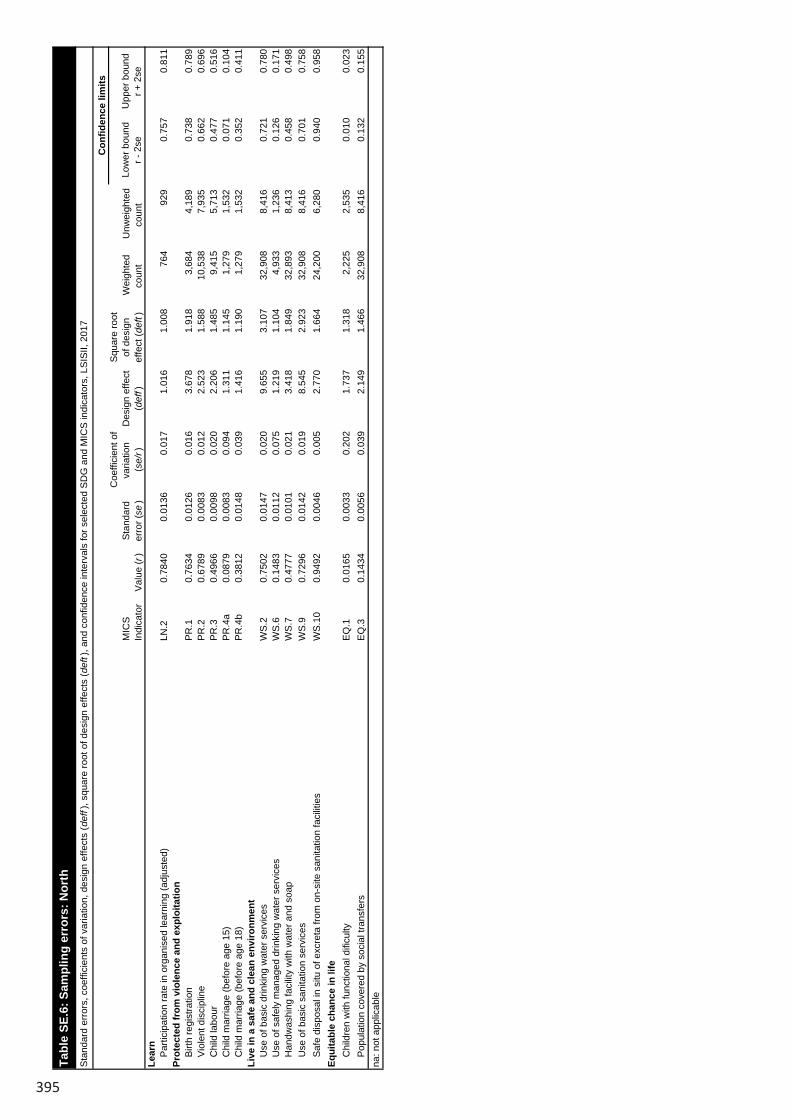
395
Low
er b
ound
r - 2
seU
pper
bou
ndr +
2se
Sam
ple
cove
rage
and
cha
ract
eris
tics
of th
e re
spon
dent
sA
cces
s to
ele
ctric
ityS
R.1
0.91
630.
0070
0.00
85.
315
2.30
532
,908
8,
416
0.90
20.
930
Ow
ners
hip
of m
obile
pho
ne (w
omen
)S
R.1
00.
6869
0.00
980.
014
4.15
52.
038
7,80
1
9,
292
0.66
70.
706
Ow
ners
hip
of m
obile
pho
ne (m
en)
SR
.10
0.85
740.
0075
0.00
92.
130
1.46
03,
824
4,61
8
0.
842
0.87
2U
se o
f int
erne
t (w
omen
)S
R.1
2a0.
1574
0.00
610.
039
2.59
21.
610
7,80
1
9,
292
0.14
50.
170
Use
of i
nter
net (
men
)S
R.1
2a0.
1546
0.00
760.
049
2.06
11.
436
3,82
4
4,
618
0.13
90.
170
ICT
skill
s (w
omen
)S
R.1
30.
0496
0.00
310.
063
1.93
61.
391
7,80
1
9,
292
0.04
30.
056
ICT
skill
s (m
en)
SR
.13
0.09
220.
0053
0.05
81.
576
1.25
53,
824
4,61
8
0.
082
0.10
3U
se o
f tob
acco
(wom
en)
SR
.14
0.04
170.
0041
0.09
83.
897
1.97
47,
801
9,29
2
0.
033
0.05
0U
se o
f tob
acco
(men
)S
R.1
40.
4239
0.01
010.
024
1.94
41.
394
3,82
4
4,
618
0.40
40.
444
Surv
ive
Neo
nata
l mor
talit
y ra
teC
S.1
202.
5284
0.12
5na
nana
na15
25In
fant
mor
talit
y ra
teC
S.3
433.
9216
0.09
1na
nana
na35
51U
nder
-five
mor
talit
y ra
teC
S.5
494.
0987
0.08
5na
nana
na40
57Th
rive
- Rep
rodu
ctiv
e an
d m
ater
nal h
ealth
Tota
l fer
tility
rate
-2.
70.
0775
0.02
8na
nana
na2.
62.
9A
dole
scen
t birt
h ra
teTM
.110
9.1
5.91
430.
054
nana
nana
97.3
120.
9…
Con
trace
ptiv
e pr
eval
ence
rate
TM.3
0.58
120.
0090
0.01
52.
489
1.57
86,
312
7,54
3
0.
563
0.59
9N
eed
for f
amily
pla
nnin
g sa
tisfie
d w
ith m
oder
n co
ntra
cept
ion
TM.4
0.80
360.
0075
0.00
91.
890
1.37
54,
385
5,24
0
0.
789
0.81
9A
nten
atal
car
e co
vera
ge (4
+)TM
.5b
0.61
970.
0207
0.03
32.
981
1.72
61,
375
1,63
6
0.
578
0.66
1S
kille
d at
tend
ant a
t del
iver
yTM
.90.
6324
0.02
070.
033
3.01
21.
736
1,37
5
1,
636
0.59
10.
674
Thriv
e - C
hild
hea
lth, n
utrit
ion
and
deve
lopm
ent
Dip
hthe
ria, p
ertu
ssis
and
teta
nus
(DP
T) im
mun
izat
ion
cove
rage
TC.3
0.54
730.
0201
0.03
71.
326
1.15
272
3
818
0.
507
0.58
7P
neum
ococ
cal (
Con
juga
te) i
mm
uniz
atio
n co
vera
geTC
.60.
4388
0.01
870.
043
1.16
51.
079
723
81
8
0.40
10.
476
Mea
sles
imm
uniz
atio
n co
vera
geTC
.10
0.61
220.
0178
0.02
91.
092
1.04
572
3
818
0.
577
0.64
8P
rimar
y re
lianc
e on
cle
an fu
els
and
tech
nolo
gies
for c
ooki
ng, s
pace
hea
ting
and
light
ing
TC.1
80.
0436
0.00
320.
073
2.02
71.
424
32,9
08
8,41
6
0.
037
0.05
0P
opul
atio
n w
ho s
lept
und
er a
n IT
NTC
.22
0.50
080.
0115
0.02
319
.770
4.44
631
,558
37
,474
0.
478
0.52
4E
xclu
sive
bre
astfe
edin
g un
der 6
mon
ths
TC.3
20.
6291
0.02
040.
032
0.75
90.
871
372
42
6
0.58
80.
670
Stu
ntin
g pr
eval
ence
(mod
erat
e an
d se
vere
)TC
.45a
0.38
860.
0112
0.02
92.
134
1.46
13,
560
4,04
4
0.
366
0.41
1W
astin
g pr
eval
ence
(mod
erat
e an
d se
vere
)TC
.46a
0.10
030.
0061
0.06
11.
663
1.29
03,
560
4,04
0
0.
088
0.11
3O
verw
eigh
t pre
vale
nce
(mod
erat
e an
d se
vere
)TC
.47a
0.04
440.
0047
0.10
52.
084
1.44
43,
560
4,04
0
0.
035
0.05
4E
arly
chi
ld d
evel
opm
ent i
ndex
TC.5
30.
8732
0.00
840.
010
1.09
21.
045
1,51
2
1,
723
0.85
60.
890
Low
er b
ound
r - 2
seU
pper
bou
ndr +
2se
Lear
nP
artic
ipat
ion
rate
in o
rgan
ised
lear
ning
(adj
uste
d)LN
.20.
7840
0.01
360.
017
1.01
61.
008
764
92
9
0.75
70.
811
Prot
ecte
d fr
om v
iole
nce
and
expl
oita
tion
Birt
h re
gist
ratio
nP
R.1
0.76
340.
0126
0.01
63.
678
1.91
83,
684
4,18
9
0.
738
0.78
9V
iole
nt d
isci
plin
eP
R.2
0.67
890.
0083
0.01
22.
523
1.58
810
,538
7,
935
0.66
20.
696
Chi
ld la
bour
PR
.30.
4966
0.00
980.
020
2.20
61.
485
9,41
5
5,
713
0.47
70.
516
Chi
ld m
arria
ge (b
efor
e ag
e 15
)P
R.4
a0.
0879
0.00
830.
094
1.31
11.
145
1,27
9
1,
532
0.07
10.
104
Chi
ld m
arria
ge (b
efor
e ag
e 18
)P
R.4
b0.
3812
0.01
480.
039
1.41
61.
190
1,27
9
1,
532
0.35
20.
411
Live
in a
saf
e an
d cl
ean
envi
ronm
ent
Use
of b
asic
drin
king
wat
er s
ervi
ces
WS
.20.
7502
0.01
470.
020
9.65
53.
107
32,9
08
8,41
6
0.
721
0.78
0U
se o
f saf
ely
man
aged
drin
king
wat
er s
ervi
ces
WS
.60.
1483
0.01
120.
075
1.21
91.
104
4,93
3
1,
236
0.12
60.
171
Han
dwas
hing
faci
lity
with
wat
er a
nd s
oap
WS
.70.
4777
0.01
010.
021
3.41
81.
849
32,8
93
8,41
3
0.
458
0.49
8U
se o
f bas
ic s
anita
tion
serv
ices
WS
.90.
7296
0.01
420.
019
8.54
52.
923
32,9
08
8,41
6
0.
701
0.75
8S
afe
disp
osal
in s
itu o
f exc
reta
from
on-
site
san
itatio
n fa
cilit
ies
WS
.10
0.94
920.
0046
0.00
52.
770
1.66
424
,200
6,
280
0.94
00.
958
Equi
tabl
e ch
ance
in li
feC
hild
ren
with
func
tiona
l difi
culty
E
Q.1
0.01
650.
0033
0.20
21.
737
1.31
82,
225
2,53
5
0.
010
0.02
3P
opul
atio
n co
vere
d by
soc
ial t
rans
fers
EQ
.30.
1434
0.00
560.
039
2.14
91.
466
32,9
08
8,41
6
0.
132
0.15
5na
: not
app
licab
le
Tabl
e SE
.6: S
ampl
ing
erro
rs: N
orth
Sta
ndar
d er
rors
, coe
ffici
ents
of v
aria
tion,
des
ign
effe
cts
(def
f), s
quar
e ro
ot o
f des
ign
effe
cts
(def
t), a
nd c
onfid
ence
inte
rval
s fo
r sel
ecte
d S
DG
and
MIC
S in
dica
tors
, LS
ISII,
201
7
MIC
SIn
dica
tor
Val
ue (r
)S
tand
ard
erro
r (se
)
Coe
ffici
ent o
f va
riatio
n(s
e/r)
Des
ign
effe
ct
(def
f)
Squ
are
root
of
des
ign
effe
ct (d
eft)
Wei
ghte
d co
unt
Unw
eigh
ted
coun
t
Con
fiden
ce li
mits
Tabl
e SE
.6: S
ampl
ing
erro
rs: N
orth
Sta
ndar
d er
rors
, coe
ffici
ents
of v
aria
tion,
des
ign
effe
cts
(def
f), s
quar
e ro
ot o
f des
ign
effe
cts
(def
t), a
nd c
onfid
ence
inte
rval
s fo
r sel
ecte
d S
DG
and
MIC
S in
dica
tors
, LS
ISII,
201
7
MIC
SIn
dica
tor
Val
ue (r
)S
tand
ard
erro
r (se
)
Coe
ffici
ent o
f va
riatio
n(s
e/r)
Des
ign
effe
ct
(def
f)
Squ
are
root
of
des
ign
effe
ct (d
eft)
Wei
ghte
d co
unt
Unw
eigh
ted
coun
t
Con
fiden
ce li
mits
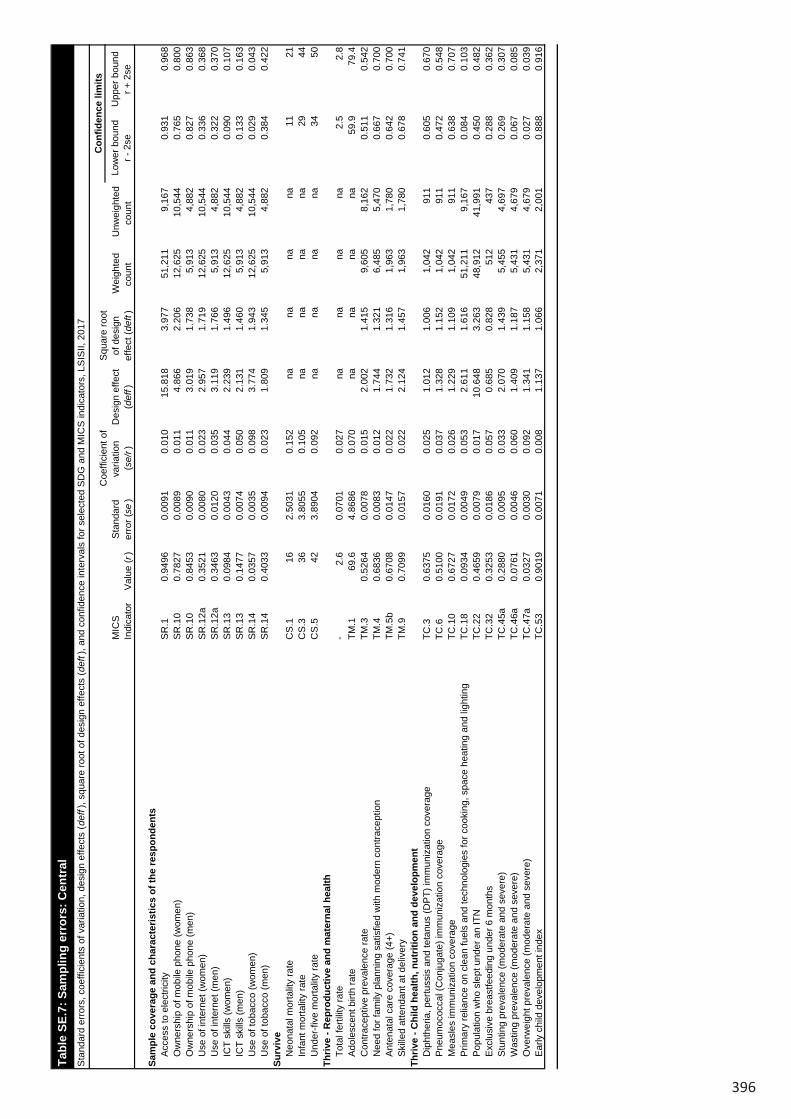
396
Low
er b
ound
r - 2
seU
pper
bou
ndr +
2se
Sam
ple
cove
rage
and
cha
ract
eris
tics
of th
e re
spon
dent
sA
cces
s to
ele
ctric
ityS
R.1
0.94
960.
0091
0.01
015
.818
3.97
751
,211
9,
167
0.93
10.
968
Ow
ners
hip
of m
obile
pho
ne (w
omen
)S
R.1
00.
7827
0.00
890.
011
4.86
62.
206
12,6
25
10,5
44
0.76
50.
800
Ow
ners
hip
of m
obile
pho
ne (m
en)
SR
.10
0.84
530.
0090
0.01
13.
019
1.73
85,
913
4,88
2
0.
827
0.86
3U
se o
f int
erne
t (w
omen
)S
R.1
2a0.
3521
0.00
800.
023
2.95
71.
719
12,6
25
10,5
44
0.33
60.
368
Use
of i
nter
net (
men
)S
R.1
2a0.
3463
0.01
200.
035
3.11
91.
766
5,91
3
4,
882
0.32
20.
370
ICT
skill
s (w
omen
)S
R.1
30.
0984
0.00
430.
044
2.23
91.
496
12,6
25
10,5
44
0.09
00.
107
ICT
skill
s (m
en)
SR
.13
0.14
770.
0074
0.05
02.
131
1.46
05,
913
4,88
2
0.
133
0.16
3U
se o
f tob
acco
(wom
en)
SR
.14
0.03
570.
0035
0.09
83.
774
1.94
312
,625
10
,544
0.
029
0.04
3U
se o
f tob
acco
(men
)S
R.1
40.
4033
0.00
940.
023
1.80
91.
345
5,91
3
4,
882
0.38
40.
422
Surv
ive
Neo
nata
l mor
talit
y ra
teC
S.1
162.
5031
0.15
2na
nana
na11
21In
fant
mor
talit
y ra
teC
S.3
363.
8055
0.10
5na
nana
na29
44U
nder
-five
mor
talit
y ra
teC
S.5
423.
8904
0.09
2na
nana
na34
50Th
rive
- Rep
rodu
ctiv
e an
d m
ater
nal h
ealth
Tota
l fer
tility
rate
-2.
60.
0701
0.02
7na
nana
na2.
52.
8A
dole
scen
t birt
h ra
teTM
.169
.64.
8686
0.07
0na
nana
na59
.979
.4…
Con
trace
ptiv
e pr
eval
ence
rate
TM.3
0.52
640.
0078
0.01
52.
002
1.41
59,
605
8,16
2
0.
511
0.54
2N
eed
for f
amily
pla
nnin
g sa
tisfie
d w
ith m
oder
n co
ntra
cept
ion
TM.4
0.68
360.
0083
0.01
21.
744
1.32
16,
485
5,47
0
0.
667
0.70
0A
nten
atal
car
e co
vera
ge (4
+)TM
.5b
0.67
080.
0147
0.02
21.
732
1.31
61,
963
1,78
0
0.
642
0.70
0S
kille
d at
tend
ant a
t del
iver
yTM
.90.
7099
0.01
570.
022
2.12
41.
457
1,96
3
1,
780
0.67
80.
741
Thriv
e - C
hild
hea
lth, n
utrit
ion
and
deve
lopm
ent
Dip
hthe
ria, p
ertu
ssis
and
teta
nus
(DP
T) im
mun
izat
ion
cove
rage
TC.3
0.63
750.
0160
0.02
51.
012
1.00
61,
042
911
0.
605
0.67
0P
neum
ococ
cal (
Con
juga
te) i
mm
uniz
atio
n co
vera
geTC
.60.
5100
0.01
910.
037
1.32
81.
152
1,04
2
91
1
0.47
20.
548
Mea
sles
imm
uniz
atio
n co
vera
geTC
.10
0.67
270.
0172
0.02
61.
229
1.10
91,
042
911
0.
638
0.70
7P
rimar
y re
lianc
e on
cle
an fu
els
and
tech
nolo
gies
for c
ooki
ng, s
pace
hea
ting
and
light
ing
TC.1
80.
0934
0.00
490.
053
2.61
11.
616
51,2
11
9,16
7
0.
084
0.10
3P
opul
atio
n w
ho s
lept
und
er a
n IT
NTC
.22
0.46
590.
0079
0.01
710
.648
3.26
348
,912
41
,991
0.
450
0.48
2E
xclu
sive
bre
astfe
edin
g un
der 6
mon
ths
TC.3
20.
3253
0.01
860.
057
0.68
50.
828
512
43
7
0.28
80.
362
Stu
ntin
g pr
eval
ence
(mod
erat
e an
d se
vere
)TC
.45a
0.28
800.
0095
0.03
32.
070
1.43
95,
455
4,69
7
0.
269
0.30
7W
astin
g pr
eval
ence
(mod
erat
e an
d se
vere
)TC
.46a
0.07
610.
0046
0.06
01.
409
1.18
75,
431
4,67
9
0.
067
0.08
5O
verw
eigh
t pre
vale
nce
(mod
erat
e an
d se
vere
)TC
.47a
0.03
270.
0030
0.09
21.
341
1.15
85,
431
4,67
9
0.
027
0.03
9E
arly
chi
ld d
evel
opm
ent i
ndex
TC.5
30.
9019
0.00
710.
008
1.13
71.
066
2,37
1
2,
001
0.88
80.
916
Low
er b
ound
r - 2
seU
pper
bou
ndr +
2se
Lear
nP
artic
ipat
ion
rate
in o
rgan
ised
lear
ning
(adj
uste
d)LN
.20.
7413
0.01
750.
024
1.67
91.
296
1,18
8
1,
058
0.70
60.
776
Prot
ecte
d fr
om v
iole
nce
and
expl
oita
tion
Birt
h re
gist
ratio
nP
R.1
0.75
310.
0100
0.01
32.
613
1.61
65,
610
4,83
3
0.
733
0.77
3V
iole
nt d
isci
plin
eP
R.2
0.73
180.
0076
0.01
02.
597
1.61
216
,023
8,
849
0.71
70.
747
Chi
ld la
bour
PR
.30.
4427
0.00
950.
021
2.31
51.
522
14,4
55
6,31
1
0.
424
0.46
2C
hild
mar
riage
(bef
ore
age
15)
PR
.4a
0.05
890.
0060
0.10
11.
102
1.05
01,
990
1,71
5
0.
047
0.07
1C
hild
mar
riage
(bef
ore
age
18)
PR
.4b
0.29
330.
0130
0.04
41.
400
1.18
31,
990
1,71
5
0.
267
0.31
9Li
ve in
a s
afe
and
clea
n en
viro
nmen
tU
se o
f bas
ic d
rinki
ng w
ater
ser
vice
sW
S.2
0.80
150.
0113
0.01
47.
407
2.72
251
,211
9,
167
0.77
90.
824
Use
of s
afel
y m
anag
ed d
rinki
ng w
ater
ser
vice
sW
S.6
0.15
210.
0113
0.07
41.
352
1.16
37,
531
1,37
2
0.
130
0.17
5H
andw
ashi
ng fa
cilit
y w
ith w
ater
and
soa
pW
S.7
0.58
710.
0125
0.02
15.
888
2.42
751
,195
9,
164
0.56
20.
612
Use
of b
asic
san
itatio
n se
rvic
esW
S.9
0.75
950.
0094
0.01
24.
469
2.11
451
,211
9,
167
0.74
10.
778
Saf
e di
spos
al in
situ
of e
xcre
ta fr
om o
n-si
te s
anita
tion
faci
litie
sW
S.1
00.
8394
0.00
740.
009
2.91
31.
707
39,1
65
7,17
7
0.
825
0.85
4Eq
uita
ble
chan
ce in
life
Chi
ldre
n w
ith fu
nctio
nal d
ificu
lty
EQ
.10.
0131
0.00
210.
164
1.07
91.
039
3,54
3
3,
022
0.00
90.
017
Pop
ulat
ion
cove
red
by s
ocia
l tra
nsfe
rsE
Q.3
0.11
590.
0048
0.04
12.
060
1.43
551
,211
9,
167
0.10
60.
125
Des
ign
effe
ct
(def
f)
Squ
are
root
of
des
ign
effe
ct (d
eft)
Wei
ghte
d co
unt
Unw
eigh
ted
coun
t
Con
fiden
ce li
mits
MIC
SIn
dica
tor
Val
ue (r
)S
tand
ard
erro
r (se
)
Coe
ffici
ent o
f va
riatio
n(s
e/r)
na: n
ot a
pplic
able
Tabl
e SE
.7: S
ampl
ing
erro
rs: C
entr
alS
tand
ard
erro
rs, c
oeffi
cien
ts o
f var
iatio
n, d
esig
n ef
fect
s (d
eff)
, squ
are
root
of d
esig
n ef
fect
s (d
eft)
, and
con
fiden
ce in
terv
als
for s
elec
ted
SD
G a
nd M
ICS
indi
cato
rs, L
SIS
II, 2
017
MIC
SIn
dica
tor
Val
ue (r
)S
tand
ard
erro
r (se
)
Coe
ffici
ent o
f va
riatio
n(s
e/r)
Des
ign
effe
ct
(def
f)
Squ
are
root
of
des
ign
effe
ct (d
eft)
Wei
ghte
d co
unt
Unw
eigh
ted
coun
t
Con
fiden
ce li
mits
Tabl
e SE
.7: S
ampl
ing
erro
rs: C
entr
alS
tand
ard
erro
rs, c
oeffi
cien
ts o
f var
iatio
n, d
esig
n ef
fect
s (d
eff)
, squ
are
root
of d
esig
n ef
fect
s (d
eft)
, and
con
fiden
ce in
terv
als
for s
elec
ted
SD
G a
nd M
ICS
indi
cato
rs, L
SIS
II, 2
017

397
Low
er b
ound
r - 2
seU
pper
bou
ndr +
2se
Sam
ple
cove
rage
and
cha
ract
eris
tics
of th
e re
spon
dent
sA
cces
s to
ele
ctric
ityS
R.1
0.94
960.
0091
0.01
015
.818
3.97
751
,211
9,
167
0.93
10.
968
Ow
ners
hip
of m
obile
pho
ne (w
omen
)S
R.1
00.
7827
0.00
890.
011
4.86
62.
206
12,6
25
10,5
44
0.76
50.
800
Ow
ners
hip
of m
obile
pho
ne (m
en)
SR
.10
0.84
530.
0090
0.01
13.
019
1.73
85,
913
4,88
2
0.
827
0.86
3U
se o
f int
erne
t (w
omen
)S
R.1
2a0.
3521
0.00
800.
023
2.95
71.
719
12,6
25
10,5
44
0.33
60.
368
Use
of i
nter
net (
men
)S
R.1
2a0.
3463
0.01
200.
035
3.11
91.
766
5,91
3
4,
882
0.32
20.
370
ICT
skill
s (w
omen
)S
R.1
30.
0984
0.00
430.
044
2.23
91.
496
12,6
25
10,5
44
0.09
00.
107
ICT
skill
s (m
en)
SR
.13
0.14
770.
0074
0.05
02.
131
1.46
05,
913
4,88
2
0.
133
0.16
3U
se o
f tob
acco
(wom
en)
SR
.14
0.03
570.
0035
0.09
83.
774
1.94
312
,625
10
,544
0.
029
0.04
3U
se o
f tob
acco
(men
)S
R.1
40.
4033
0.00
940.
023
1.80
91.
345
5,91
3
4,
882
0.38
40.
422
Surv
ive
Neo
nata
l mor
talit
y ra
teC
S.1
162.
5031
0.15
2na
nana
na11
21In
fant
mor
talit
y ra
teC
S.3
363.
8055
0.10
5na
nana
na29
44U
nder
-five
mor
talit
y ra
teC
S.5
423.
8904
0.09
2na
nana
na34
50Th
rive
- Rep
rodu
ctiv
e an
d m
ater
nal h
ealth
Tota
l fer
tility
rate
-2.
60.
0701
0.02
7na
nana
na2.
52.
8A
dole
scen
t birt
h ra
teTM
.169
.64.
8686
0.07
0na
nana
na59
.979
.4…
Con
trace
ptiv
e pr
eval
ence
rate
TM.3
0.52
640.
0078
0.01
52.
002
1.41
59,
605
8,16
2
0.
511
0.54
2N
eed
for f
amily
pla
nnin
g sa
tisfie
d w
ith m
oder
n co
ntra
cept
ion
TM.4
0.68
360.
0083
0.01
21.
744
1.32
16,
485
5,47
0
0.
667
0.70
0A
nten
atal
car
e co
vera
ge (4
+)TM
.5b
0.67
080.
0147
0.02
21.
732
1.31
61,
963
1,78
0
0.
642
0.70
0S
kille
d at
tend
ant a
t del
iver
yTM
.90.
7099
0.01
570.
022
2.12
41.
457
1,96
3
1,
780
0.67
80.
741
Thriv
e - C
hild
hea
lth, n
utrit
ion
and
deve
lopm
ent
Dip
hthe
ria, p
ertu
ssis
and
teta
nus
(DP
T) im
mun
izat
ion
cove
rage
TC.3
0.63
750.
0160
0.02
51.
012
1.00
61,
042
911
0.
605
0.67
0P
neum
ococ
cal (
Con
juga
te) i
mm
uniz
atio
n co
vera
geTC
.60.
5100
0.01
910.
037
1.32
81.
152
1,04
2
91
1
0.47
20.
548
Mea
sles
imm
uniz
atio
n co
vera
geTC
.10
0.67
270.
0172
0.02
61.
229
1.10
91,
042
911
0.
638
0.70
7P
rimar
y re
lianc
e on
cle
an fu
els
and
tech
nolo
gies
for c
ooki
ng, s
pace
hea
ting
and
light
ing
TC.1
80.
0934
0.00
490.
053
2.61
11.
616
51,2
11
9,16
7
0.
084
0.10
3P
opul
atio
n w
ho s
lept
und
er a
n IT
NTC
.22
0.46
590.
0079
0.01
710
.648
3.26
348
,912
41
,991
0.
450
0.48
2E
xclu
sive
bre
astfe
edin
g un
der 6
mon
ths
TC.3
20.
3253
0.01
860.
057
0.68
50.
828
512
43
7
0.28
80.
362
Stu
ntin
g pr
eval
ence
(mod
erat
e an
d se
vere
)TC
.45a
0.28
800.
0095
0.03
32.
070
1.43
95,
455
4,69
7
0.
269
0.30
7W
astin
g pr
eval
ence
(mod
erat
e an
d se
vere
)TC
.46a
0.07
610.
0046
0.06
01.
409
1.18
75,
431
4,67
9
0.
067
0.08
5O
verw
eigh
t pre
vale
nce
(mod
erat
e an
d se
vere
)TC
.47a
0.03
270.
0030
0.09
21.
341
1.15
85,
431
4,67
9
0.
027
0.03
9E
arl y
chi
ld d
evel
opm
ent i
ndex
TC.5
30.
9019
0.00
710.
008
1.13
71.
066
2,37
1
2,
001
0.88
80.
916
Low
er b
ound
r - 2
seU
pper
bou
ndr +
2se
Lear
nP
artic
ipat
ion
rate
in o
rgan
ised
lear
ning
(adj
uste
d)LN
.20.
7413
0.01
750.
024
1.67
91.
296
1,18
8
1,
058
0.70
60.
776
Prot
ecte
d fr
om v
iole
nce
and
expl
oita
tion
Birt
h re
gist
ratio
nP
R.1
0.75
310.
0100
0.01
32.
613
1.61
65,
610
4,83
3
0.
733
0.77
3V
iole
nt d
isci
plin
eP
R.2
0.73
180.
0076
0.01
02.
597
1.61
216
,023
8,
849
0.71
70.
747
Chi
ld la
bour
PR
.30.
4427
0.00
950.
021
2.31
51.
522
14,4
55
6,31
1
0.
424
0.46
2C
hild
mar
riage
(bef
ore
age
15)
PR
.4a
0.05
890.
0060
0.10
11.
102
1.05
01,
990
1,71
5
0.
047
0.07
1C
hild
mar
riage
(bef
ore
age
18)
PR
.4b
0.29
330.
0130
0.04
41.
400
1.18
31,
990
1,71
5
0.
267
0.31
9Li
ve in
a s
afe
and
clea
n en
viro
nmen
tU
se o
f bas
ic d
rinki
ng w
ater
ser
vice
sW
S.2
0.80
150.
0113
0.01
47.
407
2.72
251
,211
9,
167
0.77
90.
824
Use
of s
afel
y m
anag
ed d
rinki
ng w
ater
ser
vice
sW
S.6
0.15
210.
0113
0.07
41.
352
1.16
37,
531
1,37
2
0.
130
0.17
5H
andw
ashi
ng fa
cilit
y w
ith w
ater
and
soa
pW
S.7
0.58
710.
0125
0.02
15.
888
2.42
751
,195
9,
164
0.56
20.
612
Use
of b
asic
san
itatio
n se
rvic
esW
S.9
0.75
950.
0094
0.01
24.
469
2.11
451
,211
9,
167
0.74
10.
778
Saf
e di
spos
al in
situ
of e
xcre
ta fr
om o
n-si
te s
anita
tion
faci
litie
sW
S.1
00.
8394
0.00
740.
009
2.91
31.
707
39,1
65
7,17
7
0.
825
0.85
4Eq
uita
ble
chan
ce in
life
Chi
ldre
n w
ith fu
nctio
nal d
ificu
lty
EQ
.10.
0131
0.00
210.
164
1.07
91.
039
3,54
3
3,
022
0.00
90.
017
Pop
ulat
ion
cove
red
by s
ocia
l tra
nsfe
rsE
Q.3
0.11
590.
0048
0.04
12.
060
1.43
551
,211
9,
167
0.10
60.
125
Des
ign
effe
ct
(def
f)
Squ
are
root
of
des
ign
effe
ct (d
eft)
Wei
ghte
d co
unt
Unw
eigh
ted
coun
t
Con
fiden
ce li
mits
MIC
SIn
dica
tor
Val
ue (r
)S
tand
ard
erro
r (se
)
Coe
ffici
ent o
f va
riatio
n(s
e/r)
na: n
ot a
pplic
able
Tabl
e SE
.7: S
ampl
ing
erro
rs: C
entr
alS
tand
ard
erro
rs, c
oeffi
cien
ts o
f var
iatio
n, d
esig
n ef
fect
s (d
eff)
, squ
are
root
of d
esig
n ef
fect
s (d
eft)
, and
con
fiden
ce in
terv
als
for s
elec
ted
SD
G a
nd M
ICS
indi
cato
rs, L
SIS
II, 2
017
MIC
SIn
dica
tor
Val
ue (r
)S
tand
ard
erro
r (se
)
Coe
ffici
ent o
f va
riatio
n(s
e/r)
Des
ign
effe
ct
(def
f)
Squ
are
root
of
des
ign
effe
ct (d
eft)
Wei
ghte
d co
unt
Unw
eigh
ted
coun
t
Con
fiden
ce li
mits
Tabl
e SE
.7: S
ampl
ing
erro
rs: C
entr
alS
tand
ard
erro
rs, c
oeffi
cien
ts o
f var
iatio
n, d
esig
n ef
fect
s (d
eff)
, squ
are
root
of d
esig
n ef
fect
s (d
eft)
, and
con
fiden
ce in
terv
als
for s
elec
ted
SD
G a
nd M
ICS
indi
cato
rs, L
SIS
II, 2
017

398
Low
er b
ound
r - 2
seU
pper
bou
ndr +
2se
Sam
ple
cove
rage
and
cha
ract
eris
tics
of th
e re
spon
dent
sA
cces
s to
ele
ctric
ityS
R.1
0.90
300.
0143
0.01
610
.979
3.31
420
,732
4,70
40.
874
0.93
2O
wne
rshi
p of
mob
ile p
hone
(wom
en)
SR
.10
0.66
910.
0131
0.02
04.
248
2.06
14,
879
5,46
90.
643
0.69
5O
wne
rshi
p of
mob
ile p
hone
(men
)S
R.1
00.
8154
0.01
410.
017
3.30
81.
819
2,28
02,
517
0.78
70.
843
Use
of i
nter
net (
wom
en)
SR
.12a
0.21
800.
0107
0.04
93.
672
1.91
64,
879
5,46
90.
197
0.23
9U
se o
f int
erne
t (m
en)
SR
.12a
0.22
410.
0130
0.05
82.
447
1.56
42,
280
2,51
70.
198
0.25
0IC
T sk
ills
(wom
en)
SR
.13
0.04
510.
0054
0.11
93.
681
1.91
94,
879
5,46
90.
034
0.05
6IC
T sk
ills
(men
)S
R.1
30.
0893
0.00
930.
104
2.69
41.
641
2,28
02,
517
0.07
10.
108
Use
of t
obac
co (w
omen
)S
R.1
40.
2129
0.01
140.
054
4.27
72.
068
4,87
95,
469
0.19
00.
236
Use
of t
obac
co (m
en)
SR
.14
0.53
400.
0158
0.03
02.
527
1.59
02,
280
2,51
70.
502
0.56
6Su
rviv
eN
eona
tal m
orta
lity
rate
CS
.117
2.86
750.
166
nana
nana
1223
Infa
nt m
orta
lity
rate
CS
.344
5.35
090.
121
nana
nana
3355
Und
er-fi
ve m
orta
lity
rate
CS
.549
5.58
130.
114
nana
nana
3860
Thriv
e - R
epro
duct
ive
and
mat
erna
l hea
lthTo
tal f
ertil
ity ra
te-
3.1
0.11
440.
036
nana
nana
2.9
3.4
Ado
lesc
ent b
irth
rate
TM.1
76.9
6.64
180.
086
nana
nana
63.6
90.2
…C
ontra
cept
ive
prev
alen
ce ra
teTM
.30.
5086
0.01
220.
024
2.47
31.
573
3,69
74,
179
0.48
40.
533
Nee
d fo
r fam
ily p
lann
ing
satis
fied
with
mod
ern
cont
race
ptio
nTM
.40.
6529
0.01
420.
022
2.55
31.
598
2,54
72,
875
0.62
40.
681
Ant
enat
al c
are
cove
rage
(4+)
TM.5
b0.
5183
0.02
210.
043
2.04
31.
429
894
1,04
40.
474
0.56
3S
kille
d at
tend
ant a
t del
iver
yTM
.90.
5156
0.02
360.
046
2.32
31.
524
894
1,04
40.
468
0.56
3Th
rive
- Chi
ld h
ealth
, nut
ritio
n an
d de
velo
pmen
tD
ipht
heria
, per
tuss
is a
nd te
tanu
s (D
PT)
imm
uniz
atio
n co
vera
geTC
.30.
6401
0.02
470.
039
1.28
71.
135
438
486
0.59
10.
690
Pne
umoc
occa
l (C
onju
gate
) im
mun
izat
ion
cove
rage
TC.6
0.45
530.
0242
0.05
31.
144
1.06
943
848
60.
407
0.50
4M
easl
es im
mun
izat
ion
cove
rage
TC.1
00.
7068
0.02
490.
035
1.45
41.
206
438
486
0.65
70.
757
Prim
ary
relia
nce
on c
lean
fuel
s an
d te
chno
logi
es fo
r coo
king
, spa
ce h
eatin
g an
d lig
htin
gTC
.18
0.01
910.
0020
0.10
40.
991
0.99
520
,732
4 ,70
40.
015
0.02
3P
opul
atio
n w
ho s
lept
und
er a
n IT
NTC
.22
0.62
190.
0121
0.02
014
.294
3.78
120
,160
22,7
940.
598
0.64
6E
xclu
sive
bre
astfe
edin
g un
der 6
mon
ths
TC.3
20.
4356
0.02
680.
062
0.79
00.
889
246
271
0.38
20.
489
Stu
ntin
g pr
eval
ence
(mod
erat
e an
d se
vere
)TC
.45a
0.33
960.
0107
0.03
21.
349
1.16
12,
358
2,62
70.
318
0.36
1W
astin
g pr
eval
ence
(mod
erat
e an
d se
vere
)TC
.46a
0.10
730.
0071
0.06
61.
379
1.17
42,
368
2,64
30.
093
0.12
1O
verw
eigh
t pre
vale
nce
(mod
erat
e an
d se
vere
)TC
.47a
0.02
750.
0043
0.15
71.
842
1.35
72,
368
2,64
30.
019
0.03
6E
arly
chi
ld d
evel
opm
ent i
ndex
TC.5
30.
8910
0.01
200.
013
1.64
21.
282
997
1,10
90.
867
0.91
5
Low
er b
ound
r - 2
seU
pper
bou
ndr +
2se
Lear
nP
artic
ipat
ion
rate
in o
rgan
ised
lear
ning
(adj
uste
d)LN
.20.
6597
0.02
530.
038
1.67
41.
294
480
586
0.60
90.
710
Prot
ecte
d fr
om v
iole
nce
and
expl
oita
tion
Birt
h re
gist
ratio
nP
R.1
0.62
350.
0179
0.02
93.
680
1.91
82,
427
2,69
80.
588
0.65
9V
iole
nt d
isci
plin
eP
R.2
0.61
340.
0116
0.01
92.
731
1.65
37,
022
4,83
10.
590
0.63
7C
hild
labo
urP
R.3
0.28
150.
0127
0.04
52.
708
1.64
66,
502
3,41
10.
256
0.30
7C
hild
mar
riage
(bef
ore
age
15)
PR
.4a
0.07
450.
0108
0.14
51.
482
1.21
775
687
40.
053
0.09
6C
hild
mar
riage
(bef
ore
age
18)
PR
.4b
0.32
600.
0176
0.05
41.
236
1.11
275
687
40.
291
0.36
1Li
ve in
a s
afe
and
clea
n en
viro
nmen
tU
se o
f bas
ic d
rinki
ng w
ater
ser
vice
sW
S.2
0.77
790.
0136
0.01
75.
039
2.24
520
,732
4,70
40.
751
0.80
5U
se o
f saf
ely
man
aged
drin
king
wat
er s
ervi
ces
WS
.60.
1348
0.01
510.
112
1.33
81.
157
3,03
268
20.
104
0.16
5H
andw
ashi
ng fa
cilit
y w
ith w
ater
and
soa
pW
S.7
0.52
680.
0135
0.02
63.
445
1.85
620
,715
4,70
00.
500
0.55
4U
se o
f bas
ic s
anita
tion
serv
ices
WS
.90.
5575
0.01
890.
034
6.82
32.
612
20,7
324,
704
0.52
00.
595
Saf
e di
spos
al in
situ
of e
xcre
ta fr
om o
n-si
te s
anita
tion
faci
litie
sW
S.1
00.
9705
0.00
530.
005
2.71
41.
647
12,1
772,
810
0.96
00.
981
Equi
tabl
e ch
ance
in li
feC
hild
ren
with
func
tiona
l difi
culty
E
Q.1
0.04
330.
0050
0.11
61.
004
1.00
21,
482
1,64
90.
033
0.05
3P
opul
atio
n co
vere
d by
soc
ial t
rans
fers
EQ
.30.
1151
0.00
630.
054
1.81
21.
346
20,7
324,
704
0.10
30.
128
na: n
ot a
pplic
able
Tabl
e SE
.8: S
ampl
ing
erro
rs: S
outh
Sta
ndar
d er
rors
, coe
ffici
ents
of v
aria
tion,
des
ign
effe
cts
(def
f), s
quar
e ro
ot o
f des
ign
effe
cts
(def
t), a
nd c
onfid
ence
inte
rval
s fo
r sel
ecte
d S
DG
and
MIC
S in
dica
tors
, LS
ISII,
201
7
MIC
SIn
dica
tor
Val
ue (r
)S
tand
ard
erro
r (se
)
Coe
ffici
ent o
f va
riatio
n(s
e/r)
Des
ign
effe
ct
(def
f)
Squ
are
root
of
des
ign
effe
ct (d
eft)
Wei
ghte
dco
unt
Unw
eigh
ted
coun
t
Con
fiden
ce li
mits
Tabl
e SE
.8: S
ampl
ing
erro
rs: S
outh
Sta
ndar
d er
rors
, coe
ffici
ents
of v
aria
tion,
des
ign
effe
cts
(def
f), s
quar
e ro
ot o
f des
ign
effe
cts
(def
t), a
nd c
onfid
ence
inte
rval
s fo
r sel
ecte
d S
DG
and
MIC
S in
dica
tors
, LS
ISII,
201
7
MIC
SIn
dica
tor
Val
ue (r
)S
tand
ard
erro
r (se
)
Coe
ffici
ent o
f va
riatio
n(s
e/r)
Des
ign
effe
ct
(def
f)
Squ
are
root
of
des
ign
effe
ct (d
eft)
Wei
ghte
dco
unt
Unw
eigh
ted
coun
t
Con
fiden
ce li
mits

399
Low
er b
ound
r - 2
seU
pper
bou
ndr +
2se
Sam
ple
cove
rage
and
cha
ract
eris
tics
of th
e re
spon
dent
sA
cces
s to
ele
ctric
ityS
R.1
0.90
300.
0143
0.01
610
.979
3.31
420
,732
4,70
40.
874
0.93
2O
wne
rshi
p of
mob
ile p
hone
(wom
en)
SR
.10
0.66
910.
0131
0.02
04.
248
2.06
14,
879
5,46
90.
643
0.69
5O
wne
rshi
p of
mob
ile p
hone
(men
)S
R.1
00.
8154
0.01
410.
017
3.30
81.
819
2,28
02,
517
0.78
70.
843
Use
of i
nter
net (
wom
en)
SR
.12a
0.21
800.
0107
0.04
93.
672
1.91
64,
879
5,46
90.
197
0.23
9U
se o
f int
erne
t (m
en)
SR
.12a
0.22
410.
0130
0.05
82.
447
1.56
42,
280
2,51
70.
198
0.25
0IC
T sk
ills
(wom
en)
SR
.13
0.04
510.
0054
0.11
93.
681
1.91
94,
879
5,46
90.
034
0.05
6IC
T sk
ills
(men
)S
R.1
30.
0893
0.00
930.
104
2.69
41.
641
2,28
02,
517
0.07
10.
108
Use
of t
obac
co (w
omen
)S
R.1
40.
2129
0.01
140.
054
4.27
72.
068
4,87
95,
469
0.19
00.
236
Use
of t
obac
co (m
en)
SR
.14
0.53
400.
0158
0.03
02.
527
1.59
02,
280
2,51
70.
502
0.56
6Su
rviv
eN
eona
tal m
orta
lity
rate
CS
.117
2.86
750.
166
nana
nana
1223
Infa
nt m
orta
lity
rate
CS
.344
5.35
090.
121
nana
nana
3355
Und
er-fi
ve m
orta
lity
rate
CS
.549
5.58
130.
114
nana
nana
3860
Thriv
e - R
epro
duct
ive
and
mat
erna
l hea
lthTo
tal f
ertil
ity ra
te-
3.1
0.11
440.
036
nana
nana
2.9
3.4
Ado
lesc
ent b
irth
rate
TM.1
76.9
6.64
180.
086
nana
nana
63.6
90.2
…C
ontra
cept
ive
prev
alen
ce ra
teTM
.30.
5086
0.01
220.
024
2.47
31.
573
3,69
74,
179
0.48
40.
533
Nee
d fo
r fam
ily p
lann
ing
satis
fied
with
mod
ern
cont
race
ptio
nTM
.40.
6529
0.01
420.
022
2.55
31.
598
2,54
72,
875
0.62
40.
681
Ant
enat
al c
are
cove
rage
(4+)
TM.5
b0.
5183
0.02
210.
043
2.04
31.
429
894
1,04
40.
474
0.56
3S
kille
d at
tend
ant a
t del
iver
yTM
.90.
5156
0.02
360.
046
2.32
31.
524
894
1,04
40.
468
0.56
3Th
rive
- Chi
ld h
ealth
, nut
ritio
n an
d de
velo
pmen
tD
ipht
heria
, per
tuss
is a
nd te
tanu
s (D
PT)
imm
uniz
atio
n co
vera
geTC
.30.
6401
0.02
470.
039
1.28
71.
135
438
486
0.59
10.
690
Pne
umoc
occa
l (C
onju
gate
) im
mun
izat
ion
cove
rage
TC.6
0.45
530.
0242
0.05
31.
144
1.06
943
848
60.
407
0.50
4M
easl
es im
mun
izat
ion
cove
rage
TC.1
00.
7068
0.02
490.
035
1.45
41.
206
438
486
0.65
70.
757
Prim
ary
relia
nce
on c
lean
fuel
s an
d te
chno
logi
es fo
r coo
king
, spa
ce h
eatin
g an
d lig
htin
gTC
.18
0.01
910.
0020
0.10
40.
991
0.99
520
,732
4,70
40.
015
0.02
3P
opul
atio
n w
ho s
lept
und
er a
n IT
NTC
.22
0.62
190.
0121
0.02
014
.294
3.78
120
,160
22,7
940.
598
0.64
6E
xclu
sive
bre
astfe
edin
g un
der 6
mon
ths
TC.3
20.
4356
0.02
680.
062
0.79
00.
889
246
271
0.38
20.
489
Stu
ntin
g pr
eval
ence
(mod
erat
e an
d se
vere
)TC
.45a
0.33
960.
0107
0.03
21.
349
1.16
12,
358
2,62
70.
318
0.36
1W
astin
g pr
eval
ence
(mod
erat
e an
d se
vere
)TC
.46a
0.10
730.
0071
0.06
61.
379
1.17
42,
368
2,64
30.
093
0.12
1O
verw
eigh
t pre
vale
nce
(mod
erat
e an
d se
vere
)TC
.47a
0.02
750.
0043
0.15
71.
842
1.35
72,
368
2,64
30.
019
0.03
6E
arly
chi
ld d
evel
opm
ent i
ndex
TC.5
30.
8910
0.01
200.
013
1.64
21.
282
997
1,10
90.
867
0.91
5
Low
er b
ound
r - 2
seU
pper
bou
ndr +
2se
Lear
nP
artic
ipat
ion
rate
in o
rgan
ised
lear
ning
(adj
uste
d)LN
.20.
6597
0.02
530.
038
1.67
41.
294
480
586
0.60
90.
710
Prot
ecte
d fr
om v
iole
nce
and
expl
oita
tion
Birt
h re
gist
ratio
nP
R.1
0.62
350.
0179
0.02
93.
680
1.91
82,
427
2,69
80.
588
0.65
9V
iole
nt d
isci
plin
eP
R.2
0.61
340.
0116
0.01
92.
731
1.65
37,
022
4,83
10.
590
0.63
7C
hild
labo
urP
R.3
0.28
150.
0127
0.04
52.
708
1.64
66,
502
3,41
10.
256
0.30
7C
hild
mar
riage
(bef
ore
age
15)
PR
.4a
0.07
450.
0108
0.14
51.
482
1.21
775
687
40.
053
0.09
6C
hild
mar
riage
(bef
ore
age
18)
PR
.4b
0.32
600.
0176
0.05
41.
236
1.11
275
687
40.
291
0.36
1Li
ve in
a s
afe
and
clea
n en
viro
nmen
tU
se o
f bas
ic d
rinki
ng w
ater
ser
vice
sW
S.2
0.77
790.
0136
0.01
75.
039
2.24
520
,732
4,70
40.
751
0.80
5U
se o
f saf
ely
man
aged
drin
king
wat
er s
ervi
ces
WS
.60.
1348
0.01
510.
112
1.33
81.
157
3,03
268
20.
104
0.16
5H
andw
ashi
ng fa
cilit
y w
ith w
ater
and
soa
pW
S.7
0.52
680.
0135
0.02
63.
445
1.85
620
,715
4,70
00.
500
0.55
4U
se o
f bas
ic s
anita
tion
serv
ices
WS
.90.
5575
0.01
890.
034
6.82
32.
612
20,7
324,
704
0.52
00.
595
Saf
e di
spos
al in
situ
of e
xcre
ta fr
om o
n-si
te s
anita
tion
faci
litie
sW
S.1
00.
9705
0.00
530.
005
2.71
41.
647
12,1
772,
810
0.96
00.
981
Equi
tabl
e ch
ance
in li
feC
hild
ren
with
func
tiona
l difi
culty
E
Q.1
0.04
330.
0050
0.11
61.
004
1.00
21,
482
1,64
90.
033
0.05
3P
opul
atio
n co
vere
d by
soc
ial t
rans
fers
EQ
.30.
1151
0.00
630.
054
1.81
21.
346
20,7
324,
704
0.10
30.
128
na: n
ot a
pplic
able
Tabl
e SE
.8: S
ampl
ing
erro
rs: S
outh
Sta
ndar
d er
rors
, coe
ffici
ents
of v
aria
tion,
des
ign
effe
cts
(def
f), s
quar
e ro
ot o
f des
ign
effe
cts
(def
t), a
nd c
onfid
ence
inte
rval
s fo
r sel
ecte
d S
DG
and
MIC
S in
dica
tors
, LS
ISII,
201
7
MIC
SIn
dica
tor
Val
ue (r
)S
tand
ard
erro
r (se
)
Coe
ffici
ent o
f va
riatio
n(s
e/r)
Des
ign
effe
ct
(def
f)
Squ
are
root
of
des
ign
effe
ct (d
eft)
Wei
ghte
dco
unt
Unw
eigh
ted
coun
t
Con
fiden
ce li
mits
Tabl
e SE
.8: S
ampl
ing
erro
rs: S
outh
Sta
ndar
d er
rors
, coe
ffici
ents
of v
aria
tion,
des
ign
effe
cts
(def
f), s
quar
e ro
ot o
f des
ign
effe
cts
(def
t), a
nd c
onfid
ence
inte
rval
s fo
r sel
ecte
d S
DG
and
MIC
S in
dica
tors
, LS
ISII,
201
7
MIC
SIn
dica
tor
Val
ue (r
)S
tand
ard
erro
r (se
)
Coe
ffici
ent o
f va
riatio
n(s
e/r)
Des
ign
effe
ct
(def
f)
Squ
are
root
of
des
ign
effe
ct (d
eft)
Wei
ghte
dco
unt
Unw
eigh
ted
coun
t
Con
fiden
ce li
mits

400
Low
er b
ound
r - 2
seU
pper
bou
ndr +
2se
Sam
ple
cove
rage
and
cha
ract
eris
tics
of th
e re
spon
dent
sA
cces
s to
ele
ctric
ityS
R.1
0.99
810.
0014
0.00
11.
554
1.24
712
,633
1,
575
0.99
51.
000
Ow
ners
hip
of m
obile
pho
ne (w
omen
)S
R.1
00.
9677
0.00
480.
005
1.34
81.
161
3,47
3
1,
820
0.95
80.
977
Ow
ners
hip
of m
obile
pho
ne (m
en)
SR
.10
0.95
050.
0096
0.01
01.
534
1.23
91,
510
779
0.
931
0.97
0U
se o
f int
erne
t (w
omen
)S
R.1
2a0.
5803
0.01
780.
031
2.37
71.
542
3,47
3
1,
820
0.54
50.
616
Use
of i
nter
net (
men
)S
R.1
2a0.
5993
0.03
190.
053
3.29
31.
815
1,56
4
77
9
0.53
60.
663
ICT
skill
s (w
omen
)S
R.1
30.
2201
0.01
230.
056
1.61
21.
270
3,47
3
1,
820
0.19
50.
245
ICT
skill
s (m
en)
SR
.13
0.31
470.
0216
0.06
91.
678
1.29
51,
564
779
0.
272
0.35
8U
se o
f tob
acco
(wom
en)
SR
.14
0.00
550.
0022
0.40
11.
619
1.27
23,
473
1,82
0
0.
001
0.01
0U
se o
f tob
acco
(men
)S
R.1
40.
2887
0.01
780.
062
1.19
71.
094
1,56
4
77
9
0.25
30.
324
Surv
ive
Neo
nata
l mor
talit
y ra
teC
S.1
248.
4816
0.34
9na
nana
na7
41In
fant
mor
talit
y ra
teC
S.3
278.
7799
0.32
9na
nana
na9
44U
nder
-five
mor
talit
y ra
teC
S.5
359.
1663
0.26
4na
nana
na16
53Th
rive
- Rep
rodu
ctiv
e an
d m
ater
nal h
ealth
Tota
l fer
tility
rate
-2.
00.
1105
0.05
6na
nana
na1.
72.
2A
dole
scen
t birt
h ra
teTM
.126
.55.
4804
0.20
7na
nana
na15
.537
.4…
Con
trace
ptiv
e pr
eval
ence
rate
TM.3
0.50
590.
0124
0.02
50.
794
0.89
12,
488
1,28
4
0.
481
0.53
1N
eed
for f
amily
pla
nnin
g sa
tisfie
d w
ith m
oder
n co
ntra
cept
ion
TM.4
0.65
780.
0179
0.02
71.
154
1.07
41,
597
813
0.
622
0.69
4A
nten
atal
car
e co
vera
ge (4
+)TM
.5b
0.86
000.
0221
0.02
60.
836
0.91
441
8
207
0.
816
0.90
4S
kille
d at
tend
ant a
t del
iver
yTM
.90.
9765
0.00
900.
009
0.72
20.
850
418
20
7
0.95
90.
994
Thriv
e - C
hild
hea
lth, n
utrit
ion
and
deve
lopm
ent
Dip
hthe
ria, p
ertu
ssis
and
teta
nus
(DP
T) im
mun
izat
ion
cove
rage
TC.3
0.68
320.
0322
0.04
70.
542
0.73
623
7
114
0.
619
0.74
8P
neum
ococ
cal (
Con
juga
te) i
mm
uniz
atio
n co
vera
geTC
.60.
5016
0.04
230.
084
0.80
70.
898
237
11
4
0.41
70.
586
Mea
sles
imm
uniz
atio
n co
vera
geTC
.10
0.72
880.
0316
0.04
30.
572
0.75
623
7
114
0.
666
0.79
2P
rimar
y re
lianc
e on
cle
an fu
els
and
tech
nolo
gies
for c
ooki
ng, s
pace
hea
ting
and
light
ing
TC.1
80.
2708
0.01
760.
065
2.47
51.
573
12,6
33
1,57
5
0.
236
0.30
6P
opul
atio
n w
ho s
lept
und
er a
n IT
NTC
.22
0.09
420.
0097
0.10
27.
157
2.67
512
,076
6,
560
0.07
50.
114
Exc
lusi
ve b
reas
tfeed
ing
unde
r 6 m
onth
sTC
.32
0.20
970.
0524
0.25
00.
811
0.90
010
7
50
0.10
50.
314
Stu
ntin
g pr
eval
ence
(mod
erat
e an
d se
vere
)TC
.45a
0.13
800.
0178
0.12
91.
476
1.21
51,
134
556
0.
102
0.17
4W
astin
g pr
eval
ence
(mod
erat
e an
d se
vere
)TC
.46a
0.05
500.
0095
0.17
20.
937
0.96
81,
111
546
0.
036
0.07
4O
verw
eigh
t pre
vale
nce
(mod
erat
e an
d se
vere
)TC
.47a
0.05
910.
0106
0.18
01.
111
1.05
41,
111
546
0.
038
0.08
0E
arly
chi
ld d
evel
opm
ent i
ndex
TC.5
30.
9310
0.01
760.
019
1.22
11.
105
516
25
4
0.89
60.
966
Low
er b
ound
r - 2
seU
pper
bou
ndr +
2se
Lear
nP
artic
ipat
ion
rate
in o
rgan
ised
lear
ning
(adj
uste
d)LN
.20.
9180
0.02
190.
024
0.78
70.
887
234
12
5
0.87
40.
962
Prot
ecte
d fr
om v
iole
nce
and
expl
oita
tion
Birt
h re
gist
ratio
nP
R.1
0.91
970.
0118
0.01
31.
093
1.04
51,
181
581
0.
896
0.94
3V
iole
nt d
isci
plin
eP
R.2
0.65
520.
0167
0.02
61.
471
1.21
33,
090
1,18
7
0.
622
0.68
9C
hild
labo
urP
R.3
0.25
600.
0190
0.07
41.
729
1.31
52,
725
913
0.
218
0.29
4C
hild
mar
riage
(bef
ore
age
15)
PR
.4a
0.01
420.
0075
0.53
01.
132
1.06
453
3
281
0.
000
0.02
9C
hild
mar
riage
(bef
ore
age
18)
PR
.4b
0.14
460.
0198
0.13
70.
888
0.94
253
3
281
0.
105
0.18
4Li
ve in
a s
afe
and
clea
n en
viro
nmen
tU
se o
f bas
ic d
rinki
ng w
ater
ser
vice
sW
S.2
0.94
280.
0177
0.01
99.
126
3.02
112
,633
1,
575
0.90
70.
978
Use
of s
afel
y m
anag
ed d
rinki
ng w
ater
ser
vice
sW
S.6
0.25
610.
0296
0.11
61.
084
1.04
11,
865
236
0.
197
0.31
5H
andw
ashi
ng fa
cilit
y w
ith w
ater
and
soa
pW
S.7
0.88
160.
0110
0.01
21.
826
1.35
112
,629
1,
574
0.86
00.
904
Use
of b
asic
san
itatio
n se
rvic
esW
S.9
0.96
310.
0068
0.00
72.
055
1.43
412
,633
1,
575
0.94
90.
977
Saf
e di
spos
al in
situ
of e
xcre
ta fr
om o
n-si
te s
anita
tion
faci
litie
sW
S.1
00.
6623
0.01
870.
028
2.38
01.
543
12,2
62
1,52
1
0.
625
0.70
0Eq
uita
ble
chan
ce in
life
Chi
ldre
n w
ith fu
nctio
nal d
ificu
lty
EQ
.10.
0022
0.00
220.
999
0.80
90.
899
751
37
1
0.00
00.
007
Pop
ulat
ion
cove
red
by s
ocia
l tra
nsfe
rsE
Q.3
0.14
740.
0116
0.07
91.
689
1.30
012
,633
1,
575
0.12
40.
171
na: n
ot a
pplic
able
Con
fiden
ce li
mits
Coe
ffici
ent o
f va
riatio
n(s
e/r)
Des
ign
effe
ct
(def
f)
Squ
are
root
of
des
ign
effe
ct (d
eft)
Wei
ghte
d co
unt
Unw
eigh
ted
coun
t
Tabl
e SE
.9: S
ampl
ing
erro
rs: V
ient
iane
Cap
ital
Sta
ndar
d er
rors
, coe
ffici
ents
of v
aria
tion,
des
ign
effe
cts
(def
f), s
quar
e ro
ot o
f des
ign
effe
cts
(def
t), a
nd c
onfid
ence
inte
rval
s fo
r sel
ecte
d S
DG
and
MIC
S in
dica
tors
, LS
ISII,
201
7
MIC
SIn
dica
tor
Val
ue (r
)S
tand
ard
erro
r (se
)
Coe
ffici
ent o
f va
riatio
n(s
e/r)
Des
ign
effe
ct
(def
f)
Squ
are
root
of
des
ign
effe
ct (d
eft)
Wei
ghte
d co
unt
Unw
eigh
ted
coun
t
Con
fiden
ce li
mits

401
Low
er b
ound
r - 2
seU
pper
bou
ndr +
2se
Sam
ple
cove
rage
and
cha
ract
eris
tics
of th
e re
spon
dent
sA
cces
s to
ele
ctric
ityS
R.1
0.99
810.
0014
0.00
11.
554
1.24
712
,633
1,
575
0.99
51.
000
Ow
ners
hip
of m
obile
pho
ne (w
omen
)S
R.1
00.
9677
0.00
480.
005
1.34
81.
161
3,47
3
1,
820
0.95
80.
977
Ow
ners
hip
of m
obile
pho
ne (m
en)
SR
.10
0.95
050.
0096
0.01
01.
534
1.23
91,
510
779
0.
931
0.97
0U
se o
f int
erne
t (w
omen
)S
R.1
2a0.
5803
0.01
780.
031
2.37
71.
542
3,47
3
1,
820
0.54
50.
616
Use
of i
nter
net (
men
)S
R.1
2a0.
5993
0.03
190.
053
3.29
31.
815
1,56
4
77
9
0.53
60.
663
ICT
skill
s (w
omen
)S
R.1
30.
2201
0.01
230.
056
1.61
21.
270
3,47
3
1,
820
0.19
50.
245
ICT
skill
s (m
en)
SR
.13
0.31
470.
0216
0.06
91.
678
1.29
51,
564
779
0.
272
0.35
8U
se o
f tob
acco
(wom
en)
SR
.14
0.00
550.
0022
0.40
11.
619
1.27
23,
473
1,82
0
0.
001
0.01
0U
se o
f tob
acco
(men
)S
R.1
40.
2887
0.01
780.
062
1.19
71.
094
1,56
4
77
9
0.25
30.
324
Surv
ive
Neo
nata
l mor
talit
y ra
teC
S.1
248.
4816
0.34
9na
nana
na7
41In
fant
mor
talit
y ra
teC
S.3
278.
7799
0.32
9na
nana
na9
44U
nder
-five
mor
talit
y ra
teC
S.5
359.
1663
0.26
4na
nana
na16
53Th
rive
- Rep
rodu
ctiv
e an
d m
ater
nal h
ealth
Tota
l fer
tility
rate
-2.
00.
1105
0.05
6na
nana
na1.
72.
2A
dole
scen
t birt
h ra
teTM
.126
.55.
4804
0.20
7na
nana
na15
.537
.4…
Con
trace
ptiv
e pr
eval
ence
rate
TM.3
0.50
590.
0124
0.02
50.
794
0.89
12,
488
1,28
4
0.
481
0.53
1N
eed
for f
amily
pla
nnin
g sa
tisfie
d w
ith m
oder
n co
ntra
cept
ion
TM.4
0.65
780.
0179
0.02
71.
154
1.07
41,
597
813
0.
622
0.69
4A
nten
atal
car
e co
vera
ge (4
+)TM
.5b
0.86
000.
0221
0.02
60.
836
0.91
441
8
207
0.
816
0.90
4S
kille
d at
tend
ant a
t del
iver
yTM
.90.
9765
0.00
900.
009
0.72
20.
850
418
20
7
0.95
90.
994
Thriv
e - C
hild
hea
lth, n
utrit
ion
and
deve
lopm
ent
Dip
hthe
ria, p
ertu
ssis
and
teta
nus
(DP
T) im
mun
izat
ion
cove
rage
TC.3
0.68
320.
0322
0.04
70.
542
0.73
623
7
114
0.
619
0.74
8P
neum
ococ
cal (
Con
juga
te) i
mm
uniz
atio
n co
vera
geTC
.60.
5016
0.04
230.
084
0.80
70.
898
237
11
4
0.41
70.
586
Mea
sles
imm
uniz
atio
n co
vera
geTC
.10
0.72
880.
0316
0.04
30.
572
0.75
623
7
114
0.
666
0.79
2P
rimar
y re
lianc
e on
cle
an fu
els
and
tech
nolo
gies
for c
ooki
ng, s
pace
hea
ting
and
light
ing
TC.1
80.
2708
0.01
760.
065
2.47
51.
573
12,6
33
1,57
5
0.
236
0.30
6P
opul
atio
n w
ho s
lept
und
er a
n IT
NTC
.22
0.09
420.
0097
0.10
27.
157
2.67
512
,076
6,
560
0.07
50.
114
Exc
lusi
ve b
reas
tfeed
ing
unde
r 6 m
onth
sTC
.32
0.20
970.
0524
0.25
00.
811
0.90
010
7
50
0.10
50.
314
Stu
ntin
g pr
eval
ence
(mod
erat
e an
d se
vere
)TC
.45a
0.13
800.
0178
0.12
91.
476
1.21
51,
134
556
0.
102
0.17
4W
astin
g pr
eval
ence
(mod
erat
e an
d se
vere
)TC
.46a
0.05
500.
0095
0.17
20.
937
0.96
81,
111
546
0.
036
0.07
4O
verw
eigh
t pre
vale
nce
(mod
erat
e an
d se
vere
)TC
.47a
0.05
910.
0106
0.18
01.
111
1.05
41,
111
546
0.
038
0.08
0E
arly
chi
ld d
evel
opm
ent i
ndex
TC.5
30.
9310
0.01
760.
019
1.22
11.
105
516
25
4
0.89
60.
966
Low
er b
ound
r - 2
seU
pper
bou
ndr +
2se
Lear
nP
artic
ipat
ion
rate
in o
rgan
ised
lear
ning
(adj
uste
d)LN
.20.
9180
0.02
190.
024
0.78
70.
887
234
12
5
0.87
40.
962
Prot
ecte
d fr
om v
iole
nce
and
expl
oita
tion
Birt
h re
gist
ratio
nP
R.1
0.91
970.
0118
0.01
31.
093
1.04
51,
181
581
0.
896
0.94
3V
iole
nt d
isci
plin
eP
R.2
0.65
520.
0167
0.02
61.
471
1.21
33,
090
1,18
7
0.
622
0.68
9C
hild
labo
urP
R.3
0.25
600.
0190
0.07
41.
729
1.31
52,
725
913
0.
218
0.29
4C
hild
mar
riage
(bef
ore
age
15)
PR
.4a
0.01
420.
0075
0.53
01.
132
1.06
453
3
281
0.
000
0.02
9C
hild
mar
riage
(bef
ore
age
18)
PR
.4b
0.14
460.
0198
0.13
70.
888
0.94
253
3
281
0.
105
0.18
4Li
ve in
a s
afe
and
clea
n en
viro
nmen
tU
se o
f bas
ic d
rinki
ng w
ater
ser
vice
sW
S.2
0.94
280.
0177
0.01
99.
126
3.02
112
,633
1,
575
0.90
70.
978
Use
of s
afel
y m
anag
ed d
rinki
ng w
ater
ser
vice
sW
S.6
0.25
610.
0296
0.11
61.
084
1.04
11,
865
236
0.
197
0.31
5H
andw
ashi
ng fa
cilit
y w
ith w
ater
and
soa
pW
S.7
0.88
160.
0110
0.01
21.
826
1.35
112
,629
1,
574
0.86
00.
904
Use
of b
asic
san
itatio
n se
rvic
esW
S.9
0.96
310.
0068
0.00
72.
055
1.43
412
,633
1,
575
0.94
90.
977
Saf
e di
spos
al in
situ
of e
xcre
ta fr
om o
n-si
te s
anita
tion
faci
litie
sW
S.1
00.
6623
0.01
870.
028
2.38
01.
543
12,2
62
1,52
1
0.
625
0.70
0Eq
uita
ble
chan
ce in
life
Chi
ldre
n w
ith fu
nctio
nal d
ificu
lty
EQ
.10.
0022
0.00
220.
999
0.80
90.
899
751
37
1
0.00
00.
007
Pop
ulat
ion
cove
red
by s
ocia
l tra
nsfe
rsE
Q.3
0.14
740.
0116
0.07
91.
689
1.30
012
,633
1,
575
0.12
40.
171
na: n
ot a
pplic
able
Con
fiden
ce li
mits
Coe
ffici
ent o
f va
riatio
n(s
e/r)
Des
ign
effe
ct
(def
f)
Squ
are
root
of
des
ign
effe
ct (d
eft)
Wei
ghte
d co
unt
Unw
eigh
ted
coun
t
Tabl
e SE
.9: S
ampl
ing
erro
rs: V
ient
iane
Cap
ital
Sta
ndar
d er
rors
, coe
ffici
ents
of v
aria
tion,
des
ign
effe
cts
(def
f), s
quar
e ro
ot o
f des
ign
effe
cts
(def
t), a
nd c
onfid
ence
inte
rval
s fo
r sel
ecte
d S
DG
and
MIC
S in
dica
tors
, LS
ISII,
201
7
MIC
SIn
dica
tor
Val
ue (r
)S
tand
ard
erro
r (se
)
Tabl
e SE
.9: S
ampl
ing
erro
rs: V
ient
iane
Cap
ital
Sta
ndar
d er
rors
, coe
ffici
ents
of v
aria
tion,
des
ign
effe
cts
(def
f), s
quar
e ro
ot o
f des
ign
effe
cts
(def
t), a
nd c
onfid
ence
inte
rval
s fo
r sel
ecte
d S
DG
and
MIC
S in
dica
tors
, LS
ISII,
201
7
MIC
SIn
dica
tor
Val
ue (r
)S
tand
ard
erro
r (se
)
Coe
ffici
ent o
f va
riatio
n(s
e/r)
Des
ign
effe
ct
(def
f)
Squ
are
root
of
des
ign
effe
ct (d
eft)
Wei
ghte
d co
unt
Unw
eigh
ted
coun
t
Con
fiden
ce li
mits

402
Low
er b
ound
r - 2
seU
pper
bou
ndr +
2se
Sam
ple
cove
rage
and
cha
ract
eris
tics
of th
e re
spon
dent
sA
cces
s to
ele
ctric
ityS
R.1
0.88
850.
0200
0.02
34.
226
2.05
63,
166
1,04
50.
848
0.92
9O
wne
rshi
p of
mob
ile p
hone
(wom
en)
SR
.10
0.64
490.
0377
0.05
86.
561
2.56
170
01,
059
0.57
00.
720
Ow
ners
hip
of m
obile
pho
ne (m
en)
SR
.10
0.86
790.
0217
0.02
52.
348
1.53
237
357
50.
825
0.91
1U
se o
f int
erne
t (w
omen
)S
R.1
2a0.
1795
0.01
760.
098
2.23
71.
496
700
1,05
90.
144
0.21
5U
se o
f int
erne
t (m
en)
SR
.12a
0.24
120.
0249
0.10
31.
939
1.39
337
357
50.
191
0.29
1IC
T sk
ills
(wom
en)
SR
.13
0.04
010.
0075
0.18
81.
563
1.25
070
01,
059
0.02
50.
055
ICT
skill
s (m
en)
SR
.13
0.09
350.
0152
0.16
31.
574
1.25
537
357
50.
063
0.12
4U
se o
f tob
acco
(wom
en)
SR
.14
0.05
060.
0127
0.25
13.
554
1.88
570
01,
059
0.02
50.
076
Use
of t
obac
co (m
en)
SR
.14
0.63
280.
0246
0.03
91.
492
1.22
237
357
50.
584
0.68
2Su
rviv
eN
eona
tal m
orta
lity
rate
CS
.127
80.
301
nana
nana
1144
Infa
nt m
orta
lity
rate
CS
.360
150.
260
nana
nana
2991
Und
er-fi
ve m
orta
lity
rate
CS
.568
150.
215
nana
nana
3998
Thriv
e - R
epro
duct
ive
and
mat
erna
l hea
lthTo
tal f
ertil
ity ra
te-
2.8
0.19
650.
069
nana
nana
2.4
3.2
Ado
lesc
ent b
irth
rate
TM.1
104.
717
.782
30.
170
nana
nana
69.2
140.
3…
Con
trace
ptiv
e pr
eval
ence
rate
TM.3
0.56
770.
0217
0.03
81.
694
1.30
258
588
70.
524
0.61
1N
eed
for f
amily
pla
nnin
g sa
tisfie
d w
ith m
oder
n co
ntra
cept
ion
TM.4
0.84
890.
0132
0.01
60.
762
0.87
336
456
00.
822
0.87
5A
nten
atal
car
e co
vera
ge (4
+)TM
.5b
0.41
030.
0670
0.16
33.
521
1.87
612
719
10.
276
0.54
4S
kille
d at
tend
ant a
t del
iver
yTM
.90.
3733
0.04
780.
128
1.85
71.
363
127
191
0.27
80.
469
Thriv
e - C
hild
hea
lth, n
utrit
ion
and
deve
lopm
ent
Dip
hthe
ria, p
ertu
ssis
and
teta
nus
(DP
T) im
mun
izat
ion
cove
rage
TC.3
0.36
050.
0472
0.13
10.
890
0.94
467
930.
266
0.45
5P
neum
ococ
cal (
Con
juga
te) i
mm
uniz
atio
n co
vera
geTC
.60.
2773
0.03
080.
111
0.43
60.
660
6793
0.21
60.
339
Mea
sles
imm
uniz
atio
n co
vera
geTC
.10
0.50
170.
0563
0.11
21.
165
1.07
967
930.
389
0.61
4P
rimar
y re
lianc
e on
cle
an fu
els
and
tech
nolo
gies
for c
ooki
ng, s
pace
hea
ting
and
light
ing
TC.1
80.
0207
0.00
370.
177
0.69
40.
833
3,16
61,
045
0.01
30.
028
Pop
ulat
ion
who
sle
pt u
nder
an
ITN
TC.2
20.
7610
0.03
010.
039
23.1
554.
812
3,11
64,
663
0.70
10.
821
Exc
lusi
ve b
reas
tfeed
ing
unde
r 6 m
onth
sTC
.32
0.49
350.
0524
0.10
60.
581
0.76
237
540.
389
0.59
8S
tunt
ing
prev
alen
ce (m
oder
ate
and
seve
re)
TC.4
5a0.
5400
0.02
970.
055
1.61
91.
272
320
457
0.48
10.
599
Was
ting
prev
alen
ce (m
oder
ate
and
seve
re)
TC.4
6a0.
0894
0.01
330.
149
1.00
81.
004
327
463
0.06
30.
116
Ove
rwei
ght p
reva
lenc
e (m
oder
ate
and
seve
re)
TC.4
7a0.
0998
0.01
230.
123
0.77
90.
883
327
463
0.07
50.
124
Ear
ly c
hild
dev
elop
men
t ind
exTC
.53
0.79
740.
0293
0.03
71.
051
1.02
514
319
90.
739
0.85
6
Low
er b
ound
r - 2
seU
pper
bou
ndr +
2se
Lear
nP
artic
ipat
ion
rate
in o
rgan
ised
lear
ning
(adj
uste
d)LN
.20.
7242
0.04
970.
069
1.53
31.
238
8012
50.
625
0.82
4Pr
otec
ted
from
vio
lenc
e an
d ex
ploi
tatio
nB
irth
regi
stra
tion
PR
.10.
7175
0.02
410.
034
1.41
11.
188
346
494
0.66
90.
766
Vio
lent
dis
cipl
ine
PR
.20.
8306
0.01
640.
020
1.80
71.
344
1,03
694
80.
798
0.86
3C
hild
labo
urP
R.3
0.52
870.
0277
0.05
22.
080
1.44
291
967
80.
473
0.58
4C
hild
mar
riage
(bef
ore
age
15)
PR
.4a
0.06
180.
0188
0.30
41.
009
1.00
410
916
70.
024
0.09
9C
hild
mar
riage
(bef
ore
age
18)
PR
.4b
0.42
190.
0534
0.12
71.
940
1.39
310
916
70.
315
0.52
9Li
ve in
a s
afe
and
clea
n en
viro
nmen
tU
se o
f bas
ic d
rinki
ng w
ater
ser
vice
sW
S.2
0.80
670.
0445
0.05
513
.231
3.63
73,
166
1,04
50.
718
0.89
6U
se o
f saf
ely
man
aged
drin
king
wat
er s
ervi
ces
WS
.60.
1368
0.03
150.
230
1.21
61.
103
496
146
0.07
40.
200
Han
dwas
hing
faci
lity
with
wat
er a
nd s
oap
WS
.70.
4762
0.03
530.
074
5.22
22.
285
3,16
61,
045
0.40
60.
547
Use
of b
asic
san
itatio
n se
rvic
esW
S.9
0.51
730.
0590
0.11
414
.551
3.81
53,
166
1,04
50.
399
0.63
5S
afe
disp
osal
in s
itu o
f exc
reta
from
on-
site
san
itatio
n fa
cilit
ies
WS
.10
0.99
420.
0030
0.00
30.
872
0.93
41,
659
579
0.98
81.
000
Equi
tabl
e ch
ance
in li
feC
hild
ren
with
func
tiona
l difi
culty
E
Q.1
0.03
210.
0084
0.26
10.
673
0.82
021
029
80.
015
0.04
9P
opul
atio
n co
vere
d by
soc
ial t
rans
fers
EQ
.30.
0879
0.00
880.
100
1.00
31.
001
3,16
61,
045
0.07
00.
105
na: n
ot a
pplic
able
Tabl
e SE
.10:
Sam
plin
g er
rors
: Pho
ngsa
lyS
tand
ard
erro
rs, c
oeffi
cien
ts o
f var
iatio
n, d
esig
n ef
fect
s (d
eff)
, squ
are
root
of d
esig
n ef
fect
s (d
eft)
, and
con
fiden
ce in
terv
als
for s
elec
ted
SD
G a
nd M
ICS
indi
cato
rs, P
hong
saly
, 201
7
MIC
SIn
dica
tor
Val
ue (r
)S
tand
ard
erro
r (se
)
Coe
ffici
ent o
f va
riatio
n(s
e/r)
Des
ign
effe
ct
(def
f)
Squ
are
root
of
des
ign
effe
ct (d
eft)
Wei
ghte
dco
unt
Unw
eigh
ted
coun
t
Con
fiden
ce li
mits
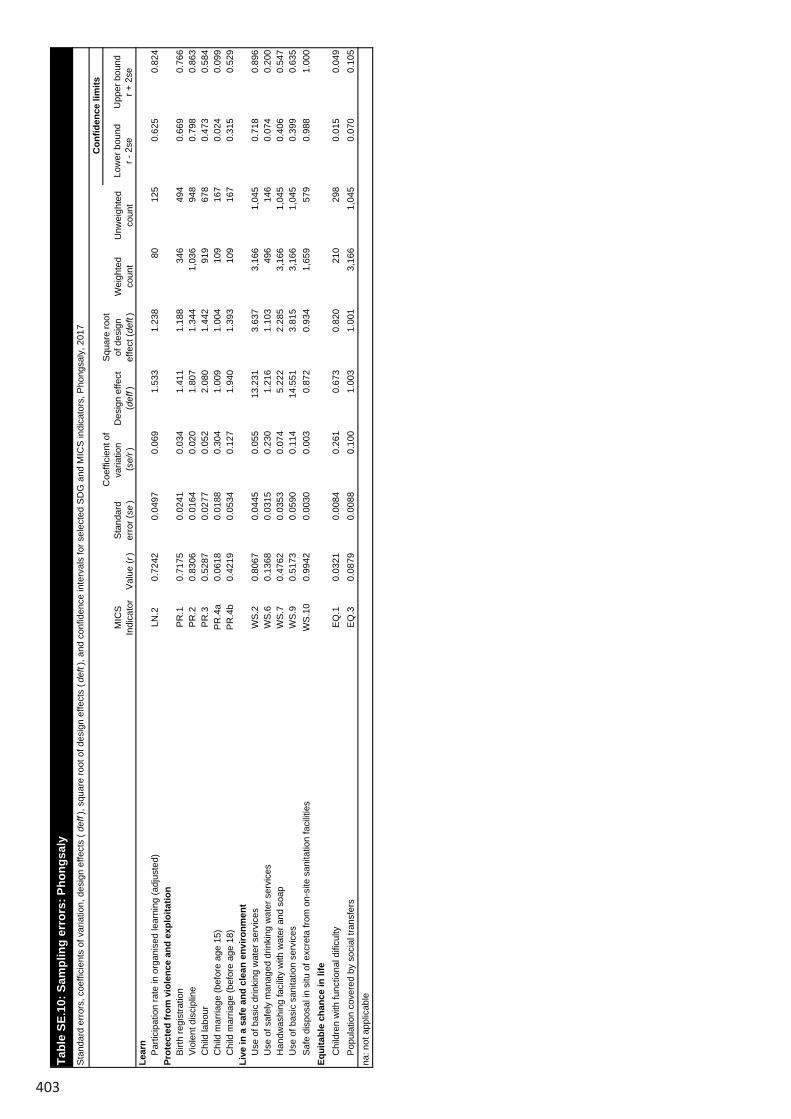
403
Low
er b
ound
r - 2
seU
pper
bou
ndr +
2se
Sam
ple
cove
rage
and
cha
ract
eris
tics
of th
e re
spon
dent
sA
cces
s to
ele
ctric
ityS
R.1
0.88
850.
0200
0.02
34.
226
2.05
63,
166
1,04
50.
848
0.92
9O
wne
rshi
p of
mob
ile p
hone
(wom
en)
SR
.10
0.64
490.
0377
0.05
86.
561
2.56
170
01,
059
0.57
00.
720
Ow
ners
hip
of m
obile
pho
ne (m
en)
SR
.10
0.86
790.
0217
0.02
52.
348
1.53
237
357
50.
825
0.91
1U
se o
f int
erne
t (w
omen
)S
R.1
2a0.
1795
0.01
760.
098
2.23
71.
496
700
1,05
90.
144
0.21
5U
se o
f int
erne
t (m
en)
SR
.12a
0.24
120.
0249
0.10
31.
939
1.39
337
357
50.
191
0.29
1IC
T sk
ills
(wom
en)
SR
.13
0.04
010.
0075
0.18
81.
563
1.25
070
01,
059
0.02
50.
055
ICT
skill
s (m
en)
SR
.13
0.09
350.
0152
0.16
31.
574
1.25
537
357
50.
063
0.12
4U
se o
f tob
acco
(wom
en)
SR
.14
0.05
060.
0127
0.25
13.
554
1.88
570
01,
059
0.02
50.
076
Use
of t
obac
co (m
en)
SR
.14
0.63
280.
0246
0.03
91.
492
1.22
237
357
50.
584
0.68
2Su
rviv
eN
eona
tal m
orta
lity
rate
CS
.127
80.
301
nana
nana
1144
Infa
nt m
orta
lity
rate
CS
.360
150.
260
nana
nana
2991
Und
er-fi
ve m
orta
lity
rate
CS
.568
150.
215
nana
nana
3998
Thriv
e - R
epro
duct
ive
and
mat
erna
l hea
lthTo
tal f
ertil
ity ra
te-
2.8
0.19
650.
069
nana
nana
2.4
3.2
Ado
lesc
ent b
irth
rate
TM.1
104.
717
.782
30.
170
nana
nana
69.2
140.
3…
Con
trace
ptiv
e pr
eval
ence
rate
TM.3
0.56
770.
0217
0.03
81.
694
1.30
258
588
70.
524
0.61
1N
eed
for f
amily
pla
nnin
g sa
tisfie
d w
ith m
oder
n co
ntra
cept
ion
TM.4
0.84
890.
0132
0.01
60.
762
0.87
336
456
00.
822
0.87
5A
nten
atal
car
e co
vera
ge (4
+)TM
.5b
0.41
030.
0670
0.16
33.
521
1.87
612
719
10.
276
0.54
4S
kille
d at
tend
ant a
t del
iver
yTM
.90.
3733
0.04
780.
128
1.85
71.
363
127
191
0.27
80.
469
Thriv
e - C
hild
hea
lth, n
utrit
ion
and
deve
lopm
ent
Dip
hthe
ria, p
ertu
ssis
and
teta
nus
(DP
T) im
mun
izat
ion
cove
rage
TC.3
0.36
050.
0472
0.13
10.
890
0.94
467
930.
266
0.45
5P
neum
ococ
cal (
Con
juga
te) i
mm
uniz
atio
n co
vera
geTC
.60.
2773
0.03
080.
111
0.43
60.
660
6793
0.21
60.
339
Mea
sles
imm
uniz
atio
n co
vera
geTC
.10
0.50
170.
0563
0.11
21.
165
1.07
967
930.
389
0.61
4P
rimar
y re
lianc
e on
cle
an fu
els
and
tech
nolo
gies
for c
ooki
ng, s
pace
hea
ting
and
light
ing
TC.1
80.
0207
0.00
370.
177
0.69
40.
833
3,16
61,
045
0.01
30.
028
Pop
ulat
ion
who
sle
pt u
nder
an
ITN
TC.2
20.
7610
0.03
010.
039
23.1
554.
812
3,11
64,
663
0.70
10.
821
Exc
lusi
ve b
reas
tfeed
ing
unde
r 6 m
onth
sTC
.32
0.49
350.
0524
0.10
60.
581
0.76
237
540.
389
0.59
8S
tunt
ing
prev
alen
ce (m
oder
ate
and
seve
re)
TC.4
5a0.
5400
0.02
970.
055
1.61
91.
272
320
457
0.48
10.
599
Was
ting
prev
alen
ce (m
oder
ate
and
seve
re)
TC.4
6a0.
0894
0.01
330.
149
1.00
81.
004
327
463
0.06
30.
116
Ove
rwei
ght p
reva
lenc
e (m
oder
ate
and
seve
re)
TC.4
7a0.
0998
0.01
230.
123
0.77
90.
883
327
463
0.07
50.
124
Ear
ly c
hild
dev
elop
men
t ind
exTC
.53
0.79
740.
0293
0.03
71.
051
1.02
514
319
90.
739
0.85
6
Low
er b
ound
r - 2
seU
pper
bou
ndr +
2se
Lear
nP
artic
ipat
ion
rate
in o
rgan
ised
lear
ning
(adj
uste
d)LN
.20.
7242
0.04
970.
069
1.53
31.
238
8012
50.
625
0.82
4Pr
otec
ted
from
vio
lenc
e an
d ex
ploi
tatio
nB
irth
regi
stra
tion
PR
.10.
7175
0.02
410.
034
1.41
11.
188
346
494
0.66
90.
766
Vio
lent
dis
cipl
ine
PR
.20.
8306
0.01
640.
020
1.80
71.
344
1,03
694
80.
798
0.86
3C
hild
labo
urP
R.3
0.52
870.
0277
0.05
22.
080
1.44
291
967
80.
473
0.58
4C
hild
mar
riage
(bef
ore
age
15)
PR
.4a
0.06
180.
0188
0.30
41.
009
1.00
410
916
70.
024
0.09
9C
hild
mar
riage
(bef
ore
age
18)
PR
.4b
0.42
190.
0534
0.12
71.
940
1.39
310
916
70.
315
0.52
9Li
ve in
a s
afe
and
clea
n en
viro
nmen
tU
se o
f bas
ic d
rinki
ng w
ater
ser
vice
sW
S.2
0.80
670.
0445
0.05
513
.231
3.63
73,
166
1,04
50.
718
0.89
6U
se o
f saf
ely
man
aged
drin
king
wat
er s
ervi
ces
WS
.60.
1368
0.03
150.
230
1.21
61.
103
496
146
0.07
40.
200
Han
dwas
hing
faci
lity
with
wat
er a
nd s
oap
WS
.70.
4762
0.03
530.
074
5.22
22.
285
3,16
61,
045
0.40
60.
547
Use
of b
asic
san
itatio
n se
rvic
esW
S.9
0.51
730.
0590
0.11
414
.551
3.81
53,
166
1,04
50.
399
0.63
5S
afe
disp
osal
in s
itu o
f exc
reta
from
on-
site
san
itatio
n fa
cilit
ies
WS
.10
0.99
420.
0030
0.00
30.
872
0.93
41,
659
579
0.98
81.
000
Equi
tabl
e ch
ance
in li
feC
hild
ren
with
func
tiona
l difi
culty
E
Q.1
0.03
210.
0084
0.26
10.
673
0.82
021
029
80.
015
0.04
9P
opul
atio
n co
vere
d by
soc
ial t
rans
fers
EQ
.30.
0879
0.00
880.
100
1.00
31.
001
3,16
61,
045
0.07
00.
105
na: n
ot a
pplic
able
Tabl
e SE
.10:
Sam
plin
g er
rors
: Pho
ngsa
lyS
tand
ard
erro
rs, c
oeffi
cien
ts o
f var
iatio
n, d
esig
n ef
fect
s (d
eff)
, squ
are
root
of d
esig
n ef
fect
s (d
eft)
, and
con
fiden
ce in
terv
als
for s
elec
ted
SD
G a
nd M
ICS
indi
cato
rs, P
hong
saly
, 201
7
MIC
SIn
dica
tor
Val
ue (r
)S
tand
ard
erro
r (se
)
Coe
ffici
ent o
f va
riatio
n(s
e/r)
Des
ign
effe
ct
(def
f)
Squ
are
root
of
des
ign
effe
ct (d
eft)
Wei
ghte
dco
unt
Unw
eigh
ted
coun
t
Con
fiden
ce li
mits
Tabl
e SE
.10:
Sam
plin
g er
rors
: Pho
ngsa
lyS
tand
ard
erro
rs, c
oeffi
cien
ts o
f var
iatio
n, d
esig
n ef
fect
s (d
eff)
, squ
are
root
of d
esig
n ef
fect
s (d
eft)
, and
con
fiden
ce in
terv
als
for s
elec
ted
SD
G a
nd M
ICS
indi
cato
rs, P
hong
saly
, 201
7
MIC
SIn
dica
tor
Val
ue (r
)S
tand
ard
erro
r (se
)
Coe
ffici
ent o
f va
riatio
n(s
e/r)
Des
ign
effe
ct
(def
f)
Squ
are
root
of
des
ign
effe
ct (d
eft)
Wei
ghte
dco
unt
Unw
eigh
ted
coun
t
Con
fiden
ce li
mits

404
Low
er b
ound
r - 2
seU
pper
bou
ndr +
2se
Sam
ple
cove
rage
and
cha
ract
eris
tics
of th
e re
spon
dent
sA
cces
s to
ele
ctric
ityS
R.1
0.92
140.
0164
0.01
83.
971
1.99
32,
952
1,07
1
0.
889
0.95
4O
wne
rshi
p of
mob
ile p
hone
(wom
en)
SR
.10
0.74
300.
0274
0.03
74.
614
2.14
869
2
1,17
7
0.
688
0.79
8O
wne
rshi
p of
mob
ile p
hone
(men
)S
R.1
00.
8813
0.01
510.
017
1.26
61.
125
350
57
9
0.85
10.
912
Use
of i
nter
net (
wom
en)
SR
.12a
0.19
000.
0165
0.08
72.
087
1.44
569
2
1,17
7
0.
157
0.22
3U
se o
f int
erne
t (m
en)
SR
.12a
0.05
090.
0138
0.27
12.
276
1.50
935
0
579
0.
023
0.07
9IC
T sk
ills
(wom
en)
SR
.13
0.06
150.
0087
0.14
21.
550
1.24
569
2
1,17
7
0.
044
0.07
9IC
T sk
ills
(men
)S
R.1
30.
0900
0.01
650.
184
1.92
81.
389
350
57
9
0.05
70.
123
Use
of t
obac
co (w
omen
)S
R.1
40.
0617
0.01
160.
188
2.72
61.
651
692
1,
177
0.03
90.
085
Use
of t
obac
co (m
en)
SR
.14
0.52
530.
0317
0.06
02.
332
1.52
735
0
579
0.
462
0.58
9Su
rviv
eN
eona
tal m
orta
lity
rate
CS
.110
4.09
930.
427
nana
nana
118
Infa
nt m
orta
lity
rate
CS
.326
6.94
420.
264
nana
nana
1240
Und
er-fi
ve m
orta
lity
rate
CS
.542
8.94
610.
215
nana
nana
2460
Thriv
e - R
epro
duct
ive
and
mat
erna
l hea
lthTo
tal f
ertil
ity ra
te-
2.5
0.15
320.
060
nana
nana
2.2
2.8
Ado
lesc
ent b
irth
rate
TM.1
121.
414
.866
70.
122
nana
nana
91.7
151.
1…
Con
trace
ptiv
e pr
eval
ence
rate
TM.3
0.63
130.
0175
0.02
81.
271
1.12
756
5
962
0.
596
0.66
6N
eed
for f
amily
pla
nnin
g sa
tisfie
d w
ith m
oder
n co
ntra
cept
ion
TM.4
0.85
130.
0151
0.01
81.
253
1.11
940
8
696
0.
821
0.88
2A
nten
atal
car
e co
vera
ge (4
+)TM
.5b
0.68
620.
0392
0.05
71.
346
1.16
011
2
190
0.
608
0.76
5S
kille
d at
tend
ant a
t del
iver
yTM
.90.
7427
0.04
920.
066
2.39
21.
547
112
19
0
0.64
40.
841
Thriv
e - C
hild
hea
lth, n
utrit
ion
and
deve
lopm
ent
Dip
hthe
ria, p
ertu
ssis
and
teta
nus
(DP
T) im
mun
izat
ion
cove
rage
TC.3
0.67
480.
0419
0.06
20.
735
0.85
857
93
0.
591
0.75
9P
neum
ococ
cal (
Con
juga
te) i
mm
uniz
atio
n co
vera
geTC
.60.
3666
0.04
280.
117
0.72
50.
851
57
93
0.28
10.
452
Mea
sles
imm
uniz
atio
n co
vera
geTC
.10
0.63
320.
0491
0.07
80.
955
0.97
757
93
0.
535
0.73
1P
rimar
y re
lianc
e on
cle
an fu
els
and
tech
nolo
gies
for c
ooki
ng, s
pace
hea
ting
and
light
ing
TC.1
80.
0530
0.00
910.
171
1.74
61.
322
2,95
2
1,
071
0.03
50.
071
Pop
ulat
ion
who
sle
pt u
nder
an
ITN
TC.2
20.
6275
0.01
520.
024
4.82
52.
197
2,84
1
4,
886
0.59
70.
658
Exc
lusi
ve b
reas
tfeed
ing
unde
r 6 m
onth
sTC
.32
0.66
680.
0633
0.09
50.
973
0.98
634
55
0.
540
0.79
3S
tunt
ing
prev
alen
ce (m
oder
ate
and
seve
re)
TC.4
5a0.
3407
0.02
660.
078
1.58
21.
258
308
50
5
0.28
80.
394
Was
ting
prev
alen
ce (m
oder
ate
and
seve
re)
TC.4
6a0.
0296
0.00
770.
261
1.04
71.
023
308
50
5
0.01
40.
045
Ove
rwei
ght p
reva
lenc
e (m
oder
ate
and
seve
re)
TC.4
7a0.
0184
0.00
610.
332
1.04
01.
020
308
50
5
0.00
60.
031
Ear
ly c
hild
dev
elop
men
t ind
exTC
.53
0.73
830.
0218
0.03
00.
565
0.75
214
1
231
0.
695
0.78
2
Low
er b
ound
r - 2
seU
pper
bou
ndr +
2se
Lear
nP
artic
ipat
ion
rate
in o
rgan
ised
lear
ning
(adj
uste
d)LN
.20.
6523
0.05
310.
081
1.49
41.
222
70
12
1
0.54
60.
759
Prot
ecte
d fr
om v
iole
nce
and
expl
oita
tion
Birt
h re
gist
ratio
nP
R.1
0.85
590.
0220
0.02
62.
063
1.43
632
1
527
0.
812
0.90
0V
iole
nt d
isci
plin
eP
R.2
0.83
250.
0162
0.01
92.
011
1.41
81,
004
1,06
6
0.
800
0.86
5C
hild
labo
urP
R.3
0.49
460.
0272
0.05
52.
297
1.51
689
6
777
0.
440
0.54
9C
hild
mar
riage
(bef
ore
age
15)
PR
.4a
0.10
500.
0190
0.18
10.
800
0.89
412
2
209
0.
067
0.14
3C
hild
mar
riage
(bef
ore
age
18)
PR
.4b
0.39
420.
0426
0.10
81.
577
1.25
612
2
209
0.
309
0.47
9Li
ve in
a s
afe
and
clea
n en
viro
nmen
tU
se o
f bas
ic d
rinki
ng w
ater
ser
vice
sW
S.2
0.93
210.
0166
0.01
84.
649
2.15
62,
952
1,07
1
0.
899
0.96
5U
se o
f saf
ely
man
aged
drin
king
wat
er s
ervi
ces
WS
.60.
0690
0.01
920.
279
0.89
90.
948
425
15
7
0.03
00.
107
Han
dwas
hing
faci
lity
with
wat
er a
nd s
oap
WS
.70.
5065
0.02
400.
047
2.47
51.
573
2,95
2
1,
071
0.45
80.
555
Use
of b
asic
san
itatio
n se
rvic
esW
S.9
0.79
000.
0333
0.04
27.
147
2.67
32,
952
1,07
1
0.
723
0.85
7S
afe
disp
osal
in s
itu o
f exc
reta
from
on-
site
san
itatio
n fa
cilit
ies
WS
.10
0.95
530.
0063
0.00
70.
807
0.89
82,
399
863
0.
943
0.96
8Eq
uita
ble
chan
ce in
life
Chi
ldre
n w
ith fu
nctio
nal d
ificu
lty
EQ
.10.
0058
0.00
420.
728
1.02
41.
012
203
33
3
0.00
00.
014
Pop
ulat
ion
cove
red
by s
ocia
l tra
nsfe
rsE
Q.3
0.06
360.
0088
0.13
81.
393
1.18
02,
952
1,07
1
0.
046
0.08
1na
: not
app
licab
le
Tabl
e SE
.11:
Sam
plin
g er
rors
: Lua
ngna
mth
aS
tand
ard
erro
rs, c
oeffi
cien
ts o
f var
iatio
n, d
esig
n ef
fect
s (d
eff)
, squ
are
root
of d
esig
n ef
fect
s (d
eft)
, and
con
fiden
ce in
terv
als
for s
elec
ted
SD
G a
nd M
ICS
indi
cato
rs, L
SIS
II, 2
017
MIC
SIn
dica
tor
Val
ue (r
)S
tand
ard
erro
r (se
)
Coe
ffici
ent o
f va
riatio
n(s
e/r)
Des
ign
effe
ct
(def
f)
Squ
are
root
of
des
ign
effe
ct (d
eft)
Wei
ghte
d co
unt
Unw
eigh
ted
coun
t
Con
fiden
ce li
mits

405
Low
er b
ound
r - 2
seU
pper
bou
ndr +
2se
Sam
ple
cove
rage
and
cha
ract
eris
tics
of th
e re
spon
dent
sA
cces
s to
ele
ctric
ityS
R.1
0.92
140.
0164
0.01
83.
971
1.99
32,
952
1,07
1
0.
889
0.95
4O
wne
rshi
p of
mob
ile p
hone
(wom
en)
SR
.10
0.74
300.
0274
0.03
74.
614
2.14
869
2
1,17
7
0.
688
0.79
8O
wne
rshi
p of
mob
ile p
hone
(men
)S
R.1
00.
8813
0.01
510.
017
1.26
61.
125
350
57
9
0.85
10.
912
Use
of i
nter
net (
wom
en)
SR
.12a
0.19
000.
0165
0.08
72.
087
1.44
569
2
1,17
7
0.
157
0.22
3U
se o
f int
erne
t (m
en)
SR
.12a
0.05
090.
0138
0.27
12.
276
1.50
935
0
579
0.
023
0.07
9IC
T sk
ills
(wom
en)
SR
.13
0.06
150.
0087
0.14
21.
550
1.24
569
2
1,17
7
0.
044
0.07
9IC
T sk
ills
(men
)S
R.1
30.
0900
0.01
650.
184
1.92
81.
389
350
57
9
0.05
70.
123
Use
of t
obac
co (w
omen
)S
R.1
40.
0617
0.01
160.
188
2.72
61.
651
692
1,
177
0.03
90.
085
Use
of t
obac
co (m
en)
SR
.14
0.52
530.
0317
0.06
02.
332
1.52
735
0
579
0.
462
0.58
9Su
rviv
eN
eona
tal m
orta
lity
rate
CS
.110
4.09
930.
427
nana
nana
118
Infa
nt m
orta
lity
rate
CS
.326
6.94
420.
264
nana
nana
1240
Und
er-fi
ve m
orta
lity
rate
CS
.542
8.94
610.
215
nana
nana
2460
Thriv
e - R
epro
duct
ive
and
mat
erna
l hea
lthTo
tal f
ertil
ity ra
te-
2.5
0.15
320.
060
nana
nana
2.2
2.8
Ado
lesc
ent b
irth
rate
TM.1
121.
414
.866
70.
122
nana
nana
91.7
151.
1…
Con
trace
ptiv
e pr
eval
ence
rate
TM.3
0.63
130.
0175
0.02
81.
271
1.12
756
5
962
0.
596
0.66
6N
eed
for f
amily
pla
nnin
g sa
tisfie
d w
ith m
oder
n co
ntra
cept
ion
TM.4
0.85
130.
0151
0.01
81.
253
1.11
940
8
696
0.
821
0.88
2A
nten
atal
car
e co
vera
ge (4
+)TM
.5b
0.68
620.
0392
0.05
71.
346
1.16
011
2
190
0.
608
0.76
5S
kille
d at
tend
ant a
t del
iver
yTM
.90.
7427
0.04
920.
066
2.39
21.
547
112
19
0
0.64
40.
841
Thriv
e - C
hild
hea
lth, n
utrit
ion
and
deve
lopm
ent
Dip
hthe
ria, p
ertu
ssis
and
teta
nus
(DP
T) im
mun
izat
ion
cove
rage
TC.3
0.67
480.
0419
0.06
20.
735
0.85
857
93
0.
591
0.75
9P
neum
ococ
cal (
Con
juga
te) i
mm
uniz
atio
n co
vera
geTC
.60.
3666
0.04
280.
117
0.72
50.
851
57
93
0.28
10.
452
Mea
sles
imm
uniz
atio
n co
vera
geTC
.10
0.63
320.
0491
0.07
80.
955
0.97
757
93
0.
535
0.73
1P
rimar
y re
lianc
e on
cle
an fu
els
and
tech
nolo
gies
for c
ooki
ng, s
pace
hea
ting
and
light
ing
TC.1
80.
0530
0.00
910.
171
1.74
61.
322
2,95
2
1,
071
0.03
50.
071
Pop
ulat
ion
who
sle
pt u
nder
an
ITN
TC.2
20.
6275
0.01
520.
024
4.82
52.
197
2,84
1
4,
886
0.59
70.
658
Exc
lusi
ve b
reas
tfeed
ing
unde
r 6 m
onth
sTC
.32
0.66
680.
0633
0.09
50.
973
0.98
634
55
0.
540
0.79
3S
tunt
ing
prev
alen
ce (m
oder
ate
and
seve
re)
TC.4
5a0.
3407
0.02
660.
078
1.58
21.
258
308
50
5
0.28
80.
394
Was
ting
prev
alen
ce (m
oder
ate
and
seve
re)
TC.4
6a0.
0296
0.00
770.
261
1.04
71.
023
308
50
5
0.01
40.
045
Ove
rwei
ght p
reva
lenc
e (m
oder
ate
and
seve
re)
TC.4
7a0.
0184
0.00
610.
332
1.04
01.
020
308
50
5
0.00
60.
031
Ear
ly c
hild
dev
elop
men
t ind
exTC
.53
0.73
830.
0218
0.03
00.
565
0.75
214
1
231
0.
695
0.78
2
Low
er b
ound
r - 2
seU
pper
bou
ndr +
2se
Lear
nP
artic
ipat
ion
rate
in o
rgan
ised
lear
ning
(adj
uste
d)LN
.20.
6523
0.05
310.
081
1.49
41.
222
70
12
1
0.54
60.
759
Prot
ecte
d fr
om v
iole
nce
and
expl
oita
tion
Birt
h re
gist
ratio
nP
R.1
0.85
590.
0220
0.02
62.
063
1.43
632
1
527
0.
812
0.90
0V
iole
nt d
isci
plin
eP
R.2
0.83
250.
0162
0.01
92.
011
1.41
81,
004
1,06
6
0.
800
0.86
5C
hild
labo
urP
R.3
0.49
460.
0272
0.05
52.
297
1.51
689
6
777
0.
440
0.54
9C
hild
mar
riage
(bef
ore
age
15)
PR
.4a
0.10
500.
0190
0.18
10.
800
0.89
412
2
209
0.
067
0.14
3C
hild
mar
riage
(bef
ore
age
18)
PR
.4b
0.39
420.
0426
0.10
81.
577
1.25
612
2
209
0.
309
0.47
9Li
ve in
a s
afe
and
clea
n en
viro
nmen
tU
se o
f bas
ic d
rinki
ng w
ater
ser
vice
sW
S.2
0.93
210.
0166
0.01
84.
649
2.15
62,
952
1,07
1
0.
899
0.96
5U
se o
f saf
ely
man
aged
drin
king
wat
er s
ervi
ces
WS
.60.
0690
0.01
920.
279
0.89
90.
948
425
15
7
0.03
00.
107
Han
dwas
hing
faci
lity
with
wat
er a
nd s
oap
WS
.70.
5065
0.02
400.
047
2.47
51.
573
2,95
2
1,
071
0.45
80.
555
Use
of b
asic
san
itatio
n se
rvic
esW
S.9
0.79
000.
0333
0.04
27.
147
2.67
32,
952
1,07
1
0.
723
0.85
7S
afe
disp
osal
in s
itu o
f exc
reta
from
on-
site
san
itatio
n fa
cilit
ies
WS
.10
0.95
530.
0063
0.00
70.
807
0.89
82,
399
863
0.
943
0.96
8Eq
uita
ble
chan
ce in
life
Chi
ldre
n w
ith fu
nctio
nal d
ificu
lty
EQ
.10.
0058
0.00
420.
728
1.02
41.
012
203
33
3
0.00
00.
014
Pop
ulat
ion
cove
red
by s
ocia
l tra
nsfe
rsE
Q.3
0.06
360.
0088
0.13
81.
393
1.18
02,
952
1,07
1
0.
046
0.08
1na
: not
app
licab
le
Tabl
e SE
.11:
Sam
plin
g er
rors
: Lua
ngna
mth
aS
tand
ard
erro
rs, c
oeffi
cien
ts o
f var
iatio
n, d
esig
n ef
fect
s (d
eff)
, squ
are
root
of d
esig
n ef
fect
s (d
eft)
, and
con
fiden
ce in
terv
als
for s
elec
ted
SD
G a
nd M
ICS
indi
cato
rs, L
SIS
II, 2
017
MIC
SIn
dica
tor
Val
ue (r
)S
tand
ard
erro
r (se
)
Coe
ffici
ent o
f va
riatio
n(s
e/r)
Des
ign
effe
ct
(def
f)
Squ
are
root
of
des
ign
effe
ct (d
eft)
Wei
ghte
d co
unt
Unw
eigh
ted
coun
t
Con
fiden
ce li
mits
Tabl
e SE
.11:
Sam
plin
g er
rors
: Lua
ngna
mth
aS
tand
ard
erro
rs, c
oeffi
cien
ts o
f var
iatio
n, d
esig
n ef
fect
s (d
eff)
, squ
are
root
of d
esig
n ef
fect
s (d
eft)
, and
con
fiden
ce in
terv
als
for s
elec
ted
SD
G a
nd M
ICS
indi
cato
rs, L
SIS
II, 2
017
MIC
SIn
dica
tor
Val
ue (r
)S
tand
ard
erro
r (se
)
Coe
ffici
ent o
f va
riatio
n(s
e/r)
Des
ign
effe
ct
(def
f)
Squ
are
root
of
des
ign
effe
ct (d
eft)
Wei
ghte
d co
unt
Unw
eigh
ted
coun
t
Con
fiden
ce li
mits

406
Low
er b
ound
r - 2
seU
pper
bou
ndr +
2se
Sam
ple
cove
rage
and
cha
ract
eris
tics
of th
e re
spon
dent
sA
cces
s to
ele
ctric
ityS
R.1
0.89
910.
0194
0.02
25.
060
2.24
95,
525
1,22
0
0.
860
0.93
8O
wne
rshi
p of
mob
ile p
hone
(wom
en)
SR
.10
0.61
620.
0256
0.04
24.
304
2.07
51,
402
1,54
8
0.
565
0.66
7O
wne
rshi
p of
mob
ile p
hone
(men
)S
R.1
00.
8152
0.01
810.
022
1.54
51.
243
640
71
4
0.77
90.
851
Use
of i
nter
net (
wom
en)
SR
.12a
0.04
380.
0054
0.12
41.
085
1.04
21,
402
1,54
8
0.
033
0.05
5U
se o
f int
erne
t (m
en)
SR
.12a
0.09
160.
0177
0.19
32.
672
1.63
564
0
714
0.
056
0.12
7IC
T sk
ills
(wom
en)
SR
.13
0.05
160.
0078
0.15
01.
899
1.37
81,
402
1,54
8
0.
036
0.06
7IC
T sk
ills
(men
)S
R.1
30.
1230
0.01
790.
146
2.12
61.
458
640
71
4
0.08
70.
159
Use
of t
obac
co (w
omen
)S
R.1
40.
0725
0.01
590.
219
5.80
52.
409
1,40
2
1,
548
0.04
10.
104
Use
of t
obac
co (m
en)
SR
.14
0.40
080.
0233
0.05
81.
616
1.27
164
0
714
0.
354
0.44
7Su
rviv
eN
eona
tal m
orta
lity
rate
CS
.128
7.86
910.
277
nana
nana
1344
Infa
nt m
orta
lity
rate
CS
.368
11.5
095
0.16
9na
nana
na45
91U
nder
-five
mor
talit
y ra
teC
S.5
7112
.018
10.
170
nana
nana
4795
Thriv
e - R
epro
duct
ive
and
mat
erna
l hea
lthTo
tal f
ertil
ity ra
te-
3.1
0.22
290.
072
nana
nana
2.7
3.6
Ado
lesc
ent b
irth
rate
TM.1
104.
813
.393
10.
128
nana
nana
78.0
131.
6…
Con
trace
ptiv
e pr
eval
ence
rate
TM.3
0.53
600.
0225
0.04
22.
459
1.56
81,
099
1,21
0
0.
491
0.58
1N
eed
for f
amily
pla
nnin
g sa
tisfie
d w
ith m
oder
n co
ntra
cept
ion
TM.4
0.72
180.
0237
0.03
32.
288
1.51
374
4
819
0.
674
0.76
9A
nten
atal
car
e co
vera
ge (4
+)TM
.5b
0.60
280.
0542
0.09
03.
552
1.88
526
7
290
0.
494
0.71
1S
kille
d at
tend
ant a
t del
iver
yTM
.90.
5612
0.04
830.
086
2.74
31.
656
267
29
0
0.46
50.
658
Thriv
e - C
hild
hea
lth, n
utrit
ion
and
deve
lopm
ent
Dip
hthe
ria, p
ertu
ssis
and
teta
nus
(DP
T) im
mun
izat
ion
cove
rage
TC.3
0.43
910.
0511
0.11
61.
450
1.20
413
3
138
0.
337
0.54
1P
neum
ococ
cal (
Con
juga
te) i
mm
uniz
atio
n co
vera
geTC
.60.
2885
0.04
180.
145
1.16
61.
080
133
13
8
0.20
50.
372
Mea
sles
imm
uniz
atio
n co
vera
geTC
.10
0.48
120.
0536
0.11
11.
578
1.25
613
3
138
0.
374
0.58
8P
rimar
y re
lianc
e on
cle
an fu
els
and
tech
nolo
gies
for c
ooki
ng, s
pace
hea
ting
and
light
ing
TC.1
80.
0385
0.00
800.
207
2.09
91.
449
5,52
5
1,
220
0.02
30.
054
Pop
ulat
ion
who
sle
pt u
nder
an
ITN
TC.2
20.
4274
0.02
450.
057
13.8
653.
724
5,21
7
5,
650
0.37
80.
476
Exc
lusi
ve b
reas
tfeed
ing
unde
r 6 m
onth
sTC
.32
0.66
980.
0197
0.02
90.
133
0.36
575
77
0.
630
0.70
9S
tunt
ing
prev
alen
ce (m
oder
ate
and
seve
re)
TC.4
5a0.
4267
0.02
560.
060
1.90
41.
380
685
71
3
0.37
60.
478
Was
ting
prev
alen
ce (m
oder
ate
and
seve
re)
TC.4
6a0.
0624
0.00
950.
153
1.10
91.
053
686
71
4
0.04
30.
082
Ove
rwei
ght p
reva
lenc
e (m
oder
ate
and
seve
re)
TC.4
7a0.
0169
0.00
450.
265
0.86
10.
928
686
71
4
0.00
80.
026
Ear
ly c
hild
dev
elop
men
t ind
exTC
.53
0.78
720.
0248
0.03
21.
018
1.00
926
3
278
0.
738
0.83
7
Low
er b
ound
r - 2
seU
pper
bou
ndr +
2se
Lear
nP
artic
ipat
ion
rate
in o
rgan
ised
lear
ning
(adj
uste
d)LN
.20.
7640
0.03
140.
041
0.82
10.
906
139
15
1
0.70
10.
827
Prot
ecte
d fr
om v
iole
nce
and
expl
oita
tion
Birt
h re
gist
ratio
nP
R.1
0.70
920.
0341
0.04
84.
058
2.01
469
0
719
0.
641
0.77
8V
iole
nt d
isci
plin
eP
R.2
0.72
260.
0224
0.03
13.
042
1.74
41,
822
1,21
6
0.
678
0.76
7C
hild
labo
urP
R.3
0.46
360.
0164
0.03
50.
901
0.94
91,
631
839
0.
431
0.49
6C
hild
mar
riage
(bef
ore
age
15)
PR
.4a
0.06
140.
0152
0.24
81.
127
1.06
225
5
281
0.
031
0.09
2C
hild
mar
riage
(bef
ore
age
18)
PR
.4b
0.32
480.
0289
0.08
91.
063
1.03
125
5
281
0.
267
0.38
2Li
ve in
a s
afe
and
clea
n en
viro
nmen
tU
se o
f bas
ic d
rinki
ng w
ater
ser
vice
sW
S.2
0.84
850.
0258
0.03
06.
313
2.51
35,
525
1,22
0
0.
797
0.90
0U
se o
f saf
ely
man
aged
drin
king
wat
er s
ervi
ces
WS
.60.
0489
0.01
150.
236
0.50
40.
710
840
17
7
0.02
60.
072
Han
dwas
hing
faci
lity
with
wat
er a
nd s
oap
WS
.70.
3112
0.02
760.
089
4.31
52.
077
5,52
3
1,
219
0.25
60.
366
Use
of b
asic
san
itatio
n se
rvic
esW
S.9
0.68
930.
0310
0.04
55.
486
2.34
25,
525
1,22
0
0.
627
0.75
1S
afe
disp
osal
in s
itu o
f exc
reta
from
on-
site
san
itatio
n fa
cilit
ies
WS
.10
0.95
120.
0053
0.00
60.
530
0.72
83,
966
882
0.
941
0.96
2Eq
uita
ble
chan
ce in
life
Chi
ldre
n w
ith fu
nctio
nal d
ificu
lty
EQ
.10.
0100
0.00
480.
484
1.00
71.
003
405
42
6
0.00
00.
020
Pop
ulat
ion
cove
red
by s
ocia
l tra
nsfe
rsE
Q.3
0.37
770.
0213
0.05
62.
350
1.53
35,
525
1,22
0
0.
335
0.42
0na
: not
app
licab
le
Tabl
e SE
.12:
Sam
plin
g er
rors
: Oud
omxa
yS
tand
ard
erro
rs, c
oeffi
cien
ts o
f var
iatio
n, d
esig
n ef
fect
s (d
eff)
, squ
are
root
of d
esig
n ef
fect
s (d
eft)
, and
con
fiden
ce in
terv
als
for s
elec
ted
SD
G a
nd M
ICS
indi
cato
rs, L
SIS
II, 2
017
MIC
SIn
dica
tor
Val
ue (r
)S
tand
ard
erro
r (se
)
Coe
ffici
ent o
f va
riatio
n(s
e/r)
Des
ign
effe
ct
(def
f)
Squ
are
root
of
des
ign
effe
ct (d
eft)
Wei
ghte
d co
unt
Unw
eigh
ted
coun
t
Con
fiden
ce li
mits

407
Low
er b
ound
r - 2
seU
pper
bou
ndr +
2se
Sam
ple
cove
rage
and
cha
ract
eris
tics
of th
e re
spon
dent
sA
cces
s to
ele
ctric
ityS
R.1
0.89
910.
0194
0.02
25.
060
2.24
95,
525
1,22
0
0.
860
0.93
8O
wne
rshi
p of
mob
ile p
hone
(wom
en)
SR
.10
0.61
620.
0256
0.04
24.
304
2.07
51,
402
1,54
8
0.
565
0.66
7O
wne
rshi
p of
mob
ile p
hone
(men
)S
R.1
00.
8152
0.01
810.
022
1.54
51.
243
640
71
4
0.77
90.
851
Use
of i
nter
net (
wom
en)
SR
.12a
0.04
380.
0054
0.12
41.
085
1.04
21,
402
1,54
8
0.
033
0.05
5U
se o
f int
erne
t (m
en)
SR
.12a
0.09
160.
0177
0.19
32.
672
1.63
564
0
714
0.
056
0.12
7IC
T sk
ills
(wom
en)
SR
.13
0.05
160.
0078
0.15
01.
899
1.37
81,
402
1,54
8
0.
036
0.06
7IC
T sk
ills
(men
)S
R.1
30.
1230
0.01
790.
146
2.12
61.
458
640
71
4
0.08
70.
159
Use
of t
obac
co (w
omen
)S
R.1
40.
0725
0.01
590.
219
5.80
52.
409
1,40
2
1,
548
0.04
10.
104
Use
of t
obac
co (m
en)
SR
.14
0.40
080.
0233
0.05
81.
616
1.27
164
0
714
0.
354
0.44
7Su
rviv
eN
eona
tal m
orta
lity
rate
CS
.128
7.86
910.
277
nana
nana
1344
Infa
nt m
orta
lity
rate
CS
.368
11.5
095
0.16
9na
nana
na45
91U
nder
-five
mor
talit
y ra
teC
S.5
7112
.018
10.
170
nana
nana
4795
Thriv
e - R
epro
duct
ive
and
mat
erna
l hea
lthTo
tal f
ertil
ity ra
te-
3.1
0.22
290.
072
nana
nana
2.7
3.6
Ado
lesc
ent b
irth
rate
TM.1
104.
813
.393
10.
128
nana
nana
78.0
131.
6…
Con
trace
ptiv
e pr
eval
ence
rate
TM.3
0.53
600.
0225
0.04
22.
459
1.56
81,
099
1,21
0
0.
491
0.58
1N
eed
for f
amily
pla
nnin
g sa
tisfie
d w
ith m
oder
n co
ntra
cept
ion
TM.4
0.72
180.
0237
0.03
32.
288
1.51
374
4
819
0.
674
0.76
9A
nten
atal
car
e co
vera
ge (4
+)TM
.5b
0.60
280.
0542
0.09
03.
552
1.88
526
7
290
0.
494
0.71
1S
kille
d at
tend
ant a
t del
iver
yTM
.90.
5612
0.04
830.
086
2.74
31.
656
267
29
0
0.46
50.
658
Thriv
e - C
hild
hea
lth, n
utrit
ion
and
deve
lopm
ent
Dip
hthe
ria, p
ertu
ssis
and
teta
nus
(DP
T) im
mun
izat
ion
cove
rage
TC.3
0.43
910.
0511
0.11
61.
450
1.20
413
3
138
0.
337
0.54
1P
neum
ococ
cal (
Con
juga
te) i
mm
uniz
atio
n co
vera
geTC
.60.
2885
0.04
180.
145
1.16
61.
080
133
13
8
0.20
50.
372
Mea
sles
imm
uniz
atio
n co
vera
geTC
.10
0.48
120.
0536
0.11
11.
578
1.25
613
3
138
0.
374
0.58
8P
rimar
y re
lianc
e on
cle
an fu
els
and
tech
nolo
gies
for c
ooki
ng, s
pace
hea
ting
and
light
ing
TC.1
80.
0385
0.00
800.
207
2.09
91.
449
5,52
5
1,
220
0.02
30.
054
Pop
ulat
ion
who
sle
pt u
nder
an
ITN
TC.2
20.
4274
0.02
450.
057
13.8
653.
724
5,21
7
5,
650
0.37
80.
476
Exc
lusi
ve b
reas
tfeed
ing
unde
r 6 m
onth
sTC
.32
0.66
980.
0197
0.02
90.
133
0.36
575
77
0.
630
0.70
9S
tunt
ing
prev
alen
ce (m
oder
ate
and
seve
re)
TC.4
5a0.
4267
0.02
560.
060
1.90
41.
380
685
71
3
0.37
60.
478
Was
ting
prev
alen
ce (m
oder
ate
and
seve
re)
TC.4
6a0.
0624
0.00
950.
153
1.10
91.
053
686
71
4
0.04
30.
082
Ove
rwei
ght p
reva
lenc
e (m
oder
ate
and
seve
re)
TC.4
7a0.
0169
0.00
450.
265
0.86
10.
928
686
71
4
0.00
80.
026
Ear
ly c
hild
dev
elop
men
t ind
exTC
.53
0.78
720.
0248
0.03
21.
018
1.00
926
3
278
0.
738
0.83
7
Low
er b
ound
r - 2
seU
pper
bou
ndr +
2se
Lear
nP
artic
ipat
ion
rate
in o
rgan
ised
lear
ning
(adj
uste
d)LN
.20.
7640
0.03
140.
041
0.82
10.
906
139
15
1
0.70
10.
827
Prot
ecte
d fr
om v
iole
nce
and
expl
oita
tion
Birt
h re
gist
ratio
nP
R.1
0.70
920.
0341
0.04
84.
058
2.01
469
0
719
0.
641
0.77
8V
iole
nt d
isci
plin
eP
R.2
0.72
260.
0224
0.03
13.
042
1.74
41,
822
1,21
6
0.
678
0.76
7C
hild
labo
urP
R.3
0.46
360.
0164
0.03
50.
901
0.94
91,
631
839
0.
431
0.49
6C
hild
mar
riage
(bef
ore
age
15)
PR
.4a
0.06
140.
0152
0.24
81.
127
1.06
225
5
281
0.
031
0.09
2C
hild
mar
riage
(bef
ore
age
18)
PR
.4b
0.32
480.
0289
0.08
91.
063
1.03
125
5
281
0.
267
0.38
2Li
ve in
a s
afe
and
clea
n en
viro
nmen
tU
se o
f bas
ic d
rinki
ng w
ater
ser
vice
sW
S.2
0.84
850.
0258
0.03
06.
313
2.51
35,
525
1,22
0
0.
797
0.90
0U
se o
f saf
ely
man
aged
drin
king
wat
er s
ervi
ces
WS
.60.
0489
0.01
150.
236
0.50
40.
710
840
17
7
0.02
60.
072
Han
dwas
hing
faci
lity
with
wat
er a
nd s
oap
WS
.70.
3112
0.02
760.
089
4.31
52.
077
5,52
3
1,
219
0.25
60.
366
Use
of b
asic
san
itatio
n se
rvic
esW
S.9
0.68
930.
0310
0.04
55.
486
2.34
25,
525
1,22
0
0.
627
0.75
1S
afe
disp
osal
in s
itu o
f exc
reta
from
on-
site
san
itatio
n fa
cilit
ies
WS
.10
0.95
120.
0053
0.00
60.
530
0.72
83,
966
882
0.
941
0.96
2Eq
uita
ble
chan
ce in
life
Chi
ldre
n w
ith fu
nctio
nal d
ificu
lty
EQ
.10.
0100
0.00
480.
484
1.00
71.
003
405
42
6
0.00
00.
020
Pop
ulat
ion
cove
red
by s
ocia
l tra
nsfe
rsE
Q.3
0.37
770.
0213
0.05
62.
350
1.53
35,
525
1,22
0
0.
335
0.42
0na
: not
app
licab
le
Tabl
e SE
.12:
Sam
plin
g er
rors
: Oud
omxa
yS
tand
ard
erro
rs, c
oeffi
cien
ts o
f var
iatio
n, d
esig
n ef
fect
s (d
eff)
, squ
are
root
of d
esig
n ef
fect
s (d
eft)
, and
con
fiden
ce in
terv
als
for s
elec
ted
SD
G a
nd M
ICS
indi
cato
rs, L
SIS
II, 2
017
MIC
SIn
dica
tor
Val
ue (r
)S
tand
ard
erro
r (se
)
Coe
ffici
ent o
f va
riatio
n(s
e/r)
Des
ign
effe
ct
(def
f)
Squ
are
root
of
des
ign
effe
ct (d
eft)
Wei
ghte
d co
unt
Unw
eigh
ted
coun
t
Con
fiden
ce li
mits
Tabl
e SE
.12:
Sam
plin
g er
rors
: Oud
omxa
yS
tand
ard
erro
rs, c
oeffi
cien
ts o
f var
iatio
n, d
esig
n ef
fect
s (d
eff)
, squ
are
root
of d
esig
n ef
fect
s (d
eft)
, and
con
fiden
ce in
terv
als
for s
elec
ted
SD
G a
nd M
ICS
indi
cato
rs, L
SIS
II, 2
017
MIC
SIn
dica
tor
Val
ue (r
)S
tand
ard
erro
r (se
)
Coe
ffici
ent o
f va
riatio
n(s
e/r)
Des
ign
effe
ct
(def
f)
Squ
are
root
of
des
ign
effe
ct (d
eft)
Wei
ghte
d co
unt
Unw
eigh
ted
coun
t
Con
fiden
ce li
mits

408
Low
er b
ound
r - 2
seU
pper
bou
ndr +
2se
Sam
ple
cove
rage
and
cha
ract
eris
tics
of th
e re
spon
dent
sA
cces
s to
ele
ctric
ityS
R.1
0.97
030.
0111
0.01
14.
418
2.10
23,
025
1,04
3
0.
948
0.99
2O
wne
rshi
p of
mob
ile p
hone
(wom
en)
SR
.10
0.74
710.
0270
0.03
64.
542
2.13
172
4
1,17
7
0.
693
0.80
1O
wne
rshi
p of
mob
ile p
hone
(men
)S
R.1
00.
8766
0.01
700.
019
1.45
51.
206
341
54
3
0.84
20.
911
Use
of i
nter
net (
wom
en)
SR
.12a
0.35
390.
0263
0.07
43.
557
1.88
672
4
1,17
7
0.
301
0.40
6U
se o
f int
erne
t (m
en)
SR
.12a
0.48
130.
0279
0.05
81.
686
1.29
834
1
543
0.
426
0.53
7IC
T sk
ills
(wom
en)
SR
.13
0.07
330.
0102
0.13
91.
811
1.34
672
4
1,17
7
0.
053
0.09
4IC
T sk
ills
(men
)S
R.1
30.
1693
0.02
230.
132
1.91
81.
385
341
54
3
0.12
50.
214
Use
of t
obac
co (w
omen
)S
R.1
40.
0621
0.01
650.
265
5.49
12.
343
724
1,
177
0.02
90.
095
Use
of t
obac
co (m
en)
SR
.14
0.34
630.
0316
0.09
12.
393
1.54
734
1
543
0.
283
0.41
0Su
rviv
eN
eona
tal m
orta
lity
rate
CS
.126
6.49
440.
253
nana
nana
1339
Infa
nt m
orta
lity
rate
CS
.353
10.5
869
0.20
0na
nana
na32
74U
nder
-five
mor
talit
y ra
teC
S.5
599.
5485
0.16
2na
nana
na40
78Th
rive
- Rep
rodu
ctiv
e an
d m
ater
nal h
ealth
Tota
l fer
tility
rate
-2.
90.
3177
0.10
8na
nana
na2.
33.
6A
dole
scen
t birt
h ra
teTM
.111
2.9
19.8
489
0.17
6na
nana
na73
.215
2.6
…C
ontra
cept
ive
prev
alen
ce ra
teTM
.30.
6180
0.03
460.
056
4.88
52.
210
595
96
5
0.54
90.
687
Nee
d fo
r fam
ily p
lann
ing
satis
fied
with
mod
ern
cont
race
ptio
nTM
.40.
8418
0.01
930.
023
1.93
61.
392
420
69
2
0.80
30.
880
Ant
enat
al c
are
cove
rage
(4+)
TM.5
b0.
5325
0.05
880.
110
3.05
81.
749
141
22
1
0.41
50.
650
Ski
lled
atte
ndan
t at d
eliv
ery
TM.9
0.68
020.
0591
0.08
73.
538
1.88
114
1
221
0.
562
0.79
9Th
rive
- Chi
ld h
ealth
, nut
ritio
n an
d de
velo
pmen
tD
ipht
heria
, per
tuss
is a
nd te
tanu
s (D
PT)
imm
uniz
atio
n co
vera
geTC
.30.
4731
0.05
360.
113
1.24
51.
116
72
10
9
0.36
60.
580
Pne
umoc
occa
l (C
onju
gate
) im
mun
izat
ion
cove
rage
TC.6
0.40
130.
0565
0.14
11.
434
1.19
772
109
0.
288
0.51
4M
easl
es im
mun
izat
ion
cove
rage
TC.1
00.
6211
0.05
830.
094
1.56
11.
249
72
10
9
0.50
40.
738
Prim
ary
relia
nce
on c
lean
fuel
s an
d te
chno
logi
es fo
r coo
king
, spa
ce h
eatin
g an
d lig
htin
gTC
.18
0.12
410.
0191
0.15
43.
497
1.87
03,
025
1,04
3
0.
086
0.16
2P
opul
atio
n w
ho s
lept
und
er a
n IT
NTC
.22
0.28
210.
0223
0.07
911
.413
3.37
82,
819
4,63
5
0.
237
0.32
7E
xclu
sive
bre
astfe
edin
g un
der 6
mon
ths
TC.3
20.
6309
0.05
500.
087
0.84
50.
919
43
66
0.52
10.
741
Stu
ntin
g pr
eval
ence
(mod
erat
e an
d se
vere
)TC
.45a
0.34
720.
0373
0.10
83.
302
1.81
736
0
538
0.
273
0.42
2W
astin
g pr
eval
ence
(mod
erat
e an
d se
vere
)TC
.46a
0.04
030.
0079
0.19
60.
866
0.93
136
1
539
0.
025
0.05
6O
verw
eigh
t pre
vale
nce
(mod
erat
e an
d se
vere
)TC
.47a
0.01
850.
0040
0.21
40.
466
0.68
336
1
539
0.
011
0.02
6E
arly
chi
ld d
evel
opm
ent i
ndex
TC.5
30.
8187
0.02
660.
032
1.11
51.
056
156
23
5
0.76
50.
872
Low
er b
ound
r - 2
seU
pper
bou
ndr +
2se
Lear
nP
artic
ipat
ion
rate
in o
rgan
ised
lear
ning
(adj
uste
d)LN
.20.
8078
0.03
860.
048
1.21
21.
101
79
12
7
0.73
10.
885
Prot
ecte
d fr
om v
iole
nce
and
expl
oita
tion
Birt
h re
gist
ratio
nP
R.1
0.79
000.
0308
0.03
93.
171
1.78
137
3
556
0.
728
0.85
2V
iole
nt d
isci
plin
eP
R.2
0.63
160.
0235
0.03
72.
363
1.53
797
3
996
0.
585
0.67
9C
hild
labo
urP
R.3
0.43
690.
0285
0.06
52.
317
1.52
286
0
701
0.
380
0.49
4C
hild
mar
riage
(bef
ore
age
15)
PR
.4a
0.09
920.
0259
0.26
11.
425
1.19
411
9
191
0.
047
0.15
1C
hild
mar
riage
(bef
ore
age
18)
PR
.4b
0.36
810.
0358
0.09
71.
046
1.02
311
9
191
0.
296
0.44
0Li
ve in
a s
afe
and
clea
n en
viro
nmen
tU
se o
f bas
ic d
rinki
ng w
ater
ser
vice
sW
S.2
0.47
640.
0332
0.07
04.
596
2.14
43,
025
1,04
3
0.
410
0.54
3U
se o
f saf
ely
man
aged
drin
king
wat
er s
ervi
ces
WS
.60.
0749
0.01
640.
219
0.59
40.
770
434
15
4
0.04
20.
108
Han
dwas
hing
faci
lity
with
wat
er a
nd s
oap
WS
.70.
6803
0.03
370.
049
5.42
72.
330
3,02
5
1,
043
0.61
30.
748
Use
of b
asic
san
itatio
n se
rvic
esW
S.9
0.73
320.
0462
0.06
311
.347
3.36
93,
025
1,04
3
0.
641
0.82
6S
afe
disp
osal
in s
itu o
f exc
reta
from
on-
site
san
itatio
n fa
cilit
ies
WS
.10
0.96
220.
0079
0.00
81.
470
1.21
22,
392
855
0.
946
0.97
8Eq
uita
ble
chan
ce in
life
Chi
ldre
n w
ith fu
nctio
nal d
ificu
lty
EQ
.10.
0145
0.00
500.
347
0.57
90.
761
220
32
8
0.00
40.
025
Pop
ulat
ion
cove
red
by s
ocia
l tra
nsfe
rsE
Q.3
0.12
940.
0124
0.09
61.
413
1.18
93,
025
1,04
3
0.
105
0.15
4na
: not
app
licab
le
Tabl
e SE
.13:
Sam
plin
g er
rors
: Bok
eoS
tand
ard
erro
rs, c
oeffi
cien
ts o
f var
iatio
n, d
esig
n ef
fect
s (d
eff)
, squ
are
root
of d
esig
n ef
fect
s (d
eft)
, and
con
fiden
ce in
terv
als
for s
elec
ted
SD
G a
nd M
ICS
indi
cato
rs, L
SIS
II, 2
017
MIC
SIn
dica
tor
Val
ue (r
)S
tand
ard
erro
r (se
)
Coe
ffici
ent o
f va
riatio
n(s
e/r)
Des
ign
effe
ct
(def
f)
Squ
are
root
of
des
ign
effe
ct (d
eft)
Wei
ghte
d co
unt
Unw
eigh
ted
coun
t
Con
fiden
ce li
mits

409
Low
er b
ound
r - 2
seU
pper
bou
ndr +
2se
Sam
ple
cove
rage
and
cha
ract
eris
tics
of th
e re
spon
dent
sA
cces
s to
ele
ctric
ityS
R.1
0.97
030.
0111
0.01
14.
418
2.10
23,
025
1,04
3
0.
948
0.99
2O
wne
rshi
p of
mob
ile p
hone
(wom
en)
SR
.10
0.74
710.
0270
0.03
64.
542
2.13
172
4
1,17
7
0.
693
0.80
1O
wne
rshi
p of
mob
ile p
hone
(men
)S
R.1
00.
8766
0.01
700.
019
1.45
51.
206
341
54
3
0.84
20.
911
Use
of i
nter
net (
wom
en)
SR
.12a
0.35
390.
0263
0.07
43.
557
1.88
672
4
1,17
7
0.
301
0.40
6U
se o
f int
erne
t (m
en)
SR
.12a
0.48
130.
0279
0.05
81.
686
1.29
834
1
543
0.
426
0.53
7IC
T sk
ills
(wom
en)
SR
.13
0.07
330.
0102
0.13
91.
811
1.34
672
4
1,17
7
0.
053
0.09
4IC
T sk
ills
(men
)S
R.1
30.
1693
0.02
230.
132
1.91
81.
385
341
54
3
0.12
50.
214
Use
of t
obac
co (w
omen
)S
R.1
40.
0621
0.01
650.
265
5.49
12.
343
724
1,
177
0.02
90.
095
Use
of t
obac
co (m
en)
SR
.14
0.34
630.
0316
0.09
12.
393
1.54
734
1
543
0.
283
0.41
0Su
rviv
eN
eona
tal m
orta
lity
rate
CS
.126
6.49
440.
253
nana
nana
1339
Infa
nt m
orta
lity
rate
CS
.353
10.5
869
0.20
0na
nana
na32
74U
nder
-five
mor
talit
y ra
teC
S.5
599.
5485
0.16
2na
nana
na40
78Th
rive
- Rep
rodu
ctiv
e an
d m
ater
nal h
ealth
Tota
l fer
tility
rate
-2.
90.
3177
0.10
8na
nana
na2.
33.
6A
dole
scen
t birt
h ra
teTM
.111
2.9
19.8
489
0.17
6na
nana
na73
.215
2.6
…C
ontra
cept
ive
prev
alen
ce ra
teTM
.30.
6180
0.03
460.
056
4.88
52.
210
595
96
5
0.54
90.
687
Nee
d fo
r fam
ily p
lann
ing
satis
fied
with
mod
ern
cont
race
ptio
nTM
.40.
8418
0.01
930.
023
1.93
61.
392
420
69
2
0.80
30.
880
Ant
enat
al c
are
cove
rage
(4+)
TM.5
b0.
5325
0.05
880.
110
3.05
81.
749
141
22
1
0.41
50.
650
Ski
lled
atte
ndan
t at d
eliv
ery
TM.9
0.68
020.
0591
0.08
73.
538
1.88
114
1
221
0.
562
0.79
9Th
rive
- Chi
ld h
ealth
, nut
ritio
n an
d de
velo
pmen
tD
ipht
heria
, per
tuss
is a
nd te
tanu
s (D
PT)
imm
uniz
atio
n co
vera
geTC
.30.
4731
0.05
360.
113
1.24
51.
116
72
10
9
0.36
60.
580
Pne
umoc
occa
l (C
onju
gate
) im
mun
izat
ion
cove
rage
TC.6
0.40
130.
0565
0.14
11.
434
1.19
772
109
0.
288
0.51
4M
easl
es im
mun
izat
ion
cove
rage
TC.1
00.
6211
0.05
830.
094
1.56
11.
249
72
10
9
0.50
40.
738
Prim
ary
relia
nce
on c
lean
fuel
s an
d te
chno
logi
es fo
r coo
king
, spa
ce h
eatin
g an
d lig
htin
gTC
.18
0.12
410.
0191
0.15
43.
497
1.87
03,
025
1,04
3
0.
086
0.16
2P
opul
atio
n w
ho s
lept
und
er a
n IT
NTC
.22
0.28
210.
0223
0.07
911
.413
3.37
82,
819
4,63
5
0.
237
0.32
7E
xclu
sive
bre
astfe
edin
g un
der 6
mon
ths
TC.3
20.
6309
0.05
500.
087
0.84
50.
919
43
66
0.52
10.
741
Stu
ntin
g pr
eval
ence
(mod
erat
e an
d se
vere
)TC
.45a
0.34
720.
0373
0.10
83.
302
1.81
736
0
538
0.
273
0.42
2W
astin
g pr
eval
ence
(mod
erat
e an
d se
vere
)TC
.46a
0.04
030.
0079
0.19
60.
866
0.93
136
1
539
0.
025
0.05
6O
verw
eigh
t pre
vale
nce
(mod
erat
e an
d se
vere
)TC
.47a
0.01
850.
0040
0.21
40.
466
0.68
336
1
539
0.
011
0.02
6E
arly
chi
ld d
evel
opm
ent i
ndex
TC.5
30.
8187
0.02
660.
032
1.11
51.
056
156
23
5
0.76
50.
872
Low
er b
ound
r - 2
seU
pper
bou
ndr +
2se
Lear
nP
artic
ipat
ion
rate
in o
rgan
ised
lear
ning
(adj
uste
d)LN
.20.
8078
0.03
860.
048
1.21
21.
101
79
12
7
0.73
10.
885
Prot
ecte
d fr
om v
iole
nce
and
expl
oita
tion
Birt
h re
gist
ratio
nP
R.1
0.79
000.
0308
0.03
93.
171
1.78
137
3
556
0.
728
0.85
2V
iole
nt d
isci
plin
eP
R.2
0.63
160.
0235
0.03
72.
363
1.53
797
3
996
0.
585
0.67
9C
hild
labo
urP
R.3
0.43
690.
0285
0.06
52.
317
1.52
286
0
701
0.
380
0.49
4C
hild
mar
riage
(bef
ore
age
15)
PR
.4a
0.09
920.
0259
0.26
11.
425
1.19
411
9
191
0.
047
0.15
1C
hild
mar
riage
(bef
ore
age
18)
PR
.4b
0.36
810.
0358
0.09
71.
046
1.02
311
9
191
0.
296
0.44
0Li
ve in
a s
afe
and
clea
n en
viro
nmen
tU
se o
f bas
ic d
rinki
ng w
ater
ser
vice
sW
S.2
0.47
640.
0332
0.07
04.
596
2.14
43,
025
1,04
3
0.
410
0.54
3U
se o
f saf
ely
man
aged
drin
king
wat
er s
ervi
ces
WS
.60.
0749
0.01
640.
219
0.59
40.
770
434
15
4
0.04
20.
108
Han
dwas
hing
faci
lity
with
wat
er a
nd s
oap
WS
.70.
6803
0.03
370.
049
5.42
72.
330
3,02
5
1,
043
0.61
30.
748
Use
of b
asic
san
itatio
n se
rvic
esW
S.9
0.73
320.
0462
0.06
311
.347
3.36
93,
025
1,04
3
0.
641
0.82
6S
afe
disp
osal
in s
itu o
f exc
reta
from
on-
site
san
itatio
n fa
cilit
ies
WS
.10
0.96
220.
0079
0.00
81.
470
1.21
22,
392
855
0.
946
0.97
8Eq
uita
ble
chan
ce in
life
Chi
ldre
n w
ith fu
nctio
nal d
ificu
lty
EQ
.10.
0145
0.00
500.
347
0.57
90.
761
220
32
8
0.00
40.
025
Pop
ulat
ion
cove
red
by s
ocia
l tra
nsfe
rsE
Q.3
0.12
940.
0124
0.09
61.
413
1.18
93,
025
1,04
3
0.
105
0.15
4na
: not
app
licab
le
Tabl
e SE
.13:
Sam
plin
g er
rors
: Bok
eoS
tand
ard
erro
rs, c
oeffi
cien
ts o
f var
iatio
n, d
esig
n ef
fect
s (d
eff)
, squ
are
root
of d
esig
n ef
fect
s (d
eft)
, and
con
fiden
ce in
terv
als
for s
elec
ted
SD
G a
nd M
ICS
indi
cato
rs, L
SIS
II, 2
017
MIC
SIn
dica
tor
Val
ue (r
)S
tand
ard
erro
r (se
)
Coe
ffici
ent o
f va
riatio
n(s
e/r)
Des
ign
effe
ct
(def
f)
Squ
are
root
of
des
ign
effe
ct (d
eft)
Wei
ghte
d co
unt
Unw
eigh
ted
coun
t
Con
fiden
ce li
mits
Tabl
e SE
.13:
Sam
plin
g er
rors
: Bok
eoS
tand
ard
erro
rs, c
oeffi
cien
ts o
f var
iatio
n, d
esig
n ef
fect
s (d
eff)
, squ
are
root
of d
esig
n ef
fect
s (d
eft)
, and
con
fiden
ce in
terv
als
for s
elec
ted
SD
G a
nd M
ICS
indi
cato
rs, L
SIS
II, 2
017
MIC
SIn
dica
tor
Val
ue (r
)S
tand
ard
erro
r (se
)
Coe
ffici
ent o
f va
riatio
n(s
e/r)
Des
ign
effe
ct
(def
f)
Squ
are
root
of
des
ign
effe
ct (d
eft)
Wei
ghte
d co
unt
Unw
eigh
ted
coun
t
Con
fiden
ce li
mits
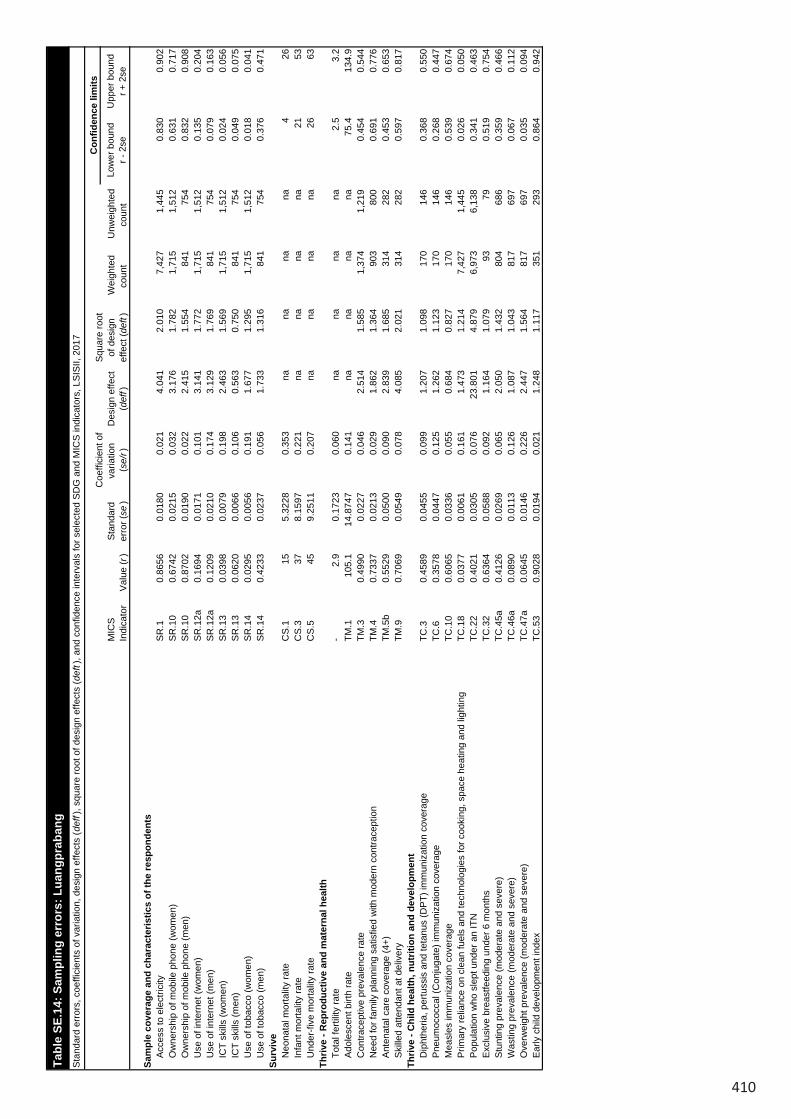
410
Low
er b
ound
r - 2
seU
pper
bou
ndr +
2se
Sam
ple
cove
rage
and
cha
ract
eris
tics
of th
e re
spon
dent
sA
cces
s to
ele
ctric
ityS
R.1
0.86
560.
0180
0.02
14.
041
2.01
07,
427
1,44
5
0.
830
0.90
2O
wne
rshi
p of
mob
ile p
hone
(wom
en)
SR
.10
0.67
420.
0215
0.03
23.
176
1.78
21,
715
1,51
2
0.
631
0.71
7O
wne
rshi
p of
mob
ile p
hone
(men
)S
R.1
00.
8702
0.01
900.
022
2.41
51.
554
841
75
4
0.83
20.
908
Use
of i
nter
net (
wom
en)
SR
.12a
0.16
940.
0171
0.10
13.
141
1.77
21,
715
1,51
2
0.
135
0.20
4U
se o
f int
erne
t (m
en)
SR
.12a
0.12
090.
0210
0.17
43.
129
1.76
984
1
754
0.
079
0.16
3IC
T sk
ills
(wom
en)
SR
.13
0.03
980.
0079
0.19
82.
463
1.56
91,
715
1,51
2
0.
024
0.05
6IC
T sk
ills
(men
)S
R.1
30.
0620
0.00
660.
106
0.56
30.
750
841
75
4
0.04
90.
075
Use
of t
obac
co (w
omen
)S
R.1
40.
0295
0.00
560.
191
1.67
71.
295
1,71
5
1,
512
0.01
80.
041
Use
of t
obac
co (m
en)
SR
.14
0.42
330.
0237
0.05
61.
733
1.31
684
1
754
0.
376
0.47
1Su
rviv
eN
eona
tal m
orta
lity
rate
CS
.115
5.32
280.
353
nana
nana
426
Infa
nt m
orta
lity
rate
CS
.337
8.15
970.
221
nana
nana
2153
Und
er-fi
ve m
orta
lity
rate
CS
.545
9.25
110.
207
nana
nana
2663
Thriv
e - R
epro
duct
ive
and
mat
erna
l hea
lthTo
tal f
ertil
ity ra
te-
2.9
0.17
230.
060
nana
nana
2.5
3.2
Ado
lesc
ent b
irth
rate
TM.1
105.
114
.874
70.
141
nana
nana
75.4
134.
9…
Con
trace
ptiv
e pr
eval
ence
rate
TM.3
0.49
900.
0227
0.04
62.
514
1.58
51,
374
1,21
9
0.
454
0.54
4N
eed
for f
amily
pla
nnin
g sa
tisfie
d w
ith m
oder
n co
ntra
cept
ion
TM.4
0.73
370.
0213
0.02
91.
862
1.36
490
3
800
0.
691
0.77
6A
nten
atal
car
e co
vera
ge (4
+)TM
.5b
0.55
290.
0500
0.09
02.
839
1.68
531
4
282
0.
453
0.65
3S
kille
d at
tend
ant a
t del
iver
yTM
.90.
7069
0.05
490.
078
4.08
52.
021
314
28
2
0.59
70.
817
Thriv
e - C
hild
hea
lth, n
utrit
ion
and
deve
lopm
ent
Dip
hthe
ria, p
ertu
ssis
and
teta
nus
(DP
T) im
mun
izat
ion
cove
rage
TC.3
0.45
890.
0455
0.09
91.
207
1.09
817
0
146
0.
368
0.55
0P
neum
ococ
cal (
Con
juga
te) i
mm
uniz
atio
n co
vera
geTC
.60.
3578
0.04
470.
125
1.26
21.
123
170
14
6
0.26
80.
447
Mea
sles
imm
uniz
atio
n co
vera
geTC
.10
0.60
650.
0336
0.05
50.
684
0.82
717
0
146
0.
539
0.67
4P
rimar
y re
lianc
e on
cle
an fu
els
and
tech
nolo
gies
for c
ooki
ng, s
pace
hea
ting
and
light
ing
TC.1
80.
0377
0.00
610.
161
1.47
31.
214
7,42
7
1,
445
0.02
60.
050
Pop
ulat
ion
who
sle
pt u
nder
an
ITN
TC.2
20.
4021
0.03
050.
076
23.8
014.
879
6,97
3
6,
138
0.34
10.
463
Exc
lusi
ve b
reas
tfeed
ing
unde
r 6 m
onth
sTC
.32
0.63
640.
0588
0.09
21.
164
1.07
993
79
0.
519
0.75
4S
tunt
ing
prev
alen
ce (m
oder
ate
and
seve
re)
TC.4
5a0.
4126
0.02
690.
065
2.05
01.
432
804
68
6
0.35
90.
466
Was
ting
prev
alen
ce (m
oder
ate
and
seve
re)
TC.4
6a0.
0890
0.01
130.
126
1.08
71.
043
817
69
7
0.06
70.
112
Ove
rwei
ght p
reva
lenc
e (m
oder
ate
and
seve
re)
TC.4
7a0.
0645
0.01
460.
226
2.44
71.
564
817
69
7
0.03
50.
094
Ear
ly c
hild
dev
elop
men
t ind
exTC
.53
0.90
280.
0194
0.02
11.
248
1.11
735
1
293
0.
864
0.94
2
Low
er b
ound
r - 2
seU
pper
bou
ndr +
2se
Lear
nP
artic
ipat
ion
rate
in o
rgan
ised
lear
ning
(adj
uste
d)LN
.20.
7947
0.03
330.
042
0.94
00.
969
158
13
9
0.72
80.
861
Prot
ecte
d fr
om v
iole
nce
and
expl
oita
tion
Birt
h re
gist
ratio
nP
R.1
0.65
560.
0352
0.05
43.
949
1.98
784
4
719
0.
585
0.72
6V
iole
nt d
isci
plin
eP
R.2
0.65
210.
0204
0.03
12.
497
1.58
02,
456
1,36
4
0.
611
0.69
3C
hild
labo
urP
R.3
0.54
980.
0259
0.04
72.
650
1.62
82,
165
977
0.
498
0.60
2C
hild
mar
riage
(bef
ore
age
15)
PR
.4a
0.09
630.
0208
0.21
61.
149
1.07
226
4
233
0.
055
0.13
8C
hild
mar
riage
(bef
ore
age
18)
PR
.4b
0.33
550.
0401
0.11
91.
670
1.29
226
4
233
0.
255
0.41
6Li
ve in
a s
afe
and
clea
n en
viro
nmen
tU
se o
f bas
ic d
rinki
ng w
ater
ser
vice
sW
S.2
0.55
690.
0509
0.09
115
.165
3.89
47,
427
1,44
5
0.
455
0.65
9U
se o
f saf
ely
man
aged
drin
king
wat
er s
ervi
ces
WS
.60.
1586
0.02
940.
185
1.39
01.
179
1,12
8
21
6
0.10
00.
217
Han
dwas
hing
faci
lity
with
wat
er a
nd s
oap
WS
.70.
3598
0.01
850.
051
2.14
01.
463
7,42
7
1,
445
0.32
30.
397
Use
of b
asic
san
itatio
n se
rvic
esW
S.9
0.68
600.
0314
0.04
66.
599
2.56
97,
427
1,44
5
0.
623
0.74
9S
afe
disp
osal
in s
itu o
f exc
reta
from
on-
site
san
itatio
n fa
cilit
ies
WS
.10
0.95
360.
0084
0.00
91.
599
1.26
55,
096
997
0.
937
0.97
0Eq
uita
ble
chan
ce in
life
Chi
ldre
n w
ith fu
nctio
nal d
ificu
lty
EQ
.10.
0363
0.01
260.
346
1.91
81.
385
504
42
6
0.01
10.
061
Pop
ulat
ion
cove
red
by s
ocia
l tra
nsfe
rsE
Q.3
0.10
490.
0137
0.13
12.
894
1.70
17,
427
1,44
5
0.
077
0.13
2na
: not
app
licab
le
Tabl
e SE
.14:
Sam
plin
g er
rors
: Lua
ngpr
aban
gS
tand
ard
erro
rs, c
oeffi
cien
ts o
f var
iatio
n, d
esig
n ef
fect
s (d
eff)
, squ
are
root
of d
esig
n ef
fect
s (d
eft)
, and
con
fiden
ce in
terv
als
for s
elec
ted
SD
G a
nd M
ICS
indi
cato
rs, L
SIS
II, 2
017
MIC
SIn
dica
tor
Val
ue (r
)S
tand
ard
erro
r (se
)
Coe
ffici
ent o
f va
riatio
n(s
e/r)
Des
ign
effe
ct
(def
f)
Squ
are
root
of
des
ign
effe
ct (d
eft)
Wei
ghte
d co
unt
Unw
eigh
ted
coun
t
Con
fiden
ce li
mits

411
Low
er b
ound
r - 2
seU
pper
bou
ndr +
2se
Sam
ple
cove
rage
and
cha
ract
eris
tics
of th
e re
spon
dent
sA
cces
s to
ele
ctric
ityS
R.1
0.86
560.
0180
0.02
14.
041
2.01
07,
427
1,44
5
0.
830
0.90
2O
wne
rshi
p of
mob
ile p
hone
(wom
en)
SR
.10
0.67
420.
0215
0.03
23.
176
1.78
21,
715
1,51
2
0.
631
0.71
7O
wne
rshi
p of
mob
ile p
hone
(men
)S
R.1
00.
8702
0.01
900.
022
2.41
51.
554
841
75
4
0.83
20.
908
Use
of i
nter
net (
wom
en)
SR
.12a
0.16
940.
0171
0.10
13.
141
1.77
21,
715
1,51
2
0.
135
0.20
4U
se o
f int
erne
t (m
en)
SR
.12a
0.12
090.
0210
0.17
43.
129
1.76
984
1
754
0.
079
0.16
3IC
T sk
ills
(wom
en)
SR
.13
0.03
980.
0079
0.19
82.
463
1.56
91,
715
1,51
2
0.
024
0.05
6IC
T sk
ills
(men
)S
R.1
30.
0620
0.00
660.
106
0.56
30.
750
841
75
4
0.04
90.
075
Use
of t
obac
co (w
omen
)S
R.1
40.
0295
0.00
560.
191
1.67
71.
295
1,71
5
1,
512
0.01
80.
041
Use
of t
obac
co (m
en)
SR
.14
0.42
330.
0237
0.05
61.
733
1.31
684
1
754
0.
376
0.47
1Su
rviv
eN
eona
tal m
orta
lity
rate
CS
.115
5.32
280.
353
nana
nana
426
Infa
nt m
orta
lity
rate
CS
.337
8.15
970.
221
nana
nana
2153
Und
er-fi
ve m
orta
lity
rate
CS
.545
9.25
110.
207
nana
nana
2663
Thriv
e - R
epro
duct
ive
and
mat
erna
l hea
lthTo
tal f
ertil
ity ra
te-
2.9
0.17
230.
060
nana
nana
2.5
3.2
Ado
lesc
ent b
irth
rate
TM.1
105.
114
.874
70.
141
nana
nana
75.4
134.
9…
Con
trace
ptiv
e pr
eval
ence
rate
TM.3
0.49
900.
0227
0.04
62.
514
1.58
51,
374
1,21
9
0.
454
0.54
4N
eed
for f
amily
pla
nnin
g sa
tisfie
d w
ith m
oder
n co
ntra
cept
ion
TM.4
0.73
370.
0213
0.02
91.
862
1.36
490
3
800
0.
691
0.77
6A
nten
atal
car
e co
vera
ge (4
+)TM
.5b
0.55
290.
0500
0.09
02.
839
1.68
531
4
282
0.
453
0.65
3S
kille
d at
tend
ant a
t del
iver
yTM
.90.
7069
0.05
490.
078
4.08
52.
021
314
28
2
0.59
70.
817
Thriv
e - C
hild
hea
lth, n
utrit
ion
and
deve
lopm
ent
Dip
hthe
ria, p
ertu
ssis
and
teta
nus
(DP
T) im
mun
izat
ion
cove
rage
TC.3
0.45
890.
0455
0.09
91.
207
1.09
817
0
146
0.
368
0.55
0P
neum
ococ
cal (
Con
juga
te) i
mm
uniz
atio
n co
vera
geTC
.60.
3578
0.04
470.
125
1.26
21.
123
170
14
6
0.26
80.
447
Mea
sles
imm
uniz
atio
n co
vera
geTC
.10
0.60
650.
0336
0.05
50.
684
0.82
717
0
146
0.
539
0.67
4P
rimar
y re
lianc
e on
cle
an fu
els
and
tech
nolo
gies
for c
ooki
ng, s
pace
hea
ting
and
light
ing
TC.1
80.
0377
0.00
610.
161
1.47
31.
214
7,42
7
1,
445
0.02
60.
050
Pop
ulat
ion
who
sle
pt u
nder
an
ITN
TC.2
20.
4021
0.03
050.
076
23.8
014.
879
6,97
3
6,
138
0.34
10.
463
Exc
lusi
ve b
reas
tfeed
ing
unde
r 6 m
onth
sTC
.32
0.63
640.
0588
0.09
21.
164
1.07
993
79
0.
519
0.75
4S
tunt
ing
prev
alen
ce (m
oder
ate
and
seve
re)
TC.4
5a0.
4126
0.02
690.
065
2.05
01.
432
804
68
6
0.35
90.
466
Was
ting
prev
alen
ce (m
oder
ate
and
seve
re)
TC.4
6a0.
0890
0.01
130.
126
1.08
71.
043
817
69
7
0.06
70.
112
Ove
rwei
ght p
reva
lenc
e (m
oder
ate
and
seve
re)
TC.4
7a0.
0645
0.01
460.
226
2.44
71.
564
817
69
7
0.03
50.
094
Ear
ly c
hild
dev
elop
men
t ind
exTC
.53
0.90
280.
0194
0.02
11.
248
1.11
735
1
293
0.
864
0.94
2
Low
er b
ound
r - 2
seU
pper
bou
ndr +
2se
Lear
nP
artic
ipat
ion
rate
in o
rgan
ised
lear
ning
(adj
uste
d)LN
.20.
7947
0.03
330.
042
0.94
00.
969
158
13
9
0.72
80.
861
Prot
ecte
d fr
om v
iole
nce
and
expl
oita
tion
Birt
h re
gist
ratio
nP
R.1
0.65
560.
0352
0.05
43.
949
1.98
784
4
719
0.
585
0.72
6V
iole
nt d
isci
plin
eP
R.2
0.65
210.
0204
0.03
12.
497
1.58
02,
456
1,36
4
0.
611
0.69
3C
hild
labo
urP
R.3
0.54
980.
0259
0.04
72.
650
1.62
82,
165
977
0.
498
0.60
2C
hild
mar
riage
(bef
ore
age
15)
PR
.4a
0.09
630.
0208
0.21
61.
149
1.07
226
4
233
0.
055
0.13
8C
hild
mar
riage
(bef
ore
age
18)
PR
.4b
0.33
550.
0401
0.11
91.
670
1.29
226
4
233
0.
255
0.41
6Li
ve in
a s
afe
and
clea
n en
viro
nmen
tU
se o
f bas
ic d
rinki
ng w
ater
ser
vice
sW
S.2
0.55
690.
0509
0.09
115
.165
3.89
47,
427
1,44
5
0.
455
0.65
9U
se o
f saf
ely
man
aged
drin
king
wat
er s
ervi
ces
WS
.60.
1586
0.02
940.
185
1.39
01.
179
1,12
8
21
6
0.10
00.
217
Han
dwas
hing
faci
lity
with
wat
er a
nd s
oap
WS
.70.
3598
0.01
850.
051
2.14
01.
463
7,42
7
1,
445
0.32
30.
397
Use
of b
asic
san
itatio
n se
rvic
esW
S.9
0.68
600.
0314
0.04
66.
599
2.56
97,
427
1,44
5
0.
623
0.74
9S
afe
disp
osal
in s
itu o
f exc
reta
from
on-
site
san
itatio
n fa
cilit
ies
WS
.10
0.95
360.
0084
0.00
91.
599
1.26
55,
096
997
0.
937
0.97
0Eq
uita
ble
chan
ce in
life
Chi
ldre
n w
ith fu
nctio
nal d
ificu
lty
EQ
.10.
0363
0.01
260.
346
1.91
81.
385
504
42
6
0.01
10.
061
Pop
ulat
ion
cove
red
by s
ocia
l tra
nsfe
rsE
Q.3
0.10
490.
0137
0.13
12.
894
1.70
17,
427
1,44
5
0.
077
0.13
2na
: not
app
licab
le
Tabl
e SE
.14:
Sam
plin
g er
rors
: Lua
ngpr
aban
gS
tand
ard
erro
rs, c
oeffi
cien
ts o
f var
iatio
n, d
esig
n ef
fect
s (d
eff)
, squ
are
root
of d
esig
n ef
fect
s (d
eft)
, and
con
fiden
ce in
terv
als
for s
elec
ted
SD
G a
nd M
ICS
indi
cato
rs, L
SIS
II, 2
017
MIC
SIn
dica
tor
Val
ue (r
)S
tand
ard
erro
r (se
)
Coe
ffici
ent o
f va
riatio
n(s
e/r)
Des
ign
effe
ct
(def
f)
Squ
are
root
of
des
ign
effe
ct (d
eft)
Wei
ghte
d co
unt
Unw
eigh
ted
coun
t
Con
fiden
ce li
mits
Tabl
e SE
.14:
Sam
plin
g er
rors
: Lua
ngpr
aban
gS
tand
ard
erro
rs, c
oeffi
cien
ts o
f var
iatio
n, d
esig
n ef
fect
s (d
eff)
, squ
are
root
of d
esig
n ef
fect
s (d
eft)
, and
con
fiden
ce in
terv
als
for s
elec
ted
SD
G a
nd M
ICS
indi
cato
rs, L
SIS
II, 2
017
MIC
SIn
dica
tor
Val
ue (r
)S
tand
ard
erro
r (se
)
Coe
ffici
ent o
f va
riatio
n(s
e/r)
Des
ign
effe
ct
(def
f)
Squ
are
root
of
des
ign
effe
ct (d
eft)
Wei
ghte
d co
unt
Unw
eigh
ted
coun
t
Con
fiden
ce li
mits

412
Low
er b
ound
r - 2
seU
pper
bou
ndr +
2se
Sam
ple
cove
rage
and
cha
ract
eris
tics
of th
e re
spon
dent
sA
cces
s to
ele
ctric
ityS
R.1
0.92
600.
0233
0.02
59.
190
3.03
24,
697
1,16
3
0.
879
0.97
3O
wne
rshi
p of
mob
ile p
hone
(wom
en)
SR
.10
0.56
310.
0293
0.05
24.
637
2.15
31,
045
1,32
9
0.
505
0.62
2O
wne
rshi
p of
mob
ile p
hone
(men
)S
R.1
00.
8220
0.01
980.
024
1.94
91.
396
568
72
9
0.78
20.
862
Use
of i
nter
net (
wom
en)
SR
.12a
0.10
300.
0115
0.11
21.
917
1.38
51,
045
1,32
9
0.
080
0.12
6U
se o
f int
erne
t (m
en)
SR
.12a
0.23
280.
0212
0.09
11.
830
1.35
356
8
729
0.
190
0.27
5IC
T sk
ills
(wom
en)
SR
.13
0.03
140.
0061
0.19
41.
614
1.27
01,
045
1,32
9
0.
019
0.04
4IC
T sk
ills
(men
)S
R.1
30.
0800
0.01
320.
165
1.71
51.
310
568
72
9
0.05
40.
106
Use
of t
obac
co (w
omen
)S
R.1
40.
0157
0.00
530.
337
2.40
41.
551
1,04
5
1,
329
0.00
50.
026
Use
of t
obac
co (m
en)
SR
.14
0.35
920.
0286
0.08
02.
590
1.60
956
8
729
0.
302
0.41
6Su
rviv
eN
eona
tal m
orta
lity
rate
CS
.127
6.73
210.
249
nana
nana
1440
Infa
nt m
orta
lity
rate
CS
.344
9.33
390.
211
nana
nana
2663
Und
er-fi
ve m
orta
lity
rate
CS
.544
9.33
390.
211
nana
nana
2663
Thriv
e - R
epro
duct
ive
and
mat
erna
l hea
lthTo
tal f
ertil
ity ra
te-
2.9
0.19
050.
066
nana
nana
2.5
3.3
Ado
lesc
ent b
irth
rate
TM.1
135.
917
.199
30.
127
nana
nana
101.
517
0.3
…C
ontra
cept
ive
prev
alen
ce ra
teTM
.30.
5019
0.02
050.
041
1.83
41.
354
858
1,
089
0.46
10.
543
Nee
d fo
r fam
ily p
lann
ing
satis
fied
with
mod
ern
cont
race
ptio
nTM
.40.
7536
0.02
010.
027
1.52
11.
233
547
69
8
0.71
30.
794
Ant
enat
al c
are
cove
rage
(4+)
TM.5
b0.
6335
0.03
600.
057
1.42
31.
193
202
25
6
0.56
20.
706
Ski
lled
atte
ndan
t at d
eliv
ery
TM.9
0.48
850.
0462
0.09
52.
176
1.47
520
2
256
0.
396
0.58
1Th
rive
- Chi
ld h
ealth
, nut
ritio
n an
d de
velo
pmen
tD
ipht
heria
, per
tuss
is a
nd te
tanu
s (D
PT)
imm
uniz
atio
n co
vera
geTC
.30.
6765
0.04
700.
070
1.37
41.
172
113
13
7
0.58
20.
770
Pne
umoc
occa
l (C
onju
gate
) im
mun
izat
ion
cove
rage
TC.6
0.62
450.
0450
0.07
21.
176
1.08
511
3
137
0.
534
0.71
5M
easl
es im
mun
izat
ion
cove
rage
TC.1
00.
6422
0.04
520.
070
1.21
01.
100
113
13
7
0.55
20.
733
Prim
ary
relia
nce
on c
lean
fuel
s an
d te
chno
logi
es fo
r coo
king
, spa
ce h
eatin
g an
d lig
htin
gTC
.18
0.02
570.
0060
0.23
31.
670
1.29
24,
697
1,16
3
0.
014
0.03
8P
opul
atio
n w
ho s
lept
und
er a
n IT
NTC
.22
0.74
490.
0222
0.03
014
.944
3.86
64,
614
5,76
2
0.
701
0.78
9E
xclu
sive
bre
astfe
edin
g un
der 6
mon
ths
TC.3
20.
6038
0.04
150.
069
0.41
70.
646
49
59
0.52
10.
687
Stu
ntin
g pr
eval
ence
(mod
erat
e an
d se
vere
)TC
.45a
0.40
740.
0265
0.06
51.
878
1.37
054
0
646
0.
354
0.46
0W
astin
g pr
eval
ence
(mod
erat
e an
d se
vere
)TC
.46a
0.16
400.
0217
0.13
22.
145
1.46
552
2
626
0.
121
0.20
7O
verw
eigh
t pre
vale
nce
(mod
erat
e an
d se
vere
)TC
.47a
0.04
110.
0108
0.26
21.
835
1.35
552
2
626
0.
020
0.06
3E
arly
chi
ld d
evel
opm
ent i
ndex
TC.5
30.
9782
0.00
740.
008
0.71
20.
844
236
28
1
0.96
30.
993
Low
er b
ound
r - 2
seU
pper
bou
ndr +
2se
Lear
nP
artic
ipat
ion
rate
in o
rgan
ised
lear
ning
(adj
uste
d)LN
.20.
7441
0.02
890.
039
0.61
90.
787
113
14
2
0.68
60.
802
Prot
ecte
d fr
om v
iole
nce
and
expl
oita
tion
Birt
h re
gist
ratio
nP
R.1
0.78
180.
0252
0.03
22.
451
1.56
655
3
662
0.
732
0.83
2V
iole
nt d
isci
plin
eP
R.2
0.62
690.
0220
0.03
52.
504
1.58
21,
637
1,21
1
0.
583
0.67
1C
hild
labo
urP
R.3
0.60
330.
0247
0.04
12.
127
1.45
81,
455
835
0.
554
0.65
3C
hild
mar
riage
(bef
ore
age
15)
PR
.4a
0.13
970.
0237
0.16
91.
128
1.06
219
2
243
0.
092
0.18
7C
hild
mar
riage
(bef
ore
age
18)
PR
.4b
0.45
720.
0438
0.09
61.
870
1.36
719
2
243
0.
370
0.54
5Li
ve in
a s
afe
and
clea
n en
viro
nmen
tU
se o
f bas
ic d
rinki
ng w
ater
ser
vice
sW
S.2
0.82
660.
0121
0.01
51.
189
1.09
04,
697
1,16
3
0.
802
0.85
1U
se o
f saf
ely
man
aged
drin
king
wat
er s
ervi
ces
WS
.60.
1539
0.02
820.
183
1.06
71.
033
710
17
6
0.09
80.
210
Han
dwas
hing
faci
lity
with
wat
er a
nd s
oap
WS
.70.
4191
0.03
530.
084
5.94
12.
437
4,69
3
1,
162
0.34
90.
490
Use
of b
asic
san
itatio
n se
rvic
esW
S.9
0.73
470.
0429
0.05
810
.975
3.31
34,
697
1,16
3
0.
649
0.82
1S
afe
disp
osal
in s
itu o
f exc
reta
from
on-
site
san
itatio
n fa
cilit
ies
WS
.10
0.98
430.
0035
0.00
40.
661
0.81
33,
194
814
0.
977
0.99
1Eq
uita
ble
chan
ce in
life
Chi
ldre
n w
ith fu
nctio
nal d
ificu
lty
EQ
.10.
0064
0.00
390.
606
0.97
10.
986
344
41
1
0.00
00.
014
Pop
ulat
ion
cove
red
by s
ocia
l tra
nsfe
rsE
Q.3
0.14
720.
0146
0.09
91.
964
1.40
24,
697
1,16
3
0.
118
0.17
6na
: not
app
licab
le
Tabl
e SE
.15:
Sam
plin
g er
rors
: Hua
phan
hS
tand
ard
erro
rs, c
oeffi
cien
ts o
f var
iatio
n, d
esig
n ef
fect
s (d
eff)
, squ
are
root
of d
esig
n ef
fect
s (d
eft)
, and
con
fiden
ce in
terv
als
for s
elec
ted
SD
G a
nd M
ICS
indi
cato
rs, L
SIS
II, 2
017
MIC
SIn
dica
tor
Val
ue (r
)S
tand
ard
erro
r (se
)
Coe
ffici
ent o
f va
riatio
n(s
e/r)
Des
ign
effe
ct
(def
f)
Squ
are
root
of
des
ign
effe
ct (d
eft)
Wei
ghte
d co
unt
Unw
eigh
ted
coun
t
Con
fiden
ce li
mits

413
Low
er b
ound
r - 2
seU
pper
bou
ndr +
2se
Sam
ple
cove
rage
and
cha
ract
eris
tics
of th
e re
spon
dent
sA
cces
s to
ele
ctric
ityS
R.1
0.92
600.
0233
0.02
59.
190
3.03
24,
697
1,16
3
0.
879
0.97
3O
wne
rshi
p of
mob
ile p
hone
(wom
en)
SR
.10
0.56
310.
0293
0.05
24.
637
2.15
31,
045
1,32
9
0.
505
0.62
2O
wne
rshi
p of
mob
ile p
hone
(men
)S
R.1
00.
8220
0.01
980.
024
1.94
91.
396
568
72
9
0.78
20.
862
Use
of i
nter
net (
wom
en)
SR
.12a
0.10
300.
0115
0.11
21.
917
1.38
51,
045
1,32
9
0.
080
0.12
6U
se o
f int
erne
t (m
en)
SR
.12a
0.23
280.
0212
0.09
11.
830
1.35
356
8
729
0.
190
0.27
5IC
T sk
ills
(wom
en)
SR
.13
0.03
140.
0061
0.19
41.
614
1.27
01,
045
1,32
9
0.
019
0.04
4IC
T sk
ills
(men
)S
R.1
30.
0800
0.01
320.
165
1.71
51.
310
568
72
9
0.05
40.
106
Use
of t
obac
co (w
omen
)S
R.1
40.
0157
0.00
530.
337
2.40
41.
551
1,04
5
1,
329
0.00
50.
026
Use
of t
obac
co (m
en)
SR
.14
0.35
920.
0286
0.08
02.
590
1.60
956
8
729
0.
302
0.41
6Su
rviv
eN
eona
tal m
orta
lity
rate
CS
.127
6.73
210.
249
nana
nana
1440
Infa
nt m
orta
lity
rate
CS
.344
9.33
390.
211
nana
nana
2663
Und
er-fi
ve m
orta
lity
rate
CS
.544
9.33
390.
211
nana
nana
2663
Thriv
e - R
epro
duct
ive
and
mat
erna
l hea
lthTo
tal f
ertil
ity ra
te-
2.9
0.19
050.
066
nana
nana
2.5
3.3
Ado
lesc
ent b
irth
rate
TM.1
135.
917
.199
30.
127
nana
nana
101.
517
0.3
…C
ontra
cept
ive
prev
alen
ce ra
teTM
.30.
5019
0.02
050.
041
1.83
41.
354
858
1,
089
0.46
10.
543
Nee
d fo
r fam
ily p
lann
ing
satis
fied
with
mod
ern
cont
race
ptio
nTM
.40.
7536
0.02
010.
027
1.52
11.
233
547
69
8
0.71
30.
794
Ant
enat
al c
are
cove
rage
(4+)
TM.5
b0.
6335
0.03
600.
057
1.42
31.
193
202
25
6
0.56
20.
706
Ski
lled
atte
ndan
t at d
eliv
ery
TM.9
0.48
850.
0462
0.09
52.
176
1.47
520
2
256
0.
396
0.58
1Th
rive
- Chi
ld h
ealth
, nut
ritio
n an
d de
velo
pmen
tD
ipht
heria
, per
tuss
is a
nd te
tanu
s (D
PT)
imm
uniz
atio
n co
vera
geTC
.30.
6765
0.04
700.
070
1.37
41.
172
113
13
7
0.58
20.
770
Pne
umoc
occa
l (C
onju
gate
) im
mun
izat
ion
cove
rage
TC.6
0.62
450.
0450
0.07
21.
176
1.08
511
3
137
0.
534
0.71
5M
easl
es im
mun
izat
ion
cove
rage
TC.1
00.
6422
0.04
520.
070
1.21
01.
100
113
13
7
0.55
20.
733
Prim
ary
relia
nce
on c
lean
fuel
s an
d te
chno
logi
es fo
r coo
king
, spa
ce h
eatin
g an
d lig
htin
gTC
.18
0.02
570.
0060
0.23
31.
670
1.29
24,
697
1,16
3
0.
014
0.03
8P
opul
atio
n w
ho s
lept
und
er a
n IT
NTC
.22
0.74
490.
0222
0.03
014
.944
3.86
64,
614
5,76
2
0.
701
0.78
9E
xclu
sive
bre
astfe
edin
g un
der 6
mon
ths
TC.3
20.
6038
0.04
150.
069
0.41
70.
646
49
59
0.52
10.
687
Stu
ntin
g pr
eval
ence
(mod
erat
e an
d se
vere
)TC
.45a
0.40
740.
0265
0.06
51.
878
1.37
054
0
646
0.
354
0.46
0W
astin
g pr
eval
ence
(mod
erat
e an
d se
vere
)TC
.46a
0.16
400.
0217
0.13
22.
145
1.46
552
2
626
0.
121
0.20
7O
verw
eigh
t pre
vale
nce
(mod
erat
e an
d se
vere
)TC
.47a
0.04
110.
0108
0.26
21.
835
1.35
552
2
626
0.
020
0.06
3E
arly
chi
ld d
evel
opm
ent i
ndex
TC.5
30.
9782
0.00
740.
008
0.71
20.
844
236
28
1
0.96
30.
993
Low
er b
ound
r - 2
seU
pper
bou
ndr +
2se
Lear
nP
artic
ipat
ion
rate
in o
rgan
ised
lear
ning
(adj
uste
d)LN
.20.
7441
0.02
890.
039
0.61
90.
787
113
14
2
0.68
60.
802
Prot
ecte
d fr
om v
iole
nce
and
expl
oita
tion
Birt
h re
gist
ratio
nP
R.1
0.78
180.
0252
0.03
22.
451
1.56
655
3
662
0.
732
0.83
2V
iole
nt d
isci
plin
eP
R.2
0.62
690.
0220
0.03
52.
504
1.58
21,
637
1,21
1
0.
583
0.67
1C
hild
labo
urP
R.3
0.60
330.
0247
0.04
12.
127
1.45
81,
455
835
0.
554
0.65
3C
hild
mar
riage
(bef
ore
age
15)
PR
.4a
0.13
970.
0237
0.16
91.
128
1.06
219
2
243
0.
092
0.18
7C
hild
mar
riage
(bef
ore
age
18)
PR
.4b
0.45
720.
0438
0.09
61.
870
1.36
719
2
243
0.
370
0.54
5Li
ve in
a s
afe
and
clea
n en
viro
nmen
tU
se o
f bas
ic d
rinki
ng w
ater
ser
vice
sW
S.2
0.82
660.
0121
0.01
51.
189
1.09
04,
697
1,16
3
0.
802
0.85
1U
se o
f saf
ely
man
aged
drin
king
wat
er s
ervi
ces
WS
.60.
1539
0.02
820.
183
1.06
71.
033
710
17
6
0.09
80.
210
Han
dwas
hing
faci
lity
with
wat
er a
nd s
oap
WS
.70.
4191
0.03
530.
084
5.94
12.
437
4,69
3
1,
162
0.34
90.
490
Use
of b
asic
san
itatio
n se
rvic
esW
S.9
0.73
470.
0429
0.05
810
.975
3.31
34,
697
1,16
3
0.
649
0.82
1S
afe
disp
osal
in s
itu o
f exc
reta
from
on-
site
san
itatio
n fa
cilit
ies
WS
.10
0.98
430.
0035
0.00
40.
661
0.81
33,
194
814
0.
977
0.99
1Eq
uita
ble
chan
ce in
life
Chi
ldre
n w
ith fu
nctio
nal d
ificu
lty
EQ
.10.
0064
0.00
390.
606
0.97
10.
986
344
41
1
0.00
00.
014
Pop
ulat
ion
cove
red
by s
ocia
l tra
nsfe
rsE
Q.3
0.14
720.
0146
0.09
91.
964
1.40
24,
697
1,16
3
0.
118
0.17
6na
: not
app
licab
le
Tabl
e SE
.15:
Sam
plin
g er
rors
: Hua
phan
hS
tand
ard
erro
rs, c
oeffi
cien
ts o
f var
iatio
n, d
esig
n ef
fect
s (d
eff)
, squ
are
root
of d
esig
n ef
fect
s (d
eft)
, and
con
fiden
ce in
terv
als
for s
elec
ted
SD
G a
nd M
ICS
indi
cato
rs, L
SIS
II, 2
017
MIC
SIn
dica
tor
Val
ue (r
)S
tand
ard
erro
r (se
)
Coe
ffici
ent o
f va
riatio
n(s
e/r)
Des
ign
effe
ct
(def
f)
Squ
are
root
of
des
ign
effe
ct (d
eft)
Wei
ghte
d co
unt
Unw
eigh
ted
coun
t
Con
fiden
ce li
mits
Tabl
e SE
.15:
Sam
plin
g er
rors
: Hua
phan
hS
tand
ard
erro
rs, c
oeffi
cien
ts o
f var
iatio
n, d
esig
n ef
fect
s (d
eff)
, squ
are
root
of d
esig
n ef
fect
s (d
eft)
, and
con
fiden
ce in
terv
als
for s
elec
ted
SD
G a
nd M
ICS
indi
cato
rs, L
SIS
II, 2
017
MIC
SIn
dica
tor
Val
ue (r
)S
tand
ard
erro
r (se
)
Coe
ffici
ent o
f va
riatio
n(s
e/r)
Des
ign
effe
ct
(def
f)
Squ
are
root
of
des
ign
effe
ct (d
eft)
Wei
ghte
d co
unt
Unw
eigh
ted
coun
t
Con
fiden
ce li
mits

414
Low
er b
ound
r - 2
seU
pper
bou
ndr +
2se
Sam
ple
cove
rage
and
cha
ract
eris
tics
of th
e re
spon
dent
sA
cces
s to
ele
ctric
ityS
R.1
0.97
110.
0094
0.01
04.
498
2.12
16,
116
1,42
9
0.
952
0.99
0O
wne
rshi
p of
mob
ile p
hone
(wom
en)
SR
.10
0.81
6297
20.
0197
0.02
43.
850
1.96
21,
523
1,49
0
0.
777
0.85
6O
wne
rshi
p of
mob
ile p
hone
(men
)S
R.1
00.
8817
0.01
840.
021
2.34
01.
530
712
72
4
0.84
50.
918
Use
of i
nter
net (
wom
en)
SR
.12a
0.16
750.
0147
0.08
82.
296
1.51
51,
523
1,49
0
0.
138
0.19
7U
se o
f int
erne
t (m
en)
SR
.12a
0.03
820.
0084
0.22
11.
397
1.18
271
2
724
0.
021
0.05
5IC
T sk
ills
(wom
en)
SR
.13
0.05
880.
0077
0.13
01.
578
1.25
61,
523
1,49
0
0.
043
0.07
4IC
T sk
ills
(men
)S
R.1
30.
0735
0.01
180.
160
1.46
81.
212
712
72
4
0.05
00.
097
Use
of t
obac
co (w
omen
)S
R.1
40.
0220
0.00
690.
314
3.30
71.
819
1,52
3
1,
490
0.00
80.
036
Use
of t
obac
co (m
en)
SR
.14
0.37
500.
0227
0.06
11.
591
1.26
171
2
724
0.
330
0.42
0Su
rviv
eN
eona
tal m
orta
lity
rate
CS
.17
3.58
820.
509
nana
nana
014
Infa
nt m
orta
lity
rate
CS
.39
4.93
440.
547
nana
nana
-119
Und
er-fi
ve m
orta
lity
rate
CS
.511
5.36
650.
474
nana
nana
122
Thriv
e - R
epro
duct
ive
and
mat
erna
l hea
lthTo
tal f
ertil
ity ra
te-
2.1
0.13
460.
065
nana
nana
1.8
2.3
Ado
lesc
ent b
irth
rate
TM.1
88.2
12.3
722
0.14
0na
nana
na63
.411
2.9
…C
ontra
cept
ive
prev
alen
ce ra
teTM
.30.
7335
0.01
880.
026
2.19
41.
481
1,23
7
1,
211
0.69
60.
771
Nee
d fo
r fam
ily p
lann
ing
satis
fied
with
mod
ern
cont
race
ptio
nTM
.40.
9034
0.01
170.
013
1.52
41.
234
998
97
5
0.88
00.
927
Ant
enat
al c
are
cove
rage
(4+)
TM.5
b0.
8761
0.03
570.
041
2.40
91.
552
211
20
6
0.80
50.
948
Ski
lled
atte
ndan
t at d
eliv
ery
TM.9
0.81
500.
0472
0.05
83.
030
1.74
121
1
206
0.
721
0.90
9Th
rive
- Chi
ld h
ealth
, nut
ritio
n an
d de
velo
pmen
tD
ipht
heria
, per
tuss
is a
nd te
tanu
s (D
PT)
imm
uniz
atio
n co
vera
geTC
.30.
7758
0.04
260.
055
1.05
11.
025
111
10
2
0.69
10.
861
Pne
umoc
occa
l (C
onju
gate
) im
mun
izat
ion
cove
rage
TC.6
0.71
23
0.
0353
0.05
00.
614
0.78
411
1
102
0.
642
0.78
3M
easl
es im
mun
izat
ion
cove
rage
TC.1
00.
7973
0.03
090.
039
0.59
90.
774
111
10
2
0.73
50.
859
Prim
ary
relia
nce
on c
lean
fuel
s an
d te
chno
logi
es fo
r coo
king
, spa
ce h
eatin
g an
d lig
htin
gTC
.18
0.03
680.
0077
0.20
82.
365
1.53
86,
116
1,42
9
0.
021
0.05
2P
opul
atio
n w
ho s
lept
und
er a
n IT
NTC
.22
0.39
870.
0311
0.07
823
.185
4.81
55,
979
5,74
0
0.
336
0.46
1E
xclu
sive
bre
astfe
edin
g un
der 6
mon
ths
TC.3
2(0
.659
1)(0
.057
9)(0
.087
8)(0
.522
7)(0
.723
0)40
36
(0
.543
2)(0
.744
9)S
tunt
ing
prev
alen
ce (m
oder
ate
and
seve
re)
TC.4
5a0.
2515
0.02
670.
106
1.87
91.
371
542
49
9
0.19
80.
305
Was
ting
prev
alen
ce (m
oder
ate
and
seve
re)
TC.4
6a0.
1913
0.02
590.
135
2.14
41.
464
539
49
6
0.14
00.
243
Ove
rwei
ght p
reva
lenc
e (m
oder
ate
and
seve
re)
TC.4
7a0.
0508
0.01
460.
288
2.19
61.
482
539
49
6
0.02
20.
080
Ear
ly c
hild
dev
elop
men
t ind
exTC
.53
0.98
980.
0072
0.00
71.
042
1.02
122
2
206
0.
975
1.00
0
Low
er b
ound
r - 2
seU
pper
bou
ndr +
2se
Lear
nP
artic
ipat
ion
rate
in o
rgan
ised
lear
ning
(adj
uste
d)LN
.20.
9241
0.02
600.
028
1.18
71.
089
126
12
4
0.87
20.
976
Prot
ecte
d fr
om v
iole
nce
and
expl
oita
tion
Birt
h re
gist
ratio
nP
R.1
0.93
320.
0189
0.02
02.
919
1.70
855
6
512
0.
896
0.97
1V
iole
nt d
isci
plin
eP
R.2
0.55
860.
0190
0.03
41.
664
1.29
01,
611
1,13
4
0.
521
0.59
7C
hild
labo
urP
R.3
0.36
730.
0243
0.06
62.
292
1.51
41,
488
906
0.
319
0.41
6C
hild
mar
riage
(bef
ore
age
15)
PR
.4a
0.06
010.
0236
0.39
22.
036
1.42
721
8
208
0.
013
0.10
7C
hild
mar
riage
(bef
ore
age
18)
PR
.4b
0.41
530.
0301
0.07
30.
773
0.87
921
8
208
0.
355
0.47
6Li
ve in
a s
afe
and
clea
n en
viro
nmen
tU
se o
f bas
ic d
rinki
ng w
ater
ser
vice
sW
S.2
0.85
600.
0237
0.02
86.
522
2.55
46,
116
1,42
9
0.
809
0.90
3U
se o
f saf
ely
man
aged
drin
king
wat
er s
ervi
ces
WS
.60.
3030
0.03
590.
119
1.27
61.
129
900
21
0
0.23
10.
375
Han
dwas
hing
faci
lity
with
wat
er a
nd s
oap
WS
.70.
7031
0.01
730.
025
2.04
81.
431
6,10
8
1,
428
0.66
80.
738
Use
of b
asic
san
itatio
n se
rvic
esW
S.9
0.89
400.
0222
0.02
57.
412
2.72
36,
116
1,42
9
0.
850
0.93
8S
afe
disp
osal
in s
itu o
f exc
reta
from
on-
site
san
itatio
n fa
cilit
ies
WS
.10
0.90
140.
0176
0.01
94.
473
2.11
55,
494
1,29
0
0.
866
0.93
7Eq
uita
ble
chan
ce in
life
Chi
ldre
n w
ith fu
nctio
nal d
ificu
lty
EQ
.10.
0031
0.00
310.
995
0.96
30.
982
338
31
3
0.00
00.
009
Pop
ulat
ion
cove
red
by s
ocia
l tra
nsfe
rsE
Q.3
0.04
960.
0069
0.13
91.
439
1.20
06,
116
1,42
9
0.
036
0.06
3na
: not
app
licab
le
Des
ign
effe
ct
(def
f)
Squ
are
root
of
des
ign
effe
ct (d
eft)
Wei
ghte
d co
unt
Unw
eigh
ted
coun
t
Con
fiden
ce li
mits
MIC
SIn
dica
tor
Val
ue (r
)S
tand
ard
erro
r (se
)
Coe
ffici
ent o
f va
riatio
n(s
e/r)
( ) F
igur
es th
at a
re b
ased
on
25-4
9 un
wei
ghte
d ca
ses
Tabl
e SE
.16:
Sam
plin
g er
rors
: Xay
abur
yS
tand
ard
erro
rs, c
oeffi
cien
ts o
f var
iatio
n, d
esig
n ef
fect
s (d
eff)
, squ
are
root
of d
esig
n ef
fect
s (d
eft)
, and
con
fiden
ce in
terv
als
for s
elec
ted
SD
G a
nd M
ICS
indi
cato
rs, L
SIS
II, 2
017
MIC
SIn
dica
tor
Val
ue (r
)S
tand
ard
erro
r (se
)
Coe
ffici
ent o
f va
riatio
n(s
e/r)
Des
ign
effe
ct
(def
f)
Squ
are
root
of
des
ign
effe
ct (d
eft)
Wei
ghte
d co
unt
Unw
eigh
ted
coun
t
Con
fiden
ce li
mits
Tabl
e SE
.16:
Sam
plin
g er
rors
: Xay
abur
yS
tand
ard
erro
rs, c
oeffi
cien
ts o
f var
iatio
n, d
esig
n ef
fect
s (d
eff)
, squ
are
root
of d
esig
n ef
fect
s (d
eft)
, and
con
fiden
ce in
terv
als
for s
elec
ted
SD
G a
nd M
ICS
indi
cato
rs, L
SIS
II, 2
017
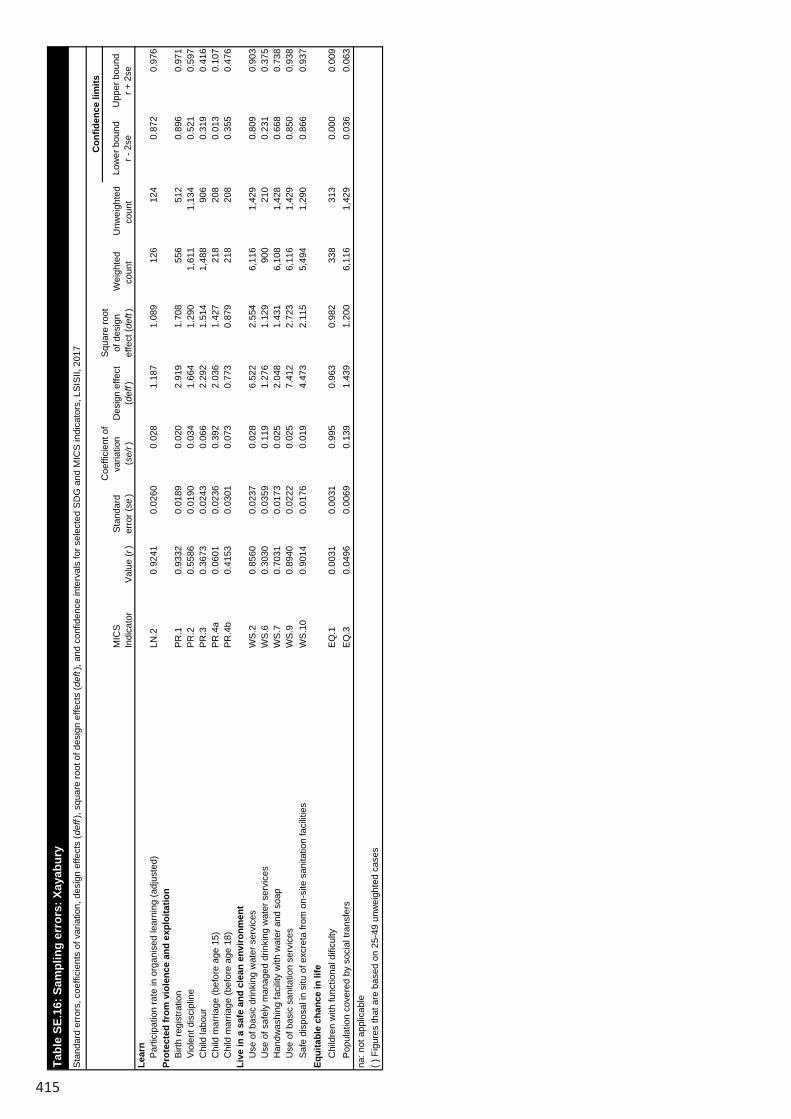
415
Low
er b
ound
r - 2
seU
pper
bou
ndr +
2se
Sam
ple
cove
rage
and
cha
ract
eris
tics
of th
e re
spon
dent
sA
cces
s to
ele
ctric
ityS
R.1
0.97
110.
0094
0.01
04.
498
2.12
16,
116
1,42
9
0.
952
0.99
0O
wne
rshi
p of
mob
ile p
hone
(wom
en)
SR
.10
0.81
6297
20.
0197
0.02
43.
850
1.96
21,
523
1,49
0
0.
777
0.85
6O
wne
rshi
p of
mob
ile p
hone
(men
)S
R.1
00.
8817
0.01
840.
021
2.34
01.
530
712
72
4
0.84
50.
918
Use
of i
nter
net (
wom
en)
SR
.12a
0.16
750.
0147
0.08
82.
296
1.51
51,
523
1,49
0
0.
138
0.19
7U
se o
f int
erne
t (m
en)
SR
.12a
0.03
820.
0084
0.22
11.
397
1.18
271
2
724
0.
021
0.05
5IC
T sk
ills
(wom
en)
SR
.13
0.05
880.
0077
0.13
01.
578
1.25
61,
523
1,49
0
0.
043
0.07
4IC
T sk
ills
(men
)S
R.1
30.
0735
0.01
180.
160
1.46
81.
212
712
72
4
0.05
00.
097
Use
of t
obac
co (w
omen
)S
R.1
40.
0220
0.00
690.
314
3.30
71.
819
1,52
3
1,
490
0.00
80.
036
Use
of t
obac
co (m
en)
SR
.14
0.37
500.
0227
0.06
11.
591
1.26
171
2
724
0.
330
0.42
0Su
rviv
eN
eona
tal m
orta
lity
rate
CS
.17
3.58
820.
509
nana
nana
014
Infa
nt m
orta
lity
rate
CS
.39
4.93
440.
547
nana
nana
-119
Und
er-fi
ve m
orta
lity
rate
CS
.511
5.36
650.
474
nana
nana
122
Thriv
e - R
epro
duct
ive
and
mat
erna
l hea
lthTo
tal f
ertil
ity ra
te-
2.1
0.13
460.
065
nana
nana
1.8
2.3
Ado
lesc
ent b
irth
rate
TM.1
88.2
12.3
722
0.14
0na
nana
na63
.411
2.9
…C
ontra
cept
ive
prev
alen
ce ra
teTM
.30.
7335
0.01
880.
026
2.19
41.
481
1,23
7
1,
211
0.69
60.
771
Nee
d fo
r fam
ily p
lann
ing
satis
fied
with
mod
ern
cont
race
ptio
nTM
.40.
9034
0.01
170.
013
1.52
41.
234
998
97
5
0.88
00.
927
Ant
enat
al c
are
cove
rage
(4+)
TM.5
b0.
8761
0.03
570.
041
2.40
91.
552
211
20
6
0.80
50.
948
Ski
lled
atte
ndan
t at d
eliv
ery
TM.9
0.81
500.
0472
0.05
83.
030
1.74
121
1
206
0.
721
0.90
9Th
rive
- Chi
ld h
ealth
, nut
ritio
n an
d de
velo
pmen
tD
ipht
heria
, per
tuss
is a
nd te
tanu
s (D
PT)
imm
uniz
atio
n co
vera
geTC
.30.
7758
0.04
260.
055
1.05
11.
025
111
10
2
0.69
10.
861
Pne
umoc
occa
l (C
onju
gate
) im
mun
izat
ion
cove
rage
TC.6
0.71
23
0.
0353
0.05
00.
614
0.78
411
1
102
0.
642
0.78
3M
easl
es im
mun
izat
ion
cove
rage
TC.1
00.
7973
0.03
090.
039
0.59
90.
774
111
10
2
0.73
50.
859
Prim
ary
relia
nce
on c
lean
fuel
s an
d te
chno
logi
es fo
r coo
king
, spa
ce h
eatin
g an
d lig
htin
gTC
.18
0.03
680.
0077
0.20
82.
365
1.53
86,
116
1,42
9
0.
021
0.05
2P
opul
atio
n w
ho s
lept
und
er a
n IT
NTC
.22
0.39
870.
0311
0.07
823
.185
4.81
55,
979
5,74
0
0.
336
0.46
1E
xclu
sive
bre
astfe
edin
g un
der 6
mon
ths
TC.3
2(0
.659
1)(0
.057
9)(0
.087
8)(0
.522
7)(0
.723
0)40
36
(0
.543
2)(0
.744
9)S
tunt
ing
prev
alen
ce (m
oder
ate
and
seve
re)
TC.4
5a0.
2515
0.02
670.
106
1.87
91.
371
542
49
9
0.19
80.
305
Was
ting
prev
alen
ce (m
oder
ate
and
seve
re)
TC.4
6a0.
1913
0.02
590.
135
2.14
41.
464
539
49
6
0.14
00.
243
Ove
rwei
ght p
reva
lenc
e (m
oder
ate
and
seve
re)
TC.4
7a0.
0508
0.01
460.
288
2.19
61.
482
539
49
6
0.02
20.
080
Ear
ly c
hild
dev
elop
men
t ind
exTC
.53
0.98
980.
0072
0.00
71.
042
1.02
122
2
206
0.
975
1.00
0
Low
er b
ound
r - 2
seU
pper
bou
ndr +
2se
Lear
nP
artic
ipat
ion
rate
in o
rgan
ised
lear
ning
(adj
uste
d)LN
.20.
9241
0.02
600.
028
1.18
71.
089
126
12
4
0.87
20.
976
Prot
ecte
d fr
om v
iole
nce
and
expl
oita
tion
Birt
h re
gist
ratio
nP
R.1
0.93
320.
0189
0.02
02.
919
1.70
855
6
512
0.
896
0.97
1V
iole
nt d
isci
plin
eP
R.2
0.55
860.
0190
0.03
41.
664
1.29
01,
611
1,13
4
0.
521
0.59
7C
hild
labo
urP
R.3
0.36
730.
0243
0.06
62.
292
1.51
41,
488
906
0.
319
0.41
6C
hild
mar
riage
(bef
ore
age
15)
PR
.4a
0.06
010.
0236
0.39
22.
036
1.42
721
8
208
0.
013
0.10
7C
hild
mar
riage
(bef
ore
age
18)
PR
.4b
0.41
530.
0301
0.07
30.
773
0.87
921
8
208
0.
355
0.47
6Li
ve in
a s
afe
and
clea
n en
viro
nmen
tU
se o
f bas
ic d
rinki
ng w
ater
ser
vice
sW
S.2
0.85
600.
0237
0.02
86.
522
2.55
46,
116
1,42
9
0.
809
0.90
3U
se o
f saf
ely
man
aged
drin
king
wat
er s
ervi
ces
WS
.60.
3030
0.03
590.
119
1.27
61.
129
900
21
0
0.23
10.
375
Han
dwas
hing
faci
lity
with
wat
er a
nd s
oap
WS
.70.
7031
0.01
730.
025
2.04
81.
431
6,10
8
1,
428
0.66
80.
738
Use
of b
asic
san
itatio
n se
rvic
esW
S.9
0.89
400.
0222
0.02
57.
412
2.72
36,
116
1,42
9
0.
850
0.93
8S
afe
disp
osal
in s
itu o
f exc
reta
from
on-
site
san
itatio
n fa
cilit
ies
WS
.10
0.90
140.
0176
0.01
94.
473
2.11
55,
494
1,29
0
0.
866
0.93
7Eq
uita
ble
chan
ce in
life
Chi
ldre
n w
ith fu
nctio
nal d
ificu
lty
EQ
.10.
0031
0.00
310.
995
0.96
30.
982
338
31
3
0.00
00.
009
Pop
ulat
ion
cove
red
by s
ocia
l tra
nsfe
rsE
Q.3
0.04
960.
0069
0.13
91.
439
1.20
06,
116
1,42
9
0.
036
0.06
3na
: not
app
licab
le
Des
ign
effe
ct
(def
f)
Squ
are
root
of
des
ign
effe
ct (d
eft)
Wei
ghte
d co
unt
Unw
eigh
ted
coun
t
Con
fiden
ce li
mits
MIC
SIn
dica
tor
Val
ue (r
)S
tand
ard
erro
r (se
)
Coe
ffici
ent o
f va
riatio
n(s
e/r)
( ) F
igur
es th
at a
re b
ased
on
25-4
9 un
wei
ghte
d ca
ses
Tabl
e SE
.16:
Sam
plin
g er
rors
: Xay
abur
yS
tand
ard
erro
rs, c
oeffi
cien
ts o
f var
iatio
n, d
esig
n ef
fect
s (d
eff)
, squ
are
root
of d
esig
n ef
fect
s (d
eft)
, and
con
fiden
ce in
terv
als
for s
elec
ted
SD
G a
nd M
ICS
indi
cato
rs, L
SIS
II, 2
017
MIC
SIn
dica
tor
Val
ue (r
)S
tand
ard
erro
r (se
)
Coe
ffici
ent o
f va
riatio
n(s
e/r)
Des
ign
effe
ct
(def
f)
Squ
are
root
of
des
ign
effe
ct (d
eft)
Wei
ghte
d co
unt
Unw
eigh
ted
coun
t
Con
fiden
ce li
mits
Tabl
e SE
.16:
Sam
plin
g er
rors
: Xay
abur
yS
tand
ard
erro
rs, c
oeffi
cien
ts o
f var
iatio
n, d
esig
n ef
fect
s (d
eff)
, squ
are
root
of d
esig
n ef
fect
s (d
eft)
, and
con
fiden
ce in
terv
als
for s
elec
ted
SD
G a
nd M
ICS
indi
cato
rs, L
SIS
II, 2
017
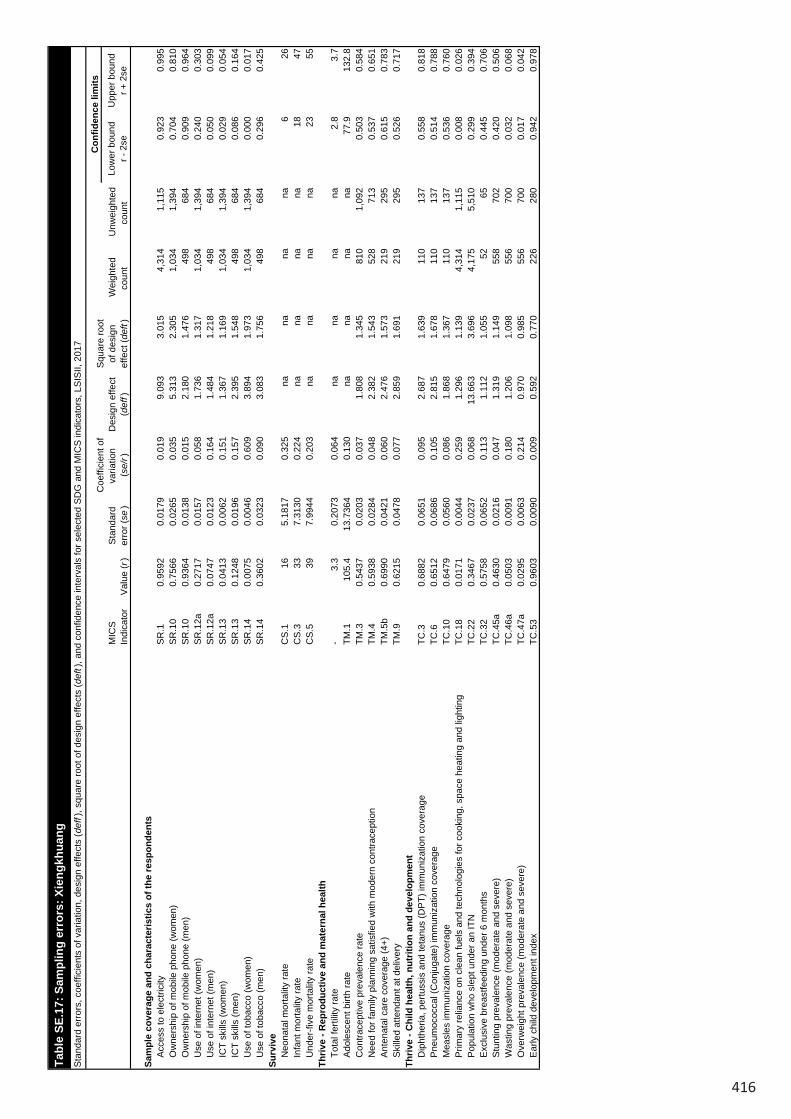
416
Low
er b
ound
r - 2
seU
pper
bou
ndr +
2se
Sam
ple
cove
rage
and
cha
ract
eris
tics
of th
e re
spon
dent
sA
cces
s to
ele
ctric
ityS
R.1
0.95
920.
0179
0.01
99.
093
3.01
54,
314
1,
115
0.92
30.
995
Ow
ners
hip
of m
obile
pho
ne (w
omen
)S
R.1
00.
7566
0.02
650.
035
5.31
32.
305
1,03
4
1,39
4
0.
704
0.81
0O
wne
rshi
p of
mob
ile p
hone
(men
)S
R.1
00.
9364
0.01
380.
015
2.18
01.
476
498
684
0.
909
0.96
4U
se o
f int
erne
t (w
omen
)S
R.1
2a0.
2717
0.01
570.
058
1.73
61.
317
1,03
4
1,39
4
0.
240
0.30
3U
se o
f int
erne
t (m
en)
SR
.12a
0.07
470.
0123
0.16
41.
484
1.21
849
8
68
4
0.05
00.
099
ICT
skill
s (w
omen
)S
R.1
30.
0413
0.00
620.
151
1.36
71.
169
1,03
4
1,39
4
0.
029
0.05
4IC
T sk
ills
(men
)S
R.1
30.
1248
0.01
960.
157
2.39
51.
548
498
684
0.
086
0.16
4U
se o
f tob
acco
(wom
en)
SR
.14
0.00
750.
0046
0.60
93.
894
1.97
31,
034
1,
394
0.00
00.
017
Use
of t
obac
co (m
en)
SR
.14
0.36
020.
0323
0.09
03.
083
1.75
649
8
68
4
0.29
60.
425
Surv
ive
Neo
nata
l mor
talit
y ra
teC
S.1
165.
1817
0.32
5na
nana
na6
26In
fant
mor
talit
y ra
teC
S.3
337.
3130
0.22
4na
nana
na18
47U
nder
-five
mor
talit
y ra
teC
S.5
397.
9944
0.20
3na
nana
na23
55Th
rive
- Rep
rodu
ctiv
e an
d m
ater
nal h
ealth
Tota
l fer
tility
rate
-3.
30.
2073
0.06
4na
nana
na2.
83.
7A
dole
scen
t birt
h ra
teTM
.110
5.4
13.7
364
0.13
0na
nana
na77
.913
2.8
…C
ontra
cept
ive
prev
alen
ce ra
teTM
.30.
5437
0.02
030.
037
1.80
81.
345
810
1,09
2
0.
503
0.58
4N
eed
for f
amily
pla
nnin
g sa
tisfie
d w
ith m
oder
n co
ntra
cept
ion
TM.4
0.59
380.
0284
0.04
82.
382
1.54
352
8
71
3
0.53
70.
651
Ant
enat
al c
are
cove
rage
(4+)
TM.5
b0.
6990
0.04
210.
060
2.47
61.
573
219
295
0.
615
0.78
3S
kille
d at
tend
ant a
t del
iver
yTM
.90.
6215
0.04
780.
077
2.85
91.
691
219
295
0.
526
0.71
7Th
rive
- Chi
ld h
ealth
, nut
ritio
n an
d de
velo
pmen
tD
ipht
heria
, per
tuss
is a
nd te
tanu
s (D
PT)
imm
uniz
atio
n co
vera
geTC
.30.
6882
0.06
510.
095
2.68
71.
639
110
137
0.
558
0.81
8P
neum
ococ
cal (
Con
juga
te) i
mm
uniz
atio
n co
vera
geTC
.60.
6512
0.06
860.
105
2.81
51.
678
110
137
0.
514
0.78
8M
easl
es im
mun
izat
ion
cove
rage
TC.1
00.
6479
0.05
600.
086
1.86
81.
367
110
137
0.
536
0.76
0P
rimar
y re
lianc
e on
cle
an fu
els
and
tech
nolo
gies
for c
ooki
ng, s
pace
hea
ting
and
light
ing
TC.1
80.
0171
0.00
440.
259
1.29
61.
139
4,31
4
1,11
5
0.
008
0.02
6P
opul
atio
n w
ho s
lept
und
er a
n IT
NTC
.22
0.34
670.
0237
0.06
813
.663
3.69
64,
175
5,
510
0.29
90.
394
Exc
lusi
ve b
reas
tfeed
ing
unde
r 6 m
onth
sTC
.32
0.57
580.
0652
0.11
31.
112
1.05
552
65
0.44
50.
706
Stu
ntin
g pr
eval
ence
(mod
erat
e an
d se
vere
)TC
.45a
0.46
300.
0216
0.04
71.
319
1.14
955
8
70
2
0.42
00.
506
Was
ting
prev
alen
ce (m
oder
ate
and
seve
re)
TC.4
6a0.
0503
0.00
910.
180
1.20
61.
098
556
700
0.
032
0.06
8O
verw
eigh
t pre
vale
nce
(mod
erat
e an
d se
vere
)TC
.47a
0.02
950.
0063
0.21
40.
970
0.98
555
6
70
0
0.01
70.
042
Ear
ly c
hild
dev
elop
men
t ind
exTC
.53
0.96
030.
0090
0.00
90.
592
0.77
022
6
28
0
0.94
20.
978
Low
er b
ound
r - 2
seU
pper
bou
ndr +
2se
Lear
nP
artic
ipat
ion
rate
in o
rgan
ised
lear
ning
(adj
uste
d)LN
.20.
8799
0.04
260.
048
2.31
41.
521
103
136
0.
795
0.96
5Pr
otec
ted
from
vio
lenc
e an
d ex
ploi
tatio
nB
irth
regi
stra
tion
PR
.10.
7876
0.02
260.
029
2.16
61.
472
565
710
0.
742
0.83
3V
iole
nt d
isci
plin
eP
R.2
0.79
170.
0199
0.02
52.
816
1.67
81,
470
1,
176
0.75
20.
831
Chi
ld la
bour
PR
.30.
6642
0.02
170.
033
1.66
11.
289
1,28
4
786
0.
621
0.70
8C
hild
mar
riage
(bef
ore
age
15)
PR
.4a
0.10
030.
0148
0.14
70.
616
0.78
518
7
25
5
0.07
10.
130
Chi
ld m
arria
ge (b
efor
e ag
e 18
)P
R.4
b0.
3596
0.02
820.
078
0.87
50.
935
187
255
0.
303
0.41
6Li
ve in
a s
afe
and
clea
n en
viro
nmen
tU
se o
f bas
ic d
rinki
ng w
ater
ser
vice
sW
S.2
0.90
800.
0213
0.02
36.
067
2.46
34,
314
1,
115
0.86
50.
951
Use
of s
afel
y m
anag
ed d
rinki
ng w
ater
ser
vice
sW
S.6
0.17
180.
0303
0.17
61.
070
1.03
463
6
16
7
0.11
10.
232
Han
dwas
hing
faci
lity
with
wat
er a
nd s
oap
WS
.70.
5826
0.03
220.
055
4.75
82.
181
4,31
4
1,11
5
0.
518
0.64
7U
se o
f bas
ic s
anita
tion
serv
ices
WS
.90.
8472
0.02
930.
035
7.37
62.
716
4,31
4
1,11
5
0.
789
0.90
6S
afe
disp
osal
in s
itu o
f exc
reta
from
on-
site
san
itatio
n fa
cilit
ies
WS
.10
0.97
640.
0071
0.00
72.
157
1.46
93,
775
98
5
0.96
20.
991
Equi
tabl
e ch
ance
in li
feC
hild
ren
with
func
tiona
l difi
culty
E
Q.1
0.00
220.
0022
0.98
70.
904
0.95
133
5
42
0
0.00
00.
007
Pop
ulat
ion
cove
red
by s
ocia
l tra
nsfe
rsE
Q.3
0.10
340.
0112
0.10
81.
507
1.22
84,
314
1,
115
0.08
10.
126
na: n
ot a
pplic
able
Tabl
e SE
.17:
Sam
plin
g er
rors
: Xie
ngkh
uang
Sta
ndar
d er
rors
, coe
ffici
ents
of v
aria
tion,
des
ign
effe
cts
(def
f), s
quar
e ro
ot o
f des
ign
effe
cts
(def
t), a
nd c
onfid
ence
inte
rval
s fo
r sel
ecte
d S
DG
and
MIC
S in
dica
tors
, LS
ISII,
201
7
MIC
SIn
dica
tor
Val
ue (r
)S
tand
ard
erro
r (se
)
Coe
ffici
ent o
f va
riatio
n(s
e/r)
Des
ign
effe
ct
(def
f)
Squ
are
root
of
des
ign
effe
ct (d
eft)
Wei
ghte
d co
unt
Unw
eigh
ted
coun
t
Con
fiden
ce li
mits
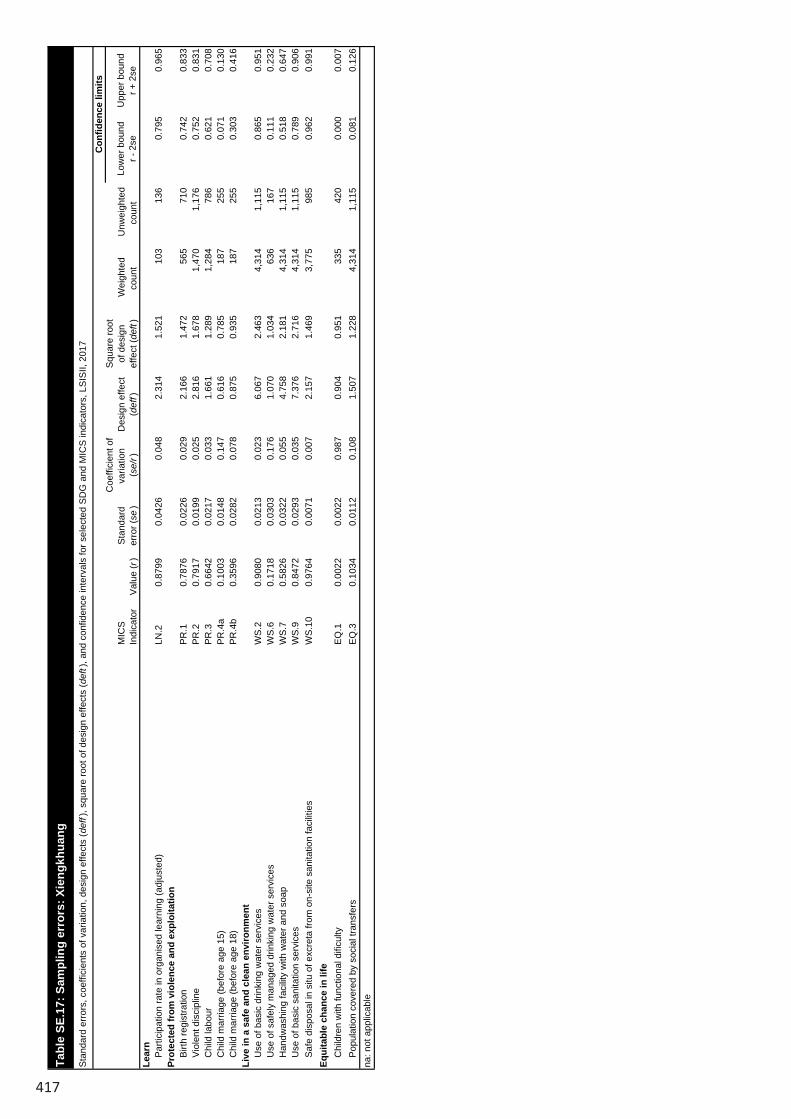
417
Low
er b
ound
r - 2
seU
pper
bou
ndr +
2se
Sam
ple
cove
rage
and
cha
ract
eris
tics
of th
e re
spon
dent
sA
cces
s to
ele
ctric
ityS
R.1
0.95
920.
0179
0.01
99.
093
3.01
54,
314
1,
115
0.92
30.
995
Ow
ners
hip
of m
obile
pho
ne (w
omen
)S
R.1
00.
7566
0.02
650.
035
5.31
32.
305
1,03
4
1,39
4
0.
704
0.81
0O
wne
rshi
p of
mob
ile p
hone
(men
)S
R.1
00.
9364
0.01
380.
015
2.18
01.
476
498
684
0.
909
0.96
4U
se o
f int
erne
t (w
omen
)S
R.1
2a0.
2717
0.01
570.
058
1.73
61.
317
1,03
4
1,39
4
0.
240
0.30
3U
se o
f int
erne
t (m
en)
SR
.12a
0.07
470.
0123
0.16
41.
484
1.21
849
8
68
4
0.05
00.
099
ICT
skill
s (w
omen
)S
R.1
30.
0413
0.00
620.
151
1.36
71.
169
1,03
4
1,39
4
0.
029
0.05
4IC
T sk
ills
(men
)S
R.1
30.
1248
0.01
960.
157
2.39
51.
548
498
684
0.
086
0.16
4U
se o
f tob
acco
(wom
en)
SR
.14
0.00
750.
0046
0.60
93.
894
1.97
31,
034
1,
394
0.00
00.
017
Use
of t
obac
co (m
en)
SR
.14
0.36
020.
0323
0.09
03.
083
1.75
649
8
68
4
0.29
60.
425
Surv
ive
Neo
nata
l mor
talit
y ra
teC
S.1
165.
1817
0.32
5na
nana
na6
26In
fant
mor
talit
y ra
teC
S.3
337.
3130
0.22
4na
nana
na18
47U
nder
-five
mor
talit
y ra
teC
S.5
397.
9944
0.20
3na
nana
na23
55Th
rive
- Rep
rodu
ctiv
e an
d m
ater
nal h
ealth
Tota
l fer
tility
rate
-3.
30.
2073
0.06
4na
nana
na2.
83.
7A
dole
scen
t birt
h ra
teTM
.110
5.4
13.7
364
0.13
0na
nana
na77
.913
2.8
…C
ontra
cept
ive
prev
alen
ce ra
teTM
.30.
5437
0.02
030.
037
1.80
81.
345
810
1,09
2
0.
503
0.58
4N
eed
for f
amily
pla
nnin
g sa
tisfie
d w
ith m
oder
n co
ntra
cept
ion
TM.4
0.59
380.
0284
0.04
82.
382
1.54
352
8
71
3
0.53
70.
651
Ant
enat
al c
are
cove
rage
(4+)
TM.5
b0.
6990
0.04
210.
060
2.47
61.
573
219
295
0.
615
0.78
3S
kille
d at
tend
ant a
t del
iver
yTM
.90.
6215
0.04
780.
077
2.85
91.
691
219
295
0.
526
0.71
7Th
rive
- Chi
ld h
ealth
, nut
ritio
n an
d de
velo
pmen
tD
ipht
heria
, per
tuss
is a
nd te
tanu
s (D
PT)
imm
uniz
atio
n co
vera
geTC
.30.
6882
0.06
510.
095
2.68
71.
639
110
137
0.
558
0.81
8P
neum
ococ
cal (
Con
juga
te) i
mm
uniz
atio
n co
vera
geTC
.60.
6512
0.06
860.
105
2.81
51.
678
110
137
0.
514
0.78
8M
easl
es im
mun
izat
ion
cove
rage
TC.1
00.
6479
0.05
600.
086
1.86
81.
367
110
137
0.
536
0.76
0P
rimar
y re
lianc
e on
cle
an fu
els
and
tech
nolo
gies
for c
ooki
ng, s
pace
hea
ting
and
light
ing
TC.1
80.
0171
0.00
440.
259
1.29
61.
139
4,31
4
1,11
5
0.
008
0.02
6P
opul
atio
n w
ho s
lept
und
er a
n IT
NTC
.22
0.34
670.
0237
0.06
813
.663
3.69
64,
175
5,
510
0.29
90.
394
Exc
lusi
ve b
reas
tfeed
ing
unde
r 6 m
onth
sTC
.32
0.57
580.
0652
0.11
31.
112
1.05
552
65
0.44
50.
706
Stu
ntin
g pr
eval
ence
(mod
erat
e an
d se
vere
)TC
.45a
0.46
300.
0216
0.04
71.
319
1.14
955
8
70
2
0.42
00.
506
Was
ting
prev
alen
ce (m
oder
ate
and
seve
re)
TC.4
6a0.
0503
0.00
910.
180
1.20
61.
098
556
700
0.
032
0.06
8O
verw
eigh
t pre
vale
nce
(mod
erat
e an
d se
vere
)TC
.47a
0.02
950.
0063
0.21
40.
970
0.98
555
6
70
0
0.01
70.
042
Ear
ly c
hild
dev
elop
men
t ind
exTC
.53
0.96
030.
0090
0.00
90.
592
0.77
022
6
28
0
0.94
20.
978
Low
er b
ound
r - 2
seU
pper
bou
ndr +
2se
Lear
nP
artic
ipat
ion
rate
in o
rgan
ised
lear
ning
(adj
uste
d)LN
.20.
8799
0.04
260.
048
2.31
41.
521
103
136
0.
795
0.96
5Pr
otec
ted
from
vio
lenc
e an
d ex
ploi
tatio
nB
irth
regi
stra
tion
PR
.10.
7876
0.02
260.
029
2.16
61.
472
565
710
0.
742
0.83
3V
iole
nt d
isci
plin
eP
R.2
0.79
170.
0199
0.02
52.
816
1.67
81,
470
1,
176
0.75
20.
831
Chi
ld la
bour
PR
.30.
6642
0.02
170.
033
1.66
11.
289
1,28
4
786
0.
621
0.70
8C
hild
mar
riage
(bef
ore
age
15)
PR
.4a
0.10
030.
0148
0.14
70.
616
0.78
518
7
25
5
0.07
10.
130
Chi
ld m
arria
ge (b
efor
e ag
e 18
)P
R.4
b0.
3596
0.02
820.
078
0.87
50.
935
187
255
0.
303
0.41
6Li
ve in
a s
afe
and
clea
n en
viro
nmen
tU
se o
f bas
ic d
rinki
ng w
ater
ser
vice
sW
S.2
0.90
800.
0213
0.02
36.
067
2.46
34,
314
1,
115
0.86
50.
951
Use
of s
afel
y m
anag
ed d
rinki
ng w
ater
ser
vice
sW
S.6
0.17
180.
0303
0.17
61.
070
1.03
463
6
16
7
0.11
10.
232
Han
dwas
hing
faci
lity
with
wat
er a
nd s
oap
WS
.70.
5826
0.03
220.
055
4.75
82.
181
4,31
4
1,11
5
0.
518
0.64
7U
se o
f bas
ic s
anita
tion
serv
ices
WS
.90.
8472
0.02
930.
035
7.37
62.
716
4,31
4
1,11
5
0.
789
0.90
6S
afe
disp
osal
in s
itu o
f exc
reta
from
on-
site
san
itatio
n fa
cilit
ies
WS
.10
0.97
640.
0071
0.00
72.
157
1.46
93,
775
98
5
0.96
20.
991
Equi
tabl
e ch
ance
in li
feC
hild
ren
with
func
tiona
l difi
culty
E
Q.1
0.00
220.
0022
0.98
70.
904
0.95
133
5
42
0
0.00
00.
007
Pop
ulat
ion
cove
red
by s
ocia
l tra
nsfe
rsE
Q.3
0.10
340.
0112
0.10
81.
507
1.22
84,
314
1,
115
0.08
10.
126
na: n
ot a
pplic
able
Tabl
e SE
.17:
Sam
plin
g er
rors
: Xie
ngkh
uang
Sta
ndar
d er
rors
, coe
ffici
ents
of v
aria
tion,
des
ign
effe
cts
(def
f), s
quar
e ro
ot o
f des
ign
effe
cts
(def
t), a
nd c
onfid
ence
inte
rval
s fo
r sel
ecte
d S
DG
and
MIC
S in
dica
tors
, LS
ISII,
201
7
MIC
SIn
dica
tor
Val
ue (r
)S
tand
ard
erro
r (se
)
Coe
ffici
ent o
f va
riatio
n(s
e/r)
Des
ign
effe
ct
(def
f)
Squ
are
root
of
des
ign
effe
ct (d
eft)
Wei
ghte
d co
unt
Unw
eigh
ted
coun
t
Con
fiden
ce li
mits
Tabl
e SE
.17:
Sam
plin
g er
rors
: Xie
ngkh
uang
Sta
ndar
d er
rors
, coe
ffici
ents
of v
aria
tion,
des
ign
effe
cts
(def
f), s
quar
e ro
ot o
f des
ign
effe
cts
(def
t), a
nd c
onfid
ence
inte
rval
s fo
r sel
ecte
d S
DG
and
MIC
S in
dica
tors
, LS
ISII,
201
7
MIC
SIn
dica
tor
Val
ue (r
)S
tand
ard
erro
r (se
)
Coe
ffici
ent o
f va
riatio
n(s
e/r)
Des
ign
effe
ct
(def
f)
Squ
are
root
of
des
ign
effe
ct (d
eft)
Wei
ghte
d co
unt
Unw
eigh
ted
coun
t
Con
fiden
ce li
mits
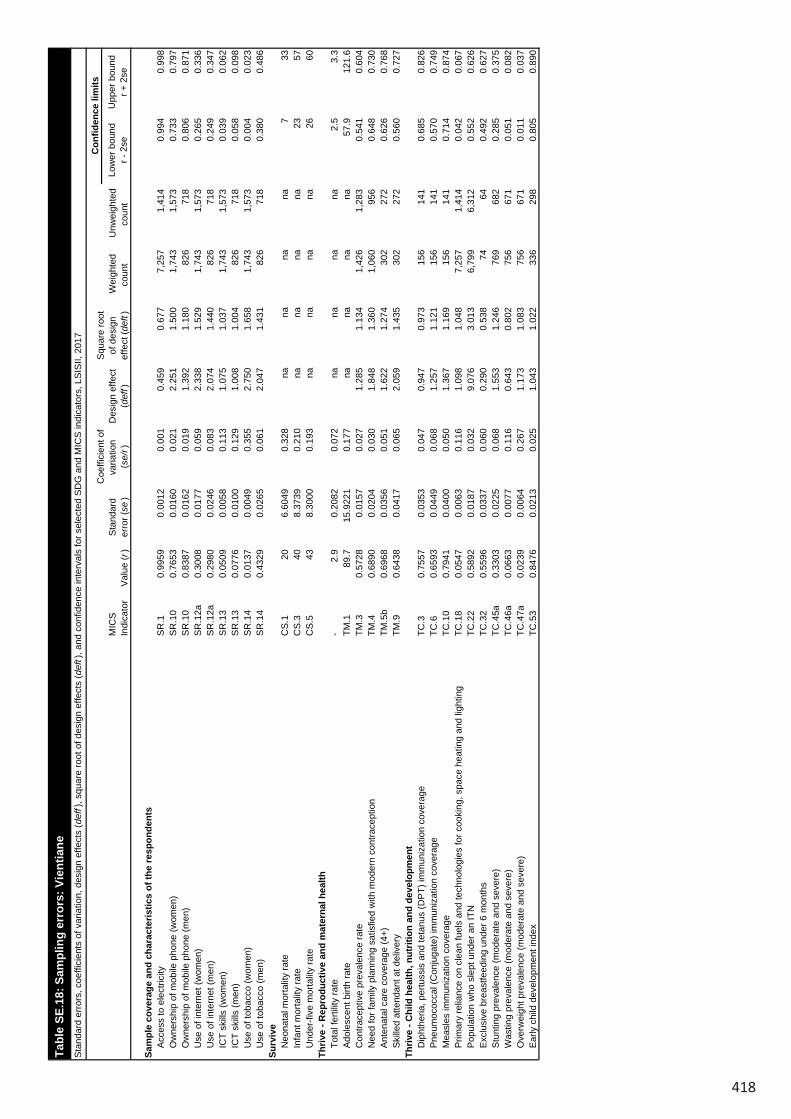
418
Low
er b
ound
r - 2
seU
pper
bou
ndr +
2se
Sam
ple
cove
rage
and
cha
ract
eris
tics
of th
e re
spon
dent
sA
cces
s to
ele
ctric
ityS
R.1
0.99
590.
0012
0.00
10.
459
0.67
77,
257
1,41
4
0.
994
0.99
8O
wne
rshi
p of
mob
ile p
hone
(wom
en)
SR
.10
0.76
530.
0160
0.02
12.
251
1.50
01,
743
1,57
3
0.
733
0.79
7O
wne
rshi
p of
mob
ile p
hone
(men
)S
R.1
00.
8387
0.01
620.
019
1.39
21.
180
826
71
8
0.80
60.
871
Use
of i
nter
net (
wom
en)
SR
.12a
0.30
080.
0177
0.05
92.
338
1.52
91,
743
1,57
3
0.
265
0.33
6U
se o
f int
erne
t (m
en)
SR
.12a
0.29
800.
0246
0.08
32.
074
1.44
082
6
718
0.
249
0.34
7IC
T sk
ills
(wom
en)
SR
.13
0.05
090.
0058
0.11
31.
075
1.03
71,
743
1,57
3
0.
039
0.06
2IC
T sk
ills
(men
)S
R.1
30.
0776
0.01
000.
129
1.00
81.
004
826
71
8
0.05
80.
098
Use
of t
obac
co (w
omen
)S
R.1
40.
0137
0.00
490.
355
2.75
01.
658
1,74
3
1,
573
0.00
40.
023
Use
of t
obac
co (m
en)
SR
.14
0.43
290.
0265
0.06
12.
047
1.43
182
6
718
0.
380
0.48
6Su
rviv
eN
eona
tal m
orta
lity
rate
CS
.120
6.60
490.
328
nana
nana
733
Infa
nt m
orta
lity
rate
CS
.340
8.37
390.
210
nana
nana
2357
Und
er-fi
ve m
orta
lity
rate
CS
.543
8.30
000.
193
nana
nana
2660
Thriv
e - R
epro
duct
ive
and
mat
erna
l hea
lthTo
tal f
ertil
ity ra
te-
2.9
0.20
820.
072
nana
nana
2.5
3.3
Ado
lesc
ent b
irth
rate
TM.1
89.7
15.9
221
0.17
7na
nana
na57
.912
1.6
…C
ontra
cept
ive
prev
alen
ce ra
teTM
.30.
5728
0.01
570.
027
1.28
51.
134
1,42
6
1,
283
0.54
10.
604
Nee
d fo
r fam
ily p
lann
ing
satis
fied
with
mod
ern
cont
race
ptio
nTM
.40.
6890
0.02
040.
030
1.84
81.
360
1,06
0
95
6
0.64
80.
730
Ant
enat
al c
are
cove
rage
(4+)
TM.5
b0.
6968
0.03
560.
051
1.62
21.
274
302
27
2
0.62
60.
768
Ski
lled
atte
ndan
t at d
eliv
ery
TM.9
0.64
380.
0417
0.06
52.
059
1.43
530
2
272
0.
560
0.72
7Th
rive
- Chi
ld h
ealth
, nut
ritio
n an
d de
velo
pmen
tD
ipht
heria
, per
tuss
is a
nd te
tanu
s (D
PT)
imm
uniz
atio
n co
vera
geTC
.30.
7557
0.03
530.
047
0.94
70.
973
156
14
1
0.68
50.
826
Pne
umoc
occa
l (C
onju
gate
) im
mun
izat
ion
cove
rage
TC.6
0.65
930.
0449
0.06
81.
257
1.12
115
6
141
0.
570
0.74
9M
easl
es im
mun
izat
ion
cove
rage
TC.1
00.
7941
0.04
000.
050
1.36
71.
169
156
14
1
0.71
40.
874
Prim
ary
relia
nce
on c
lean
fuel
s an
d te
chno
logi
es fo
r coo
king
, spa
ce h
eatin
g an
d lig
htin
gTC
.18
0.05
470.
0063
0.11
61.
098
1.04
87,
257
1,41
4
0.
042
0.06
7P
opul
atio
n w
ho s
lept
und
er a
n IT
NTC
.22
0.58
920.
0187
0.03
29.
076
3.01
36,
799
6,31
2
0.
552
0.62
6E
xclu
sive
bre
astfe
edin
g un
der 6
mon
ths
TC.3
20.
5596
0.03
370.
060
0.29
00.
538
74
64
0.49
20.
627
Stu
ntin
g pr
eval
ence
(mod
erat
e an
d se
vere
)TC
.45a
0.33
030.
0225
0.06
81.
553
1.24
676
9
682
0.
285
0.37
5W
astin
g pr
eval
ence
(mod
erat
e an
d se
vere
)TC
.46a
0.06
630.
0077
0.11
60.
643
0.80
275
6
671
0.
051
0.08
2O
verw
eigh
t pre
vale
nce
(mod
erat
e an
d se
vere
)TC
.47a
0.02
390.
0064
0.26
71.
173
1.08
375
6
671
0.
011
0.03
7E
arly
chi
ld d
evel
opm
ent i
ndex
TC.5
30.
8476
0.02
130.
025
1.04
31.
022
336
29
8
0.80
50.
890
Low
er b
ound
r - 2
seU
pper
bou
ndr +
2se
Lear
nP
artic
ipat
ion
rate
in o
rgan
ised
lear
ning
(adj
uste
d)LN
.20.
8647
0.02
300.
027
0.69
00.
830
171
15
4
0.81
90.
911
Prot
ecte
d fr
om v
iole
nce
and
expl
oita
tion
Birt
h re
gist
ratio
nP
R.1
0.66
430.
0246
0.03
71.
925
1.38
780
3
713
0.
615
0.71
3V
iole
nt d
isci
plin
eP
R.2
0.79
760.
0173
0.02
22.
514
1.58
52,
318
1,35
7
0.
763
0.83
2C
hild
labo
urP
R.3
0.47
240.
0243
0.05
12.
386
1.54
52,
174
1,01
2
0.
424
0.52
1C
hild
mar
riage
(bef
ore
age
15)
PR
.4a
0.06
250.
0133
0.21
30.
753
0.86
827
5
249
0.
036
0.08
9C
hild
mar
riage
(bef
ore
age
18)
PR
.4b
0.34
930.
0413
0.11
81.
857
1.36
327
5
249
0.
267
0.43
2Li
ve in
a s
afe
and
clea
n en
viro
nmen
tU
se o
f bas
ic d
rinki
ng w
ater
ser
vice
sW
S.2
0.82
170.
0176
0.02
13.
001
1.73
27,
257
1,41
4
0.
786
0.85
7U
se o
f saf
ely
man
aged
drin
king
wat
er s
ervi
ces
WS
.60.
0597
0.01
530.
256
0.88
00.
938
1,11
0
21
3
0.02
90.
090
Han
dwas
hing
faci
lity
with
wat
er a
nd s
oap
WS
.70.
5602
0.02
440.
044
3.41
71.
848
7,25
7
1,
414
0.51
10.
609
Use
of b
asic
san
itatio
n se
rvic
esW
S.9
0.84
920.
0175
0.02
13.
361
1.83
37,
257
1,41
4
0.
814
0.88
4S
afe
disp
osal
in s
itu o
f exc
reta
from
on-
site
san
itatio
n fa
cilit
ies
WS
.10
0.93
230.
0105
0.01
12.
223
1.49
16,
401
1,26
5
0.
911
0.95
3Eq
uita
ble
chan
ce in
life
Chi
ldre
n w
ith fu
nctio
nal d
ificu
lty
EQ
.10.
0182
0.00
660.
364
1.10
01.
049
506
44
8
0.00
50.
032
Pop
ulat
ion
cove
red
by s
ocia
l tra
nsfe
rsE
Q.3
0.19
720.
0161
0.08
12.
301
1.51
77,
257
1,41
4
0.
165
0.22
9na
: not
app
licab
le
Tabl
e SE
.18:
Sam
plin
g er
rors
: Vie
ntia
neS
tand
ard
erro
rs, c
oeffi
cien
ts o
f var
iatio
n, d
esig
n ef
fect
s (d
eff)
, squ
are
root
of d
esig
n ef
fect
s (d
eft)
, and
con
fiden
ce in
terv
als
for s
elec
ted
SD
G a
nd M
ICS
indi
cato
rs, L
SIS
II, 2
017
MIC
SIn
dica
tor
Val
ue (r
)S
tand
ard
erro
r (se
)
Coe
ffici
ent o
f va
riatio
n(s
e/r)
Des
ign
effe
ct
(def
f)
Squ
are
root
of
des
ign
effe
ct (d
eft)
Wei
ghte
d co
unt
Unw
eigh
ted
coun
t
Con
fiden
ce li
mits
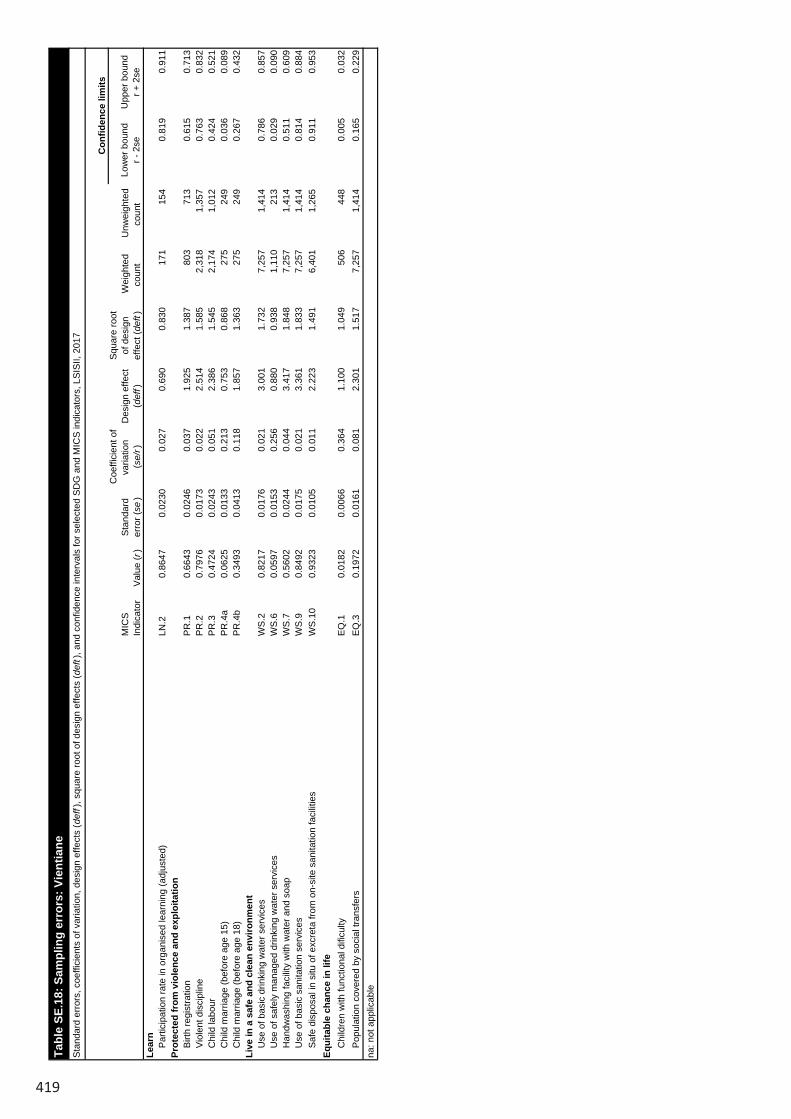
419
Low
er b
ound
r - 2
seU
pper
bou
ndr +
2se
Sam
ple
cove
rage
and
cha
ract
eris
tics
of th
e re
spon
dent
sA
cces
s to
ele
ctric
ityS
R.1
0.99
590.
0012
0.00
10.
459
0.67
77,
257
1,41
4
0.
994
0.99
8O
wne
rshi
p of
mob
ile p
hone
(wom
en)
SR
.10
0.76
530.
0160
0.02
12.
251
1.50
01,
743
1,57
3
0.
733
0.79
7O
wne
rshi
p of
mob
ile p
hone
(men
)S
R.1
00.
8387
0.01
620.
019
1.39
21.
180
826
71
8
0.80
60.
871
Use
of i
nter
net (
wom
en)
SR
.12a
0.30
080.
0177
0.05
92.
338
1.52
91,
743
1,57
3
0.
265
0.33
6U
se o
f int
erne
t (m
en)
SR
.12a
0.29
800.
0246
0.08
32.
074
1.44
082
6
718
0.
249
0.34
7IC
T sk
ills
(wom
en)
SR
.13
0.05
090.
0058
0.11
31.
075
1.03
71,
743
1,57
3
0.
039
0.06
2IC
T sk
ills
(men
)S
R.1
30.
0776
0.01
000.
129
1.00
81.
004
826
71
8
0.05
80.
098
Use
of t
obac
co (w
omen
)S
R.1
40.
0137
0.00
490.
355
2.75
01.
658
1,74
3
1,
573
0.00
40.
023
Use
of t
obac
co (m
en)
SR
.14
0.43
290.
0265
0.06
12.
047
1.43
182
6
718
0.
380
0.48
6Su
rviv
eN
eona
tal m
orta
lity
rate
CS
.120
6.60
490.
328
nana
nana
733
Infa
nt m
orta
lity
rate
CS
.340
8.37
390.
210
nana
nana
2357
Und
er-fi
ve m
orta
lity
rate
CS
.543
8.30
000.
193
nana
nana
2660
Thriv
e - R
epro
duct
ive
and
mat
erna
l hea
lthTo
tal f
ertil
ity ra
te-
2.9
0.20
820.
072
nana
nana
2.5
3.3
Ado
lesc
ent b
irth
rate
TM.1
89.7
15.9
221
0.17
7na
nana
na57
.912
1.6
…C
ontra
cept
ive
prev
alen
ce ra
teTM
.30.
5728
0.01
570.
027
1.28
51.
134
1,42
6
1,
283
0.54
10.
604
Nee
d fo
r fam
ily p
lann
ing
satis
fied
with
mod
ern
cont
race
ptio
nTM
.40.
6890
0.02
040.
030
1.84
81.
360
1,06
0
95
6
0.64
80.
730
Ant
enat
al c
are
cove
rage
(4+)
TM.5
b0.
6968
0.03
560.
051
1.62
21.
274
302
27
2
0.62
60.
768
Ski
lled
atte
ndan
t at d
eliv
ery
TM.9
0.64
380.
0417
0.06
52.
059
1.43
530
2
272
0.
560
0.72
7Th
rive
- Chi
ld h
ealth
, nut
ritio
n an
d de
velo
pmen
tD
ipht
heria
, per
tuss
is a
nd te
tanu
s (D
PT)
imm
uniz
atio
n co
vera
geTC
.30.
7557
0.03
530.
047
0.94
70.
973
156
14
1
0.68
50.
826
Pne
umoc
occa
l (C
onju
gate
) im
mun
izat
ion
cove
rage
TC.6
0.65
930.
0449
0.06
81.
257
1.12
115
6
141
0.
570
0.74
9M
easl
es im
mun
izat
ion
cove
rage
TC.1
00.
7941
0.04
000.
050
1.36
71.
169
156
14
1
0.71
40.
874
Prim
ary
relia
nce
on c
lean
fuel
s an
d te
chno
logi
es fo
r coo
king
, spa
ce h
eatin
g an
d lig
htin
gTC
.18
0.05
470.
0063
0.11
61.
098
1.04
87,
257
1,41
4
0.
042
0.06
7P
opul
atio
n w
ho s
lept
und
er a
n IT
NTC
.22
0.58
920.
0187
0.03
29.
076
3.01
36,
799
6,31
2
0.
552
0.62
6E
xclu
sive
bre
astfe
edin
g un
der 6
mon
ths
TC.3
20.
5596
0.03
370.
060
0.29
00.
538
74
64
0.49
20.
627
Stu
ntin
g pr
eval
ence
(mod
erat
e an
d se
vere
)TC
.45a
0.33
030.
0225
0.06
81.
553
1.24
676
9
682
0.
285
0.37
5W
astin
g pr
eval
ence
(mod
erat
e an
d se
vere
)TC
.46a
0.06
630.
0077
0.11
60.
643
0.80
275
6
671
0.
051
0.08
2O
verw
eigh
t pre
vale
nce
(mod
erat
e an
d se
vere
)TC
.47a
0.02
390.
0064
0.26
71.
173
1.08
375
6
671
0.
011
0.03
7E
arly
chi
ld d
evel
opm
ent i
ndex
TC.5
30.
8476
0.02
130.
025
1.04
31.
022
336
29
8
0.80
50.
890
Low
er b
ound
r - 2
seU
pper
bou
ndr +
2se
Lear
nP
artic
ipat
ion
rate
in o
rgan
ised
lear
ning
(adj
uste
d)LN
.20.
8647
0.02
300.
027
0.69
00.
830
171
15
4
0.81
90.
911
Prot
ecte
d fr
om v
iole
nce
and
expl
oita
tion
Birt
h re
gist
ratio
nP
R.1
0.66
430.
0246
0.03
71.
925
1.38
780
3
713
0.
615
0.71
3V
iole
nt d
isci
plin
eP
R.2
0.79
760.
0173
0.02
22.
514
1.58
52,
318
1,35
7
0.
763
0.83
2C
hild
labo
urP
R.3
0.47
240.
0243
0.05
12.
386
1.54
52,
174
1,01
2
0.
424
0.52
1C
hild
mar
riage
(bef
ore
age
15)
PR
.4a
0.06
250.
0133
0.21
30.
753
0.86
827
5
249
0.
036
0.08
9C
hild
mar
riage
(bef
ore
age
18)
PR
.4b
0.34
930.
0413
0.11
81.
857
1.36
327
5
249
0.
267
0.43
2Li
ve in
a s
afe
and
clea
n en
viro
nmen
tU
se o
f bas
ic d
rinki
ng w
ater
ser
vice
sW
S.2
0.82
170.
0176
0.02
13.
001
1.73
27,
257
1,41
4
0.
786
0.85
7U
se o
f saf
ely
man
aged
drin
king
wat
er s
ervi
ces
WS
.60.
0597
0.01
530.
256
0.88
00.
938
1,11
0
21
3
0.02
90.
090
Han
dwas
hing
faci
lity
with
wat
er a
nd s
oap
WS
.70.
5602
0.02
440.
044
3.41
71.
848
7,25
7
1,
414
0.51
10.
609
Use
of b
asic
san
itatio
n se
rvic
esW
S.9
0.84
920.
0175
0.02
13.
361
1.83
37,
257
1,41
4
0.
814
0.88
4S
afe
disp
osal
in s
itu o
f exc
reta
from
on-
site
san
itatio
n fa
cilit
ies
WS
.10
0.93
230.
0105
0.01
12.
223
1.49
16,
401
1,26
5
0.
911
0.95
3Eq
uita
ble
chan
ce in
life
Chi
ldre
n w
ith fu
nctio
nal d
ificu
lty
EQ
.10.
0182
0.00
660.
364
1.10
01.
049
506
44
8
0.00
50.
032
Pop
ulat
ion
cove
red
by s
ocia
l tra
nsfe
rsE
Q.3
0.19
720.
0161
0.08
12.
301
1.51
77,
257
1,41
4
0.
165
0.22
9na
: not
app
licab
le
Tabl
e SE
.18:
Sam
plin
g er
rors
: Vie
ntia
neS
tand
ard
erro
rs, c
oeffi
cien
ts o
f var
iatio
n, d
esig
n ef
fect
s (d
eff)
, squ
are
root
of d
esig
n ef
fect
s (d
eft)
, and
con
fiden
ce in
terv
als
for s
elec
ted
SD
G a
nd M
ICS
indi
cato
rs, L
SIS
II, 2
017
MIC
SIn
dica
tor
Val
ue (r
)S
tand
ard
erro
r (se
)
Coe
ffici
ent o
f va
riatio
n(s
e/r)
Des
ign
effe
ct
(def
f)
Squ
are
root
of
des
ign
effe
ct (d
eft)
Wei
ghte
d co
unt
Unw
eigh
ted
coun
t
Con
fiden
ce li
mits
Tabl
e SE
.18:
Sam
plin
g er
rors
: Vie
ntia
neS
tand
ard
erro
rs, c
oeffi
cien
ts o
f var
iatio
n, d
esig
n ef
fect
s (d
eff)
, squ
are
root
of d
esig
n ef
fect
s (d
eft)
, and
con
fiden
ce in
terv
als
for s
elec
ted
SD
G a
nd M
ICS
indi
cato
rs, L
SIS
II, 2
017
MIC
SIn
dica
tor
Val
ue (r
)S
tand
ard
erro
r (se
)
Coe
ffici
ent o
f va
riatio
n(s
e/r)
Des
ign
effe
ct
(def
f)
Squ
are
root
of
des
ign
effe
ct (d
eft)
Wei
ghte
d co
unt
Unw
eigh
ted
coun
t
Con
fiden
ce li
mits

420
Low
er b
ound
r - 2
seU
pper
bou
ndr +
2se
Sam
ple
cove
rage
and
cha
ract
eris
tics
of th
e re
spon
dent
sA
cces
s to
ele
ctric
ityS
R.1
0.99
780.
0013
0.00
10.
854
0.92
44,
521
1,13
2
0.
995
1.00
0O
wne
rshi
p of
mob
ile p
hone
(wom
en)
SR
.10
0.87
520.
0138
0.01
62.
348
1.53
21,
129
1,35
0
0.
848
0.90
3O
wne
rshi
p of
mob
ile p
hone
(men
)S
R.1
00.
8800
0.01
670.
019
1.61
81.
272
521
61
6
0.84
70.
913
Use
of i
nter
net (
wom
en)
SR
.12a
0.42
950.
0176
0.04
11.
701
1.30
41,
129
1,35
0
0.
394
0.46
5U
se o
f int
erne
t (m
en)
SR
.12a
0.43
380.
0210
0.04
81.
108
1.05
252
1
616
0.
392
0.47
6IC
T sk
ills
(wom
en)
SR
.13
0.05
700.
0085
0.15
01.
829
1.35
31,
129
1,35
0
0.
040
0.07
4IC
T sk
ills
(men
)S
R.1
30.
1389
0.02
260.
163
2.63
51.
623
521
61
6
0.09
40.
184
Use
of t
obac
co (w
omen
)S
R.1
40.
0098
0.00
350.
360
1.73
01.
315
1,12
9
1,
350
0.00
30.
017
Use
of t
obac
co (m
en)
SR
.14
0.43
990.
0258
0.05
91.
659
1.28
852
1
616
0.
388
0.49
1Su
rviv
eN
eona
tal m
orta
lity
rate
CS
.120
6.54
530.
327
nana
nana
733
Infa
nt m
orta
lity
rate
CS
.340
9.34
040.
231
nana
nana
2259
Und
er-fi
ve m
orta
lity
rate
CS
.542
9.52
810.
227
nana
nana
2361
Thriv
e - R
epro
duct
ive
and
mat
erna
l hea
lthTo
tal f
ertil
ity ra
te-
2.8
0.17
030.
060
nana
nana
2.5
3.2
Ado
lesc
ent b
irth
rate
TM.1
85.1
18.2
411
0.21
4na
nana
na48
.612
1.6
…C
ontra
cept
ive
prev
alen
ce ra
teTM
.30.
6715
0.01
530.
023
1.18
91.
090
929
1,
117
0.64
10.
702
Nee
d fo
r fam
ily p
lann
ing
satis
fied
with
mod
ern
cont
race
ptio
nTM
.40.
7175
0.02
160.
030
1.93
31.
390
710
84
3
0.67
40.
761
Ant
enat
al c
are
cove
rage
(4+)
TM.5
b0.
6830
0.04
850.
071
2.61
11.
616
196
24
1
0.58
60.
780
Ski
lled
atte
ndan
t at d
eliv
ery
TM.9
0.78
070.
0446
0.05
72.
790
1.67
019
6
241
0.
692
0.87
0Th
rive
- Chi
ld h
ealth
, nut
ritio
n an
d de
velo
pmen
tD
ipht
heria
, per
tuss
is a
nd te
tanu
s (D
PT)
imm
uniz
atio
n co
vera
geTC
.30.
8407
0.04
510.
054
1.77
61.
332
98
11
8
0.75
10.
931
Pne
umoc
occa
l (C
onju
gate
) im
mun
izat
ion
cove
rage
TC.6
0.62
800.
0539
0.08
61.
454
1.20
698
118
0.
520
0.73
6M
easl
es im
mun
izat
ion
cove
rage
TC.1
00.
8473
0.04
240.
050
1.62
81.
276
98
11
8
0.76
20.
932
Prim
ary
relia
nce
on c
lean
fuel
s an
d te
chno
logi
es fo
r coo
king
, spa
ce h
eatin
g an
d lig
htin
gTC
.18
0.08
060.
0110
0.13
61.
839
1.35
64,
521
1,13
2
0.
059
0.10
3P
opul
atio
n w
ho s
lept
und
er a
n IT
NTC
.22
0.29
510.
0250
0.08
515
.082
3.88
34,
259
5,01
6
0.
245
0.34
5E
xclu
sive
bre
astfe
edin
g un
der 6
mon
ths
TC.3
20.
4763
0.04
260.
089
0.41
50.
644
57
58
0.39
10.
562
Stu
ntin
g pr
eval
ence
(mod
erat
e an
d se
vere
)TC
.45a
0.29
870.
0258
0.08
61.
875
1.36
952
0
590
0.
247
0.35
0W
astin
g pr
eval
ence
(mod
erat
e an
d se
vere
)TC
.46a
0.05
570.
0106
0.19
01.
264
1.12
452
3
594
0.
035
0.07
7O
verw
eigh
t pre
vale
nce
(mod
erat
e an
d se
vere
)TC
.47a
0.04
810.
0095
0.19
81.
170
1.08
252
3
594
0.
029
0.06
7E
arly
chi
ld d
evel
opm
ent i
ndex
TC.5
30.
7281
0.02
710.
037
0.81
20.
901
195
22
0
0.67
40.
782
Low
er b
ound
r - 2
seU
pper
bou
ndr +
2se
Lear
nP
artic
ipat
ion
rate
in o
rgan
ised
lear
ning
(adj
uste
d)LN
.20.
7910
0.05
240.
066
1.95
71.
399
101
11
9
0.68
60.
896
Prot
ecte
d fr
om v
iole
nce
and
expl
oita
tion
Birt
h re
gist
ratio
nP
R.1
0.81
700.
0237
0.02
92.
241
1.49
752
7
599
0.
770
0.86
4V
iole
nt d
isci
plin
eP
R.2
0.80
850.
0189
0.02
32.
427
1.55
81,
402
1,05
6
0.
771
0.84
6C
hild
labo
urP
R.3
0.63
290.
0215
0.03
41.
533
1.23
81,
274
768
0.
590
0.67
6C
hild
mar
riage
(bef
ore
age
15)
PR
.4a
0.09
230.
0243
0.26
31.
394
1.18
116
4
199
0.
044
0.14
1C
hild
mar
riage
(bef
ore
age
18)
PR
.4b
0.42
380.
0449
0.10
61.
632
1.27
716
4
199
0.
334
0.51
3Li
ve in
a s
afe
and
clea
n en
viro
nmen
tU
se o
f bas
ic d
rinki
ng w
ater
ser
vice
sW
S.2
0.81
010.
0207
0.02
63.
147
1.77
44,
521
1,13
2
0.
769
0.85
1U
se o
f saf
ely
man
aged
drin
king
wat
er s
ervi
ces
WS
.60.
2010
0.02
990.
149
0.94
70.
973
678
17
1
0.14
10.
261
Han
dwas
hing
faci
lity
with
wat
er a
nd s
oap
WS
.70.
4509
0.01
820.
040
1.51
91.
232
4,52
1
1,
132
0.41
40.
487
Use
of b
asic
san
itatio
n se
rvic
esW
S.9
0.89
460.
0095
0.01
11.
076
1.03
74,
521
1,13
2
0.
876
0.91
4S
afe
disp
osal
in s
itu o
f exc
reta
from
on-
site
san
itatio
n fa
cilit
ies
WS
.10
0.95
930.
0155
0.01
66.
401
2.53
04,
177
1,04
5
0.
928
0.99
0Eq
uita
ble
chan
ce in
life
Chi
ldre
n w
ith fu
nctio
nal d
ificu
lty
EQ
.10.
0589
0.01
160.
196
0.85
00.
922
316
35
3
0.03
60.
082
Pop
ulat
ion
cove
red
by s
ocia
l tra
nsfe
rsE
Q.3
0.21
480.
0227
0.10
63.
457
1.85
94,
521
1,13
2
0.
169
0.26
0na
: not
app
licab
le
Tabl
e SE
.19:
Sam
plin
g er
rors
: Bor
ikha
mxa
yS
tand
ard
erro
rs, c
oeffi
cien
ts o
f var
iatio
n, d
esig
n ef
fect
s (d
eff)
, squ
are
root
of d
esig
n ef
fect
s (d
eft)
, and
con
fiden
ce in
terv
als
for s
elec
ted
SD
G a
nd M
ICS
indi
cato
rs, L
SIS
II, 2
017
MIC
SIn
dica
tor
Val
ue (r
)S
tand
ard
erro
r (se
)
Coe
ffici
ent o
f va
riatio
n(s
e/r)
Des
ign
effe
ct
(def
f)
Squ
are
root
of
des
ign
effe
ct (d
eft)
Wei
ghte
d co
unt
Unw
eigh
ted
coun
t
Con
fiden
ce li
mits
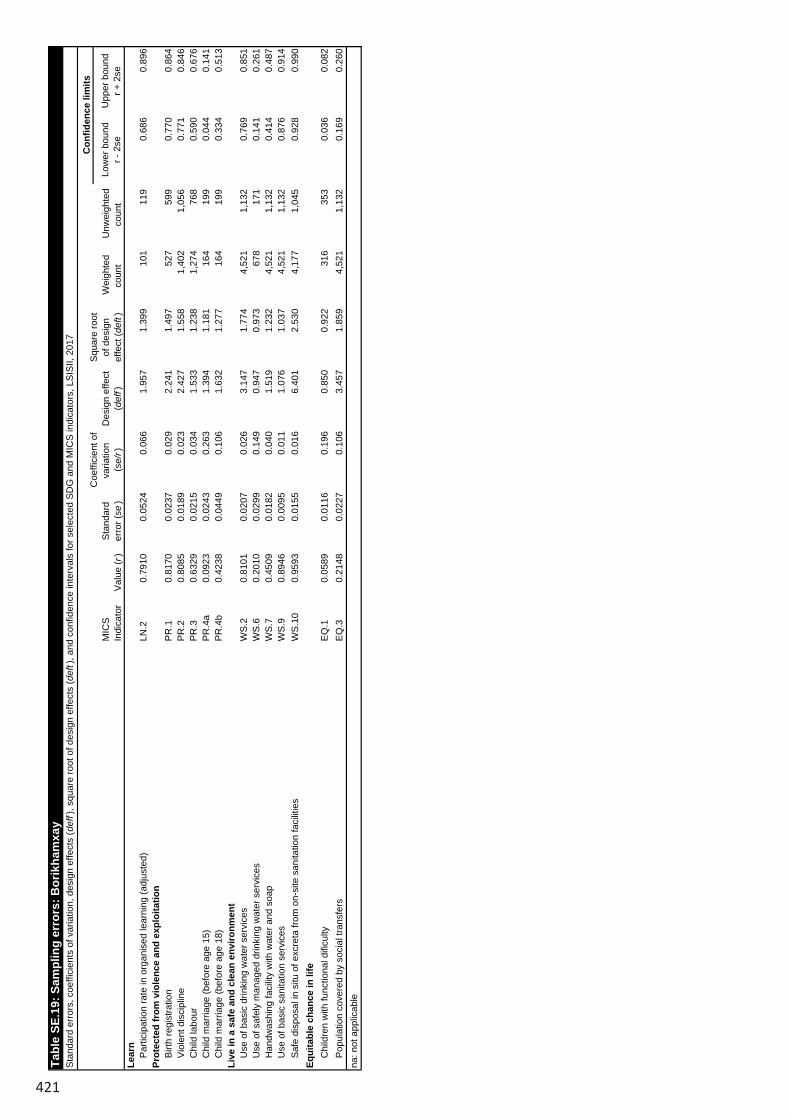
421
Low
er b
ound
r - 2
seU
pper
bou
ndr +
2se
Sam
ple
cove
rage
and
cha
ract
eris
tics
of th
e re
spon
dent
sA
cces
s to
ele
ctric
ityS
R.1
0.99
780.
0013
0.00
10.
854
0.92
44,
521
1,13
2
0.
995
1.00
0O
wne
rshi
p of
mob
ile p
hone
(wom
en)
SR
.10
0.87
520.
0138
0.01
62.
348
1.53
21,
129
1,35
0
0.
848
0.90
3O
wne
rshi
p of
mob
ile p
hone
(men
)S
R.1
00.
8800
0.01
670.
019
1.61
81.
272
521
61
6
0.84
70.
913
Use
of i
nter
net (
wom
en)
SR
.12a
0.42
950.
0176
0.04
11.
701
1.30
41,
129
1,35
0
0.
394
0.46
5U
se o
f int
erne
t (m
en)
SR
.12a
0.43
380.
0210
0.04
81.
108
1.05
252
1
616
0.
392
0.47
6IC
T sk
ills
(wom
en)
SR
.13
0.05
700.
0085
0.15
01.
829
1.35
31,
129
1,35
0
0.
040
0.07
4IC
T sk
ills
(men
)S
R.1
30.
1389
0.02
260.
163
2.63
51.
623
521
61
6
0.09
40.
184
Use
of t
obac
co (w
omen
)S
R.1
40.
0098
0.00
350.
360
1.73
01.
315
1,12
9
1,
350
0.00
30.
017
Use
of t
obac
co (m
en)
SR
.14
0.43
990.
0258
0.05
91.
659
1.28
852
1
616
0.
388
0.49
1Su
rviv
eN
eona
tal m
orta
lity
rate
CS
.120
6.54
530.
327
nana
nana
733
Infa
nt m
orta
lity
rate
CS
.340
9.34
040.
231
nana
nana
2259
Und
er-fi
ve m
orta
lity
rate
CS
.542
9.52
810.
227
nana
nana
2361
Thriv
e - R
epro
duct
ive
and
mat
erna
l hea
lthTo
tal f
ertil
ity ra
te-
2.8
0.17
030.
060
nana
nana
2.5
3.2
Ado
lesc
ent b
irth
rate
TM.1
85.1
18.2
411
0.21
4na
nana
na48
.612
1.6
…C
ontra
cept
ive
prev
alen
ce ra
teTM
.30.
6715
0.01
530.
023
1.18
91.
090
929
1,
117
0.64
10.
702
Nee
d fo
r fam
ily p
lann
ing
satis
fied
with
mod
ern
cont
race
ptio
nTM
.40.
7175
0.02
160.
030
1.93
31.
390
710
84
3
0.67
40.
761
Ant
enat
al c
are
cove
rage
(4+)
TM.5
b0.
6830
0.04
850.
071
2.61
11.
616
196
24
1
0.58
60.
780
Ski
lled
atte
ndan
t at d
eliv
ery
TM.9
0.78
070.
0446
0.05
72.
790
1.67
019
6
241
0.
692
0.87
0Th
rive
- Chi
ld h
ealth
, nut
ritio
n an
d de
velo
pmen
tD
ipht
heria
, per
tuss
is a
nd te
tanu
s (D
PT)
imm
uniz
atio
n co
vera
geTC
.30.
8407
0.04
510.
054
1.77
61.
332
98
11
8
0.75
10.
931
Pne
umoc
occa
l (C
onju
gate
) im
mun
izat
ion
cove
rage
TC.6
0.62
800.
0539
0.08
61.
454
1.20
698
118
0.
520
0.73
6M
easl
es im
mun
izat
ion
cove
rage
TC.1
00.
8473
0.04
240.
050
1.62
81.
276
98
11
8
0.76
20.
932
Prim
ary
relia
nce
on c
lean
fuel
s an
d te
chno
logi
es fo
r coo
king
, spa
ce h
eatin
g an
d lig
htin
gTC
.18
0.08
060.
0110
0.13
61.
839
1.35
64,
521
1,13
2
0.
059
0.10
3P
opul
atio
n w
ho s
lept
und
er a
n IT
NTC
.22
0.29
510.
0250
0.08
515
.082
3.88
34,
259
5,01
6
0.
245
0.34
5E
xclu
sive
bre
astfe
edin
g un
der 6
mon
ths
TC.3
20.
4763
0.04
260.
089
0.41
50.
644
57
58
0.39
10.
562
Stu
ntin
g pr
eval
ence
(mod
erat
e an
d se
vere
)TC
.45a
0.29
870.
0258
0.08
61.
875
1.36
952
0
590
0.
247
0.35
0W
astin
g pr
eval
ence
(mod
erat
e an
d se
vere
)TC
.46a
0.05
570.
0106
0.19
01.
264
1.12
452
3
594
0.
035
0.07
7O
verw
eigh
t pre
vale
nce
(mod
erat
e an
d se
vere
)TC
.47a
0.04
810.
0095
0.19
81.
170
1.08
252
3
594
0.
029
0.06
7E
arly
chi
ld d
evel
opm
ent i
ndex
TC.5
30.
7281
0.02
710.
037
0.81
20.
901
195
22
0
0.67
40.
782
Low
er b
ound
r - 2
seU
pper
bou
ndr +
2se
Lear
nP
artic
ipat
ion
rate
in o
rgan
ised
lear
ning
(adj
uste
d)LN
.20.
7910
0.05
240.
066
1.95
71.
399
101
11
9
0.68
60.
896
Prot
ecte
d fr
om v
iole
nce
and
expl
oita
tion
Birt
h re
gist
ratio
nP
R.1
0.81
700.
0237
0.02
92.
241
1.49
752
7
599
0.
770
0.86
4V
iole
nt d
isci
plin
eP
R.2
0.80
850.
0189
0.02
32.
427
1.55
81,
402
1,05
6
0.
771
0.84
6C
hild
labo
urP
R.3
0.63
290.
0215
0.03
41.
533
1.23
81,
274
768
0.
590
0.67
6C
hild
mar
riage
(bef
ore
age
15)
PR
.4a
0.09
230.
0243
0.26
31.
394
1.18
116
4
199
0.
044
0.14
1C
hild
mar
riage
(bef
ore
age
18)
PR
.4b
0.42
380.
0449
0.10
61.
632
1.27
716
4
199
0.
334
0.51
3Li
ve in
a s
afe
and
clea
n en
viro
nmen
tU
se o
f bas
ic d
rinki
ng w
ater
ser
vice
sW
S.2
0.81
010.
0207
0.02
63.
147
1.77
44,
521
1,13
2
0.
769
0.85
1U
se o
f saf
ely
man
aged
drin
king
wat
er s
ervi
ces
WS
.60.
2010
0.02
990.
149
0.94
70.
973
678
17
1
0.14
10.
261
Han
dwas
hing
faci
lity
with
wat
er a
nd s
oap
WS
.70.
4509
0.01
820.
040
1.51
91.
232
4,52
1
1,
132
0.41
40.
487
Use
of b
asic
san
itatio
n se
rvic
esW
S.9
0.89
460.
0095
0.01
11.
076
1.03
74,
521
1,13
2
0.
876
0.91
4S
afe
disp
osal
in s
itu o
f exc
reta
from
on-
site
san
itatio
n fa
cilit
ies
WS
.10
0.95
930.
0155
0.01
66.
401
2.53
04,
177
1,04
5
0.
928
0.99
0Eq
uita
ble
chan
ce in
life
Chi
ldre
n w
ith fu
nctio
nal d
ificu
lty
EQ
.10.
0589
0.01
160.
196
0.85
00.
922
316
35
3
0.03
60.
082
Pop
ulat
ion
cove
red
by s
ocia
l tra
nsfe
rsE
Q.3
0.21
480.
0227
0.10
63.
457
1.85
94,
521
1,13
2
0.
169
0.26
0na
: not
app
licab
le
Tabl
e SE
.19:
Sam
plin
g er
rors
: Bor
ikha
mxa
yS
tand
ard
erro
rs, c
oeffi
cien
ts o
f var
iatio
n, d
esig
n ef
fect
s (d
eff)
, squ
are
root
of d
esig
n ef
fect
s (d
eft)
, and
con
fiden
ce in
terv
als
for s
elec
ted
SD
G a
nd M
ICS
indi
cato
rs, L
SIS
II, 2
017
MIC
SIn
dica
tor
Val
ue (r
)S
tand
ard
erro
r (se
)
Coe
ffici
ent o
f va
riatio
n(s
e/r)
Des
ign
effe
ct
(def
f)
Squ
are
root
of
des
ign
effe
ct (d
eft)
Wei
ghte
d co
unt
Unw
eigh
ted
coun
t
Con
fiden
ce li
mits
Tabl
e SE
.19:
Sam
plin
g er
rors
: Bor
ikha
mxa
yS
tand
ard
erro
rs, c
oeffi
cien
ts o
f var
iatio
n, d
esig
n ef
fect
s (d
eff)
, squ
are
root
of d
esig
n ef
fect
s (d
eft)
, and
con
fiden
ce in
terv
als
for s
elec
ted
SD
G a
nd M
ICS
indi
cato
rs, L
SIS
II, 2
017
MIC
SIn
dica
tor
Val
ue (r
)S
tand
ard
erro
r (se
)
Coe
ffici
ent o
f va
riatio
n(s
e/r)
Des
ign
effe
ct
(def
f)
Squ
are
root
of
des
ign
effe
ct (d
eft)
Wei
ghte
d co
unt
Unw
eigh
ted
coun
t
Con
fiden
ce li
mits

422
Low
er b
ound
r - 2
seU
pper
bou
ndr +
2se
Sam
ple
cove
rage
and
cha
ract
eris
tics
of th
e re
spon
dent
sA
cces
s to
ele
ctric
ityS
R.1
0.92
670.
0235
0.02
511
.047
3.32
46,
346
1,35
6
0.
880
0.97
4O
wne
rshi
p of
mob
ile p
hone
(wom
en)
SR
.10
0.70
450.
0169
0.02
41.
939
1.39
21,
541
1,41
9
0.
671
0.73
8O
wne
rshi
p of
mob
ile p
hone
(men
)S
R.1
00.
7994
0.03
040.
038
3.40
01.
844
704
59
2
0.73
90.
860
Use
of i
nter
net (
wom
en)
SR
.12a
0.25
290.
0131
0.05
21.
289
1.13
51,
541
1,41
9
0.
227
0.27
9U
se o
f int
erne
t (m
en)
SR
.12a
0.17
510.
0214
0.12
21.
870
1.36
770
4
592
0.
132
0.21
8IC
T sk
ills
(wom
en)
SR
.13
0.06
830.
0081
0.11
91.
465
1.21
01,
541
1,41
9
0.
052
0.08
5IC
T sk
ills
(men
)S
R.1
30.
1189
0.01
850.
156
1.93
81.
392
704
59
2
0.08
20.
156
Use
of t
obac
co (w
omen
)S
R.1
40.
0632
0.00
880.
140
1.87
41.
369
1,54
1
1,
419
0.04
60.
081
Use
of t
obac
co (m
en)
SR
.14
0.49
590.
0293
0.05
92.
024
1.42
370
4
592
0.
437
0.55
4Su
rviv
eN
eona
tal m
orta
lity
rate
CS
.123
7.28
360.
322
nana
nana
837
Infa
nt m
orta
lity
rate
CS
.354
11.4
293
0.21
2na
nana
na31
77U
nder
-five
mor
talit
y ra
teC
S.5
6312
.533
00.
199
nana
nana
3888
Thriv
e - R
epro
duct
ive
and
mat
erna
l hea
lthTo
tal f
ertil
ity ra
te-
2.6
0.19
210.
073
nana
nana
2.2
3.0
Ado
lesc
ent b
irth
rate
TM.1
71.0
11.9
157
0.16
8na
nana
na47
.294
.8…
Con
trace
ptiv
e pr
eval
ence
rate
TM.3
0.55
510.
0181
0.03
31.
454
1.20
61,
191
1,09
8
0.
519
0.59
1N
eed
for f
amily
pla
nnin
g sa
tisfie
d w
ith m
oder
n co
ntra
cept
ion
TM.4
0.76
330.
0164
0.02
21.
109
1.05
380
7
744
0.
730
0.79
6A
nten
atal
car
e co
vera
ge (4
+)TM
.5b
0.58
180.
0412
0.07
11.
532
1.23
824
3
221
0.
500
0.66
4S
kille
d at
tend
ant a
t del
iver
yTM
.90.
5816
0.04
140.
071
1.54
81.
244
243
22
1
0.49
90.
664
Thriv
e - C
hild
hea
lth, n
utrit
ion
and
deve
lopm
ent
Dip
hthe
ria, p
ertu
ssis
and
teta
nus
(DP
T) im
mun
izat
ion
cove
rage
TC.3
0.79
420.
0245
0.03
10.
375
0.61
311
4
103
0.
745
0.84
3P
neum
ococ
cal (
Con
juga
te) i
mm
uniz
atio
n co
vera
geTC
.60.
7185
0.03
600.
050
0.65
20.
808
114
10
3
0.64
70.
790
Mea
sles
imm
uniz
atio
n co
vera
geTC
.10
0.78
220.
0397
0.05
10.
944
0.97
211
4
103
0.
703
0.86
2P
rimar
y re
lianc
e on
cle
an fu
els
and
tech
nolo
gies
for c
ooki
ng, s
pace
hea
ting
and
light
ing
TC.1
80.
0322
0.00
500.
155
1.08
71.
042
6,34
6
1,
356
0.02
20.
042
Pop
ulat
ion
who
sle
pt u
nder
an
ITN
TC.2
20.
7915
0.01
200.
015
5.05
72.
249
6,07
3
5,
779
0.76
70.
816
Exc
lusi
ve b
reas
tfeed
ing
unde
r 6 m
onth
sTC
.32
0.14
380.
0470
0.32
70.
916
0.95
756
52
0.
050
0.23
8S
tunt
ing
prev
alen
ce (m
oder
ate
and
seve
re)
TC.4
5a0.
2971
0.02
110.
071
1.27
81.
131
653
59
8
0.25
50.
339
Was
ting
prev
alen
ce (m
oder
ate
and
seve
re)
TC.4
6a0.
0984
0.01
310.
133
1.15
31.
074
653
59
8
0.07
20.
125
Ove
rwei
ght p
reva
lenc
e (m
oder
ate
and
seve
re)
TC.4
7a0.
0201
0.00
540.
268
0.87
70.
936
653
59
8
0.00
90.
031
Ear
ly c
hild
dev
elop
men
t ind
exTC
.53
0.88
300.
0209
0.02
41.
127
1.06
129
3
267
0.
841
0.92
5
Low
er b
ound
r - 2
seU
pper
bou
ndr +
2se
Lear
nP
artic
ipat
ion
rate
in o
rgan
ised
lear
ning
(adj
uste
d)LN
.20.
7441
0.04
190.
056
1.24
51.
116
140
13
6
0.66
00.
828
Prot
ecte
d fr
om v
iole
nce
and
expl
oita
tion
Birt
h re
gist
ratio
nP
R.1
0.64
440.
0290
0.04
52.
261
1.50
467
4
615
0.
586
0.70
2V
iole
nt d
isci
plin
eP
R.2
0.78
020.
0167
0.02
11.
967
1.40
32,
089
1,21
0
0.
747
0.81
4C
hild
labo
urP
R.3
0.42
160.
0254
0.06
02.
339
1.52
91,
885
886
0.
371
0.47
2C
hild
mar
riage
(bef
ore
age
15)
PR
.4a
0.04
590.
0130
0.28
30.
803
0.89
622
8
209
0.
020
0.07
2C
hild
mar
riage
(bef
ore
age
18)
PR
.4b
0.29
470.
0307
0.10
40.
943
0.97
122
8
209
0.
233
0.35
6Li
ve in
a s
afe
and
clea
n en
viro
nmen
tU
se o
f bas
ic d
rinki
ng w
ater
ser
vice
sW
S.2
0.68
160.
0218
0.03
22.
971
1.72
46,
346
1,35
6
0.
638
0.72
5U
se o
f saf
ely
man
aged
drin
king
wat
er s
ervi
ces
WS
.60.
0544
0.01
910.
352
1.44
51.
202
971
20
4
0.01
60.
093
Han
dwas
hing
faci
lity
with
wat
er a
nd s
oap
WS
.70.
6389
0.02
430.
038
3.47
61.
864
6,34
6
1,
356
0.59
00.
688
Use
of b
asic
san
itatio
n se
rvic
esW
S.9
0.63
560.
0250
0.03
93.
671
1.91
66,
346
1,35
6
0.
586
0.68
6S
afe
disp
osal
in s
itu o
f exc
reta
from
on-
site
san
itatio
n fa
cilit
ies
WS
.10
0.86
030.
0150
0.01
71.
542
1.24
23,
841
829
0.
830
0.89
0Eq
uita
ble
chan
ce in
life
Chi
ldre
n w
ith fu
nctio
nal d
ificu
lty
EQ
.10.
0174
0.00
870.
497
1.75
51.
325
440
40
2
0.00
00.
035
Pop
ulat
ion
cove
red
by s
ocia
l tra
nsfe
rsE
Q.3
0.07
100.
0093
0.13
11.
765
1.32
86,
346
1,35
6
0.
052
0.08
9na
: not
app
licab
le
Tabl
e SE
.20:
Sam
plin
g er
rors
: Kha
mm
uane
Sta
ndar
d er
rors
, coe
ffici
ents
of v
aria
tion,
des
ign
effe
cts
(def
f), s
quar
e ro
ot o
f des
ign
effe
cts
(def
t), a
nd c
onfid
ence
inte
rval
s fo
r sel
ecte
d S
DG
and
MIC
S in
dica
tors
, LS
ISII,
201
7
MIC
SIn
dica
tor
Val
ue (r
)S
tand
ard
erro
r (se
)
Coe
ffici
ent o
f va
riatio
n(s
e/r)
Des
ign
effe
ct
(def
f)
Squ
are
root
of
des
ign
effe
ct (d
eft)
Wei
ghte
d co
unt
Unw
eigh
ted
coun
t
Con
fiden
ce li
mits

423
Low
er b
ound
r - 2
seU
pper
bou
ndr +
2se
Sam
ple
cove
rage
and
cha
ract
eris
tics
of th
e re
spon
dent
sA
cces
s to
ele
ctric
ityS
R.1
0.92
670.
0235
0.02
511
.047
3.32
46,
346
1,35
6
0.
880
0.97
4O
wne
rshi
p of
mob
ile p
hone
(wom
en)
SR
.10
0.70
450.
0169
0.02
41.
939
1.39
21,
541
1,41
9
0.
671
0.73
8O
wne
rshi
p of
mob
ile p
hone
(men
)S
R.1
00.
7994
0.03
040.
038
3.40
01.
844
704
59
2
0.73
90.
860
Use
of i
nter
net (
wom
en)
SR
.12a
0.25
290.
0131
0.05
21.
289
1.13
51,
541
1,41
9
0.
227
0.27
9U
se o
f int
erne
t (m
en)
SR
.12a
0.17
510.
0214
0.12
21.
870
1.36
770
4
592
0.
132
0.21
8IC
T sk
ills
(wom
en)
SR
.13
0.06
830.
0081
0.11
91.
465
1.21
01,
541
1,41
9
0.
052
0.08
5IC
T sk
ills
(men
)S
R.1
30.
1189
0.01
850.
156
1.93
81.
392
704
59
2
0.08
20.
156
Use
of t
obac
co (w
omen
)S
R.1
40.
0632
0.00
880.
140
1.87
41.
369
1,54
1
1,
419
0.04
60.
081
Use
of t
obac
co (m
en)
SR
.14
0.49
590.
0293
0.05
92.
024
1.42
370
4
592
0.
437
0.55
4Su
rviv
eN
eona
tal m
orta
lity
rate
CS
.123
7.28
360.
322
nana
nana
837
Infa
nt m
orta
lity
rate
CS
.354
11.4
293
0.21
2na
nana
na31
77U
nder
-five
mor
talit
y ra
teC
S.5
6312
.533
00.
199
nana
nana
3888
Thriv
e - R
epro
duct
ive
and
mat
erna
l hea
lthTo
tal f
ertil
ity ra
te-
2.6
0.19
210.
073
nana
nana
2.2
3.0
Ado
lesc
ent b
irth
rate
TM.1
71.0
11.9
157
0.16
8na
nana
na47
.294
.8…
Con
trace
ptiv
e pr
eval
ence
rate
TM.3
0.55
510.
0181
0.03
31.
454
1.20
61,
191
1,09
8
0.
519
0.59
1N
eed
for f
amily
pla
nnin
g sa
tisfie
d w
ith m
oder
n co
ntra
cept
ion
TM.4
0.76
330.
0164
0.02
21.
109
1.05
380
7
744
0.
730
0.79
6A
nten
atal
car
e co
vera
ge (4
+)TM
.5b
0.58
180.
0412
0.07
11.
532
1.23
824
3
221
0.
500
0.66
4S
kille
d at
tend
ant a
t del
iver
yTM
.90.
5816
0.04
140.
071
1.54
81.
244
243
22
1
0.49
90.
664
Thriv
e - C
hild
hea
lth, n
utrit
ion
and
deve
lopm
ent
Dip
hthe
ria, p
ertu
ssis
and
teta
nus
(DP
T) im
mun
izat
ion
cove
rage
TC.3
0.79
420.
0245
0.03
10.
375
0.61
311
4
103
0.
745
0.84
3P
neum
ococ
cal (
Con
juga
te) i
mm
uniz
atio
n co
vera
geTC
.60.
7185
0.03
600.
050
0.65
20.
808
114
10
3
0.64
70.
790
Mea
sles
imm
uniz
atio
n co
vera
geTC
.10
0.78
220.
0397
0.05
10.
944
0.97
211
4
103
0.
703
0.86
2P
rimar
y re
lianc
e on
cle
an fu
els
and
tech
nolo
gies
for c
ooki
ng, s
pace
hea
ting
and
light
ing
TC.1
80.
0322
0.00
500.
155
1.08
71.
042
6,34
6
1,
356
0.02
20.
042
Pop
ulat
ion
who
sle
pt u
nder
an
ITN
TC.2
20.
7915
0.01
200.
015
5.05
72.
249
6,07
3
5,
779
0.76
70.
816
Exc
lusi
ve b
reas
tfeed
ing
unde
r 6 m
onth
sTC
.32
0.14
380.
0470
0.32
70.
916
0.95
756
52
0.
050
0.23
8S
tunt
ing
prev
alen
ce (m
oder
ate
and
seve
re)
TC.4
5a0.
2971
0.02
110.
071
1.27
81.
131
653
59
8
0.25
50.
339
Was
ting
prev
alen
ce (m
oder
ate
and
seve
re)
TC.4
6a0.
0984
0.01
310.
133
1.15
31.
074
653
59
8
0.07
20.
125
Ove
rwei
ght p
reva
lenc
e (m
oder
ate
and
seve
re)
TC.4
7a0.
0201
0.00
540.
268
0.87
70.
936
653
59
8
0.00
90.
031
Ear
ly c
hild
dev
elop
men
t ind
exTC
.53
0.88
300.
0209
0.02
41.
127
1.06
129
3
267
0.
841
0.92
5
Low
er b
ound
r - 2
seU
pper
bou
ndr +
2se
Lear
nP
artic
ipat
ion
rate
in o
rgan
ised
lear
ning
(adj
uste
d)LN
.20.
7441
0.04
190.
056
1.24
51.
116
140
13
6
0.66
00.
828
Prot
ecte
d fr
om v
iole
nce
and
expl
oita
tion
Birt
h re
gist
ratio
nP
R.1
0.64
440.
0290
0.04
52.
261
1.50
467
4
615
0.
586
0.70
2V
iole
nt d
isci
plin
eP
R.2
0.78
020.
0167
0.02
11.
967
1.40
32,
089
1,21
0
0.
747
0.81
4C
hild
labo
urP
R.3
0.42
160.
0254
0.06
02.
339
1.52
91,
885
886
0.
371
0.47
2C
hild
mar
riage
(bef
ore
age
15)
PR
.4a
0.04
590.
0130
0.28
30.
803
0.89
622
8
209
0.
020
0.07
2C
hild
mar
riage
(bef
ore
age
18)
PR
.4b
0.29
470.
0307
0.10
40.
943
0.97
122
8
209
0.
233
0.35
6Li
ve in
a s
afe
and
clea
n en
viro
nmen
tU
se o
f bas
ic d
rinki
ng w
ater
ser
vice
sW
S.2
0.68
160.
0218
0.03
22.
971
1.72
46,
346
1,35
6
0.
638
0.72
5U
se o
f saf
ely
man
aged
drin
king
wat
er s
ervi
ces
WS
.60.
0544
0.01
910.
352
1.44
51.
202
971
20
4
0.01
60.
093
Han
dwas
hing
faci
lity
with
wat
er a
nd s
oap
WS
.70.
6389
0.02
430.
038
3.47
61.
864
6,34
6
1,
356
0.59
00.
688
Use
of b
asic
san
itatio
n se
rvic
esW
S.9
0.63
560.
0250
0.03
93.
671
1.91
66,
346
1,35
6
0.
586
0.68
6S
afe
disp
osal
in s
itu o
f exc
reta
from
on-
site
san
itatio
n fa
cilit
ies
WS
.10
0.86
030.
0150
0.01
71.
542
1.24
23,
841
829
0.
830
0.89
0Eq
uita
ble
chan
ce in
life
Chi
ldre
n w
ith fu
nctio
nal d
ificu
lty
EQ
.10.
0174
0.00
870.
497
1.75
51.
325
440
40
2
0.00
00.
035
Pop
ulat
ion
cove
red
by s
ocia
l tra
nsfe
rsE
Q.3
0.07
100.
0093
0.13
11.
765
1.32
86,
346
1,35
6
0.
052
0.08
9na
: not
app
licab
le
Tabl
e SE
.20:
Sam
plin
g er
rors
: Kha
mm
uane
Sta
ndar
d er
rors
, coe
ffici
ents
of v
aria
tion,
des
ign
effe
cts
(def
f), s
quar
e ro
ot o
f des
ign
effe
cts
(def
t), a
nd c
onfid
ence
inte
rval
s fo
r sel
ecte
d S
DG
and
MIC
S in
dica
tors
, LS
ISII,
201
7
MIC
SIn
dica
tor
Val
ue (r
)S
tand
ard
erro
r (se
)
Coe
ffici
ent o
f va
riatio
n(s
e/r)
Des
ign
effe
ct
(def
f)
Squ
are
root
of
des
ign
effe
ct (d
eft)
Wei
ghte
d co
unt
Unw
eigh
ted
coun
t
Con
fiden
ce li
mits
Tabl
e SE
.20:
Sam
plin
g er
rors
: Kha
mm
uane
Sta
ndar
d er
rors
, coe
ffici
ents
of v
aria
tion,
des
ign
effe
cts
(def
f), s
quar
e ro
ot o
f des
ign
effe
cts
(def
t), a
nd c
onfid
ence
inte
rval
s fo
r sel
ecte
d S
DG
and
MIC
S in
dica
tors
, LS
ISII,
201
7
MIC
SIn
dica
tor
Val
ue (r
)S
tand
ard
erro
r (se
)
Coe
ffici
ent o
f va
riatio
n(s
e/r)
Des
ign
effe
ct
(def
f)
Squ
are
root
of
des
ign
effe
ct (d
eft)
Wei
ghte
d co
unt
Unw
eigh
ted
coun
t
Con
fiden
ce li
mits
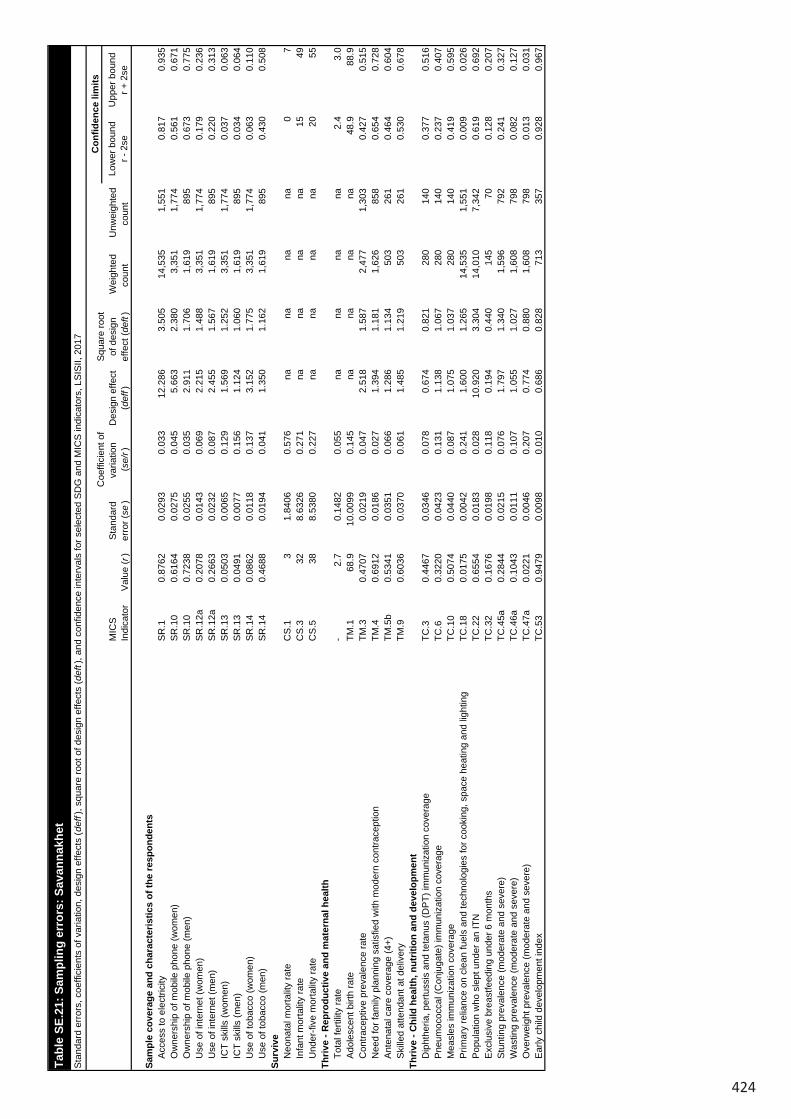
424
Low
er b
ound
r - 2
seU
pper
bou
ndr +
2se
Sam
ple
cove
rage
and
cha
ract
eris
tics
of th
e re
spon
dent
sA
cces
s to
ele
ctric
ityS
R.1
0.87
620.
0293
0.03
312
.286
3.50
514
,535
1,
551
0.81
70.
935
Ow
ners
hip
of m
obile
pho
ne (w
omen
)S
R.1
00.
6164
0.02
750.
045
5.66
32.
380
3,35
1
1,
774
0.56
10.
671
Ow
ners
hip
of m
obile
pho
ne (m
en)
SR
.10
0.72
380.
0255
0.03
52.
911
1.70
61,
619
895
0.
673
0.77
5U
se o
f int
erne
t (w
omen
)S
R.1
2a0.
2078
0.01
430.
069
2.21
51.
488
3,35
1
1,
774
0.17
90.
236
Use
of i
nter
net (
men
)S
R.1
2a0.
2663
0.02
320.
087
2.45
51.
567
1,61
9
89
5
0.22
00.
313
ICT
skill
s (w
omen
)S
R.1
30.
0503
0.00
650.
129
1.56
91.
252
3,35
1
1,
774
0.03
70.
063
ICT
skill
s (m
en)
SR
.13
0.04
910.
0077
0.15
61.
124
1.06
01,
619
895
0.
034
0.06
4U
se o
f tob
acco
(wom
en)
SR
.14
0.08
620.
0118
0.13
73.
152
1.77
53,
351
1,77
4
0.
063
0.11
0U
se o
f tob
acco
(men
)S
R.1
40.
4688
0.01
940.
041
1.35
01.
162
1,61
9
89
5
0.43
00.
508
Surv
ive
Neo
nata
l mor
talit
y ra
teC
S.1
31.
8406
0.57
6na
nana
na0
7In
fant
mor
talit
y ra
teC
S.3
328.
6326
0.27
1na
nana
na15
49U
nder
-five
mor
talit
y ra
teC
S.5
388.
5380
0.22
7na
nana
na20
55Th
rive
- Rep
rodu
ctiv
e an
d m
ater
nal h
ealth
Tota
l fer
tility
rate
-2.
70.
1482
0.05
5na
nana
na2.
43.
0A
dole
scen
t birt
h ra
teTM
.168
.910
.009
90.
145
nana
nana
48.9
88.9
…C
ontra
cept
ive
prev
alen
ce ra
teTM
.30.
4707
0.02
190.
047
2.51
81.
587
2,47
7
1,
303
0.42
70.
515
Nee
d fo
r fam
ily p
lann
ing
satis
fied
with
mod
ern
cont
race
ptio
nTM
.40.
6912
0.01
860.
027
1.39
41.
181
1,62
6
85
8
0.65
40.
728
Ant
enat
al c
are
cove
rage
(4+)
TM.5
b0.
5341
0.03
510.
066
1.28
61.
134
503
26
1
0.46
40.
604
Ski
lled
atte
ndan
t at d
eliv
ery
TM.9
0.60
360.
0370
0.06
11.
485
1.21
950
3
261
0.
530
0.67
8Th
rive
- Chi
ld h
ealth
, nut
ritio
n an
d de
velo
pmen
tD
ipht
heria
, per
tuss
is a
nd te
tanu
s (D
PT)
imm
uniz
atio
n co
vera
geTC
.30.
4467
0.03
460.
078
0.67
40.
821
280
14
0
0.37
70.
516
Pne
umoc
occa
l (C
onju
gate
) im
mun
izat
ion
cove
rage
TC.6
0.32
200.
0423
0.13
11.
138
1.06
728
0
140
0.
237
0.40
7M
easl
es im
mun
izat
ion
cove
rage
TC.1
00.
5074
0.04
400.
087
1.07
51.
037
280
14
0
0.41
90.
595
Prim
ary
relia
nce
on c
lean
fuel
s an
d te
chno
logi
es fo
r coo
king
, spa
ce h
eatin
g an
d lig
htin
gTC
.18
0.01
750.
0042
0.24
11.
600
1.26
514
,535
1,
551
0.00
90.
026
Pop
ulat
ion
who
sle
pt u
nder
an
ITN
TC.2
20.
6554
0.01
830.
028
10.9
203.
304
14,0
10
7,34
2
0.
619
0.69
2E
xclu
sive
bre
astfe
edin
g un
der 6
mon
ths
TC.3
20.
1676
0.01
980.
118
0.19
40.
440
145
70
0.12
80.
207
Stu
ntin
g pr
eval
ence
(mod
erat
e an
d se
vere
)TC
.45a
0.28
440.
0215
0.07
61.
797
1.34
01,
596
792
0.
241
0.32
7W
astin
g pr
eval
ence
(mod
erat
e an
d se
vere
)TC
.46a
0.10
430.
0111
0.10
71.
055
1.02
71,
608
798
0.
082
0.12
7O
verw
eigh
t pre
vale
nce
(mod
erat
e an
d se
vere
)TC
.47a
0.02
210.
0046
0.20
70.
774
0.88
01,
608
798
0.
013
0.03
1E
arly
chi
ld d
evel
opm
ent i
ndex
TC.5
30.
9479
0.00
980.
010
0.68
60.
828
713
35
7
0.92
80.
967
Low
er b
ound
r - 2
seU
pper
bou
ndr +
2se
Lear
nP
artic
ipat
ion
rate
in o
rgan
ised
lear
ning
(adj
uste
d)LN
.20.
5292
0.04
080.
077
1.33
61.
156
386
20
1
0.44
80.
611
Prot
ecte
d fr
om v
iole
nce
and
expl
oita
tion
Birt
h re
gist
ratio
nP
R.1
0.67
460.
0257
0.03
82.
415
1.55
41,
625
806
0.
623
0.72
6V
iole
nt d
isci
plin
eP
R.2
0.67
700.
0182
0.02
72.
348
1.53
25,
018
1,54
3
0.
640
0.71
3C
hild
labo
urP
R.3
0.42
040.
0196
0.04
71.
765
1.32
84,
553
1,12
1
0.
381
0.46
0C
hild
mar
riage
(bef
ore
age
15)
PR
.4a
0.07
210.
0159
0.22
01.
044
1.02
253
0
279
0.
040
0.10
4C
hild
mar
riage
(bef
ore
age
18)
PR
.4b
0.32
120.
0303
0.09
41.
172
1.08
353
0
279
0.
261
0.38
2Li
ve in
a s
afe
and
clea
n en
viro
nmen
tU
se o
f bas
ic d
rinki
ng w
ater
ser
vice
sW
S.2
0.69
510.
0326
0.04
77.
766
2.78
714
,535
1,
551
0.63
00.
760
Use
of s
afel
y m
anag
ed d
rinki
ng w
ater
ser
vice
sW
S.6
0.14
280.
0256
0.17
91.
218
1.10
32,
046
228
0.
092
0.19
4H
andw
ashi
ng fa
cilit
y w
ith w
ater
and
soa
pW
S.7
0.41
100.
0374
0.09
18.
957
2.99
314
,523
1,
550
0.33
60.
486
Use
of b
asic
san
itatio
n se
rvic
esW
S.9
0.53
450.
0264
0.04
94.
327
2.08
014
,535
1,
551
0.48
20.
587
Saf
e di
spos
al in
situ
of e
xcre
ta fr
om o
n-si
te s
anita
tion
faci
litie
sW
S.1
00.
8799
0.01
310.
015
1.40
81.
187
7,64
7
86
6
0.85
40.
906
Equi
tabl
e ch
ance
in li
feC
hild
ren
with
func
tiona
l difi
culty
E
Q.1
0.00
660.
0034
0.51
70.
935
0.96
71,
049
524
0.
000
0.01
3P
opul
atio
n co
vere
d by
soc
ial t
rans
fers
EQ
.30.
0404
0.00
610.
150
1.47
21.
213
14,5
35
1,55
1
0.
028
0.05
3na
: not
app
licab
le
Tabl
e SE
.21:
Sam
plin
g er
rors
: Sav
anna
khet
Sta
ndar
d er
rors
, coe
ffici
ents
of v
aria
tion,
des
ign
effe
cts
(def
f), s
quar
e ro
ot o
f des
ign
effe
cts
(def
t), a
nd c
onfid
ence
inte
rval
s fo
r sel
ecte
d S
DG
and
MIC
S in
dica
tors
, LS
ISII,
201
7
MIC
SIn
dica
tor
Val
ue (r
)S
tand
ard
erro
r (se
)
Coe
ffici
ent o
f va
riatio
n(s
e/r)
Des
ign
effe
ct
(def
f)
Squ
are
root
of
des
ign
effe
ct (d
eft)
Wei
ghte
d co
unt
Unw
eigh
ted
coun
t
Con
fiden
ce li
mits

425
Low
er b
ound
r - 2
seU
pper
bou
ndr +
2se
Sam
ple
cove
rage
and
cha
ract
eris
tics
of th
e re
spon
dent
sA
cces
s to
ele
ctric
ityS
R.1
0.87
620.
0293
0.03
312
.286
3.50
514
,535
1,
551
0.81
70.
935
Ow
ners
hip
of m
obile
pho
ne (w
omen
)S
R.1
00.
6164
0.02
750.
045
5.66
32.
380
3,35
1
1,
774
0.56
10.
671
Ow
ners
hip
of m
obile
pho
ne (m
en)
SR
.10
0.72
380.
0255
0.03
52.
911
1.70
61,
619
895
0.
673
0.77
5U
se o
f int
erne
t (w
omen
)S
R.1
2a0.
2078
0.01
430.
069
2.21
51.
488
3,35
1
1,
774
0.17
90.
236
Use
of i
nter
net (
men
)S
R.1
2a0.
2663
0.02
320.
087
2.45
51.
567
1,61
9
89
5
0.22
00.
313
ICT
skill
s (w
omen
)S
R.1
30.
0503
0.00
650.
129
1.56
91.
252
3,35
1
1,
774
0.03
70.
063
ICT
skill
s (m
en)
SR
.13
0.04
910.
0077
0.15
61.
124
1.06
01,
619
895
0.
034
0.06
4U
se o
f tob
acco
(wom
en)
SR
.14
0.08
620.
0118
0.13
73.
152
1.77
53,
351
1,77
4
0.
063
0.11
0U
se o
f tob
acco
(men
)S
R.1
40.
4688
0.01
940.
041
1.35
01.
162
1,61
9
89
5
0.43
00.
508
Surv
ive
Neo
nata
l mor
talit
y ra
teC
S.1
31.
8406
0.57
6na
nana
na0
7In
fant
mor
talit
y ra
teC
S.3
328.
6326
0.27
1na
nana
na15
49U
nder
-five
mor
talit
y ra
teC
S.5
388.
5380
0.22
7na
nana
na20
55Th
rive
- Rep
rodu
ctiv
e an
d m
ater
nal h
ealth
Tota
l fer
tility
rate
-2.
70.
1482
0.05
5na
nana
na2.
43.
0A
dole
scen
t birt
h ra
teTM
.168
.910
.009
90.
145
nana
nana
48.9
88.9
…C
ontra
cept
ive
prev
alen
ce ra
teTM
.30.
4707
0.02
190.
047
2.51
81.
587
2,47
7
1,
303
0.42
70.
515
Nee
d fo
r fam
ily p
lann
ing
satis
fied
with
mod
ern
cont
race
ptio
nTM
.40.
6912
0.01
860.
027
1.39
41.
181
1,62
6
85
8
0.65
40.
728
Ant
enat
al c
are
cove
rage
(4+)
TM.5
b0.
5341
0.03
510.
066
1.28
61.
134
503
26
1
0.46
40.
604
Ski
lled
atte
ndan
t at d
eliv
ery
TM.9
0.60
360.
0370
0.06
11.
485
1.21
950
3
261
0.
530
0.67
8Th
rive
- Chi
ld h
ealth
, nut
ritio
n an
d de
velo
pmen
tD
ipht
heria
, per
tuss
is a
nd te
tanu
s (D
PT)
imm
uniz
atio
n co
vera
geTC
.30.
4467
0.03
460.
078
0.67
40.
821
280
14
0
0.37
70.
516
Pne
umoc
occa
l (C
onju
gate
) im
mun
izat
ion
cove
rage
TC.6
0.32
200.
0423
0.13
11.
138
1.06
728
0
140
0.
237
0.40
7M
easl
es im
mun
izat
ion
cove
rage
TC.1
00.
5074
0.04
400.
087
1.07
51.
037
280
14
0
0.41
90.
595
Prim
ary
relia
nce
on c
lean
fuel
s an
d te
chno
logi
es fo
r coo
king
, spa
ce h
eatin
g an
d lig
htin
gTC
.18
0.01
750.
0042
0.24
11.
600
1.26
514
,535
1,
551
0.00
90.
026
Pop
ulat
ion
who
sle
pt u
nder
an
ITN
TC.2
20.
6554
0.01
830.
028
10.9
203.
304
14,0
10
7,34
2
0.
619
0.69
2E
xclu
sive
bre
astfe
edin
g un
der 6
mon
ths
TC.3
20.
1676
0.01
980.
118
0.19
40.
440
145
70
0.12
80.
207
Stu
ntin
g pr
eval
ence
(mod
erat
e an
d se
vere
)TC
.45a
0.28
440.
0215
0.07
61.
797
1.34
01,
596
792
0.
241
0.32
7W
astin
g pr
eval
ence
(mod
erat
e an
d se
vere
)TC
.46a
0.10
430.
0111
0.10
71.
055
1.02
71,
608
798
0.
082
0.12
7O
verw
eigh
t pre
vale
nce
(mod
erat
e an
d se
vere
)TC
.47a
0.02
210.
0046
0.20
70.
774
0.88
01,
608
798
0.
013
0.03
1E
arly
chi
ld d
evel
opm
ent i
ndex
TC.5
30.
9479
0.00
980.
010
0.68
60.
828
713
35
7
0.92
80.
967
Low
er b
ound
r - 2
seU
pper
bou
ndr +
2se
Lear
nP
artic
ipat
ion
rate
in o
rgan
ised
lear
ning
(adj
uste
d)LN
.20.
5292
0.04
080.
077
1.33
61.
156
386
20
1
0.44
80.
611
Prot
ecte
d fr
om v
iole
nce
and
expl
oita
tion
Birt
h re
gist
ratio
nP
R.1
0.67
460.
0257
0.03
82.
415
1.55
41,
625
806
0.
623
0.72
6V
iole
nt d
isci
plin
eP
R.2
0.67
700.
0182
0.02
72.
348
1.53
25,
018
1,54
3
0.
640
0.71
3C
hild
labo
urP
R.3
0.42
040.
0196
0.04
71.
765
1.32
84,
553
1,12
1
0.
381
0.46
0C
hild
mar
riage
(bef
ore
age
15)
PR
.4a
0.07
210.
0159
0.22
01.
044
1.02
253
0
279
0.
040
0.10
4C
hild
mar
riage
(bef
ore
age
18)
PR
.4b
0.32
120.
0303
0.09
41.
172
1.08
353
0
279
0.
261
0.38
2Li
ve in
a s
afe
and
clea
n en
viro
nmen
tU
se o
f bas
ic d
rinki
ng w
ater
ser
vice
sW
S.2
0.69
510.
0326
0.04
77.
766
2.78
714
,535
1,
551
0.63
00.
760
Use
of s
afel
y m
anag
ed d
rinki
ng w
ater
ser
vice
sW
S.6
0.14
280.
0256
0.17
91.
218
1.10
32,
046
228
0.
092
0.19
4H
andw
ashi
ng fa
cilit
y w
ith w
ater
and
soa
pW
S.7
0.41
100.
0374
0.09
18.
957
2.99
314
,523
1,
550
0.33
60.
486
Use
of b
asic
san
itatio
n se
rvic
esW
S.9
0.53
450.
0264
0.04
94.
327
2.08
014
,535
1,
551
0.48
20.
587
Saf
e di
spos
al in
situ
of e
xcre
ta fr
om o
n-si
te s
anita
tion
faci
litie
sW
S.1
00.
8799
0.01
310.
015
1.40
81.
187
7,64
7
86
6
0.85
40.
906
Equi
tabl
e ch
ance
in li
feC
hild
ren
with
func
tiona
l difi
culty
E
Q.1
0.00
660.
0034
0.51
70.
935
0.96
71,
049
524
0.
000
0.01
3P
opul
atio
n co
vere
d by
soc
ial t
rans
fers
EQ
.30.
0404
0.00
610.
150
1.47
21.
213
14,5
35
1,55
1
0.
028
0.05
3na
: not
app
licab
le
Tabl
e SE
.21:
Sam
plin
g er
rors
: Sav
anna
khet
Sta
ndar
d er
rors
, coe
ffici
ents
of v
aria
tion,
des
ign
effe
cts
(def
f), s
quar
e ro
ot o
f des
ign
effe
cts
(def
t), a
nd c
onfid
ence
inte
rval
s fo
r sel
ecte
d S
DG
and
MIC
S in
dica
tors
, LS
ISII,
201
7
MIC
SIn
dica
tor
Val
ue (r
)S
tand
ard
erro
r (se
)
Coe
ffici
ent o
f va
riatio
n(s
e/r)
Des
ign
effe
ct
(def
f)
Squ
are
root
of
des
ign
effe
ct (d
eft)
Wei
ghte
d co
unt
Unw
eigh
ted
coun
t
Con
fiden
ce li
mits
Tabl
e SE
.21:
Sam
plin
g er
rors
: Sav
anna
khet
Sta
ndar
d er
rors
, coe
ffici
ents
of v
aria
tion,
des
ign
effe
cts
(def
f), s
quar
e ro
ot o
f des
ign
effe
cts
(def
t), a
nd c
onfid
ence
inte
rval
s fo
r sel
ecte
d S
DG
and
MIC
S in
dica
tors
, LS
ISII,
201
7
MIC
SIn
dica
tor
Val
ue (r
)S
tand
ard
erro
r (se
)
Coe
ffici
ent o
f va
riatio
n(s
e/r)
Des
ign
effe
ct
(def
f)
Squ
are
root
of
des
ign
effe
ct (d
eft)
Wei
ghte
d co
unt
Unw
eigh
ted
coun
t
Con
fiden
ce li
mits
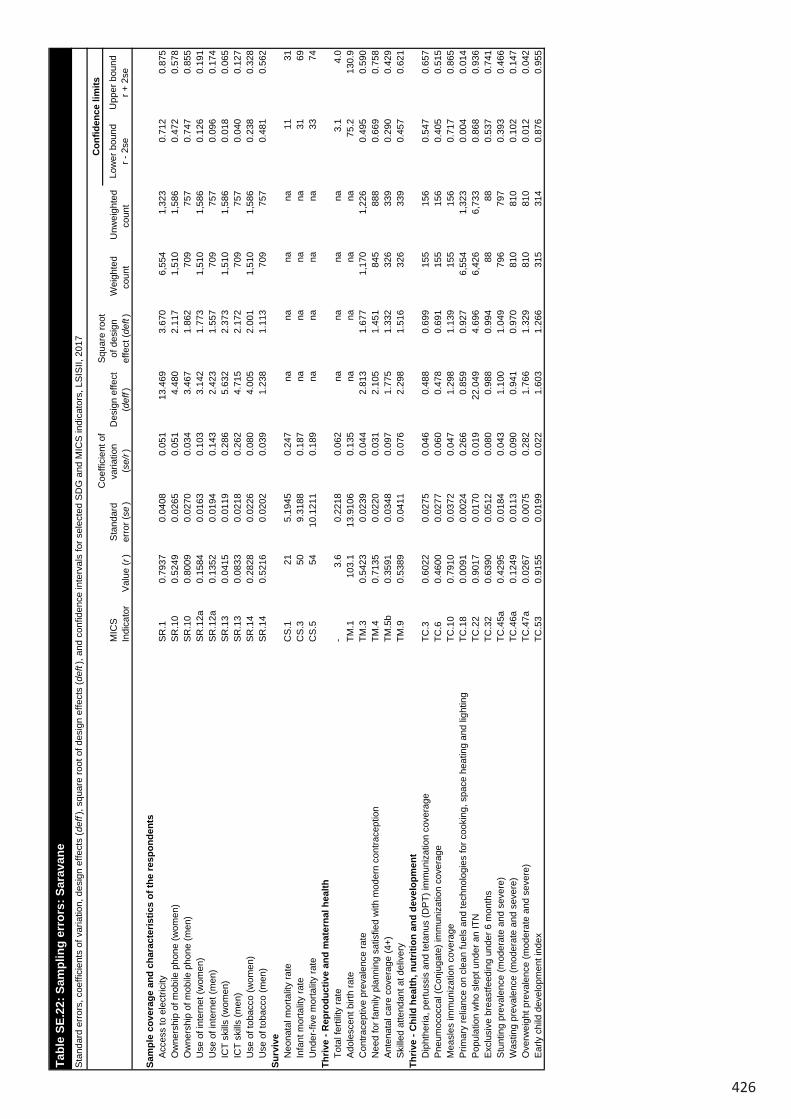
426
Low
er b
ound
r - 2
seU
pper
bou
ndr +
2se
Sam
ple
cove
rage
and
cha
ract
eris
tics
of th
e re
spon
dent
sA
cces
s to
ele
ctric
ityS
R.1
0.79
370.
0408
0.05
113
.469
3.67
06,
554
1,32
3
0.
712
0.87
5O
wne
rshi
p of
mob
ile p
hone
(wom
en)
SR
.10
0.52
490.
0265
0.05
14.
480
2.11
71,
510
1,58
6
0.
472
0.57
8O
wne
rshi
p of
mob
ile p
hone
(men
)S
R.1
00.
8009
0.02
700.
034
3.46
71.
862
709
75
7
0.74
70.
855
Use
of i
nter
net (
wom
en)
SR
.12a
0.15
840.
0163
0.10
33.
142
1.77
31,
510
1,58
6
0.
126
0.19
1U
se o
f int
erne
t (m
en)
SR
.12a
0.13
520.
0194
0.14
32.
423
1.55
770
9
757
0.
096
0.17
4IC
T sk
ills
(wom
en)
SR
.13
0.04
150.
0119
0.28
65.
632
2.37
31,
510
1,58
6
0.
018
0.06
5IC
T sk
ills
(men
)S
R.1
30.
0833
0.02
180.
262
4.71
52.
172
709
75
7
0.04
00.
127
Use
of t
obac
co (w
omen
)S
R.1
40.
2828
0.02
260.
080
4.00
52.
001
1,51
0
1,
586
0.23
80.
328
Use
of t
obac
co (m
en)
SR
.14
0.52
160.
0202
0.03
91.
238
1.11
370
9
757
0.
481
0.56
2Su
rviv
eN
eona
tal m
orta
lity
rate
CS
.121
5.19
450.
247
nana
nana
1131
Infa
nt m
orta
lity
rate
CS
.350
9.31
880.
187
nana
nana
3169
Und
er-fi
ve m
orta
lity
rate
CS
.554
10.1
211
0.18
9na
nana
na33
74Th
rive
- Rep
rodu
ctiv
e an
d m
ater
nal h
ealth
Tota
l fer
tility
rate
-3.
60.
2218
0.06
2na
nana
na3.
14.
0A
dole
scen
t birt
h ra
teTM
.110
3.1
13.9
106
0.13
5na
nana
na75
.213
0.9
…C
ontra
cept
ive
prev
alen
ce ra
teTM
.30.
5423
0.02
390.
044
2.81
31.
677
1,17
0
1,
226
0.49
50.
590
Nee
d fo
r fam
ily p
lann
ing
satis
fied
with
mod
ern
cont
race
ptio
nTM
.40.
7135
0.02
200.
031
2.10
51.
451
845
88
8
0.66
90.
758
Ant
enat
al c
are
cove
rage
(4+)
TM.5
b0.
3591
0.03
480.
097
1.77
51.
332
326
33
9
0.29
00.
429
Ski
lled
atte
ndan
t at d
eliv
ery
TM.9
0.53
890.
0411
0.07
62.
298
1.51
632
6
339
0.
457
0.62
1Th
rive
- Chi
ld h
ealth
, nut
ritio
n an
d de
velo
pmen
tD
ipht
heria
, per
tuss
is a
nd te
tanu
s (D
PT)
imm
uniz
atio
n co
vera
geTC
.30.
6022
0.02
750.
046
0.48
80.
699
155
15
6
0.54
70.
657
Pne
umoc
occa
l (C
onju
gate
) im
mun
izat
ion
cove
rage
TC.6
0.46
000.
0277
0.06
00.
478
0.69
115
5
156
0.
405
0.51
5M
easl
es im
mun
izat
ion
cove
rage
TC.1
00.
7910
0.03
720.
047
1.29
81.
139
155
15
6
0.71
70.
865
Prim
ary
relia
nce
on c
lean
fuel
s an
d te
chno
logi
es fo
r coo
king
, spa
ce h
eatin
g an
d lig
htin
gTC
.18
0.00
910.
0024
0.26
60.
859
0.92
76,
554
1,32
3
0.
004
0.01
4P
opul
atio
n w
ho s
lept
und
er a
n IT
NTC
.22
0.90
170.
0170
0.01
922
.049
4.69
66,
426
6,73
3
0.
868
0.93
6E
xclu
sive
bre
astfe
edin
g un
der 6
mon
ths
TC.3
20.
6390
0.05
120.
080
0.98
80.
994
88
88
0.53
70.
741
Stu
ntin
g pr
eval
ence
(mod
erat
e an
d se
vere
)TC
.45a
0.42
950.
0184
0.04
31.
100
1.04
979
6
797
0.
393
0.46
6W
astin
g pr
eval
ence
(mod
erat
e an
d se
vere
)TC
.46a
0.12
490.
0113
0.09
00.
941
0.97
081
0
810
0.
102
0.14
7O
verw
eigh
t pre
vale
nce
(mod
erat
e an
d se
vere
)TC
.47a
0.02
670.
0075
0.28
21.
766
1.32
981
0
810
0.
012
0.04
2E
arly
chi
ld d
evel
opm
ent i
ndex
TC.5
30.
9155
0.01
990.
022
1.60
31.
266
315
31
4
0.87
60.
955
Low
er b
ound
r - 2
seU
pper
bou
ndr +
2se
Lear
nP
artic
ipat
ion
rate
in o
rgan
ised
lear
ning
(adj
uste
d)LN
.20.
6668
0.04
080.
061
1.44
91.
204
180
19
4
0.58
50.
749
Prot
ecte
d fr
om v
iole
nce
and
expl
oita
tion
Birt
h re
gist
ratio
nP
R.1
0.59
560.
0361
0.06
14.
446
2.10
882
1
821
0.
523
0.66
8V
iole
nt d
isci
plin
eP
R.2
0.35
060.
0219
0.06
23.
002
1.73
32,
342
1,42
6
0.
307
0.39
4C
hild
labo
urP
R.3
0.18
130.
0209
0.11
52.
858
1.69
12,
102
976
0.
140
0.22
3C
hild
mar
riage
(bef
ore
age
15)
PR
.4a
0.08
780.
0227
0.25
91.
597
1.26
423
8
249
0.
042
0.13
3C
hild
mar
riage
(bef
ore
age
18)
PR
.4b
0.34
730.
0360
0.10
41.
419
1.19
123
8
249
0.
275
0.41
9Li
ve in
a s
afe
and
clea
n en
viro
nmen
tU
se o
f bas
ic d
rinki
ng w
ater
ser
vice
sW
S.2
0.69
860.
0307
0.04
45.
936
2.43
66,
554
1,32
3
0.
637
0.76
0U
se o
f saf
ely
man
aged
drin
king
wat
er s
ervi
ces
WS
.60.
1760
0.03
240.
184
1.41
81.
191
969
19
7
0.11
10.
241
Han
dwas
hing
faci
lity
with
wat
er a
nd s
oap
WS
.70.
3925
0.02
530.
065
3.55
11.
884
6,55
0
1,
322
0.34
20.
443
Use
of b
asic
san
itatio
n se
rvic
esW
S.9
0.33
270.
0365
0.11
07.
914
2.81
36,
554
1,32
3
0.
260
0.40
6S
afe
disp
osal
in s
itu o
f exc
reta
from
on-
site
san
itatio
n fa
cilit
ies
WS
.10
0.96
110.
0101
0.01
01.
341
1.15
82,
261
496
0.
941
0.98
1Eq
uita
ble
chan
ce in
life
Chi
ldre
n w
ith fu
nctio
nal d
ificu
lty
EQ
.10.
0179
0.00
690.
384
1.29
31.
137
481
48
1
0.00
40.
032
Pop
ulat
ion
cove
red
by s
ocia
l tra
nsfe
rsE
Q.3
0.14
240.
0135
0.09
51.
975
1.40
56,
554
1,32
3
0.
115
0.16
9na
: not
app
licab
le
Tabl
e SE
.22:
Sam
plin
g er
rors
: Sar
avan
eS
tand
ard
erro
rs, c
oeffi
cien
ts o
f var
iatio
n, d
esig
n ef
fect
s (d
eff)
, squ
are
root
of d
esig
n ef
fect
s (d
eft)
, and
con
fiden
ce in
terv
als
for s
elec
ted
SD
G a
nd M
ICS
indi
cato
rs, L
SIS
II, 2
017
MIC
SIn
dica
tor
Val
ue (r
)S
tand
ard
erro
r (se
)
Coe
ffici
ent o
f va
riatio
n(s
e/r)
Des
ign
effe
ct
(def
f)
Squ
are
root
of
des
ign
effe
ct (d
eft)
Wei
ghte
d co
unt
Unw
eigh
ted
coun
t
Con
fiden
ce li
mits

427
Low
er b
ound
r - 2
seU
pper
bou
ndr +
2se
Sam
ple
cove
rage
and
cha
ract
eris
tics
of th
e re
spon
dent
sA
cces
s to
ele
ctric
ityS
R.1
0.79
370.
0408
0.05
113
.469
3.67
06,
554
1,32
3
0.
712
0.87
5O
wne
rshi
p of
mob
ile p
hone
(wom
en)
SR
.10
0.52
490.
0265
0.05
14.
480
2.11
71,
510
1,58
6
0.
472
0.57
8O
wne
rshi
p of
mob
ile p
hone
(men
)S
R.1
00.
8009
0.02
700.
034
3.46
71.
862
709
75
7
0.74
70.
855
Use
of i
nter
net (
wom
en)
SR
.12a
0.15
840.
0163
0.10
33.
142
1.77
31,
510
1,58
6
0.
126
0.19
1U
se o
f int
erne
t (m
en)
SR
.12a
0.13
520.
0194
0.14
32.
423
1.55
770
9
757
0.
096
0.17
4IC
T sk
ills
(wom
en)
SR
.13
0.04
150.
0119
0.28
65.
632
2.37
31,
510
1,58
6
0.
018
0.06
5IC
T sk
ills
(men
)S
R.1
30.
0833
0.02
180.
262
4.71
52.
172
709
75
7
0.04
00.
127
Use
of t
obac
co (w
omen
)S
R.1
40.
2828
0.02
260.
080
4.00
52.
001
1,51
0
1,
586
0.23
80.
328
Use
of t
obac
co (m
en)
SR
.14
0.52
160.
0202
0.03
91.
238
1.11
370
9
757
0.
481
0.56
2Su
rviv
eN
eona
tal m
orta
lity
rate
CS
.121
5.19
450.
247
nana
nana
1131
Infa
nt m
orta
lity
rate
CS
.350
9.31
880.
187
nana
nana
3169
Und
er-fi
ve m
orta
lity
rate
CS
.554
10.1
211
0.18
9na
nana
na33
74Th
rive
- Rep
rodu
ctiv
e an
d m
ater
nal h
ealth
Tota
l fer
tility
rate
-3.
60.
2218
0.06
2na
nana
na3.
14.
0A
dole
scen
t birt
h ra
teTM
.110
3.1
13.9
106
0.13
5na
nana
na75
.213
0.9
…C
ontra
cept
ive
prev
alen
ce ra
teTM
.30.
5423
0.02
390.
044
2.81
31.
677
1,17
0
1,
226
0.49
50.
590
Nee
d fo
r fam
ily p
lann
ing
satis
fied
with
mod
ern
cont
race
ptio
nTM
.40.
7135
0.02
200.
031
2.10
51.
451
845
88
8
0.66
90.
758
Ant
enat
al c
are
cove
rage
(4+)
TM.5
b0.
3591
0.03
480.
097
1.77
51.
332
326
33
9
0.29
00.
429
Ski
lled
atte
ndan
t at d
eliv
ery
TM.9
0.53
890.
0411
0.07
62.
298
1.51
632
6
339
0.
457
0.62
1Th
rive
- Chi
ld h
ealth
, nut
ritio
n an
d de
velo
pmen
tD
ipht
heria
, per
tuss
is a
nd te
tanu
s (D
PT)
imm
uniz
atio
n co
vera
geTC
.30.
6022
0.02
750.
046
0.48
80.
699
155
15
6
0.54
70.
657
Pne
umoc
occa
l (C
onju
gate
) im
mun
izat
ion
cove
rage
TC.6
0.46
000.
0277
0.06
00.
478
0.69
115
5
156
0.
405
0.51
5M
easl
es im
mun
izat
ion
cove
rage
TC.1
00.
7910
0.03
720.
047
1.29
81.
139
155
15
6
0.71
70.
865
Prim
ary
relia
nce
on c
lean
fuel
s an
d te
chno
logi
es fo
r coo
king
, spa
ce h
eatin
g an
d lig
htin
gTC
.18
0.00
910.
0024
0.26
60.
859
0.92
76,
554
1,32
3
0.
004
0.01
4P
opul
atio
n w
ho s
lept
und
er a
n IT
NTC
.22
0.90
170.
0170
0.01
922
.049
4.69
66,
426
6,73
3
0.
868
0.93
6E
xclu
sive
bre
astfe
edin
g un
der 6
mon
ths
TC.3
20.
6390
0.05
120.
080
0.98
80.
994
88
88
0.53
70.
741
Stu
ntin
g pr
eval
ence
(mod
erat
e an
d se
vere
)TC
.45a
0.42
950.
0184
0.04
31.
100
1.04
979
6
797
0.
393
0.46
6W
astin
g pr
eval
ence
(mod
erat
e an
d se
vere
)TC
.46a
0.12
490.
0113
0.09
00.
941
0.97
081
0
810
0.
102
0.14
7O
verw
eigh
t pre
vale
nce
(mod
erat
e an
d se
vere
)TC
.47a
0.02
670.
0075
0.28
21.
766
1.32
981
0
810
0.
012
0.04
2E
arly
chi
ld d
evel
opm
ent i
ndex
TC.5
30.
9155
0.01
990.
022
1.60
31.
266
315
31
4
0.87
60.
955
Low
er b
ound
r - 2
seU
pper
bou
ndr +
2se
Lear
nP
artic
ipat
ion
rate
in o
rgan
ised
lear
ning
(adj
uste
d)LN
.20.
6668
0.04
080.
061
1.44
91.
204
180
19
4
0.58
50.
749
Prot
ecte
d fr
om v
iole
nce
and
expl
oita
tion
Birt
h re
gist
ratio
nP
R.1
0.59
560.
0361
0.06
14.
446
2.10
882
1
821
0.
523
0.66
8V
iole
nt d
isci
plin
eP
R.2
0.35
060.
0219
0.06
23.
002
1.73
32,
342
1,42
6
0.
307
0.39
4C
hild
labo
urP
R.3
0.18
130.
0209
0.11
52.
858
1.69
12,
102
976
0.
140
0.22
3C
hild
mar
riage
(bef
ore
age
15)
PR
.4a
0.08
780.
0227
0.25
91.
597
1.26
423
8
249
0.
042
0.13
3C
hild
mar
riage
(bef
ore
age
18)
PR
.4b
0.34
730.
0360
0.10
41.
419
1.19
123
8
249
0.
275
0.41
9Li
ve in
a s
afe
and
clea
n en
viro
nmen
tU
se o
f bas
ic d
rinki
ng w
ater
ser
vice
sW
S.2
0.69
860.
0307
0.04
45.
936
2.43
66,
554
1,32
3
0.
637
0.76
0U
se o
f saf
ely
man
aged
drin
king
wat
er s
ervi
ces
WS
.60.
1760
0.03
240.
184
1.41
81.
191
969
19
7
0.11
10.
241
Han
dwas
hing
faci
lity
with
wat
er a
nd s
oap
WS
.70.
3925
0.02
530.
065
3.55
11.
884
6,55
0
1,
322
0.34
20.
443
Use
of b
asic
san
itatio
n se
rvic
esW
S.9
0.33
270.
0365
0.11
07.
914
2.81
36,
554
1,32
3
0.
260
0.40
6S
afe
disp
osal
in s
itu o
f exc
reta
from
on-
site
san
itatio
n fa
cilit
ies
WS
.10
0.96
110.
0101
0.01
01.
341
1.15
82,
261
496
0.
941
0.98
1Eq
uita
ble
chan
ce in
life
Chi
ldre
n w
ith fu
nctio
nal d
ificu
lty
EQ
.10.
0179
0.00
690.
384
1.29
31.
137
481
48
1
0.00
40.
032
Pop
ulat
ion
cove
red
by s
ocia
l tra
nsfe
rsE
Q.3
0.14
240.
0135
0.09
51.
975
1.40
56,
554
1,32
3
0.
115
0.16
9na
: not
app
licab
le
Tabl
e SE
.22:
Sam
plin
g er
rors
: Sar
avan
eS
tand
ard
erro
rs, c
oeffi
cien
ts o
f var
iatio
n, d
esig
n ef
fect
s (d
eff)
, squ
are
root
of d
esig
n ef
fect
s (d
eft)
, and
con
fiden
ce in
terv
als
for s
elec
ted
SD
G a
nd M
ICS
indi
cato
rs, L
SIS
II, 2
017
MIC
SIn
dica
tor
Val
ue (r
)S
tand
ard
erro
r (se
)
Coe
ffici
ent o
f va
riatio
n(s
e/r)
Des
ign
effe
ct
(def
f)
Squ
are
root
of
des
ign
effe
ct (d
eft)
Wei
ghte
d co
unt
Unw
eigh
ted
coun
t
Con
fiden
ce li
mits
Tabl
e SE
.22:
Sam
plin
g er
rors
: Sar
avan
eS
tand
ard
erro
rs, c
oeffi
cien
ts o
f var
iatio
n, d
esig
n ef
fect
s (d
eff)
, squ
are
root
of d
esig
n ef
fect
s (d
eft)
, and
con
fiden
ce in
terv
als
for s
elec
ted
SD
G a
nd M
ICS
indi
cato
rs, L
SIS
II, 2
017
MIC
SIn
dica
tor
Val
ue (r
)S
tand
ard
erro
r (se
)
Coe
ffici
ent o
f va
riatio
n(s
e/r)
Des
ign
effe
ct
(def
f)
Squ
are
root
of
des
ign
effe
ct (d
eft)
Wei
ghte
d co
unt
Unw
eigh
ted
coun
t
Con
fiden
ce li
mits

428
Low
er b
ound
r - 2
seU
pper
bou
ndr +
2se
Sam
ple
cove
rage
and
cha
ract
eris
tics
of th
e re
spon
dent
sA
cces
s to
ele
ctric
ityS
R.1
0.84
760.
0404
0.04
813
.308
3.64
81,
931
1,05
6
0.
767
0.92
8O
wne
rshi
p of
mob
ile p
hone
(wom
en)
SR
.10
0.52
120.
0258
0.04
93.
322
1.82
343
1
1,24
7
0.
470
0.57
3O
wne
rshi
p of
mob
ile p
hone
(men
)S
R.1
00.
7042
0.02
750.
039
2.21
51.
488
209
60
9
0.64
90.
759
Use
of i
nter
net (
wom
en)
SR
.12a
0.15
900.
0142
0.08
91.
875
1.36
943
1
1,24
7
0.
131
0.18
7U
se o
f int
erne
t (m
en)
SR
.12a
0.23
870.
0221
0.09
31.
637
1.27
920
9
609
0.
194
0.28
3IC
T sk
ills
(wom
en)
SR
.13
0.04
570.
0076
0.16
71.
660
1.28
843
1
1,24
7
0.
030
0.06
1IC
T sk
ills
(men
)S
R.1
30.
0997
0.01
410.
141
1.34
01.
157
209
60
9
0.07
20.
128
Use
of t
obac
co (w
omen
)S
R.1
40.
3366
0.03
170.
094
5.59
52.
365
431
1,
247
0.27
30.
400
Use
of t
obac
co (m
en)
SR
.14
0.60
520.
0211
0.03
51.
128
1.06
220
9
609
0.
563
0.64
7Su
rviv
eN
eona
tal m
orta
lity
rate
CS
.112
4.69
800.
391
nana
nana
321
Infa
nt m
orta
lity
rate
CS
.328
6.81
370.
243
nana
nana
1442
Und
er-fi
ve m
orta
lity
rate
CS
.535
7.33
750.
207
nana
nana
2150
Thriv
e - R
epro
duct
ive
and
mat
erna
l hea
lthTo
tal f
ertil
ity ra
te-
3.4
0.22
070.
066
nana
nana
2.9
3.8
Ado
lesc
ent b
irth
rate
TM.1
97.1
14.5
788
0.15
0na
nana
na67
.912
6.3
…C
ontra
cept
ive
prev
alen
ce ra
teTM
.30.
4012
0.02
550.
064
2.64
51.
626
335
97
5
0.35
00.
452
Nee
d fo
r fam
ily p
lann
ing
satis
fied
with
mod
ern
cont
race
ptio
nTM
.40.
5621
0.03
080.
055
2.43
11.
559
218
63
2
0.50
10.
624
Ant
enat
al c
are
cove
rage
(4+)
TM.5
b0.
5282
0.05
120.
097
2.78
51.
669
92
26
6
0.42
60.
631
Ski
lled
atte
ndan
t at d
eliv
ery
TM.9
0.48
350.
0383
0.07
91.
553
1.24
692
266
0.
407
0.56
0Th
rive
- Chi
ld h
ealth
, nut
ritio
n an
d de
velo
pmen
tD
ipht
heria
, per
tuss
is a
nd te
tanu
s (D
PT)
imm
uniz
atio
n co
vera
geTC
.30.
6790
0.05
580.
082
1.81
21.
346
46
12
8
0.56
70.
791
Pne
umoc
occa
l (C
onju
gate
) im
mun
izat
ion
cove
rage
TC.6
0.48
140.
0435
0.09
00.
962
0.98
146
128
0.
394
0.56
8M
easl
es im
mun
izat
ion
cove
rage
TC.1
00.
7419
0.02
800.
038
0.52
20.
722
46
12
8
0.68
60.
798
Prim
ary
relia
nce
on c
lean
fuel
s an
d te
chno
logi
es fo
r coo
king
, spa
ce h
eatin
g an
d lig
htin
gTC
.18
0.01
460.
0044
0.29
91.
393
1.18
01,
931
1,05
6
0.
006
0.02
3P
opul
atio
n w
ho s
lept
und
er a
n IT
NTC
.22
0.78
440.
0195
0.02
512
.202
3.49
31,
881
5,44
1
0.
745
0.82
3E
xclu
sive
bre
astfe
edin
g un
der 6
mon
ths
TC.3
20.
5620
0.05
730.
102
0.79
90.
894
21
61
0.44
70.
677
Stu
ntin
g pr
eval
ence
(mod
erat
e an
d se
vere
)TC
.45a
0.49
900.
0261
0.05
21.
894
1.37
624
7
694
0.
447
0.55
1W
astin
g pr
eval
ence
(mod
erat
e an
d se
vere
)TC
.46a
0.07
980.
0184
0.23
13.
222
1.79
524
9
699
0.
043
0.11
7O
verw
eigh
t pre
vale
nce
(mod
erat
e an
d se
vere
)TC
.47a
0.02
230.
0063
0.28
41.
287
1.13
524
9
699
0.
010
0.03
5E
arly
chi
ld d
evel
opm
ent i
ndex
TC.5
30.
7862
0.02
660.
034
1.22
61.
107
105
29
3
0.73
30.
839
Low
er b
ound
r - 2
seU
pper
bou
ndr +
2se
Lear
nP
artic
ipat
ion
rate
in o
rgan
ised
lear
ning
(adj
uste
d)LN
.20.
6737
0.06
230.
092
2.73
81.
655
55
15
6
0.54
90.
798
Prot
ecte
d fr
om v
iole
nce
and
expl
oita
tion
Birt
h re
gist
ratio
nP
R.1
0.71
940.
0388
0.05
45.
325
2.30
825
6
716
0.
642
0.79
7V
iole
nt d
isci
plin
eP
R.2
0.70
570.
0151
0.02
11.
337
1.15
676
4
1,22
3
0.
676
0.73
6C
hild
labo
urP
R.3
0.48
120.
0208
0.04
31.
354
1.16
467
9
786
0.
440
0.52
3C
hild
mar
riage
(bef
ore
age
15)
PR
.4a
0.09
850.
0188
0.19
10.
881
0.93
978
223
0.
061
0.13
6C
hild
mar
riage
(bef
ore
age
18)
PR
.4b
0.37
870.
0439
0.11
61.
819
1.34
978
223
0.
291
0.46
7Li
ve in
a s
afe
and
clea
n en
viro
nmen
tU
se o
f bas
ic d
rinki
ng w
ater
ser
vice
sW
S.2
0.77
120.
0245
0.03
23.
599
1.89
71,
931
1,05
6
0.
722
0.82
0U
se o
f saf
ely
man
aged
drin
king
wat
er s
ervi
ces
WS
.60.
1300
0.03
930.
302
1.89
51.
376
277
14
0
0.05
10.
208
Han
dwas
hing
faci
lity
with
wat
er a
nd s
oap
WS
.70.
4991
0.01
330.
027
0.74
60.
864
1,93
0
1,
055
0.47
30.
526
Use
of b
asic
san
itatio
n se
rvic
esW
S.9
0.63
190.
0343
0.05
45.
324
2.30
71,
931
1,05
6
0.
563
0.70
0S
afe
disp
osal
in s
itu o
f exc
reta
from
on-
site
san
itatio
n fa
cilit
ies
WS
.10
0.98
590.
0054
0.00
51.
490
1.22
11,
305
711
0.
975
0.99
7Eq
uita
ble
chan
ce in
life
Chi
ldre
n w
ith fu
nctio
nal d
ificu
lty
EQ
.10.
2183
0.02
680.
123
1.87
71.
370
159
44
6
0.16
50.
272
Pop
ulat
ion
cove
red
by s
ocia
l tra
nsfe
rsE
Q.3
0.09
900.
0127
0.12
81.
893
1.37
61,
931
1,05
6
0.
074
0.12
4na
: not
app
licab
le
Tabl
e SE
.23:
Sam
plin
g er
rors
: Sek
ong
Sta
ndar
d er
rors
, coe
ffici
ents
of v
aria
tion,
des
ign
effe
cts
(def
f), s
quar
e ro
ot o
f des
ign
effe
cts
(def
t), a
nd c
onfid
ence
inte
rval
s fo
r sel
ecte
d S
DG
and
MIC
S in
dica
tors
, LS
ISII,
201
7
MIC
SIn
dica
tor
Val
ue (r
)S
tand
ard
erro
r (se
)
Coe
ffici
ent o
f va
riatio
n(s
e/r)
Des
ign
effe
ct
(def
f)
Squ
are
root
of
des
ign
effe
ct (d
eft)
Wei
ghte
d co
unt
Unw
eigh
ted
coun
t
Con
fiden
ce li
mits

429
Low
er b
ound
r - 2
seU
pper
bou
ndr +
2se
Sam
ple
cove
rage
and
cha
ract
eris
tics
of th
e re
spon
dent
sA
cces
s to
ele
ctric
ityS
R.1
0.84
760.
0404
0.04
813
.308
3.64
81,
931
1,05
6
0.
767
0.92
8O
wne
rshi
p of
mob
ile p
hone
(wom
en)
SR
.10
0.52
120.
0258
0.04
93.
322
1.82
343
1
1,24
7
0.
470
0.57
3O
wne
rshi
p of
mob
ile p
hone
(men
)S
R.1
00.
7042
0.02
750.
039
2.21
51.
488
209
60
9
0.64
90.
759
Use
of i
nter
net (
wom
en)
SR
.12a
0.15
900.
0142
0.08
91.
875
1.36
943
1
1,24
7
0.
131
0.18
7U
se o
f int
erne
t (m
en)
SR
.12a
0.23
870.
0221
0.09
31.
637
1.27
920
9
609
0.
194
0.28
3IC
T sk
ills
(wom
en)
SR
.13
0.04
570.
0076
0.16
71.
660
1.28
843
1
1,24
7
0.
030
0.06
1IC
T sk
ills
(men
)S
R.1
30.
0997
0.01
410.
141
1.34
01.
157
209
60
9
0.07
20.
128
Use
of t
obac
co (w
omen
)S
R.1
40.
3366
0.03
170.
094
5.59
52.
365
431
1,
247
0.27
30.
400
Use
of t
obac
co (m
en)
SR
.14
0.60
520.
0211
0.03
51.
128
1.06
220
9
609
0.
563
0.64
7Su
rviv
eN
eona
tal m
orta
lity
rate
CS
.112
4.69
800.
391
nana
nana
321
Infa
nt m
orta
lity
rate
CS
.328
6.81
370.
243
nana
nana
1442
Und
er-fi
ve m
orta
lity
rate
CS
.535
7.33
750.
207
nana
nana
2150
Thriv
e - R
epro
duct
ive
and
mat
erna
l hea
lthTo
tal f
ertil
ity ra
te-
3.4
0.22
070.
066
nana
nana
2.9
3.8
Ado
lesc
ent b
irth
rate
TM.1
97.1
14.5
788
0.15
0na
nana
na67
.912
6.3
…C
ontra
cept
ive
prev
alen
ce ra
teTM
.30.
4012
0.02
550.
064
2.64
51.
626
335
97
5
0.35
00.
452
Nee
d fo
r fam
ily p
lann
ing
satis
fied
with
mod
ern
cont
race
ptio
nTM
.40.
5621
0.03
080.
055
2.43
11.
559
218
63
2
0.50
10.
624
Ant
enat
al c
are
cove
rage
(4+)
TM.5
b0.
5282
0.05
120.
097
2.78
51.
669
92
26
6
0.42
60.
631
Ski
lled
atte
ndan
t at d
eliv
ery
TM.9
0.48
350.
0383
0.07
91.
553
1.24
692
266
0.
407
0.56
0Th
rive
- Chi
ld h
ealth
, nut
ritio
n an
d de
velo
pmen
tD
ipht
heria
, per
tuss
is a
nd te
tanu
s (D
PT)
imm
uniz
atio
n co
vera
geTC
.30.
6790
0.05
580.
082
1.81
21.
346
46
12
8
0.56
70.
791
Pne
umoc
occa
l (C
onju
gate
) im
mun
izat
ion
cove
rage
TC.6
0.48
140.
0435
0.09
00.
962
0.98
146
128
0.
394
0.56
8M
easl
es im
mun
izat
ion
cove
rage
TC.1
00.
7419
0.02
800.
038
0.52
20.
722
46
12
8
0.68
60.
798
Prim
ary
relia
nce
on c
lean
fuel
s an
d te
chno
logi
es fo
r coo
king
, spa
ce h
eatin
g an
d lig
htin
gTC
.18
0.01
460.
0044
0.29
91.
393
1.18
01,
931
1,05
6
0.
006
0.02
3P
opul
atio
n w
ho s
lept
und
er a
n IT
NTC
.22
0.78
440.
0195
0.02
512
.202
3.49
31,
881
5,44
1
0.
745
0.82
3E
xclu
sive
bre
astfe
edin
g un
der 6
mon
ths
TC.3
20.
5620
0.05
730.
102
0.79
90.
894
21
61
0.44
70.
677
Stu
ntin
g pr
eval
ence
(mod
erat
e an
d se
vere
)TC
.45a
0.49
900.
0261
0.05
21.
894
1.37
624
7
694
0.
447
0.55
1W
astin
g pr
eval
ence
(mod
erat
e an
d se
vere
)TC
.46a
0.07
980.
0184
0.23
13.
222
1.79
524
9
699
0.
043
0.11
7O
verw
eigh
t pre
vale
nce
(mod
erat
e an
d se
vere
)TC
.47a
0.02
230.
0063
0.28
41.
287
1.13
524
9
699
0.
010
0.03
5E
arly
chi
ld d
evel
opm
ent i
ndex
TC.5
30.
7862
0.02
660.
034
1.22
61.
107
105
29
3
0.73
30.
839
Low
er b
ound
r - 2
seU
pper
bou
ndr +
2se
Lear
nP
artic
ipat
ion
rate
in o
rgan
ised
lear
ning
(adj
uste
d)LN
.20.
6737
0.06
230.
092
2.73
81.
655
55
15
6
0.54
90.
798
Prot
ecte
d fr
om v
iole
nce
and
expl
oita
tion
Birt
h re
gist
ratio
nP
R.1
0.71
940.
0388
0.05
45.
325
2.30
825
6
716
0.
642
0.79
7V
iole
nt d
isci
plin
eP
R.2
0.70
570.
0151
0.02
11.
337
1.15
676
4
1,22
3
0.
676
0.73
6C
hild
labo
urP
R.3
0.48
120.
0208
0.04
31.
354
1.16
467
9
786
0.
440
0.52
3C
hild
mar
riage
(bef
ore
age
15)
PR
.4a
0.09
850.
0188
0.19
10.
881
0.93
978
223
0.
061
0.13
6C
hild
mar
riage
(bef
ore
age
18)
PR
.4b
0.37
870.
0439
0.11
61.
819
1.34
978
223
0.
291
0.46
7Li
ve in
a s
afe
and
clea
n en
viro
nmen
tU
se o
f bas
ic d
rinki
ng w
ater
ser
vice
sW
S.2
0.77
120.
0245
0.03
23.
599
1.89
71,
931
1,05
6
0.
722
0.82
0U
se o
f saf
ely
man
aged
drin
king
wat
er s
ervi
ces
WS
.60.
1300
0.03
930.
302
1.89
51.
376
277
14
0
0.05
10.
208
Han
dwas
hing
faci
lity
with
wat
er a
nd s
oap
WS
.70.
4991
0.01
330.
027
0.74
60.
864
1,93
0
1,
055
0.47
30.
526
Use
of b
asic
san
itatio
n se
rvic
esW
S.9
0.63
190.
0343
0.05
45.
324
2.30
71,
931
1,05
6
0.
563
0.70
0S
afe
disp
osal
in s
itu o
f exc
reta
from
on-
site
san
itatio
n fa
cilit
ies
WS
.10
0.98
590.
0054
0.00
51.
490
1.22
11,
305
711
0.
975
0.99
7Eq
uita
ble
chan
ce in
life
Chi
ldre
n w
ith fu
nctio
nal d
ificu
lty
EQ
.10.
2183
0.02
680.
123
1.87
71.
370
159
44
6
0.16
50.
272
Pop
ulat
ion
cove
red
by s
ocia
l tra
nsfe
rsE
Q.3
0.09
900.
0127
0.12
81.
893
1.37
61,
931
1,05
6
0.
074
0.12
4na
: not
app
licab
le
Tabl
e SE
.23:
Sam
plin
g er
rors
: Sek
ong
Sta
ndar
d er
rors
, coe
ffici
ents
of v
aria
tion,
des
ign
effe
cts
(def
f), s
quar
e ro
ot o
f des
ign
effe
cts
(def
t), a
nd c
onfid
ence
inte
rval
s fo
r sel
ecte
d S
DG
and
MIC
S in
dica
tors
, LS
ISII,
201
7
MIC
SIn
dica
tor
Val
ue (r
)S
tand
ard
erro
r (se
)
Coe
ffici
ent o
f va
riatio
n(s
e/r)
Des
ign
effe
ct
(def
f)
Squ
are
root
of
des
ign
effe
ct (d
eft)
Wei
ghte
d co
unt
Unw
eigh
ted
coun
t
Con
fiden
ce li
mits
Tabl
e SE
.23:
Sam
plin
g er
rors
: Sek
ong
Sta
ndar
d er
rors
, coe
ffici
ents
of v
aria
tion,
des
ign
effe
cts
(def
f), s
quar
e ro
ot o
f des
ign
effe
cts
(def
t), a
nd c
onfid
ence
inte
rval
s fo
r sel
ecte
d S
DG
and
MIC
S in
dica
tors
, LS
ISII,
201
7
MIC
SIn
dica
tor
Val
ue (r
)S
tand
ard
erro
r (se
)
Coe
ffici
ent o
f va
riatio
n(s
e/r)
Des
ign
effe
ct
(def
f)
Squ
are
root
of
des
ign
effe
ct (d
eft)
Wei
ghte
d co
unt
Unw
eigh
ted
coun
t
Con
fiden
ce li
mits
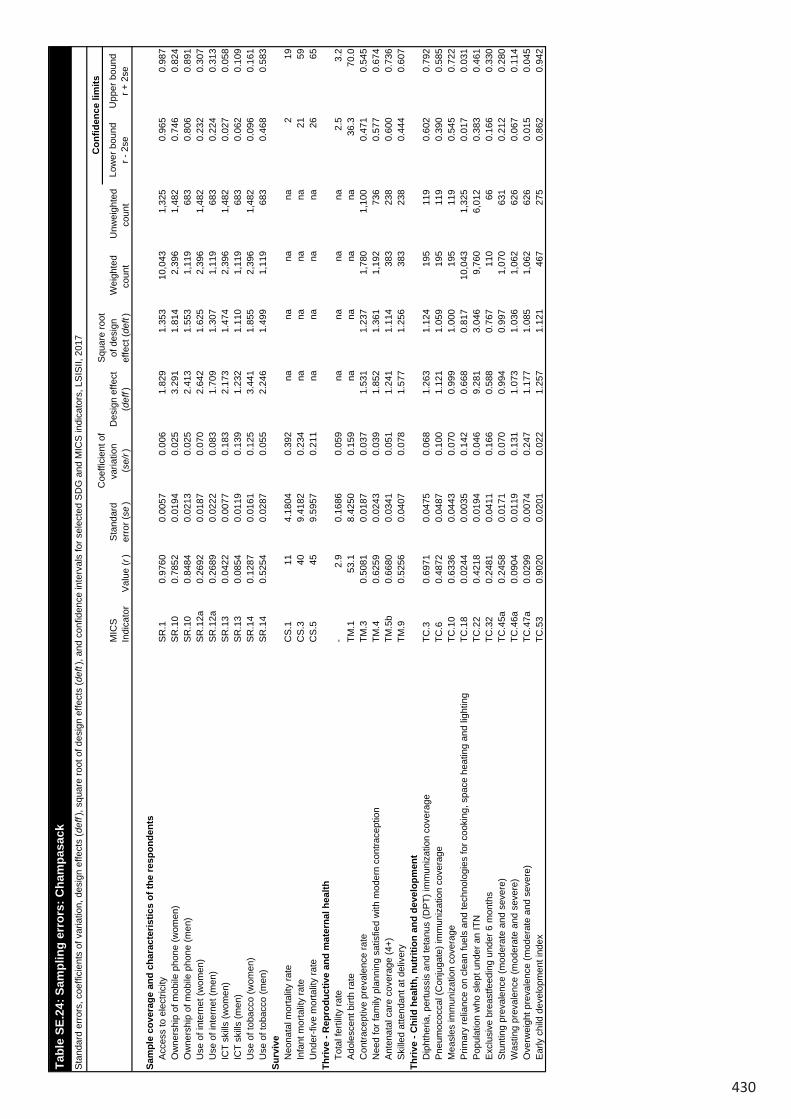
430
Low
er b
ound
r - 2
seU
pper
bou
ndr +
2se
Sam
ple
cove
rage
and
cha
ract
eris
tics
of th
e re
spon
dent
sA
cces
s to
ele
ctric
ityS
R.1
0.97
600.
0057
0.00
61.
829
1.35
310
,043
1,
325
0.96
50.
987
Ow
ners
hip
of m
obile
pho
ne (w
omen
)S
R.1
00.
7852
0.01
940.
025
3.29
11.
814
2,39
6
1,
482
0.74
60.
824
Ow
ners
hip
of m
obile
pho
ne (m
en)
SR
.10
0.84
840.
0213
0.02
52.
413
1.55
31,
119
683
0.
806
0.89
1U
se o
f int
erne
t (w
omen
)S
R.1
2a0.
2692
0.01
870.
070
2.64
21.
625
2,39
6
1,
482
0.23
20.
307
Use
of i
nter
net (
men
)S
R.1
2a0.
2689
0.02
220.
083
1.70
91.
307
1,11
9
68
3
0.22
40.
313
ICT
skill
s (w
omen
)S
R.1
30.
0422
0.00
770.
183
2.17
31.
474
2,39
6
1,
482
0.02
70.
058
ICT
skill
s (m
en)
SR
.13
0.08
540.
0119
0.13
91.
232
1.11
01,
119
683
0.
062
0.10
9U
se o
f tob
acco
(wom
en)
SR
.14
0.12
870.
0161
0.12
53.
441
1.85
52,
396
1,48
2
0.
096
0.16
1U
se o
f tob
acco
(men
)S
R.1
40.
5254
0.02
870.
055
2.24
61.
499
1,11
9
68
3
0.46
80.
583
Surv
ive
Neo
nata
l mor
talit
y ra
teC
S.1
114.
1804
0.39
2na
nana
na2
19In
fant
mor
talit
y ra
teC
S.3
409.
4182
0.23
4na
nana
na21
59U
nder
-five
mor
talit
y ra
teC
S.5
459.
5957
0.21
1na
nana
na26
65Th
rive
- Rep
rodu
ctiv
e an
d m
ater
nal h
ealth
Tota
l fer
tility
rate
-2.
90.
1686
0.05
9na
nana
na2.
53.
2A
dole
scen
t birt
h ra
teTM
.153
.18.
4250
0.15
9na
nana
na36
.370
.0…
Con
trace
ptiv
e pr
eval
ence
rate
TM.3
0.50
810.
0187
0.03
71.
531
1.23
71,
780
1,10
0
0.
471
0.54
5N
eed
for f
amily
pla
nnin
g sa
tisfie
d w
ith m
oder
n co
ntra
cept
ion
TM.4
0.62
590.
0243
0.03
91.
852
1.36
11,
192
736
0.
577
0.67
4A
nten
atal
car
e co
vera
ge (4
+)TM
.5b
0.66
800.
0341
0.05
11.
241
1.11
438
3
238
0.
600
0.73
6S
kille
d at
tend
ant a
t del
iver
yTM
.90.
5256
0.04
070.
078
1.57
71.
256
383
23
8
0.44
40.
607
Thriv
e - C
hild
hea
lth, n
utrit
ion
and
deve
lopm
ent
Dip
hthe
ria, p
ertu
ssis
and
teta
nus
(DP
T) im
mun
izat
ion
cove
rage
TC.3
0.69
710.
0475
0.06
81.
263
1.12
419
5
119
0.
602
0.79
2P
neum
ococ
cal (
Con
juga
te) i
mm
uniz
atio
n co
vera
geTC
.60.
4872
0.04
870.
100
1.12
11.
059
195
11
9
0.39
00.
585
Mea
sles
imm
uniz
atio
n co
vera
geTC
.10
0.63
360.
0443
0.07
00.
999
1.00
019
5
119
0.
545
0.72
2P
rimar
y re
lianc
e on
cle
an fu
els
and
tech
nolo
gies
for c
ooki
ng, s
pace
hea
ting
and
light
ing
TC.1
80.
0244
0.00
350.
142
0.66
80.
817
10,0
43
1,32
5
0.
017
0.03
1P
opul
atio
n w
ho s
lept
und
er a
n IT
NTC
.22
0.42
180.
0194
0.04
69.
281
3.04
69,
760
6,01
2
0.
383
0.46
1E
xclu
sive
bre
astfe
edin
g un
der 6
mon
ths
TC.3
20.
2481
0.04
110.
166
0.58
80.
767
110
66
0.16
60.
330
Stu
ntin
g pr
eval
ence
(mod
erat
e an
d se
vere
)TC
.45a
0.24
580.
0171
0.07
00.
994
0.99
71,
070
631
0.
212
0.28
0W
astin
g pr
eval
ence
(mod
erat
e an
d se
vere
)TC
.46a
0.09
040.
0119
0.13
11.
073
1.03
61,
062
626
0.
067
0.11
4O
verw
eigh
t pre
vale
nce
(mod
erat
e an
d se
vere
)TC
.47a
0.02
990.
0074
0.24
71.
177
1.08
51,
062
626
0.
015
0.04
5E
arly
chi
ld d
evel
opm
ent i
ndex
TC.5
30.
9020
0.02
010.
022
1.25
71.
121
467
27
5
0.86
20.
942
Low
er b
ound
r - 2
seU
pper
bou
ndr +
2se
Lear
nP
artic
ipat
ion
rate
in o
rgan
ised
lear
ning
(adj
uste
d)LN
.20.
6317
0.04
640.
073
1.06
21.
031
191
11
6
0.53
90.
724
Prot
ecte
d fr
om v
iole
nce
and
expl
oita
tion
Birt
h re
gist
ratio
nP
R.1
0.62
170.
0260
0.04
21.
857
1.36
31,
101
648
0.
570
0.67
4V
iole
nt d
isci
plin
eP
R.2
0.74
990.
0151
0.02
01.
474
1.21
43,
164
1,21
9
0.
720
0.78
0C
hild
labo
urP
R.3
0.30
050.
0220
0.07
32.
123
1.45
72,
999
923
0.
256
0.34
4C
hild
mar
riage
(bef
ore
age
15)
PR
.4a
0.05
350.
0163
0.30
51.
149
1.07
235
2
220
0.
021
0.08
6C
hild
mar
riage
(bef
ore
age
18)
PR
.4b
0.28
380.
0259
0.09
10.
724
0.85
135
2
220
0.
232
0.33
6Li
ve in
a s
afe
and
clea
n en
viro
nmen
tU
se o
f bas
ic d
rinki
ng w
ater
ser
vice
sW
S.2
0.82
810.
0180
0.02
23.
015
1.73
610
,043
1,
325
0.79
20.
864
Use
of s
afel
y m
anag
ed d
rinki
ng w
ater
ser
vice
sW
S.6
0.12
630.
0216
0.17
10.
814
0.90
21,
454
193
0.
083
0.17
0H
andw
ashi
ng fa
cilit
y w
ith w
ater
and
soa
pW
S.7
0.58
600.
0218
0.03
72.
594
1.61
110
,031
1,
323
0.54
20.
630
Use
of b
asic
san
itatio
n se
rvic
esW
S.9
0.67
910.
0289
0.04
35.
087
2.25
510
,043
1,
325
0.62
10.
737
Saf
e di
spos
al in
situ
of e
xcre
ta fr
om o
n-si
te s
anita
tion
faci
litie
sW
S.1
00.
9750
0.00
790.
008
2.53
31.
591
7,20
2
98
1
0.95
90.
991
Equi
tabl
e ch
ance
in li
feC
hild
ren
with
func
tiona
l difi
culty
E
Q.1
0.01
540.
0051
0.33
30.
687
0.82
968
4
398
0.
005
0.02
6P
opul
atio
n co
vere
d by
soc
ial t
rans
fers
EQ
.30.
0659
0.00
790.
121
1.35
61.
165
10,0
43
1,32
5
0.
050
0.08
2na
: not
app
licab
le
Tabl
e SE
.24:
Sam
plin
g er
rors
: Cha
mpa
sack
Sta
ndar
d er
rors
, coe
ffici
ents
of v
aria
tion,
des
ign
effe
cts
(def
f), s
quar
e ro
ot o
f des
ign
effe
cts
(def
t), a
nd c
onfid
ence
inte
rval
s fo
r sel
ecte
d S
DG
and
MIC
S in
dica
tors
, LS
ISII,
201
7
MIC
SIn
dica
tor
Val
ue (r
)S
tand
ard
erro
r (se
)
Coe
ffici
ent o
f va
riatio
n(s
e/r)
Des
ign
effe
ct
(def
f)
Squ
are
root
of
des
ign
effe
ct (d
eft)
Wei
ghte
d co
unt
Unw
eigh
ted
coun
t
Con
fiden
ce li
mits
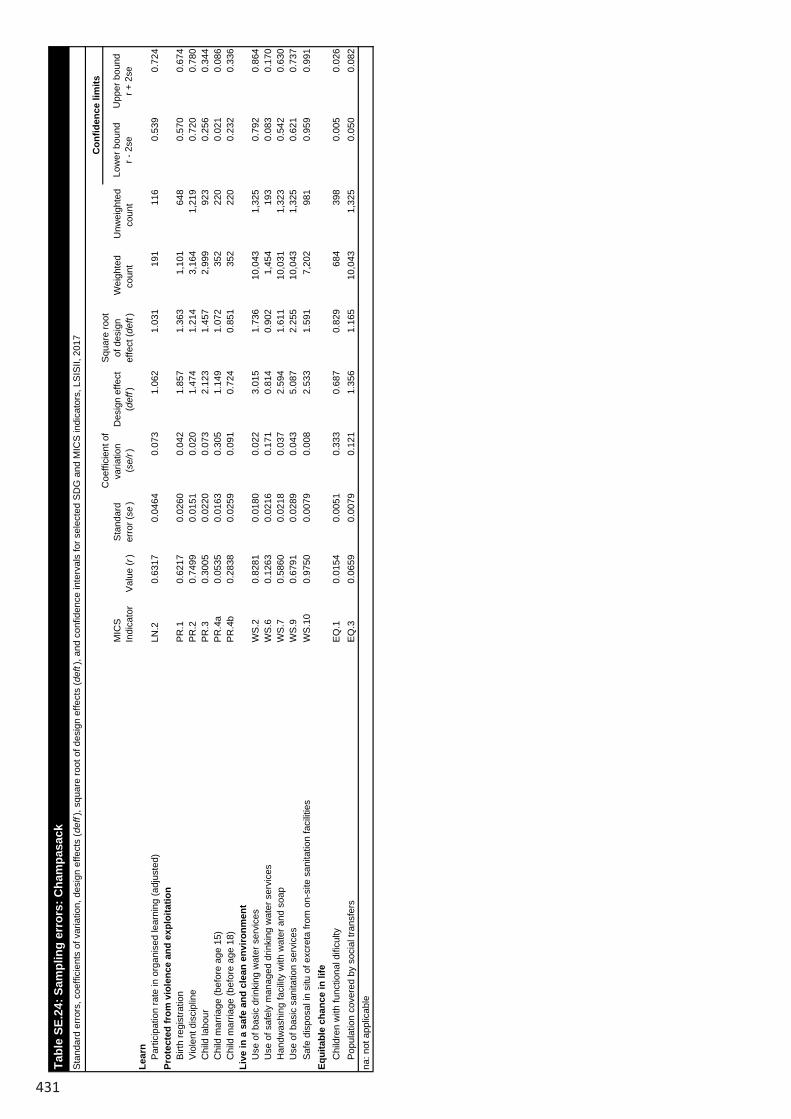
431
Low
er b
ound
r - 2
seU
pper
bou
ndr +
2se
Sam
ple
cove
rage
and
cha
ract
eris
tics
of th
e re
spon
dent
sA
cces
s to
ele
ctric
ityS
R.1
0.97
600.
0057
0.00
61.
829
1.35
310
,043
1,
325
0.96
50.
987
Ow
ners
hip
of m
obile
pho
ne (w
omen
)S
R.1
00.
7852
0.01
940.
025
3.29
11.
814
2,39
6
1,
482
0.74
60.
824
Ow
ners
hip
of m
obile
pho
ne (m
en)
SR
.10
0.84
840.
0213
0.02
52.
413
1.55
31,
119
683
0.
806
0.89
1U
se o
f int
erne
t (w
omen
)S
R.1
2a0.
2692
0.01
870.
070
2.64
21.
625
2,39
6
1,
482
0.23
20.
307
Use
of i
nter
net (
men
)S
R.1
2a0.
2689
0.02
220.
083
1.70
91.
307
1,11
9
68
3
0.22
40.
313
ICT
skill
s (w
omen
)S
R.1
30.
0422
0.00
770.
183
2.17
31.
474
2,39
6
1,
482
0.02
70.
058
ICT
skill
s (m
en)
SR
.13
0.08
540.
0119
0.13
91.
232
1.11
01,
119
683
0.
062
0.10
9U
se o
f tob
acco
(wom
en)
SR
.14
0.12
870.
0161
0.12
53.
441
1.85
52,
396
1,48
2
0.
096
0.16
1U
se o
f tob
acco
(men
)S
R.1
40.
5254
0.02
870.
055
2.24
61.
499
1,11
9
68
3
0.46
80.
583
Surv
ive
Neo
nata
l mor
talit
y ra
teC
S.1
114.
1804
0.39
2na
nana
na2
19In
fant
mor
talit
y ra
teC
S.3
409.
4182
0.23
4na
nana
na21
59U
nder
-five
mor
talit
y ra
teC
S.5
459.
5957
0.21
1na
nana
na26
65Th
rive
- Rep
rodu
ctiv
e an
d m
ater
nal h
ealth
Tota
l fer
tility
rate
-2.
90.
1686
0.05
9na
nana
na2.
53.
2A
dole
scen
t birt
h ra
teTM
.153
.18.
4250
0.15
9na
nana
na36
.370
.0…
Con
trace
ptiv
e pr
eval
ence
rate
TM.3
0.50
810.
0187
0.03
71.
531
1.23
71,
780
1,10
0
0.
471
0.54
5N
eed
for f
amily
pla
nnin
g sa
tisfie
d w
ith m
oder
n co
ntra
cept
ion
TM.4
0.62
590.
0243
0.03
91.
852
1.36
11,
192
736
0.
577
0.67
4A
nten
atal
car
e co
vera
ge (4
+)TM
.5b
0.66
800.
0341
0.05
11.
241
1.11
438
3
238
0.
600
0.73
6S
kille
d at
tend
ant a
t del
iver
yTM
.90.
5256
0.04
070.
078
1.57
71.
256
383
23
8
0.44
40.
607
Thriv
e - C
hild
hea
lth, n
utrit
ion
and
deve
lopm
ent
Dip
hthe
ria, p
ertu
ssis
and
teta
nus
(DP
T) im
mun
izat
ion
cove
rage
TC.3
0.69
710.
0475
0.06
81.
263
1.12
419
5
119
0.
602
0.79
2P
neum
ococ
cal (
Con
juga
te) i
mm
uniz
atio
n co
vera
geTC
.60.
4872
0.04
870.
100
1.12
11.
059
195
11
9
0.39
00.
585
Mea
sles
imm
uniz
atio
n co
vera
geTC
.10
0.63
360.
0443
0.07
00.
999
1.00
019
5
119
0.
545
0.72
2P
rimar
y re
lianc
e on
cle
an fu
els
and
tech
nolo
gies
for c
ooki
ng, s
pace
hea
ting
and
light
ing
TC.1
80.
0244
0.00
350.
142
0.66
80.
817
10,0
43
1,32
5
0.
017
0.03
1P
opul
atio
n w
ho s
lept
und
er a
n IT
NTC
.22
0.42
180.
0194
0.04
69.
281
3.04
69,
760
6,01
2
0.
383
0.46
1E
xclu
sive
bre
astfe
edin
g un
der 6
mon
ths
TC.3
20.
2481
0.04
110.
166
0.58
80.
767
110
66
0.16
60.
330
Stu
ntin
g pr
eval
ence
(mod
erat
e an
d se
vere
)TC
.45a
0.24
580.
0171
0.07
00.
994
0.99
71,
070
631
0.
212
0.28
0W
astin
g pr
eval
ence
(mod
erat
e an
d se
vere
)TC
.46a
0.09
040.
0119
0.13
11.
073
1.03
61,
062
626
0.
067
0.11
4O
verw
eigh
t pre
vale
nce
(mod
erat
e an
d se
vere
)TC
.47a
0.02
990.
0074
0.24
71.
177
1.08
51,
062
626
0.
015
0.04
5E
arly
chi
ld d
evel
opm
ent i
ndex
TC.5
30.
9020
0.02
010.
022
1.25
71.
121
467
27
5
0.86
20.
942
Low
er b
ound
r - 2
seU
pper
bou
ndr +
2se
Lear
nP
artic
ipat
ion
rate
in o
rgan
ised
lear
ning
(adj
uste
d)LN
.20.
6317
0.04
640.
073
1.06
21.
031
191
11
6
0.53
90.
724
Prot
ecte
d fr
om v
iole
nce
and
expl
oita
tion
Birt
h re
gist
ratio
nP
R.1
0.62
170.
0260
0.04
21.
857
1.36
31,
101
648
0.
570
0.67
4V
iole
nt d
isci
plin
eP
R.2
0.74
990.
0151
0.02
01.
474
1.21
43,
164
1,21
9
0.
720
0.78
0C
hild
labo
urP
R.3
0.30
050.
0220
0.07
32.
123
1.45
72,
999
923
0.
256
0.34
4C
hild
mar
riage
(bef
ore
age
15)
PR
.4a
0.05
350.
0163
0.30
51.
149
1.07
235
2
220
0.
021
0.08
6C
hild
mar
riage
(bef
ore
age
18)
PR
.4b
0.28
380.
0259
0.09
10.
724
0.85
135
2
220
0.
232
0.33
6Li
ve in
a s
afe
and
clea
n en
viro
nmen
tU
se o
f bas
ic d
rinki
ng w
ater
ser
vice
sW
S.2
0.82
810.
0180
0.02
23.
015
1.73
610
,043
1,
325
0.79
20.
864
Use
of s
afel
y m
anag
ed d
rinki
ng w
ater
ser
vice
sW
S.6
0.12
630.
0216
0.17
10.
814
0.90
21,
454
193
0.
083
0.17
0H
andw
ashi
ng fa
cilit
y w
ith w
ater
and
soa
pW
S.7
0.58
600.
0218
0.03
72.
594
1.61
110
,031
1,
323
0.54
20.
630
Use
of b
asic
san
itatio
n se
rvic
esW
S.9
0.67
910.
0289
0.04
35.
087
2.25
510
,043
1,
325
0.62
10.
737
Saf
e di
spos
al in
situ
of e
xcre
ta fr
om o
n-si
te s
anita
tion
faci
litie
sW
S.1
00.
9750
0.00
790.
008
2.53
31.
591
7,20
2
98
1
0.95
90.
991
Equi
tabl
e ch
ance
in li
feC
hild
ren
with
func
tiona
l difi
culty
E
Q.1
0.01
540.
0051
0.33
30.
687
0.82
968
4
398
0.
005
0.02
6P
opul
atio
n co
vere
d by
soc
ial t
rans
fers
EQ
.30.
0659
0.00
790.
121
1.35
61.
165
10,0
43
1,32
5
0.
050
0.08
2na
: not
app
licab
le
Tabl
e SE
.24:
Sam
plin
g er
rors
: Cha
mpa
sack
Sta
ndar
d er
rors
, coe
ffici
ents
of v
aria
tion,
des
ign
effe
cts
(def
f), s
quar
e ro
ot o
f des
ign
effe
cts
(def
t), a
nd c
onfid
ence
inte
rval
s fo
r sel
ecte
d S
DG
and
MIC
S in
dica
tors
, LS
ISII,
201
7
MIC
SIn
dica
tor
Val
ue (r
)S
tand
ard
erro
r (se
)
Coe
ffici
ent o
f va
riatio
n(s
e/r)
Des
ign
effe
ct
(def
f)
Squ
are
root
of
des
ign
effe
ct (d
eft)
Wei
ghte
d co
unt
Unw
eigh
ted
coun
t
Con
fiden
ce li
mits
Tabl
e SE
.24:
Sam
plin
g er
rors
: Cha
mpa
sack
Sta
ndar
d er
rors
, coe
ffici
ents
of v
aria
tion,
des
ign
effe
cts
(def
f), s
quar
e ro
ot o
f des
ign
effe
cts
(def
t), a
nd c
onfid
ence
inte
rval
s fo
r sel
ecte
d S
DG
and
MIC
S in
dica
tors
, LS
ISII,
201
7
MIC
SIn
dica
tor
Val
ue (r
)S
tand
ard
erro
r (se
)
Coe
ffici
ent o
f va
riatio
n(s
e/r)
Des
ign
effe
ct
(def
f)
Squ
are
root
of
des
ign
effe
ct (d
eft)
Wei
ghte
d co
unt
Unw
eigh
ted
coun
t
Con
fiden
ce li
mits
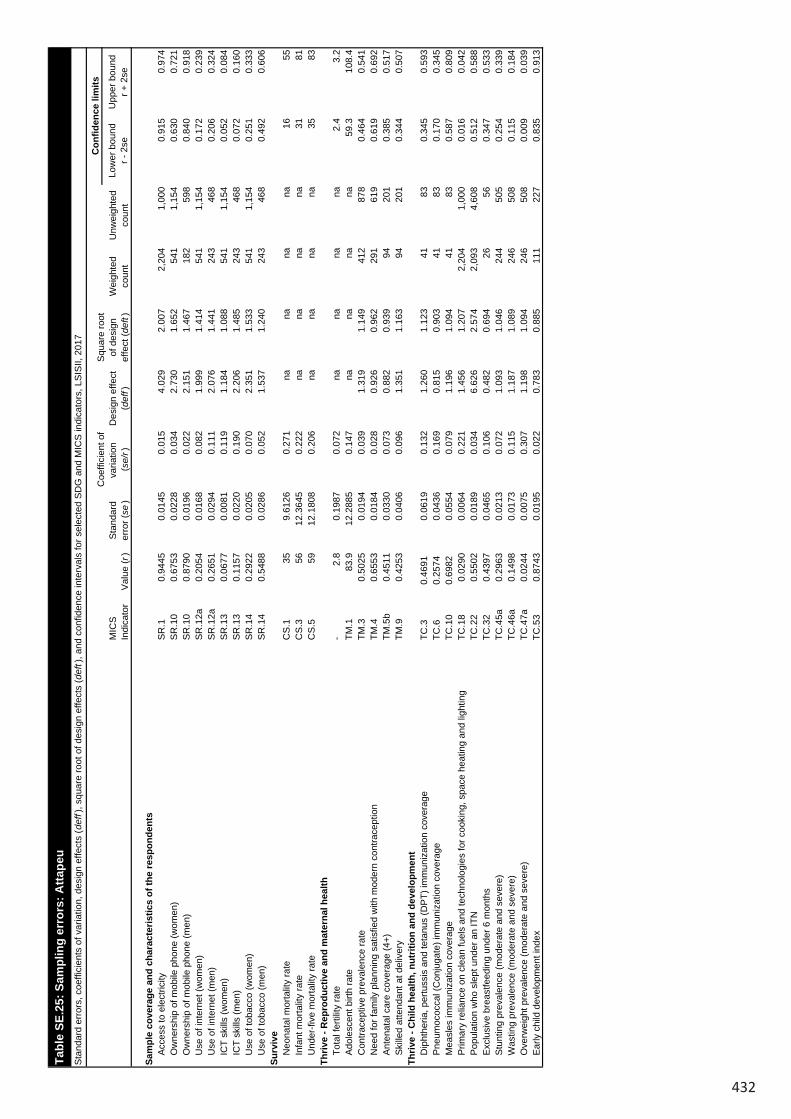
432
Low
er b
ound
r - 2
seU
pper
bou
ndr +
2se
Sam
ple
cove
rage
and
cha
ract
eris
tics
of th
e re
spon
dent
sA
cces
s to
ele
ctric
ityS
R.1
0.94
450.
0145
0.01
54.
029
2.00
72,
204
1,00
00.
915
0.97
4O
wne
rshi
p of
mob
ile p
hone
(wom
en)
SR
.10
0.67
530.
0228
0.03
42.
730
1.65
254
11,
154
0.63
00.
721
Ow
ners
hip
of m
obile
pho
ne (m
en)
SR
.10
0.87
900.
0196
0.02
22.
151
1.46
718
259
80.
840
0.91
8U
se o
f int
erne
t (w
omen
)S
R.1
2a0.
2054
0.01
680.
082
1.99
91.
414
541
1,15
40.
172
0.23
9U
se o
f int
erne
t (m
en)
SR
.12a
0.26
510.
0294
0.11
12.
076
1.44
124
346
80.
206
0.32
4IC
T sk
ills
(wom
en)
SR
.13
0.06
770.
0081
0.11
91.
184
1.08
854
11,
154
0.05
20.
084
ICT
skill
s (m
en)
SR
.13
0.11
570.
0220
0.19
02.
206
1.48
524
346
80.
072
0.16
0U
se o
f tob
acco
(wom
en)
SR
.14
0.29
220.
0205
0.07
02.
351
1.53
354
11,
154
0.25
10.
333
Use
of t
obac
co (m
en)
SR
.14
0.54
880.
0286
0.05
21.
537
1.24
024
346
80.
492
0.60
6Su
rviv
eN
eona
tal m
orta
lity
rate
CS
.135
9.61
260.
271
nana
nana
1655
Infa
nt m
orta
lity
rate
CS
.356
12.3
645
0.22
2na
nana
na31
81U
nder
-five
mor
talit
y ra
teC
S.5
5912
.180
80.
206
nana
nana
3583
Thriv
e - R
epro
duct
ive
and
mat
erna
l hea
lthTo
tal f
ertil
ity ra
te-
2.8
0.19
870.
072
nana
nana
2.4
3.2
Ado
lesc
ent b
irth
rate
TM.1
83.9
12.2
885
0.14
7na
nana
na59
.310
8.4
…C
ontra
cept
ive
prev
alen
ce ra
teTM
.30.
5025
0.01
940.
039
1.31
91.
149
412
878
0.46
40.
541
Nee
d fo
r fam
ily p
lann
ing
satis
fied
with
mod
ern
cont
race
ptio
nTM
.40.
6553
0.01
840.
028
0.92
60.
962
291
619
0.61
90.
692
Ant
enat
al c
are
cove
rage
(4+)
TM.5
b0.
4511
0.03
300.
073
0.88
20.
939
9420
10.
385
0.51
7S
kille
d at
tend
ant a
t del
iver
yTM
.90.
4253
0.04
060.
096
1.35
11.
163
9420
10.
344
0.50
7Th
rive
- Chi
ld h
ealth
, nut
ritio
n an
d de
velo
pmen
tD
ipht
heria
, per
tuss
is a
nd te
tanu
s (D
PT)
imm
uniz
atio
n co
vera
geTC
.30.
4691
0.
0619
0.13
21.
260
1.12
341
830.
345
0.59
3P
neum
ococ
cal (
Con
juga
te) i
mm
uniz
atio
n co
vera
geTC
.60.
2574
0.
0436
0.16
90.
815
0.90
341
830.
170
0.34
5M
easl
es im
mun
izat
ion
cove
rage
TC.1
00.
6982
0.
0554
0.07
91.
196
1.09
441
830.
587
0.80
9P
rimar
y re
lianc
e on
cle
an fu
els
and
tech
nolo
gies
for c
ooki
ng, s
pace
hea
ting
and
light
ing
TC.1
80.
0290
0.00
640.
221
1.45
61.
207
2,20
41,
000
0.01
60.
042
Pop
ulat
ion
who
sle
pt u
nder
an
ITN
TC.2
20.
5502
0.01
890.
034
6.62
62.
574
2,09
34,
608
0.51
20.
588
Exc
lusi
ve b
reas
tfeed
ing
unde
r 6 m
onth
sTC
.32
0.43
970.
0465
0.10
60.
482
0.69
426
560.
347
0.53
3S
tunt
ing
prev
alen
ce (m
oder
ate
and
seve
re)
TC.4
5a0.
2963
0.02
130.
072
1.09
31.
046
244
505
0.25
40.
339
Was
ting
prev
alen
ce (m
oder
ate
and
seve
re)
TC.4
6a0.
1498
0.01
730.
115
1.18
71.
089
246
508
0.11
50.
184
Ove
rwei
ght p
reva
lenc
e (m
oder
ate
and
seve
re)
TC.4
7a0.
0244
0.00
750.
307
1.19
81.
094
246
508
0.00
90.
039
Ear
ly c
hild
dev
elop
men
t ind
exTC
.53
0.87
430.
0195
0.02
20.
783
0.88
511
122
70.
835
0.91
3
Low
er b
ound
r - 2
seU
pper
bou
ndr +
2se
Lear
nP
artic
ipat
ion
rate
in o
rgan
ised
lear
ning
(adj
uste
d)LN
.20.
7209
0.05
010.
070
1.48
61.
219
5412
00.
621
0.82
1Pr
otec
ted
from
vio
lenc
e an
d ex
ploi
tatio
nB
irth
regi
stra
tion
PR
.10.
6252
0.03
140.
050
2.15
41.
468
248
513
0.56
20.
688
Vio
lent
dis
cipl
ine
PR
.20.
7634
0.01
690.
022
1.52
51.
235
753
963
0.73
00.
797
Chi
ld la
bour
PR
.30.
3062
0.02
300.
075
1.80
31.
343
723
726
0.26
00.
352
Chi
ld m
arria
ge (b
efor
e ag
e 15
)P
R.4
a0.
1012
0.02
000.
198
0.79
90.
894
8818
20.
061
0.14
1C
hild
mar
riage
(bef
ore
age
18)
PR
.4b
0.39
050.
0344
0.08
80.
898
0.94
888
182
0.32
20.
459
Live
in a
saf
e an
d cl
ean
envi
ronm
ent
Use
of b
asic
drin
king
wat
er s
ervi
ces
WS
.20.
7910
0.02
730.
035
4.51
72.
125
2,20
41,
000
0.73
60.
846
Use
of s
afel
y m
anag
ed d
rinki
ng w
ater
ser
vice
sW
S.6
0.05
570.
0117
0.21
00.
392
0.62
633
215
20.
032
0.07
9H
andw
ashi
ng fa
cilit
y w
ith w
ater
and
soa
pW
S.7
0.68
080.
0155
0.02
31.
104
1.05
12,
204
1,00
00.
650
0.71
2U
se o
f bas
ic s
anita
tion
serv
ices
WS
.90.
6071
0.02
470.
041
2.56
01.
600
2,20
41,
000
0.55
80.
657
Saf
e di
spos
al in
situ
of e
xcre
ta fr
om o
n-si
te s
anita
tion
faci
litie
sW
S.1
00.
9482
0.01
130.
012
1.62
11.
273
1,40
962
20.
926
0.97
1Eq
uita
ble
chan
ce in
life
Chi
ldre
n w
ith fu
nctio
nal d
ificu
lty
EQ
.10.
0652
0.01
790.
275
1.70
61.
306
158
324
0.02
90.
101
Pop
ulat
ion
cove
red
by s
ocia
l tra
nsfe
rsE
Q.3
0.27
230.
0197
0.07
21.
961
1.40
02,
204
1,00
00.
233
0.31
2na
: not
app
licab
le
Tabl
e SE
.25:
Sam
plin
g er
rors
: Atta
peu
Sta
ndar
d er
rors
, coe
ffici
ents
of v
aria
tion,
des
ign
effe
cts
(def
f), s
quar
e ro
ot o
f des
ign
effe
cts
(def
t), a
nd c
onfid
ence
inte
rval
s fo
r sel
ecte
d S
DG
and
MIC
S in
dica
tors
, LS
ISII,
201
7
MIC
SIn
dica
tor
Val
ue (r
)S
tand
ard
erro
r (se
)
Coe
ffici
ent o
f va
riatio
n(s
e/r)
Des
ign
effe
ct
(def
f)
Squ
are
root
of
des
ign
effe
ct (d
eft)
Wei
ghte
dco
unt
Unw
eigh
ted
coun
t
Con
fiden
ce li
mits

433
Low
er b
ound
r - 2
seU
pper
bou
ndr +
2se
Sam
ple
cove
rage
and
cha
ract
eris
tics
of th
e re
spon
dent
sA
cces
s to
ele
ctric
ityS
R.1
0.94
450.
0145
0.01
54.
029
2.00
72,
204
1,00
00.
915
0.97
4O
wne
rshi
p of
mob
ile p
hone
(wom
en)
SR
.10
0.67
530.
0228
0.03
42.
730
1.65
254
11,
154
0.63
00.
721
Ow
ners
hip
of m
obile
pho
ne (m
en)
SR
.10
0.87
900.
0196
0.02
22.
151
1.46
718
259
80.
840
0.91
8U
se o
f int
erne
t (w
omen
)S
R.1
2a0.
2054
0.01
680.
082
1.99
91.
414
541
1,15
40.
172
0.23
9U
se o
f int
erne
t (m
en)
SR
.12a
0.26
510.
0294
0.11
12.
076
1.44
124
346
80.
206
0.32
4IC
T sk
ills
(wom
en)
SR
.13
0.06
770.
0081
0.11
91.
184
1.08
854
11,
154
0.05
20.
084
ICT
skill
s (m
en)
SR
.13
0.11
570.
0220
0.19
02.
206
1.48
524
346
80.
072
0.16
0U
se o
f tob
acco
(wom
en)
SR
.14
0.29
220.
0205
0.07
02.
351
1.53
354
11,
154
0.25
10.
333
Use
of t
obac
co (m
en)
SR
.14
0.54
880.
0286
0.05
21.
537
1.24
024
346
80.
492
0.60
6Su
rviv
eN
eona
tal m
orta
lity
rate
CS
.135
9.61
260.
271
nana
nana
1655
Infa
nt m
orta
lity
rate
CS
.356
12.3
645
0.22
2na
nana
na31
81U
nder
-five
mor
talit
y ra
teC
S.5
5912
.180
80.
206
nana
nana
3583
Thriv
e - R
epro
duct
ive
and
mat
erna
l hea
lthTo
tal f
ertil
ity ra
te-
2.8
0.19
870.
072
nana
nana
2.4
3.2
Ado
lesc
ent b
irth
rate
TM.1
83.9
12.2
885
0.14
7na
nana
na59
.310
8.4
…C
ontra
cept
ive
prev
alen
ce ra
teTM
.30.
5025
0.01
940.
039
1.31
91.
149
412
878
0.46
40.
541
Nee
d fo
r fam
ily p
lann
ing
satis
fied
with
mod
ern
cont
race
ptio
nTM
.40.
6553
0.01
840.
028
0.92
60.
962
291
619
0.61
90.
692
Ant
enat
al c
are
cove
rage
(4+)
TM.5
b0.
4511
0.03
300.
073
0.88
20.
939
9420
10.
385
0.51
7S
kille
d at
tend
ant a
t del
iver
yTM
.90.
4253
0.04
060.
096
1.35
11.
163
9420
10.
344
0.50
7Th
rive
- Chi
ld h
ealth
, nut
ritio
n an
d de
velo
pmen
tD
ipht
heria
, per
tuss
is a
nd te
tanu
s (D
PT)
imm
uniz
atio
n co
vera
geTC
.30.
4691
0.
0619
0.13
21.
260
1.12
341
830.
345
0.59
3P
neum
ococ
cal (
Con
juga
te) i
mm
uniz
atio
n co
vera
geTC
.60.
2574
0.
0436
0.16
90.
815
0.90
341
830.
170
0.34
5M
easl
es im
mun
izat
ion
cove
rage
TC.1
00.
6982
0.
0554
0.07
91.
196
1.09
441
830.
587
0.80
9P
rimar
y re
lianc
e on
cle
an fu
els
and
tech
nolo
gies
for c
ooki
ng, s
pace
hea
ting
and
light
ing
TC.1
80.
0290
0.00
640.
221
1.45
61.
207
2,20
41,
000
0.01
60.
042
Pop
ulat
ion
who
sle
pt u
nder
an
ITN
TC.2
20.
5502
0.01
890.
034
6.62
62.
574
2,09
34,
608
0.51
20.
588
Exc
lusi
ve b
reas
tfeed
ing
unde
r 6 m
onth
sTC
.32
0.43
970.
0465
0.10
60.
482
0.69
426
560.
347
0.53
3S
tunt
ing
prev
alen
ce (m
oder
ate
and
seve
re)
TC.4
5a0.
2963
0.02
130.
072
1.09
31.
046
244
505
0.25
40.
339
Was
ting
prev
alen
ce (m
oder
ate
and
seve
re)
TC.4
6a0.
1498
0.01
730.
115
1.18
71.
089
246
508
0.11
50.
184
Ove
rwei
ght p
reva
lenc
e (m
oder
ate
and
seve
re)
TC.4
7a0.
0244
0.00
750.
307
1.19
81.
094
246
508
0.00
90.
039
Ear
ly c
hild
dev
elop
men
t ind
exTC
.53
0.87
430.
0195
0.02
20.
783
0.88
511
122
70.
835
0.91
3
Low
er b
ound
r - 2
seU
pper
bou
ndr +
2se
Lear
nP
artic
ipat
ion
rate
in o
rgan
ised
lear
ning
(adj
uste
d)LN
.20.
7209
0.05
010.
070
1.48
61.
219
5412
00.
621
0.82
1Pr
otec
ted
from
vio
lenc
e an
d ex
ploi
tatio
nB
irth
regi
stra
tion
PR
.10.
6252
0.03
140.
050
2.15
41.
468
248
513
0.56
20.
688
Vio
lent
dis
cipl
ine
PR
.20.
7634
0.01
690.
022
1.52
51.
235
753
963
0.73
00.
797
Chi
ld la
bour
PR
.30.
3062
0.02
300.
075
1.80
31.
343
723
726
0.26
00.
352
Chi
ld m
arria
ge (b
efor
e ag
e 15
)P
R.4
a0.
1012
0.02
000.
198
0.79
90.
894
8818
20.
061
0.14
1C
hild
mar
riage
(bef
ore
age
18)
PR
.4b
0.39
050.
0344
0.08
80.
898
0.94
888
182
0.32
20.
459
Live
in a
saf
e an
d cl
ean
envi
ronm
ent
Use
of b
asic
drin
king
wat
er s
ervi
ces
WS
.20.
7910
0.02
730.
035
4.51
72.
125
2,20
41,
000
0.73
60.
846
Use
of s
afel
y m
anag
ed d
rinki
ng w
ater
ser
vice
sW
S.6
0.05
570.
0117
0.21
00.
392
0.62
633
215
20.
032
0.07
9H
andw
ashi
ng fa
cilit
y w
ith w
ater
and
soa
pW
S.7
0.68
080.
0155
0.02
31.
104
1.05
12,
204
1,00
00.
650
0.71
2U
se o
f bas
ic s
anita
tion
serv
ices
WS
.90.
6071
0.02
470.
041
2.56
01.
600
2,20
41,
000
0.55
80.
657
Saf
e di
spos
al in
situ
of e
xcre
ta fr
om o
n-si
te s
anita
tion
faci
litie
sW
S.1
00.
9482
0.01
130.
012
1.62
11.
273
1,40
962
20.
926
0.97
1Eq
uita
ble
chan
ce in
life
Chi
ldre
n w
ith fu
nctio
nal d
ificu
lty
EQ
.10.
0652
0.01
790.
275
1.70
61.
306
158
324
0.02
90.
101
Pop
ulat
ion
cove
red
by s
ocia
l tra
nsfe
rsE
Q.3
0.27
230.
0197
0.07
21.
961
1.40
02,
204
1,00
00.
233
0.31
2na
: not
app
licab
le
Tabl
e SE
.25:
Sam
plin
g er
rors
: Atta
peu
Sta
ndar
d er
rors
, coe
ffici
ents
of v
aria
tion,
des
ign
effe
cts
(def
f), s
quar
e ro
ot o
f des
ign
effe
cts
(def
t), a
nd c
onfid
ence
inte
rval
s fo
r sel
ecte
d S
DG
and
MIC
S in
dica
tors
, LS
ISII,
201
7
MIC
SIn
dica
tor
Val
ue (r
)S
tand
ard
erro
r (se
)
Coe
ffici
ent o
f va
riatio
n(s
e/r)
Des
ign
effe
ct
(def
f)
Squ
are
root
of
des
ign
effe
ct (d
eft)
Wei
ghte
dco
unt
Unw
eigh
ted
coun
t
Con
fiden
ce li
mits
Tabl
e SE
.25:
Sam
plin
g er
rors
: Atta
peu
Sta
ndar
d er
rors
, coe
ffici
ents
of v
aria
tion,
des
ign
effe
cts
(def
f), s
quar
e ro
ot o
f des
ign
effe
cts
(def
t), a
nd c
onfid
ence
inte
rval
s fo
r sel
ecte
d S
DG
and
MIC
S in
dica
tors
, LS
ISII,
201
7
MIC
SIn
dica
tor
Val
ue (r
)S
tand
ard
erro
r (se
)
Coe
ffici
ent o
f va
riatio
n(s
e/r)
Des
ign
effe
ct
(def
f)
Squ
are
root
of
des
ign
effe
ct (d
eft)
Wei
ghte
dco
unt
Unw
eigh
ted
coun
t
Con
fiden
ce li
mits

434
Low
er b
ound
r - 2
seU
pper
bou
ndr +
2se
Sam
ple
cove
rage
and
cha
ract
eris
tics
of th
e re
spon
dent
sA
cces
s to
ele
ctric
ityS
R.1
0.95
310.
0100
0.01
02.
274
1.50
81,
606
1,02
40.
933
0.97
3O
wne
rshi
p of
mob
ile p
hone
(wom
en)
SR
.10
0.75
110.
0278
0.03
75.
013
2.23
935
31,
214
0.69
50.
807
Ow
ners
hip
of m
obile
pho
ne (m
en)
SR
.10
0.87
900.
0196
0.02
22.
151
1.46
718
359
80.
840
0.91
8U
se o
f int
erne
t (w
omen
)S
R.1
2a0.
1507
0.01
570.
104
2.32
81.
526
353
1,21
40.
119
0.18
2U
se o
f int
erne
t (m
en)
SR
.12a
0.25
830.
0289
0.11
22.
610
1.61
618
259
80.
200
0.31
6IC
T sk
ills
(wom
en)
SR
.13
0.02
290.
0054
0.23
51.
577
1.25
635
31,
214
0.01
20.
034
ICT
skill
s (m
en)
SR
.13
0.10
860.
0215
0.19
82.
852
1.68
918
259
80.
066
0.15
2U
se o
f tob
acco
(wom
en)
SR
.14
0.00
770.
0023
0.29
40.
809
0.90
035
31,
214
0.00
30.
012
Use
of t
obac
co (m
en)
SR
.14
0.32
730.
0271
0.08
31.
990
1.41
118
259
80.
273
0.38
1Su
rviv
eN
eona
tal m
orta
lity
rate
CS
.127
10.4
327
0.39
1na
nana
na6
48In
fant
mor
talit
y ra
teC
S.3
4714
.152
40.
303
nana
nana
1875
Und
er-fi
ve m
orta
lity
rate
CS
.551
14.4
710
0.28
4na
nana
na22
80Th
rive
- Rep
rodu
ctiv
e an
d m
ater
nal h
ealth
Tota
l fer
tility
rate
-3.
80.
2086
0.05
5na
nana
na3.
44.
2A
dole
scen
t birt
h ra
teTM
.113
8.4
11.7
584
0.08
5na
nana
na11
4.8
161.
9…
Con
trace
ptiv
e pr
eval
ence
rate
TM.3
0.31
430.
0213
0.06
82.
077
1.44
128
498
50.
272
0.35
7N
eed
for f
amily
pla
nnin
g sa
tisfie
d w
ith m
oder
n co
ntra
cept
ion
TM.4
0.56
980.
0299
0.05
31.
980
1.40
715
554
30.
510
0.63
0A
nten
atal
car
e co
vera
ge (4
+)TM
.5b
0.60
740.
0448
0.07
42.
370
1.53
982
283
0.51
80.
697
Ski
lled
atte
ndan
t at d
eliv
ery
TM.9
0.69
010.
0428
0.06
22.
411
1.55
382
283
0.60
50.
776
Thriv
e - C
hild
hea
lth, n
utrit
ion
and
deve
lopm
ent
Dip
hthe
ria, p
ertu
ssis
and
teta
nus
(DP
T) im
mun
izat
ion
cove
rage
TC.3
0.22
44
0.
0464
0.20
71.
942
1.39
447
158
0.13
20.
317
Pne
umoc
occa
l (C
onju
gate
) im
mun
izat
ion
cove
rage
TC.6
0.09
22
0.
0298
0.32
31.
663
1.28
947
158
0.03
30.
152
Mea
sles
imm
uniz
atio
n co
vera
geTC
.10
0.39
72
0.
0408
0.10
31.
090
1.04
447
158
0.31
60.
479
Prim
ary
relia
nce
on c
lean
fuel
s an
d te
chno
logi
es fo
r coo
king
, spa
ce h
eatin
g an
d lig
htin
gTC
.18
0.04
240.
0085
0.20
11.
825
1.35
11,
606
1,02
40.
025
0.05
9P
opul
atio
n w
ho s
lept
und
er a
n IT
NTC
.22
0.62
550.
0212
0.03
410
.522
3.24
41,
519
5,47
20.
583
0.66
8E
xclu
sive
bre
astfe
edin
g un
der 6
mon
ths
TC.3
20.
6286
0.05
500.
087
0.99
80.
999
2278
0.51
90.
739
Stu
ntin
g pr
eval
ence
(mod
erat
e an
d se
vere
)TC
.45a
0.44
010.
0191
0.04
31.
146
1.07
122
577
70.
402
0.47
8W
astin
g pr
eval
ence
(mod
erat
e an
d se
vere
)TC
.46a
0.05
790.
0130
0.22
52.
402
1.55
022
477
20.
032
0.08
4O
verw
eigh
t pre
vale
nce
(mod
erat
e an
d se
vere
)TC
.47a
0.01
600.
0058
0.36
61.
676
1.29
522
477
20.
004
0.02
8E
arly
chi
ld d
evel
opm
ent i
ndex
TC.5
30.
8647
0.02
170.
025
1.30
61.
143
9332
50.
821
0.90
8
Low
er b
ound
r - 2
seU
pper
bou
ndr +
2se
Lear
nP
artic
ipat
ion
rate
in o
rgan
ised
lear
ning
(adj
uste
d)LN
.20.
7338
0.03
080.
042
0.90
50.
951
5218
70.
672
0.79
5Pr
otec
ted
from
vio
lenc
e an
d ex
ploi
tatio
nB
irth
regi
stra
tion
PR
.10.
8493
0.02
000.
024
2.52
21.
588
234
809
0.80
90.
889
Vio
lent
dis
cipl
ine
PR
.20.
8309
0.01
290.
016
1.56
11.
249
636
1,32
00.
805
0.85
7C
hild
labo
urP
R.3
0.54
820.
0225
0.04
11.
682
1.29
756
082
50.
503
0.59
3C
hild
mar
riage
(bef
ore
age
15)
PR
.4a
0.13
760.
0160
0.11
60.
522
0.72
272
243
0.10
60.
170
Chi
ld m
arria
ge (b
efor
e ag
e 18
)P
R.4
b0.
5011
0.03
180.
063
0.97
90.
989
7224
30.
437
0.56
5Li
ve in
a s
afe
and
clea
n en
viro
nmen
tU
se o
f bas
ic d
rinki
ng w
ater
ser
vice
sW
S.2
0.72
590.
0199
0.02
72.
028
1.42
41,
606
1,02
40.
686
0.76
6U
se o
f saf
ely
man
aged
drin
king
wat
er s
ervi
ces
WS
.60.
0506
0.02
310.
455
1.68
21.
297
225
153
0.00
50.
097
Han
dwas
hing
faci
lity
with
wat
er a
nd s
oap
WS
.70.
1747
0.01
910.
109
2.59
01.
609
1,60
61,
023
0.13
70.
213
Use
of b
asic
san
itatio
n se
rvic
esW
S.9
0.66
150.
0210
0.03
22.
019
1.42
11,
606
1,02
40.
620
0.70
4S
afe
disp
osal
in s
itu o
f exc
reta
from
on-
site
san
itatio
n fa
cilit
ies
WS
.10
1.00
000.
0000
0.00
01,
062
666
1.00
01.
000
Equi
tabl
e ch
ance
in li
feC
hild
ren
with
func
tiona
l difi
culty
E
Q.1
0.01
100.
0034
0.30
90.
533
0.73
014
550
40.
004
0.01
8P
opul
atio
n co
vere
d by
soc
ial t
rans
fers
EQ
.30.
1151
0.01
190.
103
1.41
81.
191
1,60
61,
024
0.09
10.
139
na: n
ot a
pplic
able
Tabl
e SE
.26:
Sam
plin
g er
rors
: Xay
som
boun
Sta
ndar
d er
rors
, coe
ffici
ents
of v
aria
tion,
des
ign
effe
cts
(def
f), s
quar
e ro
ot o
f des
ign
effe
cts
(def
t), a
nd c
onfid
ence
inte
rval
s fo
r sel
ecte
d S
DG
and
MIC
S in
dica
tors
, LS
ISII,
201
7
MIC
SIn
dica
tor
Val
ue (r
)S
tand
ard
erro
r (se
)
Coe
ffici
ent o
f va
riatio
n(s
e/r)
Des
ign
effe
ct
(def
f)
Squ
are
root
of
des
ign
effe
ct (d
eft)
Wei
ghte
dco
unt
Unw
eigh
ted
coun
t
Con
fiden
ce li
mits

435
Low
er b
ound
r - 2
seU
pper
bou
ndr +
2se
Sam
ple
cove
rage
and
cha
ract
eris
tics
of th
e re
spon
dent
sA
cces
s to
ele
ctric
ityS
R.1
0.95
310.
0100
0.01
02.
274
1.50
81,
606
1,02
40.
933
0.97
3O
wne
rshi
p of
mob
ile p
hone
(wom
en)
SR
.10
0.75
110.
0278
0.03
75.
013
2.23
935
31,
214
0.69
50.
807
Ow
ners
hip
of m
obile
pho
ne (m
en)
SR
.10
0.87
900.
0196
0.02
22.
151
1.46
718
359
80.
840
0.91
8U
se o
f int
erne
t (w
omen
)S
R.1
2a0.
1507
0.01
570.
104
2.32
81.
526
353
1,21
40.
119
0.18
2U
se o
f int
erne
t (m
en)
SR
.12a
0.25
830.
0289
0.11
22.
610
1.61
618
259
80.
200
0.31
6IC
T sk
ills
(wom
en)
SR
.13
0.02
290.
0054
0.23
51.
577
1.25
635
31,
214
0.01
20.
034
ICT
skill
s (m
en)
SR
.13
0.10
860.
0215
0.19
82.
852
1.68
918
259
80.
066
0.15
2U
se o
f tob
acco
(wom
en)
SR
.14
0.00
770.
0023
0.29
40.
809
0.90
035
31,
214
0.00
30.
012
Use
of t
obac
co (m
en)
SR
.14
0.32
730.
0271
0.08
31.
990
1.41
118
259
80.
273
0.38
1Su
rviv
eN
eona
tal m
orta
lity
rate
CS
.127
10.4
327
0.39
1na
nana
na6
48In
fant
mor
talit
y ra
teC
S.3
4714
.152
40.
303
nana
nana
1875
Und
er-fi
ve m
orta
lity
rate
CS
.551
14.4
710
0.28
4na
nana
na22
80Th
rive
- Rep
rodu
ctiv
e an
d m
ater
nal h
ealth
Tota
l fer
tility
rate
-3.
80.
2086
0.05
5na
nana
na3.
44.
2A
dole
scen
t birt
h ra
teTM
.113
8.4
11.7
584
0.08
5na
nana
na11
4.8
161.
9…
Con
trace
ptiv
e pr
eval
ence
rate
TM.3
0.31
430.
0213
0.06
82.
077
1.44
128
498
50.
272
0.35
7N
eed
for f
amily
pla
nnin
g sa
tisfie
d w
ith m
oder
n co
ntra
cept
ion
TM.4
0.56
980.
0299
0.05
31.
980
1.40
715
554
30.
510
0.63
0A
nten
atal
car
e co
vera
ge (4
+)TM
.5b
0.60
740.
0448
0.07
42.
370
1.53
982
283
0.51
80.
697
Ski
lled
atte
ndan
t at d
eliv
ery
TM.9
0.69
010.
0428
0.06
22.
411
1.55
382
283
0.60
50.
776
Thriv
e - C
hild
hea
lth, n
utrit
ion
and
deve
lopm
ent
Dip
hthe
ria, p
ertu
ssis
and
teta
nus
(DP
T) im
mun
izat
ion
cove
rage
TC.3
0.22
44
0.
0464
0.20
71.
942
1.39
447
158
0.13
20.
317
Pne
umoc
occa
l (C
onju
gate
) im
mun
izat
ion
cove
rage
TC.6
0.09
22
0.
0298
0.32
31.
663
1.28
947
158
0.03
30.
152
Mea
sles
imm
uniz
atio
n co
vera
geTC
.10
0.39
72
0.
0408
0.10
31.
090
1.04
447
158
0.31
60.
479
Prim
ary
relia
nce
on c
lean
fuel
s an
d te
chno
logi
es fo
r coo
king
, spa
ce h
eatin
g an
d lig
htin
gTC
.18
0.04
240.
0085
0.20
11.
825
1.35
11,
606
1,02
40.
025
0.05
9P
opul
atio
n w
ho s
lept
und
er a
n IT
NTC
.22
0.62
550.
0212
0.03
410
.522
3.24
41,
519
5,47
20.
583
0.66
8E
xclu
sive
bre
astfe
edin
g un
der 6
mon
ths
TC.3
20.
6286
0.05
500.
087
0.99
80.
999
2278
0.51
90.
739
Stu
ntin
g pr
eval
ence
(mod
erat
e an
d se
vere
)TC
.45a
0.44
010.
0191
0.04
31.
146
1.07
122
577
70.
402
0.47
8W
astin
g pr
eval
ence
(mod
erat
e an
d se
vere
)TC
.46a
0.05
790.
0130
0.22
52.
402
1.55
022
477
20.
032
0.08
4O
verw
eigh
t pre
vale
nce
(mod
erat
e an
d se
vere
)TC
.47a
0.01
600.
0058
0.36
61.
676
1.29
522
477
20.
004
0.02
8E
arly
chi
ld d
evel
opm
ent i
ndex
TC.5
30.
8647
0.02
170.
025
1.30
61.
143
9332
50.
821
0.90
8
Low
er b
ound
r - 2
seU
pper
bou
ndr +
2se
Lear
nP
artic
ipat
ion
rate
in o
rgan
ised
lear
ning
(adj
uste
d)LN
.20.
7338
0.03
080.
042
0.90
50.
951
5218
70.
672
0.79
5Pr
otec
ted
from
vio
lenc
e an
d ex
ploi
tatio
nB
irth
regi
stra
tion
PR
.10.
8493
0.02
000.
024
2.52
21.
588
234
809
0.80
90.
889
Vio
lent
dis
cipl
ine
PR
.20.
8309
0.01
290.
016
1.56
11.
249
636
1,32
00.
805
0.85
7C
hild
labo
urP
R.3
0.54
820.
0225
0.04
11.
682
1.29
756
082
50.
503
0.59
3C
hild
mar
riage
(bef
ore
age
15)
PR
.4a
0.13
760.
0160
0.11
60.
522
0.72
272
243
0.10
60.
170
Chi
ld m
arria
ge (b
efor
e ag
e 18
)P
R.4
b0.
5011
0.03
180.
063
0.97
90.
989
7224
30.
437
0.56
5Li
ve in
a s
afe
and
clea
n en
viro
nmen
tU
se o
f bas
ic d
rinki
ng w
ater
ser
vice
sW
S.2
0.72
590.
0199
0.02
72.
028
1.42
41,
606
1,02
40.
686
0.76
6U
se o
f saf
ely
man
aged
drin
king
wat
er s
ervi
ces
WS
.60.
0506
0.02
310.
455
1.68
21.
297
225
153
0.00
50.
097
Han
dwas
hing
faci
lity
with
wat
er a
nd s
oap
WS
.70.
1747
0.01
910.
109
2.59
01.
609
1,60
61,
023
0.13
70.
213
Use
of b
asic
san
itatio
n se
rvic
esW
S.9
0.66
150.
0210
0.03
22.
019
1.42
11,
606
1,02
40.
620
0.70
4S
afe
disp
osal
in s
itu o
f exc
reta
from
on-
site
san
itatio
n fa
cilit
ies
WS
.10
1.00
000.
0000
0.00
01,
062
666
1.00
01.
000
Equi
tabl
e ch
ance
in li
feC
hild
ren
with
func
tiona
l difi
culty
E
Q.1
0.01
100.
0034
0.30
90.
533
0.73
014
550
40.
004
0.01
8P
opul
atio
n co
vere
d by
soc
ial t
rans
fers
EQ
.30.
1151
0.01
190.
103
1.41
81.
191
1,60
61,
024
0.09
10.
139
na: n
ot a
pplic
able
Tabl
e SE
.26:
Sam
plin
g er
rors
: Xay
som
boun
Sta
ndar
d er
rors
, coe
ffici
ents
of v
aria
tion,
des
ign
effe
cts
(def
f), s
quar
e ro
ot o
f des
ign
effe
cts
(def
t), a
nd c
onfid
ence
inte
rval
s fo
r sel
ecte
d S
DG
and
MIC
S in
dica
tors
, LS
ISII,
201
7
MIC
SIn
dica
tor
Val
ue (r
)S
tand
ard
erro
r (se
)
Coe
ffici
ent o
f va
riatio
n(s
e/r)
Des
ign
effe
ct
(def
f)
Squ
are
root
of
des
ign
effe
ct (d
eft)
Wei
ghte
dco
unt
Unw
eigh
ted
coun
t
Con
fiden
ce li
mits
Tabl
e SE
.26:
Sam
plin
g er
rors
: Xay
som
boun
Sta
ndar
d er
rors
, coe
ffici
ents
of v
aria
tion,
des
ign
effe
cts
(def
f), s
quar
e ro
ot o
f des
ign
effe
cts
(def
t), a
nd c
onfid
ence
inte
rval
s fo
r sel
ecte
d S
DG
and
MIC
S in
dica
tors
, LS
ISII,
201
7
MIC
SIn
dica
tor
Val
ue (r
)S
tand
ard
erro
r (se
)
Coe
ffici
ent o
f va
riatio
n(s
e/r)
Des
ign
effe
ct
(def
f)
Squ
are
root
of
des
ign
effe
ct (d
eft)
Wei
ghte
dco
unt
Unw
eigh
ted
coun
t
Con
fiden
ce li
mits

436
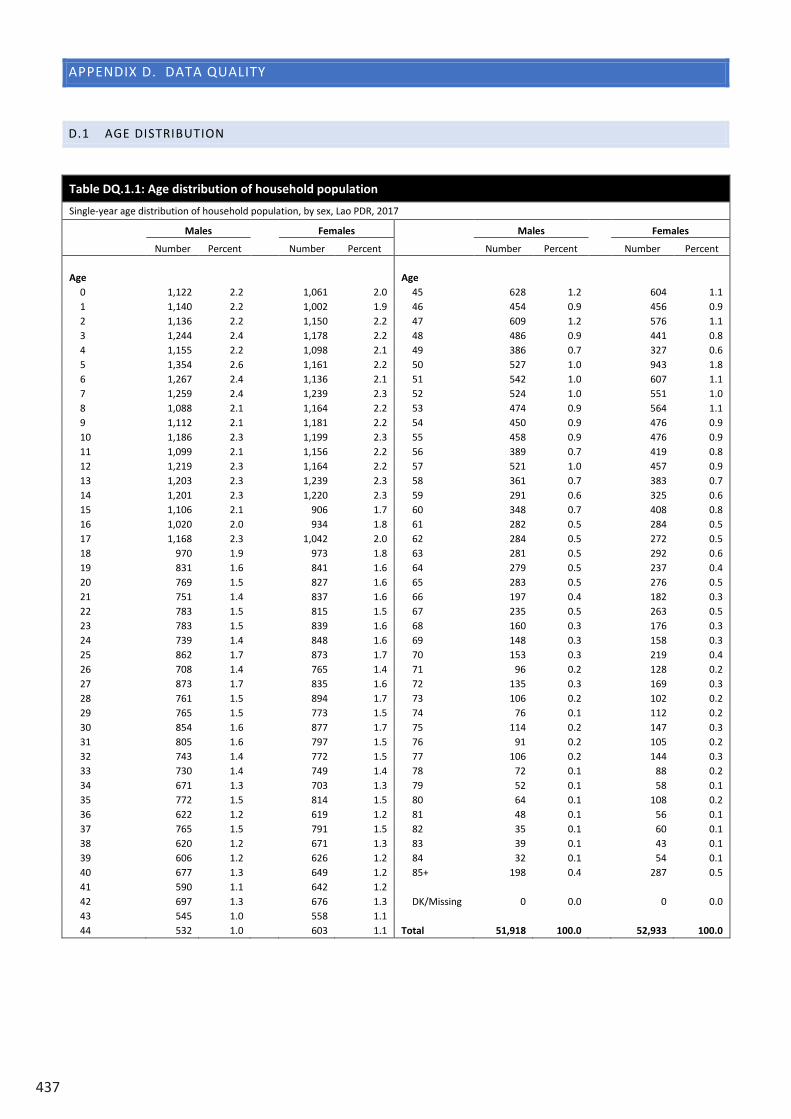
437
APPENDIX D. DATA QUALITY
D.1 AGE DISTRIBUTION
Table DQ.1.1: Age distribution of household population
Single-year age distribution of household population, by sex, Lao PDR, 2017
Males
Females
Males
Females
Number Percent Number Percent Number Percent Number Percent
Age
Age
0 1,122 2.2
1,061 2.0 45 628 1.2
604 1.1
1 1,140 2.2
1,002 1.9 46 454 0.9
456 0.9 2 1,136 2.2
1,150 2.2 47 609 1.2
576 1.1
3 1,244 2.4
1,178 2.2 48 486 0.9
441 0.8 4 1,155 2.2
1,098 2.1 49 386 0.7
327 0.6
5 1,354 2.6
1,161 2.2 50 527 1.0
943 1.8 6 1,267 2.4
1,136 2.1 51 542 1.0
607 1.1
7 1,259 2.4
1,239 2.3 52 524 1.0
551 1.0 8 1,088 2.1
1,164 2.2 53 474 0.9
564 1.1
9 1,112 2.1
1,181 2.2 54 450 0.9
476 0.9 10 1,186 2.3
1,199 2.3 55 458 0.9
476 0.9
11 1,099 2.1
1,156 2.2 56 389 0.7
419 0.8 12 1,219 2.3
1,164 2.2 57 521 1.0
457 0.9
13 1,203 2.3
1,239 2.3 58 361 0.7
383 0.7 14 1,201 2.3
1,220 2.3 59 291 0.6
325 0.6
15 1,106 2.1
906 1.7 60 348 0.7
408 0.8 16 1,020 2.0
934 1.8 61 282 0.5
284 0.5
17 1,168 2.3
1,042 2.0 62 284 0.5
272 0.5 18 970 1.9
973 1.8 63 281 0.5
292 0.6
19 831 1.6
841 1.6 64 279 0.5
237 0.4 20 769 1.5
827 1.6 65 283 0.5
276 0.5
21 751 1.4
837 1.6 66 197 0.4
182 0.3 22 783 1.5
815 1.5 67 235 0.5
263 0.5
23 783 1.5
839 1.6 68 160 0.3
176 0.3 24 739 1.4
848 1.6 69 148 0.3
158 0.3
25 862 1.7
873 1.7 70 153 0.3
219 0.4 26 708 1.4
765 1.4 71 96 0.2
128 0.2
27 873 1.7
835 1.6 72 135 0.3
169 0.3 28 761 1.5
894 1.7 73 106 0.2
102 0.2
29 765 1.5
773 1.5 74 76 0.1
112 0.2 30 854 1.6
877 1.7 75 114 0.2
147 0.3
31 805 1.6
797 1.5 76 91 0.2
105 0.2 32 743 1.4
772 1.5 77 106 0.2
144 0.3
33 730 1.4
749 1.4 78 72 0.1
88 0.2 34 671 1.3
703 1.3 79 52 0.1
58 0.1
35 772 1.5
814 1.5 80 64 0.1
108 0.2 36 622 1.2
619 1.2 81 48 0.1
56 0.1
37 765 1.5
791 1.5 82 35 0.1
60 0.1 38 620 1.2
671 1.3 83 39 0.1
43 0.1
39 606 1.2
626 1.2 84 32 0.1
54 0.1 40 677 1.3
649 1.2 85+ 198 0.4
287 0.5
41 590 1.1
642 1.2
42 697 1.3
676 1.3 DK/Missing 0 0.0
0 0.0
43 545 1.0
558 1.1
44 532 1.0 603 1.1 Total 51,918 100.0 52,933 100.0
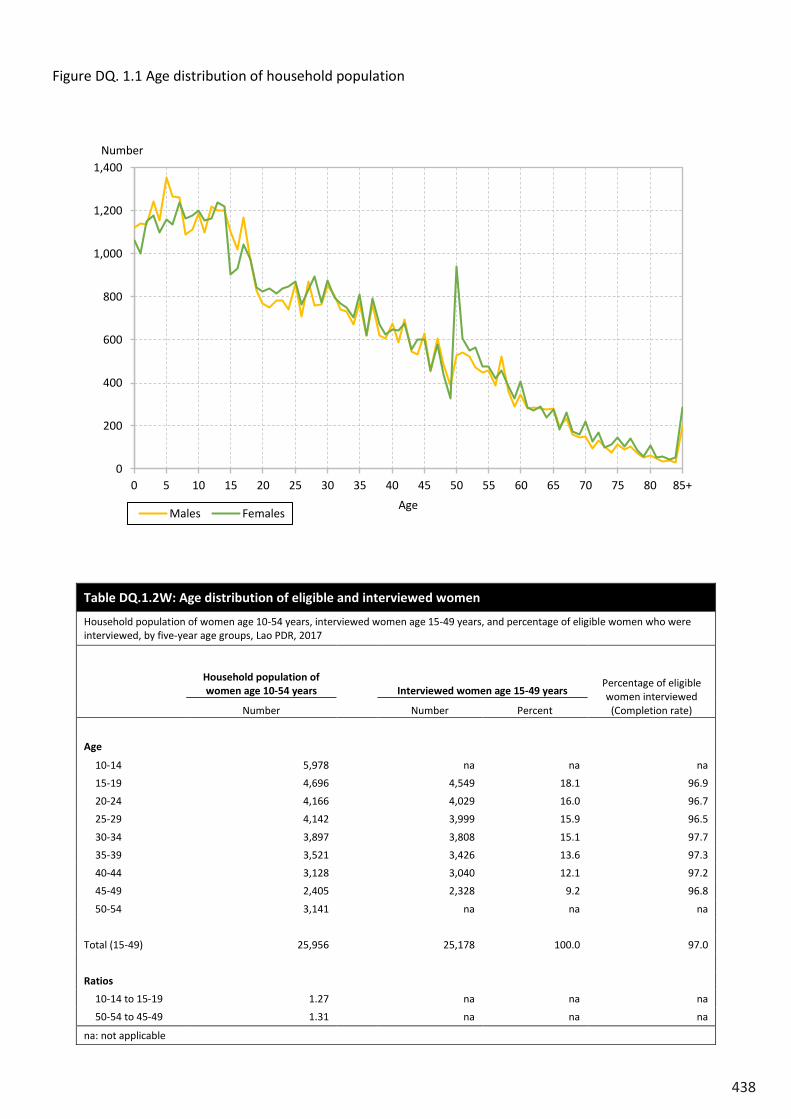
438
Figure DQ. 1.1 Age distribution of household population
Table DQ.1.2W: Age distribution of eligible and interviewed women
Household population of women age 10-54 years, interviewed women age 15-49 years, and percentage of eligible women who were interviewed, by five-year age groups, Lao PDR, 2017
Household population of women age 10-54 years
Interviewed women age 15-49 years
Percentage of eligible women interviewed
(Completion rate) Number Number Percent
Age
10-14 5,978
na na na
15-19 4,696
4,549 18.1 96.9
20-24 4,166
4,029 16.0 96.7
25-29 4,142
3,999 15.9 96.5
30-34 3,897
3,808 15.1 97.7
35-39 3,521
3,426 13.6 97.3
40-44 3,128
3,040 12.1 97.2
45-49 2,405
2,328 9.2 96.8
50-54 3,141
na na na
Total (15-49) 25,956
25,178 100.0 97.0
Ratios
10-14 to 15-19 1.27
na na na
50-54 to 45-49 1.31 na na na
na: not applicable
0
200
400
600
800
1,000
1,200
1,400
0 5 10 15 20 25 30 35 40 45 50 55 60 65 70 75 80 85+
Number
Age Males Females
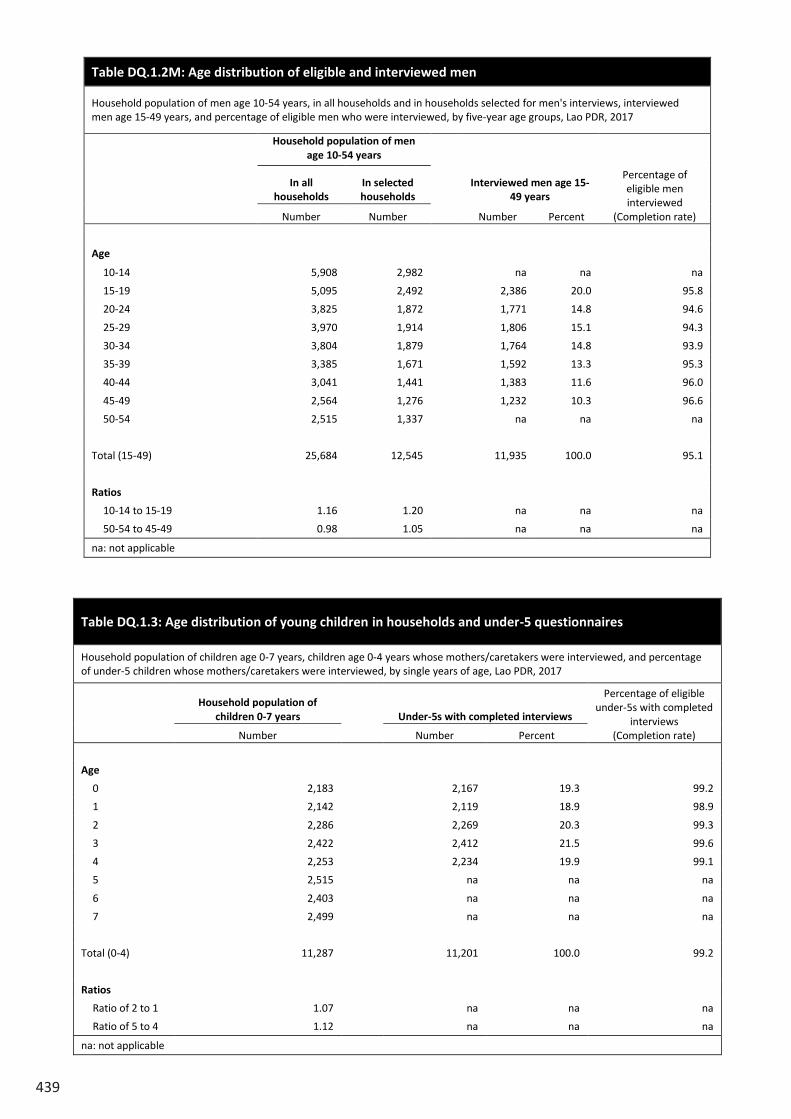
439
Table DQ.1.2M: Age distribution of eligible and interviewed men
Household population of men age 10-54 years, in all households and in households selected for men's interviews, interviewed men age 15-49 years, and percentage of eligible men who were interviewed, by five-year age groups, Lao PDR, 2017
Household population of men age 10-54 years
Interviewed men age 15-49 years
Percentage of eligible men interviewed
(Completion rate)
In all households
In selected households
Number Number Number Percent
Age
10-14 5,908 2,982
na na na
15-19 5,095 2,492
2,386 20.0 95.8
20-24 3,825 1,872
1,771 14.8 94.6
25-29 3,970 1,914
1,806 15.1 94.3
30-34 3,804 1,879
1,764 14.8 93.9
35-39 3,385 1,671
1,592 13.3 95.3
40-44 3,041 1,441
1,383 11.6 96.0
45-49 2,564 1,276
1,232 10.3 96.6
50-54 2,515 1,337
na na na
Total (15-49) 25,684 12,545
11,935 100.0 95.1
Ratios
10-14 to 15-19 1.16 1.20
na na na
50-54 to 45-49 0.98 1.05 na na na
na: not applicable
Table DQ.1.3: Age distribution of young children in households and under-5 questionnaires
Household population of children age 0-7 years, children age 0-4 years whose mothers/caretakers were interviewed, and percentage of under-5 children whose mothers/caretakers were interviewed, by single years of age, Lao PDR, 2017
Household population of children 0-7 years Under-5s with completed interviews
Percentage of eligible under-5s with completed
interviews (Completion rate) Number Number Percent
Age
0 2,183
2,167 19.3 99.2
1 2,142
2,119 18.9 98.9
2 2,286
2,269 20.3 99.3
3 2,422
2,412 21.5 99.6
4 2,253
2,234 19.9 99.1
5 2,515
na na na
6 2,403
na na na
7 2,499
na na na
Total (0-4) 11,287
11,201 100.0 99.2
Ratios
Ratio of 2 to 1 1.07
na na na
Ratio of 5 to 4 1.12 na na na
na: not applicable
Figure DQ. 1.1 Age distribution of household population
Table DQ.1.2W: Age distribution of eligible and interviewed women
Household population of women age 10-54 years, interviewed women age 15-49 years, and percentage of eligible women who were interviewed, by five-year age groups, Lao PDR, 2017
Household population of women age 10-54 years
Interviewed women age 15-49 years
Percentage of eligible women interviewed
(Completion rate) Number Number Percent
Age
10-14 5,978
na na na
15-19 4,696
4,549 18.1 96.9
20-24 4,166
4,029 16.0 96.7
25-29 4,142
3,999 15.9 96.5
30-34 3,897
3,808 15.1 97.7
35-39 3,521
3,426 13.6 97.3
40-44 3,128
3,040 12.1 97.2
45-49 2,405
2,328 9.2 96.8
50-54 3,141
na na na
Total (15-49) 25,956
25,178 100.0 97.0
Ratios
10-14 to 15-19 1.27
na na na
50-54 to 45-49 1.31 na na na
na: not applicable
0
200
400
600
800
1,000
1,200
1,400
0 5 10 15 20 25 30 35 40 45 50 55 60 65 70 75 80 85+
Number
Age Males Females
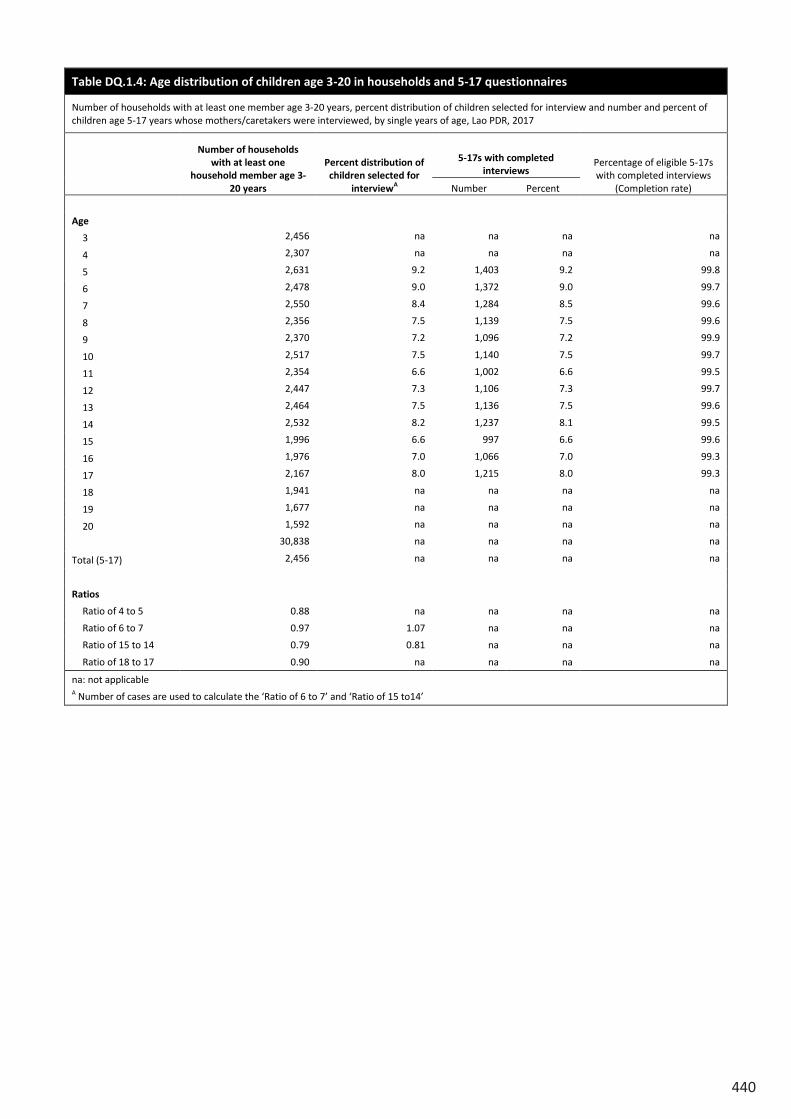
440
Table DQ.1.4: Age distribution of children age 3-20 in households and 5-17 questionnaires
Number of households with at least one member age 3-20 years, percent distribution of children selected for interview and number and percent of children age 5-17 years whose mothers/caretakers were interviewed, by single years of age, Lao PDR, 2017
Number of households with at least one
household member age 3-20 years
Percent distribution of children selected for
interviewA
5-17s with completed interviews
Percentage of eligible 5-17s with completed interviews
(Completion rate) Number Percent
Age
3 2,456 na na na na
4 2,307 na na na na
5 2,631 9.2 1,403 9.2 99.8
6 2,478 9.0 1,372 9.0 99.7
7 2,550 8.4 1,284 8.5 99.6
8 2,356 7.5 1,139 7.5 99.6
9 2,370 7.2 1,096 7.2 99.9
10 2,517 7.5 1,140 7.5 99.7
11 2,354 6.6 1,002 6.6 99.5
12 2,447 7.3 1,106 7.3 99.7
13 2,464 7.5 1,136 7.5 99.6
14 2,532 8.2 1,237 8.1 99.5
15 1,996 6.6 997 6.6 99.6
16 1,976 7.0 1,066 7.0 99.3
17 2,167 8.0 1,215 8.0 99.3
18 1,941 na na na na
19 1,677 na na na na
20 1,592 na na na na
30,838 na na na na
Total (5-17) 2,456 na na na na
Ratios
Ratio of 4 to 5 0.88 na na na na
Ratio of 6 to 7 0.97 1.07 na na na
Ratio of 15 to 14 0.79 0.81 na na na
Ratio of 18 to 17 0.90 na na na na
na: not applicable A Number of cases are used to calculate the ‘Ratio of 6 to 7’ and ‘Ratio of 15 to14’
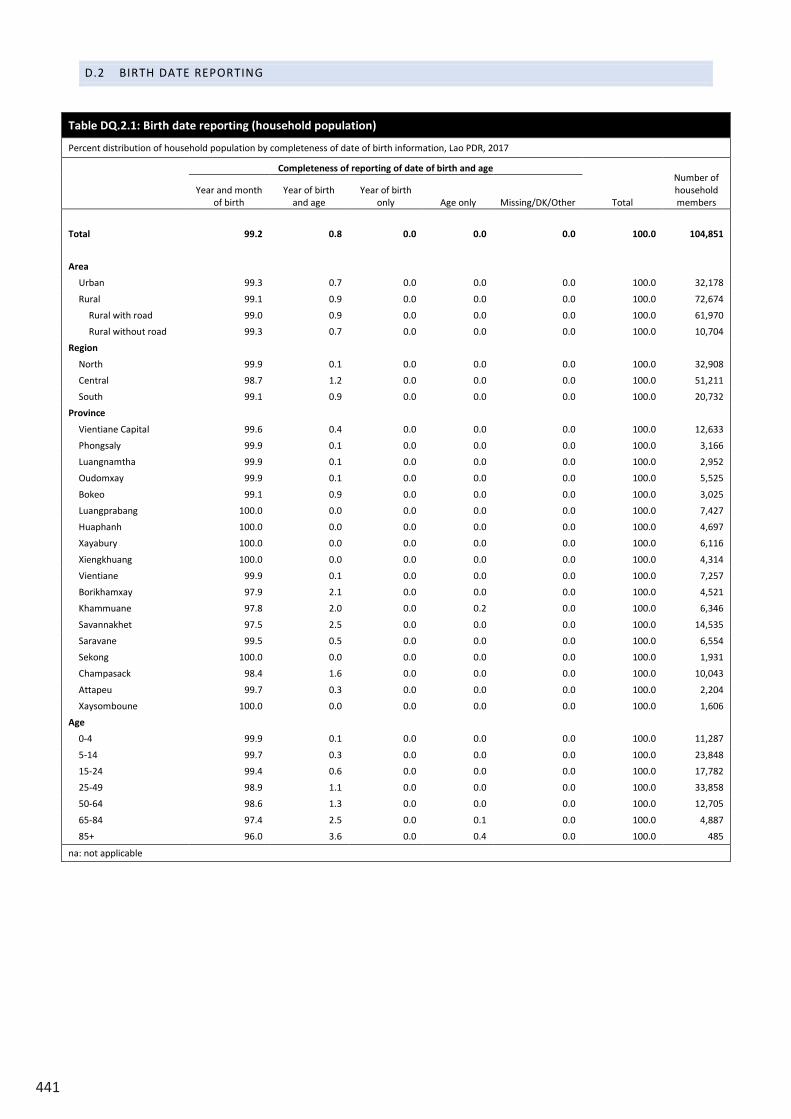
441
D.2 BIRTH DATE REPORTING
Table DQ.2.1: Birth date reporting (household population)
Percent distribution of household population by completeness of date of birth information, Lao PDR, 2017
Completeness of reporting of date of birth and age
Total
Number of household members
Year and month of birth
Year of birth and age
Year of birth only Age only Missing/DK/Other
Total 99.2 0.8 0.0 0.0 0.0 100.0 104,851
Area
Urban 99.3 0.7 0.0 0.0 0.0 100.0 32,178
Rural 99.1 0.9 0.0 0.0 0.0 100.0 72,674
Rural with road 99.0 0.9 0.0 0.0 0.0 100.0 61,970
Rural without road 99.3 0.7 0.0 0.0 0.0 100.0 10,704
Region
North 99.9 0.1 0.0 0.0 0.0 100.0 32,908
Central 98.7 1.2 0.0 0.0 0.0 100.0 51,211
South 99.1 0.9 0.0 0.0 0.0 100.0 20,732
Province
Vientiane Capital 99.6 0.4 0.0 0.0 0.0 100.0 12,633
Phongsaly 99.9 0.1 0.0 0.0 0.0 100.0 3,166
Luangnamtha 99.9 0.1 0.0 0.0 0.0 100.0 2,952
Oudomxay 99.9 0.1 0.0 0.0 0.0 100.0 5,525
Bokeo 99.1 0.9 0.0 0.0 0.0 100.0 3,025
Luangprabang 100.0 0.0 0.0 0.0 0.0 100.0 7,427
Huaphanh 100.0 0.0 0.0 0.0 0.0 100.0 4,697
Xayabury 100.0 0.0 0.0 0.0 0.0 100.0 6,116
Xiengkhuang 100.0 0.0 0.0 0.0 0.0 100.0 4,314
Vientiane 99.9 0.1 0.0 0.0 0.0 100.0 7,257
Borikhamxay 97.9 2.1 0.0 0.0 0.0 100.0 4,521
Khammuane 97.8 2.0 0.0 0.2 0.0 100.0 6,346
Savannakhet 97.5 2.5 0.0 0.0 0.0 100.0 14,535
Saravane 99.5 0.5 0.0 0.0 0.0 100.0 6,554
Sekong 100.0 0.0 0.0 0.0 0.0 100.0 1,931
Champasack 98.4 1.6 0.0 0.0 0.0 100.0 10,043
Attapeu 99.7 0.3 0.0 0.0 0.0 100.0 2,204
Xaysomboune 100.0 0.0 0.0 0.0 0.0 100.0 1,606
Age
0-4 99.9 0.1 0.0 0.0 0.0 100.0 11,287
5-14 99.7 0.3 0.0 0.0 0.0 100.0 23,848
15-24 99.4 0.6 0.0 0.0 0.0 100.0 17,782
25-49 98.9 1.1 0.0 0.0 0.0 100.0 33,858
50-64 98.6 1.3 0.0 0.0 0.0 100.0 12,705
65-84 97.4 2.5 0.0 0.1 0.0 100.0 4,887
85+ 96.0 3.6 0.0 0.4 0.0 100.0 485
na: not applicable
Table DQ.1.4: Age distribution of children age 3-20 in households and 5-17 questionnaires
Number of households with at least one member age 3-20 years, percent distribution of children selected for interview and number and percent of children age 5-17 years whose mothers/caretakers were interviewed, by single years of age, Lao PDR, 2017
Number of households with at least one
household member age 3-20 years
Percent distribution of children selected for
interviewA
5-17s with completed interviews
Percentage of eligible 5-17s with completed interviews
(Completion rate) Number Percent
Age
3 2,456 na na na na
4 2,307 na na na na
5 2,631 9.2 1,403 9.2 99.8
6 2,478 9.0 1,372 9.0 99.7
7 2,550 8.4 1,284 8.5 99.6
8 2,356 7.5 1,139 7.5 99.6
9 2,370 7.2 1,096 7.2 99.9
10 2,517 7.5 1,140 7.5 99.7
11 2,354 6.6 1,002 6.6 99.5
12 2,447 7.3 1,106 7.3 99.7
13 2,464 7.5 1,136 7.5 99.6
14 2,532 8.2 1,237 8.1 99.5
15 1,996 6.6 997 6.6 99.6
16 1,976 7.0 1,066 7.0 99.3
17 2,167 8.0 1,215 8.0 99.3
18 1,941 na na na na
19 1,677 na na na na
20 1,592 na na na na
30,838 na na na na
Total (5-17) 2,456 na na na na
Ratios
Ratio of 4 to 5 0.88 na na na na
Ratio of 6 to 7 0.97 1.07 na na na
Ratio of 15 to 14 0.79 0.81 na na na
Ratio of 18 to 17 0.90 na na na na
na: not applicable A Number of cases are used to calculate the ‘Ratio of 6 to 7’ and ‘Ratio of 15 to14’
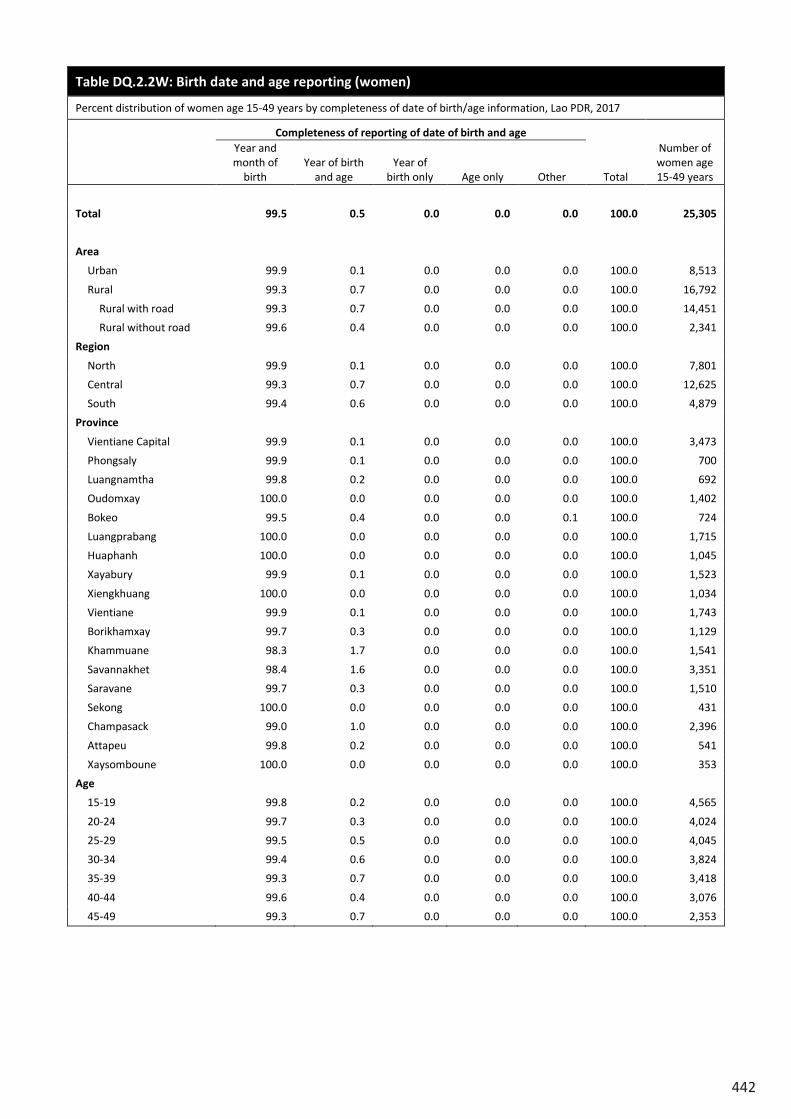
442
Table DQ.2.2W: Birth date and age reporting (women)
Percent distribution of women age 15-49 years by completeness of date of birth/age information, Lao PDR, 2017
Completeness of reporting of date of birth and age
Total
Number of women age 15-49 years
Year and month of
birth Year of birth
and age Year of
birth only Age only Other
Total 99.5 0.5 0.0 0.0 0.0 100.0 25,305
Area
Urban 99.9 0.1 0.0 0.0 0.0 100.0 8,513
Rural 99.3 0.7 0.0 0.0 0.0 100.0 16,792
Rural with road 99.3 0.7 0.0 0.0 0.0 100.0 14,451
Rural without road 99.6 0.4 0.0 0.0 0.0 100.0 2,341
Region
North 99.9 0.1 0.0 0.0 0.0 100.0 7,801
Central 99.3 0.7 0.0 0.0 0.0 100.0 12,625
South 99.4 0.6 0.0 0.0 0.0 100.0 4,879
Province
Vientiane Capital 99.9 0.1 0.0 0.0 0.0 100.0 3,473
Phongsaly 99.9 0.1 0.0 0.0 0.0 100.0 700
Luangnamtha 99.8 0.2 0.0 0.0 0.0 100.0 692
Oudomxay 100.0 0.0 0.0 0.0 0.0 100.0 1,402
Bokeo 99.5 0.4 0.0 0.0 0.1 100.0 724
Luangprabang 100.0 0.0 0.0 0.0 0.0 100.0 1,715
Huaphanh 100.0 0.0 0.0 0.0 0.0 100.0 1,045
Xayabury 99.9 0.1 0.0 0.0 0.0 100.0 1,523
Xiengkhuang 100.0 0.0 0.0 0.0 0.0 100.0 1,034
Vientiane 99.9 0.1 0.0 0.0 0.0 100.0 1,743
Borikhamxay 99.7 0.3 0.0 0.0 0.0 100.0 1,129
Khammuane 98.3 1.7 0.0 0.0 0.0 100.0 1,541
Savannakhet 98.4 1.6 0.0 0.0 0.0 100.0 3,351
Saravane 99.7 0.3 0.0 0.0 0.0 100.0 1,510
Sekong 100.0 0.0 0.0 0.0 0.0 100.0 431
Champasack 99.0 1.0 0.0 0.0 0.0 100.0 2,396
Attapeu 99.8 0.2 0.0 0.0 0.0 100.0 541
Xaysomboune 100.0 0.0 0.0 0.0 0.0 100.0 353
Age
15-19 99.8 0.2 0.0 0.0 0.0 100.0 4,565
20-24 99.7 0.3 0.0 0.0 0.0 100.0 4,024
25-29 99.5 0.5 0.0 0.0 0.0 100.0 4,045
30-34 99.4 0.6 0.0 0.0 0.0 100.0 3,824
35-39 99.3 0.7 0.0 0.0 0.0 100.0 3,418
40-44 99.6 0.4 0.0 0.0 0.0 100.0 3,076
45-49 99.3 0.7 0.0 0.0 0.0 100.0 2,353
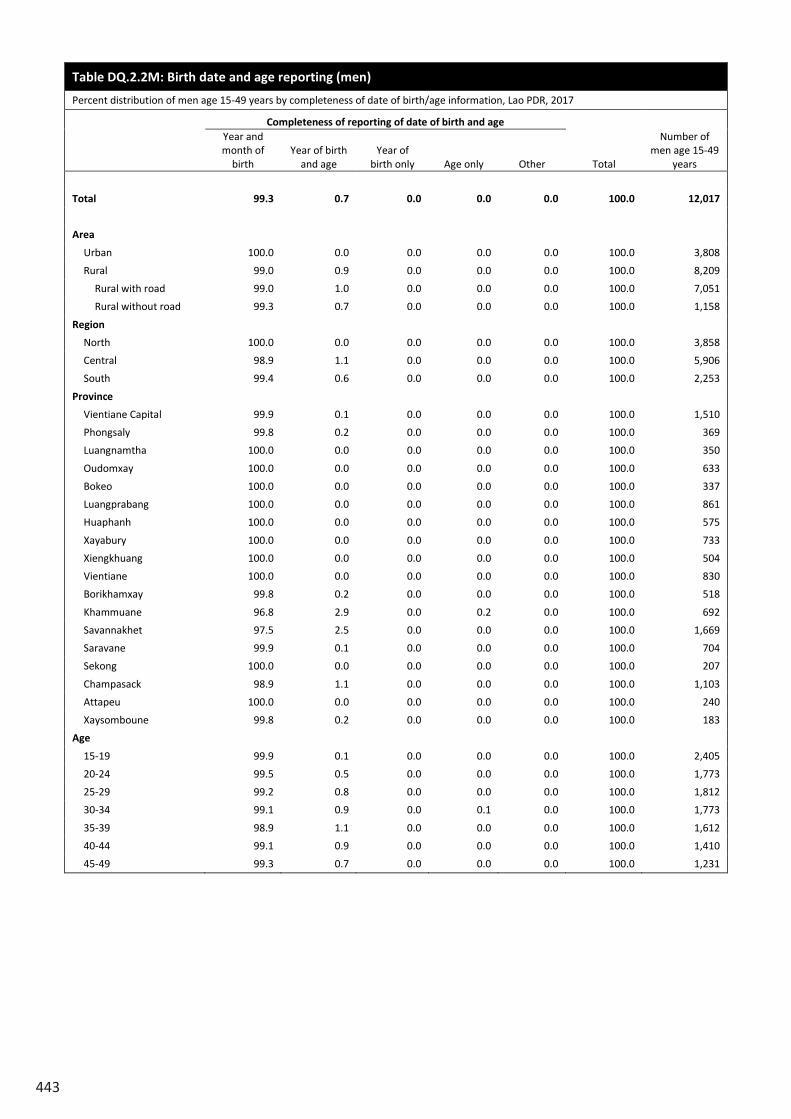
443
Table DQ.2.2M: Birth date and age reporting (men)
Percent distribution of men age 15-49 years by completeness of date of birth/age information, Lao PDR, 2017
Completeness of reporting of date of birth and age
Total
Number of men age 15-49
years
Year and month of
birth Year of birth
and age Year of
birth only Age only Other
Total 99.3 0.7 0.0 0.0 0.0 100.0 12,017
Area
Urban 100.0 0.0 0.0 0.0 0.0 100.0 3,808
Rural 99.0 0.9 0.0 0.0 0.0 100.0 8,209
Rural with road 99.0 1.0 0.0 0.0 0.0 100.0 7,051
Rural without road 99.3 0.7 0.0 0.0 0.0 100.0 1,158
Region
North 100.0 0.0 0.0 0.0 0.0 100.0 3,858
Central 98.9 1.1 0.0 0.0 0.0 100.0 5,906
South 99.4 0.6 0.0 0.0 0.0 100.0 2,253
Province
Vientiane Capital 99.9 0.1 0.0 0.0 0.0 100.0 1,510
Phongsaly 99.8 0.2 0.0 0.0 0.0 100.0 369
Luangnamtha 100.0 0.0 0.0 0.0 0.0 100.0 350
Oudomxay 100.0 0.0 0.0 0.0 0.0 100.0 633
Bokeo 100.0 0.0 0.0 0.0 0.0 100.0 337
Luangprabang 100.0 0.0 0.0 0.0 0.0 100.0 861
Huaphanh 100.0 0.0 0.0 0.0 0.0 100.0 575
Xayabury 100.0 0.0 0.0 0.0 0.0 100.0 733
Xiengkhuang 100.0 0.0 0.0 0.0 0.0 100.0 504
Vientiane 100.0 0.0 0.0 0.0 0.0 100.0 830
Borikhamxay 99.8 0.2 0.0 0.0 0.0 100.0 518
Khammuane 96.8 2.9 0.0 0.2 0.0 100.0 692
Savannakhet 97.5 2.5 0.0 0.0 0.0 100.0 1,669
Saravane 99.9 0.1 0.0 0.0 0.0 100.0 704
Sekong 100.0 0.0 0.0 0.0 0.0 100.0 207
Champasack 98.9 1.1 0.0 0.0 0.0 100.0 1,103
Attapeu 100.0 0.0 0.0 0.0 0.0 100.0 240
Xaysomboune 99.8 0.2 0.0 0.0 0.0 100.0 183
Age
15-19 99.9 0.1 0.0 0.0 0.0 100.0 2,405
20-24 99.5 0.5 0.0 0.0 0.0 100.0 1,773
25-29 99.2 0.8 0.0 0.0 0.0 100.0 1,812
30-34 99.1 0.9 0.0 0.1 0.0 100.0 1,773
35-39 98.9 1.1 0.0 0.0 0.0 100.0 1,612
40-44 99.1 0.9 0.0 0.0 0.0 100.0 1,410
45-49 99.3 0.7 0.0 0.0 0.0 100.0 1,231
Table DQ.2.2W: Birth date and age reporting (women)
Percent distribution of women age 15-49 years by completeness of date of birth/age information, Lao PDR, 2017
Completeness of reporting of date of birth and age
Total
Number of women age 15-49 years
Year and month of
birth Year of birth
and age Year of
birth only Age only Other
Total 99.5 0.5 0.0 0.0 0.0 100.0 25,305
Area
Urban 99.9 0.1 0.0 0.0 0.0 100.0 8,513
Rural 99.3 0.7 0.0 0.0 0.0 100.0 16,792
Rural with road 99.3 0.7 0.0 0.0 0.0 100.0 14,451
Rural without road 99.6 0.4 0.0 0.0 0.0 100.0 2,341
Region
North 99.9 0.1 0.0 0.0 0.0 100.0 7,801
Central 99.3 0.7 0.0 0.0 0.0 100.0 12,625
South 99.4 0.6 0.0 0.0 0.0 100.0 4,879
Province
Vientiane Capital 99.9 0.1 0.0 0.0 0.0 100.0 3,473
Phongsaly 99.9 0.1 0.0 0.0 0.0 100.0 700
Luangnamtha 99.8 0.2 0.0 0.0 0.0 100.0 692
Oudomxay 100.0 0.0 0.0 0.0 0.0 100.0 1,402
Bokeo 99.5 0.4 0.0 0.0 0.1 100.0 724
Luangprabang 100.0 0.0 0.0 0.0 0.0 100.0 1,715
Huaphanh 100.0 0.0 0.0 0.0 0.0 100.0 1,045
Xayabury 99.9 0.1 0.0 0.0 0.0 100.0 1,523
Xiengkhuang 100.0 0.0 0.0 0.0 0.0 100.0 1,034
Vientiane 99.9 0.1 0.0 0.0 0.0 100.0 1,743
Borikhamxay 99.7 0.3 0.0 0.0 0.0 100.0 1,129
Khammuane 98.3 1.7 0.0 0.0 0.0 100.0 1,541
Savannakhet 98.4 1.6 0.0 0.0 0.0 100.0 3,351
Saravane 99.7 0.3 0.0 0.0 0.0 100.0 1,510
Sekong 100.0 0.0 0.0 0.0 0.0 100.0 431
Champasack 99.0 1.0 0.0 0.0 0.0 100.0 2,396
Attapeu 99.8 0.2 0.0 0.0 0.0 100.0 541
Xaysomboune 100.0 0.0 0.0 0.0 0.0 100.0 353
Age
15-19 99.8 0.2 0.0 0.0 0.0 100.0 4,565
20-24 99.7 0.3 0.0 0.0 0.0 100.0 4,024
25-29 99.5 0.5 0.0 0.0 0.0 100.0 4,045
30-34 99.4 0.6 0.0 0.0 0.0 100.0 3,824
35-39 99.3 0.7 0.0 0.0 0.0 100.0 3,418
40-44 99.6 0.4 0.0 0.0 0.0 100.0 3,076
45-49 99.3 0.7 0.0 0.0 0.0 100.0 2,353
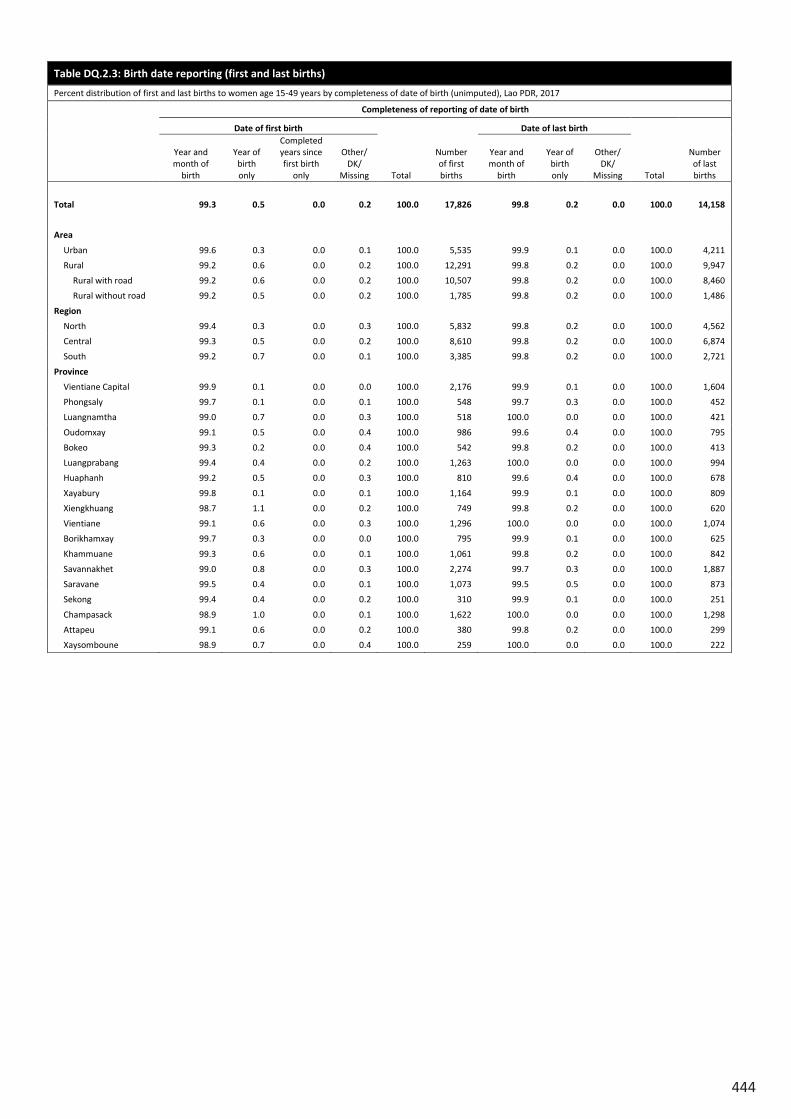
444
Table DQ.2.4: Birth date and age reporting (children under age 5 years)
Percent distribution children under 5 by completeness of date of birth/age information, Lao PDR, 2017
Completeness of reporting of date of birth and age
Total
Number of under-5 children
Year and month of
birth Year of birth
and age Year of
birth only Age only
Total 100.0 0.0 0.0 0.0 100.0 11,720
Area
Urban 100.0 0.0 0.0 0.0 100.0 3,179
Rural 100.0 0.0 0.0 0.0 100.0 8,541
Rural with road 100.0 0.0 0.0 0.0 100.0 7,124
Rural without road 100.0 0.0 0.0 0.0 100.0 1,417
Region
North 100.0 0.0 0.0 0.0 100.0 3,684
Central 100.0 0.0 0.0 0.0 100.0 5,610
South 100.0 0.0 0.0 0.0 100.0 2,427
Province
Vientiane Capital 100.0 0.0 0.0 0.0 100.0 1,181
Phongsaly 100.0 0.0 0.0 0.0 100.0 346
Luangnamtha 100.0 0.0 0.0 0.0 100.0 321
Oudomxay 100.0 0.0 0.0 0.0 100.0 690
Bokeo 100.0 0.0 0.0 0.0 100.0 373
Luangprabang 100.0 0.0 0.0 0.0 100.0 844
Huaphanh 100.0 0.0 0.0 0.0 100.0 553
Xayabury 100.0 0.0 0.0 0.0 100.0 556
Xiengkhuang 100.0 0.0 0.0 0.0 100.0 565
Vientiane 100.0 0.0 0.0 0.0 100.0 803
Borikhamxay 100.0 0.0 0.0 0.0 100.0 527
Khammuane 100.0 0.0 0.0 0.0 100.0 674
Savannakhet 100.0 0.0 0.0 0.0 100.0 1,625
Saravane 100.0 0.0 0.0 0.0 100.0 821
Sekong 100.0 0.0 0.0 0.0 100.0 256
Champasack 100.0 0.0 0.0 0.0 100.0 1,101
Attapeu 100.0 0.0 0.0 0.0 100.0 248
Xaysomboune 100.0 0.0 0.0 0.0 100.0 234
Age
0 100.0 0.0 0.0 0.0 100.0 2,253
1 100.0 0.0 0.0 0.0 100.0 2,217
2 100.0 0.0 0.0 0.0 100.0 2,369
3 100.0 0.0 0.0 0.0 100.0 2,553
4 100.0 0.0 0.0 0.0 100.0 2,328
Table DQ.2.3: Birth date reporting (first and last births)
Percent distribution of first and last births to women age 15-49 years by completeness of date of birth (unimputed), Lao PDR, 2017
Completeness of reporting of date of birth
Date of first birth
Total
Number of first births
Date of last birth
Total
Number of last births
Year and month of
birth
Year of birth only
Completed years since first birth
only
Other/ DK/
Missing
Year and month of
birth
Year of birth only
Other/ DK/
Missing
Total 99.3 0.5 0.0 0.2 100.0 17,826 99.8 0.2 0.0 100.0 14,158
Area
Urban 99.6 0.3 0.0 0.1 100.0 5,535 99.9 0.1 0.0 100.0 4,211
Rural 99.2 0.6 0.0 0.2 100.0 12,291 99.8 0.2 0.0 100.0 9,947
Rural with road 99.2 0.6 0.0 0.2 100.0 10,507 99.8 0.2 0.0 100.0 8,460
Rural without road 99.2 0.5 0.0 0.2 100.0 1,785 99.8 0.2 0.0 100.0 1,486
Region
North 99.4 0.3 0.0 0.3 100.0 5,832 99.8 0.2 0.0 100.0 4,562
Central 99.3 0.5 0.0 0.2 100.0 8,610 99.8 0.2 0.0 100.0 6,874
South 99.2 0.7 0.0 0.1 100.0 3,385 99.8 0.2 0.0 100.0 2,721
Province
Vientiane Capital 99.9 0.1 0.0 0.0 100.0 2,176 99.9 0.1 0.0 100.0 1,604
Phongsaly 99.7 0.1 0.0 0.1 100.0 548 99.7 0.3 0.0 100.0 452
Luangnamtha 99.0 0.7 0.0 0.3 100.0 518 100.0 0.0 0.0 100.0 421
Oudomxay 99.1 0.5 0.0 0.4 100.0 986 99.6 0.4 0.0 100.0 795
Bokeo 99.3 0.2 0.0 0.4 100.0 542 99.8 0.2 0.0 100.0 413
Luangprabang 99.4 0.4 0.0 0.2 100.0 1,263 100.0 0.0 0.0 100.0 994
Huaphanh 99.2 0.5 0.0 0.3 100.0 810 99.6 0.4 0.0 100.0 678
Xayabury 99.8 0.1 0.0 0.1 100.0 1,164 99.9 0.1 0.0 100.0 809
Xiengkhuang 98.7 1.1 0.0 0.2 100.0 749 99.8 0.2 0.0 100.0 620
Vientiane 99.1 0.6 0.0 0.3 100.0 1,296 100.0 0.0 0.0 100.0 1,074
Borikhamxay 99.7 0.3 0.0 0.0 100.0 795 99.9 0.1 0.0 100.0 625
Khammuane 99.3 0.6 0.0 0.1 100.0 1,061 99.8 0.2 0.0 100.0 842
Savannakhet 99.0 0.8 0.0 0.3 100.0 2,274 99.7 0.3 0.0 100.0 1,887
Saravane 99.5 0.4 0.0 0.1 100.0 1,073 99.5 0.5 0.0 100.0 873
Sekong 99.4 0.4 0.0 0.2 100.0 310 99.9 0.1 0.0 100.0 251
Champasack 98.9 1.0 0.0 0.1 100.0 1,622 100.0 0.0 0.0 100.0 1,298
Attapeu 99.1 0.6 0.0 0.2 100.0 380 99.8 0.2 0.0 100.0 299
Xaysomboune 98.9 0.7 0.0 0.4 100.0 259 100.0 0.0 0.0 100.0 222
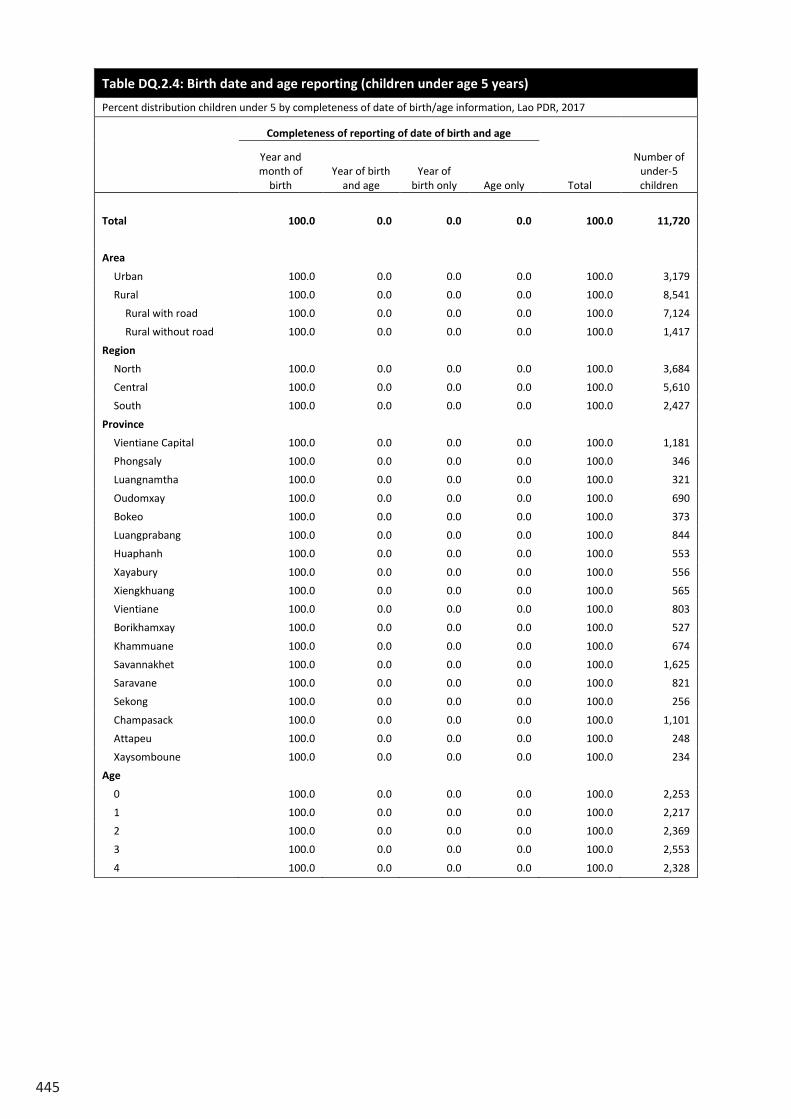
445
Table DQ.2.4: Birth date and age reporting (children under age 5 years)
Percent distribution children under 5 by completeness of date of birth/age information, Lao PDR, 2017
Completeness of reporting of date of birth and age
Total
Number of under-5 children
Year and month of
birth Year of birth
and age Year of
birth only Age only
Total 100.0 0.0 0.0 0.0 100.0 11,720
Area
Urban 100.0 0.0 0.0 0.0 100.0 3,179
Rural 100.0 0.0 0.0 0.0 100.0 8,541
Rural with road 100.0 0.0 0.0 0.0 100.0 7,124
Rural without road 100.0 0.0 0.0 0.0 100.0 1,417
Region
North 100.0 0.0 0.0 0.0 100.0 3,684
Central 100.0 0.0 0.0 0.0 100.0 5,610
South 100.0 0.0 0.0 0.0 100.0 2,427
Province
Vientiane Capital 100.0 0.0 0.0 0.0 100.0 1,181
Phongsaly 100.0 0.0 0.0 0.0 100.0 346
Luangnamtha 100.0 0.0 0.0 0.0 100.0 321
Oudomxay 100.0 0.0 0.0 0.0 100.0 690
Bokeo 100.0 0.0 0.0 0.0 100.0 373
Luangprabang 100.0 0.0 0.0 0.0 100.0 844
Huaphanh 100.0 0.0 0.0 0.0 100.0 553
Xayabury 100.0 0.0 0.0 0.0 100.0 556
Xiengkhuang 100.0 0.0 0.0 0.0 100.0 565
Vientiane 100.0 0.0 0.0 0.0 100.0 803
Borikhamxay 100.0 0.0 0.0 0.0 100.0 527
Khammuane 100.0 0.0 0.0 0.0 100.0 674
Savannakhet 100.0 0.0 0.0 0.0 100.0 1,625
Saravane 100.0 0.0 0.0 0.0 100.0 821
Sekong 100.0 0.0 0.0 0.0 100.0 256
Champasack 100.0 0.0 0.0 0.0 100.0 1,101
Attapeu 100.0 0.0 0.0 0.0 100.0 248
Xaysomboune 100.0 0.0 0.0 0.0 100.0 234
Age
0 100.0 0.0 0.0 0.0 100.0 2,253
1 100.0 0.0 0.0 0.0 100.0 2,217
2 100.0 0.0 0.0 0.0 100.0 2,369
3 100.0 0.0 0.0 0.0 100.0 2,553
4 100.0 0.0 0.0 0.0 100.0 2,328
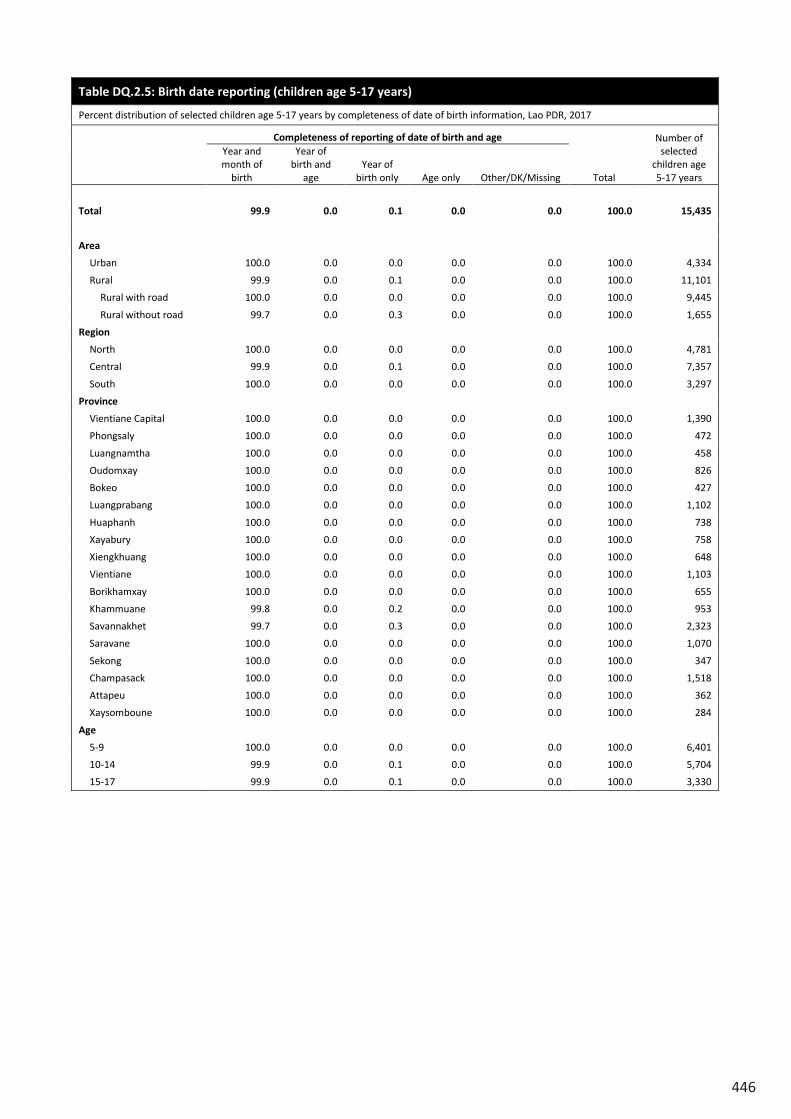
446
Table DQ.2.5: Birth date reporting (children age 5-17 years)
Percent distribution of selected children age 5-17 years by completeness of date of birth information, Lao PDR, 2017
Completeness of reporting of date of birth and age
Total
Number of selected
children age 5-17 years
Year and month of
birth
Year of birth and
age Year of
birth only Age only Other/DK/Missing
Total 99.9 0.0 0.1 0.0 0.0 100.0 15,435
Area
Urban 100.0 0.0 0.0 0.0 0.0 100.0 4,334
Rural 99.9 0.0 0.1 0.0 0.0 100.0 11,101
Rural with road 100.0 0.0 0.0 0.0 0.0 100.0 9,445
Rural without road 99.7 0.0 0.3 0.0 0.0 100.0 1,655
Region
North 100.0 0.0 0.0 0.0 0.0 100.0 4,781
Central 99.9 0.0 0.1 0.0 0.0 100.0 7,357
South 100.0 0.0 0.0 0.0 0.0 100.0 3,297
Province
Vientiane Capital 100.0 0.0 0.0 0.0 0.0 100.0 1,390
Phongsaly 100.0 0.0 0.0 0.0 0.0 100.0 472
Luangnamtha 100.0 0.0 0.0 0.0 0.0 100.0 458
Oudomxay 100.0 0.0 0.0 0.0 0.0 100.0 826
Bokeo 100.0 0.0 0.0 0.0 0.0 100.0 427
Luangprabang 100.0 0.0 0.0 0.0 0.0 100.0 1,102
Huaphanh 100.0 0.0 0.0 0.0 0.0 100.0 738
Xayabury 100.0 0.0 0.0 0.0 0.0 100.0 758
Xiengkhuang 100.0 0.0 0.0 0.0 0.0 100.0 648
Vientiane 100.0 0.0 0.0 0.0 0.0 100.0 1,103
Borikhamxay 100.0 0.0 0.0 0.0 0.0 100.0 655
Khammuane 99.8 0.0 0.2 0.0 0.0 100.0 953
Savannakhet 99.7 0.0 0.3 0.0 0.0 100.0 2,323
Saravane 100.0 0.0 0.0 0.0 0.0 100.0 1,070
Sekong 100.0 0.0 0.0 0.0 0.0 100.0 347
Champasack 100.0 0.0 0.0 0.0 0.0 100.0 1,518
Attapeu 100.0 0.0 0.0 0.0 0.0 100.0 362
Xaysomboune 100.0 0.0 0.0 0.0 0.0 100.0 284
Age
5-9 100.0 0.0 0.0 0.0 0.0 100.0 6,401
10-14 99.9 0.0 0.1 0.0 0.0 100.0 5,704
15-17 99.9 0.0 0.1 0.0 0.0 100.0 3,330
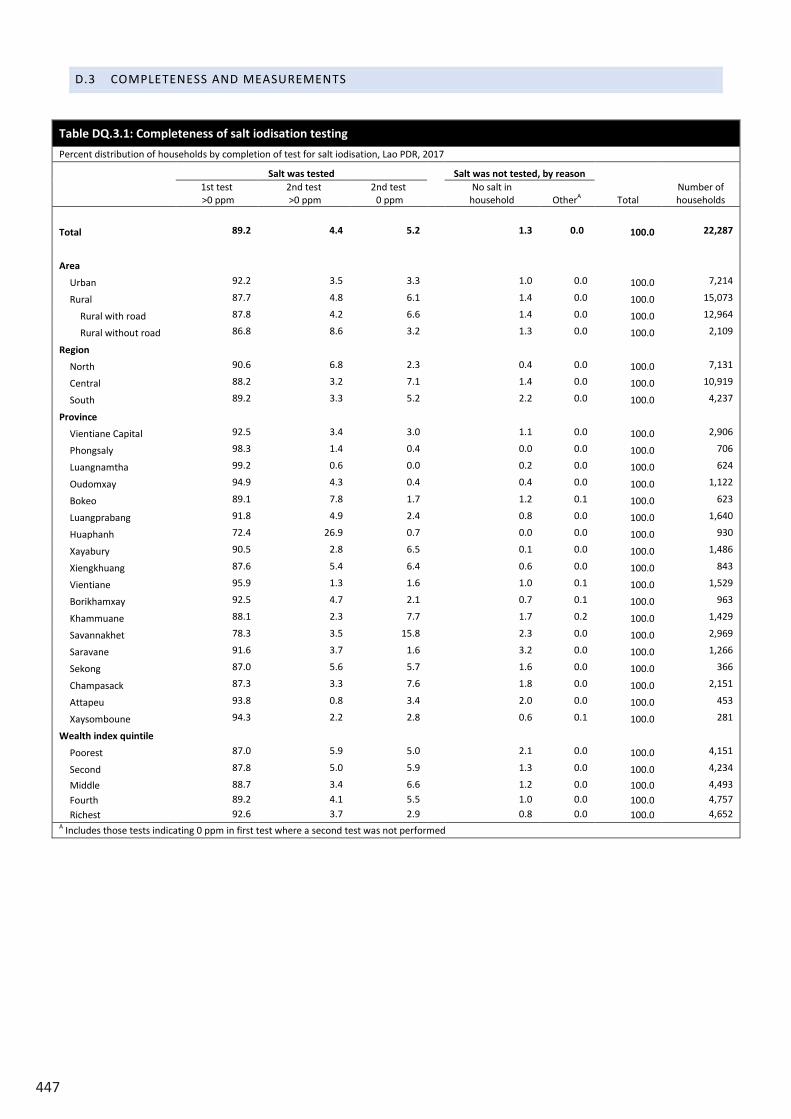
447
D.3 COMPLETENESS AND MEASUREMENTS
Table DQ.3.1: Completeness of salt iodisation testing
Percent distribution of households by completion of test for salt iodisation, Lao PDR, 2017
Salt was tested Salt was not tested, by reason
Total Number of households
1st test >0 ppm
2nd test >0 ppm
2nd test 0 ppm
No salt in household OtherA
Total 89.2 4.4 5.2 1.3 0.0 100.0 22,287
Area
Urban 92.2 3.5 3.3 1.0 0.0 100.0 7,214
Rural 87.7 4.8 6.1 1.4 0.0 100.0 15,073
Rural with road 87.8 4.2 6.6 1.4 0.0 100.0 12,964
Rural without road 86.8 8.6 3.2 1.3 0.0 100.0 2,109
Region
North 90.6 6.8 2.3 0.4 0.0 100.0 7,131
Central 88.2 3.2 7.1 1.4 0.0 100.0 10,919
South 89.2 3.3 5.2 2.2 0.0 100.0 4,237
Province
Vientiane Capital 92.5 3.4 3.0 1.1 0.0 100.0 2,906
Phongsaly 98.3 1.4 0.4 0.0 0.0 100.0 706
Luangnamtha 99.2 0.6 0.0 0.2 0.0 100.0 624
Oudomxay 94.9 4.3 0.4 0.4 0.0 100.0 1,122
Bokeo 89.1 7.8 1.7 1.2 0.1 100.0 623
Luangprabang 91.8 4.9 2.4 0.8 0.0 100.0 1,640
Huaphanh 72.4 26.9 0.7 0.0 0.0 100.0 930
Xayabury 90.5 2.8 6.5 0.1 0.0 100.0 1,486
Xiengkhuang 87.6 5.4 6.4 0.6 0.0 100.0 843
Vientiane 95.9 1.3 1.6 1.0 0.1 100.0 1,529
Borikhamxay 92.5 4.7 2.1 0.7 0.1 100.0 963
Khammuane 88.1 2.3 7.7 1.7 0.2 100.0 1,429
Savannakhet 78.3 3.5 15.8 2.3 0.0 100.0 2,969
Saravane 91.6 3.7 1.6 3.2 0.0 100.0 1,266
Sekong 87.0 5.6 5.7 1.6 0.0 100.0 366
Champasack 87.3 3.3 7.6 1.8 0.0 100.0 2,151
Attapeu 93.8 0.8 3.4 2.0 0.0 100.0 453
Xaysomboune 94.3 2.2 2.8 0.6 0.1 100.0 281
Wealth index quintile
Poorest 87.0 5.9 5.0 2.1 0.0 100.0 4,151
Second 87.8 5.0 5.9 1.3 0.0 100.0 4,234
Middle 88.7 3.4 6.6 1.2 0.0 100.0 4,493
Fourth 89.2 4.1 5.5 1.0 0.0 100.0 4,757
Richest 92.6 3.7 2.9 0.8 0.0 100.0 4,652 A Includes those tests indicating 0 ppm in first test where a second test was not performed
Table DQ.2.5: Birth date reporting (children age 5-17 years)
Percent distribution of selected children age 5-17 years by completeness of date of birth information, Lao PDR, 2017
Completeness of reporting of date of birth and age
Total
Number of selected
children age 5-17 years
Year and month of
birth
Year of birth and
age Year of
birth only Age only Other/DK/Missing
Total 99.9 0.0 0.1 0.0 0.0 100.0 15,435
Area
Urban 100.0 0.0 0.0 0.0 0.0 100.0 4,334
Rural 99.9 0.0 0.1 0.0 0.0 100.0 11,101
Rural with road 100.0 0.0 0.0 0.0 0.0 100.0 9,445
Rural without road 99.7 0.0 0.3 0.0 0.0 100.0 1,655
Region
North 100.0 0.0 0.0 0.0 0.0 100.0 4,781
Central 99.9 0.0 0.1 0.0 0.0 100.0 7,357
South 100.0 0.0 0.0 0.0 0.0 100.0 3,297
Province
Vientiane Capital 100.0 0.0 0.0 0.0 0.0 100.0 1,390
Phongsaly 100.0 0.0 0.0 0.0 0.0 100.0 472
Luangnamtha 100.0 0.0 0.0 0.0 0.0 100.0 458
Oudomxay 100.0 0.0 0.0 0.0 0.0 100.0 826
Bokeo 100.0 0.0 0.0 0.0 0.0 100.0 427
Luangprabang 100.0 0.0 0.0 0.0 0.0 100.0 1,102
Huaphanh 100.0 0.0 0.0 0.0 0.0 100.0 738
Xayabury 100.0 0.0 0.0 0.0 0.0 100.0 758
Xiengkhuang 100.0 0.0 0.0 0.0 0.0 100.0 648
Vientiane 100.0 0.0 0.0 0.0 0.0 100.0 1,103
Borikhamxay 100.0 0.0 0.0 0.0 0.0 100.0 655
Khammuane 99.8 0.0 0.2 0.0 0.0 100.0 953
Savannakhet 99.7 0.0 0.3 0.0 0.0 100.0 2,323
Saravane 100.0 0.0 0.0 0.0 0.0 100.0 1,070
Sekong 100.0 0.0 0.0 0.0 0.0 100.0 347
Champasack 100.0 0.0 0.0 0.0 0.0 100.0 1,518
Attapeu 100.0 0.0 0.0 0.0 0.0 100.0 362
Xaysomboune 100.0 0.0 0.0 0.0 0.0 100.0 284
Age
5-9 100.0 0.0 0.0 0.0 0.0 100.0 6,401
10-14 99.9 0.0 0.1 0.0 0.0 100.0 5,704
15-17 99.9 0.0 0.1 0.0 0.0 100.0 3,330
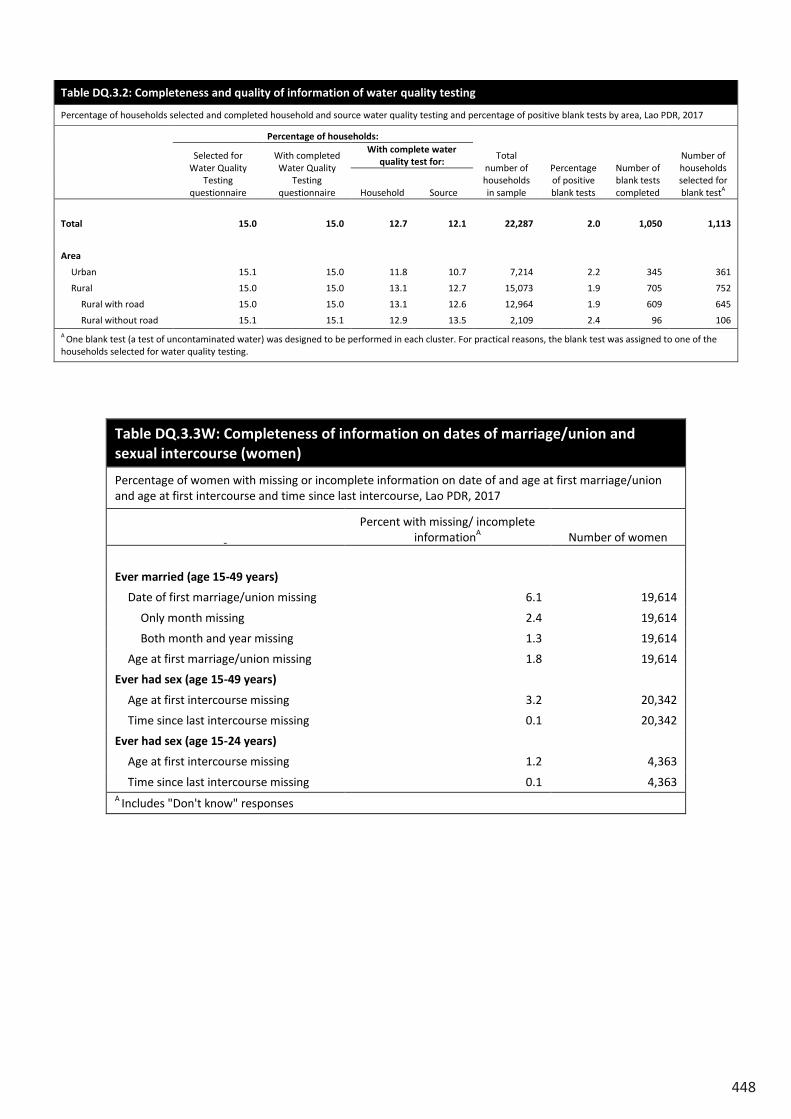
448
Table DQ.3.2: Completeness and quality of information of water quality testing
Percentage of households selected and completed household and source water quality testing and percentage of positive blank tests by area, Lao PDR, 2017
Percentage of households:
Total number of households in sample
Percentage of positive blank tests
Number of blank tests completed
Number of households selected for blank testA
Selected for Water Quality
Testing questionnaire
With completed Water Quality
Testing questionnaire
With complete water quality test for:
Household Source
Total 15.0 15.0 12.7 12.1 22,287 2.0 1,050 1,113
Area
Urban 15.1 15.0 11.8 10.7 7,214 2.2 345 361
Rural 15.0 15.0 13.1 12.7 15,073 1.9 705 752
Rural with road 15.0 15.0 13.1 12.6 12,964 1.9 609 645
Rural without road 15.1 15.1 12.9 13.5 2,109 2.4 96 106 A One blank test (a test of uncontaminated water) was designed to be performed in each cluster. For practical reasons, the blank test was assigned to one of the households selected for water quality testing.
Table DQ.3.3W: Completeness of information on dates of marriage/union and sexual intercourse (women)
Percentage of women with missing or incomplete information on date of and age at first marriage/union and age at first intercourse and time since last intercourse, Lao PDR, 2017
Percent with missing/ incomplete
informationA Number of women
Ever married (age 15-49 years)
Date of first marriage/union missing 6.1 19,614
Only month missing 2.4 19,614
Both month and year missing 1.3 19,614
Age at first marriage/union missing 1.8 19,614
Ever had sex (age 15-49 years)
Age at first intercourse missing 3.2 20,342
Time since last intercourse missing 0.1 20,342
Ever had sex (age 15-24 years)
Age at first intercourse missing 1.2 4,363
Time since last intercourse missing 0.1 4,363 A Includes "Don't know" responses
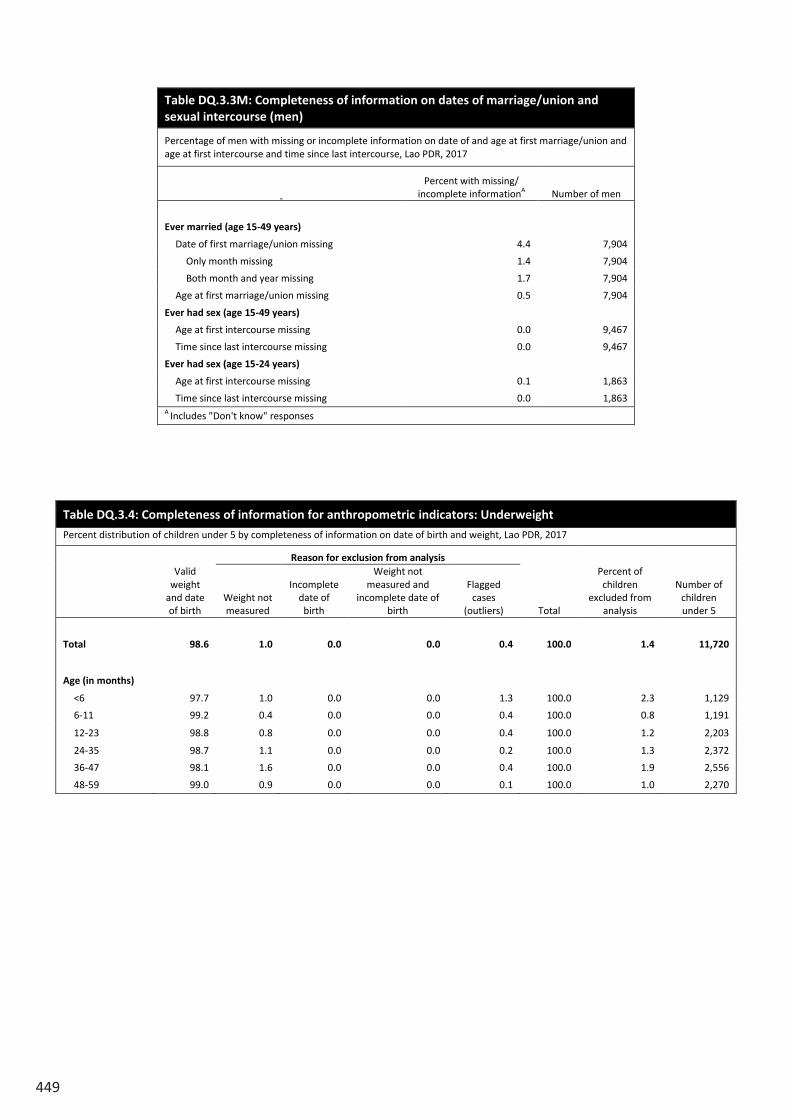
449
Table DQ.3.3M: Completeness of information on dates of marriage/union and sexual intercourse (men)
Percentage of men with missing or incomplete information on date of and age at first marriage/union and age at first intercourse and time since last intercourse, Lao PDR, 2017
Percent with missing/
incomplete informationA Number of men
Ever married (age 15-49 years)
Date of first marriage/union missing 4.4 7,904
Only month missing 1.4 7,904
Both month and year missing 1.7 7,904
Age at first marriage/union missing 0.5 7,904
Ever had sex (age 15-49 years)
Age at first intercourse missing 0.0 9,467
Time since last intercourse missing 0.0 9,467
Ever had sex (age 15-24 years)
Age at first intercourse missing 0.1 1,863
Time since last intercourse missing 0.0 1,863 A Includes "Don't know" responses
Table DQ.3.4: Completeness of information for anthropometric indicators: Underweight
Percent distribution of children under 5 by completeness of information on date of birth and weight, Lao PDR, 2017
Valid weight
and date of birth
Reason for exclusion from analysis
Total
Percent of children
excluded from analysis
Number of children under 5
Weight not measured
Incomplete date of birth
Weight not measured and
incomplete date of birth
Flagged cases
(outliers)
Total 98.6 1.0 0.0 0.0 0.4 100.0 1.4 11,720
Age (in months)
<6 97.7 1.0 0.0 0.0 1.3 100.0 2.3 1,129
6-11 99.2 0.4 0.0 0.0 0.4 100.0 0.8 1,191
12-23 98.8 0.8 0.0 0.0 0.4 100.0 1.2 2,203
24-35 98.7 1.1 0.0 0.0 0.2 100.0 1.3 2,372
36-47 98.1 1.6 0.0 0.0 0.4 100.0 1.9 2,556
48-59 99.0 0.9 0.0 0.0 0.1 100.0 1.0 2,270
Table DQ.3.2: Completeness and quality of information of water quality testing
Percentage of households selected and completed household and source water quality testing and percentage of positive blank tests by area, Lao PDR, 2017
Percentage of households:
Total number of households in sample
Percentage of positive blank tests
Number of blank tests completed
Number of households selected for blank testA
Selected for Water Quality
Testing questionnaire
With completed Water Quality
Testing questionnaire
With complete water quality test for:
Household Source
Total 15.0 15.0 12.7 12.1 22,287 2.0 1,050 1,113
Area
Urban 15.1 15.0 11.8 10.7 7,214 2.2 345 361
Rural 15.0 15.0 13.1 12.7 15,073 1.9 705 752
Rural with road 15.0 15.0 13.1 12.6 12,964 1.9 609 645
Rural without road 15.1 15.1 12.9 13.5 2,109 2.4 96 106 A One blank test (a test of uncontaminated water) was designed to be performed in each cluster. For practical reasons, the blank test was assigned to one of the households selected for water quality testing.
Table DQ.3.3W: Completeness of information on dates of marriage/union and sexual intercourse (women)
Percentage of women with missing or incomplete information on date of and age at first marriage/union and age at first intercourse and time since last intercourse, Lao PDR, 2017
Percent with missing/ incomplete
informationA Number of women
Ever married (age 15-49 years)
Date of first marriage/union missing 6.1 19,614
Only month missing 2.4 19,614
Both month and year missing 1.3 19,614
Age at first marriage/union missing 1.8 19,614
Ever had sex (age 15-49 years)
Age at first intercourse missing 3.2 20,342
Time since last intercourse missing 0.1 20,342
Ever had sex (age 15-24 years)
Age at first intercourse missing 1.2 4,363
Time since last intercourse missing 0.1 4,363 A Includes "Don't know" responses
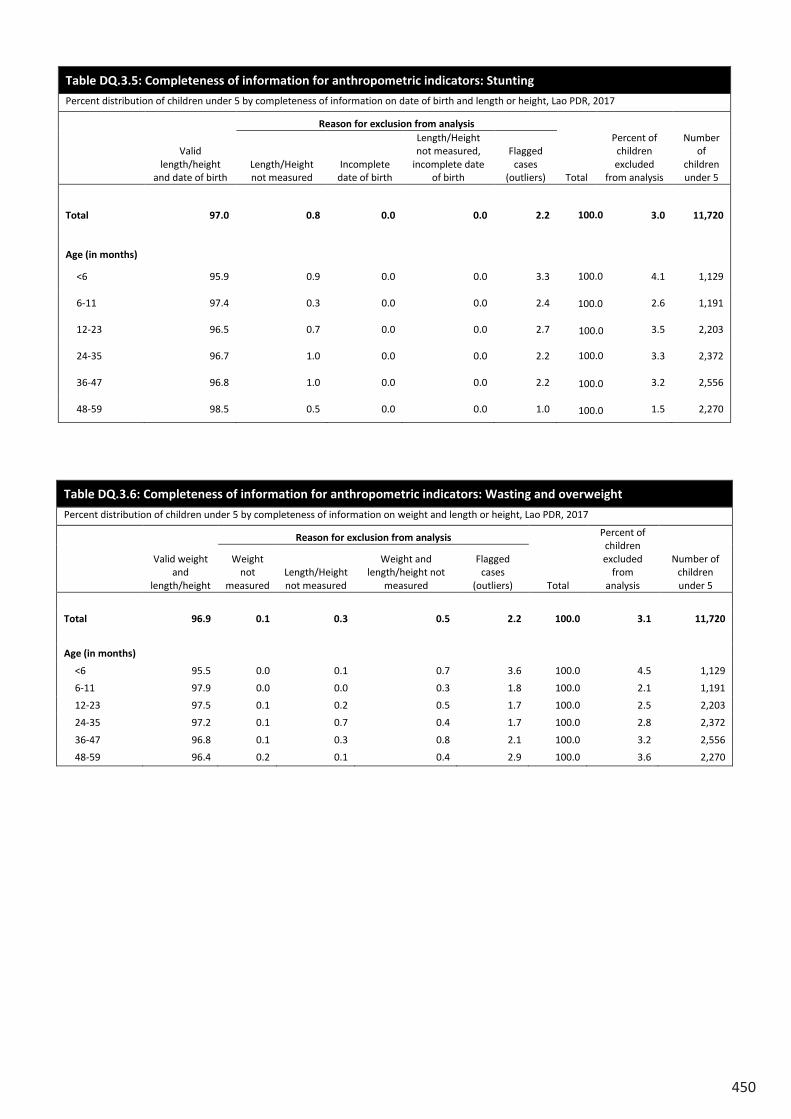
450
Table DQ.3.5: Completeness of information for anthropometric indicators: Stunting
Percent distribution of children under 5 by completeness of information on date of birth and length or height, Lao PDR, 2017
Valid length/height
and date of birth
Reason for exclusion from analysis
Total
Percent of children excluded
from analysis
Number of
children under 5
Length/Height not measured
Incomplete date of birth
Length/Height not measured,
incomplete date of birth
Flagged cases
(outliers)
Total 97.0 0.8 0.0 0.0 2.2 100.0 3.0 11,720
Age (in months)
<6 95.9 0.9 0.0 0.0 3.3 100.0 4.1 1,129
6-11 97.4 0.3 0.0 0.0 2.4 2.6 1,191
12-23 96.5 0.7 0.0 0.0 2.7 3.5 2,203
24-35 96.7 1.0 0.0 0.0 2.2 3.3 2,372
36-47 96.8 1.0 0.0 0.0 2.2 3.2 2,556
48-59 98.5 0.5 0.0 0.0 1.0 1.5 2,270
Table DQ.3.6: Completeness of information for anthropometric indicators: Wasting and overweight
Percent distribution of children under 5 by completeness of information on weight and length or height, Lao PDR, 2017
Valid weight and
length/height
Reason for exclusion from analysis
Total
Percent of children excluded
from analysis
Number of children under 5
Weight not
measured Length/Height not measured
Weight and length/height not
measured
Flagged cases
(outliers)
Total 96.9 0.1 0.3 0.5 2.2 100.0 3.1 11,720
Age (in months)
<6 95.5 0.0 0.1 0.7 3.6 100.0 4.5 1,129
6-11 97.9 0.0 0.0 0.3 1.8 100.0 2.1 1,191
12-23 97.5 0.1 0.2 0.5 1.7 100.0 2.5 2,203
24-35 97.2 0.1 0.7 0.4 1.7 100.0 2.8 2,372
36-47 96.8 0.1 0.3 0.8 2.1 100.0 3.2 2,556
48-59 96.4 0.2 0.1 0.4 2.9 100.0 3.6 2,270
100.0
100.0
100.0
100.0
100.0
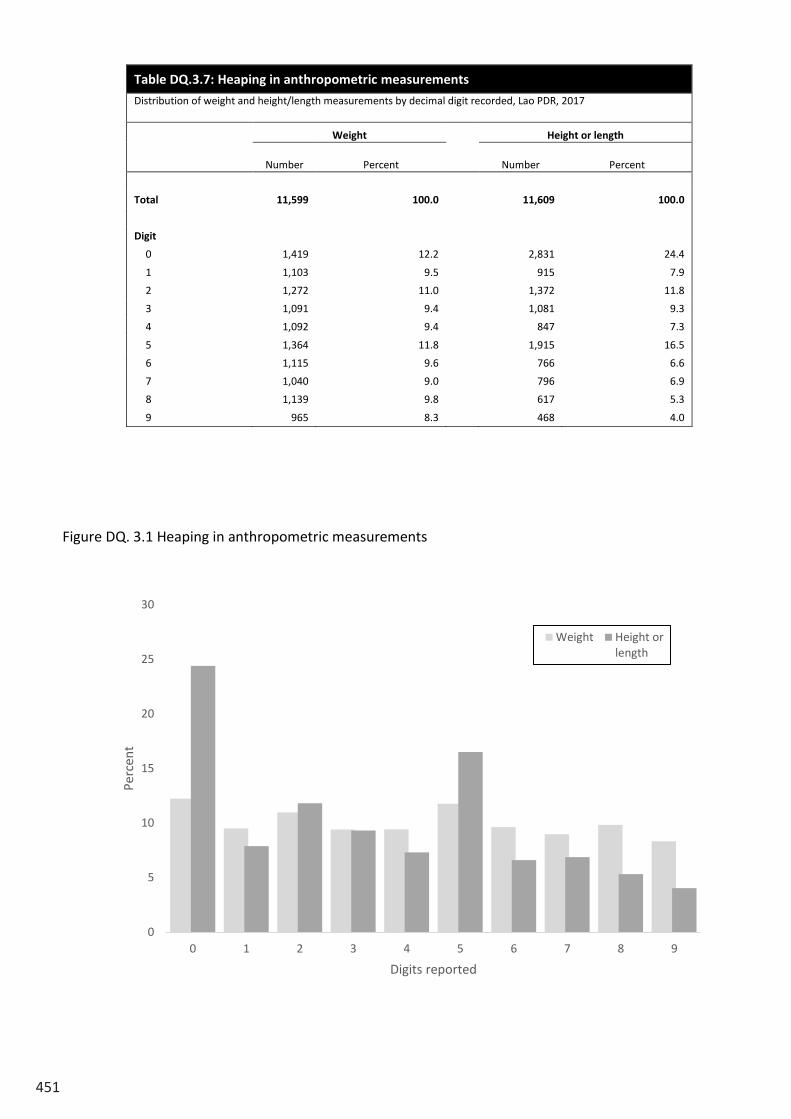
451
Figure DQ. 3.1 Heaping in anthropometric measurements
Table DQ.3.7: Heaping in anthropometric measurements
Distribution of weight and height/length measurements by decimal digit recorded, Lao PDR, 2017
Weight
Height or length
Number Percent Number Percent
Total 11,599 100.0
11,609 100.0
Digit
0 1,419 12.2
2,831 24.4
1 1,103 9.5
915 7.9
2 1,272 11.0
1,372 11.8
3 1,091 9.4
1,081 9.3
4 1,092 9.4
847 7.3
5 1,364 11.8
1,915 16.5
6 1,115 9.6
766 6.6
7 1,040 9.0
796 6.9
8 1,139 9.8
617 5.3
9 965 8.3
468 4.0
0
5
10
15
20
25
30
0 1 2 3 4 5 6 7 8 9
Perc
ent
Digits reported
Weight Height orlength
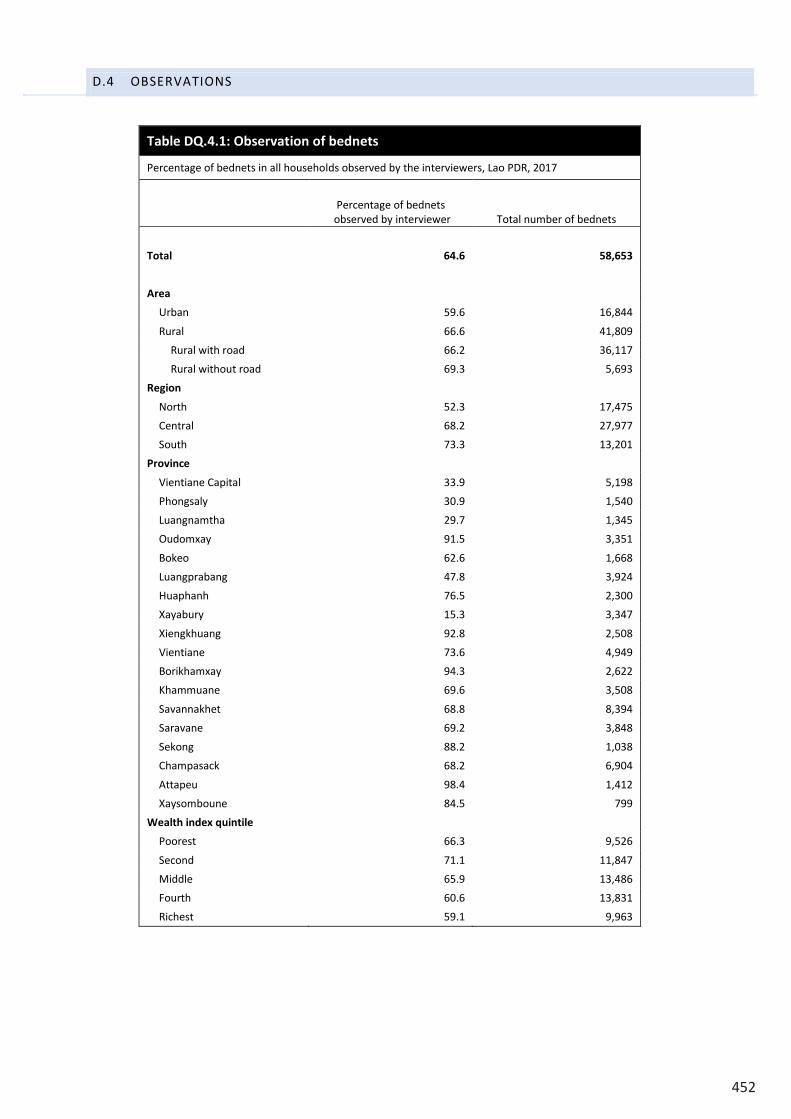
452
D.4 OBSERVATIONS
Table DQ.4.1: Observation of bednets
Percentage of bednets in all households observed by the interviewers, Lao PDR, 2017
Percentage of bednets observed by interviewer Total number of bednets
Total 64.6 58,653
Area
Urban 59.6 16,844
Rural 66.6 41,809
Rural with road 66.2 36,117
Rural without road 69.3 5,693
Region
North 52.3 17,475
Central 68.2 27,977
South 73.3 13,201
Province
Vientiane Capital 33.9 5,198
Phongsaly 30.9 1,540
Luangnamtha 29.7 1,345
Oudomxay 91.5 3,351
Bokeo 62.6 1,668
Luangprabang 47.8 3,924
Huaphanh 76.5 2,300
Xayabury 15.3 3,347
Xiengkhuang 92.8 2,508
Vientiane 73.6 4,949
Borikhamxay 94.3 2,622
Khammuane 69.6 3,508
Savannakhet 68.8 8,394
Saravane 69.2 3,848
Sekong 88.2 1,038
Champasack 68.2 6,904
Attapeu 98.4 1,412
Xaysomboune 84.5 799
Wealth index quintile
Poorest 66.3 9,526
Second 71.1 11,847
Middle 65.9 13,486
Fourth 60.6 13,831
Richest 59.1 9,963
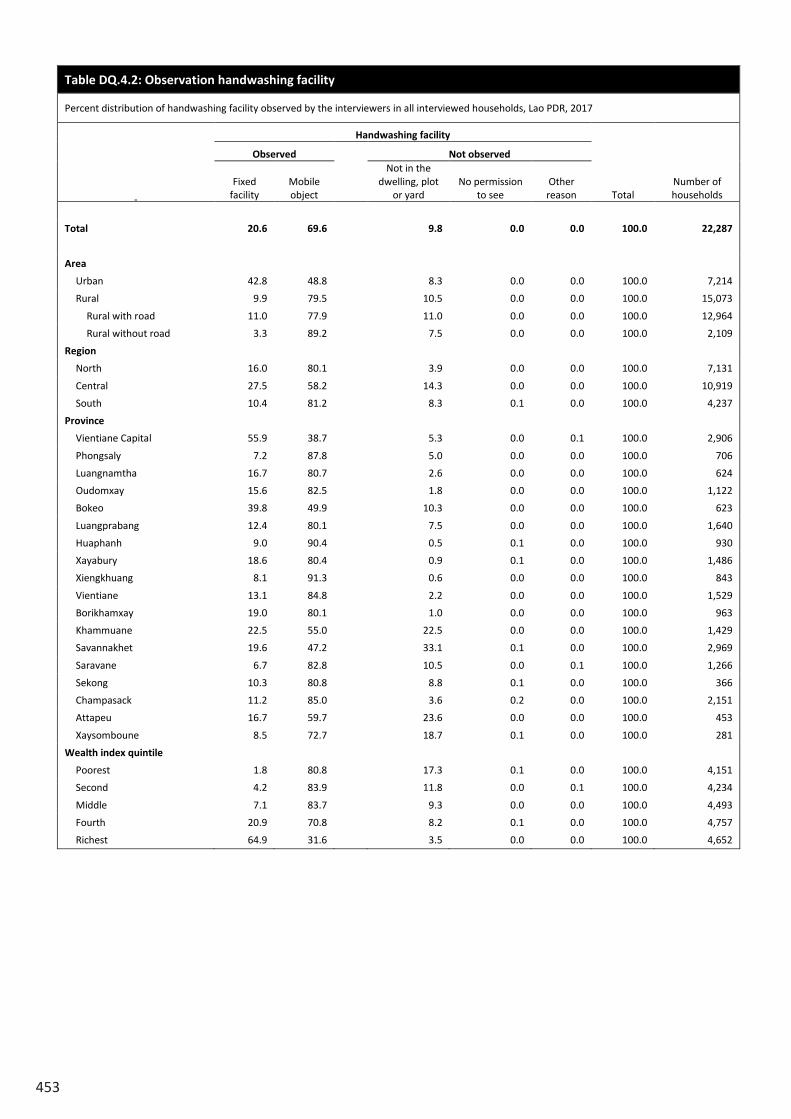
453
Table DQ.4.2: Observation handwashing facility
Percent distribution of handwashing facility observed by the interviewers in all interviewed households, Lao PDR, 2017
Handwashing facility
Total Number of households
Observed Not observed
Fixed facility
Mobile object
Not in the dwelling, plot
or yard No permission
to see Other reason
Total 20.6 69.6
9.8 0.0 0.0 100.0 22,287
Area
Urban 42.8 48.8
8.3 0.0 0.0 100.0 7,214
Rural 9.9 79.5
10.5 0.0 0.0 100.0 15,073
Rural with road 11.0 77.9
11.0 0.0 0.0 100.0 12,964
Rural without road 3.3 89.2
7.5 0.0 0.0 100.0 2,109
Region
North 16.0 80.1
3.9 0.0 0.0 100.0 7,131
Central 27.5 58.2
14.3 0.0 0.0 100.0 10,919
South 10.4 81.2
8.3 0.1 0.0 100.0 4,237
Province
Vientiane Capital 55.9 38.7
5.3 0.0 0.1 100.0 2,906
Phongsaly 7.2 87.8
5.0 0.0 0.0 100.0 706
Luangnamtha 16.7 80.7
2.6 0.0 0.0 100.0 624
Oudomxay 15.6 82.5
1.8 0.0 0.0 100.0 1,122
Bokeo 39.8 49.9
10.3 0.0 0.0 100.0 623
Luangprabang 12.4 80.1
7.5 0.0 0.0 100.0 1,640
Huaphanh 9.0 90.4
0.5 0.1 0.0 100.0 930
Xayabury 18.6 80.4
0.9 0.1 0.0 100.0 1,486
Xiengkhuang 8.1 91.3
0.6 0.0 0.0 100.0 843
Vientiane 13.1 84.8
2.2 0.0 0.0 100.0 1,529
Borikhamxay 19.0 80.1
1.0 0.0 0.0 100.0 963
Khammuane 22.5 55.0
22.5 0.0 0.0 100.0 1,429
Savannakhet 19.6 47.2
33.1 0.1 0.0 100.0 2,969
Saravane 6.7 82.8
10.5 0.0 0.1 100.0 1,266
Sekong 10.3 80.8
8.8 0.1 0.0 100.0 366
Champasack 11.2 85.0
3.6 0.2 0.0 100.0 2,151
Attapeu 16.7 59.7
23.6 0.0 0.0 100.0 453
Xaysomboune 8.5 72.7
18.7 0.1 0.0 100.0 281
Wealth index quintile
Poorest 1.8 80.8
17.3 0.1 0.0 100.0 4,151
Second 4.2 83.9
11.8 0.0 0.1 100.0 4,234
Middle 7.1 83.7
9.3 0.0 0.0 100.0 4,493
Fourth 20.9 70.8
8.2 0.1 0.0 100.0 4,757
Richest 64.9 31.6 3.5 0.0 0.0 100.0 4,652
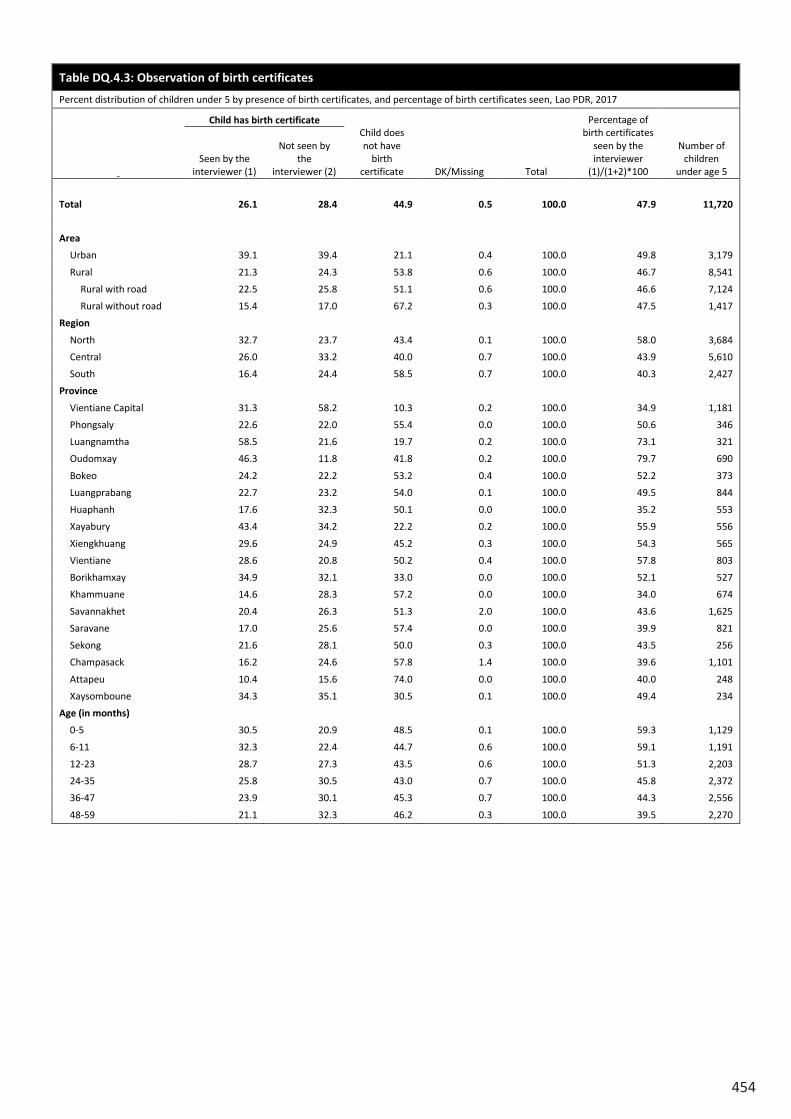
454
Table DQ.4.3: Observation of birth certificates
Percent distribution of children under 5 by presence of birth certificates, and percentage of birth certificates seen, Lao PDR, 2017
Child has birth certificate Child does not have
birth certificate DK/Missing Total
Percentage of birth certificates
seen by the interviewer
(1)/(1+2)*100
Number of children
under age 5 Seen by the
interviewer (1)
Not seen by the
interviewer (2)
Total 26.1 28.4 44.9 0.5 100.0 47.9 11,720
Area
Urban 39.1 39.4 21.1 0.4 100.0 49.8 3,179
Rural 21.3 24.3 53.8 0.6 100.0 46.7 8,541
Rural with road 22.5 25.8 51.1 0.6 100.0 46.6 7,124
Rural without road 15.4 17.0 67.2 0.3 100.0 47.5 1,417
Region
North 32.7 23.7 43.4 0.1 100.0 58.0 3,684
Central 26.0 33.2 40.0 0.7 100.0 43.9 5,610
South 16.4 24.4 58.5 0.7 100.0 40.3 2,427
Province
Vientiane Capital 31.3 58.2 10.3 0.2 100.0 34.9 1,181
Phongsaly 22.6 22.0 55.4 0.0 100.0 50.6 346
Luangnamtha 58.5 21.6 19.7 0.2 100.0 73.1 321
Oudomxay 46.3 11.8 41.8 0.2 100.0 79.7 690
Bokeo 24.2 22.2 53.2 0.4 100.0 52.2 373
Luangprabang 22.7 23.2 54.0 0.1 100.0 49.5 844
Huaphanh 17.6 32.3 50.1 0.0 100.0 35.2 553
Xayabury 43.4 34.2 22.2 0.2 100.0 55.9 556
Xiengkhuang 29.6 24.9 45.2 0.3 100.0 54.3 565
Vientiane 28.6 20.8 50.2 0.4 100.0 57.8 803
Borikhamxay 34.9 32.1 33.0 0.0 100.0 52.1 527
Khammuane 14.6 28.3 57.2 0.0 100.0 34.0 674
Savannakhet 20.4 26.3 51.3 2.0 100.0 43.6 1,625
Saravane 17.0 25.6 57.4 0.0 100.0 39.9 821
Sekong 21.6 28.1 50.0 0.3 100.0 43.5 256
Champasack 16.2 24.6 57.8 1.4 100.0 39.6 1,101
Attapeu 10.4 15.6 74.0 0.0 100.0 40.0 248
Xaysomboune 34.3 35.1 30.5 0.1 100.0 49.4 234
Age (in months)
0-5 30.5 20.9 48.5 0.1 100.0 59.3 1,129
6-11 32.3 22.4 44.7 0.6 100.0 59.1 1,191
12-23 28.7 27.3 43.5 0.6 100.0 51.3 2,203
24-35 25.8 30.5 43.0 0.7 100.0 45.8 2,372
36-47 23.9 30.1 45.3 0.7 100.0 44.3 2,556
48-59 21.1 32.3 46.2 0.3 100.0 39.5 2,270
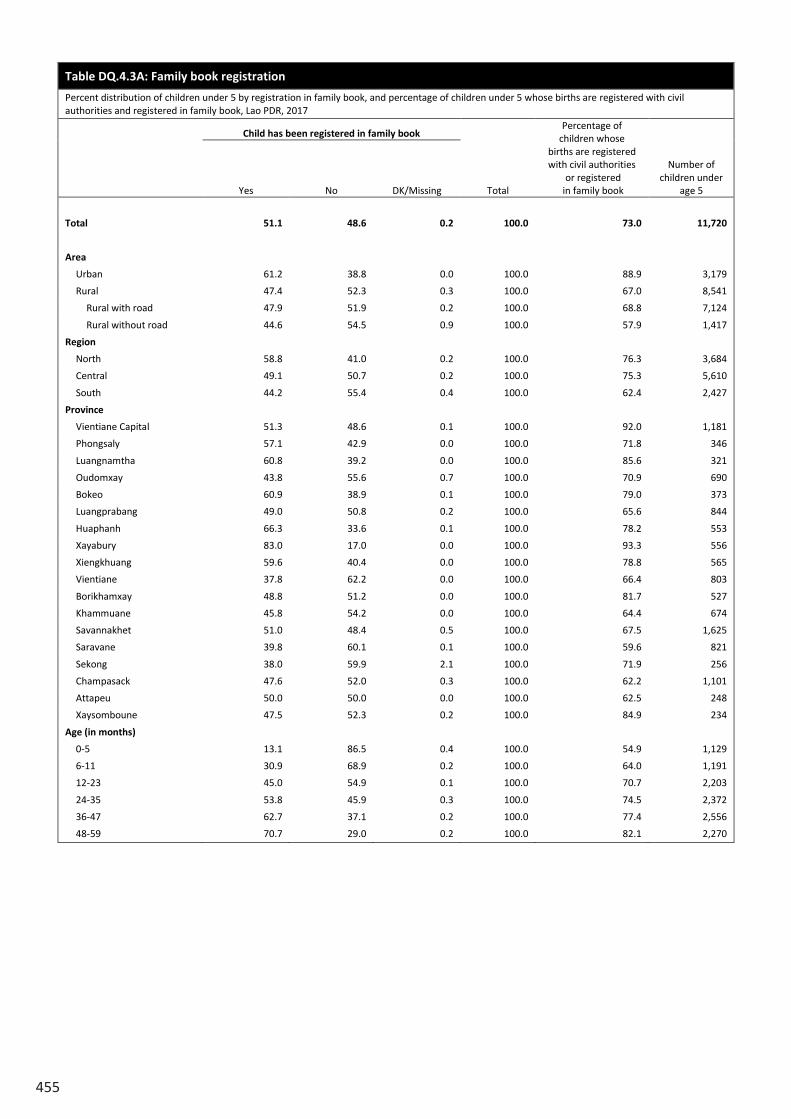
455
Table DQ.4.3A: Family book registration
Percent distribution of children under 5 by registration in family book, and percentage of children under 5 whose births are registered with civil authorities and registered in family book, Lao PDR, 2017
Child has been registered in family book
Total
Percentage of children whose
births are registered with civil authorities
or registered in family book
Number of children under
age 5 Yes No DK/Missing
Total 51.1 48.6 0.2 100.0 73.0 11,720
Area
Urban 61.2 38.8 0.0 100.0 88.9 3,179
Rural 47.4 52.3 0.3 100.0 67.0 8,541
Rural with road 47.9 51.9 0.2 100.0 68.8 7,124
Rural without road 44.6 54.5 0.9 100.0 57.9 1,417
Region
North 58.8 41.0 0.2 100.0 76.3 3,684
Central 49.1 50.7 0.2 100.0 75.3 5,610
South 44.2 55.4 0.4 100.0 62.4 2,427
Province
Vientiane Capital 51.3 48.6 0.1 100.0 92.0 1,181
Phongsaly 57.1 42.9 0.0 100.0 71.8 346
Luangnamtha 60.8 39.2 0.0 100.0 85.6 321
Oudomxay 43.8 55.6 0.7 100.0 70.9 690
Bokeo 60.9 38.9 0.1 100.0 79.0 373
Luangprabang 49.0 50.8 0.2 100.0 65.6 844
Huaphanh 66.3 33.6 0.1 100.0 78.2 553
Xayabury 83.0 17.0 0.0 100.0 93.3 556
Xiengkhuang 59.6 40.4 0.0 100.0 78.8 565
Vientiane 37.8 62.2 0.0 100.0 66.4 803
Borikhamxay 48.8 51.2 0.0 100.0 81.7 527
Khammuane 45.8 54.2 0.0 100.0 64.4 674
Savannakhet 51.0 48.4 0.5 100.0 67.5 1,625
Saravane 39.8 60.1 0.1 100.0 59.6 821
Sekong 38.0 59.9 2.1 100.0 71.9 256
Champasack 47.6 52.0 0.3 100.0 62.2 1,101
Attapeu 50.0 50.0 0.0 100.0 62.5 248
Xaysomboune 47.5 52.3 0.2 100.0 84.9 234
Age (in months)
0-5 13.1 86.5 0.4 100.0 54.9 1,129
6-11 30.9 68.9 0.2 100.0 64.0 1,191
12-23 45.0 54.9 0.1 100.0 70.7 2,203
24-35 53.8 45.9 0.3 100.0 74.5 2,372
36-47 62.7 37.1 0.2 100.0 77.4 2,556
48-59 70.7 29.0 0.2 100.0 82.1 2,270
Table DQ.4.3: Observation of birth certificates
Percent distribution of children under 5 by presence of birth certificates, and percentage of birth certificates seen, Lao PDR, 2017
Child has birth certificate Child does not have
birth certificate DK/Missing Total
Percentage of birth certificates
seen by the interviewer
(1)/(1+2)*100
Number of children
under age 5 Seen by the
interviewer (1)
Not seen by the
interviewer (2)
Total 26.1 28.4 44.9 0.5 100.0 47.9 11,720
Area
Urban 39.1 39.4 21.1 0.4 100.0 49.8 3,179
Rural 21.3 24.3 53.8 0.6 100.0 46.7 8,541
Rural with road 22.5 25.8 51.1 0.6 100.0 46.6 7,124
Rural without road 15.4 17.0 67.2 0.3 100.0 47.5 1,417
Region
North 32.7 23.7 43.4 0.1 100.0 58.0 3,684
Central 26.0 33.2 40.0 0.7 100.0 43.9 5,610
South 16.4 24.4 58.5 0.7 100.0 40.3 2,427
Province
Vientiane Capital 31.3 58.2 10.3 0.2 100.0 34.9 1,181
Phongsaly 22.6 22.0 55.4 0.0 100.0 50.6 346
Luangnamtha 58.5 21.6 19.7 0.2 100.0 73.1 321
Oudomxay 46.3 11.8 41.8 0.2 100.0 79.7 690
Bokeo 24.2 22.2 53.2 0.4 100.0 52.2 373
Luangprabang 22.7 23.2 54.0 0.1 100.0 49.5 844
Huaphanh 17.6 32.3 50.1 0.0 100.0 35.2 553
Xayabury 43.4 34.2 22.2 0.2 100.0 55.9 556
Xiengkhuang 29.6 24.9 45.2 0.3 100.0 54.3 565
Vientiane 28.6 20.8 50.2 0.4 100.0 57.8 803
Borikhamxay 34.9 32.1 33.0 0.0 100.0 52.1 527
Khammuane 14.6 28.3 57.2 0.0 100.0 34.0 674
Savannakhet 20.4 26.3 51.3 2.0 100.0 43.6 1,625
Saravane 17.0 25.6 57.4 0.0 100.0 39.9 821
Sekong 21.6 28.1 50.0 0.3 100.0 43.5 256
Champasack 16.2 24.6 57.8 1.4 100.0 39.6 1,101
Attapeu 10.4 15.6 74.0 0.0 100.0 40.0 248
Xaysomboune 34.3 35.1 30.5 0.1 100.0 49.4 234
Age (in months)
0-5 30.5 20.9 48.5 0.1 100.0 59.3 1,129
6-11 32.3 22.4 44.7 0.6 100.0 59.1 1,191
12-23 28.7 27.3 43.5 0.6 100.0 51.3 2,203
24-35 25.8 30.5 43.0 0.7 100.0 45.8 2,372
36-47 23.9 30.1 45.3 0.7 100.0 44.3 2,556
48-59 21.1 32.3 46.2 0.3 100.0 39.5 2,270
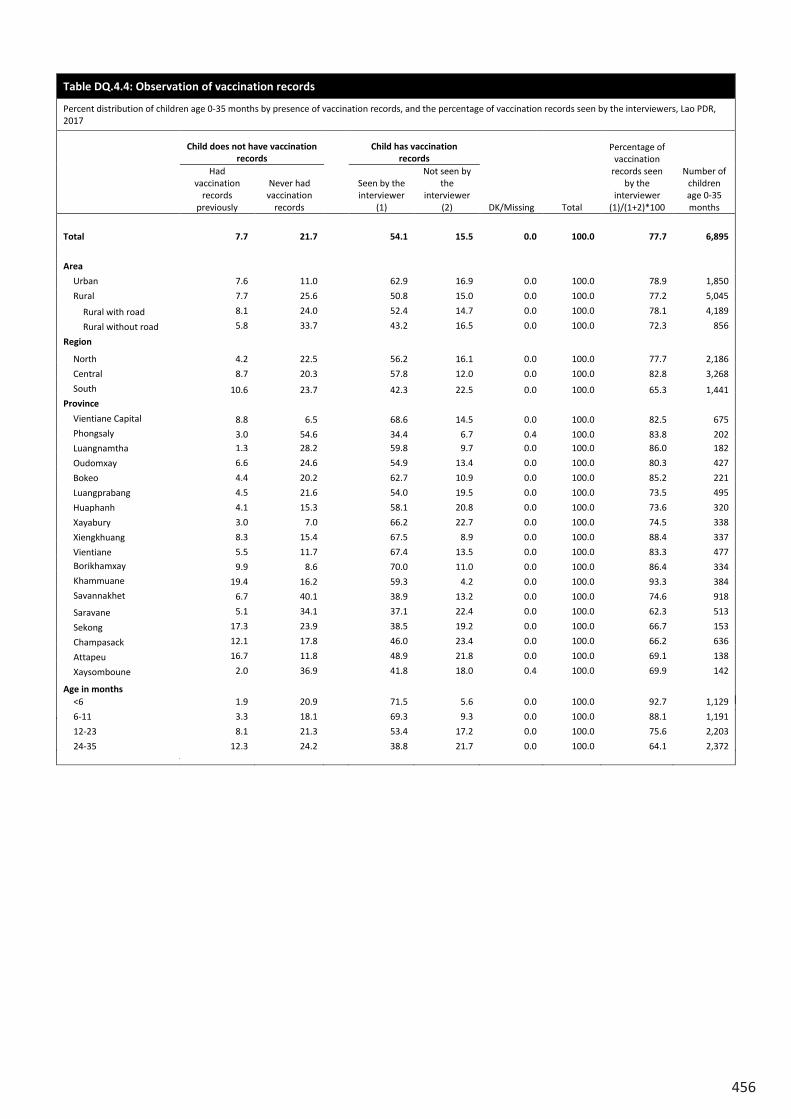
456
Table DQ.4.4: Observation of vaccination records
Percent distribution of children age 0-35 months by presence of vaccination records, and the percentage of vaccination records seen by the interviewers, Lao PDR, 2017
Child does not have vaccination records
Child has vaccination records
DK/Missing Total
Percentage of vaccination
records seen by the
interviewer (1)/(1+2)*100
Number of children age 0-35 months
Had vaccination
records previously
Never had vaccination
records
Seen by the interviewer
(1)
Not seen by the
interviewer (2)
Total 7.7 21.7 54.1 15.5 0.0 100.0 77.7 6,895
Area
7.6 11.0 62.9 16.9 0.0 100.0 78.9 1,850
7.7 25.6 50.8 15.0 0.0 100.0 77.2 5,045
8.1 24.0 52.4 14.7 0.0 100.0 78.1 4,189
Urban
Rural
5.8 33.7 43.2 16.5 0.0 100.0 72.3 856 Rural with road
Rural without road
4.2 22.5 56.2 16.1 0.0 100.0 77.7 2,186
Region
8.7 20.3 57.8 12.0 0.0 100.0 82.8 3,268
North
10.6 23.7 42.3 22.5 0.0 100.0 65.3 1,441
Central
South
8.8 6.5 68.6 14.5 0.0 100.0 82.5 675
Province
3.0 54.6 34.4 6.7 0.4 100.0 83.8 202 1.3 28.2 59.8 9.7 0.0 100.0 86.0 182
6.6 24.6 54.9 13.4 0.0 100.0 80.3 427
4.4 20.2 62.7 10.9 0.0 100.0 85.2 221
4.5 21.6 54.0 19.5 0.0 100.0 73.5 495
4.1 15.3 58.1 20.8 0.0 100.0 73.6 320
3.0 7.0 66.2 22.7 0.0 100.0 74.5 338
8.3 15.4 67.5 8.9 0.0 100.0 88.4 337
5.5 11.7 67.4 13.5 0.0 100.0 83.3 477
9.9 8.6 70.0 11.0 0.0 100.0 86.4 334
Vientiane Capital
Phongsaly
Luangnamtha
Oudomxay
Bokeo
Luangprabang
Huaphanh
Xayabury
Xiengkhuang
Vientiane
19.4 16.2 59.3 4.2 0.0 100.0 93.3 384
6.7 40.1 38.9 13.2 0.0 100.0 74.6 918
5.1 34.1 37.1 22.4 0.0 100.0 62.3 513
Borikhamxay
Khammuane
Savannakhet
17.3 23.9 38.5 19.2 0.0 100.0 66.7 153
12.1 17.8 46.0 23.4 0.0 100.0 66.2 636
16.7 11.8 48.9 21.8 0.0 100.0 69.1 138
2.0 36.9 41.8 18.0 0.4 100.0 69.9 142
1.9 20.9 71.5 5.6 0.0 100.0 92.7 1,129
3.3 18.1 69.3 9.3 0.0 100.0 88.1 1,191
8.1 21.3 53.4 17.2 0.0 100.0 75.6 2,203
Saravane
Sekong
Champasack
Attapeu
Xaysomboune
<66-11
12-23
24-35 12.3 24.2 38.8 21.7 0.0 100.0 64.1 2,372
Age in months
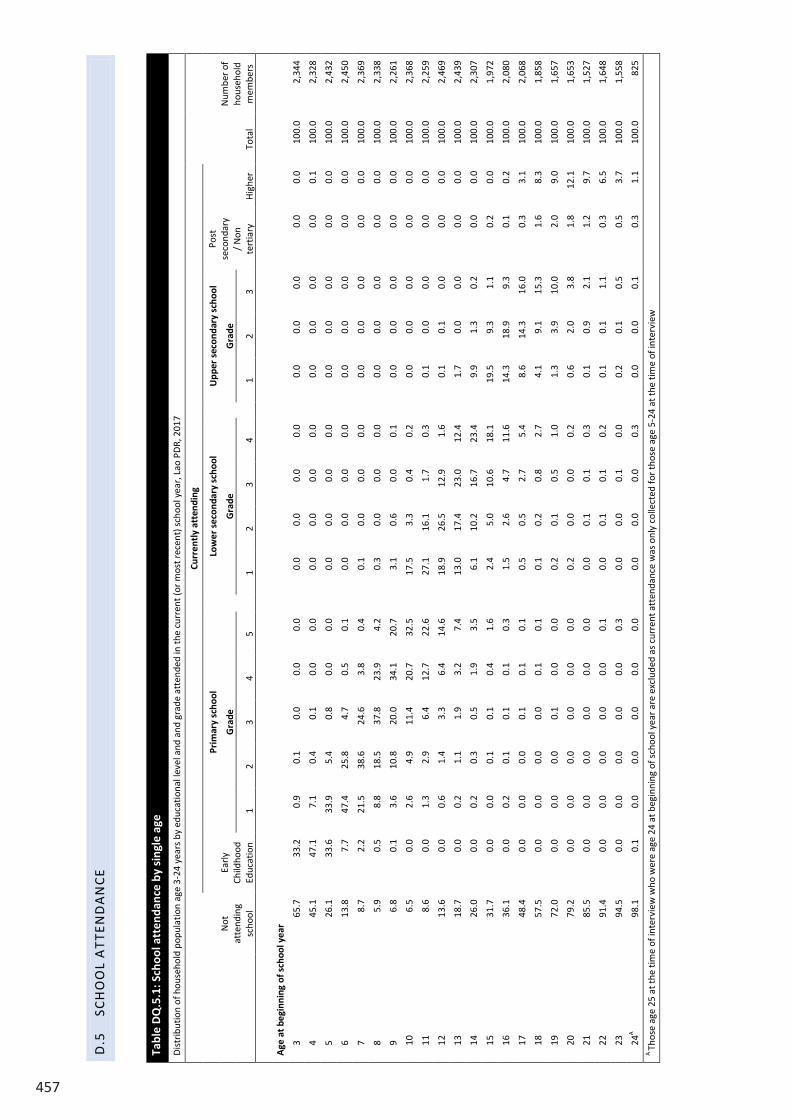
457
D.5
SC
HO
OL
ATT
END
AN
CE
Tabl
e D
Q.5
.1: S
choo
l att
enda
nce
by s
ingl
e ag
e
Dis
trib
utio
n of
hou
seho
ld p
opul
atio
n ag
e 3-
24 y
ears
by
educ
atio
nal l
evel
and
and
gra
de a
tten
ded
in th
e cu
rren
t (or
mos
t rec
ent)
sch
ool y
ear,
Lao
PD
R, 2
017
Not
at
tend
ing
scho
ol
Curr
entl
y at
tend
ing
Tota
l
Num
ber o
f ho
useh
old
mem
bers
Early
Ch
ildho
od
Educ
atio
n
Prim
ary
scho
ol
Lo
wer
sec
onda
ry s
choo
l
Upp
er s
econ
dary
sch
ool
Post
se
cond
ary
/ N
on
tert
iary
H
ighe
r
Gra
de
G
rade
Gra
de
1 2
3 4
5
1 2
3 4
1
2 3
Age
at b
egin
ning
of s
choo
l yea
r
3 65
.7
33.2
0.
9 0.
1 0.
0 0.
0 0.
0
0.0
0.0
0.0
0.0
0.
0 0.
0 0.
0 0.
0 0.
0 10
0.0
2,34
4
4 45
.1
47.1
7.
1 0.
4 0.
1 0.
0 0.
0
0.0
0.0
0.0
0.0
0.
0 0.
0 0.
0 0.
0 0.
1 10
0.0
2,32
8
5 26
.1
33.6
33
.9
5.4
0.8
0.0
0.0
0.
0 0.
0 0.
0 0.
0
0.0
0.0
0.0
0.0
0.0
100.
0 2,
432
6 13
.8
7.7
47.4
25
.8
4.7
0.5
0.1
0.
0 0.
0 0.
0 0.
0
0.0
0.0
0.0
0.0
0.0
100.
0 2,
450
7 8.
7 2.
2 21
.5
38.6
24
.6
3.8
0.4
0.
1 0.
0 0.
0 0.
0
0.0
0.0
0.0
0.0
0.0
100.
0 2,
369
8 5.
9 0.
5 8.
8 18
.5
37.8
23
.9
4.2
0.
3 0.
0 0.
0 0.
0
0.0
0.0
0.0
0.0
0.0
100.
0 2,
338
9 6.
8 0.
1 3.
6 10
.8
20.0
34
.1
20.7
3.1
0.6
0.0
0.1
0.
0 0.
0 0.
0 0.
0 0.
0 10
0.0
2,26
1
10
6.5
0.0
2.6
4.9
11.4
20
.7
32.5
17.5
3.
3 0.
4 0.
2
0.0
0.0
0.0
0.0
0.0
100.
0 2,
368
11
8.6
0.0
1.3
2.9
6.4
12.7
22
.6
27
.1
16.1
1.
7 0.
3
0.1
0.0
0.0
0.0
0.0
100.
0 2,
259
12
13.6
0.
0 0.
6 1.
4 3.
3 6.
4 14
.6
18
.9
26.5
12
.9
1.6
0.
1 0.
1 0.
0 0.
0 0.
0 10
0.0
2,46
9
13
18.7
0.
0 0.
2 1.
1 1.
9 3.
2 7.
4
13.0
17
.4
23.0
12
.4
1.
7 0.
0 0.
0 0.
0 0.
0 10
0.0
2,43
9
14
26.0
0.
0 0.
2 0.
3 0.
5 1.
9 3.
5
6.1
10.2
16
.7
23.4
9.9
1.3
0.2
0.0
0.0
100.
0 2,
307
15
31.7
0.
0 0.
0 0.
1 0.
1 0.
4 1.
6
2.4
5.0
10.6
18
.1
19
.5
9.3
1.1
0.2
0.0
100.
0 1,
972
16
36.1
0.
0 0.
2 0.
1 0.
1 0.
1 0.
3
1.5
2.6
4.7
11.6
14.3
18
.9
9.3
0.1
0.2
100.
0 2,
080
17
48.4
0.
0 0.
0 0.
0 0.
1 0.
1 0.
1
0.5
0.5
2.7
5.4
8.
6 14
.3
16.0
0.
3 3.
1 10
0.0
2,06
8
18
57.5
0.
0 0.
0 0.
0 0.
0 0.
1 0.
1
0.1
0.2
0.8
2.7
4.
1 9.
1 15
.3
1.6
8.3
100.
0 1,
858
19
72.0
0.
0 0.
0 0.
0 0.
1 0.
0 0.
0
0.2
0.1
0.5
1.0
1.
3 3.
9 10
.0
2.0
9.0
100.
0 1,
657
20
79.2
0.
0 0.
0 0.
0 0.
0 0.
0 0.
0
0.2
0.0
0.0
0.2
0.
6 2.
0 3.
8 1.
8 12
.1
100.
0 1,
653
21
85.5
0.
0 0.
0 0.
0 0.
0 0.
0 0.
0
0.0
0.1
0.1
0.3
0.
1 0.
9 2.
1 1.
2 9.
7 10
0.0
1,52
7
22
91.4
0.
0 0.
0 0.
0 0.
0 0.
0 0.
1
0.0
0.1
0.1
0.2
0.
1 0.
1 1.
1 0.
3 6.
5 10
0.0
1,64
8
23
94.5
0.
0 0.
0 0.
0 0.
0 0.
0 0.
3
0.0
0.0
0.1
0.0
0.
2 0.
1 0.
5 0.
5 3.
7 10
0.0
1,55
8
24A
98.1
0.
1 0.
0 0.
0 0.
0 0.
0 0.
0
0.0
0.0
0.0
0.3
0.
0 0.
0 0.
1 0.
3 1.
1 10
0.0
825
A Th
ose
age
25 a
t the
tim
e of
inte
rvie
w w
ho w
ere
age
24 a
t beg
inni
ng o
f sch
ool y
ear a
re e
xclu
ded
as c
urre
nt a
tten
danc
e w
as o
nly
colle
cted
for t
hose
age
5-2
4 at
the
time
of in
terv
iew
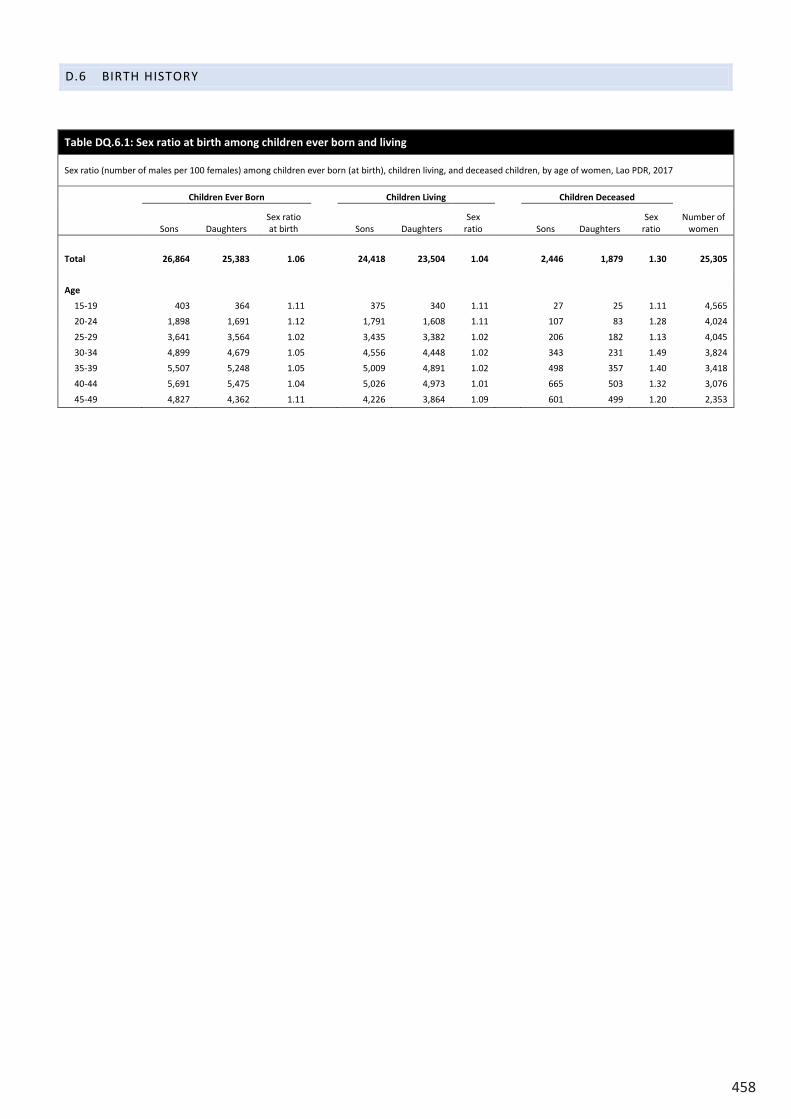
458
D.6 BIRTH HISTORY
Table DQ.6.1: Sex ratio at birth among children ever born and living
Sex ratio (number of males per 100 females) among children ever born (at birth), children living, and deceased children, by age of women, Lao PDR, 2017
Children Ever Born
Children Living
Children Deceased
Number of women Sons Daughters
Sex ratio at birth Sons Daughters
Sex ratio Sons Daughters
Sex ratio
Total 26,864 25,383 1.06
24,418 23,504 1.04
2,446 1,879 1.30 25,305
Age
15-19 403 364 1.11
375 340 1.11
27 25 1.11 4,565
20-24 1,898 1,691 1.12
1,791 1,608 1.11
107 83 1.28 4,024
25-29 3,641 3,564 1.02
3,435 3,382 1.02
206 182 1.13 4,045
30-34 4,899 4,679 1.05
4,556 4,448 1.02
343 231 1.49 3,824
35-39 5,507 5,248 1.05
5,009 4,891 1.02
498 357 1.40 3,418
40-44 5,691 5,475 1.04
5,026 4,973 1.01
665 503 1.32 3,076
45-49 4,827 4,362 1.11 4,226 3,864 1.09 601 499 1.20 2,353
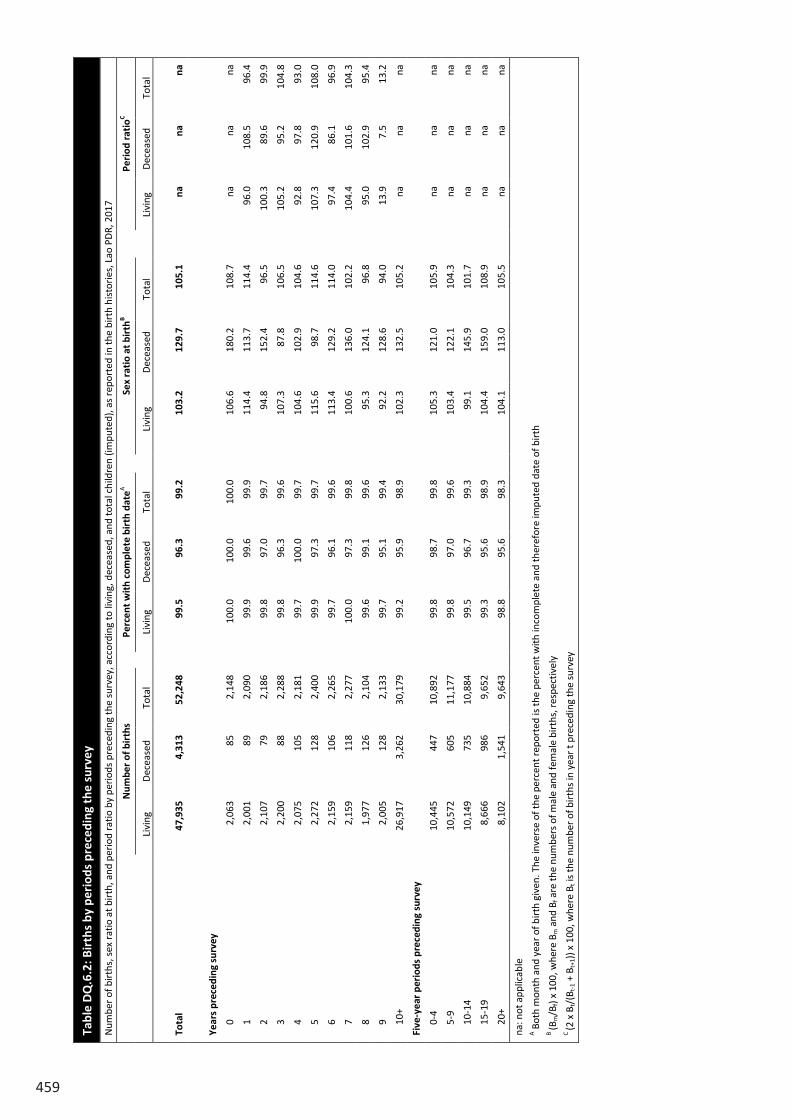
459
Tabl
e D
Q.6
.2: B
irth
s by
per
iods
pre
cedi
ng t
he s
urve
y
Num
ber o
f birt
hs, s
ex r
atio
at b
irth
, and
per
iod
ratio
by
perio
ds p
rece
ding
the
surv
ey, a
ccor
ding
to li
ving
, dec
ease
d, a
nd to
tal c
hild
ren
(impu
ted)
, as
repo
rted
in th
e bi
rth
hist
orie
s, L
ao P
DR,
201
7
N
umbe
r of
bir
ths
Pe
rcen
t wit
h co
mpl
ete
birt
h da
teA
Se
x ra
tio
at b
irth
B
Peri
od ra
tioC
Livi
ng
Dec
ease
d To
tal
Li
ving
D
ecea
sed
Tota
l
Livi
ng
Dec
ease
d To
tal
Li
ving
D
ecea
sed
Tota
l
Tota
l 47
,935
4,
313
52,2
48
99
.5
96.3
99
.2
10
3.2
129.
7 10
5.1
na
na
na
Year
s pr
eced
ing
surv
ey
0 2,
063
85
2,14
8
100.
0 10
0.0
100.
0
106.
6 18
0.2
108.
7
na
na
na
1 2,
001
89
2,09
0
99.9
99
.6
99.9
114.
4 11
3.7
114.
4
96.0
10
8.5
96.4
2 2,
107
79
2,18
6
99.8
97
.0
99.7
94.8
15
2.4
96.5
100.
3 89
.6
99.9
3 2,
200
88
2,28
8
99.8
96
.3
99.6
107.
3 87
.8
106.
5
105.
2 95
.2
104.
8
4 2,
075
105
2,18
1
99.7
10
0.0
99.7
104.
6 10
2.9
104.
6
92.8
97
.8
93.0
5 2,
272
128
2,40
0
99.9
97
.3
99.7
115.
6 98
.7
114.
6
107.
3 12
0.9
108.
0
6 2,
159
106
2,26
5
99.7
96
.1
99.6
113.
4 12
9.2
114.
0
97.4
86
.1
96.9
7 2,
159
118
2,27
7
100.
0 97
.3
99.8
100.
6 13
6.0
102.
2
104.
4 10
1.6
104.
3
8 1,
977
126
2,10
4
99.6
99
.1
99.6
95.3
12
4.1
96.8
95.0
10
2.9
95.4
9 2,
005
128
2,13
3
99.7
95
.1
99.4
92.2
12
8.6
94.0
13.9
7.
5 13
.2
10+
26,9
17
3,26
2 30
,179
99.2
95
.9
98.9
102.
3 13
2.5
105.
2
na
na
na
Five
-yea
r pe
riod
s pr
eced
ing
surv
ey
0-4
10,4
45
447
10,8
92
99
.8
98.7
99
.8
10
5.3
121.
0 10
5.9
na
na
na
5-9
10,5
72
605
11,1
77
99
.8
97.0
99
.6
10
3.4
122.
1 10
4.3
na
na
na
10-1
4 10
,149
73
5 10
,884
99.5
96
.7
99.3
99.1
14
5.9
101.
7
na
na
na
15-1
9 8,
666
986
9,65
2
99.3
95
.6
98.9
104.
4 15
9.0
108.
9
na
na
na
20+
8,10
2 1,
541
9,64
3
98.8
95
.6
98.3
104.
1 11
3.0
105.
5
na
na
na
na: n
ot a
pplic
able
A B
oth
mon
th a
nd y
ear o
f birt
h gi
ven.
The
inve
rse
of th
e pe
rcen
t rep
orte
d is
the
perc
ent w
ith in
com
plet
e an
d th
eref
ore
impu
ted
date
of b
irth
B
(Bm
/Bf)
x 10
0, w
here
Bm
and
Bf a
re th
e nu
mbe
rs o
f mal
e an
d fe
mal
e bi
rths
, res
pect
ivel
y C
(2 x
Bt/
(Bt-
1 + B
t+1)
) x 1
00, w
here
Bt i
s th
e nu
mbe
r of b
irth
s in
yea
r t p
rece
ding
the
surv
ey
D.6 BIRTH HISTORY
Table DQ.6.1: Sex ratio at birth among children ever born and living
Sex ratio (number of males per 100 females) among children ever born (at birth), children living, and deceased children, by age of women, Lao PDR, 2017
Children Ever Born
Children Living
Children Deceased
Number of women Sons Daughters
Sex ratio at birth Sons Daughters
Sex ratio Sons Daughters
Sex ratio
Total 26,864 25,383 1.06
24,418 23,504 1.04
2,446 1,879 1.30 25,305
Age
15-19 403 364 1.11
375 340 1.11
27 25 1.11 4,565
20-24 1,898 1,691 1.12
1,791 1,608 1.11
107 83 1.28 4,024
25-29 3,641 3,564 1.02
3,435 3,382 1.02
206 182 1.13 4,045
30-34 4,899 4,679 1.05
4,556 4,448 1.02
343 231 1.49 3,824
35-39 5,507 5,248 1.05
5,009 4,891 1.02
498 357 1.40 3,418
40-44 5,691 5,475 1.04
5,026 4,973 1.01
665 503 1.32 3,076
45-49 4,827 4,362 1.11 4,226 3,864 1.09 601 499 1.20 2,353
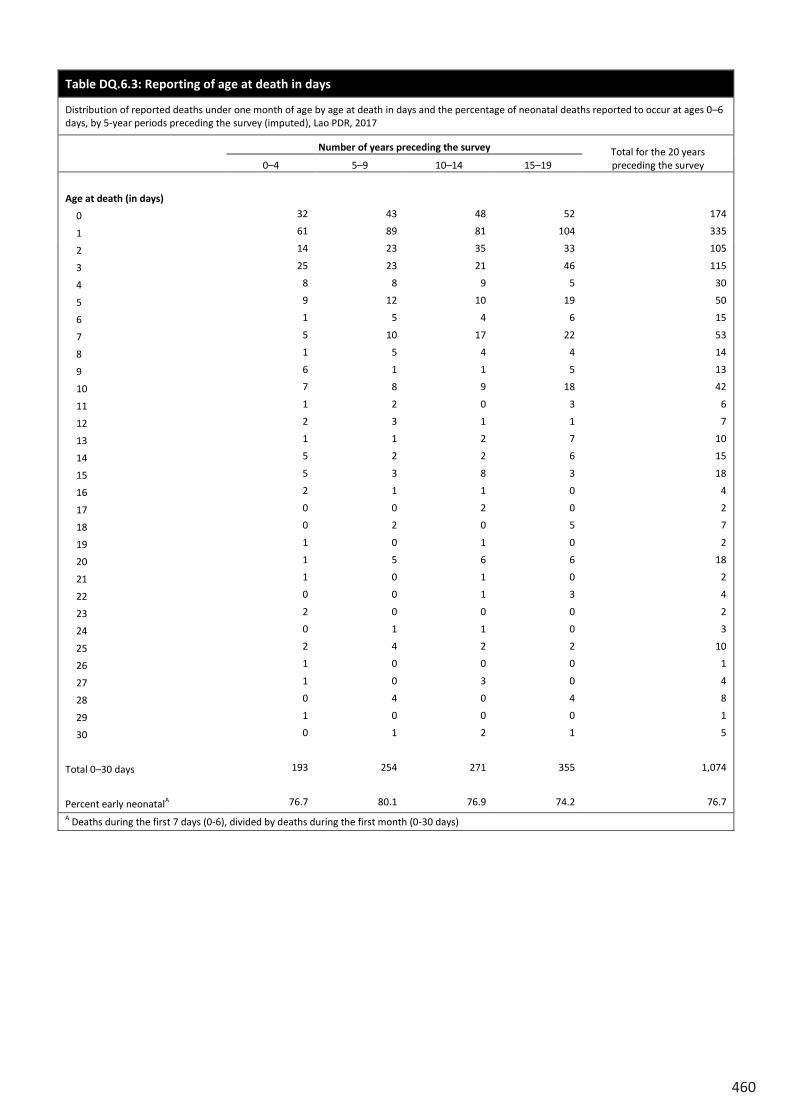
460
Table DQ.6.3: Reporting of age at death in days
Distribution of reported deaths under one month of age by age at death in days and the percentage of neonatal deaths reported to occur at ages 0–6 days, by 5-year periods preceding the survey (imputed), Lao PDR, 2017
Number of years preceding the survey Total for the 20 years
preceding the survey 0–4 5–9 10–14 15–19
Age at death (in days)
0 32 43 48 52 174
1 61 89 81 104 335
2 14 23 35 33 105
3 25 23 21 46 115
4 8 8 9 5 30
5 9 12 10 19 50
6 1 5 4 6 15
7 5 10 17 22 53
8 1 5 4 4 14
9 6 1 1 5 13
10 7 8 9 18 42
11 1 2 0 3 6
12 2 3 1 1 7
13 1 1 2 7 10
14 5 2 2 6 15
15 5 3 8 3 18
16 2 1 1 0 4
17 0 0 2 0 2
18 0 2 0 5 7
19 1 0 1 0 2
20 1 5 6 6 18
21 1 0 1 0 2
22 0 0 1 3 4
23 2 0 0 0 2
24 0 1 1 0 3
25 2 4 2 2 10
26 1 0 0 0 1
27 1 0 3 0 4
28 0 4 0 4 8
29 1 0 0 0 1
30 0 1 2 1 5
Total 0–30 days 193 254 271 355 1,074
Percent early neonatalA 76.7 80.1 76.9 74.2 76.7 A Deaths during the first 7 days (0-6), divided by deaths during the first month (0-30 days)
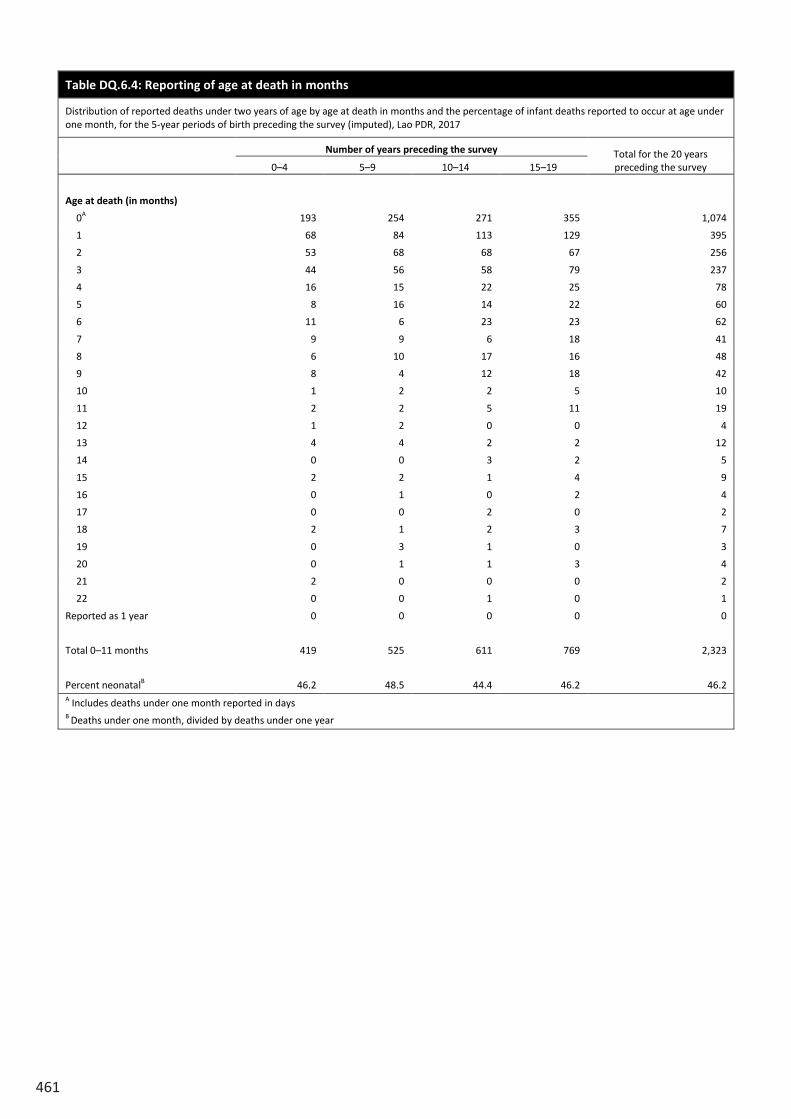
461
Table DQ.6.4: Reporting of age at death in months
Distribution of reported deaths under two years of age by age at death in months and the percentage of infant deaths reported to occur at age under one month, for the 5-year periods of birth preceding the survey (imputed), Lao PDR, 2017
Number of years preceding the survey Total for the 20 years
preceding the survey 0–4 5–9 10–14 15–19
Age at death (in months)
0A 193 254 271 355 1,074
1 68 84 113 129 395
2 53 68 68 67 256
3 44 56 58 79 237
4 16 15 22 25 78
5 8 16 14 22 60
6 11 6 23 23 62
7 9 9 6 18 41
8 6 10 17 16 48
9 8 4 12 18 42
10 1 2 2 5 10
11 2 2 5 11 19
12 1 2 0 0 4
13 4 4 2 2 12
14 0 0 3 2 5
15 2 2 1 4 9
16 0 1 0 2 4
17 0 0 2 0 2
18 2 1 2 3 7
19 0 3 1 0 3
20 0 1 1 3 4
21 2 0 0 0 2
22 0 0 1 0 1
Reported as 1 year 0 0 0 0 0
Total 0–11 months 419 525 611 769 2,323
Percent neonatalB 46.2 48.5 44.4 46.2 46.2 A Includes deaths under one month reported in days B Deaths under one month, divided by deaths under one year
Table DQ.6.3: Reporting of age at death in days
Distribution of reported deaths under one month of age by age at death in days and the percentage of neonatal deaths reported to occur at ages 0–6 days, by 5-year periods preceding the survey (imputed), Lao PDR, 2017
Number of years preceding the survey Total for the 20 years
preceding the survey 0–4 5–9 10–14 15–19
Age at death (in days)
0 32 43 48 52 174
1 61 89 81 104 335
2 14 23 35 33 105
3 25 23 21 46 115
4 8 8 9 5 30
5 9 12 10 19 50
6 1 5 4 6 15
7 5 10 17 22 53
8 1 5 4 4 14
9 6 1 1 5 13
10 7 8 9 18 42
11 1 2 0 3 6
12 2 3 1 1 7
13 1 1 2 7 10
14 5 2 2 6 15
15 5 3 8 3 18
16 2 1 1 0 4
17 0 0 2 0 2
18 0 2 0 5 7
19 1 0 1 0 2
20 1 5 6 6 18
21 1 0 1 0 2
22 0 0 1 3 4
23 2 0 0 0 2
24 0 1 1 0 3
25 2 4 2 2 10
26 1 0 0 0 1
27 1 0 3 0 4
28 0 4 0 4 8
29 1 0 0 0 1
30 0 1 2 1 5
Total 0–30 days 193 254 271 355 1,074
Percent early neonatalA 76.7 80.1 76.9 74.2 76.7 A Deaths during the first 7 days (0-6), divided by deaths during the first month (0-30 days)

462
463
LSIS II.HH.1
APPENDIX E. LAO SOCIAL INDICATOR SURVEY QUESTIONNAIRES
The questionnaires of the LSIS II are presented in Appendix E:
- Household questionnaire - Water Quality Testing Questionnaire - Questionnaire for Individual Women - Questionnaire for Individual Men - Questionnaire for Children Under Five - Questionnaire for Children Age 5-17
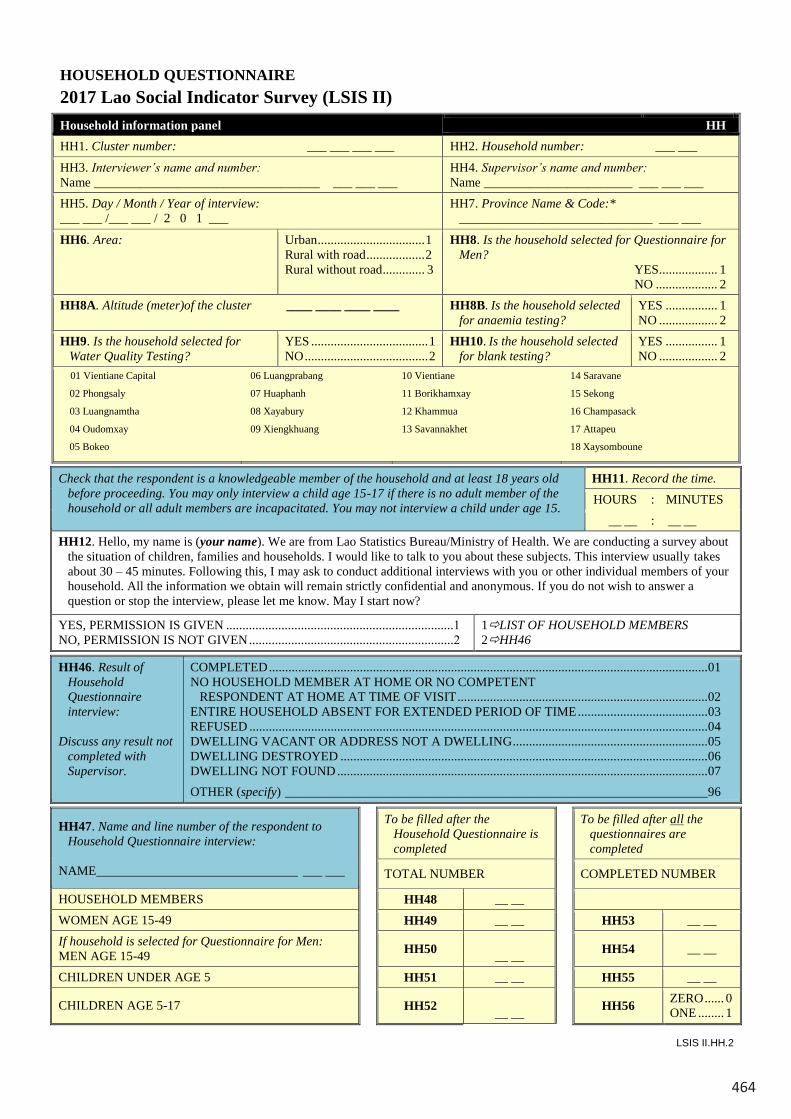
464
LSIS II.HH.2
HOUSEHOLD QUESTIONNAIRE 2017 Lao Social Indicator Survey (LSIS II)Household information panel HHHH1. Cluster number: ___ ___ ___ ___ HH2. Household number: ___ ___
HH3. Interviewer’s name and number:Name ___________________________________ ___ ___ ___
HH4. Supervisor’s name and number:Name _______________________ ___ ___ ___
HH5. Day / Month / Year of interview:___ ___ /___ ___ / 2 0 1 ___
HH7. Province Name & Code:*______________________________ ___ ___
HH6. Area: Urban.................................1Rural with road..................2Rural without road............. 3
HH8. Is the household selected for Questionnaire for Men?
YES.................. 1NO ................... 2
HH8A. Altitude (meter)of the cluster ____ ____ ____ ____ HH8B. Is the household selected for anaemia testing?
YES ................ 1NO .................. 2
HH9. Is the household selected for Water Quality Testing?
YES ....................................1NO......................................2
HH10. Is the household selected for blank testing?
YES ................ 1NO .................. 2
01 Vientiane Capital
02 Phongsaly
03 Luangnamtha
04 Oudomxay
05 Bokeo
06 Luangprabang
07 Huaphanh
08 Xayabury
09 Xiengkhuang
10 Vientiane
11 Borikhamxay
12 Khammua
13 Savannakhet
14 Saravane
15 Sekong
16 Champasack
17 Attapeu
18 Xaysomboune
Check that the respondent is a knowledgeable member of the household and at least 18 years old before proceeding. You may only interview a child age 15-17 if there is no adult member of the household or all adult members are incapacitated. You may not interview a child under age 15.
HH11. Record the time.HOURS : MINUTES
__ __ : __ __HH12. Hello, my name is (your name). We are from Lao Statistics Bureau/Ministry of Health. We are conducting a survey about
the situation of children, families and households. I would like to talk to you about these subjects. This interview usually takes about 30 – 45 minutes. Following this, I may ask to conduct additional interviews with you or other individual members of your household. All the information we obtain will remain strictly confidential and anonymous. If you do not wish to answer a question or stop the interview, please let me know. May I start now?
YES, PERMISSION IS GIVEN ......................................................................1NO, PERMISSION IS NOT GIVEN...............................................................2
1LIST OF HOUSEHOLD MEMBERS2HH46
HH46. Result of Household Questionnaire interview:
Discuss any result not completed with Supervisor.
COMPLETED.......................................................................................................................................01NO HOUSEHOLD MEMBER AT HOME OR NO COMPETENT
RESPONDENT AT HOME AT TIME OF VISIT.............................................................................02ENTIRE HOUSEHOLD ABSENT FOR EXTENDED PERIOD OF TIME........................................03REFUSED .............................................................................................................................................04DWELLING VACANT OR ADDRESS NOT A DWELLING............................................................05DWELLING DESTROYED .................................................................................................................06DWELLING NOT FOUND..................................................................................................................07OTHER (specify) _________________________________________________________________96
HH47. Name and line number of the respondent to Household Questionnaire interview:
NAME_______________________________ ___ ___
To be filled after the Household Questionnaire is completed
To be filled after all the questionnaires are completed
TOTAL NUMBER COMPLETED NUMBER
HOUSEHOLD MEMBERS HH48 __ __WOMEN AGE 15-49 HH49 __ __ HH53 __ __If household is selected for Questionnaire for Men:MEN AGE 15-49 HH50 __ __ HH54 __ __
CHILDREN UNDER AGE 5 HH51 __ __ HH55 __ __
CHILDREN AGE 5-17 HH52 __ __ HH56 ZERO...... 0ONE ........ 1
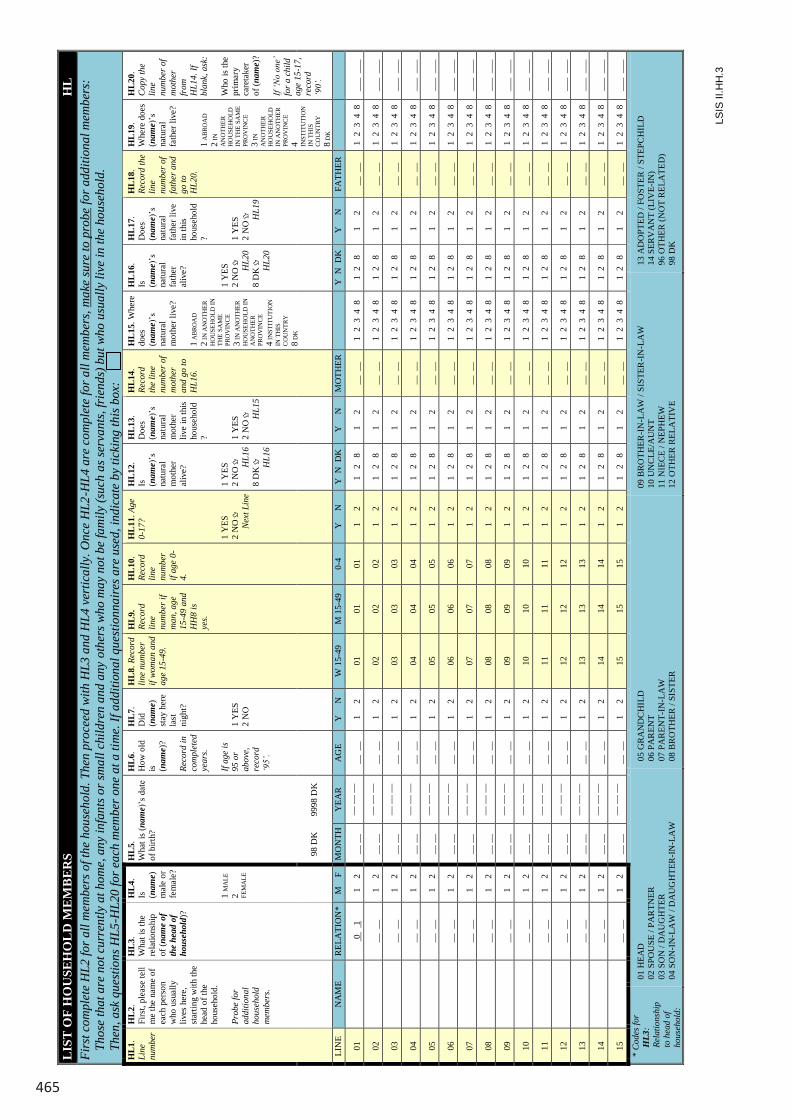
465
LSIS
II.H
H.3
LIS
T O
F H
OU
SEH
OL
D M
EM
BE
RS
HL
Firs
t com
plet
e H
L2 fo
r all
mem
bers
of t
he h
ouse
hold
. The
n pr
ocee
d w
ith H
L3 a
nd H
L4 v
ertic
ally
. Onc
e H
L2-H
L4 a
re c
ompl
ete
for a
ll m
embe
rs, m
ake
sure
to p
robe
for a
dditi
onal
mem
bers
: Th
ose
that
are
not
cur
rent
ly a
t hom
e, a
ny in
fant
s or s
mal
l chi
ldre
n an
d an
y ot
hers
who
may
not
be
fam
ily (s
uch
as se
rvan
ts, f
rien
ds) b
ut w
ho u
sual
ly li
ve in
the
hous
ehol
d.
Then
, ask
que
stio
ns H
L5-H
L20
for e
ach
mem
ber o
ne a
t a ti
me.
If a
dditi
onal
que
stio
nnai
res a
re u
sed,
indi
cate
by
ticki
ng th
is b
ox:
HL
1.Li
nenu
mbe
r
HL
2.Fi
rst,
plea
se te
ll m
e th
e na
me
of
each
per
son
who
usu
ally
liv
es h
ere,
st
artin
g w
ith th
e he
ad o
f the
ho
useh
old.
Prob
e fo
r ad
ditio
nal
hous
ehol
d m
embe
rs.
HL
3.W
hat i
s the
re
latio
nshi
p of
(nam
e of
th
e he
ad o
f ho
useh
old)
?
HL
4.Is
(n
ame)
mal
e or
fe
mal
e?
1M
ALE
2 FEM
ALE
HL
5.W
hat i
s (na
me)
’s d
ate
of b
irth?
HL
6.H
ow o
ld
is (nam
e)?
Reco
rd in
co
mpl
eted
ye
ars.
If ag
e is
95
or
abov
e,
reco
rd
‘95’
.
HL
7.D
id( n
ame)
stay
her
e la
st
nigh
t?
1Y
ES2
NO
HL
8.Re
cord
lin
e nu
mbe
r if
wom
an a
nd
age
15-4
9.
HL
9.Re
cord
lin
e nu
mbe
r if
man
, age
15
-49
and
HH
8 is
ye
s.
HL
10.
Reco
rd
line
num
ber
if ag
e 0-
4.
HL
11.A
ge
0-17
?
1Y
ES2
NO
Nex
t Lin
e
HL
12.
Is
(nam
e)’s
na
tura
l m
othe
r al
ive?
1Y
ES2
NO H
L16
8 D
K H
L16
HL
13.
Doe
s (n
ame)
’s
natu
ral
mot
her
live
in th
is ho
useh
old
? 1Y
ES2
NO H
L15
HL
14.
Reco
rd
the
line
num
ber o
f m
othe
r an
d go
to
HL1
6.
HL
15. W
here
do
es
(nam
e)’s
na
tura
l m
othe
r liv
e?
1A
BRO
AD
2IN
AN
OTH
ER
HO
USE
HO
LD IN
TH
E SA
ME
PRO
VIN
CE
3IN
AN
OTH
ER
HO
USE
HO
LD IN
A
NO
THER
PR
OV
INC
E4
INST
ITU
TIO
N
IN T
HIS
C
OU
NTR
Y8
DK
HL
16.
Is
(nam
e)’s
na
tura
l fa
ther
al
ive?
1Y
ES2
NO HL2
08
DK HL2
0
HL
17.
Doe
s (n
ame)
’s
natu
ral
fath
er li
ve
in th
is ho
useh
old
? 1Y
ES2
NO H
L19
HL
18.
Reco
rd th
e lin
e nu
mbe
r of
fath
er a
nd
go to
H
L20.
HL
19.
Whe
re d
oes
(nam
e)’s
na
tura
l fa
ther
live
?
1A
BRO
AD
2IN
A
NO
THER
H
OU
SEH
OLD
IN
TH
E SA
ME
PRO
VIN
CE
3IN
A
NO
THER
H
OU
SEH
OLD
IN
AN
OTH
ER
PRO
VIN
CE
4 INST
ITU
TIO
N
IN T
HIS
C
OU
NTR
Y8
DK
HL
20.
Cop
y th
e lin
e nu
mbe
r of
mot
her
from
H
L14.
If
blan
k, a
sk:
Who
is th
e pr
imar
y ca
reta
ker
of (n
ame)
?
If ‘N
o on
e’
for a
chi
ld
age
15-1
7,
reco
rd
‘90’
.98
DK
9998
DK
LIN
EN
AM
ER
ELA
TIO
N*
M
FM
ON
THY
EAR
AG
EY
N
W 1
5-49
M 1
5-49
0-4
Y
NY
N D
KY
N
MO
THER
Y N
DK
Y
NFA
THER
010
11
2
__ _
___
__
__
____
__
1
201
0101
1
21
2
81
2
__ _
_1
2 3
4 8
1 2
8
1
2__
__
1 2
3 4
8__
_ _
__
02__
__
1
2__
__
__ _
_ __
__
__ _
_1
2
0202
021
2
1 2
8
1
2__
__
1 2
3 4
81
2
81
2
__ _
_1
2 3
4 8
___
___
03__
__
1
2__
__
__ _
_ __
__
__ _
_1
2
0303
031
2
1 2
8
1
2__
__
1 2
3 4
81
2
81
2
__ _
_1
2 3
4 8
___
___
04__
__
1
2__
__
__ _
_ __
__
__ _
_1
2
0404
041
2
1 2
8
1
2__
__
1 2
3 4
81
2
81
2
__ _
_1
2 3
4 8
___
___
05__
__
1
2__
__
__ _
_ __
__
__ _
_1
2
0505
051
2
1 2
8
1
2__
__
1 2
3 4
81
2
81
2
__ _
_1
2 3
4 8
___
___
06__
__
1
2__
__
__ _
_ __
__
__ _
_1
2
0606
061
2
1 2
8
1
2__
__
1 2
3 4
81
2
81
2
__ _
_1
2 3
4 8
___
___
07__
__
1
2__
__
__ _
_ __
__
__ _
_1
2
0707
071
2
1 2
8
1
2__
__
1 2
3 4
81
2
81
2
__ _
_1
2 3
4 8
___
___
08__
__
1
2__
__
__ _
_ __
__
__ _
_1
2
0808
081
2
1 2
8
1
2__
__
1 2
3 4
81
2
81
2
__ _
_1
2 3
4 8
___
___
09__
__
1
2__
__
__ _
_ __
__
__ _
_1
2
0909
091
2
1 2
8
1
2__
__
1 2
3 4
81
2
81
2
__ _
_1
2 3
4 8
___
___
10__
__
1
2__
__
__ _
_ __
__
__ _
_1
2
1010
101
2
1 2
8
1
2__
__
1 2
3 4
81
2
81
2
__ _
_1
2 3
4 8
___
___
11__
__
1
2__
__
__ _
_ __
__
__ _
_1
2
1111
111
2
1 2
8
1
2__
__
1 2
3 4
81
2
81
2
__ _
_1
2 3
4 8
___
___
12__
__
1
2__
__
__ _
_ __
__
__ _
_1
2
1212
121
2
1 2
8
1
2__
__
1 2
3 4
81
2
81
2
__ _
_1
2 3
4 8
___
___
13__
__
1
2__
__
__ _
_ __
__
__ _
_1
2
1313
131
2
1 2
8
1
2__
__
1 2
3 4
81
2
81
2
__ _
_1
2 3
4 8
___
___
14__
__
1
2__
__
__ _
_ __
__
__ _
_1
2
1414
141
2
1 2
8
1
2__
__
1 2
3 4
81
2
81
2
__ _
_1
2 3
4 8
___
___
15__
__
1
2__
__
__ _
_ __
__
__ _
_1
2
1515
151
2
1 2
8
1
2__
__
1 2
3 4
81
2
81
2
__ _
_1
2 3
4 8
___
___
*C
odes
for
HL3
:Re
latio
nshi
p to
hea
d of
ho
useh
old:
01 H
EAD
02 S
POU
SE /
PAR
TNER
03
SO
N /
DA
UG
HTE
R04
SO
N-I
N-L
AW
/ D
AU
GH
TER
-IN
-LA
W
05 G
RA
ND
CH
ILD
06 P
AR
ENT
07 P
AR
ENT-
IN-L
AW
08 B
RO
THER
/ SI
STER
09 B
RO
THER
-IN-L
AW
/ SI
STER
-IN-L
AW
10 U
NC
LE/A
UN
T 11
NIE
CE
/ NEP
HEW
12 O
THER
REL
ATI
VE
13 A
DO
PTED
/ FO
STER
/ ST
EPC
HIL
D
14 S
ERV
AN
T (L
IVE-
IN)
96 O
THER
(NO
T R
ELA
TED
)98
DK
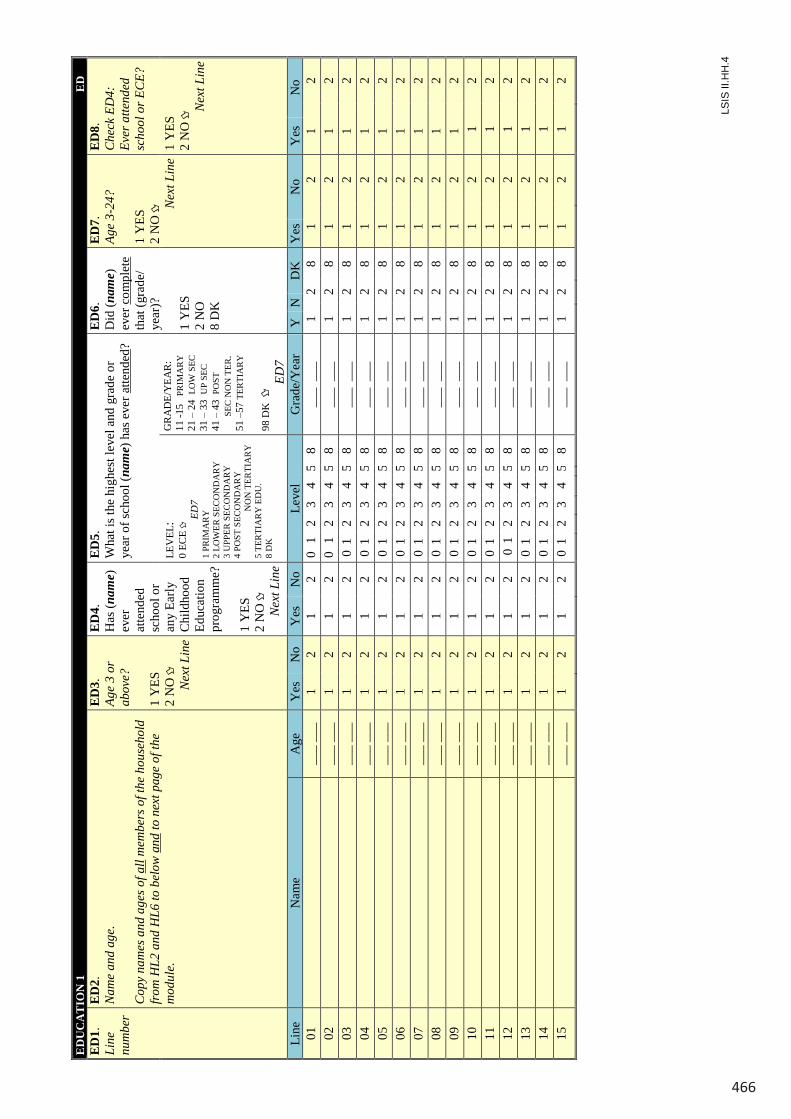
466
LSIS
II.H
H.4
ED
UC
AT
ION
1
ED
E
D1.
Li
ne
num
ber
ED
2.
Nam
e an
d ag
e.
Cop
y na
mes
and
age
s of a
ll m
embe
rs o
f the
hou
seho
ld
from
HL2
and
HL6
to b
elow
and
to n
ext p
age
of th
e m
odul
e.
ED
3.
Age
3 or
ab
ove?
1
YES
2
NO
N
ext L
ine
ED
4.
Has
(nam
e)
ever
at
tend
ed
scho
ol o
r an
y Ea
rly
Chi
ldho
od
Educ
atio
n pr
ogra
mm
e?
1 Y
ES
2 N
O
N
ext L
ine
ED
5.
Wha
t is t
he h
ighe
st le
vel a
nd g
rade
or
year
of s
choo
l (na
me)
has
eve
r atte
nded
?
ED
6.
Did
(nam
e)
ever
com
plet
e th
at (g
rade
/ ye
ar)?
1
YES
2
NO
8
DK
ED
7.
Age
3-24
? 1
YES
2
NO
Nex
t Lin
e
ED
8.
Che
ck E
D4:
Ev
er a
ttend
ed
scho
ol o
r EC
E?
1 Y
ES
2 N
O
Nex
t Lin
e
LEV
EL:
0 EC
E
ED
7 1
PRIM
AR
Y
2 LO
WER
SEC
ON
DA
RY
3
UPP
ER S
ECO
ND
AR
Y
4 PO
ST S
ECO
ND
AR
Y
N
ON
TER
TIA
RY
5
TER
TIA
RY
ED
U.
8
DK
GR
AD
E/Y
EAR
: 11
-15
PR
IMA
RY
21
– 2
4 L
OW
SEC
31
– 3
3 U
P SE
C
41 –
43
PO
ST
SE
C N
ON
TER
. 51
–57
TER
TIA
RY
98
DK
ED
7 Li
ne
Nam
e A
ge
Yes
N
o Y
es
No
Leve
l G
rade
/Yea
r Y
N
D
K
Yes
N
o Y
es
No
01
__
_ __
_ 1
2 1
2 0
1
2 3
4 5
8 __
_ _
__
1 2
8 1
2 1
2 02
___
___
1 2
1 2
0 1
2
3 4
5 8
___
___
1
2 8
1 2
1 2
03
__
_ __
_ 1
2 1
2 0
1
2 3
4 5
8 __
_ _
__
1 2
8 1
2 1
2 04
___
___
1 2
1 2
0 1
2
3 4
5 8
___
___
1
2 8
1 2
1 2
05
__
_ __
_ 1
2 1
2 0
1
2 3
4 5
8 __
_ _
__
1 2
8 1
2 1
2 06
___
___
1 2
1 2
0 1
2
3 4
5 8
___
___
1
2 8
1 2
1 2
07
__
_ __
_ 1
2 1
2 0
1
2 3
4 5
8 __
_ _
__
1 2
8 1
2 1
2 08
___
___
1 2
1 2
0 1
2
3 4
5 8
___
___
1
2 8
1 2
1 2
09
__
_ __
_ 1
2 1
2 0
1
2 3
4 5
8 __
_ _
__
1 2
8 1
2 1
2 10
___
___
1 2
1 2
0 1
2
3 4
5 8
___
___
1
2 8
1 2
1 2
11
__
_ __
_ 1
2 1
2 0
1
2 3
4 5
8 __
_ _
__
1 2
8 1
2 1
2 12
___
___
1 2
1 2
0 1
2
3 4
5 8
___
___
1
2 8
1 2
1 2
13
__
_ __
_ 1
2 1
2 0
1
2 3
4 5
8 __
_ _
__
1 2
8 1
2 1
2 14
___
___
1 2
1 2
0 1
2
3 4
5 8
___
___
1
2 8
1 2
1 2
15
__
_ __
_ 1
2 1
2 0
1
2 3
4 5
8 __
_ _
__
1 2
8 1
2 1
2
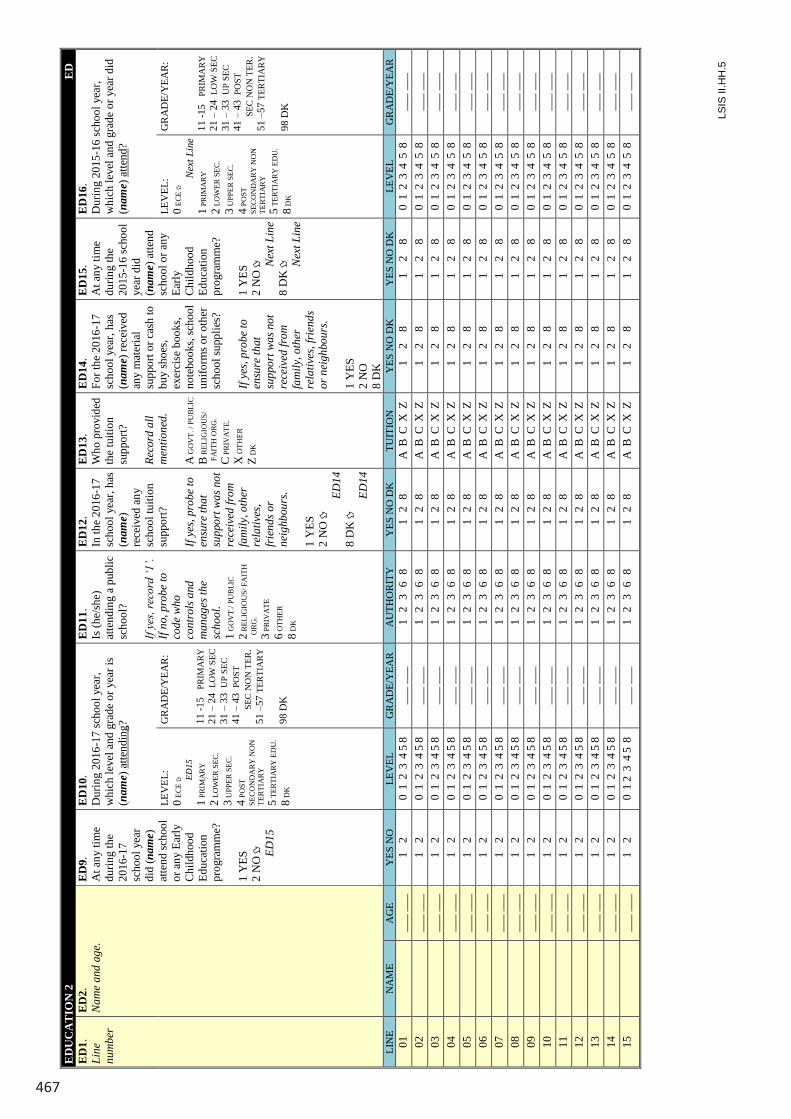
467
LSIS
II.H
H.5
ED
UC
AT
ION
2
ED
E
D1.
Li
ne
num
ber
ED
2.
Nam
e an
d ag
e.
ED
9.
At a
ny ti
me
durin
g th
e 20
16-1
7 sc
hool
yea
r di
d (n
ame)
at
tend
scho
ol
or a
ny E
arly
C
hild
hood
Ed
ucat
ion
prog
ram
me?
1
YES
2
NO
ED15
ED
10.
Dur
ing
2016
-17
scho
ol y
ear,
whi
ch le
vel a
nd g
rade
or y
ear i
s (n
ame)
atte
ndin
g?
ED
11.
Is (h
e/sh
e)
atte
ndin
g a
publ
ic
scho
ol?
If ye
s, re
cord
‘1’.
If no
, pro
be to
co
de w
ho
cont
rols
and
m
anag
es th
e sc
hool
. 1
GO
VT.
/ PU
BLIC
2 RE
LIG
IOU
S/ F
AIT
H
ORG
. 3
PRIV
ATE
6 O
THER
8 D
K
ED
12.
In th
e 20
16-1
7 sc
hool
yea
r, ha
s (n
ame)
re
ceiv
ed a
ny
scho
ol tu
ition
su
ppor
t?
If ye
s, pr
obe
to
ensu
re th
at
supp
ort w
as n
ot
rece
ived
from
fa
mily
, oth
er
rela
tives
, fr
iend
s or
neig
hbou
rs.
1 Y
ES
2 N
O
ED
14
8 D
K
ED
14 E
D13
. W
ho p
rovi
ded
the
tuiti
on
supp
ort?
Re
cord
all
men
tione
d.
A G
OV
T. /
PUBL
IC
B R
ELIG
IOU
S/
FAIT
H O
RG.
C P
RIV
ATE
.
X O
THER
Z D
K
ED
14.
For t
he 2
016-
17
scho
ol y
ear,
has
(nam
e) re
ceiv
ed
any
mat
eria
l su
ppor
t or c
ash
to
buy
shoe
s, ex
erci
se b
ooks
, no
tebo
oks,
scho
ol
unifo
rms o
r oth
er
scho
ol su
pplie
s?
If ye
s, pr
obe
to
ensu
re th
at
supp
ort w
as n
ot
rece
ived
from
fa
mily
, oth
er
rela
tives
, fri
ends
or
nei
ghbo
urs.
1 Y
ES
2 N
O
8 D
K
ED
15.
At a
ny ti
me
durin
g th
e 20
15-1
6 sc
hool
ye
ar d
id
(nam
e) a
ttend
sc
hool
or a
ny
Early
C
hild
hood
Ed
ucat
ion
prog
ram
me?
1
YES
2
NO
Nex
t Lin
e 8
DK
Nex
t Lin
e
ED
16.
Dur
ing
2015
-16
scho
ol y
ear,
whi
ch le
vel a
nd g
rade
or y
ear d
id
(nam
e) a
ttend
?
LEV
EL:
0 EC
E
ED
15
1 PR
IMA
RY
2 LO
WER
SEC
.
3 U
PPER
SEC
.
4 PO
ST
SECO
ND
ARY
NO
N
TERT
IARY
5
TERT
IARY
ED
U.
8 D
K
GR
AD
E/Y
EAR
: 11
-15
PR
IMA
RY
21
– 2
4 L
OW
SEC
31
– 3
3 U
P SE
C
41 –
43
PO
ST
SE
C N
ON
TER
. 51
–57
TER
TIA
RY
98
DK
LEV
EL:
0 EC
E
Nex
t Lin
e 1
PRIM
ARY
2 LO
WER
SEC
.
3 U
PPER
SEC
.
4 PO
ST
SECO
ND
ARY
NO
N
TERT
IARY
5
TERT
IARY
ED
U.
8 D
K
GR
AD
E/Y
EAR
: 11
-15
PR
IMA
RY
21
– 2
4 L
OW
SEC
31
– 3
3 U
P SE
C
41 –
43
PO
ST
SE
C N
ON
TER
. 51
–57
TER
TIA
RY
98
DK
LIN
E N
AM
E A
GE
YES
NO
LE
VEL
G
RA
DE/
YEA
R
AU
THO
RIT
Y
YES
NO
DK
TU
ITIO
N
YES
NO
DK
Y
ES N
O D
K
LEV
EL
GR
AD
E/Y
EAR
01
___
___
1
2 0
1 2
3 4
5 8
__
_ __
_ 1
2
3 6
8
1 2
8
A B
C X
Z
1
2
8
1
2
8
0 1
2 3
4 5
8
___
___
02
__
_ __
_ 1
2
0 1
2 3
4 5
8
___
___
1 2
3
6
8 1
2
8 A
B C
X Z
1
2
8
1
2
8
0
1 2
3 4
5 8
__
_ __
_ 03
___
___
1
2 0
1 2
3 4
5 8
__
_ __
_ 1
2
3 6
8
1 2
8
A B
C X
Z
1
2
8
1
2
8
0 1
2 3
4 5
8
___
___
04
__
_ __
_ 1
2
0 1
2 3
4 5
8
___
___
1 2
3
6
8 1
2
8 A
B C
X Z
1
2
8
1
2
8
0
1 2
3 4
5 8
__
_ __
_ 05
___
___
1
2 0
1 2
3 4
5 8
__
_ __
_ 1
2
3 6
8
1 2
8
A B
C X
Z
1
2
8
1
2
8
0 1
2 3
4 5
8
___
___
06
__
_ __
_ 1
2
0 1
2 3
4 5
8
___
___
1 2
3
6
8 1
2
8 A
B C
X Z
1
2
8
1
2
8
0
1 2
3 4
5 8
__
_ __
_ 07
___
___
1
2 0
1 2
3 4
5 8
__
_ __
_ 1
2
3 6
8
1 2
8
A B
C X
Z
1
2
8
1
2
8
0 1
2 3
4 5
8
___
___
08
__
_ __
_ 1
2
0 1
2 3
4 5
8
___
___
1 2
3
6
8 1
2
8 A
B C
X Z
1
2
8
1
2
8
0
1 2
3 4
5 8
__
_ __
_ 09
___
___
1
2 0
1 2
3 4
5 8
__
_ __
_ 1
2
3 6
8
1 2
8
A B
C X
Z
1
2
8
1
2
8
0 1
2 3
4 5
8
___
___
10
__
_ __
_ 1
2
0 1
2 3
4 5
8
___
___
1 2
3
6
8 1
2
8 A
B C
X Z
1
2
8
1
2
8
0
1 2
3 4
5 8
__
_ __
_ 11
___
___
1
2 0
1 2
3 4
5 8
__
_ __
_ 1
2
3 6
8
1 2
8
A B
C X
Z
1
2
8
1
2
8
0 1
2 3
4 5
8
___
___
12
__
_ __
_ 1
2
0 1
2 3
4 5
8
___
___
1 2
3
6
8 1
2
8 A
B C
X Z
1
2
8
1
2
8
0
1 2
3 4
5 8
__
_ __
_ 13
___
___
1
2 0
1 2
3 4
5 8
__
_ __
_ 1
2
3 6
8
1 2
8
A B
C X
Z
1
2
8
1
2
8
0 1
2 3
4 5
8
___
___
14
__
_ __
_ 1
2
0 1
2 3
4 5
8
___
___
1 2
3
6
8 1
2
8 A
B C
X Z
1
2
8
1
2
8
0
1 2
3 4
5 8
__
_ __
_ 15
___
___
1
2 0
1 2
3 4
5 8
__
_ __
_ 1
2
3 6
8
1 2
8
A B
C X
Z
1
2
8
1
2
8
0 1
2 3
4 5
8
___
___
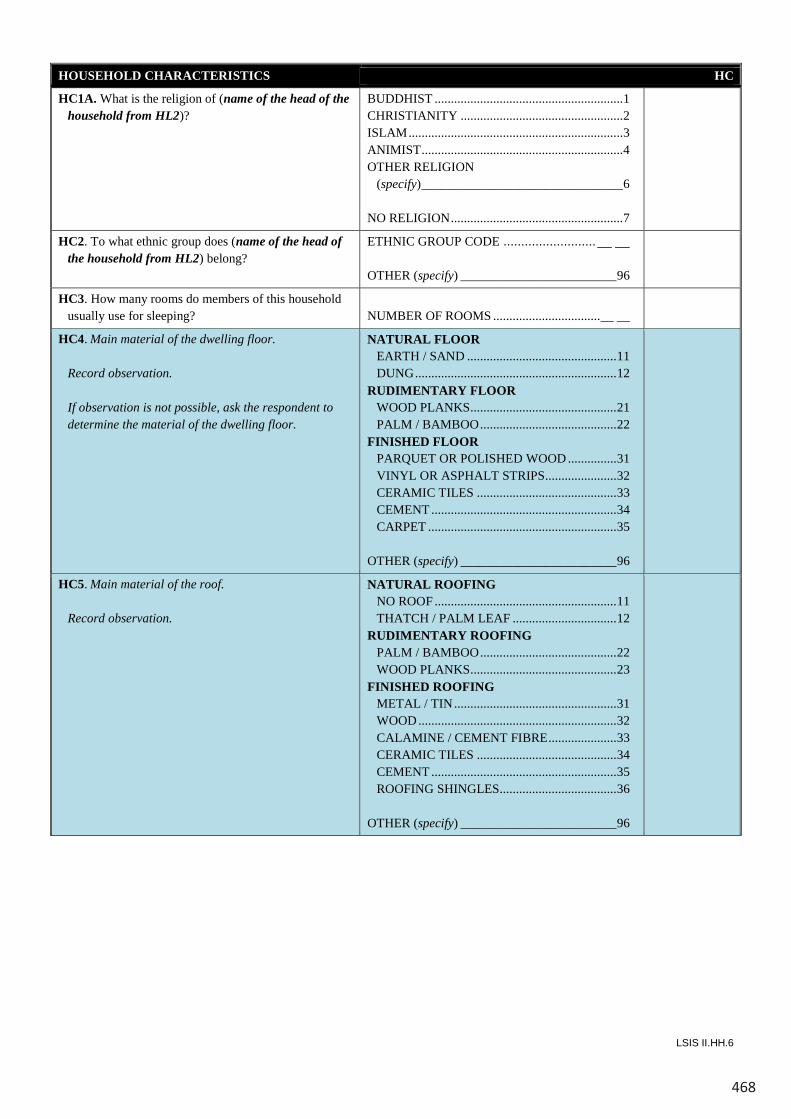
468
LSIS II.HH.6
HOUSEHOLD CHARACTERISTICS HC
HC1A. What is the religion of (name of the head of the household from HL2)?
BUDDHIST ..........................................................1CHRISTIANITY ..................................................2ISLAM..................................................................3ANIMIST..............................................................4OTHER RELIGION
(specify)_______________________________6
NO RELIGION.....................................................7
HC2. To what ethnic group does (name of the head of the household from HL2) belong?
ETHNIC GROUP CODE .......................... __ __
OTHER (specify) ________________________96
HC3. How many rooms do members of this household usually use for sleeping? NUMBER OF ROOMS .................................__ __
HC4. Main material of the dwelling floor.
Record observation.
If observation is not possible, ask the respondent to determine the material of the dwelling floor.
NATURAL FLOOREARTH / SAND ..............................................11DUNG..............................................................12
RUDIMENTARY FLOORWOOD PLANKS.............................................21PALM / BAMBOO..........................................22
FINISHED FLOORPARQUET OR POLISHED WOOD ...............31VINYL OR ASPHALT STRIPS......................32CERAMIC TILES ...........................................33CEMENT .........................................................34CARPET ..........................................................35
OTHER (specify) ________________________96
HC5. Main material of the roof.
Record observation.
NATURAL ROOFINGNO ROOF ........................................................11THATCH / PALM LEAF ................................12
RUDIMENTARY ROOFINGPALM / BAMBOO..........................................22WOOD PLANKS.............................................23
FINISHED ROOFINGMETAL / TIN..................................................31WOOD.............................................................32CALAMINE / CEMENT FIBRE.....................33CERAMIC TILES ...........................................34CEMENT .........................................................35ROOFING SHINGLES....................................36
OTHER (specify) ________________________96
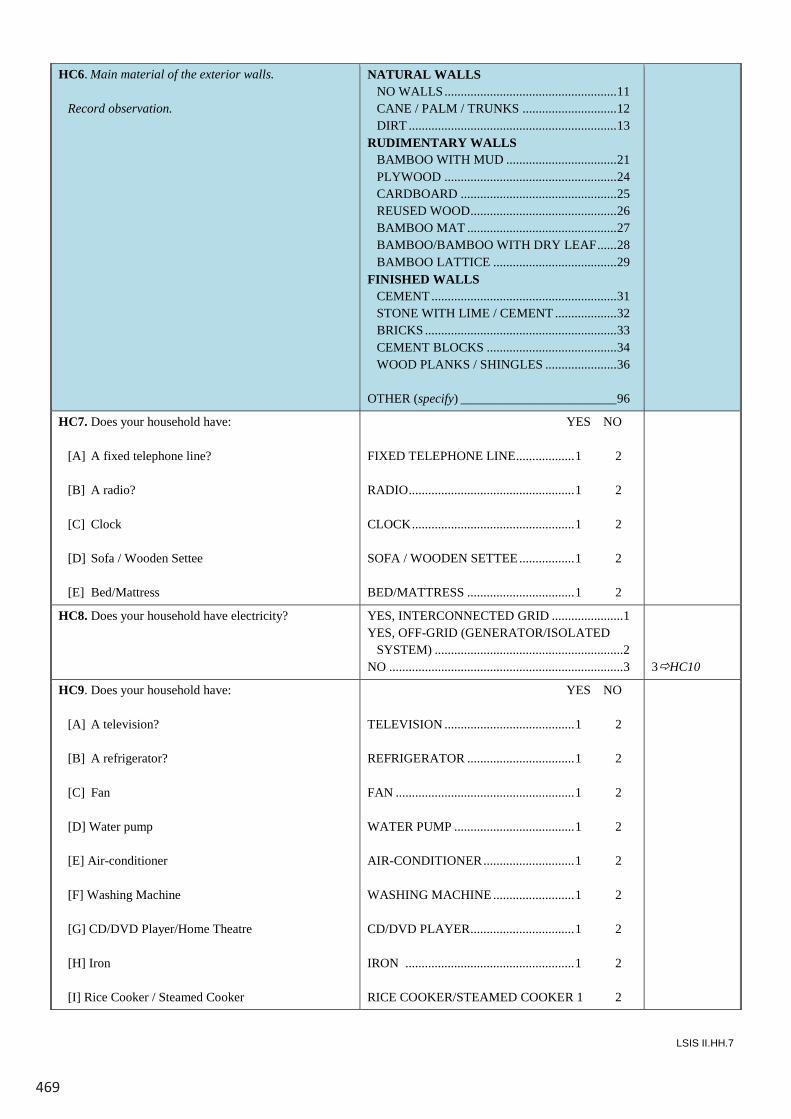
469
LSIS II.HH.7
HC6. Main material of the exterior walls. Record observation.
NATURAL WALLS NO WALLS ..................................................... 11 CANE / PALM / TRUNKS ............................. 12 DIRT ................................................................ 13 RUDIMENTARY WALLS BAMBOO WITH MUD .................................. 21 PLYWOOD ..................................................... 24 CARDBOARD ................................................ 25 REUSED WOOD ............................................. 26 BAMBOO MAT .............................................. 27 BAMBOO/BAMBOO WITH DRY LEAF ...... 28 BAMBOO LATTICE ...................................... 29 FINISHED WALLS CEMENT ......................................................... 31 STONE WITH LIME / CEMENT ................... 32 BRICKS ........................................................... 33 CEMENT BLOCKS ........................................ 34 WOOD PLANKS / SHINGLES ...................... 36 OTHER (specify) ________________________ 96
HC7. Does your household have: [A] A fixed telephone line? [B] A radio? [C] Clock [D] Sofa / Wooden Settee [E] Bed/Mattress
YES NO FIXED TELEPHONE LINE .................. 1 2 RADIO ................................................... 1 2 CLOCK .................................................. 1 2 SOFA / WOODEN SETTEE ................. 1 2 BED/MATTRESS ................................. 1 2
HC8. Does your household have electricity?
YES, INTERCONNECTED GRID ...................... 1 YES, OFF-GRID (GENERATOR/ISOLATED
SYSTEM) .......................................................... 2 NO ........................................................................ 3
3HC10
HC9. Does your household have: [A] A television? [B] A refrigerator? [C] Fan [D] Water pump [E] Air-conditioner [F] Washing Machine [G] CD/DVD Player/Home Theatre [H] Iron [I] Rice Cooker / Steamed Cooker
YES NO TELEVISION ........................................ 1 2 REFRIGERATOR ................................. 1 2 FAN ....................................................... 1 2 WATER PUMP ..................................... 1 2 AIR-CONDITIONER ............................ 1 2 WASHING MACHINE ......................... 1 2 CD/DVD PLAYER ................................ 1 2 IRON .................................................... 1 2 RICE COOKER/STEAMED COOKER 1 2
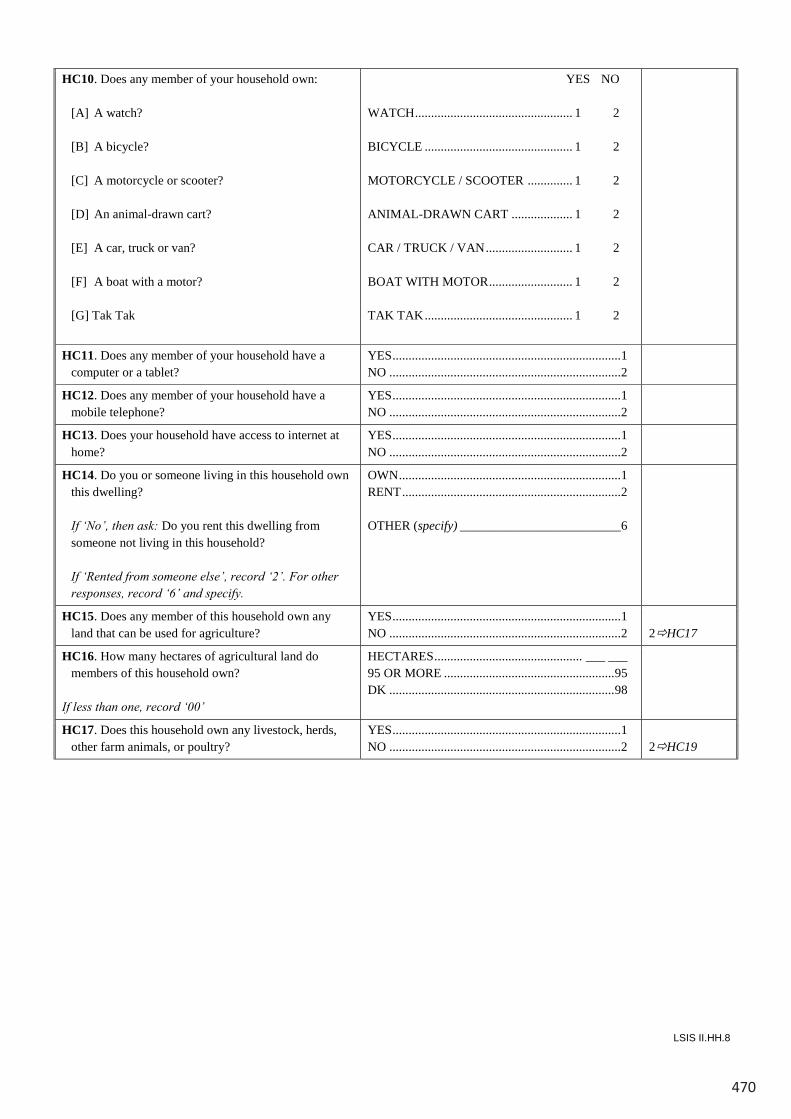
470
LSIS II.HH.8
HC10. Does any member of your household own: [A] A watch? [B] A bicycle? [C] A motorcycle or scooter? [D] An animal-drawn cart? [E] A car, truck or van? [F] A boat with a motor? [G] Tak Tak
YES NO WATCH ................................................. 1 2 BICYCLE .............................................. 1 2 MOTORCYCLE / SCOOTER .............. 1 2 ANIMAL-DRAWN CART ................... 1 2 CAR / TRUCK / VAN ........................... 1 2 BOAT WITH MOTOR .......................... 1 2 TAK TAK .............................................. 1 2
HC11. Does any member of your household have a computer or a tablet?
YES ....................................................................... 1 NO ........................................................................ 2
HC12. Does any member of your household have a mobile telephone?
YES ....................................................................... 1 NO ........................................................................ 2
HC13. Does your household have access to internet at home?
YES ....................................................................... 1 NO ........................................................................ 2
HC14. Do you or someone living in this household own this dwelling?
If ‘No’, then ask: Do you rent this dwelling from
someone not living in this household? If ‘Rented from someone else’, record ‘2’. For other
responses, record ‘6’ and specify.
OWN ..................................................................... 1 RENT .................................................................... 2 OTHER (specify) _________________________ 6
HC15. Does any member of this household own any land that can be used for agriculture?
YES ....................................................................... 1 NO ........................................................................ 2
2HC17
HC16. How many hectares of agricultural land do members of this household own?
If less than one, record ‘00’
HECTARES .............................................. ___ ___ 95 OR MORE ..................................................... 95 DK ...................................................................... 98
HC17. Does this household own any livestock, herds, other farm animals, or poultry?
YES ....................................................................... 1 NO ........................................................................ 2
2HC19
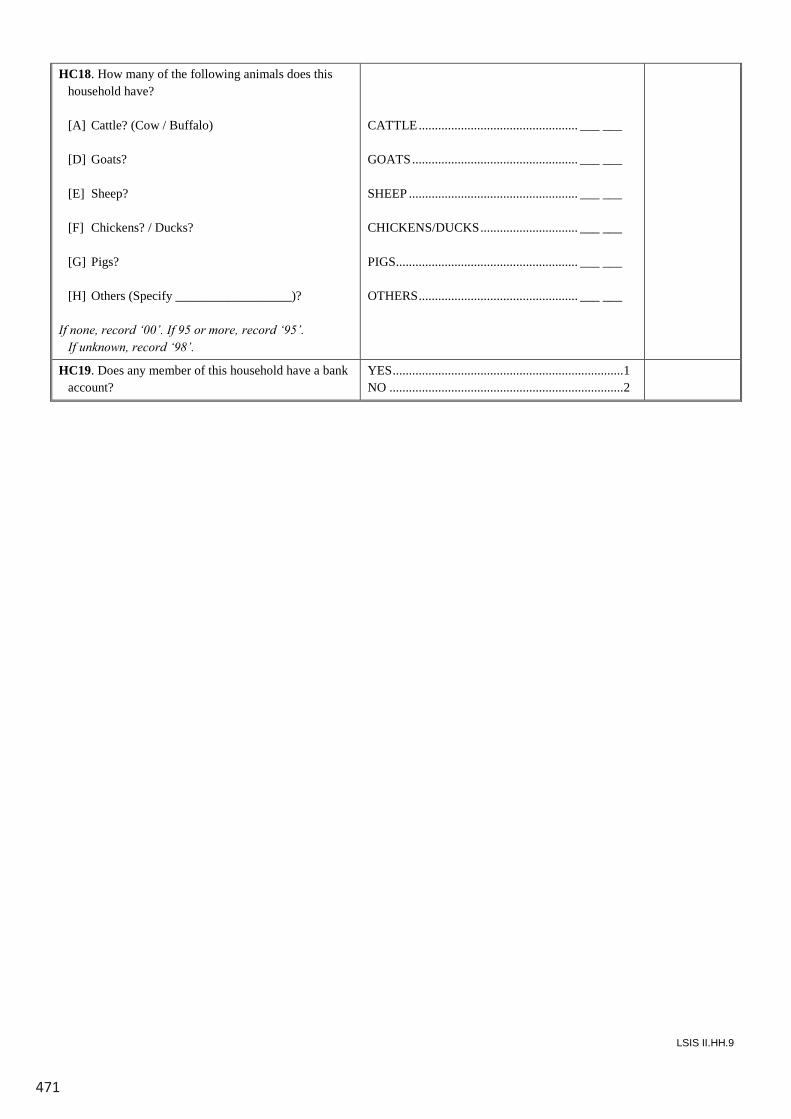
471
LSIS II.HH.9
HC18. How many of the following animals does this household have?
[A] Cattle? (Cow / Buffalo) [D] Goats? [E] Sheep? [F] Chickens? / Ducks? [G] Pigs? [H] Others (Specify __________________)? If none, record ‘00’. If 95 or more, record ‘95’. If unknown, record ‘98’.
CATTLE ................................................. ___ ___ GOATS ................................................... ___ ___ SHEEP .................................................... ___ ___ CHICKENS/DUCKS .............................. ___ ___ PIGS ........................................................ ___ ___ OTHERS ................................................. ___ ___
HC19. Does any member of this household have a bank account?
YES ....................................................................... 1 NO ........................................................................ 2
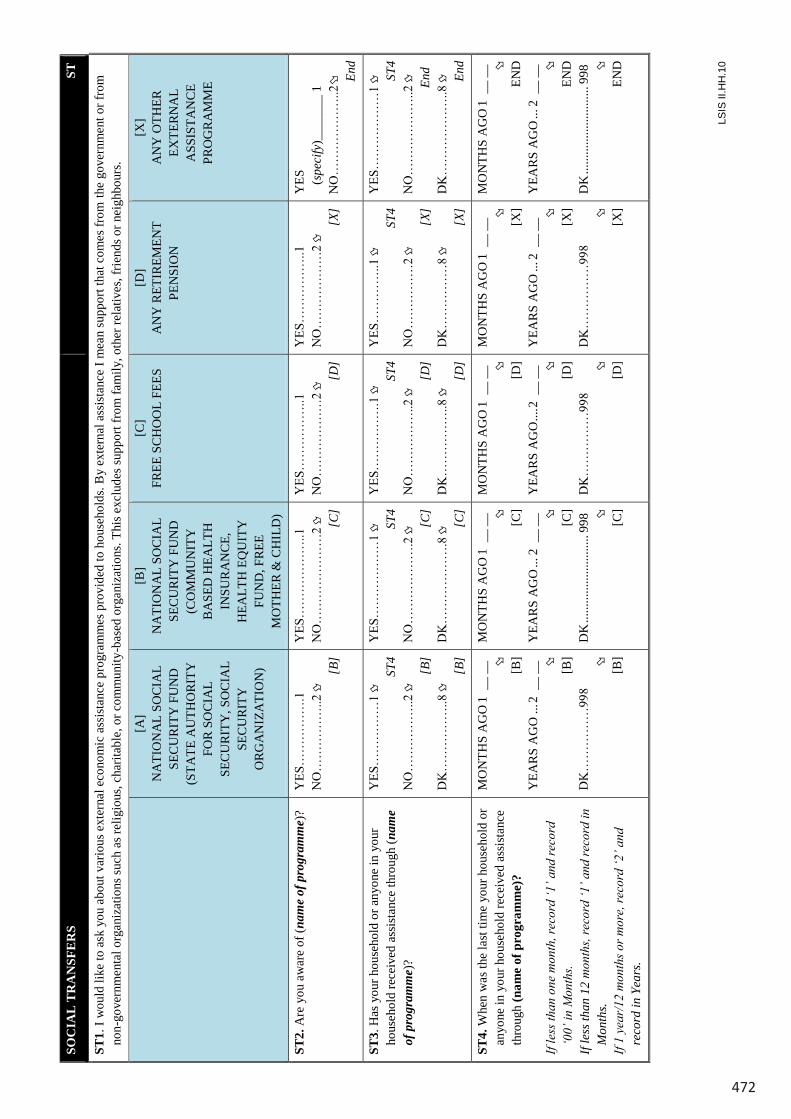
472
LSIS
II.H
H.1
0
SOC
IAL
TR
AN
SFE
RS
ST
ST1.
I w
ould
like
to a
sk y
ou a
bout
var
ious
ext
erna
l eco
nom
ic a
ssis
tanc
e pr
ogra
mm
es p
rovi
ded
to h
ouse
hold
s. B
y ex
tern
al a
ssis
tanc
e I m
ean
supp
ort t
hat c
omes
from
the
gove
rnm
ent o
r fro
m
non-
gove
rnm
enta
l org
aniz
atio
ns su
ch a
s rel
igio
us, c
harit
able
, or c
omm
unity
-bas
ed o
rgan
izat
ions
. Thi
s exc
lude
s sup
port
from
fam
ily, o
ther
rela
tives
, frie
nds o
r nei
ghbo
urs.
[A
] N
ATI
ON
AL
SOC
IAL
SEC
UR
ITY
FU
ND
(S
TATE
AU
THO
RIT
Y
FOR
SOC
IAL
SEC
UR
ITY
, SO
CIA
L SE
CU
RIT
Y
OR
GA
NIZ
ATI
ON
)
[B]
NA
TIO
NA
L SO
CIA
L SE
CU
RIT
Y F
UN
D
(CO
MM
UN
ITY
B
ASE
D H
EALT
H
INSU
RA
NC
E,
HEA
LTH
EQ
UIT
Y
FUN
D, F
REE
M
OTH
ER &
CH
ILD
)
[C]
FREE
SC
HO
OL
FEES
[D
] A
NY
RET
IREM
ENT
PEN
SIO
N
[X]
AN
Y O
THER
EX
TER
NA
L A
SSIS
TAN
CE
PRO
GR
AM
ME
ST2.
Are
you
aw
are
of (n
ame
of p
rogr
amm
e)?
YES
……
……
….1
N
O…
……
……
..2
[B
]
YES
……
……
……
..1
NO
……
……
……
…2
[C
]
YES
……
……
…..1
N
O…
……
……
…2
[D]
YES
……
……
…..1
N
O…
……
……
…2
[X
]
YES
(spe
cify
)___
____
1
NO
……
……
……
..2
End
ST3.
Has
you
r hou
seho
ld o
r any
one
in y
our
hous
ehol
d re
ceiv
ed a
ssis
tanc
e th
roug
h (n
ame
of p
rogr
amm
e)?
YES
……
……
…1
ST4
NO
……
……
…..2
[B
] D
K…
……
……
..8
[B
]
YES
……
……
……
1 ST
4 N
O…
……
……
….2
[C]
DK
……
……
……
.8
[C]
YES
……
……
….1
ST4
NO
……
……
…..2
[D]
DK
……
……
…..8
[D]
YES
……
……
..1
ST
4 N
O…
……
……
2
[X]
DK
……
……
…8
[X
]
YES
……
……
……
1 ST
4 N
O…
……
……
…..2
En
d
DK
……
……
……
..8
End
ST4.
Whe
n w
as th
e la
st ti
me
your
hou
seho
ld o
r an
yone
in y
our h
ouse
hold
rece
ived
ass
ista
nce
thro
ugh
(nam
e of
pro
gram
me)
? If
less
than
one
mon
th, r
ecor
d ‘1
’ and
reco
rd
‘00’
in M
onth
s. If
less
than
12
mon
ths,
reco
rd ‘1
’ and
reco
rd in
M
onth
s. If
1 ye
ar/1
2 m
onth
s or m
ore,
reco
rd ‘2
’ and
re
cord
in Y
ears
.
MO
NTH
S A
GO
1 _
_ __
[B]
YEA
RS
AG
O ..
. 2 _
_ __
[B]
DK
……
……
…99
8
[B
]
MO
NTH
S A
GO
1 _
_ __
[C]
YEA
RS
AG
O ...
2 _
_ __
[C]
DK
......
......
......
......
... 9
98
[C]
MO
NTH
S A
GO
1 _
_ __
[D]
YEA
RS
AG
O ...
. 2 _
_ __
[D]
DK
……
……
…99
8
[D
]
MO
NTH
S A
GO
1 _
_ __
[X]
YEA
RS
AG
O ..
. 2 _
_ __
[X]
DK
……
……
…99
8
[X
]
MO
NTH
S A
GO
1 _
_ __
END
Y
EAR
S A
GO
... 2
__
__
END
D
K ...
......
......
......
......
998
EN
D
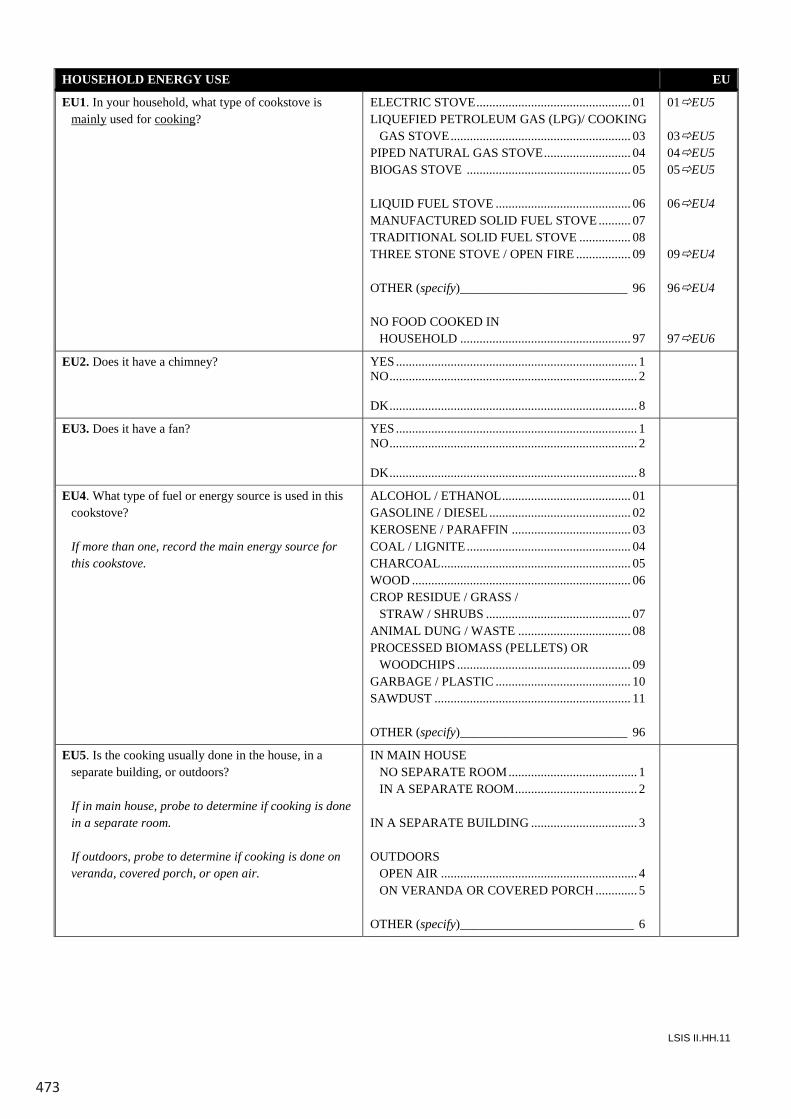
473
LSIS II.HH.11
HOUSEHOLD ENERGY USE EU
EU1. In your household, what type of cookstove is mainly used for cooking?
ELECTRIC STOVE ................................................ 01 LIQUEFIED PETROLEUM GAS (LPG)/ COOKING
GAS STOVE ........................................................ 03 PIPED NATURAL GAS STOVE ........................... 04 BIOGAS STOVE ................................................... 05 LIQUID FUEL STOVE .......................................... 06 MANUFACTURED SOLID FUEL STOVE .......... 07 TRADITIONAL SOLID FUEL STOVE ................ 08 THREE STONE STOVE / OPEN FIRE ................. 09 OTHER (specify) __________________________ 96 NO FOOD COOKED IN HOUSEHOLD ..................................................... 97
01EU5 03EU5 04EU5 05EU5 06EU4 09EU4 96EU4 97EU6
EU2. Does it have a chimney? YES ........................................................................... 1 NO ............................................................................. 2 DK ............................................................................. 8
EU3. Does it have a fan? YES ........................................................................... 1 NO ............................................................................. 2 DK ............................................................................. 8
EU4. What type of fuel or energy source is used in this cookstove?
If more than one, record the main energy source for
this cookstove.
ALCOHOL / ETHANOL ........................................ 01 GASOLINE / DIESEL ............................................ 02 KEROSENE / PARAFFIN ..................................... 03 COAL / LIGNITE ................................................... 04 CHARCOAL ........................................................... 05 WOOD .................................................................... 06 CROP RESIDUE / GRASS / STRAW / SHRUBS ............................................. 07 ANIMAL DUNG / WASTE ................................... 08 PROCESSED BIOMASS (PELLETS) OR
WOODCHIPS ...................................................... 09 GARBAGE / PLASTIC .......................................... 10 SAWDUST ............................................................. 11 OTHER (specify) __________________________ 96
EU5. Is the cooking usually done in the house, in a separate building, or outdoors?
If in main house, probe to determine if cooking is done
in a separate room. If outdoors, probe to determine if cooking is done on
veranda, covered porch, or open air.
IN MAIN HOUSE NO SEPARATE ROOM ........................................ 1 IN A SEPARATE ROOM ...................................... 2 IN A SEPARATE BUILDING ................................. 3 OUTDOORS OPEN AIR ............................................................. 4 ON VERANDA OR COVERED PORCH ............. 5 OTHER (specify) ___________________________ 6
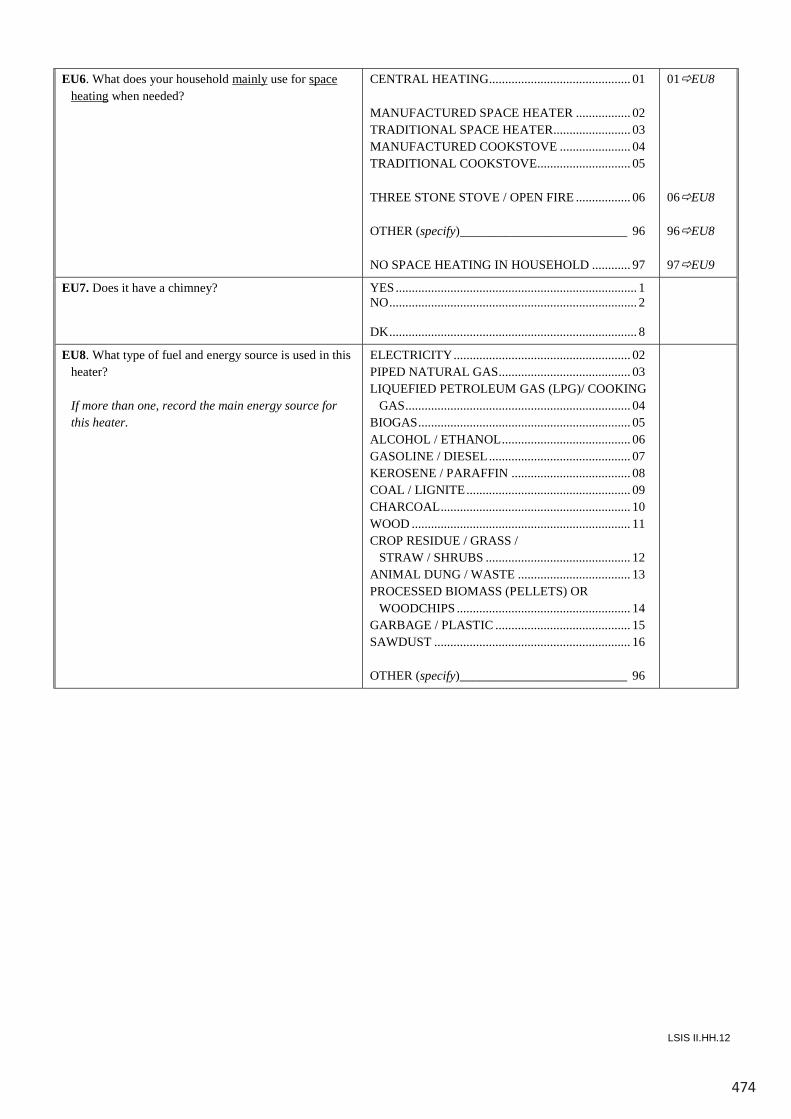
474
LSIS II.HH.12
EU6. What does your household mainly use for space heating when needed?
CENTRAL HEATING ............................................ 01 MANUFACTURED SPACE HEATER ................. 02 TRADITIONAL SPACE HEATER ........................ 03 MANUFACTURED COOKSTOVE ...................... 04 TRADITIONAL COOKSTOVE ............................. 05 THREE STONE STOVE / OPEN FIRE ................. 06 OTHER (specify) __________________________ 96 NO SPACE HEATING IN HOUSEHOLD ............ 97
01EU8 06EU8 96EU8 97EU9
EU7. Does it have a chimney? YES ........................................................................... 1 NO ............................................................................. 2 DK ............................................................................. 8
EU8. What type of fuel and energy source is used in this heater?
If more than one, record the main energy source for
this heater.
ELECTRICITY ....................................................... 02 PIPED NATURAL GAS ......................................... 03 LIQUEFIED PETROLEUM GAS (LPG)/ COOKING
GAS ...................................................................... 04 BIOGAS .................................................................. 05 ALCOHOL / ETHANOL ........................................ 06 GASOLINE / DIESEL ............................................ 07 KEROSENE / PARAFFIN ..................................... 08 COAL / LIGNITE ................................................... 09 CHARCOAL ........................................................... 10 WOOD .................................................................... 11 CROP RESIDUE / GRASS / STRAW / SHRUBS ............................................. 12 ANIMAL DUNG / WASTE ................................... 13 PROCESSED BIOMASS (PELLETS) OR
WOODCHIPS ...................................................... 14 GARBAGE / PLASTIC .......................................... 15 SAWDUST ............................................................. 16 OTHER (specify) __________________________ 96
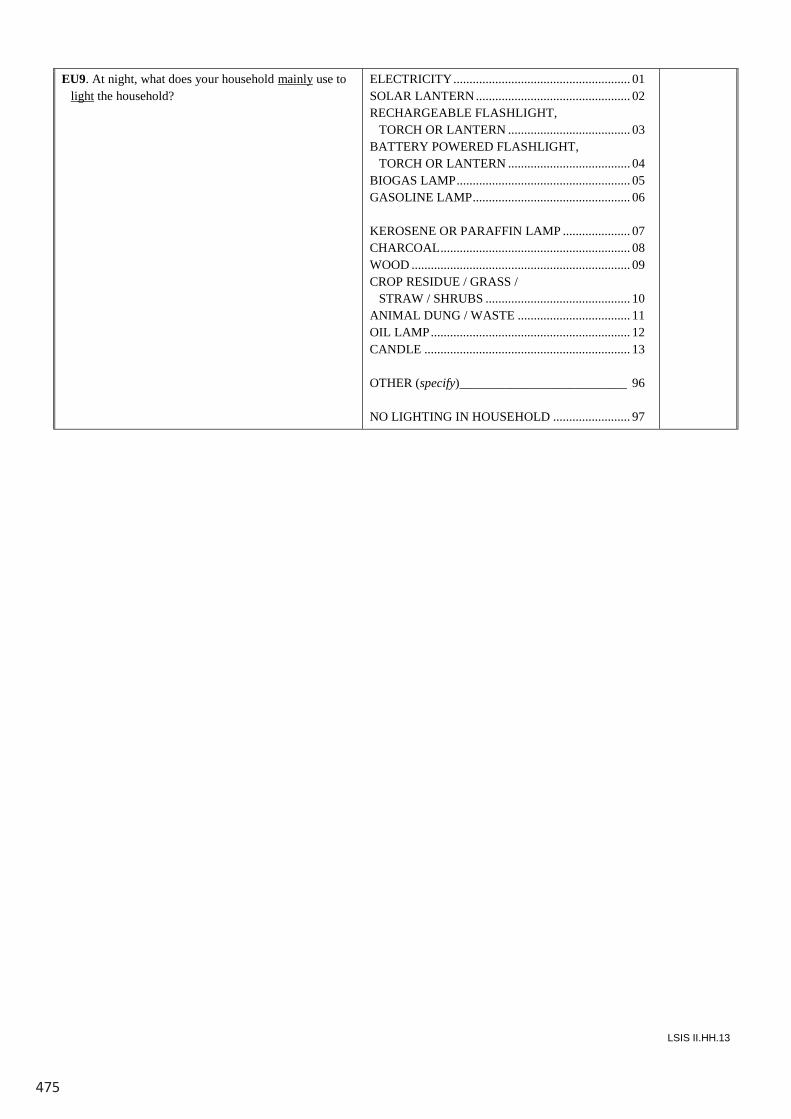
475
LSIS II.HH.13
EU9. At night, what does your household mainly use to light the household?
ELECTRICITY ....................................................... 01 SOLAR LANTERN ................................................ 02 RECHARGEABLE FLASHLIGHT, TORCH OR LANTERN ...................................... 03 BATTERY POWERED FLASHLIGHT, TORCH OR LANTERN ...................................... 04 BIOGAS LAMP ...................................................... 05 GASOLINE LAMP ................................................. 06 KEROSENE OR PARAFFIN LAMP ..................... 07 CHARCOAL ........................................................... 08 WOOD .................................................................... 09 CROP RESIDUE / GRASS / STRAW / SHRUBS ............................................. 10 ANIMAL DUNG / WASTE ................................... 11 OIL LAMP .............................................................. 12 CANDLE ................................................................ 13 OTHER (specify) __________________________ 96 NO LIGHTING IN HOUSEHOLD ........................ 97
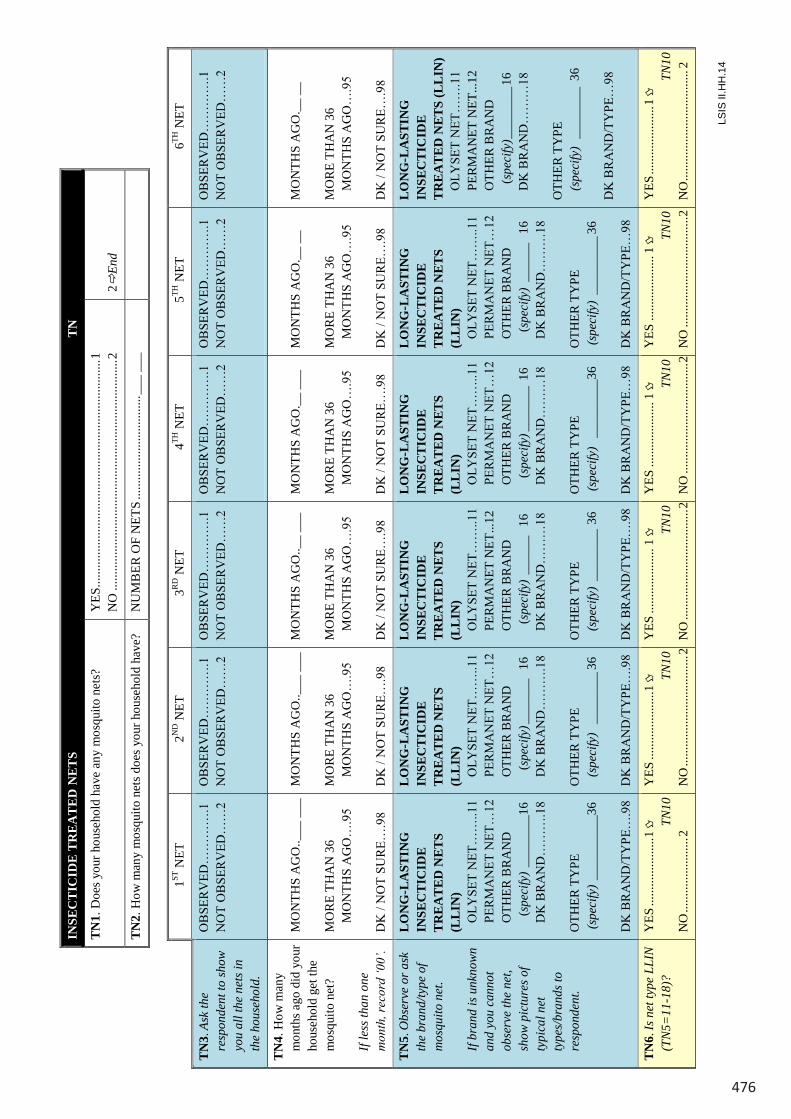
476
LSIS
II.H
H.1
4
INSE
CT
ICID
E T
RE
AT
ED
NE
TS
TN
TN
1. D
oes y
our h
ouse
hold
hav
e an
y m
osqu
ito n
ets?
Y
ES ...
......
......
......
......
......
......
......
......
......
......
......
. 1
NO
.....
......
......
......
......
......
......
......
......
......
......
......
2 2
End
TN
2. H
ow m
any
mos
quito
net
s doe
s you
r hou
seho
ld h
ave?
N
UM
BER
OF
NET
S ...
......
......
......
......
..... _
__ _
__
1ST
NET
2N
D N
ET
3RD N
ET
4TH N
ET
5TH N
ET
6TH N
ET
TN
3. A
sk th
e re
spon
dent
to sh
ow
you
all t
he n
ets i
n th
e ho
useh
old.
OB
SERV
ED…
……
….1
N
OT
OB
SERV
ED…
…2
OB
SERV
ED…
……
….1
N
OT
OB
SERV
ED…
…2
OB
SERV
ED…
……
….1
N
OT
OB
SERV
ED…
…2
OB
SERV
ED…
……
….1
N
OT
OB
SERV
ED…
…2
OB
SERV
ED…
……
….1
N
OT
OB
SERV
ED…
…2
OB
SERV
ED…
……
….1
N
OT
OB
SERV
ED…
…2
TN
4. H
ow m
any
mon
ths a
go d
id y
our
hous
ehol
d ge
t the
m
osqu
ito n
et?
If
less
than
one
m
onth
, rec
ord
‘00’
.
MO
NTH
S A
GO
..___
___
M
OR
E TH
AN
36
M
ON
THS
AG
O…
.95
DK
/ N
OT
SURE
….9
8
MO
NTH
S A
GO
..___
___
M
OR
E TH
AN
36
M
ON
THS
AG
O…
.95
DK
/ N
OT
SURE
….9
8
MO
NTH
S A
GO
..__
___
MO
RE
THA
N 3
6
MO
NTH
S A
GO
….9
5 D
K /
NO
T SU
RE…
.98
MO
NTH
S A
GO
.__
___
MO
RE
THA
N 3
6
MO
NTH
S A
GO
….9
5 D
K /
NO
T SU
RE…
.98
MO
NTH
S A
GO
.__
__
MO
RE
THA
N 3
6
MO
NTH
S A
GO
….9
5 D
K /
NO
T SU
RE…
.98
MO
NTH
S A
GO
.__
__
MO
RE
THA
N 3
6
MO
NTH
S A
GO
….9
5 D
K /
NO
T SU
RE…
.98
TN
5. O
bser
ve o
r ask
th
e br
and/
type
of
mos
quito
net
.
If br
and
is u
nkno
wn
and
you
cann
ot
obse
rve
the
net,
show
pic
ture
s of
typi
cal n
et
type
s/br
ands
to
resp
onde
nt.
LO
NG
-LA
STIN
G
INSE
CT
ICID
E
TR
EA
TE
D N
ET
S (L
LIN
)
OLY
SET
NET
……
..11
PE
RMA
NET
NET
…12
OTH
ER B
RA
ND
(sp
ecify
) __
____
__16
DK
BR
AN
D…
……
.18
OTH
ER T
YPE
(s
peci
fy)
____
____
__36
D
K B
RA
ND
/TY
PE…
.98
LO
NG
-LA
STIN
G
INSE
CT
ICID
E
TR
EA
TE
D N
ET
S (L
LIN
)
OLY
SET
NET
……
..11
PE
RMA
NET
NET
…12
OTH
ER B
RA
ND
(sp
ecify
) ___
____
16
DK
BR
AN
D…
……
.18
OTH
ER T
YPE
(spe
cify
) __
____
__ 3
6 D
K B
RA
ND
/TY
PE…
.98
LO
NG
-LA
STIN
G
INSE
CT
ICID
E
TR
EA
TE
D N
ET
S (L
LIN
)
OLY
SET
NET
……
..11
PE
RM
AN
ET N
ET...
12
O
THER
BR
AN
D
(
spec
ify)
____
__
16
D
K B
RA
ND
……
…18
O
THER
TY
PE
(s
peci
fy)
____
____
36
DK
BR
AN
D/T
YPE
….9
8
LO
NG
-LA
STIN
G
INSE
CT
ICID
E
TR
EA
TE
D N
ET
S (L
LIN
)
OLY
SET
NET
……
..11
PE
RMA
NET
NET
…12
OTH
ER B
RA
ND
(sp
ecify
) ___
____
16
D
K B
RA
ND
……
…18
O
THER
TY
PE
(spe
cify
) __
____
___3
6 D
K B
RA
ND
/TY
PE…
98
LO
NG
-LA
STIN
G
INSE
CT
ICID
E
TR
EA
TE
D N
ET
S (L
LIN
)
OLY
SET
NET
……
..11
PE
RMA
NET
NET
…12
OTH
ER B
RA
ND
(sp
ecify
) __
____
16
DK
BR
AN
D…
……
18
OTH
ER T
YPE
(s
peci
fy)
____
____
_ 36
D
K B
RA
ND
/TY
PE…
98
LO
NG
-LA
STIN
G
INSE
CT
ICID
E
TR
EA
TE
D N
ET
S (L
LIN
)
OLY
SET
NET
……
.11
PE
RM
AN
ET N
ET...
12
O
THER
BR
AN
D
(
spec
ify) _
____
___ 1
6
DK
BR
AN
D…
……
18
OTH
ER T
YPE
(spe
cify
) __
____
__ 3
6 D
K B
RA
ND
/TY
PE…
98
TN
6. Is
net
type
LLI
N
(TN
5=11
-18)
? Y
ES ...
......
......
......
1 TN
10
NO
......
......
......
..... 2
YES
.....
......
......
....1
TN10
N
O ...
......
......
......
......
......
. 2 Y
ES ..
......
......
......
1
TN10
N
O ...
......
......
......
......
......
. 2 Y
ES ..
......
......
......
1
TN10
N
O ..
......
......
......
......
......
.. 2 Y
ES ..
......
......
......
1
TN10
N
O ..
......
......
......
......
......
.. 2
YES
......
......
......
... 1
TN10
N
O ...
......
......
......
......
......
. 2
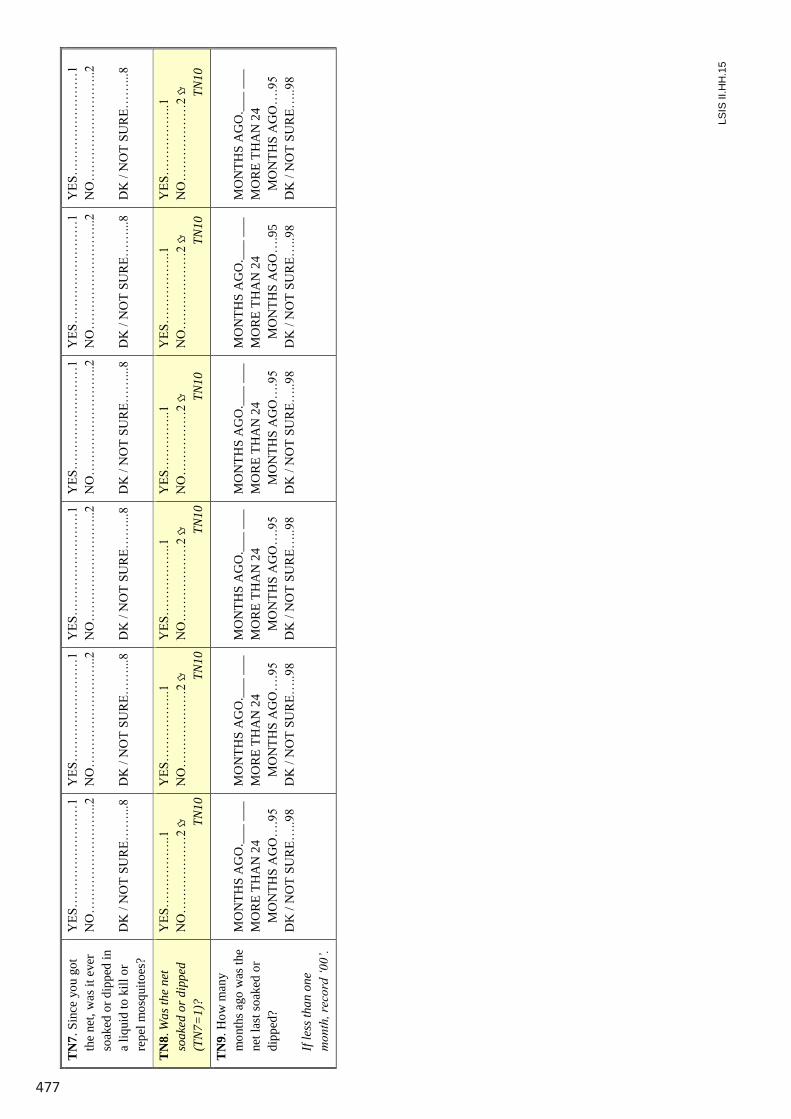
477
LSIS
II.H
H.1
5
TN
7. S
ince
you
got
th
e ne
t, w
as it
eve
r so
aked
or d
ippe
d in
a
liqui
d to
kill
or
repe
l mos
quito
es?
YES
……
……
……
……
1 N
O…
……
……
……
…..2
D
K /
NO
T SU
RE…
…...
8
YES
……
……
……
……
1 N
O…
……
……
……
…..2
D
K /
NO
T SU
RE…
…...
8
YES
……
……
……
……
1 N
O…
……
……
……
…..2
D
K /
NO
T SU
RE…
…...
8
YES
……
……
……
……
1 N
O…
……
……
……
…..2
D
K /
NO
T SU
RE…
…...
8
YES
……
……
……
……
1 N
O…
……
……
……
…..2
D
K /
NO
T SU
RE…
…...
8
YES
……
……
……
……
1 N
O…
……
……
……
…..2
D
K /
NO
T SU
RE…
…...
8
TN
8. W
as th
e ne
t so
aked
or d
ippe
d (T
N7=
1)?
YES
……
……
…..1
N
O…
……
……
…2
TN10
YES
……
……
…..1
N
O…
……
……
…2
TN10
YES
……
……
…..1
N
O…
……
……
…2
TN10
YES
……
……
..1
NO
……
……
…2
TN1
0
YES
……
……
…..1
N
O…
……
……
…2
T
N10
YES
……
……
…..1
N
O…
……
……
…2
T
N10
TN
9. H
ow m
any
mon
ths a
go w
as th
e ne
t las
t soa
ked
or
dipp
ed?
If
less
than
one
m
onth
, rec
ord
‘00’
.
MO
NTH
S A
GO
.___
___
M
OR
E TH
AN
24
MO
NTH
S A
GO
….9
5 D
K /
NO
T SU
RE…
..98
MO
NTH
S A
GO
.___
___
M
OR
E TH
AN
24
MO
NTH
S A
GO
….9
5 D
K /
NO
T SU
RE…
..98
MO
NTH
S A
GO
.___
___
M
OR
E TH
AN
24
MO
NTH
S A
GO
….9
5 D
K /
NO
T SU
RE…
..98
MO
NTH
S A
GO
.___
___
M
OR
E TH
AN
24
MO
NTH
S A
GO
….9
5 D
K /
NO
T SU
RE…
..98
MO
NTH
S A
GO
.___
___
M
OR
E TH
AN
24
MO
NTH
S A
GO
….9
5 D
K /
NO
T SU
RE…
..98
MO
NTH
S A
GO
.___
___
M
OR
E TH
AN
24
MO
NTH
S A
GO
….9
5 D
K /
NO
T SU
RE…
..98
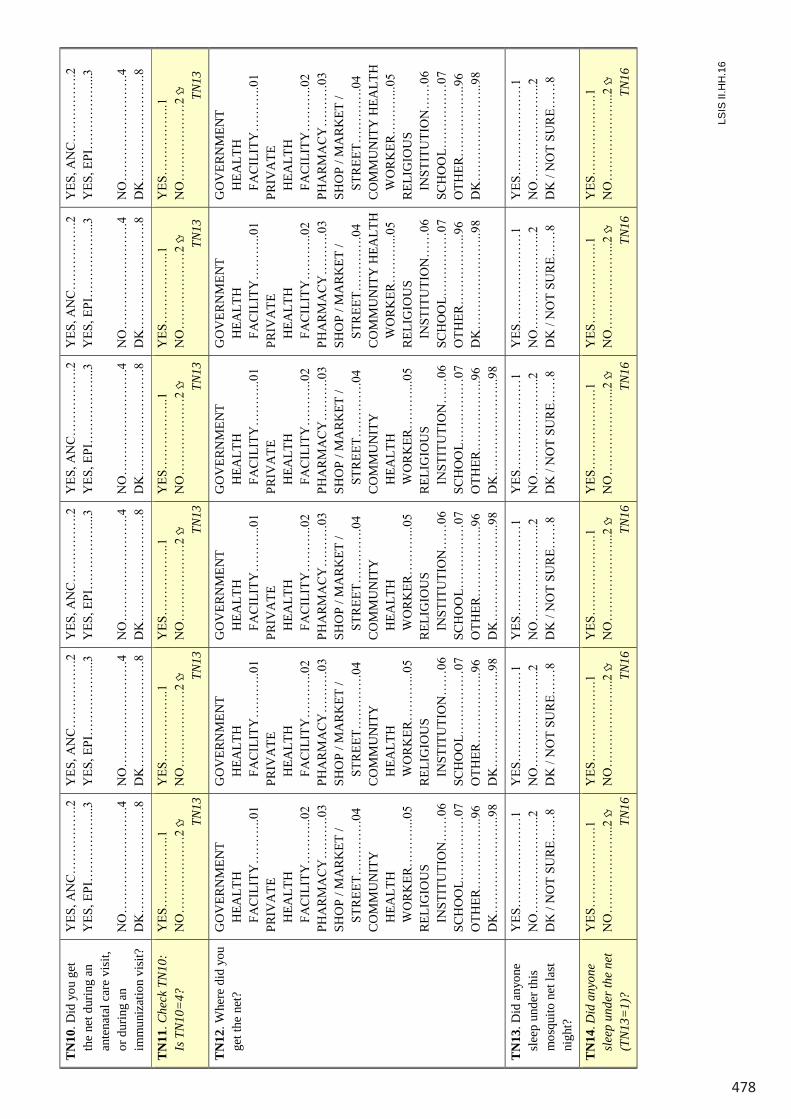
478
LSIS
II.H
H.1
6
TN
10. D
id y
ou g
et
the
net d
urin
g an
an
tena
tal c
are
visi
t, or
dur
ing
an
imm
uniz
atio
n vi
sit?
YES
, AN
C……
……
….2
Y
ES, E
PI…
……
……
...3
NO
……
……
……
……
.4
DK
……
……
……
……
.8
YES
, AN
C……
……
….2
Y
ES, E
PI…
……
……
...3
NO
……
……
……
……
.4
DK
……
……
……
……
.8
YES
, AN
C……
……
….2
Y
ES, E
PI…
……
……
...3
NO
……
……
……
……
.4
DK
……
……
……
……
.8
YES
, AN
C……
……
….2
Y
ES, E
PI…
……
……
...3
NO
……
……
……
……
.4
DK
……
……
……
……
.8
YES
, AN
C……
……
….2
Y
ES, E
PI…
……
……
...3
NO
……
……
……
……
.4
DK
……
……
……
……
.8
YES
, AN
C……
……
….2
Y
ES, E
PI…
……
……
...3
NO
……
……
……
……
.4
DK
……
……
……
……
.8
TN
11. C
heck
TN1
0:
Is T
N10=
4?
YES
……
……
…..1
N
O…
……
……
…2
TN13
YES
……
……
…..1
N
O…
……
……
…2
TN13
YES
……
……
…..1
N
O…
……
……
…2
TN13
YES
……
……
…..1
N
O…
……
……
…2
T
N13
YES
……
……
…..1
N
O…
……
……
…2
T
N13
YES
……
……
…..1
N
O…
……
……
…2
T
N13
TN
12. W
here
did
you
ge
t the
net
? G
OV
ERN
MEN
T
HEA
LTH
FA
CILI
TY…
……
..01
PRIV
ATE
HEA
LTH
FA
CILI
TY…
……
..02
PHA
RMA
CY…
……
.03
SHO
P / M
AR
KET
/
STRE
ET…
……
….0
4 C
OM
MU
NIT
Y
HEA
LTH
WO
RKER
……
…...
05
REL
IGIO
US
IN
STIT
UTI
ON
……
06
SCH
OO
L……
……
…07
O
THER
……
……
…..9
6 D
K…
……
……
……
..98
GO
VER
NM
ENT
H
EALT
H
FACI
LITY
……
…..0
1 PR
IVA
TE
H
EALT
H
FACI
LITY
……
…..0
2 PH
ARM
ACY
……
….0
3 SH
OP
/ MA
RK
ET /
ST
REET
……
……
.04
CO
MM
UN
ITY
H
EALT
H
W
ORK
ER…
……
...05
R
ELIG
IOU
S
INST
ITU
TIO
N…
…06
SC
HO
OL…
……
……
07
OTH
ER…
……
……
..96
DK
……
……
……
…..9
8
GO
VER
NM
ENT
H
EALT
H
FACI
LITY
……
…..0
1 PR
IVA
TE
H
EALT
H
FACI
LITY
……
…..0
2 PH
ARM
ACY
……
….0
3 SH
OP
/ MA
RK
ET /
ST
REET
……
……
.04
CO
MM
UN
ITY
H
EALT
H
W
ORK
ER…
……
...05
R
ELIG
IOU
S
INST
ITU
TIO
N…
…06
SC
HO
OL…
……
……
07
OTH
ER…
……
……
..96
DK
……
……
……
…..9
8
GO
VER
NM
ENT
H
EALT
H
FACI
LITY
……
…..0
1 PR
IVA
TE
H
EALT
H
FACI
LITY
……
…..0
2 PH
ARM
ACY
……
….0
3 SH
OP
/ MA
RK
ET /
ST
REET
……
……
.04
CO
MM
UN
ITY
H
EALT
H
W
ORK
ER…
……
...05
R
ELIG
IOU
S
INST
ITU
TIO
N…
…06
SC
HO
OL…
……
……
07
OTH
ER…
……
……
..96
DK
……
……
……
…..9
8
GO
VER
NM
ENT
H
EALT
H
FACI
LITY
……
…..0
1 PR
IVA
TE
H
EALT
H
FACI
LITY
……
…..0
2 PH
ARM
ACY
……
….0
3 SH
OP
/ MA
RK
ET /
ST
REET
……
……
.04
CO
MM
UN
ITY
HEA
LTH
WO
RKER
……
…...
05
REL
IGIO
US
IN
STIT
UTI
ON
……
06
SCH
OO
L……
……
…07
O
THER
……
……
…..9
6 D
K…
……
……
……
..98
GO
VER
NM
ENT
H
EALT
H
FACI
LITY
……
…..0
1 PR
IVA
TE
H
EALT
H
FAC
ILIT
Y…
……
..02
PHA
RMA
CY…
……
.03
SHO
P / M
AR
KET
/
STRE
ET…
……
….0
4 C
OM
MU
NIT
Y H
EALT
H
W
ORK
ER…
……
...05
R
ELIG
IOU
S
INST
ITU
TIO
N…
…06
SC
HO
OL…
……
……
07
OTH
ER…
……
……
..96
DK
……
……
……
…..9
8
TN
13. D
id a
nyon
e sl
eep
unde
r thi
s m
osqu
ito n
et la
st
nigh
t?
YES
……
……
……
…1
NO
……
……
……
…..2
D
K /
NO
T SU
RE…
…8
YES
……
……
……
…1
NO
……
……
……
…..2
D
K /
NO
T SU
RE…
…8
YES
……
……
……
…1
NO
……
……
……
…..2
D
K /
NO
T SU
RE…
…8
YES
……
……
……
…1
NO
……
……
……
…..2
D
K /
NO
T SU
RE…
…8
YES
……
……
……
…1
NO
……
……
……
…..2
D
K /
NO
T SU
RE…
…8
YES
……
……
……
…1
NO
……
……
……
…..2
D
K /
NO
T SU
RE…
…8
TN
14. D
id a
nyon
e sl
eep
unde
r the
net
(T
N13
=1)
?
YES
……
……
……
.1
NO
……
……
……
...2
TN
16
YES
……
……
……
.1
NO
……
……
……
...2
TN
16
YES
……
……
……
.1
NO
……
……
……
...2
TN
16
YES
……
……
……
.1
NO
……
……
……
...2
T
N16
YES
……
……
……
.1
NO
……
……
……
...2
T
N16
YES
……
……
……
.1
NO
……
……
……
...2
T
N16
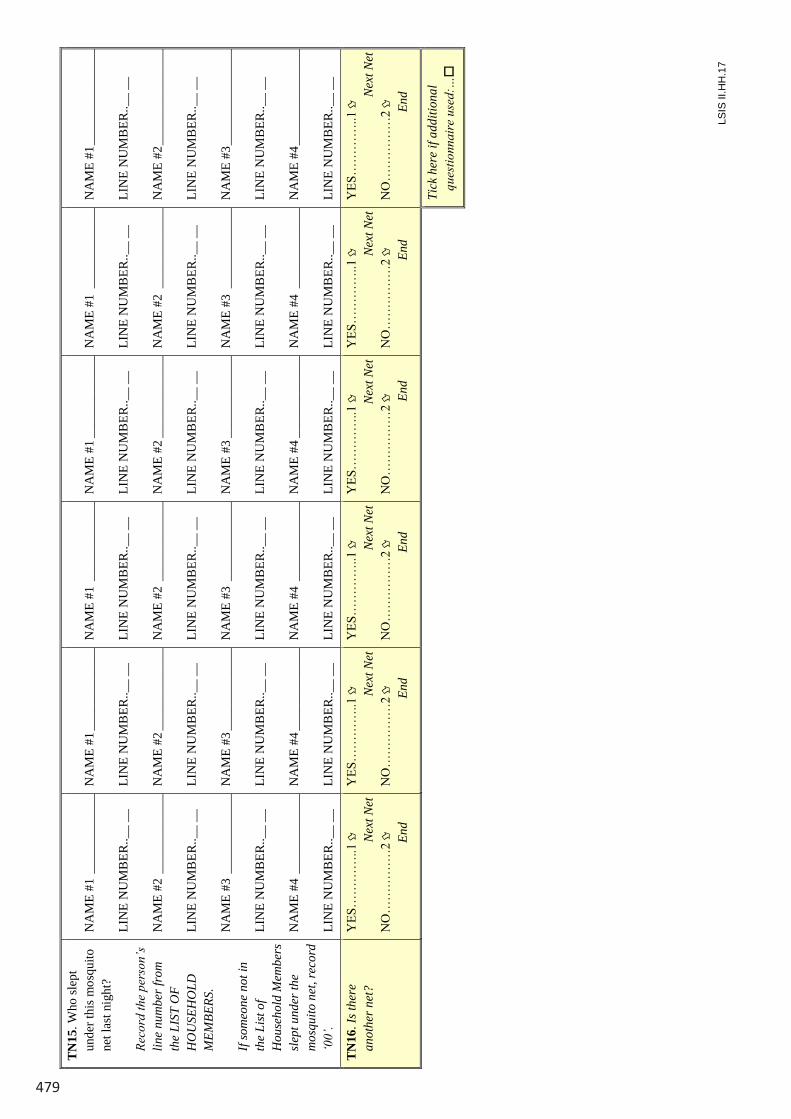
479
LSIS
II.H
H.1
7
TN
15. W
ho sl
ept
unde
r thi
s mos
quito
ne
t las
t nig
ht?
Re
cord
the
pers
on’s
lin
e nu
mbe
r fro
m
the
LIST
OF
HO
USE
HO
LD
MEM
BERS
.
If so
meo
ne n
ot in
th
e Li
st of
H
ouse
hold
Mem
bers
sl
ept u
nder
the
mos
quito
net
, rec
ord
‘00’
.
NA
ME
#1 _
____
____
____
_
LIN
E N
UM
BER
..__
__
NA
ME
#2 _
____
____
____
_
LIN
E N
UM
BER
..__
__
NA
ME
#3 _
____
____
____
_
LIN
E N
UM
BER
..__
__
NA
ME
#4 _
____
____
____
_
LIN
E N
UM
BER
..__
__
NA
ME
#1 __
____
____
____
_ LI
NE
NU
MB
ER.._
_ __
N
AM
E #2
____
____
____
___
LIN
E N
UM
BER
..__
__
NA
ME
#3 __
____
____
____
_ LI
NE
NU
MB
ER.._
_ __
N
AM
E #4
____
____
____
___
LIN
E N
UM
BER
..__
__
NA
ME
#1 _
____
____
____
_
LIN
E N
UM
BER
..__
__
NA
ME
#2 _
____
____
____
_
LIN
E N
UM
BER
..__
__
NA
ME
#3 _
____
____
____
_
LIN
E N
UM
BER
..__
__
NA
ME
#4 _
____
____
____
_
LIN
E N
UM
BER
..__
__
NA
ME
#1 _
____
____
____
_
LIN
E N
UM
BER
..__
__
NA
ME
#2 _
____
____
____
_
LIN
E N
UM
BER
..__
__
NA
ME
#3 _
____
____
____
_
LIN
E N
UM
BER
..__
__
NA
ME
#4 _
____
____
____
_
LIN
E N
UM
BER
..__
__
NA
ME
#1 _
____
____
____
_
LIN
E N
UM
BER
..__
__
NA
ME
#2 _
____
____
____
_
LIN
E N
UM
BER
..__
__
NA
ME
#3 _
____
____
____
_
LIN
E N
UM
BER
..__
__
NA
ME
#4 _
____
____
____
_
LIN
E N
UM
BER
..__
__
NA
ME
#1 __
____
____
____
_ LI
NE
NU
MB
ER.._
_ __
N
AM
E #2
____
____
____
___
LIN
E N
UM
BER
..__
__
NA
ME
#3 __
____
____
____
_ LI
NE
NU
MB
ER.._
_ __
N
AM
E #4
____
____
____
___
LIN
E N
UM
BER
..__
__
TN
16. I
s the
re
anot
her n
et?
YES
……
……
..1
N
ext N
et
NO
……
……
…2
E
nd
YES
……
……
..1
N
ext N
et
NO
……
……
…2
E
nd
YES
……
……
..1
N
ext N
et
NO
……
……
…2
E
nd
YES
……
……
..1
N
ext N
et
NO
……
……
…2
En
d
YES
……
……
..1
Nex
t Net
N
O…
……
……
2
E
nd
YES
……
……
..1
Nex
t Net
N
O…
……
……
2
E
nd
Ti
ck h
ere
if ad
ditio
nal
ques
tionn
aire
use
d:…
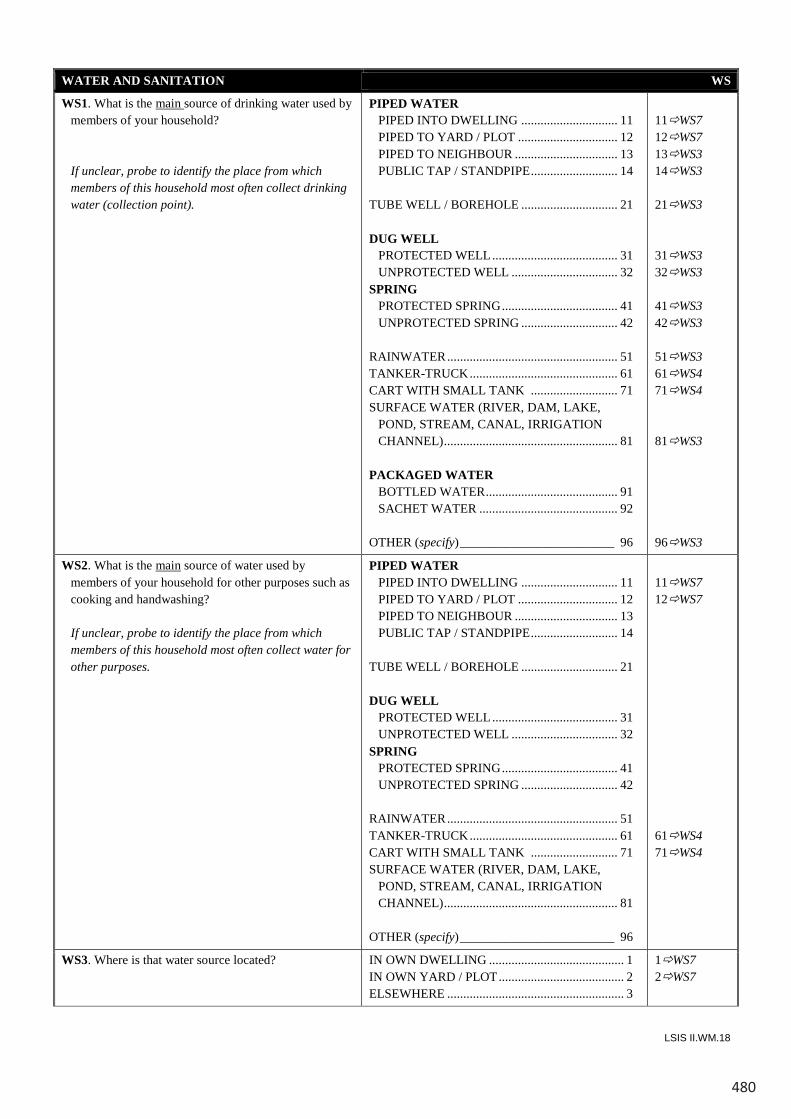
480
LSIS II.WM.18
WATER AND SANITATION WS
WS1. What is the main source of drinking water used by members of your household?
If unclear, probe to identify the place from which
members of this household most often collect drinking water (collection point).
PIPED WATER PIPED INTO DWELLING .............................. 11 PIPED TO YARD / PLOT ............................... 12 PIPED TO NEIGHBOUR ................................ 13 PUBLIC TAP / STANDPIPE ........................... 14 TUBE WELL / BOREHOLE .............................. 21 DUG WELL PROTECTED WELL ....................................... 31 UNPROTECTED WELL ................................. 32 SPRING PROTECTED SPRING .................................... 41 UNPROTECTED SPRING .............................. 42 RAINWATER ..................................................... 51 TANKER-TRUCK .............................................. 61 CART WITH SMALL TANK ........................... 71 SURFACE WATER (RIVER, DAM, LAKE,
POND, STREAM, CANAL, IRRIGATION CHANNEL) ...................................................... 81
PACKAGED WATER BOTTLED WATER ......................................... 91 SACHET WATER ........................................... 92 OTHER (specify) ________________________ 96
11WS7 12WS7 13WS3 14WS3 21WS3 31WS3 32WS3 41WS3 42WS3 51WS3 61WS4 71WS4 81WS3 96WS3
WS2. What is the main source of water used by members of your household for other purposes such as cooking and handwashing?
If unclear, probe to identify the place from which
members of this household most often collect water for other purposes.
PIPED WATER PIPED INTO DWELLING .............................. 11 PIPED TO YARD / PLOT ............................... 12 PIPED TO NEIGHBOUR ................................ 13 PUBLIC TAP / STANDPIPE ........................... 14 TUBE WELL / BOREHOLE .............................. 21 DUG WELL PROTECTED WELL ....................................... 31 UNPROTECTED WELL ................................. 32 SPRING PROTECTED SPRING .................................... 41 UNPROTECTED SPRING .............................. 42 RAINWATER ..................................................... 51 TANKER-TRUCK .............................................. 61 CART WITH SMALL TANK ........................... 71 SURFACE WATER (RIVER, DAM, LAKE,
POND, STREAM, CANAL, IRRIGATION CHANNEL) ...................................................... 81
OTHER (specify) ________________________ 96
11WS7 12WS7 61WS4 71WS4
WS3. Where is that water source located? IN OWN DWELLING .......................................... 1 IN OWN YARD / PLOT ....................................... 2 ELSEWHERE ....................................................... 3
1WS7 2WS7
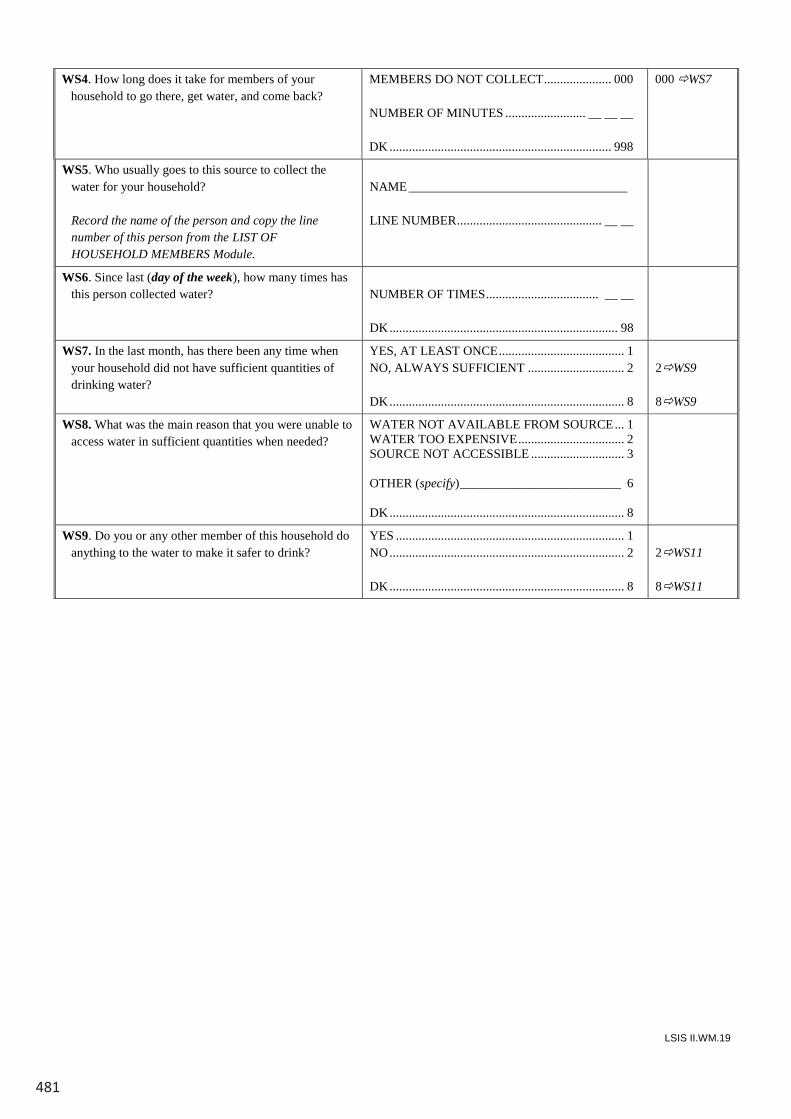
481
LSIS II.WM.19
WS4. How long does it take for members of your household to go there, get water, and come back?
MEMBERS DO NOT COLLECT ..................... 000 NUMBER OF MINUTES ......................... __ __ __ DK ..................................................................... 998
000 WS7
WS5. Who usually goes to this source to collect the water for your household?
Record the name of the person and copy the line
number of this person from the LIST OF HOUSEHOLD MEMBERS Module.
NAME __________________________________ LINE NUMBER ............................................. __ __
WS6. Since last (day of the week), how many times has this person collected water?
NUMBER OF TIMES ................................... __ __ DK ....................................................................... 98
WS7. In the last month, has there been any time when your household did not have sufficient quantities of drinking water?
YES, AT LEAST ONCE ....................................... 1 NO, ALWAYS SUFFICIENT .............................. 2 DK ......................................................................... 8
2WS9 8WS9
WS8. What was the main reason that you were unable to access water in sufficient quantities when needed?
WATER NOT AVAILABLE FROM SOURCE ... 1 WATER TOO EXPENSIVE ................................. 2 SOURCE NOT ACCESSIBLE ............................. 3 OTHER (specify) _________________________ 6 DK ......................................................................... 8
WS9. Do you or any other member of this household do anything to the water to make it safer to drink?
YES ....................................................................... 1 NO ......................................................................... 2 DK ......................................................................... 8
2WS11 8WS11
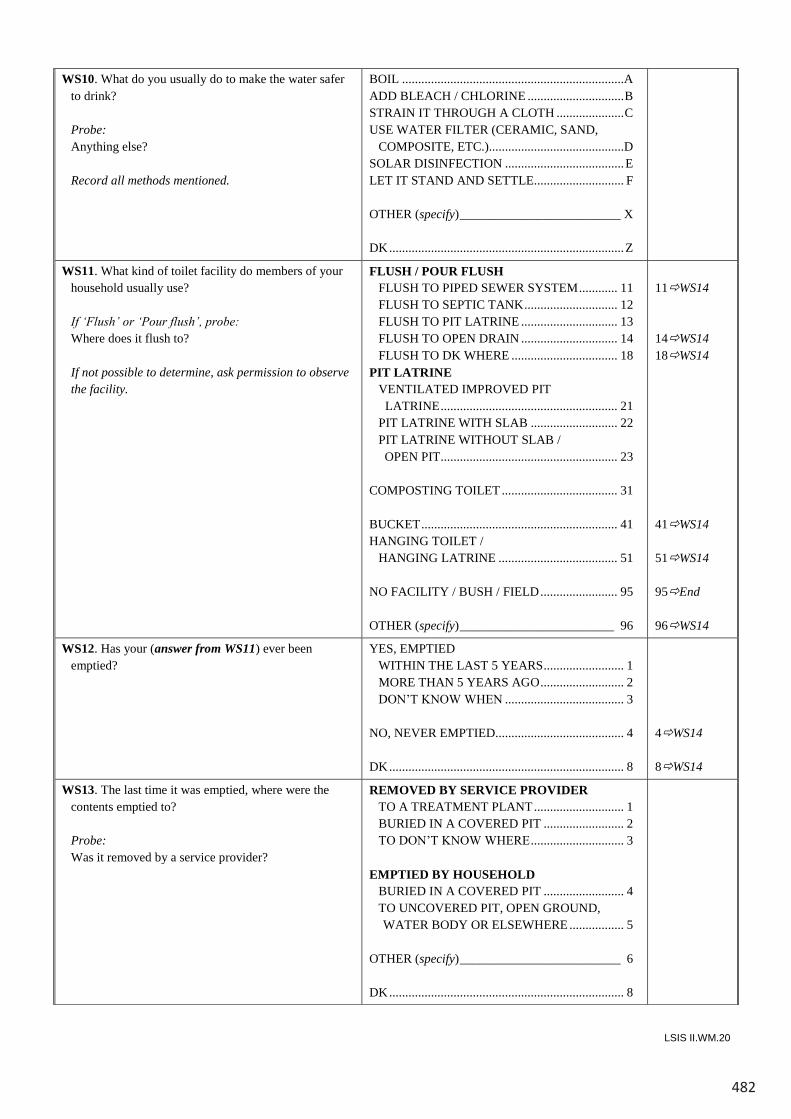
482
LSIS II.WM.20
WS10. What do you usually do to make the water safer to drink?
Probe: Anything else? Record all methods mentioned.
BOIL .....................................................................A ADD BLEACH / CHLORINE .............................. B STRAIN IT THROUGH A CLOTH ..................... C USE WATER FILTER (CERAMIC, SAND,
COMPOSITE, ETC.)..........................................D SOLAR DISINFECTION ..................................... E LET IT STAND AND SETTLE............................ F OTHER (specify) _________________________ X DK ......................................................................... Z
WS11. What kind of toilet facility do members of your household usually use?
If ‘Flush’ or ‘Pour flush’, probe: Where does it flush to? If not possible to determine, ask permission to observe
the facility.
FLUSH / POUR FLUSH FLUSH TO PIPED SEWER SYSTEM ............ 11 FLUSH TO SEPTIC TANK ............................. 12 FLUSH TO PIT LATRINE .............................. 13 FLUSH TO OPEN DRAIN .............................. 14 FLUSH TO DK WHERE ................................. 18 PIT LATRINE VENTILATED IMPROVED PIT LATRINE ....................................................... 21 PIT LATRINE WITH SLAB ........................... 22 PIT LATRINE WITHOUT SLAB / OPEN PIT ....................................................... 23 COMPOSTING TOILET .................................... 31 BUCKET ............................................................. 41 HANGING TOILET / HANGING LATRINE ..................................... 51 NO FACILITY / BUSH / FIELD ........................ 95 OTHER (specify) ________________________ 96
11WS14 14WS14 18WS14 41WS14 51WS14 95End 96WS14
WS12. Has your (answer from WS11) ever been emptied?
YES, EMPTIED WITHIN THE LAST 5 YEARS ......................... 1 MORE THAN 5 YEARS AGO .......................... 2 DON’T KNOW WHEN ..................................... 3 NO, NEVER EMPTIED........................................ 4 DK ......................................................................... 8
4WS14 8WS14
WS13. The last time it was emptied, where were the contents emptied to?
Probe: Was it removed by a service provider?
REMOVED BY SERVICE PROVIDER TO A TREATMENT PLANT ............................ 1 BURIED IN A COVERED PIT ......................... 2 TO DON’T KNOW WHERE ............................. 3 EMPTIED BY HOUSEHOLD BURIED IN A COVERED PIT ......................... 4 TO UNCOVERED PIT, OPEN GROUND,
WATER BODY OR ELSEWHERE ................. 5 OTHER (specify) _________________________ 6 DK ......................................................................... 8
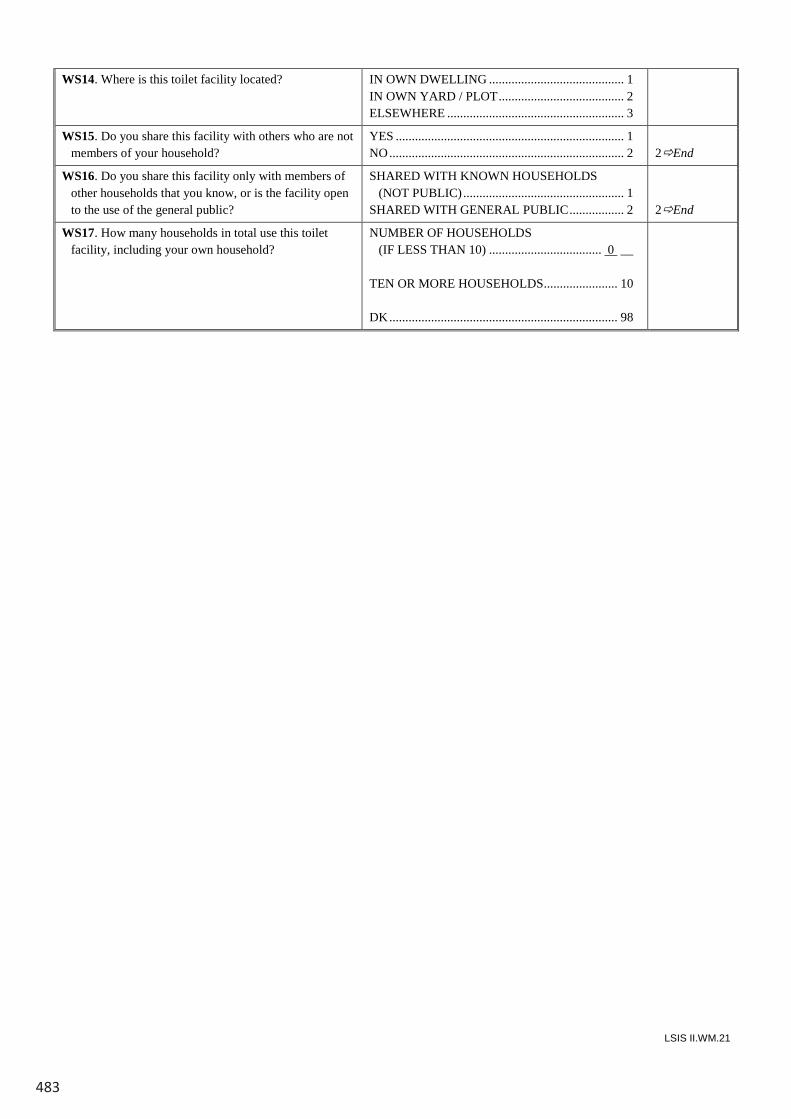
483
LSIS II.WM.21
WS14. Where is this toilet facility located? IN OWN DWELLING .......................................... 1 IN OWN YARD / PLOT ....................................... 2 ELSEWHERE ....................................................... 3
WS15. Do you share this facility with others who are not members of your household?
YES ....................................................................... 1 NO ......................................................................... 2
2End
WS16. Do you share this facility only with members of other households that you know, or is the facility open to the use of the general public?
SHARED WITH KNOWN HOUSEHOLDS (NOT PUBLIC) .................................................. 1 SHARED WITH GENERAL PUBLIC ................. 2
2End
WS17. How many households in total use this toilet facility, including your own household?
NUMBER OF HOUSEHOLDS (IF LESS THAN 10) ................................... 0 __ TEN OR MORE HOUSEHOLDS ....................... 10 DK ....................................................................... 98
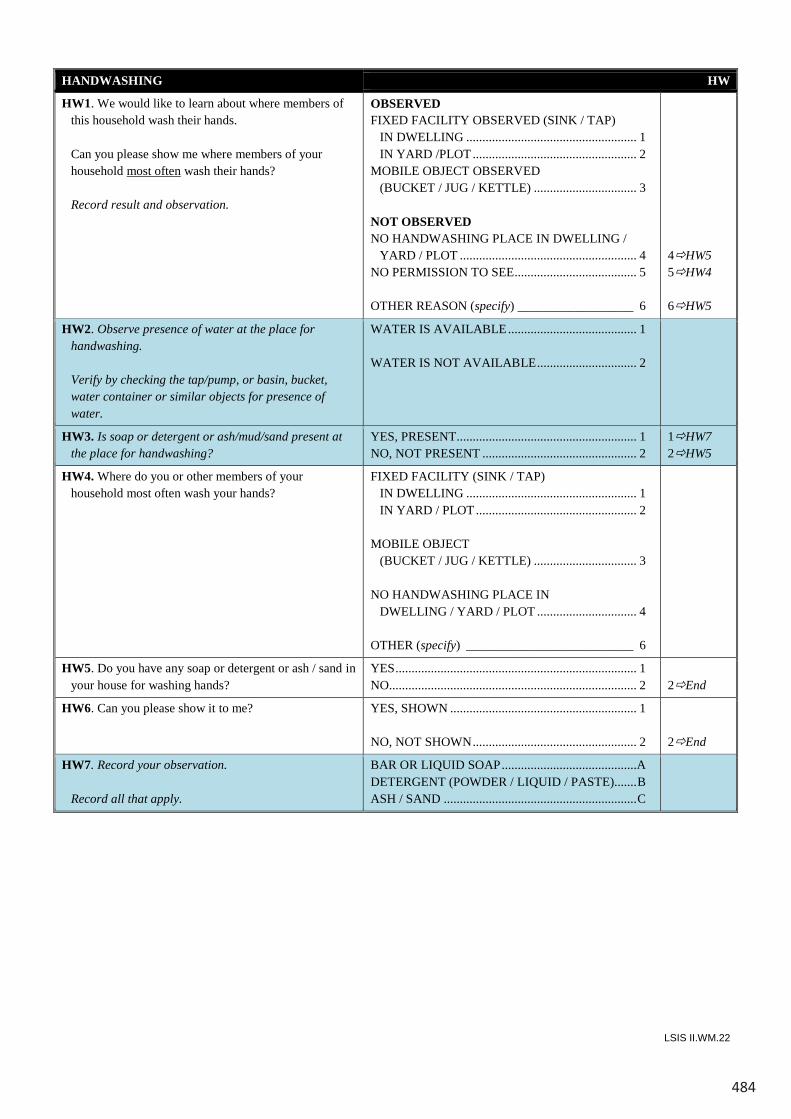
484
LSIS II.WM.22
HANDWASHING HW
HW1. We would like to learn about where members of this household wash their hands.
Can you please show me where members of your
household most often wash their hands? Record result and observation.
OBSERVED FIXED FACILITY OBSERVED (SINK / TAP) IN DWELLING ..................................................... 1 IN YARD /PLOT ................................................... 2 MOBILE OBJECT OBSERVED (BUCKET / JUG / KETTLE) ................................ 3 NOT OBSERVED NO HANDWASHING PLACE IN DWELLING / YARD / PLOT ....................................................... 4 NO PERMISSION TO SEE ...................................... 5 OTHER REASON (specify) __________________ 6
4HW5 5HW4 6HW5
HW2. Observe presence of water at the place for handwashing.
Verify by checking the tap/pump, or basin, bucket,
water container or similar objects for presence of water.
WATER IS AVAILABLE ........................................ 1 WATER IS NOT AVAILABLE ............................... 2
HW3. Is soap or detergent or ash/mud/sand present at the place for handwashing?
YES, PRESENT ........................................................ 1 NO, NOT PRESENT ................................................ 2
1HW7 2HW5
HW4. Where do you or other members of your household most often wash your hands?
FIXED FACILITY (SINK / TAP) IN DWELLING ..................................................... 1 IN YARD / PLOT .................................................. 2 MOBILE OBJECT (BUCKET / JUG / KETTLE) ................................ 3 NO HANDWASHING PLACE IN DWELLING / YARD / PLOT ............................... 4 OTHER (specify) __________________________ 6
HW5. Do you have any soap or detergent or ash / sand in your house for washing hands?
YES ........................................................................... 1 NO............................................................................. 2
2End
HW6. Can you please show it to me? YES, SHOWN .......................................................... 1 NO, NOT SHOWN ................................................... 2
2End
HW7. Record your observation. Record all that apply.
BAR OR LIQUID SOAP ..........................................A DETERGENT (POWDER / LIQUID / PASTE)....... B ASH / SAND ............................................................ C
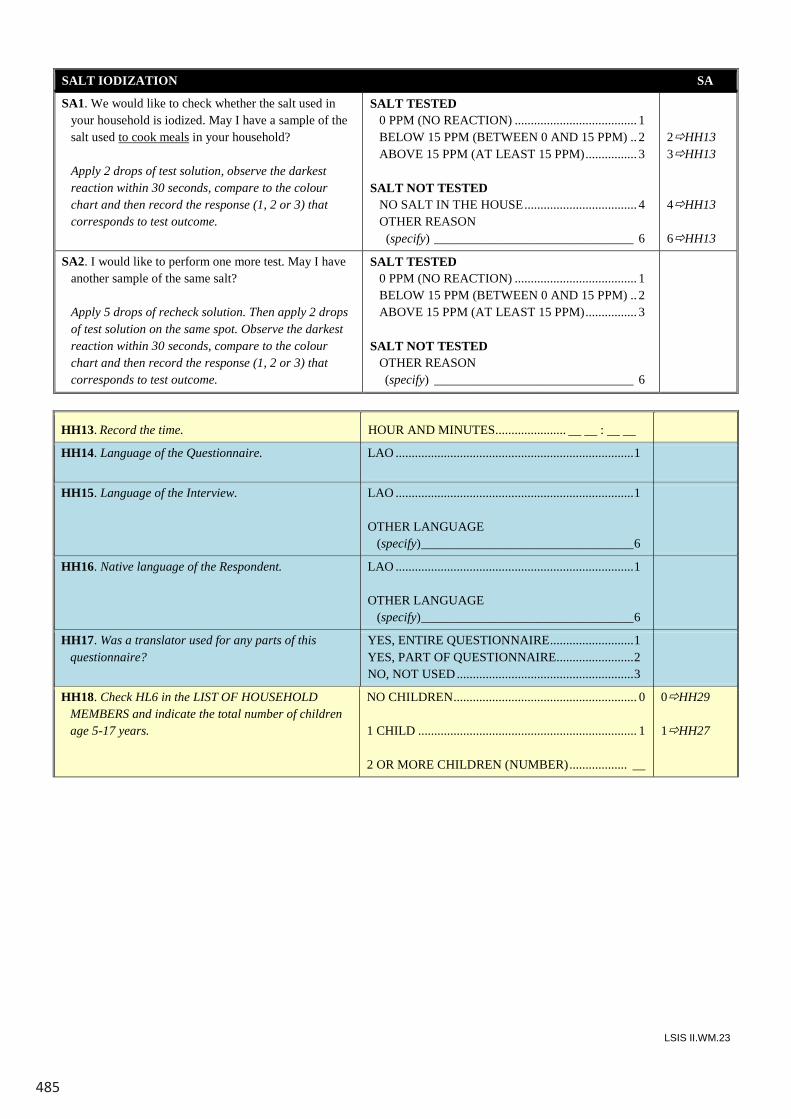
485
LSIS II.WM.23
SALT IODIZATION SA
SA1. We would like to check whether the salt used in your household is iodized. May I have a sample of the salt used to cook meals in your household?
Apply 2 drops of test solution, observe the darkest
reaction within 30 seconds, compare to the colour chart and then record the response (1, 2 or 3) that corresponds to test outcome.
SALT TESTED 0 PPM (NO REACTION) ...................................... 1 BELOW 15 PPM (BETWEEN 0 AND 15 PPM) .. 2 ABOVE 15 PPM (AT LEAST 15 PPM) ................ 3 SALT NOT TESTED NO SALT IN THE HOUSE ................................... 4 OTHER REASON (specify) _______________________________ 6
2HH13 3HH13 4HH13 6HH13
SA2. I would like to perform one more test. May I have another sample of the same salt?
Apply 5 drops of recheck solution. Then apply 2 drops
of test solution on the same spot. Observe the darkest reaction within 30 seconds, compare to the colour chart and then record the response (1, 2 or 3) that corresponds to test outcome.
SALT TESTED 0 PPM (NO REACTION) ...................................... 1 BELOW 15 PPM (BETWEEN 0 AND 15 PPM) .. 2 ABOVE 15 PPM (AT LEAST 15 PPM) ................ 3 SALT NOT TESTED OTHER REASON (specify) _______________________________ 6
HH13. Record the time. HOUR AND MINUTES ...................... __ __ : __ __
HH14. Language of the Questionnaire. LAO .......................................................................... 1
HH15. Language of the Interview. LAO .......................................................................... 1 OTHER LANGUAGE (specify) _________________________________ 6
HH16. Native language of the Respondent. LAO .......................................................................... 1 OTHER LANGUAGE (specify) _________________________________ 6
HH17. Was a translator used for any parts of this questionnaire?
YES, ENTIRE QUESTIONNAIRE .......................... 1 YES, PART OF QUESTIONNAIRE........................ 2 NO, NOT USED ....................................................... 3
HH18. Check HL6 in the LIST OF HOUSEHOLD MEMBERS and indicate the total number of children age 5-17 years.
NO CHILDREN ......................................................... 0 1 CHILD .................................................................... 1 2 OR MORE CHILDREN (NUMBER) .................. __
0HH29 1HH27
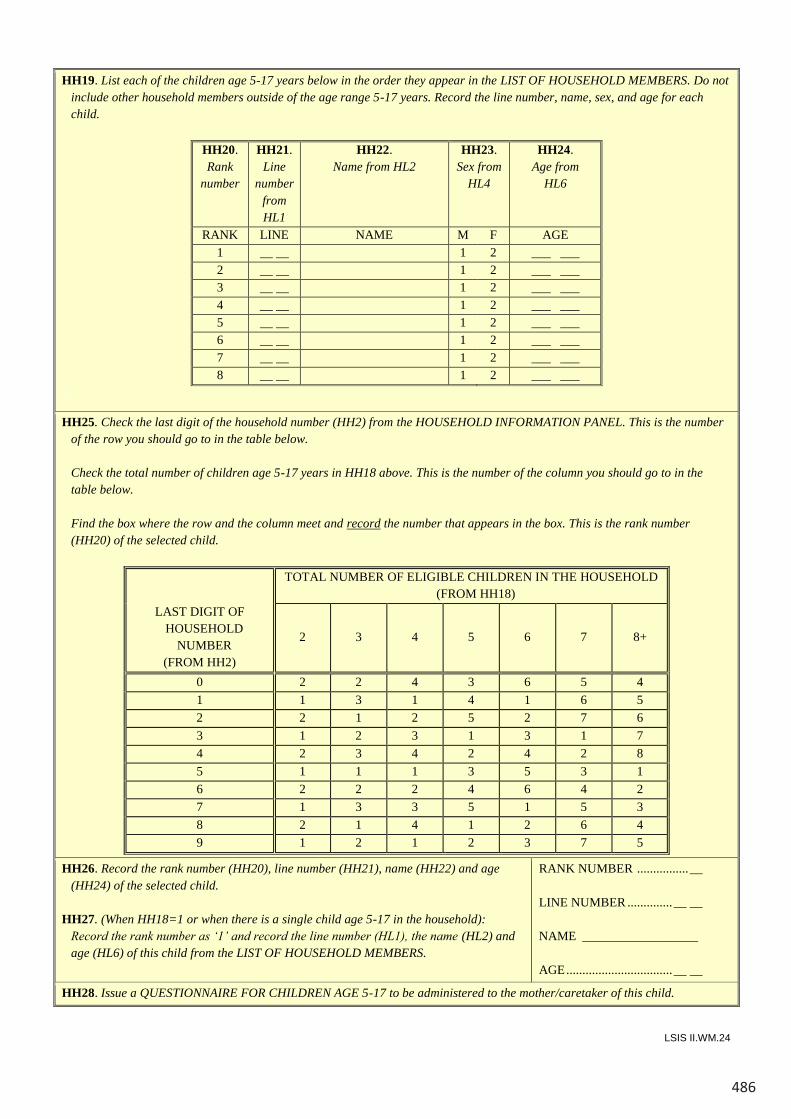
486
LSIS II.WM.24
HH19. List each of the children age 5-17 years below in the order they appear in the LIST OF HOUSEHOLD MEMBERS. Do not include other household members outside of the age range 5-17 years. Record the line number, name, sex, and age for each child.
HH20. Rank
number
HH21. Line
number from HL1
HH22. Name from HL2
HH23. Sex from
HL4
HH24. Age from
HL6
RANK LINE NAME M F AGE 1 __ __ 1 2 ___ ___ 2 __ __ 1 2 ___ ___ 3 __ __ 1 2 ___ ___ 4 __ __ 1 2 ___ ___ 5 __ __ 1 2 ___ ___ 6 __ __ 1 2 ___ ___ 7 __ __ 1 2 ___ ___ 8 __ __ 1 2 ___ ___
o
HH25. Check the last digit of the household number (HH2) from the HOUSEHOLD INFORMATION PANEL. This is the number of the row you should go to in the table below.
Check the total number of children age 5-17 years in HH18 above. This is the number of the column you should go to in the
table below. Find the box where the row and the column meet and record the number that appears in the box. This is the rank number
(HH20) of the selected child.
TOTAL NUMBER OF ELIGIBLE CHILDREN IN THE HOUSEHOLD
(FROM HH18) LAST DIGIT OF
HOUSEHOLD NUMBER
(FROM HH2)
2 3 4 5 6 7 8+
0 2 2 4 3 6 5 4 1 1 3 1 4 1 6 5 2 2 1 2 5 2 7 6 3 1 2 3 1 3 1 7 4 2 3 4 2 4 2 8 5 1 1 1 3 5 3 1 6 2 2 2 4 6 4 2 7 1 3 3 5 1 5 3 8 2 1 4 1 2 6 4 9 1 2 1 2 3 7 5
HH26. Record the rank number (HH20), line number (HH21), name (HH22) and age (HH24) of the selected child.
HH27. (When HH18=1 or when there is a single child age 5-17 in the household):
Record the rank number as ‘1’ and record the line number (HL1), the name (HL2) and age (HL6) of this child from the LIST OF HOUSEHOLD MEMBERS.
RANK NUMBER ................ __ LINE NUMBER .............. __ __ NAME __________________ AGE ................................. __ __
HH28. Issue a QUESTIONNAIRE FOR CHILDREN AGE 5-17 to be administered to the mother/caretaker of this child.
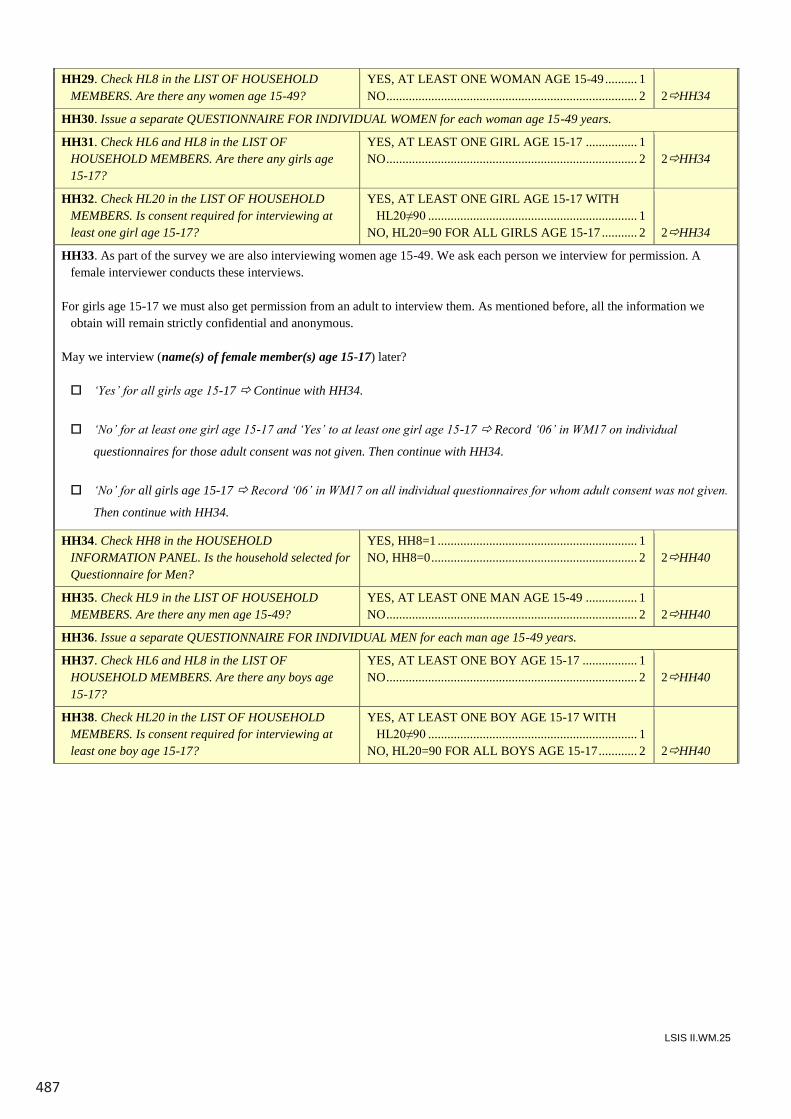
487
LSIS II.WM.25
HH29. Check HL8 in the LIST OF HOUSEHOLD MEMBERS. Are there any women age 15-49?
YES, AT LEAST ONE WOMAN AGE 15-49 .......... 1 NO .............................................................................. 2
2HH34
HH30. Issue a separate QUESTIONNAIRE FOR INDIVIDUAL WOMEN for each woman age 15-49 years.
HH31. Check HL6 and HL8 in the LIST OF HOUSEHOLD MEMBERS. Are there any girls age 15-17?
YES, AT LEAST ONE GIRL AGE 15-17 ................ 1 NO .............................................................................. 2
2HH34
HH32. Check HL20 in the LIST OF HOUSEHOLD MEMBERS. Is consent required for interviewing at least one girl age 15-17?
YES, AT LEAST ONE GIRL AGE 15-17 WITH HL20≠90 ................................................................. 1
NO, HL20=90 FOR ALL GIRLS AGE 15-17 ........... 2
2HH34
HH33. As part of the survey we are also interviewing women age 15-49. We ask each person we interview for permission. A female interviewer conducts these interviews.
For girls age 15-17 we must also get permission from an adult to interview them. As mentioned before, all the information we
obtain will remain strictly confidential and anonymous. May we interview (name(s) of female member(s) age 15-17) later? ‘Yes’ for all girls age 15-17 Continue with HH34.
‘No’ for at least one girl age 15-17 and ‘Yes’ to at least one girl age 15-17 Record ‘06’ in WM17 on individual
questionnaires for those adult consent was not given. Then continue with HH34.
‘No’ for all girls age 15-17 Record ‘06’ in WM17 on all individual questionnaires for whom adult consent was not given.
Then continue with HH34.
HH34. Check HH8 in the HOUSEHOLD INFORMATION PANEL. Is the household selected for Questionnaire for Men?
YES, HH8=1 .............................................................. 1 NO, HH8=0 ................................................................ 2
2HH40
HH35. Check HL9 in the LIST OF HOUSEHOLD MEMBERS. Are there any men age 15-49?
YES, AT LEAST ONE MAN AGE 15-49 ................ 1 NO .............................................................................. 2
2HH40
HH36. Issue a separate QUESTIONNAIRE FOR INDIVIDUAL MEN for each man age 15-49 years.
HH37. Check HL6 and HL8 in the LIST OF HOUSEHOLD MEMBERS. Are there any boys age 15-17?
YES, AT LEAST ONE BOY AGE 15-17 ................. 1 NO .............................................................................. 2
2HH40
HH38. Check HL20 in the LIST OF HOUSEHOLD MEMBERS. Is consent required for interviewing at least one boy age 15-17?
YES, AT LEAST ONE BOY AGE 15-17 WITH HL20≠90 ................................................................. 1
NO, HL20=90 FOR ALL BOYS AGE 15-17 ............ 2
2HH40
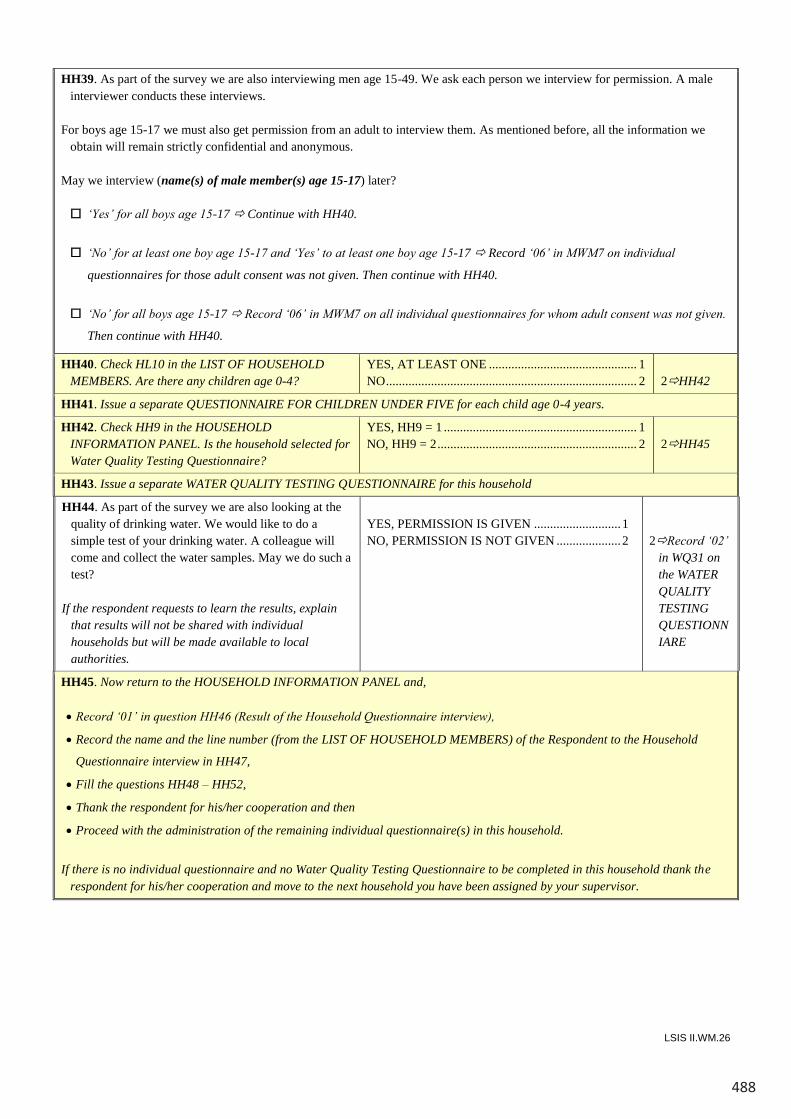
488
LSIS II.WM.26
HH39. As part of the survey we are also interviewing men age 15-49. We ask each person we interview for permission. A male interviewer conducts these interviews.
For boys age 15-17 we must also get permission from an adult to interview them. As mentioned before, all the information we obtain will remain strictly confidential and anonymous.
May we interview (name(s) of male member(s) age 15-17) later?
‘Yes’ for all boys age 15-17 Continue with HH40.
‘No’ for at least one boy age 15-17 and ‘Yes’ to at least one boy age 15-17 Record ‘06’ in MWM7 on individual
questionnaires for those adult consent was not given. Then continue with HH40.
‘No’ for all boys age 15-17 Record ‘06’ in MWM7 on all individual questionnaires for whom adult consent was not given.
Then continue with HH40.
HH40. Check HL10 in the LIST OF HOUSEHOLD MEMBERS. Are there any children age 0-4?
YES, AT LEAST ONE .............................................. 1NO.............................................................................. 2 2HH42
HH41. Issue a separate QUESTIONNAIRE FOR CHILDREN UNDER FIVE for each child age 0-4 years.
HH42. Check HH9 in the HOUSEHOLD INFORMATION PANEL. Is the household selected for Water Quality Testing Questionnaire?
YES, HH9 = 1 ............................................................ 1NO, HH9 = 2.............................................................. 2 2HH45
HH43. Issue a separate WATER QUALITY TESTING QUESTIONNAIRE for this household
HH44. As part of the survey we are also looking at the quality of drinking water. We would like to do a simple test of your drinking water. A colleague will come and collect the water samples. May we do such a test?
If the respondent requests to learn the results, explain that results will not be shared with individual households but will be made available to local authorities.
YES, PERMISSION IS GIVEN ...........................1NO, PERMISSION IS NOT GIVEN ....................2 2Record ‘02’
in WQ31 on the WATER QUALITY TESTING QUESTIONNIARE
HH45. Now return to the HOUSEHOLD INFORMATION PANEL and,
Record ‘01’ in question HH46 (Result of the Household Questionnaire interview),
Record the name and the line number (from the LIST OF HOUSEHOLD MEMBERS) of the Respondent to the Household
Questionnaire interview in HH47,
Fill the questions HH48 – HH52,
Thank the respondent for his/her cooperation and then
Proceed with the administration of the remaining individual questionnaire(s) in this household.
If there is no individual questionnaire and no Water Quality Testing Questionnaire to be completed in this household thank therespondent for his/her cooperation and move to the next household you have been assigned by your supervisor.
489
LSIS II.WM.27
INTERVIEWER’S OBSERVATIONS
SUPERVISOR’S OBSERVATIONS
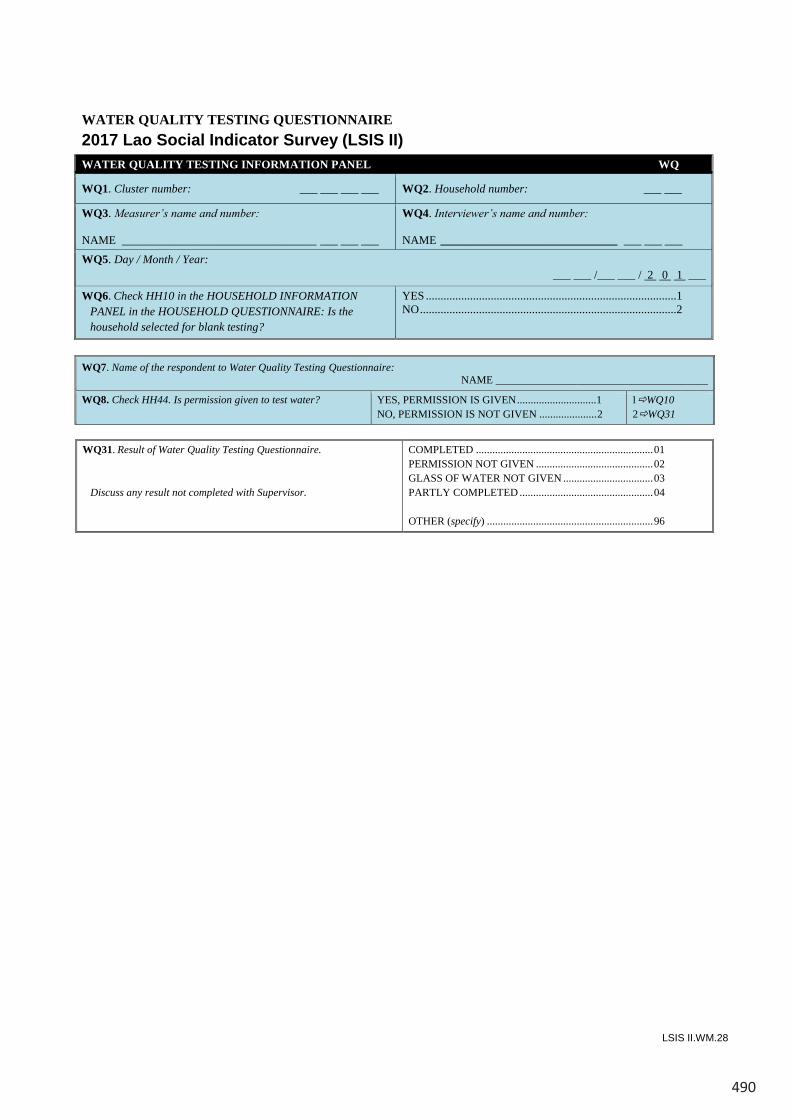
490
LSIS II.WM.28
WATER QUALITY TESTING QUESTIONNAIRE2017 Lao Social Indicator Survey (LSIS II)WATER QUALITY TESTING INFORMATION PANEL WQ
WQ1. Cluster number: ___ ___ ___ ___ WQ2. Household number: ___ ___
WQ3. Measurer’s name and number:
NAME _________________________________ ___ ___ ___
WQ4. Interviewer’s name and number:
NAME ______________________________ ___ ___ ___WQ5. Day / Month / Year:
___ ___ /___ ___ / 2 0 1 ___
WQ6. Check HH10 in the HOUSEHOLD INFORMATION PANEL in the HOUSEHOLD QUESTIONNAIRE: Is the household selected for blank testing?
YES .....................................................................................1NO.......................................................................................2
WQ7. Name of the respondent to Water Quality Testing Questionnaire:NAME _______________________________________
WQ8. Check HH44. Is permission given to test water? ...... 1NO, PERMISSION IS NOT GIVEN .....................2YES, PERMISSION IS GIVEN .............................1 1WQ10
2WQ31
WQ31. Result of Water Quality Testing Questionnaire.
Discuss any result not completed with Supervisor.
COMPLETED ................................................................. 01PERMISSION NOT GIVEN ...........................................02GLASS OF WATER NOT GIVEN ................................. 03PARTLY COMPLETED .................................................04
OTHER (specify) .............................................................96
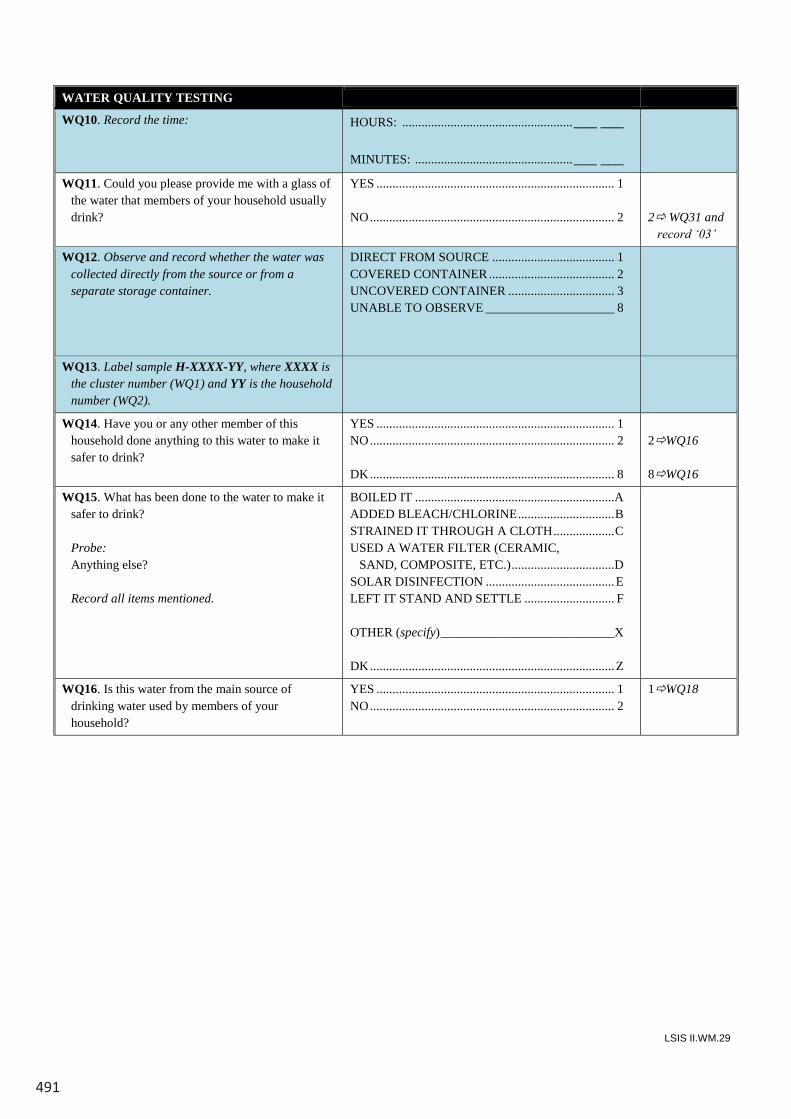
491
LSIS II.WM.29
WATER QUALITY TESTING
WQ10. Record the time: HOURS: .....................................................___ ___
MINUTES: .................................................___ ___WQ11. Could you please provide me with a glass of
the water that members of your household usually drink?
YES .......................................................................... 1
NO............................................................................ 2 2 WQ31 and record ‘03’
WQ12. Observe and record whether the water was collected directly from the source or from a separate storage container.
DIRECT FROM SOURCE ...................................... 1COVERED CONTAINER ....................................... 2UNCOVERED CONTAINER ................................. 3UNABLE TO OBSERVE ____________________ 8
WQ13. Label sample H-XXXX-YY, where XXXX is the cluster number (WQ1) and YY is the household number (WQ2).
WQ14. Have you or any other member of this household done anything to this water to make it safer to drink?
YES .......................................................................... 1NO............................................................................ 2
DK............................................................................ 8
2WQ16
8WQ16
WQ15. What has been done to the water to make it safer to drink?
Probe:Anything else?
Record all items mentioned.
BOILED IT ..............................................................AADDED BLEACH/CHLORINE..............................BSTRAINED IT THROUGH A CLOTH...................CUSED A WATER FILTER (CERAMIC,
SAND, COMPOSITE, ETC.)................................DSOLAR DISINFECTION ........................................ELEFT IT STAND AND SETTLE ............................ F
OTHER (specify)___________________________X
DK............................................................................Z
WQ16. Is this water from the main source of drinking water used by members of your household?
YES .......................................................................... 1NO............................................................................ 2
1WQ18
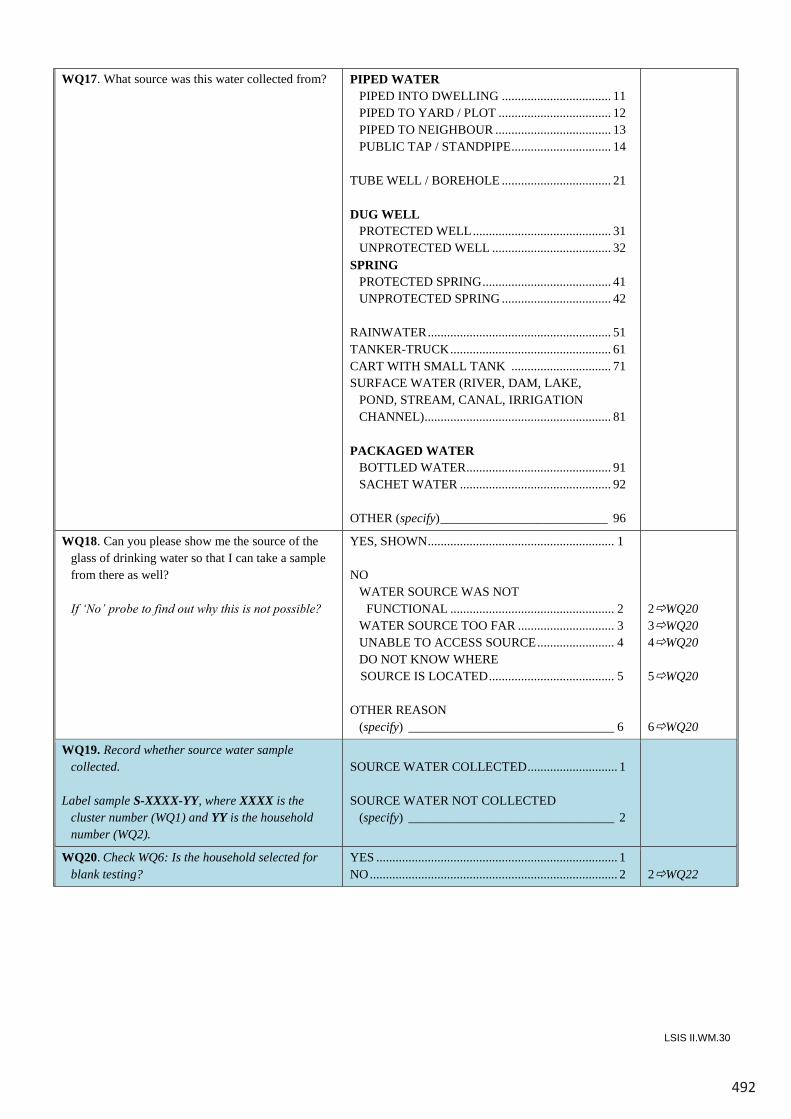
492
LSIS II.WM.30
WQ17. What source was this water collected from? PIPED WATER PIPED INTO DWELLING .................................. 11PIPED TO YARD / PLOT ................................... 12PIPED TO NEIGHBOUR .................................... 13PUBLIC TAP / STANDPIPE............................... 14
TUBE WELL / BOREHOLE .................................. 21
DUG WELLPROTECTED WELL........................................... 31UNPROTECTED WELL ..................................... 32
SPRINGPROTECTED SPRING........................................ 41UNPROTECTED SPRING .................................. 42
RAINWATER......................................................... 51TANKER-TRUCK.................................................. 61CART WITH SMALL TANK ............................... 71SURFACE WATER (RIVER, DAM, LAKE,
POND, STREAM, CANAL, IRRIGATION CHANNEL).......................................................... 81
PACKAGED WATERBOTTLED WATER............................................. 91SACHET WATER ............................................... 92
OTHER (specify)__________________________ 96
WQ18. Can you please show me the source of the glass of drinking water so that I can take a sample from there as well?
If ‘No’ probe to find out why this is not possible?
YES, SHOWN.......................................................... 1
NOWATER SOURCE WAS NOT
FUNCTIONAL ................................................... 2WATER SOURCE TOO FAR .............................. 3UNABLE TO ACCESS SOURCE........................ 4DO NOT KNOW WHERE SOURCE IS LOCATED....................................... 5
OTHER REASON(specify) ________________________________ 6
2WQ203WQ204WQ20
5WQ20
6WQ20
WQ19. Record whether source water samplecollected.
Label sample S-XXXX-YY, where XXXX is the cluster number (WQ1) and YY is the household number (WQ2).
SOURCE WATER COLLECTED............................ 1
SOURCE WATER NOT COLLECTED(specify) ________________________________ 2
WQ20. Check WQ6: Is the household selected for blank testing?
YES ........................................................................... 1NO............................................................................. 2 2WQ22
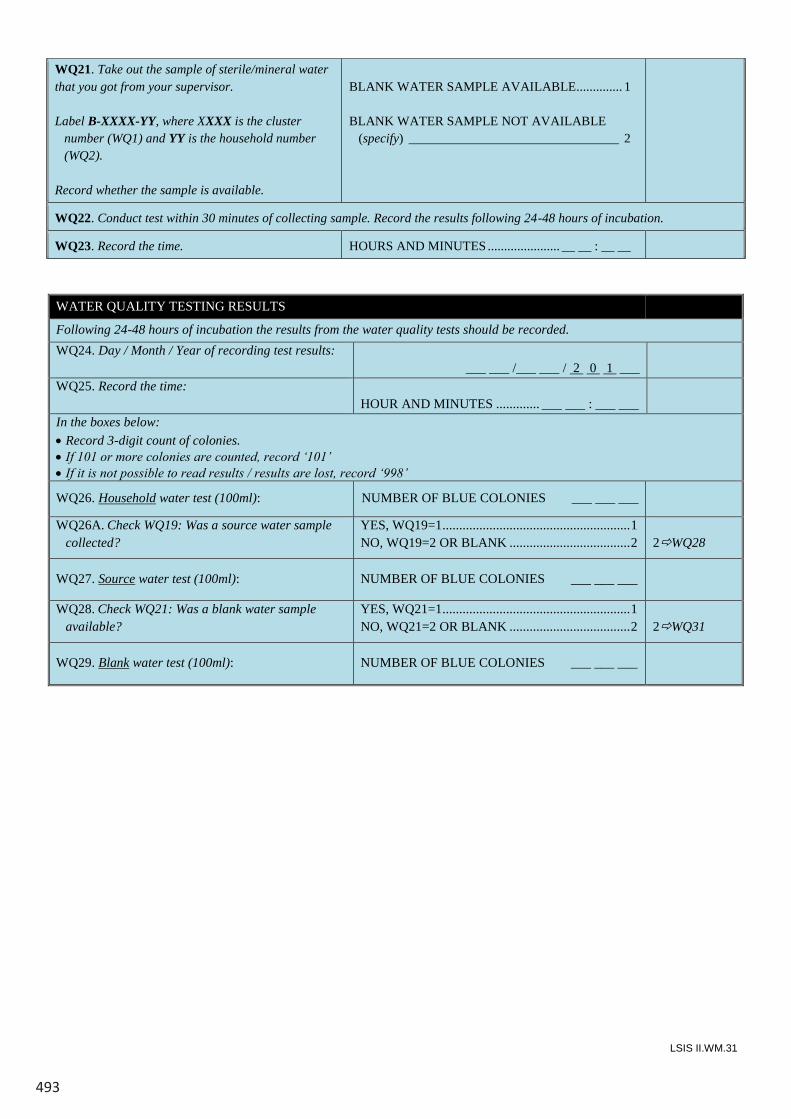
493
LSIS II.WM.31
WQ21. Take out the sample of sterile/mineral water that you got from your supervisor.
Label B-XXXX-YY, where XXXX is the cluster number (WQ1) and YY is the household number (WQ2).
Record whether the sample is available.
BLANK WATER SAMPLE AVAILABLE.............. 1
BLANK WATER SAMPLE NOT AVAILABLE(specify) ________________________________ 2
WQ22. Conduct test within 30 minutes of collecting sample. Record the results following 24-48 hours of incubation.
WQ23. Record the time. HOURS AND MINUTES ...................... __ __ : __ __
WATER QUALITY TESTING RESULTS
Following 24-48 hours of incubation the results from the water quality tests should be recorded.WQ24. Day / Month / Year of recording test results:
___ ___ /___ ___ / 2 0 1 ___WQ25. Record the time:
HOUR AND MINUTES ............. ___ ___ : ___ ___In the boxes below: Record 3-digit count of colonies. If 101 or more colonies are counted, record ‘101’ If it is not possible to read results / results are lost, record ‘998’
WQ26. Household water test (100ml): NUMBER OF BLUE COLONIES ___ ___ ___
WQ26A. Check WQ19: Was a source water sample collected?
YES, WQ19=1........................................................1NO, WQ19=2 OR BLANK ....................................2 2WQ28
WQ27. Source water test (100ml): NUMBER OF BLUE COLONIES ___ ___ ___
WQ28. Check WQ21: Was a blank water sample available?
YES, WQ21=1........................................................1NO, WQ21=2 OR BLANK ....................................2 2WQ31
WQ29. Blank water test (100ml): NUMBER OF BLUE COLONIES ___ ___ ___
494
LSIS II.WM.32
MEASURER’S OBSERVATIONS
SUPERVISOR’S OBSERVATIONS
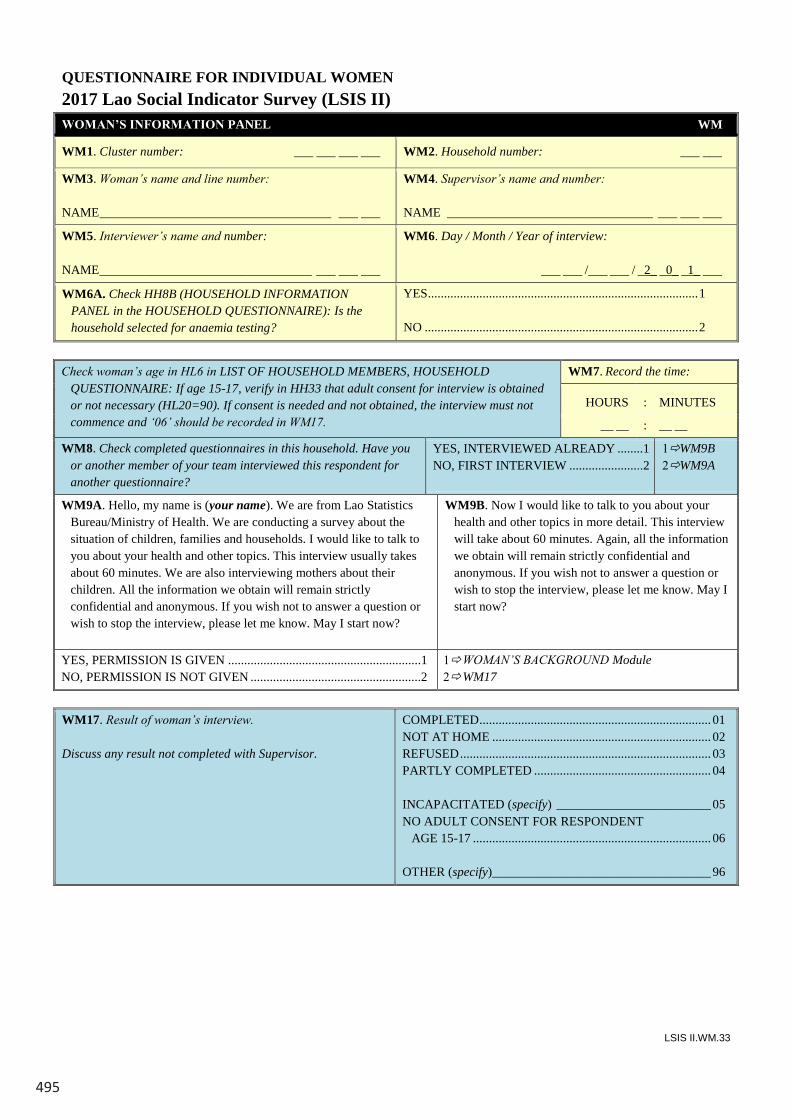
495
LSIS II.WM.33
QUESTIONNAIRE FOR INDIVIDUAL WOMEN 2017 Lao Social Indicator Survey (LSIS II)WOMAN’S INFORMATION PANEL WM
WM1. Cluster number: ___ ___ ___ ___ WM2. Household number: ___ ___
WM3. Woman’s name and line number:
NAME____________________________________ ___ ___
WM4. Supervisor’s name and number:
NAME ________________________________ ___ ___ ___
WM5. Interviewer’s name and number:
NAME_________________________________ ___ ___ ___
WM6. Day / Month / Year of interview:
___ ___ /___ ___ / _2_ _0_ _1_ ___
WM6A. Check HH8B (HOUSEHOLD INFORMATION PANEL in the HOUSEHOLD QUESTIONNAIRE): Is the household selected for anaemia testing?
YES....................................................................................1
NO .....................................................................................2
Check woman’s age in HL6 in LIST OF HOUSEHOLD MEMBERS, HOUSEHOLD QUESTIONNAIRE: If age 15-17, verify in HH33 that adult consent for interview is obtained or not necessary (HL20=90). If consent is needed and not obtained, the interview must not commence and ‘06’ should be recorded in WM17.
WM7. Record the time:
HOURS : MINUTES
__ __ : __ __
WM8. Check completed questionnaires in this household. Have you or another member of your team interviewed this respondent for another questionnaire?
1. 2
YES, INTERVIEWED ALREADY ........1 1WM9BNO, FIRST INTERVIEW .......................2 2WM9A
WM9A. Hello, my name is (your name). We are from Lao Statistics Bureau/Ministry of Health. We are conducting a survey about the situation of children, families and households. I would like to talk to you about your health and other topics. This interview usually takes about 60 minutes. We are also interviewing mothers about their children. All the information we obtain will remain strictly confidential and anonymous. If you wish not to answer a question or wish to stop the interview, please let me know. May I start now?
WM9B. Now I would like to talk to you about your health and other topics in more detail. This interview will take about 60 minutes. Again, all the information we obtain will remain strictly confidential and anonymous. If you wish not to answer a question or wish to stop the interview, please let me know. May I start now?
12
YES, PERMISSION IS GIVEN ............................................................1 1WOMAN’S BACKGROUND ModuleNO, PERMISSION IS NOT GIVEN .....................................................2 2WM17
WM17. Result of woman’s interview.
Discuss any result not completed with Supervisor.
COMPLETED........................................................................ 01NOT AT HOME .................................................................... 02REFUSED.............................................................................. 03PARTLY COMPLETED ....................................................... 04
INCAPACITATED (specify) ________________________ 05NO ADULT CONSENT FOR RESPONDENT
AGE 15-17 .......................................................................... 06
OTHER (specify)__________________________________ 96
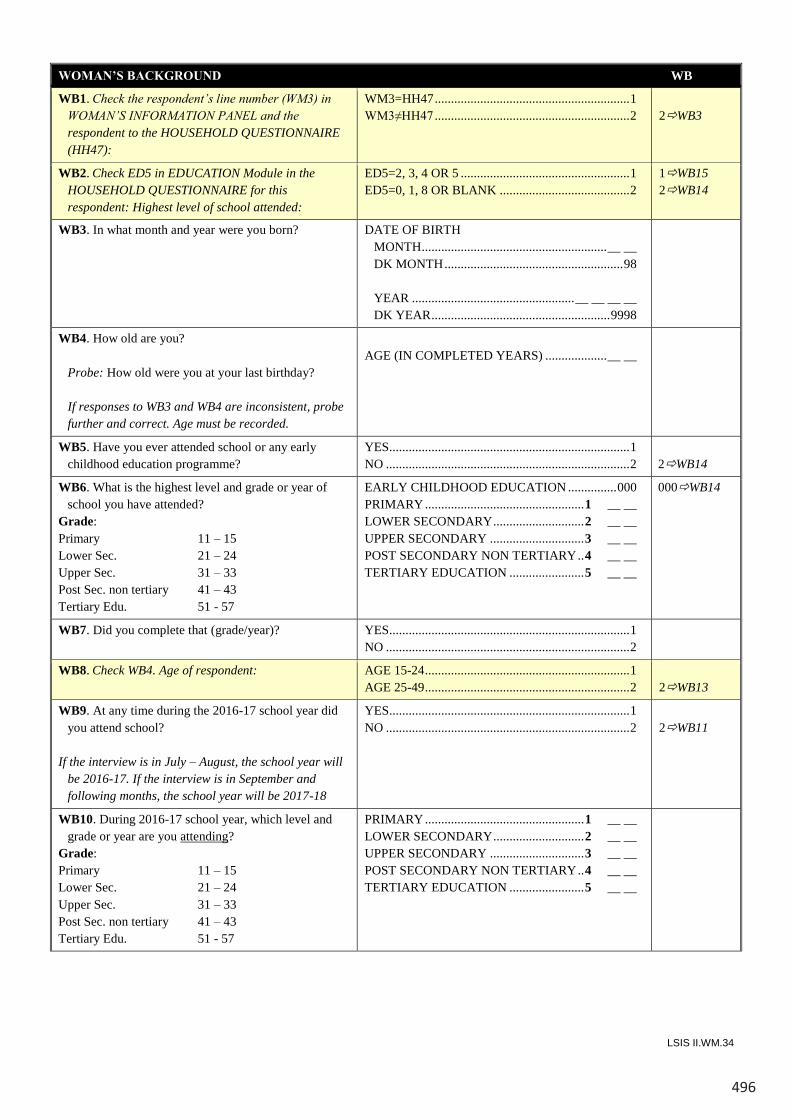
496
LSIS II.WM.34
WOMAN’S BACKGROUND WB
WB1. Check the respondent’s line number (WM3) in WOMAN’S INFORMATION PANEL and the respondent to the HOUSEHOLD QUESTIONNAIRE (HH47):
WM3=HH47 ............................................................ 1 WM3≠HH47 ............................................................ 2
2WB3
WB2. Check ED5 in EDUCATION Module in the HOUSEHOLD QUESTIONNAIRE for this respondent: Highest level of school attended:
ED5=2, 3, 4 OR 5 .................................................... 1 ED5=0, 1, 8 OR BLANK ........................................ 2
1WB15 2WB14
WB3. In what month and year were you born? DATE OF BIRTH MONTH ......................................................... __ __
DK MONTH ....................................................... 98 YEAR .................................................. __ __ __ __ DK YEAR ....................................................... 9998
WB4. How old are you? Probe: How old were you at your last birthday? If responses to WB3 and WB4 are inconsistent, probe
further and correct. Age must be recorded.
AGE (IN COMPLETED YEARS) ................... __ __
WB5. Have you ever attended school or any early childhood education programme?
YES .......................................................................... 1 NO ........................................................................... 2
2WB14
WB6. What is the highest level and grade or year of school you have attended?
Grade: Primary 11 – 15 Lower Sec. 21 – 24 Upper Sec. 31 – 33 Post Sec. non tertiary 41 – 43 Tertiary Edu. 51 - 57
EARLY CHILDHOOD EDUCATION ............... 000 PRIMARY ................................................. 1 __ __ LOWER SECONDARY ............................ 2 __ __ UPPER SECONDARY ............................. 3 __ __ POST SECONDARY NON TERTIARY .. 4 __ __ TERTIARY EDUCATION ....................... 5 __ __
000WB14
WB7. Did you complete that (grade/year)? YES .......................................................................... 1 NO ........................................................................... 2
WB8. Check WB4. Age of respondent: AGE 15-24 ............................................................... 1 AGE 25-49 ............................................................... 2
2WB13
WB9. At any time during the 2016-17 school year did you attend school?
If the interview is in July – August, the school year will
be 2016-17. If the interview is in September and following months, the school year will be 2017-18
YES .......................................................................... 1 NO ........................................................................... 2
2WB11
WB10. During 2016-17 school year, which level and grade or year are you attending?
Grade: Primary 11 – 15 Lower Sec. 21 – 24 Upper Sec. 31 – 33 Post Sec. non tertiary 41 – 43 Tertiary Edu. 51 - 57
PRIMARY ................................................. 1 __ __ LOWER SECONDARY ............................ 2 __ __ UPPER SECONDARY ............................. 3 __ __ POST SECONDARY NON TERTIARY .. 4 __ __ TERTIARY EDUCATION ....................... 5 __ __
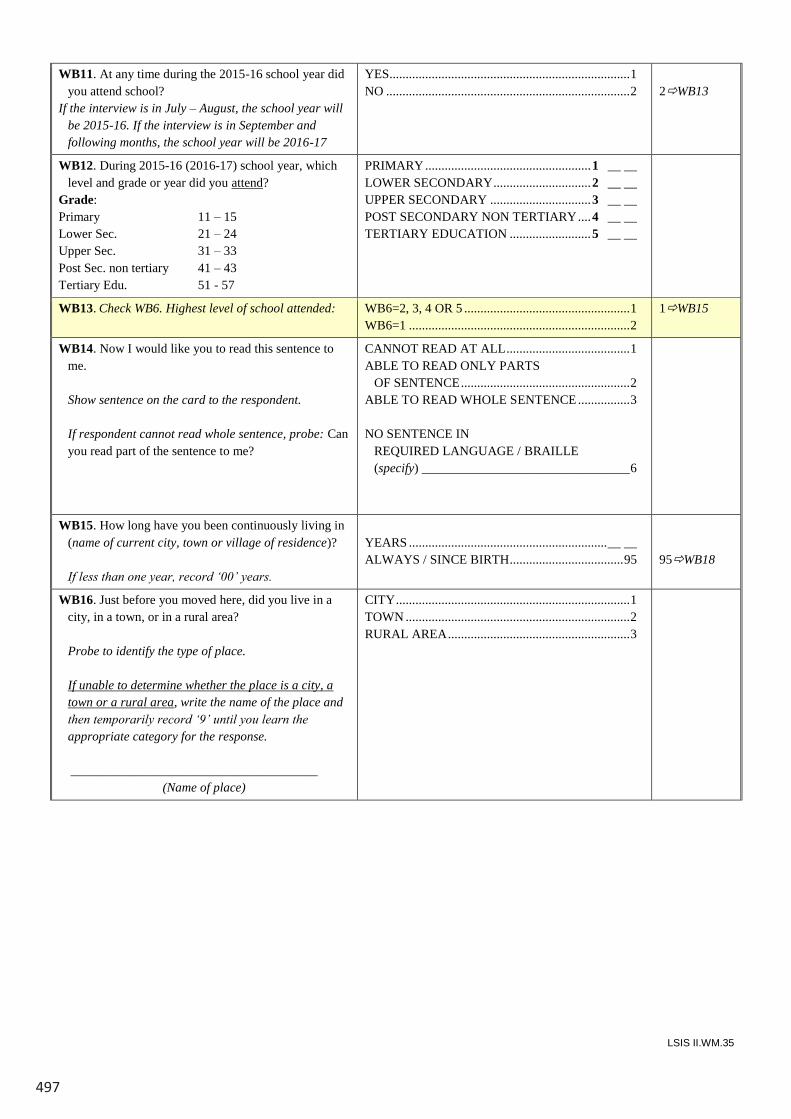
497
LSIS II.WM.35
WB11. At any time during the 2015-16 school year did you attend school?
If the interview is in July – August, the school year will be 2015-16. If the interview is in September and following months, the school year will be 2016-17
YES .......................................................................... 1 NO ........................................................................... 2
2WB13
WB12. During 2015-16 (2016-17) school year, which level and grade or year did you attend?
Grade: Primary 11 – 15 Lower Sec. 21 – 24 Upper Sec. 31 – 33 Post Sec. non tertiary 41 – 43 Tertiary Edu. 51 - 57
PRIMARY ................................................... 1 __ __ LOWER SECONDARY .............................. 2 __ __ UPPER SECONDARY ............................... 3 __ __ POST SECONDARY NON TERTIARY .... 4 __ __ TERTIARY EDUCATION ......................... 5 __ __
WB13. Check WB6. Highest level of school attended: WB6=2, 3, 4 OR 5 ................................................... 1 WB6=1 .................................................................... 2
1WB15
WB14. Now I would like you to read this sentence to me.
Show sentence on the card to the respondent. If respondent cannot read whole sentence, probe: Can
you read part of the sentence to me?
CANNOT READ AT ALL ...................................... 1 ABLE TO READ ONLY PARTS OF SENTENCE .................................................... 2 ABLE TO READ WHOLE SENTENCE ................ 3 NO SENTENCE IN REQUIRED LANGUAGE / BRAILLE (specify) ________________________________ 6
WB15. How long have you been continuously living in (name of current city, town or village of residence)?
If less than one year, record ‘00’ years.
YEARS ............................................................. __ __ ALWAYS / SINCE BIRTH ................................... 95
95WB18
WB16. Just before you moved here, did you live in a city, in a town, or in a rural area?
Probe to identify the type of place. If unable to determine whether the place is a city, a
town or a rural area, write the name of the place and then temporarily record ‘9’ until you learn the appropriate category for the response.
______________________________________
(Name of place)
CITY ........................................................................ 1 TOWN ..................................................................... 2 RURAL AREA ........................................................ 3
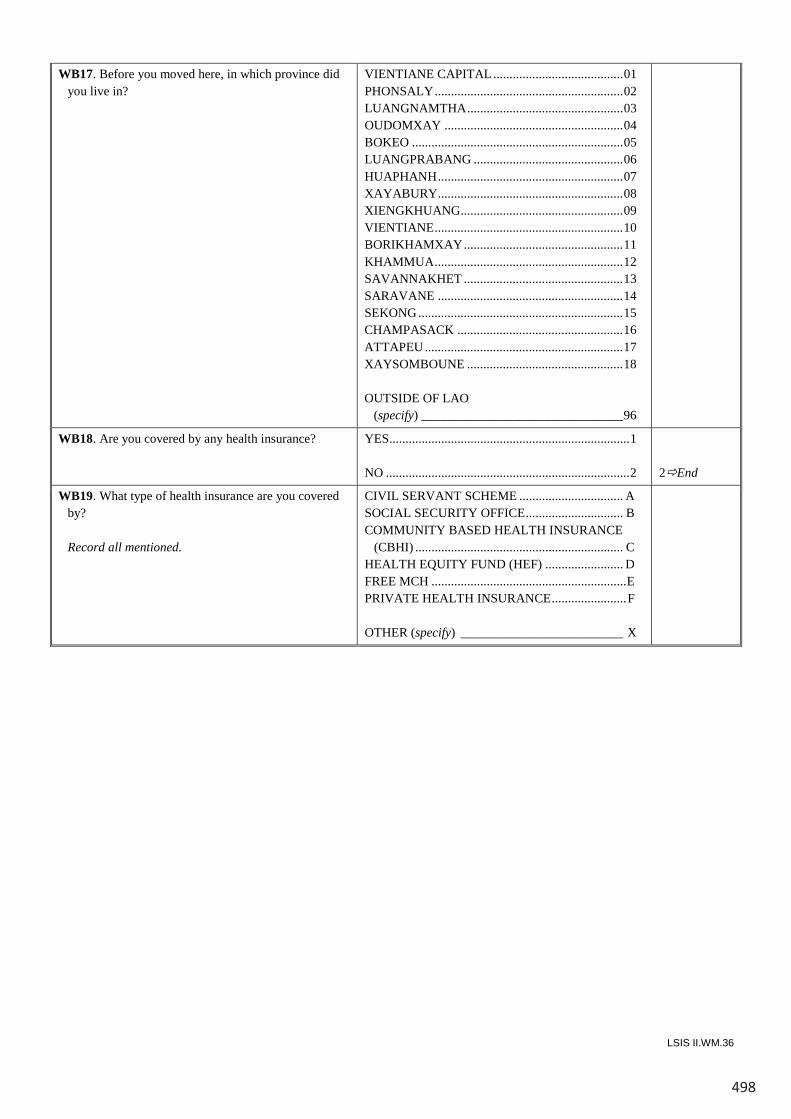
498
LSIS II.WM.36
WB17. Before you moved here, in which province did you live in?
VIENTIANE CAPITAL ........................................ 01 PHONSALY .......................................................... 02 LUANGNAMTHA ................................................ 03 OUDOMXAY ....................................................... 04 BOKEO ................................................................. 05 LUANGPRABANG .............................................. 06 HUAPHANH ......................................................... 07 XAYABURY ......................................................... 08 XIENGKHUANG.................................................. 09 VIENTIANE .......................................................... 10 BORIKHAMXAY ................................................. 11 KHAMMUA .......................................................... 12 SAVANNAKHET ................................................. 13 SARAVANE ......................................................... 14 SEKONG ............................................................... 15 CHAMPASACK ................................................... 16 ATTAPEU ............................................................. 17 XAYSOMBOUNE ................................................ 18 OUTSIDE OF LAO (specify) _______________________________ 96
WB18. Are you covered by any health insurance? YES .......................................................................... 1 NO ........................................................................... 2
2End
WB19. What type of health insurance are you covered by?
Record all mentioned.
CIVIL SERVANT SCHEME ................................ A SOCIAL SECURITY OFFICE .............................. B COMMUNITY BASED HEALTH INSURANCE
(CBHI) ................................................................ C HEALTH EQUITY FUND (HEF) ........................ D FREE MCH ............................................................ E PRIVATE HEALTH INSURANCE ....................... F OTHER (specify) _________________________ X
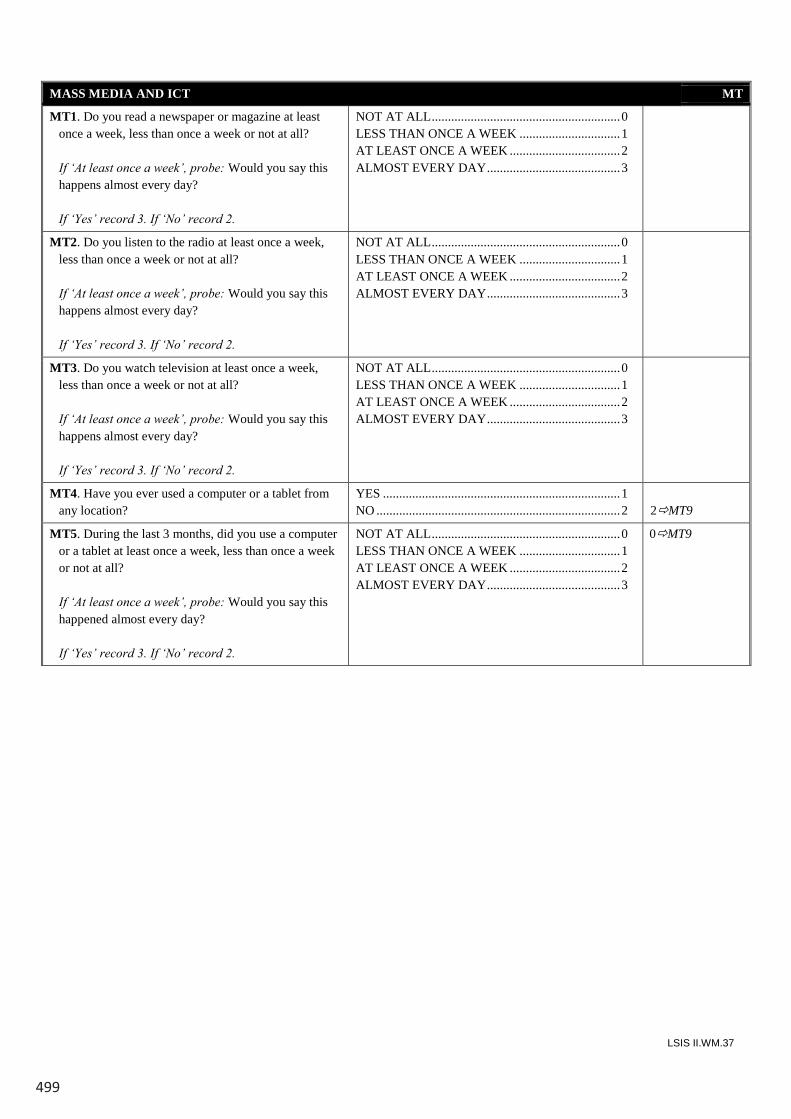
499
LSIS II.WM.37
MASS MEDIA AND ICT MT
MT1. Do you read a newspaper or magazine at least once a week, less than once a week or not at all?
If ‘At least once a week’, probe: Would you say this
happens almost every day? If ‘Yes’ record 3. If ‘No’ record 2.
NOT AT ALL .......................................................... 0 LESS THAN ONCE A WEEK ............................... 1 AT LEAST ONCE A WEEK .................................. 2 ALMOST EVERY DAY ......................................... 3
MT2. Do you listen to the radio at least once a week, less than once a week or not at all?
If ‘At least once a week’, probe: Would you say this
happens almost every day? If ‘Yes’ record 3. If ‘No’ record 2.
NOT AT ALL .......................................................... 0 LESS THAN ONCE A WEEK ............................... 1 AT LEAST ONCE A WEEK .................................. 2 ALMOST EVERY DAY ......................................... 3
MT3. Do you watch television at least once a week, less than once a week or not at all?
If ‘At least once a week’, probe: Would you say this
happens almost every day? If ‘Yes’ record 3. If ‘No’ record 2.
NOT AT ALL .......................................................... 0 LESS THAN ONCE A WEEK ............................... 1 AT LEAST ONCE A WEEK .................................. 2 ALMOST EVERY DAY ......................................... 3
MT4. Have you ever used a computer or a tablet from any location?
YES ......................................................................... 1 NO ........................................................................... 2
2MT9
MT5. During the last 3 months, did you use a computer or a tablet at least once a week, less than once a week or not at all?
If ‘At least once a week’, probe: Would you say this
happened almost every day? If ‘Yes’ record 3. If ‘No’ record 2.
NOT AT ALL .......................................................... 0 LESS THAN ONCE A WEEK ............................... 1 AT LEAST ONCE A WEEK .................................. 2 ALMOST EVERY DAY ......................................... 3
0MT9
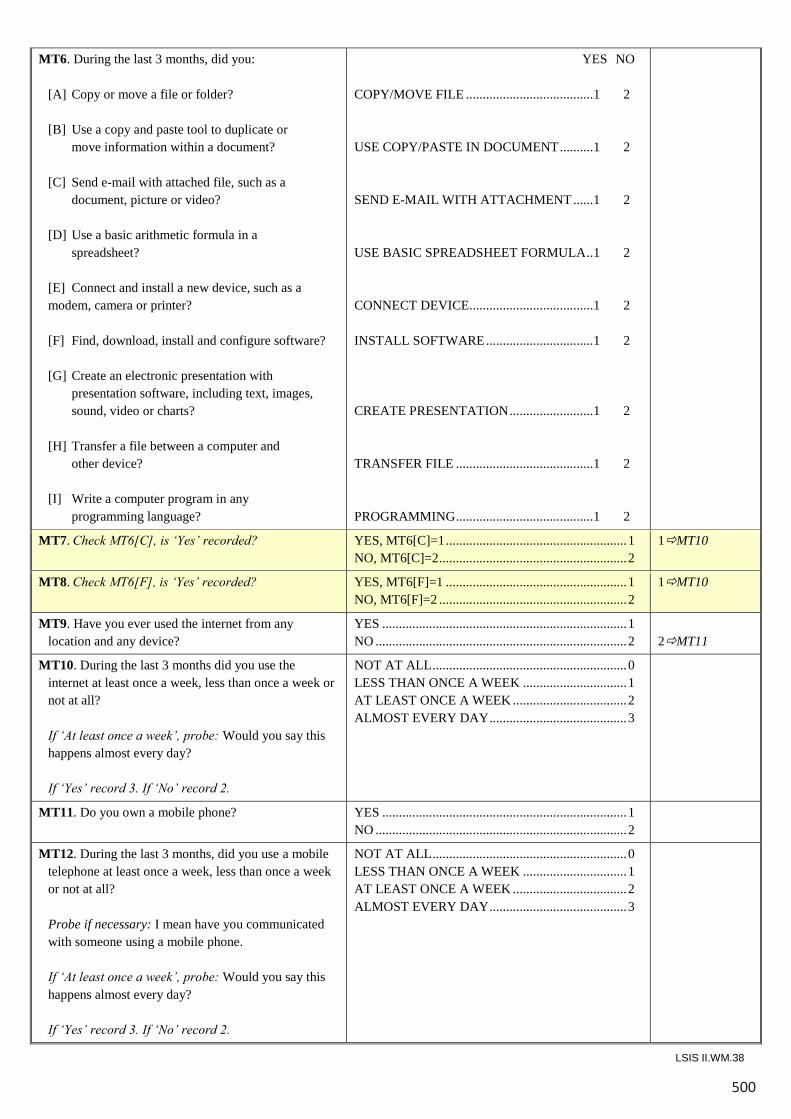
500
LSIS II.WM.38
MT6. During the last 3 months, did you: [A] Copy or move a file or folder? [B] Use a copy and paste tool to duplicate or
move information within a document? [C] Send e-mail with attached file, such as a
document, picture or video? [D] Use a basic arithmetic formula in a
spreadsheet? [E] Connect and install a new device, such as a
modem, camera or printer? [F] Find, download, install and configure software? [G] Create an electronic presentation with
presentation software, including text, images, sound, video or charts?
[H] Transfer a file between a computer and
other device? [I] Write a computer program in any
programming language?
YES NO COPY/MOVE FILE ...................................... 1 2 USE COPY/PASTE IN DOCUMENT .......... 1 2 SEND E-MAIL WITH ATTACHMENT ...... 1 2 USE BASIC SPREADSHEET FORMULA .. 1 2 CONNECT DEVICE..................................... 1 2 INSTALL SOFTWARE ................................ 1 2 CREATE PRESENTATION ......................... 1 2 TRANSFER FILE ......................................... 1 2 PROGRAMMING ......................................... 1 2
MT7. Check MT6[C], is ‘Yes’ recorded? YES, MT6[C]=1 ...................................................... 1 NO, MT6[C]=2 ........................................................ 2
1MT10
MT8. Check MT6[F], is ‘Yes’ recorded? YES, MT6[F]=1 ...................................................... 1 NO, MT6[F]=2 ........................................................ 2
1MT10
MT9. Have you ever used the internet from any location and any device?
YES ......................................................................... 1 NO ........................................................................... 2
2MT11
MT10. During the last 3 months did you use the internet at least once a week, less than once a week or not at all?
If ‘At least once a week’, probe: Would you say this
happens almost every day? If ‘Yes’ record 3. If ‘No’ record 2.
NOT AT ALL .......................................................... 0 LESS THAN ONCE A WEEK ............................... 1 AT LEAST ONCE A WEEK .................................. 2 ALMOST EVERY DAY ......................................... 3
MT11. Do you own a mobile phone? YES ......................................................................... 1 NO ........................................................................... 2
MT12. During the last 3 months, did you use a mobile telephone at least once a week, less than once a week or not at all?
Probe if necessary: I mean have you communicated
with someone using a mobile phone. If ‘At least once a week’, probe: Would you say this
happens almost every day? If ‘Yes’ record 3. If ‘No’ record 2.
NOT AT ALL .......................................................... 0 LESS THAN ONCE A WEEK ............................... 1 AT LEAST ONCE A WEEK .................................. 2 ALMOST EVERY DAY ......................................... 3
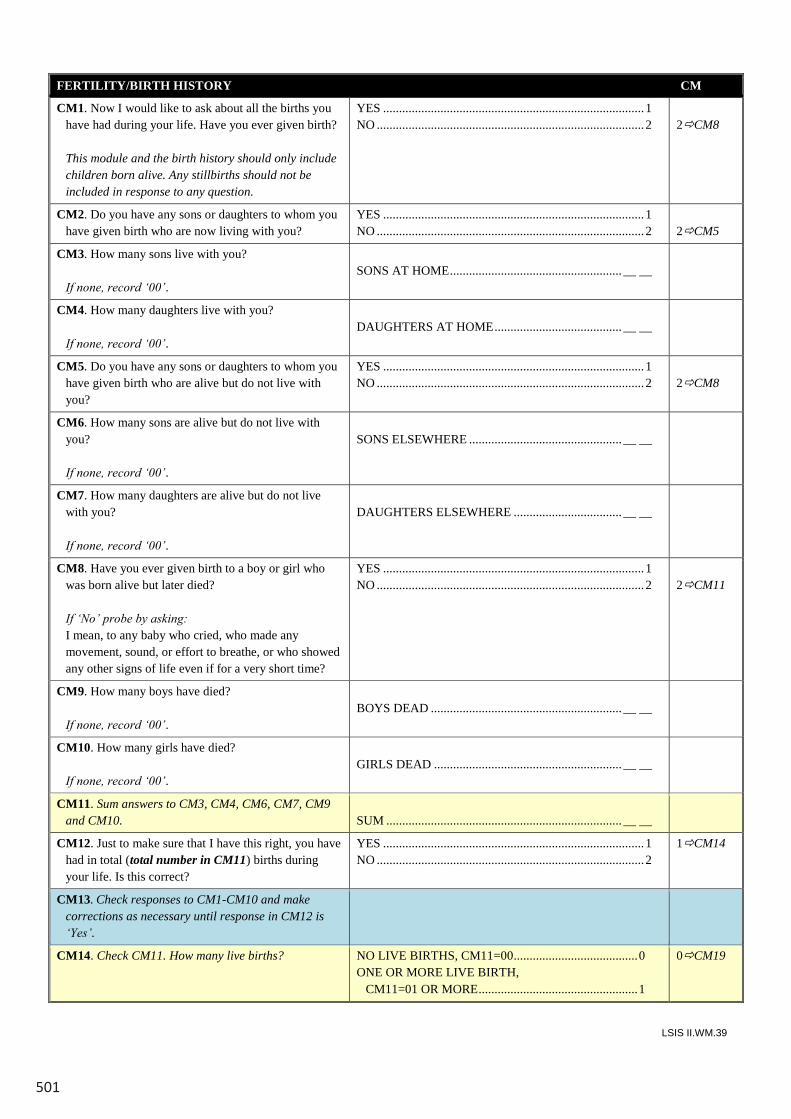
501
LSIS II.WM.39
FERTILITY/BIRTH HISTORY CM
CM1. Now I would like to ask about all the births you have had during your life. Have you ever given birth?
This module and the birth history should only include
children born alive. Any stillbirths should not be included in response to any question.
YES .................................................................................. 1 NO .................................................................................... 2
2CM8
CM2. Do you have any sons or daughters to whom you have given birth who are now living with you?
YES .................................................................................. 1 NO .................................................................................... 2
2CM5
CM3. How many sons live with you? If none, record ‘00’.
SONS AT HOME ...................................................... __ __
CM4. How many daughters live with you? If none, record ‘00’.
DAUGHTERS AT HOME ........................................ __ __
CM5. Do you have any sons or daughters to whom you have given birth who are alive but do not live with you?
YES .................................................................................. 1 NO .................................................................................... 2
2CM8
CM6. How many sons are alive but do not live with you?
If none, record ‘00’.
SONS ELSEWHERE ................................................ __ __
CM7. How many daughters are alive but do not live with you?
If none, record ‘00’.
DAUGHTERS ELSEWHERE .................................. __ __
CM8. Have you ever given birth to a boy or girl who was born alive but later died?
If ‘No’ probe by asking: I mean, to any baby who cried, who made any
movement, sound, or effort to breathe, or who showed any other signs of life even if for a very short time?
YES .................................................................................. 1 NO .................................................................................... 2
2CM11
CM9. How many boys have died? If none, record ‘00’.
BOYS DEAD ............................................................ __ __
CM10. How many girls have died? If none, record ‘00’.
GIRLS DEAD ........................................................... __ __
CM11. Sum answers to CM3, CM4, CM6, CM7, CM9 and CM10.
SUM .......................................................................... __ __
CM12. Just to make sure that I have this right, you have had in total (total number in CM11) births during your life. Is this correct?
YES .................................................................................. 1 NO .................................................................................... 2
1CM14
CM13. Check responses to CM1-CM10 and make corrections as necessary until response in CM12 is ‘Yes’.
CM14. Check CM11. How many live births? NO LIVE BIRTHS, CM11=00 ....................................... 0 ONE OR MORE LIVE BIRTH, CM11=01 OR MORE .................................................. 1
0CM19
LSIS II.WM.38
MT6. During the last 3 months, did you: [A] Copy or move a file or folder? [B] Use a copy and paste tool to duplicate or
move information within a document? [C] Send e-mail with attached file, such as a
document, picture or video? [D] Use a basic arithmetic formula in a
spreadsheet? [E] Connect and install a new device, such as a
modem, camera or printer? [F] Find, download, install and configure software? [G] Create an electronic presentation with
presentation software, including text, images, sound, video or charts?
[H] Transfer a file between a computer and
other device? [I] Write a computer program in any
programming language?
YES NO COPY/MOVE FILE ...................................... 1 2 USE COPY/PASTE IN DOCUMENT .......... 1 2 SEND E-MAIL WITH ATTACHMENT ...... 1 2 USE BASIC SPREADSHEET FORMULA .. 1 2 CONNECT DEVICE..................................... 1 2 INSTALL SOFTWARE ................................ 1 2 CREATE PRESENTATION ......................... 1 2 TRANSFER FILE ......................................... 1 2 PROGRAMMING ......................................... 1 2
MT7. Check MT6[C], is ‘Yes’ recorded? YES, MT6[C]=1 ...................................................... 1 NO, MT6[C]=2 ........................................................ 2
1MT10
MT8. Check MT6[F], is ‘Yes’ recorded? YES, MT6[F]=1 ...................................................... 1 NO, MT6[F]=2 ........................................................ 2
1MT10
MT9. Have you ever used the internet from any location and any device?
YES ......................................................................... 1 NO ........................................................................... 2
2MT11
MT10. During the last 3 months did you use the internet at least once a week, less than once a week or not at all?
If ‘At least once a week’, probe: Would you say this
happens almost every day? If ‘Yes’ record 3. If ‘No’ record 2.
NOT AT ALL .......................................................... 0 LESS THAN ONCE A WEEK ............................... 1 AT LEAST ONCE A WEEK .................................. 2 ALMOST EVERY DAY ......................................... 3
MT11. Do you own a mobile phone? YES ......................................................................... 1 NO ........................................................................... 2
MT12. During the last 3 months, did you use a mobile telephone at least once a week, less than once a week or not at all?
Probe if necessary: I mean have you communicated
with someone using a mobile phone. If ‘At least once a week’, probe: Would you say this
happens almost every day? If ‘Yes’ record 3. If ‘No’ record 2.
NOT AT ALL .......................................................... 0 LESS THAN ONCE A WEEK ............................... 1 AT LEAST ONCE A WEEK .................................. 2 ALMOST EVERY DAY ......................................... 3
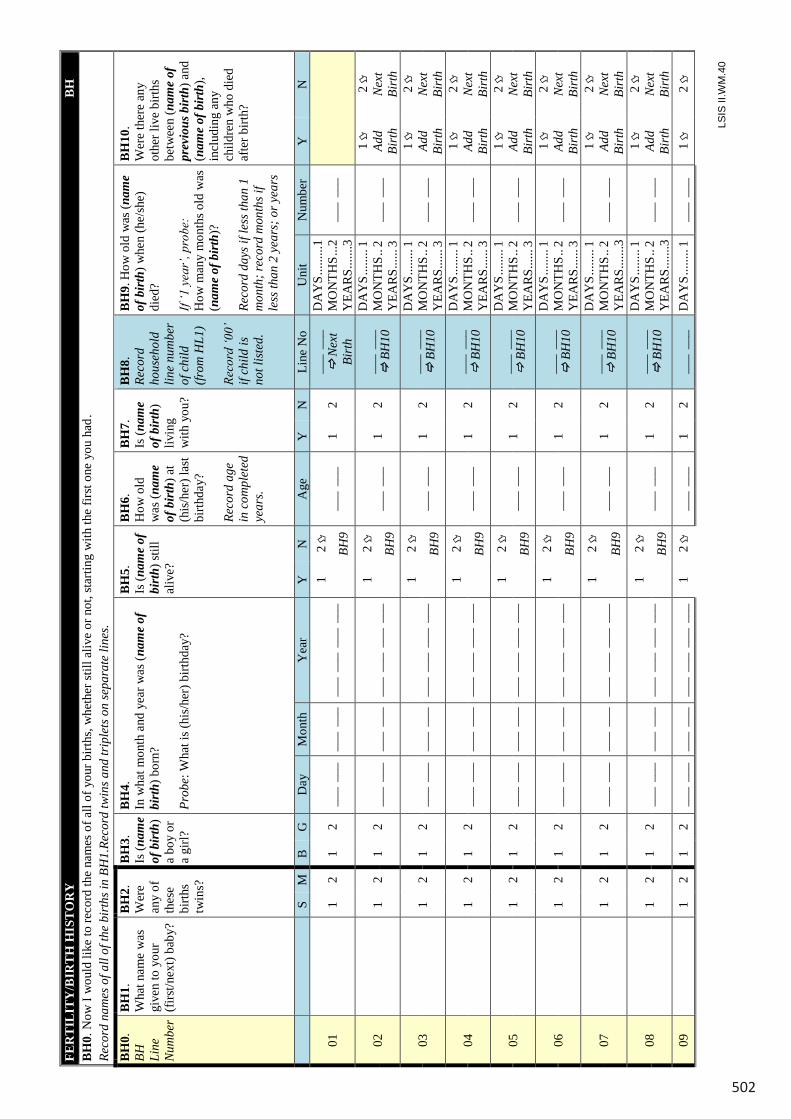
502
LSIS
II.W
M.4
0
FER
TIL
ITY
/BIR
TH
HIS
TO
RY
B
H
BH
0. N
ow I
wou
ld li
ke to
reco
rd th
e na
mes
of a
ll of
you
r birt
hs, w
heth
er st
ill a
live
or n
ot, s
tarti
ng w
ith th
e fir
st o
ne y
ou h
ad.
Reco
rd n
ames
of a
ll of
the
birth
s in
BH1.
Reco
rd tw
ins a
nd tr
iple
ts o
n se
para
te li
nes.
B
H0.
BH
Li
ne
Num
ber
BH
1.
Wha
t nam
e w
as
give
n to
you
r (fi
rst/n
ext)
baby
?
BH
2.
Wer
e an
y of
th
ese
birth
s tw
ins?
BH
3.
Is (n
ame
of b
irth
) a
boy
or
a gi
rl?
BH
4.
In w
hat m
onth
and
yea
r was
(nam
e of
bi
rth)
bor
n?
Prob
e: W
hat i
s (hi
s/he
r) b
irthd
ay?
BH
5.
Is (n
ame
of
birt
h) st
ill
aliv
e?
BH
6.
How
old
w
as (n
ame
of b
irth
) at
(his
/her
) las
t bi
rthda
y?
Reco
rd a
ge
in c
ompl
eted
ye
ars.
BH
7.
Is (n
ame
of b
irth
) liv
ing
with
you
?
BH
8.
Reco
rd
hous
ehol
d lin
e nu
mbe
r of
chi
ld
(from
HL1
) Re
cord
‘00’
if
child
is
not l
iste
d.
BH
9. H
ow o
ld w
as (n
ame
of b
irth
) whe
n (h
e/sh
e)
died
? If
‘1 y
ear’
, pro
be:
How
man
y m
onth
s old
was
(n
ame
of b
irth
)?
Reco
rd d
ays i
f les
s tha
n 1
mon
th; r
ecor
d m
onth
s if
less
than
2 y
ears
; or y
ears
BH
10.
Wer
e th
ere
any
othe
r liv
e bi
rths
betw
een
(nam
e of
pr
evio
us b
irth
) and
(n
ame
of b
irth
), in
clud
ing
any
child
ren
who
die
d af
ter b
irth?
S M
B
G
D
ay
Mon
th
Yea
r Y
N
A
ge
Y
N
Line
No
Uni
t N
umbe
r Y
N
01
1
2 1
2 __
_ _
__
___
___
__
_ _
__ _
__ _
__
1 2
__
_ _
__
1 2
___
___
Nex
t Bi
rth
DA
YS .
......
..1
MO
NTH
S ...2
Y
EAR
S ....
...3
___
___
BH
9
02
1
2 1
2 __
_ _
__
___
___
__
_ _
__ _
__ _
__
1 2
__
_ _
__
1 2
___
___
BH
10
DA
YS .
......
. 1
MO
NTH
S .. 2
Y
EAR
S ....
.. 3
___
___
1
Ad
d Bi
rth
2
Nex
t Bi
rth
BH
9
03
1
2 1
2 __
_ _
__
___
___
__
_ _
__ _
__ _
__
1 2
__
_ _
__
1 2
___
___
BH
10
DA
YS .
......
. 1
MO
NTH
S .. 2
Y
EAR
S ....
.. 3
___
___
1
Ad
d Bi
rth
2
Nex
t Bi
rth
BH
9
04
1
2 1
2 __
_ _
__
___
___
__
_ _
__ _
__ _
__
1 2
__
_ _
__
1 2
___
___
BH
10
DA
YS .
......
. 1
MO
NTH
S .. 2
Y
EAR
S ....
.. 3
___
___
1
Ad
d Bi
rth
2
Nex
t Bi
rth
BH
9
05
1
2 1
2 __
_ _
__
___
___
__
_ _
__ _
__ _
__
1 2
__
_ _
__
1 2
___
___
BH
10
DA
YS .
......
. 1
MO
NTH
S .. 2
Y
EAR
S ....
.. 3
___
___
1
Ad
d Bi
rth
2
Nex
t Bi
rth
BH
9
06
1
2 1
2 __
_ _
__
___
___
__
_ _
__ _
__ _
__
1 2
__
_ _
__
1 2
___
___
BH
10
DA
YS .
......
. 1
MO
NTH
S .. 2
Y
EAR
S ....
.. 3
___
___
1
Ad
d Bi
rth
2
Nex
t Bi
rth
BH
9
07
1
2 1
2 __
_ _
__
___
___
__
_ _
__ _
__ _
__
1 2
__
_ _
__
1 2
___
___
BH
10
DA
YS .
......
. 1
MO
NTH
S .. 2
Y
EAR
S ....
...3
___
___
1
Ad
d Bi
rth
2
Nex
t Bi
rth
BH
9
08
1
2 1
2 __
_ _
__
___
___
__
_ _
__ _
__ _
__
1 2
__
_ _
__
1 2
___
___
BH
10
DA
YS .
......
. 1
MO
NTH
S .. 2
Y
EAR
S ....
...3
___
___
1
Ad
d Bi
rth
2
Nex
t Bi
rth
BH
9
09
1
2 1
2 __
_ _
__
___
___
__
_ _
__ _
__ _
__
1 2
__
_ _
__
1 2
___
___
D
AY
S ....
.... 1
__
_ _
__
1
2
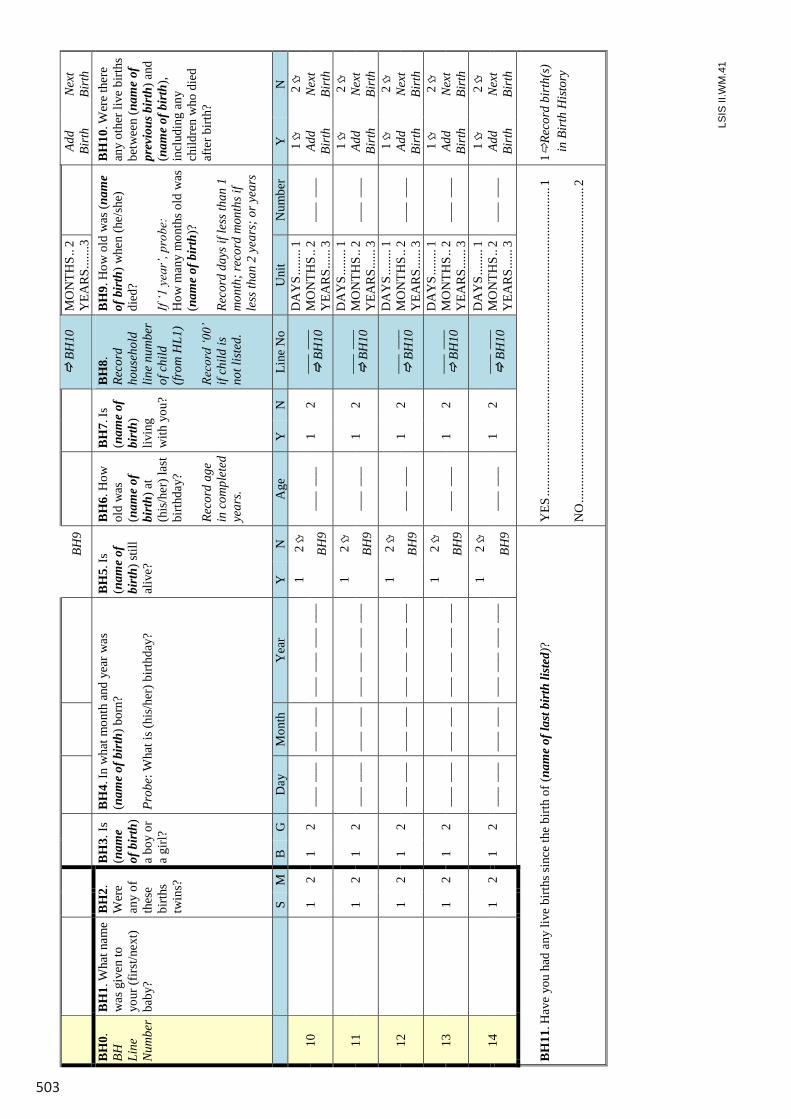
503
LSIS
II.W
M.4
1
BH
9
BH
10
MO
NTH
S .. 2
Y
EAR
S ....
...3
Add
Birt
h N
ext
Birt
h B
H0.
BH
Li
ne
Num
ber
BH
1. W
hat n
ame
was
giv
en to
yo
ur (f
irst/n
ext)
baby
?
BH
2.
Wer
e an
y of
th
ese
birth
s tw
ins?
BH
3. Is
(n
ame
of b
irth
) a
boy
or
a gi
rl?
BH
4. In
wha
t mon
th a
nd y
ear w
as
(nam
e of
bir
th) b
orn?
Pr
obe:
Wha
t is (
his/
her)
birt
hday
?
BH
5. Is
(n
ame
of
birt
h) st
ill
aliv
e?
BH
6. H
ow
old
was
(n
ame
of
birt
h) a
t (h
is/h
er) l
ast
birth
day?
Re
cord
age
in
com
plet
ed
year
s.
BH
7. Is
(n
ame
of
birt
h)
livin
g w
ith y
ou?
BH
8.
Reco
rd
hous
ehol
d lin
e nu
mbe
r of
chi
ld
(from
HL1
) Re
cord
‘00’
if
child
is
not l
iste
d.
BH
9. H
ow o
ld w
as (n
ame
of b
irth
) whe
n (h
e/sh
e)
died
? If
‘1 y
ear’
, pro
be:
How
man
y m
onth
s old
was
(n
ame
of b
irth
)?
Reco
rd d
ays i
f les
s tha
n 1
mon
th; r
ecor
d m
onth
s if
less
than
2 y
ears
; or y
ears
BH
10. W
ere
ther
e an
y ot
her l
ive
birth
s be
twee
n (n
ame
of
prev
ious
bir
th) a
nd
(nam
e of
bir
th),
incl
udin
g an
y ch
ildre
n w
ho d
ied
afte
r birt
h?
S M
B
G
D
ay
Mon
th
Yea
r Y
N
A
ge
Y
N
Line
No
Uni
t N
umbe
r Y
N
10
1
2 1
2 __
_ _
__
___
___
__
_ _
__ _
__ _
__
1 2
__
_ _
__
1 2
___
___
BH
10
DA
YS .
......
. 1
MO
NTH
S .. 2
Y
EAR
S ....
.. 3
___
___
1
Ad
d Bi
rth
2
Nex
t Bi
rth
BH
9
11
1
2 1
2 __
_ _
__
___
___
__
_ _
__ _
__ _
__
1 2
__
_ _
__
1 2
___
___
BH
10
DA
YS .
......
. 1
MO
NTH
S .. 2
Y
EAR
S ....
.. 3
___
___
1
Ad
d Bi
rth
2
Nex
t Bi
rth
BH
9
12
1
2 1
2 __
_ _
__
___
___
__
_ _
__ _
__ _
__
1 2
__
_ _
__
1 2
___
___
BH
10
DA
YS .
......
. 1
MO
NTH
S .. 2
Y
EAR
S ....
.. 3
___
___
1
Ad
d Bi
rth
2
Nex
t Bi
rth
BH
9
13
1
2 1
2 __
_ _
__
___
___
__
_ _
__ _
__ _
__
1 2
__
_ _
__
1 2
___
___
BH
10
DA
YS .
......
. 1
MO
NTH
S .. 2
Y
EAR
S ....
.. 3
___
___
1
Ad
d Bi
rth
2
Nex
t Bi
rth
BH
9
14
1
2 1
2 __
_ _
__
___
___
__
_ _
__ _
__ _
__
1 2
__
_ _
__
1 2
___
___
BH
10
DA
YS .
......
. 1
MO
NTH
S .. 2
Y
EAR
S ....
.. 3
___
___
1
Ad
d Bi
rth
2
Nex
t Bi
rth
BH
9
BH
11. H
ave
you
had
any
live
birth
s sin
ce th
e bi
rth o
f (na
me
of la
st b
irth
liste
d)?
YES
......
......
......
......
......
......
......
......
......
......
......
......
......
......
......
..... 1
N
O ...
......
......
......
......
......
......
......
......
......
......
......
......
......
......
......
.... 2
1Re
cord
bir
th(s
) in
Bir
th H
isto
ry
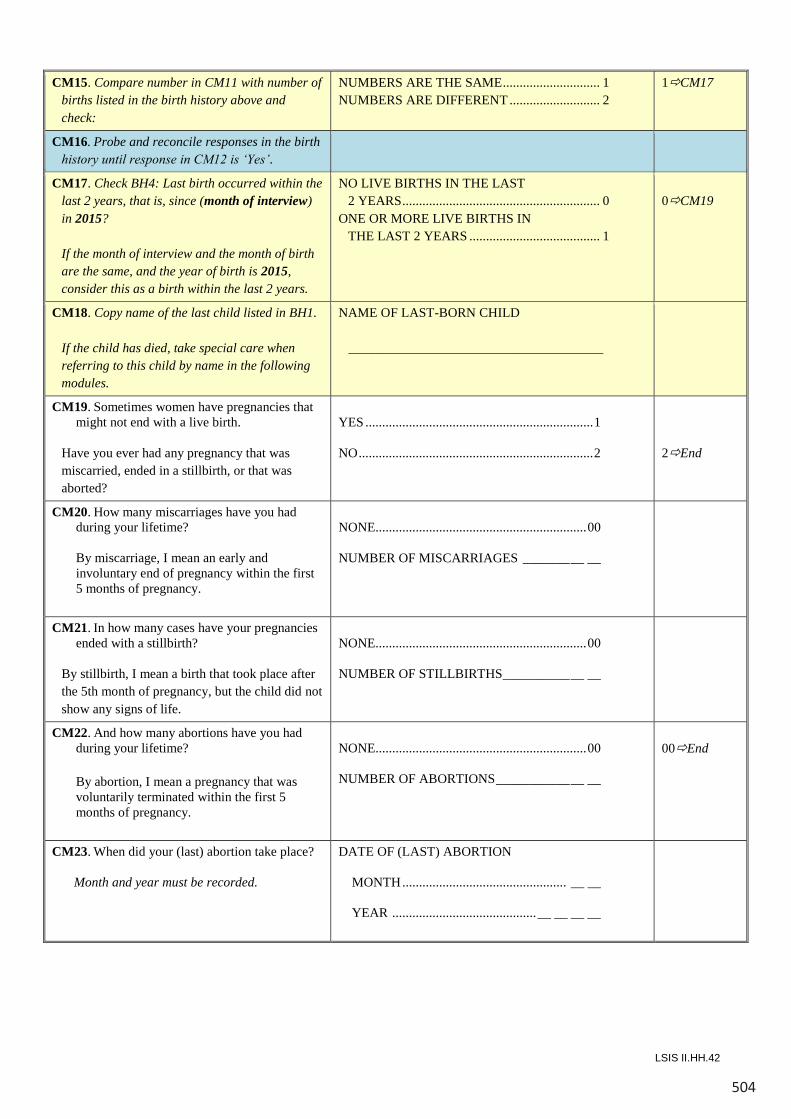
504
LSIS II.HH.42
CM15. Compare number in CM11 with number of births listed in the birth history above and check:
NUMBERS ARE THE SAME ............................. 1 NUMBERS ARE DIFFERENT ........................... 2
1CM17
CM16. Probe and reconcile responses in the birth history until response in CM12 is ‘Yes’.
CM17. Check BH4: Last birth occurred within the last 2 years, that is, since (month of interview) in 2015?
If the month of interview and the month of birth
are the same, and the year of birth is 2015, consider this as a birth within the last 2 years.
NO LIVE BIRTHS IN THE LAST 2 YEARS ........................................................... 0 ONE OR MORE LIVE BIRTHS IN THE LAST 2 YEARS ....................................... 1
0CM19
CM18. Copy name of the last child listed in BH1. If the child has died, take special care when
referring to this child by name in the following modules.
NAME OF LAST-BORN CHILD ______________________________________
CM19. Sometimes women have pregnancies that might not end with a live birth.
Have you ever had any pregnancy that was
miscarried, ended in a stillbirth, or that was aborted?
YES .................................................................... 1 NO ...................................................................... 2
2End
CM20. How many miscarriages have you had during your lifetime?
By miscarriage, I mean an early and
involuntary end of pregnancy within the first 5 months of pregnancy.
NONE............................................................... 00 NUMBER OF MISCARRIAGES _______ __ __
CM21. In how many cases have your pregnancies ended with a stillbirth?
By stillbirth, I mean a birth that took place after
the 5th month of pregnancy, but the child did not show any signs of life.
NONE............................................................... 00 NUMBER OF STILLBIRTHS __________ __ __
CM22. And how many abortions have you had during your lifetime?
By abortion, I mean a pregnancy that was
voluntarily terminated within the first 5 months of pregnancy.
NONE............................................................... 00 NUMBER OF ABORTIONS ___________ __ __
00End
CM23. When did your (last) abortion take place?
Month and year must be recorded.
DATE OF (LAST) ABORTION MONTH ................................................. __ __ YEAR ........................................... __ __ __ __
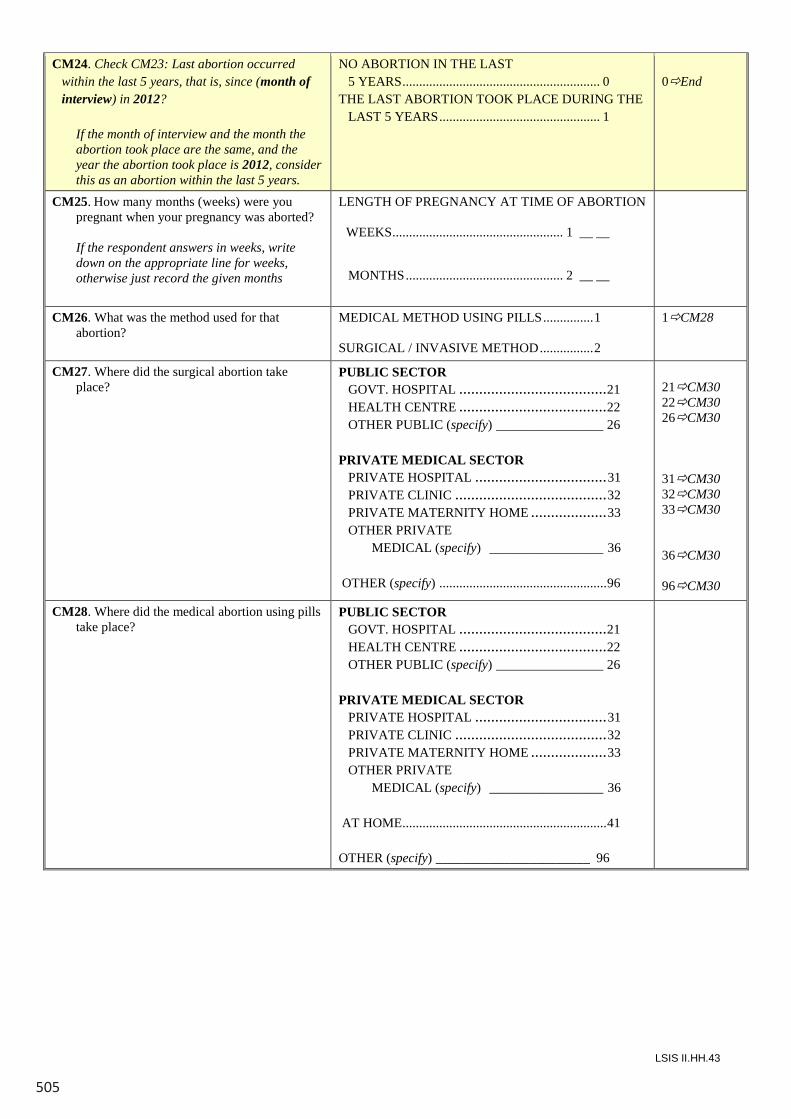
505
LSIS II.HH.43
CM24. Check CM23: Last abortion occurred within the last 5 years, that is, since (month of interview) in 2012?
If the month of interview and the month the
abortion took place are the same, and the year the abortion took place is 2012, consider this as an abortion within the last 5 years.
NO ABORTION IN THE LAST 5 YEARS ........................................................... 0 THE LAST ABORTION TOOK PLACE DURING THE
LAST 5 YEARS ................................................ 1
0End
CM25. How many months (weeks) were you pregnant when your pregnancy was aborted?
If the respondent answers in weeks, write down on the appropriate line for weeks, otherwise just record the given months
LENGTH OF PREGNANCY AT TIME OF ABORTION
WEEKS ................................................... 1 __ __ MONTHS ............................................... 2 __ __
CM26. What was the method used for that abortion?
MEDICAL METHOD USING PILLS ............... 1 SURGICAL / INVASIVE METHOD ................ 2
1CM28
CM27. Where did the surgical abortion take place?
PUBLIC SECTOR GOVT. HOSPITAL ..................................... 21 HEALTH CENTRE ..................................... 22 OTHER PUBLIC (specify) ________________ 26 PRIVATE MEDICAL SECTOR PRIVATE HOSPITAL ................................. 31 PRIVATE CLINIC ...................................... 32 PRIVATE MATERNITY HOME ................... 33 OTHER PRIVATE MEDICAL (specify) _________________ 36 OTHER (specify) .................................................. 96
21CM30 22CM30 26CM30 31CM30 32CM30 33CM30 36CM30 96CM30
CM28. Where did the medical abortion using pills take place?
PUBLIC SECTOR GOVT. HOSPITAL ..................................... 21 HEALTH CENTRE ..................................... 22 OTHER PUBLIC (specify) ________________ 26 PRIVATE MEDICAL SECTOR PRIVATE HOSPITAL ................................. 31 PRIVATE CLINIC ...................................... 32 PRIVATE MATERNITY HOME ................... 33 OTHER PRIVATE MEDICAL (specify) _________________ 36 AT HOME ............................................................. 41 OTHER (specify) _______________________ 96
LSIS II.HH.42
CM15. Compare number in CM11 with number of births listed in the birth history above and check:
NUMBERS ARE THE SAME ............................. 1 NUMBERS ARE DIFFERENT ........................... 2
1CM17
CM16. Probe and reconcile responses in the birth history until response in CM12 is ‘Yes’.
CM17. Check BH4: Last birth occurred within the last 2 years, that is, since (month of interview) in 2015?
If the month of interview and the month of birth
are the same, and the year of birth is 2015, consider this as a birth within the last 2 years.
NO LIVE BIRTHS IN THE LAST 2 YEARS ........................................................... 0 ONE OR MORE LIVE BIRTHS IN THE LAST 2 YEARS ....................................... 1
0CM19
CM18. Copy name of the last child listed in BH1. If the child has died, take special care when
referring to this child by name in the following modules.
NAME OF LAST-BORN CHILD ______________________________________
CM19. Sometimes women have pregnancies that might not end with a live birth.
Have you ever had any pregnancy that was
miscarried, ended in a stillbirth, or that was aborted?
YES .................................................................... 1 NO ...................................................................... 2
2End
CM20. How many miscarriages have you had during your lifetime?
By miscarriage, I mean an early and
involuntary end of pregnancy within the first 5 months of pregnancy.
NONE............................................................... 00 NUMBER OF MISCARRIAGES _______ __ __
CM21. In how many cases have your pregnancies ended with a stillbirth?
By stillbirth, I mean a birth that took place after
the 5th month of pregnancy, but the child did not show any signs of life.
NONE............................................................... 00 NUMBER OF STILLBIRTHS __________ __ __
CM22. And how many abortions have you had during your lifetime?
By abortion, I mean a pregnancy that was
voluntarily terminated within the first 5 months of pregnancy.
NONE............................................................... 00 NUMBER OF ABORTIONS ___________ __ __
00End
CM23. When did your (last) abortion take place?
Month and year must be recorded.
DATE OF (LAST) ABORTION MONTH ................................................. __ __ YEAR ........................................... __ __ __ __
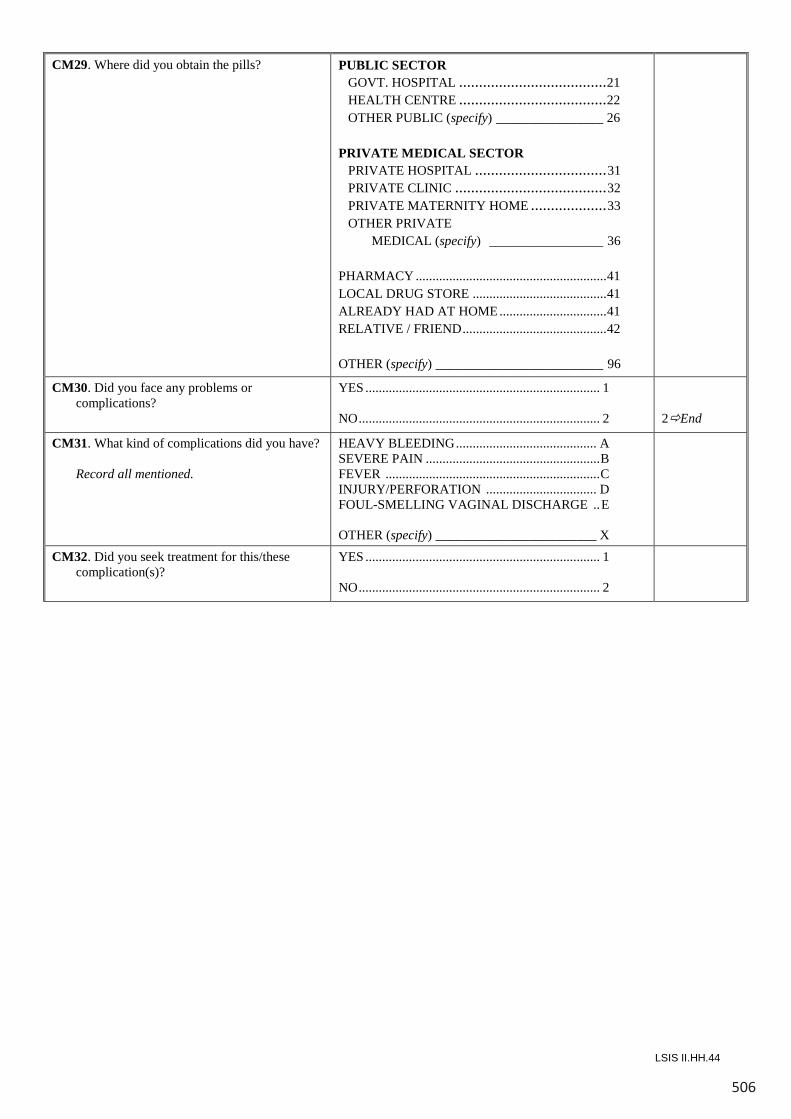
506
LSIS II.HH.44
CM29. Where did you obtain the pills? PUBLIC SECTOR GOVT. HOSPITAL ..................................... 21 HEALTH CENTRE ..................................... 22 OTHER PUBLIC (specify) ________________ 26 PRIVATE MEDICAL SECTOR PRIVATE HOSPITAL ................................. 31 PRIVATE CLINIC ...................................... 32 PRIVATE MATERNITY HOME ................... 33 OTHER PRIVATE MEDICAL (specify) _________________ 36 PHARMACY ......................................................... 41 LOCAL DRUG STORE ........................................ 41 ALREADY HAD AT HOME ................................ 41 RELATIVE / FRIEND ........................................... 42 OTHER (specify) _________________________ 96
CM30. Did you face any problems or complications?
YES ...................................................................... 1 NO ........................................................................ 2
2End
CM31. What kind of complications did you have? Record all mentioned.
HEAVY BLEEDING .......................................... A SEVERE PAIN .................................................... B FEVER ................................................................ C INJURY/PERFORATION ................................. D FOUL-SMELLING VAGINAL DISCHARGE .. E OTHER (specify) ________________________ X
CM32. Did you seek treatment for this/these complication(s)?
YES ...................................................................... 1 NO ........................................................................ 2
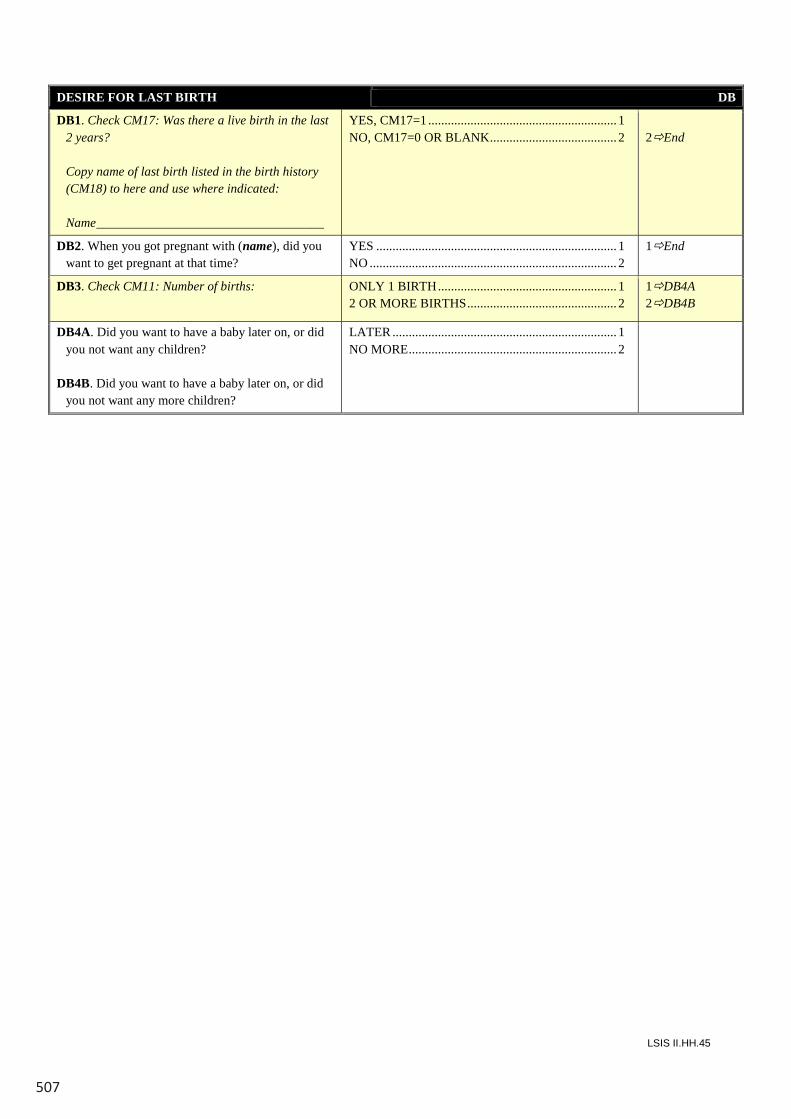
507
LSIS II.HH.45
DESIRE FOR LAST BIRTH DB
DB1. Check CM17: Was there a live birth in the last 2 years?
Copy name of last birth listed in the birth history
(CM18) to here and use where indicated: Name ___________________________________
YES, CM17=1 .......................................................... 1 NO, CM17=0 OR BLANK ....................................... 2
2End
DB2. When you got pregnant with (name), did you want to get pregnant at that time?
YES .......................................................................... 1 NO ............................................................................ 2
1End
DB3. Check CM11: Number of births: ONLY 1 BIRTH ....................................................... 1 2 OR MORE BIRTHS .............................................. 2
1DB4A 2DB4B
DB4A. Did you want to have a baby later on, or did you not want any children?
DB4B. Did you want to have a baby later on, or did
you not want any more children?
LATER ..................................................................... 1 NO MORE ................................................................ 2
LSIS II.HH.44
CM29. Where did you obtain the pills? PUBLIC SECTOR GOVT. HOSPITAL ..................................... 21 HEALTH CENTRE ..................................... 22 OTHER PUBLIC (specify) ________________ 26 PRIVATE MEDICAL SECTOR PRIVATE HOSPITAL ................................. 31 PRIVATE CLINIC ...................................... 32 PRIVATE MATERNITY HOME ................... 33 OTHER PRIVATE MEDICAL (specify) _________________ 36 PHARMACY ......................................................... 41 LOCAL DRUG STORE ........................................ 41 ALREADY HAD AT HOME ................................ 41 RELATIVE / FRIEND ........................................... 42 OTHER (specify) _________________________ 96
CM30. Did you face any problems or complications?
YES ...................................................................... 1 NO ........................................................................ 2
2End
CM31. What kind of complications did you have? Record all mentioned.
HEAVY BLEEDING .......................................... A SEVERE PAIN .................................................... B FEVER ................................................................ C INJURY/PERFORATION ................................. D FOUL-SMELLING VAGINAL DISCHARGE .. E OTHER (specify) ________________________ X
CM32. Did you seek treatment for this/these complication(s)?
YES ...................................................................... 1 NO ........................................................................ 2
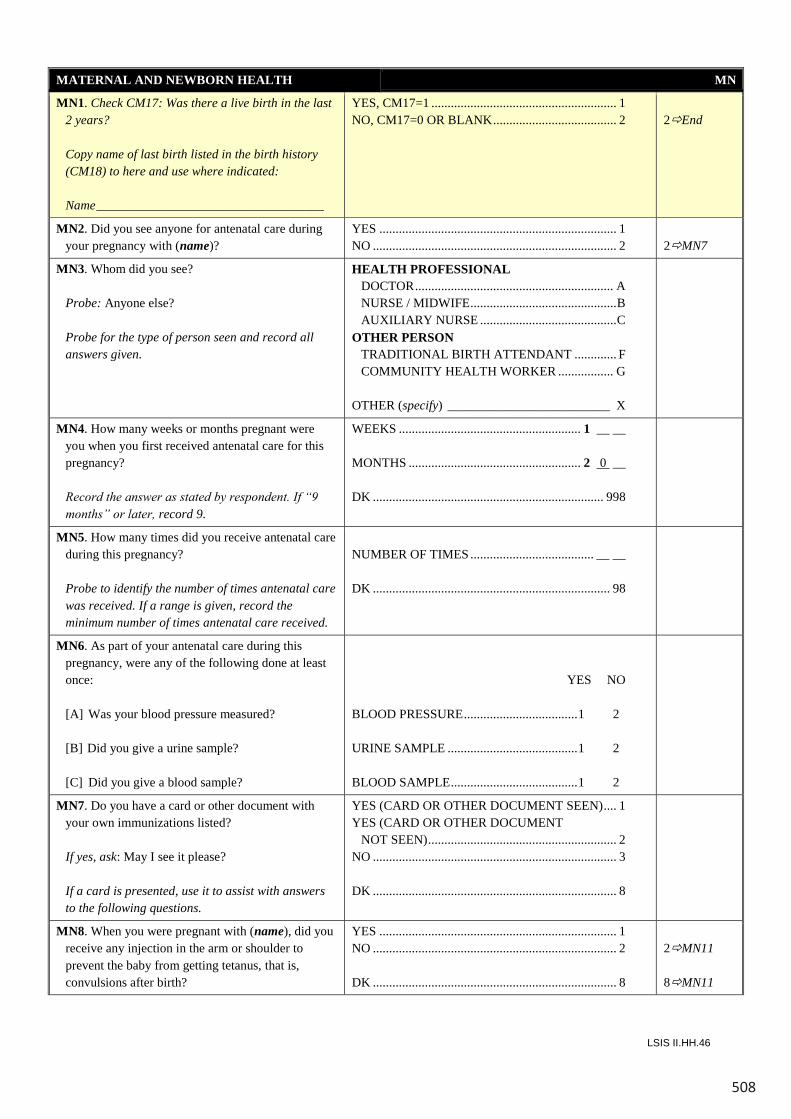
508
LSIS II.HH.46
MATERNAL AND NEWBORN HEALTH MN
MN1. Check CM17: Was there a live birth in the last 2 years?
Copy name of last birth listed in the birth history
(CM18) to here and use where indicated: Name ___________________________________
YES, CM17=1 ......................................................... 1 NO, CM17=0 OR BLANK ...................................... 2
2End
MN2. Did you see anyone for antenatal care during your pregnancy with (name)?
YES ......................................................................... 1 NO ........................................................................... 2
2MN7
MN3. Whom did you see? Probe: Anyone else? Probe for the type of person seen and record all
answers given.
HEALTH PROFESSIONAL DOCTOR ............................................................. A NURSE / MIDWIFE ............................................. B AUXILIARY NURSE .......................................... C OTHER PERSON TRADITIONAL BIRTH ATTENDANT ............. F COMMUNITY HEALTH WORKER ................. G OTHER (specify) _________________________ X
MN4. How many weeks or months pregnant were you when you first received antenatal care for this pregnancy?
Record the answer as stated by respondent. If “9
months” or later, record 9.
WEEKS ........................................................ 1 __ __ MONTHS ..................................................... 2 0 __ DK ....................................................................... 998
MN5. How many times did you receive antenatal care during this pregnancy?
Probe to identify the number of times antenatal care
was received. If a range is given, record the minimum number of times antenatal care received.
NUMBER OF TIMES ...................................... __ __ DK ......................................................................... 98
MN6. As part of your antenatal care during this pregnancy, were any of the following done at least once:
[A] Was your blood pressure measured? [B] Did you give a urine sample? [C] Did you give a blood sample?
YES NO BLOOD PRESSURE ................................... 1 2 URINE SAMPLE ........................................ 1 2 BLOOD SAMPLE ....................................... 1 2
MN7. Do you have a card or other document with your own immunizations listed?
If yes, ask: May I see it please? If a card is presented, use it to assist with answers
to the following questions.
YES (CARD OR OTHER DOCUMENT SEEN) .... 1 YES (CARD OR OTHER DOCUMENT NOT SEEN) .......................................................... 2 NO ........................................................................... 3 DK ........................................................................... 8
MN8. When you were pregnant with (name), did you receive any injection in the arm or shoulder to prevent the baby from getting tetanus, that is, convulsions after birth?
YES ......................................................................... 1 NO ........................................................................... 2 DK ........................................................................... 8
2MN11 8MN11
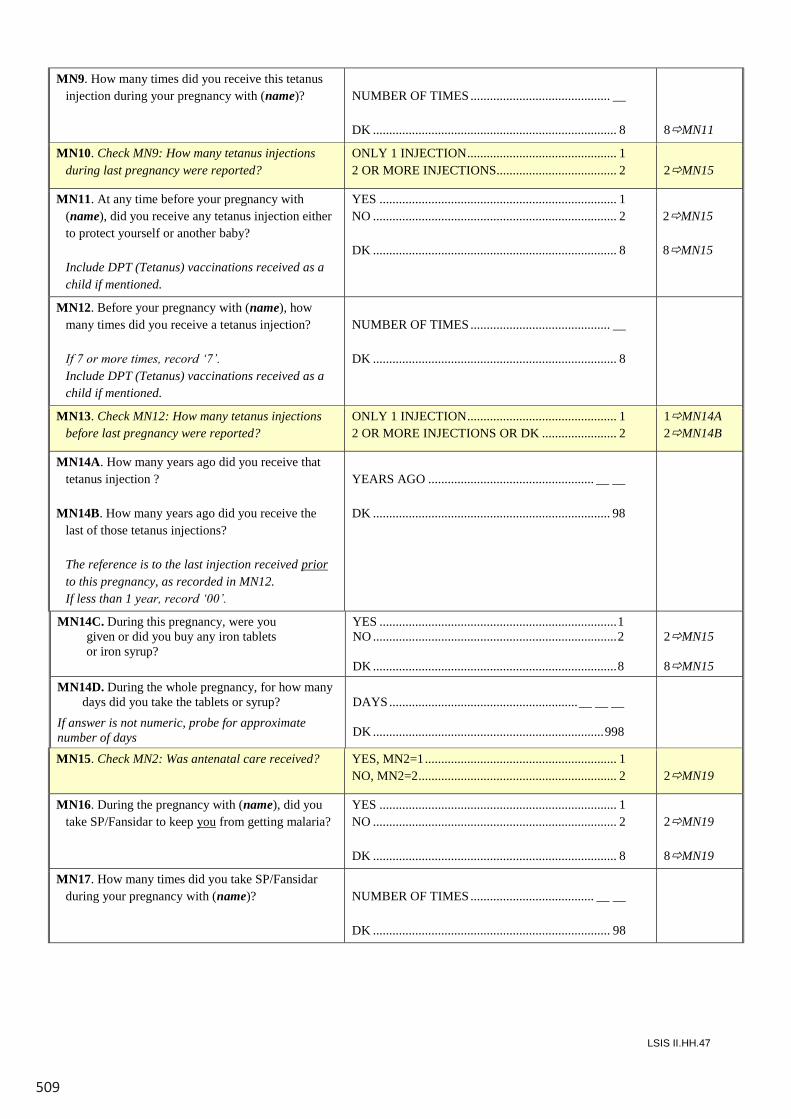
509
LSIS II.HH.47
MN9. How many times did you receive this tetanus injection during your pregnancy with (name)?
NUMBER OF TIMES ........................................... __ DK ........................................................................... 8
8MN11
MN10. Check MN9: How many tetanus injections during last pregnancy were reported?
ONLY 1 INJECTION .............................................. 1 2 OR MORE INJECTIONS..................................... 2
2MN15
MN11. At any time before your pregnancy with (name), did you receive any tetanus injection either to protect yourself or another baby?
Include DPT (Tetanus) vaccinations received as a
child if mentioned.
YES ......................................................................... 1 NO ........................................................................... 2 DK ........................................................................... 8
2MN15 8MN15
MN12. Before your pregnancy with (name), how many times did you receive a tetanus injection?
If 7 or more times, record ‘7’. Include DPT (Tetanus) vaccinations received as a
child if mentioned.
NUMBER OF TIMES ........................................... __ DK ........................................................................... 8
MN13. Check MN12: How many tetanus injections before last pregnancy were reported?
ONLY 1 INJECTION .............................................. 1 2 OR MORE INJECTIONS OR DK ....................... 2
1MN14A 2MN14B
MN14A. How many years ago did you receive that tetanus injection ?
MN14B. How many years ago did you receive the
last of those tetanus injections? The reference is to the last injection received prior
to this pregnancy, as recorded in MN12. If less than 1 year, record ‘00’.
YEARS AGO ................................................... __ __ DK ......................................................................... 98
MN14C. During this pregnancy, were you given or did you buy any iron tablets or iron syrup?
YES ......................................................................... 1 NO ........................................................................... 2 DK ........................................................................... 8
2MN15 8MN15
MN14D. During the whole pregnancy, for how many days did you take the tablets or syrup?
If answer is not numeric, probe for approximate number of days
DAYS .......................................................... __ __ __ DK ....................................................................... 998
MN15. Check MN2: Was antenatal care received? YES, MN2=1 ........................................................... 1 NO, MN2=2 ............................................................. 2
2MN19
MN16. During the pregnancy with (name), did you take SP/Fansidar to keep you from getting malaria?
YES ......................................................................... 1 NO ........................................................................... 2 DK ........................................................................... 8
2MN19 8MN19
MN17. How many times did you take SP/Fansidar during your pregnancy with (name)?
NUMBER OF TIMES ...................................... __ __ DK ......................................................................... 98
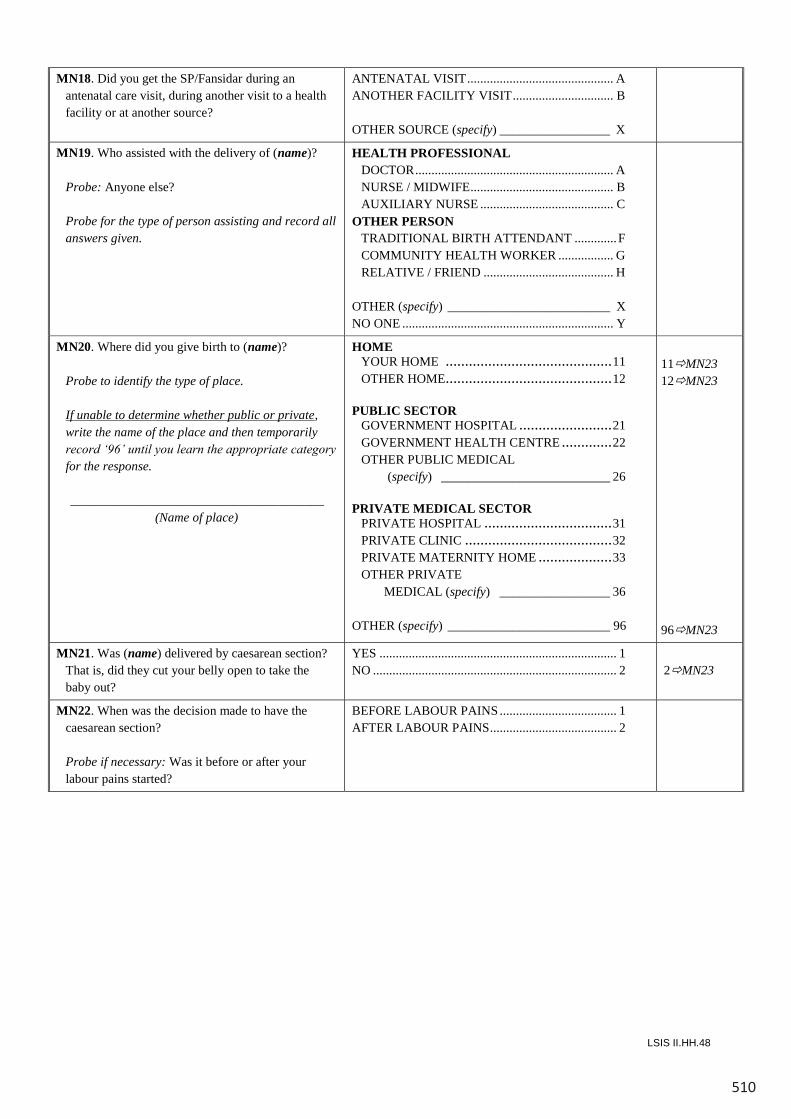
510
LSIS II.HH.48
MN18. Did you get the SP/Fansidar during an antenatal care visit, during another visit to a health facility or at another source?
ANTENATAL VISIT ............................................. A ANOTHER FACILITY VISIT ............................... B OTHER SOURCE (specify) _________________ X
MN19. Who assisted with the delivery of (name)? Probe: Anyone else? Probe for the type of person assisting and record all
answers given.
HEALTH PROFESSIONAL DOCTOR ............................................................. A NURSE / MIDWIFE ............................................ B AUXILIARY NURSE ......................................... C OTHER PERSON TRADITIONAL BIRTH ATTENDANT ............. F COMMUNITY HEALTH WORKER ................. G RELATIVE / FRIEND ........................................ H OTHER (specify) _________________________ X NO ONE ................................................................. Y
MN20. Where did you give birth to (name)? Probe to identify the type of place. If unable to determine whether public or private,
write the name of the place and then temporarily record ‘96’ until you learn the appropriate category for the response.
_______________________________________
(Name of place)
HOME YOUR HOME ........................................... 11 OTHER HOME........................................... 12 PUBLIC SECTOR GOVERNMENT HOSPITAL ........................ 21 GOVERNMENT HEALTH CENTRE ............. 22 OTHER PUBLIC MEDICAL (specify) __________________________ 26 PRIVATE MEDICAL SECTOR PRIVATE HOSPITAL ................................. 31 PRIVATE CLINIC ...................................... 32 PRIVATE MATERNITY HOME ................... 33 OTHER PRIVATE MEDICAL (specify) _________________ 36 OTHER (specify) _________________________ 96
11MN23 12MN23
96MN23
MN21. Was (name) delivered by caesarean section? That is, did they cut your belly open to take the baby out?
YES ......................................................................... 1 NO ........................................................................... 2
2MN23
MN22. When was the decision made to have the caesarean section?
Probe if necessary: Was it before or after your
labour pains started?
BEFORE LABOUR PAINS .................................... 1 AFTER LABOUR PAINS ....................................... 2
511
LSIS II.HH.49
MN23. Immediately after the birth, was (name) put directly on the bare skin of your chest?
If necessary, show the picture of skin-to-skin
position.
YES ......................................................................... 1 NO ........................................................................... 2 DK/ DON’T REMEMBER...................................... 8
2MN25 8MN25
MN24. Before being placed on the bare skin of your chest, was the baby wrapped up?
YES ......................................................................... 1 NO ........................................................................... 2 DK/ DON’T REMEMBER...................................... 8
MN25. Was (name) dried or wiped soon after birth? YES ......................................................................... 1 NO ........................................................................... 2 DK/ DON’T REMEMBER...................................... 8
MN26. How long after the birth was (name) bathed for the first time? If “immediately” or less than 1 hour, record ‘000’.
If less than 24 hours, record hours.
If “1 day” or “next day”, probe: About how many hours after the delivery?
If “24 hours”, probe to ensure best estimate of less than 24 hours or 1 day.
If 24 hours or more, record days.
IMMEDIATELY/LESS THAN 1 HOUR ........... 000 HOURS......................................................... 1 __ __ DAYS ........................................................... 2 __ __ NEVER BATHED ............................................... 997 DK / DON’T REMEMBER................................. 998
MN27. Check MN20: Was the child delivered in a health facility?
YES, MN20=21-36 .................................................. 1 NO, MN20=11-12 or 96 .......................................... 2
1MN30
MN28. What was used to cut the cord? NEW BLADE .......................................................... 1 BLADE USED FOR OTHER PURPOSES ............. 2 SCISSORS ............................................................... 3 OTHER (specify) __________________________ 6 DK ........................................................................... 8
MN29. Was the instrument used to cut the cord boiled or sterilised prior to use?
YES ......................................................................... 1 NO ........................................................................... 2 DK / DON’T REMEMBER..................................... 8
MN30. After the cord was cut and until it fell off, was anything applied to the cord?
YES ......................................................................... 1 NO ........................................................................... 2 DK / DON’T REMEMBER..................................... 8
2MN32 8MN32
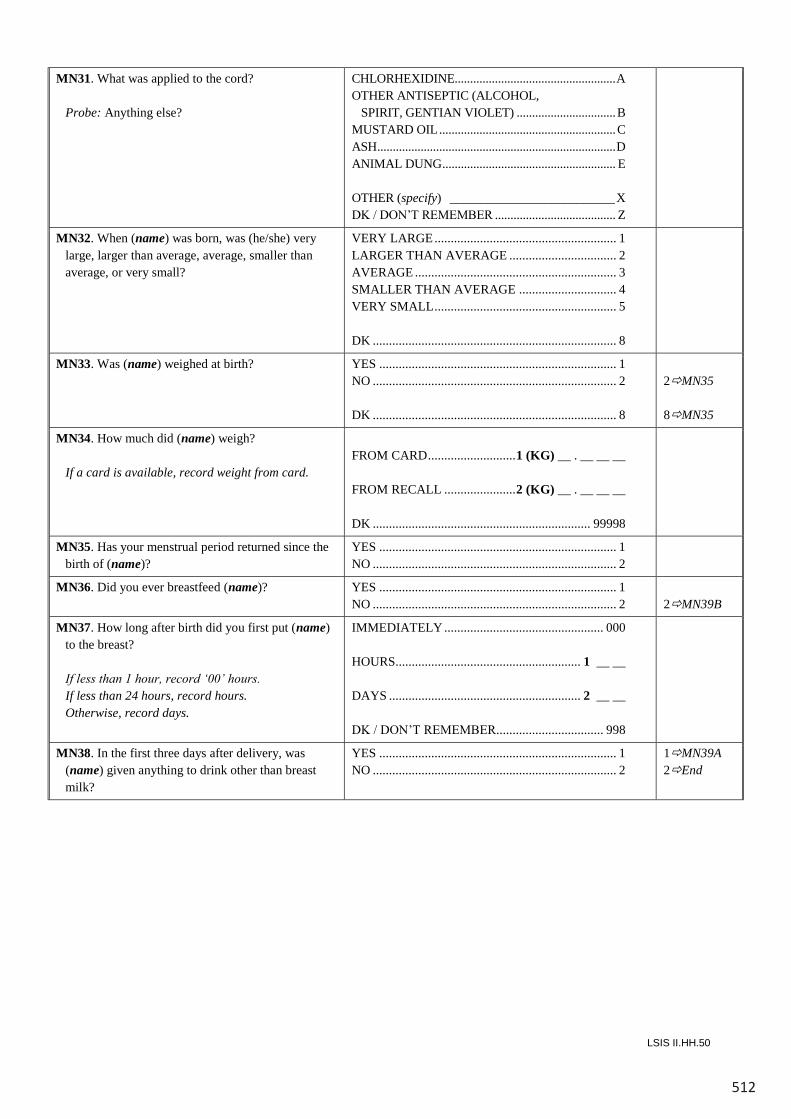
512
LSIS II.HH.50
MN31. What was applied to the cord? Probe: Anything else?
CHLORHEXIDINE.................................................... A OTHER ANTISEPTIC (ALCOHOL, SPIRIT, GENTIAN VIOLET) ................................ B MUSTARD OIL ......................................................... C ASH ............................................................................. D ANIMAL DUNG ........................................................ E OTHER (specify) __________________________ X DK / DON’T REMEMBER ....................................... Z
MN32. When (name) was born, was (he/she) very large, larger than average, average, smaller than average, or very small?
VERY LARGE ........................................................ 1 LARGER THAN AVERAGE ................................. 2 AVERAGE .............................................................. 3 SMALLER THAN AVERAGE .............................. 4 VERY SMALL ........................................................ 5 DK ........................................................................... 8
MN33. Was (name) weighed at birth? YES ......................................................................... 1 NO ........................................................................... 2 DK ........................................................................... 8
2MN35 8MN35
MN34. How much did (name) weigh? If a card is available, record weight from card.
FROM CARD ........................... 1 (KG) __ . __ __ __ FROM RECALL ...................... 2 (KG) __ . __ __ __ DK ................................................................... 99998
MN35. Has your menstrual period returned since the birth of (name)?
YES ......................................................................... 1 NO ........................................................................... 2
MN36. Did you ever breastfeed (name)? YES ......................................................................... 1 NO ........................................................................... 2
2MN39B
MN37. How long after birth did you first put (name) to the breast?
If less than 1 hour, record ‘00’ hours. If less than 24 hours, record hours. Otherwise, record days.
IMMEDIATELY ................................................. 000 HOURS......................................................... 1 __ __ DAYS ........................................................... 2 __ __ DK / DON’T REMEMBER................................. 998
MN38. In the first three days after delivery, was (name) given anything to drink other than breast milk?
YES ......................................................................... 1 NO ........................................................................... 2
1MN39A 2End
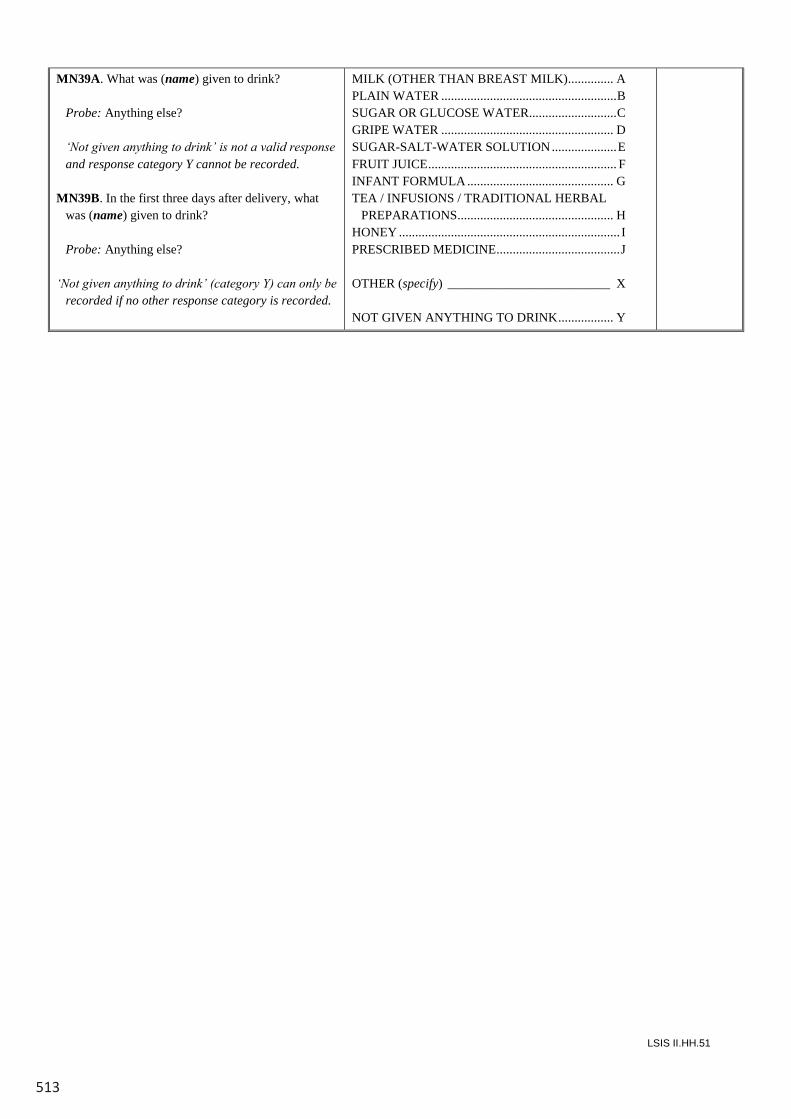
513
LSIS II.HH.51
MN39A. What was (name) given to drink? Probe: Anything else? ‘Not given anything to drink’ is not a valid response
and response category Y cannot be recorded. MN39B. In the first three days after delivery, what
was (name) given to drink? Probe: Anything else? ‘Not given anything to drink’ (category Y) can only be
recorded if no other response category is recorded.
MILK (OTHER THAN BREAST MILK) .............. A PLAIN WATER ...................................................... B SUGAR OR GLUCOSE WATER ........................... C GRIPE WATER ..................................................... D SUGAR-SALT-WATER SOLUTION .................... E FRUIT JUICE .......................................................... F INFANT FORMULA ............................................. G TEA / INFUSIONS / TRADITIONAL HERBAL
PREPARATIONS................................................ H HONEY .................................................................... I PRESCRIBED MEDICINE...................................... J OTHER (specify) _________________________ X NOT GIVEN ANYTHING TO DRINK ................. Y
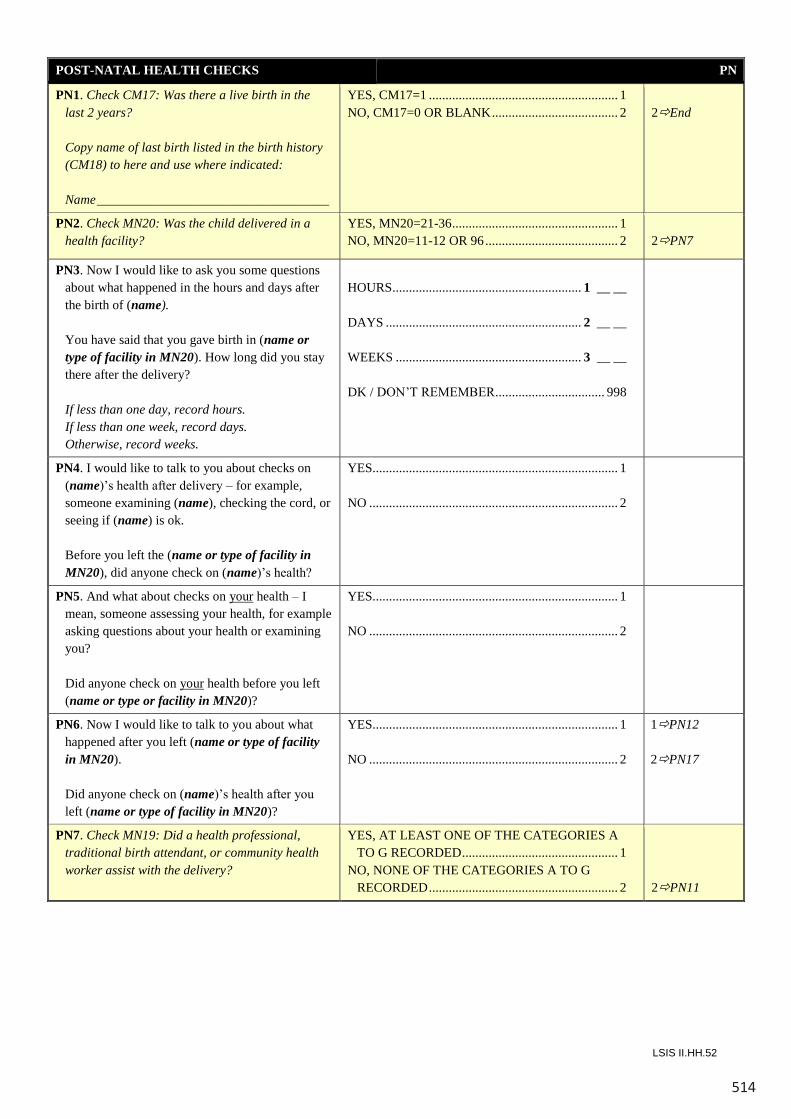
514
LSIS II.HH.52
POST-NATAL HEALTH CHECKS PN
PN1. Check CM17: Was there a live birth in the last 2 years?
Copy name of last birth listed in the birth history
(CM18) to here and use where indicated: Name ___________________________________
YES, CM17=1 ......................................................... 1 NO, CM17=0 OR BLANK ...................................... 2
2End
PN2. Check MN20: Was the child delivered in a health facility?
YES, MN20=21-36 .................................................. 1 NO, MN20=11-12 OR 96 ........................................ 2
2PN7
PN3. Now I would like to ask you some questions about what happened in the hours and days after the birth of (name).
You have said that you gave birth in (name or
type of facility in MN20). How long did you stay there after the delivery?
If less than one day, record hours. If less than one week, record days. Otherwise, record weeks.
HOURS ......................................................... 1 __ __ DAYS ........................................................... 2 __ __ WEEKS ........................................................ 3 __ __ DK / DON’T REMEMBER ................................. 998
PN4. I would like to talk to you about checks on (name)’s health after delivery – for example, someone examining (name), checking the cord, or seeing if (name) is ok.
Before you left the (name or type of facility in
MN20), did anyone check on (name)’s health?
YES.......................................................................... 1 NO ........................................................................... 2
PN5. And what about checks on your health – I mean, someone assessing your health, for example asking questions about your health or examining you?
Did anyone check on your health before you left
(name or type or facility in MN20)?
YES.......................................................................... 1 NO ........................................................................... 2
PN6. Now I would like to talk to you about what happened after you left (name or type of facility in MN20).
Did anyone check on (name)’s health after you
left (name or type of facility in MN20)?
YES.......................................................................... 1 NO ........................................................................... 2
1PN12 2PN17
PN7. Check MN19: Did a health professional, traditional birth attendant, or community health worker assist with the delivery?
YES, AT LEAST ONE OF THE CATEGORIES A TO G RECORDED ............................................... 1
NO, NONE OF THE CATEGORIES A TO G RECORDED ......................................................... 2
2PN11
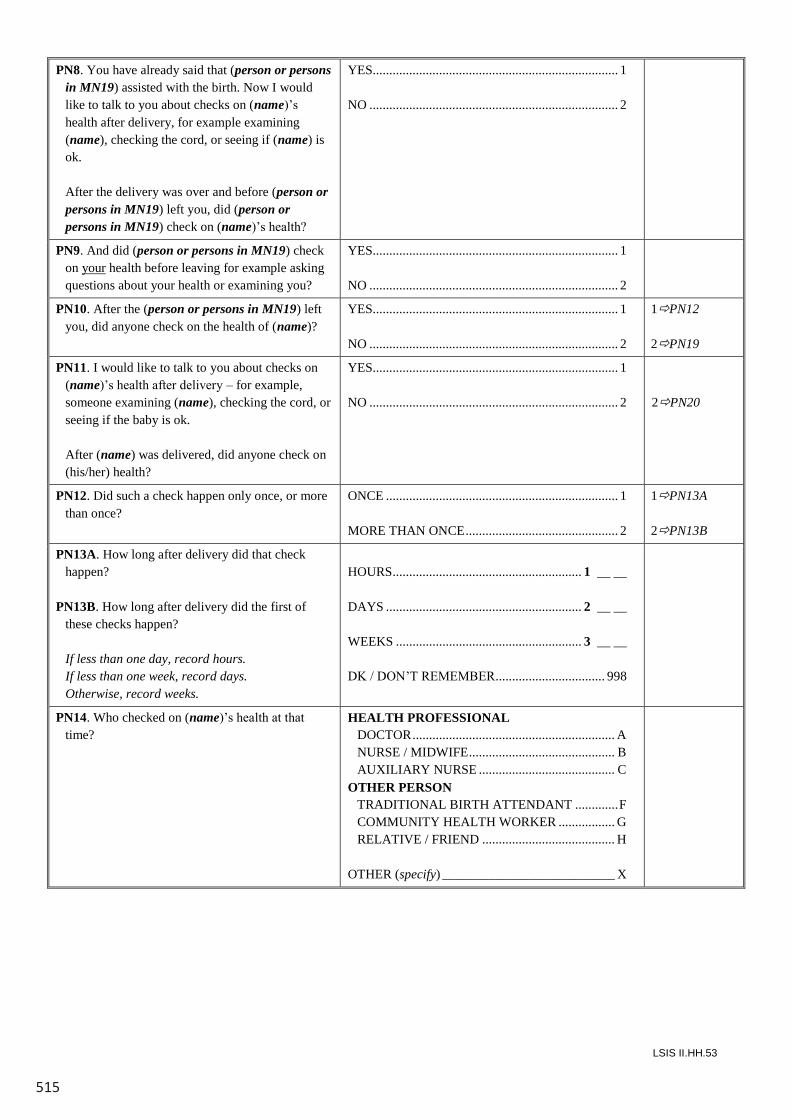
515
LSIS II.HH.53
PN8. You have already said that (person or persons in MN19) assisted with the birth. Now I would like to talk to you about checks on (name)’s health after delivery, for example examining (name), checking the cord, or seeing if (name) is ok.
After the delivery was over and before (person or
persons in MN19) left you, did (person or persons in MN19) check on (name)’s health?
YES.......................................................................... 1 NO ........................................................................... 2
PN9. And did (person or persons in MN19) check on your health before leaving for example asking questions about your health or examining you?
YES.......................................................................... 1 NO ........................................................................... 2
PN10. After the (person or persons in MN19) left you, did anyone check on the health of (name)?
YES.......................................................................... 1 NO ........................................................................... 2
1PN12 2PN19
PN11. I would like to talk to you about checks on (name)’s health after delivery – for example, someone examining (name), checking the cord, or seeing if the baby is ok.
After (name) was delivered, did anyone check on
(his/her) health?
YES.......................................................................... 1 NO ........................................................................... 2
2PN20
PN12. Did such a check happen only once, or more than once?
ONCE ...................................................................... 1 MORE THAN ONCE .............................................. 2
1PN13A 2PN13B
PN13A. How long after delivery did that check happen?
PN13B. How long after delivery did the first of
these checks happen? If less than one day, record hours. If less than one week, record days. Otherwise, record weeks.
HOURS ......................................................... 1 __ __ DAYS ........................................................... 2 __ __ WEEKS ........................................................ 3 __ __ DK / DON’T REMEMBER ................................. 998
PN14. Who checked on (name)’s health at that time?
HEALTH PROFESSIONAL DOCTOR ............................................................. A NURSE / MIDWIFE ............................................ B AUXILIARY NURSE ......................................... C OTHER PERSON TRADITIONAL BIRTH ATTENDANT ............. F COMMUNITY HEALTH WORKER ................. G RELATIVE / FRIEND ........................................ H OTHER (specify) __________________________ X
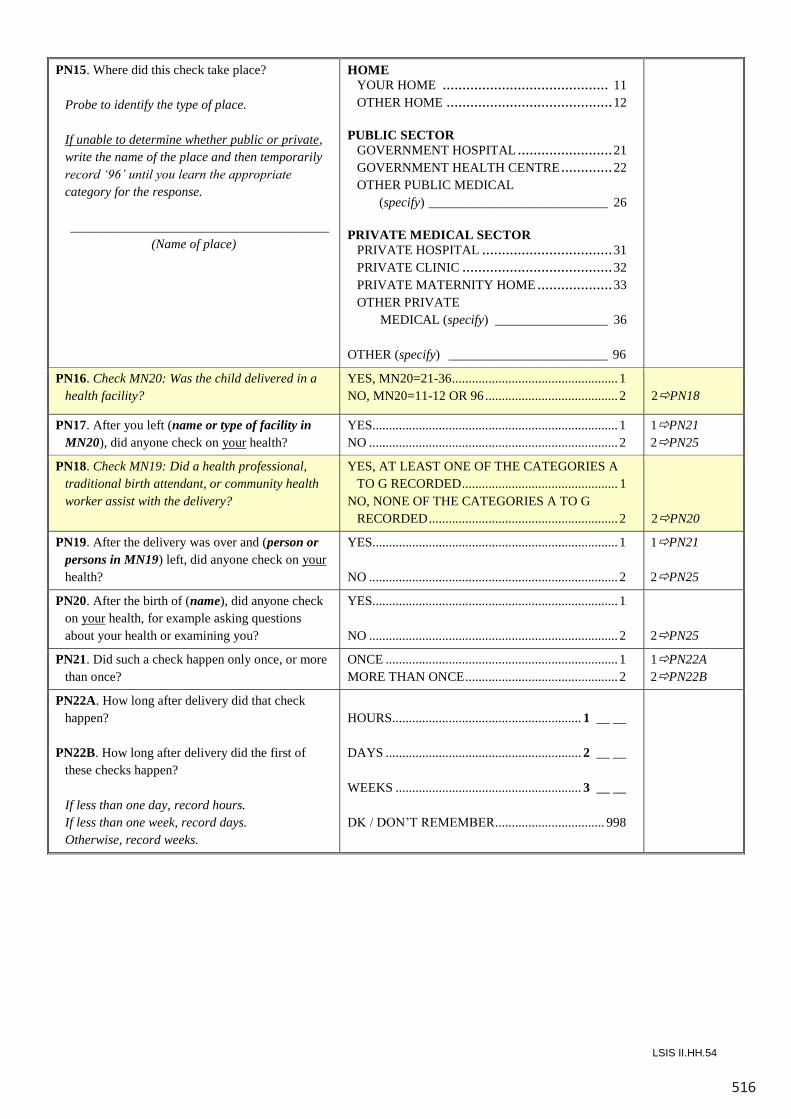
516
LSIS II.HH.54
PN15. Where did this check take place? Probe to identify the type of place. If unable to determine whether public or private,
write the name of the place and then temporarily record ‘96’ until you learn the appropriate category for the response.
_______________________________________
(Name of place)
HOME YOUR HOME .......................................... 11 OTHER HOME .......................................... 12 PUBLIC SECTOR GOVERNMENT HOSPITAL ........................ 21 GOVERNMENT HEALTH CENTRE ............. 22 OTHER PUBLIC MEDICAL (specify) ___________________________ 26 PRIVATE MEDICAL SECTOR PRIVATE HOSPITAL ................................. 31 PRIVATE CLINIC ...................................... 32 PRIVATE MATERNITY HOME ................... 33 OTHER PRIVATE MEDICAL (specify) _________________ 36 OTHER (specify) ________________________ 96
PN16. Check MN20: Was the child delivered in a health facility?
YES, MN20=21-36 .................................................. 1 NO, MN20=11-12 OR 96 ........................................ 2
2PN18
PN17. After you left (name or type of facility in MN20), did anyone check on your health?
YES.......................................................................... 1 NO ........................................................................... 2
1PN21 2PN25
PN18. Check MN19: Did a health professional, traditional birth attendant, or community health worker assist with the delivery?
YES, AT LEAST ONE OF THE CATEGORIES A TO G RECORDED ............................................... 1
NO, NONE OF THE CATEGORIES A TO G RECORDED ......................................................... 2
2PN20
PN19. After the delivery was over and (person or persons in MN19) left, did anyone check on your health?
YES.......................................................................... 1 NO ........................................................................... 2
1PN21 2PN25
PN20. After the birth of (name), did anyone check on your health, for example asking questions about your health or examining you?
YES.......................................................................... 1 NO ........................................................................... 2
2PN25
PN21. Did such a check happen only once, or more than once?
ONCE ...................................................................... 1 MORE THAN ONCE .............................................. 2
1PN22A 2PN22B
PN22A. How long after delivery did that check happen?
PN22B. How long after delivery did the first of
these checks happen? If less than one day, record hours. If less than one week, record days. Otherwise, record weeks.
HOURS ......................................................... 1 __ __ DAYS ........................................................... 2 __ __ WEEKS ........................................................ 3 __ __ DK / DON’T REMEMBER ................................. 998
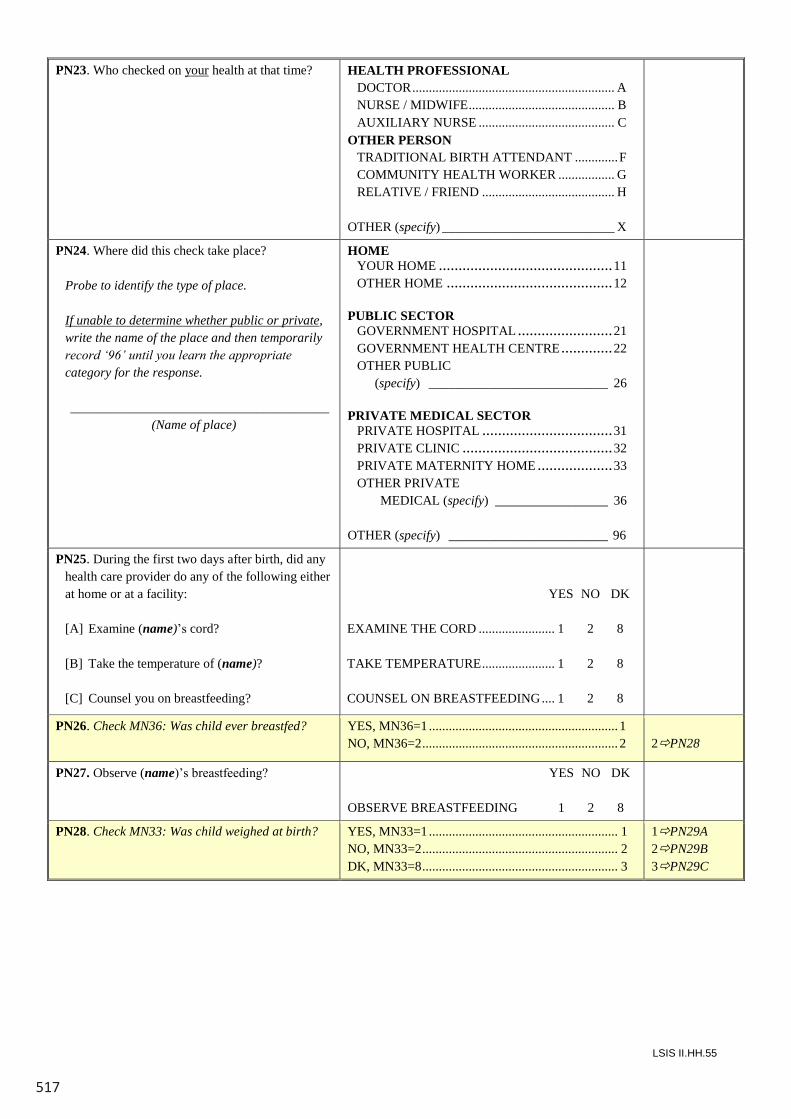
517
LSIS II.HH.55
PN23. Who checked on your health at that time? HEALTH PROFESSIONAL DOCTOR ............................................................. A NURSE / MIDWIFE ............................................ B AUXILIARY NURSE ......................................... C OTHER PERSON TRADITIONAL BIRTH ATTENDANT ............. F COMMUNITY HEALTH WORKER ................. G RELATIVE / FRIEND ........................................ H OTHER (specify) __________________________ X
PN24. Where did this check take place? Probe to identify the type of place. If unable to determine whether public or private,
write the name of the place and then temporarily record ‘96’ until you learn the appropriate category for the response.
_______________________________________
(Name of place)
HOME YOUR HOME ............................................ 11 OTHER HOME .......................................... 12 PUBLIC SECTOR GOVERNMENT HOSPITAL ........................ 21 GOVERNMENT HEALTH CENTRE ............. 22 OTHER PUBLIC (specify) ___________________________ 26 PRIVATE MEDICAL SECTOR PRIVATE HOSPITAL ................................. 31 PRIVATE CLINIC ...................................... 32 PRIVATE MATERNITY HOME ................... 33 OTHER PRIVATE MEDICAL (specify) _________________ 36 OTHER (specify) ________________________ 96
PN25. During the first two days after birth, did any health care provider do any of the following either at home or at a facility:
[A] Examine (name)’s cord? [B] Take the temperature of (name)? [C] Counsel you on breastfeeding?
YES NO DK EXAMINE THE CORD ....................... 1 2 8 TAKE TEMPERATURE ...................... 1 2 8 COUNSEL ON BREASTFEEDING .... 1 2 8
PN26. Check MN36: Was child ever breastfed? YES, MN36=1 ......................................................... 1 NO, MN36=2 ........................................................... 2
2PN28
PN27. Observe (name)’s breastfeeding? YES NO DK OBSERVE BREASTFEEDING 1 2 8
PN28. Check MN33: Was child weighed at birth? YES, MN33=1 ......................................................... 1 NO, MN33=2 ........................................................... 2 DK, MN33=8 ........................................................... 3
1PN29A 2PN29B 3PN29C
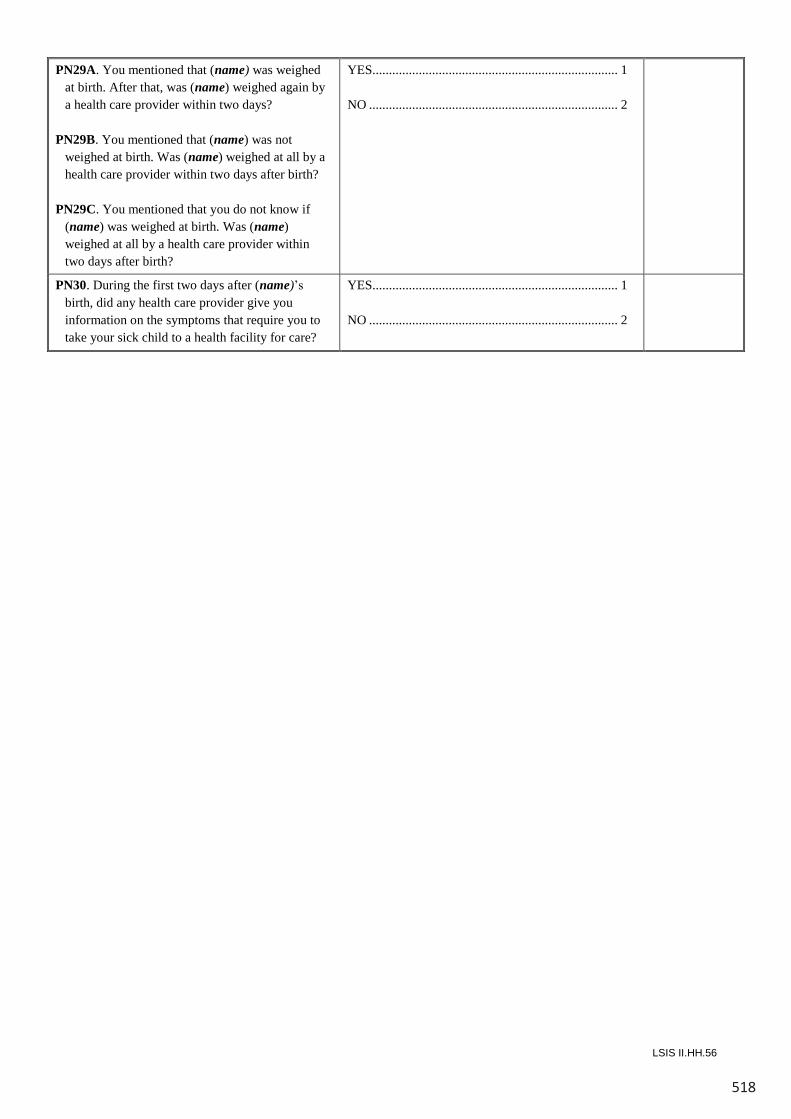
518
LSIS II.HH.56
PN29A. You mentioned that (name) was weighed at birth. After that, was (name) weighed again by a health care provider within two days?
PN29B. You mentioned that (name) was not
weighed at birth. Was (name) weighed at all by a health care provider within two days after birth?
PN29C. You mentioned that you do not know if
(name) was weighed at birth. Was (name) weighed at all by a health care provider within two days after birth?
YES.......................................................................... 1 NO ........................................................................... 2
PN30. During the first two days after (name)’s birth, did any health care provider give you information on the symptoms that require you to take your sick child to a health facility for care?
YES.......................................................................... 1 NO ........................................................................... 2
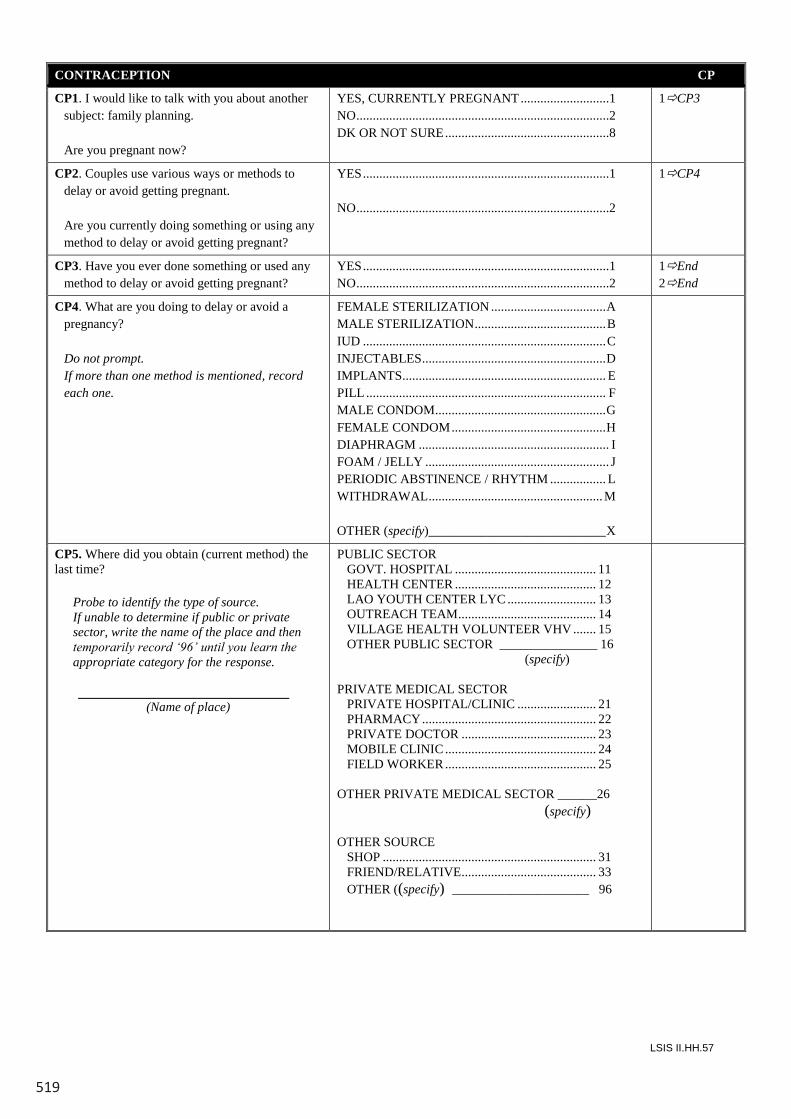
519
LSIS II.HH.57
CONTRACEPTION CP
CP1. I would like to talk with you about another subject: family planning.
Are you pregnant now?
YES, CURRENTLY PREGNANT ...........................1NO.............................................................................2DK OR NOT SURE..................................................8
1CP3
CP2. Couples use various ways or methods to delay or avoid getting pregnant.
Are you currently doing something or using any method to delay or avoid getting pregnant?
YES...........................................................................1
NO.............................................................................2
1CP4
CP3. Have you ever done something or used any method to delay or avoid getting pregnant?
YES...........................................................................1NO.............................................................................2
1End2End
CP4. What are you doing to delay or avoid a pregnancy?
Do not prompt.If more than one method is mentioned, record each one.
FEMALE STERILIZATION ...................................AMALE STERILIZATION........................................BIUD ..........................................................................CINJECTABLES........................................................DIMPLANTS.............................................................. EPILL ......................................................................... FMALE CONDOM....................................................GFEMALE CONDOM...............................................HDIAPHRAGM .......................................................... IFOAM / JELLY ........................................................ JPERIODIC ABSTINENCE / RHYTHM ................. LWITHDRAWAL.....................................................M
OTHER (specify)___________________________X
CP5. Where did you obtain (current method) the last time?
Probe to identify the type of source. If unable to determine if public or private sector, write the name of the place and then temporarily record ‘96’ until you learn the appropriate category for the response.
(Name of place)
PUBLIC SECTORGOVT. HOSPITAL ........................................... 11HEALTH CENTER ........................................... 12LAO YOUTH CENTER LYC ........................... 13OUTREACH TEAM.......................................... 14VILLAGE HEALTH VOLUNTEER VHV ....... 15OTHER PUBLIC SECTOR _______________ 16
(specify)
PRIVATE MEDICAL SECTORPRIVATE HOSPITAL/CLINIC ........................ 21PHARMACY..................................................... 22PRIVATE DOCTOR ......................................... 23MOBILE CLINIC .............................................. 24FIELD WORKER.............................................. 25
OTHER PRIVATE MEDICAL SECTOR ______26(specify)
OTHER SOURCESHOP ................................................................. 31FRIEND/RELATIVE......................................... 33OTHER ((specify) _____________________ 96
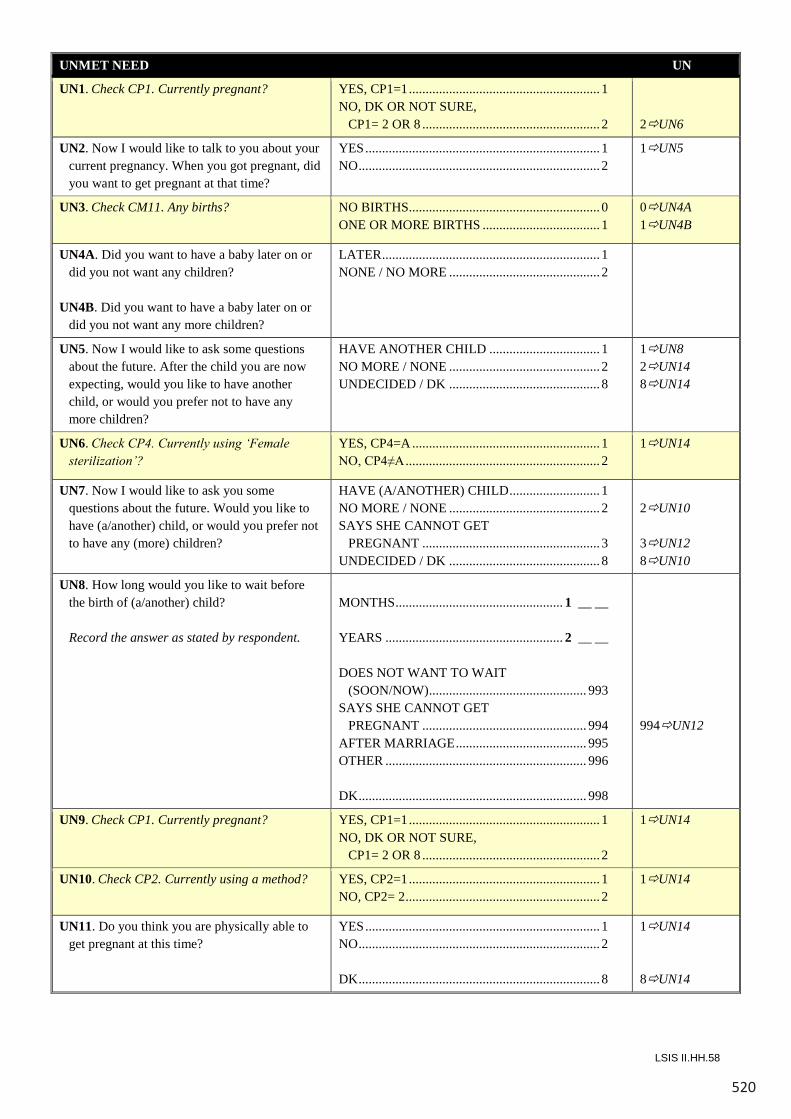
520
LSIS II.HH.58
UNMET NEED UN
UN1. Check CP1. Currently pregnant? YES, CP1=1 ......................................................... 1 NO, DK OR NOT SURE, CP1= 2 OR 8 ..................................................... 2
2UN6
UN2. Now I would like to talk to you about your current pregnancy. When you got pregnant, did you want to get pregnant at that time?
YES ...................................................................... 1 NO ........................................................................ 2
1UN5
UN3. Check CM11. Any births? NO BIRTHS ......................................................... 0 ONE OR MORE BIRTHS ................................... 1
0UN4A 1UN4B
UN4A. Did you want to have a baby later on or did you not want any children?
UN4B. Did you want to have a baby later on or
did you not want any more children?
LATER ................................................................. 1 NONE / NO MORE ............................................. 2
UN5. Now I would like to ask some questions about the future. After the child you are now expecting, would you like to have another child, or would you prefer not to have any more children?
HAVE ANOTHER CHILD ................................. 1 NO MORE / NONE ............................................. 2 UNDECIDED / DK ............................................. 8
1UN8 2UN14 8UN14
UN6. Check CP4. Currently using ‘Female sterilization’?
YES, CP4=A ........................................................ 1 NO, CP4≠A .......................................................... 2
1UN14
UN7. Now I would like to ask you some questions about the future. Would you like to have (a/another) child, or would you prefer not to have any (more) children?
HAVE (A/ANOTHER) CHILD ........................... 1 NO MORE / NONE ............................................. 2 SAYS SHE CANNOT GET PREGNANT ..................................................... 3 UNDECIDED / DK ............................................. 8
2UN10 3UN12 8UN10
UN8. How long would you like to wait before the birth of (a/another) child?
Record the answer as stated by respondent.
MONTHS .................................................. 1 __ __ YEARS ..................................................... 2 __ __ DOES NOT WANT TO WAIT (SOON/NOW)............................................... 993 SAYS SHE CANNOT GET PREGNANT ................................................. 994 AFTER MARRIAGE ....................................... 995 OTHER ............................................................ 996 DK .................................................................... 998
994UN12
UN9. Check CP1. Currently pregnant? YES, CP1=1 ......................................................... 1 NO, DK OR NOT SURE, CP1= 2 OR 8 ..................................................... 2
1UN14
UN10. Check CP2. Currently using a method? YES, CP2=1 ......................................................... 1 NO, CP2= 2 .......................................................... 2
1UN14
UN11. Do you think you are physically able to get pregnant at this time?
YES ...................................................................... 1 NO ........................................................................ 2 DK ........................................................................ 8
1UN14 8UN14
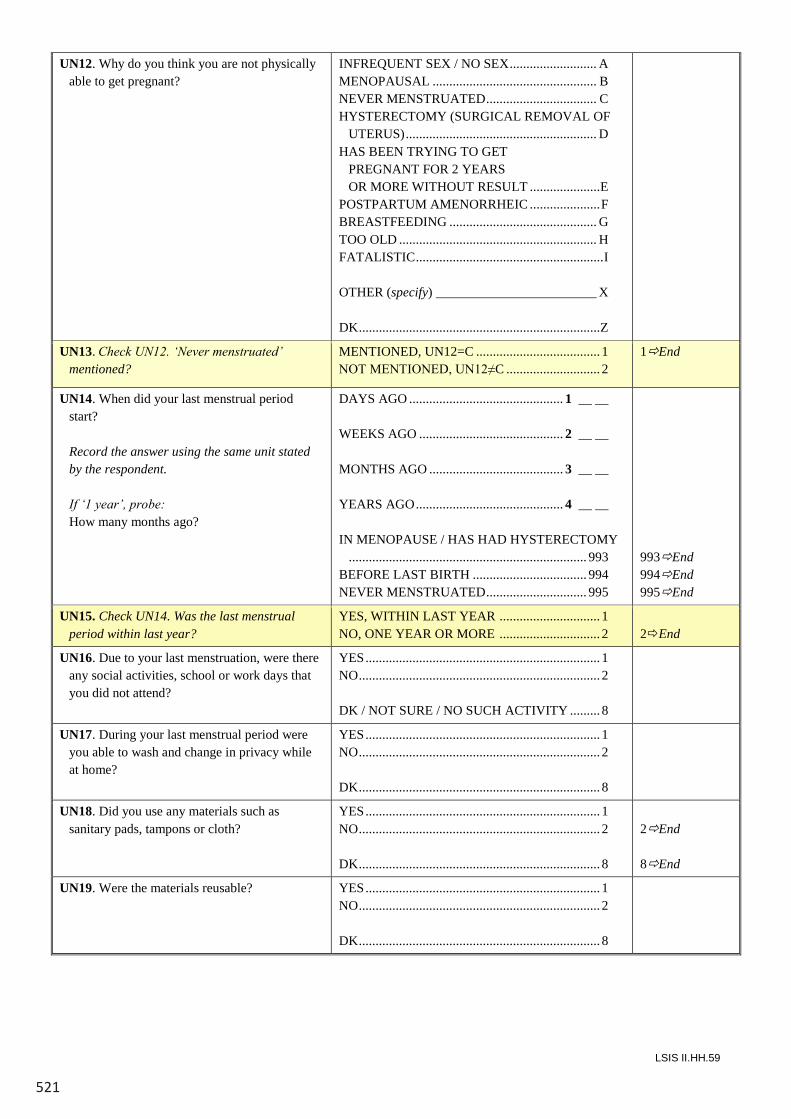
521
LSIS II.HH.59
UN12. Why do you think you are not physically able to get pregnant?
INFREQUENT SEX / NO SEX .......................... A MENOPAUSAL ................................................. B NEVER MENSTRUATED ................................. C HYSTERECTOMY (SURGICAL REMOVAL OF
UTERUS) ......................................................... D HAS BEEN TRYING TO GET PREGNANT FOR 2 YEARS OR MORE WITHOUT RESULT ..................... E POSTPARTUM AMENORRHEIC ..................... F BREASTFEEDING ............................................ G TOO OLD ........................................................... H FATALISTIC ........................................................ I OTHER (specify) ________________________ X DK ........................................................................ Z
UN13. Check UN12. ‘Never menstruated’ mentioned?
MENTIONED, UN12=C ..................................... 1 NOT MENTIONED, UN12≠C ............................ 2
1End
UN14. When did your last menstrual period start?
Record the answer using the same unit stated
by the respondent. If ‘1 year’, probe: How many months ago?
DAYS AGO .............................................. 1 __ __ WEEKS AGO ........................................... 2 __ __ MONTHS AGO ........................................ 3 __ __ YEARS AGO ............................................ 4 __ __ IN MENOPAUSE / HAS HAD HYSTERECTOMY
....................................................................... 993 BEFORE LAST BIRTH .................................. 994 NEVER MENSTRUATED .............................. 995
993End 994End 995End
UN15. Check UN14. Was the last menstrual period within last year?
YES, WITHIN LAST YEAR .............................. 1 NO, ONE YEAR OR MORE .............................. 2
2End
UN16. Due to your last menstruation, were there any social activities, school or work days that you did not attend?
YES ...................................................................... 1 NO ........................................................................ 2 DK / NOT SURE / NO SUCH ACTIVITY ......... 8
UN17. During your last menstrual period were you able to wash and change in privacy while at home?
YES ...................................................................... 1 NO ........................................................................ 2 DK ........................................................................ 8
UN18. Did you use any materials such as sanitary pads, tampons or cloth?
YES ...................................................................... 1 NO ........................................................................ 2 DK ........................................................................ 8
2End 8End
UN19. Were the materials reusable? YES ...................................................................... 1 NO ........................................................................ 2 DK ........................................................................ 8
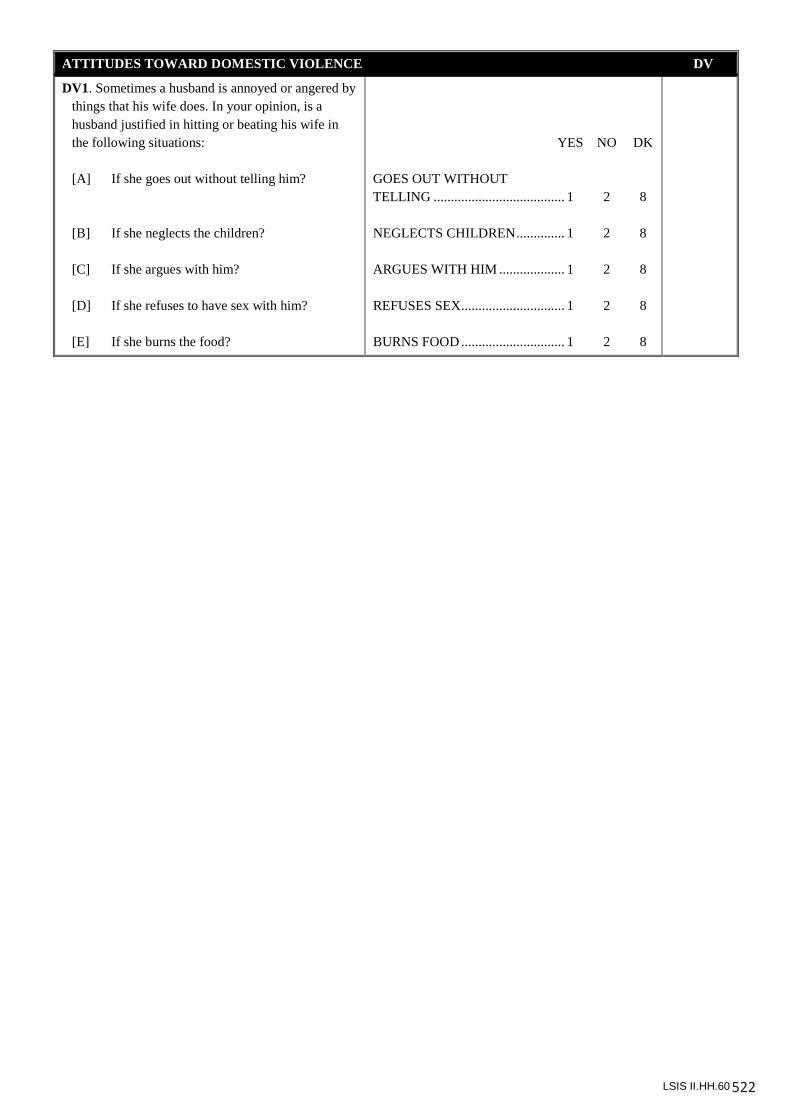
522
LSIS II.HH.60
ATTITUDES TOWARD DOMESTIC VIOLENCE DV
DV1. Sometimes a husband is annoyed or angered by things that his wife does. In your opinion, is a husband justified in hitting or beating his wife in the following situations:
[A] If she goes out without telling him? [B] If she neglects the children? [C] If she argues with him? [D] If she refuses to have sex with him? [E] If she burns the food?
YES NO DK GOES OUT WITHOUT TELLING ...................................... 1 2 8 NEGLECTS CHILDREN .............. 1 2 8 ARGUES WITH HIM ................... 1 2 8 REFUSES SEX .............................. 1 2 8 BURNS FOOD .............................. 1 2 8
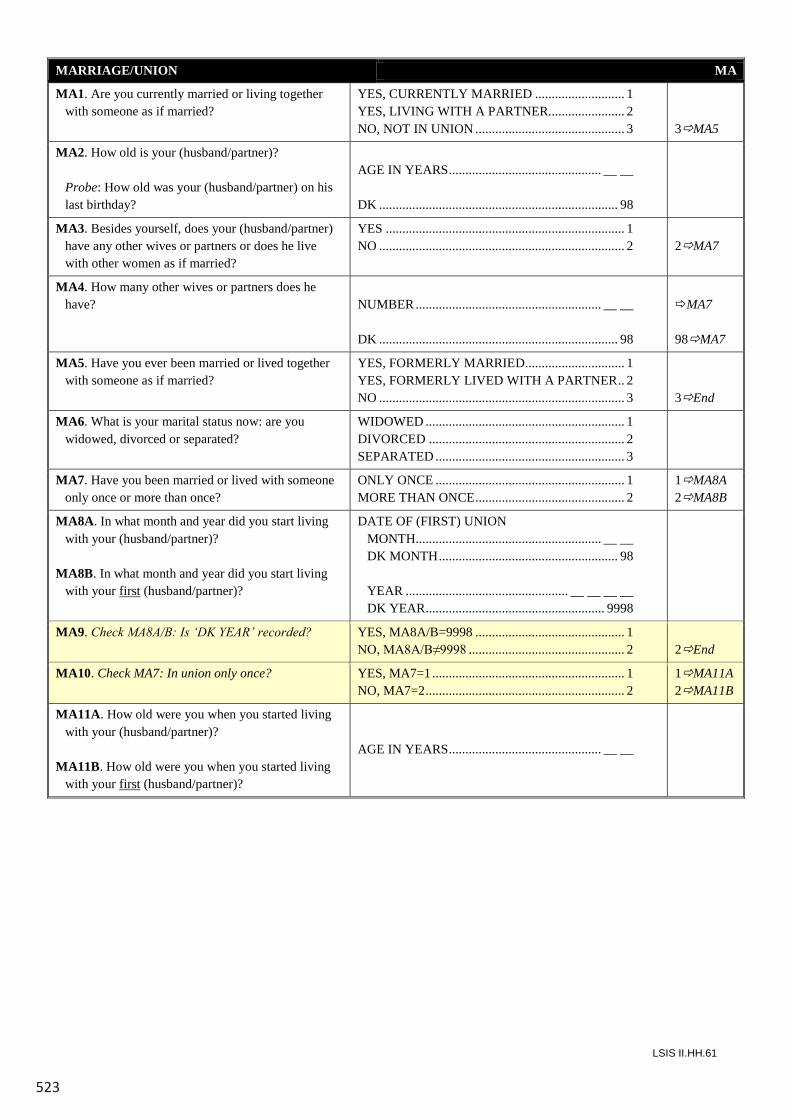
523
LSIS II.HH.61
MARRIAGE/UNION MA
MA1. Are you currently married or living together with someone as if married?
YES, CURRENTLY MARRIED ........................... 1 YES, LIVING WITH A PARTNER....................... 2 NO, NOT IN UNION ............................................. 3
3MA5
MA2. How old is your (husband/partner)? Probe: How old was your (husband/partner) on his
last birthday?
AGE IN YEARS .............................................. __ __ DK ........................................................................ 98
MA3. Besides yourself, does your (husband/partner) have any other wives or partners or does he live with other women as if married?
YES ........................................................................ 1 NO .......................................................................... 2
2MA7
MA4. How many other wives or partners does he have?
NUMBER ........................................................ __ __ DK ........................................................................ 98
MA7 98MA7
MA5. Have you ever been married or lived together with someone as if married?
YES, FORMERLY MARRIED .............................. 1 YES, FORMERLY LIVED WITH A PARTNER .. 2 NO .......................................................................... 3
3End
MA6. What is your marital status now: are you widowed, divorced or separated?
WIDOWED ............................................................ 1 DIVORCED ........................................................... 2 SEPARATED ......................................................... 3
MA7. Have you been married or lived with someone only once or more than once?
ONLY ONCE ......................................................... 1 MORE THAN ONCE ............................................. 2
1MA8A 2MA8B
MA8A. In what month and year did you start living with your (husband/partner)?
MA8B. In what month and year did you start living
with your first (husband/partner)?
DATE OF (FIRST) UNION MONTH........................................................ __ __ DK MONTH ...................................................... 98 YEAR ................................................. __ __ __ __ DK YEAR ...................................................... 9998
MA9. Check MA8A/B: Is ‘DK YEAR’ recorded? YES, MA8A/B=9998 ............................................. 1 NO, MA8A/B≠9998 ............................................... 2
2End
MA10. Check MA7: In union only once? YES, MA7=1 .......................................................... 1 NO, MA7=2 ............................................................ 2
1MA11A 2MA11B
MA11A. How old were you when you started living with your (husband/partner)?
MA11B. How old were you when you started living
with your first (husband/partner)?
AGE IN YEARS .............................................. __ __
LSIS II.HH.60
ATTITUDES TOWARD DOMESTIC VIOLENCE DV
DV1. Sometimes a husband is annoyed or angered by things that his wife does. In your opinion, is a husband justified in hitting or beating his wife in the following situations:
[A] If she goes out without telling him? [B] If she neglects the children? [C] If she argues with him? [D] If she refuses to have sex with him? [E] If she burns the food?
YES NO DK GOES OUT WITHOUT TELLING ...................................... 1 2 8 NEGLECTS CHILDREN .............. 1 2 8 ARGUES WITH HIM ................... 1 2 8 REFUSES SEX .............................. 1 2 8 BURNS FOOD .............................. 1 2 8
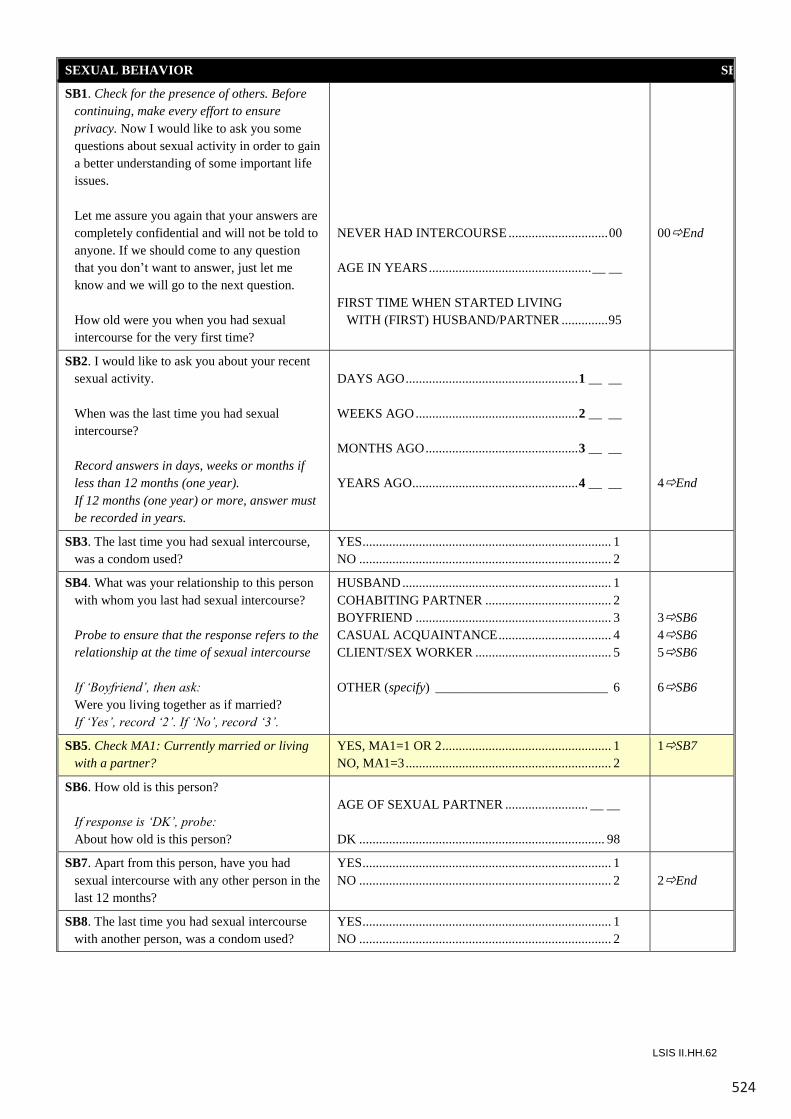
524
LSIS II.HH.62
SEXUAL BEHAVIOR SB
SB1. Check for the presence of others. Before continuing, make every effort to ensure privacy. Now I would like to ask you some questions about sexual activity in order to gain a better understanding of some important life issues.
Let me assure you again that your answers are
completely confidential and will not be told to anyone. If we should come to any question that you don’t want to answer, just let me know and we will go to the next question.
How old were you when you had sexual
intercourse for the very first time?
NEVER HAD INTERCOURSE .............................. 00 AGE IN YEARS ................................................. __ __ FIRST TIME WHEN STARTED LIVING WITH (FIRST) HUSBAND/PARTNER .............. 95
00End
SB2. I would like to ask you about your recent sexual activity.
When was the last time you had sexual
intercourse? Record answers in days, weeks or months if
less than 12 months (one year). If 12 months (one year) or more, answer must
be recorded in years.
DAYS AGO .................................................... 1 __ __ WEEKS AGO ................................................. 2 __ __ MONTHS AGO .............................................. 3 __ __ YEARS AGO.................................................. 4 __ __
4End
SB3. The last time you had sexual intercourse, was a condom used?
YES ........................................................................... 1 NO ............................................................................ 2
SB4. What was your relationship to this person with whom you last had sexual intercourse?
Probe to ensure that the response refers to the
relationship at the time of sexual intercourse If ‘Boyfriend’, then ask: Were you living together as if married? If ‘Yes’, record ‘2’. If ‘No’, record ‘3’.
HUSBAND ............................................................... 1 COHABITING PARTNER ...................................... 2 BOYFRIEND ........................................................... 3 CASUAL ACQUAINTANCE .................................. 4 CLIENT/SEX WORKER ......................................... 5 OTHER (specify) __________________________ 6
3SB6 4SB6 5SB6 6SB6
SB5. Check MA1: Currently married or living with a partner?
YES, MA1=1 OR 2 ................................................... 1 NO, MA1=3 .............................................................. 2
1SB7
SB6. How old is this person? If response is ‘DK’, probe: About how old is this person?
AGE OF SEXUAL PARTNER ......................... __ __ DK .......................................................................... 98
SB7. Apart from this person, have you had sexual intercourse with any other person in the last 12 months?
YES ........................................................................... 1 NO ............................................................................ 2
2End
SB8. The last time you had sexual intercourse with another person, was a condom used?
YES ........................................................................... 1 NO ............................................................................ 2
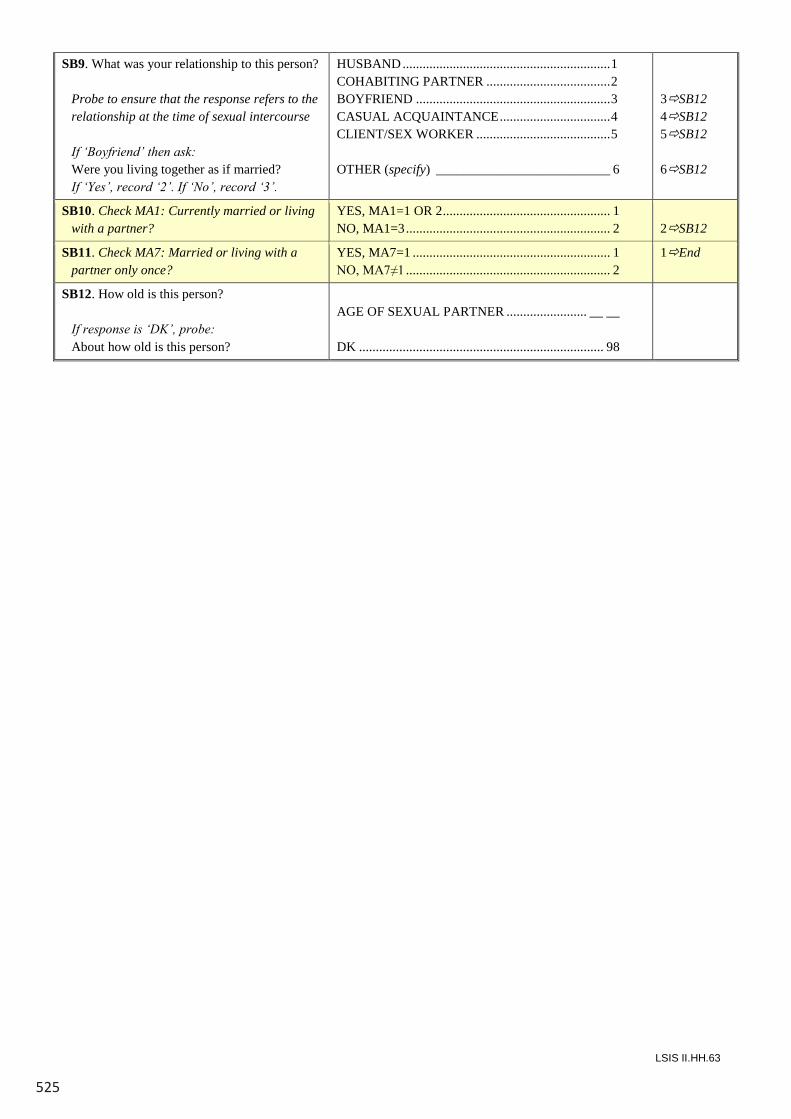
525
LSIS II.HH.63
SB9. What was your relationship to this person? Probe to ensure that the response refers to the
relationship at the time of sexual intercourse If ‘Boyfriend’ then ask: Were you living together as if married? If ‘Yes’, record ‘2’. If ‘No’, record ‘3’.
HUSBAND .............................................................. 1 COHABITING PARTNER ..................................... 2 BOYFRIEND .......................................................... 3 CASUAL ACQUAINTANCE ................................. 4 CLIENT/SEX WORKER ........................................ 5 OTHER (specify) __________________________ 6
3SB12 4SB12 5SB12 6SB12
SB10. Check MA1: Currently married or living with a partner?
YES, MA1=1 OR 2 .................................................. 1 NO, MA1=3 ............................................................. 2
2SB12
SB11. Check MA7: Married or living with a partner only once?
YES, MA7=1 ........................................................... 1 NO, MA7≠1 ............................................................. 2
1End
SB12. How old is this person? If response is ‘DK’, probe: About how old is this person?
AGE OF SEXUAL PARTNER ........................ __ __ DK ......................................................................... 98
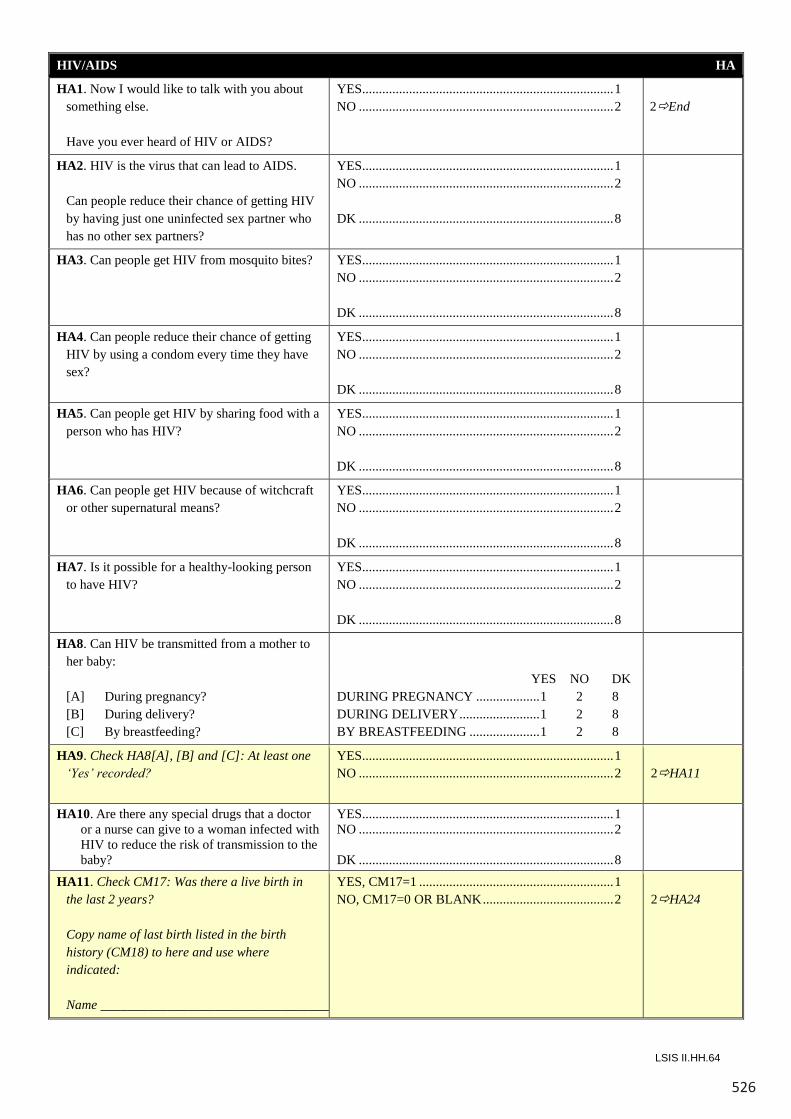
526
LSIS II.HH.64
HIV/AIDS HA
HA1. Now I would like to talk with you about something else.
Have you ever heard of HIV or AIDS?
YES ........................................................................... 1 NO ............................................................................ 2
2End
HA2. HIV is the virus that can lead to AIDS. Can people reduce their chance of getting HIV
by having just one uninfected sex partner who has no other sex partners?
YES ........................................................................... 1 NO ............................................................................ 2 DK ............................................................................ 8
HA3. Can people get HIV from mosquito bites? YES ........................................................................... 1 NO ............................................................................ 2 DK ............................................................................ 8
HA4. Can people reduce their chance of getting HIV by using a condom every time they have sex?
YES ........................................................................... 1 NO ............................................................................ 2 DK ............................................................................ 8
HA5. Can people get HIV by sharing food with a person who has HIV?
YES ........................................................................... 1 NO ............................................................................ 2 DK ............................................................................ 8
HA6. Can people get HIV because of witchcraft or other supernatural means?
YES ........................................................................... 1 NO ............................................................................ 2 DK ............................................................................ 8
HA7. Is it possible for a healthy-looking person to have HIV?
YES ........................................................................... 1 NO ............................................................................ 2 DK ............................................................................ 8
HA8. Can HIV be transmitted from a mother to her baby:
[A] During pregnancy? [B] During delivery? [C] By breastfeeding?
YES NO DK DURING PREGNANCY ................... 1 2 8 DURING DELIVERY ........................ 1 2 8 BY BREASTFEEDING ..................... 1 2 8
HA9. Check HA8[A], [B] and [C]: At least one ‘Yes’ recorded?
YES ........................................................................... 1 NO ............................................................................ 2
2HA11
HA10. Are there any special drugs that a doctor or a nurse can give to a woman infected with HIV to reduce the risk of transmission to the baby?
YES ........................................................................... 1 NO ............................................................................ 2 DK ............................................................................ 8
HA11. Check CM17: Was there a live birth in the last 2 years?
Copy name of last birth listed in the birth
history (CM18) to here and use where indicated:
Name ___________________________________
YES, CM17=1 .......................................................... 1 NO, CM17=0 OR BLANK ....................................... 2
2HA24
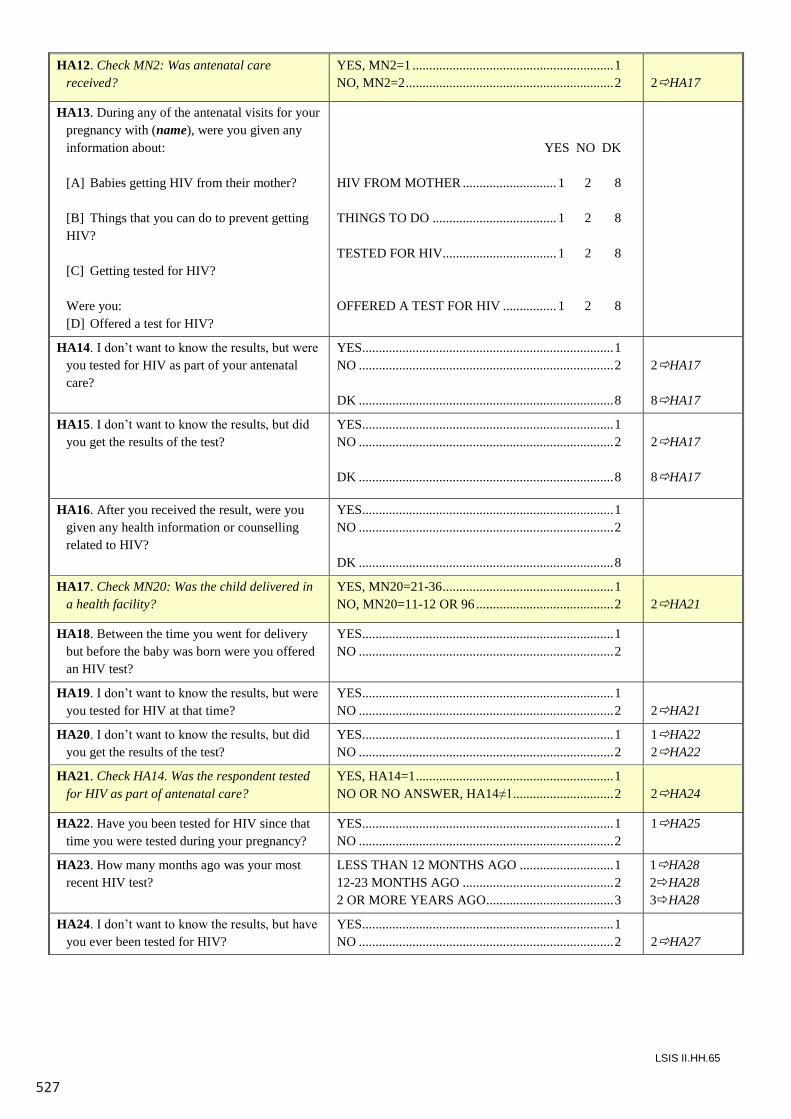
527
LSIS II.HH.65
HA12. Check MN2: Was antenatal care received?
YES, MN2=1 ............................................................ 1 NO, MN2=2 .............................................................. 2
2HA17
HA13. During any of the antenatal visits for your pregnancy with (name), were you given any information about:
[A] Babies getting HIV from their mother? [B] Things that you can do to prevent getting
HIV? [C] Getting tested for HIV? Were you: [D] Offered a test for HIV?
YES NO DK HIV FROM MOTHER ............................ 1 2 8 THINGS TO DO ..................................... 1 2 8 TESTED FOR HIV.................................. 1 2 8 OFFERED A TEST FOR HIV ................ 1 2 8
HA14. I don’t want to know the results, but were you tested for HIV as part of your antenatal care?
YES ........................................................................... 1 NO ............................................................................ 2 DK ............................................................................ 8
2HA17 8HA17
HA15. I don’t want to know the results, but did you get the results of the test?
YES ........................................................................... 1 NO ............................................................................ 2 DK ............................................................................ 8
2HA17 8HA17
HA16. After you received the result, were you given any health information or counselling related to HIV?
YES ........................................................................... 1 NO ............................................................................ 2 DK ............................................................................ 8
HA17. Check MN20: Was the child delivered in a health facility?
YES, MN20=21-36 ................................................... 1 NO, MN20=11-12 OR 96 ......................................... 2
2HA21
HA18. Between the time you went for delivery but before the baby was born were you offered an HIV test?
YES ........................................................................... 1 NO ............................................................................ 2
HA19. I don’t want to know the results, but were you tested for HIV at that time?
YES ........................................................................... 1 NO ............................................................................ 2
2HA21
HA20. I don’t want to know the results, but did you get the results of the test?
YES ........................................................................... 1 NO ............................................................................ 2
1HA22 2HA22
HA21. Check HA14. Was the respondent tested for HIV as part of antenatal care?
YES, HA14=1 ........................................................... 1 NO OR NO ANSWER, HA14≠1.............................. 2
2HA24
HA22. Have you been tested for HIV since that time you were tested during your pregnancy?
YES ........................................................................... 1 NO ............................................................................ 2
1HA25
HA23. How many months ago was your most recent HIV test?
LESS THAN 12 MONTHS AGO ............................ 1 12-23 MONTHS AGO ............................................. 2 2 OR MORE YEARS AGO...................................... 3
1HA28 2HA28 3HA28
HA24. I don’t want to know the results, but have you ever been tested for HIV?
YES ........................................................................... 1 NO ............................................................................ 2
2HA27
LSIS II.HH.64
HIV/AIDS HA
HA1. Now I would like to talk with you about something else.
Have you ever heard of HIV or AIDS?
YES ........................................................................... 1 NO ............................................................................ 2
2End
HA2. HIV is the virus that can lead to AIDS. Can people reduce their chance of getting HIV
by having just one uninfected sex partner who has no other sex partners?
YES ........................................................................... 1 NO ............................................................................ 2 DK ............................................................................ 8
HA3. Can people get HIV from mosquito bites? YES ........................................................................... 1 NO ............................................................................ 2 DK ............................................................................ 8
HA4. Can people reduce their chance of getting HIV by using a condom every time they have sex?
YES ........................................................................... 1 NO ............................................................................ 2 DK ............................................................................ 8
HA5. Can people get HIV by sharing food with a person who has HIV?
YES ........................................................................... 1 NO ............................................................................ 2 DK ............................................................................ 8
HA6. Can people get HIV because of witchcraft or other supernatural means?
YES ........................................................................... 1 NO ............................................................................ 2 DK ............................................................................ 8
HA7. Is it possible for a healthy-looking person to have HIV?
YES ........................................................................... 1 NO ............................................................................ 2 DK ............................................................................ 8
HA8. Can HIV be transmitted from a mother to her baby:
[A] During pregnancy? [B] During delivery? [C] By breastfeeding?
YES NO DK DURING PREGNANCY ................... 1 2 8 DURING DELIVERY ........................ 1 2 8 BY BREASTFEEDING ..................... 1 2 8
HA9. Check HA8[A], [B] and [C]: At least one ‘Yes’ recorded?
YES ........................................................................... 1 NO ............................................................................ 2
2HA11
HA10. Are there any special drugs that a doctor or a nurse can give to a woman infected with HIV to reduce the risk of transmission to the baby?
YES ........................................................................... 1 NO ............................................................................ 2 DK ............................................................................ 8
HA11. Check CM17: Was there a live birth in the last 2 years?
Copy name of last birth listed in the birth
history (CM18) to here and use where indicated:
Name ___________________________________
YES, CM17=1 .......................................................... 1 NO, CM17=0 OR BLANK ....................................... 2
2HA24
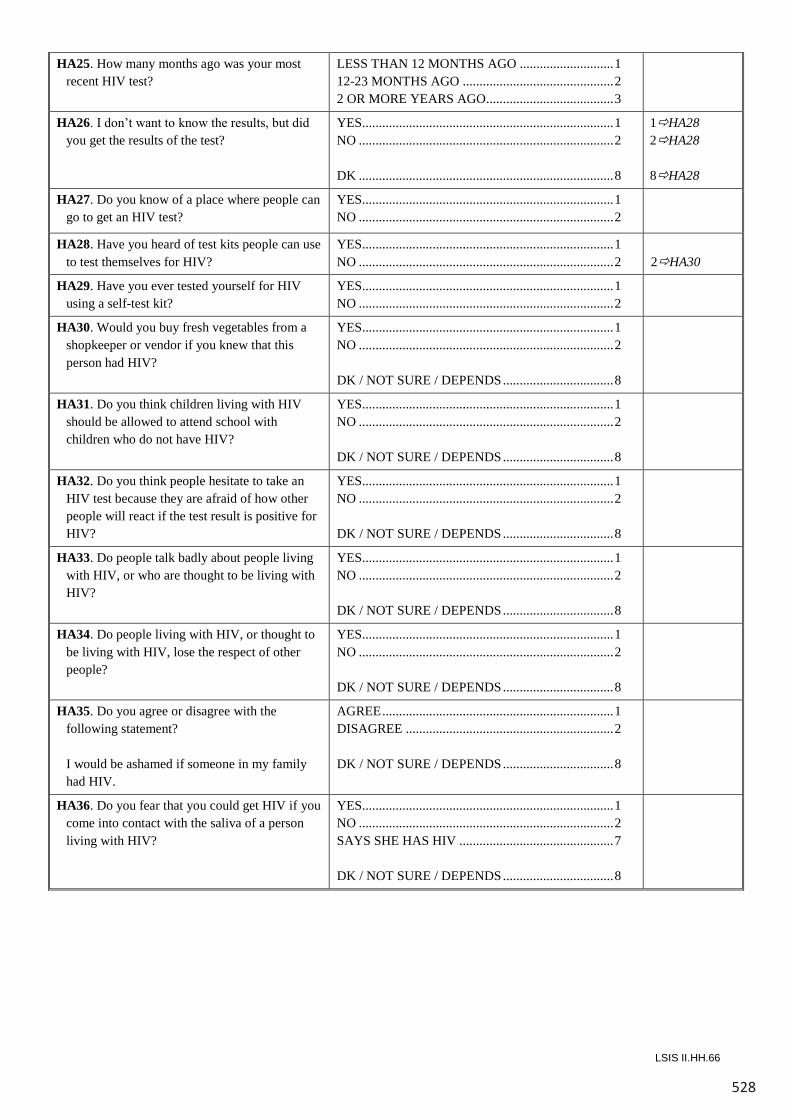
528
LSIS II.HH.66
HA25. How many months ago was your most recent HIV test?
LESS THAN 12 MONTHS AGO ............................ 1 12-23 MONTHS AGO ............................................. 2 2 OR MORE YEARS AGO...................................... 3
HA26. I don’t want to know the results, but did you get the results of the test?
YES ........................................................................... 1 NO ............................................................................ 2 DK ............................................................................ 8
1HA28 2HA28 8HA28
HA27. Do you know of a place where people can go to get an HIV test?
YES ........................................................................... 1 NO ............................................................................ 2
HA28. Have you heard of test kits people can use to test themselves for HIV?
YES ........................................................................... 1 NO ............................................................................ 2
2HA30
HA29. Have you ever tested yourself for HIV using a self-test kit?
YES ........................................................................... 1 NO ............................................................................ 2
HA30. Would you buy fresh vegetables from a shopkeeper or vendor if you knew that this person had HIV?
YES ........................................................................... 1 NO ............................................................................ 2 DK / NOT SURE / DEPENDS ................................. 8
HA31. Do you think children living with HIV should be allowed to attend school with children who do not have HIV?
YES ........................................................................... 1 NO ............................................................................ 2 DK / NOT SURE / DEPENDS ................................. 8
HA32. Do you think people hesitate to take an HIV test because they are afraid of how other people will react if the test result is positive for HIV?
YES ........................................................................... 1 NO ............................................................................ 2 DK / NOT SURE / DEPENDS ................................. 8
HA33. Do people talk badly about people living with HIV, or who are thought to be living with HIV?
YES ........................................................................... 1 NO ............................................................................ 2 DK / NOT SURE / DEPENDS ................................. 8
HA34. Do people living with HIV, or thought to be living with HIV, lose the respect of other people?
YES ........................................................................... 1 NO ............................................................................ 2 DK / NOT SURE / DEPENDS ................................. 8
HA35. Do you agree or disagree with the following statement?
I would be ashamed if someone in my family
had HIV.
AGREE ..................................................................... 1 DISAGREE .............................................................. 2 DK / NOT SURE / DEPENDS ................................. 8
HA36. Do you fear that you could get HIV if you come into contact with the saliva of a person living with HIV?
YES ........................................................................... 1 NO ............................................................................ 2 SAYS SHE HAS HIV .............................................. 7 DK / NOT SURE / DEPENDS ................................. 8
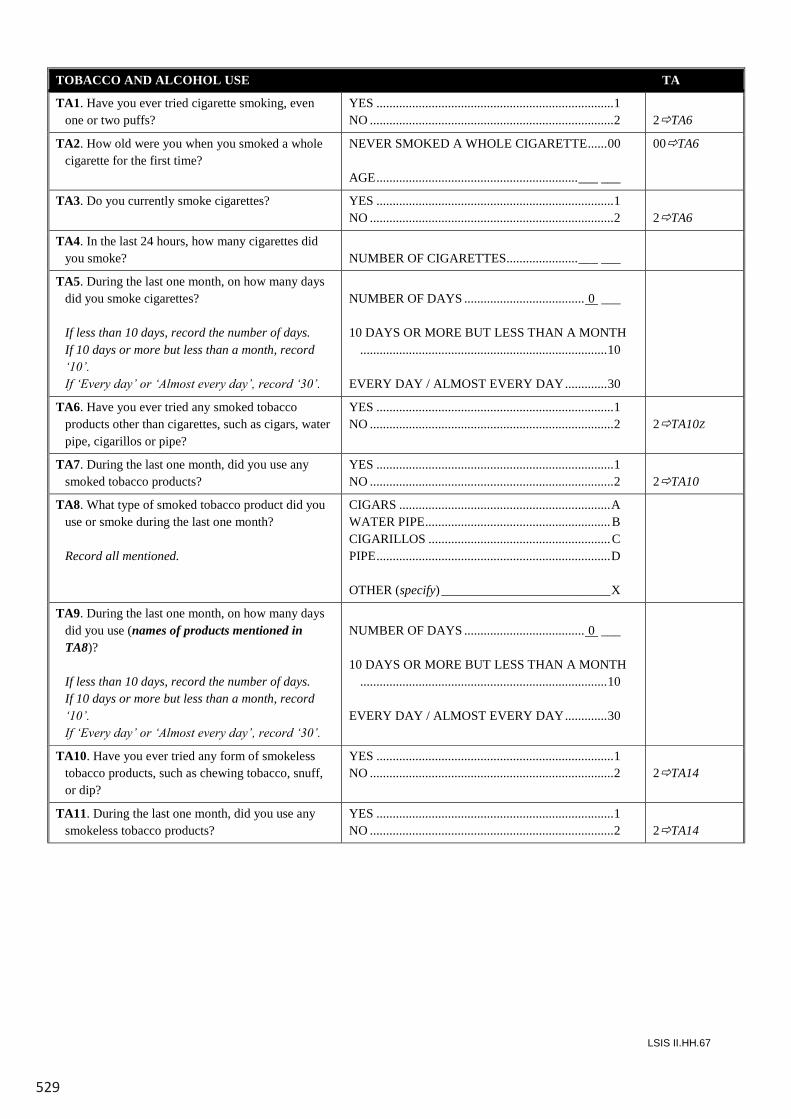
529
LSIS II.HH.67
TOBACCO AND ALCOHOL USE TA
TA1. Have you ever tried cigarette smoking, even one or two puffs?
YES ......................................................................... 1 NO ........................................................................... 2
2TA6
TA2. How old were you when you smoked a whole cigarette for the first time?
NEVER SMOKED A WHOLE CIGARETTE ...... 00 AGE .............................................................. ___ ___
00TA6
TA3. Do you currently smoke cigarettes? YES ......................................................................... 1 NO ........................................................................... 2
2TA6
TA4. In the last 24 hours, how many cigarettes did you smoke?
NUMBER OF CIGARETTES ...................... ___ ___
TA5. During the last one month, on how many days did you smoke cigarettes?
If less than 10 days, record the number of days. If 10 days or more but less than a month, record
‘10’. If ‘Every day’ or ‘Almost every day’, record ‘30’.
NUMBER OF DAYS ..................................... 0 ___ 10 DAYS OR MORE BUT LESS THAN A MONTH
............................................................................ 10 EVERY DAY / ALMOST EVERY DAY ............. 30
TA6. Have you ever tried any smoked tobacco products other than cigarettes, such as cigars, water pipe, cigarillos or pipe?
YES ......................................................................... 1 NO ........................................................................... 2
2TA10Z
TA7. During the last one month, did you use any smoked tobacco products?
YES ......................................................................... 1 NO ........................................................................... 2
2TA10
TA8. What type of smoked tobacco product did you use or smoke during the last one month?
Record all mentioned.
CIGARS ................................................................. A WATER PIPE ......................................................... B CIGARILLOS ........................................................ C PIPE ........................................................................ D OTHER (specify) __________________________ X
TA9. During the last one month, on how many days did you use (names of products mentioned in TA8)?
If less than 10 days, record the number of days. If 10 days or more but less than a month, record
‘10’. If ‘Every day’ or ‘Almost every day’, record ‘30’.
NUMBER OF DAYS ..................................... 0 ___ 10 DAYS OR MORE BUT LESS THAN A MONTH
............................................................................ 10 EVERY DAY / ALMOST EVERY DAY ............. 30
TA10. Have you ever tried any form of smokeless tobacco products, such as chewing tobacco, snuff, or dip?
YES ......................................................................... 1 NO ........................................................................... 2
2TA14
TA11. During the last one month, did you use any smokeless tobacco products?
YES ......................................................................... 1 NO ........................................................................... 2
2TA14
LSIS II.HH.66
HA25. How many months ago was your most recent HIV test?
LESS THAN 12 MONTHS AGO ............................ 1 12-23 MONTHS AGO ............................................. 2 2 OR MORE YEARS AGO...................................... 3
HA26. I don’t want to know the results, but did you get the results of the test?
YES ........................................................................... 1 NO ............................................................................ 2 DK ............................................................................ 8
1HA28 2HA28 8HA28
HA27. Do you know of a place where people can go to get an HIV test?
YES ........................................................................... 1 NO ............................................................................ 2
HA28. Have you heard of test kits people can use to test themselves for HIV?
YES ........................................................................... 1 NO ............................................................................ 2
2HA30
HA29. Have you ever tested yourself for HIV using a self-test kit?
YES ........................................................................... 1 NO ............................................................................ 2
HA30. Would you buy fresh vegetables from a shopkeeper or vendor if you knew that this person had HIV?
YES ........................................................................... 1 NO ............................................................................ 2 DK / NOT SURE / DEPENDS ................................. 8
HA31. Do you think children living with HIV should be allowed to attend school with children who do not have HIV?
YES ........................................................................... 1 NO ............................................................................ 2 DK / NOT SURE / DEPENDS ................................. 8
HA32. Do you think people hesitate to take an HIV test because they are afraid of how other people will react if the test result is positive for HIV?
YES ........................................................................... 1 NO ............................................................................ 2 DK / NOT SURE / DEPENDS ................................. 8
HA33. Do people talk badly about people living with HIV, or who are thought to be living with HIV?
YES ........................................................................... 1 NO ............................................................................ 2 DK / NOT SURE / DEPENDS ................................. 8
HA34. Do people living with HIV, or thought to be living with HIV, lose the respect of other people?
YES ........................................................................... 1 NO ............................................................................ 2 DK / NOT SURE / DEPENDS ................................. 8
HA35. Do you agree or disagree with the following statement?
I would be ashamed if someone in my family
had HIV.
AGREE ..................................................................... 1 DISAGREE .............................................................. 2 DK / NOT SURE / DEPENDS ................................. 8
HA36. Do you fear that you could get HIV if you come into contact with the saliva of a person living with HIV?
YES ........................................................................... 1 NO ............................................................................ 2 SAYS SHE HAS HIV .............................................. 7 DK / NOT SURE / DEPENDS ................................. 8
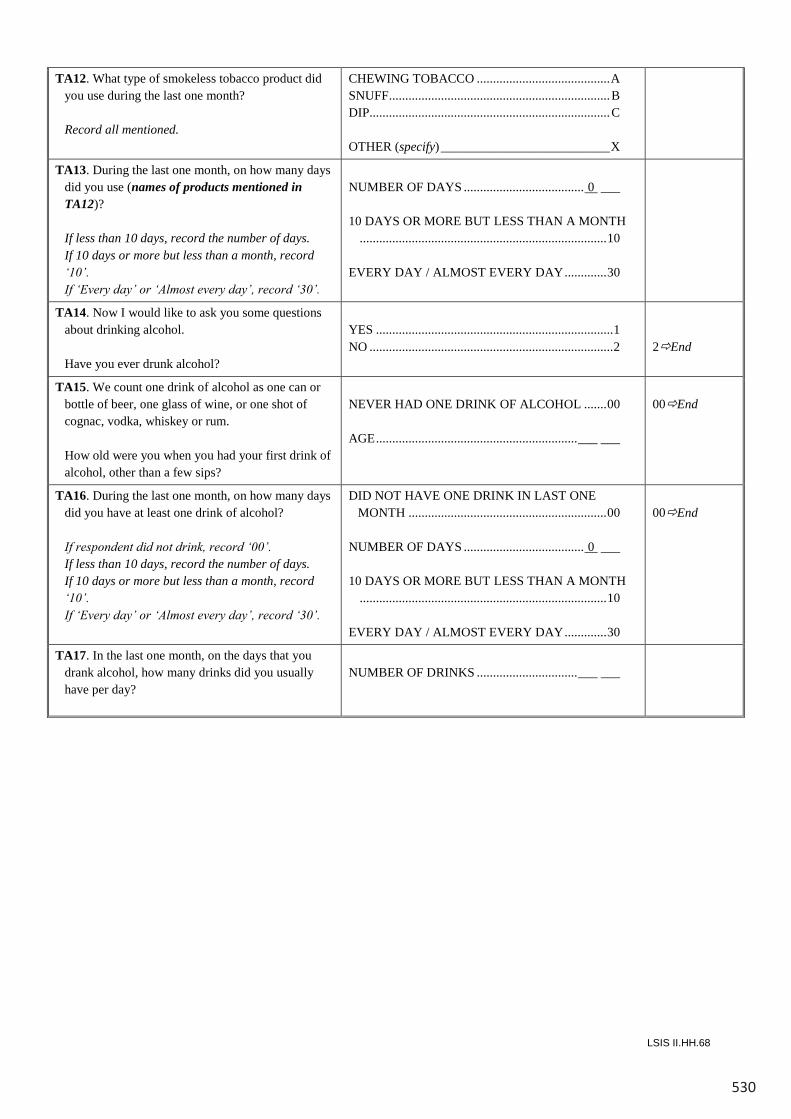
530
LSIS II.HH.69
WM10. Record the time. HOURS AND MINUTES ..................__ __ : __ __
WM11. Was the entire interview completed in private or was there anyone else during the entire interview or part of it?
YES, THE ENTIRE INTERVIEW WAS COMPLETED IN PRIVATE ........................................................... 1
NO, OTHERS WERE PRESENT DURING THE ENTIRE INTERVIEW(specify) _________________________________2
NO, OTHERS WERE PRESENT DURING PART OF THE INTERVIEW(specify) _________________________________ 3
WM12. Language of the Questionnaire. LAO............................................................................1
WM13. Language of the Interview. LAO............................................................................1OTHER LANGUAGE
(specify) _________________________________6
WM14. Native language of the Respondent. LAO............................................................................1OTHER LANGUAGE
(specify) _________________________________6
WM15. Was a translator used for any parts of this questionnaire?
YES, THE ENTIRE QUESTIONNAIRE...................1YES, PARTS OF THE QUESTIONNAIRE ..............2NO, NOT USED.........................................................3
WM15A. Check WM6A in WOMAN’S INFORMATION PANEL: Is the household selected for anaemia testing?
YES ............................................................................ 1NO .............................................................................. 2
2WM16WM15B. Tell the respondent that you will need to measure her haemoglobin level before you leave the household and a
colleague will come to lead the measurements. Issue the ANAEMIA MODULE FORM for this woman and complete the Information Panel on that Form.
WM16. Check columns HL10 and HL20 in LIST OF HOUSEHOLD MEMBERS, HOUSEHOLD QUESTIONNAIRE: Is the respondent the mother or caretaker of any child age 0-4 living in this household?
Yes Go to WM17 in WOMAN’S INFORMATION PANEL and record ‘01’. Then go to the QUESTIONNAIRE FOR CHILDREN UNDER FIVE for that child and start the interview with thisrespondent.
No Check HH26-HH27 in HOUSEHOLD QUESTIONNAIRE: Is there a child age 5-17 selected forQUESTIONNAIRE FOR CHILDREN AGE 5-17?
Yes Check column HL20 in LIST OF HOUSEHOLD MEMBERS, HOUSEHOLDQUESTIONNAIRE: Is the respondent the mother or caretaker of the child selected forQUESTIONNAIRE FOR CHILDREN AGE 5-17 in this household?
Yes Go to WM17 in WOMAN’S INFORMATION PANEL and record ‘01’. Then go to the QUESTIONNAIRE FOR CHILDREN AGE 5-17 for that child andstart the interview with this respondent.
No Go to WM17 in WOMAN’S INFORMATION PANEL and record ‘01’. Then end theinterview with this respondent by thanking her for her cooperation. Check to seeif there are other questionnaires to be administered in this household.
No Go to WM17 in WOMAN’S INFORMATION PANEL and record ‘01’. Then end theinterview with this respondent by thanking her for her cooperation. Check to seeif there are other questionnaires to be administered in this household.
LSIS II.HH.68
TA12. What type of smokeless tobacco product did you use during the last one month?
Record all mentioned.
CHEWING TOBACCO ......................................... A SNUFF .................................................................... B DIP.......................................................................... C OTHER (specify) __________________________ X
TA13. During the last one month, on how many days did you use (names of products mentioned in TA12)?
If less than 10 days, record the number of days. If 10 days or more but less than a month, record
‘10’. If ‘Every day’ or ‘Almost every day’, record ‘30’.
NUMBER OF DAYS ..................................... 0 ___ 10 DAYS OR MORE BUT LESS THAN A MONTH
............................................................................ 10 EVERY DAY / ALMOST EVERY DAY ............. 30
TA14. Now I would like to ask you some questions about drinking alcohol.
Have you ever drunk alcohol?
YES ......................................................................... 1 NO ........................................................................... 2
2End
TA15. We count one drink of alcohol as one can or bottle of beer, one glass of wine, or one shot of cognac, vodka, whiskey or rum.
How old were you when you had your first drink of
alcohol, other than a few sips?
NEVER HAD ONE DRINK OF ALCOHOL ....... 00 AGE .............................................................. ___ ___
00End
TA16. During the last one month, on how many days did you have at least one drink of alcohol?
If respondent did not drink, record ‘00’. If less than 10 days, record the number of days. If 10 days or more but less than a month, record
‘10’. If ‘Every day’ or ‘Almost every day’, record ‘30’.
DID NOT HAVE ONE DRINK IN LAST ONE MONTH ............................................................. 00
NUMBER OF DAYS ..................................... 0 ___ 10 DAYS OR MORE BUT LESS THAN A MONTH
............................................................................ 10 EVERY DAY / ALMOST EVERY DAY ............. 30
00End
TA17. In the last one month, on the days that you drank alcohol, how many drinks did you usually have per day?
NUMBER OF DRINKS ............................... ___ ___
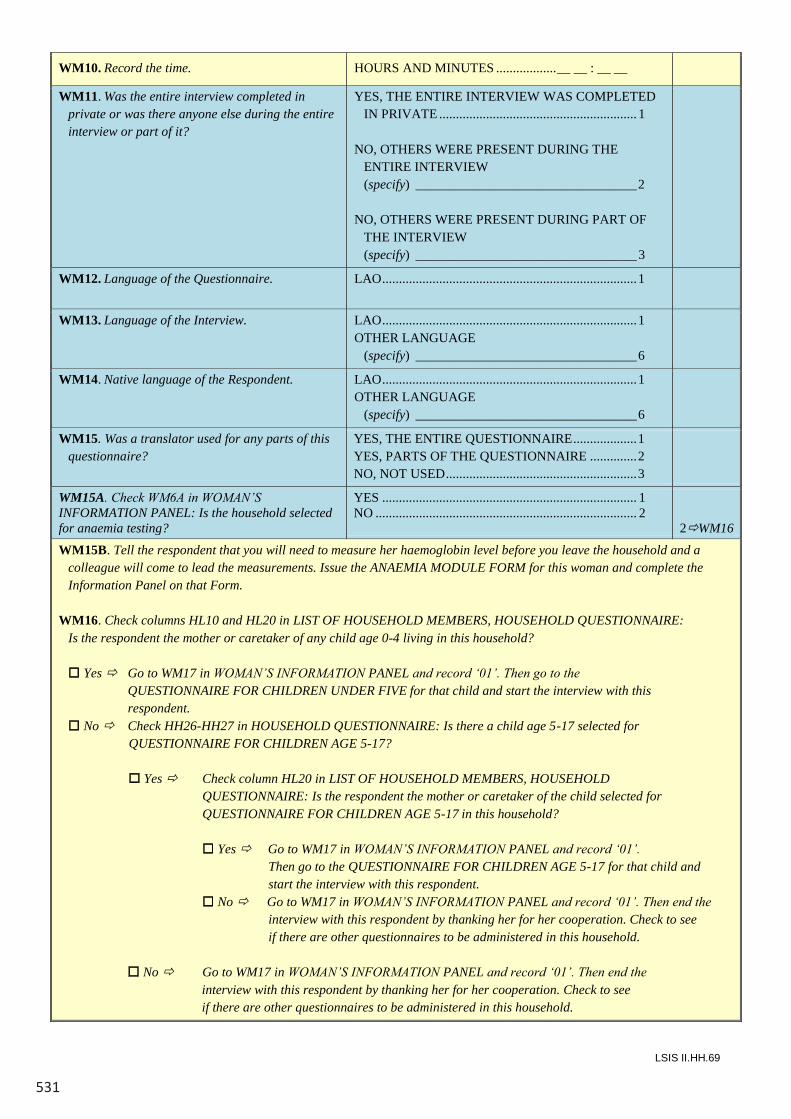
531
LSIS II.HH.69
WM10. Record the time. HOURS AND MINUTES ..................__ __ : __ __
WM11. Was the entire interview completed in private or was there anyone else during the entire interview or part of it?
YES, THE ENTIRE INTERVIEW WAS COMPLETED IN PRIVATE ........................................................... 1
NO, OTHERS WERE PRESENT DURING THE ENTIRE INTERVIEW(specify) _________________________________2
NO, OTHERS WERE PRESENT DURING PART OF THE INTERVIEW(specify) _________________________________ 3
WM12. Language of the Questionnaire. LAO............................................................................1
WM13. Language of the Interview. LAO............................................................................1OTHER LANGUAGE
(specify) _________________________________6
WM14. Native language of the Respondent. LAO............................................................................1OTHER LANGUAGE
(specify) _________________________________6
WM15. Was a translator used for any parts of this questionnaire?
YES, THE ENTIRE QUESTIONNAIRE...................1YES, PARTS OF THE QUESTIONNAIRE ..............2NO, NOT USED.........................................................3
WM15A. Check WM6A in WOMAN’S INFORMATION PANEL: Is the household selected for anaemia testing?
YES ............................................................................ 1NO .............................................................................. 2
2WM16WM15B. Tell the respondent that you will need to measure her haemoglobin level before you leave the household and a
colleague will come to lead the measurements. Issue the ANAEMIA MODULE FORM for this woman and complete the Information Panel on that Form.
WM16. Check columns HL10 and HL20 in LIST OF HOUSEHOLD MEMBERS, HOUSEHOLD QUESTIONNAIRE: Is the respondent the mother or caretaker of any child age 0-4 living in this household?
Yes Go to WM17 in WOMAN’S INFORMATION PANEL and record ‘01’. Then go to the QUESTIONNAIRE FOR CHILDREN UNDER FIVE for that child and start the interview with thisrespondent.
No Check HH26-HH27 in HOUSEHOLD QUESTIONNAIRE: Is there a child age 5-17 selected forQUESTIONNAIRE FOR CHILDREN AGE 5-17?
Yes Check column HL20 in LIST OF HOUSEHOLD MEMBERS, HOUSEHOLDQUESTIONNAIRE: Is the respondent the mother or caretaker of the child selected forQUESTIONNAIRE FOR CHILDREN AGE 5-17 in this household?
Yes Go to WM17 in WOMAN’S INFORMATION PANEL and record ‘01’. Then go to the QUESTIONNAIRE FOR CHILDREN AGE 5-17 for that child andstart the interview with this respondent.
No Go to WM17 in WOMAN’S INFORMATION PANEL and record ‘01’. Then end theinterview with this respondent by thanking her for her cooperation. Check to seeif there are other questionnaires to be administered in this household.
No Go to WM17 in WOMAN’S INFORMATION PANEL and record ‘01’. Then end theinterview with this respondent by thanking her for her cooperation. Check to seeif there are other questionnaires to be administered in this household.
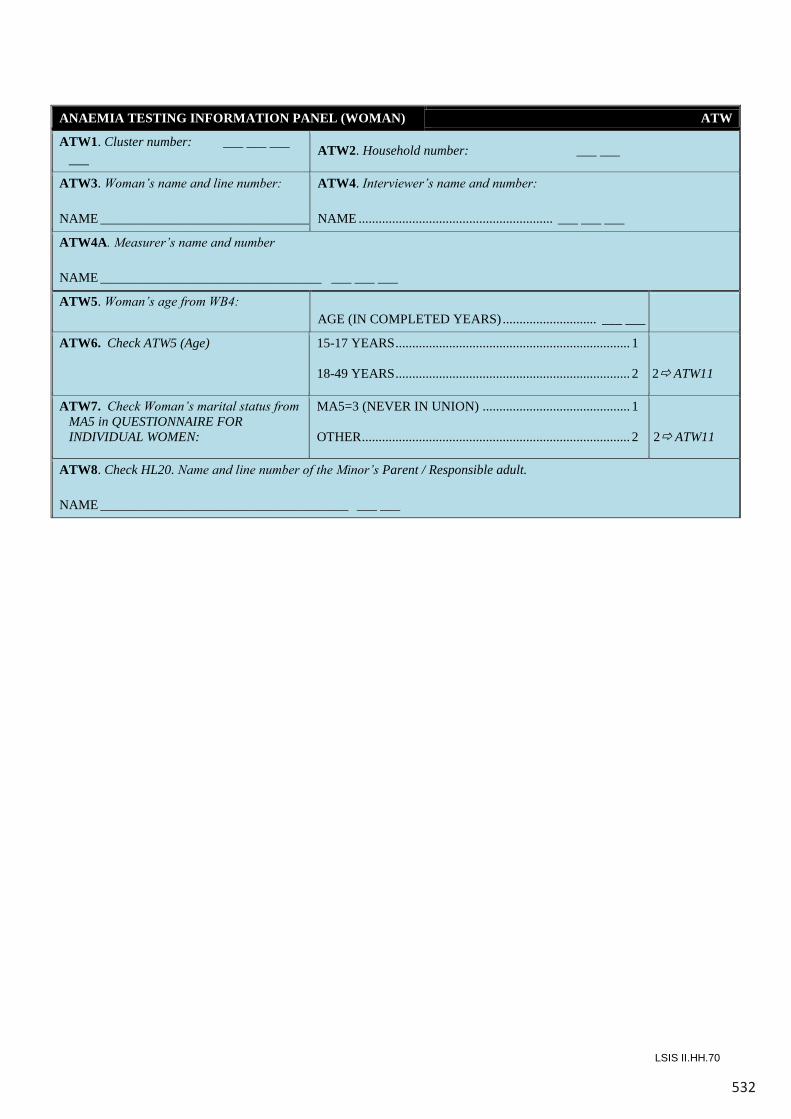
532
LSIS II.HH.70
ANAEMIA TESTING INFORMATION PANEL (WOMAN) ATW
ATW1. Cluster number: ___ ___ ___ ___
ATW2. Household number: ___ ___
ATW3. Woman’s name and line number: NAME ___________________________________ ___ ___
ATW4. Interviewer’s name and number: NAME .......................................................... ___ ___ ___
ATW4A. Measurer’s name and number NAME _________________________________ ___ ___ ___
ATW5. Woman’s age from WB4:
AGE (IN COMPLETED YEARS) ............................ ___ ___
ATW6. Check ATW5 (Age) 15-17 YEARS ...................................................................... 1 18-49 YEARS ...................................................................... 2
2 ATW11
ATW7. Check Woman’s marital status from MA5 in QUESTIONNAIRE FOR INDIVIDUAL WOMEN:
MA5=3 (NEVER IN UNION) ............................................ 1 OTHER ................................................................................ 2
2 ATW11
ATW8. Check HL20. Name and line number of the Minor’s Parent / Responsible adult. NAME _____________________________________ ___ ___
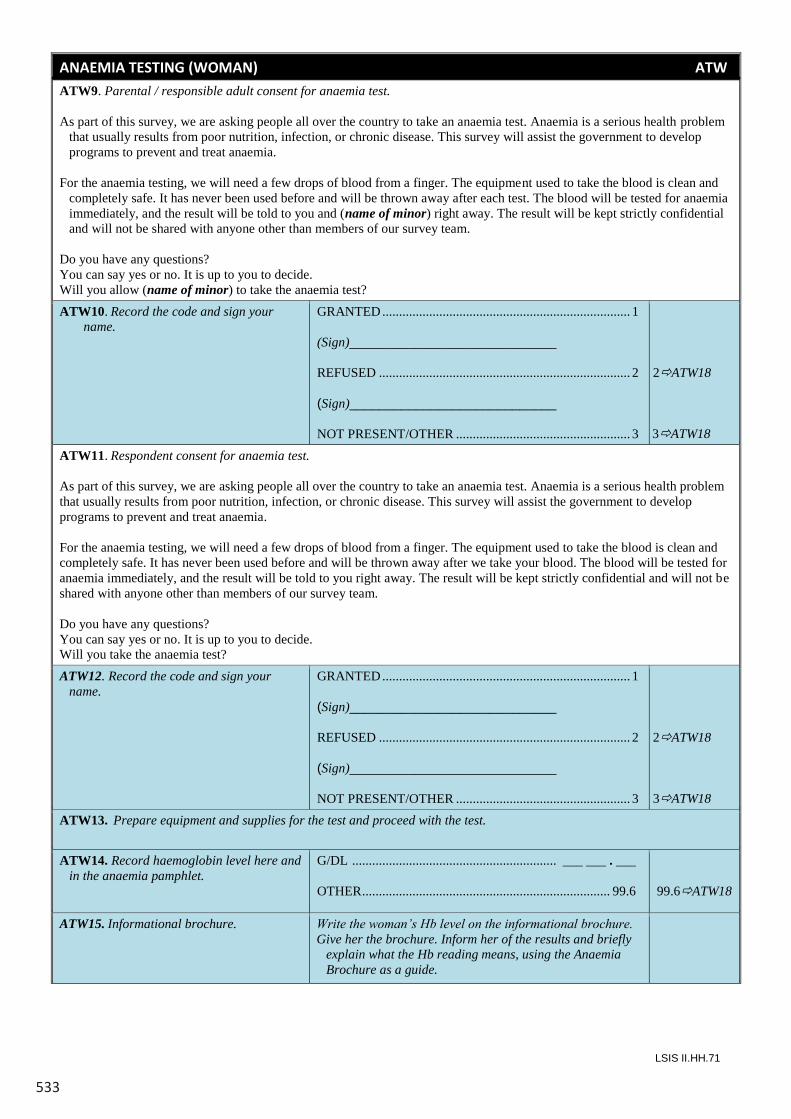
533
LSIS II.HH.71
ANAEMIA TESTING (WOMAN) ATW ATW9. Parental / responsible adult consent for anaemia test. As part of this survey, we are asking people all over the country to take an anaemia test. Anaemia is a serious health problem
that usually results from poor nutrition, infection, or chronic disease. This survey will assist the government to develop programs to prevent and treat anaemia.
For the anaemia testing, we will need a few drops of blood from a finger. The equipment used to take the blood is clean and
completely safe. It has never been used before and will be thrown away after each test. The blood will be tested for anaemia immediately, and the result will be told to you and (name of minor) right away. The result will be kept strictly confidential and will not be shared with anyone other than members of our survey team.
Do you have any questions? You can say yes or no. It is up to you to decide. Will you allow (name of minor) to take the anaemia test? ATW10. Record the code and sign your
name. GRANTED .......................................................................... 1 (Sign)____________________________ REFUSED ........................................................................... 2 (Sign)____________________________ NOT PRESENT/OTHER .................................................... 3
2ATW18
3ATW18 ATW11. Respondent consent for anaemia test. As part of this survey, we are asking people all over the country to take an anaemia test. Anaemia is a serious health problem that usually results from poor nutrition, infection, or chronic disease. This survey will assist the government to develop programs to prevent and treat anaemia. For the anaemia testing, we will need a few drops of blood from a finger. The equipment used to take the blood is clean and completely safe. It has never been used before and will be thrown away after we take your blood. The blood will be tested for anaemia immediately, and the result will be told to you right away. The result will be kept strictly confidential and will not be shared with anyone other than members of our survey team. Do you have any questions? You can say yes or no. It is up to you to decide. Will you take the anaemia test? ATW12. Record the code and sign your
name. GRANTED .......................................................................... 1 (Sign)____________________________ REFUSED ........................................................................... 2 (Sign)____________________________ NOT PRESENT/OTHER .................................................... 3
2ATW18
3ATW18
ATW13. Prepare equipment and supplies for the test and proceed with the test.
ATW14. Record haemoglobin level here and in the anaemia pamphlet.
G/DL ............................................................. ___ ___ . ___ OTHER .......................................................................... 99.6
99.6ATW18
ATW15. Informational brochure. Write the woman’s Hb level on the informational brochure. Give her the brochure. Inform her of the results and briefly
explain what the Hb reading means, using the Anaemia Brochure as a guide.
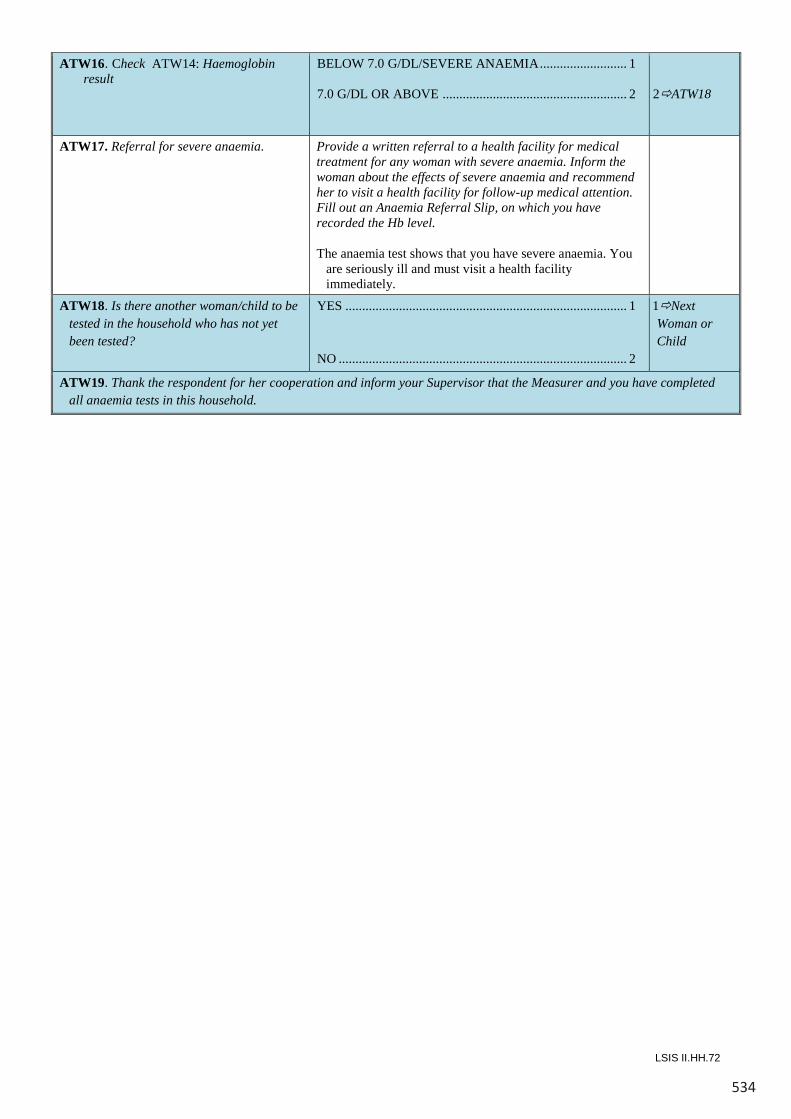
534
LSIS II.HH.72
ATW16. Check ATW14: Haemoglobin result
BELOW 7.0 G/DL/SEVERE ANAEMIA .......................... 1 7.0 G/DL OR ABOVE ....................................................... 2
2ATW18
ATW17. Referral for severe anaemia. Provide a written referral to a health facility for medical treatment for any woman with severe anaemia. Inform the woman about the effects of severe anaemia and recommend her to visit a health facility for follow-up medical attention. Fill out an Anaemia Referral Slip, on which you have recorded the Hb level. The anaemia test shows that you have severe anaemia. You
are seriously ill and must visit a health facility immediately.
ATW18. Is there another woman/child to be tested in the household who has not yet been tested?
YES .................................................................................... 1 NO ...................................................................................... 2
1Next Woman or Child
ATW19. Thank the respondent for her cooperation and inform your Supervisor that the Measurer and you have completed all anaemia tests in this household.
535
LSIS II.HH.73
INTERVIEWER’S OBSERVATIONS
SUPERVISOR’S OBSERVATIONS
LSIS II.HH.72
ATW16. Check ATW14: Haemoglobin result
BELOW 7.0 G/DL/SEVERE ANAEMIA .......................... 1 7.0 G/DL OR ABOVE ....................................................... 2
2ATW18
ATW17. Referral for severe anaemia. Provide a written referral to a health facility for medical treatment for any woman with severe anaemia. Inform the woman about the effects of severe anaemia and recommend her to visit a health facility for follow-up medical attention. Fill out an Anaemia Referral Slip, on which you have recorded the Hb level. The anaemia test shows that you have severe anaemia. You
are seriously ill and must visit a health facility immediately.
ATW18. Is there another woman/child to be tested in the household who has not yet been tested?
YES .................................................................................... 1 NO ...................................................................................... 2
1Next Woman or Child
ATW19. Thank the respondent for her cooperation and inform your Supervisor that the Measurer and you have completed all anaemia tests in this household.
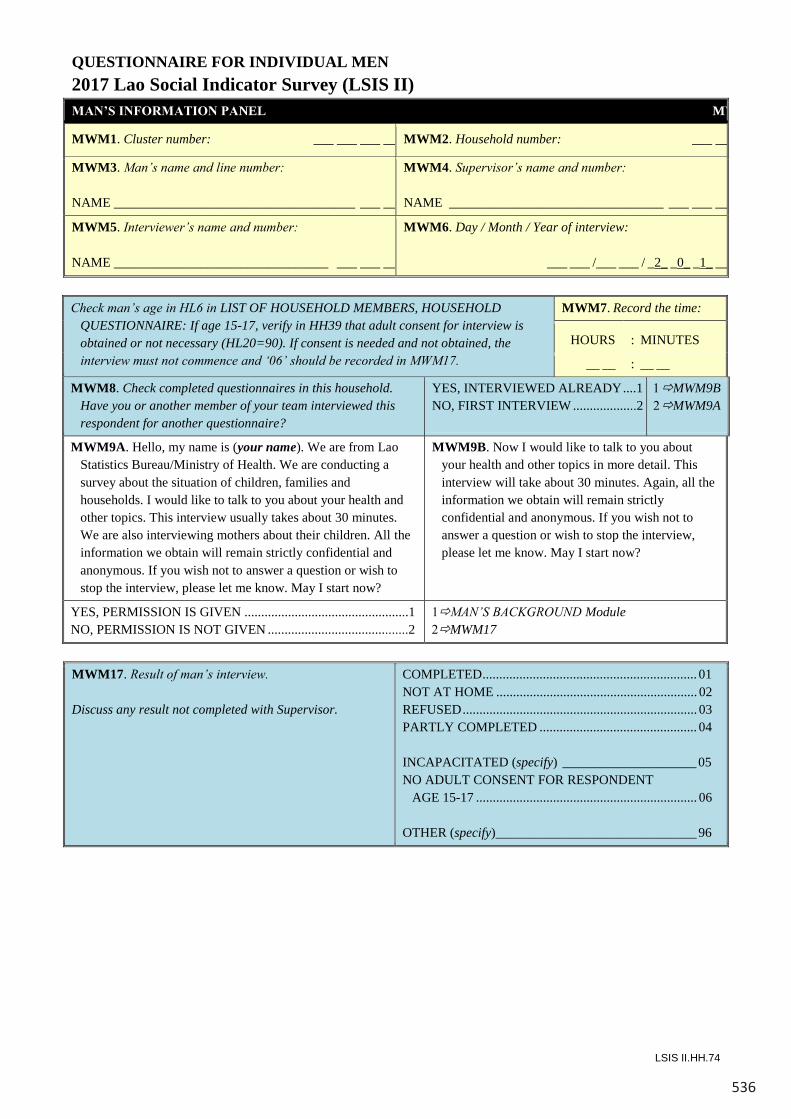
536
LSIS II.HH.74
QUESTIONNAIRE FOR INDIVIDUAL MEN 2017 Lao Social Indicator Survey (LSIS II)MAN’S INFORMATION PANEL MWM
MWM1. Cluster number: ___ ___ ___ ___MWM2. Household number: ___ ___
MWM3. Man’s name and line number:
NAME ____________________________________ ___ ___
MWM4. Supervisor’s name and number:
NAME ________________________________ ___ ___ ___
MWM5. Interviewer’s name and number:
NAME ________________________________ ___ ___ ___
MWM6. Day / Month / Year of interview:
___ ___ /___ ___ / _2_ _0_ _1_ ___
Check man’s age in HL6 in LIST OF HOUSEHOLD MEMBERS, HOUSEHOLD QUESTIONNAIRE: If age 15-17, verify in HH39 that adult consent for interview is obtained or not necessary (HL20=90). If consent is needed and not obtained, the interview must not commence and ‘06’ should be recorded in MWM17.
MWM7. Record the time:
HOURS : MINUTES
__ __ : __ __
MWM8. Check completed questionnaires in this household. Have you or another member of your team interviewed this respondent for another questionnaire?
12
YES, INTERVIEWED ALREADY ....1 1MWM9BNO, FIRST INTERVIEW ...................2 2MWM9A
MWM9A. Hello, my name is (your name). We are from Lao Statistics Bureau/Ministry of Health. We are conducting a survey about the situation of children, families and households. I would like to talk to you about your health and other topics. This interview usually takes about 30 minutes. We are also interviewing mothers about their children. All the information we obtain will remain strictly confidential and anonymous. If you wish not to answer a question or wish to stop the interview, please let me know. May I start now?
MWM9B. Now I would like to talk to you about your health and other topics in more detail. This interview will take about 30 minutes. Again, all the information we obtain will remain strictly confidential and anonymous. If you wish not to answer a question or wish to stop the interview, please let me know. May I start now?
12
YES, PERMISSION IS GIVEN .................................................1 1MAN’S BACKGROUND ModuleNO, PERMISSION IS NOT GIVEN ..........................................2 2MWM17
MWM17. Result of man’s interview.
Discuss any result not completed with Supervisor.
COMPLETED................................................................ 01NOT AT HOME ............................................................ 02REFUSED...................................................................... 03PARTLY COMPLETED ............................................... 04
INCAPACITATED (specify) ____________________ 05NO ADULT CONSENT FOR RESPONDENT
AGE 15-17 .................................................................. 06
OTHER (specify)______________________________ 96
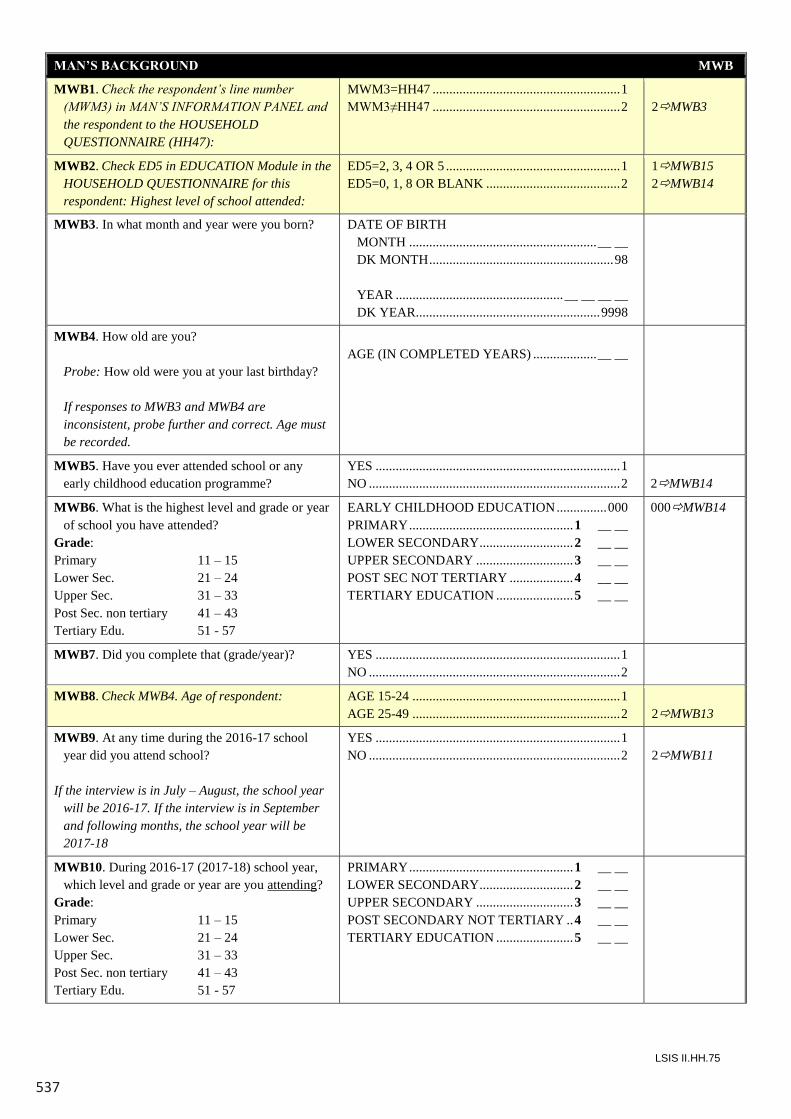
537
LSIS II.HH.75
MAN’S BACKGROUND MWB
MWB1. Check the respondent’s line number (MWM3) in MAN’S INFORMATION PANEL and the respondent to the HOUSEHOLD QUESTIONNAIRE (HH47):
MWM3=HH47 ........................................................ 1 MWM3≠HH47 ........................................................ 2
2MWB3
MWB2. Check ED5 in EDUCATION Module in the HOUSEHOLD QUESTIONNAIRE for this respondent: Highest level of school attended:
ED5=2, 3, 4 OR 5 .................................................... 1 ED5=0, 1, 8 OR BLANK ........................................ 2
1MWB15 2MWB14
MWB3. In what month and year were you born? DATE OF BIRTH MONTH ........................................................ __ __
DK MONTH ....................................................... 98 YEAR .................................................. __ __ __ __ DK YEAR....................................................... 9998
MWB4. How old are you? Probe: How old were you at your last birthday? If responses to MWB3 and MWB4 are
inconsistent, probe further and correct. Age must be recorded.
AGE (IN COMPLETED YEARS) ................... __ __
MWB5. Have you ever attended school or any early childhood education programme?
YES ......................................................................... 1 NO ........................................................................... 2
2MWB14
MWB6. What is the highest level and grade or year of school you have attended?
Grade: Primary 11 – 15 Lower Sec. 21 – 24 Upper Sec. 31 – 33 Post Sec. non tertiary 41 – 43 Tertiary Edu. 51 - 57
EARLY CHILDHOOD EDUCATION ............... 000 PRIMARY ................................................. 1 __ __ LOWER SECONDARY ............................ 2 __ __ UPPER SECONDARY ............................. 3 __ __ POST SEC NOT TERTIARY ................... 4 __ __ TERTIARY EDUCATION ....................... 5 __ __
000MWB14
MWB7. Did you complete that (grade/year)? YES ......................................................................... 1 NO ........................................................................... 2
MWB8. Check MWB4. Age of respondent: AGE 15-24 .............................................................. 1 AGE 25-49 .............................................................. 2
2MWB13
MWB9. At any time during the 2016-17 school year did you attend school?
If the interview is in July – August, the school year
will be 2016-17. If the interview is in September and following months, the school year will be 2017-18
YES ......................................................................... 1 NO ........................................................................... 2
2MWB11
MWB10. During 2016-17 (2017-18) school year, which level and grade or year are you attending?
Grade: Primary 11 – 15 Lower Sec. 21 – 24 Upper Sec. 31 – 33 Post Sec. non tertiary 41 – 43 Tertiary Edu. 51 - 57
PRIMARY ................................................. 1 __ __ LOWER SECONDARY ............................ 2 __ __ UPPER SECONDARY ............................. 3 __ __ POST SECONDARY NOT TERTIARY .. 4 __ __ TERTIARY EDUCATION ....................... 5 __ __
LSIS II.HH.74
QUESTIONNAIRE FOR INDIVIDUAL MEN 2017 Lao Social Indicator Survey (LSIS II)MAN’S INFORMATION PANEL MWM
MWM1. Cluster number: ___ ___ ___ ___MWM2. Household number: ___ ___
MWM3. Man’s name and line number:
NAME ____________________________________ ___ ___
MWM4. Supervisor’s name and number:
NAME ________________________________ ___ ___ ___
MWM5. Interviewer’s name and number:
NAME ________________________________ ___ ___ ___
MWM6. Day / Month / Year of interview:
___ ___ /___ ___ / _2_ _0_ _1_ ___
Check man’s age in HL6 in LIST OF HOUSEHOLD MEMBERS, HOUSEHOLD QUESTIONNAIRE: If age 15-17, verify in HH39 that adult consent for interview is obtained or not necessary (HL20=90). If consent is needed and not obtained, the interview must not commence and ‘06’ should be recorded in MWM17.
MWM7. Record the time:
HOURS : MINUTES
__ __ : __ __
MWM8. Check completed questionnaires in this household. Have you or another member of your team interviewed this respondent for another questionnaire?
12
YES, INTERVIEWED ALREADY ....1 1MWM9BNO, FIRST INTERVIEW ...................2 2MWM9A
MWM9A. Hello, my name is (your name). We are from Lao Statistics Bureau/Ministry of Health. We are conducting a survey about the situation of children, families and households. I would like to talk to you about your health and other topics. This interview usually takes about 30 minutes. We are also interviewing mothers about their children. All the information we obtain will remain strictly confidential and anonymous. If you wish not to answer a question or wish to stop the interview, please let me know. May I start now?
MWM9B. Now I would like to talk to you about your health and other topics in more detail. This interview will take about 30 minutes. Again, all the information we obtain will remain strictly confidential and anonymous. If you wish not to answer a question or wish to stop the interview, please let me know. May I start now?
12
YES, PERMISSION IS GIVEN .................................................1 1MAN’S BACKGROUND ModuleNO, PERMISSION IS NOT GIVEN ..........................................2 2MWM17
MWM17. Result of man’s interview.
Discuss any result not completed with Supervisor.
COMPLETED................................................................ 01NOT AT HOME ............................................................ 02REFUSED...................................................................... 03PARTLY COMPLETED ............................................... 04
INCAPACITATED (specify) ____________________ 05NO ADULT CONSENT FOR RESPONDENT
AGE 15-17 .................................................................. 06
OTHER (specify)______________________________ 96
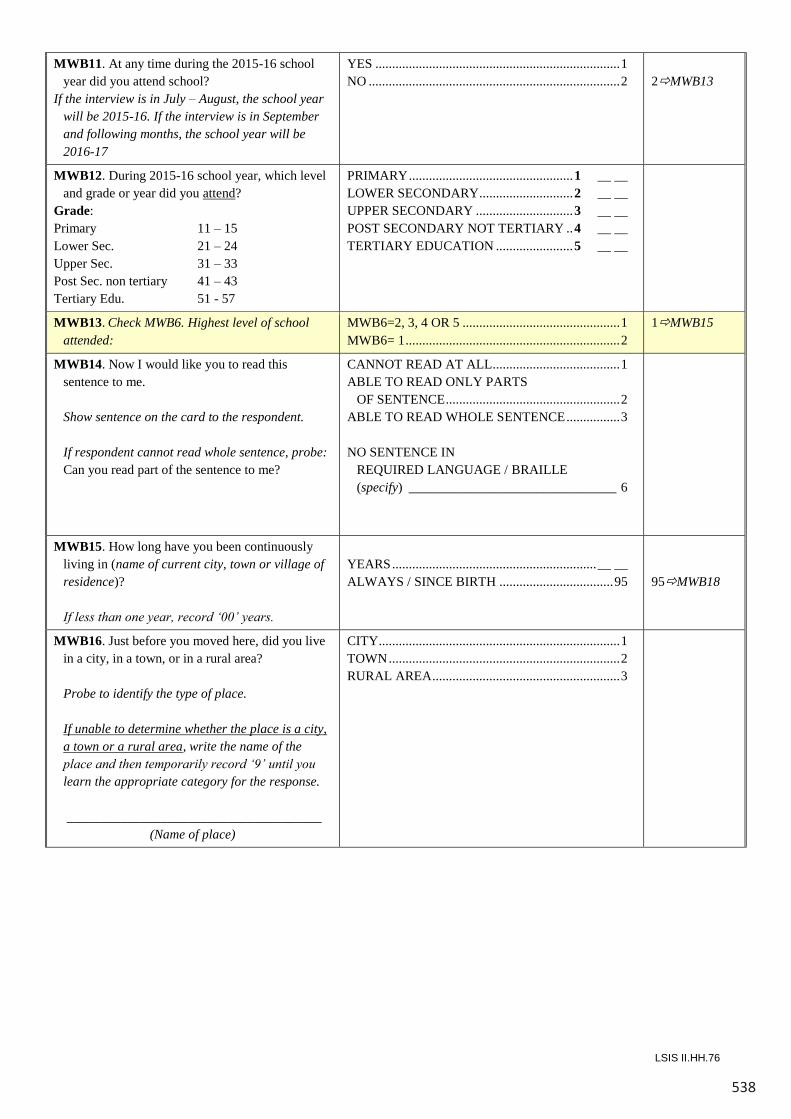
538
LSIS II.HH.77
MWB17. Before you moved here, in which province did you live in?
VIENTIANE CAPITAL ........................................ 01 PHONSALY .......................................................... 02 LUANGNAMTHA ................................................ 03 OUDOMXAY ....................................................... 04 BOKEO ................................................................. 05 LUANGPRABANG .............................................. 06 HUAPHANH ......................................................... 07 XAYABURY ........................................................ 08 XIENGKHUANG ................................................. 09 VIENTIANE.......................................................... 10 BORIKHAMXAY ................................................. 11 KHAMMUA.......................................................... 12 SAVANNAKHET ................................................. 13 SARAVANE ......................................................... 14 SEKONG ............................................................... 15 CHAMPASACK ................................................... 16 ATTAPEU ............................................................. 17 XAYSOMBOUNE ................................................ 18 OUTSIDE OF LAOS (specify) ______________________________ 96
MWB18. Are you covered by any health insurance?
YES ......................................................................... 1 NO ........................................................................... 2
2End
MWB19. What type of health insurance are you covered by?
Record all mentioned.
CIVIL SERVANT SCHEME ................................ A SOCIAL SECURITY OFFICE...............................B COMMUNITY BASED HEALTH INSURANCE
(CBHI) .................................................................C HEALTH EQUITY FUND (HEF) ........................ D FREE MCH ............................................................ E PRIVATE HEALTH INSURANCE ....................... F OTHER (specify) __________________________ X
LSIS II.HH.76
MWB11. At any time during the 2015-16 school year did you attend school?
If the interview is in July – August, the school year will be 2015-16. If the interview is in September and following months, the school year will be 2016-17
YES ......................................................................... 1 NO ........................................................................... 2
2MWB13
MWB12. During 2015-16 school year, which level and grade or year did you attend?
Grade: Primary 11 – 15 Lower Sec. 21 – 24 Upper Sec. 31 – 33 Post Sec. non tertiary 41 – 43 Tertiary Edu. 51 - 57
PRIMARY ................................................. 1 __ __ LOWER SECONDARY ............................ 2 __ __ UPPER SECONDARY ............................. 3 __ __ POST SECONDARY NOT TERTIARY .. 4 __ __ TERTIARY EDUCATION ....................... 5 __ __
MWB13. Check MWB6. Highest level of school attended:
MWB6=2, 3, 4 OR 5 ............................................... 1 MWB6= 1 ................................................................ 2
1MWB15
MWB14. Now I would like you to read this sentence to me.
Show sentence on the card to the respondent. If respondent cannot read whole sentence, probe:
Can you read part of the sentence to me?
CANNOT READ AT ALL ...................................... 1 ABLE TO READ ONLY PARTS OF SENTENCE .................................................... 2 ABLE TO READ WHOLE SENTENCE ................ 3 NO SENTENCE IN REQUIRED LANGUAGE / BRAILLE (specify) _______________________________ 6
MWB15. How long have you been continuously living in (name of current city, town or village of residence)?
If less than one year, record ‘00’ years.
YEARS ............................................................. __ __ ALWAYS / SINCE BIRTH .................................. 95
95MWB18
MWB16. Just before you moved here, did you live in a city, in a town, or in a rural area?
Probe to identify the type of place. If unable to determine whether the place is a city,
a town or a rural area, write the name of the place and then temporarily record ‘9’ until you learn the appropriate category for the response.
______________________________________
(Name of place)
CITY ........................................................................ 1 TOWN ..................................................................... 2 RURAL AREA ........................................................ 3
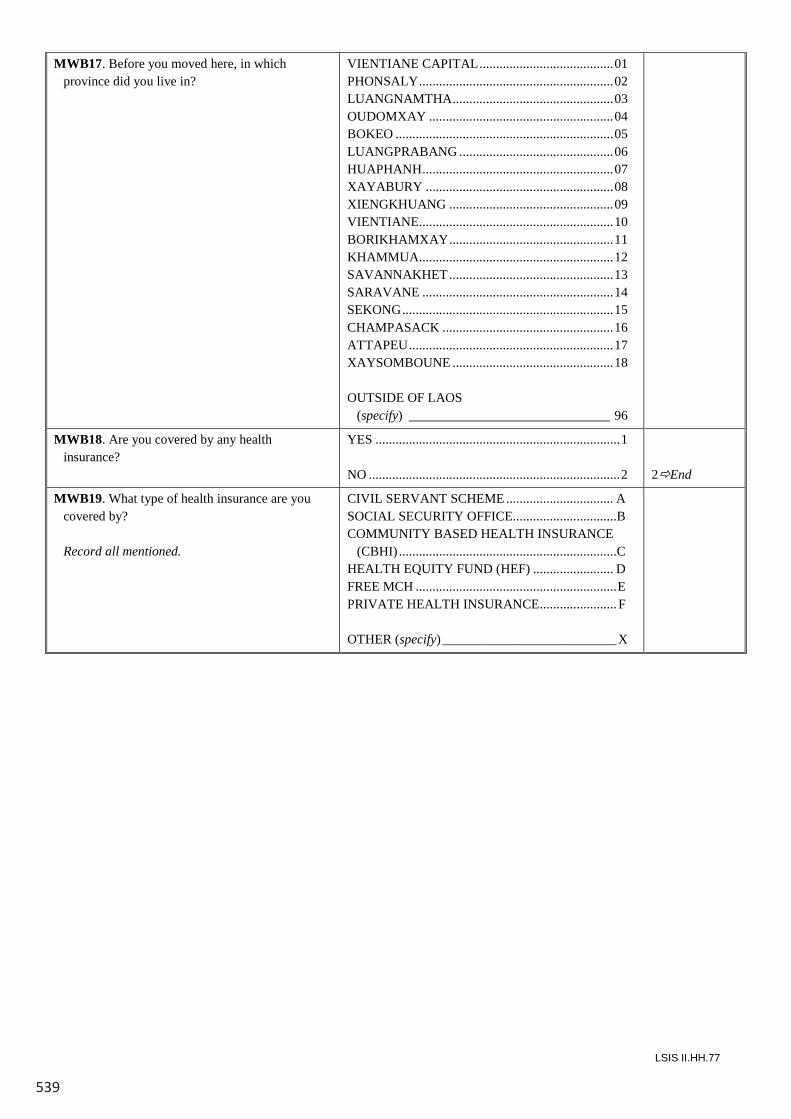
539
LSIS II.HH.77
MWB17. Before you moved here, in which province did you live in?
VIENTIANE CAPITAL ........................................ 01 PHONSALY .......................................................... 02 LUANGNAMTHA ................................................ 03 OUDOMXAY ....................................................... 04 BOKEO ................................................................. 05 LUANGPRABANG .............................................. 06 HUAPHANH ......................................................... 07 XAYABURY ........................................................ 08 XIENGKHUANG ................................................. 09 VIENTIANE.......................................................... 10 BORIKHAMXAY ................................................. 11 KHAMMUA.......................................................... 12 SAVANNAKHET ................................................. 13 SARAVANE ......................................................... 14 SEKONG ............................................................... 15 CHAMPASACK ................................................... 16 ATTAPEU ............................................................. 17 XAYSOMBOUNE ................................................ 18 OUTSIDE OF LAOS (specify) ______________________________ 96
MWB18. Are you covered by any health insurance?
YES ......................................................................... 1 NO ........................................................................... 2
2End
MWB19. What type of health insurance are you covered by?
Record all mentioned.
CIVIL SERVANT SCHEME ................................ A SOCIAL SECURITY OFFICE...............................B COMMUNITY BASED HEALTH INSURANCE
(CBHI) .................................................................C HEALTH EQUITY FUND (HEF) ........................ D FREE MCH ............................................................ E PRIVATE HEALTH INSURANCE ....................... F OTHER (specify) __________________________ X
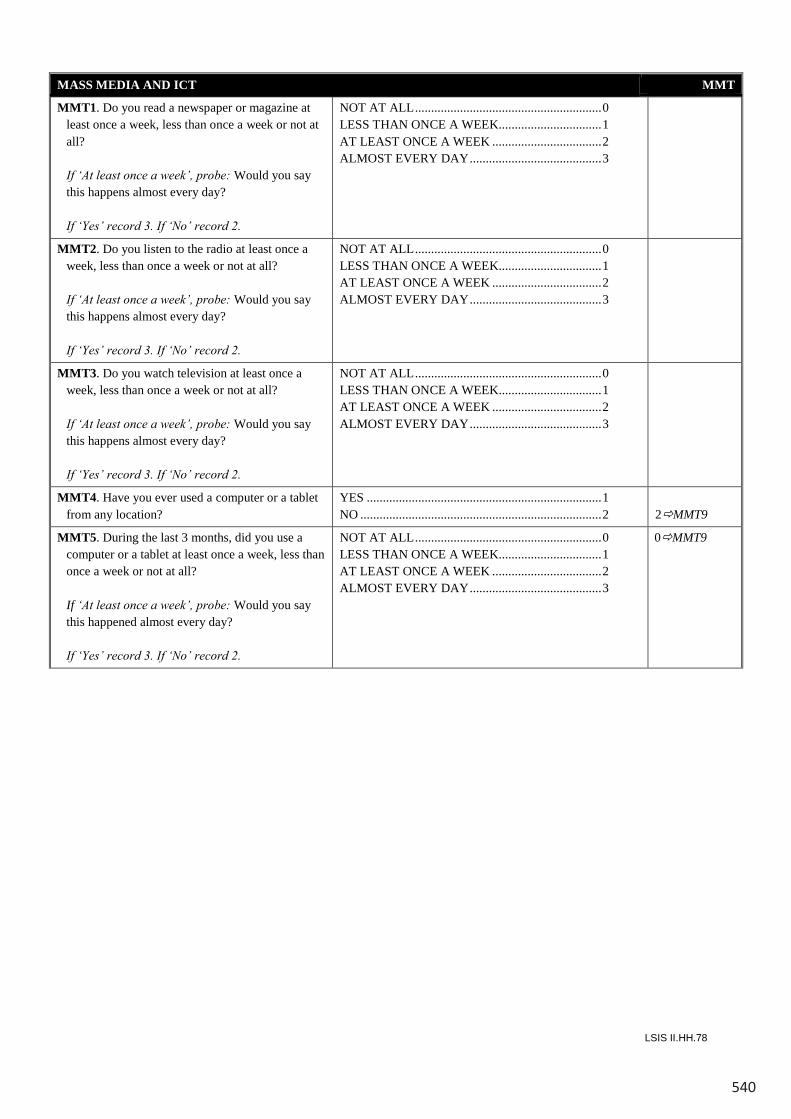
540
LSIS II.HH.78
MASS MEDIA AND ICT MMT
MMT1. Do you read a newspaper or magazine at least once a week, less than once a week or not at all?
If ‘At least once a week’, probe: Would you say
this happens almost every day? If ‘Yes’ record 3. If ‘No’ record 2.
NOT AT ALL .......................................................... 0 LESS THAN ONCE A WEEK................................ 1 AT LEAST ONCE A WEEK .................................. 2 ALMOST EVERY DAY ......................................... 3
MMT2. Do you listen to the radio at least once a week, less than once a week or not at all?
If ‘At least once a week’, probe: Would you say
this happens almost every day? If ‘Yes’ record 3. If ‘No’ record 2.
NOT AT ALL .......................................................... 0 LESS THAN ONCE A WEEK................................ 1 AT LEAST ONCE A WEEK .................................. 2 ALMOST EVERY DAY ......................................... 3
MMT3. Do you watch television at least once a week, less than once a week or not at all?
If ‘At least once a week’, probe: Would you say
this happens almost every day? If ‘Yes’ record 3. If ‘No’ record 2.
NOT AT ALL .......................................................... 0 LESS THAN ONCE A WEEK................................ 1 AT LEAST ONCE A WEEK .................................. 2 ALMOST EVERY DAY ......................................... 3
MMT4. Have you ever used a computer or a tablet from any location?
YES ......................................................................... 1 NO ........................................................................... 2
2MMT9
MMT5. During the last 3 months, did you use a computer or a tablet at least once a week, less than once a week or not at all?
If ‘At least once a week’, probe: Would you say
this happened almost every day? If ‘Yes’ record 3. If ‘No’ record 2.
NOT AT ALL .......................................................... 0 LESS THAN ONCE A WEEK................................ 1 AT LEAST ONCE A WEEK .................................. 2 ALMOST EVERY DAY ......................................... 3
0MMT9
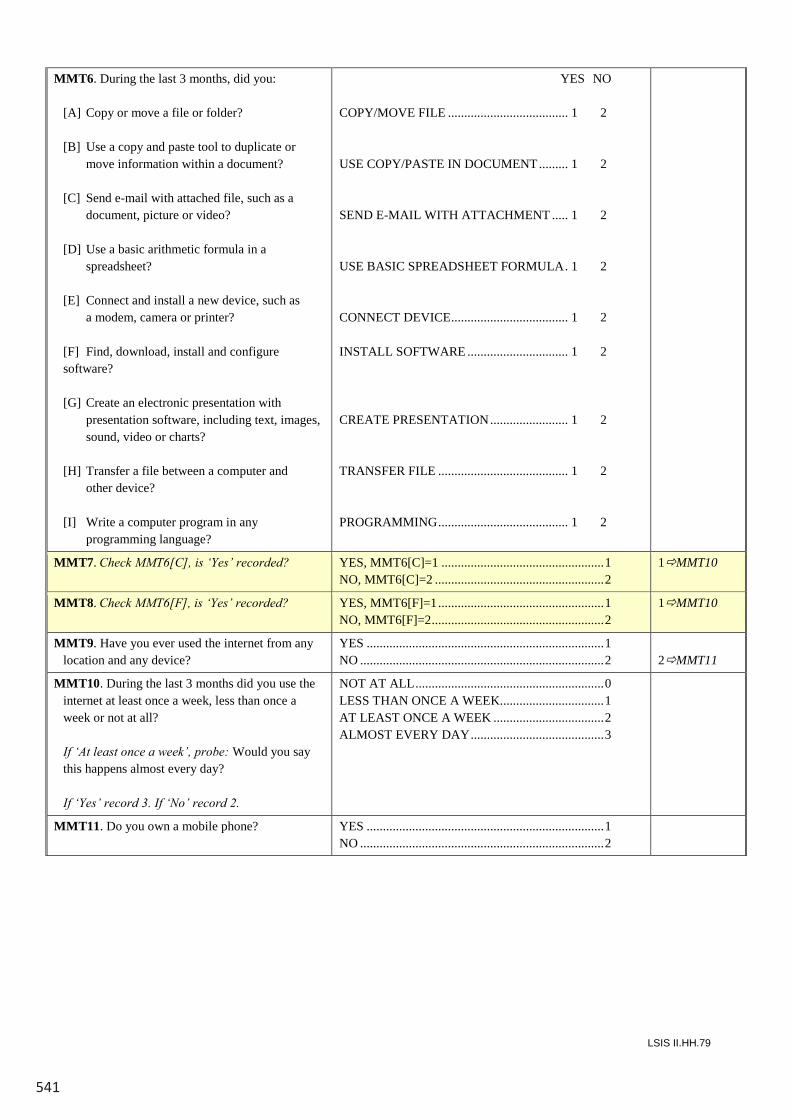
541
LSIS II.HH.79
MMT6. During the last 3 months, did you: [A] Copy or move a file or folder? [B] Use a copy and paste tool to duplicate or
move information within a document? [C] Send e-mail with attached file, such as a
document, picture or video? [D] Use a basic arithmetic formula in a
spreadsheet? [E] Connect and install a new device, such as
a modem, camera or printer? [F] Find, download, install and configure
software? [G] Create an electronic presentation with
presentation software, including text, images, sound, video or charts?
[H] Transfer a file between a computer and
other device? [I] Write a computer program in any
programming language?
YES NO COPY/MOVE FILE ..................................... 1 2 USE COPY/PASTE IN DOCUMENT ......... 1 2 SEND E-MAIL WITH ATTACHMENT ..... 1 2 USE BASIC SPREADSHEET FORMULA . 1 2 CONNECT DEVICE .................................... 1 2 INSTALL SOFTWARE ............................... 1 2 CREATE PRESENTATION ........................ 1 2 TRANSFER FILE ........................................ 1 2 PROGRAMMING ........................................ 1 2
MMT7. Check MMT6[C], is ‘Yes’ recorded? YES, MMT6[C]=1 .................................................. 1 NO, MMT6[C]=2 .................................................... 2
1MMT10
MMT8. Check MMT6[F], is ‘Yes’ recorded? YES, MMT6[F]=1 ................................................... 1 NO, MMT6[F]=2 ..................................................... 2
1MMT10
MMT9. Have you ever used the internet from any location and any device?
YES ......................................................................... 1 NO ........................................................................... 2
2MMT11
MMT10. During the last 3 months did you use the internet at least once a week, less than once a week or not at all?
If ‘At least once a week’, probe: Would you say
this happens almost every day? If ‘Yes’ record 3. If ‘No’ record 2.
NOT AT ALL .......................................................... 0 LESS THAN ONCE A WEEK................................ 1 AT LEAST ONCE A WEEK .................................. 2 ALMOST EVERY DAY ......................................... 3
MMT11. Do you own a mobile phone? YES ......................................................................... 1 NO ........................................................................... 2
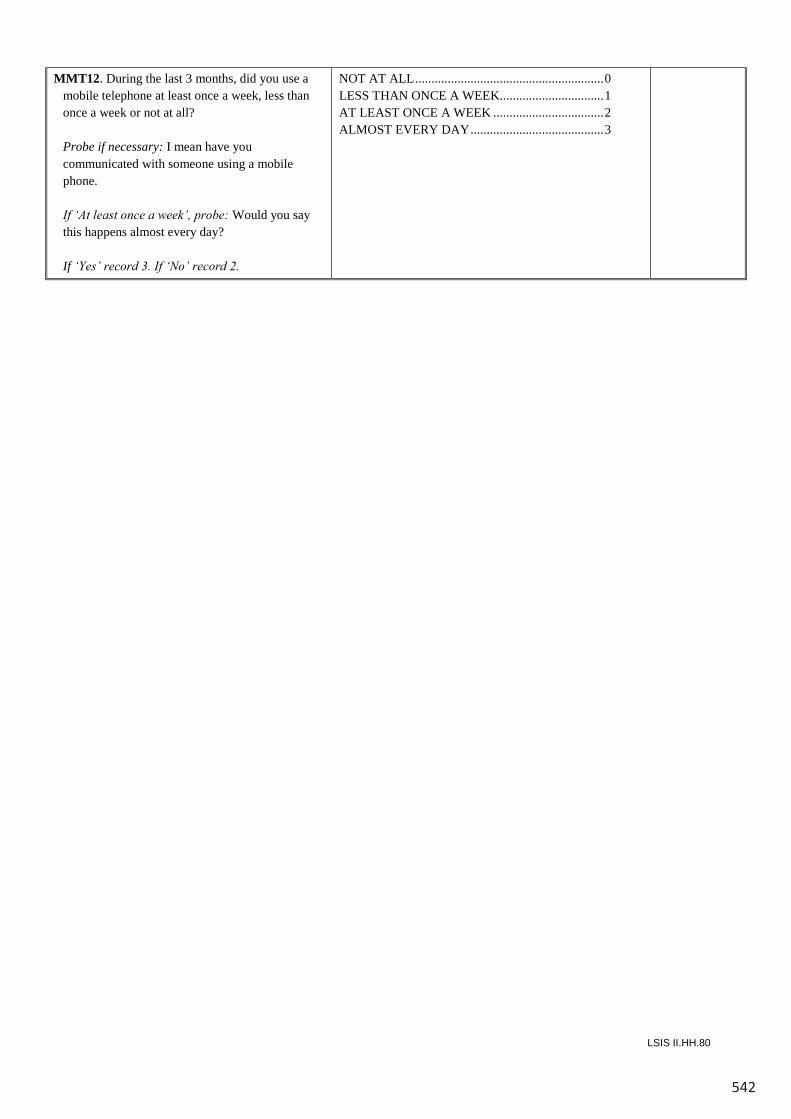
542
LSIS II.HH.80
MMT12. During the last 3 months, did you use a mobile telephone at least once a week, less than once a week or not at all?
Probe if necessary: I mean have you
communicated with someone using a mobile phone.
If ‘At least once a week’, probe: Would you say
this happens almost every day? If ‘Yes’ record 3. If ‘No’ record 2.
NOT AT ALL .......................................................... 0 LESS THAN ONCE A WEEK................................ 1 AT LEAST ONCE A WEEK .................................. 2 ALMOST EVERY DAY ......................................... 3
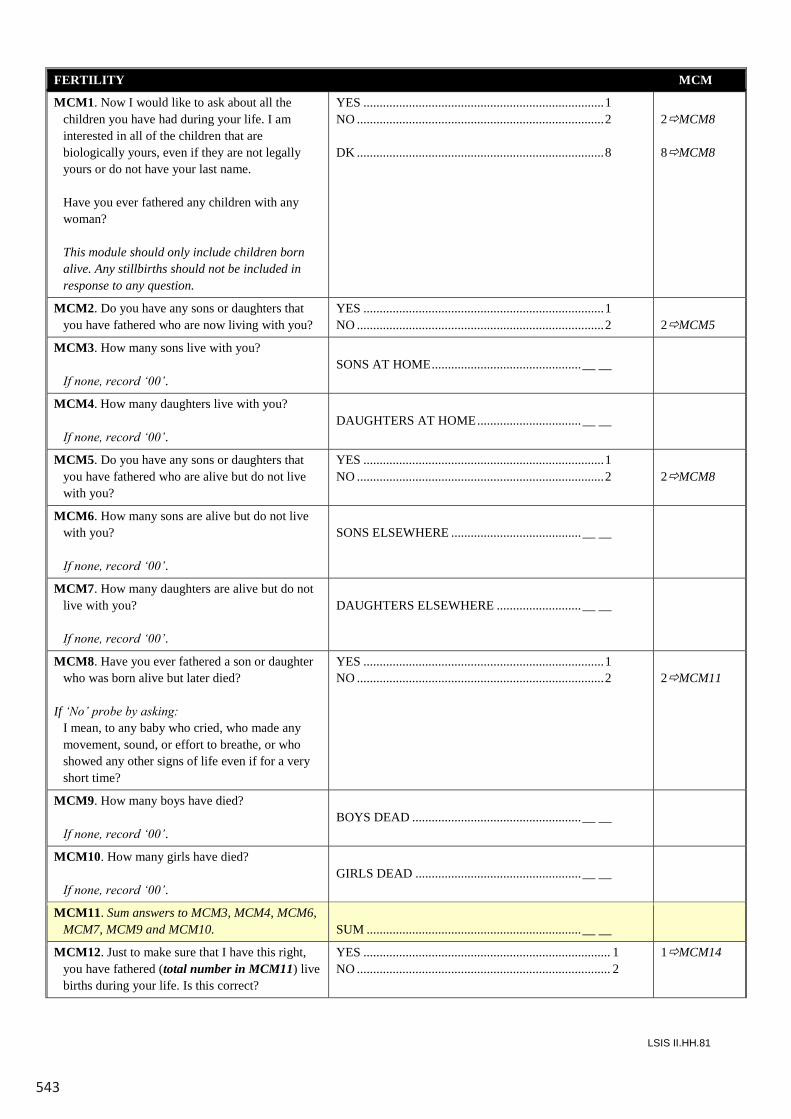
543
LSIS II.HH.81
FERTILITY MCM
MCM1. Now I would like to ask about all the children you have had during your life. I am interested in all of the children that are biologically yours, even if they are not legally yours or do not have your last name.
Have you ever fathered any children with any
woman? This module should only include children born
alive. Any stillbirths should not be included in response to any question.
YES .......................................................................... 1 NO ............................................................................ 2 DK ............................................................................ 8
2MCM8 8MCM8
MCM2. Do you have any sons or daughters that you have fathered who are now living with you?
YES .......................................................................... 1 NO ............................................................................ 2
2MCM5
MCM3. How many sons live with you? If none, record ‘00’.
SONS AT HOME .............................................. __ __
MCM4. How many daughters live with you? If none, record ‘00’.
DAUGHTERS AT HOME ................................ __ __
MCM5. Do you have any sons or daughters that you have fathered who are alive but do not live with you?
YES .......................................................................... 1 NO ............................................................................ 2
2MCM8
MCM6. How many sons are alive but do not live with you?
If none, record ‘00’.
SONS ELSEWHERE ........................................ __ __
MCM7. How many daughters are alive but do not live with you?
If none, record ‘00’.
DAUGHTERS ELSEWHERE .......................... __ __
MCM8. Have you ever fathered a son or daughter who was born alive but later died?
If ‘No’ probe by asking: I mean, to any baby who cried, who made any
movement, sound, or effort to breathe, or who showed any other signs of life even if for a very short time?
YES .......................................................................... 1 NO ............................................................................ 2
2MCM11
MCM9. How many boys have died? If none, record ‘00’.
BOYS DEAD .................................................... __ __
MCM10. How many girls have died? If none, record ‘00’.
GIRLS DEAD ................................................... __ __
MCM11. Sum answers to MCM3, MCM4, MCM6, MCM7, MCM9 and MCM10.
SUM .................................................................. __ __
MCM12. Just to make sure that I have this right, you have fathered (total number in MCM11) live births during your life. Is this correct?
YES ............................................................................ 1 NO .............................................................................. 2
1MCM14
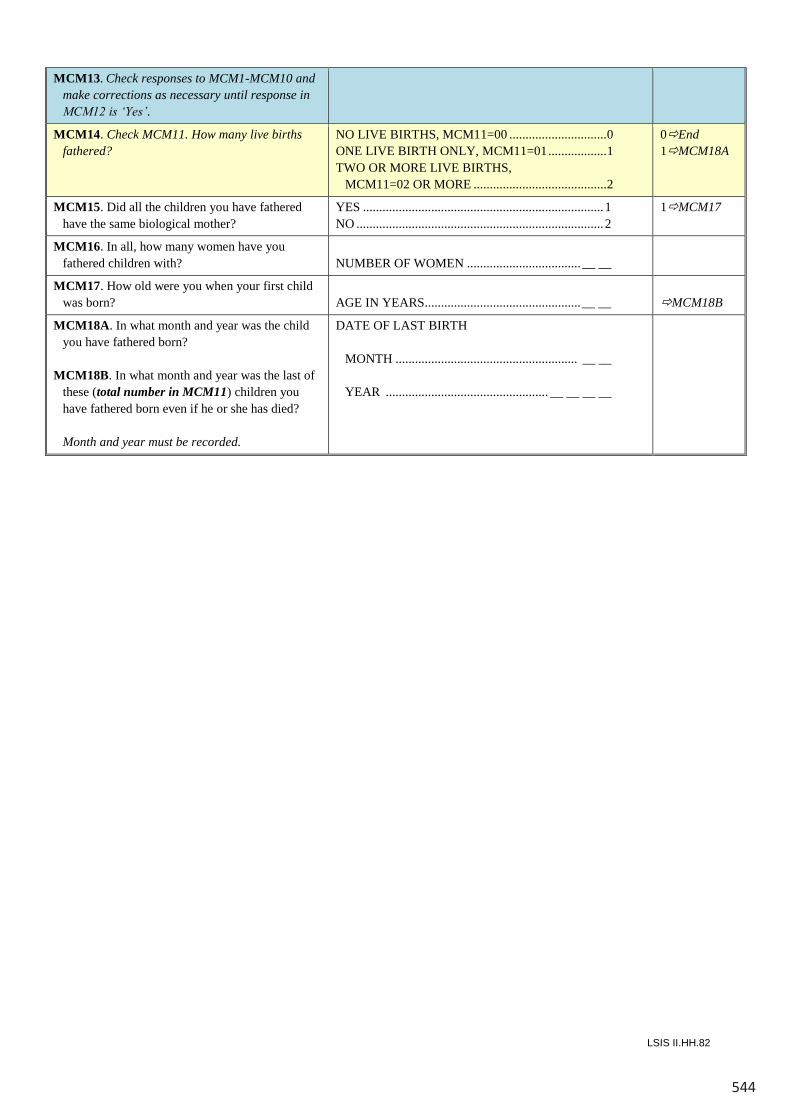
544
LSIS II.HH.82
MCM13. Check responses to MCM1-MCM10 and make corrections as necessary until response in MCM12 is ‘Yes’.
MCM14. Check MCM11. How many live births fathered?
NO LIVE BIRTHS, MCM11=00 .............................. 0 ONE LIVE BIRTH ONLY, MCM11=01 .................. 1 TWO OR MORE LIVE BIRTHS, MCM11=02 OR MORE ......................................... 2
0End 1MCM18A
MCM15. Did all the children you have fathered have the same biological mother?
YES .......................................................................... 1 NO ............................................................................ 2
1MCM17
MCM16. In all, how many women have you fathered children with?
NUMBER OF WOMEN ................................... __ __
MCM17. How old were you when your first child was born?
AGE IN YEARS................................................ __ __
MCM18B
MCM18A. In what month and year was the child you have fathered born?
MCM18B. In what month and year was the last of
these (total number in MCM11) children you have fathered born even if he or she has died?
Month and year must be recorded.
DATE OF LAST BIRTH MONTH ........................................................ __ __ YEAR .................................................. __ __ __ __
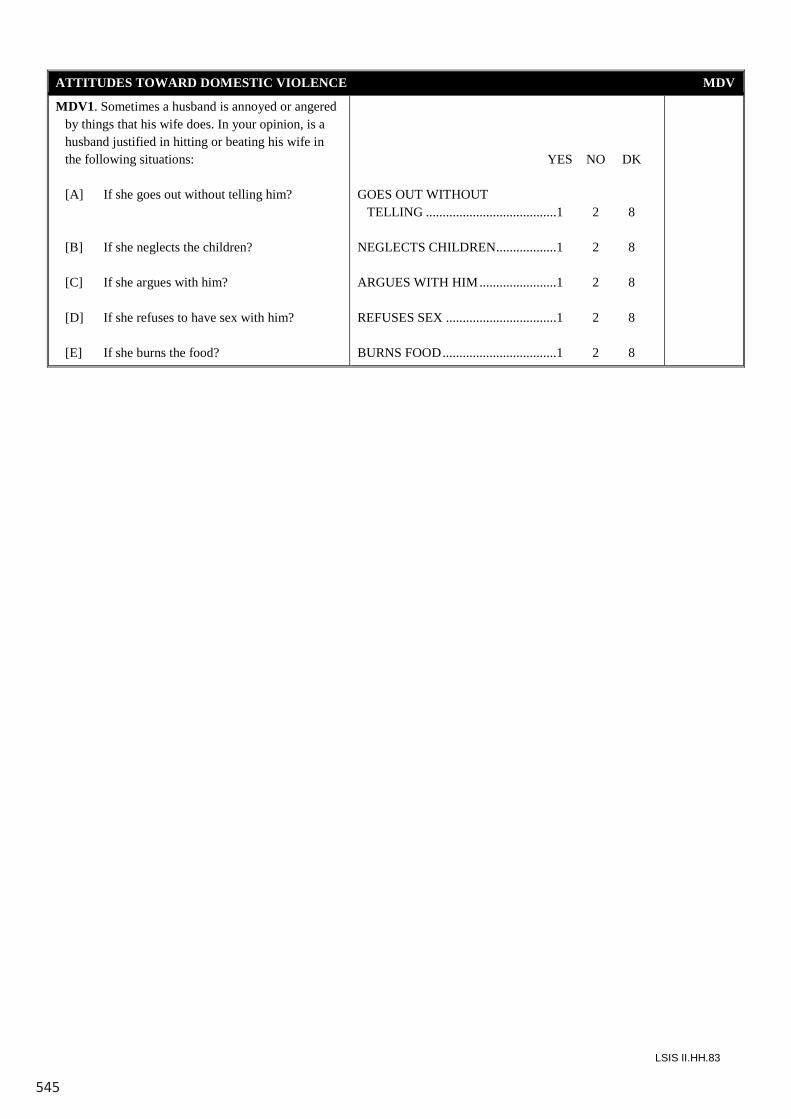
545
LSIS II.HH.83
ATTITUDES TOWARD DOMESTIC VIOLENCE MDV
MDV1. Sometimes a husband is annoyed or angered by things that his wife does. In your opinion, is a husband justified in hitting or beating his wife in the following situations:
[A] If she goes out without telling him? [B] If she neglects the children? [C] If she argues with him? [D] If she refuses to have sex with him? [E] If she burns the food?
YES NO DK GOES OUT WITHOUT TELLING .......................................1 2 8 NEGLECTS CHILDREN ..................1 2 8 ARGUES WITH HIM .......................1 2 8 REFUSES SEX .................................1 2 8 BURNS FOOD ..................................1 2 8
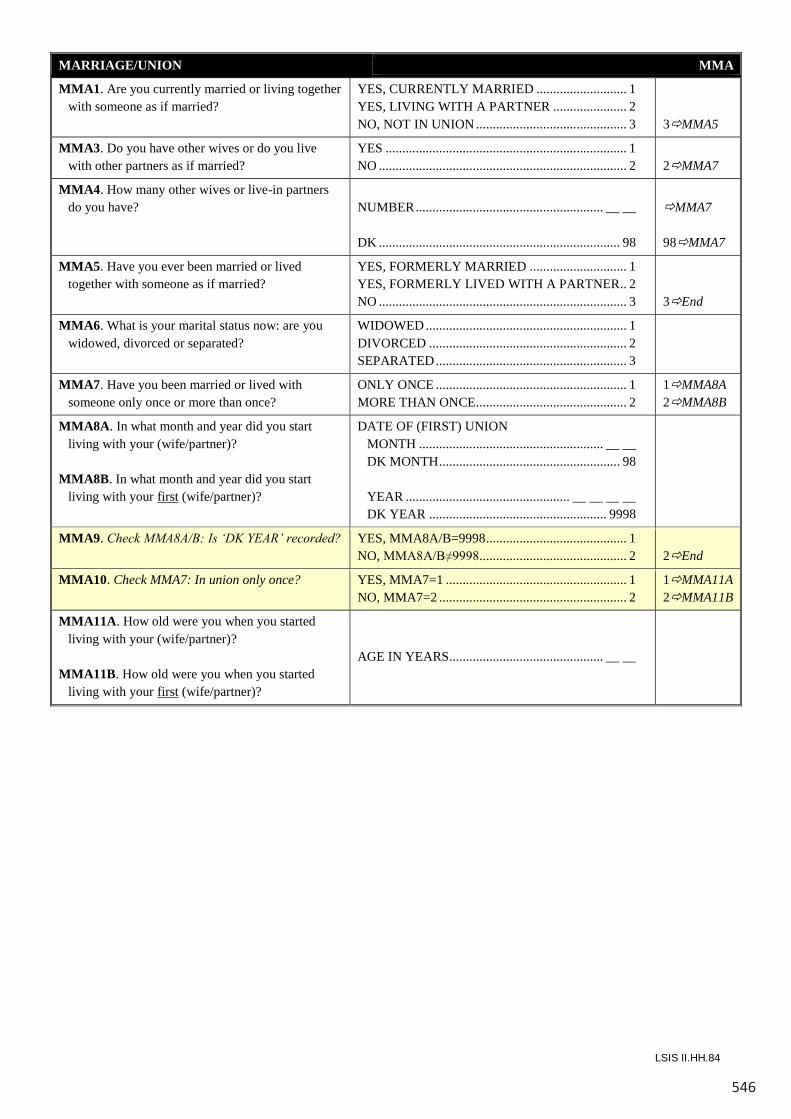
546
LSIS II.HH.84
MARRIAGE/UNION MMA
MMA1. Are you currently married or living together with someone as if married?
YES, CURRENTLY MARRIED ........................... 1 YES, LIVING WITH A PARTNER ...................... 2 NO, NOT IN UNION ............................................. 3
3MMA5
MMA3. Do you have other wives or do you live with other partners as if married?
YES ........................................................................ 1 NO .......................................................................... 2
2MMA7
MMA4. How many other wives or live-in partners do you have?
NUMBER ........................................................ __ __ DK ........................................................................ 98
MMA7 98MMA7
MMA5. Have you ever been married or lived together with someone as if married?
YES, FORMERLY MARRIED ............................. 1 YES, FORMERLY LIVED WITH A PARTNER .. 2 NO .......................................................................... 3
3End
MMA6. What is your marital status now: are you widowed, divorced or separated?
WIDOWED ............................................................ 1 DIVORCED ........................................................... 2 SEPARATED ......................................................... 3
MMA7. Have you been married or lived with someone only once or more than once?
ONLY ONCE ......................................................... 1 MORE THAN ONCE ............................................. 2
1MMA8A 2MMA8B
MMA8A. In what month and year did you start living with your (wife/partner)?
MMA8B. In what month and year did you start
living with your first (wife/partner)?
DATE OF (FIRST) UNION MONTH ....................................................... __ __ DK MONTH ...................................................... 98 YEAR ................................................. __ __ __ __ DK YEAR ..................................................... 9998
MMA9. Check MMA8A/B: Is ‘DK YEAR’ recorded? YES, MMA8A/B=9998 .......................................... 1 NO, MMA8A/B≠9998............................................ 2
2End
MMA10. Check MMA7: In union only once? YES, MMA7=1 ...................................................... 1 NO, MMA7=2 ........................................................ 2
1MMA11A 2MMA11B
MMA11A. How old were you when you started living with your (wife/partner)?
MMA11B. How old were you when you started
living with your first (wife/partner)?
AGE IN YEARS.............................................. __ __
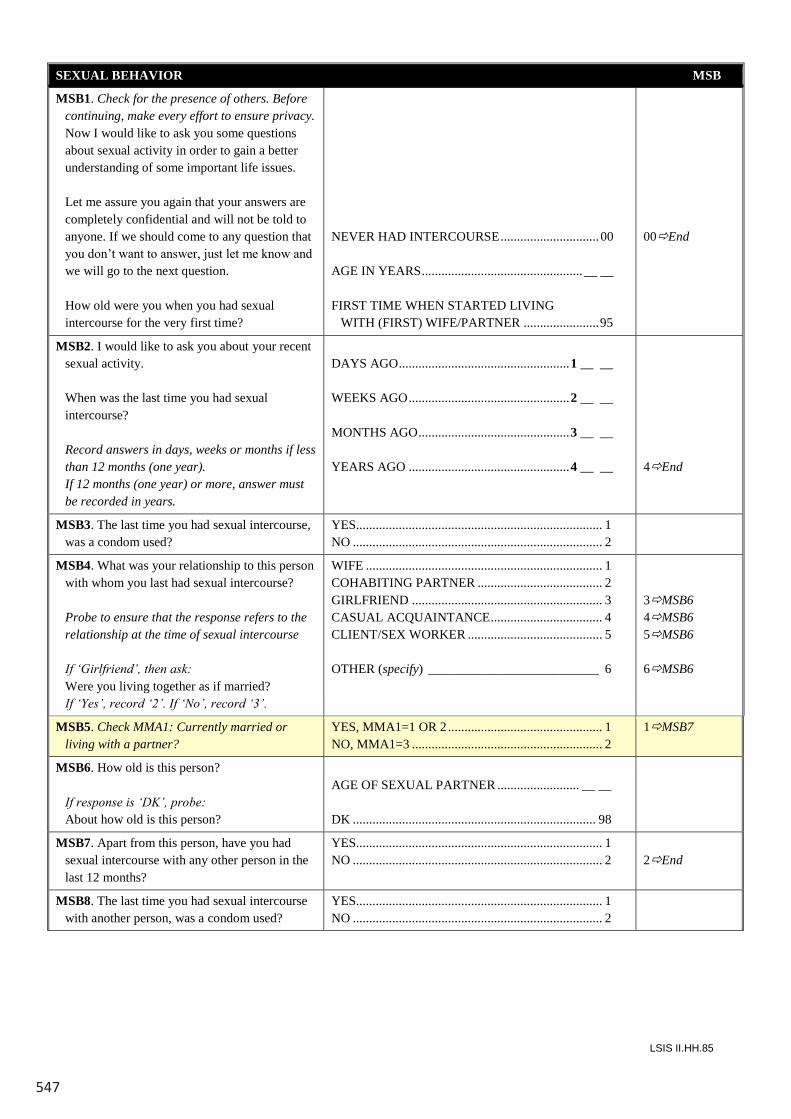
547
LSIS II.HH.85
SEXUAL BEHAVIOR MSB
MSB1. Check for the presence of others. Before continuing, make every effort to ensure privacy. Now I would like to ask you some questions about sexual activity in order to gain a better understanding of some important life issues.
Let me assure you again that your answers are
completely confidential and will not be told to anyone. If we should come to any question that you don’t want to answer, just let me know and we will go to the next question.
How old were you when you had sexual
intercourse for the very first time?
NEVER HAD INTERCOURSE .............................. 00 AGE IN YEARS ................................................. __ __ FIRST TIME WHEN STARTED LIVING WITH (FIRST) WIFE/PARTNER ....................... 95
00End
MSB2. I would like to ask you about your recent sexual activity.
When was the last time you had sexual
intercourse? Record answers in days, weeks or months if less
than 12 months (one year). If 12 months (one year) or more, answer must
be recorded in years.
DAYS AGO .................................................... 1 __ __ WEEKS AGO ................................................. 2 __ __ MONTHS AGO .............................................. 3 __ __ YEARS AGO ................................................. 4 __ __
4End
MSB3. The last time you had sexual intercourse, was a condom used?
YES........................................................................... 1 NO ............................................................................ 2
MSB4. What was your relationship to this person with whom you last had sexual intercourse?
Probe to ensure that the response refers to the
relationship at the time of sexual intercourse If ‘Girlfriend’, then ask: Were you living together as if married? If ‘Yes’, record ‘2’. If ‘No’, record ‘3’.
WIFE ........................................................................ 1 COHABITING PARTNER ...................................... 2 GIRLFRIEND .......................................................... 3 CASUAL ACQUAINTANCE .................................. 4 CLIENT/SEX WORKER ......................................... 5 OTHER (specify) __________________________ 6
3MSB6 4MSB6 5MSB6 6MSB6
MSB5. Check MMA1: Currently married or living with a partner?
YES, MMA1=1 OR 2 ............................................... 1 NO, MMA1=3 .......................................................... 2
1MSB7
MSB6. How old is this person? If response is ‘DK’, probe: About how old is this person?
AGE OF SEXUAL PARTNER ......................... __ __ DK .......................................................................... 98
MSB7. Apart from this person, have you had sexual intercourse with any other person in the last 12 months?
YES........................................................................... 1 NO ............................................................................ 2
2End
MSB8. The last time you had sexual intercourse with another person, was a condom used?
YES........................................................................... 1 NO ............................................................................ 2
LSIS II.HH.84
MARRIAGE/UNION MMA
MMA1. Are you currently married or living together with someone as if married?
YES, CURRENTLY MARRIED ........................... 1 YES, LIVING WITH A PARTNER ...................... 2 NO, NOT IN UNION ............................................. 3
3MMA5
MMA3. Do you have other wives or do you live with other partners as if married?
YES ........................................................................ 1 NO .......................................................................... 2
2MMA7
MMA4. How many other wives or live-in partners do you have?
NUMBER ........................................................ __ __ DK ........................................................................ 98
MMA7 98MMA7
MMA5. Have you ever been married or lived together with someone as if married?
YES, FORMERLY MARRIED ............................. 1 YES, FORMERLY LIVED WITH A PARTNER .. 2 NO .......................................................................... 3
3End
MMA6. What is your marital status now: are you widowed, divorced or separated?
WIDOWED ............................................................ 1 DIVORCED ........................................................... 2 SEPARATED ......................................................... 3
MMA7. Have you been married or lived with someone only once or more than once?
ONLY ONCE ......................................................... 1 MORE THAN ONCE ............................................. 2
1MMA8A 2MMA8B
MMA8A. In what month and year did you start living with your (wife/partner)?
MMA8B. In what month and year did you start
living with your first (wife/partner)?
DATE OF (FIRST) UNION MONTH ....................................................... __ __ DK MONTH ...................................................... 98 YEAR ................................................. __ __ __ __ DK YEAR ..................................................... 9998
MMA9. Check MMA8A/B: Is ‘DK YEAR’ recorded? YES, MMA8A/B=9998 .......................................... 1 NO, MMA8A/B≠9998............................................ 2
2End
MMA10. Check MMA7: In union only once? YES, MMA7=1 ...................................................... 1 NO, MMA7=2 ........................................................ 2
1MMA11A 2MMA11B
MMA11A. How old were you when you started living with your (wife/partner)?
MMA11B. How old were you when you started
living with your first (wife/partner)?
AGE IN YEARS.............................................. __ __
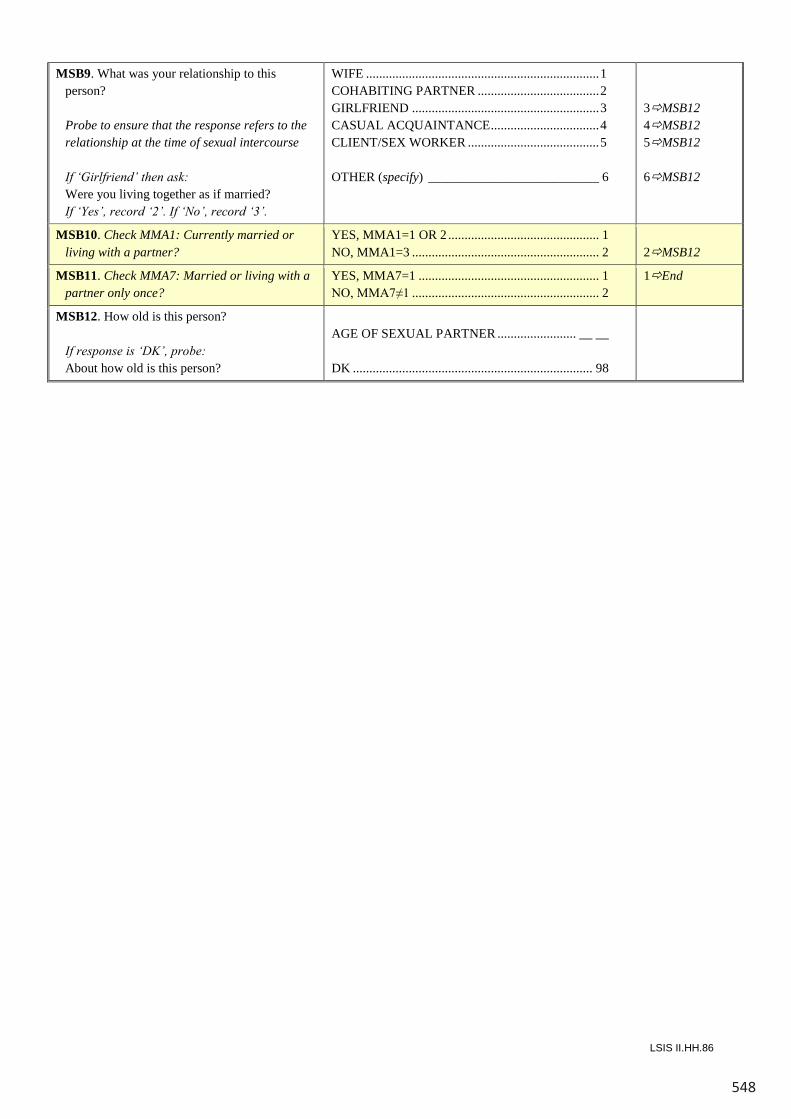
548
LSIS II.HH.86
MSB9. What was your relationship to this person?
Probe to ensure that the response refers to the
relationship at the time of sexual intercourse If ‘Girlfriend’ then ask: Were you living together as if married? If ‘Yes’, record ‘2’. If ‘No’, record ‘3’.
WIFE ....................................................................... 1 COHABITING PARTNER ..................................... 2 GIRLFRIEND ......................................................... 3 CASUAL ACQUAINTANCE ................................. 4 CLIENT/SEX WORKER ........................................ 5 OTHER (specify) __________________________ 6
3MSB12 4MSB12 5MSB12 6MSB12
MSB10. Check MMA1: Currently married or living with a partner?
YES, MMA1=1 OR 2 .............................................. 1 NO, MMA1=3 ......................................................... 2
2MSB12
MSB11. Check MMA7: Married or living with a partner only once?
YES, MMA7=1 ....................................................... 1 NO, MMA7≠1 ......................................................... 2
1End
MSB12. How old is this person? If response is ‘DK’, probe: About how old is this person?
AGE OF SEXUAL PARTNER ........................ __ __ DK ......................................................................... 98
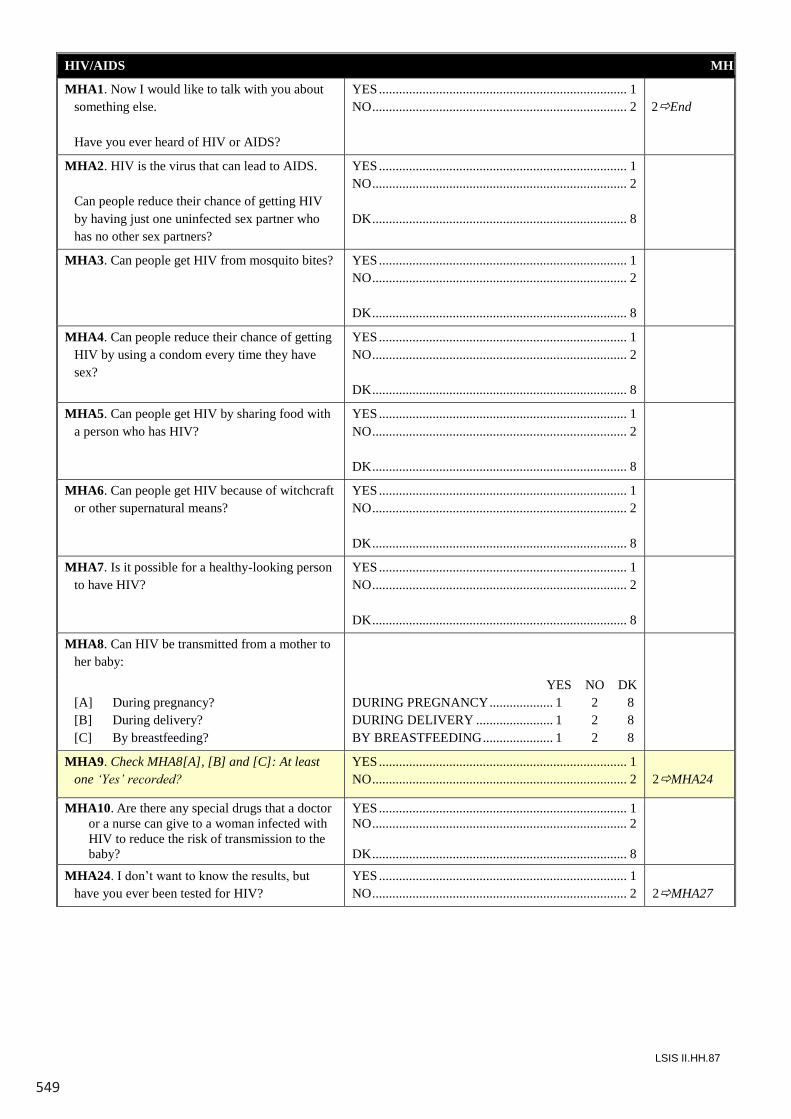
549
LSIS II.HH.87
HIV/AIDS MHA
MHA1. Now I would like to talk with you about something else.
Have you ever heard of HIV or AIDS?
YES .......................................................................... 1 NO ............................................................................ 2
2End
MHA2. HIV is the virus that can lead to AIDS. Can people reduce their chance of getting HIV
by having just one uninfected sex partner who has no other sex partners?
YES .......................................................................... 1 NO ............................................................................ 2 DK ............................................................................ 8
MHA3. Can people get HIV from mosquito bites? YES .......................................................................... 1 NO ............................................................................ 2 DK ............................................................................ 8
MHA4. Can people reduce their chance of getting HIV by using a condom every time they have sex?
YES .......................................................................... 1 NO ............................................................................ 2 DK ............................................................................ 8
MHA5. Can people get HIV by sharing food with a person who has HIV?
YES .......................................................................... 1 NO ............................................................................ 2 DK ............................................................................ 8
MHA6. Can people get HIV because of witchcraft or other supernatural means?
YES .......................................................................... 1 NO ............................................................................ 2 DK ............................................................................ 8
MHA7. Is it possible for a healthy-looking person to have HIV?
YES .......................................................................... 1 NO ............................................................................ 2 DK ............................................................................ 8
MHA8. Can HIV be transmitted from a mother to her baby:
[A] During pregnancy? [B] During delivery? [C] By breastfeeding?
YES NO DK DURING PREGNANCY ................... 1 2 8 DURING DELIVERY ....................... 1 2 8 BY BREASTFEEDING ..................... 1 2 8
MHA9. Check MHA8[A], [B] and [C]: At least one ‘Yes’ recorded?
YES .......................................................................... 1 NO ............................................................................ 2
2MHA24
MHA10. Are there any special drugs that a doctor or a nurse can give to a woman infected with HIV to reduce the risk of transmission to the baby?
YES .......................................................................... 1 NO ............................................................................ 2 DK ............................................................................ 8
MHA24. I don’t want to know the results, but have you ever been tested for HIV?
YES .......................................................................... 1 NO ............................................................................ 2
2MHA27
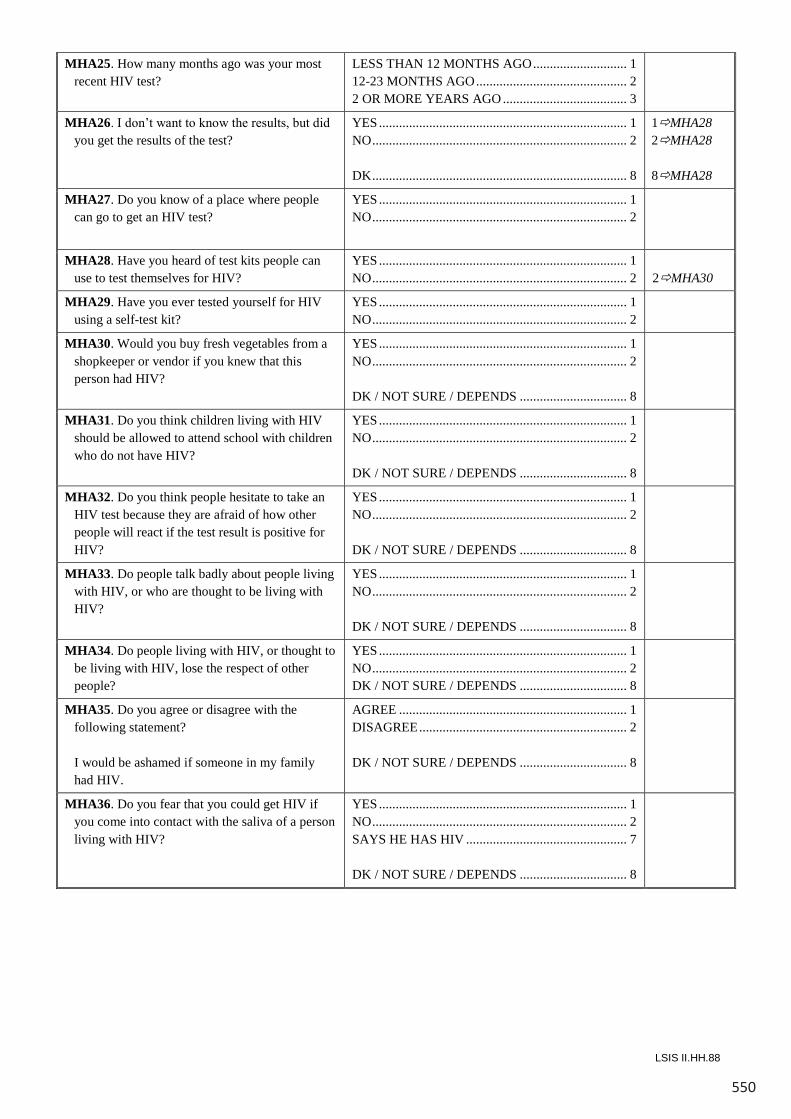
550
LSIS II.HH.88
MHA25. How many months ago was your most recent HIV test?
LESS THAN 12 MONTHS AGO ............................ 1 12-23 MONTHS AGO ............................................. 2 2 OR MORE YEARS AGO ..................................... 3
MHA26. I don’t want to know the results, but did you get the results of the test?
YES .......................................................................... 1 NO ............................................................................ 2 DK ............................................................................ 8
1MHA28 2MHA28 8MHA28
MHA27. Do you know of a place where people can go to get an HIV test?
YES .......................................................................... 1 NO ............................................................................ 2
MHA28. Have you heard of test kits people can use to test themselves for HIV?
YES .......................................................................... 1 NO ............................................................................ 2
2MHA30
MHA29. Have you ever tested yourself for HIV using a self-test kit?
YES .......................................................................... 1 NO ............................................................................ 2
MHA30. Would you buy fresh vegetables from a shopkeeper or vendor if you knew that this person had HIV?
YES .......................................................................... 1 NO ............................................................................ 2 DK / NOT SURE / DEPENDS ................................ 8
MHA31. Do you think children living with HIV should be allowed to attend school with children who do not have HIV?
YES .......................................................................... 1 NO ............................................................................ 2 DK / NOT SURE / DEPENDS ................................ 8
MHA32. Do you think people hesitate to take an HIV test because they are afraid of how other people will react if the test result is positive for HIV?
YES .......................................................................... 1 NO ............................................................................ 2 DK / NOT SURE / DEPENDS ................................ 8
MHA33. Do people talk badly about people living with HIV, or who are thought to be living with HIV?
YES .......................................................................... 1 NO ............................................................................ 2 DK / NOT SURE / DEPENDS ................................ 8
MHA34. Do people living with HIV, or thought to be living with HIV, lose the respect of other people?
YES .......................................................................... 1 NO ............................................................................ 2 DK / NOT SURE / DEPENDS ................................ 8
MHA35. Do you agree or disagree with the following statement?
I would be ashamed if someone in my family
had HIV.
AGREE .................................................................... 1 DISAGREE .............................................................. 2 DK / NOT SURE / DEPENDS ................................ 8
MHA36. Do you fear that you could get HIV if you come into contact with the saliva of a person living with HIV?
YES .......................................................................... 1 NO ............................................................................ 2 SAYS HE HAS HIV ................................................ 7 DK / NOT SURE / DEPENDS ................................ 8
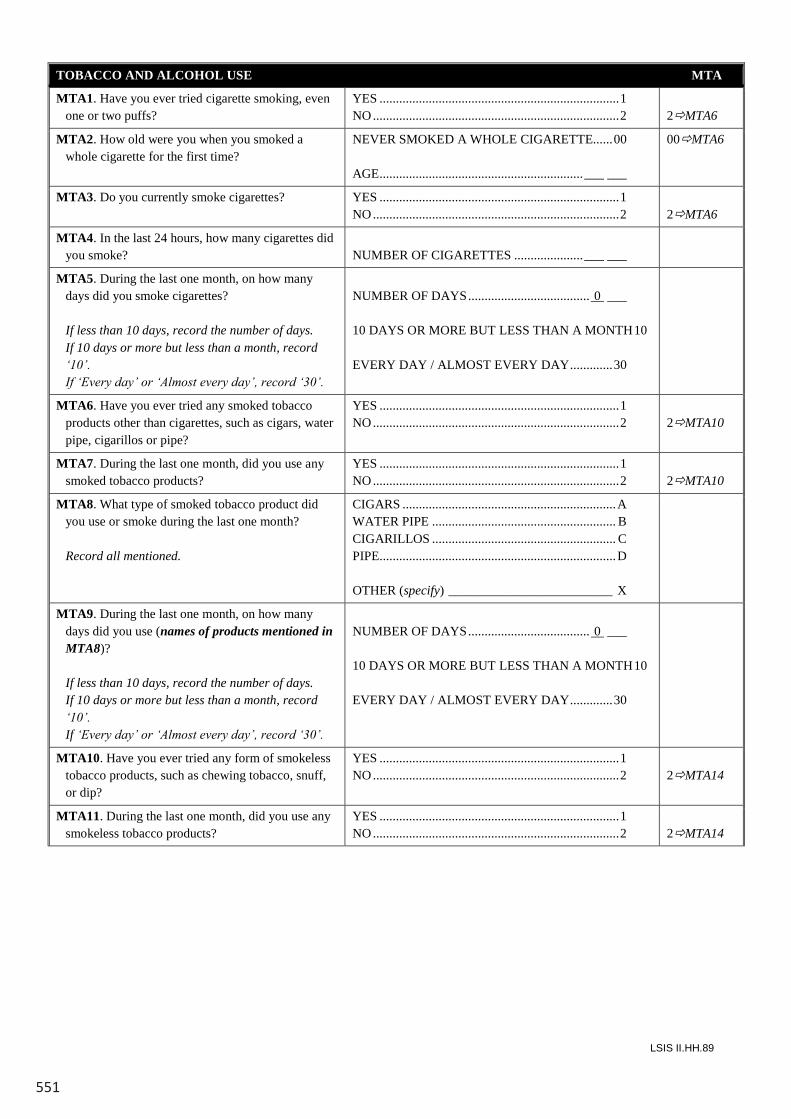
551
LSIS II.HH.89
TOBACCO AND ALCOHOL USE MTA
MTA1. Have you ever tried cigarette smoking, even one or two puffs?
YES ......................................................................... 1 NO ........................................................................... 2
2MTA6
MTA2. How old were you when you smoked a whole cigarette for the first time?
NEVER SMOKED A WHOLE CIGARETTE...... 00 AGE .............................................................. ___ ___
00MTA6
MTA3. Do you currently smoke cigarettes? YES ......................................................................... 1 NO ........................................................................... 2
2MTA6
MTA4. In the last 24 hours, how many cigarettes did you smoke?
NUMBER OF CIGARETTES ..................... ___ ___
MTA5. During the last one month, on how many days did you smoke cigarettes?
If less than 10 days, record the number of days. If 10 days or more but less than a month, record
‘10’. If ‘Every day’ or ‘Almost every day’, record ‘30’.
NUMBER OF DAYS ..................................... 0 ___ 10 DAYS OR MORE BUT LESS THAN A MONTH 10 EVERY DAY / ALMOST EVERY DAY ............. 30
MTA6. Have you ever tried any smoked tobacco products other than cigarettes, such as cigars, water pipe, cigarillos or pipe?
YES ......................................................................... 1 NO ........................................................................... 2
2MTA10
MTA7. During the last one month, did you use any smoked tobacco products?
YES ......................................................................... 1 NO ........................................................................... 2
2MTA10
MTA8. What type of smoked tobacco product did you use or smoke during the last one month?
Record all mentioned.
CIGARS ................................................................. A WATER PIPE ........................................................ B CIGARILLOS ........................................................ C PIPE ........................................................................ D OTHER (specify) _________________________ X
MTA9. During the last one month, on how many days did you use (names of products mentioned in MTA8)?
If less than 10 days, record the number of days. If 10 days or more but less than a month, record
‘10’. If ‘Every day’ or ‘Almost every day’, record ‘30’.
NUMBER OF DAYS ..................................... 0 ___ 10 DAYS OR MORE BUT LESS THAN A MONTH 10 EVERY DAY / ALMOST EVERY DAY ............. 30
MTA10. Have you ever tried any form of smokeless tobacco products, such as chewing tobacco, snuff, or dip?
YES ......................................................................... 1 NO ........................................................................... 2
2MTA14
MTA11. During the last one month, did you use any smokeless tobacco products?
YES ......................................................................... 1 NO ........................................................................... 2
2MTA14
LSIS II.HH.88
MHA25. How many months ago was your most recent HIV test?
LESS THAN 12 MONTHS AGO ............................ 1 12-23 MONTHS AGO ............................................. 2 2 OR MORE YEARS AGO ..................................... 3
MHA26. I don’t want to know the results, but did you get the results of the test?
YES .......................................................................... 1 NO ............................................................................ 2 DK ............................................................................ 8
1MHA28 2MHA28 8MHA28
MHA27. Do you know of a place where people can go to get an HIV test?
YES .......................................................................... 1 NO ............................................................................ 2
MHA28. Have you heard of test kits people can use to test themselves for HIV?
YES .......................................................................... 1 NO ............................................................................ 2
2MHA30
MHA29. Have you ever tested yourself for HIV using a self-test kit?
YES .......................................................................... 1 NO ............................................................................ 2
MHA30. Would you buy fresh vegetables from a shopkeeper or vendor if you knew that this person had HIV?
YES .......................................................................... 1 NO ............................................................................ 2 DK / NOT SURE / DEPENDS ................................ 8
MHA31. Do you think children living with HIV should be allowed to attend school with children who do not have HIV?
YES .......................................................................... 1 NO ............................................................................ 2 DK / NOT SURE / DEPENDS ................................ 8
MHA32. Do you think people hesitate to take an HIV test because they are afraid of how other people will react if the test result is positive for HIV?
YES .......................................................................... 1 NO ............................................................................ 2 DK / NOT SURE / DEPENDS ................................ 8
MHA33. Do people talk badly about people living with HIV, or who are thought to be living with HIV?
YES .......................................................................... 1 NO ............................................................................ 2 DK / NOT SURE / DEPENDS ................................ 8
MHA34. Do people living with HIV, or thought to be living with HIV, lose the respect of other people?
YES .......................................................................... 1 NO ............................................................................ 2 DK / NOT SURE / DEPENDS ................................ 8
MHA35. Do you agree or disagree with the following statement?
I would be ashamed if someone in my family
had HIV.
AGREE .................................................................... 1 DISAGREE .............................................................. 2 DK / NOT SURE / DEPENDS ................................ 8
MHA36. Do you fear that you could get HIV if you come into contact with the saliva of a person living with HIV?
YES .......................................................................... 1 NO ............................................................................ 2 SAYS HE HAS HIV ................................................ 7 DK / NOT SURE / DEPENDS ................................ 8
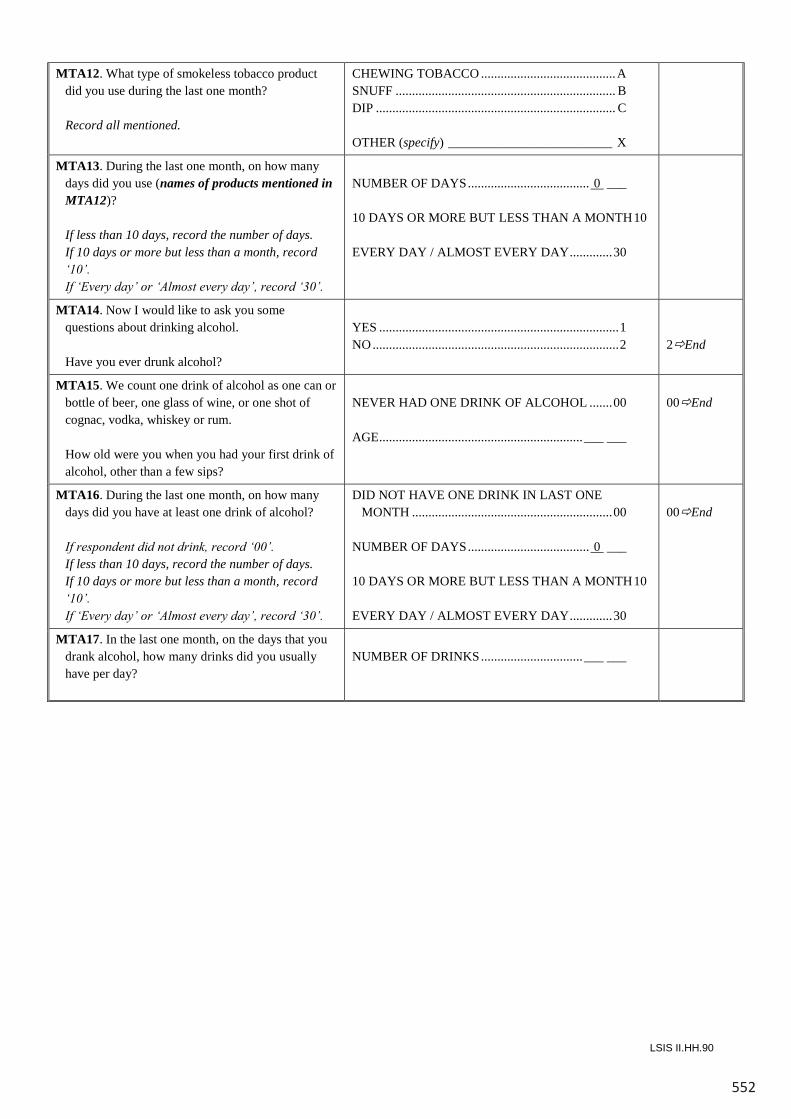
552
LSIS II.HH.90
MTA12. What type of smokeless tobacco product did you use during the last one month?
Record all mentioned.
CHEWING TOBACCO ......................................... A SNUFF ................................................................... B DIP ......................................................................... C OTHER (specify) _________________________ X
MTA13. During the last one month, on how many days did you use (names of products mentioned in MTA12)?
If less than 10 days, record the number of days. If 10 days or more but less than a month, record
‘10’. If ‘Every day’ or ‘Almost every day’, record ‘30’.
NUMBER OF DAYS ..................................... 0 ___ 10 DAYS OR MORE BUT LESS THAN A MONTH 10 EVERY DAY / ALMOST EVERY DAY ............. 30
MTA14. Now I would like to ask you some questions about drinking alcohol.
Have you ever drunk alcohol?
YES ......................................................................... 1 NO ........................................................................... 2
2End
MTA15. We count one drink of alcohol as one can or bottle of beer, one glass of wine, or one shot of cognac, vodka, whiskey or rum.
How old were you when you had your first drink of
alcohol, other than a few sips?
NEVER HAD ONE DRINK OF ALCOHOL ....... 00 AGE .............................................................. ___ ___
00End
MTA16. During the last one month, on how many days did you have at least one drink of alcohol?
If respondent did not drink, record ‘00’. If less than 10 days, record the number of days. If 10 days or more but less than a month, record
‘10’. If ‘Every day’ or ‘Almost every day’, record ‘30’.
DID NOT HAVE ONE DRINK IN LAST ONE MONTH ............................................................. 00
NUMBER OF DAYS ..................................... 0 ___ 10 DAYS OR MORE BUT LESS THAN A MONTH 10 EVERY DAY / ALMOST EVERY DAY ............. 30
00End
MTA17. In the last one month, on the days that you drank alcohol, how many drinks did you usually have per day?
NUMBER OF DRINKS ............................... ___ ___
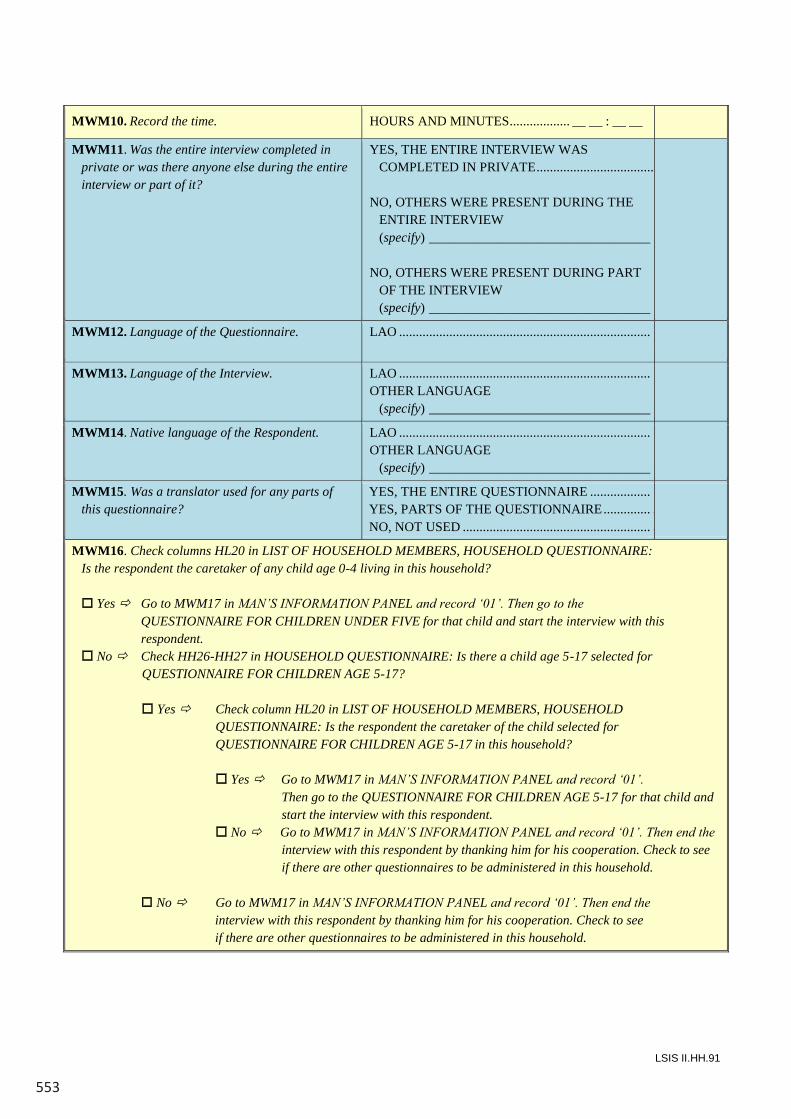
553
LSIS II.HH.91
MWM10. Record the time. HOURS AND MINUTES .................. __ __ : __ __
MWM11. Was the entire interview completed in private or was there anyone else during the entire interview or part of it?
YES, THE ENTIRE INTERVIEW WAS COMPLETED IN PRIVATE ...................................1
NO, OTHERS WERE PRESENT DURING THE
ENTIRE INTERVIEW (specify) _________________________________ 2 NO, OTHERS WERE PRESENT DURING PART
OF THE INTERVIEW (specify) _________________________________ 3
MWM12. Language of the Questionnaire. LAO ........................................................................... 1
MWM13. Language of the Interview. LAO ........................................................................... 1 OTHER LANGUAGE (specify) _________________________________ 6
MWM14. Native language of the Respondent. LAO ........................................................................... 1 OTHER LANGUAGE (specify) _________________________________ 6
MWM15. Was a translator used for any parts of this questionnaire?
YES, THE ENTIRE QUESTIONNAIRE .................. 1 YES, PARTS OF THE QUESTIONNAIRE .............. 2 NO, NOT USED ........................................................ 3
MWM16. Check columns HL20 in LIST OF HOUSEHOLD MEMBERS, HOUSEHOLD QUESTIONNAIRE: Is the respondent the caretaker of any child age 0-4 living in this household? Yes Go to MWM17 in MAN’S INFORMATION PANEL and record ‘01’. Then go to the QUESTIONNAIRE FOR CHILDREN UNDER FIVE for that child and start the interview with this
respondent. No Check HH26-HH27 in HOUSEHOLD QUESTIONNAIRE: Is there a child age 5-17 selected for QUESTIONNAIRE FOR CHILDREN AGE 5-17? Yes Check column HL20 in LIST OF HOUSEHOLD MEMBERS, HOUSEHOLD QUESTIONNAIRE: Is the respondent the caretaker of the child selected for QUESTIONNAIRE FOR CHILDREN AGE 5-17 in this household? Yes Go to MWM17 in MAN’S INFORMATION PANEL and record ‘01’. Then go to the QUESTIONNAIRE FOR CHILDREN AGE 5-17 for that child and start the interview with this respondent. No Go to MWM17 in MAN’S INFORMATION PANEL and record ‘01’. Then end the interview with this respondent by thanking him for his cooperation. Check to see if there are other questionnaires to be administered in this household. No Go to MWM17 in MAN’S INFORMATION PANEL and record ‘01’. Then end the interview with this respondent by thanking him for his cooperation. Check to see if there are other questionnaires to be administered in this household.
554
LSIS II.HH.92
INTERVIEWER’S OBSERVATIONS
SUPERVISOR’S OBSERVATIONS
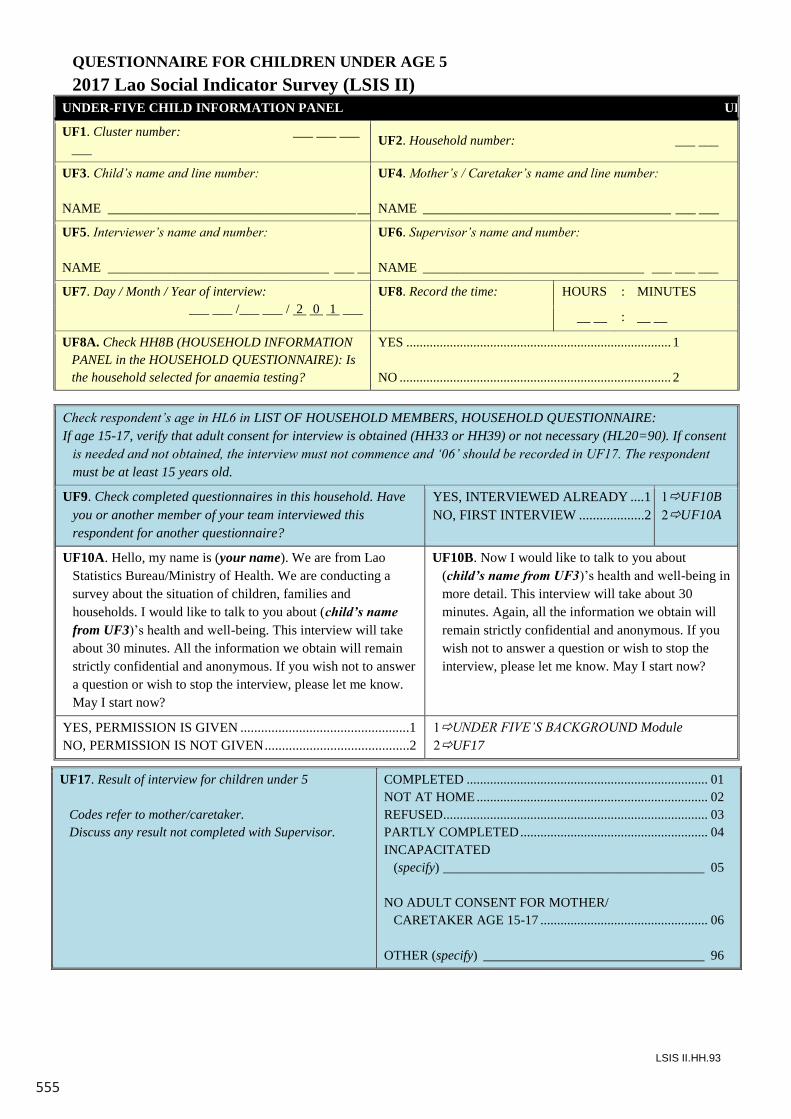
555
LSIS II.HH.93
QUESTIONNAIRE FOR CHILDREN UNDER AGE 52017 Lao Social Indicator Survey (LSIS II)
UNDER-FIVE CHILD INFORMATION PANEL UF
UF1. Cluster number: ___ ___ ___ ___
UF2. Household number: ___ ___
UF3. Child’s name and line number:
NAME _____________________________________ ___ ___
UF4. Mother’s / Caretaker’s name and line number:
NAME _____________________________________ ___ ___
UF5. Interviewer’s name and number:
NAME _________________________________ ___ ___ ___
UF6. Supervisor’s name and number:
NAME _________________________________ ___ ___ ___
UF7. Day / Month / Year of interview:___ ___ /___ ___ / 2 0 1 ___
UF8. Record the time: HOURS : MINUTES
__ __ : __ __
UF8A. Check HH8B (HOUSEHOLD INFORMATION PANEL in the HOUSEHOLD QUESTIONNAIRE): Is the household selected for anaemia testing?
YES ............................................................................... 1
NO ................................................................................. 2
Check respondent’s age in HL6 in LIST OF HOUSEHOLD MEMBERS, HOUSEHOLD QUESTIONNAIRE:If age 15-17, verify that adult consent for interview is obtained (HH33 or HH39) or not necessary (HL20=90). If consent
is needed and not obtained, the interview must not commence and ‘06’ should be recorded in UF17. The respondent must be at least 15 years old.
UF9. Check completed questionnaires in this household. Have you or another member of your team interviewed this respondent for another questionnaire?
1. 2
YES, INTERVIEWED ALREADY ....1 1UF10BNO, FIRST INTERVIEW ...................2 2UF10A
UF10A. Hello, my name is (your name). We are from Lao Statistics Bureau/Ministry of Health. We are conducting a survey about the situation of children, families and households. I would like to talk to you about (child’s name from UF3)’s health and well-being. This interview will take about 30 minutes. All the information we obtain will remain strictly confidential and anonymous. If you wish not to answer a question or wish to stop the interview, please let me know. May I start now?
UF10B. Now I would like to talk to you about (child’s name from UF3)’s health and well-being in more detail. This interview will take about 30minutes. Again, all the information we obtain will remain strictly confidential and anonymous. If you wish not to answer a question or wish to stop the interview, please let me know. May I start now?
......12
YES, PERMISSION IS GIVEN .................................................1 1UNDER FIVE’S BACKGROUND Module NO, PERMISSION IS NOT GIVEN ..........................................2 2UF17
UF17. Result of interview for children under 5
Codes refer to mother/caretaker.Discuss any result not completed with Supervisor.
COMPLETED ........................................................................ 01NOT AT HOME ..................................................................... 02REFUSED............................................................................... 03PARTLY COMPLETED........................................................ 04INCAPACITATED
(specify) _______________________________________ 05
NO ADULT CONSENT FOR MOTHER/CARETAKER AGE 15-17 .................................................. 06
OTHER (specify) _________________________________ 96
LSIS II.HH.92
INTERVIEWER’S OBSERVATIONS
SUPERVISOR’S OBSERVATIONS
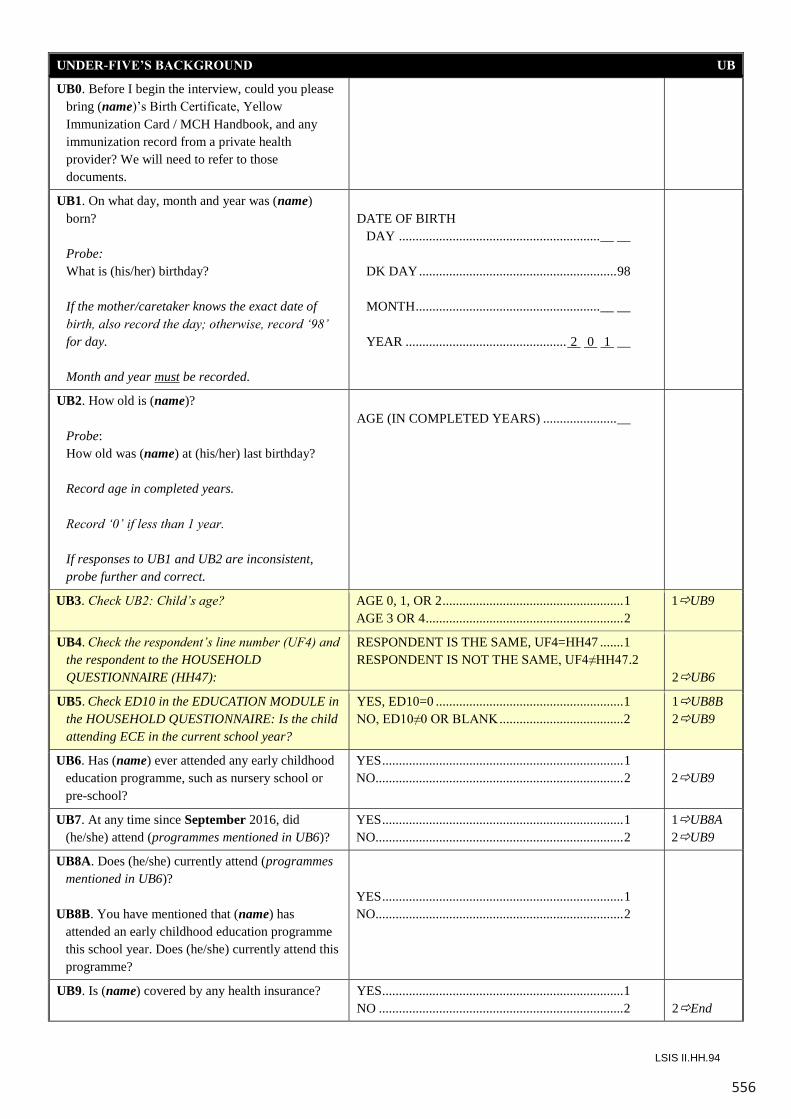
556
LSIS II.HH.94
UNDER-FIVE’S BACKGROUND UB
UB0. Before I begin the interview, could you please bring (name)’s Birth Certificate, Yellow Immunization Card / MCH Handbook, and any immunization record from a private health provider? We will need to refer to those documents.
UB1. On what day, month and year was (name)born?
Probe:What is (his/her) birthday?
If the mother/caretaker knows the exact date of birth, also record the day; otherwise, record ‘98’ for day.
Month and year must be recorded.
DATE OF BIRTHDAY ............................................................__ __
DK DAY...........................................................98
MONTH.......................................................__ __
YEAR ................................................ 2 0 1 __
UB2. How old is (name)?
Probe:How old was (name) at (his/her) last birthday?
Record age in completed years.
Record ‘0’ if less than 1 year.
If responses to UB1 and UB2 are inconsistent, probe further and correct.
AGE (IN COMPLETED YEARS) ......................__
UB3. Check UB2: Child’s age? AGE 0, 1, OR 2......................................................1AGE 3 OR 4...........................................................2
1UB9
UB4. Check the respondent’s line number (UF4) and the respondent to the HOUSEHOLD QUESTIONNAIRE (HH47):
RESPONDENT IS THE SAME, UF4=HH47 .......1RESPONDENT IS NOT THE SAME, UF4≠HH47.2
2UB6
UB5. Check ED10 in the EDUCATION MODULE in the HOUSEHOLD QUESTIONNAIRE: Is the child attending ECE in the current school year?
YES, ED10=0 ........................................................1NO, ED10≠0 OR BLANK .....................................2
1UB8B2UB9
UB6. Has (name) ever attended any early childhood education programme, such as nursery school or pre-school?
YES........................................................................1NO..........................................................................2 2UB9
UB7. At any time since September 2016, did (he/she) attend (programmes mentioned in UB6)?
YES........................................................................1NO..........................................................................2
1UB8A2UB9
UB8A. Does (he/she) currently attend (programmes mentioned in UB6)?
UB8B. You have mentioned that (name) has attended an early childhood education programme this school year. Does (he/she) currently attend this programme?
YES........................................................................1NO..........................................................................2
UB9. Is (name) covered by any health insurance? YES........................................................................1NO .........................................................................2 2End
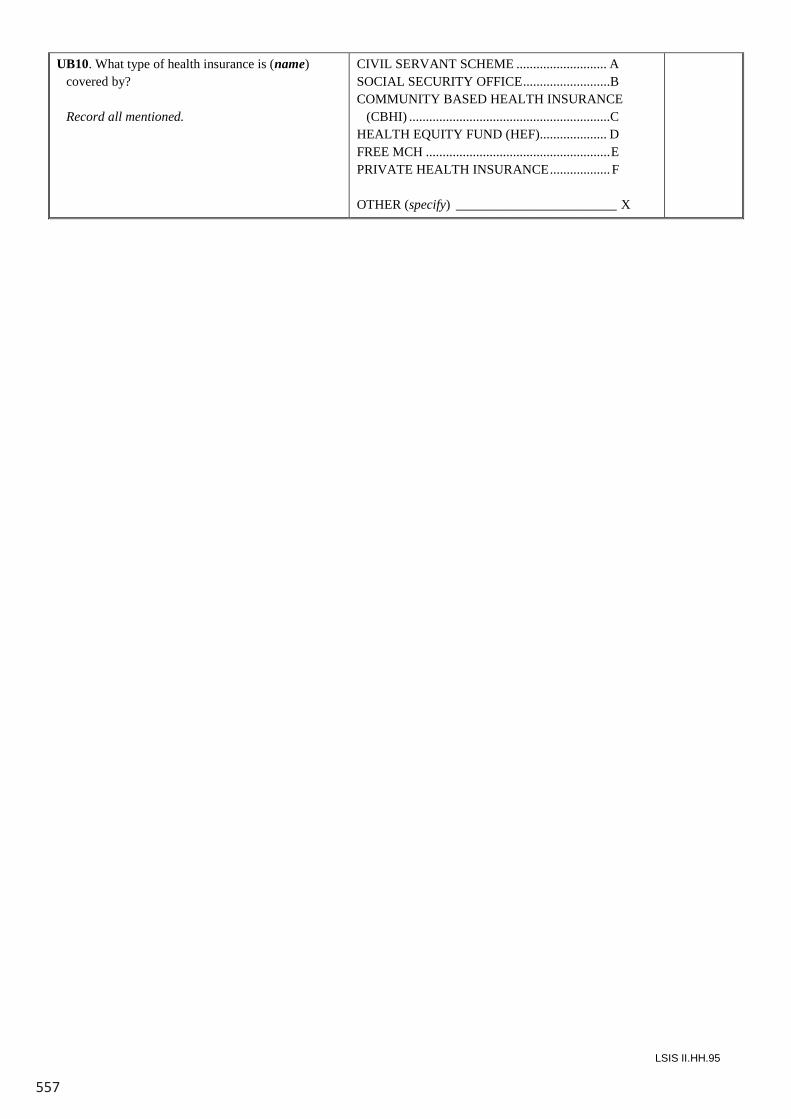
557
LSIS II.HH.95
UB10. What type of health insurance is (name) covered by?
Record all mentioned.
CIVIL SERVANT SCHEME ........................... A SOCIAL SECURITY OFFICE ..........................B COMMUNITY BASED HEALTH INSURANCE
(CBHI) ............................................................C HEALTH EQUITY FUND (HEF).................... D FREE MCH ....................................................... E PRIVATE HEALTH INSURANCE .................. F OTHER (specify) ________________________ X
LSIS II.HH.94
UNDER-FIVE’S BACKGROUND UB
UB0. Before I begin the interview, could you please bring (name)’s Birth Certificate, Yellow Immunization Card / MCH Handbook, and any immunization record from a private health provider? We will need to refer to those documents.
UB1. On what day, month and year was (name)born?
Probe:What is (his/her) birthday?
If the mother/caretaker knows the exact date of birth, also record the day; otherwise, record ‘98’ for day.
Month and year must be recorded.
DATE OF BIRTHDAY ............................................................__ __
DK DAY...........................................................98
MONTH.......................................................__ __
YEAR ................................................ 2 0 1 __
UB2. How old is (name)?
Probe:How old was (name) at (his/her) last birthday?
Record age in completed years.
Record ‘0’ if less than 1 year.
If responses to UB1 and UB2 are inconsistent, probe further and correct.
AGE (IN COMPLETED YEARS) ......................__
UB3. Check UB2: Child’s age? AGE 0, 1, OR 2......................................................1AGE 3 OR 4...........................................................2
1UB9
UB4. Check the respondent’s line number (UF4) and the respondent to the HOUSEHOLD QUESTIONNAIRE (HH47):
RESPONDENT IS THE SAME, UF4=HH47 .......1RESPONDENT IS NOT THE SAME, UF4≠HH47.2
2UB6
UB5. Check ED10 in the EDUCATION MODULE in the HOUSEHOLD QUESTIONNAIRE: Is the child attending ECE in the current school year?
YES, ED10=0 ........................................................1NO, ED10≠0 OR BLANK .....................................2
1UB8B2UB9
UB6. Has (name) ever attended any early childhood education programme, such as nursery school or pre-school?
YES........................................................................1NO..........................................................................2 2UB9
UB7. At any time since September 2016, did (he/she) attend (programmes mentioned in UB6)?
YES........................................................................1NO..........................................................................2
1UB8A2UB9
UB8A. Does (he/she) currently attend (programmes mentioned in UB6)?
UB8B. You have mentioned that (name) has attended an early childhood education programme this school year. Does (he/she) currently attend this programme?
YES........................................................................1NO..........................................................................2
UB9. Is (name) covered by any health insurance? YES........................................................................1NO .........................................................................2 2End
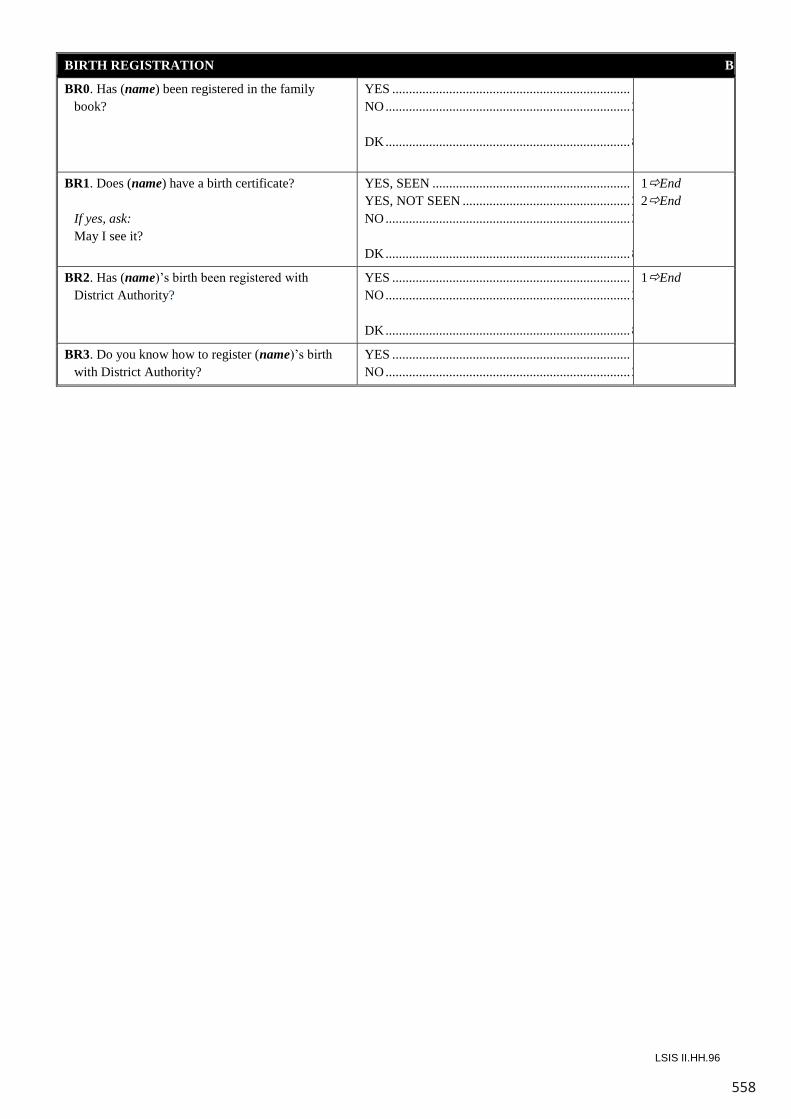
558
LSIS II.HH.96
BIRTH REGISTRATION BR
BR0. Has (name) been registered in the family book?
YES ....................................................................... 1 NO ......................................................................... 2 DK ......................................................................... 8
BR1. Does (name) have a birth certificate?
If yes, ask: May I see it?
YES, SEEN ........................................................... 1 YES, NOT SEEN .................................................. 2 NO ......................................................................... 3 DK ......................................................................... 8
1End 2End
BR2. Has (name)’s birth been registered with District Authority?
YES ....................................................................... 1 NO ......................................................................... 2 DK ......................................................................... 8
1End
BR3. Do you know how to register (name)’s birth with District Authority?
YES ....................................................................... 1 NO ......................................................................... 2
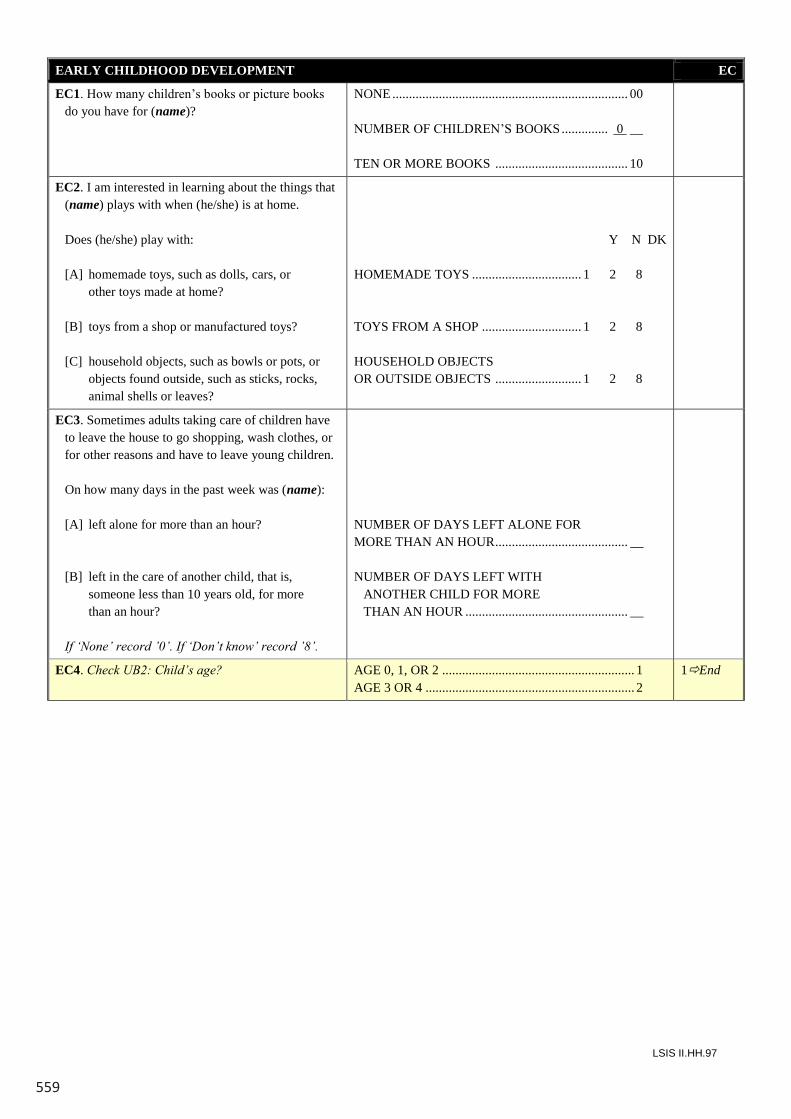
559
LSIS II.HH.97
EARLY CHILDHOOD DEVELOPMENT EC
EC1. How many children’s books or picture books do you have for (name)?
NONE ....................................................................... 00 NUMBER OF CHILDREN’S BOOKS .............. 0 __ TEN OR MORE BOOKS ........................................ 10
EC2. I am interested in learning about the things that (name) plays with when (he/she) is at home.
Does (he/she) play with: [A] homemade toys, such as dolls, cars, or
other toys made at home? [B] toys from a shop or manufactured toys? [C] household objects, such as bowls or pots, or
objects found outside, such as sticks, rocks, animal shells or leaves?
Y N DK HOMEMADE TOYS ................................. 1 2 8 TOYS FROM A SHOP .............................. 1 2 8 HOUSEHOLD OBJECTS OR OUTSIDE OBJECTS .......................... 1 2 8
EC3. Sometimes adults taking care of children have to leave the house to go shopping, wash clothes, or for other reasons and have to leave young children.
On how many days in the past week was (name): [A] left alone for more than an hour? [B] left in the care of another child, that is,
someone less than 10 years old, for more than an hour?
If ‘None’ record ’0’. If ‘Don’t know’ record ’8’.
NUMBER OF DAYS LEFT ALONE FOR MORE THAN AN HOUR ........................................ __ NUMBER OF DAYS LEFT WITH ANOTHER CHILD FOR MORE THAN AN HOUR ................................................. __
EC4. Check UB2: Child’s age? AGE 0, 1, OR 2 .......................................................... 1 AGE 3 OR 4 ............................................................... 2
1End
LSIS II.HH.96
BIRTH REGISTRATION BR
BR0. Has (name) been registered in the family book?
YES ....................................................................... 1 NO ......................................................................... 2 DK ......................................................................... 8
BR1. Does (name) have a birth certificate?
If yes, ask: May I see it?
YES, SEEN ........................................................... 1 YES, NOT SEEN .................................................. 2 NO ......................................................................... 3 DK ......................................................................... 8
1End 2End
BR2. Has (name)’s birth been registered with District Authority?
YES ....................................................................... 1 NO ......................................................................... 2 DK ......................................................................... 8
1End
BR3. Do you know how to register (name)’s birth with District Authority?
YES ....................................................................... 1 NO ......................................................................... 2
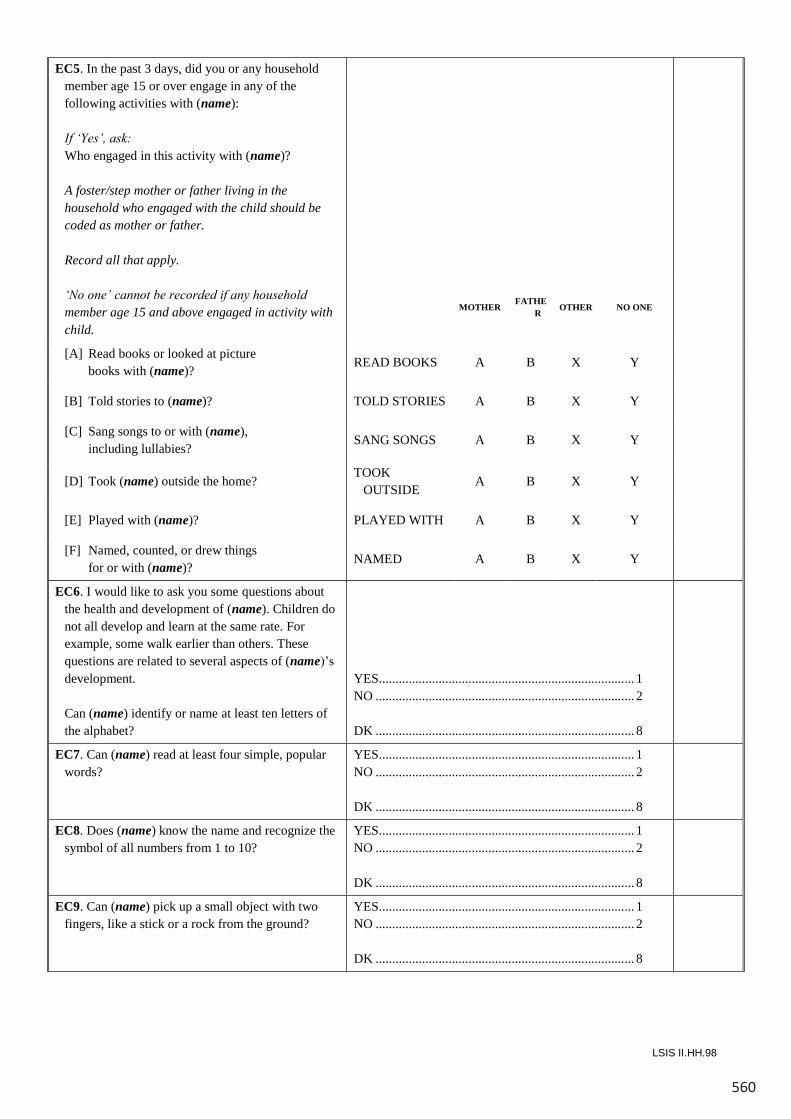
560
LSIS II.HH.98
EC5. In the past 3 days, did you or any household member age 15 or over engage in any of the following activities with (name):
If ‘Yes’, ask: Who engaged in this activity with (name)? A foster/step mother or father living in the
household who engaged with the child should be coded as mother or father.
Record all that apply. ‘No one’ cannot be recorded if any household
member age 15 and above engaged in activity with child.
MOTHER FATHER OTHER NO ONE
[A] Read books or looked at picture books with (name)?
READ BOOKS A B X Y
[B] Told stories to (name)? TOLD STORIES A B X Y
[C] Sang songs to or with (name), including lullabies?
SANG SONGS A B X Y
[D] Took (name) outside the home? TOOK
OUTSIDE A B X Y
[E] Played with (name)? PLAYED WITH A B X Y
[F] Named, counted, or drew things for or with (name)?
NAMED A B X Y
EC6. I would like to ask you some questions about the health and development of (name). Children do not all develop and learn at the same rate. For example, some walk earlier than others. These questions are related to several aspects of (name)’s development.
Can (name) identify or name at least ten letters of
the alphabet?
YES ............................................................................. 1 NO .............................................................................. 2 DK .............................................................................. 8
EC7. Can (name) read at least four simple, popular words?
YES ............................................................................. 1 NO .............................................................................. 2 DK .............................................................................. 8
EC8. Does (name) know the name and recognize the symbol of all numbers from 1 to 10?
YES ............................................................................. 1 NO .............................................................................. 2 DK .............................................................................. 8
EC9. Can (name) pick up a small object with two fingers, like a stick or a rock from the ground?
YES ............................................................................. 1 NO .............................................................................. 2 DK .............................................................................. 8
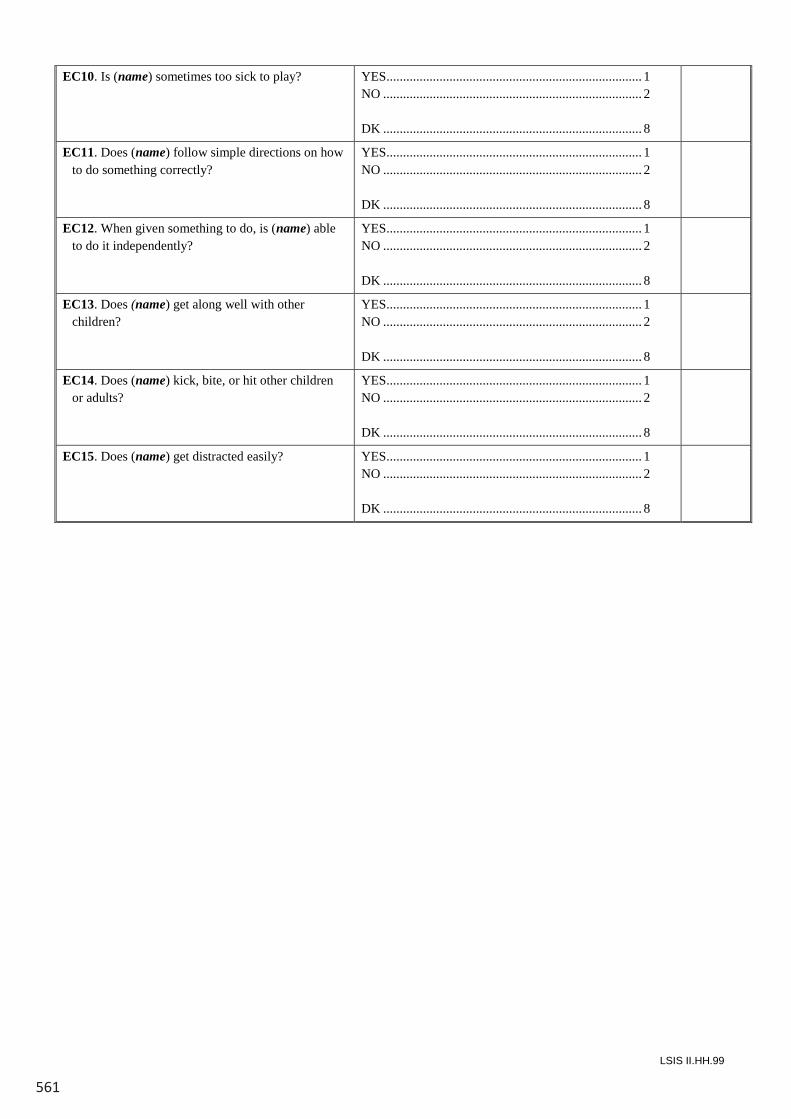
561
LSIS II.HH.99
EC10. Is (name) sometimes too sick to play? YES............................................................................. 1NO .............................................................................. 2
DK .............................................................................. 8
EC11. Does (name) follow simple directions on how to do something correctly?
YES............................................................................. 1NO .............................................................................. 2
DK .............................................................................. 8
EC12. When given something to do, is (name) able to do it independently?
YES............................................................................. 1NO .............................................................................. 2
DK .............................................................................. 8
EC13. Does (name) get along well with other children?
YES............................................................................. 1NO .............................................................................. 2
DK .............................................................................. 8
EC14. Does (name) kick, bite, or hit other children or adults?
YES............................................................................. 1NO .............................................................................. 2
DK .............................................................................. 8
EC15. Does (name) get distracted easily? YES............................................................................. 1NO .............................................................................. 2
DK .............................................................................. 8
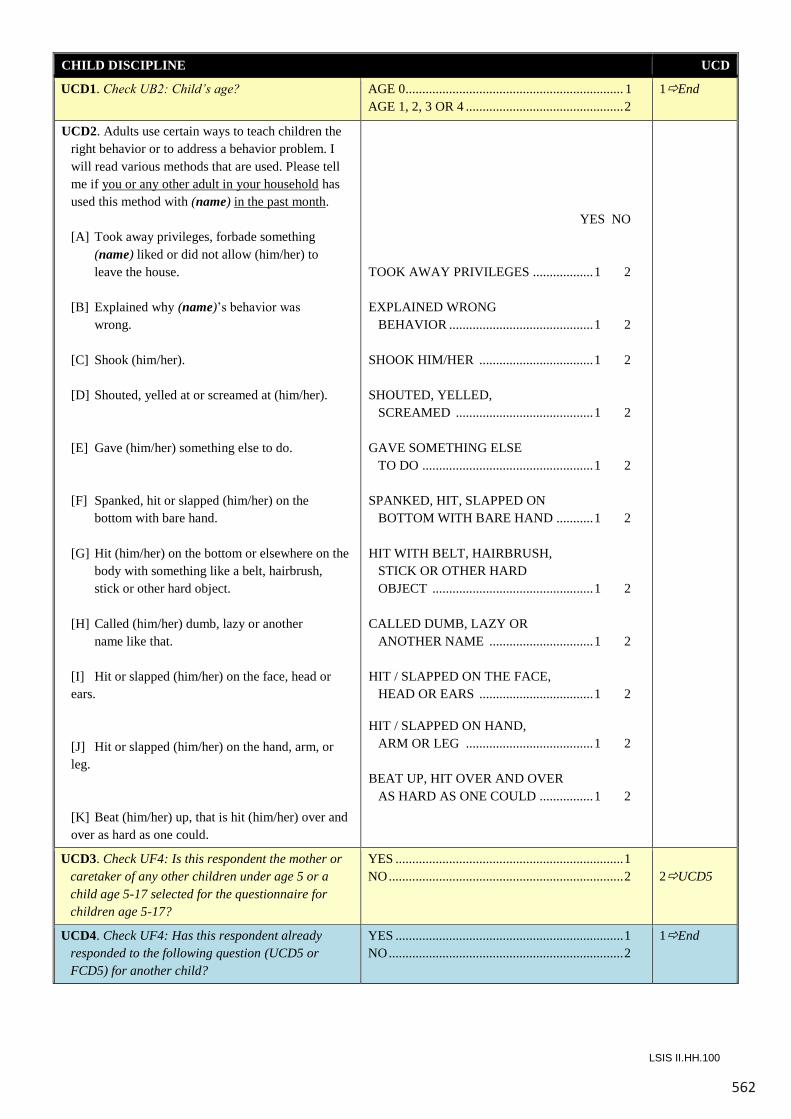
562
LSIS II.HH.100
CHILD DISCIPLINE UCD
UCD1. Check UB2: Child’s age? AGE 0................................................................. 1 AGE 1, 2, 3 OR 4 ............................................... 2
1End
UCD2. Adults use certain ways to teach children the right behavior or to address a behavior problem. I will read various methods that are used. Please tell me if you or any other adult in your household has used this method with (name) in the past month.
[A] Took away privileges, forbade something
(name) liked or did not allow (him/her) to leave the house.
[B] Explained why (name)’s behavior was
wrong. [C] Shook (him/her). [D] Shouted, yelled at or screamed at (him/her). [E] Gave (him/her) something else to do. [F] Spanked, hit or slapped (him/her) on the
bottom with bare hand. [G] Hit (him/her) on the bottom or elsewhere on the
body with something like a belt, hairbrush, stick or other hard object.
[H] Called (him/her) dumb, lazy or another
name like that. [I] Hit or slapped (him/her) on the face, head or
ears. [J] Hit or slapped (him/her) on the hand, arm, or
leg. [K] Beat (him/her) up, that is hit (him/her) over and
over as hard as one could.
YES NO TOOK AWAY PRIVILEGES .................. 1 2 EXPLAINED WRONG BEHAVIOR ........................................... 1 2 SHOOK HIM/HER .................................. 1 2 SHOUTED, YELLED, SCREAMED ......................................... 1 2 GAVE SOMETHING ELSE TO DO ................................................... 1 2 SPANKED, HIT, SLAPPED ON BOTTOM WITH BARE HAND ........... 1 2 HIT WITH BELT, HAIRBRUSH, STICK OR OTHER HARD OBJECT ................................................ 1 2 CALLED DUMB, LAZY OR ANOTHER NAME ............................... 1 2 HIT / SLAPPED ON THE FACE, HEAD OR EARS .................................. 1 2 HIT / SLAPPED ON HAND, ARM OR LEG ...................................... 1 2 BEAT UP, HIT OVER AND OVER AS HARD AS ONE COULD ................ 1 2
UCD3. Check UF4: Is this respondent the mother or caretaker of any other children under age 5 or a child age 5-17 selected for the questionnaire for children age 5-17?
YES .................................................................... 1 NO ...................................................................... 2
2UCD5
UCD4. Check UF4: Has this respondent already responded to the following question (UCD5 or FCD5) for another child?
YES .................................................................... 1 NO ...................................................................... 2
1End
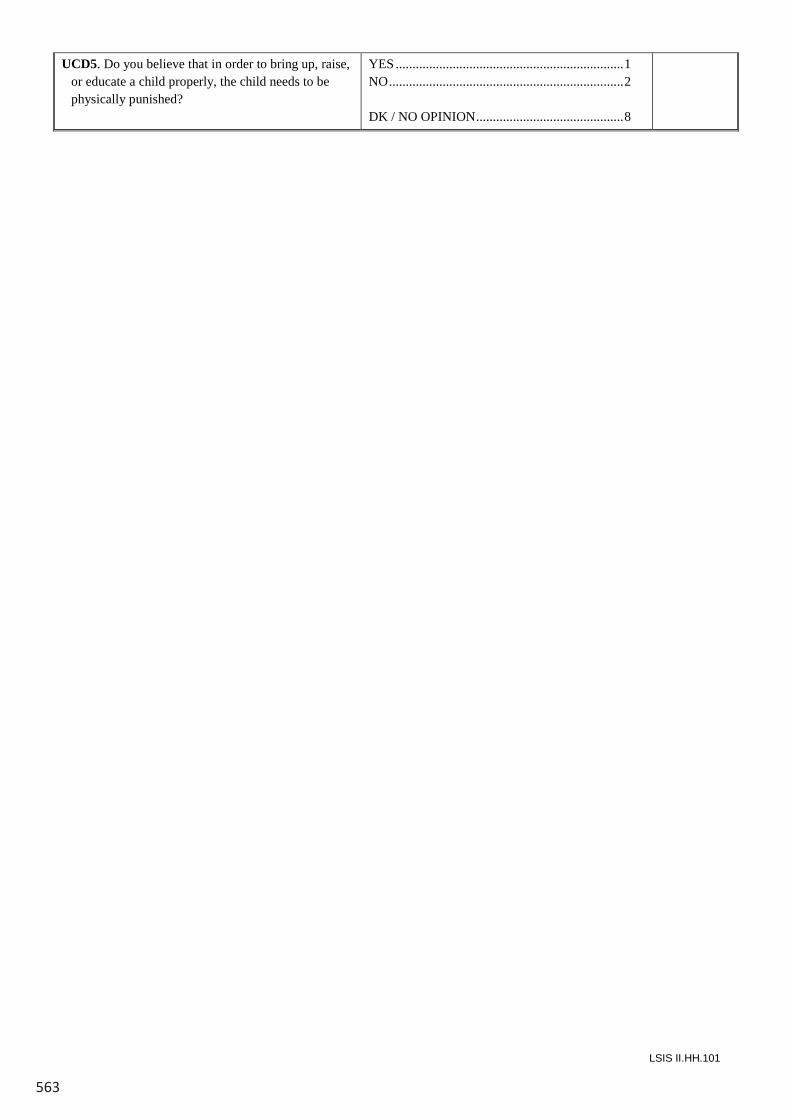
563
LSIS II.HH.101
UCD5. Do you believe that in order to bring up, raise, or educate a child properly, the child needs to be physically punished?
YES ....................................................................1NO......................................................................2
DK / NO OPINION............................................8
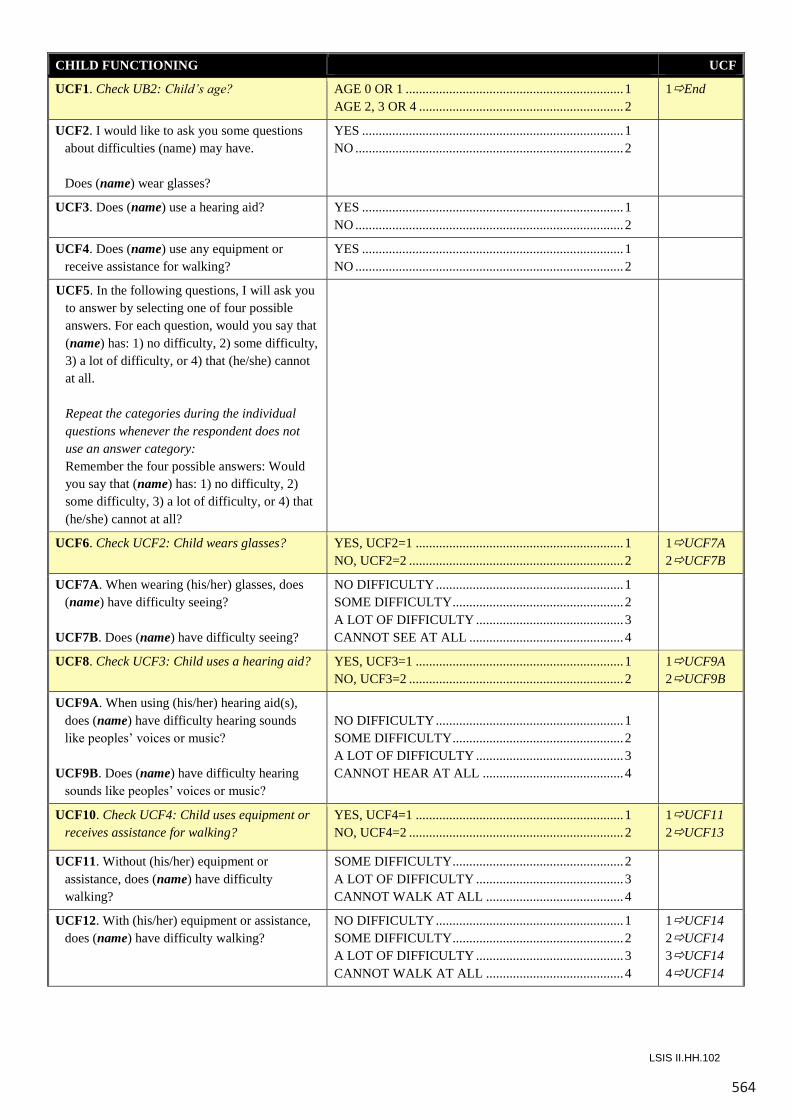
564
LSIS II.HH.103
UCF13. Compared with children of the same age, does (name) have difficulty walking?
NO DIFFICULTY........................................................1SOME DIFFICULTY...................................................2A LOT OF DIFFICULTY ............................................3CANNOT WALK AT ALL .........................................4
UCF14. Compared with children of the same age, does (name) have difficulty picking up small objects with (his/her) hand?
NO DIFFICULTY........................................................1SOME DIFFICULTY...................................................2A LOT OF DIFFICULTY ............................................3CANNOT PICK UP AT ALL ......................................4
UCF15. Does (name) have difficulty understanding you?
NO DIFFICULTY........................................................1SOME DIFFICULTY...................................................2A LOT OF DIFFICULTY ............................................3CANNOT UNDERSTAND AT ALL ..........................4
UCF16. When (name) speaks, do you have difficulty understanding (him/her)?
NO DIFFICULTY........................................................1SOME DIFFICULTY...................................................2A LOT OF DIFFICULTY ............................................3CANNOT BE UNDERSTOOD AT ALL ....................4
UCF17. Compared with children of the same age, does (name) have difficulty learning things?
NO DIFFICULTY........................................................1SOME DIFFICULTY...................................................2A LOT OF DIFFICULTY ............................................3CANNOT LEARN THINGS AT ALL.........................4
UCF18. Compared with children of the same age, does (name) have difficulty playing?
NO DIFFICULTY........................................................1SOME DIFFICULTY...................................................2A LOT OF DIFFICULTY ............................................3CANNOT PLAY AT ALL...........................................4
UCF19. The next question has five different options for answers. I am going to read these to you after the question.
Compared with children of the same age, how much does (name) kick, bite or hit other children or adults?
Would you say: not at all, less, the same, moreor a lot more?
NOT AT ALL...............................................................1LESS.............................................................................2THE SAME ..................................................................3MORE ..........................................................................4A LOT MORE..............................................................5
LSIS II.HH.102
CHILD FUNCTIONING UCF
UCF1. Check UB2: Child’s age? AGE 0 OR 1 .................................................................1AGE 2, 3 OR 4 .............................................................2
1End
UCF2. I would like to ask you some questions about difficulties (name) may have.
Does (name) wear glasses?
YES ..............................................................................1NO ................................................................................ 2
UCF3. Does (name) use a hearing aid? YES ..............................................................................1NO ................................................................................ 2
UCF4. Does (name) use any equipment or receive assistance for walking?
YES ..............................................................................1NO ................................................................................ 2
UCF5. In the following questions, I will ask you to answer by selecting one of four possible answers. For each question, would you say that (name) has: 1) no difficulty, 2) some difficulty, 3) a lot of difficulty, or 4) that (he/she) cannotat all.
Repeat the categories during the individual questions whenever the respondent does not use an answer category:Remember the four possible answers: Would you say that (name) has: 1) no difficulty, 2) some difficulty, 3) a lot of difficulty, or 4) that (he/she) cannot at all?
UCF6. Check UCF2: Child wears glasses? YES, UCF2=1 ..............................................................1NO, UCF2=2 ................................................................ 2
1UCF7A2UCF7B
UCF7A. When wearing (his/her) glasses, does (name) have difficulty seeing?
UCF7B. Does (name) have difficulty seeing?
NO DIFFICULTY........................................................1SOME DIFFICULTY...................................................2A LOT OF DIFFICULTY ............................................3CANNOT SEE AT ALL ..............................................4
UCF8. Check UCF3: Child uses a hearing aid? YES, UCF3=1 ..............................................................1NO, UCF3=2 ................................................................ 2
1UCF9A2UCF9B
UCF9A. When using (his/her) hearing aid(s), does (name) have difficulty hearing sounds like peoples’ voices or music?
UCF9B. Does (name) have difficulty hearing sounds like peoples’ voices or music?
NO DIFFICULTY........................................................1SOME DIFFICULTY...................................................2A LOT OF DIFFICULTY ............................................3CANNOT HEAR AT ALL ..........................................4
UCF10. Check UCF4: Child uses equipment or receives assistance for walking?
YES, UCF4=1 ..............................................................1NO, UCF4=2 ................................................................ 2
1UCF112UCF13
UCF11. Without (his/her) equipment or assistance, does (name) have difficulty walking?
SOME DIFFICULTY...................................................2A LOT OF DIFFICULTY ............................................3CANNOT WALK AT ALL .........................................4
UCF12. With (his/her) equipment or assistance, does (name) have difficulty walking?
NO DIFFICULTY........................................................1SOME DIFFICULTY...................................................2A LOT OF DIFFICULTY ............................................3CANNOT WALK AT ALL .........................................4
1UCF142UCF143UCF144UCF14
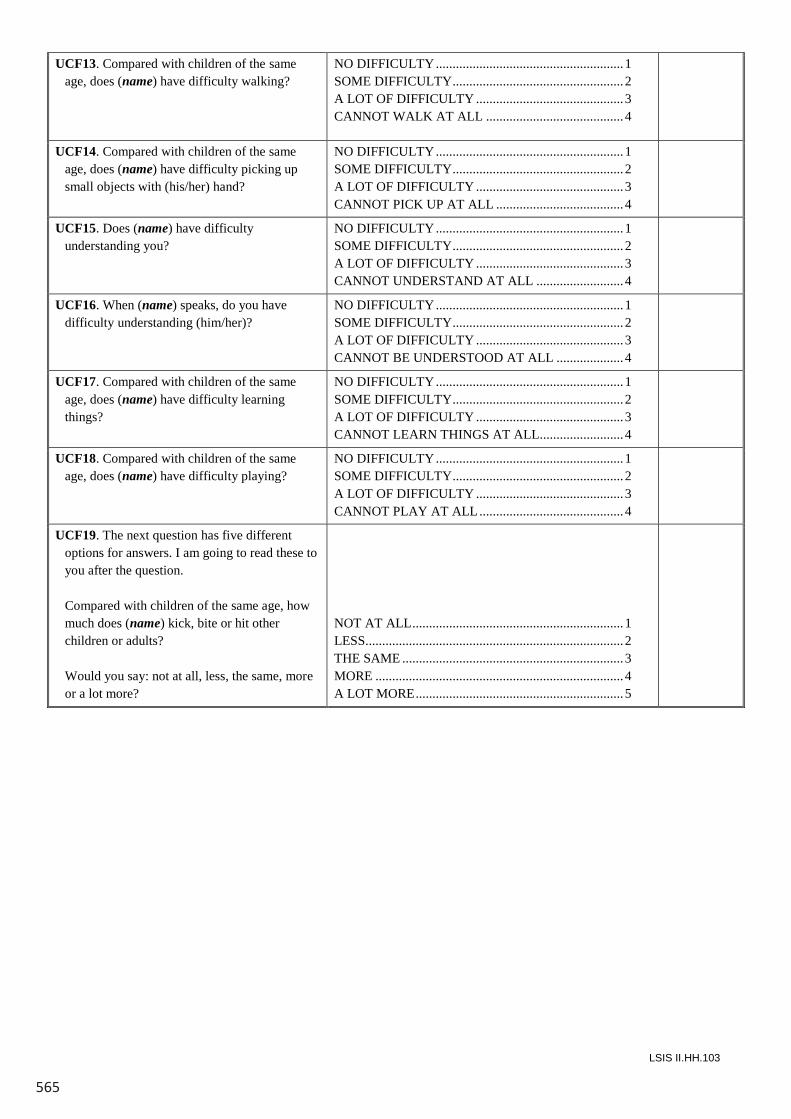
565
LSIS II.HH.103
UCF13. Compared with children of the same age, does (name) have difficulty walking?
NO DIFFICULTY........................................................1SOME DIFFICULTY...................................................2A LOT OF DIFFICULTY ............................................3CANNOT WALK AT ALL .........................................4
UCF14. Compared with children of the same age, does (name) have difficulty picking up small objects with (his/her) hand?
NO DIFFICULTY........................................................1SOME DIFFICULTY...................................................2A LOT OF DIFFICULTY ............................................3CANNOT PICK UP AT ALL ......................................4
UCF15. Does (name) have difficulty understanding you?
NO DIFFICULTY........................................................1SOME DIFFICULTY...................................................2A LOT OF DIFFICULTY ............................................3CANNOT UNDERSTAND AT ALL ..........................4
UCF16. When (name) speaks, do you have difficulty understanding (him/her)?
NO DIFFICULTY........................................................1SOME DIFFICULTY...................................................2A LOT OF DIFFICULTY ............................................3CANNOT BE UNDERSTOOD AT ALL ....................4
UCF17. Compared with children of the same age, does (name) have difficulty learning things?
NO DIFFICULTY........................................................1SOME DIFFICULTY...................................................2A LOT OF DIFFICULTY ............................................3CANNOT LEARN THINGS AT ALL.........................4
UCF18. Compared with children of the same age, does (name) have difficulty playing?
NO DIFFICULTY........................................................1SOME DIFFICULTY...................................................2A LOT OF DIFFICULTY ............................................3CANNOT PLAY AT ALL...........................................4
UCF19. The next question has five different options for answers. I am going to read these to you after the question.
Compared with children of the same age, how much does (name) kick, bite or hit other children or adults?
Would you say: not at all, less, the same, moreor a lot more?
NOT AT ALL...............................................................1LESS.............................................................................2THE SAME ..................................................................3MORE ..........................................................................4A LOT MORE..............................................................5
LSIS II.HH.102
CHILD FUNCTIONING UCF
UCF1. Check UB2: Child’s age? AGE 0 OR 1 .................................................................1AGE 2, 3 OR 4 .............................................................2
1End
UCF2. I would like to ask you some questions about difficulties (name) may have.
Does (name) wear glasses?
YES ..............................................................................1NO ................................................................................2
UCF3. Does (name) use a hearing aid? YES ..............................................................................1NO ................................................................................2
UCF4. Does (name) use any equipment or receive assistance for walking?
YES ..............................................................................1NO ................................................................................2
UCF5. In the following questions, I will ask you to answer by selecting one of four possible answers. For each question, would you say that (name) has: 1) no difficulty, 2) some difficulty, 3) a lot of difficulty, or 4) that (he/she) cannotat all.
Repeat the categories during the individual questions whenever the respondent does not use an answer category:Remember the four possible answers: Would you say that (name) has: 1) no difficulty, 2) some difficulty, 3) a lot of difficulty, or 4) that (he/she) cannot at all?
UCF6. Check UCF2: Child wears glasses? YES, UCF2=1 ..............................................................1NO, UCF2=2 ................................................................ 2
1UCF7A2UCF7B
UCF7A. When wearing (his/her) glasses, does (name) have difficulty seeing?
UCF7B. Does (name) have difficulty seeing?
NO DIFFICULTY........................................................1SOME DIFFICULTY...................................................2A LOT OF DIFFICULTY ............................................3CANNOT SEE AT ALL ..............................................4
UCF8. Check UCF3: Child uses a hearing aid? YES, UCF3=1 ..............................................................1NO, UCF3=2 ................................................................ 2
1UCF9A2UCF9B
UCF9A. When using (his/her) hearing aid(s), does (name) have difficulty hearing sounds like peoples’ voices or music?
UCF9B. Does (name) have difficulty hearing sounds like peoples’ voices or music?
NO DIFFICULTY........................................................1SOME DIFFICULTY...................................................2A LOT OF DIFFICULTY ............................................3CANNOT HEAR AT ALL ..........................................4
UCF10. Check UCF4: Child uses equipment or receives assistance for walking?
YES, UCF4=1 ..............................................................1NO, UCF4=2 ................................................................ 2
1UCF112UCF13
UCF11. Without (his/her) equipment or assistance, does (name) have difficulty walking?
SOME DIFFICULTY...................................................2A LOT OF DIFFICULTY ............................................3CANNOT WALK AT ALL .........................................4
UCF12. With (his/her) equipment or assistance, does (name) have difficulty walking?
NO DIFFICULTY........................................................1SOME DIFFICULTY...................................................2A LOT OF DIFFICULTY ............................................3CANNOT WALK AT ALL .........................................4
1UCF142UCF143UCF144UCF14
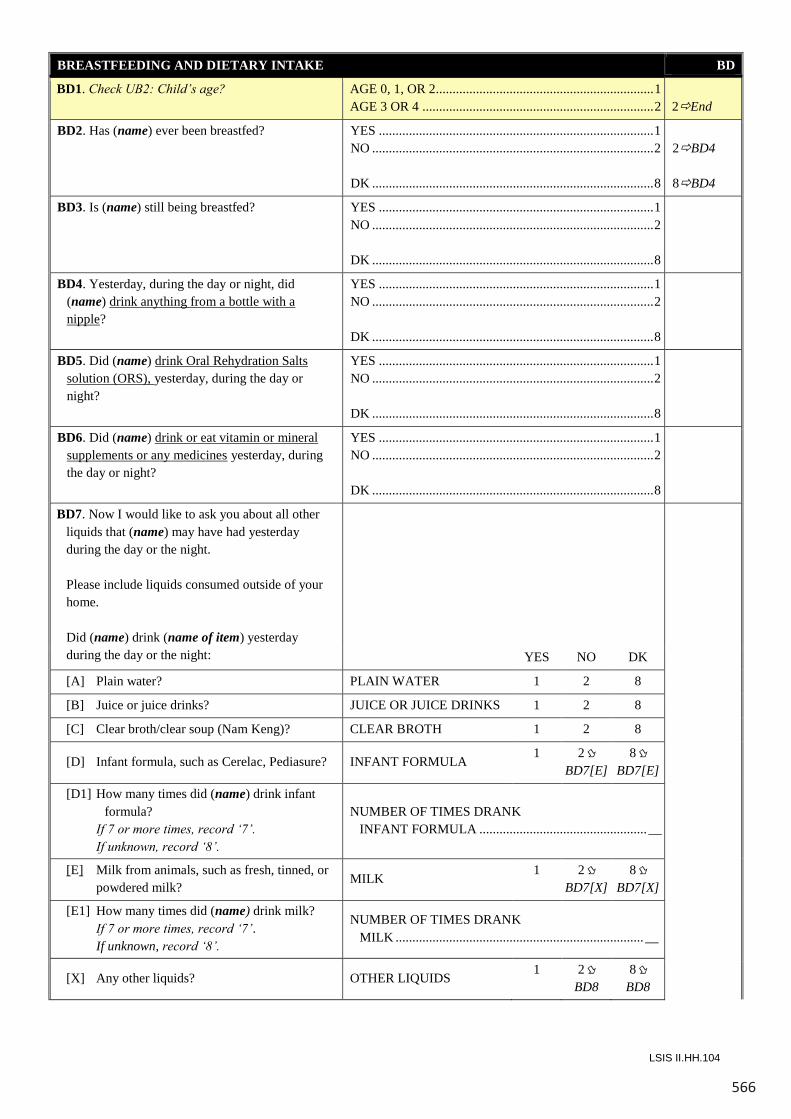
566
LSIS II.HH.104
BREASTFEEDING AND DIETARY INTAKE BD
BD1. Check UB2: Child’s age? AGE 0, 1, OR 2................................................................. 1 AGE 3 OR 4 ..................................................................... 2
2End
BD2. Has (name) ever been breastfed? YES .................................................................................. 1 NO .................................................................................... 2 DK .................................................................................... 8
2BD4 8BD4
BD3. Is (name) still being breastfed? YES .................................................................................. 1 NO .................................................................................... 2 DK .................................................................................... 8
BD4. Yesterday, during the day or night, did (name) drink anything from a bottle with a nipple?
YES .................................................................................. 1 NO .................................................................................... 2 DK .................................................................................... 8
BD5. Did (name) drink Oral Rehydration Salts solution (ORS), yesterday, during the day or night?
YES .................................................................................. 1 NO .................................................................................... 2 DK .................................................................................... 8
BD6. Did (name) drink or eat vitamin or mineral supplements or any medicines yesterday, during the day or night?
YES .................................................................................. 1 NO .................................................................................... 2 DK .................................................................................... 8
BD7. Now I would like to ask you about all other liquids that (name) may have had yesterday during the day or the night.
Please include liquids consumed outside of your
home. Did (name) drink (name of item) yesterday
during the day or the night:
YES NO DK
[A] Plain water? PLAIN WATER 1 2 8
[B] Juice or juice drinks? JUICE OR JUICE DRINKS 1 2 8
[C] Clear broth/clear soup (Nam Keng)? CLEAR BROTH 1 2 8
[D] Infant formula, such as Cerelac, Pediasure? INFANT FORMULA 1
2 BD7[E]
8 BD7[E]
[D1] How many times did (name) drink infant formula?
If 7 or more times, record ‘7’. If unknown, record ‘8’.
NUMBER OF TIMES DRANK INFANT FORMULA .................................................. __
[E] Milk from animals, such as fresh, tinned, or powdered milk?
MILK 1
2 BD7[X]
8 BD7[X]
[E1] How many times did (name) drink milk? If 7 or more times, record ‘7’. If unknown, record ‘8’.
NUMBER OF TIMES DRANK MILK .......................................................................... __
[X] Any other liquids? OTHER LIQUIDS 1 2
BD8 8
BD8
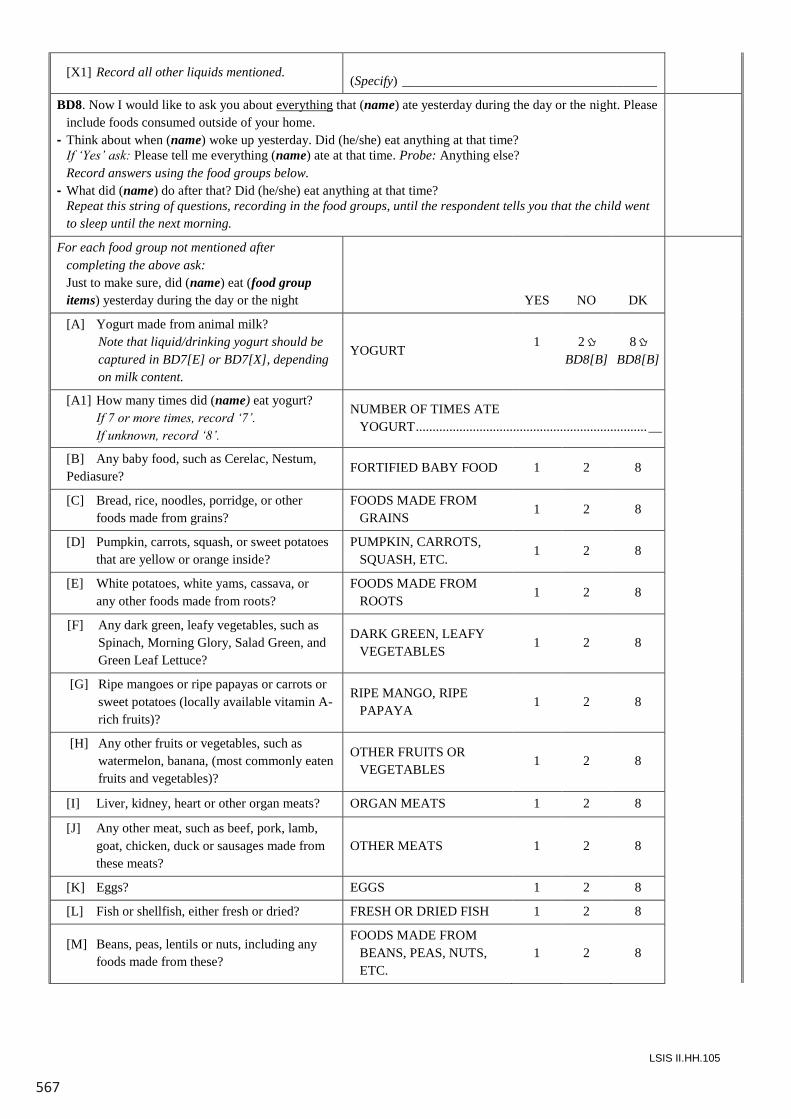
567
LSIS II.HH.105
[X1] Record all other liquids mentioned.(Specify) ______________________________________
BD8. Now I would like to ask you about everything that (name) ate yesterday during the day or the night. Please include foods consumed outside of your home.
- Think about when (name) woke up yesterday. Did (he/she) eat anything at that time?If ‘Yes’ ask: Please tell me everything (name) ate at that time. Probe: Anything else?Record answers using the food groups below.
- What did (name) do after that? Did (he/she) eat anything at that time?Repeat this string of questions, recording in the food groups, until the respondent tells you that the child went to sleep until the next morning.
For each food group not mentioned after completing the above ask:Just to make sure, did (name) eat (food group items) yesterday during the day or the night YES NO DK
[A] Yogurt made from animal milk?Note that liquid/drinking yogurt should be captured in BD7[E] or BD7[X], depending on milk content.
YOGURT1 2
BD8[B]8
BD8[B]
[A1] How many times did (name) eat yogurt?If 7 or more times, record ‘7’.If unknown, record ‘8’.
NUMBER OF TIMES ATEYOGURT..................................................................... __
[B] Any baby food, such as Cerelac, Nestum, Pediasure?
FORTIFIED BABY FOOD 1 2 8
[C] Bread, rice, noodles, porridge, or other foods made from grains?
FOODS MADE FROM GRAINS
1 2 8
[D] Pumpkin, carrots, squash, or sweet potatoes that are yellow or orange inside?
PUMPKIN, CARROTS, SQUASH, ETC.
1 2 8
[E] White potatoes, white yams, cassava, or any other foods made from roots?
FOODS MADE FROM ROOTS
1 2 8
[F] Any dark green, leafy vegetables, such as Spinach, Morning Glory, Salad Green, and Green Leaf Lettuce?
DARK GREEN, LEAFY VEGETABLES
1 2 8
[G] Ripe mangoes or ripe papayas or carrots or sweet potatoes (locally available vitamin A-rich fruits)?
RIPE MANGO, RIPE PAPAYA
1 2 8
[H] Any other fruits or vegetables, such as watermelon, banana, (most commonly eaten fruits and vegetables)?
OTHER FRUITS OR VEGETABLES
1 2 8
[I] Liver, kidney, heart or other organ meats? ORGAN MEATS 1 2 8
[J] Any other meat, such as beef, pork, lamb, goat, chicken, duck or sausages made from these meats?
OTHER MEATS 1 2 8
[K] Eggs? EGGS 1 2 8
[L] Fish or shellfish, either fresh or dried? FRESH OR DRIED FISH 1 2 8
[M] Beans, peas, lentils or nuts, including any foods made from these?
FOODS MADE FROM BEANS, PEAS, NUTS, ETC.
1 2 8
LSIS II.HH.104
BREASTFEEDING AND DIETARY INTAKE BD
BD1. Check UB2: Child’s age? AGE 0, 1, OR 2................................................................. 1 AGE 3 OR 4 ..................................................................... 2
2End
BD2. Has (name) ever been breastfed? YES .................................................................................. 1 NO .................................................................................... 2 DK .................................................................................... 8
2BD4 8BD4
BD3. Is (name) still being breastfed? YES .................................................................................. 1 NO .................................................................................... 2 DK .................................................................................... 8
BD4. Yesterday, during the day or night, did (name) drink anything from a bottle with a nipple?
YES .................................................................................. 1 NO .................................................................................... 2 DK .................................................................................... 8
BD5. Did (name) drink Oral Rehydration Salts solution (ORS), yesterday, during the day or night?
YES .................................................................................. 1 NO .................................................................................... 2 DK .................................................................................... 8
BD6. Did (name) drink or eat vitamin or mineral supplements or any medicines yesterday, during the day or night?
YES .................................................................................. 1 NO .................................................................................... 2 DK .................................................................................... 8
BD7. Now I would like to ask you about all other liquids that (name) may have had yesterday during the day or the night.
Please include liquids consumed outside of your
home. Did (name) drink (name of item) yesterday
during the day or the night:
YES NO DK
[A] Plain water? PLAIN WATER 1 2 8
[B] Juice or juice drinks? JUICE OR JUICE DRINKS 1 2 8
[C] Clear broth/clear soup (Nam Keng)? CLEAR BROTH 1 2 8
[D] Infant formula, such as Cerelac, Pediasure? INFANT FORMULA 1
2 BD7[E]
8 BD7[E]
[D1] How many times did (name) drink infant formula?
If 7 or more times, record ‘7’. If unknown, record ‘8’.
NUMBER OF TIMES DRANK INFANT FORMULA .................................................. __
[E] Milk from animals, such as fresh, tinned, or powdered milk?
MILK 1
2 BD7[X]
8 BD7[X]
[E1] How many times did (name) drink milk? If 7 or more times, record ‘7’. If unknown, record ‘8’.
NUMBER OF TIMES DRANK MILK .......................................................................... __
[X] Any other liquids? OTHER LIQUIDS 1 2
BD8 8
BD8
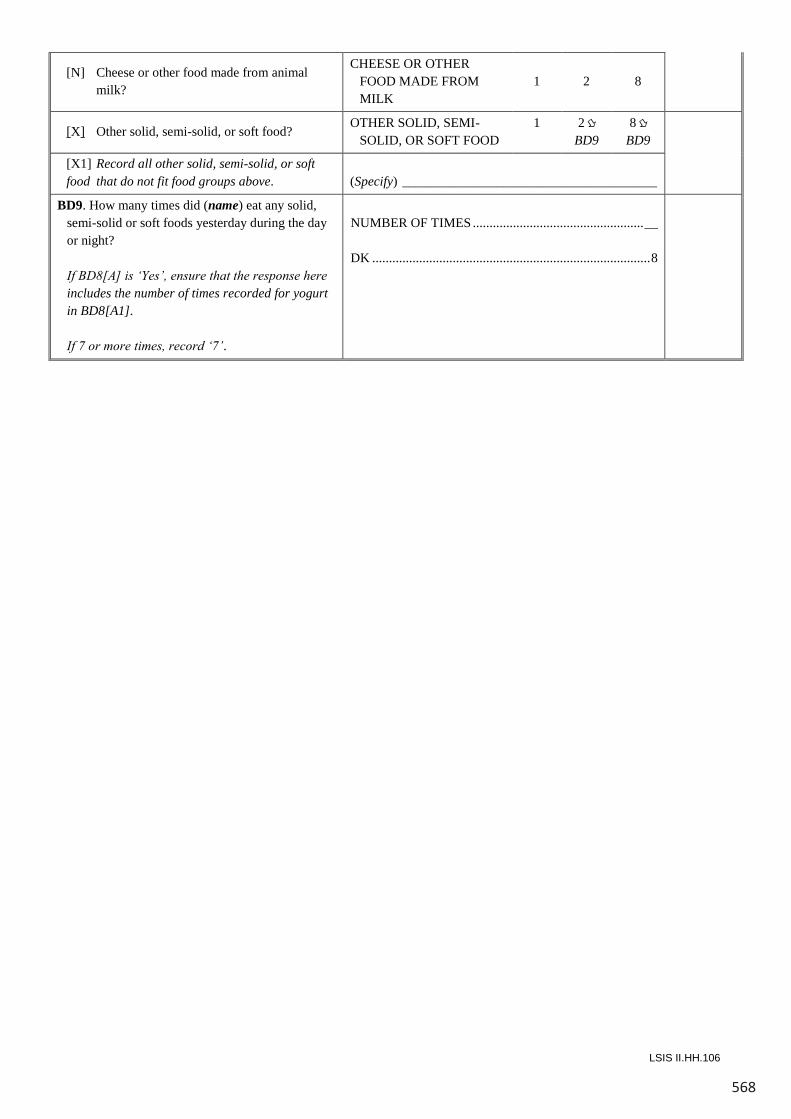
568
LSIS II.HH.106
[N] Cheese or other food made from animal milk?
CHEESE OR OTHER FOOD MADE FROM MILK
1 2 8
[X] Other solid, semi-solid, or soft food? OTHER SOLID, SEMI-
SOLID, OR SOFT FOOD 1
2 BD9
8 BD9
[X1] Record all other solid, semi-solid, or soft food that do not fit food groups above.
(Specify) ______________________________________
BD9. How many times did (name) eat any solid, semi-solid or soft foods yesterday during the day or night?
If BD8[A] is ‘Yes’, ensure that the response here
includes the number of times recorded for yogurt in BD8[A1].
If 7 or more times, record ‘7’.
NUMBER OF TIMES ................................................... __ DK ................................................................................... 8
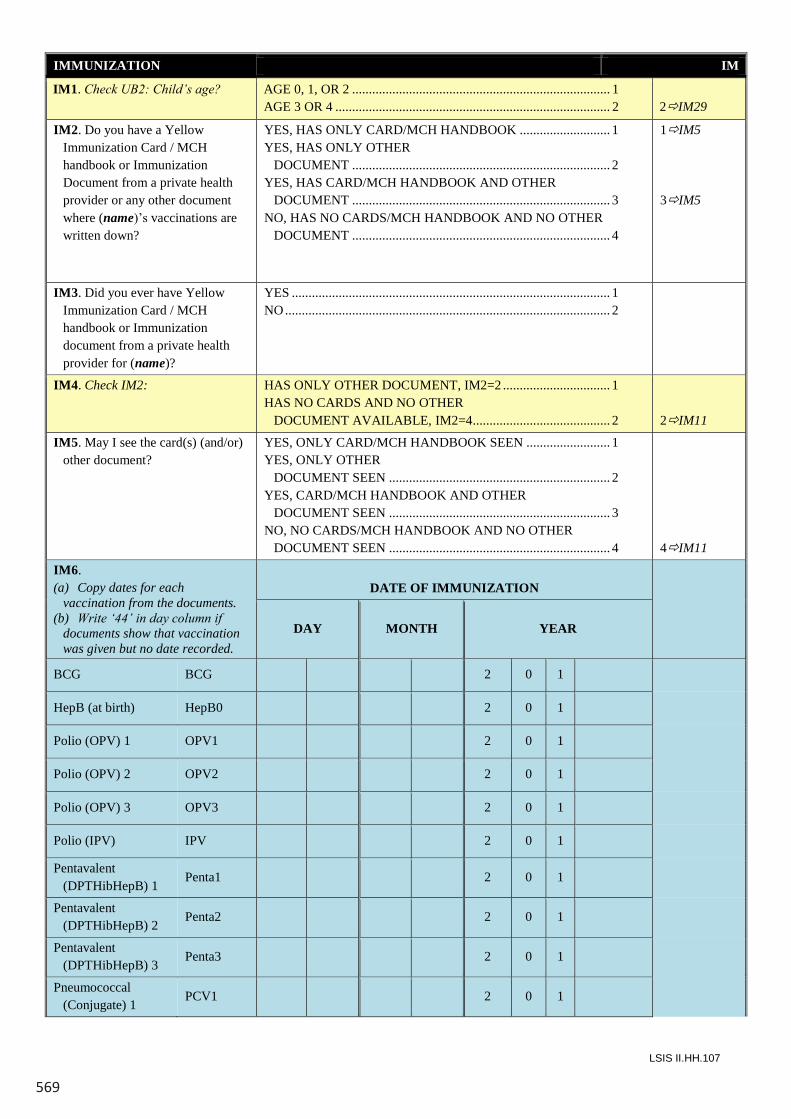
569
LSIS II.HH.107
IMMUNIZATION IM
IM1. Check UB2: Child’s age? AGE 0, 1, OR 2 ............................................................................. 1 AGE 3 OR 4 .................................................................................. 2
2IM29
IM2. Do you have a Yellow Immunization Card / MCH handbook or Immunization Document from a private health provider or any other document where (name)’s vaccinations are written down?
YES, HAS ONLY CARD/MCH HANDBOOK ........................... 1 YES, HAS ONLY OTHER DOCUMENT ............................................................................. 2 YES, HAS CARD/MCH HANDBOOK AND OTHER DOCUMENT ............................................................................. 3 NO, HAS NO CARDS/MCH HANDBOOK AND NO OTHER
DOCUMENT ............................................................................. 4
1IM5 3IM5
IM3. Did you ever have Yellow Immunization Card / MCH handbook or Immunization document from a private health provider for (name)?
YES ............................................................................................... 1 NO ................................................................................................. 2
IM4. Check IM2: HAS ONLY OTHER DOCUMENT, IM2=2 ................................ 1 HAS NO CARDS AND NO OTHER DOCUMENT AVAILABLE, IM2=4 ......................................... 2
2IM11
IM5. May I see the card(s) (and/or) other document?
YES, ONLY CARD/MCH HANDBOOK SEEN ......................... 1 YES, ONLY OTHER DOCUMENT SEEN .................................................................. 2 YES, CARD/MCH HANDBOOK AND OTHER DOCUMENT SEEN .................................................................. 3 NO, NO CARDS/MCH HANDBOOK AND NO OTHER
DOCUMENT SEEN .................................................................. 4
4IM11
IM6. (a) Copy dates for each
vaccination from the documents. (b) Write ‘44’ in day column if
documents show that vaccination was given but no date recorded.
DATE OF IMMUNIZATION
DAY MONTH YEAR
BCG BCG 2 0 1
HepB (at birth) HepB0 2 0 1
Polio (OPV) 1 OPV1 2 0 1
Polio (OPV) 2 OPV2 2 0 1
Polio (OPV) 3 OPV3 2 0 1
Polio (IPV) IPV 2 0 1
Pentavalent (DPTHibHepB) 1
Penta1 2 0 1
Pentavalent (DPTHibHepB) 2
Penta2 2 0 1
Pentavalent (DPTHibHepB) 3
Penta3 2 0 1
Pneumococcal (Conjugate) 1
PCV1 2 0 1
LSIS II.HH.106
[N] Cheese or other food made from animal milk?
CHEESE OR OTHER FOOD MADE FROM MILK
1 2 8
[X] Other solid, semi-solid, or soft food? OTHER SOLID, SEMI-
SOLID, OR SOFT FOOD 1
2 BD9
8 BD9
[X1] Record all other solid, semi-solid, or soft food that do not fit food groups above.
(Specify) ______________________________________
BD9. How many times did (name) eat any solid, semi-solid or soft foods yesterday during the day or night?
If BD8[A] is ‘Yes’, ensure that the response here
includes the number of times recorded for yogurt in BD8[A1].
If 7 or more times, record ‘7’.
NUMBER OF TIMES ................................................... __ DK ................................................................................... 8
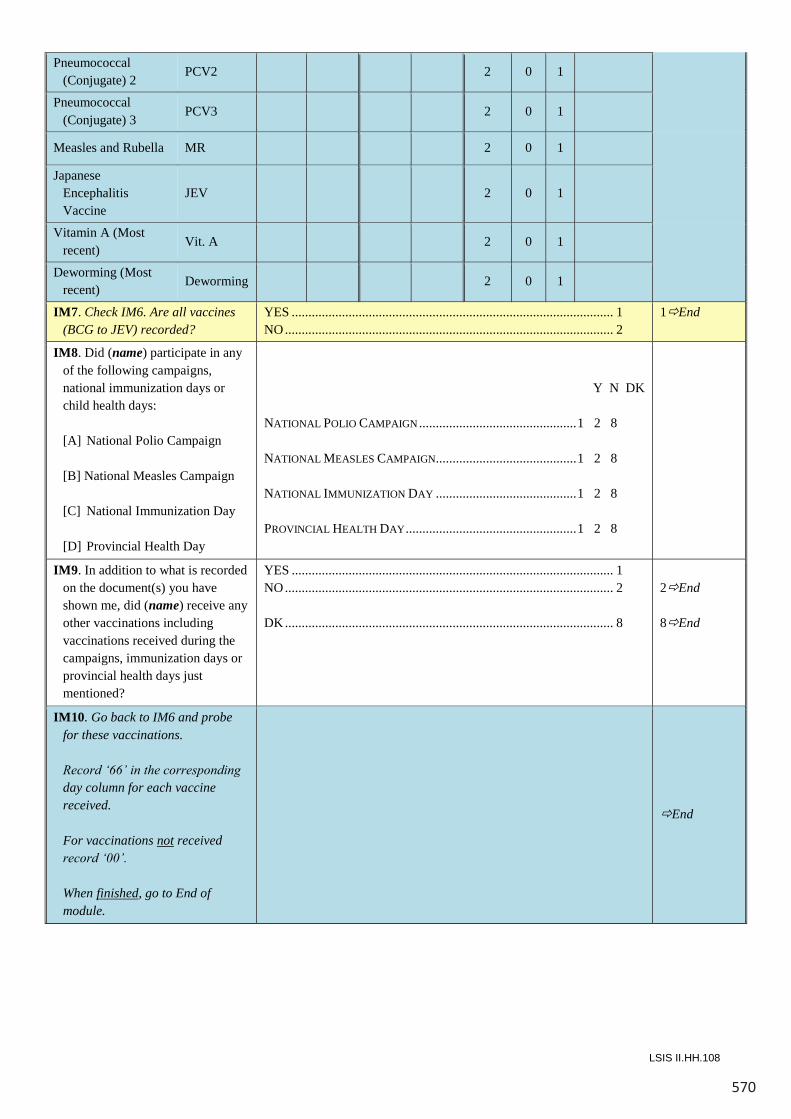
570
LSIS II.HH.108
Pneumococcal (Conjugate) 2
PCV2 2 0 1
Pneumococcal (Conjugate) 3
PCV3 2 0 1
Measles and Rubella MR 2 0 1
Japanese Encephalitis Vaccine
JEV 2 0 1
Vitamin A (Most recent)
Vit. A 2 0 1
Deworming (Most recent)
Deworming 2 0 1
IM7. Check IM6. Are all vaccines (BCG to JEV) recorded?
YES ................................................................................................ 1 NO .................................................................................................. 2
1End
IM8. Did (name) participate in any of the following campaigns, national immunization days or child health days:
[A] National Polio Campaign [B] National Measles Campaign [C] National Immunization Day [D] Provincial Health Day
Y N DK NATIONAL POLIO CAMPAIGN ............................................... 1 2 8 NATIONAL MEASLES CAMPAIGN.......................................... 1 2 8 NATIONAL IMMUNIZATION DAY .......................................... 1 2 8 PROVINCIAL HEALTH DAY ................................................... 1 2 8
IM9. In addition to what is recorded on the document(s) you have shown me, did (name) receive any other vaccinations including vaccinations received during the campaigns, immunization days or provincial health days just mentioned?
YES ................................................................................................ 1 NO .................................................................................................. 2 DK .................................................................................................. 8
2End 8End
IM10. Go back to IM6 and probe for these vaccinations.
Record ‘66’ in the corresponding
day column for each vaccine received.
For vaccinations not received
record ‘00’. When finished, go to End of
module.
End
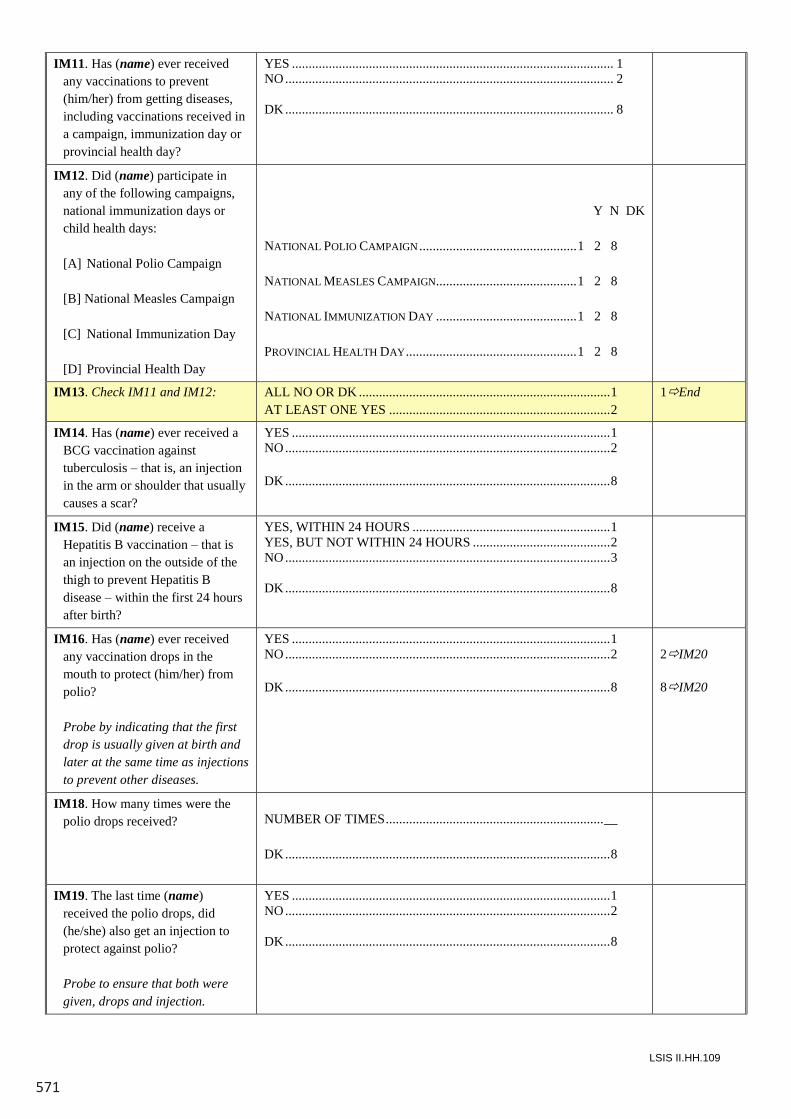
571
LSIS II.HH.109
IM11. Has (name) ever received any vaccinations to prevent (him/her) from getting diseases, including vaccinations received in a campaign, immunization day or provincial health day?
YES ................................................................................................ 1 NO .................................................................................................. 2 DK .................................................................................................. 8
IM12. Did (name) participate in any of the following campaigns, national immunization days or child health days:
[A] National Polio Campaign [B] National Measles Campaign [C] National Immunization Day [D] Provincial Health Day
Y N DK NATIONAL POLIO CAMPAIGN ............................................... 1 2 8 NATIONAL MEASLES CAMPAIGN.......................................... 1 2 8 NATIONAL IMMUNIZATION DAY .......................................... 1 2 8 PROVINCIAL HEALTH DAY ................................................... 1 2 8
IM13. Check IM11 and IM12: ALL NO OR DK ........................................................................... 1 AT LEAST ONE YES .................................................................. 2
1End
IM14. Has (name) ever received a BCG vaccination against tuberculosis – that is, an injection in the arm or shoulder that usually causes a scar?
YES ............................................................................................... 1 NO ................................................................................................. 2 DK ................................................................................................. 8
IM15. Did (name) receive a Hepatitis B vaccination – that is an injection on the outside of the thigh to prevent Hepatitis B disease – within the first 24 hours after birth?
YES, WITHIN 24 HOURS ........................................................... 1 YES, BUT NOT WITHIN 24 HOURS ......................................... 2 NO ................................................................................................. 3 DK ................................................................................................. 8
IM16. Has (name) ever received any vaccination drops in the mouth to protect (him/her) from polio?
Probe by indicating that the first
drop is usually given at birth and later at the same time as injections to prevent other diseases.
YES ............................................................................................... 1 NO ................................................................................................. 2 DK ................................................................................................. 8
2IM20 8IM20
IM18. How many times were the polio drops received?
NUMBER OF TIMES ................................................................. __ DK ................................................................................................. 8
IM19. The last time (name) received the polio drops, did (he/she) also get an injection to protect against polio?
Probe to ensure that both were
given, drops and injection.
YES ............................................................................................... 1 NO ................................................................................................. 2 DK ................................................................................................. 8
LSIS II.HH.108
Pneumococcal (Conjugate) 2
PCV2 2 0 1
Pneumococcal (Conjugate) 3
PCV3 2 0 1
Measles and Rubella MR 2 0 1
Japanese Encephalitis Vaccine
JEV 2 0 1
Vitamin A (Most recent)
Vit. A 2 0 1
Deworming (Most recent)
Deworming 2 0 1
IM7. Check IM6. Are all vaccines (BCG to JEV) recorded?
YES ................................................................................................ 1 NO .................................................................................................. 2
1End
IM8. Did (name) participate in any of the following campaigns, national immunization days or child health days:
[A] National Polio Campaign [B] National Measles Campaign [C] National Immunization Day [D] Provincial Health Day
Y N DK NATIONAL POLIO CAMPAIGN ............................................... 1 2 8 NATIONAL MEASLES CAMPAIGN.......................................... 1 2 8 NATIONAL IMMUNIZATION DAY .......................................... 1 2 8 PROVINCIAL HEALTH DAY ................................................... 1 2 8
IM9. In addition to what is recorded on the document(s) you have shown me, did (name) receive any other vaccinations including vaccinations received during the campaigns, immunization days or provincial health days just mentioned?
YES ................................................................................................ 1 NO .................................................................................................. 2 DK .................................................................................................. 8
2End 8End
IM10. Go back to IM6 and probe for these vaccinations.
Record ‘66’ in the corresponding
day column for each vaccine received.
For vaccinations not received
record ‘00’. When finished, go to End of
module.
End
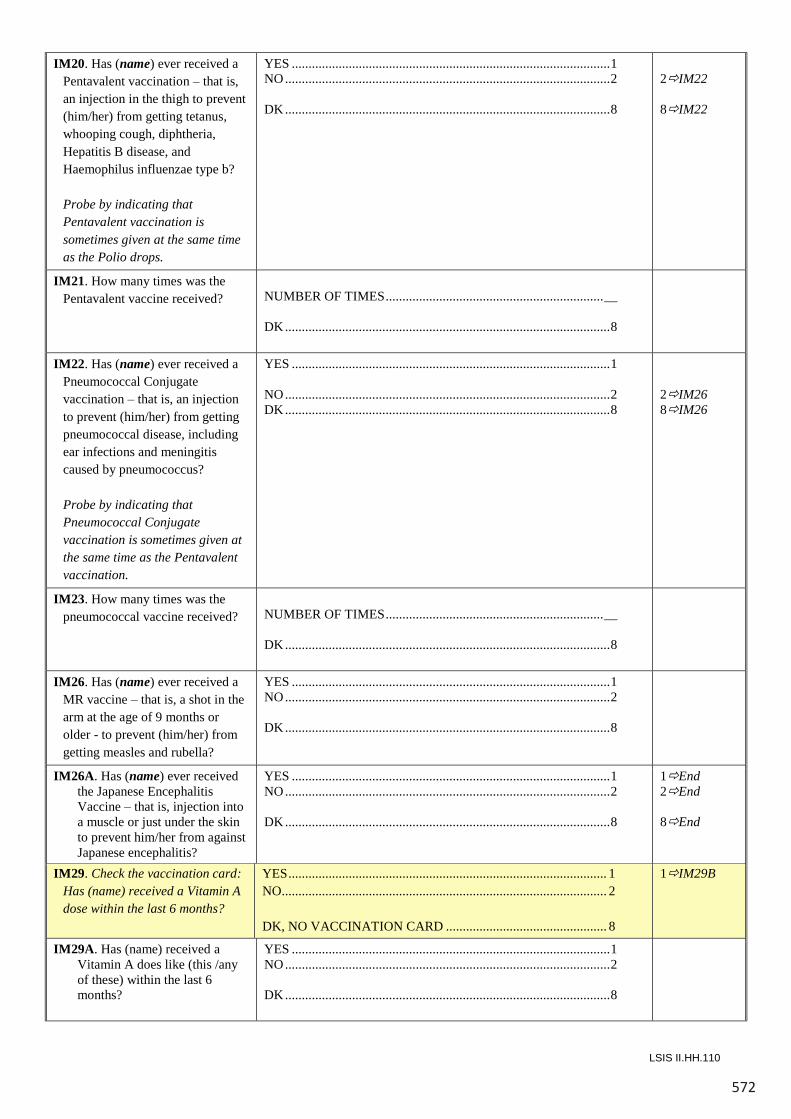
572
LSIS II.HH.110
IM20. Has (name) ever received a Pentavalent vaccination – that is, an injection in the thigh to prevent (him/her) from getting tetanus, whooping cough, diphtheria, Hepatitis B disease, and Haemophilus influenzae type b?
Probe by indicating that
Pentavalent vaccination is sometimes given at the same time as the Polio drops.
YES ............................................................................................... 1 NO ................................................................................................. 2 DK ................................................................................................. 8
2IM22 8IM22
IM21. How many times was the Pentavalent vaccine received?
NUMBER OF TIMES ................................................................. __ DK ................................................................................................. 8
IM22. Has (name) ever received a Pneumococcal Conjugate vaccination – that is, an injection to prevent (him/her) from getting pneumococcal disease, including ear infections and meningitis caused by pneumococcus?
Probe by indicating that
Pneumococcal Conjugate vaccination is sometimes given at the same time as the Pentavalent vaccination.
YES ............................................................................................... 1 NO ................................................................................................. 2 DK ................................................................................................. 8
2IM26 8IM26
IM23. How many times was the pneumococcal vaccine received?
NUMBER OF TIMES ................................................................. __ DK ................................................................................................. 8
IM26. Has (name) ever received a MR vaccine – that is, a shot in the arm at the age of 9 months or older - to prevent (him/her) from getting measles and rubella?
YES ............................................................................................... 1 NO ................................................................................................. 2 DK ................................................................................................. 8
IM26A. Has (name) ever received the Japanese Encephalitis Vaccine – that is, injection into a muscle or just under the skin to prevent him/her from against Japanese encephalitis?
YES ............................................................................................... 1 NO ................................................................................................. 2 DK ................................................................................................. 8
1End 2End 8End
IM29. Check the vaccination card: Has (name) received a Vitamin A dose within the last 6 months?
YES ............................................................................................... 1 NO ................................................................................................. 2 DK, NO VACCINATION CARD ................................................ 8
1IM29B
IM29A. Has (name) received a Vitamin A does like (this /any of these) within the last 6 months?
YES ............................................................................................... 1 NO ................................................................................................. 2 DK ................................................................................................. 8
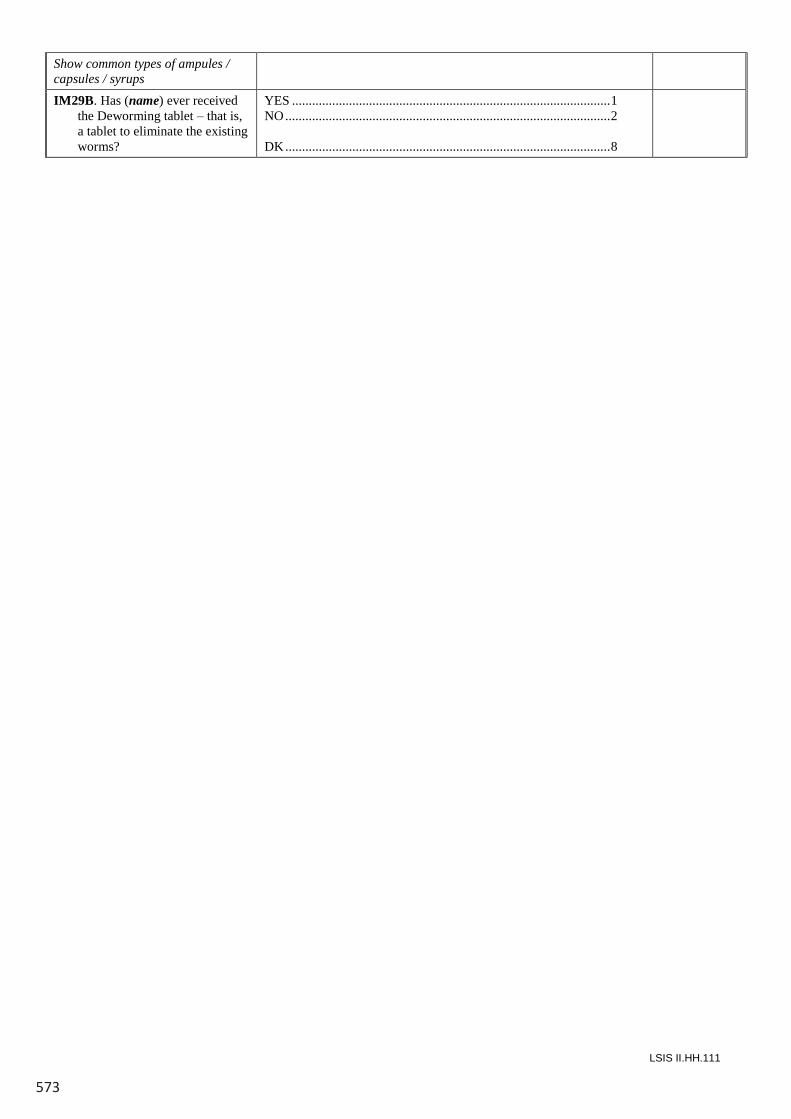
573
LSIS II.HH.111
Show common types of ampules / capsules / syrups IM29B. Has (name) ever received
the Deworming tablet – that is, a tablet to eliminate the existing worms?
YES ............................................................................................... 1 NO ................................................................................................. 2 DK ................................................................................................. 8
LSIS II.HH.110
IM20. Has (name) ever received a Pentavalent vaccination – that is, an injection in the thigh to prevent (him/her) from getting tetanus, whooping cough, diphtheria, Hepatitis B disease, and Haemophilus influenzae type b?
Probe by indicating that
Pentavalent vaccination is sometimes given at the same time as the Polio drops.
YES ............................................................................................... 1 NO ................................................................................................. 2 DK ................................................................................................. 8
2IM22 8IM22
IM21. How many times was the Pentavalent vaccine received?
NUMBER OF TIMES ................................................................. __ DK ................................................................................................. 8
IM22. Has (name) ever received a Pneumococcal Conjugate vaccination – that is, an injection to prevent (him/her) from getting pneumococcal disease, including ear infections and meningitis caused by pneumococcus?
Probe by indicating that
Pneumococcal Conjugate vaccination is sometimes given at the same time as the Pentavalent vaccination.
YES ............................................................................................... 1 NO ................................................................................................. 2 DK ................................................................................................. 8
2IM26 8IM26
IM23. How many times was the pneumococcal vaccine received?
NUMBER OF TIMES ................................................................. __ DK ................................................................................................. 8
IM26. Has (name) ever received a MR vaccine – that is, a shot in the arm at the age of 9 months or older - to prevent (him/her) from getting measles and rubella?
YES ............................................................................................... 1 NO ................................................................................................. 2 DK ................................................................................................. 8
IM26A. Has (name) ever received the Japanese Encephalitis Vaccine – that is, injection into a muscle or just under the skin to prevent him/her from against Japanese encephalitis?
YES ............................................................................................... 1 NO ................................................................................................. 2 DK ................................................................................................. 8
1End 2End 8End
IM29. Check the vaccination card: Has (name) received a Vitamin A dose within the last 6 months?
YES ............................................................................................... 1 NO ................................................................................................. 2 DK, NO VACCINATION CARD ................................................ 8
1IM29B
IM29A. Has (name) received a Vitamin A does like (this /any of these) within the last 6 months?
YES ............................................................................................... 1 NO ................................................................................................. 2 DK ................................................................................................. 8
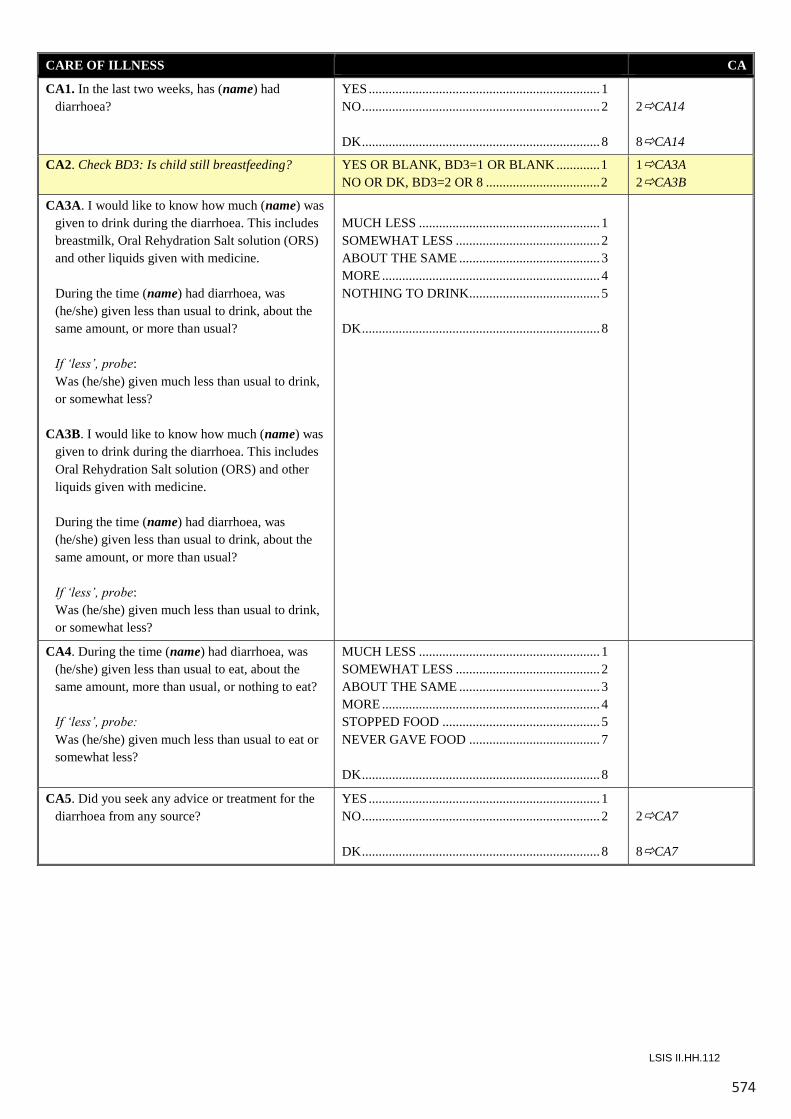
574
LSIS II.HH.112
CARE OF ILLNESS CA
CA1. In the last two weeks, has (name) had diarrhoea?
YES..................................................................... 1NO....................................................................... 2
DK....................................................................... 8
2CA14
8CA14
CA2. Check BD3: Is child still breastfeeding? YES OR BLANK, BD3=1 OR BLANK .............1NO OR DK, BD3=2 OR 8 ..................................2
1CA3A2CA3B
CA3A. I would like to know how much (name) was given to drink during the diarrhoea. This includes breastmilk, Oral Rehydration Salt solution (ORS) and other liquids given with medicine.
During the time (name) had diarrhoea, was (he/she) given less than usual to drink, about the same amount, or more than usual?
If ‘less’, probe:Was (he/she) given much less than usual to drink, or somewhat less?
CA3B. I would like to know how much (name) was given to drink during the diarrhoea. This includes Oral Rehydration Salt solution (ORS) and other liquids given with medicine.
During the time (name) had diarrhoea, was (he/she) given less than usual to drink, about the same amount, or more than usual?
If ‘less’, probe:Was (he/she) given much less than usual to drink, or somewhat less?
MUCH LESS ...................................................... 1SOMEWHAT LESS ........................................... 2ABOUT THE SAME .......................................... 3MORE ................................................................. 4NOTHING TO DRINK....................................... 5
DK....................................................................... 8
CA4. During the time (name) had diarrhoea, was (he/she) given less than usual to eat, about the same amount, more than usual, or nothing to eat?
If ‘less’, probe:Was (he/she) given much less than usual to eat or somewhat less?
MUCH LESS ...................................................... 1SOMEWHAT LESS ........................................... 2ABOUT THE SAME .......................................... 3MORE ................................................................. 4STOPPED FOOD ............................................... 5NEVER GAVE FOOD ....................................... 7
DK....................................................................... 8
CA5. Did you seek any advice or treatment for the diarrhoea from any source?
YES..................................................................... 1NO....................................................................... 2
DK....................................................................... 8
2CA7
8CA7
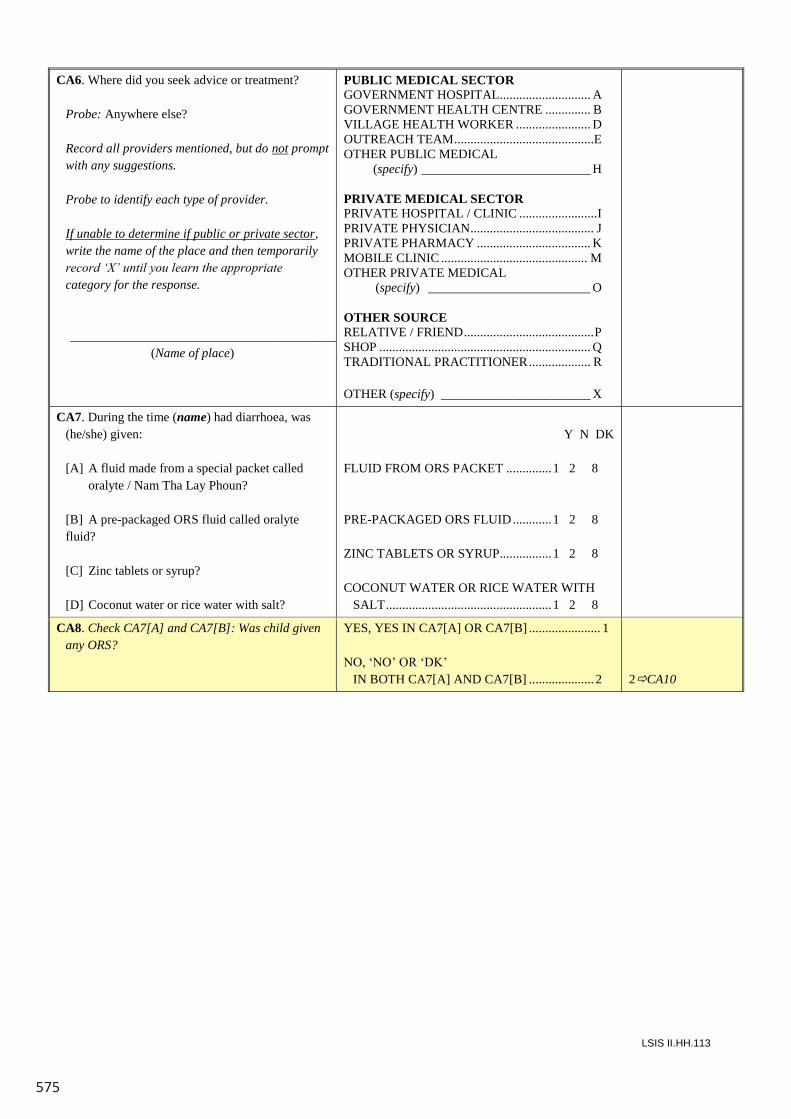
575
LSIS II.HH.113
CA6. Where did you seek advice or treatment?
Probe: Anywhere else?
Record all providers mentioned, but do not prompt with any suggestions.
Probe to identify each type of provider.
If unable to determine if public or private sector,write the name of the place and then temporarily record ‘X’ until you learn the appropriate category for the response.
_________________________________________(Name of place)
PUBLIC MEDICAL SECTORGOVERNMENT HOSPITAL............................ AGOVERNMENT HEALTH CENTRE .............. BVILLAGE HEALTH WORKER ....................... DOUTREACH TEAM...........................................EOTHER PUBLIC MEDICAL
(specify) __________________________ H
PRIVATE MEDICAL SECTOR PRIVATE HOSPITAL / CLINIC ........................IPRIVATE PHYSICIAN...................................... JPRIVATE PHARMACY ................................... KMOBILE CLINIC ............................................. MOTHER PRIVATE MEDICAL
(specify) _________________________ O
OTHER SOURCE RELATIVE / FRIEND........................................PSHOP ................................................................. QTRADITIONAL PRACTITIONER................... R
OTHER (specify) _______________________ X
CA7. During the time (name) had diarrhoea, was (he/she) given:
[A] A fluid made from a special packet called oralyte / Nam Tha Lay Phoun?
[B] A pre-packaged ORS fluid called oralyte fluid?
[C] Zinc tablets or syrup?
[D] Coconut water or rice water with salt?
Y N DK
FLUID FROM ORS PACKET ..............1 2 8
PRE-PACKAGED ORS FLUID............1 2 8
ZINC TABLETS OR SYRUP................1 2 8
COCONUT WATER OR RICE WATER WITH SALT...................................................1 2 8
CA8. Check CA7[A] and CA7[B]: Was child given any ORS?
YES, YES IN CA7[A] OR CA7[B] ...................... 1
NO, ‘NO’ OR ‘DK’ IN BOTH CA7[A] AND CA7[B] .................... 2 2CA10
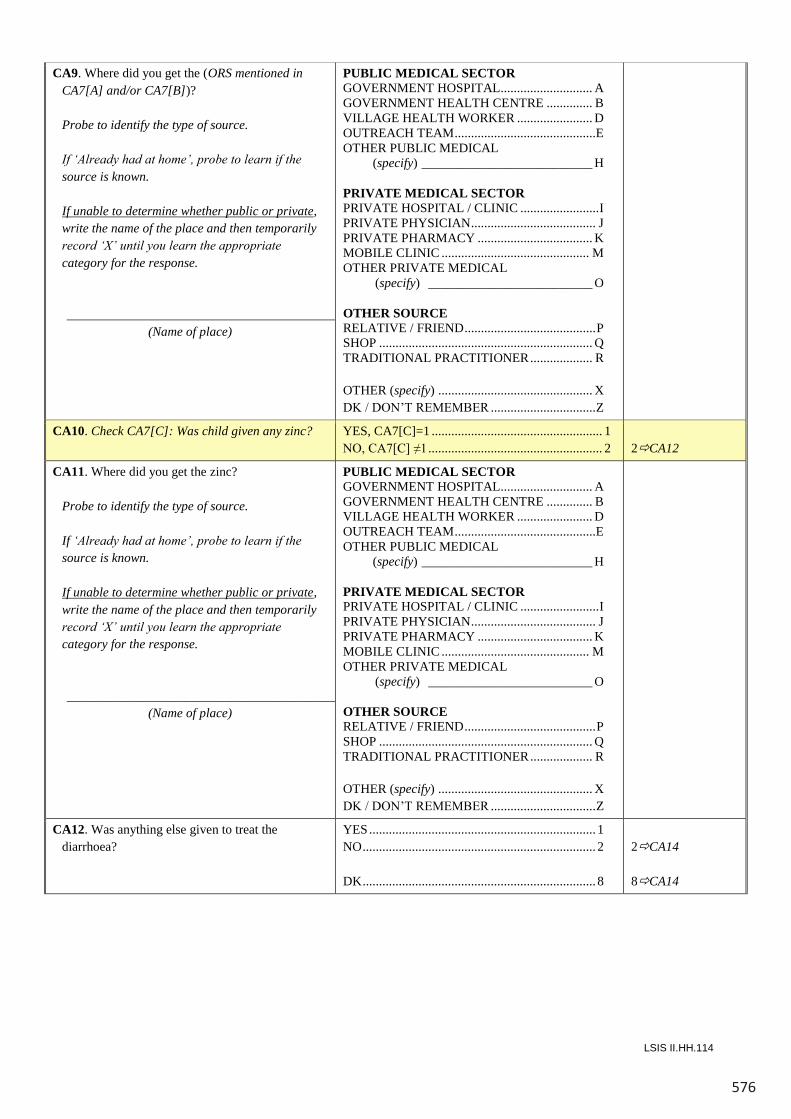
576
LSIS II.HH.114
CA9. Where did you get the (ORS mentioned in CA7[A] and/or CA7[B])?
Probe to identify the type of source. If ‘Already had at home’, probe to learn if the
source is known. If unable to determine whether public or private,
write the name of the place and then temporarily record ‘X’ until you learn the appropriate category for the response.
_________________________________________
(Name of place)
PUBLIC MEDICAL SECTOR GOVERNMENT HOSPITAL............................ A GOVERNMENT HEALTH CENTRE .............. B VILLAGE HEALTH WORKER ....................... D OUTREACH TEAM ...........................................E OTHER PUBLIC MEDICAL (specify) __________________________ H PRIVATE MEDICAL SECTOR PRIVATE HOSPITAL / CLINIC ........................ I PRIVATE PHYSICIAN ...................................... J PRIVATE PHARMACY ................................... K MOBILE CLINIC ............................................. M OTHER PRIVATE MEDICAL (specify) _________________________ O OTHER SOURCE RELATIVE / FRIEND ........................................ P SHOP ................................................................. Q TRADITIONAL PRACTITIONER ................... R OTHER (specify) ............................................... X DK / DON’T REMEMBER ................................ Z
CA10. Check CA7[C]: Was child given any zinc? YES, CA7[C]=1 .................................................... 1 NO, CA7[C] ≠1 ..................................................... 2
2CA12
CA11. Where did you get the zinc? Probe to identify the type of source. If ‘Already had at home’, probe to learn if the
source is known. If unable to determine whether public or private,
write the name of the place and then temporarily record ‘X’ until you learn the appropriate category for the response.
_________________________________________
(Name of place)
PUBLIC MEDICAL SECTOR GOVERNMENT HOSPITAL............................ A GOVERNMENT HEALTH CENTRE .............. B VILLAGE HEALTH WORKER ....................... D OUTREACH TEAM ...........................................E OTHER PUBLIC MEDICAL (specify) __________________________ H PRIVATE MEDICAL SECTOR PRIVATE HOSPITAL / CLINIC ........................ I PRIVATE PHYSICIAN ...................................... J PRIVATE PHARMACY ................................... K MOBILE CLINIC ............................................. M OTHER PRIVATE MEDICAL (specify) _________________________ O OTHER SOURCE RELATIVE / FRIEND ........................................ P SHOP ................................................................. Q TRADITIONAL PRACTITIONER ................... R OTHER (specify) ............................................... X DK / DON’T REMEMBER ................................ Z
CA12. Was anything else given to treat the diarrhoea?
YES ..................................................................... 1 NO ....................................................................... 2 DK ....................................................................... 8
2CA14 8CA14
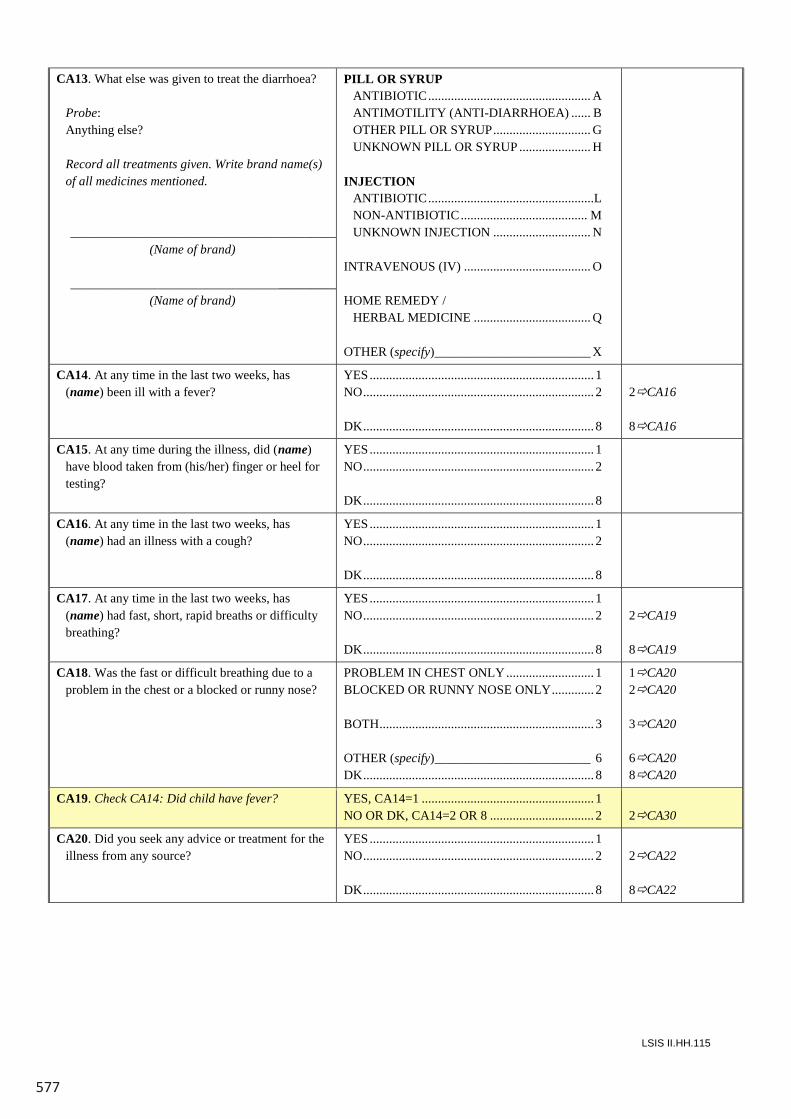
577
LSIS II.HH.115
CA13. What else was given to treat the diarrhoea?
Probe:Anything else?
Record all treatments given. Write brand name(s) of all medicines mentioned.
_________________________________________(Name of brand)
_________________________________________(Name of brand)
PILL OR SYRUPANTIBIOTIC.................................................. AANTIMOTILITY (ANTI-DIARRHOEA) ...... BOTHER PILL OR SYRUP.............................. GUNKNOWN PILL OR SYRUP ...................... H
INJECTIONANTIBIOTIC...................................................LNON-ANTIBIOTIC....................................... MUNKNOWN INJECTION .............................. N
INTRAVENOUS (IV) ....................................... O
HOME REMEDY /HERBAL MEDICINE .................................... Q
OTHER (specify)________________________ X
CA14. At any time in the last two weeks, has (name) been ill with a fever?
YES..................................................................... 1NO....................................................................... 2
DK....................................................................... 8
2CA16
8CA16
CA15. At any time during the illness, did (name)have blood taken from (his/her) finger or heel for testing?
YES..................................................................... 1NO....................................................................... 2
DK....................................................................... 8
CA16. At any time in the last two weeks, has (name) had an illness with a cough?
YES..................................................................... 1NO....................................................................... 2
DK....................................................................... 8
CA17. At any time in the last two weeks, has (name) had fast, short, rapid breaths or difficulty breathing?
YES..................................................................... 1NO....................................................................... 2
DK....................................................................... 8
2CA19
8CA19
CA18. Was the fast or difficult breathing due to a problem in the chest or a blocked or runny nose?
PROBLEM IN CHEST ONLY........................... 1BLOCKED OR RUNNY NOSE ONLY............. 2
BOTH.................................................................. 3
OTHER (specify)________________________ 6DK....................................................................... 8
1CA202CA20
3CA20
6CA208CA20
CA19. Check CA14: Did child have fever? YES, CA14=1 ..................................................... 1NO OR DK, CA14=2 OR 8 ................................ 2 2CA30
CA20. Did you seek any advice or treatment for the illness from any source?
YES..................................................................... 1NO....................................................................... 2
DK....................................................................... 8
2CA22
8CA22
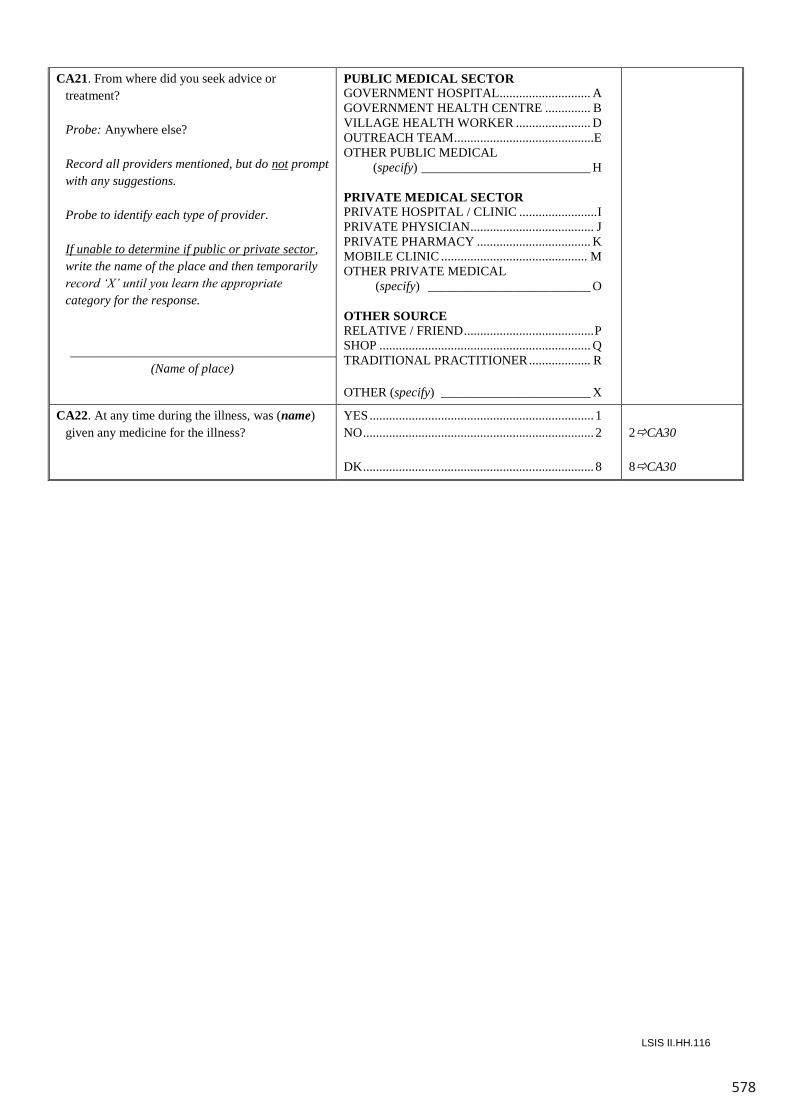
578
LSIS II.HH.116
CA21. From where did you seek advice or treatment?
Probe: Anywhere else? Record all providers mentioned, but do not prompt
with any suggestions. Probe to identify each type of provider. If unable to determine if public or private sector,
write the name of the place and then temporarily record ‘X’ until you learn the appropriate category for the response.
_________________________________________
(Name of place)
PUBLIC MEDICAL SECTOR GOVERNMENT HOSPITAL............................ A GOVERNMENT HEALTH CENTRE .............. B VILLAGE HEALTH WORKER ....................... D OUTREACH TEAM ...........................................E OTHER PUBLIC MEDICAL (specify) __________________________ H PRIVATE MEDICAL SECTOR PRIVATE HOSPITAL / CLINIC ........................ I PRIVATE PHYSICIAN ...................................... J PRIVATE PHARMACY ................................... K MOBILE CLINIC ............................................. M OTHER PRIVATE MEDICAL (specify) _________________________ O OTHER SOURCE RELATIVE / FRIEND ........................................ P SHOP ................................................................. Q TRADITIONAL PRACTITIONER ................... R OTHER (specify) _______________________ X
CA22. At any time during the illness, was (name) given any medicine for the illness?
YES ..................................................................... 1 NO ....................................................................... 2 DK ....................................................................... 8
2CA30 8CA30
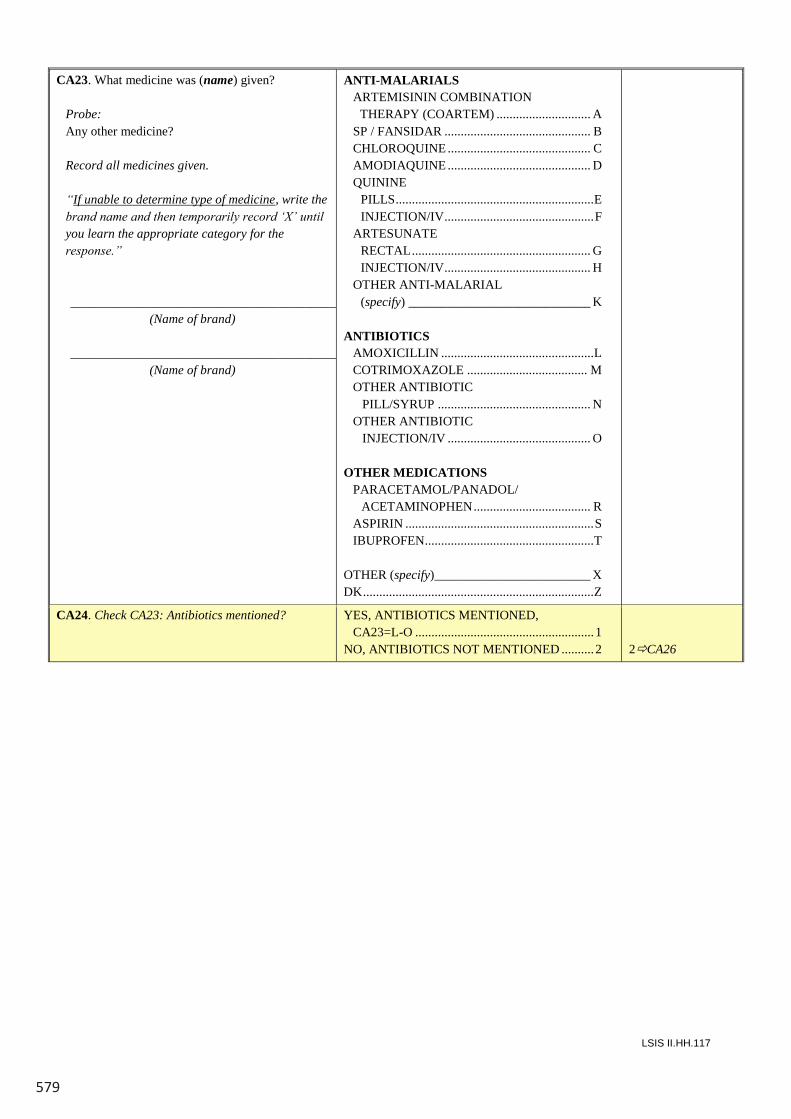
579
LSIS II.HH.117
CA23. What medicine was (name) given?
Probe:Any other medicine?
Record all medicines given.
“If unable to determine type of medicine, write the brand name and then temporarily record ‘X’ until you learn the appropriate category for the response.”
_________________________________________(Name of brand)
_________________________________________(Name of brand)
ANTI-MALARIALSARTEMISININ COMBINATION
THERAPY (COARTEM) ............................. ASP / FANSIDAR ............................................. BCHLOROQUINE ............................................ CAMODIAQUINE ............................................ DQUININE
PILLS.............................................................EINJECTION/IV..............................................F
ARTESUNATERECTAL....................................................... GINJECTION/IV............................................. H
OTHER ANTI-MALARIAL(specify) ____________________________ K
ANTIBIOTICSAMOXICILLIN ...............................................LCOTRIMOXAZOLE ..................................... MOTHER ANTIBIOTIC
PILL/SYRUP ............................................... NOTHER ANTIBIOTIC
INJECTION/IV ............................................ O
OTHER MEDICATIONSPARACETAMOL/PANADOL/
ACETAMINOPHEN.................................... RASPIRIN ..........................................................SIBUPROFEN....................................................T
OTHER (specify)________________________ XDK.......................................................................Z
CA24. Check CA23: Antibiotics mentioned? YES, ANTIBIOTICS MENTIONED, CA23=L-O .......................................................1
NO, ANTIBIOTICS NOT MENTIONED ..........2 2CA26
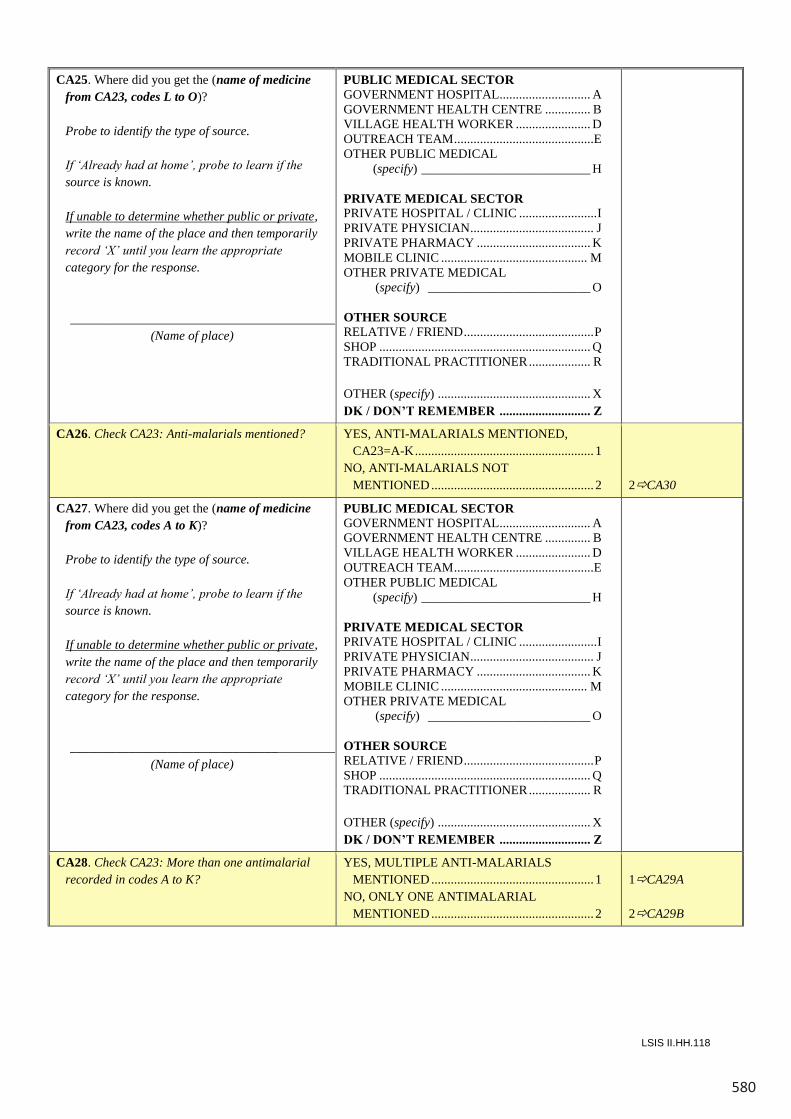
580
LSIS II.HH.118
CA25. Where did you get the (name of medicine from CA23, codes L to O)?
Probe to identify the type of source. If ‘Already had at home’, probe to learn if the
source is known. If unable to determine whether public or private,
write the name of the place and then temporarily record ‘X’ until you learn the appropriate category for the response.
_________________________________________
(Name of place)
PUBLIC MEDICAL SECTOR GOVERNMENT HOSPITAL............................ A GOVERNMENT HEALTH CENTRE .............. B VILLAGE HEALTH WORKER ....................... D OUTREACH TEAM ...........................................E OTHER PUBLIC MEDICAL (specify) __________________________ H PRIVATE MEDICAL SECTOR PRIVATE HOSPITAL / CLINIC ........................ I PRIVATE PHYSICIAN ...................................... J PRIVATE PHARMACY ................................... K MOBILE CLINIC ............................................. M OTHER PRIVATE MEDICAL (specify) _________________________ O OTHER SOURCE RELATIVE / FRIEND ........................................ P SHOP ................................................................. Q TRADITIONAL PRACTITIONER ................... R OTHER (specify) ............................................... X DK / DON’T REMEMBER ............................ Z
CA26. Check CA23: Anti-malarials mentioned? YES, ANTI-MALARIALS MENTIONED, CA23=A-K ....................................................... 1
NO, ANTI-MALARIALS NOT MENTIONED .................................................. 2
2CA30
CA27. Where did you get the (name of medicine from CA23, codes A to K)?
Probe to identify the type of source. If ‘Already had at home’, probe to learn if the
source is known. If unable to determine whether public or private,
write the name of the place and then temporarily record ‘X’ until you learn the appropriate category for the response.
_________________________________________
(Name of place)
PUBLIC MEDICAL SECTOR GOVERNMENT HOSPITAL............................ A GOVERNMENT HEALTH CENTRE .............. B VILLAGE HEALTH WORKER ....................... D OUTREACH TEAM ...........................................E OTHER PUBLIC MEDICAL (specify) __________________________ H PRIVATE MEDICAL SECTOR PRIVATE HOSPITAL / CLINIC ........................ I PRIVATE PHYSICIAN ...................................... J PRIVATE PHARMACY ................................... K MOBILE CLINIC ............................................. M OTHER PRIVATE MEDICAL (specify) _________________________ O OTHER SOURCE RELATIVE / FRIEND ........................................ P SHOP ................................................................. Q TRADITIONAL PRACTITIONER ................... R OTHER (specify) ............................................... X DK / DON’T REMEMBER ............................ Z
CA28. Check CA23: More than one antimalarial recorded in codes A to K?
YES, MULTIPLE ANTI-MALARIALS MENTIONED .................................................. 1
NO, ONLY ONE ANTIMALARIAL MENTIONED .................................................. 2
1CA29A 2CA29B
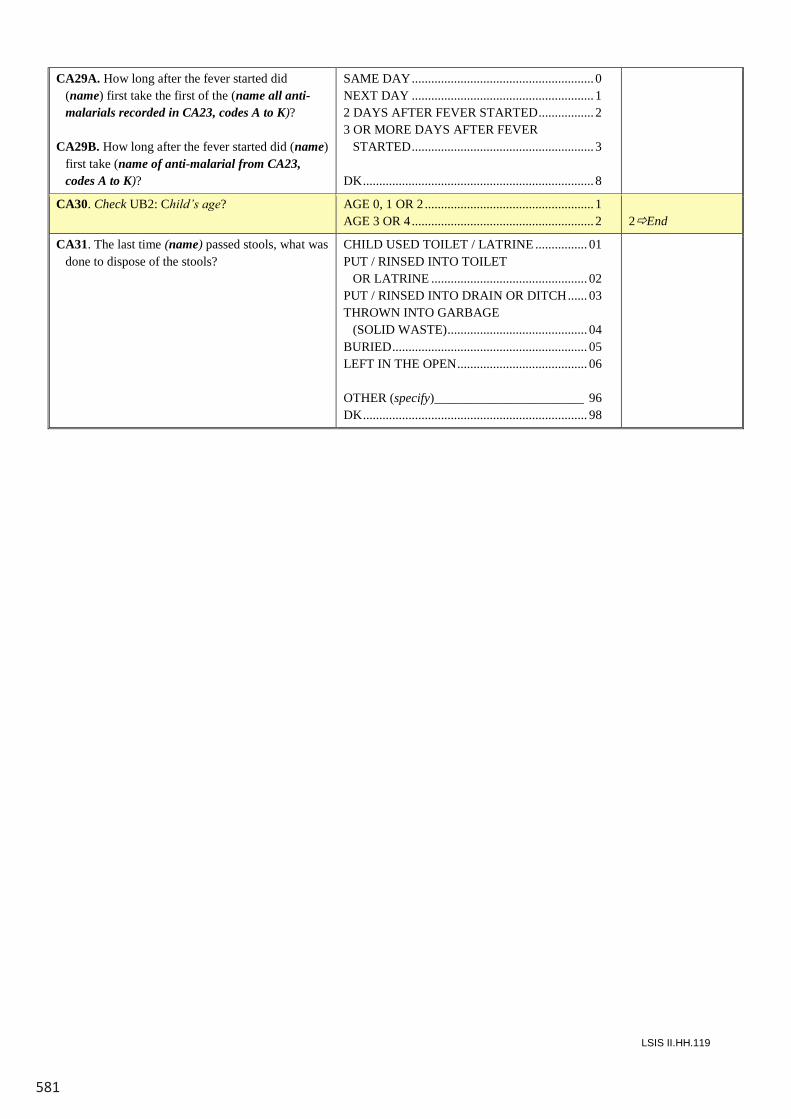
581
LSIS II.HH.119
CA29A. How long after the fever started did (name) first take the first of the (name all anti-malarials recorded in CA23, codes A to K)?
CA29B. How long after the fever started did (name)
first take (name of anti-malarial from CA23, codes A to K)?
SAME DAY ........................................................ 0 NEXT DAY ........................................................ 1 2 DAYS AFTER FEVER STARTED ................. 2 3 OR MORE DAYS AFTER FEVER STARTED ........................................................ 3 DK ....................................................................... 8
CA30. Check UB2: Child’s age? AGE 0, 1 OR 2 .................................................... 1 AGE 3 OR 4 ........................................................ 2
2End
CA31. The last time (name) passed stools, what was done to dispose of the stools?
CHILD USED TOILET / LATRINE ................ 01 PUT / RINSED INTO TOILET OR LATRINE ................................................ 02 PUT / RINSED INTO DRAIN OR DITCH ...... 03 THROWN INTO GARBAGE (SOLID WASTE) ........................................... 04 BURIED ............................................................ 05 LEFT IN THE OPEN ........................................ 06 OTHER (specify) _______________________ 96 DK ..................................................................... 98
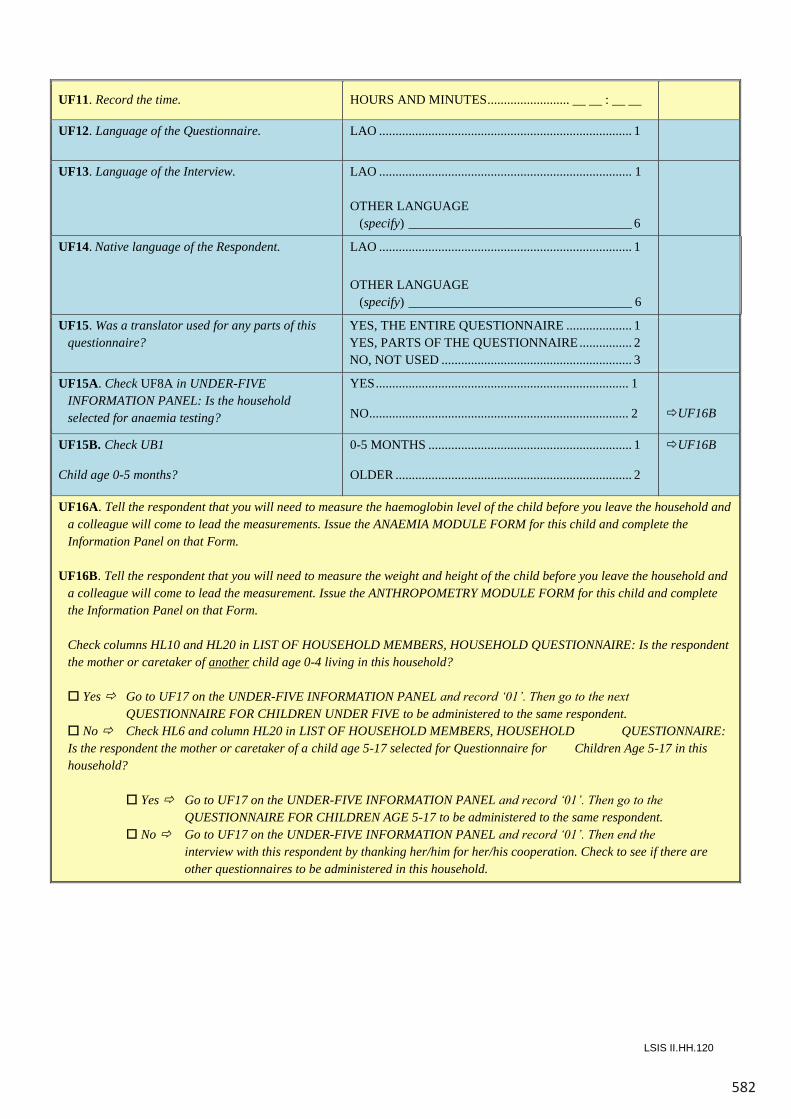
582
LSIS II.HH.120
UF11. Record the time. HOURS AND MINUTES......................... __ __ : __ __
UF12. Language of the Questionnaire. LAO ............................................................................. 1
UF13. Language of the Interview. LAO ............................................................................. 1
OTHER LANGUAGE(specify) __________________________________ 6
UF14. Native language of the Respondent. LAO ............................................................................. 1
OTHER LANGUAGE(specify) __________________________________ 6
UF15. Was a translator used for any parts of this questionnaire?
YES, THE ENTIRE QUESTIONNAIRE .................... 1YES, PARTS OF THE QUESTIONNAIRE................ 2NO, NOT USED .......................................................... 3
UF15A. Check UF8A in UNDER-FIVEINFORMATION PANEL: Is the household selected for anaemia testing?
YES............................................................................. 1
NO............................................................................... 2 UF16B
UF15B. Check UB1
Child age 0-5 months?
0-5 MONTHS .............................................................. 1
OLDER ........................................................................ 2
UF16B
UF16A. Tell the respondent that you will need to measure the haemoglobin level of the child before you leave the household and a colleague will come to lead the measurements. Issue the ANAEMIA MODULE FORM for this child and complete the Information Panel on that Form.
UF16B. Tell the respondent that you will need to measure the weight and height of the child before you leave the household and a colleague will come to lead the measurement. Issue the ANTHROPOMETRY MODULE FORM for this child and complete the Information Panel on that Form.
Check columns HL10 and HL20 in LIST OF HOUSEHOLD MEMBERS, HOUSEHOLD QUESTIONNAIRE: Is the respondent the mother or caretaker of another child age 0-4 living in this household?
Yes Go to UF17 on the UNDER-FIVE INFORMATION PANEL and record ‘01’. Then go to the next QUESTIONNAIRE FOR CHILDREN UNDER FIVE to be administered to the same respondent.
No Check HL6 and column HL20 in LIST OF HOUSEHOLD MEMBERS, HOUSEHOLD QUESTIONNAIRE:Is the respondent the mother or caretaker of a child age 5-17 selected for Questionnaire for Children Age 5-17 in this household?
Yes Go to UF17 on the UNDER-FIVE INFORMATION PANEL and record ‘01’. Then go to the QUESTIONNAIRE FOR CHILDREN AGE 5-17 to be administered to the same respondent.
No Go to UF17 on the UNDER-FIVE INFORMATION PANEL and record ‘01’. Then end the interview with this respondent by thanking her/him for her/his cooperation. Check to see if there are other questionnaires to be administered in this household.
583
LSIS II.HH.121
INTERVIEWER’S OBSERVATIONS
SUPERVISOR’S OBSERVATIONS
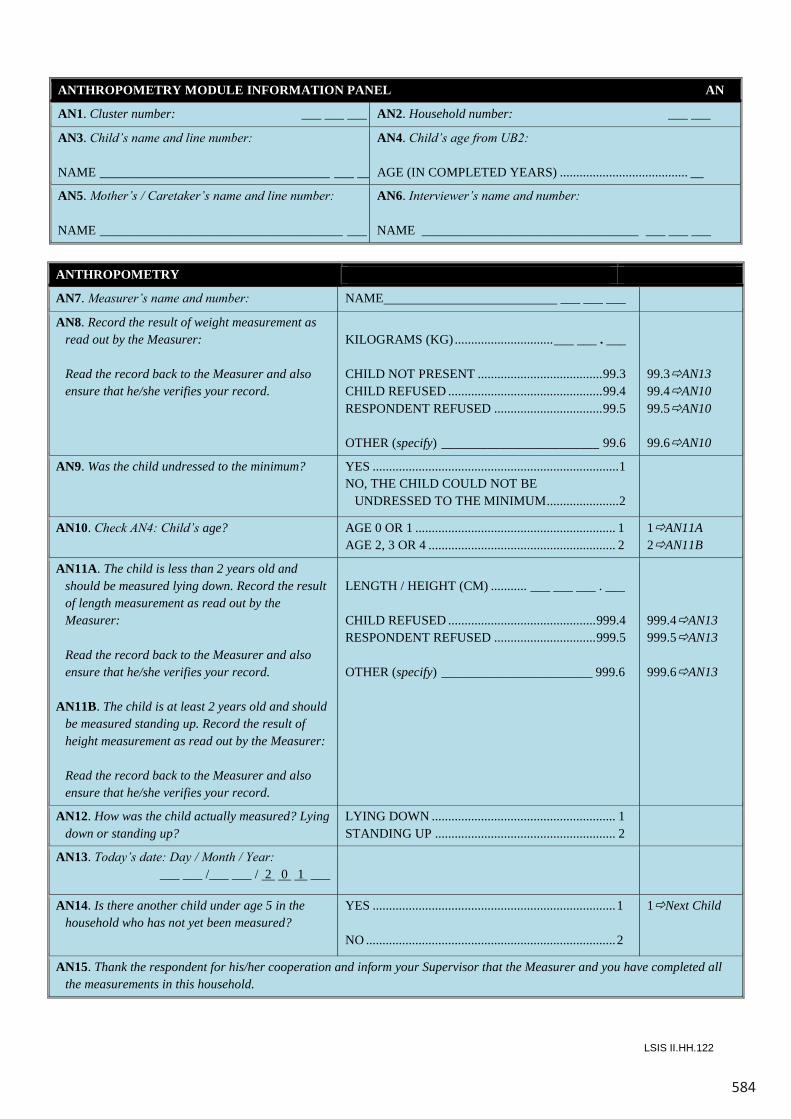
584
LSIS II.HH.123
INTERVIEWER’S OBSERVATIONS FOR ANTHROPOMETRY MODULE
MEASURER’S OBSERVATIONS FOR ANTHROPOMETRY MODULE
SUPERVISOR’S OBSERVATIONS FOR ANTHROPOMETRY MODULE
LSIS II.HH.122
ANTHROPOMETRY MODULE INFORMATION PANEL AN
AN1. Cluster number: ___ ___ ___ ___AN2. Household number: ___ ___
AN3. Child’s name and line number:
NAME ___________________________________ ___ ___
AN4. Child’s age from UB2:
AGE (IN COMPLETED YEARS) ....................................... __
AN5. Mother’s / Caretaker’s name and line number:
NAME _____________________________________ ___ ___
AN6. Interviewer’s name and number:
NAME _________________________________ ___ ___ ___
ANTHROPOMETRY
AN7. Measurer’s name and number: NAME ___ ___ ___
AN8. Record the result of weight measurement as read out by the Measurer:
Read the record back to the Measurer and also ensure that he/she verifies your record.
KILOGRAMS (KG)..............................___ ___ . ___
CHILD NOT PRESENT ......................................99.3CHILD REFUSED ...............................................99.4RESPONDENT REFUSED .................................99.5
OTHER (specify) ________________________ 99.6
99.3AN1399.4AN1099.5AN10
99.6AN10
AN9. Was the child undressed to the minimum? YES ...........................................................................1NO, THE CHILD COULD NOT BE
UNDRESSED TO THE MINIMUM......................2
AN10. Check AN4: Child’s age? AGE 0 OR 1 ............................................................. 1AGE 2, 3 OR 4 ......................................................... 2
1AN11A2AN11B
AN11A. The child is less than 2 years old and should be measured lying down. Record the result of length measurement as read out by the Measurer:
Read the record back to the Measurer and also ensure that he/she verifies your record.
AN11B. The child is at least 2 years old and should be measured standing up. Record the result of height measurement as read out by the Measurer:
Read the record back to the Measurer and also ensure that he/she verifies your record.
LENGTH / HEIGHT (CM) ........... ___ ___ ___ . ___
CHILD REFUSED .............................................999.4RESPONDENT REFUSED ...............................999.5
OTHER (specify) _______________________ 999.6
999.4AN13999.5AN13
999.6AN13
AN12. How was the child actually measured? Lying down or standing up?
LYING DOWN ........................................................ 1STANDING UP ....................................................... 2
AN13. Today’s date: Day / Month / Year:___ ___ /___ ___ / 2 0 1 ___
AN14. Is there another child under age 5 in the household who has not yet been measured?
YES ..........................................................................1
NO ............................................................................2
1Next Child
AN15. Thank the respondent for his/her cooperation and inform your Supervisor that the Measurer and you have completed all the measurements in this household.
585
LSIS II.HH.123
INTERVIEWER’S OBSERVATIONS FOR ANTHROPOMETRY MODULE
MEASURER’S OBSERVATIONS FOR ANTHROPOMETRY MODULE
SUPERVISOR’S OBSERVATIONS FOR ANTHROPOMETRY MODULE
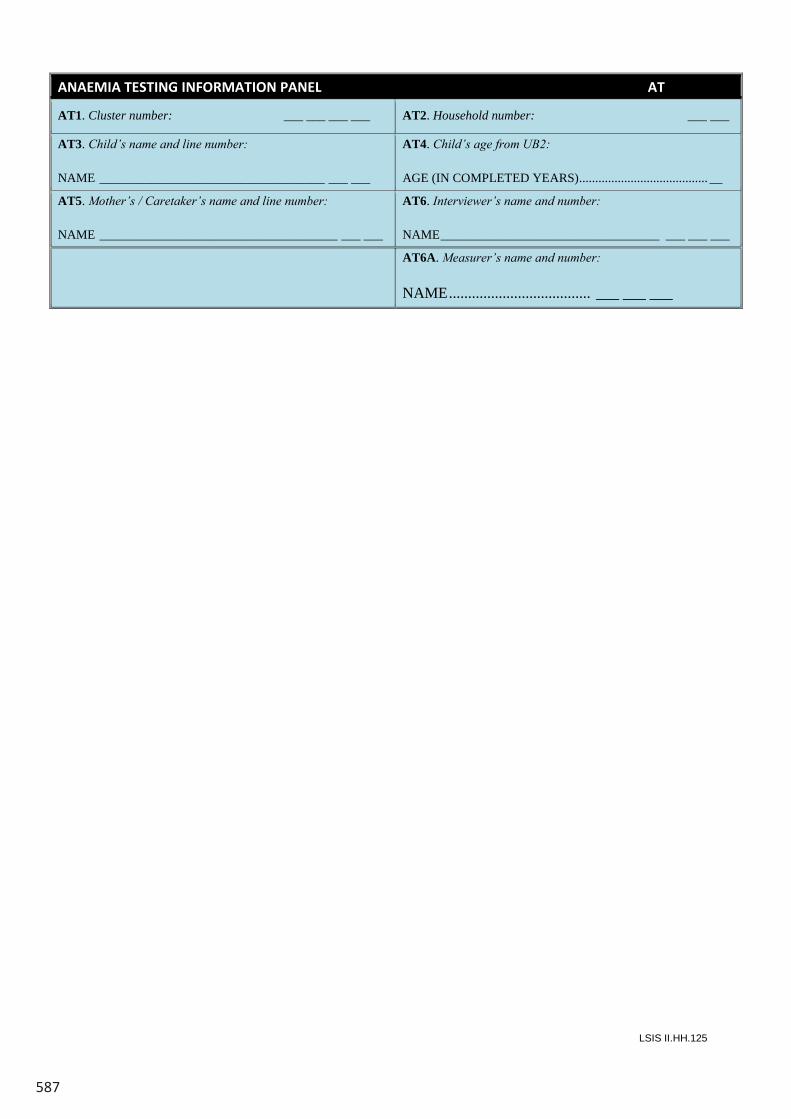
587
LSIS II.HH.125
ANAEMIA TESTING INFORMATION PANEL AT
AT1. Cluster number: ___ ___ ___ ___ AT2. Household number: ___ ___
AT3. Child’s name and line number:
NAME ___________________________________ ___ ___
AT4. Child’s age from UB2:
AGE (IN COMPLETED YEARS)........................................ __
AT5. Mother’s / Caretaker’s name and line number:
NAME _____________________________________ ___ ___
AT6. Interviewer’s name and number:
NAME__________________________________ ___ ___ ___
AT6A. Measurer’s name and number:
NAME..................................... ___ ___ ___
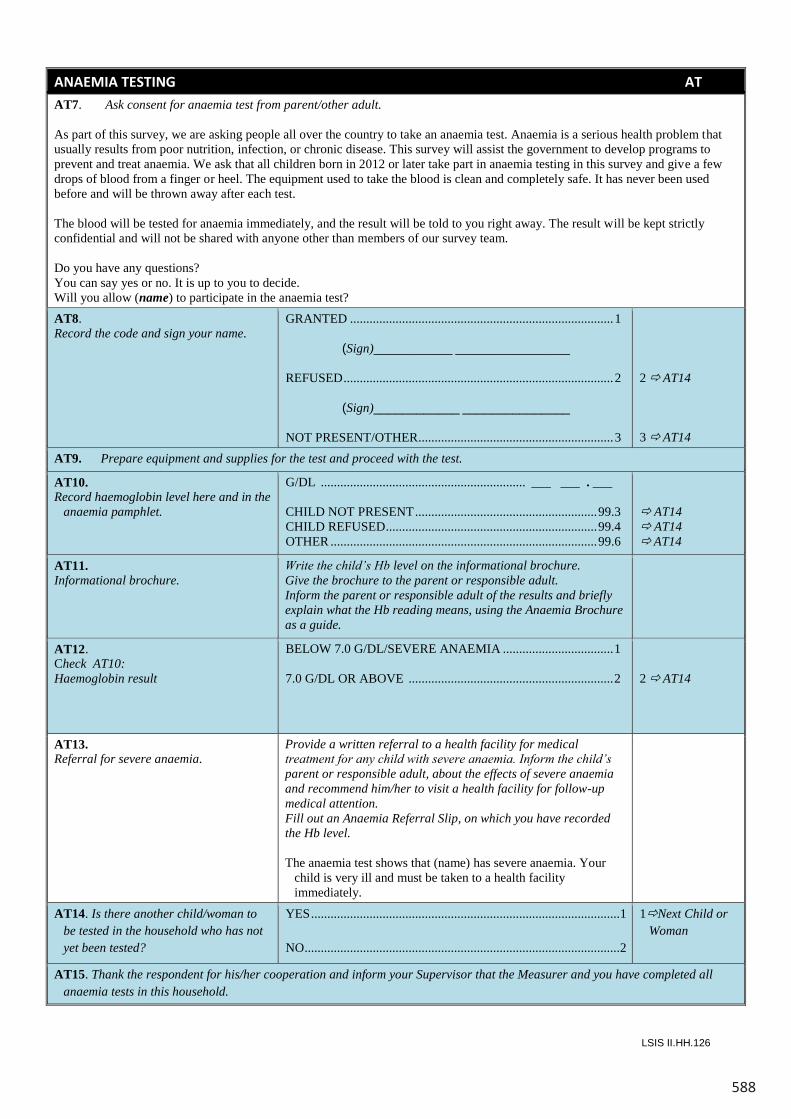
588
LSIS II.HH.126
ANAEMIA TESTING AT AT7. Ask consent for anaemia test from parent/other adult. As part of this survey, we are asking people all over the country to take an anaemia test. Anaemia is a serious health problem that usually results from poor nutrition, infection, or chronic disease. This survey will assist the government to develop programs to prevent and treat anaemia. We ask that all children born in 2012 or later take part in anaemia testing in this survey and give a few drops of blood from a finger or heel. The equipment used to take the blood is clean and completely safe. It has never been used before and will be thrown away after each test. The blood will be tested for anaemia immediately, and the result will be told to you right away. The result will be kept strictly confidential and will not be shared with anyone other than members of our survey team. Do you have any questions? You can say yes or no. It is up to you to decide. Will you allow (name) to participate in the anaemia test? AT8. Record the code and sign your name.
GRANTED ................................................................................. 1 (Sign)___________ ________________ REFUSED ................................................................................... 2 (Sign)____________ _______________ NOT PRESENT/OTHER ............................................................ 3
2 AT14 3 AT14
AT9. Prepare equipment and supplies for the test and proceed with the test.
AT10. Record haemoglobin level here and in the
anaemia pamphlet.
G/DL ............................................................... ___ ___ . ___ CHILD NOT PRESENT ........................................................ 99.3 CHILD REFUSED ................................................................. 99.4 OTHER .................................................................................. 99.6
AT14 AT14 AT14
AT11. Informational brochure.
Write the child’s Hb level on the informational brochure. Give the brochure to the parent or responsible adult. Inform the parent or responsible adult of the results and briefly explain what the Hb reading means, using the Anaemia Brochure as a guide.
AT12. Check AT10: Haemoglobin result
BELOW 7.0 G/DL/SEVERE ANAEMIA .................................. 1 7.0 G/DL OR ABOVE ............................................................... 2
2 AT14
AT13. Referral for severe anaemia.
Provide a written referral to a health facility for medical treatment for any child with severe anaemia. Inform the child’s parent or responsible adult, about the effects of severe anaemia and recommend him/her to visit a health facility for follow-up medical attention. Fill out an Anaemia Referral Slip, on which you have recorded the Hb level. The anaemia test shows that (name) has severe anaemia. Your
child is very ill and must be taken to a health facility immediately.
AT14. Is there another child/woman to be tested in the household who has not yet been tested?
YES ............................................................................................... 1 NO ................................................................................................. 2
1Next Child or Woman
AT15. Thank the respondent for his/her cooperation and inform your Supervisor that the Measurer and you have completed all anaemia tests in this household.
589
LSIS II.HH.127
INTERVIEWER’S OBSERVATIONS FOR ANAEMIA TESTING MODULE
MEASURER’S OBSERVATIONS FOR ANAEMIA TESTING MODULE
SUPERVISOR’S OBSERVATIONS FOR ANAEMIA TESTING MODULE
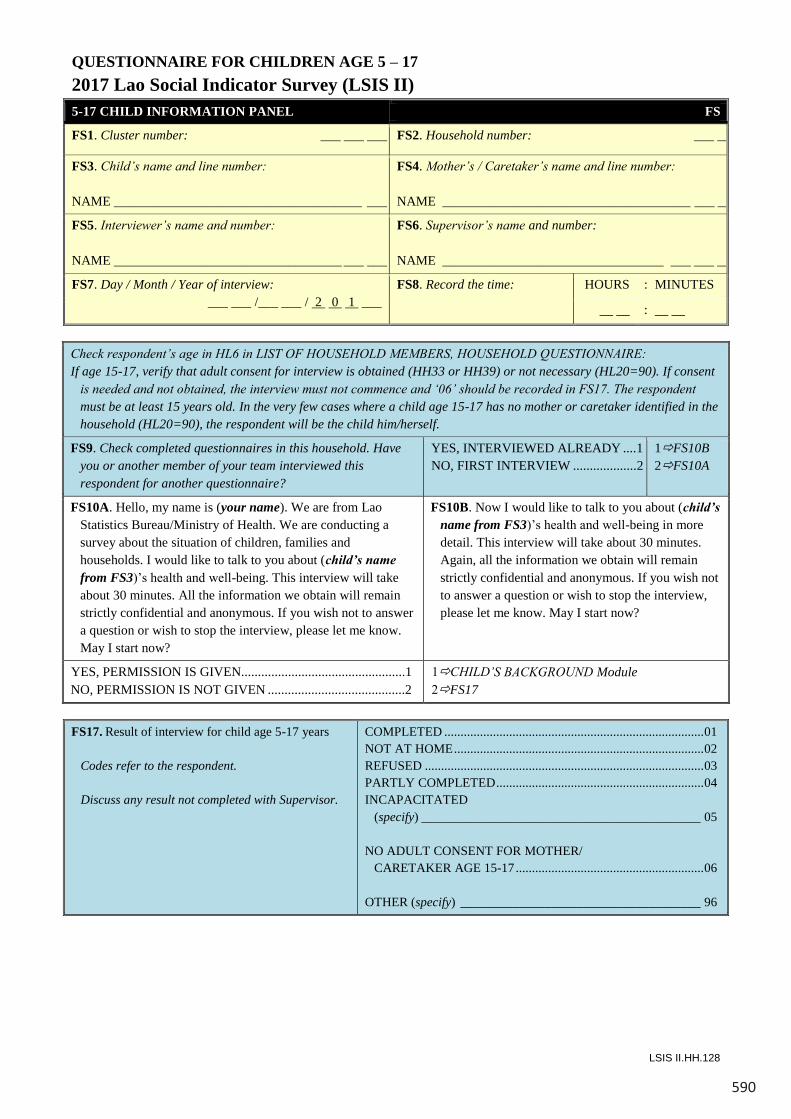
590
LSIS II.HH.128
QUESTIONNAIRE FOR CHILDREN AGE 5 – 17 2017 Lao Social Indicator Survey (LSIS II)5-17 CHILD INFORMATION PANEL FS
FS1. Cluster number: ___ ___ ___ ___FS2. Household number: ___ ___
FS3. Child’s name and line number:
NAME _____________________________________ ___ ___
FS4. Mother’s / Caretaker’s name and line number:
NAME _____________________________________ ___ ___
FS5. Interviewer’s name and number:
NAME __________________________________ ___ ___ ___
FS6. Supervisor’s name and number:
NAME _________________________________ ___ ___ ___
FS7. Day / Month / Year of interview:___ ___ /___ ___ / 2 0 1 ___
FS8. Record the time: HOURS : MINUTES
__ __ : __ __
Check respondent’s age in HL6 in LIST OF HOUSEHOLD MEMBERS, HOUSEHOLD QUESTIONNAIRE:If age 15-17, verify that adult consent for interview is obtained (HH33 or HH39) or not necessary (HL20=90). If consent
is needed and not obtained, the interview must not commence and ‘06’ should be recorded in FS17. The respondent must be at least 15 years old. In the very few cases where a child age 15-17 has no mother or caretaker identified in the household (HL20=90), the respondent will be the child him/herself.
FS9. Check completed questionnaires in this household. Have you or another member of your team interviewed this respondent for another questionnaire?
YES, INTERVIEWED ALREADY ....1NO, FIRST INTERVIEW ...................2
1FS10B2FS10A
FS10A. Hello, my name is (your name). We are from Lao Statistics Bureau/Ministry of Health. We are conducting a survey about the situation of children, families and households. I would like to talk to you about (child’s name from FS3)’s health and well-being. This interview will take about 30 minutes. All the information we obtain will remain strictly confidential and anonymous. If you wish not to answer a question or wish to stop the interview, please let me know. May I start now?
FS10B. Now I would like to talk to you about (child’s name from FS3)’s health and well-being in more detail. This interview will take about 30 minutes. Again, all the information we obtain will remain strictly confidential and anonymous. If you wish not to answer a question or wish to stop the interview, please let me know. May I start now?
...... 12
YES, PERMISSION IS GIVEN.................................................1 1CHILD’S BACKGROUND ModuleNO, PERMISSION IS NOT GIVEN .........................................2 2FS17
FS17. Result of interview for child age 5-17 years
Codes refer to the respondent.
Discuss any result not completed with Supervisor.
COMPLETED ................................................................................01NOT AT HOME.............................................................................02REFUSED ......................................................................................03PARTLY COMPLETED................................................................04INCAPACITATED
(specify) ___________________________________________ 05
NO ADULT CONSENT FOR MOTHER/CARETAKER AGE 15-17..........................................................06
OTHER (specify) _____________________________________ 96
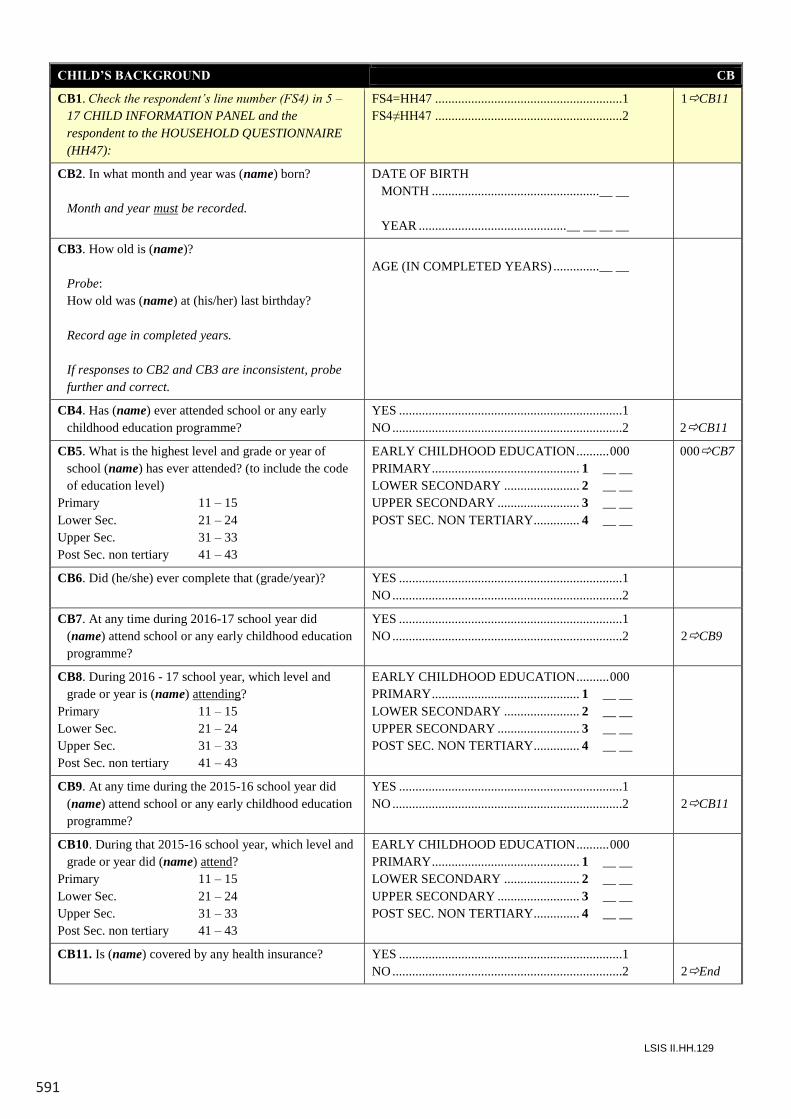
591
LSIS II.HH.129
CHILD’S BACKGROUND CB
CB1. Check the respondent’s line number (FS4) in 5 –17 CHILD INFORMATION PANEL and the respondent to the HOUSEHOLD QUESTIONNAIRE(HH47):
FS4=HH47 .........................................................1FS4≠HH47 .........................................................2
1CB11
CB2. In what month and year was (name) born?
Month and year must be recorded.
DATE OF BIRTHMONTH ...................................................__ __
YEAR .............................................__ __ __ __
CB3. How old is (name)?
Probe:How old was (name) at (his/her) last birthday?
Record age in completed years.
If responses to CB2 and CB3 are inconsistent, probe further and correct.
AGE (IN COMPLETED YEARS) ..............__ __
CB4. Has (name) ever attended school or any early childhood education programme?
YES ....................................................................1NO ......................................................................2 2CB11
CB5. What is the highest level and grade or year of school (name) has ever attended? (to include the code of education level)
Primary 11 – 15Lower Sec. 21 – 24Upper Sec. 31 – 33Post Sec. non tertiary 41 – 43
EARLY CHILDHOOD EDUCATION..........000PRIMARY............................................. 1 __ __LOWER SECONDARY ....................... 2 __ __UPPER SECONDARY ......................... 3 __ __POST SEC. NON TERTIARY.............. 4 __ __
000CB7
CB6. Did (he/she) ever complete that (grade/year)? YES ....................................................................1NO ......................................................................2
CB7. At any time during 2016-17 school year did (name) attend school or any early childhood education programme?
YES ....................................................................1NO ......................................................................2 2CB9
CB8. During 2016 - 17 school year, which level and grade or year is (name) attending?
Primary 11 – 15Lower Sec. 21 – 24Upper Sec. 31 – 33Post Sec. non tertiary 41 – 43
EARLY CHILDHOOD EDUCATION..........000PRIMARY............................................. 1 __ __LOWER SECONDARY ....................... 2 __ __UPPER SECONDARY ......................... 3 __ __POST SEC. NON TERTIARY.............. 4 __ __
CB9. At any time during the 2015-16 school year did (name) attend school or any early childhood education programme?
YES ....................................................................1NO ......................................................................2 2CB11
CB10. During that 2015-16 school year, which level and grade or year did (name) attend?
Primary 11 – 15Lower Sec. 21 – 24Upper Sec. 31 – 33Post Sec. non tertiary 41 – 43
EARLY CHILDHOOD EDUCATION..........000PRIMARY............................................. 1 __ __LOWER SECONDARY ....................... 2 __ __UPPER SECONDARY ......................... 3 __ __POST SEC. NON TERTIARY.............. 4 __ __
CB11. Is (name) covered by any health insurance? YES ....................................................................1NO ......................................................................2 2End
LSIS II.HH.128
QUESTIONNAIRE FOR CHILDREN AGE 5 – 17 2017 Lao Social Indicator Survey (LSIS II)5-17 CHILD INFORMATION PANEL FS
FS1. Cluster number: ___ ___ ___ ___FS2. Household number: ___ ___
FS3. Child’s name and line number:
NAME _____________________________________ ___ ___
FS4. Mother’s / Caretaker’s name and line number:
NAME _____________________________________ ___ ___
FS5. Interviewer’s name and number:
NAME __________________________________ ___ ___ ___
FS6. Supervisor’s name and number:
NAME _________________________________ ___ ___ ___
FS7. Day / Month / Year of interview:___ ___ /___ ___ / 2 0 1 ___
FS8. Record the time: HOURS : MINUTES
__ __ : __ __
Check respondent’s age in HL6 in LIST OF HOUSEHOLD MEMBERS, HOUSEHOLD QUESTIONNAIRE:If age 15-17, verify that adult consent for interview is obtained (HH33 or HH39) or not necessary (HL20=90). If consent
is needed and not obtained, the interview must not commence and ‘06’ should be recorded in FS17. The respondent must be at least 15 years old. In the very few cases where a child age 15-17 has no mother or caretaker identified in the household (HL20=90), the respondent will be the child him/herself.
FS9. Check completed questionnaires in this household. Have you or another member of your team interviewed this respondent for another questionnaire?
YES, INTERVIEWED ALREADY ....1NO, FIRST INTERVIEW ...................2
1FS10B2FS10A
FS10A. Hello, my name is (your name). We are from Lao Statistics Bureau/Ministry of Health. We are conducting a survey about the situation of children, families and households. I would like to talk to you about (child’s name from FS3)’s health and well-being. This interview will take about 30 minutes. All the information we obtain will remain strictly confidential and anonymous. If you wish not to answer a question or wish to stop the interview, please let me know. May I start now?
FS10B. Now I would like to talk to you about (child’s name from FS3)’s health and well-being in more detail. This interview will take about 30 minutes. Again, all the information we obtain will remain strictly confidential and anonymous. If you wish not to answer a question or wish to stop the interview, please let me know. May I start now?
...... 12
YES, PERMISSION IS GIVEN.................................................1 1CHILD’S BACKGROUND ModuleNO, PERMISSION IS NOT GIVEN .........................................2 2FS17
FS17. Result of interview for child age 5-17 years
Codes refer to the respondent.
Discuss any result not completed with Supervisor.
COMPLETED ................................................................................01NOT AT HOME.............................................................................02REFUSED ......................................................................................03PARTLY COMPLETED................................................................04INCAPACITATED
(specify) ___________________________________________ 05
NO ADULT CONSENT FOR MOTHER/CARETAKER AGE 15-17..........................................................06
OTHER (specify) _____________________________________ 96
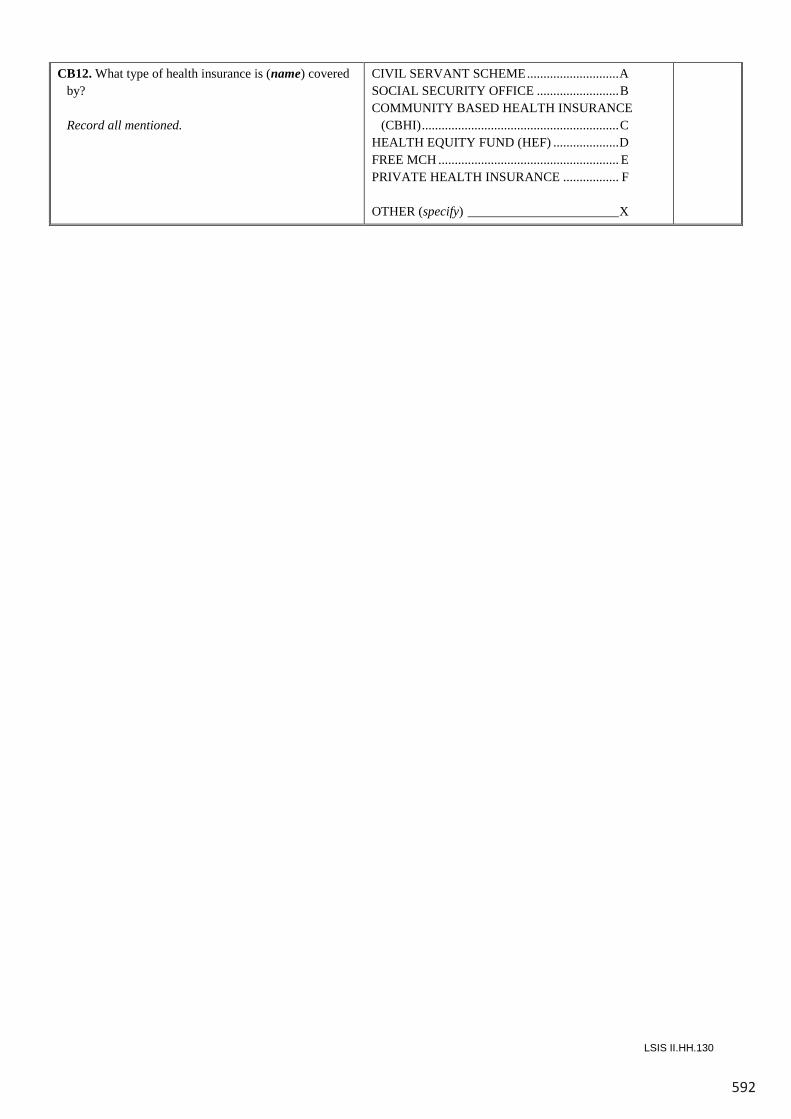
592
LSIS II.HH.130
CB12. What type of health insurance is (name) covered by?
Record all mentioned.
CIVIL SERVANT SCHEME............................ASOCIAL SECURITY OFFICE .........................BCOMMUNITY BASED HEALTH INSURANCE
(CBHI)............................................................CHEALTH EQUITY FUND (HEF) ....................DFREE MCH ....................................................... EPRIVATE HEALTH INSURANCE ................. F
OTHER (specify) _______________________X
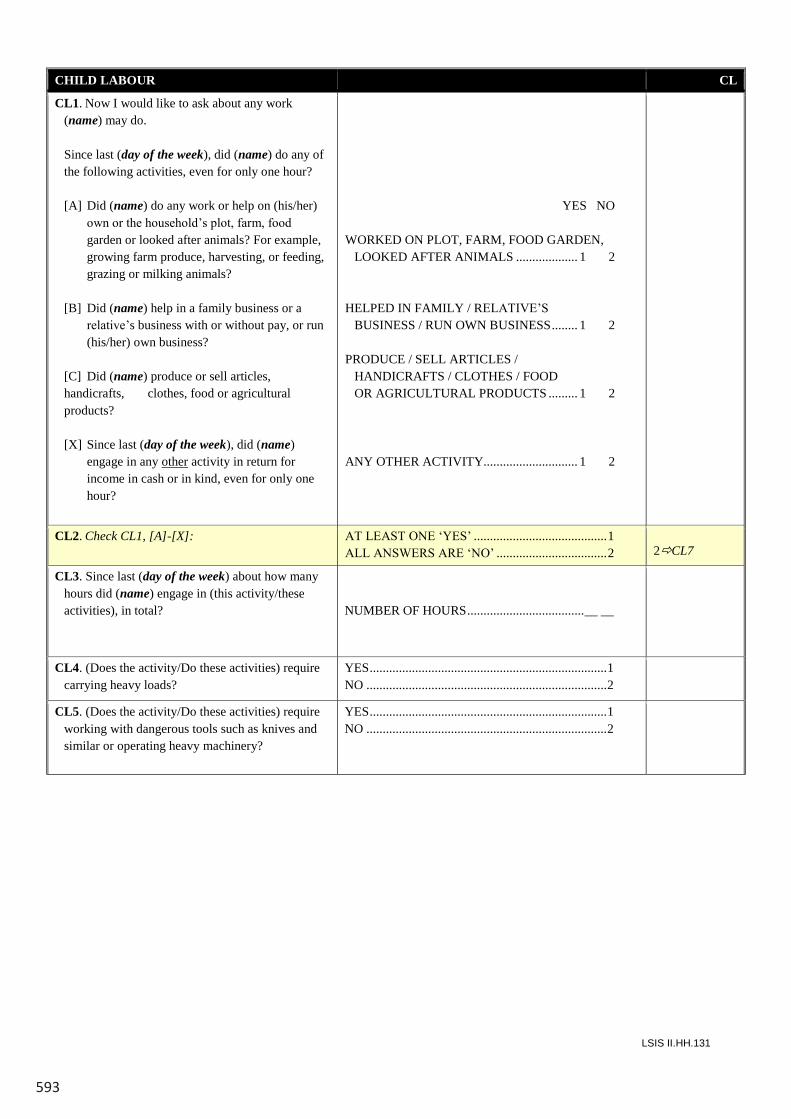
593
LSIS II.HH.131
CHILD LABOUR CL
CL1. Now I would like to ask about any work (name) may do.
Since last (day of the week), did (name) do any of
the following activities, even for only one hour? [A] Did (name) do any work or help on (his/her)
own or the household’s plot, farm, food garden or looked after animals? For example, growing farm produce, harvesting, or feeding, grazing or milking animals?
[B] Did (name) help in a family business or a
relative’s business with or without pay, or run (his/her) own business?
[C] Did (name) produce or sell articles,
handicrafts, clothes, food or agricultural products?
[X] Since last (day of the week), did (name)
engage in any other activity in return for income in cash or in kind, even for only one hour?
YES NO WORKED ON PLOT, FARM, FOOD GARDEN,
LOOKED AFTER ANIMALS ................... 1 2 HELPED IN FAMILY / RELATIVE’S BUSINESS / RUN OWN BUSINESS ........ 1 2 PRODUCE / SELL ARTICLES / HANDICRAFTS / CLOTHES / FOOD OR AGRICULTURAL PRODUCTS ......... 1 2 ANY OTHER ACTIVITY............................. 1 2
CL2. Check CL1, [A]-[X]: AT LEAST ONE ‘YES’ ......................................... 1 ALL ANSWERS ARE ‘NO’ .................................. 2
2CL7
CL3. Since last (day of the week) about how many hours did (name) engage in (this activity/these activities), in total?
NUMBER OF HOURS .................................... __ __
CL4. (Does the activity/Do these activities) require carrying heavy loads?
YES ......................................................................... 1 NO .......................................................................... 2
CL5. (Does the activity/Do these activities) require working with dangerous tools such as knives and similar or operating heavy machinery?
YES ......................................................................... 1 NO .......................................................................... 2
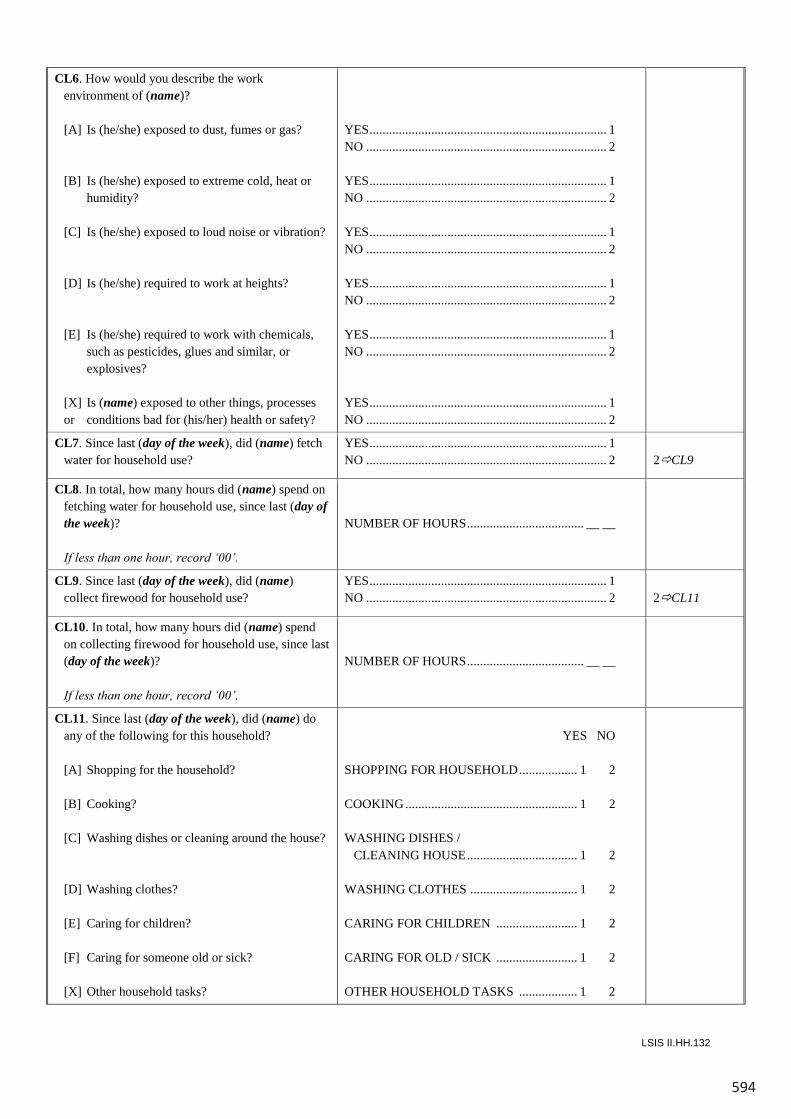
594
LSIS II.HH.132
CL6. How would you describe the work environment of (name)?
[A] Is (he/she) exposed to dust, fumes or gas?
[B] Is (he/she) exposed to extreme cold, heat or humidity?
[C] Is (he/she) exposed to loud noise or vibration?
[D] Is (he/she) required to work at heights?
[E] Is (he/she) required to work with chemicals, such as pesticides, glues and similar, or explosives?
[X] Is (name) exposed to other things, processes or conditions bad for (his/her) health or safety?
YES......................................................................... 1NO .......................................................................... 2
YES......................................................................... 1NO .......................................................................... 2
YES......................................................................... 1NO .......................................................................... 2
YES......................................................................... 1NO .......................................................................... 2
YES......................................................................... 1NO .......................................................................... 2
YES......................................................................... 1NO .......................................................................... 2
CL7. Since last (day of the week), did (name) fetch water for household use?
YES......................................................................... 1NO .......................................................................... 2 2CL9
CL8. In total, how many hours did (name) spend on fetching water for household use, since last (day of the week)?
If less than one hour, record ‘00’.
NUMBER OF HOURS.................................... __ __
CL9. Since last (day of the week), did (name)collect firewood for household use?
YES......................................................................... 1NO .......................................................................... 2 2CL11
CL10. In total, how many hours did (name) spend on collecting firewood for household use, since last (day of the week)?
If less than one hour, record ‘00’.
NUMBER OF HOURS.................................... __ __
CL11. Since last (day of the week), did (name) do any of the following for this household?
[A] Shopping for the household?
[B] Cooking?
[C] Washing dishes or cleaning around the house?
[D] Washing clothes?
[E] Caring for children?
[F] Caring for someone old or sick?
[X] Other household tasks?
YES NO
SHOPPING FOR HOUSEHOLD.................. 1 2
COOKING..................................................... 1 2
WASHING DISHES / CLEANING HOUSE.................................. 1 2
WASHING CLOTHES ................................. 1 2
CARING FOR CHILDREN ......................... 1 2
CARING FOR OLD / SICK ......................... 1 2
OTHER HOUSEHOLD TASKS .................. 1 2
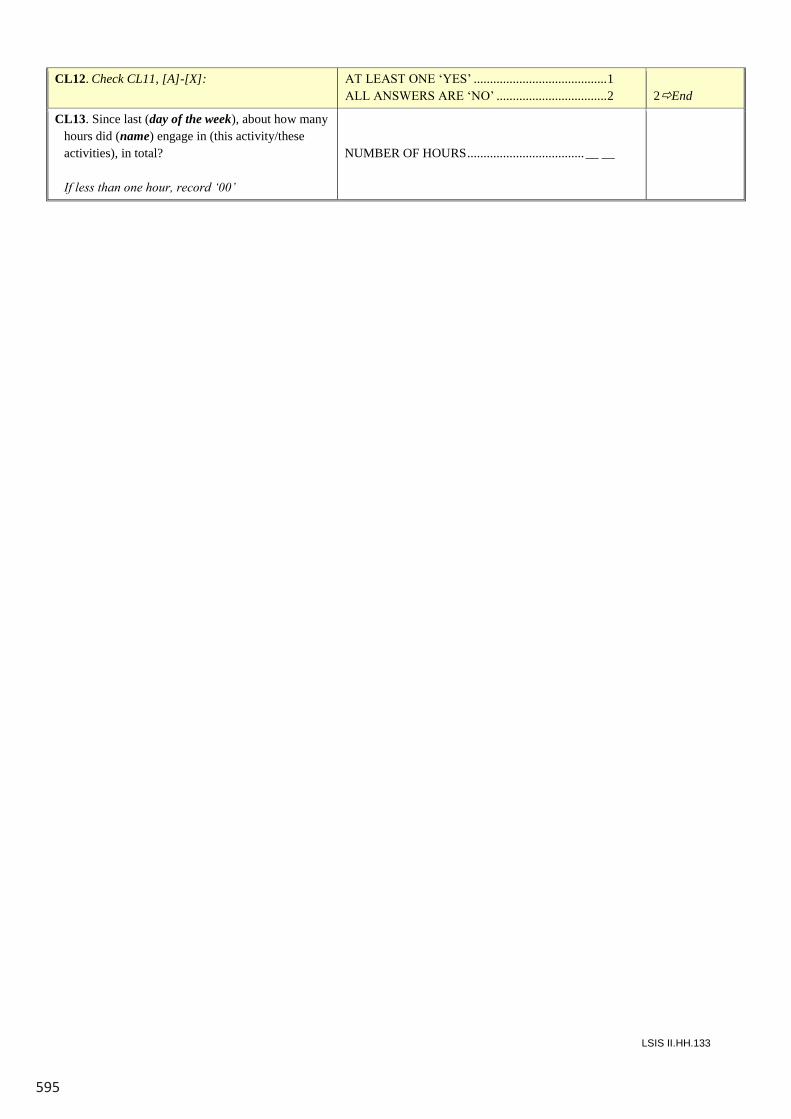
595
LSIS II.HH.133
CL12. Check CL11, [A]-[X]: AT LEAST ONE ‘YES’ .........................................1ALL ANSWERS ARE ‘NO’ ..................................2 2End
CL13. Since last (day of the week), about how many hours did (name) engage in (this activity/these activities), in total?
If less than one hour, record ‘00’
NUMBER OF HOURS....................................__ __
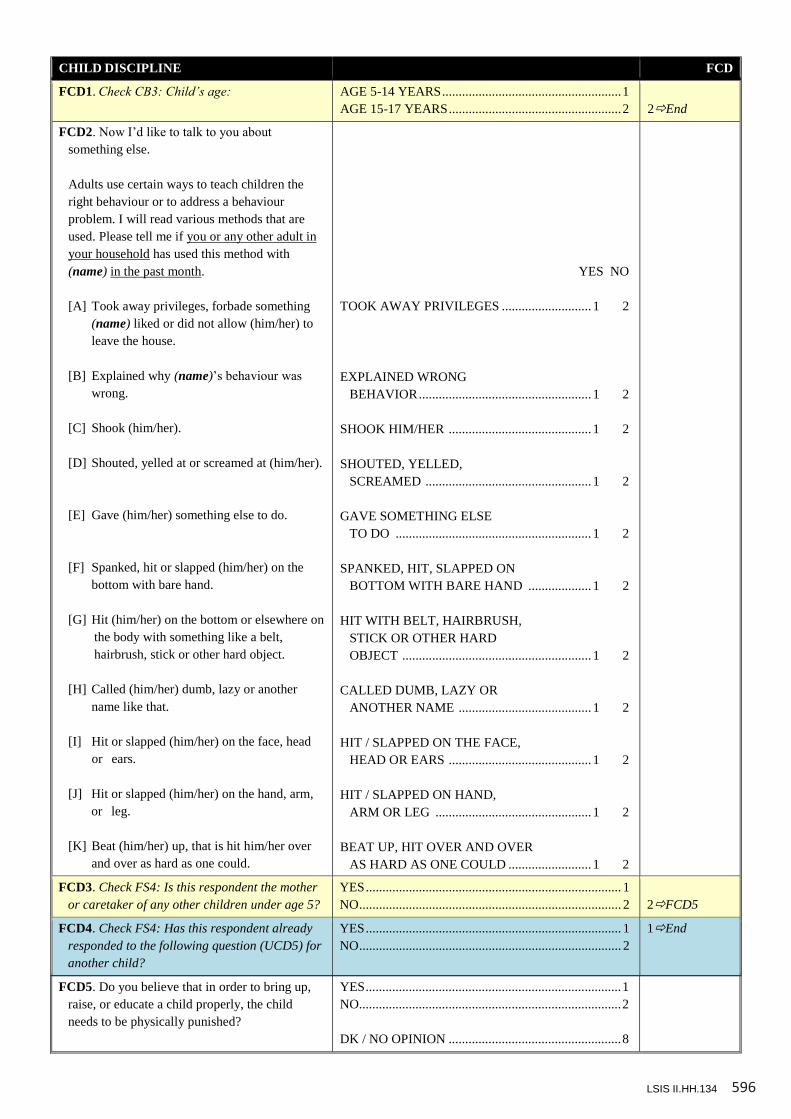
596LSIS II.HH.134
CHILD DISCIPLINE FCD
FCD1. Check CB3: Child’s age: AGE 5-14 YEARS......................................................1AGE 15-17 YEARS....................................................2 2End
FCD2. Now I’d like to talk to you about something else.
Adults use certain ways to teach children the right behaviour or to address a behaviour problem. I will read various methods that are used. Please tell me if you or any other adult in your household has used this method with (name) in the past month.
[A] Took away privileges, forbade something (name) liked or did not allow (him/her) to leave the house.
[B] Explained why (name)’s behaviour was wrong.
[C] Shook (him/her).
[D] Shouted, yelled at or screamed at (him/her).
[E] Gave (him/her) something else to do.
[F] Spanked, hit or slapped (him/her) on the bottom with bare hand.
[G] Hit (him/her) on the bottom or elsewhere on the body with something like a belt,hairbrush, stick or other hard object.
[H] Called (him/her) dumb, lazy or another name like that.
[I] Hit or slapped (him/her) on the face, head or ears.
[J] Hit or slapped (him/her) on the hand, arm, or leg.
[K] Beat (him/her) up, that is hit him/her over and over as hard as one could.
YES NO
TOOK AWAY PRIVILEGES ........................... 1 2
EXPLAINED WRONG BEHAVIOR .................................................... 1 2
SHOOK HIM/HER ........................................... 1 2
SHOUTED, YELLED, SCREAMED .................................................. 1 2
GAVE SOMETHING ELSE TO DO ........................................................... 1 2
SPANKED, HIT, SLAPPED ON BOTTOM WITH BARE HAND ................... 1 2
HIT WITH BELT, HAIRBRUSH, STICK OR OTHER HARD OBJECT ......................................................... 1 2
CALLED DUMB, LAZY OR ANOTHER NAME ........................................ 1 2
HIT / SLAPPED ON THE FACE, HEAD OR EARS ........................................... 1 2
HIT / SLAPPED ON HAND,ARM OR LEG ............................................... 1 2
BEAT UP, HIT OVER AND OVER AS HARD AS ONE COULD ......................... 1 2
FCD3. Check FS4: Is this respondent the mother or caretaker of any other children under age 5?
YES............................................................................. 1NO............................................................................... 2 2FCD5
FCD4. Check FS4: Has this respondent already responded to the following question (UCD5) for another child?
YES............................................................................. 1NO............................................................................... 2
1End
FCD5. Do you believe that in order to bring up, raise, or educate a child properly, the child needs to be physically punished?
YES ............................................................................. 1 NO............................................................................... 2
DK / NO OPINION .................................................... 8
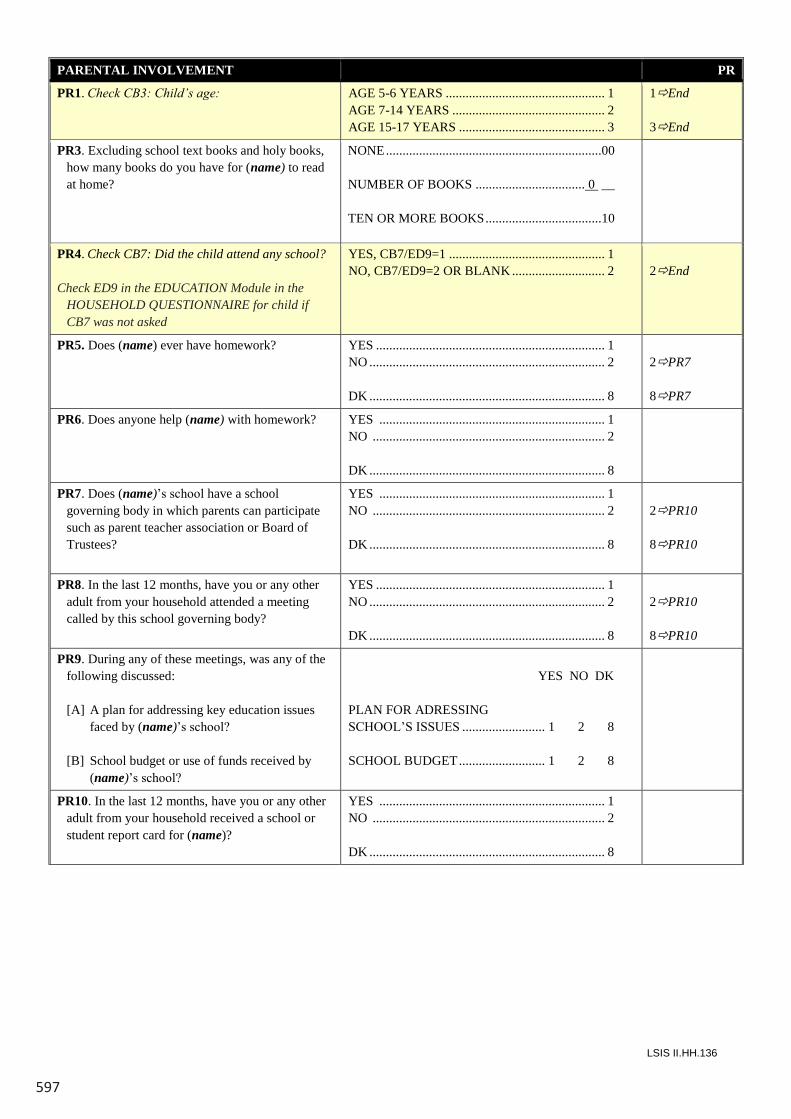
597
LSIS II.HH.136
PARENTAL INVOLVEMENT PR
PR1. Check CB3: Child’s age: AGE 5-6 YEARS ................................................ 1AGE 7-14 YEARS .............................................. 2AGE 15-17 YEARS ............................................ 3
1End
3End
PR3. Excluding school text books and holy books, how many books do you have for (name) to read at home?
NONE.................................................................00
NUMBER OF BOOKS ................................. 0 __
TEN OR MORE BOOKS...................................10
PR4. Check CB7: Did the child attend any school?
Check ED9 in the EDUCATION Module in the HOUSEHOLD QUESTIONNAIRE for child if CB7 was not asked
YES, CB7/ED9=1 ............................................... 1NO, CB7/ED9=2 OR BLANK ............................ 2 2End
PR5. Does (name) ever have homework? YES ..................................................................... 1NO ....................................................................... 2
DK ....................................................................... 8
2PR7
8PR7
PR6. Does anyone help (name) with homework? YES .................................................................... 1NO ...................................................................... 2
DK ....................................................................... 8
PR7. Does (name)’s school have a school governing body in which parents can participate such as parent teacher association or Board of Trustees?
YES .................................................................... 1NO ...................................................................... 2
DK ....................................................................... 8
2PR10
8PR10
PR8. In the last 12 months, have you or any other adult from your household attended a meeting called by this school governing body?
YES ..................................................................... 1NO ....................................................................... 2
DK ....................................................................... 8
2PR10
8PR10
PR9. During any of these meetings, was any of the following discussed:
[A] A plan for addressing key education issues faced by (name)’s school?
[B] School budget or use of funds received by (name)’s school?
YES NO DK
PLAN FOR ADRESSING SCHOOL’S ISSUES ......................... 1 2 8
SCHOOL BUDGET.......................... 1 2 8
PR10. In the last 12 months, have you or any other adult from your household received a school or student report card for (name)?
YES .................................................................... 1NO ...................................................................... 2
DK ....................................................................... 8
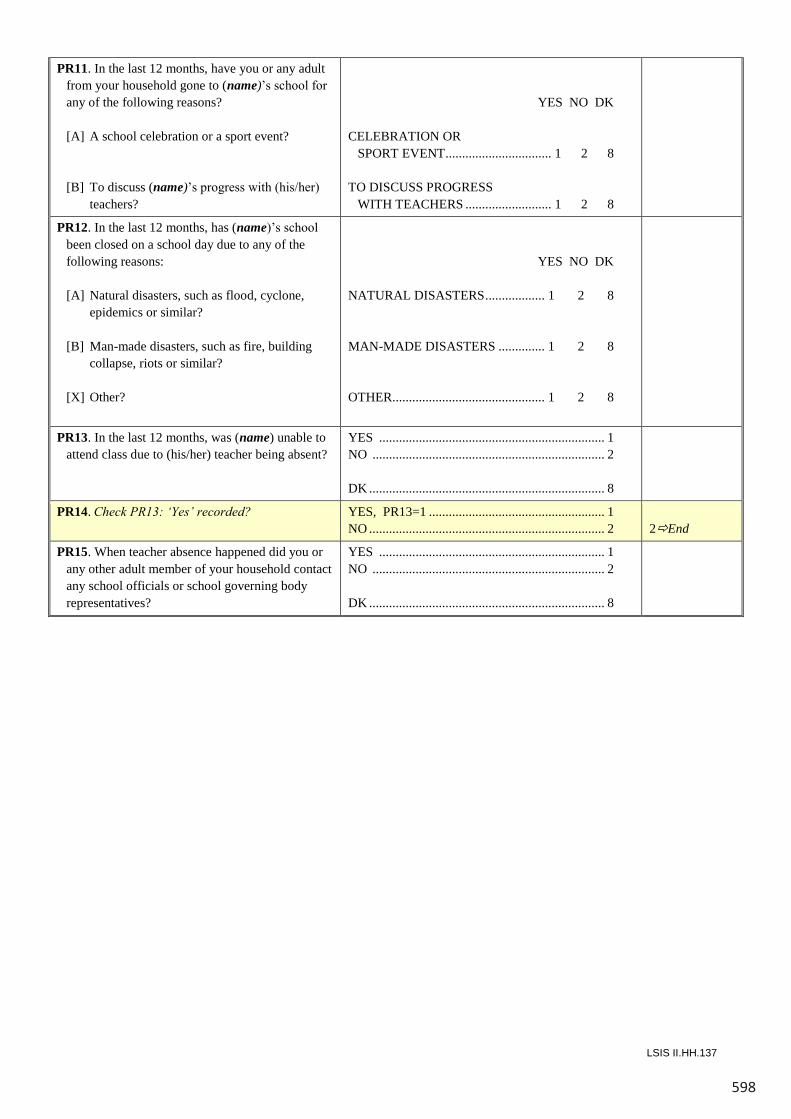
598
LSIS II.HH.137
PR11. In the last 12 months, have you or any adult from your household gone to (name)’s school for any of the following reasons?
[A] A school celebration or a sport event?
[B] To discuss (name)’s progress with (his/her) teachers?
..................................................... YES NO DK
CELEBRATION OR SPORT EVENT................................ 1 2 8
TO DISCUSS PROGRESSWITH TEACHERS .......................... 1 2 8
PR12. In the last 12 months, has (name)’s school been closed on a school day due to any of the following reasons:
[A] Natural disasters, such as flood, cyclone, epidemics or similar?
[B] Man-made disasters, such as fire, building collapse, riots or similar?
[X] Other?
YES NO DK
NATURAL DISASTERS.................. 1 2 8
MAN-MADE DISASTERS .............. 1 2 8
OTHER.............................................. 1 2 8
PR13. In the last 12 months, was (name) unable to attend class due to (his/her) teacher being absent?
YES .................................................................... 1NO ...................................................................... 2
DK ....................................................................... 8
PR14. Check PR13: ‘Yes’ recorded? YES, PR13=1 ..................................................... 1NO ....................................................................... 2 2End
PR15. When teacher absence happened did you or any other adult member of your household contact any school officials or school governing body representatives?
YES .................................................................... 1NO ...................................................................... 2
DK ....................................................................... 8
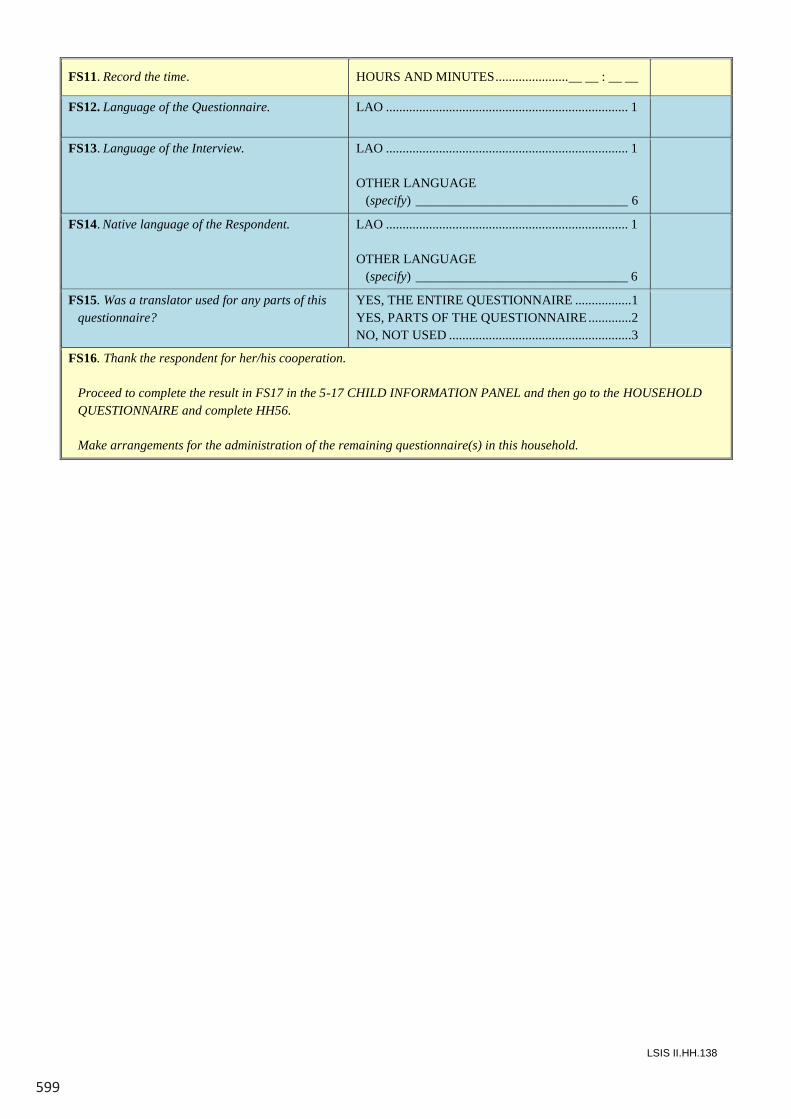
599
LSIS II.HH.138
FS11. Record the time. HOURS AND MINUTES......................__ __ : __ __
FS12. Language of the Questionnaire. LAO ......................................................................... 1
FS13. Language of the Interview. LAO ......................................................................... 1
OTHER LANGUAGE(specify) ________________________________ 6
FS14. Native language of the Respondent. LAO ......................................................................... 1
OTHER LANGUAGE(specify) ________________________________ 6
FS15. Was a translator used for any parts of this questionnaire?
YES, THE ENTIRE QUESTIONNAIRE .................1YES, PARTS OF THE QUESTIONNAIRE.............2NO, NOT USED .......................................................3
FS16. Thank the respondent for her/his cooperation.
Proceed to complete the result in FS17 in the 5-17 CHILD INFORMATION PANEL and then go to the HOUSEHOLDQUESTIONNAIRE and complete HH56.
Make arrangements for the administration of the remaining questionnaire(s) in this household.
600
LSIS II.HH.139
INTERVIEWER’S OBSERVATIONS
SUPERVISOR’S OBSERVATIONS
ຊ່ືປ້ຶມ: Lao Social Indicator Survey II (LSIS II) 2017
ພິມຄ້ັງທີ: 1
ພາສາລາວ ແລະ ພາສາອັງກິດ
ຊ່ືຜູ�ແຕ�ງ: ສູນສະຖິຕິແຫ�ງຊາດ
ຂະໜາດພິມ: A4
ຈ�ານວນໜ�າພິມ: 622 ໜ�າ
ເລກຖະບຽນພິມຈ�າໜ�າຍ: 144/ພຈ 22062018
ຈຸດປະສົງພິມໃນການພິມ: ແຈກຢາຍ
ພິມທີ່: ປານຄ�າ ຈ�າປາ