kinetics of hepatitis c virus reinfection after liver transplantation
TRANSCRIPT
ORIGINAL ARTICLE
Kinetics of Hepatitis C Virus Reinfection AfterLiver TransplantationKimberly A. Powers,1 Ruy M. Ribeiro,1 Keyur Patel,2,3 Stephen Pianko,3 Lisa Nyberg,3,4 Paul Pockros,3
Andrew J. Conrad,5 John McHutchison,2,3 and Alan S. Perelson1
1Theoretical Biology & Biophysics Group, Los Alamos National Laboratory, Los Alamos, NM; 2Duke ClinicalResearch Institute and Division of Gastroenterology, Duke University Medical Center, Durham, NC; 3Divisionof Gastroenterology and Hepatology, Scripps Clinic, La Jolla, CA; 4Kaiser Permanente Medical Care Plan,San Diego, CA; and 5National Genetics Institute, Los Angeles, CA
Improved understanding of hepatitis C virus (HCV) dynamics during and after liver transplantation can be useful in optimizingantiviral therapy in transplant recipients. We analyzed serum HCV ribonucleic acid (RNA) levels during and after cadaveric livertransplantation in 6 HCV patients. After removal of the liver and before the new liver started producing virions, HCV RNA levelsdropped with an average half-life (t1/2) of 0.8 hours. Viral loads then continued to drop up to 23 hours postimplantation (t1/2 �3.4 hours), and began to rise (doubling-time � 2.0 days) as soon as 15 hours after the anhepatic phase. In 3 patients the viralload reached a plateau before rising, suggesting that a nonhepatic source supplied virions and balanced their intrinsicclearance. However, from the decline in viral load over the first 24 hours of the postanhepatic phase, we estimate thatnonhepatic sources can at most correspond to 4% of total viral production, 96% of which occurs in the liver, even after wecorrected for fluid exchanges during surgery. As the new liver was reinfected, production increased and viral load rose to a newsteady state. Using nonlinear regression, we were able to fit the patients’ HCV RNA data to a viral dynamic model and estimatethe de novo infection rate (mean 1.5 � 10�6 mL/virion/day), as well as the average percentage of hepatocytes infected at theposttransplantation steady state (19%). In conclusion, we have quantified liver reinfection dynamics in the absence ofposttransplantation antiviral therapy. Our findings support the notion that early antiviral therapy may delay or preventreinfection. Liver Transpl 12:207-216, 2006. © 2006 AASLD.
Received May 23, 2005; accepted July 28, 2005.
See Editorial on Page 194
End-stage liver disease due to hepatitis C virus (HCV)infection is the most common indication for liver trans-plantation in the United States.1,2 While many patientsinitially appear to do well following transplantation,graft reinfection as measured by detectable serum HCVribonucleic acid (RNA) is universal.2,3
Serum HCV RNA decreases rapidly during and imme-diately after the removal of the infected liver and the
implantation of the new, uninfected one.4–9 This is fol-lowed by a steady increase in viral concentrationswithin days.4-12 Once the new liver becomes infected—presumably by circulating virions that remain2,6,12 orfrom extrahepatic compartments13-19—hepatic viralreplication resumes, causing serum HCV RNA levels torise. Complications of interpretation may arise if theliver is also a major site of virion clearance, as has beensuggested in human immunodeficiency virus-1 infec-tion.20 The resumption of viral replication is probablyhastened by the immunosuppression that accompanies
Abbreviations: HCV, hepatitis C virus; RNA, ribonucleic acid.Supported by National Institutes of Health (NIH) grant RR06555 (to A.S.P.), a General Clinical Research Center grant at Scripps Clinic(MO1-RR00833); and the U.S. Department of Energy (under contract W-7405-ENG-36). R.M.R. was partially funded by a Marie Curie Fellowshipof the European Community program “Quality of Life” (contract number QLK2-CT-2002-51691).Kimberly A. Powers and Ruy M. Ribeiro contributed equally to this work.Address reprint requests to Alan S. Perelson, MS-K710, T-10, Theoretical Biology & Biophysics Group, Los Alamos National Laboratory, LosAlamos, NM 87545. Telephone: 505-667-6829; FAX: 505-665-3493; E-mail: [email protected]
DOI 10.1002/lt.20572Published online in Wiley InterScience (www.interscience.wiley.com).
LIVER TRANSPLANTATION 12:207-216, 2006
© 2006 American Association for the Study of Liver Diseases.
organ transplantation,6,8,12,16,21-25 as significant HCVRNA increases have been observed in patients receivingsteroids outside the transplantation setting.26,27
Mathematical models have been successfully usedto study the viral dynamics of human immunodefi-ciency virus-1 infection and responses to antiretrovi-ral therapy.28,29 Similar models have also been ap-plied to hepatitis B virus infection after initiation ofantiviral therapy,30,31 and these have provided both agreater understanding of the lifecycle of these vi-ruses, and insight into the rationale for therapy. Theextension of these models to the study of viral dynam-ics in chronic HCV infection has been facilitated bythe development of sensitive quantitative assays forHCV RNA, which have provided an accurate means offollowing viral replication and elimination of the vi-rus, particularly during antiviral therapy. Frequentmeasurements of serum HCV RNA in the initialphases of interferon-based therapy for chronic HCVinfection have also allowed mathematical modeling ofviral kinetics during treatment, and provided insightsinto possible mechanisms of interferon resistanceand the early, accurate prediction of virologic re-sponses to therapy.32,33 Taken together, viral kinet-ics studies may allow the clinician to better select,optimize, and target treatment for those patients withexpected poor responses to antiviral therapy.
In the setting of liver transplantation, it is currentlyunknown whether the evaluation of viral kinetics andviral burden early in the postoperative period followingliver transplantation will provide greater insight intodisease recurrence and severity, as well as provide arationale for treating patients according to viral andhost factors. Greater understanding of the reinfectiontime-course, the effects of immunosuppression, thepresence of extrahepatic replication as a potentialsource of reinfection, and the predictive value of serumHCV RNA levels could be used to optimize immunosup-pressive and antiviral therapy regimens in liver trans-plant recipients. A recent report has analyzed in detailthe viral decline during the early postanhepaticphase.34 Here we center our analyses on the kinetics ofviral resurgence following liver transplantation in 6
HCV-infected patients. We use a model to show thatquantitative insights can be gained into the events thatfollow transplantation. Our study adds new informa-tion about the kinetics of reinfection and the level ofviremia attained after reinfection, and it estimates howmuch of the liver needs to be infected before viral re-surgence is seen. Our analysis also provides support forthe existence of extrahepatic sites of HCV replication.
PATIENTS AND METHODS
Patients and Data Collection
The study population included 6 patients who wereundergoing cadaveric liver transplantation for end-stage liver disease due to chronic HCV infection. Base-line characteristics are summarized in Table 1. Thestudy protocol was approved by the institutional reviewboard (Scripps Clinic) and all patients provided in-formed consent.
Serum samples for HCV RNA levels were collectedfrom peripheral veins in all patients every 2 hours in thepreoperative stage, every hour during the preanhepaticphase (during mobilization of the recipient’s diseasedliver), every 15 minutes during the anhepatic phase(removal of recipient liver), and hourly in the postanhe-patic phase (following the insertion of the transplantedliver and unclamping of the porto-caval vessels) untilthe end of the operation. Thereafter, serum sampleswere obtained every 4 to 6 hours in the first 2 dayspostoperatively, and daily until discharge from the hos-pital. Following discharge, serum for HCV RNA wascollected weekly for 10-12 weeks. All patients weregiven induction immunosuppressive therapy duringthe immediate preoperative period, and thereafter re-ceived an immunosuppressive regimen as indicated inTable 1.
The number of serum HCV RNA measurementsranged from 4 to 9 in the preanhepatic phase, 2 to 4 inthe brief anhepatic phase, and 22 to 31 in the postan-hepatic phase. All serum samples were separatedwithin 2 hours and stored at �70°C until analysis.Serum HCV RNA was measured by a reverse transcrip-
TABLE 1. Baseline Characteristics
Pat
HCV RNA*
(105 copies/mL) Genotype
Explant liver
weight (gm)
Donor liver
weight† (gm)
Immunosuppressive
Therapy
1 11.6 1b 975 2251 CSA, MMF, PRED2 0.5 1b 1296 2284 CSA‡, MMF3 1.1 1a 1777 1970 TL, AZA, PRED4 2.0 1b 1743 1819 CSA, MMF, PRED5 35.7 1b 950 1346 TL, MMF, PRED6 8.4 3a 1203 1681 TL, MMF, PRED
Abbreviations: CSA, cyclosporine; MMF, mycophenylate mofetil; PRED, prednisolone; RAPA, rapamycin; TL, tacrolimus; AZA,azathioprine.*Mean preanhepatic serum HCV RNA.†Based on weight and height of donors and Heinemann et al.41
‡Changed to RAPA.
208 POWERS ET AL.
LIVER TRANSPLANTATION.DOI 10.1002/lt. Published on behalf of the American Association for the Study of Liver Diseases
tion polymerase chain reaction assay (Superquant;NGI, Los Angeles, CA) with a lower limit of detection of100 copies/mL as previously described.35 A value of100 copies/mL was used in all analyses at points whereHCV RNA levels dropped below the detection limit.Samples with HCV RNA levels �5,000,000 copies/mLwere diluted further and quantified. HCV genotypingwas performed using a line-probe assay (Inno-LiPA; In-nogenetics NV, Zwijnaarde, Belgium).36
Mathematical Modeling
Neumann et al.33 have modeled HCV infection with thefollowing equations:
dT/dt � s�dT � �VT (1)
dI/dt � �VT � �I (2)
dV/dt � pI � cV , (3)
where T is the number of target cells, I is the number ofproductively infected cells, and V is the viral concentra-tion in copies/mL of serum HCV RNA. The parameter sdenotes the rate at which target cells are produced andd their per capita death rate. The rate constant for denovo infection is �, and the per capita rate at whichinfected cells are lost is �. The production of hepatitis Cvirions occurs at mean rate p per infected cell, andclearance of these virions occurs at rate c per virion.
If we assume that removal of the liver results in acomplete lack of productively infected cells (that is, I �0) during the anhepatic phase and shortly thereafter,before virion production starts in the new liver, then Eq.3 reduces to
dV/dt � � cV . (4)
The value of c, then, is given by the slope of the naturallogarithm of the serum HCV RNA concentration vs.time. To calculate this value, we used the data duringthe anhepatic phase and the first 4 hours of the post-anhepatic phase, before there was time for viral produc-tion to restart.
To model the postanhepatic resurgence in viral con-centration, we modified the Neumann et al.33 equa-tions. We assumed that on the time scale of the post-anhepatic viral resurgence, the number of target cellswas not substantially changed by new target cell pro-duction or death, and thus only the relatively rapidprocess of infection (as described by the �VT term in Eq.1) was needed to describe changes in the number oftarget cells. In this scenario, Eqs. 1-3 reduce to
dT/dt � � �VT (5)
dI/dt � �VT � �I (6)
dV/dt � pI � cV . (7)
Using nonlinear least squares regression, we fitted themodel given by Eqs. 5-7 to serum HCV RNA measure-ments during the postanhepatic resurgence. For eachfit of the resurgence kinetics, the viral level at the startof resurgence, Vor, was fixed at the patient’s final pre-
resurgence measurement, and the clearance rate c wasfixed at the value determined from the anhepatic andearly postanhepatic decay slope. In patients 1, 5, and 6,we fitted the resurgence beginning with the HCV RNAminimum that followed the postanhepatic decline andimmediately preceded the subsequent increase. In pa-tients 2, 3 and 4, who had plateaus in their HCV RNAlevels between the decline and increase, we fitted theresurgence starting with the last data point of the pla-teau.
The data could be fit with � that was 0 to at least 3decimal places in all patients, possibly reflecting theeffects of immunosuppression on cell-mediated im-mune responses and the fact that over the 90 days offollow-up, the effects of a small � are not measurable.Given this result, we removed the �I term from themodel to reduce the number of parameters and improvethe reliability of our parameter estimates. In addition,from viral load measurements one can not estimate theparameter p. To see this, use the new variables I � pIand T � pT, and the corresponding model equations:
dT/dt � � �VT (8)
dI/dt � �VT (9)
dV/dt � I � cV (10)
Fitting the viral load data to this model, we could reli-ably estimate 2 parameters from the resurgence data: �and pT0r, the initial condition of the new variable T. Forthese fits, the values of V0r and c were fixed at the finalpreresurgence measurement, as described above forthe fits of Eqs. 5-7. The initial number of infected hepa-tocytes at the start of resurgence (I0r) is given by cV0r/pand thus I0r � cV0.
Fluid Balance
During the transplant surgery patients lose blood, andare given compensatory amounts of fluid and cells.Fluid balance was monitored for each patient duringthe surgery and we used the patient’s chart to correctthe viral concentration for blood loss and fluid input,assumed to occur mostly during the anhepatic andpostanhepatic phases. Consider the total number ofviral particles (VT) and total fluid volume (F) in a patient,then these quantities change according to
dVT
dt� pIT � cVT � �
VT
F(11)
dFdt
� � � � (12)
where � is the fluid input rate and � is the blood lossrate, which we assume constant during the anhepaticand postanhepatic phases. That is, we use the patient’scharts to calculate the total fluid intake and blood lossand then divide these by the duration of the anhepaticand postanhepatic phases, assuming that 20% of thefluid exchanges occur between the start of surgery andthe time the liver is removed, and that 80% of the fluid
HCV REINFECTION AFTER LIVER TRANSPLANTATION 209
LIVER TRANSPLANTATION.DOI 10.1002/lt. Published on behalf of the American Association for the Study of Liver Diseases
exchanges occur during the anhepatic and postanhe-patic phases. In general, these values will differ frompatient to patient, but we use this approximation be-cause the exact times of blood loss and fluid infusionare not available. Fluid input does not change the totalbody viral burden, but can lower the virus concentra-tion through dilution. Furthermore, loss of blood con-taining virus does not change the virus concentrationbut leads to a reduction in total viral burden at rate �VT.We assume V, the viral concentration, is the same inserum and other extracellular fluids and hence is givenby V � VT/F. Taking into account the fluid exchanges,the viral concentration changes according to
dVdt
�pIT
F� �c �
�
F�V. (13)
From Eq. 12, F � F0 (� � �)t, where F0 is the total bodyfluid at baseline, which we calculated based on thepatient’s weight and assuming that a 70 kg patient hasa normal extracellular fluid volume of 15 L.37 As before,we assume that during the anhepatic phase the viralproduction term is 0, and solving Eq. 13 shows that thenatural logarithm of V decreases approximately withslope �(c �/F0), instead of just c. The input of fluidincludes the volume of plasma, cryoglobulins, saline/dextrose solution and 40% of the volume of packed redcells given to the patient. Input of cell-saver units wasassumed to include virus at the same concentration asfound in blood, and thus to not change the concentra-tion of virus. We used our estimates of � and F0 tocalculate c from the viral decay slope during the anhe-patic phase. It was this value of c that we used as a fixedparameter in our model fits (Eqs. 8-10).
Statistical Analysis
We used linear regression to assess the relationshipsbetween continuous variables. Viral concentrationslopes were calculated by linear random effects regres-sion with HCV RNA measurements expressed in natu-ral logarithm using SPlus (Insightful, Seattle, WA). Theelimination half-life of hepatitis C virions during HCVRNA decline and HCV doubling time during periods ofincrease were calculated as ln(2)/slope, where ln(2) rep-resents the natural logarithm of 2. Confidence intervals(95%) were obtained with bootstrap resampling using500 simulations. Results are presented as mean standard deviation.
RESULTS
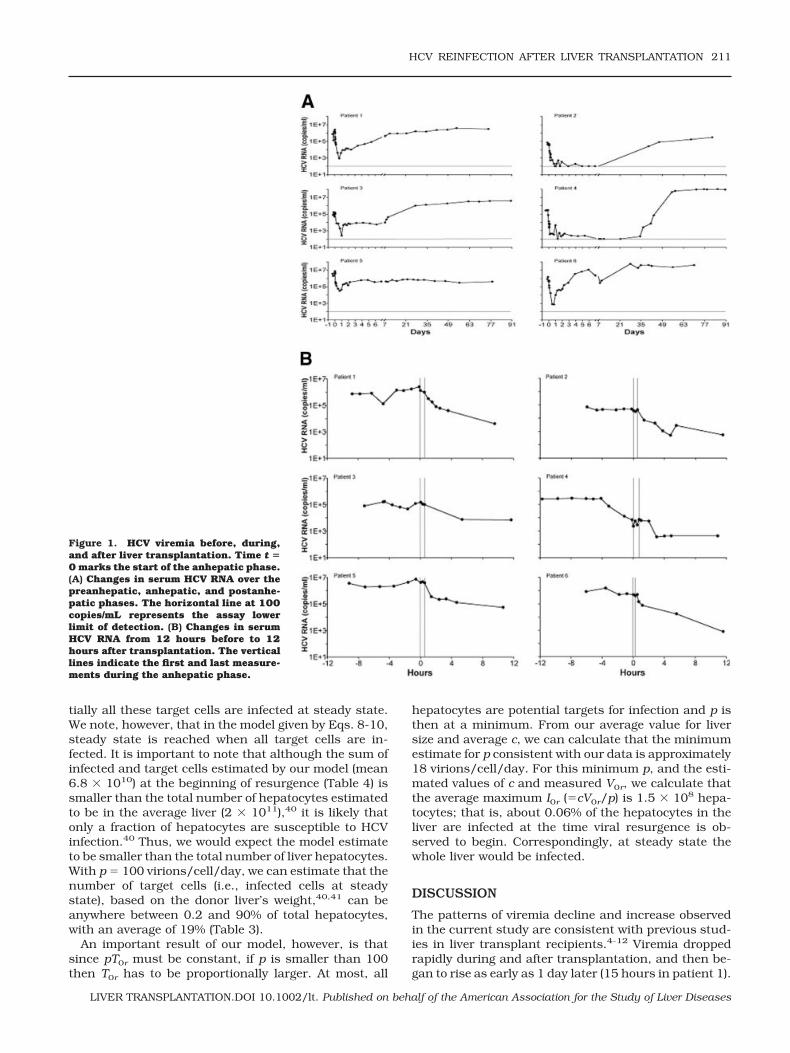
In most patients, HCV RNA levels decreased rapidlyduring and after transplantation and subsequently be-gan to increase—reaching above pretransplantationlevels in all but 1 patient (patient 5)—within a few daysof the procedure (Fig. 1). During the anhepatic phase,which ranged from 28 to 53 minutes, and early graftreperfusion (less than 4-hour postanhepatic phase), se-rum HCV RNA levels decreased in all 6 patients by anaverage of 1.0 log10 0.52 log10. The mean decay slope
during this phase was �0.99 0.18 per hour (Table 2).We then estimated the clearance rate, c, by correctingthese slopes for the average fluid input rate during thisperiod (see Patients and Methods). The mean value ofthe virion clearance rate (c) was estimated as 0.87 0.15 per hour (mean t1/2 � 0.82 hours) (Table 2).
Serum HCV RNA concentration continued to declinerapidly up to 23 hours into the postanhepatic phase(Table 3), with a mean decrease of 1.6 log10. The meandecay slope during this period was �0.23 0.08 perhour, and the mean viral elimination half-life was 3.4 1.3 hours (Table 2). In patients 2 and 4, this decline wasfollowed by a plateau in serum HCV RNA levels beforethey began to rise again; in these patients, serum HCVRNA slopes were nearly 0 for 6 to 34 days after thepostanhepatic decline ended (Fig. 1; Table 3). Similarly,patient 3 experienced a plateau between days 2 and 7,although this plateau followed a brief initial increase inHCV RNA levels after the decline (Fig. 1).
HCV RNA concentration increases following the ini-tial postanhepatic decline were dramatic, ranging from1.4 log10 to 6.0 log10, and reached a steady state higherthan the pretransplantation level in patients 1, 2, 3, 4,and 6 within 4 to 82 days (Fig. 1; Table 3). These newsteady states were between 1.4 and 450 times higherthan the mean preanhepatic serum HCV RNA levels.Interestingly, patients with higher baseline viral loadsreached the posttransplantation steady state faster (p �0.04). During the postanhepatic viral resurgence, themean slope was 0.77 0.64 per day, and the meanHCV RNA doubling time was 2.0 2.0 days (Table 2). Ifwe consider only those patients with at least a 2 log10
increase during the first week after transplantation, ashas been done previously,6 we obtain a doubling time of18.6 11.8 hours.
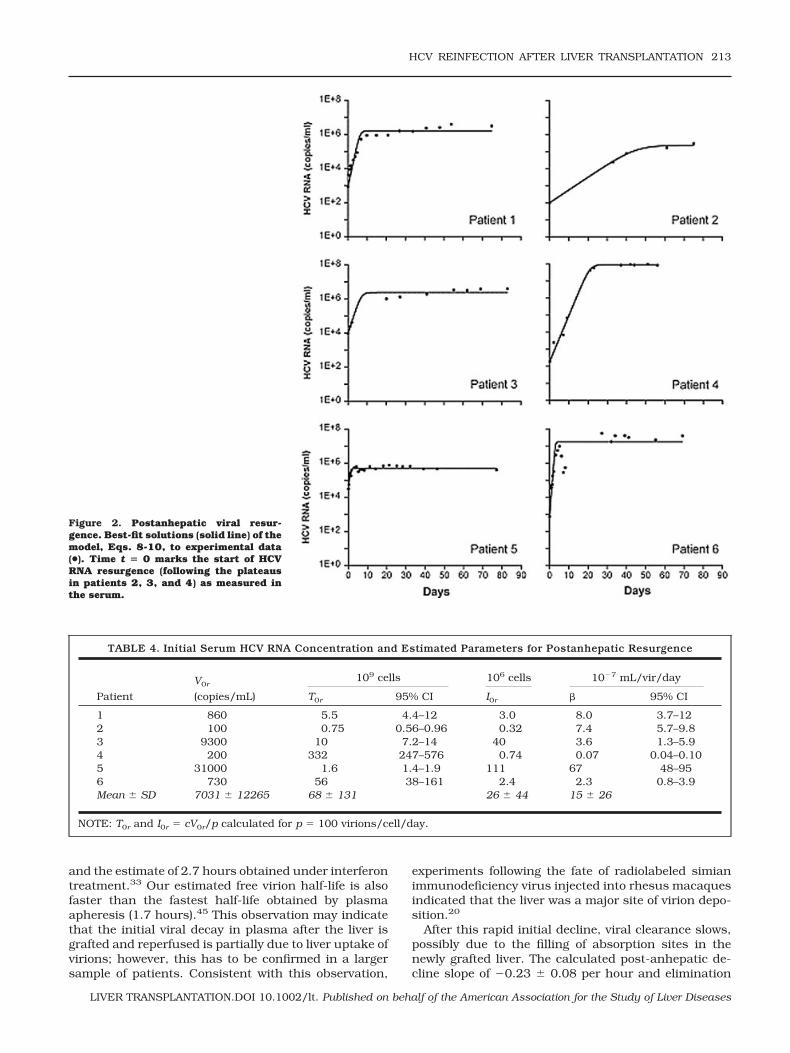
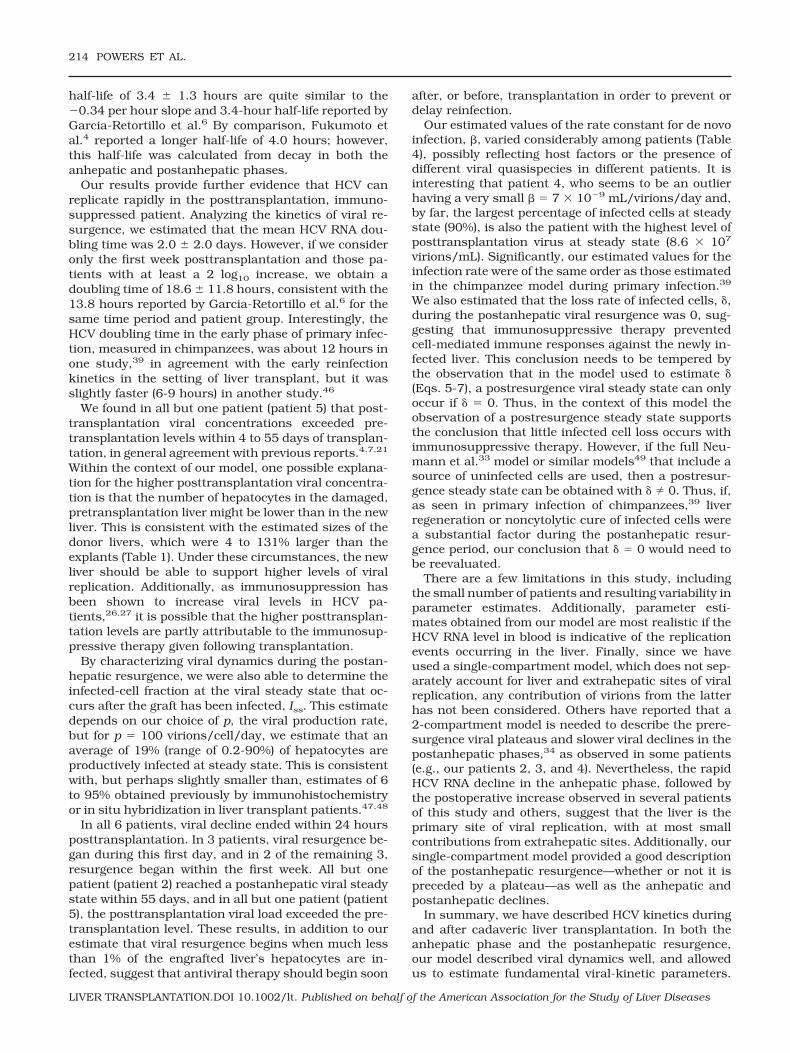
Our model of posttransplantation HCV dynamics,given by Eqs. 8-10, provided a good description of thepostanhepatic viral resurgence, as illustrated by the fitof each patient’s resurgence data to the model (Fig. 2).We fixed c at the values estimated above, and used theposttransplantation data to estimate, via nonlinearleast-squares regression, the de novo infection rateconstant (�) as 1.5 � 10�6 2.6 � 10�6 mL/virion/day, with relatively small 95% confidence intervals foreach patient obtained from bootstrap resampling (Table4). As explained in Patients and Methods, the otherparameter estimated was the product pT0r. The numberof virions produced per infected cell (p) is not known inhumans. But the difficulty in detecting HCV replicationintermediates in the liver, by immunoblot, in situ im-munochemistry, and other techniques, indicates that pshould be small.38 In addition, a recent study of HCVprimary infection in chimpanzees also estimated smallvalues for p (range 0.1-300 virions/cell/day) in thisanimal model.39 If we assume that p � 100 virions/cell/day, then we can estimate that the number ofhepatocytes susceptible to infection (T0r) is about 7 �1010 and the corresponding number of infected hepa-tocytes (I0r) is 2.6 � 107, before resurgence (Table 4).These results are consistent with the results in Table 3,where, by solving Eqs. 8-10, we estimate that essen-
210 POWERS ET AL.
LIVER TRANSPLANTATION.DOI 10.1002/lt. Published on behalf of the American Association for the Study of Liver Diseases
tially all these target cells are infected at steady state.We note, however, that in the model given by Eqs. 8-10,steady state is reached when all target cells are in-fected. It is important to note that although the sum ofinfected and target cells estimated by our model (mean6.8 � 1010) at the beginning of resurgence (Table 4) issmaller than the total number of hepatocytes estimatedto be in the average liver (2 � 1011),40 it is likely thatonly a fraction of hepatocytes are susceptible to HCVinfection.40 Thus, we would expect the model estimateto be smaller than the total number of liver hepatocytes.With p � 100 virions/cell/day, we can estimate that thenumber of target cells (i.e., infected cells at steadystate), based on the donor liver’s weight,40,41 can beanywhere between 0.2 and 90% of total hepatocytes,with an average of 19% (Table 3).
An important result of our model, however, is thatsince pT0r must be constant, if p is smaller than 100then T0r has to be proportionally larger. At most, all
hepatocytes are potential targets for infection and p isthen at a minimum. From our average value for liversize and average c, we can calculate that the minimumestimate for p consistent with our data is approximately18 virions/cell/day. For this minimum p, and the esti-mated values of c and measured V0r, we calculate thatthe average maximum I0r (�cV0r/p) is 1.5 � 108 hepa-tocytes; that is, about 0.06% of the hepatocytes in theliver are infected at the time viral resurgence is ob-served to begin. Correspondingly, at steady state thewhole liver would be infected.
DISCUSSION
The patterns of viremia decline and increase observedin the current study are consistent with previous stud-ies in liver transplant recipients.4-12 Viremia droppedrapidly during and after transplantation, and then be-gan to rise as early as 1 day later (15 hours in patient 1).
Figure 1. HCV viremia before, during,and after liver transplantation. Time t �0 marks the start of the anhepatic phase.(A) Changes in serum HCV RNA over thepreanhepatic, anhepatic, and postanhe-patic phases. The horizontal line at 100copies/mL represents the assay lowerlimit of detection. (B) Changes in serumHCV RNA from 12 hours before to 12hours after transplantation. The verticallines indicate the first and last measure-ments during the anhepatic phase.
HCV REINFECTION AFTER LIVER TRANSPLANTATION 211
LIVER TRANSPLANTATION.DOI 10.1002/lt. Published on behalf of the American Association for the Study of Liver Diseases
The mean anhepatic decline of 1.0 log10 0.52 log10
was larger than previously reported.6 We were inter-ested in the decay of viral load before the new liverstarted producing virions, and as such we calculatedthe decay over the first 4 hours of anhepatic phase andgraft reperfusion, whereas in the previous report theauthors considered only the anhepatic phase.6 Thesubsequent mean decline of 1.6 log10 during the first 2to 23 hours of the postanhepatic phase was similar tothe decrease of 1.5 log10 observed by Garcia-Retortilloet al.6 during the first 8 to 24 hours after transplanta-tion.
The fact that HCV RNA falls to �1% of its initial level(i.e., declines by �2 log10) 24 hours postanhepaticphase (Fig. 1) suggests that at least 99% of HCV isproduced in the liver. However, if we take into consid-eration the dilution effects of fluid input during theanhepatic and postanhepatic phases, we estimate HCVRNA falls to about 4% (a decline of 1.8 log10) of its initialvalue due to lack of viral production, indicating that aminimum of approximately 96% of this production oc-
curs in the liver. However, the observation that HCVRNA does not simply continue to decline and becomeundetectable indicates that either infection of the newliver starts extremely rapidly or that virus productionby extrahepatic sources or leakage from extrahepaticreservoirs, such as the surfaces of follicular dendriticcells,42 provides a continuing low level of HCV RNA. In3 patients (patients 2, 3, and 4) there was a plateau inHCV RNA levels before viral resurgence occurred (Fig.1A; Table 3), consistent with a low rate of viral produc-tion, possibly extrahepatic. Indeed, Dahari et al.34
found, by modeling the early postanhepatic phase, thatany extrahepatic compartments would be responsiblefor approximately 3% of virus in circulation. The exactnature of these extrahepatic sites is unknown, but pe-ripheral blood mononuclear cells have been suggestedas likely candidates.43,44
From the kinetics of viral decline, we estimated thatthe free virion half-life was 0.8 0.2 hours during theanhepatic and early postanhepatic phase, much fasterthan the 2.2-hour estimate of Garcia-Retortillo et al.6
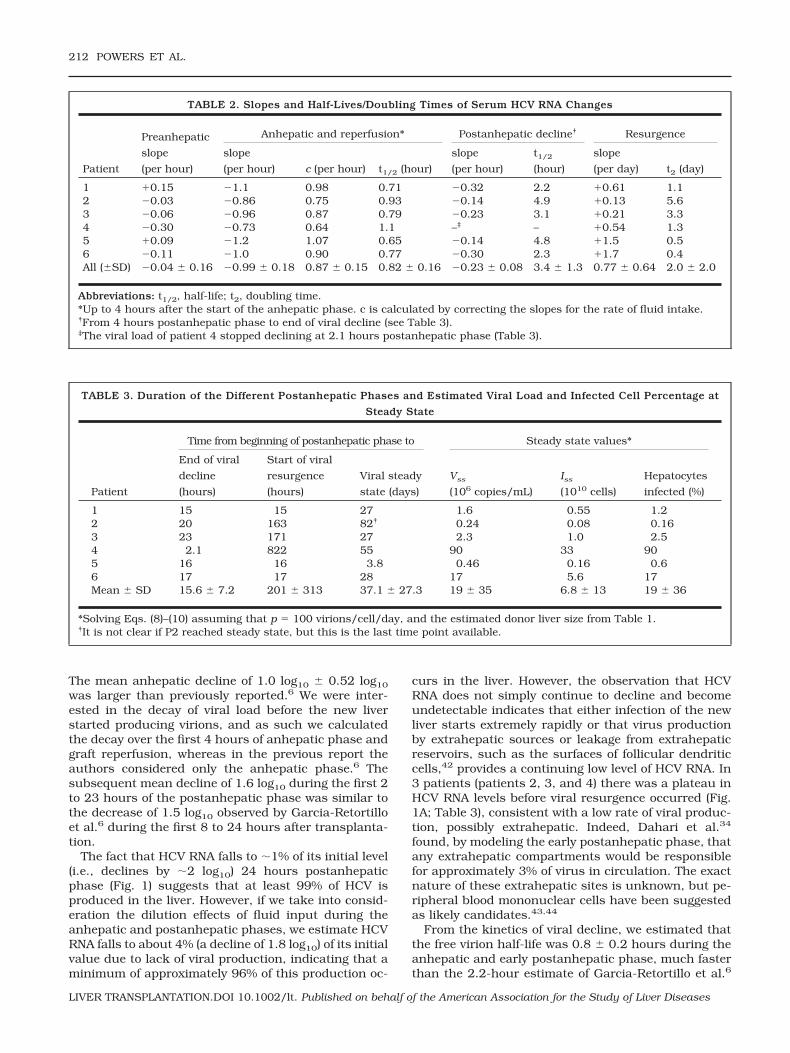
TABLE 2. Slopes and Half-Lives/Doubling Times of Serum HCV RNA Changes
Patient
Preanhepatic
slope
(per hour)
Anhepatic and reperfusion* Postanhepatic decline† Resurgence
slope
(per hour) c (per hour) t1/2 (hour)
slope
(per hour)
t1/2
(hour)
slope
(per day) t2 (day)
1 0.15 �1.1 0.98 0.71 �0.32 2.2 0.61 1.12 �0.03 �0.86 0.75 0.93 �0.14 4.9 0.13 5.63 �0.06 �0.96 0.87 0.79 �0.23 3.1 0.21 3.34 �0.30 �0.73 0.64 1.1 –‡ – 0.54 1.35 0.09 �1.2 1.07 0.65 �0.14 4.8 1.5 0.56 �0.11 �1.0 0.90 0.77 �0.30 2.3 1.7 0.4All (SD) �0.04 0.16 �0.99 0.18 0.87 0.15 0.82 0.16 �0.23 0.08 3.4 1.3 0.77 0.64 2.0 2.0
Abbreviations: t1/2, half-life; t2, doubling time.*Up to 4 hours after the start of the anhepatic phase. c is calculated by correcting the slopes for the rate of fluid intake.†From 4 hours postanhepatic phase to end of viral decline (see Table 3).‡The viral load of patient 4 stopped declining at 2.1 hours postanhepatic phase (Table 3).
TABLE 3. Duration of the Different Postanhepatic Phases and Estimated Viral Load and Infected Cell Percentage at
Steady State
Patient
Time from beginning of postanhepatic phase to Steady state values*
End of viral
decline
(hours)
Start of viral
resurgence
(hours)
Viral steady
state (days)
Vss
(106 copies/mL)
Iss
(1010 cells)
Hepatocytes
infected (%)
1 15 15 27 1.6 0.55 1.22 20 163 82† 0.24 0.08 0.163 23 171 27 2.3 1.0 2.54 2.1 822 55 90 33 905 16 16 3.8 0.46 0.16 0.66 17 17 28 17 5.6 17Mean SD 15.6 7.2 201 313 37.1 27.3 19 35 6.8 13 19 36
*Solving Eqs. (8)–(10) assuming that p � 100 virions/cell/day, and the estimated donor liver size from Table 1.†It is not clear if P2 reached steady state, but this is the last time point available.
212 POWERS ET AL.
LIVER TRANSPLANTATION.DOI 10.1002/lt. Published on behalf of the American Association for the Study of Liver Diseases
and the estimate of 2.7 hours obtained under interferontreatment.33 Our estimated free virion half-life is alsofaster than the fastest half-life obtained by plasmaapheresis (1.7 hours).45 This observation may indicatethat the initial viral decay in plasma after the liver isgrafted and reperfused is partially due to liver uptake ofvirions; however, this has to be confirmed in a largersample of patients. Consistent with this observation,
experiments following the fate of radiolabeled simianimmunodeficiency virus injected into rhesus macaquesindicated that the liver was a major site of virion depo-sition.20
After this rapid initial decline, viral clearance slows,possibly due to the filling of absorption sites in thenewly grafted liver. The calculated post-anhepatic de-cline slope of �0.23 0.08 per hour and elimination
TABLE 4. Initial Serum HCV RNA Concentration and Estimated Parameters for Postanhepatic Resurgence
Patient
V0r
(copies/mL)
109 cells 106 cells 10�7 mL/vir/day
T0r 95% CI I0r � 95% CI
1 860 5.5 4.4–12 3.0 8.0 3.7–122 100 0.75 0.56–0.96 0.32 7.4 5.7–9.83 9300 10 7.2–14 40 3.6 1.3–5.94 200 332 247–576 0.74 0.07 0.04–0.105 31000 1.6 1.4–1.9 111 67 48–956 730 56 38–161 2.4 2.3 0.8–3.9Mean SD 7031 12265 68 131 26 44 15 26
NOTE: T0r and I0r � cV0r/p calculated for p � 100 virions/cell/day.
Figure 2. Postanhepatic viral resur-gence. Best-fit solutions (solid line) of themodel, Eqs. 8-10, to experimental data(●). Time t � 0 marks the start of HCVRNA resurgence (following the plateausin patients 2, 3, and 4) as measured inthe serum.
HCV REINFECTION AFTER LIVER TRANSPLANTATION 213
LIVER TRANSPLANTATION.DOI 10.1002/lt. Published on behalf of the American Association for the Study of Liver Diseases
half-life of 3.4 1.3 hours are quite similar to the�0.34 per hour slope and 3.4-hour half-life reported byGarcia-Retortillo et al.6 By comparison, Fukumoto etal.4 reported a longer half-life of 4.0 hours; however,this half-life was calculated from decay in both theanhepatic and postanhepatic phases.
Our results provide further evidence that HCV canreplicate rapidly in the posttransplantation, immuno-suppressed patient. Analyzing the kinetics of viral re-surgence, we estimated that the mean HCV RNA dou-bling time was 2.0 2.0 days. However, if we consideronly the first week posttransplantation and those pa-tients with at least a 2 log10 increase, we obtain adoubling time of 18.6 11.8 hours, consistent with the13.8 hours reported by Garcia-Retortillo et al.6 for thesame time period and patient group. Interestingly, theHCV doubling time in the early phase of primary infec-tion, measured in chimpanzees, was about 12 hours inone study,39 in agreement with the early reinfectionkinetics in the setting of liver transplant, but it wasslightly faster (6-9 hours) in another study.46
We found in all but one patient (patient 5) that post-transplantation viral concentrations exceeded pre-transplantation levels within 4 to 55 days of transplan-tation, in general agreement with previous reports.4,7,21
Within the context of our model, one possible explana-tion for the higher posttransplantation viral concentra-tion is that the number of hepatocytes in the damaged,pretransplantation liver might be lower than in the newliver. This is consistent with the estimated sizes of thedonor livers, which were 4 to 131% larger than theexplants (Table 1). Under these circumstances, the newliver should be able to support higher levels of viralreplication. Additionally, as immunosuppression hasbeen shown to increase viral levels in HCV pa-tients,26,27 it is possible that the higher posttransplan-tation levels are partly attributable to the immunosup-pressive therapy given following transplantation.
By characterizing viral dynamics during the postan-hepatic resurgence, we were also able to determine theinfected-cell fraction at the viral steady state that oc-curs after the graft has been infected, Iss. This estimatedepends on our choice of p, the viral production rate,but for p � 100 virions/cell/day, we estimate that anaverage of 19% (range of 0.2-90%) of hepatocytes areproductively infected at steady state. This is consistentwith, but perhaps slightly smaller than, estimates of 6to 95% obtained previously by immunohistochemistryor in situ hybridization in liver transplant patients.47,48
In all 6 patients, viral decline ended within 24 hoursposttransplantation. In 3 patients, viral resurgence be-gan during this first day, and in 2 of the remaining 3,resurgence began within the first week. All but onepatient (patient 2) reached a postanhepatic viral steadystate within 55 days, and in all but one patient (patient5), the posttransplantation viral load exceeded the pre-transplantation level. These results, in addition to ourestimate that viral resurgence begins when much lessthan 1% of the engrafted liver’s hepatocytes are in-fected, suggest that antiviral therapy should begin soon
after, or before, transplantation in order to prevent ordelay reinfection.
Our estimated values of the rate constant for de novoinfection, �, varied considerably among patients (Table4), possibly reflecting host factors or the presence ofdifferent viral quasispecies in different patients. It isinteresting that patient 4, who seems to be an outlierhaving a very small � � 7 � 10�9 mL/virions/day and,by far, the largest percentage of infected cells at steadystate (90%), is also the patient with the highest level ofposttransplantation virus at steady state (8.6 � 107
virions/mL). Significantly, our estimated values for theinfection rate were of the same order as those estimatedin the chimpanzee model during primary infection.39
We also estimated that the loss rate of infected cells, �,during the postanhepatic viral resurgence was 0, sug-gesting that immunosuppressive therapy preventedcell-mediated immune responses against the newly in-fected liver. This conclusion needs to be tempered bythe observation that in the model used to estimate �(Eqs. 5-7), a postresurgence viral steady state can onlyoccur if � � 0. Thus, in the context of this model theobservation of a postresurgence steady state supportsthe conclusion that little infected cell loss occurs withimmunosuppressive therapy. However, if the full Neu-mann et al.33 model or similar models49 that include asource of uninfected cells are used, then a postresur-gence steady state can be obtained with � � 0. Thus, if,as seen in primary infection of chimpanzees,39 liverregeneration or noncytolytic cure of infected cells werea substantial factor during the postanhepatic resur-gence period, our conclusion that � � 0 would need tobe reevaluated.
There are a few limitations in this study, includingthe small number of patients and resulting variability inparameter estimates. Additionally, parameter esti-mates obtained from our model are most realistic if theHCV RNA level in blood is indicative of the replicationevents occurring in the liver. Finally, since we haveused a single-compartment model, which does not sep-arately account for liver and extrahepatic sites of viralreplication, any contribution of virions from the latterhas not been considered. Others have reported that a2-compartment model is needed to describe the prere-surgence viral plateaus and slower viral declines in thepostanhepatic phases,34 as observed in some patients(e.g., our patients 2, 3, and 4). Nevertheless, the rapidHCV RNA decline in the anhepatic phase, followed bythe postoperative increase observed in several patientsof this study and others, suggest that the liver is theprimary site of viral replication, with at most smallcontributions from extrahepatic sites. Additionally, oursingle-compartment model provided a good descriptionof the postanhepatic resurgence—whether or not it ispreceded by a plateau—as well as the anhepatic andpostanhepatic declines.
In summary, we have described HCV kinetics duringand after cadaveric liver transplantation. In both theanhepatic phase and the postanhepatic resurgence,our model described viral dynamics well, and allowedus to estimate fundamental viral-kinetic parameters.
214 POWERS ET AL.
LIVER TRANSPLANTATION.DOI 10.1002/lt. Published on behalf of the American Association for the Study of Liver Diseases
We used the model to estimate at less than 4% thecontribution to viral load of any putative extrahepaticsource, in agreement with previous estimates.34 In ad-dition, we estimated the number of infected and targetcells at the start of the posttransplantation viral resur-gence, as well as the number of infected hepatocytes atthe subsequent viral steady state. Our analysis alsosuggests that loss of infected cells is negligible duringthe 3-month postanhepatic follow-up period, consis-tent with immunosuppression effectively preventing animmune response against infected liver cells. Contin-ued work toward elucidating extrahepatic replication,the time-course of reinfection, the effects of immuno-suppressive therapy, and the relationships among vire-mia, infection, and liver damage will be beneficial inoptimizing treatment for HCV patients undergoing livertransplantation.
ACKNOWLEDGMENTSR.M.R. thanks R. May for comments on the manuscriptand the Department of Zoology, University of Oxford,South Parks Road, Oxford, UK, for generous hospitalityduring parts of this work.
REFERENCES
1. Seeff LB, Hoofnagle JH. Appendix: the National Institutesof Health Consensus Development Conference Manage-ment of Hepatitis C 2002. Clin Liver Dis 2003;7:261-287.
2. Rosen HR. Hepatitis C virus in the human liver transplan-tation model. Clin Liver Dis 2003;7:107-125.
3. Wright TL, Donegan E, Hsu HH, Ferrell L, Lake JR, Kim M,et al. Recurrent and acquired hepatitis C viral infection inliver transplant recipients. Gastroenterology 1992;103:317-322.
4. Fukumoto T, Berg T, Ku Y, Bechstein WO, Knoop M, Lem-mens HP, et al. Viral dynamics of hepatitis C early afterorthotopic liver transplantation: evidence for rapid turn-over of serum virions. Hepatology 1996;24:1351-1354.
5. Gane EJ, Naoumov NV, Qian KP, Mondelli MU, MaertensG, Portmann BC, et al. A longitudinal analysis of hepatitisC virus replication following liver transplantation. Gastro-enterology 1996;110:167-177.
6. Garcia-Retortillo M, Forns X, Feliu A, Moitinho E, Costa J,Navasa M, et al. Hepatitis C virus kinetics during andimmediately after liver transplantation. Hepatology 2002;35:680-687.
7. Gretch DR, Bacchi CE, Corey L, dela Rosa C, LesniewskiRR, Kowdley K, et al. Persistent hepatitis C virus infectionafter liver transplantation: clinical and virological fea-tures. Hepatology 1995;22:1-9.
8. Pelletier SJ, Raymond DP, Crabtree TD, Berg CL, IezzoniJC, Hahn YS, et al. Hepatitis C-induced hepatic allograftinjury is associated with a pretransplantation elevatedviral replication rate. Hepatology 2000;32:418-426.
9. Sreekumar R, Gonzalez-Koch A, Maor-Kendler Y, Batts K,Moreno-Luna L, Poterucha J, et al. Early identification ofrecipients with progressive histologic recurrence of hepa-titis C after liver transplantation. Hepatology 2000;32:1125-1130.
10. Guerrero RB, Batts KP, Burgart LJ, Barrett SL, GermerJJ, Poterucha JJ, et al. Early detection of hepatitis Callograft reinfection after orthotopic liver transplantation:a molecular and histologic study. Mod Pathol 2000;13:229-237.
11. Park YN, Boros P, Zhang DY, Sheiner P, Kim-Schluger L,Thung SN. Serum hepatitis C virus RNA levels and histo-logic findings in liver allografts with early recurrent hep-atitis C. Arch Pathol Lab Med 2000;124:1623-1627.
12. Negro F, Giostra E, Krawczynski K, Quadri R, Rubbia-Brandt L, Mentha G, et al. Detection of intrahepatic hep-atitis C virus replication by strand-specific semi-quanti-tative RT-PCR: preliminary application to the livertransplantation model. J Hepatol 1998;29:1-11.
13. Hu Y, Shahidi A, Park S, Guilfoyle D, Hirshfield I. Detec-tion of extrahepatic hepatitis C virus replication by anovel, highly sensitive, single-tube nested polymerasechain reaction. Am J Clin Pathol 2003;119:95-100.
14. Kao JH, Chen PJ, Lai MY, Wang TH, Chen DS. Positive andnegative strand of hepatitis C virus RNA sequences inperipheral blood mononuclear cells in patients withchronic hepatitis C: no correlation with viral genotypes 1b,2a, and 2b. J Med Virol 1997;52:270-274.
15. Laskus T, Radkowski M, Wang LF, Vargas H, Rakela J.Search for hepatitis C virus extrahepatic replication sitesin patients with acquired immunodeficiency syndrome:specific detection of negative-strand viral RNA in varioustissues. Hepatology 1998;28:1398-1401.
16. Laskus T, Radkowski M, Wang LF, Vargas H, Rakela J.The presence of active hepatitis C virus replication in lym-phoid tissue in patients coinfected with human immuno-deficiency virus type 1. J Infect Dis 1998;178:1189-1192.
17. Lerat H, Berby F, Trabaud MA, Vidalin O, Major M, TrepoC, Inchauspe G. Specific detection of hepatitis C virusminus strand RNA in hematopoietic cells. J Clin Invest1996;97:845-851.
18. Moldvay J, Deny P, Pol S, Brechot C, Lamas E. Detectionof hepatitis C virus RNA in peripheral blood mononuclearcells of infected patients by in situ hybridization. Blood1994;83:269-273.
19. Sung VM, Shimodaira S, Doughty AL, Picchio GR, Can H,Yen TS, et al. Establishment of B-cell lymphoma cell linespersistently infected with hepatitis C virus in vivo and invitro: the apoptotic effects of virus infection. J Virol 2003;77:2134-2146.
20. Zhang L, Dailey PJ, Gettie A, Blanchard J, Ho DD. Theliver is a major organ for clearing simian immunodefi-ciency virus in rhesus monkeys. J Virol 2002;76:5271-5273.
21. Chazouilleres O, Kim M, Combs C, Ferrell L, Bacchetti P,Roberts J, et al. Quantitation of hepatitis C virus RNA inliver transplant recipients. Gastroenterology 1994;106:994-999.
22. Feray C, Gigou M, Samuel D, Paradis V, Wilber J, DavidMF, et al. The course of hepatitis C virus infection afterliver transplantation. Hepatology 1994;20:1137-1143.
23. Lau JY, Davis GL, Brunson ME, Qian KP, Lin HJ, Quan S,et al. Hepatitis C virus infection in kidney transplant re-cipients. Hepatology 1993;18:1027-1031.
24. Loriot MA, Bronowicki JP, Lagorce D, Lakehal F, Persico T,Barba G, et al. Permissiveness of human biliary epithelialcells to infection by hepatitis C virus. Hepatology 1999;29:1587-1595.
25. Sheiner PA, Schwartz ME, Mor E, Schluger LK, Theise N,Kishikawa K, et al. Severe or multiple rejection episodesare associated with early recurrence of hepatitis C afterorthotopic liver transplantation. Hepatology 1995;21:30-34.
26. McHutchison JG, Ponnudurai R, Bylund DL, Anguiano A,Pockros PJ, Mondala T, Wilkes LB. Prednisone withdrawalfollowed by interferon alpha for treatment of chronic hep-atitis C infection: results of a randomized controlled trial.J Clin Gastroenterol 2001;32:133-137.
27. Fong TL, Valinluck B, Govindarajan S, Charboneau F,Adkins RH, Redeker AG. Short-term prednisone therapy
HCV REINFECTION AFTER LIVER TRANSPLANTATION 215
LIVER TRANSPLANTATION.DOI 10.1002/lt. Published on behalf of the American Association for the Study of Liver Diseases
affects aminotransferase activity and hepatitis C virusRNA levels in chronic hepatitis C. Gastroenterology 1994;107:196-199.
28. Perelson AS, Neumann AU, Markowitz M, Leonard JM, HoDD. HIV-1 dynamics in vivo: virion clearance rate, infectedcell life-span, and viral generation time. Science 1996;271:1582-1586.
29. Ho DD, Neumann AU, Perelson AS, Chen W, Leonard JM,Markowitz M. Rapid turnover of plasma virions and CD4lymphocytes in HIV-1 infection. Nature 1995;373:123-126.
30. Nowak MA, Bonhoeffer S, Hill AM, Boehme R, Thomas HC,McDade H. Viral dynamics in hepatitis B virus infection.Proc Natl Acad Sci USA 1996;93:4398-4402.
31. Tsiang M, Rooney JF, Toole JJ, Gibbs CS. Biphasic clear-ance kinetics of hepatitis B virus from patients duringadefovir dipivoxil therapy. Hepatology 1999;29:1863-1869.
32. Layden TJ, Layden JE, Ribeiro RM, Perelson AS. Mathe-matical modeling of viral kinetics: a tool to understandand optimize therapy. Clin Liver Dis 2003;7:163-178.
33. Neumann AU, Lam NP, Dahari H, Gretch DR, Wiley TE,Layden TJ, Perelson AS. Hepatitis C viral dynamics in vivoand the antiviral efficacy of interferon-alpha therapy. Sci-ence 1998;282:103-107.
34. Dahari H, Feliu A, Garcia-Retortillo M, Forns X, NeumannAU. Second hepatitis C replication compartment indicatedby viral dynamics during liver transplantation. J Hepatol2005;42:491-498.
35. Tong MJ, Hwang SJ, Lefkowitz M, Lee SD, Co RL, ConradA, et al. Correlation of serum HCV RNA and alanine ami-notransferase levels in chronic hepatitis C patients duringtreatment with ribavirin. J Gastroenterol Hepatol 1994;9:587-591.
36. Stuyver L, Rossau R, Wyseur A, Duhamel M, Vander-borght B, Van Heuverswyn H, Maertens G. Typing of hep-atitis C virus isolates and characterization of new sub-types using a line probe assay. J Gen Virol 1993;74(Pt6):1093-1102.
37. Guyton AC. Textbook of Medical Physiology, 5th ed. Phil-adelphia: W.B. Saunders, 1976:425.
38. Gowans EJ. Distribution of markers of hepatitis C virus
infection throughout the body. Semin Liver Dis 2000;20:85-102.
39. Dahari H, Major M, Zhang X, Mihalik K, Rice CM, PerelsonAS, et al. Mathematical modeling of primary hepatitis Cinfection: noncytolytic clearance and early blockage of virionproduction. Gastroenterology 2005;128:1056-1066.
40. Sherlock S, Dooley J. Diseases of the Liver and BiliarySystem. Oxford: Blackwell Science, 2002: 1-18.
41. Heinemann A, Wischhusen F, Puschel K, Rogiers X. Stan-dard liver volume in the Caucasian population. LiverTranspl Surg 1999;5:366-368.
42. Hlavacek WS, Wofsy C, Perelson AS. Dissociation of HIV-1from follicular dendritic cells during HAART: mathemati-cal analysis. Proc Natl Acad Sci USA 1999;96:14681-14686.
43. Ducoulombier D, Roque-Afonso AM, Di Liberto G, Penin F,Kara R, Richard Y, et al. Frequent compartmentalizationof hepatitis C virus variants in circulating B cells andmonocytes. Hepatology 2004;39:817-825.
44. Roque-Afonso AM, Ducoulombier D, Di Liberto G, Kara R,Gigou M, Dussaix E, et al. Compartmentalization of hep-atitis C virus genotypes between plasma and peripheralblood mononuclear cells. J Virol 2005;79:6349-6357.
45. Ramratnam B, Bonhoeffer S, Binley J, Hurley A, Zhang L,Mittler JE, et al. Rapid production and clearance of HIV-1and hepatitis C virus assessed by large volume plasmaapheresis. Lancet 1999;354:1782-1785.
46. Tanaka J, Katayama K, Kumagai J, Komiya Y, Yugi H,Kishimoto S, et al. Early dynamics of hepatitis C virus inthe circulation of chimpanzees with experimental infec-tion. Intervirology 2005;48:120-123.
47. Ballardini G, De Raffele E, Groff P, Bioulac-Sage P, GrassiA, Ghetti S, et al. Timing of reinfection and mechanisms ofhepatocellular damage in transplanted hepatitis C virus-reinfected liver. Liver Transpl 2002;8:10-20.
48. Chang M, Marquardt AP, Wood BL, Williams O, Cotler SJ,Taylor SL, et al. In situ distribution of hepatitis C virusreplicative-intermediate RNA in hepatic tissue and its cor-relation with liver disease. J Virol 2000;74:944-955.
49. Lewin SR, Ribeiro RM, Walters T, Lau GK, Bowden S,Locarnini S, Perelson AS. Analysis of hepatitis B viral loaddecline under potent therapy: complex decay profiles ob-served. Hepatology 2001;34:1012-1020.
216 POWERS ET AL.
LIVER TRANSPLANTATION.DOI 10.1002/lt. Published on behalf of the American Association for the Study of Liver Diseases