kepler15b: a hot jupiter enriched in heavy elements and the first kepler mission planet confirmed...
TRANSCRIPT
The Astrophysical Journal Supplement Series, 197:13 (11pp), 2011 November doi:10.1088/0067-0049/197/1/13C© 2011. The American Astronomical Society. All rights reserved. Printed in the U.S.A.
KEPLER-15b: A HOT JUPITER ENRICHED IN HEAVY ELEMENTS AND THE FIRST KEPLER MISSIONPLANET CONFIRMED WITH THE HOBBY–EBERLY TELESCOPE∗
Michael Endl1, Phillip J. MacQueen1, William D. Cochran1, Erik J. Brugamyer2, Lars A. Buchhave3, Jason Rowe4,Phillip Lucas5, Howard Isaacson6, Steve Bryson7, Steve B. Howell7, Jonathan J. Fortney8, Terese Hansen9,William J. Borucki7, Douglas Caldwell7, Jessie L. Christiansen7, David R. Ciardi10, Brice-Olivier Demory11,Mark Everett12, Eric B. Ford13, Michael R. Haas7, Matthew J. Holman14, Elliott Horch15, Jon M. Jenkins16,
David J. Koch7, Jack J. Lissauer7, Pavel Machalek17, Martin Still7, William F. Welsh18, Dwight T. Sanderfer16,Shawn E. Seader16, Jeffrey C. Smith16, Susan E. Thompson16, and Joseph D. Twicken16
1 McDonald Observatory, The University of Texas at Austin, Austin, TX 78712, USA2 Astronomy Department, The University of Texas at Austin, Austin, TX 78712, USA
3 Niels Bohr Institute, University of Copenhagen, Denmark Centre for Star and Planet Formation, University of Copenhagen, Denmark4 SETI Institute, Moffett Field, CA 94035, USA
5 Centre for Astrophysics Research, University of Hertfordshire, College Lane, Hatfield AL10 9AB, UK6 Department of Astronomy, University of California, Berkeley, CA 94720, USA
7 NASA-Ames Research Center, Moffett Field, CA 94035, USA8 Department of Astronomy and Astrophysics, University of California, Santa Cruz, CA 95064, USA
9 Niels Bohr Institute, University of Copenhagen, Denmark10 NASA Exoplanet Science Institute/Caltech, Pasadena, CA 91125, USA
11 Department of Earth, Atmospheric and Planetary Sciences, Massachusetts Institute of Technology, Cambridge, MA 02139, USA12 NOAO, 950 N. Cherry Ave., Tucson, AZ 85719, USA
13 Astronomy Department, University of Florida, 211 Bryant Space Sciences Center, Gainesville, FL 32111, USA14 Harvard-Smithsonian Center for Astrophysics, 60 Garden Street, Cambridge, MA 02138, USA
15 Department of Physics, Southern Connecticut State University, New Haven, CT 06515, USA16 SETI Institute/NASA-Ames Research Center, Moffett Field, CA 94035, USA17 SETI Institute, 189 North Bernardo Ave 100, Mountain View, CA 94043, USA
18 Astronomy Department, San Diego State University, San Diego, CA 92182, USAReceived 2011 July 8; accepted 2011 October 18; published 2011 November 4
ABSTRACT
We report the discovery of Kepler-15b (KOI-128), a new transiting exoplanet detected by NASA’s Kepler mission.The transit signal with a period of 4.94 days was detected in the quarter 1 (Q1) Kepler photometry. For the firsttime, we have used the High Resolution Spectrograph (HRS) at the Hobby–Eberly Telescope (HET) to determinethe mass of a Kepler planet via precise radial velocity (RV) measurements. The 24 HET/HRS RVs and 6 additionalmeasurements from the Fibre-fed Echelle Spectrograph spectrograph at the Nordic Optical Telescope reveal aDoppler signal with the same period and phase as the transit ephemeris. We used one HET/HRS spectrum ofKepler-15 taken without the iodine cell to determine accurate stellar parameters. The host star is a metal-rich([Fe/H] = 0.36 ± 0.07) G-type main-sequence star with Teff = 5515 ± 124 K. The semi-amplitude K of the RVorbit is 78.7+8.5
−9.5 m s−1, which yields a planet mass of 0.66 ± 0.1 MJup. The planet has a radius of 0.96 ± 0.06 RJupand a mean bulk density of 0.9 ± 0.2 g cm−3. The radius of Kepler-15b is smaller than the majority of transitingplanets with similar mass and irradiation level. This suggests that the planet is more enriched in heavy elementsthan most other transiting giant planets. For Kepler-15b we estimate a heavy element mass of 30–40 M⊕.
Key words: planetary systems – stars: individual (Kepler-15, KOI-128, KIC 11359879,2MASS J19444814+4908244) – techniques: image processing – techniques: photometric – techniques: radialvelocities – techniques: spectroscopic
Online-only material: color figures
1. INTRODUCTION
The Kepler mission is designed to provide the very firstestimate of the frequency of Earth-size planets in the habitablezone of Sun-like stars. The Kepler spacecraft continuouslymonitors 156,453 stars (Borucki et al. 2011) to search for thesignatures of transiting planetary companions. The mission isdescribed in detail in Borucki et al. (2010).
The small transit depth of 84 ppm produced by an Earth-size planet defined the photometric precision requirement of
∗ Based on observations obtained with the Hobby–Eberly Telescope, which isa joint project of the University of Texas at Austin, the Pennsylvania StateUniversity, Stanford University, Ludwig-Maximilians-Universitat Munchen,and Georg-August-Universitat Gottingen.
Kepler at 20 ppm over 6.5 hr for a 12th magnitude Sun-likestar. Kepler is achieving a precision of 30 ppm or better over alarge dynamic range (Jenkins et al. 2010b). The constant streamof photometry at this precision level makes the detection oftransits of giant planets, with transit depths of ≈10,000 ppm,relatively easy. Furthermore, giant planets also produce largerradial velocity (RV) amplitudes that allow the planet to beconfirmed in short time. It is thus no surprise that the majorityof early Kepler planets were gas giant planets in short periodicorbits: Kepler-5b, 6b, 7b, and 8b (Koch et al. 2010; Dunhamet al. 2010; Latham et al. 2010; Jenkins et al. 2010a). As allKepler light curves from the first four months are publiclyavailable, hot Jupiters are also confirmed by other groups, e.g.,KOI-428b (Santerne et al. 2011). However, Jupiter-class planets
1
The Astrophysical Journal Supplement Series, 197:13 (11pp), 2011 November Endl et al.
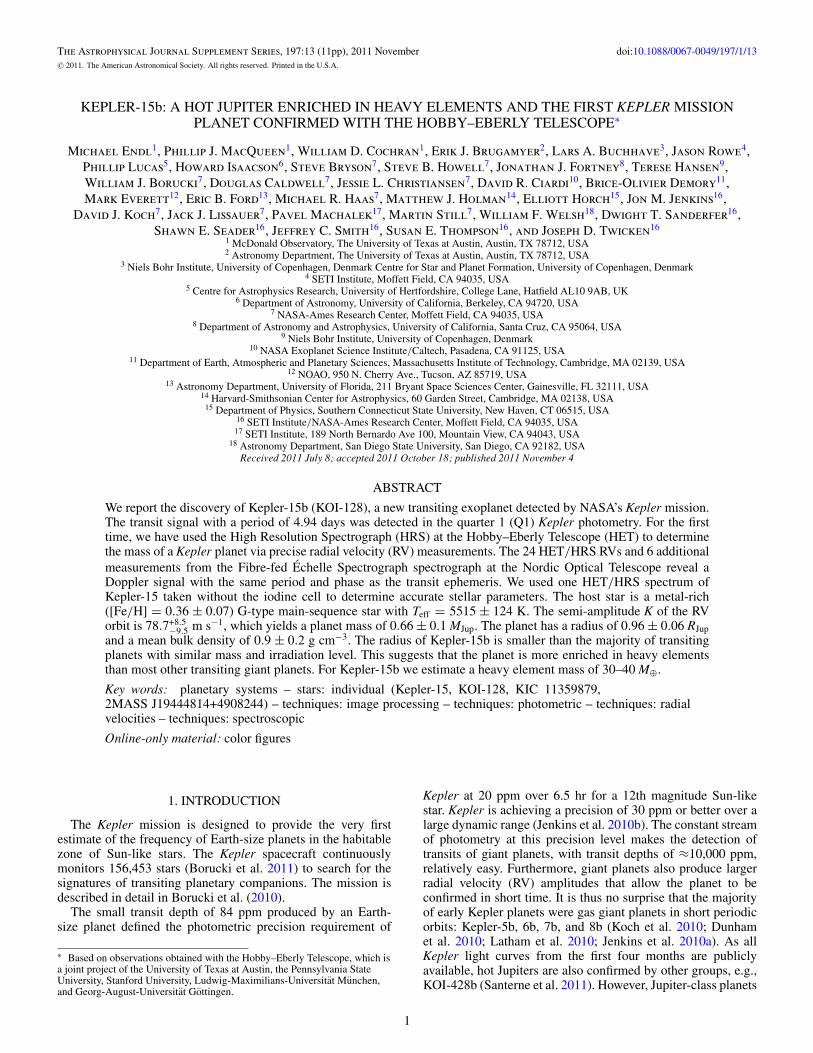
Figure 1. Kepler light curve of Kepler-15. The top panel displays the detrended (using a median filter) Q1 to Q6 time series photometry. The triangles mark the timesof the transits. The lower panel contains the data phased to the transit period of 4.943 days, with the transit at phase 0.75.
(A color version of this figure is available in the online journal.)
represent the minority of Kepler planet candidates, Boruckiet al. (2011) derive an intrinsic frequency of Jupiter-size planets(0.55 RJup < Rp < 1.36 RJup) of only 2%.
In this paper we describe Kepler-15b, the first giant planetfrom the Kepler mission confirmed with the Hobby–EberlyTelescope (HET) at McDonald Observatory. We use the HETto observe KOIs with a period and mass range (typically in thegiant planet range) that make them suitable for queue scheduledobservations. In 2010 we spent a total of 65 hr of HET timeon the Kepler field and collected data for 11 KOIs. Besidesthe planet presented here, we have confirmed several other giantplanets around Kepler stars, e.g., Kepler-17b (Desert et al. 2011).The remaining HET planet confirmations will be included in acatalog of Kepler giant planets (D. Caldwell et al. 2012, inpreparation).
Additional RV measurements for Kepler-15 were also col-lected with the FIbre-fed Echelle Spectrograph (FIES) at the2.5 m Nordic Optical Telescope (NOT) that are fully consistentwith the HET/High Resolution Spectrograph (HRS) results. Inthe following sections, we describe the Kepler photometry forKepler-15 and the subsequent ground-based follow-up observa-tions to reject a false-positive and to confirm the planet. Finally,we will discuss the radius of Kepler-15b and the planet’s internalcomposition.
2. KEPLER PHOTOMETRY AND TRANSIT SIGNATURE
2.1. Light Curve Analysis
Kepler-15 was already identified as a planet candidate inthe 35 days of the first quarter (Q1) of Kepler photometryand was assigned the Kepler-Object-of-Interest (KOI) identifierKOI-128. The target star has a Kepler magnitude (Kp) of 13.76(Kp is defined by the Kepler response function and covers thewavelength range of 4230–8970 Å; Koch et al. 2010). Kepler-15 is 2MASS J19444814+4908244 and its basic parametersare summarized in Table 1. Processing of the photometrywas carried out using the standard Kepler pipeline (Jenkinset al. 2010b). The data were sampled at the typical 30 minute“long cadence.” Figure 1 displays the Kepler light curve forKepler-15. The top panel shows the Photometric Analysis(PA) light curve for Q1 through Q6 after removal of dataartifacts using a 2 day median filter (in-transit photometry wasmasked prior to the application of this filter). The detrendedout-of-transit data have a standard deviation of 223 ppm. The
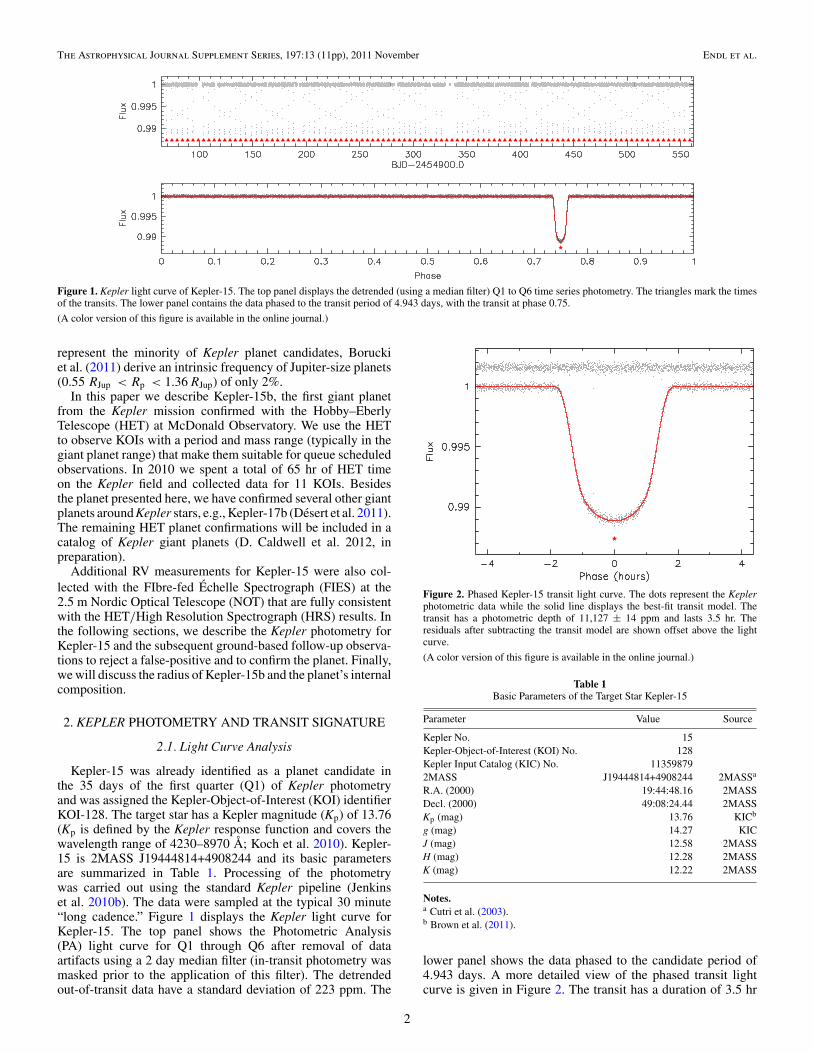
Figure 2. Phased Kepler-15 transit light curve. The dots represent the Keplerphotometric data while the solid line displays the best-fit transit model. Thetransit has a photometric depth of 11,127 ± 14 ppm and lasts 3.5 hr. Theresiduals after subtracting the transit model are shown offset above the lightcurve.
(A color version of this figure is available in the online journal.)
Table 1Basic Parameters of the Target Star Kepler-15
Parameter Value Source
Kepler No. 15Kepler-Object-of-Interest (KOI) No. 128Kepler Input Catalog (KIC) No. 113598792MASS J19444814+4908244 2MASSa
R.A. (2000) 19:44:48.16 2MASSDecl. (2000) 49:08:24.44 2MASSKp (mag) 13.76 KICb
g (mag) 14.27 KICJ (mag) 12.58 2MASSH (mag) 12.28 2MASSK (mag) 12.22 2MASS
Notes.a Cutri et al. (2003).b Brown et al. (2011).
lower panel shows the data phased to the candidate period of4.943 days. A more detailed view of the phased transit lightcurve is given in Figure 2. The transit has a duration of 3.5 hr
2
The Astrophysical Journal Supplement Series, 197:13 (11pp), 2011 November Endl et al.
1135987911359883
11359880
in transit
362 364 366
1002
1004
1006
0
5
10
15x 10
6
1135987911359883
11359880
out of transit
362 364 366
1002
1004
1006
0
5
10
15x 10
6
1135987911359883
11359880
difference image
362 364 366
1002
1004
1006
0
5
10
15x 10
4
1135987911359883
11359880
optimal aperture
362 364 366
1002
1004
1006
0
0.5
1
362 364 366
1002
1004
1006
13.75815.9942
16.209
column
row
kepmag of mask stars
20
40
60
362 364 366
1002
1004
1006
12.57714.419
14.483
column
row
jmag of mask stars
NE
20
40
60
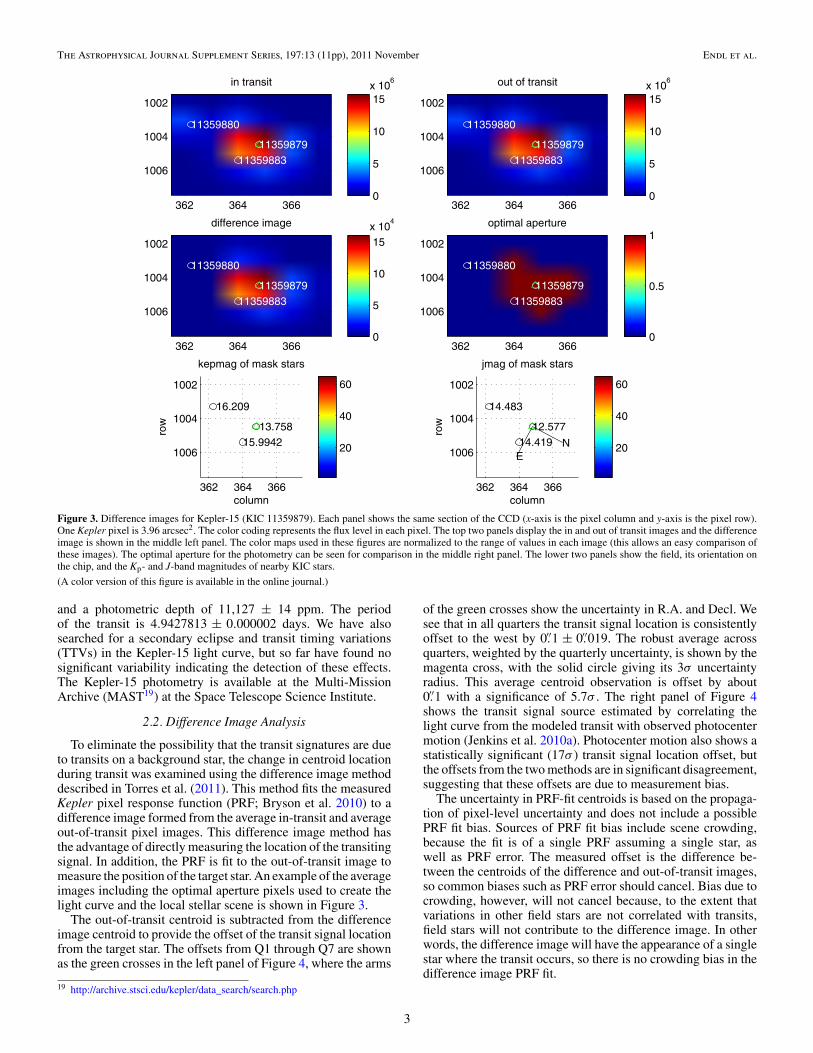
Figure 3. Difference images for Kepler-15 (KIC 11359879). Each panel shows the same section of the CCD (x-axis is the pixel column and y-axis is the pixel row).One Kepler pixel is 3.96 arcsec2. The color coding represents the flux level in each pixel. The top two panels display the in and out of transit images and the differenceimage is shown in the middle left panel. The color maps used in these figures are normalized to the range of values in each image (this allows an easy comparison ofthese images). The optimal aperture for the photometry can be seen for comparison in the middle right panel. The lower two panels show the field, its orientation onthe chip, and the Kp- and J-band magnitudes of nearby KIC stars.
(A color version of this figure is available in the online journal.)
and a photometric depth of 11,127 ± 14 ppm. The periodof the transit is 4.9427813 ± 0.000002 days. We have alsosearched for a secondary eclipse and transit timing variations(TTVs) in the Kepler-15 light curve, but so far have found nosignificant variability indicating the detection of these effects.The Kepler-15 photometry is available at the Multi-MissionArchive (MAST19) at the Space Telescope Science Institute.
2.2. Difference Image Analysis
To eliminate the possibility that the transit signatures are dueto transits on a background star, the change in centroid locationduring transit was examined using the difference image methoddescribed in Torres et al. (2011). This method fits the measuredKepler pixel response function (PRF; Bryson et al. 2010) to adifference image formed from the average in-transit and averageout-of-transit pixel images. This difference image method hasthe advantage of directly measuring the location of the transitingsignal. In addition, the PRF is fit to the out-of-transit image tomeasure the position of the target star. An example of the averageimages including the optimal aperture pixels used to create thelight curve and the local stellar scene is shown in Figure 3.
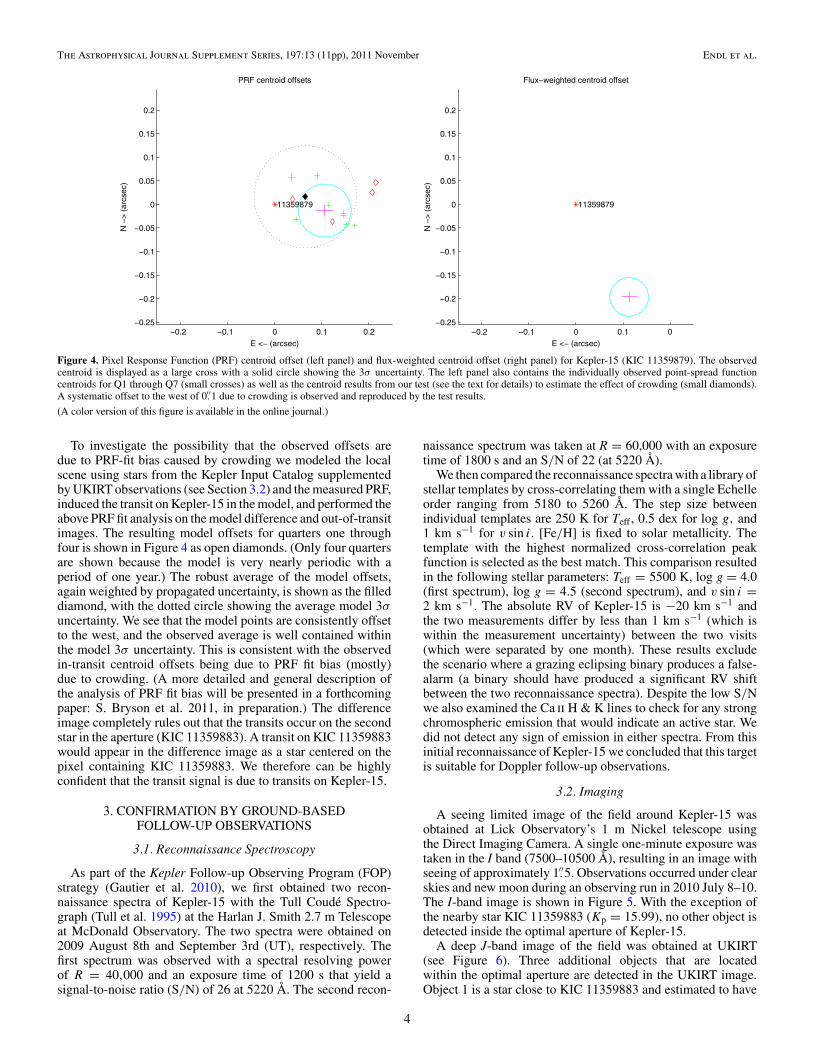
The out-of-transit centroid is subtracted from the differenceimage centroid to provide the offset of the transit signal locationfrom the target star. The offsets from Q1 through Q7 are shownas the green crosses in the left panel of Figure 4, where the arms
19 http://archive.stsci.edu/kepler/data_search/search.php
of the green crosses show the uncertainty in R.A. and Decl. Wesee that in all quarters the transit signal location is consistentlyoffset to the west by 0.′′1 ± 0.′′019. The robust average acrossquarters, weighted by the quarterly uncertainty, is shown by themagenta cross, with the solid circle giving its 3σ uncertaintyradius. This average centroid observation is offset by about0.′′1 with a significance of 5.7σ . The right panel of Figure 4shows the transit signal source estimated by correlating thelight curve from the modeled transit with observed photocentermotion (Jenkins et al. 2010a). Photocenter motion also shows astatistically significant (17σ ) transit signal location offset, butthe offsets from the two methods are in significant disagreement,suggesting that these offsets are due to measurement bias.
The uncertainty in PRF-fit centroids is based on the propaga-tion of pixel-level uncertainty and does not include a possiblePRF fit bias. Sources of PRF fit bias include scene crowding,because the fit is of a single PRF assuming a single star, aswell as PRF error. The measured offset is the difference be-tween the centroids of the difference and out-of-transit images,so common biases such as PRF error should cancel. Bias due tocrowding, however, will not cancel because, to the extent thatvariations in other field stars are not correlated with transits,field stars will not contribute to the difference image. In otherwords, the difference image will have the appearance of a singlestar where the transit occurs, so there is no crowding bias in thedifference image PRF fit.
3
The Astrophysical Journal Supplement Series, 197:13 (11pp), 2011 November Endl et al.
−0.2 −0.1 0 0.1 0.2−0.25
−0.2
−0.15
−0.1
−0.05
0
0.05
0.1
0.15
0.2
PRF centroid offsets
11359879
E <− (arcsec)
N −
> (
arcs
ec)
−0.2 −0.1 0 0.1 0−0.25
−0.2
−0.15
−0.1
−0.05
0
0.05
0.1
0.15
0.2
Flux−weighted centroid offset
11359879
E <− (arcsec)
N −
> (
arcs
ec)
Figure 4. Pixel Response Function (PRF) centroid offset (left panel) and flux-weighted centroid offset (right panel) for Kepler-15 (KIC 11359879). The observedcentroid is displayed as a large cross with a solid circle showing the 3σ uncertainty. The left panel also contains the individually observed point-spread functioncentroids for Q1 through Q7 (small crosses) as well as the centroid results from our test (see the text for details) to estimate the effect of crowding (small diamonds).A systematic offset to the west of 0.′′1 due to crowding is observed and reproduced by the test results.
(A color version of this figure is available in the online journal.)
To investigate the possibility that the observed offsets aredue to PRF-fit bias caused by crowding we modeled the localscene using stars from the Kepler Input Catalog supplementedby UKIRT observations (see Section 3.2) and the measured PRF,induced the transit on Kepler-15 in the model, and performed theabove PRF fit analysis on the model difference and out-of-transitimages. The resulting model offsets for quarters one throughfour is shown in Figure 4 as open diamonds. (Only four quartersare shown because the model is very nearly periodic with aperiod of one year.) The robust average of the model offsets,again weighted by propagated uncertainty, is shown as the filleddiamond, with the dotted circle showing the average model 3σuncertainty. We see that the model points are consistently offsetto the west, and the observed average is well contained withinthe model 3σ uncertainty. This is consistent with the observedin-transit centroid offsets being due to PRF fit bias (mostly)due to crowding. (A more detailed and general description ofthe analysis of PRF fit bias will be presented in a forthcomingpaper: S. Bryson et al. 2011, in preparation.) The differenceimage completely rules out that the transits occur on the secondstar in the aperture (KIC 11359883). A transit on KIC 11359883would appear in the difference image as a star centered on thepixel containing KIC 11359883. We therefore can be highlyconfident that the transit signal is due to transits on Kepler-15.
3. CONFIRMATION BY GROUND-BASEDFOLLOW-UP OBSERVATIONS
3.1. Reconnaissance Spectroscopy
As part of the Kepler Follow-up Observing Program (FOP)strategy (Gautier et al. 2010), we first obtained two recon-naissance spectra of Kepler-15 with the Tull Coude Spectro-graph (Tull et al. 1995) at the Harlan J. Smith 2.7 m Telescopeat McDonald Observatory. The two spectra were obtained on2009 August 8th and September 3rd (UT), respectively. Thefirst spectrum was observed with a spectral resolving powerof R = 40,000 and an exposure time of 1200 s that yield asignal-to-noise ratio (S/N) of 26 at 5220 Å. The second recon-
naissance spectrum was taken at R = 60,000 with an exposuretime of 1800 s and an S/N of 22 (at 5220 Å).
We then compared the reconnaissance spectra with a library ofstellar templates by cross-correlating them with a single Echelleorder ranging from 5180 to 5260 Å. The step size betweenindividual templates are 250 K for Teff , 0.5 dex for log g, and1 km s−1 for v sin i. [Fe/H] is fixed to solar metallicity. Thetemplate with the highest normalized cross-correlation peakfunction is selected as the best match. This comparison resultedin the following stellar parameters: Teff = 5500 K, log g = 4.0(first spectrum), log g = 4.5 (second spectrum), and v sin i =2 km s−1. The absolute RV of Kepler-15 is −20 km s−1 andthe two measurements differ by less than 1 km s−1 (which iswithin the measurement uncertainty) between the two visits(which were separated by one month). These results excludethe scenario where a grazing eclipsing binary produces a false-alarm (a binary should have produced a significant RV shiftbetween the two reconnaissance spectra). Despite the low S/Nwe also examined the Ca ii H & K lines to check for any strongchromospheric emission that would indicate an active star. Wedid not detect any sign of emission in either spectra. From thisinitial reconnaissance of Kepler-15 we concluded that this targetis suitable for Doppler follow-up observations.
3.2. Imaging
A seeing limited image of the field around Kepler-15 wasobtained at Lick Observatory’s 1 m Nickel telescope usingthe Direct Imaging Camera. A single one-minute exposure wastaken in the I band (7500–10500 Å), resulting in an image withseeing of approximately 1.′′5. Observations occurred under clearskies and new moon during an observing run in 2010 July 8–10.The I-band image is shown in Figure 5. With the exception ofthe nearby star KIC 11359883 (Kp = 15.99), no other object isdetected inside the optimal aperture of Kepler-15.
A deep J-band image of the field was obtained at UKIRT(see Figure 6). Three additional objects that are locatedwithin the optimal aperture are detected in the UKIRT image.Object 1 is a star close to KIC 11359883 and estimated to have
4

The Astrophysical Journal Supplement Series, 197:13 (11pp), 2011 November Endl et al.
K00128 − 11"x11" Field of view
0 5 10 15 20 25 30pixels
0
5
10
15
20
25
30
pixe
ls
0.368"/pixel
Figure 5. I-band image of the field centered on Kepler-15 (KOI-128) taken withthe 1 m telescope at Lick Observatory. The scale is 11 × 11 arcsec, north is upand east is left. KIC 11359883—the other KIC star is the Kepler-15 aperture—isvisible 4 arcsec to the east.
(A color version of this figure is available in the online journal.)
Figure 6. J-band image of the field around Kepler-15 (center) taken with UKIRT.North is up and east is left. The scale is ∼25 × 40 arcsec. We detect threeadditional objects located within the optimal aperture of Kepler-15 (besidesKIC 11359883). Objects 1 and 2 are real, but object 3 is an artifact. The twoother stars seen in this image to the far east and south are located outside theoptimal aperture.
(A color version of this figure is available in the online journal.)
Kp = 19.4 ± 0.6. Object 2 is very close to Kepler-15 and weestimate Kp = 21.4±0.9. Object 3 is an artifact caused by elec-tronic cross-talk. We estimate the Kp values from the measuredJ-band magnitudes and the typical Kp − J color according tothe Besancon synthetic Galactic population model (Robin et al.2003) for stars of this J magnitude at this place on the sky.Object 1 is also barely visible in the wings of the point-spreadfunction of KIC 11359883 in the Lick I-band image.
Figure 7. Reconstructed R-band speckle image of Kepler-15 taken with theWIYN telescope at Kitt Peak. No additional stars are detected within the annulusfrom 0.′′05 to 1.′′8 to a limit of (5σ ) 3.52 mag fainter than the target star. Theimage is 2.′′8 × 2.′′8 and north is up and east is to the left.
We have also obtained speckle observations at the WIYN3.5 m telescope located on Kitt Peak. The observations make useof the Differential Speckle Survey Instrument (DSSI), a recentlyupgraded speckle camera described in Horch et al. (2010) andHowell et al. (2011). The DSSI provides simultaneous observa-tions in two filters by employing a dichroic beam splitter andtwo identical EMCCDs as the imagers. We observed Kepler-15simultaneously in “V” and “R” bandpasses where “V” has acentral wavelength of 5620 Å, and “R” has a central wavelengthof 6920 Å, and each filter has an FWHM = 400 Å. The detailsof how we obtain, reduce, and analyze the speckle results andspecifics about how they are used to eliminate false positivesand aid in transit detection are described in Howell et al. (2011).
The speckle observations of the Kepler-15 were obtained on2010 October 24 (UT) and consisted of five sets of 1000, 40 msindividual speckle images. Our R-band reconstructed imageis shown in Figure 7 with details of the image compositiondescribed in Howell et al. (2011). Along with a nearly identicalV-band reconstructed image, the speckle results reveal nocompanion star near Kepler-15 within the annulus from 0.′′05to 1.′′8 to a limit of (5σ ) 3.52 mag fainter in R and 3.16 magfainter in V relative to the Kp = 13.76 target star.
As a result of the direct imaging of the field around Kepler-15we found that two additional stars (besides KIC 11359883) arelocated within the optimal aperture of Kepler-15. However, bothstars are fainter than Kp = 19 and have a negligible effect on thephotometry. Only KIC 11359883 (Kp = 15.99) has a significanteffect and we take the diluting effect of its light contribution intoaccount for the light curve modeling.
3.3. Precise Radial Velocity Measurements
We performed precise RV follow-up observations ofKepler-15 with the HET (Ramsey et al. 1998) and its HRS spec-trograph (Tull 1998). The queue-scheduled observing mode ofthe HET usually leads to the situation that on a given nightdata for many different projects and with different instrumentsare obtained. The observations are ranked according to priori-ties distributed by the HET time-allocation committees as well
5
The Astrophysical Journal Supplement Series, 197:13 (11pp), 2011 November Endl et al.
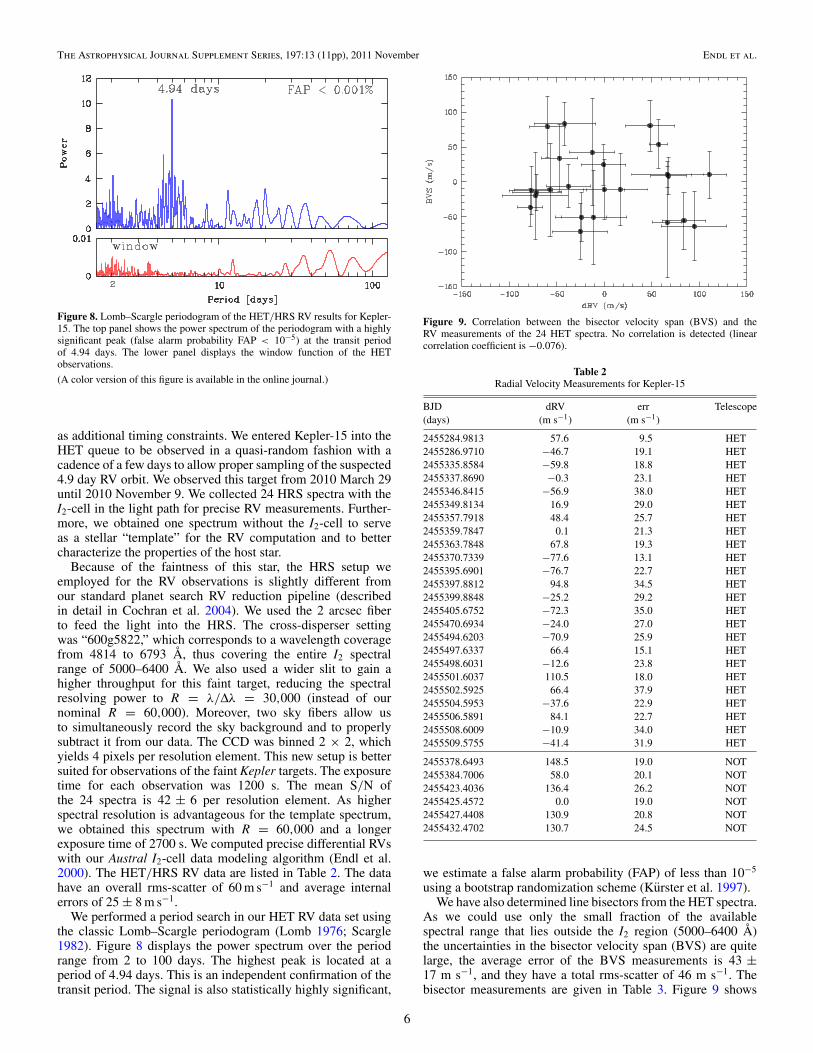
Figure 8. Lomb–Scargle periodogram of the HET/HRS RV results for Kepler-15. The top panel shows the power spectrum of the periodogram with a highlysignificant peak (false alarm probability FAP < 10−5) at the transit periodof 4.94 days. The lower panel displays the window function of the HETobservations.
(A color version of this figure is available in the online journal.)
as additional timing constraints. We entered Kepler-15 into theHET queue to be observed in a quasi-random fashion with acadence of a few days to allow proper sampling of the suspected4.9 day RV orbit. We observed this target from 2010 March 29until 2010 November 9. We collected 24 HRS spectra with theI2-cell in the light path for precise RV measurements. Further-more, we obtained one spectrum without the I2-cell to serveas a stellar “template” for the RV computation and to bettercharacterize the properties of the host star.
Because of the faintness of this star, the HRS setup weemployed for the RV observations is slightly different fromour standard planet search RV reduction pipeline (describedin detail in Cochran et al. 2004). We used the 2 arcsec fiberto feed the light into the HRS. The cross-disperser settingwas “600g5822,” which corresponds to a wavelength coveragefrom 4814 to 6793 Å, thus covering the entire I2 spectralrange of 5000–6400 Å. We also used a wider slit to gain ahigher throughput for this faint target, reducing the spectralresolving power to R = λ/Δλ = 30,000 (instead of ournominal R = 60,000). Moreover, two sky fibers allow usto simultaneously record the sky background and to properlysubtract it from our data. The CCD was binned 2 × 2, whichyields 4 pixels per resolution element. This new setup is bettersuited for observations of the faint Kepler targets. The exposuretime for each observation was 1200 s. The mean S/N ofthe 24 spectra is 42 ± 6 per resolution element. As higherspectral resolution is advantageous for the template spectrum,we obtained this spectrum with R = 60,000 and a longerexposure time of 2700 s. We computed precise differential RVswith our Austral I2-cell data modeling algorithm (Endl et al.2000). The HET/HRS RV data are listed in Table 2. The datahave an overall rms-scatter of 60 m s−1 and average internalerrors of 25 ± 8 m s−1.
We performed a period search in our HET RV data set usingthe classic Lomb–Scargle periodogram (Lomb 1976; Scargle1982). Figure 8 displays the power spectrum over the periodrange from 2 to 100 days. The highest peak is located at aperiod of 4.94 days. This is an independent confirmation of thetransit period. The signal is also statistically highly significant,
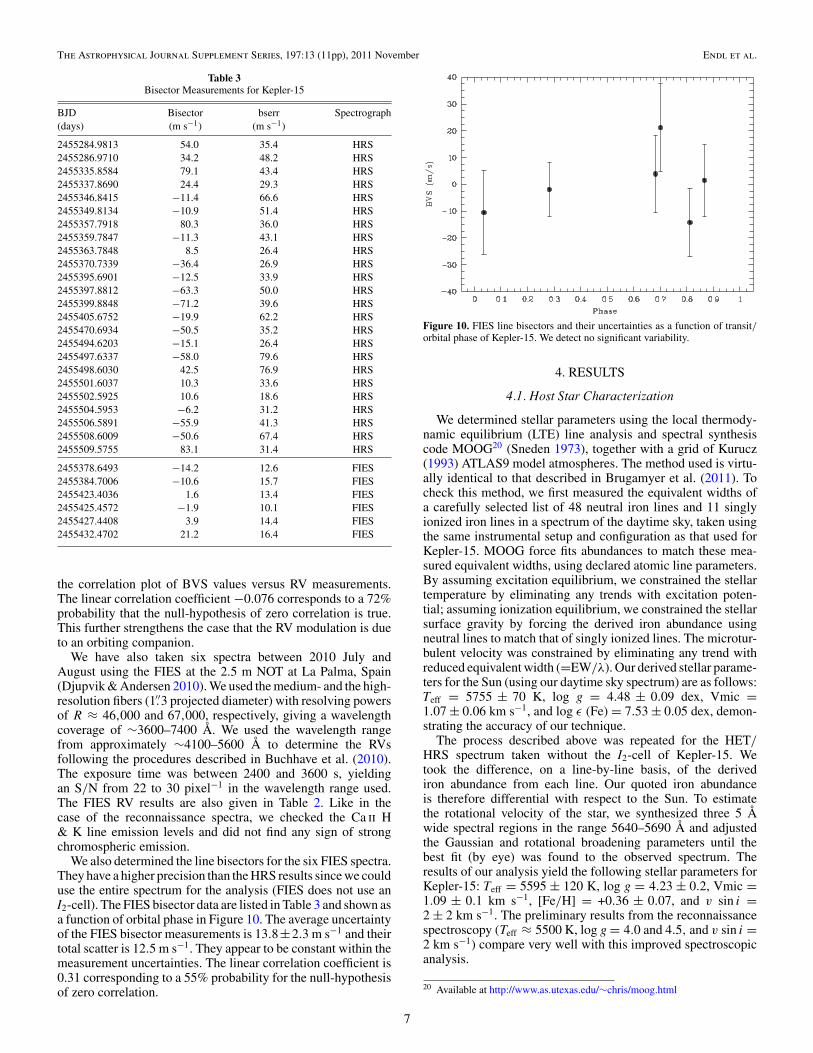
Figure 9. Correlation between the bisector velocity span (BVS) and theRV measurements of the 24 HET spectra. No correlation is detected (linearcorrelation coefficient is −0.076).
Table 2Radial Velocity Measurements for Kepler-15
BJD dRV err Telescope(days) (m s−1) (m s−1)
2455284.9813 57.6 9.5 HET2455286.9710 −46.7 19.1 HET2455335.8584 −59.8 18.8 HET2455337.8690 −0.3 23.1 HET2455346.8415 −56.9 38.0 HET2455349.8134 16.9 29.0 HET2455357.7918 48.4 25.7 HET2455359.7847 0.1 21.3 HET2455363.7848 67.8 19.3 HET2455370.7339 −77.6 13.1 HET2455395.6901 −76.7 22.7 HET2455397.8812 94.8 34.5 HET2455399.8848 −25.2 29.2 HET2455405.6752 −72.3 35.0 HET2455470.6934 −24.0 27.0 HET2455494.6203 −70.9 25.9 HET2455497.6337 66.4 15.1 HET2455498.6031 −12.6 23.8 HET2455501.6037 110.5 18.0 HET2455502.5925 66.4 37.9 HET2455504.5953 −37.6 22.9 HET2455506.5891 84.1 22.7 HET2455508.6009 −10.9 34.0 HET2455509.5755 −41.4 31.9 HET
2455378.6493 148.5 19.0 NOT2455384.7006 58.0 20.1 NOT2455423.4036 136.4 26.2 NOT2455425.4572 0.0 19.0 NOT2455427.4408 130.9 20.8 NOT2455432.4702 130.7 24.5 NOT
we estimate a false alarm probability (FAP) of less than 10−5
using a bootstrap randomization scheme (Kurster et al. 1997).We have also determined line bisectors from the HET spectra.
As we could use only the small fraction of the availablespectral range that lies outside the I2 region (5000–6400 Å)the uncertainties in the bisector velocity span (BVS) are quitelarge, the average error of the BVS measurements is 43 ±17 m s−1, and they have a total rms-scatter of 46 m s−1. Thebisector measurements are given in Table 3. Figure 9 shows
6
The Astrophysical Journal Supplement Series, 197:13 (11pp), 2011 November Endl et al.
Table 3Bisector Measurements for Kepler-15
BJD Bisector bserr Spectrograph(days) (m s−1) (m s−1)
2455284.9813 54.0 35.4 HRS2455286.9710 34.2 48.2 HRS2455335.8584 79.1 43.4 HRS2455337.8690 24.4 29.3 HRS2455346.8415 −11.4 66.6 HRS2455349.8134 −10.9 51.4 HRS2455357.7918 80.3 36.0 HRS2455359.7847 −11.3 43.1 HRS2455363.7848 8.5 26.4 HRS2455370.7339 −36.4 26.9 HRS2455395.6901 −12.5 33.9 HRS2455397.8812 −63.3 50.0 HRS2455399.8848 −71.2 39.6 HRS2455405.6752 −19.9 62.2 HRS2455470.6934 −50.5 35.2 HRS2455494.6203 −15.1 26.4 HRS2455497.6337 −58.0 79.6 HRS2455498.6030 42.5 76.9 HRS2455501.6037 10.3 33.6 HRS2455502.5925 10.6 18.6 HRS2455504.5953 −6.2 31.2 HRS2455506.5891 −55.9 41.3 HRS2455508.6009 −50.6 67.4 HRS2455509.5755 83.1 31.4 HRS
2455378.6493 −14.2 12.6 FIES2455384.7006 −10.6 15.7 FIES2455423.4036 1.6 13.4 FIES2455425.4572 −1.9 10.1 FIES2455427.4408 3.9 14.4 FIES2455432.4702 21.2 16.4 FIES
the correlation plot of BVS values versus RV measurements.The linear correlation coefficient −0.076 corresponds to a 72%probability that the null-hypothesis of zero correlation is true.This further strengthens the case that the RV modulation is dueto an orbiting companion.
We have also taken six spectra between 2010 July andAugust using the FIES at the 2.5 m NOT at La Palma, Spain(Djupvik & Andersen 2010). We used the medium- and the high-resolution fibers (1.′′3 projected diameter) with resolving powersof R ≈ 46,000 and 67,000, respectively, giving a wavelengthcoverage of ∼3600–7400 Å. We used the wavelength rangefrom approximately ∼4100–5600 Å to determine the RVsfollowing the procedures described in Buchhave et al. (2010).The exposure time was between 2400 and 3600 s, yieldingan S/N from 22 to 30 pixel−1 in the wavelength range used.The FIES RV results are also given in Table 2. Like in thecase of the reconnaissance spectra, we checked the Ca ii H& K line emission levels and did not find any sign of strongchromospheric emission.
We also determined the line bisectors for the six FIES spectra.They have a higher precision than the HRS results since we coulduse the entire spectrum for the analysis (FIES does not use anI2-cell). The FIES bisector data are listed in Table 3 and shown asa function of orbital phase in Figure 10. The average uncertaintyof the FIES bisector measurements is 13.8±2.3 m s−1 and theirtotal scatter is 12.5 m s−1. They appear to be constant within themeasurement uncertainties. The linear correlation coefficient is0.31 corresponding to a 55% probability for the null-hypothesisof zero correlation.
Figure 10. FIES line bisectors and their uncertainties as a function of transit/orbital phase of Kepler-15. We detect no significant variability.
4. RESULTS
4.1. Host Star Characterization
We determined stellar parameters using the local thermody-namic equilibrium (LTE) line analysis and spectral synthesiscode MOOG20 (Sneden 1973), together with a grid of Kurucz(1993) ATLAS9 model atmospheres. The method used is virtu-ally identical to that described in Brugamyer et al. (2011). Tocheck this method, we first measured the equivalent widths ofa carefully selected list of 48 neutral iron lines and 11 singlyionized iron lines in a spectrum of the daytime sky, taken usingthe same instrumental setup and configuration as that used forKepler-15. MOOG force fits abundances to match these mea-sured equivalent widths, using declared atomic line parameters.By assuming excitation equilibrium, we constrained the stellartemperature by eliminating any trends with excitation poten-tial; assuming ionization equilibrium, we constrained the stellarsurface gravity by forcing the derived iron abundance usingneutral lines to match that of singly ionized lines. The microtur-bulent velocity was constrained by eliminating any trend withreduced equivalent width (=EW/λ). Our derived stellar parame-ters for the Sun (using our daytime sky spectrum) are as follows:Teff = 5755 ± 70 K, log g = 4.48 ± 0.09 dex, Vmic =1.07 ± 0.06 km s−1, and log ε (Fe) = 7.53 ± 0.05 dex, demon-strating the accuracy of our technique.
The process described above was repeated for the HET/HRS spectrum taken without the I2-cell of Kepler-15. Wetook the difference, on a line-by-line basis, of the derivediron abundance from each line. Our quoted iron abundanceis therefore differential with respect to the Sun. To estimatethe rotational velocity of the star, we synthesized three 5 Åwide spectral regions in the range 5640–5690 Å and adjustedthe Gaussian and rotational broadening parameters until thebest fit (by eye) was found to the observed spectrum. Theresults of our analysis yield the following stellar parameters forKepler-15: Teff = 5595 ± 120 K, log g = 4.23 ± 0.2, Vmic =1.09 ± 0.1 km s−1, [Fe/H] = +0.36 ± 0.07, and v sin i =2 ± 2 km s−1. The preliminary results from the reconnaissancespectroscopy (Teff ≈ 5500 K, log g = 4.0 and 4.5, and v sin i =2 km s−1) compare very well with this improved spectroscopicanalysis.
20 Available at http://www.as.utexas.edu/∼chris/moog.html
7
The Astrophysical Journal Supplement Series, 197:13 (11pp), 2011 November Endl et al.
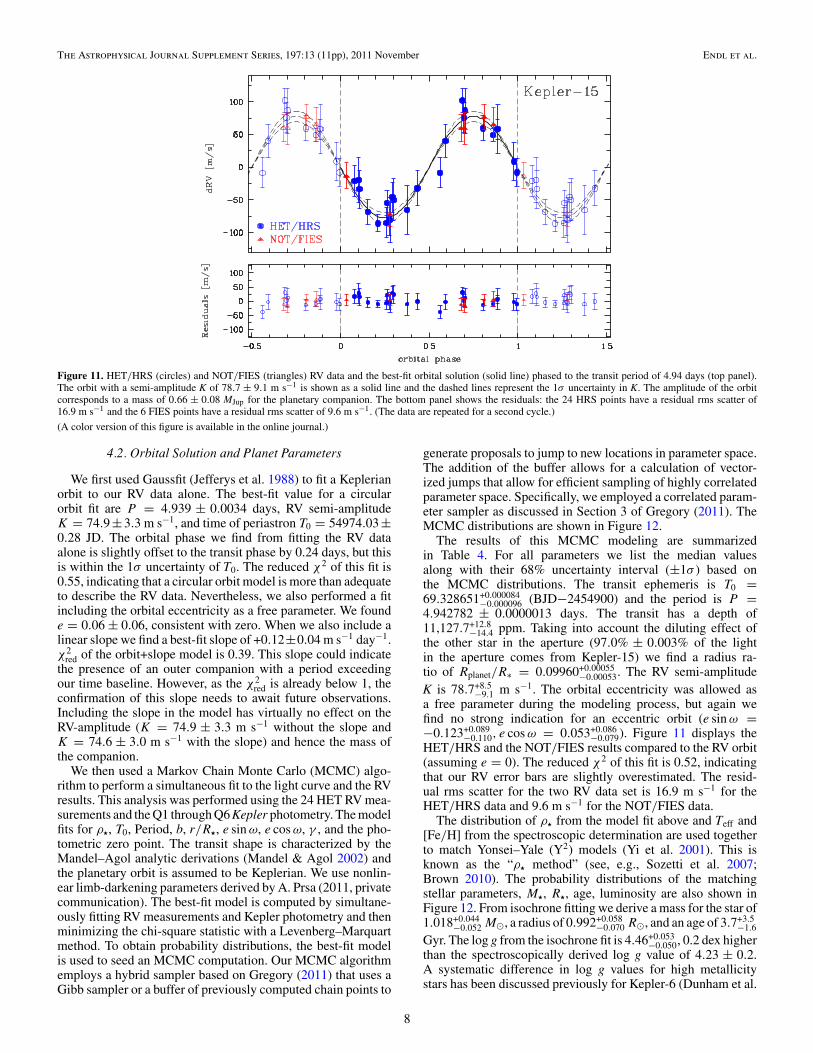
Figure 11. HET/HRS (circles) and NOT/FIES (triangles) RV data and the best-fit orbital solution (solid line) phased to the transit period of 4.94 days (top panel).The orbit with a semi-amplitude K of 78.7 ± 9.1 m s−1 is shown as a solid line and the dashed lines represent the 1σ uncertainty in K. The amplitude of the orbitcorresponds to a mass of 0.66 ± 0.08 MJup for the planetary companion. The bottom panel shows the residuals: the 24 HRS points have a residual rms scatter of16.9 m s−1 and the 6 FIES points have a residual rms scatter of 9.6 m s−1. (The data are repeated for a second cycle.)
(A color version of this figure is available in the online journal.)
4.2. Orbital Solution and Planet Parameters
We first used Gaussfit (Jefferys et al. 1988) to fit a Keplerianorbit to our RV data alone. The best-fit value for a circularorbit fit are P = 4.939 ± 0.0034 days, RV semi-amplitudeK = 74.9±3.3 m s−1, and time of periastron T0 = 54974.03±0.28 JD. The orbital phase we find from fitting the RV dataalone is slightly offset to the transit phase by 0.24 days, but thisis within the 1σ uncertainty of T0. The reduced χ2 of this fit is0.55, indicating that a circular orbit model is more than adequateto describe the RV data. Nevertheless, we also performed a fitincluding the orbital eccentricity as a free parameter. We founde = 0.06 ± 0.06, consistent with zero. When we also include alinear slope we find a best-fit slope of +0.12±0.04 m s−1 day−1.χ2
red of the orbit+slope model is 0.39. This slope could indicatethe presence of an outer companion with a period exceedingour time baseline. However, as the χ2
red is already below 1, theconfirmation of this slope needs to await future observations.Including the slope in the model has virtually no effect on theRV-amplitude (K = 74.9 ± 3.3 m s−1 without the slope andK = 74.6 ± 3.0 m s−1 with the slope) and hence the mass ofthe companion.
We then used a Markov Chain Monte Carlo (MCMC) algo-rithm to perform a simultaneous fit to the light curve and the RVresults. This analysis was performed using the 24 HET RV mea-surements and the Q1 through Q6 Kepler photometry. The modelfits for ρ�, T0, Period, b, r/R�, e sin ω, e cos ω, γ , and the pho-tometric zero point. The transit shape is characterized by theMandel–Agol analytic derivations (Mandel & Agol 2002) andthe planetary orbit is assumed to be Keplerian. We use nonlin-ear limb-darkening parameters derived by A. Prsa (2011, privatecommunication). The best-fit model is computed by simultane-ously fitting RV measurements and Kepler photometry and thenminimizing the chi-square statistic with a Levenberg–Marquartmethod. To obtain probability distributions, the best-fit modelis used to seed an MCMC computation. Our MCMC algorithmemploys a hybrid sampler based on Gregory (2011) that uses aGibb sampler or a buffer of previously computed chain points to
generate proposals to jump to new locations in parameter space.The addition of the buffer allows for a calculation of vector-ized jumps that allow for efficient sampling of highly correlatedparameter space. Specifically, we employed a correlated param-eter sampler as discussed in Section 3 of Gregory (2011). TheMCMC distributions are shown in Figure 12.
The results of this MCMC modeling are summarizedin Table 4. For all parameters we list the median valuesalong with their 68% uncertainty interval (±1σ ) based onthe MCMC distributions. The transit ephemeris is T0 =69.328651+0.000084
−0.000096 (BJD−2454900) and the period is P =4.942782 ± 0.0000013 days. The transit has a depth of11,127.7+12.8
−14.4 ppm. Taking into account the diluting effect ofthe other star in the aperture (97.0% ± 0.003% of the lightin the aperture comes from Kepler-15) we find a radius ra-tio of Rplanet/R∗ = 0.09960+0.00055
−0.00053. The RV semi-amplitudeK is 78.7+8.5
−9.1 m s−1. The orbital eccentricity was allowed asa free parameter during the modeling process, but again wefind no strong indication for an eccentric orbit (e sin ω =−0.123+0.089
−0.110, e cos ω = 0.053+0.086−0.079). Figure 11 displays the
HET/HRS and the NOT/FIES results compared to the RV orbit(assuming e = 0). The reduced χ2 of this fit is 0.52, indicatingthat our RV error bars are slightly overestimated. The resid-ual rms scatter for the two RV data set is 16.9 m s−1 for theHET/HRS data and 9.6 m s−1 for the NOT/FIES data.
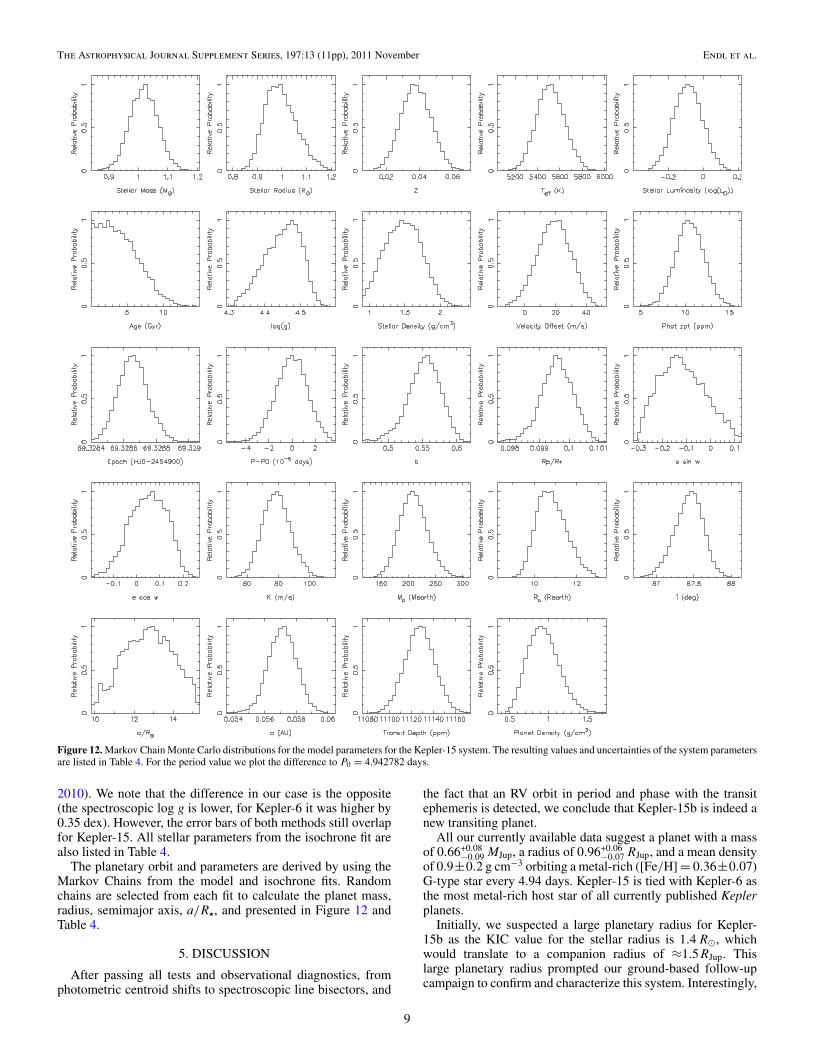
The distribution of ρ� from the model fit above and Teff and[Fe/H] from the spectroscopic determination are used togetherto match Yonsei–Yale (Y2) models (Yi et al. 2001). This isknown as the “ρ� method” (see, e.g., Sozetti et al. 2007;Brown 2010). The probability distributions of the matchingstellar parameters, M�, R�, age, luminosity are also shown inFigure 12. From isochrone fitting we derive a mass for the star of1.018+0.044
−0.052 M�, a radius of 0.992+0.058−0.070 R�, and an age of 3.7+3.5
−1.6
Gyr. The log g from the isochrone fit is 4.46+0.053−0.050, 0.2 dex higher
than the spectroscopically derived log g value of 4.23 ± 0.2.A systematic difference in log g values for high metallicitystars has been discussed previously for Kepler-6 (Dunham et al.
8
The Astrophysical Journal Supplement Series, 197:13 (11pp), 2011 November Endl et al.
Figure 12. Markov Chain Monte Carlo distributions for the model parameters for the Kepler-15 system. The resulting values and uncertainties of the system parametersare listed in Table 4. For the period value we plot the difference to P0 = 4.942782 days.
2010). We note that the difference in our case is the opposite(the spectroscopic log g is lower, for Kepler-6 it was higher by0.35 dex). However, the error bars of both methods still overlapfor Kepler-15. All stellar parameters from the isochrone fit arealso listed in Table 4.
The planetary orbit and parameters are derived by using theMarkov Chains from the model and isochrone fits. Randomchains are selected from each fit to calculate the planet mass,radius, semimajor axis, a/R�, and presented in Figure 12 andTable 4.
5. DISCUSSION
After passing all tests and observational diagnostics, fromphotometric centroid shifts to spectroscopic line bisectors, and
the fact that an RV orbit in period and phase with the transitephemeris is detected, we conclude that Kepler-15b is indeed anew transiting planet.
All our currently available data suggest a planet with a massof 0.66+0.08
−0.09 MJup, a radius of 0.96+0.06−0.07 RJup, and a mean density
of 0.9±0.2 g cm−3 orbiting a metal-rich ([Fe/H] = 0.36±0.07)G-type star every 4.94 days. Kepler-15 is tied with Kepler-6 asthe most metal-rich host star of all currently published Keplerplanets.
Initially, we suspected a large planetary radius for Kepler-15b as the KIC value for the stellar radius is 1.4 R�, whichwould translate to a companion radius of ≈1.5 RJup. Thislarge planetary radius prompted our ground-based follow-upcampaign to confirm and characterize this system. Interestingly,
9
The Astrophysical Journal Supplement Series, 197:13 (11pp), 2011 November Endl et al.
Table 4Parameters of the Kepler-15 Transiting System
Parameter (unit) Value +1σ −1σ Notes
Period (days) 4.942782 +0.0000013 −0.0000013T0 (BJD) 2454969.328651 +0.000084 −0.000096ρ� (g cm−3) 1.47 +0.26 −0.28b 0.554 +0.023 −0.024Rplanet/R� 0.0996 +0.00055 −0.00053i (deg) 87.44 +0.18 −0.20a/R� 12.8 +1.2 −1.5
M� [M�] 1.018 +0.044 −0.052 (isochrone fit)R� [R�] 0.992 +0.058 −0.070 (isochrone fit)Age (Gyr) 3.7 +1.5 −3.6 (isochrone fit)Teff (K) 5515 +122 −130 (isochrone fit)log L/L� −0.087 +0.078 −0.088 (isochrone fit)log g (cgs) 4.46 +0.053 −0.050 (isochrone fit)log g (cgs) 4.23 +0.2 −0.2 (spectroscopic fit)[Fe/H] 0.36 +0.07 −0.07 (spectroscopic fit)Vrot (km s−1) 2.0 +2.0 −2.0 (spectroscopic fit)RV (km s−1) −20.0 +1.0 −1.0 (spectroscopic fit)
Rplanet (RJup) 0.96 +0.06 −0.07K (m s−1) 78.7 +8.5 −9.5e sin ω −0.123 +0.089 −0.110e cos ω 0.053 +0.086 −0.079Mplanet (MJup) 0.66 +0.08 −0.09a (AU) 0.05714 +0.00086 −0.00093ρplanet (g cm−3) 0.93 +0.18 −0.22
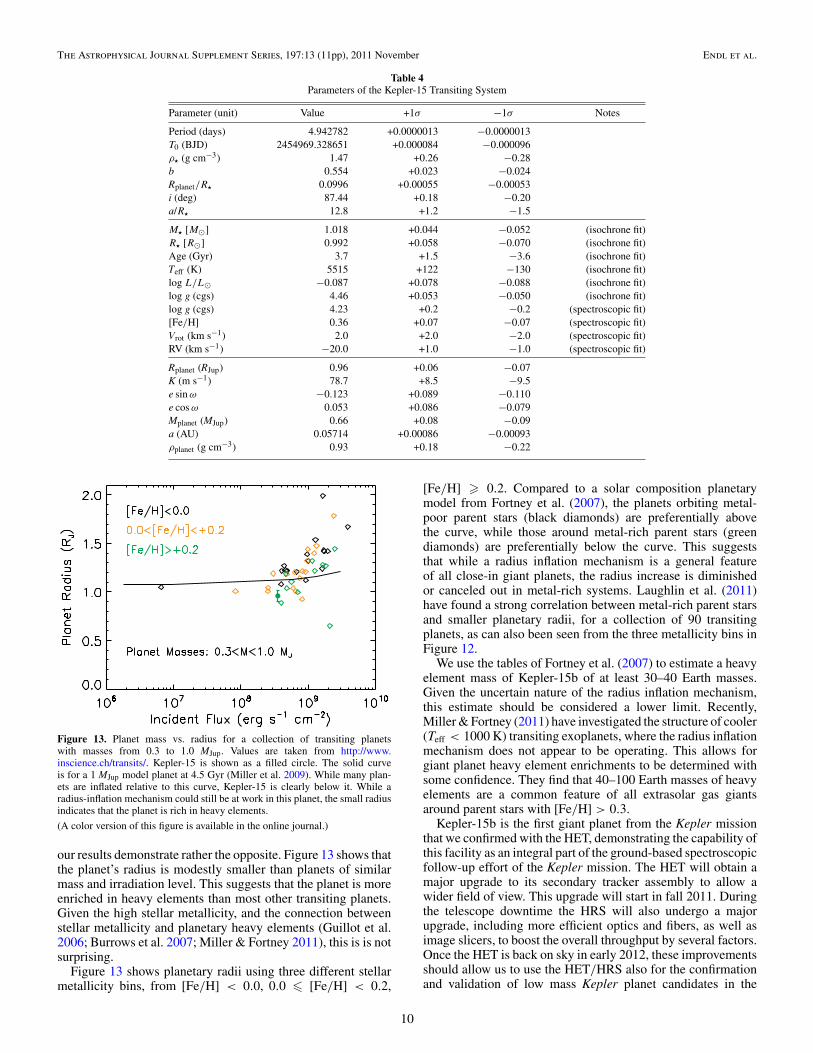
Figure 13. Planet mass vs. radius for a collection of transiting planetswith masses from 0.3 to 1.0 MJup. Values are taken from http://www.inscience.ch/transits/. Kepler-15 is shown as a filled circle. The solid curveis for a 1 MJup model planet at 4.5 Gyr (Miller et al. 2009). While many plan-ets are inflated relative to this curve, Kepler-15 is clearly below it. While aradius-inflation mechanism could still be at work in this planet, the small radiusindicates that the planet is rich in heavy elements.
(A color version of this figure is available in the online journal.)
our results demonstrate rather the opposite. Figure 13 shows thatthe planet’s radius is modestly smaller than planets of similarmass and irradiation level. This suggests that the planet is moreenriched in heavy elements than most other transiting planets.Given the high stellar metallicity, and the connection betweenstellar metallicity and planetary heavy elements (Guillot et al.2006; Burrows et al. 2007; Miller & Fortney 2011), this is is notsurprising.
Figure 13 shows planetary radii using three different stellarmetallicity bins, from [Fe/H] < 0.0, 0.0 � [Fe/H] < 0.2,
[Fe/H] � 0.2. Compared to a solar composition planetarymodel from Fortney et al. (2007), the planets orbiting metal-poor parent stars (black diamonds) are preferentially abovethe curve, while those around metal-rich parent stars (greendiamonds) are preferentially below the curve. This suggeststhat while a radius inflation mechanism is a general featureof all close-in giant planets, the radius increase is diminishedor canceled out in metal-rich systems. Laughlin et al. (2011)have found a strong correlation between metal-rich parent starsand smaller planetary radii, for a collection of 90 transitingplanets, as can also been seen from the three metallicity bins inFigure 12.
We use the tables of Fortney et al. (2007) to estimate a heavyelement mass of Kepler-15b of at least 30–40 Earth masses.Given the uncertain nature of the radius inflation mechanism,this estimate should be considered a lower limit. Recently,Miller & Fortney (2011) have investigated the structure of cooler(Teff < 1000 K) transiting exoplanets, where the radius inflationmechanism does not appear to be operating. This allows forgiant planet heavy element enrichments to be determined withsome confidence. They find that 40–100 Earth masses of heavyelements are a common feature of all extrasolar gas giantsaround parent stars with [Fe/H] > 0.3.
Kepler-15b is the first giant planet from the Kepler missionthat we confirmed with the HET, demonstrating the capability ofthis facility as an integral part of the ground-based spectroscopicfollow-up effort of the Kepler mission. The HET will obtain amajor upgrade to its secondary tracker assembly to allow awider field of view. This upgrade will start in fall 2011. Duringthe telescope downtime the HRS will also undergo a majorupgrade, including more efficient optics and fibers, as well asimage slicers, to boost the overall throughput by several factors.Once the HET is back on sky in early 2012, these improvementsshould allow us to use the HET/HRS also for the confirmationand validation of low mass Kepler planet candidates in the
10
The Astrophysical Journal Supplement Series, 197:13 (11pp), 2011 November Endl et al.
Neptune and Super-Earth range, similar to Kepler-10b (Batalhaet al. 2011).
Funding for this Discovery mission is provided by NASA’sScience Mission Directorate. We thank the hundreds of peoplewho make this mission successful. The Hobby–Eberly Tele-scope (HET) is a joint project of the University of Texas atAustin, the Pennsylvania State University, Stanford University,Ludwig-Maximilians-Universitat Munchen, and Georg-August-Universitat Gottingen. The HET is named in honor of its princi-pal benefactors, William P. Hobby and Robert E. Eberly. Basedin part on observations made with the Nordic Optical Telescope,operated on the island of La Palma jointly by Denmark, Finland,Iceland, Norway, and Sweden, in the Spanish Observatorio delRoque de los Muchachos of the Instituto de Astrofisica de Ca-narias. We also thank the anonymous referee for many helpfulsuggestions to improve the manuscript.
REFERENCES
Batalha, N., Borucki, W., Bryson, S., et al. 2011, ApJ, 729, 27Borucki, W. J., Koch, D., Basri, G., et al. 2010, Science, 327, 977Borucki, W. J., Koch, D. J., Basri, G., et al. 2011, ApJ, 736, 19Brown, T. M. 2010, ApJ, 709, 535Brown, T. M., Latham, D. W., Everett, M. E., & Esquerdo, G. A. 2011, AJ, 142,
112Brugamyer, E., Dodson-Robinson, S. E., Cochran, W. D., & Sneden, C.
2011, ApJ, 738, 97Bryson, S. T., Tenenbaum, P., Jenkins, J. M., et al. 2010, ApJ, 713, L97Buchhave, L. A., Bakos, G. A., Hartman, J. D., et al. 2010, ApJ, 720,
1118Burrows, A., Hubeny, I., Budaj, J., & Hubbard, W. B. 2007, ApJ, 661,
502Cochran, W. D., Endl, M., McArthur, B., et al. 2004, ApJ, 611, 133Cutri, R. M., Skrutskie, M. F., van Dyk, S., et al. 2003, VizieR On-line Data
Catalog: II/246
Djupvik, A. A., & Andersen, J. 2010, in Highlights of Spanish AstrophysicsV, ed. J. M. Diego, L. J. Goicoechea, J. I. Gonzalez-Serrano, & J. Gorgas(Berlin: Springer), 211
Desert, J.-M., Charbonneau, D., Demory, B.-O., et al. 2011, ApJS, 197, 14Dunham, E. W., Borucki, W. J., Koch, D. G., et al. 2010, ApJ, 713, L136Endl, M., Kurster, M., & Els, S. 2000, A&A, 362, 585Fortney, J. J., Marley, M. S., & Barnes, J. W. 2007, ApJ, 659, 1661Gautier, T. N., Batalha, N. M., Borucki, W. J., et al. 2010, arXiv:1001.0352Gregory, P. C. 2011, MNRAS, 410, 94Guillot, T., Santos, N. C., Pont, F., et al. 2006, A&A, 453, L21Horch, E. P., Gomez, S. C., Sherry, W. H., et al. 2010, AJ, 141, 45Howell, S. B., Everett, M. E., Sherry, W., Horch, E., & Ciardi, D. R. 2011, AJ,
142, 19Jefferys, W. H., Fitzpatrick, M. J., & McArthur, B. E. 1988, Celest. Mech., 41,
39Jenkins, J. M., Borucki, W. J., Koch, D. G., et al. 2010a, ApJ, 724, 1108Jenkins, J. M., Caldwell, D. A., Chandrasekaran, H., et al. 2010b, ApJ, 713, L87Koch, D. G., Borucki, W. J., Basri, G., et al. 2010, ApJ, 713, L79Kurster, M., Schmitt, J. H. M. M., Cutispoto, G., & Dennerl, K. 1997, A&A,
320, 831Kurucz, R. 1993, ATLAS9 Stellar Atmosphere Programs and 2 km/s Grid
(Kurucz CD-ROM No. 13.; Cambridge: Smithsonian Astrophys. Obs.)Latham, D. W., Borucki, W. J., Koch, D. G., et al. 2010, ApJ, 713, L140Laughlin, G., Crismani, M., & Adams, F. C. 2011, ApJ, 729, 7Lomb, N. R. 1976, Ap&SS, 39, 447Mandel, K., & Agol, E. 2002, ApJ, 580, L171Miller, N., & Fortney, J. J. 2011, ApJ, 736, 29Miller, N., Fortney, J. J., & Jackson, B. 2009, ApJ, 702, 1413Ramsey, L. W., Adams, M. T., Barnes, Thomas G., et al. 1998, Proc. SPIE,
3352, 34Robin, A. C., Reyle, C., Derriere, S., & Picaud, S. 2003, A&A, 409, 523Santerne, A., Diaz, R. F., Bouchy, F., et al. 2011, A&A, 528, 63Scargle, J. D. 1982, ApJ, 263, 835Sneden, C. A. 1973, PhD thesis, Univ. Texas at AustinSozetti, A., Torres, G., Charbonneau, D., et al. 2007, ApJ, 664, 1190Torres, G., Fressin, F., Batalha, N. M., et al. 2011, ApJ, 727, 24Tull, R. G. 1998, Proc. SPIE, 3355, 387Tull, R. G., MacQueen, P. J., Sneden, C., & Lambert, D. L. 1995, PASP, 107,
251Yi, S., Demarque, P., Kim, Y.-C., et al. 2001, ApJS, 136, 417
11