j'wmts l = j sun sk'ii* \t\i*log\ - international nuclear
TRANSCRIPT
s $ ,
"* , ' ' '
'J'WMtS
t ,
i. •=
l = j
vun iM 1I-;FORs u n sk'ii* \t\i*LOG\
ACXRF96
ASIAN CONFERENCEON
X-RAYS AND RELATED TECHNIQUES IN RESEARCH AND INDUSTRY(ACXRI96)
June 6-8, 1996Ipoh, Perak, Malaysia
Organised by
School of Materials and Mineral Resources EngineeringUniversiti Sains Malaysia, Perak Branch Campus
31750 Tronoh, Perak, Malaysia
Co-Organiser
Malaysian Institute for Nuclear Technology Research(MINT)
i t imimI N S T I T U T EFOR IVCLUtUCMOlOtTn s f . u c n
Publication Sponsored by
Perak Foundation, Ipoh
VOL 2 8 i t ' /
ACXPI'96
Universiti Sains Malaysia1996
The University is not resfonsible as a bodyfor the facts and opinions expressed in this publication.
ISBN983-9700-40-5
Printed by
(perceta^an Zainon Kjissim
Ipoh, (PemkJDaruCtRidzuan
Malaysia
11

AXCRI96
Supporting Organisations /Industries
State of Perak
Perak Foundation
Philips Electronic Systems (M) Sdn. Bhd.
Delta Advantech (M) Sdn. Bhd.
Kumpulan Abex Sdn. Bhd.
Southern Steel Berhad
Perkin Elmer Instruments (M) Sdn. Bhd.
Percetakan Zainon Kassim
Casuarina Hotel, Ipoh
Bumi-Sains Sdn. Bhd.
Darul Teknik Sdn. Bhd.
111

ACXRI 96
International Advisory Committee
1. Prof. W.T. Robinson (University of Canterbury, New Zealand)2. Prof. P. Ramachandra Rao (National Metallurgical Laboratory, India)3. Prof. Dr. Marsongkohadi (Indonesian National Atomic Energy Agency, Indonesia)4. Prof. B. Wilshire (University of Wales, Swansea, United Kingdom)5. Prof. G. Inden (Max Plank Institute, Dusseldorf, Germany)6. Prof. Emeritus R.R. Hasiguti (University of Tokyo. Japan)7. Prof. Chong Chon Sing (Universiti Sains Malaysia, Malaysia)8. Prof. Phathana Pharanantha (Chulalongkorn University Bangkok, Thailand)9. Prof. Sukiman Sarmani (University Kebangsaan Malaysia, Malaysia)
Local Organising Committee
1. Y. Bhg. Dato Prof. Ishak Tambi Kechik, Vice Chancellor -(Patron)2. Assoc. Prof. Dr. Azmi Rahmat -(Chairman)3. Dr. Ahmad Sobri Hj. Hashirm -(Co. Chairman)4. Assoc. Prof. Dr. Kamarudin Hussin -(Dy. Chairman)5. Dr. Zainal Arifin Ahmad -(Secretary)6. Dr. Zul Azhar Zahid Jamal -(Treasurer)7. Prof. Suraj Bhan8. Prof. PR. Khangoankar9. Assoc. Prof. Dr. Radzali Othman10. Assoc. Prof. Dr. D.G.S. Sharma11. Dr. Abdul Fatah Awang Mat12. Dr. Azali Muhammad13. Dr. Khairun Azizi Azizli14. Dr. Abdul Kadir Masrom15. Mr. Tuan Besar Tuan Sarif16. Mr. Mian Khalid Habib
Editorial Committee
1. Prof. Suraj Bhan2. Dr. Zainal Arifin Ahmad3. Dr. Zul Azhar Zahid Jamal
IV
ACXRI 96
This volume contains the proceedings of the Asian Conference on X-raysand Related Techniques in Research and Industry held at Ipoh during June 6 - 8 ,1996.
Ipoh is capital of Perak State rich in mineral and natural resources and alsohouses the Engineering Campus of the Universiti Sains Malaysia. Therefore it hasa unique position to be the venue of the conference.
X-rays were put to use in medical radiography immediately after thediscovery by Roentgen in 1895 followed by the wide use in industry and materialsresearch. In the course of time the related techniques using XRF, XRD, TEM,SEM, EDX, Auger electron microscopy, etc. have been developed, refined and putto use in diverse fields. The conference provides an opportunity for mutualdiscussion on the recent developments both in instrumentation and applicationsincluding limitations and scope for improvements. A few delegates from themanufacturers and suppliers are also there to brief on the latest equipment.
I am happy to note that the papers for presentation are from wide spectrumstressing the interdisciplinary nature of the topic of the conference. It is quitesatisfying that we have delegates in the conference right from Canada in the westand Japan in the east. I am confident that the conference will contribute to betterunderstanding of the scope of applications of these analytical techniques.
I also extend my sincere thanks to Perak State Government and otherorganisations, industries and agencies for contributing generously to theconference.
Our special thanks are to the Vice-Chancellor, Y. Bhg. Dato' Prof. IshakTambi Kechik for his guidance and encouragement. We are also thankful to theDirector General and his colleagues of the Malaysian Institute for NuclearTechnology (MINT) for agreeing to be co-organiser.
ASSOC. PROF. AZMlRAHMATChairmanOrganising Committee ACXRI '96
ACXRI 96
TABLE OF CONTENTS
Paper No. Page
INVITED PAPERS
1. Applications of Neutron Powder Diffraction in Materials Research 1S. J. Kennedy
2. Application of Electron Back-Scatter Diffraction to Texture Research 11V. Randle
3. A New Characterization Method of the Microstructure by Utilizing the 21Macroscopic Composition Gradient in AlloysT. Miyazaki, T. Koyama & S. Kobayashi
4. The Role of Textures in the Forming of Automotive Sheet Steels 31Sanak Mishra
5. Quantitative Phase Analysis in Industrial Research 40Ahmad Monshi
45. Structural and Morphological Properties of Electroceramics for Chemical 307SensorsEnrico Traversa
CONTRIBUTED PAPERS
6. Orientation-Related Phenomena in Al-Li Sheet During Superplastic Forming 47V. Randle & B. Wilshire
7. XRF, XRD & SEM Facilities in the School of Materials & Mineral Resources 53Engineering, Universiti Sains MalaysiaAzmi Rah mat
8. Composition & Quantification of Phases in the Solid-State Reduction of 61Chromite Using SEM-EDX & EPMA-WDS TechniquesR. F. Johnston & H. V. Duong
9. Application of Energy Dispersive XRF Technique in the Hydrometallurgy 67Study of Local ZirconMeor Yusof Sulaiman & Kamarudin Hussin and Azizan Aziz
10. Quality Control of Clinker Products by SEM and XRF Analysis 73ZiadAbu Kaddourah & Khairun Azizi
11. Analysis of Monazite Samples 80Kartiwa Sumadi & Yayah Rohayati
vi
ACXRI 96
12. Application of X-Ray Diffraction Techniques to the Understanding of the 86Dry Sliding Wear Behaviour of Aluminium and TitaniumZoheir N. Farhat, Ahmet T. Alpas & Derek O. Northwood
13. Application of X-Ray Method for Measuring Internal Stress in the Gear 92Teeth Surface layerTadeusz Zaborowski
14. Residual Stress Characterization of Welds Using X-Ray Diffraction 97TechniquesJames A. Pineault, Michael E. Brauss & John S. Eckersley
15. Effect of Cold Work on CO2 Corrosion Behaviour Of 13% Cr (420 Type) 107Stainless Steel in Brine Medium With and Without Addition of SodiumSulphideAkram AH Agil, Azmi Rahmat & Suraj Bhan
16. Mechanical Characterization of Surface Layers by X-Ray Diffraction - 116Application to TribologyG. H. Farrahi
17. Advances in Low Atomic Number Element Analysis by Wavelength 122Dispersive X-Ray Fluorescence SpectronetryBruno Vrebos
18. X-Ray Crystallography Studies at the School of Physics, Universiti Sains 130MalaysiaHoong Kurt Fun
19. Small-Angle Neutron Scattering Instrument at MINT 134M. A. M. Sufi, Y. Abdullah, J. Hamid, R. Kassim, S. Radiman, M. Deraman& A. G. Ramli
20. Small-Angle X-Ray Scattering Studies on a Ternary Monolayer Surfactant 144SystemsShahidan Radiman, Thomas Rieker & R. P. Hjelm Jr.
21. Effective Applications of Auger Electron Spectroscopy 150H. Golnabi
22. Determination of Molecular Packing in Langmuir- Blodgett Films by X-Ray 158DiffractionNorani M. Mohamed
23. Crystal Structure Studies of ct-Agl Superionic Conductor by Rietveld Profile 165Analysis MethodNurdin Effendi, P. Marsongkohadi & Rochim Suratman
VII
ACXRI 9624. Structural & Morphological Optimisation of Solid State Ionic Systems 171
R. V. Kumar
25. EXAFSoflron Polymer Electrolytes 183M. Aziz
26. The Metallurgical Approach on the Solder Voids Behaviour in Surface Mount 189DevicesMohabattul Zatnan Bukhari
27. Thermosonic Wire Bonding of IC Devices Using Palladium Wire 197Shze J. Hu, M. T. Poll & R. M. Tan
28. Structural Studies of Antimony-Doped Tin Selenide (SnSe:Sb) Thin Films 205Samsudi Sakrani, Nawialt Rosdi & Yussof Wahab
29. A Study of the Crystallisation of Amorphous Silicon Prepared by Vacuum 213Evaporation TechniqueS. Sail eh, K. Ibrahim & Z. Jama I
30. Studies on SiC(p) Reinforced Al-Al3Ni Eutectic Matrix Composites 217A. K. Masrom, L. C. Foo & A. B. Ismail
31. SEM Evaluation Study of Ni Cr Al Coating Composition from Sputtering 225YieldsLuay B. Hussain, John Nicholls & Peter Hancock
32. A Study on the Phase Transformation of MgO-P2O5 Glass by X-Ray 233DiffractionM. R. Sahar & N. Kamaruddin
33. 'Ratio of Slopes Method' for Quantitative Analysis in Ceramic Bodies 237Zainal Arifin Ahmad, Ahmad Fauzi Mohd Noor, Radzali Othman &Peter F. Messer
34. Microstructure Investigation of Ba-Sr Mixed Ferrites, Using SEM Technique 243J. Amighian & M. Mozaffari
35. Influence of Clay Mineralogy on Clay-Based Ceramic Products 247Radzali Othman, Tuan Besar Tuan Sarif, Zainal Arifin Ahmad,Ahmad Fauzi Mohd Noor and Abu Bakar Aramjat
36. Investigation of X-Ray Energy for Computed Tomography Using Film 253TechniqueSomyot Srisatit, Nares Chankow & Attaporn Pattarasumunt
37. Real-Time Digital X-Ray Radioscopic Inspection System 259M. H. Ahmad Fadzil, A. A. Razali & W. H. Wan Mustafa
viii

ACXRI '96
38. Study of Austempering Reaction in Austempered Ductile Iron 265Ja'far Farltan Al-sharab, D. G. R. Sharma & Samsul Bahar Sadli
39. Phase Composition of Rapidly Solidified Ag-Sn-Cu Dental Alloys 271Lecong Dzuong & Do Minh Ngltiep
40. The Application of SEM in Analyzing the Damage to the Petroleum 275Reservoirs Caused by Drilling FluidsAbdul Razak Ismail
41. Magnetic Field Influence on Substructure Formed by Electric Spark 281TreatmentReza Rahbari G. & A. N. Ivanov
42. XRD Studies on Solid State Amorphisation in Electroless Ni/P and 285Ni/B DepositsP. Sampath Kumar & P. Kesavan Nair
43. Growth Crystallography of Silicon Phase in Unmodified, Impurity andChill Modified Al-Si Eutectic Alloys 293Engku Moltd Nazim Engku Abu Bakar & All Ourjini
44. Structure of SnO2-Ln2O3 (Ln=La, Pr, Nd, Sm, Gd) 299Wan Azelee Wan Abu Bakar
IX
ACXRI 96
APPLICATIONS OF NEUTRON POWDER DIFFRACTION • ! • • - - - •
IN MATERIALS RESEARCH 111111111111:1111MY9700777
S. J. KennedyNeutron Scattering Group
Australian Nuclear Science and Technology OrganisationPrivate Mail Bag 1, Menai NSW 2234, Australia
Abstract
The aim of this article is to provide an overview of the applications of neutron powderdiffraction in materials science. The technique is introduced with particular attention tocomparison with the X-ray powder diffraction technique to which it is complementary. Thediffractometers and special environment ancillaries operating around the HIFAR researchreactor at the Australian Nuclear Science and Technology Organisation (ANSTO) aredescribed. Applications of the technique which take advantage of the unique properties ofthermal neutrons have been selected from recent materials studies undertaken at ANSTO.
Introduction
Although the ability of neutron diffraction to determine atomic and magneticstructures has been recognised for many years, the technique has traditionally beenconsidered cumbersome to compete with x-ray powder diffraction for routine structuralinvestigations. With improvements in diffractometer technology and increased primaryneutron fluxes it is now possible to obtain high quality neutron powder diffraction data inrelatively short times. Thus a wide range of problems in materials research that takeadvantage of the unique properties of the neutron can now be solved at many neutronscattering centres around the world. It is outside the scope of this article to discuss thedevelopment of the technique in any detail. My intention is simply to provide anintroduction to the technique and to indicate that neutron powder diffraction is a powerfultool and is readily available to many of those interested in materials research. As recentimprovements in the neutron powder diffraction facilities have allowed us to realise theadvantages of the technique in the study of phase transitions, I have picked some examplesof applications in materials research that are now being explored at ANSTO. Theseexamples all involved measurements on our medium resolution neutron powderdiffractometer (MRPD) and include investigations of phase transitions and dynamics inmetal hydrides, magnetic materials, ceramics and fullerenes.
It is appropriate to begin with an outline of the properties of thermal neutrons as theyapply to neutron diffraction, and the features of neutron powder diffraction in comparisonwith X-ray diffraction.
Properties of thermal neutrons
The term 'thermal neutrons' describes neutrons which have been brought to thermalequilibrium with a moderating medium (such as deuterated water) at room temperature.Thermal neutrons are characterized by a Maxwellian wavelength distribution which peaksat -0.12 nanometres (nm) and are produced either in nuclear research reactors or spallationneutron sources. For diffraction purposes it is possible to select a relatively intense beam of
ACXRI 96
any wavelength in the range 0.1 to 0.3 nm by the use of single crystal monochromators.This wavelength range is ideal as the interplanar spacings in most crystalline solids aretypically a few tenths of a nanometre.
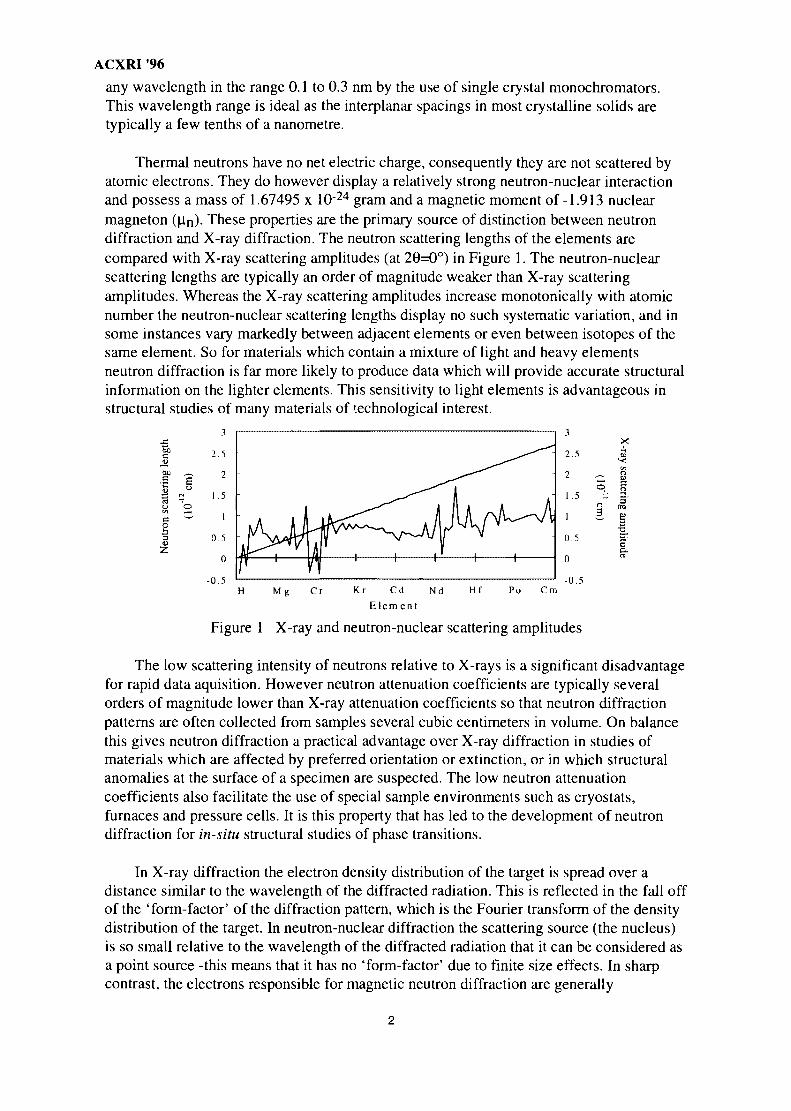
Thermal neutrons have no net electric charge, consequently they are not scattered byatomic electrons. They do however display a relatively strong neutron-nuclear interactionand possess a mass of 1.67495 x 10"24 gram and a magnetic moment of -1.913 nuclearmagneton (fin)- These properties are the primary source of distinction between neutrondiffraction and X-ray diffraction. The neutron scattering lengths of the elements arecompared with X-ray scattering amplitudes (at 26=0°) in Figure 1. The neutron-nuclearscattering lengths are typically an order of magnitude weaker than X-ray scatteringamplitudes. Whereas the X-ray scattering amplitudes increase monotonically with atomicnumber the neutron-nuclear scattering lengths display no such systematic variation, and insome instances vary markedly between adjacent elements or even between isotopes of thesame element. So for materials which contain a mixture of light and heavy elementsneutron diffraction is far more likely to produce data which will provide accurate structuralinformation on the lighter elements. This sensitivity to light elements is advantageous instructural studies of many materials of technological interest.
2.5
cC
H Me Cr Kr Cd Nd Hf Po Cm
8
3.TO
8-
- 0 . 5 -0 .5
Figure 1 X-ray and neutron-nuclear scattering amplitudes
The low scattering intensity of neutrons relative to X-rays is a significant disadvantagefor rapid data aquisition. However neutron attenuation coefficients are typically severalorders of magnitude lower than X-ray attenuation coefficients so that neutron diffractionpatterns are often collected from samples several cubic centimeters in volume. On balancethis gives neutron diffraction a practical advantage over X-ray diffraction in studies ofmaterials which are affected by preferred orientation or extinction, or in which structuralanomalies at the surface of a specimen are suspected. The low neutron attenuationcoefficients also facilitate the use of special sample environments such as cryostats,furnaces and pressure cells. It is this property that has led to the development of neutrondiffraction for in-situ structural studies of phase transitions.
In X-ray diffraction the electron density distribution of the target is spread over adistance similar to the wavelength of the diffracted radiation. This is reflected in the fall offof the 'form-factor' of the diffraction pattern, which is the Fourier transform of the densitydistribution of the target. In neutron-nuclear diffraction the scattering source (the nucleus)is so small relative to the wavelength of the diffracted radiation that it can be considered asa point source -this means that it has no 'form-factor' due to finite size effects. In sharpcontrast, the electrons responsible for magnetic neutron diffraction are generally
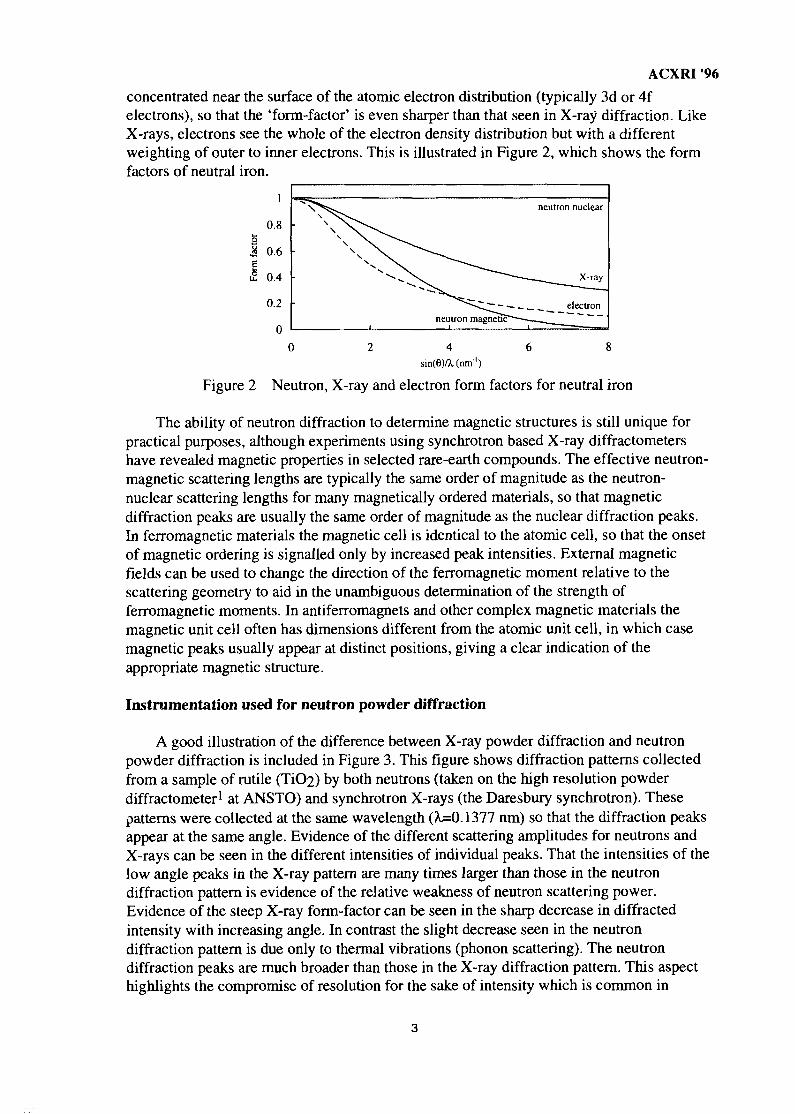
ACXRI '96concentrated near the surface of the atomic electron distribution (typically 3d or 4felectrons), so that the 'form-factor' is even sharper than that seen in X-ray diffraction. LikeX-rays, electrons see the whole of the electron density distribution but with a differentweighting of outer to inner electrons. This is illustrated in Figure 2, which shows the formfactors of neutral iron.
0.8
I 0.6
i£ 0.4
0.2
0neutron magnetic""-
neutron nuclear
-— ____X-ray
electron
- —- 11"""'0 8
sin(e)A.(nm')
Figure 2 Neutron, X-ray and electron form factors for neutral iron
The ability of neutron diffraction to determine magnetic structures is still unique forpractical purposes, although experiments using synchrotron based X-ray diffractometershave revealed magnetic properties in selected rare-earth compounds. The effective neutron-magnetic scattering lengths are typically the same order of magnitude as the neutron-nuclear scattering lengths for many magnetically ordered materials, so that magneticdiffraction peaks are usually the same order of magnitude as the nuclear diffraction peaks.In ferromagnetic materials the magnetic cell is identical to the atomic cell, so that the onsetof magnetic ordering is signalled only by increased peak intensities. External magneticfields can be used to change the direction of the ferromagnetic moment relative to thescattering geometry to aid in the unambiguous determination of the strength offerromagnetic moments. In antiferromagnets and other complex magnetic materials themagnetic unit cell often has dimensions different from the atomic unit cell, in which casemagnetic peaks usually appear at distinct positions, giving a clear indication of theappropriate magnetic structure.
Instrumentation used for neutron powder diffraction
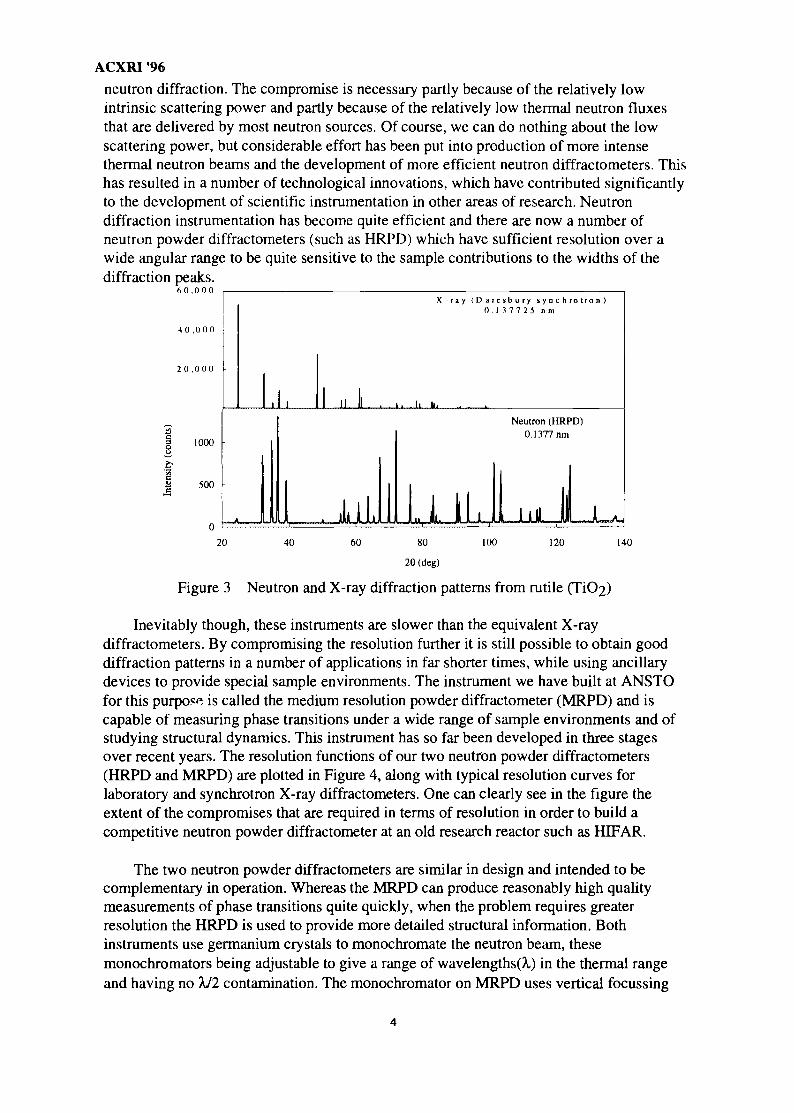
A good illustration of the difference between X-ray powder diffraction and neutronpowder diffraction is included in Figure 3. This figure shows diffraction patterns collectedfrom a sample of rutile (TiO2) by both neutrons (taken on the high resolution powderdiffractometer1 at ANSTO) and synchrotron X-rays (the Daresbury synchrotron). Thesepatterns were collected at the same wavelength (X=0.1377 nm) so that the diffraction peaksappear at the same angle. Evidence of the different scattering amplitudes for neutrons andX-rays can be seen in the different intensities of individual peaks. That the intensities of thelow angle peaks in the X-ray pattern are many times larger than those in the neutrondiffraction pattern is evidence of the relative weakness of neutron scattering power.Evidence of the steep X-ray form-factor can be seen in the sharp decrease in diffractedintensity with increasing angle. In contrast the slight decrease seen in the neutrondiffraction pattern is due only to thermal vibrations (phonon scattering). The neutrondiffraction peaks are much broader than those in the X-ray diffraction pattern. This aspecthighlights the compromise of resolution for the sake of intensity which is common in
ACXRI '96
neutron diffraction. The compromise is necessary partly because of the relatively lowintrinsic scattering power and partly because of the relatively low thermal neutron fluxesthat are delivered by most neutron sources. Of course, we can do nothing about the lowscattering power, but considerable effort has been put into production of more intensethermal neutron beams and the development of more efficient neutron diffractometers. Thishas resulted in a number of technological innovations, which have contributed significantlyto the development of scientific instrumentation in other areas of research. Neutrondiffraction instrumentation has become quite efficient and there are now a number ofneutron powder diffractometers (such as HRPD) which have sufficient resolution over awide angular range to be quite sensitive to the sample contributions to the widths of thediffraction peaks.
6 0 . 0 0 0
4 0 , 0 0 0 -
2 0 , 0 0 0 -
1000
1a 500
-
1 1
X - r a y ( D a r e s b u r y s y n c h r o t r o n )0 . 3 7 7 2 5 n m
1 II ll . I . 1, l l .
1 . u1I l l l ,
Neutron (HRPD)
0.1377 nm
20 40 60 80
26 (deg)
100 120 140
Figure 3 Neutron and X-ray diffraction patterns from rutile (TiC>2)
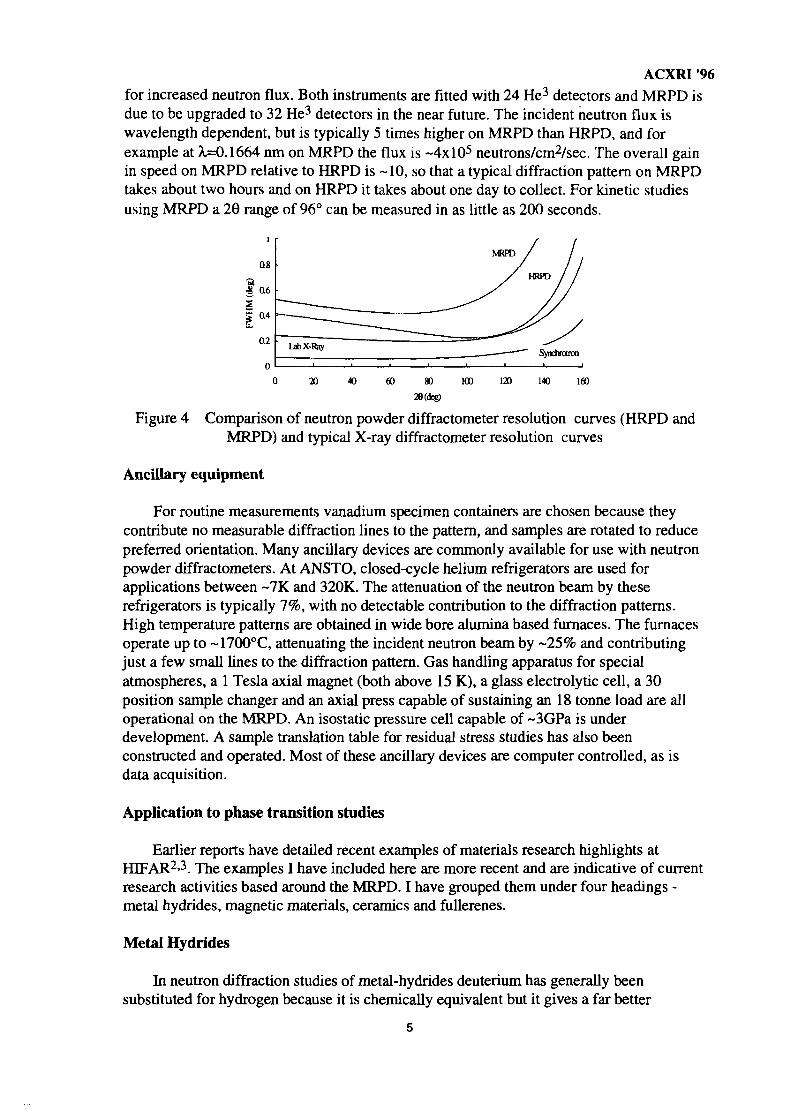
Inevitably though, these instruments are slower than the equivalent X-raydiffractometers. By compromising the resolution further it is still possible to obtain gooddiffraction patterns in a number of applications in far shorter times, while using ancillarydevices to provide special sample environments. The instrument we have built at ANSTOfor this purpose is called the medium resolution powder diffractometer (MRPD) and iscapable of measuring phase transitions under a wide range of sample environments and ofstudying structural dynamics. This instrument has so far been developed in three stagesover recent years. The resolution functions of our two neutron powder diffractometers(HRPD and MRPD) are plotted in Figure 4, along with typical resolution curves forlaboratory and synchrotron X-ray diffractometers. One can clearly see in the figure theextent of the compromises that are required in terms of resolution in order to build acompetitive neutron powder diffractometer at an old research reactor such as HIFAR.
The two neutron powder diffractometers are similar in design and intended to becomplementary in operation. Whereas the MRPD can produce reasonably high qualitymeasurements of phase transitions quite quickly, when the problem requires greaterresolution the HRPD is used to provide more detailed structural information. Bothinstruments use germanium crystals to monochromate the neutron beam, thesemonochromators being adjustable to give a range of wavelengths(A.) in the thermal rangeand having no 7J2 contamination. The monochromator on MRPD uses vertical focussing
ACXRI 96for increased neutron flux. Both instruments are fitted with 24 He3 detectors and MRPD isdue to be upgraded to 32 He3 detectors in the near future. The incident neutron flux iswavelength dependent, but is typically 5 times higher on MRPD than HRPD, and forexample at X=0.1664 nm on MRPD the flux is ~4xl05 neutrons/cm2/sec. The overall gainin speed on MRPD relative to HRPD is -10, so that a typical diffraction pattern on MRPDtakes about two hours and on HRPD it takes about one day to collect. For kinetic studiesusing MRPD a 26 range of 96° can be measured in as little as 200 seconds.
20 40 60 80
28(deg)
100
Figure 4 Comparison of neutron powder diffractometer resolution curves (HRPD andMRPD) and typical X-ray diffractometer resolution curves
Ancillary equipment
For routine measurements vanadium specimen containers are chosen because theycontribute no measurable diffraction lines to the pattern, and samples are rotated to reducepreferred orientation. Many ancillary devices are commonly available for use with neutronpowder diffractometers. At ANSTO, closed-cycle helium refrigerators are used forapplications between -7K and 320K. The attenuation of the neutron beam by theserefrigerators is typically 7%, with no detectable contribution to the diffraction patterns.High temperature patterns are obtained in wide bore alumina based furnaces. The furnacesoperate up to ~1700°C, attenuating the incident neutron beam by ~25% and contributingjust a few small lines to the diffraction pattern. Gas handling apparatus for specialatmospheres, a 1 Tesla axial magnet (both above 15 K), a glass electrolytic cell, a 30position sample changer and an axial press capable of sustaining an 18 tonne load are alloperational on the MRPD. An isostatic pressure cell capable of ~3GPa is underdevelopment. A sample translation table for residual stress studies has also beenconstructed and operated. Most of these ancillary devices are computer controlled, as isdata acquisition.
Application to phase transition studies
Earlier reports have detailed recent examples of materials research highlights atHIFAR2'3. The examples I have included here are more recent and are indicative of currentresearch activities based around the MRPD. I have grouped them under four headings -metal hydrides, magnetic materials, ceramics and fullerenes.
Metal Hydrides
In neutron diffraction studies of metal-hydrides deuterium has generally beensubstituted for hydrogen because it is chemically equivalent but it gives a far better
ACXRI '96
diffraction pattern. Experiments at HIFAR include a detailed investigation of the phasediagram of lanthanum-nickel deuteride using finely powdered LaNi5 and a gas handlingsystem to control deuterium concentration4'5. Experiments which use electrolytic control ofdeuterium concentration in LaNi5 and in T^Ni6 are now underway. The palladium-deuteride system has been extensively studied both with gas phase7-8-9 and electrolyticloading of deuterium10. In another study on ZJ^Ti detailed structural investigations usingHRPD and XRD were performed11.
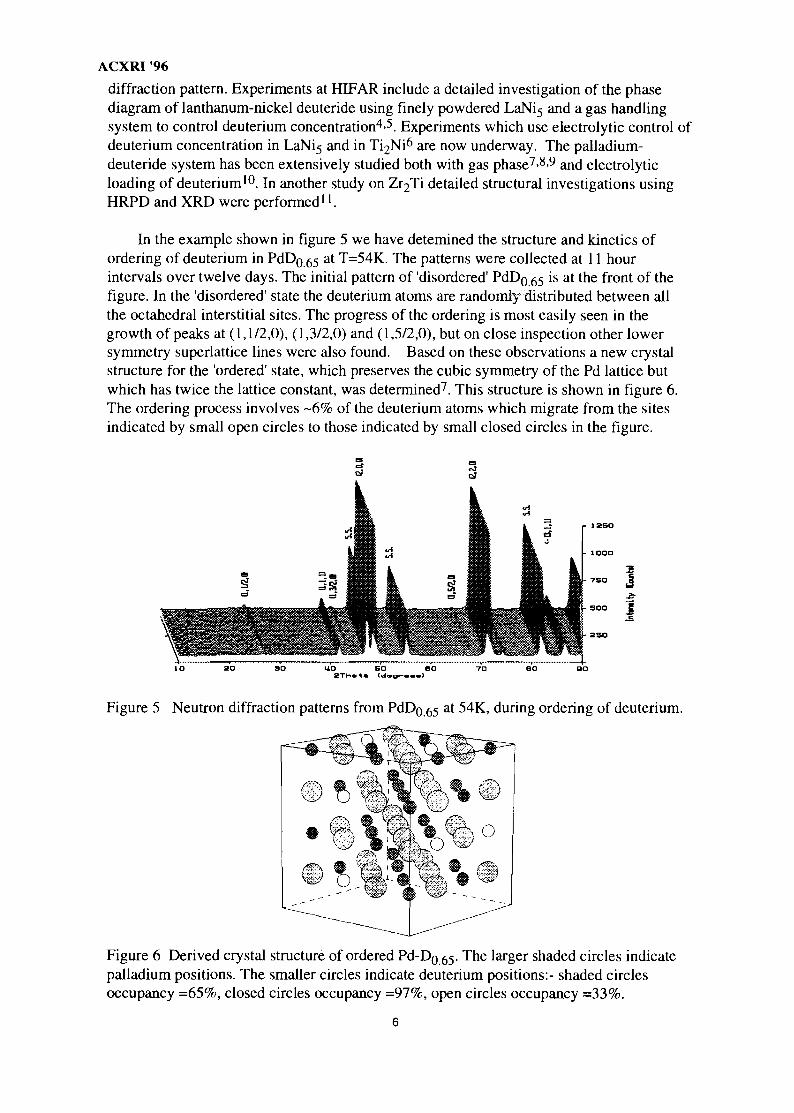
In the example shown in figure 5 we have detemined the structure and kinetics ofordering of deuterium in PdDg 55 at T=54K. The patterns were collected at 11 hourintervals over twelve days. The initial pattern of 'disordered' PdDg 55 is at the front of thefigure. In the 'disordered' state the deuterium atoms are randomly distributed between allthe octahedral interstitial sites. The progress of the ordering is most easily seen in thegrowth of peaks at (1,1/2,0), (1,3/2,0) and (1,5/2,0), but on close inspection other lowersymmetry superlattice lines were also found. Based on these observations a new crystalstructure for the 'ordered' state, which preserves the cubic symmetry of the Pd lattice butwhich has twice the lattice constant, was determined7. This structure is shown in figure 6.The ordering process involves -6% of the deuterium atoms which migrate from the sitesindicated by small open circles to those indicated by small closed circles in the figure.
Figure 5 Neutron diffraction patterns from PdDg 65 a t 54K, during ordering of deuterium.
Figure 6 Derived crystal structure of ordered Pd-D0 55- The larger shaded circles indicatepalladium positions. The smaller circles indicate deuterium positions:- shaded circlesoccupancy =65%, closed circles occupancy =97%, open circles occupancy =33%.
ACXRI '96
Magnetic structure determination
The scientific literature is rich with reports of magnetic structures that have beendetermined by neutron diffraction. The scope ranges from simple ferromagnetic materialsto the more exotic materials with sinusoidal and/or helical spin arrangements. Examples ofrecent successful magnetic studies at ANSTO include magnetoelastic effects in y-MnNialloys12, mixed ferro/antiferromagnetic order in Fe2MnSi13, and investigation of the quasi-two dimensional antiferromagnet MnPS314<15. Other studies include the magnetic structureof Ca4Mn3Oj016 and of the effects of particle size in oc-FeOOH17 and gross atomicdisorder on magnetic properties in ball-milled C^MnAl18.
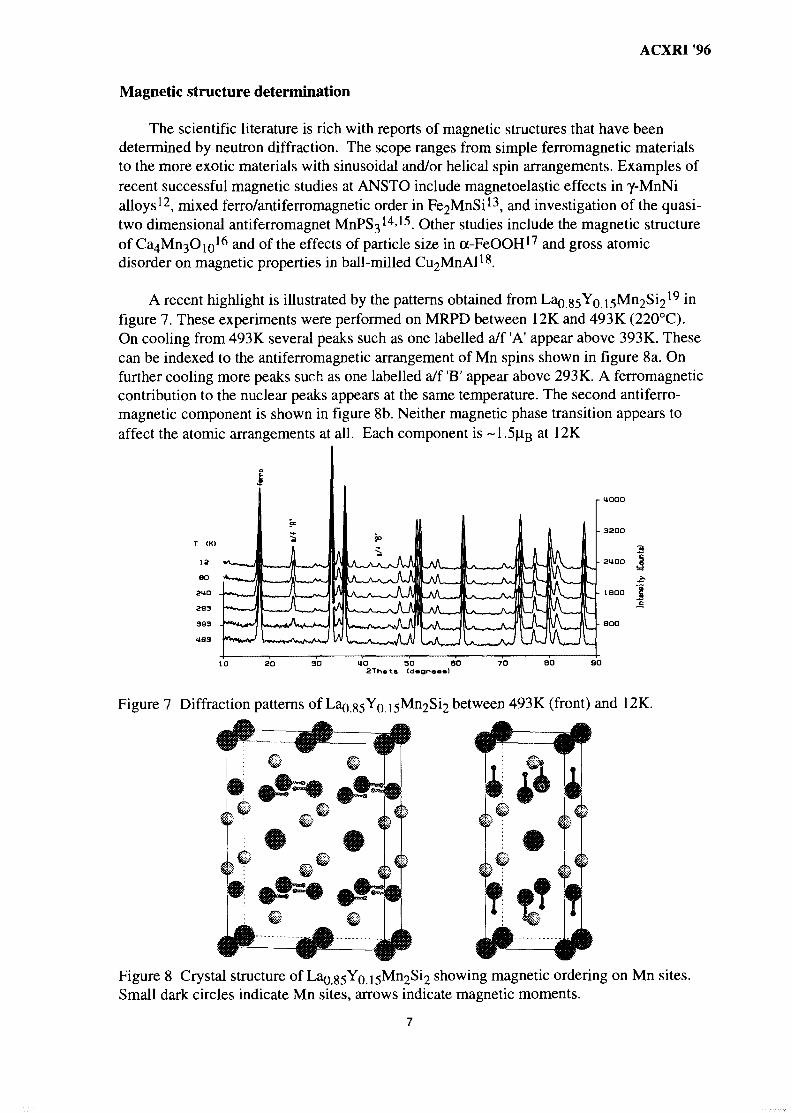
A recent highlight is illustrated by the patterns obtained from Lao g5Y0 i5Mn2Si219 m
figure 7. These experiments were performed on MRPD between 12K and 493K (220°C).On cooling from 493 K several peaks such as one labelled a/f 'A' appear above 393 K. Thesecan be indexed to the antiferromagnetic arrangement of Mn spins shown in figure 8a. Onfurther cooling more peaks such as one labelled a/f 'B' appear above 293K. A ferromagneticcontribution to the nuclear peaks appears at the same temperature. The second antiferro-magnetic component is shown in figure 8b. Neither magnetic phase transition appears toaffect the atomic arrangements at all. Each component is ~1 .5u.g at 12K
i
40 50 602Th«ta (digrsa*)
Figure 7 Diffraction patterns of La^.35Yo between 493K (front) and 12K.
Figure 8 Crystal structure of Lag^Yo i5Mn2Si2 showing magnetic ordering on Mn sites.Small dark circles indicate Mn sites, arrows indicate magnetic moments.
ACXRI 96Engineering Ceramics
Neutron diffraction is ideally suited to structural investigations of ceramic materialsfrom the point of view of its ability to provide superior site occupancy data and thecapability of measuring phase changes and reaction kinetics in situ using high temperaturefurnaces. Several neutron diffraction highlights at ANSTO have concerned zirconiatoughened ceramics20'21'22'23 and rutiles24-25.
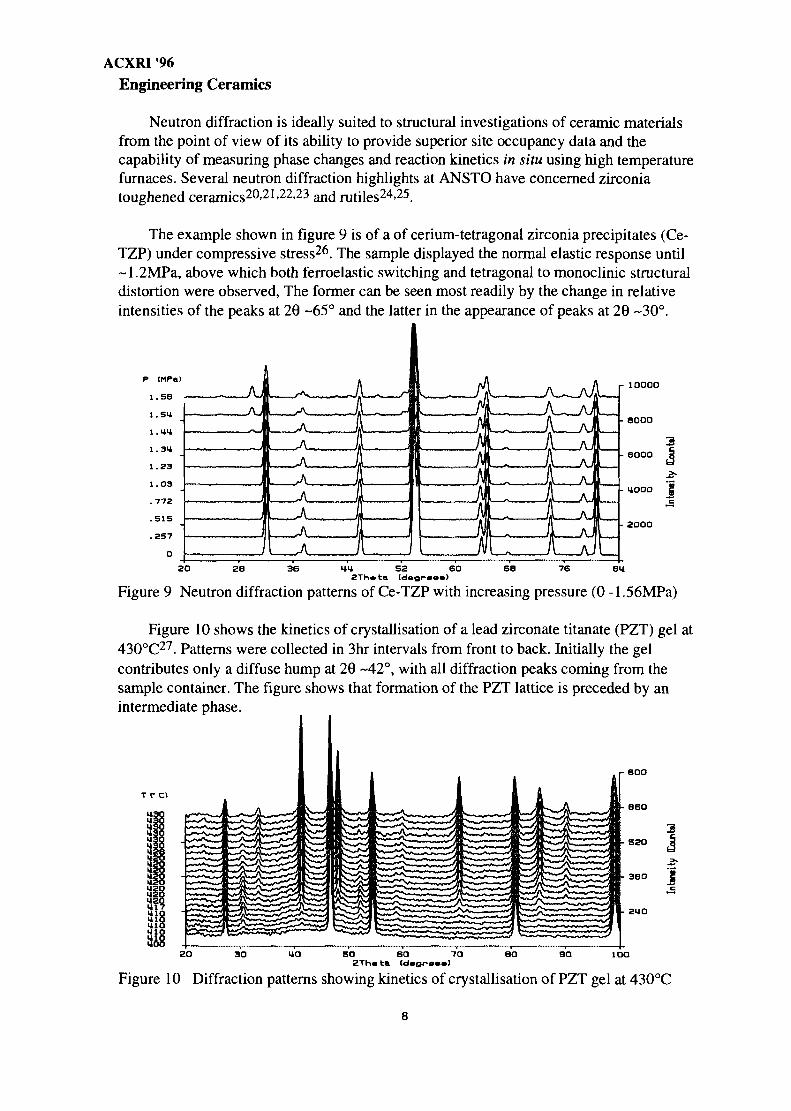
The example shown in figure 9 is of a of cerium-tetragonal zirconia precipitates (Ce-TZP) under compressive stress26. The sample displayed the normal elastic response until~1.2MPa, above which both ferroelastic switching and tetragonal to monoclinic structuraldistortion were observed, The former can be seen most readily by the change in relativeintensities of the peaks at 29 -65° and the latter in the appearance of peaks at 20 ~30°.
r 1OO0O
sa 3 6 44 52 602Th.to Idagrrail
6 8 7 6 8 4
Figure 9 Neutron diffraction patterns of Ce-TZP with increasing pressure (0 -1.56MPa)
Figure 10 shows the kinetics of crystallisation of a lead zirconate titanate (PZT) gel at430°C27. Patterns were collected in 3hr intervals from front to back. Initially the gelcontributes only a diffuse hump at 20 -42°, with all diffraction peaks coining from thesample container. The figure shows that formation of the PZT lattice is preceded by anintermediate phase.
BOO
660
530
380
240
3
1
1OO
Figure 10 Diffraction patterns showing kinetics of crystallisation of PZT gel at 430°C
ACXRI '96Fullerenes
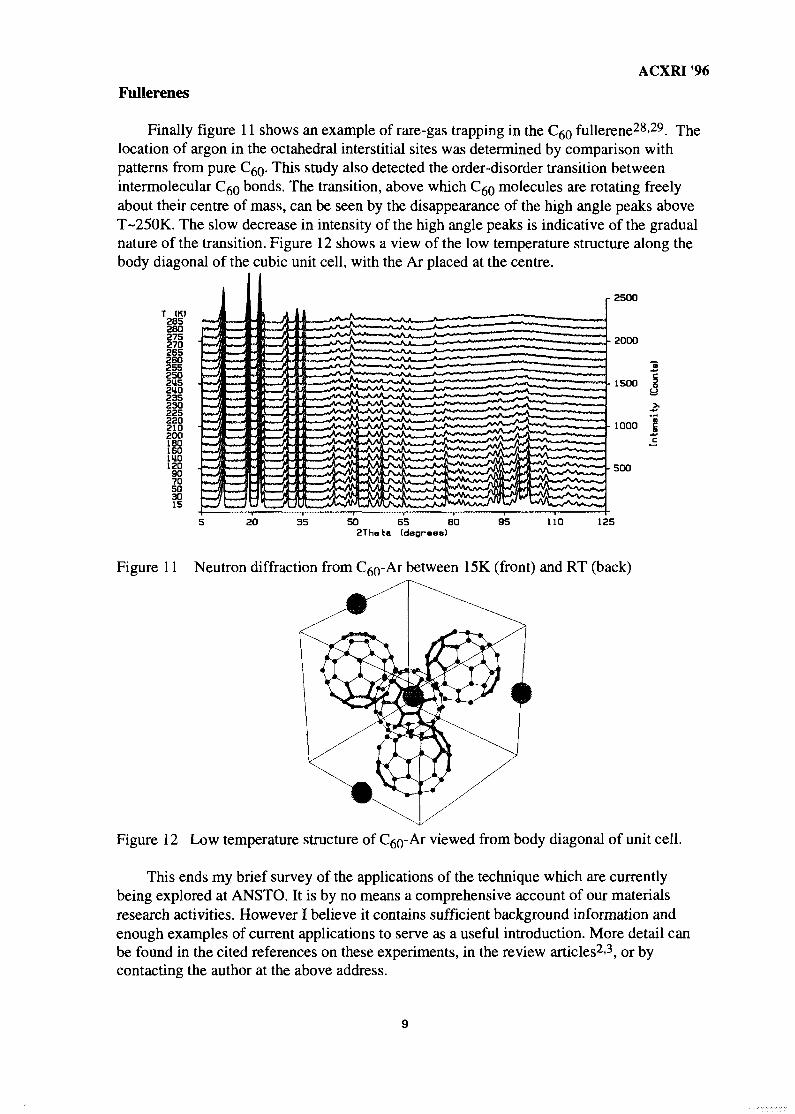
Finally figure 11 shows an example of rare-gas trapping in the C^o fullerene28-29. Thelocation of argon in the octahedral interstitial sites was determined by comparison withpatterns from pure C^. This study also detected the order-disorder transition betweenintermolecular CgQ bonds. The transition, above which C^Q molecules are rotating freelyabout their centre of mass, can be seen by the disappearance of the high angle peaks aboveT-250K. The slow decrease in intensity of the high angle peaks is indicative of the gradualnature of the transition. Figure 12 shows a view of the low temperature structure along thebody diagonal of the cubic unit cell, with the Ar placed at the centre.
2500
- 2000
1500
- IOOO
500
20 35 50 65 802Thets (degrees)
95 110 125
Figure 11 Neutron diffraction from C^-Ai between 15K (front) and RT (back)
Figure 12 Low temperature structure of C^Q-AI viewed from body diagonal of unit cell.
This ends my brief survey of the applications of the technique which are currentlybeing explored at ANSTO. It is by no means a comprehensive account of our materialsresearch activities. However I believe it contains sufficient background information andenough examples of current applications to serve as a useful introduction. More detail canbe found in the cited references on these experiments, in the review articles2'3, or bycontacting the author at the above address.

ACXRI '96Acknowledgements
There are many people who deserve acknowledgement for this article, from those atANSTO who have contributed to the development of the instrument to the researchers atAustralian universities and at ANSTO who have collaborated in these experiments. I haveindicated those responsible for the results in the reference list. Financial support for theinstrument development came from the Australian Institute of Nuclear Science andEngineering and from Australian Research Council grants as well as from ANSTO.
References
I. C J Howard, C J Ball, R L Davis and M M Elcombe, Aust. J. Phys., 1983, 35, 5072 C J Howard and S J Kennedy: Materials Forum, 1994, J8, 155-1763. S J Kennedy, Advances in X-ray Analysis, 1995, 3_8, 35-464. EH Kisi, E M Gray and S J Kennedy, J Alloys & Compounds, 1994, 2jj6, 123-1295. EM Gray, C E Buckley and E H Kisi, J Alloys & Compounds, 1994, 2JL5, 2016. B Luan, N Cui H Zhao H K Liu and S X Dou, J. Power Sources, 1995, 55, 101-67. S J Kennedy, E Wu, E H Kisi, E M Gray and B J Kennedy, J Phys:Condensed Matter,
1995,7,L33-408. E Wu, S J Kennedy, E H Kisi, E M Gray and B J Kennedy, J Alloys & Compounds,
1995,23J., 108-1149. E Wu, S J Kennedy, E M Gray & E H Kisi, J Phys Condensed matter, 1996 (in press)10. C Fong, B J Kennedy and M M Elcombe, 1993 (private communication)II. MM Elcombe, S J Campbell, C J Howard, H G Buttner and F Aubertin, J Alloys &
Compounds, 1996,232, 174-17912. G T Etheridge, L D Cussen and S J Kennedy, Physica B, 1995, 213 & 214. 351-313. T Ersez, S J Kennedy and T J Hicks, J Phys: Condensed Matter, 1995, 7, 8423-2714. A R Wildes, S J Kennedy and T J Hicks: J. Phys: Condensed Matter 1994, 6, L335-4115. A R Wildes, S J Kennedy & T J Hicks, Physica B, 1995, 213 & 214. 372-416. H J Rossell, P Goodman, S Bulcock, R H March, S J Kennedy, T J White, F J Lincoln
and K S Murray, Aust. J. of Chemistry, 1996 (in press)17. S Bocquet and S J Kennedy, J. Magn. Magn. Mater., 1992,109, 260-418. J S Robinson, S J Kennedy, P McCormick and R Street, (to be published)19. M Hofmann, S J Campbell and S J Kennedy, (to be published)20. E H Kisi, C J Howard and R J Hill, J. Am. Ceram. Soc, 1989, 72, 175721. C J Howard, R H J Hannink, E H Kisi and M V Swain, J. Am. Ceram. Soc., 1994, 77.
57122. A van Riessen and B H O'Connor, J. Am. Ceram. Soc, 1993, 76, 213323. D N Argyriou, C J Howard and R I Smith, J. Am. Ceram. Soc., 1994, 77, 3073-7624. M Sakata, T Uno, M Takata and C J Howard, J. Appl. Cryst., 1993, 26, 159-6525. A A Bolzan, C Fong B J Kennedy and C J Howard, Acta Cryst.B, 1996, (in press)26. E H Kisi, S J Kennedy and C J Howard, J. Am. Ceram. Soc., 1996, (in press)27. S J Kennedy, C J Howard, S Natarajan and A K Cheetham, Chem. Mater., (to be
published)28. G J Gadd, M James, S Moricca, P J Evans and R L Davis, Fullerene Sci. & Tech. 1996
(in press)29. G J Gadd, S J Kennedy, M James, S Moricca and P J Evans (to be published)
10
ACXRI '96APPLICATION OF ELECTRON BACK-SCATTER DIFFRACTION TO
TEXTURE RESEARCH.
Valerie Randle MY9700778Department of Materials Engineering, University of Swansea,
Swansea SA2 8PP, UK.
Abstract: The application of electron back-scatter diffraction (EBSD) to materials researchis reviewed. A brief history of the technique is given, followed by a description of present-dayoperation. The methodology of'microtexture', i.e. spatially specific orientations, is describedand recent examples of its application using EBSD are given, in particular to interstitial-freesteel processing, growth of phases in a white iron and grain boundary phenomena in asuperplastic alloy. The advantages and disadvantages of EBSD compared to use of X-rays fortexture determination are discussed in detail.
Introduction
Electron back-scatter diffraction (EBSD) evolved in the early 1980s, initially to studyphase identification in the scanning electron microscope (SEM). Its potential for orientationmeasurement was also recognised and developed until now EBSD is at the forefront of present-day texture analysis and a complement to, or in some cases a replacement for, X-ray texturemeasurements12. In the present work, the principles and practice of EBSD are summarised,with examples of its applications. Since hitherto the major technique for measurement oftextures has been X-ray methods, it is instructive to compare the advantages and disadvantagesof the modern technique with the more traditional. EBSD is sometimes also known as 'EBSP',electron back-scatter patterns, or 'BKD', backscatter kikuchi diffraction.
Principles of electron back-scatter diffraction
Electron back-scatter diffraction is essentially an SEM phenomenon. For normalimaging mode in an SEM the interaction between the primary (incoming) electron beam andthe specimen is such that most of the beam is absorbed and only a very small proportion of itis backscattered, i.e. diffracted by the planes near the surface of the specimen and scatteredfrom the specimen having lost hardly any energy. The very simple expedient of tilting thespecimen until it makes an angle of only 30-20° with the incoming beam has the effect ofshortening the path length of the elastically scattered electrons and increasing dramatically theproportion of signal which is backscattered rather than absorbed. The intensity of thebackscattered electron beam after tilting the specimen is such that the diffraction pattern canbe captured on film or screen if the recording medium is introduced into the microscopechamber.
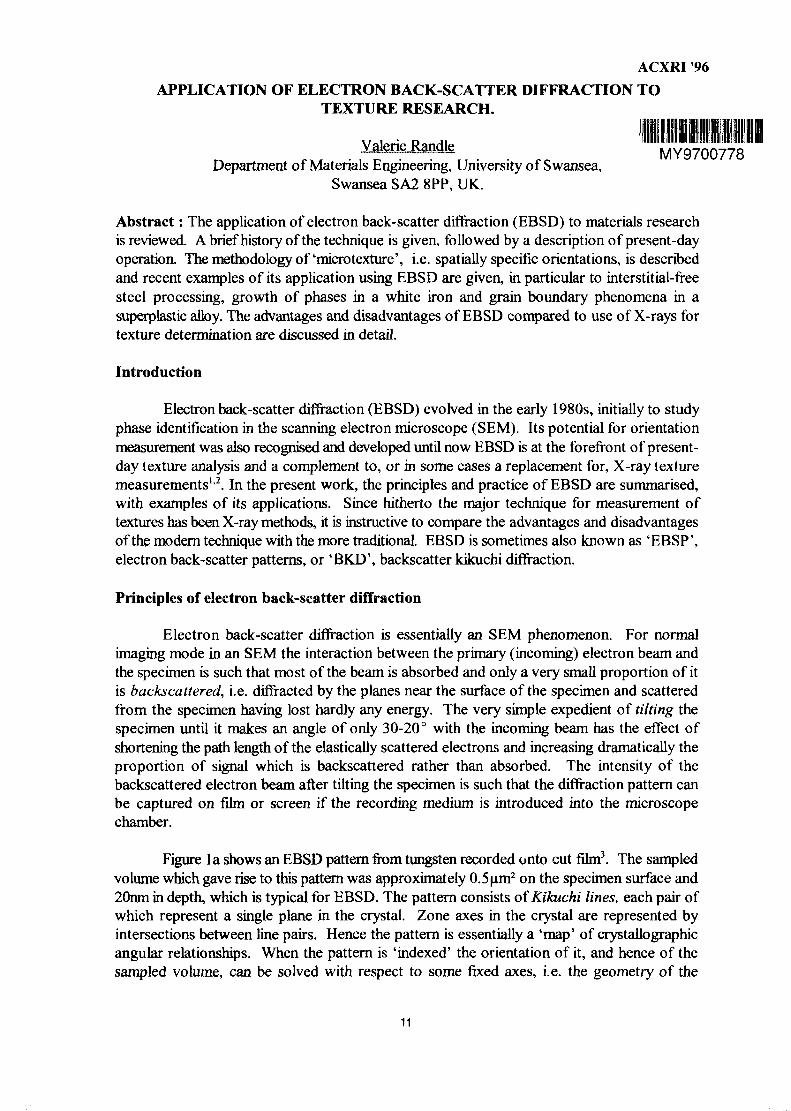
Figure la shows an EBSD pattern from tungsten recorded onto cut film3. The sampledvolume which gave rise to this pattern was approximately 0.5um2 on the specimen surface and20nm in depth, which is typical for EBSD. The pattern consists of Kikuchi lines, each pair ofwhich represent a single plane in the crystal. Zone axes in the crystal are represented byintersections between line pairs. Hence the pattern is essentially a 'map' of crystallographicangular relationships. When the pattern is 'indexed' the orientation of it, and hence of thesampled volume, can be solved with respect to some fixed axes, i.e. the geometry of the
11
ACXRI '96
specimen.
The potential of these Kikuchi patterns for measuring orientations was not fullyappreciated until the early 1970s when a series of papers reported observation of the patternsand in an SEM and gave them the name of 'electron backscattering' patterns45. Thediffraction patterns were observed not on cut film but rather by placing a fluorescent screenabout 25mm from the tilted specimen and viewing it using a low-light TV camera. Thisarrangement forms the basis of a present-day EBSD system.
At the time when the first EBSD systems were built the principal problem encounteredin applying the technique to the measurement of orientations was the uncertainty in the positionof the emitting point of back-scattered electrons on the specimen, the pattern source point, andits counterpart on the diffraction pattern, the pattern centre or origin. The pattern centre ismarked with a cross on figure lb. Various options were used to overcome this challenge, themost popular being the use of an (001) calibration crystal combined with a known angle ofspecimen tilt, namely 70.5°6. Another method involves a mechanism to retract the camera andtherefore view the pattern at more than one magnification7'8. Both these methods are usedtoday.
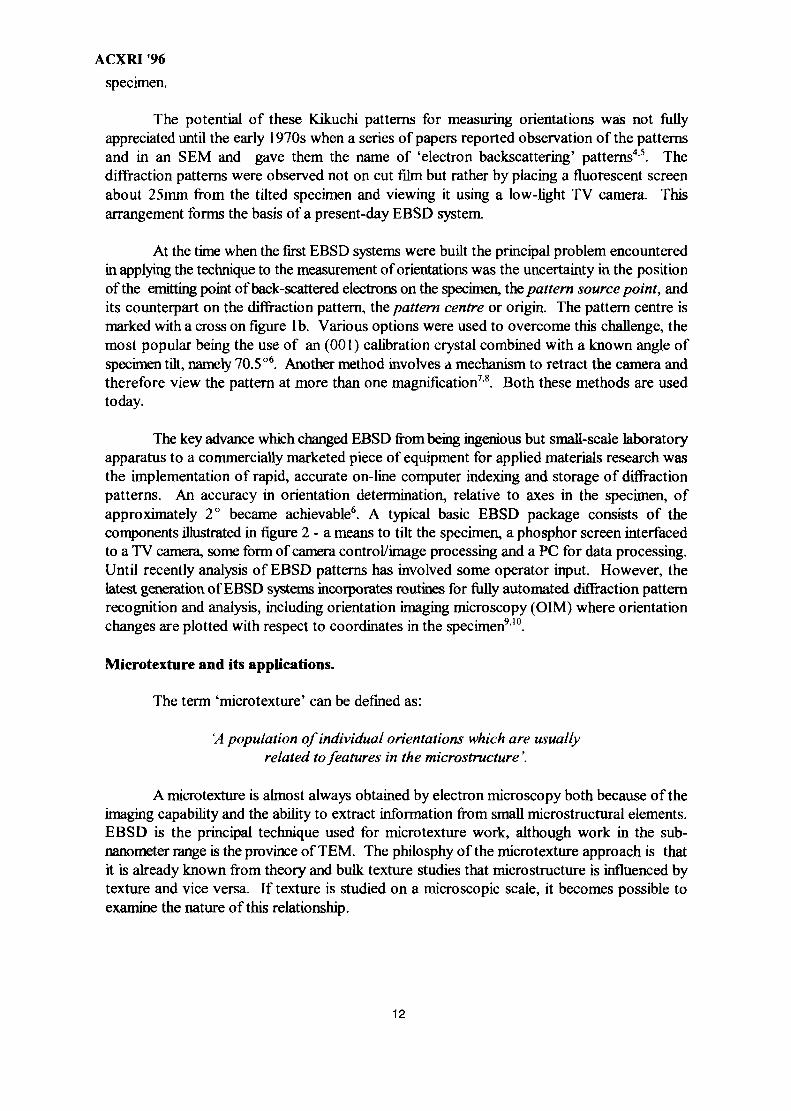
The key advance which changed EBSD from being ingenious but small-scale laboratoryapparatus to a commercially marketed piece of equipment for applied materials research wasthe implementation of rapid, accurate on-line computer indexing and storage of diffractionpatterns. An accuracy in orientation determination, relative to axes in the specimen, ofapproximately 2° became achievable6. A typical basic EBSD package consists of thecomponents illustrated in figure 2 - a means to tilt the specimen, a phosphor screen interfacedto a TV camera, some form of camera control/image processing and a PC for data processing.Until recently analysis of EBSD patterns has involved some operator input. However, thelatest generation of EBSD systems incorporates routines for fully automated diffraction patternrecognition and analysis, including orientation imaging microscopy (OIM) where orientationchanges are plotted with respect to coordinates in the specimen910.
Microtexture and its applications.
The term 'microtexture' can be defined as:
'A population of individual orientations which are usuallyrelated to features in the microstructure'.
A microtexture is almost always obtained by electron microscopy both because of theimaging capability and the ability to extract information from small microstructural elements.EBSD is the principal technique used for microtexture work, although work in the sub-nanometer range is the province of TEM. The philosphy of the microtexture approach is thatit is already known from theory and bulk texture studies that microstructure is influenced bytexture and vice versa. If texture is studied on a microscopic scale, it becomes possible toexamine the nature of this relationship.
12
ACXRI '96Some recent applications of EBSD to microtexture include:
• To study fatigue mechanisms1'• Crystallographic analysis of facet planes and transgranular cracks12
• Creep in superalloys13
• Integrity of single crystals• In-service reliability of microelectronic interconnects14
• Fracture facet crystallography15
• Oxygen diffusion along crystal directions in a high temperature superconductor16
• Deformation studies1718
• Sheet metal processing19
The concept of microtexture encompasses further the re-expression of two contiguousorientations as a misorientation, which in turn allows the geometry of interfaces such as grainboundaries to be explored. This 'texture between grains' has also been referred to asmesotexture®. With additional spatial information the crystallographic indices of the interfacescan also be determined. Some recent examples of interfacial studies involving EBSD include:
• Corrosion, cracking, fracture212223
• Boundary migration24
• Segregation and precipitation25 26
• Twinning27
• Recrystallisation28
• Orientation relationships29
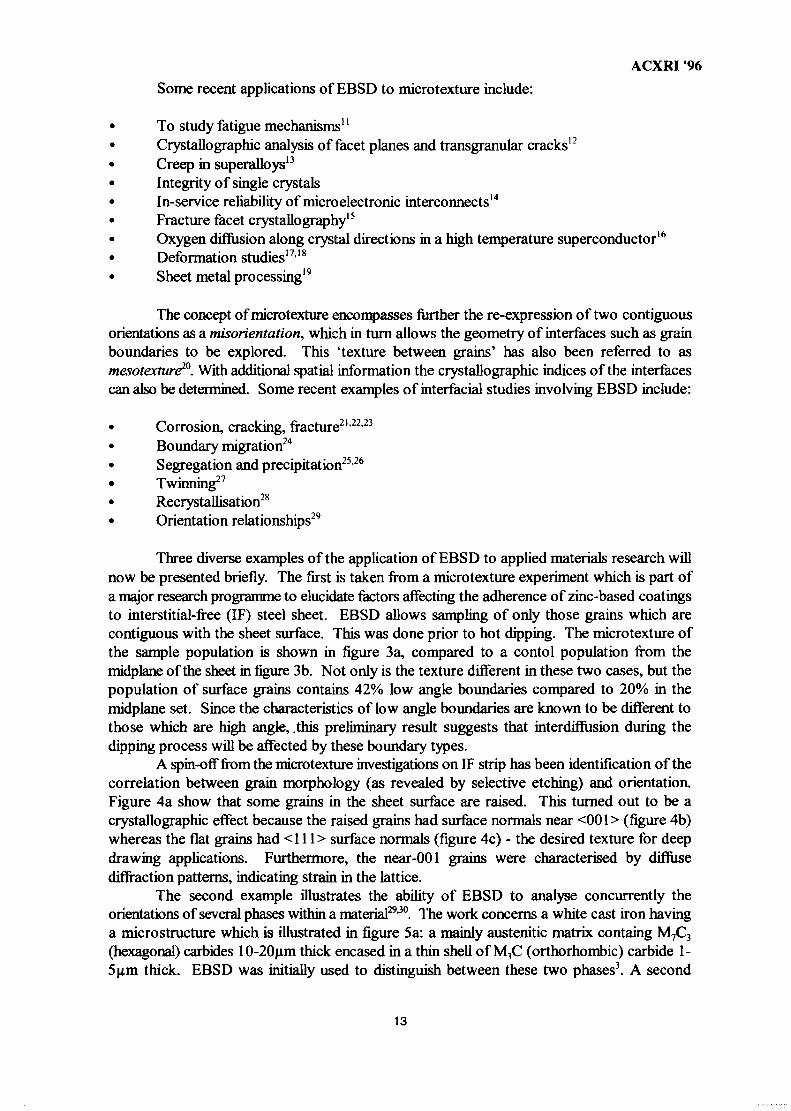
Three diverse examples of the application of EBSD to applied materials research willnow be presented briefly. The first is taken from a microtexture experiment which is part ofa major research programme to elucidate factors affecting the adherence of zinc-based coatingsto interstitial-free (IF) steel sheet. EBSD allows sampling of only those grains which arecontiguous with the sheet surface. This was done prior to hot dipping. The microtexture ofthe sample population is shown in figure 3a, compared to a contol population from themidplane of the sheet in figure 3b. Not only is the texture different in these two cases, but thepopulation of surface grains contains 42% low angle boundaries compared to 20% in themidplane set. Since the characteristics of low angle boundaries are known to be different tothose which are high angle, this preliminary result suggests that interdiffusion during thedipping process will be affected by these boundary types.
A spin-off from the microtexture investigations on IF strip has been identification of thecorrelation between grain morphology (as revealed by selective etching) and orientation.Figure 4a show that some grains in the sheet surface are raised. This turned out to be acrystallographic effect because the raised grains had surface normals near <001> (figure 4b)whereas the flat grains had <111> surface normals (figure 4c) - the desired texture for deepdrawing applications. Furthermore, the near-001 grains were characterised by diffusediffraction patterns, indicating strain in the lattice.
The second example illustrates the ability of EBSD to analyse concurrently theorientations of several phases within a material29'30. The work concerns a white cast iron havinga micro structure which is illustrated in figure 5a: a mainly austenitic matrix containg M7C3
(hexagonal) carbides 10-20um thick encased in a thin shell of M3C (orthorhombic) carbide 1-5urn thick. EBSD was initially used to distinguish between these two phases3. A second
13
ACXRI '96specimen, having a slightly modified chemistry so that the peritectic reaction forming M3C wassuppressed and the alloy contained only M7C3 carbide, was also examined. Subsets of themicrotexture results are shown in figure 5b,c,d. M7C3 carbides without MSC shells grewpredominantly in the <0001> direction whereas those with M3C shells were much less texturedand the M3C phase itself had a random texture. These results show that coupled growth occurswithin white cast iron specimens containing only hexagonal carbides, whereas no specificrelationship could be discerned when duplex carbides were present.
Whereas many EBSD investigations are devoted to grain boundary studies viaorientation measurements of neighbouring grains and calculation of the misorientation31'32, amore advanced analysis involves measurement of the interface - or crack5- planecrystallography. This has the advantage of providing more detailed structural informationwhich can subsequently be applied to studies of interfacial degradation phenomena, etc. Theinterface plane data is obtained by a procedure which employs both orientations andmorphological information from calibrated serial sectioning or other procedures33'34.
Comparison between EBSD and X-ray texture
The study of texture using X-rays is a mature subject area in materials engineering,spanning many decades. The average texture of a whole specimen is obtained from measuringthe diffracted X-ray intensity from particular lattice planes and displaying the data as a polefigure or inverse pole figure in contours of 'times random'. The information from at least twopole figures can be used to calculate an orientation distribution function (ODF) which is acomplete texture description35. Individual texture components can be extracted from peaks inthe pole figure or ODF and quantified according to the volume fraction of the componentpresent.
Figure 6a shows a 111 X-ray pole figure from a commercial aluminium alloy, AA8079,rolled 97% and annealed at 400 °C. This can be compared with figure 6b which shows a 111microtexture pole figure from 600 contiguous grains in the same specimen19. The keydifference between the presentation of these two data sets is that the X-ray pole figure exhibitsintensity contours representing the volume fraction present whereas the microtexture case isin the form of discrete data points, each referring to a specific point in the microstructure.(The microtexture pole figure can subsequently be smoothed to contours and also weightedaccording to grain volume if required. However, the link to individual data points is then lost).The similarity between the X-ray and microtexture pole figure indicates that the microtexturein the sampled region was homogeneous and equivalent to the average texture. This is notalways the case, since the texture may be inhomogeneous throughout the material. Figure 3illustrated one aspect of this by showing the difference in texture between the surface grainsand midplane grains in material processed to sheet.
The advantages of using EBSD to obtain microtexture data compared to X-rays are:
• The cardinal reason for using EBSD to obtain a microtexture rather than X-rays togenerate a 'macrotexture' is the spatial specificity of the former, enabling orientationto be linked directly to structure and processing parameters (figures 3,4,6)'.
• Interfacial parameters between specific grains can be calculated from individualorientations (figure 7), whereas this is not possible for X-ray data20.
• X-ray diffraction measures only the proportions of particular planes present, which is
14
ACXRI '96
effectively two-dimensional information. The algoritms used to calculate ODFs frompole figures are known to contain inherent inaccuracies35. These drawbacks do notapply to EBSD, since a true, three-dimensional orientation is the primary EBSDmeasurement.
• More than one phase can be analysed at a time, with regard to position in themicrostructure, using EBSD (figure 5)29.
• Since the X-ray methodology relies on the volume fraction of particular planes present,a large volume fraction of one texture, e.g. present in large grains only, can mask thepresence of another texture occurring only in very small grains36.
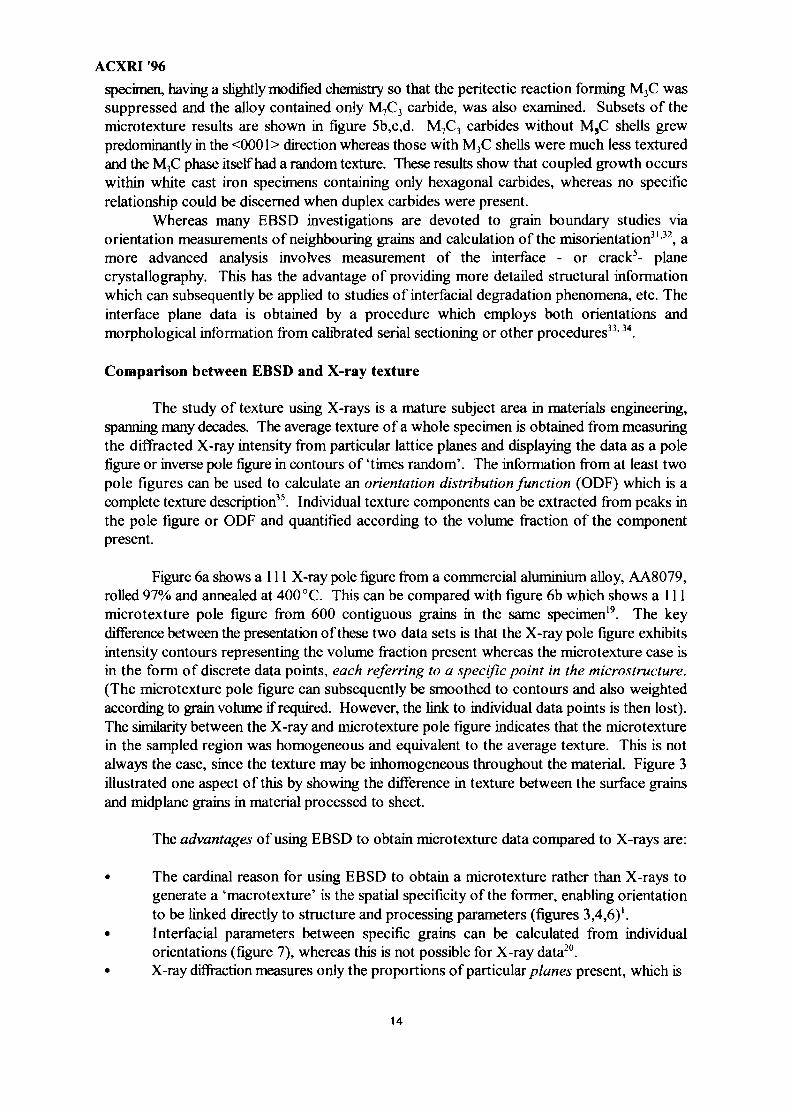
• X-ray diffraction does not distinguish between different variants of the same texture.For example the S-texture, which is a common deformation texture in some fee metalsand alloys, is denoted by {123}<412> using the 'ideal orientation' notation. Thisdesignation actually subsumes four orientations: (123)[412~], (123)[4T2], (213)[142],(213)[T42]. These four orientations are distinct in the sense that they are related by highangle boundaries, and their distribution in the microstructure may be significant tophenomena such as slip transmission, grain boundary type and subsequent properties.EBSD, on the other hand, is able to distinguish between these variants as illustrated onfigure 7. Other textures and their variants are also shown on this map along with lowangle boundaries. There are several pieces of evidence to show that there can beselective occurrence of particular texture variants in different regions of a specimen3738.
The disadvantages of using EBSD to obtain microtexture data compared to X-rays are:
• The most inhibiting disadvantage of EBSD compared to X-ray work is that the formeris labour intensive if a semi-automatic EBSD system is used, since the sampling probemust be sited individually and pattern analysis data inputted1. However, this situationimproves enormously if a system where the patterns are indexed automatically isavailable, and such systems are currently superceding the semi-automatic type. Afurther improvement is gained if programmable stage/beam control is available.
• Sampling of orientations - either interactively in real time or in predetermined steps -is under operator contol for EBSD. Care must be taken to ensure that the statistics arenot biased in any way. Such considerations do not apply to X-ray data since typicallythousands of grains are sampled together.
• EBSD patterns become unacceptably diffuse from highly deformed specimens, whichis not usually a restriction for X-ray diffraction. Furthermore, incorrect specimenpreparation (e.g. harsh diamond polishing as a final step) degrades the quality of anEBSD pattern. This is not usually a problem for most materials, since the recommendedpreparation procedures, such as electropolishing, are routine'.
• As yet there is no standardisation for EBSD since it is an innovative techniquecompared to the well-established X-ray case.
EBSD data processing
As illustrated in figures 3 and 6, EBSD data can be processed and outputted as a polefigure. The main motivation behind this form of data representation is that it is familiar becauseof its close association with X-ray texture. However, whereas EBSD data can be displayedusing standard macrotexture methods such as pole figures and Euler space, in this section othermethods of data processing and display, more suited to the discrete orientations inherent in
1.5
ACXRI '96
microtexture, will be briefly considered.
The basic parameters of an individual orientation as measured by EBSD are embodiedin a 3x3 matrix, which expresses the crystallographic orientation of the sampled volume withrespect to fixed axes relating to the specimen geometry12. Further computation is requires tooutput orientation information in a practical form. Some or all of this may be an integral partof the EBSD software, depending on the sophistication of the package and the specificity ofthe user requirement.
In practice particular aspects of data are best highlighted by apposite choice ofprocessing methodology and representation. These can be considered in three 'levels', in termsof complexity39:
• Qualitative statistics: either individual orientations are approximated (e.g. using the'ideal orientation1 nomenclature) or the EBSD data population is represented pictoriallyas pole figures, in Euler space or in Rodrigues-Frank space40'41.
• Quantitative statistics: secondary computations permit the microtextures to be analysedquantitatively and outputted in the form of histograms, tables, etc19. Moreover, farthercalculations can give measurements of interest in a particular experiment, e.g. anglesbetween specified crystal directions.
• Positional information: additional data concerning the spatial location of sample pointsis often required. Coded data points, coded maps, orientation imaging micrographs andcompressed data scans are used18'27'32.
Examples of EBSD data processing are included in the relevant references.
Concluding remarks
This review has summarised the principles and practice of state-of-the-art EBSD formicrotexture determination. The number of installations worldwide is increasing rapidly, as arethe number of research papers which demonstrate use of this technique to help solve materialsproblems. The technology is continuing to develop, particularly in the area of fall automationand orientation imaging.
References
1. V. Randle,'Microtexture Determination and its Applications', Inst. Mat., London, 1992
2. D.J. Dingley & V. Randle, J. Mat. Sci., 1992,21,4545
3. D.J. Dingley, K. Baba-Kishi & V. Randle, 'Atlas of Electron Back-scatter DiffractionPatterns', Inst. Phys. Pub. Ltd, Bristol, UK, 1995
4. J.A. Venables & C.J. Harland, Phil. Mag., 1973,22, 1193
5. J.A. Venadles & R. Bin Jaya, Phil. Mag., 1977,21, 1317
6. D.J. Dingley, Scan. Elect. Mic, 1981, & 273
16
ACXRI '967. J. Hjelen, R. Orsund, E. Hoel, P. Runde, T. Furu & E. Nes, Tex.& Micros., 1993, 2Û, 29
8. A. Drake & S. Vale, Inst. Phys. Conf. Ser. No 147, 'EMAG95', Birmingham, UK, Inst.Phys. Pub. Ltd 1995
9. N.C. Krieger Lassen, D. Juul Jensen & К. Conradsen, Scan. Micros., 1992,6, 1, 115
10. B.L. Adams, D.J. Dingley, K. Kunze & S.I. Wright, Mat. Sei. For., 1994, 157-162. 31
И.О. Engler and G. Gottstein, Steel Research, 1992, 63r 413
12. W.Liu, M. Bayerlein, H. Mughrabi, A. Day & P.N. Quested, Acta Met. Mat., 1992, 4Д1763
13. D.P. Field & B.L. Adams, Acta Met. Mat., 1992,4Q, 1145
14. J.E. Sanchez, V. Rändle, О. Kraft & E. Artz, SPIE, 1992, HQS, 222
15. D.C. Skvik, J.A. Wert & R.P. Gangloff, J. Mater. Res., 1993, & 2482
16. J. Claus, G.Borchardt, S. Weber & S. Scherrer, Mat. Sei. For., 1994, 157-162. 1161
17. N. Hansen & D. Juul Jensen, Mat. Sei. For., 1994, 157-162. 1211
18. V. Rändle, D. Juul Jensen &N. Hansen, Phil. Mag., in press.
19. R.K. Davies, V. Rändle & G.J. Marshall, Proc. 16th Riso Inter. Conf., on'Microstructural and Crystallographic Aspects of Recrystallisation', Ed. N. Hansen et al, RisoNational Laboratory, Denmark, 1995, 315.
20. V. Rändle, 'The Measurement of Grain Boundary Geometry', Inst. Phys. Pub. Ltd, 1993
21. P. Lin,G. Palumbo, U. Erb & K.T. Aust, Scripta Met. Mat., 1995, 3J. 1387
22. H. Lin & D.P. Pope, Acta Met. Mat., 1993,41553
23. B.L. Adams, J. Zhao&D. O'Hara, Acta Met. Mat, 1990, 3JL 953.
24. B. Dorner, P.-J. Wildbrandt & P. Haasen, Mat. Sei. For., 1994,157-162. 927
25. S.R. Ortner & V. Rändle, Scripta Met., 1989, 21, 1903
26. C.B. Thomson & V. Rändle, J. Mat. Sei., in press.
27. S.I. Wright & F. Heidelbach, Mat. Sei. For., 1994, 157-162 1313
28. J. Hjelen, R. Orsund & E. Nes, Acta Met. Mat., 1991,22, 1377
17
ACXRI '96
29. V. Randle&G. Laird II, J. Mat. Sci., 1993,21, 4245
30. V. Randle & G.L.F. Powell, J. Mat. Sci. Lett., 1993, 12, 779
31. V. Randle, Acta Met. Mat., 1994,42, 1769
32. V. Randle, Acta Met. Mat, 1995, 411741
33. V. Randle, Mat. Char., 1995,24, 29
34. V. Randle, J. Mat. Sci., 1995, 3JL 3983
35. H.J. Bunge, in 'Preferred Orientation in Deformed Metals and Rocks', Ed. H.R. Wenk,Academic Press, London, 1985, 73
36. V. Randle, 'Microtexture Determination and its Applications, Inst. Mat., London, 1992,118.
37. V. Randle, Tex. & Micros., 1993, 21, 219
38. J. Hjelen & E. Nes, Proc. Conf. ICOTOM8, Ed. J.S. Kallend & G. Gottstein, TheMetallurgical Press, USA, 1988, 1187
39. V. Randle & M. Caul, Mat. Sci. Tech., in press
40. V. Randle, Proc. Roy. Soc. Lond., 1990, 43LA, 61
41. V. Randle & A. Day, Mat. Sci. Tech., 1993, 2, 1069
ELECTION BEAM
OUTPUT AS
ORIENTATION
DIFFRACTION PATTERN ENHANCEMENT
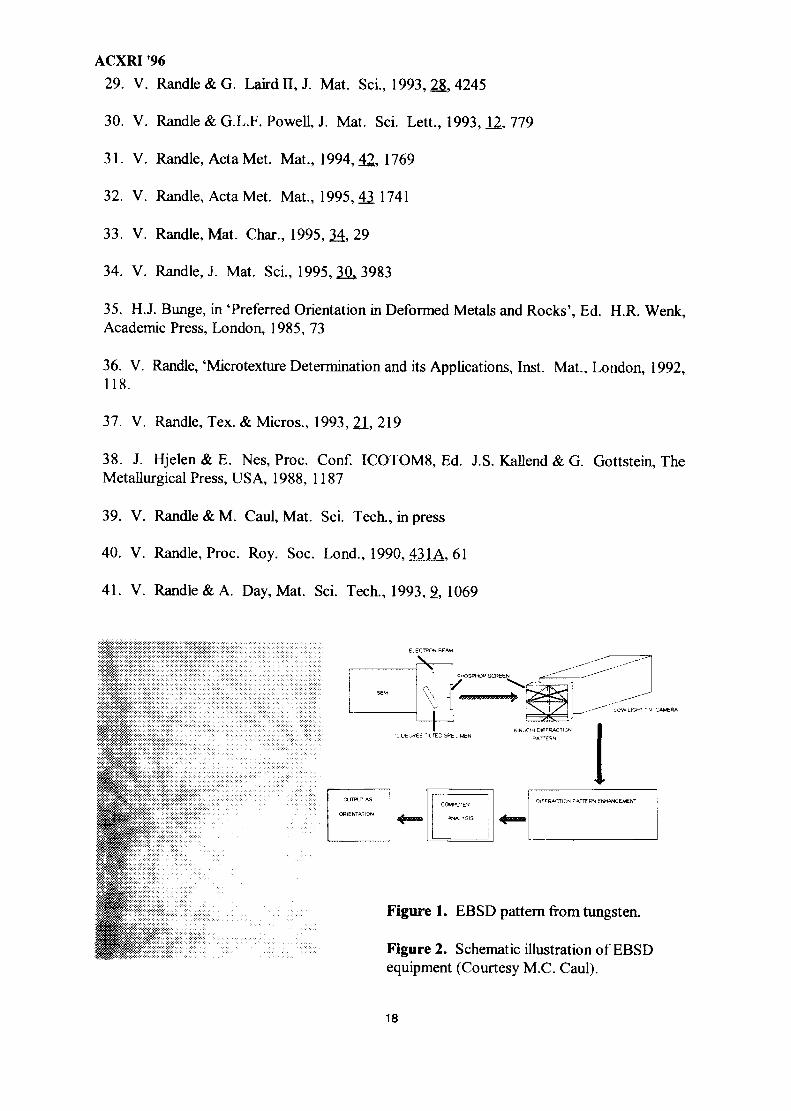
Figure 1. EBSD pattern from tungsten.
Figure 2. Schematic illustration of EBSDequipment (Courtesy M.C. Caul).
18
ACXRI '96
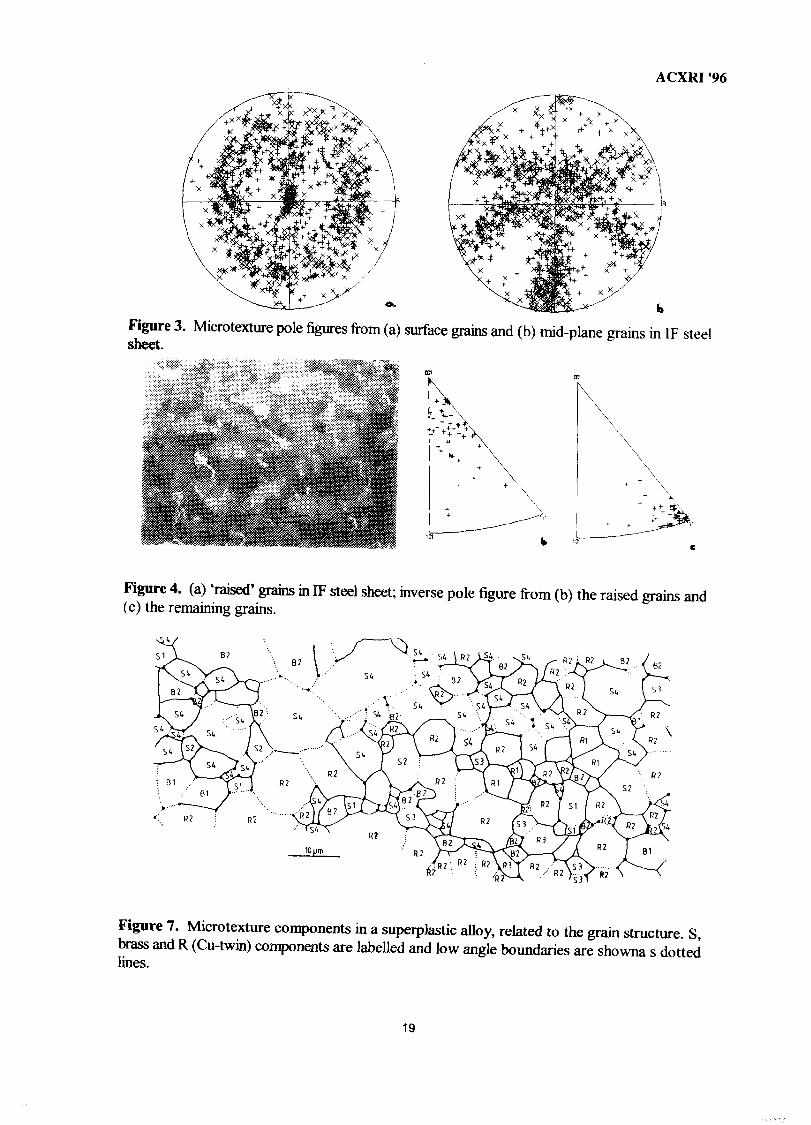
Figure 3.sheet.
Microtexture pole figures from (a) surface grains and (b) mid-plane grains in IF steel
Figure 4. (a) 'raised' grains in IF steel sheet; inverse pole figure from (b) the raised grains and(c) the remaining grains.
R2
Figure 7. Microtexture components in a superplastic alloy, related to the grain structure. S,brass and R (Cu-twin) components are labelled and low angle boundaries are showna s dottedlines.
19
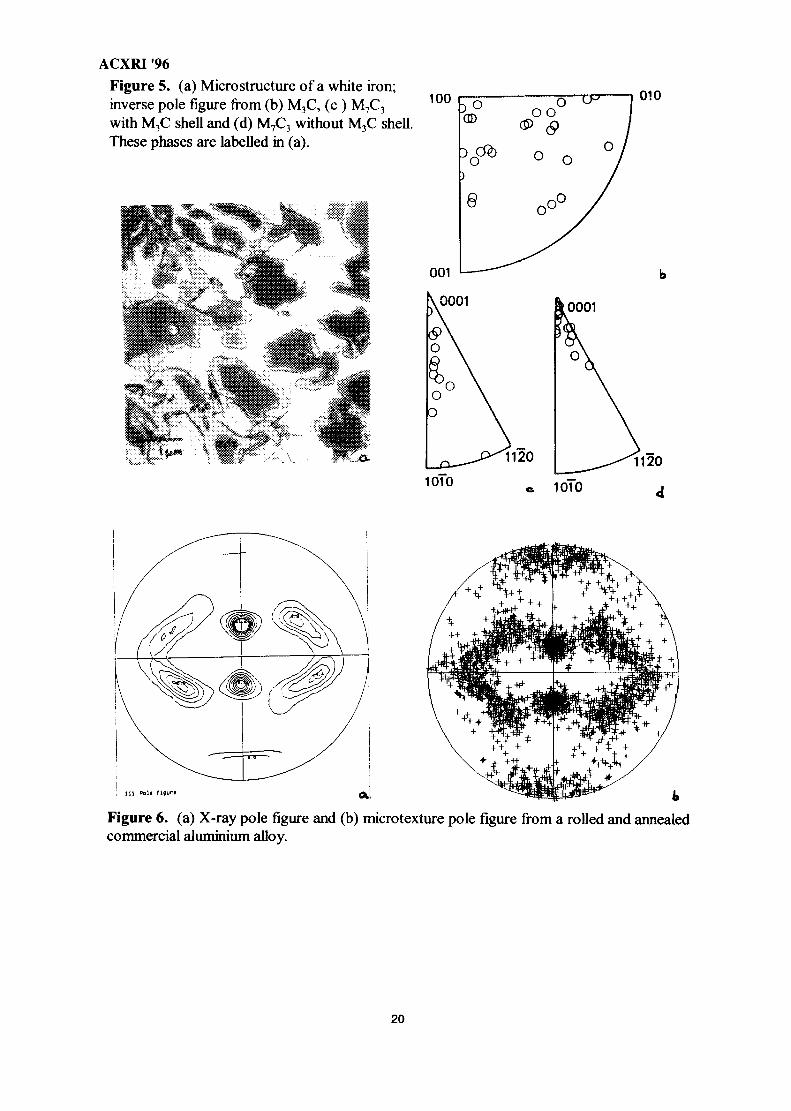
ACXRI '96Figure 5. (a) Microstructure of a white iron;inverse pole figure from (b) M3C, (c ) M7C3
with M3C shell and (d) M7C3 without M3C shell.These phases are labelled in (a).
100 010
1010
Figure 6. (a) X-ray pole figure and (b) microtexture pole figure from a rolled and annealedcommercial aluminium alloy.
20
ACXRI '96
A NEW CHARACTERIZATION METHOD OF THEMICROSTRUCTURE BY UTILIZING THE MACROSCOPIC
COMPOSITION GRADIENT IN ALLOYS- • • • • • • I ra • • » • • V H IHI1 HHIH • • ! ? ! ! « • • ! IUUIU H
T.Mivazaki, T.Koyama and S.Kobayashi MY9700779Dept. of Materials Science and Engineering,
Nagoya Institute of Technology, Nagoya 466, Japan.
Abstract: a new experimental method to determine the phase boundary and phase equilibrium isaccomplished by means of analytical transmission electron microscopy for alloys with amacroscopic composition gradient. The various phase boundaries, i.e. the coherent binodal andspinodal lines, incoherent binodal line and order/disorder transformation line are distinctlydetermined for the Cu-Ti alloy and the other alloy systems. Furthermore, the equilibriumcompositions at the interface of precipitate/matrix can experimentally be obtained for variousparticle sizes, and thus the Gibbs-Thomson's relation is verified. It is expected that thecomposition gradient method proposed in the present will become an important experimentalmethod of the microstructural characterization.
1. Introduction
A comprehensive description of phase transformations should be realized in the form ofthe three dimensional diagram having the temperature(T), time(t) and composition(c) axes^-2).The section parallel to the temperature(T) and the composition (c) axes is well known as phasediagram, and the section parallel to the temperature(T) and the time(t) axes is the TTT diagram.A section parallel to the composition(c) and time(t) axes is also important as well as the phasediagram and the TTT diagram, nevertheless it has not received attention yet. In the T-t-cdiagram, the experiments whose variables are the T-axis and t-axis are known as the thermalanalysis and the isothermal ageing, respectively. Since the c-axis is an important element of theT-t-c diagram, experiments whose variable is composition c should be conducted.
Recently, we proposed^-2) a new characterization method of the microstructure, socalled "Macroscopic Composition Gradient Method", for analyzing the section parallel to thecomposition(c) and the time(t) axes. Using this method we can successfully analyze the variousphase transformations such as the coherent or incoherent precipitation limits, the order-disorderphase transitions, morphological boundary between the spinodal and the N-G typedecompositions, phase equilibria depending on the particle size, i.e. Gibbs-Thomson relation andso on.
In the present paper, we show the various experimental results obtained by thecomposition gradient method for determination of the various phase boundaries and phaseequilibria in Cu-Ti, Ni-Mo and Fe-Al alloys.
2. Experimental Procedures
There are many preparation methods to create a macroscopic composition gradient inthe specimen, i.e. diffusion coupling, imperfect arc melting of sandwiched metals, imperfecthomogenization of coarse discontinuous precipitates and so on. The macroscopic compositiongradient was realized in a Cu-Ti alloy by utilizing imperfect homogenization of a coarsediscontinuous precipitates. A Cu-4at.%Ti alloy was firstly prepared in the vacuum inductionfurnace, and then forged and rolled to a thin plate of about 1 mm in thickness and solutiontreated at 1173 K for suitable duration. After the homogenization at 1173K the specimens were
21
ACXRI '96aged at 973 K for a long duration to make a large discontinuous Cu3Ti precipitates whose interlamella distance was over 200 micron. These specimens were again heated at 1173 K for a shortduration so as to be imperfectly homogenized and then directly quenched to the ageingtemperatures. By this heat treatment the macroscopic gradient of the solute composition wasrealized in the Cu-Ti supersaturated solid solution. The Ni-20at.%Mo alloy was prepared byarc melting and then coupled with Pure Ni by arc melting for a short duration. The Fe-50at.%Alalloy was also coupled with the pure Fe by a short time arc melting. The specimen are cutvertically to the interface with about 0.5mm in thickness and then are sealed in the silicaevacuated tube.The specimens were annealed at 1373K for 7.2ks so as to make the macroscopiccomposition gradient of solute atoms stabilized, and then quenched into the iced brine.
These specimens having the macroscopic composition gradient were aged at varioustemperatures for suitable duration, i.e. 773-873K for Cu-Ti alloy, 923-1123K for Ni-Mo alloyand 1023K for Fe-Al alloys, and then quenched into iced brine. The specimens were prepared tothin foils by electro-polishing in an electrolyte of HNO:CH3OH=1:3 at 240 K for Cu-Ti alloy,H2SO4:C2H5OH=1:9 at 240K for Ni-Mo alloy and HCLO4:CH3OH=1:9 at 205K. Themicrostructural observation was performed by the analytical transmission electron microscopeand the solute composition analysis by the energy dispersive X-ray spectroscopy (EDS) wasconcurrently performed at several locations in the same thin foil. The electron microscope,JEM 2000FX, was operated at 200 KV. The LaB6 filament was used at an accelerating voltageof 200 KV and the beryllium mesh was used. The K-factor defined by the Cliff-Lorimermethod^3) was estimated in the limit of a thin film specimen, and determined by the EDSmeasurement on standard samples whose chemical compositions were already known. Themeasuring error of each point was within ±0.1%. The chemical composition at any locationscan be estimated by using a composition vs.distance curve obtained by the EDS measurements.Since the size of the incident electron beam was operated so as to be large enough to cover thearea containing several precipitates, the measured values of solute composition indicates thelocally average composition CA
3. Experimental Results3.1 Determination of the Phase Boundaries3.1.1 Coherent phase boundaries in Ni-Mo binary systems
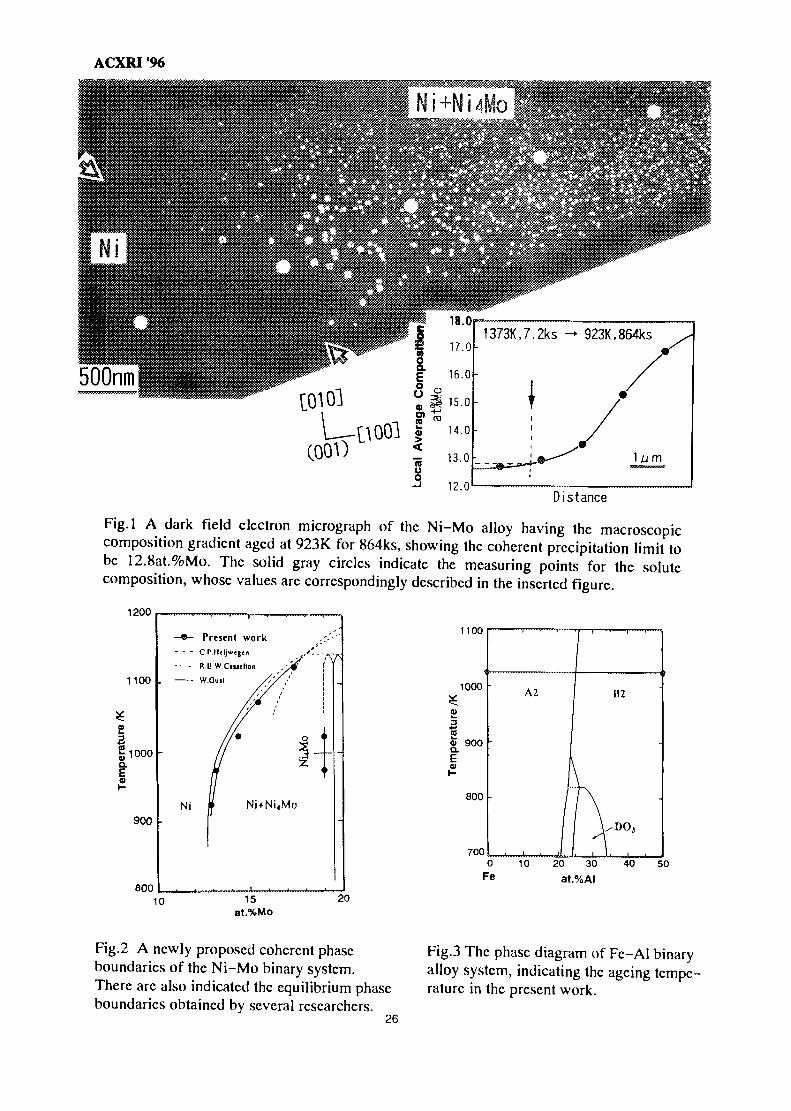
Fig. 1 shows a dark field image of microstructure formed by aging in the Ni-Mo al loyhaving the macroscopic composition gradient. The white cuboids in Fig.l are Ni4Mo-precipitates. The solid gray circles in the figure indicate the measuring points for the solutecomposition, whose values are shown in a small figure inserted in Fig.l, which clearly shows thecontinuous change of solute composition. In the photograph many coherent particles can be seenin the high composition area, while in the lower solute area the particles decreases in number andfinaly become unable to be observed. Thus, a virtual line connecting the two arrows in Fig. 1must be coherent binodal, determined to be 12.8 at.%Mo from the Fig. 1.
The identical experiments performed for other ageing temperatures give a coherentphase boundaries shown in Fig.2. In Fig.2, there are also drawn the equilibrium phase boundariesobtained by HeijwegenW, Casselton(5) and Gust(6), investigated by the diffusion couple, themeasurements of lattice parameter and X-ray diffraction, respectively. Our results are in goodagreement with the Heijewegent's and Gust's results, but differ a little from Casselton's one.
3.1.2 Order(B2)-disorder(A2) transition in Fe-Al alloy
Figure 3 shows the phase diagram of Fe-Al binary system(9) where order(B2 and DO3)-disorder(A2) transition lines can be seen. Many researchers have investigated the order-
22
ACXRI '96disorder phase transitions in this alloy systemC7-11), but the experimental investigation detailedfor the microstructural change in the vicinity of the transition line has hardly been performed,possibly because it was difficult to prepare many specimens whose solute content variesgradually but precisely. However, by utilizing the continues microstructure change due to thecomposition gradient, we can easily observed the details of the microstructural change in thevicinity of the transition line.
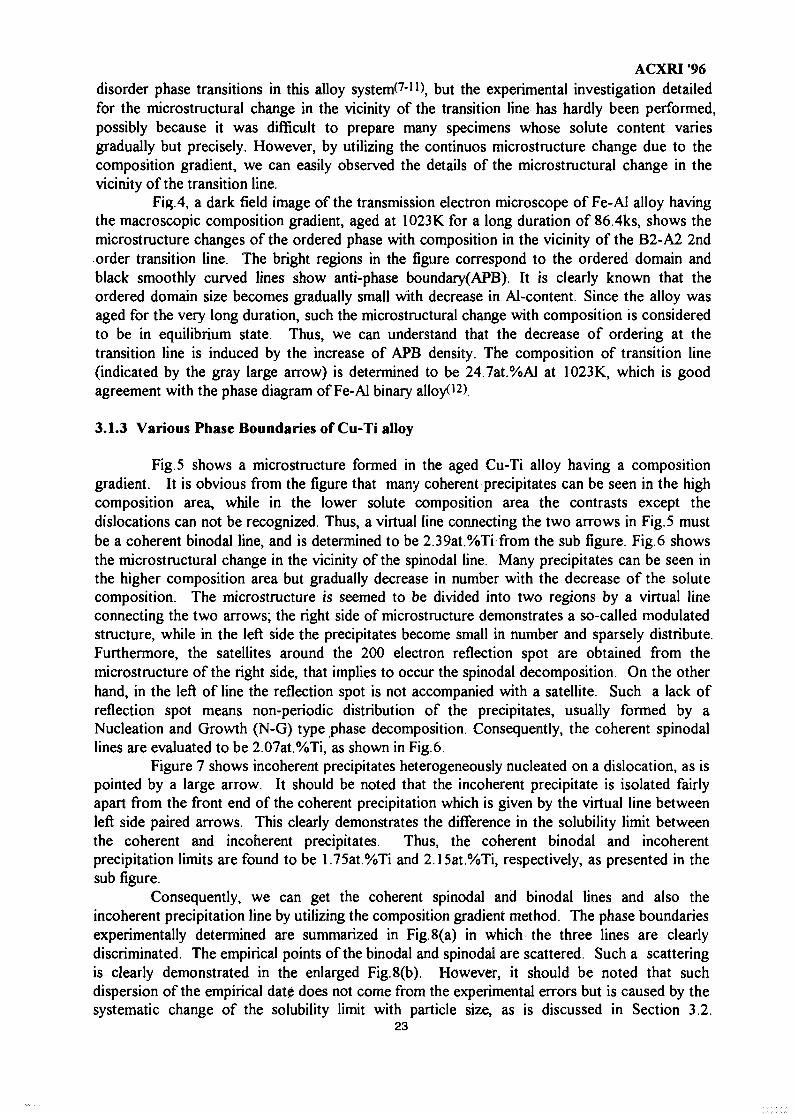
Fig.4, a dark field image of the transmission electron microscope of Fe-Al alloy havingthe macroscopic composition gradient, aged at 1023K for a long duration of 86.4ks, shows themicrostructure changes of the ordered phase with composition in the vicinity of the B2-A2 2ndorder transition line. The bright regions in the figure correspond to the ordered domain andblack smoothly curved lines show anti-phase boundary(APB). It is clearly known that theordered domain size becomes gradually small with decrease in Al-content. Since the alloy wasaged for the very long duration, such the microstructural change with composition is consideredto be in equilibrium state. Thus, we can understand that the decrease of ordering at thetransition line is induced by the increase of APB density. The composition of transition line(indicated by the gray large arrow) is determined to be 24.7at.%A1 at 1023K, which is goodagreement with the phase diagram of Fe-Al binary alloy*12).
3.1.3 Various Phase Boundaries of Cu-Ti alloy
Fig. 5 shows a microstructure formed in the aged Cu-Ti alloy having a compositiongradient. It is obvious from the figure that many coherent precipitates can be seen in the highcomposition area, while in the lower solute composition area the contrasts except thedislocations can not be recognized. Thus, a virtual line connecting the two arrows in Fig. 5 mustbe a coherent binodal line, and is determined to be 2.39at.%Ti from the sub figure. Fig.6 showsthe microstructural change in the vicinity of the spinodal line. Many precipitates can be seen inthe higher composition area but gradually decrease in number with the decrease of the solutecomposition. The microstructure is seemed to be divided into two regions by a virtual lineconnecting the two arrows; the right side of microstructure demonstrates a so-called modulatedstructure, while in the left side the precipitates become small in number and sparsely distribute.Furthermore, the satellites around the 200 electron reflection spot are obtained from themicrostructure of the right side, that implies to occur the spinodal decomposition. On the otherhand, in the left of line the reflection spot is not accompanied with a satellite. Such a lack ofreflection spot means non-periodic distribution of the precipitates, usually formed by aNucleation and Growth (N-G) type phase decomposition. Consequently, the coherent spinodallines are evaluated to be 2.07at.%Ti, as shown in Fig.6.
Figure 7 shows incoherent precipitates heterogeneously nucleated on a dislocation, as ispointed by a large arrow. It should be noted that the incoherent precipitate is isolated fairlyapart from the front end of the coherent precipitation which is given by the virtual line betweenleft side paired arrows. This clearly demonstrates the difference in the solubility limit betweenthe coherent and incoherent precipitates. Thus, the coherent binodal and incoherentprecipitation limits are found to be 1.75at.%Ti and 2.15at.%Ti, respectively, as presented in thesub figure.
Consequently, we can get the coherent spinodal and binodal lines and also theincoherent precipitation line by utilizing the composition gradient method. The phase boundariesexperimentally determined are summarized in Fig.8(a) in which the three lines are clearlydiscriminated. The empirical points of the binodal and spinodal are scattered. Such a scatteringis clearly demonstrated in the enlarged Fig.8(b). However, it should be noted that suchdispersion of the empirical date does not come from the experimental errors but is caused by thesystematic change of the solubility limit with particle size, as is discussed in Section 3.2.
23
ACXRI '96Therefore, in Fig.8(a) and (b) the binodal and spinodal lines are drawn so as to accord with theminimum value in the solubility.
3.2 Size Dependence of the Equilibrium Composition at the Particle Interface(Gibbs-Thomson's Relation)
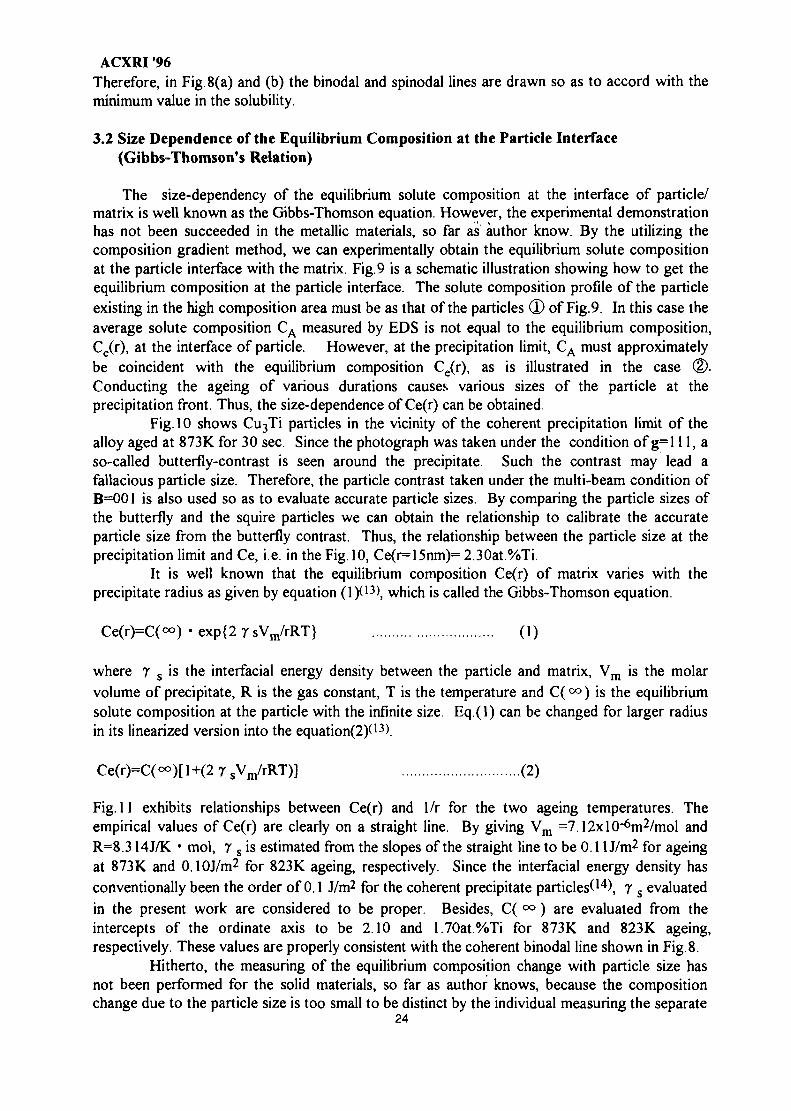
The size-dependency of the equilibrium solute composition at the interface of particle/matrix is well known as the Gibbs-Thomson equation. However, the experimental demonstrationhas not been succeeded in the metallic materials, so far as author know. By the utilizing thecomposition gradient method, we can experimentally obtain the equilibrium solute compositionat the particle interface with the matrix. Fig.9 is a schematic illustration showing how to get theequilibrium composition at the particle interface. The solute composition profile of the particleexisting in the high composition area must be as that of the particles ® of Fig. 9. In this case theaverage solute composition CA measured by EDS is not equal to the equilibrium composition,Ce(r), at the interface of particle. However, at the precipitation limit, CA must approximatelybe coincident with the equilibrium composition Ce(r), as is illustrated in the case ©.Conducting the ageing of various durations causes various sizes of the particle at theprecipitation front. Thus, the size-dependence of Ce(r) can be obtained.
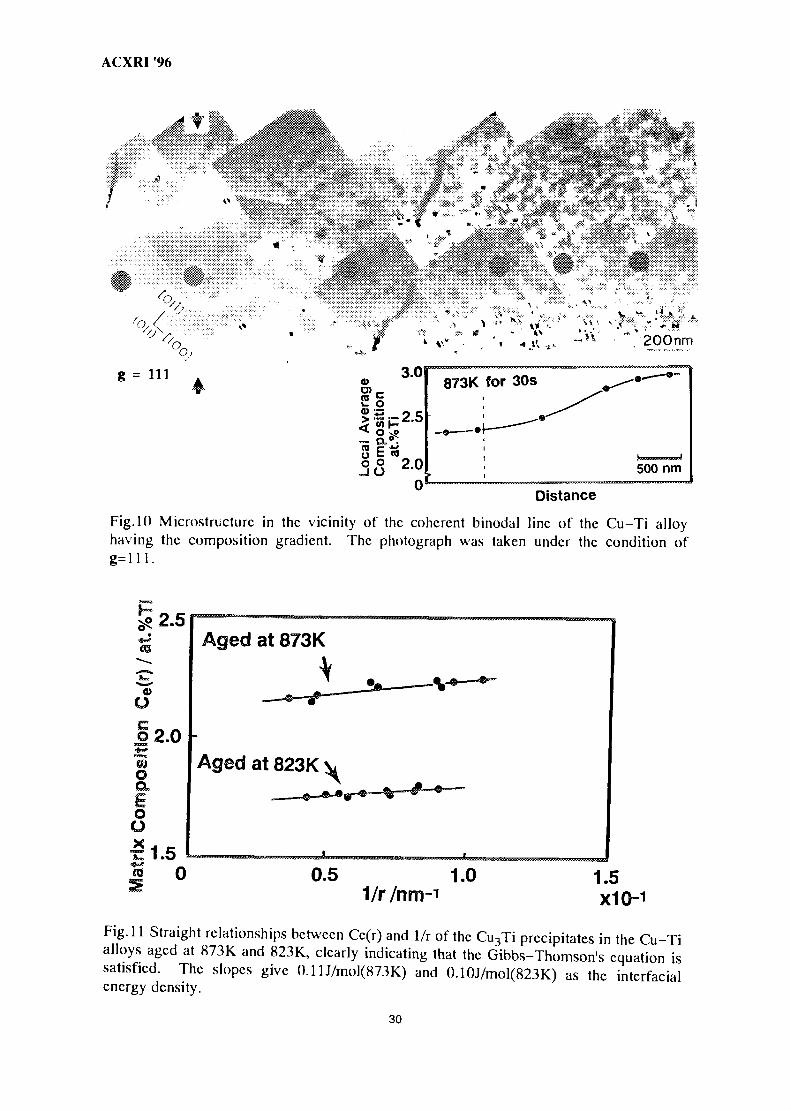
Fig. 10 shows Cu3Ti particles in the vicinity of the coherent precipitation limit of thealloy aged at 873K for 30 sec. Since the photograph was taken under the condition of g=l 11, aso-called butterfly-contrast is seen around the precipitate. Such the contrast may lead afallacious particle size. Therefore, the particle contrast taken under the multi-beam condition ofB=001 is also used so as to evaluate accurate particle sizes. By comparing the particle sizes ofthe butterfly and the squire particles we can obtain the relationship to calibrate the accurateparticle size from the butterfly contrast. Thus, the relationship between the particle size at theprecipitation limit and Ce, i.e. in the Fig. 10, Ce(r=15nm)= 2.30at.%Ti.
It is well known that the equilibrium composition Ce(r) of matrix varies with theprecipitate radius as given by equation (1)<13), which is called the Gibbs-Thomson equation.
Ce(r)=C(°°) • exp{2 r sVm/rRT} (1)
where 7 s is the interfacial energy density between the particle and matrix, Vm is the molarvolume of precipitate, R is the gas constant, T is the temperature and C( °°) is the equilibriumsolute composition at the particle with the infinite size. Eq.(l) can be changed for larger radiusin its linearized version into the equation(2)(13).
Ce(r)=C(°o)[i+(2 7sVm/rRT)] (2)
Fig. 11 exhibits relationships between Ce(r) and 1/r for the two ageing temperatures. Theempirical values of Ce(r) are clearly on a straight line. By giving Vm =7.12xlO'6m2/mol andR=8.314J/K • mol, 7 s is estimated from the slopes of the straight line to be 0.11 J/m2 for ageingat 873K and 0.10J/m2 for 823K ageing, respectively. Since the interfacial energy density hasconventionally been the order of 0.1 J/m2 for the coherent precipitate particles^14), 7 s evaluatedin the present work are considered to be proper. Besides, C( °°) are evaluated from theintercepts of the ordinate axis to be 2.10 and 1.70at.%Ti for 873K and 823K ageing,respectively. These values are properly consistent with the coherent binodal line shown in Fig. 8.
Hitherto, the measuring of the equilibrium composition change with particle size hasnot been performed for the solid materials, so far as author knows, because the compositionchange due to the particle size is too small to be distinct by the individual measuring the separate
24
ACXRI '96specimens. The composition gradient method proposed here is considered to open a newmethod of the microstructural evaluation.
4.Discussion
It should be estimated whether the existence of the macroscopic composition gradientgives some influence on the phase decomposition process or not. In order to know the degreeof the influence we can use the composition gradient energy proposed by Cahn(15), K(dc/dx)2,where K is the gradient energy coefficient. The typical value of (dc/dx) for the macroscopiccomposition gradient is the order of l(H/nm because the composition change is roughly 0.5%for the distance of 1 fim, which is, as an example, shown in Fig 10, while (dc/dx) due to thephase decomposition is considered to be lO'Vnm since the composition change of several tens ofpercents occurs at the interface of precipitate whose width is about lnm(16). Therefore, thechange of K(dcAix)2 due to the macroscopic composition gradient is extremely small, comparedwith the value for the case of precipitate-formation, i.e. approximately 10"6. Consequently, themacroscopic composition gradient is hardly influenced on the phase decomposition process.
S.Conclusion
An Electron microscopic investigation on aged alloys containing a macroscopiccomposition gradient yields the accurate phase boundaries and phase equilibria. The variousphase boundaries, i.e. the coherent binodal and spinodal lines and incoherent binodal line aredistinctly determined for the Ni-Mo and Cu-Ti alloy systems. The microstructural change withcomposition is also observed in the vicinity of order-disorder transition line of Fe-AJ alloy.Furthermore, the equilibrium compositions at the particle interface with the matrix areexperimentally obtained for various particle sizes, and the Gibbs-Thomson's relation is verified.
It is expected that the composition gradient method proposed in the present becomes animportant experimental method for the characterization of the microstructure.
References
1. T. Miyazaki, T. Koyama and M. Doi, Mater. Sci. and Eng., 1991, A136, 1512. T. Koyama and T. Miyazaki, J.Japan Inst. Metals, 1989, 53, 6513. G. Cliff and G.W. Lorimer, J.Microsc, 1975, 103,2034. C.P.Heijwegen and J.D,Rieck, Z. Metallkd., 1973, 64, 4505. R.E.W.Casselton and Hume-Rothery, J, 1 ess-Common Metals, 1964,7,2126. W.Gust,T.Nguyen-TatandB.Predel, Z.Metallkd, 1979, 70, 2417. H.Okamoto and P.A.Beck, Met.Trans, 1971, 2, 5698. P.R.Swann, W.R.DuffandR.M.Fisher: Met. Trans., 1972, 3, 409. ,9. K.Oki, M.Hasaka and T.Eguti: Jpn. J. Appl. Phys., 1973, \2, 1522lO.S.M.Allen and J.W.Cahn: ActaMetall., 1975, 23,1017.ll.W.Koster and T.Godecke: Z. Metallkd,, 1980, 7J_, 765.12.0.Kubaschewski, 'Iron-Binary Phase Diagrams', Spring-Verlag, New York, 1982, 45613.J.W. Martin and R.D. Doherty, 'Stability of Microstructure in Metallic System1,
Cambrige University Press, Cambridge, 1976, 16314. A.J. Ardell, ActaMetall., 1972, 20, 6115. J.W.Cahn, ActaMetall., 1961, 9, 79516. R. Wagner and R. Kampmann, 'Phase Transformations in Materials',
(Vol.5 of Materials Science and Technology) Ed. by P. Haasen,VCH Press, Weinheim, 1991, 252
25
ACXRI '96
12.0
1373K,7.2ks ~* 923K,864ks
Distance
Fig.l A dark field electron micrograph of the Ni-Mo alloy having the macroscopiccomposition gradient aged at 923K for 864ks, showing the coherent precipitation limit tobe 12.8at.%Mo. The solid gray circles indicate the measuring points for the solutecomposition, whose values are correspondingly described in the inserted figure.
1200
1100
£
£1000
900
800
Present workCP lleljwcgcn
R I! W Ciucllon
W.Ouil
Ni
S!3
20)Q.E(-
1100
1000
900
800
700
A2
I\
. . .
B2
-
\
K •1 i i i i 1
0Fe
10 20 30at.%AI
40 50
10 15at.%Mo
20
Fig.2 A newly proposed coherent phaseboundaries of the Ni-Mo binary system.There are also indicated the equilibrium phaseboundaries obtained by several researchers.
Fig.3 The phase diagram of Fe-Al binaryalloy system, indicating the ageing tempe-rature in the present work.
26
ACXRT96
>„,"«*•
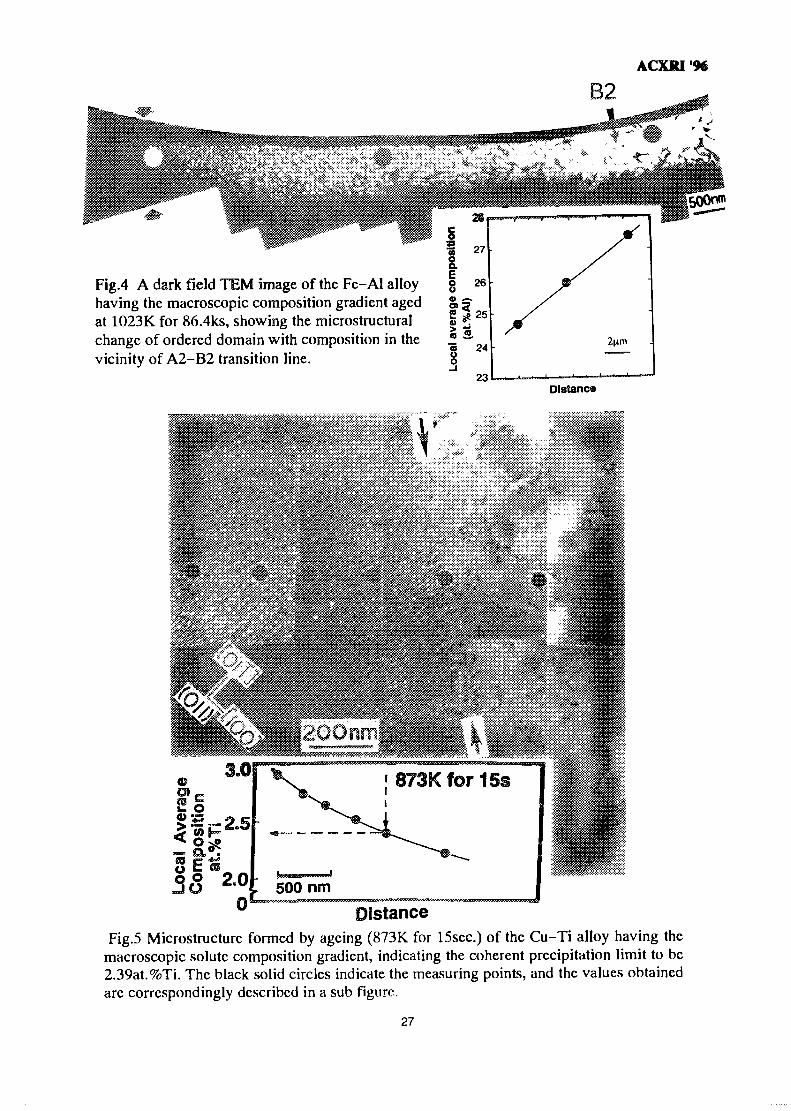
Fig.4 A dark field TEM image of the Fe-Al alloyhaving the macroscopic composition gradient agedat 1023K for 86.4ks, showing the microstructuralchange of ordered domain with composition in thevicinity of A2-B2 transition line. S 24
23
2nm
Distance
DistanceFig.5 Microstructurc formed by ageing (873K for 15sec.) of the Cu-Ti alloy having the
macroscopic solute composition gradient, indicating the coherent precipitation limit to be2.39at.%Ti. The black solid circles indicate the measuring points, and the values obtainedarc correspondingly described in a sub figure.
27
ACXRI '96
*'*•••-- . :^w • 4.0 r— — "™ " >*• . ! # • ' . * „ i. o>,- 77. K for 1.2ks /
•••'7/Op; ' \ ' * ^ | i = 2.0500 nm
Distance
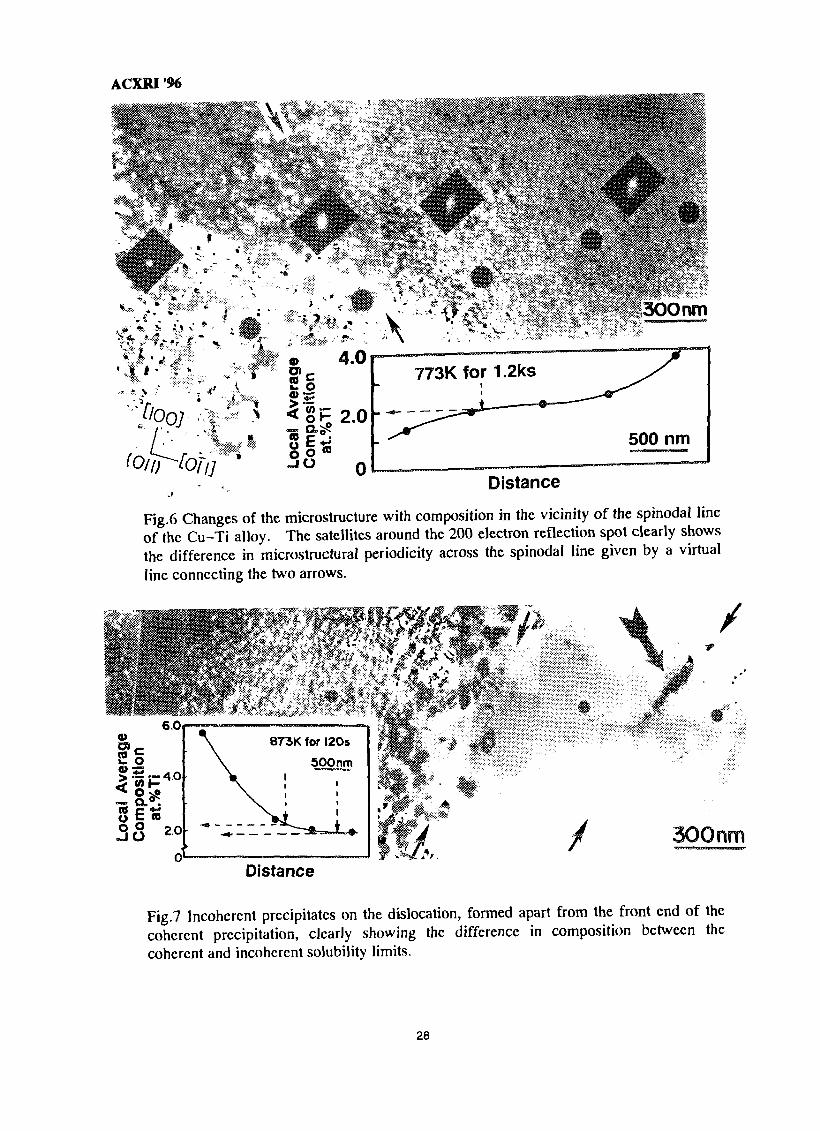
Fig.6 Changes of the microstructure with composition in the vicinity of the spinodal lineof the Cu-Ti alloy. The satellites around the 200 electron reflection spot clearly showsthe difference in microstructural periodicity across the spinodal line given by a virtualline connecting the two arrows.
6.0
If* 2.0
873K for 120s
500 nm
300nmDistance
Fig.7 Incoherent precipitates on the dislocation, formed apart from the front end of thecoherent precipitation, clearly showing the difference in composition between thecoherent and incoherent solubility limits.
28
ACXRI '96
1373
1
1273
1173
1073
973
873
773
673
(a)923
873
823
(b)
,4®
.em* • m
/
—— coherent binodal line
1.5
coherent binodal line
2.0
coherent spinodal lineincoherent precipitation line
2.5at%Tl
2.0 4.0 6.0 8.0 10.0Qt%TI
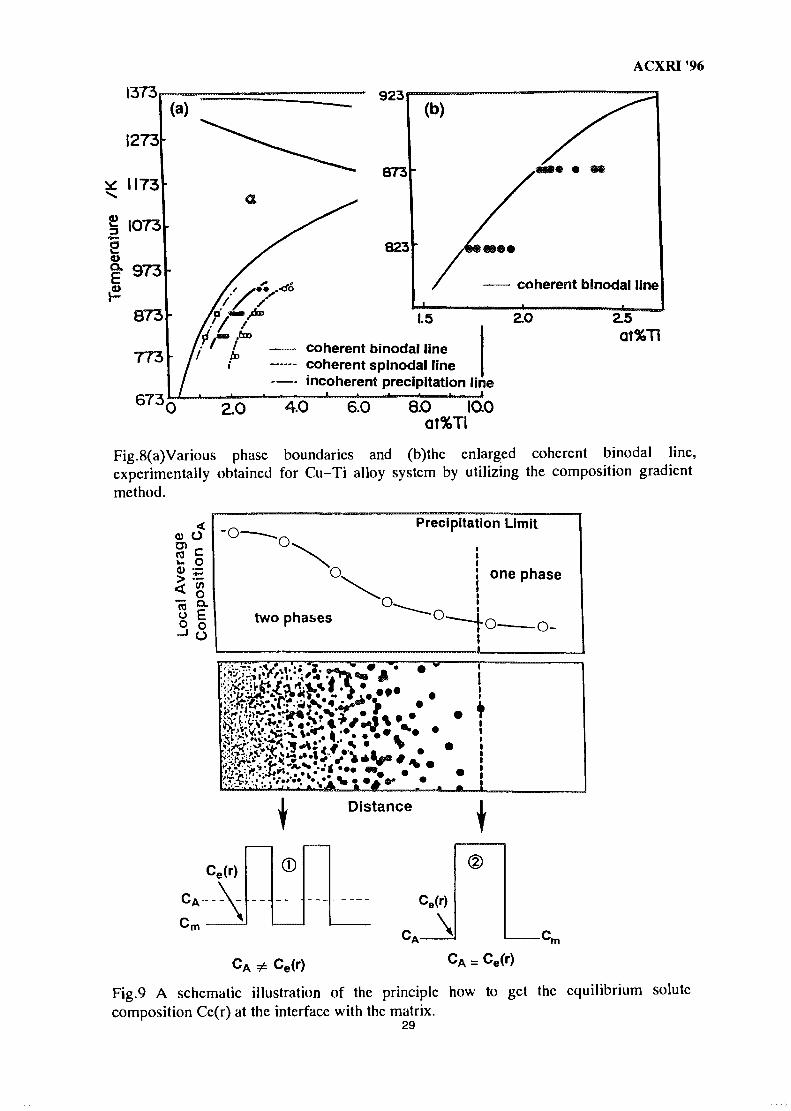
Fig.8(a)Various phase boundaries and (b)the enlarged coherent binodal line,experimentally obtained for Cu-Ti alloy system by utilizing the composition gradientmethod.
Precipitation Limit
one phase
Ce(r) = Ce(r)
Fig.9 A schematic illustration of the principle how to get the equilibrium solutecomposition Cc(r) at the interface with the matrix.
29
ACXRI '96
V „
A
/>.o.o,
g = 111 3.0
In * 200 nm
en _w O
i2 0
873K for 30s
500 nm
Distance
Fig. 10 Microstructurc in the vicinity of the coherent binodal line of the Cu-Ti alloyhaving the composition gradient. The photograph was taken under the condition of
2.5
m
U
J2.0mo
oO
Aged at 873K
Aged at 823K
0.5 1.01/r/nm-i
1.5X10⁻¹
Fig.l 1 Straight relationships between Ce(r) and 1/r of the Cu3Ti precipitates in the Cu-Tialloys aged at 873K and 823K, clearly indicating that the Gibbs-Thomson's equation issatisfied. The slopes give 0.11J/mol(873K) and 0.10J/mol(823K) as the interfacialenergy density.
30
ACXRI '96THE ROLE OF TEXTURES IN THE FORMING OF
AUTOMOTIVE SHEET STEELSMY9700780
Sanak MishraR&D Centre for Iron & Steel, SAIL
Ranchi - 834 002, India
Abstract : Crystallographic textures generally have a strong bearing on the drawability ofsheet steels. Particularly in the case of automotive sheets, texture control is of paramountimportance. In the last two decades, therefore, texture research has assumed muchsignificance in the steel industry.
X-ray diffraction continues to remain the most used tool for the study of textures. Earlyresearches, from about 1940 to 1980, were invariably carried out by the pole figure method.However, for more quantitative results the ODF (Orientation Distribution Functions) analysistechnique was developed. Since 1980, the ODF analysis has come to be used extensively.
In the present paper, several unique features of textures in automotive grade deepdrawing steels, as revealed from X-ray ODFs, will be presented. The relative importance ofthe various textural components with respect to forming will also be dealt with.
Introduction :
Low-carbon steel sheets find extensive use in press forming applications, in particular ofautomotive components. The metallurgy of such steels has been the subject of considerableresearch and development and many comprehensive reviews on the topic are available in theliterature1"5.
The formability of sheet steels can be fairly well described in terms of deep drawability,punch stretchability and bendability. Whereas in some cases the shape of the component maybe such that only one of the above-mentioned characteristics is important, quite often allthree modes of deformation may be involved. A combination of stretching and drawing is infact frequently encountered.
Stretchability represents the ability of the material to resist localised necking and therebywithstand complex non-uniform stresses. Good stretching behaviour is exhibited in sheetsteel with a high value of work hardening exponent n. The stretchability is comonlydetermined by cupping height measurements, e.g. Erichsen test. The drawability, on the otherhand, can be assessed by measuring the limiting drawing ratio (LDR), that is the ratio of themaximum blank diameter, dmax, deep drawn without failure and the diameter of the punch, dp.Cup drawing limits commonly measured in terms of the LDR are strongly influenced by thenormal plastic anisotropy.
31
ACXRI '96Relationship between Texture and Formability
In order to understand the formability of steel sheets, particularly in drawing, Lankford etal.6 were the first to adopt the plastic strain ratio parameter r, defined as the ratio of truestrains in the width and thickness directions during plastic extension in a tensile test:
r = ew /en = ln(wo/wf)/ln(to/tf) ... (1)
where ew and et are the true strains in the width and thickness directions; w^ and Wf are theinitial and final widths and t0 and tf are the initial and final thicknesses. The r value can thenbe best understood physically as the capacity to resist thinning. Additionally, since the flowstrength and hence plastic strain vary in the plane of the sheet itself, it is necessary toconceive an average plastic anisotropy ratio r for the whole sheet.
r = (r0 + 2r45 + r9o)/4 ... (2)
where the r0, r45 and r^ are the r values measured parallel, at 45° and at 90° to the rollingdirection.
The magnetic torque measurements to Lankford et al.6 indicated that plastic anisotropy isrelated to the preferred orientation of grains. Subsequently, Whiteley7 published his work in1960 which conclusively demonstrated that crystallographic texture is the most importantmaterial property influencing the performance of ordinary ductile materials in cup drawingand that the drawability of-suitably textured sheets is superior to that of isotropic material.
Fig.l illustrates some common textural components observed in sheet steels. Variousstudies, as summarised in Ref. 1-5, suggest that as far as aluminium-killed cold-rolled andannealed steels are concerned, whether they are box-annealed or continuously annealed, themost desirable texture for achieving high r values around 1.6-2.0 is the {lll}<110> type.When the steel contains higher levels of phosphorous, high r values (>2) are attained with asharp {111 }<112> texture. In the case of interstitial-free Ti-stabilized or Nb-stablized steels,the high r values are associated with either sharp {111} <112> or {554}<225> textureswhich are actually very close to each other in terms of crystallographic orientation. The newclass of bake-hardnable steels produced by continuous annealing exhibit a sharp {111}texture.
A good example of the close relationship between {111} type texture and r is to befound in the work of Held8 (Fig.2), which also showed that the {001} is an undesirablecomponent. Interestingly, work by Mishra et al.9 on aluminium-killed deep drawing steels hassuggested that such correlations may also be observed by taking other different combinationsof texture components. In their investigation both normal and inverse pole figures weredetermined for specimens with different r values. The normal pole figures indicated, inaddition to strong {lll}<110> and {111}<112> components, a strong {112}<110>orientation as well. This was an important observation as it had not been reported in theliterature earlier. In the inverse pole figure measurements also, not only did the intensity ofthe {111} components increase with r but also that of the {112}. In addition, the intensitiesof the {110} and {001} reflections decreased with r. In order to have a meaningful
32
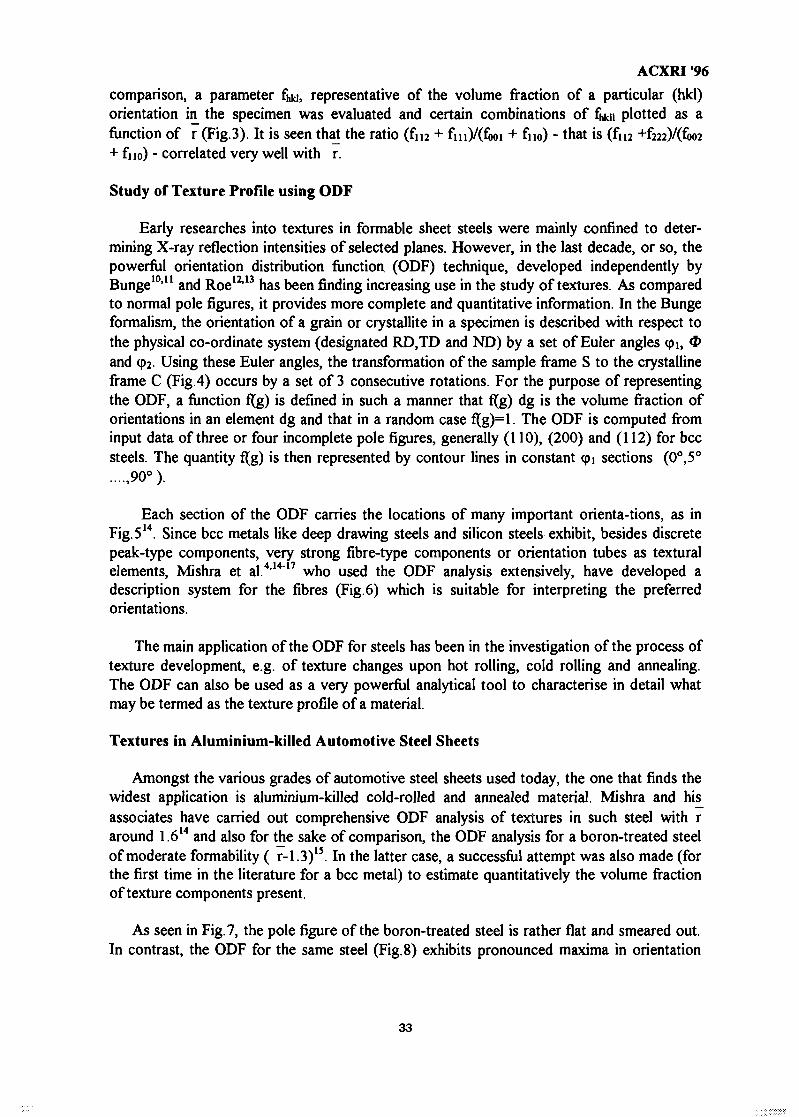
ACXRI '96
comparison, a parameter ftki, representative of the volume fraction of a particular (hkl)orientation in the specimen was evaluated and certain combinations of fhkii plotted as afunction of r (Fig.3). It is seen that the ratio (fm + fin)/(fooi + fno) - that is (fn2 +f222)/(foo2+ fno) - correlated very well with r.
Study of Texture Profile using ODF
Early researches into textures in formable sheet steels were mainly confined to deter-mining X-ray reflection intensities of selected planes. However, in the last decade, or so, thepowerful orientation distribution function (ODF) technique, developed independently byBunge10'11 and Roe12"13 has been finding increasing use in the study of textures. As comparedto normal pole figures, it provides more complete and quantitative information. In the Bungeformalism, the orientation of a grain or crystallite in a specimen is described with respect tothe physical co-ordinate system (designated RD,TD and ND) by a set of Euler angles q>i, <J>and q>2. Using these Euler angles, the transformation of the sample frame S to the crystallineframe C (Fig.4) occurs by a set of 3 consecutive rotations. For the purpose of representingthe ODF, a function f(g) is defined in such a manner that f(g) dg is the volume fraction oforientations in an element dg and that in a random case f(g)=l. The ODF is computed frominput data of three or four incomplete pole figures, generally (110), (200) and (112) for bccsteels. The quantity f(g) is then represented by contour lines in constant q>i sections (0°,5°.....90°).
Each section of the ODF carries the locations of many important orienta-tions, as inFig.514. Since bcc metals like deep drawing steels and silicon steels exhibit, besides discretepeak-type components, very strong fibre-type components or orientation tubes as texturalelements, Mishra et al.4'14"17 who used the ODF analysis extensively, have developed adescription system for the fibres (Fig.6) which is suitable for interpreting the preferredorientations.
The main application of the ODF for steels has been in the investigation of the process oftexture development, e.g. of texture changes upon hot rolling, cold rolling and annealing.The ODF can also be used as a very powerful analytical tool to characterise in detail whatmay be termed as the texture profile of a material.
Textures in Aluminium-killed Automotive Steel Sheets
Amongst the various grades of automotive steel sheets used today, the one that finds thewidest application is aluminium-killed cold-rolled and annealed material. Mishra and hisassociates have carried out comprehensive ODF analysis of textures in such steel with raround 1 614 and also for the sake of comparison, the ODF analysis for a boron-treated steelof moderate formability ( r-1.3)15. In the latter case, a successful attempt was also made (forthe first time in the literature for a bcc metal) to estimate quantitatively the volume fractionof texture components present.
As seen in Fig. 7, the pole figure of the boron-treated steel is rather flat and smeared out.In contrast, the ODF for the same steel (Fig. 8) exhibits pronounced maxima in orientation
33

ACXRI '96
space. This is a classic example of the much-enhanced resolution of textural components thatcan be achieved with the ODF vis-a-vis the pole figure.
The pole figure of the Al-killed steel shows a sharp texture centred around {111} planes(Fig.9). The ODF is also well defined (Fig. 10).
Considering first the intensity peaks in the ODFs in Figs. 8 and 10, one finds that thestrongest component is the {lll}<110> . The {lll}<110> is in fact a component of analmost ideal <111>||ND fibre, or orientation tube, running from (111)[1 To] to (111)[1 12].A notable difference is that in the Al-killed, steel the strength, i.e. orientation density, of the<111> fibre is higher, which explains its higher r value. The <111>||ND fibre appears to bea general feature in the recrystallisation textures of many deep drawing steels14'15.
It may be noted in Figs.8 and 10 that apart from the <111>||ND fibre, another majorcomponent is a limited (incomplete) fibre centred around <337>|| ND, with highest intensityat (337)[1 10]. Amongst other components (minor) in both steels are {110}<001> and
Concluding Remarks
1. The ODF analysis technique is an extremely valuable tool for the study of the textureprofile in automotive grade sheet steels, since it provides a high degree of resolution oftextural components and permits quantitative comparison of their relative intensities.
2. In deep drawing steels the following two concepts have to be used in describing thetextural features : (a) peak type components, i.e. more or less isotropic scattering rangesaround certain ideal orientations, and (b) complete, and incomplete orientation tubes orfibres.
3. The major textural component in aluminium-killed automotive sheet steel is a complete<111> fibre parallel to sheet plane normal direction.
4. An orientation tube along the <111>||ND fibre axis in fact appears to be a commonfeature of textures in deep drawing steels.
References
1. D.J. Blickwede, Trans.ASM, 1968, 61, 653.2. S. Mishra & C. Darmann, Int.Metall.Rev., 1982, 27, 307.3. W.B. Hutchinson, Int.Metall.Rev., 1984, 29, 25.4. S. Mishra, Ind.J.Technology, 1990, 28, 1952.5. S. Mishra, Bull.Materials Science, 1993, 16, 583.6. W.T.Lankford, S.C. Snyder & J.A.Bauscher, Trans.ASM, 1950, 42,, 1197.7. R.L. Whiteley, Trans.ASM, 1960, 52, 154.8. J.F. Held, First Operating Metallurgy Conf.of ACME, Pittsburgh, USA, 1965.9. S. Mishra, S.K. Paul & R.K. Nandi, Fourteenth Congress of the International Deep
Drawing Research Group, Cologne, Germany, 1985.10. H.J. Bunge, Z. Metallkunde, 1965, 56, 872.
34
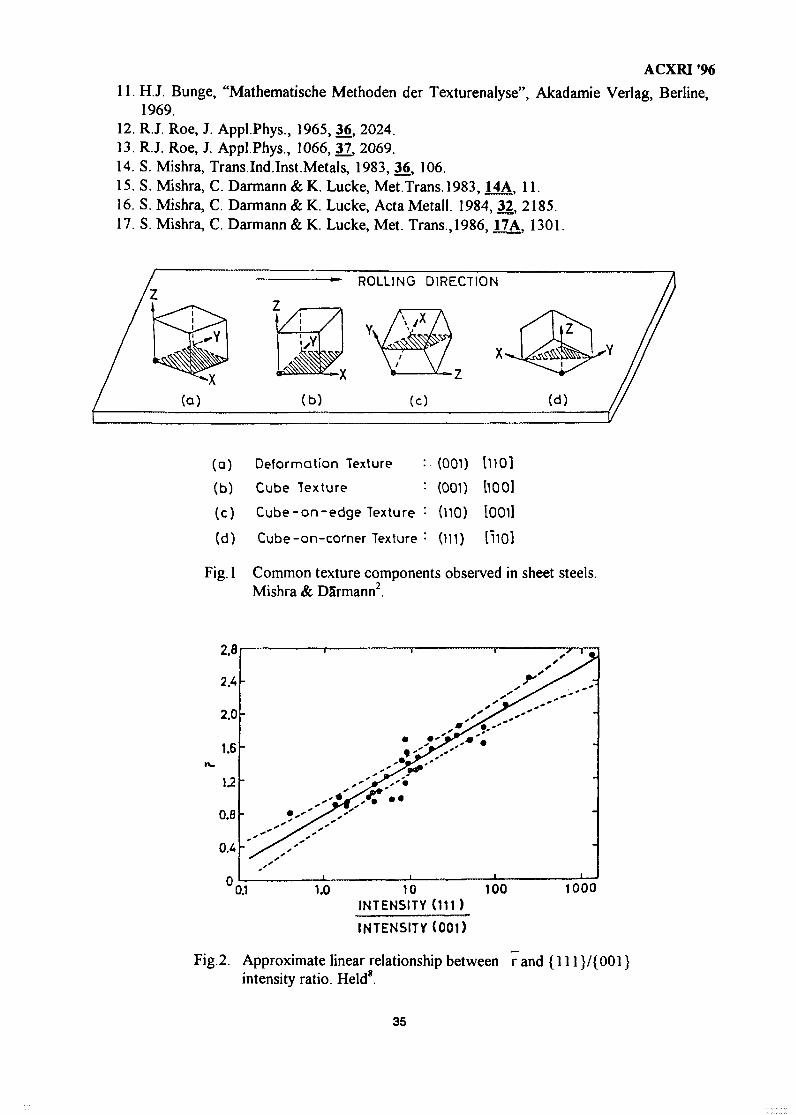
ACXRI '9611. H.J. Bunge, "Mathematische Methoden der Texturenalyse", Akadamie Verlag, Berline,
1969.12. R.J. Roe, J. Appl.Phys., 1965, 36, 2024.13. R.J. Roe, J. Appl.Phys., 1066, 37, 2069.14. S. Mishra, Trans.Ind.Inst.Metals, 1983, 36, 106.15. S. Mishra, C. Darmann & K. Lucke, Met.Trans.1983, ±4A, 11.16. S. Mishra, C. Darmann & K. Lucke, Acta Metall. 1984, 32, 2185.17. S. Mishra, C. Darmann & K. Lucke, Met. Trans,1986, HA, 1301.
(a) (b)
ROLLING DIRECTION
Y,
(c) (d)
(a) Deformation Texture : (001) UlO]
(b) Cube Texture : (001) llOOl
(c) Cube-on-edge Texture : (110) lOOil
(d) Cube-on-corner Texture : (111) t i lOl
Fig. 1 Common texture components obsei'ved in sheet steels.Mishra & DSrmann2.
1.0 10INTENSITY (111)
INTENSITY (001)
100 1000
Fig.2. Approximate linear relationship between r and {111 }/{001}intensity ratio. Held8.
35
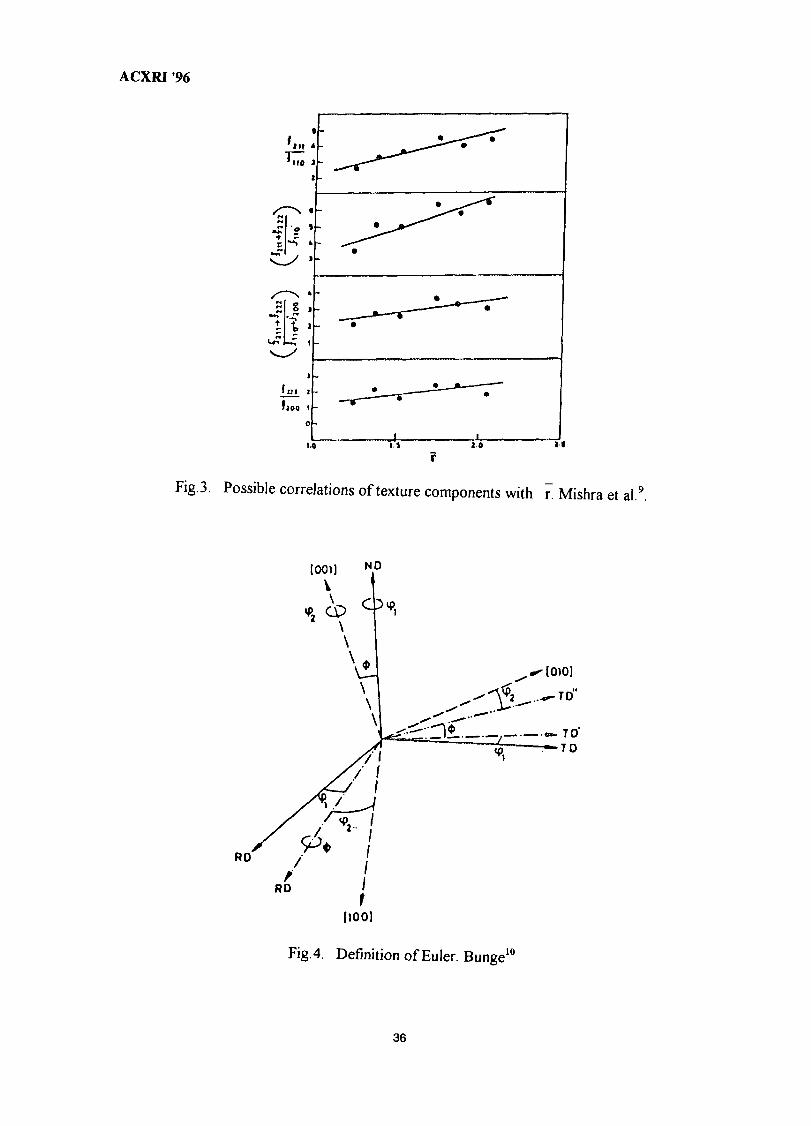
ACXRI '96
nt
no
• m i
!joo i
o
10 i t l.o
rM
Fig. 3. Possible correlations of texture components with r. Mishra et al.9.
Fig.4. Definition of Euler. Bunge10
36
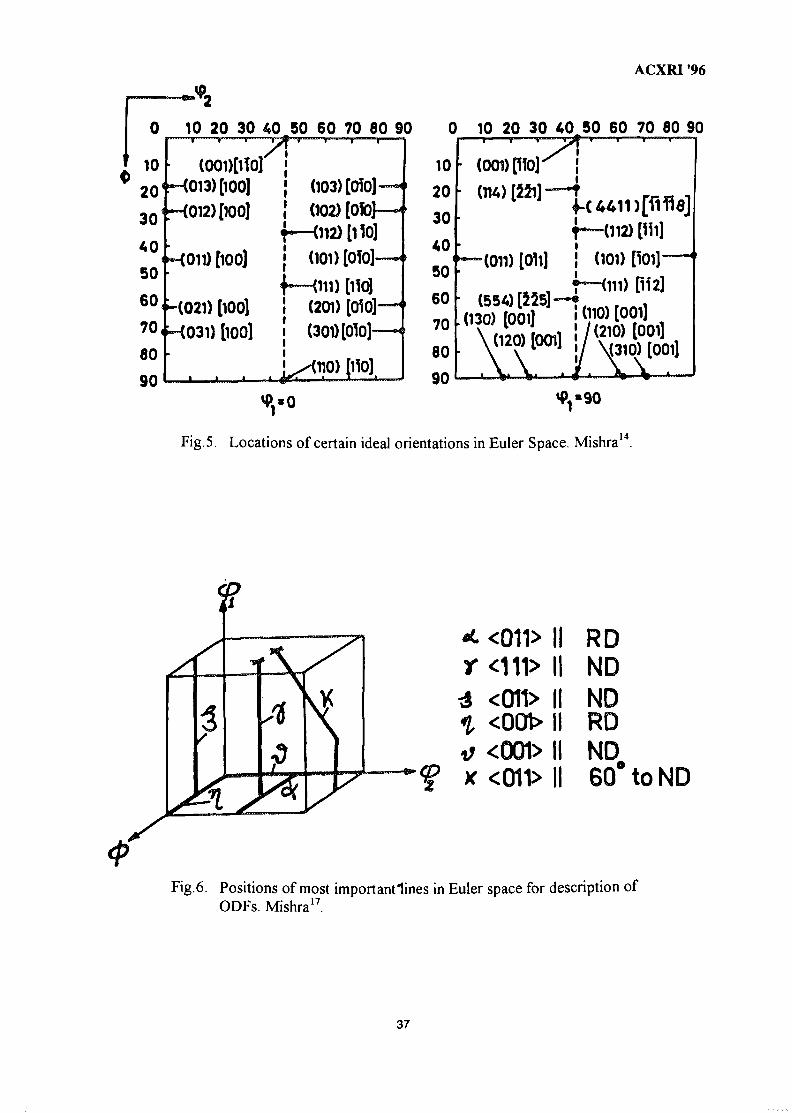
ACXRI '96
0
10
10 20 30 40 50 60 70 80 90 0 10 20 30 40 50 60 70 80 90
30
506 0
(001)[iT0j13) [100]
012) [100]
< -(011) [100]
-(021) [100]7°f-<031)[i00]80
90
40.A
(103) [OfO]-
(102) [OfoJ—•
(101) [OTO]
\ (111) [110](201) [OlO]
(301) [010]
Fig. 5. Locations of certain ideal orientations in Euler Space. Mishra14.
II
<cni> II<00>ll
t; <001> IIx <011> II
RDNDNDRDND60° to ND
Fig.6. Positions of most importantiines in Euler space for description ofODFs. Mishra17.
37
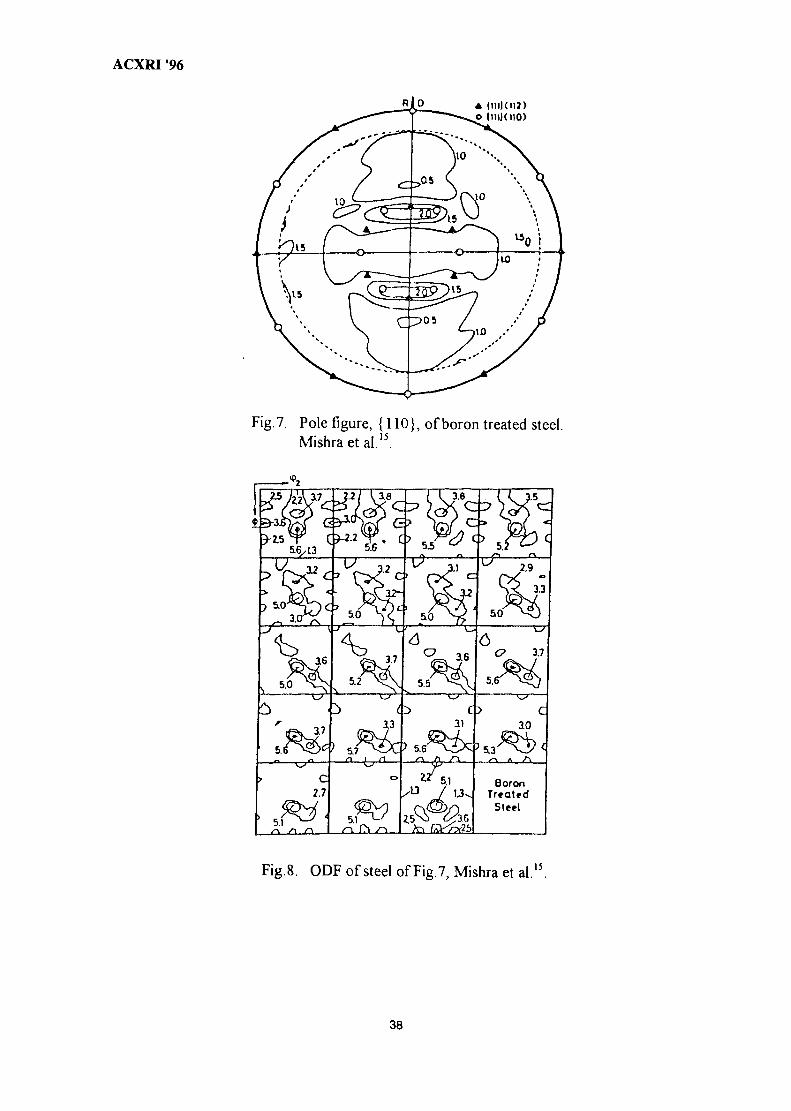
ACXRI '96
A |1I))O12)o IniKiio)
Fig. 7. Pole figure, {110}, of boron treated steel.Mishraet al.15.
$B-3J
5iU3
« 2
O^ie'
.2 Ua 3.B
55 V >I? uP-
50
>
.312 C ' CV ,2
32H
50 ao
2.9
3.3
6
5.0
3.7
5.2
3.6 G> 3.7
5.5
c3.7 ai
5,7 5.6 5,3
C
2.7a/;,
•u
5.1
BoronTreated
Steel
Fig.8. ODF of steel of Fig.7, Mishra et al.15.
38
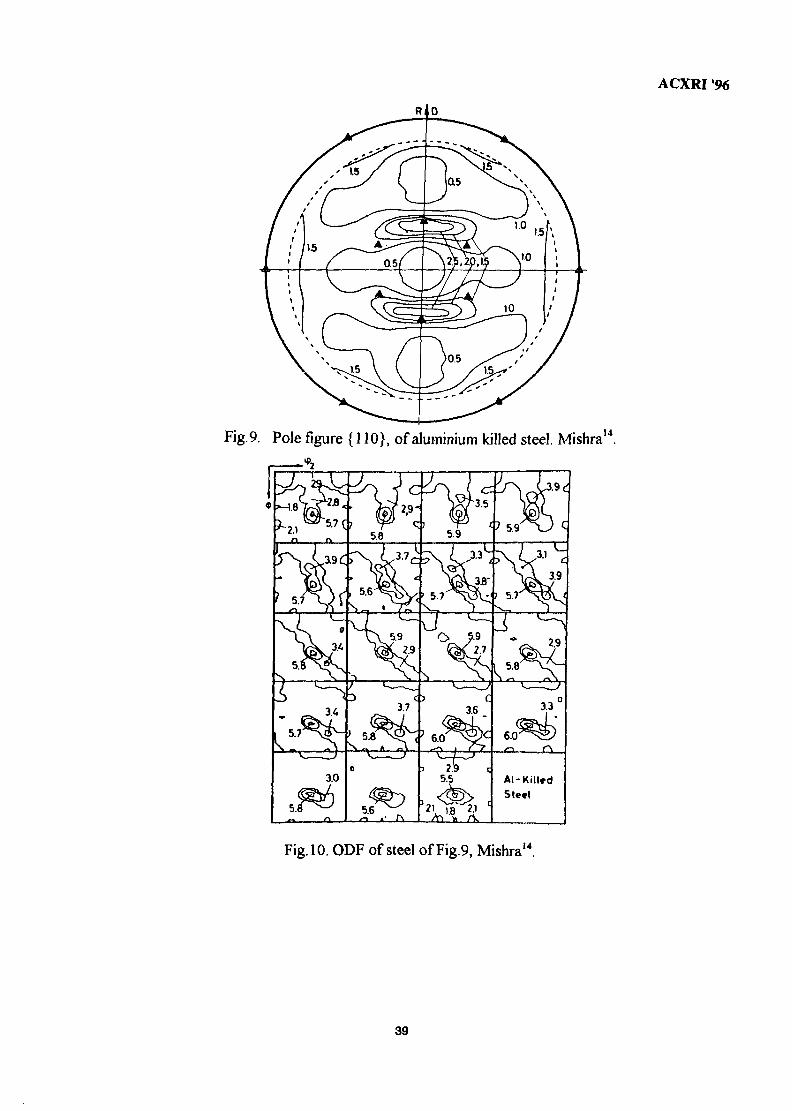
ACXRI '96
Fig.9. Pole figure {110}, of aluminium killed steel. Mishra14.
Fig. 10. ODF of steel of Fig.9, Mishra14
39
— ,..,, . . , „ mmm IBIII nal
ACXRI'96 MY9700781
Quantitative Phase Analysis inIndustrial Research
AHMAD MONSHIAssociate Professor of Materials DepartmentIsfahan University of TechnologyIsfahan, 84156Iran.
ABSTRACT:
X- Ray Diffraction (XRD) is the only technique able to identify phase and all theother analytical techniques give information about the elements. Quantitative phaseanalysis of minerals and industrial products is logically the next step after a qualitativeexamination and is of great importance in industrial research. Since the application ofXRD in industry, early in this century, workers were trying to develop quantitative XRDmethods. In this paper some of the important methods are briefly discussed and partlycompared. These methods are Internal Standard, Known Additions, Double Dilution,External Standard, Direct Comparison, Diffraction Absorption and Ratio of Slopes.
INTRODUCTION:
The intensity of X-ray diffracted by a particular set of planes (peak number e) ofphase / in the X-ray sample/ is given by Alexander & Klug in 1948 [1-2] to be:
Ieij = Kei. Xij / uj (1)
where Xij is the weight fraction of phase i in sample j , Kei is a constant which dependson the nature of the phase and the particular reflection considered and the experimentalinstrument and arrangement including the intensity of original beam, uj is the averagemass absorption coefficient of the sample. This factor depends on summation of massabsorption (or mass attenuation) coefficients of individual n phases multiplied by thecorresponding weight fraction of them in the sample.
uj = (upl .Xpl) + (up2.XP2) + + (npn.Xpn) (2)
This can also be shown as:
+ + (jaem.Xem) (3)
while jxei is the mass absorption coefficients of element i with weight fraction Xei for allthe m elements in the sample j . The values of |aei for each element in the specificradiation used (like Cu Ka radiation) is given in the handbooks and some texts [3].
40
ACXRI '96INTERNAL STANDARD METHOD:
This is the first formulated method [1] and widely used procedure for mixtureanalysis by XRD. An early application was by Clark & Reynolds in 1936 [4] for thequantitative analysis of quartz in mine dusts. A standard substance S is added to themixture to be analyzed in a known and fixed weight proportion. Reflections from S andfrom different components are compared using (a). S in known mixtures to establishcalibration curves and (b). S in the unknown mixture.
Let Ws be the weight of S added to one gram of the mixture to be analysed. Theweight proportion of S is then Ws / (1 + Ws) and the weight proportion of phase i is Wi /(1+Ws),then:
(Ieij / Ihsj) = (Kei /Khs). (Wi / Ws) (4)
By dividing the intensity diffracted from peak e of phase i to intensity diffracted frompeak h of standard material S, the mass absorption coefficient of sample/ is eliminated.
If we keep the weight proportion of Ws gram of S to one gram of mixture constantin all the tests, equation (4) can be rewritten as :
(Ieij / Ihsj) = Reihs . Wi (5)
Known values of pure compound / are diluted to one gram by a phase not presentin the mixture to be analysed, or diluted by glass powder. It is then mixed completely bya fixed Ws gram of standard material. By measuring diffracted intensities (area under thepeaks) of Ieij and Ihsj and dividing them, then plotting against Wi in different samples,calibration curve is obtained which is a straight line passing through the origin. Theconstant Reihs is the slope of that line.
For analysis, Ws gram of S with one gram of unknown mixture is blended and X-rayed. The value of Wi in mixture is read from the calibration line, as indicated in Figure1.
METHOD OF KNOWN ADDITIONS:
When the composition of a multicomponent system varies greatly and only a fewspecimens are to be analysed for component i, we can avoid the labour of setting up acalibration curve.
In this method, developed by Copeland & Bragg in 1958 [5], a known weight ofpure component /, Yi grams, is added to one gram of a mixture containing that componentand the diffracted intensities of that phase (Ieji) and another phase in the mixture (Ifuj) forpeak/of component u, are measured.
41
ACXRI '96
If the weight fraction of component / and u in the original specimen are:
Xli = W i / l (6-a)
Xlu = Wu/l (6-b)
The new weight fraction of phases / and u are:
X2i = (Wi + Yi) / (1 +Yi) (7-a)
X2u = Wu/(1+Yi) (7-b)
Figure 2 shows that the plot of (Ieji .Ifuj) versus the added amount of pure phase, Yi, is astraight line whose intercept with negative part of abscissa gives the analysis of-Wi.
DOUBLE DILUTION METHOD:
This method developed by Monshi & Messer in 1989 [6] is a developed method,combining methods of Internal Standard and Known Additions. It can analyzequantitatively all the phases of a multicomponent specimen, by adding pure phases andwithout the need to construct calibration curves and with as few as two or three mixturesprepared for X-ray diffraction.
Since the mathematics of the method require space, and the pages of this papermust be limited, the reader is asked to study the reference. It has been successfullyapplied to analyze alumina, mullite, quartz, silicon and the balance amount of glassyphases in a ceramic specimen with only three mixtures prepared for XRD. If a material isfired to two different temperatures and the amount of any phases is changed, the analysisby Double Dilution Method gives two parallel lines. This factor helps to control theresults and check the accuracy. In the appendix of the article given in ComplexMicrostructures [6] an Extension of Method of Known Additions (Dilution Method) formulticomponent systems is presented. When there are minor amounts of some phases ina multiphases system, using results with respect to widely used Internal Standard Method.This is because stronger peaks are formed and the error due to background noise isreduced.
EXTERNAL STANDARD METHOD:
A mixture of fine grained pure phases 1,2,3, , n with known weights of WI,W2, W3, , Wn is homegeneously mixed and X-rayed. The ratio of each twosuitable intensities is proportional to the ratio of the amounts:
(12 / II) = (K2 /Kl) . (W2 / WI) = (M21). (W2 /WI) (8)
42
ACXRI '96
The values of M21, etc. can then be calculated. Now let XI, X2, X3, , Xn bethe weight of these phases in one gram of specimen to be analyzed, which is the phasefractions required, so that:
X1+X2 + X3 + + X n = l (9)
If the amount of XI is required, we divide all the terms to XI:
(X2 / XI) + (X3 /Xl) + + (Xn /Xl) = (1 /Xl) - 1 (10)
By replacing the weight ratios to equivalent intensity ratios:
(X2/X1) = (I2/I1)/M21 (11)
The unknown XI in equation (10) can then be calculated. The method fails when largeproportions of amorphous material are present, because all the phases are assumed to becrystalline with a suitable peak to be measured accurately. If refecence materials ofknown composition are available to be X-rayed and calculate M21, M31, , Mnl, thismethod can be very helpful in metallurgy. Phase fraction of XI in an alloy may beidentified without the need to make any powder.
DIRECT COMPARISON METHOD:
This is of greatest metallurgical interest because it can be applied directly topolycrystalline aggregates. Since its development by Averbach and Cohen [7] in 1948, ithas been widely used for measuring the amount of retained austenite in hardened steel.Austenite is not a stable phase at room temperature and it is difficult to produce areference material of known composition to calculate the values of Kl and K2, or M21, inequation (8). Therefore these factors in this method should be calculatedcrystallographically from a knowledge of the crystal structure and lattice parameters ofboth phases (retained austenite & transformed martensite) [3]. Once (X2 /Xl) is foundfrom equation (11), the values of XI and X2 can be obtained from the additonalrelationship:
XI + X2 = 1
The same principle can be used for more than two phases.
DIFFRACTION ABSORPTION METHOD:
These are some methods which use diffraction and absorption fundamentals. Theauthor presented a few techniques [8] which can be useful in surface engineering(tribology). If we have a single phase alloy of known compositon, the mass absorptioncoefficient of the metal (uj) can be calculated by using equation (3). After measurementof diffracted intensity (Ieij), considering Xij = 1 in single phase alloy, the constant Keican be calculated by using equation (1).
43
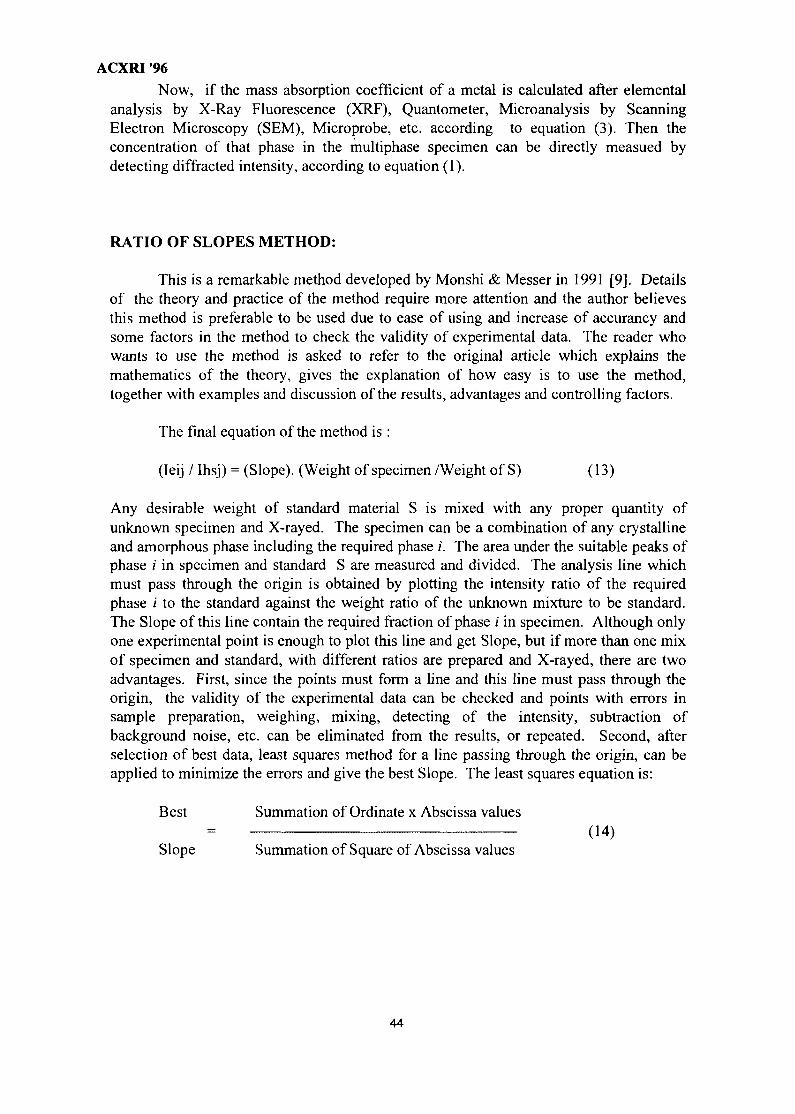
ACXRI '96
Now, if the mass absorption coefficient of a metal is calculated after elementalanalysis by X-Ray Fluorescence (XRF), Quantometer, Microanalysis by ScanningElectron Microscopy (SEM), Microprobe, etc. according to equation (3). Then theconcentration of that phase in the multiphase specimen can be directly measued bydetecting diffracted intensity, according to equation (1).
RATIO OF SLOPES METHOD:
This is a remarkable method developed by Monshi & Messer in 1991 [9]. Detailsof the theory and practice of the method require more attention and the author believesthis method is preferable to be used due to ease of using and increase of accurancy andsome factors in the method to check the validity of experimental data. The reader whowants to use the method is asked to refer to the original article which explains themathematics of the theory, gives the explanation of how easy is to use the method,together with examples and discussion of the results, advantages and controlling factors.
The final equation of the method is :
(Ieij / Ihsj) = (Slope). (Weight of specimen /Weight of S) (13)
Any desirable weight of standard material S is mixed with any proper quantity ofunknown specimen and X-rayed. The specimen can be a combination of any crystallineand amorphous phase including the required phase /. The area under the suitable peaks ofphase /' in specimen and standard S are measured and divided. The analysis line whichmust pass through the origin is obtained by plotting the intensity ratio of the requiredphase ; to the standard against the weight ratio of the unknown mixture to be standard.The Slope of this line contain the required fraction of phase / in specimen. Although onlyone experimental point is enough to plot this line and get Slope, but if more than one mixof specimen and standard, with different ratios are prepared and X-rayed, there are twoadvantages. First, since the points must form a line and this line must pass through theorigin, the validity of the experimental data can be checked and points with errors insample preparation, weighing, mixing, detecting of the intensity, subtraction ofbackground noise, etc. can be eliminated from the results, or repeated. Second, afterselection of best data, least squares method for a line passing through the origin, can beapplied to minimize the errors and give the best Slope. The least squares equation is:
Best Summation of Ordinate x Abscissa values= (14)
Slope Summation of Square of Abscissa values
44
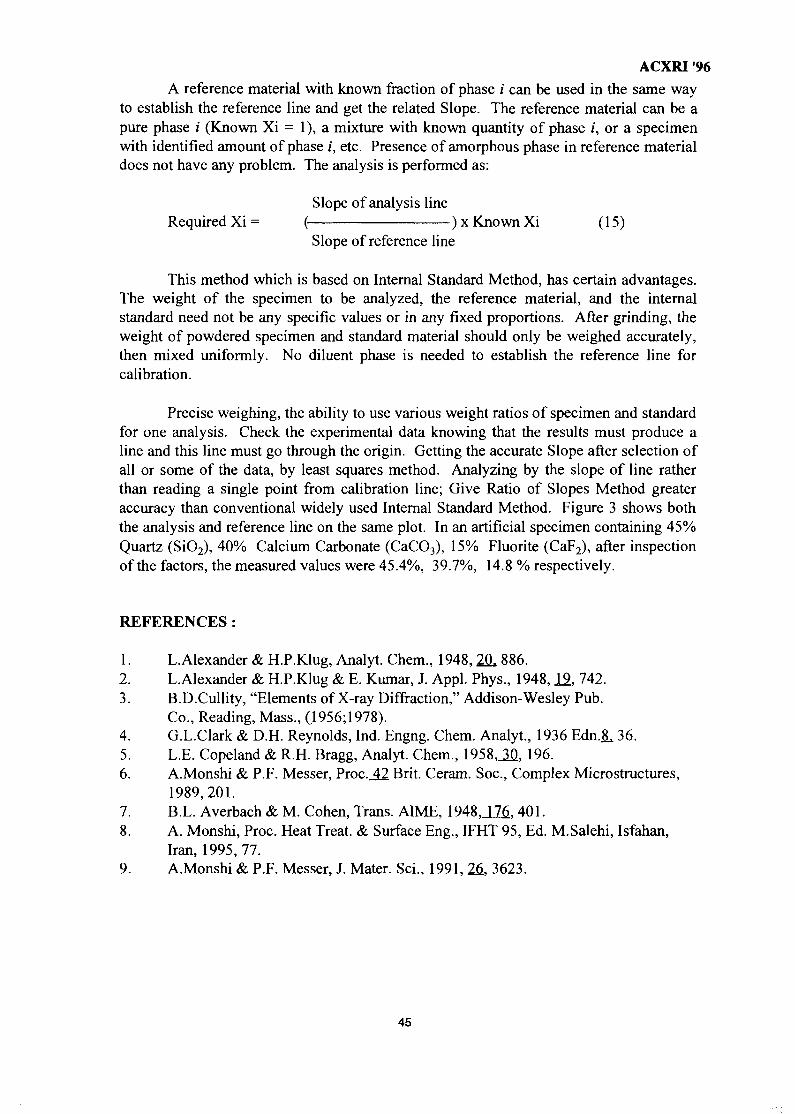
ACXRI '96
A reference material with known fraction of phase / can be used in the same wayto establish the reference line and get the related Slope. The reference material can be apure phase / (Known Xi = 1), a mixture with known quantity of phase /, or a specimenwith identified amount of phase /, etc. Presence of amorphous phase in reference materialdoes not have any problem. The analysis is performed as:
Slope of analysis lineRequired Xi = ( ) x Known Xi (15)
Slope of reference line
This method which is based on Internal Standard Method, has certain advantages.The weight of the specimen to be analyzed, the reference material, and the internalstandard need not be any specific values or in any fixed proportions. After grinding, theweight of powdered specimen and standard material should only be weighed accurately,then mixed uniformly. No diluent phase is needed to establish the reference line forcalibration.
Precise weighing, the ability to use various weight ratios of specimen and standardfor one analysis. Check the experimental data knowing that the results must produce aline and this line must go through the origin. Getting the accurate Slope after selection ofall or some of the data, by least squares method. Analyzing by the slope of line ratherthan reading a single point from calibration line; Give Ratio of Slopes Method greateraccuracy than conventional widely used Internal Standard Method. Figure 3 shows boththe analysis and reference line on the same plot. In an artificial specimen containing 45%Quartz (SiO2), 40% Calcium Carbonate (CaCO3), 15% Fluorite (CaF2), after inspectionof the factors, the measured values were 45.4%, 39.7%, 14.8 % respectively.
REFERENCES:
1. L.Alexander & H.P.Klug, Analyt. Chem., 1948,2H 886.2. L.Alexander & H.P.Klug & E. Kumar, J. Appl. Phys., 1948, JJ>, 742.3. B.D.Cullity, "Elements of X-ray Diffraction," Addison-Wesley Pub.
Co., Reading, Mass., (1956;1978).4. G.L.Clark & D.H. Reynolds, Ind. Engng. Chem. Analyt., 1936 Edn.JL 36.5. L.E. Copeland & R.H. Bragg, Analyt. Chem., 1958,J0_, 196.6. A.Monshi & P.F. Messer, Proc.j42 Brit. Ceram. Soc, Complex Microstructures,
1989,201.7. B.L. Averbach & M. Cohen, Trans. AIME, 1948,_H6_, 401.8. A. Monshi, Proc. Heat Treat. & Surface Eng., IFHT 95, Ed. M.Salehi, Isfahan,
Iran, 1995,77.9. A.Monshi & P.F. Messer, J. Mater. Sci., 1991,26, 3623.
45
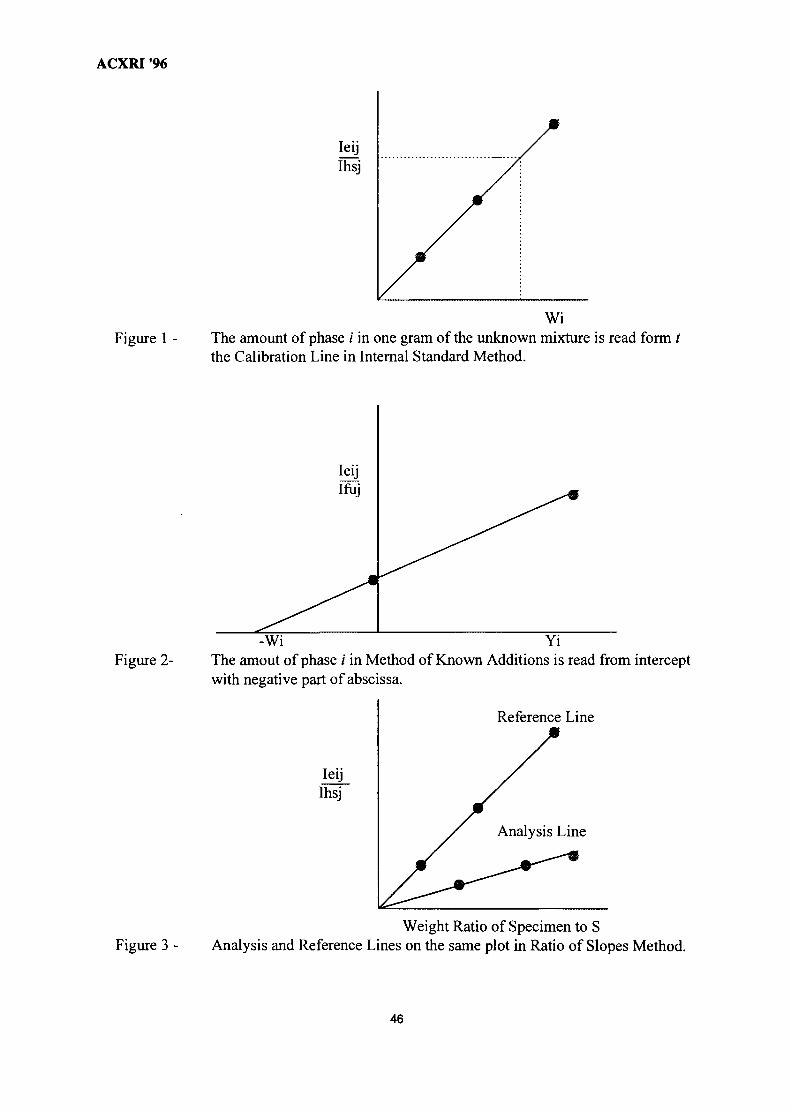
ACXRI '96
Ieijihsj
WiFigure 1 - The amount of phase / in one gram of the unknown mixture is read form t
the Calibration Line in Internal Standard Method.
Figure 2--Wi Yi
The amout of phase / in Method of Known Additions is read from interceptwith negative part of abscissa.
Reference Line
IeijIhsj
Figure 3 -Weight Ratio of Specimen to S
Analysis and Reference Lines on the same plot in Ratio of Slopes Method.
46
ACXRI '96ORIENTATION-RELATED PHENOMENA EN Al-Li SHEET DURING
SUPERPLASTIC FORMING.
» • • • • ' ™ '•»'• *••• IMII • m i HIM >Mi! a m it
Valerie Randle and Brian Wilshire MY9700782Dept. of Materials Engineering, University of Swansea,
Swansea, SA2 8PP, UK
Abstract: The microtexture of superplastically deformed 8090 Al-Li sheet has been measuredusing electron back-scatter diffraction, for true strains of 0, 0.25, 0.75, 1.5 and 2.4. The datahave been interpreted in terms of individual texture variants, grain boundary types (low angleor high angle) and grain junction types (I-lines or U-lines, as defined by an extension to the O-lattice theory).
Introduction
Previous work has indicated that the texture of Al-Li sheet changes considerably duringsuperplastic deformation under biaxial loading1. In general, the rotation and sliding of grainsby which superplastic flow takes place is manifested by weakening of the texture However, itis also argued that where the deformation process is dominated more by slip or dislocationcreep2 (i.e. at high stresses and/or high strain rates), texture will be retained. Evidence from themicro structure and texture examination in1 suggested that slip occurs in the early stages ofdeformation, since some grains were elongated and so cannot rotate easily, and that this isaccompanied by a small amount of texture strengthening. However, once grains becameequiaxed they were free to rotate and slide, and a decrease in texture resulted. Hence texturechanges are indicative of the processes which are occurring during superplastic flow
Other work on Al-Li sheet which had undergone the same superplastic deformation asin1 has focussed on local texture effects, in particular the characteristics of grain boundariesand grain junctions after true strains in excess of 2.43. It is well established that grainboundaries are the key microstructural elements in superplasticity because grain boundarysliding/rotation underpins the entire phenomenon4 The importance of grain junctions in thiscontext is that these are the sites at which relaxation processes known loosely as'accommodation' must take place in order to expedite grain rotation/sliding and thus sustainsuperplastic flow5 Grain junctions (or 'triple lines') have been studied less frequently than havegrain boundaries, both in superplastic materials and as the subject of microstructuralinvestigations in general.
Evidence from the interfacial (i.e. grain boundary and grain junction) cavitation whichwas reported in3 showed that high angle boundaries and U-lines are more resistant to cavitationthan are low angle boundaries (LABs) and I-lines. 'I-line' refers to the designation of a grainjunction as low energy because a dislocation balance situation exists and conversely 'U-lines'are higher energy, tube-like defects The theory for the calculation is based on the O-latticemodel6, and the methodology for obtaining I-line/U-line classifications from orientation datahas been described elsewhere3'6'7'. Furthermore, it has been proposed that the proportion of I-lines and U-lines present after plastic deformation was indicative of the dominant deformationmechanism: a high proportion of I-lines was associated with dislocation mechanisms (slip,dislocation creep) whereas U-lines were associated with diffusion accommodated flow.
47
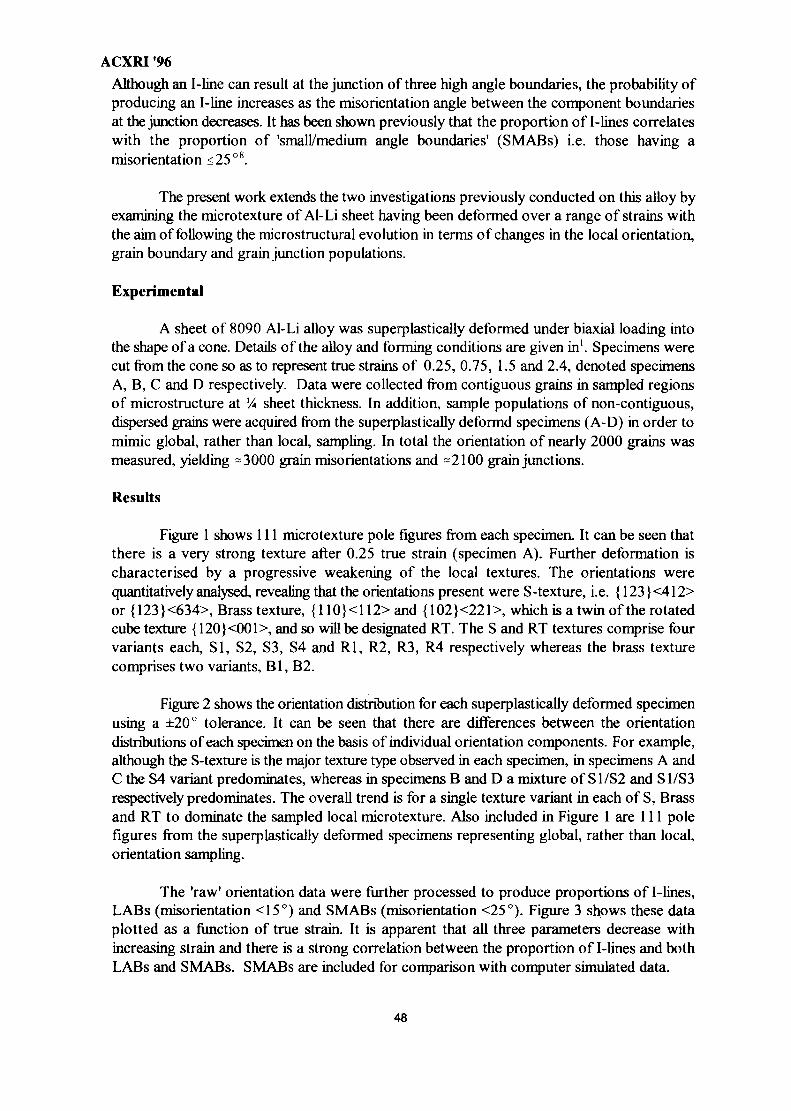
ACXRI '96
Although an I-line can result at the junction of three high angle boundaries, the probability ofproducing an I-line increases as the misorientation angle between the component boundariesat the junction decreases. It has been shown previously that the proportion of I-lines correlateswith the proportion of 'small/medium angle boundaries' (SMABs) i.e. those having amisorientation <25°8.
The present work extends the two investigations previously conducted on this alloy byexamining the microtexture of Al-Li sheet having been deformed over a range of strains withthe aim of following the microstructural evolution in terms of changes in the local orientation,grain boundary and grain junction populations.
Experimental
A sheet of 8090 Al-Li alloy was superplastically deformed under biaxial loading intothe shape of a cone. Details of the alloy and forming conditions are given in1. Specimens werecut from the cone so as to represent true strains of 0.25, 0.75, 1.5 and 2.4, denoted specimensA, B, C and D respectively. Data were collected from contiguous grains in sampled regionsof microstructure at !4 sheet thickness. In addition, sample populations of non-contiguous,dispersed grains were acquired from the superplastically deformd specimens (A-D) in order tomimic global, rather than local, sampling. In total the orientation of nearly 2000 grains wasmeasured, yielding -3000 grain misorientations and -2100 grain junctions.
Results
Figure 1 shows 111 microtexture pole figures from each specimen. It can be seen thatthere is a very strong texture after 0.25 true strain (specimen A). Further deformation ischaracterised by a progressive weakening of the local textures. The orientations werequantitatively analysed, revealing that the orientations present were S-texture, i.e. {123}<412>or {123}<634>, Brass texture, {110}<l 12> and {102}<221>, which is a twin of the rotatedcube texture {120}<001>, and so will be designated RT. The S and RT textures comprise fourvariants each, SI, S2, S3, S4 and Rl, R2, R3, R4 respectively whereas the brass texturecomprises two variants, Bl, B2.
Figure 2 shows the orientation distribution for each superplastically deformed specimenusing a ±20° tolerance. It can be seen that there are differences between the orientationdistributions of each specimen on the basis of individual orientation components. For example,although the S-texture is the major texture type observed in each specimen, in specimens A andC the S4 variant predominates, whereas in specimens B and D a mixture of S1/S2 and S1/S3respectively predominates. The overall trend is for a single texture variant in each of S, Brassand RT to dominate the sampled local microtexture. Also included in Figure 1 are 111 polefigures from the superplastically deformed specimens representing global, rather than local,orientation sampling.
The 'raw' orientation data were further processed to produce proportions of I-lines,LABs (misorientation <15°) and SMABs (misorientation <25°). Figure 3 shows these dataplotted as a function of true strain. It is apparent that all three parameters decrease withincreasing strain and there is a strong correlation between the proportion of I-lines and bothLABs and SMABs. SMABs are included for comparison with computer simulated data.
48
ACXRI '96Discussion
Some of the texture characteristics which were revealed by X-ray measurements in1 asa function of strain, are also observed here, namely that there is an initial increase in texture atthe onset of superplastic deformation followed by an overall decrease in texture as deformationproceeds. The RT texture was not observed using X-rays, and it is possible that this componentwas masked by the brass texture. Furthermore the texture decrease with strain is less markedfor the present data than for the X-ray case, which may be because here a 20 ° texture tolerancewas chosen to categorise the data, and also the present measurements were acquired at 14thickness of the sheet rather than XA thickness as in the X-ray case.
A key feature of Figures 1 and 2 is the diversity in texture variants which was recorded.Such differences are not apparent in the X-ray data. When microtexture data are collected froma specific region in the microstructure it may not necessarily reflect the macrotexture, sincelocal areas of orientation clustering or grouping are often present. However, if EBSD is usedto sample grains on a regular step basis rather than on a contiguous basis, we can obtain alsoan estimation of the global texture. For each superplastically deformed specimen a microtexturewas obtained in this global manner by sampling orientations every 1 OOum in linear scans. The111 pole figures for these data sets are included in Figure 1. It can be seen that the microtextureis spread more evenly between most of the texture variants in the globally sampled data setsthan in those which were sampled locally. In other words, there is orientation clustering on alocal scale in the material, particularly with respect to dominance of one or perhaps twoparticular texture variants.
Since formally the misorientation distribution is a re-expression of the parentorientations, the particular variant(s) of texture components which occurs will affect markedlythe resulting misorientations. For example, two SI orientations occurring as neighbouringgrains will have a LAB between them whereas S1 and S2, or S3 and S4 orientations occuringas neighbours are related by a 60° (twin) misorientation8 i.e. a S = 3 boundary in coincidencesite lattice (CSL) notation. Similarly Bl and B2 are twin-related. Moreover, small/mediumangle boundaries result from the juxtaposition of several other variants, e.g. Bl and S1, B2 andS3, Rl and Bl are among those having a misorientation of about 20°.
It is clear then that the misorientation angle distribution will be heavily biased towardssmall angles where the number of S, B and R texture variants is limited in a region. Theseeffects are directly responsible for the distribution of LABs and SMABs in the data sets. Forexample, specimen B, which contains 85% SMABs, has three-quarters of its orientationsrepresented by either S4 or B2. In addition to the fact that many of the grains will have like-textured neighbours, the misorientation between S4 and B2 is 20°. Hence a high proportionof SMABs is bound to occur in this data set. From Figure 3 we see that the trend fordecreasing proportions of LABs and SMABs with increasing strain is very strong and is entirelya consequence of the texture. There is a strong correlation between the proportion of I-linesand SMABs. Computer simulation of orientations in trios has shown that there is a sigmoidalrelationship between the I-line and SMAB fraction, and over the linear part of the curve theratio I/SMAB is 1.268. For the superplastically deformed specimens examined here this ratioranges from 1.05 to 1.17, which is in good agreement with the simulated data.
We turn now to the effect of the measured micro structural parameters on the
49
ACXRI '96
mechanisms of superplastic deformation in Al-Li sheet. The high proportion of LABs in theearly stages of deformation was not predicted from previous texture work, since X-ray datadoes not supply the information necessary to compute the grain boundary parameters. Ingeneral LABs are resistant to sliding and migration, although previous work has shown thatLABs with misorientations 5-15° are capable of sliding during superplastic deformation9.However, the rate of sliding for high angle boundaries and LABs is likely to be different,suggesting that grains divided by LABs deform as a group, with rotation in addition to theoccurrence of sliding in order to maintain continuity at high angle boundaries.
The high proportion of I-lines present at low strains as a consequence of SMABinteractions suggests that slip can occur easily since dislocations can flow through an I-lineexactly as if they were in a single crystal6. It has been suggested that dislocation creep canoccur also readily at I-lines for the same reason. It is therefore proposed that the mechanismfor the continuation of superplastic flow at low strains is controlled by dislocation absorptionand transmission at I-lines, which in turn is controlled by the special structure of I-lines whichinvolves the balance of dislocations from the three component grain boundaries.
As superplastic deformation proceeds, the proportion of I-lines reduces with strain to28% (Figure 3), and at this high strain the triple junction distribution is mainly dominated byU-lines. U-lines have an open structure and therefore are easy diffusion paths, like high angleboundaries, and so will facilitate the accommodation processes at grain junctions which mustaccompany grain rotations. Conversely, I-lines and LABs have lower diffusivities. Thereduction in the proportion of I-lines and LABs as superplastic flow proceeds could indicatea progressive change in the major deformation mechanism from dislocation creep/slip todiffusion creep in the sampled regions.
Conclusions
1. Microtexture measurements from superplastically deformed Al-Li sheet show that the texturevaries on a local scale, and in the sampled regions only a few texture variants dominate thusgiving rise to a high proportion of LABs.2. In the early stages of superplastic deformation the grain interface distribution, i.e. grainboundaries and grain junctions, is dominated by I-lines and LABs. These proportions decreasewith increasing strain.3. It is suggested that as superplastic deformation proceeds the dominant mechanism changesfrom dislocation related phenomena (slip, dislocation creep), which is facilitated by a highproportion of I-lines, to difrusional processes which favour high angle boundaries and U-linesto effect accommodation at grain junctions.
References
1. A.W. Bowen, Tex. and Micros., 1988, £&9_, 233
2. M.F. Ashby and R.A. Verrall, Acta Met, 1973, 21, 149
3. V. Randle, Acta Met. Mat., 1995, 4j>, 1741
4. R. Raj, J. de Phys., 1988, 42, C5-35
50
ACXRI '96
5. T.G. Langdon, Mat. Sci. Eng., 1991. A127. 1
6. W. Bollmann, Phil. Mag., 1988,_5_ZA, 637
7. V. Randle, Acta Met. Mat., 1994, 42, 1769
8. V. Randle, submitted to Acta Met. Mat.
9. K. Matsuki, T. Iwaki, M. Tokizawa, and Y. Murakami, Mat. Sci. Tech, 1991,2, 513T T
* • • !
• * . ,
• r-5-
Figure 1 111polemicrotexture
figures for specimensA-D sampled on alocal basis (left handcolumn), plus 111pole figures for thesespecimens sampledon a global (i.e. stepsampling) basis (righthand column).
51
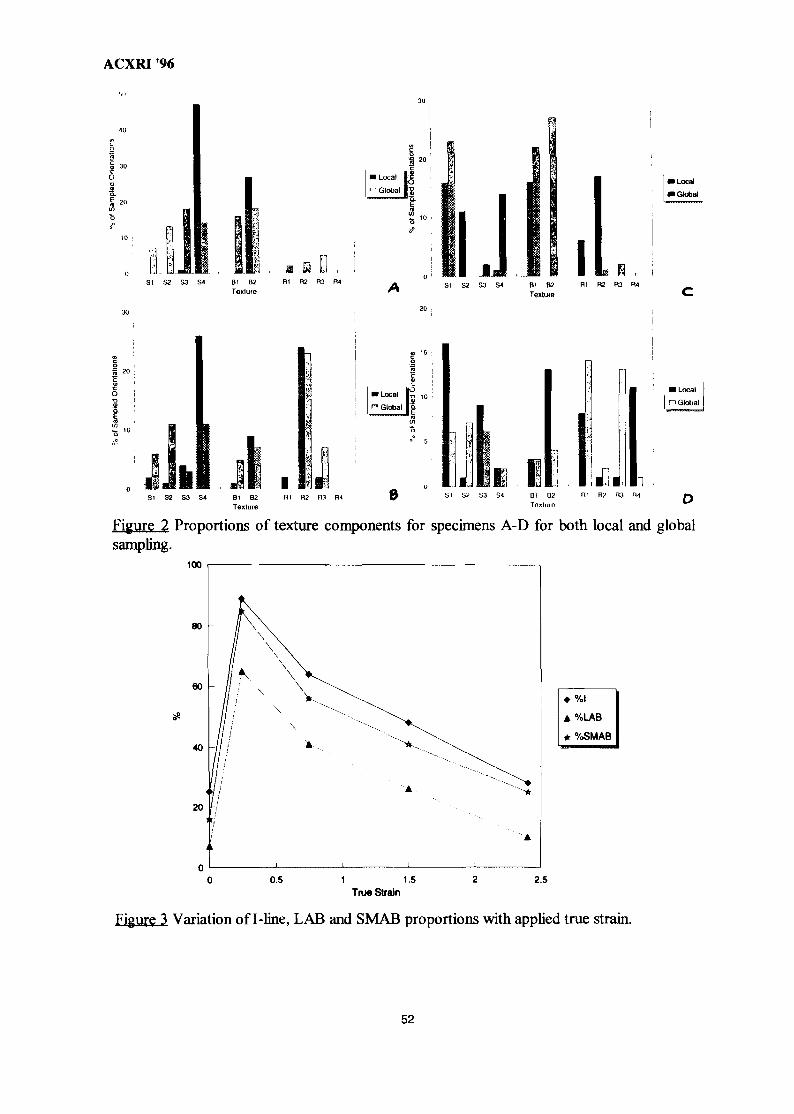
ACXRI '96
SI S2 S3 S4
!
|
Bl
1s
B2
Texture
• Localn Global
a 0 0 ,Rl R2 R3 R4 ^
lo1
mpl
(55* 10
5?
0S1 S2 S3 S*
IBl B2 Rl R2 R3 R4
Texture
• Local
• Global
Bl B2 Rl R2 03 RlTexture
II
• Localn Global
1 ISI 52 S3 S4 BJ D2 Rl R2 R3 R4
Texlum
Figuxe_2 Proportions of texture components for specimens A-D for both local and globalsampling.
100
A %LAB
* %SMAB
1 1.5True Strain
Figure 3 Variation of I-line, LAB and SMAB proportions with applied true strain.
52
ACXRI '96
XRF, XRD and SEM Facilities in the School of Materials andMineral Resources Engineering, Universiti Sains Malaysia,
Azmi RahmatSchool of Materials and Mineral Resources Engineering, MY9700783
Universiti Sains Malaysia, Perak Branch Campus,Sri Iskandar 31750 Tronoh, Perak
Malaysia
ABSTRACT
The School has acquired excellent facilities for elemental analysis by XRF and EDXand phase analysis by XRD. The type of research work carried out in the School isdescribed. The school also assists the local industries in trying to solve their problemsfully utilizing these facilities along with other testing units.
INTRODUCTION
The Universiti Sains Malaysia was established as the second University in the country in1969 with a mandate to promote higher education in the field of natural sciences, appliedsciences, pharmaceutical sciences, medicine, management, social science andhumanities. The University started an Applied Science School in 1972 at Penang. Later,the Applied Science School was converted into two different school i.e. School ofEngineering and the School of Industrial Technology. In 1986, the School ofEngineering was shifted to Ipoh and to the present campus in 1990. Presently, there arefive schools viz. School of Electrical and Electronic Engineering, School of Materialsand Mineral Resources Engineering and School of Chemical Engineering. Though eachschool is like a faculty with related subjects grouped into schools but interschoolcooperation and interdisciplinary research is encouraged. The School of Materials andMineral Resources Engineering has Materials Engineering programme involving metals,ceramics, polymers and composites and mineral Resources Engineering programmeinvolving mineral beneficiation, extractive metallurgy and mining.
EQUIPMENT AND FACILITIES:
In addition to the usual facilities for materials discipline e.g. metallography, mechanicaltesting, NDT, etc. The school has the following sophisticated equipment:
53
ACXRI '96
X-ray diffractometery:
The school has Philips PW1820 diffractometer with the range of 2.5 to 145.0° for 2-thetaand can take samples in the pressed powder form or solid with flat surface 25mmdiameter x 3 mm thick or 14mm x 14mm x 3mm thick. The diffractometer along withthe stabilized generator unit was commissioned in 1987 and has been extensively usedfor phase identification in clays, minerals, metals and alloys and ceramics. Theequipment is also used in the measurement of residual stresses.
X-ray Flourescence Analysis:
The XRF facility Rigaku RIX3000 unit with Rh tube target was commissioned in 1994.It has the capability of detection of the elements from Berrylium to Uranium. The lowerlimit of detection is 100 ppm. It takes samples in the pressed powder pellet, fused glassbead or solid with a flat surface. The sample dimension are 32 mm diameter x 5mm inthickness. The facility has not only met the analysis needs of the School but also catersto the industries in solving their problems.
Scanning Electron Microscopy:
The scanning electron microscope stereoscan S200 Cambridge, U.K was acquired in1987 and has a resolution of 60A (6.0nm). The dimension of the chamber are 270 x270x 270 mm. The magnification available from the instrument varies from 30 to 300,000at a working distance of 15mm. The instrument has contributed immensely for theimprovement of the quality of research in the school. It has also catered to the needs ofthe electronic, ceramic, mineral, polymer and metal industries. Some of the typicalexamples will be described later. The EDX attachment with the unit has the usualdetection limit of lOOOppm but it has been possible to improve it to 10 to 20 ppm incertain cases.
BRIEF OUTLINES OF THE TYPE OF RESEARCH WORK IN THE SCHOOL
The school is actualy engaged in research work in the wide area of metals, ceramics andcomposites. Few recent examples where XRD has been used with success aremechanical alloying of nickel aluminides and metal-matrix composites. Mechanicalalloying of the composition Ni3Al from the elemental powders led to almost totaldisppearance of the aluminium reflections (Fig.l) while nickel reflections were stillthere. Few possibilities were explored. Aluminium could become amorphous, it couldform solid solution, though maximum solid solubility of Al in Ni is much less than 25at % Al but it could be extended in metastable solid solution. One or more intermetallicscould also be formed on mechanical alloying. However, all these possibilities could beeliminated by careful XRD results. Ball-milling of Al powder alone for more than 40hours did not result in the formation of amorphous material. Mechanical alloyed powderof Ni and Al in the atomic ratio of 3 to 1 was totally ferromagnetic and could be liftedcompletely by a magnet. The reflections of any intermetallic were not detected in
54

ACXRI '96
XRD(Fig. 1). The SEM pictures showed mixing of Al and Ni powders on nanoscale. Albeing more ductile than Ni, the agglomerate particles contained Al at the centre and Nisurrounding it thereby resulting in the elimination of Al reflections in the XRD. Thelattice constant measurement of the agglomate showed only slight change in the latticeconstant of Ni thereby eleminating the possiblity of extended solid solution formation.
Another interesting example is from the work by Dr. Abdul Kadir group on interfacereaction during sintering of green compact of metal-matrix/SiC composite where Si andA1C could be detected by XRD (Fig. 2). The detailed results will be presented by Dr.Abdul Kadir. XRD facilities have also been used with success by our ceramic group forinvestigation of clays and electroceramics. Some of the results will be presented by theceramic group.
The corrosion group has used XRD facility to detect the corrosion products and todetermine the residual stresses in steels to asses the effect of residual stresses on thecorrosion behaviour. The results will be presented in another paper.
CONSULTANCY AND TESTING
The school provides consultancy and testing facility to the industries in the region. XRF,XRD and SEM are used on regular basis for the following industries:-
XRF Applications
Cement Industry: 1. Quantitative analysis of raw materials2. Quantitative analysis of fluxes.3. Analysis of cement for quality control
Metal Industry: 1. Purity check for metal ingots2. Compositional analysis of products (castings, weldments,
forgings and extruded parts)3. Quantitative analysis for metal recovery
Electronic/Electrical 1. Analysis of raw materials used for ferrite coresIndustry 2. Compositional analysis of finished products for quality
control
Ceramic Industry: 1. Raw materials analysis2. Compositional analysis of glazes
The XRF system has in-built standards for semi-quantitative analysis. Though XRFsystem analyses the elements in the sample but it has capability to give results inpercentage oxides. Table 1 gives a typical example for the sample received from acement factory.
55

ACXRI 96
XRD Applications
The facility caters to the following needs of the industry:
Mineral Processing Industry: Analysis of the minerals in the ores to asses its quality
Metal Industry:
Ceramic Industry:
1. Assesment of the effectiveness of heat treatment(Retained austenite in martensite)
2. Residual stress measurement3. Presence and types of phases in the sample
1. Phase analysis of raw materials (clays, fluxes andsands)
2. Phase analysis in fired products.
Fig. 3 Shows a typical phase analysis where scheelite (CaWO4) and quartz (SiO2) can beeasily identified in the sample. The software package is found to work very well in caseof minerals or stoichmetric componds without any solid solubility range. However, itfails where solid solutions are encountered when the programme cannot match 'd' valuesin solid solutions, it invariably gives wrong result.
SEM & EDX Facilities
These facilities are constantly used by various industries. The following is a briefdescription about the nature of work and type of industry:
Electronic Industry: 1.2.3.
Ceramic Industry:
Polymer:
Mineral Industry:
Metal Industry:
2.
1.2.
1.2.3.4.
CorrosionBondingIntermetallic formation at boundary layer
Surface topographyFailure Analysis
Failure Analysis
Distribution of minerals in the oresElemental analysis of selected phases in the ores
FractographyFailure AnalysisDistribution and orientation of phasesOxidation/Corrosion
56

ACXRI '96
Some of the examples of SEM analysis are as follows:-
Fig. 4[a] and Fig. 4[b] show the SEM picture of an ore where it was suspected that itcontains some traces of radioactive elements. It was possible to observe the radioactiveelement and also to identify it by EDX analysis.
Fig. 5 is the SEM picture of glaze on ceramic and shows defect in the form of pores inthe glaze layer.
Fig. 6 is the SEM picture of a defective wire bond in an I.C component.
Fig. 7 is the SEM picture of a tile where iron oxide is segregated.
Fig. 8 shows the corrosion product in an electronic circuit.
CONCLUSION
Well, there can be many more examples from the consultancy and testing work carriedout by the Unit especially in failure analysis area, but I have confined to few only. Inbrief it can be said that the School has reasonably good facilities not only for meeting thedemand of the various research groups but also for catering to the needs of the localindustry.
57
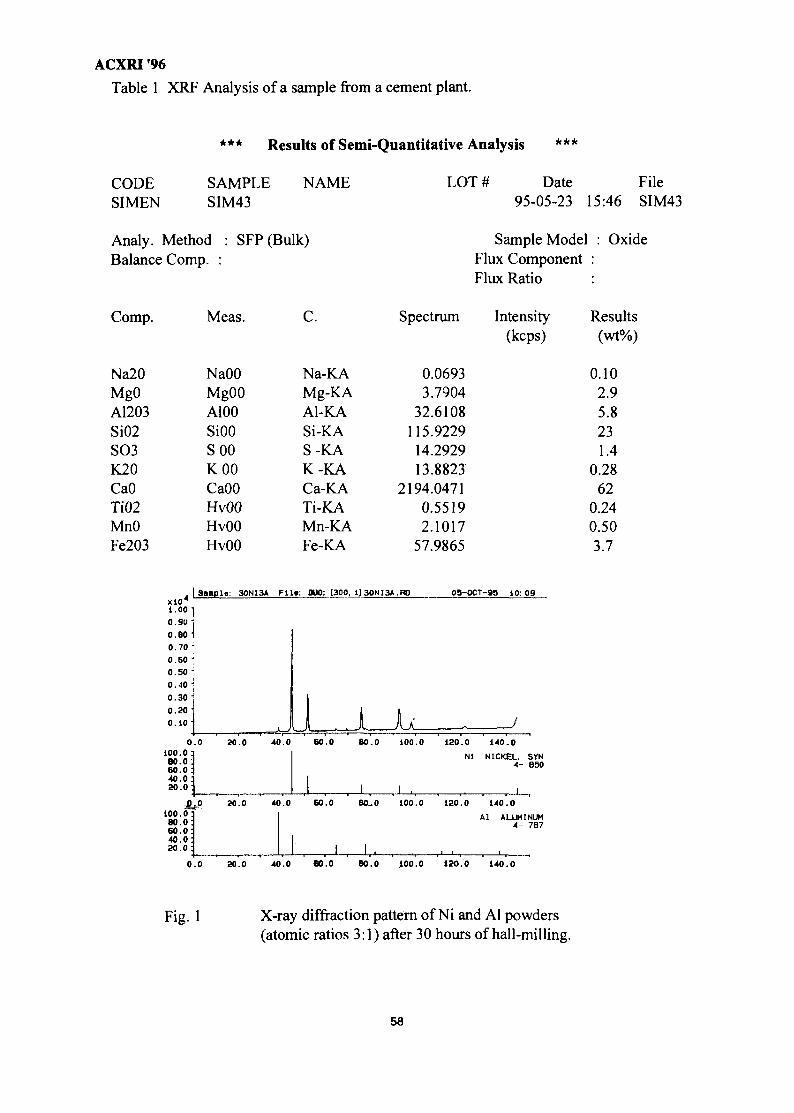
ACXRI "96
Table 1 XRF Analysis of a sample from a cement plant.
CODESIMEN
*** Results of Semi-Quantitative Analysis ***
NAMESAMPLESIM43
LOT # Date File95-05-23 15:46 SIM43
Analy. Method : SFPBalance Сотр. :
Сотр.
Na20MgOA1203SiO2SO3K20CaOТЮ2MnOFe203
xlO 4
1.00
0.9U
0.80
0.70
0.60
O.SO
0.40-
0.30
0.30
0.10
0100.0:8 0 . 0 :6 0 . 0 :4 0 . 0 :20.0
л100.0
BO.O60.040.020.0
Meas.
NaOO
MgOO
A100
SiOO
S 00
К 00
CaOO
HvOO
HvOO
HvOO
(Bulk)
С
Na-KAMg-KAAl-KASi-KAS-KAK-KACa-KATi-KAMn-KAFe-KA
Sanpl«: 30NI3A File: DUO: [300.
, 1 1 i '
.0 20.0
£p 20.0
1 ..40.0 60.0
40.0 60.0
1
Spectrum
0.06933.7904
32.6108115.9229
14.292913.8823
2194.04710.55192.1017
57.9865
Sample ModelFlux ComponentFlux Ratio
Intensity(kcps)
1130NI3A.WJ 0 5 - 0 C T - 9 5 1 0 : 0 9
JLJL .80.0 100.0 120.0
У140.0
Ni NICKEL. SYN4- 850
II.BO.O 100.0 120.0
1 .
140.0Al ALUMINUM
4 - 787
: Oxide
Results(wt%)
0.102.95.8231.4
0.2862
0.240.503.7
0.0 20.0 40.0 60.0 BO.O 100.0 130.0 140.0
Fig. 1 X-ray diffraction pattern of Ni and Al powders(atomic ratios 3:1) after 30 hours of hall-milling.
58
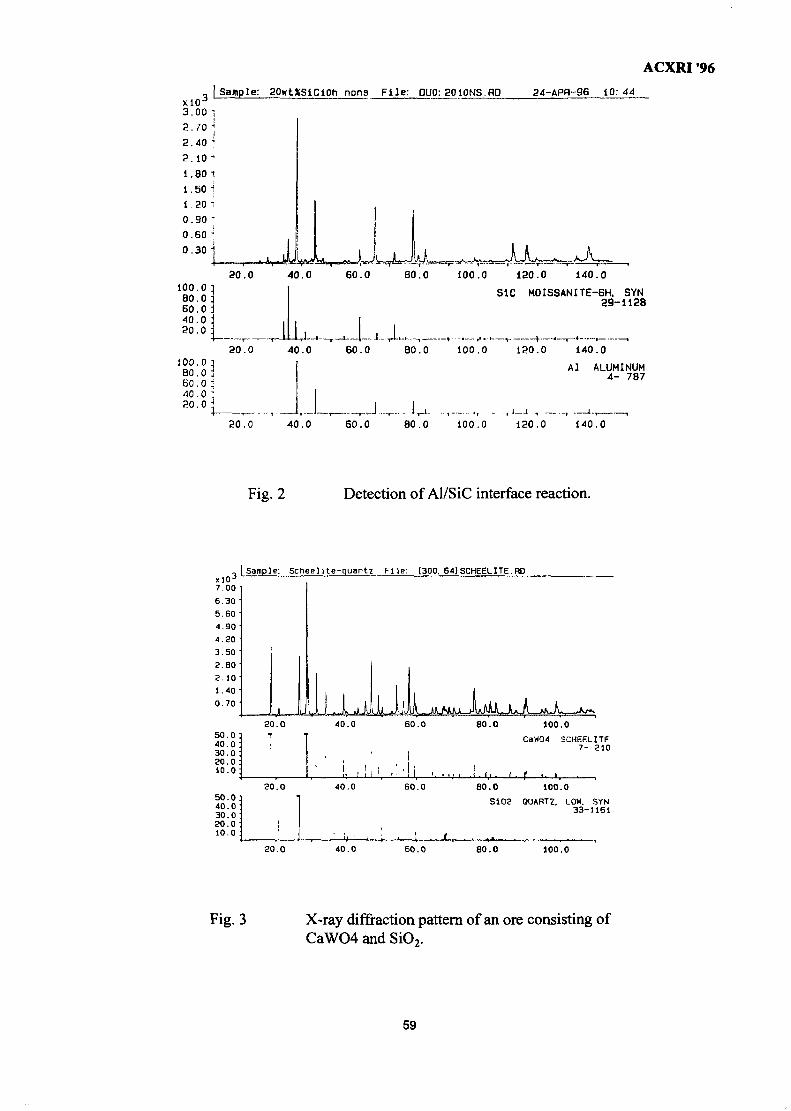
ACXRI '96
xlOJ
3.00 12.70 j2 .40 "i2 . 1 0 4
1.80 11.50 i1.20 •
0.90 "0.60 "0 .30 I
Sample: 20wtXSlC10h non3 File: DUO: 20IONS.HO 24-APR-96 10:44
ji
20.0100.0 l80.0]60.0 j40.0 J20.0 ]
2 0 . 0100.0 TBO.O j60 .0 :40.0 :j
40.0 60.0 80.0 100.0 120.0 140.0
SIC M0ISSANITE-6H. SYN29-1128
40.0 60.0 80.0 100.0 120.0 140.0Al ALUMINUM
4- 7B7
, !.„,
20.0 40.0 60.0 BO.O 100.0 120.0 140.0
Fig. 2 Detection of Al/SiC interface reaction.
xlOSample: Scheelite-quar-tz File: 1300. 64)SCHEELITE.RD
50.040.030.020.010.0
20.0
40.0
40.0
W A L J ^ ^60.0 80.0
' ' . ' • . < • < _ • •
60.0 80.0
100.0
CaWCM SCHEELITE7- 210
100.0
S102 QUARTZ. LOW. SYN33-1161
40.0 60.0 80.0 100.0
Fig. 3 X-ray diffraction pattern of an ore consisting ofCaWO4 and SiO2.
59
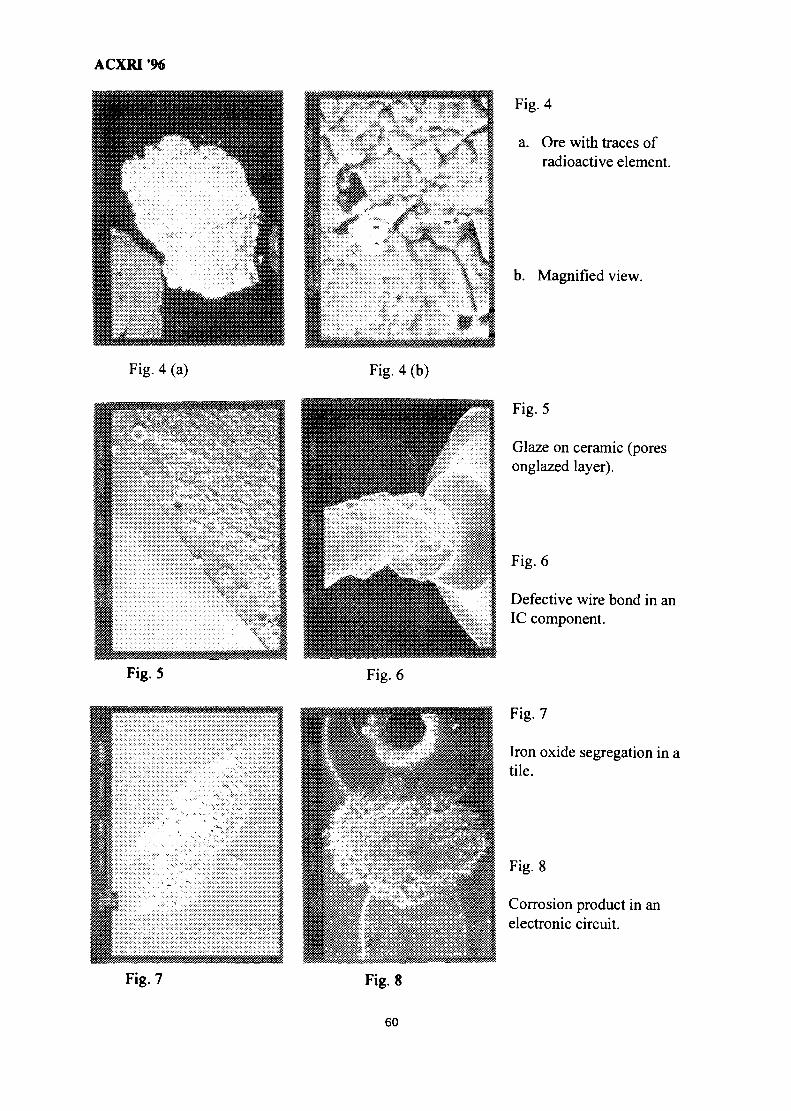
ACXRI96
Fig. 4 (a)
Fig. 5
Fig. 4 (b)
Fig. 6
Fig. 4
a. Ore with traces ofradioactive element.
b. Magnified view.
Fig. 5
Glaze on ceramic (poresonglazed layer).
Fig. 6
Defective wire bond in anIC component.
Fig. 7
Iron oxide segregation in atile.
Fig. 8
Corrosion product in anelectronic circuit.
Fig. 7 Fig. 8
60
ACXRI "96COMPOSITION AND QUANTIFICATION OF PHASES IN THE SOLID-STATE
REDUCTION OF CHROMITE USING SEM-EDX AND EPMA-WDSTECHNIQUES
R.F.Johnston and H.V.Duong MY9700784Science and Engineering, LaTrobe University, PO Box 199, Bendigo, VIC3550, Australia.
Abstract: Phase changes in the solid-state reduction of chromite ore((Mg,Fe)(Fe,Al,Cr)2Q4) with coal have been studied in the temperature range 1000°C to1400°C using SEM-EDX and EPMA-WDS techniques. EDX mapping of the reducedchromite gave qualitative chemical composition and structural characteristics of thephases. These pnases were then quantified by the EPMA-WDS technique. No significantreduction of the chromite ore was seen at l000°C and 1100°C. At I200°C, iron wasbeing reduced, resulting in zoning of chromite particles as reduction proceeded. At highertemperatures, chromium was being reduced simultaneously with the iron in the chromite.This was followed by some silicon reduction. Carbon was not found in the chromite grainswhich suggested that reduction of chromite ore by coal occurs mostly through carbonmonoxide as a reaction intermediate. Various ferroalloy phases containing silicon and/orcarbon were found and quantified. The slag was found to contain chromium, iron andcarbon.
Introduction
SEM-EDX (Scanning Electron Microscope-Energy Dispersive X-ray) is animportant tool for studying the structure and composition of solid phases. When electronimages are used in conjunction with the EDX technique, quantitative information of thephases can be determined. However, this technique is not as accurate as the EPMA-WDS(Electron Probe Microanalysis-Wavelength Dispersive Spectrometry) technique which hascome under increasing use in the past few years. Its usefulness in quantifying theelemental composition of microphases gives advantage over other X-ray techniques such asXRF and it can quantify light elements such as carbon.
The mechanism of solid state reduction of chromite is very complex sincethe reaction system is heterogeneous and involves many elements. The interfacialreactions prevailing in the reduction process may involve gas-solid, solid-slag, gas-slag andgas-solid-slag equilibria. Reactions take place at the interface regions and diffusion withinthe various phases also takes place. There have been numerous studies on the solid-statereduction of chromite ore by carbonaceous materials and many mechanisms have beensuggested. These include solid-state ionic diffusion1'2-3, carbon diffusion^ and gaseousdiffusion^ mechanisms. This study attempts to clarify the reduction mechanisms andidentify the composition of the phases present.
Experimental
Chromite ore
Details of the procedure and experimental conditions for carrying out thesolid-state reduction of Coobina chromite ore (Western Australia) with coal has beendescribed?. Some of these samples from that study were used in this study. The reducedchromite samples were fixed in a resin and polished. Final polishing was carried out in a 1micron AI2O3 powder medium. The samples were then coated with a thin layer of purecarbon. In the quantitative study, carbon coating on the standards and on the chromitesamples were carried out under the same conditions.
61
ACXRI '96
SEM-EDX
A Cambridge SI50 Scanning Electron Microscope equipped with an EnergyDispersive X-ray spectrometer (SEM-EDX) was used to obtain chemically sensitivebackscatter scanning electron images and EDX maps. Filament current was set at 2.4 mAat an accelerating voltage of 20KeV. EDX maps were acquired using a Link Analyticalsoftware package with a resolution of 128 by 128 pixels and 10ms dwell time. Mappingimages were stored digitally and were processed using an NIH Image software package.
EPMA-WDS
The chemical composition of the chromite samples were determined byelectron probe microanalysis (EPMA-WDS) using a Cameca SX50 instrument. Thisinstrument is equipped with four vertical wavelength spectrometers with LiF, PET, TAP,and PC2 signal detectors. The instrument was operated at an accelerating voltage of25KeV with current intensity of 25nA. The electron beam diameter was 5 m. Countingtime was 10s. The measured chemical quantities were treated with a PAP (Pouchou andPichoir) correction procedure supplied with the instrument. The detection limit was around±5%. The total error on weight concentration was below 5%.
Results
There was no significant structure and compositional change to the chromiteparticle for reduction carried out at 1000°C and 1100°C as seen in the EDX maps. Thisshowed that reduction had not yet started at temperatures below 1100°C.
Chromite ore reduction at 1200°C
Figure 1 shows clear zoning of the chromite particle with the outer layer(dark grey in the electron micrograph) corresponding to the reduction of the ironcomponent in the chromite. This phase appears to be porous. Most of the iron wasreduced at the surface of the chromite particle and within the cracks. The core of thechromite (light grey) is the unreacted chromite. At this temperature, slag formation wasfound to be minimal. It may have just formed as analysed at spot 3 in Figure 1. Themetallic phase (bright areas) consists mainly of iron. Qualitative distribution of the mainelements present in the chromite sample can be clearly seen in the EDX maps. Bright areasindicate high X-ray counts of the element. Dark areas correspond to the resin.
Quantitative composition of the phases identified in Figure 1 are:-
(i) Chromite ore (spot 1), found in the core of the chromite particle,(ii) Partially reduced chromite ore (spot 2) surrounds the chromite core. This phase
consists mainly of picochromite (MgCr2O4),(iii)Slag (MgO.Al2 O3-SiO2) (spot 3), just beginning to form at this temperature occupies
outer areas of the chromite particle,(iv)Iron (bright areas in the electron micrograph), found mainly within the cracks of the
chromite grains at this temperature,(v) Iron carbide, located around the surface areas of the chromite grains.
62
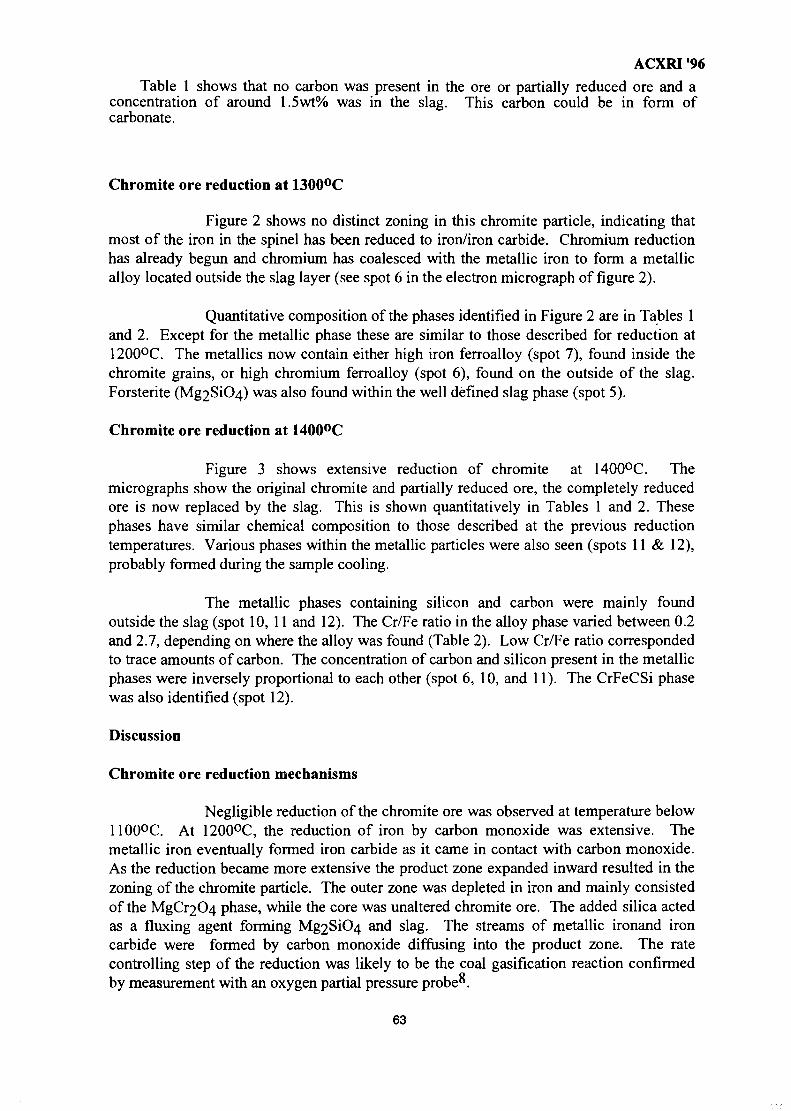
ACXRI '96
Table 1 shows that no carbon was present in the ore or partially reduced ore and aconcentration of around 1.5wt% was in the slag. This carbon could be in form ofcarbonate.
Chromite ore reduction at 1300°C
Figure 2 shows no distinct zoning in this chromite particle, indicating thatmost of the iron in the spinel has been reduced to iron/iron carbide. Chromium reductionhas already begun and chromium has coalesced with the metallic iron to form a metallicalloy located outside the slag layer (see spot 6 in the electron micrograph of figure 2).
Quantitative composition of the phases identified in Figure 2 are in Tables 1and 2. Except for the metallic phase these are similar to those described for reduction at1200°C. The metallics now contain either high iron ferroalloy (spot 7), found inside thechromite grains, or high chromium ferroalloy (spot 6), found on the outside of the slag.Forsterite (Mg2SiC>4) was also found within the well defined slag phase (spot 5).
Chromite ore reduction at 1400°C
Figure 3 shows extensive reduction of chromite at 1400°C. Themicrographs show the original chromite and partially reduced ore, the completely reducedore is now replaced by the slag. This is shown quantitatively in Tables 1 and 2. Thesephases have similar chemical composition to those described at the previous reductiontemperatures. Various phases within the metallic particles were also seen (spots 11 & 12),probably formed during the sample cooling.
The metallic phases containing silicon and carbon were mainly foundoutside the slag (spot 10, 11 and 12). The Cr/Fe ratio in the alloy phase varied between 0.2and 2.7, depending on where the alloy was found (Table 2). Low Cr/Fe ratio correspondedto trace amounts of carbon. The concentration of carbon and silicon present in the metallicphases were inversely proportional to each other (spot 6, 10, and 11). The CrFeCSi phasewas also identified (spot 12).
Discussion
Chromite ore reduction mechanisms
Negligible reduction of the chromite ore was observed at temperature below1100°C. At 1200°C, the reduction of iron by carbon monoxide was extensive. Themetallic iron eventually formed iron carbide as it came in contact with carbon monoxide.As the reduction became more extensive the product zone expanded inward resulted in thezoning of the chromite particle. The outer zone was depleted in iron and mainly consistedof the MgCr2C<4 phase, while the core was unaltered chromite ore. The added silica actedas a fluxing agent forming Mg2SiO>4 and slag. The streams of metallic ironand ironcarbide were formed by carbon monoxide diffusing into the product zone. The ratecontrolling step of the reduction was likely to be the coal gasification reaction confirmedby measurement with an oxygen partial pressure probe*.
63
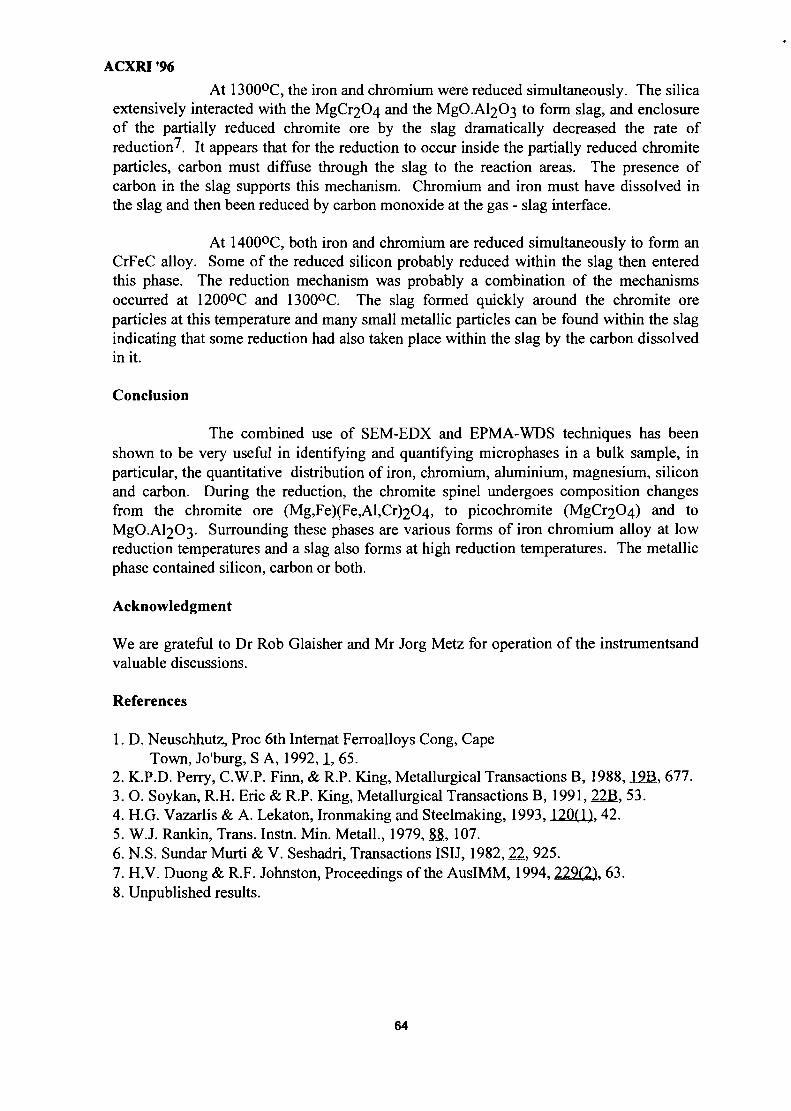
ACXRI '96
At 1300°C, the iron and chromium were reduced simultaneously. The silicaextensively interacted with the MgCr2O4 and the MgO.Al2O3 to form slag, and enclosureof the partially reduced chromite ore by the slag dramatically decreased the rate ofreduction?. It appears that for the reduction to occur inside the partially reduced chromiteparticles, carbon must diffuse through the slag to the reaction areas. The presence ofcarbon in the slag supports this mechanism. Chromium and iron must have dissolved inthe slag and then been reduced by carbon monoxide at the gas - slag interface.
At 1400°C, both iron and chromium are reduced simultaneously to form anCrFeC alloy. Some of the reduced silicon probably reduced within the slag then enteredthis phase. The reduction mechanism was probably a combination of the mechanismsoccurred at 1200°C and 1300°C. The slag formed quickly around the chromite oreparticles at this temperature and many small metallic particles can be found within the slagindicating that some reduction had also taken place within the slag by the carbon dissolvedin it.
Conclusion
The combined use of SEM-EDX and EPMA-WDS techniques has beenshown to be very useful in identifying and quantifying microphases in a bulk sample, inparticular, the quantitative distribution of iron, chromium, aluminium, magnesium, siliconand carbon. During the reduction, the chromite spinel undergoes composition changesfrom the chromite ore (Mg,Fe)(Fe,Al,Cr)2O4, to picochromite (MgCr2O4) and toMgO.Al2O3- Surrounding these phases are various forms of iron chromium alloy at lowreduction temperatures and a slag also forms at high reduction temperatures. The metallicphase contained silicon, carbon or both.
Acknowledgment
We are grateful to Dr Rob Glaisher and Mr Jorg Metz for operation of the instrumentsandvaluable discussions.
References
1. D. Neuschhutz, Proc 6th Internat Ferroalloys Cong, CapeTown, Jo'burg, S A, 1992,1, 65.
2. K.P.D. Perry, C.W.P. Finn, & R.P. King, Metallurgical Transactions B, 1988,19JB, 677.3. O. Soykan, R.H. Eric & R.P. King, Metallurgical Transactions B, 1991, 22B, 53.4. H.G. Vazarlis & A. Lekaton, Ironmaking and Steelmaking, 1993, 120(1), 42.5. W.J. Rankin, Trans. Instn. Min. Metall., 1979, ££, 107.6. N.S. Sundar Murti & V. Seshadri, Transactions ISIJ, 1982, 22, 925.7. H.V. Duong & R.F. Johnston, Proceedings of the AusIMM, 1994, 229(2)T 63.8. Unpublished results.
64
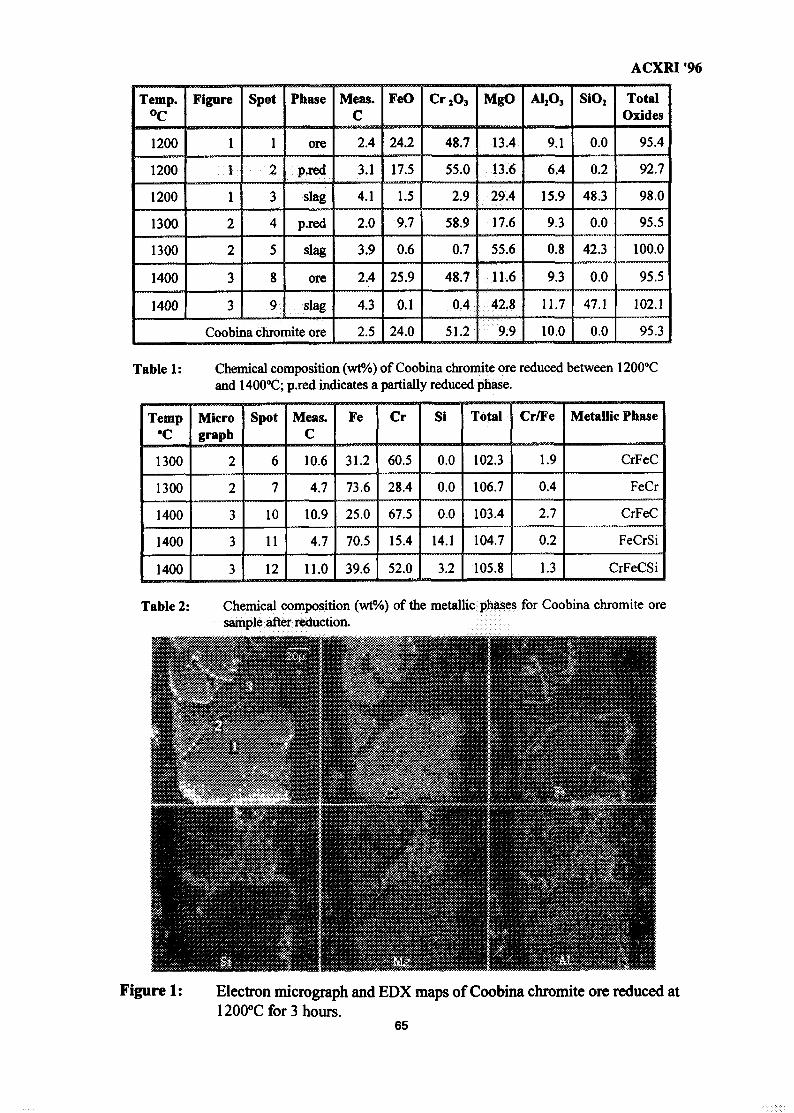
ACXRI '96
Temp.°C
1200
1200
1200
1300
1300
1400
1400
Figure
1
1
1
2
2
3
3
Spot
1
2
3
4
5
8
9
Phase
ore
p.red
slag
p.red
slag
ore
slag
Coobina chromite ore
Meas.C
2.4
3.1
4.1
2.0
3.9
2.4
4.3
2.5
FeO
24.2
17.5
1.5
9.7
0.6
25.9
0.1
24.0
Cr2O3
48.7
55.0
2.9
58.9
0.7
48.7
0.4
51.2
MgO
13.4
13.6
29.4
17.6
55.6
11.6
42.8
9.9
AI2O,
9.1
6.4
15.9
9.3
0.8
9.3
11.7
10.0
SiOj
0.0
0.2
48.3
0.0
42.3
0.0
47.1
0.0
TotalOxides
95.4
92.7
98.0
95.5
100.0
95.5
102.1
95.3
Table 1: Chemical composition (wt%) of Coobina chromite ore reduced between 1200°Cand 1400°C; p.red indicates a partially reduced phase.
Temp°C
1300
1300
1400
1400
1400
Micrograph
2
2
3
3
3
Spot
6
7
10
11
12
Meas.C
10.6
4.7
10.9
4.7
11.0
Fe
31.2
73.6
25.0
70.5
39.6
Cr
60.5
28.4
67.5
15.4
52.0
Si
0.0
0.0
0.0
14.1
3.2
Total
102.3
106.7
103.4
104.7
105.8
Cr/Fe
1.9
0.4
2.7
0.2
1.3
Metallic Phase
CrFeC
FeCr
CrFeC
FeCrSi
CrFeCSi
Table 2: Chemical composition (wt%) of the metallic phases for Coobina chroniite oresample after reduction.
Figure 1: Electron micrograph and EDX maps of Coobina chromite ore reduced at1200°C for 3 hours.
65
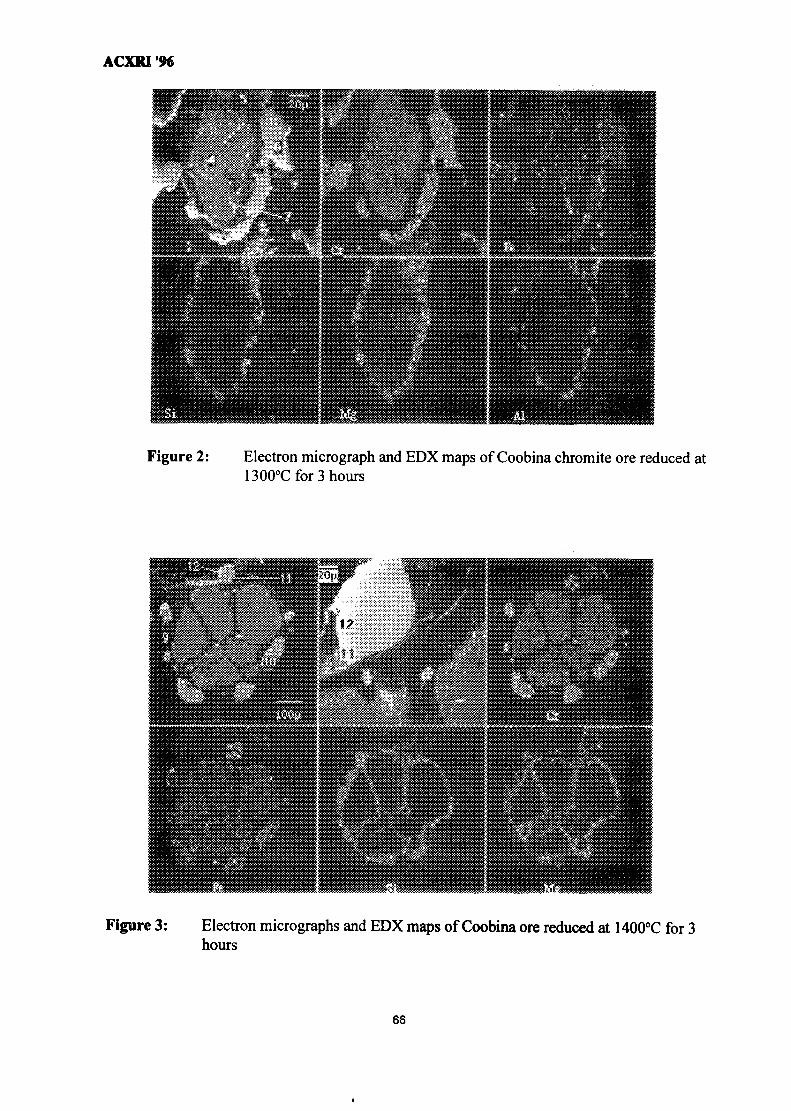
ACXRT96
Figure 2: Electron micrograph and EDX maps of Coobina chromite ore reduced at1300°Cfor3hours
Figure 3: Electron micrographs and EDX maps of Coobina ore reduced at 1400°C for 3hours
66
ACXRI '96
APPLICATION OF ENERGY-DISPERSIVE XRF TECHNIQUE IN THEHYDROMETALLURGY STUDY OF LOCAL ZIRCON
Meor Yusoff Sulaiman , Kamarudin Hussin and Azizan Aziz MY9700785School of Material and Mineral Resources Engineering,
USM Perak Branch Campus.
Abstract
In this study, energy-dispersive X-ray Fluorescence (EDXRF) was used to analyse theelemental composition of the starting zircon mineral as well as that of associatedelements in the leaching solution. Besides analysing the major elements i.e.of zirconium,silicon and hafnium, trace elemental analysis for iron, titanium and the naturallyoccurring radioactive element thorium and uranium are important in establishing thegrades of Malaysian zircon. The technique was also used in determine the optimumconditions for zirconium and hafnium recovery during the leaching process.
Introduction
Energy-dispersive X-ray Fluorescence (EDXRF) is a qualitative and quantitativeinstrumental technique for elemental analysis. The technique is based on the fact thatwhen a sample is being excited by a x-ray source, electron shell transitions tend to occur.This will eventually result to the release of photons, whose energy is characteristic to thatof its elemental contents. Detection limit is from ppm to 100% and this normally "is moresensitive as the atomic number is greater . It is normal for this technique to determineelements from sodium (atomic no. = 11) to uranium (atomic no. = 92) but of late thiscould even be enhanced to detect fluorine using windowless x-ray tube and operatedunder vacuum. One of the advantages of this technique is its capability of analysing allthe elements simultaneously and the spectrum acquisition can be done in less than 100seconds. In most instances, samples are analysed with minimal sample preparation andthe sample could be either solid, powder, liquid or thin films. The nondestructiveness ofthe method is also important when analysing precious and small samples, also this willhelp to do repeatitive analysis on a given sample.
Besides cassiterite (tin ore), Malaysian alluvial tin mines also produce a by-product ofmixed heavy minerals that is locally termed as amang. One of the major heavy mineralthat is found in this by-product is zircon (ZrSiO4). Even though zircon is widely used inboth the traditional and high technology applications, most of its export from Malaysia isin the form of raw mineral. Production of zircon reached its peak in 1989 where 25,671tons were produced 1 . Thereafter the volume dropped and this may be attributed to thelow market price, low demand of this mineral and also the closing of tin mines inMalaysia 1 $-.
A study was done to process local zircon into value-added zirconia products by means ofhydrometallurgy. Malaysian zircons from different localities have to be analysed for its
67
ACXRI '96
grade and also impurities present. The elements of interest are zirconium, silicon andhafnium as the major elements and also iron, titanium , uranium and thorium as itsimpurities.
One of the important stages in hydrometallurgy study is the leaching process. The amountof associated element that is being leached out will directly relate to its elementalrecovery. Various parameters such as acid concentration, temperature and time areincorporated in this process for maximum recovery . The leaching process for thedissolution of sodium- zirconyl silicate, a product formed after the alkaline fusion ofzircon, can be represented by the reaction below^ ;
Na2ZrSi05 + 4HC1 -> ZrOCl2 + 2NaCl + SiO2 + 2H2O
The accuracy of the investigation is much depends on the elemental analysis technique.As hafnium is also present in substantial quantity and has properties similar to zirconium, the analyses of these two elements are carried out by the EDXRF technique.
Experimental Method
a) Zircon sample
The zircon samples used in this study are collected from tin mines and amang plantsthroughout the country. Only drying and grinding was carried out for the samples toproduce a sample of 150 micron particle size. This is to ensure a better homogenoussample during the analysis 4 . Parameters used for the acquisition of the spectrum areshown in Table 1.
Quantitative analysis of the zircon samples was based on reference materials of the sameminerals produced by British Chemical Standards (BCS 388 zircon) and StandardsAssociation of Australia (ASCRM-008 zircon). Quantitative method of analysis was byusing a software called NBS-GSC Fundamental Parameters Technique. The techniquethat was developed by the U.S. National Bureau of Standards and the Geological Surveyof Canada is suitable for analysis involving minimum number of reference standards 5.
68
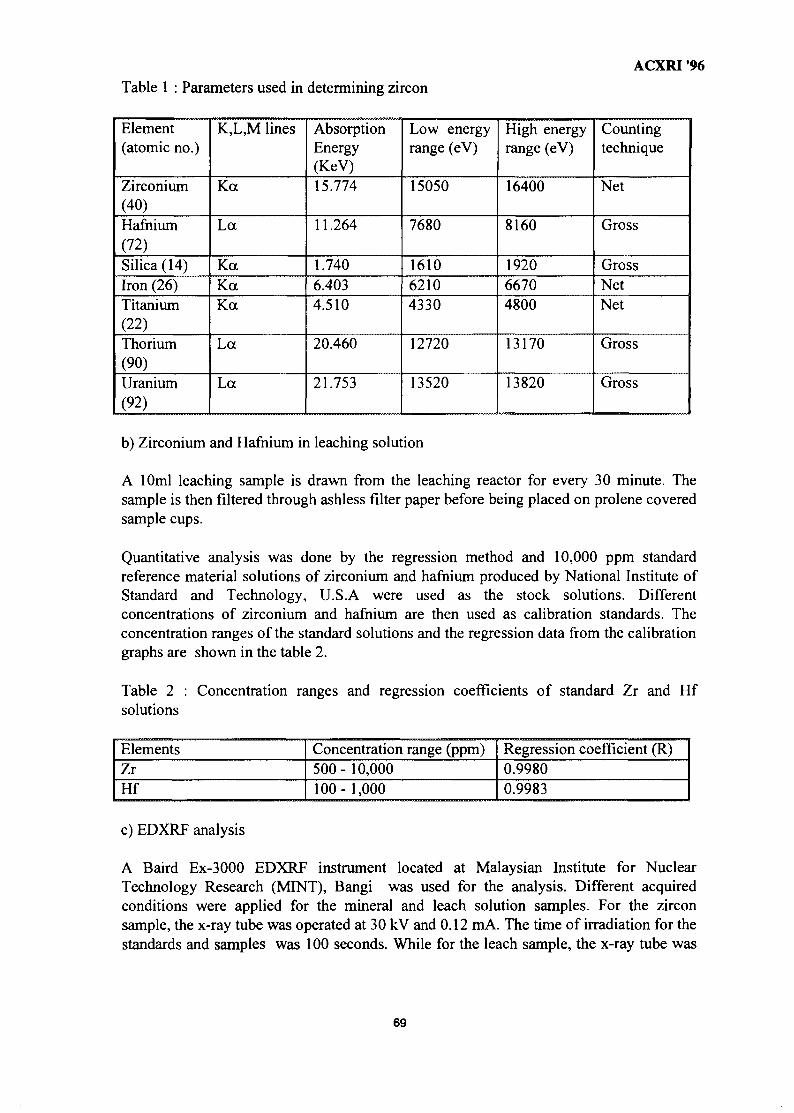
ACXRI '96
Table 1 : Parameters used in determining zircon
Element(atomic no.)
Zirconium(40)Hafnium(72)Silica (14)Iron (26)Titanium(22)Thorium(90)Uranium(92)
K,L,M lines
Ka
La
KaKaKa
La
La
AbsorptionEnergy(KeV)15.774
11.264
1.7406.4034.510
20.460
21.753
Low energyrange (eV)
15050
7680
161062104330
12720
13520
High energyrange (eV)
16400
8160
192066704800
13170
13820
Countingtechnique
Net
Gross
GrossNetNet
Gross
Gross
b) Zirconium and Hafnium in leaching solution
A 10ml leaching sample is drawn from the leaching reactor for every 30 minute. Thesample is then filtered through ashless filter paper before being placed on prolene coveredsample cups.
Quantitative analysis was done by the regression method and 10,000 ppm standardreference material solutions of zirconium and hafnium produced by National Institute ofStandard and Technology, U.S.A were used as the stock solutions. Differentconcentrations of zirconium and hafnium are then used as calibration standards. Theconcentration ranges of the standard solutions and the regression data from the calibrationgraphs are shown in the table 2.
Table 2solutions
Concentration ranges and regression coefficients of standard Zr and Hf
ElementsZrHf
Concentration range (ppm)500-10,000100-1,000
Regression coefficient (R)0.99800.9983
c) EDXRF analysis
A Baird Ex-3000 EDXRF instrument located at Malaysian Institute for NuclearTechnology Research (MINT), Bangi was used for the analysis. Different acquiredconditions were applied for the mineral and leach solution samples. For the zirconsample, the x-ray tube was operated at 30 kV and 0.12 mA. The time of irradiation for thestandards and samples was 100 seconds. While for the leach sample, the x-ray tube was
69
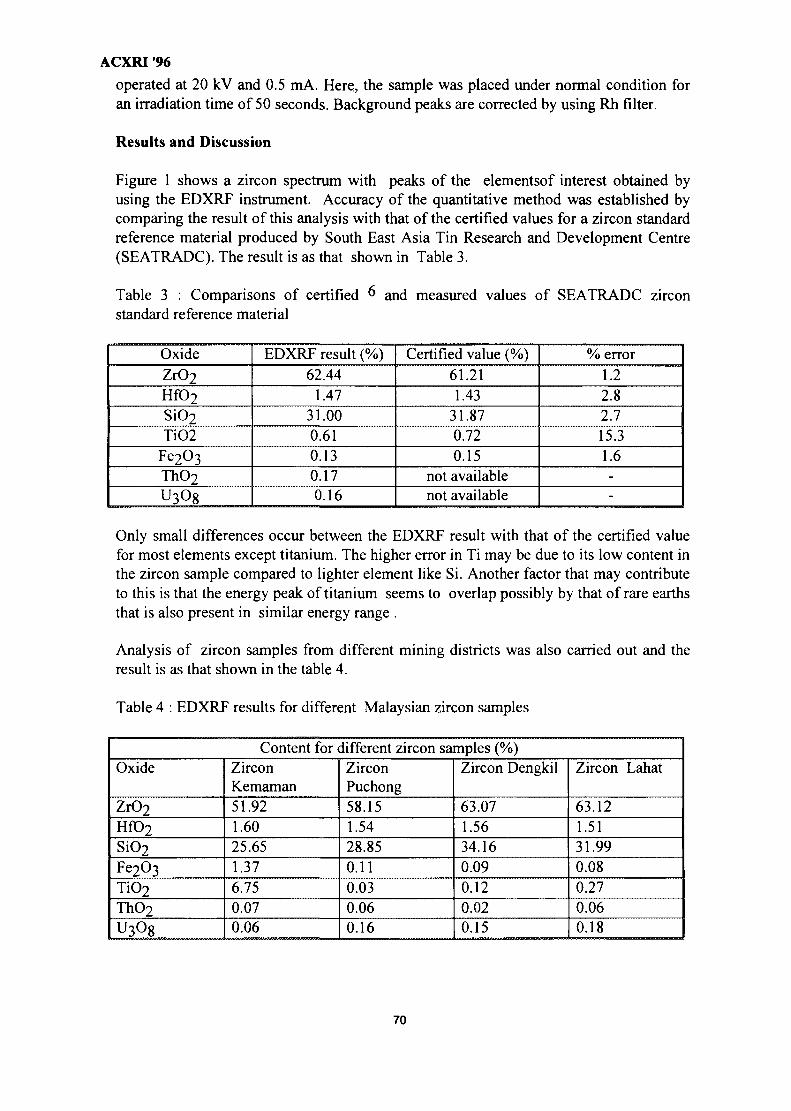
ACXRI '96
operated at 20 kV and 0.5 mA. Here, the sample was placed under normal condition foran irradiation time of 50 seconds. Background peaks are corrected by using Rh filter.
Results and Discussion
Figure 1 shows a zircon spectrum with peaks of the elementsof interest obtained byusing the EDXRF instrument. Accuracy of the quantitative method was established bycomparing the result of this analysis with that of the certified values for a zircon standardreference material produced by South East Asia Tin Research and Development Centre(SEATRADC). The result is as that shown in Table 3.
Table 3 : Comparisons of certified 6 and measured values of SEATRADC zirconstandard reference material
Oxide
ZrO2
HfO2
SiO2
TiO2Fe2O3
ThO2
U3O8
EDXRF result (%)62.44
1.4731.000.610.130.170.16
Certified value (%)61.211.43
31.870.720.15
not availablenot available
% error1.22.82.715.31.6--
Only small differences occur between the EDXRF result with that of the certified valuefor most elements except titanium. The higher error in Ti may be due to its low content inthe zircon sample compared to lighter element like Si. Another factor that may contributeto this is that the energy peak of titanium seems to overlap possibly by that of rare earthsthat is also present in similar energy range .
Analysis of zircon samples from different mining districts was also carried out and theresult is as that shown in the table 4.
Table 4 : EDXRF results for different Malaysian zircon samples
Content for different zircon samples (%)Oxide
ZrO2
HfO2
SiO2
Fe2O3TiO2
ThO2
u3o8
ZirconKemaman51.921.6025.651.376.750.070.06
ZirconPuchong58.151.5428.850.110.030.060.16
Zircon Dengkil
63.071.5634.160.090.120.020.15
Zircon Lahat
63.121.5131.990.080.270.060.18
70
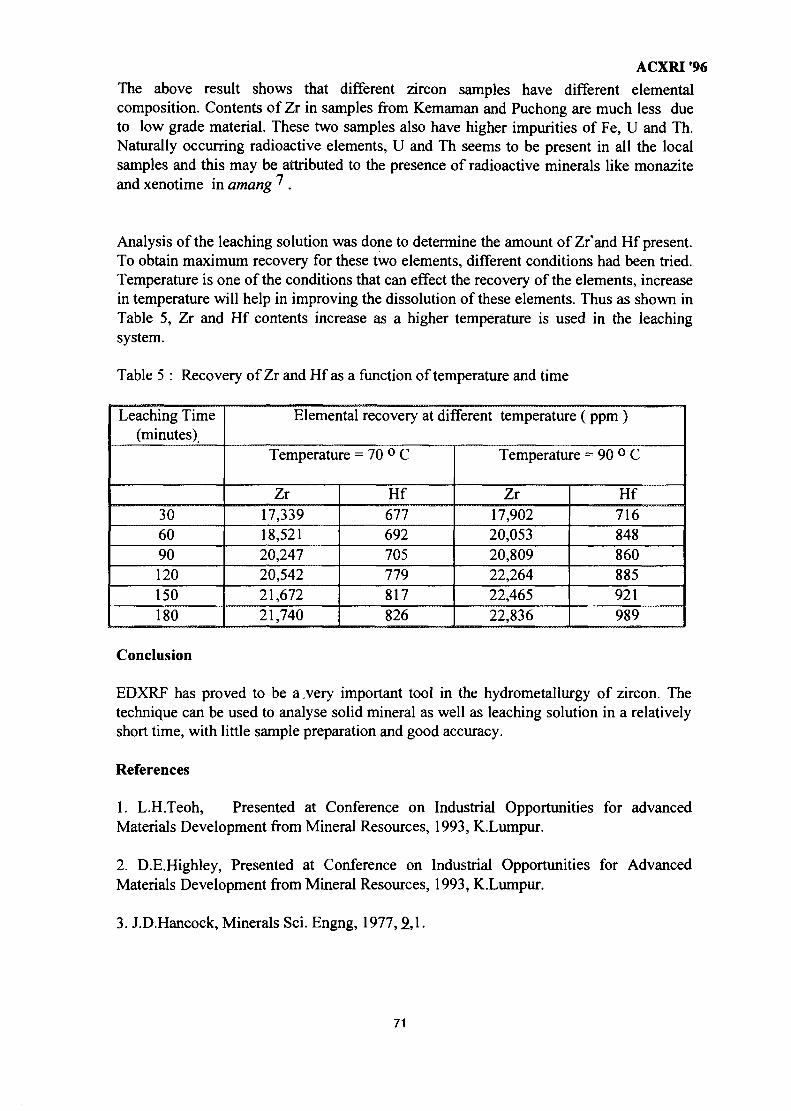
ACXRI '96
The above result shows that different zircon samples have different elementalcomposition. Contents of Zr in samples from Kemaman and Puchong are much less dueto low grade material. These two samples also have higher impurities of Fe, U and Th.Naturally occurring radioactive elements, U and Th seems to be present in all the localsamples and this may be attributed to the presence of radioactive minerals like monaziteand xenotime in among 7 .
Analysis of the leaching solution was done to determine the amount of Zr'and Hf present.To obtain maximum recovery for these two elements, different conditions had been tried.Temperature is one of the conditions that can effect the recovery of the elements, increasein temperature will help in improving the dissolution of these elements. Thus as shown inTable 5, Zr and Hf contents increase as a higher temperature is used in the leachingsystem.
Table 5 : Recovery of Zr and Hf as a function of temperature and time
Leaching Time(minutes)
306090120150180
Elemental recovery at different temperature ( ppm )
Temperature = 70 ° C
Zr17,33918,52120,24720,54221,67221,740
Hf677692705779817826
Temperature = 90 ° C
Zr17,90220,05320,80922,26422,46522,836
Hf716848860885921989
Conclusion
EDXRF has proved to be a very important tool in the hydrometallurgy of zircon. Thetechnique can be used to analyse solid mineral as well as leaching solution in a relativelyshort time, with little sample preparation and good accuracy.
References
1. L.H.Teoh, Presented at Conference on Industrial Opportunities for advancedMaterials Development from Mineral Resources, 1993, K.Lumpur.
2. D.E.Highley, Presented at Conference on Industrial Opportunities for AdvancedMaterials Development from Mineral Resources, 1993, K.Lumpur.
3. J.D.Hancock, Minerals Sci. Engng, 1977, 9_,1.
71
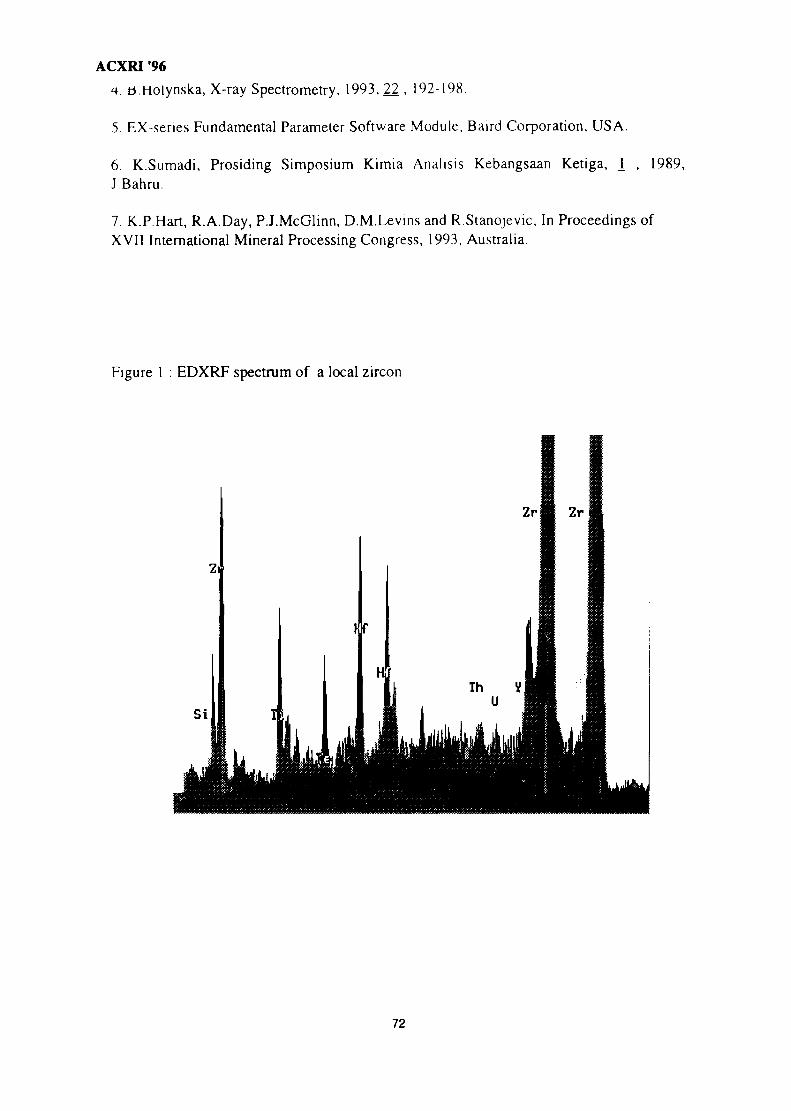
ACXRI '96
4. b.Holynska, X-ray Spectrometry, 1993, 22 , 192-198.
5. EX-series Fundamental Parameter Software Module, Baird Corporation, USA.
6. K.Sumadi, Prosiding Simposium Kimia Analisis Kebangsaan Ketiga, 1J Bahru.
1989,
7. K.P.Hart, R.A.Day, P.J.McGlinn, D.M.Levins and R.Stanojevic, In Proceedings ofXVII International Mineral Processing Congress, 1993, Australia.
Figure 1 : EDXRF spectrum of a local zircon
72
ACXRI '96
Quality Control of Clinker Products By SEM and XRF Analysis
Ziad Abu Kaddourah and Khairun Azizi MY9700786School of Materials and Mineral Resources Eng., Universiti Sains Malaysia
31750 Tronoh, Perak, Malaysia.
ABSTRACT
The microstructure and chemical properties of industrial Portland cement clinkershave been examined by SEM and XRF methods to establish the nature of the clinkers andhow variations in the clinker characteristics can be used to control the clinker quality. Theclinker nodules were found to show differences in the chemical composition andmicrostructure between the inner and outer parts of the clinker nodules. Microstructurestudies of industrial Portland cement clinker have shown that the outer part of the nodulesare enriched in silicate more than the inner part. There is better crystallization and largeralite crystal 9ize in the outer part than in the inner part. The alite crystal size variedbetween 16.2-46.12um. The clinker chemical composition was found to affect theresidual >45um, where a higher belite content causes an increase in the residual >45um inthe cement product and will cause a decrease in the concrete strength of the cementproduct. The aluminate and ferrite crystals and the microcracks within the alite crystal areclear in some clinker only. The quality of the raw material preparation, burning andcooling stages can be controlled using the microstructure of the clinker product.
INTRODUCTION
Examination of manufactured industrial clinkers using the Scanning ElectronMicroscope (SEM) is usually conducted to study problems that can't be defined by thenormal quality control procedures. Such a study can be used to give better informationand knowledge about clinkers characteristics and how variations in the clinkercharacteristics are affected by variations in the various stages during the manufacturingprocess.
Portland cement clinker nodules usually show differences in the chemicalcomposition and microstructure between the inner and outer parts1"3. The outer part isalways enriched with A12O3 and Fe2O3, while the inner part is enriched with SO3, K2O +Na2O and free lime2. Microcracks within alite crystal occur by shrinkage of the volumeduring the crystallisation of the interstitial liquid "aluminate and ferrite", and it depends onthe rate and the extent of crystallisation during the cooling0 '2).
The degree of the raw meal grinding is affected by the cluster of free lime andbelite. It can be shown by the presence of large clusters of free lime or belite if thegrinding of the raw meal is not enough4. One5 concluded that the alite crystal was anindication of the ratio of heating to the clinker temperature. Which if high, will result insmaller crystals. Slow cooling will increase the alite crystal, cause resorption of alite, withdeposition of small crystals of belite as fringes on the alite crystal and in the interstitialmaterial, and also cause larger aluminate and ferrite crystals6. While fast cooling willdecrease the alite crystal size and cause small crystals of ferrite and aluminate, which willbe mixed on the small scale.(6'7)
73
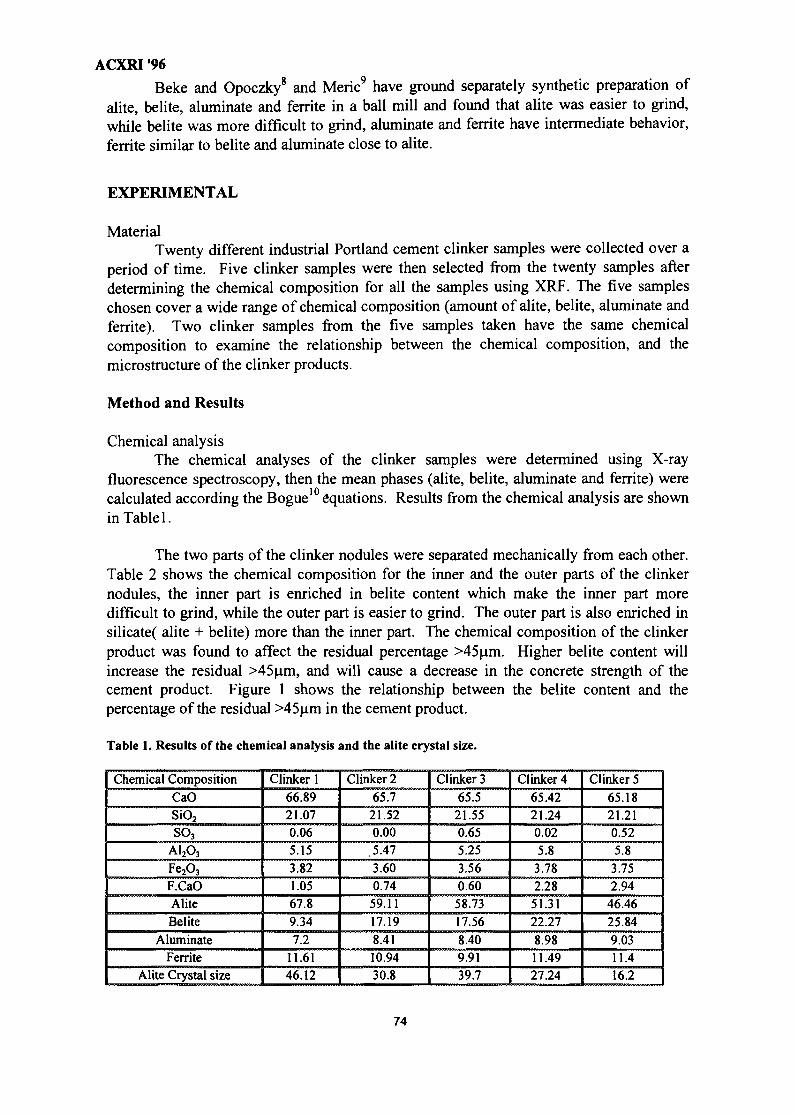
ACXRI 96
Beke and Opoczky8 and Meric9 have ground separately synthetic preparation ofalite, belite, aluminate and ferrite in a ball mill and found that alite was easier to grind,while belite was more difficult to grind, aluminate and ferrite have intermediate behavior,ferrite similar to belite and aluminate close to alite.
EXPERIMENTAL
MaterialTwenty different industrial Portland cement clinker samples were collected over a
period of time. Five clinker samples were then selected from the twenty samples afterdetermining the chemical composition for all the samples using XRF. The five sampleschosen cover a wide range of chemical composition (amount of alite, belite, aluminate andferrite). Two clinker samples from the five samples taken have the same chemicalcomposition to examine the relationship between the chemical composition, and themicrostructure of the clinker products.
Method and Results
Chemical analysisThe chemical analyses of the clinker samples were determined using X-ray
fluorescence spectroscopy, then the mean phases (alite, belite, aluminate and ferrite) werecalculated according the Bogue10 equations. Results from the chemical analysis are shownin Table 1.
The two parts of the clinker nodules were separated mechanically from each other.Table 2 shows the chemical composition for the inner and the outer parts of the clinkernodules, the inner part is enriched in belite content which make the inner part moredifficult to grind, while the outer part is easier to grind. The outer part is also enriched insilicate( alite + belite) more than the inner part. The chemical composition of the clinkerproduct was found to affect the residual percentage >45um. Higher belite content willincrease the residual >45um, and will cause a decrease in the concrete strength of thecement product. Figure 1 shows the relationship between the belite content and thepercentage of the residual >45um in the cement product.
Table 1. Results of the chemical analysis and the alite crystal size.
Chemical Composition
CaOSiO2
SO3
A12O3
Fe2O3
F.CaO
Alite
Belite
Aluminate
Ferrite
Alite Crystal size
Clinker 1
66.89
21.07
0.06
5.15
3.82
1.05
67.8
9.34
7.211.6146.12
Clinker 2
65.7
21.52
0.00
5.47
3.60
0.74
59.11
17.19
8.41
10.94
30.8
Clinker 3
65.5
21.55
0.65
5.25
3.56
0.60
58.73
17.56
8.40
9.91
39.7
Clinker 4
65.4221.24
0.02
5.83.78
2.28
51.31
22.27
8.9811.49
27.24
Clinker 5
65.18
21.21
0.52
5.83.75
2.94
46.46
25.84
9.0311.4
16.2
74
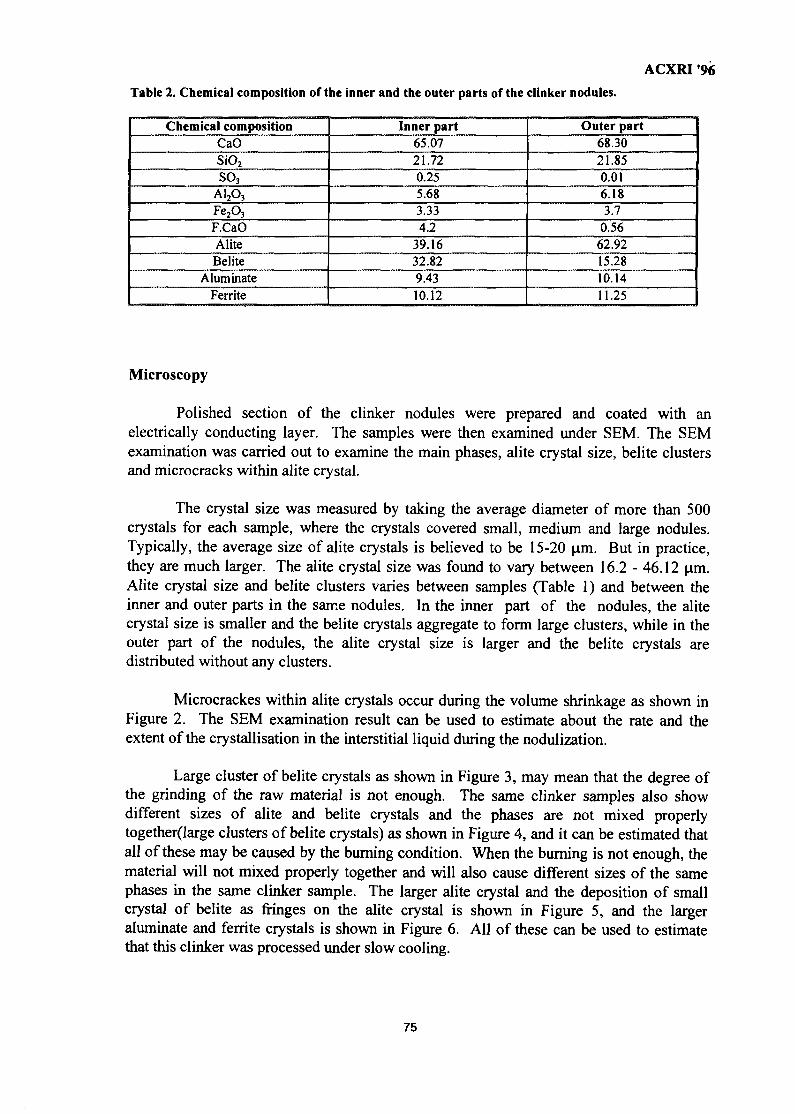
ACXRI '96Table 2. Chemical composition of the inner and the outer parts of the clinker nodules.
Chemical compositionCaOSiO2
SO3
A12O3
FeAF.CaOAliteBelite
AluminateFerrite
Inner part65.0721.720.255.683.334.2
39.1632.829.4310.12
Outer part68.3021.850.016.183.7
0.5662.9215.2810.1411.25
Microscopy
Polished section of the clinker nodules were prepared and coated with anelectrically conducting layer. The samples were then examined under SEM. The SEMexamination was carried out to examine the main phases, alite crystal size, belite clustersand microcracks within alite crystal.
The crystal size was measured by taking the average diameter of more than 500crystals for each sample, where the crystals covered small, medium and large nodules.Typically, the average size of alite crystals is believed to be 15-20 um. But in practice,they are much larger. The alite crystal size was found to vary between 16.2 - 46.12 urn.Alite crystal size and belite clusters varies between samples (Table 1) and between theinner and outer parts in the same nodules. In the inner part of the nodules, the alitecrystal size is smaller and the belite crystals aggregate to form large clusters, while in theouter part of the nodules, the alite crystal size is larger and the belite crystals aredistributed without any clusters.
Microcrackes within alite crystals occur during the volume shrinkage as shown inFigure 2. The SEM examination result can be used to estimate about the rate and theextent of the crystallisation in the interstitial liquid during the nodulization.
Large cluster of belite crystals as shown in Figure 3, may mean that the degree ofthe grinding of the raw material is not enough. The same clinker samples also showdifferent sizes of alite and belite crystals and the phases are not mixed properlytogether(large clusters of belite crystals) as shown in Figure 4, and it can be estimated thatall of these may be caused by the burning condition. When the burning is not enough, thematerial will not mixed properly together and will also cause different sizes of the samephases in the same clinker sample. The larger alite crystal and the deposition of smallcrystal of belite as fringes on the alite crystal is shown in Figure 5, and the largeraluminate and ferrite crystals is shown in Figure 6. All of these can be used to estimatethat this clinker was processed under slow cooling.
75
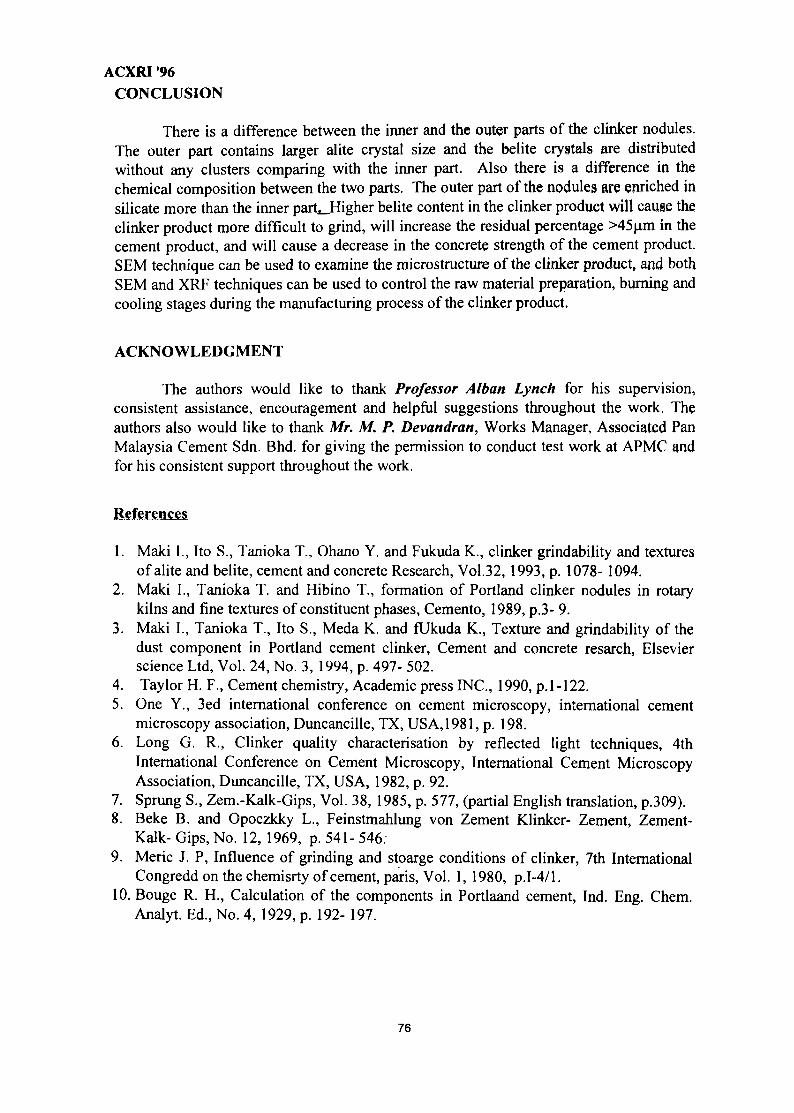
ACXRI '96CONCLUSION
There is a difference between the inner and the outer parts of the clinker nodules.The outer part contains larger alite crystal size and the belite crystals are distributedwithout any clusters comparing with the inner part. Also there is a difference in thechemical composition between the two parts. The outer part of the nodules are enriched insilicate more than the inner part^Higher belite content in the clinker product will cause theclinker product more difficult to grind, will increase the residual percentage >45u.m in thecement product, and will cause a decrease in the concrete strength of the cement product.SEM technique can be used to examine the microstructure of the clinker product, and bothSEM and XRP techniques can be used to control the raw material preparation, burning andcooling stages during the manufacturing process of the clinker product.
ACKNOWLEDGMENT
The authors would like to thank Professor Alban Lynch for his supervision,consistent assistance, encouragement and helpful suggestions throughout the work. Theauthors also would like to thank Mr. M. P. Devandran, Works Manager, Associated PanMalaysia Cement Sdn. Bhd. for giving the permission to conduct test work at APMC andfor his consistent support throughout the work.
References
1. Maki I., Ito S., Tanioka T., Ohano Y. and Fukuda K., clinker grindability and texturesof alite and belite, cement and concrete Research, Vol.32, 1993, p. 1078- 1094.
2. Maki I., Tanioka T. and Hibino T., formation of Portland clinker nodules in rotarykilns and fine textures of constituent phases, Cemento, 1989, p.3- 9.
3. Maki I., Tanioka T., Ito S., Meda K. and fUkuda K., Texture and grindability of thedust component in Portland cement clinker, Cement and concrete resarch, Elsevierscience Ltd, Vol. 24, No. 3, 1994, p. 497- 502.
4. Taylor H. F., Cement chemistry, Academic press INC., 1990, p.1-122.5. One Y., 3ed international conference on cement microscopy, international cement
microscopy association, Duncancille, TX, USA, 1981, p. 198.6. Long G. R., Clinker quality characterisation by reflected light techniques, 4th
International Conference on Cement Microscopy, International Cement MicroscopyAssociation, Duncancille, TX, USA, 1982, p. 92.
7. Sprung S., Zem.-Kalk-Gips, Vol. 38, 1985, p. 577, (partial English translation, p.309).8. Beke B. and Opoczkky L., Feinstmahlung von Zetnent Klinker- Zement, Zement-
Kalk- Gips, No. 12,1969, p. 541- 546.9. Meric J. P, Influence of grinding and stoarge conditions of clinker, 7th International
Congredd on the chemisrty of cement, paris, Vol. 1, 1980, p.1-4/1.10. Bouge R. H., Calculation of the components in Portlaand cement, Ind. Eng. Chem.
Analyt. Ed., No. 4, 1929, p. 192- 197.
76
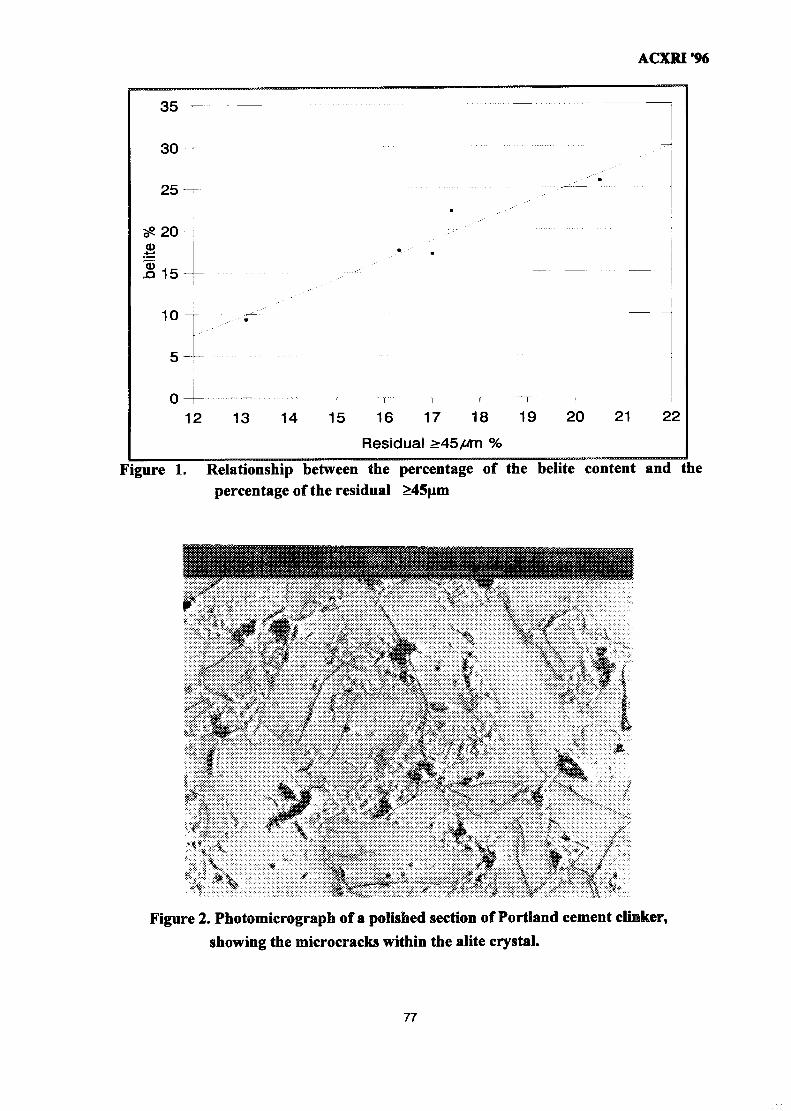
ACXRI'96
13 14 15 16 17 18 19 20 21
Residual >45//m %Figure 1. Relationship between the percentage of the belite content and the
percentage of the residual >45p.m
Figure 2. Photomicrograph of a polished section of Portland cement clinker,
showing the microcracks within the alite crystal.
77
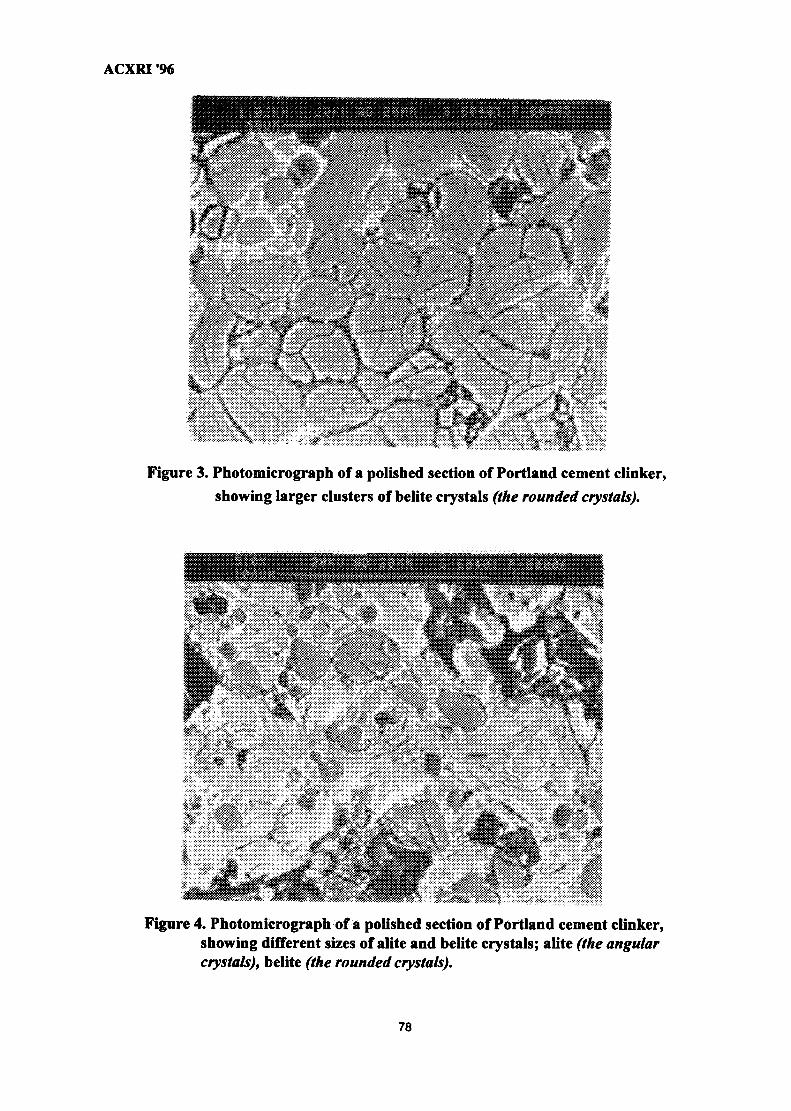
ACXRI '96
^
Figure 3. Photomicrograph of a polished section of Portland cement clinker,
showing larger clusters of belite crystals (the rounded crystals).
Figure 4. Photomicrograph of a polished section of Portland cement clinker,showing different sizes of alite and belite crystals; alite (the angularcrystals), belite (the rounded crystals).
78
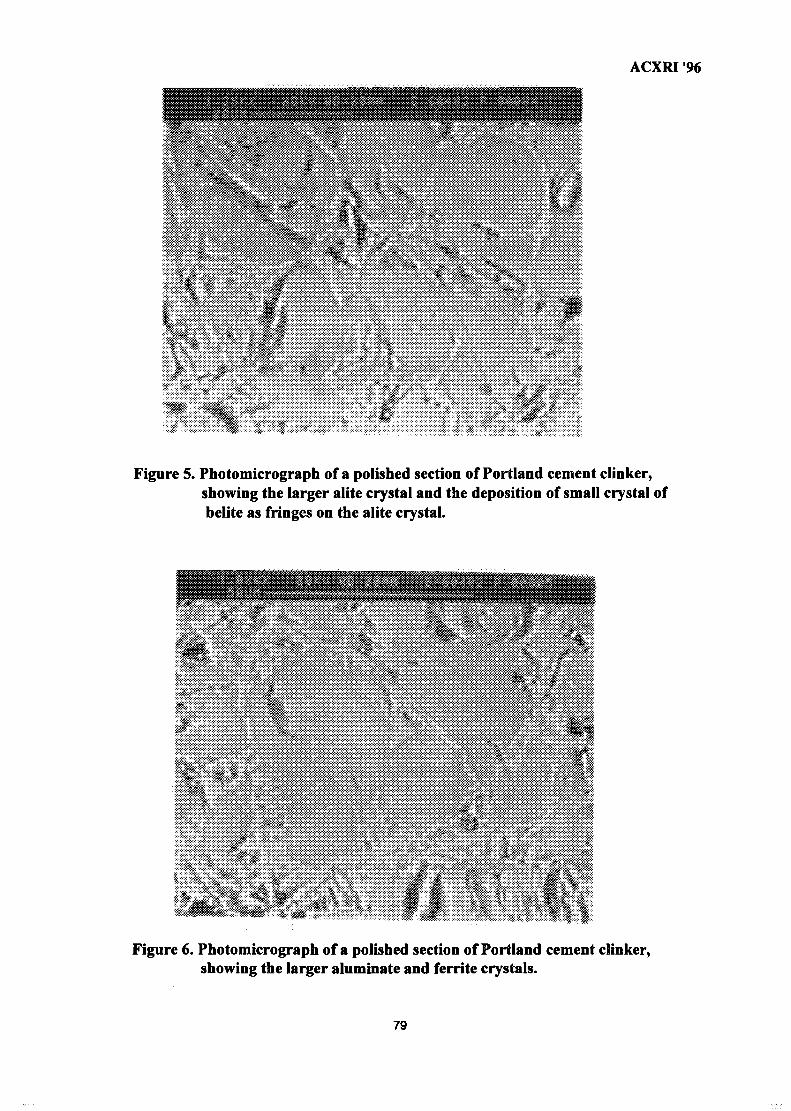
ACXRI '96
Figure 5. Photomicrograph of a polished section of Portland cement clinker,showing the larger alite crystal and the deposition of small crystal ofbelite as fringes on the alite crystal.
Figure 6. Photomicrograph of a polished section of Portland cement clinker,showing the larger aluminate and ferrite crystals.
79
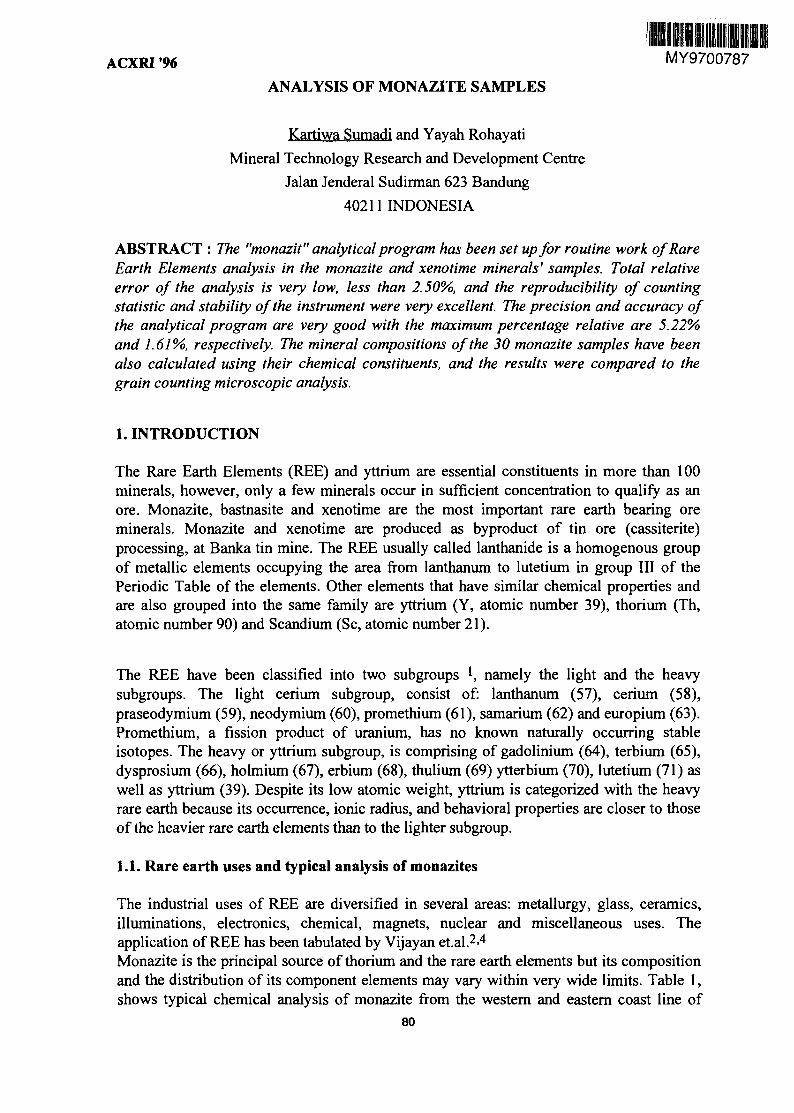
ACXRI'96 MY9700787
ANALYSIS OF MONAZITE SAMPLES
Kartiwa Sumadi and Yayah Rohayati
Mineral Technology Research and Development Centre
Jalan Jenderal Sudirman 623 Bandung
40211 INDONESIA
ABSTRACT : The "monazit" analytical program has been set up for routine work of RareEarth Elements analysis in the monazite and xenotime minerals' samples. Total relativeerror of the analysis is very low, less than 2.50%, and the reproducibility of countingstatistic and stability of the instrument were very excellent. The precision and accuracy ofthe analytical program are very good with the maximum percentage relative are 5.22%and 1.61%, respectively. The mineral compositions of the 30 monazite samples have beenalso calculated using their chemical constituents, and the results were compared to thegrain counting microscopic analysis.
1. INTRODUCTION
The Rare Earth Elements (REE) and yttrium are essential constituents in more than 100minerals, however, only a few minerals occur in sufficient concentration to qualify as anore. Monazite, bastnasite and xenotime are the most important rare earth bearing oreminerals. Monazite and xenotime are produced as byproduct of tin ore (cassiterite)processing, at Banka tin mine. The REE usually called lanthanide is a homogenous groupof metallic elements occupying the area from lanthanum to lutetium in group III of thePeriodic Table of the elements. Other elements that have similar chemical properties andare also grouped into the same family are yttrium (Y, atomic number 39), thorium (Th,atomic number 90) and Scandium (Sc, atomic number 21).
The REE have been classified into two subgroups l, namely the light and the heavysubgroups. The light cerium subgroup, consist of: lanthanum (57), cerium (58),praseodymium (59), neodymium (60), promethium (61), samarium (62) and europium (63).Promethium, a fission product of uranium, has no known naturally occurring stableisotopes. The heavy or yttrium subgroup, is comprising of gadolinium (64), terbium (65),dysprosium (66), holmium (67), erbium (68), thulium (69) ytterbium (70), lutetium (71) aswell as yttrium (39). Despite its low atomic weight, yttrium is categorized with the heavyrare earth because its occurrence, ionic radius, and behavioral properties are closer to thoseof the heavier rare earth elements than to the lighter subgroup.
1.1. Rare earth uses and typical analysis of monazites
The industrial uses of REE are diversified in several areas: metallurgy, glass, ceramics,illuminations, electronics, chemical, magnets, nuclear and miscellaneous uses. Theapplication of REE has been tabulated by Vijayan et.al.2-4
Monazite is the principal source of thorium and the rare earth elements but its compositionand the distribution of its component elements may vary within very wide limits. Table 1,shows typical chemical analysis of monazite from the western and eastern coast line of
80
ACXRI '96
Australia, black monazite from Taiwan and reference standard monazite that has beenprepared by Seatrad Centre from Malaysia.2-3 The model analysis of Seatrad Centrereference sample is shown in the Table 2,
1.3. Objective
The aims of this activity are:
. To study and prepare a standard analytical method of rare earth elements containingminerals (monazite and xenotime), by using X-ray fluorescence spectrometrytechnique, which can be used for routine work.
• To develop a method of quantitative mineralogical analysis of monazite sample byusing its chemical formula and it's elemental content so that the calculatedconcentration can be used for routine work.
. To compare the mineral composition of the monazite samples that has been analyzedby microscopic grain counting method with the chemical formula calculation.
2. EXPERIMENT
2.1. Standard Calibration
It has been known that the XRF technique is a comparative method. Therefore, theaccuracy and precision of the analysis depend upon the quality of the standard calibration.The "monazit" program uses 30 standards when plotting the calibration curve by mixingthe monazite and xenotime of Seatrad Centre reference sample. To get the series ofappropriate REE concentration and to wider the area of the calibration, ultra pure chemicalreagent of RE spex-mix 1031-2 ex LABSPEC and gold label of CeO2, P^O] i, Nd2C>3,EU2O3, Tb4O7, HO2O3, Tm2O3, LU2O3, ThO2 and U3O8 FROM Aldrich chemicalCompany were added to these reference samples above.
2.2. Error of AnalysisIn the analysis with the XRF technique, a random error could happen in association witheach reading of the intensity (count-rate) and defined as precision of the measurement(Table3).This error comprises of three major sources:
• Counting statistic, which is dependent only on time of the exposed X-ray radiation• Instrumental error (generator, X-ray tube stability)• Sample preparation error.
2.3. Precision and accuracy
The precision of an analysis is the degree of agreement among the replicate determinationsmade under SAME conditions as nearly as possible. Quantitatively, it is the differencebetween the individual analysis and the mean values of a large number (in this experiment10 times) of independent replicate analysis, usually expressed in percentage. The greater orbetter the precision, the smaller is its numerical value.( Table 4).
81
ACXRI '96
The accuracy of an analysis is the degree of agreement of the analysis result with the"true", accepted or most reliable known value. Quantitatively the accuracy is the differencebetween the individual analysis result and the "true" value, usually expressed inpercentage. Numerically, the greater or better the accuracy, the smaller is its numericalvalue.
2.4. Analytical Results
Thirty monazite samples which had been prepared by PPBT Mentok of PT Timah, wereanalyzed by using a created analytical program "monazite".
2.5. Mineralogical Analysis
On the basis of chemical formula of monazite, its mineral content was calculated asfollowing formula:
Method 1: (La, Ce, Nd, Th) PO4Method 2: (Cei.714 Lai.305 Tho.43O Ndo.350 Pr o.lio) (PO4)4Method 3: (La, Ce, Nd) PO4.
3. DISCUSSION
3.1. Chemical composition
The concentrations of REE constituents in the 30 analyzed monazite samples are muchlower than the Australian.monazite (Table 1). This might be due to the fact that monaziteproduced is contaminated with xenotime (Y, Er) (PO4).
The Y2O3 and Er2O3 content, in the analyzed samples are still very high. Theconcentration of Y2O3 and Er2O3 in the sample are (2.297-8.858%) and (0.24-1.12%)respectively, while the Australian monazite has (0.03-0.60%) for Y2O3 and no availabledata is available for Er2O3.
Figure 1 shows the diffractograms of sample codes VII and XXX with the monazitecontent 70.35% and 35.58%, respectively. In the diffractogram XXX, the xenotime hasvery intense peak compared to monazite peak, while the diffractogram VII has monazitepeak height, nearly twice of the XXX difractogram.
3.2. Mineralogical compositionThe grain counting analysis is assumed as the most reliable one for monazite content in theanalyzed samples. The difference of the third chemical calculation method compared to therespective grain counting result, is less than 10 % for the method 3.The accuracy of chemical calculation methods could be increased by using a series ofstandards as reference samples. In the experiment the analyzed samples were compareddirectly to the Seatrad Center's reference sample, therefore, the analytical accuracy dependson the quality of the reference sample.
82
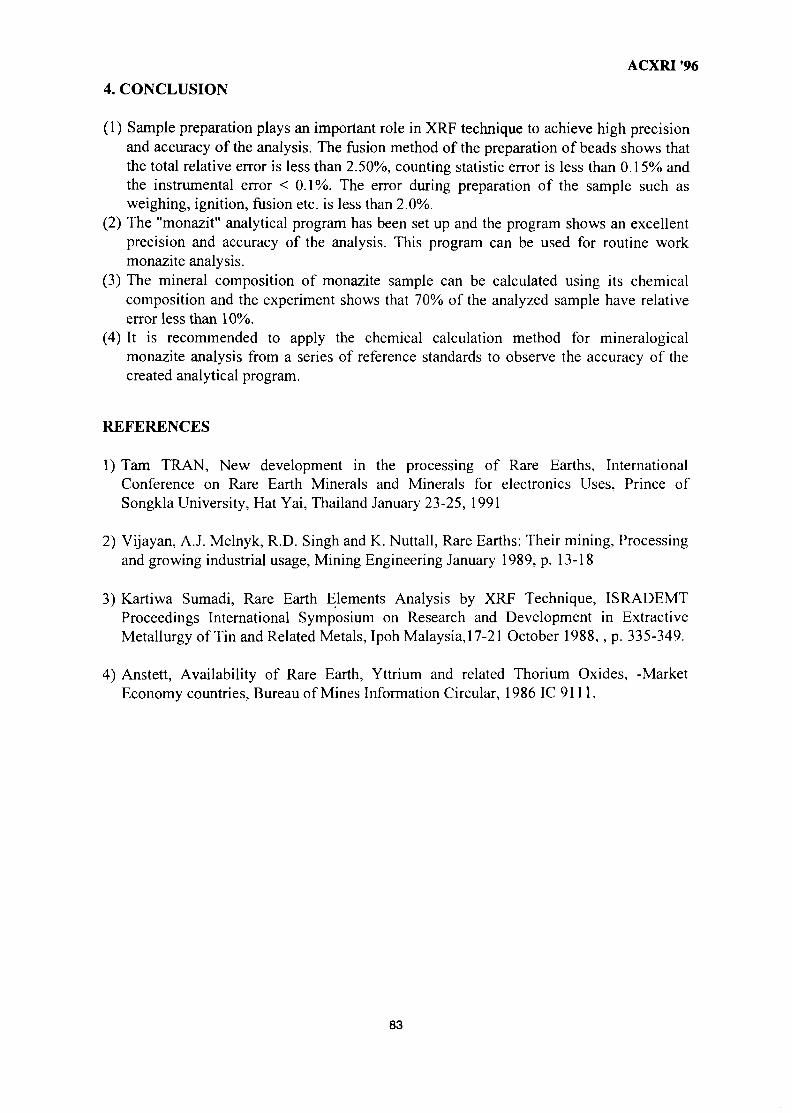
ACXRI '96
4. CONCLUSION
(1) Sample preparation plays an important role in XRP technique to achieve high precisionand accuracy of the analysis. The fusion method of the preparation of beads shows thatthe total relative error is less than 2.50%, counting statistic error is less than 0.15% andthe instrumental error < 0.1%. The error during preparation of the sample such asweighing, ignition, fusion etc. is less than 2.0%.
(2) The "monazit" analytical program has been set up and the program shows an excellentprecision and accuracy of the analysis. This program can be used for routine workmonazite analysis.
(3) The mineral composition of monazite sample can be calculated using its chemicalcomposition and the experiment shows that 70% of the analyzed sample have relativeerror less than 10%.
(4) It is recommended to apply the chemical calculation method for mineralogicalmonazite analysis from a series of reference standards to observe the accuracy of thecreated analytical program.
REFERENCES
1) Tarn TRAN, New development in the processing of Rare Earths, InternationalConference on Rare Earth Minerals and Minerals for electronics Uses, Prince ofSongkla University, Hat Yai, Thailand January 23-25, 1991
2) Vijayan, A.J. Melnyk, R.D. Singh and K. Nuttall, Rare Earths: Their mining, Processingand growing industrial usage, Mining Engineering January 1989, p. 13-18
3) Kartiwa Sumadi, Rare Earth Elements Analysis by XRF Technique, ISRADEMTProceedings International Symposium on Research and Development in ExtractiveMetallurgy of Tin and Related Metals, Ipoh Malaysia, 17-21 October 1988,, p. 335-349.
4) Anstett, Availability of Rare Earth, Yttrium and related Thorium Oxides, -MarketEconomy countries, Bureau of Mines Information Circular, 1986 IC 9111.
83
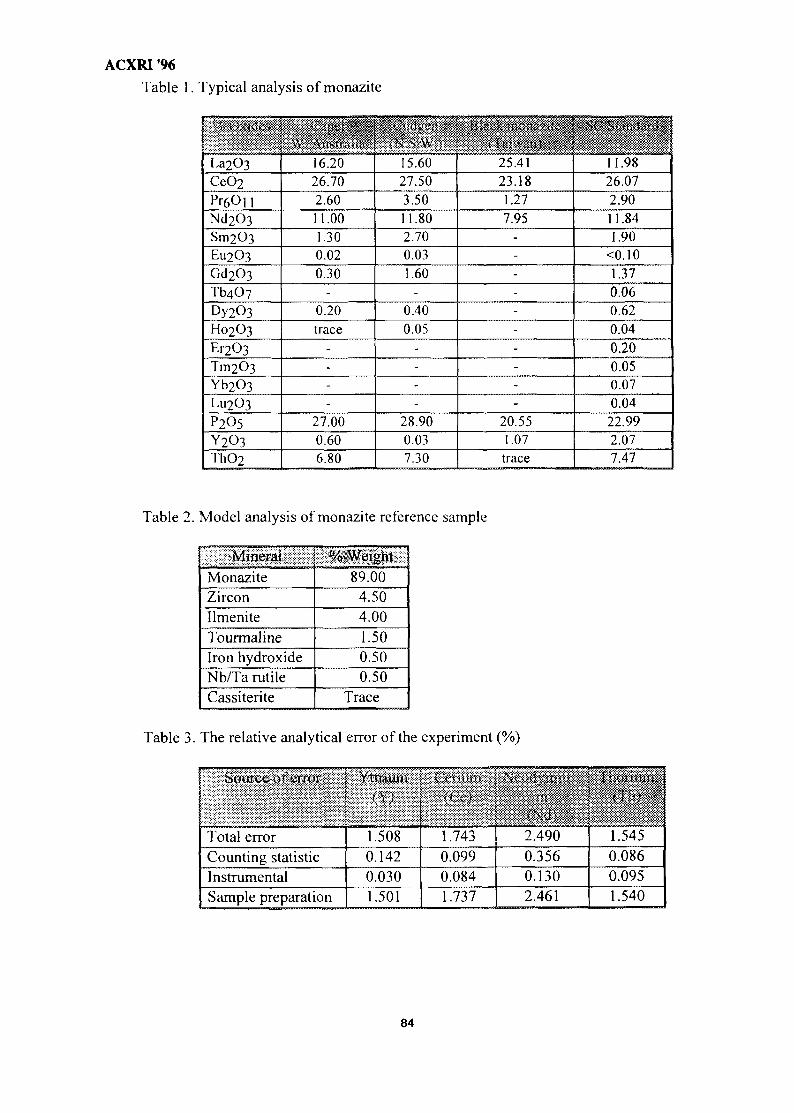
ACXRI 96Table 1. Typical analysis of monazite
%0*^'U*A5B§La2O3CeO2Pr60] ]NCI2O3S1T12O3
EU2O3
Gd2O3
Tb4O7Dy2O3
HO2O3Er2O3
T1T12O3
Yb2O3L112O3
P2O5Y 2 O 3
TI1O2
16.2026.702.6011.001.300.020.30
-0.20trace
----
27.000.606.80
15.6027.50
3.5011.802.700.031.60
-0.400.05
----
28.900.037.30
25.4123.181.277.95
----------
20.551.07
trace
11.9826.072.9011.841.90
<0.101.370.060.620.040.200.050.070.04
22.992.077.47
Table 2. Model analysis of monazite reference sample
•MineralMonaziteZirconIlmeniteTourmalineIron hydroxideNb/Ta rutileCassiterite
%-Weight89.00
4.504.001.500.500.50
Trace
Table 3. The relative analytical error of the experiment (%)
Source of error
Total errorCounting statisticInstrumentalSample preparation
Yttrium
1.5080.1420.0301.501
€t-i ium i
1.7430.0990.0841.737
- m '•
im2.4900.3560.1302.461
an <1.5450.0860.0951.540
84
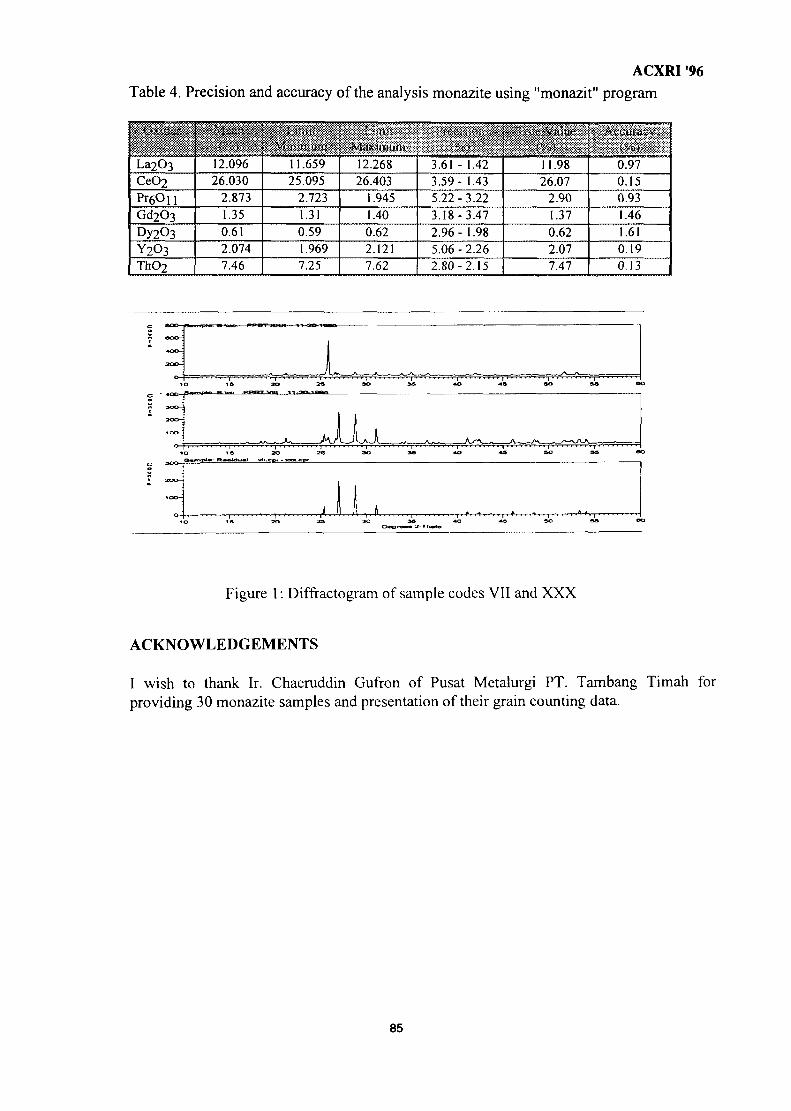
ACXRI "96Table 4. Precision and accuracy of the analysis monazite using "monazit" program
La2O3CeO2Pr6OnGd2O3
Dy2O3
Y2O3
ThO2
12.09626.030
2.8731.350.612.0747.46
; '4Mi\i , '
11.65925.095
2.7231.310.591.9697.25
Maximum^12.26826.403
1.9451.400.622.1217.62
3.61 - 1.423.59- 1.435.22-3.223.18-3.472.96- 1.985.06-2.262.80-2.15
•m - -11.9826.07
2.901.370.622.077.47
A«eurs«¥/o> "
0.970.150.931.461.610.190.13
Figure 1: Diffractogram of sample codes VII and XXX
ACKNOWLEDGEMENTS
I wish to thank Ir. Chaeruddin Gufron of Pusat Metalurgi PT. Tambang Timah forproviding 30 monazite samples and presentation of their grain counting data.
85
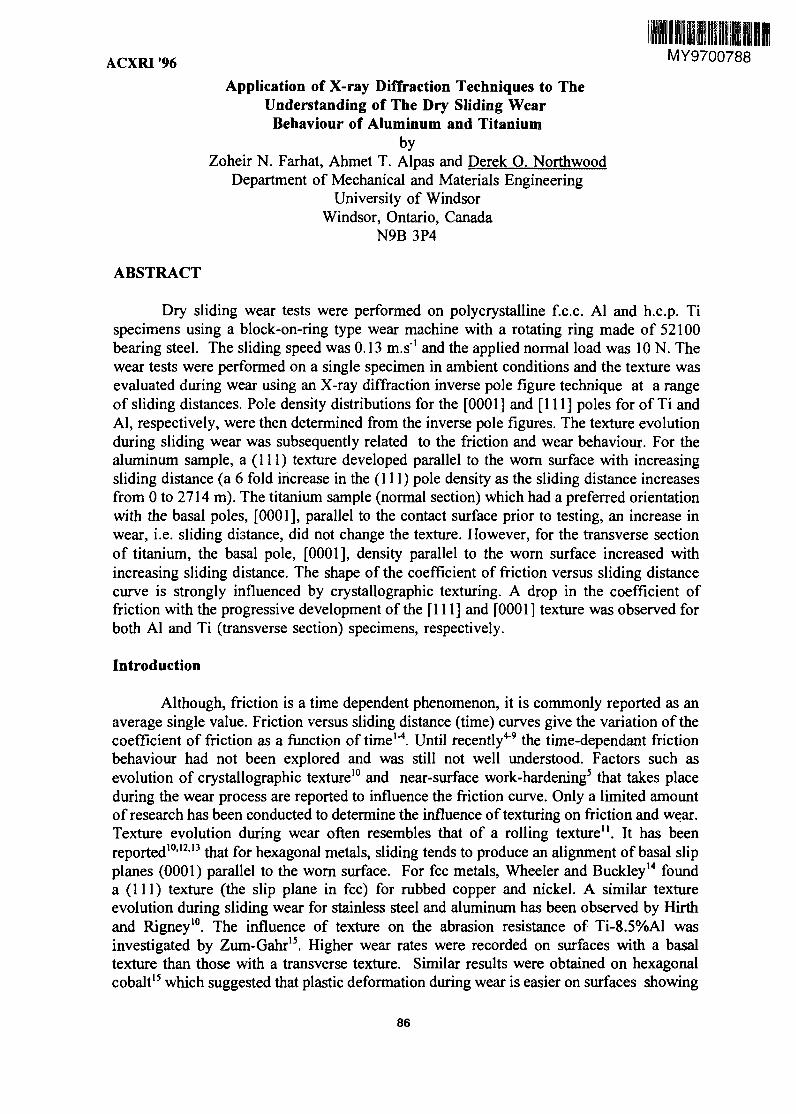
ACXRI '96 MY9700788
Application of X-ray Diffraction Techniques to TheUnderstanding of The Dry Sliding Wear
Behaviour of Aluminum and Titaniumby
Zoheir N. Farhat, Ahmet T. Alpas and Derek O. NorthwoodDepartment of Mechanical and Materials Engineering
University of WindsorWindsor, Ontario, Canada
N9B 3P4
ABSTRACT
Dry sliding wear tests were performed on polycrystalline f.c.c. Al and h.c.p. Tispecimens using a block-on-ring type wear machine with a rotating ring made of 52100bearing steel. The sliding speed was 0.13 m.s1 and the applied normal load was ION. Thewear tests were performed on a single specimen in ambient conditions and the texture wasevaluated during wear using an X-ray diffraction inverse pole figure technique at a rangeof sliding distances. Pole density distributions for the [0001] and [111] poles for of Ti andAl, respectively, were then determined from the inverse pole figures. The texture evolutionduring sliding wear was subsequently related to the friction and wear behaviour. For thealuminum sample, a (111) texture developed parallel to the worn surface with increasingsliding distance (a 6 fold increase in the (111) pole density as the sliding distance increasesfrom 0 to 2714 m). The titanium sample (normal section) which had a preferred orientationwith the basal poles, [0001], parallel to the contact surface prior to testing, an increase inwear, i.e. sliding distance, did not change the texture. However, for the transverse sectionof titanium, the basal pole, [0001], density parallel to the worn surface increased withincreasing sliding distance. The shape of the coefficient of friction versus sliding distancecurve is strongly influenced by crystallographic texturing. A drop in the coefficient offriction with the progressive development of the [111] and [0001] texture was observed forboth Al and Ti (transverse section) specimens, respectively.
Introduction
Although, friction is a time dependent phenomenon, it is commonly reported as anaverage single value. Friction versus sliding distance (time) curves give the variation of thecoefficient of friction as a function of time1"4. Until recently4'9 the time-dependant frictionbehaviour had not been explored and was still not well understood. Factors such asevolution of crystallographic texture10 and near-surface work-hardening5 that takes placeduring the wear process are reported to influence the friction curve. Only a limited amountof research has been conducted to determine the influence of texturing on friction and wear.Texture evolution during wear often resembles that of a rolling texture11. It has beenreported101213 that for hexagonal metals, sliding tends to produce an alignment of basal slipplanes (0001) parallel to the worn surface. For fee metals, Wheeler and Buckley14 founda (111) texture (the slip plane in fee) for rubbed copper and nickel. A similar textureevolution during sliding wear for stainless steel and aluminum has been observed by Hirthand Rigney10. The influence of texture on the abrasion resistance of Ti-8.5%A1 wasinvestigated by Zum-Gahr15. Higher wear rates were recorded on surfaces with a basaltexture than those with a transverse texture. Similar results were obtained on hexagonalcobalt15 which suggested that plastic deformation during wear is easier on surfaces showing
86
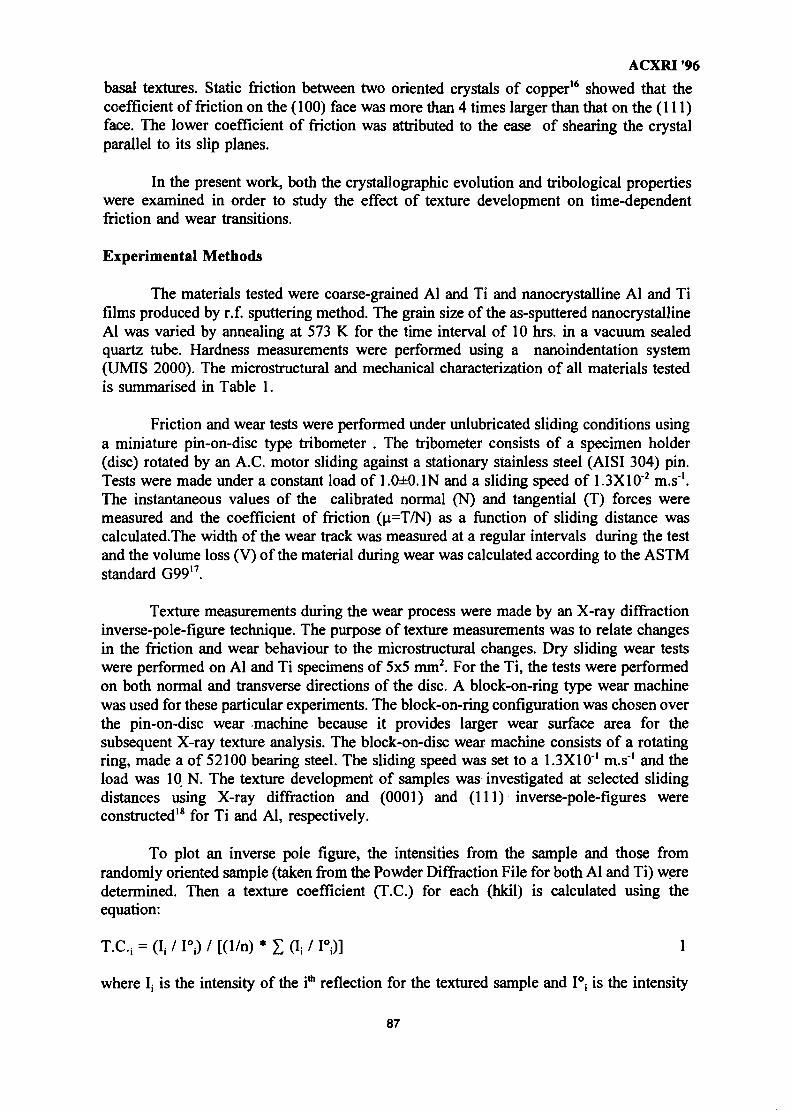
ACXRI '96
basal textures. Static friction between two oriented crystals of copper16 showed that thecoefficient of friction on the (100) face was more than 4 times larger than that on the (111)face. The lower coefficient of friction was attributed to the ease of shearing the crystalparallel to its slip planes.
In the present work, both the crystallographic evolution and tribological propertieswere examined in order to study the effect of texture development on time-dependentfriction and wear transitions.
Experimental Methods
The materials tested were coarse-grained Al and Ti and nanocrystalline Al and Tifilms produced by r.f. sputtering method. The grain size of the as-sputtered nanocrystallineAl was varied by annealing at 573 K for the time interval of 10 hrs. in a vacuum sealedquartz tube. Hardness measurements were performed using a nanoindentation system(UMIS 2000). The microstructural and mechanical characterization of all materials testedis summarised in Table 1.
Friction and wear tests were performed under unlubricated sliding conditions usinga miniature pin-on-disc type tribometer . The tribometer consists of a specimen holder(disc) rotated by an A.C. motor sliding against a stationary stainless steel (AISI 304) pin.Tests were made under a constant load of 1.0±0.1N and a sliding speed of 1.3X10'2 m.s"1.The instantaneous values of the calibrated normal (N) and tangential (T) forces weremeasured and the coefficient of friction (u=T/N) as a function of sliding distance wascalculated.The width of the wear track was measured at a regular intervals during the testand the volume loss (V) of the material during wear was calculated according to the ASTMstandard G9917.
Texture measurements during the wear process were made by an X-ray diffractioninverse-pole-figure technique. The purpose of texture measurements was to relate changesin the friction and wear behaviour to the microstructural changes. Dry sliding wear testswere performed on Al and Ti specimens of 5x5 mm2. For the Ti, the tests were performedon both normal and transverse directions of the disc. A block-on-ring type wear machinewas used for these particular experiments. The block-on-ring configuration was chosen overthe pin-on-disc wear machine because it provides larger wear surface area for thesubsequent X-ray texture analysis. The block-on-disc wear machine consists of a rotatingring, made a of 52100 bearing steel. The sliding speed was set to a 1.3X10' m.s"1 and theload was 10 N. The texture development of samples was investigated at selected slidingdistances using X-ray diffraction and (0001) and (111) inverse-pole-figures wereconstructed18 for Ti and Al, respectively.
To plot an inverse pole figure, the intensities from the sample and those fromrandomly oriented sample (taken from the Powder Diffraction File for both Al and Ti) weredetermined. Then a texture coefficient (T.C.) for each (hkil) is calculated using theequation:
where If is the intensity of the i* reflection for the textured sample and I°j is the intensity
87
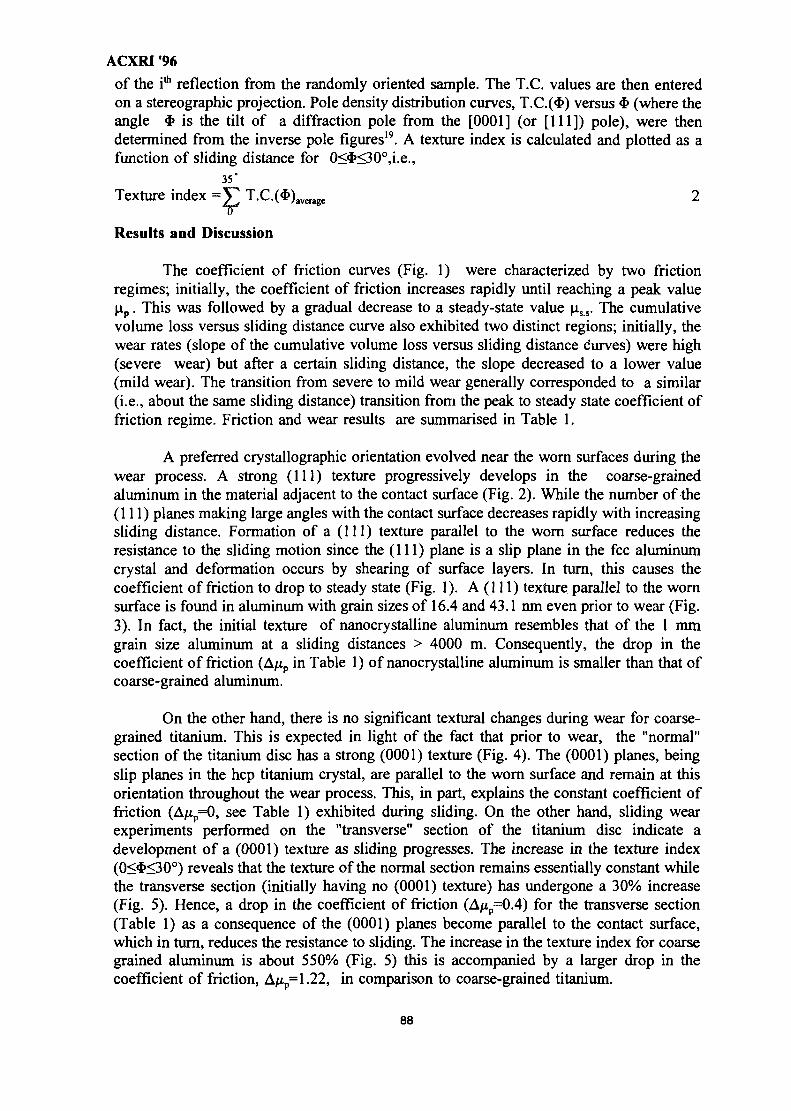
ACXRI '96
of the i* reflection from the randomly oriented sample. The T.C. values are then enteredon a stereographic projection. Pole density distribution curves, T.C.(#) versus $ (where theangle * is the tilt of a diffraction pole from the [0001] (or [111]) pole), were thendetermined from the inverse pole figures19. A texture index is calculated and plotted as afunction of sliding distance for 0<$<30°,i.e.,
35°
Texture index =J] T.C.(#)average 2
Results and Discussion
The coefficient of friction curves (Fig. 1) were characterized by two frictionregimes; initially, the coefficient of friction increases rapidly until reaching a peak value| i p . This was followed by a gradual decrease to a steady-state value \iss. The cumulativevolume loss versus sliding distance curve also exhibited two distinct regions; initially, thewear rates (slope of the cumulative volume loss versus sliding distance curves) were high(severe wear) but after a certain sliding distance, the slope decreased to a lower value(mild wear). The transition from severe to mild wear generally corresponded to a similar(i.e., about the same sliding distance) transition from the peak to steady state coefficient offriction regime. Friction and wear results are summarised in Table 1.
A preferred crystallographic orientation evolved near the worn surfaces during thewear process. A strong (111) texture progressively develops in the coarse-grainedaluminum in the material adjacent to the contact surface (Fig. 2). While the number of the(111) planes making large angles with the contact surface decreases rapidly with increasingsliding distance. Formation of a (111) texture parallel to the worn surface reduces theresistance to the sliding motion since the (111) plane is a slip plane in the fee aluminumcrystal and deformation occurs by shearing of surface layers. In turn, this causes thecoefficient of friction to drop to steady state (Fig. 1). A (111) texture parallel to the wornsurface is found in aluminum with grain sizes of 16.4 and 43.1 nm even prior to wear (Fig.3). In fact, the initial texture of nanocrystalline aluminum resembles that of the 1 mmgrain size aluminum at a sliding distances > 4000 m. Consequently, the drop in thecoefficient of friction (A/np in Table 1) of nanocrystalline aluminum is smaller than that ofcoarse-grained aluminum.
On the other hand, there is no significant textural changes during wear for coarse-grained titanium. This is expected in light of the fact that prior to wear, the "normal"section of the titanium disc has a strong (0001) texture (Fig. 4). The (0001) planes, beingslip planes in the hep titanium crystal, are parallel to the worn surface and remain at thisorientation throughout the wear process. This, in part, explains the constant coefficient offriction (Ajtp=0, see Table 1) exhibited during sliding. On the other hand, sliding wearexperiments performed on the "transverse" section of the titanium disc indicate adevelopment of a (0001) texture as sliding progresses. The increase in the texture index(0<$<30°) reveals that the texture of the normal section remains essentially constant whilethe transverse section (initially having no (0001) texture) has undergone a 30% increase(Fig. 5). Hence, a drop in the coefficient of friction (A/x^O.4) for the transverse section(Table 1) as a consequence of the (0001) planes become parallel to the contact surface,which in turn, reduces the resistance to sliding. The increase in the texture index for coarsegrained aluminum is about 550% (Fig. 5) this is accompanied by a larger drop in thecoefficient of friction, A/*p=1.22, in comparison to coarse-grained titanium.
88
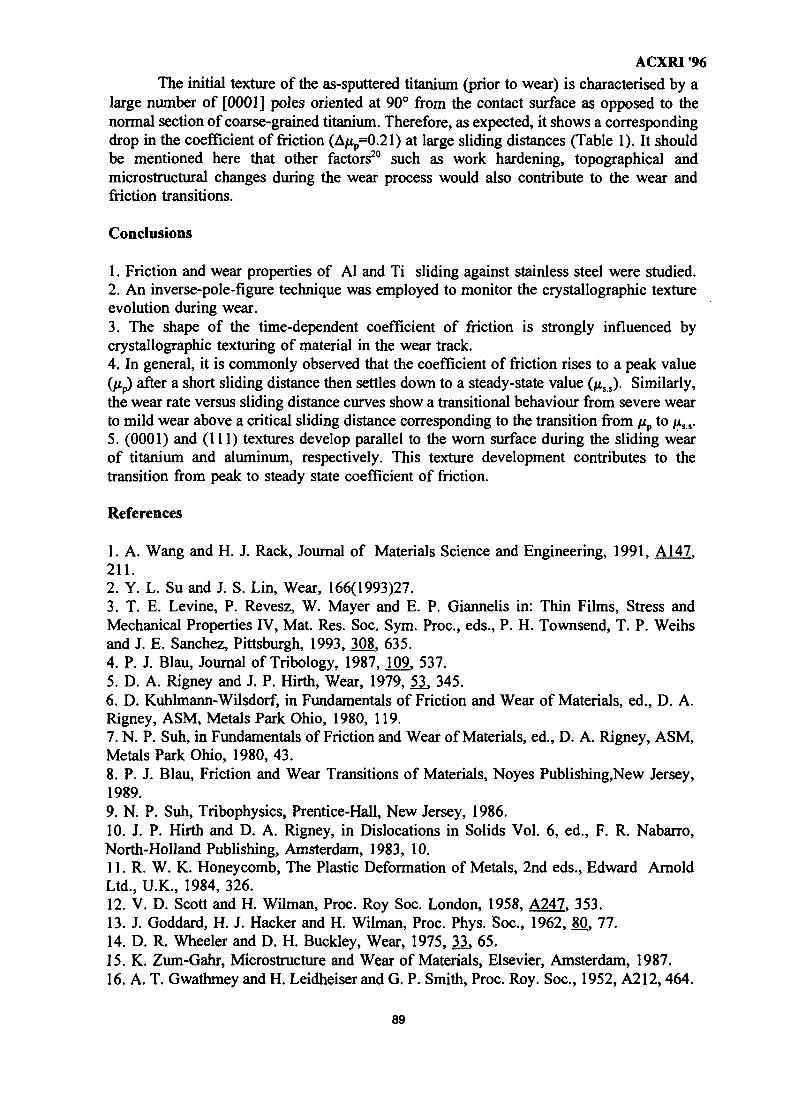
ACXRI '96The initial texture of the as-sputtered titanium (prior to wear) is characterised by a
large number of [0001] poles oriented at 90° from the contact surface as opposed to thenormal section of coarse-grained titanium. Therefore, as expected, it shows a correspondingdrop in the coefficient of friction (Ajnp=0.21) at large sliding distances (Table 1). It shouldbe mentioned here that other factors20 such as work hardening, topographical andmicrostructural changes during the wear process would also contribute to the wear andfriction transitions.
Conclusions
1. Friction and wear properties of Al and Ti sliding against stainless steel were studied.2. An inverse-pole-figure technique was employed to monitor the crystallographic textureevolution during wear.3. The shape of the time-dependent coefficient of friction is strongly influenced bycrystallographic texturing of material in the wear track.4. In general, it is commonly observed that the coefficient of friction rises to a peak value(pip) after a short sliding distance then settles down to a steady-state value (/xs s). Similarly,the wear rate versus sliding distance curves show a transitional behaviour from severe wearto mild wear above a critical sliding distance corresponding to the transition from /JIP to fxss.5. (0001) and (111) textures develop parallel to the worn surface during the sliding wearof titanium and aluminum, respectively. This texture development contributes to thetransition from peak to steady state coefficient of friction.
References
1. A. Wang and H. J. Rack, Journal of Materials Science and Engineering, 1991, A147.211.2. Y. L. Su and J. S. Lin, Wear, 166(1993)27.3. T. E. Levine, P. Revesz, W. Mayer and E. P. Giannelis in: Thin Films, Stress andMechanical Properties IV, Mat. Res. Soc. Sym. Proa, eds., P. H. Townsend, T. P. Weihsand J. E. Sanchez, Pittsburgh, 1993, 308, 635.4. P. J. Blau, Journal of Tribology, 1987,109, 537.5. D. A. Rigney and J. P. Hirth, Wear, 1979, 53, 345.6. D. Kuhlmann-Wilsdorf, in Fundamentals of Friction and Wear of Materials, ed., D. A.Rigney, ASM, Metals Park Ohio, 1980, 119.7. N. P. Suh, in Fundamentals of Friction and Wear of Materials, ed., D. A. Rigney, ASM,Metals Park Ohio, 1980, 43.8. P. J. Blau, Friction and Wear Transitions of Materials, Noyes Publishing.New Jersey,1989.9. N. P. Suh, Tribophysics, Prentice-Hall, New Jersey, 1986.10. J. P. Hirth and D. A. Rigney, in Dislocations in Solids Vol. 6, ed., F. R. Nabarro,North-Holland Publishing, Amsterdam, 1983, 10.11. R. W. K. Honeycomb, The Plastic Deformation of Metals, 2nd eds., Edward ArnoldLtd., U.K., 1984, 326.12. V. D. Scott and H. Wilman, Proc. Roy Soc. London, 1958, A247. 353.13. J. Goddard, H. J. Hacker and H. Wilman, Proc. Phys. Soc, 1962, 80, 77.14. D. R. Wheeler and D. H. Buckley, Wear, 1975, 33, 65.15. K. Zum-Gahr, Microstructure and Wear of Materials, Elsevier, Amsterdam, 1987.16. A. T. Gwathmey and H. Leidheiser and G. P. Smith, Proc. Roy. Soc, 1952, A212,464.
89
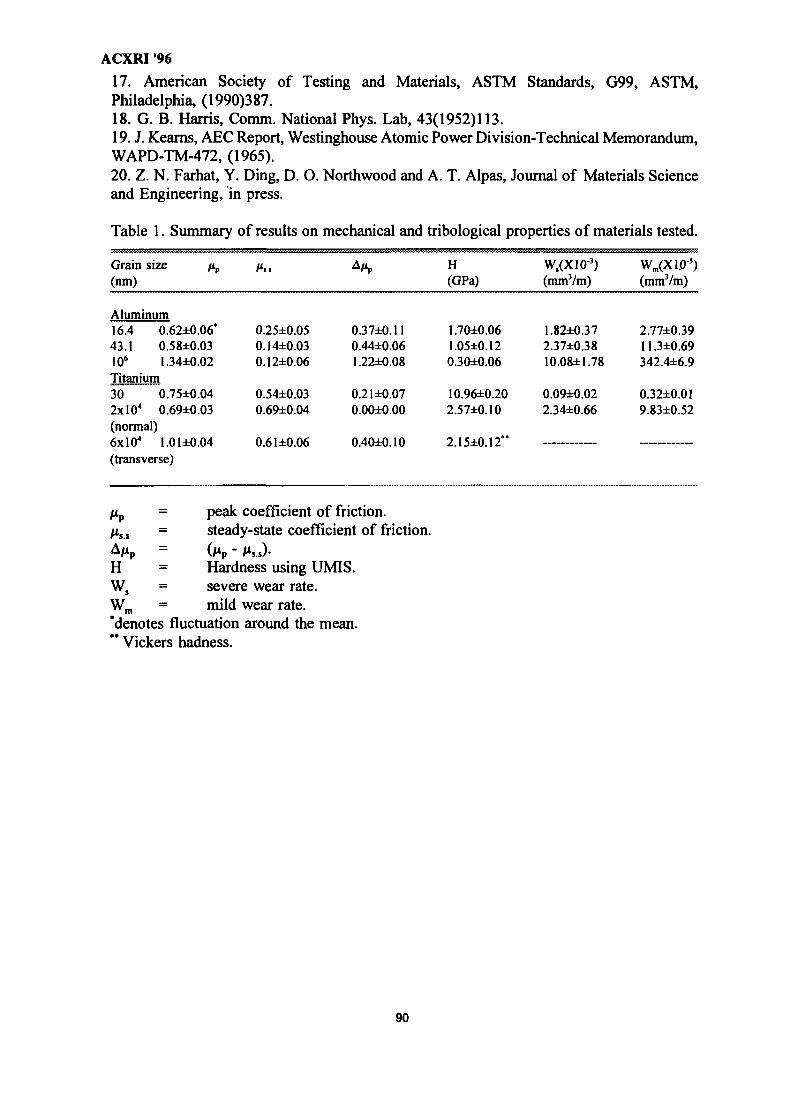
ACXRI '96
17. American Society of Testing and Materials, ASTM Standards, G99, ASTM,Philadelphia, (1990)387.18. G. B. Harris, Comm. National Phys. Lab, 43(1952)113.19. J. Kearns, AEC Report, Westinghouse Atomic Power Division-Technical Memorandum,WAPD-TM-472, (1965).20. Z. N. Farhat, Y. Ding, D. O. Northwood and A. T. Alpas, Journal of Materials Scienceand Engineering, in press.
Table 1. Summary of results on mechanical and tribological properties of materials tested.
Grain size /xp
(nm)
Aluminum16.4 0.62±0.06*43.1 O.58±O.O3106 1.34±0.02Titanium30 0.75±0.042xlO4 0.69±0.03(normal)6xlO4 1.01 ±0.04(transverse)
0.25±0.050.14±0.030.12±0.06
0.54±0.030.69±0.04
0.61 ±0.06
0.37±0.110.44±0.061.22±0.08
0.21±0.070.00±0.00
0.40±0.10
H(GPa)
1.70±0.061.05±0.120.30±0.06
10.96±0.202.57±0.10
2.15±0.12"
W,(X10'3)(mm3/m)
1.82±0.372.37±0.3810.08±1.78
0.09±0.022.34±0.66
W.CXIKT5)(mm3/m)
2.77±0.39U.3±0.69342.4±6.9
0.32±0.019.83±0.52
Ms.s
peak coefficient of friction,steady-state coefficient of friction.
HW,
= Hardness using UMIS.= severe wear rate.
Wm = mild wear rate,'denotes fluctuation around the mean." Vickers hadness.
90
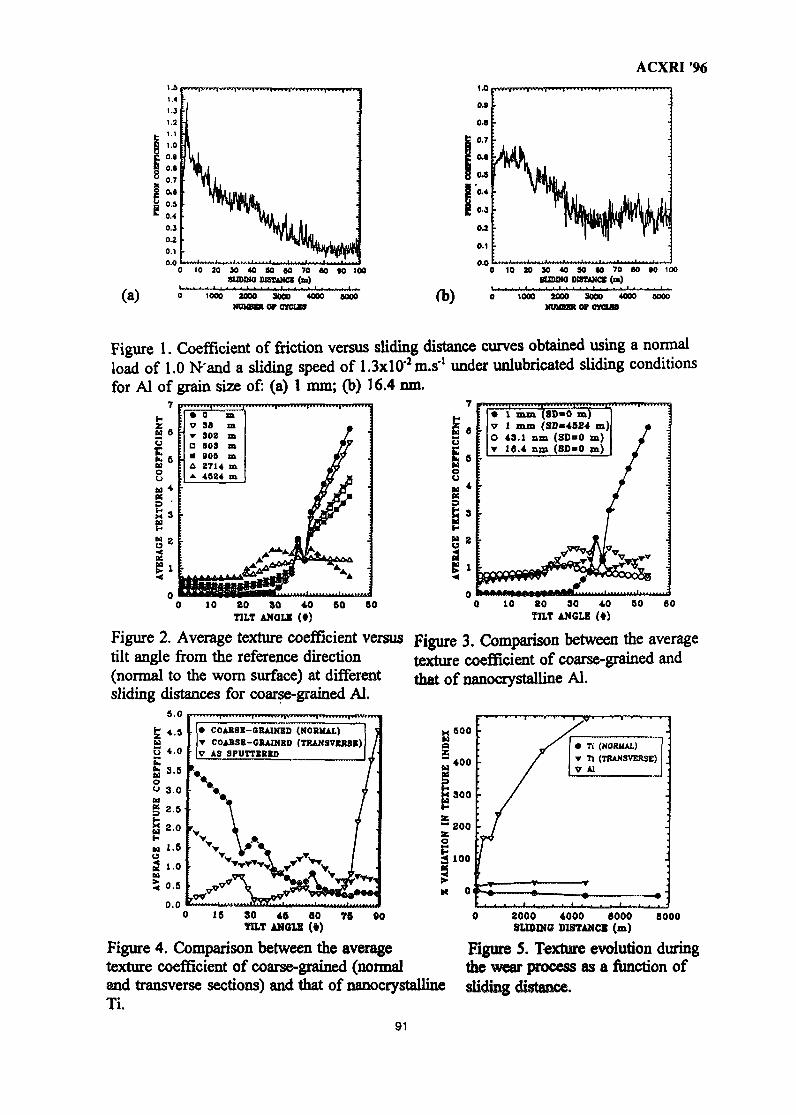
ACXRI '96
(a)
20 30 40 SO 60 70 80 »0 1003UDM0 WUgCt (m)
1000 2000 3000 4000Ninon* or cma»
4000
10 20 30 40 SO «0 70 60 »0 100SUSINO DffltUJCB (m)
1000 2000 9000 4000XIMEBB OF CW3JB
8000
Figure 1.load of 1for Al of
Coefficient of friction versus sliding distance curves obtained using a normal^m.s'1 under unlubricated sliding conditions0 N-'and a sliding speed of
grain size of: (a) 1 mm; (b) 16.4 nm.
S
i2
•
• 1 mm (8D«0 m)7 1 mm (SD>4524 m)O 43.1 nm (SD«0 m)T IS.4 nm (SD»0 m)
/ •
SooSs
10 20 30 40 60 60 10 SO 30 40 60 00
ANGLE (•>TILT ANGLE (•)
Figure 2. Average texture coefficient versus Figure 3. Comparison between the averagetilt angle from the reference direction texture coefficient of coarse-grained and(normal to the worn surface) at different && of nanocrystalline Al.sliding distances for coarse-grained Al.
5.0
uU 4.0
0.0
• C0AKSI-GRAIN8D (N0B1OL)T COABSB-GEAINSD (TRANSVKRSI)V AS SPUTTKBKD
• Ti (NORMAL]T Tl (TRANSVERSE)V Al
15 30 46 SO 76TILT ANGLE («)
2000 4000 6000SLIDING DISTANCE (m)
6000
Figure 4. Comparison between the average Figure 5. Texture evolution duringtexture coefficient of coarse-grained (normal the wear process as a function ofand transverse sections) and that of nanocrystalline sliding distance.Ti.
91
MY9700789ACXRI '96APPLICATION OF X-RAY METHOD FOR MEASURING INTERNAL STRESS IN
THE GEAR TEETH SURFACE LAYER
Tadeusz ZABOROWSKIInstitute for Scientific Research and Expertises
66-400 Gorzow Wlkp., St . Lokietka 29, Poland
ABSTRACT
This paper presents the methodics of the internal stress measurements concerning thecylindrical gear teeth of involute profile. There are the method selected, relation betweenstress and strain presented and conditions of investigation discussed in the study, includingpreparation of samples for investigation and conditions of the strain measurement.Exemplifying results of stress measurements for teeth of gears made of 40H steel areshown. Suitability of the developed investigation method is indicated.
1. INTRODUCTION
Some difficulties exist when measuring internal stresses in a gear teeth. Therefore theX-ray method should be employed to measure them. This method is a time-consuming onebut it enables to have results of measurement along and deep into an involute profile at atooth point, reference diameter and tooth root. Obtained measurement results make itpossible to evaluate a stress value, sign and pattern. That is why assuming specificmethodics for internal stress measurements is so important.
2. METHODICS OF INTERNAL STRESS MEASUREMENTS
2.1. Selection of a measurement method
Considering a sample profile (a gear teeth), the measurements of a strain wereperformed with X-ray method.
The following relationship [4] was used when measuring a distortion of a crystallattice:
j (1)a
where:A0 = 0 - 0 r )
0 - Bragg angle0O - angle of deflection for the undistorted latticed - interplanar distance
To ensure an adequate accuracy of the distortion measurements a family of the latticeplanes was chosen which had given the deflection of the X-ray beam for Bragg anglessituated above 75 grades in the 0 scale. For the crystal lattice of the Fea iron thiscondition can be accomplished with employment of radiation emitted by the X-ray tubewith the chromium anticathode and by the measurement of diffraction at planes with {211}
92
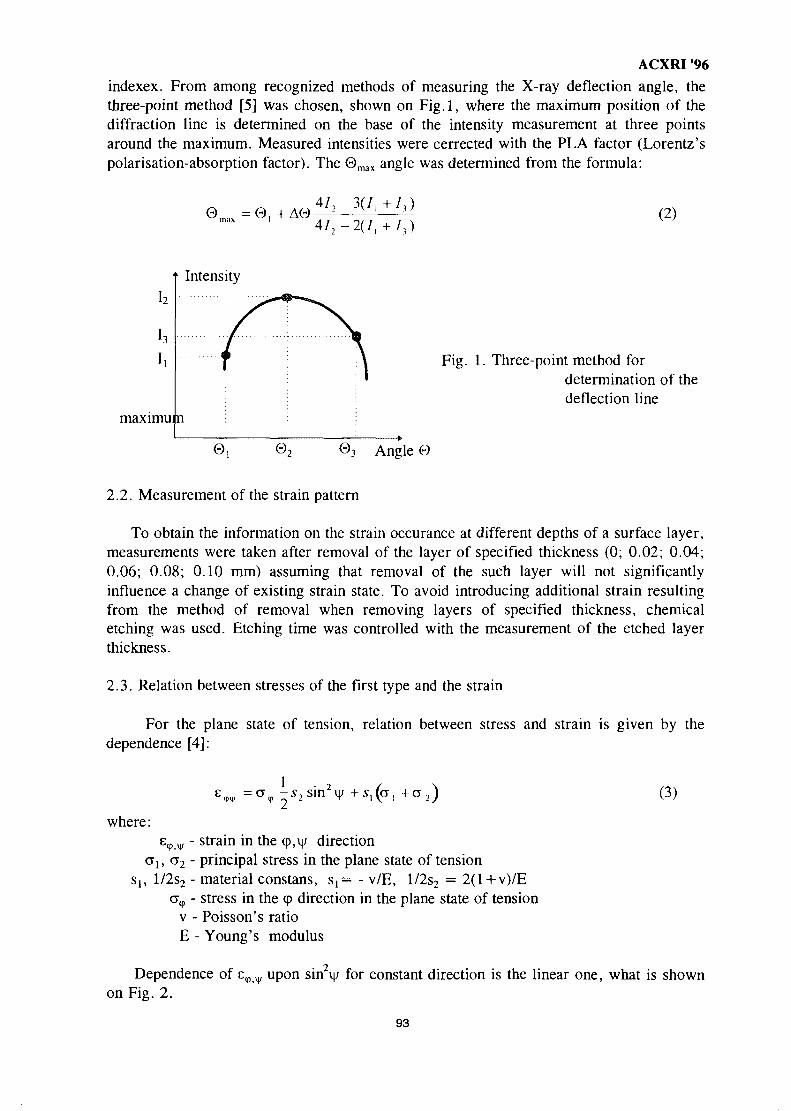
ACXRI '96
indexex. From among recognized methods of measuring the X-ray deflection angle, thethree-point method [5] was chosen, shown on Fig.l, where the maximum position of thediffraction line is determined on the base of the intensity measurement at three pointsaround the maximum. Measured intensities were cerrected with the PLA factor (Lorentz'spolarisation-absorption factor). The 0max angle was determined from the formula:
0 raax=0, A04/2 3(7,
(2)
• Intensity
h
hI.
maximum
Fig. 1. Three-point method fordetermination of thedeflection line
©, 0 3 Angle 0
2.2. Measurement of the strain pattern
To obtain the information on the strain occurance at different depths of a surface layer,measurements were taken after removal of the layer of specified thickness (0; 0.02; 0.04;0.06; 0.08; 0.10 mm) assuming that removal of the such layer will not significantlyinfluence a change of existing strain state. To avoid introducing additional strain resultingfrom the method of removal when removing layers of specified thickness, chemicaletching was used. Etching time was controlled with the measurement of the etched layerthickness.
2.3. Relation between stresses of the first type and the strain
For the plane state of tension, relation between stress and strain is given by thedependence [4]:
where:e,p_v - strain in the cp,v direction
a b a2 - principal stress in the plane state of tensionSj, l/2s2 - material constans, s,= - v/E, l/2s2 = 2(l+v)/E
a,,, - stress in the <p direction in the plane state of tensionv - Poisson's ratioE - Young's modulus
(3)
Dependence of eon Fig. 2.
upon sin2\\i for constant direction is the linear one, what is shown
93
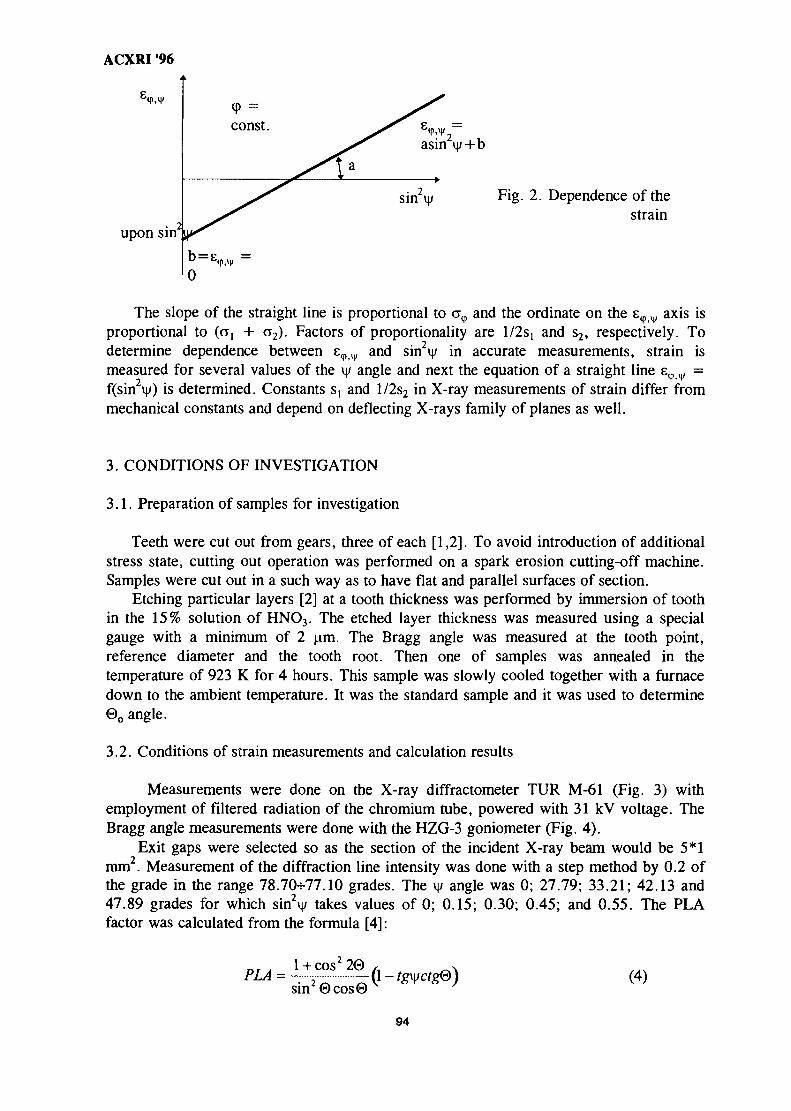
ACXRI '96
upon sin'
pv2asin vy+b
Fig. 2. Dependence of thestrain
The slope of the straight line is proportional to a,,, and the ordinate on the s^ v axis isproportional to (c^ + a2). Factors of proportionality are l/2sj and s2, respectively. Todetermine dependence between £<pi|/ and sin2i|/ in accurate measurements, strain ismeasured for several values of the \\) angle and next the equation of a straight line £<p v =f(sin2vj;) is determined. Constants st and l/2s2 in X-ray measurements of strain differ frommechanical constants and depend on deflecting X-rays family of planes as well.
3. CONDITIONS OF INVESTIGATION
3.1. Preparation of samples for investigation
Teeth were cut out from gears, three of each [1,2]. To avoid introduction of additionalstress state, cutting out operation was performed on a spark erosion cutting-off machine.Samples were cut out in a such way as to have flat and parallel surfaces of section.
Etching particular layers [2] at a tooth thickness was performed by immersion of toothin the 15% solution of HNO3. The etched layer thickness was measured using a specialgauge with a minimum of 2 urn. The Bragg angle was measured at the tooth point,reference diameter and the tooth root. Then one of samples was annealed in thetemperature of 923 K for 4 hours. This sample was slowly cooled together with a furnacedown to the ambient temperature. It was the standard sample and it was used to determine0O angle.
3.2. Conditions of strain measurements and calculation results
Measurements were done on the X-ray diffractometer TUR M-61 (Fig. 3) withemployment of filtered radiation of the chromium tube, powered with 31 kV voltage. TheBragg angle measurements were done with the HZG-3 goniometer (Fig. 4).
Exit gaps were selected so as the section of the incident X-ray beam would be 5*1mm2. Measurement of the diffraction line intensity was done with a step method by 0.2 ofthe grade in the range 78.70V77.10 grades. The \\i angle was 0; 27.79; 33.21; 42.13 and47.89 grades for which sinV takes values of 0; 0.15; 0.30; 0.45; and 0.55. The PLAfactor was calculated from the formula [4]:
PLA =1 +cos2 20
sin ©cos0(4)
94
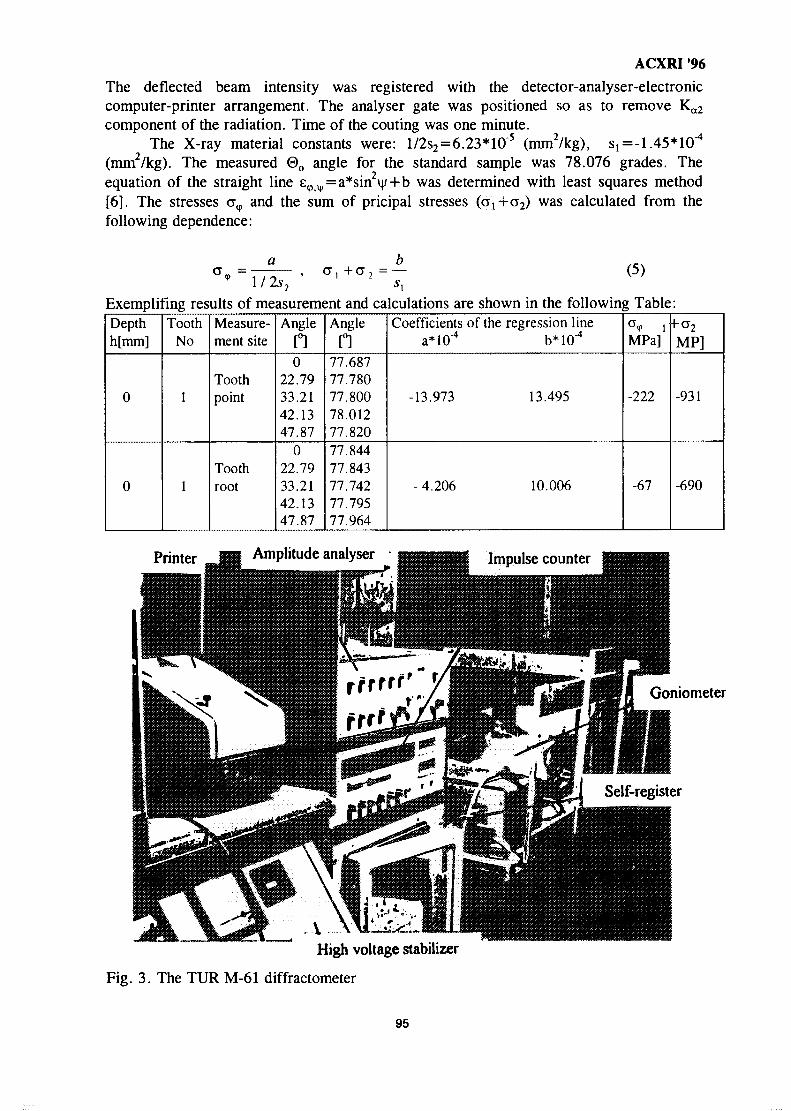
ACXRI '96
The deflected beam intensity was registered with the detector-analyser-electroniccomputer-printer arrangement. The analyser gate was positioned so as to remove K^component of the radiation. Time of the couting was one minute.
The X-ray material constants were: l/2s2=6.23*10"5 (mm2/kg), s,=-l.45*10"*(mm2/kg). The measured 0O angle for the standard sample was 78.076 grades. Theequation of the straight line e(pM,=a*sin2y+b was determined with least squares method[6]. The stresses a^ and the sum of pricipal stresses (crj+a2) was calculated from thefollowing dependence:
aa , +CT, = (5)
Exemplifing results of measurement and calculations are shown in the following Table:Depthh[mm]
0
0
ToothNo
1
1
Measure-ment site
Toothpoint
Toothroot
Angle[°]0
22.7933.2142.1347.87
022.7933.2142.1347.87
Angle[°]
77.68777.78077.80078.01277.82077.84477.84377.74277.79577.964
Coefficients of the regression linea*10"4 b*10"4
-13.973 13.495
- 4.206 10.006
CT«p lMPa]
-222
-67
MP]
-931
-690
Printer Amplitude analyser
Goniometer
Self-register
High voltage stabilizer
Fig. 3. The TUR M-61 diffractometer
95
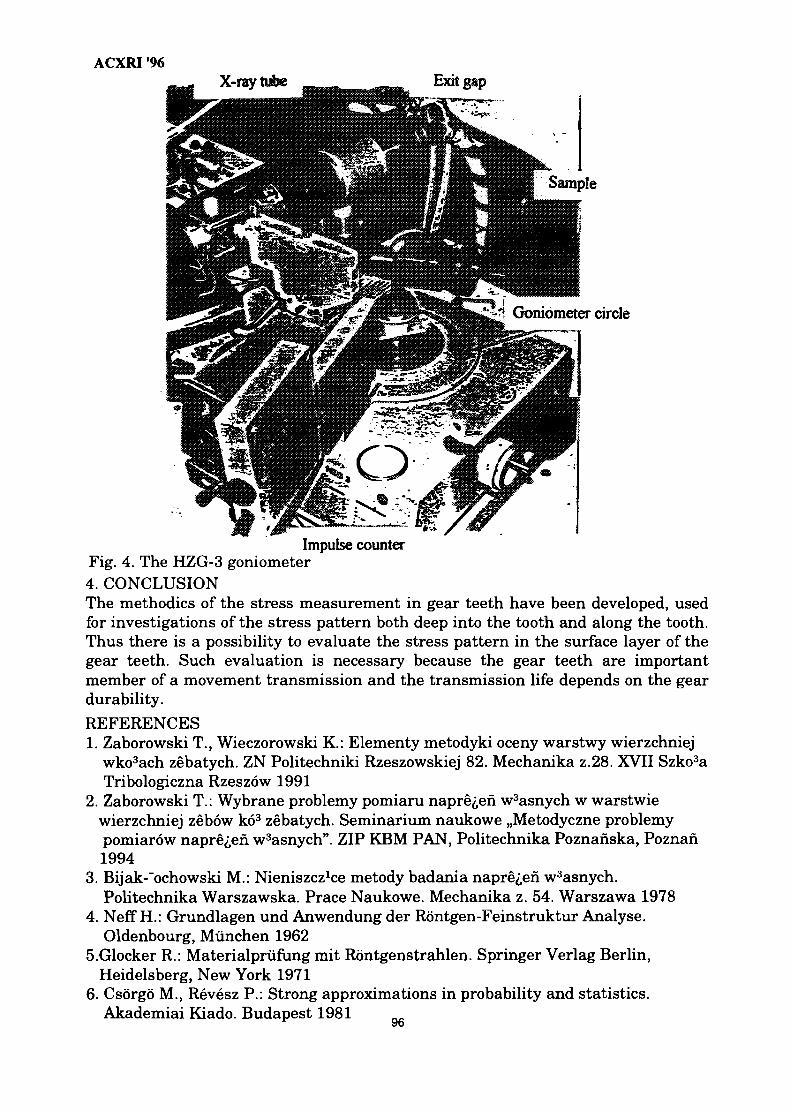
ACXRI '96X-ray tube Exit gap
Sample
Goniometer circle
Impulse counterFig. 4. The HZG-3 goniometer4. CONCLUSIONThe methodics of the stress measurement in gear teeth have been developed, usedfor investigations of the stress pattern both deep into the tooth and along the tooth.Thus there is a possibility to evaluate the stress pattern in the surface layer of thegear teeth. Such evaluation is necessary because the gear teeth are importantmember of a movement transmission and the transmission life depends on the geardurability.
REFERENCES1. Zaborowski T., Wieczorowski K.: Elementy metodyki oceny warstwy wierzchniej
wko3ach zebatych. ZN Politechniki Rzeszowskiej 82. Mechanika z.28. XVII Szko3aTribologiczna Rzeszow 1991
2. Zaborowski T.: Wybrane problemy pomiaru napre^efi w3asnych w warstwiewierzchniej zebow ko3 zebatych. Seminarium naukowe ,,Metodyczne problemypomiarow napre^en w3asnych". ZIP KBM PAN, Politechnika Poznanska, Poznan1994
3. Bijak-'ochowski M.: Nieniszcz^e metody badania napre^en w3asnych.Politechnika Warszawska. Prace Naukowe. Mechanika z. 54. Warszawa 1978
4. Neff H.: Grundlagen und Anwendung der Rontgen-Feinstruktur Analyse.Oldenbourg, Munchen 1962
5.Glocker R.: Materialpriifung mit Rontgenstrahlen. Springer Verlag Berlin,Heidelsberg, New York 1971
6. Csorgo M., Revesz P.: Strong approximations in probability and statistics.Akademiai Kiado. Budapest 1981
yo
ACXRI '96
immediately adjacent to a weld simply because the HAZ is left in a state of very high residualtensile stress as a result of the shrinkage and differential cooling occurring in most welds.Tensile stresses (residual or applied) are the main component of the stress corrosion crackingtriangle: the other two are a susceptible metal and an environment that often needs to be onlyslightly corrosive to that metal. For instance, grade 316 stainless steel is essentially inert tothe corrosive effect of common salt unless tensile stresses are present, when it becomes verysensitive to chloride induced SCC. There are a number of possible solutions. The obviousone is to change the environment, but that is rarely possible. The next is to change the metal,but usually that is expensive and if the equipment is already built, impractical. Thermalstress relieving is a partial solution at best because, to relieve all the tensile stresses in theHAZ, it is necessary for the heating to reach the annealing temperature and the materialproperties will be lost.
Corrosion engineers have long recognized that an effective solution for the retardationor even prevention of SCC is the introduction of compressive stresses in the HAZ. This canbe done using controlled shot peening. Surface residual tensile stresses in the HAZ mayapproach or even exceed the yield strength of the material but if the surface is shot peened,the dimpling action of the shot bombardment can reduce out the tensile stresses and evenreplace them with residual stresses that are in compression if properly done.
Hence, there is a clear need for accurate nondestructive residual stresscharacterization of welds to verify the residual stress state of weld HAZs in components thatmay be susceptible to SCC. This type of weld characterization can be performednondestructively on components that are already in service and ideally, on weldedcomponents before they go into service.
Advances in XRD TechnologyAccurate characterization of residual stresses in welds has been difficult and often
impractical since most residual stress measurement techniques are destructive and lack theresolution to accurately characterize the steep stress gradients that exist in weld HAZs.Recently, the measurement of residual stresses using x-ray diffraction techniques has becomeboth practical and efficient. In addition, the introduction of stress mapping techniques hasallowed the quick and precise characterization of entire welds, including areas of interest suchas steep stress gradients and their associated tensile residual stress maxima. The stress mapdisplay has given engineers a complete and accurate visual analysis of the magnitude anddistribution of residual stresses in their welded components.
Since surface stress measurements using x-ray diffraction techniques are non-contactand nondestructive, measurements can be performed at the same point before and after aprocess such as post weld heat treating or shot peening, so that residual stresses can becharacterized at all steps of the manufacturing process. This can help in the optimization ofthese manufacturing processes and the management of their associated residual stresses.
Measurement ApparatusThe residual stress measurements were performed at the Proto Mfg. Ltd. x-ray
diffraction laboratory and in the field using a dual solid state detector diffractometer withautomated stress mapping hardware and software.
98
ACXRI '96
Residual Stress Characterization of WeldsUsing X-Ray Diffraction Techniques
MY9700790James A. Pineault & Michael. E. Brauss
Proto Manufacturing Ltd.2175 Solar Cr., Oldcastle, Ontario, Canada
John S. EckersleyMetal Improvement Company
41200 Coca Cola Drive, Belleville, Michigan, U.S.A.
Abstract : Neglect of residual stresses created during welding processes can lead to stresscorrosion cracking, distortion, fatigue cracking, premature failures in components, andinstances of over design. Automated residual stress mapping and truly portable equipmenthave now made the characterization of residual stresses using x-ray diffraction (XRD)practical. The nondestructive nature of the x-ray diffraction technique has made the residualstress characterization of welds a useful tool for process optimization and failure analysis,particularly since components can be measured before and after welding and post weldingprocesses.
This paper illustrates the importance of residual stress characterization in welds andpresents examples where x-ray diffraction techniques were applied in the characterization ofvarious kinds of welds including arc welds, TIG welds, resistance welds, laser welds andelectron beam welds. Numerous techniques are available to help manage potentially harmfulresidual stresses created during the welding process thus, the effects of a few example postweld processes such as grinding, heat treating and shot peening are also addressed.
IntroductionThe advantages of XRD and three areas of concern regarding residual stress and weld
quality, stress corrosion cracking, fatigue, and stress concentrations, will be briefly discussed.
Fatigue and Stress ConcentrationsTensile residual stress fields created during the welding process often contribute to
decreases in the fatigue life of welded components, especially when they exist in the HAZ.The residual stress state existing in certain weld toes and undercuts can also be critical whenstress concentration geometries exist which can magnify the effects of applied loads. Whenissues of fatigue cracking are considered, potentially harmful tensile residual stresses alone orin combination with stress concentrations can lead to fatigue crack initiation and propagation.This means that accurate residual stress characterization must be performed in key areas suchas the toe and the HAZ of welds to understand fatigue failures, help in the experimentalverification of stress concentration factors predicted by finite element models and to reduceinstances of over-design and unneeded increases in weight.
Environmentally Assisted Weld CrackingAlso known as Stress Corrosion Cracking or SCC, environmentally assisted cracking
is a major source of potential failures in the process industries, in pulp mills, in storagevessels, and even in aircraft. Most often, SCC occurs in the heat affected zone (HAZ)
97
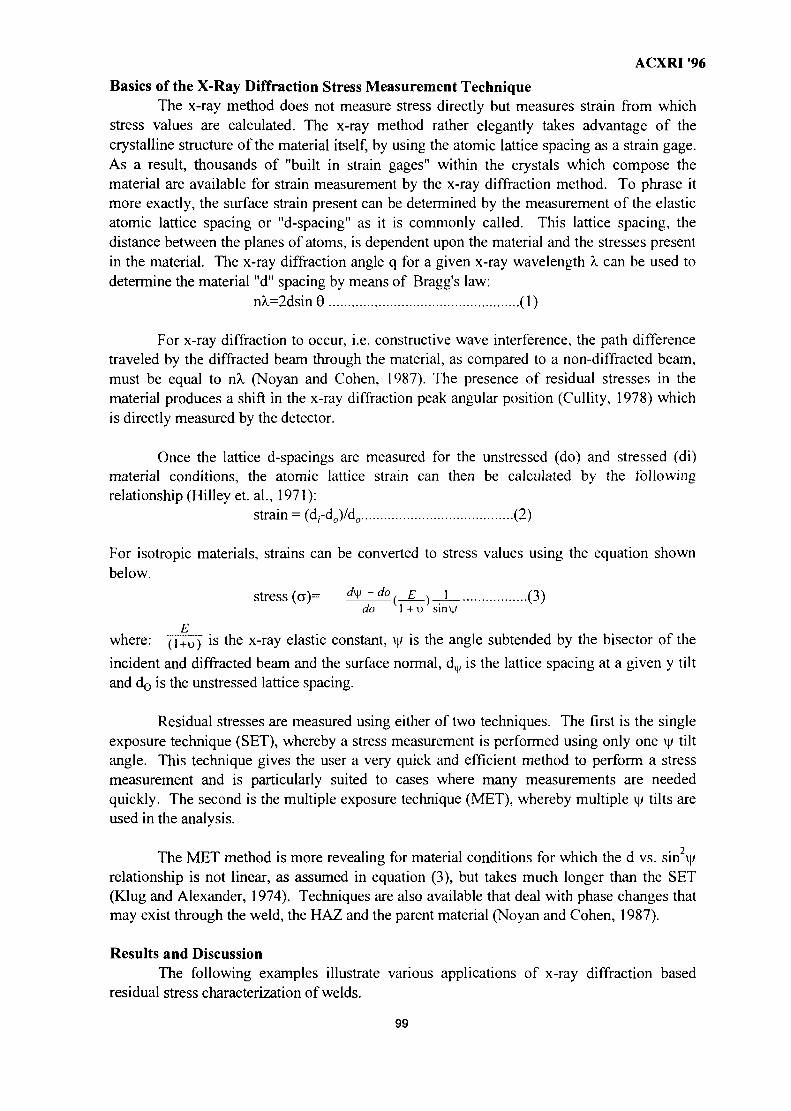
ACXRI '96
Basics of the X-Ray Diffraction Stress Measurement TechniqueThe x-ray method does not measure stress directly but measures strain from which
stress values are calculated. The x-ray method rather elegantly takes advantage of thecrystalline structure of the material itself, by using the atomic lattice spacing as a strain gage.As a result, thousands of "built in strain gages" within the crystals which compose thematerial are available for strain measurement by the x-ray diffraction method. To phrase itmore exactly, the surface strain present can be determined by the measurement of the elasticatomic lattice spacing or "d-spacing" as it is commonly called. This lattice spacing, thedistance between the planes of atoms, is dependent upon the material and the stresses presentin the material. The x-ray diffraction angle q for a given x-ray wavelength A. can be used todetermine the material "d" spacing by means of Bragg's law:
nX=2dsin9 (1)
For x-ray diffraction to occur, i.e. constructive wave interference, the path differencetraveled by the diffracted beam through the material, as compared to a non-diffracted beam,must be equal to nX. (Noyan and Cohen, 1987). The presence of residual stresses in thematerial produces a shift in the x-ray diffraction peak angular position (Cullity, 1978) whichis directly measured by the detector.
Once the lattice d-spacings are measured for the unstressed (do) and stressed (di)material conditions, the atomic lattice strain can then be calculated by the followingrelationship (Hilley et. al., 1971):
strain = (d,-do)/do (2)
For isotropic materials, strains can be converted to stress values using the equation shownbelow.
stress (a)= ^ - ^ ( _ ^ ) _ j _ (3)do 1 +u siny
£
where: (i+u) ls the x-ray elastic constant, \\i is the angle subtended by the bisector of theincident and diffracted beam and the surface normal, dM, is the lattice spacing at a given y tiltand do is the unstressed lattice spacing.
Residual stresses are measured using either of two techniques. The first is the singleexposure technique (SET), whereby a stress measurement is performed using only one \\i tiltangle. This technique gives the user a very quick and efficient method to perform a stressmeasurement and is particularly suited to cases where many measurements are neededquickly. The second is the multiple exposure technique (MET), whereby multiple vj/ tilts areused in the analysis.
The MET method is more revealing for material conditions for which the d vs. sin \\irelationship is not linear, as assumed in equation (3), but takes much longer than the SET(Klug and Alexander, 1974). Techniques are also available that deal with phase changes thatmay exist through the weld, the HAZ and the parent material (Noyan and Cohen, 1987).
Results and DiscussionThe following examples illustrate various applications of x-ray diffraction based
residual stress characterization of welds.
99

ACXRI '96
Arc Welded Monorail Box GirderAn area of concern in the installation of monorail girders is the residual stresses due
to welds. These are of particular interest because high stress gradients can be created by thelarge amounts of differential heating and cooling inherent in the welding process. A stressgradient profile was performed across a weld splice where two monorail girders were weldedtogether.
This particular section of the box girder was also heat straightened. Looking atFigure 1 reveals the tensile stresses in the weld and in the heat straightened area and how theyare different from the baseline compressive residual stresses in the parent material. Theseareas of tensile residual stress will be susceptible to SCC and fatigue cracking. The effect ofthe tensile residual stresses will be increased since the rolling stock passing over theselocations will add an additional tensile load to the already tensile residual stress state at theselocations.
Laser Welded Stainless Steel PipeThe residual stresses in a 316 stainless steel pipe that was laser welded were mapped
through the weld and parent material. The concern was that the laser weld had created tensileresidual stress levels near yield which could decrease the burst strength of the pipe while inservice.
The residual stress map in Figure 2 reveals a slightly tensile residual stress field in thecenter of the laser weld. If this section of pipe were placed in service, the tensile residualstress maxima already existing in the center of the weld would be increased even more so dueto the applied stress of the working pressure on the pipe thus making this area highlysusceptible to SCC. Should SCC be a concern, some post weld residual stress managementprocess would be recommended to introduce compressive surface stresses in the weld andHAZ.
Electron Beam Welded InconelResidual stress profiles were measured at the surface and at depth in the weld metal,
in the heat affected zone and on the parent material of an Inconel sample that was electronbeam welded. Because the surface of the weld and the adjacent parent material weremachined, surface measurements were affected significantly by the cold working of thematerial (see Figure 3).
Here tensile residual stress maxima exist in the center of the weld. These stressesshould also be managed to increase the service life of this weld.
Resistance Welded Stainless Steel Saw BladesStainless steel band saw blades, resistance welded, "annealed" and ground were
failing prematurely under normal service. It was suspected that residual stresses createdduring the welding, post welding heat treatment and grinding processes were causing thefailure.
Residual stress mapping techniques were used to identify at which stage in theprocess harmful residual stresses were introduced. Figures 4, 5 and 6 show blades in thewelded, welded and heat treated, and welded, heat treated and ground conditions respectively.
100
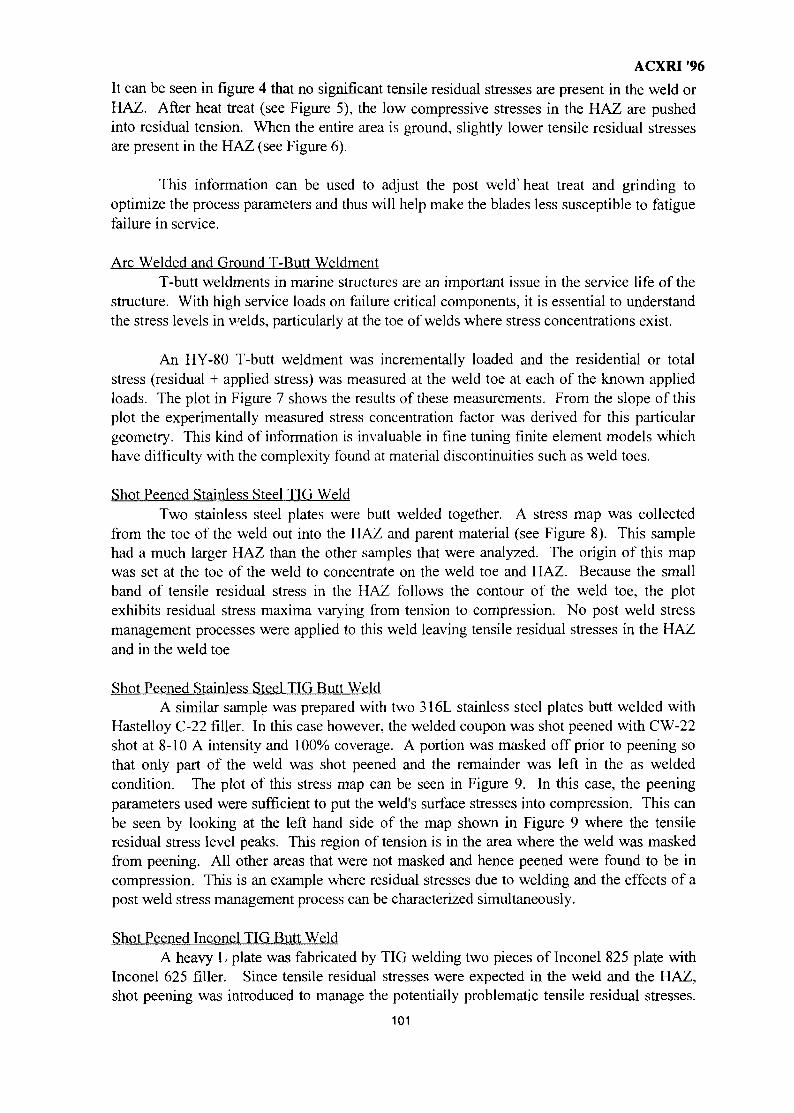
ACXRI '96
It can be seen in figure 4 that no significant tensile residual stresses are present in the weld orHAZ. After heat treat (see Figure 5), the low compressive stresses in the HAZ are pushedinto residual tension. When the entire area is ground, slightly lower tensile residual stressesare present in the HAZ (see Figure 6).
This information can be used to adjust the post weld' heat treat and grinding tooptimize the process parameters and thus will help make the blades less susceptible to fatiguefailure in service.
Arc Welded and Ground T-Butt WeldmentT-butt weldments in marine structures are an important issue in the service life of the
structure. With high service loads on failure critical components, it is essential to understandthe stress levels in welds, particularly at the toe of welds where stress concentrations exist.
An HY-80 T-butt weldment was incrementally loaded and the residential or totalstress (residual + applied stress) was measured at the weld toe at each of the known appliedloads. The plot in Figure 7 shows the results of these measurements. From the slope of thisplot the experimentally measured stress concentration factor was derived for this particulargeometry. This kind of information is invaluable in fine tuning finite element models whichhave difficulty with the complexity found at material discontinuities such as weld toes.
Shot Peened Stainless Steel TIG WeldTwo stainless steel plates were butt welded together. A stress map was collected
from the toe of the weld out into the HAZ and parent material (see Figure 8). This samplehad a much larger HAZ than the other samples that were analyzed. The origin of this mapwas set at the toe of the weld to concentrate on the weld toe and HAZ. Because the smallband of tensile residual stress in the HAZ follows the contour of the weld toe, the plotexhibits residual stress maxima varying from tension to compression. No post weld stressmanagement processes were applied to this weld leaving tensile residual stresses in the HAZand in the weld toe
Shot Peened Stainless Steel TIG Butt WeldA similar sample was prepared with two 316L stainless steel plates butt welded with
Hastelloy C-22 filler. In this case however, the welded coupon was shot peened with CW-22shot at 8-10 A intensity and 100% coverage. A portion was masked off prior to peening sothat only part of the weld was shot peened and the remainder was left in the as weldedcondition. The plot of this stress map can be seen in Figure 9. In this case, the peeningparameters used were sufficient to put the weld's surface stresses into compression. This canbe seen by looking at the left hand side of the map shown in Figure 9 where the tensileresidual stress level peaks. This region of tension is in the area where the weld was maskedfrom peening. All other areas that were not masked and hence peened were found to be incompression. This is an example where residual stresses due to welding and the effects of apost weld stress management process can be characterized simultaneously.
Shot Peened Inconel TIG Butt WeldA heavy L plate was fabricated by TIG welding two pieces of Inconel 825 plate with
Inconel 625 filler. Since tensile residual stresses were expected in the weld and the HAZ,shot peening was introduced to manage the potentially problematic tensile residual stresses.
101
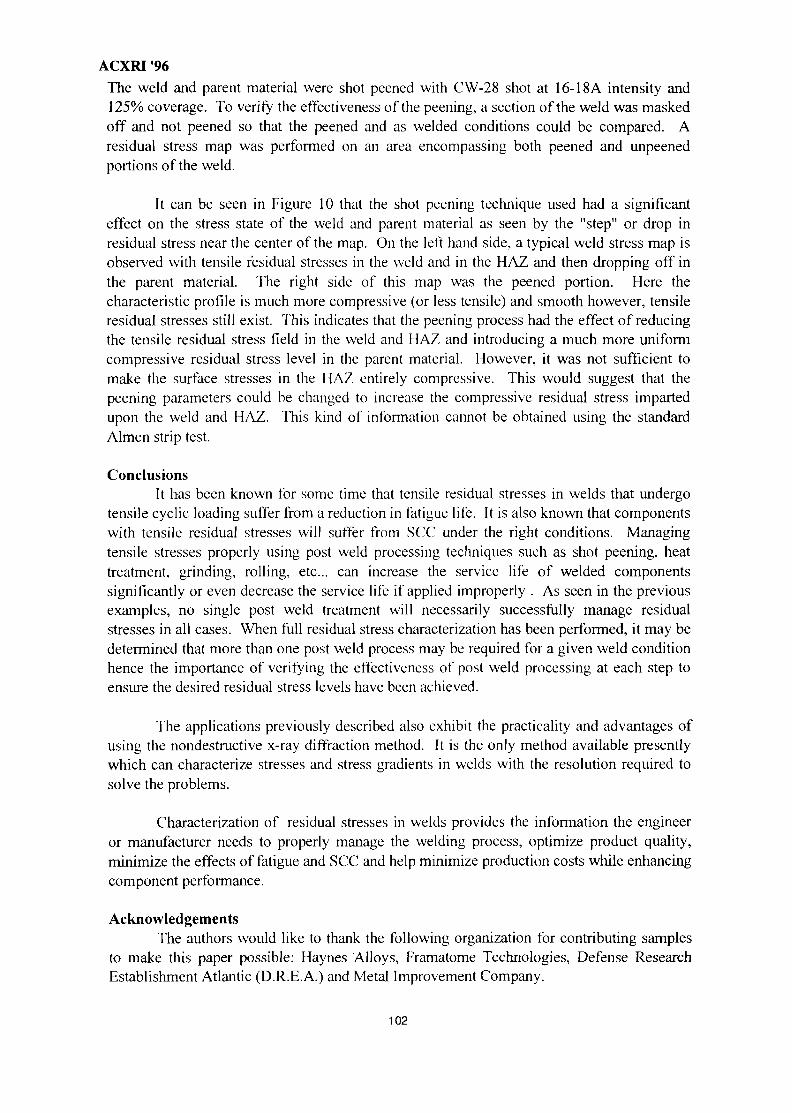
ACXRI 96
The weld and parent material were shot peened with CW-28 shot at 16-18A intensity and125% coverage. To verify the effectiveness of the peening, a section of the weld was maskedoff and not peened so that the peened and as welded conditions could be compared. Aresidual stress map was performed on an area encompassing both peened and unpeenedportions of the weld.
It can be seen in Figure 10 that the shot peening technique used had a significanteffect on the stress state of the weld and parent material as seen by the "step" or drop inresidual stress near the center of the map. On the left hand side, a typical weld stress map isobserved with tensile residual stresses in the weld and in the HAZ and then dropping off inthe parent material. The right side of this map was the peened portion. Here thecharacteristic profile is much more compressive (or less tensile) and smooth however, tensileresidual stresses still exist. This indicates that the peening process had the effect of reducingthe tensile residual stress field in the weld and HAZ and introducing a much more uniformcompressive residual stress level in the parent material. However, it was not sufficient tomake the surface stresses in the HAZ entirely compressive. This would suggest that thepeening parameters could be changed to increase the compressive residual stress impartedupon the weld and HAZ. This kind of information cannot be obtained using the standardAlmen strip test.
ConclusionsIt has been known for some time that tensile residual stresses in welds that undergo
tensile cyclic loading suffer from a reduction in fatigue life. It is also known that componentswith tensile residual stresses will suffer from SCC under the right conditions. Managingtensile stresses properly using post weld processing techniques such as shot peening, heattreatment, grinding, rolling, etc... can increase the service life of welded componentssignificantly or even decrease the service life if applied improperly . As seen in the previousexamples, no single post weld treatment will necessarily successfully manage residualstresses in all cases. When full residual stress characterization has been performed, it may bedetermined that more than one post weld process may be required for a given weld conditionhence the importance of verifying the effectiveness of post weld processing at each step toensure the desired residual stress levels have been achieved.
The applications previously described also exhibit the practicality and advantages ofusing the nondestructive x-ray diffraction method. It is the only method available presentlywhich can characterize stresses and stress gradients in welds with the resolution required tosolve the problems.
Characterization of residual stresses in welds provides the information the engineeror manufacturer needs to properly manage the welding process, optimize product quality,minimize the effects of fatigue and SCC and help minimize production costs while enhancingcomponent performance.
AcknowledgementsThe authors would like to thank the following organization for contributing samples
to make this paper possible: Haynes Alloys, Framatome Technologies, Defense ResearchEstablishment Atlantic (D.R.E.A.) and Metal Improvement Company.
102

ACXRI '96
Note : Regarding Stress Map PlotsStress map displays are normally presented in a color plot with tensile stresses shown
as red lines and compressive stresses shown as green lines. This of course is not possible inthis black and white article. It should also be noted that on the z-axis or stress scale of thestress map plots that the scale is often multiplied by a power shown as (ksiEl) whichindicates that the results are in ksi (1000 psi) and are multiplied by 1x10 .
References1. B.D. Cullity, 1978, "Elements of X-Ray Diffraction", 2nd Edition, Addison-Wesley
Publishing Co. Inc., Reading, Mass.2. M.E.. Hilley et. al.., 1971, "Residual Stress by X-Ray Diffraction - SAE J784a", Society
of Automotive Engineers, Inc., Warrendale, PA.3. H.P. Klug, L.E. Alexander, 1974, "X-Ray Diffraction Procedures", 2nd Edition, Wiley-
Interscience, U.S.A.4. I.C. Noyan, J.B. Cohen, 1987, "Residual Stress Measurement by Diffraction and
Interpretation", Springer-Verlag, New York.5. J.A. Pineault, M.E. Brauss, 1993, "Measuring Residual Stress Using X-Ray Diffraction
on Shot Peened Components", MAT-TEC, France.
103
ACXRI *96
20
10
E 0CO
j.,0E"-20
WELD Heat Applied Area
-30
/
A ,
n /I
If
' \
\
\
-20 -10 0 10 20 30Distance From Weld Splice (inches)
40
Figure 1 - Welded and heat straightened box girder
BTJtESS HAPPING S t r « l » ( h i t ) VS. X View) PLPOtC
Figure 2 - Laser welded 316 stainless steel pipe
Electron Beam Welded Inconel
|
80
70
,60
.50
40
30
20
10
-WeldEdges
-0.4 -0.2 0 0.2 0.4Distance From Weld Center (in.)
Figure 3 - Electron beam welded Inconel specimen
104
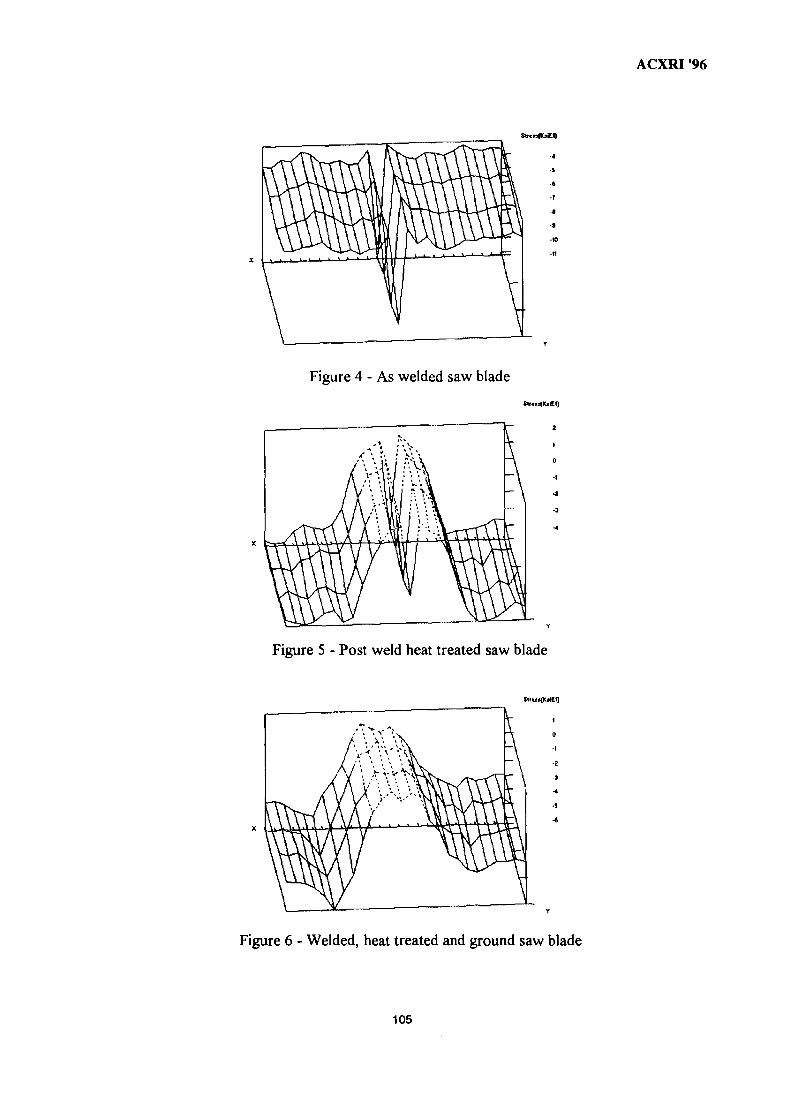
ACXRI '96
SUosfbCI)
5
•
-r
-»
•s
•10
•n
Figure 4 - As welded saw blade
Figure 5 - Post weld heat treated saw blade
Figure 6 - Welded, heat treated and ground saw blade
105
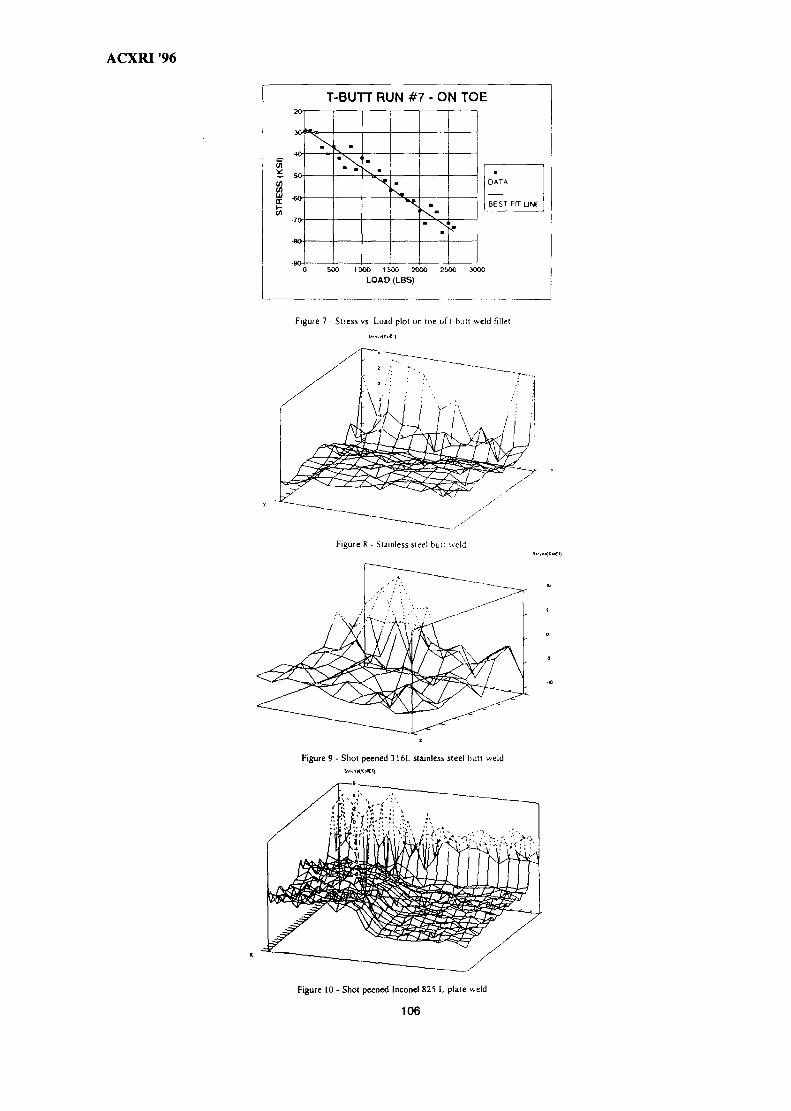
ACXRI '96
T-BUTT RUN #7 - ON TOE
UJ
tr
DATA
BEST FIT UNE
0 SOO 1000 1500 2000 25O0 3000
LOAD (LBS)
Figure 7 - Stress vs Load plot on toe of t-butt weld fillet
Figure 8 - Stainless steel bun
Figure 9 - Shot peened 316L stainless steel butt weld
Figure 10 - Shot peened Inconel 825 L plate weld
106

ACXRI '96
EFFECT OF COLD WORK ON CO2 CORROSION BEHAVIOROF 13% Cr (420 Type) STAINLESS STEEL IN BRINE
MEDIUM WITH AND WITHOUT ADDITION MY9700791OF SODIUM SULPHIDE
Akram AH Agil, Azmi Rahmat and Suraj BhanSchool of Materials and Mineral Resources Engineering
Universiti Sains Malaysia, Perak Branch Campus31750 Tronoh, Perak / Malaysia
Abstract : Cold work introduces residual stresses and increases internal stored energy.Plastic deformation also causes slip steps on the surface. All these factors effect corrosionrate as corrosion is controlled by surface reaction. The residual stresses are caused byinhomogeneous deformation in cold rolling and are maximum at low deformation and thendecrease as the samples get thinner on further rolling. In the absence of CO2 the corrosionrates are found relatively low in brine solution with or without addition of Na2S, with onlyslight variation with % total deformation. However simultaneous presence of CO2 andNa2S has synergic effect increasing the corrosion rate appreciably. Presence of sulphur isalso found to increase the pitting tendency in the steel.
Introduction : Deep sour wells often contain CO2 and H2S along with high levels ofchlorides necessitating demand for steel with good corrosion resistance in theseenvironments. Due to its practical importance, the area is receiving a great deal of interestnot only for generating data base but also for elucidating the corrosion mechanisms [1-18].On the other hand there is very limited information available on the effect of cold work onthe corrosion behaviour of steels used in oil and gas industry. In addition to bending andhandling, severe cold work regions with large residual stresses are encountered duringinstallation procedures.
Out of the several mechanisms proposed for corrosion in aqueous sour gasenvironments, hydrogen evolution and anodic dissolution in acidic solutions involves animportant aspect of chemisorption process. Plastic deformation results in increase ofinternal stored energy and causes slip steps on the surface. The slip steps and residualstresses change the chemisorption process both at the anode and cathode affecting the areaof steel for hydrogen coverage. It has been stated that cold work increases active sites oflow activation energy for anodic dissolution [19]. The cold work is found to affectcorrosion of iron and steel differently with no effect on iron but increase in corrosion ratein case of steel as a result of combination of imperfections introduced by plasticdeformation and interstitial carbon atoms producing lower H2 overvoltage on thesespecific sites [20].
In general, the information on the effect of cold work on corrosion behaviour israther conflicting with reports of increase, decrease or no effect [21]. Recent work on theeffect of cold work on electrochemical aspects of mild steel in sour gas environments hasbeen reported [22]. The authors indicate that cold work affects hydorgen coverage on thecorroding electrode and promotes FeS2 formations. The corrosion rate is found to increasewith cold work but decreases to some extent when FeS2 is formed with cold work inexcess of 20%. The cathodic current density is found to increase with cold work while theanodic polarization is reported to be independent of cold work. The authors [22] did not
107
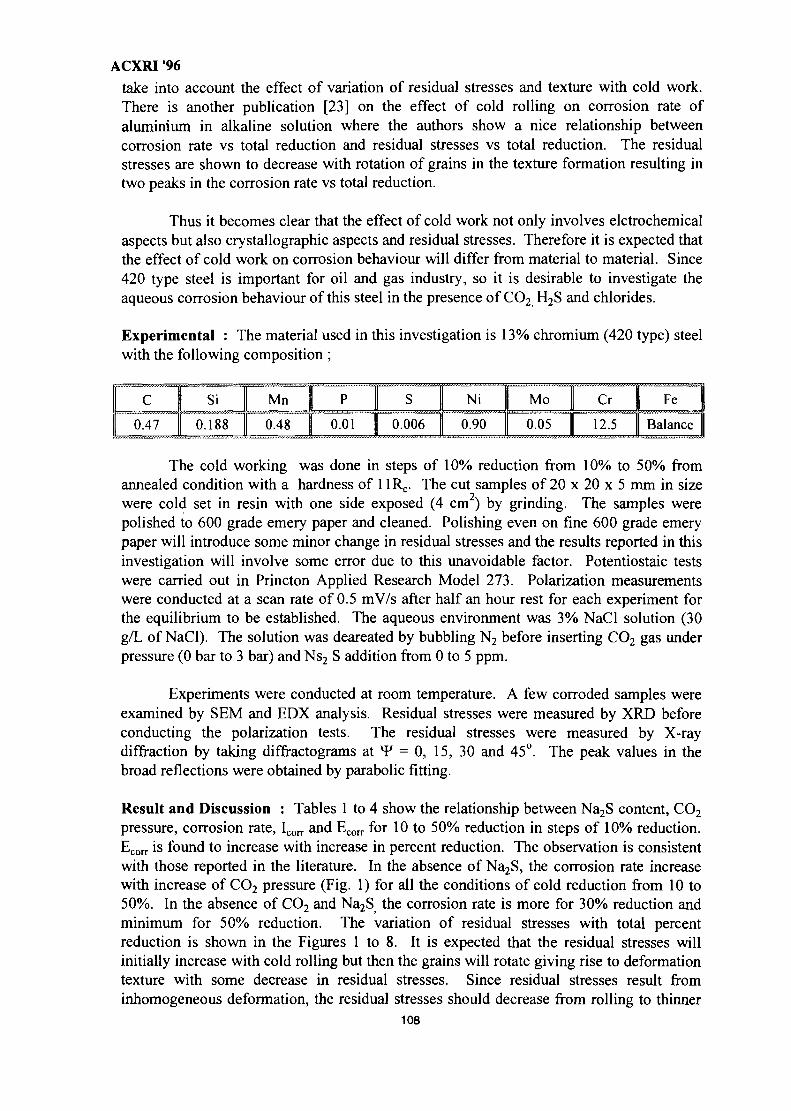
ACXRI '96
take into account the effect of variation of residual stresses and texture with cold work.There is another publication [23] on the effect of cold rolling on corrosion rate ofaluminium in alkaline solution where the authors show a nice relationship betweencorrosion rate vs total reduction and residual stresses vs total reduction. The residualstresses are shown to decrease with rotation of grains in the texture formation resulting intwo peaks in the corrosion rate vs total reduction.
Thus it becomes clear that the effect of cold work not only involves elctrochemicalaspects but also crystallographic aspects and residual stresses. Therefore it is expected thatthe effect of cold work on corrosion behaviour will differ from material to material. Since420 type steel is important for oil and gas industry, so it is desirable to investigate theaqueous corrosion behaviour of this steel in the presence of CO2 H2S and chlorides.
Experimental : The material used in this investigation is 13% chromium (420 type) steelwith the following composition ;
Ni Mo Cr Fe
0.47 0.188 0.48 0.01 0.006 0.90 0.05 12.5 Balance
The cold working was done in steps of 10% reduction from 10% to 50% fromannealed condition with a hardness of 11R,.. The cut samples of 20 x 20 x 5 mm in sizewere cold set in resin with one side exposed (4 cm ) by grinding. The samples werepolished to 600 grade emery paper and cleaned. Polishing even on fine 600 grade emerypaper will introduce some minor change in residual stresses and the results reported in thisinvestigation will involve some error due to this unavoidable factor. Potentiostaic testswere carried out in Princton Applied Research Model 273. Polarization measurementswere conducted at a scan rate of 0.5 mV/s after half an hour rest for each experiment forthe equilibrium to be established. The aqueous environment was 3% NaCl solution (30g/L of NaCl). The solution was deareated by bubbling N2 before inserting CO2 gas underpressure (0 bar to 3 bar) and Ns2 S addition from 0 to 5 ppm.
Experiments were conducted at room temperature. A few corroded samples wereexamined by SEM and EDX analysis. Residual stresses were measured by XRD beforeconducting the polarization tests. The residual stresses were measured by X-raydiffraction by taking diffractograms at *F = 0, 15, 30 and 45°. The peak values in thebroad reflections were obtained by parabolic fitting.
Result and Discussion : Tables 1 to 4 show the relationship between Na2S content, CO2
pressure, corrosion rate, Icorr and Ecorr for 10 to 50% reduction in steps of 10% reduction.Ecorr is found to increase with increase in percent reduction. The observation is consistentwith those reported in the literature. In the absence of Na2S, the corrosion rate increasewith increase of CO2 pressure (Fig. 1) for all the conditions of cold reduction from 10 to50%. In the absence of CO2 and Na2S the corrosion rate is more for 30% reduction andminimum for 50% reduction. The variation of residual stresses with total percentreduction is shown in the Figures 1 to 8. It is expected that the residual stresses willinitially increase with cold rolling but then the grains will rotate giving rise to deformationtexture with some decrease in residual stresses. Since residual stresses result frominhomogeneous deformation, the residual stresses should decrease from rolling to thinner
108
ACXRI '96
samples. 10% cold reduction is found to give maximum residual stresses. The decrease inresidual stresses with more than 10% reduction upto 50% is found to decrease linearlywithin the experimental erros. However, it should be pointed out that standarddeviation in stress measurement due to X-ray line broadening is around 30%.
Figure 5 shows the variation of corrosion rate versus total percent reduction in 3%NaCl solution and 0 to 5 ppm Na2S addition at zero bar CO2 pressure. For all theconditions, corrosion rate is low from 1.5 to 3 mpy, maximum variation being observedfor 30% reduction. Therefore it can be said that in the absence of CO2, addition of Na2S inthe range of 0 to 5 ppm to 3% NaCl solution does not increase the corrosion rateappreciably with defermation/residual stresses. In the presence of both Na2S and CO2 inthe chloride solution, the overall corrosion rate is found to increase appreciably with all thefour conditions of solution as shown in the Figures 6 to 8. The NaCl solution containing 1bar CO2 shows slight decrease in corrosion rate from 10 to 30% total reduction in all thefour conditions but then it is found to increase abruptly about 2.5 times for 3 ppm Na2Saddition. The corrosion rate is initially more upto 30% reduction for the solutioncontaining 5 ppm than the condition for 3 ppm Na2S but then the trend changes for the 30to 50% deformation range (Fig. 6). The results are quite similar with those obtained byA.M.Y. Taher et al [24] in 420 type steel even in the absence of deformation. Thecombination of Na2S and CO2 in the chloride solution containing 2 and 3 bar CO2 is foundto increase the corrosion rate in general with deformation. For 2 bar CO2 condition, theincrease in corrosion rate is almost linear with deformation for 0, 3 and 5 ppm Na2Sconditions but with 1 ppm Na2S it shows a peak at 30% reduction (Fig. 7).
Since the cold working provides active sites of low activation energy for anodicdissolution and also changes the chemisorption process by increasing the density ofimperfections and internal stored energy, the corrosion rate shows increase with cold work.However, formation of iron carbonate and/or iron sulphide at the surface should bringdown the corrosion rate. It has been observed that the corrosion rate in chloride solutioncontaining either CO2 or Na2S alone is relatively low but it increases when both CO2 andNa2S are present.
Since the crystal structures of FeCO3 and FeS are not compatible with each otheri.e. the two structures do not have any common plane. Therefore, simultaneous depositionof these two phases result in high energy interface which is strained and involves highstresses. The net result of simultaneous deposition of these two phases will providesynergic effect with increase in corrosion rate.
Acknowledgement : The research work is a part of the M.Sc. thesis of Mr. Akram AliAgil and the authors are thankful to the Universiti Sains Malaysia for the permission topublish the results.
References :1. G.I. Ogundele, W.E. White, Corrosion 42 (1986), p. 398.2. G.I. Ogundele, W.E. White, Corrosion 42 (1986), p. 665.3. B.J.Berkowitz, F.H. Heubaum, Corrosion 40 (1984), p. 240.4. H. Asahi, Y. Sogo, M. Ueno, H. Higashiyama, Corrosion 45 (1989), p. 519.5. A.K. Dunlop, Corrosion 34 (1978), p. 88.6. S.M. Wilhelm, R.D. Kane, Corrosion 40 (1984), p. 431.
109
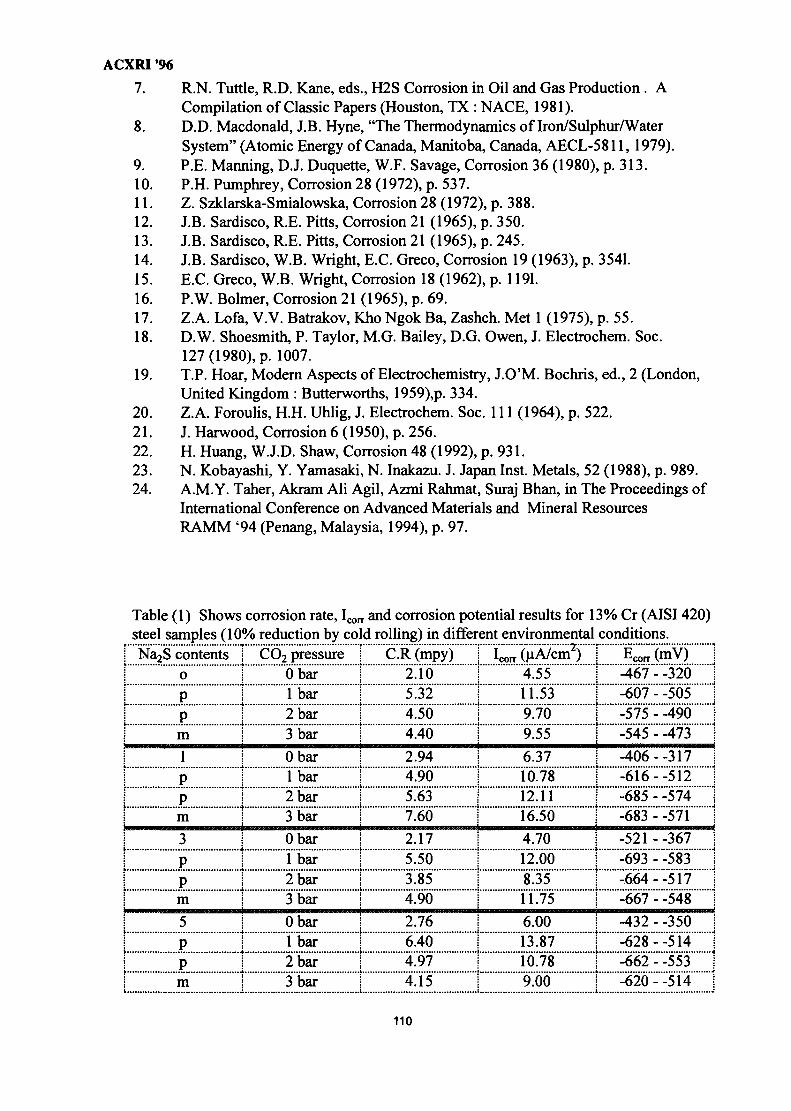
ACXRI '967. R.N. Turtle, R.D. Kane, eds., H2S Corrosion in Oil and Gas Production . A
Compilation of Classic Papers (Houston, TX : NACE, 1981).8. D.D. Macdonald, J.B. Hyne, "The Thermodynamics of Iron/Sulphur/Water
System" (Atomic Energy of Canada, Manitoba, Canada, AECL-5811, 1979).9. P.E. Manning, D.J. Duquette, W.F. Savage, Corrosion 36 (1980), p. 313.10. P.H. Pumphrey, Corrosion 28 (1972), p. 537.11. Z. Szklarska-Smialowska, Corrosion 28 (1972), p. 388.12. J.B. Sardisco, R.E. Pitts, Corrosion 21 (1965), p. 350.13. J.B. Sardisco, R.E. Pitts, Corrosion 21 (1965), p. 245.14. J.B. Sardisco, W.B. Wright, E.C. Greco, Corrosion 19 (1963), p. 3541.15. E.C. Greco, W.B. Wright, Corrosion 18 (1962), p. 1191.16. P.W. Bolmer, Corrosion 21 (1965), p. 69.17. Z.A. Lofa, V.V. Batrakov, Kho Ngok Ba, Zashch. Met 1 (1975), p. 55.18. D.W. Shoesmith, P. Taylor, M.G. Bailey, D.G. Owen, J. Electrochem. Soc.
127 (1980), p. 1007.19. T.P. Hoar, Modern Aspects of Electrochemistry, J.O'M. Bochris, ed., 2 (London,
United Kingdom : Butterworths, 1959),p. 334.20. Z.A. Foroulis, H.H. Uhlig, J. Electrochem. Soc. 111 (1964), p. 522.21. J. Harwood, Corrosion 6 (1950), p. 256.22. H. Huang, W.J.D. Shaw, Corrosion 48 (1992), p. 931.23. N. Kobayashi, Y. Yamasaki, N. Inakazu. J. Japan Inst. Metals, 52 (1988), p. 989.24. A.M.Y. Taher, Akram AH Agil, Azmi Rahmat, Suraj Bhan, in The Proceedings of
International Conference on Advanced Materials and Mineral ResourcesRAMM '94 (Penang, Malaysia, 1994), p. 97.
Table (1) Shows corrosion rate, Icorr and corrosion potential results for 13% Cr (AISI 420)steel samples (10% reduction by cold rolling) in different environmental conditions.
! Na2S contents! o
1 P1 p
m! 1
1 P[ P! m
I 31 P1 P
m1 5i pi p
m
CO2 pressureObarlbar2 bar3 bar
Obarlbar2 bar3 bar
Obarlbar2 bar3 bar
Obarlbar2 bar3 bar
C.R (mpy)2.105.324.504.40
2.944.905.637.60
2.175.503.854.90
2.766.404.974.15
Icorr (uA/cm j4.5511.539.709.55
6.3710.7812.1116.50
4.7012.008.3511.75
6.0013.8710.789.00
Ecorr (mV)-467 - -320-607 - -505-575 - -490.545 . .473
-406--317-616--512-685 - -574 j-683 - -571 |
-521 - -367 j-693 - -583 i-664--517-667 - -548
-432 - -350 !-628--514 i-662 - -553 !-620--514 !
110
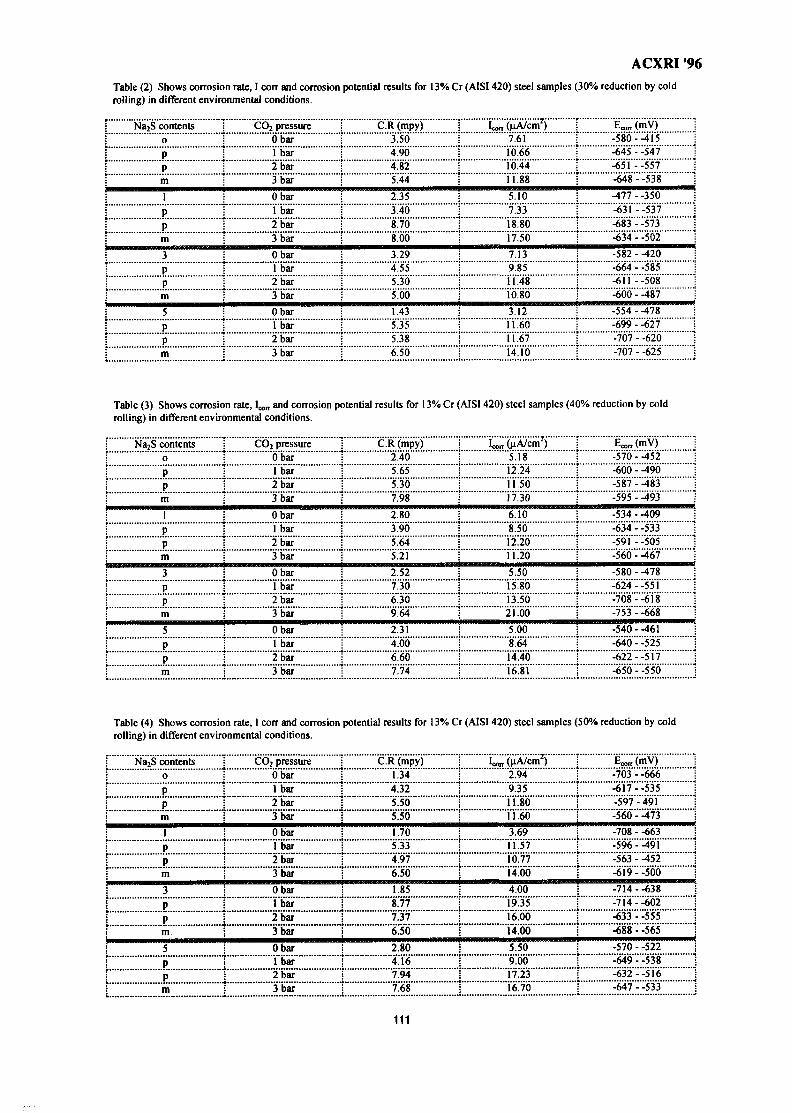
ACXRI '96
Table (2) Shows corrosion rate, I corr and corrosion potential results for 13% Cr (AISI 420) steel samples (30% reduction by coldrolling) in different environmental conditions.
j Na2S contents1 o
1 PI Pi m
; l
i P
i pi m
• 3
1 Pi P1 m
! 5
! Pi PE
CO2 pressureObarlbar2 bar3 "bar
Obar1 bar2 bar3 bar
Obar1 bar2 bar3 bar
Obar1 bar2 bar3 bar
C.R (mpy)3.504.904.825.44
2.353.408.708.00
3.294.555.305.00
1.435.355.386.50
7.6110.6610.4411 88
5.107.3318.8017.50
7.139.8"511.4810.80
3.1211.6011.6714.10
£«,„ (mV)-580- -415-645 - -547-651--557-648 - -538"
-477 - -350-631--537-683 - -573-634 - -502
-582 - -420-664 - -585-611 --508-600 - -487
-554 --478-699 - -627-707 - -620-707 - -625
Table (3) Shows corrosion rate, I , ^ and corrosion potential results for 13% Cr (AISI 420) steel samples (40% reduction by coldrolling) in different environmental conditions.
j Na2S contents: 0
: P: P
m1
PPm3pp
: mi e
I P: p
E
CO2 pressureObarI bar2 bar3 bar
Obar1 bar2 bar3 bar
Obarlbar2 bar3 bar
Obarlbar2 bar3 bar
C.R (mpy)2.405.655.307.98
2.803.905.645.21
2.527.306.309.64
2.314.006.607.74
ie^GiA/cm7)5.1812.2411.5017.30
6.108.5012.2011.20
5.5015.8013.5021.00
5.008.6414.4016.81
Ecorr(mV)
-570 - -452-600 - -490-587 - -483-595 - -493
-534 - -409 :-634 - -533-591--'505-560 - -467
-580 - -478-624--551-708--618-753 - -668
-540 - -461-640 - -525-622- -517^50-- '550
Table (4) Shows corrosion rate, I corr and corrosion potential results for 13% Cr (AISI 420) steel samples (50% reduction by coldrolling) in different environmental conditions.
: Na2S contents
; o: P
pm
i I
i Pi P; m
! 3
i P! P
m5
1 P: P: m
CO2 pressureObar1 bar2 "bar3 bar
Obar1 bar2 bar3 bar
Obar1 bar2 bar3 bar
ObarThar2 bar3 "bar
C.R (mpy)1.344.325.505.50
1.705.334.976.50
1.85
.....?,!7.7.376.50
2.804.167.947.68
i^^A/cm7)2.949.3511.8011.60
3.6911.5710.7714.00
4.0019.3516.0014.00
5.509.0017.2316.70
E»(«V) i-703 - -666 !-617--535 !-597-491 !-560 - -473 j
-708 - -663 j-596--491 j-563 - -452 :Jsi'9 - -500 i
-714 --638-714- -602 j-633 - -555 j-688 - -565
-570 - -522^649 - -538-632--516-647 - -533
111
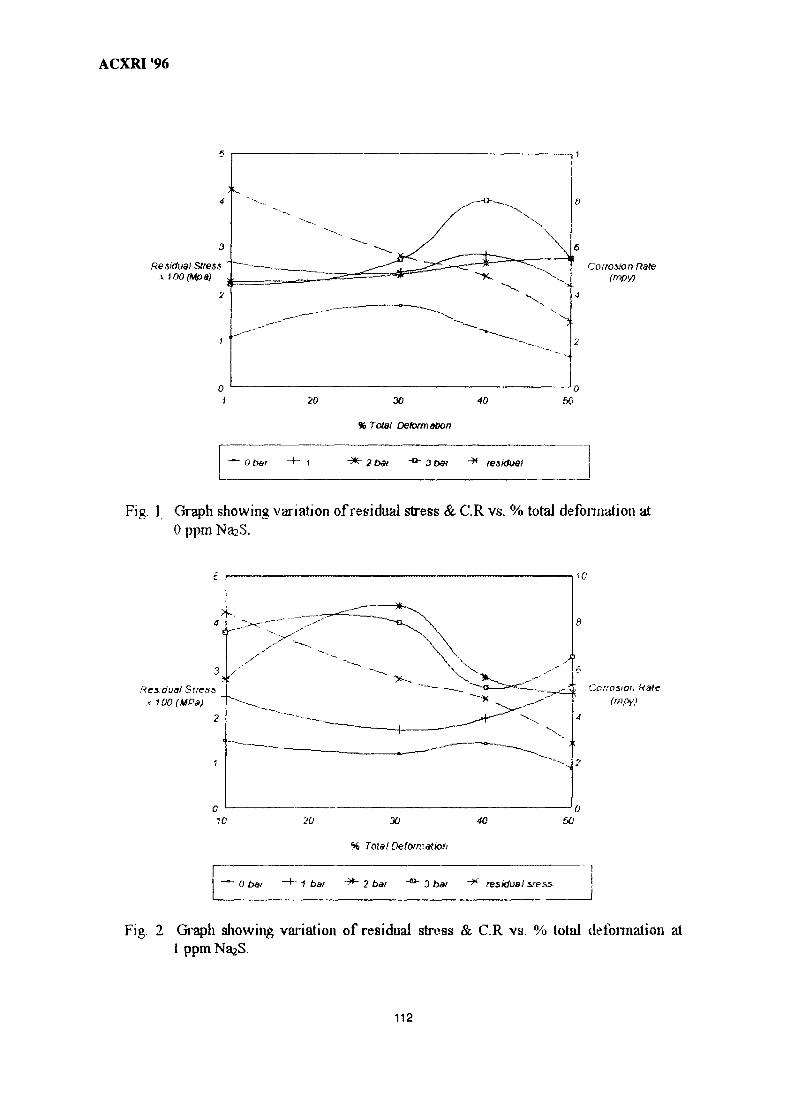
ACXRI '96
Residual StfessxtOOfMpa)
Corrosion Rate
30 40
% Total Deformation
50
Ob&r 3t>w "^ residual
Fig. 1 Graph showing variation of residual stress & C.R vs. % total deformation at0 ppm Na^S.
Res:-duat Stress^ 100 (UPa)
Corrosion Rate
% Total Deform^ion
0 bar -+" 1 bar ~*~ 2 bar -^ 3 bar ~* residual sress
Fig. 2 Graph showing variation of residual stress & C.R vs. % total deformation at1 ppmNaaS.
112
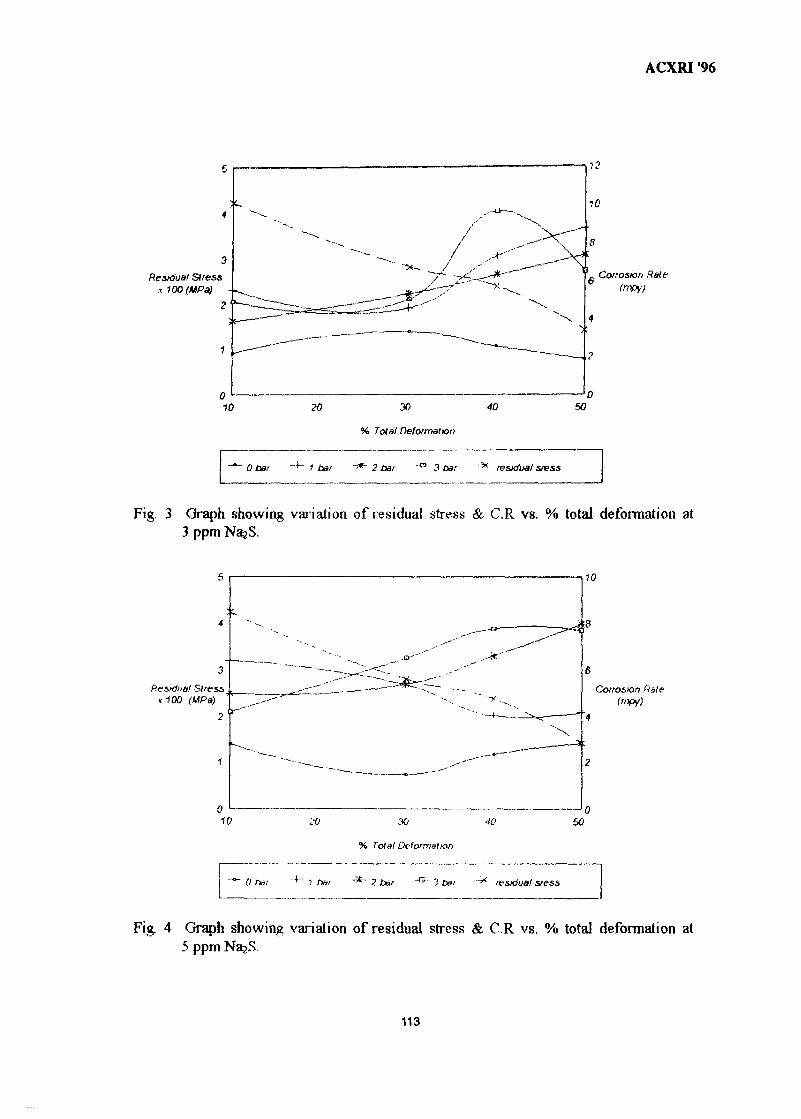
Residual Stressx100 (UPa)
ACXRI '96
Corrosion Rale
10
% Total Deformation
0 bar 1 bar -^ 2 bar -°" 3 ba: "* residual sress
Fig. 3 Graph showing variation of residual stress & C.R vs. % total deformation at3 ppm NajS.
Residual Stressx 100 (MPa)
% Total Deformation
Corrosion Rale(rnpy)
50
0 ba: ? bar "*" ? bar "G" 3 bar residual sress
Fig. 4 Graph showing variation of residual stress & C.R vs. % total deformation at5 ppm
113
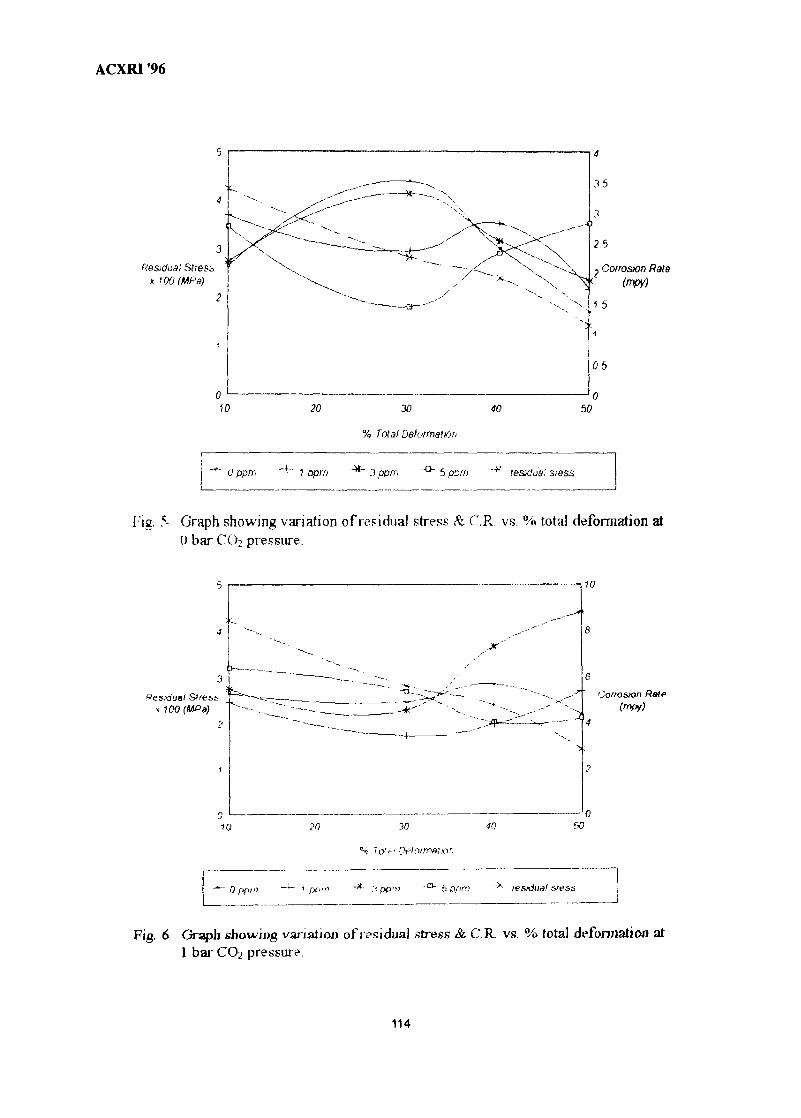
ACXRI '96
Residual Slres&xUX)(MPa)
25
Corrosion Rale
20 30 40
% Total Deformation
50
0 ppni 1 oprn 3 ppiri "°" 5 ppm residua!
Fig. 5 Graph showing variation of residual stress & C.R. vs. % total deformation at0 bar CO; pressure.
Residual Stress f~'J
x 100 (MPa)Corrosion Rale
10
-*• C'.ppm tesidua! s
Fig. 6 Graph showing variation of residua) stress & C.R. vs. % total deformation at1 bar CO2 pressure
114
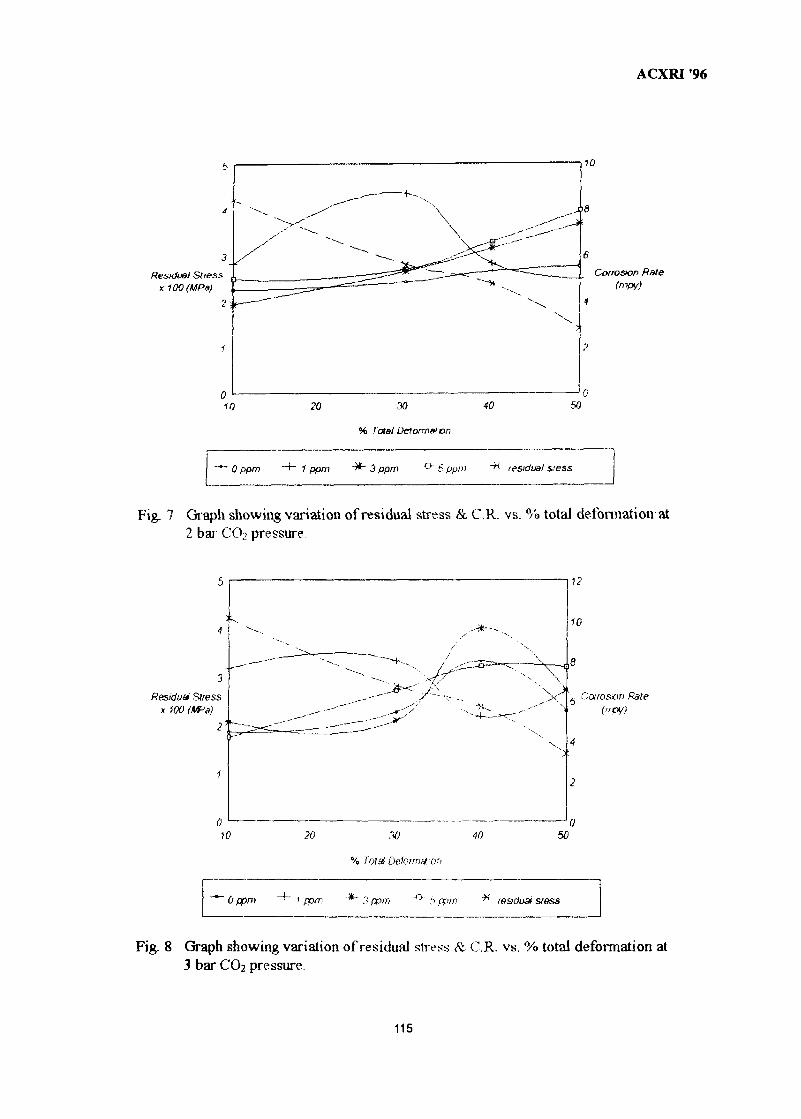
ACXRI '96
Residual Sl/essx1M(MPa)
Corrosion Rate
10 20 30 40
% Total Defonvat on
' 0 pom "+" 1 ppm 3 ppm °~ 6 pom residual siess
Fig. 7 Graph showing variation of residual stress & C.R. vs. % total deformation-at2 bar CO.? pressure.
Residua Stressx 100 (MF-'s)
2
. - * - • - .
10
6 'Carosvri Rale("PV)
10 20 40 50
% Total Deformation
' 0 rpm ~^~ 1 ppm "*" 3 ppm "° t> ppm sress
Fig. 8 Graph showing variation of residual stress & C.R. vs. % total deformation at3 bar CO2 pressure.
115
MY9700792ACXRI '96
Mechanical Characterisation of Surface Layers by X-rayDiffraction - Application to Tribology
•
G. H. FARRAHI
Faculty of Engineering, Bu-Ali Sina University, Hamadan 65174, Iran
Abstract - The results presented in this paper show that X-ray diffraction can be employed forthe characterisation of surface layer damage through residual stresses and work- hardening bysome tribological actions such as fretting and dry sliding X-ray diffraction technique can also beemployed for a rapid and non-destructive measurement of hardness of hardened steel Thediffraction profile analysis can offer a good indication about the material's characteristics and themicrostructural evolution caused by heat treatment or by mechanical loading.
IntroductionThe mechanical and chemical state of a surface have an important role in tribological
phenomenon and may be characterised by a number of parameters, including:(i) micro-geometry (surface roughness), (ii) physico-chemical nature of the surface, (iii)mechanical characteristics (hardness, work-hardening, residual stresses. ) of the surface.One of the methods allowing us to determine these mechanical parameters is the X-raydiffraction technique This method being non-destructive makes it possible to study thesurface layers of 5 to 100 urn dependent on the material and the nature of the employedX-ray tube. By X-ray diffraction, we can measure the residual stresses, also obtain someinformation on the material's characteristics or the microstructural evolution induced byheat treatments Since an X-ray diffraction line broadens considerably when steels changeinto martensitic structure on quenching, therefore, X-ray diffraction technique can beemployed for a rapid and non-destructive measurement of hardness of hardened steel
Steel and Spence's investigation confirms the fact that the extent of plasticdeformation in steel can be estimated with hardness test [ 1 ] Marburger and Koistinen [2]showed that the hardness of certain quenched and tempered steels is related to the breadthat half-maximum intensity Kurita [3] also showed that X-ray diffraction technique usingthe Gaussian curve parameter allowed the measurement of hardness of hardened steels Ithas been recognised, since Warren-Averbach's method appeared in the fifties, that theanalysis of broadened X-ray diffraction profiles could be used to study the microstructuresof crystalline materials [4]
This paper introduces the technique for measuring the residual stresses as well as thehardness by X-ray diffraction By employing this method surface layer damage caused bysome tribological phenomenon such as fretting and sliding is characterised throughresidual stresses and work- hardening
X-ray Diffraction Method
Residual stresses measurementThe X-ray method measures strains in the surface layers of a material These strains
are then converted into stresses using various assumptions. The basic principle ofobtaining the strain is simple [5] The interplanar spacing of a specific form of planes isobtained from grains of different orientations to the surface normal. This is determined by
116
ACXRI '96
tilting and rotating the specimen with respect to the incident beam This spacing is thenconverted into strains using the formula :
- do)/do (1)
where d0 is the interplanar spacing for a stress free material, and EA^ is the spacing inthe direction (J)V[/, defined by the angles $ and \\) (Fig. 1) The spacing 8 ^ in Eq (1) isobtained from the angular value of the Bragg peak corresponding to the diffraction planesusing the formula:
2d sin0 = X (2)
where 1 is the wavelength of the radiation Differentiating Bragg's equation andsubstituting into Eq.(l) gives
e = - 1/2 (cotg 9) A26 (3)
with A26 = 26 - 20O , where 6 0 is the angular position of the diffraction for a stress-
free material The strain 8 ^ in the direction $\\i can be related to the stress G by:
e«j,H/ = [(l+v)/E]a()).sin2vi/ (4)
where E is Young's modulus and n is Poisson's ratio for the material SubstitutingEq (4) into Eq (3) results in
A29 = - [(360/TC) tan6] {[(l+v)/E] Cfy . sin2\|/} (5)
where (l+v)/E = 1/2 S2 is the X-ray elastic constant which depends on the materialand the orientation of the diffracting planes By measuring the value of 20 at differentincident angles (|), a linear relationship is found (for an isotropic material) of A20 againstsin2v|/. The slope gives the value of the stress GA. The measurement of 8 ^ for at leastthree directions of (j> together with the 3D-stress strain relationship enables us to obtain thestress tensor
Diffraction profile analysisWhen a steel is hardened by quenching, the X-ray lines become very broad because of
the martensite formation and the presence of a very high dislocation density in thequenched material. The corresponding hardness is also important With annealing, thequenched steel releases its internal micro-stresses Due to the thermal effect the initial veryhigh dislocation density decreases and subsequently the hardness decreases compared withthe quenched steel In order to explain the modification of the diffraction line after havingundergone plastic deformation, we consider that the material is divided into small crystaldomains called coherent diffraction domains Each domain is formed from series of unitcell columns These columns of the length L are perpendicular to diffraction planes Theaverage of the lengths L of these columns is the average coherent domain size D. Eachdomain, itself, can be deformed elastically of a length AL, which enables us to introducethe distortion eL = AL/L for each column ( Fig 2 ) Considering all columns with L length,from 6L we can define root mean square strain S^ ^ ^ Regarding the line form, it isaccepted qualitatively that a diffraction line is broader when coherent domain is smallerand deformed elastically. Moreover, several analysis methods can give a semi-quantitativeor quantitative description of the microstructure evolution in the material such as stackedenergy and dislocation density[6,7] The quantitative analysis involving Fourier analysis of
117
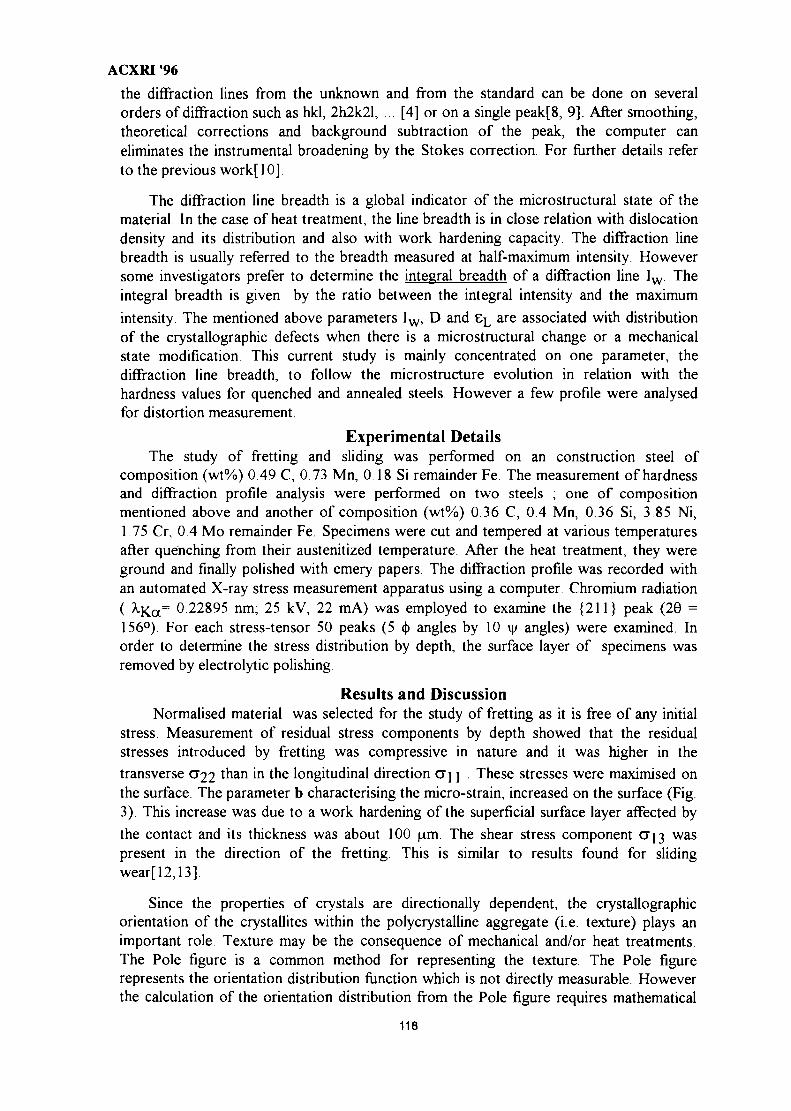
ACXRI '96
the diffraction lines from the unknown and from the standard can be done on severalorders of diffraction such as hkl, 2h2k21, ... [4] or on a single peak[8, 9]. After smoothing,theoretical corrections and background subtraction of the peak, the computer caneliminates the instrumental broadening by the Stokes correction. For further details referto the previous work[10]
The diffraction line breadth is a global indicator of the microstructural state of thematerial In the case of heat treatment, the line breadth is in close relation with dislocationdensity and its distribution and also with work hardening capacity The diffraction linebreadth is usually referred to the breadth measured at half-maximum intensity Howeversome investigators prefer to determine the integral breadth of a diffraction line I w Theintegral breadth is given by the ratio between the integral intensity and the maximum
intensity The mentioned above parameters Iw , D and e^ are associated with distributionof the crystallographic defects when there is a microstructural change or a mechanicalstate modification This current study is mainly concentrated on one parameter, thediffraction line breadth, to follow the microstructure evolution in relation with thehardness values for quenched and annealed steels However a few profile were analysedfor distortion measurement
Experimental DetailsThe study of fretting and sliding was performed on an construction steel of
composition (wt%) 0 49 C, 0.73 Mn, 0 18 Si remainder Fe The measurement of hardnessand diffraction profile analysis were performed on two steels , one of compositionmentioned above and another of composition (wt%) 0.36 C, 0 4 Mn, 0 36 Si, 3.85 Ni,1 75 Cr, 0 4 Mo remainder Fe Specimens were cut and tempered at various temperaturesafter quenching from their austenitized temperature After the heat treatment, they wereground and finally polished with emery papers. The diffraction profile was recorded withan automated X-ray stress measurement apparatus using a computer Chromium radiation( >*Ka= 0 22895 nm; 25 kV, 22 mA) was employed to examine the {211} peak (26 =156°) For each stress-tensor 50 peaks (5 <j) angles by 10 vj/ angles) were examined. Inorder to determine the stress distribution by depth, the surface layer of specimens wasremoved by electrolytic polishing.
Results and DiscussionNormalised material was selected for the study of fretting as it is free of any initial
stress Measurement of residual stress components by depth showed that the residualstresses introduced by fretting was compressive in nature and it was higher in the
transverse O22 t n a n in t n e longitudinal direction <5\ \ . These stresses were maximised onthe surface. The parameter b characterising the micro-strain, increased on the surface (Fig.3). This increase was due to a work hardening of the superficial surface layer affected bythe contact and its thickness was about 100 u.m The shear stress component (7] 3 waspresent in the direction of the fretting This is similar to results found for slidingwear[12,13].
Since the properties of crystals are directionally dependent, the crystallographicorientation of the crystallites within the polycrystalline aggregate (i.e. texture) plays animportant role Texture may be the consequence of mechanical and/or heat treatments.The Pole figure is a common method for representing the texture. The Pole figurerepresents the orientation distribution function which is not directly measurable Howeverthe calculation of the orientation distribution from the Pole figure requires mathematical
118
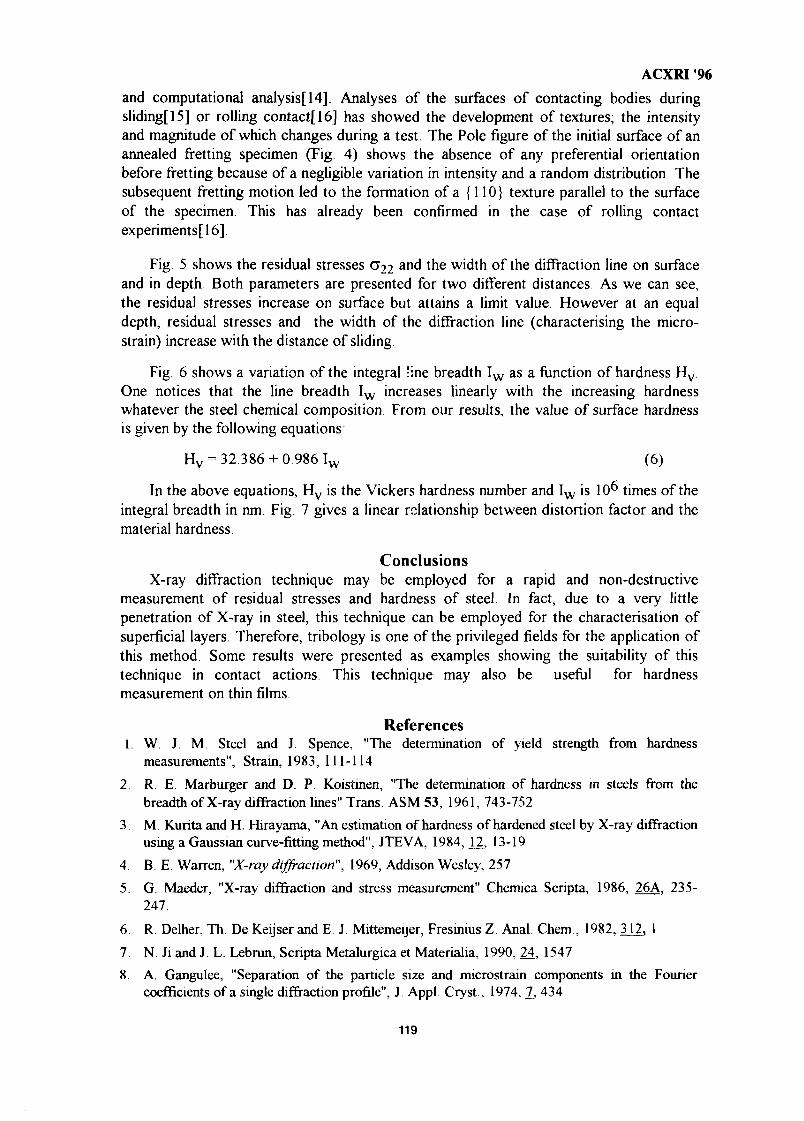
ACXRI '96
and computational analysis[14]. Analyses of the surfaces of contacting bodies duringsliding[15] or rolling contact[16] has showed the development of textures; the intensityand magnitude of which changes during a test The Pole figure of the initial surface of anannealed fretting specimen (Fig. 4) shows the absence of any preferential orientationbefore fretting because of a negligible variation in intensity and a random distribution Thesubsequent fretting motion led to the formation of a {110} texture parallel to the surfaceof the specimen. This has already been confirmed in the case of rolling contactexperiments [ 16]
Fig. 5 shows the residual stresses G22 an<* the width of the diffraction line on surface
and in depth Both parameters are presented for two different distances As we can see,the residual stresses increase on surface but attains a limit value However at an equaldepth, residual stresses and the width of the diffraction line (characterising the micro-strain) increase with the distance of sliding
Fig. 6 shows a variation of the integral line breadth I w as a function of hardness Hv.One notices that the line breadth I w increases linearly with the increasing hardnesswhatever the steel chemical composition. From our results, the value of surface hardnessis given by the following equations
Hv = 32.386 +0.986 I w (6)
In the above equations, Hv is the Vickers hardness number and I w is 10^ times of theintegral breadth in nm Fig 7 gives a linear relationship between distortion factor and thematerial hardness
ConclusionsX-ray diffraction technique may be employed for a rapid and non-destructive
measurement of residual stresses and hardness of steel In fact, due to a very littlepenetration of X-ray in steel, this technique can be employed for the characterisation ofsuperficial layers Therefore, tribology is one of the privileged fields for the application ofthis method Some results were presented as examples showing the suitability of thistechnique in contact actions This technique may also be useful for hardnessmeasurement on thin films
References1. W. J. M Steel and J. Spence, "The determination of yield strength from hardness
measurements", Strain, 1983, 111-114
2. R. E. Marburger and D. P. Koistmen, "The determination of hardness in steels from thebreadth of X-ray diffraction lines" Trans ASM 53, 1961, 743-752
3 M Kurita and H. Hirayama, "An estimation of hardness of hardened steel by X-ray diffractionusing a Gaussian curve-fitting method", JTEVA, 1984,12, 13-19
4. B. E. Warren, "X-ray diffraction", 1969, Addison Wesley, 257
5. G. Maeder, "X-ray diffraction and stress measurement" Chemica Scripta, 1986, 26A. 235-247.
6 R. Delher, Th. De Keijser and E J Mittemeijer, Fresinius Z. Anal Chem , 1982, 312, 1
7. N. Ji and J L. Lebrun, Scripta Metalurgica et Materialia, 1990, 24, 1547
8 A. Gangulee, "Separation of the particle size and microstrain components in the Fouriercoefficients of a single diffraction profile", J Appl Cryst., 1974, 7, 434
119
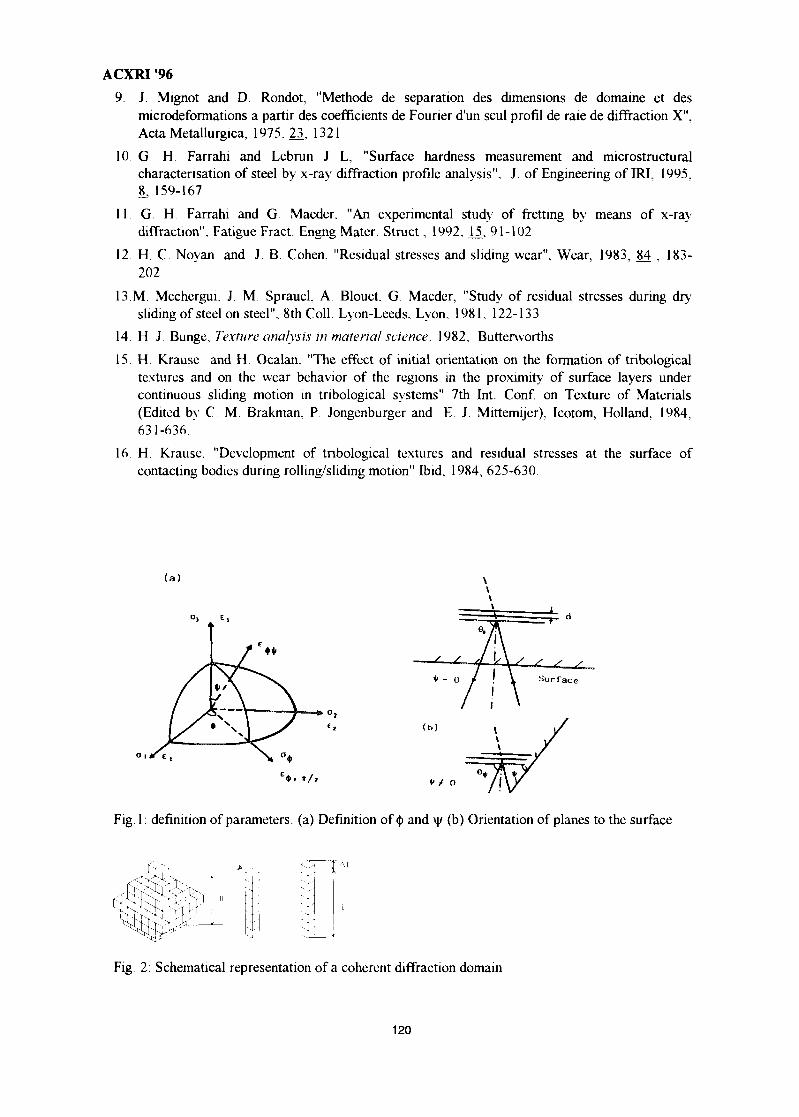
ACXRI '96
9. J Mignot and D Rondot, "Methode de separation des dimensions de domaine et desmicrodeformations a partir des coefficients de Fourier d'un seul profil de raie de diffraction X",Acta Metallurgica, 1975,23, 1321
10 G H Farrahi and Lebrun J L, "Surface hardness measurement and microstructuralcharacterisation of steel by x-ray diffraction profile analysis", J of Engineering of IRI, 1995,8, 159-167
11 G H Farrahi and G Maeder, "An experimental study of fretting by means of x-raydiffraction". Fatigue Fract Engng Mater Struct, 1992, .15, 91-102
12 H C. Noyan and J. B. Cohen, "Residual stresses and sliding wear", Wear, 1983, 84 , 183-202
13.M. Mechergui. J. M Sprauel, A Blouet. G Maeder, "Study of residual stresses during drysliding of steel on steel". 8th Coll. Lyon-Leeds. Lyon, 1981, 122-133
14 H J Bunge. Texture analysis in material science, 1982, Butterworths
15 H Krause and H Ocalan, "The effect of initial orientation on the formation of tnbologicaltextures and on the wear behavior of the regions in the proximity of surface layers undercontinuous sliding motion in tnbological systems" 7th Int. Conf. on Texture of Materials(Edited by C M Brakman. P Jongenburger and E J Mittemijer). Icotom, Holland, 1984,631-636
16 H. Krause, "Development of tnbological textures and residual stresses at the surface ofcontacting bodies during rolling/sliding motion" Ibid, 1984, 625-630.
(a )
( b )
* * O
Fig 1: definition of parameters (a) Definition of § and \\i (b) Orientation of planes to the surface
Fig 2: Schematical representation of a coherent diffraction domain
120
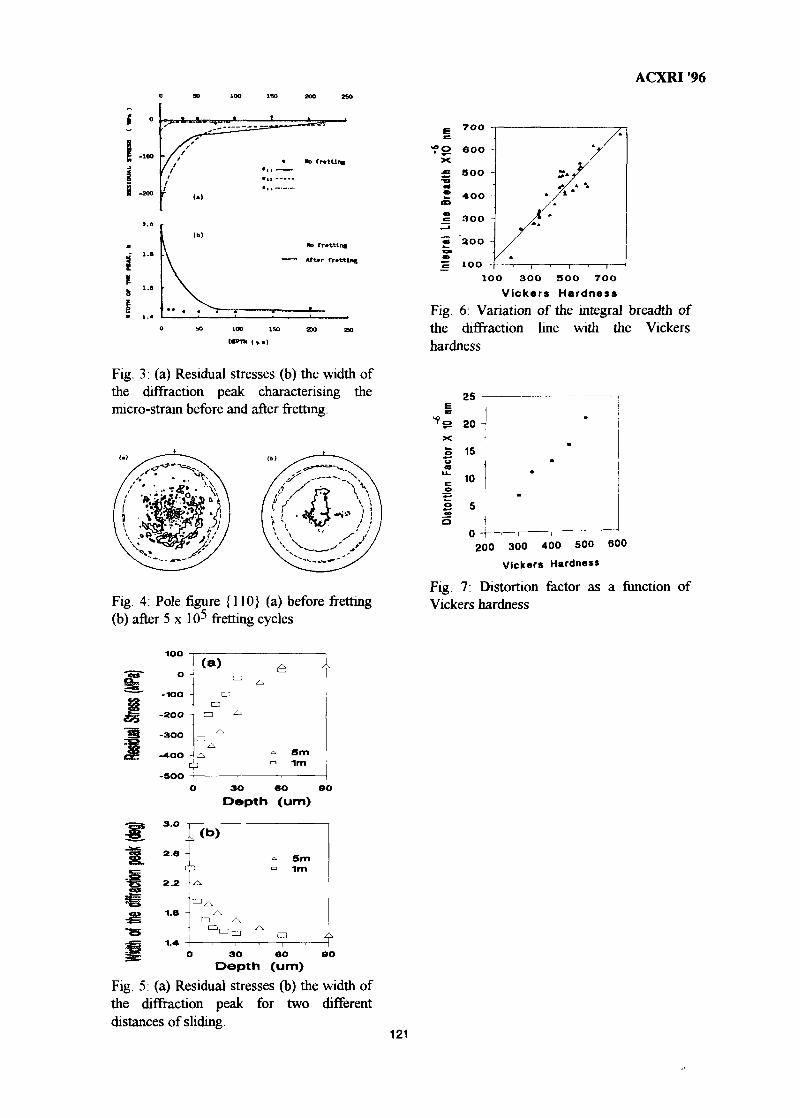
ACXRI '96100 ISO ZOO 250
1.6
l .e
l . «
( b )
yno fr*ttln*
— — After fretting
SO 100 ISO 200
on*™ ( »•>
Fig. 3: (a) Residual stresses (b) the width ofthe diffraction peak characterising themicro-stram before and after fretting.
Fig. 4: Pole figure {110} (a) before fretting(b) after 5x10^ fretting cycles
7OO
f O 60O -
1OO -100 3O0 5OO 7OO
Vickers Hardness
Fig. 6: Variation of the integral breadth ofthe diffraction line with the Vickershardness
25E
^ o aox5 15
3 5O
0200 300 400 500 600
Vickers Hardness
Fig. 7: Distortion factor as a function ofVickers hardness
1 0 0
o -
-ioo -
-2OO
-3OO -
-*OO -
-SOO -
C
•
3
a ):—;
CD
CD
•=• S m=• 1 m
O 3O 6O SO
Depth (um)
2 . 2
o 30 eo soDepth (um)
Fig. 5: (a) Residual stresses (b) the width ofthe diffraction peak for two differentdistances of sliding.
121
MY9700793ACXRI '96
ADVANCES IN LOW ATOMIC NUMBER ELEMENT ANALYSIS BYWAVELENGTH DISPERSIVE X-RAY FLUORESCENCE SPECTROMETRY
Bruno VrebosPhilips Analytical X-Ray BVLelyweg 1, 7602 EA Almelo
The Netherlands
AbstractTraditionally, the analysis of low atomic number has been a challenging task for
wavelength dispersive x-ray fluorescence spectrometry. Among the most important factorsinfluencing analysis of the low atomic number elements (from Z=ll downwards) are thefluorescence yield, absorption and the dispersion. The effect of each of these factors on theoverall performance will be illustrated.
The long wavelengths involved (longer than 1 nm) used to pose severe problemsconcerning the monochromator used. Early instruments relied on lead stearate or Blodgett-Langmuir soap films for the diffraction of the characteristic radiation. Nowadays, syntheticmultilayers are commonly used. The performance of these multilayers is determined by thereflectivity, the resolution and the absorption of the characteristic radiation to be diffracted.These parameters can be optimised by adequately selecting the composition of the materi-als involved. The sensitivity of the modern instruments is sufficient to allow quantitativeanalysis. However, this aspect of WDS XRF is still met with considerable scepticism. Ex-amples of quantitative analysis will be given to illustrate the current capability.
IntroductionModern wavelength dispersive x-ray fluorescence is a non destructive elemental
analysis method, with a high element specificity. It is very reproducible, accurate and pre-cise. It can analyse almost all elements in liquids and solids. It can also be used for theelemental analysis of gases, though this is a somewhat neglected area of application.Analysis of the low atomic number elements, however, has always been a challenge.
The term iow atomic number' element is somewhat arbitrary. For this paper, ele-ments with characteristic K-lines with energies below 1 KeV are labelled low atomic num-ber elements. This will limit the elements to those with atomic number, Z, less than 10.These are also often referred to as light elements, although the density by itself is not anapplicable criterion in this context. Nowadays, the elements Na (Z=l 1) and Mg (Z=12) arenot posing more problems than other elements with higher Z. The limit on the atomicnumber of the element that can be analysed satisfactorily is pushed downwards. It must benoted that many elements with higher atomic numbers have many characteristic lines be-low 1 KeV. This radiation suffers in general from the same (or similar) limitations as theK lines of the low atomic number elements do.
Limiting factors in analysis of low atomic number elementsThe analysis of low atomic number elements has been a problem throughout the
years. There are several reasons for this, but the most important limitations are the fluores-cence yield, dispersion and absorption.
- Fluorescence yieldThe fluorescent yield, GO, is a physical quantity expressing the fraction of initial va-
cancies in the shell of interest that yield a characteristic photon upon relaxation. This fluo-
122
ACXRI '96
rescence yield is element dependent, and, for a given element, it also depends on the shellconsidered. Values for the fluorescence yield for the low atomic number elements are givenin Table 1. The data shown is taken from Bambynek et.al}. The fluorescence yield for thelow atomic number elements is very low, and it increases rapidly with the atomic numberof the element. For comparison, 005 = 0.08 and COR; = 0.34. The emitted intensity is roughly(excluding absorption effects) proportional to the fluorescence yield. So, under identicalconditions, the sensitivity of the spectrometer will decrease with decreasing values for thefluorescence yield.
- Dispersion devices for long wavelengthsWavelength dispersive x-ray fluorescence spectrometry uses single crystals as mono-
chromators to select a particular, characteristic wavelength from the total spectrum emittedby the specimen. For the shorter wavelengths naturally occurring crystals can be used asthe monochromator. Popular crystals are LiF, Ge and PE. From Bragg's law
(where n is the order of diffraction, A, is the wavelength of the radiation to be diffracted, dis the interplanar distance of the crystal used and 8 is the angle of diffraction) it followsthat the longest wavelength, "kmax, that can be diffracted is given by the d spacing of thecrystal and the maximum angle, Qmax, allowed by the goniometer of the instrument:
For wavelengths longer than roughly 1 nm very few suitable crystals exist. Crystalssuch as ADP (ammonium dihydrogen phosphate, 2d 1.06 nm) allow the analysis of Mgwhile TIAP (thallium hydrogen phosphate, 2d 2.6 nm) can be used for the determination ofMg, Na and F. For the longer wavelengths, naturally occurring crystals with a high reflec-tivity are not available. Langmuir-Blodgett films (soap films, such as lead stearate) havebeen used for the determination of carbon and other low atomic number elements. Suchfilms now have been largely superseded by synthetic multilayers.
- Absorption and reflectivitySynthetic multilayer structures2 are made of a sequence of two layers with different
electron densities. This sequence is then repeated 150 to 250 times. The reflectivity ofsuch devices is determined by, among others, the composition and the thickness of the lay-ers and the structure of the interfaces between the layers. The overall performance in termsof reflectivity is also affected by the absorption of the radiation within the multilayer.
As an example, the attenuation coefficient of different elements for boron Ka isshown in Figure 1. Clearly, elements with a low attenuation coefficient are to be preferredto minimise absorption. From the graph (Figure 1), it follows that H and He, B and C, Cland Ar, and the elements between Zr and Sn are better suited than others.
The reflectivity of multilayers increases if the difference of the electron density be-tween the layers increases. For that reason, the two types of layers should be made of ma-terials with large difference in electron densities. A multilayer consisting of alternating lay-ers of B4C and Mo is commonly used for the analysis of boron: B, C and Mo have a rela-tively low mass attenuation coefficient for boron Ka and the electron density between Band C on the one hand and Mo on the other is quite large. The reflectivity of some multi-
123
ACXRI '96
layers is shown in Figure 2, for the Koc radiation of several low atomic number elements.(The reflectivity for a given wavelength is defined here as the intensity of a given wave-length in the diffracted beam compared to the intensity of the same wavelength in thebeam, incident on the multilayer.) Data is shown for three commonly used multilayers:W/Si, Ni/C and M0/B4C. The reflectivity for boron Koc, for example, is high with aM0/B4C multilayer. A W/Si multilayer, however, has a very low reflectivity for the samewavelength. Most of this behaviour can be explained in terms of absorption within themultilayer. Boron Ka radiation is readily absorbed by the silicon and, to a lesser degree, bythe tungsten in the W/Si multilayer : the large value of the mass attenuation coefficient ofsilicon for boron Ka (84x103 cm2/g) can be seen from the graph in Figure 1. From thegraph, it can also be seen that there is not a single multilayer exhibiting a high reflectivityfor all the low atomic number elements between beryllium and fluor. M0/B4C multilayerscan be used for the analysis of beryllium and boron, Ni/C for carbon and W/Si for oxygenand fluor. Figure 2 also indicates why certain multilayers such as M0/B4C and Ni/C arereferred to as element-specific : they are very good for the analysis of a single element, andtheir reflectivity decreases rapidly for others. The multilayers shown in Figure 2 are not theonly ones commercially available. There are currently element specific multilayers avail-able for the analysis of nitrogen and beryllium that yield a superior performance over'general purpose' multilayers.
Absorption and reflectivity are not the only parameters to be reckoned with when de-veloping multilayers. Factors such as thermal and mechanical behaviour must be com-patible with the environment of the spectrometer and interdiffusion (diffusion of the ele-ments between the layers) must be avoided.
- Problems associated with multilayersThere are some problems associated with multilayers. They exhibit refraction effects,
(which make Bragg's law more complex by adding a correction for refraction3) and theyhave a low spectral resolution, which leads to increased line overlap. The spectral resolu-tion (AAA) of the multilayers is generally far inferior compared to that of crystals. Thisleads to increased line overlap. The spectral region near the characteristic wavelengths ofthe low atomic number elements is quite densely populated with radiation from other ele-ments. For example for, there are 50 to 60 lines listed in the wavelength region between 3.5nm and 5.5 nm, which is around the carbon Ka. Some organic crystals, such as OHM(octadecyl hydrogen maleate), with a 2d spacing of 6.3 nm, and OAO (dioctadecyl adipate,2d 9.2 nm) can be used for the analysis of long wavelengths, with a 10 fold better resolu-tion than multilayers, but their reflectivity is two orders of magnitude lower. The resultingsensitivities are in general too low for practical application. These crystals have been usedin combination with a low energy windowless tube for the study of the chemical state andvalence effects of the transition metals4.
All multilayer structures are deposited on a very flat substrate, which is often amonocrystalline silicon wafer. This substrate can therefore diffract higher energy radiation.Modern detector electronics can adequately discriminate against these higher energy pho-tons but care must be taken. Finally, most multilayer structures do have considerableamounts of the analyte element, for which they have been optimised. This again is a con-sequence of the need to minimise absorption. The high concentration of the analyte ele-ment in the multilayer, however, causes considerable 'crystal' fluorescence.
124
ACXRI '96Specimen absorptionAnother factor limiting the performance is the absorption within the sample. The ab-
sorption by the specimen is always present, and it can not be avoided. For the radiation ofthe low atomic number elements, with large attenuation coefficients, this absorption be-comes very important. This is illustrated in Table 2, where some data is collated for theanalysis of carbon in steel. For comparison, the corresponding data for the analysis of sul-phur in steel is also given. For the calculations in Table 2, a specimen diameter of 30 mmis assumed. The exit angle of the spectrometer is taken as 40 degrees. The mass attenua-tion coefficients are from the work from Henke et.al.5 The concentration of the analyte istaken arbitrarily at 0.1 %; this allows quick recalculation for other concentrations. The datain Table 2 clearly indicates the minute masses involved in the determination of low atomicnumber elements: for the analysis of carbon, the analysed depth of the sample is limited to0.25 |im, for sulphur this depth is already increased to 2.7 nm. This depth will increaselinearly with decreasing mass attenuation coefficient. If the analysed depth increases, moreof the specimen is analysed, and the measurement becomes less and less surface sensitive.X-ray analysis, however, is 'never' a true bulk analysis; except if the analyte radiation isvery energetic (for example Sn Ka) and the matrix is very light (composed of low atomicnumber elements). In this case, the analysed depth can be of the order of a few centime-tres. A consequence of the latter requirement is that the analyte itself is present at low con-centrations.
ApplicationsAnalysis under these conditions raises a few questions, such as whether the surface
layer analysed is representative for the bulk of the material. Also, the specimen prepara-tion method used must be such that the surface layer is prepared reproducible. This obvi-ously will also depend on the homogeneity of the material itself. If the material is not ho-mogeneous, successive preparations will expose layers with different compositions. Let usfocus on the analysis of carbon in low alloy steel. Over a period of 10 years, the same suiteof standard specimens was analysed for carbon. The concentrations of carbon found fortwo specimens of this suite are given in Figures 3 and 4. The data presented was obtainedusing a variety of x-ray spectrometers. Furthermore, the configuration of these spectrome-ters was not identical; they have been fitted with different tubes, different monochromatorcrystals and so on. Both simultaneous spectrometers (with curved crystal optics) and se-quential spectrometers (with flat crystals and a collimator system) were used. Also, thespecimen preparation and the subsequent analysis were done by different operators. Thedata is thus not restricted to a single determination, or to single, fixed configuration. Thespecimens were prepared by grinding them at least twice shortly before the measurementwith 60 or 120 grid paper (either alumina or zirconia based).
The data for the specimen containing 0.34 % C is given in Figure 3. The 'chemical'value is represented by the first column on the left. The individual data columns are theconcentrations found for each of the measurements. The last column represents the aver-age of the XRF determinations. The results are in good agreement with the chemical value;the average is exactly equal to the stated value of 0.34 %. This data indicates that thespecimen is homogeneous. It indicates that after each preparation of the specimen, the sur-face layer is quite similar, that its composition is quite constant, and that the composition isclose to the certified value.
The data for the specimen containing 0.03 % carbon (Figure 4) offers a quite differ-ent view. The earlier results (to the left of Figure 4) are scattered quite dramatically; only
125
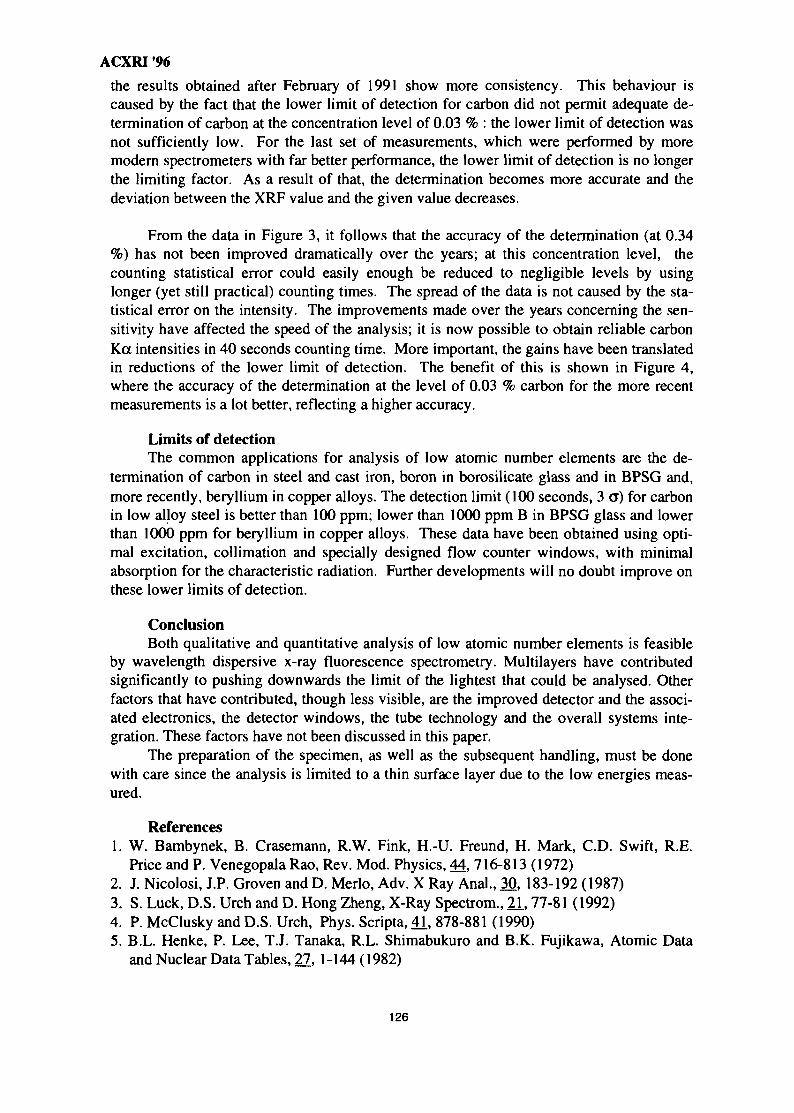
ACXRI '96
the results obtained after February of 1991 show more consistency. This behaviour iscaused by the fact that the lower limit of detection for carbon did not permit adequate de-termination of carbon at the concentration level of 0.03 % : the lower limit of detection wasnot sufficiently low. For the last set of measurements, which were performed by moremodern spectrometers with far better performance, the lower limit of detection is no longerthe limiting factor. As a result of that, the determination becomes more accurate and thedeviation between the XRF value and the given value decreases.
From the data in Figure 3, it follows that the accuracy of the determination (at 0.34%) has not been improved dramatically over the years; at this concentration level, thecounting statistical error could easily enough be reduced to negligible levels by usinglonger (yet still practical) counting times. The spread of the data is not caused by the sta-tistical error on the intensity. The improvements made over the years concerning the sen-sitivity have affected the speed of the analysis; it is now possible to obtain reliable carbonKa intensities in 40 seconds counting time. More important, the gains have been translatedin reductions of the lower limit of detection. The benefit of this is shown in Figure 4,where the accuracy of the determination at the level of 0.03 % carbon for the more recentmeasurements is a lot better, reflecting a higher accuracy.
Limits of detectionThe common applications for analysis of low atomic number elements are the de-
termination of carbon in steel and cast iron, boron in borosilicate glass and in BPSG and,more recently, beryllium in copper alloys. The detection limit (100 seconds, 3 a) for carbonin low alloy steel is better than 100 ppm; lower than 1000 ppm B in BPSG glass and lowerthan 1000 ppm for beryllium in copper alloys. These data have been obtained using opti-mal excitation, collimation and specially designed flow counter windows, with minimalabsorption for the characteristic radiation. Further developments will no doubt improve onthese lower limits of detection.
ConclusionBoth qualitative and quantitative analysis of low atomic number elements is feasible
by wavelength dispersive x-ray fluorescence spectrometry. Multilayers have contributedsignificantly to pushing downwards the limit of the lightest that could be analysed. Otherfactors that have contributed, though less visible, are the improved detector and the associ-ated electronics, the detector windows, the tube technology and the overall systems inte-gration. These factors have not been discussed in this paper.
The preparation of the specimen, as well as the subsequent handling, must be donewith care since the analysis is limited to a thin surface layer due to the low energies meas-ured.
References1. W. Bambynek, B. Crasemann, R.W. Fink, H.-U. Freund, H. Mark, CD. Swift, R.E.
Price and P. Venegopala Rao, Rev. Mod. Physics, 44, 716-813 (1972)2. J. Nicolosi, J.P. Graven and D. Merlo, Adv. X Ray Anal., 30, 183-192 (1987)3. S. Luck, D.S. Urch and D. Hong Zheng, X-Ray Spectrom., 21,77-81 (1992)4. P. McClusky and D.S. Urch, Phys. Scripta, 4J, 878-881 (1990)5. B.L. Henke, P. Lee, T.J. Tanaka, R.L. Shimabukuro and B.K. Fujikawa, Atomic Data
and Nuclear Data Tables, 27, 1 -144 (1982)
126
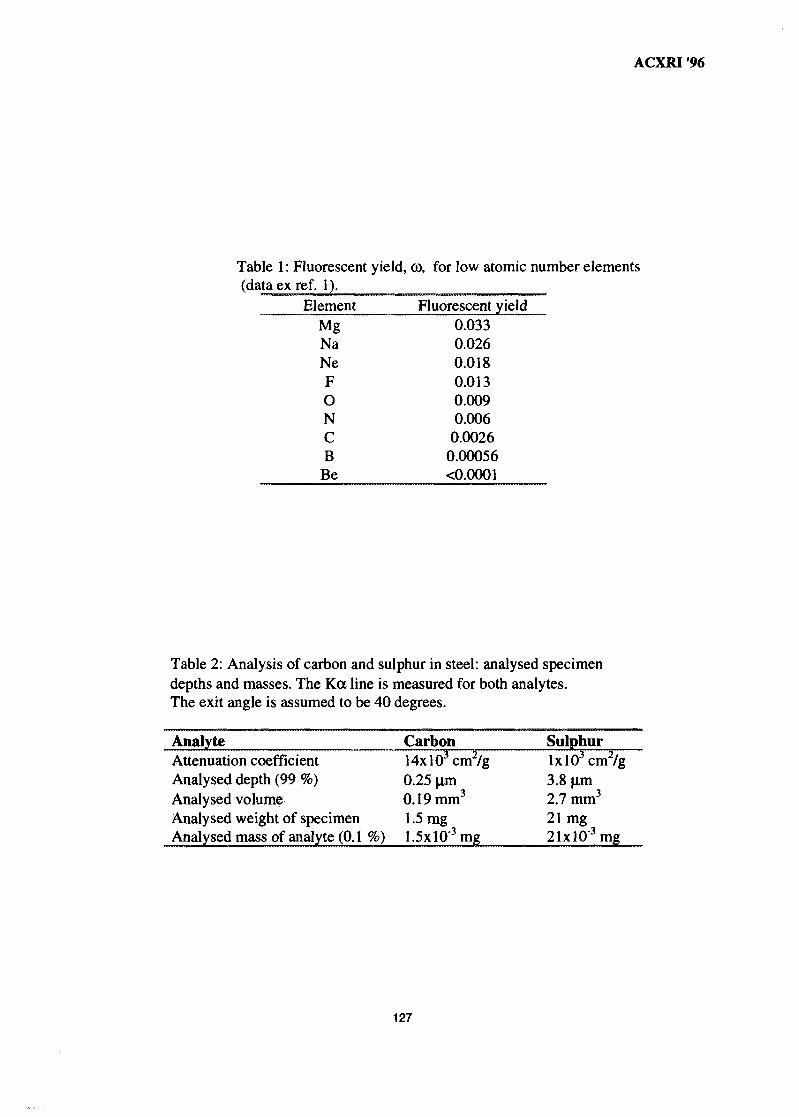
ACXRI '96
Table 1: Fluorescent yield, 0), for low atomic number elements(dataexref. 1).
ElementMgNaNeFONCB
Be
Fluorescent yield0.0330.0260.0180.0130.0090.006
0.00260.00056<0.0001
Table 2: Analysis of carbon and sulphur in steel: analysed specimendepths and masses. The Ka line is measured for both analytes.The exit angle is assumed to be 40 degrees.
AnalyteAttenuation coefficientAnalysed depth (99 %)Analysed volumeAnalysed weight of specimenAnalysed mass of analyte (0.1 %)
Carbon14xl03cm2/g0.25 urn0.19 mm3
1.5 mg1.5xlO"3mg
SulphurlxlO3 cm2/g3.8 pin2.7 mm3
21 mg21xl0"3mg
127
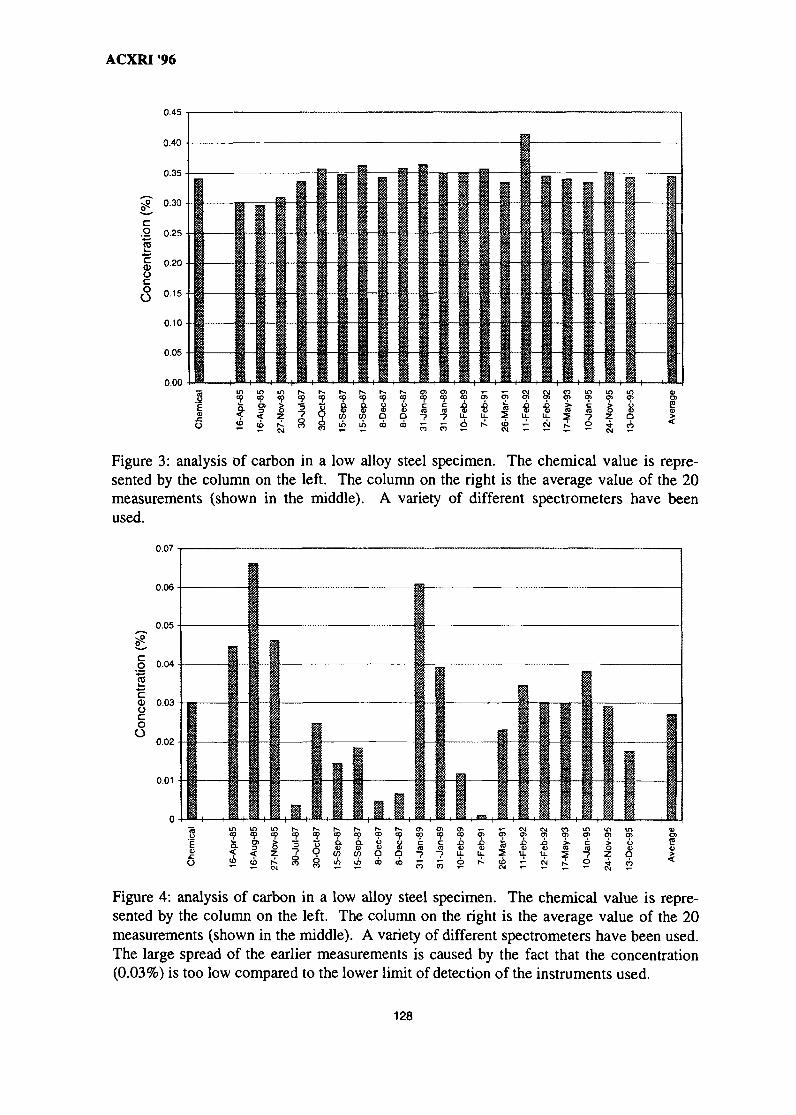
ACXRI '96
0.45
0.40
0.35
g 0.30C.2 0.25
8
0.20
0 1 5
0.10
0.05
0.00
ical
1o
-85
-Apr
<D
-85
Aug
16-
-85
Nov
27-
-87
8
-87
sn
-87
Sep
15-
-87
Sep
15-
-87
Dec
CO
-87
Dec
00-8
9
cra
n
-89
cm
CO
O) * - * - c \ i o j
Figure 3: analysis of carbon in a low alloy steel specimen. The chemical value is repre-sented by the column on the left. The column on the right is the average value of the 20measurements (shown in the middle). A variety of different spectrometers have beenused.
co
0.07
0.06
0.05
0.04
§ 0.03
O
o 0.02
0.01
i n t o
6
CO CO
< < zss * j j
1 is Q- °-2 9 « <S
CO CO
9 9CO CO
a• T . ^ f
Figure 4: analysis of carbon in a low alloy steel specimen. The chemical value is repre-sented by the column on the left. The column on the right is the average value of the 20measurements (shown in the middle). A variety of different spectrometers have been used.The large spread of the earlier measurements is caused by the fact that the concentration(0.03%) is too low compared to the lower limit of detection of the instruments used.
128
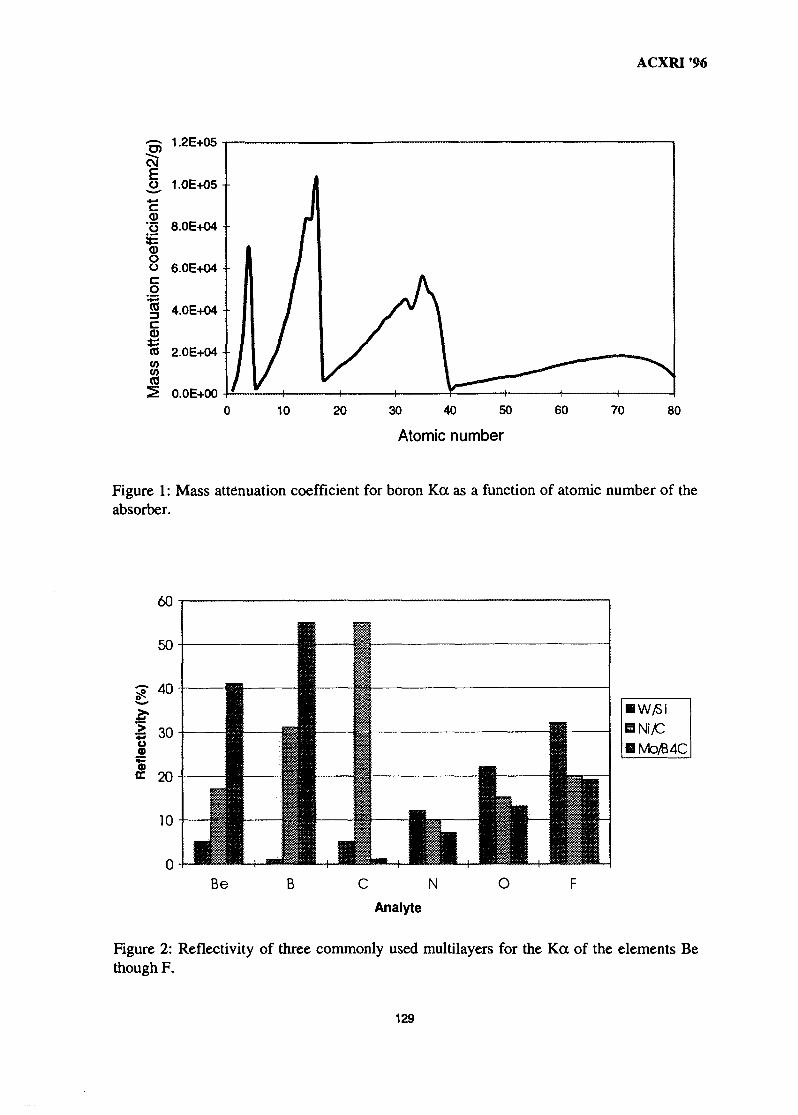
ACXRI '96
3 1-2E+05
,0, 1.0E+05
10 30 40 50
Atomic number
60 70 80
Figure 1: Mass attenuation coefficient for boron Ka as a function of atomic number of theabsorber.
IWySiINiyCIMO/64C
Figure 2: Reflectivity of three commonly used multilayers for the Ka of the elements Bethough F.
129
MY9700794ACXRI '96
X-RAY CRYSTALLOGRAPHIC STUDIES AT SCHOOL OFPHYSICS, UNIVERSITI SAINS MALAYSIA
Hoong Kun FunX-Ray Crystallography Laboratory, School of Physics
Universiti Sains Malaysia,11800 Penang, Malaysia
ABSTRACT: This paper outlines the facilities available for X-ray diffraction studies atSchool of Physics, Universiti Sains Malaysia and the researches being conducted at ourlaboratory. Both single crystal as well as powder diffraction studies are undertaken atroom temperature and at low temperatures (up to liquid nitrogen temperature). Singlecrystal studies involves the three dimensional structure determination of organic,organometallic and inorganic compounds. Rietveld analysis of high temperaturesuperconducting materials and ceramics, using powder diffraction data, were alsoperformed. In addition, 'ab inito' structure determination from powder diffraction datawas successfully carried out. Regular consultancy work involving both powder andsingle crystal diffraction studies are also routinely carried out.
INTRODUCTION: The X-Ray Crystallography Laboratory, School of Physics,Universiti Sains Malaysia has the state of the art facilities for X-Ray diffraction studies ofboth single crystal and powder samples. The facilities include a Siemens P4 single crystaldiffractometer and a Siemens D5000 powder diffractometer. Both these systems arecapable of operating at room temperature and at low temperatures (up to the liquidnitrogen temperature). Other instruments include the Weissenberg cameras, the Buergerprecession camera, the reciprocal lattice explorer, the Debye-Scherrer cameras and theflat plate Laue cameras. Apart from training students in the X-ray diffraction methods formaterials characterization, extensive research is also carried out. Research work can beclassified under two major headings such as single crystal diffraction studies and powderdiffraction studies.
SINGLE CRYSTAL DIFFRACTION STUDIES: Three dimensional structuredetermination using single crystal X-ray diffraction methods play an important role in theunderstanding of the chemistry involved in the synthesis of materials. More interestingly,the physico-chemical properties of the compounds are better explained with crystalstructures and their packing modes in the solid state. In biology and medicine, theknowledge of the three dimensional structures of the molecules is necessary to understandthe probable sites of action; it also leads to the synthesis of new drugs with potentialbiological activity. In our laboratory, we have determined the crystal structures of morethan 200 new compounds of organic, organometallic and inorganic nature. Most are themare studied for potential applications in chemistry, pharmacy and agriculture. Some ofthem are described below.
130
ACXRI '96
Thiourea Derivatives: Crystal structure analyses of many metal complexes of thioureaand a few of those with substituted thioureas have been reported in the past. There is nostructural report exclusively on the substituted thiourea derivatives; this may be due thedifficulty in getting good crystals suitable for X-ray diffraction studies. These thioureasfind applications as rubber accelerator and intermediates for dye preparation; they arealso very useful agrochemical intermediates. We are interested in the molecularconformations and N-H...S hydrogen bond formation details of these molecules in thesolid state. We were able to crystallize more than fifteen thiourea derivatives anddetermined their molecular structure by X-ray diffraction methods1"2. We have classifiedthem as symmetrically substituted and unsymmetrically substituted thioureas. Thestructural information we observed are highly interesting with respect to varioussubstitutions. The packing of the molecules in the crystal lattice are governed mainly byN-H...S hydrogen bonds and leads to one dimensional chains of molecules, dimerformation and two dimensional nets.
Organic dyes: Coumarin dyes are well known photosensitizing agents having wideapplications in biology and physics. They have been found to be useful in the field of dyelaser because of their high gain and wide tunability. Under nitrogen laser excitation, certainaminocoumarin dyes give dual amplified stimulated emission. This is attributed to twistingof the amino group and to be due to what is called Twisted Intramolecular Charge Transfer.Hence the crystal structure determination of a number of aminocoumarin derivatives werecarried out to give a structure-based correlation3"4. A new series of acridine dyes andimidazonaphthyridine derivatives showing good DNA binding efficiencies are taken up forstructural studies as a part of a new project .
Organometallic compounds: Crystal structure determination of organometalliccompounds like transition metal complexes6"10, tin complexes", metal clusters12,ferrocene complexes and heteropolyacids1 are being undertaken in our laboratory. Theresults are useful in understanding the synthesis processes and catalytic action. Moreuseful information are obtained about the mode of binding of the ligand molecules to themetal atom site. Crystal structures of new supercomducting molecular systems withdifferent cation environments have also been studied.
Disordered molecular systems: During the course of our studies on the crystal structuredetermination of molecular systems, we have come across many disordered structures.Nowadays crystal structure refinement has become a routine work with high speedcomputers and software packages being available. Even then it is not a routine work inthe scientific sense, in that many problems are faced in individual cases particularly whenthe structure has some form of disorder. Hence one has to be careful in analyzing theintermediate results of the refinement procedure and in carrying out the next step withreasoning. Analysis of the modes of disorder and to suitably carrying out the refinementwith constrains and restraints come with experience. Some examples encountered in ourlaboratory are rotation of a group of atoms with respect to a bond15, disorders due to theconformational flexibility of certain rings16 and mixture of two isomorphous structures17
A detailed survey of all such disordered cases encountered in our laboratory and howeach such structure was refined to give a good model, will be discussed. The presentation
131
ACXRI '96
will also include how to identify the minor conformational components present in thestructure and model them to get better structural information.
Miscellaneous: Studies are also conducted on high Tc superconductors18, ternary alloy19
and on natural products and its derivatives such as flavanones , lactones andgrandisin22.
POWDER DIFFRACTION STUDIES: As it is well known now, powder diffractionstudies play an important role in many aspects ranging from identification of unknowncompounds to 'ab initio' structure determination. Our research is focused mainly on theRietveld refinement of crystal structures from powder data " 5. 'Ab initio' structuredetermination from powder data is becoming a viable tool of the day due to theavailability of highly intense synchrotron radiation sources. Considerable success hasalso been achieved using the data taken from the laboratory diffractometer by manyresearch groups. We were also successful in demonstrating the possibility of solving thecrystal structure 'ab initio' from our Siemens D5000 powder diffractometer26. Aninteresting aspect of our Rietveld analysis was on the study of Pr ordering leading toantiferromagnetic ordering mechanism in Tl(Ba2.xSrx)PrCu207.y (1212) compounds. Thisis probably an unique case whereby a magnetic phenomenon is being elucidated by acrystallographic study27"28. This study shall be discussed during the presentation.
SUMMARY: This paper present the facilities available at the X-Ray CrystallographyLaboratory, School of Physics, Universiti Sains Malaysia. It also describe the past andcurrent researches being done here in collaboration with various research groups insideand outside Malaysia. The paper is intended to be as comprehensive as possible and anyomission is greatly regretted.
ACKNOWLEDGMENTS: The author thanks the various research groups which havecollaborated in the studies outlined above. These studies have been supported by theMalaysian Government and Universiti Sains Malaysia under the research grant No. 123-3417-2201. The author also appreciates the assistance of Dr. K. Sivakumar in thepreparation of this article.
REFERENCES:
1. A. Ramanathan, K. Sivakumar, K. Subramanian, N. Janarthanan, K. Ramadas &H. K. Fun, Acta Crystallographies 1995, £51, 1627.
2 A. Ramanathan, K. Sivakumar, K. Subramanian, N. Janarthanan, K. Ramadas &H. K. Fun, Acta Crystallographies 1996, £5_1, 2446.
3. B. C. Yip, H. K. Fun , K. Sivakumar, Z. H. Zhou, O. b. Shawkataly & S. G.Teoh, Acta Crystallographies 1995, £5_1, 956.
4. B. C. Yip, O. L. Law, L. H. Ong, H. K. Fun & K. Sivakumar, ActaCrystallographies 1995, £51, 2087.
5. H. K. Fun, K.Sivakumar, S. O. Chua, M. F. Ooi, M. A. S. Anwair, E. K. Gan &W. R. Jackson, Acta Crystallographies 1996, Submitted.
132
ACXRI '966. H. K. Fun, B. C. Yip, B. L. Song, R. G. Xiong & X. Z. You, Acta
Crystallographies 1995, £51, 1980.7. Mohamad Abu Bakar, H. K. Fun, K. Chinnakali, S. G. Teoh and O. b.
Shawkataly, Acta Crystallographica, 1993, £49, 582.8. Y. Farinda, Bohari M. Yamin, H. K. Fun, B. C. Yip & S. G. Teoh, Acta
Crystallographies 1995, £ 5 1 , 1537.9. A. H. Othman, H. K. Fun & K. Sivakumar, Acta Crystallographica, 1996,
C52 (in press)10. C. Pakawatchai, K. Sivakumar & H. K. Fun, Acta Crystallographica, 1996,
C52 (accepted)11. M.I. Mohamed Ismail, C. K. Khor, H. K. Fun & K. Sivakumar, Acta
Crystallographica, 1996, C52. (in press).12. H. K. Fun, O. b. Shawkataly, R. b. Othman, S. G. Teoh & T. S. Yeoh, Acta
Crystallographica, 1990, £46, 1417.13. Bohari M. Yamin, H. K. Fun, B. C. Yip, O. b. Shawkataly & S. G. Teoh, Acta
Crystallographica, 1994. C50. 1551.14. H. K. Fun, B.C. Yip, J-Y Niu & X-Z You, Acta Crystallographica, 1996,
C52. (in press).15. R. Akilan, K. Sivakumar, V. Venkatachalam, K. Ramalingam, K. Chinnakali &
H. K. Fun, Acta Crystallographic, 1995, £5_1, 368.16. R. Velavan, K. Sivakumar, U.S. Pathak, K. S. Jain, S. Singh & H. K. Fun, Acta
Crystallographic, 1995, C5_L 2092.17. H. K. Fun, K. Sivakumar, H. B. Ang & T. W. Sam, Acta Crystallographica, 1995,
£51, 2450.18. H. K. Fun, A. Wang, C. H. Chou, T. J. Lee, H. Y. Tang, M. K. Wu, L. S. Liou
& J. C. Wang, Chinese Journal of Physics, 1993, 31 (6-IR 1157.19. H. K. Fun, H. C. Lin, T. J. Lee & B. C. Yip, Acta Crystallographica, 1994, £50,
661.20. E. Kendi, S. Ozbey, R. Ertan, H. K. Fun & B. C. Yip, Acta Crystalloraphica,
1995, £5_1, 1880.21. H. K. Fun, K. Sivakumar, H. B. Ang & T. W. Sam, Acta Crystallographica,
1995, £5J_, 1330.22. H. K. Fun, K. Sivakumar, B. C. Yip, A. H. Othman & I. M. Said, Acta
Crystallographica, 1996. C52 (in press).23. H. K. Fun, P. Yang, R. Othman, T. J. Lee, C. C. Lai & H. C. Ku, Powder
Diffraction, 1994, 9_Q) , 194.24. P. Yang, H. K. Fun, I. A. Rahman &M. I. Saleh, Ceramics International, 1995,
21, 137.25. T. J. Lee, H. K. Fun, A. Wang and C. H. Chou, Chinese Journal of Physics, 1993,
3K6-ID. 1255.26. P. Yang, K. Sivakumar, H. K. Fun, T. J. Lee, H. C. Ku & C. C. Lai, Powder
Diffraction, 1995.10(31154.27. H. K. Fun, P. Yang, C.C. Lai, H. C. Ku & T. J. Lee, Physica C, 1994, 221, 267.28. C. C. Lai, T. J. Lee, H. K. Fun, H. C. Ku & J. C. Ho, Physical Review B, 1994,
50 (6). 4092.
133
MY9700795ACXRI '96
SMALL-ANGLE NEUTRON SCATTERING INSTRUMENT AT MINT
M. A. M. Sufi. Y. Abdullah, J. Hamid R. Kassim,S. Radiman*, M. Deraman* and A.G. Ramli**.
Malaysian Institute for Nuclear Technology Research, MINT,Komplek MINT, Bangi, 43000 KAJANG.
*National University of Malaysia, Bangi, 43000 KAJANG.**Defence Science Centre, KUALA LUMPUR.
Abstract: The Small Angle Neutron Scattering (SANS) Instrument has been developed atMalaysian Institute for Nuclear Technology Research (MINT) for studying structuralproperties of materials on the length scale lnm to 100 nm. This is the length scale whichis relevant for many topics within soft condensed matter, like polymers, colloids,biological macromolecules, etc. The SANS is a complementary technique to X-ray andelectron scattering. However, while these later techniques give information on structuresnear surface, SANS concerns the structure of the bulk. Samples studied by SANStechnique are typically bulk materials of the sizes mm's to em's, or materials dissolved ina liquid. This paper described the general characteristics of SANS instrument as well asthe experimental formulation in neutron scattering. The preliminary results obtained bythis instrument are shown.
Introduction:
The TRIGA MARK II research reactor at the Malaysian Institute for NuclearTechnology Research (MINT) was commissioned in July 1982. Since then, variousactivities have been done to utilise neutrons produced from this steady state reactor. Thevast applications of this reactor are to produce isotopes for medical and industrial use.Another applications of this reactor are delayed neutron analysis(DNA) and neutronactivation analysis(NAA) which also utilise an irradiation facility inside the reactor core.In order to increase the utilisation of the reactor, especially in the uses of its neutron beamports, a neutron radiography(NR) facility have been constructed and commissioned inJanuary 1985. The NR facility utilised a beam port #3 which is a radial beam port with avoid in the graphite reflector as inlet. The available neutron fluxes at the entrance areapproximately 1-2 x 10¹² neutrons cm"2 s"1. Although the neutron flux is low but withsome limitation, this low flux neutrons can also be used in the neutron scatteringexperiment. With this reason and the availability of the beam port, therefore neutronscattering instrument was proposed to be constructed as a first neutron-beamexperimental facility. Among the different neutron scattering techniques, a small angleneutron scattering(SANS) is perhaps, the one that can closer the gap between applied andbasic research.
The SANS instrument is the realisation of an IRPA project, initiated in January1986 to provide a national facility for carrying out neutron scattering experiment in
134
ACXRI '96
Malaysia. Detailed engineering design1 commenced in 1989 and the construction andinstallation are completed by the end of 1994. The instrumental detailed will be discussedin the following topic. The SANS technique has been developed for studying structuralproperties of materials on the length scale 1 nm to 500 nm. In principal, SANS measuresthe scattering from inhomogenities in material. The measured scattering function providesinformation on the average structure such as surface area, volume and shape of theinhomogenities, on their size distribution function and on the inter particle distances.
The ability of neutrons interact with nuclei and the different scattering length ofisotopes of the same atom make the SANS technique a unique method for structuralstudies. This 'contras variation' in the SANS technique is widely used in the polymer2 andbiological3 studies, in which hydrogen can be substituted by deuterium or H2O issubstituted by D2O. The range of topics currently studied by SANS technique extendsfrom matter within basic physics to applied metallurgy4, polymer5 and colloidal science6
and biology7. The SANS technique is not stand alone. Others techniques such as high-resolution electron microscopy(EM), scanning tunnelling microscopy(STM) and atomicforce microscopy(ATM) are among complementary techniques to SANS which also giveinformation on the same length scale. Since neutrons can penetrate more deeply in thebulk materials compare to X-rays or electrons, the thickness of the sample studied bySANS can be varied from mm's to em's or in a liquid form.
Main hardware features
An isometric view of the SANS instrument is shown in figure 1. The instrumentconsists in principle of a neutron source, a monochromator system, a collimator, sampleholders and detector system. Moreover, the data acquisition system is normally anintegrated part of the instrument. This instrument is connected to 1 MW research reactorvia a radial piercing beam port. Details of the instrument parts and their functions are asfollows:Coarse collimator : This is an aluminium tube 110 mm diameter and 1.5 m long. Annularlead blocks are fitted to the ends of the tube and the space between lead is filled withparaffin-boric mixture. This collimator is placed inside the beam port #4 of the reactorand serves to collimate the incoming neutron beam to within a divergence angle justsufficient to illuminate the monochromator and at the same time suit the mosaic width ofthe monochromator crystal. This will ensure that shielding requirement is minimised dueto the removal of unused neutrons.Biological shielding : The biological shielding houses the monochromator and berylliumfilter assemblies. It is a concentric layers of lead and concrete with dimension 2.6 m(L) x3.0 m(W) x 2.3 m(H). Unwanted neutrons and Gamma radiations are stopped by a beamtrap made up of borated paraffin and lead.Be filter : The filter consists of 16 bars of pure polycrystalline beryllium block, each 3 x 3x 15 cm2, each assembled in a pigeon-hole mesh of 1.0 mm Cadmium. The designensures a small cross-sectional area relative to the length of each element which make itan effective neutron filter by the absorption of highly-scattered neutrons. The matrixstructure ensures a large surface area sufficient to cover the entire beam size. The filter is
135
ACXRI '96
cooled by thermally linked to a LN2 reservoir and inserted in a cryostat chamber. Thecooled(77K) Be filter removes all neutrons below 0.4 nm.Monochromator : The neutron beam from the reactor passes through the Be filter consistsof multiple neutron wavelengths. Wavelength selection with a mechanical velocityselector8 which often being used at many places, is not feasible in MINT, due to the highcontamination of the beam with fast neutron. Therefore, 9 crystal pairs of highly-orientedpyrolitic graphite are used as monochromator. This monochromator reflects neutrons withan average wavelength of 0.5 nm. The monochromator can be positioned along the beamaxes by stepper motor and controlled remotely from outside the biological shield.Neutron monitor : The neutron monitor is placed at the entrance of the main collimator,after the monochromator assembly. The monitor which is consists of a uranium fissionchamber and NIM modules is used to measure the incoming neutron flux before enteringthe main collimator.Main collimator : An evacuated shielded steel tube, 4 m long and 100 mm diameter. It ismade in 2 x 1.0 m and 2.0 m sections to enable length adjustment. A sample can beplaced at the exit of the collimator and the entrance and exit aperture diameters can bevaried between 1 mm to 10 mm.Sample area : At the moment, a sample is placed in air at the exit of the main collimator.In the future, a sample chamber will be fitted to accommodate standard samples andspecialised ancillary equipment. Automatic slit positioning and sample stage positioningare also planned to be fitted in this area.Secondary flight-tube : An evacuated shielded steel tube, 1.0 m in diameter. It is made in2 x 0.5, 1.0 and 2 m sections to enable length adjustment. A neutron position sensitivedetector(PSD) is placed at the end section of the flight-tube to measure the scatteredneutrons from the samples.Neutron detector : The PSD with an active area of 128 by 128 cm2 and resolution elementdimension of 0.5 by 0.5 cm2 is used for neutron detection. A beam stopper is placed infront of the detector to prevent a direct beam and the detector efficiency is 83%.Data acquisition : An IBM PC computer is used for acquisition and display of all dataobtained on-line. The scattered neutron data are displayed both in 2D, 10-colour contourand 3D isometric views. The software have been developed to permit the user to interactwith the dedicated PC in a simple and direct fashion.
The instrument is rather flexible, as the effective length can be varied between 2 and 8m. The specification of the instrument is shown in table 1.
Performance
The instrument performance is calculated1 in terms of the minimum observablemomentum transfer, Qmin, operable Q-range, maximum resolvable dimension, D andneutron intensity, I at the sample position. The maximum momentum transfer rangecovered by the instrument is limited by half detector size, i.e. 32 cm at neutronwavelength 0.5 nm and the minimum sample-detector distance of 1 m can be achieved toobtained larger Q-range. With a minimum Q given by half the size of the beam stop, i.e.10 cm for the given wavelength and maximum sample-detector distance is 4 m, that give
136
ACXRI '96
a total momentum transfer range of 0.08 nnr1 < Q > 3.6 nnr1. Table 2 summarised theexpected performance of the instrument.
Experimental Formulation in SANS
The theory and experimental practise of small angle scattering have beenpresented in excellent review papers910 else where. In the following, only a shortintroduction is given which emphasis on a simple experimental formulation. Theinteraction between neutron and matter is dominated by the interaction with the nuclei.The intensity of the scattered neutron is given by
= K.P(Q).S(Q)
where Q is a momentum transfer, with length
Q = (47c/X)sin(9/2)
A, is a neutron wavelength and 6 is an angle between incident and the scattered beam. K isa prefactor which contains information on the particle volume, concentration andscattering length density. P(Q) is a form factor which gives information on size and shapeof the particle and S(Q) is called a structure factor which describes the inter-particlecorrelations such as the average distance between the particles. The scattering functionI(Q), gives information of inhomogenities (difference in mass density) in the samplestudies. In general, the interpretation of I(Q) needs a fitting procedures of the structuralmodels to the scattering data. However, approximation can be made through Guinier'slaw9 in low Q and Porod's law9 at high Q-range. At small values of QD, where D is thelinear dimension of the particle, for dilute solution (i.e. S(Q) —> 1), P(Q) is given by
P(Q) = exp(-Rg2Q2/3)
and
P(Q) =
for Guineir and Porod plots respectively, where Rg is the radius of gyration, S is the totalsurface area and n determines the shape of the particles. The Guineir plot of In I(Q) vs.Q2, has a slope giving the particle size and an intercept giving the product of the volumefraction, the particle volume and the square of scattering length density difference. ThePorod plot of In I(Q) vs. In Q, is linear and the slope giving the total internal surface area.In the case of less dilute system (high scatterer), where S(Q) not equal 1, the Fouriertransformation of the I(Q) will predict the distance between the particles. More ever, thefirst peak in I(Q) vs. Q occurs giving the average distance between the particles by D = 2rc
/Qo-
137
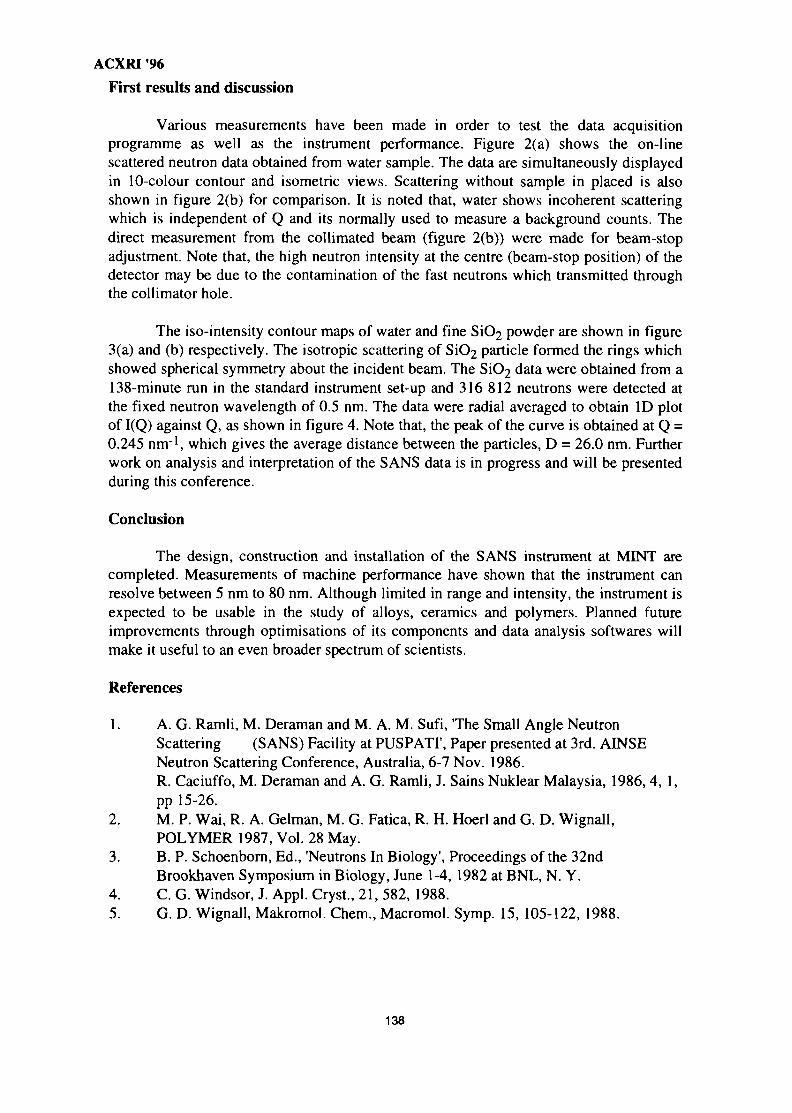
ACXRI '96
First results and discussion
Various measurements have been made in order to test the data acquisitionprogramme as well as the instrument performance. Figure 2(a) shows the on-linescattered neutron data obtained from water sample. The data are simultaneously displayedin 10-colour contour and isometric views. Scattering without sample in placed is alsoshown in figure 2(b) for comparison. It is noted that, water shows incoherent scatteringwhich is independent of Q and its normally used to measure a background counts. Thedirect measurement from the collimated beam (figure 2(b)) were made for beam-stopadjustment. Note that, the high neutron intensity at the centre (beam-stop position) of thedetector may be due to the contamination of the fast neutrons which transmitted throughthe collimator hole.
The iso-intensity contour maps of water and fine SiC>2 powder are shown in figure3(a) and (b) respectively. The isotropic scattering of SiC>2 particle formed the rings whichshowed spherical symmetry about the incident beam. The S1O2 data were obtained from a138-minute run in the standard instrument set-up and 316 812 neutrons were detected atthe fixed neutron wavelength of 0.5 nm. The data were radial averaged to obtain ID plotof I(Q) against Q, as shown in figure 4. Note that, the peak of the curve is obtained at Q =0.245 nm"1, which gives the average distance between the particles, D = 26.0 nm. Furtherwork on analysis and interpretation of the SANS data is in progress and will be presentedduring this conference.
Conclusion
The design, construction and installation of the SANS instrument at MINT arecompleted. Measurements of machine performance have shown that the instrument canresolve between 5 nm to 80 nm. Although limited in range and intensity, the instrument isexpected to be usable in the study of alloys, ceramics and polymers. Planned futureimprovements through optimisations of its components and data analysis softwares willmake it useful to an even broader spectrum of scientists.
References
1. A. G. Ramli, M. Deraman and M. A. M. Sufi, The Small Angle NeutronScattering (SANS) Facility at PUSPATI1, Paper presented at 3rd. AINSENeutron Scattering Conference, Australia, 6-7 Nov. 1986.R. Caciuffo, M. Deraman and A. G. Ramli, J. Sains Nuklear Malaysia, 1986,4, 1,pp 15-26.
2. M. P. Wai, R. A. Gelman, M. G. Fatica, R. H. Hoerl and G. D. Wignall,POLYMER 1987, Vol. 28 May.
3. B. P. Schoenborn, Ed., 'Neutrons In Biology', Proceedings of the 32ndBrookhaven Symposium in Biology, June 1-4, 1982 at BNL, N. Y.
4. C. G. Windsor, J. Appl. Cryst., 21, 582, 1988.5. G. D. Wignall, Makromol. Chem., Macromol. Symp. 15, 105-122, 1988.
138
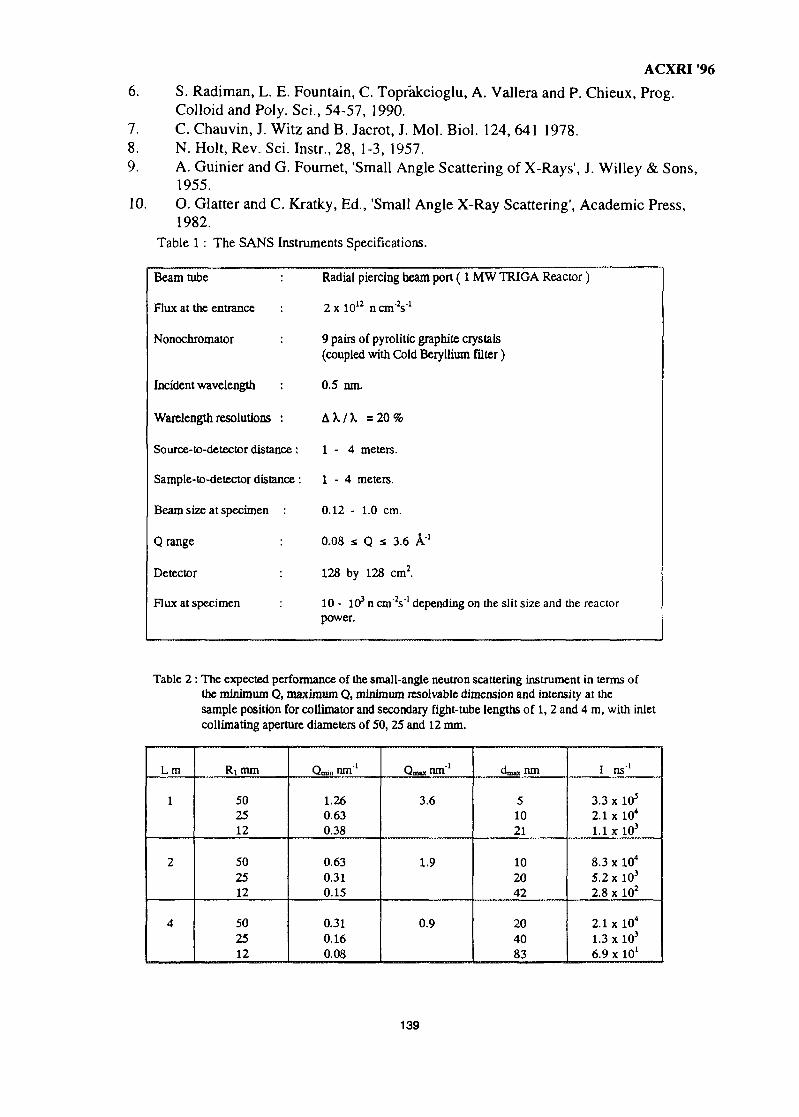
ACXRI '96
6. S. Radiman, L. E. Fountain, C. Toprakcioglu, A. Vallera and P. Chieux, Prog.Colloid and Poly. Sei., 54-57, 1990.
7. С. Chauvin, J. Witz and В. Jacrot, J. Mol. Biol. 124, 641 1978.8. N. Holt, Rev. Sei. Instr., 28, 1-3, 1957.9. A. Guinier and G. Fournet, 'Small Angle Scattering of X-Rays', J. Willey & Sons,
1955.10. O. Glatter and С Kratky, Ed., 'Small Angle X-Ray Scattering', Academic Press,
1982.Table 1 : The SANS Instruments Specifications.
Beam tube :
Flux at the entrance :
Nonochromator :
Incident wavelength :
Warelength resolutions :
Source-to-detector distance :
Sample-to-detector distance :
Beam size at specimen :
Q range :
Detector :
Flux at specimen :
Radial piercing beam port ( 1 MW TRIGA Reactor )
2xlO 1 2 n c m V
9 pairs of pyrolitic graphite crystals(coupled with Cold Beryllium filter )
0.5 nm.
ДХ/Х = 2 0 %
1 - 4 meters.
1 - 4 meters.
0.12 - 1.0 cm.
0.08 s Q s 3.6 Â"1
128 by 128 cm2.
10 - 103 n cm'V1 depending on the slit size and the reactorpower.
Table 2 : The expected performance of the small-angle neutron scattering instrument in terms ofthe minimum Q, maximum Q, minimum resolvable dimension and intensity at thesample position for collimator and secondary fight-tube lengths of 1,2 and 4 m, with inletcollimating aperture diameters of 50, 25 and 12 mm.
Lm
1
2
4
Rtrran
502512
502512
502512
Qmjn Ш П 1
1.260.630.38
0.630.310.15
0.310.160.08
ОпихШП1
3.6
1.9
0.9
d„„ nm
51021
102042
204083
I ns1
3.3 x 10³
2.1x10"1.1 xlO3
8.3 x 10⁴
5.2 x 10³
2.8 x 10²
2.1 x 10⁴
1.3 xlO3
6.9 x 101
139
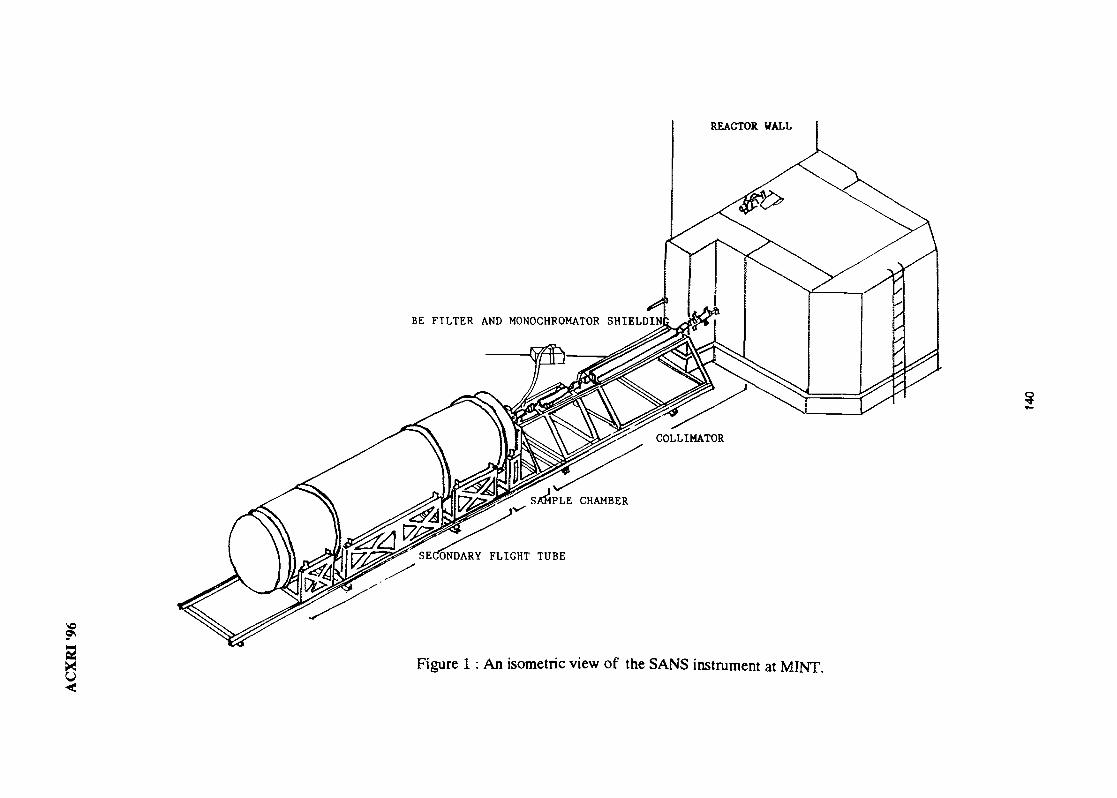
s0<
BE FILTER AND MONOCHROMATOR SHIELDIN;
SECONDARY FLIGHT TUBE
Figure 1: An isometric view of the SANS instrument at MINT.
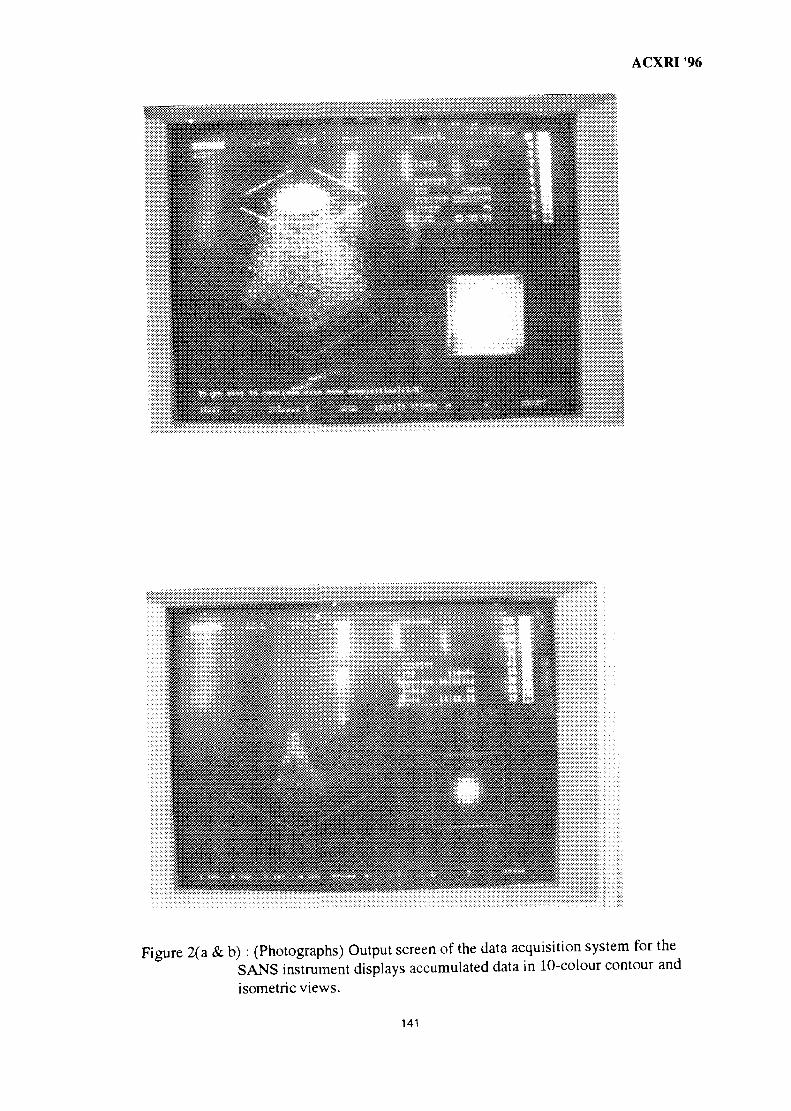
ACXRI 96
Figure 2(a & b) : (Photographs) Output screen of the data acquisition system for theSANS instrument displays accumulated data in 10-colour contour andisometric views.
141
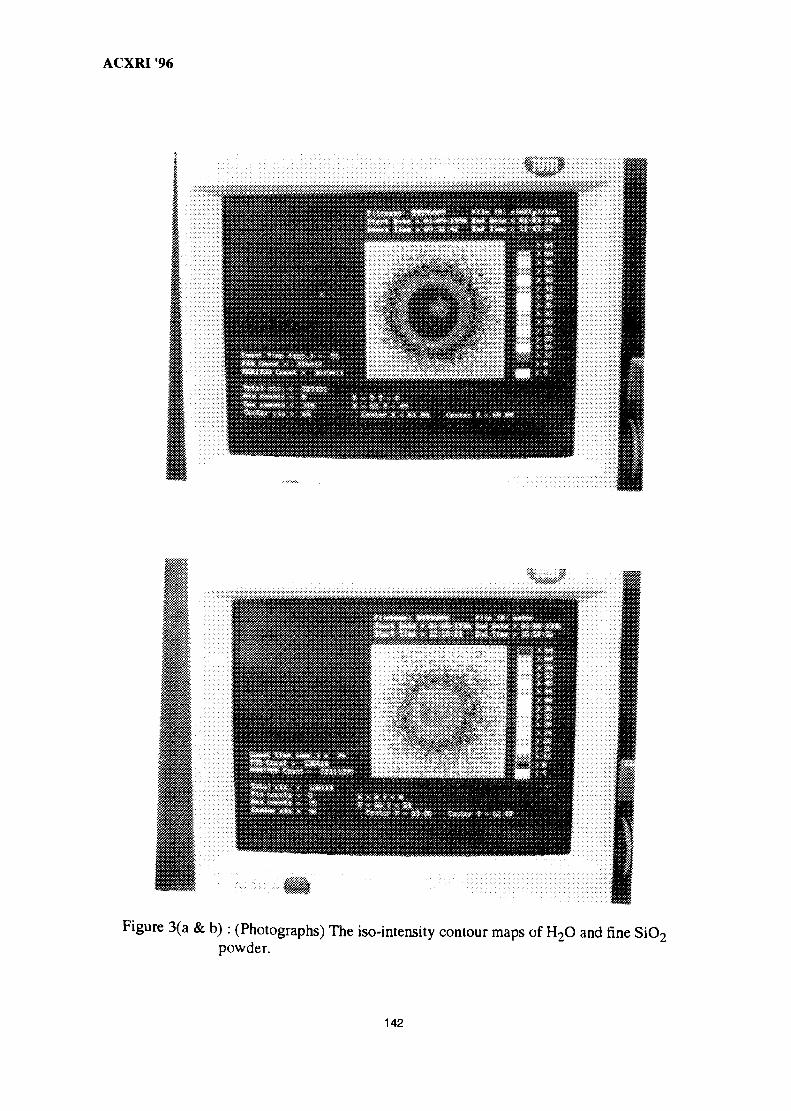
ACXRI '96
Figure 3(a & b) : (Photographs) The iso-intensity contour maps of H2O and fine SiO2
powder.
142
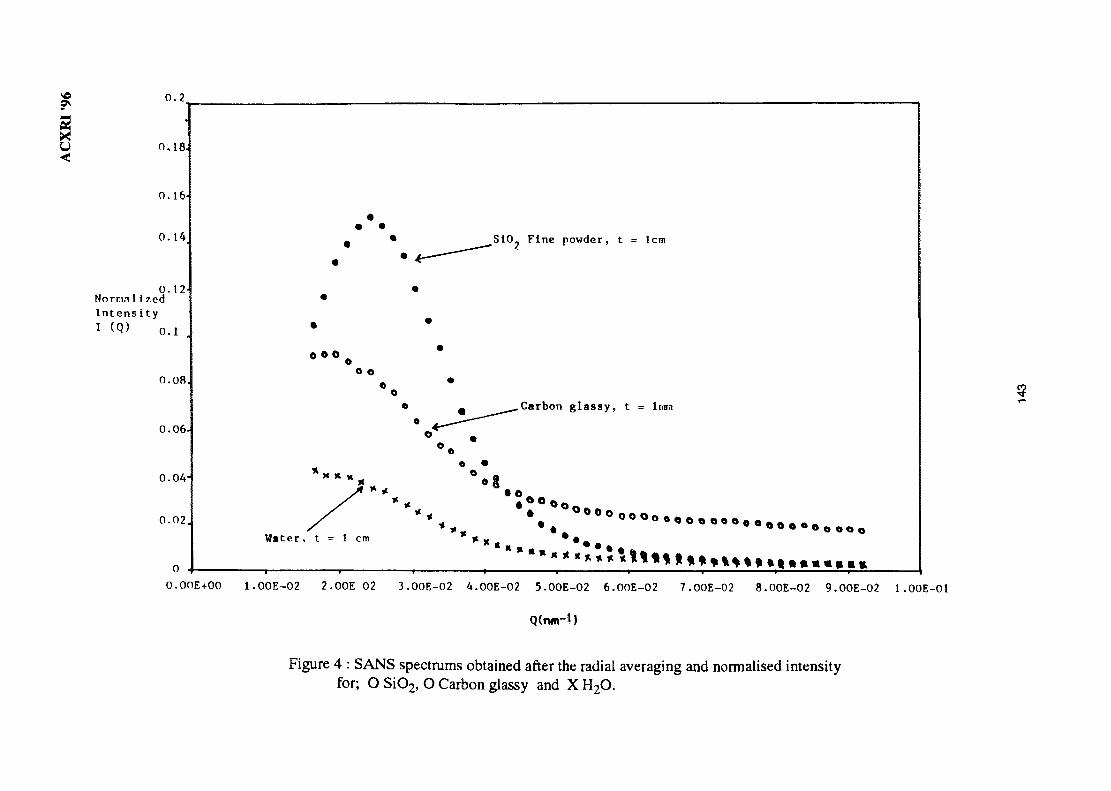
au
0.2
0,18.
0.16-
0.14,
0.12Nornn11 zedIntensity1 <Q> o.i
0.08
0.06-
0.04-
0.02
,S10_ Fine powder, t = lcrn
o ©
Carbon glassy , t = lrnm
o o o o o o o o o o o o o
Water, t = 1 cm
0O.OOE+00 1.00E-02 2.OOE-O2 3.OOE-O2 4.OOE-O2 5.OOE-O2 6.OOE-O2 7.OOE-02 8.OOE-O2 9.OOE-O2 1.00E-01
Q(nm-l)
Figure 4 : SANS spectrums obtained after the radial averaging and normalised intensityfor; O SiO2, O Carbon glassy and X H2O.
MY9700796ACXRI 96
SMALL - ANGLE X-RAY SCATTERING STUDIES ON A TERNARYMONOLAYER SURFACTANT SYSTEMS
Shahidan Radiman , Thomas Rieker and R.P Hjelm Jr.
1. Department of Nuclear Science, Universiti Kebangsaan Malaysia, Bangi 43600,Selangor, Malaysia.
2. Org 1841, MS 1349, Sandia National Laboratories, Albuquergue NM 87185-1349, USA.
3. LANSCE, MS H805, Los Alamos National Laboratory, Los Alamos NM 87545,USA.
Abstract : We report small-angle X-ray scattering (SAXS) studies on the systemdodecylethyl dimethyl ammonium bromide-water-dodecane in and around the cubicphase region. Geometric constraints on the molecule put the region to be between 40-50percent weight in water and less than 10 percent weight in dodecane. The cubic phasefound is consistent with an Ia3d symmetry. Quantitative arguments are given to support amonolayer rather than a bilayer structure.
Introduction
Cubic surfactant systems have been intensely studied in recent years not onlybecause it is now believed to be a true stable phase but also because of its polymorphismsand connecting role between real crystals with that of lyotopic liquid crystal systems.Structural studies in the lyotropic cubic crystals have shown that geometric packingconstraints would allow two bicontinuous topologies viz. a bilayer and a monolayermembranes. For some systems as exemplified by the ternary system didodecyl dimethylammonium bromide/water/alkane, bilayer topology is chosen (1,2). This is due to thealready bilayer nature of this surfactants in water (vesicular phase). In the ethoxylatedsurfactants denoted by CmEn, it was found that a bilayer to monolayer transition ispossible in the cubic phase (3). Here we report the formation of a monolayer cubic phasein the system dodecylethyl dimethyl ammonium bromide (DEAB)/dodecane/water. Thegeometry of the surfactant molecule is shown in fig. 1.
Experimental procedure
Dodecylethyl dimethyl ammonium bromide were bought from Fluka and used asreceived. Dodecane is from Sigma (HPLC grade) and distilled water prepared in a cleanroom with resistivity of 18.2 Mohm. The surfactant powder were weighed, dissolved in
144
ACXRI '96
water and later mixed homogeneously with dodecane in Kimmax 10 ml culture tubes.The samples were also warmed to 60 deg. C for complete homogenisation and phasediagram determined using an optical microscope with polarising filter and visualobservations. The cubic phase was determined from optical isotropy and ringingbehaviour (when tapped in the culture tubes).
Small-angle x-ray scattering measurements were made at the Farris EngineeringCenter, University of New Mexico, Albuquerque, New Mexico, USA and was in apinhole geometry. The samples undergo a series of heating and quenching in the culturetubes 10 minutes before being delivered using a spatula into a teflon ring and sandwichedin between Kapton tapes. This heating and quenching cysles were made to prevent largecrystallite formations which would prevent powder scattering from the samples. Mostsamples were put in the X-ray beam for a total of one to two hours after several samplerotations. Samples that showed anisotropy (shown by its two dimensional spectrum)were discarded and other samples (heated and quenched several times) were used. Ashort geometry was used throughout since the scattering peaks occur in the Q rangecovered by this geometry.
Experimental results and discussions
Description of the phase diagram. The phase diagram is shown in fig. 2 with thecubic phase subtended by two crossing grids namely 0-10% dodecane and 45-55% waterfractions. Below the cubic phase (containing more water) there is an oil-in-watermicroemulsion region consisting of a clear isotropic viscous phase. Separating thelamellar and the cubic phase at 40-50% water fraction is a mixture of cubic and lamellarphase where the samples look faily rigid and slightly birefringent, characterised by theirtranslucent or turbid appearances. In the denoted lamellar region, its existence is notedby excess oil, showing the existence of fairly strong van der Waals force that prevent oil-swelling of this phase. The cubic phase is characterised by : I) single (presumably ofIa3d) symmetry (no transition between symmetries as in didodecyl dimethyl ammoniumbromide-water-alkane systems which are cubic bilayer systems), II) lower melting pointwhen compared to the DDAB/water/alkane system and III) its small lattice parameter-therefore it is possible to have a large genus - this can be confirmed either by determiningthe diffusion constants of the oil or water using NMR techniques or direct observationusing cryo- or freeze-fracture electron microscopy.
Examples of the scattering spectra showing Ia3d arrangements are shown infigures 3 and 4 for samples DEDD32, DEDD33, DEDD37 and DEDD6. Only two peaksare discernible. The Ia3d symmetry (space group 230) should give a peak at J 6, j 8, J 14,J16, J20 corresponding to relection planes of (211), (220), (321), (400) and (420). Itshould be noted that spacegroup 220 (I43d symmetry) also gave the same peaks butfollowing Luzzati's notation, the group with the highest symmetry is chosen, especiallywhen higher distingushing peaks do not appear or become too weak. Some samplesshowed only a single peak, probably due to overlapping of the two close peaks due to a)comparable intensity and b) occurrence of crystallites that orient at the right direction.
145
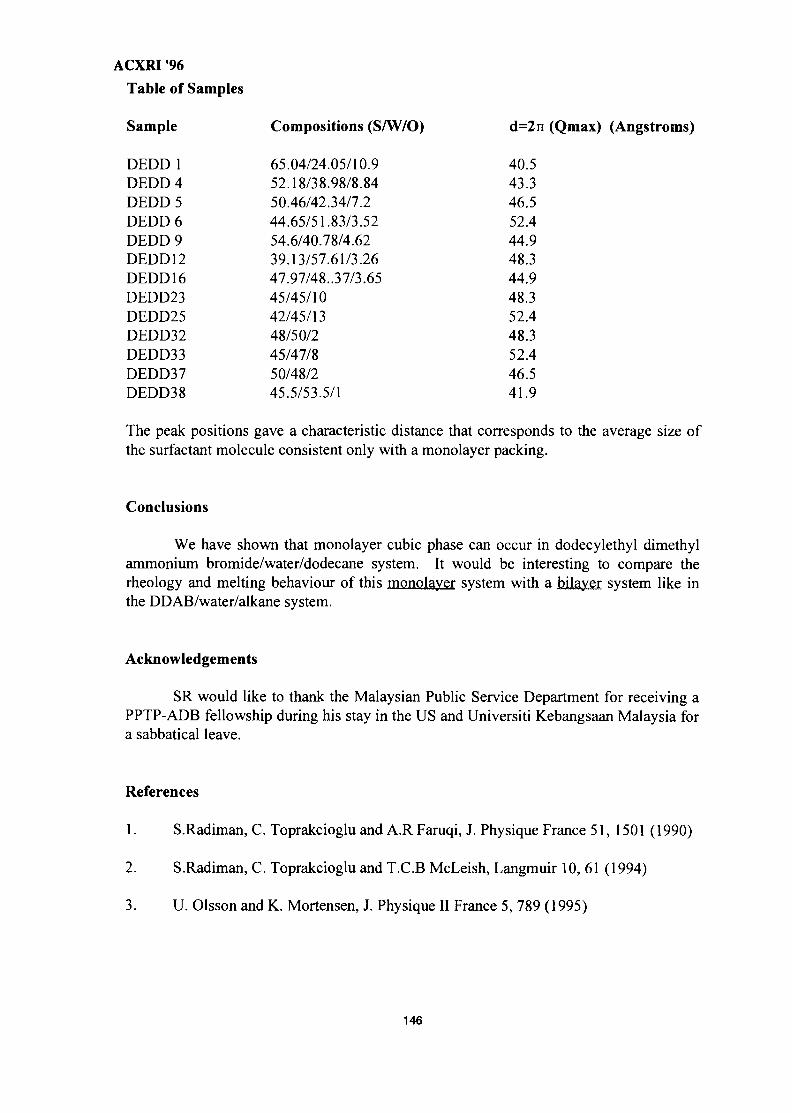
ACXRI '96Table of Samples
Sample
DEDD 1DEDD4DEDD 5DEDD 6DEDD 9DEDD 12DEDD 16DEDD23DEDD25DEDD32DEDD33DEDD37DEDD38
Compositions (S
65.04/24.05/10.952.18/38.98/8.8450.46/42.34/7.244.65/51.83/3.5254.6/40.78/4.6239.13/57.61/3.2647.97/48..37/3.6545/45/1042/45/1348/50/245/47/850/48/245.5/53.5/1
'O) d=2n (Qmax) (Angstroms)
40.543.346.552.444.948.344.948.352.448.352.446.541.9
The peak positions gave a characteristic distance that corresponds to the average size ofthe surfactant molecule consistent only with a monolayer packing.
Conclusions
We have shown that monolayer cubic phase can occur in dodecylethyl dimethylammonium bromide/water/dodecane system. It would be interesting to compare therheology and melting behaviour of this monolayer system with a bilayer system like inthe DDAB/water/alkane system.
Acknowledgements
SR would like to thank the Malaysian Public Service Department for receiving aPPTP-ADB fellowship during his stay in the US and Universiti Kebangsaan Malaysia fora sabbatical leave.
References
1. S.Radiman, C. Toprakcioglu and A.R Faruqi, J. Physique France 51, 1501 (1990)
2. S.Radiman, C. Toprakcioglu and T.C.B McLeish, Langmuir 10, 61 (1994)
3. U. Olsson and K. Mortensen, J. Physique II France 5, 789 (1995)
146
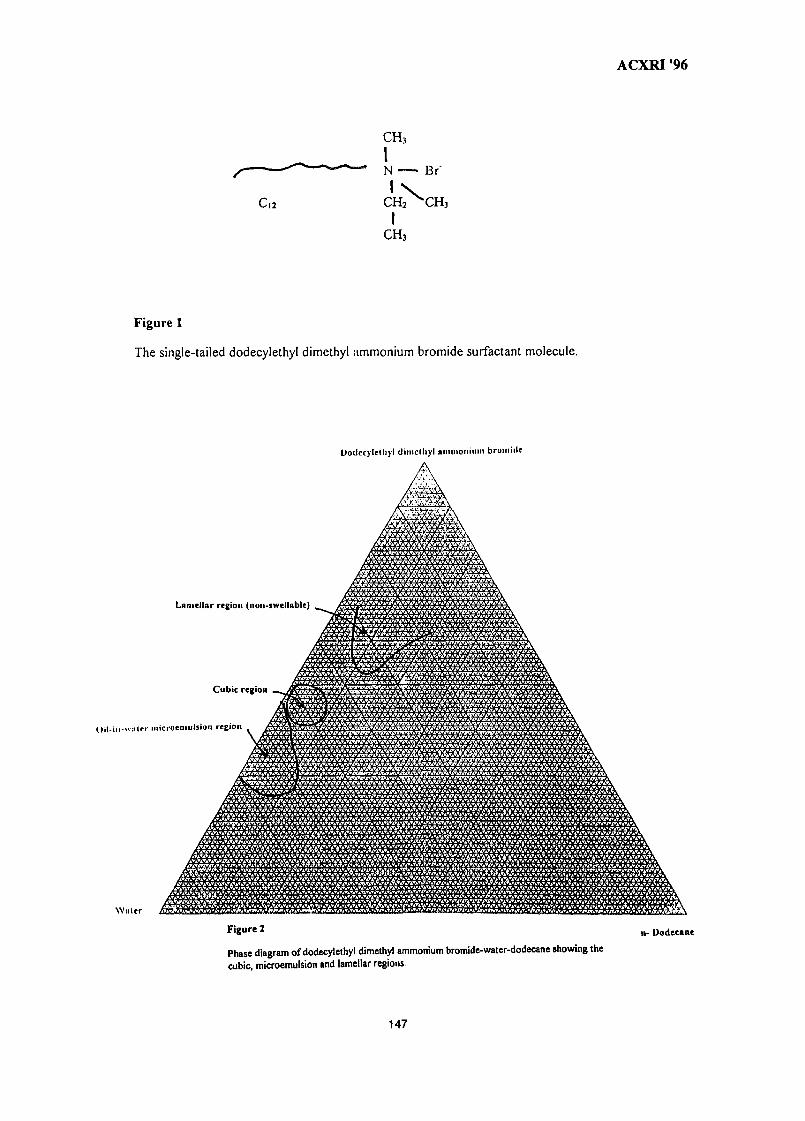
ACXRI '96
CH3
N Br"
ICH3
Figure 1
The single-tailed dodecylethyl dimethyl ammonium bromide surfactant molecule.
Dodecylelliyl diinclliyl ainiiioiiiinii bromide
Lamellar region (nou-swellable) __^ >O9fr
Cubic region
Oil-iii-wnicr microeiiiulsioii region
F£impA*&£rjMe'AV&t9&jW&&&&k*#JWAWjnFJ£Wk1W&&Bp^&iT&&#ffim^*m!SZ
Wnlcr
Figure 2
Phase diagram of dodecylethyl dimethyl ammonium bromide-water-dodecane showing the
cubic, microemulsion and lamellar regions.
n- Dodecune
147
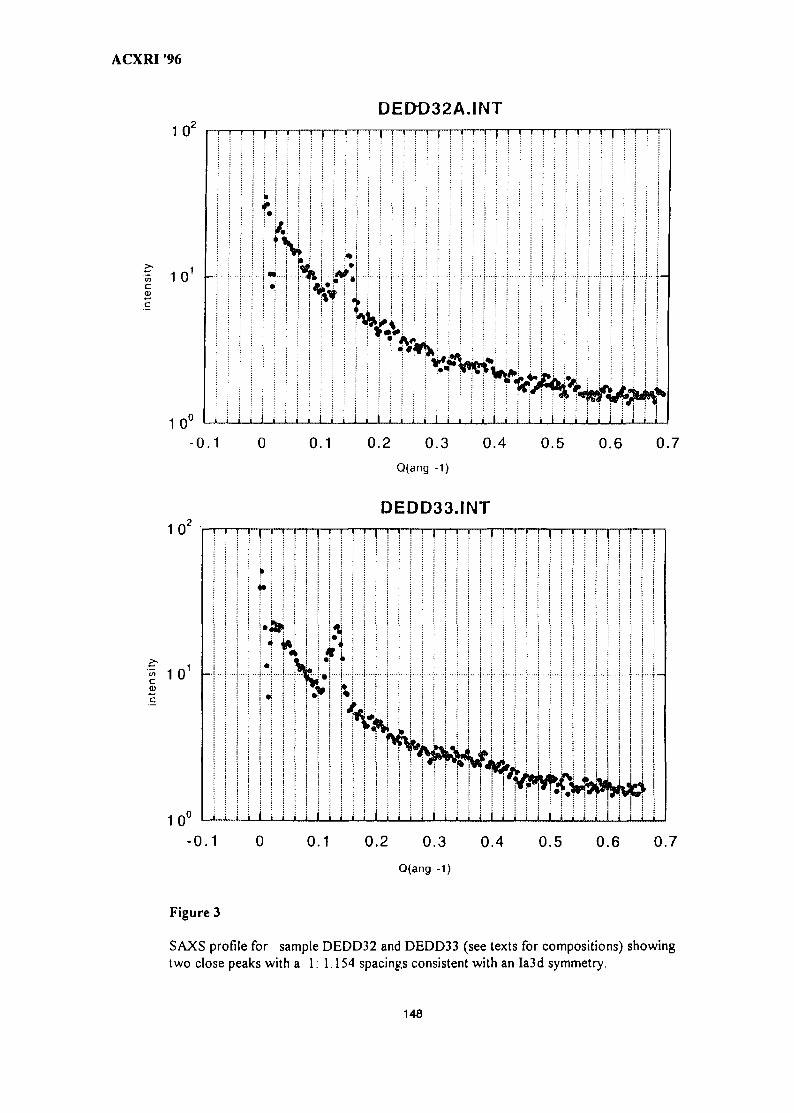
ACXRI '96
DEDD32A.INT
c<D
10 ' -
1 0
DEDD33.INT1 0
2 .
10' -
)
1
0
I—!—I—
i j
1 !
f
-
\
i
i—
V
j
1 j
>%4v M•
\
1
*\
i—
i«V
i—|—
K%
' ! ! ! ! !
Er>
T~
' nJ M
T—I
-0.1 0 0.1 0.2 0.3 0.4 0.5 0.6 0.7
Q(ang -1)
1
0 ' ' i
•• i '•
] I j «
N !
I \ \
i
• i
h
f i
i i
• \ \
> i
, i i j
M ! 1 i 1 I rl i i l I i i i .
i ! ! ! M M i i ! J
1 I I 1 i i I I 1 | I 1
! i i i i 1 i i 1 i ! !10-0.1 0 0.1 0.2 0.3 0.4 0.5 0.6 0.7
Q(ang -1)
Figure 3
SAXS profile for sample DEDD32 and DEDD33 (see texts for compositions) showingtwo close peaks with a 1: 1.154 spacings consistent with an Ia3d symmetry.
148
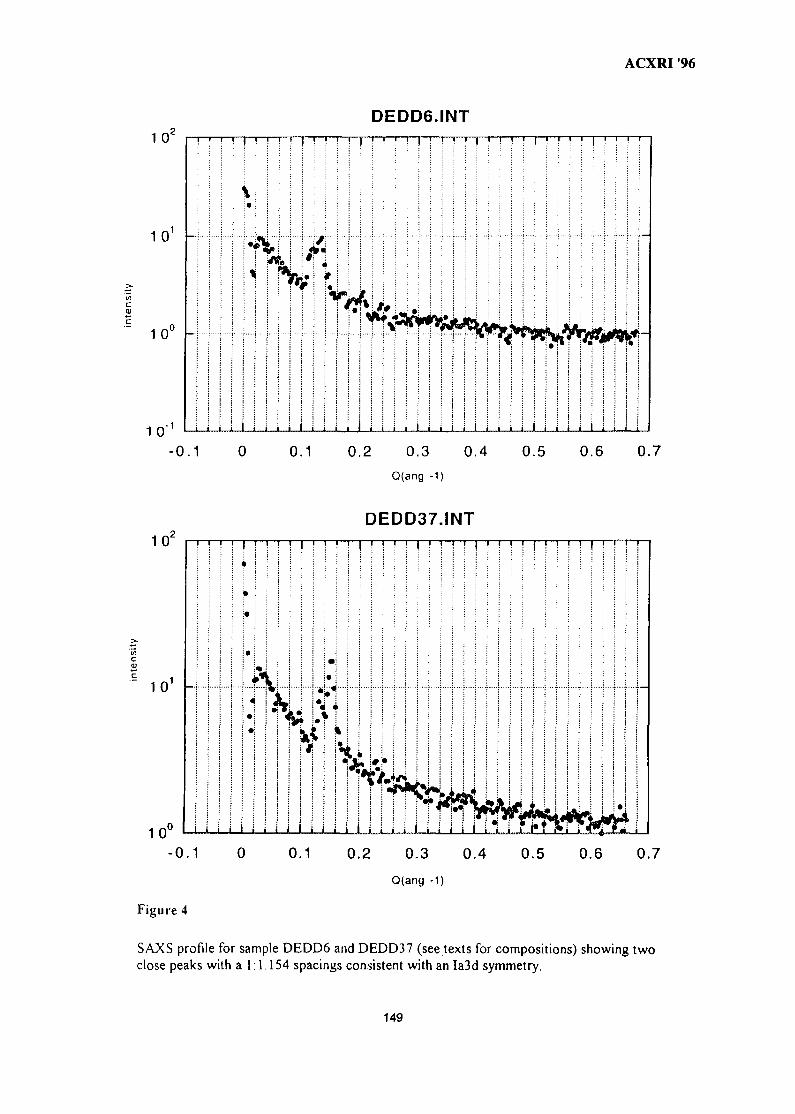
ACXRI '96
DEDD6.INT
10' -
1 0"
1
0
1
-
! 1 ! ! !
4i
•<
t
....
•
i
i
a ft U
! 1
ij l
i
-10" -
-0.1 0 0 . 1 0 . 2 0 . 3 0 . 4 0 . 5 0 . 6 0 . 7
Q(ang -1)
DEDD37.INT
101
10" i
•
i» \ \
•
•
•
• i •
i
•
: •••»
•
<
1<
....
*
! I
t.•I
i
! i I
•
; ]; ;
• ;
,
• «
1 !
4Cri•1
!!
• j LA.
w (Jii
- 0 . 1 0 0 .1 0 . 2 0 . 3 0 . 4 0 . 5 0 . 6 0 . 7
Q(ang -1)
Figure 4
SAXS profile for sample DEDD6 and DEDD37 (see texts for compositions) showing twoclose peaks with a 1:1.154 spacings consistent with an Ia3d symmetry.
149
ACXRI'96 MY9700797
EFFECTIVE APPLICATIONS OF AUGER ELECTRONSPECTROSCOPY
H. GolnabiInstitute of Water and Energy, Sharif University of Technology
P. O. Box 11365 - 8639, Tehran, Iran
Abstract : The goal of this study is to explore different aspects of the AES processand to present the new techniques which can be used effectively for analyticalpurposes. More emphasis is given to AES data acquisition, sensitivity factor andAuger intensity. The experimental details of a typical scanning Auger microprobe(SAM) is also presented. Applications of AES to selected systems such asmicroelectronic devices, supperconductors, and in metallurgy are described.
IntroductionWhen a sample is excited with x - ray or energetic electrons, core electrons may
be ejected from an energy level Ex and core hole Ex is then filled by an internalprocess in which electron from energy level Ex fall into the core holes E^. Energyblanced is achieved either by x - ray emission or by ejection of a third electron fromenergy energy level Ez. The energy of the third electron (Auger electron), EAis givenby:
EA= Ez+Ey-Ex (1)
which is unique for each element. If the Auger energy spectrum frm 0-2 keV ismeasured, then all the elements present on be sample can be identified. AES is asurface sensitive technique because of the intense inelastic scattering that can occurfor electrons in the energy range of 0-2 keV, illustrated in Fig. 1. only Auger electronsfrom the outmost 0.5-3 nm of a solid survive to be ejected and measured in thespectrum.
With the modified Auger electron spectrometer it is possible to obtain bothAuger and secondary images of the sample under study. The modified apparatus isknown as a scanning Auger Microprobe (SAM), which provides Auger spectra oflocalized areas of about 25 nm-l^m. A SAM system can also function as a medium -resolution SEM.
Experimental Arrangement.A typical SAM consists of a stainless-steel ultra-high-vaccum chamber, which
contains the electron gun and electron kinetic energy analyzer, a data-acquisition andanalysis computer with associated displays and printer system. There are two mainreasons for UHV environment, first the Auger electrons must not be scattered by theambient gas and second the rate of sample contimination must be slow for a goodanalysis.
The electronic and mechanical stability of the electron gun are of utmostimportance. The lack of stability, or drift, of the electron gun can severely limit theability to analyze small samples (o.lyum) over long period of time (lh). Two types ofthermoionic emitters and field emissision gun are used in AES electron gun. Thedevelopemet of the beam quality over 20 years is shown in Table 1. The electronkinetic energy analyzer is the heart of Auger spectrometer. Most systems useelectrostatic analyzer and two types are the cylindrical mirror analyzer (CMA) and
150
ACXRI '96the hemispherical sector analyzer (HSA).
For current detection multistage or continnuousus dynode electron multipliers(CDEM) are employed. A new development is the use of position sensitive detectorsin electron specroscopy. As mentioned, a secondary electron detector is added to theAuger electron spectrometer which permits to be used as a SEM. A semiconductorx-ray detector is also added to the AES system which permits energy dispersive x -ray analysis (EDX) to be perfomed. However, EDX analysis is not surface sensitive,because x-ray emanate from a region l-2/«n in diameter. Thus with the combinedsystem the number and identitiy of electrons in the sample block may be rapidlyidentified.
All modern spectrometers are equipped with a sputter ion gun, which allows forbombardment of the specimen surface by an energetic beam of rare gas ions. Sputterion guns are used both to clean and erode the surface by energetic ion impact. Thesample handeling includes : sample stage, sample carousel, and sample heating andcooling. It is suggested that 5 degrees of freedom in sample movement should beavailable (3 translationnal and 2 tilts). A carousel - type sample holder, allowingmultiple samples to be located into the vaccum chamber. Sample heating may beuseful (600 °C) for several hours, and cooling is usually done by liquid nitrogen.Sample fracture stages use an impact hammer or chisel to fracture the sample, whichplaces the sample in both tension and compression. All practical fracture stagesprovide for liquid - nitrogen cooling of the sample to attempt a brittle fracture.Another method operating a clean surface is by mechanical removal of the originalsurface and its associated contimination (scribe or scratch).
Sensitivity Factor and Auger IntesityThe emitted Auger electrons are detected by an electron analyzer with a
transmission efficiency T (EA) and a detector of efficiency D(EA). Thus, the current,IA, may be written as
IA= Io^Ep) [l+rM(EA,a)] T(EA)D(E)J NA(Z)exp[-Z/Am(EA) cos 9] dZ (2)
where <rA is the ionization cross section, rM is the backscattering term, a is theangle between the surface normal and the incident electron beam. NA(z) is theA-atom distibution with depth z into the sample surface. AM is the the inelastic meanfree path, and 9 is the angle of emission. The current is integrated over theappropriate angular enterance aperature of the electron spectrometer.
At the present Eq.(2) is not used directly for the data analysis. Instead it is usedas a starting point and various simplifications are made to determine the workfunction of the specimen.
Considering a homogenous binary system,AB, the number of unknowns inEq.(2) can be reduced by considering the ratio of intensities for the pure elementstandards IA°° /IB°° , recorded on the same AES instruments,
2k = F A BA JA/JAL (3)
XB ^ IB / IB00 V 'where XA and XB are the mole fractions of A and B, respectively, in the solid
AB, and FABA are the Auger electron matrix factors. For the case that the matrix
factor are ignored, then Eq.(3) reduces to
= I A
i =0 An / In
151
(4)
ACXRI 96
In the absence of a large number of pure elemental standards from whichvalues for IA°° and IB°° etc. may be obtained, the Auger signal from the sample maybe normalized relative to both(l) the signals of all the sample Auger peaks present inthe spectrum and(2)the signal of the pure sample element compared to the signalfrom a pure elemental target,typically silver. Thus we can write
where IA is the intensity of the Auger peak associated with element A, and SA is theAuger sensivity factor for element A at the particular ionization potential employed.The choice of Auger intensities IA and IB is a matter of some debate, but usuallypeak-to background ratios are used. More recently the major sources of errors inAES measurements have been reported1.
Data Acquisition and Analysis
l.Techniques: Data acquisition system includes AES spectrometer digitalcontrol,SAM data analysis computer and ancillary SAM capability. Digital systemfacilitates system automation and contributes to faster analyses and improves dataaccuracy. The function of the analysis computer are as follows: (1) spectral displayand expansion(2) smoothing,(3)derivative spectra,(4)peak integration and areameasurements,(5)analysis of overlaping spectral features,(6)addition and subtraction,of spectra and (7) noise spike removal.
AES experimental techniques include, Auger data acqusition, Auger pointspectra, Auger line spectra, and Auger mapping. The electron energydistribution,N(E) vs E, is recorded by pulse counting(Ip <10'7 A)or bycurrent-to-digital conversion methd(Ip>10"7 A). The most common are single ormultiple point spectra, in which the electron beam remains at one point I(Xj,yj) on thesample for the duration of the data collection. Similarly multiple data points,Ii=in(xj,yi) can be obtained in which I is the Auger signal at one point and n is thenumber of points. Often line scan is usefull,specially when the sample is presentedsuch that a cross sectional view of an interface is observable.
By scanning the electron beam across the sample, and measuring intensity I(x,y), an image may be constructed in which the intensity of each pixel represents theamount of the element present. A two-dimensional view, or Auger map, of theconcentration across a surface can be constructed.
2. Depth Profile Analysis: The combination of an Auger spectrometer and an ion guncan be employed to obtain a compositional depth profile of a surface. This may bedone either seqentially or continuously. In the continuous method, the chemicalcomposition of the surface at each depth , for each time, is slightly different and asimultaneous analysis is possible. Specimen rotation during sputtering has shown animproved interfacial resolution for multilayer samples2.
The data obtained consists of Auger signal intensities,I, as a function ofsputtering time,t, and must be converted to concentration C vs. depth,z. The sputterrate Z (m/s)is described by
Z= (M/pNe) S JP (6)
where M is the atomic mass number, p is the density (kg m'3),N Avogadro's number,e electron charge, S is the sputtering yield(atom/ion), and Jp is the primary ioncurrent density(A m2). From Eq.(6) Z can be calculated by knowing S from
152
ACXRI f96literature3 and measuring Jp.
A better method to obtain Z is to measure the time required to sputter througha layer of known thickness(anodized tantalum foils). A third method is to measurethe actual sputter depth after depth profiling by conventional interferometry or stylusmethod.
3. Depth Deconvolution Techniques: An efficient method is the factor analysis4 whichcan be applied to Auger line shape spectra to determine the presence and number ofnew chemical states formed at interface. This technique can provide informationabout the number of components, qualititative analysis from overlaping spectra,andextraction of spectra for unidentified components with a good speed of analysis.
Figure 2 shows a conventional Auger depth profile of Pt-Zirconia, while it iscompared with a chemical state depth profile computed from Auger line-shapeinformation, Fig. 2b. Spectra of the three individual components Pt,Pt Zr, and Zr O2 ,have been calculated by the factor analysis technique.
Depth profiling of multilayers has been accomplished by using a logisticfunction. For a solid/solid interface the Auger depth profiling can be determined by alogistic function of the form
Y= A+a(T-T0) B+b(T-To)l+ex l+e x ^ ;
where Y is the surface elemental concentration of the components that defines theinterface. A is a measure of the preinterface and B is for the postinterfaceconcentration,where" pre" and "post" are taken in the sense of time. To is themidpoint of the interface region,and x is a dimensionless reduced time defined as(T-To)/D. D is the characteristic time for sputtering through the interface region. Aleast-squares fitting program has been employed which fits the Eq. (7) to themeasured Auger spectral intensities.
ApplicationsA list of AES applicatins to a variety of problems is given in Table 2. A
scanning Auger microprobe, because of its high lateral (50 - 100 nm) and depthresolutions (0.5 - 3 nm) and inherent capability to function as a SEM, is ideally suitedto identify and correlate submicrometer features with elemental analysis of thesefeatures. By combining AES with ion - beams sputter etching, depth profiling onsmall scale ( 2 nm resolution in < 100 - nm depths) may be performed.
There are several applications of AES in microelectronics. In metallurgy, grain -boundary segregtion, thin film interdiffusion studies and historical metallurgy can beaccomplished. Alloyed superconducting Nb3 Sn - bronze wire filaments werefractured under UHV (3xl0~10Torr,4xl0~7pa)and struture and elemenrtal composionof the individual wire filaments were examined. Other applications of AES consernswith corrosion, insulating samples and mineralogy and also surface extended energy -loss fine structures. AES also can be used as a valence - band spectroscopy that issurface sensitive. Observed changess in Auger line shapes have been useful inidentifing chemical states of elements at surfaces, particulary carbon, sulfur, nitrogen,and oxygen.
A summary of the capablities of AES is presented in Table 3. In order torecognize the strong aspects of the AES and to take full advantage of the system itspotentials are explained in terms of the sample form, size, topography and preprationprocess.
153
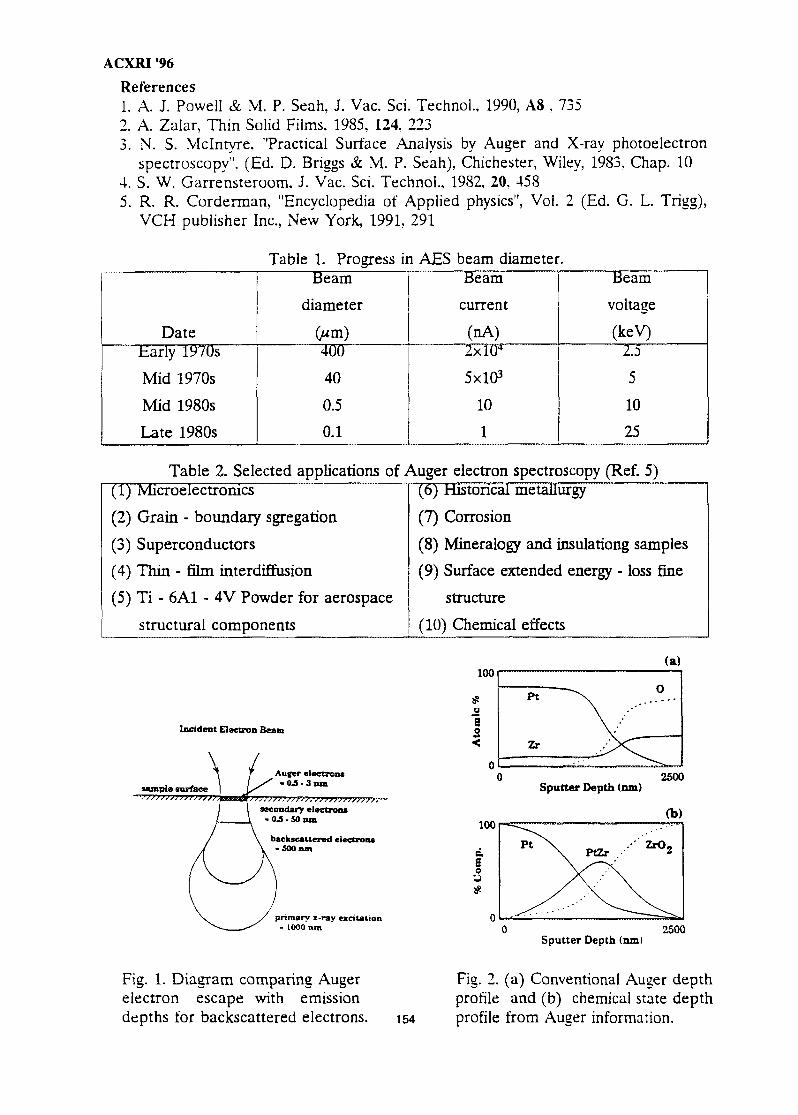
ACXRI '96
References1. A. J. Powell & M. P. Seah, J. Vac. Sci. Technol., 1990, A8 , 7352. A. Zalar, Thin Solid Films. 1985, 124, 2233. N. S. Mclntyre. "Practical Surface Analysis by Auger and X-ray photoelectron
spectroscopy'', (Ed. D. Briggs & M. P. Seah), Chichester, Wiley, 1983. Chap. 104. S. W. Garrensteroom. J. Vac. Sci. Technol., 1982, 20, 4585. R. R. Corderman, "Encyclopedia of Applied physics", Vol. 2 (Ed. G. L. Trigg),
VCH publisher Inc., New York, 1991, 291
Table 1. Progress in AES beam diameter.
DateEarly 1970s
Mid 1970s
Mid 1980s
Late 1980s
Beam
diameter
Cam)400
40
0.5
0.1
Beam
current
(nA)2xl04
5X10³
10
1
Beam
voltage
(keV)2.55
10
25
Table 2. Selected applications of Auger electron spectroscopy (Ref. 5)(1) Microelectronics
(2) Grain - boundary sgregation
(3) Superconductors
(4) Thin - film interdiffusion
(5) Ti - 6A1 - 4V Powder for aerospace
structural components
(6) Historical metallurgy
(7) Corrosion
(8) Mineralogy and insulationg samples
(9) Surface extended energy - loss fine
structure
(10) Chemical effects
Incident Electron Beam
sample surface
Auger electrons• 0 A - 3 run Sputter Depth (nm)
2500
secondary electrons50 nm
backscauered electrons-SOOnm
primary x-ray excitation• 1000 nm
100
Sputter Depth (tun)2500
Fig. 1. Diagram comparing Augerelectron escape with emissiondepths for backscattered electrons. 154
Fig. 2. (a) Conventional Auger depthprofile and (b) chemical state depthprofile from Auger information.
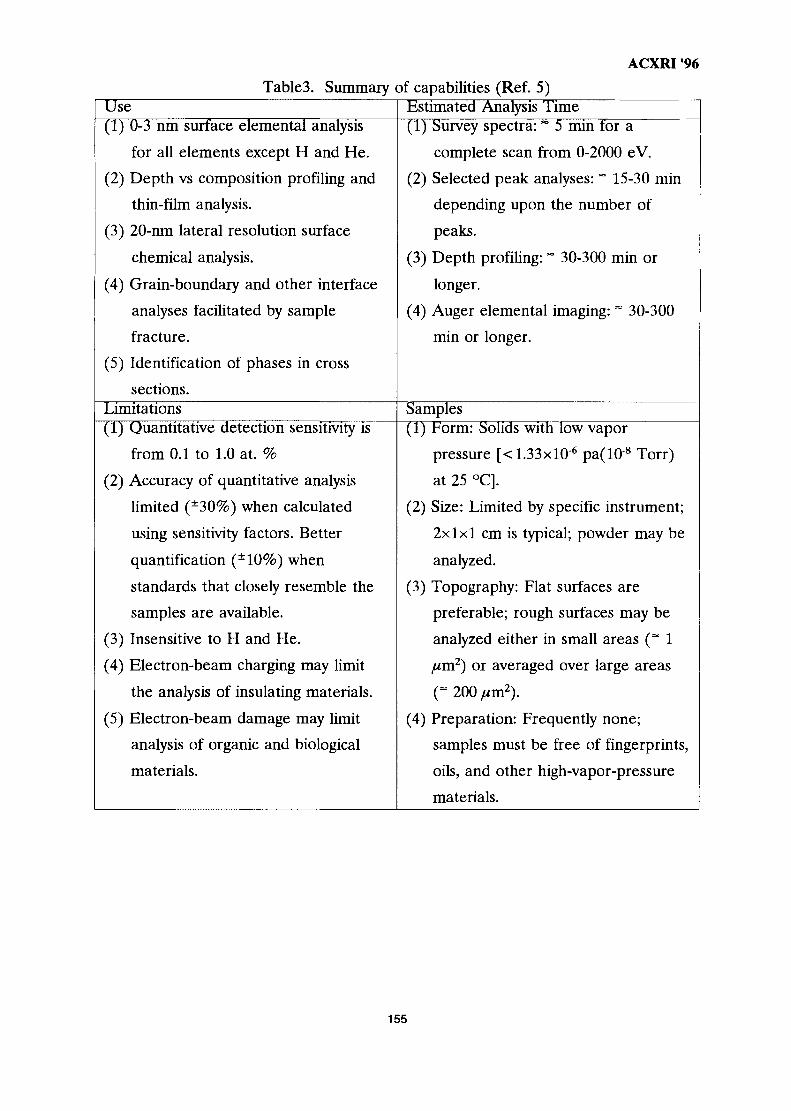
ACXRI '96Table3. Summary of capabilities (Ref. 5)
Use(1) 0-3 nm surface elemental analysis
for all elements except H and He.
(2) Depth vs composition profiling and
thin-film analysis.
(3) 20-nm lateral resolution surface
chemical analysis.
(4) Grain-boundary and other interface
analyses facilitated by sample
fracture.
(5) Identification of phases in cross
sections.Limitations(1) Quantitative detection sensitivity is
from 0.1 to 1.0 at. %
(2) Accuracy of quantitative analysis
limited (±30%) when calculated
using sensitivity factors. Better
quantification (±10%) when
standards that closely resemble the
samples are available.
(3) Insensitive to H and He.
(4) Electron-beam charging may limit
the analysis of insulating materials.
(5) Electron-beam damage may limit
analysis of organic and biological
materials.
Estimated Analysis Time(1) Survey spectra: " 5 min for a
complete scan from 0-2000 eV.
(2) Selected peak analyses:"" 15-30 min
depending upon the number of
peaks.
(3) Depth profiling: - 30-300 min or
longer.
(4) Auger elemental imaging: ~ 30-300
min or longer.
Samples(1) Form: Solids with low vapor
pressure [< 1.33x10-* pa(108 Torr)
at 25 °C].
(2) Size: Limited by specific instrument;
2x1x1 cm is typical; powder may be
analyzed.
(3) Topography: Flat surfaces are
preferable; rough surfaces may be
analyzed either in small areas (= 1
//m2) or averaged over large areas
(- 200 m2).
(4) Preparation: Frequently none;
samples must be free of fingerprints,
oils, and other high-vapor-pressure
materials.
155
MY9700798ACXRI '96
DETERMINATION OF MOLECULAR PACKING IN LANGMUIR-BLODGETTFILMS BY X-RAY DIFFRACTION
Norani M. MohamedSchool of Materials and Mineral Resources Engineering,
Universiti Sains Malaysia, Seri Iskandar, 31750Tronoh, Perak, Malaysia.
Abstract: This paper is intended to impart to the researchers unfamiliar to this field, ageneral introduction to the fabrication of Langmuir-Blodgett (abbreviated as LB) filmswith the focus on the techniques used to provide infomation on molecular arrrangement inmultilayers film of a metal substituted phthalocyanine. A molecular packing in LB filmsfor pure and mixed materials are proposed based on the isotherm and x-ray diffractionstudies. The results of the isotherm and x-ray diffraction for the pure material suggest thatin the region of ordered multilayers, the molecules are arranged with their planesperpendicular to the substrate surface. For all the mixing ratios investigated in the mixedLB films, d-spacings appeared to be determined by just one of the components.
Introduction
Monomolecular assemblies on substrates, now termed Langmuir-Blodgett (hereafterabbreviated as LB) films, have been studied for over half a century. LB films are now anintegral part of the field of molecular electronics. It seems inevitable that they will playsome role in replacing inorganic materials in certain areas of application in themicroelectronics and optoelectronics industries. The ability for the synthetic organicchemist to produce organic materials with tailored properties has been used to advantage inseveral applications. The best example is that of liquid crystals and their use in displaysand digital thermometers. In the search for any new phenomena and possible practicalapplications of LB films, one should not overlook the pressing need for a sufficientfundamental knowledge of structure-property relationship. This paper reports thedetermination of the film thickness of substituted nickel phthalocyanine and the mixturesby x-ray diffraction technique. The results would provide a valuable insight into theirstructural form in the pure and mixed LB films.
LB Technique of Film Deposition
The LB technique has three basic procedures: spreading a monolayer onto watersurface, compressing it and then removing it. Before spreading a monolayer, the materialis first dissolved in an organic solvent (also known as the spreading solvent) which shouldbe immiscible with water. As the solvent evaporates, a monolayer is formed as dictated bythe amphiphilic nature of the molecules with the hyrophilic headgroups immersed in thewater surface and the hydrophobic tailgroups remaining above the water surface in arandom manner. This is illustrated schematically in Figure la. At this stage themonolayer is loosely packed whereby the interactions are small. If the monolayer iscompressed sufficiently with the aid of the barrier system, the hydrophobic chains whichare initially distributed randomly near the water surface are being lifted away (Figure lb).Further compression will results the monolayer to undergo a change from a liquidlike stateas shown in Figure lb to an ordered solidlike arrangement of the two dimensional arraymolecules as in Figure lc. Beyond a certain surface pressure which depends on suchfactors as the rate of compression and the stability of the monolayer, further compressionwould force the monolayer to buckle and collapse into a multilayer (see Figure Id).
The basic representation of monolayer behaviour at a given temperature is thepressure-area isotherm. Studies of the pressure-area isotherm can provide a wealth ofuseful information about molecular sizes and intermolecular force of monolayers on the
156
ACXRI '96
water surface. However, it should be pointed out that the resurgence of interest in this areahas been largely due to the fact that films can be transferred from the water surface ontosolid substrate using what has become universally known as the LB technique.
To form a solid multilayer film, a suitable substrate is normally dipped repeatedly intothe compact monolayer resident at an air-water surface. The deposition of a solid filmfrom floating monolayer is usually carried out at a surface pressure just below the collapseregion. The initial deposition is dependent on the type of substrate used. Deposition ontoa hydrophilic substrate will occur when the headgroups attach to the substrate as it iswithdrawn from the water surface. Further deposition follows the sequence of eventsshown in Figure 2a. This type of deposition, in which the monolayer is deposited eachtime the substrate moves across the phase boundary is known as Y type. If the depositionoccurs only when the substrate enters the subphase, then the process is refered to as Xtype. Z type deposition is refered to the deposition which occur only when the substrateleaves the subphase.
Experimental Details
Preparation of the LB films was carried out using a double compartmentpolytetrafluoroethylene (PTFE) trough. The two compartments are separated by a PTFErotating cylinder which acted as a substrate holder. The clockwise rotation of thissubstrate holder allowed the substrate to be immersed in one compartment and withdrawnfrom the other compartment. Water for the subphase (resistivity > 18Mohm cm) waspurified by reverse osmosis and then by passage through a milllipore Milli G Organexwater purifying system. The subphase temperature was maintained at room temperature.The substituted nickel phthalocyanine [with the side chain of O(CH2)2CH3J was providedby Dr.MJ. Cook, University of East Anglia, England. Details of this material is describedelsewhere '. The material was first dissolved in Analar-grade chloroform and then spreadonto the water surface. The surface pressure versus area isotherm was recorded after thesolvent had evaporated. The film was compressed to a surface pressure of 30 mNnr1 andfilm transfer to clean hydrophilic glass slide was carried out at 3.0 mm per minute.Constant pressure was maintained using an electronic servo-feedback system.
Evaluation of Film Thickness
The beauty of the LB technique is the ability to deposit organic layers with an ultrafinecontrol of the layer thickness. Therefore the evaluation of this parameter is of paramountimportance in any LB film study. Many techniques can be used for this evaluation, but itis noted that some of these methods do not give an independent measurement of layerthickness, in other words other physical parameters must also be determined accurately.For instance, some optical techniques require the refractive index of the material to beknown; electrical measurements (e.g., reciprocal capacitance versus film thickness) requireknowledge of the permittivity.
X-ray diffraction techniques have been used extensively to determine the monolayerthickness of LB films. Most of the work involved long chain (saturated and unsaturated)fatty acids 2"8. However, other materials namely, long chain esters 9 1 4 , substitutedaromatics 15-17> performed polymers 18 and biological materials 19~21 have also beeninvestigated. X-ray scattering can occur for all atoms in the molecules but the process iscomparatively more efficient for heavier atoms such as metal ions than for lighter atomssuch as carbon and hydrogen. Thus in some molecules which have been substituted withmetal ions, the d-spacing measured by x-ray diffraction corresponds to the distancebetween adjacent planes containing metal ions.
Past studies 22> 2 3 have shown that for some materials, only a few diffraction peaks canbe observed enabling only determination of layer spacing. However, together with theisotherm data, a general idea about the packing of the molecules can also be derived. Withsome other materials 2^ sufficient diffraction peaks are observed to allow a reasonable
157
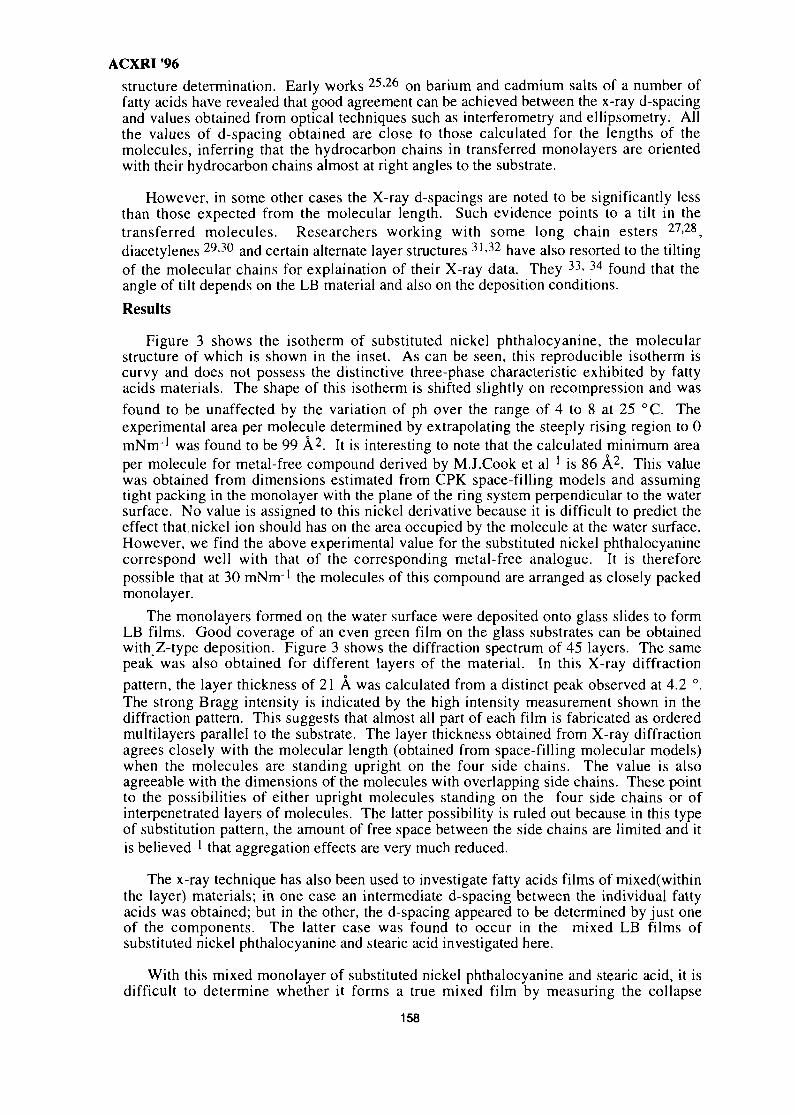
ACXRI '96
structure determination. Early works 25>26 on barium and cadmium salts of a number offatty acids have revealed that good agreement can be achieved between the x-ray d-spacingand values obtained from optical techniques such as interferometry and ellipsometry: Allthe values of d-spacing obtained are close to those calculated for the lengths of themolecules, inferring that the hydrocarbon chains in transferred monolayers are orientedwith their hydrocarbon chains almost at right angles to the substrate.
However, in some other cases the X-ray d-spacings are noted to be significantly lessthan those expected from the molecular length. Such evidence points to a tilt in thetransferred molecules. Researchers working with some long chain esters 27>28,diacetylenes 29-30 and certain alternate layer structures 31<32 have also resorted to the tiltingof the molecular chains for explaination of their X-ray data. They 33' 34 found that theangle of tilt depends on the LB material and also on the deposition conditions.
Results
Figure 3 shows the isotherm of substituted nickel phthalocyanine, the molecularstructure of which is shown in the inset. As can be seen, this reproducible isotherm iscurvy and does not possess the distinctive three-phase characteristic exhibited by fattyacids materials. The shape of this isotherm is shifted slightly on recompression and wasfound to be unaffected by the variation of ph over the range of 4 to 8 at 25 °C. Theexperimental area per molecule determined by extrapolating the steeply rising region to 0mNnr1 was found to be 99 A2. It is interesting to note that the calculated minimum areaper molecule for metal-free compound derived by M.J.Cook et al ' is 86 A2. This valuewas obtained from dimensions estimated from CPK space-filling models and assumingtight packing in the monolayer with the plane of the ring system perpendicular to the watersurface. No value is assigned to this nickel derivative because it is difficult to predict theeffect that, nickel ion should has on the area occupied by the molecule at the water surface.However, we find the above experimental value for the substituted nickel phthalocyaninecorrespond well with that of the corresponding metal-free analogue. It is thereforepossible that at 30 mNnr1 the molecules of this compound are arranged as closely packedmonolayer.
The monolayers formed on the water surface were deposited onto glass slides to formLB films. Good coverage of an even green film on the glass substrates can be obtainedwith Z-type deposition. Figure 3 shows the diffraction spectrum of 45 layers. The samepeak was also obtained for different layers of the material. In this X-ray diffractionpattern, the layer thickness of 21 A was calculated from a distinct peak observed at 4.2 °.The strong Bragg intensity is indicated by the high intensity measurement shown in thediffraction pattern. This suggests that almost all part of each film is fabricated as orderedmultilayers parallel to the substrate. The layer thickness obtained from X-ray diffractionagrees closely with the molecular length (obtained from space-filling molecular models)when the molecules are standing upright on the four side chains. The value is alsoagreeable with the dimensions of the molecules with overlapping side chains. These pointto the possibilities of either upright molecules standing on the four side chains or ofinterpenetrated layers of molecules. The latter possibility is ruled out because in this typeof substitution pattern, the amount of free space between the side chains are limited and itis believed ' that aggregation effects are very much reduced.
The x-ray technique has also been used to investigate fatty acids films of mixed(withinthe layer) materials; in one case an intermediate d-spacing between the individual fattyacids was obtained; but in the other, the d-spacing appeared to be determined by just oneof the components. The latter case was found to occur in the mixed LB films ofsubstituted nickel phthalocyanine and stearic acid investigated here.
With this mixed monolayer of substituted nickel phthalocyanine and stearic acid, it isdifficult to determine whether it forms a true mixed film by measuring the collapse
158
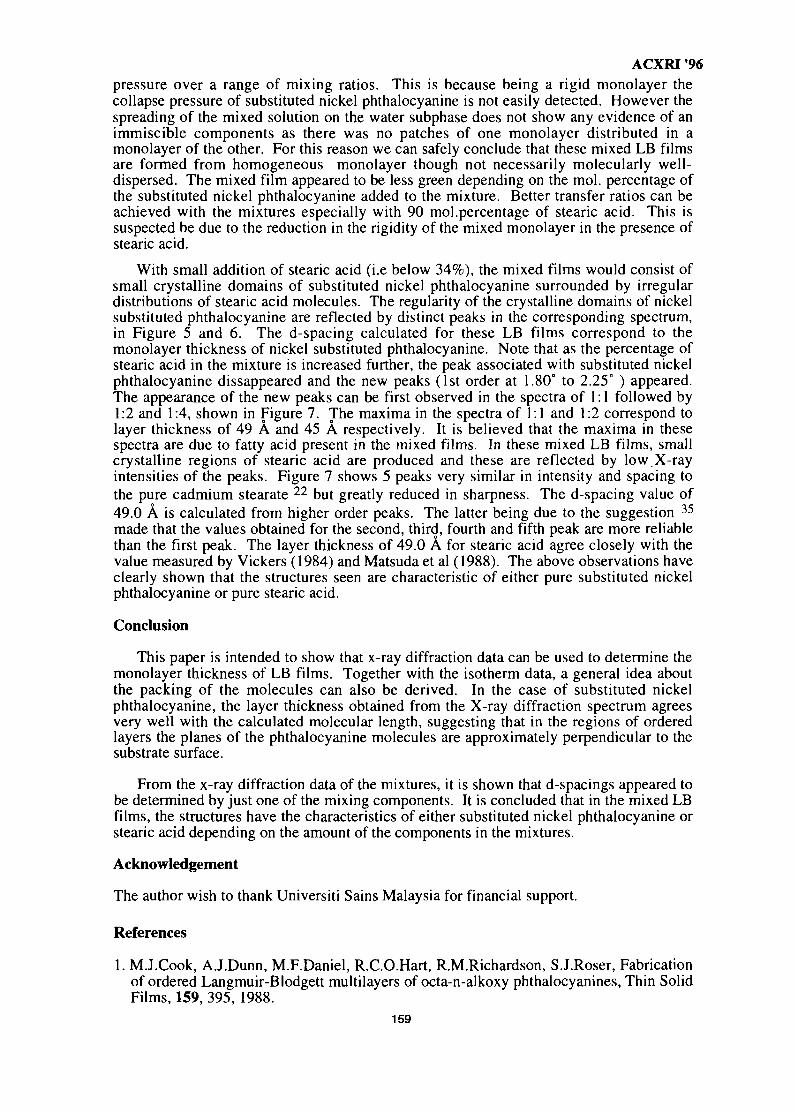
ACXRI '96pressure over a range of mixing ratios. This is because being a rigid monolayer thecollapse pressure of substituted nickel phthalocyanine is not easily detected. However thespreading of the mixed solution on the water subphase does not show any evidence of animmiscible components as there was no patches of one monolayer distributed in amonolayer of the other. For this reason we can safely conclude that these mixed LB filmsare formed from homogeneous monolayer though not necessarily molecularly well-dispersed. The mixed film appeared to be less green depending on the mol. percentage ofthe substituted nickel phthalocyanine added to the mixture. Better transfer ratios can beachieved with the mixtures especially with 90 mol.percentage of stearic acid. This issuspected be due to the reduction in the rigidity of the mixed monolayer in the presence ofstearic acid.
With small addition of stearic acid (i.e below 34%), the mixed films would consist ofsmall crystalline domains of substituted nickel phthalocyanine surrounded by irregulardistributions of stearic acid molecules. The regularity of the crystalline domains of nickelsubstituted phthalocyanine are reflected by distinct peaks in the corresponding spectrum,in Figure 5 and 6. The d-spacing calculated for these LB films correspond to themonolayer thickness of nickel substituted phthalocyanine. Note that as the percentage ofstearic acid in the mixture is increased further, the peak associated with substituted nickelphthalocyanine dissappeared and the new peaks (1st order at 1.80° to 2.25° ) appeared.The appearance of the new peaks can be first observed in the spectra of 1:1 followed by1:2 and 1:4, shown in Figure 7. The maxima in the spectra of 1:1 and 1:2 correspond tolayer thickness of 49 A and 45 A respectively. It is believed that the maxima in thesespectra are due to fatty acid present in the mixed films. In these mixed LB films, smallcrystalline regions of stearic acid are produced and these are reflected by low X-rayintensities of the peaks. Figure 7 shows 5 peaks very similar in intensity and spacing tothe pure cadmium stearate 2 2 but greatly reduced in sharpness. The d-spacing value of49.0 A is calculated from higher order peaks. The latter being due to the suggestion 35
made that the values obtained for the second, third, fourth and fifth peak are more reliablethan the first peak. The layer thickness of 49.0 A for stearic acid agree closely with thevalue measured by Vickers (1984) and Matsuda et al (1988). The above observations haveclearly shown that the structures seen are characteristic of either pure substituted nickelphthalocyanine or pure stearic acid.
Conclusion
This paper is intended to show that x-ray diffraction data can be used to determine themonolayer thickness of LB films. Together with the isotherm data, a general idea aboutthe packing of the molecules can also be derived. In the case of substituted nickelphthalocyanine, the layer thickness obtained from the X-ray diffraction spectrum agreesvery well with the calculated molecular length, suggesting that in the regions of orderedlayers the planes of the phthalocyanine molecules are approximately perpendicular to thesubstrate surface.
From the x-ray diffraction data of the mixtures, it is shown that d-spacings appeared tobe determined by just one of the mixing components. It is concluded that in the mixed LBfilms, the structures have the characteristics of either substituted nickel phthalocyanine orstearic acid depending on the amount of the components in the mixtures.
Acknowledgement
The author wish to thank Universiti Sains Malaysia for financial support.
References
1. M.J.Cook, AJ.Dunn, M.F.Daniel, R.C.O.Hart, R.M.Richardson, S.J.Roser, Fabricationof ordered Langmuir-Blodgett multilayers of octa-n-alkoxy phthalocyanines, Thin SolidFilms, 159, 395, 1988.
159

ACXRI '962. M.Prakash, J.B.Ketterson, P.Dutta, Study of in-plane structure in lead-fatty acid LB
films using x-ray diffraction, Thin Solid Films, 134, 1, 1985.3. S.Hirota, U.Itoh, M.Sugi, Polymmerization and optical properties of mixed LB films of
b-parinaric acid and stearic acid, Thin Solid Films, 132, 125, 1985.4. Y.M.Lvov, L.A.Feigin, Small-angle X-ray investigation of the structure of LB
molecular films, Stud. Biophys., 112, 221, 1986.5. M.Pomerantz, A.Segmuller, High resolution X-ray diffraction from small numbers of LB
layers of manganese stearate, Thin Solid Films, 68, 33, 1980.6. P.Fromherz, U.Oelschlagel, W.Wilke, Medium X-ray scattering of LB films of cadmium
salts of fatty acids, Thin Solid Films, 159, 421, 1988.7. S.Hirota, U.Itoh, M.Sugi, Polymmerization and optical properties of mixed LB films of b-
parinaric acid and stearic acid, Thin Solid Films, 132, 125, 1985.8. T.Fukui, A.Matsuda, M.Sugi, S.Iizima, Temperature dependence of the thickness of
Langmuir multilayer assembly films, Phys.Rev. B, 22, 4898, 1980.9. A.Cemel, T.Fort, Jr., J.B.Lando, Polymerization of vinyl stearate multilayers, J.Polym.Sci.,
Al, 10,2061, 1972.10. M.Puterman, T.Fort, Jr., J.B.Lando, The polymerization and structure of mixed multilayers
of ethyl and vinyl stearate, J.Colloid Interface Sci., 47, 705, 1974.11. V.Enkelman, J.B.Lando, Polymerization of ordered tail-to-tail vinyl stearate bilayers,
J.Polym.Sci., 15, 1843, 1977.12. D.Naegele, J.B.Lando, H.Ringsdorf, Polymerization of cadmium octadecylfumarate in
multilayers, Macromolecules, 10, 1339, 1977.13. K.Fukuda, T.Shiozawa, Conditions for formation and structural characterization of x-ray
type and y-type multilayers of long-chain esters, Thin Solid Films, 687, 55, 1980.14. A.Banerjie, J.B.Lando, Radiation-induced solid state polymerization of oriented ultrathin
films of octadecylacrylamide, thin Solid Films, 68, 67, 1980.15. R.Jones, R.H.Tredgold, A.Hoorfar, R.A.Allen, Crystal formation and growth in Langmuir-
Blodgett multilayers of azobenzene derivatives: Optical and structural studies, Thin SolidFilms, 134, 57, 1985.
16. B.Belboch, M.Roulliay, M.Tournarie, Evidence of chain interdigitation in Langmuir-Blodgett films, Thin Solid Films, 134, 89, 1985.
17. Y.Yoshida, H.Nakahara, K.Fukuda, Photopolymerization in Langmuir-Blodgett films ofmonoacids containing phenyl and diacetylene groups simultaneously, Thin Solid Films,133, 11, 1985.
18. R.H.Tredgold, A.J.Vickers, A.Hoorfar, P.Hodge, E.Khoshdel, X-ray analysis of someporphyrin and polymer Langmuir-Blodgett films, J.Phys.D, 18, 1139, 1985.
19. Y.K.Levine, A.I.Bailey, M.H.F.Wilkins, Multilayers of phospholipid bimolecular leaflets,Nature, 220,577, 1968.
20. J.P.Green, M.C.Philips, G.G.Shipley, Structural investigations of lipid, polypeptide andprotein multilayers, Biochim. Biophys. Acta. 330, 243, 1973.
21. N.P.Franks, K.A.Snook, The structure and peameability of reconstructed membranes, ThinSolid Films, 99, 139, 1983.
22. A.J.Vickers, Ph.D. Thesis, Univ. of Lancaster, U.K., 1984.23. M.C.J.Young, R.Jones, R.H.Tredgold, W.X.Lu, Z.Ali-Adib, Thin Solid Films, 182, 319,
1989.24. R.Allen, Ph.D Thesis, Univ.of Lancaster, U.K., 1988.25. V.K.Srivastava, A.R.Verma, Interferometric and x-ray diffraction study of "built-up"
molecular films of some long chain compounds, Solid State Commun., 4, 367, 1966.26. A.Matsuda, M.Sugi, T.Fukui, S.Iizima, M.Miyahara, Y.Otsuba, Structure study of
multilayer assembly films, J.Appl.Phys., 48, 771, 1977.27. M.Puterman, T.Fort, Jr., J.B.Lando, The polymerization and structure of mixed multilayers
of ethyl and vinyl stearate, J.Colloid Interface Sci., 47, 705, 1974.28. D.Naegele, J.B.Lando, H.Ringsdorf, Polymerization of cadmium octadecylfumarate in
multilayers, Macromolecules, 10, 1339, 1977.29. B.Tieke, G.Lieser, Influences of the structure of long-chain diynoic acids on their
polymerization properties in Langmuir-Blodgett multilayers, J.Colloid Interface Sci., 88,471, 1982.
30. B.Tieke, G.Lieser, K.Weiss, Parameters influencing the polymerization and structure oflong-chain diynoic acids in multilayers, Thin Solid Films, 99, 95, 1983.
160
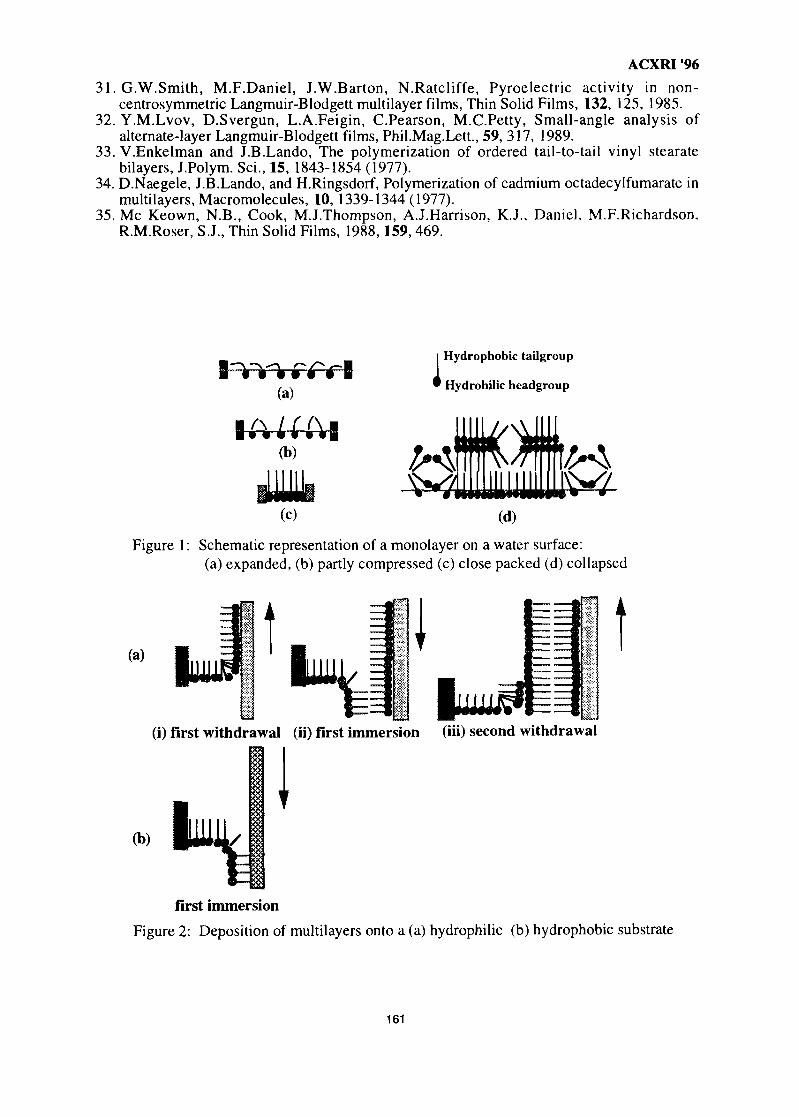
ACXRI "9631. G.W.Smith, M.F.Daniel, J.W.Barton, N.Ratcliffe, Pyroelectric activity in non-
centrosymmetric Langmuir-Blodgett multilayer films, Thin Solid Films, 132, 125, 1985.32. Y.M.Lvov, D.Svergun, L.A.Feigin, C.Pearson, M.C.Petty, Small-angle analysis of
alternate-layer Langmuir-Blodgett films, Phil.Mag.Lett., 59, 317, 1989.33. V.Enkelman and J.B.Lando, The polymerization of ordered tail-to-tail vinyl stearate
bilayers, J.Polym. Sci., 15, 1843-1854 (1977).34. D.Naegele, J.B.Lando, and H.Ringsdorf, Polymerization of cadmium octadecylfumarate in
multilayers, Macromolecules, 10, 1339-1344(1977).35. Me Keown, N.B., Cook, M.J.Thompson, A.J.Harrison, K.J., Daniel, M.F.Richardson,
R.M.Roser, S.J., Thin Solid Films, 1988,159, 469.
(a)IHydrophobic tailgroup
Hydrohilic headgroup
(b)
(C) (d)
Figure 1: Schematic representation of a monolayer on a water surface:(a) expanded, (b) partly compressed (c) close packed (d) collapsed
(a)I in 1
(i) first withdrawal (ii) first immersion (Hi) second withdrawal
(b)
first immersion
Figure 2: Deposition of multilayers onto a (a) hydrophilic (b) hydrophobic substrate
161
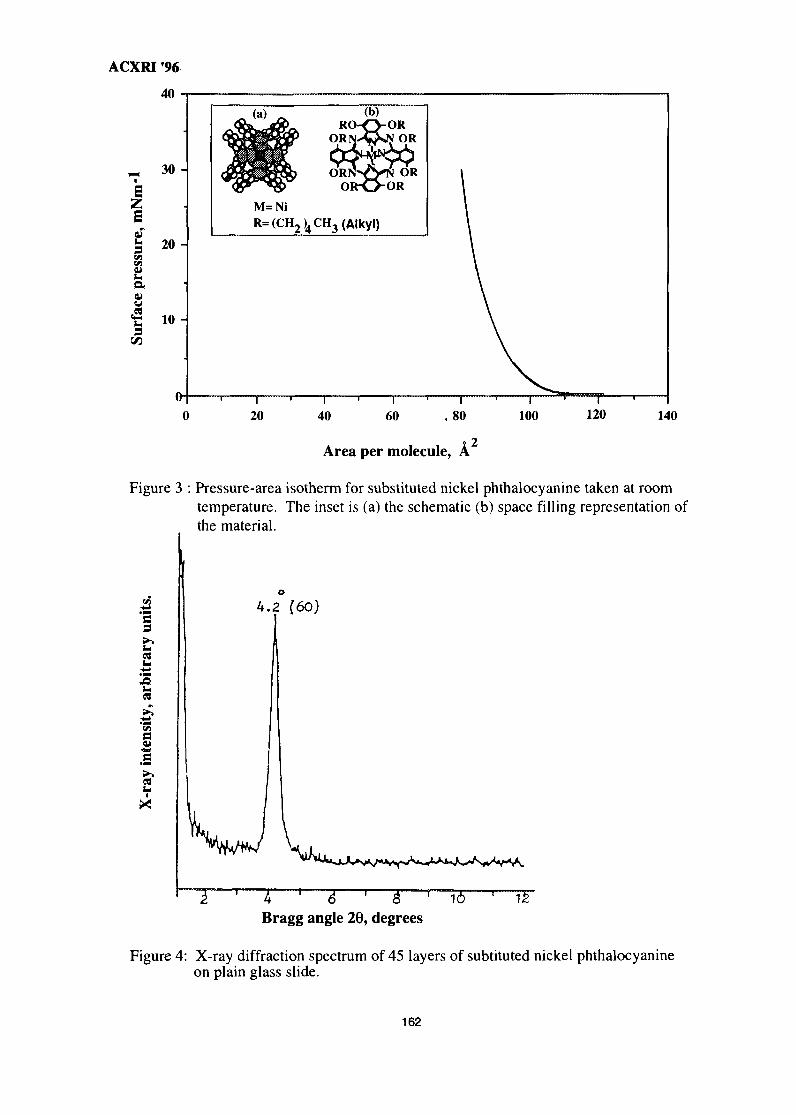
ACXRI 96
40
~ 30-
Z
0i
VI
Iaw•c9
20 -
10 -
~ RO-Q-ORORN^QsN OR
M=NiR=(CH2)4CH3(Alkyl)
20 40 60 .80
Area per molecule, A
Figure 3 : Pressure-area isotherm for substituted nickel phthalocyanine taken at roomtemperature. The inset is (a) the schematic (b) space filling representation ofthe material.
s
2
v\
2
4.2 [60)
U 6 ' BBragg angle 26, degrees
Figure 4: X-ray diffraction spectrum of 45 layers of subtituted nickel phthalocyanineon plain glass slide.
162
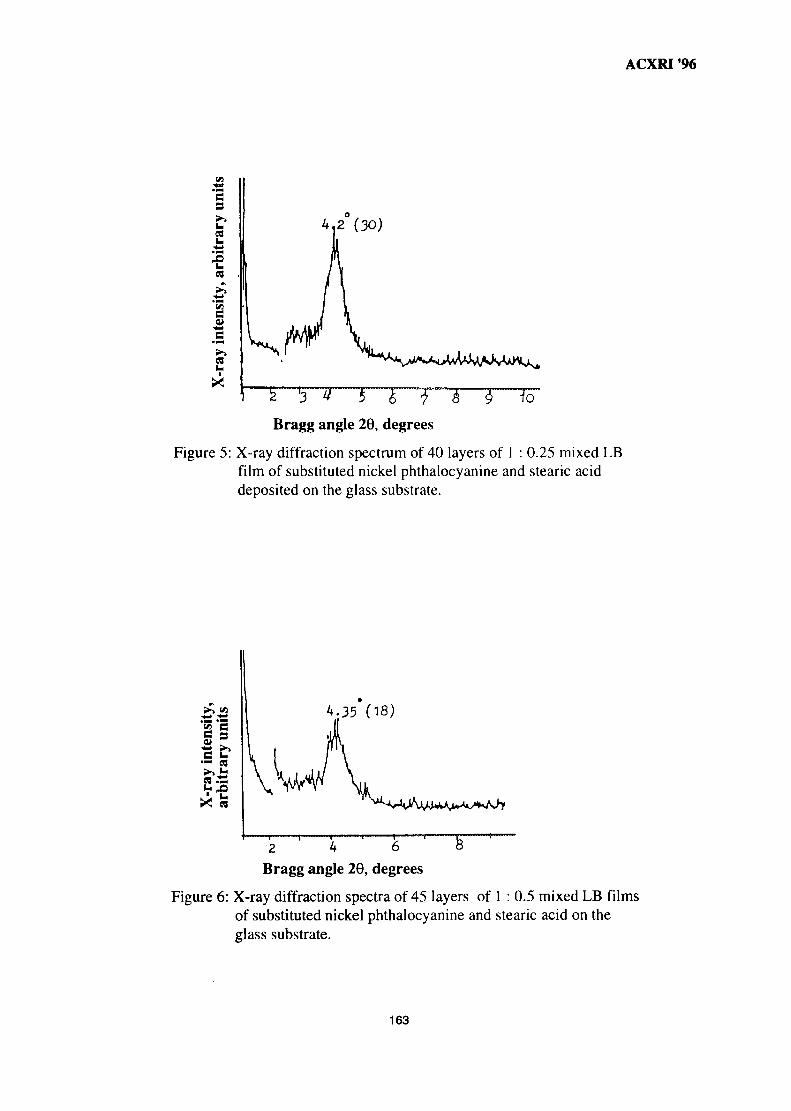
ACXRI '96
s
24.2 (30)
Bragg angle 20, degrees
Figure 5: X-ray diffraction spectrum of 40 layers of 1 : 0.25 mixed LBfilm of substituted nickel phthalocyanine and stearic aciddeposited on the glass substrate.
.35 (18)
2 A 6Bragg angle 29, degrees
8
Figure 6: X-ray diffraction spectra of 45 layers of 1 : 0.5 mixed LB filmsof substituted nickel phthalocyanine and stearic acid on theglass substrate.
163
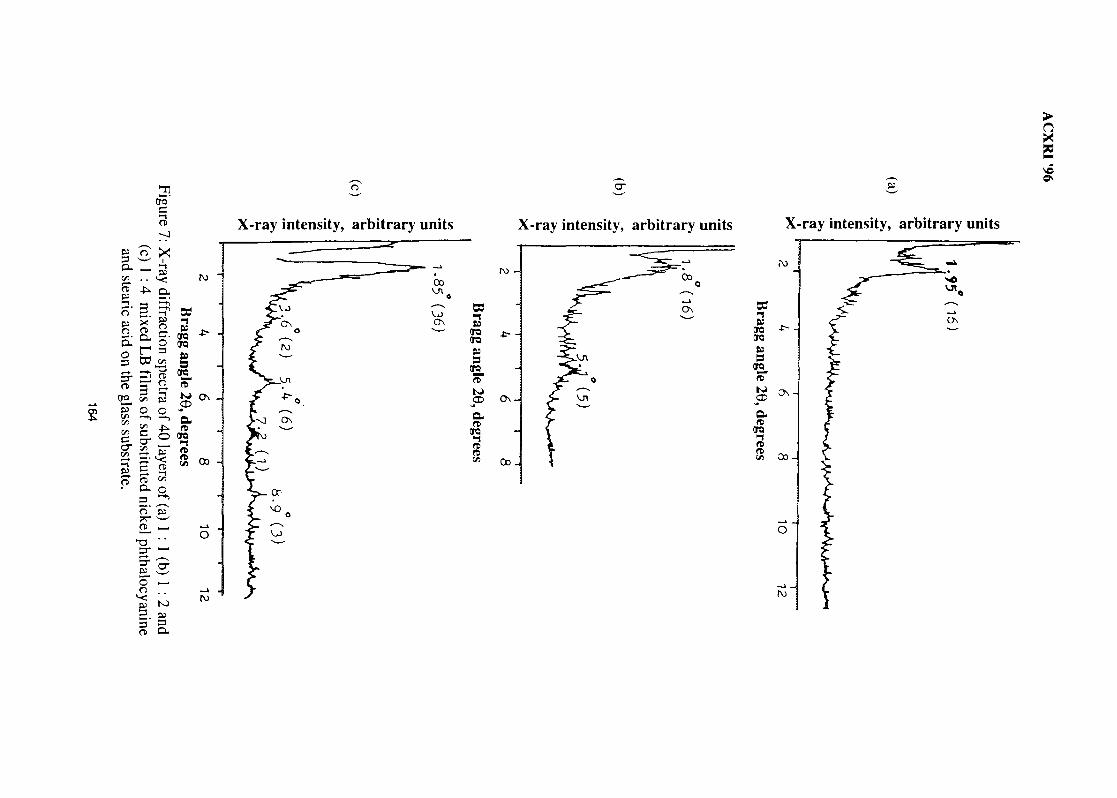
o
X-ray intensity, arbitrary units X-ray intensity, arbitrary units X-ray intensity, arbitrary units
><g3
s: ^ I" §f§3 CD « S
^ ^ CDO O ~"*> - n Q,
Oo 4
2- —T3 ' '
o —o
TOTOSiS
"ELST
are
TO
•fc-H
OoJ
CS
TOTO
QTQ_
•C--J
TO
nv\ CO
o
to
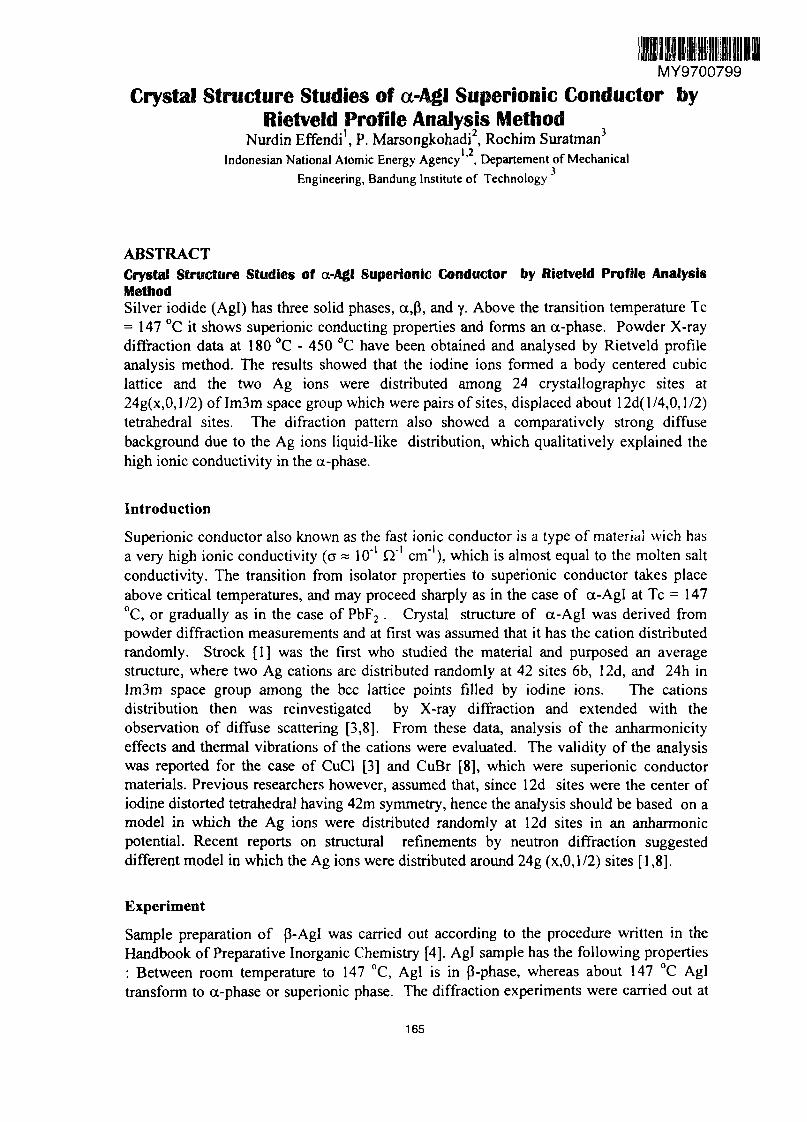
MY9700799
Crystal Structure Studies of a-Agl Superionic Conductor byRietveld Profile Analysis Method
Nurdin Effendi1, P. Marsongkohadi2, Rochim Suratman3
Indonesian National Atomic Energy Agency ' , Departement of Mechanical
Engineering, Bandung Institute of Technology
ABSTRACTCrystal Structure Studies of a-Agl Superionic Conductor by Rietveld Profile AnalysisMethodSilver iodide (Agl) has three solid phases, a,P, and y. Above the transition temperature Tc= 147 °C it shows superionic conducting properties and forms an ct-phase. Powder X-raydiffraction data at 180 °C - 450 °C have been obtained and analysed by Rietveld profileanalysis method. The results showed that the iodine ions formed a body centered cubiclattice and the two Ag ions were distributed among 24 cry stall ographyc sites at24g(x,0,l/2) of Im3m space group which were pairs of sites, displaced about 12d( 1/4,0,1/2)tetrahedral sites. The difraction pattern also showed a comparatively strong diffusebackground due to the Ag ions liquid-like distribution, which qualitatively explained thehigh ionic conductivity in the a-phase.
Introduction
Superionic conductor also known as the fast ionic conductor is a type of material wich hasa very high ionic conductivity (a ~ 10"1 Q'1 cm"1), which is almost equal to the molten saltconductivity. The transition from isolator properties to superionic conductor takes placeabove critical temperatures, and may proceed sharply as in the case of a-Agl at Tc = 147°C, or gradually as in the case of PbF2. Crystal structure of a-Agl was derived frompowder diffraction measurements and at first was assumed that it has the cation distributedrandomly. Strock [1] was the first who studied the material and purposed an averagestructure, where two Ag cations are distributed randomly at 42 sites 6b, 12d, and 24h inIm3m space group among the bcc lattice points filled by iodine ions. The cationsdistribution then was reinvestigated by X-ray diffraction and extended with theobservation of diffuse scattering [3,8]. From these data, analysis of the anharmonicityeffects and thermal vibrations of the cations were evaluated. The validity of the analysiswas reported for the case of CuCl [3] and CuBr [8], which were superionic conductormaterials. Previous researchers however, assumed that, since 12d sites were the center ofiodine distorted tetrahedral having 42m symmetry, hence the analysis should be based on amodel in which the Ag ions were distributed randomly at 12d sites in an anharmonicpotential. Recent reports on structural refinements by neutron diffraction suggesteddifferent model in which the Ag ions were distributed around 24g (x,0,l/2) sites [1,8].
Experiment
Sample preparation of P-AgI was carried out according to the procedure written in theHandbook of Preparative Inorganic Chemistry [4]. Agl sample has the following properties: Between room temperature to 147 °C, Agl is in p-phase, whereas about 147 °C Agltransform to a-phase or superionic phase. The diffraction experiments were carried out at
165
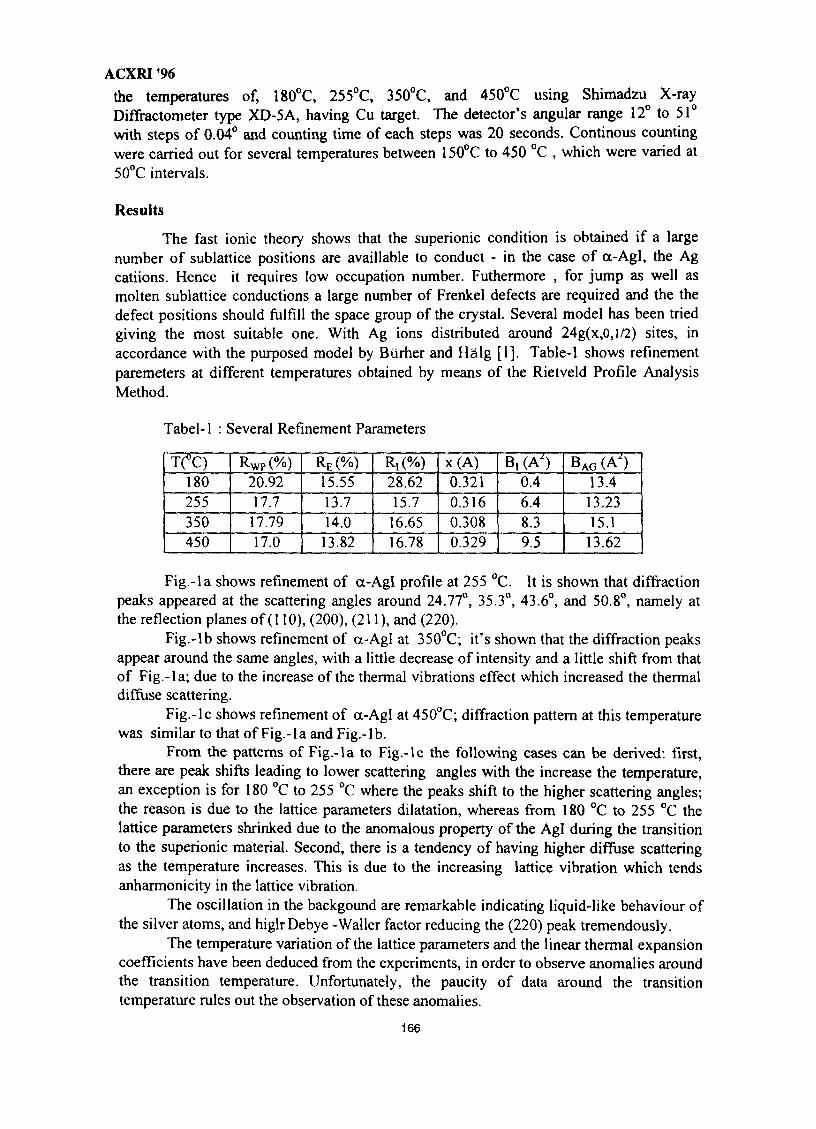
ACXRI '96the temperatures of, 180°C, 255°C, 35O°C, and 450°C using Shimadzu^ X-rayDiffractometer type XD-5A, having Cu target. The detector's angular range 12° to 51°with steps of 0.04° and counting time of each steps was 20 seconds. Continous countingwere carried out for several temperatures between 150°C to 450 °C , which were varied at50°C intervals.
Results
The fast ionic theory shows that the superionic condition is obtained if a largenumber of sublattice positions are available to conduct - in the case of a-Agl, the Agcatiions. Hence it requires low occupation number. Futhermore , for jump as well asmolten sublattice conductions a large number of Frenkel defects are required and the thedefect positions should fulfill the space group of the crystal. Several model has been triedgiving the most suitable one. With Ag ions distributed around 24g(x,0,l/2) sites, inaccordance with the purposed model by Burher and Halg [1]. Table-1 shows refinementparemeters at different temperatures obtained by means of the Rietveld Profile AnalysisMethod.
Tabel-1 : Several Refinement Parameters
T(°C)180255350450
RWP(%)20.9217.7
17.7917.0
RE(%)15.5513.714.0
13.82
R,(%)28.6215.716.6516.78
x(A)0.3210.3160.3080.329
B, (A')0.46.48.39.5
BAG (A')13.413.2315.1
13.62
Fig.-la shows refinement of a-Agl profile at 255 °C. It is shown that diffractionpeaks appeared at the scattering angles around 24.77°, 35.3°, 43.6°, and 50.8°, namely atthe reflection planes of (110), (200), (211), and (220).
Fig.-lb shows refinement of a-Agl at 350°C; it's shown that the diffraction peaksappear around the same angles, with a little decrease of intensity and a little shift from thatof Fig.-la; due to the increase of the thermal vibrations effect which increased the thermaldiffuse scattering.
Fig.-lc shows refinement of a-Agl at 450°C; diffraction pattern at this temperaturewas similar to that of Fig.-1 a and Fig.-1 b.
From the patterns of Fig.-la to Fig.-lc the following cases can be derived: first,there are peak shifts leading to lower scattering angles with the increase the temperature,an exception is for 180 °C to 255 °C where the peaks shift to the higher scattering angles;the reason is due to the lattice parameters dilatation, whereas from 180 °C to 255 °C thelattice parameters shrinked due to the anomalous property of the Agl during the transitionto the superionic material. Second, there is a tendency of having higher diffuse scatteringas the temperature increases. This is due to the increasing lattice vibration which tendsanharmonicity in the lattice vibration.
The oscillation in the backgound are remarkable indicating liquid-like behaviour ofthe silver atoms, and higlrDebye -Waller factor reducing the (220) peak tremendously.
The temperature variation of the lattice parameters and the linear thermal expansioncoefficients have been deduced from the experiments, in order to observe anomalies aroundthe transition temperature. Unfortunately, the paucity of data around the transitiontemperature rules out the observation of these anomalies.
166
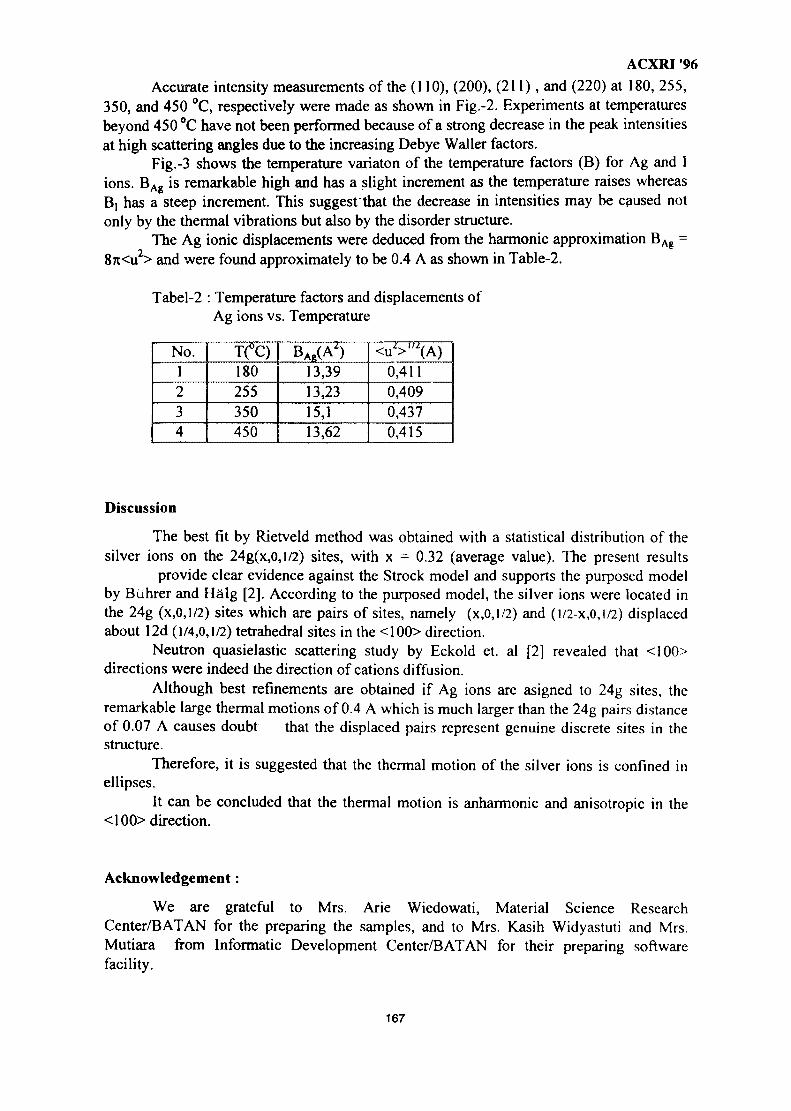
ACXRI '96
Accurate intensity measurements of the (110), (200), (211), and (220) at 180, 255,350, and 450 °C, respectively were made as shown in Fig.-2. Experiments at temperaturesbeyond 450 °C have not been performed because of a strong decrease in the peak intensitiesat high scattering angles due to the increasing Debye Waller factors.
Fig.-3 shows the temperature variaton of the temperature factors (B) for Ag and Iions. BAg is remarkable high and has a slight increment as the temperature raises whereasB, has a steep increment. This suggest that the decrease in intensities may be caused notonly by the thermal vibrations but also by the disorder structure.
The Ag ionic displacements were deduced from the harmonic approximation BAg =8rc<u2> and were found approximately to be 0.4 A as shown in Table-2.
Tabel-2 : Temperature factors and displacements ofAg ions vs. Temperature
No.1234
T(°C)180255350450
BAe(A<)13,3913,2315,113,62
<uV/2(A)0,4110,4090,4370,415
Discussion
The best fit by Rietveld method was obtained with a statistical distribution of thesilver ions on the 24g(x,0,l/2) sites, with x = 0.32 (average value). The present results
provide clear evidence against the Strock model and supports the purposed modelby Buhrer and Halg [2]. According to the purposed model, the silver ions were located inthe 24g (x,0,l/2) sites which are pairs of sites, namely (x,0,l/2) and (i/2-x,0,l/2) displacedabout 12d (1/4,0,1/2) tetrahedral sites in the <100> direction.
Neutron quasielastic scattering study by Eckold et. al [2] revealed that <100>directions were indeed the direction of cations diffusion.
Although best refinements are obtained if Ag ions are asigned to 24g sites, theremarkable large thermal motions of 0.4 A which is much larger than the 24g pairs distanceof 0.07 A causes doubt that the displaced pairs represent genuine discrete sites in thestructure.
Therefore, it is suggested that the thermal motion of the silver ions is confined inellipses.
It can be concluded that the thermal motion is anharmonic and anisotropic in the<100> direction.
Acknowledgement:
We are grateful to Mrs. Arie Wiedowati, Material Science ResearchCenter/BATAN for the preparing the samples, and to Mrs. Kasih Widyastuti and Mrs.Mutiara from Informatic Development Center/BATAN for their preparing softwarefacility.
167

ACXRI '96
Reference :
1. Wright, A.F. and Fender, B.E.F. The Structure of Superionic Compounds by PowderNeutron Diffraction I, Cation Distribution in a-Agl, J.Phys.,C: Solidstate Phys., vol.10,1977.
2. Eckold G., FunkeK., Kalus J., &Lechner RE, J. Phys. Chem. Solids 37, 1097 (1976).3. Sakata, M , Hoshino, S., Neutron Diffraction Study of Asymmetric Anharmonic
Vibration of the Copper Atom in Cuprous Chloride, Acta Cryst. A30, 655, 1974.4. Brauer G., Handbook of Preparative Inorganic Chemistry, vol.2, Academic Press, New
York, London, 1965.5. Hoshino, S. Sakuma, T., and Fujii, Y., Distributions and Anharmonic Thermal Vibration
of Cations in a-Agl, Solidstate Communications, vol.22, p 763-765, 1977.6. Chandra, S., Superionic Solids, Principle and Applications, Noth Holland Pulbish. Co.,
Amsterdam, New York, Oxford, 1981.7. Hoshino, S., Fujii, Y., Harada, J., Neutron Scattering Study of Lattice Dynamics in
CuBr, Part I. Phonon Dispersion Relations , Journal Of The Physical Society Of Japan ,vol.41 No.3, September 1976.
8. Harada, J., Suzuki, H., Hoshino, S., Neutron Scattering Study of Lattice Dynamics inCuBr, Part II. Anharmonic Effect on Debye Waller Factor, Journal Of The PhysicalSociety Of Japan, vol.41 No.5, November 1976.
168
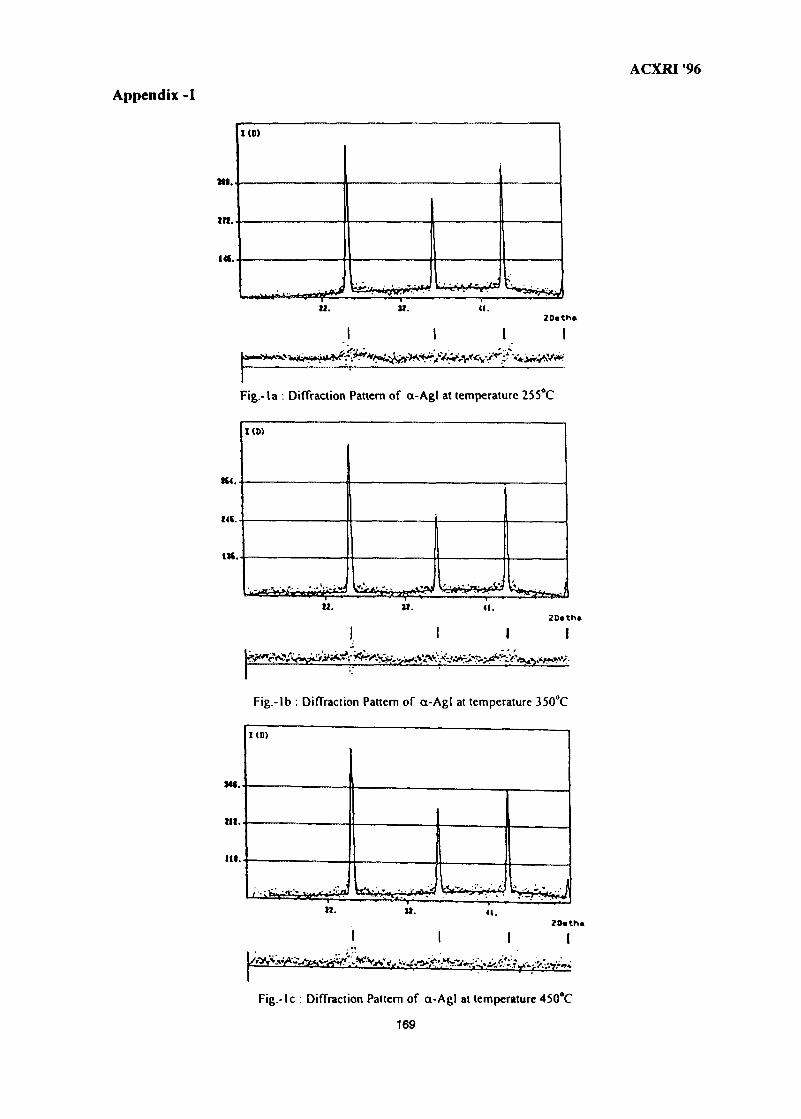
ACXRI '96
Appendix -1
m.
m.
1(0)
».ZDath*
r— • —-—7-Fig.-la : Diffraction Pattern of a-Agl at temperature 255°C
tu.
141.
IM.
1(0)
i
41.
U-^fr'
Fig.-lb : Diffraction Pattern of a-Agl at temperature 35O°C
Mt.
ttl.
III.
ZOath*
Fig.- Ic : Diffraction Pattern of a-Agl at temperature 450°C
169
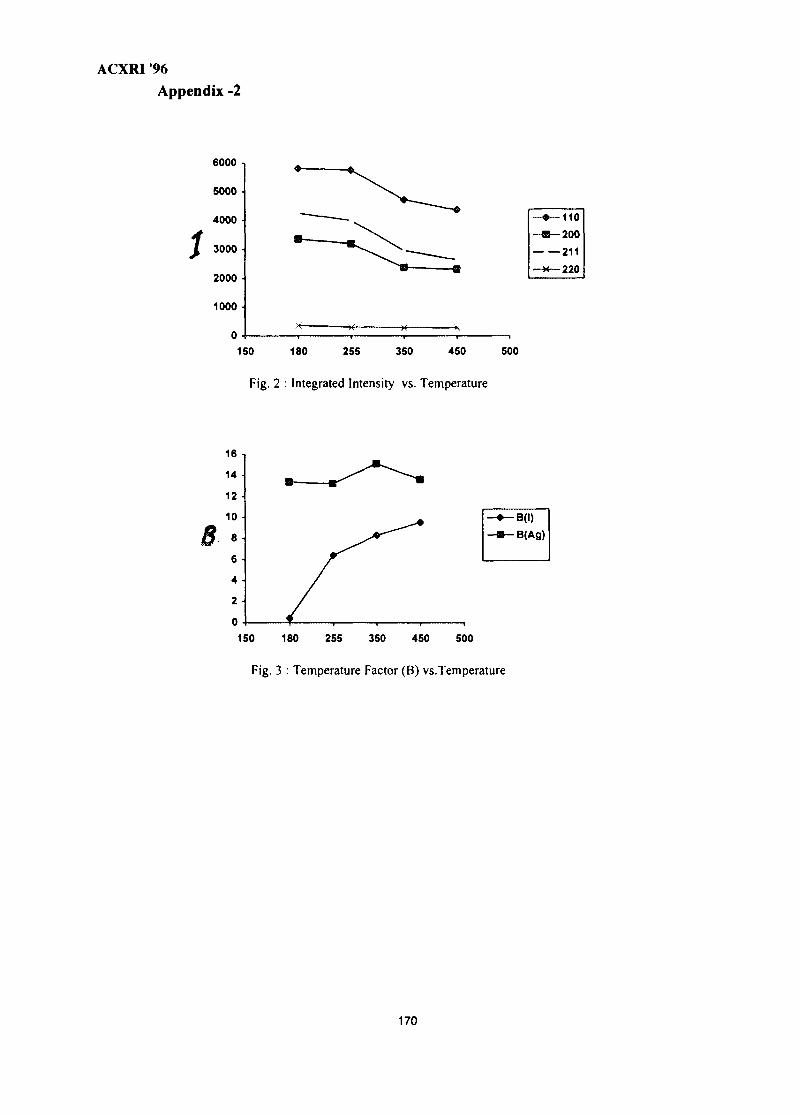
ACXRI '96Appendix -2
f
6000
5000
4000
3000
2000
1000
150 180 255 350 450 500
Fig. 2 : Integrated Intensity vs. Temperature
150 180 255 350 450 500
Fig. 3 : Temperature Factor (B) vs.Temperature
170
IIMY9700800
STRUCTURAL AND MORPHOLOGICAL OPTIMISATION OF
SOLID STATE IONIC SYSTEMS
R.V. KUMARDepartment of Mining and Mineral Engineering
University of Leeds, Leeds, UK
ABSTRACT
Solid state ionics is a major scientific area of investigation driven not only by thecuriosity of fast ionic transport in solids, but also due to potentially importanttechnological applications in fuel cells, batteries, sensors, process control,electrochromics, electrolysis and environmental protection. Characterisation of structureand morphology of solid state ionic materials is of vital importance in order to optimisethe performance of devices based on these materials. Techniques range from the use ofelectromagnetic radiation in the diffraction, scattering, absorption and reflection modesand ac electric field in impedance spectroscopy to the application of imaging andmicroanalysis at high magnifications. Some examples of application of these techniquesto novel solid state ionic systems are presented.
1. INTRODUCTION
Fast ionic transport in solids is an important area of scienific investigations andtechnological applications. Ionic conductivities in solids approaching values greater than10"3 ohm"1 cm"1 and activation energies less than 50 KJ/mole are achieved below themelting point. Such values are more typical of liquids, and therefore it is not surprisingthat the phenomena of high ionic conductivity in solids has generated great scientificinterest. Only a few decades ago, such materials were considered as special exceptionsin Materials Science and their discovery was seen as fortuitous events. In recent years,however, fast ionic conduction has been observed and studied in several hundreds of solidmaterials, ranging from ceramics to gels and polymers.
The recognition of practical application of solid state ionic conductors in a widevariety of technology such as fuel cells, batteries, sensors, transducers in process control,electrochromics and displays, electrolysis and environmental protection, has intensifiedthe effort in the field of solid state ionics. Development of practical devices have in turnraised many interesting scientific questions relating to novel behaviour of solid state ionicsystems.
Characterisation of structure and morphology of materials is invariably of tremendoussignificance in the optimisation of performance of solid state ionic systems. Wide varietyof techniques, ranging from the use of electromagnetic radiations such as X-ray and infra-red ray to alternating electric field are used to probe the materials.
2. CHARACTERISATION TECHNIQUES
2.1 X-ray Microanalysis
171
ACXRI '96
The most direct method of relating microstructure and chemical composition variationsin solid materials to properties is X-ray microanalysis, which is based on combining highmagnification imaging (electron microscopy) with X-ray analysis of chemical componentsoriginating from a volume of a few cubic u below the surface1. X-rays characteristic toan element is emitted as a result of interaction of the incoming high energy electron beamwith the inner shell of an atom. The simplest form of application of X-ray microanalysisis qualitative analysis to identify chemical elements and relate these to the microstructuralfeatures such as second phase, surface layer and other observations from imaging. Inmodern systems analysis is fully automated to produce X-ray mapping or line profile ofa single element and point analysis of particular features in the electron image. Whenquantitative chemical analysis at ^ and sub-jx levels is the main requirement, electronprobe microanalyser (EPMA) is preferred to scanning electron microscope, the latterbeing primarily designed to give images of high spatial resolution.
2.2 Diffraction Techniques
X-ray diffraction is widely used to optimise synthesis and properties of solid stateionic materials by identifying bulk phases, detecting impurities and assessingcrystallographic quality such as texture. The structure, as determined by Bragg'sreflection provide an insight into the features which contribute to promoting (orhindering) movement of ions in ionic conductors. For example, in Na B-alumina, thereis a rigid framework with blocks of A12O3 and a bridging layer between the blocks whichcontains all the Na ions in a highly disordered state2. Thus a 2-D space is created in anintricate way, which favours fast ionic motion in the solid structure (Fig. 1).
Fast ionic conduction in solids, arises directly as a result of disorder in one of thesublattices, which is manifested as a large elastic diffuse background scattering of X-raysto the Bragg peaks3. Fourier inversion of diffraction data is used to obtain the scatteringdensity distribution over a unit cell and small features of fourier maps are understood interms of defects in the structure.
2.3 AC Impedance Spectroscopv
In most applications of solid state ionic systems, conductivity may be one of the keyproperties to be optimised and is influenced by structure, composition and morphology.AC impedance spectroscopy is commonly used to measure conductivity of ionic solids.Variations used in the electrical field are typically in the frequency range of 10"2 to 107
Hz. In addition to bulk conductivity data, other useful information can be deduced byobserving the frequency dependent behaviour of impedance.
Impedance consists of both resistive and reactive components. Both the bulk and theinterfacial regions of a solid ionic material can be characterised by a resistance and acapacitance, usually placed in parallel4. The characteristic relaxation time of each parallelRC element is related to the resistance(R), capacitance(C) and frequency(fmax) at themaximum loss in the impedance spectrum:
2:tfRC = 1 (where 2nf =«jr)By assigning different C values to bulk, grain boundary, interaces, surface layers etc, itis possible to identify the electrical inhomgeneities in ionic materials. For example, bulkand grain boundary regions are readily separated in the spectrum obtained for the ionic
172
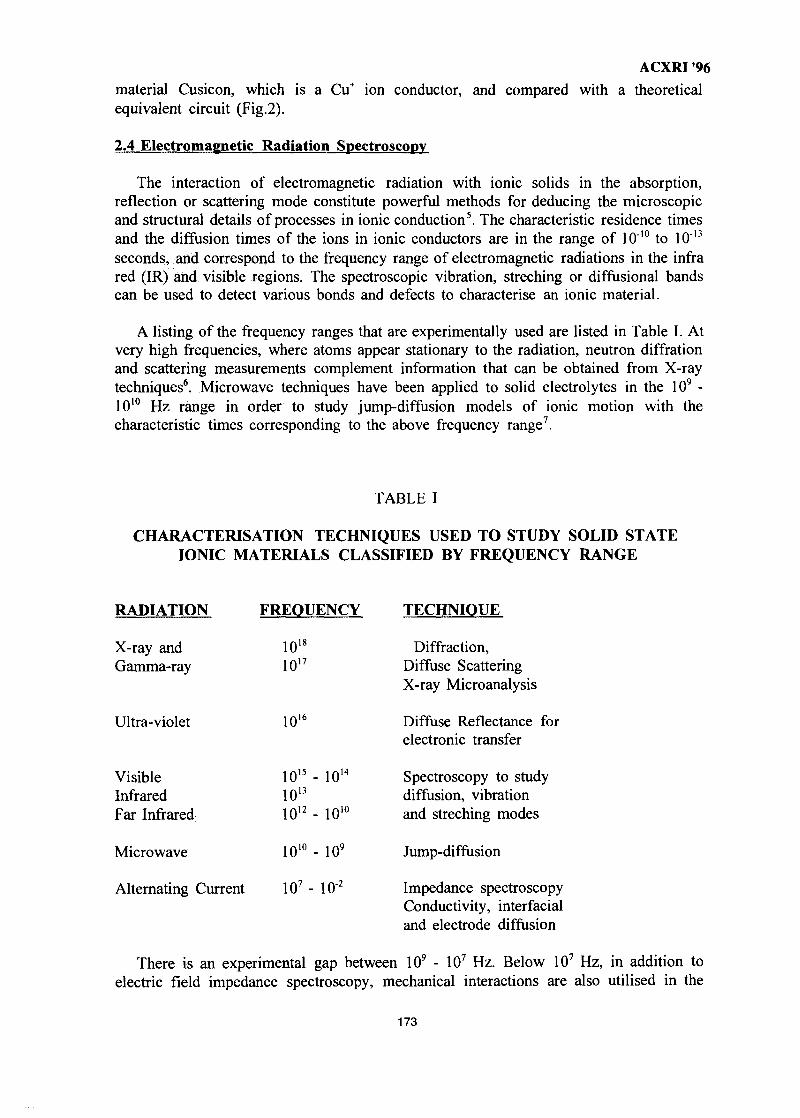
ACXRI '96
material Cusicon, which is a Cu+ ion conductor, and compared with a theoreticalequivalent circuit (Fig.2).
2.4 Electromagnetic Radiation Spectroscopy
The interaction of electromagnetic radiation with ionic solids in the absorption,reflection or scattering mode constitute powerful methods for deducing the microscopicand structural details of processes in ionic conduction5. The characteristic residence timesand the diffusion times of the ions in ionic conductors are in the range of 10'° to 10'3
seconds, and correspond to the frequency range of electromagnetic radiations in the infrared (IR) and visible regions. The spectroscopic vibration, streching or diffusional bandscan be used to detect various bonds and defects to characterise an ionic material.
A listing of the frequency ranges that are experimentally used are listed in Table I. Atvery high frequencies, where atoms appear stationary to the radiation, neutron diffrationand scattering measurements complement information that can be obtained from X-raytechniques6. Microwave techniques have been applied to solid electrolytes in the 109 -1010 Hz range in order to study jump-diffusion models of ionic motion with thecharacteristic times corresponding to the above frequency range7.
TABLE I
CHARACTERISATION TECHNIQUES USED TO STUDY SOLID STATEIONIC MATERIALS CLASSIFIED BY FREQUENCY RANGE
RADIATION
X-ray andGamma-ray
Ultra-violet
VisibleInfraredFar Infrared
Microwave
Alternating Current
FREOUENCY
10'8
10 1 7
1016
1015 - 10'4
10'3
10'2 - 1010
10'° - 109
107 - lO"2
TECHNIOUE
Diffraction,Diffuse ScatteringX-ray Microanalysis
Diffuse Reflectance forelectronic transfer
Spectroscopy to studydiffusion, vibrationand streching modes
Jump-diffusion
Impedance spectroscopyConductivity, interfacialand electrode diffusion
There is an experimental gap between 109 - 107 Hz. Below 107 Hz, in addition toelectric field impedance spectroscopy, mechanical interactions are also utilised in the
173
ACXRI '96
accoustic and ultrasonic modes8. At zero frequency, special dc electrical measurementshave been traditionally used for conductivity measurements.
3 APPLICATIONS
3.1 Direct Synthesis of Ca C-alumina and related phases
Since the discovery of high Na ionic conductivity in the Na fl- and 6"-alumina9, avariety of solid state electrochemical devices have been developed for applications in fuelcells, batteries and sensors10. The Na in the 13- and 13"- alumina phases can easily be ion-exchanged for monovalent cations of Ag, K and Li9, divalent cations of Ca, Sr and Pb"and trivalent cations of La, Nd and Bi12. Some of the ion exchanged 13 and J3" aluminashave been found to be unstable at high temperatures and decompose to other type ofphases. For example, the ion-exchanged Ca 13- or 13"- alumina transforms at elevatedtemperatures to the non-conducting magnetoplumbite phase13. However, Ca 13- aluminatype of phases can be directly synthesised under controlled conditions for applications insolid ionic systems such as sensors at elevated temperaturesl4"17, with bulk conductivityas measured by imedance spectroscopy greater than 10'4 ohm"' cm"1 at 730K. By acombination of selected area Electron Diffraction, Energy Dispersive X-ray Analysis andHigh Resolution Electron Microscopy, a modified version of highly conducting Ca 13"-alumina type of phase was identified. It has a rhombohedral structure with the followinglattice spacing a = 5.63A0 and c = 81.51 A0 (in a hexagonal cell) and can be contrastedwith the (3- and 13"- alumina structures as shown in Figure 3.
3.2 Use of Perovskite Proton Conductors in Novel Sensors
Perovskites of the type SrCeO3, BaCeO3 and CaZrO3, normally low conductivitysemiconductors, acquire extended oxygen ionic conductivity domain when doped withaliovalent cations of Yb(III), Y(III) or Nd(III) for Ce(IV)18. Remarkably, when thesematerials are exposed to hydrogen or water vapour atmosphere, electronic conductivityis replaced by protonic conductivity. Under suitable values of pH2 and/or pH2O andtemperature, the doped perovskite ionic materials operate reversibly to H2 and H2O
19.Considerable interest has been created for the potential applications in steam andhydrogen sensors, fuel cells, steam electrolysis and hydrogenation/dehydrogenationsystems19.
Steam concentration cells which operate reversibly at T > 750K have been reported20,in which H2O at the higher concentration electrode decomposes electrochemically at theanode to provide protons for transport through the electrolyte and is regenerated at thecathode. When a similar system is tested at T < 58OK, surprisingly, the higher humidityside is seen to behave cathodically, which implies transportation of a negative ion throughthe electrolyte21. The conducting ion is postulated to be OH", with the following reductionreaction at the cathode: H2O(g) + 1/2 O2(g) + 2e' —> 2 OH"; with the reverse reactiontaking place at the anode.
In order to confirm the postulated mechanism of hydroxyl transport under thespecified conditions, infrared and impedance spectroscopy (as well as GasChromatagraphy and Hall Effect) are being used. The presence of OH groups has beenconfirmed by IR absorption by monitoring the O-H streching vibrations. Impedance
174
ACXRI '96
spectroscopy based conductivity data reveals a change in the activation energy value atT = 580K, which is interpreted as indicating a change in the mode of ionic transport fromprotons to hydroxyl ions(Fig. 4).
Response of perovskite to HCl(g) is equally intriguing, where the ionic species do notconform to protons gff hydroxyl ions22. Considerable spectroscopy work is being carriedout to deduce the exact mechanisms. Progress in practical sensing device for measuringHC1 in the gas phase, however, has been excellent23. Using a novel approach, SrCeO3 hasbeen interfaced with SrCl2 - a Cl' ion conductor- such that no reference gas is required.Use of XRD and SEM/EDAX has been crucial in optimising the microstructure andcomposition of the ionic materials.
3.3 Electrochemical Texturing of Ionic Electrodes
High temperature solid state ionic transport of oxygen ions through yttria-stabilisedzirconia solid electrolyte to a sintered disk of the ionic electrode Y2Ba2Cu3O7.y (YBCO)resulted in texture enhancement of YBCO, such that c-axis orientaion was induced in thedirection of the current24. Texture in the sample was estimated by comparing the XRDpattern with that of a reference powder with random orientation for the 1006/1110,103intensity ratio (Fig. 5). Since much higher degree of texture is required in YBCO forsuperconducting applications, with elimination of all weak-link features, melt-processingwas used on the electrochemically pre-textured disk. The adavantage of using a pre-textured disk is that only a short period of melting stage is then requird mainly to meltthe untextured fine grains and promote their growth by directional solidification on theexisting habit planes of the large textured grains25. This minimises chemical reaction withthe substrate and warping effects. Highly textured materials (Fig. 6 and 7) with goodsuperconducting properties can be thus produced.
4. CONCLUSIONS
A brief overview of application of X-ray and related techniques for the optimisationof structure and morphology of solid state ionic materials, with some practical exampleshave been considered. These characterisation techniques are of immense importance forscientific studies as well as technological applications of materials and devices based onsolid state ionics.
REFERENCES
1. K. McKindley, in Chemical Characterisation, ed I Elliot, The Instutute of Metals, 1988.2. R. Collongues, J. Thery and J.P Boilot, in Solid Electrolytes, ed P Hagenmuller et al,
Academic Press, 1978.3. G. Collin and J.P. Boilot, in Proc. of the Int. Workshop on Beta-Aluminas and Beta
Batteries, Varna, Bulgaria, May 1991, p.21.4. J.T.S. Irvine, D.C. Sinclair and A.R. West, Adv. Materials. 2(3), 1990, p. 132.5. W. van Gool, in Solid Electrolytes, ed P Hagenmuller, Academic Press, 1978.6. T.W.D. Farley, W. Hayes, S. Hull, R. Ward, M.T. Hutchings and M. Alba, SolidState Ionics - 87, Proc. of the 6th Int. Conf. Garmisch-Partenkirchen, 1987, p. 139.
7. K. Funke in Solid Electrolytes, ed. P. Hagenmuller et al, Academic Press, 1978, p. 77.8. T. Ishii, Solid State Ionics -87, Proc. of the 6th Int. Conf. Garmisch-Partenkirchen,
1987, p. 67.
175
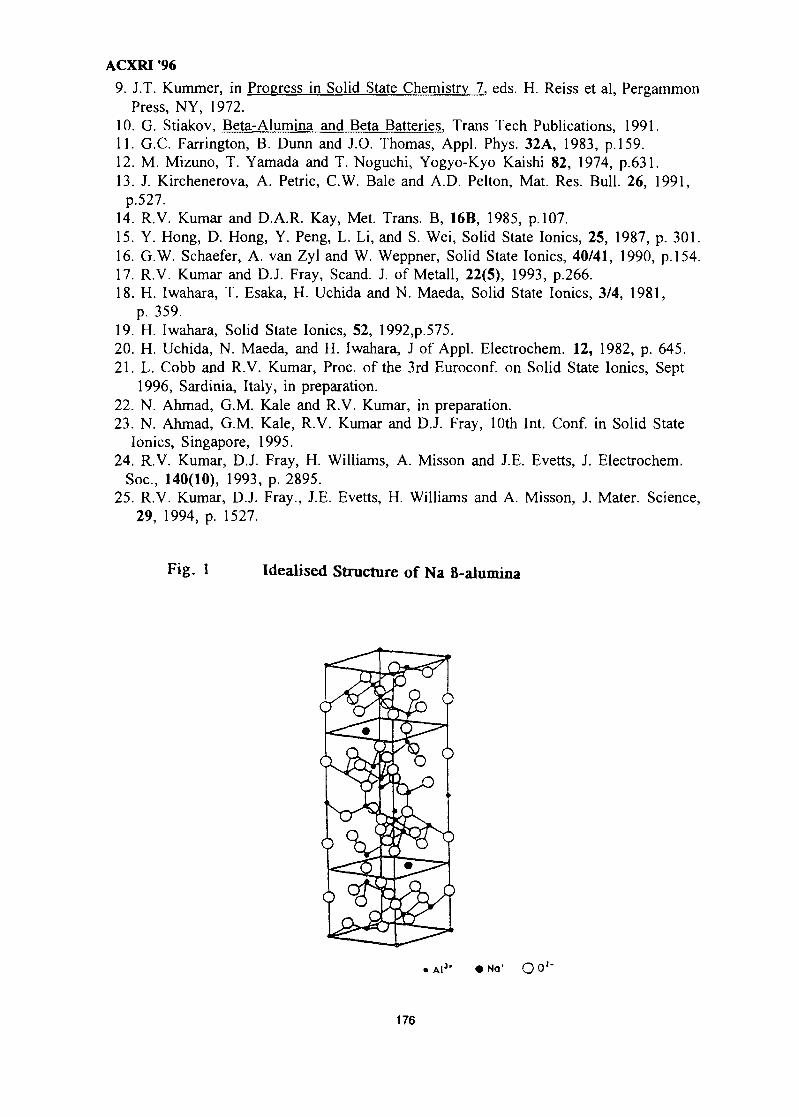
ACXRI '96
9. J.T. Kummer, in Progress in Solid State Chemistry 7, eds. H. Reiss et al, PergammonPress, NY, 1972.
10. G. Stiakov, Beta-Alumina and Beta Batteries, Trans Tech Publications, 1991.11. G.C. Farrington, B. Dunn and J.O. Thomas, Appl. Phys. 32A, 1983, p.159.12. M. Mizuno, T. Yamada and T. Noguchi, Yogyo-Kyo Kaishi 82, 1974, p.631.13. J. Kirchenerova, A. Pétrie, C.W. Bale and A.D. Pelton, Mat. Res. Bull. 26, 1991,
p.527.14. R.V. Kumar and D.A.R. Kay, Met. Trans. В, 16В, 1985, p. 107.15. Y. Hong, D. Hong, Y. Peng, L. Li, and S. Wei, Solid State Ionics, 25, 1987, p. 301.16. G.W. Schaefer, A. van Zyl and W. Weppner, Solid State Ionics, 40/41, 1990, p. 154.17. R.V. Kumar and D.J. Fray, Scand. J. of Metall, 22(5), 1993, p.266.18. H. Iwahara, T. Esaka, H. Uchida and N. Maeda, Solid State Ionics, 3/4, 1981,
p. 359.19. H. Iwahara, Solid State Ionics, 52, 1992,p.575.20. H. Uchida, N. Maeda, and H. Iwahara, J of Appl. Electrochem. 12, 1982, p. 645.21. L. Cobb and R.V. Kumar, Proc. of the 3rd Euroconf. on Solid State Ionics, Sept
1996, Sardinia, Italy, in preparation.22. N. Ahmad, G.M. Kale and R.V. Kumar, in preparation.23. N. Ahmad, G.M. Kale, R.V. Kumar and D.J. Fray, 10th Int. Conf. in Solid State
Ionics, Singapore, 1995.24. R.V. Kumar, D.J. Fray, H. Williams, A. Misson and J.E. Everts, J. Electrochem.
Soc, 140(10), 1993, p. 2895.25. R.V. Kumar, D.J. Fray., J.E. Everts, H. Williams and A. Misson, J. Mater. Science,
29, 1994, p. 1527.
Fig. 1 Idealised Structure of Na ß-alumina
No1
176
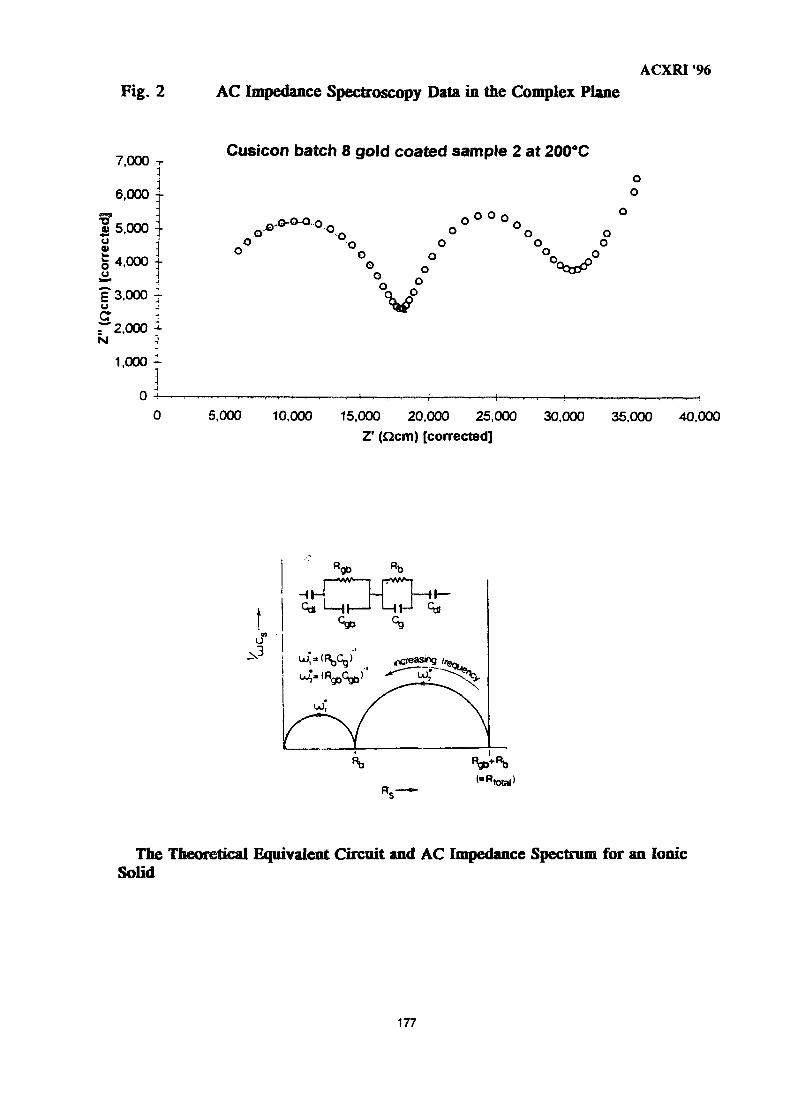
ACXRI '96
Fig. 2 AC Impedance Spectroscopy Data in the Complex Plane
7.000 -r
6,000 '--
3 5,000 :-u
5 4,000 --£L if 3,000 f6 ir 2,ooo +N ^
1,000 4-
i
Cusicon batch 8 gold coated sample 2 at 200°C
oo
°°°o
O
o o
V
5,000 10,000 15,000 20,000 25,000 30,000 35,000 40,000Z' (£2cm) [corrected]
o
'aRtota(»
The Theoretical Equivalent Circuit and AC Impedance Spectrum for an IonicSolid
177
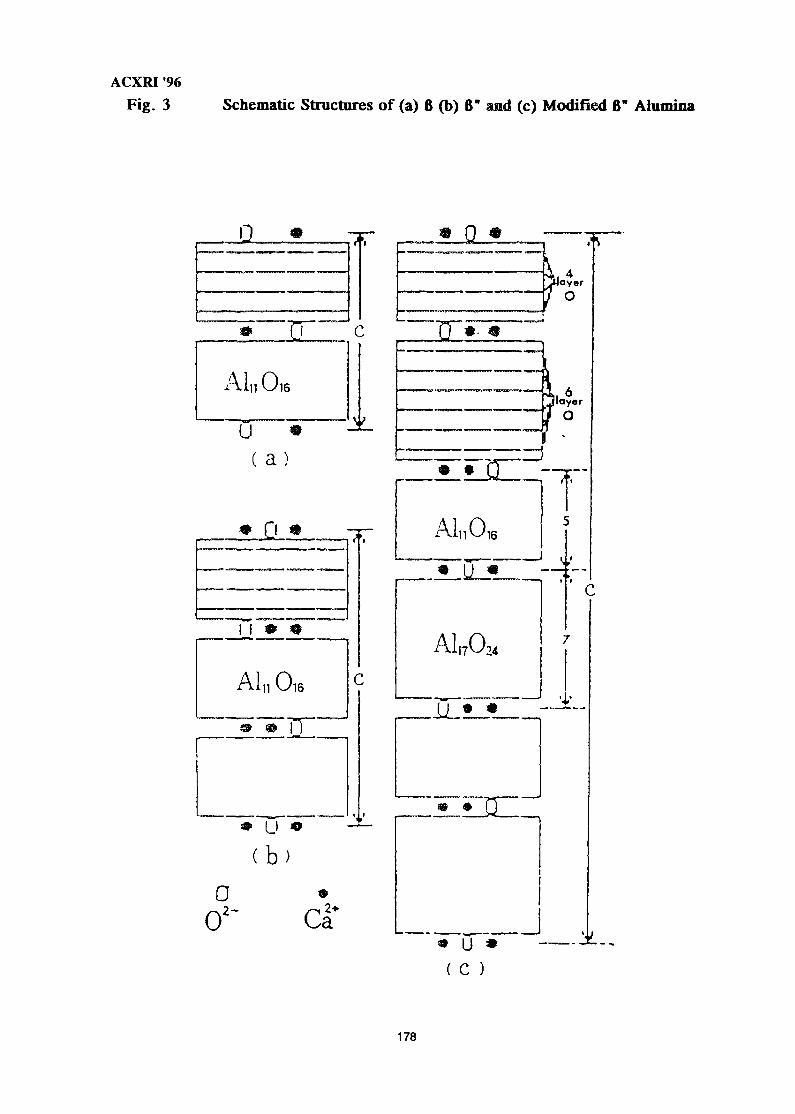
ACXRI '96Fig. 3 Schematic Structures of (a) 6 (b) fi" and (c) Modified 6" Alumina
© TT
0
JL±JL
•JL
A1,,O16
A1,7O,,
Jlayer
"T
u * -z-
0o
2 -
* U 1
( C )
178
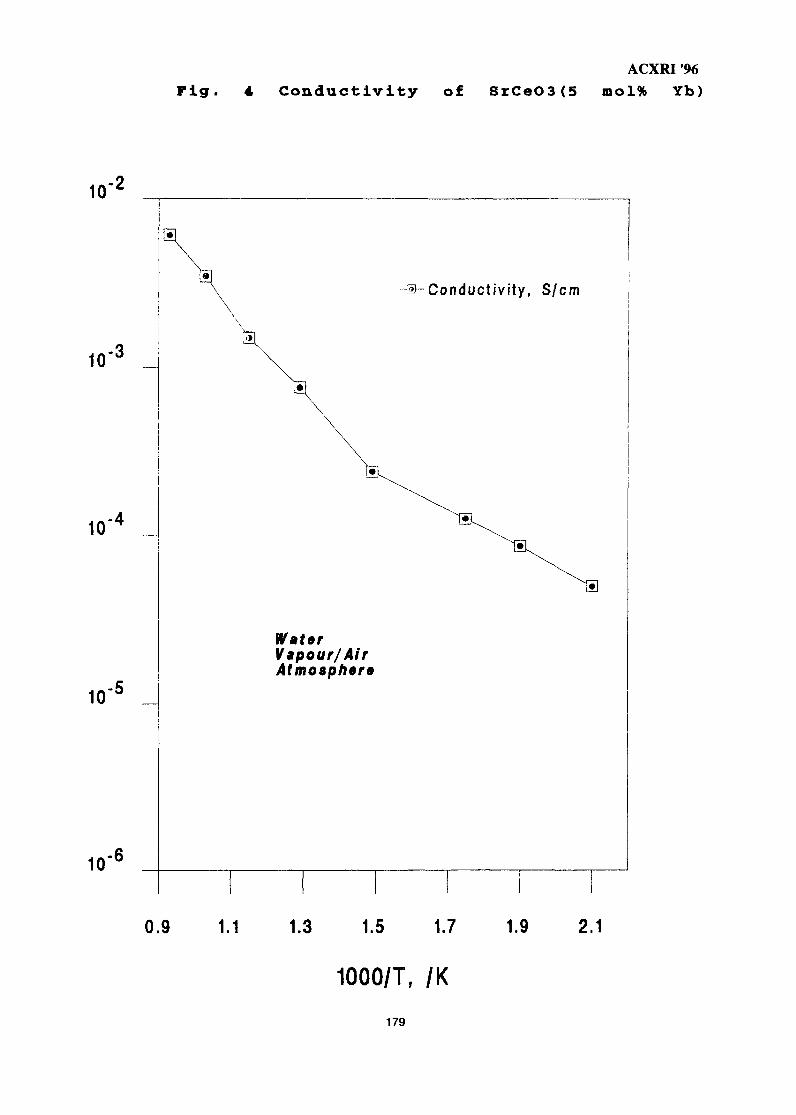
ACXRI '96
F i g . 4 C o n d u c t i v i t y of SrCeO3(5 mol% Yb)
10-2
10-3
10-4
10'5 I
10-6
Conductivity, S/cm
WaterVapour/AirAtmosphere
0.9 1.1 1.3 1.5 1.7 1.9 2.1
1000/T, /K
179
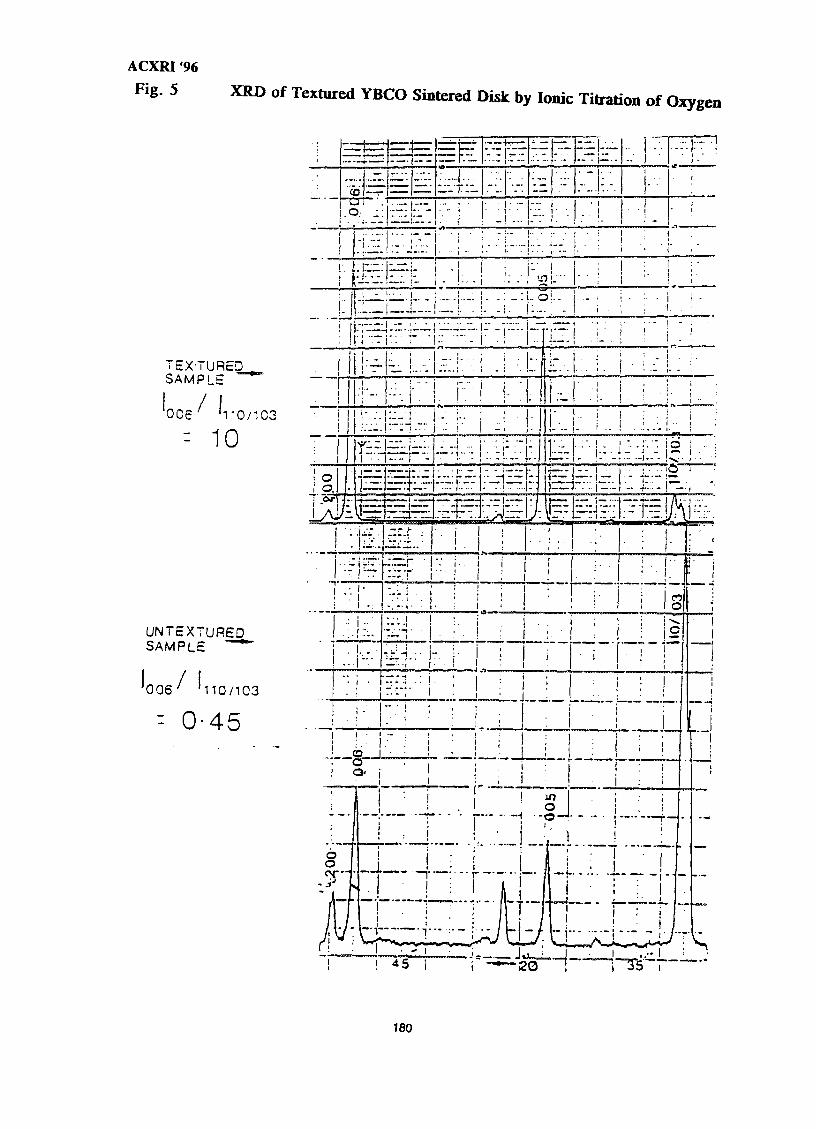
ACXRI '96
Fig. 5 XRD of Textured YBCO Sintered Disk by Ionic Titration of Oxygen
TEXTUREDSAMPLE
006 ' '11
"- 100/103
UNTEXTUREDSAMPLE """*
10/103'006' 'i
= 0-45
: 1
•
i
.
i
i
r
i o.
1/3/
i
i
i
¥Of"
L
.:_,.—_c o i "—; io- _;< .;. —
;. ...
.—;.. ... . . .——
• ; — ; ; _ -
——
" " I —
;.— - i •. . .
. I. - -I—;.
( ~ . -
.. . j .
i
- — — —• ~ - j — •[•-•
4 • -
i - -1 ! :••
. • —.
- • • ; -
-- i -
.'.t_ ! - • -
» •
~.~Z~i .TV
~.r[--_
* • — • -
« * r •
1 "•• 1 - *
i ••j -
i
Jo _
i.
- , - . { . .
,. ..
— t *- -
r...:
- $ ?
- '. : '
. . . j- • • - i • -
" . - • • * • •
• = ;
i irl " i . *. • •
" • ! ' . i
- • ! i :: i! '
!Il
O' i !• i i
1 : I
1 j . !f—j.-j.
L• i-
1
;b
• — i - *••
- • .... i . —
• • i • •_ ! . . .
i -i • "
1
-
;-,1' -! " •
- - 1 • •
f-_2H'Z£r. .i
i
iii
!
i
T •
-j
. . . , . .- • '
1
.. .
"-" I
— ,
;
'-•
J
J—\.i
i -i
1 •\ - •
1—
]~7ZT
. . , ..
I
•
t
_ . L •-
1
1!.
i i
!
I
I !L
1,
Ii
m 1
2o ^
1• ):pi i
. 1
• - • i. _ i. ..
.. j . .• i
i
! • :
! ;
i i •i . . . .
• • • " •
1
1
i ..
• 1
. ! : - .
~: LT.
• i '
•
;
' ' !
!1
I
. . . .
i
i
! • • •
- • ii
1-Ii • -
i ;
i •
; . :.. .
i . . . .
i
, ._;
. : . . • .
, —
ii
i
i
1
; i
: i
ri
. -
i; 1i
' i
1. -— — | ,
.••I
i
!
-
• -
o
no
^vo
|
—|
I
1
.... .i -
i
;
) -
:
\ - '.
i
i
ii*•
1
11
I
1
, i
Ijii
sI 45 • 2 0 T5
180
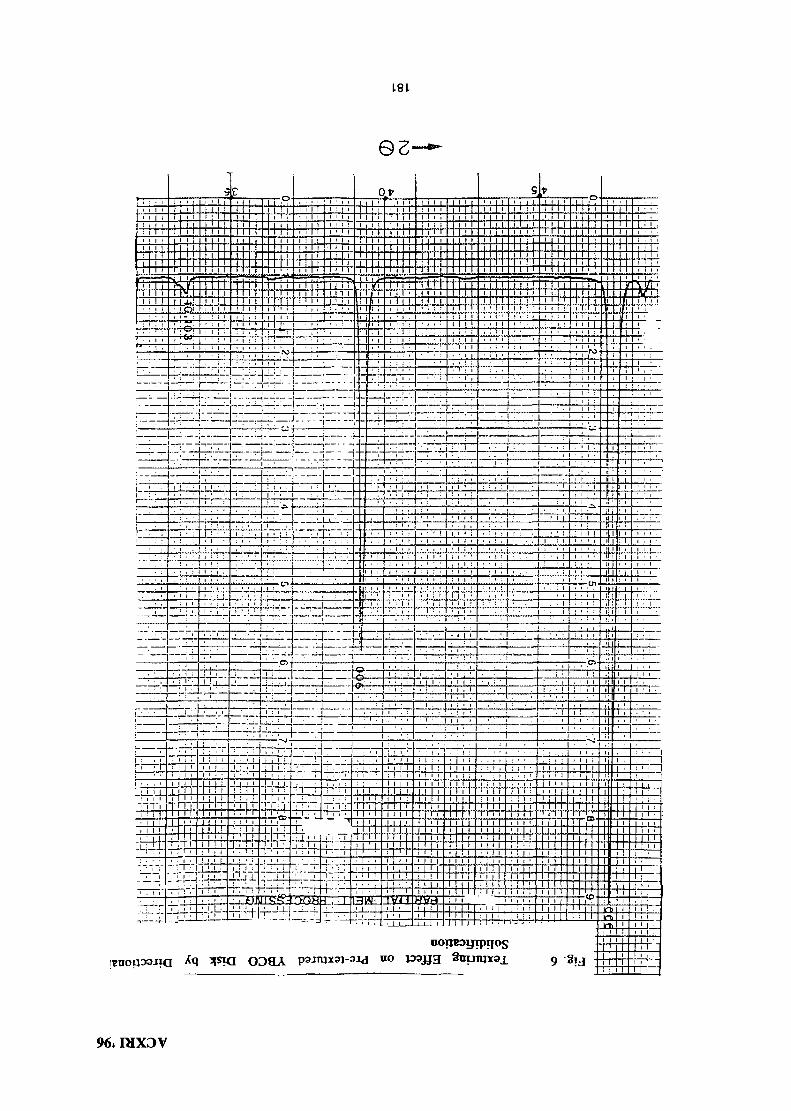
QZ-
96. IHX3V
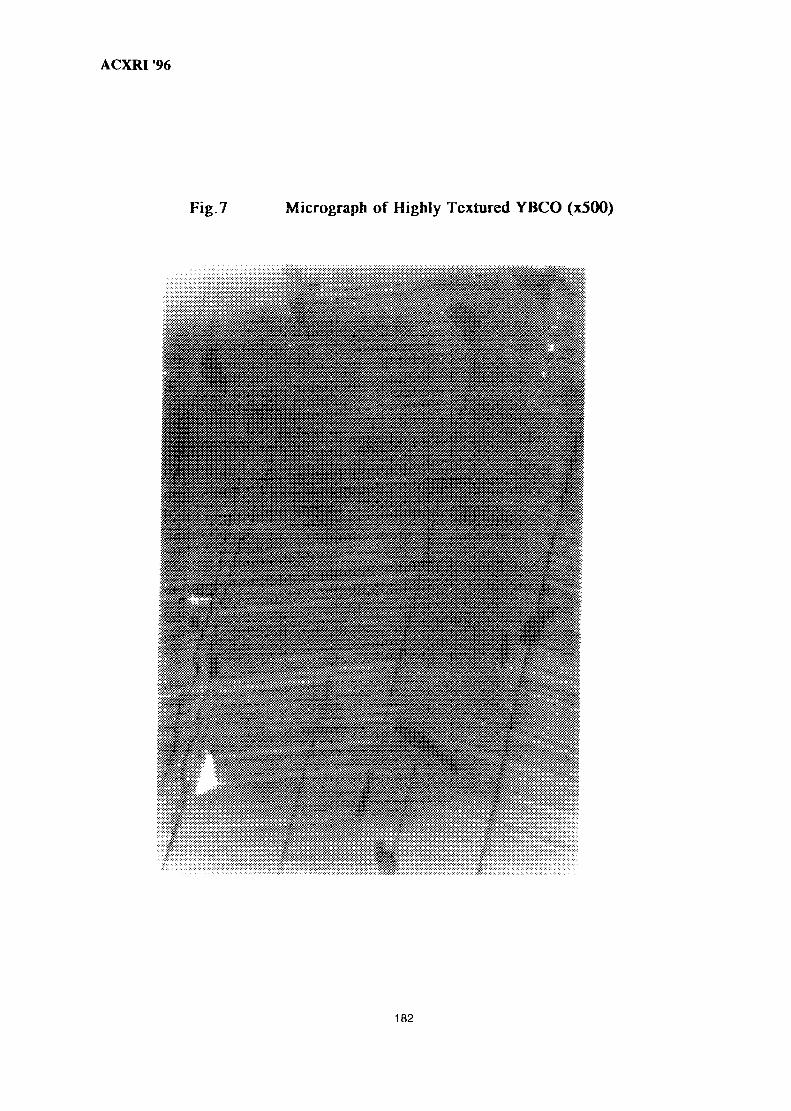
ACXRI '96
Fig.7 Micrograph of Highly Textured YBCO (x500)
i s
, ( iV ,
182
ACXRI '96EXAFS OF IRON POLYMER ELECTROLYTES
MY9700801
M. AzizDepartment of Chemistry, Faculty of Science, Universiti Teknologi Malaysia
Johor Darul Takzim, Malaysia
Abstract: Polymer electrolytes are semi-crystalline materials comprised of crystallineregime in the form of spherulites and amorphous phase. Ionic conductivity of thesematerials is mainly contributed by the amorphous phase. The lack of long range ordermade the EXAFS (extended X-ray absorption fine structure) technique useful. EXAFS ofiron polymer electrolytes were studied to determine the local structure.
Introduction
There is a considerable interest in the development of solid state batteriesincorporating polymeric electrolytes . They meet the requirement to be flexible so thatgood electrode-electrolyte contact can be maintained for this application. Polymerelectrolytes2'3 are systems in which a host polymer such as poly(ethylene oxide), PEO, actsas an 'immobile solvent' for metal salts. They are typically films of 10 - 100 (am thicknessand although they retain the mechanical properties of a solid, at the molecular level localrelaxation processes provide liquid-like degrees of freedom. The present electrolytes areinadequate ionic conductors for room temperature use. Their optimisation requires betterunderstanding of the influence of structure on electrolyte properties . Since at roomtemperature these materials are semi-crystalline, containing both amorphous and crystallineregions, conventional crystallographic techniques are not best suited for their study. Inaddition, the site of the conduction process is unambiguously identified5 in the amorphous,rather than the crystalline, region of the polymer electrolytes. Furthermore, the pertinentstructural information for an ionically conducting material is the local environment of thepotentially mobile species, which transport number studies6 have shown can be eithercations or anions for polymeric electrolytes.
EXAFS is a technique which enables precise information about nearest neighbourdistances and reasonable estimate of numbers of nearest neighbours to be obtained even indisordered materials7. This makes it particularly useful for studying the amorphousconducting region within polymer electrolytes. It is the average local environment aroundatoms of chosen element within a sample that is the object study by this form of X-rayspectroscopy. The information is obtained from a scan of X-ray absorption against energyfrom -50 to -1000 eV with respect to the K or L-III edge of the element concerned. Theinformation about nearest neighbours is contained in the region of the spectra from about50 to 1000 eV above the edge. It arises from interference between the outgoingphotoelectron wave from the target atom and the backscattered wave from the adjacentspecies. To obtain useful EXAFS spectra in a reasonable timescale (minutes) requires asynchrotron radiation source. In a typical synchrotron ring, high energy electrons producedin a linear accelerator are further accelerated in a booster synchrotron before being injected
183
ACXRI '96
into the synchrotron ring itself. When relativistic electrons accelerate by changingdirections they emit electromagnetic radiation particularly in the X-ray region. The emittedphotons pass along beam lines on which experimental stations are located. An EXAFSstation incorporates a scanning monochromator usually involving double crystal togetherwith appropriate photon counting devices and amplifiers and suitable sample holders forstudies under controlled atmosphere, temperature, etc.
In this paper the local structure information from EXAFS experiments is compared forthe two common oxidation states of iron in the form of iron(II) bromide and iron(III)bromide.
Experimental
Poly(ethvlene oxide) was supplied by Aldrich in powdered form (relative molecularmass 4 x 1 0 ) and was dried under vacuum at 50°C for 48 hours before use. Anhydrousferrous bromide and ferric bromide (Alfa; 99% purity) were used as received. Ultrapureethanol and acetonitrile supplied by Aldrich were used for preparing all the samples. Filmswere prepared using a two-component solvent to ensure that both the salt and polymerwere fully dissolved at room temperature. Solutions were made by dissolving theappropriate amount of salt (to give the desired O:Mn+ ratio) in a mixture of 75 cm ofacetonitrile and 25 cm3 of methanol, followed by the slow addition of 1 g of PEO, stirringcontinually. The solutions were left to stir for about 48 hours at room temperature. All ofthese operations were carried out in an argon recirculating glove box. The sealed flaskswere then transferred to another glove box and the solutions were cast in glass rings on aTeflon sheet base. This glove box was continually purged with dry nitrogen, in order toremove the solvent, which was allowed to evaporate slowly at room temperature. Theresulting 'dry' films were further dried under vacuum for 48 hours and stored in adesiccator for subsequent use. The resulting films were 50-150 \xm thick and brick red toreddish brown in colour.
The EXAFS studies on dry PEOn:FeBr2 and PEOn:FeBr3 films (where n = 8, 20 and 50)were carried out at the Synchrotron Radiation Source (SRS), Daresbury,U.K., using station7.1. Samples were prepared by sandwiching a portion of the film (1 cm x 1 cm) betweentwo mylar sheets and mounted on a sample holder having a 'knife-edge'seal surroundingthe central hole which trapped the film between the mylar sheets. During this work theSRS was operating at a beam energy of 2.0 GeV and a typical average stored ring currentwas 200 mA. Data were acquired in the EXAFS transmission mode with argon-filled ionchambers using an Si(ll l) double-crystal monochromator with 50% harmonic rejection.Thus absorbance could be measured for each position of the monochromator correspondingan energy range in the £-space of 2-15 A"1, where fc=[0.263(£-Zso)]
H. E is the energy of theincident X-ray beam and Eo is the energy of the absorption edge iron; k is the wave vectorof the incoming beam.
Results184
ACXRI '96
The experimental EXAFS spectra were calibrated and background subtracted using theDaresbury EXCALIB and EXBACK suite of computer program. Figure 1 and Figure 2show typical EXAFS results for PEOn:FeBr2 and PEOn:FeBr3 respectively. The upperparts of the figures show the £-space, background subtracted, &3-weighted spectra and thelower parts are the fast Fourier transforms of these data. In all cases the solid lines areexperimental data and the dashed lines represent the results of iterative fitting usingEXCURV92 (version 2.2) procedure. The phase shifts were calculated using the XALPHAroutine within EXCURV92. The results obtained for the deconvolution of the EXAFS dataare shown in Tables 1 and 2. The results shown are for the best fits of the theoretical datain which one oxygen nearest neighbour shell have been considered. The best agreementbetween calculated and experimental data corresponded to 3 nearest oxygen neighbouratoms for both types of iron systems, located at 2.15A and 2.08A for the Fe(II) and Fe(III)systems respectively.
Discussions
Polymeric electrolytes for solid state applications are normally below 100 urn in thicknessand are diluted in salt. The present work showed that the physical form of the electrolytematerial was very suitable for direct transmission EXAFS experiments without any samplemodification. For certain applications, samples containing very low concentrations areemployed and for these it may be necessary to use fluorescent EXAFS8. An examinationof the EXAFS data shows that, in all cases for the iron bromides considered in this workthe cation has both bromine and oxygen nearest neighbours. Because oxygen issubstantially smaller than Br-, the Fe-0 distance is naturally less than the Fe-Br distance.The distances between metal species and their nearest neighbours indicate clearly that thereare interactions between the salt and the solvating polymer. A low Debye-Waller factor fora nearest neighbour correlates with a low uncertainty in the coordination number. Theresults show that the bromine in PEOn:FeBrx (x = 2 and 3) could be present in octahedralenvironment. The value exhibited by the Fe(II) samples at 2.15A are similar to[Fe(H2O)6]
2+ octahedra quoted in Phillips and Williams9 at 2.17A, 2.14A and 2.10A. In theFe(III) samples the Fe-0 distance are nearly the same as shown in Fe3+(EDTA)10 at a valueof 2.05A. The Fe-Br distance in all the samples, irrespective of the oxidation state of Feare the same at a value of 2.32A. A significant complication to the use of EXAFS for studyof local structure in polymeric electrolytes is the mixed morphological nature of thepolymer electrolyte film. It has been shown using polarising optical, and scanningelectron, microscopy that polymeric electrolytes contain spherulites. These are three-dimensional entities, which contain crystalline lamellae between which amorphousmaterial is enclosed. The number and size of the spherulites is too great for tit to bepractical to select a region that is purely amorphous. Even if the transmitted beam isrestricted to a spherulitic area; the spherulite itself contains both amorphous and crystallineregions and the spherulite may not completely occupy the portion of the electrolyte filmthat is intersected by the X-ray beam because some amorphous material may occur withinthe cylindrical volume through which the beam passes. Such material could be locatedabove or below the spherulite, i.e. between the spherulite boundary and the film surface.Consequently, any EXAFS study of these types of spherulitic films involves sampling both
185
ACXRI '96
amorphous and crystalline regions and the results represent some form of averaging ofmore than one environment. Thus, although EXAFS is a technique which provides anaverage local structure, the results are consistent with those from the spectroscopyexperiments .
References
1. R.E. Whetton, Br. Patent. No. 35990/76
2. MB. Armand, J.M. Chabagno & M.J. Duclot, 'Fast Ion Transport in Solids', (Ed. P.Vashishta, J.N. Mundy & G.K. Shenoy), Elservier North Holland, Amsterdam, 1979,131
3. P.G. Bruce & C.A. Vincent, J. Chem. Soc, Faraday Trans., 1993, £9_, 3187
4. R.J. Neat, M.D. Glasse, R.G. Linford & A. Hooper, Solid State Ionics, 1986, 18/19.1088
5. C. Berthier, W. Gorecki, M.Minier, M.B. Armand, J.M. Chabagno & P. Rigaud, SolidState Ionics, 1983,11,91
6. P.R. Sorensen & T. Jacobsen, Electrochim. Acta, 1982,22, 1671
7. M.F. Tbney & J. McBreen, Interface, 1993, Spring Issue, 22
8. M. Aziz, RJ.Latham, R.G. Linford & W.S. Schlindwein, Electrochim. Acta, 1995, 4_Q,2119
9. C.S.G. Phillips & R.J.P Williams, Inorganic Chemistry Vol.2, Oxford University Press,Oxford, 1966,249
10. C.S.G. Phillips & R.J.P Williams, Inorganic Chemistry Vol.2, Oxford University Press,Oxford, 1966,231
11. H.M.N. Bandara, W.S. Schlindwein, R.J. Latham and R.G. Linford, J. Chem. Soc,Faraday Trans., 1994, 2Q, 3549
186
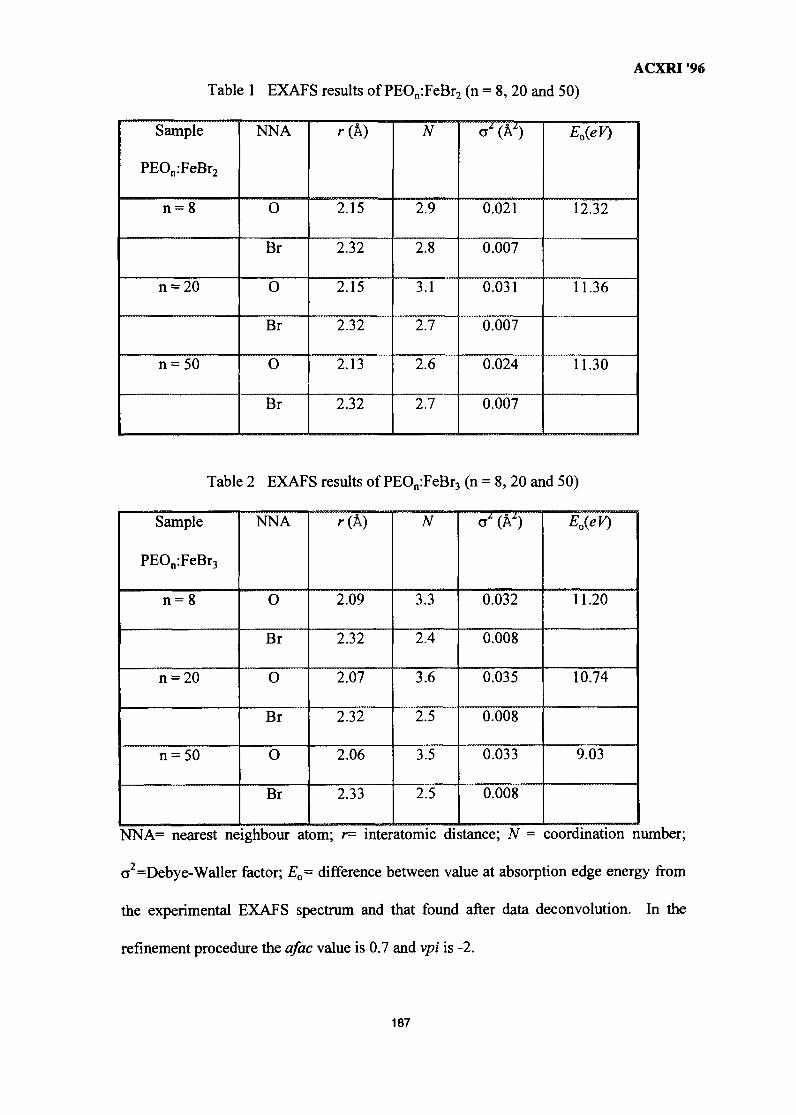
ACXRI '96Table 1 EXAFS results of PEOn:FeBr2 (n = 8,20 and 50)
Sample
PEOn:FeBr2
n = 8
n = 20
n = 5 0
NNA
0
Br
0
Br
0
Br
r(A)
2.15
2.32
2.15
2.32
2.13
2.32
N
2.9
2.8
3.1
2.7
2.6
2.7
0.021
0.007
0.031
0.007
0.024
0.007
E0{eV)
12.32
11.36
11.30
Table 2 EXAFS results of PEOn:FeBr3 (n = 8, 20 and 50)
Sample
PEOn:FeBr3
n = 8
n = 20
n = 50
NNA
0
Br
0
Br
0
Br
r(A)
2.09
2.32
2.07
2.32
2.06
2.33
N
3.3
2.4
3.6
2.5
3.5
2.5
o" (Az)
0.032
0.008
0.035
0.008
0.033
0.008
EoieV)
11.20
10.74
9.03
NNA= nearest neighbour atom; r= interatomic distance; N = coordination number;
cr2=Debye-Waller factor; Eo= difference between value at absorption edge energy from
the experimental EXAFS spectrum and that found after data deconvolution. In the
refinement procedure the afac value is 0.7 and vpi is -2.
187
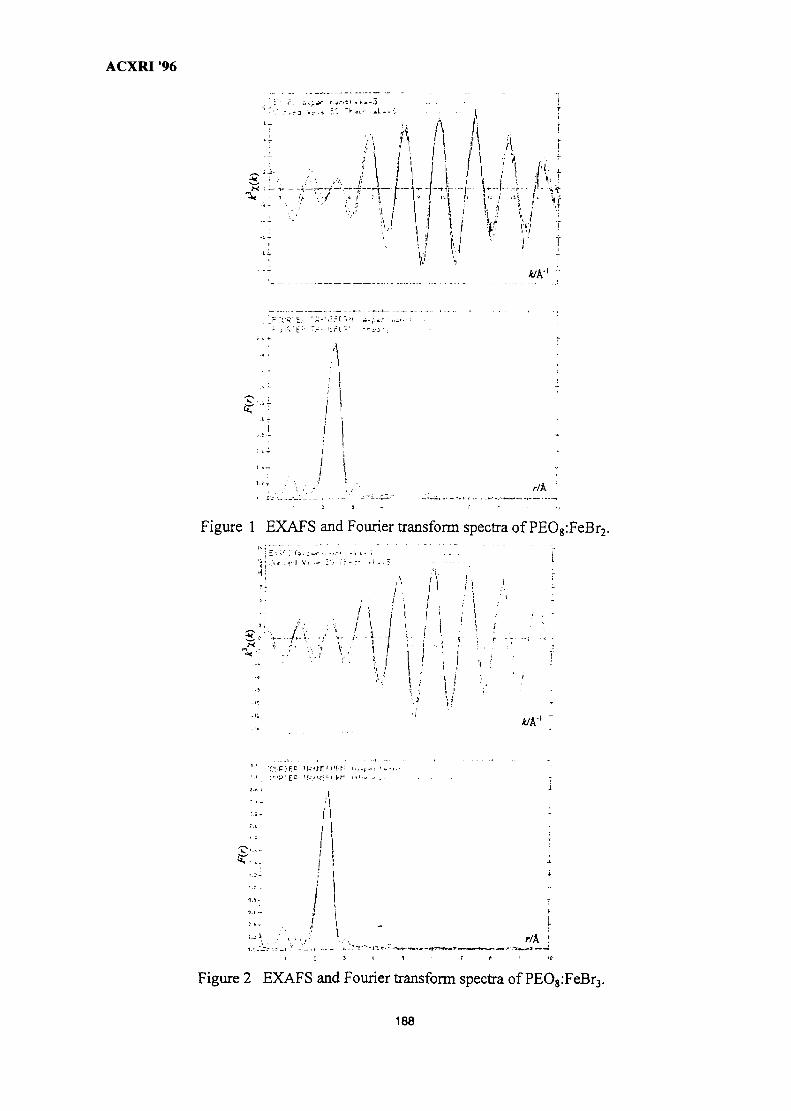
ACXRI '96
r
" U ! I V v! T? I'. I i !
rlk
Figure 1 EXAFS and Fourier transform spectra of PEO8:FeBr2.
• • / '
.' iiI :
T.-.'BIEP 'U ' / r 'MPr ,-=i
l !
I;
r/A '
Figure 2 EXAFS and Fourier transform spectra of PEOg:FeBr3.
188
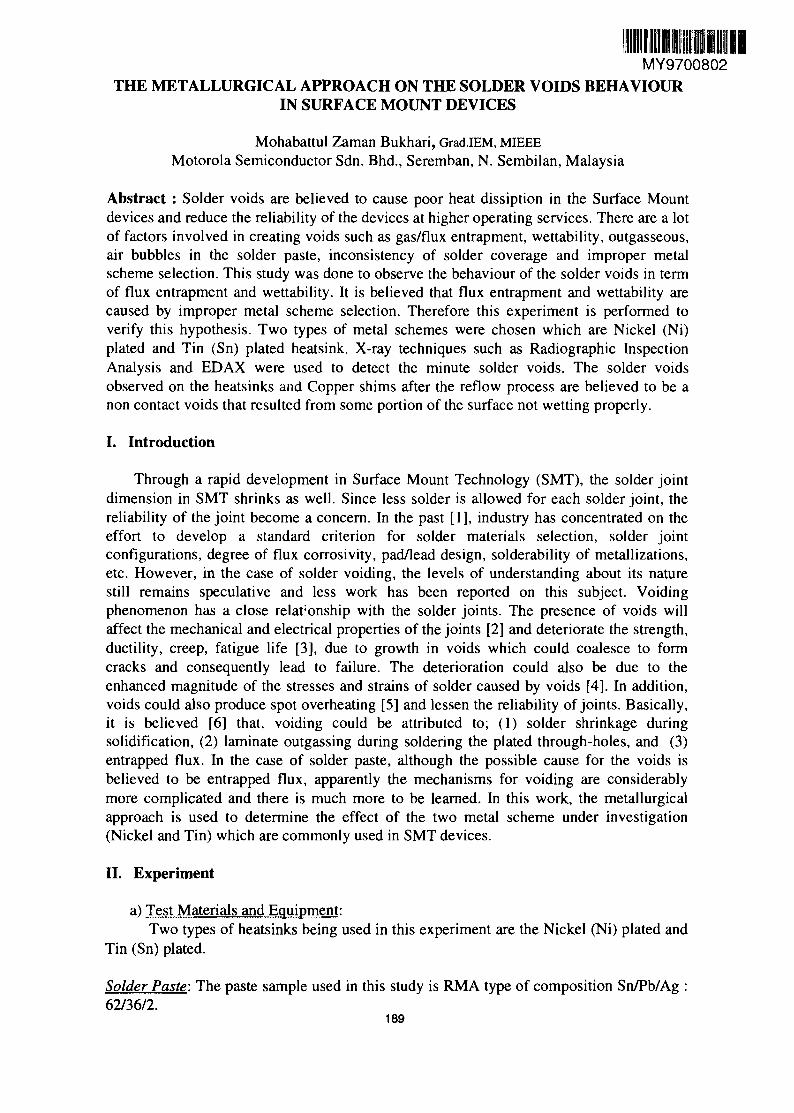
•IlllilillMY9700802
THE METALLURGICAL APPROACH ON THE SOLDER VOIDS BEHAVIOURIN SURFACE MOUNT DEVICES
Mohabattul Zaman Bukhari, Grad.IEM, MIEEEMotorola Semiconductor Sdn. Bhd., Seremban, N. Sembilan, Malaysia
Abstract : Solder voids are believed to cause poor heat dissiption in the Surface Mountdevices and reduce the reliability of the devices at higher operating services. There are a lotof factors involved in creating voids such as gas/flux entrapment, wettability, outgasseous,air bubbles in the solder paste, inconsistency of solder coverage and improper metalscheme selection. This study was done to observe the behaviour of the solder voids in termof flux entrapment and wettability. It is believed that flux entrapment and wettability arecaused by improper metal scheme selection. Therefore this experiment is performed toverify this hypothesis. Two types of metal schemes were chosen which are Nickel (Ni)plated and Tin (Sn) plated heatsink. X-ray techniques such as Radiographic InspectionAnalysis and EDAX were used to detect the minute solder voids. The solder voidsobserved on the heatsinks and Copper shims after the reflow process are believed to be anon contact voids that resulted from some portion of the surface not wetting properly.
I. Introduction
Through a rapid development in Surface Mount Technology (SMT), the solder jointdimension in SMT shrinks as well. Since less solder is allowed for each solder joint, thereliability of the joint become a concern. In the past [1], industry has concentrated on theeffort to develop a standard criterion for solder materials selection, solder jointconfigurations, degree of flux corrosivity, pad/lead design, solderability of metallizations,etc. However, in the case of solder voiding, the levels of understanding about its naturestill remains speculative and less work has been reported on this subject. Voidingphenomenon has a close relationship with the solder joints. The presence of voids willaffect the mechanical and electrical properties of the joints [2] and deteriorate the strength,ductility, creep, fatigue life [3], due to growth in voids which could coalesce to formcracks and consequently lead to failure. The deterioration could also be due to theenhanced magnitude of the stresses and strains of solder caused by voids [4]. In addition,voids could also produce spot overheating [5] and lessen the reliability of joints. Basically,it is believed [6] that, voiding could be attributed to; (1) solder shrinkage duringsolidification, (2) laminate outgassing during soldering the plated through-holes, and (3)entrapped flux. In the case of solder paste, although the possible cause for the voids isbelieved to be entrapped flux, apparently the mechanisms for voiding are considerablymore complicated and there is much more to be learned. In this work, the metallurgicalapproach is used to determine the effect of the two metal scheme under investigation(Nickel and Tin) which are commonly used in SMT devices.
II. Experiment
a) Test Materials and Equipment:Two types of heatsinks being used in this experiment are the Nickel (Ni) plated and
Tin (Sn) plated.
Solder Paste: The paste sample used in this study is RMA type of composition Sn/Pb/Ag :62/36/2.
189

ACXRI "96Shim: Copper (Cu) shim plated with solder (Sn/Pb : 60/40).
Solder Dispensing Machine: Solder paste (in the syringe) with metal content of 85% hasbeen used. Dispensing technique has been used to place the solder on the heatsink.Machine used is Asymtek Solder Dispense.
Solder Printing Machine: Solder paste with a metal content of 90% has to be printed onthe Copper Shim. Machine used for this purpose is DEK machine.
Reflow Machine: Reflow machine used in this experiment is the conduction furnace(Falcon-8 Sikama Reflow Machine). Units havebeen put on the boats at the final assemblystage. The boats together with the units are reflowed. This reflow machine has beenassociated with a nitrogen gas.
Accel Cleaning Machine: After the reflow process, all the units had to be subjected to thecleaning process to clean off the remaining flux residue on the PCB. The centrifugalcleaning method has been used with cleaning chemical known as either Terpene or Ionox.
X-Ray Radiosraphic Inspection: Equipment used for this purpose is the Fein FocusMachine.
SEM & EDAX: SEM equipment used is JEOL with magnification of lOO.OOOX whereas theED AX equipment used is KEVEX.
X - Sectioning Process: Samples were encapsulated in the epoxy resins and Buehler Cross-Sectioning equipment was used to perform the x-sectioning process. One micron diamondpaste together with colloidal silica was used as a first and final stage of polishing processrespectively.
High Power Microscope: Mideo Expert System inline with the Interactive Multimedia wasused to capture the x-sectioning pictures which showed the location of solder voids at thejoints interface.
b) Experiment Procedures:Hundred units of heatsinks were used which consist of fifty units of Ni-plated
heatsinks and fifty units of Sn-plated heatsinks. These samples of heatsinks had undergonethe solder dispensing process through the Asymtex machine. At the same time, hundredunits of copper-shim had undergone the solder printing process. These copper shims wereplaced in its respective boats prior to the soldering reflow process. After the completion ofthe shim placement process (in the boats), the Ni-plated and Sn-plated heatsinks wereplace onto the copper shims. On top of these heatsinks, PCB of the FR-4 materials wasplaced. These units were then reflowed in the Sikama Reflow Machine.
After the reflow process, all the units underwent a cleaning process in the Accelcleaning machine. Once this process was completed, all the units were examined under x-ray radiographic inspection analysis. Samples from each types of heatsinks were furthertaken for voids analysis. A grid size of 20 x 10 mm was used to measure the voidingpercentages on each unit.
Meantime, a sample of Sn-plated heatsink tested by x-ray radiography was furtherinvestigated through the x-sectioning process to detect the location of solder voids. SEM
190
ACXRI '96and EDAX were used to determine the microstructure and any foreign materials embeddedat the voids location of the Sn-plated heatsink respectively.
III. Results / Discussions
Figure 1 gives the graph of the mean and variances of voids calculated on Sn-platedversus Ni-plated heatsinks. Figure 2 gives the summary of the one way ANOVA results.
Statistical methods used to compare the variability and the mean of the two populationsare known as the F-test and the t-test respectively. Based on the above results, F-test and t-test indicated that the variances and mean of both samples are significantly different@95% C.I. The voids level for both samples remains around 9.5% to 20.0%. Thereforefrom this statistical comparison, it showed that voids level between the two samples (Ni-plated heatsinks and Sn-plated heatsinks) are different. From Figure (4) and (5), we canconclude that voids happened in both metal layer of heatsinks (Ni and Sn). Anyway, thevoids pattern seems to be worse in the metal layer of Nickel compared to Tin. This is wellexplained in Figure (6) and (7). In Figure (6), we found that the Sn-plated heatsink exhibitsthe high wetting area on its surface and this revealed that Sn has high affinity with thePbSnAg solder.
Considering the condition that solder joints are commonly exposed to during servicelife, several metallurgical phenomenon occurring in solder materials [7], are intimatelyrelated to the integrity of solder joints like plastic deformation, strain hardening,recrystallization, solid solution hardening, precipitation-hardening and superplasticity(during reflow process). The general rule of thumb for formation of solid solution betweentwo elements of solder composition are; the two elements having the same crystal structuretend to form a complete solid solution and the formation of solid solution is favoured whenthe size difference between the two element is less that 15 percent. It been found that thesystem of Ni and Sn having significant atomic size difference which are 0.1246 and 0.1509A respectively while both of them also have different crystal structure.
Therefore it is believed that Sn which originated from heatsink tends to create a solidsolution with the solder and this is due to their commensurate crystal structure. The abilityto form solid-solution between Sn from the heatsink and Sn from the solder helps toincrease the wettability of the solder on the Sn-plated heatsink [Figure 6]. On the contrary,we found that Ni-plated heatsink exhibits the high non-wetting area on its surface and thisrevealed that Ni does not have high affinity with the PbSnAg solder [Figure 7]. In fact, thesystem of Ni and Sn have different crystal structure and significant atomic size differenceand these offer a negligible solid solution at temperature below than 400 C. The reflowtemperature used is 230° C which is about 50°C higher than the liquidus temperature(179°C). In fact, the rate of dissolution of Nickel in the PbSnAg solder is very slow. Nickelacts as a barrier layer to prevent the dissolution of Cu (heatsink's core material)metallization into the solder. During reflow process, the Ni-Sn intermetallic compoundsare formed and the formation of these intermetallics continues even when the solder hassolidified. Therefore it is believed that these intermetallics will retard the adhesion of thesolder to the metallic surface. As a result, the wettability factor will became poor. Thisexplains why we still can see the surface of the Ni-plated heatsink not being fully coveredby the solder. Anyway, if we refer to the Figure 7, we still can see the solder spread on theheatsink's surface although it is not fully covered with it. This happenes because at thebottom layer of the PCB which is attached to the solder, there is a layer of gold. The
191
ACXRI '96
melting temperature of the solder used is 179°C and at temperature of 175°C, the goldleaching phenomenon is believed to happen and this helps in spreading the solder on thesurface of the Ni and Sn-plated heatsink. Gold has the high rate of dissolution in the solderduring soldering process and gold is also prone to dissolution in the Tin (Sn). This explainswhy the wettability of the Sn-plated heatsinks is much better compared to Ni-platedheatsinks. As a matter of fact, we can conclude that the Sn-plated heatsink has a goodwettability characteristics compared to Ni-plated heatsink.
Based on these findings, we further evaluated the Sn-plated heatsink. The X-Sectioningmethodology was performed on the Sn-plated heatsink which revealed that the isolatedvoids occurred at the solder joints interface [Figure 8]. The void is believed to be a non-contact void and this type of void can result from many different factors such as surfacecontamination, flux entrapment, etc. Therefore, this study indicates that there are otherfactors than the metal scheme alone which create the voids. From the EDAX analysis, itshows that the elements detected at the void area still remain the same as what beenobserved on the region next to the voids area. This shows that although the metal schemeof Sn-plated heatsink produced a significant improvement in term of wettability comparedto Ni-plated heatsink, we still can see voids which probably resulted from entrapped flux.
IV Conclusion
Sn-plated heatsink exhibits high wetting areas on its surface and this is due to the samecrystal structure that it has with Sn in the PbSnAg solder system. On the contrary, wefound that Ni-plated heatsink that undergoes the same process exhibits a high non-wettingarea on it surface and it is due to their different crystal structures.
Although, this metallurgical approach helps to prove that Sn plated heatsink has a betterwetting characteristics compared to the Ni plated and helps in improving the quality, but tosome extent it is also clear that this will not help to eliminate the void issue. There areother factors contributing to the void formation. It is highly recommended that to resolvethis chronic void formation issue, a more robust package (heatsink management) or higheradhesive materials should be evaluated.
The internal controls that we can have on our process and also on the pastemanufacturer are; (1) Improving component/substrate solderability, (2) Using fluxes withhigher flux activity, (3) Reducing solder powder oxide, (4) Using inert heatingatmosphere and (5) Reducing the preheat stage to promote fluxing before reflow.
References
1. Wanda B. Hance and Dr. Ning-Cheng Lee, "Voiding Mechanism in SMT," IndiumCorporation of America Utica NY, pp : 1-9 (1991).
2. D.T Novick, "A Metallurgical Approach to Cracked Joints," Welding J. Res. Suppl.52,(4), 154S-1582 (1973).
3. V. Tvergaard, "Material Failure by Void Growth to Coalescence," Advances inApplied Mechanics, Vol. 27 (1989), Pergamon Press, pp. 83-149.
192
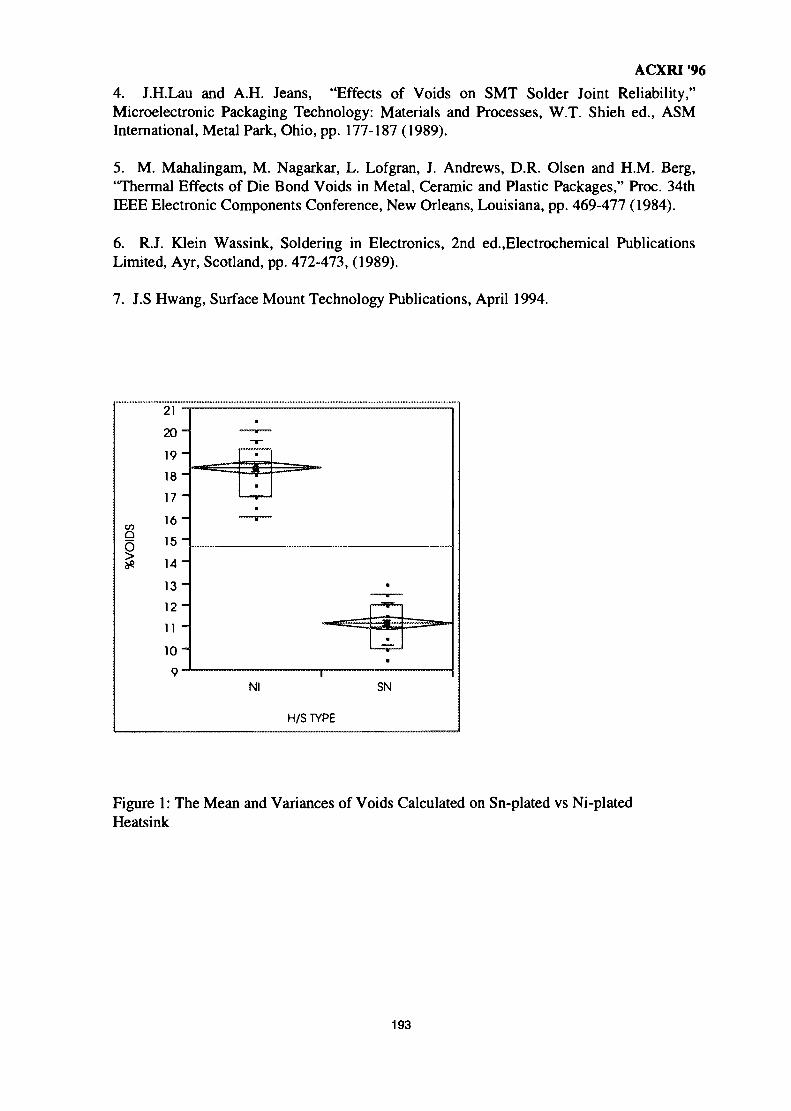
ACXRI '96
4. J.H.Lau and A.H. Jeans, "Effects of Voids on SMT Solder Joint Reliability,"Microelectronic Packaging Technology: Materials and Processes, W.T. Shieh ed., ASMInternational, Metal Park, Ohio, pp. 177-187 (1989).
5. M. Mahalingam, M. Nagarkar, L. Lofgran, J. Andrews, D.R. Olsen and H.M. Berg,'Thermal Effects of Die Bond Voids in Metal, Ceramic and Plastic Packages," Proc. 34thIEEE Electronic Components Conference, New Orleans, Louisiana, pp. 469-477 (1984).
6. R.J. Klein Wassink, Soldering in Electronics, 2nd ed.,Electrochemical PublicationsLimited, Ayr, Scotland, pp. 472-473, (1989).
7. J.S Hwang, Surface Mount Technology Publications, April 1994.
CO
Q
i
2 1 •
20-
19"
18-
1 7 •
16"
15-
14-
13-
12"
11 "
Nl SN
H/S TYPE
Figure 1: The Mean and Variances of Voids Calculated on Sn-plated vs Ni-platedHeatsink
193

ACXRI '96
Oneway AnovaSummary of Fit
SourceModelErrorC Total
RSquare 0.904798RSquare Adj 0.903827Root Mean Square Error 1.166497Mean of Response 14.73Observations (or Sum Wgts) 100
t-Testt-Test DF Prob>ltl
30.5187348 98 0.0000
Assuming equal variances
Analysis of VarianceDF Sum of Squares Mean Square
1 1267.3600 1267.3698 133.3500 1.3699 1400.7100
Means for Oneway AnovaLevel Number Mean Std ErrorNI 50 18.2900 0.16497SN 50 11.1700 0.16497
F Ratio931.3932
Prob>F0.0000
LevelNISN
Std Error uses a pooled estimate of error variance
Mean and Std DeviationsNumber Mean Std Dev
50 18.2900 1.3057650 11.1700 1.00818
LevelNISN
Tests that the Variances are EqualCount Std Dev MeanAbsDif to Mean
50 1.305756 1.09840050 1.008181 0.863600
Std Err Mean0.184660.14258
MeanAbsDif to Median1.0900000.850000
TestO'Brien[.5]Brown-ForsytheLeveneBartlett
F Ratio5.76913.40293.77973.2091
DF Num DF Den1 981 981 98
Prob>F0.01820.06810.05470.0732
Welch Anova testing Means Equal, allowing Std's Not EqualF Ratio DFNum DFDen Prob>F
931.3932 1 92.104 0.0000t-Test
30.5187
Summary :RSquare Adjust: 0.903827 (90%)Means : Ni-plated heatsink = 18.29 ± 0.164
Sn-plated heatsink = 11.17 ± 0.164t-Test: (Null Hypothesis) Ho : Ni = Sn
Hi • Ni Sn
p-value = 0,
Conclusion : Reject the Null hypothesis and accept the alternative that voids percentages of Ni is not same as
in Sn.F-Test: From the ANOVA result, it showed that the value of Prob>F = 0.0000. Therefore the variability ofboth populations are significantly different.
Figure 2 : The One way ANOVA Results and Summary
194
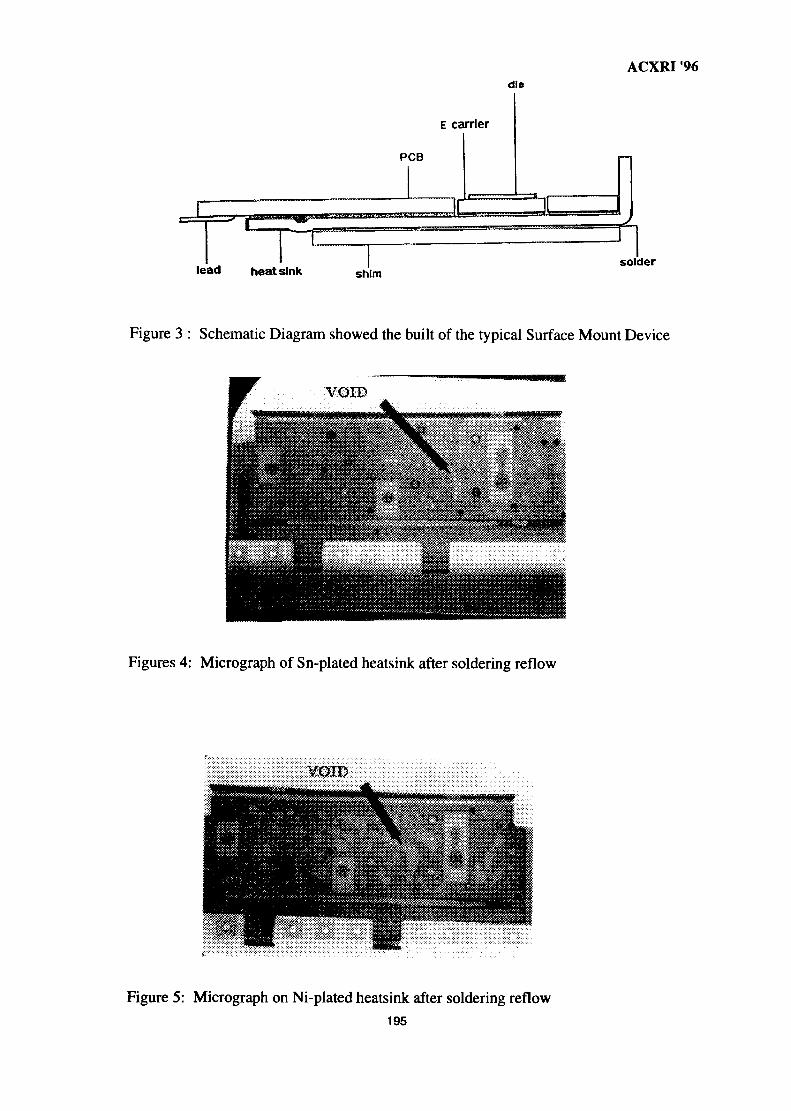
ACXRI '96die
E carrier
PCB
lead heatsink soldershim
Figure 3 : Schematic Diagram showed the built of the typical Surface Mount Device
Figures 4: Micrograph of Sn-plated heatsink after soldering reflow
Figure 5: Micrograph on Ni-plated heatsink after soldering reflow
195
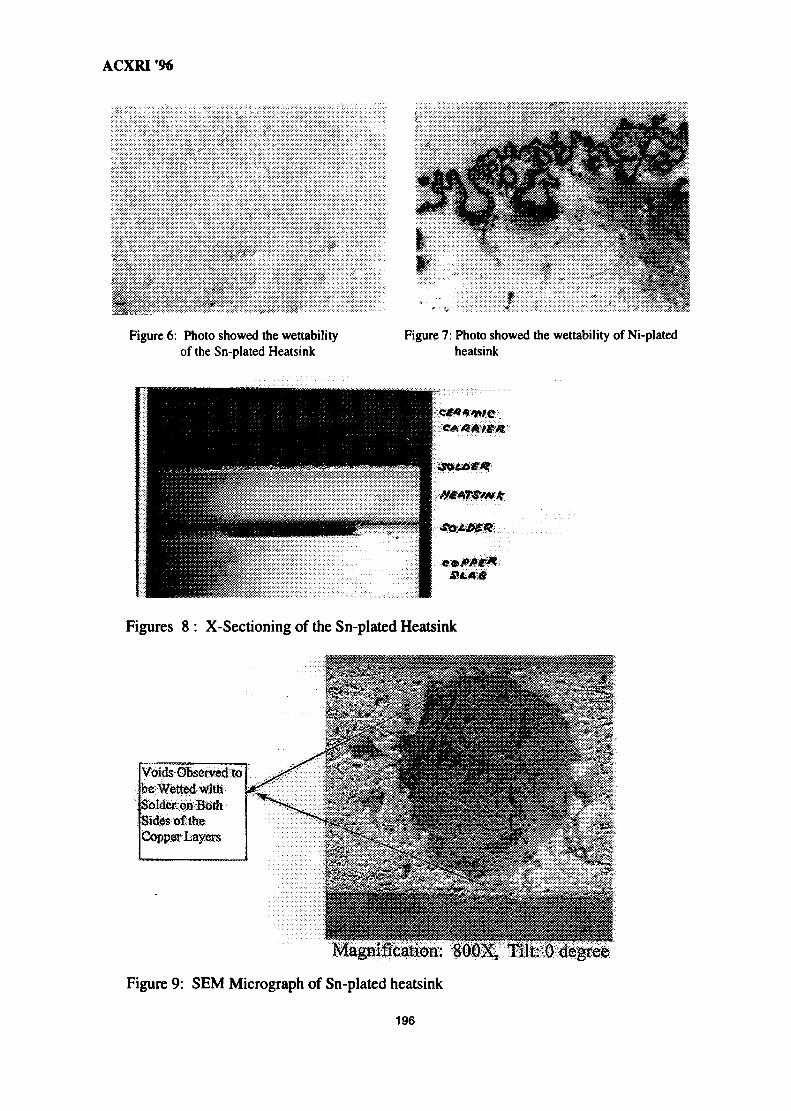
ACXRI '96
Figure 6: Photo showed the wettabilityof the Sn-plated Heatsink
rFigure 7: Photo showed the wettability of Ni-plated
heatsink
Figures 8 : X-Sectioning of the Sn-plated Heatsink
Voids Observed tobe Wetted withSolder, OB BothSides of theCopper Layers
Magnification: SOGX, Tilt: 0 degree
Figure 9: SEM Micrograph of Sn-plated heatsink
196
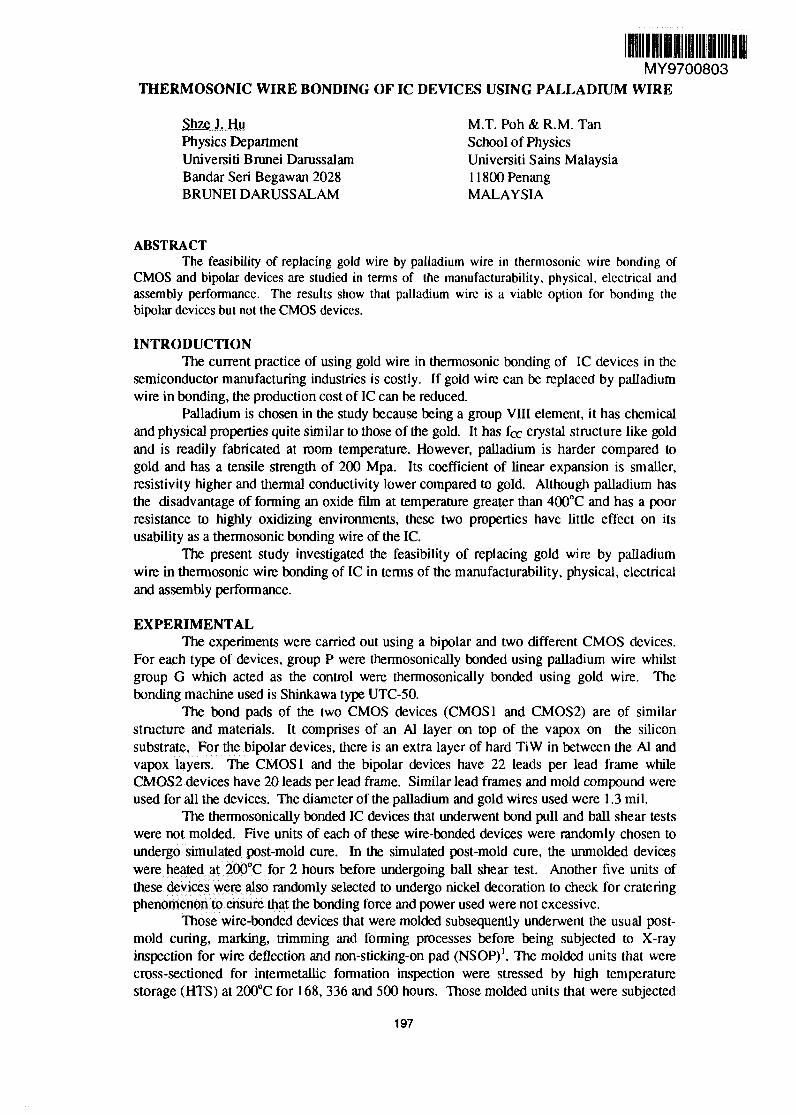
MY9700803THERMOSONIC WIRE BONDING OF IC DEVICES USING PALLADIUM WIRE
Shze J. Hu M.T. Poh & R.M. TanPhysics Department School of PhysicsUniversiti Brunei Darussalam Universiti Sains MalaysiaBandar Seri Begawan 2028 11800 PenangBRUNEI DARUSSALAM MALAYSIA
ABSTRACTThe feasibility of replacing gold wire by palladium wire in thermosonic wire bonding of
CMOS and bipolar devices are studied in terms of the manufacturability, physical, electrical andassembly performance. The results show that palladium wire is a viable option for bonding thebipolar devices but not the CMOS devices.
INTRODUCTIONThe current practice of using gold wire in thermosonic bonding of IC devices in the
semiconductor manufacturing industries is costly. If gold wire can be replaced by palladiumwire in bonding, the production cost of IC can be reduced.
Palladium is chosen in the study because being a group VIII element, it has chemicaland physical properties quite similar to those of the gold. It has fee crystal structure like goldand is readily fabricated at room temperature. However, palladium is harder compared togold and has a tensile strength of 200 Mpa. Its coefficient of linear expansion is smaller,resistivity higher and thermal conductivity lower compared to gold. Although palladium hasthe disadvantage of forming an oxide film at temperature greater than 400°C and has a poorresistance to highly oxidizing environments, these two properties have little effect on itsusability as a thermosonic bonding wire of the IC.
The present study investigated the feasibility of replacing gold wire by palladiumwire in thermosonic wire bonding of IC in terms of the manufacturability, physical, electricaland assembly performance.
EXPERIMENTALThe experiments were carried out using a bipolar and two different CMOS devices.
For each type of devices, group P were thermosonically bonded using palladium wire whilstgroup G which acted as the control were thermosonically bonded using gold wire. Thebonding machine used is Shinkawa type UTC-50.
The bond pads of the two CMOS devices (CMOS1 and CMOS2) are of similarstructure and materials. It comprises of an Al layer on top of the vapox on the siliconsubstrate. For the bipolar devices, there is an extra layer of hard TiW in between the Al andvapox layers. The CMOS1 and the bipolar devices have 22 leads per lead frame whileCMOS2 devices have 20 leads per lead frame. Similar lead frames and mold compound wereused for all the devices. The diameter of the palladium and gold wires used were 1.3 mil.
The thermosonically bonded IC devices that underwent bond pull and ball shear testswere not molded. Five units of each of these wire-bonded devices were randomly chosen toundergo simulated post-mold cure. In the simulated post-mold cure, the unmolded deviceswere heated at 200°C for 2 hours before undergoing ball shear test. Another five units ofthese devices were also randomly selected to undergo nickel decoration to check for crateringphenomenon to ensure that the bonding force and power used were not excessive.
Those wire-bonded devices that were molded subsequently underwent the usual post-mold curing, marking, trimming and forming processes before being subjected to X-rayinspection for wire deflection and non-sticking-on pad (NSOP)1. The molded units that werecross-sectioned for intermetallic formation inspection were stressed by high temperaturestorage (HTS) at 200°C for 168, 336 and 500 hours. Those molded units that were subjected
197
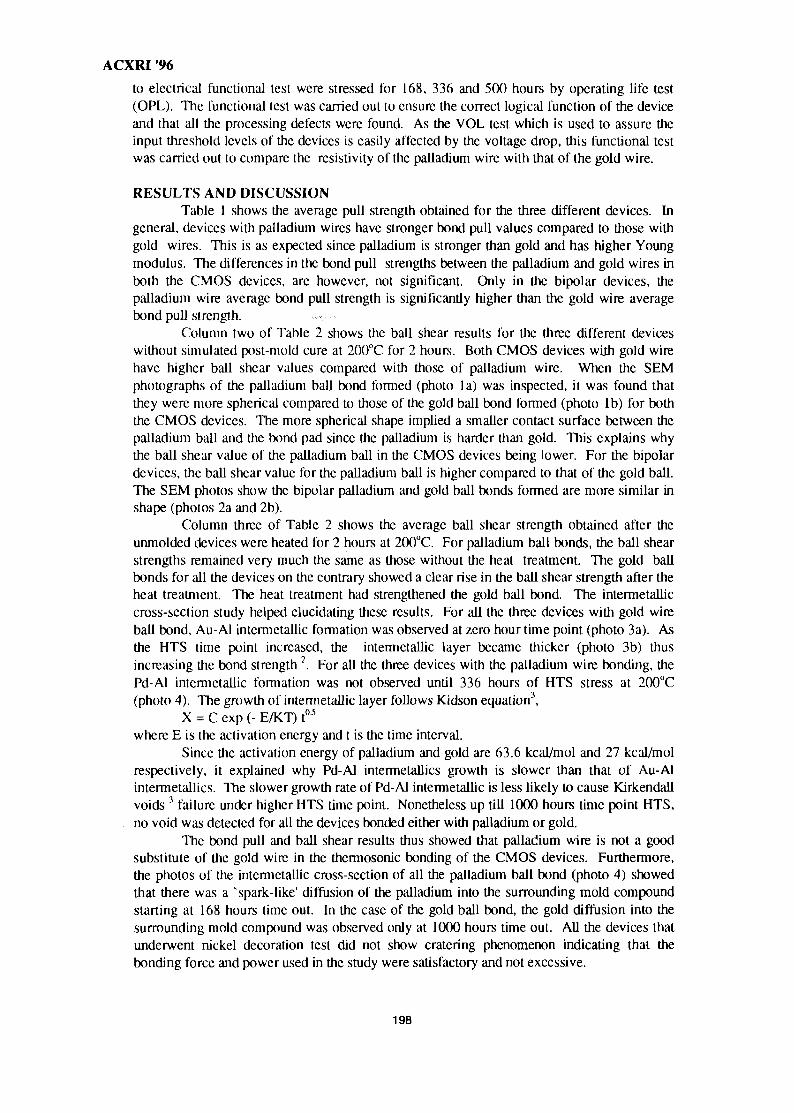
ACXRI '96
to electrical functional test were stressed for 168, 336 and 500 hours by operating life test(OPL). The functional test was carried out to ensure the correct logical function of the deviceand that all the processing defects were found. As the VOL test which is used to assure theinput threshold levels of the devices is easily affected by the voltage drop, this functional testwas carried out to compare the resistivity of the palladium wire with that of the gold wire.
RESULTS AND DISCUSSIONTable 1 shows the average pull strength obtained for the three different devices. In
general, devices with palladium wires have stronger bond pull values compared to those withgold wires. This is as expected since palladium is stronger than gold and has higher Youngmodulus. The differences in the bond pull strengths between the palladium and gold wires inboth the CMOS devices, are however, not significant. Only in the bipolar devices, thepalladium wire average bond pull strength is significantly higher than the gold wire averagebond pull strength.
Column two of Table 2 shows the ball shear results for the three different deviceswithout simulated post-mold cure at 200°C for 2 hours. Both CMOS devices with gold wirehave higher ball shear values compared with those of palladium wire. When the SEMphotographs of the palladium ball bond formed (photo la) was inspected, it was found thatthey were more spherical compared to those of the gold ball bond formed (photo lb) for boththe CMOS devices. The more spherical shape implied a smaller contact surface between thepalladium ball and the bond pad since the palladium is harder than gold. This explains whythe ball shear value of the palladium ball in the CMOS devices being lower. For the bipolardevices, the ball shear value for the palladium ball is higher compared to that of the gold ball.The SEM photos show the bipolar palladium and gold ball bonds formed are more similar inshape (photos 2a and 2b).
Column three of Table 2 shows the average ball shear strength obtained after theunmolded devices were heated for 2 hours at 200°C. For palladium ball bonds, the ball shearstrengths remained very much the same as those without the heat treatment. The gold ballbonds for all the devices on the contrary showed a clear rise in the ball shear strength after theheat treatment. The heat treatment had strengthened the gold ball bond. The intermetalliccross-section study helped elucidating these results. For all the three devices with gold wireball bond, Au-Al intermetallic formation was observed at zero hour time point (photo 3a). Asthe HTS time point increased, the intermetallic layer became thicker (photo 3b) thusincreasing the bond strength 2. For all the three devices with the palladium wire bonding, thePd-Al intermetallic formation was not observed until 336 hours of HTS stress at 200°C(photo 4). The growth of intermetallic layer follows Kidson equation3,
X = C exp (- E/KT) tos
where E is the activation energy and t is the time interval.Since the activation energy of palladium and gold are 63.6 kcal/mol and 27 kcal/mol
respectively, it explained why Pd-Al intermetallics growth is slower than that of Au-Alintermetallics. The slower growth rate of Pd-Al intermetallic is less likely to cause Kirkendallvoids 3 failure under higher HTS time point. Nonetheless up till 1000 hours time point HTS,no void was detected for all the devices bonded either with palladium or gold.
The bond pull and ball shear results thus showed that palladium wire is not a goodsubstitute of the gold wire in the thermosonic bonding of the CMOS devices. Furthermore,the photos of the intermetallic cross-section of all the palladium ball bond (photo 4) showedthat there was a v spark-like' diffusion of the palladium into the surrounding mold compoundstarting at 168 hours time out. In the case of the gold ball bond, the gold diffusion into thesurrounding mold compound was observed only at 1000 hours time out. All the devices thatunderwent nickel decoration test did not show cratering phenomenon indicating that thebonding force and power used in the study were satisfactory and not excessive.
198
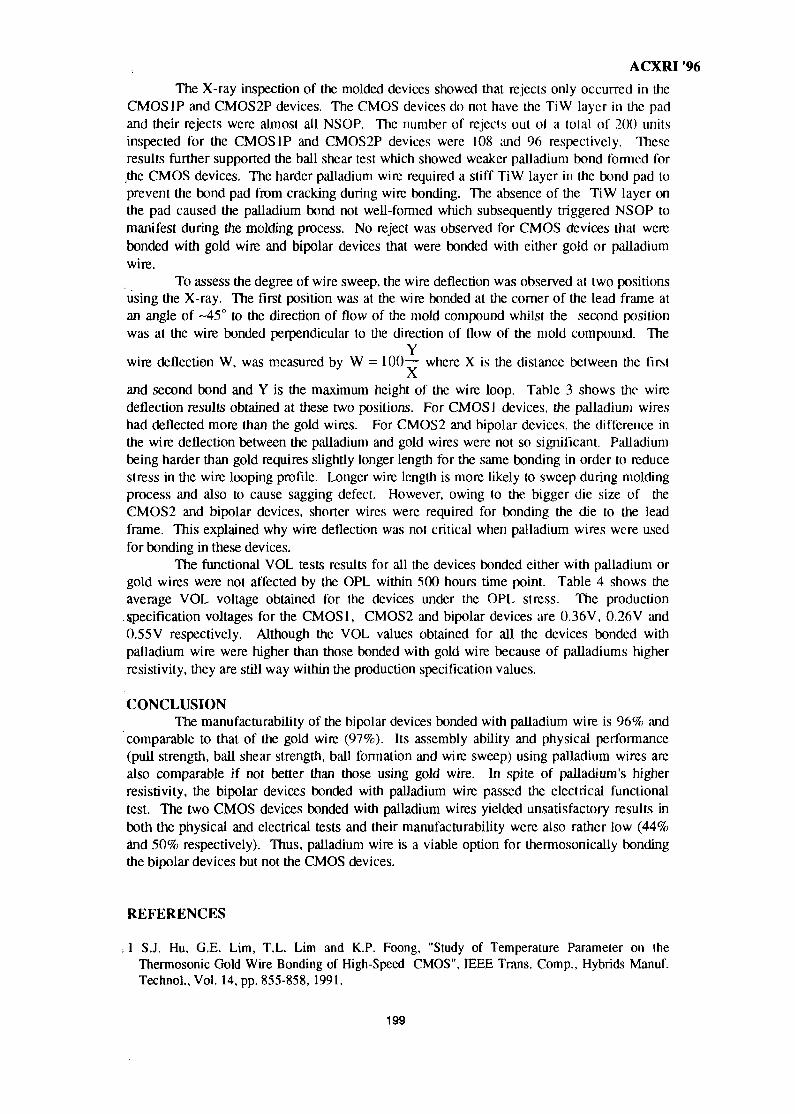
ACXRI '96
The X-ray inspection of the molded devices showed that rejects only occurred in theCMOS IP and CMOS2P devices. The CMOS devices do not have the TiW layer in the padand their rejects were almost all NSOP. The number of rejects out ol a lotal of 200 unitsinspected for the CMOS IP and CMOS2P devices were 108 and 96 respectively. Theseresults further supported the ball shear test which showed weaker palladium bond formed forthe CMOS devices. The harder palladium wire required a stiff TiW layer in the bond pad toprevent the bond pad from cracking during wire bonding. The absence of the TiW layer onthe pad caused the palladium bond not well-formed which subsequently triggered NSOP tomanifest during the molding process. No reject was observed for CMOS devices that werebonded with gold wire and bipolar devices that were bonded with either gold or palladiumwire.
To assess the degree of wire sweep, the wire deflection was observed at two positionsusing the X-ray. The first position was at the wire bonded at the corner of the lead frame atan angle of ~45° to the direction of flow of the mold compound whilst the second positionwas at the wire bonded perpendicular to the direction of flow of the mold compound. The
Ywire deflection W, was measured by W = 100— where X is the distance between the first
Xand second bond and Y is the maximum height of the wire loop. Table 3 shows the wiredeflection results obtained at these two positions. For CMOS 1 devices, the palladium wireshad deflected more than the gold wires. For CMOS2 and bipolar devices, the difference inthe wire deflection between the palladium and gold wires were not so significant. Palladiumbeing harder than gold requires slightly longer length for the same bonding in order to reducestress in the wire looping profile. Longer wire length is more likely to sweep during moldingprocess and also to cause sagging defect. However, owing to the bigger die size of theCMOS2 and bipolar devices, shorter wires were required for bonding the die to the leadframe. This explained why wire deflection was not critical when palladium wires were usedfor bonding in these devices.
The functional VOL tests results for all the devices bonded either with palladium orgold wires were not affected by the OPL within 500 hours time point. Table 4 shows theaverage VOL voltage obtained for the devices under the OPL stress. The productionSpecification voltages for the CMOS1, CMOS2 and bipolar devices are 0.36V, 0.26V and0.55V respectively. Although the VOL values obtained for all the devices bonded withpalladium wire were higher than those bonded with gold wire because of palladiums higherresistivity, they are still way within the production specification values.
CONCLUSIONThe manufacturability of the bipolar devices bonded with palladium wire is 96% and
comparable to that of the gold wire (97%). Its assembly ability and physical performance(pull strength, ball shear strength, ball formation and wire sweep) using palladium wires arealso comparable if not better than those using gold wire. In spite of palladium's higherresistivity, the bipolar devices bonded with palladium wire passed the electrical functionaltest. The two CMOS devices bonded with palladium wires yielded unsatisfactory results inboth the physical and electrical tests and their manufacturability were also rather low (44%and 50% respectively). Thus, palladium wire is a viable option for thermosonically bondingthe bipolar devices but not the CMOS devices.
REFERENCES
»1 S.J. Hu, G.E. Lim, T.L. Lim and K.P. Foong, "Study of Temperature Parameter on theThermosonic Gold Wire Bonding of High-Speed CMOS", IEEE Trans. Comp., Hybrids Manuf.Technol., Vol. 14, pp. 855-858, 1991.
199

ACXRI '962 G. Magni, C. Nobilc, G. Ottaviani, M. Costato and E. Galli, "Gold-Aluminium Thin Film
Interactions and Compound Formation", J. Appl. Phys., Vol. 52, pp. 4047-4054, 1981.
3 Elliot Philofsky, "Purple Plague Revisited", Solid State Electronics, Vol. 13, No. 10, pp. 1391-1399, 1970.
Table The average pull strengths of the devices bonded with gold or palladium wires.
DevicesCMOS1GCMOS IPCMOS2GCMOS2PBipolar GBipolar P
Average pull strength (g)12.90 ± 1.6314.28 ± 2.4011.84 ± 1.8412.36 ±2.1011.42 ±1.7815.11 ±2.31
Table 2: The average ball shear strength of the bonded devices without and with simulated post-moid cure at 200°C for 2 hours.
Devices
CMOS1GCMOS IPCMOS2GCMOS2PBipolar GBipolar P
Average strength (g)without simulated post-mold cure
58.91 ±4.1537.69 ±5.0758.27 ±6.0434.10 ±4.9947.77 ± 5.4751.05 ±6.92
Average strength (g)with simulated post-mold cure
67.70 ±6.2136.94 ± 4.4077.33 ±9.9934.94 ±4.1359.91 ±5.1050.60 ± 5.57
Table 3: The wire deflection at position 1 and position 2 of the bonded die.
DevicesCMOS1GCMOS IPCMOS2GCMOS2PBipolar GBipolar P
Position 11.98 ±0.795.02 ±2.511.70 ±0.572.34 ± 0.672.34 ± 0.882.60± 1.11
Position 21.50 ±1.034.34 ± 2.242.84 ± 1.224.38 ± 2.542.42 ± 0.923.50 ± 1.57
Table 4: The average VOL voltage of the bonded devices.
DevicesCMOS1GCMOS IPCMOS2GCMOS2PBipolar GBipolar P
Average voltage (V)0.1630.1790.1590.1880.3670.382
200
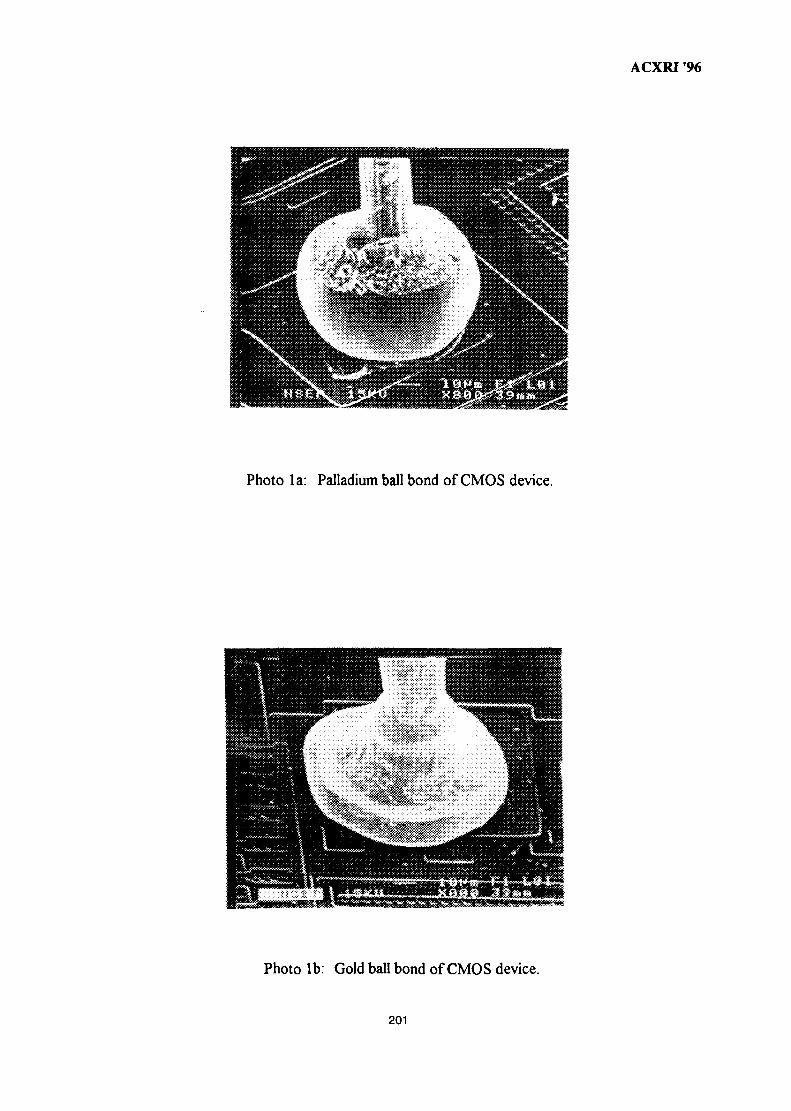
ACXRI '96
Photo la: Palladium ball bond of CMOS device.
Photo lb: Gold ball bond of CMOS device.
201
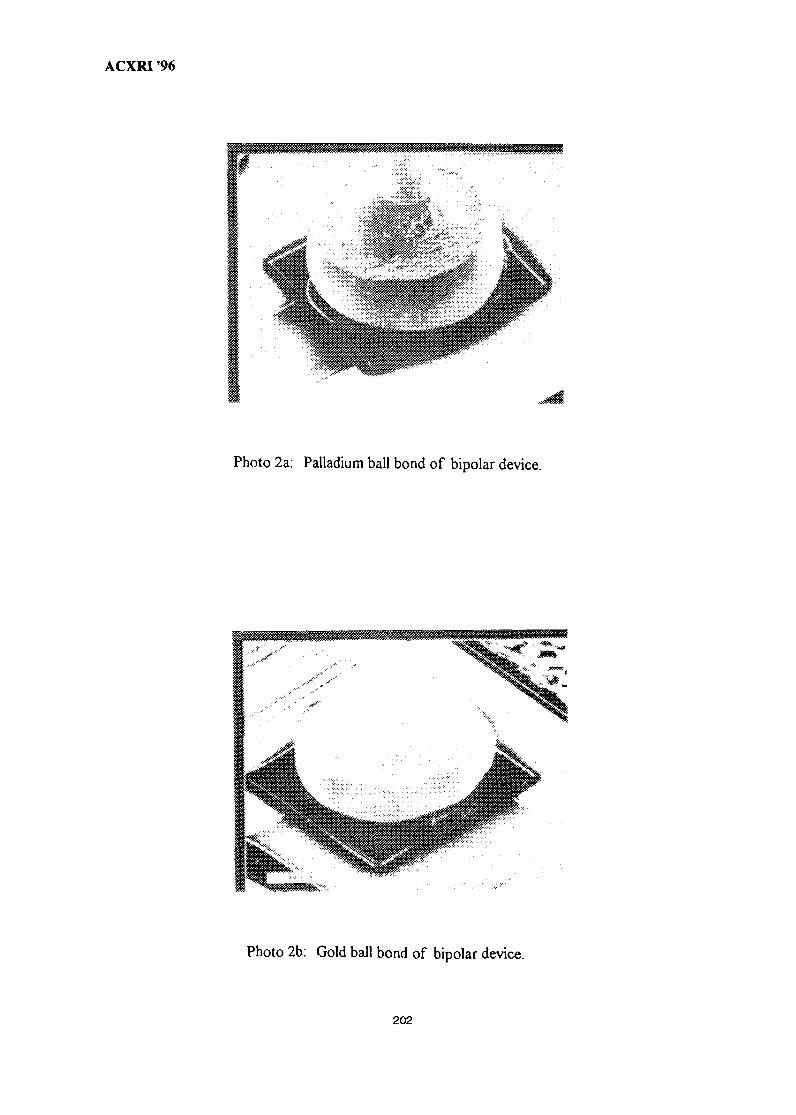
ACXRI '96
Photo 2a: Palladium ball bond of bipolar device.
Photo 2b: Gold ball bond of bipolar device.
202
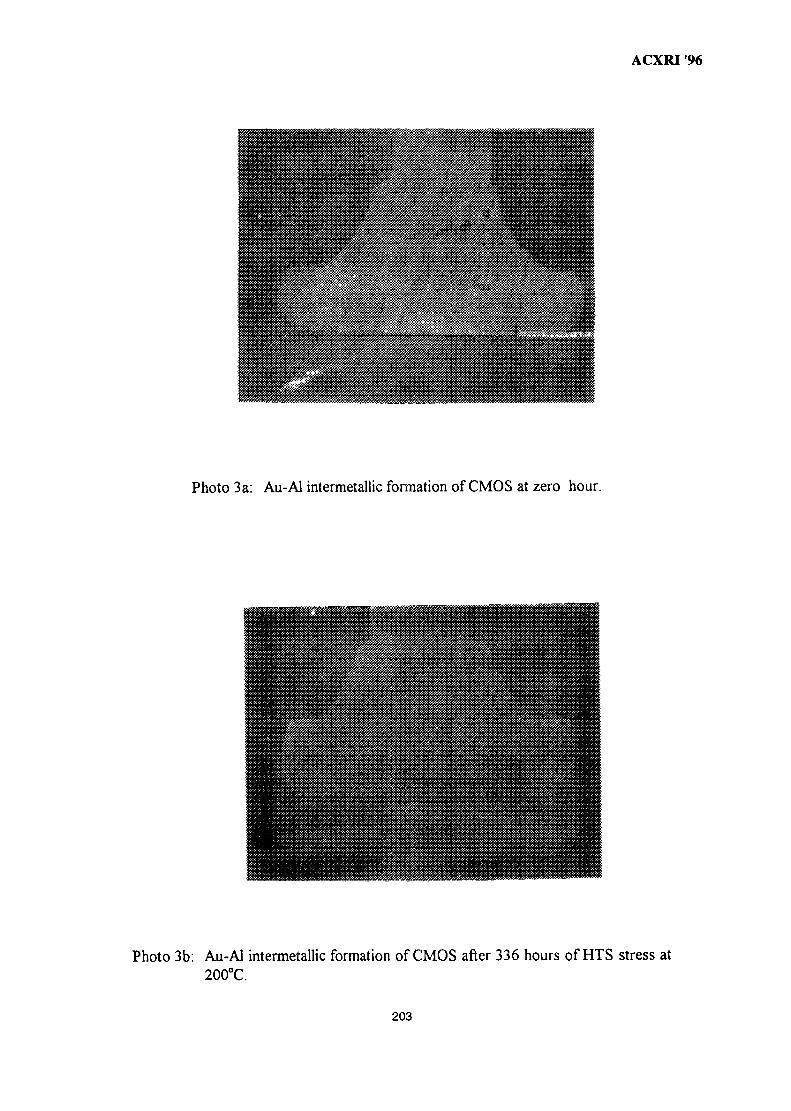
ACXRI 96
Photo 3a: Au-Al intermetallic formation of CMOS at zero hour.
Photo 3b: Au-Al intermetallic formation of CMOS after 336 hours of HTS stress at200°C.
203
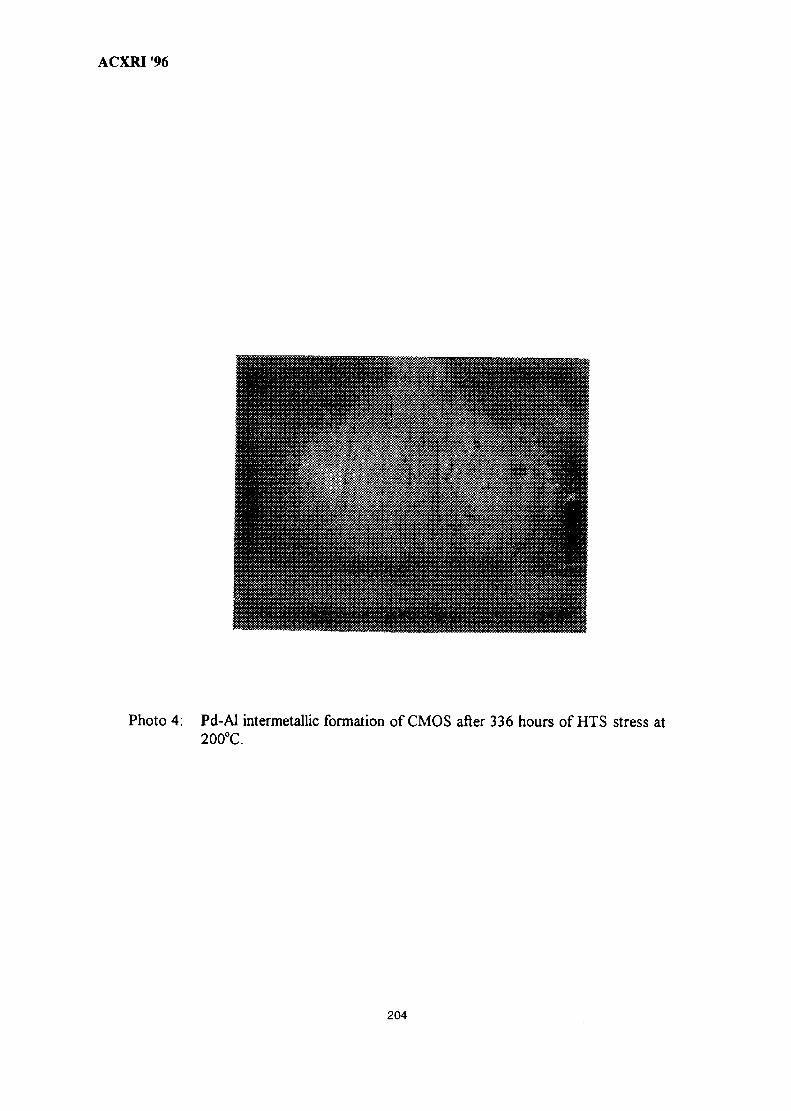
ACXRI '96
Photo 4: Pd-Al intermetallic formation of CMOS after 336 hours of HTS stress at200°C.
204
MY9700804STRUCTURAL STUDIES OF ANTIMONY-DOPED TIN SELENIDE
(SnSe:Sb) THIN FILMS
Samsudi Sakrani, Nawiah Rosdi and Yussof WahabThin Film Laboratory, Material Science Panel
Physics Department, Universiti Teknologi MalaysiaLocked Bag 791, 80990 Johor Bahru
Malaysia
ABSTRACT
This paper deals with the structural developement leading to the formation ofantimony-doped tin selenide thin films. The samples have been prepared onto glasssubstrates using the combined thermal evaporation in vacuum and solid state reactiontechniques. The materials were evaporated according to the Sn/Se/Sn stacked layers atsubstrate temperatures 200-270°C and at film thicknesses 150/300/150 nm. X-rayanalysis results showed that stoichiometric SnSe thin films were formed at substratetemperatures above 230°C, and these were confirmed by XRF/EDAX results. SnSe:Sbthin films were then prepared in similar manner (Sn/Se/Sb/Sn) with Sb concentrationfixed between 1.8-5.3%. It was found that, from the XRD patterns, effective dopingprocess took place in SnSe thin film with 1.8% Sb, either substitutionally, interstitiallyor a combination of both mechanisms. Observation on SEM micrographs revealed thechange from the rough-like to grain appearance, suggesting the polycrystallinestructures of SnSe:Sb.
INTRODUCTION
SnSe is currently receiving much attention as electronic and optoelectronic materialsfrom the standpoint of both electrical and optical properties. Its bandgap of 1.05-1.25eV [1] closely approximates 1.2 eV for Si, the high absorption coefficient of the order105 cm"1 in the visible light region [1], exhibiting p-type conductivity and lowresistivity of 0.1-10.5 Hem [2], Hall mobility 20-40 cm2 (Vs)1 and carrier density ~1018 cm"3 [3] exist in polycrystalline films when prepared under room and elevatedtemperature conditions. The most commonly used preparation techniques werevacuum deposition [4], hot wall epitaxy [5] and chemical method [6]. Less literatureis available on doped SnSe thin films except those reported for bulk material or singlecrystal [7].
Basically, SnSe belongs to the orthorhombic space group, D162h and has a distorted
NaCl-type lattice structure shown in Figure 1. Its primitive cell comprises of eightatoms of four Sn and four Se arranged in alternate layers; the atoms in a single layerare joined to three nearest neighbours by covalent bonds which form zigzag chainsalong the c-axis. This means that individual atom in the unit cell is surrounded by fouratoms. The lattice dimensions are as follows: a=0.444 nm, b=0.415 nm and c= 1.149nm. The crystals cleave exceptionally easily in the a-b plane with the van der Waalsbonding along the c-axis. Its anisotropic crystal structure may lead to significantdifferences in optical responses along the respective planes [8].
205
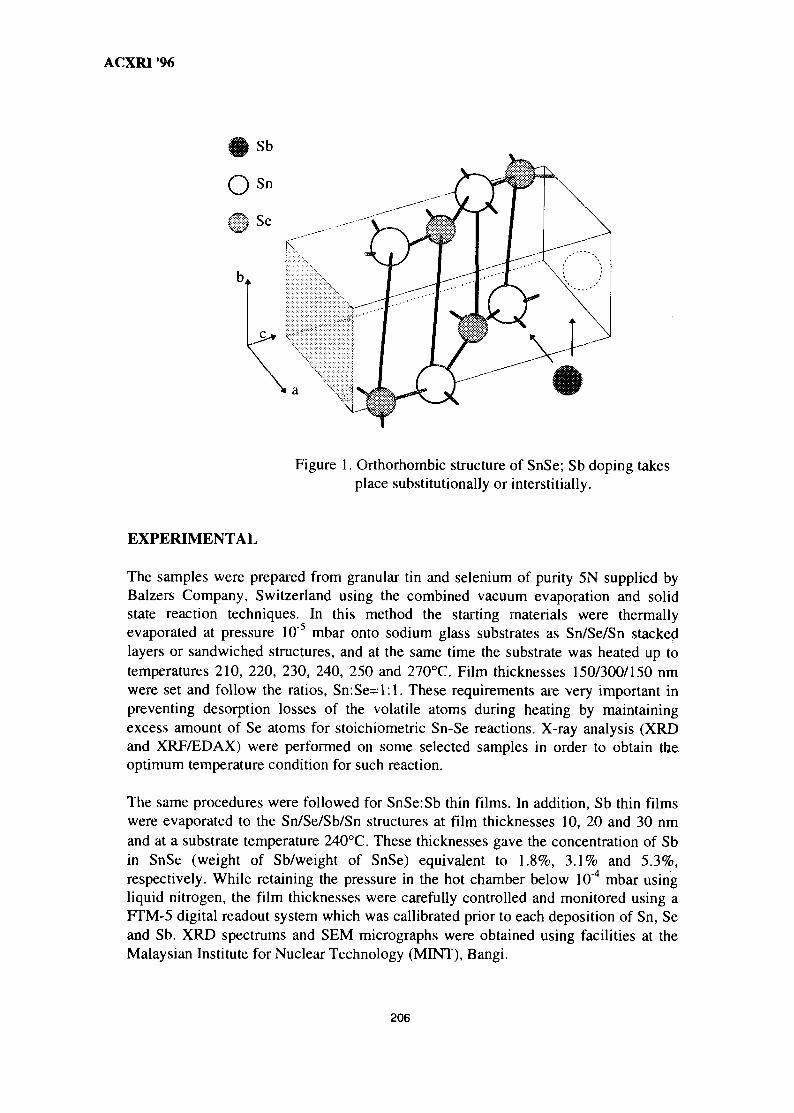
ACXRI '96
Figure 1. Orthorhombic structure of SnSe; Sb doping takesplace substitutionally or interstitially.
EXPERIMENTAL
The samples were prepared from granular tin and selenium of purity 5N supplied byBalzers Company, Switzerland using the combined vacuum evaporation and solidstate reaction techniques. In this method the starting materials were thermallyevaporated at pressure 105 mbar onto sodium glass substrates as Sn/Se/Sn stackedlayers or sandwiched structures, and at the same time the substrate was heated up totemperatures 210, 220, 230, 240, 250 and 270°C. Film thicknesses 150/300/150 nmwere set and follow the ratios, Sn:Se=l:l. These requirements are very important inpreventing desorption losses of the volatile atoms during heating by maintainingexcess amount of Se atoms for stoichiometric Sn-Se reactions. X-ray analysis (XRDand XRf/EDAX) were performed on some selected samples in order to obtain theoptimum temperature condition for such reaction.
The same procedures were followed for SnSe:Sb thin films. In addition, Sb thin filmswere evaporated to the Sn/Se/Sb/Sn structures at film thicknesses 10, 20 and 30 nmand at a substrate temperature 240°C. These thicknesses gave the concentration of Sbin SnSe (weight of Sb/weight of SnSe) equivalent to 1.8%, 3.1% and 5.3%,respectively. While retaining the pressure in the hot chamber below 10"4 mbar usingliquid nitrogen, the film thicknesses were carefully controlled and monitored using aFTM-5 digital readout system which was callibrated prior to each deposition of Sn, Seand Sb. XRD spectrums and SEM micrographs were obtained using facilities at theMalaysian Institute for Nuclear Technology (MINT), Bangi.
206
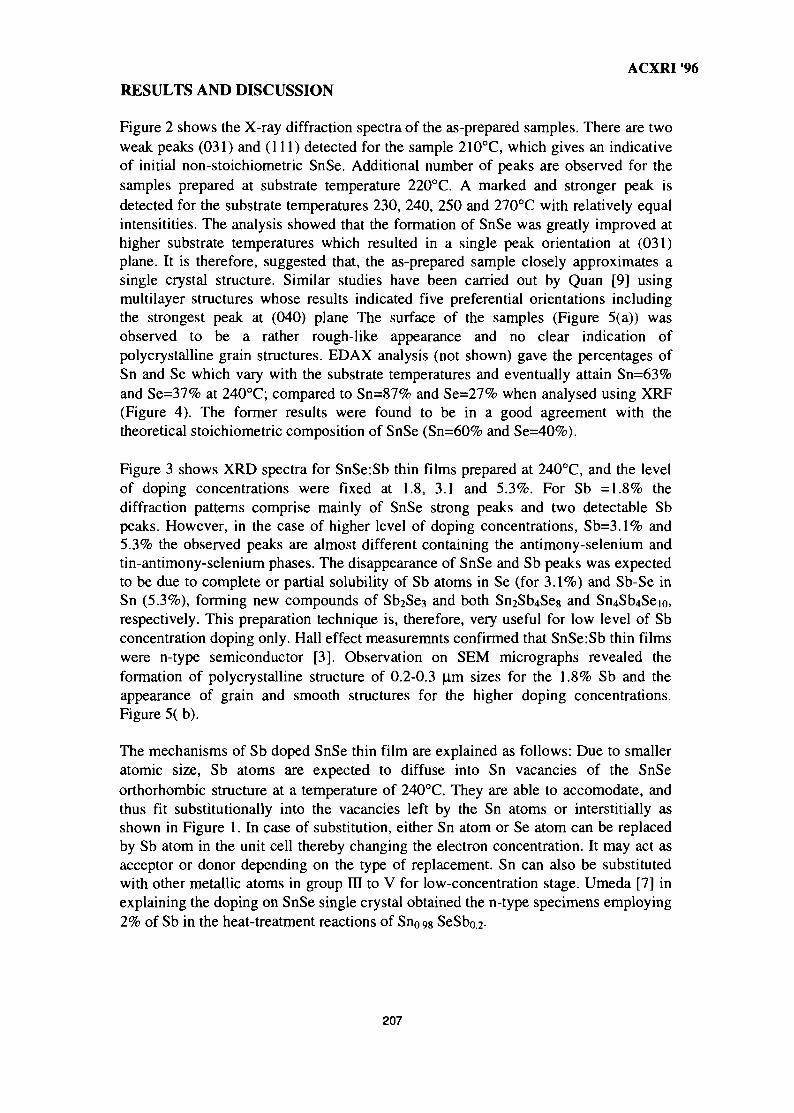
ACXRI '96RESULTS AND DISCUSSION
Figure 2 shows the X-ray diffraction spectra of the as-prepared samples. There are twoweak peaks (031) and (111) detected for the sample 210°C, which gives an indicativeof initial non-stoichiometric SnSe. Additional number of peaks are observed for thesamples prepared at substrate temperature 220°C. A marked and stronger peak isdetected for the substrate temperatures 230, 240, 250 and 270°C with relatively equalintensitities. The analysis showed that the formation of SnSe was greatly improved athigher substrate temperatures which resulted in a single peak orientation at (031)plane. It is therefore, suggested that, the as-prepared sample closely approximates asingle crystal structure. Similar studies have been carried out by Quan [9] usingmultilayer structures whose results indicated five preferential orientations includingthe strongest peak at (040) plane The surface of the samples (Figure 5(a)) wasobserved to be a rather rough-like appearance and no clear indication ofpolycrystalline grain structures. EDAX analysis (not shown) gave the percentages ofSn and Se which vary with the substrate temperatures and eventually attain Sn=63%and Se=37% at 240°C; compared to Sn=87% and Se=27% when analysed using XRF(Figure 4). The former results were found to be in a good agreement with thetheoretical stoichiometric composition of SnSe (Sn=60% and Se=40%).
Figure 3 shows XRD spectra for SnSe:Sb thin films prepared at 240°C, and the levelof doping concentrations were fixed at 1.8, 3.1 and 5.3%. For Sb =1.8% thediffraction patterns comprise mainly of SnSe strong peaks and two detectable Sbpeaks. However, in the case of higher level of doping concentrations, Sb=3.1% and5.3% the observed peaks are almost different containing the antimony-selenium andtin-antimony-selenium phases. The disappearance of SnSe and Sb peaks was expectedto be due to complete or partial solubility of Sb atoms in Se (for 3.1%) and Sb-Se inSn (5.3%), forming new compounds of Sb2Se3 and both Sn2Sb4Seg and Sn4Sb4Sejo,respectively. This preparation technique is, therefore, very useful for low level of Sbconcentration doping only. Hall effect measuremnts confirmed that SnSe:Sb thin filmswere n-type semiconductor [3]. Observation on SEM micrographs revealed theformation of polycrystalline structure of 0.2-0.3 |U.m sizes for the 1.8% Sb and theappearance of grain and smooth structures for the higher doping concentrations.Figure 5( b).
The mechanisms of Sb doped SnSe thin film are explained as follows: Due to smalleratomic size, Sb atoms are expected to diffuse into Sn vacancies of the SnSeorthorhombic structure at a temperature of 240°C. They are able to accomodate, andthus fit substitutionally into the vacancies left by the Sn atoms or interstitially asshown in Figure 1. In case of substitution, either Sn atom or Se atom can be replacedby Sb atom in the unit cell thereby changing the electron concentration. It may act asacceptor or donor depending on the type of replacement. Sn can also be substitutedwith other metallic atoms in group III to V for low-concentration stage. Umeda [7] inexplaining the doping on SnSe single crystal obtained the n-type specimens employing2% of Sb in the heat-treatment reactions of Sno.98 SeSbo.2-
207

ACXRI '96CONCLUSIONS
It is concluded that, from the analysis, SnSe thin films were formed at substratetemperatures between 230-270°C. The films were found to be stoichiometric incompositions, and exhibiting tendency toward layered structure indicated by thepresence of a single peak orientation at (031) plane. The low-concentration doping ofSnSe took place effectively at 1.8% Sb, above which different phase transformationbecame the dominant mechanisms, and resulted in the formation of new unwantedcompounds. With the polycrystalline nature of the surface it is expected that, the Sb-doped n-type SnSe is very useful for both homojunction and heterojunction devicetechnology in future.
ACKNOWLEDGEMENTS
The authors are indebted to the Ministry of Science, Technology and EnvironmentTechnology for providing financial support during the IRPA 1994-95 ResearchProgramme (Vot No. 2-07-07-046). Least but not the less to all the colleagues andmembers of Thin Film Research Group, Physics Department, Universiti TeknologiMalaysia and every one involved, in various technical works, discussion and writingfor the success of the programme.
REFERENCES
1. Sabar D. Hutagalung, Samsudi Sakrani and Yussof Wahab, The Measurement ofOptical Bandgap of SnSe Thin Films, Paper presented at Simposium FisikaNasional XV-94, Surabaya Indonesia, 11-13 Dec. 1994.
2. Sabar D. Hutagalung, Samsudi Sakrani, Yussof Wahab, The Resistivity of TinSelenide Thin Films, Paper Presented at The Malaysian and TechnologyCongress, Perdanasiswa, Universiti Malaya, Kuala Lumpur, 22-25 August 1995.
3. Sakena A. Jabar, Electrical Conduction in SnSe and SnSe:Sb Thin Films, B.Sc.Thesis, Universiti Teknologi Malaysia (1996).
4. K.J. John, B. Pradeep and E. Mathai, Tin Selenide (SnSe) Thin Film Preparationby Ractive Evaporation, J. Mat. Sci., 29 (1994), 1581.
5. J.P. Singh and R.K. Bedi, Thin Selenide Films Grown by Hot Wall Epitaxy, 7.Appl. Phys., 68(6) (1990), 2776.
6. P. Pramanik and S. Bhattacharya, A Chemical Method for Deposition of Tin (II)Selenide Thin Films, J. Mat. Sci. Lett., 7 (1988), 305.
7. J. Umeda, Electrical Properties of Sb-Doped n-SnSe, J. Phys. Soc. Japan, 16(1961), 124.
8. A. Erdemir, Crystal Chemistry and Solid Lubricating Properties of TheMonochalcogenides Gallium Selenide and Tin Selenide, TribologyTransactions, 37 (1994), 3, 471.
208
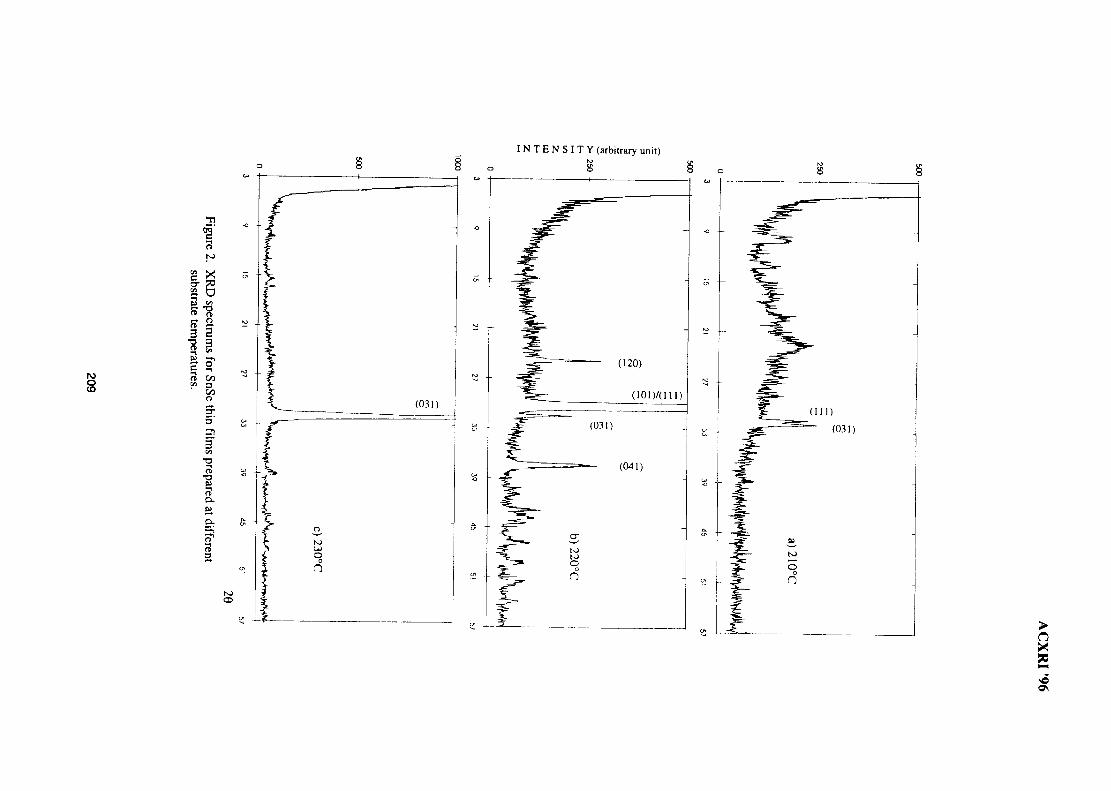
I N T E N S I T Y (arbitrary unit)
8
8
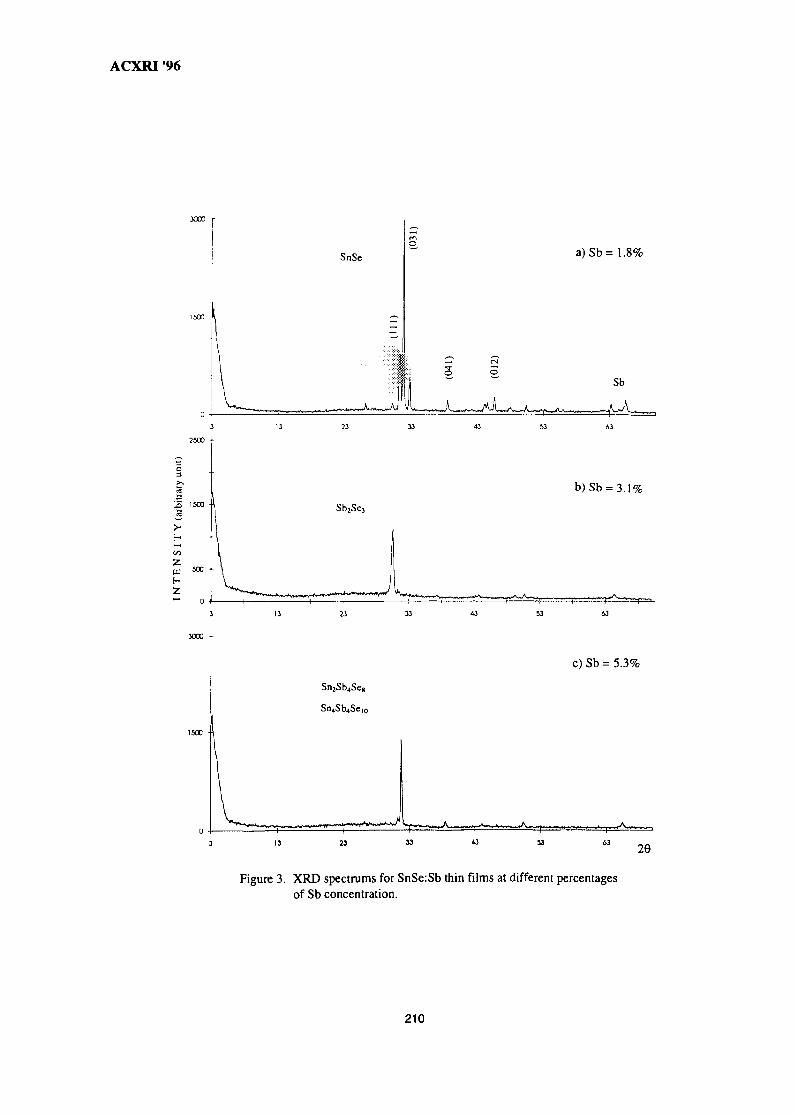
ACXRI '96
MOO
SnSe a)Sb= 1.1
Sb
Sn2Sb4Se8
c) Sb = 5.3%
29
Figure 3. XRD spectrums for SnSe:Sb thin films at different percentagesof Sb concentration.
210
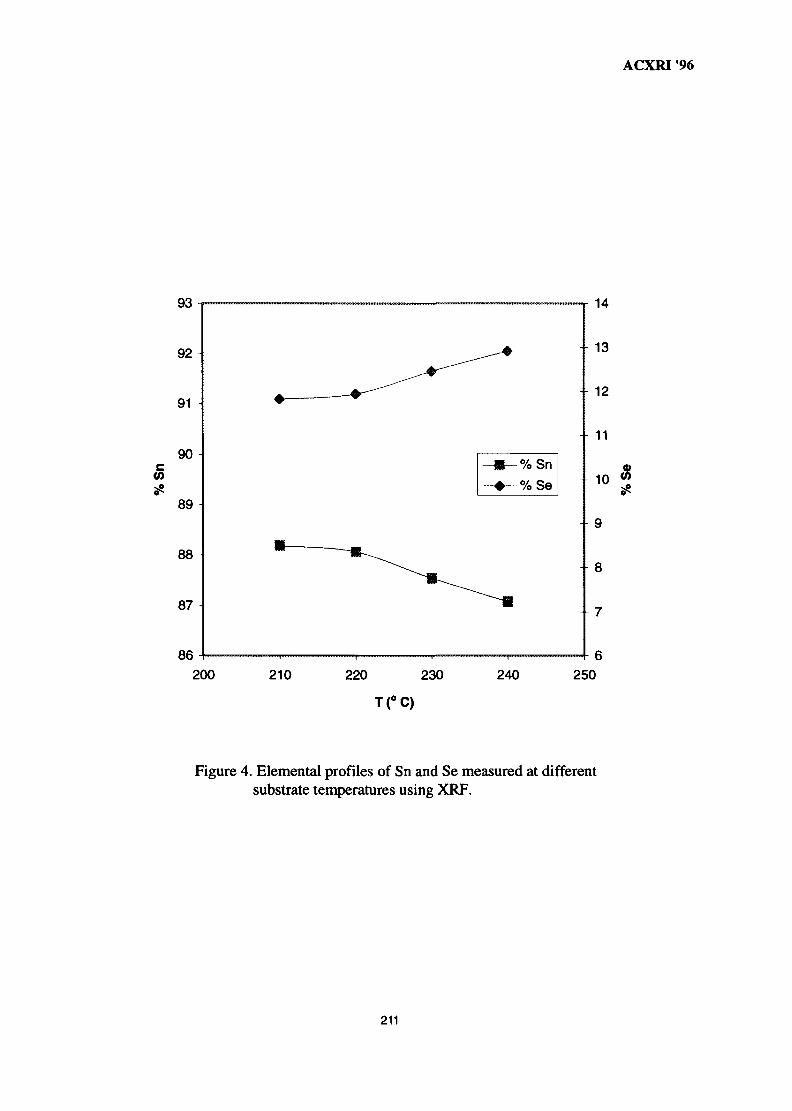
ACXRI '96
93
CO
89
88
87
86
200 250
Figure 4. Elemental profiles of Sn and Se measured at differentsubstrate temperatures using XRF.
211
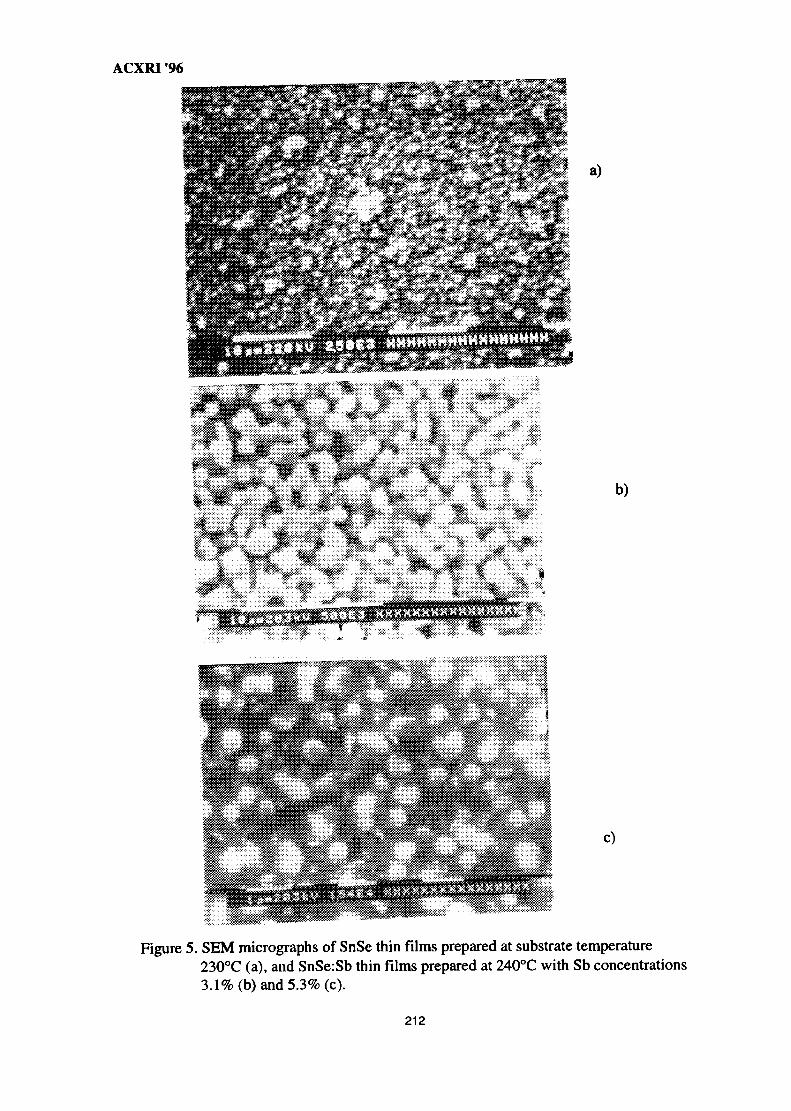
ACXRI "96
b)
c)
Figure 5. SEM micrographs of SnSe thin films prepared at substrate temperature230°C (a), and SnSe:Sb thin films prepared at 240°C with Sb concentrations3.1% (b) and 5.3% (c).
212
MY9700805A STUDY OF THE CRYSTALLISATION OF AMORPHOUS SILICON
PREPARED BY VACUUM EVAPORATION TECHNIQUE
S. Salleh and K. IbrahimSchool of Physics, Universiti Sains Malaysia
11800PulauPinang
Z. JamalSchool of Materials & Mineral Resources Engineering
Universiti Sains Malaysia, Perak Branch Campus31750 Tronoh, Seri Iskandar, Perak
Abstract : In this study, thin Si film is prepared by evaporating Si on to a thin SiO2
layer using a vacuum evaporator. The preparation of the thin thermal SiO2 layer on to aSi substrate was done earlier by using the standard dry thermal oxidation technique. It isfound out that the microstructure of the deposited Si depends on the depositionparameters especially on the deposition substrate temperature. At lower substratetemperature no Si crystal structure is formed and the film is in a amorphous state. Thecrystallisation of the amorphous Si is observed only when the sample is annealed attemperatures above 500°C. This formation of polycrystalline Si which is a solid phasecrystallisation process is confirmed by the four point probe and x-ray diffraction results.
Introduction
Thin film polycrystalline Si or better known as polysilicon is widely used in themicroelectronic industry especially as the gate material for metal oxide semiconductor(MOS) transistor, conducting material between connections, capacitor electrode andresistor. It is also used as the semiconductor material in solar cells and as the active layerin thin film transistors of various display devices. The electrical property of polysilicondepends on its microstructure (e.g. thickness, grain size and orientation) and composition.The microstructure in turn is influenced directly by the deposition technique used tofabricate the polysilicon (i.e. the deposition parameters) and other processing steps doneafter deposition.
Deposition of polysilicon is typically done through chemical vapour depositiontechnique using silane, disilane or dichlorosilane as Si gaseous sources. Other commonlyused techniques2 are vacuum evaporation, molecular beam epitaxy, pirolysis andsputtering. This paper explain the fabrication and characterisation of polysilicon usingvacuum evaporation technique equipped with an electron gun.
Experimental
Polysilicon of approximately 0.3 urn is deposited using vacuum evaporationtechnique (at working pressure of l-3xlO"5 torr) on to a Si wafer (p-type, <111>, p=1.00+0.25Qcm) of which surface is covered with a layer of SiO2 of approximately 0.1 m inthickness. The SiO2 is earlier grown thermally using standard dry oxidation technique.Figure 1 shows schematically the cross-section of the whole structure.
213
ACXRI '96
The vacuum evaporator is equipped with an electron gun (Model 980-7104) ofinput power DC 4kV and maximum radiation current 500mA. The electron gun is usedto melt the high purity Si chunks (99.9995%) that are used as the Si source. Thethickness of the Si film is monitored by a thickness monitor (Model QM-300) whichutilises a quartz-crystal sensor. Deposition of the film is carried out at substratetemperatures of 300°C and 400°C which are accurately determined by a thermocouple.The deposition rate is maintained at 1.6-2.0A/s.
The recrystallisation is then carried out by solid phase crystallisation process byannealing the sample in a furnace. Annealing is carried out in a nitrogen environmentwith flow of 4 litre per minute. The annealing temperatures is varied from 500°C to1000°C with the annealing time set at 8 hours. The samples are then characterised usingthe four point probe technique to obtain the sheet resistivity values. X-ray diffractionanalysis is then performed on the samples to determine the onset of polysiliconformation.
Results
Table 1 summarises the four point probe results. This is best viewed in the graphof sheet resistivity values versus annealing temperatures plotted in figure 2. Note that theresistivity values are quite similar at both substrate temperatures (300°C and 400°C).
X-ray diffraction results on all annealed samples show a similar profile with onlyone clear peak associated with Si. This peak is from the <111> diffraction plane of the Sisingle crystal substrate. However, further investigation on the data obtained from thecomputer of all possible peaks not seen on the profiles indicate the presence of weakpeaks on samples which have been annealed at 800°C and above. The new peakscorrespond very well with Si planes of <220>, <311> and <620>.
Discussions
The x-ray diffraction results clearly show that crystallisation or grain growth ofthe thin Si film had occurred after undergoing heat treatment. Kamins et al3 havereported that thin film of amoorphous Si is not stable with significant number ofcrystalline structure being formed after heat treatments. At 800°C it is reported that the<311> plane is the dominant crystallisation orientation formed. This corresponds verywell with the results obtained in this study of which other than <311> plane, <220> and<620> planes are also detected.
The formation of grains will make the samples conductive and hence will makethe resistivity values drop. This can be clearly seen in the four point probe results shownin figure 2. It is interesting to note that the temperature range where the resistivity is low,matches quite well with the x-ray diffraction results. The drop in the sheet resistivityvalues at annealing temperatures 600°C and 700°C is explained by the formation ofmicrocrystallites which can't be detected by the x-ray diffraction technique. This issupported by the work of Hatalis and Greve who report that even film deposited below
214
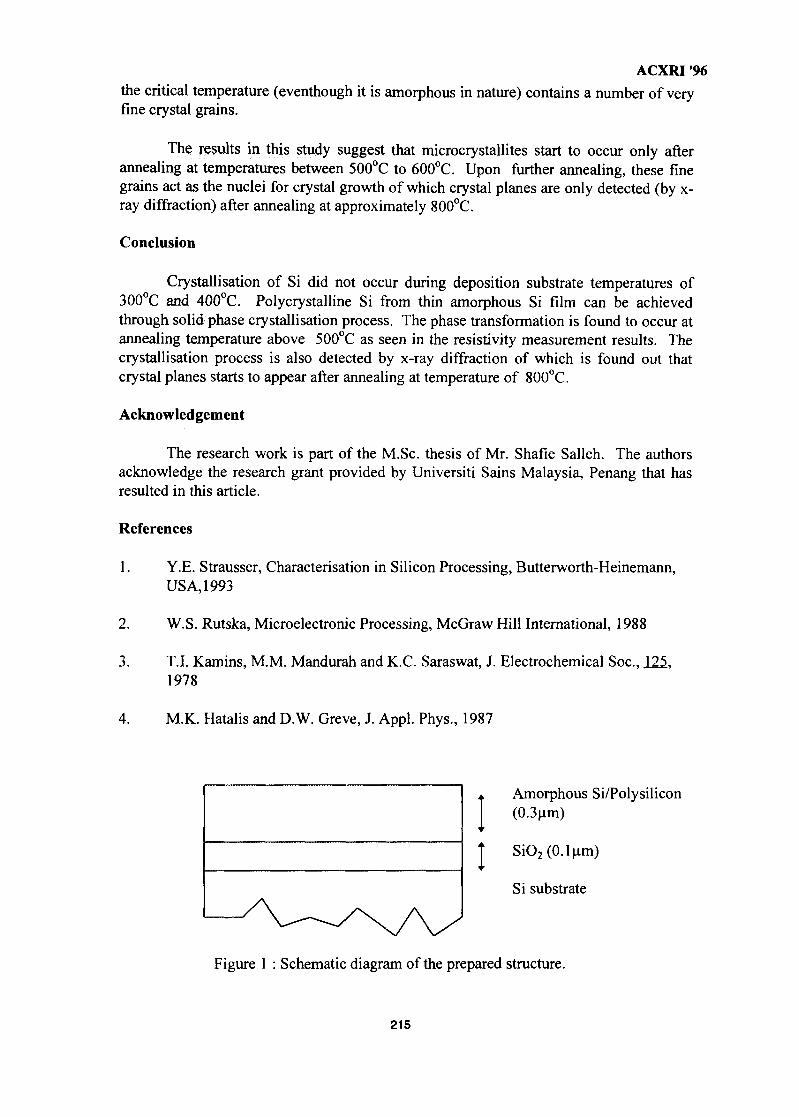
ACXRI '96
the critical temperature (eventhough it is amorphous in nature) contains a number of veryfine crystal grains.
The results in this study suggest that microcrystallites start to occur only afterannealing at temperatures between 500°C to 600°C. Upon further annealing, these finegrains act as the nuclei for crystal growth of which crystal planes are only detected (by x-ray diffraction) after annealing at approximately 800°C.
Conclusion
Crystallisation of Si did not occur during deposition substrate temperatures of300°C and 400°C. Polycrystalline Si from thin amorphous Si film can be achievedthrough solid phase crystallisation process. The phase transformation is found to occur atannealing temperature above 500°C as seen in the resistivity measurement results. Thecrystallisation process is also detected by x-ray diffraction of which is found out thatcrystal planes starts to appear after annealing at temperature of 800°C.
Acknowledgement
The research work is part of the M.Sc. thesis of Mr. Shafie Salleh. The authorsacknowledge the research grant provided by Universiti Sains Malaysia, Penang that hasresulted in this article.
References
1. Y.E. Strausser, Characterisation in Silicon Processing, Butterworth-Heinemann,USA, 1993
2. W.S. Rutska, Microelectronic Processing, McGraw Hill International, 1988
3. T.I. Kamins, M.M. Mandurah and K.C. Saraswat, J. Electrochemical Soc, 125.1978
4. M.K. Hatalis and D.W. Greve, J. Appl. Phys., 1987
Amorphous Si/Polysilicon(0.3um)
SiO2(0.1um)
Si substrate
Figure 1 : Schematic diagram of the prepared structure.
215
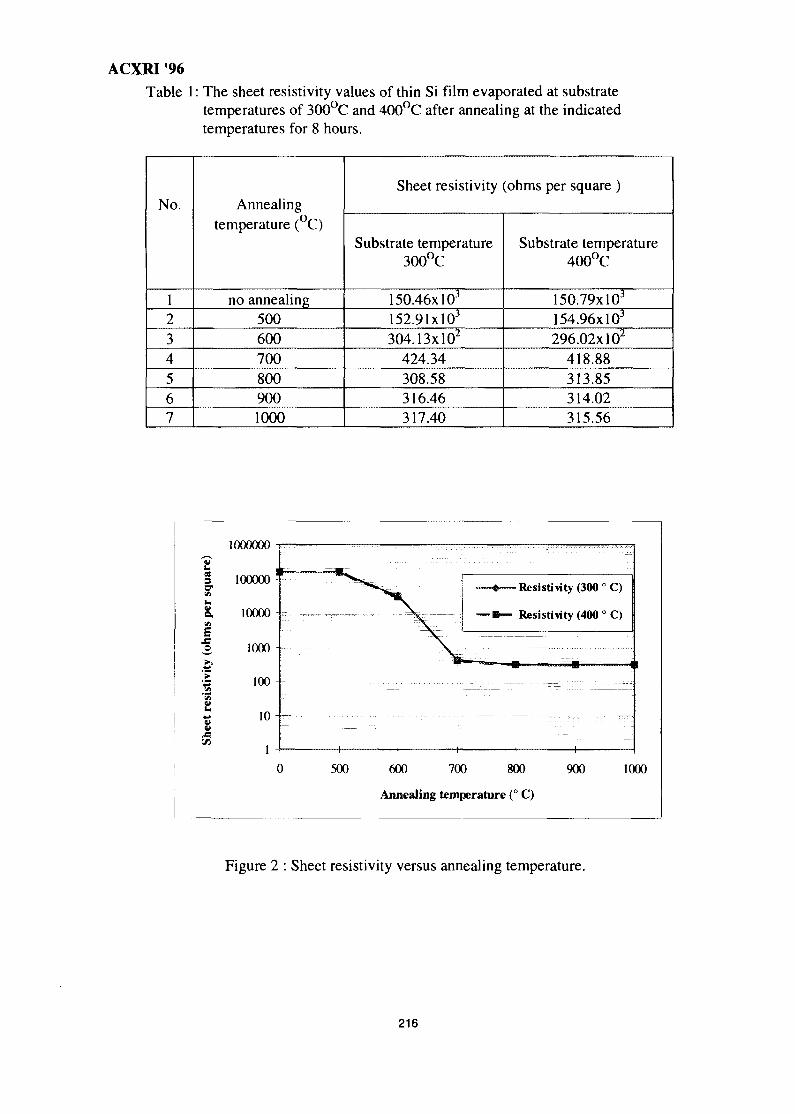
ACXRI 96
Table 1: The sheet resistivity values of thin Si film evaporated at substratetemperatures of 300°C and 400°C after annealing at the indicatedtemperatures for 8 hours.
No.
1234567
Annealingtemperature (°C)
no annealing5006007008009001000
Sheet resistivity (ohms per square )
Substrate temperature300°C
15O.46xlO3
152.91xl03
304.13xl02
424.34308.58316.46317.40
Substrate temperature400°C
150.79xl03
154.96xl03
296.02x10²
418.88313.85314.02315.56
1000000
Ifs 100000srI . 10000in
S 1000
•a 100
| 10
M 1
-Resistivity (300 °C)
Resistivity (400 ° C)
500 600 700 800
Annealing temperature (° C)
900 1000
Figure 2 : Sheet resistivity versus annealing temperature.
216
IIMY9700806
STUDIES ON SiC(p) REINFORCED AI-AI3N1EUTECTIC MATRIXCOMPOSITES
A.K. Masrom, L.C. Foo and A.B. Ismail.School of Material and Mineral Resources Engineering
Universiti Sains Malaysia,31750 Tronoh, Perak, Malaysia.
AbstractAn investigation on processing of Al-5.69wt% Ni eutectic reinforced with SiCparticulate composites is reported. The intermetallic composites are prepared byelemental powder metallurgy route and sintered at two different temperatures, i.e., 600°Cand 620°C. Results show that the metal matrix was Al-A^Ni eutectic. The phase analysisby XRD identified the presence of A13Ni and Al as dominant phases together with siliconand AI4C3 phase as minor phases. The AI4C3 and Si phases are formed during sinteringdue to SiC-Al interface reaction. SEM micrographs also reveal the formation ofmicrovoid surrounding the SiC particle.
Introduction
Metal matrix composites(MMC's) reinforced with particulate ceramics comprise a classof new generation of materials with significant increase in temperature capabilityrequired to meet the demands of future engineering applications such as for aerospace andautomotive. These composites require a balance of properties such as high specificstrength and moduli at room and elevated temperature, creep resistance and superiorenvironmental stability, excellent wear resistance, high thermal conductivity, lowcoefficient of thermal expansion and good dimension stability. Materials with highspecific strength and stiffness are required for aerospace applications and in rotatingcomponents. This has generated considerable interest in the development of MMC'sbased on light alloy matrix such as aluminium and magnesium alloy reinforced withceramic particulates or fibers. Aluminium alloy reinforced with ceramic particulates, i.eSiC in particular, have attracted great attention and are being developed for variousapplications. To date, there is large research activity in developing aluminium matrixcomposites reinforced with SiC(1]. There are several ways of fabricating the particulatereinforced composites which include liquid metal infiltration technique and by powdermetallurgy route. Powder metallurgy route has been identified as best method ofprocessing particulate reinforced composites as it is possible to obtain a composite withlarge volume of reinforcement and at the same time producing homogeneous distributionof the particulate in the matrix. There is also very limited matrix-particle reaction ascompared to technique involving liquid metal.
Increasing demand for better performance materials for high temperatureapplications has been the main driving force for development of advanced compositematerials for critical components. In view of the operating temperature limitations forconventional aluminium alloy system, interest has now focused on intermetallic andstructural ceramics. As compared to numerous works reported in the literature involvingaluminium alloys or other metallic system as a matrix, very limited work has been
217
ACXRI '96
reported in the literature regarding development of intermetallic matrix composites. Theinvestigation on intermetallics reported in literature is mainly for Al-Ni and Al-Tiintermetallics.These intermetallics have excellent engineering properties and useful forhigh temperature service. Figure 1 shows the phase diagram for Al-Ni system that canform several intermetallics such as AlNi3, A^Nis, AINi, Al3Ni2 and AI3NL All of theseintermetallics have high melting point except A13Ni intermetallic that has relativelylowmelting temperature. A13Ni - Al system has eutectic composition at about 6 wt% Ni andeutectic temperature for this system is 640°C. A^Ni is the intermetallic that has beenstudied to some extent while the eutectic A^Ni-Al got less attention. However theseeutectic matrix show promising applications due to its ability to produce directionalsolidification in composites eutectic structure. Due to the presence of ductile Al phaseand hard and brittle intermetallic phase, these materials can form a composite matrix byitself.
Materials and Experimental Procedure
The composite under investigation is an A^Ni eutectic reinforced with SiC particles. Theintermetallic A13Ni in eutectics is formed by the reaction of Al Powder with 5.69wt% Nipowder. In preparing the intermetallic composite, we have followed the elemental powdermetallurgy route. The essential steps involved in the EPM method are shown in Figure 2.Both Al and Ni powder were obtained from Fluka . The SiC powder used forreinforcements is beta-SiC having mean size of 13micron. The mixtures of Al powderwith 5.69wt% Ni were prepared and mixed with SiC and then milled in a porcelain jarusing steel balls. In this work dry milling has been employed. In order to reduce excessiveheating, intermittent milling has been carried out with 2 hours milling and one hourcooling time. These processes are repeated until a total of 10 hours milling time has beenachieved. Milling process will produce a mechanically alloyed powder . Since Al is moreductile than Ni and SiC powder, Al grains get heavily deformed with Ni and SiC particlesattached on the Al grains. After ball milling, the powder mixture is compacted uniaxiallyby pressing at 250MPa. The compacted powder was then sintered in a tube furnace undera flow of argon gas. The sintering is done at 600°C for 16 hours and 620°C for 4 and 10hours.
The sintered specimens are subjected to XRD analysis to evaluate the success ofsintering process and formation of intermetallic phase. The microstructure of thecomposite was characterized using optical microscopy and SEM equipped with EDXfacility.
Results and Discussion
Formation of eutectic AI3N1-AI
Representative micrographs of the intermetallic composites with SiC particles areillustrated in Figure 3.The microstructure observation on all samples studied shows thatthe intermetallic phase A^Ni formed in all samples sintered between 600° - 800°C.Figure 3 clearly shows the presence of A^Ni phase in the microstructure of sinteredsample. It can be seen that the intermetallic A^Ni phase formed during sintering is
218
ACXRI '96
distributed within the Al matrix and there is no SiC particle in the intermetallic grains.Increasing sintering temperature or increasing sintering time will increase the amount ofintermetallic phase. An attempt has been made by sintering the powder mixture at 800 °C,i.e. . involving liquid phase. The resulting microstructure is shown in Figure 4. It can beseen that A^Ni phase formed is coarser. Moreover, the microstructure of this sinteredspecimen reveals more pores than specimen sintered at lower temperature. This may bedue to the migration of liquid phase from internal to the surface. This is reflected by theformation of bead at the surface of the sample. The microstructure of the bead is shown inFigure 5. The XRD analysis of the sintered sample confirm the formation of intermetallicphase.
The SiC particles appear to be distributed evenly in the matrix phase. Increasingsintering temperature seems to help in reducing porosity. It is also seen that thecomposites containing higher weight percentage of SiC particles exhibit a greater degreeof clustering of SiC compared to the composite containing less weight percentage of SiC.
The detailed studies of the microstructure of intermetallic A^Ni eutectic usingSEM has been carried out. The representative SEM micrograph of the composite studiedis shown in Figure 6. The AiaNi phase formed during sintering can be seen clearly andappears as a brighter phase. The micrograph also revealed the presence of two types ofpores, i.e. isolated pores in the Al matrix and pores along the SiC particles.
XRD analysis.
The XRD analysis carried out on the samples reveals not only the presence ofintermetallic phase A^Ni, but also the presence of silicon and AI4C3 in the compositesintered between 600°- 660°C. The representative XRD patterns for the sintered samplesare shown in Figure 7. The presence of silicon in the composite sintered at 600°C is verysmall as shown by a very weak peak, however the intensity of Si peak increased withincreasing sintering temperature and sintering time. The same pattern is shown by theAI4C3 peak. The result suggests that Si and AI4C3 are formed from the reaction betweenAl-SiC. XRD analysis on samples before sintering does not show any evidence of Si andAI4C3. These confirm that both phases are only present in sintered sample and are due tothe reaction between Al and SiC at the SiC interface. It has been suggested by earlierstudies, that if the reaction between SiC and aluminium occurs, it will produce AI4C3 andSi with the following reaction;
4A1(1) + 3SiC(s) =====4 Al4C3(s) + 3Si(l)
The amount of Si and AI4C3 formed are dependent on sintering temperature and sinteringtime as revealed by these studies. Close examination on the sintered samples by SEMshows the formation of voids along the SiC particle in contact with aluminium and isanother evident of this reaction.
Earlier works by Han et.al.t21 , reported the interfacial breakdown and voidformation occured at SiC interfaces. They also reported that the initial interfacialdecoherence was most frequently observed at sites where SiC particle clusters existed andsilicon particle were often found adjacent to SiC particles. EDX analysis on the sectionshown in Figure 8 confirm the presence of silicon adjacent to SiC particles.
219

ACXRI '96Thermodynamic phase stability calculations by Argent et. al.[3] predict the
presence of AI4C3 only in equilbrium with liquid aluminium. However in the presentinvestigation, AI4C3 is detected at sintering temperature of 600°C and 620°C much lowerthen the melting point of aluminium or the eutectic temperature. The result can beexplained on the basis of release of heat on the exothermic reaction of formation of theintermetallic AI3NL The heat produced locally by the exothermic reaction is sufficient tomelt aluminium in the vicinity of the intermetallic, therby producing weak Al/SiCreaction forming very small amount of AI4C3. However if the temperature of sintering israised to 800°C (liquid phase sintering), the amount of AI4C3 formed by the interfacereaction will be more as is reflected in the present investigation.
Conclusion.
The investigation has established that there is an interface SiC/Al reaction resulting in theformation of Si and AI4C3 even at sintering temperatures lower than the melting point ofaluminium or the eutectic temperature. The observation has been explained on the basisof exothermic reaction during formation of A^Ni intermetallic.
References.1. Andreas Mortensen and Michael J. Koczak, Journal of Materials, 1993, No.3, plO-17.2. N. Han, G. Pollard and R. Stevens, Materials Science and Technology, 1992, Vol 8,
pi 84-186.3. B.B. Argent, Private Communication.
220
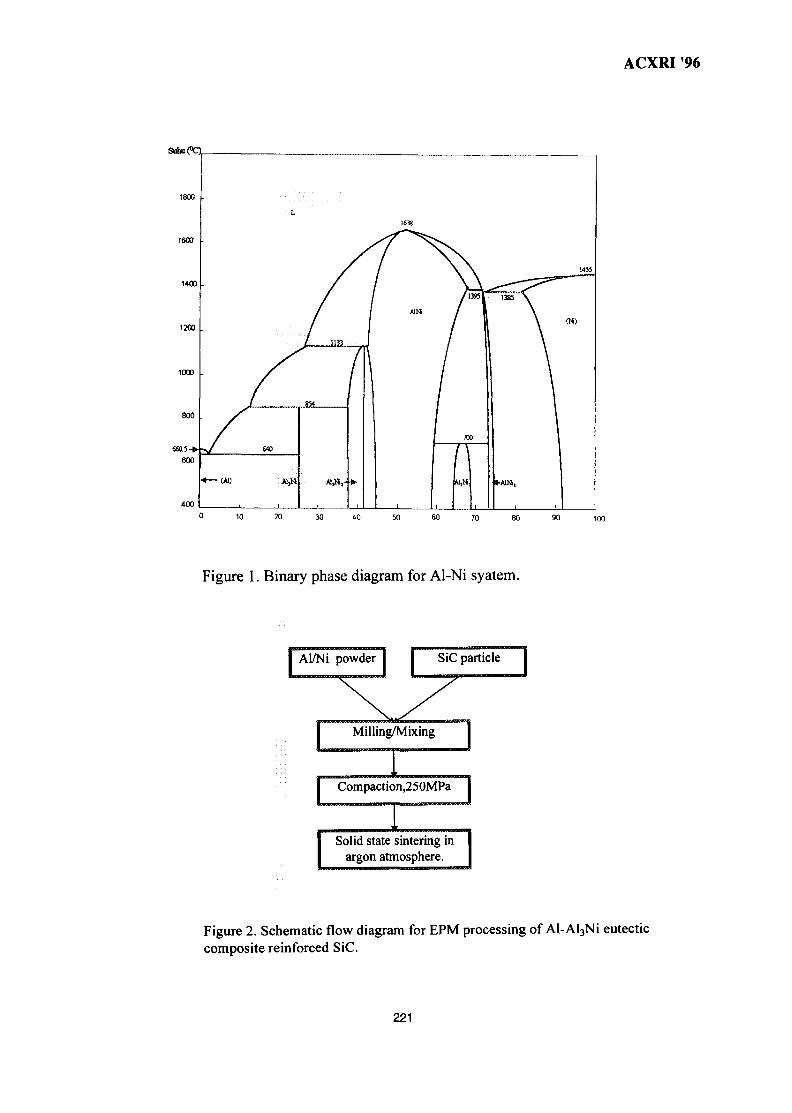
ACXRI 96
SuhufQ
1800
1600
1400
1200
1000
800
600
400
L
: r/~J 640
i >
/ / \ \
/ / », /'I " \/ 1133
L _
/ \
/
i
700
F 1
1 , .
1455
(N)
0 10 20 30 40 50 60 70 90 100
Figure 1. Binary phase diagram for Al-Ni syatem.
Milling/Mixing
Compaction,250MPa
Solid state sintering inargon atmosphere.
Figure 2. Schematic flow diagram for EPM processing of Al-Al3Ni eutecticcomposite reinforced SiC.
221
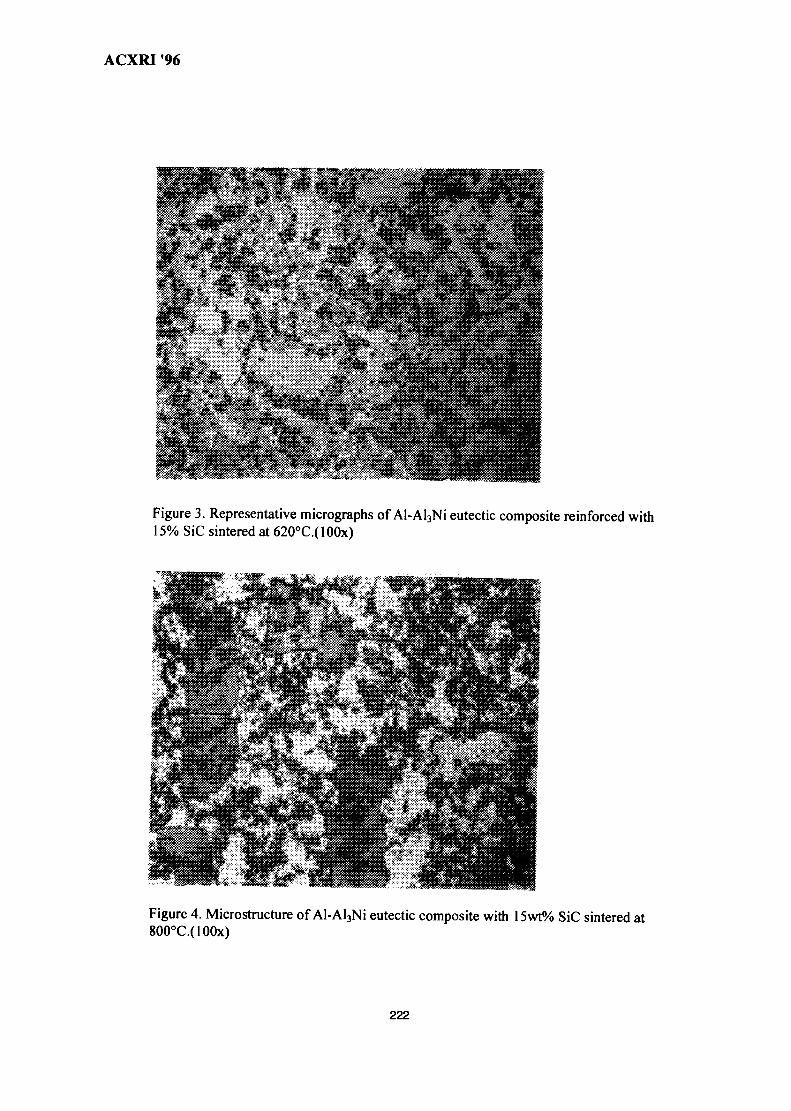
ACXRI 96
Figure 3. Representative micrographs of Al-Al3Ni eutectic composite reinforced with15% SiC sintered at 620°C.(100x)
Figure 4. Microstructure of Al-Al3Ni eutectic composite with 15wt% SiC sintered at800°C.(100x)
222
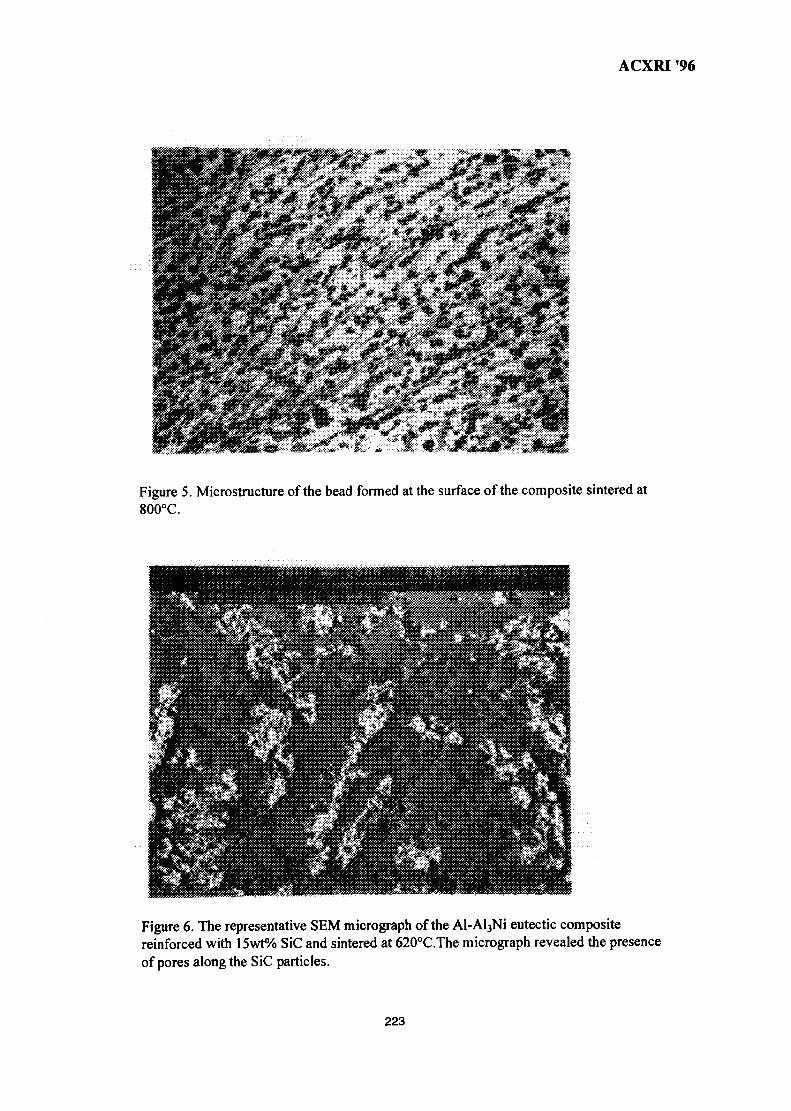
ACXRI '96
Figure 5. Microstructure of the bead formed at the surface of the composite sintered at800°C.
Figure 6. The representative SEM micrograph of the Al-Al3Ni eutectic compositereinforced with 15wt% SiC and sintered at 620°C.The micrograph revealed the presenceof pores along the SiC particles.
223
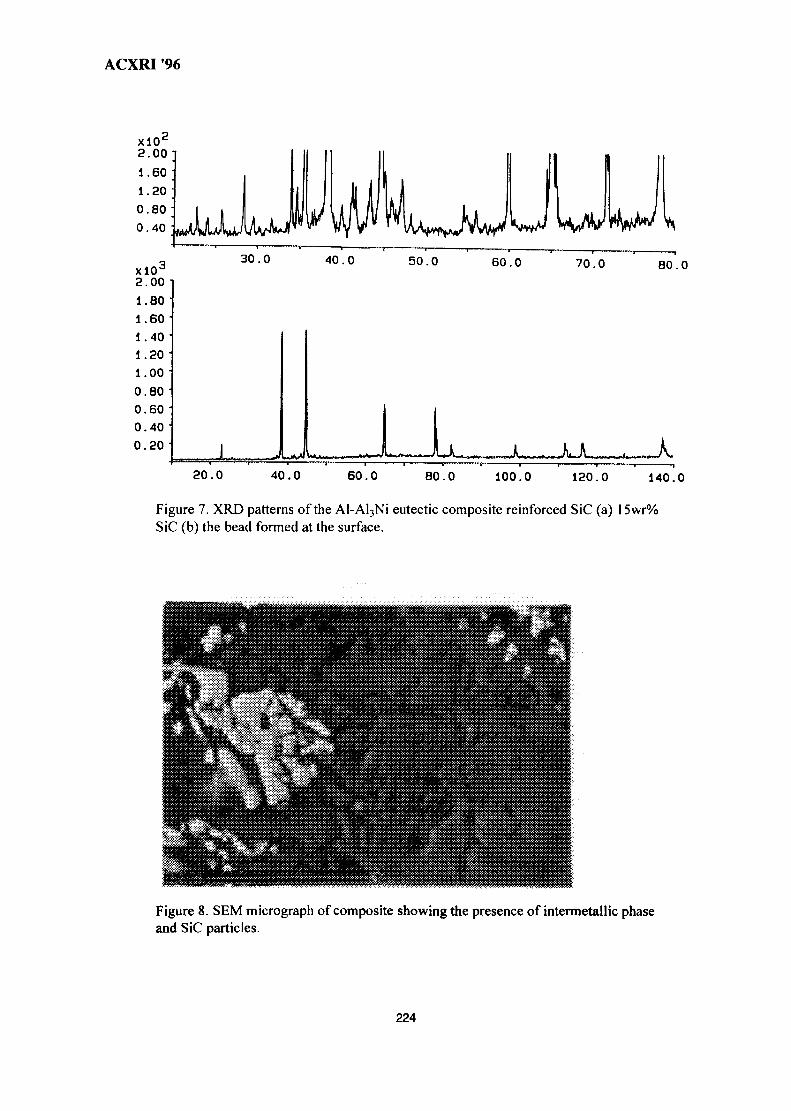
ACXRI '96
xlO*2.001.601.200.800.40
XlO°2.001.80
30.0 40.0 50.0 60.0 70.0 80.0
60402000
0.800.600.400.20 L XX
20.0 40.0 60.0 BO.O 100.0 120.0 140.0
Figure 7. XRD patterns of the AI-Al3Ni eutectic composite reinforced SiC (a) 15wr%SiC (b) the bead formed at the surface.
Figure 8. SEM micrograph of composite showing the presence of intermetallic phaseand SiC particles.
224
ACSEM EVALUATION STUDY OF Ni Cr Al COATING COMPOSITION
FROM SPUTTERING YIELD
Luay B.Hussain*. John Nicholls" & Peter Hancock**School of Materials and Mineral Resources, Universiti Sains Malaysia
Perak Branch Campus, 31750 Tronoh, Malaysia"School of Industrial and Manufacturing Science
Cranfield University, Cranfield, Bedfordshire MK43 OAL, U.K.
ABSTRACT: The feasibility assessment of Co-sputtering from a Ni Cr Al segmentedtarget in a modified planar magnetron system to develop new coating compositions can beobtained. Ni Cr Al coating compositions have been deposited onto high purity aluminaand nickel substrates mounted on marked substrate holder. Fully and semi quantitativeanalysis of Ni Cr Al coatings were carried out, thus the distribution in composition of Ni,Cr and Al weight percent as a function of angular position and sector position at variousdistances from the center of the magnetron target were plotted. For identical coatingprocedures, Reproducibility of weight percentage of NiCrAl coatings can be estimatedfrom superimposed weight % distribution plots. Electron microscopy and X-ray diffractionanalysis of as deposited coatings confirm the existence of amorphous phases. After heattreatment at 1050°C for 5 min under vacuum which encouraged the equilibrium phaseformation. X-ray diffraction produced well resolved spectra indicating, that structuralchanges in the as deposited coating had occurred during the heat treatment.
INTRODUCTIONThe development of corrosion resistant coatings has been based predominantly on theprinciple of the selective oxidation of element to form a stable, slowly thickening scale. Forhigh temperature service A12O3 and Cr2O3 scale appear to provide good protection (1). Twomajor coating systems developed to date have been based upon aluminizing of thesubstrate component from a pace source(2) or the deposition of more complexcompositions to form an overlay coating(3). Current overlay coating are typified byMCrAlY series, where M is Ni ,Co, Fe, or a combination of these(4). Y is an activeelement which greatly increases the adherence of the oxide scale under thermal cyclingcondition (5).
Overlay coatings posses desirable advantages over the more common aluminized coating.They offer inherent compositional flexibility which permits tailoring of the coating foroptimal performance. The coating provide a metal surface composition which will reactwith the environment to produce the desired protective oxide.
The aims of this work are to assess the feasibility of Co-sputtering from a nickelsegmented target to study a new nickel coating composition using scanning electronmicroscope with AEP energy dispersive analysis for semi quantitative analysis and SEMwith a fully quantitative link energy dispersive analysis system. Thus , suggestion can bemade for optimum NiCrAl coatings composition which can be used with rare earth metalsunder corrosion/oxidation environment.
EXPERIMENTAL DETAILSIn this investigation, NiCrAl compositions have been deposited onto 10x1 Ox 0.28 mmalumina substrates. 20xl0x 2.5 mm3 Nickel substrates were also used to study structural
225
ACXRI '96changes of NiCrAl coating during heat treatment under vacuum. NiCrAl coatings weredeposited using a planar magnetron coating system from segmented target, which is 120°angled Nickel (99.5%), Aluminum (99.9%) sectors and 2mm thick Chromium (99.9%)target.
This composite target was then attached to the top of the planner magnetron sputteringsource , Fig.l , with the position of each sector fixed to ensure each deposition wascarried out under identical conditions. All substrates were ultrasonically cleaned ininhibisol and two cycles of vapor degreasing in isopropyl alcohol solution. Dried andcleaned substrate samples were bonded onto a circular aluminum substrate holder 15.8 cmin diameter by means of silver paint. For convenience and reproducibility, this substrateholder was marked in circles spaced 1 cm apart and in 5° segments, Fig.2.
Sputter/Ion cleaning was also carried out to ensure that the surface to be coated was as nearatomically clean as possible. A radio frequency planner magnetron sputtering system wasused to produce all coatings.
RESULTSEvaluation NiCrAl coating composition from sputtering yields:Early coating trials were analyzed using a Cambridge S600 scanning electron microscopewith AEP energy dispersive analysis attachment. As this system is semi quantitative,coating compositions (weight %) were evaluated from measured integrated areas usingcalibration curves reproduced in Appendix A. Later coating trials were analyzed and someof the earlier trials re-analyzed, using a Cambridge S250 scanning electron microscope,with a fully quantitative link energy dispersive analysis system.
The results of these analyses were plotted on polar - coordinate graphs. The distribution ofNi,Cr and Al composition, estimated in weight percent, are plotted relative to the positionof the Ni, Cr and Al segments of the target and as a function of the distance from the centerof the magnetron target. The earlier estimation gave weight percentage 10% higher thenthose analyzed using fully quantitative analysis systems with ZAF correction procedures,especially for samples opposite the Al and Cr sectors.
Figs. 3 show the distributions in composition (weight %) of Ni , Cr and Al after ZAFcorrection as a function of angular position and sector position at various distance from thecenter of the magnetron target. Fig. 4 shows plots of Ni ,Cr and Al weight percentagesdistributions at different distance from the center respectively. If these three figures aresuperimposed then the weight percentage of Ni , Cr and Al for any position on the markedsubstrate holder, Fig.2, can be estimated, provided the coating procedures are identical.
Microstructures of as deposited coating:Surface topography, together with polished and fractured cross sections of as depositedcoating were examined by scanning electron microscopy. The surface roughness on A12O3
substrates often exists on several scales. The zone I structure (6,7) observed consisted ofsuperimposed arrays of shadowed growth boundaries, Fig 5. These open boundariesstructure were associated with surface irregularities in the A12O3 substrate. Sub-grainboundaries are also seen within the large columnar grain structures, Fig. 5. Layered coatingstructures built up over the period of deposition were observed for some of the coatingruns, Fig.6. This was found to be due to impurities in the argon supply, primarily oxygen
226
ACXRI '96and water vapor. After the sputtering system was cleaned, the gas supply lines renewed andthe Argon supply connected through a Ti-getter, these multi-layered defective coatingstructure were less pronounced, under similar deposition conditions, Fig.7.
DISCUSSIONOne of the aims of this investigation was to correlate wherever possible the NiCrAl coatingperformance to its microstructure. This discussion has implicitly assumed that thedeposition would be crystalline structure. However, this need not be correct for alldeposition condition, as has been shown by Krikorion and sneed(8). For example coatingdeposited on polycrystalline substrate are usually polycrystalline as well, also epitxeialgrowth dose not always occur during deposition even if coating and substrate consist of thesame material. Fig.8 illustrates this fact. A plot of logarithm of growth rate [which isidentical to incidence rate, P, for complete deposition] on the ordinate, against T/Tmon theabscissa(9),can be used to illustrate regions where the coatings are either amorphous,polycrystalline or single crystalline, depending on the value of p and T/Tm parameters.According to diagram, Fig. 8, both polycrystalline and amorphous phases depositesimultaneously at temperature, T3. However, at lower temperatures the phase boundariesare shown dotted in Fig. 8 and it is possible to find amorphous and polycrstalline phasesdepending on the conditions on deposition(lO). Since the NiCrAl sputtering coating weredeposited at room temperature onto water cooled substrates, T/Tm =0.2 - 0.3 under vacuumpressure - 1 0 torr. In accordance with these conditions the stable phase should beamorphous, however, it could be a mixture of amorphous and crystalline if the substratetemperature rises during deposition.
X-ray diffraction analysis and TEM studies of as deposited coating confirm the existenceof amorphous phase or very fine crystalline phase in these coatings. Heat treatment at1050°C for 5 min. under vacuum resulted in the formation of equilibrium phase (Table 1).X-ray diffraction produced well resolved spectra indicating, that structural changes in theas deposited coating had occurred during the heat treatment and as discussed elswhere(l 1).Thick NiCrAl coating 17-50 urn, deposited onto A12O3 substrate ( T/Tm =0.3 ), had acolumnar grain structure, Fig.5b with a sub-grain structure of 0.5 urn.
A number of studies in the literature have reported a grain structure consisting of texturedand fibrous grains with open boundaries grain (6), each grain extends through the thicknessof the coating (Zone I). More investigators (12) have shown that zone I structure containvery fine (0.02-0.5 ujn) equiaxed subgrain with the same orientation within the columnargrain. It was suggested that bundles of equiaxed grains give the coating regions of strongtexture and that individual columnar grains may contain many of these bundles.
In zone I , only a very few boundaries are expected to be mobile, and when one of thesemobile interfaces impinges on a stationary boundary, a new boundary is produced becauseof the sudden change in orientation. This mechanism of zone I grain growth is consistentwith the observed structures in the form of macro-scale columnar grains. TEM studies areknown to show amorphous or equiaxed sub grain structures (11). The appearance oflameller structures in some of the NiCrAl coating, Fig. 5, is thought to be due the reactionbetween the depositing vapour and trace of oxygen within the coating system. Similarlamellar coating structure deposited over a period of time have been reported in theliterature (13) which have been explained as result of reaction product from contaminationof nitrogen and/or oxygen in the air. Fig. 8 illustrates this layered structure, with
227
ACXRI '96superimposed X-ray line scans for Ni, Cr and Al across the lamellar structure. This revealsthat Cr and Ni compete with each other, in each layer, and is thought to be due to shuntingof the magnetic field by Ni-target sector which causes subsequent fluctuation of plasmaover Ni and Cr sectors and leads to enrichment in Cr in one layer and enrichment in Ni foranother. Hence attempts were made to relate the lameller structure to deposition time byevaluating the growth rate and correlating it to the coating periods with the help of theSEM photographs. It was found that no significant relation existed between shutting downof the system and the lamellar structure. These lamellar structures disappeared and thecomposition between Cr and Ni was less pronounced after the sputtering system wascleaned , the gas lines renewed and the Ar gas supply connected through a Ti getter toremove trace oxygen contamination as can be seen in Fig.5 b.
CONCLUSIONSA Variety of chemical compositions of Ni Cr Al can be produced by co-sputtering using asegmented target, consisting of Ni, Cr and Al segments and magnetron sputtering.Assessment of Ni Cr Al chemical composition coatings (Wt%) using SEM with a fullyquantitative link dispersive analysis permits a wide range of NiCrAl compositions to bestudied up to 40wt% Al and 55wt% Cr. The coating deposit with a coarse columnarstructure (zonel) and contain a fine subgrain structure , short exposures, under 5 min, at1050° C , lead to a coarsening of the structure .
REFERENCES1. N.Biks and G.H.Meier ,'Introduction to high temperature oxidation of metals',
Edward Arnold (London). 1983.2. R . Pichoir, 'Aluminized coating on Ni or Co - Base superalloys . Principal
prameters determining their morphology and composition'. High temperaturealloys for gas turbine.D.Cousouradis etal eds. Applied Science,London, PI91 -208,1978.
3. G.W.Goward, ' Coatings and coating processing for gas turbine air foils in amarine environment' Metal and Ceramic Report MCIC-75-27. Int. Conf. p277-296,1974
4. L.Hsu,W.G.Stevens and A.R.Stetson, 'Development and evaluation of processesfor deposition of Ni-Co-Cr-Al-Y (MCrAlY) coating for gas turbine components'Tech.Report AFML-TR-79-4097-1979 , pp 93.
5. S . Stecura,' Effect of Y, Al and Cr concentration in Bond Coating on theperformance of Zirconia-Yttria thermal barriers'Thin solid films, 1980,3, P481-489.
6. J.A.Thornton, J.Vac.Sci.Technol., Vol.11, 4,1974, P666-670.7. J.A.Thornton,Ann.Rev.Mater.Sci.,Vol.7,1977, P239-245.8. E.Krikorian and R.S. Sneed, J.Apply.Phys.,Vol. 37,10,1966, p3665 -3673.9. K.H.Behrndt ,J.Apply.Phys.,vol.37,1966,P3841-3853.10. H.Klaus andK.H.Behrndt, 'General consideration applicable to deposition of thin
films'. Techniques of Metals Research, R.F.Bunshah(Ed),Techniques of materialpreparation and handling, John Wiley, pi 191- 1221,1968.
11. J.R.Nicholls, L.B.Hussain and P.Hancock,'Microscopic structural study of NiCrAlTernary system' Proceedings Annual general meeting and 5th scientific conf. ofElectron Microscopy Society ,Malaysia,Nov.l995,p78-82.
12. GRM.Grovenor, HTG.Hentell and D.A.Smith, Acta.Metall.,Vol.32,1984,5,P773-781.13. L.Keller, L.Oren, R.J.Taylor, F.Schwirzke, R.E.Bunshah and C.N.J.Wagner, J. of
Nuclear Material, 111 and 112, 1982,P493-497.
228
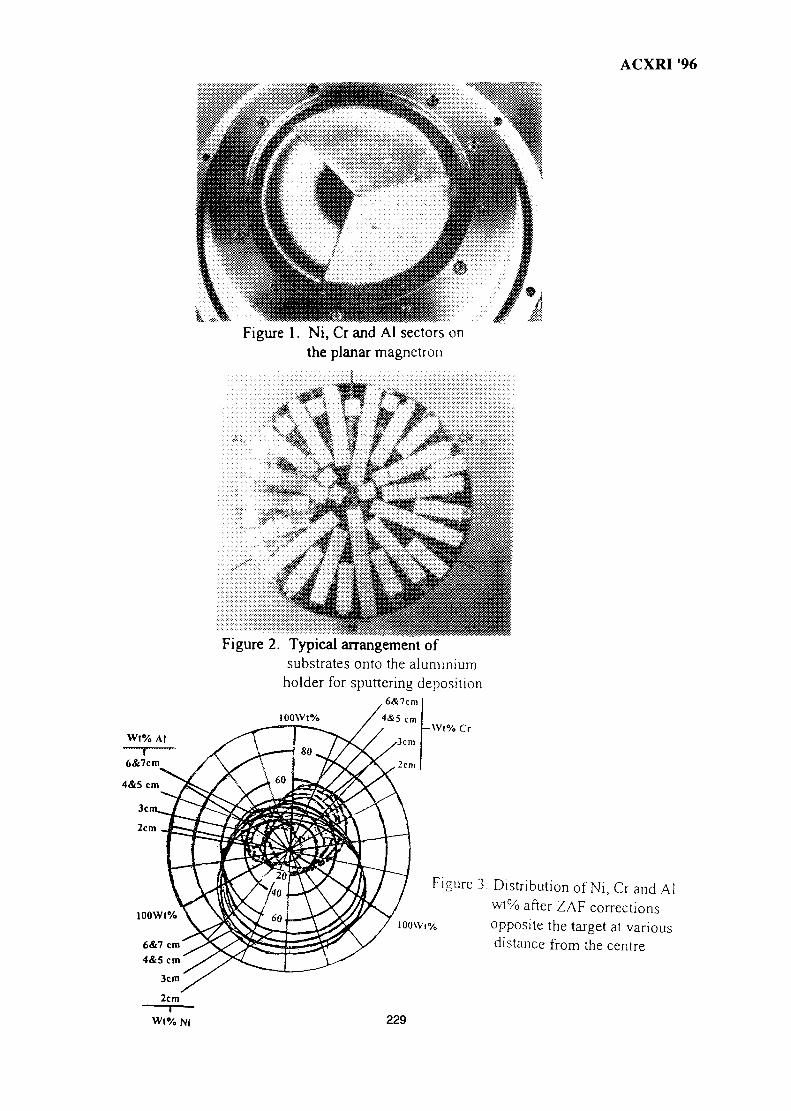
ACXRI '96
Wt% Al
Figure 1. Ni, Cr and Al sectors onthe planar magnetron
Figure 2. Typical arrangement ofsubstrates onto the aluminium
holder for sputtering deposition
-Wt%Cr
Figure 3. Distribution of Ni, Cr and Alwt% after ZAF corrections
ioo\vt% opposite the target at variousdistance from the centre
Wt% Ni 229
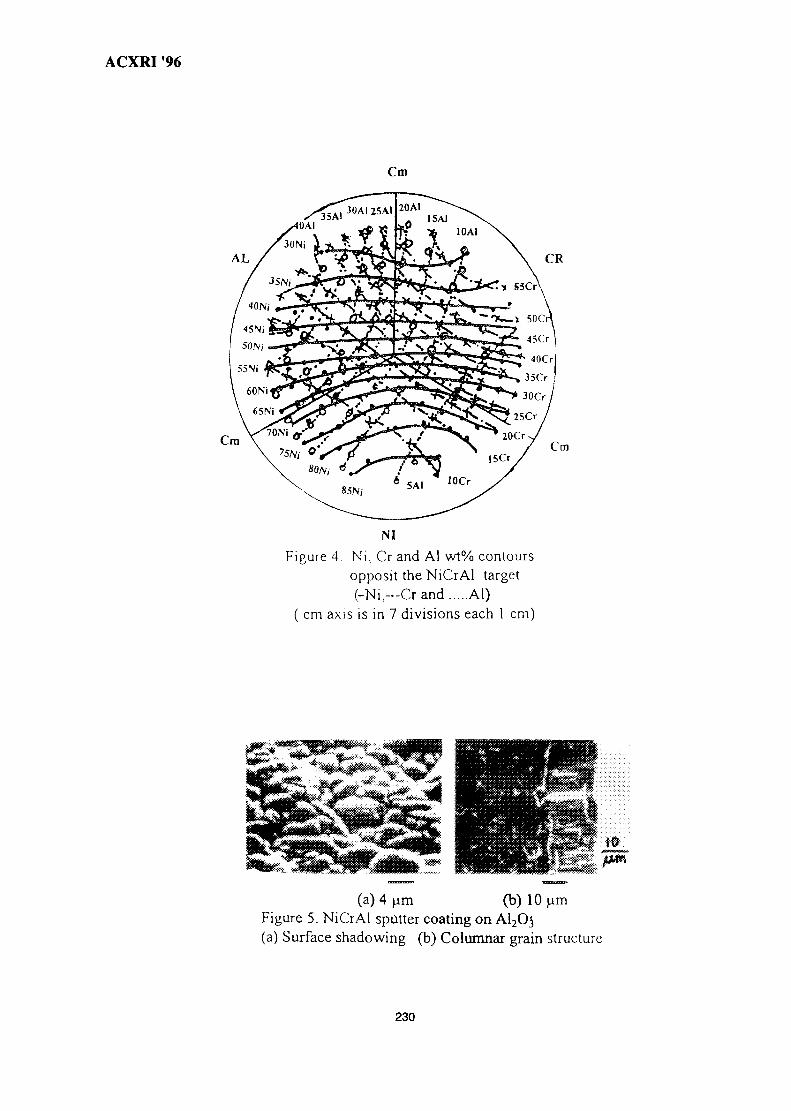
ACXRI 96
Cm
AL
NI
Figure 4 Ni, Cr and Al wt% contoursopposit the NiCrAl target(-Ni,—Crand Al)
( cm axis is in 7 divisions each 1 cm)
(a) 4 (am (b) 10 urnFigure 5. NiCrAl sputter coating on A12O$(a) Surface shadowing (b) Columnar grain structure
230
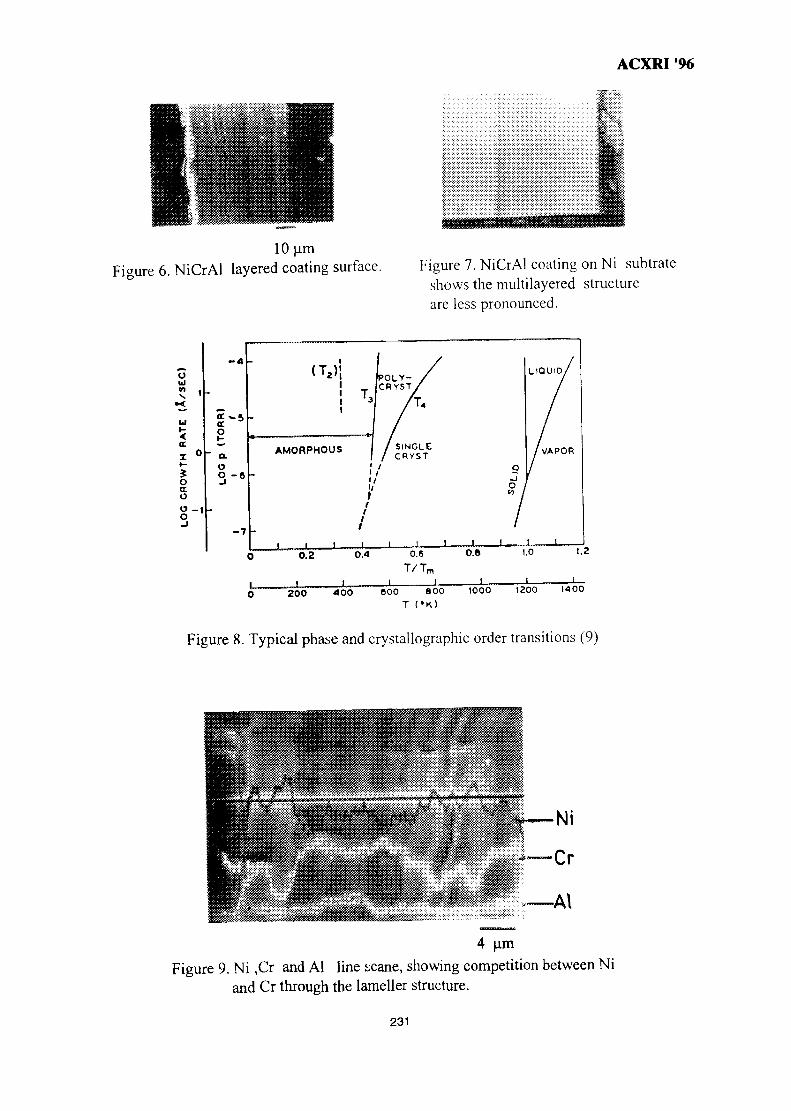
ACXRI 96
10 jimFigure 6. NiCrAl layered coating surface. Figure 7. NiCrAl coating on Ni subtrate
shows the multilayered structureare less pronounced.
oId
<
a.
oa.o
J_ JL _L _L200 400 800 800 1000 1200 1400
Figure 8. Typical phase and crystallographic order transitions (9)
Figure 9. Ni ,Cr and Al line scane, showing competition between Niand Cr through the lameller structure.
231
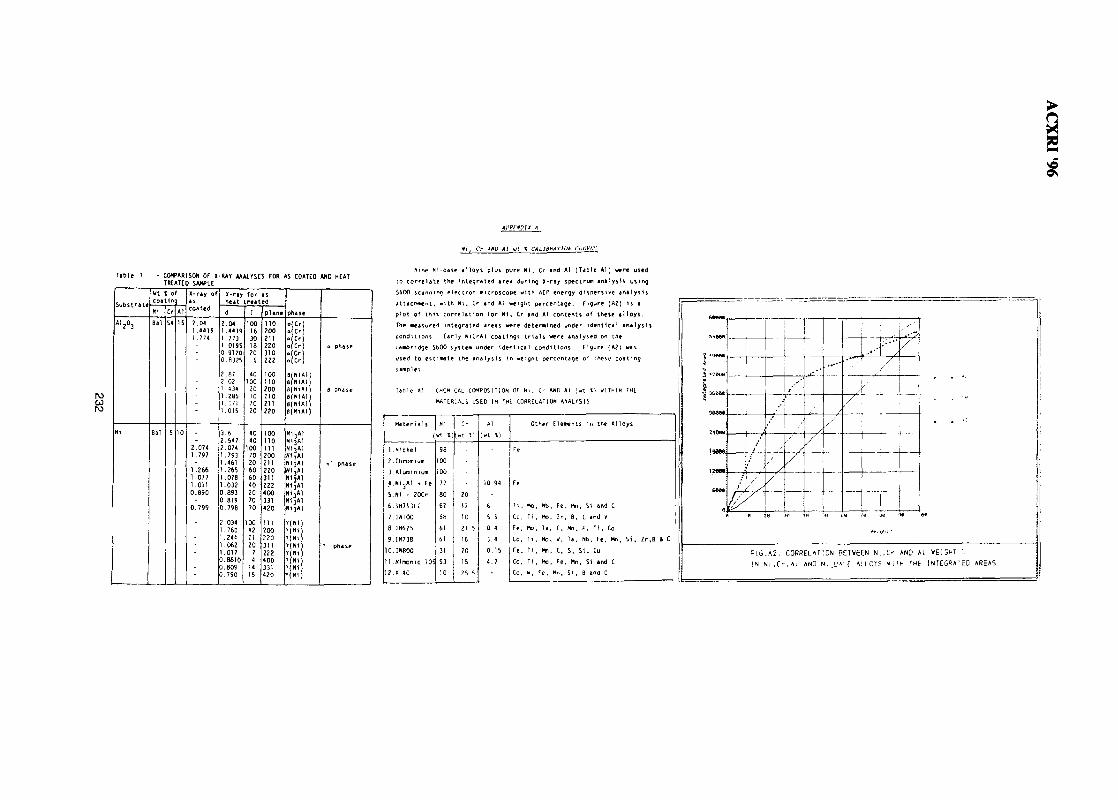
' i , Cr AND Al ut I CAIIBMTIOM CUtiVfJ
ro
is
T«t>1e 1
Substrate
Ni
• COMPARISON OF XTREATE
Wt I ofcoa
Ni
Sal
Sal
In
\r
54
S
Al
15
10
) SAMPLE
asCOAted
2.041.44191 .774
_2.0741.797
-1.2661 .0771.0310.890
0.799
-
RAY AHAIYSES FOR
heat
d
2 .M1.44191.77J1.01950.91200.8325
2.872.OZ1 .4341.2851.1711.015
3.62.5472.0741.7931.4611.2651.0781.0320.8930.8190.798
2.0341.760
.244
.0621.0170.88100.8090.790
treat
J |100
1630IS20
6
40100
20107020
4040
1007020606040207070
100«22120
74
1415
to
plane
110200211220310222
loono200210211220
1001101112002)1220311222400331420
111200220311222400331420
V> COATED
phase
. (C r )
. (C r )•.(Cr)
ajCrjo Cr.|CrjB(NIA1)«(NIA1j«(!HA1)B(NIAl)B(N1A18(N1A1)
Ni ,A lNi jAlN1,A1N1,A1HI 3AINI.A1NljtlN(3ATNI,*]NI3AINI3AI
Y(N<)Y ( » ' )T(Nl)
»<" ' )Y(N1)7(NiY(N1)Y ( » 1 )
AND HEAT
a phase
a phase
Y* phase
Y phase
Nine Hi-base a l l o y s plus pure N I , Cr and Al (Table Al ) were used
Co c e r e l i t e the i n t eg ra ted area dur i ng X~r ay spectrufli ana lys is us^^Q
S600 scann 1 no p}?ct ron *»c ^OSCOpe w i th A^P eriproy d 1 SPC^S ivc ARAlysts
<1lO
The Measured Integrated areas were determined under identical analysis
conditions Early NiCrAl coatings trials were analysed on the
Lambridge 5600 System under identical conditions. Figure (A?) was
used to estimate the analysts in weight percentage of these coating
samples -
Ta&le A' - CMCMICAL COMPOSITION OF Ni. Cr AND Al (wt I) WITHIN THE
MATERIALS USED IN THE CORRELATION ANALYSIS
1
2
3
4
5
6
7
8
9
Materials
(
Nickel
Chromium
Aluminium
Ni jAl . Fe
Ni - 20Cr
1N713LC
INI 00
1N625
IN71R
10.INRnn
11
12
Nimonic 105
*-40
Ni
wt I)
98
100
100
77
80
62
68
61
61
31
53
10
Cr
;« •.)
20
12
10
2 1 , 5
16
20
15
25 5
A]
( " t
10
6
5
0.
3.
0
4.
-
XI
94
5
4
4
15
7
Fe
Fe
Tt
Co,
Fe
Co,
Fe.
Co.
Co.
Other
Mo
Ti
Mo
Ti
T i
T i
y ,
Nh
Mo.
Tn
Mo,
Mn
Mo
f e ,
Elements in
Fe
Ir
cW,
c.Fe
Mn,
Mn, Si
B , C a
Mn P
Ta. Nb
S. S i .
Mn, Si
S i . B 1
t he
and
nd V
T i ,
Fe.
Cu
and
nd C
Alloys
C
Co
Mn, S i , Zr.B & C
C
J njaee
300M
t30M,
!?««
CAM
a
/t
• • •, ,
/
—
• - • •
/
—
. , • • _
— -
. — . . .
P I G . A 2 . CORRELATION BETWEEN N i T l > AND AL WEIGHT >
!N N i , C r , ^ i AND N , _ L M \ f ALLOTS W[ fH TM£ INTEGRATED AREAS
MY9700807A STUDY ON THE PHASE TRANSFORMATION OF MgO-P2O5 GLASS
BY X-RAY DIFFRACTION
M.R.Sahar and N.KamaruddinMaterials Science Panel
Physics DepartmentUniversiti Teknologi Malaysia
81300 Skudai, Johor DT Malaysia.
Abstract: A series of glass based on MgO^Os system has been prepared. Their phasetransformation behaviour has been studied using an x-ray diffraction technique. By thehelp of a DTA data, a tentative phase transformation diagram of this system has beenmade. It is found that glasses with low MgO content posses the phase of metaphosphatewhich gradually transforms to pyrophosphate phase as the P2O5 content increases. Thecomplete decomposition of metaphosphate occurs around 50MgO-50P2Os.
Introduction
Phosphate glasses containing modifying oxides such as MgO or CaO hasreceived considerable interest particularly as bioceramic materials l>2'3 Theirmechanical and physical properties have also been studied elswhere 4 which showed thatmost properties are compositional dependent. However, this kind of glass, if heated, willexperience some structural changes, probably because of the variation in P-O-Mgcrosslink density during the glass formation or crystallisation. The transformationespecially from the well known meta to pyrophosphate structure can well be studied byx-ray diffraction technique. This technique is relatively simple compared to the otherssuch as measurement of viscosity or dilatometry 5.
In this work, the phase transformation in MgO^Os glasses using x-raydiffraction is presented.
Experimental
Glasses with composition of (l-x)MgO-xP2C>5 are prepared using meltquenching technique. Laboratory grade analar with purity beyond 99.5 % of MgO andP2O5 oxides are used as starting materials. The glass preparation has been discribed indetail elsewhere6. The glass sample are then crystallised for 30 minutes at theircrystallisation temperature before being characterised by x-ray diffraction technique toanalyse the phases.
Results and Discussion
A series of glasses are made succesfully and Table 1 shows the details. It isfound that these glasses can only be formed in range of 0.4 < x < 0.8. For higher xvalues, the melts do not form glass while for lower x values, the melts are totallycrystallised.
233
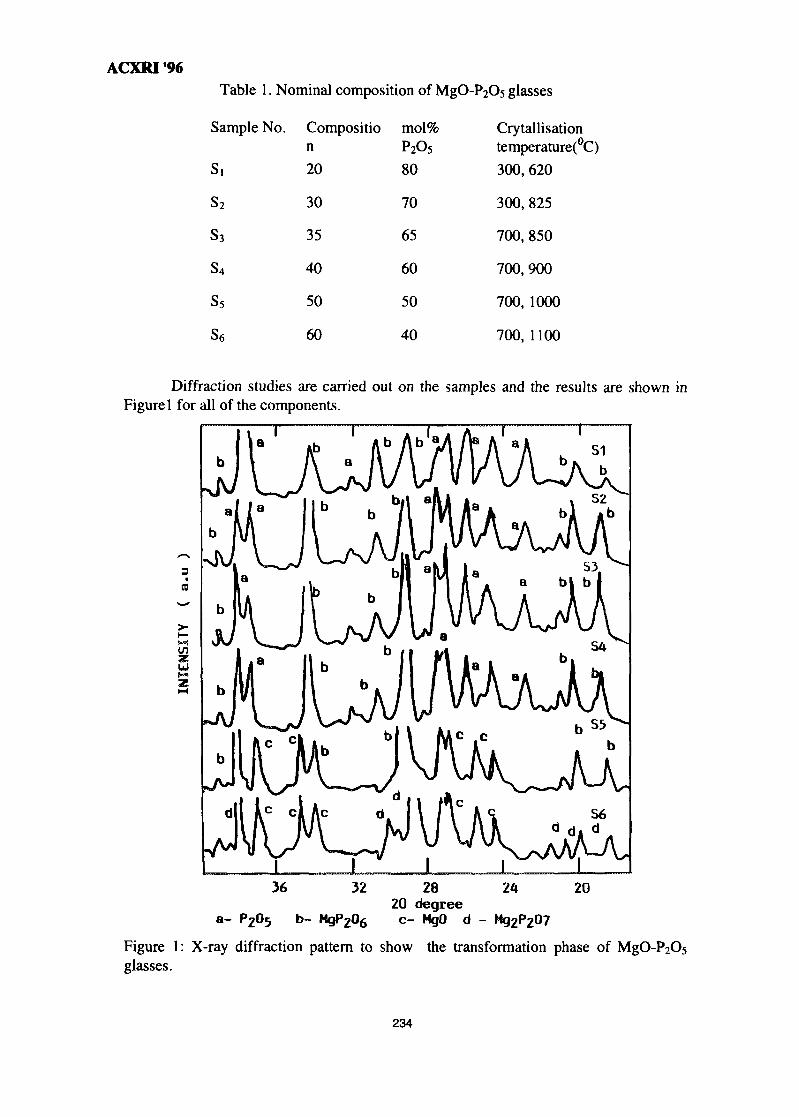
ACXRI96Table 1. Nominal composition of MgO- asses
Sample J
s,
s2
S3
s4
s5
s6
No. Compositio mol%n P2O5
20 80
30
35
40
50
60
70
65
60
50
40
Crytallisationtemperature(°C)300, 620
300, 825
700, 850
700,900
700,1000
700, 1100
Diffraction studies are carried out on the samples and the results are shown inFigure 1 for all of the components.
to
2
a-
36
P205 b- Mi
32
JP2°620
c-
28degree
MgO d -
24 20
Figure 1: X-ray diffraction pattern to show the transformation phase ofglasses.
234
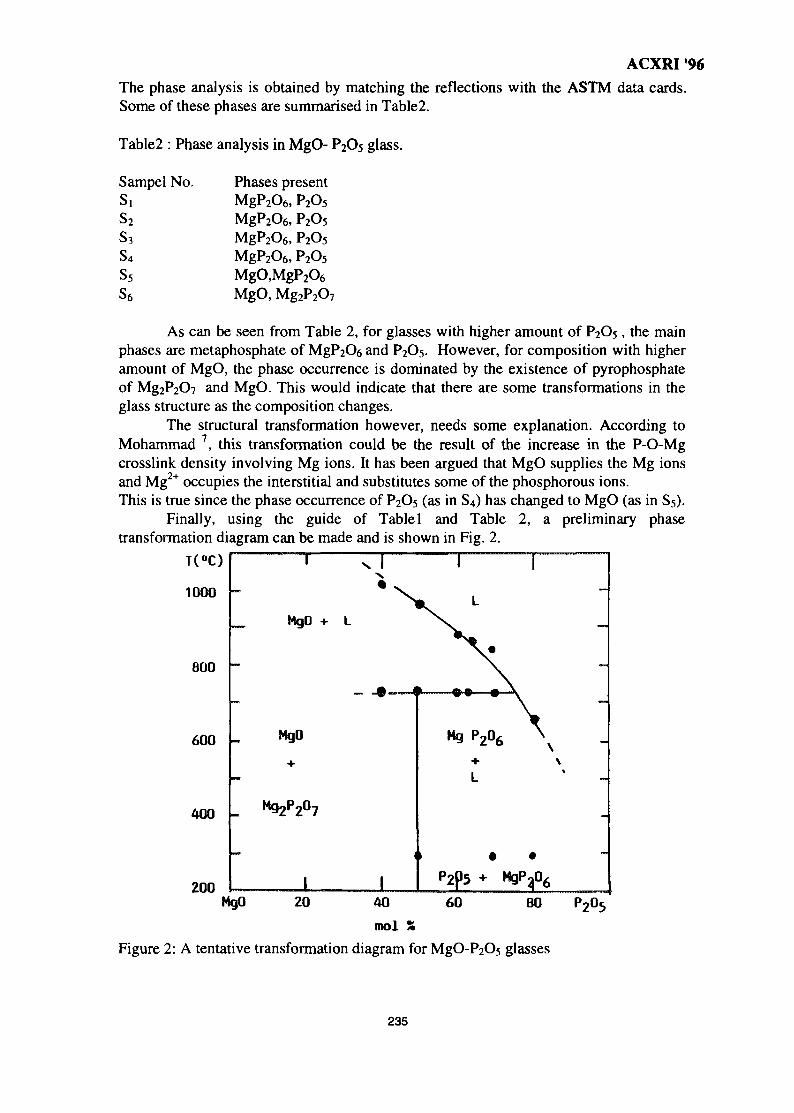
ACXRI '96
The phase analysis is obtained by matching the reflections with the ASTM data cards.Some of these phases are summarised in Table2.
Table2 : Phase analysis in MgO- P2O5 glass.
Sampel No.s,s2S3
s4s5s6
Phases presentMgP2O6, P2O5
MgP2O6, P2O5
MgP2O6, P2O5
MgP2O6, P2O5
MgO,MgP2O6
MgO, Mg2P2O7
As can be seen from Table 2, for glasses with higher amount of P2O5, the mainphases are metaphosphate of MgP2O6 and P2Os. However, for composition with higheramount of MgO, the phase occurrence is dominated by the existence of pyrophosphateof Mg2P2O7 and MgO. This would indicate that there are some transformations in theglass structure as the composition changes.
The structural transformation however, needs some explanation. According toMohammad 7, this transformation could be the result of the increase in the P-O-Mgcrosslink density involving Mg ions. It has been argued that MgO supplies the Mg ionsand Mg2+ occupies the interstitial and substitutes some of the phosphorous ions.This is true since the phase occurrence of P2Os (as in S4) has changed to MgO (as in S5).
Finally, using the guide of Table 1 and Table 2, a preliminary phasetransformation diagram can be made and is shown in Fig. 2.
T(°C)
1000
800 -
600 -
400
200
TO MgO +
MgO
+
M g 2 P 2 0 7
1
i
1
Mg P 2 0 6
L
p2ps + i
1
\" \ —
\\
-
<gP2°6MgO 20 60 8040
mol %Figure 2: A tentative transformation diagram for MgO-P2Os glasses
PoO2U5
235
ACXRI '96
From this figure, it can be deduced that for higher MgO content, the glass is dominatedby the phase Mg2?2O7 before gradually transforming to the more stable glass with thephase
Conclusion
The phase transformation in MgO-P2C>5 glass is studied by x-ray diffractiontechnique. A preliminary phase transformation diagram has been drawn by the help ofDTA and XRD.
References
1. M. Akao, H. Aoki and K. Kato, J. Mater.Sci. 16(1981)8092. F. Peruot, J. Zarzycki, F.Bannel, P. Rabischung and P.Baldet, ibid 14(1979) 1694.3. S. Kihara, A.Watanabe and Y.Abe, J.Amer.Ceram. Soc. 67(1984) c-100.4. M.R. Sahar, A.Z. Abidin, J.Mater.Sci.Letts 13(1994) 227-2295. L. Cervinka and J.Dusil, J. Non-Cryst.Sol. 21(1976)125-136.6. M.R. Sahar and A.Z. Abidin, Mal.Sol.State Sci. and Tech vol2 No2( 1994)85-90.7. H. Mohammed, Bull.Fiz(UTM) Jil.l,No2 (1988)14.
236
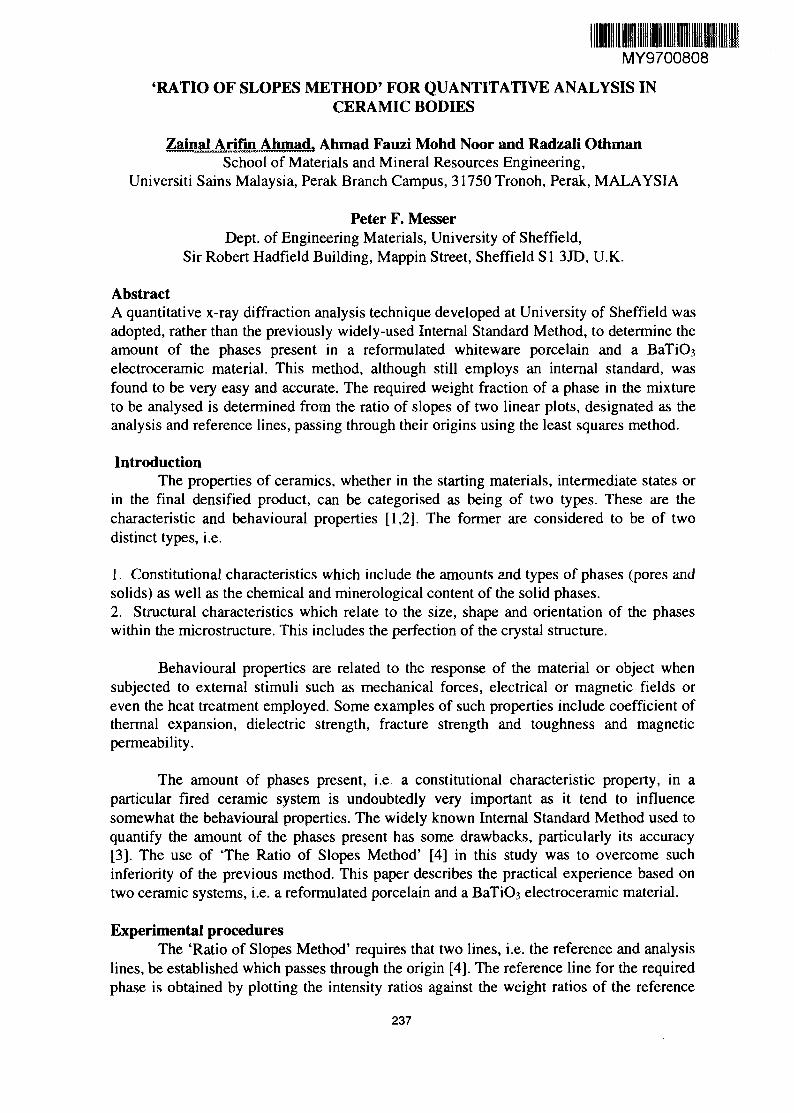
MY9700808
'RATIO OF SLOPES METHOD' FOR QUANTITATIVE ANALYSIS INCERAMIC BODIES
Zainal Arifin Ahmad. Ahmad Fauzi Mohd Noor and Radzali OthmanSchool of Materials and Mineral Resources Engineering,
Universiti Sains Malaysia, Perak Branch Campus, 31750 Tronoh, Perak, MALAYSIA
Peter F. MesserDept. of Engineering Materials, University of Sheffield,
Sir Robert Hadfield Building, Mappin Street, Sheffield S1 3JD, U.K.
AbstractA quantitative x-ray diffraction analysis technique developed at University of Sheffield wasadopted, rather than the previously widely-used Internal Standard Method, to determine theamount of the phases present in a reformulated whiteware porcelain and a BaTiC>3electroceramic material. This method, although still employs an internal standard, wasfound to be very easy and accurate. The required weight fraction of a phase in the mixtureto be analysed is determined from the ratio of slopes of two linear plots, designated as theanalysis and reference lines, passing through their origins using the least squares method.
IntroductionThe properties of ceramics, whether in the starting materials, intermediate states or
in the final densified product, can be categorised as being of two types. These are thecharacteristic and behavioural properties [1,2]. The former are considered to be of twodistinct types, i.e.
1. Constitutional characteristics which include the amounts and types of phases (pores andsolids) as well as the chemical and minerological content of the solid phases.2. Structural characteristics which relate to the size, shape and orientation of the phaseswithin the microstructure. This includes the perfection of the crystal structure.
Behavioural properties are related to the response of the material or object whensubjected to external stimuli such as mechanical forces, electrical or magnetic fields oreven the heat treatment employed. Some examples of such properties include coefficient ofthermal expansion, dielectric strength, fracture strength and toughness and magneticpermeability.
The amount of phases present, i.e. a constitutional characteristic property, in aparticular fired ceramic system is undoubtedly very important as it tend to influencesomewhat the behavioural properties. The widely known Internal Standard Method used toquantify the amount of the phases present has some drawbacks, particularly its accuracy[3]. The use of 'The Ratio of Slopes Method' [4] in this study was to overcome suchinferiority of the previous method. This paper describes the practical experience based ontwo ceramic systems, i.e. a reformulated porcelain and a BaTiC>3 electroceramic material.
Experimental proceduresThe 'Ratio of Slopes Method' requires that two lines, i.e. the reference and analysis
lines, be established which passes through the origin [4]. The reference line for the requiredphase is obtained by plotting the intensity ratios against the weight ratios of the reference
237
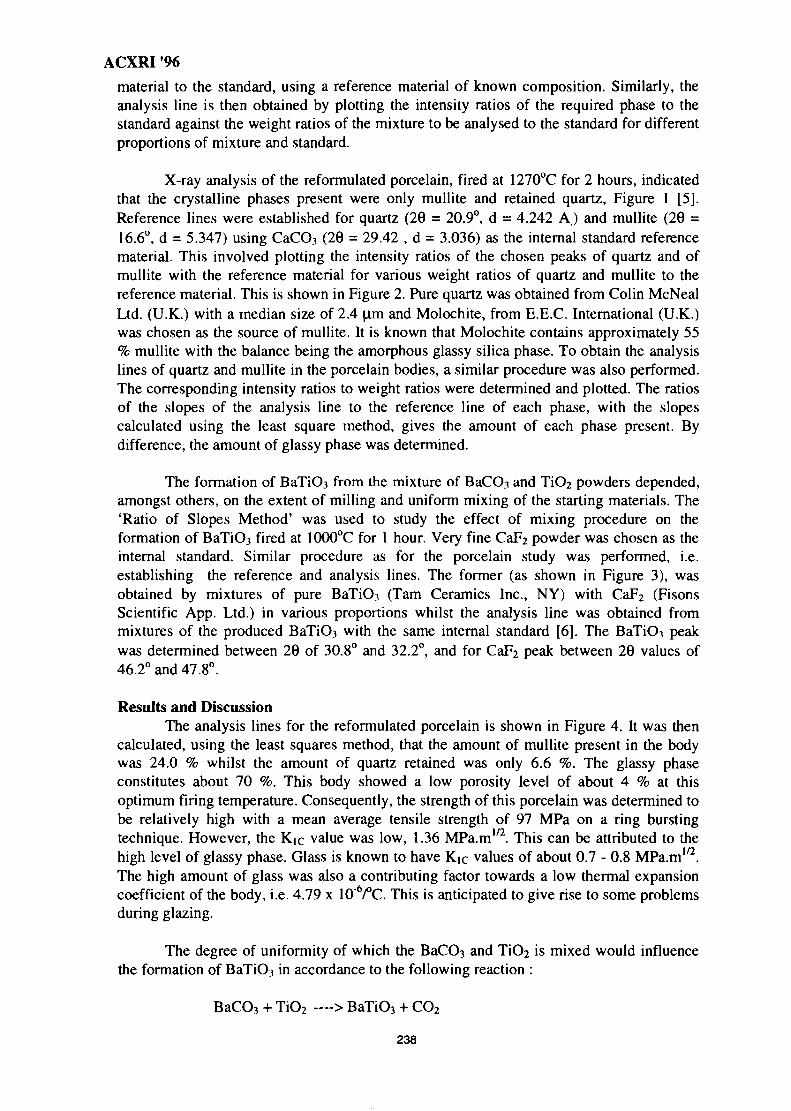
ACXRI 96
material to the standard, using a reference material of known composition. Similarly, theanalysis line is then obtained by plotting the intensity ratios of the required phase to thestandard against the weight ratios of the mixture to be analysed to the standard for differentproportions of mixture and standard.
X-ray analysis of the reformulated porcelain, fired at 1270°C for 2 hours, indicatedthat the crystalline phases present were only mullite and retained quartz, Figure 1 [5].Reference lines were established for quartz (26 = 20.9°, d = 4.242 A) and mullite (26 =16.6°, d = 5.347) using CaCO3 (26 = 29.42 , d = 3.036) as the internal standard referencematerial. This involved plotting the intensity ratios of the chosen peaks of quartz and ofmullite with the reference material for various weight ratios of quartz and mullite to thereference material. This is shown in Figure 2. Pure quartz was obtained from Colin McNealLtd. (U.K.) with a median size of 2.4 im and Molochite, from E.E.C. International (U.K.)was chosen as the source of mullite. It is known that Molochite contains approximately 55% mullite with the balance being the amorphous glassy silica phase. To obtain the analysislines of quartz and mullite in the porcelain bodies, a similar procedure was also performed.The corresponding intensity ratios to weight ratios were determined and plotted. The ratiosof the slopes of the analysis line to the reference line of each phase, with the slopescalculated using the least square method, gives the amount of each phase present. Bydifference, the amount of glassy phase was determined.
The formation of BaTiO3 from the mixture of BaCO3 and TiC>2 powders depended,amongst others, on the extent of milling and uniform mixing of the starting materials. The'Ratio of Slopes Method' was used to study the effect of mixing procedure on theformation of BaTiO3 fired at 1000°C for 1 hour. Very fine CaF2 powder was chosen as theinternal standard. Similar procedure as for the porcelain study was performed, i.e.establishing the reference and analysis lines. The former (as shown in Figure 3), wasobtained by mixtures of pure BaTiO3 (Tarn Ceramics Inc., NY) with CaF2 (FisonsScientific App. Ltd.) in various proportions whilst the analysis line was obtained frommixtures of the produced BaTiO3 with the same internal standard [6]. The BaTiO3 peakwas determined between 26 of 30.8° and 32.2°, and for CaF2 peak between 26 values of46.2° and 47.8°.
Results and DiscussionThe analysis lines for the reformulated porcelain is shown in Figure 4. It was then
calculated, using the least squares method, that the amount of mullite present in the bodywas 24.0 % whilst the amount of quartz retained was only 6.6 %. The glassy phaseconstitutes about 70 %. This body showed a low porosity level of about 4 % at thisoptimum firing temperature. Consequently, the strength of this porcelain was determined tobe relatively high with a mean average tensile strength of 97 MPa on a ring burstingtechnique. However, the Kic value was low, 1.36 MPa.ml/2. This can be attributed to thehigh level of glassy phase. Glass is known to have Kic values of about 0.7 - 0.8 MPa.m"2.The high amount of glass was also a contributing factor towards a low thermal expansioncoefficient of the body, i.e. 4.79 x 10"6/°C. This is anticipated to give rise to some problemsduring glazing.
The degree of uniformity of which the BaCC»3 and TiC»2 is mixed would influencethe formation of BaTiO3 in accordance to the following reaction :
BaCO3 + TiC-2 — > BaTiO3 + CO2
238
ACXRI '96
The effect of mixing/milling times and mixing operation is shown in Figure 5. This wasobtained upon determining the analysis lines for the BaTiC>3 compound formed for eachmilling/mixing period. It can be observed that as the milling/mixing time was prolonged,the amount of BaTiC>3 formed would also increased but to a maximum value. The resultalso show that a larger milling/mixing chamber size (Set 3), with proportionately similarnumber of milling media to the smaller chamber (Set2), would produced better uniformityand consequently more BaTiO^ formed when sintered at the same temperature. This isquite clear as the larger mill chamber would provide a better milling effect due to theharder impact when the media drops, and at the same time, improves the mixing action. InSetl, less efficient mixing due to less number of milling media in the smaller chamber wasobserved. The effect of reduction in size of the powder mixture is shown in Figure 6.
The advantage of this technique of quantitative analysis comes when weighing outthe samples to be analysed. The weights of the mixture to be analysed, the referencematerial and internal standard need not be of any specific values or in a fixed proportionbut, of course, required to be weighed precisely. The weight ratios can also be chosen sothat the peak intensities can be measured accurately. Precise weighing and the ability to usevarious weight ratios can give this method greater accuracy and flexibility than that of theconventional internal standard.
One aspect which requires careful attention is the mixing method of the powders,particularly when there is a great disparity in size distribution and fineness of the powdersto be analysed, the reference material and the internal standard. Dry mixing of the powderscan caused segregation. Consequently, a paste mixing technique was adopted. Someamount of acetone was added to the weighed powder mixtures to form a paste-like in anagate pestle and mortar and this was mixed thoroughly in a shearing mode for some time.Whilst the mixture is still in a pasty form, it was loaded on to several sample holders andsubsequent x-ray procedures were proceeded. The paste mixing technique produced a morerepeatable measurements as shown in Figure 7 for BaTiC>3 [6].
4.0 ConclusionIn conclusion, the results showed that 'The Ratio of Slopes Method' is a useful
quantitative technique which can produced an extremely high degree of accuracy, providedthe necessary care and attention is adopted. However, it does have a disadvantage when thepowder to be analysed contained multiple phases, i.e. more than 4 phases. Choosing asuitable internal standard would then be difficult.
References1. Messer, P.F.; Trans. J. Brit. Cer. Soc, 82, (1983), p.156-1622. Messer, P.F.; Trans. J. Brit. Cer. Soc, 82, (1983), p.190-1923. Othman, R.; Ph.D. Thesis, University of Sheffield, (1982)4. Monshi, A. and Messer, P.F.; J. of Mat. Sc, 26, (1991), p. 3623-36275. Mohd Noor, A.F.; Ph.D. Thesis, University of Sheffield, (1995)6. Ahmad, Z.A.B.; Ph.D. Thesis, University of Sheffield, (1995)
239
ACXRI '96
C '600
Figure 1: X-ray analysis of the reformulated porcelain, fired at 1270°C for 2 hours,indicated that the crystalline phases present were only mullite and retained quartz.
S ov
* 03
Quartz
W«ight ratio |«rMtr«y unit)
Figure 2: Reference line of quartz and mullite with CaCC>3 as the standard material
240
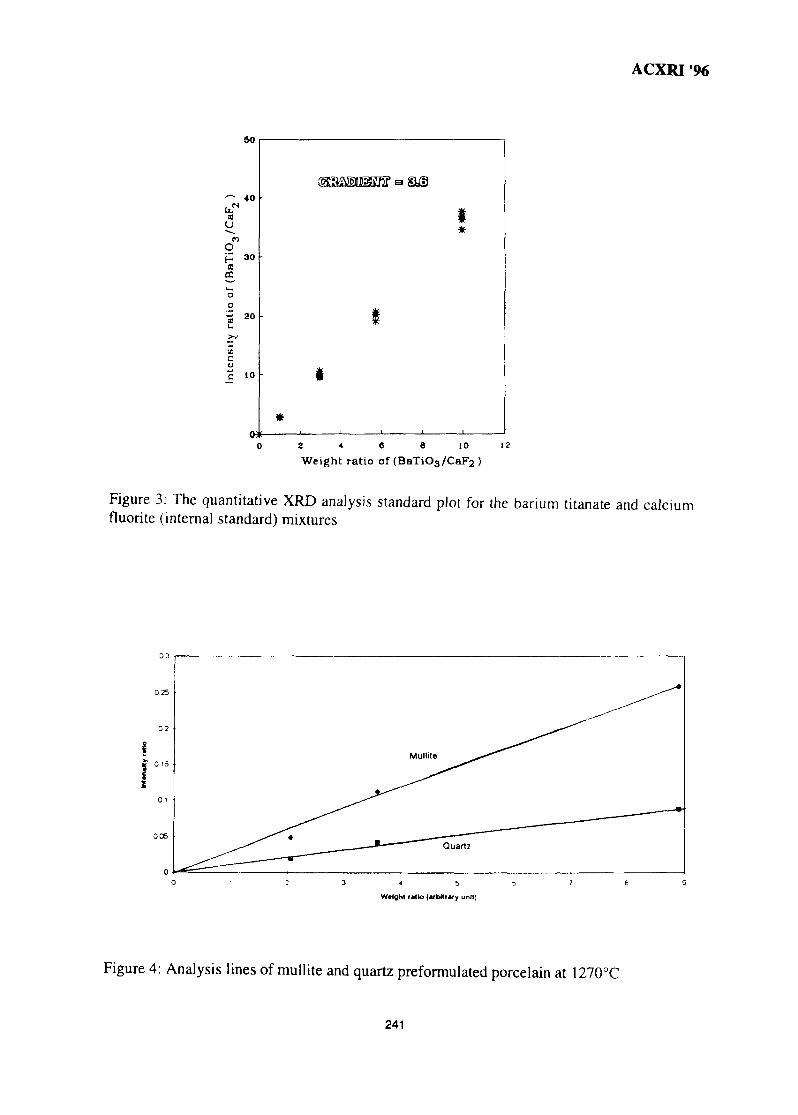
ACXRI '96
b?au
(BaT
iO,
o
y ra
tio
:nsi
lln
lc
50
40
30
20
10
03
•
*
1
1
1
1*
J 1
Z 4 6 8 10 12
Weight ratio of (BaTiO3/CaF2 )
Figure 3: The quantitative XRD analysis standard plot for the barium titanate and calciumfluorite (internal standard) mixtures
Wolghl ratio (irbltiary unit]
Figure 4: Analysis lines of mullite and quartz preformulated porcelain at 1270°C
241
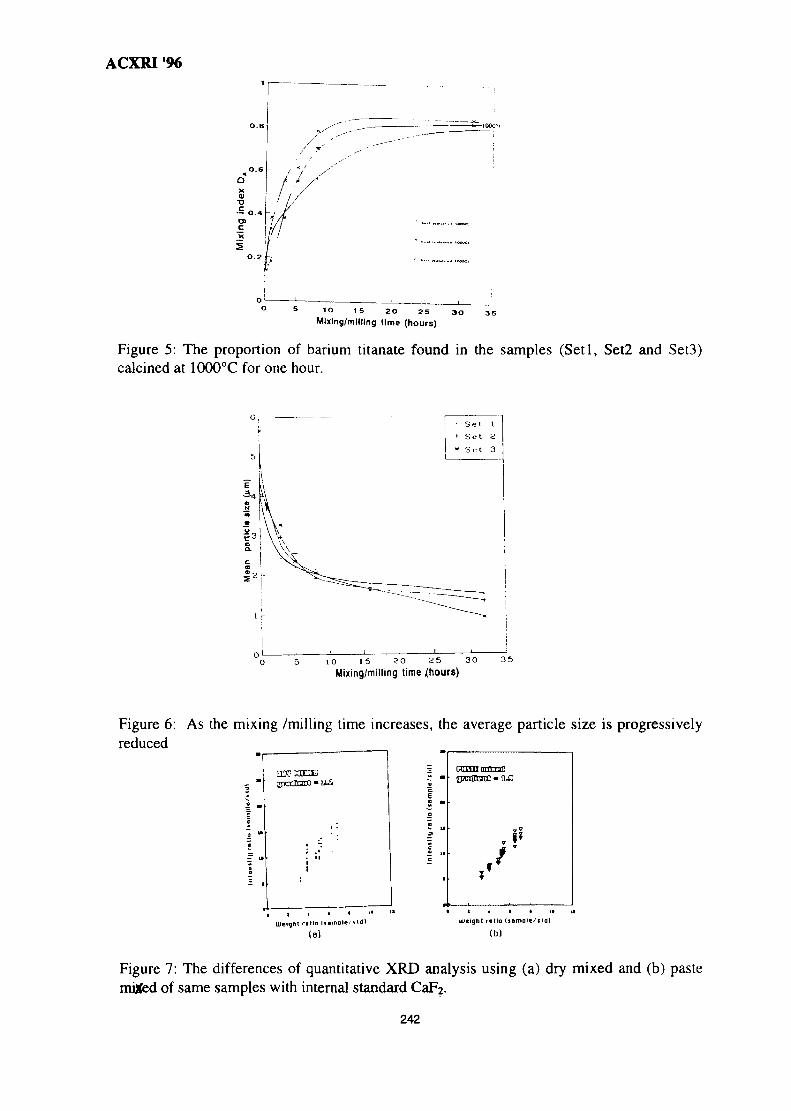
ACXRI '96
° 5 1O IS 2O 25 3O 35
Mixing/milling lime (hours)
Figure 5: The proportion of barium titanate found in the samples (Setl, Set2 and Set3)calcined at 1000°C for one hour.
Set I
* Set 2
« Set. 3
10 15 20 25 30 35
Mixing/milling time /hours)
Figure 6: As the mixing /milling time increases, the average particle size is progressivelyreduced
LDeignt ratio iiemo'c-
(a)t ralla Issmpie/iidl
(b)
Figure 7: The differences of quantitative XRD analysis using (a) dry mixed and (b) pastemixed of same samples with internal standard CaF2.
242
MY9700809
MICROSTRUCTURE INVESTIGATIONS OF Ba-Sr MIXED FERRITES, USINGSEM TECHNIQUE
J. Amighian and M. MozaffariDepartment of Physics , University of Isfahan,
Isfahan , Iran
Abstract : A series of isotropic Ba-Sr mixed ferrites were prepared, using aconventional dry technique. The starting materials were hematite by product ofIsfahan steel factory, strontium carbonate from Merck company and bariumcarbonate obtained from a local source. The principle phase of the samples waschosen to have a composition in the form of (BaO)|.x (SrO)x nFe2C>3 , in which xvaried between 0 to 1 and n was varied between 5 to 6. The raw materials werethoroughly mixed and fired in an electircal furnace for 2 hours. They were thenmilled in a vibrating ball mill, in which the optimum milling time for each sample wasobtained.
»After annealing at 750C , the powders were compacted in a cylindrical die
under 5 tons/cm2 . The compacts were then mixed with a binder and sintered in airfor 10 minutes at their optimum temperatures. Using SEM technique, themicrostructure of the samples were investigated. Using a permeameter, the coerciveforce He and remanent induction Br were measured. The microstructures obtainedfrom SEM technique can be used to control the sintering stage in ferrite fabrication.
Introduction
The hexaferrites Me Fei2Oi9, where Me represents a divalent ion such as Ba,Sr and Pb are well- known materials for the production of sintered permanentmagnets. The replacement of each ion is possible with any mixing ratio withoutchanging the crystal stucture. For example, Bao.75Sro.25 Fe-^O-ig and Sro.75Pbo.25Fe-|2Oi9 have been investigated1.
The relevant physical properties of ferrites in many cases depend on themicrostructure2. For example one of the basic requirements at any aspects ofisotropic ferrite production is the size and shape of the particles. In the case ofanisotropic production the orientation of the magnetic particles is also important3. Inrecent years new instrumental techniques have been used to study the mentionedrequirements4.
Two important factors, which characterize the improvement of permanentmagnets are coercive force He and the remanent induction Br. The coercive forcedepends on the size and shape of the particles, whereas the remanent induction is afunction of chemistry and packing of the magnetic particles in a specific volume5.
The optimum size , in the case of the hard ferrits, has a mean value of 1.3microns6. A distributed particle size around 1 micron can be achieved by milling, butthe proper optimum size can be controlled during sintering process. It has beenfound that different additives in the right proportion can control the size of thegrains during sintering7.
In this work scanning electron microscopy was used to obtain some information243
ACXRI '96about the shape, size and orientation of the particles during sintering.
Experimental procedure
In this work different compositions of (Ba-Sr) mixed ferrites were prepared,using the stoichiometric formula (BaO)|.x (SrO)x nFe2O3. The starting materialswere hematite, BaCO3 and SrCC«3. The hematite is a by- product of Isfahan steelfactory and is obtained by spray roasting HCl pickling solutions according to Ruthnerprocess. The BaCO3 is locally made and SrCO3 is from Merck company. The purityof the raw materials are more than 97%. A special mixer with 5 cylindrical Cr-steeljars was made to meet the similarity of the mixing beetween the samples. The mixedpowders with different x and n = 5.6 were calcined at different optimumtemperatures.
The calcined powders were then dry milled at different optimum milling times.The optimum milling times were fairly higher for higher x compositions. To releasethe possible stresses in the milled powders, an annealing process was performed,inwhich a temperature of 750C for 2 hours was used. Using a hydraulic press, samplesof cylindrical shape were formed at 5tons/cm2. Finally the compacts were sintered atdifferent optimum temperatures, using a programable electric furnace.
Using a philips SEM, XL30 model, micrographs of the different unmagnetizedsintered magnets were obtained. A permeameter was used to measure, the values of(BH)max- The values were then plotted against different sintering temperature, witha fixed sintering time of 10 minutes.
Results and Discussion
The effect of the sintering temperature on the micrographs of a series of thesamples with x=0.2 is shown in figures 1 and 2. The sintering temeratures in figures 1and 2 are respectively 1230C and 1260C. The variation of (BH)max for each samplewith respect to the sintering temperature is also shown in figure 3. As can be seenthe value of (BH)max at the sintering temperature of 1230C is higher than the one at1260C . The comparison of the figures 1 and 2 shows that, the size of the majority ofthe particles in figure 1 are about 1 to 2 microns, whereas in figure 2, there is aconsiderable grain growth due to higher sintering temperature, which leads to lowercoercive force or lower (BH)max- Also in figure 2 a liquid phase which is probablydue to higher sintering temperature is observed.
Conclusion
In this work it was proved useful to observe the size and shape of the particleson the sintered ferrite surface with a SEM. This observations show that the magneticparameters of the hexaferrites not only depend on the microstructure, but also canbe controlled and modify by SEM observations.
Acknowledgments
Authors wish to acknowledge the sponsorship of Isfahan University forsupporting this work and also Isfahan University of Technology for preparing theSEM micrographs. 244
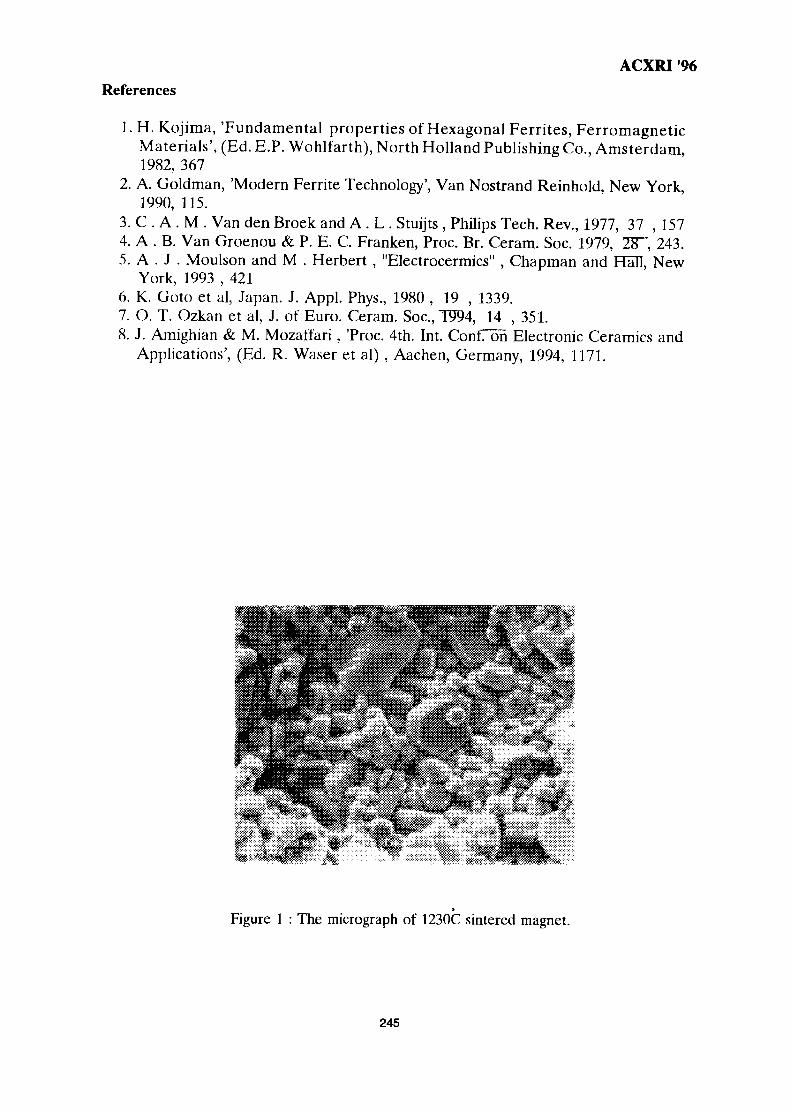
ACXRI '96
References
1. H. Kojima, 'Fundamental properties of Hexagonal Ferrites, FerromagneticMaterials', (Ed. E.P. Wohlfarth), North Holland Publishing Co., Amsterdam,1982, 367
2. A. Goldman, 'Modern Ferrite Technology', Van Nostrand Reinhold, New York,1990, 115.
3. C . A . M . Van den Broek and A. L . Stuijts , Philips Tech. Rev., 1977, 37 , 1574. A . B. Van Groenou & P. E. C. Franken, Proc. Br. Ceram. Soc. 1979, IS", 243.5. A . J . Moulson and M . Herbert , "Electrocermics" , Chapman and Hall, New
York, 1993 , 4216. K. Goto et al, Japan. J. Appl. Phys., 1980 , 19 , 1339.7. O. T. Ozkan et al, J. of Euro. Ceram. Soc.,T994, 14 , 351.8. J. Amighian & M. Mozaffari , 'Proc. 4th. Int. Conf. on Electronic Ceramics and
Applications', (Ed. R. Waser et al) , Aachen, Germany, 1994, 1171.
Figure 1 : The micrograph of 1230C sintered magnet.
245
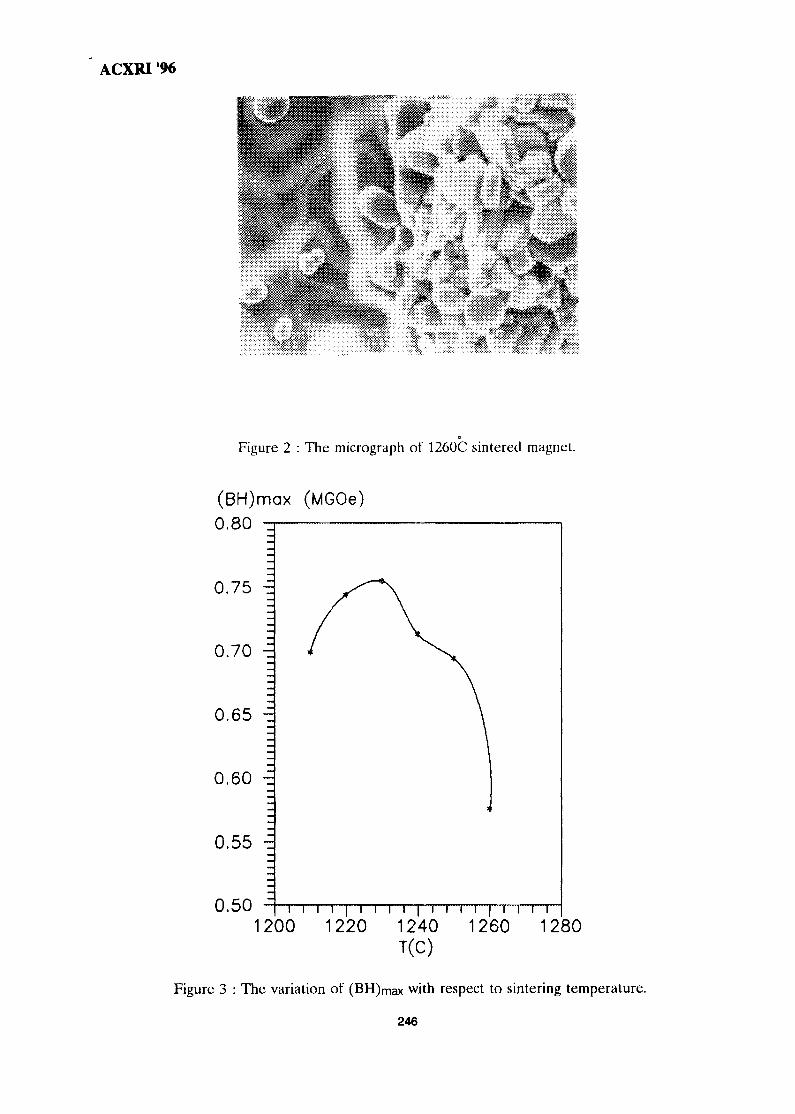
ACXRI '96
Figure 2 : The micrograph of 1260C sintered magnet.
(BH)max (MGOe)0.80 -n
0.75 -=
0.70 ~
0.65 ~
0.60 -=
0.55 ~
0.50 i i r f \ i i i | i i i r i 7 i i r1200 1220 1240 1260 1280
T(C)
Figure 3 : The variation of (BH)max with respect to sintering temperature.
246
MY9700810
Influence of Clay Mineralogy on Clay-Based Ceramic Products
Radzali Othman. Tuan Besar Tuan Sarif, ZainalArifin Ahmad,Ahmad Fauzi Mohd Noor and Abu Bakar Aramjat
UNIVERSITI SAINS MALAYSIASchool of Materials & Mineral Resources EngineeringSri Iskandar Campus, 31750 Tronoh, Perak, Malaysia
ABSTRACT
Clay-based ceramic products can either be produced directly from a suitable claysource without the need for any further addition or such products can be produced froma ceramic body formulated by additions of other raw materials such as feldspar andsilica sand. In either case, the mineralogical make-up of the clay component plays adominating role in the fabrication and properties of the ceramic product. This study wassparked off by a peculiar result observed in one of five local ball clay samples that wereused to reformulate a ceramic body. Initial characterisation tests conducted on the claysindicated that these clays can be classified as kaolinitic. However, one of these claysproduced a ceramic body that is distinctively different in terms of whiteness, smoothnessand density as compared to the other four clays. Careful re-examination of othercharacterisation data, such as particle size distribution and chemical analysis, failed tooffer any plausible explanation. Consequently, the mineralogical analysis by X-raydiffraction was repeated by paying meticulous attention to specimen preparation.Diffraction data for the clay with anomalous behaviour indicated the presence of a ~I0Apeak that diminished when the same specimen was re-tested after heating in an oven at120°C whilst the other four clays only exhibit the characteristic kaolinite(Al2O3.2SiO2.2H2O) and muscovite peaks at ~7A and ~10A before and after heattreatment. This suggests the presence of the mineral halloysite (Al2O3.2SiO2.4H2O) inthat particular clay. This difference in mineralogy can be attributed to account for thevariations in physical properties of the final product. Consequently, this paper reviews ingeneral the precautionary measures that must be adhered to during any mineralogicalinvestigation of clay minerals or clay-based materials. The common pitfalls duringspecimen preparation, machine settings and interpretation of data are also highlighted.
INTRODUCTION
Clay minerals are essential components of clays. The other components are otherminerals, often referred to as "accessory minerals", and carbonaceous matter, both ofwhich play important roles in the forming, firing and properties of clays used in the
247
ACXRI 96ceramic industry. Particles of clay minerals have sizes < 2 u,m . Due to the extremelyfine size of the clay minerals, they were long the subject of controversy and confusion,and clarification came only with advances in analytical tools such as x-ray diffraction .Structurally, clay minerals are layer silicates (phyllosilicates) and a 1980 AssociationInternationale Pour 1'Etude des Argiles (AIPEA) Nomenclature Committee definitionstates: "clay minerals belong to the family of phyllosilicates and contain continous two-dimensional tetrahedral sheets of composition T2O5 (T = Si, Al, Fe3+, ...) with tetrahedralinked by sharing three corners of each, and with the fourth corner pointing in anydirection. The tetrahedral sheets are linked in the unit structure to octahedral sheets, or togroups of coordinated cations, or individual cations" [3l There are two ways in which thelayers are grouped in the phyllosilicates, viz. the 1:1 and 2:1 types of arrangement asshown in Figure 1. In addition, layers may be separated from one another by variousinterlayer materials, including cations, hydrated cations, organic molecules, andhydroxide octahedral groups and sheets. The total assembly of a layer plus interlayermaterial is referred to as a unit structure.This phenomenon is utilised in the identificationof clay minerals by X-ray diffraction: for example, K ions intercalate the mica 2:1 layersand the thickness of the mica structure is ~10 A; in vermiculite, the intercalating cationsare moderately hydrated resulting in a -14 A unit structure; in smectites, the cations aremore highly hydrated and the unit structure height depends on both the precise nature ofthe cation and on the humidity.
Consequently, the properties of a clay-based ceramic body formulation will begreatly affected by the mineralogical constitution of the clay. A kaolinitic clay, forinstance, will not shrink as much as that of a smectite-containing clay upon firing to thenormal production temperatures. Apart from differences in properties upon firing,differences in mineralogical constitution also have a significant influence on thefabrication of ceramic products from such bodies.
MATERIALS & METHODS
Five local ball clay samples, without any prior treatment, were used in this study(labelled as BC1, BC2, BC3, BC4 and BC5). The samples, as supplied, were quartered toobtain a sizeable portion for x-ray analysis. The samples were then oven-dried for 24hours before being carefully hand-ground to pass through a 300-mesh sieve. The groundsamples were then examined with a Philips PW 1820 diffractometer at a scanning speedof 1° 28/minute starting from 5° 29 to 60° 20.
Upon observing the anomalous behaviour of one of the clay samples in thereformulation studies, the specimen preparation for x-ray difffraction was altered. Claysamples which had been quartered were made into a thick paste with water. Using a stiffpolymer sheet, the paste was smeared with a single stroke onto a halved microscopicslide[4l The paste was air-dried overnight before being mounted onto the diffractometerspecimen holder. Scanning was conducted at the same conditions as in the previous scansexcept that the initial scanning angle was set at 1.5° 28. Subsequently, the same sampleswere left exposed overnight in a dessicator containg a concentrated solution of ethylene
248
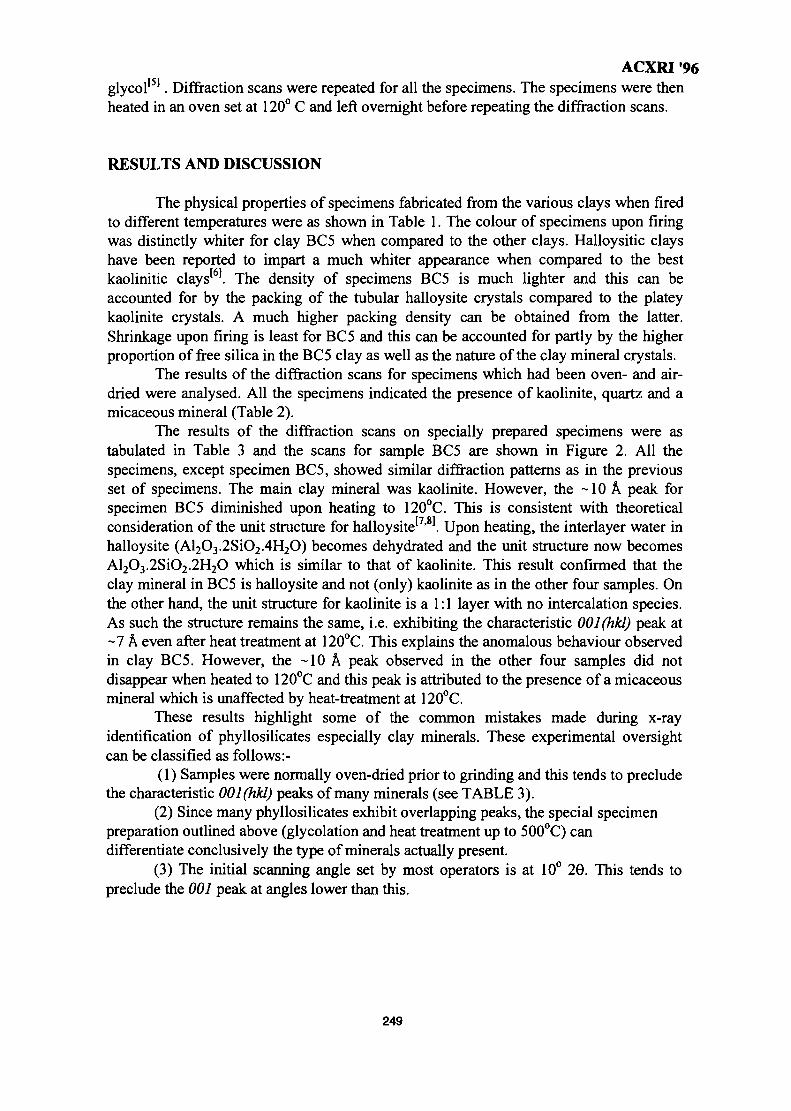
ACXRI '96glycol^ . Diffraction scans were repeated for all the specimens. The specimens were thenheated in an oven set at 120° C and left overnight before repeating the diffraction scans.
RESULTS AND DISCUSSION
The physical properties of specimens fabricated from the various clays when firedto different temperatures were as shown in Table 1. The colour of specimens upon firingwas distinctly whiter for clay BC5 when compared to the other clays. Halloysitic clayshave been reported to impart a much whiter appearance when compared to the bestkaolinitic clays . The density of specimens BC5 is much lighter and this can beaccounted for by the packing of the tubular halloysite crystals compared to the plateykaolinite crystals. A much higher packing density can be obtained from the latter.Shrinkage upon firing is least for BC5 and this can be accounted for partly by the higherproportion of free silica in the BC5 clay as well as the nature of the clay mineral crystals.
The results of the diffraction scans for specimens which had been oven- and air-dried were analysed. All the specimens indicated the presence of kaolinite, quartz and amicaceous mineral (Table 2).
The results of the diffraction scans on specially prepared specimens were astabulated in Table 3 and the scans for sample BC5 are shown in Figure 2. All thespecimens, except specimen BC5, showed similar diffraction patterns as in the previousset of specimens. The main clay mineral was kaolinite. However, the ~ 10 A peak forspecimen BC5 diminished upon heating to 120°C. This is consistent with theoreticalconsideration of the unit structure for halloysite'7'81. Upon heating, the interlayer water inhalloysite (Al2O3.2SiO2.4H2O) becomes dehydrated and the unit structure now becomesAl2O3.2SiO2.2H2O which is similar to that of kaolinite. This result confirmed that theclay mineral in BC5 is halloysite and not (only) kaolinite as in the other four samples. Onthe other hand, the unit structure for kaolinite is a 1:1 layer with no intercalation species.As such the structure remains the same, i.e. exhibiting the characteristic 001 (hkl) peak at~7 A even after heat treatment at 120°C. This explains the anomalous behaviour observedin clay BC5. However, the -10 A peak observed in the other four samples did notdisappear when heated to 120°C and this peak is attributed to the presence of a micaceousmineral which is unaffected by heat-treatment at 120°C.
These results highlight some of the common mistakes made during x-rayidentification of phyllosilicates especially clay minerals. These experimental oversightcan be classified as follows:-
(1) Samples were normally oven-dried prior to grinding and this tends to precludethe characteristic 001 (hkl) peaks of many minerals (see TABLE 3).
(2) Since many phyllosilicates exhibit overlapping peaks, the special specimenpreparation outlined above (glycolation and heat treatment up to 500°C) candifferentiate conclusively the type of minerals actually present.
(3) The initial scanning angle set by most operators is at 10° 20. This tends topreclude the 001 peak at angles lower than this.
249
ACXRI '96CONCLUSION
Diffraction data for clays needs to be intrepreted with caution. A soundunderstanding of the clay mineralogy is necessary before embarking on x-ray diffractionanalysis of clays. This would save considerable time, avoids erroneous interpretations andassures a much more meaningful conclusion. An appreciation of the mineralogical make-up of clay(s) used in ceramic body formulations is necesssary in order to optimise themanufacturing technology that entails. Close correlation between mineralogicalconstitution and properties of the final product had been proven. In many instances, themineralogical constitution can be much more helpful than chemical (elemental) analysis.
REFERENCES
[1] D. Carroll; Geol. Soc. Amer., Special Paper 126 (1971)[2] Tuan Besar Tuan Sarif and Radzali Othman; Mineralogi Lempung (Translation),
Dewan Bahasa & Pustaka, Kuala Lumpur (1993).[3] S.W. Bailey; Clay Minerals, I5_, 85-93 (1980).[4] R.J. Gibbs; Amer. Min., 5J>, 741 -751 (1965).[5] G. Brunton; Amer. Min.,4Q, 124-6 (1955).[6] F.H. Norton; Fine Ceramics, McGraw-Hill Co., USA (1970).[7] G.W. Brindley and G. Brown; Crystal Structures of Clay Minerals and their X-
Ray Identification, Mineralogical Soc, London (1980).[8] Radzali Othman; Ph.D. Thesis, University of Sheffield (1982).
250
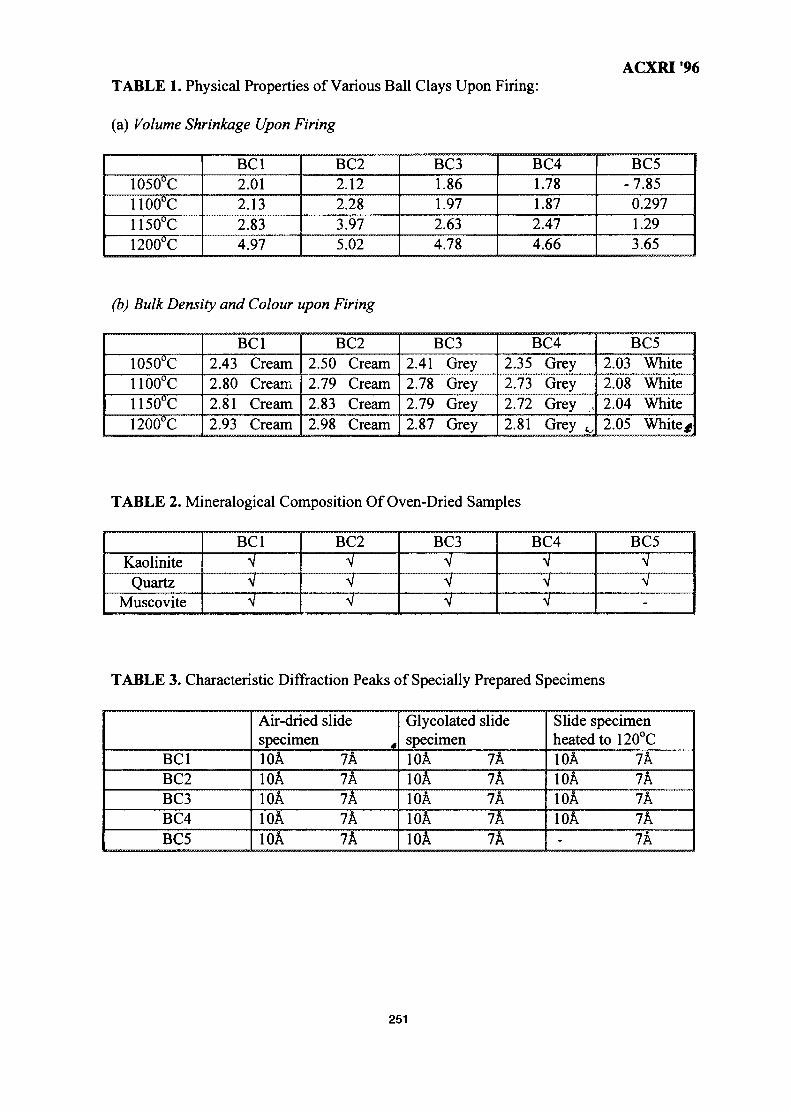
AGXRI '96TABLE 1. Physical Properties of Various Ball Clays Upon Firing:
(a) Volume Shrinkage Upon Firing
1050°C1100°C1150°C1200°C
BC12.012.132.834.97
BC22.122.283.975.02
BC31.861.972.634.78
BC41.781.872.474.66
BC5-7.85
0.2971.293.65
(b) Bulk Density and Colour upon Firing
1050°C1100°C1150°C1200°C
BC12.432.802.812.93
CreamCreamCreamCream
BC22.502.792.832.98
CreamCreamCreamCream
BC32.412.782.792.87
GreyGreyGreyGrey
BC42.352.732.722.81
GreyGreyGrey _,Grey ^
BC52.032.082.042.05
WhiteWhiteWhiteWhiter
TABLE 2. Mineralogical Composition Of Oven-Dried Samples
KaoliniteQuartz
Muscovite
BC1
VV
BC2
VVV
BC3VV
BC4VVV
BC5
VV-
TABLE 3. Characteristic Diffraction Peaks of Specially Prepared Specimens
BC1BC2BC3BC4BC5
Air-driedspecimen10A10A10A10A10A
slide
7A7A7A7AIk
Glycolatedspecimen10A10A10A10A10A
slide
IkIkIkIkIk
Slide specimenheated to 120°C10A10A10A10A-
7A7A7A7A7A
251
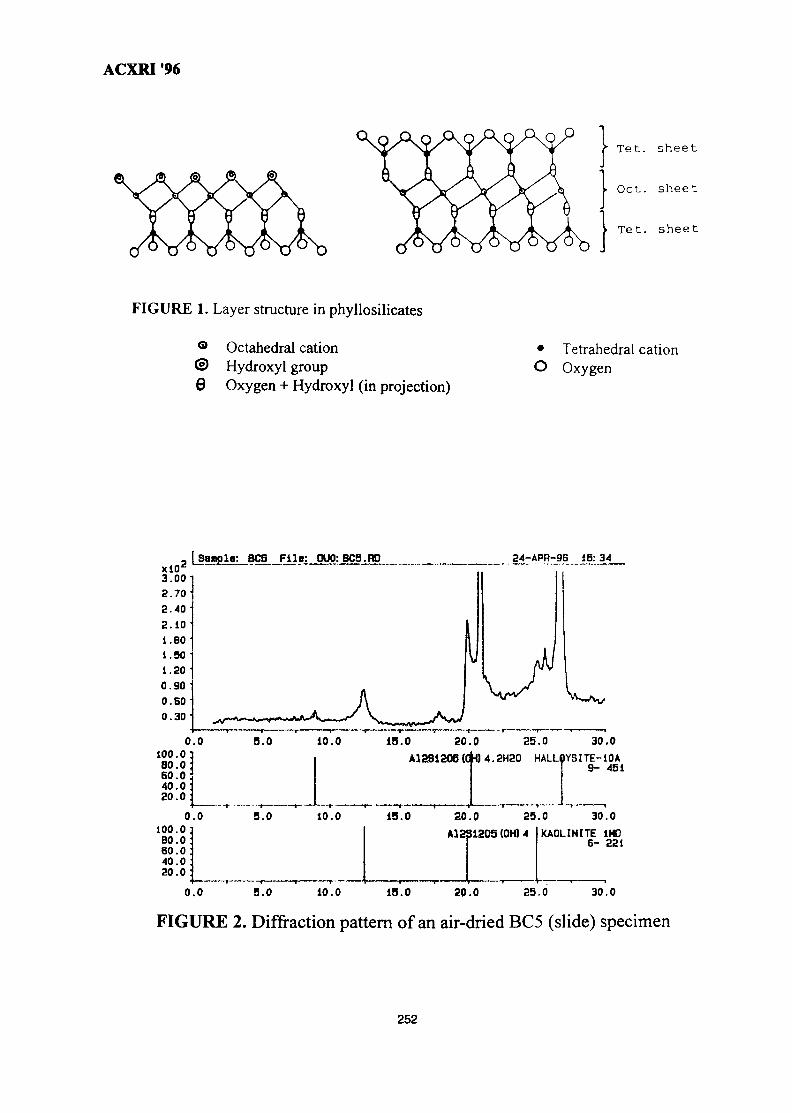
ACXRI '96
Tet. sheet
• Oct. sheet
Tet. sheet
FIGURE 1. Layer structure in phyllosilicates
® Octahedral cation© Hydroxyl group0 Oxygen + Hydroxyl (in projection)
• Tetrahedral cationO Oxygen
3.00-2.70-2.40-2.101.801.501.200.90
O.EO '0.30-
0100.0 :80.0:eo.o:40.0:20.0:
0100.0]eo.o:eo.o:40.020.0:
Sample: SCO File:
.0 5.0
.0 S.O
DU0:BC5 RD
V
AA10.0 18.0 20.
A12S120S (0
10.0 19.0 20.
A12S
24-APR-9B IB: 34
M
0 25.0 30.0
fl4.2H20 HALLDYSITE-10A9- 451
D 25.0 30.0
1205 (OH) 4 KAOLINITE 1HD6- 221
0.0 B.O 10.0 1B.0 20.0 25.0 30.0
FIGURE 2. Diffraction pattern of an air-dried BC5 (slide) specimen
252
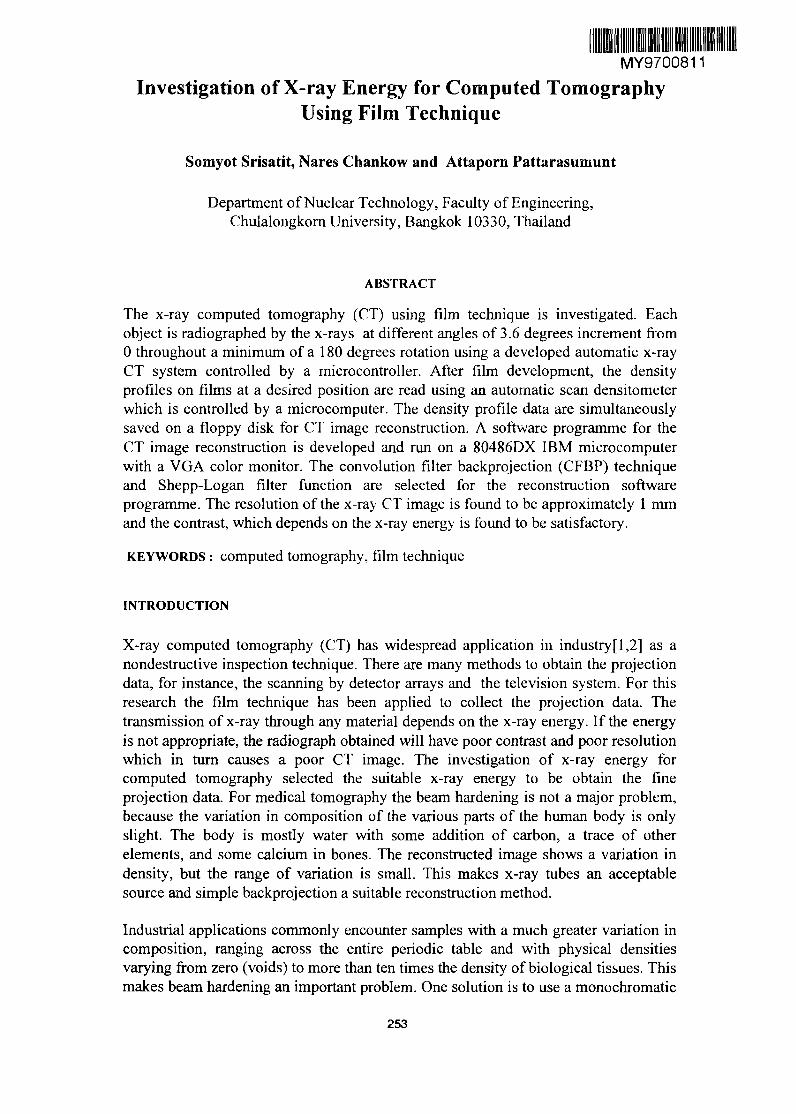
MY9700811
Investigation of X-ray Energy for Computed TomographyUsing Film Technique
Somyot Srisatit, Nares Chankow and Attaporn Pattarasumunt
Department of Nuclear Technology, Faculty of Engineering,Chulalongkorn University, Bangkok 10330, Thailand
ABSTRACT
The x-ray computed tomography (CT) using film technique is investigated. Eachobject is radiographed by the x-rays at different angles of 3.6 degrees increment from0 throughout a minimum of a 180 degrees rotation using a developed automatic x-rayCT system controlled by a microcontroller. After film development, the densityprofiles on films at a desired position are read using an automatic scan densitometerwhich is controlled by a microcomputer. The density profile data are simultaneouslysaved on a floppy disk for CT image reconstruction. A software programme for theCT image reconstruction is developed and run on a 80486DX IBM microcomputerwith a VGA color monitor. The convolution filter backprojection (CFBP) techniqueand Shepp-Logan filter function are selected for the reconstruction softwareprogramme. The resolution of the x-ray CT image is found to be approximately 1 mmand the contrast, which depends on the x-ray energy is found to be satisfactory.
KEYWORDS : computed tomography, film technique
INTRODUCTION
X-ray computed tomography (CT) has widespread application in industry [1,2] as anondestructive inspection technique. There are many methods to obtain the projectiondata, for instance, the scanning by detector arrays and the television system. For thisresearch the film technique has been applied to collect the projection data. Thetransmission of x-ray through any material depends on the x-ray energy. If the energyis not appropriate, the radiograph obtained will have poor contrast and poor resolutionwhich in turn causes a poor CT image. The investigation of x-ray energy forcomputed tomography selected the suitable x-ray energy to be obtain the fineprojection data. For medical tomography the beam hardening is not a major problem,because the variation in composition of the various parts of the human body is onlyslight. The body is mostly water with some addition of carbon, a trace of otherelements, and some calcium in bones. The reconstructed image shows a variation indensity, but the range of variation is small. This makes x-ray tubes an acceptablesource and simple backprojection a suitable reconstruction method.
Industrial applications commonly encounter samples with a much greater variation incomposition, ranging across the entire periodic table and with physical densitiesvarying from zero (voids) to more than ten times the density of biological tissues. Thismakes beam hardening an important problem. One solution is to use a monochromatic
253
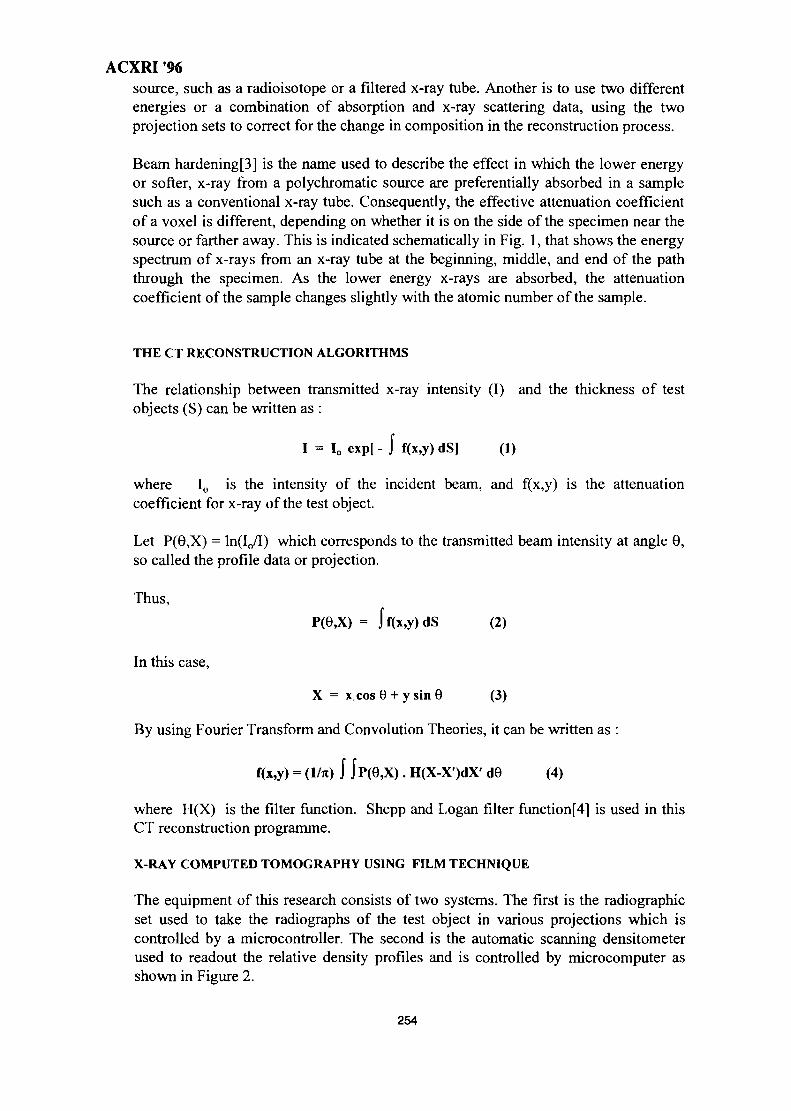
ACXRI '96source, such as a radioisotope or a filtered x-ray tube. Another is to use two differentenergies or a combination of absorption and x-ray scattering data, using the twoprojection sets to correct for the change in composition in the reconstruction process.
Beam hardening [3] is the name used to describe the effect in which the lower energyor softer, x-ray from a polychromatic source are preferentially absorbed in a samplesuch as a conventional x-ray tube. Consequently, the effective attenuation coefficientof a voxel is different, depending on whether it is on the side of the specimen near thesource or farther away. This is indicated schematically in Fig. 1, that shows the energyspectrum of x-rays from an x-ray tube at the beginning, middle, and end of the paththrough the specimen. As the lower energy x-rays are absorbed, the attenuationcoefficient of the sample changes slightly with the atomic number of the sample.
THE CT RECONSTRUCTION ALGORITHMS
The relationship between transmitted x-ray intensity (I) and the thickness of testobjects (S) can be written as :
I = Io exp[ - J f(x,y) dS] (1)
where Io is the intensity of the incident beam, and f(x,y) is the attenuationcoefficient for x-ray of the test object.
Let P(0,X) = ln(Io/I) which corresponds to the transmitted beam intensity at angle 9,so called the profile data or projection.
Thus,
P(9,X) = jf(x,y)dS (2)
In this case,
X = xcosO + ysinG (3)
By using Fourier Transform and Convolution Theories, it can be written as :
f(x,y) = (1/TI) j JP(0,X). H(X-X')dX' d0 (4)
where H(X) is the filter function. Shepp and Logan filter function[4] is used in thisCT reconstruction programme.
X-RAY COMPUTED TOMOGRAPHY USING FILM TECHNIQUE
The equipment of this research consists of two systems. The first is the radiographicset used to take the radiographs of the test object in various projections which iscontrolled by a microcontroller. The second is the automatic scanning densitometerused to readout the relative density profiles and is controlled by microcomputer asshown in Figure 2.
254
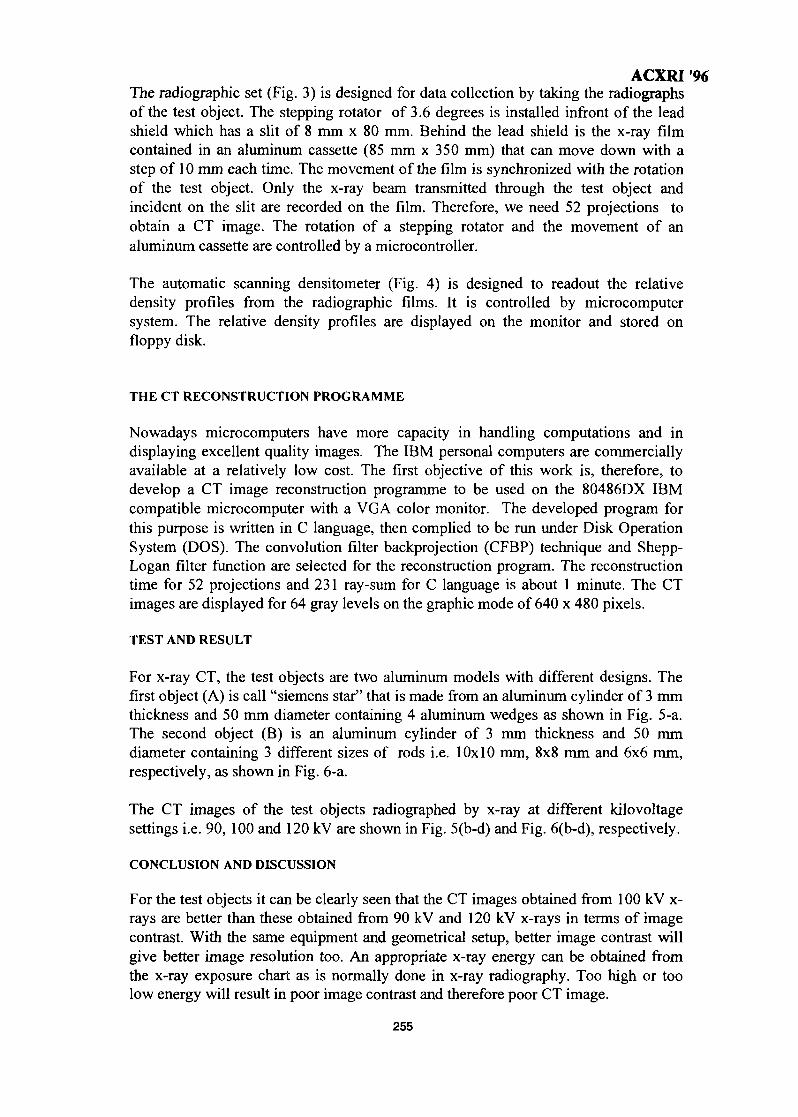
ACXRI '96The radiographic set (Fig. 3) is designed for data collection by taking the radiographsof the test object. The stepping rotator of 3.6 degrees is installed infront of the leadshield which has a slit of 8 mm x 80 mm. Behind the lead shield is the x-ray filmcontained in an aluminum cassette (85 mm x 350 mm) that can move down with astep of 10 mm each time. The movement of the film is synchronized with the rotationof the test object. Only the x-ray beam transmitted through the test object andincident on the slit are recorded on the film. Therefore, we need 52 projections toobtain a CT image. The rotation of a stepping rotator and the movement of analuminum cassette are controlled by a microcontroller.
The automatic scanning densitometer (Fig. 4) is designed to readout the relativedensity profiles from the radiographic films. It is controlled by microcomputersystem. The relative density profiles are displayed on the monitor and stored onfloppy disk.
THE CT RECONSTRUCTION PROGRAMME
Nowadays microcomputers have more capacity in handling computations and indisplaying excellent quality images. The IBM personal computers are commerciallyavailable at a relatively low cost. The first objective of this work is, therefore, todevelop a CT image reconstruction programme to be used on the 80486DX IBMcompatible microcomputer with a VGA color monitor. The developed program forthis purpose is written in C language, then complied to be run under Disk OperationSystem (DOS). The convolution filter backprojection (CFBP) technique and Shepp-Logan filter function are selected for the reconstruction program. The reconstructiontime for 52 projections and 231 ray-sum for C language is about 1 minute. The CTimages are displayed for 64 gray levels on the graphic mode of 640 x 480 pixels.
TEST AND RESULT
For x-ray CT, the test objects are two aluminum models with different designs. Thefirst object (A) is call "siemens star" that is made from an aluminum cylinder of 3 mmthickness and 50 mm diameter containing 4 aluminum wedges as shown in Fig. 5-a.The second object (B) is an aluminum cylinder of 3 mm thickness and 50 mmdiameter containing 3 different sizes of rods i.e. 10x10 mm, 8x8 mm and 6x6 mm,respectively, as shown in Fig. 6-a.
The CT images of the test objects radiographed by x-ray at different kilovoltagesettings i.e. 90, 100 and 120 kV are shown in Fig. 5(b-d) and Fig. 6(b-d), respectively.
CONCLUSION AND DISCUSSION
For the test objects it can be clearly seen that the CT images obtained from 100 kV x-rays are better than these obtained from 90 kV and 120 kV x-rays in terms of imagecontrast. With the same equipment and geometrical setup, better image contrast willgive better image resolution too. An appropriate x-ray energy can be obtained fromthe x-ray exposure chart as is normally done in x-ray radiography. Too high or toolow energy will result in poor image contrast and therefore poor CT image.
255

ACXRI '96
ACKNO WLEDG EMENT
We hereby express our gratitude to the Faculty of Engineering, ChulalongkornUniversity for providing the fund for this research project.
REFFERENCES
1. T SUMITRA, S SRISATIT, A PATTRASUMUNT, S PUNNACHAIYA, N CHANKOWAND M WANNA PRAPA, "A Moblie Computed Tomographic Unit for InspectingReinforced Concrete Columns", 9th Pacific Basin Nuclear Conference, Sydney, Australia,1-6 May 1994.
2. P WELLS, J R DAVIS, M J MORGAN, S S SOM, J GRANT, N BENCI and D SSKERRETT, "Industrial Non-destructive Testing and Evaluation Using X-ray andGamma-ray Computed Tomography", 9th Pacific Basin Nuclear Conference, Sydney,Australia, 1-6 May 1994.
3. John C. Russ, "The Image Processing Handbook", CRC Press, 19924.. ANIL K. JAIN, "Fundamentals of Digital Image Processing", Prentice-Hall, 1989
256
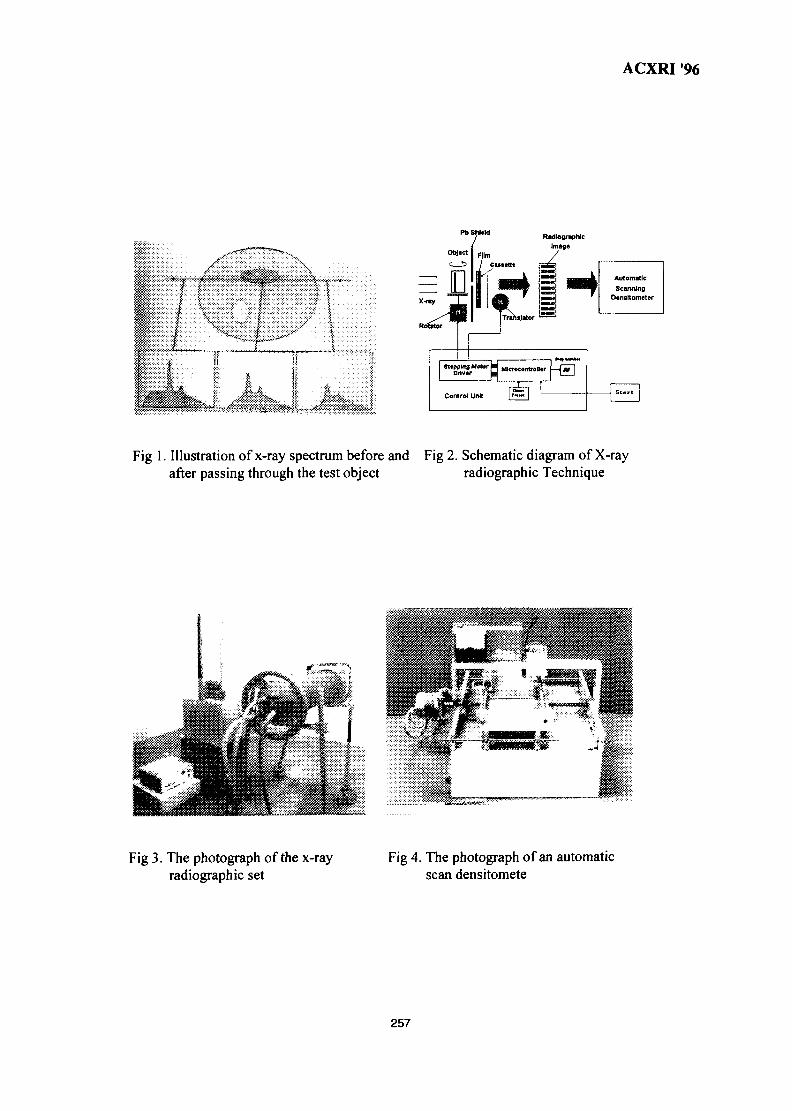
ACXRI 96
n Shield
Ob]«ct F|lm
RadiognpnlcImage
J.
hslator
Stopping Motor IDnvtr | Microcontrontr
Automatic
ScanningDensttometer
Fig 1. Illustration of x-ray spectrum before and Fig 2. Schematic diagram of X-rayafter passing through the test object radiographic Technique
Fig 3. The photograph of the x-rayradiographic set
Fig 4. The photograph of an automaticscan densitomete
257
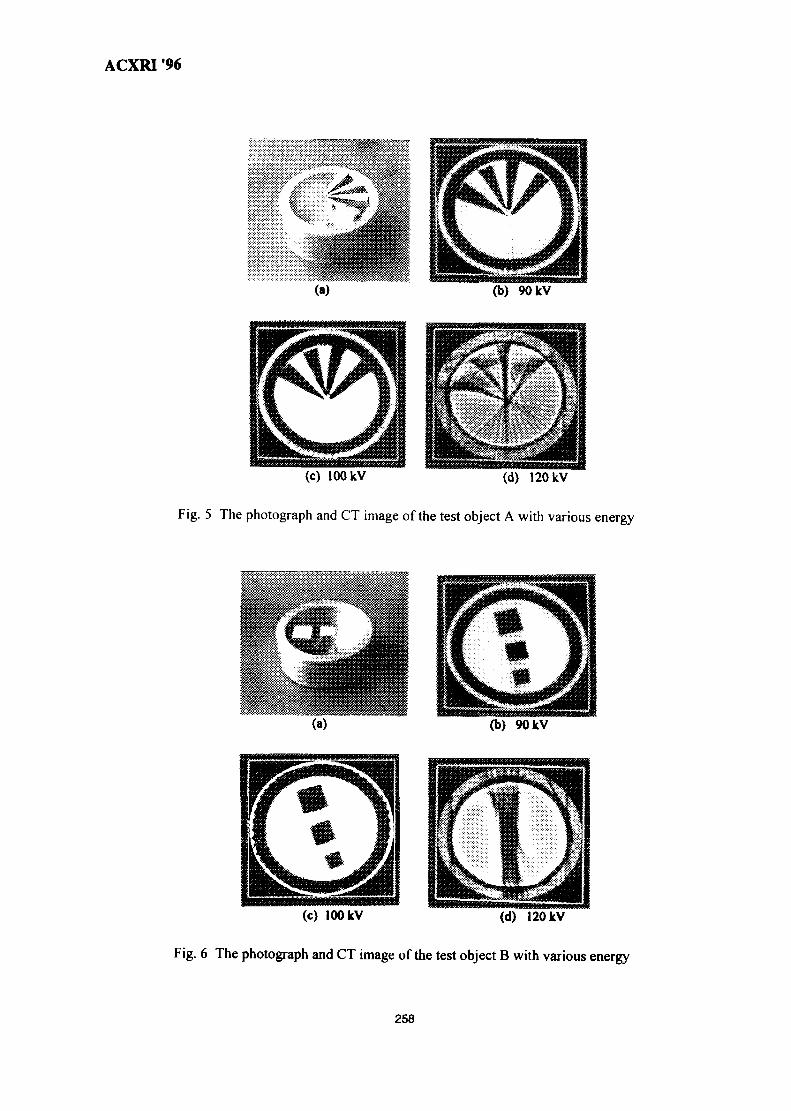
ACXRI '96
(b) 90 kV
(c) lOOkV (d) 120 kV
Fig. 5 The photograph and CT image of the test object A with various energy
(c) 100 kV (d) 120 kV
Fig. 6 The photograph and CT image of the test object B with various energy
258
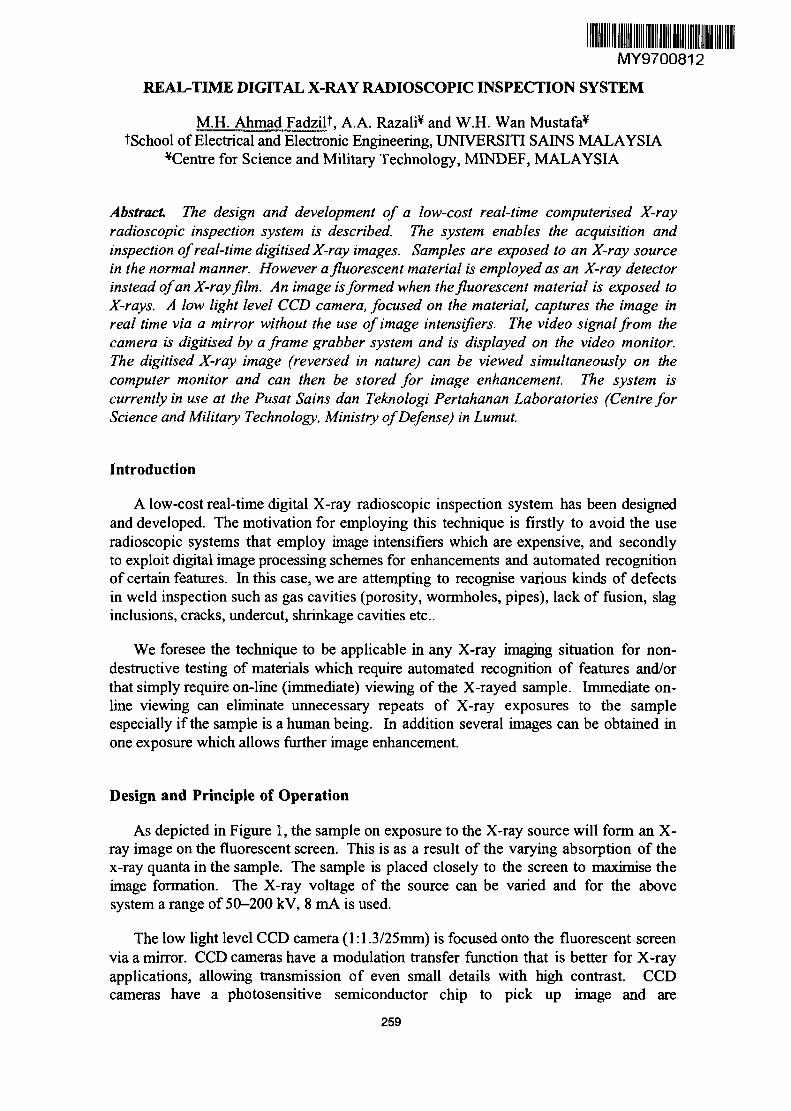
MY9700812
REAL-TIME DIGITAL X-RAY RADIOSCOPIC INSPECTION SYSTEM
M.H. Ahmad Fadzilt, A.A. Razali* and W.H. Wan Mustafa*tSchool of Electrical and Electronic Engineering, UNTVERSITI SAINS MALAYSIA
^Centre for Science and Military Technology, MINDEF, MALAYSIA
Abstract The design and development of a low-cost real-time computerised X-rayradioscopic inspection system is described. The system enables the acquisition andinspection of real-time digitised X-ray images. Samples are exposed to an X-ray sourcein the normal manner. However a fluorescent material is employed as an X-ray detectorinstead of an X-ray film. An image is formed when the fluorescent material is exposed toX-rays. A low light level CCD camera, focused on the material, captures the image inreal time via a mirror without the use of image intensifies. The video signal from thecamera is digitised by a frame grabber system and is displayed on the video monitor.The digitised X-ray image (reversed in nature) can be viewed simultaneously on thecomputer monitor and can then be stored for image enhancement. The system iscurrently in use at the Pusat Sains dan Teknologi Pertahanan Laboratories (Centre forScience and Military Technology, Ministry of Defense) in Lumut.
Introduction
A low-cost real-time digital X-ray radioscopic inspection system has been designedand developed. The motivation for employing this technique is firstly to avoid the useradioscopic systems that employ image intensifiers which are expensive, and secondlyto exploit digital image processing schemes for enhancements and automated recognitionof certain features. In this case, we are attempting to recognise various kinds of defectsin weld inspection such as gas cavities (porosity, wormholes, pipes), lack of fusion, slaginclusions, cracks, undercut, shrinkage cavities etc..
We foresee the technique to be applicable in any X-ray imaging situation for non-destructive testing of materials which require automated recognition of features and/orthat simply require on-line (immediate) viewing of the X-rayed sample. Immediate on-line viewing can eliminate unnecessary repeats of X-ray exposures to the sampleespecially if the sample is a human being. In addition several images can be obtained inone exposure which allows further image enhancement.
Design and Principle of Operation
As depicted in Figure 1, the sample on exposure to the X-ray source will form an X-ray image on the fluorescent screen. This is as a result of the varying absorption of thex-ray quanta in the sample. The sample is placed closely to the screen to maximise theimage formation. The X-ray voltage of the source can be varied and for the abovesystem a range of 50-200 kV, 8 mA is used.
The low light level CCD camera (l:1.3/25mm) is focused onto the fluorescent screenvia a mirror. CCD cameras have a modulation transfer function that is better for X-rayapplications, allowing transmission of even small details with high contrast. CCDcameras have a photosensitive semiconductor chip to pick up image and are
259
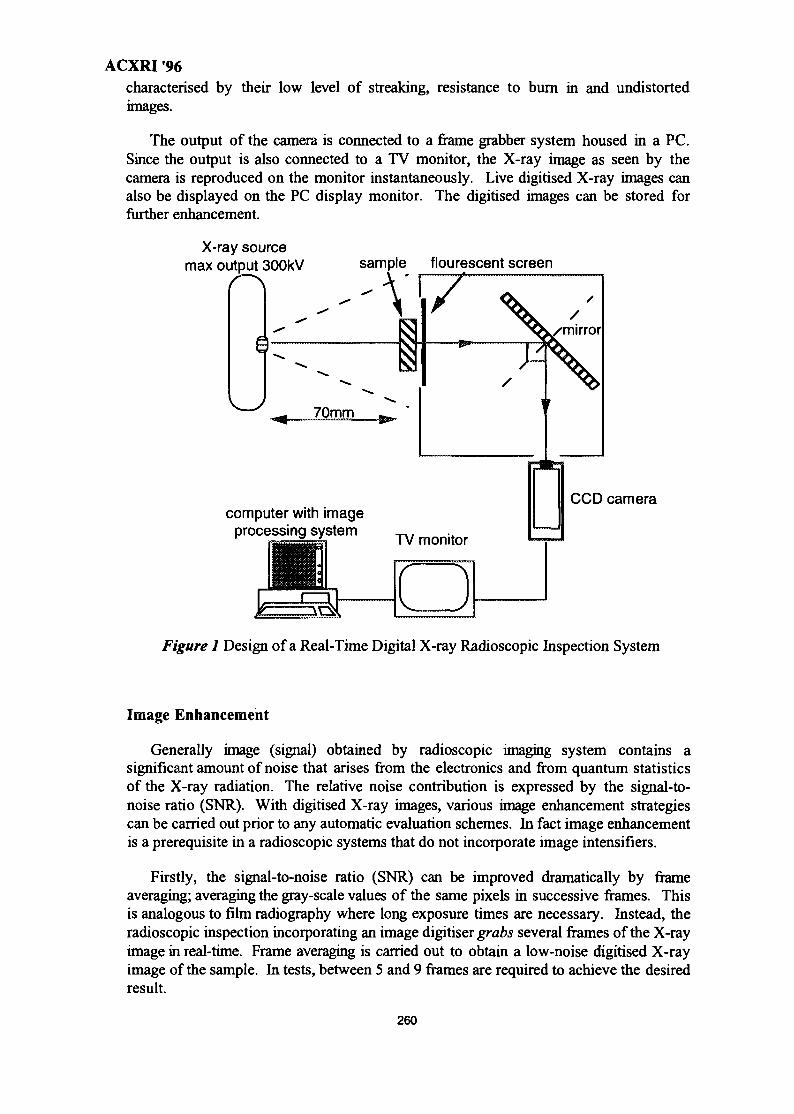
ACXRI '96characterised by their low level of streaking, resistance to burn in and undistortedimages.
The output of the camera is connected to a frame grabber system housed in a PC.Since the output is also connected to a TV monitor, the X-ray image as seen by thecamera is reproduced on the monitor instantaneously. Live digitised X-ray images canalso be displayed on the PC display monitor. The digitised images can be stored forfurther enhancement.
X-ray sourcemax output 300kV sample flourescent screen
CCD cameracomputer with image
processing systemTV monitor
Figure 1 Design of a Real-Time Digital X-ray Radioscopic Inspection System
Image Enhancement
Generally image (signal) obtained by radioscopic imaging system contains asignificant amount of noise that arises from the electronics and from quantum statisticsof the X-ray radiation. The relative noise contribution is expressed by the signal-to-noise ratio (SNR). With digitised X-ray images, various image enhancement strategiescan be carried out prior to any automatic evaluation schemes. In fact image enhancementis a prerequisite in a radioscopic systems that do not incorporate image intensifiers.
Firstly, the signal-to-noise ratio (SNR) can be improved dramatically by frameaveraging; averaging the gray-scale values of the same pixels in successive frames. Thisis analogous to film radiography where long exposure times are necessary. Instead, theradioscopic inspection incorporating an image digitiser grabs several frames of the X-rayimage in real-time. Frame averaging is carried out to obtain a low-noise digitised X-rayimage of the sample. In tests, between 5 and 9 frames are required to achieve the desiredresult.
260
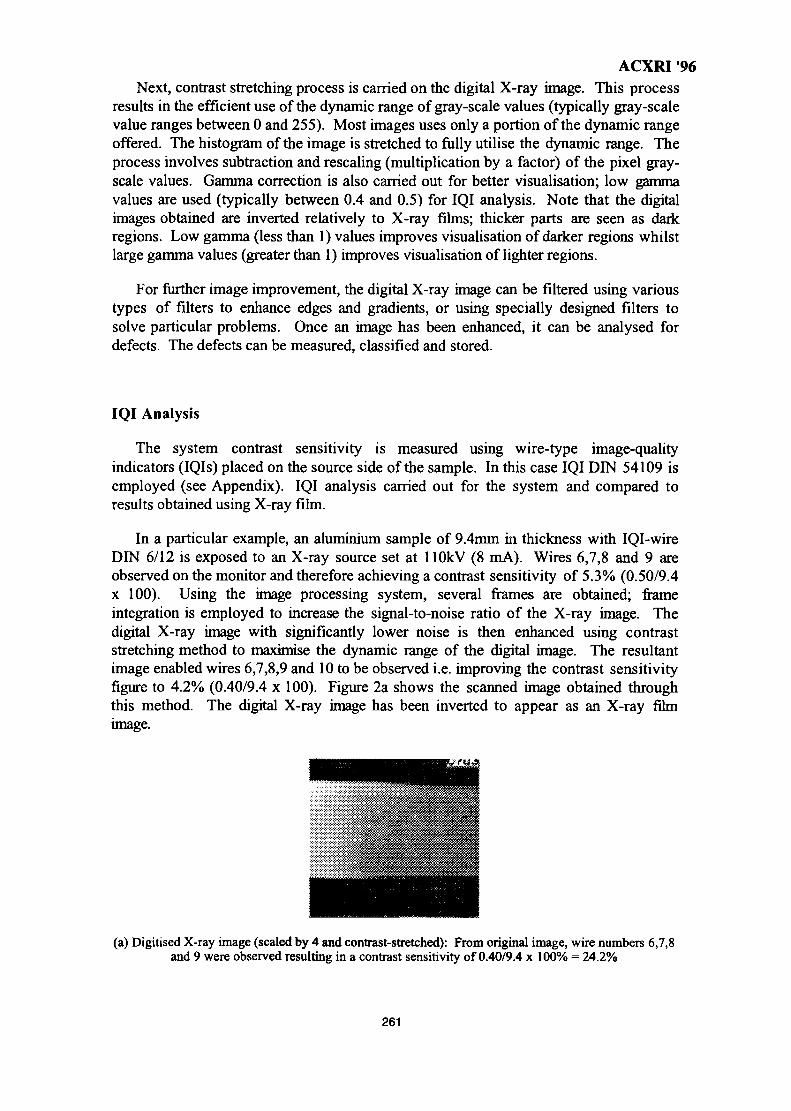
ACXRI *96Next, contrast stretching process is carried on the digital X-ray image. This process
results in the efficient use of the dynamic range of gray-scale values (typically gray-scalevalue ranges between 0 and 255). Most images uses only a portion of the dynamic rangeoffered. The histogram of the image is stretched to fully utilise the dynamic range. Theprocess involves subtraction and rescaling (multiplication by a factor) of the pixel gray-scale values. Gamma correction is also carried out for better visualisation; low gammavalues are used (typically between 0.4 and 0.5) for IQI analysis. Note that the digitalimages obtained are inverted relatively to X-ray films; thicker parts are seen as darkregions. Low gamma (less than 1) values improves visualisation of darker regions whilstlarge gamma values (greater than 1) improves visualisation of lighter regions.
For further image improvement, the digital X-ray image can be filtered using varioustypes of filters to enhance edges and gradients, or using specially designed filters tosolve particular problems. Once an image has been enhanced, it can be analysed fordefects. The defects can be measured, classified and stored.
IQI Analysis
The system contrast sensitivity is measured using wire-type image-qualityindicators (IQIs) placed on the source side of the sample. In this case IQI DIN 54109 isemployed (see Appendix). IQI analysis carried out for the system and compared toresults obtained using X-ray film.
In a particular example, an aluminium sample of 9.4mm in thickness with IQI-wireDIN 6/12 is exposed to an X-ray source set at HOkV (8 mA). Wires 6,7,8 and 9 areobserved on the monitor and therefore achieving a contrast sensitivity of 5.3% (0.50/9.4x 100). Using the image processing system, several frames are obtained; frameintegration is employed to increase the signal-to-noise ratio of the X-ray image. Thedigital X-ray image with significantly lower noise is then enhanced using contraststretching method to maximise the dynamic range of the digital image. The resultantimage enabled wires 6,7,8,9 and 10 to be observed i.e. improving the contrast sensitivityfigure to 4.2% (0.40/9.4 x 100). Figure 2a shows the scanned image obtained throughthis method. The digital X-ray image has been inverted to appear as an X-ray filmimage.
(a) Digitised X-ray image (scaled by 4 and contrast-stretched): From original image, wire numbers 6,7,8and 9 were observed resulting in a contrast sensitivity of 0.40/9.4 x 100% = 24.2%
261
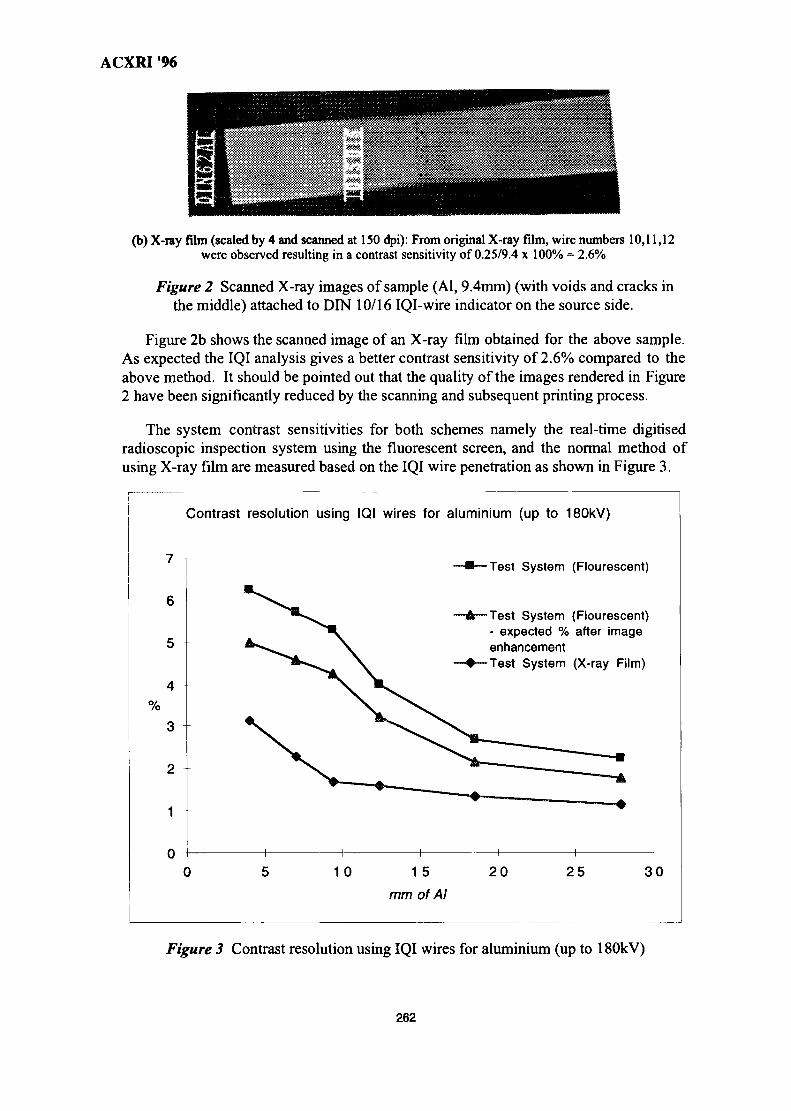
ACXRI '96
(b) X-ray film (scaled by 4 and scanned at 150 dpi): From original X-ray film, wire numbers 10,11,12were observed resulting in a contrast sensitivity of 0.25/9.4 x 100% = 2.6%
Figure 2 Scanned X-ray images of sample (Al, 9.4mm) (with voids and cracks inthe middle) attached to DIN 10/16 IQI-wire indicator on the source side.
Figure 2b shows the scanned image of an X-ray film obtained for the above sample.As expected the IQI analysis gives a better contrast sensitivity of 2.6% compared to theabove method. It should be pointed out that the quality of the images rendered in Figure2 have been significantly reduced by the scanning and subsequent printing process.
The system contrast sensitivities for both schemes namely the real-time digitisedradioscopic inspection system using the fluorescent screen, and the normal method ofusing X-ray film are measured based on the IQI wire penetration as shown in Figure 3.
7
6
5
4
3
2
1
0
Contrast resolution using IQI wires for aluminium (up to 180kV)
•Test System (Flourescent)
—A™ Test System (Flourescent)- expected % after imageenhancement
—•—Test System (X-ray Film)
0 10 15
mm of Al
20 25 30
Figure 3 Contrast resolution using IQI wires for aluminium (up to 180kV)
262
ACXRI 96Conclusion
A low cost real-time digital radioscopic system has been developed and tested. Thedigital X-ray images can be enhanced to improve contrast sensitivity/resolution. Thecontrast resolution results based on IQI wires show that the system which does notemploy image intensifiers is a practical and viable system for radioscopic inspection.
The system can now be used for defect analysis (eg size/depth of defect) and can beperformed on computer. This allows for (1) faster analysis, (2) lower cost, (3) archivingof digital images in computer which is less bulky and thus (4) easier referencing andcataloging of defects.
The system is currently under further development to incorporate several featuressuch as automatic recognition of defects and cataloging. Currently, it is planned that thesystem uses X-ray camera to obtain better contrast sensitivity/resolution (will increaseits suitability for inspection of steel samples that typically requires higher voltages 200-300kV) and thus avoid use of external fluorescent screen which actually limits the kVrange to 200kV (or less).
Acknowledgement
The work is conducted at the Pusat Sains and Teknologi Pertahanan Laboratory inLumut and at the Image Processing Research Laboratory in the School of Electrical andElectronic Engineering, Universiti Sains Malaysia. The work is financially supported byMinistry of Defense, Malaysia under an IRPA research grant. The authors would liketo thank the Director of Pusat Sains and Teknologi Pertahanan Laboratory, MINDEF,Malaysia for his support.
References
[1] J J Munro, R E McNutty, W Nuding, H P Busse, H Wiacker, R Link, K Sauerweinand R Grimm, "Weld Inspection by real-time radioscopy", Materials Evaluation, Vol.45, No. 11, pp 1303-1309. (The American Society for Nondestructive Testing, Inc.),1987.
[2] R Link, W Nuding and K Sauerwein, "Television-fluoroscopy (radioscopy) as anautomated technique in radiographic inspection", The British Journal of Non-destructiveTesting, July 1984
263
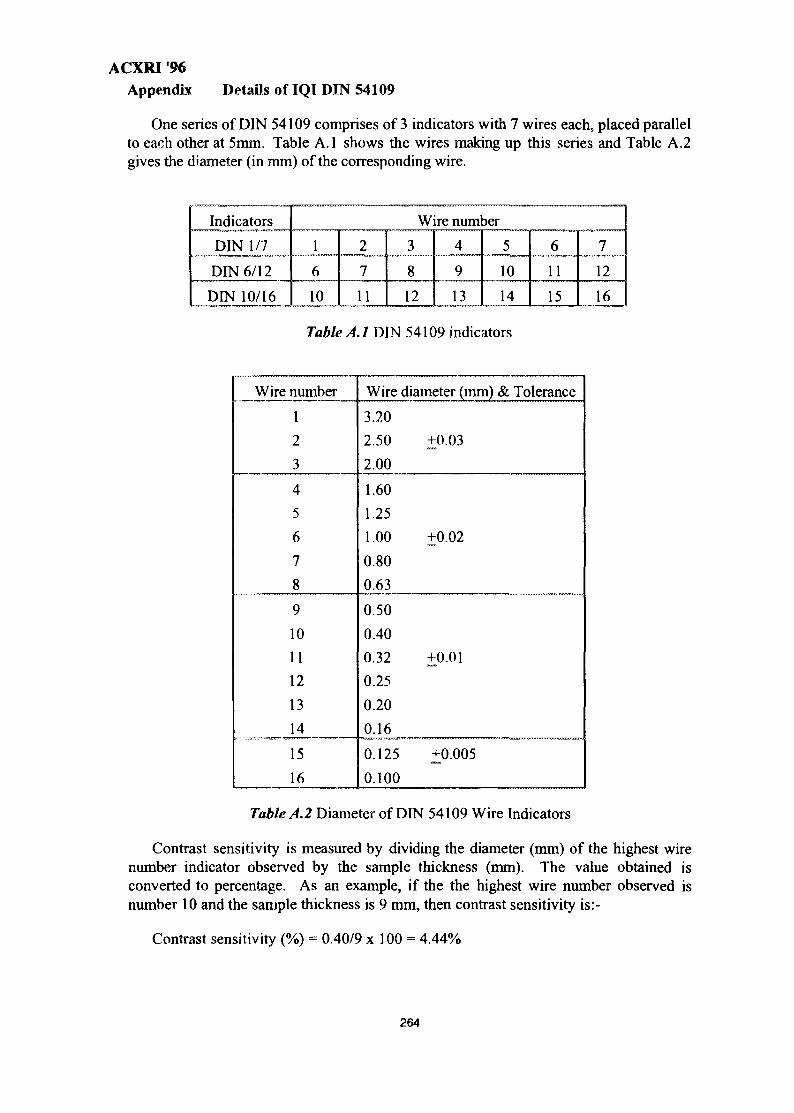
ACXRI '96Appendix Details of IQl DIN 54109
One series of DIN 54109 comprises of 3 indicators with 7 wires each, placed parallelto each other at 5mm. Table A.I shows the wires making up this series and Table A.2gives the diameter (in mm) of the corresponding wire.
Indicators
DIN 1/7
DIN 6/12
DIN 10/16
Wire number
1
6
10
2
7
11
3
8
12
4
9
13
5
10
14
6
11
15
7
12
16
Table A.I DIN 54109 indicators
Wire number
1
2
3
4
5
6
7
8
9
10
11
12
13
14
15
16
Wire
3.20
2.50
2.00
1.60
1.25
1.00
0.80
0.63
0.50
0.40
0.32
0.25
0.20
0.16
0.125
0.100
diameter (mm) & Tolerance
+0.03
+0.02
+0.01
+0.005
Table A.2 Diameter of DIN 54109 Wire Indicators
Contrast sensitivity is measured by dividing the diameter (mm) of the highest wirenumber indicator observed by the sample thickness (mm). The value obtained isconverted to percentage. As an example, if the the highest wire number observed isnumber 10 and the sample thickness is 9 mm, then contrast sensitivity is:-
Contrast sensitivity (%) = 0.40/9 x 100 = 4.44%
264
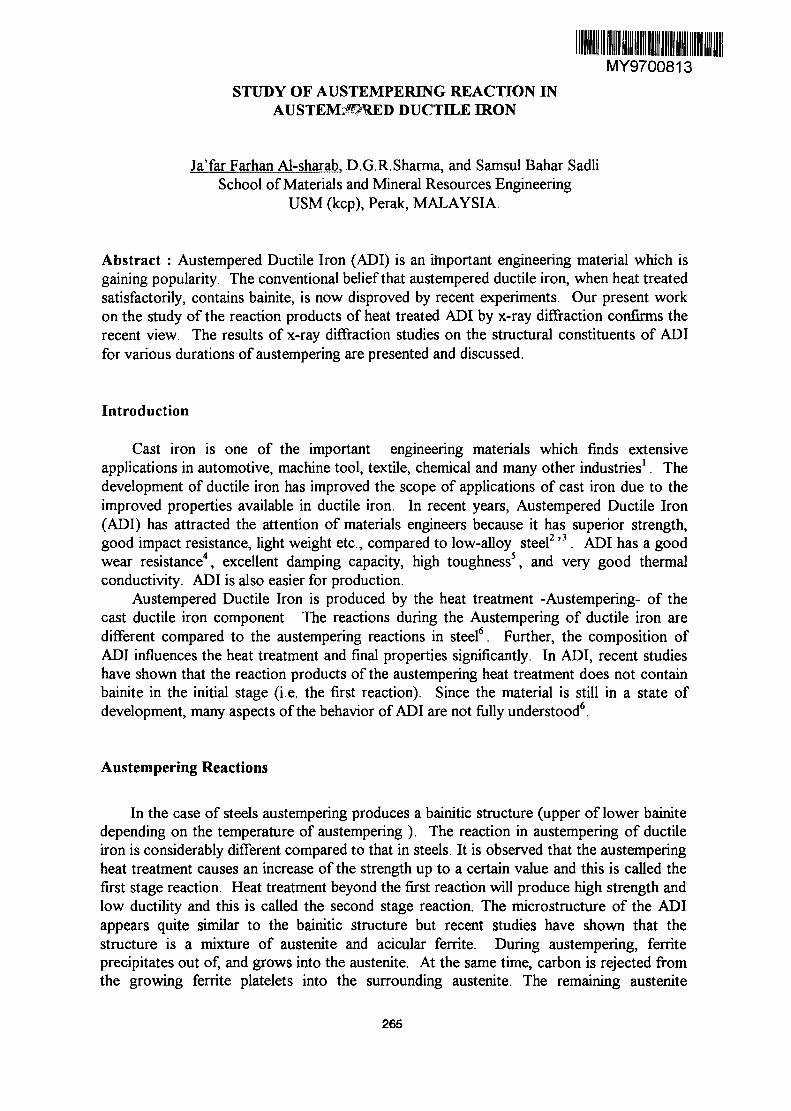
MY9700813STUDY OF AUSTEMPEREVG REACTION IN
AUSTEM^WED DUCTILE IRON
Ja'far Farhan Al-sharab. D.G.R.Sharma, and Samsul Bahar SadliSchool of Materials and Mineral Resources Engineering
USM (kcp), Perak, MALAYSIA
Abstract : Austempered Ductile Iron (ADI) is an important engineering material which isgaining popularity. The conventional belief that austempered ductile iron, when heat treatedsatisfactorily, contains bainite, is now disproved by recent experiments. Our present workon the study of the reaction products of heat treated ADI by x-ray diffraction confirms therecent view. The results of x-ray diffraction studies on the structural constituents of ADIfor various durations of austempering are presented and discussed.
Introduction
Cast iron is one of the important engineering materials which finds extensiveapplications in automotive, machine tool, textile, chemical and many other industries1. Thedevelopment of ductile iron has improved the scope of applications of cast iron due to theimproved properties available in ductile iron. In recent years, Austempered Ductile Iron(ADI) has attracted the attention of materials engineers because it has superior strength,good impact resistance, light weight etc., compared to low-alloy steel2 '3 . ADI has a goodwear resistance4, excellent damping capacity, high toughness5, and very good thermalconductivity. ADI is also easier for production.
Austempered Ductile Iron is produced by the heat treatment -Austempering- of thecast ductile iron component. The reactions during the Austempering of ductile iron aredifferent compared to the austempering reactions in steel6. Further, the composition ofADI influences the heat treatment and final properties significantly. In ADI, recent studieshave shown that the reaction products of the austempering heat treatment does not containbainite in the initial stage (i.e. the first reaction). Since the material is still in a state ofdevelopment, many aspects of the behavior of ADI are not fully understood6.
Austempering Reactions
In the case of steels austempering produces a bainitic structure (upper of lower bainitedepending on the temperature of austempering ). The reaction in austempering of ductileiron is considerably different compared to that in steels. It is observed that the austemperingheat treatment causes an increase of the strength up to a certain value and this is called thefirst stage reaction. Heat treatment beyond the first reaction will produce high strength andlow ductility and this is called the second stage reaction. The microstructure of the ADIappears quite similar to the bainitic structure but recent studies have shown that thestructure is a mixture of austenite and acicular ferrite. During austempering, ferriteprecipitates out of, and grows into the austenite. At the same time, carbon is rejected fromthe growing ferrite platelets into the surrounding austenite. The remaining austenite
265
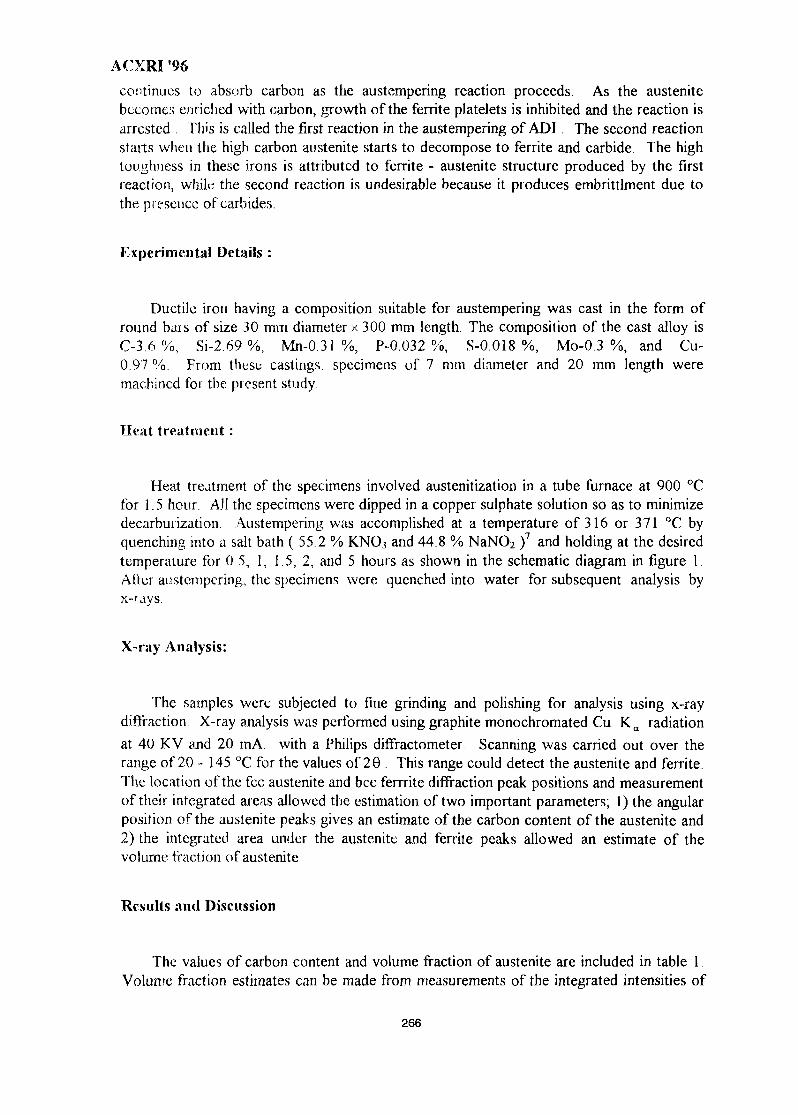
ACXRI '96
continues to absorb carbon as the austempering reaction proceeds. As the austenitebecomes enriched with carbon, growth of the ferrite platelets is inhibited and the reaction isarrested This is called the first reaction in the austempering of ADI . The second reactionstarts when the high carbon austenite starts to decompose to ferrite and carbide. The hightoughness in these irons is attributed to ferrite - austenite structure produced by the firstreaction, while the second reaction is undesirable because it produces embrittlment due tothe presence of carbides.
Experimental Details :
Ductile iron having a composition suitable for austempering was cast in the form ofround bars of size 30 mm diameter x 300 mm length. The composition of the cast alloy isC-3.6%, Si-2.69 %, Mn-0.31 %, P-0.U32 %, S-0.018 %, Mo-0.3 %, and Cu-0.97 %. From these castings, specimens of 7 mm diameter and 20 mm length weremachined for the present study.
Heat treatment :
Heat treatment of the specimens involved austenitization in a tube furnace at 900 °Cfor 1.5 hour. All the specimens were dipped in a copper sulphate solution so as to minimizedecarburization. Austempering was accomplished at a temperature of 316 or 371 °C byquenching into a salt bath ( 55.2 % KN03 and 44.8 % NaNO2 )
7 and holding at the desiredtemperature for 0 5, 1, 1.5, 2, and 5 hours as shown in the schematic diagram in figure 1.Alter austempering, the specimens were quenched into water for subsequent analysis byx-rays.
X-ray Analysis:
The samples were subjected to fine grinding and polishing for analysis using x-raydiffraction X-ray analysis was performed using graphite monochromated Cu Ka radiationat 40 KV and 20 mA. with a Philips diffractometer Scanning was carried out over therange of 20 - 145 °C for the values of 29 . This range could detect the austenite and ferrite.The location of the fee austenite and bec ferrrite diffraction peak positions and measurementof their integrated areas allowed the estimation of two important parameters; 1) the angularposition of the austenite peaks gives an estimate of the carbon content of the austenite and2) the integrated area under the austenite and ferrite peaks allowed an estimate of thevolume fraction of austenite
Results and Discussion
The values of carbon content and volume fraction of austenite are included in table 1.Volume fraction estimates can be made from measurements of the integrated intensities of
266
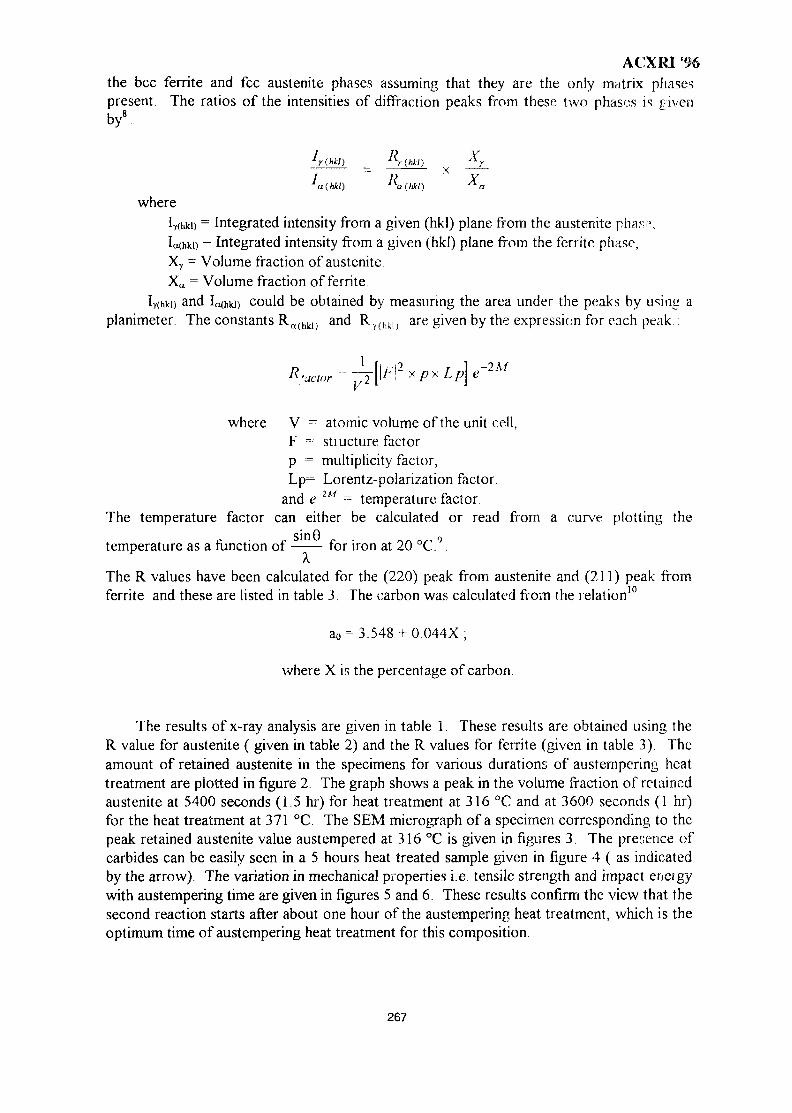
ACXRI 96the bcc ferrite and fee austenite phases assuming that they are the only matrix phasespresent. The ratios of the intensities of diffraction peaks from these two phases is pivenby8
I /? X Y'a (hkl) lya(hkl) ^ a
wherely(hki) = Integrated intensity from a given (hkl) plane from the austenite phas1,Itt(hki) = Integrated intensity from a given (hkl) plane from the ferrite phase,Xy = Volume fraction of austenite.Xa = Volume fraction of ferrite.
ly(hki) and Ia(hki) could be obtained by measuring the area under the peaks by using aplanimeter. The constants Ra(hkl) and Ry(hkl) are given by the expression for each peak.:
R'actor = 7 ^ " l^ r XPX
where V - atomic volume of the unit cell,F = structure factorp = multiplicity factor,Lp= Lorentz-polarization factor,
and e1M = temperature factor.The temperature factor can either be calculated or read from a curve plotting the
temperature as a function of for iron at 20 °C.°.A.
The R values have been calculated for the (220) peak from austenite and (211) peak fromferrite and these are listed in table 3. The carbon was calculated from the relation1"
ao = 3.548 + 0.044X,
where X is the percentage of carbon.
The results of x-ray analysis are given in table 1 These results are obtained using theR value for austenite ( given in table 2) and the R values for ferrite (given in table 3). Theamount of retained austenite in the specimens for various durations of austempering heattreatment are plotted in figure 2. The graph shows a peak in the volume fraction of retainedaustenite at 5400 seconds (1.5 hr) for heat treatment at 316 °C and at 3600 seconds (1 hr)for the heat treatment at 371 °C. The SEM micrograph of a specimen corresponding to thepeak retained austenite value austempered at 316 °C is given in figures 3. The presence ofcarbides can be easily seen in a 5 hours heat treated sample given in figure 4 ( as indicatedby the arrow). The variation in mechanical properties i.e. tensile strength and impact eneigywith austempering time are given in figures 5 and 6. These results confirm the view that thesecond reaction starts after about one hour of the austempering heat treatment, which is theoptimum time of austempering heat treatment for this composition.
267
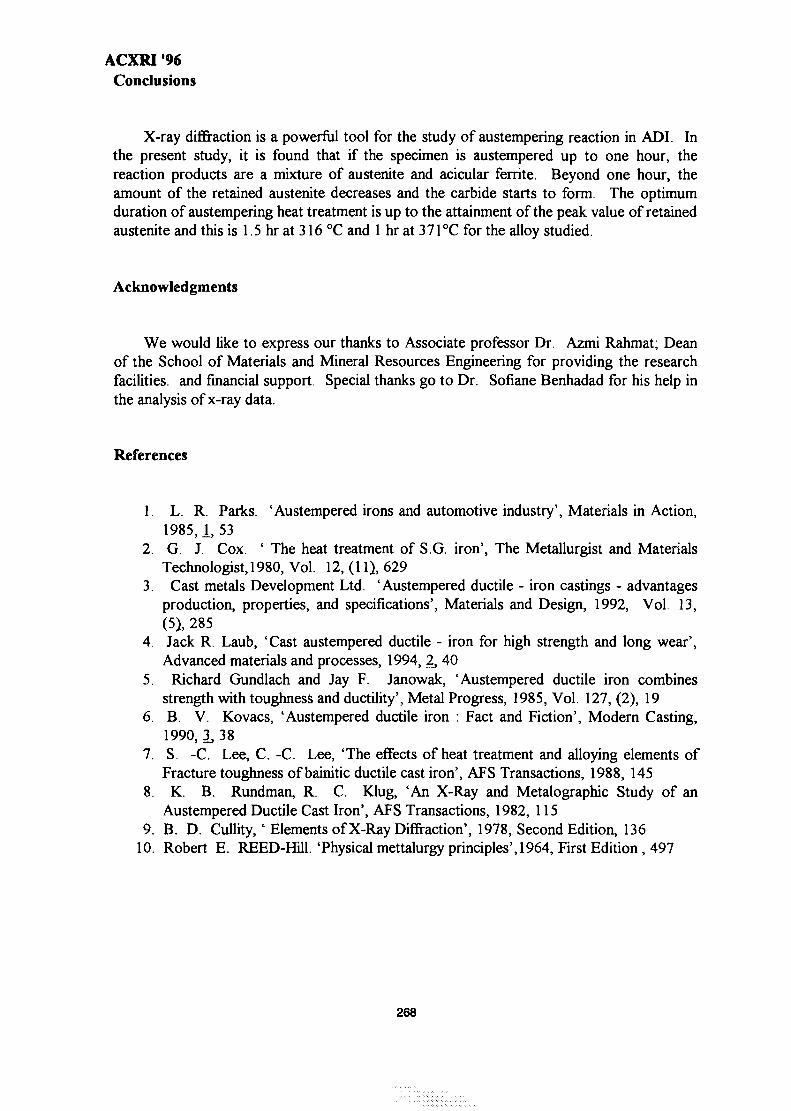
ACXRI '96Conclusions
X-ray diffraction is a powerful tool for the study of austempering reaction in ADI. Inthe present study, it is found that if the specimen is austempered up to one hour, thereaction products are a mixture of austenite and acicular ferrite. Beyond one hour, theamount of the retained austenite decreases and the carbide starts to form. The optimumduration of austempering heat treatment is up to the attainment of the peak value of retainedaustenite and this is 1.5 hr at 316 °C and 1 hr at 371°C for the alloy studied.
Acknowledgments
We would like to express our thanks to Associate professor Dr. Azmi Rahmat; Deanof the School of Materials and Mineral Resources Engineering for providing the researchfacilities, and financial support. Special thanks go to Dr. Sofiane Benhadad for his help inthe analysis of x-ray data.
References
1. L. R. Parks. 'Austempered irons and automotive industry', Materials in Action,1985,1, 53
2. G. J. Cox. ' The heat treatment of S.G. iron', The Metallurgist and MaterialsTechnologist, 1980, Vol. 12, (11), 629
3. Cast metals Development Ltd. 'Austempered ductile - iron castings - advantagesproduction, properties, and specifications', Materials and Design, 1992, Vol. 13,(5), 285
4. Jack R. Laub, 'Cast austempered ductile - iron for high strength and long wear',Advanced materials and processes, 1994, 2, 40
5. Richard Gundlach and Jay F. Janowak, 'Austempered ductile iron combinesstrength with toughness and ductility', Metal Progress, 1985, Vol. 127, (2), 19
6. B. V. Kovacs, 'Austempered ductile iron : Fact and Fiction', Modern Casting,1990, 3, 38
7. S. -C. Lee, C. -C. Lee, 'The effects of heat treatment and alloying elements ofFracture toughness of bainitic ductile cast iron', AFS Transactions, 1988, 145
8. K. B. Rundman, R. C. Klug, 'An X-Ray and Metalographic Study of anAustempered Ductile Cast Iron', AFS Transactions, 1982, 115
9. B. D. Cullity, ' Elements of X-Ray Diffraction', 1978, Second Edition, 13610. Robert E. REED-Hill. 'Physical mettalurgy principles', 1964, First Edition , 497
268
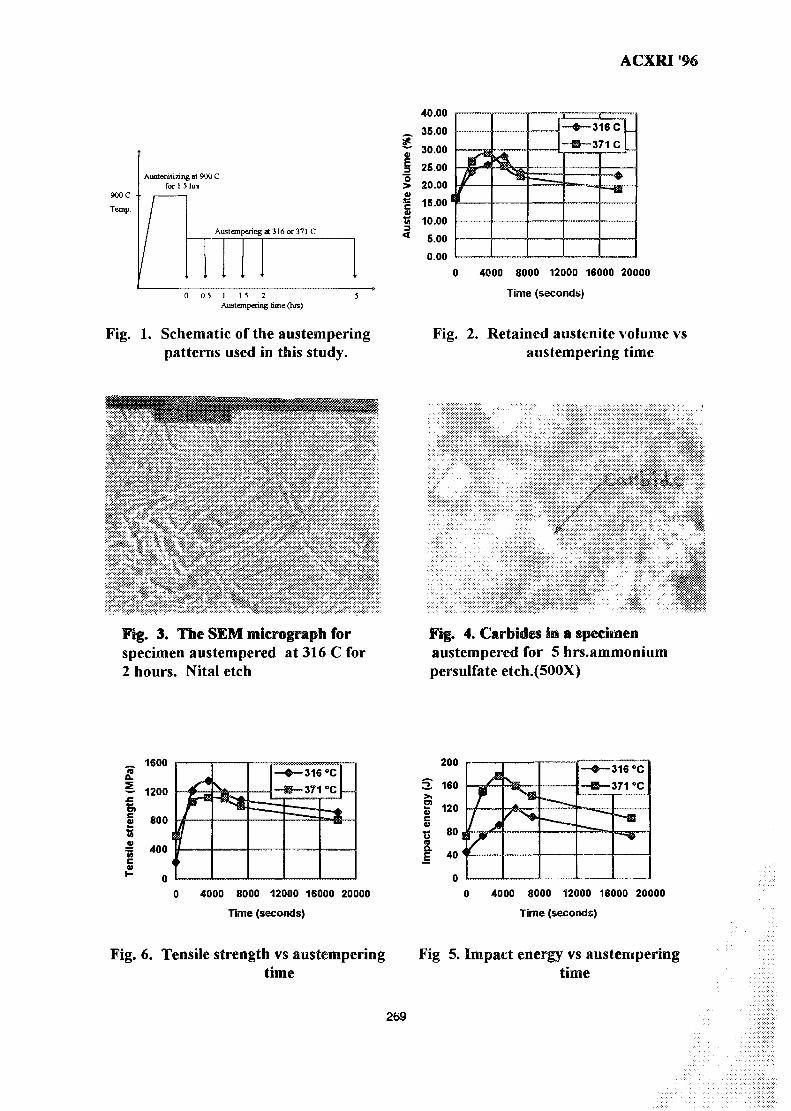
ACXRI '96
900C •
Temp
Auatenitizinfor 15
1
/
/
hrsJOC
Austempering at 316 or 371 C
0 05 1 15 2Auatempenng lime (hre)
Fig. 1. Schematic of the austemperingpatterns used in this study.
o
I
40.00
35.00
30.00
25.00
20.00
15.00
10.00
5.00
0.00
/
/
—-—„
—«-~316cL-Eh-371 C L
0 4000 8000 12000 16000 20000
Time (seconds)
Fig. 2. Retained austenite volume vsaustempering time
*
Fig. 3. The SEM micrograph forspecimen austempered at 316 C for2 hours. Nitai etch
Fig. 4. Carbides in a specimenaustempered for 5 hrs.ammoniumpersulfate etch.(500X)
_. 1600
| 400
tt
" ' • — .
—•— 316 °C
•••Hi• •
—
0 4000 8000 12000 16000
Time (seconds)
200
S 160
i1 120
•Q 80
I 40n
20000
lyA. L ,
J16°C
J71°C
4000 8000 12000 16000 20000
Time (seconds)
Fig. 6. Tensile strength vs austempering Fig 5. Impact energy vs austemperingtime time
269
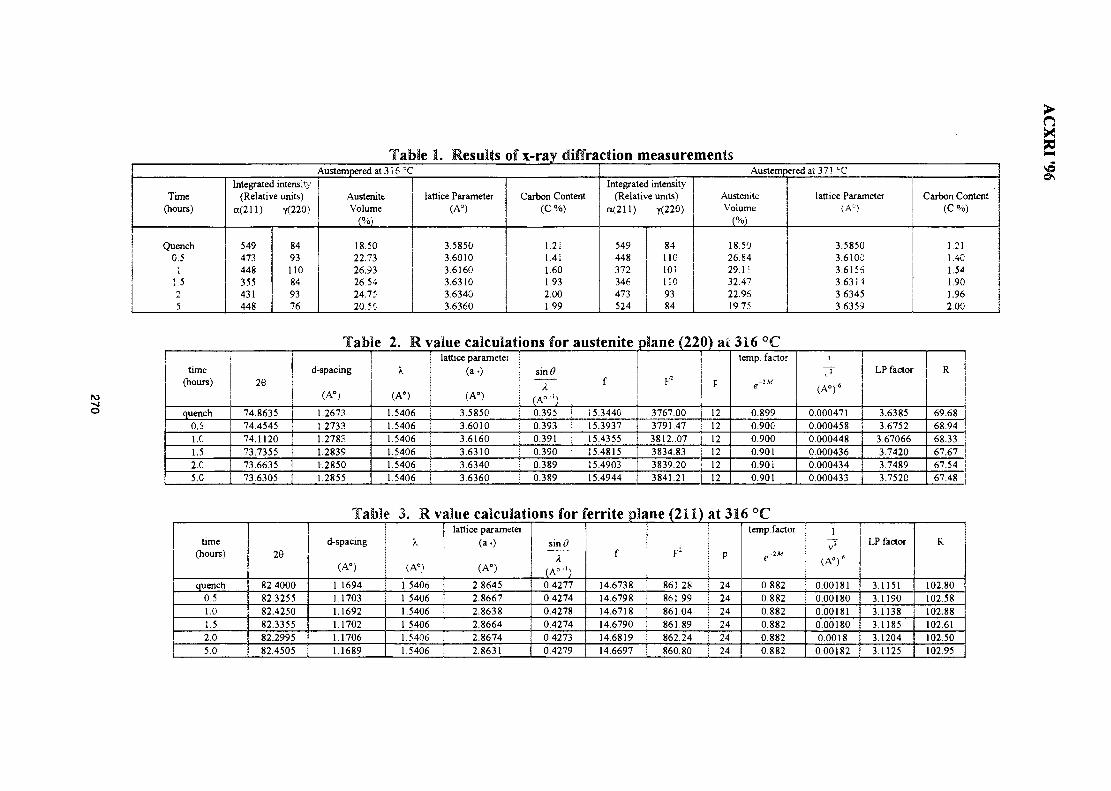
Time(hours)
Quench0.5
11.5
5
Integrated intensity(Relative units)
0X211)
549473448355431448
y(220)
8493110849376
Table 1. ResultsAustempered at 3 i 6 =C
AusteniteVolume
18.5022.7326.9326.5424.7520.56
lattice Parameter(A")
3.58503.60103.61603.63103.63403.6360
of x-ray diffraction measurements
Carbon Content(C %)
1.2;1.411.601.932.001.99
Austempered at 37! 'CIntegrated intensity
(Relative units)a(211)
549448372346473524
y(220)
8411010!1109384
AusteniteVolume
18.5026.8429.1!32.4722.9619.75
lattice Parameter(A")
3.58503.61003.61553.63143.63453.6359
Carbon Content
1.211.401.541.90 ,1.96 j2.00 I
>n2
time(hours)
quench0.5
l.C
1.52.C
5.0
26
74.863574.454574.112073.735573.663573.6305
Table 2. R vaiue calculations ford-spacing
(A°)
1.26731.27331.27831.28391.28501.2855
A
(A0)
1.54061.54061.54061.54061.54061.5406
lattice parameter(a.)
(A°)
3.58503.60103.61603.63103.63403.6360
sintf
~T(A°"')0.3950.3930.3910.3900.3890.389
austenite
15.344C15.393715.435515.481515.490315.4944
plane (220) ai
F :
3767.003791.473812..073834.833839.203841.21
F
12
1212
121212
316 °Ctemp, factor
0.8990.9000.9000.9010.9010.901
i
(A°v6
0.0004710.0004580.0004480.0004360.0004340.000433
LP factor
3.63853.6752
3.670663.74203.74893.7520
R
69.6868.9468.3367.6767.5467.48
time(hours)
quench0.5
1.0
1.52.0
5.0
28
82.400082.325582.425082.335582.299582.4505
fable 3. Rvalue calculations for ferrite plane (211)d-spacing
(A°)
1.16941.17031.16921.17021.17061.1689
1A
(A°)
1.54061.54061.54061.54061.54061.5406
lattice parameter(a.)
(A0)
2.86452.86672.86382.86642.86742.8631
sinfi'
X(A-1)0.42770.42740.42780.42740.42730.4279
f
14.673814.679814.671814.679014.681914.6697
F2
861.28861.99861.04861.89862.24860.80
ai316°C
p
24
24
24
24
24
24
temp.factor
0.8820.8820.8820.8820.8820.882
1
(A°y(
0.001810.001800.001810.001800.00180.00182
LP factor
3.11513.11903.11383.11853.12043.1125
R
102.80102.58102.88102.61102.50102.95
MY9700814PHASE COMPOSITION OF RAPIDLY SOLIDIFIED
Ag-Sn-Cu DENTAL ALLOYS
Lecong Dzuong. Do Minh NghiepNguyen van Dzan, Cao the Ha
Materials Science CenterHanoi University of Technology
Hanoi, Vietnam
Abstract: The phase composition of some rapidly solidified Ag-Sn-Cu dental alloys withdifferent copper contents (6. .22 wtpct) has been studied by XRD, EMPA and opticalmicroscopy. The samples were prepared from melt-spun ribbons The microstructure of theas-quenched ribbons was microcrystalline and consisted of the Ag. Sn, Ag4Sn, Cu^Sn andCu3iSns phases Mixing with mercury (amalgamation) led to formation of the Ag2Hg3,Sn7Hg and Cu6Sn5 phases The amount of copper atoms in the alloys played an importantrole in phase formation in the amalgams
Introduction
Traditional Ag-Sn-Cu dental alloys have generally 25-30% Sn, 3-4% Cu and 0,8-1,0% Zn (all wtpct) In recent years the Ag-Sn-Cu alloys with high copper contents (morethan 6%) became popular thanks their improved properties and low cost ]) . There are tworoutes conventionally used for the manufacture of powdered silver alloys for dentalpurposes: (1) lathe cut amalgams are obtained via traditional casting and then mechanicalmachining and (2) the more recent spherical particle amalgams are produced via meltatomization 2) . The melt-spinning technique, which is primarily used for the production ofamorphous ribbons, was used recently as a new route for preparing amalgam powders,which have the advantages of both lathe cut and spherical particle powders 3'4) .
In the present paper some features of phase composition of the high copper Ag-baseddental alloys preparing by melt-spinning technique are considered
Experimentation
The alloys of compositions of 28% Sn and 6, 9, 15, 22% Cu (Ag the rest) wereprepared by induction melting under argon. After an appropriate homogenization treatment,the ingots passed melt-spinning as well as lathe cutting to obtain rapidly solidified ribbons orfilings, which after milling gave two types of samples: rapidly solidified powder (SP-samples) and conventional powder (C-samples, for comparison) The samples were thenaged, chemical surface treated and amalgamated.
For phase structure characterizing following experimental methods were used: X-raydiffraction with SIEMENS-D5000, scanning electron microanalysis with CAMEBAXequipment and optical microscopy with NEOPHOT-2
Phase composition of the alloys
A considerable feature of microstructure of the melt-spun ribbons wasmicrocrystalline with very fine grain size of less than \-2\xva in comparison with about 50u.niin the ingots. Because of extremely high cooling rate (more than 105 °C/s) there is nopossibility of the formation of any chemical heterogeneity, whereas with conventionallycrystallization this can not be avoided The scanning lines of element distribution in cast
271
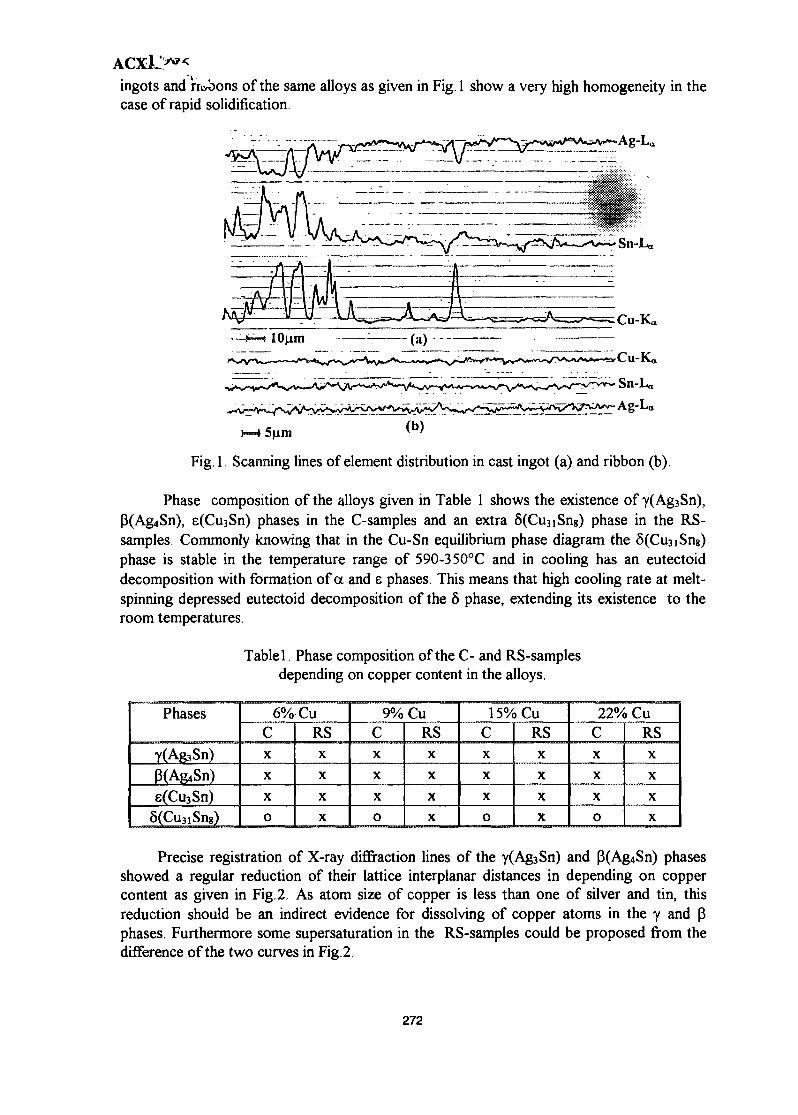
ingots and rrobons of the same alloys as given in Fig. 1 show a very high homogeneity in thecase of rapid solidification.
Ag-La
Sn-La
Cu-Ka
lOum -- (a) -
5um
Fig. 1. Scanning lines of element distribution in cast ingot (a) and ribbon (b).
Phase composition of the alloys given in Table 1 shows the existence of y(Ag3Sn),3(Ag4Sn), e(Cu3Sn) phases in the C-samples and an extra 6(Cu3iSn8) phase in the RS-samples. Commonly knowing that in the Cu-Sn equilibrium phase diagram the 8(Cu3iSng)phase is stable in the temperature range of 590-3 50°C and in cooling has an eutectoiddecomposition with formation of a and e phases. This means that high cooling rate at melt-spinning depressed eutectoid decomposition of the 5 phase, extending its existence to theroom temperatures.
Tablel. Phase composition of the C- and RS-samplesdepending on copper content in the alloys.
Phases
Y(AfoSn)3(Ag4Sn)e(Cu3Sn)
8(Cu3iSn8)
6%-CuCX
X
X
0
RSX
X
X
X
9% CuCX
X
X
0
RSX
X
X
X
15% CuCX
X
X
o
RSX
X
X
X
22% CuCX
X
X
0
RSX
X
X
X
Precise registration of X-ray diffraction lines of the y(Ag3Sn) and P(Ag4Sn) phasesshowed a regular reduction of their lattice interplanar distances in depending on coppercontent as given in Fig. 2. As atom size of copper is less than one of silver and tin, thisreduction should be an indirect evidence for dissolving of copper atoms in the y and Pphases. Furthermore some supersaturation in the RS-samples could be proposed from thedifference of the two curves in Fig. 2.
272
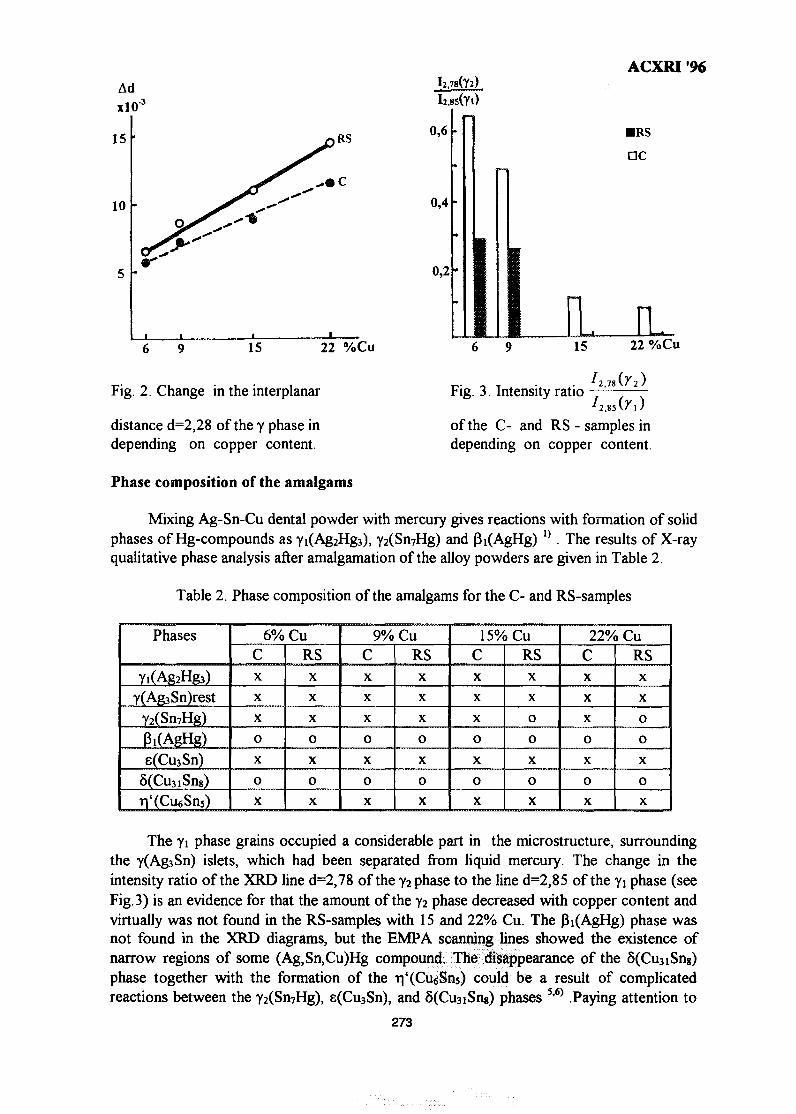
AdxlO3
15
10 0,4
0,2
ACXRI '96
•RSDC
IL15 22 %Cu
Fig. 2. Change in the interplanar
distance d=2,28 of the y phase independing on copper content.
Phase composition of the amalgams
15
Fig. 3. Intensity ratio
22 %Cu
of the C- and RS - samples independing on copper content.
Mixing Ag-Sn-Cu dental powder with mercury gives reactions with formation of solidphases of Hg-compounds as Yi(Ag2Hg3), y2(Sn7Hg) and Pi(AgHg) :) . The results of X-rayqualitative phase analysis after amalgamation of the alloy powders are given in Table 2.
Table 2. Phase composition of the amalgams for the C- and RS-samples
Phases
Yi(Ag2Hg3)Y(Ag3Sn)rest
Y2(Sn7Hg)
3i(AgHg)
e(Cu3Sn)
5(Cu3iSn8)Ti'(Cu6Sn5)
6% CuCX
X
X
0
X
oX
RSX
X
X
0
X
oX
9% CuCX
X
X
0
X
oX
RSX
X
X
0
X
oX
15% CuCX
X
X
0
X
0
X
r RSX
X
o0
X
0
X
22% CuCX
X
X
0
X
oX
RSX
Xr o
0
X
oX
The Yi phase grains occupied a considerable part in the microstructure, surroundingthe y(Ag3Sn) islets, which had been separated from liquid mercury. The change in theintensity ratio of the XRD line d=2,78 of the y2 phase to the line d=2,85 of the Yi phase (seeFig. 3) is an evidence for that the amount of the Y2 phase decreased with copper content andvirtually was not found in the RS-samples with 15 and 22% Cu. The Pi(AgHg) phase wasnot found in the XRD diagrams, but the EMPA scanning lines showed the existence ofnarrow regions of some (Ag,Sn,Cu)Hg compound. The disappearance of the 8(Cu3iSng)phase together with the formation of the ^'(CueSns) could be a result of complicatedreactions between the Y2(Sn7Hg), e(Cu3Sn), and 8(Cu3iSng) phases 5>6) Paying attention to
273
ACXRI '96the negative influence of the 72 phase on the properties of Ag-based amalgams, it isnecessary to emphasize that the rapid solidification by melt-spinning seems to be a techniquegiving possibility to produce high copper Ag-based amalgams with considerable improvedproperties.
References
1 W R Phillips, Skinner's Science of Dental Mat., Phil-London, 1984, 3072. J. R Abbot et al., Strength of Metals and Alloys (Austr Inst of Metals), Melb , 1982, I,
3473. Do Minh Nghiep & Lecong Dzuong, Rapidly Solidified Ag-based Amalgam Alloy
Powders, Vietn J of Science & Technology (in English), 1991, 1, 544 B. Vero et al., Mat. Sci & Techn., 1992, 8, 6455. N. K Sarkaretal., J. Dent Res., 1972, 51 15116 R W Cahn et al., Mat Sci & Techn , Medical and Dental Mat , Weinheim-NY, 1992,
14, 248
274
MY9700815
THE APPLICATION OF SEM IN ANALYZING THEDAMAGE TO THE PETROLEUM RESERVOIRS
CAUSED BY DRILLING FLUIDS
Abdul Razak IsmailFaculty of Chemical & Natural Resources Engineering
Universiti Teknologi Malaysia
Abstract: An experimental study has been conducted to analyze the damage to thepotential oil and gas reservoirs due to the invasion of drilling fluid during drillingoperation. Two types of rock samples representing low and high permeability were used tosimulate the petroleum reservoirs. Sea water based drilling fluids were used in this study.Detail observations to the rock samples were analyzed using scanning electron microscope(SEM). The results of both permeability restoration and SEM observation showed thatsevere permeability impairments were obtained for high permeability rock. These resultsindicate that the relative size of the barite particles and the pore size distribution andcharacteristics of the formation play an important role in determining the damage causedby the drilling fluids.
Introduction
This paper highlights the use of SEM in analyzing the damage to the petroleumreservoirs during drilling operation. The invasion of the drilling fluids into porous andpermeable rock results in the blocking or plugging of solid particles in the pore spaces ofthe rock. These fine particles and minute pore spaces cannot be seen by our own eyes orby using ordinary microscope. Therefore, the exact phenomenon of the plugging isdifficult to determine and analyze. SEM helps to determine the plugging of these fineparticles so that necessary precaution and diagnosis can be taken.
The application of SEM in determining these behaviors and other petroleum relatedareas has been used by many researchers.1"5 They found that the observations by SEM arevery helpful in evaluating the degree of the damage imposed by fine particles. SEM is alsouseful as a tool to remedy many problems involved in their research areas.
Evaluation of Rock Damage
The damage of the rock due to the drilling fluids can be evaluated in two ways. Thefirst method is to evaluate the damage ratio (DR) which is given by:
k. rock permeabUity after damage— —
k original rock permeability
The original permeability of the rock is measured after it is fully saturated with brine.After the rock sample is exposed to the drilling fluid, the rock sample is backflushed andthe permeability is measured for the second time. The later permeability is referred asdamaged permeability. The smaller value of damage ratio indicates that the rock isseverely damaged. The second method to evaluate the rock damage is to observe the rockwith the aid of SEM that give high magnification of rock structure. The pictures obtained
275
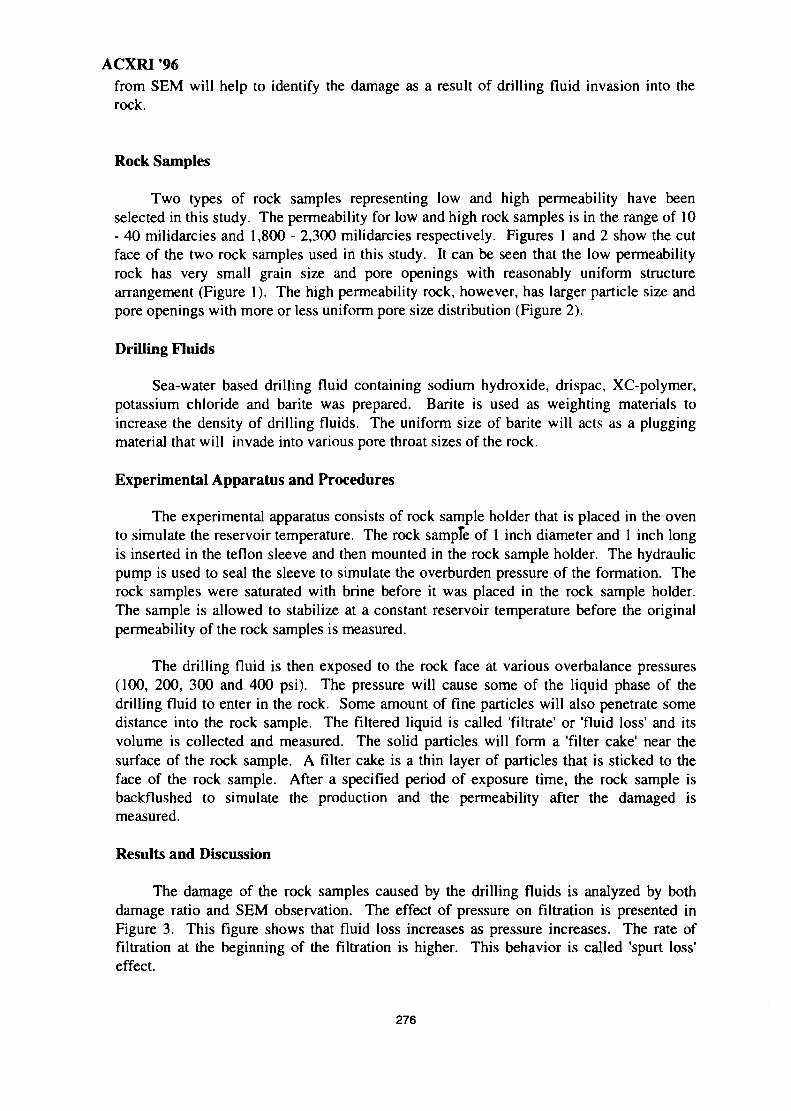
ACXRI '96from SEM will help to identify the damage as a result of drilling fluid invasion into therock.
Rock Samples
Two types of rock samples representing low and high permeability have beenselected in this study. The permeability for low and high rock samples is in the range of 10- 40 milidarcies and 1,800 - 2,300 milidarcies respectively. Figures 1 and 2 show the cutface of the two rock samples used in this study. It can be seen that the low permeabilityrock has very small grain size and pore openings with reasonably uniform structurearrangement (Figure 1). The high permeability rock, however, has larger particle size andpore openings with more or less uniform pore size distribution (Figure 2).
Drilling Fluids
Sea-water based drilling fluid containing sodium hydroxide, drispac, XC-polymer,potassium chloride and barite was prepared. Barite is used as weighting materials toincrease the density of drilling fluids. The uniform size of barite will acts as a pluggingmaterial that will invade into various pore throat sizes of the rock.
Experimental Apparatus and Procedures
The experimental apparatus consists of rock sample holder that is placed in the ovento simulate the reservoir temperature. The rock sample of 1 inch diameter and 1 inch longis inserted in the teflon sleeve and then mounted in the rock sample holder. The hydraulicpump is used to seal the sleeve to simulate the overburden pressure of the formation. Therock samples were saturated with brine before it was placed in the rock sample holder.The sample is allowed to stabilize at a constant reservoir temperature before the originalpermeability of the rock samples is measured.
The drilling fluid is then exposed to the rock face at various overbalance pressures(100, 200, 300 and 400 psi). The pressure will cause some of the liquid phase of thedrilling fluid to enter in the rock. Some amount of fine particles will also penetrate somedistance into the rock sample. The filtered liquid is called 'filtrate' or 'fluid loss' and itsvolume is collected and measured. The solid particles will form a 'filter cake' near thesurface of the rock sample. A filter cake is a thin layer of particles that is sticked to theface of the rock sample. After a specified period of exposure time, the rock sample isbackflushed to simulate the production and the permeability after the damaged ismeasured.
Results and Discussion
The damage of the rock samples caused by the drilling fluids is analyzed by bothdamage ratio and SEM observation. The effect of pressure on filtration is presented inFigure 3. This figure shows that fluid loss increases as pressure increases. The rate offiltration at the beginning of the filtration is higher. This behavior is called 'spurt loss'effect.
276

ACXRI '96Figure 4 shows the filtration behavior when different types of rock sample were
subjected at a constant pressure of 300 psi. Results show that the low permeability rockappeared to have higher fluid loss. This behavior occurs because the low permeabilityrock has smaller pore openings to permit barite particles to pass through it thus providing auniform external filter cake. The high permeability rock, however, has larger poreopenings that permits some barite particles to enter the pore spaces near the rock face toform internal bridging. This provides additional resistance to the fluid loss. Thisphenomenon is supported by the results of the damage ratio shown in Figure 5 thatindicates that higher permeability restoration is obtained for low permeability rock. Thesmaller openings inside the low permeability rock prevent particles to enter the porechannels of this rock. However, for high permeability rock, the pore openings are biggerthat permit some particles to enter and plugged the rock. During backflushing, theseparticles are rearranged inside the pore channels that resulted in the low permeabilityrestoration.
Figure 6 shows that for low permeability rock, many openings can be observed as therock sample is backflushed. On the other hand, the high permeability rock is observed tohave many pluggings as shown in Figure 7. It is also expected that the internal particlebridging suffers most of the plugging that reduced that damage ratio. These observationssupport the earlier argument on particle plugging.
Conclusions
The following conclusions can be derived from this study:
1. SEM is very useful because it helps to identify and evaluate the formation damagecaused by drilling fluids.
2. The cumulative volume of fluid loss is increased as the overburden pressure increased.
3. The relative size of pore openings and plugging materials will determine the amountof fluid and particle invasion into the formation.
4. Both permeability measurement and SEM observation showed that higher rockpermeability will be subjected to severe damage when exposed to the drilling fluidswhich contain small size of solid particles.
References1. K.E. Porter, "A Basic Scanning Electron Microscope Study of Drilling Fluids", SPE
Paper No. 8790, Fourth Symposium of Formation Damage Control, Bakersfield,California, Jan. 28-29.1980.
2. T.W. Muecke, "Formation Fines and Factors Controlling Their Movement in PorousMedia", Journal of Petroleum Technology, Feb. 1979, pp. 144-140.
3. R.F. Krueger, "An Overview of Formation Damage and Well Productivity in Oil FieldOperations", Journal of Petroleum Technology, Feb. 1986, pp. 131-152.
4. P.R. Russ, "Oilwell Batch Inhibition and Material Optimization", SPE Asia Pacific Oiland Gas Conference, Melbourne, Australia, 7-10 November 1994
5. F. Cusack, D.R. Brown, J.W. Costerton and D.M. Clementz, "Field and LaboratoryStudies of Microbial/Fines Plugging of Water Injection Wells: Mechanism, Diagnosisand Removal", Journal of Petroleum Science and Engineering, 1987, pp. 39-50.
277
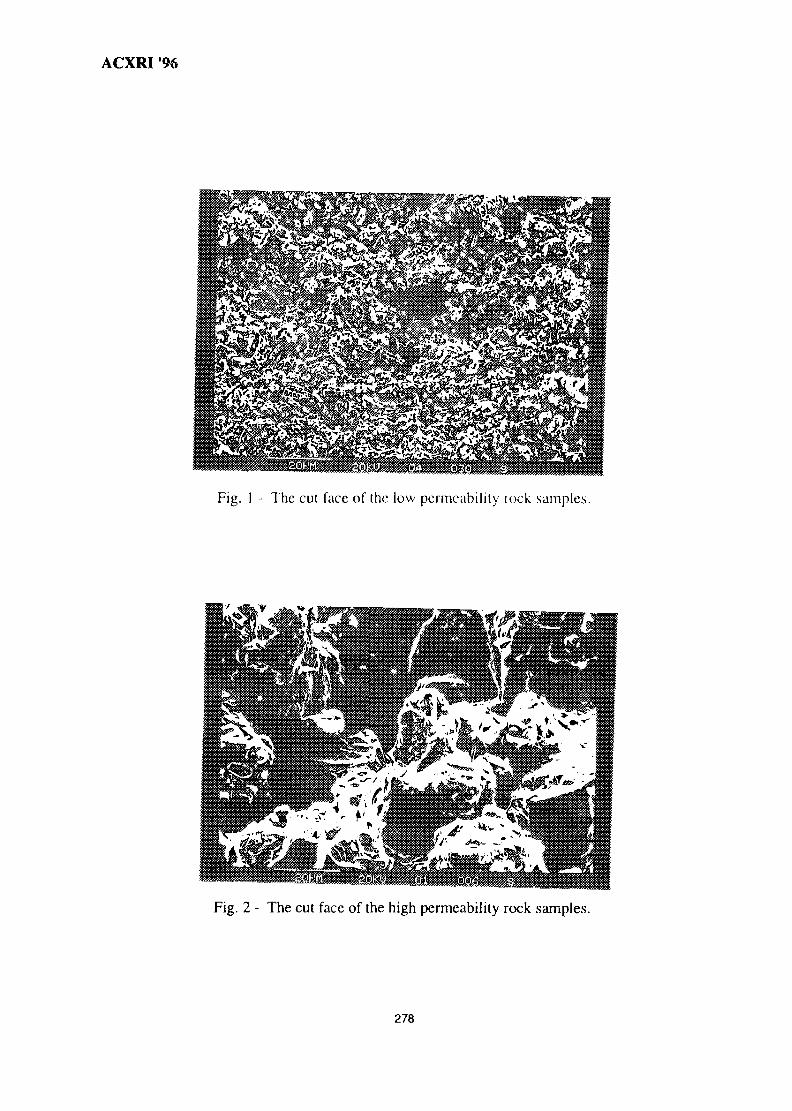
ACXRI '96
Fig. 1 - The cut face of the low permeability rock samples.
Fig. 2 - The cut face of the high permeability rock samples.
278
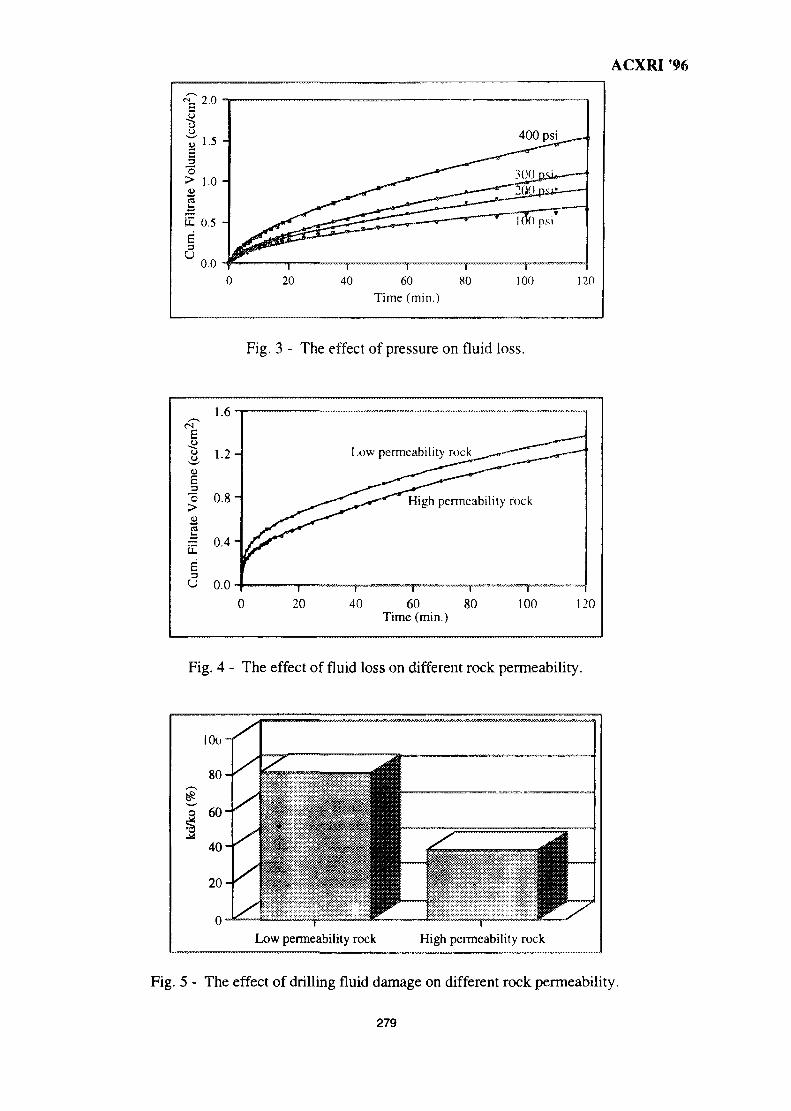
ACXRI 96
"SuIT3
"5>
£E3u
2.0 -
1.5 -
1.0 -
0.5 -
0.0 -i \0 20
C»—"^-^^
IT ! f40 60 80
Time (min.)
^^^^"^
•ar~ 2(JQjisi£—A — -—=-*-•
' 100 psi
t100
— • —
120
Fig. 3 - The effect of pressure on fluid loss.
EouI
Voli
a
iltra
E3
u
1.6-
1.2-
0.8-
0.4-
0.0-0 20
Low
w^
r •
40
permeability rock ^^v—"~*~"~^r "
' High permeability rock
r i T
60 80 100 120Time (min.)
Fig. 4 - The effect of fluid loss on different rock permeability.
' ' rLow permeability rock
' ' " X'"High permeability rock
Fig. 5 - The effect of drilling fluid damage on different rock permeability.
279
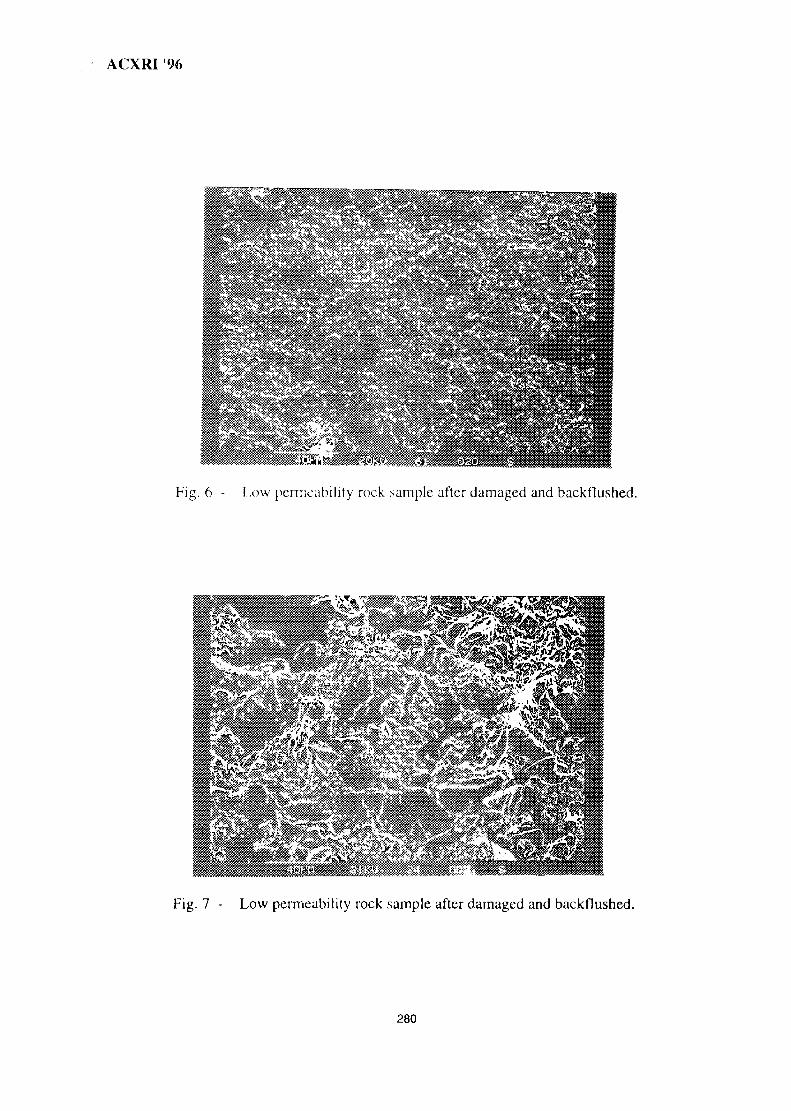
ACXRI'%
Fig. 6 - I ,ow permeability rock sample after damaged and backflushed.
Fig. 7 - Low permeability rock sample after damaged and backflushed.
280
MY9700816
MAGNETIC FIELD INFLUENCE ON SUBSTRUCTURE FORMED BYELECTRIC SPARK TREATMENT
Reza Rahbari G. and A.N.IvanovDepartment of x-ray diffraction and physics of metals,
Moscow State Institute of Steel and Alloys .RUSSIA
Abstract :The substructure of surface layer (about 10 microns thick) has been studiedby x-ray line broadening technique in the samples of plain Carbon steel (0.45%C) afterelectric spark doping with and without magnetic field (MF). The applied spark pulseenergy was 0.12 J and MF induction varied from 0 to 0.08 T. The electrode material wasthe same as that of the treated sample. It has been observed that the MF reduces the tensileresidual surface stresses from 660±15MPa (no MF) to 260±15MPa (B=O.O53 T). Theanalysis of x-ray line broadening has revealed only the existence of microstrains , whichare dependent of the MF magnitude.The microstrains have been related to the randomlydistributed dislocations with the density of about 3xl0 n cm"2.
INTRODUCTION
The first study of the influence of magnetic field (MF) on steel strengthening byaging was performed about 70 years ago . Since then the effect of MF on martensetictransformation, tempering , aging and recrystallization was investigated and its favorableinfluence on some properties has been reported [ 1 ] .
In the present paper the MF influence on fine structure and residual stresses ofsamples treated by the electric spark doping (ESD)has been investigated.
EXPERIMENTAL PROCEDURES
Samples of plain Carbon steel with 0.45%C were treated by ESD using the anodefrom the same steel . The spark pulse energy was W=0.12 J and the MF induction variedfrom 0 to 0.08 T. The treated samples of approximately 1x1x0.5 cm in size were used toobtain the profile of 110 and 211 reflections by step scanning method (FeKoc rad.).
The calculation of the reflection broadening due to microstrains and small particlesize (P) was performed by approximation technique [ 2 ] :
= 0.5B( l-b/B+ (1-h/B)*) (1)
Where B and b are the half peak breadth of a reflection for the sample and theannealed standard sample respectively.
281
ACXRI 96The ESD is a surface treatment and hence it produces the nonuniform (in sample
depth) defect distribution.Therefore , it is very important to have the same penetrationdepth of x-ray beam when 110(0 = 28.6 ° ) and 211 ( 9 = 56 ° ) lines are recorded.
It is known [ 3 ] that the x-ray penetration depth :
t = K sin a sin5 /(sina + sin5 ) , 20= a + P (2)
In the equation (2) K is a constant for all the lines of the same diffraction pattern ,ais the angle between an incident beam and irrediated sample surface ,and 8 is the anglebetween the sample surface and the reflected beam.It is clear that for a symmetrical case (a = 8 = 9 );the penetration depth t = 0.5 Ksin9 reaches maximal value .Thus 211 line wasrecorded for two S-values:(a) 5 = 1 8 ° which provides for 211 line the same penetrationdepth (t) as for 110 line at 6 = a = 0(110) ,(b) 8 = a = 0(211) = 56 ° (symmetrical case )which gave the penetration depth for 211 line 1.75 limes more than for 110 .
The calculation of the residual surface stresses were made from the angularshift(A20) of 211 line with respect to the same line position of the annealed standard.Thesum of principal surface stresses al+a2 is given by [ 4 ]
al+c2 = - (E/v)cotg0 .A20 (3)
Where E is Young's modulus in <112> direction and v is Poison's ratio .
RESULTS AND DISCUSSION
The P" -values of 110 , 211 and 211* (the asterisk marks P'211-value when 8= 18°)for the ESD treated samples at different magnitude of MF induction are given inthe table .One can see that the ratio P'211*/P'11O is equal (within the limit of anexperimental error) to tan0211/tan011O. This fact may be related to a small fraction ofparticle size broadening .
Attributing the microstrains to randomly distributed dislocations one can find itsdensity
p=A.(p '211) 2 (4)
282
ACXRI '96where A=6.4 X 10 cm"2 when P' is in degrees [ 5 ]. Thus the ESD (with and without
MF)causes the formation of dislocations in a thin surface layer .Their density isindependent (in the first approximation)of the applied MF .
Considering the difference in x-ray penetration depth discussed above ,the increase ofP'211/P'11O from 1.67 (no MF) to 2.2 (with MF) possibly means the reducing ofnonuniformity in defect distribution in the presence of MF. Meanwhile the residualstresses are remarkably reduced by the ESD in the presence of MF; though its sign remainspositive.
CONCLUSION
l.The ESD causes the broadening of x-ray lines due to microstrains produced bydislocations with density of about 3 x 10" cm2. The MF induction B= 0.08 T has noinfluence on the line broadening though it slightly reduces nonuniformity in distribution ofdefects .
2.The application of MF in ESD remarkably reduces the residual surface stresses .
REFERENCES
1. M.L.Berneshtain ; V.N.Pustavoit: Heat treatment of steel products in the magneticfield, 1987,(In Russian).
2. S.S.Gorelic,U.A.Skakof,L.N.Rastorguef: X-RAY & Electro-optical analysis,1994,(In Russian).
3. A.N.Ivanov , E.I.Fommitcheva , E.V.Shelekhov : Industrial laboratory(Diagnosistic of materials ) N12, 1989 ,P.P.41-47 (In Russian).
4. A.Taylor : X-RAY Metallography , John wily &Sons , Inc , N.Y-London,1961 .
5. B.D.Cullity :Elements of X-RAY Diffraction .Second Ed. ,Addisson-Wesley,1978
6. A.N.Ivanov et al., Industrial laboratory (Diagnostics of materials),N2 ,1987,P.P.43-48, (In Russian ) .
283
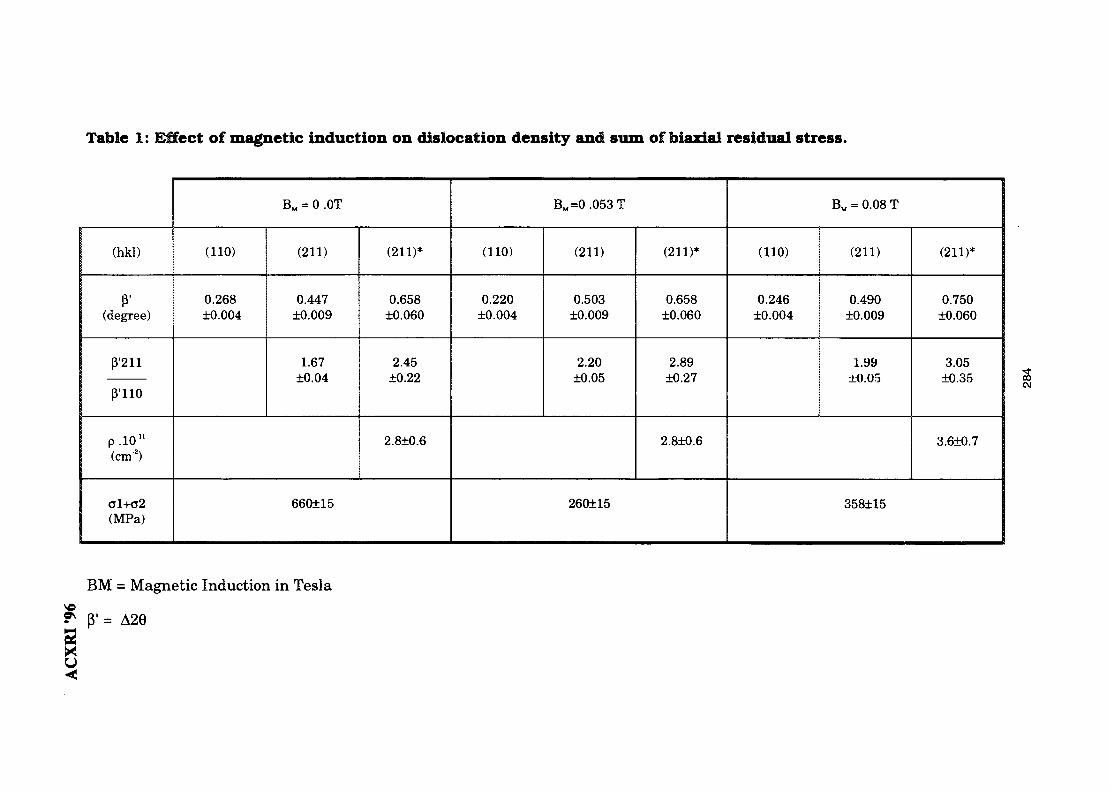
Table 1: Effect of magnetic induction on dislocation density and sum of biaxial residual stress.
(hkl)
P1
(degree)
P'211
(3110
p .10""(cm2)
O1+CT2
(MPa)
B v = 0 .OT
(110)
0.268±0.004
(211)
0.447±0.009
1.67+0.04
(211)*
0.658±0.060
2.45±0.22
2.8±0.6
660115
BM=0.053T
(110)
0.220±0.004
(211)
0.503±0.009
2.20±0.05
(211)*
0.658±0.060
2.89±0.27
2.810.6
260115
BM = 0.08 T
(110)
0.246±0.004
(211)
0.490±0.009
1.99±0.05
(211)*
0.750±0.060
3.05±0.35
3.6±0.7
358115
3C\l
BM = Magnetic Induction in Tesla
^ B' = A29
5d<
MY9700817
XRD STUDIES ON SOLID STATE AMORPRISATION INELECTROLESS Ni/P AND Ni/B DEPOSITS
P. Sampath Kumar and P. Kesavan Nair,Indian Institute of Technology, MadrasMadras- 600 036, India.
ABSTRACT
The decomposition of electroless Ni-P and Ni-B deposits on annealing at varioustemperatures is studied using x-ray diffraction techniques employing profile deconvolutionand line profile analysis. It appears that solid state amorphisation takes place in the Ni-Bdeposits in a narrow temperature range just prior to the onset of crystallisation ofamorphous phase. In the case of Ni-P deposits no evidence for solid state amorphisationcould be obtained. Thermodynamic and kinetic considerations also support such aconclusion.
1.0 INTRODUCTION:
Considerable work has been done in recent years on metal-metal and metal-silicondiffusion couples. It has been shown that a metastable amorphous alloy phase may initiallynucleate and grow by solid state amorphisation reactions(SSA) prior to the nucleation ofcrystalline intermetallics [1-4]. SSA was first observed in rhodium and amorphous silicon.Subsequently, the phenomenon has been observed in a number of metal-cation and metal-metal systems. SSA has been observed in many combinations, notably based on early/latetransition metals. Major requirements or features of SSA have been summarized asfollows:
1) Large heat of reaction between the two elements,2) One of the elements is in general a fast diffuser in the other,
establishing a diffusional asymmetry,3) the thickness of the amorphous reaction layer which can form
is limited,4) formation of amorphous phase is favoured if a deep eutectic
exists at the appropriate composition.
In most of the metal-metal or metal-cation systems, multilayered samples consistingof alternate layers of polycrystalline thin films of the two elements made by deposition ormechanical reduction have been used for studies. In such multilayer systems, study ofinter diffusion is possible through a number of experimental techniques like RutherfordBack Scattering (RBS), thin films marker experiments, X-ray characterization etc.However, in the case of electroless or electrolytic deposits, these techniques are notsuitable since the deposits lack lateral compositional homogeneity, unlike multilayeredsamples. Due to such difficulties of experimental detection, SSA in electroless depositshave not received adequate attention so far.
285
ACXRI 96XRD techniques can profitably be employed in this case. Interaction between
vanous phases can be followed through the relative intensities of diffraction profilesbelonging to the respective phases, including amorphous phases. Modem profiledeconvolution techniques can handle even heavily over lapping rejections which otherwisecould be a serious limitation. In this study an attempt is made to study the SSA reactionsin electroless nickel based deposits employing x-ray diffraction techniques.
2.0 EXPERIMENTAL:2.1 Production of Deposits:
The deposition was carried out on mild steel substrates in the form of discs of 22.5mm diameter and 7 mm thickness. The surface was polished to a metallographic finishusing appropriate grades of emery paper and then electropolished using a solution ofPerchloric acid (185 ml), Acetic anhydride (765 ml) and distilled water (45 ml). Thethickness of the deposits were controlled primarily by adjusting the duration of deposition.The thickness achieved was about 30 microns.
2.11 Nickel Phosphorous Deposits:
For production of Ni-P deposits, nickel chloride was used as the source of nickel(30 g/1) and sodium hypophosphite as the reducing agent. The other ingredients used weresodium citrate (100 g/1) as the stabiliser and ammonium chloride (50 g/1) as thecomplexing agent. The amount of metalloid introduced into the deposit was controlledby varying the reducing agent in the plating solution from 10 g/1 to 70 g/1. pH of thesolution was adjusted with ammonia solution to a value 8 to 9. The temperature ofdeposition was 90 ± 1° C.
2.12 Nickel Boron Deposits:
In this case the plating solution had sodium borohydride as the reducing agentalong with ethylenediamine (70 ml/1) as the complexing agent. The composition of thereducing agent was varied between 0.3 g/1 and 0.7 g/1 to control the boron content in thedeposit. The pH of the solution was maintained above 13 using sodium hydroxidesolution. Sodium citrate was the stabilising agent in this case also. The operatingtemperature was maintained at 90 ± 1° C.
2.2 Heat Treatment:
The deposits produced were annealed at 60,100, 200, 300, 330, 360, 400, 500 and600° C in the case of Ni-P. The Ni-B deposits on the other hand were annealed at 100,150, 175, 200, 225, 250, 275, 300, 330, 400, 500 and 600° C. The annealing time was 2 hrsand no atmosphere was employed. The deposits were air cooled after annealing.
286
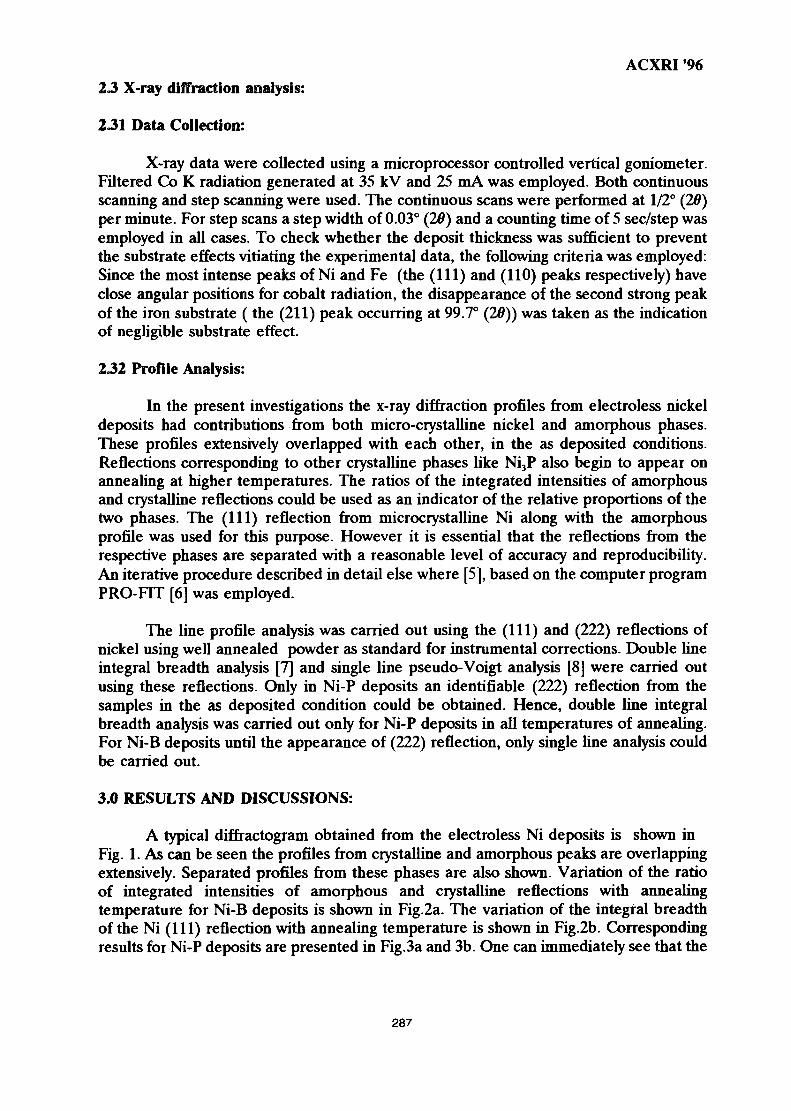
ACXRI '962J X-ray diffraction analysis:
2J1 Data Collection:
X-ray data were collected using a microprocessor controlled vertical goniometer.Filtered Co K radiation generated at 35 kV and 25 mA was employed. Both continuousscanning and step scanning were used. The continuous scans were performed at 1/2° (29)per minute. For step scans a step width of 0.03° (29) and a counting time of 5 sec/step wasemployed in all cases. To check whether the deposit thickness was sufficient to preventthe substrate effects vitiating the experimental data, the following criteria was employed:Since the most intense peaks of Ni and Fe (the (111) and (110) peaks respectively) haveclose angular positions for cobalt radiation, the disappearance of the second strong peakof the iron substrate (the (211) peak occurring at 99.7° (29)) was taken as the indicationof negligible substrate effect.
2.32 Profile Analysis:
In the present investigations the x-ray diffraction profiles from electroless nickeldeposits had contributions from both micro-crystalline nickel and amorphous phases.These profiles extensively overlapped with each other, in the as deposited conditions.Reflections corresponding to other crystalline phases like Ni3P also begin to appear onannealing at higher temperatures. The ratios of the integrated intensities of amorphousand crystalline reflections could be used as an indicator of the relative proportions of thetwo phases. The (111) reflection from microcrystalline Ni along with the amorphousprofile was used for this purpose. However it is essential that the reflections from therespective phases are separated with a reasonable level of accuracy and reproducibility.An iterative procedure described in detail else where [5], based on the computer programPRO-FIT [6] was employed.
The line profile analysis was carried out using the (111) and (222) reflections ofnickel using well annealed powder as standard for instrumental corrections. Double lineintegral breadth analysis [7] and single line pseudo-Voigt analysis [8] were carried outusing these reflections. Only in Ni-P deposits an identifiable (222) reflection from thesamples in the as deposited condition could be obtained. Hence, double line integralbreadth analysis was carried out only for Ni-P deposits in all temperatures of annealing.For Ni-B deposits until the appearance of (222) reflection, only single line analysis couldbe carried out.
3.0 RESULTS AND DISCUSSIONS:
A typical diffractogram obtained from the electroless Ni deposits is shown inFig. 1. As can be seen the profiles from crystalline and amorphous peaks are overlappingextensively. Separated profiles from these phases are also shown. Variation of the ratioof integrated intensities of amorphous and crystalline reflections with annealingtemperature for Ni-B deposits is shown in Fig.2a. The variation of the integral breadthof the Ni (111) reflection with annealing temperature is shown in Fig.2b. Correspondingresults for Ni-P deposits are presented in Fig.3a and 3b. One can immediately see that the
287
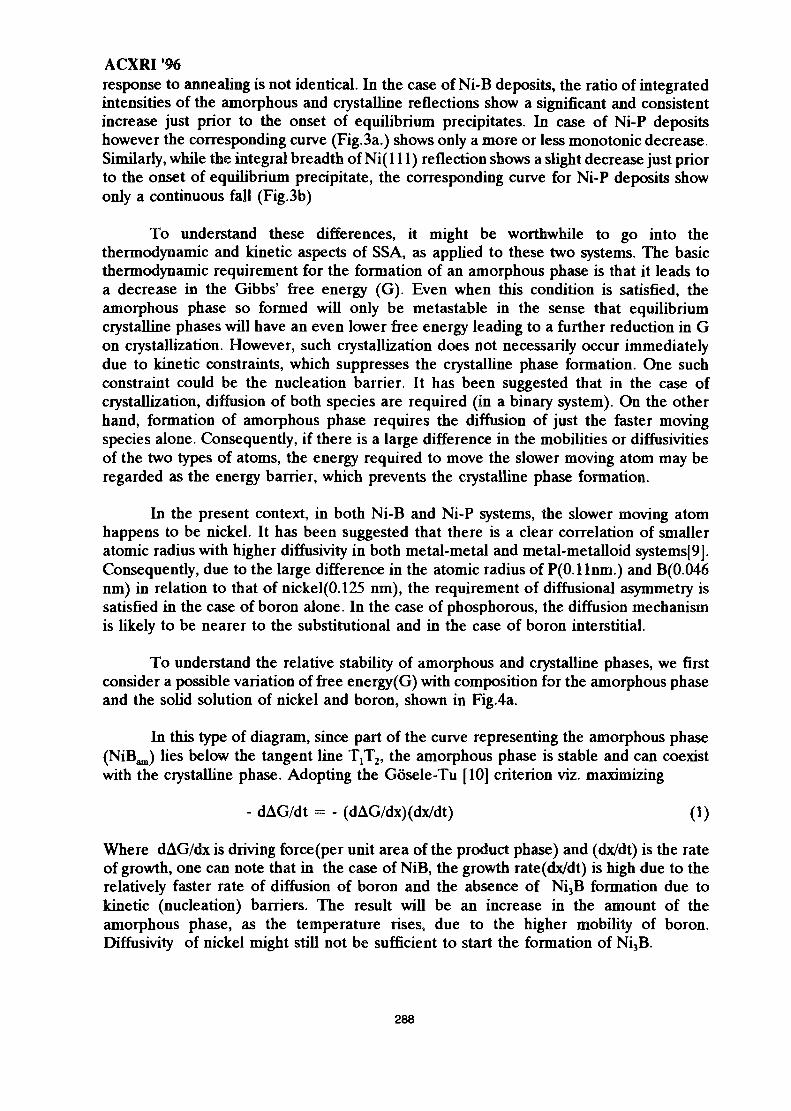
ACXRI '96response to annealing is not identical. In the case of Ni-B deposits, the ratio of integratedintensities of the amorphous and crystalline reflections show a significant and consistentincrease just prior to the onset of equilibrium precipitates. In case of Ni-P depositshowever the corresponding curve (Fig.3a.) shows only a more or less monotonic decrease.Similarly, while the integral breadth of Ni(lll) reflection shows a slight decrease just priorto the onset of equilibrium precipitate, the corresponding curve for Ni-P deposits showonly a continuous fall (Fig.3b)
To understand these differences, it might be worthwhile to go into thethermodynamic and kinetic aspects of SSA, as applied to these two systems. The basicthermodynamic requirement for the formation of an amorphous phase is that it leads toa decrease in the Gibbs' free energy (G). Even when this condition is satisfied, theamorphous phase so formed will only be metastable in the sense that equilibriumcrystalline phases will have an even lower free energy leading to a further reduction in Gon crystallization. However, such crystallization does not necessarily occur immediatelydue to kinetic constraints, which suppresses the crystalline phase formation. One suchconstraint could be the nucleation barrier. It has been suggested that in the case ofcrystallization, diffusion of both species are required (in a binary system). On the otherhand, formation of amorphous phase requires the diffusion of just the faster movingspecies alone. Consequently, if there is a large difference in the mobilities or diffusivitiesof the two types of atoms, the energy required to move the slower moving atom may beregarded as the energy barrier, which prevents the crystalline phase formation.
In the present context, in both Ni-B and Ni-P systems, the slower moving atomhappens to be nickel. It has been suggested that there is a clear correlation of smalleratomic radius with higher diffusivity in both metal-metal and metal-metalloid systems[9].Consequently, due to the large difference in the atomic radius of P(0.11nm.) and B(0.046nm) in relation to that of nickel(0.125 nm), the requirement of diffusional asymmetry issatisfied in the case of boron alone. In the case of phosphorous, the diffusion mechanismis likely to be nearer to the substitutional and in the case of boron interstitial.
To understand the relative stability of amorphous and crystalline phases, we firstconsider a possible variation of free energy(G) with composition for the amorphous phaseand the solid solution of nickel and boron, shown in Fig.4a.
In this type of diagram, since part of the curve representing the amorphous phase(NiB^) lies below the tangent line T\T2, the amorphous phase is stable and can coexistwith the crystalline phase. Adopting the G6sele-Tu [10] criterion viz. maximizing
- dAG/dt = - (dAG/dx)(dx/dt) (1)
Where dAG/dx is driving force(per unit area of the product phase) and (dx/dt) is the rateof growth, one can note that in the case of NiB, the growth rate(dx/dt) is high due to therelatively faster rate of diffusion of boron and the absence of Ni3B formation due tokinetic (nucleation) barriers. The result will be an increase in the amount of theamorphous phase, as the temperature rises, due to the higher mobility of boron.Diffusivity of nickel might still not be sufficient to start the formation of Ni3B.
288
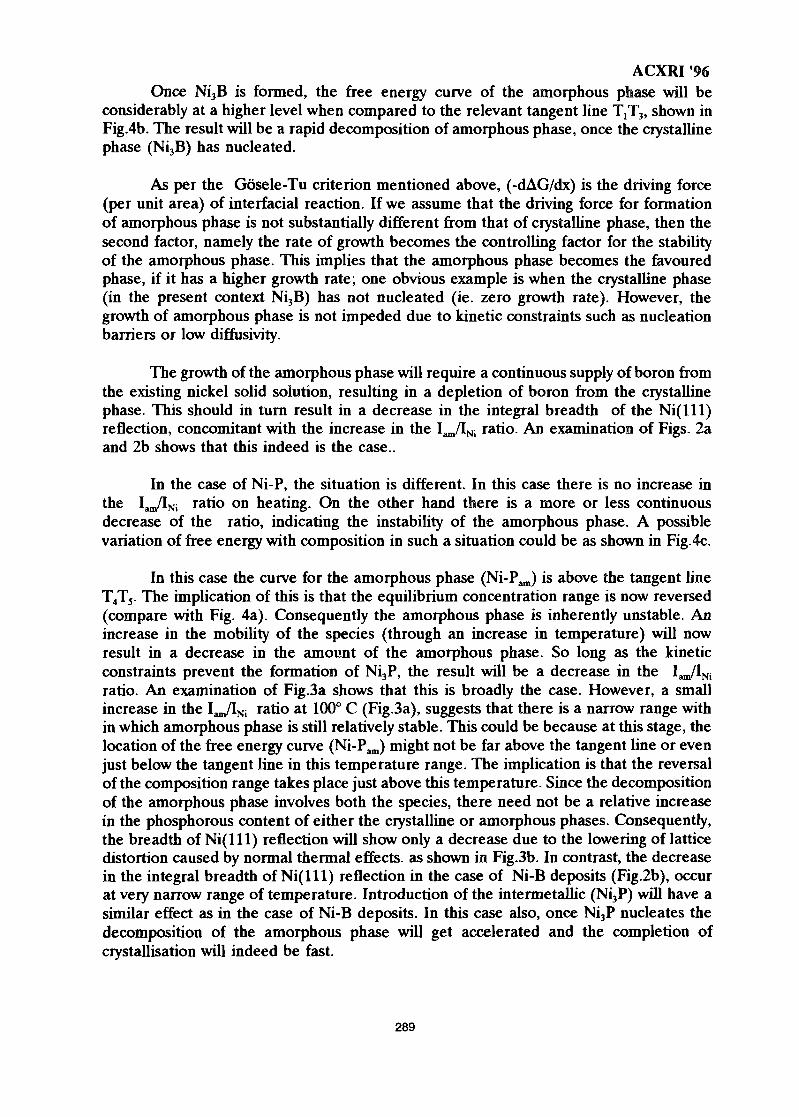
ACXRI 96Once Ni3B is formed, the free energy curve of the amorphous phase will be
considerably at a higher level when compared to the relevant tangent line T{T3, shown inFig.4b. The result will be a rapid decomposition of amorphous phase, once the crystallinephase (Ni3B) has nucleated.
As per the G6sele-Tu criterion mentioned above, (-dAG/dx) is the driving force(per unit area) of interfacial reaction. If we assume that the driving force for formationof amorphous phase is not substantially different from that of crystalline phase, then thesecond factor, namely the rate of growth becomes the controlling factor for the stabilityof the amorphous phase. This implies that the amorphous phase becomes the favouredphase, if it has a higher growth rate; one obvious example is when the crystalline phase(in the present context Ni3B) has not nucleated (ie. zero growth rate). However, thegrowth of amorphous phase is not impeded due to kinetic constraints such as nucleationbarriers or low diffusivity.
The growth of the amorphous phase will require a continuous supply of boron fromthe existing nickel solid solution, resulting in a depletion of boron from the crystallinephase. This should in turn result in a decrease in the integral breadth of the Ni(lll)reflection, concomitant with the increase in the I^/IN; ratio. An examination of Figs. 2aand 2b shows that this indeed is the case..
In the case of Ni-P, the situation is different. In this case there is no increase inthe Ian/IiMi r a t i ° o n heating. On the other hand there is a more or less continuousdecrease of the ratio, indicating the instability of the amorphous phase. A possiblevariation of free energy with composition in such a situation could be as shown in Fig.4c.
In this case the curve for the amorphous phase (Ni-Pam) is above the tangent lineT4T5. The implication of this is that the equilibrium concentration range is now reversed(compare with Fig. 4a). Consequently the amorphous phase is inherently unstable. Anincrease in the mobility of the species (through an increase in temperature) will nowresult in a decrease in the amount of the amorphous phase. So long as the kineticconstraints prevent the formation of Ni3P, the result will be a decrease in the 1^/1^ratio. An examination of Fig.3a shows that this is broadly the case. However, a smallincrease in the l^Jl^ ratio at 100° C (Fig.3a), suggests that there is a narrow range within which amorphous phase is still relatively stable. This could be because at this stage, thelocation of the free energy curve (Ni-Pam) might not be far above the tangent line or evenjust below the tangent line in this temperature range. The implication is that the reversalof the composition range takes place just above this temperature. Since the decompositionof the amorphous phase involves both the species, there need not be a relative increasein the phosphorous content of either the crystalline or amorphous phases. Consequently,the breadth of Ni(lll) reflection will show only a decrease due to the lowering of latticedistortion caused by normal thermal effects, as shown in Fig.3b. In contrast, the decreasein the integral breadth of Ni(lll) reflection in the case of Ni-B deposits (Fig.2b), occurat very narrow range of temperature. Introduction of the intermetallic (Ni3P) will have asimilar effect as in the case of Ni-B deposits. In this case also, once Ni3P nucleates thedecomposition of the amorphous phase will get accelerated and the completion ofcrystallisation will indeed be fast.
289
ACXRI 964.0 SUMMARY:
1) The decomposition behaviour of amorphous phase in electroless Ni-P and Ni-Bsystems are not identical.
2) In the case of Ni-P deposits, the amorphous phase content continuously decreaseswith temperature indicating no tendency for solid state amorphisation. In contrastNi-B deposits have a small range of temperature just prior to the onset ofrecrystallisation of amorphous phase, wherein the amount of amorphous phaseincreases with temperature indicating a definite tendency for solid stateamorphisation.
3) Thermodynamic and kinetic considerations behind the above conclusions arebriefly examined.
References:
1. Schwarz.R and Johnson W.L: Phys. Rev. Lett., Vol.51, p415(1983)2. Cahn. R.W. and Johnson W.L.: J. Mat. Res. Vol.1, p724(1986)3. Herd.S, Tu.K.N and Ahn.K.Y.: Appl. Phys. Lett. Vol.42, p597(1983)4. Holloway.K and Sinclair.R.: J. Appl. Phys. Vol.61, pl359 (1987)5. Sampath Kumar.P. and Kesavan Nair. P.: NanoCrystaline Solids, vol4(2), p 183
(1994).6. Hideo Toraya: vThe Rietveld Method', Ed. Young. R.A, Publishers: International
Union of Crystallography, Oxford University Press, p 254 (1993)7. Rama Rao.P, Anantha Raman.T.R: Z.Metallkd., Vol. 62, p732 (1971)8. Th. H. De Keijser, Mittemeijer. E.J and Rozendaal. H.C.F: J. Appl. Cryst. Vol.16,
p309(1983)9. Ricardo B. Schwarz : Proc. Int. Symposium on Advances in Phase Transitions,
McMaster's University, Ontario, Canada, Oct. 22-23, 1987; Eds: Embury.J.D andPurdy. G.D, p.166 (1988)
10. Gosele. U and Tu. K.N: J. Appl. Phys. Lett., Vol.66(6), p2619 (1989)
290
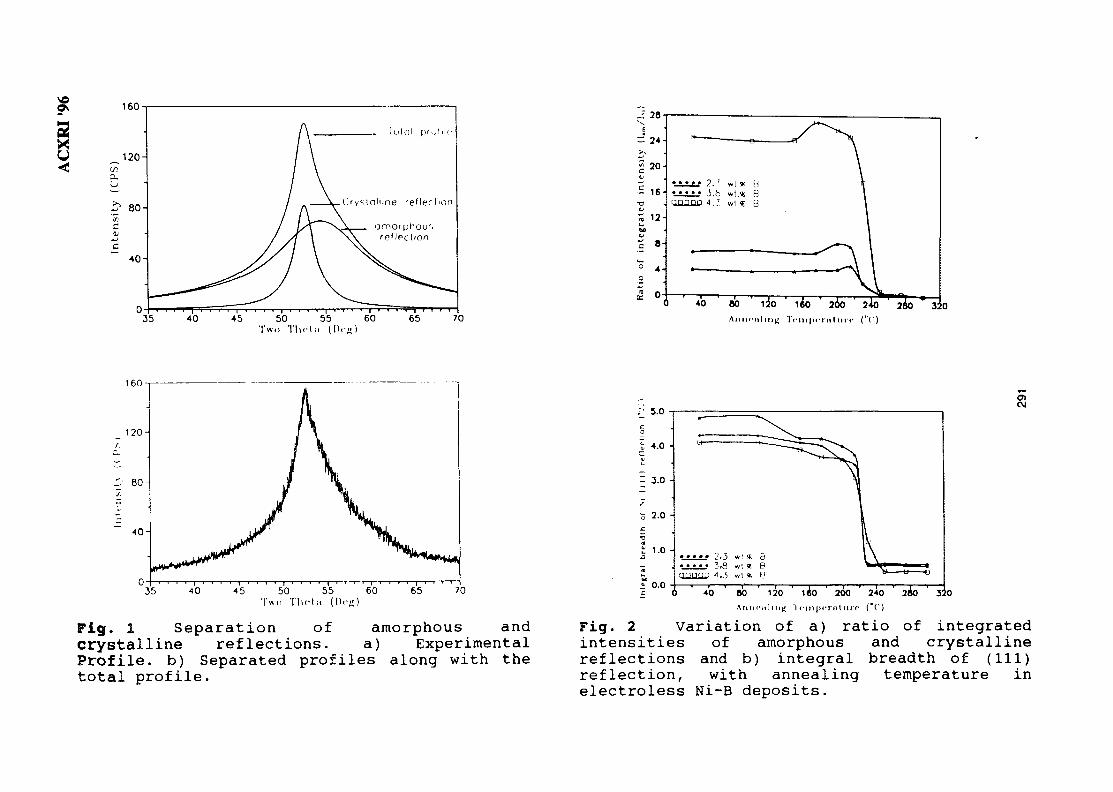
9s
X
160
120-
4 5 5 0 5 5 6 0T w o T l i c t a ([)<•«)
65 70
28
24-
20-
16-
12i
8-
4ona:
«« « »« ?. ;. wl * H3.fc wt.se B
nnnnn A.}, wl (t B
80 i4o 200 240 28
T r l l l | n T i i l l i i - | . ("(')
320
1 60 T
35 40I • • ' ' 1 ' ' ' • I
45 50 55 60Two The! a { Di'll)
70
Fig. 1 Separation of amorphous andcrystalline reflections. a) ExperimentalProfile, b) Separated profiles along with thetotal profile.
o 2.0 -
£ 1.0 -
* 0.040 60 120 lio ' 200 240 280 ' jio
1 VinptTalurc ("C)
Fig. 2 Variation of a) ratio of integratedintensities of amorphous and crystallinereflections and b) integral breadth of (111)reflection, with annealing temperature inelectroless Ni-B deposits.
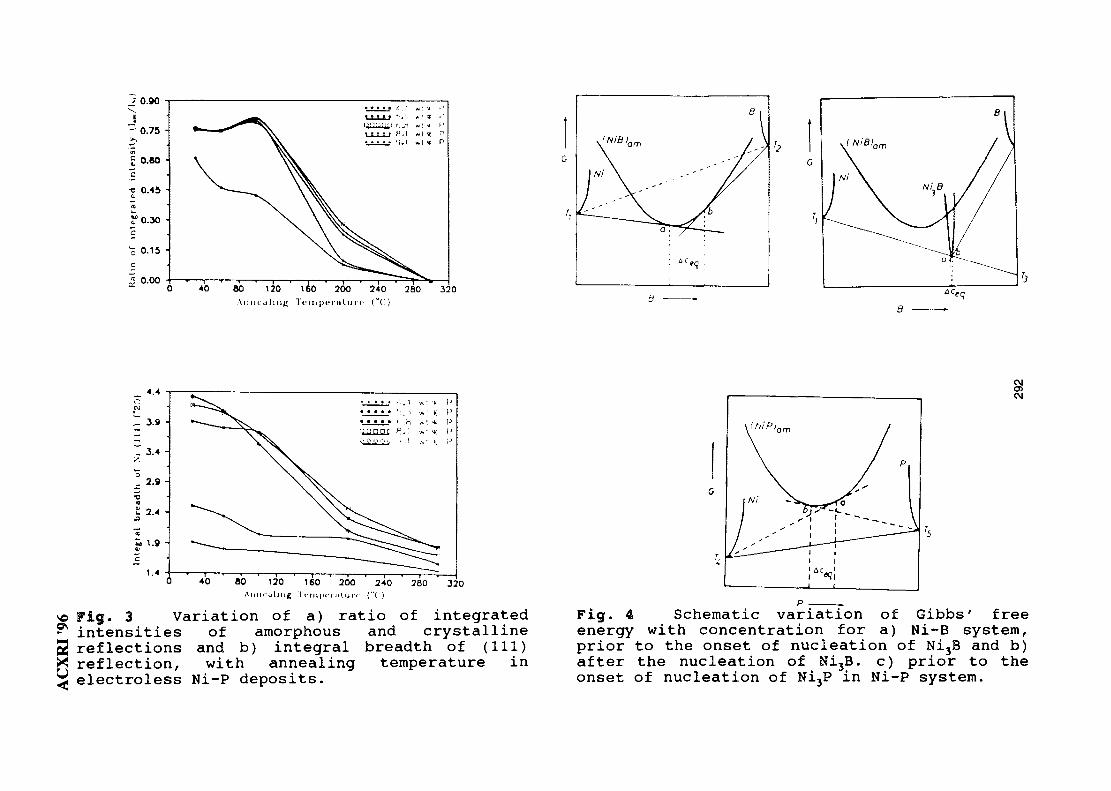
2 0.90
~ 0.75
£ 0.60c•o 0.45
0.15 •
" 0.0040 80 120 160 200 240 280
Anneal ing T e m p e r a t u r e ("C)320
G
h
\t"iB>am
\
8 |
—
G
^ NiB'am
4.4
1.44 0 80 120 160 200
A n n e a l i n g I ' e r n | x - i - n i u i • • •
240("O
280 3 2 0
v© Fig. 3 Variation of a) ratio of integrated^ intensities of amorphous and crystalline2 reflections and b) integral breadth of (111)^ reflection, with annealing temperature in^ electroless Ni-P deposits.
Fig. 4 Schematic variation of Gibbs' freeenergy with concentration for a) Ni-B system,prior to the onset of nucleation of Ni3B and b)after the nucleation of Ni3B. c) prior to theonset of nucleation of Ni3P in Ni-P system.
MY9700818
GROWTH CRYSTALLOGRAPHY OF SILICON PHASES IN UNMODIFIED,IMPURITY AND CHILL MODIFIED Al-Si EUTECTIC ALLOYS
Engku Mohd Nazim b. Engku Abu Bakar and Ali OurdjiniUniversiti Teknologi Malaysia, Faculty of Mechanical Engineering
Karung Berkunci 791, 80990 Johor Bahru
Abstract : In aluminium-silicon eutectic alloys the faceted silicon phase can have differentmorphologies and the solidification pattern can be changed by solidification conditions andby minor additions to the melt. The crystallography of eutectic silicon in the unmodifiedaluminium-silicon eutectic alloy has been studied in detail by scanning (SEM) andtransmission techniques. Modification of the silicon by strontium and treatment of thealuminium-silicon alloys by antimony as well as the effect of chill modification have alsobeen examined. The growth modes of the observed morphologies are discussed. Strontiummodification results in decreased spacing and increased undercooling and multipletwinning was observed in the silicon fibres at all growth rates. These observations arereconciled with a modification mechanism in which strontium adsorbs at the silicongrowth front, poisoning growth steps operating during flake growth and creating latticeinstabilities which result in multiple twinning. In chill modified fibres, however, onlycozonal twinning was observed and the density of twins decreased as the growth rateincreased. The growth mechanism of chill modified fibres is reconciled with a modificationmechanism that assumes a faceted-non/faceted transition in the silicon phase.
Introduction
The Al-Si eutectic is a system that displays a range of eutectic structures and itssuccess as casting alloy is strongly dependent on the control of the solidificationmicrostructures. Al-Si alloys are of industrial importance largely because of propertieswhich can be obtained as a result of modification and also because of the change instructure with solidification conditions (temperature gradient and solidification rate). It iswell known that control of the properties of these alloys is achieved by small additions ofstrontium (Sr) and sodium (Na) (impurity modification) or by chill modification at fastcooling rates. Antimony (Sb) treatment of liquid Al-Si eutectic alloys has also beenrecognized as an alternative method of structural refinement to Sr and Na. Modification bystrontium or sodium results in a drastic change in silicon morphology from flake to ahighly branched fibrous structure and that the modified structure grows at a moreisothermal interface than the unmodified flake structure.
Modification is now considered to be associated primarily with a change in theeutectic silicon phase growth mechanism. How the modified growth works to yield afibrous rather than a flake silicon morphology is not well understood. The clue, however,seems to lie in the dramatic increase in twinning density and higher growth undercoolingassociated with the modified structure1. There is considerable experimental evidence thatshows flake growth is dominated by the {111} faceting of the Si phase. That is all {111}twin planes are cozonal and parallel to a common <111> direction. A distinction shouldalso be made between modification by a minor addition (Sr or Na) and that of theconsequences of rapid solidification (chill modification). TEM studies have shown that thestructure of impurity and chill modified Si fibres are different although they appear similar
293
ACXRI '96when observed by optical and scanning electron microscopy " .In Sr treated alloys the Sifibres display a high density of multiple twins. On the other hand, twins have not beendetected in some chill modified fibres whilst in others only cozonal twins have beenobserved. The purpose of this paper is to present structural observations and study thepossible Si phase growth mechanism for Sr and Sb treated alloys solidified over a widergrowth velocity range including the velocity at which chill modification occurs.
Experimental procedure
Alloys were prepared from AI and Si of 99.99 % purity by melting in a highfrequency induction furnace under an argon atmosphere. Additions of 0.2 wt% Sb and 0.04wt% Sr was carried out by wrapping the metals in a piece of Al foil and plunging it deepinto the melt with a graphite rod. After time for dissolution and homogenization, themolten alloy was sucked up into preheated alumina tubes 200 mm in length and 2.5 mminternal diameter. The specimen was then positioned in a vertical Bridgman furnace abovea cold water reservoir which promotes directional solidification. The furnace and itsoperation have been described elsewhere6. Growth velocity in the range 20-820 urns"1 wereused with temperature gradients of 32 and 129 Kcm"'. Fine thermocouples (0.3 mm indiameter) positioned on the axis of the temperature isotherms were used to measure thegrowth temperature (interface undercooling). Samples were prepared for examination bySEM by deep etching in 2-5 % hydrochloric acid aqueous solution for extended periods.For thin film preparation for studies using transmission electron microscopy (TEM),cylindrical specimens were trepanned from directionally solidified samples by spark cuttingin either longitudinal or transverse directions. These discs were hand polished carefully to athickness of 100 fim and then dimpled. The discs were transferred to an ion beam thinnerand set at an angle of 18° to the incident beam of ionized argon gas. Using a 4 kV ionbeam, a thin and deformation free foil was produced in 5-6 days. Thinned specimens wereexamined in a 120 kV Philips EM400T electron microscope.
Experimental results and discussion
Figure 1 (a, b, c) shows the difference in eutectic microstructure in chill modifieduntreated alloys (la), Sb treated (lb) and Sr modified (lc). It is clear that the eutecticdisplays a fibrous structure when treated with Sr or solidified at higher growth velocities(chill modified) whereas in the presence of Sb the Si phase has a flake structure whensolidified at low growth velocities (where chill modification does not occur) confirmingprevious observations that Sb does not modify the eutectic structure7. Figure 1 (d, e, f) alsoshows TEM images of untreated chill modified and Sb treated alloys at low and highgrowth velocities. At low velocities, in the presence of Sb, cozonal {111} twins wereobserved in the Si flakes. This observation is the same as in untreated alloys. At highergrowth velocities where chill modification occurs, the density of twins decreased and manyfibres were twin free (figure If)- This is in contrast with the observation of multipletwinning in Sr modified alloys. As shown in figure 2 the important change in Sr treatedalloys solidified at low growth velocities, apart from the flake-fibre transition, is the drasticincrease in the twinning density within the Si fibres.
Both kinetic measurements of undercooling and interparticle spacing reportedpreviously8 and structure of the Si phase in Sb treated alloys solidified at low growthvelocities and chill modified are very similar to those in untreated alloys at constant growthvelocities. The interface spacing in less in the Sb treated alloys and the undercooling is
294
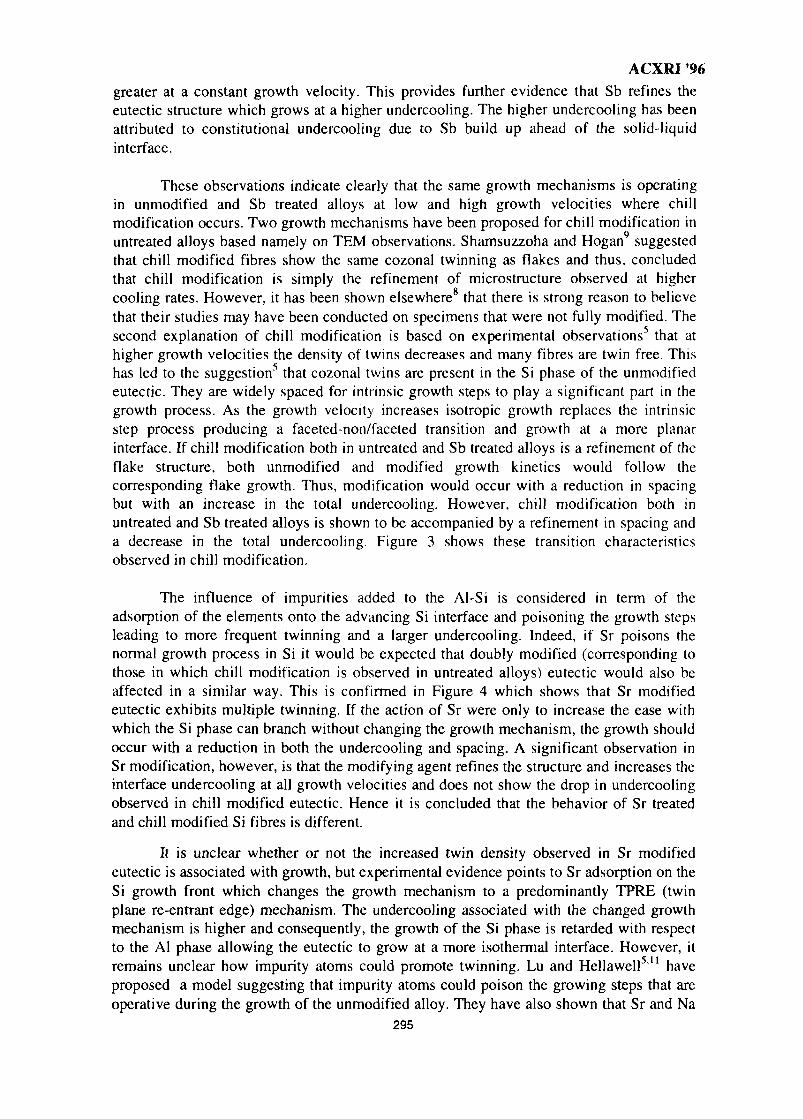
ACXRI '96
greater at a constant growth velocity. This provides further evidence that Sb refines theeutectic structure which grows at a higher undercooling. The higher undercooling has beenattributed to constitutional undercooling due to Sb build up ahead of the solid-liquidinterface.
These observations indicate clearly that the same growth mechanisms is operatingin unmodified and Sb treated alloys at low and high growth velocities where chillmodification occurs. Two growth mechanisms have been proposed for chill modification inuntreated alloys based namely on TEM observations. Shamsuzzoha and Hogan9 suggestedthat chill modified fibres show the same cozonal twinning as flakes and thus, concludedthat chill modification is simply the refinement of microstructure observed at highercooling rates. However, it has been shown elsewhere8 that there is strong reason to believethat their studies may have been conducted on specimens that were not fully modified. Thesecond explanation of chill modification is based on experimental observations5 that athigher growth velocities the density of twins decreases and many fibres are twin free. Thishas led to the suggestion' that cozonal twins are present in the Si phase of the unmodifiedeutectic. They are widely spaced for intrinsic growth steps to play a significant part in thegrowth process. As the growth velocity increases isotropic growth replaces the intrinsicstep process producing a faceted-non/faceted transition and growth at a more planarinterface. If chill modification both in untreated and Sb treated alloys is a refinement of theflake structure, both unmodified and modified growth kinetics would follow thecorresponding flake growth. Thus, modification would occur with a reduction in spacingbut with an increase in the total undercooling. However, chill modification both inuntreated and Sb treated alloys is shown to be accompanied by a refinement in spacing anda decrease in the total undercooling. Figure 3 shows these transition characteristicsobserved in chill modification.
The influence of impurities added to the Al-Si is considered in term of theadsorption of the elements onto the advancing Si interface and poisoning the growth stepsleading to more frequent twinning and a larger undercooling. Indeed, if Sr poisons thenormal growth process in Si it would be expected that doubly modified (corresponding tothose in which chill modification is observed in untreated alloys) eutectic would also beaffected in a similar way. This is confirmed in Figure 4 which shows that Sr modifiedeutectic exhibits multiple twinning. If the action of Sr were only to increase the ease withwhich the Si phase can branch without changing the growth mechanism, the growth shouldoccur with a reduction in both the undercooling and spacing. A significant observation inSr modification, however, is that the modifying agent refines the structure and increases theinterface undercooling at all growth velocities and does not show the drop in undercoolingobserved in chill modified eutectic. Hence it is concluded that the behavior of Sr treatedand chill modified Si fibres is different.
It is unclear whether or not the increased twin density observed in Sr modifiedeutectic is associated with growth, but experimental evidence points to Sr adsorption on theSi growth front which changes the growth mechanism to a predominantly TPRE (twinplane re-entrant edge) mechanism. The undercooling associated with the changed growthmechanism is higher and consequently, the growth of the Si phase is retarded with respectto the Al phase allowing the eutectic to grow at a more isothermal interface. However, itremains unclear how impurity atoms could promote twinning. Lu and Hellawell5'" haveproposed a model suggesting that impurity atoms could poison the growing steps that areoperative during the growth of the unmodified alloy. They have also shown that Sr and Na
295
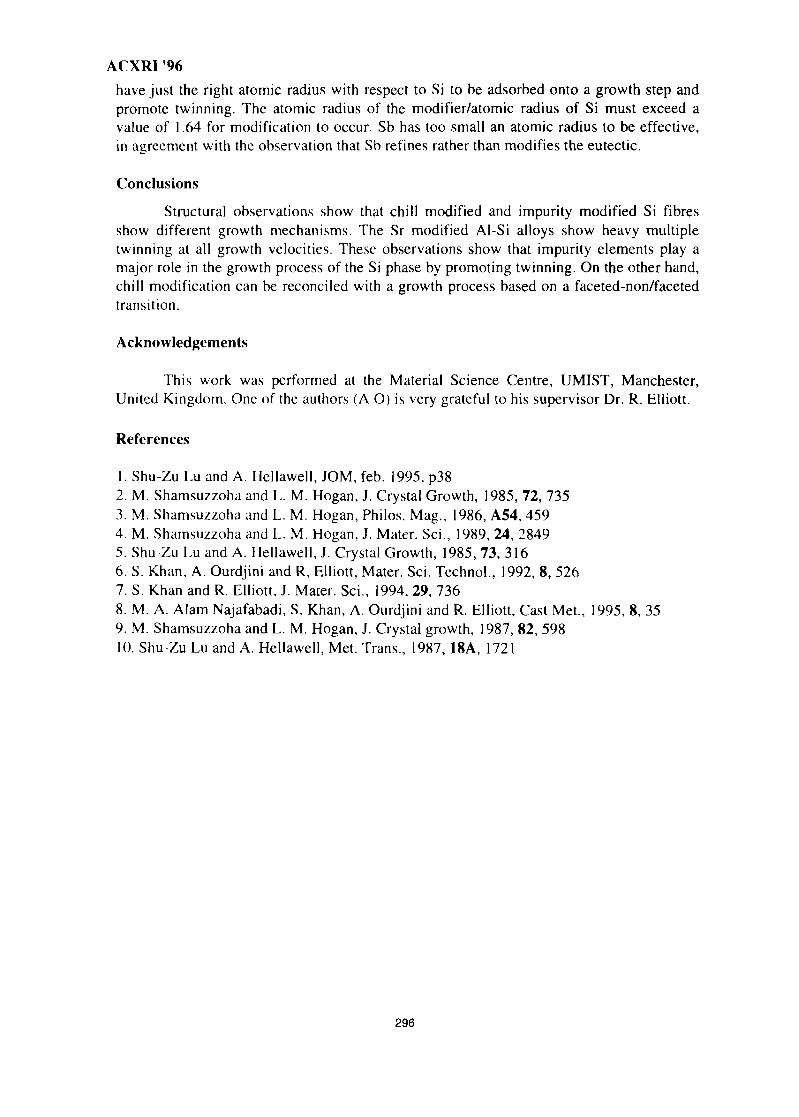
ACXRI '96
have just the right atomic radius with respect to Si to be adsorbed onto a growth step andpromote twinning. The atomic radius of the modifier/atomic radius of Si must exceed avalue of 1.64 for modification to occur. Sb has too small an atomic radius to be effective,in agreement with the observation that Sb refines rather than modifies the eutectic.
Conclusions
Structural observations show that chill modified and impurity modified Si fibresshow different growth mechanisms. The Sr modified Al-Si alloys show heavy multipletwinning at all growth velocities. These observations show that impurity elements play amajor role in the growth process of the Si phase by promoting twinning. On the other hand,chill modification can be reconciled with a growth process based on a faceted-non/facetedtransition.
Acknowledgements
This work was performed at the Material Science Centre, UMIST, Manchester,United Kingdom. One of the authors (A O) is very grateful to his supervisor Dr. R. Elliott.
References
1. Shu-Zu Lu and A. Hellawell, JOM, feb. 1995, p382. M. Shamsuzzoha and L. M. Hogan, J. Crystal Growth, 1985, 72, 7353. M. Shamsuzzoha and L. M. Hogan, Philos. Mag., 1986, A54, 4594. M. Shamsuzzoha and L. M. Hogan, J. Mater. Sci., 1989, 24, 28495. Shu-Zu Lu and A. Hellawell, J. Crystal Growth, 1985, 73, 3166. S. Khan, A. Ourdjini and R, Elliott, Mater. Sci. Technol., 1992, 8, 5267. S. Khan and R. Elliott, J. Mater. Sci., 1994, 29, 7368. M. A. Alam Najafabadi, S. Khan, A. Ourdjini and R. Elliott, Cast Met., 1995, 8, 359. M. Shamsuzzoha and L. M. Hogan, J. Crystal growth, 1987, 82, 59810. Shu Zu Lu and A. Hellawell, Met. Trans., 1987,18A, 1721
296
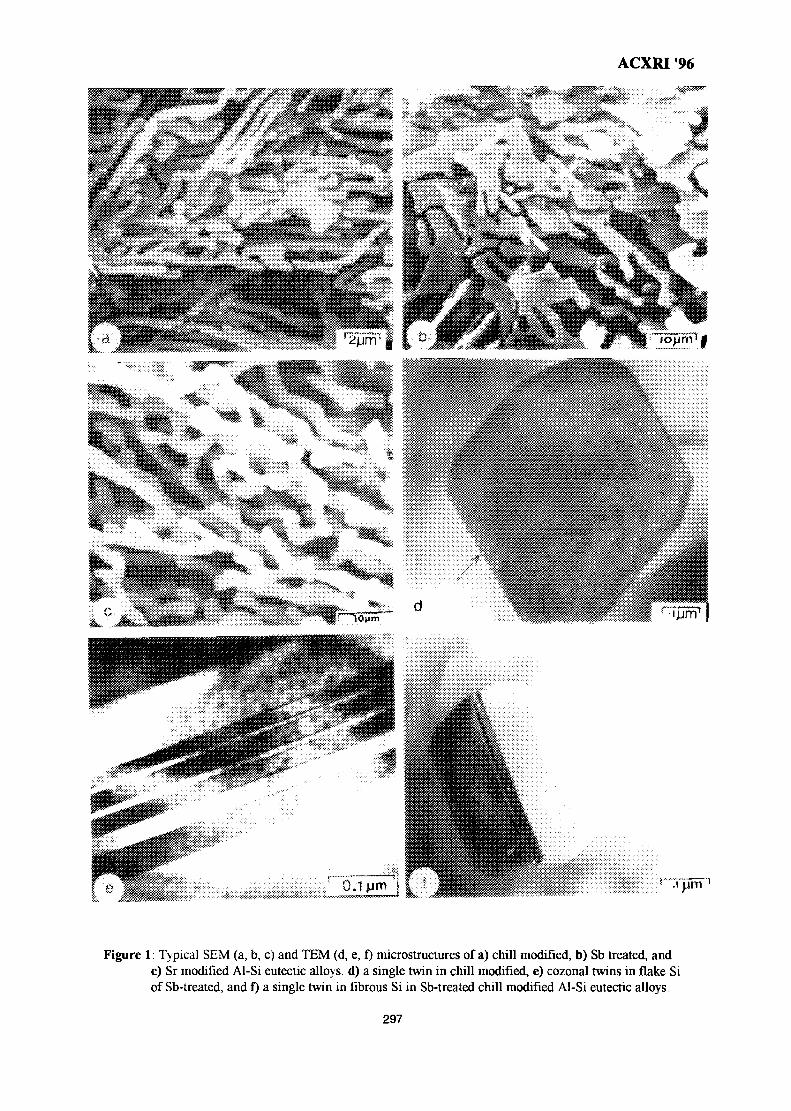
ACXRI '96
j j m
Figure 1: Typical SEM (a, b, c) and TEM (d, e, f) microstructures of a) chill modified, b) Sb treated, andc) Sr modified Al-Si eutectic alloys, d) a single twin in chill modified, e) cozonal twins in flake Siof Sb-treated, and f) a single twin in fibrous Si in Sb-treated chill modified Al-Si eutectic alloys.
297
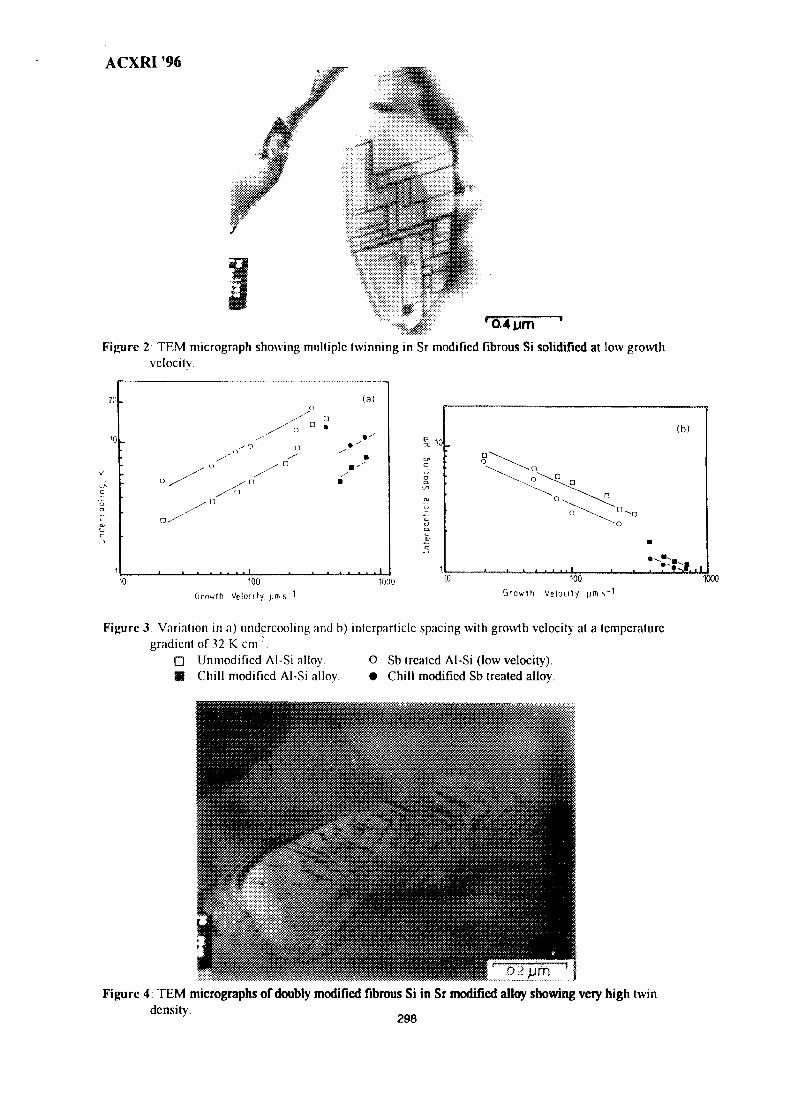
ACXRI '96
•04 urn 'Figure 2 TEM micrograph showing multiple twinning in Sr modified fibrous Si solidified at low growth
velocity
100
Growth Velocity.
1000 1000
Growth Velocity, pm s-1
Figure 3: Variation in a) undercooling and b) intcrparticlc spacing with growth velocity at a temperaturegradient of 32 K cm"'.
D Unmodified Al-Si alloy. O Sb treated Al-Si (low velocity).M Chill modified Al-Si alloy • Chill modified Sb treated alloy.
Figure 4: TEM micrographs of doubly modified fibrous Si in Sr modified alloy showing very high twindensity.
MY9700819STRUCTURE EVOLUTION IN
SnO2-Ln2O3 (Ln=La, Pr, Nd, Sm, Gd)
Wan Azelee Wan Abu Bakar
Department of Chemistry, Faculty of ScienceUniversiti Teknologi Malaysia Skudai, K.B. 791, 80990 Johor Bahru
Abstract : Uncalcined composite samples of SnO2-Lri2O3 (Ln=La, Pr, Nd, Sm, Gd)prepared by sol-gel method showed an amorphous phase of SnO2 Calcination at highertemperature, produced different phases. The ternary phase structures of SnO2Ln2O7
produced, were studied by X-ray diffraction and transmission electron microscopy inorder to elucidate the chemistry underlying these oxide materials.
Introduction
Recently, it was noted that the addition of lanthanide cations, e.g. La + into theceria has an enhanced effect on the 'oxygen storage capacity (OSC)' of ceria [1] (thesupport for exhaust emission catalysts). Interestingly, the features present aftercalcination up to 1000°C are due to separate crystalline nature of ceria and lanthanide.No new crystalline phases were observed [2]. In the present paper, the tin-lanthanidecomposite oxides were studied. The XRD and TEM techniques were employed toelucidate the morphology of the composite oxides.
Experimental
Preparation of SnO2-Ln2O3 (Ln=La, Pr, Nd, Sm, Gd) Composite Oxides
Tin (IV)-Ln(III) composite oxides were prepared by coprecipitation of thehydrous gel. To a vigorously stirred cold solution containing ca. 0.1M tin (IV) chloride(75g,, 0.288 mole) and lanthanum nitrate hexahydrate (12.467g, 0.029 mole) in triplydistilled water {ca. 500 cm ), concentrated 33wt%. Analar aqueous ammonia solutionwas added to a final pH of 4. The resultant gelatinous precipitate was washed until it wasfree of chloride ions by repeated centrifuging and redispersing in triply distilled water.The solid gel was then allowed to air dry at 60°C to give a colourless gel of the compositeSnO2-Ln2O3 catalyst. The composite oxides of SnO2-Pr2O3, SnO2-Nd2O3, SnO2-Sm2O3
and SnO2-Gd2O3, of similar family SnO2:Ln2O3 (10:1) (Ln = Pr, Nd, Sm, and Gd),prepared in a similar procedure gave greenish, yellowish, purple, and colourless crystals,respectively.
299
ACXRI 96Results and Discussion
The X-ray Diffraction of Composite SnOrLn2O3 (10:1) (Ln=La, Pr, Nd, Sm, Gd)
Oxide Materials
The X-ray diffraction analysis for composite SnO2-Ln2O3 (10:1) materials werecarried out after calcination at various temperatures. All the diffractograms obtained forthese materials exhibit very similar patterns up to calcination temperature of 800°C. Thedistinct difference is only observed from 1000°C and above, and representative X-raydiffraction patterns obtained for SnO2-Ln2O3 (10:1) materials after calcination at varioustemperatures are given in Figure 1; numerical data are collected in Table 1 showing peakpositions.
SnOrLa2O3 Oxide
At ambient temperature, this material exhibits traces comprising the four verybroad bands due to very small particulate SnO2 No bands are observed due to La2O3 .On calcination at 800°C, a band at 29 = 37.858° which is assigned to cubic La2O3 isobserved besides the bands due to tetragonal SnO2. Calcination at 1000°C showscrystallization of new phase attributed to cubic Sn2La207 (Figure 1 (a) and Table 1).This new crystalline form exhibited peaks at 2G values of 28.845, 33.425, 48.050, 57.020and 59.790°, comparable to that reported in JCPDS[3] (Table 2). The Louer program [4]gives the unit cell of Sn2La207, a = 10.7074Awhich is close to the literature value givenin JCPDSofa= 10.7020.
SnO2-Pr2O3 (10:1) Oxide
At ambient temperature, the diffractogram comprises four very broad bandsassigned to very small particulate SnO2. No bands due to Pr2O3 are observed in thewhole range of temperature studied. However, after calcination at higher temperatures ofca. 1000°C and above, the ternary of cubic phase Sn2Pr207 is produced (Figure 1 (b) andTable 1). This new crystalline phase exhibits peaks at 28 values oof 29.140, 48.620,57.575 and 60.315°, comparable to those reported [3] (Table2).
SnO2-Nd2O3 (10:1) Oxide
At ambient temperature, the diffractogram comprises of peaks attributed to SnO2.Again, no bands due to Nd2O3 are observed in the whole range of temperature studied.At the calcination temperature of 1000°C, new peaks at 29 values of 29.260, 33.845,48.670, 57.870 and 60.575° appear (Figure 1 (c) and Table 1) due to the ternary phaseSn2Nd207. These 29 values are comparable to those reported [3] (Table 2).
300
ACXRI 96
SnO2-Sm2O3 (10:1) Oxide
At ambient temperature, the diffractogram comprises broad peaks due totetragonal SnO2. At 600°C, a major peak which is attributed to Sm2O3 (29 = 29.165°)[3]is observed besides the peaks due to SnO2. On calcination at a temperature of 1000°Cand above, the ternary phase Sn2Sm2O7 is produced (Figure 1 (c) and Table 1). The peaksof this new crystalline phase occur at 26 values of 29.385, 42.610, 48.900 and 58.150°which agreed well with those reported for cubic Sn2Sm207[3] (Table 2).
SnO2-Gd2O3 (10:1) Oxide
At ambient temperature, the diffractogram comprises only broad peaks due toSnO2. However, at 400°C, a peak which is due to Gd2O3 (29 = 49.884°) is observed,besides the peaks of SnO2 which sharpen. After calcination at a temperature of 1000°Cand above, the ternary phase Sn2Gd207 is produced (Figure 1 (c) and Table 2). The peaksof this new crystalline phase occur at 29 values of 29.570, 49.280 and 58.625°. The cubicSn2Gd2O7 is in agreement to that reported [3] (Table 2).
Average Particle Size Measurements of Composite SnO2-Ln2O3 (10:1) OxideMaterials
Derived From X-Ray Diffraction
Particle size measurements deduced from line broadening for all the SnO2-Ln2O3
(10:1) oxides showed very similar behaviour with respect to calcination treatments. Theparticle sizes increase relatively little until ca. >800°C except for SnO2-Pr2O3, when avery sharp increase takes place (Figures 2 - 6 and Table 3). For SnO2-La2O3 and SnO2-Nd2O3, the particle size starts increasing at 1000°C and increases tremendously at 1100°C(>4000A). Somehow, for SnO2-Pr2O3, the particle size is still low at 1000°C but high at1100°C. For SnO2-Sm2O3, the particle size starts increasing at 1000°C, more at 1100°C,but not as much as SnO2-La2O3 and SnO2-Nd2O3. Furthermore, for SnO2-Gd2O3, theparticle size is still low at 800°C, but high (ca. 4020A) at 1000°C and almost the same at1100°C.
Overall, comparing the average particle size of SnO2-Ln2O3 materials to SnO2
alone (particle size starts increasing at 800°C), it could be concluded that the presence ofLn2O3 in these oxide mixtures, prevents sintering on calcination until at 1100°C (exceptfor Gd2O3 which hindered sintering until at 1000°C).
Transmission Electron Microscopy of SnO2-La2O3 (10:1) Oxide Material
TEM coupled with electron diffraction and EDX analysis shows that at roomtemperature, the SnO2-La2O3 material has a very similar appearance to other SnO2-basedgel materials, but calcination at 600°C causes profound changes. Three distrinct phases
301
ACXRI 96are now observed, one with a La:Sn composition virtually identical to the roomtemperature material comprising small (ca. 4 run) particles exhibiting a very weakelectron diffraction pattern. The second component is lanthanum-rich and comprisesparticles of ca. 20 nm in size some of which are more electron dense than others andexhibit a crystalline electron diffraction pattern. The third component is crystalline SnO2
exhibiting a strong electron diffraction pattern. The same three components are alsopresent after calcination at 1000°C. Now the SnO2 is present as large (60+nm) acicularlathes and rounded hexagons. The particle size of the La-rich phase has increased, andthe phase which has evolved from the mixed Sn/La component now exhibits a strongelectron diffraction pattern.
Conclusion
The results obtained from various techniques of analysis for SnO2.Ln2O3 oxidematerials, represent the complexity of characterisation of these compounds. Interestingly,the formation of ternary phases of Sn2Ln207 for these type of materials were confirmedby X-ray diffraction, Sn MAS-nmr[5], and electron microscopy data. It is also foundthat the presence of Ln2O3 oxides in these materials prevents sintering effect until at1000°C and above this calcination temperature, the particle size of the materials increasedsharply.
References
1. T. Miki, T. Ogawa, M. Haneda, N. Nakuta, A. Ueno, S. Tateishi, S. matsuura andM. Sato, J. Phys. Chern., 1990, 94, 6464-7.
2. Dale Creaser, Ph.D, Thesis, University of Nottingham, 1992.
3. Powder Diffraction File, Inorganic Phases, International Centre for DiffractionData, American Society of Testing Material, 1991.
4. D. Louer and M. Louer, J. Appl. Cryst., 1972, 5, 271.
5. Wan Azelee Wan Abu Bakar, unpublished data.
302
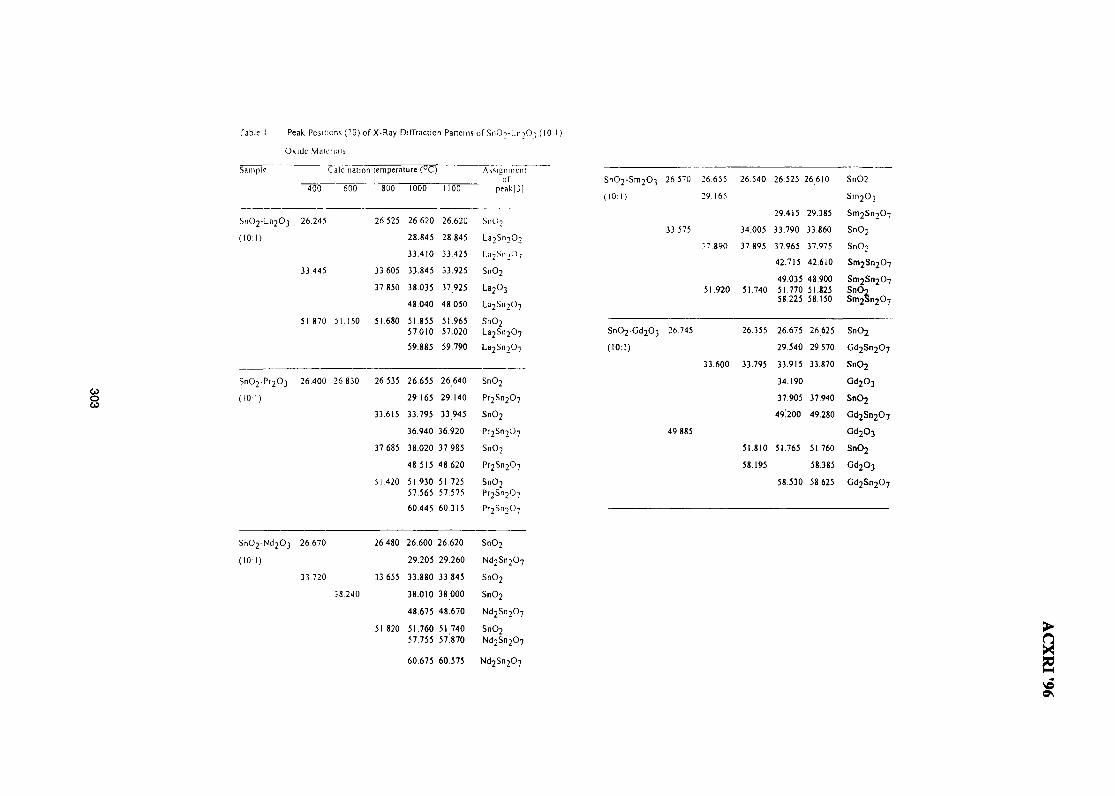
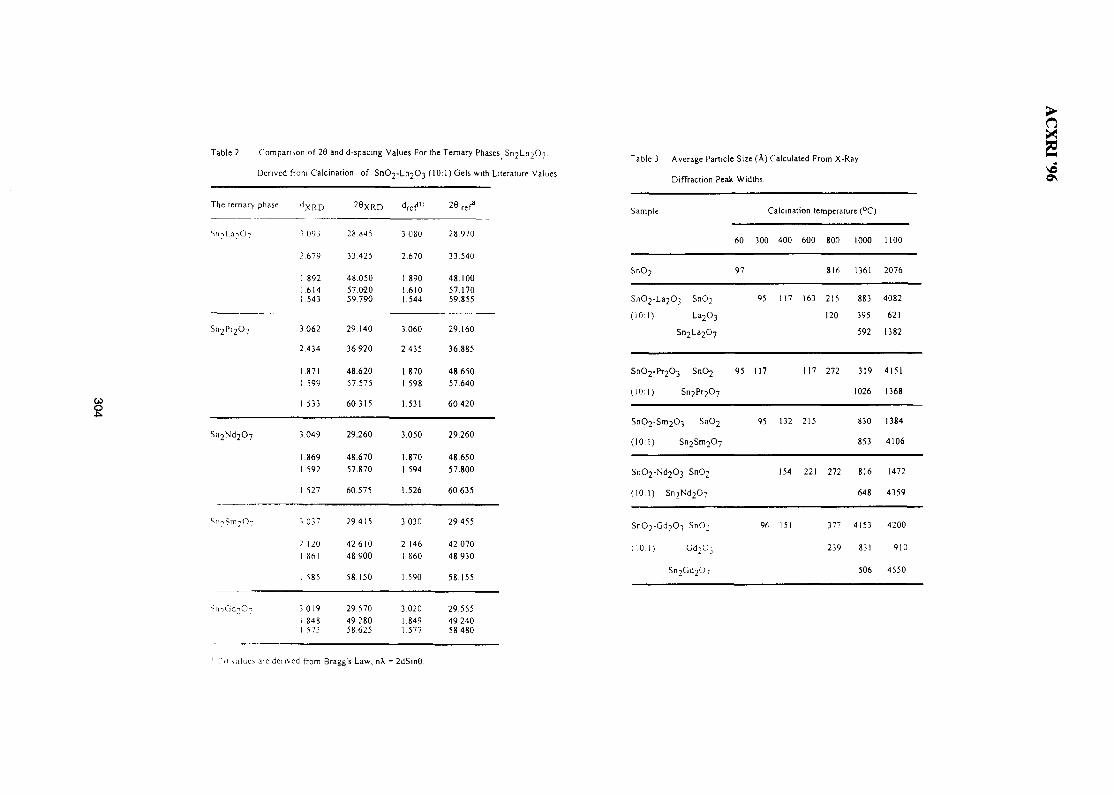
CO
s
Table 2 Comparison of 26 and d-spacing Values For the Ternary Phases Sn2Ln7O7.
Derived from Calcination of SnC^-Lr^O} (10:1) Gels with Literature Values
The ternary phase dXRD ^©XRD dre^
Sn2Pr2O7
3 003 28 845 3 080 28.970
2 679 33 425 2.670 33 540
1 892 48.050 1.890 48.1001.614 57.020 1.610 57.1701543 59.790 1.544 59.855
3.062 29.140 3.060 29.160
2.434 36.920 2.435 36.885
1.871 48.620 1.870 48.650I 599 57 575 1.598 57.640
1.533 60.315 1.531 60.420
Sn 2 Nd 2 0 7 3.049 29.260 3.050 29.260
1.869 48.670 1.870 48.6501592 57.870 1.594 57.800
I 527 60.575 1.526 60.635
Nn?Sm2<> 3 037 29.415 3.030 29 455
2 120 42 610 2.146 42.0701 861 48,900 I 860 48.930
1585 58 150 1590 58.155
SmGdiCh 3 019 29.570 3.020 29.555i 848 49 280 1.849 49.2401 573 58.625 1.577 58.480
Table 3 Average Particle Size (A) Calculated From X-Ray
Diffraction Peak Widths
Sample Calcination temperature (°C)
60 300 400 600 800 1000 1100
SnO2 97 816 1361 2076
SnO2-La2C>3 SnO2
(10:1) La2O3
Sn2La207
95 117 163 215 883 4082
120 395 621
592 1382
3 SnO2 95 117
(10:1)
117 272 319 4151
1026 1368
SnO2 95 132 215
(10:1)
830 1384
853 4106
SnO2-Nd2O3 SnO2
(10:1) Sn 2 Nd 2 0 7
154 221 272 816 1472
648 4359
SnO2-Gd2C>3 SnO; 96 151
(10 I)
Sn2Gd207
377 4153 4200
239 831 910
506 4550
>
nxS
?_0 wines are derived from Bragg's Law, n\ = 2dSm8
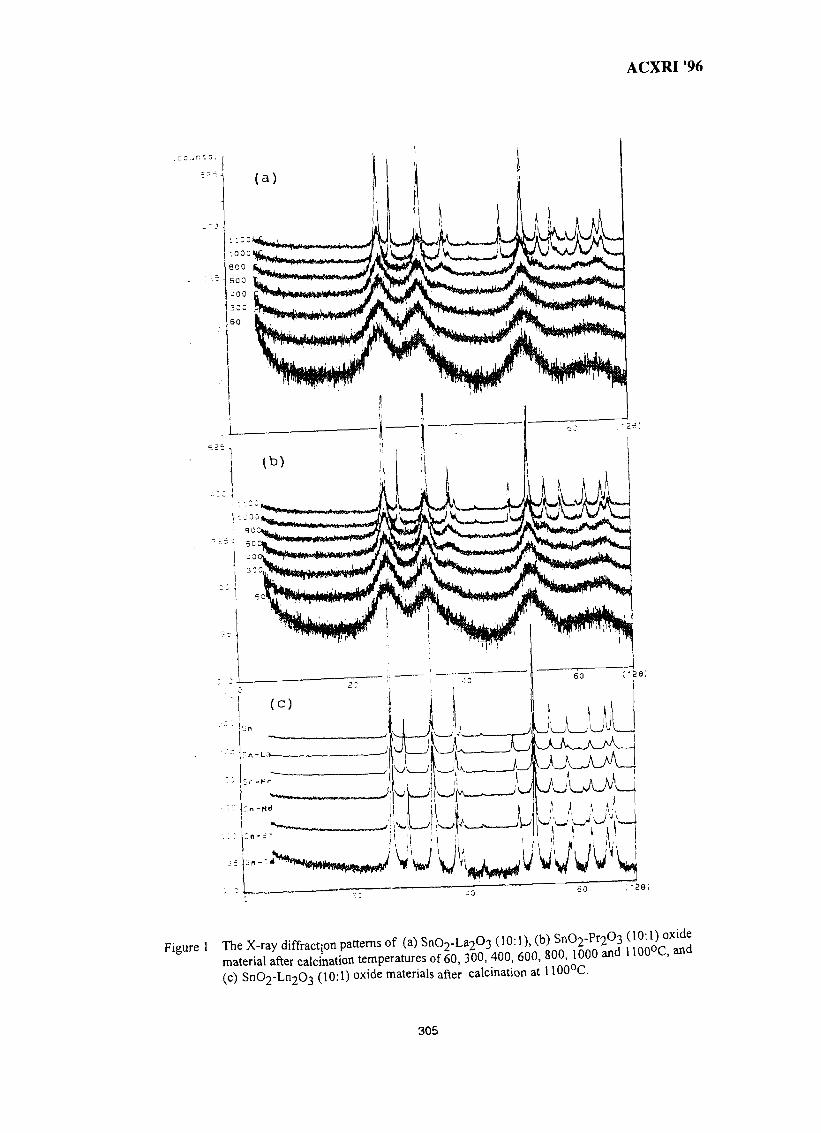
ACXRI 96
Figure 1 The X-ray diffract;on patterns of (a) SnO2-La2O3 (10:1)8 material after calcination temperatures of 60, 300, 400, 600, 800,
(c) SnC^-LnoCH (10:1) oxide materials after calcination at 1100 C.
d 1100°C, and
305
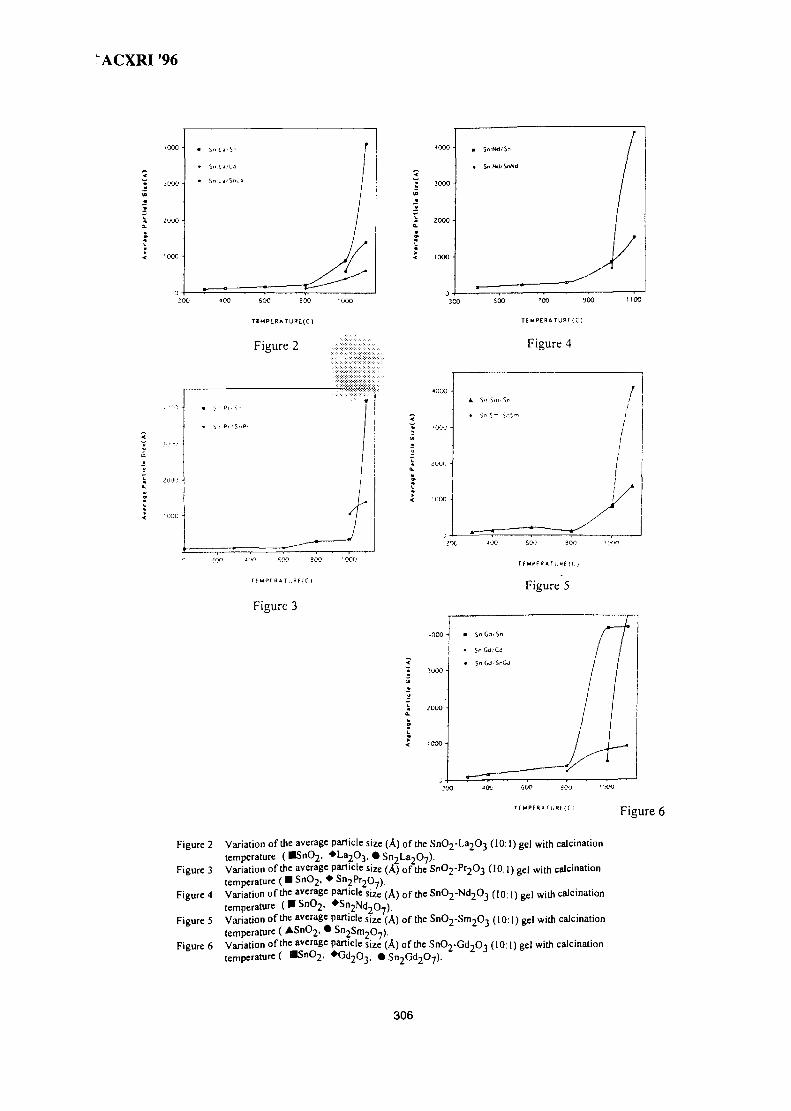
ACXRI '96
200 400 500 000 tOOO
TEMPERATURE(C)
Figure 2
>nC 4 0 " 6™? 800 1500
r F MPF R 4 T URF (C >
Figure 3
Si Nd/S"
SnN<J/SnNd
SOO 'CO 900
TEMPERATURES)
Figure 4
T F M P F R * T U » f (C i
Figure 5
«ooo •
coo •
/
/
;
/
/
1/ >y
a
a.W
-oco
,000-
:C00 -
• S"
. Sn
• Sn
a—-
Gd,S" / /
Gd'Gd / /
Gd Snao / /
/ .
iOO •»(>_' 6 0 0 SOU
T E M P E R A r u R f ( f ) Figure 6
Figure 2 Variation of the average particle size (A) of the SnO2-La2O3 (10:1) gel with calcinationtemperature ( HSnO2 , •La- 2O 3 , • S n 2 L a 2 0 7 ) .
Figure 3 Variation of the average particle size (A) of the SnO2-Pr2O3 (10:1) gel with calcinationtemperature ( • SnO2 . • Sn 2 Pr 2 o 7 ) .
Figure 4 Variation of the average particle size (A) of the SnO2-Nd2O3 (10:1) gel with calcinationtemperature ( B S n O j , • S n 2 N d 2 0 7 ) .
Figure 5 Variation of the average particle size (A) of the SnC^-SnvjC^ (10:1) gel with calcinationtemperature ( A S n O 2 , • S n 2 S m 2 0 7 ) .
Figure 6 Variation of the average particle size (A) of the SnO 2-Gd 2O 3 (10:1) gel with calcinationtemperature ( • S n O 2 , • G d 2 O 3 , • Sn 2Gd 2O 7 ) .
306
MY9700820
STRUCTURAL AND MORPHOLOGICAL PROPERTIES OFELECTROCERAMICS FOR CHEMICAL SENSORS
Enrico TraversaDipartimento di Scienze e Tecnologie Chimiche, Universita' di Roma "Tor Vergata",
Via della Ricerca Scientifica, 00133 Roma, Italy
Abstract : Ceramic materials possess a unique structure consisting of grains, grainboundaries, surfaces and pores, which makes them suitable for chemical sensors. Thecontrol of the chemical composition and microstructure of electroceramics is fundamentalfor controlling their properties. Ceramics with a given composition and microstructure canbe produced by controlling the different steps of their processing. The chemical processingof ceramics offer many advantages in terms of control and reproducibility, with respect tothe conventional ceramics processing. Results are reported about the chemical processingof perovskite-type oxides for gas sensors and about the novel humidity-sensitive electricalproperties of sol-gel processed alkali-doped titania films. The structural and morphologicalcharacterization of these materials permits the understanding of the sensitive electricalproperties of the ceramics.
Introduction
Advanced ceramics can be roughly classified in two main categories, that is structuraland functional ceramics. About 10 years ago, practical applications of structural ceramicsseemed to be imminent. As a matter of fact, however, at present electroceramics areassuming the primary role in the worldwide advanced ceramics production. This is due tothe recent advancements in key technologies such as telecommunications, automation andelectronics, which are causing deep changes in the daily life of the human population. Onetypical example is the present very wide diffusion, in Italy as well as in Malaysia, in USAas well as in Thailand, of portable telephones, the development of which has been madepossible by the advancements in the electroceramics R&D.
The very versatile and flexible functional properties of ceramics make possible theirapplication in a wide range of electrical and microelectronic devices. Ceramics can beinsulators or conductors (ionic, electronic, or mixed), can have ferro-, piezo- and pyro-electric, or even optical and magnetic properties. These properties, combined with theirmechanical, thermal, and chemical stability in aggressive environments, make them idealcandidates for electronic technologies, in devices with passive and control functions (assubstrates, resistors, capacitors, actuators, and sensors). The performance of electroceramicmaterials depends on a complex interplay between processing, chemistry and structure.The growing interest for electroceramics is proven by the last-minute organization of aspecial Symposium on this topic under the frame of the Fourth European CeramicConference,1 due to the large number of abstracts submitted, by the increasing attendanceto the series of the Electroceramics Conferences (the next, the fifth of the series, will beheld in Aveiro, Portugal, next September), and by the launch of the new Journal ofElectroceramics, edited by Harry L. Tuller, which will be published by Kluwer in 1997.
One of the most desirable use of functional ceramics is in the field of chemicalsensors. In fact, the present practical exploitation of ceramic chemical sensors is limited,whilst numerous potential applications can be identified, such as the monitoring andcontrol of environmental pollutants. Ceramics possess a unique structure consisting ofgrains, grain boundaries, surfaces and pores, which makes them suitable for chemicalsensors.2 Vapors or gases are collected in the surfaces and open pores of ceramics byadsorption, absorption, and condensation. For the detection of gases, the changes inelectrical conductivity of semiconducting oxides are used, resulting from the adsorptionand/or reaction of the gas with oxygen adsorbates on the oxide surfaces.3 For the humiditydetection, the change of surface conduction due to proton hopping between physisorbedwater molecules, with a Grotthuss chain reaction mechanism, is used, taking into accountalso the capillary condensation of water within the pores, which results in electrolyticconduction, added to protonic conduction.4
307
ACXRI '96The electrical properties of ceramics are fundamentally correlated with their chemical
composition and microstructure.5 The effect of crystal and/or pore size, of deviations fromthe stoichiometric composition, and of the presence at grain boundaries of small amountsof secondary phases on the properties of electroceramics is so important that close controlof both starting materials and preparation conditions is fundamental.6 Ceramics with givencomposition and microstructure can be produced by controlling the different steps of theirprocessing. In particular, much effort has been recently spent to the development ofinnovative chemical methods for ceramics processing, in order to control the purity ofstarting materials and to develop powder-free fabrication.7 The achievement of acontrolled ultrafine structure and chemical composition of the sensing materials has beenfound to be effective to increase their gas sensitivity. The control of the microstructure ofthe ceramic sensor element, in terms of its particle size, pore size distribution, and necksize, is essential also for the effective correlation of the surface interactions with theconductivity changes.
It is thus clear that a complete chemical, structural and morphological characterizationof electroceramics for sensors is essential for understanding their electrical properties.Techniques such as x-ray diffraction (XRD), scanning electron microscopy (SEM), energydispersive x-ray (EDX) spectroscopy, and x-ray photoelectron spectroscopy (XPS) are ofgreat help for the evaluation of the ceramic properties. The last technique, which issurface-sensitive, is particularly important for the study of materials for chemical sensors.**
In this paper, a couple of examples of the author's studies about electroceramics forchemical sensors are reviewed. First, the preparation of trimetallic perovskite-type oxidesfrom the thermal decomposition of the appropriate hexacyano-complexes is discussed.9
Then, results about the novel humidity-sensitive electrical properties of sol-gel processedalkali-doped titania films are reported.10 The correlation between composition andmicrostructure of the ceramics with their sensitive electrical properties will be emphasized.
Perovskite-Type Oxides, LnMeO3 (Ln = rare earth elements, Me = transition metals)
Recently, there is a growing interest for perovskite-type oxides, LnMeC>3, with Ln =rare earth elements and Me = transition metals. Their functional properties, such as mixedconductivity by both ion and electron migration and highly nonstoichiometric composition,permit their use in many innovative technological applications. These materials are activeoxidation catalysts,11-12 and can be employed as cathodes and membranes in solid oxidefuel cells,13 as electrode materials for electrochemical oxygen sensors,14"16 as membranesfor oxygen separation,17"19 and as sensing materials for the detection of humidity,20-21
alcohol,22 and gases,23 such as oxygen,24-25 CO,26"28 and NO2.29 '30 Some of theseapplications need either the achievement of dense structures, or the presence of porosity. Inboth cases, the preparation of ultrafine, homogenously-sized powders is fundamental.
The conventional method for the preparation of mixed oxides, like perovskite-typeoxides, is the solid-state reaction at high temperatures of the corresponding single oxides.By using this method, it is difficult to obtain single phase materials, since residual amountsof the starting oxides are likely to remain in the final product, unless repeated cycles ofmilling and heating are performed. Powders produced with this method, given that thesynthesis occurs at high temperatures, are coarse, with a non-uniformity of particle sizeand shape, have a low specific surface area, multiphase character and in certain cases lossof stoichiometry due to the volatilization of a reactant.31 The improvement of the ceramicsproperties is obtained with the development of innovative processing methods throughchemistry, which allows the preparation of ultrafine and chemically pure powders ofmixed oxides at lower temperatures and, indeed, to improve the reproducibility of theceramics properties. Several chemical methods have been tried for the preparation ofperovskite-type oxides, which include sol-gel, hydrothermal treatments, and pyrolysis,combustion or thermal decomposition of wet-chemically precipitated precursors.32"35
Particularly promising seems to be the preparation of perovskite-type oxides by thethermal decomposition at low temperatures of hexacyano complexes. These compoundsare readily precipitated from aqueous solution, as it has been firstly proposed by Gallagherin 1968.36 Stoichiometric LnMeC>3 perovskite-type oxides are obtained by the calcination
308
ACXRI 96at relatively low temperatures, about 600°C, of the appropriate complex.37 Recently, it hasbeen confirmed that homogeneous and nanosized powders of LnMeO3 perovskite-typeoxides, with relatively high specific surface area, can be synthesized by the thermaldecomposition at low temperatures of some heteronuclear complexes, if it is possible toobtain such precursors in advance.38"43
Another very interesting feature of this method is the possibility to obtain single-phase, trimetallic complexes, the decomposition of which leads to the formation oftrimetallic perovskite-type, containing either two rare earths and one transition metal44 orone rare earth and two transition metals.45 The possibility to prepare perovkite-type rareearth cobaltites containing heavy lanthanoids is discussed herebelow.
Experimental Procedure
As described elsewhere,42'43 the complexes were synthesized by mixing aqueoussolutions of equimolar amounts of hydrated Ln(III) nitrates (pure or a mixture in aprescribed ratio Ln/Ln') and K3Fe(CN)6 or K3Co(CN)6 under continuous stirring. Theresulting precipitates were washed with water, ethanol and diethyl ether, before drying inair at 50°C. The thermal decomposition behaviour of the precursors was studied bysimultaneous thermogravimetric and differential thermal analysis, with a heating rate of5°C/min in flowing air. The complexes obtained were heated up to selected temperaturesto prepare the oxide samples, with a heating rate of 5 °C/min, for 30 min in air. Thestructure of the complexes and of the decomposition products was analyzed by x-raydiffraction (XRD), using a C u K a radiation with X - 0.154 nm.
Structural Characterization of LnFeO j and LnCoOj
The bimetallic perovskite-type oxides LnFeO 3 and LnCoO3 (with Ln = La - Yb) wereobtained by the thermal decomposition of the heteronuclear complexes in the seriesLn[Fe(CN)6]nH2O and Ln[Co(CN)<5]-nH2O. The XRD spectra of the complexes showedthat their crystal structure is orthorhombic, except for Ln = La. The XRD profiles of theLaFe- and LaCo-complex are somewhat different from the patterns reported in theliterature for La[Fe(CN)6] 5H2O (JCPDS file No. 25-1198, with hexagonal structure, andfile No. 36-0675, with non defined structure) and for La[Co(CN)6]-5H20 (JCPDS file No.36-0674, non defined but with a pattern very close to the hexagonal reported in the file No.25-1198). Hulliger etal 37 have determined on single crystals two types of structures forLnFe complexes (with Ln = La, Ce, Pr, Nd), depending on the number of crystallizationwater molecules, that is hexagonal for n = 5 and orthorhombic for n = 4. A fittingprocedure of the measured XRD plots for the LaFe- and LaCo-complex showed that theyconsisted of a mixture of hexagonal and orthorhombic crystal structures.46 These resultswere confirmed by TGA measurements. The number of crystallization water moleculeswas evaluated to be 4 for the complexes which showed the orthorhombic structure, whilethe number of water molecules was about 4.5 (between 4 and 5) for the complexes whichshowed a mixture of hexagonal and orthorhombic structures.47
Hulliger et al 3 7 demonstrated that a linear relationship exists between the latticeconstants of the Ln fern- and chromi-cyanides and the radius (r) of Ln ions. Fig. 1 showsthe correlation between the lattice constants for the LnFe and LnCo complexes, ascalculated from the XRD profiles, and r. For both the series of complexes, a linearrelationship is observed, confirming the results of Hulliger et al, when the orthorhombicstructures are considered.48 Further details of the XRD analysis are reported elsewhere.49
The lattice parameters for LnCo-complexes are smaller than those of LnFe-complexes.This is probably due to the smaller size of Co ion with respect to Fe ion.
The formation temperature of the perovskite-type oxides is influenced by the Ln ionicradii. For the LnFe-complexes, the formation of the single orthorhombic LaFeO3 phase(JCPDS No. 37-1493) was observed for the product of the thermal decomposition at 600°Cof the LaFe-complex.47 Similar behaviour was observed for Ln = Pr, Nd, Sm, and Gd, butwith an increase in the formation temperature of the orthorhombic phase with decreasingthe Ln ionic radius. For Ln = Dy and Ho, the perovskite phase was accompanied by the
309
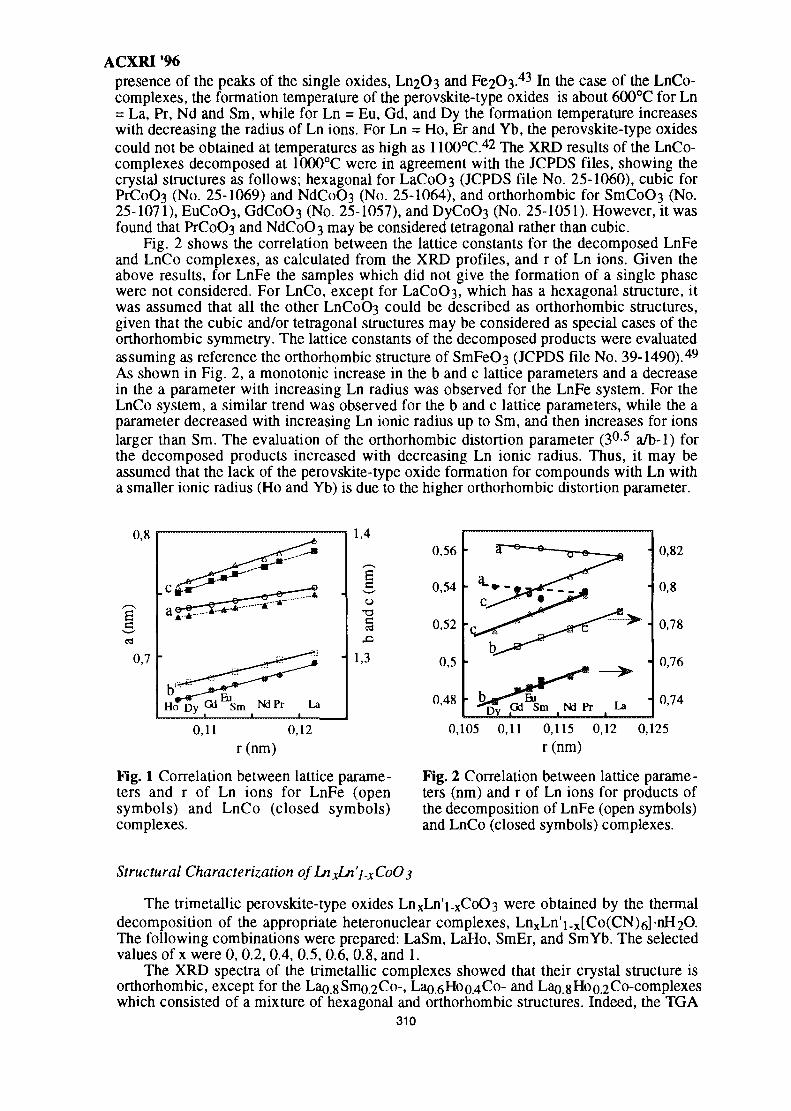
ACXRI 96presence of the peaks of the single oxides, Ln2C>3 and Fe2C>3.43 In the case of the LnCo-complexes, the formation temperature of the perovskite-type oxides is about 600°C for Ln= La, Pr, Nd and Sm, while for Ln = Eu, Gd, and Dy the formation temperature increaseswith decreasing the radius of Ln ions. For Ln = Ho, Er and Yb, the perovskite-type oxidescould not be obtained at temperatures as high as 1100°C.42 The XRD results of the LnCo-complexes decomposed at 1000°C were in agreement with the JCPDS files, showing thecrystal structures as follows; hexagonal for LaCo03 (JCPDS file No. 25-1060), cubic forPrCoO3 (No. 25-1069) and NdCoO3 (No. 25-1064), and orthorhombic for SmCoC>3 (No.25-1071), EuCoO3, GdCoO3 (No. 25-1057), and DyCoC>3 (No. 25-1051). However, it wasfound that PrCo03 and NdCoO3 may be considered tetragonal rather than cubic.
Fig. 2 shows the correlation between the lattice constants for the decomposed LnFeand LnCo complexes, as calculated from the XRD profiles, and r of Ln ions. Given theabove results, for LnFe the samples which did not give the formation of a single phasewere not considered. For LnCo, except for LaCoC>3, which has a hexagonal structure, itwas assumed that all the other LnCo03 could be described as orthorhombic structures,given that the cubic and/or tetragonal structures may be considered as special cases of theorthorhombic symmetry. The lattice constants of the decomposed products were evaluatedassuming as reference the orthorhombic structure of SmFeO3 (JCPDS file No. 39-1490).49
As shown in Fig. 2, a monotonic increase in the b and c lattice parameters and a decreasein the a parameter with increasing Ln radius was observed for the LnFe system. For theLnCo system, a similar trend was observed for the b and c lattice parameters, while the aparameter decreased with increasing Ln ionic radius up to Sm, and then increases for ionslarger than Sm. The evaluation of the orthorhombic distortion parameter (30-5 a/b-1) forthe decomposed products increased with decreasing Ln ionic radius. Thus, it may beassumed that the lack of the perovskite-type oxide formation for compounds with Ln witha smaller ionic radius (Ho and Yb) is due to the higher orthorhombic distortion parameter.
0,12
r (nm)
Fig. 1 Correlation between lattice parame-ters and r of Ln ions for LnFe (opensymbols) and LnCo (closed symbols)complexes.
• 0,820,56
0,54
0,52
0,105 0,11 0,115 0,12 0,125r (nm)
Fig. 2 Correlation between lattice parame-ters (nm) and r of Ln ions for products ofthe decomposition of LnFe (open symbols)and LnCo (closed symbols) complexes.
Structural Characterization of LnxLn'].xCoO3
The trimetallic perovskite-type oxides LnxLn'i.xCoO3 were obtained by the thermaldecomposition of the appropriate heteronuclear complexes, LnxLn'i.x[Co(CN)6]nH2O.The following combinations were prepared: LaSm, LaHo, SmEr, and SmYb. The selectedvalues of x were 0,0.2,0.4,0.5,0.6, 0.8, and 1.
The XRD spectra of the trimetallic complexes showed that their crystal structure isorthorhombic, except for the Lao.8Smo.2Co-, Lao.6Hoo.4Co- and Lao.8Ho0.2Co-complexeswhich consisted of a mixture of hexagonal and orthorhombic structures. Indeed, the TGA
310
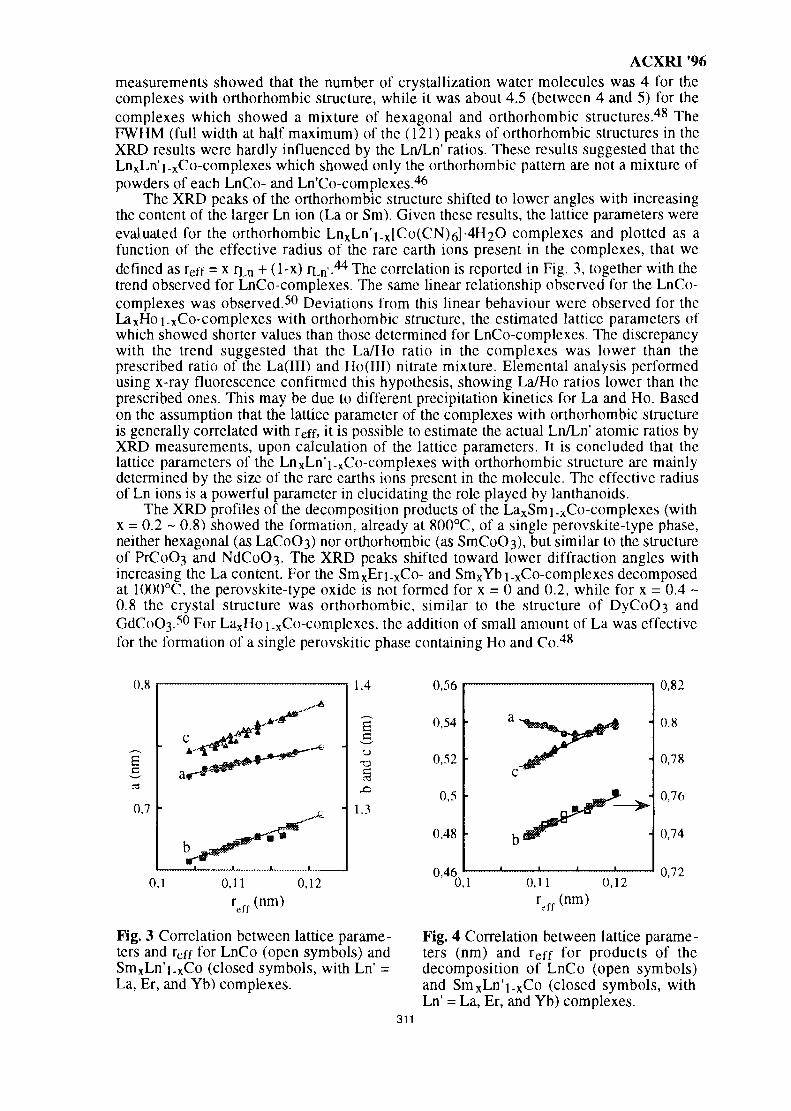
ACXRI 96measurements showed that the number of crystallization water molecules was 4 for thecomplexes with orthorhombic structure, while it was about 4.5 (between 4 and 5) for thecomplexes which showed a mixture of hexagonal and orthorhombic structures.48 TheFWHM (full width at half maximum) of the (121) peaks of orthorhombic structures in theXRD results were hardly influenced by the Ln/Ln' ratios. These results suggested that theLnxLn'i_xCo-complexes which showed only the orthorhombic pattern are not a mixture ofpowders of each LnCo- and Ln'Co-complexes.46
The XRD peaks of the orthorhombic structure shifted to lower angles with increasingthe content of the larger Ln ion (La or Sm). Given these results, the lattice parameters wereevaluated for the orthorhombic LnxLn'i_x[Co(CN)6]-4H2O complexes and plotted as afunction of the effective radius of the rare earth ions present in the complexes, that wedefined as reff = x rLn + (1-x) rLn'.44 The correlation is reported in Fig. 3, together with thetrend observed for LnCo-complexes. The same linear relationship observed for the LnCo-complexes was observed.50 Deviations from this linear behaviour were observed for theLaxHoi-xCo-complexes with orthorhombic structure, the estimated lattice parameters ofwhich showed shorter values than those determined for LnCo-complexes. The discrepancywith the trend suggested that the La/Ho ratio in the complexes was lower than theprescribed ratio of the La(III) and Ho(III) nitrate mixture. Elemental analysis performedusing x-ray fluorescence confirmed this hypothesis, showing La/Ho ratios lower than theprescribed ones. This may be due to different precipitation kinetics for La and Ho. Basedon the assumption that the lattice parameter of the complexes with orthorhombic structureis generally correlated with reff, it is possible to estimate the actual Ln/Ln' atomic ratios byXRD measurements, upon calculation of the lattice parameters. It is concluded that thelattice parameters of the LnxLn'i_xCo-complexes with orthorhombic structure are mainlydetermined by the size of the rare earths ions present in the molecule. The effective radiusof Ln ions is a powerful parameter in elucidating the role played by lanthanoids.
The XRD profiles of the decomposition products of the LaxSmi.xCo-complexes (withx = 0.2 ~ 0.8) showed the formation, already at 800°C, of a single perovskite-type phase,neither hexagonal (as LaCoC>3) nor orthorhombic (as S111C0O3), but similar to the structureof PrCoO3 and NCIC0O3. The XRD peaks shifted toward lower diffraction angles withincreasing the La content. For the SmxEri-xCo- and SmxYbi_xCo-complexes decomposedat 1000°C, the perovskite-type oxide is not formed for x = 0 and 0.2, while for x = 0.4 ~0.8 the crystal structure was orthorhombic, similar to the structure of DyCoC>3 andGdCoC^O For LaxHoi_xCo-complexes, the addition of small amount of La was effectivefor the formation of a single perovskitic phase containing Ho and Co.48
0,56 0,82
Fig. 3 Correlation between lattice parame-ters and reff for LnCo (open symbols) andSmxLn'i_xCo (closed symbols, with Ln' =La, Er, and Yb) complexes.
0,460,11 0,12
0,72
reff (nm)
Fig. 4 Correlation between lattice parame -ters (nm) and reff for products of thedecomposition of LnCo (open symbols)and SmxLn'i-xCo (closed symbols, withLn' = La, Er, and Yb) complexes.
311
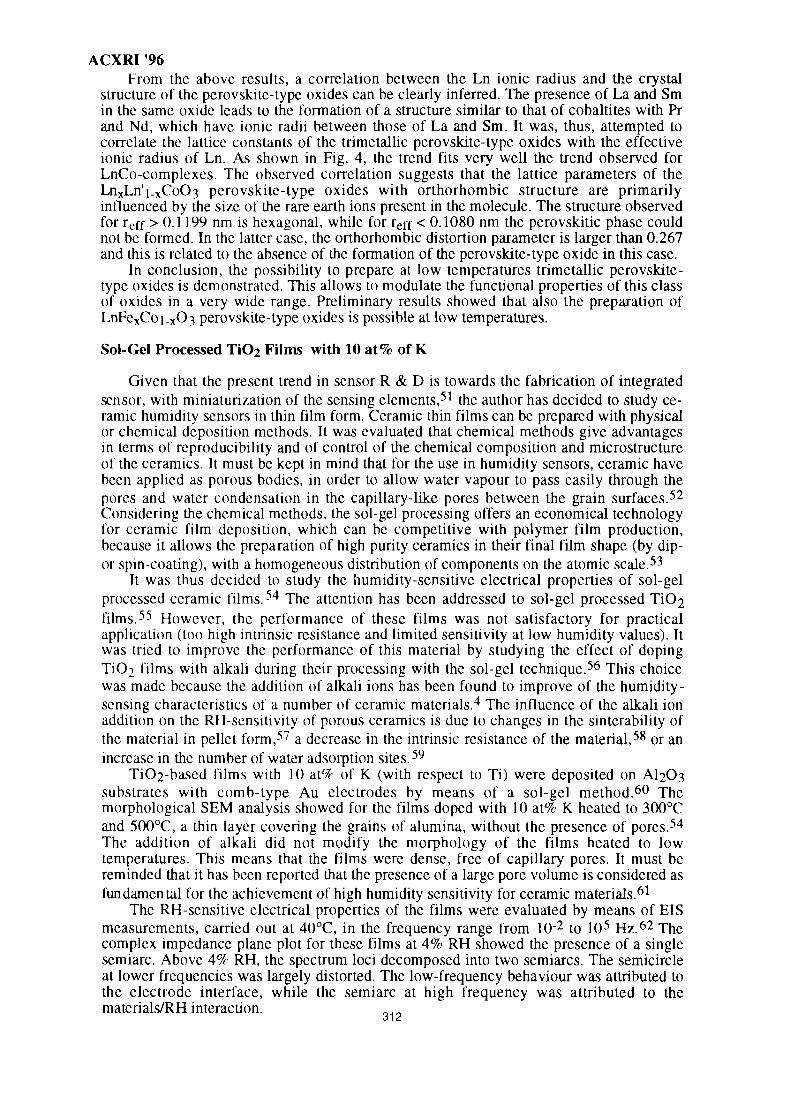
ACXRI 96From the above results, a correlation between the Ln ionic radius and the crystal
structure of the perovskite-type oxides can be clearly inferred. The presence of La and Smin the same oxide leads to the formation of a structure similar to that of cobaltites with Prand Nd, which have ionic radii between those of La and Sm. It was, thus, attempted tocorrelate the lattice constants of the trimetallic perovskite-type oxides with the effectiveionic radius of Ln. As shown in Fig. 4, the trend fits very well the trend observed forLnCo-complexes. The observed correlation suggests that the lattice parameters of theLnxLn'i_xCo03 perovskite-type oxides with orthorhombic structure are primarilyinfluenced by the size of the rare earth ions present in the molecule. The structure observedfor reff > 0.1199 nm is hexagonal, while for reff < 0.1080 nm the perovskitic phase couldnot be formed. In the latter case, the orthorhombic distortion parameter is larger than 0.267and this is related to the absence of the formation of the perovskite-type oxide in this case.
In conclusion, the possibility to prepare at low temperatures trimetallic perovskite-type oxides is demonstrated. This allows to modulate the functional properties of this classof oxides in a very wide range. Preliminary results showed that also the preparation ofLnFexCoi_xC>3 perovskite-type oxides is possible at low temperatures.
Sol-Gel Processed TiO2 Films with 10 at% of K
Given that the present trend in sensor R & D is towards the fabrication of integratedsensor, with miniaturization of the sensing elements,51 the author has decided to study ce-ramic humidity sensors in thin film form. Ceramic thin films can be prepared with physicalor chemical deposition methods. It was evaluated that chemical methods give advantagesin terms of reproducibility and of control of the chemical composition and microstructureof the ceramics. It must be kept in mind that for the use in humidity sensors, ceramic havebeen applied as porous bodies, in order to allow water vapour to pass easily through thepores and water condensation in the capillary-like pores between the grain surfaces.52
Considering the chemical methods, the sol-gel processing offers an economical technologyfor ceramic film deposition, which can be competitive with polymer film production,because it allows the preparation of high purity ceramics in their final film shape (by dip-or spin-coating), with a homogeneous distribution of components on the atomic scale.53
It was thus decided to study the humidity-sensitive electrical properties of sol-gelprocessed ceramic films.54 The attention has been addressed to sol-gel processed T1O2films.55 However, the performance of these films was not satisfactory for practicalapplication (too high intrinsic resistance and limited sensitivity at low humidity values). Itwas tried to improve the performance of this material by studying the effect of dopingTiC<2 films with alkali during their processing with the sol-gel technique.56 This choicewas made because the addition of alkali ions has been found to improve of the humidity-sensing characteristics of a number of ceramic materials.4 The influence of the alkali ionaddition on the RH-sensilivity of porous ceramics is due to changes in the sinterability ofthe material in pellet form,57 a decrease in the intrinsic resistance of the material,58 or anincrease in the number of water adsorption sites.59
TiC»2-based films with 10 at% of K (with respect to Ti) were deposited on AI2O3substrates with comb-type Au electrodes by means of a sol-gel method.60 Themorphological SEM analysis showed for the films doped with 10 at% K heated to 300°Cand 500°C, a thin layer covering the grains of alumina, without the presence of pores.54
The addition of alkali did not modify the morphology of the films heated to lowtemperatures. This means that the films were dense, free of capillary pores. It must bereminded that it has been reported that the presence of a large pore volume is considered asfundamental for the achievement of high humidity sensitivity for ceramic materials.61
The RH-sensitive electrical properties of the films were evaluated by means of EISmeasurements, carried out at 40°C, in the frequency range from 10"2 to 105 Hz.62 Thecomplex impedance plane plot for these films at 4% RH showed the presence of a singlesemiarc. Above 4% RH, the spectrum loci decomposed into two semiarcs. The semicircleat lower frequencies was largely distorted. The low-frequency behaviour was attributed tothe electrode interface, while the semiarc at high frequency was attributed to thematerials/RH interaction.
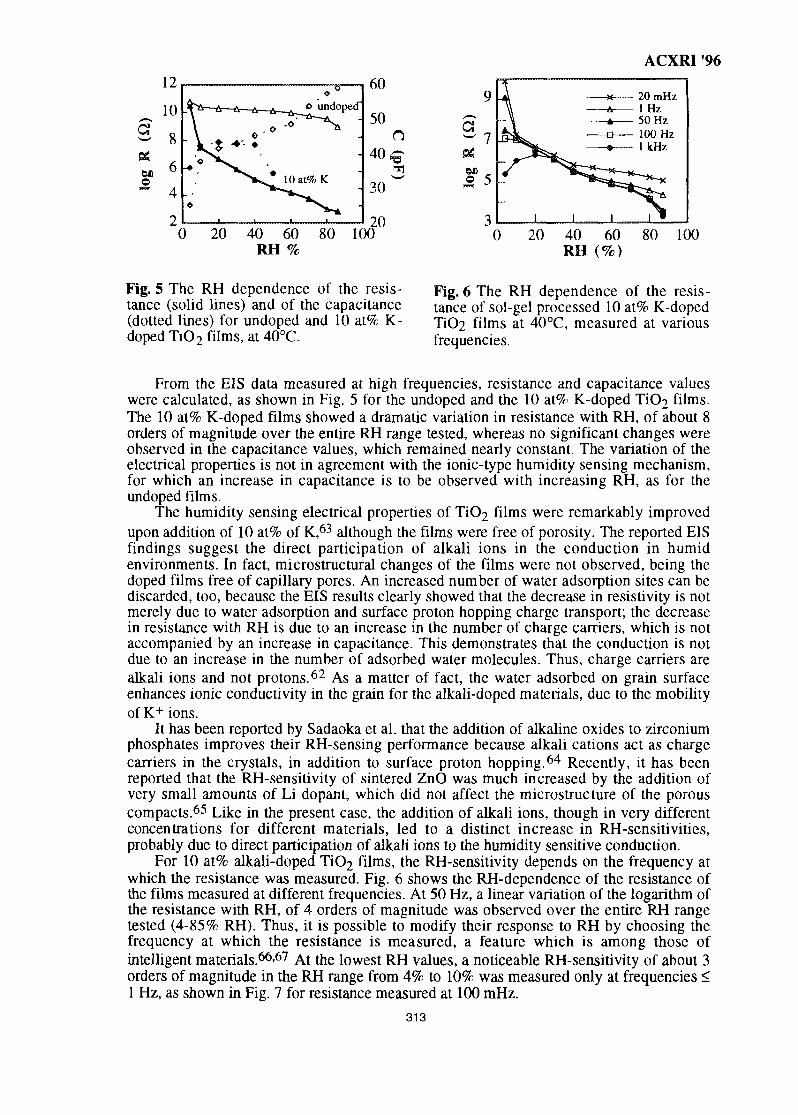
a81
12
10
86
4
2
\ .O ° '6
* •*' •
^ V , . 10at%
l _ 1 J
undoped"
K-
i
60
50
40n
30
200 20 40 60 80 100
RH %
a
W3 _
o 5
0 20 40 60RH (%)
ACXRI 96
20mHzlHz50 Hz100 Hz1kHz
80 100
Fig. 5 The RH dependence of the resis-tance (solid lines) and of the capacitance(dotted lines) for undoped and 10 at% K-doped TiO2 films, at 40°C.
Fig. 6 The RH dependence of the resis-tance of sol-gel processed 10 at% K-dopedTiO2 films at 40°C, measured at variousfrequencies.
From the EIS data measured at high frequencies, resistance and capacitance valueswere calculated, as shown in Fig. 5 for the undoped and the 10 at% K-doped T1O2 films.The 10 at% K-doped films showed a dramatic variation in resistance with RH, of about 8orders of magnitude over the entire RH range tested, whereas no significant changes wereobserved in the capacitance values, which remained nearly constant. The variation of theelectrical properties is not in agreement with the ionic-type humidity sensing mechanism,for which an increase in capacitance is to be observed with increasing RH, as for theundoped films.
The humidity sensing electrical properties of TiC>2 films were remarkably improvedupon addition of 10 at% of K,63 although the films were free of porosity. The reported EISfindings suggest the direct participation of alkali ions in the conduction in humidenvironments. In fact, microstructural changes of the films were not observed, being thedoped films free of capillary pores. An increased number of water adsorption sites can bediscarded, too, because the EIS results clearly showed that the decrease in resistivity is notmerely due to water adsorption and surface proton hopping charge transport; the decreasein resistance with RH is due to an increase in the number of charge carriers, which is notaccompanied by an increase in capacitance. This demonstrates that the conduction is notdue to an increase in the number of adsorbed water molecules. Thus, charge carriers arealkali ions and not protons.62 As a matter of fact, the water adsorbed on grain surfaceenhances ionic conductivity in the grain for the alkali-doped materials, due to the mobilityof K+ ions.
It has been reported by Sadaoka et al. that the addition of alkaline oxides to zirconiumphosphates improves their RH-sensing performance because alkali cations act as chargecarriers in the crystals, in addition to surface proton hopping.64 Recently, it has beenreported that the RH-sensitivity of sintered ZnO was much increased by the addition ofvery small amounts of Li dopant, which did not affect the microstructure of the porouscompacts.65 Like in the present case, the addition of alkali ions, though in very differentconcentrations for different materials, led to a distinct increase in RH-sensitivities,probably due to direct participation of alkali ions to the humidity sensitive conduction.
For 10 at% alkali-doped TiC>2 films, the RH-sensitivity depends on the frequency atwhich the resistance was measured. Fig. 6 shows the RH-dependence of the resistance ofthe films measured at different frequencies. At 50 Hz, a linear variation of the logarithm ofthe resistance with RH, of 4 orders of magnitude was observed over the entire RH rangetested (4-85% RH). Thus, it is possible to modify their response to RH by choosing thefrequency at which the resistance is measured, a feature which is among those ofintelligent materials.66-67 At the lowest RH values, a noticeable RH-sensitivity of about 3orders of magnitude in the RH range from 4% to 10% was measured only at frequencies <1 Hz, as shown in Fig. 7 for resistance measured at 100 mHz.
313
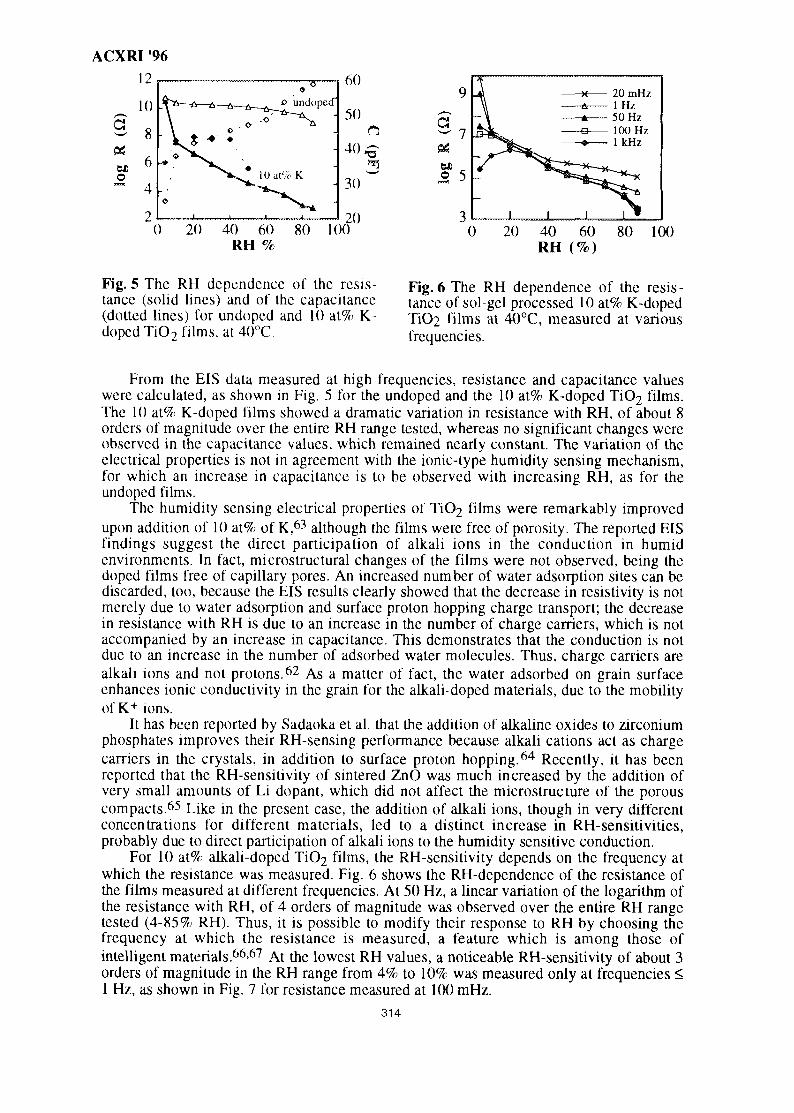
ACXRI 9612
o undoped"
40 60RH %
60
50
40,
30
20100
a
6£ _
o 5
JL
20mHzlHz50 Hz100 Hz1kHz
0 20 40 60 80 100RH (%)
Fig. 5 The RH dependence of the resis-tance (solid lines) and of the capacitance(dotted lines) for undoped and 10 at% K-doped TiCb films, at 40°C.
Fig. 6 The RH dependence of the resis-tance of sol-gel processed 10 at% K-dopedTiO2 films at 40°C, measured at variousfrequencies.
From the EIS data measured at high frequencies, resistance and capacitance valueswere calculated, as shown in Fig. 5 for the undoped and the 10 at% K-doped TiC>2 films.The 10 at% K-doped films showed a dramatic variation in resistance with RH, of about 8orders of magnitude over the entire RH range tested, whereas no significant changes wereobserved in the capacitance values, which remained nearly constant. The variation of theelectrical properties is not in agreement with the ionic-type humidity sensing mechanism,for which an increase in capacitance is to be observed with increasing RH, as for theundoped films.
The humidity sensing electrical properties of TiC>2 films were remarkably improvedupon addition of 10 at% of K,63 although the films were free of porosity. The reported EISfindings suggest the direct participation of alkali ions in the conduction in humidenvironments. In fact, microstructural changes of the films were not observed, being thedoped films free of capillary pores. An increased number of water adsorption sites can bediscarded, too, because the EIS results clearly showed that the decrease in resistivity is notmerely due to water adsorption and surface proton hopping charge transport; the decreasein resistance with RH is due to an increase in the number of charge carriers, which is notaccompanied by an increase in capacitance. This demonstrates that the conduction is notdue to an increase in the number of adsorbed water molecules. Thus, charge carriers arealkali ions and not protons.62 As a matter of fact, the water adsorbed on grain surfaceenhances ionic conductivity in the grain for the alkali-doped materials, due to the mobilityof K+ ions.
It has been reported by Sadaoka et al. that the addition of alkaline oxides to zirconiumphosphates improves their RH-sensing performance because alkali cations act as chargecarriers in the crystals, in addition to surface proton hopping.64 Recently, it has beenreported that the RH-sensitivity of sintered ZnO was much increased by the addition ofvery small amounts of Li dopant, which did not affect the microstructure of the porouscompacts.65 Like in the present case, the addition of alkali ions, though in very differentconcentrations for different materials, led to a distinct increase in RH-sensitivities,probably due to direct participation of alkali ions to the humidity sensitive conduction.
For 10 at% alkali-doped TiC>2 films, the RH-sensitivity depends on the frequency atwhich the resistance was measured. Fig. 6 shows the RH-dependence of the resistance ofthe films measured at different frequencies. At 50 Hz, a linear variation of the logarithm ofthe resistance with RH, of 4 orders of magnitude was observed over the entire RH rangetested (4-85% RH). Thus, it is possible to modify their response to RH by choosing thefrequency at which the resistance is measured, a feature which is among those ofintelligent materials.66'67 At the lowest RH values, a noticeable RH-sensitivity of about 3orders of magnitude in the RH range from 4% to 10% was measured only at frequencies <1 Hz, as shown in Fig. 7 for resistance measured at 100 mHz.
314
ACXRI 96
References
1. G. Gusmano and E. Traversa (eds.), 'Fourth Euro-Ceramics, Vol. 5: Electroceramics',Faenza Editrice, Faenza, Italy, 1995
2. T. Nitta, 'Chemical Sensor Technology, Vol. 1', (Ed. T. Seiyama), Kodansha, Tokyoand Elsevier, Amsterdam, 1988, 57
3. S.R. Morrison, Sensors and Actuators, 1982, 2, 3294. E. Traversa, Sensors and Actuators B, 1995, 23, 1355. D.C. Hill and H.L. Tuller, 'Ceramic Materials for Electronics, 2nd edition', (Ed. R.C.
Buchanan), Marcel Dekker, New York, 1991, 2496. A.J. Moulson and J.M. Herbert, 'Electroceramics', Chapman & Hall, London, 1990, 17. B.I. Lee and E J. Pope (eds.), 'Chemical Processing of Ceramics', Marcel Dekker,
New York, 19948. G. Mattogno, G. Righini, G. Montesperelli and E. Traversa, J. Mater. Res., 1994, 9,
14269. E. Traversa, P. Nunziante, M. Sakamoto and Y. Sadaoka, 'Fourth Euro-Ceramics,
Vol. 5: Electroceramics', (Ed. G. Gusmano and E. Traversa), Faenza Editrice,Faenza, Italy, 1995, 17
10. E. Traversa, G. Gusmano and A. Montenero, Eur. J. Solid State Inorg. Chem., 1995,32,719
11. G. Kremenic, J.M.L. Nieto, J.M.D. Tascon and L.G. Tejuca, J. Chem. Soc, 1985, 81,939
12. J.G. McCarly and H. Wise, Catalysis Today, 1990, 8, 23113. N.Q. Minh, J. Am. Ceram. Soc, 1993, 76, 563, and references cited therein14. T. Inoue, N. Seki, K. Eguchi and H. Arai, J. Electrochem. Soc., 1990, B7, 252315. C.B. Alcock, R.C. Doshi and Y. Shen, Solid State Ionics, 1992, 51, 28116. P. Shuk, A. Vecher, V. Kharton, L. Tichonova, H.D. Wiemhofer, U. Guth and W.
Gopel, Sensors and Actuators B, 1993,16,40117. Y. Teraoka, T. Nobunaga, K. Okamoto, N. Miura and N. Yamazoe, Solid State
Ionics, 1991,48,20718. B.A. von Hassel, T. Kawada, N. Sakai, H. Yokokawa and M. Dokiya, Solid State
Ionics, 1993,66,29519. H.J.M. Bouwmeester, H. Kruidhof and A.J. Burggraaf, Solid State Ionics. 1994,11,
18520. Y. Shimizu, M. Shimabukuro, H. Arai and T. Seiyama, Chem. Lett., 1985, 91721. J.P. Lukaszewicz, Sensors and Actuators B, 1991, 4, 22722. H. Obayashi and T. Kudo, Nippon Kagaku Kaishi, 1980, 156823. T. Arakawa, H. Kurachi and J. Shiokawa, J. Mater. Sci., 1985, 4, 120724. C. Yu, Y. Shimizu and H. Arai, Chem. Lett., 1986, 56325. M.L. Post, B.W. Sanders and P. Kennepohl, Sensors and Actuators B, 1993,13, 27226. W.B. Li, H. Yoneyama and H. Tamura, Nippon Kagaku Kaishi, 1982, 76127. Y. Takahashi and H. Taguchi J. Mater. Sci. Lett., 1984, 3, 25128. T. Arakawa, K. Takada, Y. Tsunemine and J. Shiokawa, Sensors and Actuators, 1988.
14,21529. Y. Matsuura, S. Matsushima, M. Sakamoto and Y. Sadaoka, J. Mater. Chem., 1993,
3,76730. E. Traversa, S. Matsushima, G. Okada, Y. Sadaoka, Y. Sakai and K. Watanabe,
Sensors and Actuators B, 1995, 25, 66131. M. Kakihana, J. Sol-Gel Sci. Technol., 1996, 6, 732. M. Yoshimura, S.T. Song and S. Somiya, Yogyo Kyokaishi, 1982, 90, 9133. H.M. Zhang, Y. Teraoka and N. Yamazoe, Chem. Lett., 1987, 66534. A. Furusaki, H. Konno and R. Furuichi, Nippon Kagaku Kaishi, 1992, 61235. CD. Chandler, C. Roger and M.J. Hampden-Smith, Chem. Rev., 1993, 93, 120536. P.K. Gallagher, Mater. Res. Bull, 1968, 3, 22537. F. Hulliger, M. Landolt and H. Vetsch, J. Solid State Chem., 1976,18, 28338. M. Sakamoto, Y. Komoto, H. Hojo and T. Ishimori, Nippon Kagaku Kaishi, 1990,
88739. S. Nakayama and M. Sakamoto, J. Ceram. Soc. Jpn., 1992, J00, 342
315
ACXRI 9640. M. Sakamoto, K. Matsuki, R. Ohsumi, Y. Nakayama, Y. Sadaoka, S. Nakayama, N.
Matsumoto and H. Okawa, J. Ceram. Soc. Jpn., 1992, KX), 121141. S. Nakayama, M. Sakamoto, K. Matsuki, Y. Okimura, R. Ohsumi, Y. Nakayama and
Y. Sadaoka, Chem. Lett., 1992, 214542. Y. Sadaoka, K. Watanabe, Y. Sakai and M. Sakamoto, J. Ceram. Soc. Jpn., 1995,
103,51943. Y. Sadaoka, K. Watanabe, Y. Sakai and M. Sakamoto, J. Alloys and Compounds,
1995,224, 19444. Y. Sadaoka, E. Traversa and M Sakamoto, Chem. Lett., 1996, 17745. E. Traversa, P. Nunziante, M. Sakamoto, K. Watanabe, Y. Sadaoka and Y. Sakai
Chem. Lett., 1995, 18946. Y. Sadaoka, E. Traversa and M. Sakamoto, 'Synthesis of heteronuclear complexes,
Ln'xLn"i_x[Co(CN)6]-nH2O, and their structural characterization', submitted to J.Alloys and Compounds
47. E. Traversa, M. Sakamoto and Y. Sadaoka, J. Am. Ceram. Soc., 1996,29_, in press48. Y. Sadaoka, E. Traversa and M. Sakamoto, 'Preparation and structural characteriza-
tion of perovskite-type LaxLn" i_xCoO3 by the thermal decomposition of heteronucle-ar complexes, LaxLn"i.x[Co(CN)6]nH2O (Ln"=Sm and Ho)', submitted to J. Alloysand Compounds
49. Y. Sadaoka, E. Traversa and M. Sakamoto, 'Structural characterization of LnMeC"3by the thermal decomposition of heteronuclear complexes', {Ln[Me(CN)6]nH2O (Ln= La~Yb, Me = Fe, Co), submitted to J. Ceram. Soc. Jpn.
50. Y. Sadaoka, E. Traversa and M. Sakamoto, 'Preparation and structuralcharacterization of perovskite-type LnxLn"i.xCoO3 by the thermal decomposition ofheteronuclear complexes, LnxLn"i_x[Co(CN)6]-nH2O', submitted to J. Mater. Chem.
51. Q. Wu, K.M. Lee and C.C. Liu, Sensors and Actuators B, 1993, H , 152. N. Yamazoe and Y. Shimizu, Sensors and Actuators, 1986,1Q, 37953. J.C. Brinker and G.W. Scherer, 'Sol-Gel Science', Academic Press, San Diego, 1990,
83954. E. Traversa, G. Gnappi, A. Montenero and G. Gusmano, Sensors and Actuators B,
1996,11,5955. G. Gusmano, G. Montesperelli, P. Nunziante, E. Traversa, A. Montenero, M.
Braghini, G. Mattogno and A. Bearzotti, J. Ceram. Soc. Jpn., 1993, JJ21, 109556. R. Zanoni, G. Righini, A. Montenero, G. Gnappi, G. Montesperelli, E. Traversa and
G. Gusmano, Surf. Interface Anal., 1994, 22, 37657. T. Suzuki and N. Matsui, 'Analytical Chemistry Symposia Series: Chemical Sensors,
Vol. 17', (Ed. T. Seiyama, K. Fueki, J. Shiokawa and S. Suzuki), Kodansha, Tokyoand Elsevier, Amsterdam, 1983, 381
58. F. Uchikawa and K. Shimamoto, Am. Ceram. Soc. Bull., 1985, M, 113759. Y.C. Yeh and T.Y. Tseng, IEEE Trans. Compon., Hybrids, Manuf. Technol., 1989,
CHMT-12.25960. A. Montenero, L. Lan, G. Gusmano and E. Traversa, 1994, Italian Patent n° MI94A.
00142661. Y. Shimizu, H. Arai and T. Sciyam, Sensors and Actuators, 1985, 2, 1162. G. Gusmano, A. Bianco, G. Montcsperelli and E. Traversa, Electrochim. Acta, 1996,
41, in press63. G. Montesperelli, A. Pumo, E. Traversa, G. Gusmano, A. Bearzotti, A. Montenero
and G. Gnappi, Sensors and Actuators B, 1995, 25, 70564. Y. Sadaoka, M. Matsuguchi, Y. Sakai and S. Mitsui, J. Mater. Sci., 1988, 23, 266665. E. Joanni and J.L. Baptista, Sensors and Actuators B, 1993,12, 26966. H. Yanagida, Angcw. Chem., 1988,100, 144367. E. Traversa, J. Intelligent Mater. Systems and Structures, 1995, 6, 86068. B.M. Kulwicki, J. Am. Ceram. Soc., 1991, 24, 69769. T. Nitta, Z. Terada and S. Hayakawa, J. Am. Ceram. Soc, 1980, 61, 29570. E. Traversa, J. Am. Ceram. Soc, 1995, 2&, 262571. E. Traversa, 'Progress in Ceramic Basic Science: Challenge Toward the 21st
Century', The Ceramic Society of Japan, Tokyo, 1996, 147
316
Abdullah, Y.Agil, A.A.Ahmad Fadzil, M.H.Ahmad, Z.A.Al-sharab, J.F.Alpas, A.T.Amighian, J.Aramjat, A.B.Aziz, A.Aziz, M.Bhan, S.Brauss, M.E.Bukhari, M.Z.Chankow, N.Deraman, M.Duong, H.V.Dzuong, L.E.M. Nazim, E.A.B.Eckersley, J.S.Effendi, N.Farhat, Z.N.Farrahi, G.H.Foo, L.C.Fun, H.K.Golnabi, H.Hamid, J.Hancock, P.Hjelm Jr., R.T.Hu, S.J.Husin, K.Hussain, L.B.Ibrahim, K.Ismail, A.B.Ismail, A.R.Ivanov, A.N.Jamal, Z.Johnston, R.F.Kaddourah Z.A.Kamaruddin, N.Kartiwa, S.Kassim, R.Kennedy, S.J.Khairun, A.Kobayashi, S.Koyama, T.Kumar, P.S.
AUTHORS
134107259237,247265862432476718310797189253134602712939716586116217130150134225144197672252132172752812136173233801341732121285
INDEX
Kumar, R.V.Marsongkohadi, P.Masrom, A.K.Messer, P.F.Mishra, S.Miyazaki, T.Mohamed, N.M.Mohd Noor, A.F.Monshi, A.Mozaffari, M.Nair, P.K.Nghiep, D.M.Nicholls, J.Northwood, D.O.Othman, R.Ourdjini, A.Pattarasumunt, A.Pineaunt J.A.Poh, M.T.Radiman, S.Rahbari, R. G.Rahmat, A.Ramli, A.G.Randle, V.Razali, A.A.Riekert, T.Rohayati, Y.Rosdi, N.Sadli, S.B.Sahar, M.R.Sakrani, S.Salleh, S.Sharma, D.G.R.Srisatit, S.Sufi, M.A.M.Sulaiman, M.Y.Suratman, R.Tan, R.M.Traversa, E.Tuan Sariff, T.B.Vrebos, B.Wahab, Y.Wan Mustafa, W.H.Wan. A. Bakar, W.A.Wilshire, B.Zaborowski, T.
ACXRI '96
1711652172373121158237, 2474024328527122586
237, 24729325397197134, 14428153, 10713411,4725914480205265233205213265253134671651973072471222052592994792
317