destination discovery… - sun pharma
TRANSCRIPT

Destination Discovery...
Annual Report 2004

... towards New Horizons of Wellness
Ranbaxy’s mission is to become a
Research-based International Pharmaceutical Company, committed
to constantly pushing new frontiers of
knowledge in pursuit of new horizons of
science.
Ranbaxy, India’s largest pharmaceutical
Company and one of the Top 10 generic
pharma players worldwide, is also one of
the largest ANDA (Abbreviated New
Drug Application) filers with the
US FDA. USA is the world’s most
developed pharmaceutical market and
the largest market for Ranbaxy. The
Company continues to forecast global
sales of US$ 5 Bn in 2012.
Ranbaxy is committed to increase its
R&D spend of over 7% of US$ 1 Bn in
2004, to around 10% of its targeted
turnover of US$ 2 Bn by 2007. With a
state-of-the-art fully operational R&D
center housing close to 1000 scientists
in three blocks, and a fourth underway,
Ranbaxy is fortifying its capabilities in
drug discovery, on course towards
destination discovery.
l Andrx Corporation in USA, entered
into a transfer agreement with Ranbaxy
Pharmaceuticals Inc. (RPI), whereby
Andrx waived its marketing exclusivity
rights to Ranbaxy, in exchange for a
share of Ranbaxy’s profits resulting
from the sales of Fosinopril Sodium and
Hydrochlorothiazide (Tablets, 10 mg /
12.5 mg and 20 mg / 12.5 mg)
l During the year, 29 ANDA filings were
made with the US FDA, including 3
PEPFAR ANDA filings, and 16
approvals were obtained
l The first respiratory branded
prescription product, Visclair
(Mecysteine HCL 100 mg Tablets) was
launched in UK
l Ranbaxy (UK) Limited successfully
launched immediate-release
Clarithromycin (Tablets, 250 mg and
500 mg and suspension 125 mg / 5 ml
& 250 mg / 5 ml) in the UK market
l Ranbaxy Global Consumer Healthcare,
the Consumer Healthcare division of
Ranbaxy, launched its ‘New Age
Herbals’ range with a basket of 3 new
herbal products
l Ranbaxy brands Storvas (Atorvastatin)
and Volini entered the list of Top 100
brands of the industry in India
l Revital, the flagship OTC brand of
Ranbaxy in India, was ranked No. 16
and captured the highest ever market
share of 71.6% (source : ORG-IMS,
MAT December 2004)
l Ranbaxy began operations in France as
a Top 10 generic company, after
acquiring a wholly-owned subsidiary,
RPG (Aventis) SA
l The Company joined the elite club of
Billion Dollar Companies, achieving
global sales of US$ 1 Bn (on MAT
basis) in February 2004
l Ranbaxy received the status of a Five
Star Export House by the Directorate
General of Foreign Trade (DGFT),
India
l Ranbaxy was ranked 9th amongst
BT 500 – India’s Most Valuable
Companies (source : Business Today –
November 2004, a leading business
magazine)
l Ranbaxy was listed amongst the Top
100 Pharma Companies in the World,
and was rated as the 15th Fastest
Growing Company (IMS)
l The Company extended the scope of its
agreement with the William Jefferson
Clinton Foundation to provide drugs
for HIV/AIDS to more countries
l Ranbaxy made its first Anti-retroviral
(ARV) filing with the US FDA under
US President's Emergency Plan for
AIDS Relief (PEPFAR)
l The Company implemented Radio
Frequency Identification Device
(RFID) technology on some of its USA
product packs to strengthen its global
supply chain and meet customer
expectations
Highlights
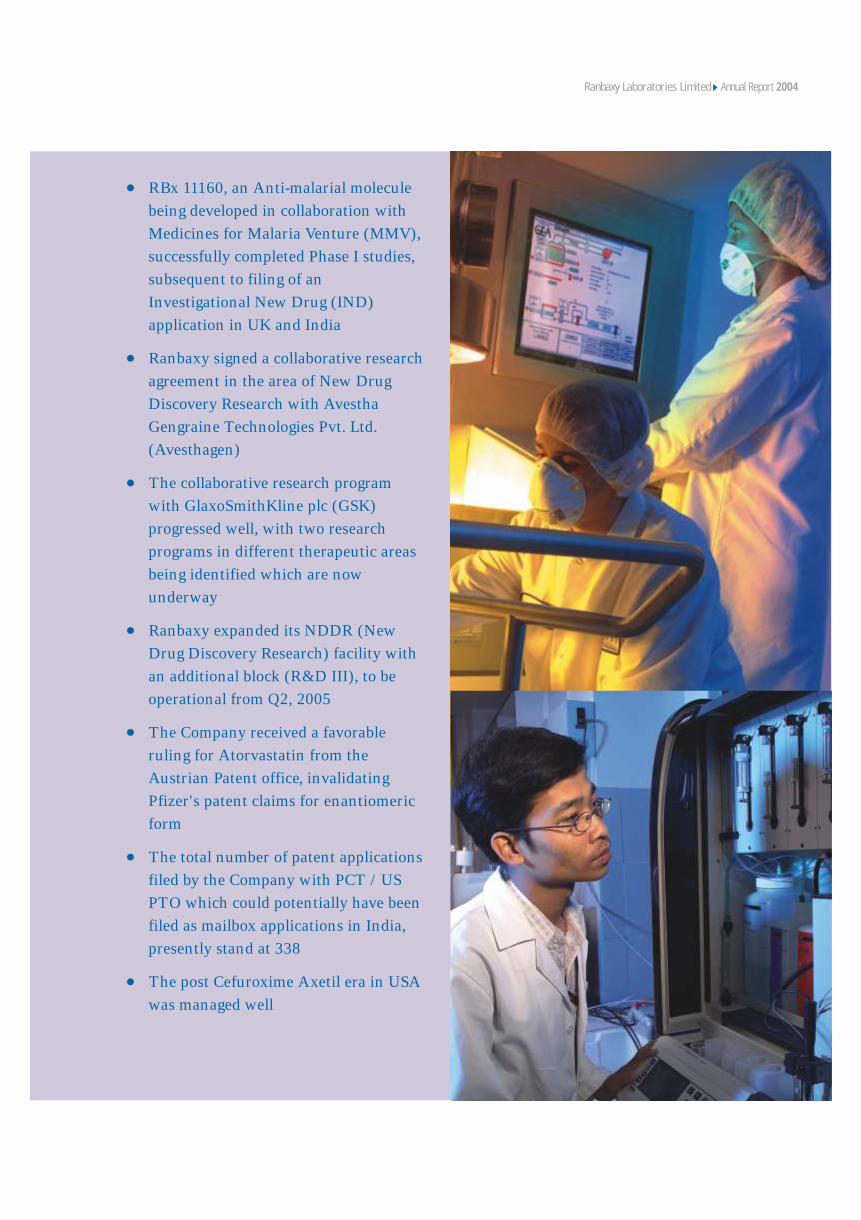
l RBx 11160, an Anti-malarial molecule
being developed in collaboration with
Medicines for Malaria Venture (MMV),
successfully completed Phase I studies,
subsequent to filing of an
Investigational New Drug (IND)
application in UK and India
l Ranbaxy signed a collaborative research
agreement in the area of New Drug
Discovery Research with Avestha
Gengraine Technologies Pvt. Ltd.
(Avesthagen)
l The collaborative research program
with GlaxoSmithKline plc (GSK)
progressed well, with two research
programs in different therapeutic areas
being identified which are now
underway
l Ranbaxy expanded its NDDR (New
Drug Discovery Research) facility with
an additional block (R&D III), to be
operational from Q2, 2005
l The Company received a favorable
ruling for Atorvastatin from the
Austrian Patent office, invalidating
Pfizer's patent claims for enantiomeric
form
l The total number of patent applications
filed by the Company with PCT / US
PTO which could potentially have been
filed as mailbox applications in India,
presently stand at 338
l The post Cefuroxime Axetil era in USA
was managed well
Annual Report 2004Ranbaxy Laboratories Limited

Chairman’s Message ..............................6
CEO & MD’s Message .........................12
Global Operations Review .................18
Financial Review .................................22
Corporate Governance.........................26
Environment, Health & Safety ...........38
Research & Development ....................42
Quality Assurance................................48
Global Markets .....................................52
Product Review ....................................64
Global Manufacturing & Global Supply Chain..........................68
Information Technology .....................72
Contents
Corporate Affairs, Global
Corporate Communications &
Corporate Social Responsibility ......................78
Human Resources...........................................82
Board of Directors ..........................................88
Report of the Directors ..................................89
Ten Years at a Glance.....................................99
Auditors’ Report ..........................................100
Financial Statements of Ranbaxy
— Standalone..............................................104
— Consolidated Indian GAAP..................128
— Consolidated US GAAP........................148
Annual Report 2004Ranbaxy Laboratories Limited
Dear Shareholders,
I am happy to share with you some
highlights of the developments in your
Company during the business year ended
December 31, 2004.
2004 was, above all, a year of significant
changes. Mr. D. S. Brar, who had been
the CEO & Managing Director since July
1999, completed his five-year tenure on
July 4, 2004, and was succeeded in this
capacity on July 5, 2004, by Dr. Brian W.
Tempest. In the interest of a smooth
transition, Dr. Tempest, who had
previously held the position of President,
Pharmaceuticals, was designated as Joint
Managing Director w.e.f. January 1,
2004. In turn, Mr. Malvinder Mohan
Singh, who had led the India Region as
Regional Director, and had earlier held
charge as Director, Global Licensing, took
Dr. Tempest’s place as President,
Pharmaceuticals, from January 1, 2004.
In June 2004, Dr. Rashmi Barbhaiya,
President, R&D, who had held this
position since April 15, 2002, left the
services of the Company to pursue other
professional options, followed a few
Chairman’s Message
Bringing new
possibilities to life
Annual Report 2004
months later by his successor, Dr. Rajinder Kumar,
who left on account of unforeseen personal
problems. In the resulting situation, Dr. Tempest,
CEO & MD, took it upon himself to closely oversee
the R&D activities directly, with separate Heads for
New Drug Discovery Research on the one hand,
and for Novel Drug Delivery Systems (NDDS) and
Generic Drugs Development on the other, reporting
to him. Certain other changes also took place at the
level of Vice President. Mr. Ramesh Adige, formerly
Whole-time Director (Corporate Affairs), Fiat-
India, joined the Company in February 2004 as
Vice President, Corporate Affairs & Corporate
Communications, while Mr. R. Sundar Rajan,
General Counsel & Vice President (Legal) with
Wipro, joined Ranbaxy as Vice President & Head,
Global Legal & Secretarial Services, in November
2004. The Vice President level in the Company was
also strengthened via internal promotions from
amongst a number of candidates of high merit.
Such changes are inevitable in dynamic
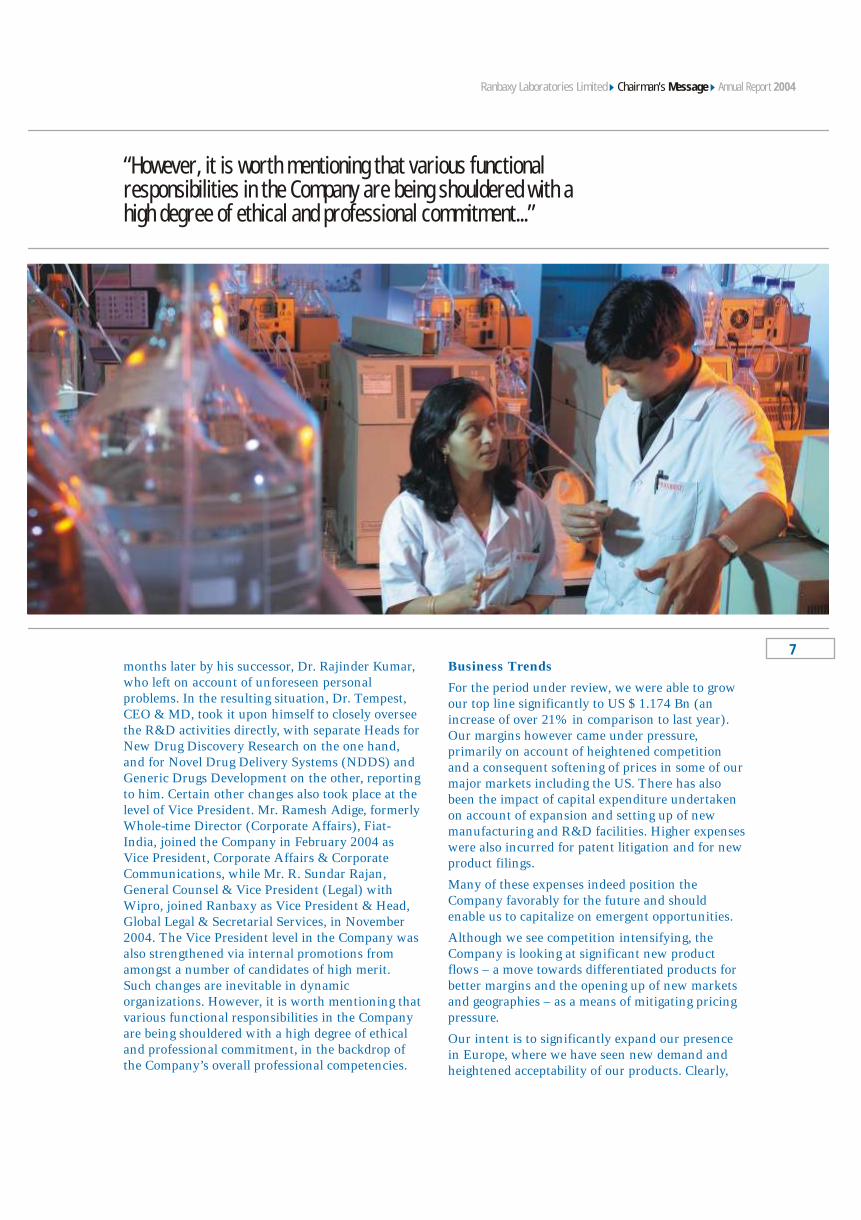
organizations. However, it is worth mentioning that
various functional responsibilities in the Company
are being shouldered with a high degree of ethical
and professional commitment, in the backdrop of
the Company’s overall professional competencies.
Business Trends
For the period under review, we were able to grow
our top line significantly to US $ 1.174 Bn (an
increase of over 21% in comparison to last year).
Our margins however came under pressure,
primarily on account of heightened competition
and a consequent softening of prices in some of our
major markets including the US. There has also
been the impact of capital expenditure undertaken
on account of expansion and setting up of new
manufacturing and R&D facilities. Higher expenses
were also incurred for patent litigation and for new
product filings.
Many of these expenses indeed position the
Company favorably for the future and should
enable us to capitalize on emergent opportunities.
Although we see competition intensifying, the
Company is looking at significant new product
flows – a move towards differentiated products for
better margins and the opening up of new markets
and geographies – as a means of mitigating pricing
pressure.
Our intent is to significantly expand our presence
in Europe, where we have seen new demand and
heightened acceptability of our products. Clearly,
“However, it is worth mentioning that various functional responsibilities in the Company are being shouldered with a high degree of ethical and professional commitment...”
Chairman's MessageRanbaxy Laboratories Limited
7
there is also the opportunity to introduce a wide
variety of generics in our therapeutic areas of Anti-
infectives, Urology, Metabolic disorders and
Inflammatory/Respiratory diseases. We are
examining possibilities of both organic and
inorganic growth as a means to expand in the
region.
We are confident that the strategy we have adopted
is prudent, carefully crafted and designed to propel
the Company into its next trajectory of growth. It
will ensure that we meet our target of US$ 2 Bn in
sales revenues by the year 2007, on the way to the
target of US$ 5 Bn for the year 2012.
Research & Development
A special point to which I would like to draw the
attention of our shareholders is that R&D revenue
expenditure, which had been US$ 52 Mn in 2003,
rose to US$ 75 Mn in 2004, showing an increase of
43%. In USA, Ranbaxy has by now cumulatively
filed about 150 Abbreviated New Drug
Applications (ANDAs) and has received approval
of about 100 ANDAs. During the year, a number of
additional scientists were recruited to support the
increasing focus on New Drug Discovery Research
(NDDR). We have recently completed the R&D III
building, which has 250,000 sq. ft. of space to meet
the augmented needs of our Drug Discovery Team.
The number of personnel in the Company’s R&D
function rose from approx. 900 at the end of 2003,
to over 1100 at the end of 2004.
Besides the substantial step-up in R&D
expenditure, keeping in view the large growth in
sales targeted by your Company, both in the
medium term and up to 2012, as a part of its ten-
year vision articulated in 2002, a capital
expenditure of US$ 117 Mn has been incurred
during 2004, for establishing additional production
capacities at a number of locations in India and
overseas, compared to a corresponding capital
expenditure of US$ 64 Mn incurred during 2003.
The expansion of production capacities is a pointer
to the significantly expanded product flow which
the Company is preparing to put out in the future.
These investments will, no doubt, yield long-term
benefits to the Company on a sustained basis in the
years to come, and their relevance and usefulness
need to be viewed in the longer-term perspective.
I would also like to apprise our shareholders that a
small fire incident occurred in October 2004, in the
drying section of one of Ranbaxy’s Bulk Drug
facilities in Mohali, which sadly resulted in the loss
of life of a diligent and dedicated worker who had
apparently rushed into that area to douse the fire.
Our sincere condolences go out to the next of kin.
Apart from providing them financial compensation,
the bereaved family has also been assured that the
spouse will be offered a suitable job in Ranbaxy as
an additional measure of rehabilitation. Your Board
of Directors has mandated the operating
management to spare no efforts to continue the
upgrade of plant safety systems at all locations to
the best of class that is technologically feasible, to
avoid such unfortunate mishaps to the maximum
possible extent. The Company’s safety protocols
and mechanisms have been inspected by
international consultants, such as DuPont of USA
and Chilworth of UK, and their recommendations
are being implemented very carefully, in a time-
bound manner.
2004 marked the last year of the ten-year transition
time afforded by WTO to developing countries, to
bring their patent laws in line with the provision of
the TRIPS (Trade Related Intellectual Property
Rights) Agreement. In the last week of December
2004, an ordinance was issued by the Government
of India introducing product patents for
pharmaceuticals, agro-chemicals, etc., w.e.f. January
1, 2005. This means that, hereafter, no Indian
pharma company will be able to make a generic
copy of a drug patented by a WTO member country
after January 1, 1995, for which the patent is still
subsisting, without obtaining a licence from the
patent holder, or unless a Compulsory Licence is
granted in its favor by the Government under
Article 27 of the TRIPS Agreement. Ranbaxy’s
product portfolio has been carefully reviewed with
regard to the new product patent regime in India
and we have concluded that our portfolio will not
be affected by the changed patent environment to
any significant extent. In order to continue their
manufacture and sale, in-licensing arrangements
are being negotiated by the Company from the
concerned patent holders.
The new Patent Regime has also made it imperative
that for its sustained future growth, a company like
Ranbaxy undertakes its own innovative research
into New Chemical Entities (NCEs) and Novel
Drug Delivery Systems (NDDS) leading to the
launch of innovative therapeutic products in the
market. This will require heightened efforts by our
R&D scientists to generate a healthy pipeline of
innovative products, which can be subjected to
further screening and evaluation through toxicity
studies and clinical trials.
After careful deliberation, a Code of Conduct for all
Ranbaxy employees was drawn up during the year,
which has since been made available to members of
the Company’s management team, including all
new recruits. It has been highlighted that all
members of the Ranbaxy staff are expected to not
only act with a high degree of professionalism,
earnestness and diligence in their assigned duties,
but also to uphold the highest standards of ethical
integrity at all times. I would like to appeal to all
our shareholders to alert Ranbaxy’s higher
management about any impropriety in the conduct
displayed by a Ranbaxy staff member, which may
reflect a violation of Ranbaxy’s Ethical Code, so
that swift enquiries can be made and timely actions
taken, wherever justified.
Going by the business results of the first quarter of
2005, this year is likely to be a comparatively tough
year for the Company, keeping in view the
pressures being faced by generics in both USA and
India. The Company will, however, strive to do its
best to upgrade its product portfolios and launch
new products, which may encounter lesser
competition and provide better margins.
With the energetic, focused and dedicated efforts
being put in by one and all, I am confident that the
Ranbaxy team led by Dr. Brian W. Tempest, our
CEO and Managing Director, fully supported by
our competent and diligent staff from the shop floor
level upwards, will collectively make a salient
contribution to driving Ranbaxy’s growth and
progression as a respected player in the global
pharmaceuticals space, in the years ahead.
My best wishes for the well-being, progress and
prosperity of all our shareholders.
Tejendra KhannaChairman
Date : May 9, 2005
Chairman's MessageRanbaxy Laboratories Limited Annual Report 2004
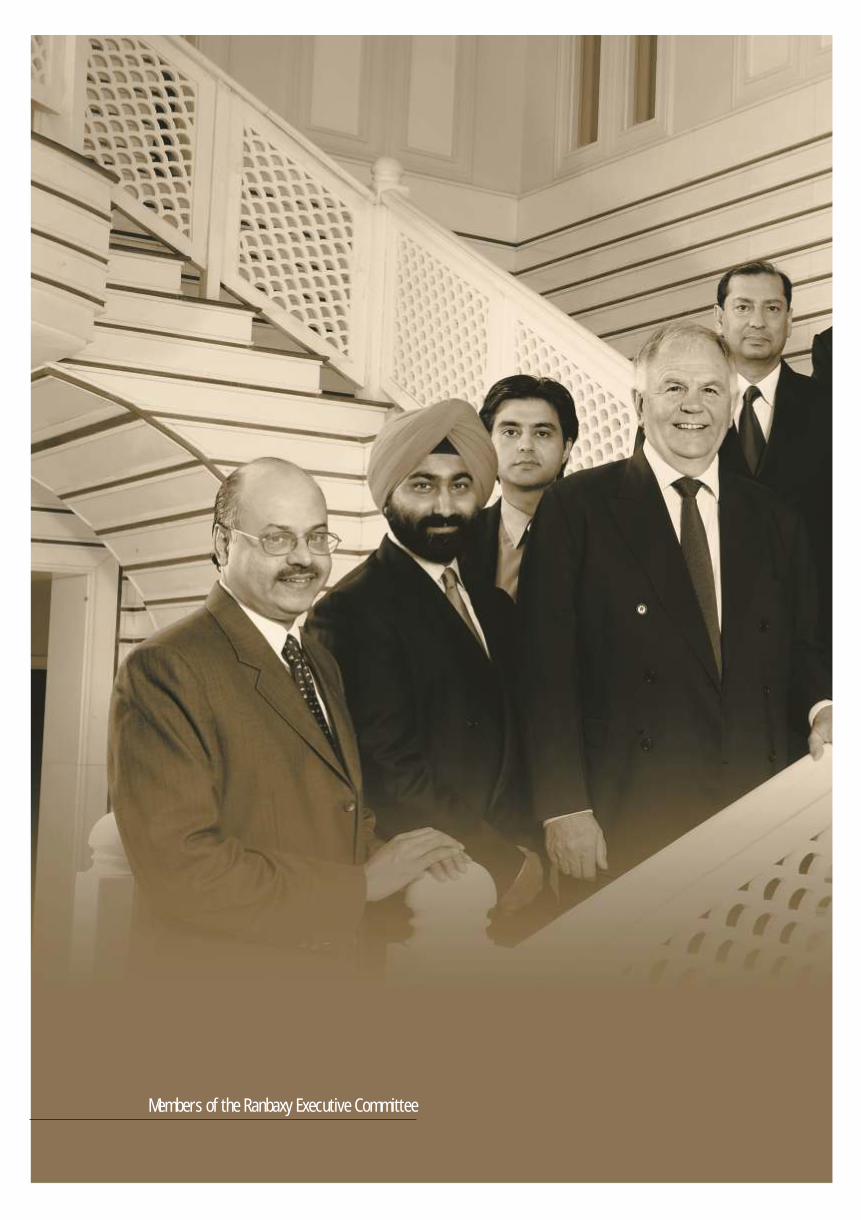
Members of the Ranbaxy Executive Committee
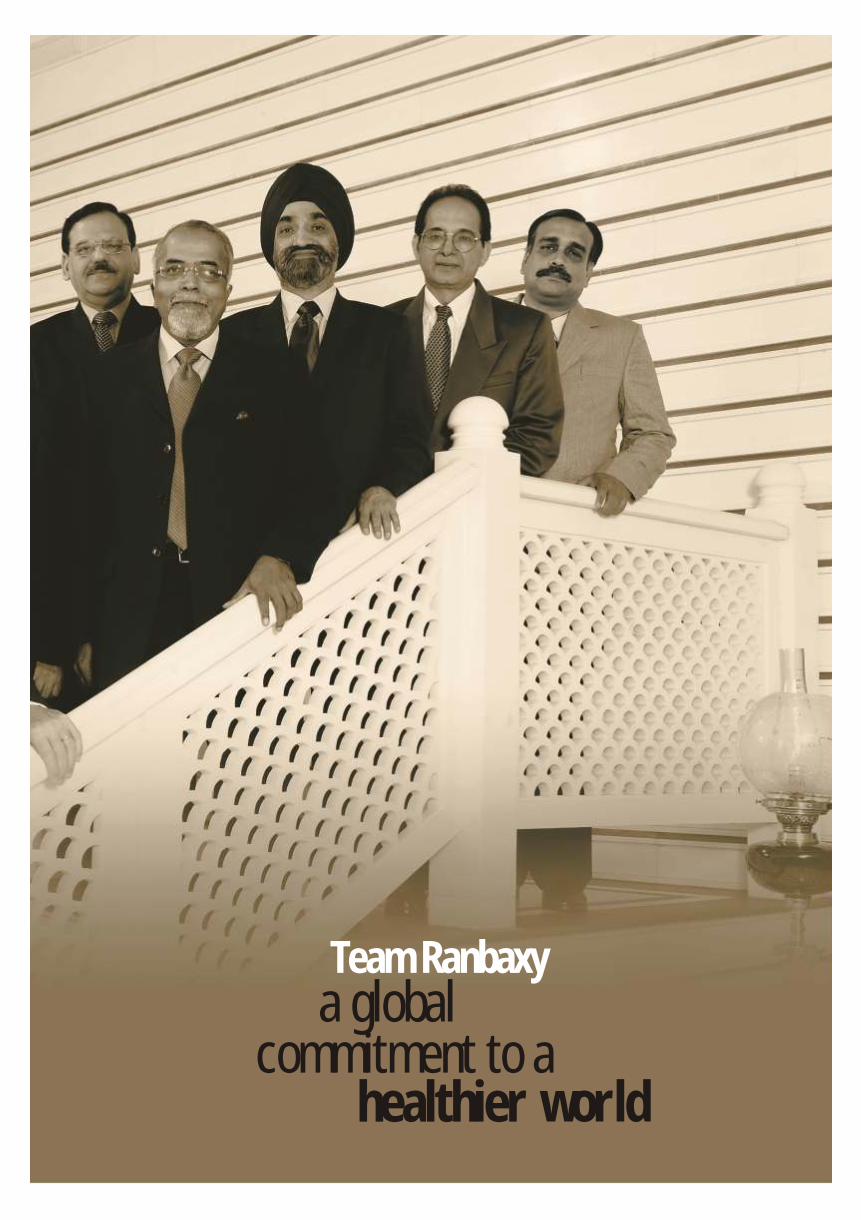
Team Ranbaxya global
commitment to a healthier world
Dear Shareholders,
The year gone by saw the achievement of a
goal that we had set for ourselves over a
decade ago. This was to become a US$ 1 Bn
Company in sales by the year 2004. It gives
me immense pride to share with you that, in
February 2004 we achieved sales of US$ 1 Bn
on a MAT (Moving Annual Total) basis, 10
months ahead of time, and for the calendar
year clocked sales of US$ 1.2 Bn, a robust
growth of 21%.
Led by Ranbaxy’s chief architect, the
Late Dr. Parvinder Singh, the journey from
being an India-centric company to one of the
leading generic companies in the world, has
been, to say the least, arduous and daunting.
Tested in the face of myriad challenges time
and again, decisions that we made way back,
stand us in good stead today as we move
surely, but steadily, towards the next phase of
growth.
Today, we are amongst the Top 10 generic
companies in the world and the only Indian
company in the Top 100 Pharmaceutical
companies across the globe. Our international
revenues, approximating 80% of our total
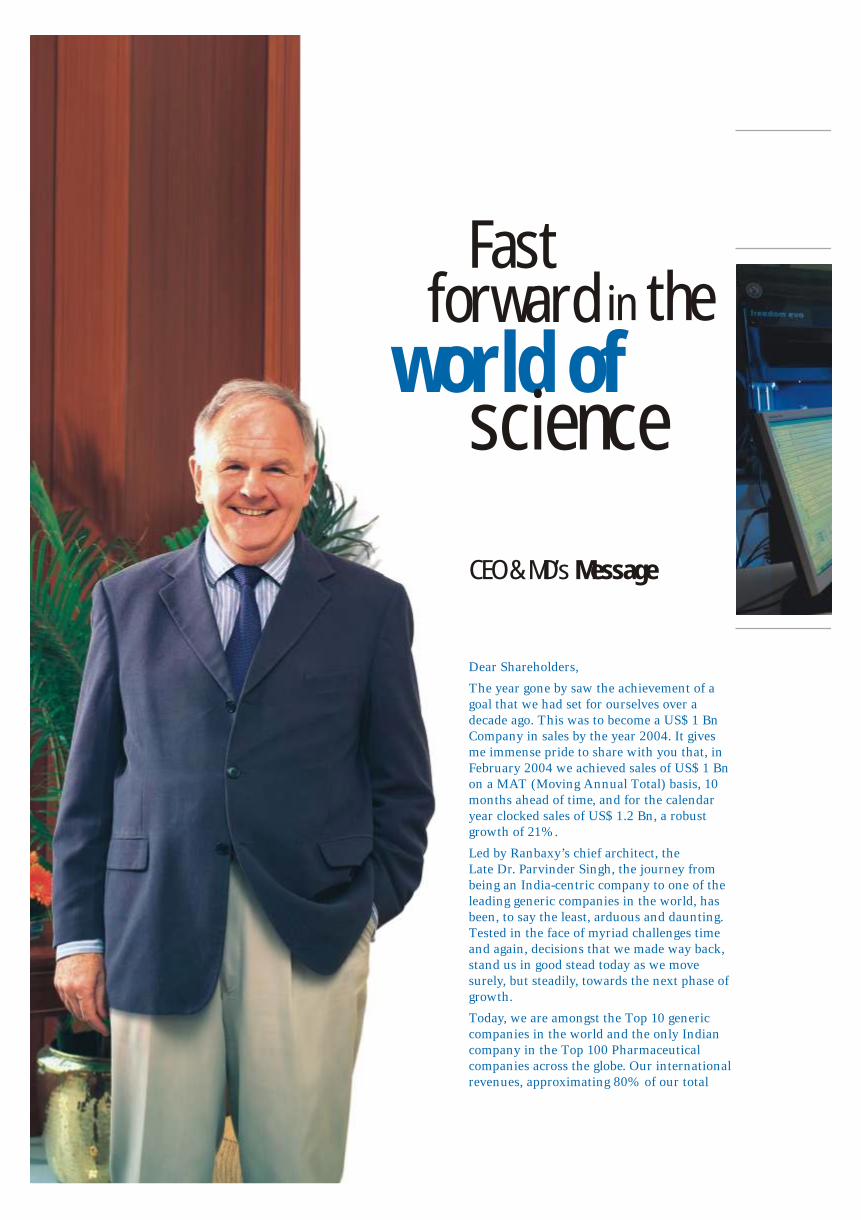
CEO & MD’s Message
Fast forward in the
world ofscience
CEO & MD's MessageRanbaxy Laboratories Limited Annual Report 2004
sales, reflect our thirst for gaining prominence in
the developed pharmaceutical markets of USA and
Europe, which now account for more than half our
sales. In our quest to become international, the
importance of a solid home base cannot be over-
emphasized. We recognized at an early stage, the
competitive advantages India offered and
capitalized on them to deliver quality products at
the doors of the western world to our benefit, and
to those of our shareholders. Being aggressive in
our home market, where there could be more than
100 brands for a single molecule, the availability of
skilled manpower percolating to a lower cost of
manufacturing and the historically proven inherent
strength of the Indian bench chemist leading to
higher productivity in R&D, are, and will remain,
at the forefront of Ranbaxy’s strategic imperatives.
The year witnessed USA continuing its dominance
across our key geographies, despite the increased
competition and the challenging market conditions,
observed primarily during the latter half of the
year. A higher number of product filings and new
product launches spread across complex-to-
manufacture products, plain vanilla generics, niche
and First-to-File molecules, will be the mainstay of
our USA business, going forward. We remain
focused in our efforts to attain a critical size in the
branded prescriptions space, having gained some
momentum by doubling our turnover and turning
the business profitable in 2004.
Europe, buoyed by our French acquisition, is now
our second growth engine and contributes 16% of
our overall revenues. With a Pan-European
presence and the opportunities that the expanded
European Union offers, this key geography will
continue to exhibit robust growth, led by
intensification of our pursuit to further bolster our
presence in this region.
Brazil, Russia, India and China, or the BRIC
countries, which are the emerging pharmaceutical
markets, contributed significantly to the top line
and bottom line of the Company in the year
gone by.
From a Networking and Alliances perspective, we
continue to leverage our capabilities and those of
our partners, both in R&D and business, to achieve
‘win-win’ situations. Utilizing such opportunities
will further strengthen our competitive position,
and combined with efforts for strategic
acquisitions, will help in long-term value building.
We strongly believe that ‘innovation’ is the
cornerstone of R&D and its unrelenting pursuit is
what creates sustainable advantages for future
13
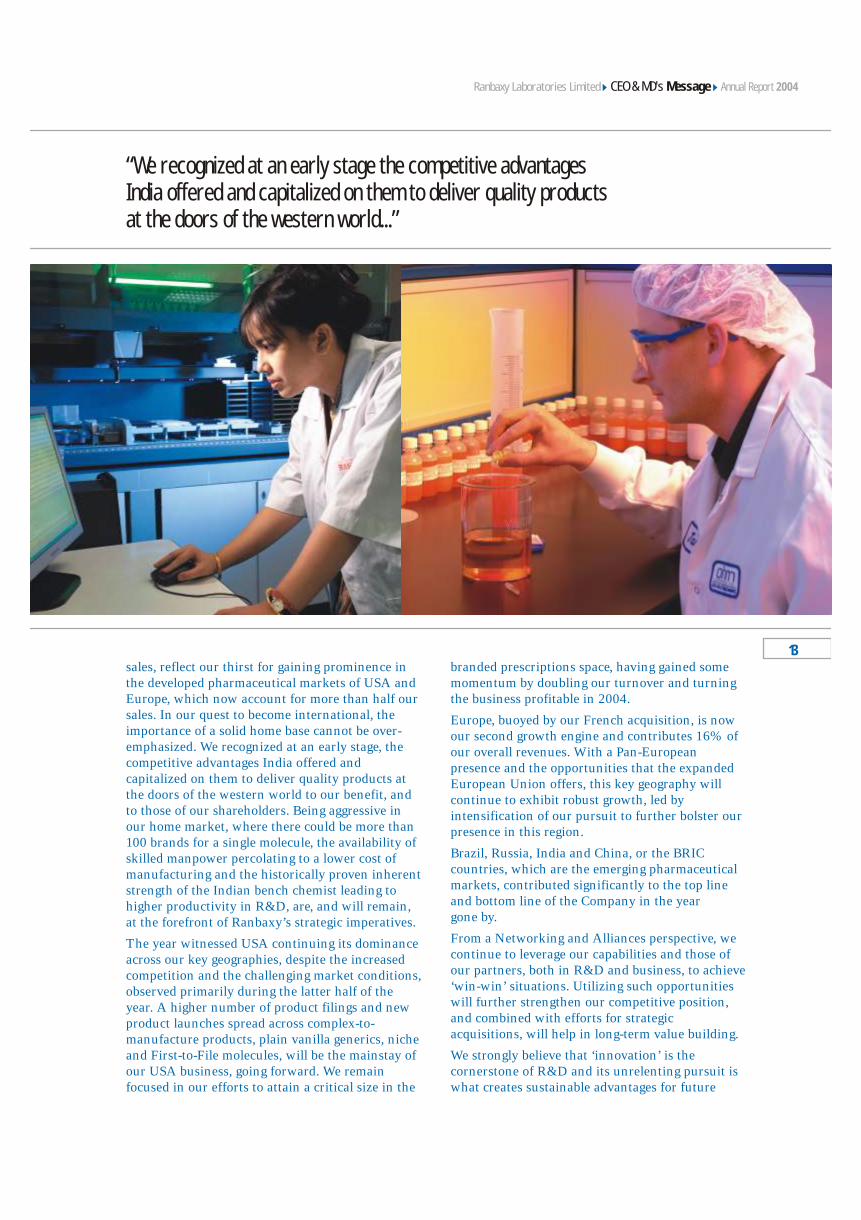
“We recognized at an early stage the competitive advantages India offered and capitalized on them to deliver quality products at the doors of the western world...”
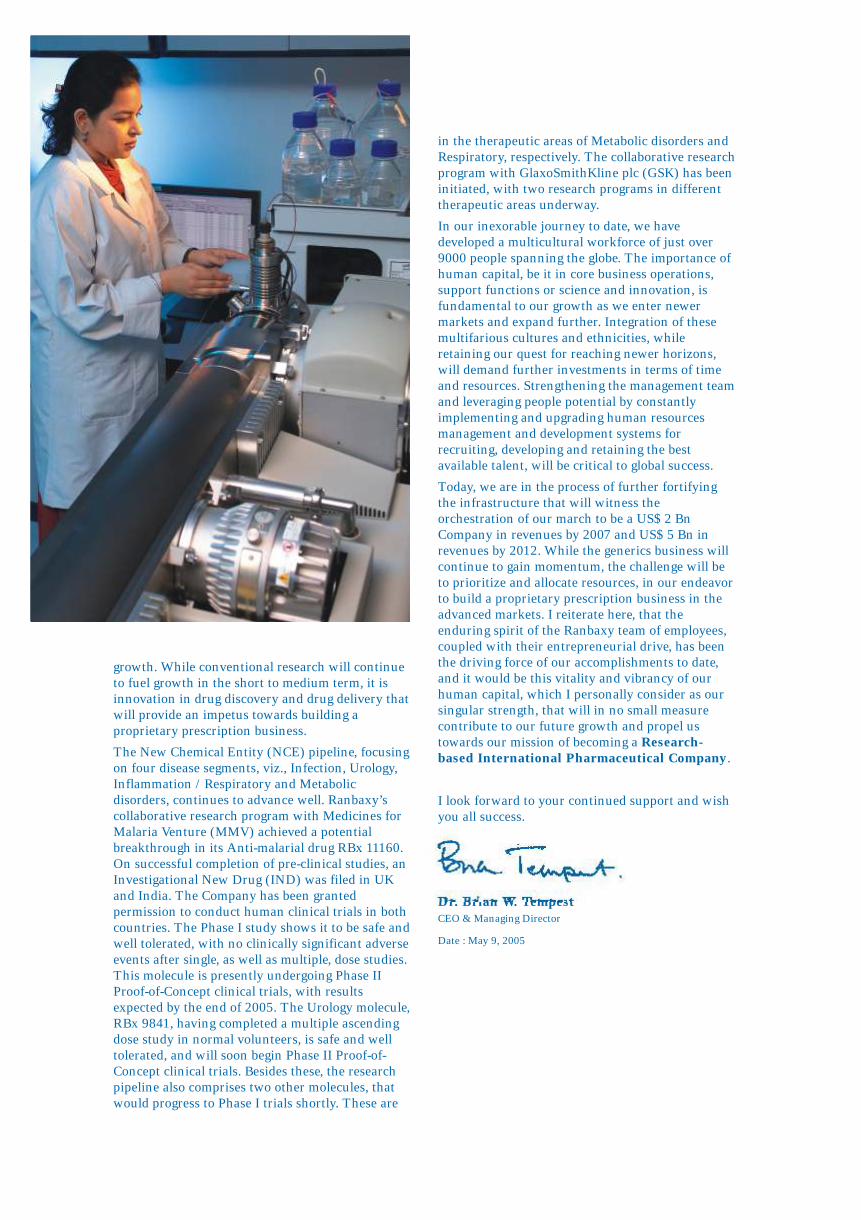
growth. While conventional research will continue
to fuel growth in the short to medium term, it is
innovation in drug discovery and drug delivery that
will provide an impetus towards building a
proprietary prescription business.
The New Chemical Entity (NCE) pipeline, focusing
on four disease segments, viz., Infection, Urology,
Inflammation / Respiratory and Metabolic
disorders, continues to advance well. Ranbaxy’s
collaborative research program with Medicines for
Malaria Venture (MMV) achieved a potential
breakthrough in its Anti-malarial drug RBx 11160.
On successful completion of pre-clinical studies, an
Investigational New Drug (IND) was filed in UK
and India. The Company has been granted
permission to conduct human clinical trials in both
countries. The Phase I study shows it to be safe and
well tolerated, with no clinically significant adverse
events after single, as well as multiple, dose studies.
This molecule is presently undergoing Phase II
Proof-of-Concept clinical trials, with results
expected by the end of 2005. The Urology molecule,
RBx 9841, having completed a multiple ascending
dose study in normal volunteers, is safe and well
tolerated, and will soon begin Phase II Proof-of-
Concept clinical trials. Besides these, the research
pipeline also comprises two other molecules, that
would progress to Phase I trials shortly. These are
in the therapeutic areas of Metabolic disorders and
Respiratory, respectively. The collaborative research
program with GlaxoSmithKline plc (GSK) has been
initiated, with two research programs in different
therapeutic areas underway.
In our inexorable journey to date, we have
developed a multicultural workforce of just over
9000 people spanning the globe. The importance of
human capital, be it in core business operations,
support functions or science and innovation, is
fundamental to our growth as we enter newer
markets and expand further. Integration of these
multifarious cultures and ethnicities, while
retaining our quest for reaching newer horizons,
will demand further investments in terms of time
and resources. Strengthening the management team
and leveraging people potential by constantly
implementing and upgrading human resources
management and development systems for
recruiting, developing and retaining the best
available talent, will be critical to global success.
Today, we are in the process of further fortifying
the infrastructure that will witness the
orchestration of our march to be a US$ 2 Bn
Company in revenues by 2007 and US$ 5 Bn in
revenues by 2012. While the generics business will
continue to gain momentum, the challenge will be
to prioritize and allocate resources, in our endeavor
to build a proprietary prescription business in the
advanced markets. I reiterate here, that the
enduring spirit of the Ranbaxy team of employees,
coupled with their entrepreneurial drive, has been
the driving force of our accomplishments to date,
and it would be this vitality and vibrancy of our
human capital, which I personally consider as our
singular strength, that will in no small measure
contribute to our future growth and propel us
towards our mission of becoming a Research-based International Pharmaceutical Company.
I look forward to your continued support and wish
you all success.
Dr. Brian W. TempestCEO & Managing Director
Date : May 9, 2005

Ranbaxy stands committed to path-breaking research that makes disease management more effective and affordable. The challenge is to constantly rise up the value-chain, while at the same time, bringing down the cost for the patients.
CEO & MD's MessageRanbaxy Laboratories Limited Annual Report 2004
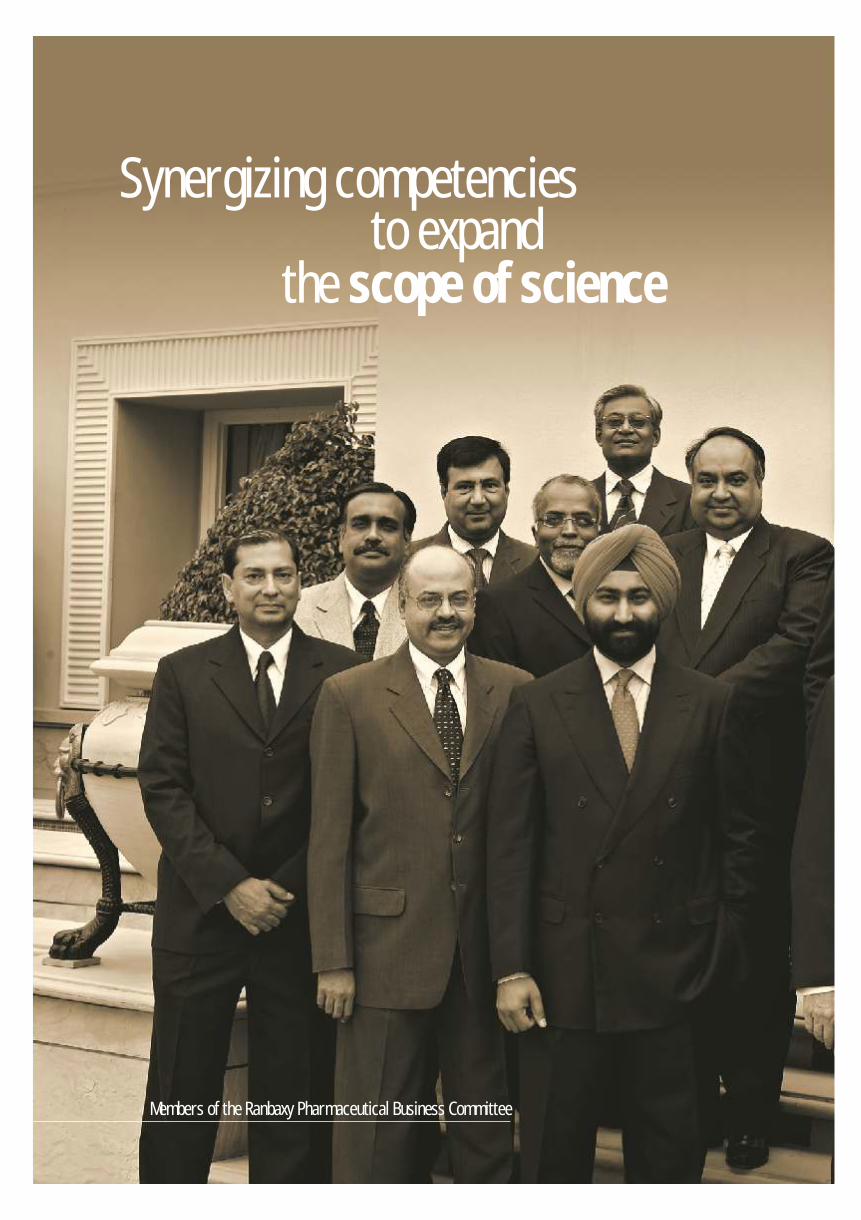
Synergizing competencies to expand
the scope of science
Members of the Ranbaxy Pharmaceutical Business Committee

Dear Shareholders,
Ranbaxy saw a year of robust
sales growth, backed by a strong
performance in Europe. During
the year, we made substantial
investments in strengthening our
product pipeline, in enhancing
our manufacturing capability and
in developing our human
resources.
Our Global sales grew by 17%
to reach Rs. 53,130 Mn
(US$ 1,174 Mn, + 21%). Of
this, dosage form sales at
US$ 1,045 Mn, represent 89% of
the total sales, compared to 87%
in 2003. Further, International
sales now constitute 79% of the
total sales of the Company, as
compared to 76% in 2003.
The consolidated Operating
Profit Before Interest,
Depreciation and
Amortization was Rs. 10,814 Mn
(US$ 239 Mn), lower than the
previous year by 4%. Profit after
Tax and Minority Interest was
New milestones
new destinations
Global Operations Review
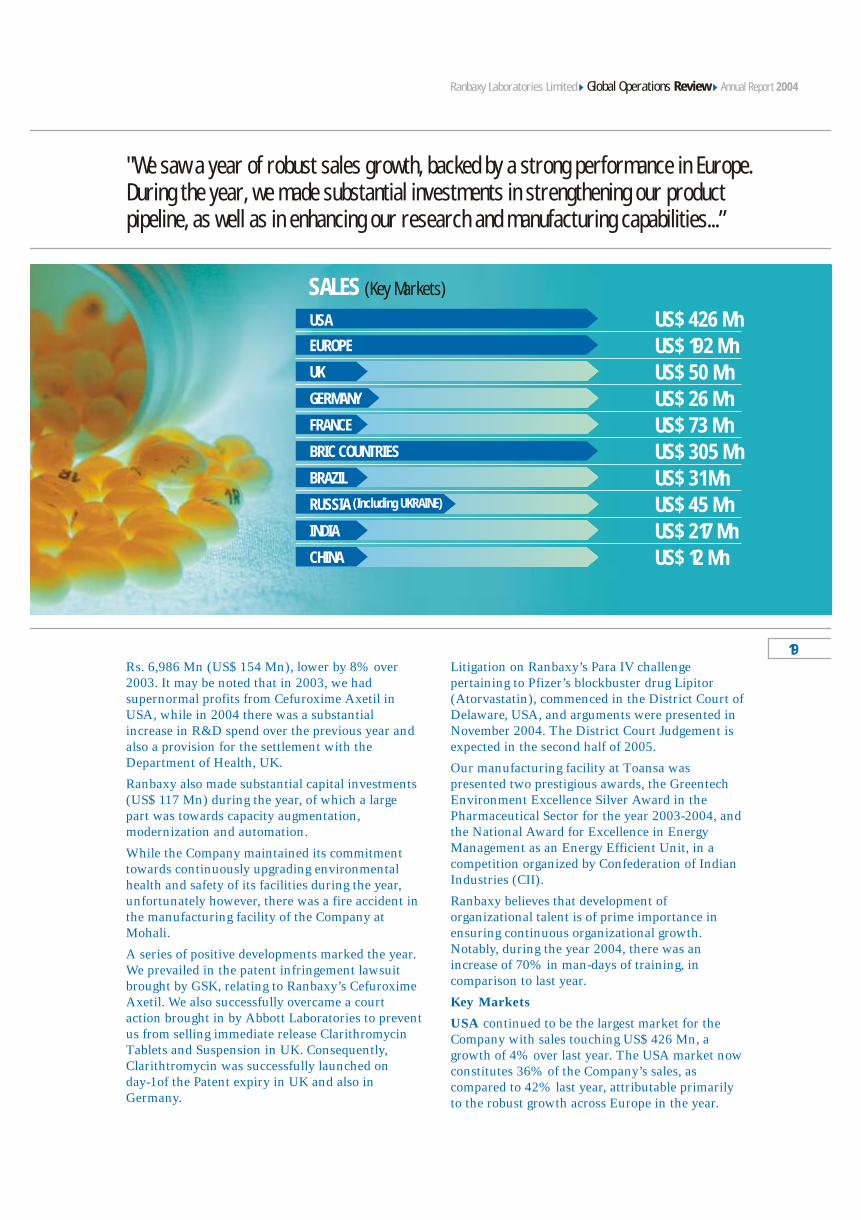
SALES (Key Markets)
USA US$ 426 Mn
US$ 50 Mn US$ 26 Mn US$ 73 Mn
US$ 31 Mn US$ 45 Mn US$ 217 Mn US$ 12 Mn
EUROPE
UK
GERMANY
FRANCE
BRIC COUNTRIES
BRAZIL
RUSSIA
INDIA
CHINA
(Including UKRAINE)
US$ 192 Mn
US$ 305 Mn
Rs. 6,986 Mn (US$ 154 Mn), lower by 8% over
2003. It may be noted that in 2003, we had
supernormal profits from Cefuroxime Axetil in
USA, while in 2004 there was a substantial
increase in R&D spend over the previous year and
also a provision for the settlement with the
Department of Health, UK.
Ranbaxy also made substantial capital investments
(US$ 117 Mn) during the year, of which a large
part was towards capacity augmentation,
modernization and automation.
While the Company maintained its commitment
towards continuously upgrading environmental
health and safety of its facilities during the year,
unfortunately however, there was a fire accident in
the manufacturing facility of the Company at
Mohali.
A series of positive developments marked the year.
We prevailed in the patent infringement lawsuit
brought by GSK, relating to Ranbaxy’s Cefuroxime
Axetil. We also successfully overcame a court
action brought in by Abbott Laboratories to prevent
us from selling immediate release Clarithromycin
Tablets and Suspension in UK. Consequently,
Clarithtromycin was successfully launched on
day-1of the Patent expiry in UK and also in
Germany.
Litigation on Ranbaxy’s Para IV challenge
pertaining to Pfizer’s blockbuster drug Lipitor
(Atorvastatin), commenced in the District Court of
Delaware, USA, and arguments were presented in
November 2004. The District Court Judgement is
expected in the second half of 2005.
Our manufacturing facility at Toansa was
presented two prestigious awards, the Greentech
Environment Excellence Silver Award in the
Pharmaceutical Sector for the year 2003-2004, and
the National Award for Excellence in Energy
Management as an Energy Efficient Unit, in a
competition organized by Confederation of Indian
Industries (CII).
Ranbaxy believes that development of
organizational talent is of prime importance in
ensuring continuous organizational growth.
Notably, during the year 2004, there was an
increase of 70% in man-days of training, in
comparison to last year.
Key Markets
USA continued to be the largest market for the
Company with sales touching US$ 426 Mn, a
growth of 4% over last year. The USA market now
constitutes 36% of the Company’s sales, as
compared to 42% last year, attributable primarily
to the robust growth across Europe in the year.
"We saw a year of robust sales growth, backed by a strong performance in Europe. During the year, we made substantial investments in strengthening our product pipeline, as well as in enhancing our research and manufacturing capabilities...”
Annual Report 2004Global Operations ReviewRanbaxy Laboratories Limited
19
In the United Kingdom, sales exceeded the US$ 50
Mn mark. The year also saw the launch of Visclair (Mecysteine) as part of the branded respiratory
portfolio. This product achieved a 22% (MAT:
December 2004) market share of the ‘Mucolytic’
solids market.
In Germany, sales grew by a robust 88%, with 8
new products having been launched during the
year, including 4 day-1 launches, following patent
expiry. During the year, Ranbaxy improved upon
its market ranking in the generics market by eight,
to close at the 28th rank.
In France, the year saw the acquisition and
successful integration of RPG Aventis into
Ranbaxy. The French operation recorded sales of
US$ 73 Mn and now constitutes the largest
operation of Ranbaxy in Europe, and the third-
largest operation in terms of sales on a global basis.
Ranbaxy also experienced robust growth in several
other markets in Europe, Poland being one of them,
where business grew by 41% over the previous
year.
The BRIC Countries (Brazil; Russia, including
Ukraine; India; China) together constituted 26% of
the total revenues of the Company, with combined
sales of US$ 305 Mn, representing a growth of 18%
over last year.
In Brazil, Ranbaxy achieved sales of US$ 31 Mn, a
growth of 37% over last year. Ranbaxy continued
to rank amongst the Top 5 generic companies in
Brazil and is today the largest foreign generics
Pharmaceutical MNC in Brazil.
During the year, we added 12 new products to our
portfolio of generics and also made 26 ANDA
(Abbreviated New Drug Applications) and 3
PEPFAR (The US President’s Emergency Plan for
AIDS Relief) ANDA filings. We also received US
FDA approvals for 16 ANDAs in the year. With
this, we have 96 cumulative approvals and 50
products which are pending approval, as of
December 2004.
The continued strengthening of our generics
product pipeline should enable us to overcome
increasing pricing pressures experienced towards
the close of 2004, which have continued in the first
half of 2005.
Sotret (Isotretinoin), the leading brand of our
branded business in USA, turned in a good
performance and closed the year with a market
share of 15%. This marked an improvement of
10% over the market share at the close of last year.
Europe had an excellent year with sales of
US$ 192 Mn, a robust growth of 116% over last
year. Ranbaxy significantly increased its regulatory
filings in the European Union (EU) and made 39
National filings for 25 products in 11 EU Reference
Member States (RMS), and 71 Mutual Recognition
Procedure (MRP) applications for 6 products in 21
EU Concerned Member States.
Ranbaxy also expanded its ground operations in
Europe, with the setting-up of wholly-owned
subsidiaries in Spain and Portugal. With this, we
now have a presence in 21 of the 25 European
countries.
In Russia (including Ukraine), sales grew strongly
by 47% over last year. A wholly-owned subsidiary
was also set-up in Russia during the year. Ranbaxy
launched Cifran OD (Ciprofloxacin once-a-day),
which now ranks as the 9th most successful new
product over the last one year (source: IMS). The
portfolio of existing products also developed well
during the year, with Fexadin (Fexofenadine) being
ranked No. 2 and Zanocin (Ofloxacin) ranked
No. 1 in its segment (source: IMS).
In India, the domestic dosage form business
performed well, with primary growth in sales of
12% over last year. This is despite sales being
impacted by the voluntary withdrawal of the
Rofibax group of products, following the
withdrawal of Vioxx (Rofecoxib) by the innovator,
on account of safety concerns.
In 2004, Ranbaxy had 3 products in the Top 30
new introductions made during the last one year.
We maintained our market ranking of No. 3 in
2004 (source: ORG, MAT. December 2004,), the
same as last year.
Significantly, Ranbaxy in India was ranked first in
image terms, in the Pharmaceutical Image
Corporate Monitor, a research survey conducted by
AC Nielsen ORG-Marg.
The Consumer Healthcare business in India
recorded sales of US$ 15 Mn, representing a 28%
growth in comparison to the previous year. Our
flagship brand in India, Revital, continued to gain
in market share and became the 10th largest brand
in the Pharma Market for the month of July 2004
Annual Report 2004Global Operations ReviewRanbaxy Laboratories Limited
(source: ORG). Three new herbal brands were also
successfully launched under the umbrella of ‘New
Age Herbals’ during the year.
In China, the sales model was re-configured during
the year, to expand the Company’s reach into
hospitals across China and to reduce the fixed cost
of operation.
A more detailed commentary on the key markets
follows in the subsequent sections.
The overall performance of the year is attributed
significantly to the dedication, commitment and
hard work of over 9000 employees at Ranbaxy,
across the globe.
Malvinder Mohan Singh
President – Pharmaceuticals & Executive Director
Date : May 9, 2005
21
Securing long-term
growth
Financial Review
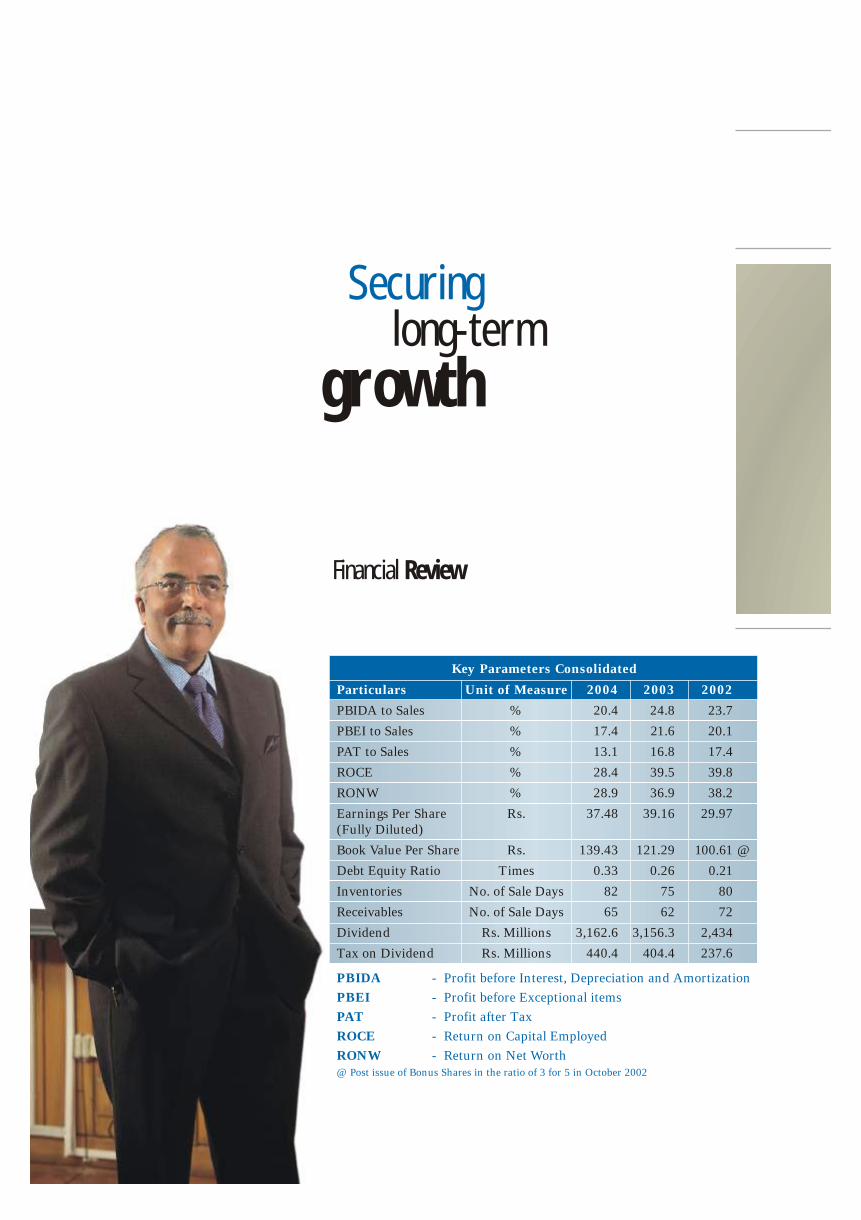
PBIDA - Profit before Interest, Depreciation and Amortization
PBEI - Profit before Exceptional items
PAT - Profit after Tax
ROCE - Return on Capital Employed
RONW - Return on Net Worth
@ Post issue of Bonus Shares in the ratio of 3 for 5 in October 2002
Key Parameters Consolidated
Particulars Unit of Measure 2004 2003 2002
PBIDA to Sales % 20.4 24.8 23.7
PBEI to Sales % 17.4 21.6 20.1
PAT to Sales % 13.1 16.8 17.4
ROCE % 28.4 39.5 39.8
RONW % 28.9 36.9 38.2
Earnings Per Share Rs. 37.48 39.16 29.97
(Fully Diluted)
Book Value Per Share Rs. 139.43 121.29 100.61 @
Debt Equity Ratio Times 0.33 0.26 0.21
Inventories No. of Sale Days 82 75 80
Receivables No. of Sale Days 65 62 72
Dividend Rs. Millions 3,162.6 3,156.3 2,434
Tax on Dividend Rs. Millions 440.4 404.4 237.6
“While Ranbaxy’s strategy of internationalization will drive the Company’s success, investments in stepping up R&D infrastructure to meet the needs of its global markets, will orchestrate Ranbaxy’s march forward.”
23
Annual Report 2004Financial ReviewRanbaxy Laboratories Limited
expenditure (Rs. 953 Mn), modernization /
augmentation of manufacturing capacities
(additional investment of nearly Rs. 2.3 Bn over
2003) and acquisition of RPG Aventis in France.
As a result of this investment, the capital employed
by the Company grew significantly in 2004,
resulting in Return on Capital Employed (ROCE)
dropping to 28.4% in 2004. The Company also
continued to maintain its strong focus on working
capital management.
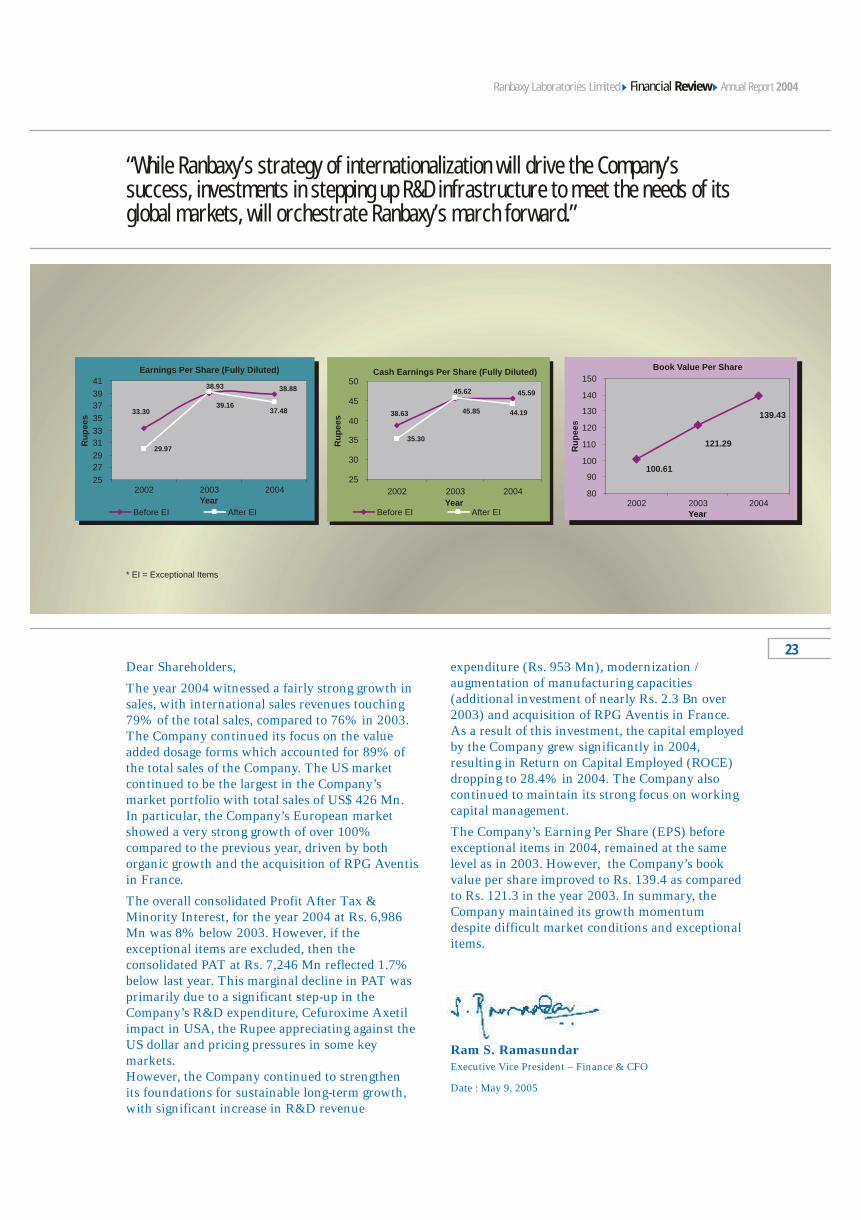
The Company’s Earning Per Share (EPS) before
exceptional items in 2004, remained at the same
level as in 2003. However, the Company’s book
value per share improved to Rs. 139.4 as compared
to Rs. 121.3 in the year 2003. In summary, the
Company maintained its growth momentum
despite difficult market conditions and exceptional
items.
Ram S. RamasundarExecutive Vice President – Finance & CFO
Date : May 9, 2005
Dear Shareholders,
The year 2004 witnessed a fairly strong growth in
sales, with international sales revenues touching
79% of the total sales, compared to 76% in 2003.
The Company continued its focus on the value
added dosage forms which accounted for 89% of
the total sales of the Company. The US market
continued to be the largest in the Company’s
market portfolio with total sales of US$ 426 Mn.
In particular, the Company’s European market
showed a very strong growth of over 100%
compared to the previous year, driven by both
organic growth and the acquisition of RPG Aventis
in France.
The overall consolidated Profit After Tax &
Minority Interest, for the year 2004 at Rs. 6,986
Mn was 8% below 2003. However, if the
exceptional items are excluded, then the
consolidated PAT at Rs. 7,246 Mn reflected 1.7%
below last year. This marginal decline in PAT was
primarily due to a significant step-up in the
Company’s R&D expenditure, Cefuroxime Axetil
impact in USA, the Rupee appreciating against the
US dollar and pricing pressures in some key
markets.
However, the Company continued to strengthen
its foundations for sustainable long-term growth,
with significant increase in R&D revenue
Cash Earnings Per Share (Fully Diluted)
35.30
38.63
45.62 45.59
45.85 44.19
25
30
35
40
45
50
2002 2003 2004
Year
Ru
pe
es
Earnings Per Share (Fully Diluted)
29.97
38.93 38.88
33.3039.16
37.48
25
27
29
31
33
35
37
39
41
2002 2003 2004Year
Ru
pe
es
Before EI After EI
Book Value Per Share
100.61
121.29
139.43
80
90
100
110
120
130
140
150
2002 2003 2004Year
Ru
pe
es
* EI = Exceptional Items
Before EI After EI
Leveraging India’s globally acclaimed intellectual wealth, Ranbaxy is making every dollar spent in research count for that much more. This is reflected in the increasing number of global patent filings of the Company, which are over 675 today.
Annual Report 2004Ranbaxy Laboratories Limited
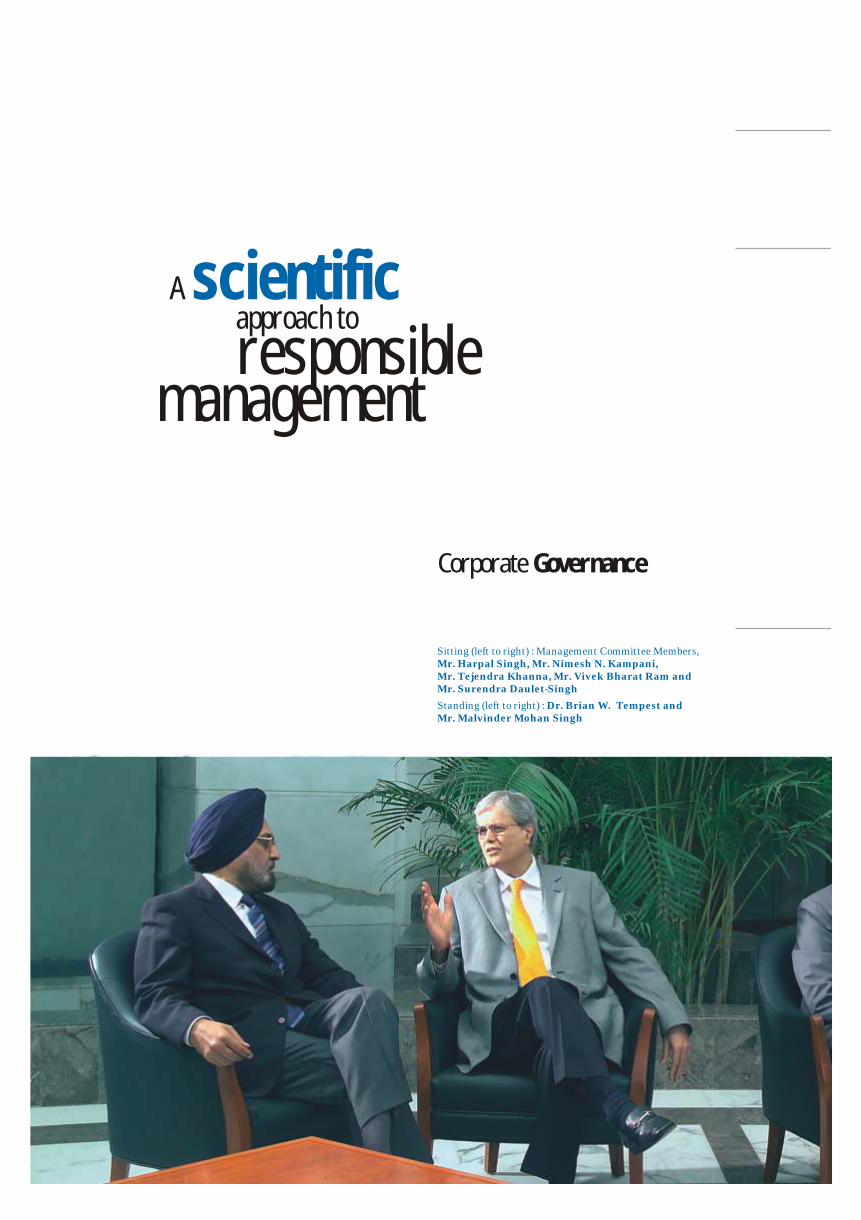
A scientific approach to responsible
management
Corporate Governance
Sitting (left to right) : Management Committee Members, Mr. Harpal Singh, Mr. Nimesh N. Kampani, Mr. Tejendra Khanna, Mr. Vivek Bharat Ram and Mr. Surendra Daulet-Singh
Standing (left to right) : Dr. Brian W. Tempest and Mr. Malvinder Mohan Singh
Ranbaxy’s first written internal Code of
Corporate Governance was adopted by the
Board in June 1999, well before SEBI
introduced recommendatory standards for
companies in India. The guidelines are reviewed
and reaffirmed on an ongoing basis to ensure
that the Code is observed in substance rather
than in mere form.
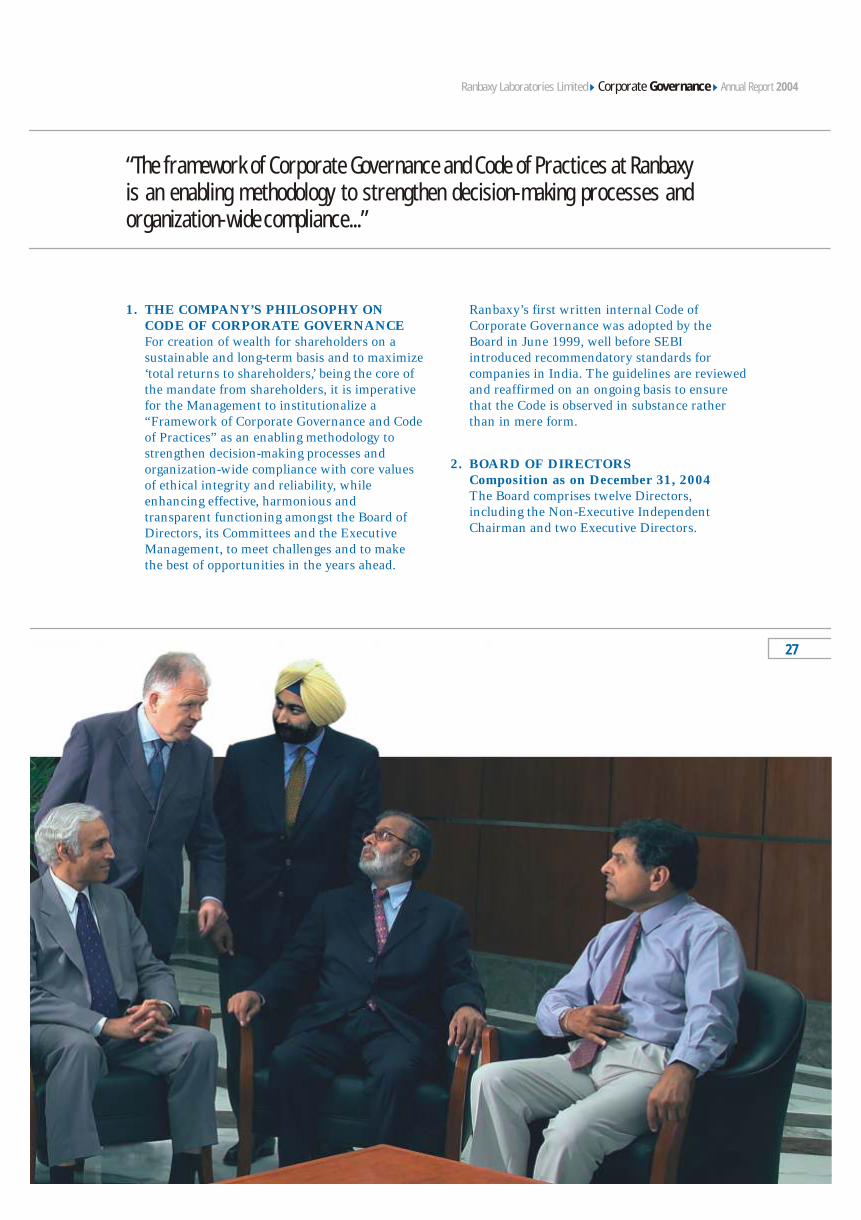
2. BOARD OF DIRECTORSComposition as on December 31, 2004The Board comprises twelve Directors,
including the Non-Executive Independent
Chairman and two Executive Directors.
“The framework of Corporate Governance and Code of Practices at Ranbaxy is an enabling methodology to strengthen decision-making processes and organization-wide compliance...”
Annual Report 2004Corporate GovernanceRanbaxy Laboratories Limited
1. THE COMPANY’S PHILOSOPHY ON CODE OF CORPORATE GOVERNANCEFor creation of wealth for shareholders on a
sustainable and long-term basis and to maximize
‘total returns to shareholders,’ being the core of
the mandate from shareholders, it is imperative
for the Management to institutionalize a
“Framework of Corporate Governance and Code
of Practices” as an enabling methodology to
strengthen decision-making processes and
organization-wide compliance with core values
of ethical integrity and reliability, while
enhancing effective, harmonious and
transparent functioning amongst the Board of
Directors, its Committees and the Executive
Management, to meet challenges and to make
the best of opportunities in the years ahead.
27
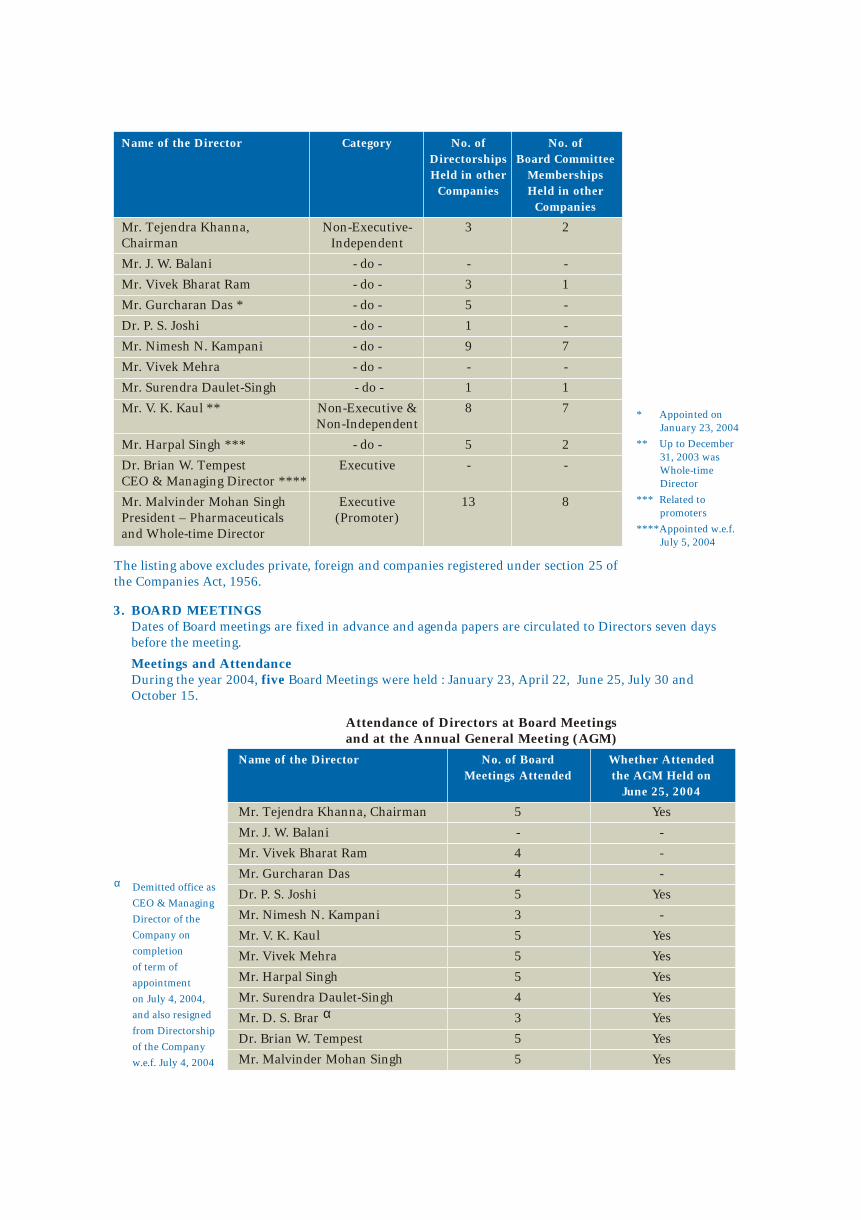
3. BOARD MEETINGSDates of Board meetings are fixed in advance and agenda papers are circulated to Directors seven days
before the meeting.
Meetings and AttendanceDuring the year 2004, five Board Meetings were held : January 23, April 22, June 25, July 30 and
October 15.
Attendance of Directors at Board Meetings and at the Annual General Meeting (AGM)
Mr. Tejendra Khanna, Chairman 5 Yes
Mr. J. W. Balani - -
Mr. Vivek Bharat Ram 4 -
Mr. Gurcharan Das 4 -
Dr. P. S. Joshi 5 Yes
Mr. Nimesh N. Kampani 3 -
Mr. V. K. Kaul 5 Yes
Mr. Vivek Mehra 5 Yes
Mr. Harpal Singh 5 Yes
Mr. Surendra Daulet-Singh 4 Yes
αMr. D. S. Brar 3 Yes
Dr. Brian W. Tempest 5 Yes
Mr. Malvinder Mohan Singh 5 Yes
Name of the Director No. of Board Whether Attended
Meetings Attended the AGM Held on
June 25, 2004
* Appointed on
January 23, 2004
** Up to December
31, 2003 was
Whole-time
Director
*** Related to
promoters
****Appointed w.e.f.
July 5, 2004
αDemitted office as
CEO & Managing
Director of the
Company on
completion
of term of
appointment
on July 4, 2004,
and also resigned
from Directorship
of the Company
w.e.f. July 4, 2004
The listing above excludes private, foreign and companies registered under section 25 of
the Companies Act, 1956.
Mr. Tejendra Khanna, Non-Executive- 3 2
Chairman Independent
Mr. J. W. Balani - do - - -
Mr. Vivek Bharat Ram - do - 3 1
Mr. Gurcharan Das * - do - 5 -
Dr. P. S. Joshi - do - 1 -
Mr. Nimesh N. Kampani - do - 9 7
Mr. Vivek Mehra - do - - -
Mr. Surendra Daulet-Singh - do - 1 1
Mr. V. K. Kaul ** Non-Executive & 8 7
Non-Independent
Mr. Harpal Singh *** - do - 5 2
Dr. Brian W. Tempest Executive - -
CEO & Managing Director ****
Mr. Malvinder Mohan Singh Executive 13 8
President – Pharmaceuticals (Promoter)
and Whole-time Director
Name of the Director Category No. of No. of
Directorships Board Committee
Held in other Memberships
Companies Held in other
Companies
• Review and approval of business
strategies and policies, merger and
acquisition proposals, medium-term plans
and annual budgets.
• Review operating performance for the
global organization.
• Approval of processes and practices
relating to human resources, succession
planning for senior management
personnel.
• Review policies, processes and systems on
Environment, Safety and Ecology.
Minutes of meetings of the Management
Committee are circulated to members of the
Committee and the Board is kept apprised.
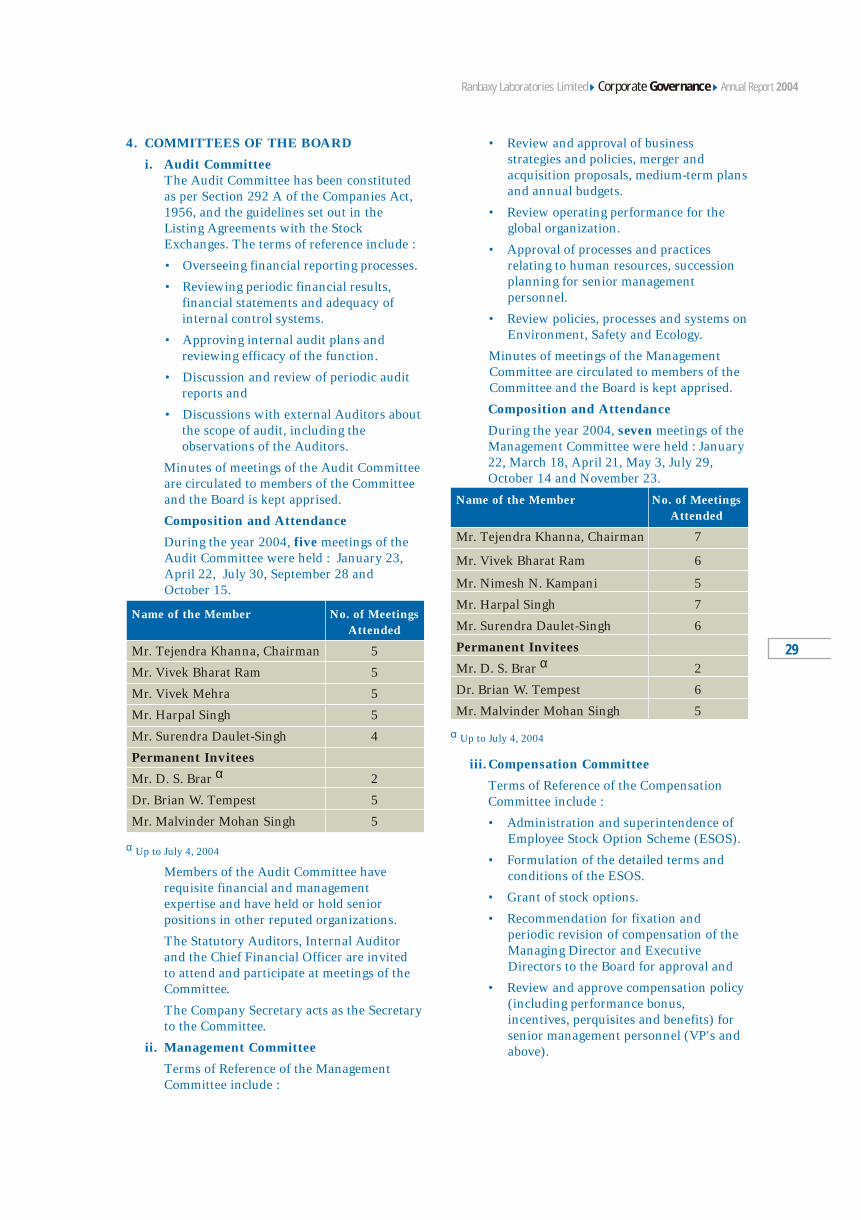
Composition and Attendance
During the year 2004, seven meetings of the
Management Committee were held : January
22, March 18, April 21, May 3, July 29,
October 14 and November 23.
α Up to July 4, 2004
iii.Compensation Committee
Terms of Reference of the Compensation
Committee include :
• Administration and superintendence of
Employee Stock Option Scheme (ESOS).
• Formulation of the detailed terms and
conditions of the ESOS.
• Grant of stock options.
• Recommendation for fixation and
periodic revision of compensation of the
Managing Director and Executive
Directors to the Board for approval and
• Review and approve compensation policy
(including performance bonus,
incentives, perquisites and benefits) for
senior management personnel (VP's and
above).
Name of the Member No. of Meetings
Attended
Mr. Tejendra Khanna, Chairman 7
Mr. Vivek Bharat Ram 6
Mr. Nimesh N. Kampani 5
Mr. Harpal Singh 7
Mr. Surendra Daulet-Singh 6
Permanent Inviteesα
Mr. D. S. Brar 2
Dr. Brian W. Tempest 6
Mr. Malvinder Mohan Singh 5
4. COMMITTEES OF THE BOARD
i. Audit CommitteeThe Audit Committee has been constituted
as per Section 292 A of the Companies Act,
1956, and the guidelines set out in the
Listing Agreements with the Stock
Exchanges. The terms of reference include :
• Overseeing financial reporting processes.
• Reviewing periodic financial results,
financial statements and adequacy of
internal control systems.
• Approving internal audit plans and
reviewing efficacy of the function.
• Discussion and review of periodic audit
reports and
• Discussions with external Auditors about
the scope of audit, including the
observations of the Auditors.
Minutes of meetings of the Audit Committee
are circulated to members of the Committee
and the Board is kept apprised.
Composition and Attendance
During the year 2004, five meetings of the
Audit Committee were held : January 23,
April 22, July 30, September 28 and
October 15.
α Up to July 4, 2004
Members of the Audit Committee have
requisite financial and management
expertise and have held or hold senior
positions in other reputed organizations.
The Statutory Auditors, Internal Auditor
and the Chief Financial Officer are invited
to attend and participate at meetings of the
Committee.
The Company Secretary acts as the Secretary
to the Committee.
ii. Management Committee
Terms of Reference of the Management
Committee include :
Name of the Member No. of Meetings
Attended
Mr. Tejendra Khanna, Chairman 5
Mr. Vivek Bharat Ram 5
Mr. Vivek Mehra 5
Mr. Harpal Singh 5
Mr. Surendra Daulet-Singh 4
Permanent Inviteesα
Mr. D. S. Brar 2
Dr. Brian W. Tempest 5
Mr. Malvinder Mohan Singh 5
29
Annual Report 2004Corporate GovernanceRanbaxy Laboratories Limited
Remuneration Policy
The Remuneration Policy of the Company for
managerial personnel is primarily based on the
following criteria :
- Performance of the Company, its divisions and
units
- Track record, potential and performance of
individual managers, and
- External competitive environment.
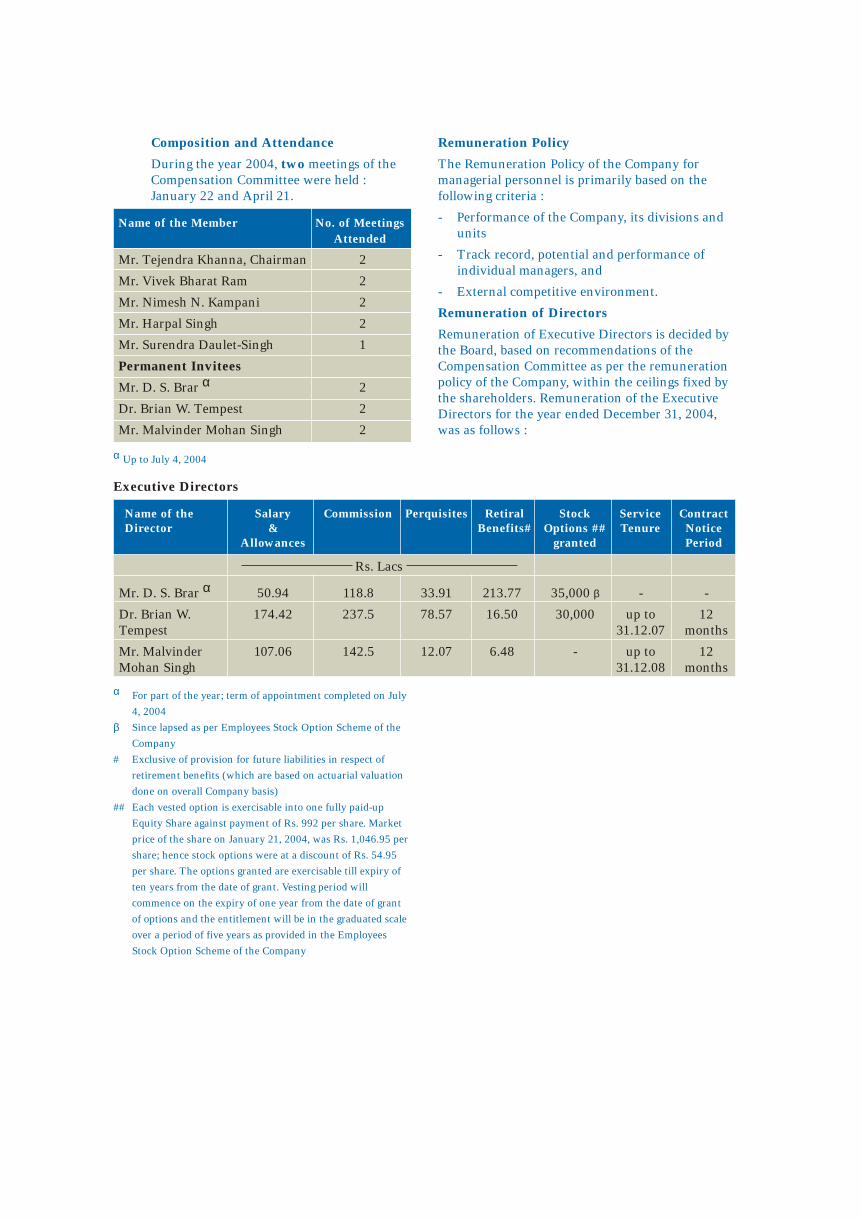
Remuneration of Directors
Remuneration of Executive Directors is decided by
the Board, based on recommendations of the
Compensation Committee as per the remuneration
policy of the Company, within the ceilings fixed by
the shareholders. Remuneration of the Executive
Directors for the year ended December 31, 2004,
was as follows :
Composition and Attendance
During the year 2004, two meetings of the
Compensation Committee were held :
January 22 and April 21.
Name of the Member No. of Meetings
Attended
Mr. Tejendra Khanna, Chairman 2
Mr. Vivek Bharat Ram 2
Mr. Nimesh N. Kampani 2
Mr. Harpal Singh 2
Mr. Surendra Daulet-Singh 1
Permanent Inviteesα
Mr. D. S. Brar 2
Dr. Brian W. Tempest 2
Mr. Malvinder Mohan Singh 2
Executive Directors
Rs. Lacs
αMr. D. S. Brar 50.94 118.8 33.91 213.77 35,000 β - -
Dr. Brian W. 174.42 237.5 78.57 16.50 30,000 up to 12
Tempest 31.12.07 months
Mr. Malvinder 107.06 142.5 12.07 6.48 - up to 12
Mohan Singh 31.12.08 months
Name of the Salary Commission Perquisites Retiral Stock Service ContractDirector & Benefits# Options ## Tenure Notice
Allowances granted Period
αFor part of the year; term of appointment completed on July
4, 2004
β Since lapsed as per Employees Stock Option Scheme of the
Company
# Exclusive of provision for future liabilities in respect of
retirement benefits (which are based on actuarial valuation
done on overall Company basis)
## Each vested option is exercisable into one fully paid-up
Equity Share against payment of Rs. 992 per share. Market
price of the share on January 21, 2004, was Rs. 1,046.95 per
share; hence stock options were at a discount of Rs. 54.95
per share. The options granted are exercisable till expiry of
ten years from the date of grant. Vesting period will
commence on the expiry of one year from the date of grant
of options and the entitlement will be in the graduated scale
over a period of five years as provided in the Employees
Stock Option Scheme of the Company
α Up to July 4, 2004
v. Science Committee
Terms of Reference of Science Committee
include :
• Approval of focus areas of research,
especially New Drug Discovery Research
(NDDR) and Novel Drug Delivery
Systems (NDDS), R&D organizational
structure and policies for the research
and development function of the
Company; and
• Monitoring progress of NDDR and
NDDS programs and laying down a
policy framework for collaborative R&D
programs.
Composition and Attendance
During the year 2004, two meetings of the
Science Committee were held : October 14
and December 21.
vi. Shareholders’ / Investors’ Grievance and Share Transfer Committee
Composition and Attendance
During the year 2004, nine meetings of the
Committee were held : January19, March 10,
May 5, June 21, July 19, August 27, October
11, November 1 and December 27.
α Up to July 4, 2004
The Company addresses all complaints,
suggestions and grievances expeditiously
and replies have been sent / issues resolved
usually within 15 days except in case of
dispute over facts or other legal constraints.
The Company received 60 shareholders'
complaints from Stock Exchanges / SEBI
which inter-alia include non-receipt of
dividend, annual report, bonus shares, etc.
Name of the Member No. of MeetingsAttended
Name of the Member No. of MeetingsAttended
Dr. P. S. Joshi, Chairman 2
Mr. Tejendra Khanna 2
Dr. Brian W. Tempest 2
Permanent Invitees
Dr. Nityanand 1
Dr. Rajinder Kumar 1
Mr. Malvinder Mohan Singh 2
Mr. Tejendra Khanna
Chairman 9
Mr. Vivek Bharat Ram 8
αMr. D. S. Brar 3
Mr. V. K. Kaul 8
31
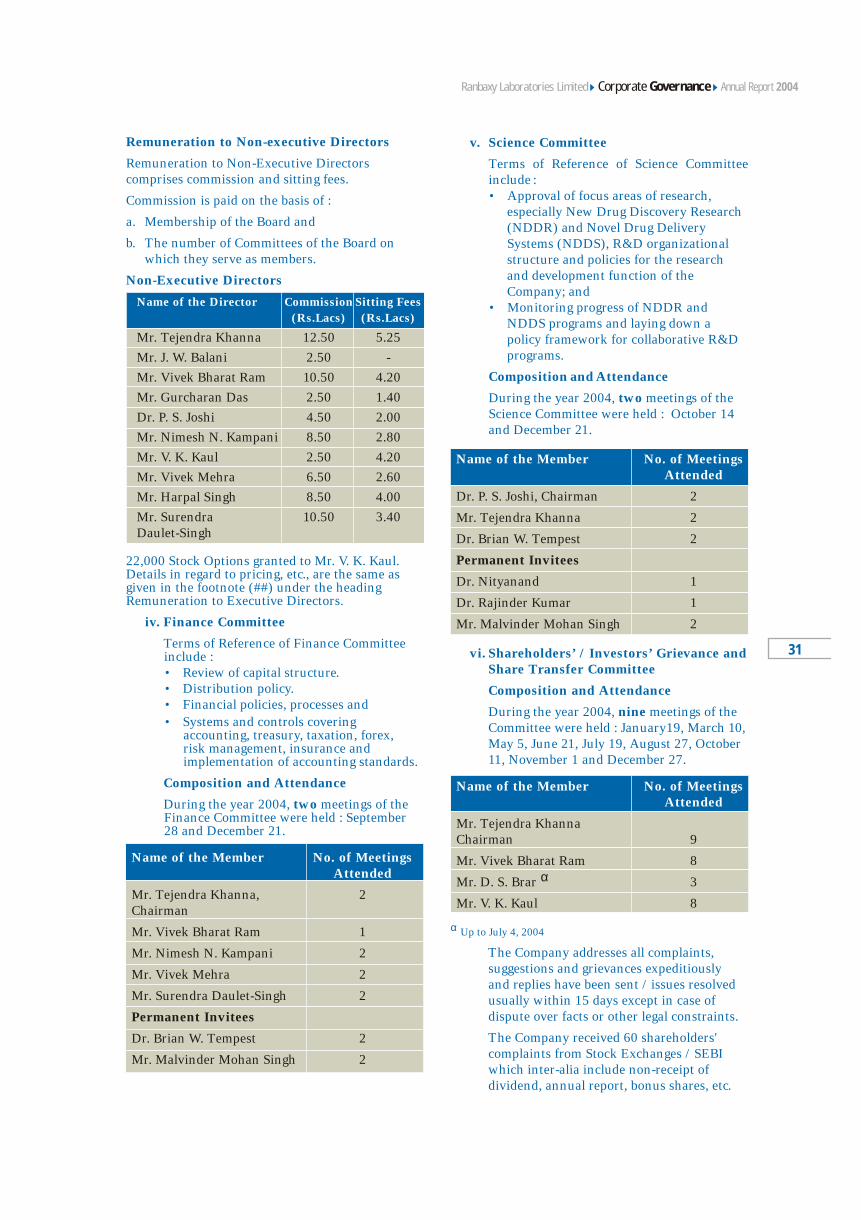
Remuneration to Non-executive Directors
Remuneration to Non-Executive Directors
comprises commission and sitting fees.
Commission is paid on the basis of :
a. Membership of the Board and
b. The number of Committees of the Board on
which they serve as members.
Non-Executive Directors
22,000 Stock Options granted to Mr. V. K. Kaul.
Details in regard to pricing, etc., are the same as
given in the footnote (##) under the heading
Remuneration to Executive Directors.
iv. Finance Committee
Terms of Reference of Finance Committee
include :
• Review of capital structure.
• Distribution policy.
• Financial policies, processes and
• Systems and controls covering
accounting, treasury, taxation, forex,
risk management, insurance and
implementation of accounting standards.
Composition and Attendance
During the year 2004, two meetings of the
Finance Committee were held : September
28 and December 21.
Name of the Director Commission Sitting Fees
(Rs.Lacs) (Rs.Lacs)
Name of the Member No. of MeetingsAttended
Mr. Tejendra Khanna 12.50 5.25
Mr. J. W. Balani 2.50 -
Mr. Vivek Bharat Ram 10.50 4.20
Mr. Gurcharan Das 2.50 1.40
Dr. P. S. Joshi 4.50 2.00
Mr. Nimesh N. Kampani 8.50 2.80
Mr. V. K. Kaul 2.50 4.20
Mr. Vivek Mehra 6.50 2.60
Mr. Harpal Singh 8.50 4.00
Mr. Surendra 10.50 3.40
Daulet-Singh
Mr. Tejendra Khanna, 2
Chairman
Mr. Vivek Bharat Ram 1
Mr. Nimesh N. Kampani 2
Mr. Vivek Mehra 2
Mr. Surendra Daulet-Singh 2
Permanent Invitees
Dr. Brian W. Tempest 2
Mr. Malvinder Mohan Singh 2
Annual Report 2004Corporate GovernanceRanbaxy Laboratories Limited
The complaints were duly attended to and
the Company has furnished necessary
documents / information to the
shareholders.
The Shareholders’ / Investors’ Grievance
and Share Transfer Committee reviews every
complaint received and appropriate action is
taken promptly.
No requests for share transfers are pending
except those that are disputed or sub-judice.
Mr. S. K. Patawari, Company Secretary, is
the Compliance Officer of the Company.
5. GENERAL BODY MEETINGS
The last three Annual General Meetings were
held as per details given below :
6. DISCLOSURES
a. Related Party Transactions
The Company has not entered into any
transaction of material nature with the
promoters, the Directors or the management,
their subsidiaries or relatives, etc., that may
have any potential conflict with the interests
of the Company.
b. Compliances by the Company
During the last three years, no penalties or
strictures have been imposed on the
Company by the Stock Exchanges or SEBI or
any other statutory authorities, on matters
related to capital markets.
7. MEANS OF COMMUNICATION
a. The Company regularly intimates unaudited
as well as audited financial results to the
Stock Exchanges, immediately after these are
Year Date Day/Time Venue
2002 28-6-2002 Friday A-9-10, Industrial
11.00 A.M. Area, S.A.S. Nagar
Punjab
2003 25-6-2003 Wednesday The National
11.00 A.M. Institute of
Pharmaceutical
Education
& Research
Sector 67
S.A.S. Nagar
Punjab
2004 25-6-2004 Friday The National
11.00 A.M. Institute of
Pharmaceutical
Education
& Research
Sector 67
S.A.S. Nagar
Punjab
taken on record by the Board. These
financial results are normally published in
Business Standard / Financial Express, the
Tribune (Punjabi Edition) publications, and
are displayed on the website of the Company
www.ranbaxy.com and simultaneously
posted on the Electronic Data Information
Filing and Retrieval website, namely
www.sebiedifar.nic.in. The website is also
accessible through a hyperlink 'EDIFAR'
from SEBI's official website,
www.sebi.gov.in.
The official news releases and the
presentations made to the investors /
analysts are also displayed on the Company's
website. The Results are not sent
individually to the shareholders.
b. The Management Discussion and Analysis
Report forms part of the Report of the
Directors.
8. SHAREHOLDER INFORMATION
Annual General Meeting
- Date : June 30, 2005
- Time : 11.00 A.M.
- Venue : The National Institute of
Pharmaceutical Education and
Research (NIPER)
Sector-67, S.A.S. Nagar,
Mohali - 160 062 (Punjab)
Financial Calendar
Adoption of Quarterly Results 3rd / 4th
for the quarter ending week of
- June 30, 2005 July 2005
- September 30, 2005 October 2005
- December 31, 2005 January 2006
- March 31, 2006 April 2006
Book Closure Dates – June 18, 2005 to
June 30, 2005
(both days inclusive)
Dividend Payment Date – on or before
July 10, 2005
LISTING ON STOCK EXCHANGES
The Equity Shares of the Company as on December
31, 2004, were listed on the Stock Exchanges at
Mumbai and the National Stock Exchange. Global
Depository Receipts (GDRs) are listed on the Stock
Exchange at Luxembourg. The Company confirms
that it has paid annual listing fees due to the Stock
Exchanges for the year 2004-2005.
STOCK CODE
1. The National Stock - Ranbaxy
Exchange of India Ltd.
2. The Stock Exchange - 359 (Physical) and
Mumbai 500359 (Demat)
Market Price Data (Rs.)
January 2004 1137.85 993.85 1136.95 993.45
February 2004 1001.30 925.85 1002.25 922.50
March 2004 990.60 894.55 990.10 886.25
April 2004 1069.15 987.80 1072.90 987.70
May 2004 1048.45 988.35 1048.00 989.55
June 2004 1012.35 878.00 1012.75 878.10
July 2004 982.95 913.00 984.25 914.70
August 2004 977.75 908.85 979.05 909.35
September 2004 1122.70 972.20 1122.70 972.30
October 2004 1103.75 1062.50 1104.25 1062.30
November 2004 1150.45 1035.20 1152.40 1035.50
December 2004 1269.35 1126.55 1269.35 1129.35
Month The Stock Exchange, Mumbai National Stock Exchange
High Low High Low
33
Annual Report 2004Corporate GovernanceRanbaxy Laboratories Limited
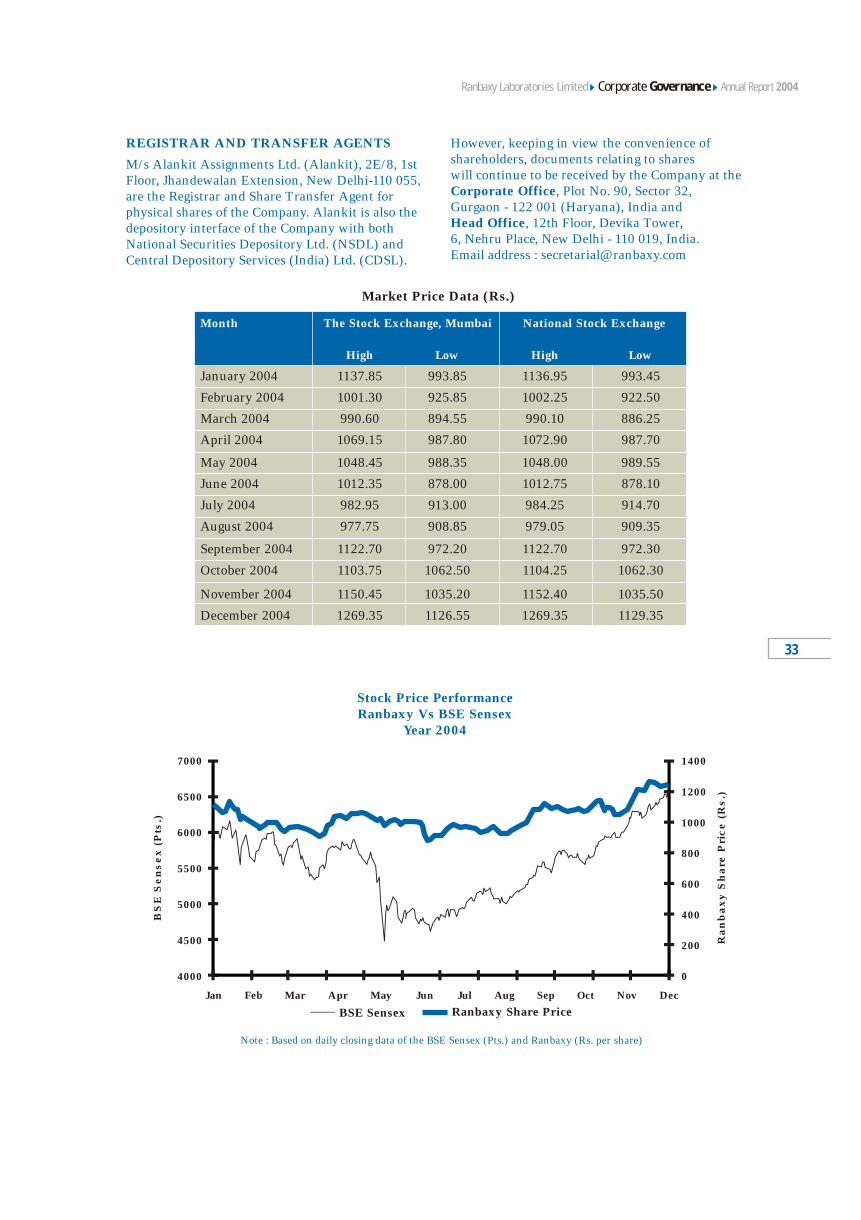
Stock Price Performance Ranbaxy Vs BSE Sensex
Year 2004
4000
4500
5000
5500
6000
6500
7000
BS
ES
en
se
x(P
ts.)
0
200
400
600
800
1000
1200
1400
Ra
nb
ax
yS
ha
reP
ric
e(R
s.)
Jan Feb Mar Apr May Jun Jul Aug Sep Oct Nov Dec
Note : Based on daily closing data of the BSE Sensex (Pts.) and Ranbaxy (Rs. per share)
BSE Sensex Ranbaxy Share Price
REGISTRAR AND TRANSFER AGENTS
M/s Alankit Assignments Ltd. (Alankit), 2E/8, 1st
Floor, Jhandewalan Extension, New Delhi-110 055,
are the Registrar and Share Transfer Agent for
physical shares of the Company. Alankit is also the
depository interface of the Company with both
National Securities Depository Ltd. (NSDL) and
Central Depository Services (India) Ltd. (CDSL).
However, keeping in view the convenience of
shareholders, documents relating to shares
will continue to be received by the Company at the
Corporate Office, Plot No. 90, Sector 32,
Gurgaon - 122 001 (Haryana), India and
Head Office, 12th Floor, Devika Tower,
6, Nehru Place, New Delhi - 110 019, India.
Email address : [email protected]
SHARE TRANSFER SYSTEM
With a view to expedite the process of share
transfers, the Board of Directors of the Company
has delegated the power of share transfer to some of
the Directors with appropriate individual limits.
The delegated Director(s) attend(s) to the share
transfer formalities at least once in a fortnight. The
shares for transfer received in physical form are
transferred expeditiously, provided the documents
are complete and the shares under transfer are not
under any dispute. The share certificates duly
endorsed are returned immediately to shareholders.
Confirmation in respect of the requests for
dematerialization of shares is sent to the respective
depositories i.e. NSDL and CDSL expeditiously.
DEMATERIALIZATION OF SHARES
The shares of the Company are in compulsory
demat segment and are available for trading in the
depository systems of both NSDL and CDSL. As on
December 31, 2004, 172154954 Equity Shares of
the Company, forming 92.61% of the Share Capital
of the Company stand dematerialized.
International Securities Identification Number
- INE015A01010 (with NSDL and CDSL)
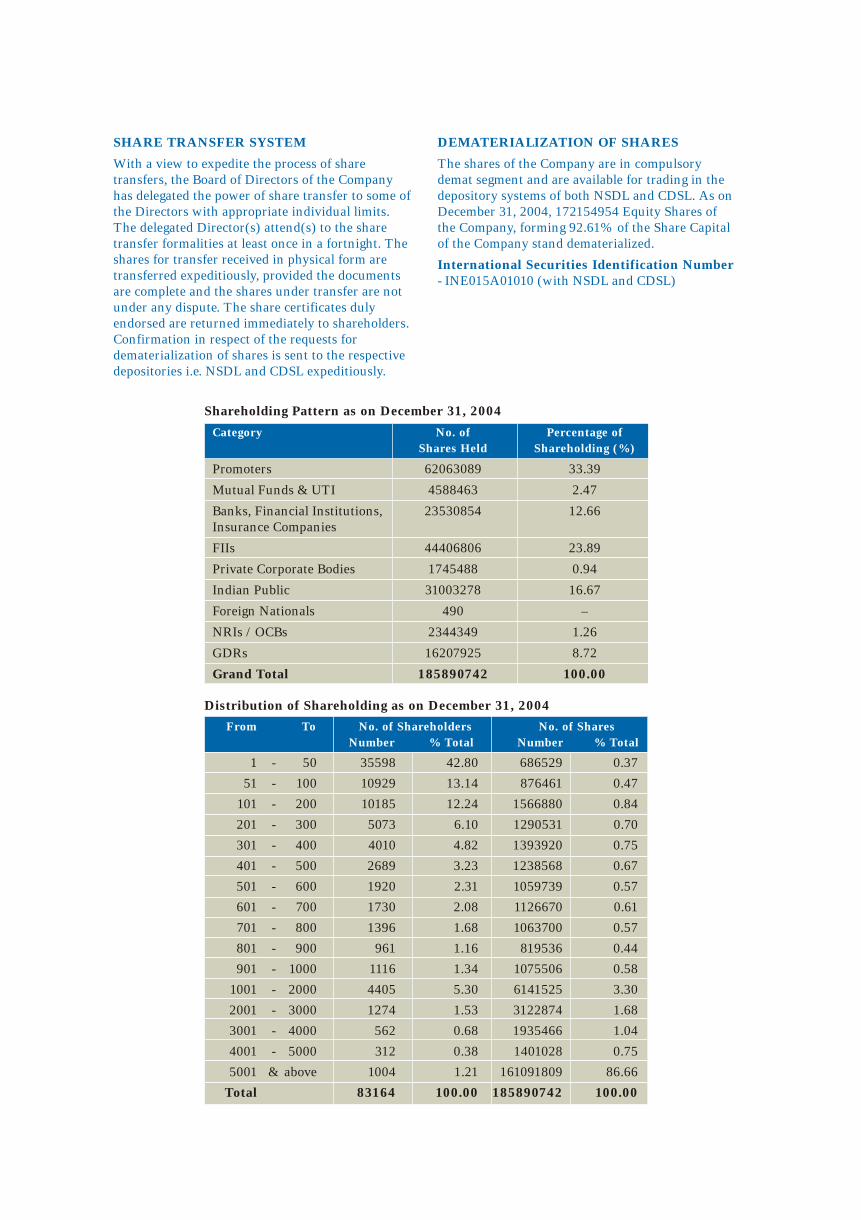
Distribution of Shareholding as on December 31, 2004
1 - 50 35598 42.80 686529 0.37
51 - 100 10929 13.14 876461 0.47
101 - 200 10185 12.24 1566880 0.84
201 - 300 5073 6.10 1290531 0.70
301 - 400 4010 4.82 1393920 0.75
401 - 500 2689 3.23 1238568 0.67
501 - 600 1920 2.31 1059739 0.57
601 - 700 1730 2.08 1126670 0.61
701 - 800 1396 1.68 1063700 0.57
801 - 900 961 1.16 819536 0.44
901 - 1000 1116 1.34 1075506 0.58
1001 - 2000 4405 5.30 6141525 3.30
2001 - 3000 1274 1.53 3122874 1.68
3001 - 4000 562 0.68 1935466 1.04
4001 - 5000 312 0.38 1401028 0.75
5001 & above 1004 1.21 161091809 86.66
Total 83164 100.00 185890742 100.00
From To No. of Shareholders No. of Shares
Number % Total Number % Total
Shareholding Pattern as on December 31, 2004
Promoters 62063089 33.39
Mutual Funds & UTI 4588463 2.47
Banks, Financial Institutions, 23530854 12.66
Insurance Companies
FIIs 44406806 23.89
Private Corporate Bodies 1745488 0.94
Indian Public 31003278 16.67
Foreign Nationals 490 –
NRIs / OCBs 2344349 1.26
GDRs 16207925 8.72
Grand Total 185890742 100.00
Category No. of Percentage of
Shares Held Shareholding (%)
Liquidity of Shares
The Equity Shares of the Company have been included in the Sensex of the leading Stock Exchanges.
Outstanding Stock Options µ
Number of Stock Options outstanding as on – 2519810
December 31, 2004.
Out of which 54540 Stock Options exercised were pending allotment.
µ Options granted up to October 3, 2002, are entitled for additional shares (3,69,831 shares) on a proportionate basis, in view of issue
of bonus shares by the Company in the ratio of 3 for 5 in October 2002.
There are no outstanding warrants or any convertible instruments.
Plant Locations of the Company in India
1. A-8, A-9, A-10 & A-11 2. Village Toansa, P.O. Railmajra
Industrial Area Distt. Nawansahar - 144 533
Phase- III Punjab
Sahibzada Ajit Singh Nagar
Mohali - 160 055
Punjab
3. Industrial Area 3 4. Village & P.O. Ganguwala
A. B. Road Teh. Paonta Sahib
Dewas - 450 001 Distt. Sirmour - 173 025
Madhya Pradesh Himachal Pradesh
5. E-47/9, Okhla Industrial Area 6. E-2 & E-3, MIDC, Jejuri
Phase-II, Okhla Distt. Pune - 412 303
New Delhi - 110 020 Maharashtra
7. Plot No. B-2
Madkaim Industrial Estate
Ponda
Goa
Address for Correspondence
Shareholders are requested to contact :
Mr. S. K. Patawari
Company Secretary
Ranbaxy Laboratories Ltd.
Plot No. 90, Sector 32
Gurgaon - 122 001 (Haryana), India
Tel : +91-124-5135000 Fax : +91-124-5106490
Email address : [email protected]
NON-MANDATORY REQUIREMENTS
1. Chairman’s Office
The Company maintains the Office of the Chairman at its Corporate Office at Plot No. 90, Sector 32,
Gurgaon - 122 001 (Haryana), India, and also reimburses the expenses incurred in performance of his
duties.
2. Remuneration Committee
The Company has constituted a Compensation Committee. Terms of Reference of the Committee have
been described at 4(iii) herein above.
3. Shareholders’ Rights
The quarterly financial results are published in the newspapers as mentioned under the heading “Means
of Communication” at Sl. No. 7 herein above and also displayed on the website of the Company. The
results are not separately circulated to the shareholders.
Auditors’ certificate on compliance with the conditions of corporate
governance under clause 49 of the listing agreement
To the Members of
Ranbaxy Laboratories Limited
We have examined the compliance of conditions of corporate governance by Ranbaxy Laboratories Limited
(“the Company”) for the year ended on December 31, 2004, as stipulated in clause 49 of the listing
agreement of the Company with the stock exchange.
The compliance of conditions of corporate governance is the responsibility of the management. Our
examination was limited to procedures and implementation thereof, adopted by the Company, for ensuring
the compliance of the conditions of corporate governance. It is neither an audit nor an expression of opinion
on the financial statements of the Company.
In our opinion and to the best of our information and according to the explanations given to us, we certify
that the Company has complied with the conditions of corporate governance as stipulated in the
abovementioned listing agreement.
We state that no investor grievances are pending for a period exceeding one month, except where disputed
or sub-judice, as per the records maintained by the Shareholders’ / Investors’ Grievance Committee.
We further state that such compliance is neither an assurance as to the future viability of the Company nor
the efficiency or effectiveness with which the management has conducted the affairs of the Company.
For Walker, Chandiok & Co
Chartered Accountants
Vinod Chandiok
Place : New Delhi Partner
Date : April 28, 2005 Membership No: 10093
Annual Report 2004Corporate GovernanceRanbaxy Laboratories Limited Annual Report 2004Corporate GovernanceRanbaxy Laboratories Limited
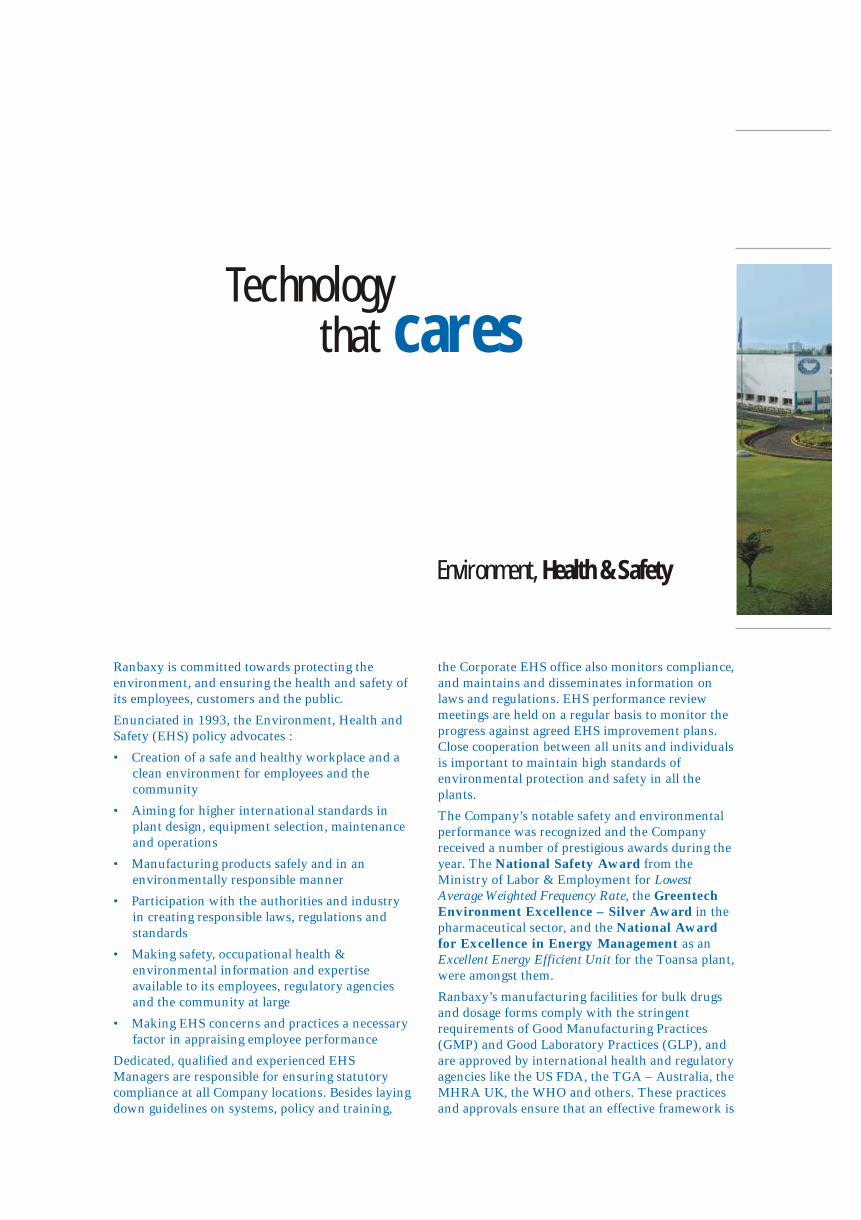
Ranbaxy is committed towards protecting the
environment, and ensuring the health and safety of
its employees, customers and the public.
Enunciated in 1993, the Environment, Health and
Safety (EHS) policy advocates :
• Creation of a safe and healthy workplace and a
clean environment for employees and the
community
• Aiming for higher international standards in
plant design, equipment selection, maintenance
and operations
• Manufacturing products safely and in an
environmentally responsible manner
• Participation with the authorities and industry
in creating responsible laws, regulations and
standards
• Making safety, occupational health &
environmental information and expertise
available to its employees, regulatory agencies
and the community at large
• Making EHS concerns and practices a necessary
factor in appraising employee performance
Dedicated, qualified and experienced EHS
Managers are responsible for ensuring statutory
compliance at all Company locations. Besides laying
down guidelines on systems, policy and training,
Environment, Health & Safety
the Corporate EHS office also monitors compliance,
and maintains and disseminates information on
laws and regulations. EHS performance review
meetings are held on a regular basis to monitor the
progress against agreed EHS improvement plans.
Close cooperation between all units and individuals
is important to maintain high standards of
environmental protection and safety in all the
plants.
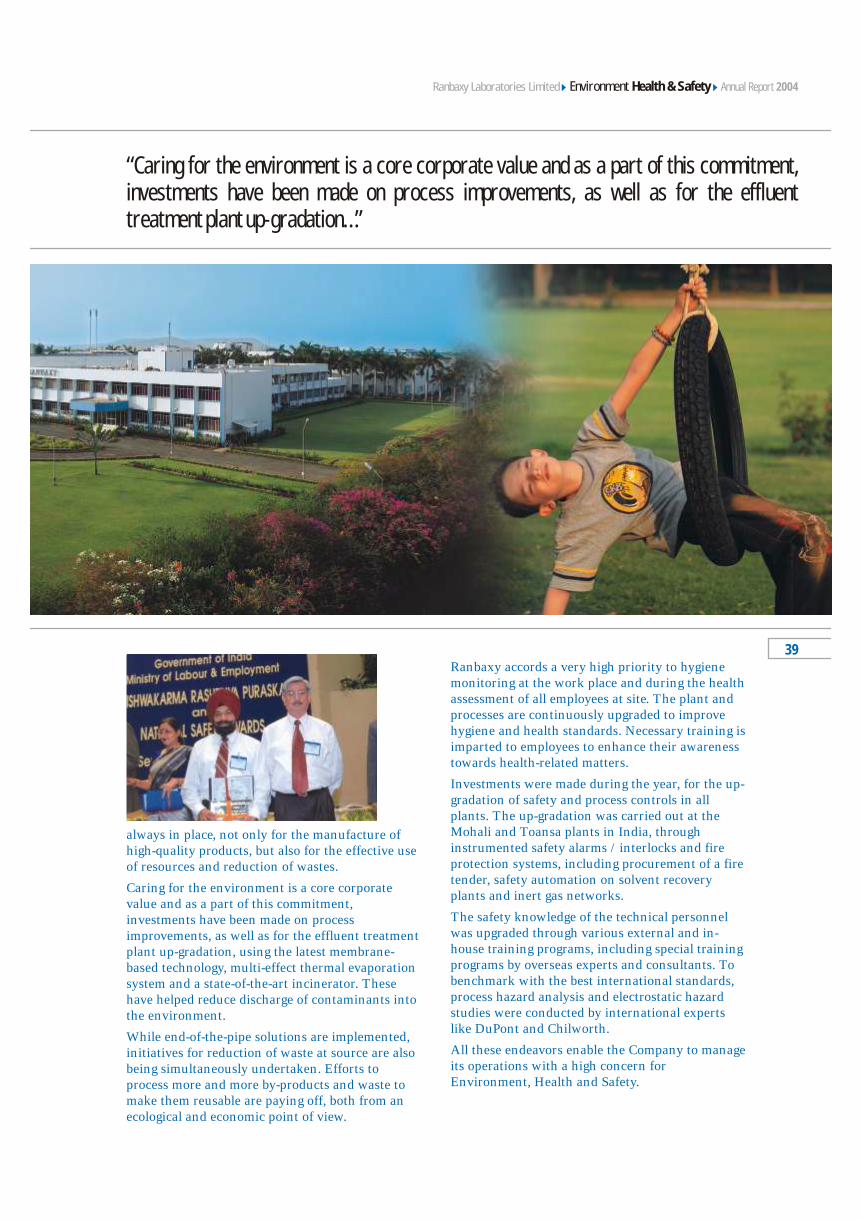
The Company’s notable safety and environmental
performance was recognized and the Company
received a number of prestigious awards during the
year. The National Safety Award from the
Ministry of Labor & Employment for Lowest
Average Weighted Frequency Rate, the Greentech Environment Excellence – Silver Award in the
pharmaceutical sector, and the National Award
for Excellence in Energy Management as an
Excellent Energy Efficient Unit for the Toansa plant,
were amongst them.
Ranbaxy’s manufacturing facilities for bulk drugs
and dosage forms comply with the stringent
requirements of Good Manufacturing Practices
(GMP) and Good Laboratory Practices (GLP), and
are approved by international health and regulatory
agencies like the US FDA, the TGA – Australia, the
MHRA UK, the WHO and others. These practices
and approvals ensure that an effective framework is
Technology that cares
Annual Report 2004
always in place, not only for the manufacture of
high-quality products, but also for the effective use
of resources and reduction of wastes.
Caring for the environment is a core corporate
value and as a part of this commitment,
investments have been made on process
improvements, as well as for the effluent treatment
plant up-gradation, using the latest membrane-
based technology, multi-effect thermal evaporation
system and a state-of-the-art incinerator. These
have helped reduce discharge of contaminants into
the environment.
While end-of-the-pipe solutions are implemented,
initiatives for reduction of waste at source are also
being simultaneously undertaken. Efforts to
process more and more by-products and waste to
make them reusable are paying off, both from an
ecological and economic point of view.
“Caring for the environment is a core corporate value and as a part of this commitment, investments have been made on process improvements, as well as for the effluent treatment plant up-gradation…”
Environment Health & SafetyRanbaxy Laboratories Limited
Ranbaxy accords a very high priority to hygiene
monitoring at the work place and during the health
assessment of all employees at site. The plant and
processes are continuously upgraded to improve
hygiene and health standards. Necessary training is
imparted to employees to enhance their awareness
towards health-related matters.
Investments were made during the year, for the up-
gradation of safety and process controls in all
plants. The up-gradation was carried out at the
Mohali and Toansa plants in India, through
instrumented safety alarms / interlocks and fire
protection systems, including procurement of a fire
tender, safety automation on solvent recovery
plants and inert gas networks.
The safety knowledge of the technical personnel
was upgraded through various external and in-
house training programs, including special training
programs by overseas experts and consultants. To
benchmark with the best international standards,
process hazard analysis and electrostatic hazard
studies were conducted by international experts
like DuPont and Chilworth.
All these endeavors enable the Company to manage
its operations with a high concern for
Environment, Health and Safety.
39


Annual Report 2004Ranbaxy Laboratories Limited
The collaborative research program
for developing a potentially path-
breaking Anti-malarial molecule is well on course. An IND has been
filed in the UK and India, and human clinical
trials are to commence
shortly in a number of countries.
New Drug Discovery Research (NDDR)
During the year, Dr. Vijay Batra with over 25 years
of experience at American Cynamide and Schering
Plough in USA, was appointed as Vice President,
NCE (New Chemical Entity) development. This
appointment rounds off the capabilities required for
the discovery of novel therapeutics and positions
Ranbaxy to carry out the Discovery and Early
Development of NCEs through Proof-of-Concept
(POC) studies in humans.
The Company continued to make progress in its
New Drug Discovery Research. The collective
efforts of this rapidly expanding group, that now
comprises a team of 300 multi-disciplinary
scientists, has resulted in establishing 10 research
programs, which are in various stages of discovery
and development. These research programs are in
the segments of Infectious Diseases (Anti-bacterials
and Anti-fungals), Urology (Benign Prostatic
Hyperplasia and Urinary Incontinence), Metabolic
Diseases (Type 2 Diabetes, Hyperlipidemia) and
Inflammatory / Respiratory Diseases (Asthma,
Chronic Obstructive Pulmonary Disease and
Rheumatoid Arthritis). All the programs are being
aimed at producing best-in-class therapies involving
targets for which Proof-of-Concept can be quickly
and easily established in the clinic.
QuestFor innovation
Research & Development
Annual Report 2004
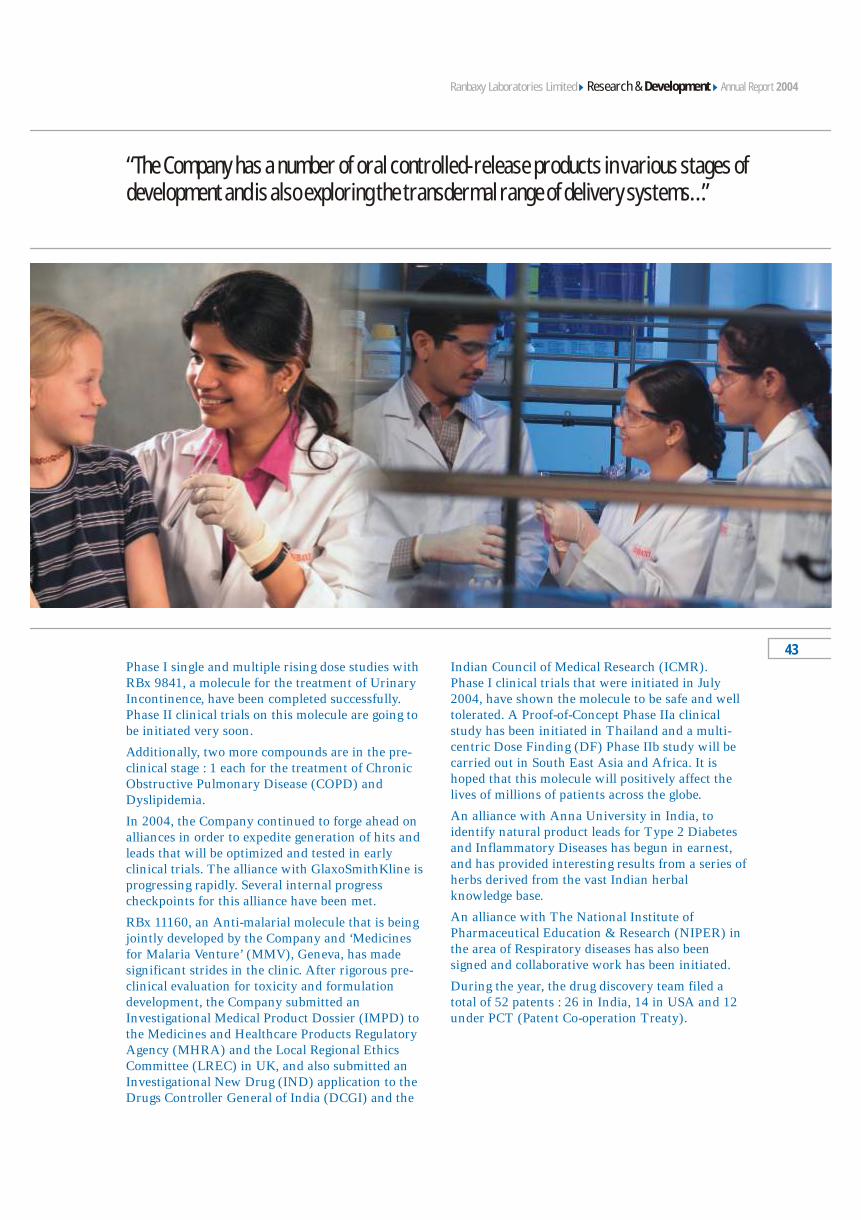
“The Company has a number of oral controlled-release products in various stages of development and is also exploring the transdermal range of delivery systems…”
43
Research & DevelopmentRanbaxy Laboratories Limited
Phase I single and multiple rising dose studies with
RBx 9841, a molecule for the treatment of Urinary
Incontinence, have been completed successfully.
Phase II clinical trials on this molecule are going to
be initiated very soon.
Additionally, two more compounds are in the pre-
clinical stage : 1 each for the treatment of Chronic
Obstructive Pulmonary Disease (COPD) and
Dyslipidemia.
In 2004, the Company continued to forge ahead on
alliances in order to expedite generation of hits and
leads that will be optimized and tested in early
clinical trials. The alliance with GlaxoSmithKline is
progressing rapidly. Several internal progress
checkpoints for this alliance have been met.
RBx 11160, an Anti-malarial molecule that is being
jointly developed by the Company and ‘Medicines
for Malaria Venture’ (MMV), Geneva, has made
significant strides in the clinic. After rigorous pre-
clinical evaluation for toxicity and formulation
development, the Company submitted an
Investigational Medical Product Dossier (IMPD) to
the Medicines and Healthcare Products Regulatory
Agency (MHRA) and the Local Regional Ethics
Committee (LREC) in UK, and also submitted an
Investigational New Drug (IND) application to the
Drugs Controller General of India (DCGI) and the
Indian Council of Medical Research (ICMR).
Phase I clinical trials that were initiated in July
2004, have shown the molecule to be safe and well
tolerated. A Proof-of-Concept Phase IIa clinical
study has been initiated in Thailand and a multi-
centric Dose Finding (DF) Phase IIb study will be
carried out in South East Asia and Africa. It is
hoped that this molecule will positively affect the
lives of millions of patients across the globe.
An alliance with Anna University in India, to
identify natural product leads for Type 2 Diabetes
and Inflammatory Diseases has begun in earnest,
and has provided interesting results from a series of
herbs derived from the vast Indian herbal
knowledge base.
An alliance with The National Institute of
Pharmaceutical Education & Research (NIPER) in
the area of Respiratory diseases has also been
signed and collaborative work has been initiated.
During the year, the drug discovery team filed a
total of 52 patents : 26 in India, 14 in USA and 12
under PCT (Patent Co-operation Treaty).
Novel Drug Delivery Systems (NDDS)
Ranbaxy made significant progress in its NDDS
programs in 2004.
During the year, the Company filed 6 NDDS
products (ANDAs) with the US FDA, and 2
products with the European regulatory agencies.
The Company also launched 3 products in the
Indian market, in the area of oral controlled-release
systems, using its patented ‘Platform Technologies.’
These were :
• Alfuzosin Hydrochloride (Flotral XL Tablets -
10 mg)
• Divalproex Sodium (Desval ER Tablets -
1000 mg)
• Minocycline Hydrochloride (Minoz OD
Capsules - 100 mg)
The Company filed 16 patents in India and 1 in
USA in this area.
Ranbaxy also received the approval from US FDA
to manufacture and market Metformin ER Tablets
500 mg and Loratadine and Pseudoephedrine
Sulfate ER Tablets 10 mg / 240 mg.
The Company has a number of oral controlled-
release products in various stages of development,
and is also exploring the transdermal range of
delivery systems for future development.
Pharmaceutical Research
During the year, 41 new products and line
extensions were introduced to the domestic market,
of which 26 were developed in-house and 15 were
outsourced.
In USA, apart from filing 6 Abbreviated New Drug
Applications (ANDAs) through the NDDS
program, the Company submitted an additional 23
ANDAs through its Pharmaceutical Research
activities. This also included 3 ANDAs under
PEPFAR (President’s Emergency Program For
Anti-retrovirals). The emphasis had been on First-
to-File ANDAs with Para IV certification.
The Company also made 39 National Filings for 25
products (including 2 NDDS products) in 11 EU
Reference Member States and 71 Mutual
Recognition Procedure applications for 6 products
in 21 EU Concerned Member States.
Intellectual Property Generated (Jan-Dec 2004)Patent Applications* Filed
Accepted / Granted Patents** (Jan-Dec 2004)
Key International Regulatory Filings and Approvals (Jan-Dec 2004) #
Approvals Filings ##
USA 16 29*
European Union (EU)
– National 22 @ 39**
– Mutual Recognition 84 @@ 71***
BRIC
– Brazil 31 12
– Russia (incl. Ukraine) 20 13
– India 33 65
– China 8 3
Rest of the World 305 326
Total 519 558
Key Countries Jan-Dec 2004
# Doesn't include OTC products, outsourced products and
tender documents
## Includes fresh / new filings only
@ 22 approvals for 19 products in 11 Reference Member
States
@@ 84 MRP licenses for 8 products in 20 Concerned Member
States
* Including 26 ANDAs plus 3 ANDAs under PEPFAR
** Filings for 25 products in 11 Reference Member States
*** Filings for 6 products in 21 Concerned Member States
under MRP
APIs
– Synthetic 73 – – 73
– Fermentation 03 – – 03
Dosage Forms 36 – – 36
Herbal 03 – – 03
NDDS 16 – 01 17
NDDR 26 12 14 52
Total 157 12 15 184
* These are first time (fresh) filings, not international or
national filings of earlier applications filed in India
Area India PCT US Total
APIs
– Synthetic 04 01 05
– Fermentation – – –
Dosage Forms 17 – 17
NDDS 08 01 09
NDDR 07 03 12
Total 36 05 43
** These are unique patents, which means that any equivalent
patents granted in other countries have not been counted
Department India US Total
Annual Report 2004Research & DevelopmentRanbaxy Laboratories Limited

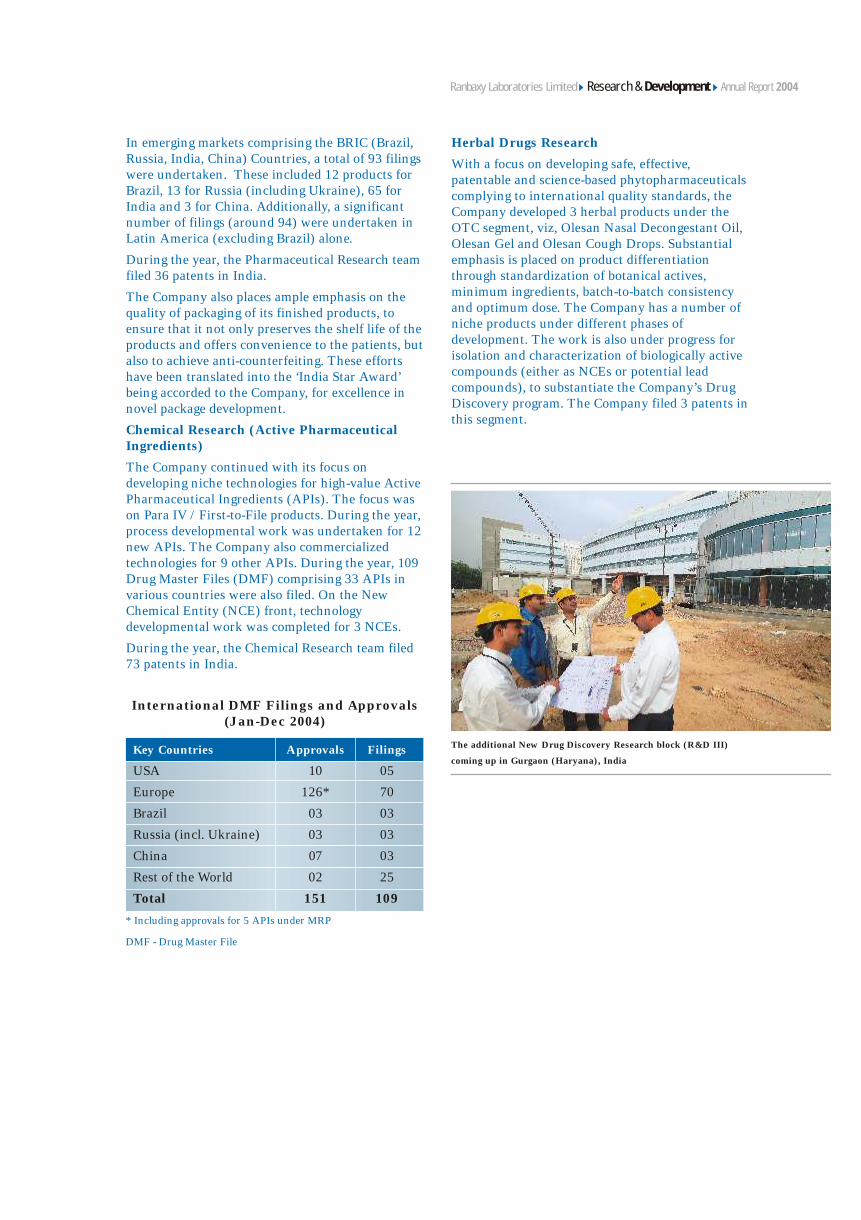
The additional New Drug Discovery Research block (R&D III)
coming up in Gurgaon (Haryana), India
International DMF Filings and Approvals (Jan-Dec 2004)
USA 10 05
Europe 126* 70
Brazil 03 03
Russia (incl. Ukraine) 03 03
China 07 03
Rest of the World 02 25
Total 151 109
Key Countries Approvals Filings
* Including approvals for 5 APIs under MRP
DMF - Drug Master File
In emerging markets comprising the BRIC (Brazil,
Russia, India, China) Countries, a total of 93 filings
were undertaken. These included 12 products for
Brazil, 13 for Russia (including Ukraine), 65 for
India and 3 for China. Additionally, a significant
number of filings (around 94) were undertaken in
Latin America (excluding Brazil) alone.
During the year, the Pharmaceutical Research team
filed 36 patents in India.
The Company also places ample emphasis on the
quality of packaging of its finished products, to
ensure that it not only preserves the shelf life of the
products and offers convenience to the patients, but
also to achieve anti-counterfeiting. These efforts
have been translated into the ‘India Star Award’
being accorded to the Company, for excellence in
novel package development.
Chemical Research (Active Pharmaceutical Ingredients)
The Company continued with its focus on
developing niche technologies for high-value Active
Pharmaceutical Ingredients (APIs). The focus was
on Para IV / First-to-File products. During the year,
process developmental work was undertaken for 12
new APIs. The Company also commercialized
technologies for 9 other APIs. During the year, 109
Drug Master Files (DMF) comprising 33 APIs in
various countries were also filed. On the New
Chemical Entity (NCE) front, technology
developmental work was completed for 3 NCEs.
During the year, the Chemical Research team filed
73 patents in India.
Herbal Drugs Research
With a focus on developing safe, effective,
patentable and science-based phytopharmaceuticals
complying to international quality standards, the
Company developed 3 herbal products under the
OTC segment, viz, Olesan Nasal Decongestant Oil,
Olesan Gel and Olesan Cough Drops. Substantial
emphasis is placed on product differentiation
through standardization of botanical actives,
minimum ingredients, batch-to-batch consistency
and optimum dose. The Company has a number of
niche products under different phases of
development. The work is also under progress for
isolation and characterization of biologically active
compounds (either as NCEs or potential lead
compounds), to substantiate the Company’s Drug
Discovery program. The Company filed 3 patents in
this segment.
Annual Report 2004Research & DevelopmentRanbaxy Laboratories Limited
The ‘Quality Culture’ at Ranbaxy fosters a deep commitment to basic business improvement through knowledge, skills, collaborative problem solving and teamwork. This has created a seamless quality value network amongst customers, producers and suppliers, to ensure that quality remains a part of the Company's international business language. This Quality character will enable Ranbaxy to successfully face the economic and social changes that are ushering in a new, more demanding global business climate.
Ranbaxy’s Quality philosophy is supported by a global quality network, consisting of a strong team spread across the world. The team is equipped to handle the complex quality attributes of a large number of intricate product portfolios, to ensure regulatory compliance across the globe. This is made possible by Ranbaxy’s Quality Management System, based on sound Quality Policies and harmonized Quality Guidelines, ensuring a complete quality compliant culture across the organization.
Being a learning organization, Ranbaxy provides continuous training to its employees in this area. This has resulted in e-Learning programs during 2004, initiated by the Global
Quality Assurance
The alchemy of excellence
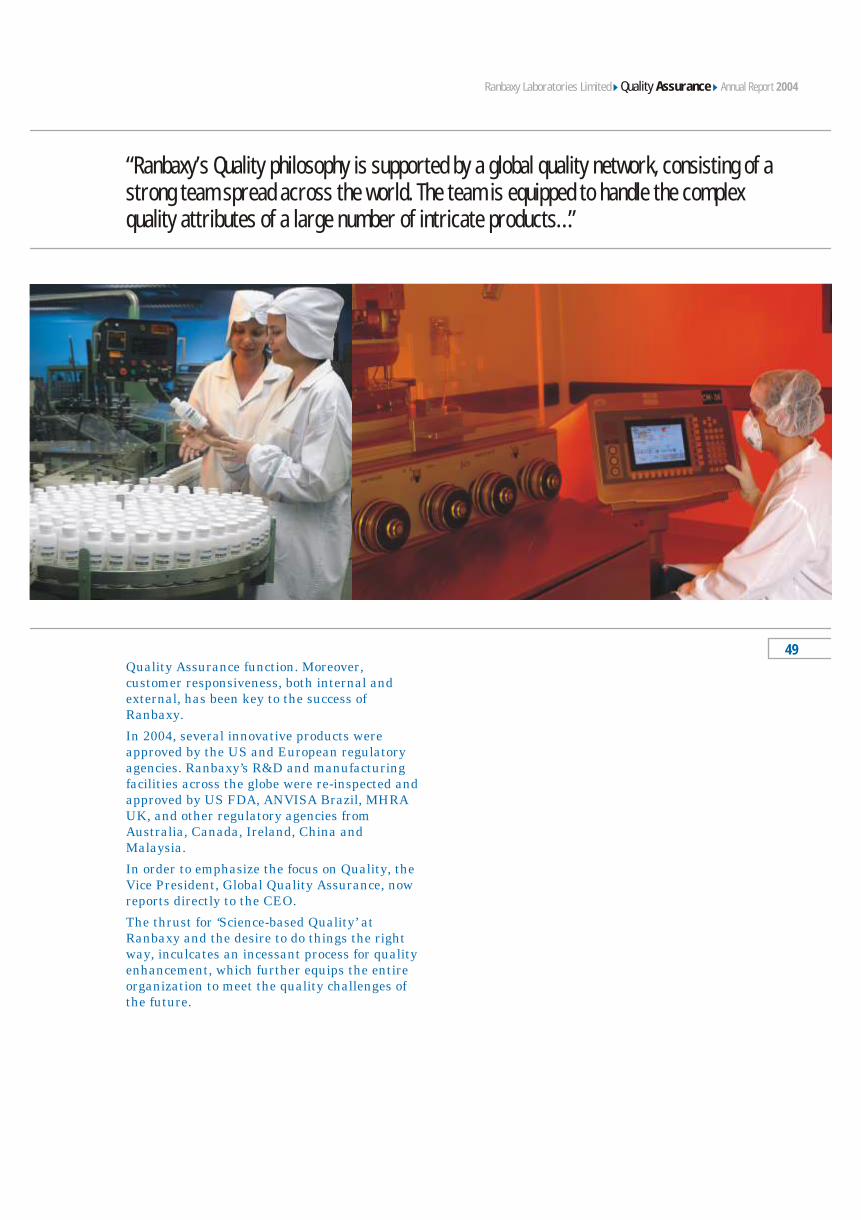
Annual Report 2004
Quality Assurance function. Moreover, customer responsiveness, both internal and external, has been key to the success of Ranbaxy.
In 2004, several innovative products were approved by the US and European regulatory agencies. Ranbaxy’s R&D and manufacturing facilities across the globe were re-inspected and approved by US FDA, ANVISA Brazil, MHRA UK, and other regulatory agencies from Australia, Canada, Ireland, China and Malaysia.
In order to emphasize the focus on Quality, the Vice President, Global Quality Assurance, now reports directly to the CEO.
The thrust for ‘Science-based Quality’ at Ranbaxy and the desire to do things the right way, inculcates an incessant process for quality enhancement, which further equips the entire organization to meet the quality challenges of the future.
“Ranbaxy’s Quality philosophy is supported by a global quality network, consisting of a strong team spread across the world. The team is equipped to handle the complex quality attributes of a large number of intricate products…”
49
Quality AssuranceRanbaxy Laboratories Limited
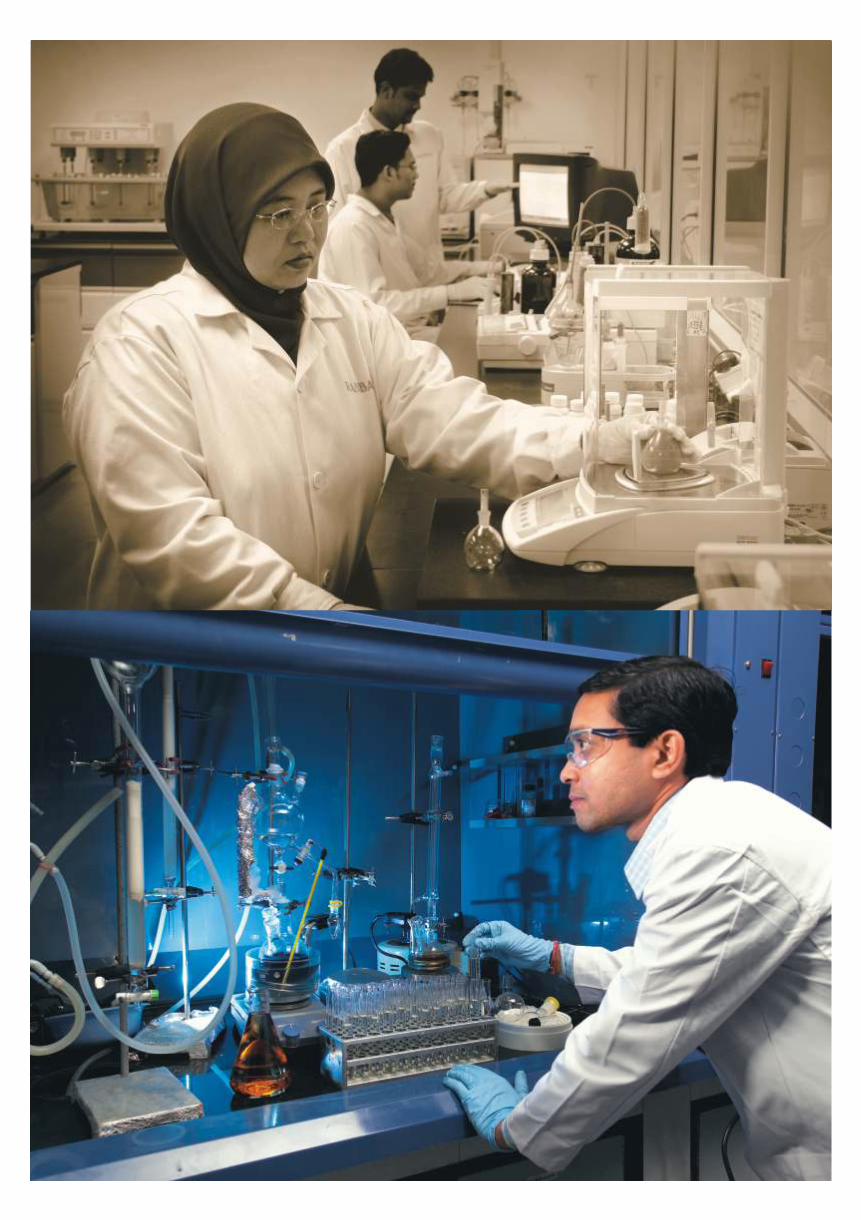
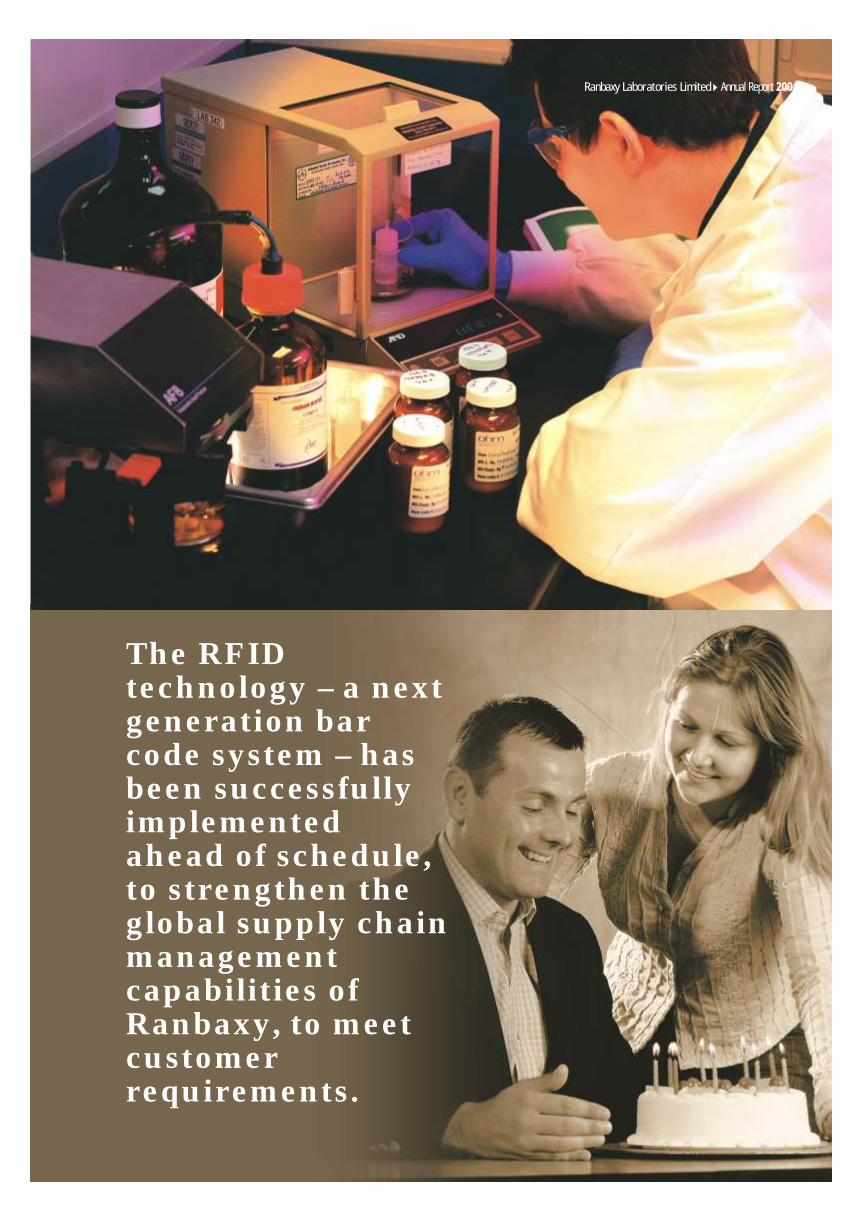
The RFID technology – a next generation bar code system – has been successfully implemented ahead of schedule, to strengthen the global supply chain management capabilities of Ranbaxy, to meet customer requirements.
Annual Report 2004Ranbaxy Laboratories Limited
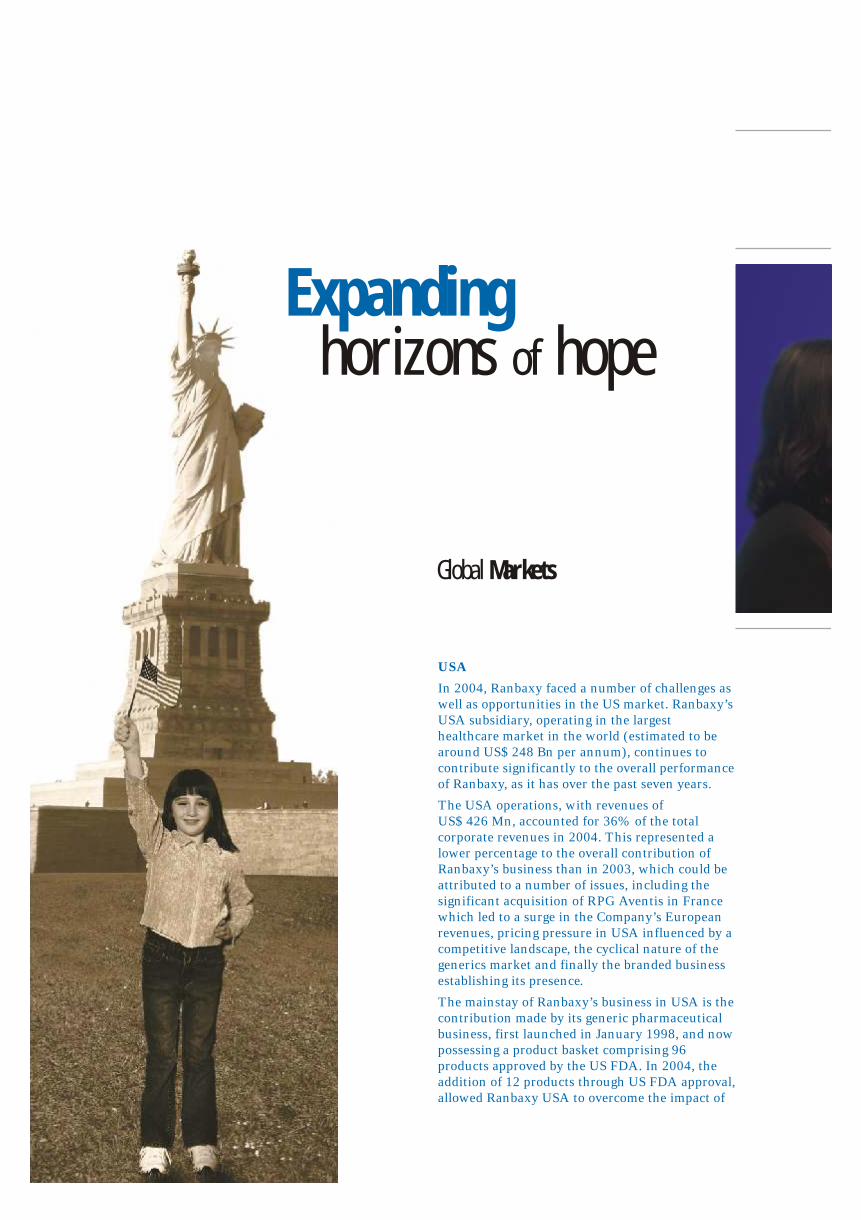
USA
In 2004, Ranbaxy faced a number of challenges as
well as opportunities in the US market. Ranbaxy’s
USA subsidiary, operating in the largest
healthcare market in the world (estimated to be
around US$ 248 Bn per annum), continues to
contribute significantly to the overall performance
of Ranbaxy, as it has over the past seven years.
The USA operations, with revenues of
US$ 426 Mn, accounted for 36% of the total
corporate revenues in 2004. This represented a
lower percentage to the overall contribution of
Ranbaxy’s business than in 2003, which could be
attributed to a number of issues, including the
significant acquisition of RPG Aventis in France
which led to a surge in the Company’s European
revenues, pricing pressure in USA influenced by a
competitive landscape, the cyclical nature of the
generics market and finally the branded business
establishing its presence.
The mainstay of Ranbaxy’s business in USA is the
contribution made by its generic pharmaceutical
business, first launched in January 1998, and now
possessing a product basket comprising 96
products approved by the US FDA. In 2004, the
addition of 12 products through US FDA approval,
allowed Ranbaxy USA to overcome the impact of
Global Markets
Expanding horizons of hope
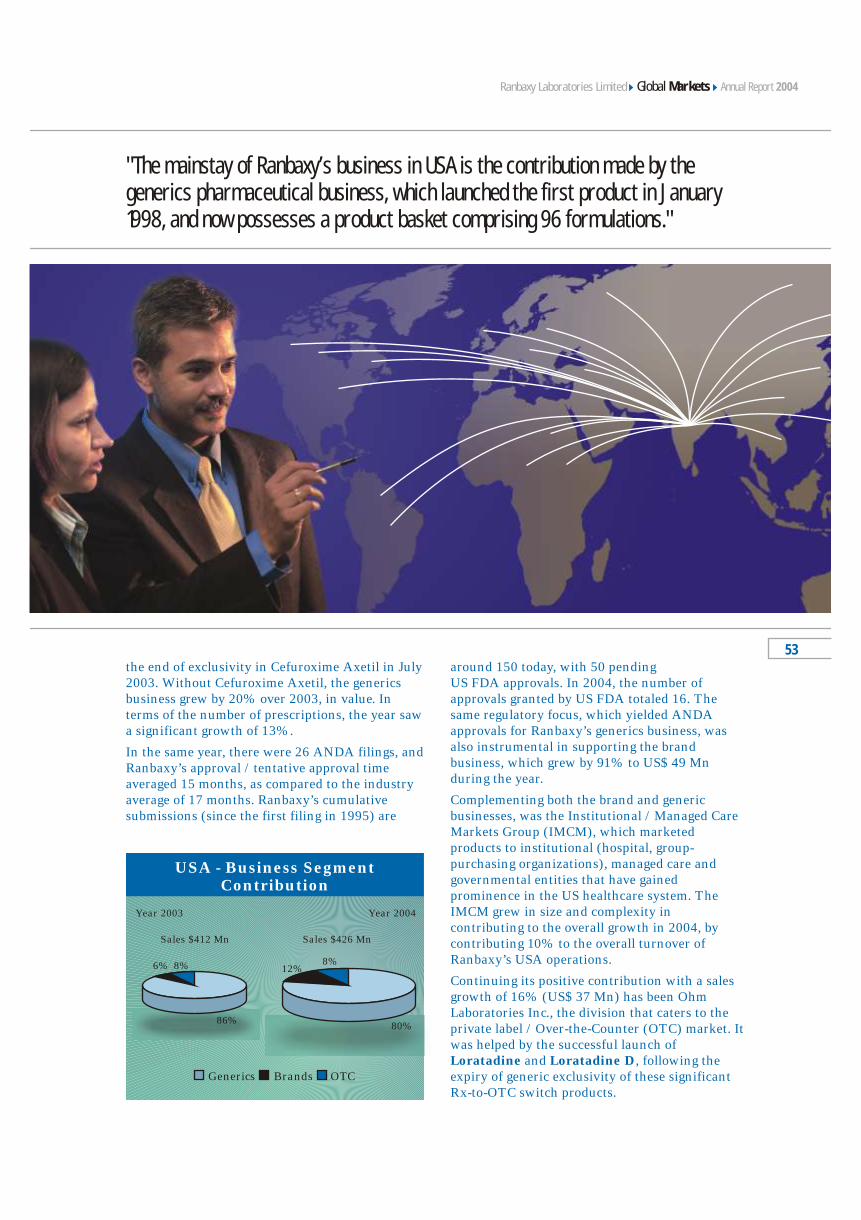
the end of exclusivity in Cefuroxime Axetil in July
2003. Without Cefuroxime Axetil, the generics
business grew by 20% over 2003, in value. In
terms of the number of prescriptions, the year saw
a significant growth of 13%.
In the same year, there were 26 ANDA filings, and
Ranbaxy’s approval / tentative approval time
averaged 15 months, as compared to the industry
average of 17 months. Ranbaxy’s cumulative
submissions (since the first filing in 1995) are
around 150 today, with 50 pending
US FDA approvals. In 2004, the number of
approvals granted by US FDA totaled 16. The
same regulatory focus, which yielded ANDA
approvals for Ranbaxy’s generics business, was
also instrumental in supporting the brand
business, which grew by 91% to US$ 49 Mn
during the year.
Complementing both the brand and generic
businesses, was the Institutional / Managed Care
Markets Group (IMCM), which marketed
products to institutional (hospital, group-
purchasing organizations), managed care and
governmental entities that have gained
prominence in the US healthcare system. The
IMCM grew in size and complexity in
contributing to the overall growth in 2004, by
contributing 10% to the overall turnover of
Ranbaxy’s USA operations.
Continuing its positive contribution with a sales
growth of 16% (US$ 37 Mn) has been Ohm
Laboratories Inc., the division that caters to the
private label / Over-the-Counter (OTC) market. It
was helped by the successful launch of
Loratadine and Loratadine D, following the
expiry of generic exclusivity of these significant
Rx-to-OTC switch products.
Sales $426 Mn
80%
USA - Business SegmentContribution
Year 2004
Sales $412 Mn
6% 8%
86%
12%8%
Year 2003
Generics Brands OTC
"The mainstay of Ranbaxy’s business in USA is the contribution made by the generics pharmaceutical business, which launched the first product in January 1998, and now possesses a product basket comprising 96 formulations."
Annual Report 2004Global MarketsRanbaxy Laboratories Limited
53
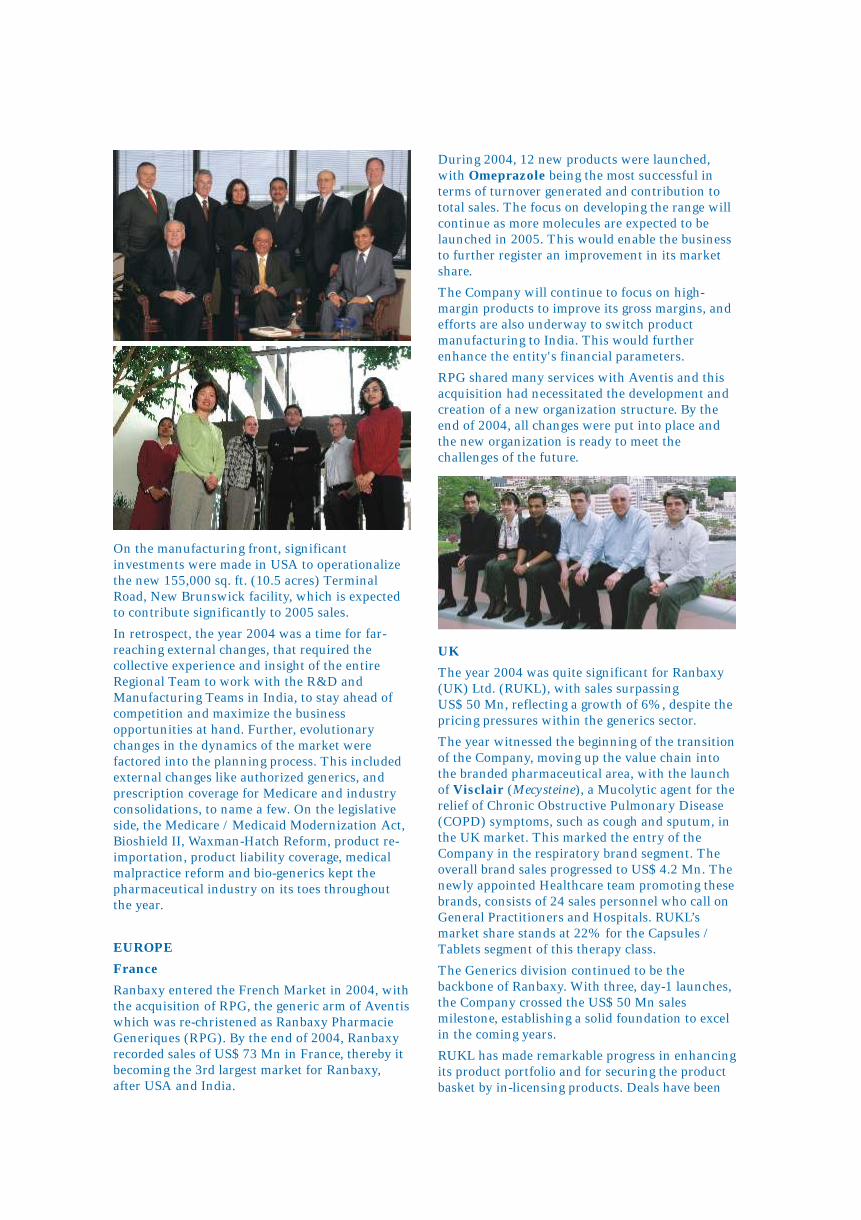
During 2004, 12 new products were launched,
with Omeprazole being the most successful in
terms of turnover generated and contribution to
total sales. The focus on developing the range will
continue as more molecules are expected to be
launched in 2005. This would enable the business
to further register an improvement in its market
share.
The Company will continue to focus on high-
margin products to improve its gross margins, and
efforts are also underway to switch product
manufacturing to India. This would further
enhance the entity's financial parameters.
RPG shared many services with Aventis and this
acquisition had necessitated the development and
creation of a new organization structure. By the
end of 2004, all changes were put into place and
the new organization is ready to meet the
challenges of the future.
UK
The year 2004 was quite significant for Ranbaxy
(UK) Ltd. (RUKL), with sales surpassing
US$ 50 Mn, reflecting a growth of 6%, despite the
pricing pressures within the generics sector.
The year witnessed the beginning of the transition
of the Company, moving up the value chain into
the branded pharmaceutical area, with the launch
of Visclair (Mecysteine), a Mucolytic agent for the
relief of Chronic Obstructive Pulmonary Disease
(COPD) symptoms, such as cough and sputum, in
the UK market. This marked the entry of the
Company in the respiratory brand segment. The
overall brand sales progressed to US$ 4.2 Mn. The
newly appointed Healthcare team promoting these
brands, consists of 24 sales personnel who call on
General Practitioners and Hospitals. RUKL’s
market share stands at 22% for the Capsules /
Tablets segment of this therapy class.
The Generics division continued to be the
backbone of Ranbaxy. With three, day-1 launches,
the Company crossed the US$ 50 Mn sales
milestone, establishing a solid foundation to excel
in the coming years.
RUKL has made remarkable progress in enhancing
its product portfolio and for securing the product
basket by in-licensing products. Deals have been
On the manufacturing front, significant
investments were made in USA to operationalize
the new 155,000 sq. ft. (10.5 acres) Terminal
Road, New Brunswick facility, which is expected
to contribute significantly to 2005 sales.
In retrospect, the year 2004 was a time for far-
reaching external changes, that required the
collective experience and insight of the entire
Regional Team to work with the R&D and
Manufacturing Teams in India, to stay ahead of
competition and maximize the business
opportunities at hand. Further, evolutionary
changes in the dynamics of the market were
factored into the planning process. This included
external changes like authorized generics, and
prescription coverage for Medicare and industry
consolidations, to name a few. On the legislative
side, the Medicare / Medicaid Modernization Act,
Bioshield II, Waxman-Hatch Reform, product re-
importation, product liability coverage, medical
malpractice reform and bio-generics kept the
pharmaceutical industry on its toes throughout
the year.
EUROPE
France
Ranbaxy entered the French Market in 2004, with
the acquisition of RPG, the generic arm of Aventis
which was re-christened as Ranbaxy Pharmacie
Generiques (RPG). By the end of 2004, Ranbaxy
recorded sales of US$ 73 Mn in France, thereby it
becoming the 3rd largest market for Ranbaxy,
after USA and India.
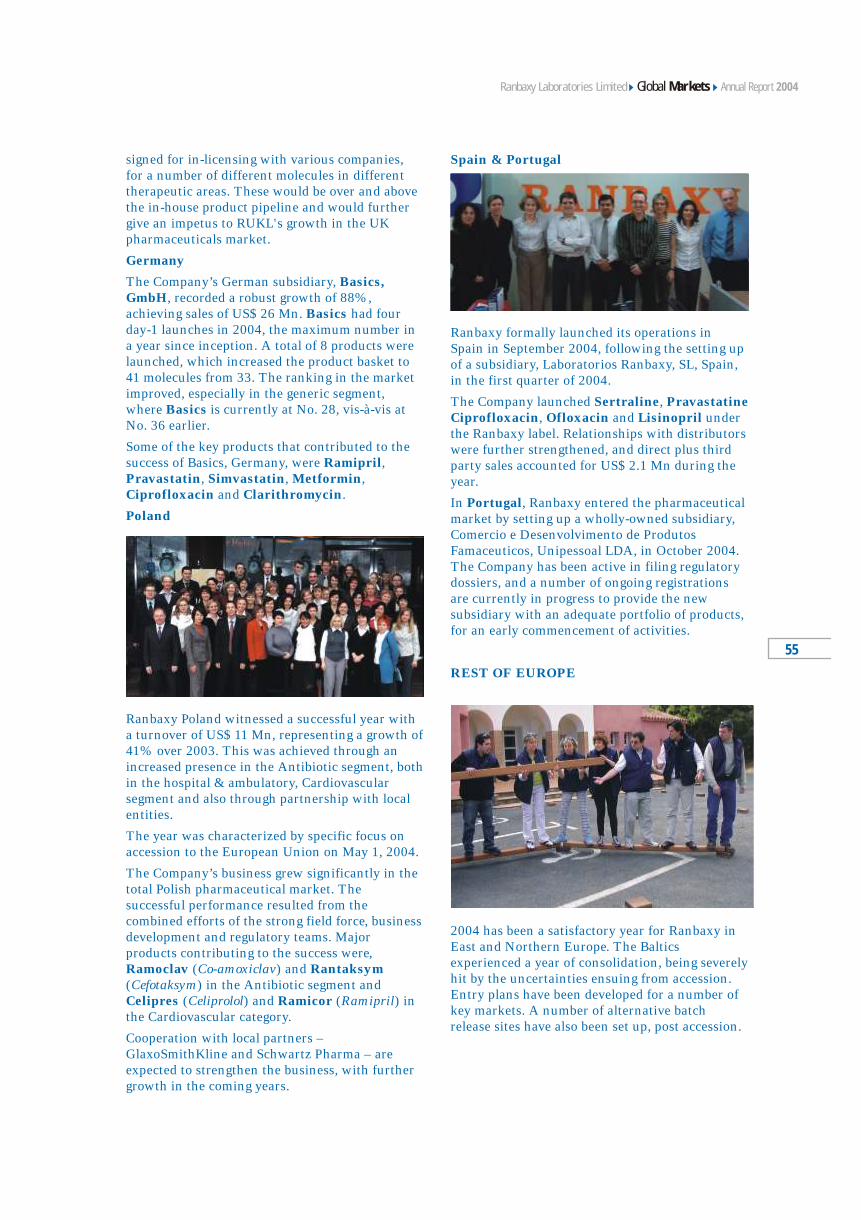
Spain & Portugal
Ranbaxy formally launched its operations in
Spain in September 2004, following the setting up
of a subsidiary, Laboratorios Ranbaxy, SL, Spain,
in the first quarter of 2004.
The Company launched Sertraline, Pravastatine
Ciprofloxacin, Ofloxacin and Lisinopril under
the Ranbaxy label. Relationships with distributors
were further strengthened, and direct plus third
party sales accounted for US$ 2.1 Mn during the
year.
In Portugal, Ranbaxy entered the pharmaceutical
market by setting up a wholly-owned subsidiary,
Comercio e Desenvolvimento de Produtos
Famaceuticos, Unipessoal LDA, in October 2004.
The Company has been active in filing regulatory
dossiers, and a number of ongoing registrations
are currently in progress to provide the new
subsidiary with an adequate portfolio of products,
for an early commencement of activities.
REST OF EUROPE
2004 has been a satisfactory year for Ranbaxy in
East and Northern Europe. The Baltics
experienced a year of consolidation, being severely
hit by the uncertainties ensuing from accession.
Entry plans have been developed for a number of
key markets. A number of alternative batch
release sites have also been set up, post accession.
signed for in-licensing with various companies,
for a number of different molecules in different
therapeutic areas. These would be over and above
the in-house product pipeline and would further
give an impetus to RUKL's growth in the UK
pharmaceuticals market.
Germany
The Company’s German subsidiary, Basics, GmbH, recorded a robust growth of 88%,
achieving sales of US$ 26 Mn. Basics had four
day-1 launches in 2004, the maximum number in
a year since inception. A total of 8 products were
launched, which increased the product basket to
41 molecules from 33. The ranking in the market
improved, especially in the generic segment,
where Basics is currently at No. 28, vis-à-vis at
No. 36 earlier.
Some of the key products that contributed to the
success of Basics, Germany, were Ramipril, Pravastatin, Simvastatin, Metformin,
Ciprofloxacin and Clarithromycin.
Poland
Ranbaxy Poland witnessed a successful year with
a turnover of US$ 11 Mn, representing a growth of
41% over 2003. This was achieved through an
increased presence in the Antibiotic segment, both
in the hospital & ambulatory, Cardiovascular
segment and also through partnership with local
entities.
The year was characterized by specific focus on
accession to the European Union on May 1, 2004.
The Company’s business grew significantly in the
total Polish pharmaceutical market. The
successful performance resulted from the
combined efforts of the strong field force, business
development and regulatory teams. Major
products contributing to the success were,
Ramoclav (Co-amoxiclav) and Rantaksym
(Cefotaksym) in the Antibiotic segment and
Celipres (Celiprolol) and Ramicor (Ramipril) in
the Cardiovascular category.
Cooperation with local partners –
GlaxoSmithKline and Schwartz Pharma – are
expected to strengthen the business, with further
growth in the coming years.
55
Annual Report 2004Global MarketsRanbaxy Laboratories Limited
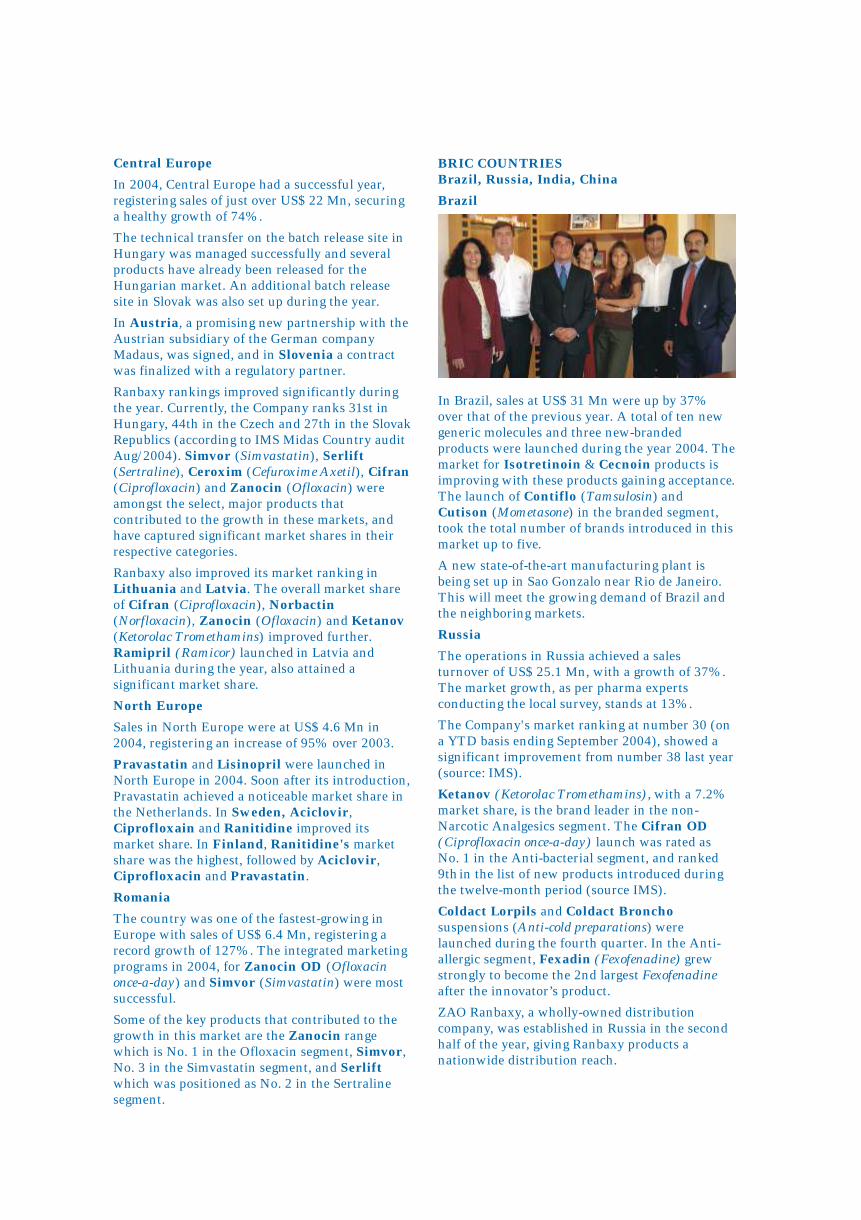
BRIC COUNTRIES Brazil, Russia, India, China
Brazil
In Brazil, sales at US$ 31 Mn were up by 37%
over that of the previous year. A total of ten new
generic molecules and three new-branded
products were launched during the year 2004. The
market for Isotretinoin & Cecnoin products is
improving with these products gaining acceptance.
The launch of Contiflo (Tamsulosin) and
Cutison (Mometasone) in the branded segment,
took the total number of brands introduced in this
market up to five.
A new state-of-the-art manufacturing plant is
being set up in Sao Gonzalo near Rio de Janeiro.
This will meet the growing demand of Brazil and
the neighboring markets.
Russia
The operations in Russia achieved a sales
turnover of US$ 25.1 Mn, with a growth of 37%.
The market growth, as per pharma experts
conducting the local survey, stands at 13%.
The Company's market ranking at number 30 (on
a YTD basis ending September 2004), showed a
significant improvement from number 38 last year
(source: IMS).
Ketanov (Ketorolac Tromethamins), with a 7.2%
market share, is the brand leader in the non-
Narcotic Analgesics segment. The Cifran OD
(Ciprofloxacin once-a-day) launch was rated as
No. 1 in the Anti-bacterial segment, and ranked
9th in the list of new products introduced during
the twelve-month period (source IMS).
Coldact Lorpils and Coldact Broncho
suspensions (Anti-cold preparations) were
launched during the fourth quarter. In the Anti-
allergic segment, Fexadin (Fexofenadine) grew
strongly to become the 2nd largest Fexofenadine after the innovator’s product.
ZAO Ranbaxy, a wholly-owned distribution
company, was established in Russia in the second
half of the year, giving Ranbaxy products a
nationwide distribution reach.
Central Europe
In 2004, Central Europe had a successful year,
registering sales of just over US$ 22 Mn, securing
a healthy growth of 74%.
The technical transfer on the batch release site in
Hungary was managed successfully and several
products have already been released for the
Hungarian market. An additional batch release
site in Slovak was also set up during the year.
In Austria, a promising new partnership with the
Austrian subsidiary of the German company
Madaus, was signed, and in Slovenia a contract
was finalized with a regulatory partner.
Ranbaxy rankings improved significantly during
the year. Currently, the Company ranks 31st in
Hungary, 44th in the Czech and 27th in the Slovak
Republics (according to IMS Midas Country audit
Aug/2004). Simvor (Simvastatin), Serlift (Sertraline), Ceroxim (Cefuroxime Axetil), Cifran (Ciprofloxacin) and Zanocin (Ofloxacin) were
amongst the select, major products that
contributed to the growth in these markets, and
have captured significant market shares in their
respective categories.
Ranbaxy also improved its market ranking in
Lithuania and Latvia. The overall market share
of Cifran (Ciprofloxacin), Norbactin (Norfloxacin), Zanocin (Ofloxacin) and Ketanov (Ketorolac Tromethamins) improved further.
Ramipril (Ramicor) launched in Latvia and
Lithuania during the year, also attained a
significant market share.
North Europe
Sales in North Europe were at US$ 4.6 Mn in
2004, registering an increase of 95% over 2003.
Pravastatin and Lisinopril were launched in
North Europe in 2004. Soon after its introduction,
Pravastatin achieved a noticeable market share in
the Netherlands. In Sweden, Aciclovir,
Ciprofloxain and Ranitidine improved its
market share. In Finland, Ranitidine's market
share was the highest, followed by Aciclovir,
Ciprofloxacin and Pravastatin.
Romania
The country was one of the fastest-growing in
Europe with sales of US$ 6.4 Mn, registering a
record growth of 127%. The integrated marketing
programs in 2004, for Zanocin OD (Ofloxacin
once-a-day) and Simvor (Simvastatin) were most
successful.
Some of the key products that contributed to the
growth in this market are the Zanocin range
which is No. 1 in the Ofloxacin segment, Simvor,
No. 3 in the Simvastatin segment, and Serlift which was positioned as No. 2 in the Sertraline
segment.
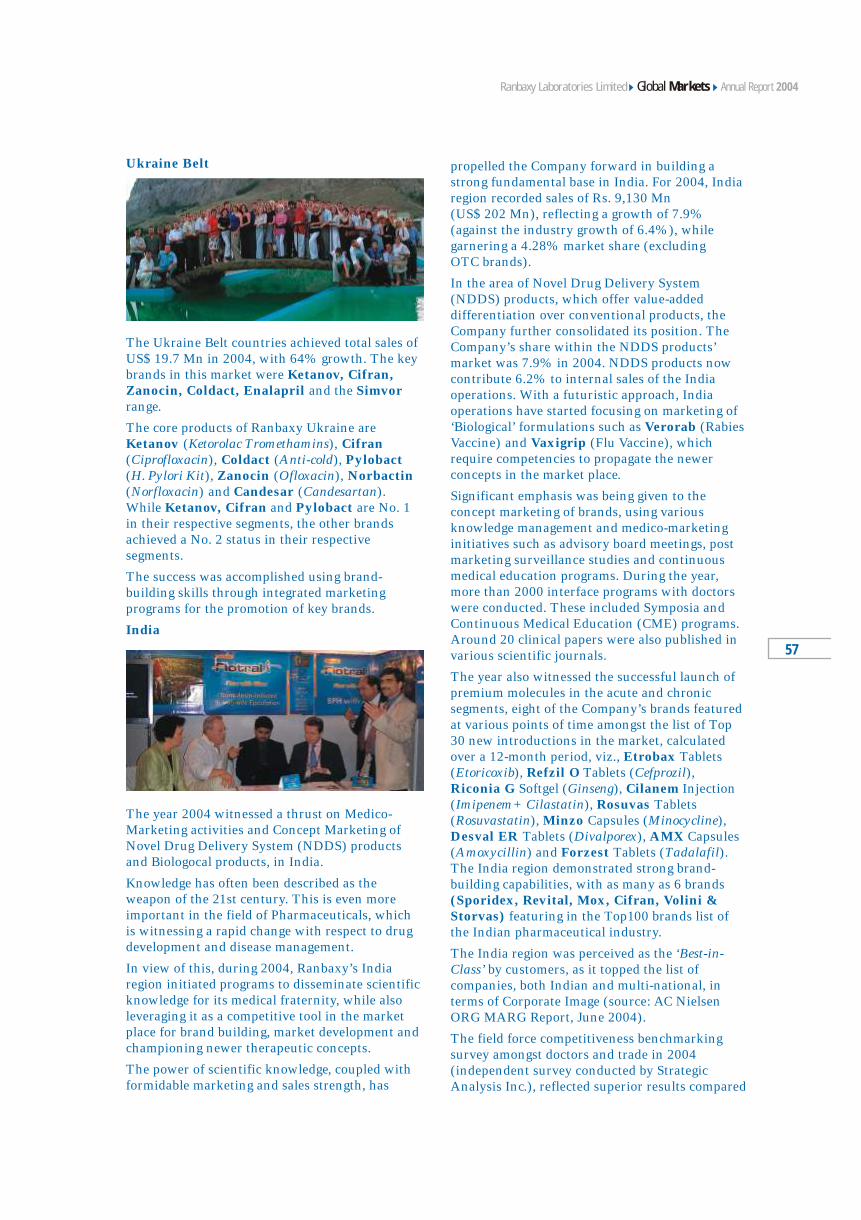
propelled the Company forward in building a
strong fundamental base in India. For 2004, India
region recorded sales of Rs. 9,130 Mn
(US$ 202 Mn), reflecting a growth of 7.9%
(against the industry growth of 6.4%), while
garnering a 4.28% market share (excluding
OTC brands).
In the area of Novel Drug Delivery System
(NDDS) products, which offer value-added
differentiation over conventional products, the
Company further consolidated its position. The
Company’s share within the NDDS products’
market was 7.9% in 2004. NDDS products now
contribute 6.2% to internal sales of the India
operations. With a futuristic approach, India
operations have started focusing on marketing of
‘Biological’ formulations such as Verorab (Rabies
Vaccine) and Vaxigrip (Flu Vaccine), which
require competencies to propagate the newer
concepts in the market place.
Significant emphasis was being given to the
concept marketing of brands, using various
knowledge management and medico-marketing
initiatives such as advisory board meetings, post
marketing surveillance studies and continuous
medical education programs. During the year,
more than 2000 interface programs with doctors
were conducted. These included Symposia and
Continuous Medical Education (CME) programs.
Around 20 clinical papers were also published in
various scientific journals.
The year also witnessed the successful launch of
premium molecules in the acute and chronic
segments, eight of the Company’s brands featured
at various points of time amongst the list of Top
30 new introductions in the market, calculated
over a 12-month period, viz., Etrobax Tablets
(Etoricoxib), Refzil O Tablets (Cefprozil),
Riconia G Softgel (Ginseng), Cilanem Injection
(Imipenem+Cilastatin), Rosuvas Tablets
(Rosuvastatin), Minzo Capsules (Minocycline),
Desval ER Tablets (Divalporex), AMX Capsules
(Amoxycillin) and Forzest Tablets (Tadalafil).
The India region demonstrated strong brand-
building capabilities, with as many as 6 brands
(Sporidex, Revital, Mox, Cifran, Volini & Storvas) featuring in the Top100 brands list of
the Indian pharmaceutical industry.
The India region was perceived as the ‘Best-in-
Class’ by customers, as it topped the list of
companies, both Indian and multi-national, in
terms of Corporate Image (source: AC Nielsen
ORG MARG Report, June 2004).
The field force competitiveness benchmarking
survey amongst doctors and trade in 2004
(independent survey conducted by Strategic
Analysis Inc.), reflected superior results compared
Ukraine Belt
The Ukraine Belt countries achieved total sales of
US$ 19.7 Mn in 2004, with 64% growth. The key
brands in this market were Ketanov, Cifran, Zanocin, Coldact, Enalapril and the Simvor range.
The core products of Ranbaxy Ukraine are
Ketanov (Ketorolac Tromethamins), Cifran (Ciprofloxacin), Coldact (Anti-cold), Pylobact (H. Pylori Kit), Zanocin (Ofloxacin), Norbactin (Norfloxacin) and Candesar (Candesartan).
While Ketanov, Cifran and Pylobact are No. 1
in their respective segments, the other brands
achieved a No. 2 status in their respective
segments.
The success was accomplished using brand-
building skills through integrated marketing
programs for the promotion of key brands.
India
The year 2004 witnessed a thrust on Medico-
Marketing activities and Concept Marketing of
Novel Drug Delivery System (NDDS) products
and Biologocal products, in India.
Knowledge has often been described as the
weapon of the 21st century. This is even more
important in the field of Pharmaceuticals, which
is witnessing a rapid change with respect to drug
development and disease management.
In view of this, during 2004, Ranbaxy’s India
region initiated programs to disseminate scientific
knowledge for its medical fraternity, while also
leveraging it as a competitive tool in the market
place for brand building, market development and
championing newer therapeutic concepts.
The power of scientific knowledge, coupled with
formidable marketing and sales strength, has
57
Annual Report 2004Global MarketsRanbaxy Laboratories Limited
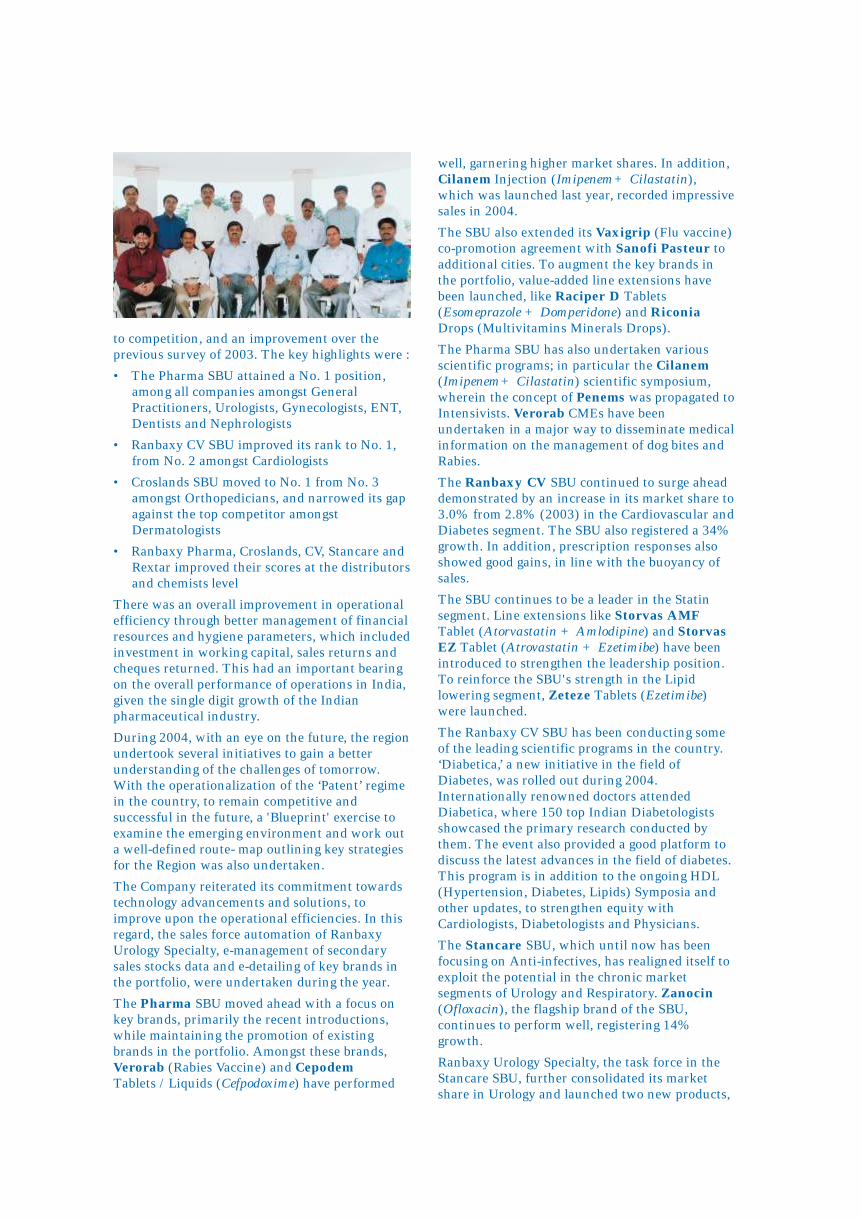
to competition, and an improvement over the
previous survey of 2003. The key highlights were :
• The Pharma SBU attained a No. 1 position,
among all companies amongst General
Practitioners, Urologists, Gynecologists, ENT,
Dentists and Nephrologists
• Ranbaxy CV SBU improved its rank to No. 1,
from No. 2 amongst Cardiologists
• Croslands SBU moved to No. 1 from No. 3
amongst Orthopedicians, and narrowed its gap
against the top competitor amongst
Dermatologists
• Ranbaxy Pharma, Croslands, CV, Stancare and
Rextar improved their scores at the distributors
and chemists level
There was an overall improvement in operational
efficiency through better management of financial
resources and hygiene parameters, which included
investment in working capital, sales returns and
cheques returned. This had an important bearing
on the overall performance of operations in India,
given the single digit growth of the Indian
pharmaceutical industry.
During 2004, with an eye on the future, the region
undertook several initiatives to gain a better
understanding of the challenges of tomorrow.
With the operationalization of the ‘Patent’ regime
in the country, to remain competitive and
successful in the future, a 'Blueprint' exercise to
examine the emerging environment and work out
a well-defined route- map outlining key strategies
for the Region was also undertaken.
The Company reiterated its commitment towards
technology advancements and solutions, to
improve upon the operational efficiencies. In this
regard, the sales force automation of Ranbaxy
Urology Specialty, e-management of secondary
sales stocks data and e-detailing of key brands in
the portfolio, were undertaken during the year.
The Pharma SBU moved ahead with a focus on
key brands, primarily the recent introductions,
while maintaining the promotion of existing
brands in the portfolio. Amongst these brands,
Verorab (Rabies Vaccine) and Cepodem
Tablets / Liquids (Cefpodoxime) have performed
well, garnering higher market shares. In addition,
Cilanem Injection (Imipenem+ Cilastatin),
which was launched last year, recorded impressive
sales in 2004.
The SBU also extended its Vaxigrip (Flu vaccine)
co-promotion agreement with Sanofi Pasteur to
additional cities. To augment the key brands in
the portfolio, value-added line extensions have
been launched, like Raciper D Tablets
(Esomeprazole + Domperidone) and Riconia
Drops (Multivitamins Minerals Drops).
The Pharma SBU has also undertaken various
scientific programs; in particular the Cilanem (Imipenem+ Cilastatin) scientific symposium,
wherein the concept of Penems was propagated to
Intensivists. Verorab CMEs have been
undertaken in a major way to disseminate medical
information on the management of dog bites and
Rabies.
The Ranbaxy CV SBU continued to surge ahead
demonstrated by an increase in its market share to
3.0% from 2.8% (2003) in the Cardiovascular and
Diabetes segment. The SBU also registered a 34%
growth. In addition, prescription responses also
showed good gains, in line with the buoyancy of
sales.
The SBU continues to be a leader in the Statin
segment. Line extensions like Storvas AMF
Tablet (Atorvastatin + Amlodipine) and Storvas EZ Tablet (Atrovastatin + Ezetimibe) have been
introduced to strengthen the leadership position.
To reinforce the SBU's strength in the Lipid
lowering segment, Zeteze Tablets (Ezetimibe)
were launched.
The Ranbaxy CV SBU has been conducting some
of the leading scientific programs in the country.
‘Diabetica,’ a new initiative in the field of
Diabetes, was rolled out during 2004.
Internationally renowned doctors attended
Diabetica, where 150 top Indian Diabetologists
showcased the primary research conducted by
them. The event also provided a good platform to
discuss the latest advances in the field of diabetes.
This program is in addition to the ongoing HDL
(Hypertension, Diabetes, Lipids) Symposia and
other updates, to strengthen equity with
Cardiologists, Diabetologists and Physicians.
The Stancare SBU, which until now has been
focusing on Anti-infectives, has realigned itself to
exploit the potential in the chronic market
segments of Urology and Respiratory. Zanocin
(Ofloxacin), the flagship brand of the SBU,
continues to perform well, registering 14%
growth.
Ranbaxy Urology Specialty, the task force in the
Stancare SBU, further consolidated its market
share in Urology and launched two new products,
Ideas to make a world of
difference
Annual Report 2004Global MarketsRanbaxy Laboratories Limited
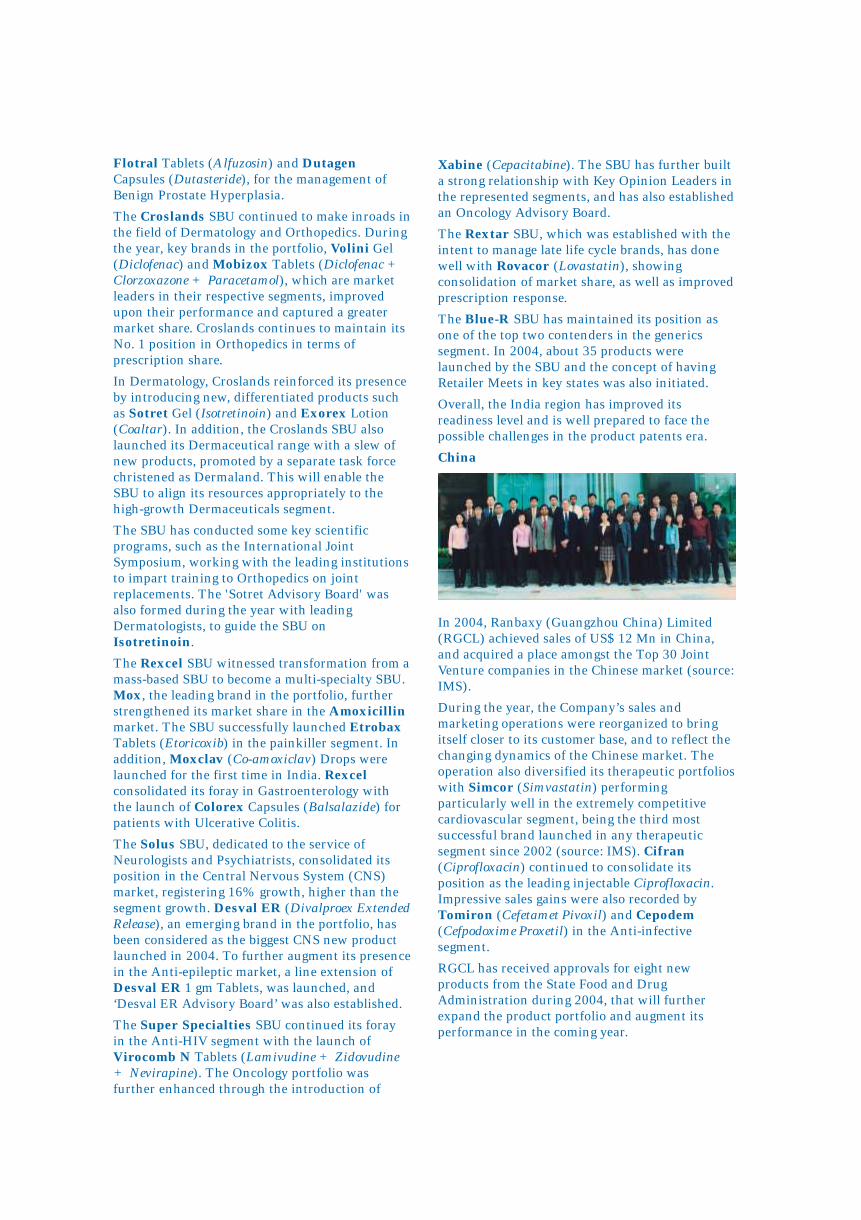
Xabine (Cepacitabine). The SBU has further built
a strong relationship with Key Opinion Leaders in
the represented segments, and has also established
an Oncology Advisory Board.
The Rextar SBU, which was established with the
intent to manage late life cycle brands, has done
well with Rovacor (Lovastatin), showing
consolidation of market share, as well as improved
prescription response.
The Blue-R SBU has maintained its position as
one of the top two contenders in the generics
segment. In 2004, about 35 products were
launched by the SBU and the concept of having
Retailer Meets in key states was also initiated.
Overall, the India region has improved its
readiness level and is well prepared to face the
possible challenges in the product patents era.
China
In 2004, Ranbaxy (Guangzhou China) Limited
(RGCL) achieved sales of US$ 12 Mn in China,
and acquired a place amongst the Top 30 Joint
Venture companies in the Chinese market (source:
IMS).
During the year, the Company’s sales and
marketing operations were reorganized to bring
itself closer to its customer base, and to reflect the
changing dynamics of the Chinese market. The
operation also diversified its therapeutic portfolios
with Simcor (Simvastatin) performing
particularly well in the extremely competitive
cardiovascular segment, being the third most
successful brand launched in any therapeutic
segment since 2002 (source: IMS). Cifran
(Ciprofloxacin) continued to consolidate its
position as the leading injectable Ciprofloxacin.
Impressive sales gains were also recorded by
Tomiron (Cefetamet Pivoxil) and Cepodem
(Cefpodoxime Proxetil) in the Anti-infective
segment.
RGCL has received approvals for eight new
products from the State Food and Drug
Administration during 2004, that will further
expand the product portfolio and augment its
performance in the coming year.
Flotral Tablets (Alfuzosin) and Dutagen
Capsules (Dutasteride), for the management of
Benign Prostate Hyperplasia.
The Croslands SBU continued to make inroads in
the field of Dermatology and Orthopedics. During
the year, key brands in the portfolio, Volini Gel
(Diclofenac) and Mobizox Tablets (Diclofenac +
Clorzoxazone + Paracetamol), which are market
leaders in their respective segments, improved
upon their performance and captured a greater
market share. Croslands continues to maintain its
No. 1 position in Orthopedics in terms of
prescription share.
In Dermatology, Croslands reinforced its presence
by introducing new, differentiated products such
as Sotret Gel (Isotretinoin) and Exorex Lotion
(Coaltar). In addition, the Croslands SBU also
launched its Dermaceutical range with a slew of
new products, promoted by a separate task force
christened as Dermaland. This will enable the
SBU to align its resources appropriately to the
high-growth Dermaceuticals segment.
The SBU has conducted some key scientific
programs, such as the International Joint
Symposium, working with the leading institutions
to impart training to Orthopedics on joint
replacements. The 'Sotret Advisory Board' was
also formed during the year with leading
Dermatologists, to guide the SBU on
Isotretinoin.
The Rexcel SBU witnessed transformation from a
mass-based SBU to become a multi-specialty SBU.
Mox, the leading brand in the portfolio, further
strengthened its market share in the Amoxicillin market. The SBU successfully launched Etrobax
Tablets (Etoricoxib) in the painkiller segment. In
addition, Moxclav (Co-amoxiclav) Drops were
launched for the first time in India. Rexcel consolidated its foray in Gastroenterology with
the launch of Colorex Capsules (Balsalazide) for
patients with Ulcerative Colitis.
The Solus SBU, dedicated to the service of
Neurologists and Psychiatrists, consolidated its
position in the Central Nervous System (CNS)
market, registering 16% growth, higher than the
segment growth. Desval ER (Divalproex Extended
Release), an emerging brand in the portfolio, has
been considered as the biggest CNS new product
launched in 2004. To further augment its presence
in the Anti-epileptic market, a line extension of
Desval ER 1 gm Tablets, was launched, and
‘Desval ER Advisory Board’ was also established.
The Super Specialties SBU continued its foray
in the Anti-HIV segment with the launch of
Virocomb N Tablets (Lamivudine + Zidovudine
+ Nevirapine). The Oncology portfolio was
further enhanced through the introduction of
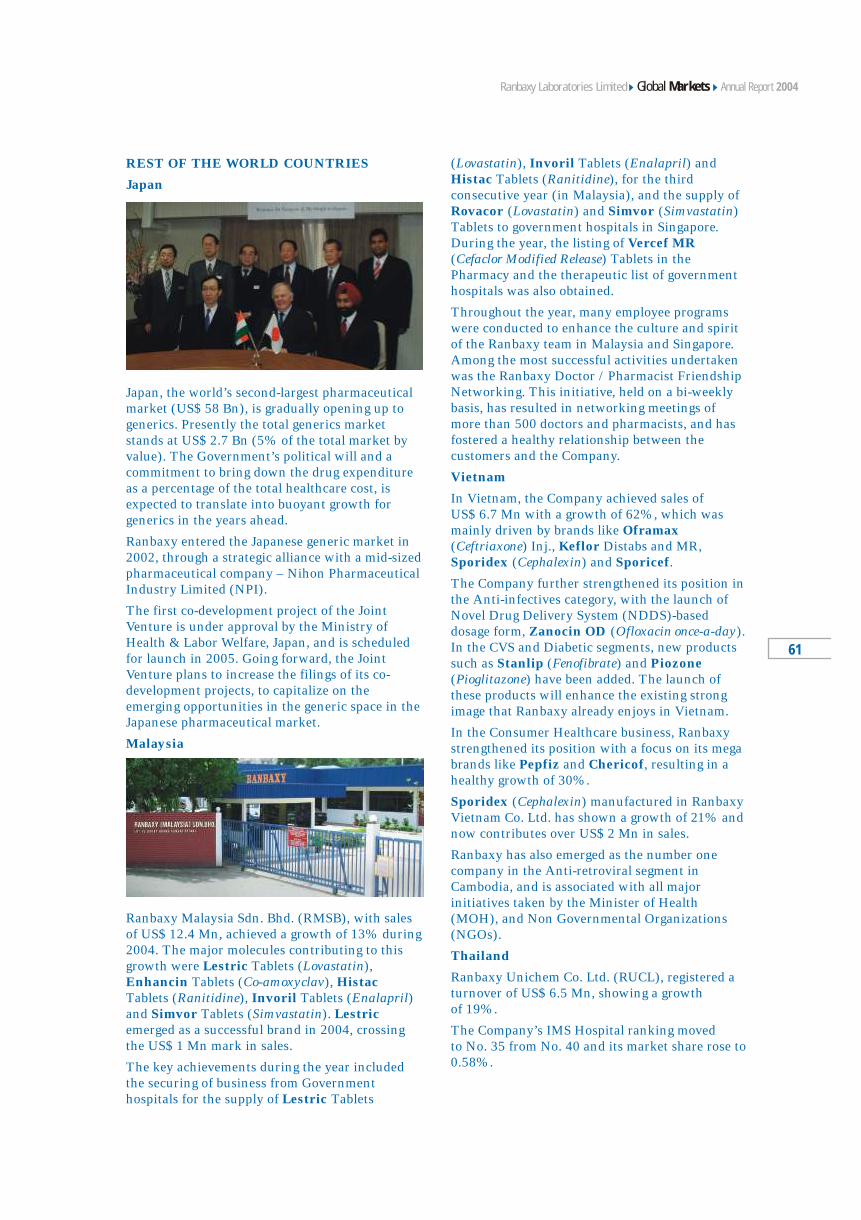
61
(Lovastatin), Invoril Tablets (Enalapril) and
Histac Tablets (Ranitidine), for the third
consecutive year (in Malaysia), and the supply of
Rovacor (Lovastatin) and Simvor (Simvastatin)
Tablets to government hospitals in Singapore.
During the year, the listing of Vercef MR (Cefaclor Modified Release) Tablets in the
Pharmacy and the therapeutic list of government
hospitals was also obtained.
Throughout the year, many employee programs
were conducted to enhance the culture and spirit
of the Ranbaxy team in Malaysia and Singapore.
Among the most successful activities undertaken
was the Ranbaxy Doctor / Pharmacist Friendship
Networking. This initiative, held on a bi-weekly
basis, has resulted in networking meetings of
more than 500 doctors and pharmacists, and has
fostered a healthy relationship between the
customers and the Company.
Vietnam
In Vietnam, the Company achieved sales of
US$ 6.7 Mn with a growth of 62%, which was
mainly driven by brands like Oframax (Ceftriaxone) Inj., Keflor Distabs and MR,
Sporidex (Cephalexin) and Sporicef.
The Company further strengthened its position in
the Anti-infectives category, with the launch of
Novel Drug Delivery System (NDDS)-based
dosage form, Zanocin OD (Ofloxacin once-a-day).
In the CVS and Diabetic segments, new products
such as Stanlip (Fenofibrate) and Piozone (Pioglitazone) have been added. The launch of
these products will enhance the existing strong
image that Ranbaxy already enjoys in Vietnam.
In the Consumer Healthcare business, Ranbaxy
strengthened its position with a focus on its mega
brands like Pepfiz and Chericof, resulting in a
healthy growth of 30%.
Sporidex (Cephalexin) manufactured in Ranbaxy
Vietnam Co. Ltd. has shown a growth of 21% and
now contributes over US$ 2 Mn in sales.
Ranbaxy has also emerged as the number one
company in the Anti-retroviral segment in
Cambodia, and is associated with all major
initiatives taken by the Minister of Health
(MOH), and Non Governmental Organizations
(NGOs).
Thailand
Ranbaxy Unichem Co. Ltd. (RUCL), registered a
turnover of US$ 6.5 Mn, showing a growth
of 19%.
The Company’s IMS Hospital ranking moved
to No. 35 from No. 40 and its market share rose to
0.58%.
REST OF THE WORLD COUNTRIES
Japan
Japan, the world’s second-largest pharmaceutical
market (US$ 58 Bn), is gradually opening up to
generics. Presently the total generics market
stands at US$ 2.7 Bn (5% of the total market by
value). The Government’s political will and a
commitment to bring down the drug expenditure
as a percentage of the total healthcare cost, is
expected to translate into buoyant growth for
generics in the years ahead.
Ranbaxy entered the Japanese generic market in
2002, through a strategic alliance with a mid-sized
pharmaceutical company – Nihon Pharmaceutical
Industry Limited (NPI).
The first co-development project of the Joint
Venture is under approval by the Ministry of
Health & Labor Welfare, Japan, and is scheduled
for launch in 2005. Going forward, the Joint
Venture plans to increase the filings of its co-
development projects, to capitalize on the
emerging opportunities in the generic space in the
Japanese pharmaceutical market.
Malaysia
Ranbaxy Malaysia Sdn. Bhd. (RMSB), with sales
of US$ 12.4 Mn, achieved a growth of 13% during
2004. The major molecules contributing to this
growth were Lestric Tablets (Lovastatin),
Enhancin Tablets (Co-amoxyclav), Histac
Tablets (Ranitidine), Invoril Tablets (Enalapril)
and Simvor Tablets (Simvastatin). Lestric
emerged as a successful brand in 2004, crossing
the US$ 1 Mn mark in sales.
The key achievements during the year included
the securing of business from Government
hospitals for the supply of Lestric Tablets
Annual Report 2004Global MarketsRanbaxy Laboratories Limited
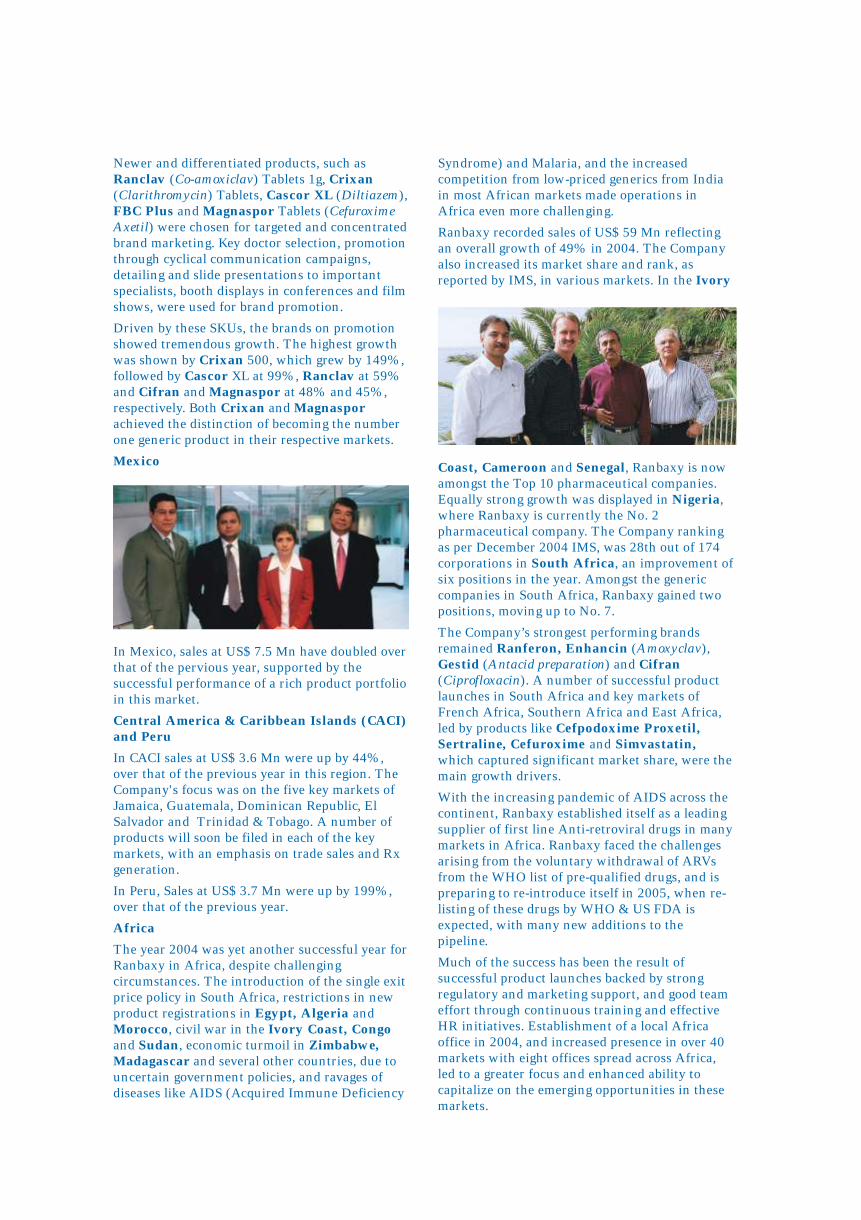
Syndrome) and Malaria, and the increased
competition from low-priced generics from India
in most African markets made operations in
Africa even more challenging.
Ranbaxy recorded sales of US$ 59 Mn reflecting
an overall growth of 49% in 2004. The Company
also increased its market share and rank, as
reported by IMS, in various markets. In the Ivory
Coast, Cameroon and Senegal, Ranbaxy is now
amongst the Top 10 pharmaceutical companies.
Equally strong growth was displayed in Nigeria,
where Ranbaxy is currently the No. 2
pharmaceutical company. The Company ranking
as per December 2004 IMS, was 28th out of 174
corporations in South Africa, an improvement of
six positions in the year. Amongst the generic
companies in South Africa, Ranbaxy gained two
positions, moving up to No. 7.
The Company’s strongest performing brands
remained Ranferon, Enhancin (Amoxyclav),
Gestid (Antacid preparation) and Cifran
(Ciprofloxacin). A number of successful product
launches in South Africa and key markets of
French Africa, Southern Africa and East Africa,
led by products like Cefpodoxime Proxetil, Sertraline, Cefuroxime and Simvastatin, which captured significant market share, were the
main growth drivers.
With the increasing pandemic of AIDS across the
continent, Ranbaxy established itself as a leading
supplier of first line Anti-retroviral drugs in many
markets in Africa. Ranbaxy faced the challenges
arising from the voluntary withdrawal of ARVs
from the WHO list of pre-qualified drugs, and is
preparing to re-introduce itself in 2005, when re-
listing of these drugs by WHO & US FDA is
expected, with many new additions to the
pipeline.
Much of the success has been the result of
successful product launches backed by strong
regulatory and marketing support, and good team
effort through continuous training and effective
HR initiatives. Establishment of a local Africa
office in 2004, and increased presence in over 40
markets with eight offices spread across Africa,
led to a greater focus and enhanced ability to
capitalize on the emerging opportunities in these
markets.
Newer and differentiated products, such as
Ranclav (Co-amoxiclav) Tablets 1g, Crixan
(Clarithromycin) Tablets, Cascor XL (Diltiazem),
FBC Plus and Magnaspor Tablets (Cefuroxime
Axetil) were chosen for targeted and concentrated
brand marketing. Key doctor selection, promotion
through cyclical communication campaigns,
detailing and slide presentations to important
specialists, booth displays in conferences and film
shows, were used for brand promotion.
Driven by these SKUs, the brands on promotion
showed tremendous growth. The highest growth
was shown by Crixan 500, which grew by 149%,
followed by Cascor XL at 99%, Ranclav at 59%
and Cifran and Magnaspor at 48% and 45%,
respectively. Both Crixan and Magnaspor
achieved the distinction of becoming the number
one generic product in their respective markets.
Mexico
In Mexico, sales at US$ 7.5 Mn have doubled over
that of the pervious year, supported by the
successful performance of a rich product portfolio
in this market.
Central America & Caribbean Islands (CACI) and Peru
In CACI sales at US$ 3.6 Mn were up by 44%,
over that of the previous year in this region. The
Company's focus was on the five key markets of
Jamaica, Guatemala, Dominican Republic, El
Salvador and Trinidad & Tobago. A number of
products will soon be filed in each of the key
markets, with an emphasis on trade sales and Rx
generation.
In Peru, Sales at US$ 3.7 Mn were up by 199%,
over that of the previous year.
Africa
The year 2004 was yet another successful year for
Ranbaxy in Africa, despite challenging
circumstances. The introduction of the single exit
price policy in South Africa, restrictions in new
product registrations in Egypt, Algeria and Morocco, civil war in the Ivory Coast, Congo
and Sudan, economic turmoil in Zimbabwe, Madagascar and several other countries, due to
uncertain government policies, and ravages of
diseases like AIDS (Acquired Immune Deficiency
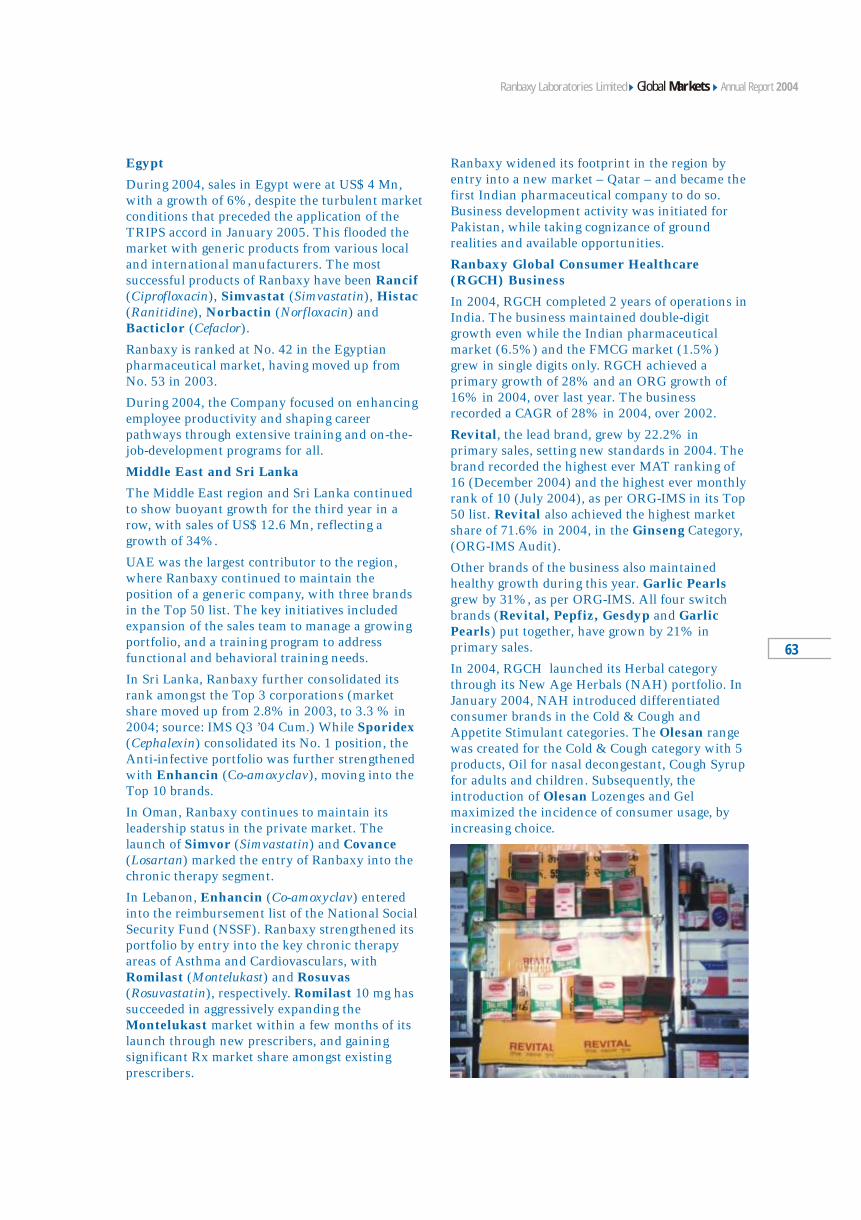
63
Ranbaxy widened its footprint in the region by
entry into a new market – Qatar – and became the
first Indian pharmaceutical company to do so.
Business development activity was initiated for
Pakistan, while taking cognizance of ground
realities and available opportunities.
Ranbaxy Global Consumer Healthcare (RGCH) Business
In 2004, RGCH completed 2 years of operations in
India. The business maintained double-digit
growth even while the Indian pharmaceutical
market (6.5%) and the FMCG market (1.5%)
grew in single digits only. RGCH achieved a
primary growth of 28% and an ORG growth of
16% in 2004, over last year. The business
recorded a CAGR of 28% in 2004, over 2002.
Revital, the lead brand, grew by 22.2% in
primary sales, setting new standards in 2004. The
brand recorded the highest ever MAT ranking of
16 (December 2004) and the highest ever monthly
rank of 10 (July 2004), as per ORG-IMS in its Top
50 list. Revital also achieved the highest market
share of 71.6% in 2004, in the Ginseng Category,
(ORG-IMS Audit).
Other brands of the business also maintained
healthy growth during this year. Garlic Pearls
grew by 31%, as per ORG-IMS. All four switch
brands (Revital, Pepfiz, Gesdyp and Garlic Pearls) put together, have grown by 21% in
primary sales.
In 2004, RGCH launched its Herbal category
through its New Age Herbals (NAH) portfolio. In
January 2004, NAH introduced differentiated
consumer brands in the Cold & Cough and
Appetite Stimulant categories. The Olesan range
was created for the Cold & Cough category with 5
products, Oil for nasal decongestant, Cough Syrup
for adults and children. Subsequently, the
introduction of Olesan Lozenges and Gel
maximized the incidence of consumer usage, by
increasing choice.
Egypt
During 2004, sales in Egypt were at US$ 4 Mn,
with a growth of 6%, despite the turbulent market
conditions that preceded the application of the
TRIPS accord in January 2005. This flooded the
market with generic products from various local
and international manufacturers. The most
successful products of Ranbaxy have been Rancif (Ciprofloxacin), Simvastat (Simvastatin), Histac (Ranitidine), Norbactin (Norfloxacin) and
Bacticlor (Cefaclor).
Ranbaxy is ranked at No. 42 in the Egyptian
pharmaceutical market, having moved up from
No. 53 in 2003.
During 2004, the Company focused on enhancing
employee productivity and shaping career
pathways through extensive training and on-the-
job-development programs for all.
Middle East and Sri Lanka
The Middle East region and Sri Lanka continued
to show buoyant growth for the third year in a
row, with sales of US$ 12.6 Mn, reflecting a
growth of 34%.
UAE was the largest contributor to the region,
where Ranbaxy continued to maintain the
position of a generic company, with three brands
in the Top 50 list. The key initiatives included
expansion of the sales team to manage a growing
portfolio, and a training program to address
functional and behavioral training needs.
In Sri Lanka, Ranbaxy further consolidated its
rank amongst the Top 3 corporations (market
share moved up from 2.8% in 2003, to 3.3 % in
2004; source: IMS Q3 ’04 Cum.) While Sporidex
(Cephalexin) consolidated its No. 1 position, the
Anti-infective portfolio was further strengthened
with Enhancin (Co-amoxyclav), moving into the
Top 10 brands.
In Oman, Ranbaxy continues to maintain its
leadership status in the private market. The
launch of Simvor (Simvastatin) and Covance
(Losartan) marked the entry of Ranbaxy into the
chronic therapy segment.
In Lebanon, Enhancin (Co-amoxyclav) entered
into the reimbursement list of the National Social
Security Fund (NSSF). Ranbaxy strengthened its
portfolio by entry into the key chronic therapy
areas of Asthma and Cardiovasculars, with
Romilast (Montelukast) and Rosuvas
(Rosuvastatin), respectively. Romilast 10 mg has
succeeded in aggressively expanding the
Montelukast market within a few months of its
launch through new prescribers, and gaining
significant Rx market share amongst existing
prescribers.
Annual Report 2004Global MarketsRanbaxy Laboratories Limited
India turned a new leaf on January 1, 2005,
when the product patent regime came into force
as per the WTO agreement. Much has been
written about the opportunities and challenges it
brings for Indian pharmaceutical companies.
However, Ranbaxy’s steady investment in
research and development over the years, has
prepared the Company to face the challenge and
ensure a healthy product flow for its various
markets, including India. Being aware of these
worldwide trends, Ranbaxy has been striving to
build a branded product portfolio, while
remaining fully committed to its strong generic
business model. In pursuit of this strategy,
Ranbaxy continued to expand and strengthen its
generic product portfolio during 2004, boosted
by a steady product flow. The year also witnessed
the successful implementation of the strategy of
diversifying into chronic therapy segments, and
at the same time maintaining the stronghold on
acute therapy segments like Anti-infectives.
Some significant launches in some of the key
markets in 2004, included Metformin XR and
Cefpodoxime Proxetil Tablets in the US,
Clarithromycin and Easyhaler Inhalers in UK,
Etrobax (Etoricoxib), Crixan OD
(Clarithromycin OD), Flotral (Alfuzosin OD),
Many facets of wellness
Product Review
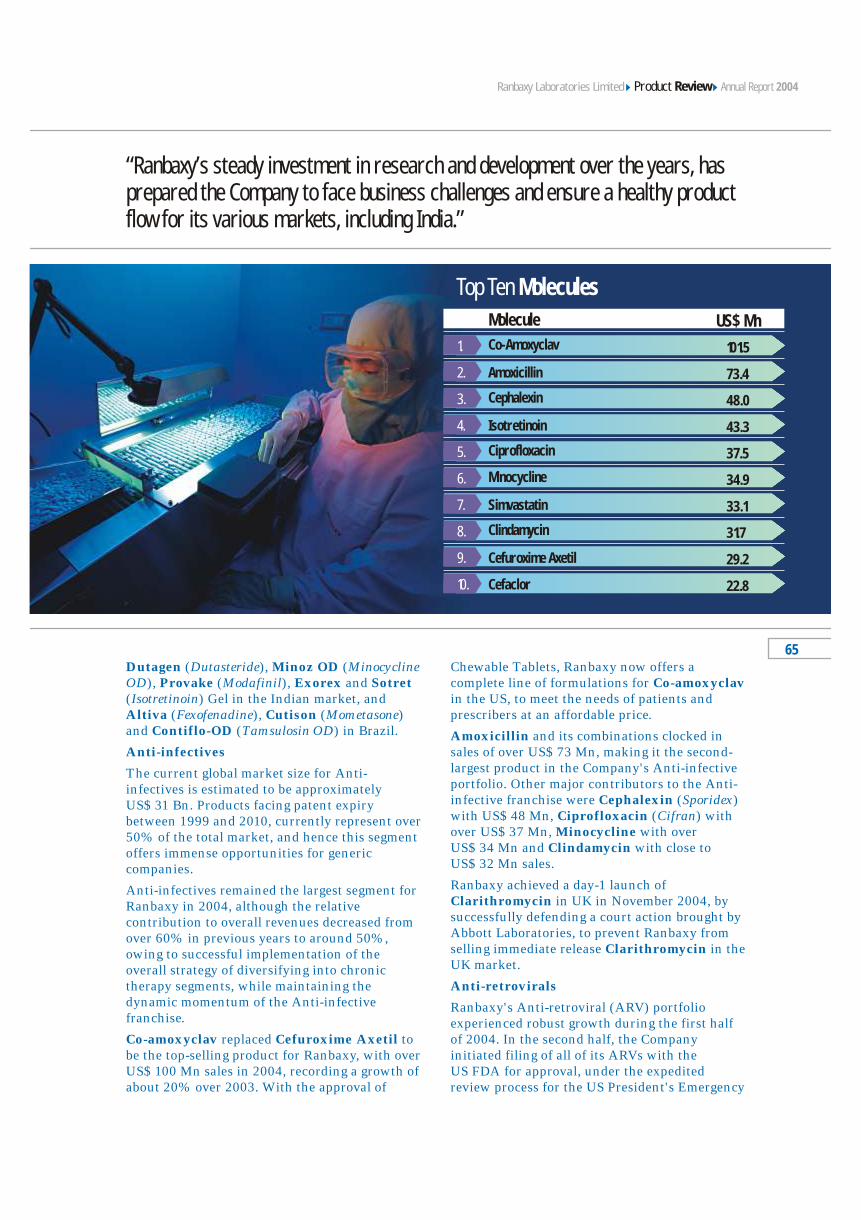
Annual Report 2004
Dutagen (Dutasteride), Minoz OD (Minocycline
OD), Provake (Modafinil), Exorex and Sotret (Isotretinoin) Gel in the Indian market, and
Altiva (Fexofenadine), Cutison (Mometasone)
and Contiflo-OD (Tamsulosin OD) in Brazil.
Anti-infectives
The current global market size for Anti-
infectives is estimated to be approximately
US$ 31 Bn. Products facing patent expiry
between 1999 and 2010, currently represent over
50% of the total market, and hence this segment
offers immense opportunities for generic
companies.
Anti-infectives remained the largest segment for
Ranbaxy in 2004, although the relative
contribution to overall revenues decreased from
over 60% in previous years to around 50%,
owing to successful implementation of the
overall strategy of diversifying into chronic
therapy segments, while maintaining the
dynamic momentum of the Anti-infective
franchise.
Co-amoxyclav replaced Cefuroxime Axetil to
be the top-selling product for Ranbaxy, with over
US$ 100 Mn sales in 2004, recording a growth of
about 20% over 2003. With the approval of
Chewable Tablets, Ranbaxy now offers a
complete line of formulations for Co-amoxyclav
in the US, to meet the needs of patients and
prescribers at an affordable price.
Amoxicillin and its combinations clocked in
sales of over US$ 73 Mn, making it the second-
largest product in the Company's Anti-infective
portfolio. Other major contributors to the Anti-
infective franchise were Cephalexin (Sporidex)
with US$ 48 Mn, Ciprofloxacin (Cifran) with
over US$ 37 Mn, Minocycline with over
US$ 34 Mn and Clindamycin with close to
US$ 32 Mn sales.
Ranbaxy achieved a day-1 launch of
Clarithromycin in UK in November 2004, by
successfully defending a court action brought by
Abbott Laboratories, to prevent Ranbaxy from
selling immediate release Clarithromycin in the
UK market.
Anti-retrovirals
Ranbaxy's Anti-retroviral (ARV) portfolio
experienced robust growth during the first half
of 2004. In the second half, the Company
initiated filing of all of its ARVs with the
US FDA for approval, under the expedited
review process for the US President's Emergency
Product ReviewRanbaxy Laboratories Limited
“Ranbaxy’s steady investment in research and development over the years, has prepared the Company to face business challenges and ensure a healthy product flow for its various markets, including India.”
65
Top Ten Molecules
Molecule
101.5
US$ Mn
Co-Amoxyclav1.
48.0
43.3
37.5
33.1
31.7
29.2
22.8
2.
3.
4.
5.
6.
7.
8.
9.
73.4
34.9
10.
Amoxicillin
Cephalexin
Isotretinoin
Ciprofloxacin
Minocycline
Simvastatin
Clindamycin
Cefuroxime Axetil
Cefaclor
Plan for AIDS Relief (PEPFAR) program. Three
ARVs were filed with the US FDA before the end
of the year. Simultaneously, the Company
decided to resubmit all its ARVs to WHO's pre-
qualification project after its voluntary
withdrawals. Ranbaxy remains committed to
making affordable ARVs of world-class quality
accessible to HIV / AIDS patients throughout the
world, particularly to those, who might not
otherwise be able to access therapy. In 2004, the
Company exported ARVs to over 50 countries.
Cardiovasculars (CVS)
Cardiovasculars represents the largest
therapeutic category worldwide, in terms of
prescriptions and dollar sales. The number of
patients seeking cardiovascular therapies is
increasing, primarily driven by diabetes and
obesity. For Ranbaxy, the Cardiovascular
segment witnessed a healthy growth of 124% in
2004, registering sales of US$ 165 Mn. Two
major sub-therapeutic segments contributing to
this growth, included Statins and ACE
inhibitors.
Among the Statins, Simvastatin (Simvor /
Simvotin) at US$ 33 Mn remained the best-
selling cardiovascular product and was also
amongst the Top 5 products for Ranbaxy.
Pravastatin, which was launched in the
European market in 2004, and Atorvastatin,
also contributed to the sales of the Statins segment in the CVS category. In the Indian
market, Storvas (Atorvastatin) and Rosuvas
(Rosuvastatin) sales facilitated a continued
leadership position in the Statins market.
Ranbaxy also launched the fixed dose
combination of Atorvastatin with Ezetimibe in
India, to further augment its presence in this
highly-competitive segment.
The Anti-hypertensive product portfolio got a
major boost in year 2004, with some notable
launches in the developed market, taking the
overall Cardiovascular revenues for the Company
to a remarkable level. Ramipril, Lisinopril, Enalapril and Fosinopril were the significant
contributors to the Cardiovascular segment for
Ranbaxy.
In view of the increasing importance of
Cardiovascular drugs in the pharmaceutical
landscape, Ranbaxy re-aligned its Cardiovascular
product portfolio in India and launched separate
divisions – Ranbaxy CV and Ranbaxy CV Life –
dedicated for promotion of Cardiovascular
therapies.
Musculoskeletal
The withdrawal of blockbuster drug Vioxx
(Rofecoxib) by the innovator was a significant
event in this therapeutic category in 2004.
Ranbaxy also followed suit, by voluntarily
withdrawing its Rofecoxib brand, Rofibax, from
its markets, reinforcing its commitment to
business ethics. Despite this challenge, the
Musculoskeletal segment is expected to continue
growing, resulting from an increasing ageing
population.
Rheumatology and Musculoskeletal drugs
grossed approximately US$ 70 Mn, showing a
growth of 37% over 2003, with Ketorolac Tromethamine (Ketanov) as the leading product
in this category. Diclofenac, with its
combinations, was the second major product in
this category. In the Indian market, Ranbaxy's
Volini (Diclofenac) entered the list of Top 100
brands and Etrobax (Etoricoxib) featured
amongst the Top 30 introductions of the year
(source: ORG-IMS, MAT December 2004).
Dermatologicals
The buoyant performance of Isotretinoin
(Sotret) has catapulted the Dermatological
segment from No. 6 in 2003, to No. 4 in year
2004, giving a boost to its position as a key
therapeutic category for Ranbaxy.
Dermatological drugs reflected a robust growth
of 60%, amounting to US$ 66 Mn for 2004.
Isotretinoin and the branded version Cecnoin,
also improved market share in Brazil.
Isotretinoin was also launched in the Indian
market as Sotret Gel.
In India, Ranbaxy launched a whole range of
products under the newly envisaged
Dermaceutical portfolio, with a dedicated task
force to promote these products. Suncros
(Sunscreen lotion), Hyclean (Dipigmenting
cream) and Repigmin (Repigmenting lotion) were
amongst the first introductions under this
portfolio.
Gastrointestinals
Gastrointestinal products were overtaken by
Dermatologicals, pushing the former to the No. 5
rank amongst the therapeutic categories.
Ranbaxy markets various prescription-based, as
well as Over-the-Counter (OTC) products in this
segment, including Ranitidine, Omeprazole,
Pepfiz, H-Pylori kits and various laxatives.
Overall, Gastrointestinal drugs registered sales of
over US$ 56 Mn in 2004, supported by
Ranitidine (Histac) and Omeprazole
(Omesec/Romesec).
Central Nervous System (CNS)
The Central Nervous System is the second-
largest therapeutic category in dollar sales for the
global pharmaceutical market and is set to
witness a healthy expansion over the next five
years. This is owing to an increase in the ageing
population, improvement in the diagnosis of
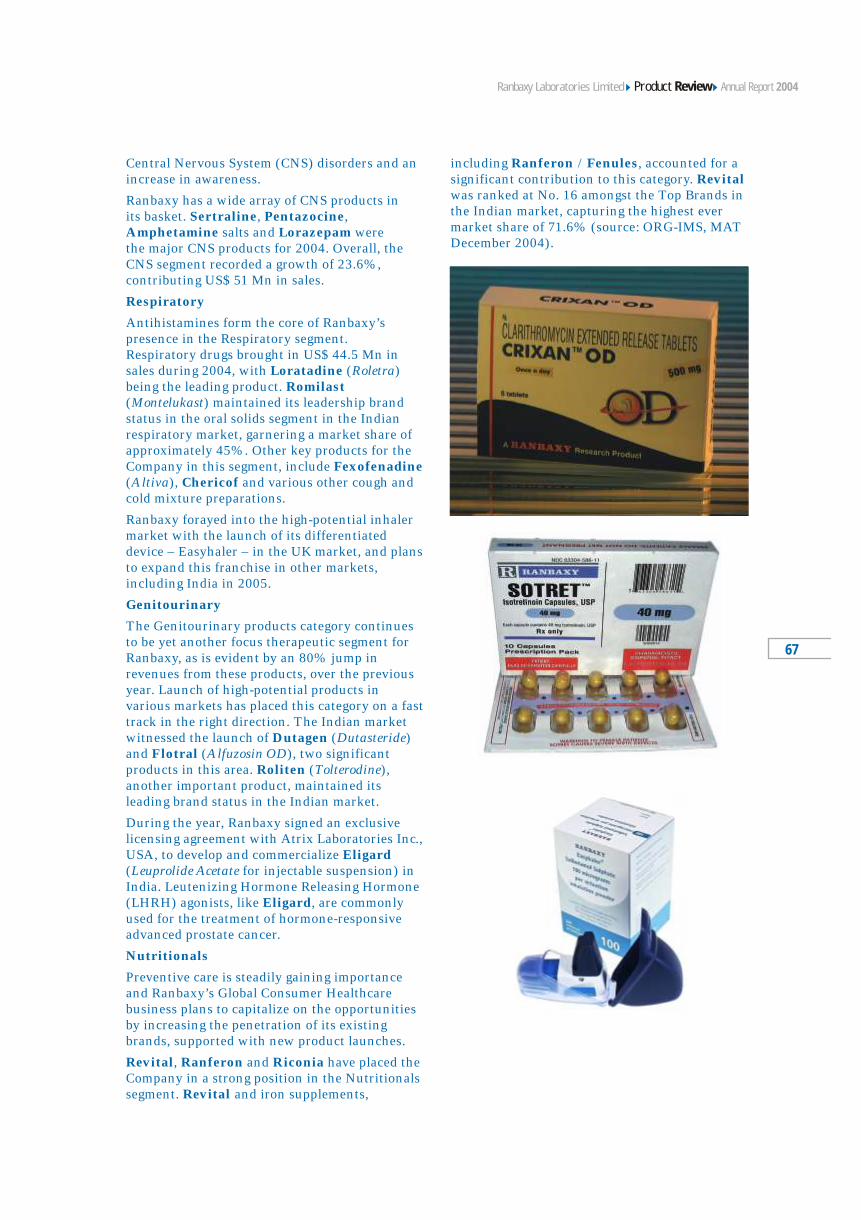
Central Nervous System (CNS) disorders and an
increase in awareness.
Ranbaxy has a wide array of CNS products in
its basket. Sertraline, Pentazocine,
Amphetamine salts and Lorazepam were
the major CNS products for 2004. Overall, the
CNS segment recorded a growth of 23.6%,
contributing US$ 51 Mn in sales.
Respiratory
Antihistamines form the core of Ranbaxy’s
presence in the Respiratory segment.
Respiratory drugs brought in US$ 44.5 Mn in
sales during 2004, with Loratadine (Roletra)
being the leading product. Romilast (Montelukast) maintained its leadership brand
status in the oral solids segment in the Indian
respiratory market, garnering a market share of
approximately 45%. Other key products for the
Company in this segment, include Fexofenadine
(Altiva), Chericof and various other cough and
cold mixture preparations.
Ranbaxy forayed into the high-potential inhaler
market with the launch of its differentiated
device – Easyhaler – in the UK market, and plans
to expand this franchise in other markets,
including India in 2005.
Genitourinary
The Genitourinary products category continues
to be yet another focus therapeutic segment for
Ranbaxy, as is evident by an 80% jump in
revenues from these products, over the previous
year. Launch of high-potential products in
various markets has placed this category on a fast
track in the right direction. The Indian market
witnessed the launch of Dutagen (Dutasteride)
and Flotral (Alfuzosin OD), two significant
products in this area. Roliten (Tolterodine),
another important product, maintained its
leading brand status in the Indian market.
During the year, Ranbaxy signed an exclusive
licensing agreement with Atrix Laboratories Inc.,
USA, to develop and commercialize Eligard
(Leuprolide Acetate for injectable suspension) in
India. Leutenizing Hormone Releasing Hormone
(LHRH) agonists, like Eligard, are commonly
used for the treatment of hormone-responsive
advanced prostate cancer.
Nutritionals
Preventive care is steadily gaining importance
and Ranbaxy’s Global Consumer Healthcare
business plans to capitalize on the opportunities
by increasing the penetration of its existing
brands, supported with new product launches.
Revital, Ranferon and Riconia have placed the
Company in a strong position in the Nutritionals
segment. Revital and iron supplements,
including Ranferon / Fenules, accounted for a
significant contribution to this category. Revital was ranked at No. 16 amongst the Top Brands in
the Indian market, capturing the highest ever
market share of 71.6% (source: ORG-IMS, MAT
December 2004).
Annual Report 2004Product ReviewRanbaxy Laboratories Limited
67
Global Manufacturing &Global Supply Chain
The year saw the culmination of 18 months work
across the Company into a structured and seamless
supply chain being commissioned across business,
sourcing, manufacturing, quality control and
logistics. Robust processes were put in place to
ensure improved customer services, reduction of
inventories, and day-1 launches of new products in
most of the countries.
As a first step, semi-automated and manual
processes were put in place. During the year, the
Company embarked on commencing APO
(Advanced Planner & Optimizer) across the entire
spectrum of marketing, sourcing, manufacturing,
quality control and logistics. The first phase will
“go live” during 2005. Use of this tool will
significantly improve customer servicing, reduce
inventories and ensure day-1 launches of new
products in various countries.
Substantial capacity augmentation was carried out
during the year at almost all manufacturing
facilities across the world. Various facilities were
inspected during the year by US FDA, MHRA UK,
and by many other regulatory agencies. All the
facilities continued to remain approved by these
agencies, and in compliance to their respective
guidelines.
Focus onmaximizing
process efficiencies
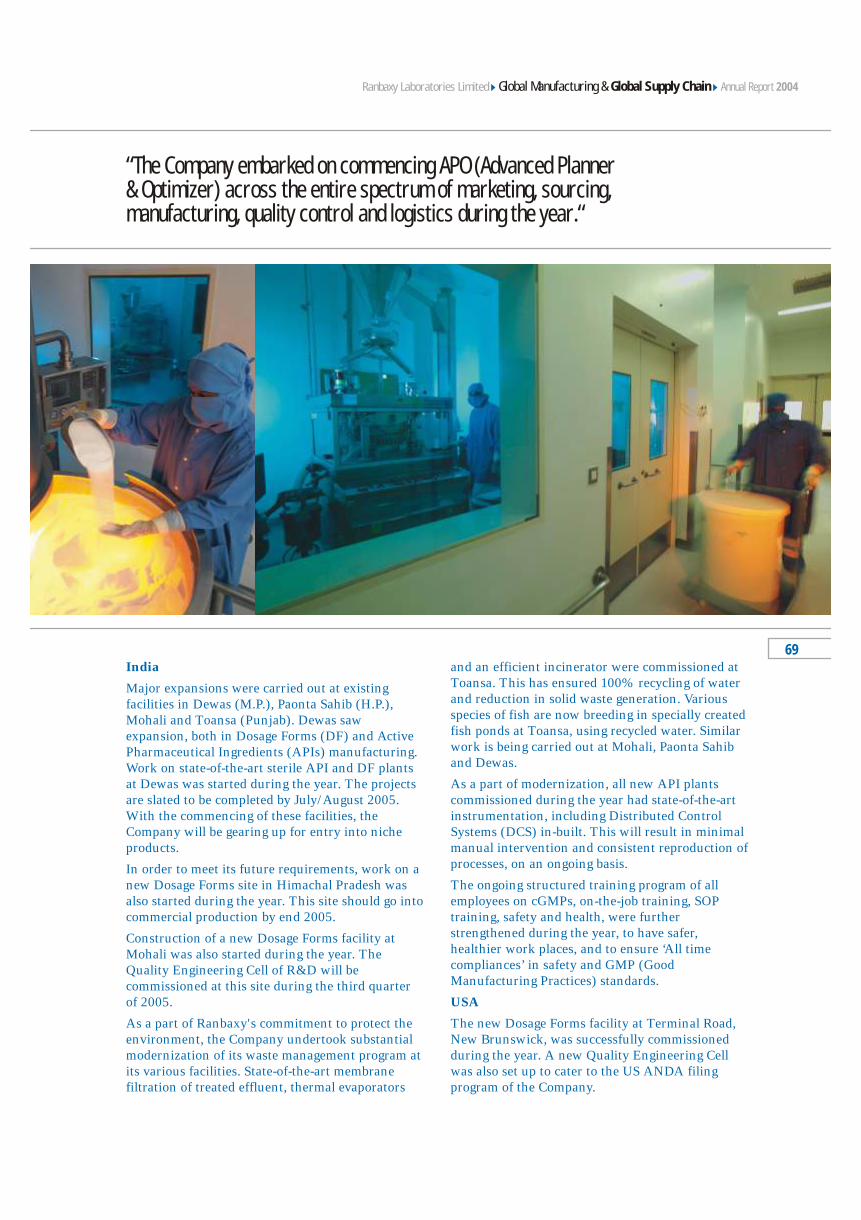
Annual Report 2004Global Manufacturing & Global Supply ChainRanbaxy Laboratories Limited
India
Major expansions were carried out at existing
facilities in Dewas (M.P.), Paonta Sahib (H.P.),
Mohali and Toansa (Punjab). Dewas saw
expansion, both in Dosage Forms (DF) and Active
Pharmaceutical Ingredients (APIs) manufacturing.
Work on state-of-the-art sterile API and DF plants
at Dewas was started during the year. The projects
are slated to be completed by July/August 2005.
With the commencing of these facilities, the
Company will be gearing up for entry into niche
products.
In order to meet its future requirements, work on a
new Dosage Forms site in Himachal Pradesh was
also started during the year. This site should go into
commercial production by end 2005.
Construction of a new Dosage Forms facility at
Mohali was also started during the year. The
Quality Engineering Cell of R&D will be
commissioned at this site during the third quarter
of 2005.
As a part of Ranbaxy's commitment to protect the
environment, the Company undertook substantial
modernization of its waste management program at
its various facilities. State-of-the-art membrane
filtration of treated effluent, thermal evaporators
and an efficient incinerator were commissioned at
Toansa. This has ensured 100% recycling of water
and reduction in solid waste generation. Various
species of fish are now breeding in specially created
fish ponds at Toansa, using recycled water. Similar
work is being carried out at Mohali, Paonta Sahib
and Dewas.
As a part of modernization, all new API plants
commissioned during the year had state-of-the-art
instrumentation, including Distributed Control
Systems (DCS) in-built. This will result in minimal
manual intervention and consistent reproduction of
processes, on an ongoing basis.
The ongoing structured training program of all
employees on cGMPs, on-the-job training, SOP
training, safety and health, were further
strengthened during the year, to have safer,
healthier work places, and to ensure ‘All time
compliances’ in safety and GMP (Good
Manufacturing Practices) standards.
USA
The new Dosage Forms facility at Terminal Road,
New Brunswick, was successfully commissioned
during the year. A new Quality Engineering Cell
was also set up to cater to the US ANDA filing
program of the Company.
“The Company embarked on commencing APO (Advanced Planner & Optimizer) across the entire spectrum of marketing, sourcing, manufacturing, quality control and logistics during the year.“
69
The existing Livingstone Road, New Brunswick, facility
was totally upgraded and modernized during the year.
The Company invested heavily in these locations in
training all employees on safety and cGMPs.
Further capacity expansion is being undertaken at the
Terminal Road facility, to meet the Company's future
growth needs.
China
A state-of-the-art, high-speed infusion line was
commissioned at the Guangzhou facility. Not only has
the capacity been augmented, but the yield has also
improved substantially.
The facility was awarded the GMP certificate by a local
regulatory agency.
Malaysia
In order to meet the growing demand in Malaysia, work
on a new modern and spacious Tablets and Capsules
facility was started during the year. This state-of-the-art
facility will be commissioned by June 2005.
Ireland
The Company made substantial investments in
installing and commencing best-in-class, state-of-the-art
packaging lines at Cashel, Ireland.
These high-speed lines package products for Europe, use
bulk Tablets supplied from India. With the commencing
of these lines, the Company has been able to be
physically closer to the customer, and fulfill customer
orders within shorter timelines.
Nigeria
Up-gradation work at the Nigerian facility was
undertaken during the year. The increased capacity will
go on-stream by mid year.
The global manufacturing and supply chain team across
19 plants, is driven by a passion for customer
satisfaction, total compliance and safety.
Annual Report 2004Global Manufacturing & Global Supply ChainRanbaxy Laboratories Limited
Value-Driven Information Technology
As a research-based organization, Ranbaxy’s
recognition of Science as the driver of its
envisioned journey is fundamental to the ethos of
the global InfoTech team.
The Company continued to pioneer deployment
and leveraging of technology-led initiatives to
enhance its competitive positioning.
Given below is a brief overview of some of the IT
activities in the year 2004:
Business Solutions focused on initiatives that add
value to business. The SAP footprint was expanded
to include ZAO Ranbaxy, the new company in
Russia, RPG France and the representative offices
of Kazakhstan, Ukraine, Lithuania, Romania, Hong
Kong and Myanmar. Thus in 2004, well over 90%
of global revenues were integrated on SAP. SAP
was also extended to HR, with SAP HR being
rolled out, capturing primary data of all Ranbaxy
employees onto the HR system at all Ranbaxy
locations. SAP APO (Advance Planner &
Optimizer) for the Supply Chain function, initiated
during the year, progressed well. Distribution
Requirement Planning (DRP) was implemented in
Europe, USA and Brazil, and the Capacity Planning
tool was implemented at Dosage Forms
Tomorrowis online
Information Technology
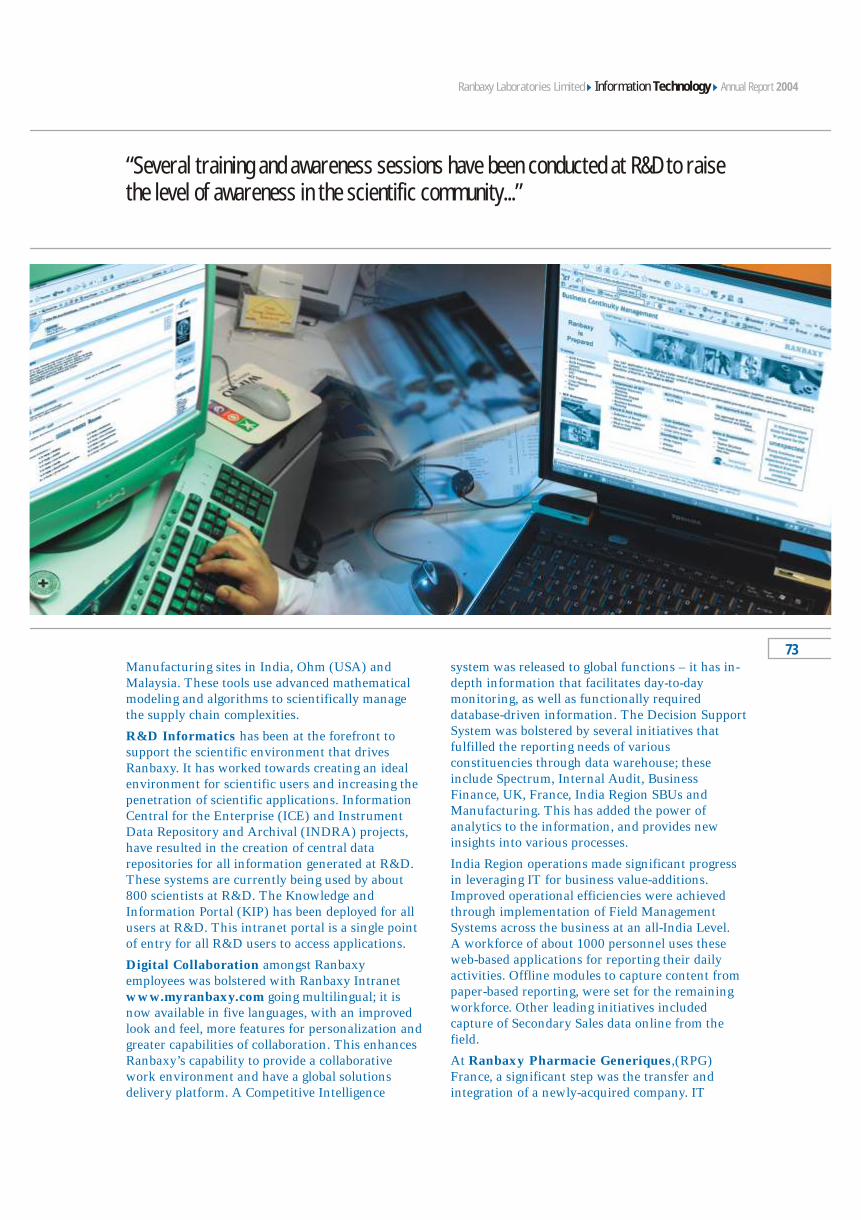
Manufacturing sites in India, Ohm (USA) and
Malaysia. These tools use advanced mathematical
modeling and algorithms to scientifically manage
the supply chain complexities.
R&D Informatics has been at the forefront to
support the scientific environment that drives
Ranbaxy. It has worked towards creating an ideal
environment for scientific users and increasing the
penetration of scientific applications. Information
Central for the Enterprise (ICE) and Instrument
Data Repository and Archival (INDRA) projects,
have resulted in the creation of central data
repositories for all information generated at R&D.
These systems are currently being used by about
800 scientists at R&D. The Knowledge and
Information Portal (KIP) has been deployed for all
users at R&D. This intranet portal is a single point
of entry for all R&D users to access applications.
Digital Collaboration amongst Ranbaxy
employees was bolstered with Ranbaxy Intranet
www.myranbaxy.com going multilingual; it is
now available in five languages, with an improved
look and feel, more features for personalization and
greater capabilities of collaboration. This enhances
Ranbaxy’s capability to provide a collaborative
work environment and have a global solutions
delivery platform. A Competitive Intelligence
system was released to global functions – it has in-
depth information that facilitates day-to-day
monitoring, as well as functionally required
database-driven information. The Decision Support
System was bolstered by several initiatives that
fulfilled the reporting needs of various
constituencies through data warehouse; these
include Spectrum, Internal Audit, Business
Finance, UK, France, India Region SBUs and
Manufacturing. This has added the power of
analytics to the information, and provides new
insights into various processes.
India Region operations made significant progress
in leveraging IT for business value-additions.
Improved operational efficiencies were achieved
through implementation of Field Management
Systems across the business at an all-India Level.
A workforce of about 1000 personnel uses these
web-based applications for reporting their daily
activities. Offline modules to capture content from
paper-based reporting, were set for the remaining
workforce. Other leading initiatives included
capture of Secondary Sales data online from the
field.
At Ranbaxy Pharmacie Generiques,(RPG)
France, a significant step was the transfer and
integration of a newly-acquired company. IT
Annual Report 2004
“Several training and awareness sessions have been conducted at R&D to raise the level of awareness in the scientific community...”
73
Information TechnologyRanbaxy Laboratories Limited
strengthened to comply with the requirements of
regulatory agencies around the world, e.g. the US
FDA 21 CFR Part 11.
In coordination with the Global Quality Assurance
(GQA) group, several training and awareness
sessions have been conducted at R&D, to raise the
level of awareness in the scientific community
around issues related to compliance with 21 CFR
Part 11 of the US FDA and Annex. 11 of EU. At
manufacturing locations where systems were
already compliant with these requirements, the
level of ‘Computer System Validation and
Compliance’ was enhanced during the year.
Compliance audits at US and India facilitated the
process of upgrading internal system and processes.
US operations invested in integrated systems to
handle Government Reporting, Government
Rebates processing applications and various aspects
of sales and reporting compliance.
To ensure Secure Operations, like being an IPR
driven organization, securing Information assets
assumes the highest priority. The year saw several
initiatives starting with deployment and up-
gradation of network firewalls and other
equipment. These have enhanced the ability of the
Company to secure and protect its intellectual
property that resides in its electronic systems.
To protect the organization against any unforeseen
natural or manmade disasters, Business Continuity and Disaster Recovery Plans were
put in place for SAP and messaging systems.
A Business Continuity Plan for R&D was also
initiated.
The focus of the Information Technology group at
Ranbaxy is to enhance and sustain the scientific
capabilities, and to assist business and research
through proactive deployment of cutting-edge
technology, in order to gain sustainable competitive
advantage and to ensure risk mitigation.
platforms and transaction systems were established,
deployed and integrated with field systems,
including mailing systems and SAP R/3.
US operations put in place a state-of-the-art
contract management and chargeback solutions
program, to achieve significant transaction coverage
via EDI (Electronic Data Interchange). RFID
(Radio Frequency Identification) tags were also
provided on a class of its products for one of its
significant customers. Ranbaxy’s technology
initiatives have been recognized as the leading edge
in its class by some of its key customers.
Implementation of Barcoding and Warehouse Management systems at its distribution centers
provided customer convenience and order
processing accuracy. Barcoding was also
implemented at the main manufacturing sites in
India. Scientific endeavors at Manufacturing were
enhanced through use of the Annual Product
Review System & Statistical Quality Control (SQC)
System, which were implemented at manufacturing
locations to improve the process and quality of our
products.
With regard to Infrastructure, the year saw
continued high performance of the core technology
infrastructure with high uptimes of critical
applications and best-in-class user response times.
Additional geographies like Germany (Basics),
Vietnam (Company and Representative Office) and
RPG France, were integrated with the corporate
mailing system, with ranbaxy.com e-mail Ids for
employees at these locations. VoIP (Voice over
Internet Portocol) telephony, previously deployed
in US, was deployed across key locations in India as
well. The network infrastructure at the R&D
facilities has been enhanced to improve
communication bandwidth and minimize
downtimes. The clinical research sites are now
connected electronically to the R&D data center.
Relevant manufacturing locations in India, US and
UK have real-time access to relevant R&D product
development information. Ranbaxy locations in US
and UK also facilitated roll-out of pharmaco
vigilance applications (previously live in US).
To support all business initiatives, Data centers
have been designed to enhance business
performance. The SAP and Business applications
datacenter, the R&D datacenter and the US
operations datacenter are in place today. SAP
response times today are less than one second. The
SAP disaster recovery site was tested for 200+
users.
Compliance and Validation of systems is an
integral activity and goes a long way in sustaining
the climate of scientific temperament. At R&D, the
computing infrastructure and systems were
Ranbaxy Laboratories Limited Annual Report 2004Information Technology
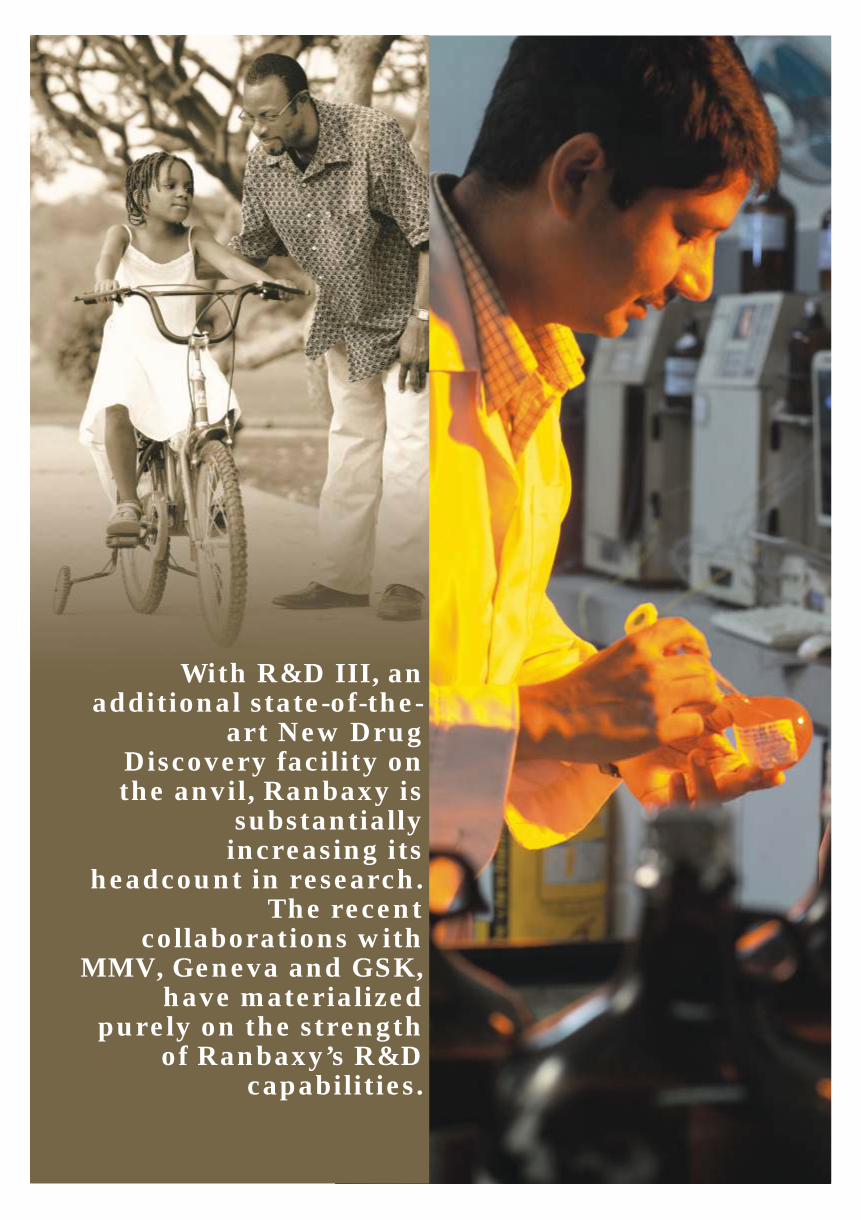
With R&D III, an additional state-of-the-
art New Drug Discovery facility on the anvil, Ranbaxy is
substantially increasing its
headcount in research. The recent
collaborations with MMV, Geneva and GSK,
have materialized purely on the strength
of Ranbaxy’s R&D capabilities.

Annual Report 2004Ranbaxy Laboratories Limited
The reputation that Ranbaxy has garnered among
national and international media, pressure groups,
government agencies and competitors is of
immense tangible value. A credible face, a positive
image and dependable reputation are the outcome
of the efforts of a persevering Corporate Affairs and
Corporate Communications team at Ranbaxy. The
year 2004 has seen the expansion of the assertive
actions of the team in India and overseas.
Corporate Affairs
Ranbaxy’s Corporate Affairs function encompasses
Government Relations, Public Policy & Public
Affairs and provides the Company the necessary
profile to participate meaningfully in the formation
of pharmaceutical policies and regulatory matters.
In 2004, the Corporate Affairs team across regions,
were involved in supporting the Company's
initiatives to bring about a favorable regulatory
environment.
Ranbaxy commanded a respectable position as a
leading Indian Pharma Company, and was deeply
involved in the consultative process with the Govt.
of India, Industry and other stakeholders in the
framing of India’s Patent (Amendment) Act 2005.
Additionally in India, it continues to contribute
effectively in shaping public policy on all critical
issues, such as Drug Price Control, that affect the
future of the pharma industry in the country. Its
amicable relations with industry peers and
government agencies has ensured speedy and
beneficial solution of many issues.
The Company’s operations also benefitted from the
Corporate initiatives related to the continuation of
the fiscal incentive for R&D, streamlining export-
import procedures and the management of drug
regulatory systems.
The team has adequately represented the
Company’s viewpoint in various industry fora such
as the Indian Pharmaceutical Alliance (IPA),
Confederation of Indian Industries (CII) &
Federation of Indian Chambers of Commerce &
Industry (FICCI).
As Ranbaxy progresses on its path to be a science-
led international pharmaceutical Company, its
Corporate Affairs team is in a unique position to
evaluate, transmit and influence best practices
across geographies by interacting with the various
stakeholders such as governments, industry,
institutions, medical community, NGO's and
patient groups.
Corporate Affairs, Global Corporate Communications& Corporate Social Responsibility
Building bridges globally
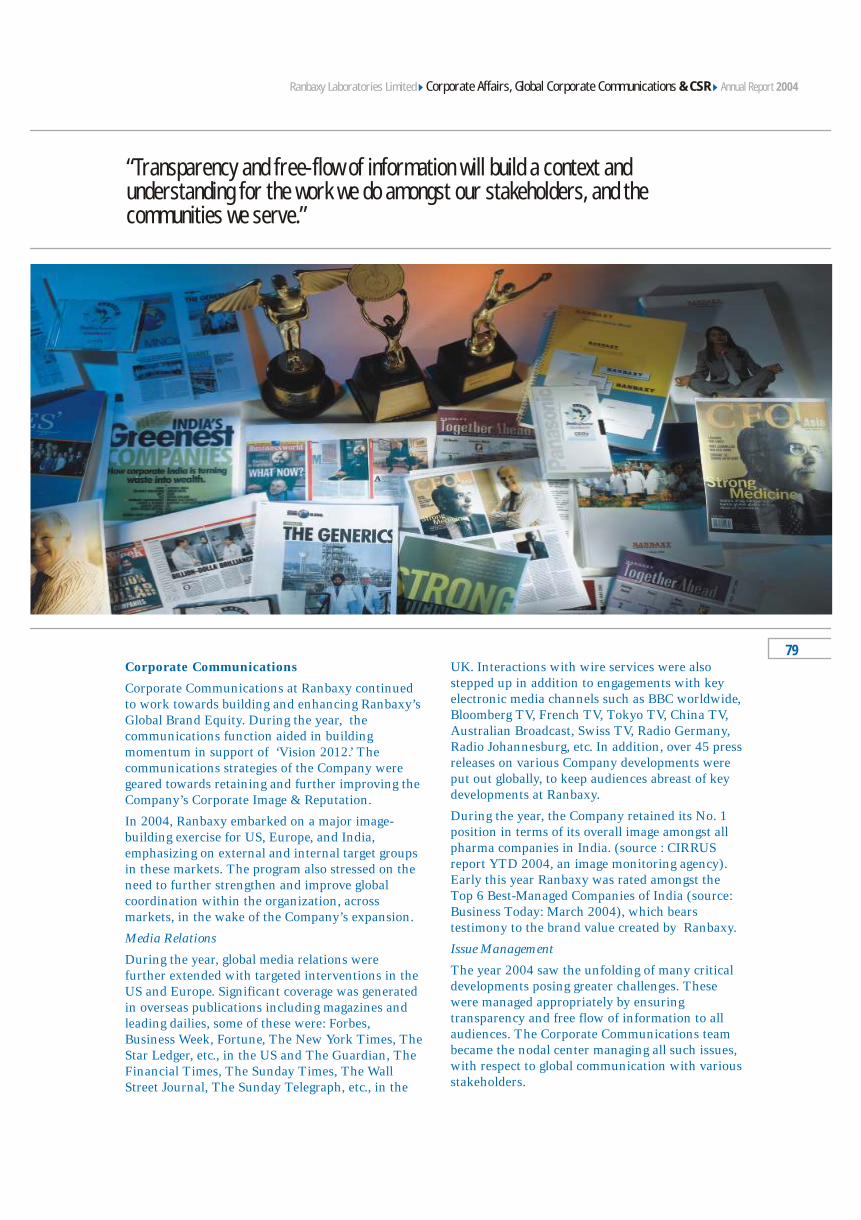
Corporate Affairs, Global Corporate Communications & CSRRanbaxy Laboratories Limited Annual Report 2004
Corporate Communications
Corporate Communications at Ranbaxy continued
to work towards building and enhancing Ranbaxy’s
Global Brand Equity. During the year, the
communications function aided in building
momentum in support of ‘Vision 2012.’ The
communications strategies of the Company were
geared towards retaining and further improving the
Company’s Corporate Image & Reputation.
In 2004, Ranbaxy embarked on a major image-
building exercise for US, Europe, and India,
emphasizing on external and internal target groups
in these markets. The program also stressed on the
need to further strengthen and improve global
coordination within the organization, across
markets, in the wake of the Company’s expansion.
Media Relations
During the year, global media relations were
further extended with targeted interventions in the
US and Europe. Significant coverage was generated
in overseas publications including magazines and
leading dailies, some of these were: Forbes,
Business Week, Fortune, The New York Times, The
Star Ledger, etc., in the US and The Guardian, The
Financial Times, The Sunday Times, The Wall
Street Journal, The Sunday Telegraph, etc., in the
“Transparency and free-flow of information will build a context and understanding for the work we do amongst our stakeholders, and the communities we serve.”
79UK. Interactions with wire services were also
stepped up in addition to engagements with key
electronic media channels such as BBC worldwide,
Bloomberg TV, French TV, Tokyo TV, China TV,
Australian Broadcast, Swiss TV, Radio Germany,
Radio Johannesburg, etc. In addition, over 45 press
releases on various Company developments were
put out globally, to keep audiences abreast of key
developments at Ranbaxy.
During the year, the Company retained its No. 1
position in terms of its overall image amongst all
pharma companies in India. (source : CIRRUS
report YTD 2004, an image monitoring agency).
Early this year Ranbaxy was rated amongst the
Top 6 Best-Managed Companies of India (source:
Business Today: March 2004), which bears
testimony to the brand value created by Ranbaxy.
Issue Management
The year 2004 saw the unfolding of many critical
developments posing greater challenges. These
were managed appropriately by ensuring
transparency and free flow of information to all
audiences. The Corporate Communications team
became the nodal center managing all such issues,
with respect to global communication with various
stakeholders.
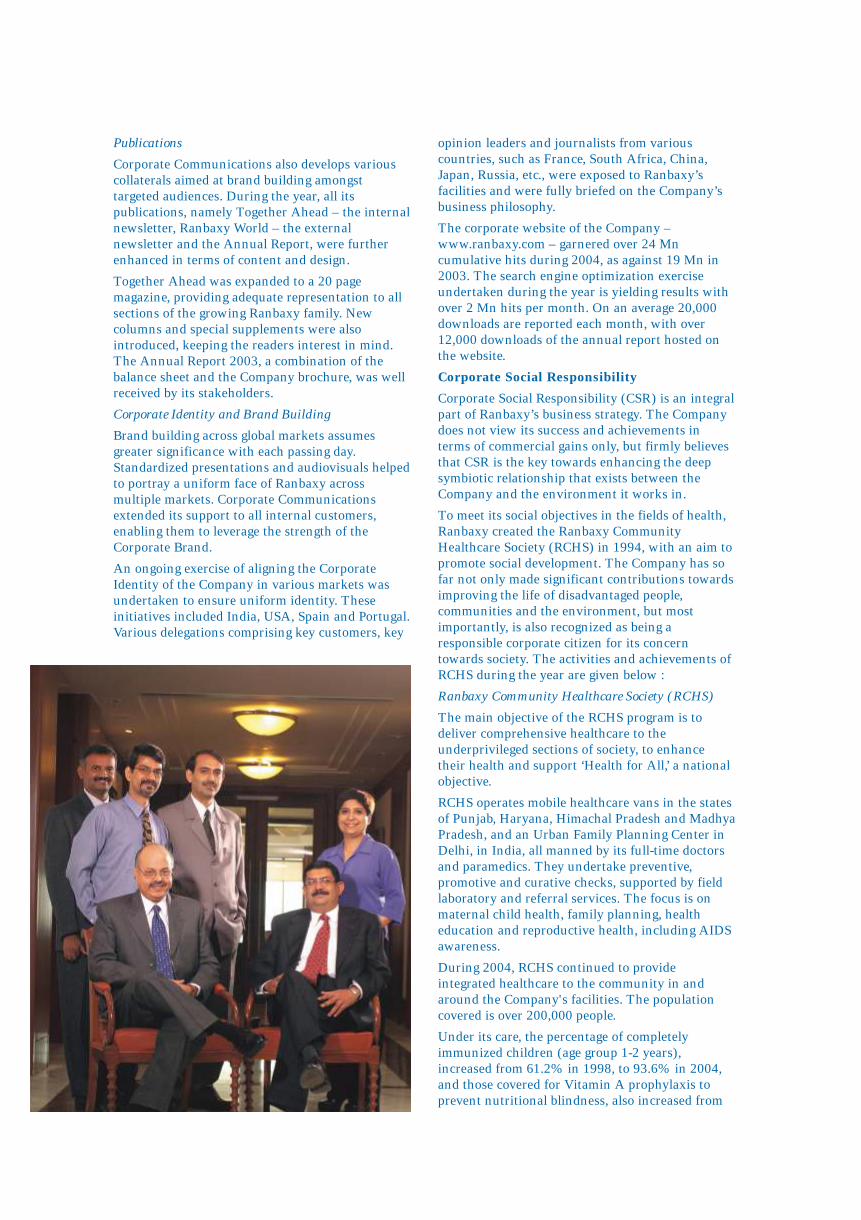
opinion leaders and journalists from various
countries, such as France, South Africa, China,
Japan, Russia, etc., were exposed to Ranbaxy’s
facilities and were fully briefed on the Company’s
business philosophy.
The corporate website of the Company –
www.ranbaxy.com – garnered over 24 Mn
cumulative hits during 2004, as against 19 Mn in
2003. The search engine optimization exercise
undertaken during the year is yielding results with
over 2 Mn hits per month. On an average 20,000
downloads are reported each month, with over
12,000 downloads of the annual report hosted on
the website.
Corporate Social Responsibility
Corporate Social Responsibility (CSR) is an integral
part of Ranbaxy’s business strategy. The Company
does not view its success and achievements in
terms of commercial gains only, but firmly believes
that CSR is the key towards enhancing the deep
symbiotic relationship that exists between the
Company and the environment it works in.
To meet its social objectives in the fields of health,
Ranbaxy created the Ranbaxy Community
Healthcare Society (RCHS) in 1994, with an aim to
promote social development. The Company has so
far not only made significant contributions towards
improving the life of disadvantaged people,
communities and the environment, but most
importantly, is also recognized as being a
responsible corporate citizen for its concern
towards society. The activities and achievements of
RCHS during the year are given below :
Ranbaxy Community Healthcare Society (RCHS)
The main objective of the RCHS program is to
deliver comprehensive healthcare to the
underprivileged sections of society, to enhance
their health and support ‘Health for All,’ a national
objective.
RCHS operates mobile healthcare vans in the states
of Punjab, Haryana, Himachal Pradesh and Madhya
Pradesh, and an Urban Family Planning Center in
Delhi, in India, all manned by its full-time doctors
and paramedics. They undertake preventive,
promotive and curative checks, supported by field
laboratory and referral services. The focus is on
maternal child health, family planning, health
education and reproductive health, including AIDS
awareness.
During 2004, RCHS continued to provide
integrated healthcare to the community in and
around the Company's facilities. The population
covered is over 200,000 people.
Under its care, the percentage of completely
immunized children (age group 1-2 years),
increased from 61.2% in 1998, to 93.6% in 2004,
and those covered for Vitamin A prophylaxis to
prevent nutritional blindness, also increased from
Publications
Corporate Communications also develops various
collaterals aimed at brand building amongst
targeted audiences. During the year, all its
publications, namely Together Ahead – the internal
newsletter, Ranbaxy World – the external
newsletter and the Annual Report, were further
enhanced in terms of content and design.
Together Ahead was expanded to a 20 page
magazine, providing adequate representation to all
sections of the growing Ranbaxy family. New
columns and special supplements were also
introduced, keeping the readers interest in mind.
The Annual Report 2003, a combination of the
balance sheet and the Company brochure, was well
received by its stakeholders.
Corporate Identity and Brand Building
Brand building across global markets assumes
greater significance with each passing day.
Standardized presentations and audiovisuals helped
to portray a uniform face of Ranbaxy across
multiple markets. Corporate Communications
extended its support to all internal customers,
enabling them to leverage the strength of the
Corporate Brand.
An ongoing exercise of aligning the Corporate
Identity of the Company in various markets was
undertaken to ensure uniform identity. These
initiatives included India, USA, Spain and Portugal.
Various delegations comprising key customers, key
59.6% in 1998, to 93.4% in 2004. Eligible couples
practising family planning rose from 56% in 1998,
to 76.9% in 2004, while delivered cases protected
with Tetanus Toxoid, increased from 79.5% in
1998, to 100% in 2004. Malnourished children (age
group 0-1 years), declined from 37.6% in 1998, to
13% in 2004.
General Health Profile
The predominant causes of infant and maternal
mortality as identified in RCHS areas were found to
be low birth pneumonia, birth asphyxia /
hypothermia, anemia in pregnancy and obstetrical
emergencies like hemorrhage. Specific
interventions implemented by RCHS for tackling
such myriad health problems proved to be very
rewarding.
The number of births and infant / maternal deaths
was seen to decline progressively; The 1998 birth
rate was 23/1000 populations, which fell to 17.3 in
2004, due to more couples practising family
planning methods. The 1998 infant mortality rate
dropped from 44.5/1000 live births, to 19.6 in
2004, while the maternal mortality rate reduced
from 4.5/1000 live births in 1998, to 1.8 in 2004,
due to the improved health status and greater
health consciousness of the community.
This speaks volumes about the availability,
utilization and effectiveness of RCHS services.
RCHS health teams also worked with community-
based local groups to promote community
involvement and self-sustainability.
Alongside, RCHS implemented several projects on
reproductive child health and family welfare, in
specific underserved areas of district Dewas
(Madhya Pradesh), Roopnagar (Punjab) and Delhi.
It also partnered with NGOs like the Population
Foundation of India (PFI) and the Society For
Service To Voluntary Agencies (SOSVA) other
NGOs and the Delhi Government on programs of
common interest.
Further RCHS took active part in all major national
health campaigns like the National Pulse Polio
Immunization drive, by holding rallies, and
administering 28,700 doses of Pulse Polio. RCHS
also participated actively in other national health
campaigns on safe motherhood, nutrition, breast-
feeding and population education programs,
including No Scalpel Vasectomy (NSV) camps, in
conjunction with the government and other NGOs,
contributing significantly to their success.
Welfare and Community Development
In addition to the RCHS initiatives during the year,
other welfare activities around our facilities in
Mohali, Toansa in Punjab; Paonta Sahib in
Himachal Pradesh and Dewas in Madhya Pradesh
were also carried out.
81
Corporate Affairs, Global Corporate Communications & CSRRanbaxy Laboratories Limited Annual Report 2004
At Toansa village, Ranbaxy addressed the water
problem by providing drinking water to 70
neighboring families through the water supply from
its factory premises, and by organizing additional
borewell facilities, and a network of water supply
pipes for another 50 families. The village was also
provided with adequate street lights and a cluster of
community toilets. The Company also undertook
renovation of the local temples and the school.
At Mohali, several contributions were made to
improve conditions for senior citizens, villagers and
children. Provision of first aid kits, steel almirahs,
ceiling fans, electrical fittings, study materials,
scholarships and other contributions in kind, were
also made to government schools and medical
dispensaries of nearby villages.
At Paonta Sahib, the drinking water project
initiated by the Company at village Kedarpur,
addressed the long standing water problems of over
500 villagers. Ranbaxy has set up an independent
borewell and a water supply network for all houses
in the village. A co-operative society by the name of
‘Kedarpur Gram Vikas Kalyan Samiti’ has also been
formed, which will be responsible for the welfare
and upliftment of the village.
Similarly a water tank has also been provided at the
Kedarpur primary school to ensure that students do
not face any drinking water problems. In addition,
the school infrastructure is also being developed
further to create a playground by using land fill.
Expressing its concern for the environment, the
Company was also engaged in a tree-planting
exercise at the school and in the village. 500 tree
guards were also provided to an NGO based in
Nahan, in Himachal Pradesh.
RCHS services were extended from 7 to 11 villages
during the year. The Company participated in the
health fair in Nahan and also organized an eye
check-up camp.
At Dewas, significant contributions were made
towards the construction of a 16-bed Police
Hospital, which will provide healthcare services to
the families of the policemen.
RCHS services were extended to more than 30
villages in the area and special programs for the
assessment and control of diabetes were carried out
in addition to the programs on education and
awareness on methods for population control.
Values First
The Human Resources function continued its initiatives to develop human capital. There was a renewed emphasis on building a value-based organization.
The Ranbaxy Code of Conduct, which focuses on ethical conduct at work, was launched as a formalized process during the year, through workshops. Employees are being further trained as facilitators to continue the value-building initiative across geographies.
Ranbaxy’s Core Values have also been embedded into the Company's Global Recruitment Process, a standardized and scientific methodology to ensure that the talent joining the organization is aligned to its values.
Talent Development
The focus on talent acquisition and development continued across Ranbaxy in 2004. Inducting and promoting high-caliber individuals, has strengthened management teams in various functions of the organization. A structured approach for people development was undertaken through regional training initiatives. Programs addressing functional and leadership competencies were developed and
Human Resources
Enabling innovation by
empowering minds
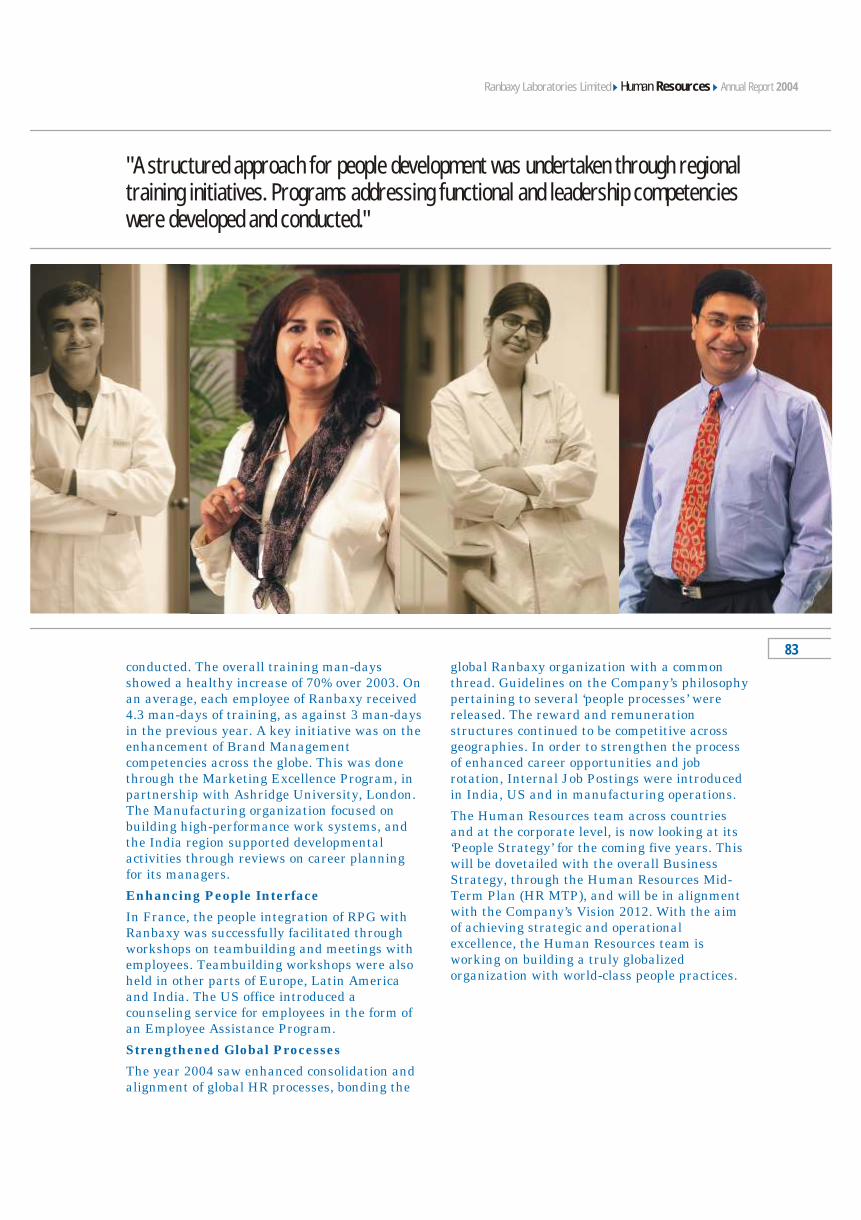
Annual Report 2004
"A structured approach for people development was undertaken through regional training initiatives. Programs addressing functional and leadership competencies were developed and conducted."
83
Human ResourcesRanbaxy Laboratories Limited
conducted. The overall training man-days showed a healthy increase of 70% over 2003. On an average, each employee of Ranbaxy received 4.3 man-days of training, as against 3 man-days in the previous year. A key initiative was on the enhancement of Brand Management competencies across the globe. This was done through the Marketing Excellence Program, in partnership with Ashridge University, London. The Manufacturing organization focused on building high-performance work systems, and the India region supported developmental activities through reviews on career planning for its managers.
Enhancing People Interface
In France, the people integration of RPG with Ranbaxy was successfully facilitated through workshops on teambuilding and meetings with employees. Teambuilding workshops were also held in other parts of Europe, Latin America and India. The US office introduced a counseling service for employees in the form of an Employee Assistance Program.
Strengthened Global Processes
The year 2004 saw enhanced consolidation and alignment of global HR processes, bonding the
global Ranbaxy organization with a common thread. Guidelines on the Company’s philosophy pertaining to several ‘people processes’ were released. The reward and remuneration structures continued to be competitive across geographies. In order to strengthen the process of enhanced career opportunities and job rotation, Internal Job Postings were introduced in India, US and in manufacturing operations.
The Human Resources team across countries and at the corporate level, is now looking at its ‘People Strategy’ for the coming five years. This will be dovetailed with the overall Business Strategy, through the Human Resources Mid-Term Plan (HR MTP), and will be in alignment with the Company’s Vision 2012. With the aim of achieving strategic and operational excellence, the Human Resources team is working on building a truly globalized organization with world-class people practices.

Ranbaxy is one of the largest ANDA filers with the US FDA. It has a cumulative basket of around 150 product filings in the US – the world’s largest and most stringent pharma market. By 2007, this market will constitute around 50% of the Company’s business.
Annual Report 2004Ranbaxy Laboratories Limited
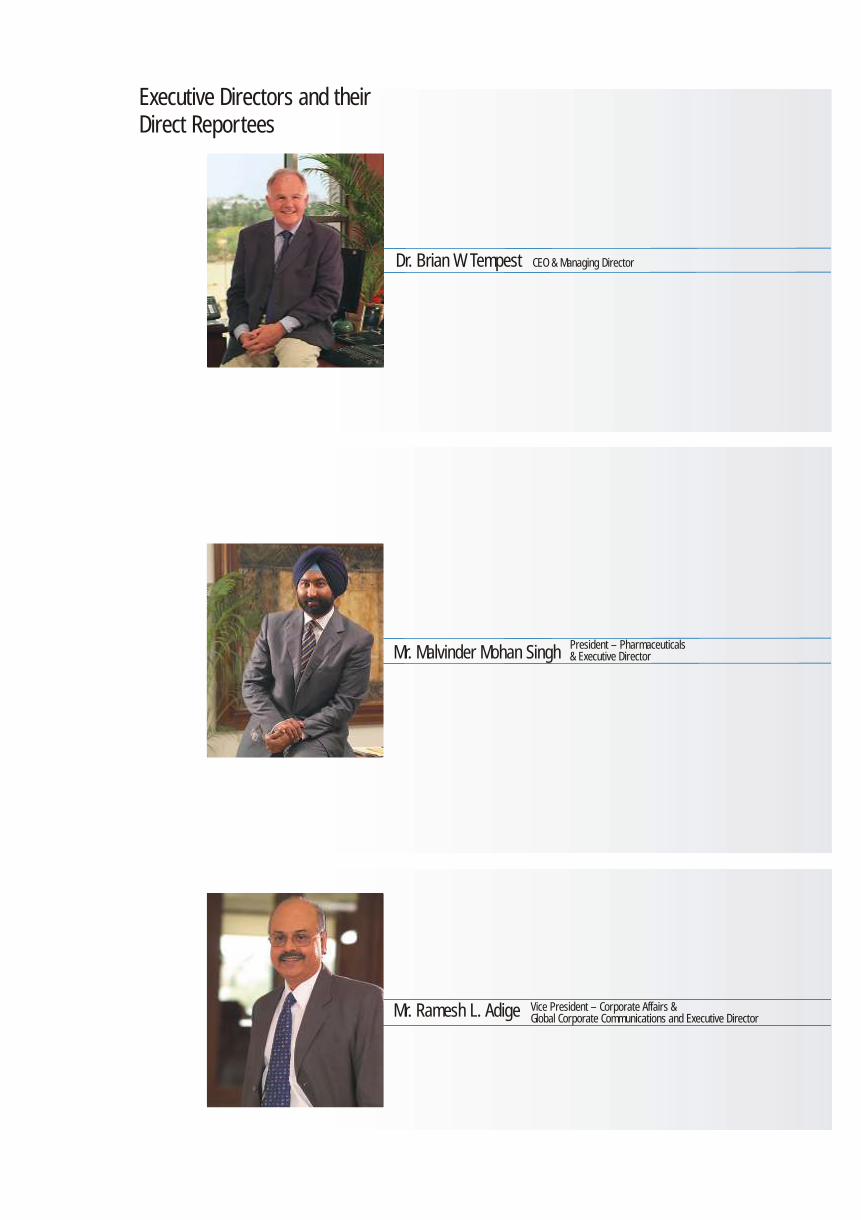
President – Pharmaceuticals & Executive Director
Dr. Brian W. Tempest CEO & Managing Director
Executive Directors and theirDirect Reportees
Mr. Ramesh L. Adige Vice President – Corporate Affairs & Global Corporate Communications and Executive Director
Mr. Malvinder Mohan Singh
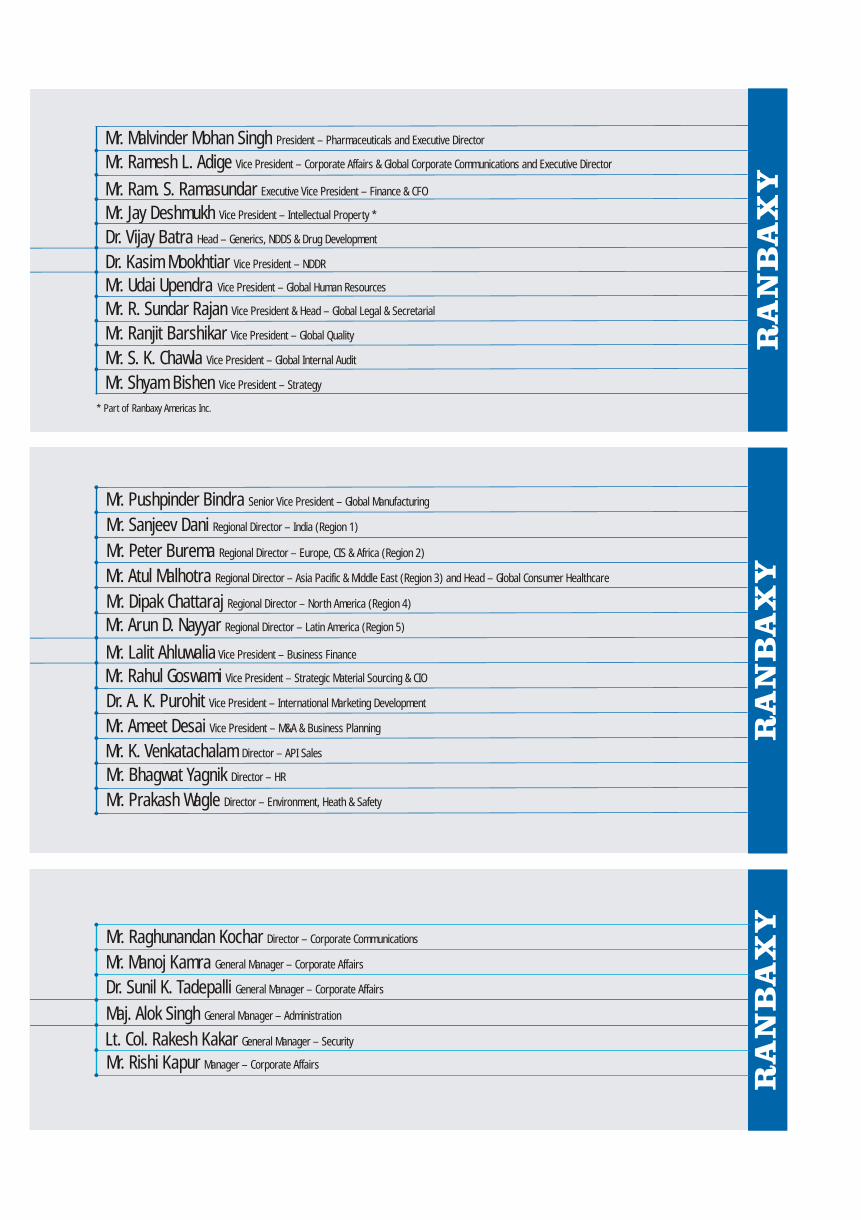
* Part of Ranbaxy Americas Inc.
Mr. Rahul Goswami Vice President – Strategic Material Sourcing & CIO
Mr. Peter Burema Regional Director – Europe, CIS & Africa (Region 2)
Mr. Lalit Ahluwalia Vice President – Business Finance
Mr. Atul Malhotra Regional Director – Asia Pacific & Middle East (Region 3) and Head – Global Consumer Healthcare
Dr. A. K. Purohit Vice President – International Marketing Development
Mr. Arun D. Nayyar Regional Director – Latin America (Region 5)
Mr. Prakash Wagle Director – Environment, Heath & Safety
Mr. K. Venkatachalam Director – API Sales
Mr. Bhagwat Yagnik Director – HR
Mr. Pushpinder Bindra Senior Vice President – Global Manufacturing
Mr. Malvinder Mohan Singh President – Pharmaceuticals and Executive Director
Mr. Ram. S. Ramasundar Executive Vice President – Finance & CFO
Mr. Ramesh L. Adige Vice President – Corporate Affairs & Global Corporate Communications and Executive Director
Mr. R. Sundar Rajan Vice President & Head – Global Legal & Secretarial
Mr. Ranjit Barshikar Vice President – Global Quality
Mr. Udai Upendra Vice President – Global Human Resources
Dr. Kasim Mookhtiar Vice President – NDDR
Dr. Vijay Batra Head – Generics, NDDS & Drug Development
Mr. S. K. Chawla Vice President – Global Internal Audit
Mr. Shyam Bishen Vice President – Strategy
Lt. Col. Rakesh Kakar General Manager – Security
Mr. Rishi Kapur Manager – Corporate Affairs
Maj. Alok Singh General Manager – Administration
Mr. Manoj Kamra General Manager – Corporate Affairs
Mr. Raghunandan Kochar Director – Corporate Communications
Dr. Sunil K. Tadepalli General Manager – Corporate Affairs
Mr. Jay Deshmukh Vice President – Intellectual Property *
Mr. Sanjeev Dani Regional Director – India (Region 1)
Mr. Ameet Desai Vice President – M&A & Business Planning
Mr. Dipak Chattaraj Regional Director – North America (Region 4)
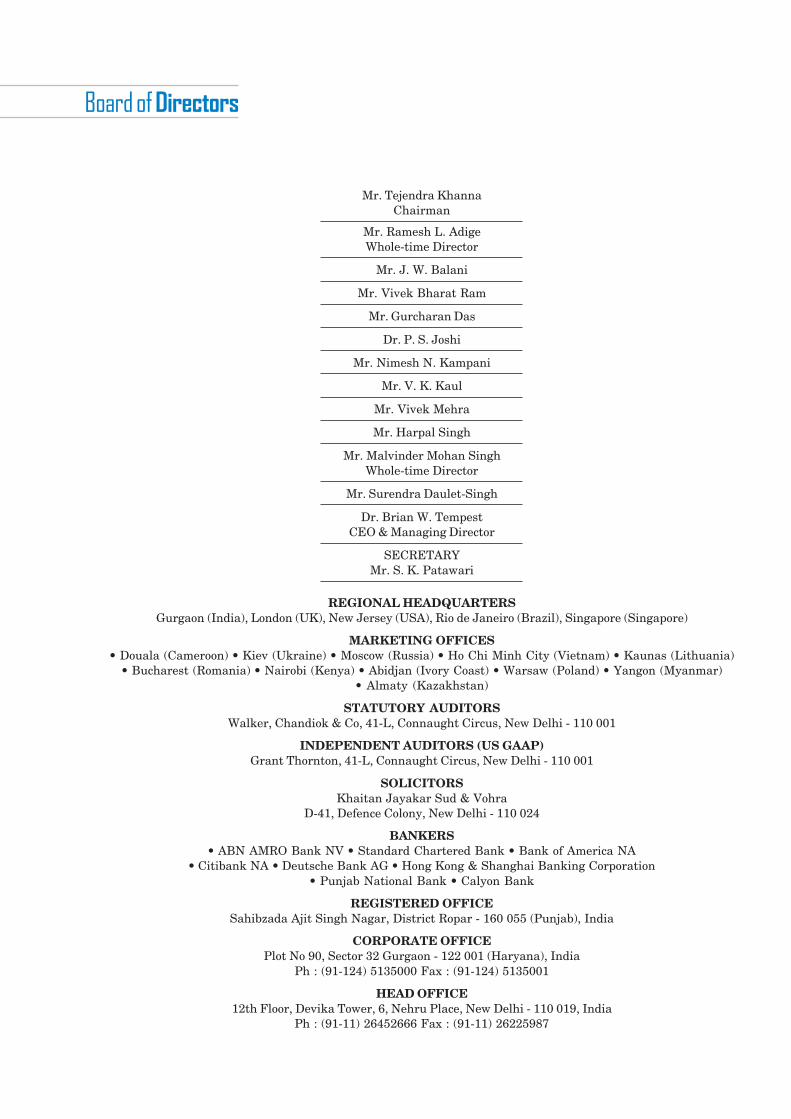
Mr. Tejendra KhannaChairman
Mr. Ramesh L. AdigeWhole-time Director
Mr. J. W. Balani
Mr. Vivek Bharat Ram
Mr. Gurcharan Das
Dr. P. S. Joshi
Mr. Nimesh N. Kampani
Mr. V. K. Kaul
Mr. Vivek Mehra
Mr. Harpal Singh
Mr. Malvinder Mohan SinghWhole-time Director
Mr. Surendra Daulet-Singh
Dr. Brian W. TempestCEO & Managing Director
SECRETARYMr. S. K. Patawari
REGIONAL HEADQUARTERSGurgaon (India), London (UK), New Jersey (USA), Rio de Janeiro (Brazil), Singapore (Singapore)
MARKETING OFFICES� Douala (Cameroon) � Kiev (Ukraine) � Moscow (Russia) � Ho Chi Minh City (Vietnam) � Kaunas (Lithuania)
� Bucharest (Romania) � Nairobi (Kenya) � Abidjan (Ivory Coast) � Warsaw (Poland) � Yangon (Myanmar)� Almaty (Kazakhstan)
STATUTORY AUDITORSWalker, Chandiok & Co, 41-L, Connaught Circus, New Delhi - 110 001
INDEPENDENT AUDITORS (US GAAP)Grant Thornton, 41-L, Connaught Circus, New Delhi - 110 001
SOLICITORSKhaitan Jayakar Sud & Vohra
D-41, Defence Colony, New Delhi - 110 024
BANKERS� ABN AMRO Bank NV � Standard Chartered Bank � Bank of America NA
� Citibank NA � Deutsche Bank AG � Hong Kong & Shanghai Banking Corporation� Punjab National Bank � Calyon Bank
REGISTERED OFFICESahibzada Ajit Singh Nagar, District Ropar - 160 055 (Punjab), India
CORPORATE OFFICEPlot No 90, Sector 32 Gurgaon - 122 001 (Haryana), India
Ph : (91-124) 5135000 Fax : (91-124) 5135001
HEAD OFFICE12th Floor, Devika Tower, 6, Nehru Place, New Delhi - 110 019, India
Ph : (91-11) 26452666 Fax : (91-11) 26225987
������������������
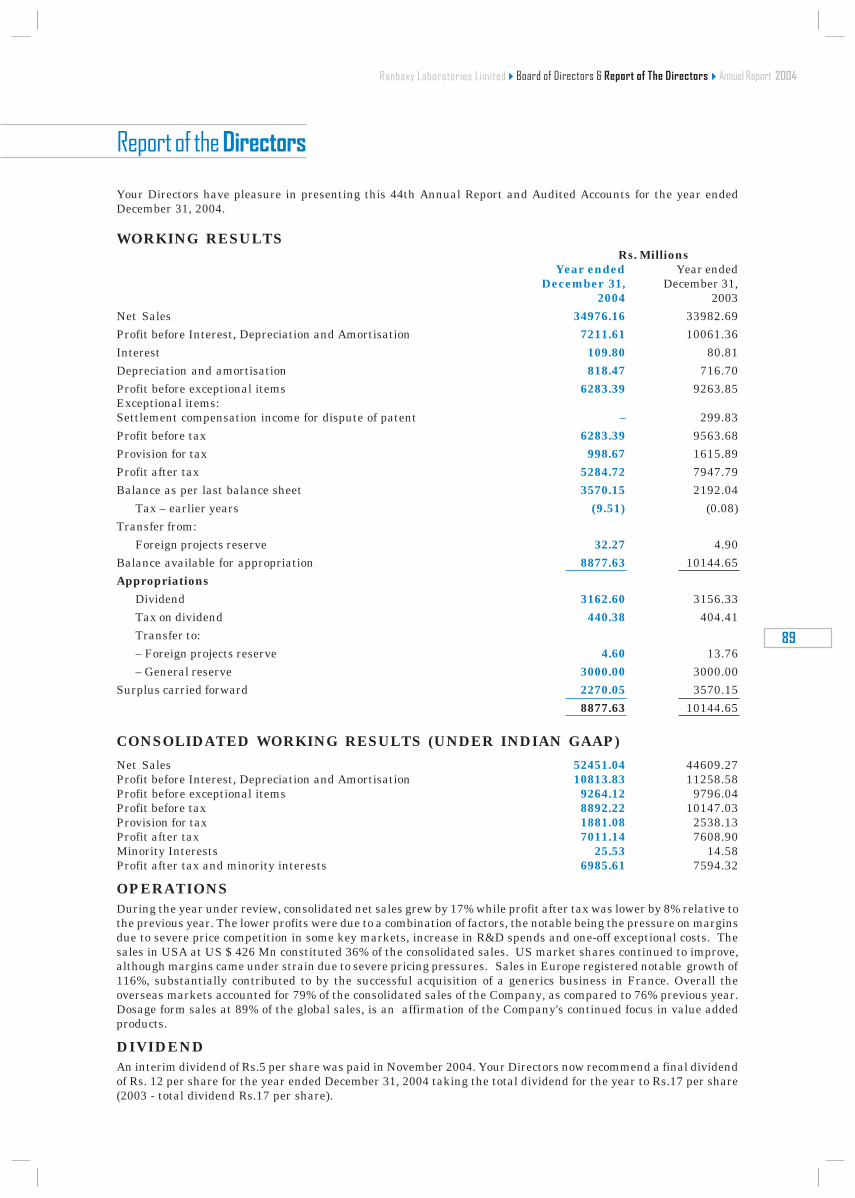
89
Annual Report 2004
Your Directors have pleasure in presenting this 44th Annual Report and Audited Accounts for the year endedDecember 31, 2004.
WORKING RESULTSRs. Millions
Year ended Year endedDecember 31, December 31,
2004 2003Net Sales 34976.16 33982.69Profit before Interest, Depreciation and Amortisation 7211.61 10061.36Interest 109.80 80.81Depreciation and amortisation 818.47 716.70Profit before exceptional items 6283.39 9263.85Exceptional items:Settlement compensation income for dispute of patent – 299.83Profit before tax 6283.39 9563.68Provision for tax 998.67 1615.89Profit after tax 5284.72 7947.79Balance as per last balance sheet 3570.15 2192.04
Tax – earlier years (9.51) (0.08)Transfer from:
Foreign projects reserve 32.27 4.90Balance available for appropriation 8877.63 10144.65Appropriations
Dividend 3162.60 3156.33Tax on dividend 440.38 404.41Transfer to:– Foreign projects reserve 4.60 13.76– General reserve 3000.00 3000.00
Surplus carried forward 2270.05 3570.158877.63 10144.65
CONSOLIDATED WORKING RESULTS (UNDER INDIAN GAAP)
Net Sales 52451.04 44609.27Profit before Interest, Depreciation and Amortisation 10813.83 11258.58Profit before exceptional items 9264.12 9796.04Profit before tax 8892.22 10147.03Provision for tax 1881.08 2538.13Profit after tax 7011.14 7608.90Minority Interests 25.53 14.58Profit after tax and minority interests 6985.61 7594.32
OPERATIONSDuring the year under review, consolidated net sales grew by 17% while profit after tax was lower by 8% relative tothe previous year. The lower profits were due to a combination of factors, the notable being the pressure on marginsdue to severe price competition in some key markets, increase in R&D spends and one-off exceptional costs. Thesales in USA at US $ 426 Mn constituted 36% of the consolidated sales. US market shares continued to improve,although margins came under strain due to severe pricing pressures. Sales in Europe registered notable growth of116%, substantially contributed to by the successful acquisition of a generics business in France. Overall theoverseas markets accounted for 79% of the consolidated sales of the Company, as compared to 76% previous year.Dosage form sales at 89% of the global sales, is an affirmation of the Company's continued focus in value addedproducts.
DIVIDENDAn interim dividend of Rs.5 per share was paid in November 2004. Your Directors now recommend a final dividendof Rs. 12 per share for the year ended December 31, 2004 taking the total dividend for the year to Rs.17 per share(2003 - total dividend Rs.17 per share).
Board of Directors & Report of The DirectorsRanbaxy Laboratories Limited
Report of the Directors
CHANGES IN CAPITAL STRUCTURE(i) Sub-Division of Equity Shares
Your Directors recommend sub-division of Equity Shares of Rs.10 each into Equity Shares of Rs.5 each andconsequential amendments in the Memorandum & Articles of Association of the Company. The proposed sub-division of the Equity Shares into shares of smaller denomination as aforesaid would make the Equity Sharesof the Company more affordable to the small investors and would enhance the liquidity of shares on the StockExchanges.
ii. Issue of shares on exercise of Employees Stock OptionsThe Company allotted Equity Shares (on pari-passu basis) pursuant to exercise of stock options by the eligibleemployees as summarised below:Date of Allotment No. of SharesJuly 9, 2004 132,614October 11, 2004 59,602January 10, 2005 93,068April 11, 2005 111,710
CONSOLIDATED FINANCIAL STATEMENTSAudited Consolidated Financial Statements for the year ended December 31, 2004 under Indian GAAP and USGAAP form part of the Annual Report.
SUBSIDIARIES AND JOINT VENTURESSome of the significant developments during the year in respect of subsidiary companies are as follows :
i) The acquisition of RPG Aventis SA, France was completed and the business was successfully integrated.RPG Aventis has since been renamed as Ranbaxy Pharmacie Generiques SAS.
ii) In line with our strategy to establish a ground presence in the key European markets, Laboratorios RanbaxySL was incorporated in Barcelona, Spain as a wholly owned subsidiary of Ranbaxy Netherlands BV. Itscommercial operations have commenced.
iii) The Company has further expanded its grounded presence in Europe and Ranbaxy Portugal was incorporatedin Portugal as a wholly owned subsidiary of Ranbaxy Netherlands BV.
iv) Ranbaxy Australia Pty Ltd was set up in Sydney, Australia as a wholly owned subsidiary of RanbaxyNetherlands BV. Australia offers a good opportunity for generic companies.
v) With a view to enhance our business and distribution network in Russia, ZAO Ranbaxy was incorporated inMoscow, Russia as a wholly owned subsidiary of Ranbaxy Netherlands BV. Its commercial operations havenow commenced.
MANAGEMENT DISCUSSION AND ANALYSIS REPORTManagement Discussion and Analysis Report as required under the Listing Agreements with Stock Exchanges isenclosed at Annexure 'A'.
EMPLOYEES’ STOCK OPTION SCHEMEInformation regarding the Employees Stock Option Scheme is enclosed at Annexure 'B'.
LISTING AT STOCK EXCHANGEPursuant to the delisting applications of the Company, the Stock Exchanges at Ludhiana and Kolkata have delistedthe Equity Shares of the Company.The Equity Shares of the Company continue to be listed on The Stock Exchange, Mumbai and The National StockExchange. The annual listing fees for the year 2004-2005 have been paid to these Exchanges.
DISCLOSURE OF PARTICULARSAs required by the Companies (Disclosure of Particulars in the Report of Board of Directors) Rules 1988, therelevant information and data is given at Annexure 'C'.
FIXED DEPOSITSThe Company neither accepted nor renewed any fixed deposits from the public during the year. In respect of existingdeposits that were due for repayment during the year under review, no deposits remained unclaimed.
DIRECTORS’ RESPONSIBILITY STATEMENTIn terms of provisions of Section 217(2AA) of the Companies Act, 1956, (Act) your Directors confirm that :
(i) In the preparation of the annual accounts, the applicable accounting standards have been followed, alongwith proper explanation relating to material departures, wherever applicable.
(ii) The Directors have selected such accounting policies and applied them consistently and made judgements
91
Annual Report 2004
and estimates that are reasonable and prudent so as to give a true and fair view of the state of affairs of theCompany as at the end of the accounting year and of the profit of the Company for that period.
(iii) The Directors have taken proper and sufficient care for the maintenance of adequate accounting records inaccordance with the provisions of this Act for safeguarding the assets of the Company and for preventing anddetecting fraud and other irregularities.
(iv) The Directors have prepared the annual accounts on a going concern basis.
DIRECTORSMr. Ramesh L. Adige, Vice President-Corporate Affairs & Global Corporate Communications of the Company wasappointed as an Additional Director of the Company effective January 18, 2005. The Board also appointed Mr.Adige as Whole-time Director effective January 18, 2005 for a period of five years subject to superannuation policyof the Company. The Company has received a notice alongwith requisite fee from a member under Section 257 of theCompanies Act, 1956 proposing the candidature of Mr. Adige as a Director of the Company. Requisite approval ofshareholders for his appointment and payment of remuneration is being sought at the ensuing Annual GeneralMeeting.In accordance with the Articles of Association of the Company, Dr. P.S. Joshi, Mr. Surendra Daulet-Singh andMr. J.W. Balani retire by rotation as Directors at the ensuing Annual General Meeting and are eligible for re-appointment.
COST AUDITThe reports of M/s R.J. Goel & Co., Cost Accountants, in respect of audit of the cost accounts of the pharmaceuticalsubstances and dosage forms units of the Company for the year ended December 31, 2004 will be submitted to theCentral Government in due course.
AUDITORSM/s Walker, Chandiok & Co., Chartered Accountants, retire as Auditors of the Company at the conclusion of theensuing Annual General Meeting and have confirmed their eligibility and willingness to accept the office of theAuditors, if re-appointed.
PARTICULARS OF EMPLOYEESAs required under Section 217(2A) of the Companies Act, 1956 and Rules framed thereunder, the names and otherparticulars of employees receiving remuneration above the prescribed threshold are set out in the annexure appendedto this Report.
ACKNOWLEDGEMENTSYour Directors commend the commitment and dedication of the employees at all levels that has contributed to thegrowth and success of the Company. The Directors would also like to thank all other stakeholders includingbankers and other business associates who have continued to provide support and encouragement. The members ofthe medical profession in India and abroad have shown their sustained confidence in the quality and efficacy of yourCompany's ethical therapeutic products. This has understandably, been critical for the Company's success. TheDirectors look forward to their continued support in the years to come.
On behalf of the Board of Directors
New Delhi (TEJENDRA KHANNA)Dated : May 11, 2005 CHAIRMAN
Report of The DirectorsRanbaxy Laboratories Limited
ANNEXURE A
MANAGEMENT DISCUSSION AND ANALYSIS REPORT
INDUSTRY STRUCTURE & DEVELOPMENTS
The Global Pharmaceutical market sales grew by 7% to reach US$550 billion with North America, Europe andJapan accounting for 88% of the audited worldwide pharmaceutical sales in 2004.
The North American pharmaceutical sales grew by 8% to reach US$248 billion, constituting 45% of all global salesin 2004.
Sales in the European Union grew by 6% to reach US$ 144 billion, constituting 26% of the total market, while theRest of Europe saw a sales growth of 12% to reach US$ 9 billion.
Japan grew by just 2% to reach US$ 58 billion, constituting 11% of the total world market.
Sales in Latin America grew by 13% to reach US$ 19 billion and pharmaceutical sales in Asia, Africa & Australiagrew by 13 % to reach US$ 40 billion. China showed the strongest growth in 2004, growing by 28% to reach US$ 9.5billion. (Source: IMS Health)
There were 82 products with sales of over US$ 1 Billion, 17 more than in 2003.The top two were cholesterol lowerers,Pfizer's Atorvastatin (Lipitor, US$ 12 billion) followed by Merck & Co's Simvastatin , (Zocor, US$ 5.9 billion).
Therapeutic classes
Cholesterol and triglyceride reducers continued to hold the number - one position in therapeutic classes worldwide,with sales of US$ 30 billion, up 12%.
Antiulcerants remained the second largest therapy class, growing 1% to US$ 25 billion, with growth slowed by thetransfer of Prilosec to over- the counter status in the United States.
In 2004, the anti-cancer class grew significantly, overtaking antidepressants and mood stabilisers as the third-ranked therapy class. Sales for anti-cancer products grew 17% to reach US$ 24 billion.
Generics
The rise in use of generics continued through 2004. Generics made up more than 30% of pharma volume in the US,Germany, Canada and the UK (Source : IMS Health). The global generic market in 2004 is estimated to be aroundUS$ 54.2 billion. With cost-containment a focus for all healthcare players and a number of medicines losing patentprotection, the growth of the generics market is outpacing the branded sector.
The Indian Pharmaceutical Market continues to be highly competitive and fragmented with about 24,000players. The size of the Indian market was estimated to be at US$ 4.6 billion in 2004 having grown by 6.4 % overlast year. The Indian pharmaceutical market ranks 4th largest in terms of volume and 13th largest in terms ofvalue, reflecting substantial lower price realisations.
Around 330 firms in this industry are in the organized sector, 15000 being in the small-scale sector and theremaining being very small without any economies of scale. More than 85% of the formulations produced in thecountry are sold in the domestic market. India is largely self-sufficient in case of formulations. India manufacturesover 400 bulk drugs and around 60,000 formulations being distributed by 500,000 chemists all over the country.
Key developments in the Indian Pharmaceutical Sector include:
• New products launched in 2004 were a major growth driver and accounted for around 31% of the overallmarket growth.
• There continued to be intense price competition with the average realizations declining by around 0.2 %, in2004.
• The chronic therapy segment continues to grow and was 28% of the total market as compared to 26 % in2003.This segment mainly includes Anti diabetics, Cardiac and Neuro psychiatry.
OUTLOOK ON OPPORTUNITIESThe outlook for the global generic drug industry is positive with patent expirations of several brand drugs over thenext few years. We estimate that around US$ 68 Billion of branded pharmaceuticals are coming off patent protectionover the next five years.
Increasing pressure from Governments and Healthcare providers across the globe to bring down healthcare costs,will ensure a conducive environment for growth of generics.
Ranbaxy is well poised to participate in this opportunity. The Company is selling its products in over 100 countriesand has an expanding international portfolio of affiliates, joint ventures and alliances, ground operations in 44countries and manufacturing operations in 7 countries.
93
Annual Report 2004
It has a robust product pipeline and cumulative Abbreviated New Drug Applications (ANDAs) filed in the USA, asat 31st December 2004 were 146, with cumulative approvals of 96. In 2004, Ranbaxy significantly increased itsregulatory filings in the European Union and made 39 National filings for 25 products in 11 EU Reference MemberStates and 71 Mutual Recognition Procedure applications for 6 products in 21 EU Concerned Member States.
Outlook on the Indian Pharma market is positive. With the introduction of the product patent regime beginning Jan1st 2005, the Indian market will be an attractive option for introduction of research-based products. Ranbaxy, theleading pharmaceutical company in India, is well set to further its growth in the Indian market.
OUTLOOK ON THREATS, RISKS AND CONCERNSThe risks of patent litigation, regulatory issues and product liability are a part of the global generics business,particularly in the developed markets. Ranbaxy has undertaken appropriate processes to regularly review risksand to mitigate to their incidence / impact into the best of its ability.
Globally, generic prices are under pressure from two fronts: Increased competition between generic companies andpharmaceutical price controls, which are gaining popularity all over the world.
We believe that Ranbaxy, with its backward integration and geographical spread, is well positioned to operate inthis highly competitive environment.
In India, the growth rate is expected to be in single digits for the next few years. The chronic segment is likely to bethe main growth driver and is expected to grow at a faster rate than the acute segment. This would requirecompanies in India to re-align their portfolios accordingly.
In the short term, changes in the tax structure with the implementation of VAT and excise based on MRP is likelyto have an impact on the first half of 2005. The recognition of product patents is not expected to have a materialimpact in the near future, however it is likely to slow down the launch of new products by Indian companies.
SEGMENT-WISE PERFORMANCERanbaxy recorded global sales of US$ 1,174 Mn registering a growth of 21% over last year (in US Dollar terms).Dosage form sales constituted 89% of the global sales as compared to 87% last year. The sales in overseas marketconstituted 79% of the total sales of the Company as compared to 76% last year.
INTERNAL CONTROL SYSTEMS AND ADEQUACYThere are well established and documented operating procedures in the Company and its subsidiaries in India andoverseas.
The Internal Audit function at Ranbaxy, headed by a Vice President, reports directly to the CEO and the AuditCommittee. The department consists of a team of well qualified and experienced professionals that conduct regularaudits covering the global operations of the Company and the reports are sent to the CEO and the Audit Committee.
The Finance function is also adequately staffed with professionally qualified and experienced personnel.
FINANCIAL PERFORMANCEFor the year, the Company recorded consolidated global sales of Rs. 53,130 Mn (US$ 1,174 Mn), registering agrowth of 17% over last year. Profit before interest, depreciation and amortization was Rs. 10,814 Mn (US$ 239Mn), lower that prior year by 4%. Profit before tax at Rs. 8,892 (US$ 196 Mn) was lower by 12 % while profit aftertax was Rs. 7,011 Mn (US$ 155 Mn), 8% lower than last year.
HUMAN RESOURCESHuman Resources are a valuable asset at Ranbaxy and the Company seeks to attract and retain the best talentavailable. The Company provides a productive work environment, aims at attracting and retaining talented peoplehaving a high level of functional expertise, focused on customers and who thrive in demanding environment. Trainingand development of its personnel is ensured through succession planning, job rotation, on the job training, trainingprograms and workshops. The total number of training man-days during 2004 were 40412 , a substantial increaseof ~ 70% over prior year, reflecting our commitment towards people development. The total number of employees ofthe Company and its subsidiaries as on December 31, 2004 stood at 9,224.
CAUTIONARY STATEMENT
Statements in the "Management Discussion and Analysis" describing the Company's objectives, estimates, expectationsor projections may be "forward looking statements " within the meaning of applicable laws and regulations. Actualresults could differ materially from those expressed or implied. Important factors that could make a difference to theCompany's operations include Government regulations, patent laws, tax regimes, economic developments within Indiaand countries in which the Company conducts business, litigation and other allied factors.
Report of The DirectorsRanbaxy Laboratories Limited
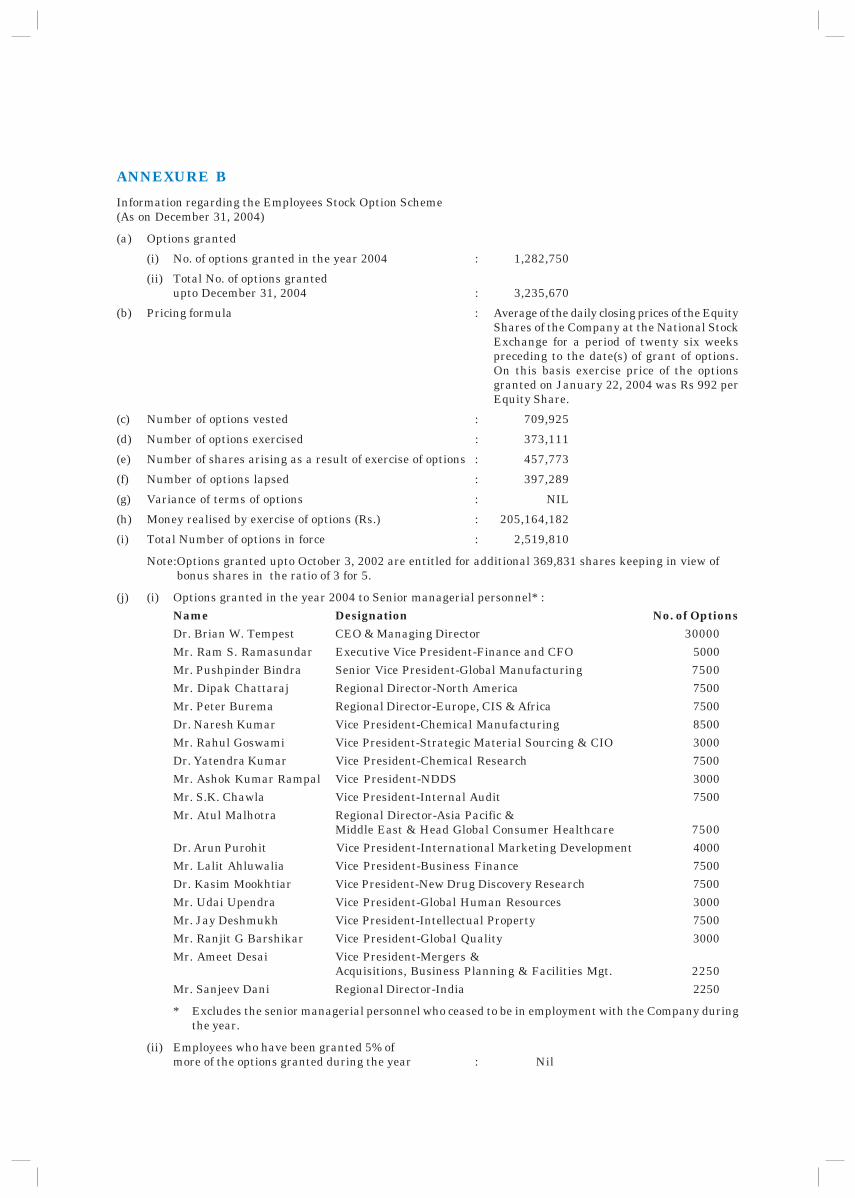
ANNEXURE B
Information regarding the Employees Stock Option Scheme(As on December 31, 2004)
(a) Options granted
(i) No. of options granted in the year 2004 : 1,282,750
(ii) Total No. of options grantedupto December 31, 2004 : 3,235,670
(b) Pricing formula : Average of the daily closing prices of the EquityShares of the Company at the National StockExchange for a period of twenty six weekspreceding to the date(s) of grant of options.On this basis exercise price of the optionsgranted on January 22, 2004 was Rs 992 perEquity Share.
(c) Number of options vested : 709,925
(d) Number of options exercised : 373,111
(e) Number of shares arising as a result of exercise of options : 457,773
(f) Number of options lapsed : 397,289
(g) Variance of terms of options : NIL
(h) Money realised by exercise of options (Rs.) : 205,164,182
(i) Total Number of options in force : 2,519,810
Note:Options granted upto October 3, 2002 are entitled for additional 369,831 shares keeping in view ofbonus shares in the ratio of 3 for 5.
(j) (i) Options granted in the year 2004 to Senior managerial personnel* :Name Designation No. of OptionsDr. Brian W. Tempest CEO & Managing Director 30000Mr. Ram S. Ramasundar Executive Vice President-Finance and CFO 5000Mr. Pushpinder Bindra Senior Vice President-Global Manufacturing 7500Mr. Dipak Chattaraj Regional Director-North America 7500Mr. Peter Burema Regional Director-Europe, CIS & Africa 7500Dr. Naresh Kumar Vice President-Chemical Manufacturing 8500Mr. Rahul Goswami Vice President-Strategic Material Sourcing & CIO 3000Dr. Yatendra Kumar Vice President-Chemical Research 7500Mr. Ashok Kumar Rampal Vice President-NDDS 3000Mr. S.K. Chawla Vice President-Internal Audit 7500Mr. Atul Malhotra Regional Director-Asia Pacific &
Middle East & Head Global Consumer Healthcare 7500Dr. Arun Purohit Vice President-International Marketing Development 4000Mr. Lalit Ahluwalia Vice President-Business Finance 7500Dr. Kasim Mookhtiar Vice President-New Drug Discovery Research 7500Mr. Udai Upendra Vice President-Global Human Resources 3000Mr. Jay Deshmukh Vice President-Intellectual Property 7500Mr. Ranjit G Barshikar Vice President-Global Quality 3000Mr. Ameet Desai Vice President-Mergers &
Acquisitions, Business Planning & Facilities Mgt. 2250Mr. Sanjeev Dani Regional Director-India 2250
* Excludes the senior managerial personnel who ceased to be in employment with the Company duringthe year.
(ii) Employees who have been granted 5% ofmore of the options granted during the year : Nil
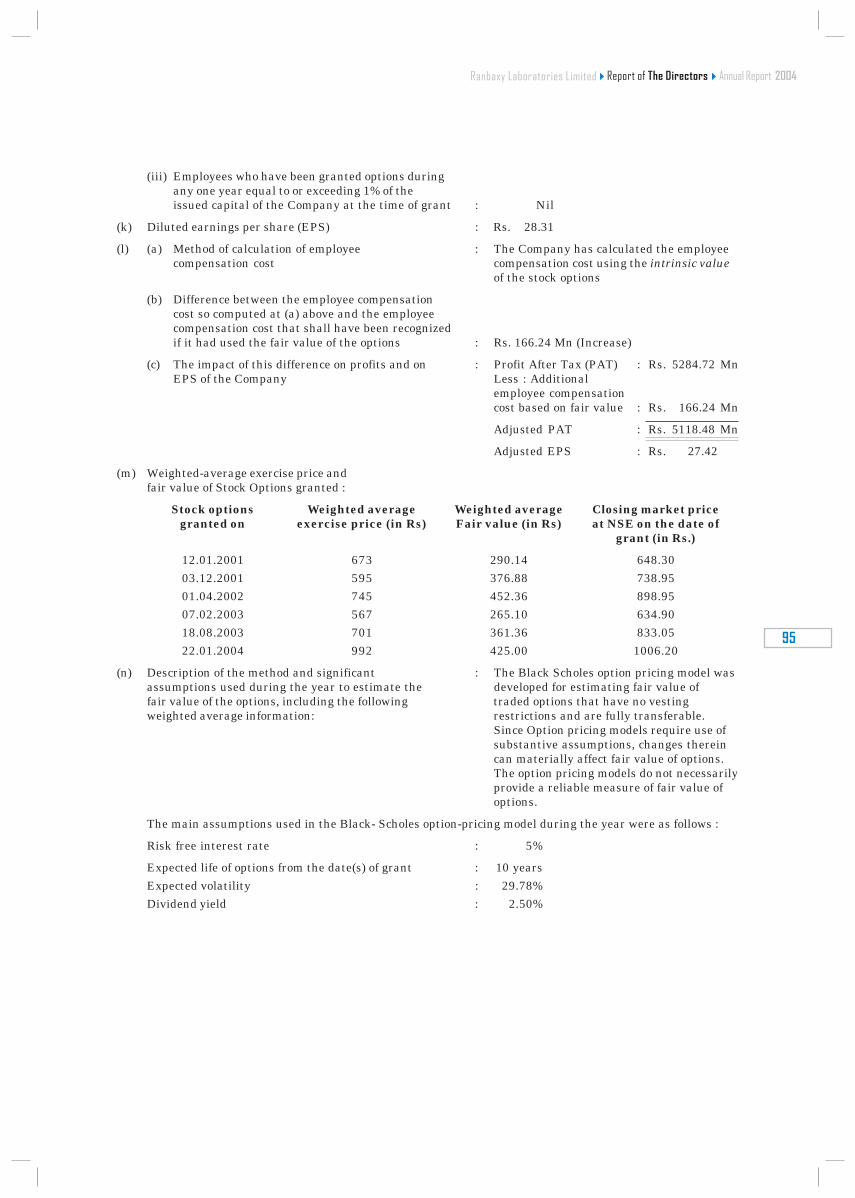
95
Annual Report 2004
(iii) Employees who have been granted options duringany one year equal to or exceeding 1% of theissued capital of the Company at the time of grant : Nil
(k) Diluted earnings per share (EPS) : Rs. 28.31
(l) (a) Method of calculation of employee : The Company has calculated the employeecompensation cost compensation cost using the intrinsic value
of the stock options
(b) Difference between the employee compensationcost so computed at (a) above and the employeecompensation cost that shall have been recognizedif it had used the fair value of the options : Rs. 166.24 Mn (Increase)
(c) The impact of this difference on profits and on : Profit After Tax (PAT) : Rs. 5284.72 MnEPS of the Company Less : Additional
employee compensationcost based on fair value : Rs. 166.24 Mn
Adjusted PAT : Rs. 5118.48 Mn
Adjusted EPS : Rs. 27.42 Ha
(m) Weighted-average exercise price andfair value of Stock Options granted :
Stock options Weighted average Weighted average Closing market pricegranted on exercise price (in Rs) Fair value (in Rs) at NSE on the date of
grant (in Rs.)
12.01.2001 673 290.14 648.3003.12.2001 595 376.88 738.9501.04.2002 745 452.36 898.9507.02.2003 567 265.10 634.9018.08.2003 701 361.36 833.0522.01.2004 992 425.00 1006.20
(n) Description of the method and significant : The Black Scholes option pricing model wasassumptions used during the year to estimate the developed for estimating fair value offair value of the options, including the following traded options that have no vestingweighted average information: restrictions and are fully transferable.
Since Option pricing models require use ofsubstantive assumptions, changes thereincan materially affect fair value of options.The option pricing models do not necessarilyprovide a reliable measure of fair value ofoptions.
The main assumptions used in the Black- Scholes option-pricing model during the year were as follows :
Risk free interest rate : 5%
Expected life of options from the date(s) of grant : 10 yearsExpected volatility : 29.78%Dividend yield : 2.50%
Report of The DirectorsRanbaxy Laboratories Limited
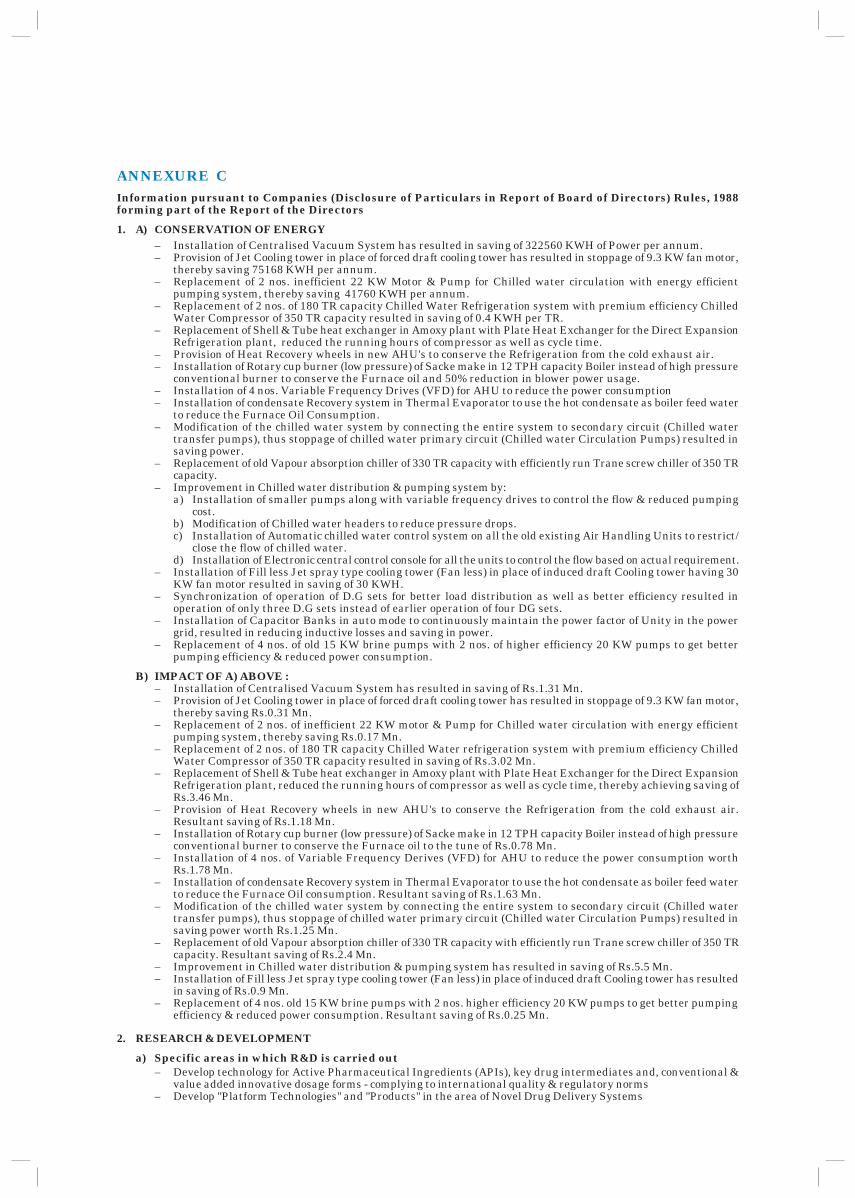
ANNEXURE CInformation pursuant to Companies (Disclosure of Particulars in Report of Board of Directors) Rules, 1988forming part of the Report of the Directors
1. A) CONSERVATION OF ENERGY– Installation of Centralised Vacuum System has resulted in saving of 322560 KWH of Power per annum.– Provision of Jet Cooling tower in place of forced draft cooling tower has resulted in stoppage of 9.3 KW fan motor,
thereby saving 75168 KWH per annum.– Replacement of 2 nos. inefficient 22 KW Motor & Pump for Chilled water circulation with energy efficient
pumping system, thereby saving 41760 KWH per annum.– Replacement of 2 nos. of 180 TR capacity Chilled Water Refrigeration system with premium efficiency Chilled
Water Compressor of 350 TR capacity resulted in saving of 0.4 KWH per TR.– Replacement of Shell & Tube heat exchanger in Amoxy plant with Plate Heat Exchanger for the Direct Expansion
Refrigeration plant, reduced the running hours of compressor as well as cycle time.– Provision of Heat Recovery wheels in new AHU's to conserve the Refrigeration from the cold exhaust air.– Installation of Rotary cup burner (low pressure) of Sacke make in 12 TPH capacity Boiler instead of high pressure
conventional burner to conserve the Furnace oil and 50% reduction in blower power usage.– Installation of 4 nos. Variable Frequency Drives (VFD) for AHU to reduce the power consumption– Installation of condensate Recovery system in Thermal Evaporator to use the hot condensate as boiler feed water
to reduce the Furnace Oil Consumption.– Modification of the chilled water system by connecting the entire system to secondary circuit (Chilled water
transfer pumps), thus stoppage of chilled water primary circuit (Chilled water Circulation Pumps) resulted insaving power.
– Replacement of old Vapour absorption chiller of 330 TR capacity with efficiently run Trane screw chiller of 350 TRcapacity.
– Improvement in Chilled water distribution & pumping system by:a) Installation of smaller pumps along with variable frequency drives to control the flow & reduced pumping
cost.b) Modification of Chilled water headers to reduce pressure drops.c) Installation of Automatic chilled water control system on all the old existing Air Handling Units to restrict/
close the flow of chilled water.d) Installation of Electronic central control console for all the units to control the flow based on actual requirement.
– Installation of Fill less Jet spray type cooling tower (Fan less) in place of induced draft Cooling tower having 30KW fan motor resulted in saving of 30 KWH.
– Synchronization of operation of D.G sets for better load distribution as well as better efficiency resulted inoperation of only three D.G sets instead of earlier operation of four DG sets.
– Installation of Capacitor Banks in auto mode to continuously maintain the power factor of Unity in the powergrid, resulted in reducing inductive losses and saving in power.
– Replacement of 4 nos. of old 15 KW brine pumps with 2 nos. of higher efficiency 20 KW pumps to get betterpumping efficiency & reduced power consumption.
B) IMPACT OF A) ABOVE :– Installation of Centralised Vacuum System has resulted in saving of Rs.1.31 Mn.– Provision of Jet Cooling tower in place of forced draft cooling tower has resulted in stoppage of 9.3 KW fan motor,
thereby saving Rs.0.31 Mn.– Replacement of 2 nos. of inefficient 22 KW motor & Pump for Chilled water circulation with energy efficient
pumping system, thereby saving Rs.0.17 Mn.– Replacement of 2 nos. of 180 TR capacity Chilled Water refrigeration system with premium efficiency Chilled
Water Compressor of 350 TR capacity resulted in saving of Rs.3.02 Mn.– Replacement of Shell & Tube heat exchanger in Amoxy plant with Plate Heat Exchanger for the Direct Expansion
Refrigeration plant, reduced the running hours of compressor as well as cycle time, thereby achieving saving ofRs.3.46 Mn.
– Provision of Heat Recovery wheels in new AHU's to conserve the Refrigeration from the cold exhaust air.Resultant saving of Rs.1.18 Mn.
– Installation of Rotary cup burner (low pressure) of Sacke make in 12 TPH capacity Boiler instead of high pressureconventional burner to conserve the Furnace oil to the tune of Rs.0.78 Mn.
– Installation of 4 nos. of Variable Frequency Derives (VFD) for AHU to reduce the power consumption worthRs.1.78 Mn.
– Installation of condensate Recovery system in Thermal Evaporator to use the hot condensate as boiler feed waterto reduce the Furnace Oil consumption. Resultant saving of Rs.1.63 Mn.
– Modification of the chilled water system by connecting the entire system to secondary circuit (Chilled watertransfer pumps), thus stoppage of chilled water primary circuit (Chilled water Circulation Pumps) resulted insaving power worth Rs.1.25 Mn.
– Replacement of old Vapour absorption chiller of 330 TR capacity with efficiently run Trane screw chiller of 350 TRcapacity. Resultant saving of Rs.2.4 Mn.
– Improvement in Chilled water distribution & pumping system has resulted in saving of Rs.5.5 Mn.– Installation of Fill less Jet spray type cooling tower (Fan less) in place of induced draft Cooling tower has resulted
in saving of Rs.0.9 Mn.– Replacement of 4 nos. old 15 KW brine pumps with 2 nos. higher efficiency 20 KW pumps to get better pumping
efficiency & reduced power consumption. Resultant saving of Rs.0.25 Mn.
2. RESEARCH & DEVELOPMENT
a) Specific areas in which R&D is carried out– Develop technology for Active Pharmaceutical Ingredients (APIs), key drug intermediates and, conventional &
value added innovative dosage forms - complying to international quality & regulatory norms– Develop "Platform Technologies" and "Products" in the area of Novel Drug Delivery Systems
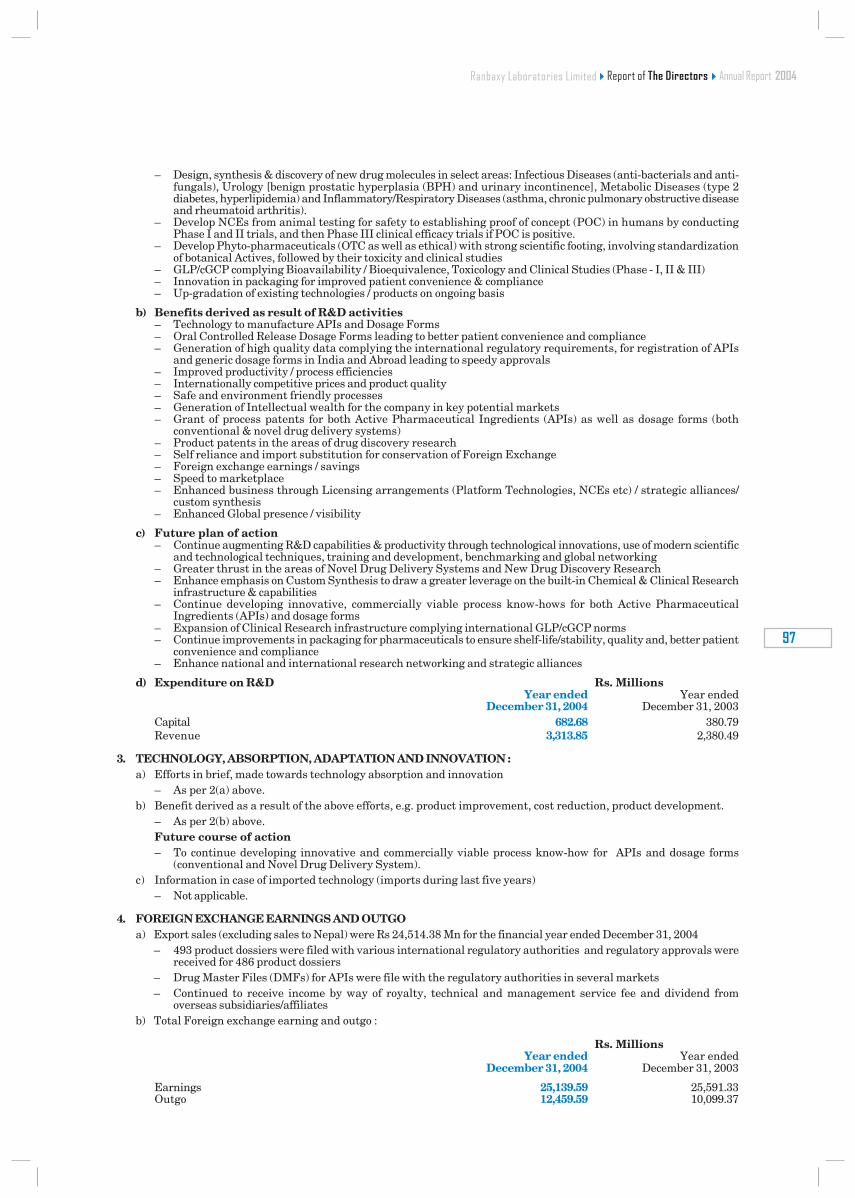
��
����������������
– Design, synthesis & discovery of new drug molecules in select areas: Infectious Diseases (anti-bacterials and anti-fungals), Urology [benign prostatic hyperplasia (BPH) and urinary incontinence], Metabolic Diseases (type 2diabetes, hyperlipidemia) and Inflammatory/Respiratory Diseases (asthma, chronic pulmonary obstructive diseaseand rheumatoid arthritis).
– Develop NCEs from animal testing for safety to establishing proof of concept (POC) in humans by conductingPhase I and II trials, and then Phase III clinical efficacy trials if POC is positive.
– Develop Phyto-pharmaceuticals (OTC as well as ethical) with strong scientific footing, involving standardizationof botanical Actives, followed by their toxicity and clinical studies
– GLP/cGCP complying Bioavailability / Bioequivalence, Toxicology and Clinical Studies (Phase - I, II & III)– Innovation in packaging for improved patient convenience & compliance– Up-gradation of existing technologies / products on ongoing basis
b) Benefits derived as result of R&D activities– Technology to manufacture APIs and Dosage Forms– Oral Controlled Release Dosage Forms leading to better patient convenience and compliance– Generation of high quality data complying the international regulatory requirements, for registration of APIs
and generic dosage forms in India and Abroad leading to speedy approvals– Improved productivity / process efficiencies– Internationally competitive prices and product quality– Safe and environment friendly processes– Generation of Intellectual wealth for the company in key potential markets– Grant of process patents for both Active Pharmaceutical Ingredients (APIs) as well as dosage forms (both
conventional & novel drug delivery systems)– Product patents in the areas of drug discovery research– Self reliance and import substitution for conservation of Foreign Exchange– Foreign exchange earnings / savings– Speed to marketplace– Enhanced business through Licensing arrangements (Platform Technologies, NCEs etc) / strategic alliances/
custom synthesis– Enhanced Global presence / visibility
c) Future plan of action– Continue augmenting R&D capabilities & productivity through technological innovations, use of modern scientific
and technological techniques, training and development, benchmarking and global networking– Greater thrust in the areas of Novel Drug Delivery Systems and New Drug Discovery Research– Enhance emphasis on Custom Synthesis to draw a greater leverage on the built-in Chemical & Clinical Research
infrastructure & capabilities– Continue developing innovative, commercially viable process know-hows for both Active Pharmaceutical
Ingredients (APIs) and dosage forms– Expansion of Clinical Research infrastructure complying international GLP/cGCP norms– Continue improvements in packaging for pharmaceuticals to ensure shelf-life/stability, quality and, better patient
convenience and compliance– Enhance national and international research networking and strategic alliances
d) Expenditure on R&D Rs. MillionsYear ended Year ended
December 31, 2004 December 31, 2003Capital 682.68 380.79Revenue 3,313.85 2,380.49
3. TECHNOLOGY, ABSORPTION, ADAPTATION AND INNOVATION :a) Efforts in brief, made towards technology absorption and innovation
– As per 2(a) above.b) Benefit derived as a result of the above efforts, e.g. product improvement, cost reduction, product development.
– As per 2(b) above.Future course of action– To continue developing innovative and commercially viable process know-how for APIs and dosage forms
(conventional and Novel Drug Delivery System).c) Information in case of imported technology (imports during last five years)
– Not applicable.
4. FOREIGN EXCHANGE EARNINGS AND OUTGOa) Export sales (excluding sales to Nepal) were Rs 24,514.38 Mn for the financial year ended December 31, 2004
– 493 product dossiers were filed with various international regulatory authorities and regulatory approvals werereceived for 486 product dossiers
– Drug Master Files (DMFs) for APIs were file with the regulatory authorities in several markets– Continued to receive income by way of royalty, technical and management service fee and dividend from
overseas subsidiaries/affiliatesb) Total Foreign exchange earning and outgo :
Rs. MillionsYear ended Year ended
December 31, 2004 December 31, 2003
Earnings 25,139.59 25,591.33Outgo 12,459.59 10,099.37
����� ������� ������������������������������
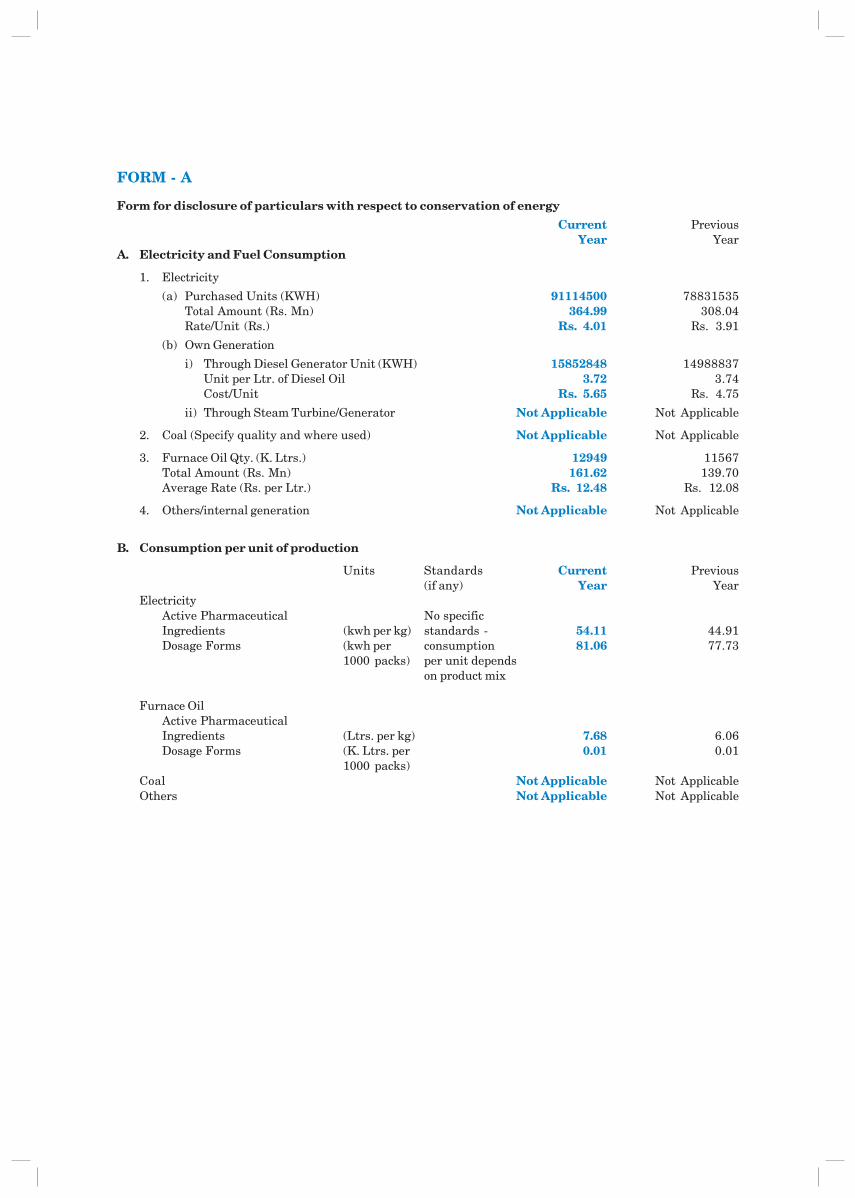
FORM - A
Form for disclosure of particulars with respect to conservation of energy
Current PreviousYear Year
A. Electricity and Fuel Consumption
1. Electricity
(a) Purchased Units (KWH) 91114500 78831535Total Amount (Rs. Mn) 364.99 308.04Rate/Unit (Rs.) Rs. 4.01 Rs. 3.91
(b) Own Generation
i) Through Diesel Generator Unit (KWH) 15852848 14988837Unit per Ltr. of Diesel Oil 3.72 3.74Cost/Unit Rs. 5.65 Rs. 4.75
ii) Through Steam Turbine/Generator Not Applicable Not Applicable
2. Coal (Specify quality and where used) Not Applicable Not Applicable
3. Furnace Oil Qty. (K. Ltrs.) 12949 11567Total Amount (Rs. Mn) 161.62 139.70Average Rate (Rs. per Ltr.) Rs. 12.48 Rs. 12.08
4. Others/internal generation Not Applicable Not Applicable
B. Consumption per unit of production
Units Standards Current Previous(if any) Year Year
ElectricityActive Pharmaceutical No specificIngredients (kwh per kg) standards - 54.11 44.91Dosage Forms (kwh per consumption 81.06 77.73
1000 packs) per unit dependson product mix
Furnace OilActive PharmaceuticalIngredients (Ltrs. per kg) 7.68 6.06Dosage Forms (K. Ltrs. per 0.01 0.01
1000 packs)Coal Not Applicable Not ApplicableOthers Not Applicable Not Applicable
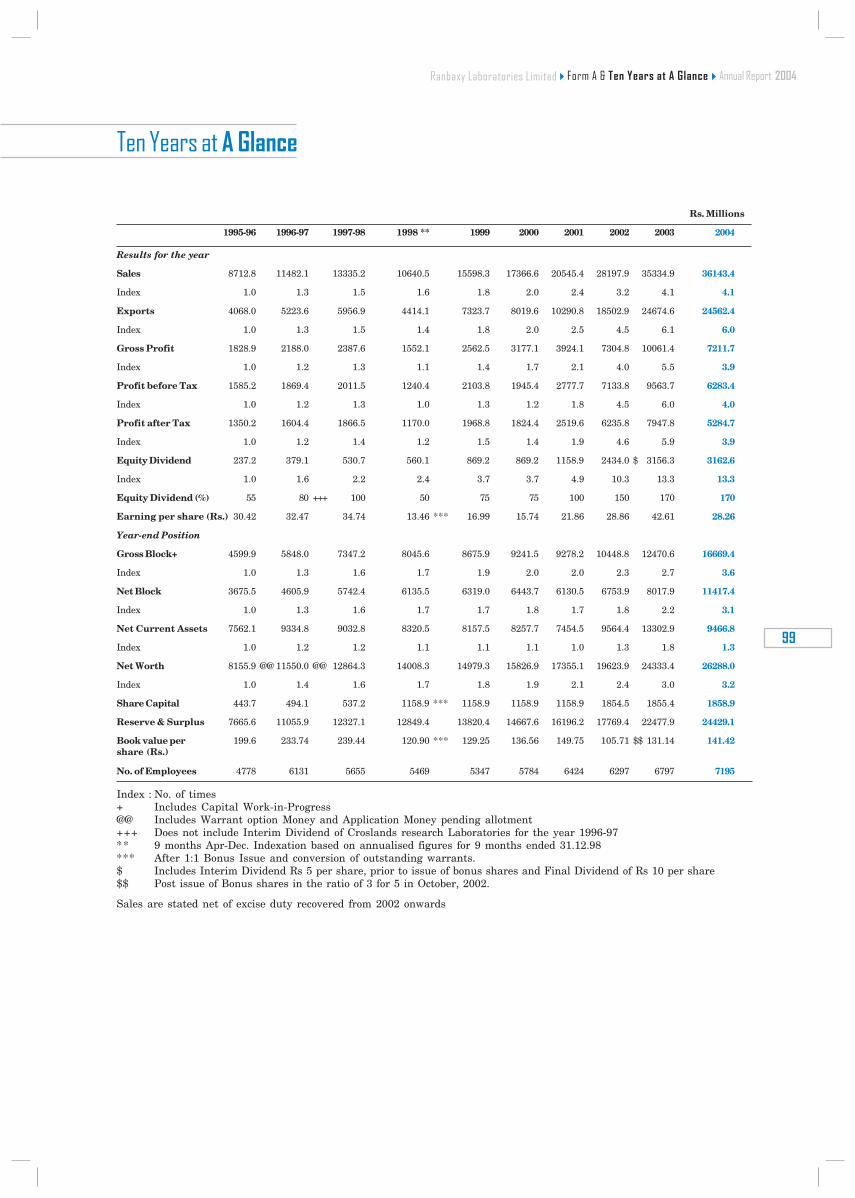
��
����������������
Rs. Millions
1995-96 1996-97 1997-98 1998 ** 1999 2000 2001 2002 2003 2004
Results for the year
Sales 8712.8 11482.1 13335.2 10640.5 15598.3 17366.6 20545.4 28197.9 35334.9 36143.4
Index 1.0 1.3 1.5 1.6 1.8 2.0 2.4 3.2 4.1 4.1
Exports 4068.0 5223.6 5956.9 4414.1 7323.7 8019.6 10290.8 18502.9 24674.6 24562.4
Index 1.0 1.3 1.5 1.4 1.8 2.0 2.5 4.5 6.1 6.0
Gross Profit 1828.9 2188.0 2387.6 1552.1 2562.5 3177.1 3924.1 7304.8 10061.4 7211.7
Index 1.0 1.2 1.3 1.1 1.4 1.7 2.1 4.0 5.5 3.9
Profit before Tax 1585.2 1869.4 2011.5 1240.4 2103.8 1945.4 2777.7 7133.8 9563.7 6283.4
Index 1.0 1.2 1.3 1.0 1.3 1.2 1.8 4.5 6.0 4.0
Profit after Tax 1350.2 1604.4 1866.5 1170.0 1968.8 1824.4 2519.6 6235.8 7947.8 5284.7
Index 1.0 1.2 1.4 1.2 1.5 1.4 1.9 4.6 5.9 3.9
Equity Dividend 237.2 379.1 530.7 560.1 869.2 869.2 1158.9 2434.0 $ 3156.3 3162.6
Index 1.0 1.6 2.2 2.4 3.7 3.7 4.9 10.3 13.3 13.3
Equity Dividend (%) 55 80 +++ 100 50 75 75 100 150 170 170
Earning per share (Rs.) 30.42 32.47 34.74 13.46 *** 16.99 15.74 21.86 28.86 42.61 28.26
Year-end Position
Gross Block+ 4599.9 5848.0 7347.2 8045.6 8675.9 9241.5 9278.2 10448.8 12470.6 16669.4
Index 1.0 1.3 1.6 1.7 1.9 2.0 2.0 2.3 2.7 3.6
Net Block 3675.5 4605.9 5742.4 6135.5 6319.0 6443.7 6130.5 6753.9 8017.9 11417.4
Index 1.0 1.3 1.6 1.7 1.7 1.8 1.7 1.8 2.2 3.1
Net Current Assets 7562.1 9334.8 9032.8 8320.5 8157.5 8257.7 7454.5 9564.4 13302.9 9466.8
Index 1.0 1.2 1.2 1.1 1.1 1.1 1.0 1.3 1.8 1.3
Net Worth 8155.9 @@ 11550.0 @@ 12864.3 14008.3 14979.3 15826.9 17355.1 19623.9 24333.4 26288.0
Index 1.0 1.4 1.6 1.7 1.8 1.9 2.1 2.4 3.0 3.2
Share Capital 443.7 494.1 537.2 1158.9 *** 1158.9 1158.9 1158.9 1854.5 1855.4 1858.9
Reserve & Surplus 7665.6 11055.9 12327.1 12849.4 13820.4 14667.6 16196.2 17769.4 22477.9 24429.1
Book value per 199.6 233.74 239.44 120.90 *** 129.25 136.56 149.75 105.71 $$ 131.14 141.42share (Rs.)
No. of Employees 4778 6131 5655 5469 5347 5784 6424 6297 6797 7195
Index : No. of times+ Includes Capital Work-in-Progress@@ Includes Warrant option Money and Application Money pending allotment+++ Does not include Interim Dividend of Croslands research Laboratories for the year 1996-97** 9 months Apr-Dec. Indexation based on annualised figures for 9 months ended 31.12.98*** After 1:1 Bonus Issue and conversion of outstanding warrants.$ Includes Interim Dividend Rs 5 per share, prior to issue of bonus shares and Final Dividend of Rs 10 per share$$ Post issue of Bonus shares in the ratio of 3 for 5 in October, 2002.
Sales are stated net of excise duty recovered from 2002 onwards
���������������������� ���������������������������
������������������ �
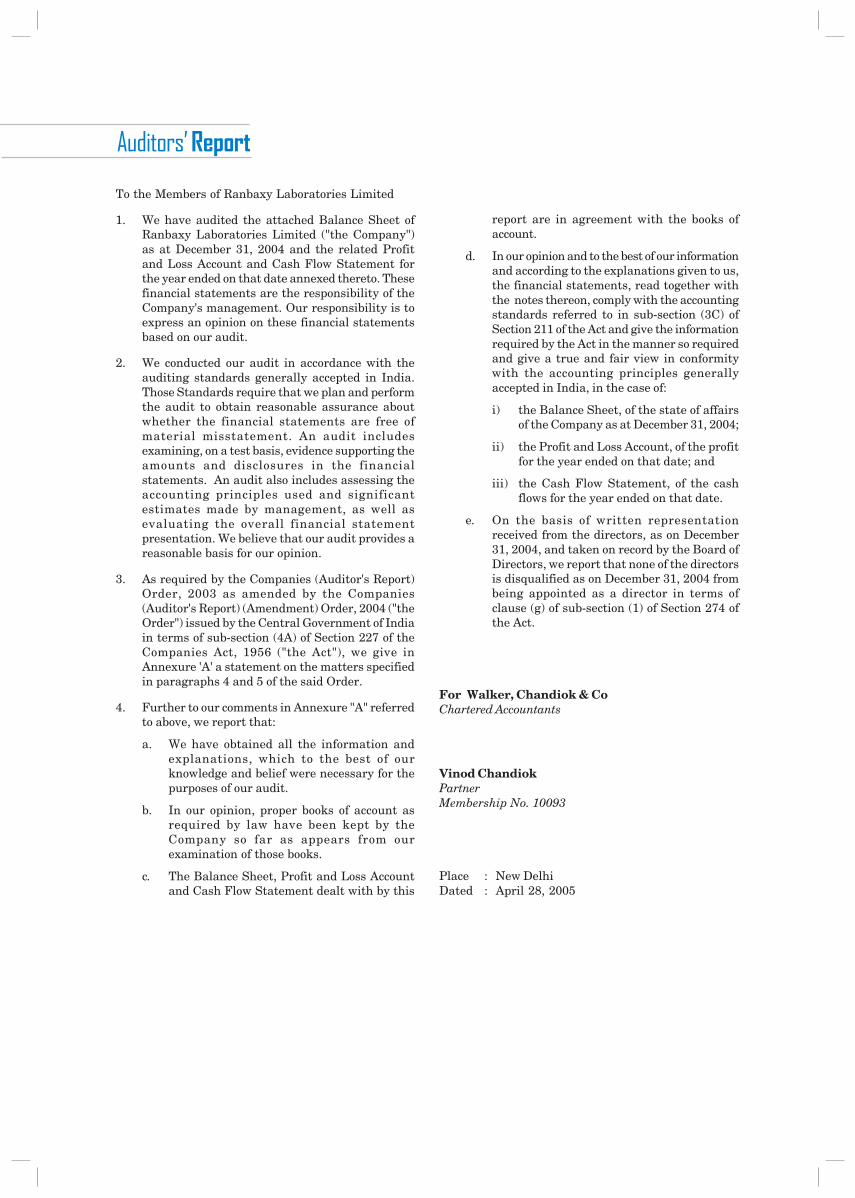
To the Members of Ranbaxy Laboratories Limited
1. We have audited the attached Balance Sheet ofRanbaxy Laboratories Limited ("the Company")as at December 31, 2004 and the related Profitand Loss Account and Cash Flow Statement forthe year ended on that date annexed thereto. Thesefinancial statements are the responsibility of theCompany's management. Our responsibility is toexpress an opinion on these financial statementsbased on our audit.
2. We conducted our audit in accordance with theauditing standards generally accepted in India.Those Standards require that we plan and performthe audit to obtain reasonable assurance aboutwhether the financial statements are free ofmaterial misstatement. An audit includesexamining, on a test basis, evidence supporting theamounts and disclosures in the financialstatements. An audit also includes assessing theaccounting principles used and significantestimates made by management, as well asevaluating the overall financial statementpresentation. We believe that our audit provides areasonable basis for our opinion.
3. As required by the Companies (Auditor's Report)Order, 2003 as amended by the Companies(Auditor's Report) (Amendment) Order, 2004 ("theOrder") issued by the Central Government of Indiain terms of sub-section (4A) of Section 227 of theCompanies Act, 1956 ("the Act"), we give inAnnexure 'A' a statement on the matters specifiedin paragraphs 4 and 5 of the said Order.
4. Further to our comments in Annexure "A" referredto above, we report that:
a. We have obtained all the information andexplanations, which to the best of ourknowledge and belief were necessary for thepurposes of our audit.
b. In our opinion, proper books of account asrequired by law have been kept by theCompany so far as appears from ourexamination of those books.
c. The Balance Sheet, Profit and Loss Accountand Cash Flow Statement dealt with by this
report are in agreement with the books ofaccount.
d. In our opinion and to the best of our informationand according to the explanations given to us,the financial statements, read together withthe notes thereon, comply with the accountingstandards referred to in sub-section (3C) ofSection 211 of the Act and give the informationrequired by the Act in the manner so requiredand give a true and fair view in conformitywith the accounting principles generallyaccepted in India, in the case of:
i) the Balance Sheet, of the state of affairsof the Company as at December 31, 2004;
ii) the Profit and Loss Account, of the profitfor the year ended on that date; and
iii) the Cash Flow Statement, of the cashflows for the year ended on that date.
e. On the basis of written representationreceived from the directors, as on December31, 2004, and taken on record by the Board ofDirectors, we report that none of the directorsis disqualified as on December 31, 2004 frombeing appointed as a director in terms ofclause (g) of sub-section (1) of Section 274 ofthe Act.
For Walker, Chandiok & CoChartered Accountants
Vinod ChandiokPartnerMembership No. 10093
Place : New DelhiDated : April 28, 2005
���������������
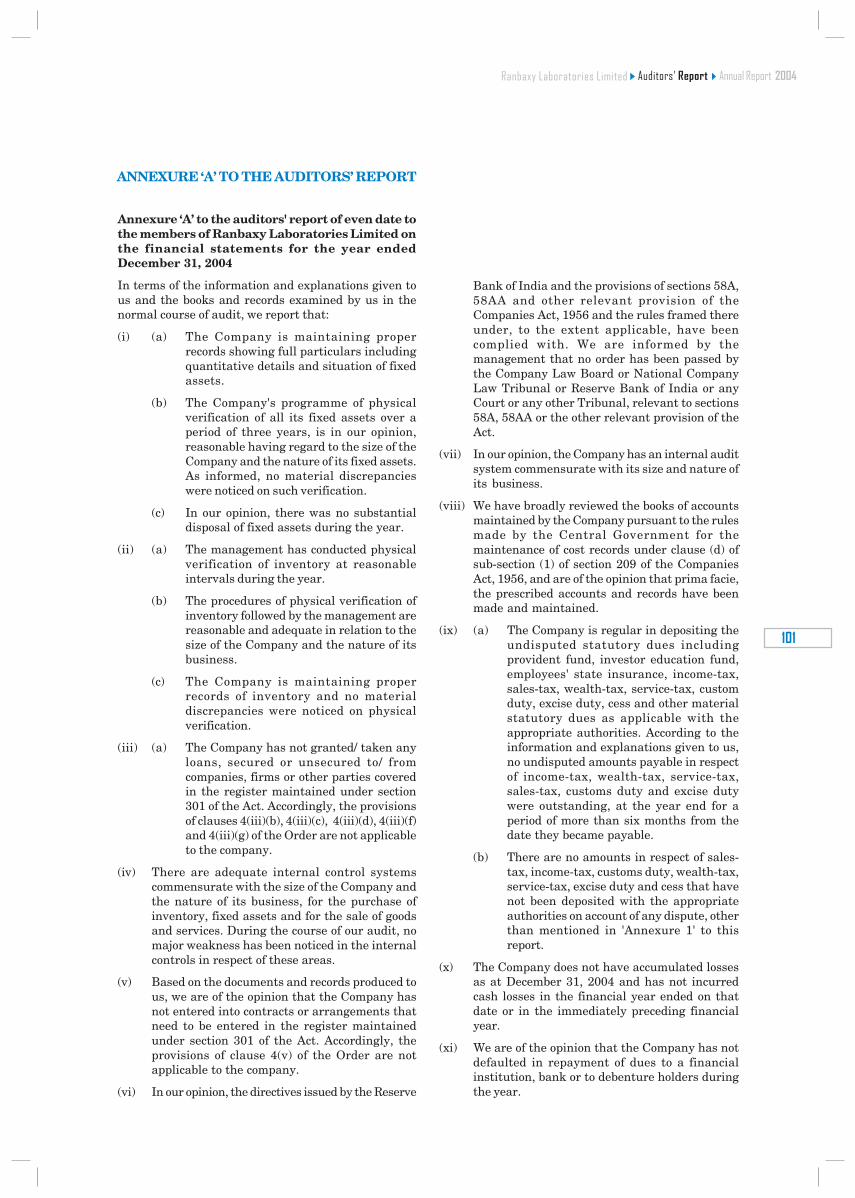
���
����������������
Annexure ‘A’ to the auditors' report of even date tothe members of Ranbaxy Laboratories Limited onthe financial statements for the year endedDecember 31, 2004
In terms of the information and explanations given tous and the books and records examined by us in thenormal course of audit, we report that:
(i) (a) The Company is maintaining properrecords showing full particulars includingquantitative details and situation of fixedassets.
(b) The Company's programme of physicalverification of all its fixed assets over aperiod of three years, is in our opinion,reasonable having regard to the size of theCompany and the nature of its fixed assets.As informed, no material discrepancieswere noticed on such verification.
(c) In our opinion, there was no substantialdisposal of fixed assets during the year.
(ii) (a) The management has conducted physicalverification of inventory at reasonableintervals during the year.
(b) The procedures of physical verification ofinventory followed by the management arereasonable and adequate in relation to thesize of the Company and the nature of itsbusiness.
(c) The Company is maintaining properrecords of inventory and no materialdiscrepancies were noticed on physicalverification.
(iii) (a) The Company has not granted/ taken anyloans, secured or unsecured to/ fromcompanies, firms or other parties coveredin the register maintained under section301 of the Act. Accordingly, the provisionsof clauses 4(iii)(b), 4(iii)(c), 4(iii)(d), 4(iii)(f)and 4(iii)(g) of the Order are not applicableto the company.
(iv) There are adequate internal control systemscommensurate with the size of the Company andthe nature of its business, for the purchase ofinventory, fixed assets and for the sale of goodsand services. During the course of our audit, nomajor weakness has been noticed in the internalcontrols in respect of these areas.
(v) Based on the documents and records produced tous, we are of the opinion that the Company hasnot entered into contracts or arrangements thatneed to be entered in the register maintainedunder section 301 of the Act. Accordingly, theprovisions of clause 4(v) of the Order are notapplicable to the company.
(vi) In our opinion, the directives issued by the Reserve
Bank of India and the provisions of sections 58A,58AA and other relevant provision of theCompanies Act, 1956 and the rules framed thereunder, to the extent applicable, have beencomplied with. We are informed by themanagement that no order has been passed bythe Company Law Board or National CompanyLaw Tribunal or Reserve Bank of India or anyCourt or any other Tribunal, relevant to sections58A, 58AA or the other relevant provision of theAct.
(vii) In our opinion, the Company has an internal auditsystem commensurate with its size and nature ofits business.
(viii) We have broadly reviewed the books of accountsmaintained by the Company pursuant to the rulesmade by the Central Government for themaintenance of cost records under clause (d) ofsub-section (1) of section 209 of the CompaniesAct, 1956, and are of the opinion that prima facie,the prescribed accounts and records have beenmade and maintained.
(ix) (a) The Company is regular in depositing theundisputed statutory dues includingprovident fund, investor education fund,employees' state insurance, income-tax,sales-tax, wealth-tax, service-tax, customduty, excise duty, cess and other materialstatutory dues as applicable with theappropriate authorities. According to theinformation and explanations given to us,no undisputed amounts payable in respectof income-tax, wealth-tax, service-tax,sales-tax, customs duty and excise dutywere outstanding, at the year end for aperiod of more than six months from thedate they became payable.
(b) There are no amounts in respect of sales-tax, income-tax, customs duty, wealth-tax,service-tax, excise duty and cess that havenot been deposited with the appropriateauthorities on account of any dispute, otherthan mentioned in 'Annexure 1' to thisreport.
(x) The Company does not have accumulated lossesas at December 31, 2004 and has not incurredcash losses in the financial year ended on thatdate or in the immediately preceding financialyear.
(xi) We are of the opinion that the Company has notdefaulted in repayment of dues to a financialinstitution, bank or to debenture holders duringthe year.
ANNEXURE ‘A’ TO THE AUDITORS’ REPORT
�����������������������������������������
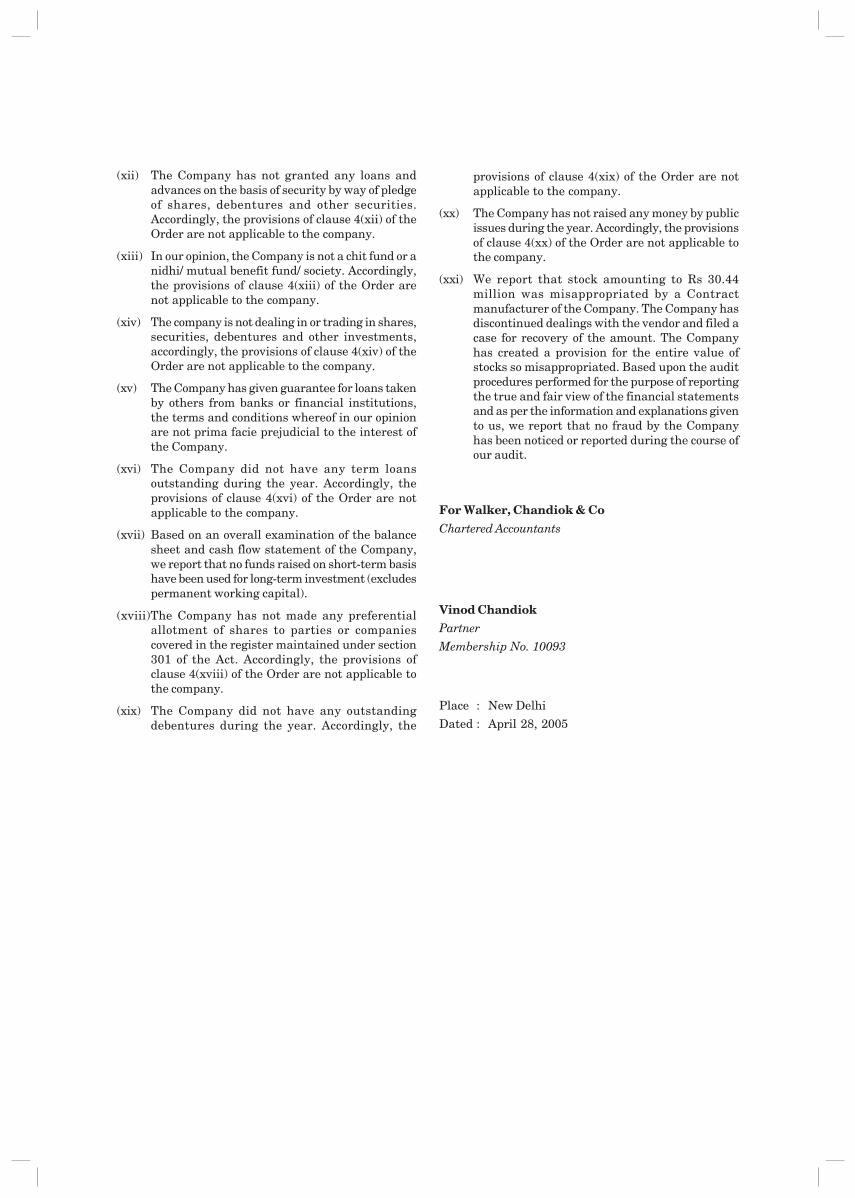
(xii) The Company has not granted any loans andadvances on the basis of security by way of pledgeof shares, debentures and other securities.Accordingly, the provisions of clause 4(xii) of theOrder are not applicable to the company.
(xiii) In our opinion, the Company is not a chit fund or anidhi/ mutual benefit fund/ society. Accordingly,the provisions of clause 4(xiii) of the Order arenot applicable to the company.
(xiv) The company is not dealing in or trading in shares,securities, debentures and other investments,accordingly, the provisions of clause 4(xiv) of theOrder are not applicable to the company.
(xv) The Company has given guarantee for loans takenby others from banks or financial institutions,the terms and conditions whereof in our opinionare not prima facie prejudicial to the interest ofthe Company.
(xvi) The Company did not have any term loansoutstanding during the year. Accordingly, theprovisions of clause 4(xvi) of the Order are notapplicable to the company.
(xvii) Based on an overall examination of the balancesheet and cash flow statement of the Company,we report that no funds raised on short-term basishave been used for long-term investment (excludespermanent working capital).
(xviii)The Company has not made any preferentialallotment of shares to parties or companiescovered in the register maintained under section301 of the Act. Accordingly, the provisions ofclause 4(xviii) of the Order are not applicable tothe company.
(xix) The Company did not have any outstandingdebentures during the year. Accordingly, the
provisions of clause 4(xix) of the Order are notapplicable to the company.
(xx) The Company has not raised any money by publicissues during the year. Accordingly, the provisionsof clause 4(xx) of the Order are not applicable tothe company.
(xxi) We report that stock amounting to Rs 30.44million was misappropriated by a Contractmanufacturer of the Company. The Company hasdiscontinued dealings with the vendor and filed acase for recovery of the amount. The Companyhas created a provision for the entire value ofstocks so misappropriated. Based upon the auditprocedures performed for the purpose of reportingthe true and fair view of the financial statementsand as per the information and explanations givento us, we report that no fraud by the Companyhas been noticed or reported during the course ofour audit.
For Walker, Chandiok & CoChartered Accountants
Vinod ChandiokPartner
Membership No. 10093
Place : New Delhi
Dated : April 28, 2005
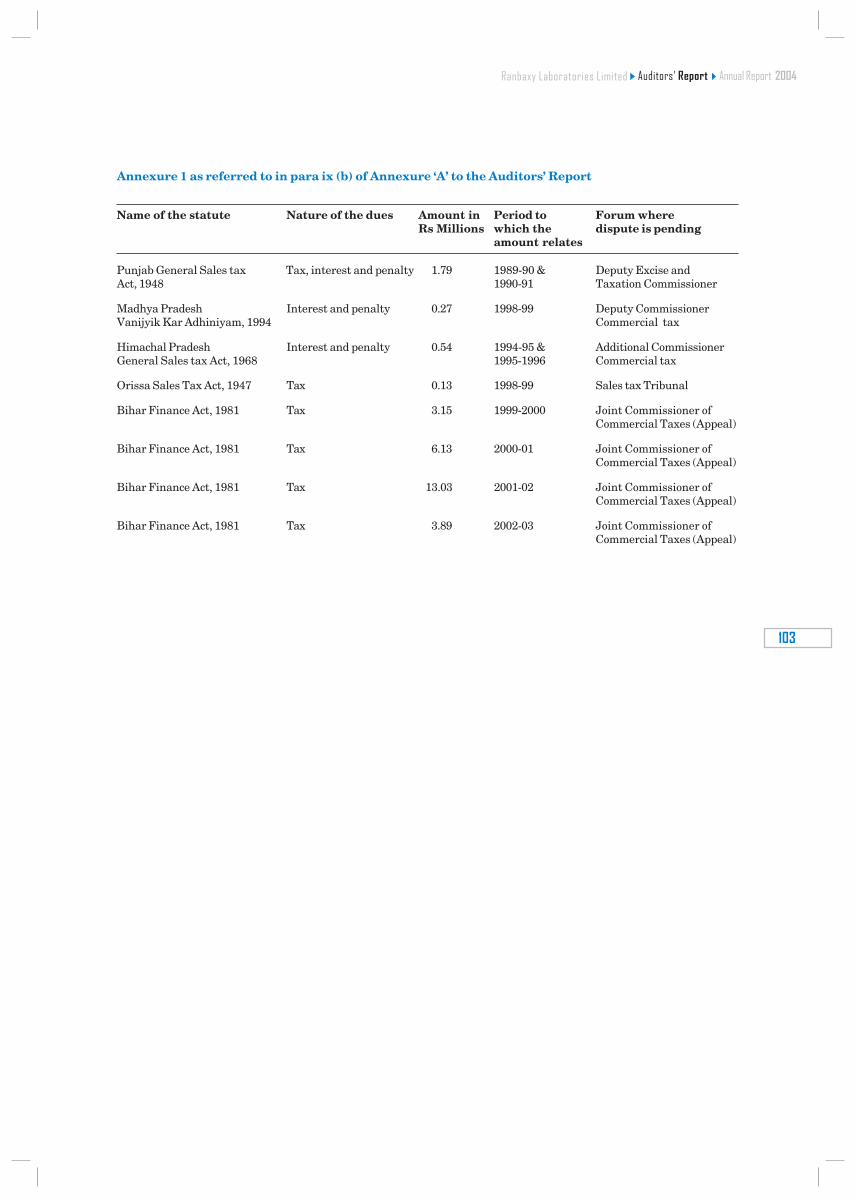
���
����������������
Annexure 1 as referred to in para ix (b) of Annexure ‘A’ to the Auditors’ Report
Name of the statute Nature of the dues Amount in Period to Forum whereRs Millions which the dispute is pending
amount relates
Punjab General Sales tax Tax, interest and penalty 1.79 1989-90 & Deputy Excise andAct, 1948 1990-91 Taxation Commissioner
Madhya Pradesh Interest and penalty 0.27 1998-99 Deputy CommissionerVanijyik Kar Adhiniyam, 1994 Commercial tax
Himachal Pradesh Interest and penalty 0.54 1994-95 & Additional CommissionerGeneral Sales tax Act, 1968 1995-1996 Commercial tax
Orissa Sales Tax Act, 1947 Tax 0.13 1998-99 Sales tax Tribunal
Bihar Finance Act, 1981 Tax 3.15 1999-2000 Joint Commissioner ofCommercial Taxes (Appeal)
Bihar Finance Act, 1981 Tax 6.13 2000-01 Joint Commissioner ofCommercial Taxes (Appeal)
Bihar Finance Act, 1981 Tax 13.03 2001-02 Joint Commissioner ofCommercial Taxes (Appeal)
Bihar Finance Act, 1981 Tax 3.89 2002-03 Joint Commissioner ofCommercial Taxes (Appeal)
�����������������������������������������
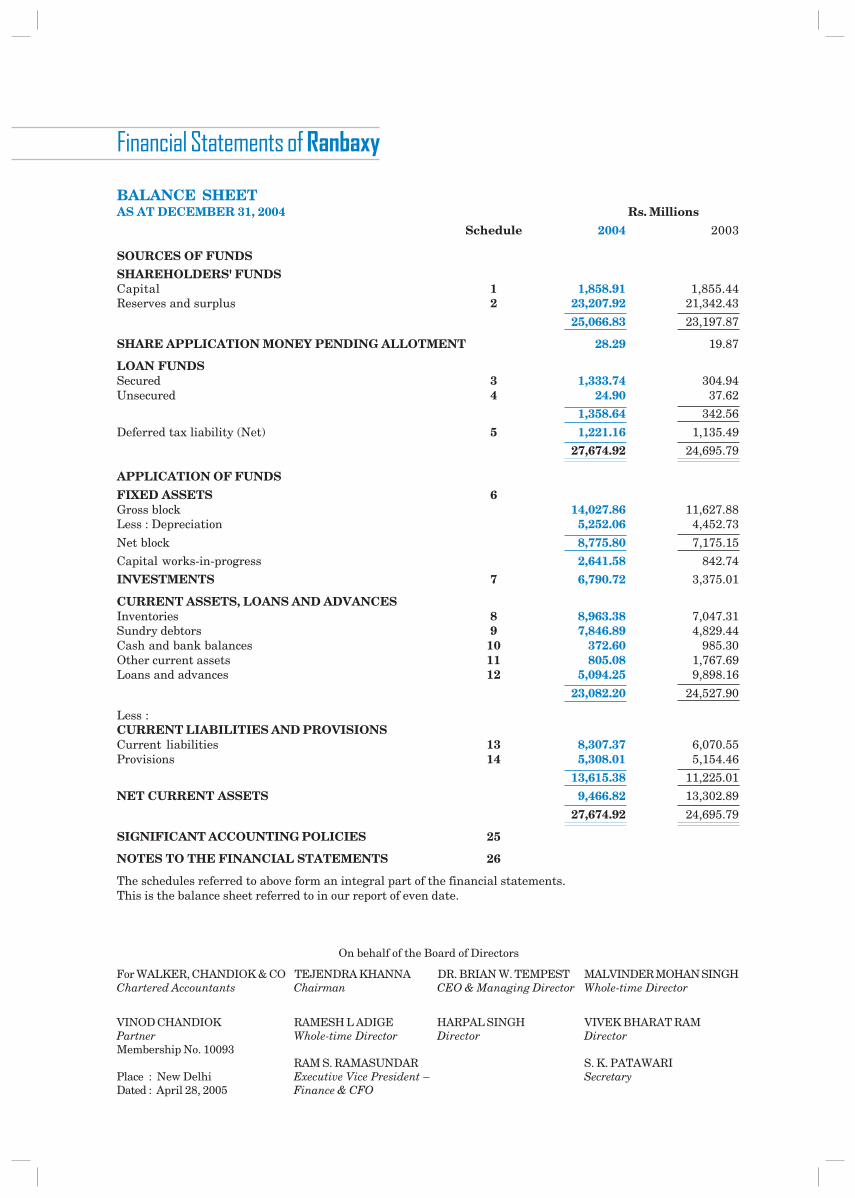
BALANCE SHEETAS AT DECEMBER 31, 2004 Rs. Millions
Schedule 2004 2003
SOURCES OF FUNDSSHAREHOLDERS' FUNDSCapital 1 1,858.91 1,855.44Reserves and surplus 2 23,207.92 21,342.43
25,066.83 23,197.87
SHARE APPLICATION MONEY PENDING ALLOTMENT 28.29 19.87
LOAN FUNDSSecured 3 1,333.74 304.94Unsecured 4 24.90 37.62
1,358.64 342.56
Deferred tax liability (Net) 5 1,221.16 1,135.49
27,674.92 24,695.79
APPLICATION OF FUNDSFIXED ASSETS 6Gross block 14,027.86 11,627.88Less : Depreciation 5,252.06 4,452.73
Net block 8,775.80 7,175.15
Capital works-in-progress 2,641.58 842.74
INVESTMENTS 7 6,790.72 3,375.01
CURRENT ASSETS, LOANS AND ADVANCESInventories 8 8,963.38 7,047.31Sundry debtors 9 7,846.89 4,829.44Cash and bank balances 10 372.60 985.30Other current assets 11 805.08 1,767.69Loans and advances 12 5,094.25 9,898.16
23,082.20 24,527.90
Less :CURRENT LIABILITIES AND PROVISIONSCurrent liabilities 13 8,307.37 6,070.55Provisions 14 5,308.01 5,154.46
13,615.38 11,225.01
NET CURRENT ASSETS 9,466.82 13,302.89
27,674.92 24,695.79
SIGNIFICANT ACCOUNTING POLICIES 25
NOTES TO THE FINANCIAL STATEMENTS 26
The schedules referred to above form an integral part of the financial statements.This is the balance sheet referred to in our report of even date.
On behalf of the Board of Directors
For WALKER, CHANDIOK & CO TEJENDRA KHANNA DR. BRIAN W. TEMPEST MALVINDER MOHAN SINGHChartered Accountants Chairman CEO & Managing Director Whole-time Director
VINOD CHANDIOK RAMESH L ADIGE HARPAL SINGH VIVEK BHARAT RAMPartner Whole-time Director Director DirectorMembership No. 10093
RAM S. RAMASUNDAR S. K. PATAWARIPlace : New Delhi Executive Vice President – SecretaryDated : April 28, 2005 Finance & CFO
��������������������� ��������
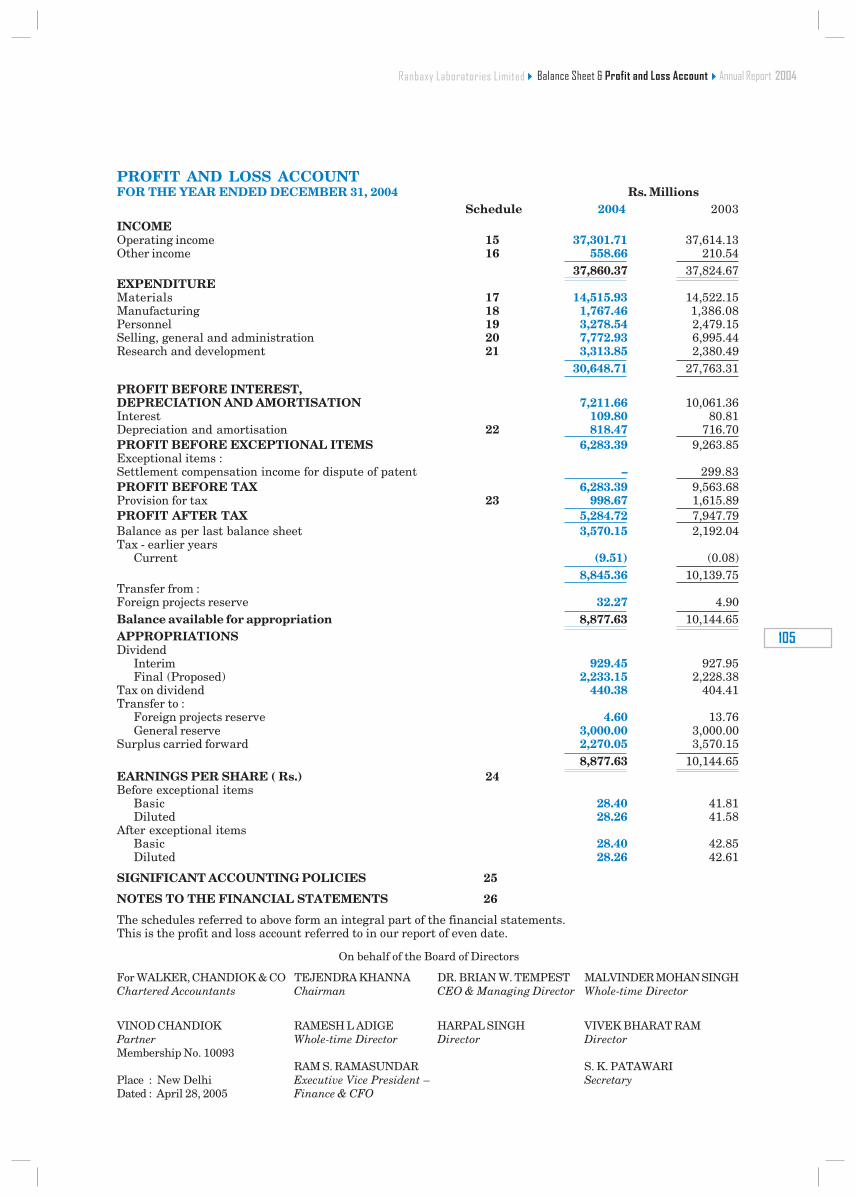
���
����������������
PROFIT AND LOSS ACCOUNTFOR THE YEAR ENDED DECEMBER 31, 2004 Rs. Millions
Schedule 2004 2003INCOMEOperating income 15 37,301.71 37,614.13Other income 16 558.66 210.54
37,860.37 37,824.67EXPENDITUREMaterials 17 14,515.93 14,522.15Manufacturing 18 1,767.46 1,386.08Personnel 19 3,278.54 2,479.15Selling, general and administration 20 7,772.93 6,995.44Research and development 21 3,313.85 2,380.49
30,648.71 27,763.31
PROFIT BEFORE INTEREST,DEPRECIATION AND AMORTISATION 7,211.66 10,061.36Interest 109.80 80.81Depreciation and amortisation 22 818.47 716.70PROFIT BEFORE EXCEPTIONAL ITEMS 6,283.39 9,263.85Exceptional items :Settlement compensation income for dispute of patent – 299.83PROFIT BEFORE TAX 6,283.39 9,563.68Provision for tax 23 998.67 1,615.89PROFIT AFTER TAX 5,284.72 7,947.79Balance as per last balance sheet 3,570.15 2,192.04Tax - earlier years
Current (9.51) (0.08) 8,845.36 10,139.75
Transfer from :Foreign projects reserve 32.27 4.90Balance available for appropriation 8,877.63 10,144.65APPROPRIATIONSDividend
Interim 929.45 927.95Final (Proposed) 2,233.15 2,228.38
Tax on dividend 440.38 404.41Transfer to :
Foreign projects reserve 4.60 13.76General reserve 3,000.00 3,000.00
Surplus carried forward 2,270.05 3,570.15 8,877.63 10,144.65
EARNINGS PER SHARE ( Rs.) 24Before exceptional items
Basic 28.40 41.81Diluted 28.26 41.58
After exceptional itemsBasic 28.40 42.85Diluted 28.26 42.61
SIGNIFICANT ACCOUNTING POLICIES 25
NOTES TO THE FINANCIAL STATEMENTS 26
The schedules referred to above form an integral part of the financial statements.This is the profit and loss account referred to in our report of even date.
On behalf of the Board of Directors
For WALKER, CHANDIOK & CO TEJENDRA KHANNA DR. BRIAN W. TEMPEST MALVINDER MOHAN SINGHChartered Accountants Chairman CEO & Managing Director Whole-time Director
VINOD CHANDIOK RAMESH L ADIGE HARPAL SINGH VIVEK BHARAT RAMPartner Whole-time Director Director DirectorMembership No. 10093
RAM S. RAMASUNDAR S. K. PATAWARIPlace : New Delhi Executive Vice President – SecretaryDated : April 28, 2005 Finance & CFO
������������������� ����!"���� �#����������������������������
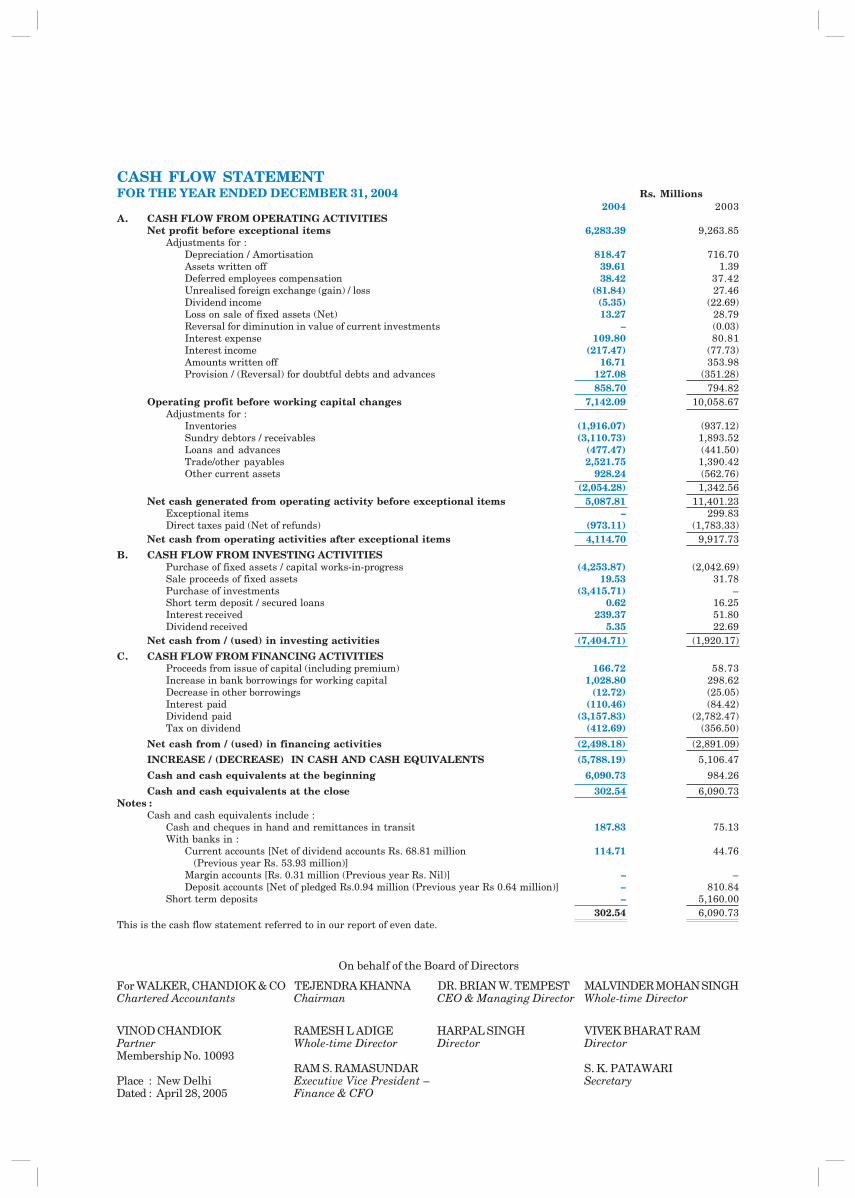
CASH FLOW STATEMENTFOR THE YEAR ENDED DECEMBER 31, 2004 Rs. Millions
2004 2003A. CASH FLOW FROM OPERATING ACTIVITIES
Net profit before exceptional items 6,283.39 9,263.85Adjustments for :
Depreciation / Amortisation 818.47 716.70Assets written off 39.61 1.39Deferred employees compensation 38.42 37.42Unrealised foreign exchange (gain) / loss (81.84) 27.46Dividend income (5.35) (22.69)Loss on sale of fixed assets (Net) 13.27 28.79Reversal for diminution in value of current investments – (0.03)Interest expense 109.80 80.81Interest income (217.47) (77.73)Amounts written off 16.71 353.98Provision / (Reversal) for doubtful debts and advances 127.08 (351.28)
858.70 794.82Operating profit before working capital changes 7,142.09 10,058.67
Adjustments for :Inventories (1,916.07) (937.12)Sundry debtors / receivables (3,110.73) 1,893.52Loans and advances (477.47) (441.50)Trade/other payables 2,521.75 1,390.42Other current assets 928.24 (562.76)
(2,054.28) 1,342.56Net cash generated from operating activity before exceptional items 5,087.81 11,401.23
Exceptional items – 299.83Direct taxes paid (Net of refunds) (973.11) (1,783.33)
Net cash from operating activities after exceptional items 4,114.70 9,917.73
B. CASH FLOW FROM INVESTING ACTIVITIESPurchase of fixed assets / capital works-in-progress (4,253.87) (2,042.69)Sale proceeds of fixed assets 19.53 31.78Purchase of investments (3,415.71) –Short term deposit / secured loans 0.62 16.25Interest received 239.37 51.80Dividend received 5.35 22.69
Net cash from / (used) in investing activities (7,404.71) (1,920.17)
C. CASH FLOW FROM FINANCING ACTIVITIESProceeds from issue of capital (including premium) 166.72 58.73Increase in bank borrowings for working capital 1,028.80 298.62Decrease in other borrowings (12.72) (25.05)Interest paid (110.46) (84.42)Dividend paid (3,157.83) (2,782.47)Tax on dividend (412.69) (356.50)
Net cash from / (used) in financing activities (2,498.18) (2,891.09)
INCREASE / (DECREASE) IN CASH AND CASH EQUIVALENTS (5,788.19) 5,106.47
Cash and cash equivalents at the beginning 6,090.73 984.26
Cash and cash equivalents at the close 302.54 6,090.73Notes :
Cash and cash equivalents include :Cash and cheques in hand and remittances in transit 187.83 75.13With banks in :
Current accounts [Net of dividend accounts Rs. 68.81 million 114.71 44.76 (Previous year Rs. 53.93 million)]Margin accounts [Rs. 0.31 million (Previous year Rs. Nil)] – –Deposit accounts [Net of pledged Rs.0.94 million (Previous year Rs 0.64 million)] – 810.84
Short term deposits – 5,160.00 302.54 6,090.73
This is the cash flow statement referred to in our report of even date.
On behalf of the Board of Directors
For WALKER, CHANDIOK & CO TEJENDRA KHANNA DR. BRIAN W. TEMPEST MALVINDER MOHAN SINGHChartered Accountants Chairman CEO & Managing Director Whole-time Director
VINOD CHANDIOK RAMESH L ADIGE HARPAL SINGH VIVEK BHARAT RAMPartner Whole-time Director Director DirectorMembership No. 10093
RAM S. RAMASUNDAR S. K. PATAWARIPlace : New Delhi Executive Vice President – SecretaryDated : April 28, 2005 Finance & CFO
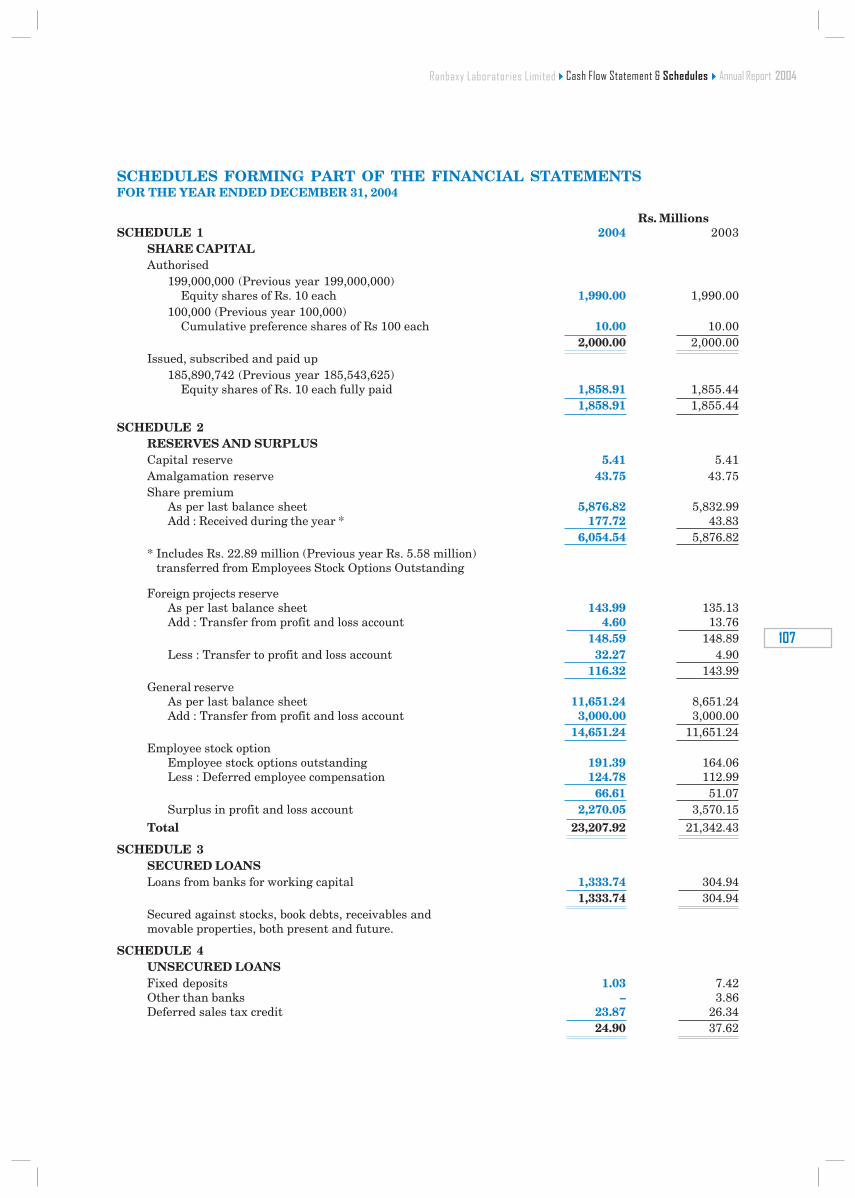
���
����������������
SCHEDULES FORMING PART OF THE FINANCIAL STATEMENTSFOR THE YEAR ENDED DECEMBER 31, 2004
Rs. MillionsSCHEDULE 1 2004 2003
SHARE CAPITALAuthorised
199,000,000 (Previous year 199,000,000)Equity shares of Rs. 10 each 1,990.00 1,990.00
100,000 (Previous year 100,000)Cumulative preference shares of Rs 100 each 10.00 10.00
2,000.00 2,000.00Issued, subscribed and paid up
185,890,742 (Previous year 185,543,625)Equity shares of Rs. 10 each fully paid 1,858.91 1,855.44
1,858.91 1,855.44
SCHEDULE 2RESERVES AND SURPLUSCapital reserve 5.41 5.41Amalgamation reserve 43.75 43.75Share premium
As per last balance sheet 5,876.82 5,832.99Add : Received during the year * 177.72 43.83
6,054.54 5,876.82* Includes Rs. 22.89 million (Previous year Rs. 5.58 million) transferred from Employees Stock Options Outstanding
Foreign projects reserveAs per last balance sheet 143.99 135.13Add : Transfer from profit and loss account 4.60 13.76
148.59 148.89Less : Transfer to profit and loss account 32.27 4.90
116.32 143.99General reserve
As per last balance sheet 11,651.24 8,651.24Add : Transfer from profit and loss account 3,000.00 3,000.00
14,651.24 11,651.24Employee stock option
Employee stock options outstanding 191.39 164.06Less : Deferred employee compensation 124.78 112.99
66.61 51.07Surplus in profit and loss account 2,270.05 3,570.15
Total 23,207.92 21,342.43
SCHEDULE 3SECURED LOANSLoans from banks for working capital 1,333.74 304.94
1,333.74 304.94Secured against stocks, book debts, receivables andmovable properties, both present and future.
SCHEDULE 4UNSECURED LOANSFixed deposits 1.03 7.42Other than banks – 3.86Deferred sales tax credit 23.87 26.34
24.90 37.62
������� �������������$ ��!#�����������������������������
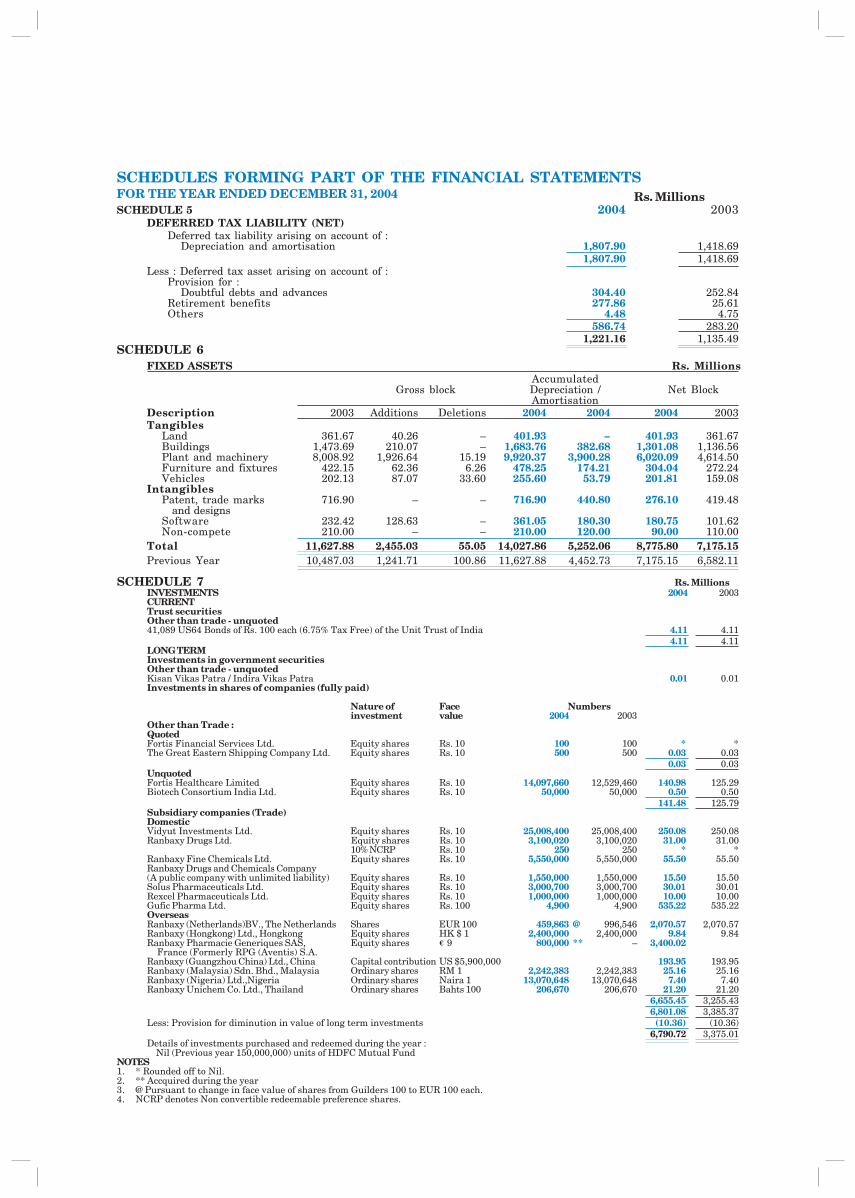
SCHEDULES FORMING PART OF THE FINANCIAL STATEMENTSFOR THE YEAR ENDED DECEMBER 31, 2004 Rs. MillionsSCHEDULE 5 2004 2003
DEFERRED TAX LIABILITY (NET)Deferred tax liability arising on account of :
Depreciation and amortisation 1,807.90 1,418.69 1,807.90 1,418.69
Less : Deferred tax asset arising on account of :Provision for :
Doubtful debts and advances 304.40 252.84Retirement benefits 277.86 25.61Others 4.48 4.75
586.74 283.20 1,221.16 1,135.49
SCHEDULE 6FIXED ASSETS Rs. Millions
AccumulatedGross block Depreciation / Net Block
AmortisationDescription 2003 Additions Deletions 2004 2004 2004 2003Tangibles
Land 361.67 40.26 – 401.93 – 401.93 361.67Buildings 1,473.69 210.07 – 1,683.76 382.68 1,301.08 1,136.56Plant and machinery 8,008.92 1,926.64 15.19 9,920.37 3,900.28 6,020.09 4,614.50Furniture and fixtures 422.15 62.36 6.26 478.25 174.21 304.04 272.24Vehicles 202.13 87.07 33.60 255.60 53.79 201.81 159.08
IntangiblesPatent, trade marks 716.90 – – 716.90 440.80 276.10 419.48 and designsSoftware 232.42 128.63 – 361.05 180.30 180.75 101.62Non-compete 210.00 – – 210.00 120.00 90.00 110.00
Total 11,627.88 2,455.03 55.05 14,027.86 5,252.06 8,775.80 7,175.15Previous Year 10,487.03 1,241.71 100.86 11,627.88 4,452.73 7,175.15 6,582.11
SCHEDULE 7 Rs. MillionsINVESTMENTS 2004 2003CURRENTTrust securitiesOther than trade - unquoted41,089 US64 Bonds of Rs. 100 each (6.75% Tax Free) of the Unit Trust of India 4.11 4.11
4.11 4.11LONG TERMInvestments in government securitiesOther than trade - unquotedKisan Vikas Patra / Indira Vikas Patra 0.01 0.01Investments in shares of companies (fully paid)
Nature of Face Numbersinvestment value 2004 2003
Other than Trade :QuotedFortis Financial Services Ltd. Equity shares Rs. 10 100 100 * *The Great Eastern Shipping Company Ltd. Equity shares Rs. 10 500 500 0.03 0.03
0.03 0.03UnquotedFortis Healthcare Limited Equity shares Rs. 10 14,097,660 12,529,460 140.98 125.29Biotech Consortium India Ltd. Equity shares Rs. 10 50,000 50,000 0.50 0.50
141.48 125.79Subsidiary companies (Trade)DomesticVidyut Investments Ltd. Equity shares Rs. 10 25,008,400 25,008,400 250.08 250.08Ranbaxy Drugs Ltd. Equity shares Rs. 10 3,100,020 3,100,020 31.00 31.00
10% NCRP Rs. 10 250 250 * *Ranbaxy Fine Chemicals Ltd. Equity shares Rs. 10 5,550,000 5,550,000 55.50 55.50Ranbaxy Drugs and Chemicals Company(A public company with unlimited liability) Equity shares Rs. 10 1,550,000 1,550,000 15.50 15.50Solus Pharmaceuticals Ltd. Equity shares Rs. 10 3,000,700 3,000,700 30.01 30.01Rexcel Pharmaceuticals Ltd. Equity shares Rs. 10 1,000,000 1,000,000 10.00 10.00Gufic Pharma Ltd. Equity shares Rs. 100 4,900 4,900 535.22 535.22OverseasRanbaxy (Netherlands)BV., The Netherlands Shares EUR 100 459,863 @ 996,546 2,070.57 2,070.57Ranbaxy (Hongkong) Ltd., Hongkong Equity shares HK $ 1 2,400,000 2,400,000 9.84 9.84Ranbaxy Pharmacie Generiques SAS, Equity shares 9 800,000 ** – 3,400.02 France (Formerly RPG (Aventis) S.A.Ranbaxy (Guangzhou China) Ltd., China Capital contribution US $5,900,000 193.95 193.95Ranbaxy (Malaysia) Sdn. Bhd., Malaysia Ordinary shares RM 1 2,242,383 2,242,383 25.16 25.16Ranbaxy (Nigeria) Ltd.,Nigeria Ordinary shares Naira 1 13,070,648 13,070,648 7.40 7.40Ranbaxy Unichem Co. Ltd., Thailand Ordinary shares Bahts 100 206,670 206,670 21.20 21.20
6,655.45 3,255.436,801.08 3,385.37
Less: Provision for diminution in value of long term investments (10.36) (10.36)6,790.72 3,375.01
Details of investments purchased and redeemed during the year : Nil (Previous year 150,000,000) units of HDFC Mutual Fund
NOTES1. * Rounded off to Nil.2. ** Accquired during the year3. @ Pursuant to change in face value of shares from Guilders 100 to EUR 100 each.4. NCRP denotes Non convertible redeemable preference shares.
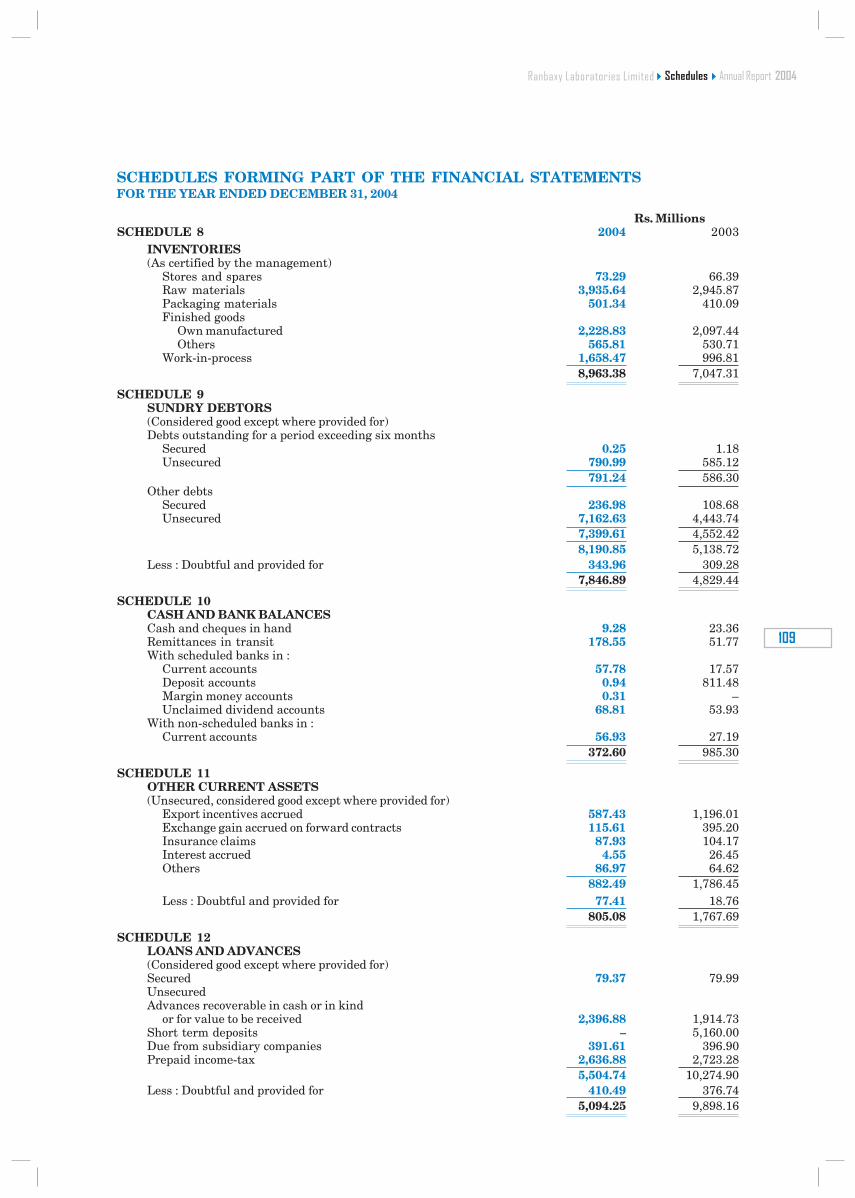
���
����������������
SCHEDULES FORMING PART OF THE FINANCIAL STATEMENTSFOR THE YEAR ENDED DECEMBER 31, 2004
Rs. MillionsSCHEDULE 8 2004 2003
INVENTORIES(As certified by the management)
Stores and spares 73.29 66.39Raw materials 3,935.64 2,945.87Packaging materials 501.34 410.09Finished goods
Own manufactured 2,228.83 2,097.44Others 565.81 530.71
Work-in-process 1,658.47 996.81 8,963.38 7,047.31
SCHEDULE 9SUNDRY DEBTORS(Considered good except where provided for)Debts outstanding for a period exceeding six months
Secured 0.25 1.18Unsecured 790.99 585.12
791.24 586.30Other debts
Secured 236.98 108.68Unsecured 7,162.63 4,443.74
7,399.61 4,552.42 8,190.85 5,138.72
Less : Doubtful and provided for 343.96 309.28 7,846.89 4,829.44
SCHEDULE 10CASH AND BANK BALANCESCash and cheques in hand 9.28 23.36Remittances in transit 178.55 51.77With scheduled banks in :
Current accounts 57.78 17.57Deposit accounts 0.94 811.48Margin money accounts 0.31 –Unclaimed dividend accounts 68.81 53.93
With non-scheduled banks in :Current accounts 56.93 27.19
372.60 985.30
SCHEDULE 11OTHER CURRENT ASSETS(Unsecured, considered good except where provided for)
Export incentives accrued 587.43 1,196.01Exchange gain accrued on forward contracts 115.61 395.20Insurance claims 87.93 104.17Interest accrued 4.55 26.45Others 86.97 64.62
882.49 1,786.45Less : Doubtful and provided for 77.41 18.76
805.08 1,767.69
SCHEDULE 12LOANS AND ADVANCES(Considered good except where provided for)Secured 79.37 79.99UnsecuredAdvances recoverable in cash or in kind
or for value to be received 2,396.88 1,914.73Short term deposits – 5,160.00Due from subsidiary companies 391.61 396.90Prepaid income-tax 2,636.88 2,723.28
5,504.74 10,274.90Less : Doubtful and provided for 410.49 376.74
5,094.25 9,898.16
$ ��!#�����������������������������
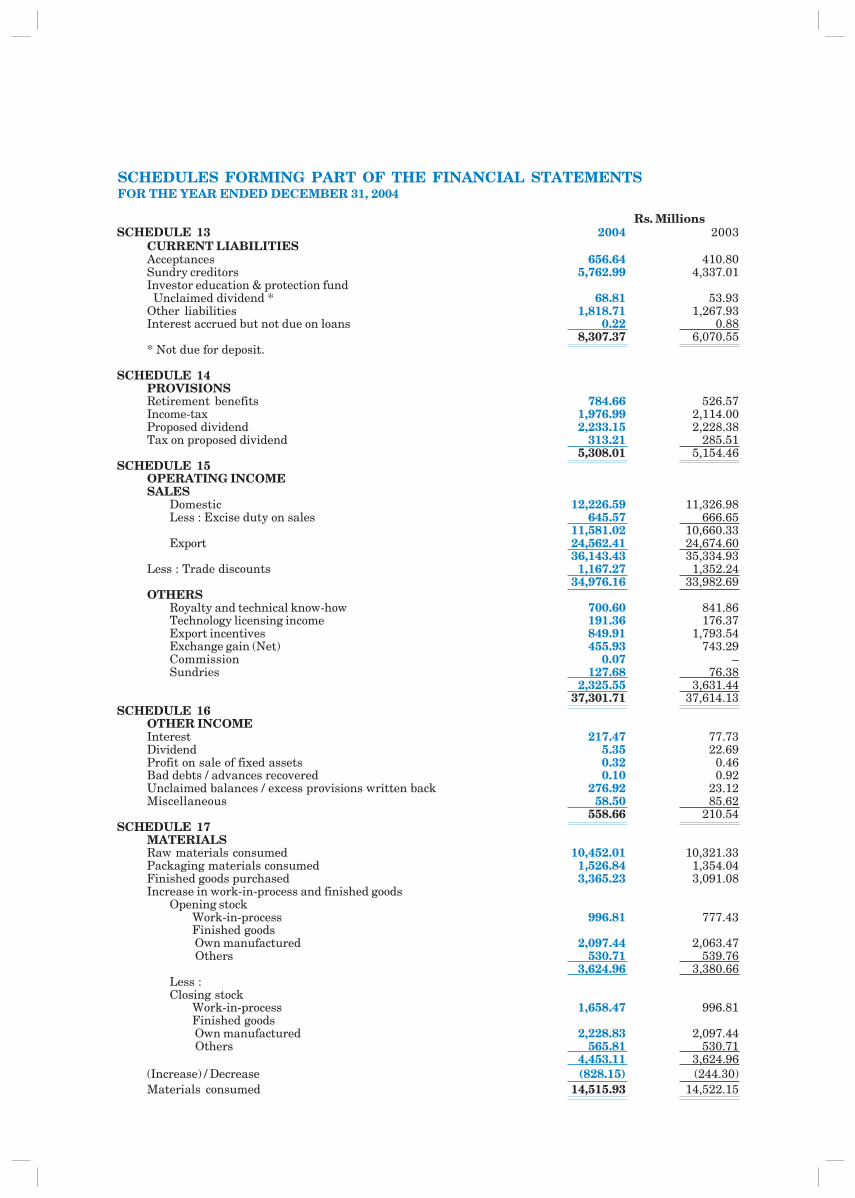
SCHEDULES FORMING PART OF THE FINANCIAL STATEMENTSFOR THE YEAR ENDED DECEMBER 31, 2004
Rs. MillionsSCHEDULE 13 2004 2003
CURRENT LIABILITIESAcceptances 656.64 410.80Sundry creditors 5,762.99 4,337.01Investor education & protection fund Unclaimed dividend * 68.81 53.93Other liabilities 1,818.71 1,267.93Interest accrued but not due on loans 0.22 0.88
8,307.37 6,070.55* Not due for deposit.
SCHEDULE 14PROVISIONSRetirement benefits 784.66 526.57Income-tax 1,976.99 2,114.00Proposed dividend 2,233.15 2,228.38Tax on proposed dividend 313.21 285.51
5,308.01 5,154.46SCHEDULE 15
OPERATING INCOMESALES
Domestic 12,226.59 11,326.98Less : Excise duty on sales 645.57 666.65
11,581.02 10,660.33Export 24,562.41 24,674.60
36,143.43 35,334.93Less : Trade discounts 1,167.27 1,352.24
34,976.16 33,982.69OTHERS
Royalty and technical know-how 700.60 841.86Technology licensing income 191.36 176.37Export incentives 849.91 1,793.54Exchange gain (Net) 455.93 743.29Commission 0.07 –Sundries 127.68 76.38
2,325.55 3,631.44 37,301.71 37,614.13
SCHEDULE 16OTHER INCOMEInterest 217.47 77.73Dividend 5.35 22.69Profit on sale of fixed assets 0.32 0.46Bad debts / advances recovered 0.10 0.92Unclaimed balances / excess provisions written back 276.92 23.12Miscellaneous 58.50 85.62
558.66 210.54SCHEDULE 17
MATERIALSRaw materials consumed 10,452.01 10,321.33Packaging materials consumed 1,526.84 1,354.04Finished goods purchased 3,365.23 3,091.08Increase in work-in-process and finished goods
Opening stockWork-in-process 996.81 777.43Finished goods Own manufactured 2,097.44 2,063.47 Others 530.71 539.76
3,624.96 3,380.66Less :Closing stock
Work-in-process 1,658.47 996.81Finished goods Own manufactured 2,228.83 2,097.44 Others 565.81 530.71
4,453.11 3,624.96(Increase) / Decrease (828.15) (244.30)Materials consumed 14,515.93 14,522.15
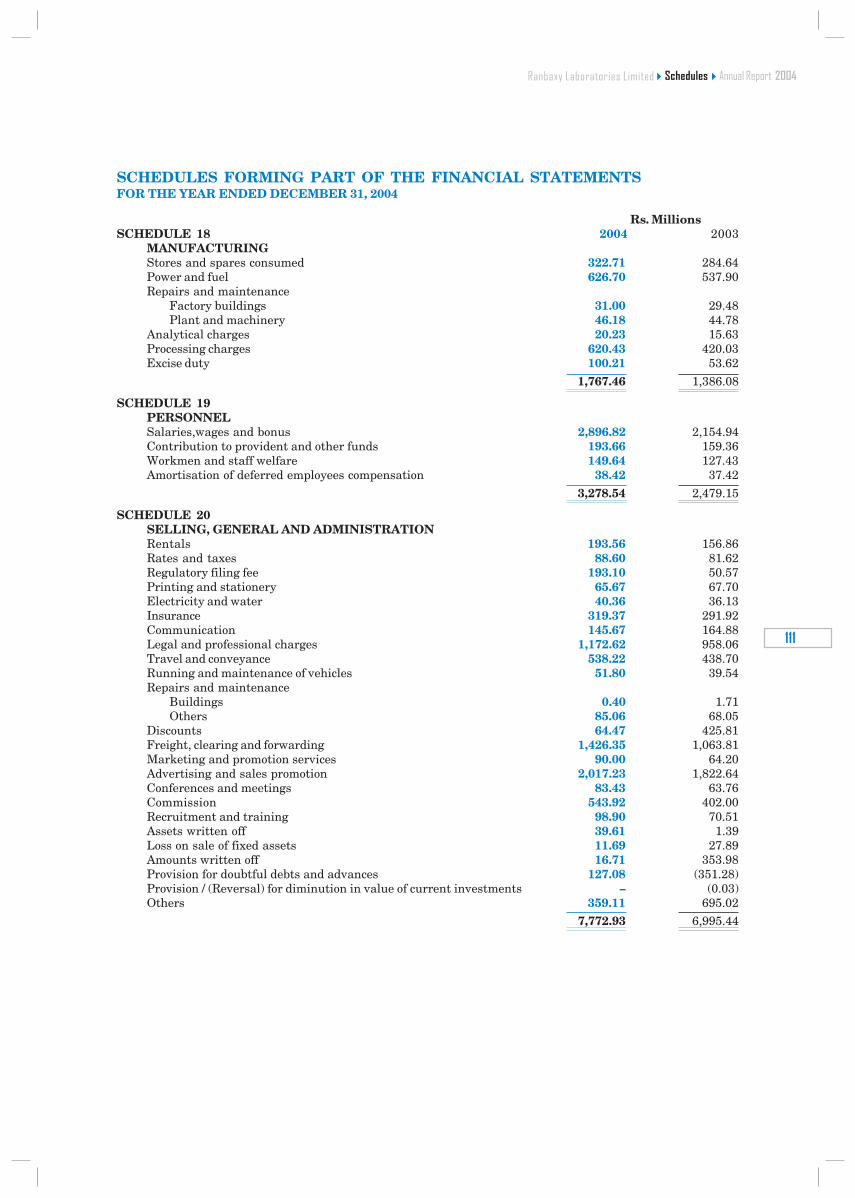
���
����������������
Rs. MillionsSCHEDULE 18 2004 2003
MANUFACTURINGStores and spares consumed 322.71 284.64Power and fuel 626.70 537.90Repairs and maintenance
Factory buildings 31.00 29.48Plant and machinery 46.18 44.78
Analytical charges 20.23 15.63Processing charges 620.43 420.03Excise duty 100.21 53.62
1,767.46 1,386.08
SCHEDULE 19PERSONNELSalaries,wages and bonus 2,896.82 2,154.94Contribution to provident and other funds 193.66 159.36Workmen and staff welfare 149.64 127.43Amortisation of deferred employees compensation 38.42 37.42
3,278.54 2,479.15
SCHEDULE 20SELLING, GENERAL AND ADMINISTRATIONRentals 193.56 156.86Rates and taxes 88.60 81.62Regulatory filing fee 193.10 50.57Printing and stationery 65.67 67.70Electricity and water 40.36 36.13Insurance 319.37 291.92Communication 145.67 164.88Legal and professional charges 1,172.62 958.06Travel and conveyance 538.22 438.70Running and maintenance of vehicles 51.80 39.54Repairs and maintenance
Buildings 0.40 1.71Others 85.06 68.05
Discounts 64.47 425.81Freight, clearing and forwarding 1,426.35 1,063.81Marketing and promotion services 90.00 64.20Advertising and sales promotion 2,017.23 1,822.64Conferences and meetings 83.43 63.76Commission 543.92 402.00Recruitment and training 98.90 70.51Assets written off 39.61 1.39Loss on sale of fixed assets 11.69 27.89Amounts written off 16.71 353.98Provision for doubtful debts and advances 127.08 (351.28)Provision / (Reversal) for diminution in value of current investments – (0.03)Others 359.11 695.02
7,772.93 6,995.44
SCHEDULES FORMING PART OF THE FINANCIAL STATEMENTSFOR THE YEAR ENDED DECEMBER 31, 2004
$ ��!#�����������������������������
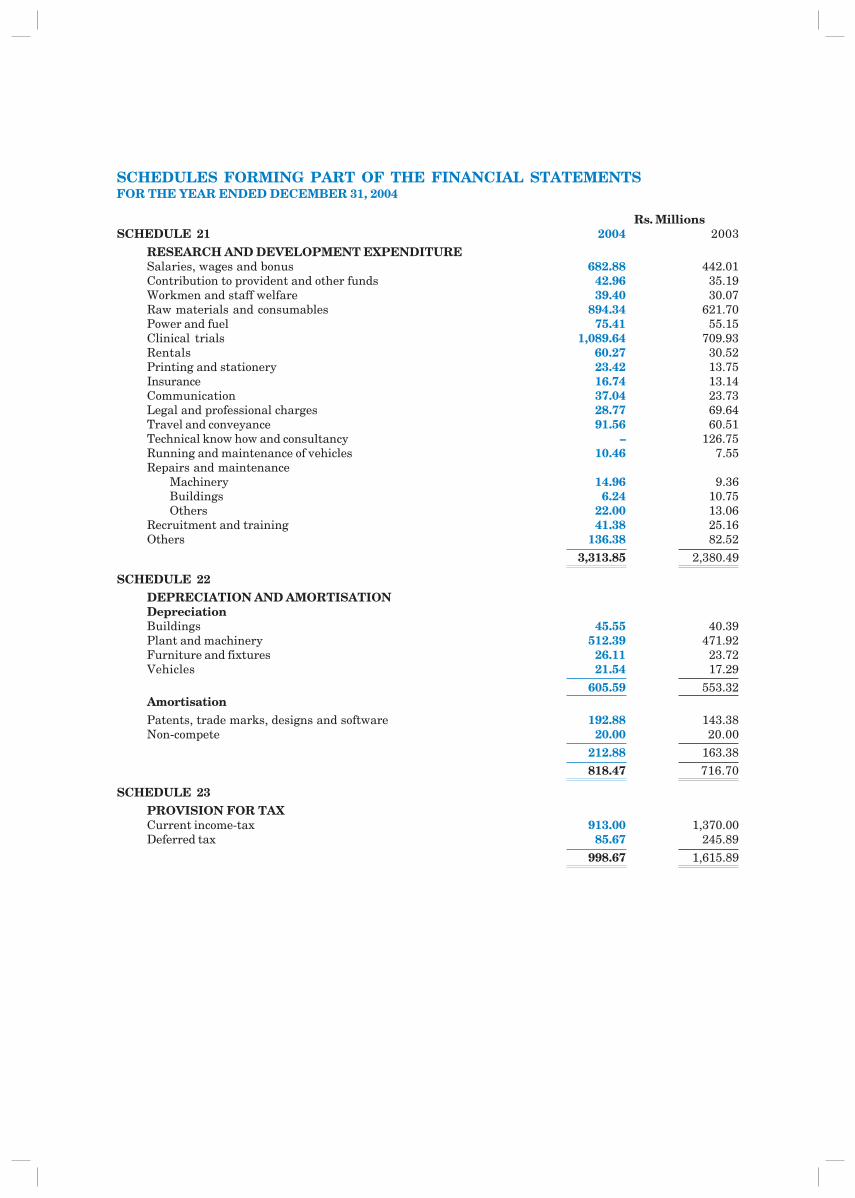
SCHEDULES FORMING PART OF THE FINANCIAL STATEMENTSFOR THE YEAR ENDED DECEMBER 31, 2004
Rs. MillionsSCHEDULE 21 2004 2003
RESEARCH AND DEVELOPMENT EXPENDITURESalaries, wages and bonus 682.88 442.01Contribution to provident and other funds 42.96 35.19Workmen and staff welfare 39.40 30.07Raw materials and consumables 894.34 621.70Power and fuel 75.41 55.15Clinical trials 1,089.64 709.93Rentals 60.27 30.52Printing and stationery 23.42 13.75Insurance 16.74 13.14Communication 37.04 23.73Legal and professional charges 28.77 69.64Travel and conveyance 91.56 60.51Technical know how and consultancy – 126.75Running and maintenance of vehicles 10.46 7.55Repairs and maintenance
Machinery 14.96 9.36Buildings 6.24 10.75Others 22.00 13.06
Recruitment and training 41.38 25.16Others 136.38 82.52
3,313.85 2,380.49
SCHEDULE 22DEPRECIATION AND AMORTISATIONDepreciationBuildings 45.55 40.39Plant and machinery 512.39 471.92Furniture and fixtures 26.11 23.72Vehicles 21.54 17.29
605.59 553.32AmortisationPatents, trade marks, designs and software 192.88 143.38Non-compete 20.00 20.00
212.88 163.38 818.47 716.70
SCHEDULE 23PROVISION FOR TAXCurrent income-tax 913.00 1,370.00Deferred tax 85.67 245.89
998.67 1,615.89
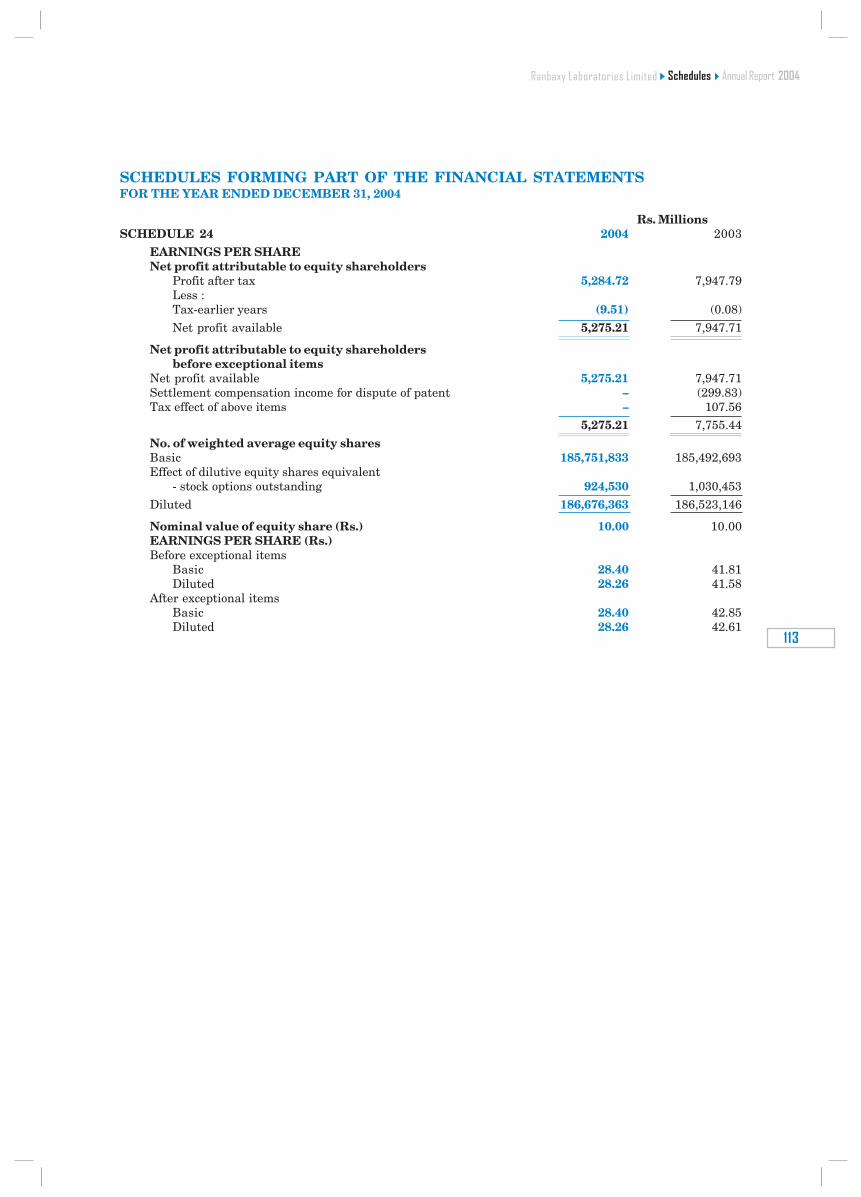
���
������������ ����
SCHEDULES FORMING PART OF THE FINANCIAL STATEMENTSFOR THE YEAR ENDED DECEMBER 31, 2004
Rs. MillionsSCHEDULE 24 2004 2003
EARNINGS PER SHARENet profit attributable to equity shareholders
Profit after tax 5,284.72 7,947.79Less :Tax-earlier years (9.51) (0.08)
Net profit available 5,275.21 7,947.71
Net profit attributable to equity shareholdersbefore exceptional items
Net profit available 5,275.21 7,947.71Settlement compensation income for dispute of patent – (299.83)Tax effect of above items – 107.56
5,275.21 7,755.44
No. of weighted average equity sharesBasic 185,751,833 185,492,693Effect of dilutive equity shares equivalent
- stock options outstanding 924,530 1,030,453
Diluted 186,676,363 186,523,146
Nominal value of equity share (Rs.) 10.00 10.00EARNINGS PER SHARE (Rs.)Before exceptional items
Basic 28.40 41.81Diluted 28.26 41.58
After exceptional itemsBasic 28.40 42.85Diluted 28.26 42.61
����� ��� ������ ���������������
SCHEDULES FORMING PART OF THE FINANCIAL STATEMENTSFOR THE YEAR ENDED DECEMBER 31, 2004
SCHEDULE 25
SIGNIFICANT ACCOUNTING POLICIES
[a] Basis of preparation
The financial statements have been prepared to comply with the mandatory Accounting Standards issued bythe Institute of Chartered Accountants of India ('ICAI') and the relevant provisions of the Companies Act,1956 (the 'Act'). The financial statements have been prepared under the historical cost convention on accrualbasis. The accounting policies have been consistently applied by the Company unless otherwise stated.
[b] Fixed assets
Fixed assets are stated at cost less accumulated depreciation and impairment losses. Cost comprises thepurchase price and any attributable cost of bringing the asset to its working condition for its intended use.
[c] Intangibles
Patents, Trademarks and Designs
Costs relating to patents, trademarks and designs, which are acquired, are capitalized and amortized on astraight-line basis over a period of 5 years.
Computer software
Pursuant to adoption of Accounting Standard 26 - Intangible Assets, issued by the ICAI, software which is notan integral part of the related hardware, is classified as an intangible asset and is being amortised over aperiod of 6 years, being the estimated useful life.
Non-compete
Costs relating to payment of non compete compensation is capitalised and amortised on a straight-line basisover the life of non-compete agreement.
[d] Depreciation
Depreciation is provided on straight-line method at the rates and in the manner prescribed in Schedule XIVof the Act.
Premium paid on perpetual leasehold land is charged to revenue on termination/renewal of lease agreements.
[e] Leases
Operating lease payments are recognized as an expense in the Profit and Loss account on a straight-line basisover the lease term.
[f] Investments
Investments that are readily realisable and intended to be held for not more than a year are classified ascurrent investments. All other investments are classified as long-term investments. Current investments arecarried at lower of cost and fair value determined on an individual investment basis. Long-term investmentsare carried at cost. However, provision for diminution in value is made to recognise a decline other thantemporary in the value of the investments.
Profit/ loss on sale of investments is computed with reference to their average cost.
[g] Inventories
Inventories are valued as follows:
Raw materials, stores and spares and packing materials
Lower of cost and net realizable value. However, materials and other items held for use in the production ofinventories are not written down below cost if the finished products in which they will be incorporated areexpected to be sold at or above cost. Cost is determined on a weighted average basis.
Finished goods
Lower of cost and net realizable value. Cost includes direct materials and labour and a proportion ofmanufacturing overheads based on normal operating capacity. Cost of finished goods includes excise duty.
Work-in-process
At cost upto estimated stage of process. Cost includes direct materials and labour and a proportion ofmanufacturing overheads based on normal operating capacity.
Net realizable value is the estimated selling price in the ordinary course of business, less estimated costs ofcompletion and the estimated costs necessary to make the sale.
���
������������ ����
Where duty paid/ indigenous materials are consumed, prior to duty-free import of materials under the AdvanceLicense Scheme, in manufacture of products for export, the estimated excess cost of such materials over thatof duty free materials is carried forward in the cost of raw materials and charged to revenue on consumptionof such duty-free materials.
[h] Revenue recognitionRevenue is recognized to the extent that it is probable that the economic benefits will flow to the Company andthe revenue can be reliably measured.
Sale of Goods:Revenue from sale of goods is recognised when the significant risks and rewards of ownership of the goods aretransferred to the customer and is stated net of trade discounts, excise duty, sales returns and sales tax.
Royalties, Technical Know-how and Licensing income:Revenue is recognised on an accrual basis in accordance with the terms of the relevant agreement.
Interest:Revenue is recognised on a time proportion basis taking into account the amount outstanding and the rateapplicable.
Dividends:Revenue is recognised when the right to receive the income is established.
[i] Research and development costsRevenue expenditure incurred on research and development is charged to revenue in the year it is incurred.
Capital expenditure is included in the respective heads under fixed assets.
[j] Expenditure on regulatory approvalsExpenditure incurred for obtaining regulatory approvals and registration of products for overseas marketsand products acquisition is charged to revenue.
[k] Employee stock option planThe accounting value of stock options representing the excess of the market price over the exercise price of theshares granted under "Employees Stock Option Scheme" of the Company, is amortised on straight-line basisover the vesting period as "Deferred employees compensation" in accordance with the SEBI (Employee StockOption Scheme and Employee Stock Purchase Scheme) Guidelines, 1999.
[l] Foreign currency translationForeign currency translations
(i) Initial Recognition
Foreign currency transactions are recorded in the reporting currency, by applying to the foreign currencyamount the exchange rate between the reporting currency and the foreign currency at the date of thetransaction.
(ii) Conversion
Foreign currency monetary items are reported using the closing rate. Non-monetary items which arecarried in terms of historical cost denominated in a foreign currency are reported using the exchange rateat the date of the transaction; and investments in foreign companies are recorded at the exchange ratesprevailing on the date of making the investments.
(iii) Exchange Differences
Exchange differences arising on the settlement of monetary items or on reporting company's monetaryitems at rates different from those at which they were initially recorded during the year, or reported inprevious financial statements, are recognised as income or as expenses in the year in which they arise,except for loans denominated in foreign currencies utilised for acquisition of fixed assets where theexchange gains/losses are adjusted to the cost of such assets.
(iv) Forward Exchange Contracts not intended for trading or speculation purposes
The premium or discount arising at the inception of forward exchange contracts is amortised as expenseor income over the life of the contract. Exchange differences on such contracts are recognised in the profitand loss in the year in which the exchange rates change. Any profit or loss arising on cancellation orrenewal of forward exchange contract is recognised as income or as expense for the year.
SCHEDULES FORMING PART OF THE FINANCIAL STATEMENTSFOR THE YEAR ENDED DECEMBER 31, 2004
SCHEDULE 25
SIGNIFICANT ACCOUNTING POLICIES (Contd.)
����� ��� ������ ���������������
Representative officesIn translating the financial statements of representative offices for incorporation in financial statements, themonetary assets and liabilities are translated at the closing rate; non monetary assets and liabilities aretranslated at exchange rates prevailing at the dates of the transactions and income and expense items areconverted at the respective monthly average rate.
[m] Retirement benefitsContributions in respect of provided fund, superannuation and gratuity are made to Trust set up by theCompany for the purpose and charged to profit and loss account.
Provisions for liabilities in respect of gratuity, pension and leave encashment benefits are made based onactuarial valuation made by an independent actuary as at the balance sheet date.
[n] Income taxesTax expenses comprises both current and deferred taxes.
The provision for current income tax is the aggregate of the balance provision for tax for three months endedMarch 31, 2004 and the estimated provision based on the taxable profit of remaining nine months up toDecember 31, 2004, the actual tax liability, for which, will be determined on the basis of the results for theperiod April 1,2004 to March 31, 2005.
Deferred income taxes reflects the impact of current year timing differences between taxable income andaccounting income for the year and reversal of timing differences of earlier years. Deferred tax is measuredbased on the tax rates and the tax laws enacted or substantively enacted at the balance sheet date. Deferredtax assets are recognised only to the extent that there is reasonable certainty that sufficient future taxableincome will be available against which such deferred tax assets can be realised.
[o] Export benefits/incentivesExport entitlements under the Duty Entitlement Pass Book("DEPB") Scheme are recognised in the profit andloss account when the right to receive credit as per the terms of the scheme is established in respect of theexports made.
Obligation / entitlements on account of Advance Licence Scheme for import of raw materials are accounted foron purchase of raw materials and / or export sales.
[p] Contingent liabilitiesDepending on facts of each case and after due evaluation of relevant legal aspects, claims against the Companynot acknowledged as debts are disclosed as contingent liabilities. In respect of statutory matters, contingentliabilities are disclosed only for those demand(s) that are contested by the Company.
[q] Use of estimatesIn preparing Company's financial statements in conformity with accounting principles generally accepted inIndia, management is required to make estimates and assumptions that affect the reported amounts ofassets and liabilities and the disclosure of contingent liabilities at the date of the financial statements andthe reported amounts of revenues and expenses during the reporting period; actual results could differ fromthose estimates.
[r] Earnings per shareBasic earnings per share are calculated by dividing the net profit or loss for the period attributable to equityshareholders by the weighted average number of equity shares outstanding during the period. The weightedaverage number of equity shares outstanding during the period are adjusted for events of bonus issue.
For the purpose of calculating diluted earnings per share, the net profit or loss for the period attributable toequity shareholders and the weighted average number of shares outstanding during the period are adjustedfor the effects of all dilutive potential equity shares.
SCHEDULES FORMING PART OF THE FINANCIAL STATEMENTSFOR THE YEAR ENDED DECEMBER 31, 2004
SCHEDULE 25
SIGNIFICANT ACCOUNTING POLICIES (Contd.)
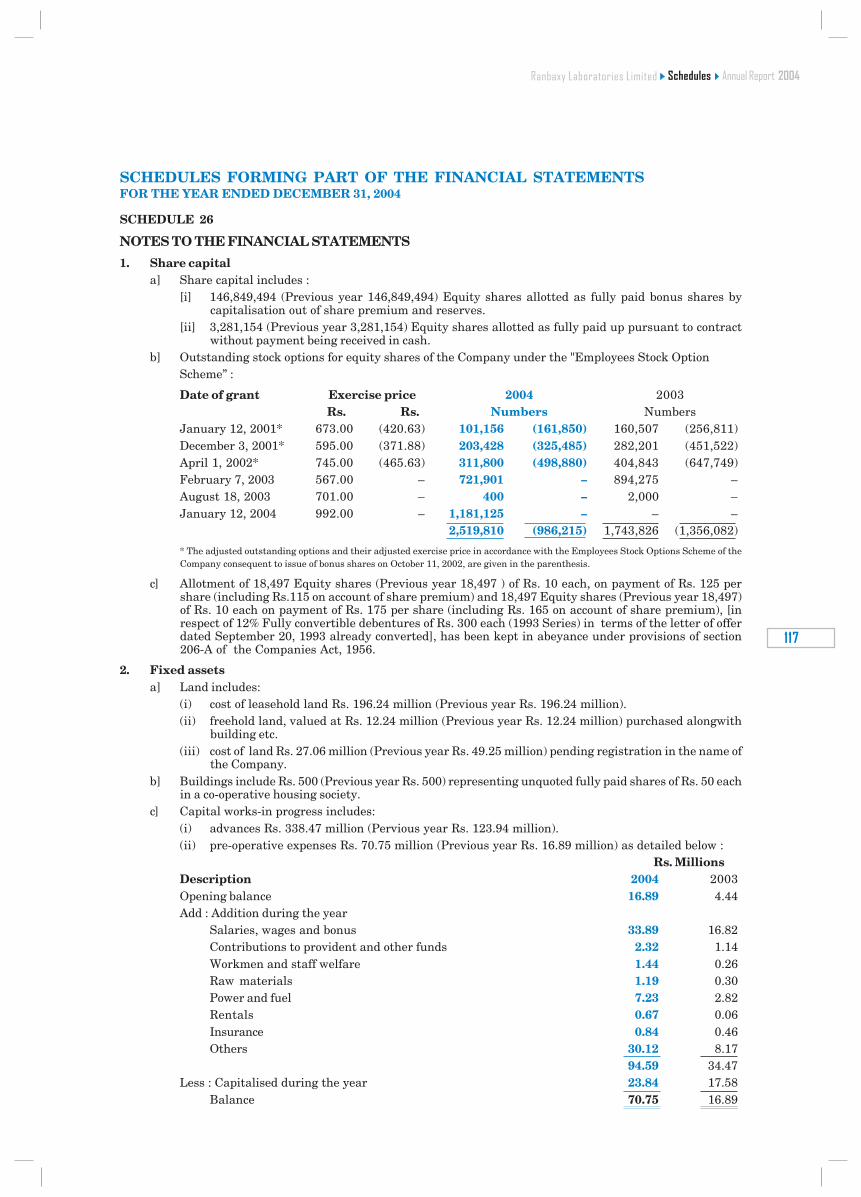
���
������������ ����
SCHEDULES FORMING PART OF THE FINANCIAL STATEMENTSFOR THE YEAR ENDED DECEMBER 31, 2004
SCHEDULE 26
NOTES TO THE FINANCIAL STATEMENTS
1. Share capitala] Share capital includes :
[i] 146,849,494 (Previous year 146,849,494) Equity shares allotted as fully paid bonus shares bycapitalisation out of share premium and reserves.
[ii] 3,281,154 (Previous year 3,281,154) Equity shares allotted as fully paid up pursuant to contractwithout payment being received in cash.
b] Outstanding stock options for equity shares of the Company under the "Employees Stock OptionScheme” :
Date of grant Exercise price 2004 2003Rs. Rs. Numbers Numbers
January 12, 2001* 673.00 (420.63) 101,156 (161,850) 160,507 (256,811)December 3, 2001* 595.00 (371.88) 203,428 (325,485) 282,201 (451,522)April 1, 2002* 745.00 (465.63) 311,800 (498,880) 404,843 (647,749)February 7, 2003 567.00 – 721,901 – 894,275 –August 18, 2003 701.00 – 400 – 2,000 –January 12, 2004 992.00 – 1,181,125 – – –
2,519,810 (986,215) 1,743,826 (1,356,082)
* The adjusted outstanding options and their adjusted exercise price in accordance with the Employees Stock Options Scheme of theCompany consequent to issue of bonus shares on October 11, 2002, are given in the parenthesis.
c] Allotment of 18,497 Equity shares (Previous year 18,497 ) of Rs. 10 each, on payment of Rs. 125 pershare (including Rs.115 on account of share premium) and 18,497 Equity shares (Previous year 18,497)of Rs. 10 each on payment of Rs. 175 per share (including Rs. 165 on account of share premium), [inrespect of 12% Fully convertible debentures of Rs. 300 each (1993 Series) in terms of the letter of offerdated September 20, 1993 already converted], has been kept in abeyance under provisions of section206-A of the Companies Act, 1956.
2. Fixed assetsa] Land includes:
(i) cost of leasehold land Rs. 196.24 million (Previous year Rs. 196.24 million).(ii) freehold land, valued at Rs. 12.24 million (Previous year Rs. 12.24 million) purchased alongwith
building etc.(iii) cost of land Rs. 27.06 million (Previous year Rs. 49.25 million) pending registration in the name of
the Company.b] Buildings include Rs. 500 (Previous year Rs. 500) representing unquoted fully paid shares of Rs. 50 each
in a co-operative housing society.c] Capital works-in progress includes:
(i) advances Rs. 338.47 million (Pervious year Rs. 123.94 million).(ii) pre-operative expenses Rs. 70.75 million (Previous year Rs. 16.89 million) as detailed below :
Rs. MillionsDescription 2004 2003Opening balance 16.89 4.44Add : Addition during the year
Salaries, wages and bonus 33.89 16.82Contributions to provident and other funds 2.32 1.14Workmen and staff welfare 1.44 0.26Raw materials 1.19 0.30Power and fuel 7.23 2.82Rentals 0.67 0.06Insurance 0.84 0.46Others 30.12 8.17
94.59 34.47Less : Capitalised during the year 23.84 17.58
Balance 70.75 16.89
����� ��� ������ ���������������
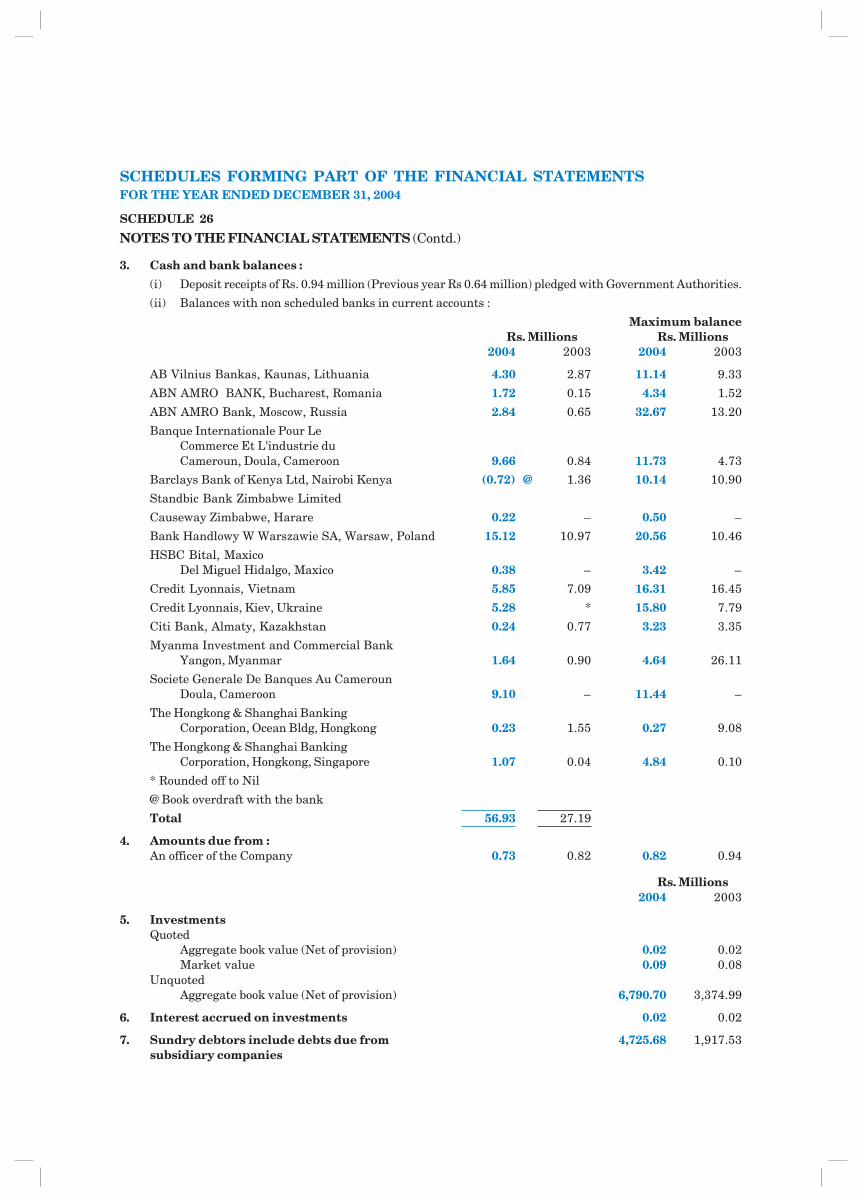
3. Cash and bank balances :
(i) Deposit receipts of Rs. 0.94 million (Previous year Rs 0.64 million) pledged with Government Authorities.
(ii) Balances with non scheduled banks in current accounts :
Maximum balanceRs. Millions Rs. Millions
2004 2003 2004 2003
AB Vilnius Bankas, Kaunas, Lithuania 4.30 2.87 11.14 9.33
ABN AMRO BANK, Bucharest, Romania 1.72 0.15 4.34 1.52
ABN AMRO Bank, Moscow, Russia 2.84 0.65 32.67 13.20
Banque Internationale Pour LeCommerce Et L'industrie duCameroun, Doula, Cameroon 9.66 0.84 11.73 4.73
Barclays Bank of Kenya Ltd, Nairobi Kenya (0.72) @ 1.36 10.14 10.90
Standbic Bank Zimbabwe Limited
Causeway Zimbabwe, Harare 0.22 – 0.50 –
Bank Handlowy W Warszawie SA, Warsaw, Poland 15.12 10.97 20.56 10.46
HSBC Bital, MaxicoDel Miguel Hidalgo, Maxico 0.38 – 3.42 –
Credit Lyonnais, Vietnam 5.85 7.09 16.31 16.45
Credit Lyonnais, Kiev, Ukraine 5.28 * 15.80 7.79
Citi Bank, Almaty, Kazakhstan 0.24 0.77 3.23 3.35
Myanma Investment and Commercial BankYangon, Myanmar 1.64 0.90 4.64 26.11
Societe Generale De Banques Au CamerounDoula, Cameroon 9.10 – 11.44 –
The Hongkong & Shanghai BankingCorporation, Ocean Bldg, Hongkong 0.23 1.55 0.27 9.08
The Hongkong & Shanghai BankingCorporation, Hongkong, Singapore 1.07 0.04 4.84 0.10
* Rounded off to Nil
@ Book overdraft with the bank
Total 56.93 27.19
4. Amounts due from :An officer of the Company 0.73 0.82 0.82 0.94
Rs. Millions2004 2003
5. InvestmentsQuoted
Aggregate book value (Net of provision) 0.02 0.02Market value 0.09 0.08
UnquotedAggregate book value (Net of provision) 6,790.70 3,374.99
6. Interest accrued on investments 0.02 0.02
7. Sundry debtors include debts due from 4,725.68 1,917.53subsidiary companies
SCHEDULES FORMING PART OF THE FINANCIAL STATEMENTSFOR THE YEAR ENDED DECEMBER 31, 2004
SCHEDULE 26
NOTES TO THE FINANCIAL STATEMENTS (Contd.)
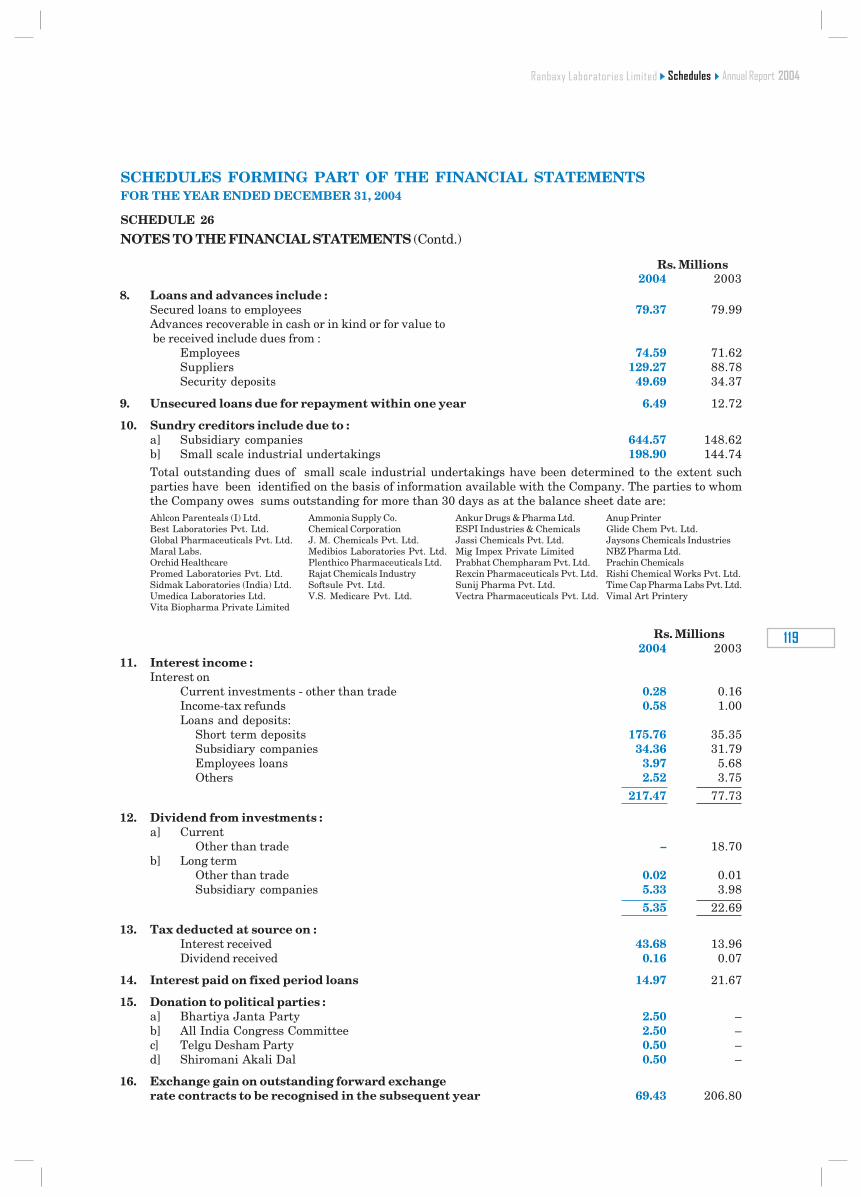
���
������������ ����
8. Loans and advances include :Secured loans to employees 79.37 79.99Advances recoverable in cash or in kind or for value to be received include dues from :
Employees 74.59 71.62Suppliers 129.27 88.78Security deposits 49.69 34.37
9. Unsecured loans due for repayment within one year 6.49 12.72
10. Sundry creditors include due to :a] Subsidiary companies 644.57 148.62b] Small scale industrial undertakings 198.90 144.74Total outstanding dues of small scale industrial undertakings have been determined to the extent suchparties have been identified on the basis of information available with the Company. The parties to whomthe Company owes sums outstanding for more than 30 days as at the balance sheet date are:Ahlcon Parenteals (I) Ltd. Ammonia Supply Co. Ankur Drugs & Pharma Ltd. Anup PrinterBest Laboratories Pvt. Ltd. Chemical Corporation ESPI Industries & Chemicals Glide Chem Pvt. Ltd.Global Pharmaceuticals Pvt. Ltd. J. M. Chemicals Pvt. Ltd. Jassi Chemicals Pvt. Ltd. Jaysons Chemicals IndustriesMaral Labs. Medibios Laboratories Pvt. Ltd. Mig Impex Private Limited NBZ Pharma Ltd.Orchid Healthcare Plenthico Pharmaceuticals Ltd. Prabhat Chempharam Pvt. Ltd. Prachin ChemicalsPromed Laboratories Pvt. Ltd. Rajat Chemicals Industry Rexcin Pharmaceuticals Pvt. Ltd. Rishi Chemical Works Pvt. Ltd.Sidmak Laboratories (India) Ltd. Softsule Pvt. Ltd. Sunij Pharma Pvt. Ltd. Time Cap Pharma Labs Pvt. Ltd.Umedica Laboratories Ltd. V.S. Medicare Pvt. Ltd. Vectra Pharmaceuticals Pvt. Ltd. Vimal Art PrinteryVita Biopharma Private Limited
Rs. Millions2004 2003
11. Interest income :Interest on
Current investments - other than trade 0.28 0.16Income-tax refunds 0.58 1.00Loans and deposits:
Short term deposits 175.76 35.35Subsidiary companies 34.36 31.79Employees loans 3.97 5.68Others 2.52 3.75
217.47 77.73
12. Dividend from investments :a] Current
Other than trade – 18.70b] Long term
Other than trade 0.02 0.01Subsidiary companies 5.33 3.98
5.35 22.69
13. Tax deducted at source on :Interest received 43.68 13.96Dividend received 0.16 0.07
14. Interest paid on fixed period loans 14.97 21.67
15. Donation to political parties :a] Bhartiya Janta Party 2.50 –b] All India Congress Committee 2.50 –c] Telgu Desham Party 0.50 –d] Shiromani Akali Dal 0.50 –
16. Exchange gain on outstanding forward exchangerate contracts to be recognised in the subsequent year 69.43 206.80
SCHEDULES FORMING PART OF THE FINANCIAL STATEMENTSFOR THE YEAR ENDED DECEMBER 31, 2004
SCHEDULE 26
NOTES TO THE FINANCIAL STATEMENTS (Contd.)
Rs. Millions2004 2003
����� ��� ������ ���������������
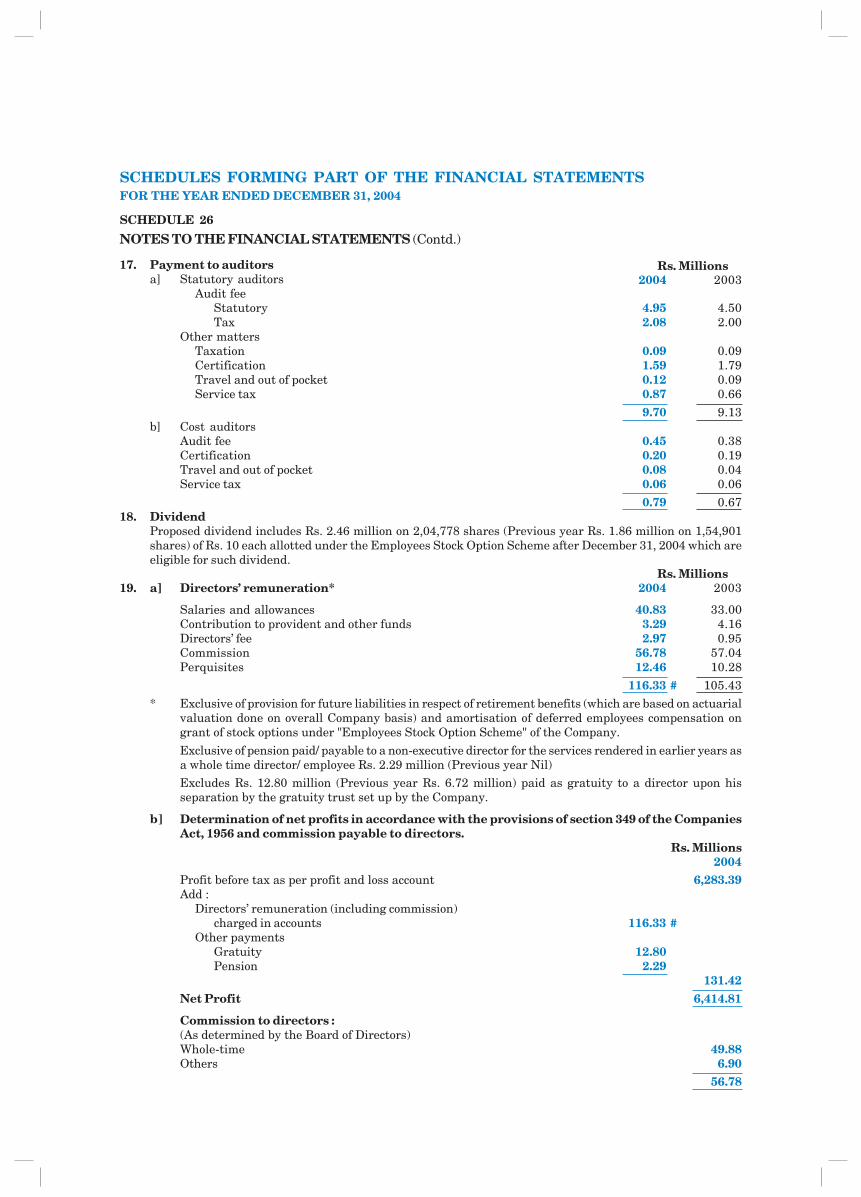
17. Payment to auditorsa] Statutory auditors
Audit feeStatutory 4.95 4.50Tax 2.08 2.00
Other mattersTaxation 0.09 0.09Certification 1.59 1.79Travel and out of pocket 0.12 0.09Service tax 0.87 0.66
9.70 9.13b] Cost auditors
Audit fee 0.45 0.38Certification 0.20 0.19Travel and out of pocket 0.08 0.04Service tax 0.06 0.06
0.79 0.6718. Dividend
Proposed dividend includes Rs. 2.46 million on 2,04,778 shares (Previous year Rs. 1.86 million on 1,54,901shares) of Rs. 10 each allotted under the Employees Stock Option Scheme after December 31, 2004 which areeligible for such dividend.
Rs. Millions19. a] Directors’ remuneration* 2004 2003
Salaries and allowances 40.83 33.00Contribution to provident and other funds 3.29 4.16Directors’ fee 2.97 0.95Commission 56.78 57.04Perquisites 12.46 10.28
116.33 # 105.43
* Exclusive of provision for future liabilities in respect of retirement benefits (which are based on actuarialvaluation done on overall Company basis) and amortisation of deferred employees compensation ongrant of stock options under "Employees Stock Option Scheme" of the Company.
Exclusive of pension paid/ payable to a non-executive director for the services rendered in earlier years asa whole time director/ employee Rs. 2.29 million (Previous year Nil)Excludes Rs. 12.80 million (Previous year Rs. 6.72 million) paid as gratuity to a director upon hisseparation by the gratuity trust set up by the Company.
b] Determination of net profits in accordance with the provisions of section 349 of the CompaniesAct, 1956 and commission payable to directors.
Rs. Millions2004
Profit before tax as per profit and loss account 6,283.39Add :
Directors’ remuneration (including commission)charged in accounts 116.33 #
Other paymentsGratuity 12.80Pension 2.29
131.42Net Profit 6,414.81
Commission to directors :(As determined by the Board of Directors)Whole-time 49.88Others 6.90
56.78
SCHEDULES FORMING PART OF THE FINANCIAL STATEMENTSFOR THE YEAR ENDED DECEMBER 31, 2004
SCHEDULE 26
NOTES TO THE FINANCIAL STATEMENTS (Contd.)
Rs. Millions2004 2003
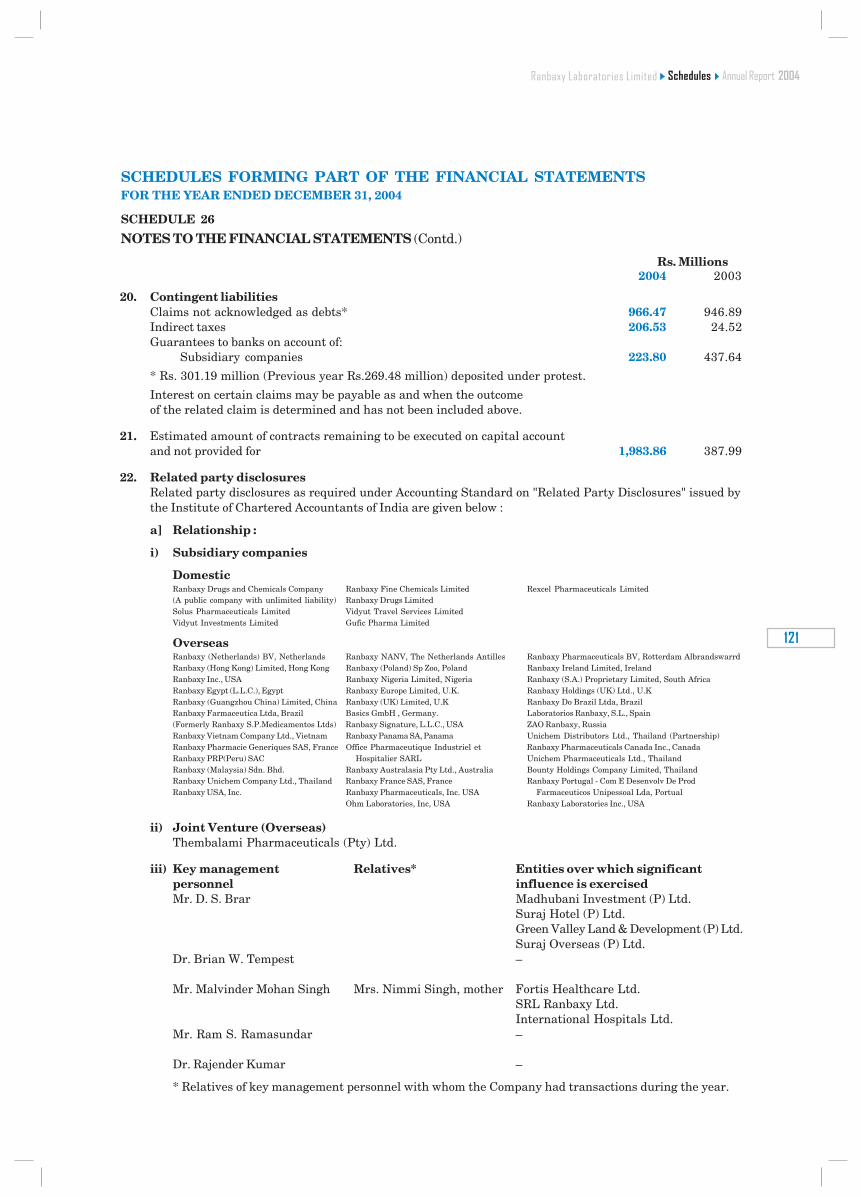
���
������������ ����
20. Contingent liabilitiesClaims not acknowledged as debts* 966.47 946.89Indirect taxes 206.53 24.52Guarantees to banks on account of:
Subsidiary companies 223.80 437.64
* Rs. 301.19 million (Previous year Rs.269.48 million) deposited under protest.
Interest on certain claims may be payable as and when the outcomeof the related claim is determined and has not been included above.
21. Estimated amount of contracts remaining to be executed on capital accountand not provided for 1,983.86 387.99
22. Related party disclosuresRelated party disclosures as required under Accounting Standard on "Related Party Disclosures" issued bythe Institute of Chartered Accountants of India are given below :
a] Relationship :
i) Subsidiary companies
DomesticRanbaxy Drugs and Chemicals Company Ranbaxy Fine Chemicals Limited Rexcel Pharmaceuticals Limited(A public company with unlimited liability) Ranbaxy Drugs LimitedSolus Pharmaceuticals Limited Vidyut Travel Services LimitedVidyut Investments Limited Gufic Pharma Limited
OverseasRanbaxy (Netherlands) BV, Netherlands Ranbaxy NANV, The Netherlands Antilles Ranbaxy Pharmaceuticals BV, Rotterdam AlbrandswarrdRanbaxy (Hong Kong) Limited, Hong Kong Ranbaxy (Poland) Sp Zoo, Poland Ranbaxy Ireland Limited, IrelandRanbaxy Inc., USA Ranbaxy Nigeria Limited, Nigeria Ranbaxy (S.A.) Proprietary Limited, South AfricaRanbaxy Egypt (L.L.C.), Egypt Ranbaxy Europe Limited, U.K. Ranbaxy Holdings (UK) Ltd., U.KRanbaxy (Guangzhou China) Limited, China Ranbaxy (UK) Limited, U.K Ranbaxy Do Brazil Ltda, BrazilRanbaxy Farmaceutica Ltda, Brazil Basics GmbH , Germany. Laboratorios Ranbaxy, S.L., Spain(Formerly Ranbaxy S.P.Medicamentos Ltds) Ranbaxy Signature, L.L.C., USA ZAO Ranbaxy, RussiaRanbaxy Vietnam Company Ltd., Vietnam Ranbaxy Panama SA, Panama Unichem Distributors Ltd., Thailand (Partnership)Ranbaxy Pharmacie Generiques SAS, France Office Pharmaceutique Industriel et Ranbaxy Pharmaceuticals Canada Inc., CanadaRanbaxy PRP(Peru) SAC Hospitalier SARL Unichem Pharmaceuticals Ltd., ThailandRanbaxy (Malaysia) Sdn. Bhd. Ranbaxy Australasia Pty Ltd., Australia Bounty Holdings Company Limited, ThailandRanbaxy Unichem Company Ltd., Thailand Ranbaxy France SAS, France Ranbaxy Portugal - Com E Desenvolv De ProdRanbaxy USA, Inc. Ranbaxy Pharmaceuticals, Inc. USA Farmaceuticos Unipessoal Lda, Portual
Ohm Laboratories, Inc, USA Ranbaxy Laboratories Inc., USA
ii) Joint Venture (Overseas)Thembalami Pharmaceuticals (Pty) Ltd.
iii) Key management Relatives* Entities over which significantpersonnel influence is exercisedMr. D. S. Brar Madhubani Investment (P) Ltd.
Suraj Hotel (P) Ltd.Green Valley Land & Development (P) Ltd.Suraj Overseas (P) Ltd.
Dr. Brian W. Tempest –
Mr. Malvinder Mohan Singh Mrs. Nimmi Singh, mother Fortis Healthcare Ltd.SRL Ranbaxy Ltd.International Hospitals Ltd.
Mr. Ram S. Ramasundar –
Dr. Rajender Kumar –
* Relatives of key management personnel with whom the Company had transactions during the year.
SCHEDULES FORMING PART OF THE FINANCIAL STATEMENTSFOR THE YEAR ENDED DECEMBER 31, 2004
SCHEDULE 26
NOTES TO THE FINANCIAL STATEMENTS (Contd.)
Rs. Millions2004 2003
����� ��� ������ ���������������
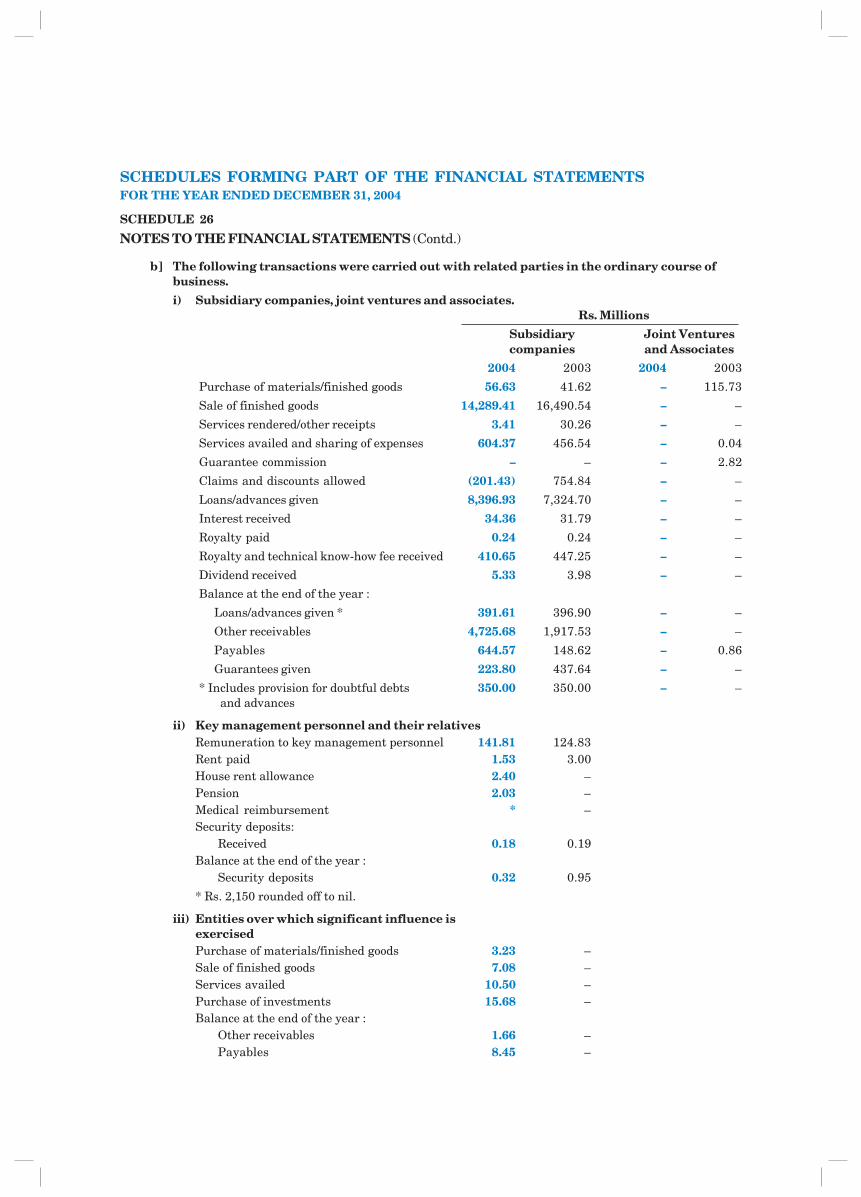
SCHEDULES FORMING PART OF THE FINANCIAL STATEMENTSFOR THE YEAR ENDED DECEMBER 31, 2004
SCHEDULE 26
NOTES TO THE FINANCIAL STATEMENTS (Contd.)
b] The following transactions were carried out with related parties in the ordinary course ofbusiness.
i) Subsidiary companies, joint ventures and associates.Rs. Millions
Subsidiary Joint Venturescompanies and Associates
2004 2003 2004 2003
Purchase of materials/finished goods 56.63 41.62 – 115.73
Sale of finished goods 14,289.41 16,490.54 – –
Services rendered/other receipts 3.41 30.26 – –
Services availed and sharing of expenses 604.37 456.54 – 0.04
Guarantee commission – – – 2.82
Claims and discounts allowed (201.43) 754.84 – –
Loans/advances given 8,396.93 7,324.70 – –
Interest received 34.36 31.79 – –
Royalty paid 0.24 0.24 – –
Royalty and technical know-how fee received 410.65 447.25 – –
Dividend received 5.33 3.98 – –
Balance at the end of the year :
Loans/advances given * 391.61 396.90 – –
Other receivables 4,725.68 1,917.53 – –
Payables 644.57 148.62 – 0.86
Guarantees given 223.80 437.64 – –
* Includes provision for doubtful debts 350.00 350.00 – – and advances
ii) Key management personnel and their relativesRemuneration to key management personnel 141.81 124.83Rent paid 1.53 3.00House rent allowance 2.40 –Pension 2.03 –Medical reimbursement * –Security deposits:
Received 0.18 0.19Balance at the end of the year :
Security deposits 0.32 0.95
* Rs. 2,150 rounded off to nil.
iii) Entities over which significant influence isexercisedPurchase of materials/finished goods 3.23 –Sale of finished goods 7.08 –Services availed 10.50 –Purchase of investments 15.68 –Balance at the end of the year :
Other receivables 1.66 –Payables 8.45 –
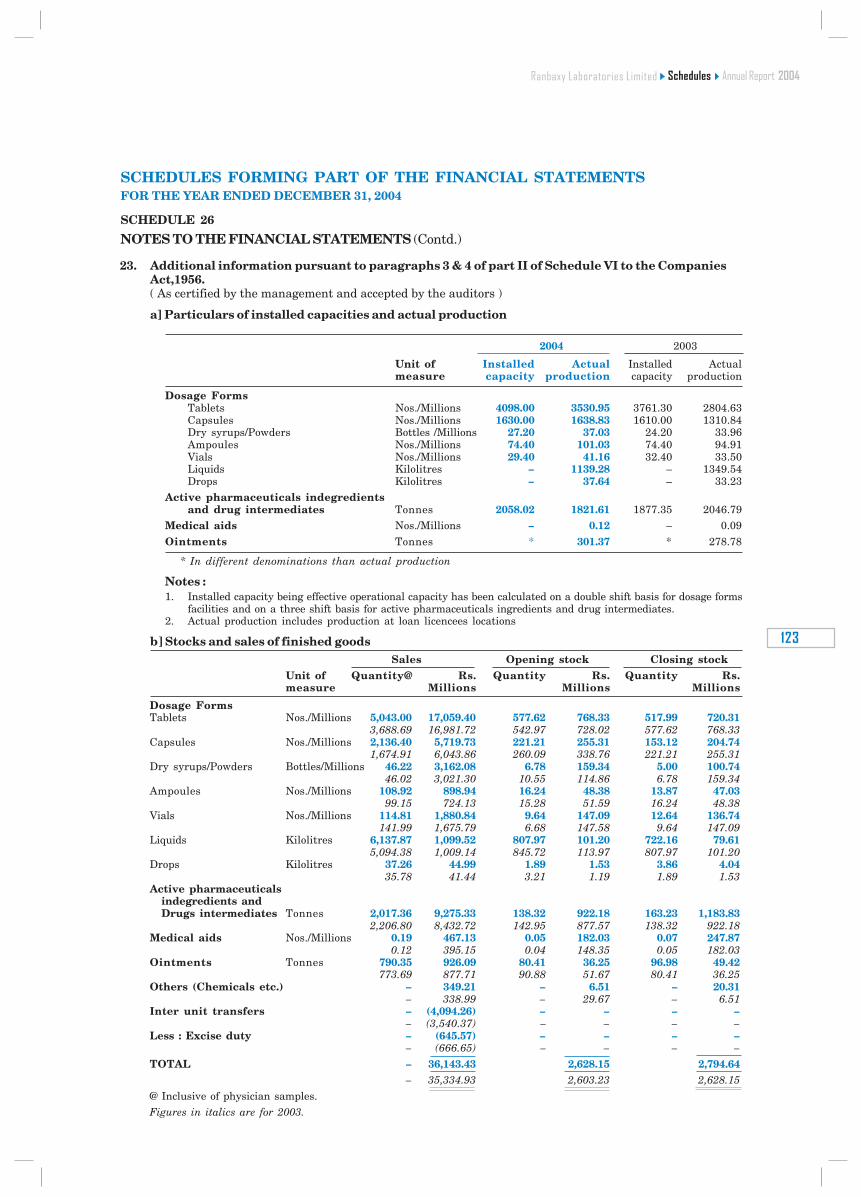
���
������������ ����
SCHEDULES FORMING PART OF THE FINANCIAL STATEMENTSFOR THE YEAR ENDED DECEMBER 31, 2004
SCHEDULE 26
NOTES TO THE FINANCIAL STATEMENTS (Contd.)
23. Additional information pursuant to paragraphs 3 & 4 of part II of Schedule VI to the CompaniesAct,1956.( As certified by the management and accepted by the auditors )
a] Particulars of installed capacities and actual production
2004 2003
Unit of Installed Actual Installed Actualmeasure capacity production capacity production
Dosage FormsTablets Nos./Millions 4098.00 3530.95 3761.30 2804.63Capsules Nos./Millions 1630.00 1638.83 1610.00 1310.84Dry syrups/Powders Bottles /Millions 27.20 37.03 24.20 33.96Ampoules Nos./Millions 74.40 101.03 74.40 94.91Vials Nos./Millions 29.40 41.16 32.40 33.50Liquids Kilolitres – 1139.28 – 1349.54Drops Kilolitres – 37.64 – 33.23
Active pharmaceuticals indegredientsand drug intermediates Tonnes 2058.02 1821.61 1877.35 2046.79
Medical aids Nos./Millions – 0.12 – 0.09Ointments Tonnes * 301.37 * 278.78
* In different denominations than actual production
Notes :1. Installed capacity being effective operational capacity has been calculated on a double shift basis for dosage forms
facilities and on a three shift basis for active pharmaceuticals ingredients and drug intermediates.2. Actual production includes production at loan licencees locations
b] Stocks and sales of finished goodsSales Opening stock Closing stock
Unit of Quantity@ Rs. Quantity Rs. Quantity Rs.measure Millions Millions Millions
Dosage FormsTablets Nos./Millions 5,043.00 17,059.40 577.62 768.33 517.99 720.31
3,688.69 16,981.72 542.97 728.02 577.62 768.33Capsules Nos./Millions 2,136.40 5,719.73 221.21 255.31 153.12 204.74
1,674.91 6,043.86 260.09 338.76 221.21 255.31Dry syrups/Powders Bottles/Millions 46.22 3,162.08 6.78 159.34 5.00 100.74
46.02 3,021.30 10.55 114.86 6.78 159.34Ampoules Nos./Millions 108.92 898.94 16.24 48.38 13.87 47.03
99.15 724.13 15.28 51.59 16.24 48.38Vials Nos./Millions 114.81 1,880.84 9.64 147.09 12.64 136.74
141.99 1,675.79 6.68 147.58 9.64 147.09Liquids Kilolitres 6,137.87 1,099.52 807.97 101.20 722.16 79.61
5,094.38 1,009.14 845.72 113.97 807.97 101.20Drops Kilolitres 37.26 44.99 1.89 1.53 3.86 4.04
35.78 41.44 3.21 1.19 1.89 1.53Active pharmaceuticals
indegredients andDrugs intermediates Tonnes 2,017.36 9,275.33 138.32 922.18 163.23 1,183.83
2,206.80 8,432.72 142.95 877.57 138.32 922.18Medical aids Nos./Millions 0.19 467.13 0.05 182.03 0.07 247.87
0.12 395.15 0.04 148.35 0.05 182.03Ointments Tonnes 790.35 926.09 80.41 36.25 96.98 49.42
773.69 877.71 90.88 51.67 80.41 36.25Others (Chemicals etc.) – 349.21 – 6.51 – 20.31
– 338.99 – 29.67 – 6.51Inter unit transfers – (4,094.26) – – – –
– (3,540.37) – – – –Less : Excise duty – (645.57) – – – –
– (666.65) – – – –
TOTAL – 36,143.43 2,628.15 2,794.64– 35,334.93 2,603.23 2,628.15
@ Inclusive of physician samples.Figures in italics are for 2003.
����� ��� ������ ���������������
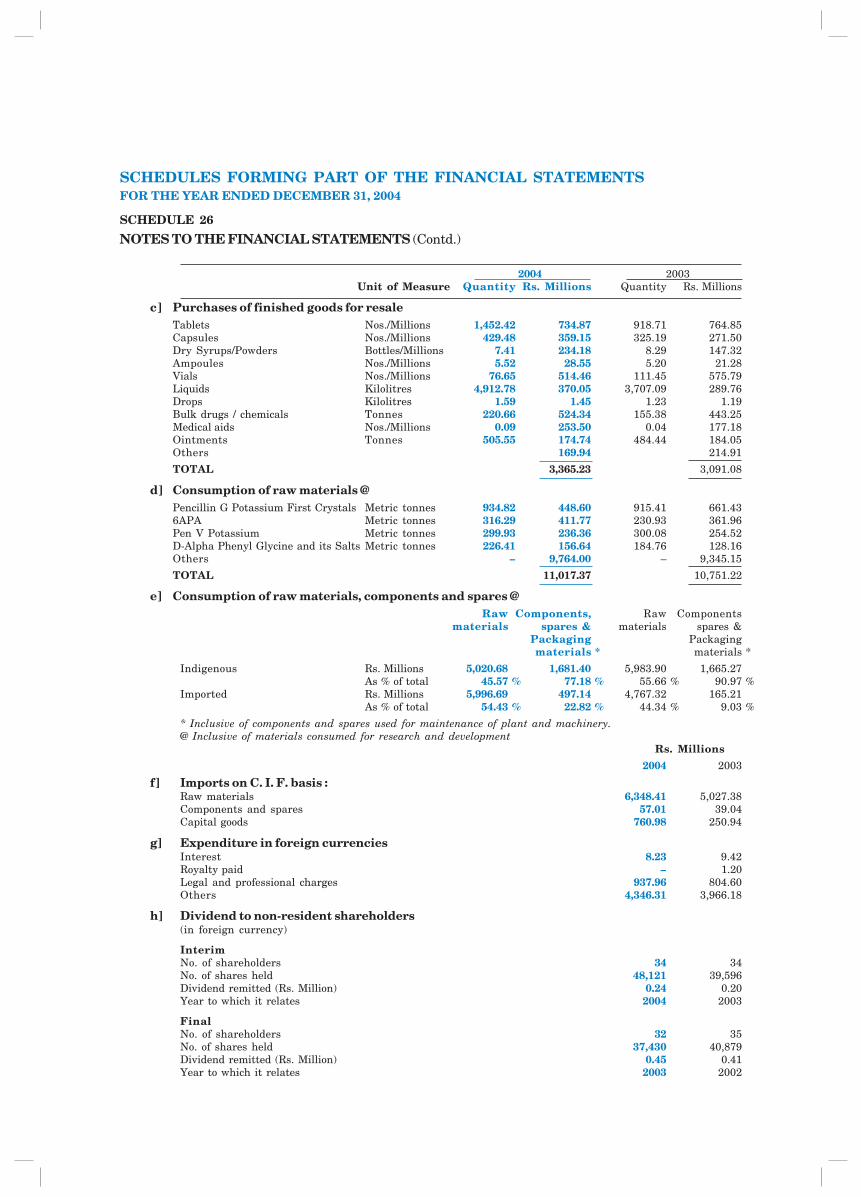
2004 2003Unit of Measure Quantity Rs. Millions Quantity Rs. Millions
c] Purchases of finished goods for resaleTablets Nos./Millions 1,452.42 734.87 918.71 764.85Capsules Nos./Millions 429.48 359.15 325.19 271.50Dry Syrups/Powders Bottles/Millions 7.41 234.18 8.29 147.32Ampoules Nos./Millions 5.52 28.55 5.20 21.28Vials Nos./Millions 76.65 514.46 111.45 575.79Liquids Kilolitres 4,912.78 370.05 3,707.09 289.76Drops Kilolitres 1.59 1.45 1.23 1.19Bulk drugs / chemicals Tonnes 220.66 524.34 155.38 443.25Medical aids Nos./Millions 0.09 253.50 0.04 177.18Ointments Tonnes 505.55 174.74 484.44 184.05Others 169.94 214.91
TOTAL 3,365.23 3,091.08
d] Consumption of raw materials @Pencillin G Potassium First Crystals Metric tonnes 934.82 448.60 915.41 661.436APA Metric tonnes 316.29 411.77 230.93 361.96Pen V Potassium Metric tonnes 299.93 236.36 300.08 254.52D-Alpha Phenyl Glycine and its Salts Metric tonnes 226.41 156.64 184.76 128.16Others – 9,764.00 – 9,345.15
TOTAL 11,017.37 10,751.22
e] Consumption of raw materials, components and spares @Raw Components, Raw Components
materials spares & materials spares &Packaging Packagingmaterials * materials *
Indigenous Rs. Millions 5,020.68 1,681.40 5,983.90 1,665.27As % of total 45.57 % 77.18 % 55.66 % 90.97 %
Imported Rs. Millions 5,996.69 497.14 4,767.32 165.21As % of total 54.43 % 22.82 % 44.34 % 9.03 %
* Inclusive of components and spares used for maintenance of plant and machinery.@ Inclusive of materials consumed for research and development
Rs. Millions
2004 2003
f] Imports on C. I. F. basis :Raw materials 6,348.41 5,027.38Components and spares 57.01 39.04Capital goods 760.98 250.94
g] Expenditure in foreign currenciesInterest 8.23 9.42Royalty paid – 1.20Legal and professional charges 937.96 804.60Others 4,346.31 3,966.18
h] Dividend to non-resident shareholders(in foreign currency)
InterimNo. of shareholders 34 34No. of shares held 48,121 39,596Dividend remitted (Rs. Million) 0.24 0.20Year to which it relates 2004 2003
FinalNo. of shareholders 32 35No. of shares held 37,430 40,879Dividend remitted (Rs. Million) 0.45 0.41Year to which it relates 2003 2002
SCHEDULES FORMING PART OF THE FINANCIAL STATEMENTSFOR THE YEAR ENDED DECEMBER 31, 2004
SCHEDULE 26
NOTES TO THE FINANCIAL STATEMENTS (Contd.)
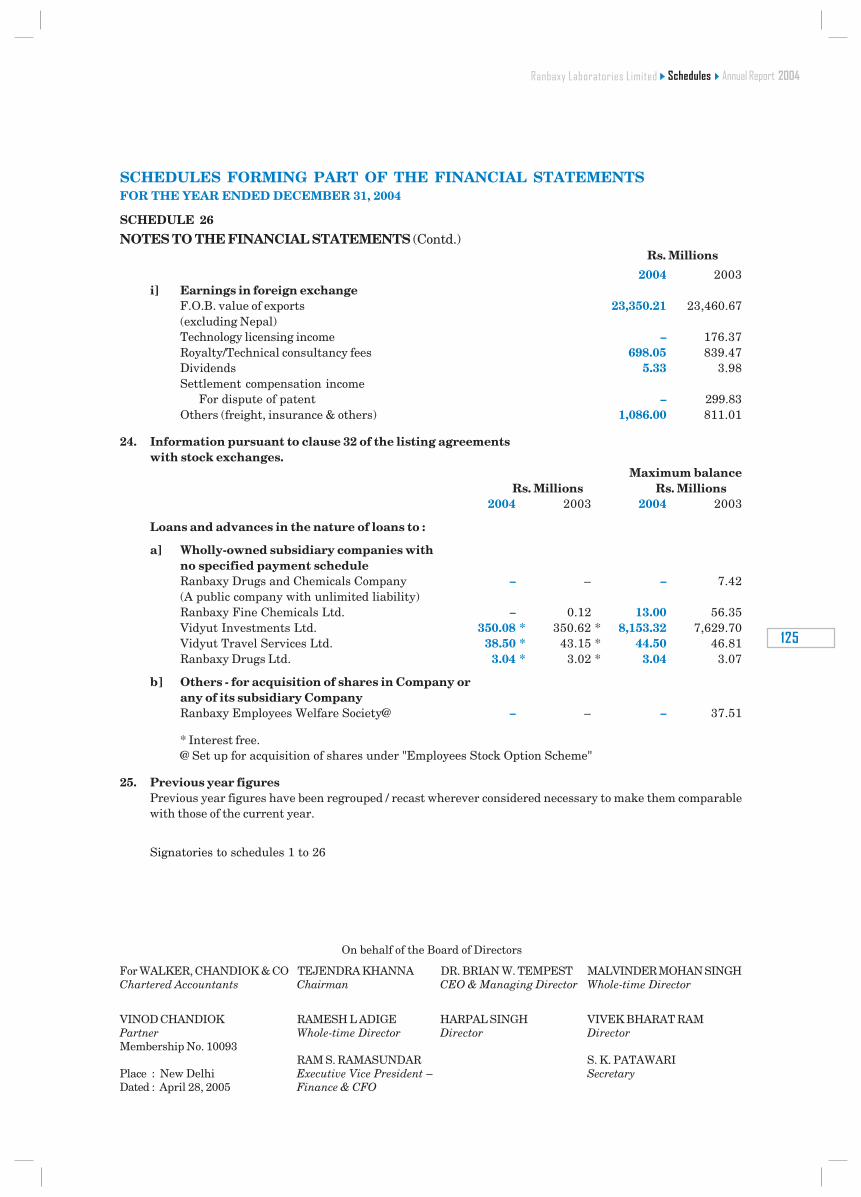
���
������������ ����
On behalf of the Board of Directors
For WALKER, CHANDIOK & CO TEJENDRA KHANNA DR. BRIAN W. TEMPEST MALVINDER MOHAN SINGHChartered Accountants Chairman CEO & Managing Director Whole-time Director
VINOD CHANDIOK RAMESH L ADIGE HARPAL SINGH VIVEK BHARAT RAMPartner Whole-time Director Director DirectorMembership No. 10093
RAM S. RAMASUNDAR S. K. PATAWARIPlace : New Delhi Executive Vice President – SecretaryDated : April 28, 2005 Finance & CFO
SCHEDULES FORMING PART OF THE FINANCIAL STATEMENTSFOR THE YEAR ENDED DECEMBER 31, 2004
SCHEDULE 26
NOTES TO THE FINANCIAL STATEMENTS (Contd.)Rs. Millions
2004 2003i] Earnings in foreign exchange
F.O.B. value of exports 23,350.21 23,460.67(excluding Nepal)Technology licensing income – 176.37Royalty/Technical consultancy fees 698.05 839.47Dividends 5.33 3.98Settlement compensation income
For dispute of patent – 299.83Others (freight, insurance & others) 1,086.00 811.01
24. Information pursuant to clause 32 of the listing agreementswith stock exchanges.
Maximum balanceRs. Millions Rs. Millions
2004 2003 2004 2003
Loans and advances in the nature of loans to :
a] Wholly-owned subsidiary companies withno specified payment scheduleRanbaxy Drugs and Chemicals Company – – – 7.42(A public company with unlimited liability)Ranbaxy Fine Chemicals Ltd. – 0.12 13.00 56.35Vidyut Investments Ltd. 350.08 * 350.62 * 8,153.32 7,629.70Vidyut Travel Services Ltd. 38.50 * 43.15 * 44.50 46.81Ranbaxy Drugs Ltd. 3.04 * 3.02 * 3.04 3.07
b] Others - for acquisition of shares in Company orany of its subsidiary CompanyRanbaxy Employees Welfare Society@ – – – 37.51
* Interest free.@ Set up for acquisition of shares under "Employees Stock Option Scheme"
25. Previous year figuresPrevious year figures have been regrouped / recast wherever considered necessary to make them comparablewith those of the current year.
Signatories to schedules 1 to 26
����� ��� ������ ���������������
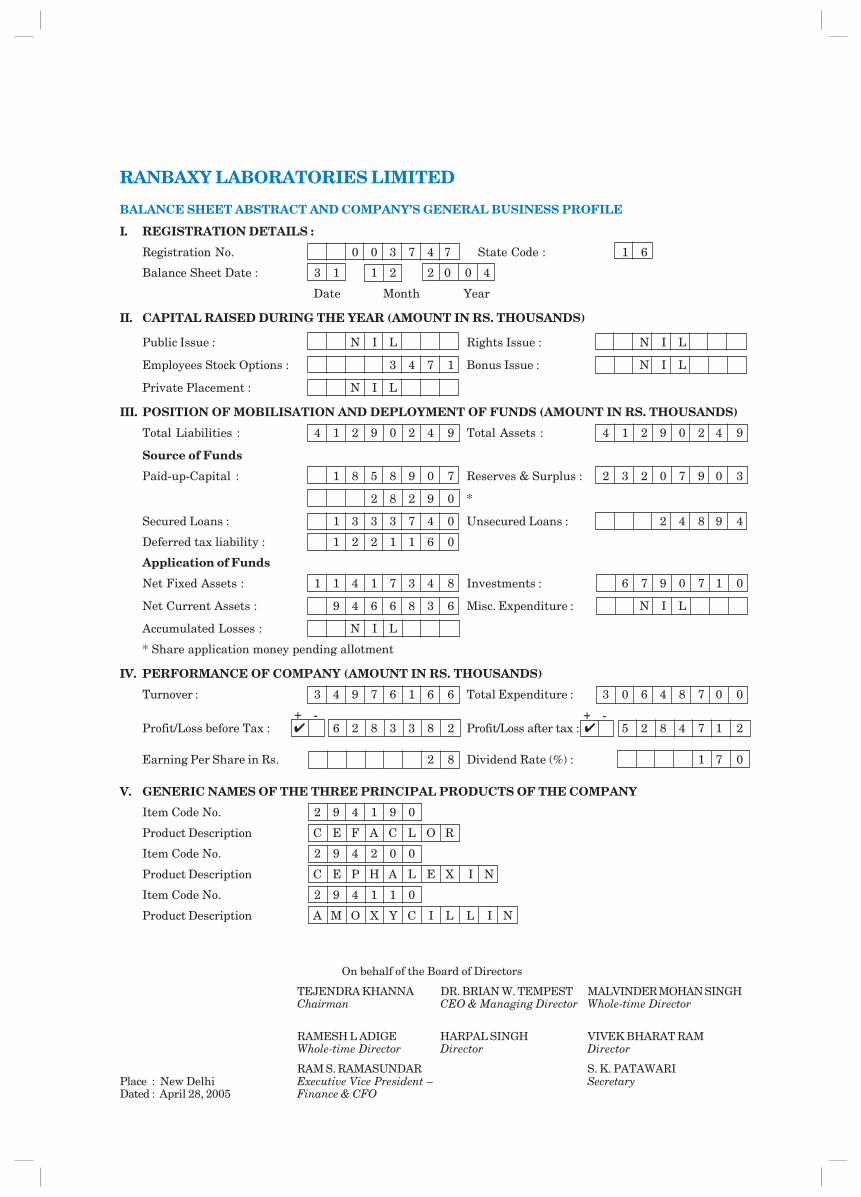
RANBAXY LABORATORIES LIMITED
BALANCE SHEET ABSTRACT AND COMPANY’S GENERAL BUSINESS PROFILE
I. REGISTRATION DETAILS :
Registration No. 0 0 3 7 4 7 State Code : 1 6
Balance Sheet Date : 3 1 1 2 2 0 0 4
Date Month Year
II. CAPITAL RAISED DURING THE YEAR (AMOUNT IN RS. THOUSANDS)
Public Issue : N I L Rights Issue : N I L
Employees Stock Options : 3 4 7 1 Bonus Issue : N I L
Private Placement : N I L
III. POSITION OF MOBILISATION AND DEPLOYMENT OF FUNDS (AMOUNT IN RS. THOUSANDS)
Total Liabilities : 4 1 2 9 0 2 4 9 Total Assets : 4 1 2 9 0 2 4 9
Source of Funds
Paid-up-Capital : 1 8 5 8 9 0 7 Reserves & Surplus : 2 3 2 0 7 9 0 3
2 8 2 9 0 *
Secured Loans : 1 3 3 3 7 4 0 Unsecured Loans : 2 4 8 9 4
Deferred tax liability : 1 2 2 1 1 6 0
Application of Funds
Net Fixed Assets : 1 1 4 1 7 3 4 8 Investments : 6 7 9 0 7 1 0
Net Current Assets : 9 4 6 6 8 3 6 Misc. Expenditure : N I L
Accumulated Losses : N I L
* Share application money pending allotment
IV. PERFORMANCE OF COMPANY (AMOUNT IN RS. THOUSANDS)
Turnover : 3 4 9 7 6 1 6 6 Total Expenditure : 3 0 6 4 8 7 0 0
Profit/Loss before Tax : 6 2 8 3 3 8 2 Profit/Loss after tax : 5 2 8 4 7 1 2
Earning Per Share in Rs. 2 8 Dividend Rate (%) : 1 7 0
V. GENERIC NAMES OF THE THREE PRINCIPAL PRODUCTS OF THE COMPANY
Item Code No. 2 9 4 1 9 0
Product Description C E F A C L O R
Item Code No. 2 9 4 2 0 0
Product Description C E P H A L E X I N
Item Code No. 2 9 4 1 1 0
Product Description A M O X Y C I L L I N
+ -+ -
On behalf of the Board of Directors
TEJENDRA KHANNA DR. BRIAN W. TEMPEST MALVINDER MOHAN SINGHChairman CEO & Managing Director Whole-time Director
RAMESH L ADIGE HARPAL SINGH VIVEK BHARAT RAMWhole-time Director Director Director
RAM S. RAMASUNDAR S. K. PATAWARIPlace : New Delhi Executive Vice President – SecretaryDated : April 28, 2005 Finance & CFO
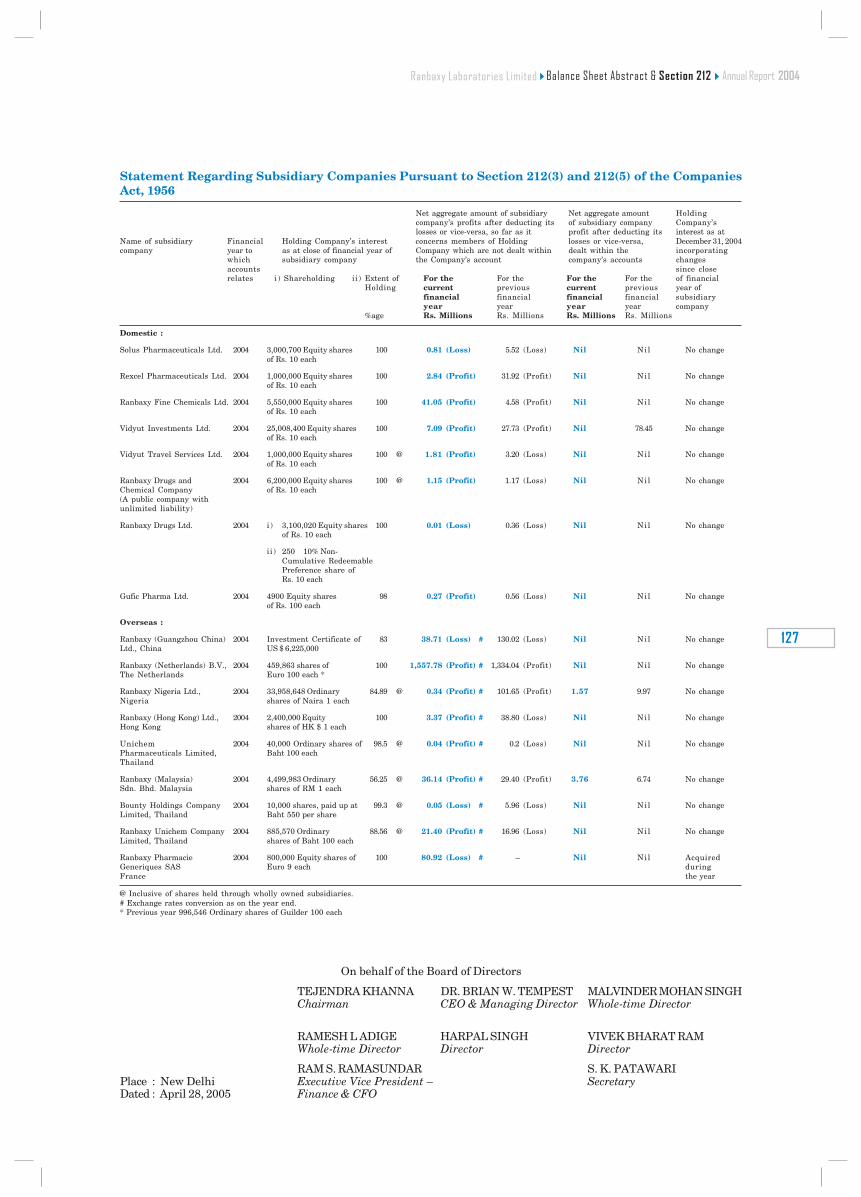
���
������������ ����
Statement Regarding Subsidiary Companies Pursuant to Section 212(3) and 212(5) of the CompaniesAct, 1956
Net aggregate amount of subsidiary Net aggregate amount Holdingcompany’s profits after deducting its of subsidiary company Company’slosses or vice-versa, so far as it profit after deducting its interest as at
Name of subsidiary Financial Holding Company’s interest concerns members of Holding losses or vice-versa, December 31, 2004company year to as at close of financial year of Company which are not dealt within dealt within the incorporating
which subsidiary company the Company’s account company’s accounts changesaccounts since closerelates i ) Shareholding ii) Extent of For the For the For the For the of financial
Holding current previous current previous year offinancial financial financial financial subsidiaryyear year year year company
%age Rs. Millions Rs. Millions Rs. Millions Rs. Millions
Domestic :
Solus Pharmaceuticals Ltd. 2004 3,000,700 Equity shares 100 0.81 (Loss) 5.52 (Loss) Nil Nil No changeof Rs. 10 each
Rexcel Pharmaceuticals Ltd. 2004 1,000,000 Equity shares 100 2.84 (Profit) 31.92 (Profit) Nil Nil No changeof Rs. 10 each
Ranbaxy Fine Chemicals Ltd. 2004 5,550,000 Equity shares 100 41.05 (Profit) 4.58 (Profit) Nil Nil No changeof Rs. 10 each
Vidyut Investments Ltd. 2004 25,008,400 Equity shares 100 7.09 (Profit) 27.73 (Profit) Nil 78.45 No changeof Rs. 10 each
Vidyut Travel Services Ltd. 2004 1,000,000 Equity shares 100 @ 1.81 (Profit) 3.20 (Loss) Nil Nil No changeof Rs. 10 each
Ranbaxy Drugs and 2004 6,200,000 Equity shares 100 @ 1.15 (Profit) 1.17 (Loss) Nil Nil No changeChemical Company of Rs. 10 each(A public company withunlimited liability)
Ranbaxy Drugs Ltd. 2004 i ) 3,100,020 Equity shares 100 0.01 (Loss) 0.36 (Loss) Nil Nil No changeof Rs. 10 each
ii) 250 10% Non-Cumulative RedeemablePreference share ofRs. 10 each
Gufic Pharma Ltd. 2004 4900 Equity shares 98 0.27 (Profit) 0.56 (Loss) Nil Nil No changeof Rs. 100 each
Overseas :
Ranbaxy (Guangzhou China) 2004 Investment Certificate of 83 38.71 (Loss) # 130.02 (Loss) Nil Nil No changeLtd., China US $ 6,225,000
Ranbaxy (Netherlands) B.V., 2004 459,863 shares of 100 1,557.78 (Profit) # 1,334.04 (Profit) Nil Nil No changeThe Netherlands Euro 100 each *
Ranbaxy Nigeria Ltd., 2004 33,958,648 Ordinary 84.89 @ 0.34 (Profit) # 101.65 (Profit) 1.57 9.97 No changeNigeria shares of Naira 1 each
Ranbaxy (Hong Kong) Ltd., 2004 2,400,000 Equity 100 3.37 (Profit) # 38.80 (Loss) Nil Nil No changeHong Kong shares of HK $ 1 each
Unichem 2004 40,000 Ordinary shares of 98.5 @ 0.04 (Profit) # 0.2 (Loss) Nil Nil No changePharmaceuticals Limited, Baht 100 eachThailand
Ranbaxy (Malaysia) 2004 4,499,983 Ordinary 56.25 @ 36.14 (Profit) # 29.40 (Profit) 3.76 6.74 No changeSdn. Bhd. Malaysia shares of RM 1 each
Bounty Holdings Company 2004 10,000 shares, paid up at 99.3 @ 0.05 (Loss) # 5.96 (Loss) Nil Nil No changeLimited, Thailand Baht 550 per share
Ranbaxy Unichem Company 2004 885,570 Ordinary 88.56 @ 21.40 (Profit) # 16.96 (Loss) Nil Nil No changeLimited, Thailand shares of Baht 100 each
Ranbaxy Pharmacie 2004 800,000 Equity shares of 100 80.92 (Loss) # – Nil Nil AcquiredGeneriques SAS Euro 9 each duringFrance the year
@ Inclusive of shares held through wholly owned subsidiaries.# Exchange rates conversion as on the year end.* Previous year 996,546 Ordinary shares of Guilder 100 each
On behalf of the Board of Directors
TEJENDRA KHANNA DR. BRIAN W. TEMPEST MALVINDER MOHAN SINGHChairman CEO & Managing Director Whole-time Director
RAMESH L ADIGE HARPAL SINGH VIVEK BHARAT RAMWhole-time Director Director Director
RAM S. RAMASUNDAR S. K. PATAWARIPlace : New Delhi Executive Vice President – SecretaryDated : April 28, 2005 Finance & CFO
��������������� ���������������������� ������ ���������������
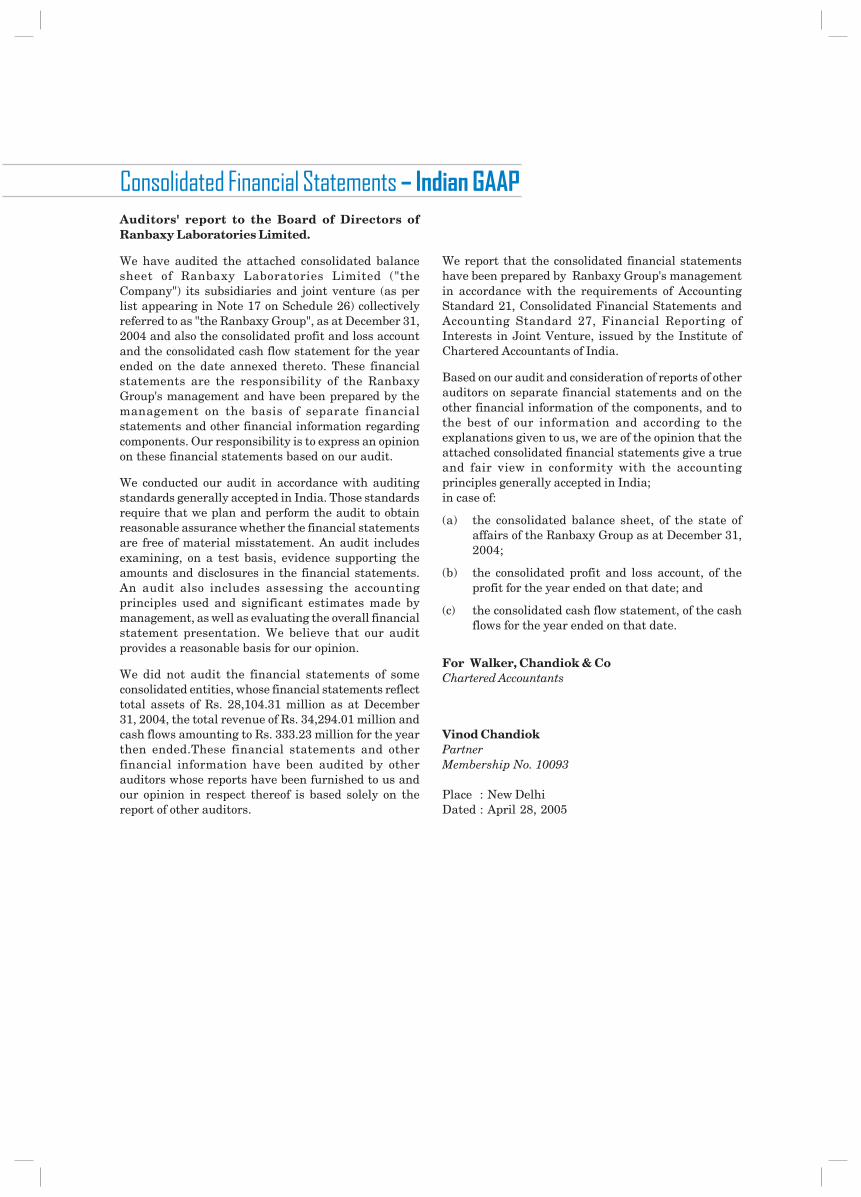
Auditors' report to the Board of Directors ofRanbaxy Laboratories Limited.
We have audited the attached consolidated balancesheet of Ranbaxy Laboratories Limited ("theCompany") its subsidiaries and joint venture (as perlist appearing in Note 17 on Schedule 26) collectivelyreferred to as "the Ranbaxy Group", as at December 31,2004 and also the consolidated profit and loss accountand the consolidated cash flow statement for the yearended on the date annexed thereto. These financialstatements are the responsibility of the RanbaxyGroup's management and have been prepared by themanagement on the basis of separate financialstatements and other financial information regardingcomponents. Our responsibility is to express an opinionon these financial statements based on our audit.
We conducted our audit in accordance with auditingstandards generally accepted in India. Those standardsrequire that we plan and perform the audit to obtainreasonable assurance whether the financial statementsare free of material misstatement. An audit includesexamining, on a test basis, evidence supporting theamounts and disclosures in the financial statements.An audit also includes assessing the accountingprinciples used and significant estimates made bymanagement, as well as evaluating the overall financialstatement presentation. We believe that our auditprovides a reasonable basis for our opinion.
We did not audit the financial statements of someconsolidated entities, whose financial statements reflecttotal assets of Rs. 28,104.31 million as at December31, 2004, the total revenue of Rs. 34,294.01 million andcash flows amounting to Rs. 333.23 million for the yearthen ended.These financial statements and otherfinancial information have been audited by otherauditors whose reports have been furnished to us andour opinion in respect thereof is based solely on thereport of other auditors.
We report that the consolidated financial statementshave been prepared by Ranbaxy Group's managementin accordance with the requirements of AccountingStandard 21, Consolidated Financial Statements andAccounting Standard 27, Financial Reporting ofInterests in Joint Venture, issued by the Institute ofChartered Accountants of India.
Based on our audit and consideration of reports of otherauditors on separate financial statements and on theother financial information of the components, and tothe best of our information and according to theexplanations given to us, we are of the opinion that theattached consolidated financial statements give a trueand fair view in conformity with the accountingprinciples generally accepted in India;in case of:
(a) the consolidated balance sheet, of the state ofaffairs of the Ranbaxy Group as at December 31,2004;
(b) the consolidated profit and loss account, of theprofit for the year ended on that date; and
(c) the consolidated cash flow statement, of the cashflows for the year ended on that date.
For Walker, Chandiok & CoChartered Accountants
Vinod ChandiokPartnerMembership No. 10093
Place : New DelhiDated : April 28, 2005
��������������������������������������������
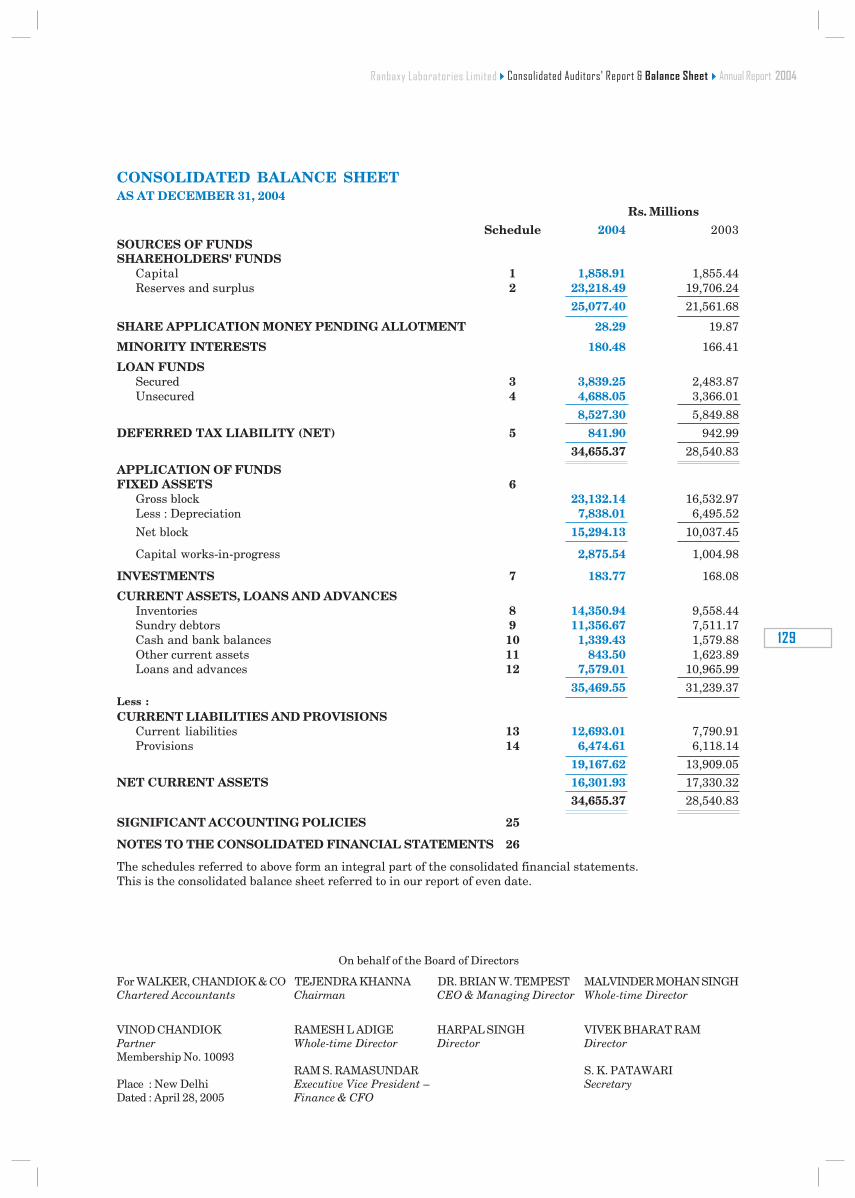
���
������������ ����
CONSOLIDATED BALANCE SHEETAS AT DECEMBER 31, 2004
Rs. MillionsSchedule 2004 2003
SOURCES OF FUNDSSHAREHOLDERS' FUNDS
Capital 1 1,858.91 1,855.44Reserves and surplus 2 23,218.49 19,706.24
25,077.40 21,561.68
SHARE APPLICATION MONEY PENDING ALLOTMENT 28.29 19.87
MINORITY INTERESTS 180.48 166.41
LOAN FUNDSSecured 3 3,839.25 2,483.87Unsecured 4 4,688.05 3,366.01
8,527.30 5,849.88
DEFERRED TAX LIABILITY (NET) 5 841.90 942.99
34,655.37 28,540.83
APPLICATION OF FUNDSFIXED ASSETS 6
Gross block 23,132.14 16,532.97Less : Depreciation 7,838.01 6,495.52
Net block 15,294.13 10,037.45
Capital works-in-progress 2,875.54 1,004.98
INVESTMENTS 7 183.77 168.08
CURRENT ASSETS, LOANS AND ADVANCESInventories 8 14,350.94 9,558.44Sundry debtors 9 11,356.67 7,511.17Cash and bank balances 10 1,339.43 1,579.88Other current assets 11 843.50 1,623.89Loans and advances 12 7,579.01 10,965.99
35,469.55 31,239.37Less :CURRENT LIABILITIES AND PROVISIONS
Current liabilities 13 12,693.01 7,790.91Provisions 14 6,474.61 6,118.14
19,167.62 13,909.05
NET CURRENT ASSETS 16,301.93 17,330.32
34,655.37 28,540.83
SIGNIFICANT ACCOUNTING POLICIES 25
NOTES TO THE CONSOLIDATED FINANCIAL STATEMENTS 26
The schedules referred to above form an integral part of the consolidated financial statements.This is the consolidated balance sheet referred to in our report of even date.
On behalf of the Board of Directors
For WALKER, CHANDIOK & CO TEJENDRA KHANNA DR. BRIAN W. TEMPEST MALVINDER MOHAN SINGHChartered Accountants Chairman CEO & Managing Director Whole-time Director
VINOD CHANDIOK RAMESH L ADIGE HARPAL SINGH VIVEK BHARAT RAMPartner Whole-time Director Director DirectorMembership No. 10093
RAM S. RAMASUNDAR S. K. PATAWARIPlace : New Delhi Executive Vice President – SecretaryDated : April 28, 2005 Finance & CFO
�������������������������������� ������������������������������
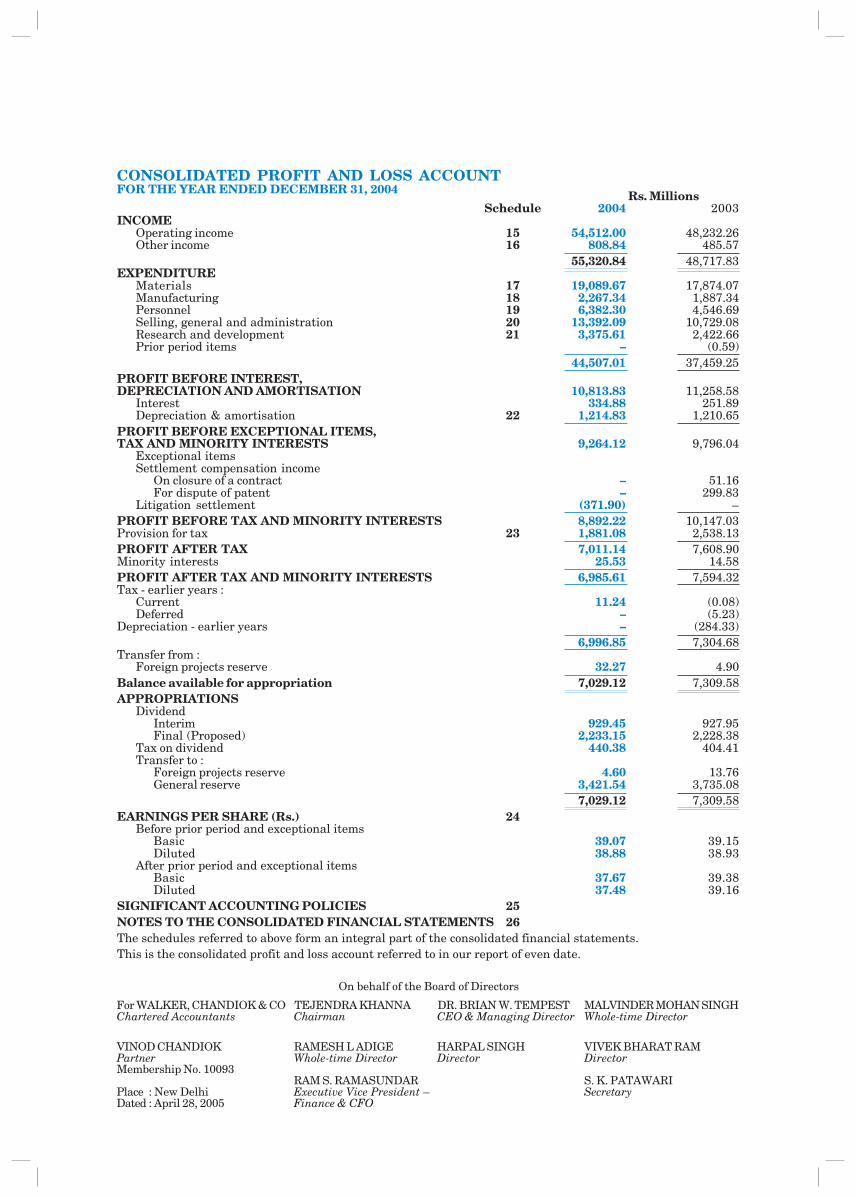
Rs. MillionsSchedule 2004 2003
INCOMEOperating income 15 54,512.00 48,232.26Other income 16 808.84 485.57
55,320.84 48,717.83EXPENDITURE
Materials 17 19,089.67 17,874.07Manufacturing 18 2,267.34 1,887.34Personnel 19 6,382.30 4,546.69Selling, general and administration 20 13,392.09 10,729.08Research and development 21 3,375.61 2,422.66Prior period items – (0.59)
44,507.01 37,459.25PROFIT BEFORE INTEREST,DEPRECIATION AND AMORTISATION 10,813.83 11,258.58
Interest 334.88 251.89Depreciation & amortisation 22 1,214.83 1,210.65
PROFIT BEFORE EXCEPTIONAL ITEMS,TAX AND MINORITY INTERESTS 9,264.12 9,796.04
Exceptional itemsSettlement compensation income
On closure of a contract – 51.16For dispute of patent – 299.83
Litigation settlement (371.90) –PROFIT BEFORE TAX AND MINORITY INTERESTS 8,892.22 10,147.03Provision for tax 23 1,881.08 2,538.13PROFIT AFTER TAX 7,011.14 7,608.90Minority interests 25.53 14.58PROFIT AFTER TAX AND MINORITY INTERESTS 6,985.61 7,594.32Tax - earlier years :
Current 11.24 (0.08)Deferred – (5.23)
Depreciation - earlier years – (284.33) 6,996.85 7,304.68
Transfer from :Foreign projects reserve 32.27 4.90
Balance available for appropriation 7,029.12 7,309.58APPROPRIATIONS
DividendInterim 929.45 927.95Final (Proposed) 2,233.15 2,228.38
Tax on dividend 440.38 404.41Transfer to :
Foreign projects reserve 4.60 13.76General reserve 3,421.54 3,735.08
7,029.12 7,309.58EARNINGS PER SHARE (Rs.) 24
Before prior period and exceptional itemsBasic 39.07 39.15Diluted 38.88 38.93
After prior period and exceptional itemsBasic 37.67 39.38Diluted 37.48 39.16
SIGNIFICANT ACCOUNTING POLICIES 25NOTES TO THE CONSOLIDATED FINANCIAL STATEMENTS 26The schedules referred to above form an integral part of the consolidated financial statements.This is the consolidated profit and loss account referred to in our report of even date.
On behalf of the Board of Directors
For WALKER, CHANDIOK & CO TEJENDRA KHANNA DR. BRIAN W. TEMPEST MALVINDER MOHAN SINGHChartered Accountants Chairman CEO & Managing Director Whole-time Director
VINOD CHANDIOK RAMESH L ADIGE HARPAL SINGH VIVEK BHARAT RAMPartner Whole-time Director Director DirectorMembership No. 10093
RAM S. RAMASUNDAR S. K. PATAWARIPlace : New Delhi Executive Vice President – SecretaryDated : April 28, 2005 Finance & CFO
CONSOLIDATED PROFIT AND LOSS ACCOUNTFOR THE YEAR ENDED DECEMBER 31, 2004
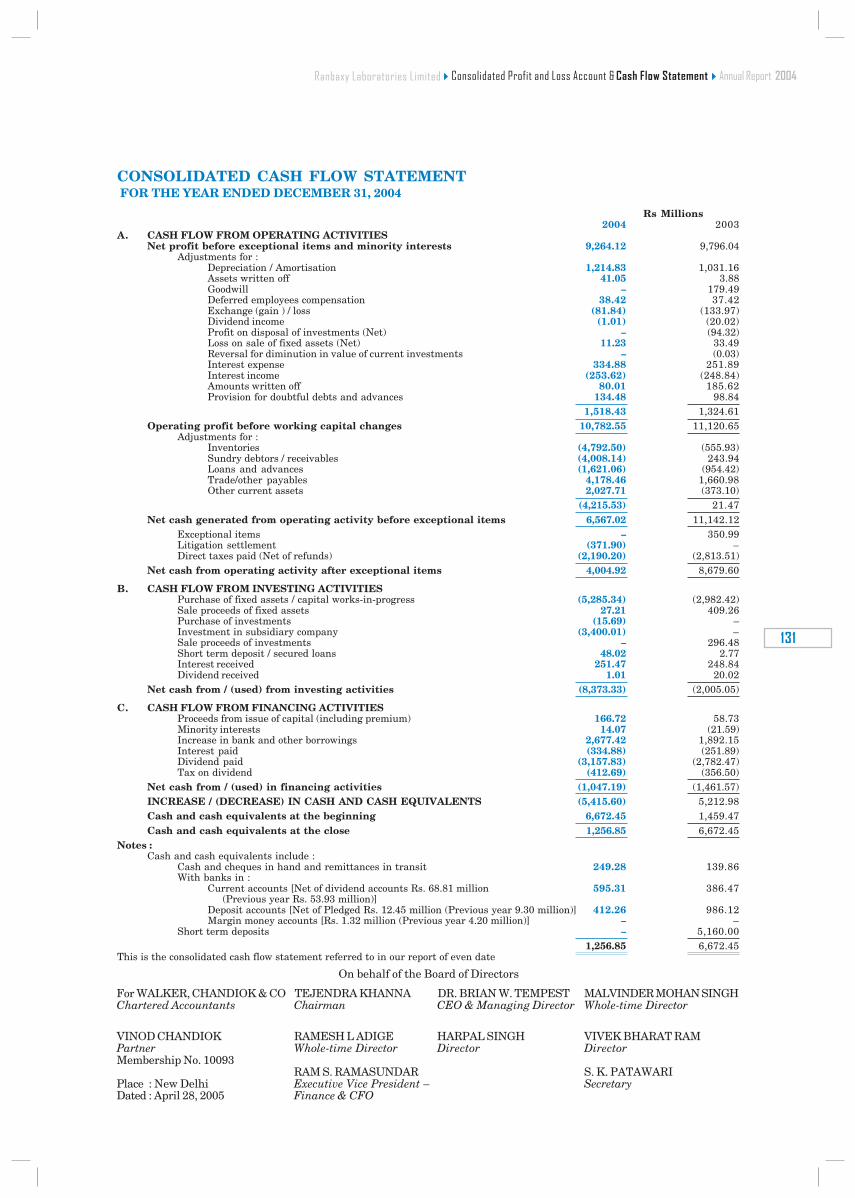
���
������������ ����
CONSOLIDATED CASH FLOW STATEMENTFOR THE YEAR ENDED DECEMBER 31, 2004
Rs Millions2004 2003
A. CASH FLOW FROM OPERATING ACTIVITIESNet profit before exceptional items and minority interests 9,264.12 9,796.04
Adjustments for :Depreciation / Amortisation 1,214.83 1,031.16Assets written off 41.05 3.88Goodwill – 179.49Deferred employees compensation 38.42 37.42Exchange (gain ) / loss (81.84) (133.97)Dividend income (1.01) (20.02)Profit on disposal of investments (Net) – (94.32)Loss on sale of fixed assets (Net) 11.23 33.49Reversal for diminution in value of current investments – (0.03)Interest expense 334.88 251.89Interest income (253.62) (248.84)Amounts written off 80.01 185.62Provision for doubtful debts and advances 134.48 98.84
1,518.43 1,324.61Operating profit before working capital changes 10,782.55 11,120.65
Adjustments for :Inventories (4,792.50) (555.93)Sundry debtors / receivables (4,008.14) 243.94Loans and advances (1,621.06) (954.42)Trade/other payables 4,178.46 1,660.98Other current assets 2,027.71 (373.10)
(4,215.53) 21.47Net cash generated from operating activity before exceptional items 6,567.02 11,142.12
Exceptional items – 350.99Litigation settlement (371.90) –Direct taxes paid (Net of refunds) (2,190.20) (2,813.51)
Net cash from operating activity after exceptional items 4,004.92 8,679.60
B. CASH FLOW FROM INVESTING ACTIVITIESPurchase of fixed assets / capital works-in-progress (5,285.34) (2,982.42)Sale proceeds of fixed assets 27.21 409.26Purchase of investments (15.69) –Investment in subsidiary company (3,400.01) –Sale proceeds of investments – 296.48Short term deposit / secured loans 48.02 2.77Interest received 251.47 248.84Dividend received 1.01 20.02
Net cash from / (used) from investing activities (8,373.33) (2,005.05)
C. CASH FLOW FROM FINANCING ACTIVITIESProceeds from issue of capital (including premium) 166.72 58.73Minority interests 14.07 (21.59)Increase in bank and other borrowings 2,677.42 1,892.15Interest paid (334.88) (251.89)Dividend paid (3,157.83) (2,782.47)Tax on dividend (412.69) (356.50)
Net cash from / (used) in financing activities (1,047.19) (1,461.57)INCREASE / (DECREASE) IN CASH AND CASH EQUIVALENTS (5,415.60) 5,212.98Cash and cash equivalents at the beginning 6,672.45 1,459.47Cash and cash equivalents at the close 1,256.85 6,672.45
Notes :Cash and cash equivalents include :
Cash and cheques in hand and remittances in transit 249.28 139.86With banks in :
Current accounts [Net of dividend accounts Rs. 68.81 million 595.31 386.47(Previous year Rs. 53.93 million)]
Deposit accounts [Net of Pledged Rs. 12.45 million (Previous year 9.30 million)] 412.26 986.12Margin money accounts [Rs. 1.32 million (Previous year 4.20 million)] – –
Short term deposits – 5,160.00 1,256.85 6,672.45
This is the consolidated cash flow statement referred to in our report of even date
On behalf of the Board of Directors
For WALKER, CHANDIOK & CO TEJENDRA KHANNA DR. BRIAN W. TEMPEST MALVINDER MOHAN SINGHChartered Accountants Chairman CEO & Managing Director Whole-time Director
VINOD CHANDIOK RAMESH L ADIGE HARPAL SINGH VIVEK BHARAT RAMPartner Whole-time Director Director DirectorMembership No. 10093
RAM S. RAMASUNDAR S. K. PATAWARIPlace : New Delhi Executive Vice President – SecretaryDated : April 28, 2005 Finance & CFO
������������������������������������������� ���������������������������������
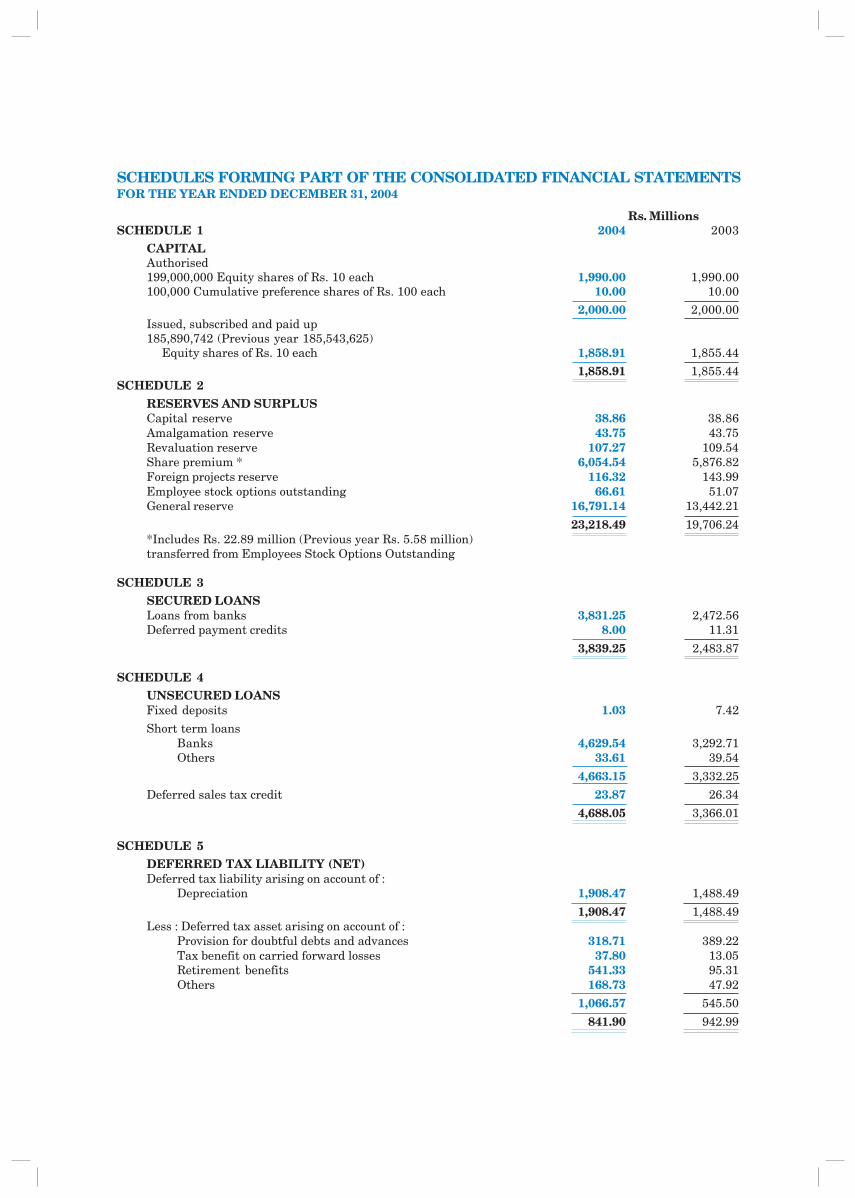
SCHEDULES FORMING PART OF THE CONSOLIDATED FINANCIAL STATEMENTSFOR THE YEAR ENDED DECEMBER 31, 2004
Rs. MillionsSCHEDULE 1 2004 2003
CAPITALAuthorised199,000,000 Equity shares of Rs. 10 each 1,990.00 1,990.00100,000 Cumulative preference shares of Rs. 100 each 10.00 10.00
2,000.00 2,000.00Issued, subscribed and paid up185,890,742 (Previous year 185,543,625)
Equity shares of Rs. 10 each 1,858.91 1,855.44
1,858.91 1,855.44SCHEDULE 2
RESERVES AND SURPLUSCapital reserve 38.86 38.86Amalgamation reserve 43.75 43.75Revaluation reserve 107.27 109.54Share premium * 6,054.54 5,876.82Foreign projects reserve 116.32 143.99Employee stock options outstanding 66.61 51.07General reserve 16,791.14 13,442.21
23,218.49 19,706.24*Includes Rs. 22.89 million (Previous year Rs. 5.58 million)transferred from Employees Stock Options Outstanding
SCHEDULE 3SECURED LOANSLoans from banks 3,831.25 2,472.56Deferred payment credits 8.00 11.31
3,839.25 2,483.87
SCHEDULE 4UNSECURED LOANSFixed deposits 1.03 7.42
Short term loansBanks 4,629.54 3,292.71Others 33.61 39.54
4,663.15 3,332.25
Deferred sales tax credit 23.87 26.34
4,688.05 3,366.01
SCHEDULE 5DEFERRED TAX LIABILITY (NET)Deferred tax liability arising on account of :
Depreciation 1,908.47 1,488.49
1,908.47 1,488.49Less : Deferred tax asset arising on account of :
Provision for doubtful debts and advances 318.71 389.22Tax benefit on carried forward losses 37.80 13.05Retirement benefits 541.33 95.31Others 168.73 47.92
1,066.57 545.50
841.90 942.99
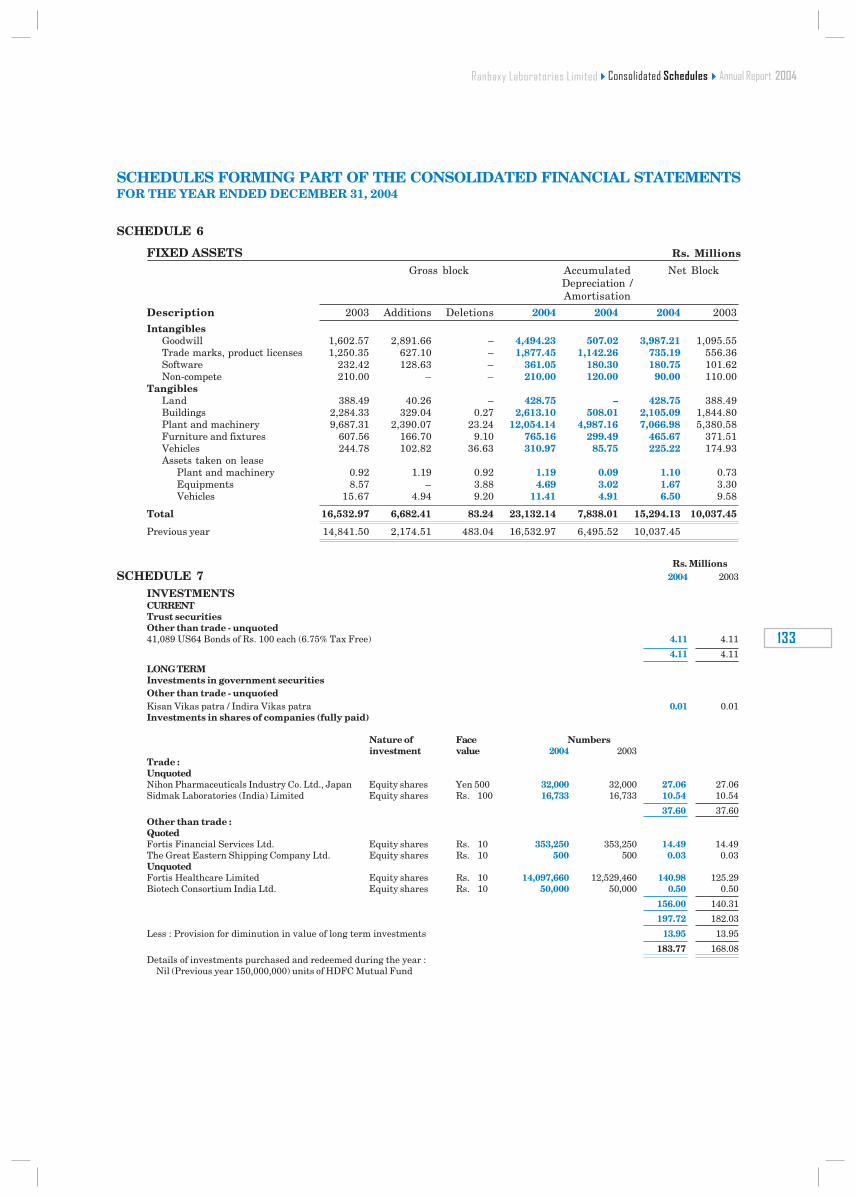
���
������������ ����
SCHEDULES FORMING PART OF THE CONSOLIDATED FINANCIAL STATEMENTSFOR THE YEAR ENDED DECEMBER 31, 2004
Rs. MillionsSCHEDULE 7 2004 2003
INVESTMENTSCURRENTTrust securitiesOther than trade - unquoted41,089 US64 Bonds of Rs. 100 each (6.75% Tax Free) 4.11 4.11
4.11 4.11
LONG TERMInvestments in government securitiesOther than trade - unquotedKisan Vikas patra / Indira Vikas patra 0.01 0.01Investments in shares of companies (fully paid)
Nature of Face Numbersinvestment value 2004 2003
Trade :UnquotedNihon Pharmaceuticals Industry Co. Ltd., Japan Equity shares Yen 500 32,000 32,000 27.06 27.06Sidmak Laboratories (India) Limited Equity shares Rs. 100 16,733 16,733 10.54 10.54
37.60 37.60Other than trade :QuotedFortis Financial Services Ltd. Equity shares Rs. 10 353,250 353,250 14.49 14.49The Great Eastern Shipping Company Ltd. Equity shares Rs. 10 500 500 0.03 0.03UnquotedFortis Healthcare Limited Equity shares Rs. 10 14,097,660 12,529,460 140.98 125.29Biotech Consortium India Ltd. Equity shares Rs. 10 50,000 50,000 0.50 0.50
156.00 140.31
197.72 182.03
Less : Provision for diminution in value of long term investments 13.95 13.95
183.77 168.08Details of investments purchased and redeemed during the year :
Nil (Previous year 150,000,000) units of HDFC Mutual Fund
SCHEDULE 6
FIXED ASSETS Rs. Millions
Gross block Accumulated Net BlockDepreciation /Amortisation
Description 2003 Additions Deletions 2004 2004 2004 2003Intangibles
Goodwill 1,602.57 2,891.66 – 4,494.23 507.02 3,987.21 1,095.55Trade marks, product licenses 1,250.35 627.10 – 1,877.45 1,142.26 735.19 556.36Software 232.42 128.63 – 361.05 180.30 180.75 101.62Non-compete 210.00 – – 210.00 120.00 90.00 110.00
TangiblesLand 388.49 40.26 – 428.75 – 428.75 388.49Buildings 2,284.33 329.04 0.27 2,613.10 508.01 2,105.09 1,844.80Plant and machinery 9,687.31 2,390.07 23.24 12,054.14 4,987.16 7,066.98 5,380.58Furniture and fixtures 607.56 166.70 9.10 765.16 299.49 465.67 371.51Vehicles 244.78 102.82 36.63 310.97 85.75 225.22 174.93Assets taken on lease
Plant and machinery 0.92 1.19 0.92 1.19 0.09 1.10 0.73Equipments 8.57 – 3.88 4.69 3.02 1.67 3.30Vehicles 15.67 4.94 9.20 11.41 4.91 6.50 9.58
Total 16,532.97 6,682.41 83.24 23,132.14 7,838.01 15,294.13 10,037.45
Previous year 14,841.50 2,174.51 483.04 16,532.97 6,495.52 10,037.45
���������� ���������������������������������
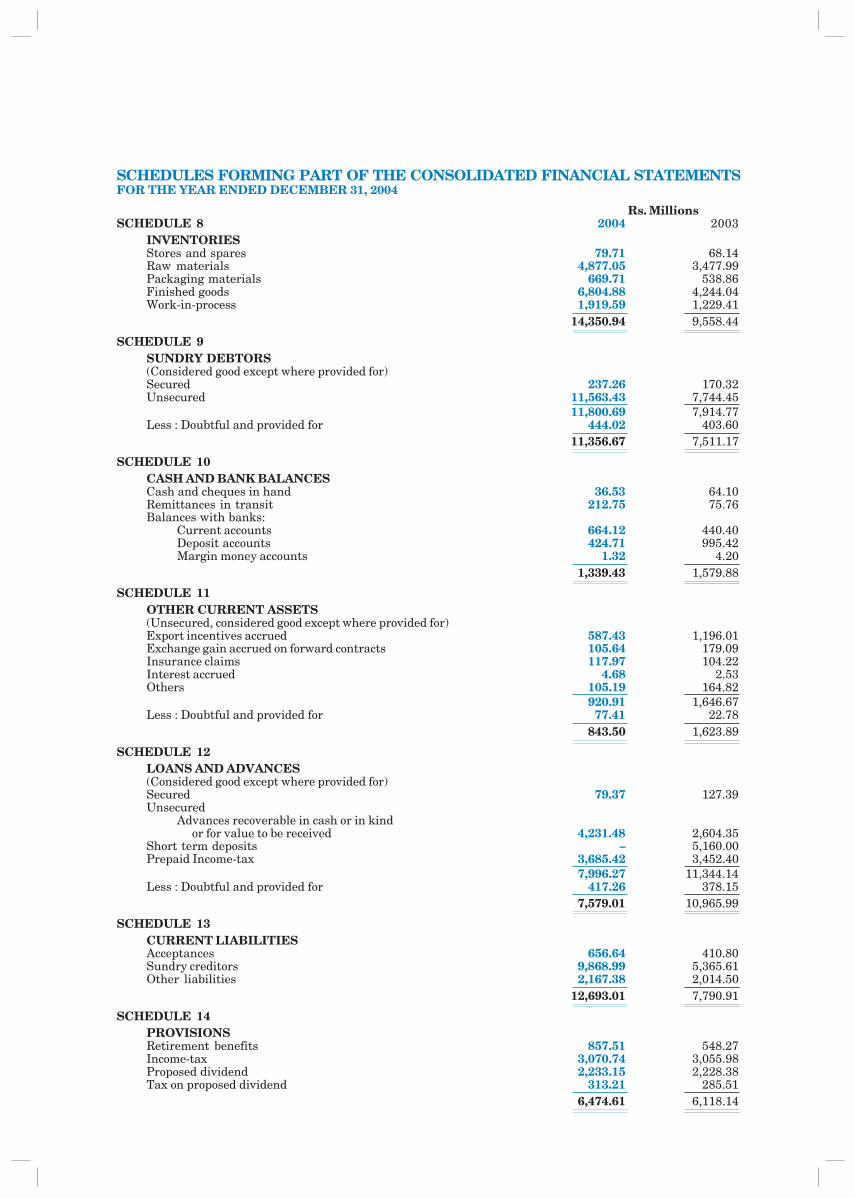
SCHEDULES FORMING PART OF THE CONSOLIDATED FINANCIAL STATEMENTSFOR THE YEAR ENDED DECEMBER 31, 2004
Rs. MillionsSCHEDULE 8 2004 2003
INVENTORIESStores and spares 79.71 68.14Raw materials 4,877.05 3,477.99Packaging materials 669.71 538.86Finished goods 6,804.88 4,244.04Work-in-process 1,919.59 1,229.41
14,350.94 9,558.44
SCHEDULE 9SUNDRY DEBTORS(Considered good except where provided for)Secured 237.26 170.32Unsecured 11,563.43 7,744.45
11,800.69 7,914.77Less : Doubtful and provided for 444.02 403.60
11,356.67 7,511.17
SCHEDULE 10CASH AND BANK BALANCESCash and cheques in hand 36.53 64.10Remittances in transit 212.75 75.76Balances with banks:
Current accounts 664.12 440.40Deposit accounts 424.71 995.42Margin money accounts 1.32 4.20
1,339.43 1,579.88
SCHEDULE 11OTHER CURRENT ASSETS(Unsecured, considered good except where provided for)Export incentives accrued 587.43 1,196.01Exchange gain accrued on forward contracts 105.64 179.09Insurance claims 117.97 104.22Interest accrued 4.68 2.53Others 105.19 164.82
920.91 1,646.67Less : Doubtful and provided for 77.41 22.78
843.50 1,623.89
SCHEDULE 12LOANS AND ADVANCES(Considered good except where provided for)Secured 79.37 127.39Unsecured
Advances recoverable in cash or in kindor for value to be received 4,231.48 2,604.35
Short term deposits – 5,160.00Prepaid Income-tax 3,685.42 3,452.40
7,996.27 11,344.14Less : Doubtful and provided for 417.26 378.15
7,579.01 10,965.99
SCHEDULE 13CURRENT LIABILITIESAcceptances 656.64 410.80Sundry creditors 9,868.99 5,365.61Other liabilities 2,167.38 2,014.50
12,693.01 7,790.91
SCHEDULE 14PROVISIONSRetirement benefits 857.51 548.27Income-tax 3,070.74 3,055.98Proposed dividend 2,233.15 2,228.38Tax on proposed dividend 313.21 285.51
6,474.61 6,118.14
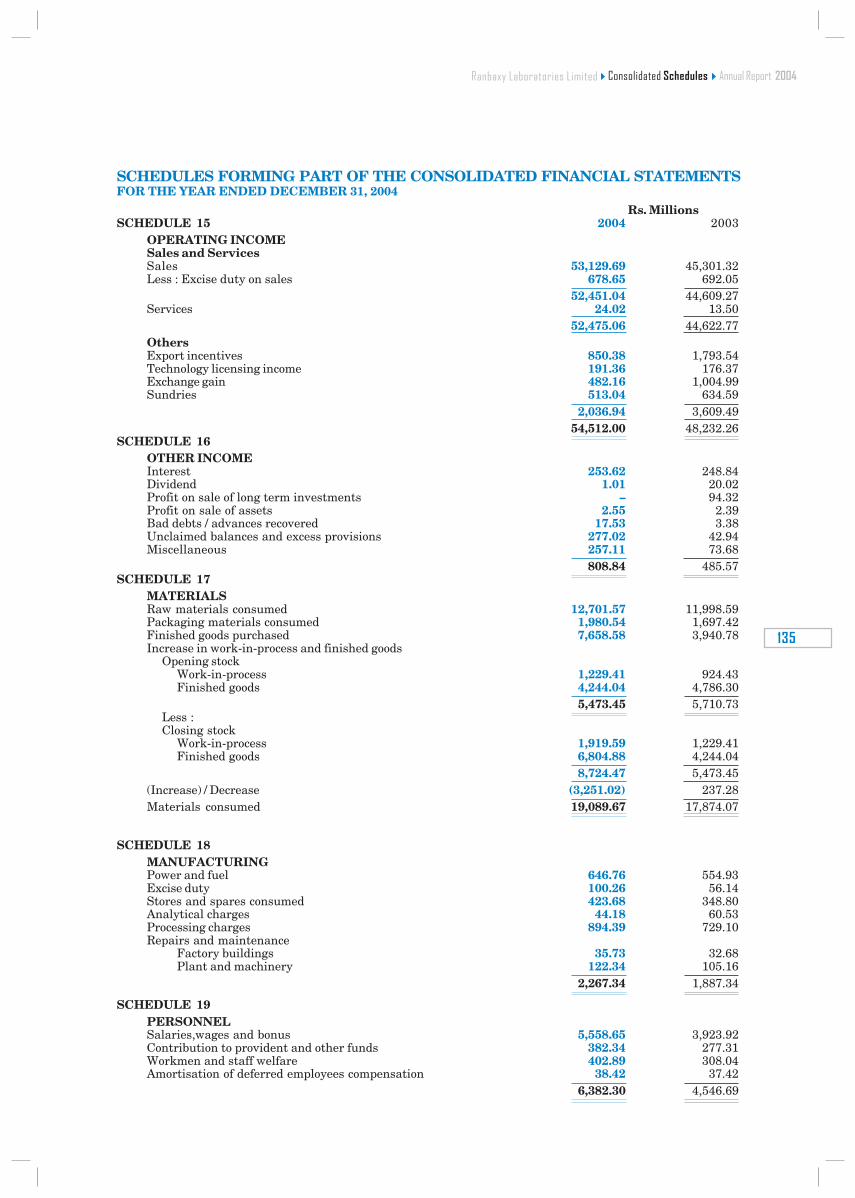
���
������������ ����
SCHEDULES FORMING PART OF THE CONSOLIDATED FINANCIAL STATEMENTSFOR THE YEAR ENDED DECEMBER 31, 2004
Rs. MillionsSCHEDULE 15 2004 2003
OPERATING INCOMESales and ServicesSales 53,129.69 45,301.32Less : Excise duty on sales 678.65 692.05
52,451.04 44,609.27Services 24.02 13.50
52,475.06 44,622.77OthersExport incentives 850.38 1,793.54Technology licensing income 191.36 176.37Exchange gain 482.16 1,004.99Sundries 513.04 634.59
2,036.94 3,609.49 54,512.00 48,232.26
SCHEDULE 16OTHER INCOMEInterest 253.62 248.84Dividend 1.01 20.02Profit on sale of long term investments – 94.32Profit on sale of assets 2.55 2.39Bad debts / advances recovered 17.53 3.38Unclaimed balances and excess provisions 277.02 42.94Miscellaneous 257.11 73.68
808.84 485.57SCHEDULE 17
MATERIALSRaw materials consumed 12,701.57 11,998.59Packaging materials consumed 1,980.54 1,697.42Finished goods purchased 7,658.58 3,940.78Increase in work-in-process and finished goods
Opening stockWork-in-process 1,229.41 924.43Finished goods 4,244.04 4,786.30
5,473.45 5,710.73Less :Closing stock
Work-in-process 1,919.59 1,229.41Finished goods 6,804.88 4,244.04
8,724.47 5,473.45(Increase) / Decrease (3,251.02) 237.28Materials consumed 19,089.67 17,874.07
SCHEDULE 18MANUFACTURINGPower and fuel 646.76 554.93Excise duty 100.26 56.14Stores and spares consumed 423.68 348.80Analytical charges 44.18 60.53Processing charges 894.39 729.10Repairs and maintenance
Factory buildings 35.73 32.68Plant and machinery 122.34 105.16
2,267.34 1,887.34
SCHEDULE 19PERSONNELSalaries,wages and bonus 5,558.65 3,923.92Contribution to provident and other funds 382.34 277.31Workmen and staff welfare 402.89 308.04Amortisation of deferred employees compensation 38.42 37.42
6,382.30 4,546.69
���������� ���������������������������������
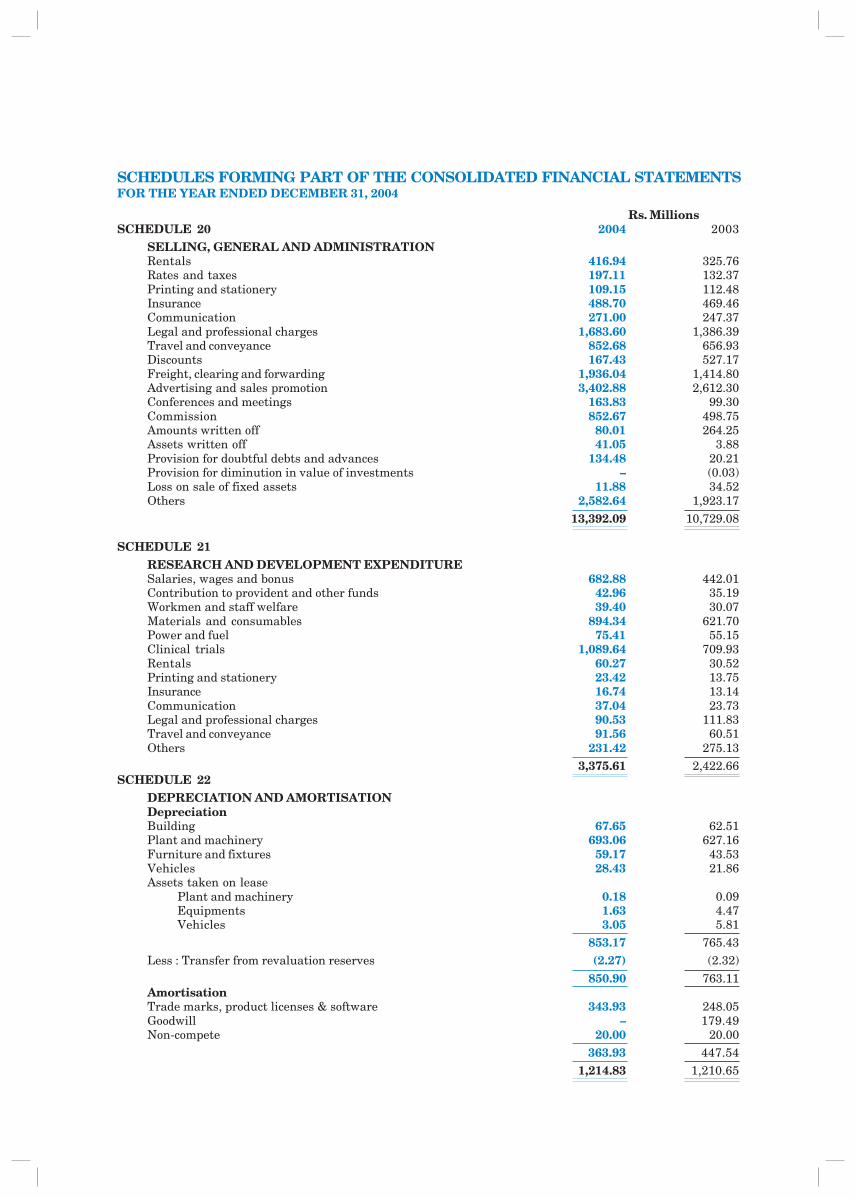
SCHEDULES FORMING PART OF THE CONSOLIDATED FINANCIAL STATEMENTSFOR THE YEAR ENDED DECEMBER 31, 2004
Rs. MillionsSCHEDULE 20 2004 2003
SELLING, GENERAL AND ADMINISTRATIONRentals 416.94 325.76Rates and taxes 197.11 132.37Printing and stationery 109.15 112.48Insurance 488.70 469.46Communication 271.00 247.37Legal and professional charges 1,683.60 1,386.39Travel and conveyance 852.68 656.93Discounts 167.43 527.17Freight, clearing and forwarding 1,936.04 1,414.80Advertising and sales promotion 3,402.88 2,612.30Conferences and meetings 163.83 99.30Commission 852.67 498.75Amounts written off 80.01 264.25Assets written off 41.05 3.88Provision for doubtful debts and advances 134.48 20.21Provision for diminution in value of investments – (0.03)Loss on sale of fixed assets 11.88 34.52Others 2,582.64 1,923.17
13,392.09 10,729.08
SCHEDULE 21RESEARCH AND DEVELOPMENT EXPENDITURESalaries, wages and bonus 682.88 442.01Contribution to provident and other funds 42.96 35.19Workmen and staff welfare 39.40 30.07Materials and consumables 894.34 621.70Power and fuel 75.41 55.15Clinical trials 1,089.64 709.93Rentals 60.27 30.52Printing and stationery 23.42 13.75Insurance 16.74 13.14Communication 37.04 23.73Legal and professional charges 90.53 111.83Travel and conveyance 91.56 60.51Others 231.42 275.13
3,375.61 2,422.66SCHEDULE 22
DEPRECIATION AND AMORTISATIONDepreciationBuilding 67.65 62.51Plant and machinery 693.06 627.16Furniture and fixtures 59.17 43.53Vehicles 28.43 21.86Assets taken on lease
Plant and machinery 0.18 0.09Equipments 1.63 4.47Vehicles 3.05 5.81
853.17 765.43Less : Transfer from revaluation reserves (2.27) (2.32)
850.90 763.11AmortisationTrade marks, product licenses & software 343.93 248.05Goodwill – 179.49Non-compete 20.00 20.00
363.93 447.54 1,214.83 1,210.65
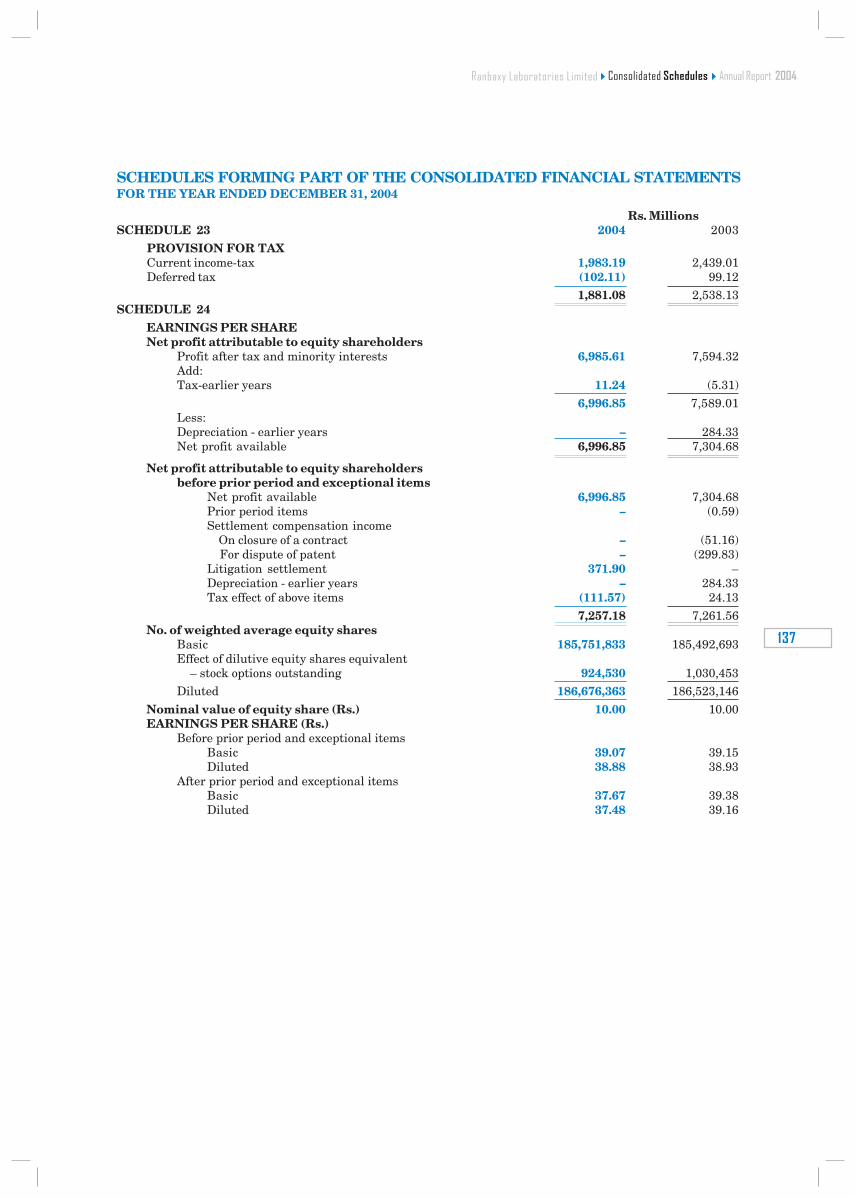
���
������������ ����
SCHEDULES FORMING PART OF THE CONSOLIDATED FINANCIAL STATEMENTSFOR THE YEAR ENDED DECEMBER 31, 2004
Rs. MillionsSCHEDULE 23 2004 2003
PROVISION FOR TAXCurrent income-tax 1,983.19 2,439.01Deferred tax (102.11) 99.12
1,881.08 2,538.13SCHEDULE 24
EARNINGS PER SHARENet profit attributable to equity shareholders
Profit after tax and minority interests 6,985.61 7,594.32Add:Tax-earlier years 11.24 (5.31)
6,996.85 7,589.01Less:Depreciation - earlier years – 284.33Net profit available 6,996.85 7,304.68
Net profit attributable to equity shareholdersbefore prior period and exceptional items
Net profit available 6,996.85 7,304.68Prior period items – (0.59)Settlement compensation income On closure of a contract – (51.16) For dispute of patent – (299.83)Litigation settlement 371.90 –Depreciation - earlier years – 284.33Tax effect of above items (111.57) 24.13
7,257.18 7,261.56No. of weighted average equity shares
Basic 185,751,833 185,492,693Effect of dilutive equity shares equivalent – stock options outstanding 924,530 1,030,453Diluted 186,676,363 186,523,146
Nominal value of equity share (Rs.) 10.00 10.00EARNINGS PER SHARE (Rs.)
Before prior period and exceptional itemsBasic 39.07 39.15Diluted 38.88 38.93
After prior period and exceptional itemsBasic 37.67 39.38Diluted 37.48 39.16
���������� ���������������������������������
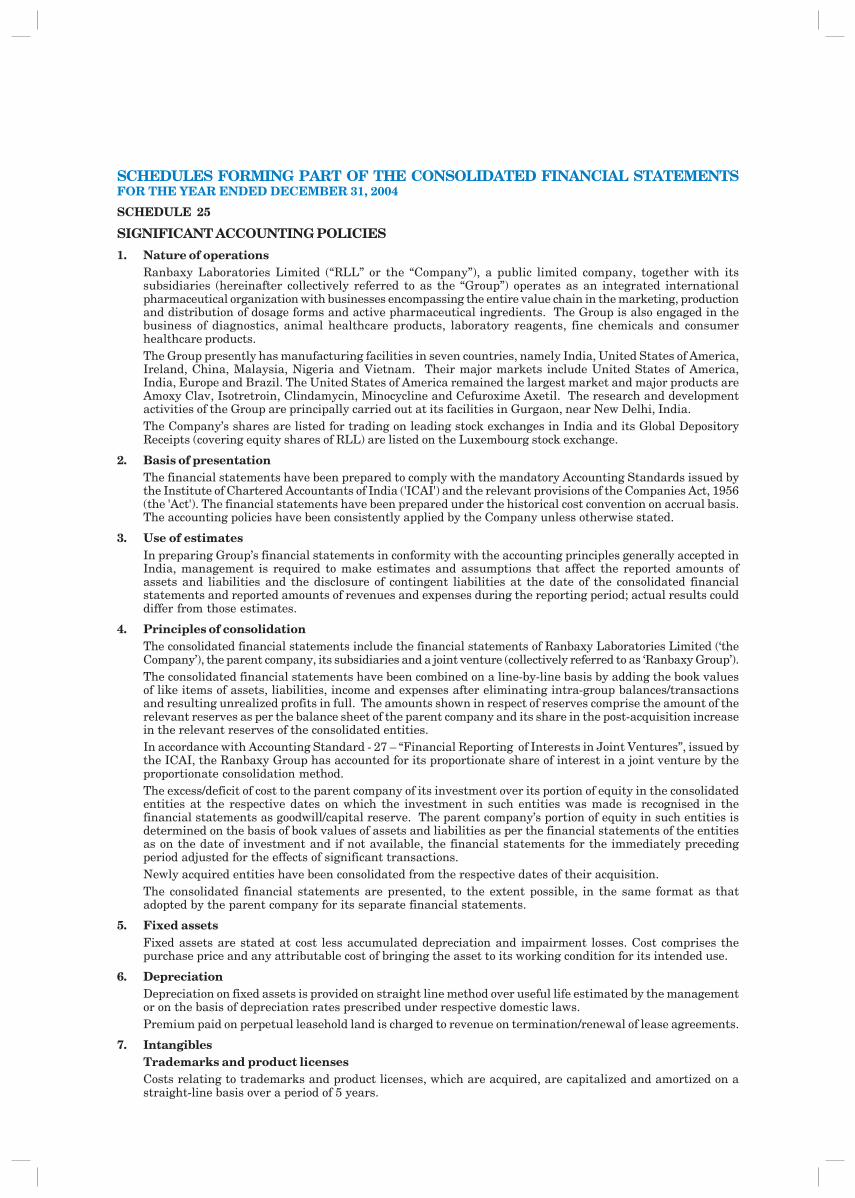
SCHEDULES FORMING PART OF THE CONSOLIDATED FINANCIAL STATEMENTSFOR THE YEAR ENDED DECEMBER 31, 2004
SCHEDULE 25
SIGNIFICANT ACCOUNTING POLICIES
1. Nature of operationsRanbaxy Laboratories Limited (“RLL” or the “Company”), a public limited company, together with itssubsidiaries (hereinafter collectively referred to as the “Group”) operates as an integrated internationalpharmaceutical organization with businesses encompassing the entire value chain in the marketing, productionand distribution of dosage forms and active pharmaceutical ingredients. The Group is also engaged in thebusiness of diagnostics, animal healthcare products, laboratory reagents, fine chemicals and consumerhealthcare products.The Group presently has manufacturing facilities in seven countries, namely India, United States of America,Ireland, China, Malaysia, Nigeria and Vietnam. Their major markets include United States of America,India, Europe and Brazil. The United States of America remained the largest market and major products areAmoxy Clav, Isotretroin, Clindamycin, Minocycline and Cefuroxime Axetil. The research and developmentactivities of the Group are principally carried out at its facilities in Gurgaon, near New Delhi, India.The Company’s shares are listed for trading on leading stock exchanges in India and its Global DepositoryReceipts (covering equity shares of RLL) are listed on the Luxembourg stock exchange.
2. Basis of presentationThe financial statements have been prepared to comply with the mandatory Accounting Standards issued bythe Institute of Chartered Accountants of India ('ICAI') and the relevant provisions of the Companies Act, 1956(the 'Act'). The financial statements have been prepared under the historical cost convention on accrual basis.The accounting policies have been consistently applied by the Company unless otherwise stated.
3. Use of estimatesIn preparing Group’s financial statements in conformity with the accounting principles generally accepted inIndia, management is required to make estimates and assumptions that affect the reported amounts ofassets and liabilities and the disclosure of contingent liabilities at the date of the consolidated financialstatements and reported amounts of revenues and expenses during the reporting period; actual results coulddiffer from those estimates.
4. Principles of consolidationThe consolidated financial statements include the financial statements of Ranbaxy Laboratories Limited (‘theCompany’), the parent company, its subsidiaries and a joint venture (collectively referred to as ‘Ranbaxy Group’).The consolidated financial statements have been combined on a line-by-line basis by adding the book valuesof like items of assets, liabilities, income and expenses after eliminating intra-group balances/transactionsand resulting unrealized profits in full. The amounts shown in respect of reserves comprise the amount of therelevant reserves as per the balance sheet of the parent company and its share in the post-acquisition increasein the relevant reserves of the consolidated entities.In accordance with Accounting Standard - 27 – “Financial Reporting of Interests in Joint Ventures”, issued bythe ICAI, the Ranbaxy Group has accounted for its proportionate share of interest in a joint venture by theproportionate consolidation method.The excess/deficit of cost to the parent company of its investment over its portion of equity in the consolidatedentities at the respective dates on which the investment in such entities was made is recognised in thefinancial statements as goodwill/capital reserve. The parent company’s portion of equity in such entities isdetermined on the basis of book values of assets and liabilities as per the financial statements of the entitiesas on the date of investment and if not available, the financial statements for the immediately precedingperiod adjusted for the effects of significant transactions.Newly acquired entities have been consolidated from the respective dates of their acquisition.The consolidated financial statements are presented, to the extent possible, in the same format as thatadopted by the parent company for its separate financial statements.
5. Fixed assetsFixed assets are stated at cost less accumulated depreciation and impairment losses. Cost comprises thepurchase price and any attributable cost of bringing the asset to its working condition for its intended use.
6. DepreciationDepreciation on fixed assets is provided on straight line method over useful life estimated by the managementor on the basis of depreciation rates prescribed under respective domestic laws.Premium paid on perpetual leasehold land is charged to revenue on termination/renewal of lease agreements.
7. IntangiblesTrademarks and product licensesCosts relating to trademarks and product licenses, which are acquired, are capitalized and amortized on astraight-line basis over a period of 5 years.
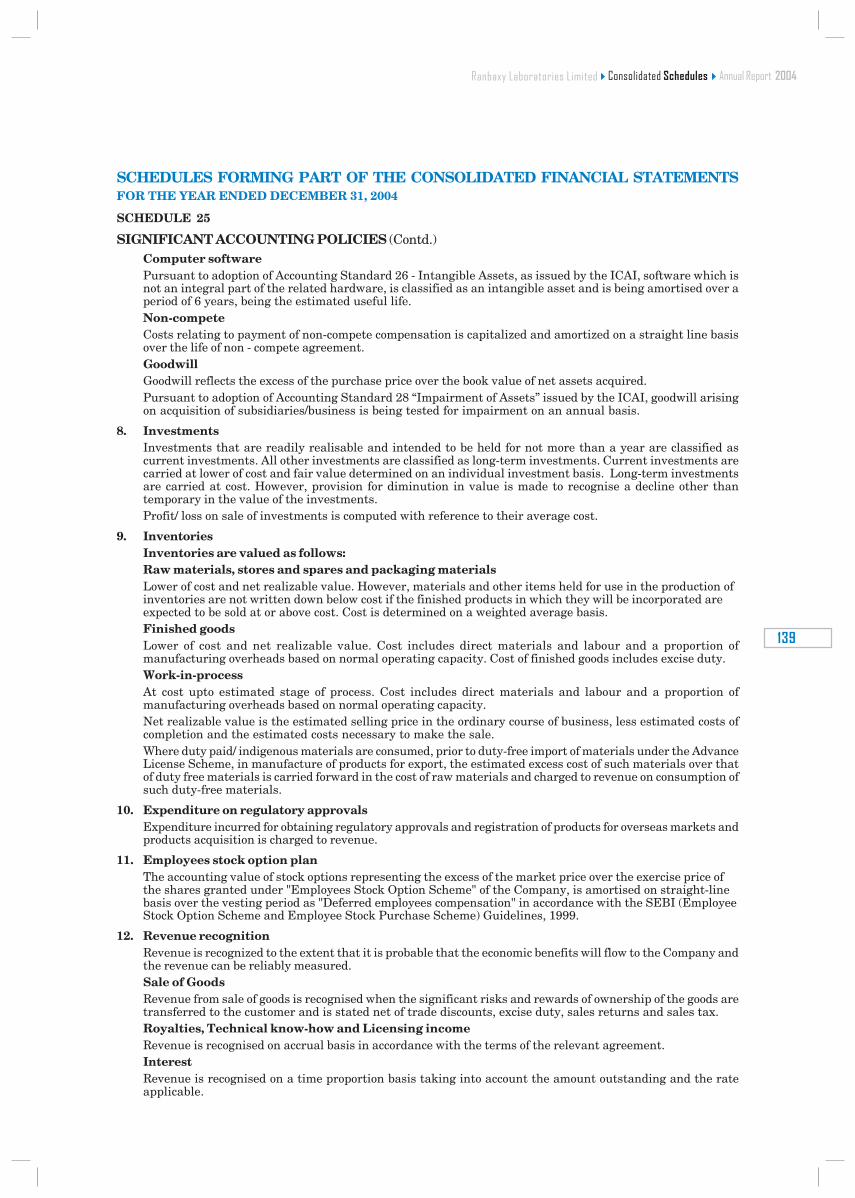
���
������������ ����
SCHEDULES FORMING PART OF THE CONSOLIDATED FINANCIAL STATEMENTSFOR THE YEAR ENDED DECEMBER 31, 2004
SCHEDULE 25
SIGNIFICANT ACCOUNTING POLICIES (Contd.)Computer softwarePursuant to adoption of Accounting Standard 26 - Intangible Assets, as issued by the ICAI, software which isnot an integral part of the related hardware, is classified as an intangible asset and is being amortised over aperiod of 6 years, being the estimated useful life.Non-competeCosts relating to payment of non-compete compensation is capitalized and amortized on a straight line basisover the life of non - compete agreement.GoodwillGoodwill reflects the excess of the purchase price over the book value of net assets acquired.Pursuant to adoption of Accounting Standard 28 “Impairment of Assets” issued by the ICAI, goodwill arisingon acquisition of subsidiaries/business is being tested for impairment on an annual basis.
8. InvestmentsInvestments that are readily realisable and intended to be held for not more than a year are classified ascurrent investments. All other investments are classified as long-term investments. Current investments arecarried at lower of cost and fair value determined on an individual investment basis. Long-term investmentsare carried at cost. However, provision for diminution in value is made to recognise a decline other thantemporary in the value of the investments.Profit/ loss on sale of investments is computed with reference to their average cost.
9. InventoriesInventories are valued as follows:Raw materials, stores and spares and packaging materialsLower of cost and net realizable value. However, materials and other items held for use in the production ofinventories are not written down below cost if the finished products in which they will be incorporated areexpected to be sold at or above cost. Cost is determined on a weighted average basis.Finished goodsLower of cost and net realizable value. Cost includes direct materials and labour and a proportion ofmanufacturing overheads based on normal operating capacity. Cost of finished goods includes excise duty.Work-in-processAt cost upto estimated stage of process. Cost includes direct materials and labour and a proportion ofmanufacturing overheads based on normal operating capacity.Net realizable value is the estimated selling price in the ordinary course of business, less estimated costs ofcompletion and the estimated costs necessary to make the sale.Where duty paid/ indigenous materials are consumed, prior to duty-free import of materials under the AdvanceLicense Scheme, in manufacture of products for export, the estimated excess cost of such materials over thatof duty free materials is carried forward in the cost of raw materials and charged to revenue on consumption ofsuch duty-free materials.
10. Expenditure on regulatory approvalsExpenditure incurred for obtaining regulatory approvals and registration of products for overseas markets andproducts acquisition is charged to revenue.
11. Employees stock option planThe accounting value of stock options representing the excess of the market price over the exercise price ofthe shares granted under "Employees Stock Option Scheme" of the Company, is amortised on straight-linebasis over the vesting period as "Deferred employees compensation" in accordance with the SEBI (EmployeeStock Option Scheme and Employee Stock Purchase Scheme) Guidelines, 1999.
12. Revenue recognitionRevenue is recognized to the extent that it is probable that the economic benefits will flow to the Company andthe revenue can be reliably measured.Sale of GoodsRevenue from sale of goods is recognised when the significant risks and rewards of ownership of the goods aretransferred to the customer and is stated net of trade discounts, excise duty, sales returns and sales tax.Royalties, Technical know-how and Licensing incomeRevenue is recognised on accrual basis in accordance with the terms of the relevant agreement.InterestRevenue is recognised on a time proportion basis taking into account the amount outstanding and the rateapplicable.
���������� ���������������������������������
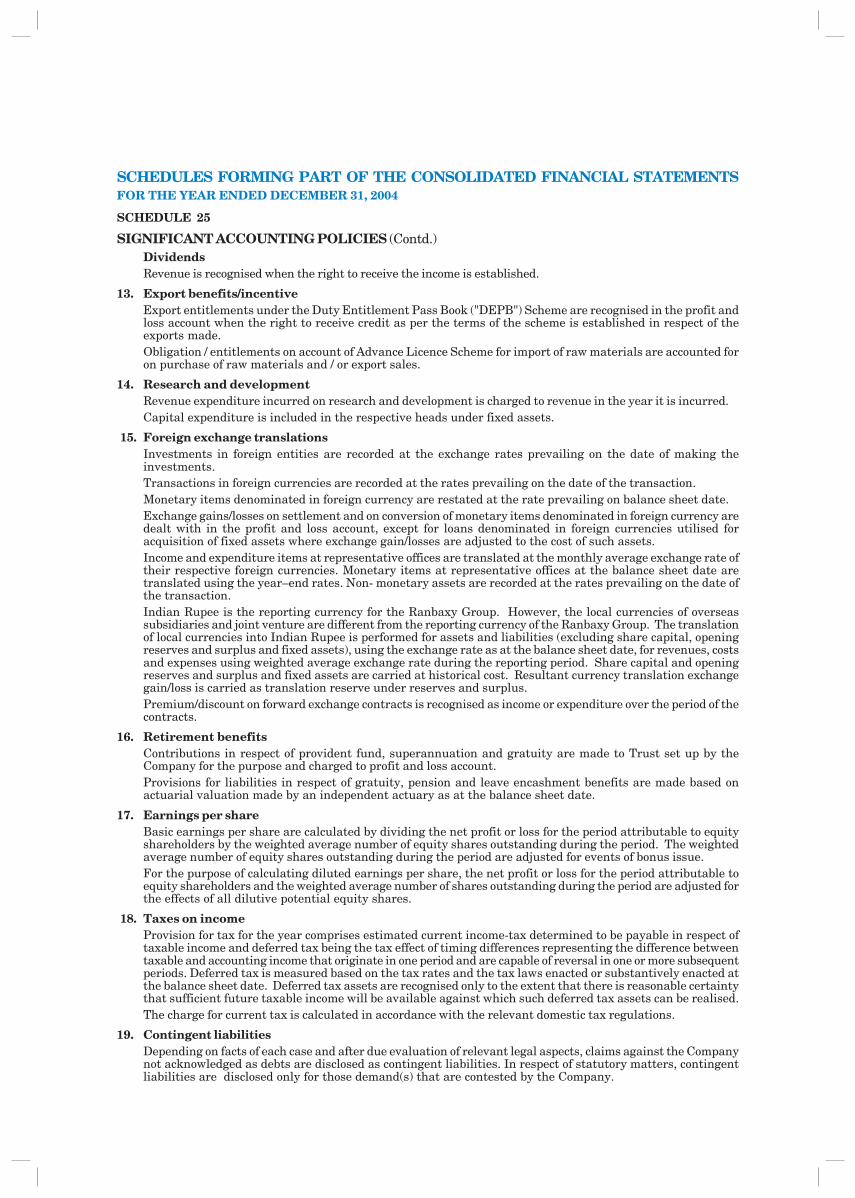
DividendsRevenue is recognised when the right to receive the income is established.
13. Export benefits/incentiveExport entitlements under the Duty Entitlement Pass Book ("DEPB") Scheme are recognised in the profit andloss account when the right to receive credit as per the terms of the scheme is established in respect of theexports made.Obligation / entitlements on account of Advance Licence Scheme for import of raw materials are accounted foron purchase of raw materials and / or export sales.
14. Research and developmentRevenue expenditure incurred on research and development is charged to revenue in the year it is incurred.Capital expenditure is included in the respective heads under fixed assets.
15. Foreign exchange translationsInvestments in foreign entities are recorded at the exchange rates prevailing on the date of making theinvestments.Transactions in foreign currencies are recorded at the rates prevailing on the date of the transaction.Monetary items denominated in foreign currency are restated at the rate prevailing on balance sheet date.Exchange gains/losses on settlement and on conversion of monetary items denominated in foreign currency aredealt with in the profit and loss account, except for loans denominated in foreign currencies utilised foracquisition of fixed assets where exchange gain/losses are adjusted to the cost of such assets.Income and expenditure items at representative offices are translated at the monthly average exchange rate oftheir respective foreign currencies. Monetary items at representative offices at the balance sheet date aretranslated using the year–end rates. Non- monetary assets are recorded at the rates prevailing on the date ofthe transaction.Indian Rupee is the reporting currency for the Ranbaxy Group. However, the local currencies of overseassubsidiaries and joint venture are different from the reporting currency of the Ranbaxy Group. The translationof local currencies into Indian Rupee is performed for assets and liabilities (excluding share capital, openingreserves and surplus and fixed assets), using the exchange rate as at the balance sheet date, for revenues, costsand expenses using weighted average exchange rate during the reporting period. Share capital and openingreserves and surplus and fixed assets are carried at historical cost. Resultant currency translation exchangegain/loss is carried as translation reserve under reserves and surplus.Premium/discount on forward exchange contracts is recognised as income or expenditure over the period of thecontracts.
16. Retirement benefitsContributions in respect of provident fund, superannuation and gratuity are made to Trust set up by theCompany for the purpose and charged to profit and loss account.Provisions for liabilities in respect of gratuity, pension and leave encashment benefits are made based onactuarial valuation made by an independent actuary as at the balance sheet date.
17. Earnings per shareBasic earnings per share are calculated by dividing the net profit or loss for the period attributable to equityshareholders by the weighted average number of equity shares outstanding during the period. The weightedaverage number of equity shares outstanding during the period are adjusted for events of bonus issue.For the purpose of calculating diluted earnings per share, the net profit or loss for the period attributable toequity shareholders and the weighted average number of shares outstanding during the period are adjusted forthe effects of all dilutive potential equity shares.
18. Taxes on incomeProvision for tax for the year comprises estimated current income-tax determined to be payable in respect oftaxable income and deferred tax being the tax effect of timing differences representing the difference betweentaxable and accounting income that originate in one period and are capable of reversal in one or more subsequentperiods. Deferred tax is measured based on the tax rates and the tax laws enacted or substantively enacted atthe balance sheet date. Deferred tax assets are recognised only to the extent that there is reasonable certaintythat sufficient future taxable income will be available against which such deferred tax assets can be realised.The charge for current tax is calculated in accordance with the relevant domestic tax regulations.
19. Contingent liabilitiesDepending on facts of each case and after due evaluation of relevant legal aspects, claims against the Companynot acknowledged as debts are disclosed as contingent liabilities. In respect of statutory matters, contingentliabilities are disclosed only for those demand(s) that are contested by the Company.
SCHEDULES FORMING PART OF THE CONSOLIDATED FINANCIAL STATEMENTSFOR THE YEAR ENDED DECEMBER 31, 2004
SCHEDULE 25
SIGNIFICANT ACCOUNTING POLICIES (Contd.)
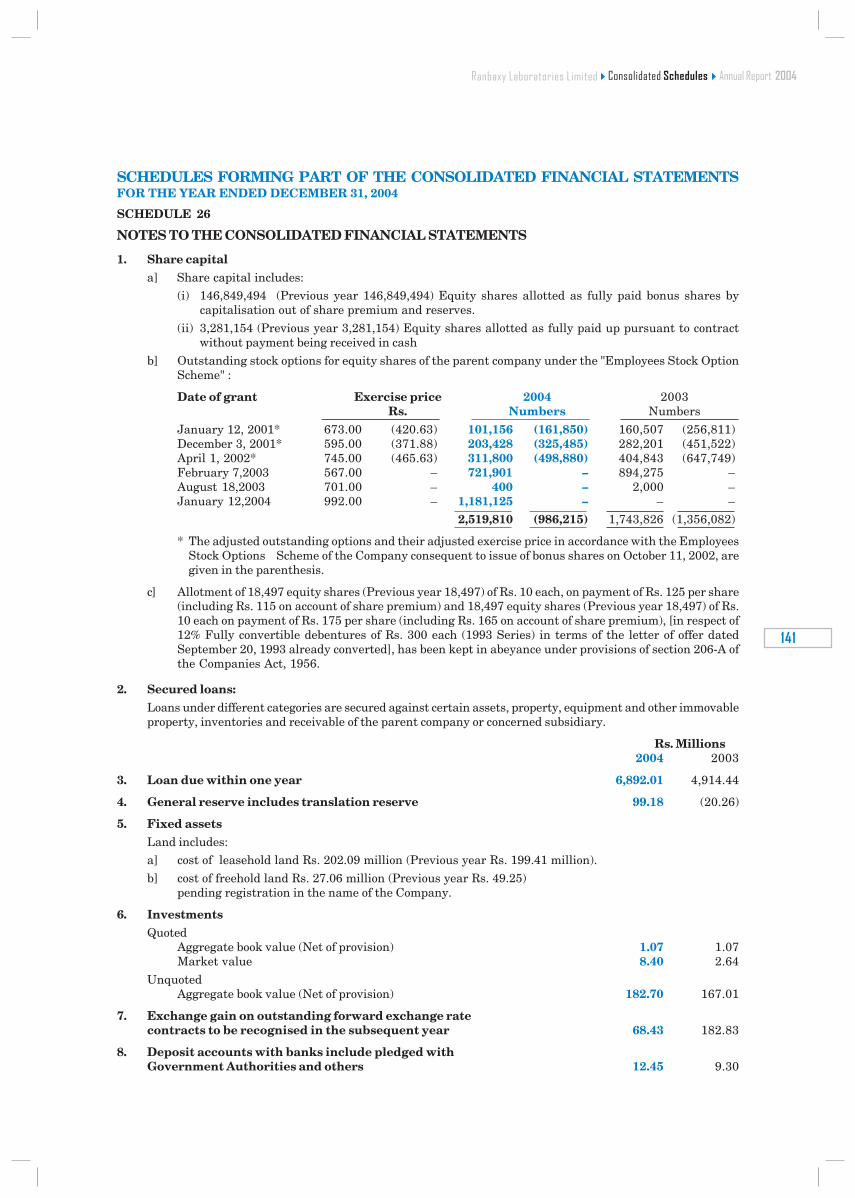
���
������������ ����
1. Share capitala] Share capital includes:
(i) 146,849,494 (Previous year 146,849,494) Equity shares allotted as fully paid bonus shares bycapitalisation out of share premium and reserves.
(ii) 3,281,154 (Previous year 3,281,154) Equity shares allotted as fully paid up pursuant to contractwithout payment being received in cash
b] Outstanding stock options for equity shares of the parent company under the "Employees Stock OptionScheme" :
Date of grant Exercise price 2004 2003Rs. Numbers Numbers
January 12, 2001* 673.00 (420.63) 101,156 (161,850) 160,507 (256,811)December 3, 2001* 595.00 (371.88) 203,428 (325,485) 282,201 (451,522)April 1, 2002* 745.00 (465.63) 311,800 (498,880) 404,843 (647,749)February 7,2003 567.00 – 721,901 – 894,275 –August 18,2003 701.00 – 400 – 2,000 –January 12,2004 992.00 – 1,181,125 – – –
2,519,810 (986,215) 1,743,826 (1,356,082)
* The adjusted outstanding options and their adjusted exercise price in accordance with the EmployeesStock Options Scheme of the Company consequent to issue of bonus shares on October 11, 2002, aregiven in the parenthesis.
c] Allotment of 18,497 equity shares (Previous year 18,497) of Rs. 10 each, on payment of Rs. 125 per share(including Rs. 115 on account of share premium) and 18,497 equity shares (Previous year 18,497) of Rs.10 each on payment of Rs. 175 per share (including Rs. 165 on account of share premium), [in respect of12% Fully convertible debentures of Rs. 300 each (1993 Series) in terms of the letter of offer datedSeptember 20, 1993 already converted], has been kept in abeyance under provisions of section 206-A ofthe Companies Act, 1956.
2. Secured loans:Loans under different categories are secured against certain assets, property, equipment and other immovableproperty, inventories and receivable of the parent company or concerned subsidiary.
Rs. Millions2004 2003
3. Loan due within one year 6,892.01 4,914.44
4. General reserve includes translation reserve 99.18 (20.26)
5. Fixed assetsLand includes:a] cost of leasehold land Rs. 202.09 million (Previous year Rs. 199.41 million).
b] cost of freehold land Rs. 27.06 million (Previous year Rs. 49.25)pending registration in the name of the Company.
6. InvestmentsQuoted
Aggregate book value (Net of provision) 1.07 1.07Market value 8.40 2.64
UnquotedAggregate book value (Net of provision) 182.70 167.01
7. Exchange gain on outstanding forward exchange ratecontracts to be recognised in the subsequent year 68.43 182.83
8. Deposit accounts with banks include pledged withGovernment Authorities and others 12.45 9.30
SCHEDULES FORMING PART OF THE CONSOLIDATED FINANCIAL STATEMENTSFOR THE YEAR ENDED DECEMBER 31, 2004
SCHEDULE 26
NOTES TO THE CONSOLIDATED FINANCIAL STATEMENTS
���������� ���������������������������������
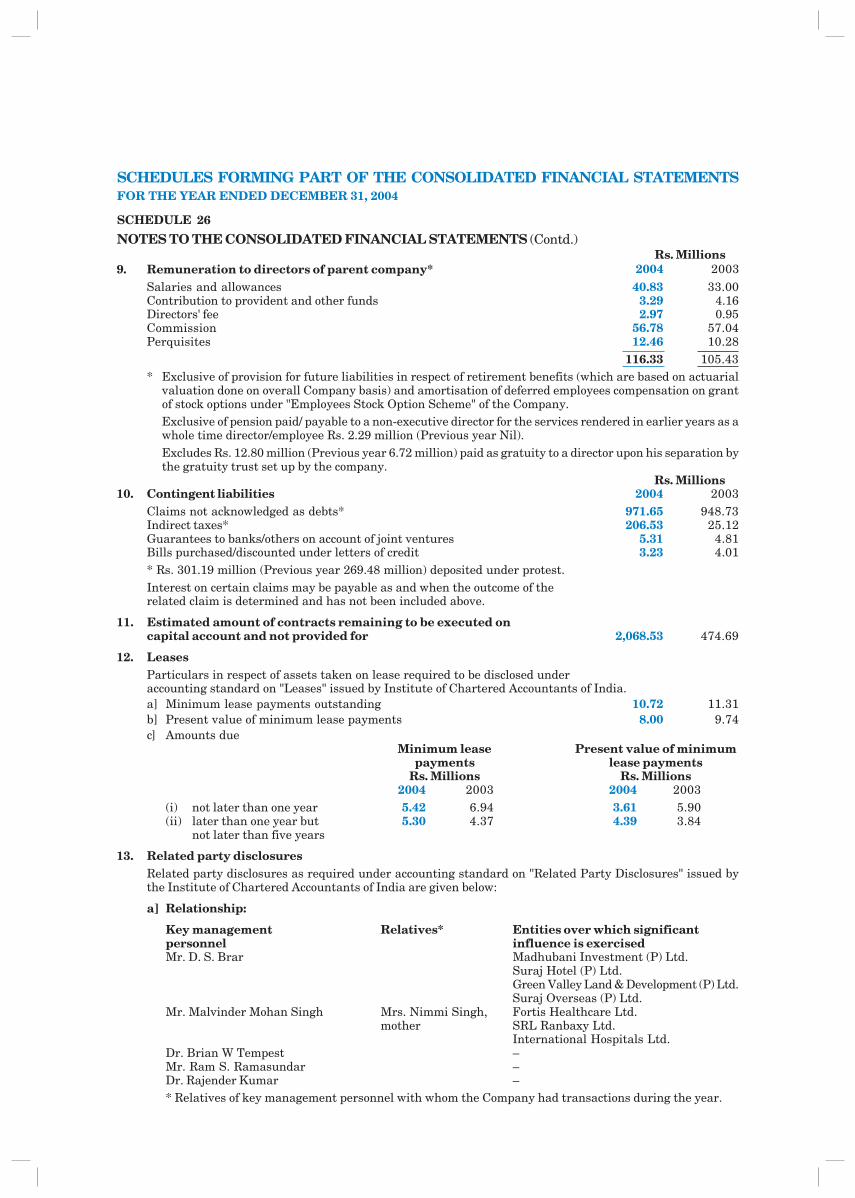
9. Remuneration to directors of parent company*Salaries and allowances 40.83 33.00Contribution to provident and other funds 3.29 4.16Directors' fee 2.97 0.95Commission 56.78 57.04Perquisites 12.46 10.28
116.33 105.43* Exclusive of provision for future liabilities in respect of retirement benefits (which are based on actuarial
valuation done on overall Company basis) and amortisation of deferred employees compensation on grantof stock options under "Employees Stock Option Scheme" of the Company.Exclusive of pension paid/ payable to a non-executive director for the services rendered in earlier years as awhole time director/employee Rs. 2.29 million (Previous year Nil).Excludes Rs. 12.80 million (Previous year 6.72 million) paid as gratuity to a director upon his separation bythe gratuity trust set up by the company.
Rs. Millions10. Contingent liabilities 2004 2003
Claims not acknowledged as debts* 971.65 948.73Indirect taxes* 206.53 25.12Guarantees to banks/others on account of joint ventures 5.31 4.81Bills purchased/discounted under letters of credit 3.23 4.01* Rs. 301.19 million (Previous year 269.48 million) deposited under protest.Interest on certain claims may be payable as and when the outcome of therelated claim is determined and has not been included above.
11. Estimated amount of contracts remaining to be executed oncapital account and not provided for 2,068.53 474.69
12. LeasesParticulars in respect of assets taken on lease required to be disclosed underaccounting standard on "Leases" issued by Institute of Chartered Accountants of India.a] Minimum lease payments outstanding 10.72 11.31b] Present value of minimum lease payments 8.00 9.74c] Amounts due
Minimum lease Present value of minimumpayments lease payments
Rs. Millions Rs. Millions2004 2003 2004 2003
(i) not later than one year 5.42 6.94 3.61 5.90(ii) later than one year but 5.30 4.37 4.39 3.84
not later than five years
13. Related party disclosuresRelated party disclosures as required under accounting standard on "Related Party Disclosures" issued bythe Institute of Chartered Accountants of India are given below:
a] Relationship:
Key management Relatives* Entities over which significantpersonnel influence is exercisedMr. D. S. Brar Madhubani Investment (P) Ltd.
Suraj Hotel (P) Ltd.Green Valley Land & Development (P) Ltd.Suraj Overseas (P) Ltd.
Mr. Malvinder Mohan Singh Mrs. Nimmi Singh, Fortis Healthcare Ltd.mother SRL Ranbaxy Ltd.
International Hospitals Ltd.Dr. Brian W Tempest –Mr. Ram S. Ramasundar –Dr. Rajender Kumar –* Relatives of key management personnel with whom the Company had transactions during the year.
SCHEDULES FORMING PART OF THE CONSOLIDATED FINANCIAL STATEMENTSFOR THE YEAR ENDED DECEMBER 31, 2004
SCHEDULE 26
NOTES TO THE CONSOLIDATED FINANCIAL STATEMENTS (Contd.)Rs. Millions
2004 2003
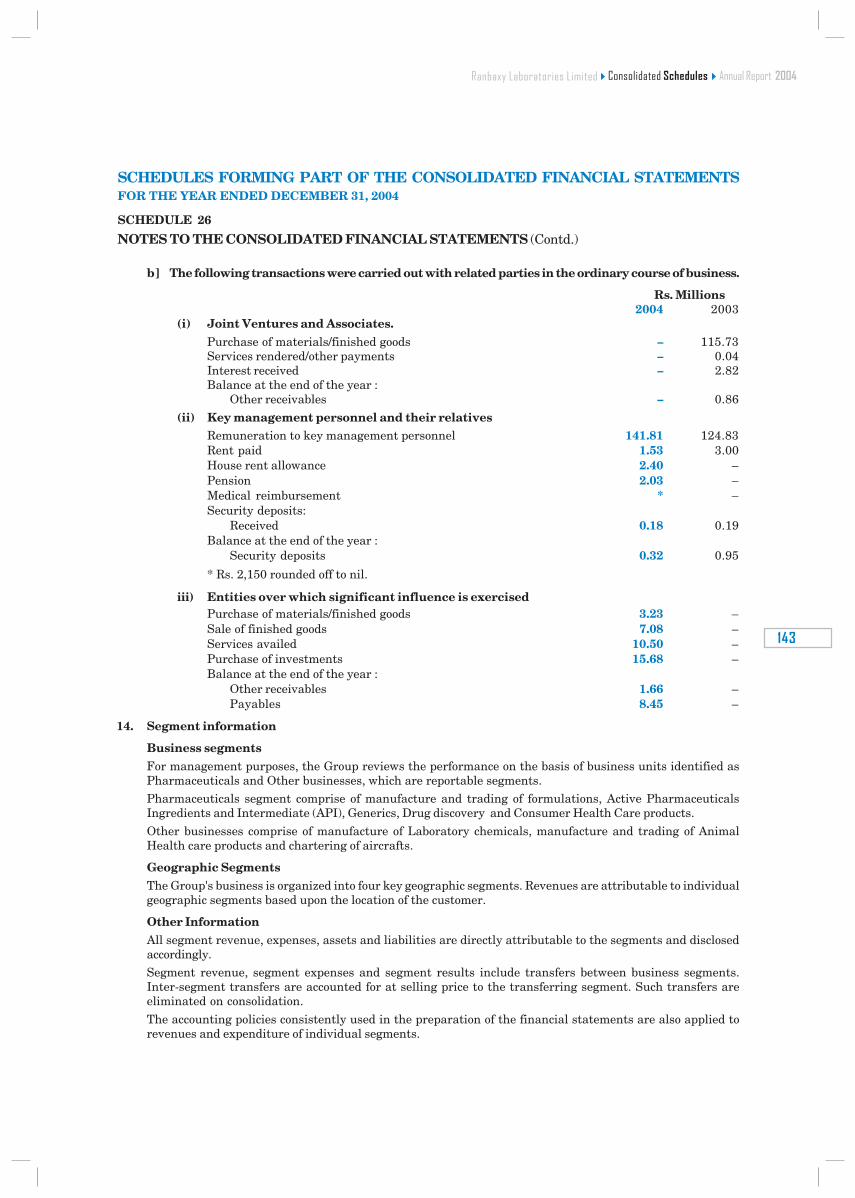
���
������������ ����
b] The following transactions were carried out with related parties in the ordinary course of business.
Rs. Millions2004 2003
(i) Joint Ventures and Associates.Purchase of materials/finished goods – 115.73Services rendered/other payments – 0.04Interest received – 2.82Balance at the end of the year :
Other receivables – 0.86
(ii) Key management personnel and their relativesRemuneration to key management personnel 141.81 124.83Rent paid 1.53 3.00House rent allowance 2.40 –Pension 2.03 –Medical reimbursement * –Security deposits:
Received 0.18 0.19Balance at the end of the year :
Security deposits 0.32 0.95
* Rs. 2,150 rounded off to nil.
iii) Entities over which significant influence is exercisedPurchase of materials/finished goods 3.23 –Sale of finished goods 7.08 –Services availed 10.50 –Purchase of investments 15.68 –Balance at the end of the year :
Other receivables 1.66 –Payables 8.45 –
14. Segment information
Business segmentsFor management purposes, the Group reviews the performance on the basis of business units identified asPharmaceuticals and Other businesses, which are reportable segments.Pharmaceuticals segment comprise of manufacture and trading of formulations, Active PharmaceuticalsIngredients and Intermediate (API), Generics, Drug discovery and Consumer Health Care products.
Other businesses comprise of manufacture of Laboratory chemicals, manufacture and trading of AnimalHealth care products and chartering of aircrafts.
Geographic SegmentsThe Group's business is organized into four key geographic segments. Revenues are attributable to individualgeographic segments based upon the location of the customer.
Other InformationAll segment revenue, expenses, assets and liabilities are directly attributable to the segments and disclosedaccordingly.Segment revenue, segment expenses and segment results include transfers between business segments.Inter-segment transfers are accounted for at selling price to the transferring segment. Such transfers areeliminated on consolidation.
The accounting policies consistently used in the preparation of the financial statements are also applied torevenues and expenditure of individual segments.
SCHEDULES FORMING PART OF THE CONSOLIDATED FINANCIAL STATEMENTSFOR THE YEAR ENDED DECEMBER 31, 2004
SCHEDULE 26
NOTES TO THE CONSOLIDATED FINANCIAL STATEMENTS (Contd.)
���������� ���������������������������������
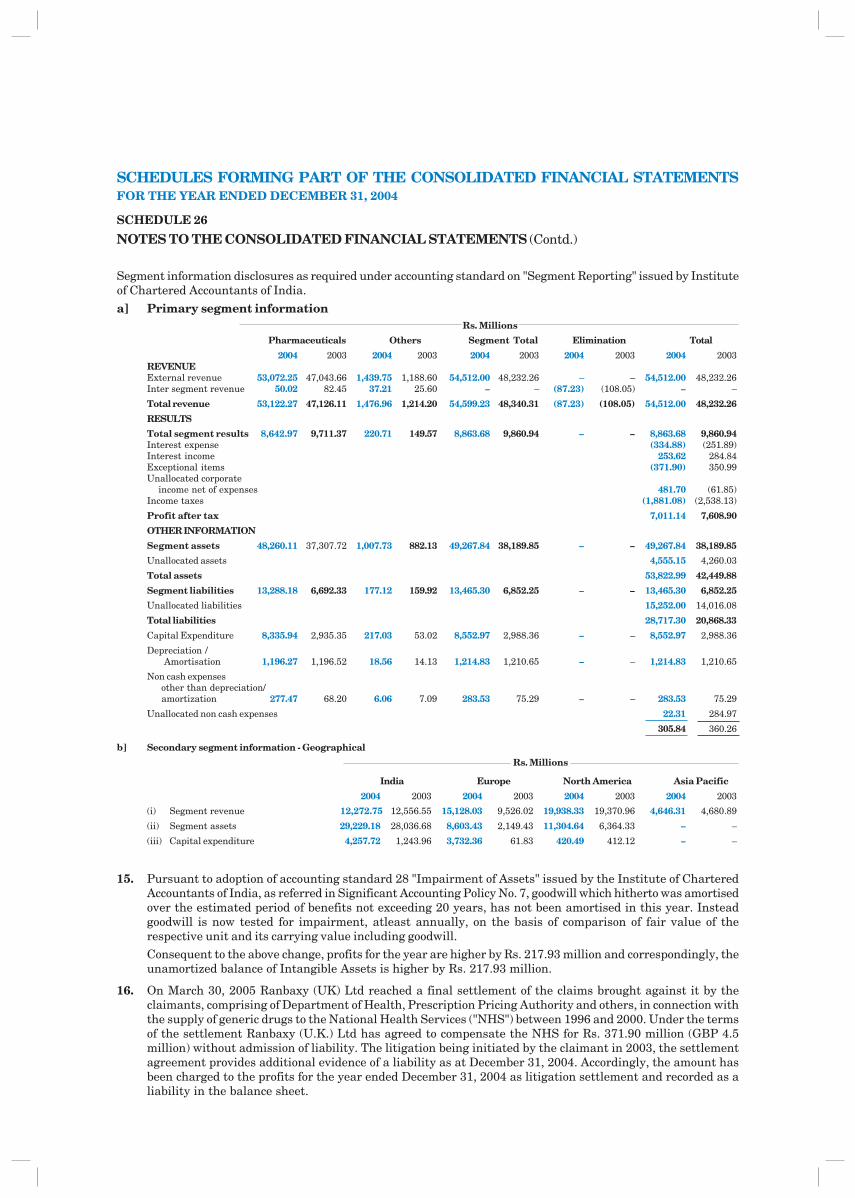
SCHEDULES FORMING PART OF THE CONSOLIDATED FINANCIAL STATEMENTSFOR THE YEAR ENDED DECEMBER 31, 2004
SCHEDULE 26
NOTES TO THE CONSOLIDATED FINANCIAL STATEMENTS (Contd.)
Segment information disclosures as required under accounting standard on "Segment Reporting" issued by Instituteof Chartered Accountants of India.
a] Primary segment informationRs. Millions
Pharmaceuticals Others Segment Total Elimination Total
2004 2003 2004 2003 2004 2003 2004 2003 2004 2003REVENUEExternal revenue 53,072.25 47,043.66 1,439.75 1,188.60 54,512.00 48,232.26 – – 54,512.00 48,232.26Inter segment revenue 50.02 82.45 37.21 25.60 – – (87.23) (108.05) – –
Total revenue 53,122.27 47,126.11 1,476.96 1,214.20 54,599.23 48,340.31 (87.23) (108.05) 54,512.00 48,232.26
RESULTS
Total segment results 8,642.97 9,711.37 220.71 149.57 8,863.68 9,860.94 – – 8,863.68 9,860.94Interest expense (334.88) (251.89)Interest income 253.62 284.84Exceptional items (371.90) 350.99Unallocated corporate income net of expenses 481.70 (61.85)Income taxes (1,881.08) (2,538.13)
Profit after tax 7,011.14 7,608.90
OTHER INFORMATION
Segment assets 48,260.11 37,307.72 1,007.73 882.13 49,267.84 38,189.85 – – 49,267.84 38,189.85
Unallocated assets 4,555.15 4,260.03
Total assets 53,822.99 42,449.88
Segment liabilities 13,288.18 6,692.33 177.12 159.92 13,465.30 6,852.25 – – 13,465.30 6,852.25
Unallocated liabilities 15,252.00 14,016.08
Total liabilities 28,717.30 20,868.33
Capital Expenditure 8,335.94 2,935.35 217.03 53.02 8,552.97 2,988.36 – – 8,552.97 2,988.36
Depreciation / Amortisation 1,196.27 1,196.52 18.56 14.13 1,214.83 1,210.65 – – 1,214.83 1,210.65
Non cash expenses other than depreciation/ amortization 277.47 68.20 6.06 7.09 283.53 75.29 – – 283.53 75.29
Unallocated non cash expenses 22.31 284.97
305.84 360.26
b] Secondary segment information - Geographical
Rs. Millions
India Europe North America Asia Pacific
2004 2003 2004 2003 2004 2003 2004 2003
(i) Segment revenue 12,272.75 12,556.55 15,128.03 9,526.02 19,938.33 19,370.96 4,646.31 4,680.89
(ii) Segment assets 29,229.18 28,036.68 8,603.43 2,149.43 11,304.64 6,364.33 – –
(iii) Capital expenditure 4,257.72 1,243.96 3,732.36 61.83 420.49 412.12 – –
15. Pursuant to adoption of accounting standard 28 "Impairment of Assets" issued by the Institute of CharteredAccountants of India, as referred in Significant Accounting Policy No. 7, goodwill which hitherto was amortisedover the estimated period of benefits not exceeding 20 years, has not been amortised in this year. Insteadgoodwill is now tested for impairment, atleast annually, on the basis of comparison of fair value of therespective unit and its carrying value including goodwill.Consequent to the above change, profits for the year are higher by Rs. 217.93 million and correspondingly, theunamortized balance of Intangible Assets is higher by Rs. 217.93 million.
16. On March 30, 2005 Ranbaxy (UK) Ltd reached a final settlement of the claims brought against it by theclaimants, comprising of Department of Health, Prescription Pricing Authority and others, in connection withthe supply of generic drugs to the National Health Services ("NHS") between 1996 and 2000. Under the termsof the settlement Ranbaxy (U.K.) Ltd has agreed to compensate the NHS for Rs. 371.90 million (GBP 4.5million) without admission of liability. The litigation being initiated by the claimant in 2003, the settlementagreement provides additional evidence of a liability as at December 31, 2004. Accordingly, the amount hasbeen charged to the profits for the year ended December 31, 2004 as litigation settlement and recorded as aliability in the balance sheet.
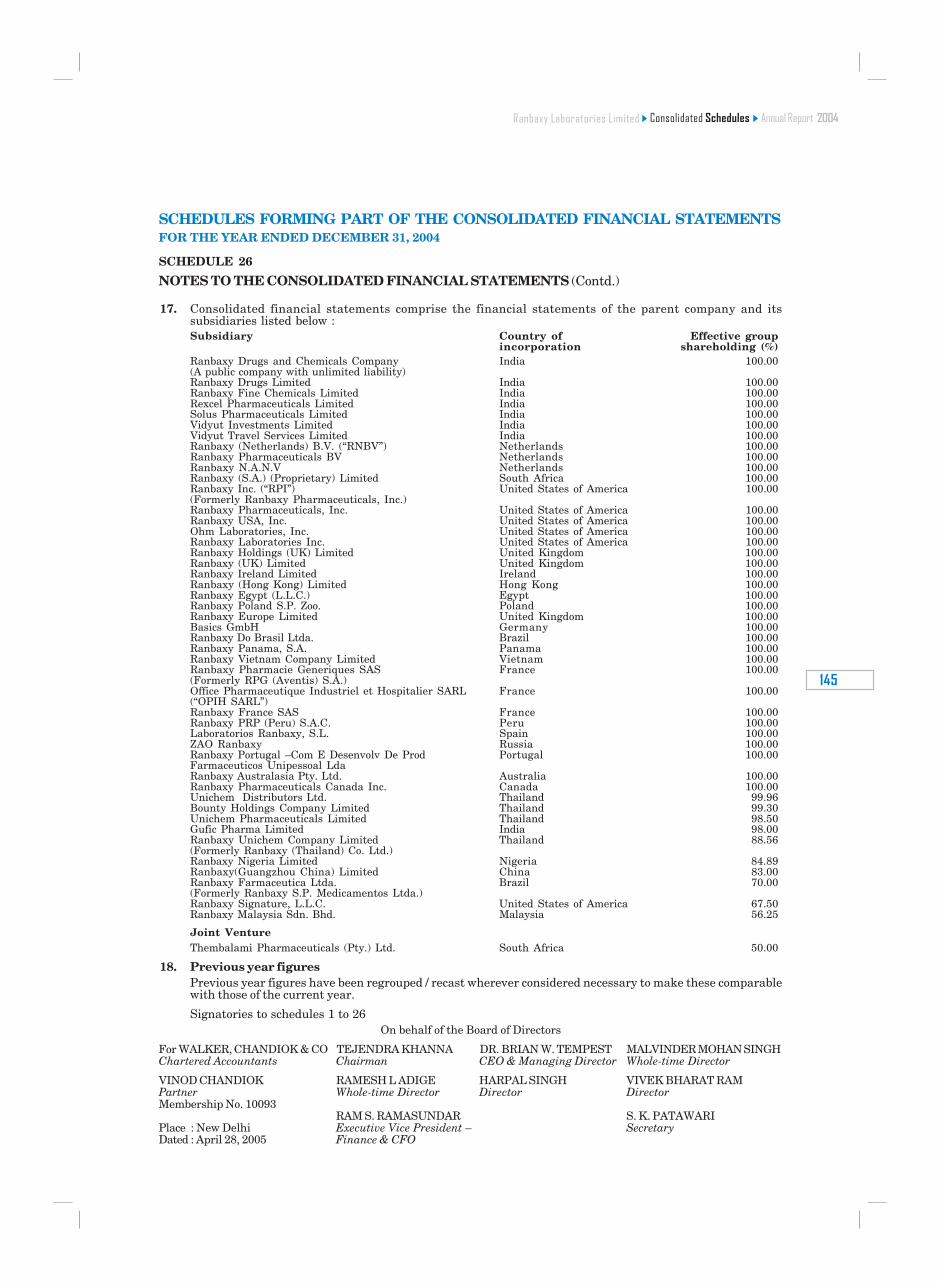
����������������
���
17. Consolidated financial statements comprise the financial statements of the parent company and itssubsidiaries listed below :Subsidiary Country of Effective group
incorporation shareholding (%)Ranbaxy Drugs and Chemicals Company India 100.00(A public company with unlimited liability)Ranbaxy Drugs Limited India 100.00Ranbaxy Fine Chemicals Limited India 100.00Rexcel Pharmaceuticals Limited India 100.00Solus Pharmaceuticals Limited India 100.00Vidyut Investments Limited India 100.00Vidyut Travel Services Limited India 100.00Ranbaxy (Netherlands) B.V. (“RNBV”) Netherlands 100.00Ranbaxy Pharmaceuticals BV Netherlands 100.00Ranbaxy N.A.N.V Netherlands 100.00Ranbaxy (S.A.) (Proprietary) Limited South Africa 100.00Ranbaxy Inc. (“RPI”) United States of America 100.00(Formerly Ranbaxy Pharmaceuticals, Inc.)Ranbaxy Pharmaceuticals, Inc. United States of America 100.00Ranbaxy USA, Inc. United States of America 100.00Ohm Laboratories, Inc. United States of America 100.00Ranbaxy Laboratories Inc. United States of America 100.00Ranbaxy Holdings (UK) Limited United Kingdom 100.00Ranbaxy (UK) Limited United Kingdom 100.00Ranbaxy Ireland Limited Ireland 100.00Ranbaxy (Hong Kong) Limited Hong Kong 100.00Ranbaxy Egypt (L.L.C.) Egypt 100.00Ranbaxy Poland S.P. Zoo. Poland 100.00Ranbaxy Europe Limited United Kingdom 100.00Basics GmbH Germany 100.00Ranbaxy Do Brasil Ltda. Brazil 100.00Ranbaxy Panama, S.A. Panama 100.00Ranbaxy Vietnam Company Limited Vietnam 100.00Ranbaxy Pharmacie Generiques SAS France 100.00(Formerly RPG (Aventis) S.A.)Office Pharmaceutique Industriel et Hospitalier SARL France 100.00(“OPIH SARL”)Ranbaxy France SAS France 100.00Ranbaxy PRP (Peru) S.A.C. Peru 100.00Laboratorios Ranbaxy, S.L. Spain 100.00ZAO Ranbaxy Russia 100.00Ranbaxy Portugal –Com E Desenvolv De Prod Portugal 100.00Farmaceuticos Unipessoal LdaRanbaxy Australasia Pty. Ltd. Australia 100.00Ranbaxy Pharmaceuticals Canada Inc. Canada 100.00Unichem Distributors Ltd. Thailand 99.96Bounty Holdings Company Limited Thailand 99.30Unichem Pharmaceuticals Limited Thailand 98.50Gufic Pharma Limited India 98.00Ranbaxy Unichem Company Limited Thailand 88.56(Formerly Ranbaxy (Thailand) Co. Ltd.)Ranbaxy Nigeria Limited Nigeria 84.89Ranbaxy(Guangzhou China) Limited China 83.00Ranbaxy Farmaceutica Ltda. Brazil 70.00(Formerly Ranbaxy S.P. Medicamentos Ltda.)Ranbaxy Signature, L.L.C. United States of America 67.50Ranbaxy Malaysia Sdn. Bhd. Malaysia 56.25
Joint VentureThembalami Pharmaceuticals (Pty.) Ltd. South Africa 50.00
18. Previous year figuresPrevious year figures have been regrouped / recast wherever considered necessary to make these comparablewith those of the current year.
Signatories to schedules 1 to 26
SCHEDULES FORMING PART OF THE CONSOLIDATED FINANCIAL STATEMENTSFOR THE YEAR ENDED DECEMBER 31, 2004
SCHEDULE 26
NOTES TO THE CONSOLIDATED FINANCIAL STATEMENTS (Contd.)
On behalf of the Board of Directors
For WALKER, CHANDIOK & CO TEJENDRA KHANNA DR. BRIAN W. TEMPEST MALVINDER MOHAN SINGHChartered Accountants Chairman CEO & Managing Director Whole-time Director
VINOD CHANDIOK RAMESH L ADIGE HARPAL SINGH VIVEK BHARAT RAMPartner Whole-time Director Director DirectorMembership No. 10093
RAM S. RAMASUNDAR S. K. PATAWARIPlace : New Delhi Executive Vice President – SecretaryDated : April 28, 2005 Finance & CFO
��������������� ��������������������������
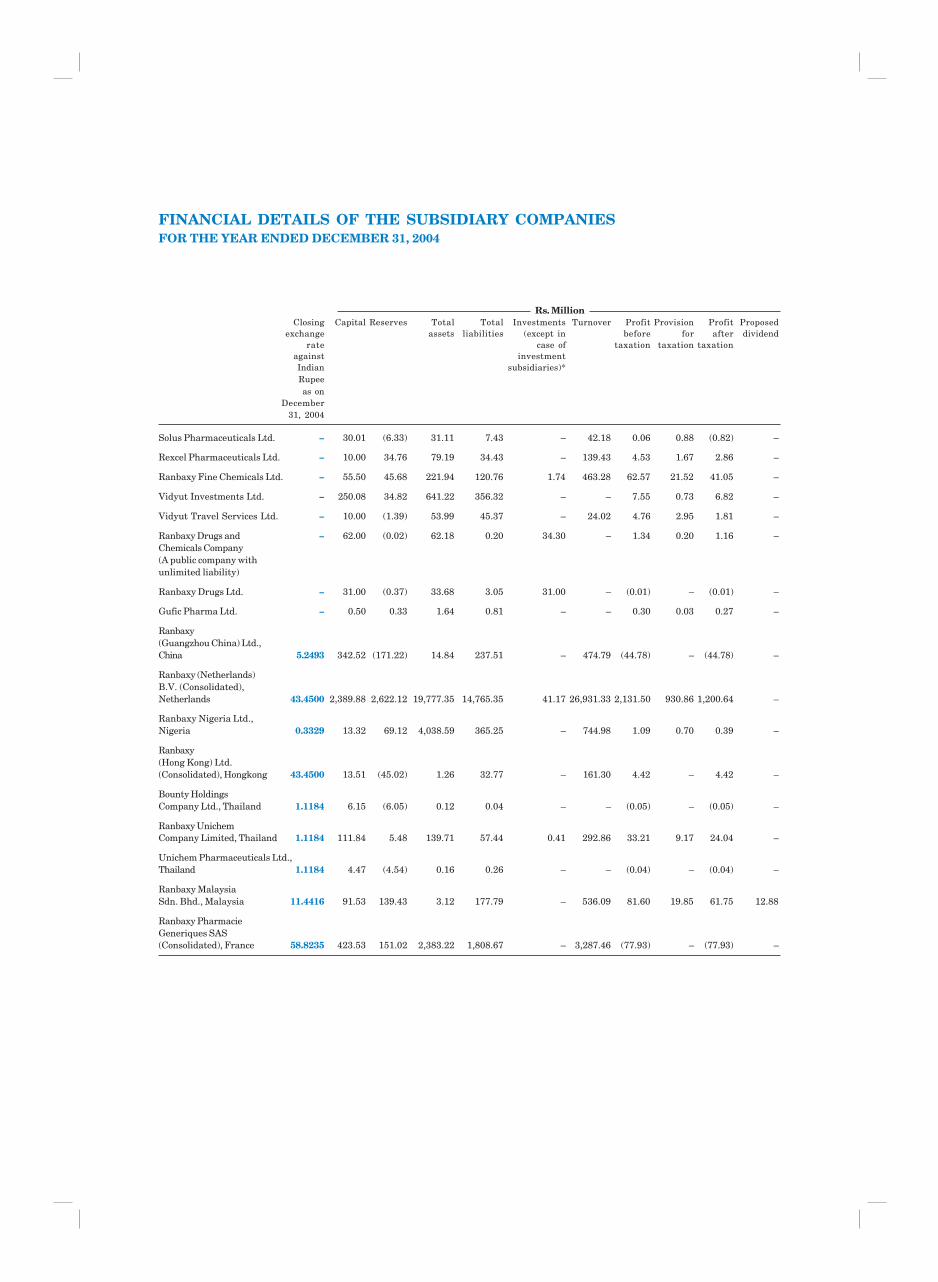
Rs. MillionClosing Capital Reserves Total Total Investments Turnover Profit Provision Profit Proposed
exchange assets liabilities (except in before for after dividendrate case of taxation taxation taxation
against investmentIndian subsidiaries)*Rupeeas on
December31, 2004
Solus Pharmaceuticals Ltd. – 30.01 (6.33) 31.11 7.43 – 42.18 0.06 0.88 (0.82) –
Rexcel Pharmaceuticals Ltd. – 10.00 34.76 79.19 34.43 – 139.43 4.53 1.67 2.86 –
Ranbaxy Fine Chemicals Ltd. – 55.50 45.68 221.94 120.76 1.74 463.28 62.57 21.52 41.05 –
Vidyut Investments Ltd. – 250.08 34.82 641.22 356.32 – – 7.55 0.73 6.82 –
Vidyut Travel Services Ltd. – 10.00 (1.39) 53.99 45.37 – 24.02 4.76 2.95 1.81 –
Ranbaxy Drugs and – 62.00 (0.02) 62.18 0.20 34.30 – 1.34 0.20 1.16 –Chemicals Company(A public company withunlimited liability)
Ranbaxy Drugs Ltd. – 31.00 (0.37) 33.68 3.05 31.00 – (0.01) – (0.01) –
Gufic Pharma Ltd. – 0.50 0.33 1.64 0.81 – – 0.30 0.03 0.27 –
Ranbaxy(Guangzhou China) Ltd.,China 5.2493 342.52 (171.22) 14.84 237.51 – 474.79 (44.78) – (44.78) –
Ranbaxy (Netherlands)B.V. (Consolidated),Netherlands 43.4500 2,389.88 2,622.12 19,777.35 14,765.35 41.17 26,931.33 2,131.50 930.86 1,200.64 –
Ranbaxy Nigeria Ltd.,Nigeria 0.3329 13.32 69.12 4,038.59 365.25 – 744.98 1.09 0.70 0.39 –
Ranbaxy(Hong Kong) Ltd.(Consolidated), Hongkong 43.4500 13.51 (45.02) 1.26 32.77 – 161.30 4.42 – 4.42 –
Bounty HoldingsCompany Ltd., Thailand 1.1184 6.15 (6.05) 0.12 0.04 – – (0.05) – (0.05) –
Ranbaxy UnichemCompany Limited, Thailand 1.1184 111.84 5.48 139.71 57.44 0.41 292.86 33.21 9.17 24.04 –
Unichem Pharmaceuticals Ltd.,Thailand 1.1184 4.47 (4.54) 0.16 0.26 – – (0.04) – (0.04) –
Ranbaxy MalaysiaSdn. Bhd., Malaysia 11.4416 91.53 139.43 3.12 177.79 – 536.09 81.60 19.85 61.75 12.88
Ranbaxy PharmacieGeneriques SAS(Consolidated), France 58.8235 423.53 151.02 2,383.22 1,808.67 – 3,287.46 (77.93) – (77.93) –
FINANCIAL DETAILS OF THE SUBSIDIARY COMPANIESFOR THE YEAR ENDED DECEMBER 31, 2004
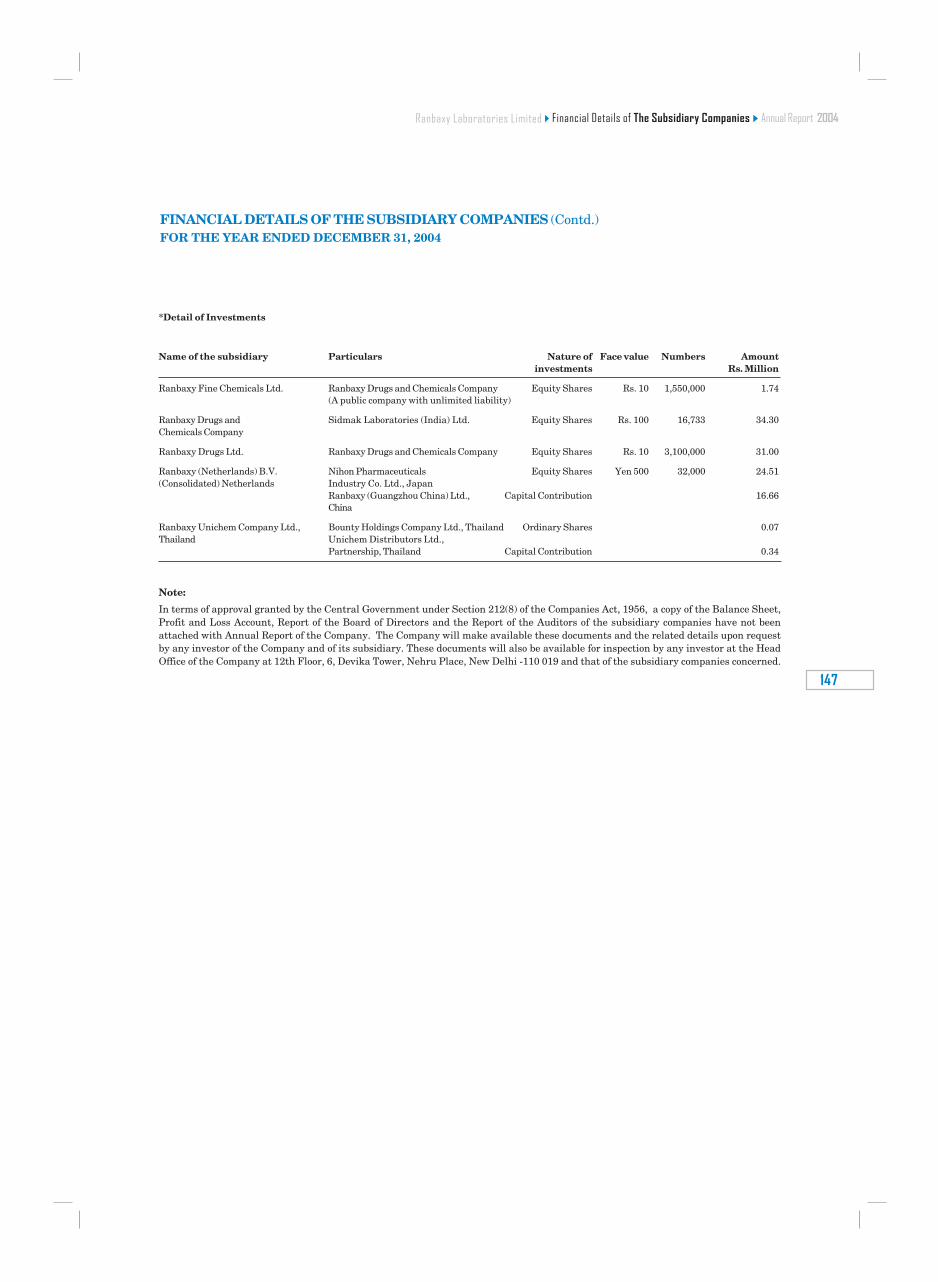
����������������
���
*Detail of Investments
Name of the subsidiary Particulars Nature of Face value Numbers Amountinvestments Rs. Million
Ranbaxy Fine Chemicals Ltd. Ranbaxy Drugs and Chemicals Company Equity Shares Rs. 10 1,550,000 1.74(A public company with unlimited liability)
Ranbaxy Drugs and Sidmak Laboratories (India) Ltd. Equity Shares Rs. 100 16,733 34.30Chemicals Company
Ranbaxy Drugs Ltd. Ranbaxy Drugs and Chemicals Company Equity Shares Rs. 10 3,100,000 31.00
Ranbaxy (Netherlands) B.V. Nihon Pharmaceuticals Equity Shares Yen 500 32,000 24.51(Consolidated) Netherlands Industry Co. Ltd., Japan
Ranbaxy (Guangzhou China) Ltd., Capital Contribution 16.66China
Ranbaxy Unichem Company Ltd., Bounty Holdings Company Ltd., Thailand Ordinary Shares 0.07Thailand Unichem Distributors Ltd.,
Partnership, Thailand Capital Contribution 0.34
FINANCIAL DETAILS OF THE SUBSIDIARY COMPANIES (Contd.)FOR THE YEAR ENDED DECEMBER 31, 2004
Note:
In terms of approval granted by the Central Government under Section 212(8) of the Companies Act, 1956, a copy of the Balance Sheet,Profit and Loss Account, Report of the Board of Directors and the Report of the Auditors of the subsidiary companies have not beenattached with Annual Report of the Company. The Company will make available these documents and the related details upon requestby any investor of the Company and of its subsidiary. These documents will also be available for inspection by any investor at the HeadOffice of the Company at 12th Floor, 6, Devika Tower, Nehru Place, New Delhi -110 019 and that of the subsidiary companies concerned.
�������������������������� ������������� ��������������������������
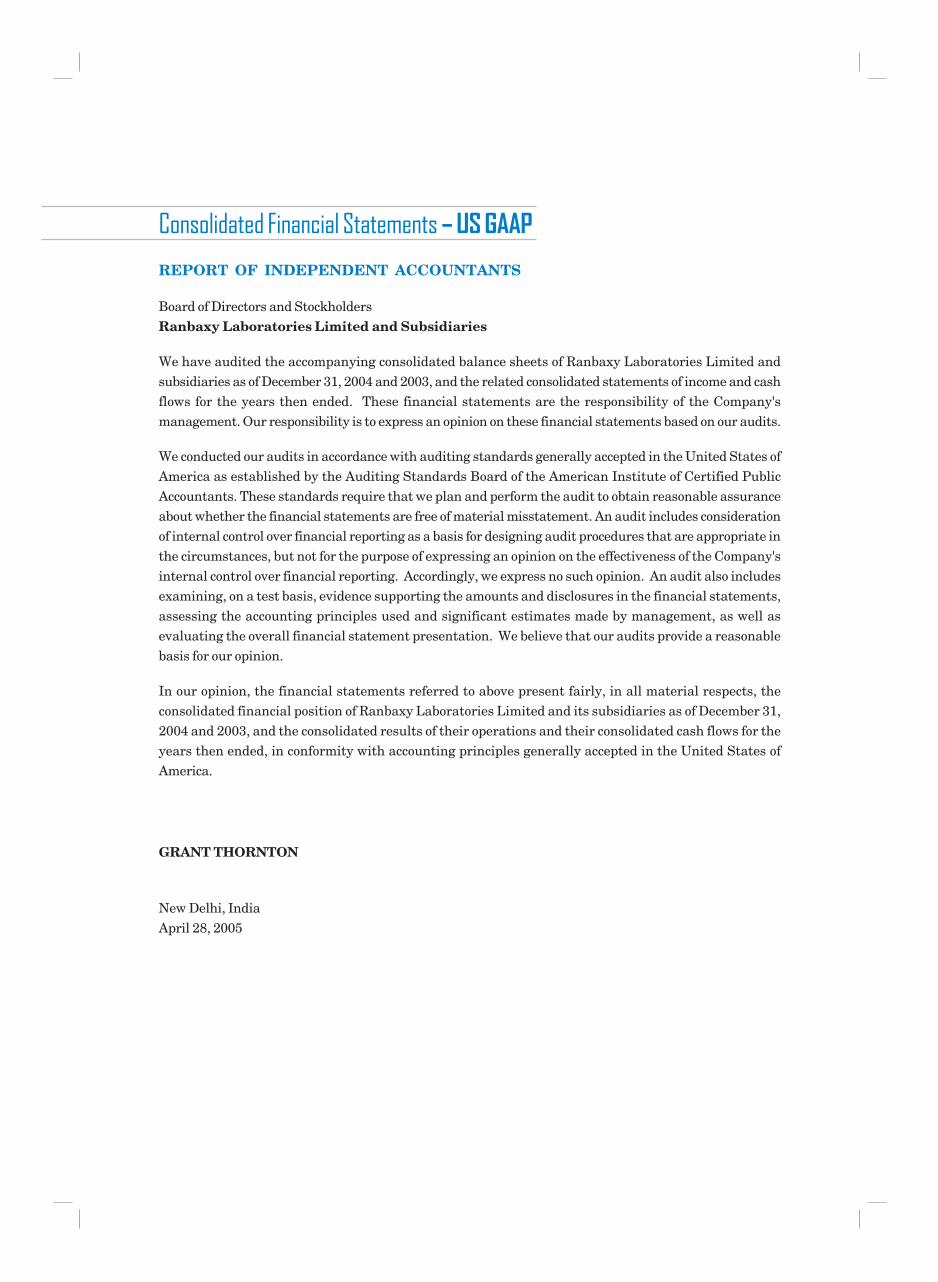
REPORT OF INDEPENDENT ACCOUNTANTS
Board of Directors and StockholdersRanbaxy Laboratories Limited and Subsidiaries
We have audited the accompanying consolidated balance sheets of Ranbaxy Laboratories Limited andsubsidiaries as of December 31, 2004 and 2003, and the related consolidated statements of income and cashflows for the years then ended. These financial statements are the responsibility of the Company'smanagement. Our responsibility is to express an opinion on these financial statements based on our audits.
We conducted our audits in accordance with auditing standards generally accepted in the United States ofAmerica as established by the Auditing Standards Board of the American Institute of Certified PublicAccountants. These standards require that we plan and perform the audit to obtain reasonable assuranceabout whether the financial statements are free of material misstatement. An audit includes considerationof internal control over financial reporting as a basis for designing audit procedures that are appropriate inthe circumstances, but not for the purpose of expressing an opinion on the effectiveness of the Company'sinternal control over financial reporting. Accordingly, we express no such opinion. An audit also includesexamining, on a test basis, evidence supporting the amounts and disclosures in the financial statements,assessing the accounting principles used and significant estimates made by management, as well asevaluating the overall financial statement presentation. We believe that our audits provide a reasonablebasis for our opinion.
In our opinion, the financial statements referred to above present fairly, in all material respects, theconsolidated financial position of Ranbaxy Laboratories Limited and its subsidiaries as of December 31,2004 and 2003, and the consolidated results of their operations and their consolidated cash flows for theyears then ended, in conformity with accounting principles generally accepted in the United States ofAmerica.
GRANT THORNTON
New Delhi, IndiaApril 28, 2005
����������������������������������������
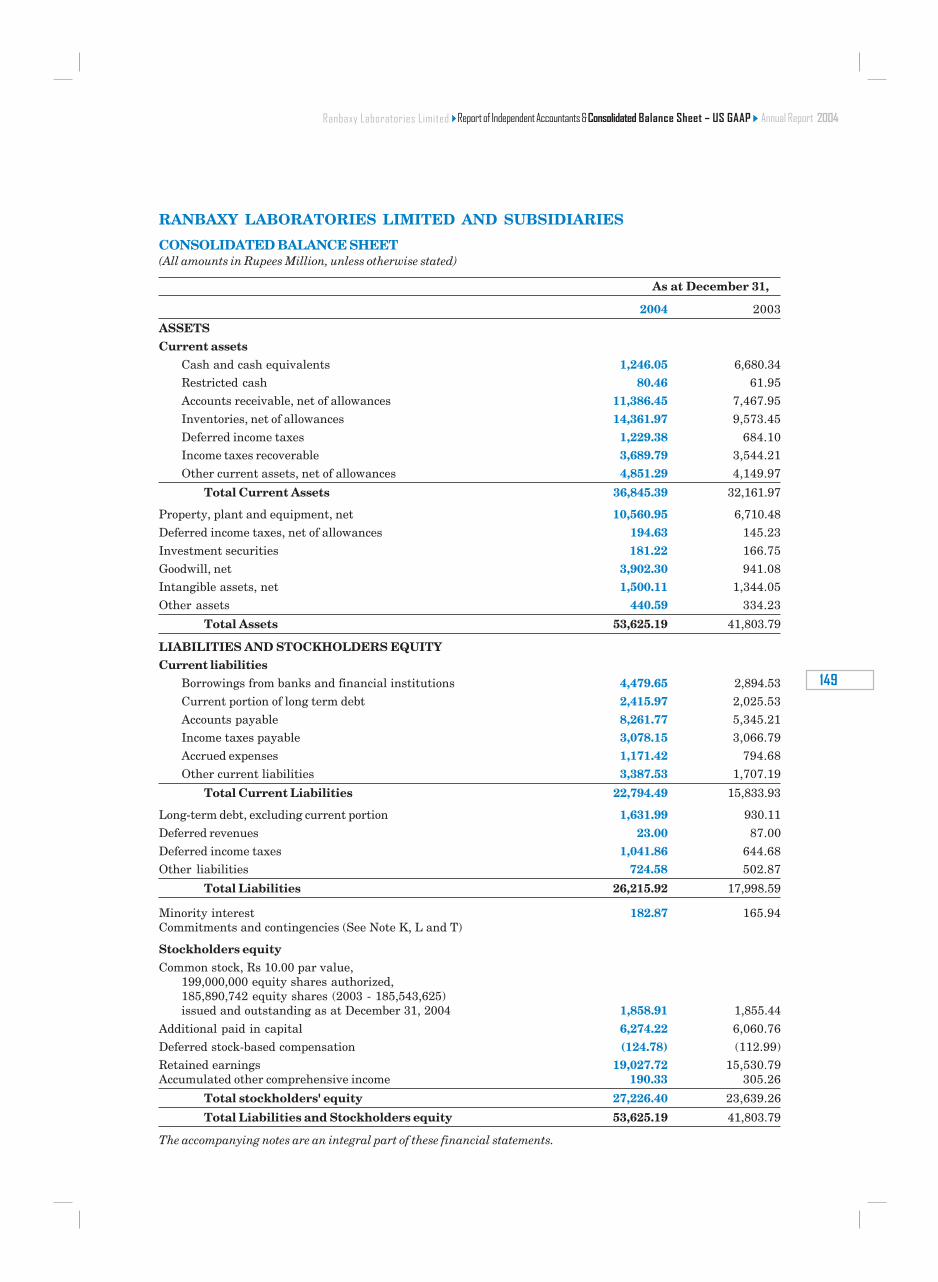
����������������
��
RANBAXY LABORATORIES LIMITED AND SUBSIDIARIES
CONSOLIDATED BALANCE SHEET(All amounts in Rupees Million, unless otherwise stated)
As at December 31,
2004 2003
ASSETSCurrent assets
Cash and cash equivalents 1,246.05 6,680.34Restricted cash 80.46 61.95
Accounts receivable, net of allowances 11,386.45 7,467.95
Inventories, net of allowances 14,361.97 9,573.45
Deferred income taxes 1,229.38 684.10Income taxes recoverable 3,689.79 3,544.21
Other current assets, net of allowances 4,851.29 4,149.97
Total Current Assets 36,845.39 32,161.97
Property, plant and equipment, net 10,560.95 6,710.48
Deferred income taxes, net of allowances 194.63 145.23
Investment securities 181.22 166.75
Goodwill, net 3,902.30 941.08Intangible assets, net 1,500.11 1,344.05
Other assets 440.59 334.23
Total Assets 53,625.19 41,803.79
LIABILITIES AND STOCKHOLDERS EQUITYCurrent liabilities
Borrowings from banks and financial institutions 4,479.65 2,894.53
Current portion of long term debt 2,415.97 2,025.53
Accounts payable 8,261.77 5,345.21Income taxes payable 3,078.15 3,066.79
Accrued expenses 1,171.42 794.68
Other current liabilities 3,387.53 1,707.19
Total Current Liabilities 22,794.49 15,833.93
Long-term debt, excluding current portion 1,631.99 930.11
Deferred revenues 23.00 87.00
Deferred income taxes 1,041.86 644.68Other liabilities 724.58 502.87
Total Liabilities 26,215.92 17,998.59
Minority interest 182.87 165.94Commitments and contingencies (See Note K, L and T)
Stockholders equityCommon stock, Rs 10.00 par value,
199,000,000 equity shares authorized,185,890,742 equity shares (2003 - 185,543,625)issued and outstanding as at December 31, 2004 1,858.91 1,855.44
Additional paid in capital 6,274.22 6,060.76
Deferred stock-based compensation (124.78) (112.99)Retained earnings 19,027.72 15,530.79Accumulated other comprehensive income 190.33 305.26
Total stockholders' equity 27,226.40 23,639.26
Total Liabilities and Stockholders equity 53,625.19 41,803.79
The accompanying notes are an integral part of these financial statements.
���������������������������������� ����!�"��������!������������������������������������
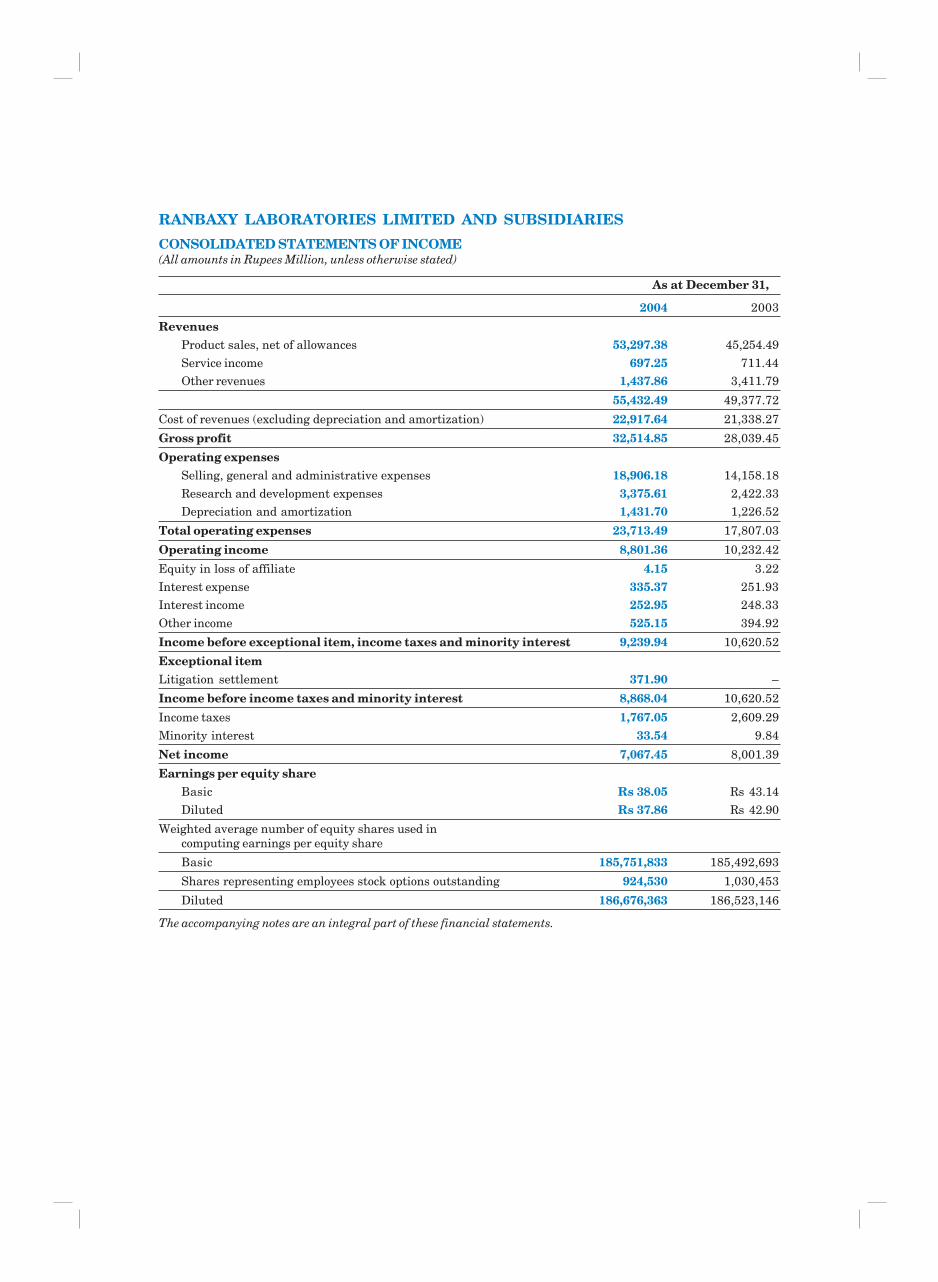
RANBAXY LABORATORIES LIMITED AND SUBSIDIARIES
CONSOLIDATED STATEMENTS OF INCOME(All amounts in Rupees Million, unless otherwise stated)
As at December 31,
2004 2003
RevenuesProduct sales, net of allowances 53,297.38 45,254.49
Service income 697.25 711.44Other revenues 1,437.86 3,411.79
55,432.49 49,377.72
Cost of revenues (excluding depreciation and amortization) 22,917.64 21,338.27
Gross profit 32,514.85 28,039.45
Operating expensesSelling, general and administrative expenses 18,906.18 14,158.18
Research and development expenses 3,375.61 2,422.33Depreciation and amortization 1,431.70 1,226.52
Total operating expenses 23,713.49 17,807.03
Operating income 8,801.36 10,232.42
Equity in loss of affiliate 4.15 3.22
Interest expense 335.37 251.93Interest income 252.95 248.33
Other income 525.15 394.92
Income before exceptional item, income taxes and minority interest 9,239.94 10,620.52
Exceptional itemLitigation settlement 371.90 –
Income before income taxes and minority interest 8,868.04 10,620.52
Income taxes 1,767.05 2,609.29
Minority interest 33.54 9.84
Net income 7,067.45 8,001.39
Earnings per equity shareBasic Rs 38.05 Rs 43.14
Diluted Rs 37.86 Rs 42.90
Weighted average number of equity shares used incomputing earnings per equity share
Basic 185,751,833 185,492,693
Shares representing employees stock options outstanding 924,530 1,030,453
Diluted 186,676,363 186,523,146
The accompanying notes are an integral part of these financial statements.
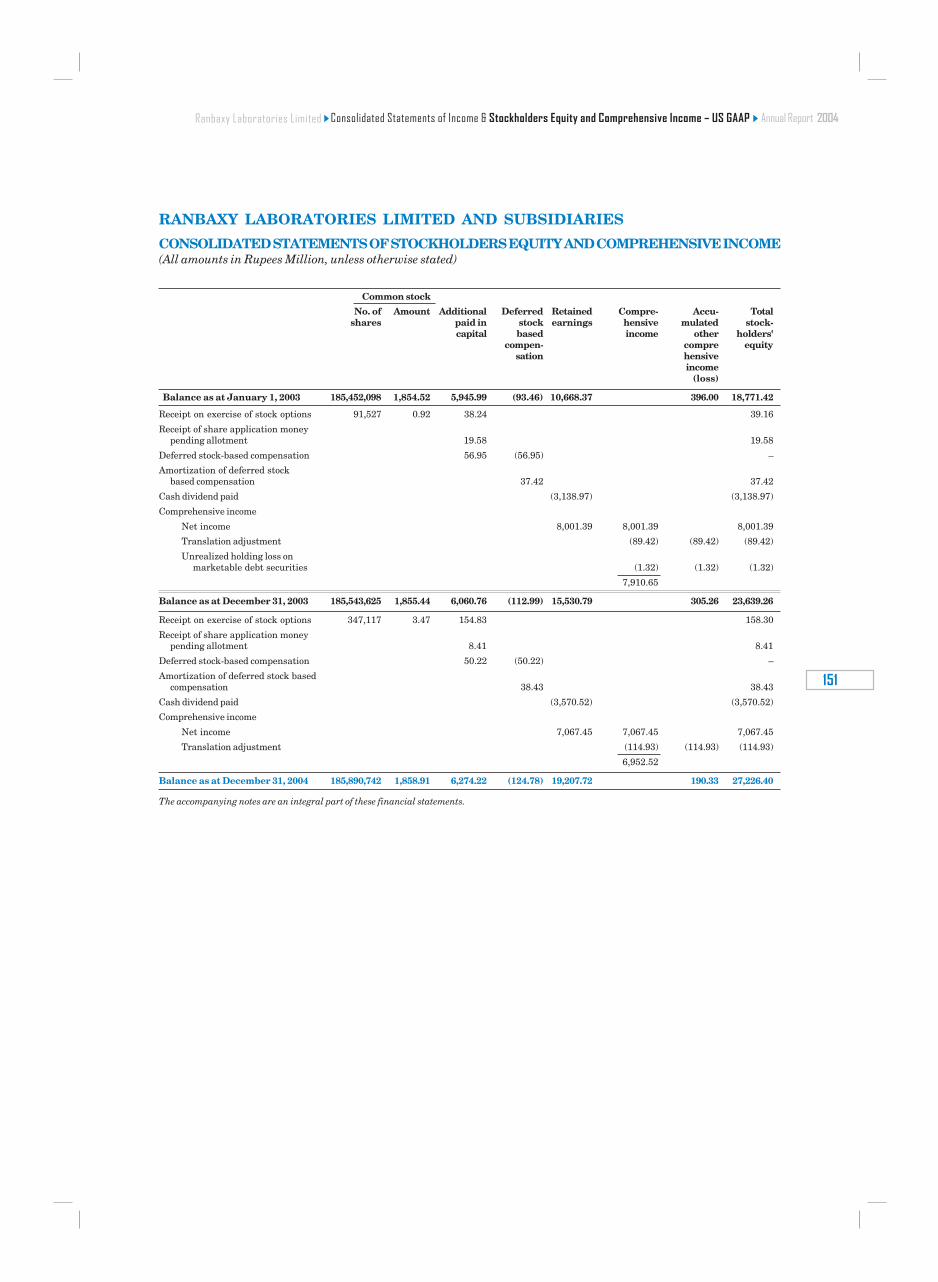
����������������
���
RANBAXY LABORATORIES LIMITED AND SUBSIDIARIES
CONSOLIDATED STATEMENTS OF STOCKHOLDERS EQUITY AND COMPREHENSIVE INCOME(All amounts in Rupees Million, unless otherwise stated)
Common stock
No. of Amount Additional Deferred Retained Compre- Accu- Totalshares paid in stock earnings hensive mulated stock-
capital based income other holders'compen- compre equity
sation hensiveincome
(loss)
Balance as at January 1, 2003 185,452,098 1,854.52 5,945.99 (93.46) 10,668.37 396.00 18,771.42
Receipt on exercise of stock options 91,527 0.92 38.24 39.16
Receipt of share application moneypending allotment 19.58 19.58
Deferred stock-based compensation 56.95 (56.95) –
Amortization of deferred stockbased compensation 37.42 37.42
Cash dividend paid (3,138.97) (3,138.97)
Comprehensive income
Net income 8,001.39 8,001.39 8,001.39
Translation adjustment (89.42) (89.42) (89.42)
Unrealized holding loss onmarketable debt securities (1.32) (1.32) (1.32)
7,910.65
Balance as at December 31, 2003 185,543,625 1,855.44 6,060.76 (112.99) 15,530.79 305.26 23,639.26
Receipt on exercise of stock options 347,117 3.47 154.83 158.30
Receipt of share application moneypending allotment 8.41 8.41
Deferred stock-based compensation 50.22 (50.22) –
Amortization of deferred stock basedcompensation 38.43 38.43
Cash dividend paid (3,570.52) (3,570.52)
Comprehensive income
Net income 7,067.45 7,067.45 7,067.45
Translation adjustment (114.93) (114.93) (114.93)
6,952.52
Balance as at December 31, 2004 185,890,742 1,858.91 6,274.22 (124.78) 19,207.72 190.33 27,226.40
The accompanying notes are an integral part of these financial statements.
��������������������������������!��#���� �$%��!������������ �&�'����������������������������������������
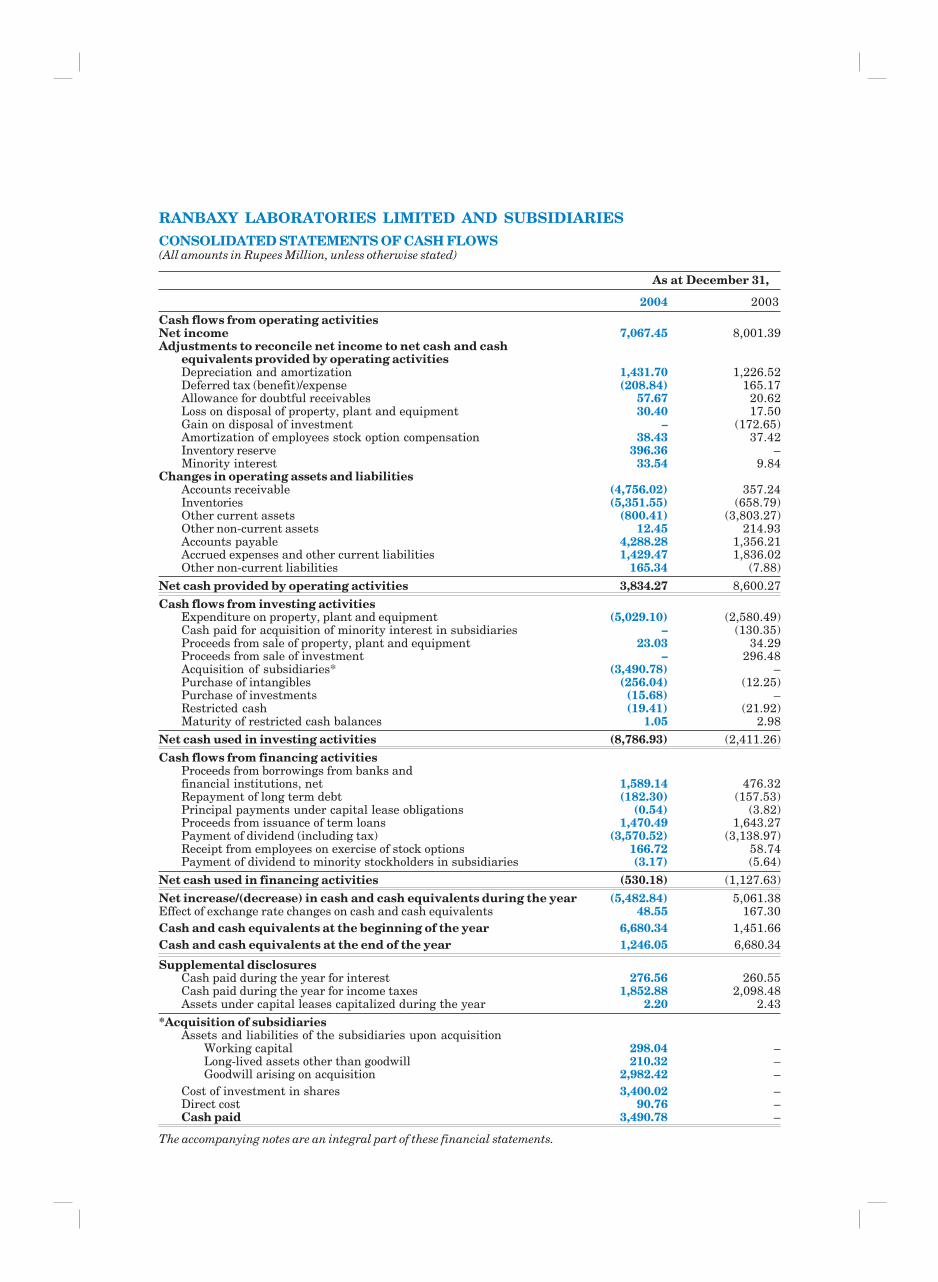
RANBAXY LABORATORIES LIMITED AND SUBSIDIARIESCONSOLIDATED STATEMENTS OF CASH FLOWS(All amounts in Rupees Million, unless otherwise stated)
As at December 31,
2004 2003Cash flows from operating activitiesNet income 7,067.45 8,001.39Adjustments to reconcile net income to net cash and cash
equivalents provided by operating activitiesDepreciation and amortization 1,431.70 1,226.52Deferred tax (benefit)/expense (208.84) 165.17Allowance for doubtful receivables 57.67 20.62Loss on disposal of property, plant and equipment 30.40 17.50Gain on disposal of investment – (172.65)Amortization of employees stock option compensation 38.43 37.42Inventory reserve 396.36 –Minority interest 33.54 9.84
Changes in operating assets and liabilitiesAccounts receivable (4,756.02) 357.24Inventories (5,351.55) (658.79)Other current assets (800.41) (3,803.27)Other non-current assets 12.45 214.93Accounts payable 4,288.28 1,356.21Accrued expenses and other current liabilities 1,429.47 1,836.02Other non-current liabilities 165.34 (7.88)
Net cash provided by operating activities 3,834.27 8,600.27
Cash flows from investing activitiesExpenditure on property, plant and equipment (5,029.10) (2,580.49)Cash paid for acquisition of minority interest in subsidiaries – (130.35)Proceeds from sale of property, plant and equipment 23.03 34.29Proceeds from sale of investment – 296.48Acquisition of subsidiaries* (3,490.78) –Purchase of intangibles (256.04) (12.25)Purchase of investments (15.68) –Restricted cash (19.41) (21.92)Maturity of restricted cash balances 1.05 2.98
Net cash used in investing activities (8,786.93) (2,411.26)
Cash flows from financing activitiesProceeds from borrowings from banks andfinancial institutions, net 1,589.14 476.32Repayment of long term debt (182.30) (157.53)Principal payments under capital lease obligations (0.54) (3.82)Proceeds from issuance of term loans 1,470.49 1,643.27Payment of dividend (including tax) (3,570.52) (3,138.97)Receipt from employees on exercise of stock options 166.72 58.74Payment of dividend to minority stockholders in subsidiaries (3.17) (5.64)
Net cash used in financing activities (530.18) (1,127.63)
Net increase/(decrease) in cash and cash equivalents during the year (5,482.84) 5,061.38Effect of exchange rate changes on cash and cash equivalents 48.55 167.30Cash and cash equivalents at the beginning of the year 6,680.34 1,451.66Cash and cash equivalents at the end of the year 1,246.05 6,680.34
Supplemental disclosuresCash paid during the year for interest 276.56 260.55Cash paid during the year for income taxes 1,852.88 2,098.48Assets under capital leases capitalized during the year 2.20 2.43
*Acquisition of subsidiariesAssets and liabilities of the subsidiaries upon acquisition
Working capital 298.04 –Long-lived assets other than goodwill 210.32 –Goodwill arising on acquisition 2,982.42 –
Cost of investment in shares 3,400.02 –Direct cost 90.76 –Cash paid 3,490.78 –
The accompanying notes are an integral part of these financial statements.
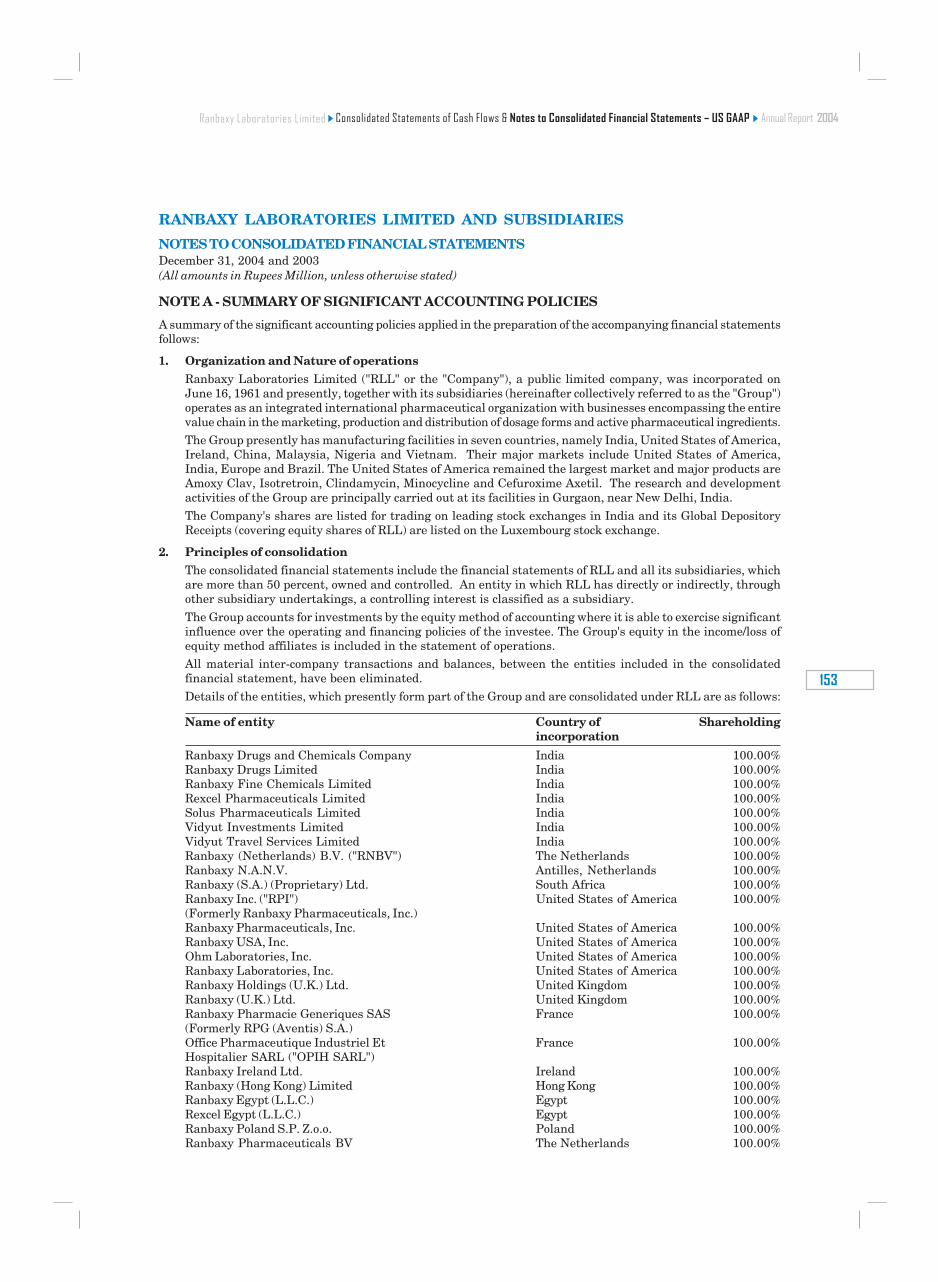
����������������
��(
RANBAXY LABORATORIES LIMITED AND SUBSIDIARIES
NOTES TO CONSOLIDATED FINANCIAL STATEMENTSDecember 31, 2004 and 2003(All amounts in Rupees Million, unless otherwise stated)
NOTE A - SUMMARY OF SIGNIFICANT ACCOUNTING POLICIES
A summary of the significant accounting policies applied in the preparation of the accompanying financial statementsfollows:
1. Organization and Nature of operationsRanbaxy Laboratories Limited ("RLL" or the "Company"), a public limited company, was incorporated onJune 16, 1961 and presently, together with its subsidiaries (hereinafter collectively referred to as the "Group")operates as an integrated international pharmaceutical organization with businesses encompassing the entirevalue chain in the marketing, production and distribution of dosage forms and active pharmaceutical ingredients.The Group presently has manufacturing facilities in seven countries, namely India, United States of America,Ireland, China, Malaysia, Nigeria and Vietnam. Their major markets include United States of America,India, Europe and Brazil. The United States of America remained the largest market and major products areAmoxy Clav, Isotretroin, Clindamycin, Minocycline and Cefuroxime Axetil. The research and developmentactivities of the Group are principally carried out at its facilities in Gurgaon, near New Delhi, India.
The Company's shares are listed for trading on leading stock exchanges in India and its Global DepositoryReceipts (covering equity shares of RLL) are listed on the Luxembourg stock exchange.
2. Principles of consolidationThe consolidated financial statements include the financial statements of RLL and all its subsidiaries, whichare more than 50 percent, owned and controlled. An entity in which RLL has directly or indirectly, throughother subsidiary undertakings, a controlling interest is classified as a subsidiary.
The Group accounts for investments by the equity method of accounting where it is able to exercise significantinfluence over the operating and financing policies of the investee. The Group's equity in the income/loss ofequity method affiliates is included in the statement of operations.All material inter-company transactions and balances, between the entities included in the consolidatedfinancial statement, have been eliminated.
Details of the entities, which presently form part of the Group and are consolidated under RLL are as follows:
Name of entity Country of Shareholdingincorporation
Ranbaxy Drugs and Chemicals Company India 100.00%Ranbaxy Drugs Limited India 100.00%Ranbaxy Fine Chemicals Limited India 100.00%Rexcel Pharmaceuticals Limited India 100.00%Solus Pharmaceuticals Limited India 100.00%Vidyut Investments Limited India 100.00%Vidyut Travel Services Limited India 100.00%Ranbaxy (Netherlands) B.V. ("RNBV") The Netherlands 100.00%Ranbaxy N.A.N.V. Antilles, Netherlands 100.00%Ranbaxy (S.A.) (Proprietary) Ltd. South Africa 100.00%Ranbaxy Inc. ("RPI") United States of America 100.00%(Formerly Ranbaxy Pharmaceuticals, Inc.)Ranbaxy Pharmaceuticals, Inc. United States of America 100.00%Ranbaxy USA, Inc. United States of America 100.00%Ohm Laboratories, Inc. United States of America 100.00%Ranbaxy Laboratories, Inc. United States of America 100.00%Ranbaxy Holdings (U.K.) Ltd. United Kingdom 100.00%Ranbaxy (U.K.) Ltd. United Kingdom 100.00%Ranbaxy Pharmacie Generiques SAS France 100.00%(Formerly RPG (Aventis) S.A.)Office Pharmaceutique Industriel Et France 100.00%Hospitalier SARL ("OPIH SARL")Ranbaxy Ireland Ltd. Ireland 100.00%Ranbaxy (Hong Kong) Limited Hong Kong 100.00%Ranbaxy Egypt (L.L.C.) Egypt 100.00%Rexcel Egypt (L.L.C.) Egypt 100.00%Ranbaxy Poland S.P. Z.o.o. Poland 100.00%Ranbaxy Pharmaceuticals BV The Netherlands 100.00%
����������������������� �����������)�! �!����� ����!�*����������!�!��! ������������������������������������
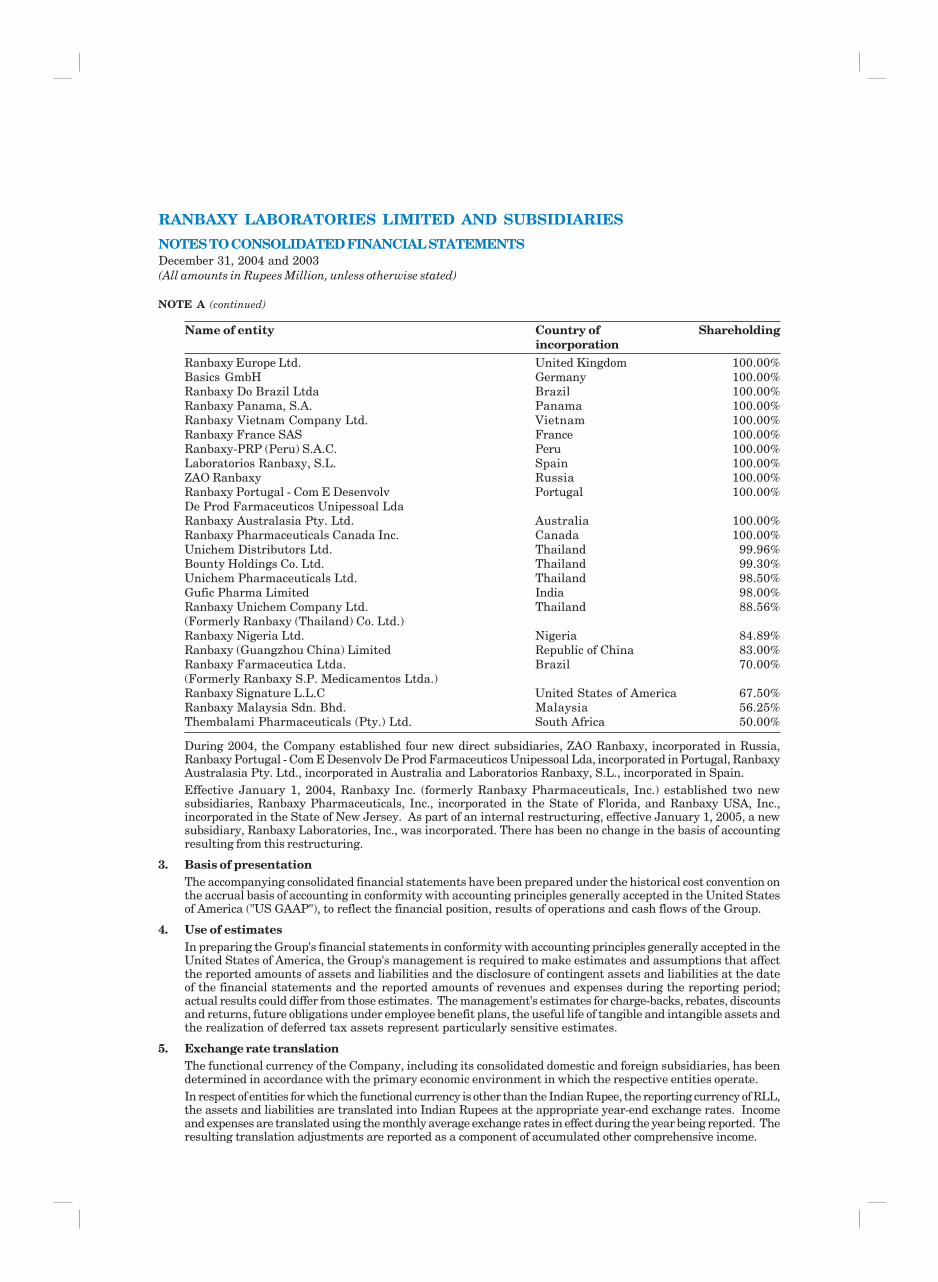
Ranbaxy Europe Ltd. United Kingdom 100.00%Basics GmbH Germany 100.00%Ranbaxy Do Brazil Ltda Brazil 100.00%Ranbaxy Panama, S.A. Panama 100.00%Ranbaxy Vietnam Company Ltd. Vietnam 100.00%Ranbaxy France SAS France 100.00%Ranbaxy-PRP (Peru) S.A.C. Peru 100.00%Laboratorios Ranbaxy, S.L. Spain 100.00%ZAO Ranbaxy Russia 100.00%Ranbaxy Portugal - Com E Desenvolv Portugal 100.00%De Prod Farmaceuticos Unipessoal LdaRanbaxy Australasia Pty. Ltd. Australia 100.00%Ranbaxy Pharmaceuticals Canada Inc. Canada 100.00%Unichem Distributors Ltd. Thailand 99.96%Bounty Holdings Co. Ltd. Thailand 99.30%Unichem Pharmaceuticals Ltd. Thailand 98.50%Gufic Pharma Limited India 98.00%Ranbaxy Unichem Company Ltd. Thailand 88.56%(Formerly Ranbaxy (Thailand) Co. Ltd.)Ranbaxy Nigeria Ltd. Nigeria 84.89%Ranbaxy (Guangzhou China) Limited Republic of China 83.00%Ranbaxy Farmaceutica Ltda. Brazil 70.00%(Formerly Ranbaxy S.P. Medicamentos Ltda.)Ranbaxy Signature L.L.C United States of America 67.50%Ranbaxy Malaysia Sdn. Bhd. Malaysia 56.25%Thembalami Pharmaceuticals (Pty.) Ltd. South Africa 50.00%
During 2004, the Company established four new direct subsidiaries, ZAO Ranbaxy, incorporated in Russia,Ranbaxy Portugal - Com E Desenvolv De Prod Farmaceuticos Unipessoal Lda, incorporated in Portugal, RanbaxyAustralasia Pty. Ltd., incorporated in Australia and Laboratorios Ranbaxy, S.L., incorporated in Spain.Effective January 1, 2004, Ranbaxy Inc. (formerly Ranbaxy Pharmaceuticals, Inc.) established two newsubsidiaries, Ranbaxy Pharmaceuticals, Inc., incorporated in the State of Florida, and Ranbaxy USA, Inc.,incorporated in the State of New Jersey. As part of an internal restructuring, effective January 1, 2005, a newsubsidiary, Ranbaxy Laboratories, Inc., was incorporated. There has been no change in the basis of accountingresulting from this restructuring.
3. Basis of presentationThe accompanying consolidated financial statements have been prepared under the historical cost convention onthe accrual basis of accounting in conformity with accounting principles generally accepted in the United Statesof America ("US GAAP"), to reflect the financial position, results of operations and cash flows of the Group.
4. Use of estimatesIn preparing the Group's financial statements in conformity with accounting principles generally accepted in theUnited States of America, the Group's management is required to make estimates and assumptions that affectthe reported amounts of assets and liabilities and the disclosure of contingent assets and liabilities at the dateof the financial statements and the reported amounts of revenues and expenses during the reporting period;actual results could differ from those estimates. The management's estimates for charge-backs, rebates, discountsand returns, future obligations under employee benefit plans, the useful life of tangible and intangible assets andthe realization of deferred tax assets represent particularly sensitive estimates.
5. Exchange rate translationThe functional currency of the Company, including its consolidated domestic and foreign subsidiaries, has beendetermined in accordance with the primary economic environment in which the respective entities operate.In respect of entities for which the functional currency is other than the Indian Rupee, the reporting currency of RLL,the assets and liabilities are translated into Indian Rupees at the appropriate year-end exchange rates. Incomeand expenses are translated using the monthly average exchange rates in effect during the year being reported. Theresulting translation adjustments are reported as a component of accumulated other comprehensive income.
RANBAXY LABORATORIES LIMITED AND SUBSIDIARIES
NOTES TO CONSOLIDATED FINANCIAL STATEMENTSDecember 31, 2004 and 2003(All amounts in Rupees Million, unless otherwise stated)
Name of entity Country of Shareholdingincorporation
NOTE A (continued)
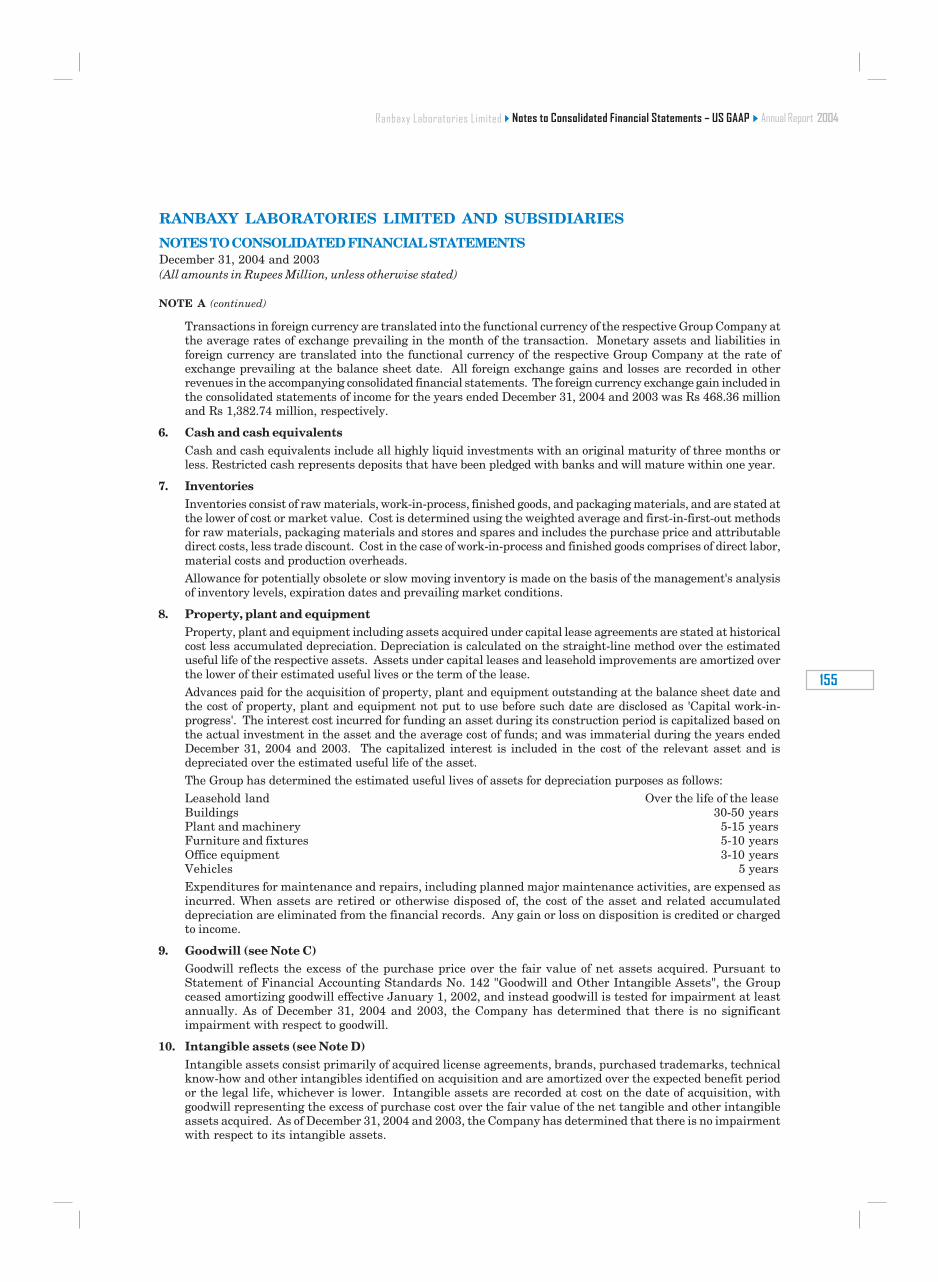
����������������
���
Transactions in foreign currency are translated into the functional currency of the respective Group Company atthe average rates of exchange prevailing in the month of the transaction. Monetary assets and liabilities inforeign currency are translated into the functional currency of the respective Group Company at the rate ofexchange prevailing at the balance sheet date. All foreign exchange gains and losses are recorded in otherrevenues in the accompanying consolidated financial statements. The foreign currency exchange gain included inthe consolidated statements of income for the years ended December 31, 2004 and 2003 was Rs 468.36 millionand Rs 1,382.74 million, respectively.
6. Cash and cash equivalentsCash and cash equivalents include all highly liquid investments with an original maturity of three months orless. Restricted cash represents deposits that have been pledged with banks and will mature within one year.
7. InventoriesInventories consist of raw materials, work-in-process, finished goods, and packaging materials, and are stated atthe lower of cost or market value. Cost is determined using the weighted average and first-in-first-out methodsfor raw materials, packaging materials and stores and spares and includes the purchase price and attributabledirect costs, less trade discount. Cost in the case of work-in-process and finished goods comprises of direct labor,material costs and production overheads.Allowance for potentially obsolete or slow moving inventory is made on the basis of the management's analysisof inventory levels, expiration dates and prevailing market conditions.
8. Property, plant and equipmentProperty, plant and equipment including assets acquired under capital lease agreements are stated at historicalcost less accumulated depreciation. Depreciation is calculated on the straight-line method over the estimateduseful life of the respective assets. Assets under capital leases and leasehold improvements are amortized overthe lower of their estimated useful lives or the term of the lease.Advances paid for the acquisition of property, plant and equipment outstanding at the balance sheet date andthe cost of property, plant and equipment not put to use before such date are disclosed as 'Capital work-in-progress'. The interest cost incurred for funding an asset during its construction period is capitalized based onthe actual investment in the asset and the average cost of funds; and was immaterial during the years endedDecember 31, 2004 and 2003. The capitalized interest is included in the cost of the relevant asset and isdepreciated over the estimated useful life of the asset.The Group has determined the estimated useful lives of assets for depreciation purposes as follows:Leasehold land Over the life of the leaseBuildings 30-50 yearsPlant and machinery 5-15 yearsFurniture and fixtures 5-10 yearsOffice equipment 3-10 yearsVehicles 5 yearsExpenditures for maintenance and repairs, including planned major maintenance activities, are expensed asincurred. When assets are retired or otherwise disposed of, the cost of the asset and related accumulateddepreciation are eliminated from the financial records. Any gain or loss on disposition is credited or chargedto income.
9. Goodwill (see Note C)Goodwill reflects the excess of the purchase price over the fair value of net assets acquired. Pursuant toStatement of Financial Accounting Standards No. 142 "Goodwill and Other Intangible Assets", the Groupceased amortizing goodwill effective January 1, 2002, and instead goodwill is tested for impairment at leastannually. As of December 31, 2004 and 2003, the Company has determined that there is no significantimpairment with respect to goodwill.
10. Intangible assets (see Note D)Intangible assets consist primarily of acquired license agreements, brands, purchased trademarks, technicalknow-how and other intangibles identified on acquisition and are amortized over the expected benefit periodor the legal life, whichever is lower. Intangible assets are recorded at cost on the date of acquisition, withgoodwill representing the excess of purchase cost over the fair value of the net tangible and other intangibleassets acquired. As of December 31, 2004 and 2003, the Company has determined that there is no impairmentwith respect to its intangible assets.
RANBAXY LABORATORIES LIMITED AND SUBSIDIARIES
NOTES TO CONSOLIDATED FINANCIAL STATEMENTSDecember 31, 2004 and 2003(All amounts in Rupees Million, unless otherwise stated)
NOTE A (continued)
)�! �!����� ����!�*����������!�!��! ������������������������������������
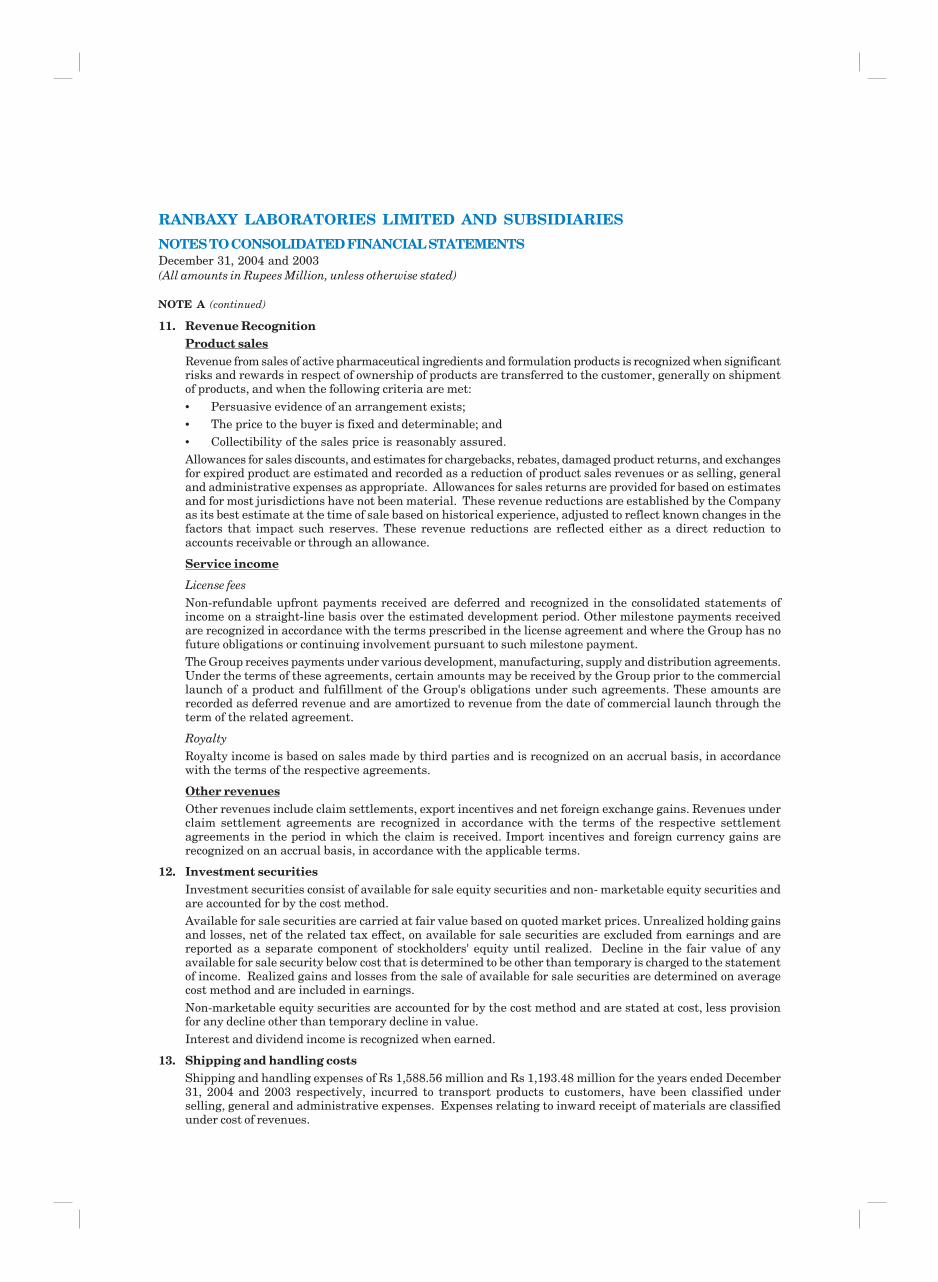
11. Revenue RecognitionProduct salesRevenue from sales of active pharmaceutical ingredients and formulation products is recognized when significantrisks and rewards in respect of ownership of products are transferred to the customer, generally on shipmentof products, and when the following criteria are met:• Persuasive evidence of an arrangement exists;• The price to the buyer is fixed and determinable; and• Collectibility of the sales price is reasonably assured.Allowances for sales discounts, and estimates for chargebacks, rebates, damaged product returns, and exchangesfor expired product are estimated and recorded as a reduction of product sales revenues or as selling, generaland administrative expenses as appropriate. Allowances for sales returns are provided for based on estimatesand for most jurisdictions have not been material. These revenue reductions are established by the Companyas its best estimate at the time of sale based on historical experience, adjusted to reflect known changes in thefactors that impact such reserves. These revenue reductions are reflected either as a direct reduction toaccounts receivable or through an allowance.
Service income
License feesNon-refundable upfront payments received are deferred and recognized in the consolidated statements ofincome on a straight-line basis over the estimated development period. Other milestone payments receivedare recognized in accordance with the terms prescribed in the license agreement and where the Group has nofuture obligations or continuing involvement pursuant to such milestone payment.The Group receives payments under various development, manufacturing, supply and distribution agreements.Under the terms of these agreements, certain amounts may be received by the Group prior to the commerciallaunch of a product and fulfillment of the Group's obligations under such agreements. These amounts arerecorded as deferred revenue and are amortized to revenue from the date of commercial launch through theterm of the related agreement.
RoyaltyRoyalty income is based on sales made by third parties and is recognized on an accrual basis, in accordancewith the terms of the respective agreements.
Other revenuesOther revenues include claim settlements, export incentives and net foreign exchange gains. Revenues underclaim settlement agreements are recognized in accordance with the terms of the respective settlementagreements in the period in which the claim is received. Import incentives and foreign currency gains arerecognized on an accrual basis, in accordance with the applicable terms.
12. Investment securitiesInvestment securities consist of available for sale equity securities and non- marketable equity securities andare accounted for by the cost method.Available for sale securities are carried at fair value based on quoted market prices. Unrealized holding gainsand losses, net of the related tax effect, on available for sale securities are excluded from earnings and arereported as a separate component of stockholders' equity until realized. Decline in the fair value of anyavailable for sale security below cost that is determined to be other than temporary is charged to the statementof income. Realized gains and losses from the sale of available for sale securities are determined on averagecost method and are included in earnings.Non-marketable equity securities are accounted for by the cost method and are stated at cost, less provisionfor any decline other than temporary decline in value.Interest and dividend income is recognized when earned.
13. Shipping and handling costsShipping and handling expenses of Rs 1,588.56 million and Rs 1,193.48 million for the years ended December31, 2004 and 2003 respectively, incurred to transport products to customers, have been classified underselling, general and administrative expenses. Expenses relating to inward receipt of materials are classifiedunder cost of revenues.
RANBAXY LABORATORIES LIMITED AND SUBSIDIARIES
NOTES TO CONSOLIDATED FINANCIAL STATEMENTSDecember 31, 2004 and 2003(All amounts in Rupees Million, unless otherwise stated)
NOTE A (continued)
����������������
���
14. Advertising costsCosts associated with advertising are expensed as incurred; and amounted to Rs 2,480.98 million andRs 2,240.17 million for the years ended December 31, 2004 and 2003 respectively.
15. Start-up costsCosts of start-up activities including organization costs are expensed as incurred.
16. Income taxesThe Group Companies account for deferred income taxes under the full liability method, in accordance with theprovisions of Statement of Financial Accounting Standards No. 109 "Accounting for Income Taxes". Deferredincome tax assets and liabilities are recognized for the future tax consequences attributable to differencesbetween carrying amounts of existing assets and liabilities in the financial statements and their respectivetax basis. Deferred income tax assets and liabilities are measured using enacted tax rates as on the date ofthe financial statements. The effect on deferred income tax assets and liabilities of a change in tax rates isrecognized in the statement of income in the period of change. Based on management's judgment, themeasurement of deferred income tax assets is reduced, if necessary, by a valuation allowance for any taxbenefits for which it is more likely than not that some portion or all of such benefits will not be realized.
17. Research and development costsResearch and development expenditures are expensed as incurred, and amounted to Rs 3,375.61 million andRs 2,422.33 million for the years ended December 31, 2004 and 2003 respectively. Capital expenditure incurredon equipment and facilities acquired or constructed for research and development activities and havingalternative future uses, is capitalized as property, plant and equipment when acquired or constructed.
18. Valuation of long-lived assetsThe Group follows the guidance of Statement of Financial Accounting Standards No. 144, "Accounting for theImpairment or Disposal of Long-lived Assets". The Group Companies review long-lived assets and certainidentifiable intangibles held and used for possible impairment whenever events or changes in circumstancesindicate that the carrying amount of an asset may not be recoverable. If such assets are considered to beimpaired, the impairment is measured by the amount by which the carrying value of the assets exceeds the fairvalue of the assets. Assets to be disposed are reported at the lower of the carrying value, or the fair value lessthe cost to sell.
19. Operating leases - lessee accountingLease rental expenses on operating leases are charged to expense over the lease term as they become payable.Certain operating lease agreements provide for scheduled rent increases over the lease term. Rental expensefor these leases is recognized on a straight-line basis over the lease term.
20. Other comprehensive incomeStatement of Financial Accounting Standards No. 130, "Reporting Comprehensive Income", establishes rulesfor the reporting of comprehensive income and its components. Comprehensive income is defined as allchanges in equity from non-owner sources. For the Group, comprehensive income consists of net earnings,changes in the cumulative foreign currency translation adjustments and unrealized holding gains and losseson available for sale securities. The Company reports comprehensive income in the consolidated statements ofstockholders' equity.
21. Earnings per shareIn accordance with Statement of Financial Accounting Standards No. 128, "Earnings per share", basic earningsper share are computed using the weighted average number of common shares outstanding during the period.Diluted earnings per share are computed using the weighted average number of common and dilutive commonequivalent shares outstanding during the period.
22. Stock-based compensationThe Company uses the intrinsic value based method as prescribed by Accounting Principles Board Opinion No.25, "Accounting for Stock Issued to Employees" and related interpretations, to account for its employee stockbased compensation plan. The Company has therefore adopted pro forma disclosure provisions of Statementof Financial Accounting Standards No. 123, "Accounting for Stock-based Compensation" ("SFAS No. 123"), asamended by Statement of Financial Accounting Standards No. 148, "Accounting for Stock-based CompensationTransition and Disclosure, an amendment of SFAS No. 123" ("SFAS No. 148"). Accordingly, compensation
RANBAXY LABORATORIES LIMITED AND SUBSIDIARIES
NOTES TO CONSOLIDATED FINANCIAL STATEMENTSDecember 31, 2004 and 2003(All amounts in Rupees Million, unless otherwise stated)
NOTE A (continued)
)�! �!����� ����!�*����������!�!��! ������������������������������������
expense is recognized over the vesting period of the options based on the difference, if any, between the marketvalue of the stock of the Company on the date of grant of the stock option and the amount to be paid by theemployee for exercising the option. As permitted by SFAS No. 123, the Company has elected to continue toemploy the intrinsic value based method of accounting and has followed the disclosure requirements of SFASNo. 148.
23. Derivative financial instrumentsThe Company enters into forward foreign exchange contracts where the counterparty is generally a bank. TheCompany purchases forward foreign exchange contracts to mitigate the risk of changes in foreign exchangerates on accounts receivable. These contracts do not qualify for hedge accounting under Statement of FinancialAccounting Standards No. 133, "Accounting for Derivative Instruments and Hedging Activities" ("SFAS No.133"), as amended. Any derivative that is either not designated as a hedge, or is so designated but is ineffectiveper SFAS No. 133, is marked to market and recognized in income immediately.As at December 31, 2004 and 2003 the Company recognized a mark-to-market gain on non-effective hedges ofRs 780.55 million and Rs 678.00 million respectively, which has been included in "other revenues" in thestatement of income and "other current assets" in the balance sheet.
24. DividendDividends paid on common stock is recorded as a reduction of equity when approved by the stockholders.
25. ReclassificationCertain prior period amounts have been reclassified to conform to the current period presentation.
26. Recent Accounting PronouncementsIn April 2003, the Financial Accounting Standards Board (the "FASB") issued Statement of FinancialAccounting Standards No. 149, "Amendment of Statement 133 on Derivative Instruments and HedgingActivities" ("SFAS No. 149"), applicable for fiscal period beginning after December 15, 2003. This Statementamends and clarifies financial accounting and reporting for derivative instruments, including certain derivativeinstruments embedded in other contracts (collectively referred to as derivatives) and for hedging activitiesunder SFAS No. 133, "Accounting for Derivative Instruments and Hedging Activities" ("SFAS No. 133"). ThisStatement amends SFAS No. 133 for decisions made (1) as part of the Derivatives Implementation Groupprocess that effectively required amendments to SFAS No. 133, (2) in connection with other Board projectsdealing with financial instruments, and (3) in connection with implementation issues raised in relation to theapplication of the definition of a derivative, in particular, the meaning of an initial net investment that issmaller than would be required for other types of contracts that would be expected to have a similar responseto changes in market factors, the meaning of underlying and the characteristics of a derivative that containsfinancing components. The Group adopted the provisions of this statement, which do not have a materialimpact on the consolidated financial position or results of operations.
In May 2003, the FASB issued Statement of Financial Accounting Standards No. 150, "Accounting for CertainFinancial Instruments with Characteristics of both Liabilities and Equity", applicable for fiscal period beginningafter December 15, 2003. This Statement establishes standards for how an issuer classifies and measurescertain financial instruments with characteristics of both liabilities and equity. It requires that an issuerclassify a financial instrument that is within its scope, which may have previously been reported as equity, asa liability (or an asset in some circumstances). This statement is effective for financial instruments enteredinto or modified after May 31, 2003, and otherwise is effective at the beginning of the first interim periodbeginning after June 15, 2003. The Group adopted the provisions of this statement, which do not have animpact on the consolidated financial position or results of operations.In January 2003, FASB issued FASB Interpretation No. 46, "Consolidation of Variable Interest Entities". FIN46 clarifies the application of Accounting Research Bulletin 51, "Consolidated Financial Statements", forcertain entities that do not have sufficient equity at risk for the entity to finance its activities without additionalsubordinated financial support from other parties or in which equity investors do not have the characteristicsof a controlling financial interest ("variable interest entities"). Variable interest entities within the scope ofFIN 46 will be required to be consolidated by their primary beneficiary. The primary beneficiary of a variableinterest entity is determined to be the party that absorbs a majority of the entity's expected losses, receives amajority of its expected returns, or both. Further, in December 2003, the FASB issued a revision to FIN No. 46to clarify some of the provisions of FIN No. 46-R and to exempt certain entities from its requirements.Management has evaluated its contractual arrangements with certain entities which might fall within the
RANBAXY LABORATORIES LIMITED AND SUBSIDIARIES
NOTES TO CONSOLIDATED FINANCIAL STATEMENTSDecember 31, 2004 and 2003(All amounts in Rupees Million, unless otherwise stated)
NOTE A (continued)
����������������
��
purview of the above guidance and does not believe that any of these entities qualify as VIEs as defined byeither FIN 46 or FIN 46-R.
In December 2003, the FASB issued SFAS No. 132 (revised 2003), "Employers' Disclosures about Pensionsand Other Postretirement Benefits" applicable for fiscal years ending after December 15, 2003. This statementrevises financial statement disclosures for pension plans and other post retirement benefit plans and requiresadditional disclosures to those in the original Statement 132 about the assets, obligations, cash flows, and netperiodic benefit cost of defined benefit pension plans and other defined benefit postretirement plans. It doesnot change the measurement or recognition of those plans. The required information is to be provided separatelyfor pension plans and for other postretirement benefit plans. The Group has adopted the provisions of thisstatement.In November 2004, the FASB issued SFAS No. 151, "Inventory Costs - an amendment of ARB No. 43, Chapter4", applicable for inventory costs incurred during fiscal years beginning after June 15, 2005. This Statementamends the guidance in ARB No. 43, Chapter 4, "Inventory Pricing", to clarify the accounting for abnormalamounts of idle facility expense, freight, handling costs, and wasted material (spoilage). Paragraph 5 of ARB43, Chapter 4, previously stated that “. . . under some circumstances, items such as idle facility expense, excessivespoilage, double freight, and rehandling costs may be so abnormal as to require treatment as current period charges. . . .” This Statement requires that those items be recognized as current-period charges regardless of whetherthey meet the criterion of "so abnormal", In addition, this Statement requires that allocation of fixed productionoverheads to the costs of conversion be based on the normal capacity of the production facilities. Themanagement believes that adoption of SFAS No. 151 will not have a material effect on the consolidatedfinancial position or results of operations.
In December 2004, the FASB issued SFAS No. 123 (revised 2004), "Share-Based Payment", applicable forfiscal years beginning after June 15, 2005. This statement supersedes APB Opinion No. 25, "Accounting forStock Issued to Employees" and establishes guidance for the accounting for transactions in which an entityexchanges its equity instruments for goods or services, focusing primarily on accounting for transactions inwhich an entity obtains employee services in share-based payment transactions. This Statement requires apublic entity to measure the cost of employee services received in exchange for an award of equity instrumentsbased on the grant-date fair value of the award. Management is in the process of determining the effect ofthese provisions on the consolidated financial statements of the Company.
In November 2002, the Emerging Issues Task Force ("EITF") reached a consensus opinion on EITF No. 00-21,"Revenue Arrangements with Multiple Deliverables", which requires that revenue arrangements with multipledeliverables be accounted for based on a determination of whether the multiple deliverables qualify to beaccounted for as separate units of accounting. The EITF consensus is effective prospectively for revenuearrangements entered into in fiscal periods beginning after June 15, 2003. The Group adopted the provisionsof this statement, which do not have a material impact on the consolidated financial position or results ofoperations.
NOTE B - BUSINESS COMBINATIONSIn June 2001, the FASB issued Statement of Financial Accounting Standards No. 141, "Business Combinations"("SFAS No. 141"), which requires that the purchase method of accounting be used for all business combinationsconsummated after June 30, 2001. SFAS No. 141 also specifies the criteria that intangible assets acquired ina purchase method business combination must meet to be recognized and reported apart from goodwill, notingthat any purchase price allocated to an assembled workforce may not be accounted for separately.
Acquisition of RPG (Aventis) S.A.On January 5, 2004, the Company acquired the entire share capital of RPG (Aventis) S.A., a French companyengaged in the business of manufacturing generic pharmaceuticals, together with its wholly owned subsidiary,OPIH SARL, for a total cash consideration of Rs 3,400.02 million (Euro 60.35 million). At the date of theacquisition, the Company recorded the cost of the acquisition as Rs 3,490.78 million, consisting of cash paidand the direct acquisition costs.
RPG (Aventis) S.A. and OPIH SARL are engaged in the marketing of generic pharmaceuticals and the majortherapeutic areas of the acquired companies include Cardiovasculars, Anti-infectives, Gastrointestinals,Rheumatoid/ Non-steroidal Anti-inflammatory Drugs, Neurology and Analgesics. Subsequent to the acquisition,RPG (Aventis) S.A. changed its name to Ranbaxy Pharmacie Generiques SAS. As a result of this acquisition,RLL gained entry into the French generics market.
RANBAXY LABORATORIES LIMITED AND SUBSIDIARIES
NOTES TO CONSOLIDATED FINANCIAL STATEMENTSDecember 31, 2004 and 2003(All amounts in Rupees Million, unless otherwise stated)
NOTE A (continued)
)�! �!����� ����!�*����������!�!��! ������������������������������������
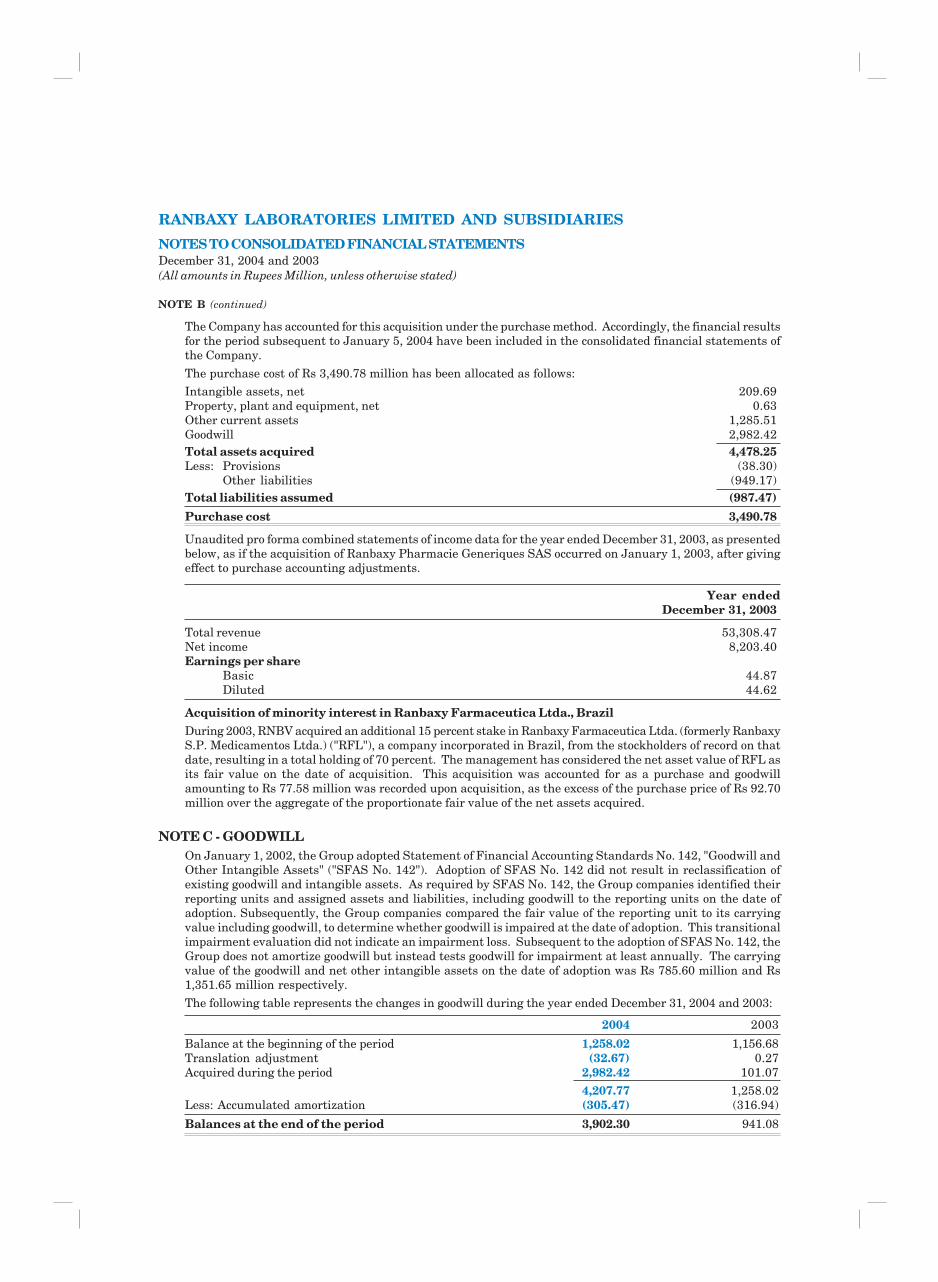
The Company has accounted for this acquisition under the purchase method. Accordingly, the financial resultsfor the period subsequent to January 5, 2004 have been included in the consolidated financial statements ofthe Company.
The purchase cost of Rs 3,490.78 million has been allocated as follows:Intangible assets, net 209.69Property, plant and equipment, net 0.63Other current assets 1,285.51Goodwill 2,982.42Total assets acquired 4,478.25Less: Provisions (38.30)
Other liabilities (949.17)Total liabilities assumed (987.47)
Purchase cost 3,490.78
Unaudited pro forma combined statements of income data for the year ended December 31, 2003, as presentedbelow, as if the acquisition of Ranbaxy Pharmacie Generiques SAS occurred on January 1, 2003, after givingeffect to purchase accounting adjustments.
Year endedDecember 31, 2003
Total revenue 53,308.47Net income 8,203.40Earnings per share
Basic 44.87Diluted 44.62
Acquisition of minority interest in Ranbaxy Farmaceutica Ltda., BrazilDuring 2003, RNBV acquired an additional 15 percent stake in Ranbaxy Farmaceutica Ltda. (formerly RanbaxyS.P. Medicamentos Ltda.) ("RFL"), a company incorporated in Brazil, from the stockholders of record on thatdate, resulting in a total holding of 70 percent. The management has considered the net asset value of RFL asits fair value on the date of acquisition. This acquisition was accounted for as a purchase and goodwillamounting to Rs 77.58 million was recorded upon acquisition, as the excess of the purchase price of Rs 92.70million over the aggregate of the proportionate fair value of the net assets acquired.
NOTE C - GOODWILLOn January 1, 2002, the Group adopted Statement of Financial Accounting Standards No. 142, "Goodwill andOther Intangible Assets" ("SFAS No. 142"). Adoption of SFAS No. 142 did not result in reclassification ofexisting goodwill and intangible assets. As required by SFAS No. 142, the Group companies identified theirreporting units and assigned assets and liabilities, including goodwill to the reporting units on the date ofadoption. Subsequently, the Group companies compared the fair value of the reporting unit to its carryingvalue including goodwill, to determine whether goodwill is impaired at the date of adoption. This transitionalimpairment evaluation did not indicate an impairment loss. Subsequent to the adoption of SFAS No. 142, theGroup does not amortize goodwill but instead tests goodwill for impairment at least annually. The carryingvalue of the goodwill and net other intangible assets on the date of adoption was Rs 785.60 million and Rs1,351.65 million respectively.
The following table represents the changes in goodwill during the year ended December 31, 2004 and 2003:
2004 2003
Balance at the beginning of the period 1,258.02 1,156.68Translation adjustment (32.67) 0.27Acquired during the period 2,982.42 101.07
4,207.77 1,258.02Less: Accumulated amortization (305.47) (316.94)
Balances at the end of the period 3,902.30 941.08
RANBAXY LABORATORIES LIMITED AND SUBSIDIARIES
NOTES TO CONSOLIDATED FINANCIAL STATEMENTSDecember 31, 2004 and 2003(All amounts in Rupees Million, unless otherwise stated)
NOTE B (continued)
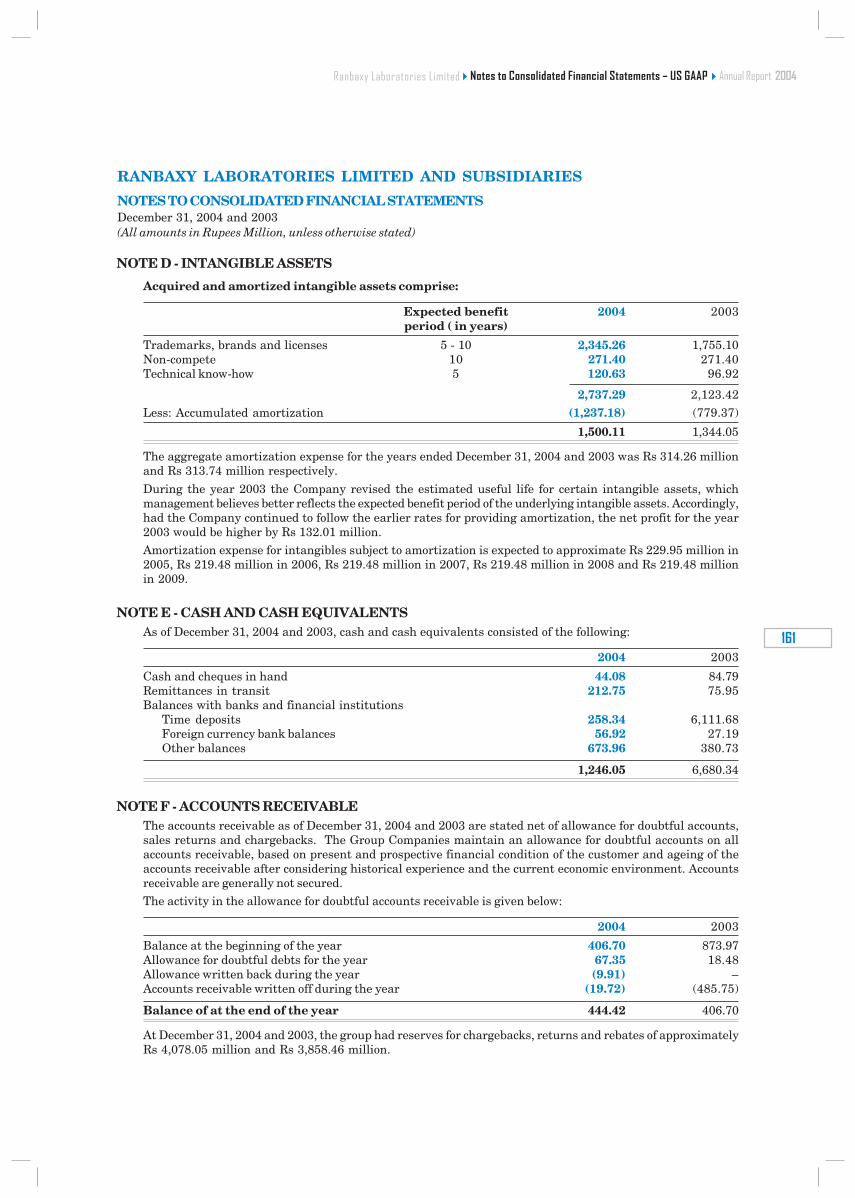
������������ ����
���
NOTE D - INTANGIBLE ASSETS
Acquired and amortized intangible assets comprise:
Expected benefit 2004 2003period ( in years)
Trademarks, brands and licenses 5 - 10 2,345.26 1,755.10Non-compete 10 271.40 271.40Technical know-how 5 120.63 96.92
2,737.29 2,123.42Less: Accumulated amortization (1,237.18) (779.37)
1,500.11 1,344.05
The aggregate amortization expense for the years ended December 31, 2004 and 2003 was Rs 314.26 millionand Rs 313.74 million respectively.
During the year 2003 the Company revised the estimated useful life for certain intangible assets, whichmanagement believes better reflects the expected benefit period of the underlying intangible assets. Accordingly,had the Company continued to follow the earlier rates for providing amortization, the net profit for the year2003 would be higher by Rs 132.01 million.Amortization expense for intangibles subject to amortization is expected to approximate Rs 229.95 million in2005, Rs 219.48 million in 2006, Rs 219.48 million in 2007, Rs 219.48 million in 2008 and Rs 219.48 millionin 2009.
NOTE E - CASH AND CASH EQUIVALENTSAs of December 31, 2004 and 2003, cash and cash equivalents consisted of the following:
2004 2003
Cash and cheques in hand 44.08 84.79Remittances in transit 212.75 75.95Balances with banks and financial institutions
Time deposits 258.34 6,111.68Foreign currency bank balances 56.92 27.19Other balances 673.96 380.73
1,246.05 6,680.34
NOTE F - ACCOUNTS RECEIVABLEThe accounts receivable as of December 31, 2004 and 2003 are stated net of allowance for doubtful accounts,sales returns and chargebacks. The Group Companies maintain an allowance for doubtful accounts on allaccounts receivable, based on present and prospective financial condition of the customer and ageing of theaccounts receivable after considering historical experience and the current economic environment. Accountsreceivable are generally not secured.The activity in the allowance for doubtful accounts receivable is given below:
2004 2003
Balance at the beginning of the year 406.70 873.97Allowance for doubtful debts for the year 67.35 18.48Allowance written back during the year (9.91) –Accounts receivable written off during the year (19.72) (485.75)
Balance of at the end of the year 444.42 406.70
At December 31, 2004 and 2003, the group had reserves for chargebacks, returns and rebates of approximatelyRs 4,078.05 million and Rs 3,858.46 million.
RANBAXY LABORATORIES LIMITED AND SUBSIDIARIES
NOTES TO CONSOLIDATED FINANCIAL STATEMENTSDecember 31, 2004 and 2003(All amounts in Rupees Million, unless otherwise stated)
��������� ���������� � ���������� �������������� ������ ���������������
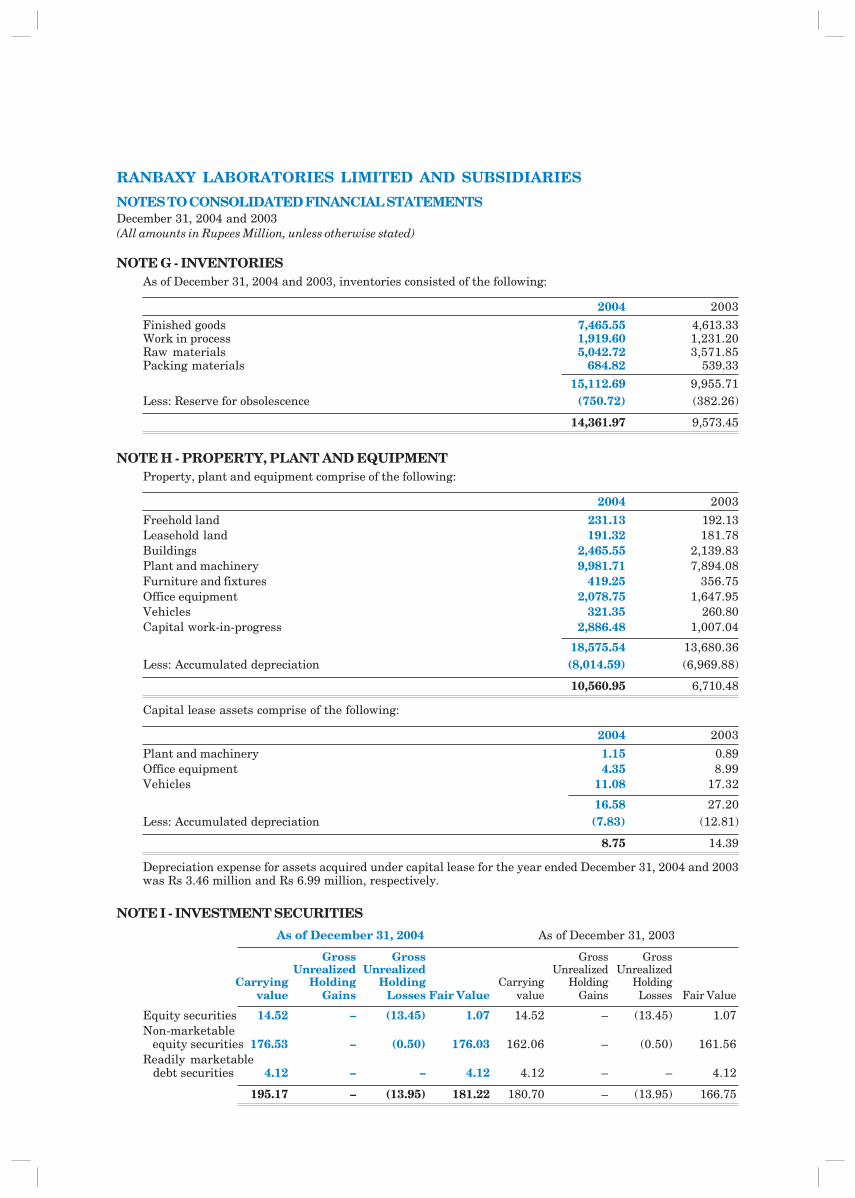
NOTE G - INVENTORIESAs of December 31, 2004 and 2003, inventories consisted of the following:
2004 2003
Finished goods 7,465.55 4,613.33Work in process 1,919.60 1,231.20Raw materials 5,042.72 3,571.85Packing materials 684.82 539.33
15,112.69 9,955.71Less: Reserve for obsolescence (750.72) (382.26)
14,361.97 9,573.45
NOTE H - PROPERTY, PLANT AND EQUIPMENTProperty, plant and equipment comprise of the following:
2004 2003
Freehold land 231.13 192.13Leasehold land 191.32 181.78Buildings 2,465.55 2,139.83Plant and machinery 9,981.71 7,894.08Furniture and fixtures 419.25 356.75Office equipment 2,078.75 1,647.95Vehicles 321.35 260.80Capital work-in-progress 2,886.48 1,007.04
18,575.54 13,680.36Less: Accumulated depreciation (8,014.59) (6,969.88)
10,560.95 6,710.48
Capital lease assets comprise of the following:
2004 2003
Plant and machinery 1.15 0.89Office equipment 4.35 8.99Vehicles 11.08 17.32
16.58 27.20Less: Accumulated depreciation (7.83) (12.81)
8.75 14.39
Depreciation expense for assets acquired under capital lease for the year ended December 31, 2004 and 2003was Rs 3.46 million and Rs 6.99 million, respectively.
NOTE I - INVESTMENT SECURITIES
As of December 31, 2004 As of December 31, 2003
Gross Gross Gross GrossUnrealized Unrealized Unrealized Unrealized
Carrying Holding Holding Carrying Holding Holdingvalue Gains Losses Fair Value value Gains Losses Fair Value
Equity securities 14.52 – (13.45) 1.07 14.52 – (13.45) 1.07Non-marketable equity securities 176.53 – (0.50) 176.03 162.06 – (0.50) 161.56Readily marketable debt securities 4.12 – – 4.12 4.12 – – 4.12
195.17 – (13.95) 181.22 180.70 – (13.95) 166.75
RANBAXY LABORATORIES LIMITED AND SUBSIDIARIES
NOTES TO CONSOLIDATED FINANCIAL STATEMENTSDecember 31, 2004 and 2003(All amounts in Rupees Million, unless otherwise stated)
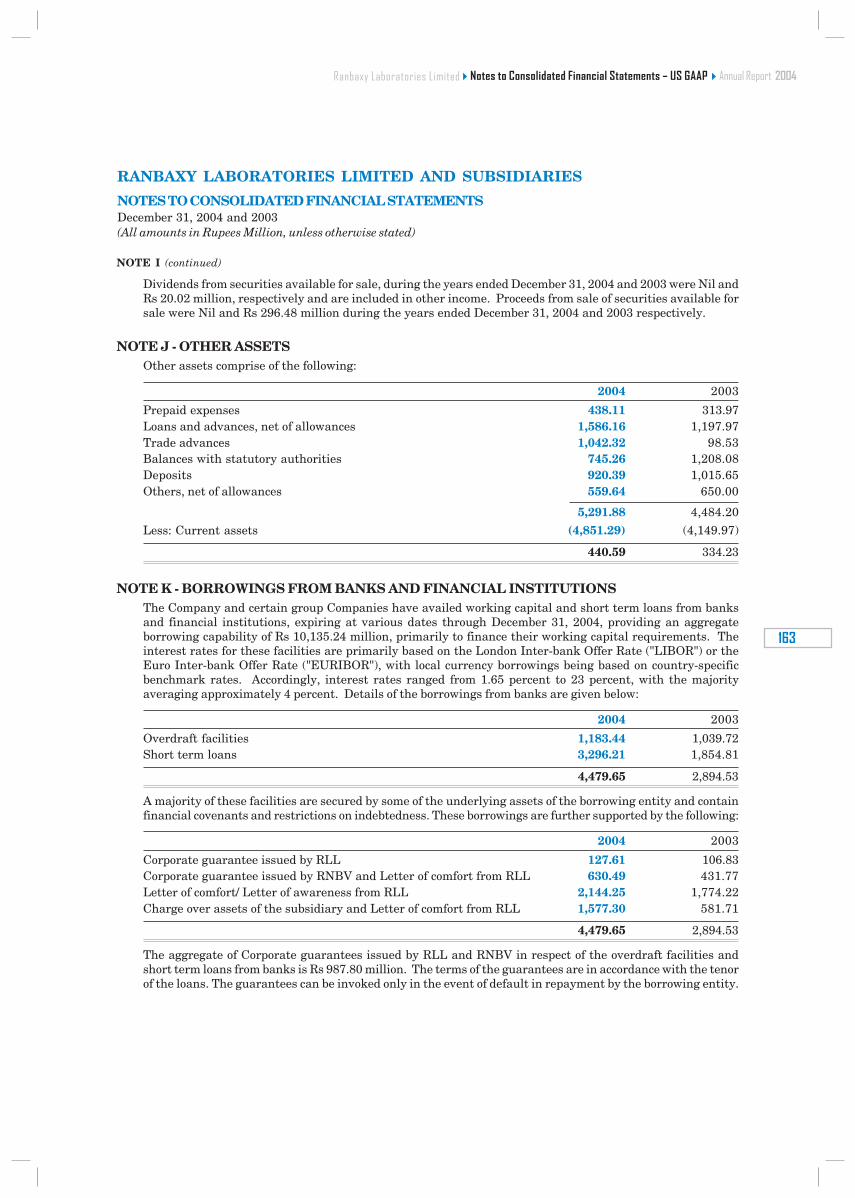
������������ ����
���
Dividends from securities available for sale, during the years ended December 31, 2004 and 2003 were Nil andRs 20.02 million, respectively and are included in other income. Proceeds from sale of securities available forsale were Nil and Rs 296.48 million during the years ended December 31, 2004 and 2003 respectively.
NOTE J - OTHER ASSETSOther assets comprise of the following:
2004 2003
Prepaid expenses 438.11 313.97Loans and advances, net of allowances 1,586.16 1,197.97Trade advances 1,042.32 98.53Balances with statutory authorities 745.26 1,208.08Deposits 920.39 1,015.65Others, net of allowances 559.64 650.00
5,291.88 4,484.20
Less: Current assets (4,851.29) (4,149.97)
440.59 334.23
NOTE K - BORROWINGS FROM BANKS AND FINANCIAL INSTITUTIONSThe Company and certain group Companies have availed working capital and short term loans from banksand financial institutions, expiring at various dates through December 31, 2004, providing an aggregateborrowing capability of Rs 10,135.24 million, primarily to finance their working capital requirements. Theinterest rates for these facilities are primarily based on the London Inter-bank Offer Rate ("LIBOR") or theEuro Inter-bank Offer Rate ("EURIBOR"), with local currency borrowings being based on country-specificbenchmark rates. Accordingly, interest rates ranged from 1.65 percent to 23 percent, with the majorityaveraging approximately 4 percent. Details of the borrowings from banks are given below:
2004 2003
Overdraft facilities 1,183.44 1,039.72Short term loans 3,296.21 1,854.81
4,479.65 2,894.53
A majority of these facilities are secured by some of the underlying assets of the borrowing entity and containfinancial covenants and restrictions on indebtedness. These borrowings are further supported by the following:
2004 2003
Corporate guarantee issued by RLL 127.61 106.83Corporate guarantee issued by RNBV and Letter of comfort from RLL 630.49 431.77Letter of comfort/ Letter of awareness from RLL 2,144.25 1,774.22Charge over assets of the subsidiary and Letter of comfort from RLL 1,577.30 581.71
4,479.65 2,894.53
The aggregate of Corporate guarantees issued by RLL and RNBV in respect of the overdraft facilities andshort term loans from banks is Rs 987.80 million. The terms of the guarantees are in accordance with the tenorof the loans. The guarantees can be invoked only in the event of default in repayment by the borrowing entity.
RANBAXY LABORATORIES LIMITED AND SUBSIDIARIES
NOTES TO CONSOLIDATED FINANCIAL STATEMENTSDecember 31, 2004 and 2003(All amounts in Rupees Million, unless otherwise stated)
NOTE I (continued)
��������� ���������� � ���������� �������������� ������ ���������������
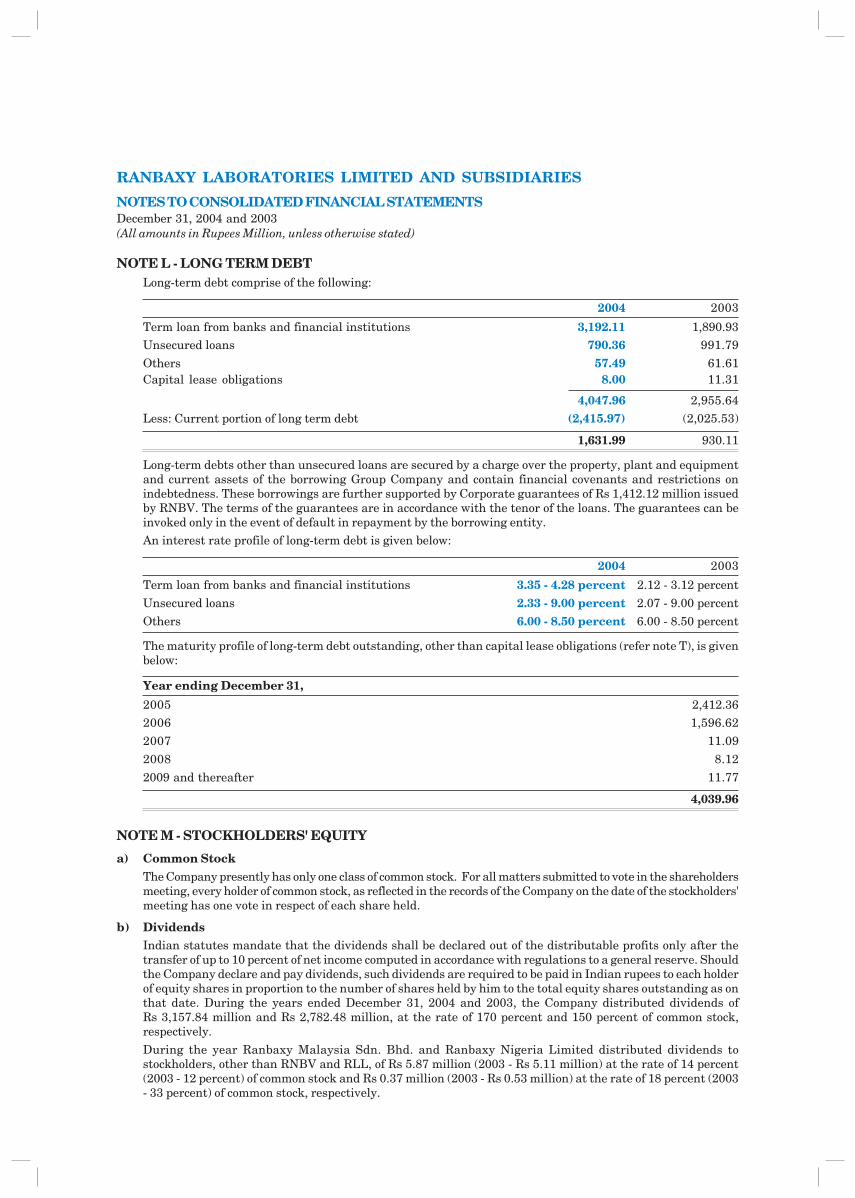
NOTE L - LONG TERM DEBTLong-term debt comprise of the following:
2004 2003
Term loan from banks and financial institutions 3,192.11 1,890.93Unsecured loans 790.36 991.79
Others 57.49 61.61Capital lease obligations 8.00 11.31
4,047.96 2,955.64Less: Current portion of long term debt (2,415.97) (2,025.53)
1,631.99 930.11
Long-term debts other than unsecured loans are secured by a charge over the property, plant and equipmentand current assets of the borrowing Group Company and contain financial covenants and restrictions onindebtedness. These borrowings are further supported by Corporate guarantees of Rs 1,412.12 million issuedby RNBV. The terms of the guarantees are in accordance with the tenor of the loans. The guarantees can beinvoked only in the event of default in repayment by the borrowing entity.An interest rate profile of long-term debt is given below:
2004 2003
Term loan from banks and financial institutions 3.35 - 4.28 percent 2.12 - 3.12 percent
Unsecured loans 2.33 - 9.00 percent 2.07 - 9.00 percent
Others 6.00 - 8.50 percent 6.00 - 8.50 percent
The maturity profile of long-term debt outstanding, other than capital lease obligations (refer note T), is givenbelow:
Year ending December 31,
2005 2,412.362006 1,596.62
2007 11.09
2008 8.12
2009 and thereafter 11.77
4,039.96
NOTE M - STOCKHOLDERS' EQUITY
a) Common StockThe Company presently has only one class of common stock. For all matters submitted to vote in the shareholdersmeeting, every holder of common stock, as reflected in the records of the Company on the date of the stockholders'meeting has one vote in respect of each share held.
b) DividendsIndian statutes mandate that the dividends shall be declared out of the distributable profits only after thetransfer of up to 10 percent of net income computed in accordance with regulations to a general reserve. Shouldthe Company declare and pay dividends, such dividends are required to be paid in Indian rupees to each holderof equity shares in proportion to the number of shares held by him to the total equity shares outstanding as onthat date. During the years ended December 31, 2004 and 2003, the Company distributed dividends ofRs 3,157.84 million and Rs 2,782.48 million, at the rate of 170 percent and 150 percent of common stock,respectively.
During the year Ranbaxy Malaysia Sdn. Bhd. and Ranbaxy Nigeria Limited distributed dividends tostockholders, other than RNBV and RLL, of Rs 5.87 million (2003 - Rs 5.11 million) at the rate of 14 percent(2003 - 12 percent) of common stock and Rs 0.37 million (2003 - Rs 0.53 million) at the rate of 18 percent (2003- 33 percent) of common stock, respectively.
RANBAXY LABORATORIES LIMITED AND SUBSIDIARIES
NOTES TO CONSOLIDATED FINANCIAL STATEMENTSDecember 31, 2004 and 2003(All amounts in Rupees Million, unless otherwise stated)
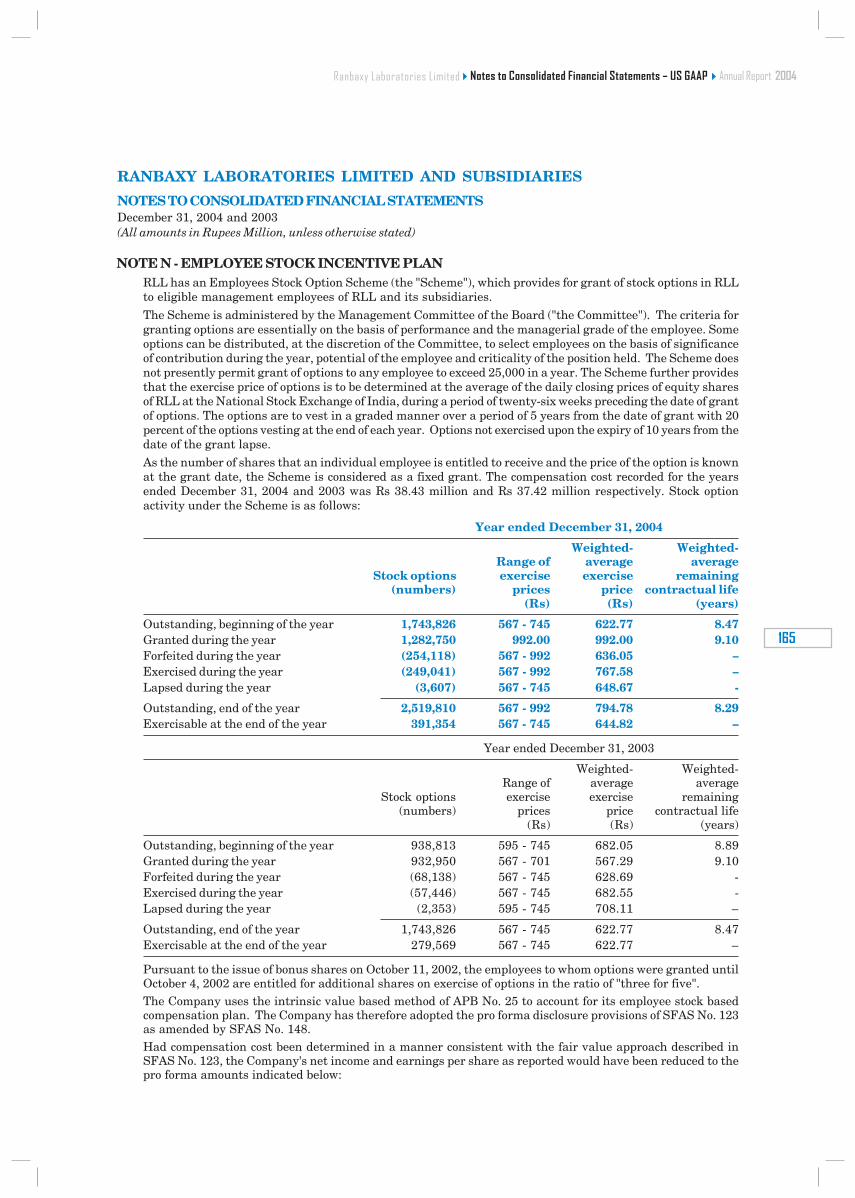
������������ ����
���
NOTE N - EMPLOYEE STOCK INCENTIVE PLANRLL has an Employees Stock Option Scheme (the "Scheme"), which provides for grant of stock options in RLLto eligible management employees of RLL and its subsidiaries.
The Scheme is administered by the Management Committee of the Board ("the Committee"). The criteria forgranting options are essentially on the basis of performance and the managerial grade of the employee. Someoptions can be distributed, at the discretion of the Committee, to select employees on the basis of significanceof contribution during the year, potential of the employee and criticality of the position held. The Scheme doesnot presently permit grant of options to any employee to exceed 25,000 in a year. The Scheme further providesthat the exercise price of options is to be determined at the average of the daily closing prices of equity sharesof RLL at the National Stock Exchange of India, during a period of twenty-six weeks preceding the date of grantof options. The options are to vest in a graded manner over a period of 5 years from the date of grant with 20percent of the options vesting at the end of each year. Options not exercised upon the expiry of 10 years from thedate of the grant lapse.As the number of shares that an individual employee is entitled to receive and the price of the option is knownat the grant date, the Scheme is considered as a fixed grant. The compensation cost recorded for the yearsended December 31, 2004 and 2003 was Rs 38.43 million and Rs 37.42 million respectively. Stock optionactivity under the Scheme is as follows:
Year ended December 31, 2004
Weighted- Weighted-Range of average average
Stock options exercise exercise remaining(numbers) prices price contractual life
(Rs) (Rs) (years)
Outstanding, beginning of the year 1,743,826 567 - 745 622.77 8.47Granted during the year 1,282,750 992.00 992.00 9.10Forfeited during the year (254,118) 567 - 992 636.05 –Exercised during the year (249,041) 567 - 992 767.58 –Lapsed during the year (3,607) 567 - 745 648.67 -
Outstanding, end of the year 2,519,810 567 - 992 794.78 8.29Exercisable at the end of the year 391,354 567 - 745 644.82 –
Year ended December 31, 2003
Weighted- Weighted-Range of average average
Stock options exercise exercise remaining(numbers) prices price contractual life
(Rs) (Rs) (years)
Outstanding, beginning of the year 938,813 595 - 745 682.05 8.89Granted during the year 932,950 567 - 701 567.29 9.10Forfeited during the year (68,138) 567 - 745 628.69 -Exercised during the year (57,446) 567 - 745 682.55 -Lapsed during the year (2,353) 595 - 745 708.11 –
Outstanding, end of the year 1,743,826 567 - 745 622.77 8.47Exercisable at the end of the year 279,569 567 - 745 622.77 –
Pursuant to the issue of bonus shares on October 11, 2002, the employees to whom options were granted untilOctober 4, 2002 are entitled for additional shares on exercise of options in the ratio of "three for five".The Company uses the intrinsic value based method of APB No. 25 to account for its employee stock basedcompensation plan. The Company has therefore adopted the pro forma disclosure provisions of SFAS No. 123as amended by SFAS No. 148.Had compensation cost been determined in a manner consistent with the fair value approach described inSFAS No. 123, the Company's net income and earnings per share as reported would have been reduced to thepro forma amounts indicated below:
RANBAXY LABORATORIES LIMITED AND SUBSIDIARIES
NOTES TO CONSOLIDATED FINANCIAL STATEMENTSDecember 31, 2004 and 2003(All amounts in Rupees Million, unless otherwise stated)
��������� ���������� � ���������� �������������� ������ ���������������
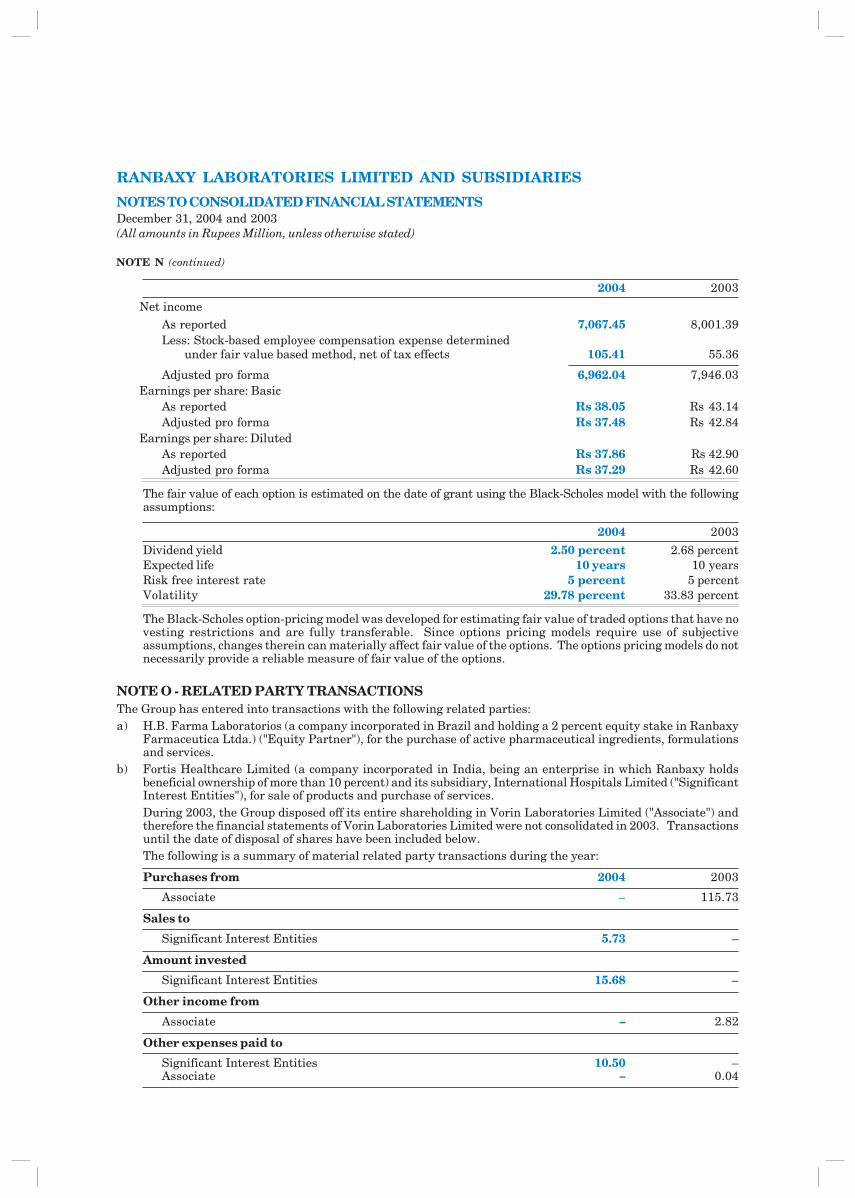
2004 2003
Net incomeAs reported 7,067.45 8,001.39Less: Stock-based employee compensation expense determined
under fair value based method, net of tax effects 105.41 55.36
Adjusted pro forma 6,962.04 7,946.03Earnings per share: Basic
As reported Rs 38.05 Rs 43.14Adjusted pro forma Rs 37.48 Rs 42.84
Earnings per share: DilutedAs reported Rs 37.86 Rs 42.90Adjusted pro forma Rs 37.29 Rs 42.60
The fair value of each option is estimated on the date of grant using the Black-Scholes model with the followingassumptions:
2004 2003
Dividend yield 2.50 percent 2.68 percentExpected life 10 years 10 yearsRisk free interest rate 5 percent 5 percentVolatility 29.78 percent 33.83 percent
The Black-Scholes option-pricing model was developed for estimating fair value of traded options that have novesting restrictions and are fully transferable. Since options pricing models require use of subjectiveassumptions, changes therein can materially affect fair value of the options. The options pricing models do notnecessarily provide a reliable measure of fair value of the options.
NOTE O - RELATED PARTY TRANSACTIONSThe Group has entered into transactions with the following related parties:a) H.B. Farma Laboratorios (a company incorporated in Brazil and holding a 2 percent equity stake in Ranbaxy
Farmaceutica Ltda.) ("Equity Partner"), for the purchase of active pharmaceutical ingredients, formulationsand services.
b) Fortis Healthcare Limited (a company incorporated in India, being an enterprise in which Ranbaxy holdsbeneficial ownership of more than 10 percent) and its subsidiary, International Hospitals Limited ("SignificantInterest Entities"), for sale of products and purchase of services.During 2003, the Group disposed off its entire shareholding in Vorin Laboratories Limited ("Associate") andtherefore the financial statements of Vorin Laboratories Limited were not consolidated in 2003. Transactionsuntil the date of disposal of shares have been included below.The following is a summary of material related party transactions during the year:
Purchases from 2004 2003
Associate – 115.73
Sales to
Significant Interest Entities 5.73 –
Amount invested
Significant Interest Entities 15.68 –
Other income from
Associate – 2.82
Other expenses paid to
Significant Interest Entities 10.50 –Associate – 0.04
RANBAXY LABORATORIES LIMITED AND SUBSIDIARIES
NOTES TO CONSOLIDATED FINANCIAL STATEMENTSDecember 31, 2004 and 2003(All amounts in Rupees Million, unless otherwise stated)
NOTE N (continued)
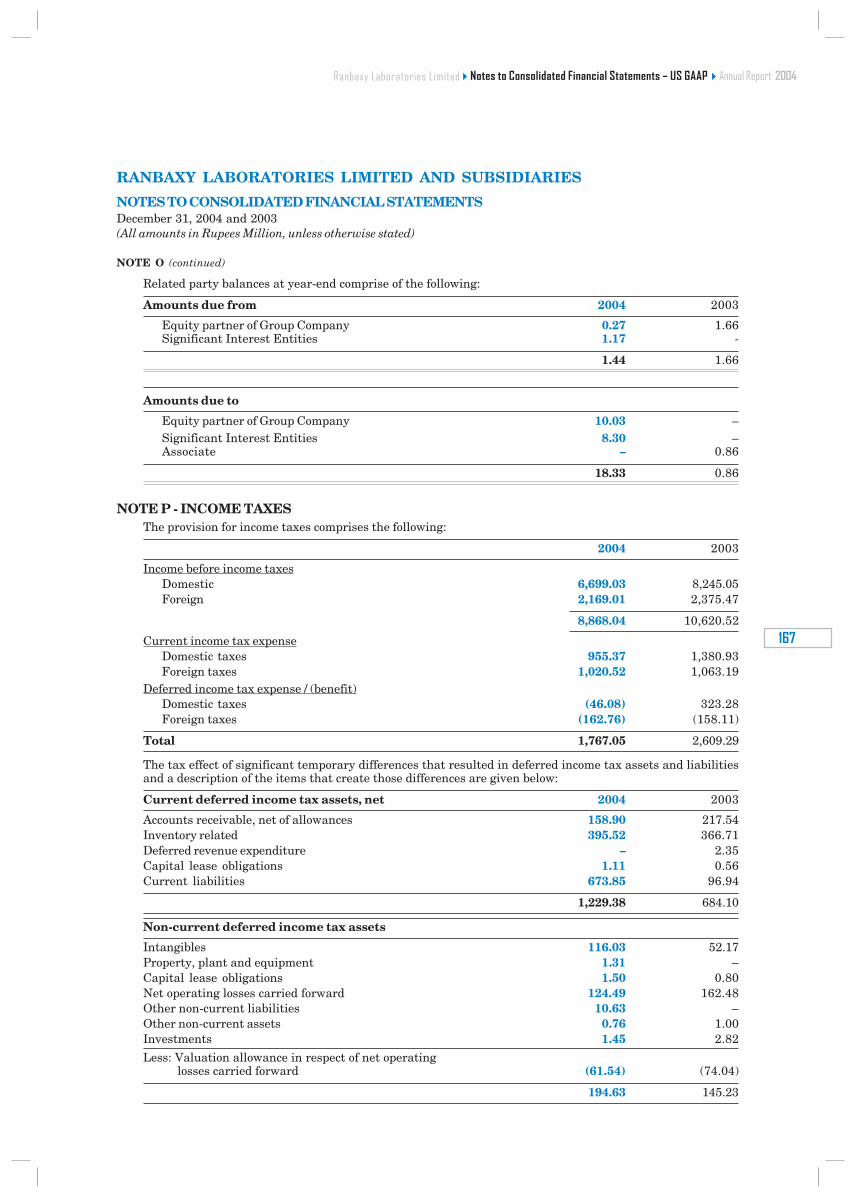
������������ ����
���
Related party balances at year-end comprise of the following:
Amounts due from 2004 2003
Equity partner of Group Company 0.27 1.66Significant Interest Entities 1.17 -
1.44 1.66
Amounts due to
Equity partner of Group Company 10.03 –Significant Interest Entities 8.30 –Associate – 0.86
18.33 0.86
NOTE P - INCOME TAXESThe provision for income taxes comprises the following:
2004 2003
Income before income taxesDomestic 6,699.03 8,245.05Foreign 2,169.01 2,375.47
8,868.04 10,620.52
Current income tax expenseDomestic taxes 955.37 1,380.93Foreign taxes 1,020.52 1,063.19
Deferred income tax expense / (benefit)Domestic taxes (46.08) 323.28Foreign taxes (162.76) (158.11)
Total 1,767.05 2,609.29
The tax effect of significant temporary differences that resulted in deferred income tax assets and liabilitiesand a description of the items that create those differences are given below:
Current deferred income tax assets, net 2004 2003
Accounts receivable, net of allowances 158.90 217.54Inventory related 395.52 366.71Deferred revenue expenditure – 2.35Capital lease obligations 1.11 0.56Current liabilities 673.85 96.94
1,229.38 684.10
Non-current deferred income tax assets
Intangibles 116.03 52.17Property, plant and equipment 1.31 –Capital lease obligations 1.50 0.80Net operating losses carried forward 124.49 162.48Other non-current liabilities 10.63 –Other non-current assets 0.76 1.00Investments 1.45 2.82
Less: Valuation allowance in respect of net operating losses carried forward (61.54) (74.04)
194.63 145.23
RANBAXY LABORATORIES LIMITED AND SUBSIDIARIES
NOTES TO CONSOLIDATED FINANCIAL STATEMENTSDecember 31, 2004 and 2003(All amounts in Rupees Million, unless otherwise stated)
NOTE O (continued)
��������� ���������� � ���������� �������������� ������ ���������������
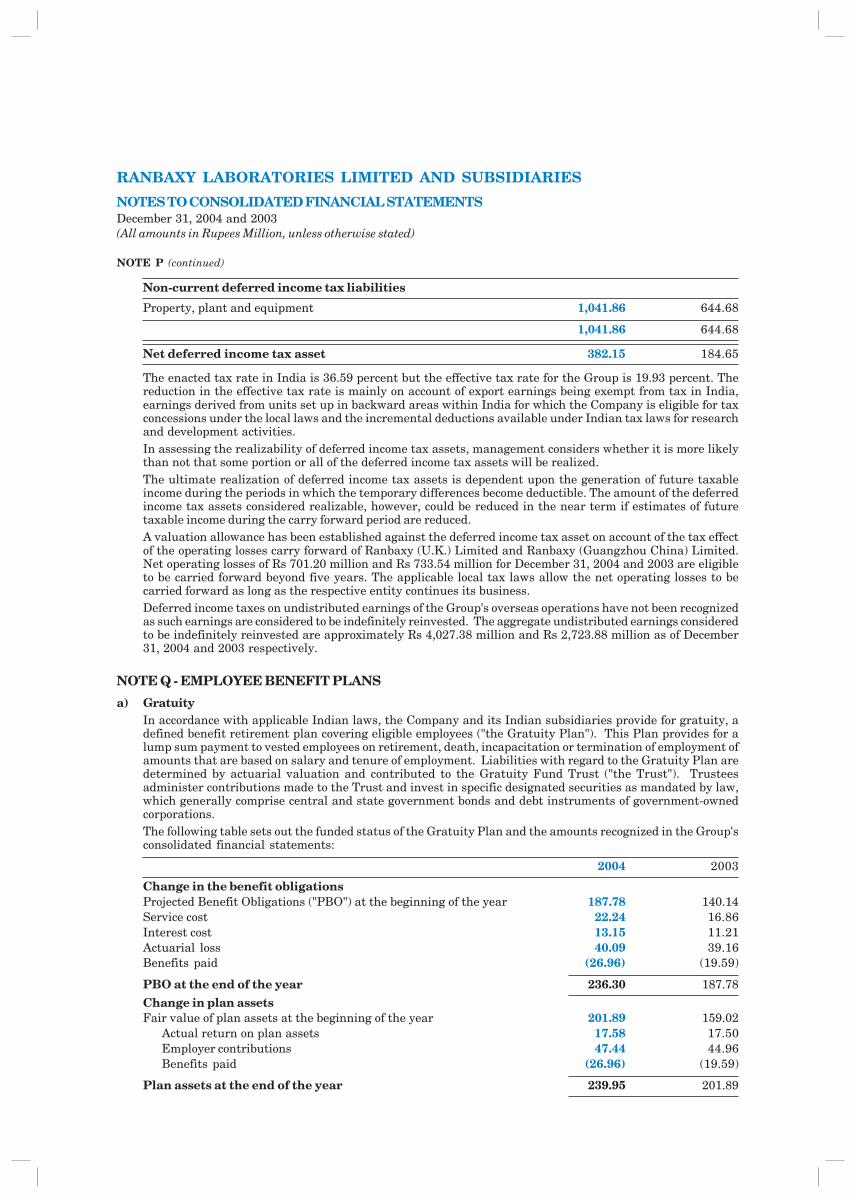
Non-current deferred income tax liabilities
Property, plant and equipment 1,041.86 644.68
1,041.86 644.68
Net deferred income tax asset 382.15 184.65
The enacted tax rate in India is 36.59 percent but the effective tax rate for the Group is 19.93 percent. Thereduction in the effective tax rate is mainly on account of export earnings being exempt from tax in India,earnings derived from units set up in backward areas within India for which the Company is eligible for taxconcessions under the local laws and the incremental deductions available under Indian tax laws for researchand development activities.In assessing the realizability of deferred income tax assets, management considers whether it is more likelythan not that some portion or all of the deferred income tax assets will be realized.The ultimate realization of deferred income tax assets is dependent upon the generation of future taxableincome during the periods in which the temporary differences become deductible. The amount of the deferredincome tax assets considered realizable, however, could be reduced in the near term if estimates of futuretaxable income during the carry forward period are reduced.A valuation allowance has been established against the deferred income tax asset on account of the tax effectof the operating losses carry forward of Ranbaxy (U.K.) Limited and Ranbaxy (Guangzhou China) Limited.Net operating losses of Rs 701.20 million and Rs 733.54 million for December 31, 2004 and 2003 are eligibleto be carried forward beyond five years. The applicable local tax laws allow the net operating losses to becarried forward as long as the respective entity continues its business.Deferred income taxes on undistributed earnings of the Group's overseas operations have not been recognizedas such earnings are considered to be indefinitely reinvested. The aggregate undistributed earnings consideredto be indefinitely reinvested are approximately Rs 4,027.38 million and Rs 2,723.88 million as of December31, 2004 and 2003 respectively.
NOTE Q - EMPLOYEE BENEFIT PLANS
a) GratuityIn accordance with applicable Indian laws, the Company and its Indian subsidiaries provide for gratuity, adefined benefit retirement plan covering eligible employees ("the Gratuity Plan"). This Plan provides for alump sum payment to vested employees on retirement, death, incapacitation or termination of employment ofamounts that are based on salary and tenure of employment. Liabilities with regard to the Gratuity Plan aredetermined by actuarial valuation and contributed to the Gratuity Fund Trust ("the Trust"). Trusteesadminister contributions made to the Trust and invest in specific designated securities as mandated by law,which generally comprise central and state government bonds and debt instruments of government-ownedcorporations.The following table sets out the funded status of the Gratuity Plan and the amounts recognized in the Group'sconsolidated financial statements:
2004 2003
Change in the benefit obligationsProjected Benefit Obligations ("PBO") at the beginning of the year 187.78 140.14Service cost 22.24 16.86Interest cost 13.15 11.21Actuarial loss 40.09 39.16Benefits paid (26.96) (19.59)
PBO at the end of the year 236.30 187.78
Change in plan assetsFair value of plan assets at the beginning of the year 201.89 159.02
Actual return on plan assets 17.58 17.50Employer contributions 47.44 44.96Benefits paid (26.96) (19.59)
Plan assets at the end of the year 239.95 201.89
RANBAXY LABORATORIES LIMITED AND SUBSIDIARIES
NOTES TO CONSOLIDATED FINANCIAL STATEMENTSDecember 31, 2004 and 2003(All amounts in Rupees Million, unless otherwise stated)
NOTE P (continued)
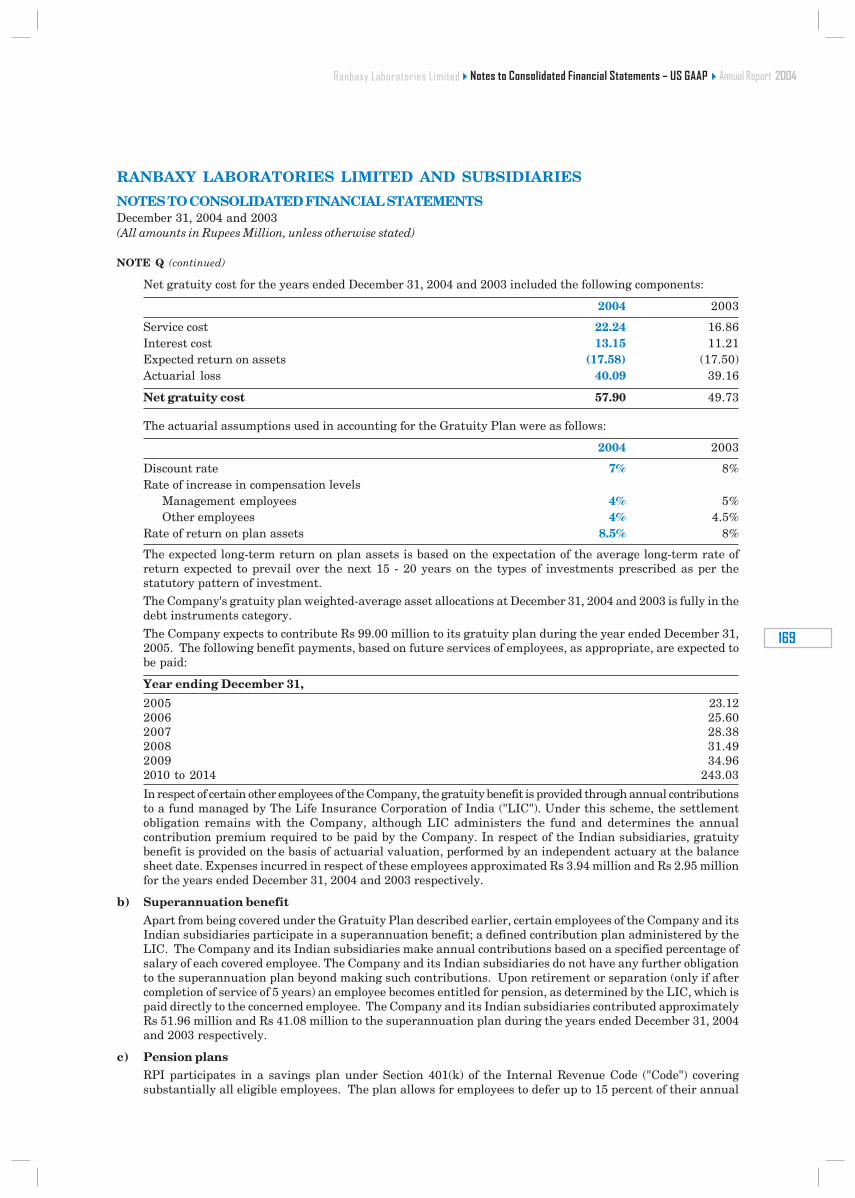
������������ ����
���
Net gratuity cost for the years ended December 31, 2004 and 2003 included the following components:
2004 2003
Service cost 22.24 16.86Interest cost 13.15 11.21Expected return on assets (17.58) (17.50)Actuarial loss 40.09 39.16
Net gratuity cost 57.90 49.73
The actuarial assumptions used in accounting for the Gratuity Plan were as follows:
2004 2003
Discount rate 7% 8%Rate of increase in compensation levels
Management employees 4% 5%Other employees 4% 4.5%
Rate of return on plan assets 8.5% 8%
The expected long-term return on plan assets is based on the expectation of the average long-term rate ofreturn expected to prevail over the next 15 - 20 years on the types of investments prescribed as per thestatutory pattern of investment.The Company's gratuity plan weighted-average asset allocations at December 31, 2004 and 2003 is fully in thedebt instruments category.
The Company expects to contribute Rs 99.00 million to its gratuity plan during the year ended December 31,2005. The following benefit payments, based on future services of employees, as appropriate, are expected tobe paid:
Year ending December 31,
2005 23.122006 25.602007 28.382008 31.492009 34.962010 to 2014 243.03
In respect of certain other employees of the Company, the gratuity benefit is provided through annual contributionsto a fund managed by The Life Insurance Corporation of India ("LIC"). Under this scheme, the settlementobligation remains with the Company, although LIC administers the fund and determines the annualcontribution premium required to be paid by the Company. In respect of the Indian subsidiaries, gratuitybenefit is provided on the basis of actuarial valuation, performed by an independent actuary at the balancesheet date. Expenses incurred in respect of these employees approximated Rs 3.94 million and Rs 2.95 millionfor the years ended December 31, 2004 and 2003 respectively.
b) Superannuation benefitApart from being covered under the Gratuity Plan described earlier, certain employees of the Company and itsIndian subsidiaries participate in a superannuation benefit; a defined contribution plan administered by theLIC. The Company and its Indian subsidiaries make annual contributions based on a specified percentage ofsalary of each covered employee. The Company and its Indian subsidiaries do not have any further obligationto the superannuation plan beyond making such contributions. Upon retirement or separation (only if aftercompletion of service of 5 years) an employee becomes entitled for pension, as determined by the LIC, which ispaid directly to the concerned employee. The Company and its Indian subsidiaries contributed approximatelyRs 51.96 million and Rs 41.08 million to the superannuation plan during the years ended December 31, 2004and 2003 respectively.
c) Pension plansRPI participates in a savings plan under Section 401(k) of the Internal Revenue Code ("Code") coveringsubstantially all eligible employees. The plan allows for employees to defer up to 15 percent of their annual
RANBAXY LABORATORIES LIMITED AND SUBSIDIARIES
NOTES TO CONSOLIDATED FINANCIAL STATEMENTSDecember 31, 2004 and 2003(All amounts in Rupees Million, unless otherwise stated)
NOTE Q (continued)
��������� ���������� � ���������� �������������� ������ ���������������
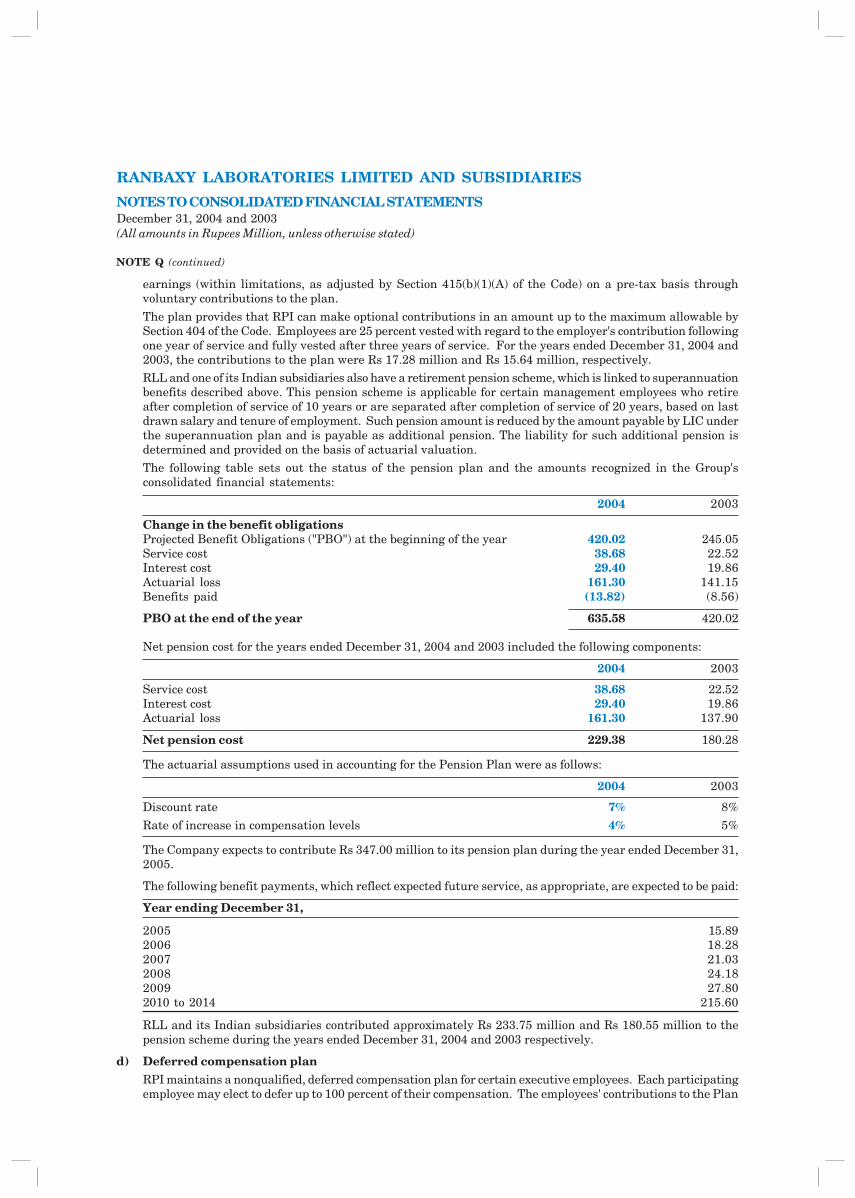
earnings (within limitations, as adjusted by Section 415(b)(1)(A) of the Code) on a pre-tax basis throughvoluntary contributions to the plan.
The plan provides that RPI can make optional contributions in an amount up to the maximum allowable bySection 404 of the Code. Employees are 25 percent vested with regard to the employer's contribution followingone year of service and fully vested after three years of service. For the years ended December 31, 2004 and2003, the contributions to the plan were Rs 17.28 million and Rs 15.64 million, respectively.RLL and one of its Indian subsidiaries also have a retirement pension scheme, which is linked to superannuationbenefits described above. This pension scheme is applicable for certain management employees who retireafter completion of service of 10 years or are separated after completion of service of 20 years, based on lastdrawn salary and tenure of employment. Such pension amount is reduced by the amount payable by LIC underthe superannuation plan and is payable as additional pension. The liability for such additional pension isdetermined and provided on the basis of actuarial valuation.
The following table sets out the status of the pension plan and the amounts recognized in the Group'sconsolidated financial statements:
2004 2003
Change in the benefit obligationsProjected Benefit Obligations ("PBO") at the beginning of the year 420.02 245.05Service cost 38.68 22.52Interest cost 29.40 19.86Actuarial loss 161.30 141.15Benefits paid (13.82) (8.56)
PBO at the end of the year 635.58 420.02
Net pension cost for the years ended December 31, 2004 and 2003 included the following components:
2004 2003
Service cost 38.68 22.52Interest cost 29.40 19.86Actuarial loss 161.30 137.90
Net pension cost 229.38 180.28
The actuarial assumptions used in accounting for the Pension Plan were as follows:
2004 2003
Discount rate 7% 8%
Rate of increase in compensation levels 4% 5%
The Company expects to contribute Rs 347.00 million to its pension plan during the year ended December 31,2005.
The following benefit payments, which reflect expected future service, as appropriate, are expected to be paid:
Year ending December 31,
2005 15.892006 18.282007 21.032008 24.182009 27.802010 to 2014 215.60
RLL and its Indian subsidiaries contributed approximately Rs 233.75 million and Rs 180.55 million to thepension scheme during the years ended December 31, 2004 and 2003 respectively.
d) Deferred compensation planRPI maintains a nonqualified, deferred compensation plan for certain executive employees. Each participatingemployee may elect to defer up to 100 percent of their compensation. The employees' contributions to the Plan
RANBAXY LABORATORIES LIMITED AND SUBSIDIARIES
NOTES TO CONSOLIDATED FINANCIAL STATEMENTSDecember 31, 2004 and 2003(All amounts in Rupees Million, unless otherwise stated)
NOTE Q (continued)
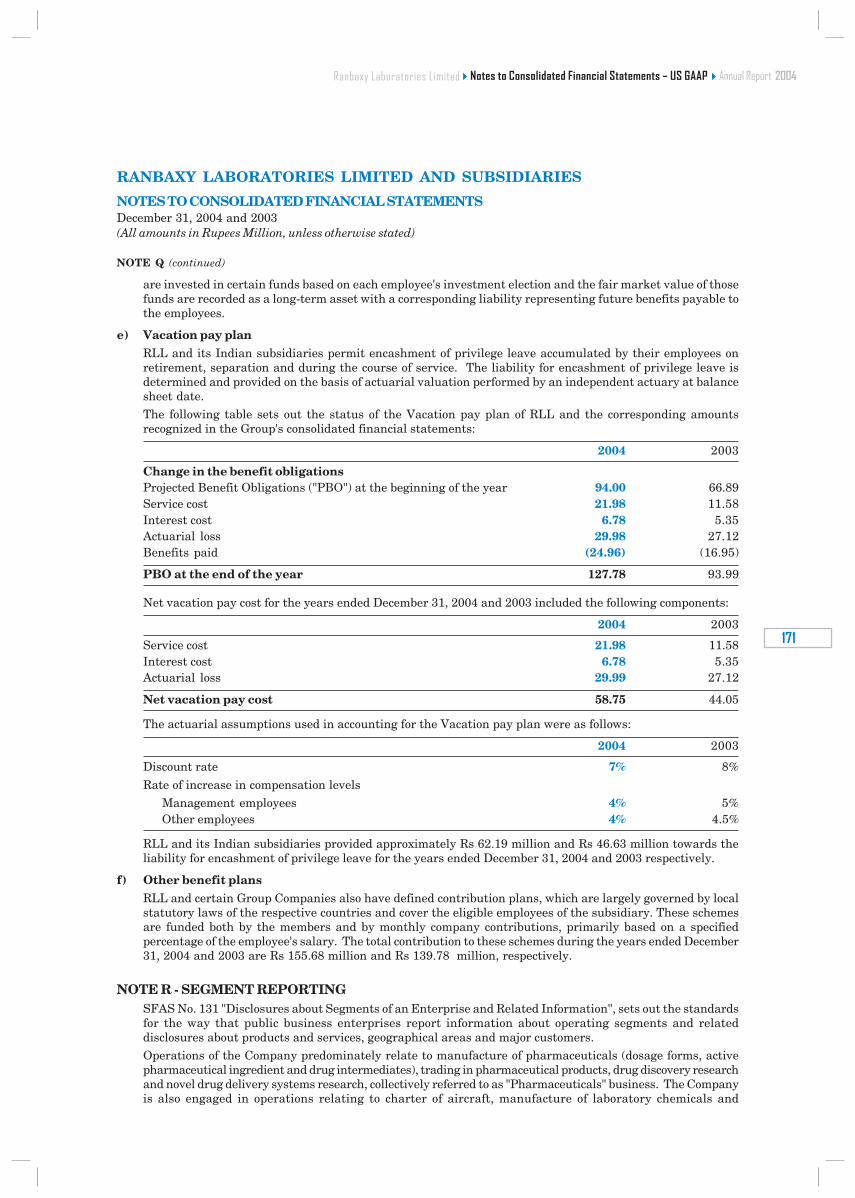
������������ ����
���
are invested in certain funds based on each employee's investment election and the fair market value of thosefunds are recorded as a long-term asset with a corresponding liability representing future benefits payable tothe employees.
e) Vacation pay planRLL and its Indian subsidiaries permit encashment of privilege leave accumulated by their employees onretirement, separation and during the course of service. The liability for encashment of privilege leave isdetermined and provided on the basis of actuarial valuation performed by an independent actuary at balancesheet date.The following table sets out the status of the Vacation pay plan of RLL and the corresponding amountsrecognized in the Group's consolidated financial statements:
2004 2003
Change in the benefit obligationsProjected Benefit Obligations ("PBO") at the beginning of the year 94.00 66.89Service cost 21.98 11.58Interest cost 6.78 5.35Actuarial loss 29.98 27.12Benefits paid (24.96) (16.95)
PBO at the end of the year 127.78 93.99
Net vacation pay cost for the years ended December 31, 2004 and 2003 included the following components:
2004 2003
Service cost 21.98 11.58Interest cost 6.78 5.35Actuarial loss 29.99 27.12
Net vacation pay cost 58.75 44.05
The actuarial assumptions used in accounting for the Vacation pay plan were as follows:
2004 2003
Discount rate 7% 8%
Rate of increase in compensation levelsManagement employees 4% 5%Other employees 4% 4.5%
RLL and its Indian subsidiaries provided approximately Rs 62.19 million and Rs 46.63 million towards theliability for encashment of privilege leave for the years ended December 31, 2004 and 2003 respectively.
f) Other benefit plansRLL and certain Group Companies also have defined contribution plans, which are largely governed by localstatutory laws of the respective countries and cover the eligible employees of the subsidiary. These schemesare funded both by the members and by monthly company contributions, primarily based on a specifiedpercentage of the employee's salary. The total contribution to these schemes during the years ended December31, 2004 and 2003 are Rs 155.68 million and Rs 139.78 million, respectively.
NOTE R - SEGMENT REPORTINGSFAS No. 131 "Disclosures about Segments of an Enterprise and Related Information", sets out the standardsfor the way that public business enterprises report information about operating segments and relateddisclosures about products and services, geographical areas and major customers.Operations of the Company predominately relate to manufacture of pharmaceuticals (dosage forms, activepharmaceutical ingredient and drug intermediates), trading in pharmaceutical products, drug discovery researchand novel drug delivery systems research, collectively referred to as "Pharmaceuticals" business. The Companyis also engaged in operations relating to charter of aircraft, manufacture of laboratory chemicals and
RANBAXY LABORATORIES LIMITED AND SUBSIDIARIES
NOTES TO CONSOLIDATED FINANCIAL STATEMENTSDecember 31, 2004 and 2003(All amounts in Rupees Million, unless otherwise stated)
NOTE Q (continued)
��������� ���������� � ���������� �������������� ������ ���������������
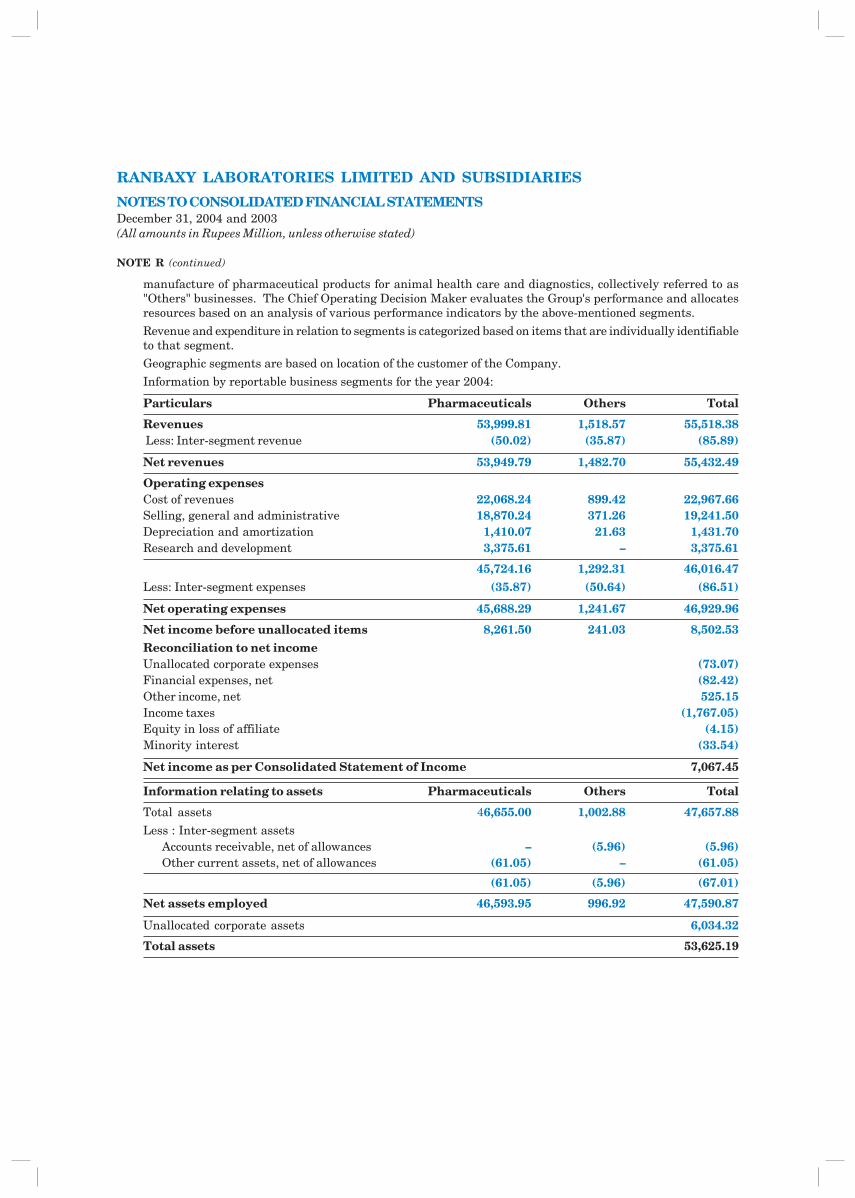
manufacture of pharmaceutical products for animal health care and diagnostics, collectively referred to as"Others" businesses. The Chief Operating Decision Maker evaluates the Group's performance and allocatesresources based on an analysis of various performance indicators by the above-mentioned segments.
Revenue and expenditure in relation to segments is categorized based on items that are individually identifiableto that segment.Geographic segments are based on location of the customer of the Company.
Information by reportable business segments for the year 2004:
Particulars Pharmaceuticals Others Total
Revenues 53,999.81 1,518.57 55,518.38 Less: Inter-segment revenue (50.02) (35.87) (85.89)
Net revenues 53,949.79 1,482.70 55,432.49
Operating expensesCost of revenues 22,068.24 899.42 22,967.66Selling, general and administrative 18,870.24 371.26 19,241.50Depreciation and amortization 1,410.07 21.63 1,431.70Research and development 3,375.61 – 3,375.61
45,724.16 1,292.31 46,016.47Less: Inter-segment expenses (35.87) (50.64) (86.51)
Net operating expenses 45,688.29 1,241.67 46,929.96
Net income before unallocated items 8,261.50 241.03 8,502.53Reconciliation to net incomeUnallocated corporate expenses (73.07)Financial expenses, net (82.42)Other income, net 525.15Income taxes (1,767.05)Equity in loss of affiliate (4.15)Minority interest (33.54)
Net income as per Consolidated Statement of Income 7,067.45
Information relating to assets Pharmaceuticals Others Total
Total assets 46,655.00 1,002.88 47,657.88Less : Inter-segment assets
Accounts receivable, net of allowances – (5.96) (5.96)Other current assets, net of allowances (61.05) – (61.05)
(61.05) (5.96) (67.01)
Net assets employed 46,593.95 996.92 47,590.87
Unallocated corporate assets 6,034.32
Total assets 53,625.19
RANBAXY LABORATORIES LIMITED AND SUBSIDIARIES
NOTES TO CONSOLIDATED FINANCIAL STATEMENTSDecember 31, 2004 and 2003(All amounts in Rupees Million, unless otherwise stated)
NOTE R (continued)
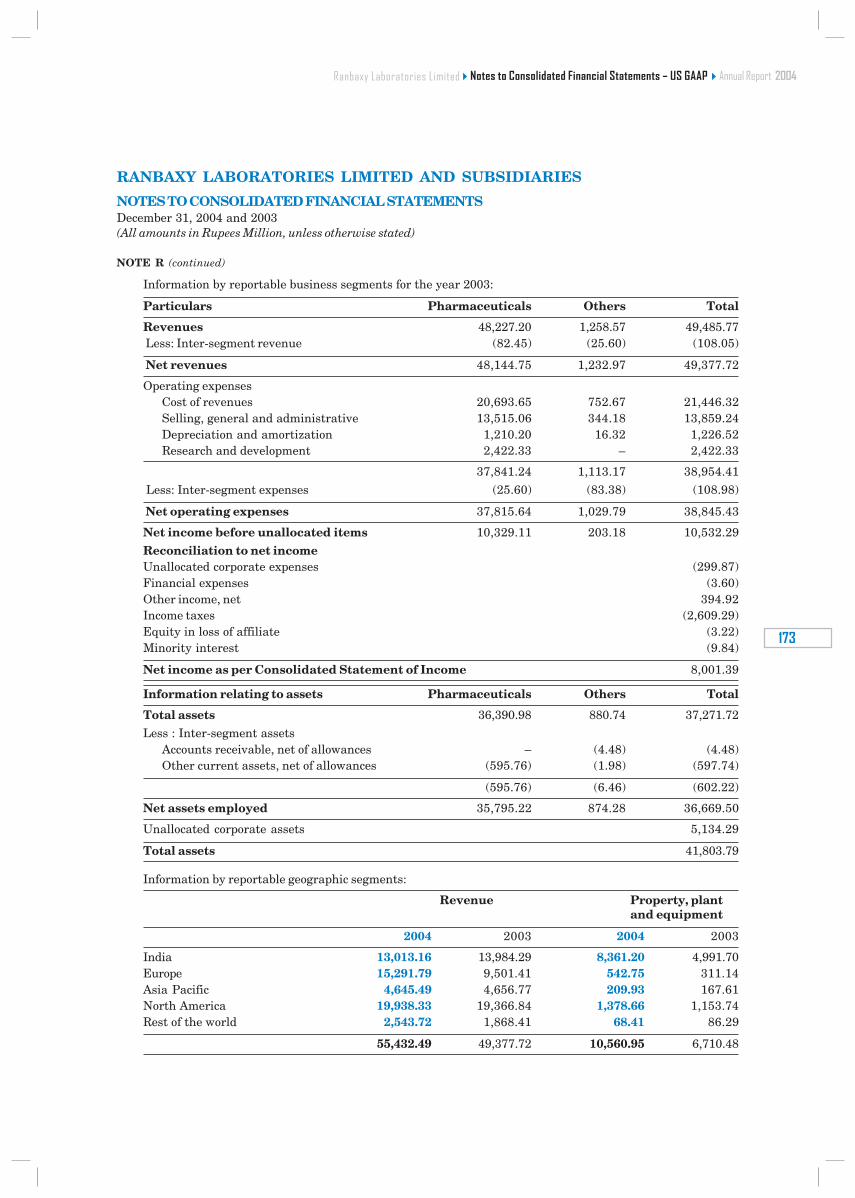
������������ ����
���
Information by reportable business segments for the year 2003:
Particulars Pharmaceuticals Others Total
Revenues 48,227.20 1,258.57 49,485.77 Less: Inter-segment revenue (82.45) (25.60) (108.05)
Net revenues 48,144.75 1,232.97 49,377.72
Operating expensesCost of revenues 20,693.65 752.67 21,446.32Selling, general and administrative 13,515.06 344.18 13,859.24Depreciation and amortization 1,210.20 16.32 1,226.52Research and development 2,422.33 – 2,422.33
37,841.24 1,113.17 38,954.41
Less: Inter-segment expenses (25.60) (83.38) (108.98)
Net operating expenses 37,815.64 1,029.79 38,845.43
Net income before unallocated items 10,329.11 203.18 10,532.29
Reconciliation to net incomeUnallocated corporate expenses (299.87)Financial expenses (3.60)Other income, net 394.92Income taxes (2,609.29)Equity in loss of affiliate (3.22)Minority interest (9.84)
Net income as per Consolidated Statement of Income 8,001.39
Information relating to assets Pharmaceuticals Others Total
Total assets 36,390.98 880.74 37,271.72
Less : Inter-segment assetsAccounts receivable, net of allowances – (4.48) (4.48)Other current assets, net of allowances (595.76) (1.98) (597.74)
(595.76) (6.46) (602.22)
Net assets employed 35,795.22 874.28 36,669.50
Unallocated corporate assets 5,134.29
Total assets 41,803.79
Information by reportable geographic segments:
Revenue Property, plantand equipment
2004 2003 2004 2003
India 13,013.16 13,984.29 8,361.20 4,991.70Europe 15,291.79 9,501.41 542.75 311.14Asia Pacific 4,645.49 4,656.77 209.93 167.61North America 19,938.33 19,366.84 1,378.66 1,153.74Rest of the world 2,543.72 1,868.41 68.41 86.29
55,432.49 49,377.72 10,560.95 6,710.48
RANBAXY LABORATORIES LIMITED AND SUBSIDIARIES
NOTES TO CONSOLIDATED FINANCIAL STATEMENTSDecember 31, 2004 and 2003(All amounts in Rupees Million, unless otherwise stated)
NOTE R (continued)
��������� ���������� � ���������� �������������� ������ ���������������
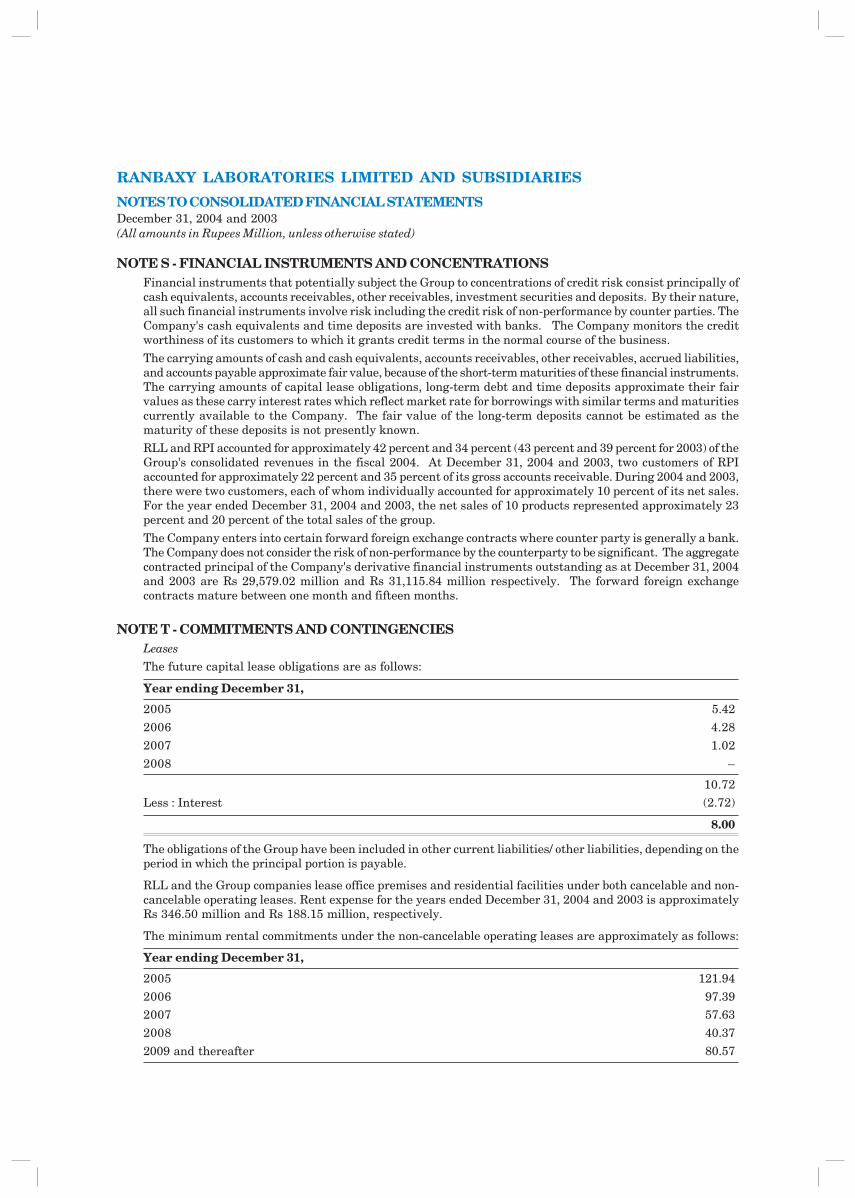
RANBAXY LABORATORIES LIMITED AND SUBSIDIARIES
NOTES TO CONSOLIDATED FINANCIAL STATEMENTSDecember 31, 2004 and 2003(All amounts in Rupees Million, unless otherwise stated)
NOTE S - FINANCIAL INSTRUMENTS AND CONCENTRATIONSFinancial instruments that potentially subject the Group to concentrations of credit risk consist principally ofcash equivalents, accounts receivables, other receivables, investment securities and deposits. By their nature,all such financial instruments involve risk including the credit risk of non-performance by counter parties. TheCompany's cash equivalents and time deposits are invested with banks. The Company monitors the creditworthiness of its customers to which it grants credit terms in the normal course of the business.
The carrying amounts of cash and cash equivalents, accounts receivables, other receivables, accrued liabilities,and accounts payable approximate fair value, because of the short-term maturities of these financial instruments.The carrying amounts of capital lease obligations, long-term debt and time deposits approximate their fairvalues as these carry interest rates which reflect market rate for borrowings with similar terms and maturitiescurrently available to the Company. The fair value of the long-term deposits cannot be estimated as thematurity of these deposits is not presently known.RLL and RPI accounted for approximately 42 percent and 34 percent (43 percent and 39 percent for 2003) of theGroup's consolidated revenues in the fiscal 2004. At December 31, 2004 and 2003, two customers of RPIaccounted for approximately 22 percent and 35 percent of its gross accounts receivable. During 2004 and 2003,there were two customers, each of whom individually accounted for approximately 10 percent of its net sales.For the year ended December 31, 2004 and 2003, the net sales of 10 products represented approximately 23percent and 20 percent of the total sales of the group.
The Company enters into certain forward foreign exchange contracts where counter party is generally a bank.The Company does not consider the risk of non-performance by the counterparty to be significant. The aggregatecontracted principal of the Company's derivative financial instruments outstanding as at December 31, 2004and 2003 are Rs 29,579.02 million and Rs 31,115.84 million respectively. The forward foreign exchangecontracts mature between one month and fifteen months.
NOTE T - COMMITMENTS AND CONTINGENCIESLeasesThe future capital lease obligations are as follows:
Year ending December 31,
2005 5.42
2006 4.28
2007 1.02
2008 –
10.72Less : Interest (2.72)
8.00
The obligations of the Group have been included in other current liabilities/ other liabilities, depending on theperiod in which the principal portion is payable.
RLL and the Group companies lease office premises and residential facilities under both cancelable and non-cancelable operating leases. Rent expense for the years ended December 31, 2004 and 2003 is approximatelyRs 346.50 million and Rs 188.15 million, respectively.
The minimum rental commitments under the non-cancelable operating leases are approximately as follows:
Year ending December 31,
2005 121.94
2006 97.392007 57.63
2008 40.37
2009 and thereafter 80.57
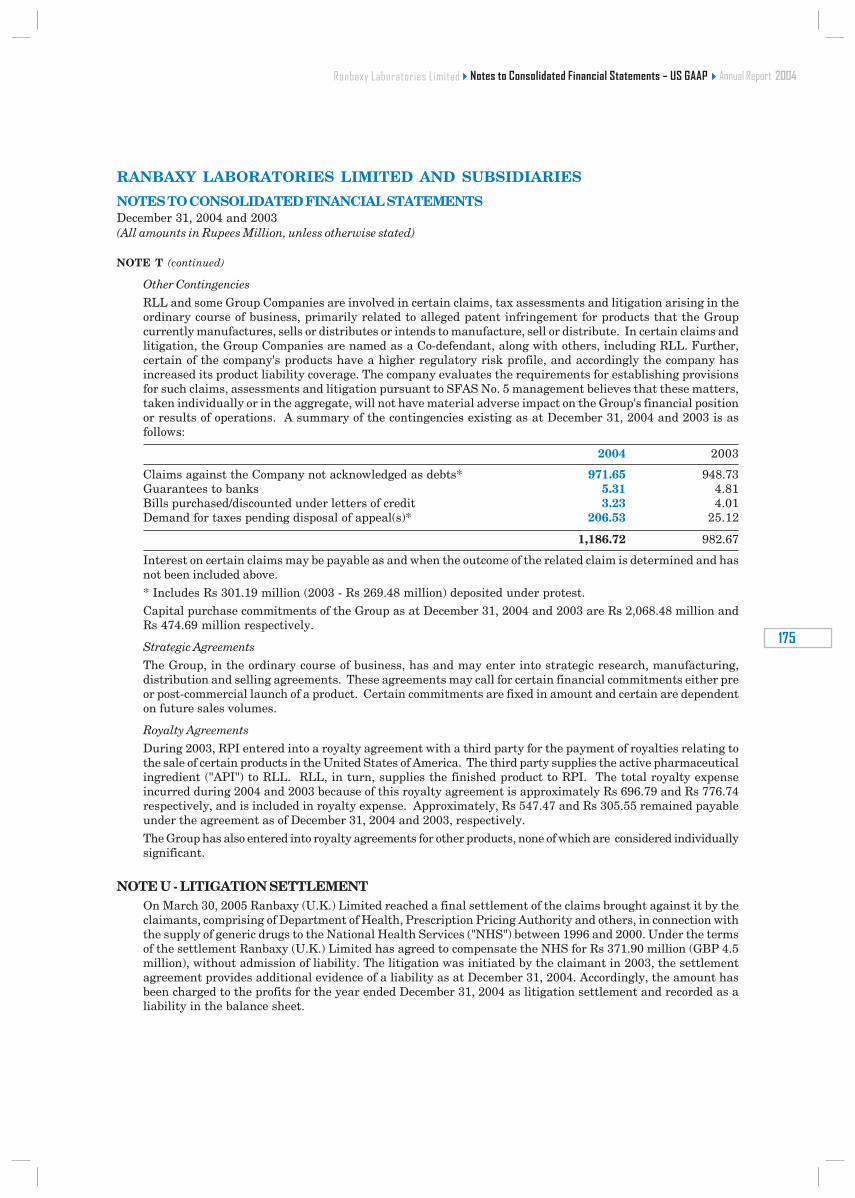
������������ ����
���
Other Contingencies
RLL and some Group Companies are involved in certain claims, tax assessments and litigation arising in theordinary course of business, primarily related to alleged patent infringement for products that the Groupcurrently manufactures, sells or distributes or intends to manufacture, sell or distribute. In certain claims andlitigation, the Group Companies are named as a Co-defendant, along with others, including RLL. Further,certain of the company's products have a higher regulatory risk profile, and accordingly the company hasincreased its product liability coverage. The company evaluates the requirements for establishing provisionsfor such claims, assessments and litigation pursuant to SFAS No. 5 management believes that these matters,taken individually or in the aggregate, will not have material adverse impact on the Group's financial positionor results of operations. A summary of the contingencies existing as at December 31, 2004 and 2003 is asfollows:
2004 2003
Claims against the Company not acknowledged as debts* 971.65 948.73Guarantees to banks 5.31 4.81Bills purchased/discounted under letters of credit 3.23 4.01Demand for taxes pending disposal of appeal(s)* 206.53 25.12
1,186.72 982.67
Interest on certain claims may be payable as and when the outcome of the related claim is determined and hasnot been included above.
* Includes Rs 301.19 million (2003 - Rs 269.48 million) deposited under protest.Capital purchase commitments of the Group as at December 31, 2004 and 2003 are Rs 2,068.48 million andRs 474.69 million respectively.
Strategic Agreements
The Group, in the ordinary course of business, has and may enter into strategic research, manufacturing,distribution and selling agreements. These agreements may call for certain financial commitments either preor post-commercial launch of a product. Certain commitments are fixed in amount and certain are dependenton future sales volumes.
Royalty Agreements
During 2003, RPI entered into a royalty agreement with a third party for the payment of royalties relating tothe sale of certain products in the United States of America. The third party supplies the active pharmaceuticalingredient ("API") to RLL. RLL, in turn, supplies the finished product to RPI. The total royalty expenseincurred during 2004 and 2003 because of this royalty agreement is approximately Rs 696.79 and Rs 776.74respectively, and is included in royalty expense. Approximately, Rs 547.47 and Rs 305.55 remained payableunder the agreement as of December 31, 2004 and 2003, respectively.
The Group has also entered into royalty agreements for other products, none of which are considered individuallysignificant.
NOTE U - LITIGATION SETTLEMENTOn March 30, 2005 Ranbaxy (U.K.) Limited reached a final settlement of the claims brought against it by theclaimants, comprising of Department of Health, Prescription Pricing Authority and others, in connection withthe supply of generic drugs to the National Health Services ("NHS") between 1996 and 2000. Under the termsof the settlement Ranbaxy (U.K.) Limited has agreed to compensate the NHS for Rs 371.90 million (GBP 4.5million), without admission of liability. The litigation was initiated by the claimant in 2003, the settlementagreement provides additional evidence of a liability as at December 31, 2004. Accordingly, the amount hasbeen charged to the profits for the year ended December 31, 2004 as litigation settlement and recorded as aliability in the balance sheet.
NOTE T (continued)
RANBAXY LABORATORIES LIMITED AND SUBSIDIARIES
NOTES TO CONSOLIDATED FINANCIAL STATEMENTSDecember 31, 2004 and 2003(All amounts in Rupees Million, unless otherwise stated)
��������� ���������� � ���������� �������������� ������ ���������������
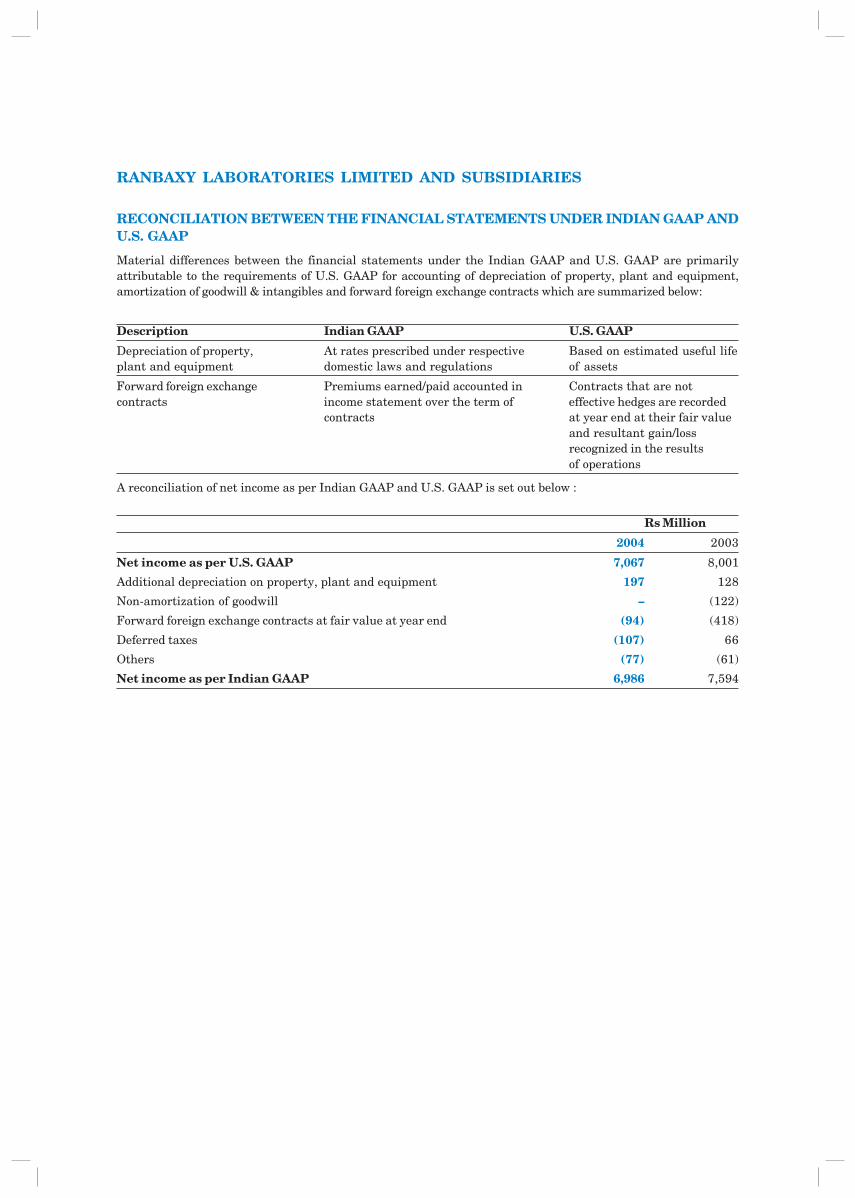
RECONCILIATION BETWEEN THE FINANCIAL STATEMENTS UNDER INDIAN GAAP ANDU.S. GAAP
Material differences between the financial statements under the Indian GAAP and U.S. GAAP are primarilyattributable to the requirements of U.S. GAAP for accounting of depreciation of property, plant and equipment,amortization of goodwill & intangibles and forward foreign exchange contracts which are summarized below:
Description Indian GAAP U.S. GAAP
Depreciation of property, At rates prescribed under respective Based on estimated useful lifeplant and equipment domestic laws and regulations of assets
Forward foreign exchange Premiums earned/paid accounted in Contracts that are notcontracts income statement over the term of effective hedges are recorded
contracts at year end at their fair valueand resultant gain/lossrecognized in the resultsof operations
A reconciliation of net income as per Indian GAAP and U.S. GAAP is set out below :
Rs Million
2004 2003
Net income as per U.S. GAAP 7,067 8,001
Additional depreciation on property, plant and equipment 197 128
Non-amortization of goodwill – (122)
Forward foreign exchange contracts at fair value at year end (94) (418)
Deferred taxes (107) 66
Others (77) (61)
Net income as per Indian GAAP 6,986 7,594
RANBAXY LABORATORIES LIMITED AND SUBSIDIARIES

Plot No. 90, Sector 32, Gurgaon - 122 001 (Haryana) India
Tel : +91-124-5135000. Fax : +91-124-5135001
Website : www.ranbaxy.com