sun j-bottom up
TRANSCRIPT
Deep-Sea Research II 97 (2013) 61–71
Contents lists available at ScienceDirect
Deep-Sea Research II
0967-06http://d
☆Thiswill be
n CorrUniversPR Chin
E-mf.yuanyuwuying
journal homepage: www.elsevier.com/locate/dsr2
Bottom-up control of phytoplankton growth in spring bloomsin Central Yellow Sea, China$
Jun Sun a,b,n, Yuanyuan Feng a,b, Dan Wang c, Shuqun Song c, Yan Jiang c, Changling Ding a,b,Ying Wu d
a College of Marine Science and Engineering, Tianjin University of Science and Technology, Tianjin 300457, PR Chinab Tianjin Key Laboratory of Marine Resources and Chemistry, Tianjin 300457, PR Chinac Institute of Oceanology, Chinese Academy of Sciences, Qingdao 266071, PR Chinad State Key Lab of Estuarine and Coastal Research, East China Normal University, 3663 Zhongshan Road North, Shanghai, 200062, PR China
a r t i c l e i n f o
Available online 28 May 2013
Keywords:External nutrientInternal nutrientRemineralized nutrientCentral Yellow SeaSpring bloomNutrient limitation
45/$ - see front matter & 2013 Elsevier Ltd. Ax.doi.org/10.1016/j.dsr2.2013.05.006
paper has not been submitted elsewhere in idduring the first 3 months after its submissionesponding author at: College of Marine Scieity of Science and Technology, No. 29 13th Ava. Tel./fax: +86 22 60601116/1101/1106.ail addresses: [email protected], [email protected] (Y. Feng), wangdan_snow@[email protected] (Y. Wu).
a b s t r a c t
The source and significance of three nutrients – nitrogen, phosphorous and silicon – were investigated bya modified dilution method performed on seawater samples from the Central Yellow Sea (CYS), in springblooming period of 2007. This modified dilution method accounted for the phytoplankton growth rate,microzooplankton grazing mortality rate, the internal and external nutrient pools, as well as nutrientssupplied through remineralization by microzooplankton grazing. The results indicate that phytoplanktongrowth during the bloom is mostly contributed by internal nutrient pools (KI¼0.062–1.730). The externalnutrient pools (KE¼o0–0.362) are also of importance for phytoplankton growth during the bloom atsome sampling sites. Furthermore, the contribution of the recycled-nutrient pool by remineralization(KR¼o0–0.751) is significant when microzooplankton grazing rate was higher than 0.5 d−1 during thespring phytoplankton blooms in the Central Yellow Sea. Compared with internal phosphorus, internalnitrogen and silicon contribute more to the phytoplankton production at most sampling stations.
& 2013 Elsevier Ltd. All rights reserved.
1. Introduction
The Yellow Sea is a semi-closed marginal sea of the northwesternPacific, bounded by Korea and China, with an average depth of ∼50 m(Lin et al., 2005). The physico-chemical characteristics of the YellowSea region are complex (KORDI, 1998). It is divided mainly into fourmajor water masses: (1) the high temperature, high salinity YellowSea Warm Current (YSWC); (2) the high nutrient Yellow Sea ColdWater (YSCW); (3) the low temperature, low salinity Coastal CurrentWater (CCW); and (4) the low salinity Changjiang River DilutedWater (CRDW) (Lie, 1984). It has been reported that the Yellow Seaspring bloom is usually associated with the mixing of large-scalewater masses in the Central Yellow Sea (CYS), and caused by theoccurrence of enhanced irradiance with the consequence of mixingof the YSWC and the nutrient enriched YSCW (Hyun and Kim, 2003).
ll rights reserved.
entical or similar form, nor itto Deep-Sea Research II.
nce and Engineering, Tianjinenue, TEDA, Tianjin 300457,
@tust.edu.cn (J. Sun),3.com (D. Wang),
The Yellow Sea is believed to be influenced by the eutrophicationcaused by anthropogenic activities, especially the high fishing pressurealong with the economic development. Earlier studies have beencarried out on nutrient distributions (Chen et al., 2002) in the YellowSea, biogenic elements (Wang et al., 1999), and the pollution status(Wei et al., 1993) along the coastal areas of the Yellow Sea. A researchon changes of the Yellow Sea environmental factors during a 25-yearperiod of the last century suggested an increasing trend of dissolvedinorganic nitrogen (DIN) concentration and Nitrogen: Phosphorus (N:P) ratio, and decreasing trends in phosphorus (PO4-P) and silicon(SiO3-Si) (Lin et al., 2005) concentrations. The change of nutrientconcentrations and stoichiometry consequently has affected phyto-plankton growth and changed the community structure and succes-sion (Turner, 2002).
There are three major pools of nutrients supporting phytoplanktongrowth: (1) external free nutrients; (2) cellular internal nutrients; and(3) nutrients remineralized by grazers (Harrison, 1983; Gilbert, 1988).For in-depth understanding of the mechanism of why one nutrientbecomes limiting, while another is in a relatively abundant supply, it isnecessary to know in which pool the nutrient is having the mostsignificant effect in the changing marine environment in the YellowSea area and to further understand, how nutrients exert bottom-upcontrol on the phytoplankton blooms in this region.
In the present study, we carried out a series of onboard incubationsusing an “all-minus-one” approach in combination with dilution
J. Sun et al. / Deep-Sea Research II 97 (2013) 61–7162
experiments, to examine the bottom-up control factors of the differentnutrient pools of N, P and Si in the Yellow Sea areas during springbloom period of April, 2007. This experimental approach was firstdeveloped by Andersen et al. (1991) by modifying the dilutionmethods of Landry and Hassett (1982), and later Elser and Frees(1985). Addition of nutrients into coastal seawater generally promotesthe phytoplankton growth and increases the biomass, indicatingnutrient limitation (Schlüter, 1998). By adding sufficient amount ofall the nutrients except for one, we are able to assume any change ofthe growth rate by dilution is caused by this single nutrient (N, P or Siin this research) (Andersen et al., 1991). The method can provide theinformation of not only which nutrients limit phytoplankton growth,but also the different pools of limiting nutrients as well. In thismethod, the selective enrichment with N, P and Si in dilutionexperiments is used to assess the relative magnitudes of both theexternal and internal pools of P and the supply of remineralized P fromgrazers. Similarly, P and Si enrichment or N and P enrichment willprovide information on the three pools of nutrient N and Si.
2. Materials and methods
2.1. Sampling Stations and general sampling procedures
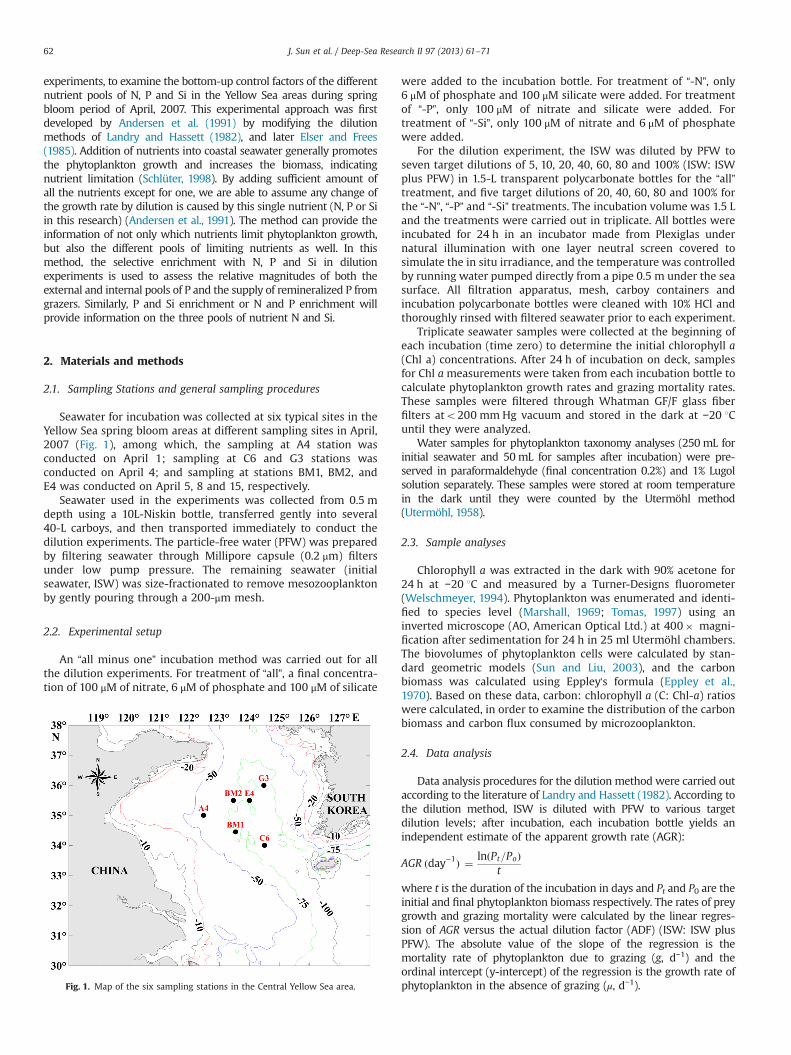
Seawater for incubation was collected at six typical sites in theYellow Sea spring bloom areas at different sampling sites in April,2007 (Fig. 1), among which, the sampling at A4 station wasconducted on April 1; sampling at C6 and G3 stations wasconducted on April 4; and sampling at stations BM1, BM2, andE4 was conducted on April 5, 8 and 15, respectively.
Seawater used in the experiments was collected from 0.5 mdepth using a 10L-Niskin bottle, transferred gently into several40-L carboys, and then transported immediately to conduct thedilution experiments. The particle-free water (PFW) was preparedby filtering seawater through Millipore capsule (0.2 μm) filtersunder low pump pressure. The remaining seawater (initialseawater, ISW) was size-fractionated to remove mesozooplanktonby gently pouring through a 200-μm mesh.
2.2. Experimental setup
An “all minus one” incubation method was carried out for allthe dilution experiments. For treatment of “all”, a final concentra-tion of 100 μM of nitrate, 6 μM of phosphate and 100 μM of silicate
Fig. 1. Map of the six sampling stations in the Central Yellow Sea area.
were added to the incubation bottle. For treatment of “-N”, only6 μM of phosphate and 100 μM silicate were added. For treatmentof “-P”, only 100 μM of nitrate and silicate were added. Fortreatment of “-Si”, only 100 μM of nitrate and 6 μM of phosphatewere added.
For the dilution experiment, the ISW was diluted by PFW toseven target dilutions of 5, 10, 20, 40, 60, 80 and 100% (ISW: ISWplus PFW) in 1.5-L transparent polycarbonate bottles for the “all”treatment, and five target dilutions of 20, 40, 60, 80 and 100% forthe “-N”, “-P” and “-Si” treatments. The incubation volume was 1.5 Land the treatments were carried out in triplicate. All bottles wereincubated for 24 h in an incubator made from Plexiglas undernatural illumination with one layer neutral screen covered tosimulate the in situ irradiance, and the temperature was controlledby running water pumped directly from a pipe 0.5 m under the seasurface. All filtration apparatus, mesh, carboy containers andincubation polycarbonate bottles were cleaned with 10% HCl andthoroughly rinsed with filtered seawater prior to each experiment.
Triplicate seawater samples were collected at the beginning ofeach incubation (time zero) to determine the initial chlorophyll a(Chl a) concentrations. After 24 h of incubation on deck, samplesfor Chl a measurements were taken from each incubation bottle tocalculate phytoplankton growth rates and grazing mortality rates.These samples were filtered through Whatman GF/F glass fiberfilters ato200 mm Hg vacuum and stored in the dark at −20 1Cuntil they were analyzed.
Water samples for phytoplankton taxonomy analyses (250 mL forinitial seawater and 50mL for samples after incubation) were pre-served in paraformaldehyde (final concentration 0.2%) and 1% Lugolsolution separately. These samples were stored at room temperaturein the dark until they were counted by the Utermöhl method(Utermöhl, 1958).
2.3. Sample analyses
Chlorophyll a was extracted in the dark with 90% acetone for24 h at −20 1C and measured by a Turner-Designs fluorometer(Welschmeyer, 1994). Phytoplankton was enumerated and identi-fied to species level (Marshall, 1969; Tomas, 1997) using aninverted microscope (AO, American Optical Ltd.) at 400� magni-fication after sedimentation for 24 h in 25 ml Utermöhl chambers.The biovolumes of phytoplankton cells were calculated by stan-dard geometric models (Sun and Liu, 2003), and the carbonbiomass was calculated using Eppley's formula (Eppley et al.,1970). Based on these data, carbon: chlorophyll a (C: Chl-a) ratioswere calculated, in order to examine the distribution of the carbonbiomass and carbon flux consumed by microzooplankton.
2.4. Data analysis
Data analysis procedures for the dilution method were carried outaccording to the literature of Landry and Hassett (1982). According tothe dilution method, ISW is diluted with PFW to various targetdilution levels; after incubation, each incubation bottle yields anindependent estimate of the apparent growth rate (AGR):
AGR ðday−1Þ ¼ lnðPt=PoÞt
where t is the duration of the incubation in days and Pt and P0 are theinitial and final phytoplankton biomass respectively. The rates of preygrowth and grazing mortality were calculated by the linear regres-sion of AGR versus the actual dilution factor (ADF) (ISW: ISW plusPFW). The absolute value of the slope of the regression is themortality rate of phytoplankton due to grazing (g, d−1) and theordinal intercept (y-intercept) of the regression is the growth rate ofphytoplankton in the absence of grazing (μ, d−1).
J. Sun et al. / Deep-Sea Research II 97 (2013) 61–71 63
For estimating the contribution of different nutrient pools(external, internal and recycled), a method described inAndersen et al., (1991) was used. In this experiment, three mainpools of nutrients supported the growth of phytoplankton duringincubation, modeled by Eq. (1):
eyt ¼ 1þ KRxþ K I þ KEx−1 ð1ÞIn which x is the actual dilution factor; y is mean growth rate of
phytoplankton (y¼m+gx), m is the apparent growth rate and g isthe microzooplankton grazing mortality rate. Both m and g valueswere calculated by linear regression from the dilution experimentsof the “all” treatments. The parameters KE, KI, and KR are thepotential production coefficients of the three different nutrientpools, and represent relative yields of external, internal andremineralized nutrients, respectively. A higher value indicates ahigher contribution of the nutrient pool to the phytoplanktonproduction. The values of KE, KI, and KR were then obtained frommultiple linear regression, with x and x−1 as independent variablesand eyt−1 as the dependent variable.
3. Results
3.1. Physical condition and phytoplankton community structure ofthe initially sampled seawater
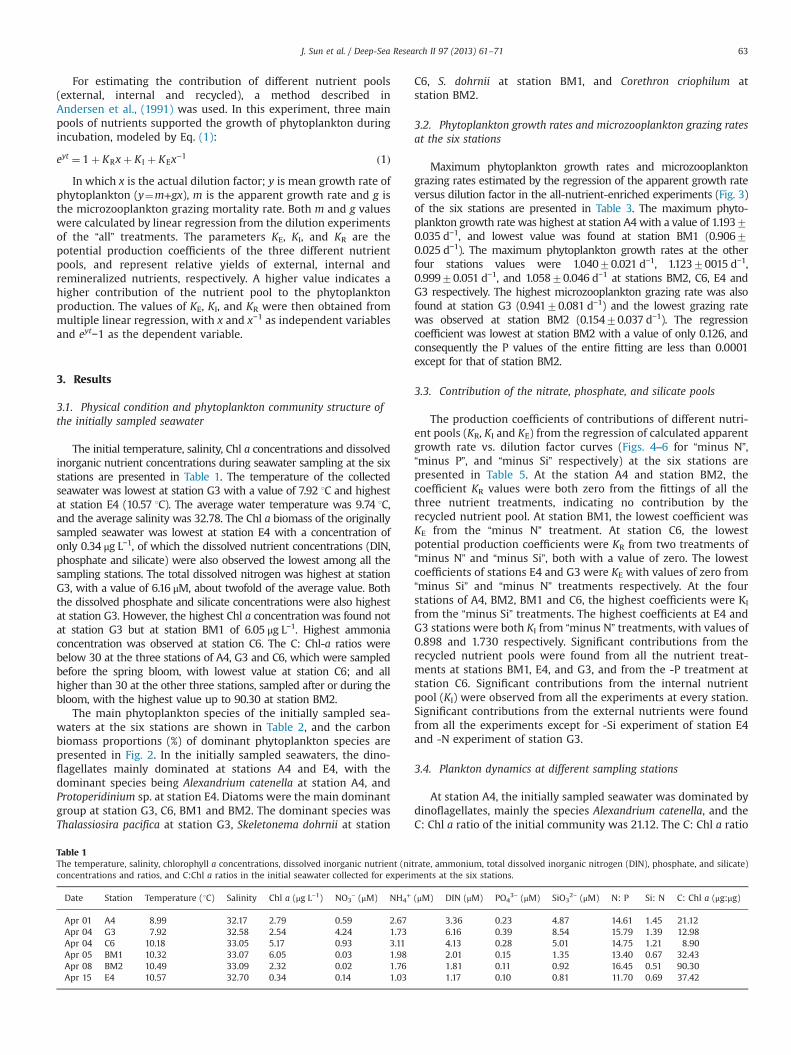
The initial temperature, salinity, Chl a concentrations and dissolvedinorganic nutrient concentrations during seawater sampling at the sixstations are presented in Table 1. The temperature of the collectedseawater was lowest at station G3 with a value of 7.92 1C and highestat station E4 (10.57 1C). The average water temperature was 9.74 1C,and the average salinity was 32.78. The Chl a biomass of the originallysampled seawater was lowest at station E4 with a concentration ofonly 0.34 μg L−1, of which the dissolved nutrient concentrations (DIN,phosphate and silicate) were also observed the lowest among all thesampling stations. The total dissolved nitrogen was highest at stationG3, with a value of 6.16 μM, about twofold of the average value. Boththe dissolved phosphate and silicate concentrations were also highestat station G3. However, the highest Chl a concentration was found notat station G3 but at station BM1 of 6.05 μg L−1. Highest ammoniaconcentration was observed at station C6. The C: Chl-a ratios werebelow 30 at the three stations of A4, G3 and C6, which were sampledbefore the spring bloom, with lowest value at station C6; and allhigher than 30 at the other three stations, sampled after or during thebloom, with the highest value up to 90.30 at station BM2.
The main phytoplankton species of the initially sampled sea-waters at the six stations are shown in Table 2, and the carbonbiomass proportions (%) of dominant phytoplankton species arepresented in Fig. 2. In the initially sampled seawaters, the dino-flagellates mainly dominated at stations A4 and E4, with thedominant species being Alexandrium catenella at station A4, andProtoperidinium sp. at station E4. Diatoms were the main dominantgroup at station G3, C6, BM1 and BM2. The dominant species wasThalassiosira pacifica at station G3, Skeletonema dohrnii at station
Table 1The temperature, salinity, chlorophyll a concentrations, dissolved inorganic nutrient (niconcentrations and ratios, and C:Chl a ratios in the initial seawater collected for experim
Date Station Temperature (1C) Salinity Chl a (μg L−1) NO3− (μM) NH4
+
Apr 01 A4 8.99 32.17 2.79 0.59 2.67Apr 04 G3 7.92 32.58 2.54 4.24 1.73Apr 04 C6 10.18 33.05 5.17 0.93 3.11Apr 05 BM1 10.32 33.07 6.05 0.03 1.98Apr 08 BM2 10.49 33.09 2.32 0.02 1.76Apr 15 E4 10.57 32.70 0.34 0.14 1.03
C6, S. dohrnii at station BM1, and Corethron criophilum atstation BM2.
3.2. Phytoplankton growth rates and microzooplankton grazing ratesat the six stations
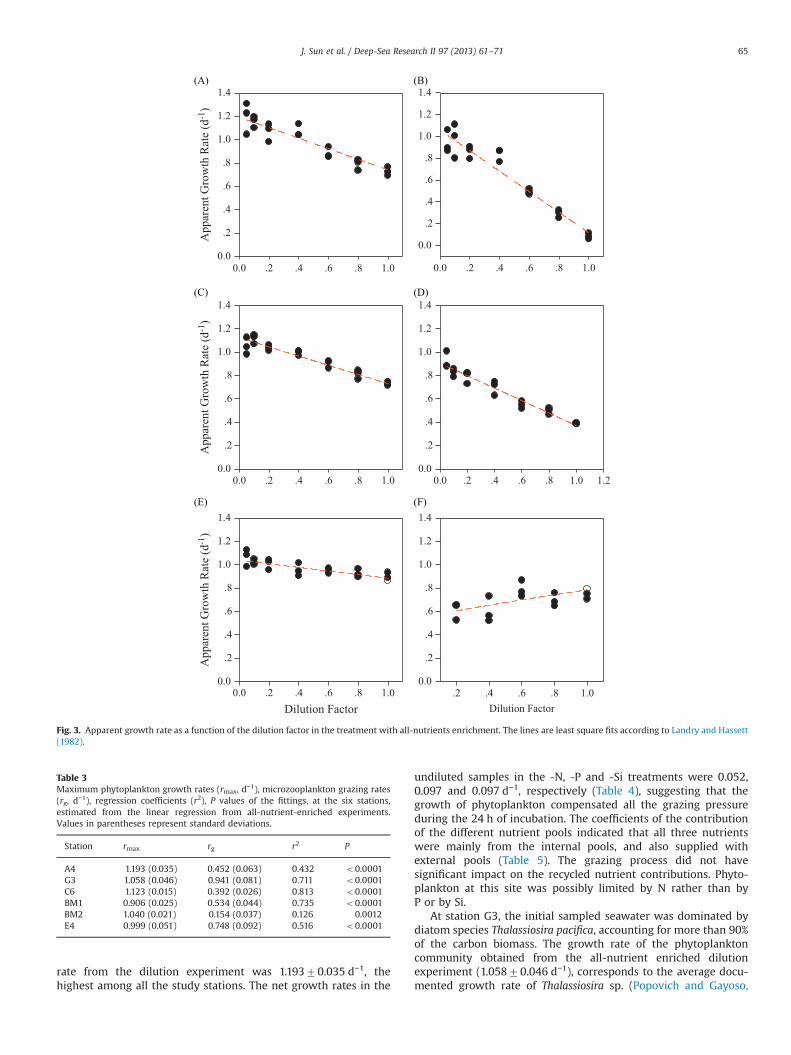
Maximum phytoplankton growth rates and microzooplanktongrazing rates estimated by the regression of the apparent growth rateversus dilution factor in the all-nutrient-enriched experiments (Fig. 3)of the six stations are presented in Table 3. The maximum phyto-plankton growth rate was highest at station A4 with a value of 1.19370.035 d−1, and lowest value was found at station BM1 (0.90670.025 d−1). The maximum phytoplankton growth rates at the otherfour stations values were 1.04070.021 d−1, 1.12370015 d−1,0.99970.051 d−1, and 1.05870.046 d−1 at stations BM2, C6, E4 andG3 respectively. The highest microzooplankton grazing rate was alsofound at station G3 (0.94170.081 d−1) and the lowest grazing ratewas observed at station BM2 (0.15470.037 d−1). The regressioncoefficient was lowest at station BM2 with a value of only 0.126, andconsequently the P values of the entire fitting are less than 0.0001except for that of station BM2.
3.3. Contribution of the nitrate, phosphate, and silicate pools
The production coefficients of contributions of different nutri-ent pools (KR, KI and KE) from the regression of calculated apparentgrowth rate vs. dilution factor curves (Figs. 4–6 for “minus N”,“minus P”, and “minus Si” respectively) at the six stations arepresented in Table 5. At the station A4 and station BM2, thecoefficient KR values were both zero from the fittings of all thethree nutrient treatments, indicating no contribution by therecycled nutrient pool. At station BM1, the lowest coefficient wasKE from the “minus N” treatment. At station C6, the lowestpotential production coefficients were KR from two treatments of“minus N” and “minus Si”, both with a value of zero. The lowestcoefficients of stations E4 and G3 were KE with values of zero from“minus Si” and “minus N” treatments respectively. At the fourstations of A4, BM2, BM1 and C6, the highest coefficients were KI
from the “minus Si” treatments. The highest coefficients at E4 andG3 stations were both KI from “minus N” treatments, with values of0.898 and 1.730 respectively. Significant contributions from therecycled nutrient pools were found from all the nutrient treat-ments at stations BM1, E4, and G3, and from the -P treatment atstation C6. Significant contributions from the internal nutrientpool (KI) were observed from all the experiments at every station.Significant contributions from the external nutrients were foundfrom all the experiments except for -Si experiment of station E4and -N experiment of station G3.
3.4. Plankton dynamics at different sampling stations
At station A4, the initially sampled seawater was dominated bydinoflagellates, mainly the species Alexandrium catenella, and theC: Chl a ratio of the initial community was 21.12. The C: Chl a ratio
trate, ammonium, total dissolved inorganic nitrogen (DIN), phosphate, and silicate)ents at the six stations.
(μM) DIN (μM) PO43− (μM) SiO3
2− (μM) N: P Si: N C: Chl a (μg:μg)
3.36 0.23 4.87 14.61 1.45 21.126.16 0.39 8.54 15.79 1.39 12.984.13 0.28 5.01 14.75 1.21 8.902.01 0.15 1.35 13.40 0.67 32.431.81 0.11 0.92 16.45 0.51 90.301.17 0.10 0.81 11.70 0.69 37.42
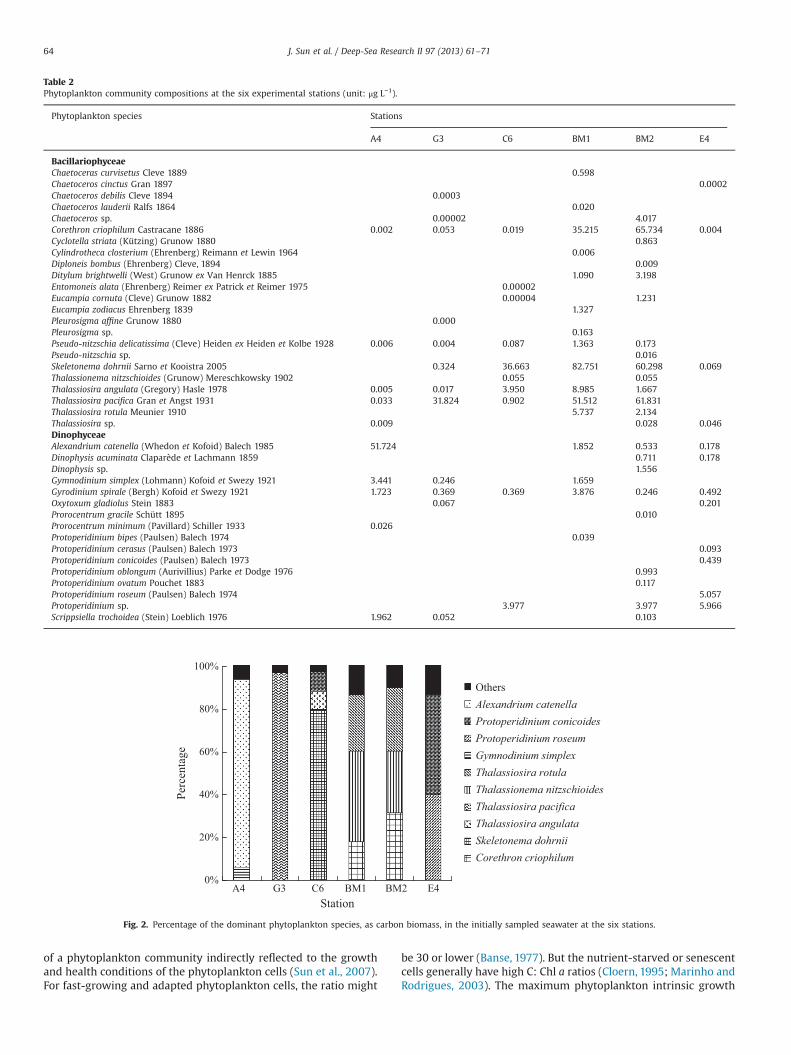
Table 2Phytoplankton community compositions at the six experimental stations (unit: μg L−1).
Phytoplankton species Stations
A4 G3 C6 BM1 BM2 E4
BacillariophyceaeChaetoceras curvisetus Cleve 1889 0.598Chaetoceros cinctus Gran 1897 0.0002Chaetoceros debilis Cleve 1894 0.0003Chaetoceros lauderii Ralfs 1864 0.020Chaetoceros sp. 0.00002 4.017Corethron criophilum Castracane 1886 0.002 0.053 0.019 35.215 65.734 0.004Cyclotella striata (Kützing) Grunow 1880 0.863Cylindrotheca closterium (Ehrenberg) Reimann et Lewin 1964 0.006Diploneis bombus (Ehrenberg) Cleve, 1894 0.009Ditylum brightwelli (West) Grunow ex Van Henrck 1885 1.090 3.198Entomoneis alata (Ehrenberg) Reimer ex Patrick et Reimer 1975 0.00002Eucampia cornuta (Cleve) Grunow 1882 0.00004 1.231Eucampia zodiacus Ehrenberg 1839 1.327Pleurosigma affine Grunow 1880 0.000Pleurosigma sp. 0.163Pseudo-nitzschia delicatissima (Cleve) Heiden ex Heiden et Kolbe 1928 0.006 0.004 0.087 1.363 0.173Pseudo-nitzschia sp. 0.016Skeletonema dohrnii Sarno et Kooistra 2005 0.324 36.663 82.751 60.298 0.069Thalassionema nitzschioides (Grunow) Mereschkowsky 1902 0.055 0.055Thalassiosira angulata (Gregory) Hasle 1978 0.005 0.017 3.950 8.985 1.667Thalassiosira pacifica Gran et Angst 1931 0.033 31.824 0.902 51.512 61.831Thalassiosira rotula Meunier 1910 5.737 2.134Thalassiosira sp. 0.009 0.028 0.046DinophyceaeAlexandrium catenella (Whedon et Kofoid) Balech 1985 51.724 1.852 0.533 0.178Dinophysis acuminata Claparède et Lachmann 1859 0.711 0.178Dinophysis sp. 1.556Gymnodinium simplex (Lohmann) Kofoid et Swezy 1921 3.441 0.246 1.659Gyrodinium spirale (Bergh) Kofoid et Swezy 1921 1.723 0.369 0.369 3.876 0.246 0.492Oxytoxum gladiolus Stein 1883 0.067 0.201Prorocentrum gracile Schütt 1895 0.010Prorocentrum minimum (Pavillard) Schiller 1933 0.026Protoperidinium bipes (Paulsen) Balech 1974 0.039Protoperidinium cerasus (Paulsen) Balech 1973 0.093Protoperidinium conicoides (Paulsen) Balech 1973 0.439Protoperidinium oblongum (Aurivillius) Parke et Dodge 1976 0.993Protoperidinium ovatum Pouchet 1883 0.117Protoperidinium roseum (Paulsen) Balech 1974 5.057Protoperidinium sp. 3.977 3.977 5.966Scrippsiella trochoidea (Stein) Loeblich 1976 1.962 0.052 0.103
0%
20%
40%
60%
80%
100%
Perc
enta
ge
A4 G3 C6 BM1 BM2 E4Station
OthersAlexandrium catenellaProtoperidinium conicoidesProtoperidinium roseumGymnodinium simplexThalassiosira rotulaThalassionema nitzschioidesThalassiosira pacificaThalassiosira angulataSkeletonema dohrniiCorethron criophilum
Fig. 2. Percentage of the dominant phytoplankton species, as carbon biomass, in the initially sampled seawater at the six stations.
J. Sun et al. / Deep-Sea Research II 97 (2013) 61–7164
of a phytoplankton community indirectly reflected to the growthand health conditions of the phytoplankton cells (Sun et al., 2007).For fast-growing and adapted phytoplankton cells, the ratio might
be 30 or lower (Banse, 1977). But the nutrient-starved or senescentcells generally have high C: Chl a ratios (Cloern, 1995; Marinho andRodrigues, 2003). The maximum phytoplankton intrinsic growth
0.0 .2 .4 .6 .8 1.0
App
aren
t Gro
wth
Rat
e (d
-1)
0.0
.2
.4
.6
.8
1.0
1.2
1.4
0.0 .2 .4 .6 .8 1.0
0.0
.2
.4
.6
.8
1.0
1.2
1.4
Dilution Factor.2 .4 .6 .8 1.0
0.0
.2
.4
.6
.8
1.0
1.2
1.4
Dilution Factor0.0 .2 .4 .6 .8 1.0
App
aren
t Gro
wth
Rat
e (d
-1)
0.0
.2
.4
.6
.8
1.0
1.2
1.4
0.0 .2 .4 .6 .8 1.0 1.20.0
.2
.4
.6
.8
1.0
1.2
1.4
0.0 .2 .4 .6 .8 1.0
App
aren
t Gro
wth
Rat
e (d
-1)
0.0
.2
.4
.6
.8
1.0
1.2
1.4
Fig. 3. Apparent growth rate as a function of the dilution factor in the treatment with all-nutrients enrichment. The lines are least square fits according to Landry and Hassett(1982).
Table 3Maximum phytoplankton growth rates (rmax, d−1), microzooplankton grazing rates(rg, d−1), regression coefficients (r2), P values of the fittings, at the six stations,estimated from the linear regression from all-nutrient-enriched experiments.Values in parentheses represent standard deviations.
Station rmax rg r2 P
A4 1.193 (0.035) 0.452 (0.063) 0.432 o0.0001G3 1.058 (0.046) 0.941 (0.081) 0.711 o0.0001C6 1.123 (0.015) 0.392 (0.026) 0.813 o0.0001BM1 0.906 (0.025) 0.534 (0.044) 0.735 o0.0001BM2 1.040 (0.021) 0.154 (0.037) 0.126 0.0012E4 0.999 (0.051) 0.748 (0.092) 0.516 o0.0001
J. Sun et al. / Deep-Sea Research II 97 (2013) 61–71 65
rate from the dilution experiment was 1.19370.035 d−1, thehighest among all the study stations. The net growth rates in the
undiluted samples in the -N, -P and -Si treatments were 0.052,0.097 and 0.097 d−1, respectively (Table 4), suggesting that thegrowth of phytoplankton compensated all the grazing pressureduring the 24 h of incubation. The coefficients of the contributionof the different nutrient pools indicated that all three nutrientswere mainly from the internal pools, and also supplied withexternal pools (Table 5). The grazing process did not havesignificant impact on the recycled nutrient contributions. Phyto-plankton at this site was possibly limited by N rather than byP or by Si.
At station G3, the initial sampled seawater was dominated bydiatom species Thalassiosira pacifica, accounting for more than 90%of the carbon biomass. The growth rate of the phytoplanktoncommunity obtained from the all-nutrient enriched dilutionexperiment (1.05870.046 d−1), corresponds to the average docu-mented growth rate of Thalassiosira sp. (Popovich and Gayoso,
Dilution Factor.2 .4 .6 .8 1.0
.2
.4
.6
.8
1.0
1.2
1.4
.2 .4 .6 .8 1.0
Mea
n G
row
th R
ate
(d-1
)
.2
.4
.6
.8
1.0
1.2
1.4
.2 .4 .6 .8 1.0.2
.4
.6
.8
1.0
1.2
1.4
.2 .4 .6 .8 1.0
Mea
n G
row
th R
ate
(d-1
)
.2
.4
.6
.8
1.0
1.2
1.4
.2 .4 .6 .8 1.0.2
.4
.6
.8
1.0
1.2
1.4
Dilution Factor.2 .4 .6 .8 1.0
Mea
n G
row
th R
ate
(d-1
)
.2
.4
.6
.8
1.0
1.2
1.4
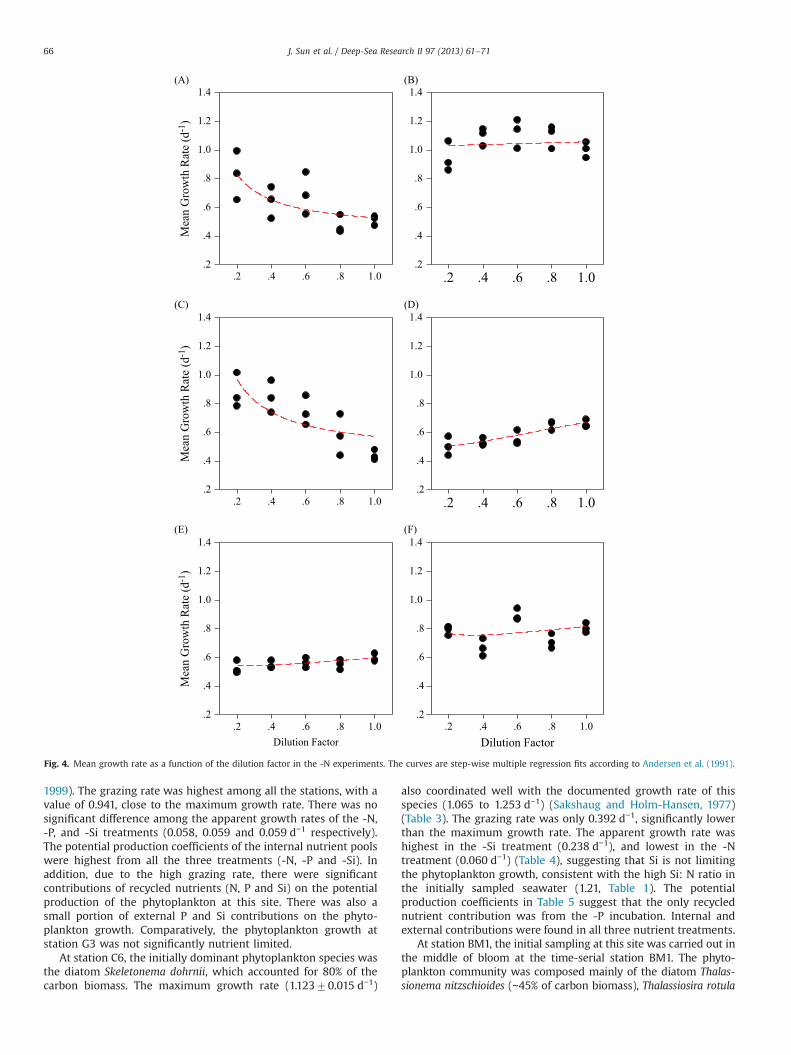
Fig. 4. Mean growth rate as a function of the dilution factor in the -N experiments. The curves are step-wise multiple regression fits according to Andersen et al. (1991).
J. Sun et al. / Deep-Sea Research II 97 (2013) 61–7166
1999). The grazing rate was highest among all the stations, with avalue of 0.941, close to the maximum growth rate. There was nosignificant difference among the apparent growth rates of the -N,-P, and -Si treatments (0.058, 0.059 and 0.059 d−1 respectively).The potential production coefficients of the internal nutrient poolswere highest from all the three treatments (-N, -P and -Si). Inaddition, due to the high grazing rate, there were significantcontributions of recycled nutrients (N, P and Si) on the potentialproduction of the phytoplankton at this site. There was also asmall portion of external P and Si contributions on the phyto-plankton growth. Comparatively, the phytoplankton growth atstation G3 was not significantly nutrient limited.
At station C6, the initially dominant phytoplankton species wasthe diatom Skeletonema dohrnii, which accounted for 80% of thecarbon biomass. The maximum growth rate (1.12370.015 d−1)
also coordinated well with the documented growth rate of thisspecies (1.065 to 1.253 d−1) (Sakshaug and Holm-Hansen, 1977)(Table 3). The grazing rate was only 0.392 d−1, significantly lowerthan the maximum growth rate. The apparent growth rate washighest in the -Si treatment (0.238 d−1), and lowest in the -Ntreatment (0.060 d−1) (Table 4), suggesting that Si is not limitingthe phytoplankton growth, consistent with the high Si: N ratio inthe initially sampled seawater (1.21, Table 1). The potentialproduction coefficients in Table 5 suggest that the only recyclednutrient contribution was from the -P incubation. Internal andexternal contributions were found in all three nutrient treatments.
At station BM1, the initial sampling at this site was carried out inthe middle of bloom at the time-serial station BM1. The phyto-plankton community was composed mainly of the diatom Thalas-sionema nitzschioides (∼45% of carbon biomass), Thalassiosira rotula
0.0 .2 .4 .6 .8 1.0
Mea
n G
row
th R
ate
(d-1
)
.2
.4
.6
.8
1.0
1.2
1.4
.2 .4 .6 .8 1.0.2
.4
.6
.8
1.0
1.2
1.4
.2 .4 .6 .8 1.0
Mea
n G
row
th R
ate
(d-1
)
.2
.4
.6
.8
1.0
1.2
1.4
.2 .4 .6 .8 1.0.2
.4
.6
.8
1.0
1.2
1.4
Dilution Factor.2 .4 .6 .8 1.0
Mea
n G
row
th R
ate
(d-1
)
.2
.4
.6
.8
1.0
1.2
1.4
Dilution Factor.2 .4 .6 .8 1.0
.2
.4
.6
.8
1.0
1.2
1.4
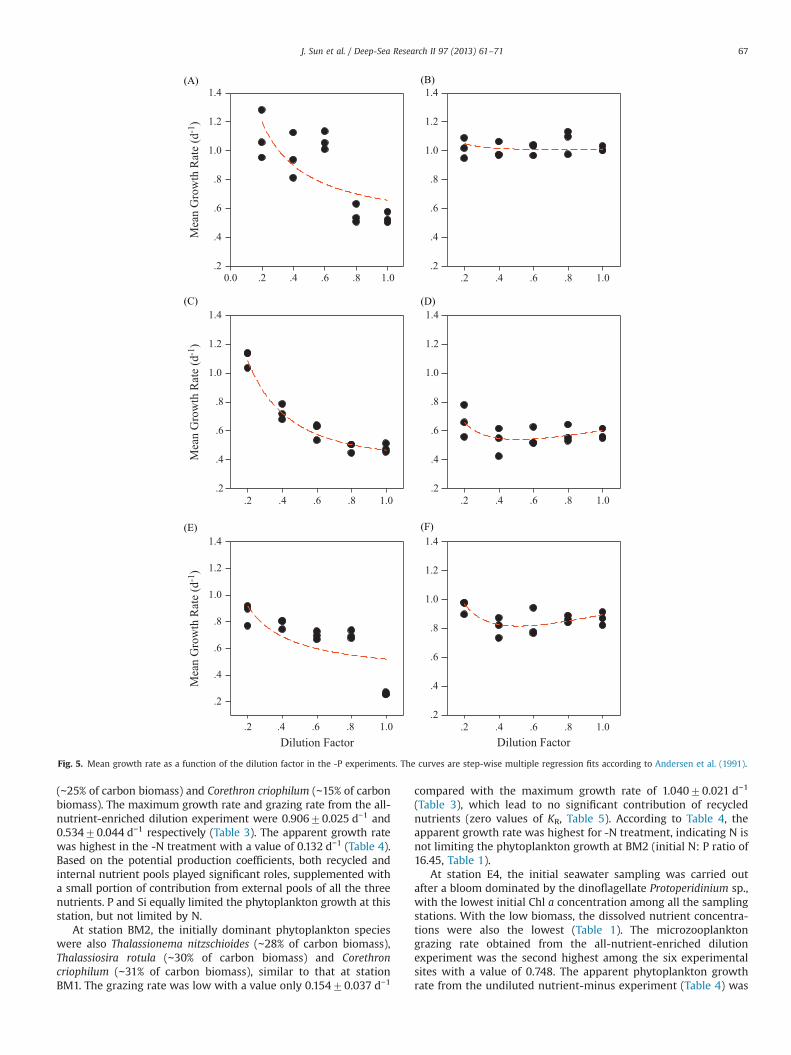
Fig. 5. Mean growth rate as a function of the dilution factor in the -P experiments. The curves are step-wise multiple regression fits according to Andersen et al. (1991).
J. Sun et al. / Deep-Sea Research II 97 (2013) 61–71 67
(∼25% of carbon biomass) and Corethron criophilum (∼15% of carbonbiomass). The maximum growth rate and grazing rate from the all-nutrient-enriched dilution experiment were 0.90670.025 d−1 and0.53470.044 d−1 respectively (Table 3). The apparent growth ratewas highest in the -N treatment with a value of 0.132 d−1 (Table 4).Based on the potential production coefficients, both recycled andinternal nutrient pools played significant roles, supplemented witha small portion of contribution from external pools of all the threenutrients. P and Si equally limited the phytoplankton growth at thisstation, but not limited by N.
At station BM2, the initially dominant phytoplankton specieswere also Thalassionema nitzschioides (∼28% of carbon biomass),Thalassiosira rotula (∼30% of carbon biomass) and Corethroncriophilum (∼31% of carbon biomass), similar to that at stationBM1. The grazing rate was low with a value only 0.15470.037 d−1
compared with the maximum growth rate of 1.04070.021 d−1
(Table 3), which lead to no significant contribution of recyclednutrients (zero values of KR, Table 5). According to Table 4, theapparent growth rate was highest for -N treatment, indicating N isnot limiting the phytoplankton growth at BM2 (initial N: P ratio of16.45, Table 1).
At station E4, the initial seawater sampling was carried outafter a bloom dominated by the dinoflagellate Protoperidinium sp.,with the lowest initial Chl a concentration among all the samplingstations. With the low biomass, the dissolved nutrient concentra-tions were also the lowest (Table 1). The microzooplanktongrazing rate obtained from the all-nutrient-enriched dilutionexperiment was the second highest among the six experimentalsites with a value of 0.748. The apparent phytoplankton growthrate from the undiluted nutrient-minus experiment (Table 4) was
0.0 .2 .4 .6 .8 1.0
Mea
n G
row
th R
ate
(d-1
)
.4
.6
.8
1.0
1.2
1.4
0.0 .2 .4 .6 .8 1.0 1.2.4
.6
.8
1.0
1.2
1.4
.2 .4 .6 .8 1.0
Mea
n G
row
th R
ate
(d-1
)
.4
.6
.8
1.0
1.2
1.4
.2 .4 .6 .8 1.0.4
.6
.8
1.0
1.2
1.4
Dilution Factor.2 .4 .6 .8 1.0
Mea
n G
row
th R
ate
(d-1
)
.4
.6
.8
1.0
1.2
1.4
Dilution Factor.2 .4 .6 .8 1.0
.4
.6
.8
1.0
1.2
1.4
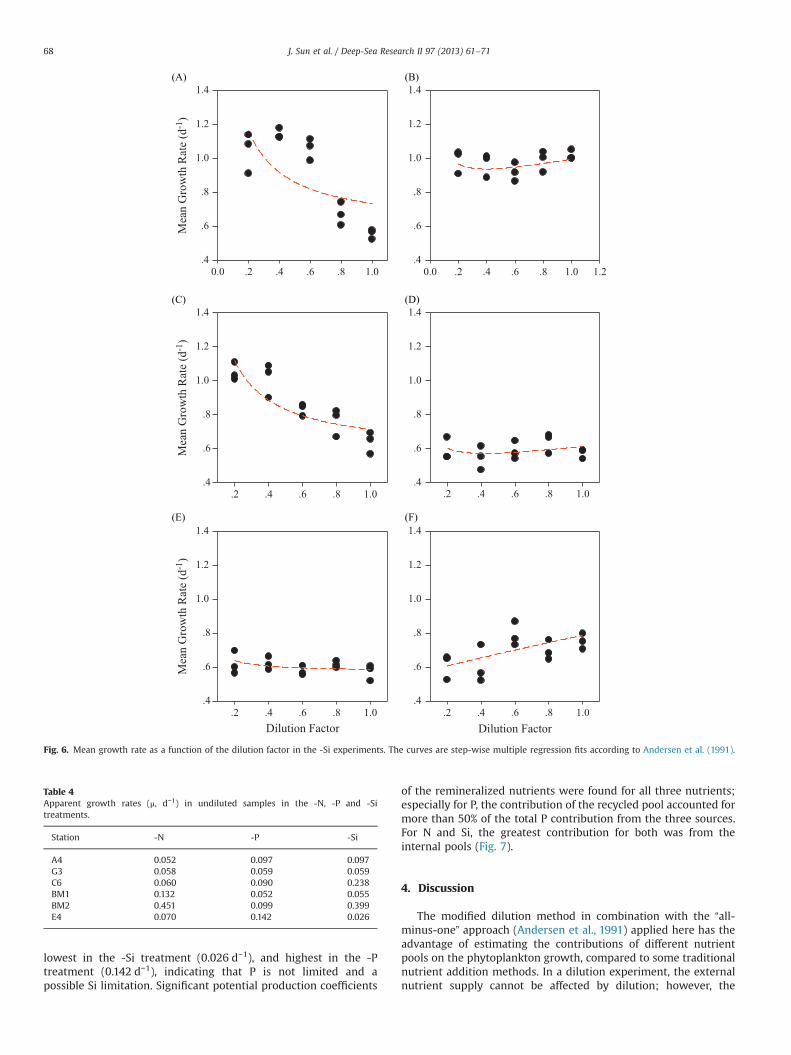
Fig. 6. Mean growth rate as a function of the dilution factor in the -Si experiments. The curves are step-wise multiple regression fits according to Andersen et al. (1991).
Table 4Apparent growth rates (μ, d−1) in undiluted samples in the -N, -P and -Sitreatments.
Station -N -P -Si
A4 0.052 0.097 0.097G3 0.058 0.059 0.059C6 0.060 0.090 0.238BM1 0.132 0.052 0.055BM2 0.451 0.099 0.399E4 0.070 0.142 0.026
J. Sun et al. / Deep-Sea Research II 97 (2013) 61–7168
lowest in the -Si treatment (0.026 d−1), and highest in the -Ptreatment (0.142 d−1), indicating that P is not limited and apossible Si limitation. Significant potential production coefficients
of the remineralized nutrients were found for all three nutrients;especially for P, the contribution of the recycled pool accounted formore than 50% of the total P contribution from the three sources.For N and Si, the greatest contribution for both was from theinternal pools (Fig. 7).
4. Discussion
The modified dilution method in combination with the “all-minus-one” approach (Andersen et al., 1991) applied here has theadvantage of estimating the contributions of different nutrientpools on the phytoplankton growth, compared to some traditionalnutrient addition methods. In a dilution experiment, the externalnutrient supply cannot be affected by dilution; however, the
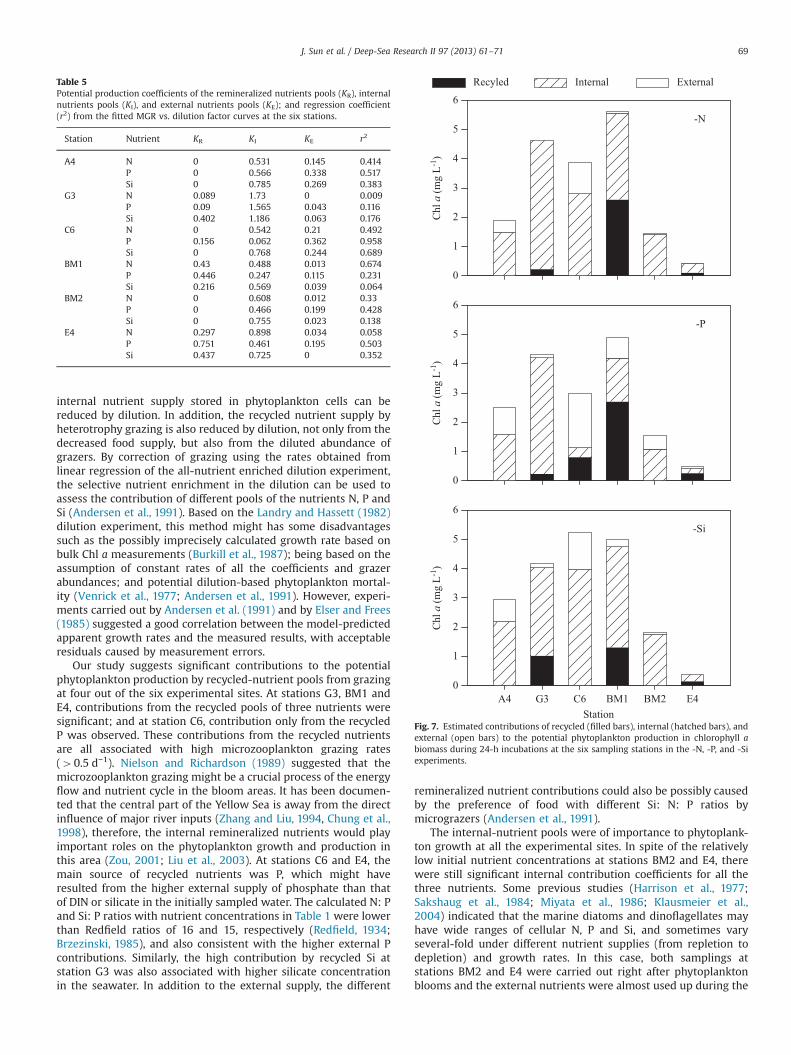
Table 5Potential production coefficients of the remineralized nutrients pools (KR), internalnutrients pools (KI), and external nutrients pools (KE); and regression coefficient(r2) from the fitted MGR vs. dilution factor curves at the six stations.
Station Nutrient KR KI KE r2
A4 N 0 0.531 0.145 0.414P 0 0.566 0.338 0.517Si 0 0.785 0.269 0.383
G3 N 0.089 1.73 0 0.009P 0.09 1.565 0.043 0.116Si 0.402 1.186 0.063 0.176
C6 N 0 0.542 0.21 0.492P 0.156 0.062 0.362 0.958Si 0 0.768 0.244 0.689
BM1 N 0.43 0.488 0.013 0.674P 0.446 0.247 0.115 0.231Si 0.216 0.569 0.039 0.064
BM2 N 0 0.608 0.012 0.33P 0 0.466 0.199 0.428Si 0 0.755 0.023 0.138
E4 N 0.297 0.898 0.034 0.058P 0.751 0.461 0.195 0.503Si 0.437 0.725 0 0.352
-Si
StationA4 G3 C6 BM1 BM2 E4
Chl
a (m
g L-1
)
0
1
2
3
4
5
6
-N
Chl
a (m
g L-1
)
0
1
2
3
4
5
6
-P
Chl
a (m
g L-1
)
0
1
2
3
4
5
6
Recyled Internal External
Fig. 7. Estimated contributions of recycled (filled bars), internal (hatched bars), andexternal (open bars) to the potential phytoplankton production in chlorophyll abiomass during 24-h incubations at the six sampling stations in the -N, -P, and -Siexperiments.
J. Sun et al. / Deep-Sea Research II 97 (2013) 61–71 69
internal nutrient supply stored in phytoplankton cells can bereduced by dilution. In addition, the recycled nutrient supply byheterotrophy grazing is also reduced by dilution, not only from thedecreased food supply, but also from the diluted abundance ofgrazers. By correction of grazing using the rates obtained fromlinear regression of the all-nutrient enriched dilution experiment,the selective nutrient enrichment in the dilution can be used toassess the contribution of different pools of the nutrients N, P andSi (Andersen et al., 1991). Based on the Landry and Hassett (1982)dilution experiment, this method might has some disadvantagessuch as the possibly imprecisely calculated growth rate based onbulk Chl a measurements (Burkill et al., 1987); being based on theassumption of constant rates of all the coefficients and grazerabundances; and potential dilution-based phytoplankton mortal-ity (Venrick et al., 1977; Andersen et al., 1991). However, experi-ments carried out by Andersen et al. (1991) and by Elser and Frees(1985) suggested a good correlation between the model-predictedapparent growth rates and the measured results, with acceptableresiduals caused by measurement errors.
Our study suggests significant contributions to the potentialphytoplankton production by recycled-nutrient pools from grazingat four out of the six experimental sites. At stations G3, BM1 andE4, contributions from the recycled pools of three nutrients weresignificant; and at station C6, contribution only from the recycledP was observed. These contributions from the recycled nutrientsare all associated with high microzooplankton grazing rates(40.5 d−1). Nielson and Richardson (1989) suggested that themicrozooplankton grazing might be a crucial process of the energyflow and nutrient cycle in the bloom areas. It has been documen-ted that the central part of the Yellow Sea is away from the directinfluence of major river inputs (Zhang and Liu, 1994, Chung et al.,1998), therefore, the internal remineralized nutrients would playimportant roles on the phytoplankton growth and production inthis area (Zou, 2001; Liu et al., 2003). At stations C6 and E4, themain source of recycled nutrients was P, which might haveresulted from the higher external supply of phosphate than thatof DIN or silicate in the initially sampled water. The calculated N: Pand Si: P ratios with nutrient concentrations in Table 1 were lowerthan Redfield ratios of 16 and 15, respectively (Redfield, 1934;Brzezinski, 1985), and also consistent with the higher external Pcontributions. Similarly, the high contribution by recycled Si atstation G3 was also associated with higher silicate concentrationin the seawater. In addition to the external supply, the different
remineralized nutrient contributions could also be possibly causedby the preference of food with different Si: N: P ratios bymicrograzers (Andersen et al., 1991).
The internal-nutrient pools were of importance to phytoplank-ton growth at all the experimental sites. In spite of the relativelylow initial nutrient concentrations at stations BM2 and E4, therewere still significant internal contribution coefficients for all thethree nutrients. Some previous studies (Harrison et al., 1977;Sakshaug et al., 1984; Miyata et al., 1986; Klausmeier et al.,2004) indicated that the marine diatoms and dinoflagellates mayhave wide ranges of cellular N, P and Si, and sometimes varyseveral-fold under different nutrient supplies (from repletion todepletion) and growth rates. In this case, both samplings atstations BM2 and E4 were carried out right after phytoplanktonblooms and the external nutrients were almost used up during the
J. Sun et al. / Deep-Sea Research II 97 (2013) 61–7170
bloom period (with high biomass), and this may be the reason thatstored intercellular nutrients became the most important contri-bution to the post-bloom phytoplankton growth (with lower Chl abiomass and high C: Chl a ratios).
Significant contribution coefficients of the external nutrientpools were found almost at all the sampling stations, except for Nexperiment at G3 and Si experiment at station E4. During thesampling at station E4, the dominant group was dinoflagellates atthe post bloom phase, with low external silicate concentration inthe seawater, which explains the zero potential production coeffi-cients of external Si. However, at station G3, the external DINconcentration was the highest among all the sampling sites.Similarly, the contribution by external P and Si were also relativelylow in spite of high concentrations of silicate and phosphate. Thismight be caused by the high storage of intercellular nutrients ofthe phytoplankton cells. Relative higher potential productioncoefficients of external nutrients were observed at stations A4and C6, with high phytoplankton intrinsic growth rates and lowgrazing rates, indicating the exponential growth phase of thephytoplankton cells prior to the spring bloom.
Interestingly, although the dominant groups at stations A4 andE4 were dinoflagellates, we observed significant potential con-tribution coefficients of Si on phytoplankton production for bothsites (internal and external contributions for station A4, andrecycled and internal contributions in the case of station E4). Asmentioned, the station A4 sampling was taken before the bloom,the silicate concentration in the seawater was also relatively high,so that the diatom cells still had the potential to bloom. The stationE4 sampling was carried after a bloom, and based on the lowinitial Chl a concentration, the recession of the dinoflagellatebloom is assumed. The internal stored Si and remineralized Sifrom the microzooplankton grazing became the main siliconsource for the potential diatom growth in the community.
This research reports not only the contributions of the threenutrients N, P, and Si on the potential phytoplankton production,but also the contributions from different nutrient pools in theYellow Sea spring bloom area. In general, the external nutrientpools of all three nutrient sources play the most significant role forthe phytoplankton production in the sampling area, indicating thatthe ability of nutrient storage in the spring bloom phytoplanktoncells might be a strategy to win in the bloom area. Nutrientremineralization is also of importance under intense microzoo-plankton grazing, especially during the post-bloom phase. Inaddition, the unbalanced contributions of recycled and externalnutrient pools to the growth imply a possible difference in theheterogeneity and the cell quota supply of nutrients; the differ-ence in the significance of the different nutrient sources amongdifferent experiments might help us to interpret the nutrientlimitation in situ at the sampling stations (Elser and Frees, 1985).Furthermore, the results presented here provide some usefulinformation on considering the bottom-up control factors in theYellow Sea spring bloom area, and are necessary complements tothe general ways to determine nutrient limitations.
Acknowledgments
The authors would like to thank the crew and captain of the R/VBeidou for the logistic support during the cruise. This study wassupported by the National Basic Research Program of China(No. 2006CB400605, 2011CB409804), and National Natural ScienceFoundation of China (Nos. 41176136, 41276124, 40776093 and40676089), and Program for New Century Excellent Talents inUniversity (No. NCET-12-1065) to Jun Sun. The authors would alsolike to thank Dr Ian Jenkinson for helpful comments.
References
Andersen, T., Schartau, A.K.L., Paasche, E., 1991. Quantifying external and internalnitrogen and phosphorus pools, as well as nitrogen and phosphorus suppliedthrough remineralization, in coastal marine plankton by means of a dilutiontechnique. Mar. Ecol.-Prog. Ser. 69, 67–80.
Banse, K., 1977. Determining the carbon-to-chlorophyll ratio of natural phytoplank-ton. Mar. Biol. 41, 199–212.
Brzezinski, M.A., 1985. The Si:C:N ratio of marine diatoms: interspecific variabilityand the effect of some environmental variables. J. Phycol. 21, 347–357.
Burkill, P.H., Mantoura, R.F.C., Llewellyn, C.A., Owens, N.J.P., 1987. Microzooplanktongrazing and selectivity of phytoplankton in coastal waters. Mar. Biol. 93, 581–590.
Chen, H., Chen, S., Zhang, J., Liu, S., Wu, Q., 2002. Distribution and changes onspecification of phosphorus in the Yellow Sea. Mar. Environ. Sci. 21, 9–13, in Chinese.
Chung, C.S., Hong, G.H., Kim, S.H., Lim, J.H., Park, J.K., Yang, D.B., 1998. Shore basedobservation on wet deposition of inorganic nutrients in the Korean Yellow Seacoast. The Yellow Sea 4, 30–39.
Cloern, J.E., 1995. An empirical model of the phytoplankton chlorophyll: carbonratio—the conversion factor between productivity and growth rate. Limnol.Oceanogr. 40, 1313–1321.
Elser, J.J., Frees, D.L., 1985. Microconsumer grazing and sources of limiting nutrientsfor phytoplankton growth: application and complications of a nutrient-dele-tion/dilution-gradient technique. Limnol. Oceanogr. 40, 1–16.
Eppley, R.W., Reid, F.M.H., Stickland, J.D.H., 1970. Estimates of phytoplankton cropsize, growth rate and primary production. Bull. Scripps Inst. Oceanogr. Univ.Calif 17, 33–42.
Gilbert, P.M., 1988. Primary productivity and pelagic nitrogen cycling. In: Blackburn,T.H., Sorensen, J. (Eds.), Nitrogen Cycling in Coastal Marine Environments.Wiley, Chichester, pp. 3–31.
Harrison, P.J., Conway, H.L., Holmes, R.W., Davis, C.O., 1977. Marine diatoms grownin chemostat under silicate or ammonium limitation. III. Cellular chemicalcomposition and morphology of Chaetoceros debilis, Skeletonema costatum, andThalassiosira gravida. Mar. Biol. 43, 19–31.
Harrison, W.G., 1983. Uptake and recycling of soluble reactive phosphorus bymarine microplankton. Mar. Ecol.-Prog. Ser. 10, 127–135.
Hyun, J.-H., Kim, K.-H., 2003. Bacterial abundance and production during theunique spring phytoplankton bloom in the central Yellow Sea. Mar. Ecol.-Prog.Ser. 252, 77–88.
KORDI (Korea Ocean Research and Development Institute), 1998. Study on WaterCirculation and Material Flux in Yellow Sea. KORDI, Ansan.
Klausmeier, C.A., Litchman, E., Levin, S.A., 2004. Phytoplankton growth andstoichiometry under multiple nutrient limitation. Limnol. Oceanogr. 49,1463–1470.
Landry, M.R., Hassett, R.P., 1982. Estimating the grazing impact of marine mcro-zooplankton. Mar. Biol. 67, 283–288.
Lie, H.J., 1984. A note on water masses and general circulation in the Yellow Sea(Hwanghae). J. Oceanol. Soc. Korea 19, 187–194.
Lin, C., Ning, X., Su, J., Lin, Y., Xu, B., 2005. Environmental changes and the responsesof the ecosystems of the Yellow Sea during 1976–2000. J. Mar. Syst. 55,223–234.
Liu, S.M., Zhang, J., Chen, S.Z., Chen, H.T., Hong, G.H., Wei, H., Wu, Q.M., 2003.Inventory of nutrient compounds in the Yellow Sea. Cont. Shelf Res. 23,1161–1174.
Marinho, M.M., Rodrigues, S.V., 2003. Phytoplankton of an eutrophic tropicalreservoir: comparison of biomass estimated from counts with chlorophyll-abiomass from HPLC measurements. Hydrobiologia 505, 77–88.
Marshall, S.M., 1969. Protozoa, order Tintinnia. Conseil International pour l'Exploration de la Mer. Fiches d'Indentification de Zooplancton, fiches, 117–127.
Miyata, K., Hattori, A., Ohtsuki, A., 1986. Variation of cellular phosphorus composi-tion of Skeletonema costatum and Heterosigma akashiwo grown in chemostats.Mar. Biol. 93, 291–297.
Nielson, T.G., Richardson, K., 1989. Food chain structure of the North Sea planktoncommunities: seasonal variations of the role of the microbial loop. Mar. Ecol.-Prog. Ser. 56, 75–87.
Popovich, C.A., Gayoso, A.M., 1999. Effect of irradiance and temperature on thegrowth of Thalassiosira curviserita Takano (Bacillariophycea), a bloom diatomin Bahia Blanca estuary (Argentina). J. Plankton Res. 21, 1101–1110.
Redfield, A.C., 1934. On the proportions of organic derivations in sea water andtheir relation to the composition of plankton. In: Daniel, R.J. (Ed.), JamesJohnstone Memorial Volume. University Press of Liverpool, pp. 177–192.
Sakshaug, E., Holm-Hansen, O., 1977. Chemical composition of Skeletonemacostatum (Grev.) Cleve and Pavlova (Monochrysis) lutheri (Droop) green as afunction of nitrate-, phosphate-, and iron-limited growth. J. Exp. Mar. Biol. Ecol.29, 1–34.
Sakshaug, E., Graneli, E., Elbrachter, M., Kayser, H., 1984. Chemical composition andalkaline phosphatase activity of nutrient-saturated and P-deficient cells of fourmarine dinoflagellates. J. Exp. Mar. Biol. Ecol. 77, 241–254.
Schlüter, L., 1998. The influence of nutrient addition on growth rates of phyto-plankton groups, mircrozooplankton grazing rates in a mesocosm experiment.J. Exp. Mar. Biol. Ecol. 228, 53–71.
Sun, J., Liu, Y., 2003. Geometric models for calculating cell biovolume and surfacearea for phytoplankton. J. Plankton Res. 25, 1331–1346.
Sun, J., Feng, Y., Zhang, Y., Hutchins, D.A., 2007. Fast microzooplankton grazing on fast-growing, low-biomass phytoplankton: a case study in spring in Chesapeake Bay,Delaware Inland Bays and Delaware Bay. Hydrobiologia 589, 127–139.

J. Sun et al. / Deep-Sea Research II 97 (2013) 61–71 71
Tomas, C.R., 1997. Identifying Marine Phytoplankton. Academic Press, London, UK,pp. 1–858.
Turner, R.E., 2002. Element ratios and aquatic food webs. Estuaries 25, 694–703.Utermöhl, H., 1958. Zur Vervollkommnung der quantitativen Phytoplankton-Methodik
Mitteilungen Internationale Vereinigung Theoretische und Angewandte. Limnologie9, 1–38.
Venrick, E.L., Beers, J.R., Heinbokel, J.F., 1977. Possible consequences of containingmicroplankton for physiological rate measurements. J. Exp. Mar. Biol. Ecol. 26,55–76.
Wang, B., Wang, G., Chung, C., Liang, D., 1999. Distribution features of bioactiveelements in seawater in the southern Yellow Sea in winter. J. Oceanogr.Huanghai Boai Seas 17, 40–45, in Chinese.
Wei, X., Tong, J., Li, Y., 1993. The pollution status of the Huanghai Sea and itsinfluence on ecosystem. J. Oceanogr. Huanghai Bohai Seas 11, 76–82, in Chinese.
Welschmeyer, N.A., 1994. Fluorometric analysis of chlorophyll a in the presence ofchlorophyll b and pheopigments. Limnol. Oceanogr. 39, 1985–1992.
Zhang, J., Liu, M.G., 1994. Observations of nutrient elements and sulphate inatmospheric wet depositions over the Northwest pacific coastal oceans—Yellow Sea. Mar. Chem. 47, 173–189.
Zou, L., 2001. An experimental study on the relationship between nutrients andphytoplankton in the coastal waters of North China. Ph.D. Thesis, OceanUniversity of Qingdao, Qingdao, P.R. China, 134 pp.