iso phase 2 benchmarking iso 19905-1 (dis) validity ... - dnv
TRANSCRIPT
Noble House
39 Tabernacle Street London
EC2A 4AA
Phone +44 20 7812 8700 Fax +44 20 7812 8701
www.gl-nobledenton.com
File: l25316-r0 - iso validity check of kfels b class.doc
Noble Denton Consultants Ltd trading as GL Noble Denton Registered in England No. 5513434 Registered Office: Noble House, 39 Tabernacle Street, London, EC2A 4AA, UK
Distribution: ISO Committee Company: ABS Attn: Mr John Stiff Attn: W/S No: 05-130553 CTR 0
REPORT
ISO PHASE 2 BENCHMARKING
ISO 19905-1 (DIS)
VALIDITY CHECK
KFELS B CLASS
Report No: L25316 , Rev O , Dated 20-11-2010
The assessment has used adjusted leg-to-hull connection stiffness and other generic parameters of KFELS B-Class jack-up units. The results presented herein are for the purposes of benchmarking alone and are not representative of KFELS
B-Class jack-up units.

PHASE 2 BENCHMARKING
VALIDITY CHECK FOR KFELS B CLASS ISO 19905-1 (DIS)
W/S No: CTR: 05-130553 0
Page 2 of 89
Report No: L25316 , Revision 0: O , Dated: 20th November 2010
File: L25316-R0 - ISO validity check of KFELS B Class.doc
REVISION DETAILS
Revision Date Description Author Checker Approver
0 20th Nov 10 Initial Issue YH MLH/ARM MJRH
DESCRIPTION OF CHANGES
Revision Section Change
INSERTED DOCUMENT/FILE REGISTER
Path and Filename Details of File
PHASE 2 BENCHMARKING
VALIDITY CHECK FOR KFELS B CLASS ISO 19905-1 (DIS)
W/S No: CTR: 05-130553 0
Page 3 of 89
Report No: L25316 , Revision 0: O , Dated: 20th November 2010
File: L25316-R0 - ISO validity check of KFELS B Class.doc
CONTENTS
SECTION PAGE
1 EXECUTIVE SUMMARY 8
2 SCOPE OF WORK 9
2.1 INTRODUCTION 9 2.2 SCOPE OF WORK 9 3 SITE SPECIFIC ASSESSMENT OF THE KFELS B CLASS 11
3.1 GENERAL 11 3.3 ASSESSMENT SITUATIONS 13 3.4 RIG DATA 13 3.5 SITE DATA 14 3.6 METOCEAN DATA 14 3.7 MINIMUM HULL ELEVATION CHECK 15 3.8 GEOTECHNICAL AND GEOPHYSICAL DATA 15 3.9 LEG LENGTH RESERVE CHECK 16 3.10 LEG AND SPUDCAN BUOYANCY 16 3.11 HYDRODYNAMIC COEFFICIENTS 17 4 ALIGNMENT POINTS AND COMMENTS 22
4.1 GENERAL 22 4.2 ALIGNMENT POINT 1 - GEOTECHNICAL CALCULATIONS 22 4.3 ALIGNMENT POINT 2 - OVERALL SYSTEM CHECKS 27 4.4 ALIGNMENT POINT 3 - ENVIRONMENTAL LOADINGS 34 4.5 ALIGNMENT POINT 4 - STICK MODEL RESPONSES 38 4.6 ALIGNMENT POINT 5 - FINAL ASSESSMENT RESULTS 44 5 ISO / SNAME COMPARISON 48
5.1 INTRODUCTION 48 5.2 FOUNDATION INPUT PARAMETERS 48 5.3 NATURAL PERIODS 49 5.4 SWAY STIFFNESS 49 5.5 WIND LOADS 50 5.6 WAVE LOADS 51 5.7 DYNAMIC AMPLIFICATION FACTORS (DAF’S) 52 5.8 INERTIA LOADSETS 53 5.9 TOTAL QUASI-STATIC LOADING 54 5.10 UTILISATION CHECKS 57 5.11 CONCLUSION 58
REFERENCES 62
PHASE 2 BENCHMARKING
VALIDITY CHECK FOR KFELS B CLASS ISO 19905-1 (DIS)
W/S No: CTR: 05-130553 0
Page 4 of 89
Report No: L25316 , Revision 0: O , Dated: 20th November 2010
File: L25316-R0 - ISO validity check of KFELS B Class.doc
APPENDIX A COMMENTS SUBMITTED TO ISO 75
APPENDIX B FINAL QUASI-STATIC RESULTS COMPARISON OF ISO & SNAME RESULTS TO ISO USING SNAME WIND 89
PHASE 2 BENCHMARKING
VALIDITY CHECK FOR KFELS B CLASS ISO 19905-1 (DIS)
W/S No: CTR: 05-130553 0
Page 5 of 89
Report No: L25316 , Revision 0: O , Dated: 20th November 2010
File: L25316-R0 - ISO validity check of KFELS B Class.doc
FIGURES
Figure 3-1 Flow chart for the overall assessment 12
Figure 3-2 Chord section axes system 20
Figure 4-1: 3 Stick Leg Model (showing hull beam grillage) 30
Figure 4-2: Example portion of F.E. Model of Leg 31
Figure 5-1 - ISO predicted leg penetration resistance curves for the B-Class - SAND assessment 63
Figure 5-2 - SNAME predicted leg penetration resistance curves for the B-Class - SAND assessment 64
Figure 5-3 - ISO predicted V-H envelope for the B-Class - SAND assessment 65
Figure 5-4 - SNAME predicted V-H envelope for the B-Class - SAND assessment 66
Figure 5-5 - ISO predicted ultimate capacities and stiffnesses for the B-Class - SAND assessment 67
Figure 5-6 - SNAME predicted ultimate capacities and stiffnesses for the B-Class - SAND assessment 68
Figure 5-7 - ISO predicted leg penetration resistance curves for the B-Class - CLAY assessment 69
Figure 5-8 - SNAME predicted leg penetration resistance curves for the B-Class - CLAY assessment 70
Figure 5-9 - ISO predicted V-H envelope for the B-Class - CLAY assessment 71
Figure 5-10 - SNAME predicted V-H envelope for the B-Class - CLAY assessment 72
Figure 5-11 - ISO predicted ultimate capacities and stiffnesses for the B-Class - CLAY assessment 73
Figure 5-12 - SNAME predicted ultimate capacities and stiffnesses for the B-Class - CLAY assessment 74
PHASE 2 BENCHMARKING
VALIDITY CHECK FOR KFELS B CLASS ISO 19905-1 (DIS)
W/S No: CTR: 05-130553 0
Page 6 of 89
Report No: L25316 , Revision 0: O , Dated: 20th November 2010
File: L25316-R0 - ISO validity check of KFELS B Class.doc
TABLES
Table 3-1 Assessment Situations of the Unit 13
Table 3-2 Assembled Rig Data 13
Table 3-3 Assembled Site Data 14
Table 3-4 Assembled Metocean Data 14 [1]
Table 3-5 Hull Elevation Check 15
Table 3-6 Assembled Foundation Data 15 [1]
Table 3-7 Leg Length Reserve Check 16
Table 3-8 Leg & Spudcan Buoyancy 16
Table 3-9 Hydrodynamic Surface Condition Levels 17
Table 3-10 Hydrodynamic Leg Sections for Site 1 (sand) 17
Table 3-11 Hydrodynamic Leg Sections for Site 2 (clay) 18
Table 3-12 Member Details for Hydrodynamics calculations 18
Table 3-13 Base Hydrodynamic Coefficients for Tubulars 19
Table 3-14 Chord hydrodynamic coefficients 20
Table 3-15 Equivalent Hydrodynamic Coefficients for Stick Leg Model 21
Table 4-1 Summary of Site 1 (sand) assessment key inputs and outputs from analyses 22
Table 4-2 Summary of Site 2 (clay) foundation key inputs and outputs from analyses 24
Table 4-3 Leg Length Reserve Check 27
Table 4-4 Wind Area Calculations (m ) 27 2
Table 4-5 Equivalent Hydrodynamic Coefficients for Stick Leg Model for Site 1 28
Table 4-6 Equivalent Hydrodynamic Coefficients for Stick Leg Model for Site 2 29
Table 4-7 Linear Natural Periods for hull sway condition (max hull weight = 10 070 tonnes) 31
Table 4-8 Natural Periods Alignment 32
Table 4-9 Hull Displacements and Sway Stiffness 32
Table 4-10 Footing reactions from gravity loadcase 33
Table 4-11 Wind Loads 34
Table 4-12 GLND vs BASS Wind Loads 35
Table 4-13 Wave / Current Loads (LF=1,15) 35
Table 4-14 Summary of actions considered 36
Table 4-15 DAF from the Dynamic MPME (Hull Weight = 10069,8t) 37 R
Table 4-16 DAF from the Dynamic MPME (Hull Weight = 8770,3t) 37 R
Table 4-17 DAF Alignment (Hull Weight = 10069,8t) 37 R
Table 4-18 Inertia Loads (LF=1.15) 38
Table 4-19 Inertia Loads Alignment (Hull Weight = 10069,8t) 38
Table 4-20 Total Loading Alignment (Hull Weight = 10069,8t) 39
Table 4-21 Hull Sways (m) 39
Table 4-22 Hull Sways Alignment (m) (Hull Weight = 10069,8t) 39
PHASE 2 BENCHMARKING
VALIDITY CHECK FOR KFELS B CLASS ISO 19905-1 (DIS)
W/S No: CTR: 05-130553 0
Page 7 of 89
Report No: L25316 , Revision 0: O , Dated: 20th November 2010
File: L25316-R0 - ISO validity check of KFELS B Class.doc
Table 4-23 Footing Reactions for Site 1: Sand 40
Table 4-24 Footing Reactions for Site 1: Sand, Alignment (Hull Weight = 10069,8t) 40
Table 4-25 Footing Reactions at Site 2: Clay 41
Table 4-26 Footing Reactions at Site 2: Clay, Alignment (Hull Weight = 10069,8t) 41
Table 4-27 Lower Guide Reactions at Site 1: Sand 42
Table 4-28 Lower Guide Reactions at Site 2: Clay 43
Table 4-29 Footing Reactions from the Global Responses (Site: SAND; Units: MN) 44
Table 4-30 Footing Reactions from the Global Responses (Site: CLAY; Units: MN) 44
Table 4-31 Member Checks (Hull Weight = 10069,8t) 45
Table 4-32 Maximum Utilisations of the Chocks 46
Table 4-33 Final assessment results 46
Table 4-34 Final assessment results 47
Table 5-1 Foundation parameters 48
Table 5-2 Natural periods 49 [1]
Table 5-3 Wind loads 50
Table 5-4 Wave - Current Loads 51
Table 5-5 Averaged Dynamic amplification factors (DAFs) 52
Table 5-6 Inertia loadset 53
Table 5-7 Total quasi-static loading 54
Table 5-8 Hull sway 54
Table 5-9 Reactions in leg at base of rack chock - Maximum Hull Weight 55
Table 5-10 Reactions in leg at base of rack chock - Minimum Hull Weight 55
Table 5-11 Reactions at base of leg - Maximum Hull Weight 56
Table 5-12 Reactions at base of leg - Minimum Hull Weight 56
Table 5-13 Summary of critical structural utilisations - Site 1 (sand) 57
Table 5-14 Summary of critical structural utilisations - Site 2 (clay) 57
Table 5-15 Differences between ISO and SNAME 60
PHASE 2 BENCHMARKING
VALIDITY CHECK FOR KFELS B CLASS ISO 19905-1 (DIS)
W/S No: CTR: 05-130553 0
Page 8 of 89
Report No: L25316 , Revision 0: O , Dated: 20th November 2010
File: L25316-R0 - ISO validity check of KFELS B Class.doc
1.1
1.2
1.3
1.4
1.5
1.6
1.7
1.8
1.9
1 EXECUTIVE SUMMARY The purpose of this work is to undertake a complete run through of the entire Draft International Standard (DIS) ISO 19905-1 and to make numerical comparisons to ensure that the results obtained are on reasonable compliance with the results from a similar analysis to the SNAME bulletin 5-5A (Ref [1]), as “Phase 2” benchmarking of the proposed ISO 19905-1 DIS (Ref [2]) document used for Site Specific Assessment of Mobile Offshore Units.
This analysis has been designed to check the validity of the ISO 19905-1 DIS results through the study of a typical jack-up design, KFELS B Class unit using adjusted leg-to-hull connection stiffness values. Assessment has been completed at the two typical locations, comparing to SNAME bulletin 5-5A (Ref [1]) following the completeness check undertaken in “Phase 1” benchmarking (Ref [3]). It is noted that because the assessment has used adjusted leg-to-hull connection stiffness values, the results presented are for the purposes of benchmarking alone, and are not representative of the B Class
This analysis using the entire ISO 19905-1 DIS document included the initial steps of; overall considerations, assembling the data, determining the analysis methods at different stages, finite element (FE) modelling, response analyses and the final assessment of structural strength of leg members and foundation capacities, etc. Excel spreadsheets, generally recognised commercial FE software PAFEC and two in-house programs, the analytical tool JUSTAS and the PAFEC-based FE programme FORCE-3, have been used to assist the analysis.
For each step, both input and output data are explicitly presented and the methods applied are extensively explained so that the entire process of the analysis can be followed and repeated. The intermediate results from each step were cross-checked with the Bennett & Associates (BASS), the consultant running parallel analyses for this unit before continuing to the next step. Any discrepancy is reported and the reasons are explained.
The ISO assessment results are compared to assessment results based on SNAME bulletin 5-5A (Ref[1]), presented in Section 5.
Comments relating to the ISO document regarding errors, omissions and ambiguities are included in Appendix A
The results from this assessment show that assessment using the ISO 19905-1 approach has been found to be valid, with total loading condition similar to that of SNAME; slightly less onerous than SNAME for site 1 (sand), and near-identical or slightly more onerous than SNAME for site 2 (clay).
For site 1 (sand) this is generally reflected in the utilisations, where ISO generally shows similar results to those of SNAME for the basic assessment checks (overturning / preload). However, the different methodology to assessing leg strength checks and foundation bearing capacity checks in ISO results in improved utilisations.
For site 2 (deep penetration in clay) the results show ISO to be more onerous for overturning capacity (based on a slightly increased loading condition and larger hull sway), but otherwise shows lower utilisations than when compared to SNAME. ISO leg and holding system strength checks are based on checks that allow for greater capacity, and likewise the horizontal foundation capacity (used as basis for sliding capacity checks) is significantly larger when calculated to ISO than to SNAME
PHASE 2 BENCHMARKING
VALIDITY CHECK FOR KFELS B CLASS ISO 19905-1 (DIS)
W/S No: CTR: 05-130553 0
Page 9 of 89
Report No: L25316 , Revision 0: O , Dated: 20th November 2010
File: L25316-R0 - ISO validity check of KFELS B Class.doc
2.1
2.2
2 SCOPE OF WORK
INTRODUCTION
2.1.1 GL Noble Denton has been instructed by ABS, on behalf of the ISO benchmarking committee, to carry out the phase 2 benchmarking of the ISO 19905-1 “Petroleum and natural gas industries - Site-specific assessment of mobile offshore units - Part 1: Jack-Ups” (Draft Industry Standard) (ISO) (Ref [2]) which has been developed from SNAME bulletin 5-5A (Ref [1]).
2.1.2 The phase 2 benchmarking process involves the completion of a full site assessment analysis, running through the entire standard to check that the document is not only complete but that the specified methodology will yield reasonable and useful results. A comparison is also made with SNAME bulletin 5-5A Rev 3 (Ref [1]), with the inclusion of "SAGE fixity", from which the ISO document is derived. The intermediate results from each stage of the analysis have been checked against those calculated by Global Maritime, who have performed an identical analysis. Any differences have been resolved prior to recommencement of the analysis.
2.1.3 All questions which arose during the work and any clauses which caused doubt as to the exact methodology to follow are identified in the report with appropriate comments and the decisions which were made such that the analysis could be continued.
2.1.4 For the purpose of the benchmarking work, the use of in-house specialist programs normally used in routine assessment work has been avoided where possible with the results presented in open-format calculations, tables and graphs.
SCOPE OF WORK
2.2.1 The purpose of this work is to provide a validity check of the proposed ISO 19905-1 (DIS) (Ref [2]) document used for Site Specific Assessment of Mobile Offshore Units.
2.2.2 To perform this analysis a typical jack-up, location and metocean conditions were selected as shown below:
Jack-Up KFELS B Class unit
Location A typical sand foundation condition (Site 1)
A typical clay foundation condition (Site 2)
Metocean A 50-year extreme storm conditions based on operations manual design storm condition.
PHASE 2 BENCHMARKING
VALIDITY CHECK FOR KFELS B CLASS ISO 19905-1 (DIS)
W/S No: CTR: 05-130553 0
Page 10 of 89
Report No: L25316 , Revision 0: O , Dated: 20th November 2010
File: L25316-R0 - ISO validity check of KFELS B Class.doc
2.2.3 The analysis following the ISO document has been divided into 5 alignment points for step by step comparisons:
Alignment Point 1: Calculate the leg penetration and foundation spring stiffnesses for the two interpreted soils conditions, one sand and one clay.
Alignment Point 2: Undertake the overall system geometry checks, calculate the wind areas and leg hydrodynamic coefficients, prepare a model that complies with the requirements of the standard, calculate both a pinned natural period and one incorporating spudcan fixity and also determine sway stiffness to a ‘unit’ loading applied to the hull.
Alignment Point 3: Determine loading directions, develop quasi-static wind, wave and current loads and calculate the dynamic amplification factors.
Alignment Point 4: Calculate the structural response and summarise the breakdown of loadings (wind, wave-current, inertia) and responses (hull sway, footing reactions and forces in legs at base of rack chock).
Alignment Point 5 - Final results: Assess the strengths, addressing the effects of any additional penetration, develop the chord and bracing loads and utilisation checks for the leg members, holding system and any remaining limit states set out in the standard.
2.2.4 The deliverables include a report that details the findings of the study. Some specific items that need to be brought out in the report include:
Executive Summary.
Completed Tables with inputs and outputs.
Inputs and outputs of the complicated calculations
Intermediate results and comments.
Full comments and results at Alignment Points. The report shall include quantification of any differences in results between the two consultants and the significance of those differences.
Detailed analysis of differences between SNAME and ISO.
Commentary on clauses which caused confusion or that required making assumptions.

PHASE 2 BENCHMARKING
VALIDITY CHECK FOR KFELS B CLASS ISO 19905-1 (DIS)
W/S No: CTR: 05-130553 0
Page 11 of 89
Report No: L25316 , Revision 0: O , Dated: 20th November 2010
File: L25316-R0 - ISO validity check of KFELS B Class.doc
3.1
3.2
3 SITE SPECIFIC ASSESSMENT OF THE KFELS B CLASS
GENERAL
3.1.1 This site specific analysis is intended to follow the methods recommended in the ISO document while checking that the document is complete and generates reasonable results.
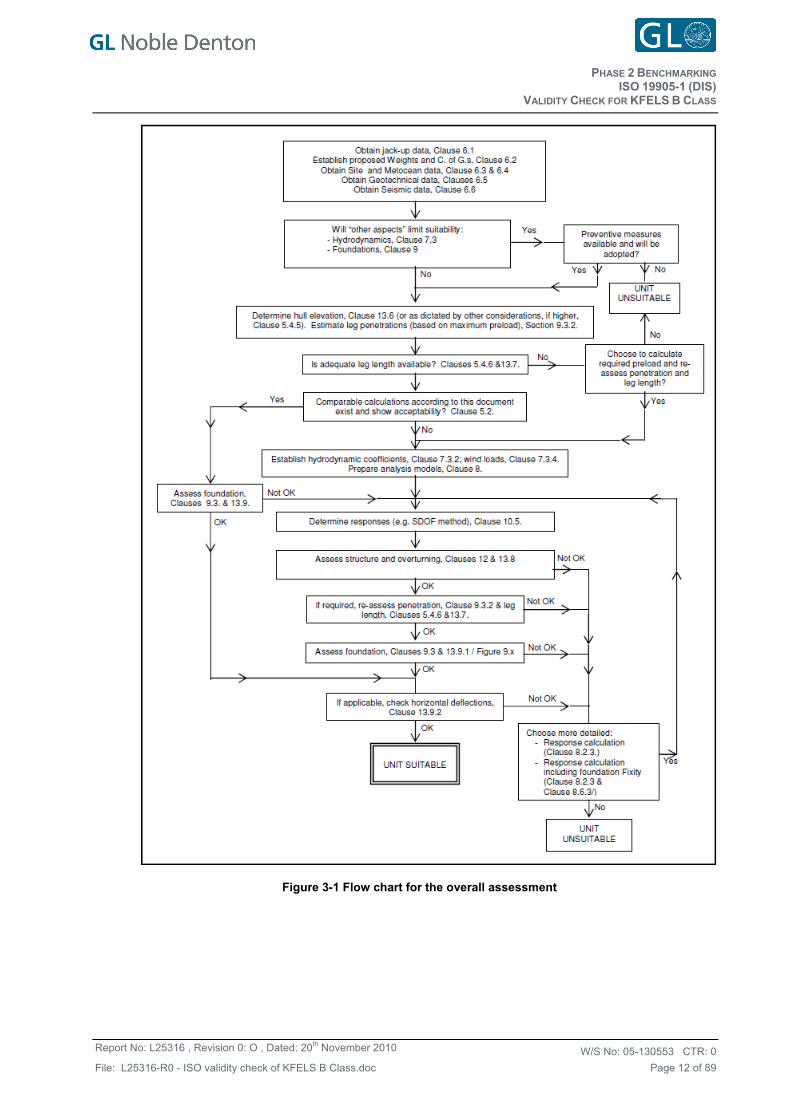
3.1.2 Figure 3-1 shows the flowchart from Figure 5.2-1 in the ISO document. It gives the guidance for a general analysis route and provides the basic structure of this analysis.
The site assessment analysis is based on an exemplary Keppel FELS B-Class jack-up unit adjusted leg-to-hull connection stiffness values, with the results at each alignment point cross checked with those of Bennet and Associates. The results at each alignment point along with those of Bennet and Associates and the equivalent SNAME analysis have been presented in the following sections. It is noted that because the assessment has used adjusted leg-to-hull connection stiffness values, the results presented are for the purposes of benchmarking alone, and are not representative of the B Class
PHASE 2 BENCHMARKING
VALIDITY CHECK FOR KFELS B CLASS ISO 19905-1 (DIS)
W/S No: CTR: 05-130553 0
Page 12 of 89
Report No: L25316 , Revision 0: O , Dated: 20th November 2010
File: L25316-R0 - ISO validity check of KFELS B Class.doc
Figure 3-1 Flow chart for the overall assessment
PHASE 2 BENCHMARKING
VALIDITY CHECK FOR KFELS B CLASS ISO 19905-1 (DIS)
W/S No: CTR: 05-130553 0
Page 13 of 89
Report No: L25316 , Revision 0: O , Dated: 20th November 2010
File: L25316-R0 - ISO validity check of KFELS B Class.doc
3.3 ASSESSMENT SITUATIONS
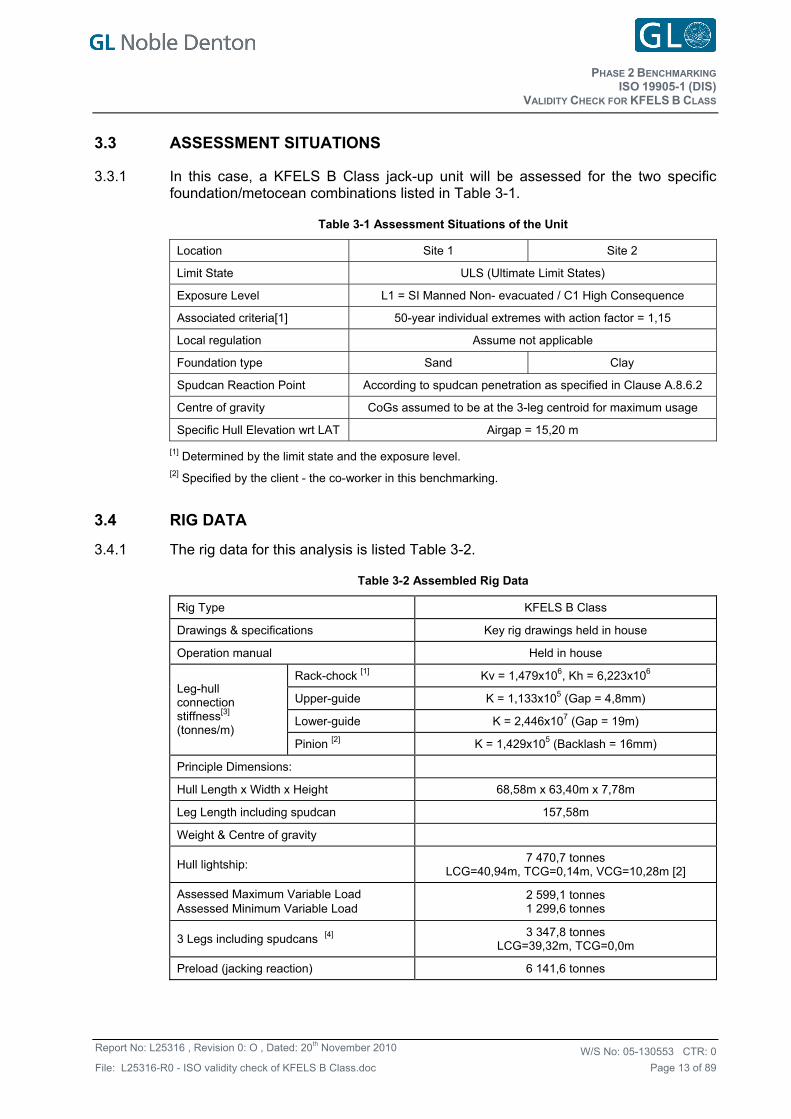
3.3.1 In this case, a KFELS B Class jack-up unit will be assessed for the two specific foundation/metocean combinations listed in Table 3-1.
Table 3-1 Assessment Situations of the Unit
Location Site 1 Site 2
Limit State ULS (Ultimate Limit States)
Exposure Level L1 = SI Manned Non- evacuated / C1 High Consequence
Associated criteria[1] 50-year individual extremes with action factor = 1,15
Local regulation Assume not applicable
Foundation type Sand Clay
Spudcan Reaction Point According to spudcan penetration as specified in Clause A.8.6.2
Centre of gravity CoGs assumed to be at the 3-leg centroid for maximum usage
Specific Hull Elevation wrt LAT Airgap = 15,20 m
[1] Determined by the limit state and the exposure level. [2] Specified by the client - the co-worker in this benchmarking.
3.4 RIG DATA
3.4.1 The rig data for this analysis is listed Table 3-2.
Table 3-2 Assembled Rig Data
Rig Type KFELS B Class
Drawings & specifications Key rig drawings held in house
Operation manual Held in house
Rack-chock [1] Kv = 1,479x106, Kh = 6,223x106
Upper-guide K = 1,133x105 (Gap = 4,8mm)
Lower-guide K = 2,446x107 (Gap = 19m)
Leg-hull connection stiffness[3] (tonnes/m)
Pinion [2] K = 1,429x105 (Backlash = 16mm)
Principle Dimensions:
Hull Length x Width x Height 68,58m x 63,40m x 7,78m
Leg Length including spudcan 157,58m
Weight & Centre of gravity
Hull lightship: 7 470,7 tonnes
LCG=40,94m, TCG=0,14m, VCG=10,28m [2]
Assessed Maximum Variable Load Assessed Minimum Variable Load
2 599,1 tonnes 1 299,6 tonnes
3 Legs including spudcans [4] 3 347,8 tonnes LCG=39,32m, TCG=0,0m
Preload (jacking reaction) 6 141,6 tonnes
PHASE 2 BENCHMARKING
VALIDITY CHECK FOR KFELS B CLASS ISO 19905-1 (DIS)
W/S No: CTR: 05-130553 0
Page 14 of 89
Report No: L25316 , Revision 0: O , Dated: 20th November 2010
File: L25316-R0 - ISO validity check of KFELS B Class.doc
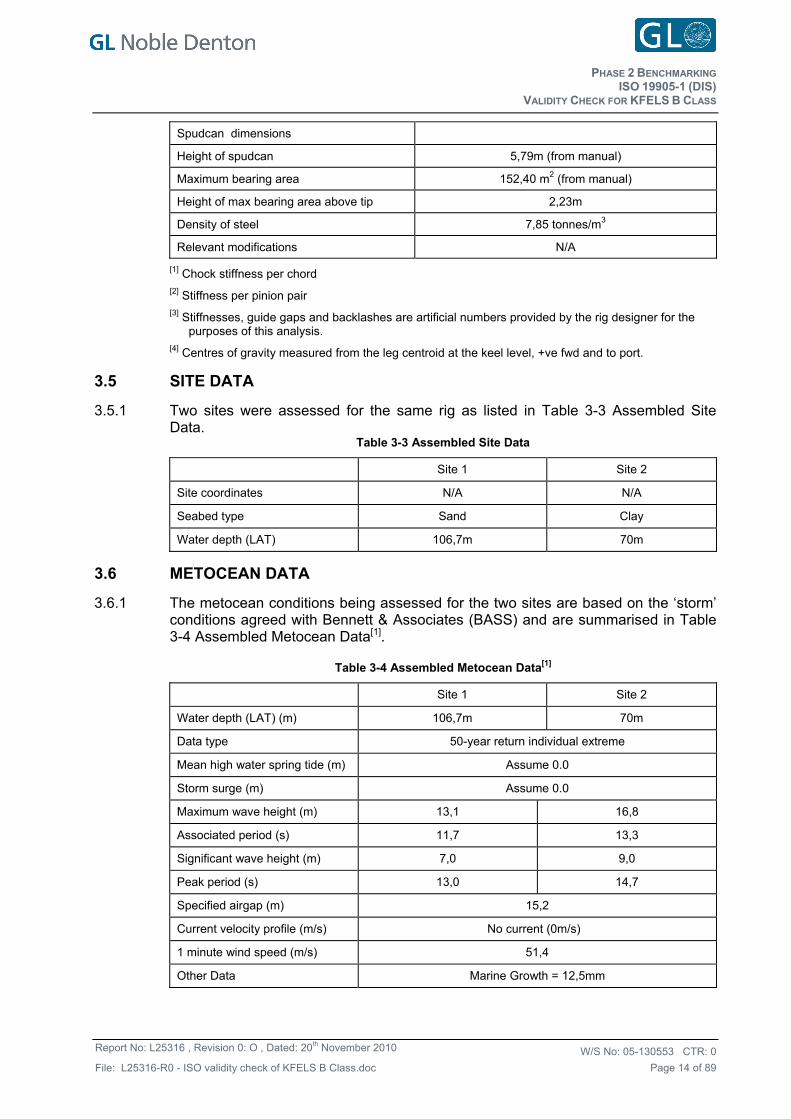
Spudcan dimensions
Height of spudcan 5,79m (from manual)
Maximum bearing area 152,40 m2 (from manual)
Height of max bearing area above tip 2,23m
Density of steel 7,85 tonnes/m3
Relevant modifications N/A
[1] Chock stiffness per chord [2] Stiffness per pinion pair [3] Stiffnesses, guide gaps and backlashes are artificial numbers provided by the rig designer for the
purposes of this analysis. [4] Centres of gravity measured from the leg centroid at the keel level, +ve fwd and to port.
3.5 SITE DATA
3.5.1 Two sites were assessed for the same rig as listed in Table 3-3 Assembled Site Data.
Table 3-3 Assembled Site Data
Site 1 Site 2
Site coordinates N/A N/A
Seabed type Sand Clay
Water depth (LAT) 106,7m 70m
3.6 METOCEAN DATA
3.6.1 The metocean conditions being assessed for the two sites are based on the ‘storm’ conditions agreed with Bennett & Associates (BASS) and are summarised in Table 3-4 Assembled Metocean Data[1].
Table 3-4 Assembled Metocean Data[1]
Site 1 Site 2
Water depth (LAT) (m) 106,7m 70m
Data type 50-year return individual extreme
Mean high water spring tide (m) Assume 0.0
Storm surge (m) Assume 0.0
Maximum wave height (m) 13,1 16,8
Associated period (s) 11,7 13,3
Significant wave height (m) 7,0 9,0
Peak period (s) 13,0 14,7
Specified airgap (m) 15,2
Current velocity profile (m/s) No current (0m/s)
1 minute wind speed (m/s) 51,4
Other Data Marine Growth = 12,5mm
PHASE 2 BENCHMARKING
VALIDITY CHECK FOR KFELS B CLASS ISO 19905-1 (DIS)
W/S No: CTR: 05-130553 0
Page 15 of 89
Report No: L25316 , Revision 0: O , Dated: 20th November 2010
File: L25316-R0 - ISO validity check of KFELS B Class.doc
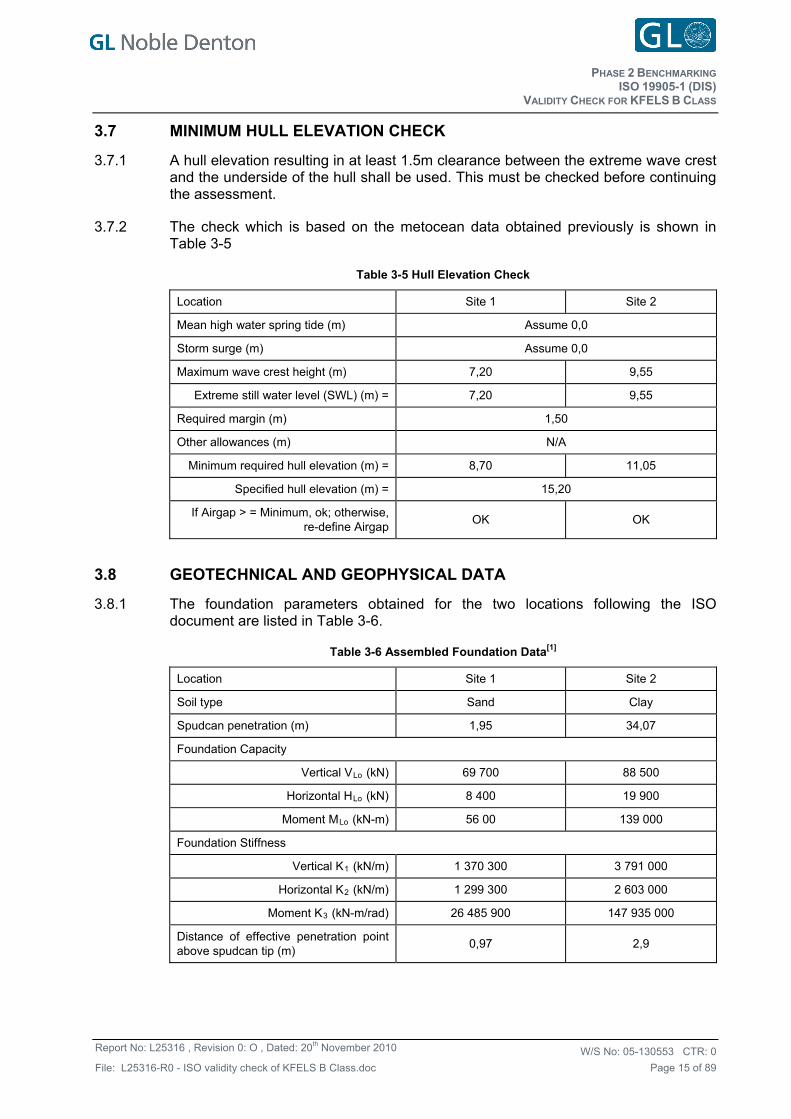
3.7 MINIMUM HULL ELEVATION CHECK
3.7.1 A hull elevation resulting in at least 1.5m clearance between the extreme wave crest and the underside of the hull shall be used. This must be checked before continuing the assessment.
3.7.2 The check which is based on the metocean data obtained previously is shown in Table 3-5
Table 3-5 Hull Elevation Check
Location Site 1 Site 2
Mean high water spring tide (m) Assume 0,0
Storm surge (m) Assume 0,0
Maximum wave crest height (m) 7,20 9,55
Extreme still water level (SWL) (m) = 7,20 9,55
Required margin (m) 1,50
Other allowances (m) N/A
Minimum required hull elevation (m) = 8,70 11,05
Specified hull elevation (m) = 15,20
If Airgap > = Minimum, ok; otherwise, re-define Airgap
OK OK
3.8 GEOTECHNICAL AND GEOPHYSICAL DATA
3.8.1 The foundation parameters obtained for the two locations following the ISO document are listed in Table 3-6.
Table 3-6 Assembled Foundation Data[1]
Location Site 1 Site 2
Soil type Sand Clay
Spudcan penetration (m) 1,95 34,07
Foundation Capacity
Vertical VLo (kN) 69 700 88 500
Horizontal HLo (kN) 8 400 19 900
Moment MLo (kN-m) 56 00 139 000
Foundation Stiffness
Vertical K1 (kN/m) 1 370 300 3 791 000
Horizontal K2 (kN/m) 1 299 300 2 603 000
Moment K3 (kN-m/rad) 26 485 900 147 935 000
Distance of effective penetration point above spudcan tip (m)
0,97 2,9
PHASE 2 BENCHMARKING
VALIDITY CHECK FOR KFELS B CLASS ISO 19905-1 (DIS)
W/S No: CTR: 05-130553 0
Page 16 of 89
Report No: L25316 , Revision 0: O , Dated: 20th November 2010
File: L25316-R0 - ISO validity check of KFELS B Class.doc
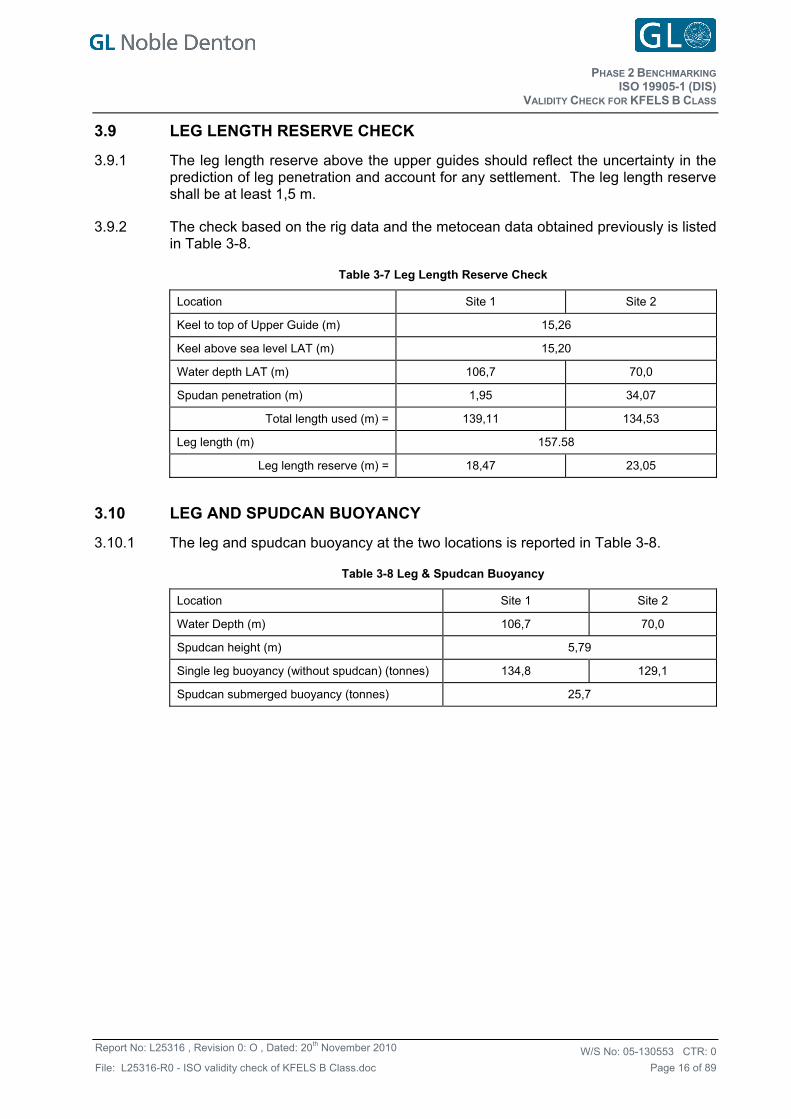
3.9 LEG LENGTH RESERVE CHECK
3.9.1 The leg length reserve above the upper guides should reflect the uncertainty in the prediction of leg penetration and account for any settlement. The leg length reserve shall be at least 1,5 m.
3.9.2 The check based on the rig data and the metocean data obtained previously is listed in Table 3-8.
Table 3-7 Leg Length Reserve Check
Location Site 1 Site 2
Keel to top of Upper Guide (m) 15,26
Keel above sea level LAT (m) 15,20
Water depth LAT (m) 106,7 70,0
Spudan penetration (m) 1,95 34,07
Total length used (m) = 139,11 134,53
Leg length (m) 157.58
Leg length reserve (m) = 18,47 23,05
3.10 LEG AND SPUDCAN BUOYANCY
3.10.1 The leg and spudcan buoyancy at the two locations is reported in Table 3-8.
Table 3-8 Leg & Spudcan Buoyancy
Location Site 1 Site 2
Water Depth (m) 106,7 70,0
Spudcan height (m) 5,79
Single leg buoyancy (without spudcan) (tonnes) 134,8 129,1
Spudcan submerged buoyancy (tonnes) 25,7
PHASE 2 BENCHMARKING
VALIDITY CHECK FOR KFELS B CLASS ISO 19905-1 (DIS)
W/S No: CTR: 05-130553 0
Page 17 of 89
Report No: L25316 , Revision 0: O , Dated: 20th November 2010
File: L25316-R0 - ISO validity check of KFELS B Class.doc
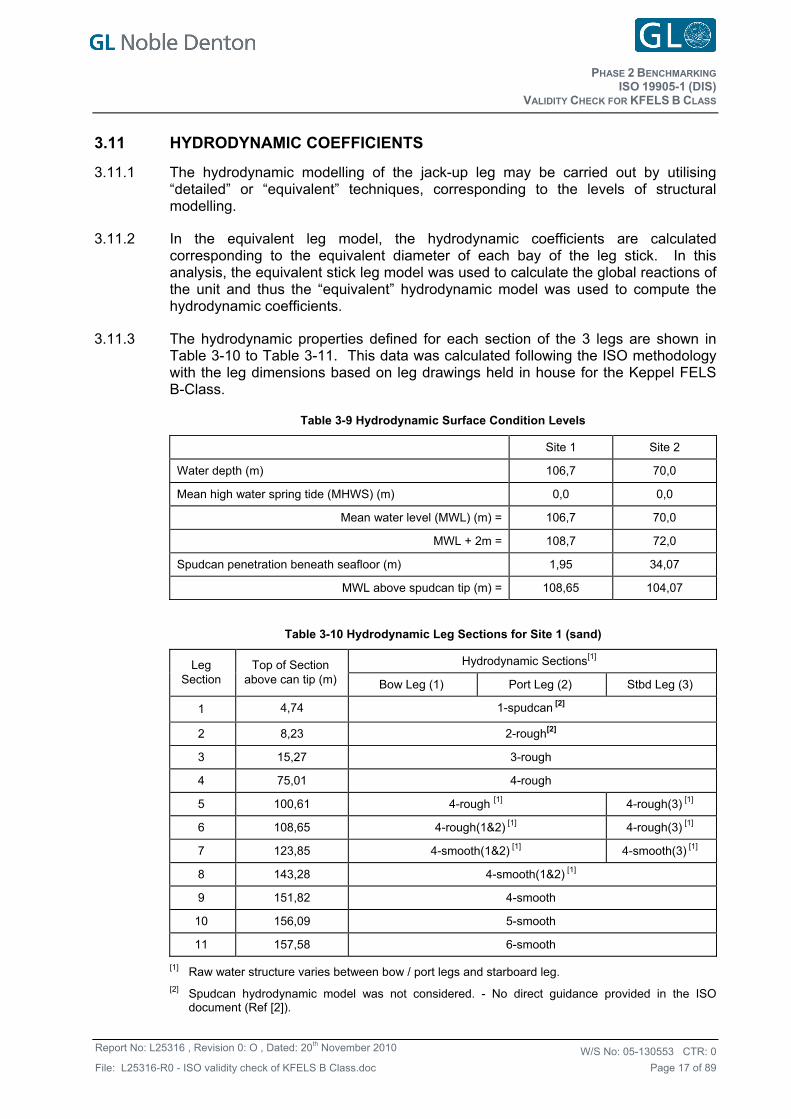
3.11 HYDRODYNAMIC COEFFICIENTS
3.11.1 The hydrodynamic modelling of the jack-up leg may be carried out by utilising “detailed” or “equivalent” techniques, corresponding to the levels of structural modelling.
3.11.2 In the equivalent leg model, the hydrodynamic coefficients are calculated corresponding to the equivalent diameter of each bay of the leg stick. In this analysis, the equivalent stick leg model was used to calculate the global reactions of the unit and thus the “equivalent” hydrodynamic model was used to compute the hydrodynamic coefficients.
3.11.3 The hydrodynamic properties defined for each section of the 3 legs are shown in Table 3-10 to Table 3-11. This data was calculated following the ISO methodology with the leg dimensions based on leg drawings held in house for the Keppel FELS B-Class.
Table 3-9 Hydrodynamic Surface Condition Levels
Site 1 Site 2
Water depth (m) 106,7 70,0
Mean high water spring tide (MHWS) (m) 0,0 0,0
Mean water level (MWL) (m) = 106,7 70,0
MWL + 2m = 108,7 72,0
Spudcan penetration beneath seafloor (m) 1,95 34,07
MWL above spudcan tip (m) = 108,65 104,07
Table 3-10 Hydrodynamic Leg Sections for Site 1 (sand)
Hydrodynamic Sections[1] Leg Section
Top of Section above can tip (m) Bow Leg (1) Port Leg (2) Stbd Leg (3)
1 4,74 1-spudcan [2]
2 8,23 2-rough[2]
3 15,27 3-rough
4 75,01 4-rough
5 100,61 4-rough [1] 4-rough(3) [1]
6 108,65 4-rough(1&2) [1] 4-rough(3) [1]
7 123,85 4-smooth(1&2) [1] 4-smooth(3) [1]
8 143,28 4-smooth(1&2) [1]
9 151,82 4-smooth
10 156,09 5-smooth
11 157,58 6-smooth
[1] Raw water structure varies between bow / port legs and starboard leg. [2] Spudcan hydrodynamic model was not considered. - No direct guidance provided in the ISO
document (Ref [2]).
PHASE 2 BENCHMARKING
VALIDITY CHECK FOR KFELS B CLASS ISO 19905-1 (DIS)
W/S No: CTR: 05-130553 0
Page 18 of 89
Report No: L25316 , Revision 0: O , Dated: 20th November 2010
File: L25316-R0 - ISO validity check of KFELS B Class.doc
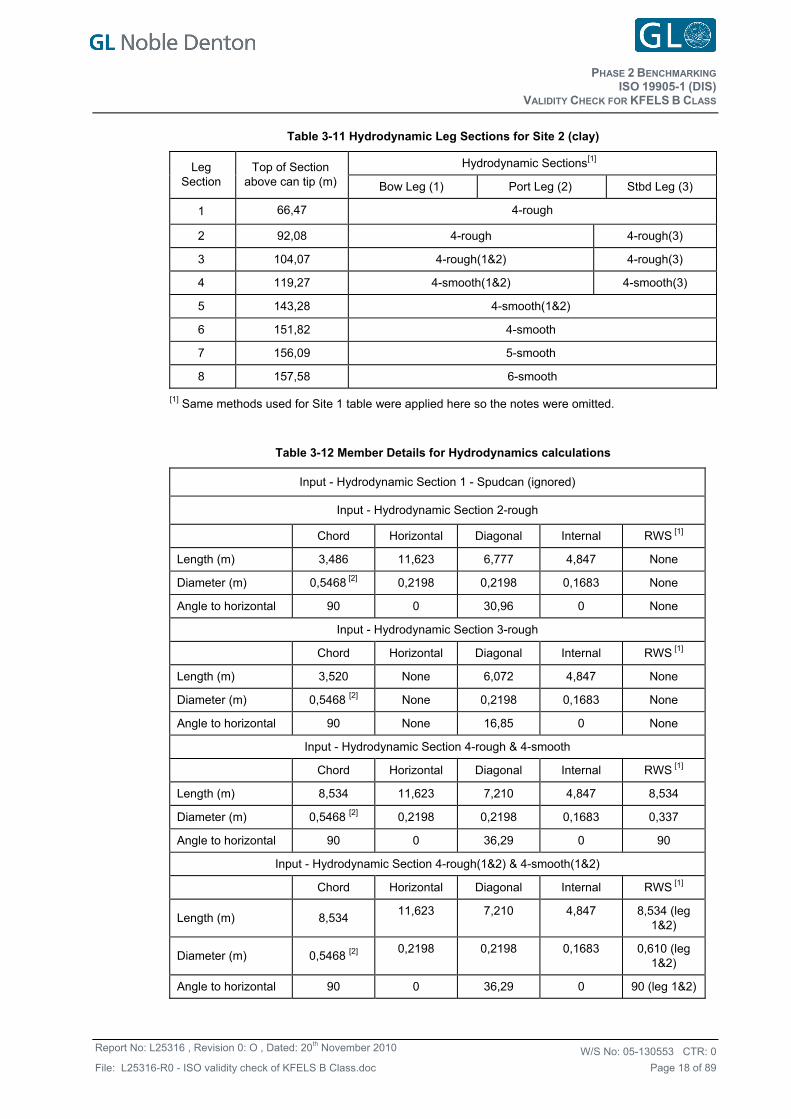
Table 3-11 Hydrodynamic Leg Sections for Site 2 (clay)
Hydrodynamic Sections[1] Leg Section
Top of Section above can tip (m) Bow Leg (1) Port Leg (2) Stbd Leg (3)
1 66,47 4-rough
2 92,08 4-rough 4-rough(3)
3 104,07 4-rough(1&2) 4-rough(3)
4 119,27 4-smooth(1&2) 4-smooth(3)
5 143,28 4-smooth(1&2)
6 151,82 4-smooth
7 156,09 5-smooth
8 157,58 6-smooth
[1] Same methods used for Site 1 table were applied here so the notes were omitted.
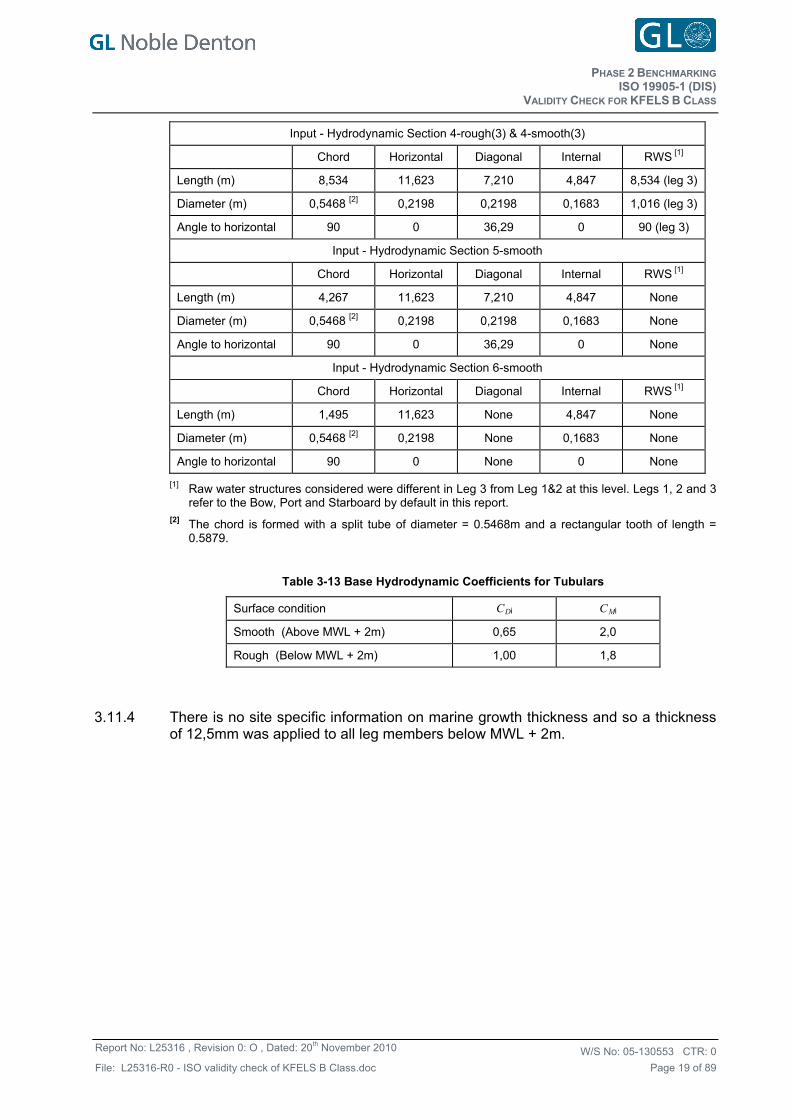
Table 3-12 Member Details for Hydrodynamics calculations
Input - Hydrodynamic Section 1 - Spudcan (ignored)
Input - Hydrodynamic Section 2-rough
Chord Horizontal Diagonal Internal RWS [1]
Length (m) 3,486 11,623 6,777 4,847 None
Diameter (m) 0,5468 [2] 0,2198 0,2198 0,1683 None
Angle to horizontal 90 0 30,96 0 None
Input - Hydrodynamic Section 3-rough
Chord Horizontal Diagonal Internal RWS [1]
Length (m) 3,520 None 6,072 4,847 None
Diameter (m) 0,5468 [2] None 0,2198 0,1683 None
Angle to horizontal 90 None 16,85 0 None
Input - Hydrodynamic Section 4-rough & 4-smooth
Chord Horizontal Diagonal Internal RWS [1]
Length (m) 8,534 11,623 7,210 4,847 8,534
Diameter (m) 0,5468 [2] 0,2198 0,2198 0,1683 0,337
Angle to horizontal 90 0 36,29 0 90
Input - Hydrodynamic Section 4-rough(1&2) & 4-smooth(1&2)
Chord Horizontal Diagonal Internal RWS [1]
Length (m) 8,534 11,623 7,210 4,847 8,534 (leg
1&2)
Diameter (m) 0,5468 [2] 0,2198 0,2198 0,1683 0,610 (leg
1&2)
Angle to horizontal 90 0 36,29 0 90 (leg 1&2)
PHASE 2 BENCHMARKING
VALIDITY CHECK FOR KFELS B CLASS ISO 19905-1 (DIS)
W/S No: CTR: 05-130553 0
Page 19 of 89
Report No: L25316 , Revision 0: O , Dated: 20th November 2010
File: L25316-R0 - ISO validity check of KFELS B Class.doc
Input - Hydrodynamic Section 4-rough(3) & 4-smooth(3)
Chord Horizontal Diagonal Internal RWS [1]
Length (m) 8,534 11,623 7,210 4,847 8,534 (leg 3)
Diameter (m) 0,5468 [2] 0,2198 0,2198 0,1683 1,016 (leg 3)
Angle to horizontal 90 0 36,29 0 90 (leg 3)
Input - Hydrodynamic Section 5-smooth
Chord Horizontal Diagonal Internal RWS [1]
Length (m) 4,267 11,623 7,210 4,847 None
Diameter (m) 0,5468 [2] 0,2198 0,2198 0,1683 None
Angle to horizontal 90 0 36,29 0 None
Input - Hydrodynamic Section 6-smooth
Chord Horizontal Diagonal Internal RWS [1]
Length (m) 1,495 11,623 None 4,847 None
Diameter (m) 0,5468 [2] 0,2198 None 0,1683 None
Angle to horizontal 90 0 None 0 None
[1] Raw water structures considered were different in Leg 3 from Leg 1&2 at this level. Legs 1, 2 and 3 refer to the Bow, Port and Starboard by default in this report.
[2] The chord is formed with a split tube of diameter = 0.5468m and a rectangular tooth of length = 0.5879.
Table 3-13 Base Hydrodynamic Coefficients for Tubulars
Surface condition CDi CMi
Smooth (Above MWL + 2m) 0,65 2,0
Rough (Below MWL + 2m) 1,00 1,8
3.11.4 There is no site specific information on marine growth thickness and so a thickness of 12,5mm was applied to all leg members below MWL + 2m.
PHASE 2 BENCHMARKING
VALIDITY CHECK FOR KFELS B CLASS ISO 19905-1 (DIS)
W/S No: CTR: 05-130553 0
Page 20 of 89
Report No: L25316 , Revision 0: O , Dated: 20th November 2010
File: L25316-R0 - ISO validity check of KFELS B Class.doc
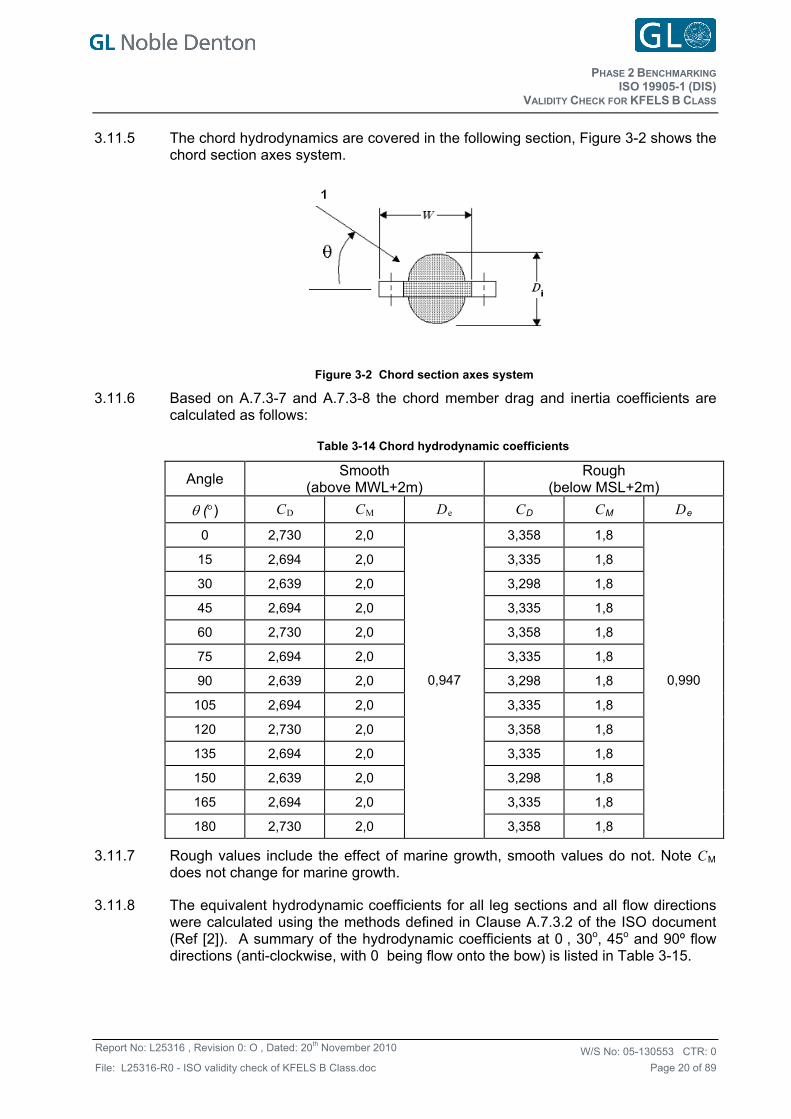
3.11.5 The chord hydrodynamics are covered in the following section, Figure 3-2 shows the chord section axes system.
Figure 3-2 Chord section axes system
3.11.6 Based on A.7.3-7 and A.7.3-8 the chord member drag and inertia coefficients are calculated as follows:
Table 3-14 Chord hydrodynamic coefficients
Angle Smooth
(above MWL+2m) Rough
(below MSL+2m)
() CD CM De CD CM De
0 2,730 2,0 3,358 1,8
15 2,694 2,0 3,335 1,8
30 2,639 2,0 3,298 1,8
45 2,694 2,0 3,335 1,8
60 2,730 2,0 3,358 1,8
75 2,694 2,0 3,335 1,8
90 2,639 2,0 3,298 1,8
105 2,694 2,0 3,335 1,8
120 2,730 2,0 3,358 1,8
135 2,694 2,0 3,335 1,8
150 2,639 2,0 3,298 1,8
165 2,694 2,0 3,335 1,8
180 2,730 2,0
0,947
3,358 1,8
0,990
3.11.7 Rough values include the effect of marine growth, smooth values do not. Note CM does not change for marine growth.
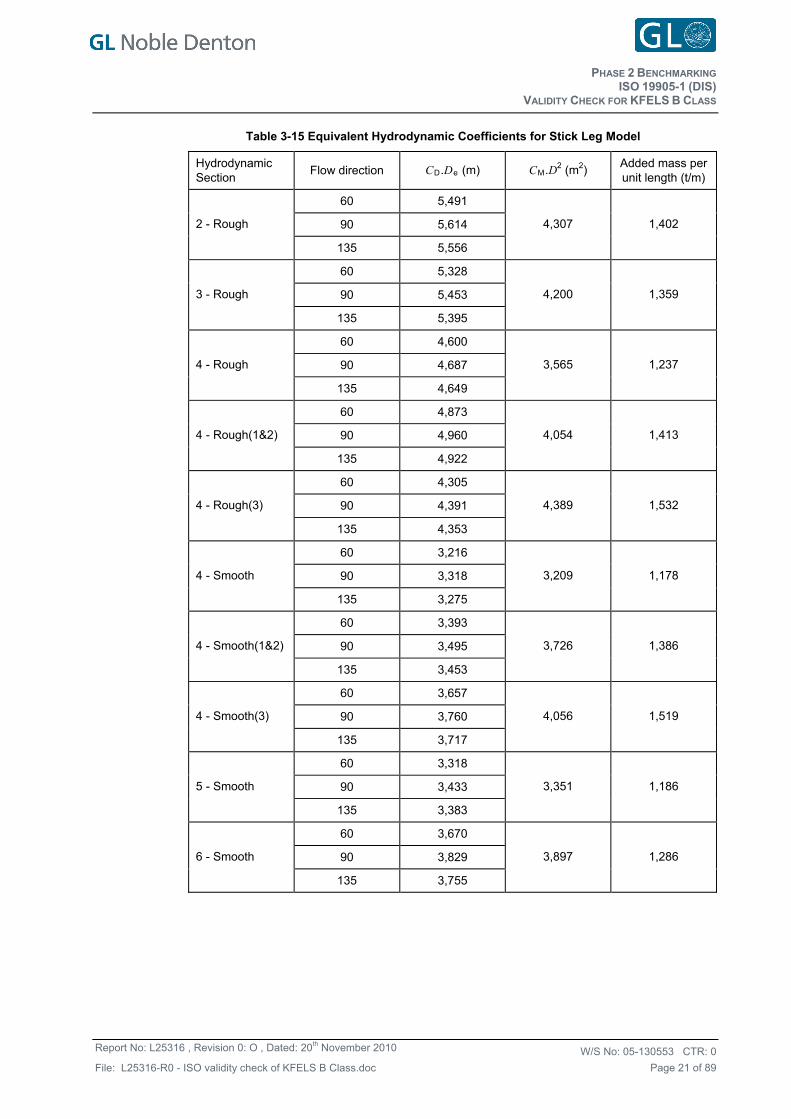
3.11.8 The equivalent hydrodynamic coefficients for all leg sections and all flow directions were calculated using the methods defined in Clause A.7.3.2 of the ISO document (Ref [2]). A summary of the hydrodynamic coefficients at 0 , 30o, 45o and 90º flow directions (anti-clockwise, with 0 being flow onto the bow) is listed in Table 3-15.
PHASE 2 BENCHMARKING
VALIDITY CHECK FOR KFELS B CLASS ISO 19905-1 (DIS)
W/S No: CTR: 05-130553 0
Page 21 of 89
Report No: L25316 , Revision 0: O , Dated: 20th November 2010
File: L25316-R0 - ISO validity check of KFELS B Class.doc
Table 3-15 Equivalent Hydrodynamic Coefficients for Stick Leg Model
Hydrodynamic Section
Flow direction CD.De (m) CM.D2 (m2) Added mass per unit length (t/m)
60 5,491
90 5,614 2 - Rough
135 5,556
4,307 1,402
60 5,328
90 5,453 3 - Rough
135 5,395
4,200 1,359
60 4,600
90 4,687 4 - Rough
135 4,649
3,565 1,237
60 4,873
90 4,960 4 - Rough(1&2)
135 4,922
4,054 1,413
60 4,305
90 4,391 4 - Rough(3)
135 4,353
4,389 1,532
60 3,216
90 3,318 4 - Smooth
135 3,275
3,209 1,178
60 3,393
90 3,495 4 - Smooth(1&2)
135 3,453
3,726 1,386
60 3,657
90 3,760 4 - Smooth(3)
135 3,717
4,056 1,519
60 3,318
90 3,433 5 - Smooth
135 3,383
3,351 1,186
60 3,670
90 3,829 6 - Smooth
135 3,755
3,897 1,286
PHASE 2 BENCHMARKING
VALIDITY CHECK FOR KFELS B CLASS ISO 19905-1 (DIS)
W/S No: CTR: 05-130553 0
Page 22 of 89
Report No: L25316 , Revision 0: O , Dated: 20th November 2010
File: L25316-R0 - ISO validity check of KFELS B Class.doc
4.1
4.2
4 ALIGNMENT POINTS AND COMMENTS
GENERAL
4.1.1 The analysis using the ISO recommended approaches has been divided into 5 steps and at each step, the results were cross-checked with the BASS. This is called Alignment Points and is presented in this section.
4.1.2 All data presented as submission for alignment is duplicated in the following sections with comments on any differences at each alignment point.
ALIGNMENT POINT 1 - GEOTECHNICAL CALCULATIONS
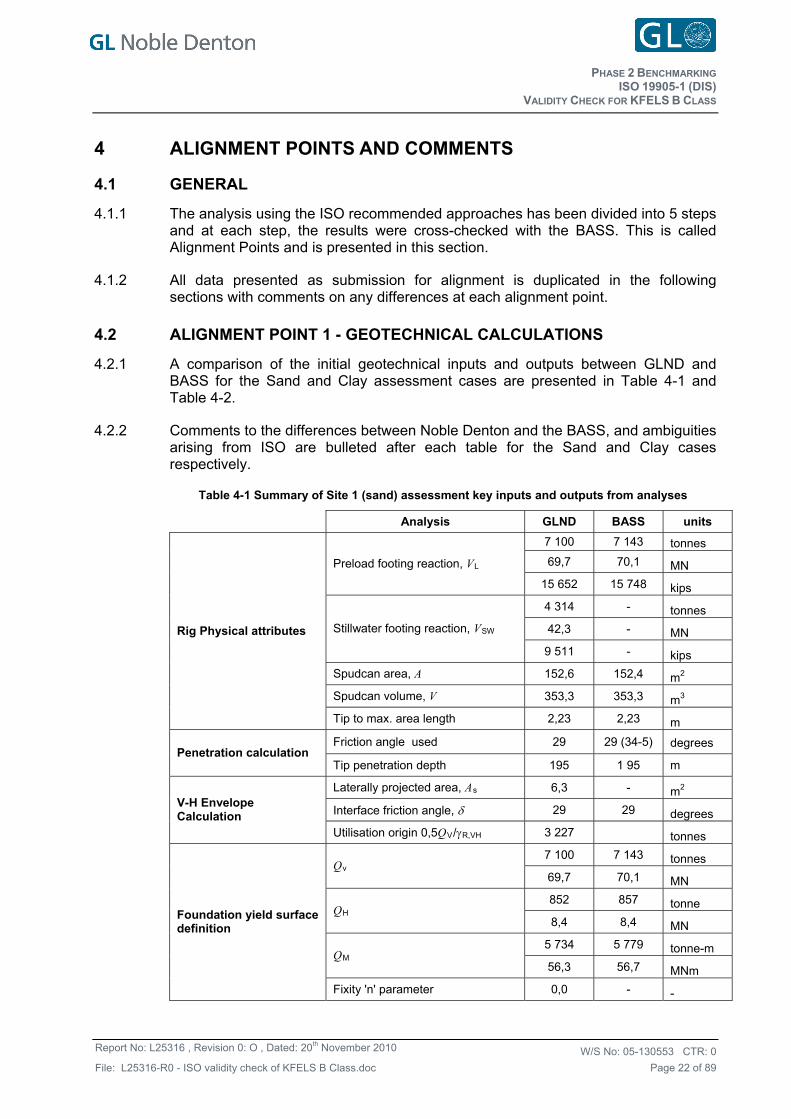
4.2.1 A comparison of the initial geotechnical inputs and outputs between GLND and BASS for the Sand and Clay assessment cases are presented in Table 4-1 and Table 4-2.
4.2.2 Comments to the differences between Noble Denton and the BASS, and ambiguities arising from ISO are bulleted after each table for the Sand and Clay cases respectively.
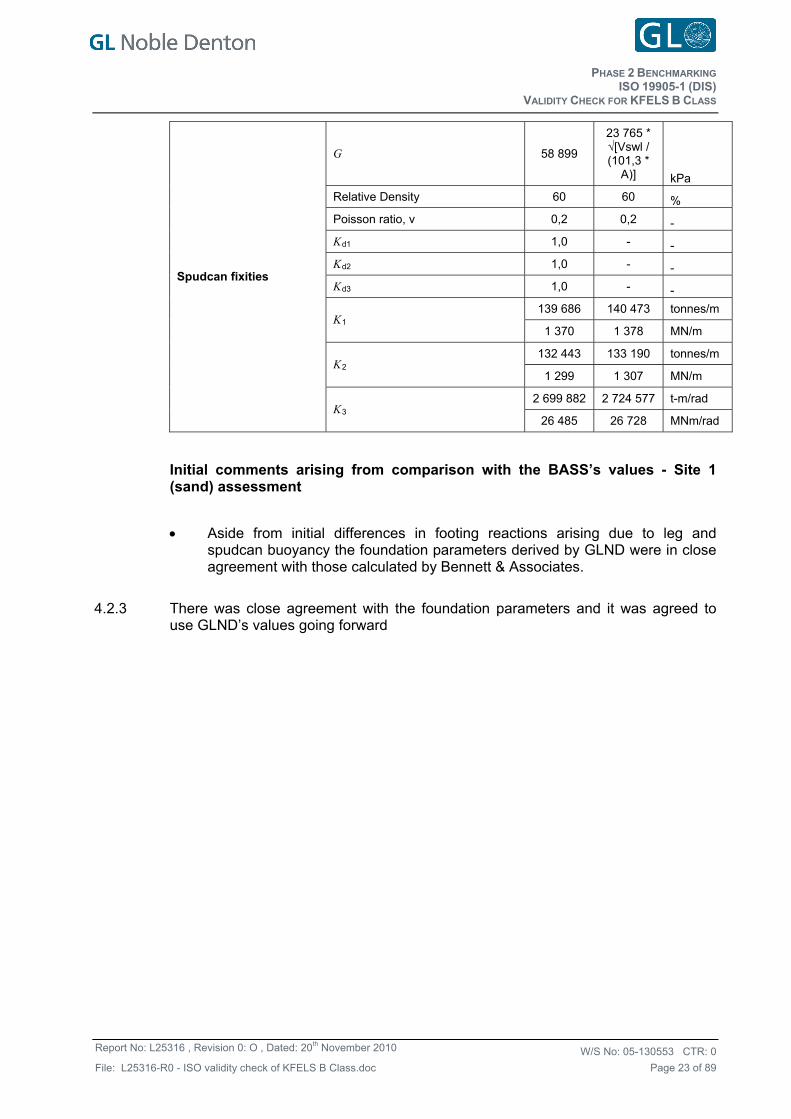
Table 4-1 Summary of Site 1 (sand) assessment key inputs and outputs from analyses
Analysis GLND BASS units
7 100 7 143 tonnes
69,7 70,1 MN Preload footing reaction, VL
15 652 15 748 kips
4 314 - tonnes
42,3 - MN Stillwater footing reaction, VSW
9 511 - kips
Spudcan area, A 152,6 152,4 m2
Spudcan volume, V 353,3 353,3 m3
Rig Physical attributes
Tip to max. area length 2,23 2,23 m
Friction angle used 29 29 (34-5) degrees Penetration calculation
Tip penetration depth 195 1 95 m
Laterally projected area, As 6,3 - m2
Interface friction angle, 29 29 degrees V-H Envelope Calculation
Utilisation origin 0,5QV/R,VH 3 227 tonnes
7 100 7 143 tonnes Qv
69,7 70,1 MN
852 857 tonne QH
8,4 8,4 MN
5 734 5 779 tonne-m QM
56,3 56,7 MNm
Foundation yield surface definition
Fixity 'n' parameter 0,0 - -
PHASE 2 BENCHMARKING
VALIDITY CHECK FOR KFELS B CLASS ISO 19905-1 (DIS)
W/S No: CTR: 05-130553 0
Page 23 of 89
Report No: L25316 , Revision 0: O , Dated: 20th November 2010
File: L25316-R0 - ISO validity check of KFELS B Class.doc
G 58 899
23 765 * √[Vswl / (101,3 *
A)] kPa
Relative Density 60 60 %
Poisson ratio, v 0,2 0,2 -
Kd1 1,0 - -
Kd2 1,0 - -
Kd3 1,0 - -
139 686 140 473 tonnes/m K1
1 370 1 378 MN/m
132 443 133 190 tonnes/m K2
1 299 1 307 MN/m
2 699 882 2 724 577 t-m/rad
Spudcan fixities
K3 26 485 26 728 MNm/rad
Initial comments arising from comparison with the BASS’s values - Site 1 (sand) assessment
Aside from initial differences in footing reactions arising due to leg and spudcan buoyancy the foundation parameters derived by GLND were in close agreement with those calculated by Bennett & Associates.
4.2.3 There was close agreement with the foundation parameters and it was agreed to use GLND’s values going forward
PHASE 2 BENCHMARKING
VALIDITY CHECK FOR KFELS B CLASS ISO 19905-1 (DIS)
W/S No: CTR: 05-130553 0
Page 24 of 89
Report No: L25316 , Revision 0: O , Dated: 20th November 2010
File: L25316-R0 - ISO validity check of KFELS B Class.doc
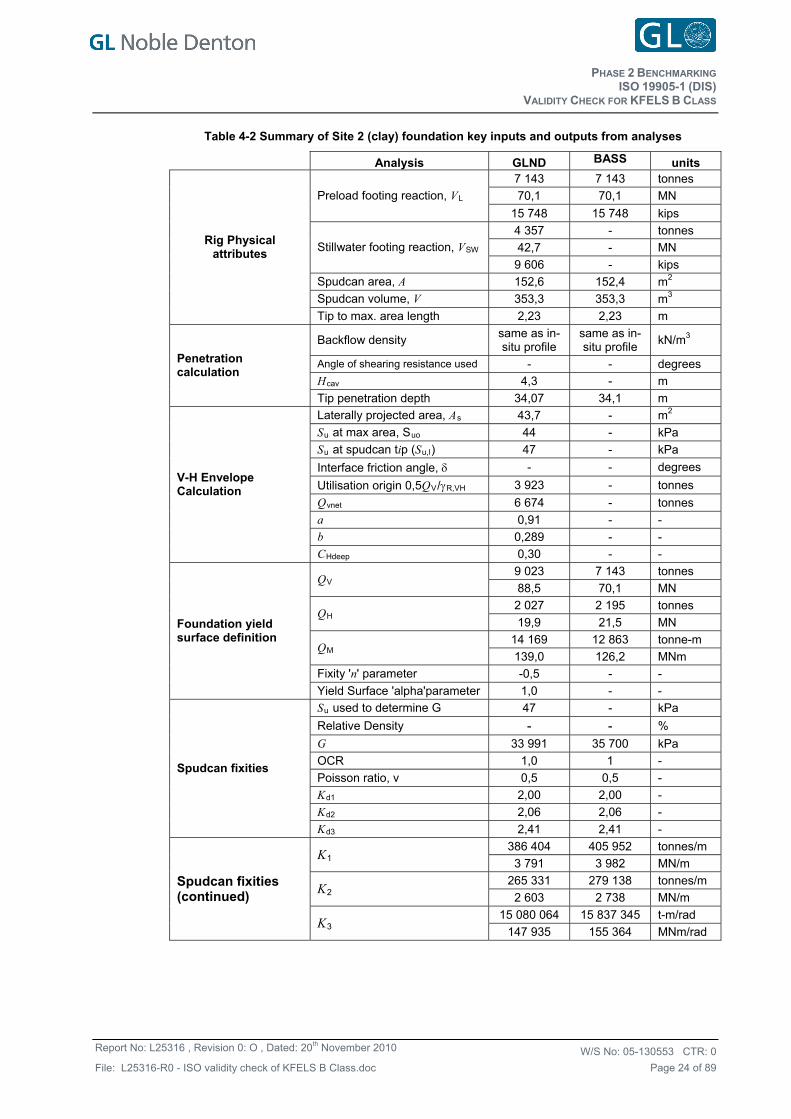
Table 4-2 Summary of Site 2 (clay) foundation key inputs and outputs from analyses
Analysis GLND BASS units 7 143 7 143 tonnes
70,1 70,1 MN Preload footing reaction, VL
15 748 15 748 kips
4 357 - tonnes
42,7 - MN Stillwater footing reaction, VSW
9 606 - kips
Spudcan area, A 152,6 152,4 m2
Spudcan volume, V 353,3 353,3 m3
Rig Physical attributes
Tip to max. area length 2,23 2,23 m
Backflow density same as in-situ profile
same as in-situ profile
kN/m3
Angle of shearing resistance used - - degrees
Hcav 4,3 - m
Penetration calculation
Tip penetration depth 34,07 34,1 m
Laterally projected area, As 43,7 - m2
Su at max area, Suo 44 - kPa
Su at spudcan tip (Su,l) 47 - kPa
Interface friction angle, - - degrees
Utilisation origin 0,5QV/R,VH 3 923 - tonnes
Qvnet 6 674 - tonnes
a 0,91 - -
b 0,289 - -
V-H Envelope Calculation
CHdeep 0,30 - -
9 023 7 143 tonnes QV
88,5 70,1 MN
2 027 2 195 tonnes QH
19,9 21,5 MN
14 169 12 863 tonne-m QM
139,0 126,2 MNm
Fixity 'n' parameter -0,5 - -
Foundation yield surface definition
Yield Surface 'alpha'parameter 1,0 - -
Su used to determine G 47 - kPa
Relative Density - - %
G 33 991 35 700 kPa
OCR 1,0 1 -
Poisson ratio, v 0,5 0,5 -
Kd1 2,00 2,00 -
Kd2 2,06 2,06 -
Spudcan fixities
Kd3 2,41 2,41 -
386 404 405 952 tonnes/m K1 3 791 3 982 MN/m
265 331 279 138 tonnes/m K2 2 603 2 738 MN/m
15 080 064 15 837 345 t-m/rad
Spudcan fixities (continued)
K3 147 935 155 364 MNm/rad
PHASE 2 BENCHMARKING
VALIDITY CHECK FOR KFELS B CLASS ISO 19905-1 (DIS)
W/S No: CTR: 05-130553 0
Page 25 of 89
Report No: L25316 , Revision 0: O , Dated: 20th November 2010
File: L25316-R0 - ISO validity check of KFELS B Class.doc
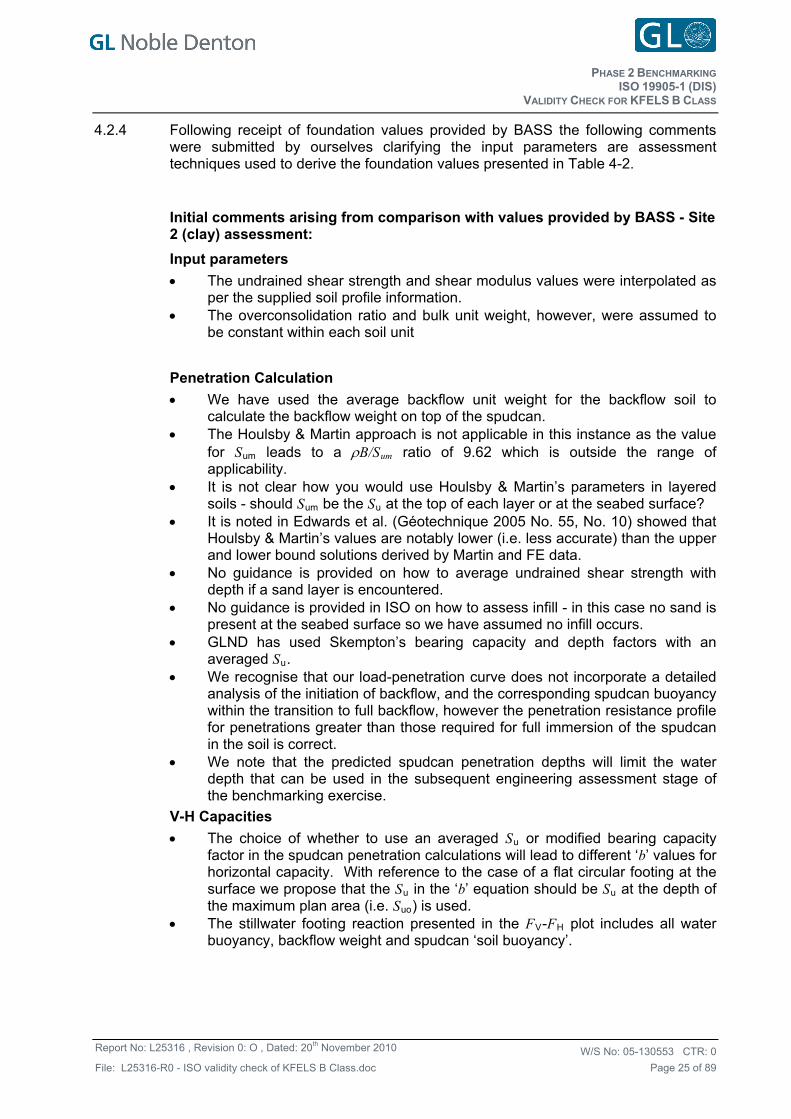
4.2.4 Following receipt of foundation values provided by BASS the following comments were submitted by ourselves clarifying the input parameters are assessment techniques used to derive the foundation values presented in Table 4-2.
Initial comments arising from comparison with values provided by BASS - Site 2 (clay) assessment:
Input parameters
The undrained shear strength and shear modulus values were interpolated as per the supplied soil profile information.
The overconsolidation ratio and bulk unit weight, however, were assumed to be constant within each soil unit
Penetration Calculation
We have used the average backflow unit weight for the backflow soil to calculate the backflow weight on top of the spudcan.
The Houlsby & Martin approach is not applicable in this instance as the value for Sum leads to a B/Sum ratio of 9.62 which is outside the range of applicability.
It is not clear how you would use Houlsby & Martin’s parameters in layered soils - should Sum be the Su at the top of each layer or at the seabed surface?
It is noted in Edwards et al. (Géotechnique 2005 No. 55, No. 10) showed that Houlsby & Martin’s values are notably lower (i.e. less accurate) than the upper and lower bound solutions derived by Martin and FE data.
No guidance is provided on how to average undrained shear strength with depth if a sand layer is encountered.
No guidance is provided in ISO on how to assess infill - in this case no sand is present at the seabed surface so we have assumed no infill occurs.
GLND has used Skempton’s bearing capacity and depth factors with an averaged Su.
We recognise that our load-penetration curve does not incorporate a detailed analysis of the initiation of backflow, and the corresponding spudcan buoyancy within the transition to full backflow, however the penetration resistance profile for penetrations greater than those required for full immersion of the spudcan in the soil is correct.
We note that the predicted spudcan penetration depths will limit the water depth that can be used in the subsequent engineering assessment stage of the benchmarking exercise.
V-H Capacities
The choice of whether to use an averaged Su or modified bearing capacity factor in the spudcan penetration calculations will lead to different ‘b’ values for horizontal capacity. With reference to the case of a flat circular footing at the surface we propose that the Su in the ‘b’ equation should be Su at the depth of the maximum plan area (i.e. Suo) is used.
The stillwater footing reaction presented in the FV-FH plot includes all water buoyancy, backflow weight and spudcan ‘soil buoyancy’.
PHASE 2 BENCHMARKING
VALIDITY CHECK FOR KFELS B CLASS ISO 19905-1 (DIS)
W/S No: CTR: 05-130553 0
Page 26 of 89
Report No: L25316 , Revision 0: O , Dated: 20th November 2010
File: L25316-R0 - ISO validity check of KFELS B Class.doc
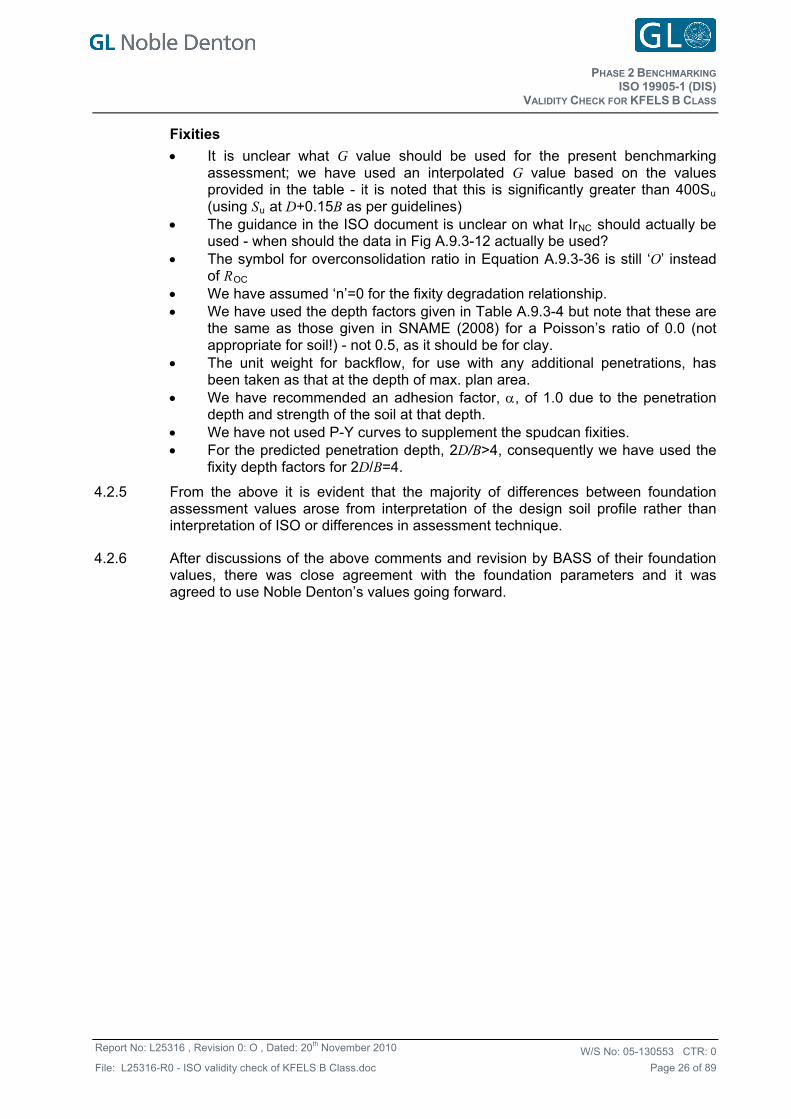
Fixities
It is unclear what G value should be used for the present benchmarking assessment; we have used an interpolated G value based on the values provided in the table - it is noted that this is significantly greater than 400Su (using Su at D+0.15B as per guidelines)
The guidance in the ISO document is unclear on what IrNC should actually be used - when should the data in Fig A.9.3-12 actually be used?
The symbol for overconsolidation ratio in Equation A.9.3-36 is still ‘O’ instead of ROC
We have assumed ‘n’=0 for the fixity degradation relationship. We have used the depth factors given in Table A.9.3-4 but note that these are
the same as those given in SNAME (2008) for a Poisson’s ratio of 0.0 (not appropriate for soil!) - not 0.5, as it should be for clay.
The unit weight for backflow, for use with any additional penetrations, has been taken as that at the depth of max. plan area.
We have recommended an adhesion factor, , of 1.0 due to the penetration depth and strength of the soil at that depth.
We have not used P-Y curves to supplement the spudcan fixities. For the predicted penetration depth, 2D/B>4, consequently we have used the
fixity depth factors for 2D/B=4.
4.2.5 From the above it is evident that the majority of differences between foundation assessment values arose from interpretation of the design soil profile rather than interpretation of ISO or differences in assessment technique.
4.2.6 After discussions of the above comments and revision by BASS of their foundation values, there was close agreement with the foundation parameters and it was agreed to use Noble Denton’s values going forward.
PHASE 2 BENCHMARKING
VALIDITY CHECK FOR KFELS B CLASS ISO 19905-1 (DIS)
W/S No: CTR: 05-130553 0
Page 27 of 89
Report No: L25316 , Revision 0: O , Dated: 20th November 2010
File: L25316-R0 - ISO validity check of KFELS B Class.doc
4.3 ALIGNMENT POINT 2 - OVERALL SYSTEM CHECKS
4.3.1 At this point, the following calculations were submitted for alignment:
Overall system geometry checks (leg length reserve);
Wind area and leg hydrodynamic coefficients;
Natural periods (pinned, with 80% fixity and 100% fixity, with or without P-Delta effect);
Hull sagging.
In addition to these a model was prepared which complied with the requirements of the standard, where possible based on an existing model of the unit.
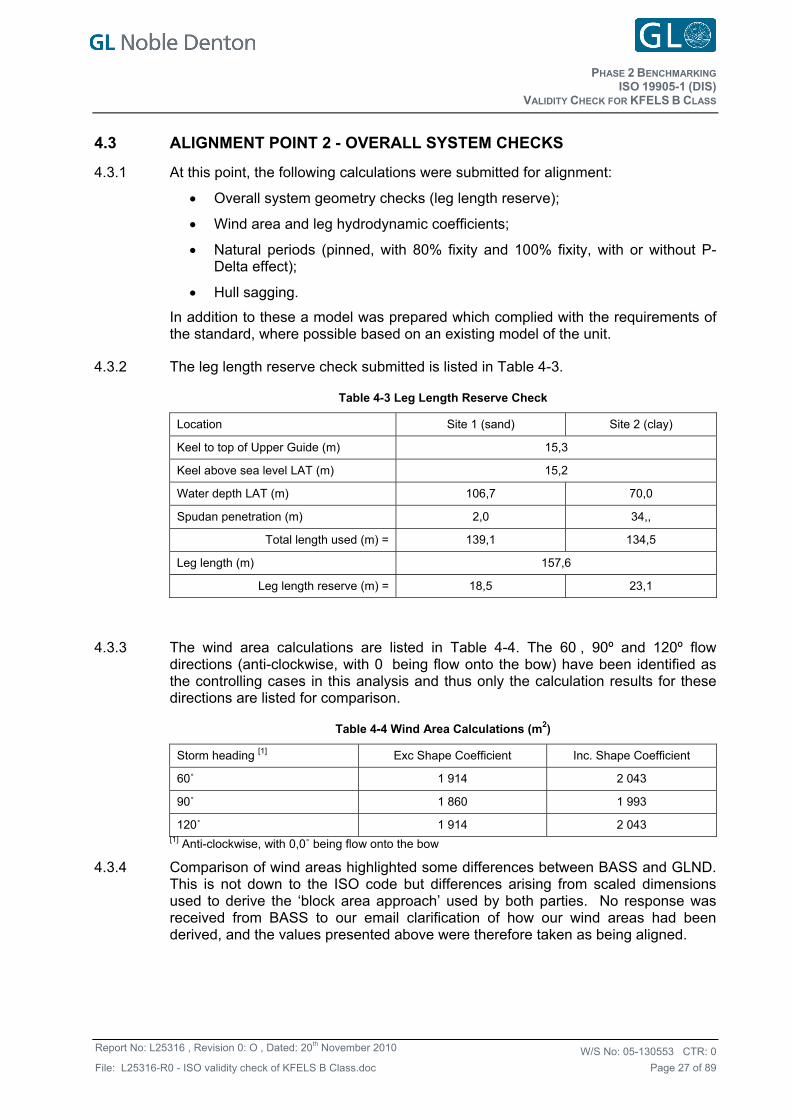
4.3.2 The leg length reserve check submitted is listed in Table 4-3.
Table 4-3 Leg Length Reserve Check
Location Site 1 (sand) Site 2 (clay)
Keel to top of Upper Guide (m) 15,3
Keel above sea level LAT (m) 15,2
Water depth LAT (m) 106,7 70,0
Spudan penetration (m) 2,0 34,,
Total length used (m) = 139,1 134,5
Leg length (m) 157,6
Leg length reserve (m) = 18,5 23,1
4.3.3 The wind area calculations are listed in Table 4-4. The 60 , 90º and 120º flow directions (anti-clockwise, with 0 being flow onto the bow) have been identified as the controlling cases in this analysis and thus only the calculation results for these directions are listed for comparison.
Table 4-4 Wind Area Calculations (m2)
Storm heading [1] Exc Shape Coefficient Inc. Shape Coefficient
60˚ 1 914 2 043
90˚ 1 860 1 993
120˚ 1 914 2 043 [1] Anti-clockwise, with 0,0˚ being flow onto the bow
4.3.4 Comparison of wind areas highlighted some differences between BASS and GLND. This is not down to the ISO code but differences arising from scaled dimensions used to derive the ‘block area approach’ used by both parties. No response was received from BASS to our email clarification of how our wind areas had been derived, and the values presented above were therefore taken as being aligned.
PHASE 2 BENCHMARKING
VALIDITY CHECK FOR KFELS B CLASS ISO 19905-1 (DIS)
W/S No: CTR: 05-130553 0
Page 28 of 89
Report No: L25316 , Revision 0: O , Dated: 20th November 2010
File: L25316-R0 - ISO validity check of KFELS B Class.doc
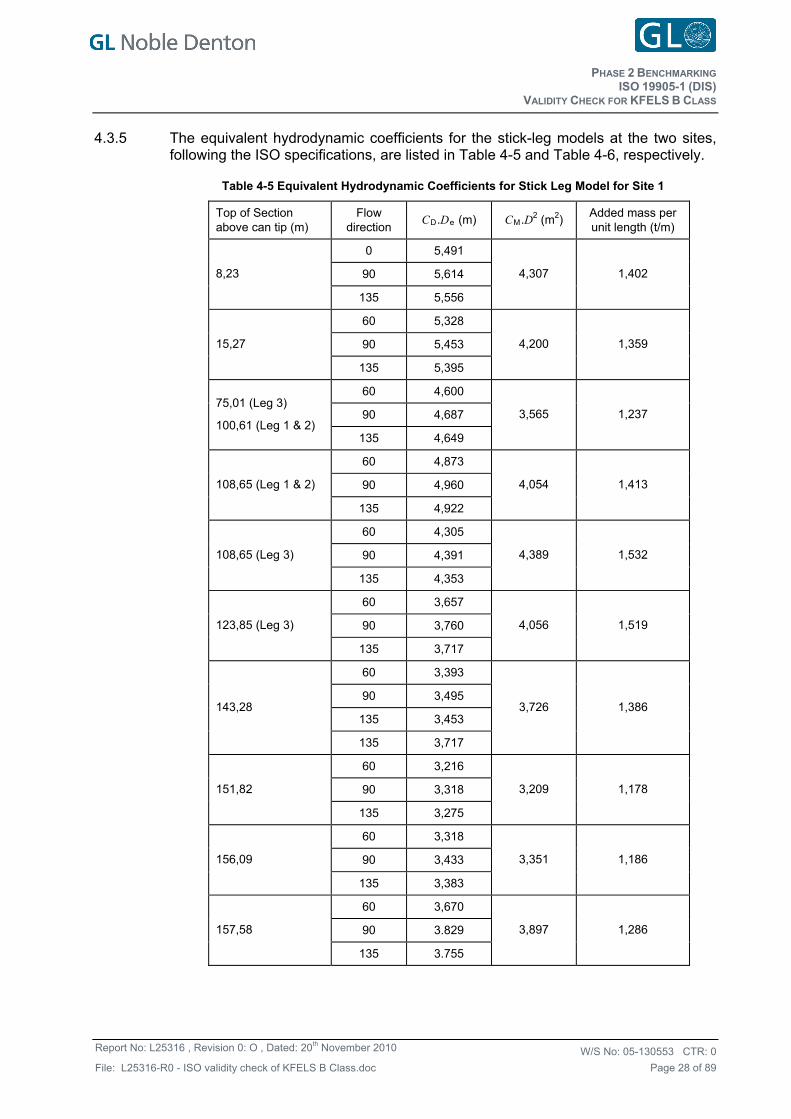
4.3.5 The equivalent hydrodynamic coefficients for the stick-leg models at the two sites, following the ISO specifications, are listed in Table 4-5 and Table 4-6, respectively.
Table 4-5 Equivalent Hydrodynamic Coefficients for Stick Leg Model for Site 1
Top of Section above can tip (m)
Flow direction
CD.De (m) CM.D2 (m2) Added mass per unit length (t/m)
0 5,491
90 5,614 8,23
135 5,556
4,307 1,402
60 5,328
90 5,453 15,27
135 5,395
4,200 1,359
60 4,600
90 4,687 75,01 (Leg 3)
100,61 (Leg 1 & 2) 135 4,649
3,565 1,237
60 4,873
90 4,960 108,65 (Leg 1 & 2)
135 4,922
4,054 1,413
60 4,305
90 4,391 108,65 (Leg 3)
135 4,353
4,389 1,532
60 3,657
90 3,760 123,85 (Leg 3)
135 3,717
4,056 1,519
60 3,393
90 3,495
135 3,453 143,28
135 3,717
3,726 1,386
60 3,216
90 3,318 151,82
135 3,275
3,209 1,178
60 3,318
90 3,433 156,09
135 3,383
3,351 1,186
60 3,670
90 3.829 157,58
135 3.755
3,897 1,286
PHASE 2 BENCHMARKING
VALIDITY CHECK FOR KFELS B CLASS ISO 19905-1 (DIS)
W/S No: CTR: 05-130553 0
Page 29 of 89
Report No: L25316 , Revision 0: O , Dated: 20th November 2010
File: L25316-R0 - ISO validity check of KFELS B Class.doc
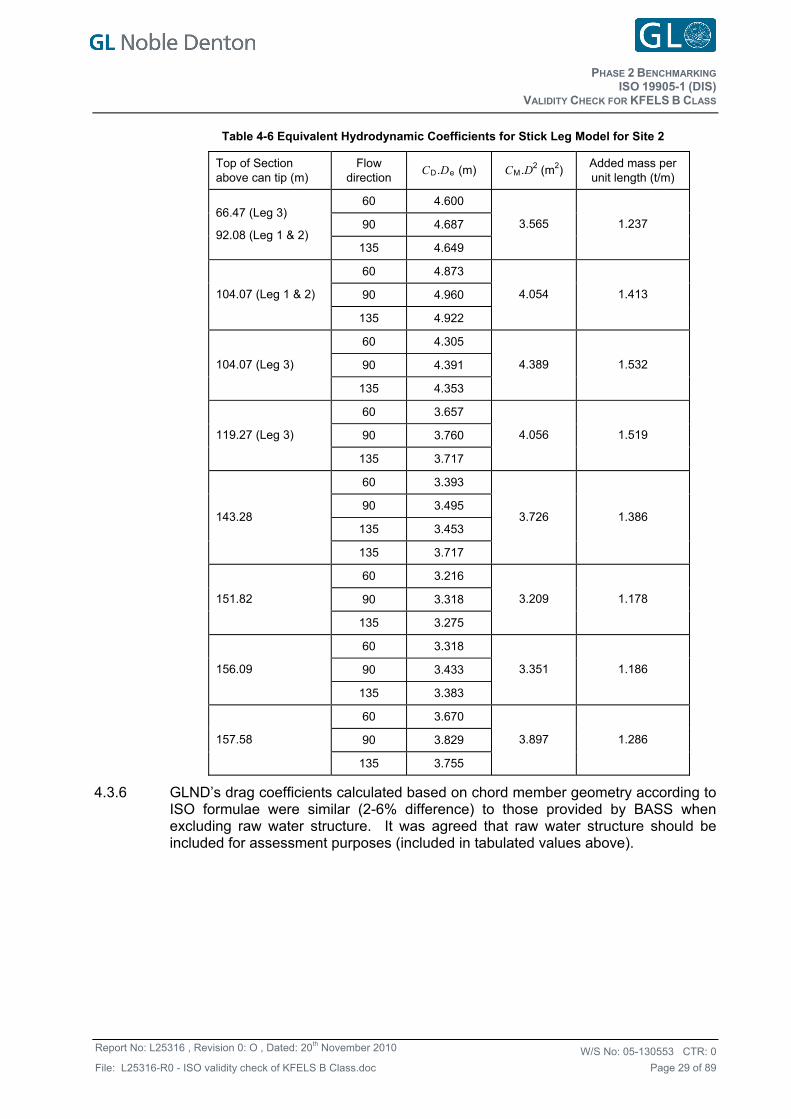
Table 4-6 Equivalent Hydrodynamic Coefficients for Stick Leg Model for Site 2
Top of Section above can tip (m)
Flow direction
CD.De (m) CM.D2 (m2) Added mass per unit length (t/m)
60 4.600
90 4.687 66.47 (Leg 3)
92.08 (Leg 1 & 2) 135 4.649
3.565 1.237
60 4.873
90 4.960 104.07 (Leg 1 & 2)
135 4.922
4.054 1.413
60 4.305
90 4.391 104.07 (Leg 3)
135 4.353
4.389 1.532
60 3.657
90 3.760 119.27 (Leg 3)
135 3.717
4.056 1.519
60 3.393
90 3.495
135 3.453 143.28
135 3.717
3.726 1.386
60 3.216
90 3.318 151.82
135 3.275
3.209 1.178
60 3.318
90 3.433 156.09
135 3.383
3.351 1.186
60 3.670
90 3.829 157.58
135 3.755
3.897 1.286
4.3.6 GLND’s drag coefficients calculated based on chord member geometry according to ISO formulae were similar (2-6% difference) to those provided by BASS when excluding raw water structure. It was agreed that raw water structure should be included for assessment purposes (included in tabulated values above).
PHASE 2 BENCHMARKING
VALIDITY CHECK FOR KFELS B CLASS ISO 19905-1 (DIS)
W/S No: CTR: 05-130553 0
Page 30 of 89
Report No: L25316 , Revision 0: O , Dated: 20th November 2010
File: L25316-R0 - ISO validity check of KFELS B Class.doc
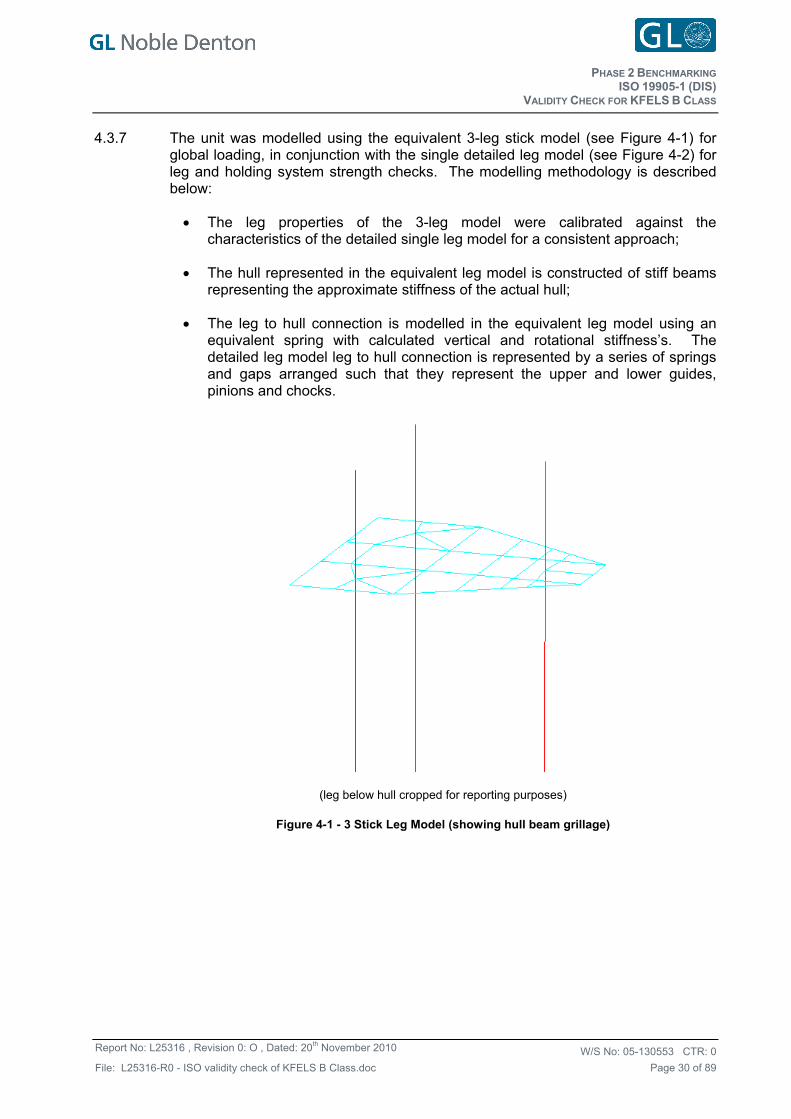
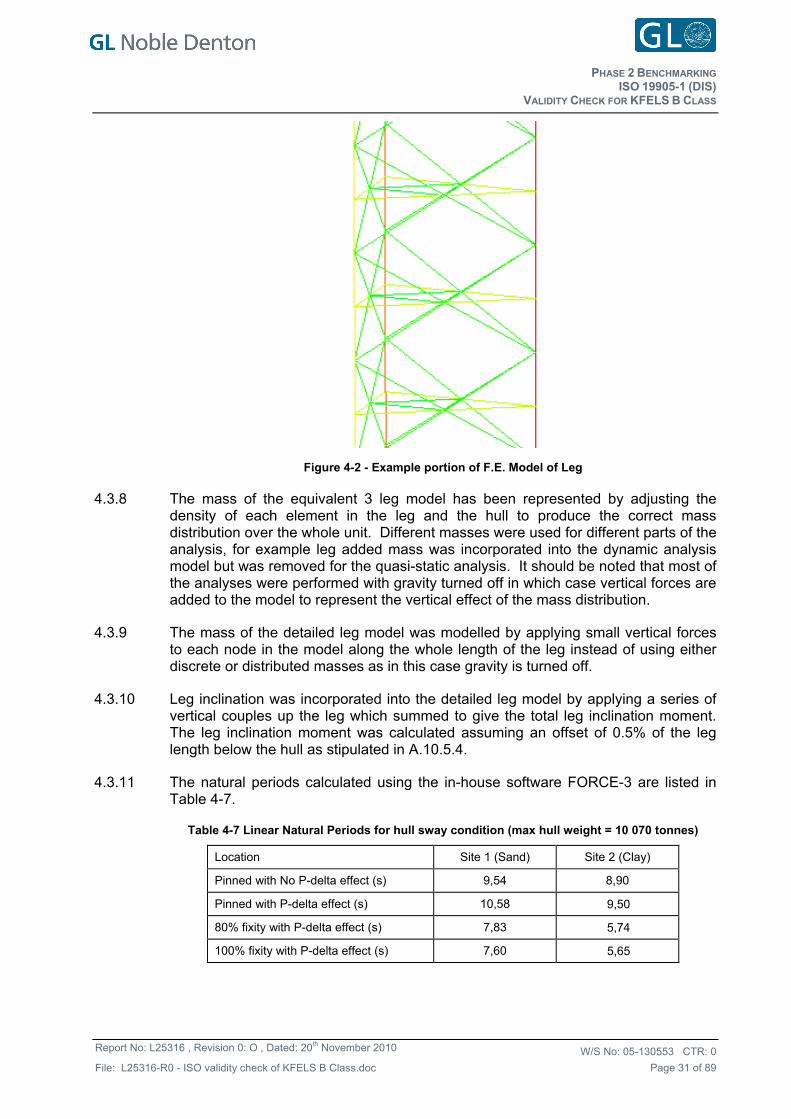
4.3.7 The unit was modelled using the equivalent 3-leg stick model (see Figure 4-1) for global loading, in conjunction with the single detailed leg model (see Figure 4-2) for leg and holding system strength checks. The modelling methodology is described below:
The leg properties of the 3-leg model were calibrated against the characteristics of the detailed single leg model for a consistent approach;
The hull represented in the equivalent leg model is constructed of stiff beams representing the approximate stiffness of the actual hull;
The leg to hull connection is modelled in the equivalent leg model using an equivalent spring with calculated vertical and rotational stiffness’s. The detailed leg model leg to hull connection is represented by a series of springs and gaps arranged such that they represent the upper and lower guides, pinions and chocks.
(leg below hull cropped for reporting purposes)
Figure 4-1 - 3 Stick Leg Model (showing hull beam grillage)
PHASE 2 BENCHMARKING
VALIDITY CHECK FOR KFELS B CLASS ISO 19905-1 (DIS)
W/S No: CTR: 05-130553 0
Page 31 of 89
Report No: L25316 , Revision 0: O , Dated: 20th November 2010
File: L25316-R0 - ISO validity check of KFELS B Class.doc
Figure 4-2 - Example portion of F.E. Model of Leg
4.3.8 The mass of the equivalent 3 leg model has been represented by adjusting the density of each element in the leg and the hull to produce the correct mass distribution over the whole unit. Different masses were used for different parts of the analysis, for example leg added mass was incorporated into the dynamic analysis model but was removed for the quasi-static analysis. It should be noted that most of the analyses were performed with gravity turned off in which case vertical forces are added to the model to represent the vertical effect of the mass distribution.
4.3.9 The mass of the detailed leg model was modelled by applying small vertical forces to each node in the model along the whole length of the leg instead of using either discrete or distributed masses as in this case gravity is turned off.
4.3.10 Leg inclination was incorporated into the detailed leg model by applying a series of vertical couples up the leg which summed to give the total leg inclination moment. The leg inclination moment was calculated assuming an offset of 0.5% of the leg length below the hull as stipulated in A.10.5.4.
4.3.11 The natural periods calculated using the in-house software FORCE-3 are listed in Table 4-7.
Table 4-7 Linear Natural Periods for hull sway condition (max hull weight = 10 070 tonnes)
Location Site 1 (Sand) Site 2 (Clay)
Pinned with No P-delta effect (s) 9,54 8,90
Pinned with P-delta effect (s) 10,58 9,50
80% fixity with P-delta effect (s) 7,83 5,74
100% fixity with P-delta effect (s) 7,60 5,65
PHASE 2 BENCHMARKING
VALIDITY CHECK FOR KFELS B CLASS ISO 19905-1 (DIS)
W/S No: CTR: 05-130553 0
Page 32 of 89
Report No: L25316 , Revision 0: O , Dated: 20th November 2010
File: L25316-R0 - ISO validity check of KFELS B Class.doc
4.3.12 There were some initial discrepancies between the GLND and BASS results; this was resolved after investigation and attributed to differences in the leg section stiffness calculations. (The BASS natural periods were originally calculated based on the full chord section, i.e. including all the tooth area, while our calculation for chord section stiffness has included only 10% tooth area as suggested in the ISO document (Ref [2]). BASS then recalculated their chord section stiffness using 10% tooth area and re-submitted their natural periods for pinned conditions which are in closer agreement with GLND natural periods (see Table 4-8) below.
Table 4-8 Natural Periods Alignment
Location Site 1 (Sand) Site 2 (Clay)
Assessor GLND BASS GLND BASS
Pinned with No P-delta effect (s) 9,54 9,64 8,90 8,91
Pinned with P-delta effect (s) 10,58 10,32 9,50 9,64
4.3.13 The sway stiffness has been analysed with a unit loading of 1MN (102 tonnes) applied at the hull centre of gravity (CoG) for cases without p-delta loading. Results are summarised in Table 4-9.
Table 4-9 Hull Displacements and Sway Stiffness
Foundation conditions
Displacements (m) Sway stiffness (MN/m)
Site 1 (sand)
Pinned 0,196 5,09
Linear Fixity: 80% K3 (rot) 100% K3 (rot)
0,121 0,114
8,26 8,77
Site 2 (clay)
Pinned 0,171 5,86
Linear Fixity: 80% K3 (rot) 100% K3 (rot)
0,072 0,070
1,39 1,43
4.3.14 No comparable data was received from BASS
PHASE 2 BENCHMARKING
VALIDITY CHECK FOR KFELS B CLASS ISO 19905-1 (DIS)
W/S No: CTR: 05-130553 0
Page 33 of 89
Report No: L25316 , Revision 0: O , Dated: 20th November 2010
File: L25316-R0 - ISO validity check of KFELS B Class.doc
4.3.15 Reactions are reported for a gravity loadcase with ‘pinned’ foundation restraint condition accounting for 25% hull sag. Footing reactions are reported in Table 4-10
Table 4-10 Footing reactions from gravity loadcase
Leg F-X (kN) F-Y (kN) F-Z (kN)
Bow -73 0 42 086
Port 36 -86 42 031
Stbd 36 86 42 031 Site 1 (sand)
Total 0 0 126 150
Bow -86 0 42 163
Port 43 -103 42 077
Stbd 43 103 42 077 Site 2 (clay)
Total 0 0 126 320
4.3.16 The difference in vertical reaction of approximately 170kN is due to additional leg buoyancy in the sand case attributed to a the combination of slightly greater penetration and increased waterdepth.
4.3.17 No comparable data was received from BASS.
PHASE 2 BENCHMARKING
VALIDITY CHECK FOR KFELS B CLASS ISO 19905-1 (DIS)
W/S No: CTR: 05-130553 0
Page 34 of 89
Report No: L25316 , Revision 0: O , Dated: 20th November 2010
File: L25316-R0 - ISO validity check of KFELS B Class.doc
4.4 ALIGNMENT POINT 3 - ENVIRONMENTAL LOADINGS
4.4.1 At this point, the following calculations were submitted for alignment:
Loading direction for analysis
Quasi-static wave and current loads
Dynamic amplification factors (DAFs)
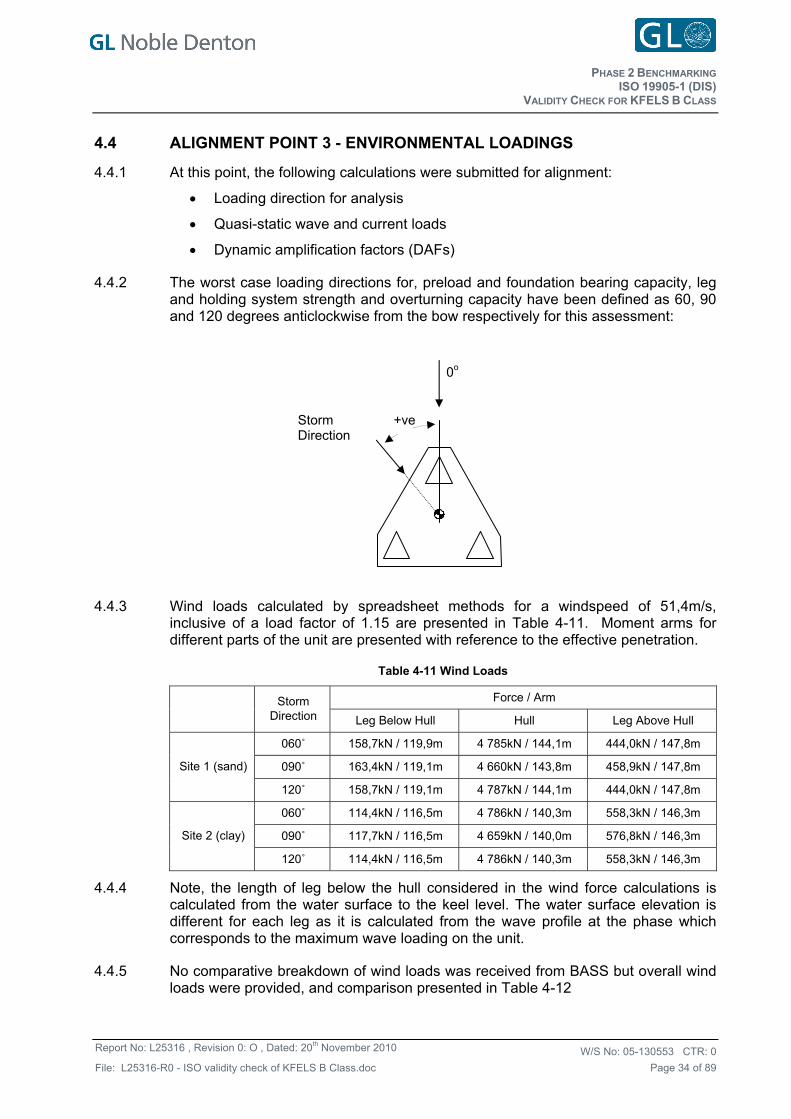
4.4.2 The worst case loading directions for, preload and foundation bearing capacity, leg and holding system strength and overturning capacity have been defined as 60, 90 and 120 degrees anticlockwise from the bow respectively for this assessment:
o 0
Storm Direction
+ve
4.4.3 Wind loads calculated by spreadsheet methods for a windspeed of 51,4m/s, inclusive of a load factor of 1.15 are presented in Table 4-11. Moment arms for different parts of the unit are presented with reference to the effective penetration.
Table 4-11 Wind Loads
Force / Arm
Storm Direction Leg Below Hull Hull Leg Above Hull
060˚ 158,7kN / 119,9m 4 785kN / 144,1m 444,0kN / 147,8m
090˚ 163,4kN / 119,1m 4 660kN / 143,8m 458,9kN / 147,8m Site 1 (sand)
120˚ 158,7kN / 119,1m 4 787kN / 144,1m 444,0kN / 147,8m
060˚ 114,4kN / 116,5m 4 786kN / 140,3m 558,3kN / 146,3m
090˚ 117,7kN / 116,5m 4 659kN / 140,0m 576,8kN / 146,3m Site 2 (clay)
120˚ 114,4kN / 116,5m 4 786kN / 140,3m 558,3kN / 146,3m
4.4.4 Note, the length of leg below the hull considered in the wind force calculations is calculated from the water surface to the keel level. The water surface elevation is different for each leg as it is calculated from the wave profile at the phase which corresponds to the maximum wave loading on the unit.
4.4.5 No comparative breakdown of wind loads was received from BASS but overall wind loads were provided, and comparison presented in Table 4-12
PHASE 2 BENCHMARKING
VALIDITY CHECK FOR KFELS B CLASS ISO 19905-1 (DIS)
W/S No: CTR: 05-130553 0
Page 35 of 89
Report No: L25316 , Revision 0: O , Dated: 20th November 2010
File: L25316-R0 - ISO validity check of KFELS B Class.doc
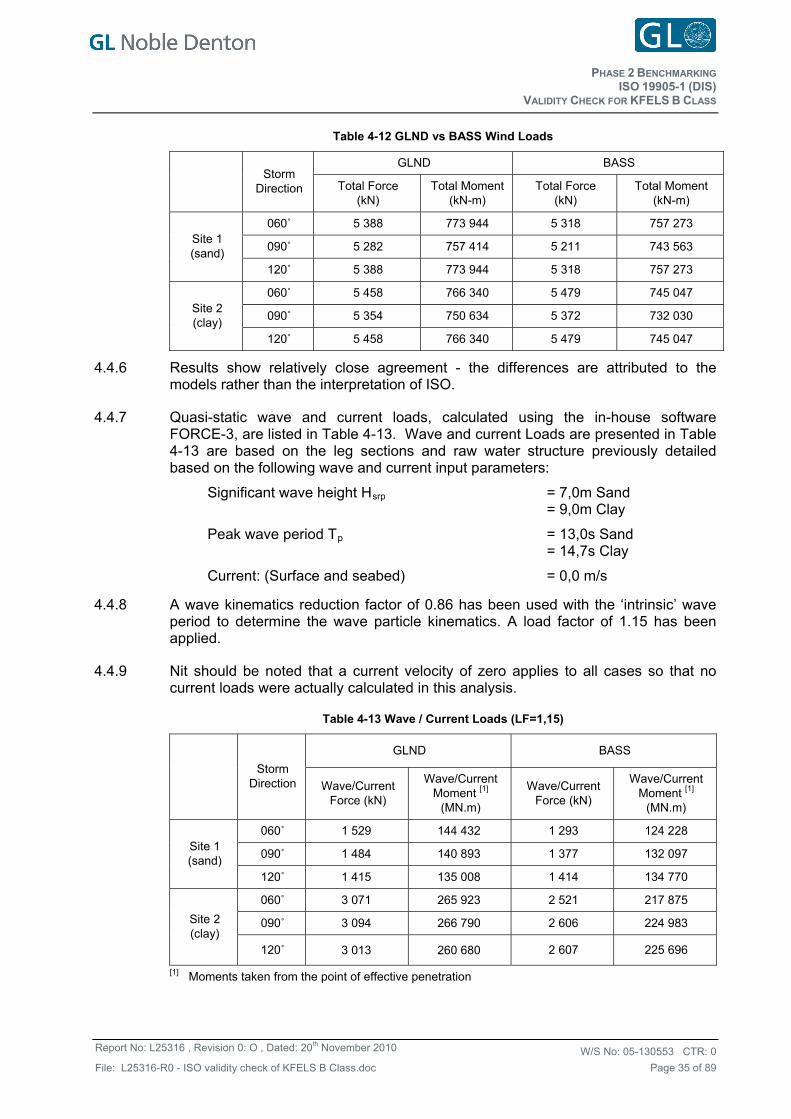
Table 4-12 GLND vs BASS Wind Loads
GLND BASS
Storm
Direction Total Force (kN)
Total Moment(kN-m)
Total Force (kN)
Total Moment (kN-m)
060˚ 5 388 773 944 5 318 757 273
090˚ 5 282 757 414 5 211 743 563 Site 1 (sand)
120˚ 5 388 773 944 5 318 757 273
060˚ 5 458 766 340 5 479 745 047
090˚ 5 354 750 634 5 372 732 030 Site 2 (clay)
120˚ 5 458 766 340 5 479 745 047
4.4.6 Results show relatively close agreement - the differences are attributed to the models rather than the interpretation of ISO.
4.4.7 Quasi-static wave and current loads, calculated using the in-house software FORCE-3, are listed in Table 4-13. Wave and current Loads are presented in Table 4-13 are based on the leg sections and raw water structure previously detailed based on the following wave and current input parameters:
Significant wave height Hsrp = 7,0m Sand = 9,0m Clay
Peak wave period Tp = 13,0s Sand = 14,7s Clay
Current: (Surface and seabed) = 0,0 m/s
4.4.8 A wave kinematics reduction factor of 0.86 has been used with the ‘intrinsic’ wave period to determine the wave particle kinematics. A load factor of 1.15 has been applied.
4.4.9 Nit should be noted that a current velocity of zero applies to all cases so that no current loads were actually calculated in this analysis.
Table 4-13 Wave / Current Loads (LF=1,15)
GLND BASS
Storm
Direction Wave/Current Force (kN)
Wave/Current Moment [1]
(MN.m)
Wave/Current Force (kN)
Wave/Current Moment [1]
(MN.m)
060˚ 1 529 144 432 1 293 124 228
090˚ 1 484 140 893 1 377 132 097 Site 1 (sand)
120˚ 1 415 135 008 1 414 134 770
060˚ 3 071 265 923 2 521 217 875
090˚ 3 094 266 790 2 606 224 983 Site 2 (clay)
120˚ 3 013 260 680 2 607 225 696
[1] Moments taken from the point of effective penetration
PHASE 2 BENCHMARKING
VALIDITY CHECK FOR KFELS B CLASS ISO 19905-1 (DIS)
W/S No: CTR: 05-130553 0
Page 36 of 89
Report No: L25316 , Revision 0: O , Dated: 20th November 2010
File: L25316-R0 - ISO validity check of KFELS B Class.doc
4.4.10 The wave loads calculated by BASS are about 8% less than those by GLND for the sand case while for the clay case the difference is up to 19% less. This may be due to the different way of using kinematics factors in the calculations.
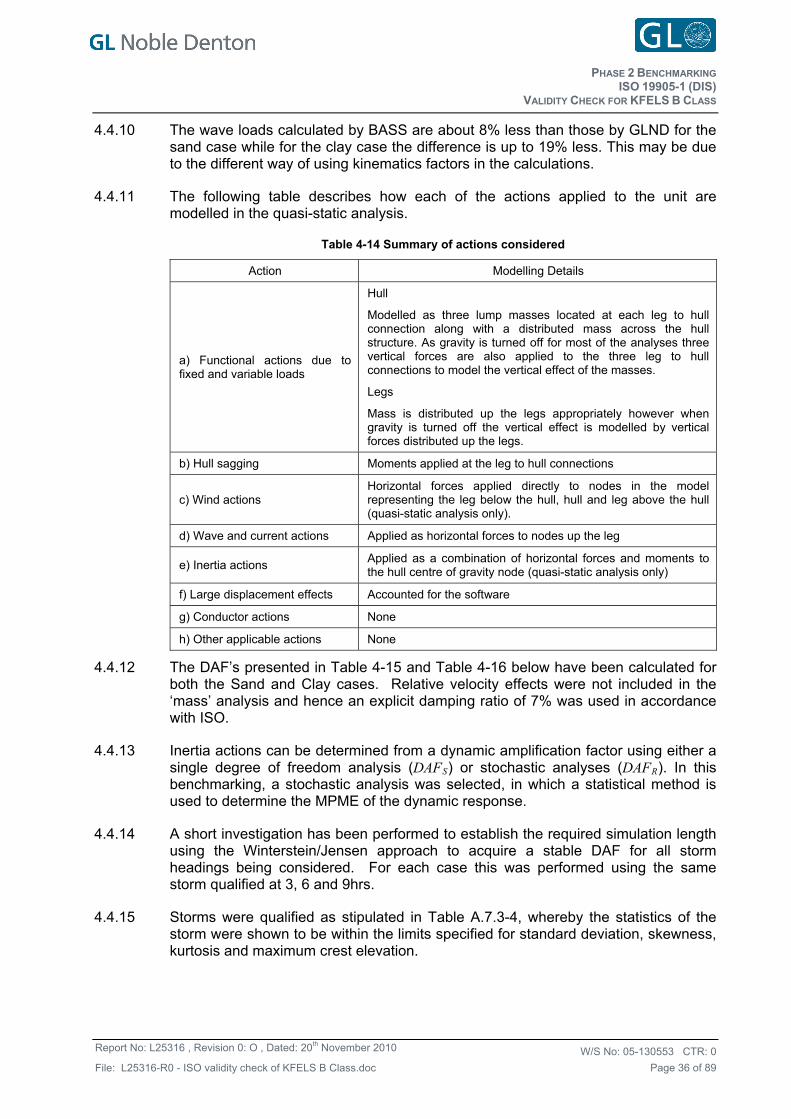
4.4.11 The following table describes how each of the actions applied to the unit are modelled in the quasi-static analysis.
Table 4-14 Summary of actions considered
Action Modelling Details
a) Functional actions due to fixed and variable loads
Hull
Modelled as three lump masses located at each leg to hull connection along with a distributed mass across the hull structure. As gravity is turned off for most of the analyses three vertical forces are also applied to the three leg to hull connections to model the vertical effect of the masses.
Legs
Mass is distributed up the legs appropriately however when gravity is turned off the vertical effect is modelled by vertical forces distributed up the legs.
b) Hull sagging Moments applied at the leg to hull connections
c) Wind actions Horizontal forces applied directly to nodes in the model representing the leg below the hull, hull and leg above the hull (quasi-static analysis only).
d) Wave and current actions Applied as horizontal forces to nodes up the leg
e) Inertia actions Applied as a combination of horizontal forces and moments to the hull centre of gravity node (quasi-static analysis only)
f) Large displacement effects Accounted for the software
g) Conductor actions None
h) Other applicable actions None
4.4.12 The DAF’s presented in Table 4-15 and Table 4-16 below have been calculated for both the Sand and Clay cases. Relative velocity effects were not included in the ‘mass’ analysis and hence an explicit damping ratio of 7% was used in accordance with ISO.
4.4.13 Inertia actions can be determined from a dynamic amplification factor using either a single degree of freedom analysis (DAFS) or stochastic analyses (DAFR). In this benchmarking, a stochastic analysis was selected, in which a statistical method is used to determine the MPME of the dynamic response.
4.4.14 A short investigation has been performed to establish the required simulation length using the Winterstein/Jensen approach to acquire a stable DAF for all storm headings being considered. For each case this was performed using the same storm qualified at 3, 6 and 9hrs.
4.4.15 Storms were qualified as stipulated in Table A.7.3-4, whereby the statistics of the storm were shown to be within the limits specified for standard deviation, skewness, kurtosis and maximum crest elevation.
PHASE 2 BENCHMARKING
VALIDITY CHECK FOR KFELS B CLASS ISO 19905-1 (DIS)
W/S No: CTR: 05-130553 0
Page 37 of 89
Report No: L25316 , Revision 0: O , Dated: 20th November 2010
File: L25316-R0 - ISO validity check of KFELS B Class.doc
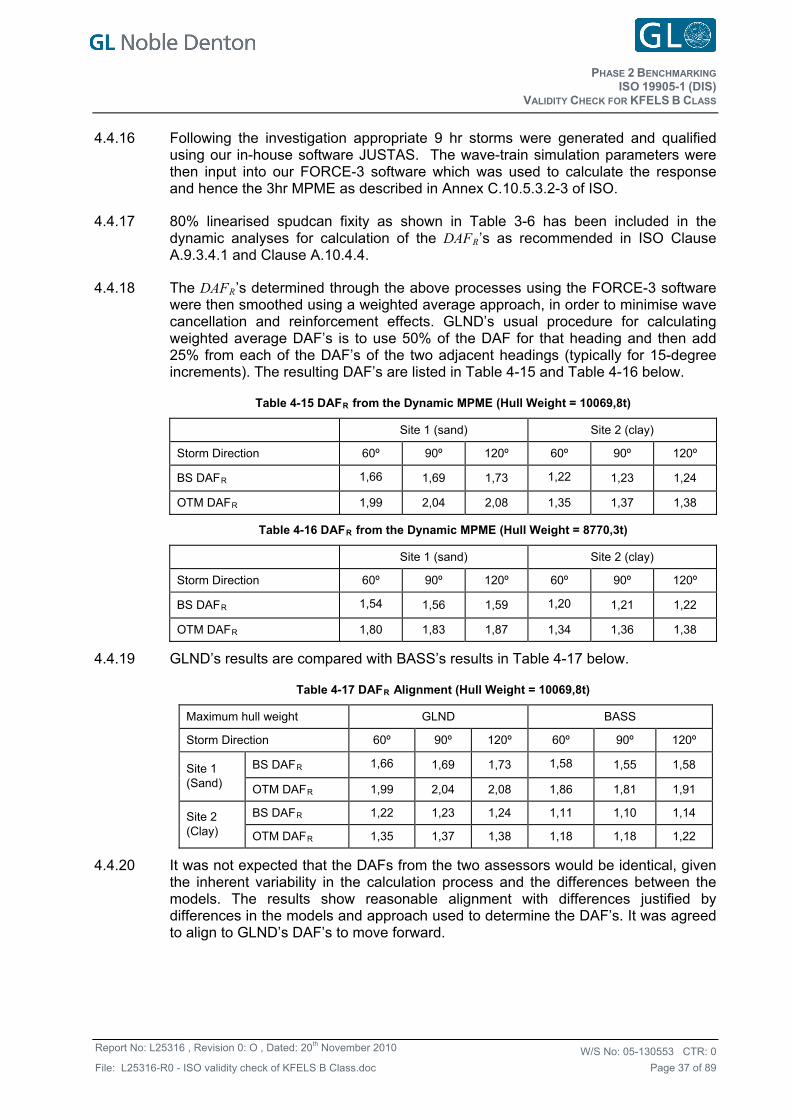
4.4.16 Following the investigation appropriate 9 hr storms were generated and qualified using our in-house software JUSTAS. The wave-train simulation parameters were then input into our FORCE-3 software which was used to calculate the response and hence the 3hr MPME as described in Annex C.10.5.3.2-3 of ISO.
4.4.17 80% linearised spudcan fixity as shown in Table 3-6 has been included in the dynamic analyses for calculation of the DAFR’s as recommended in ISO Clause A.9.3.4.1 and Clause A.10.4.4.
4.4.18 The DAFR’s determined through the above processes using the FORCE-3 software were then smoothed using a weighted average approach, in order to minimise wave cancellation and reinforcement effects. GLND’s usual procedure for calculating weighted average DAF’s is to use 50% of the DAF for that heading and then add 25% from each of the DAF’s of the two adjacent headings (typically for 15-degree increments). The resulting DAF’s are listed in Table 4-15 and Table 4-16 below.
Table 4-15 DAFR from the Dynamic MPME (Hull Weight = 10069,8t)
Site 1 (sand) Site 2 (clay)
Storm Direction 60º 90º 120º 60º 90º 120º
BS DAFR 1,66 1,69 1,73 1,22 1,23 1,24
OTM DAFR 1,99 2,04 2,08 1,35 1,37 1,38
Table 4-16 DAFR from the Dynamic MPME (Hull Weight = 8770,3t)
Site 1 (sand) Site 2 (clay)
Storm Direction 60º 90º 120º 60º 90º 120º
BS DAFR 1,54 1,56 1,59 1,20 1,21 1,22
OTM DAFR 1,80 1,83 1,87 1,34 1,36 1,38
4.4.19 GLND’s results are compared with BASS’s results in Table 4-17 below.
Table 4-17 DAFR Alignment (Hull Weight = 10069,8t)
Maximum hull weight GLND BASS
Storm Direction 60º 90º 120º 60º 90º 120º
BS DAFR 1,66 1,69 1,73 1,58 1,55 1,58 Site 1 (Sand) OTM DAFR 1,99 2,04 2,08 1,86 1,81 1,91
BS DAFR 1,22 1,23 1,24 1,11 1,10 1,14 Site 2 (Clay) OTM DAFR 1,35 1,37 1,38 1,18 1,18 1,22
4.4.20 It was not expected that the DAFs from the two assessors would be identical, given the inherent variability in the calculation process and the differences between the models. The results show reasonable alignment with differences justified by differences in the models and approach used to determine the DAF’s. It was agreed to align to GLND’s DAF’s to move forward.
PHASE 2 BENCHMARKING
VALIDITY CHECK FOR KFELS B CLASS ISO 19905-1 (DIS)
W/S No: CTR: 05-130553 0
Page 38 of 89
Report No: L25316 , Revision 0: O , Dated: 20th November 2010
File: L25316-R0 - ISO validity check of KFELS B Class.doc
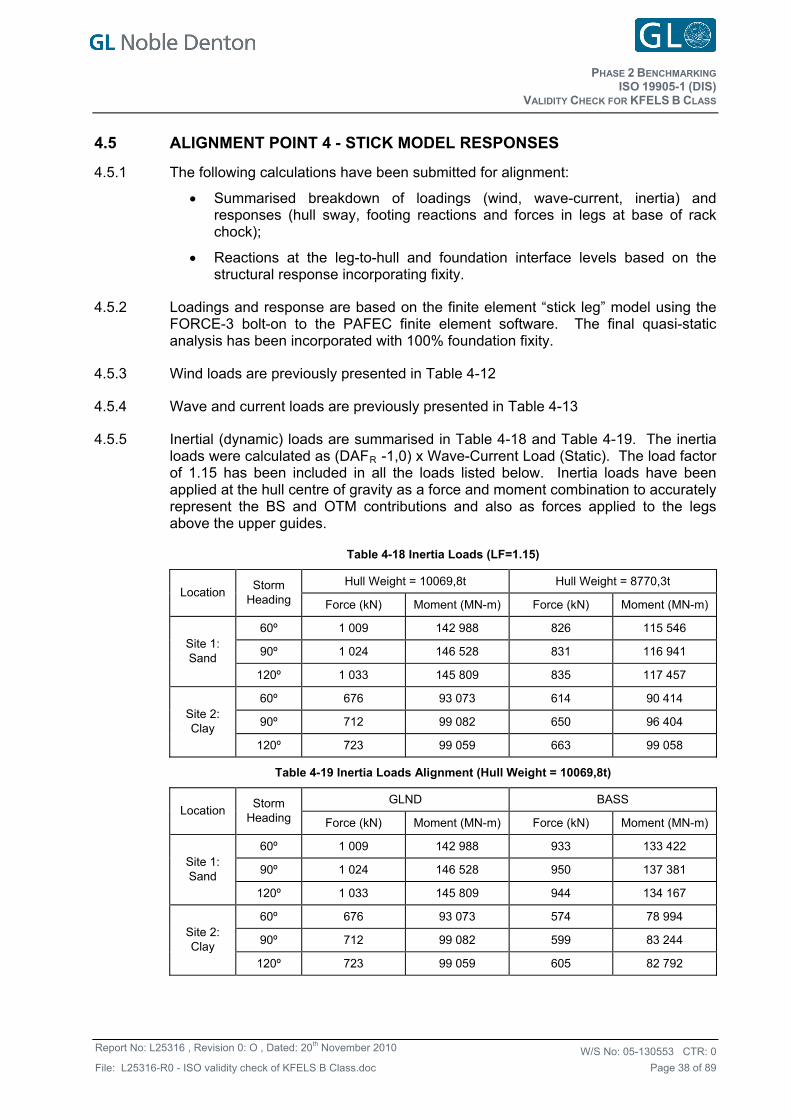
4.5 ALIGNMENT POINT 4 - STICK MODEL RESPONSES
4.5.1 The following calculations have been submitted for alignment:
Summarised breakdown of loadings (wind, wave-current, inertia) and responses (hull sway, footing reactions and forces in legs at base of rack chock);
Reactions at the leg-to-hull and foundation interface levels based on the structural response incorporating fixity.
4.5.2 Loadings and response are based on the finite element “stick leg” model using the FORCE-3 bolt-on to the PAFEC finite element software. The final quasi-static analysis has been incorporated with 100% foundation fixity.
4.5.3 Wind loads are previously presented in Table 4-12
4.5.4 Wave and current loads are previously presented in Table 4-13
4.5.5 Inertial (dynamic) loads are summarised in Table 4-18 and Table 4-19. The inertia loads were calculated as (DAFR -1,0) x Wave-Current Load (Static). The load factor of 1.15 has been included in all the loads listed below. Inertia loads have been applied at the hull centre of gravity as a force and moment combination to accurately represent the BS and OTM contributions and also as forces applied to the legs above the upper guides.
Table 4-18 Inertia Loads (LF=1.15)
Hull Weight = 10069,8t Hull Weight = 8770,3t Location
Storm Heading Force (kN) Moment (MN-m) Force (kN) Moment (MN-m)
60º 1 009 142 988 826 115 546
90º 1 024 146 528 831 116 941 Site 1: Sand
120º 1 033 145 809 835 117 457
60º 676 93 073 614 90 414
90º 712 99 082 650 96 404 Site 2: Clay
120º 723 99 059 663 99 058
Table 4-19 Inertia Loads Alignment (Hull Weight = 10069,8t)
GLND BASS Location
Storm Heading Force (kN) Moment (MN-m) Force (kN) Moment (MN-m)
60º 1 009 142 988 933 133 422
90º 1 024 146 528 950 137 381 Site 1: Sand
120º 1 033 145 809 944 134 167
60º 676 93 073 574 78 994
90º 712 99 082 599 83 244 Site 2: Clay
120º 723 99 059 605 82 792
PHASE 2 BENCHMARKING
VALIDITY CHECK FOR KFELS B CLASS ISO 19905-1 (DIS)
W/S No: CTR: 05-130553 0
Page 39 of 89
Report No: L25316 , Revision 0: O , Dated: 20th November 2010
File: L25316-R0 - ISO validity check of KFELS B Class.doc
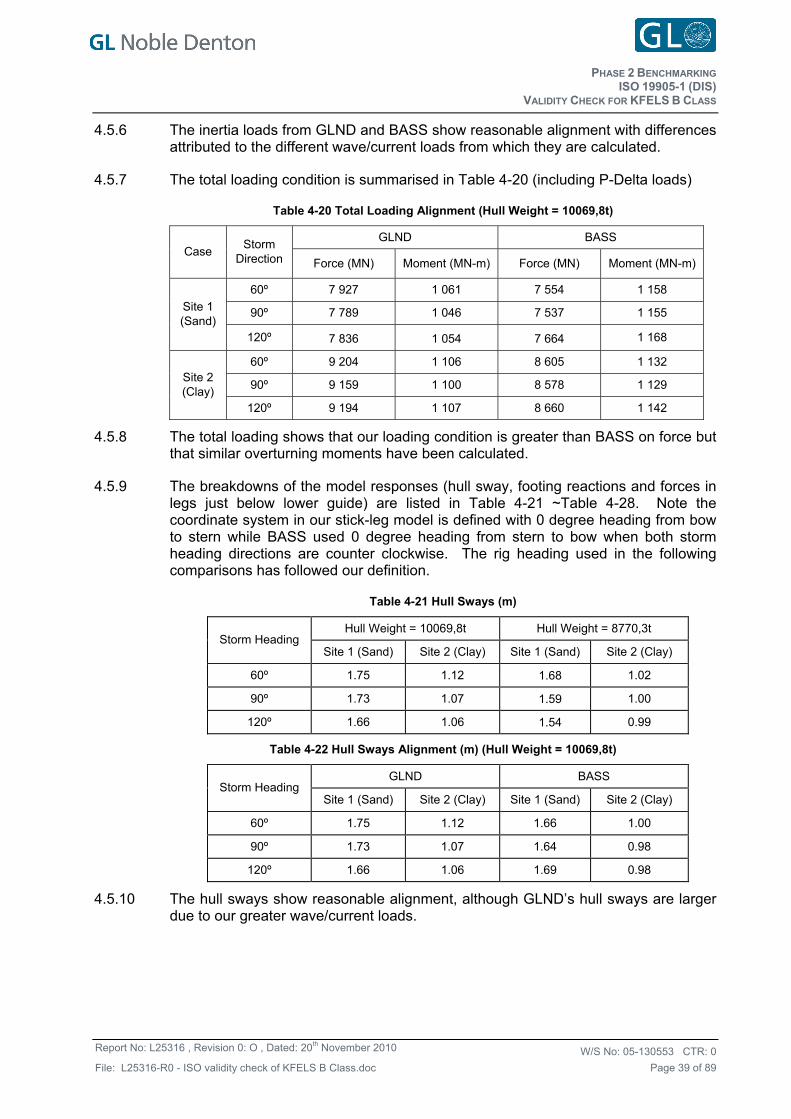
4.5.6 The inertia loads from GLND and BASS show reasonable alignment with differences attributed to the different wave/current loads from which they are calculated.
4.5.7 The total loading condition is summarised in Table 4-20 (including P-Delta loads)
Table 4-20 Total Loading Alignment (Hull Weight = 10069,8t)
GLND BASS Case
Storm Direction Force (MN) Moment (MN-m) Force (MN) Moment (MN-m)
60º 7 927 1 061 7 554 1 158
90º 7 789 1 046 7 537 1 155 Site 1 (Sand)
120º 7 836 1 054 7 664 1 168
60º 9 204 1 106 8 605 1 132
90º 9 159 1 100 8 578 1 129 Site 2 (Clay)
120º 9 194 1 107 8 660 1 142
4.5.8 The total loading shows that our loading condition is greater than BASS on force but that similar overturning moments have been calculated.
4.5.9 The breakdowns of the model responses (hull sway, footing reactions and forces in legs just below lower guide) are listed in Table 4-21 ~Table 4-28. Note the coordinate system in our stick-leg model is defined with 0 degree heading from bow to stern while BASS used 0 degree heading from stern to bow when both storm heading directions are counter clockwise. The rig heading used in the following comparisons has followed our definition.
Table 4-21 Hull Sways (m)
Hull Weight = 10069,8t Hull Weight = 8770,3t Storm Heading
Site 1 (Sand) Site 2 (Clay) Site 1 (Sand) Site 2 (Clay)
60º 1.75 1.12 1.68 1.02
90º 1.73 1.07 1.59 1.00
120º 1.66 1.06 1.54 0.99
Table 4-22 Hull Sways Alignment (m) (Hull Weight = 10069,8t)
GLND BASS Storm Heading
Site 1 (Sand) Site 2 (Clay) Site 1 (Sand) Site 2 (Clay)
60º 1.75 1.12 1.66 1.00
90º 1.73 1.07 1.64 0.98
120º 1.66 1.06 1.69 0.98
4.5.10 The hull sways show reasonable alignment, although GLND’s hull sways are larger due to our greater wave/current loads.
PHASE 2 BENCHMARKING
VALIDITY CHECK FOR KFELS B CLASS ISO 19905-1 (DIS)
W/S No: CTR: 05-130553 0
Page 40 of 89
Report No: L25316 , Revision 0: O , Dated: 20th November 2010
File: L25316-R0 - ISO validity check of KFELS B Class.doc
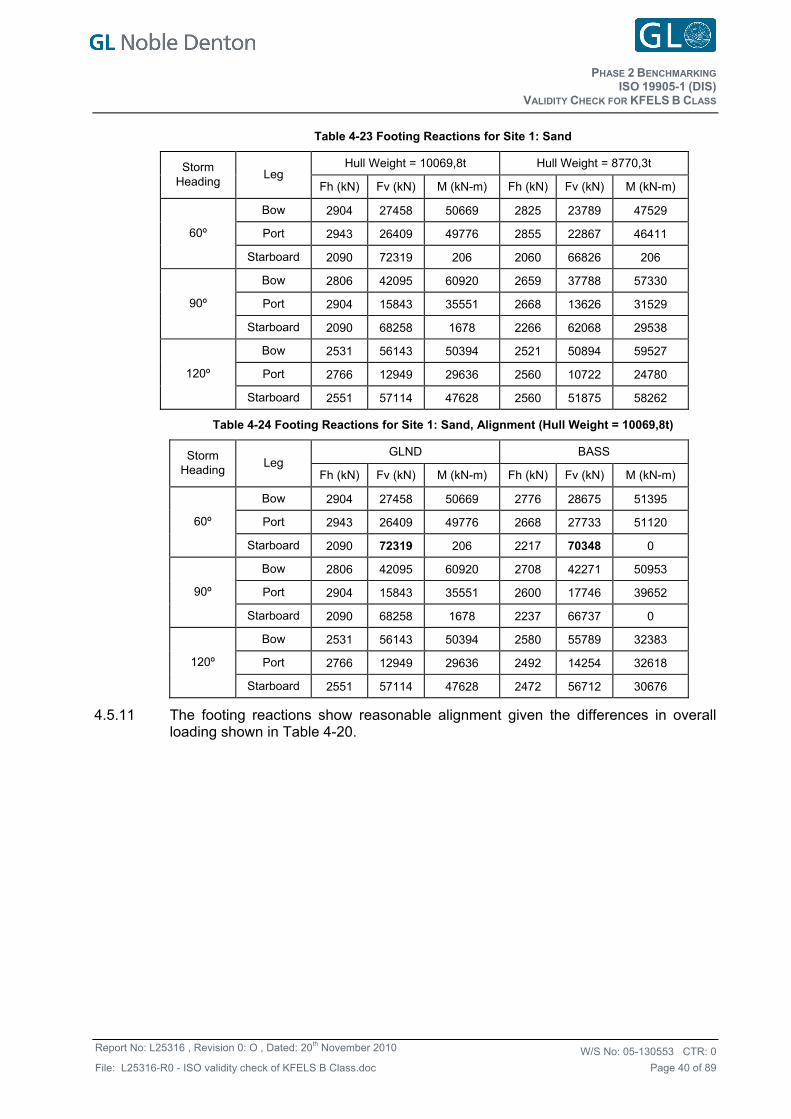
Table 4-23 Footing Reactions for Site 1: Sand
Hull Weight = 10069,8t Hull Weight = 8770,3t Storm Heading
Leg Fh (kN) Fv (kN) M (kN-m) Fh (kN) Fv (kN) M (kN-m)
Bow 2904 27458 50669 2825 23789 47529
Port 2943 26409 49776 2855 22867 46411 60º
Starboard 2090 72319 206 2060 66826 206
Bow 2806 42095 60920 2659 37788 57330
Port 2904 15843 35551 2668 13626 31529 90º
Starboard 2090 68258 1678 2266 62068 29538
Bow 2531 56143 50394 2521 50894 59527
Port 2766 12949 29636 2560 10722 24780 120º
Starboard 2551 57114 47628 2560 51875 58262
Table 4-24 Footing Reactions for Site 1: Sand, Alignment (Hull Weight = 10069,8t)
GLND BASS Storm Heading
Leg Fh (kN) Fv (kN) M (kN-m) Fh (kN) Fv (kN) M (kN-m)
Bow 2904 27458 50669 2776 28675 51395
Port 2943 26409 49776 2668 27733 51120 60º
Starboard 2090 72319 206 2217 70348 0
Bow 2806 42095 60920 2708 42271 50953
Port 2904 15843 35551 2600 17746 39652 90º
Starboard 2090 68258 1678 2237 66737 0
Bow 2531 56143 50394 2580 55789 32383
Port 2766 12949 29636 2492 14254 32618 120º
Starboard 2551 57114 47628 2472 56712 30676
4.5.11 The footing reactions show reasonable alignment given the differences in overall loading shown in Table 4-20.
PHASE 2 BENCHMARKING
VALIDITY CHECK FOR KFELS B CLASS ISO 19905-1 (DIS)
W/S No: CTR: 05-130553 0
Page 41 of 89
Report No: L25316 , Revision 0: O , Dated: 20th November 2010
File: L25316-R0 - ISO validity check of KFELS B Class.doc
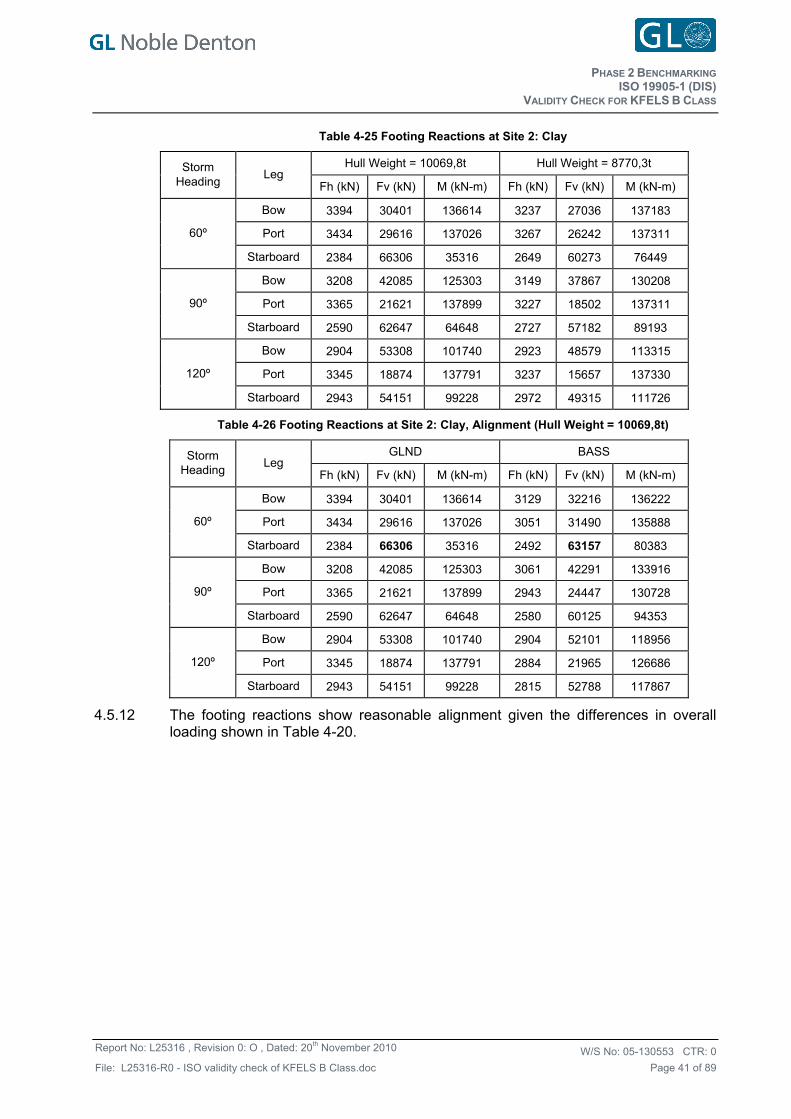
Table 4-25 Footing Reactions at Site 2: Clay
Hull Weight = 10069,8t Hull Weight = 8770,3t Storm Heading
Leg Fh (kN) Fv (kN) M (kN-m) Fh (kN) Fv (kN) M (kN-m)
Bow 3394 30401 136614 3237 27036 137183
Port 3434 29616 137026 3267 26242 137311 60º
Starboard 2384 66306 35316 2649 60273 76449
Bow 3208 42085 125303 3149 37867 130208
Port 3365 21621 137899 3227 18502 137311 90º
Starboard 2590 62647 64648 2727 57182 89193
Bow 2904 53308 101740 2923 48579 113315
Port 3345 18874 137791 3237 15657 137330 120º
Starboard 2943 54151 99228 2972 49315 111726
Table 4-26 Footing Reactions at Site 2: Clay, Alignment (Hull Weight = 10069,8t)
GLND BASS Storm Heading
Leg Fh (kN) Fv (kN) M (kN-m) Fh (kN) Fv (kN) M (kN-m)
Bow 3394 30401 136614 3129 32216 136222
Port 3434 29616 137026 3051 31490 135888 60º
Starboard 2384 66306 35316 2492 63157 80383
Bow 3208 42085 125303 3061 42291 133916
Port 3365 21621 137899 2943 24447 130728 90º
Starboard 2590 62647 64648 2580 60125 94353
Bow 2904 53308 101740 2904 52101 118956
Port 3345 18874 137791 2884 21965 126686 120º
Starboard 2943 54151 99228 2815 52788 117867
4.5.12 The footing reactions show reasonable alignment given the differences in overall loading shown in Table 4-20.
PHASE 2 BENCHMARKING
VALIDITY CHECK FOR KFELS B CLASS ISO 19905-1 (DIS)
W/S No: CTR: 05-130553 0
Page 42 of 89
Report No: L25316 , Revision 0: O , Dated: 20th November 2010
File: L25316-R0 - ISO validity check of KFELS B Class.doc
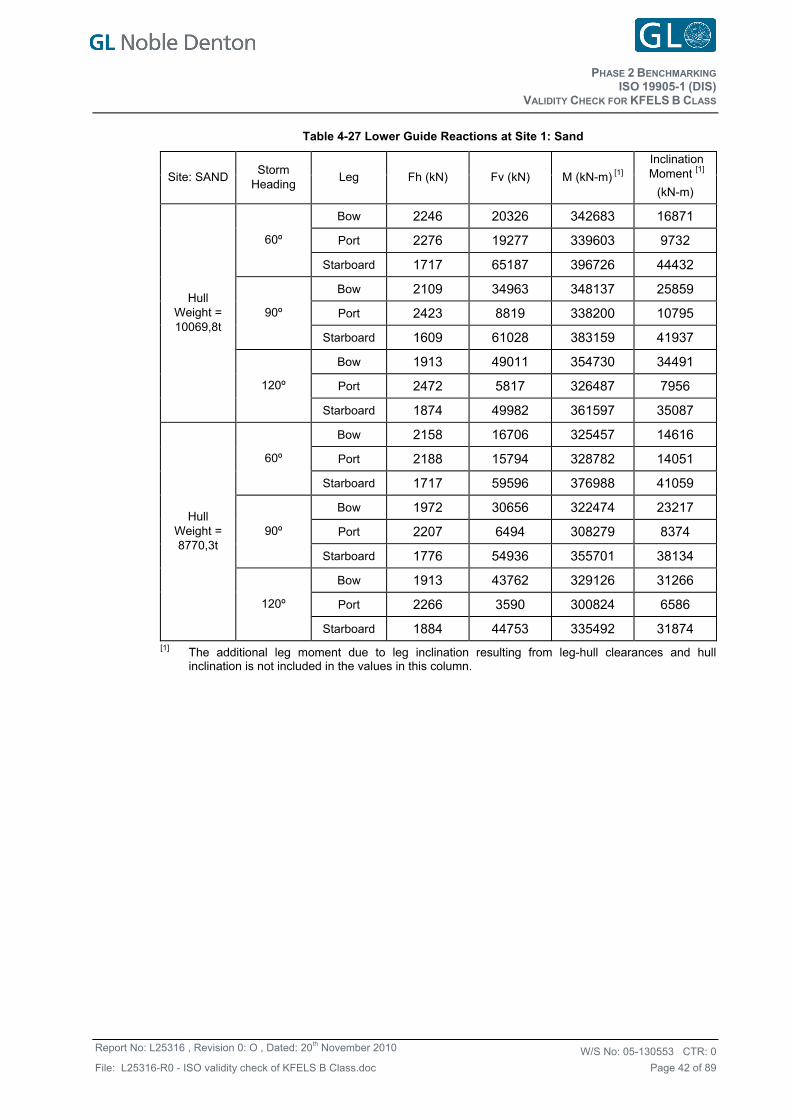
Table 4-27 Lower Guide Reactions at Site 1: Sand
Site: SAND Storm
Heading Leg Fh (kN) Fv (kN) M (kN-m) [1]
Inclination Moment [1]
(kN-m)
Bow 2246 20326 342683 16871
Port 2276 19277 339603 9732 60º
Starboard 1717 65187 396726 44432
Bow 2109 34963 348137 25859
Port 2423 8819 338200 10795 90º
Starboard 1609 61028 383159 41937
Bow 1913 49011 354730 34491
Port 2472 5817 326487 7956
Hull Weight = 10069,8t
120º
Starboard 1874 49982 361597 35087
Bow 2158 16706 325457 14616
Port 2188 15794 328782 14051 60º
Starboard 1717 59596 376988 41059
Bow 1972 30656 322474 23217
Port 2207 6494 308279 8374 90º
Starboard 1776 54936 355701 38134
Bow 1913 43762 329126 31266
Port 2266 3590 300824 6586
Hull Weight = 8770,3t
120º
Starboard 1884 44753 335492 31874 [1] The additional leg moment due to leg inclination resulting from leg-hull clearances and hull
inclination is not included in the values in this column.
PHASE 2 BENCHMARKING
VALIDITY CHECK FOR KFELS B CLASS ISO 19905-1 (DIS)
W/S No: CTR: 05-130553 0
Page 43 of 89
Report No: L25316 , Revision 0: O , Dated: 20th November 2010
File: L25316-R0 - ISO validity check of KFELS B Class.doc
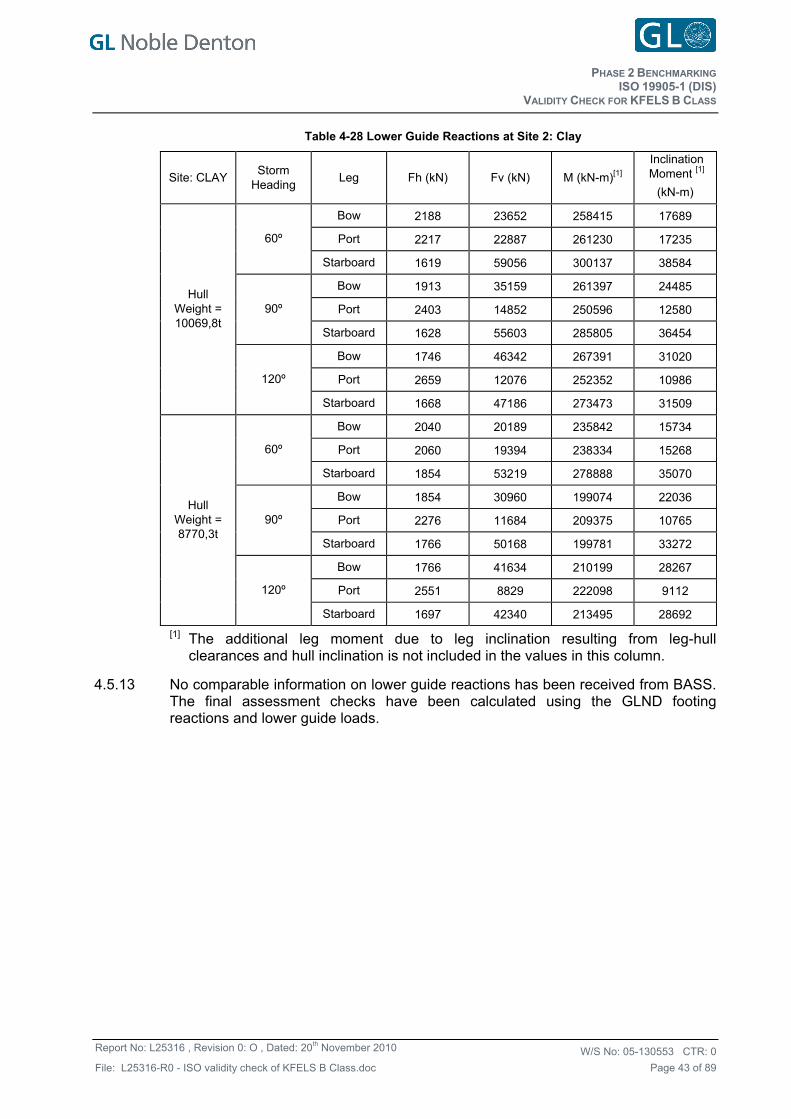
Table 4-28 Lower Guide Reactions at Site 2: Clay
Site: CLAY Storm
Heading Leg Fh (kN) Fv (kN) M (kN-m)[1]
Inclination Moment [1]
(kN-m)
Bow 2188 23652 258415 17689
Port 2217 22887 261230 17235 60º
Starboard 1619 59056 300137 38584
Bow 1913 35159 261397 24485
Port 2403 14852 250596 12580 90º
Starboard 1628 55603 285805 36454
Bow 1746 46342 267391 31020
Port 2659 12076 252352 10986
Hull Weight = 10069,8t
120º
Starboard 1668 47186 273473 31509
Bow 2040 20189 235842 15734
Port 2060 19394 238334 15268 60º
Starboard 1854 53219 278888 35070
Bow 1854 30960 199074 22036
Port 2276 11684 209375 10765 90º
Starboard 1766 50168 199781 33272
Bow 1766 41634 210199 28267
Port 2551 8829 222098 9112
Hull Weight = 8770,3t
120º
Starboard 1697 42340 213495 28692
[1] The additional leg moment due to leg inclination resulting from leg-hull clearances and hull inclination is not included in the values in this column.
4.5.13 No comparable information on lower guide reactions has been received from BASS. The final assessment checks have been calculated using the GLND footing reactions and lower guide loads.
PHASE 2 BENCHMARKING
VALIDITY CHECK FOR KFELS B CLASS ISO 19905-1 (DIS)
W/S No: CTR: 05-130553 0
Page 44 of 89
Report No: L25316 , Revision 0: O , Dated: 20th November 2010
File: L25316-R0 - ISO validity check of KFELS B Class.doc
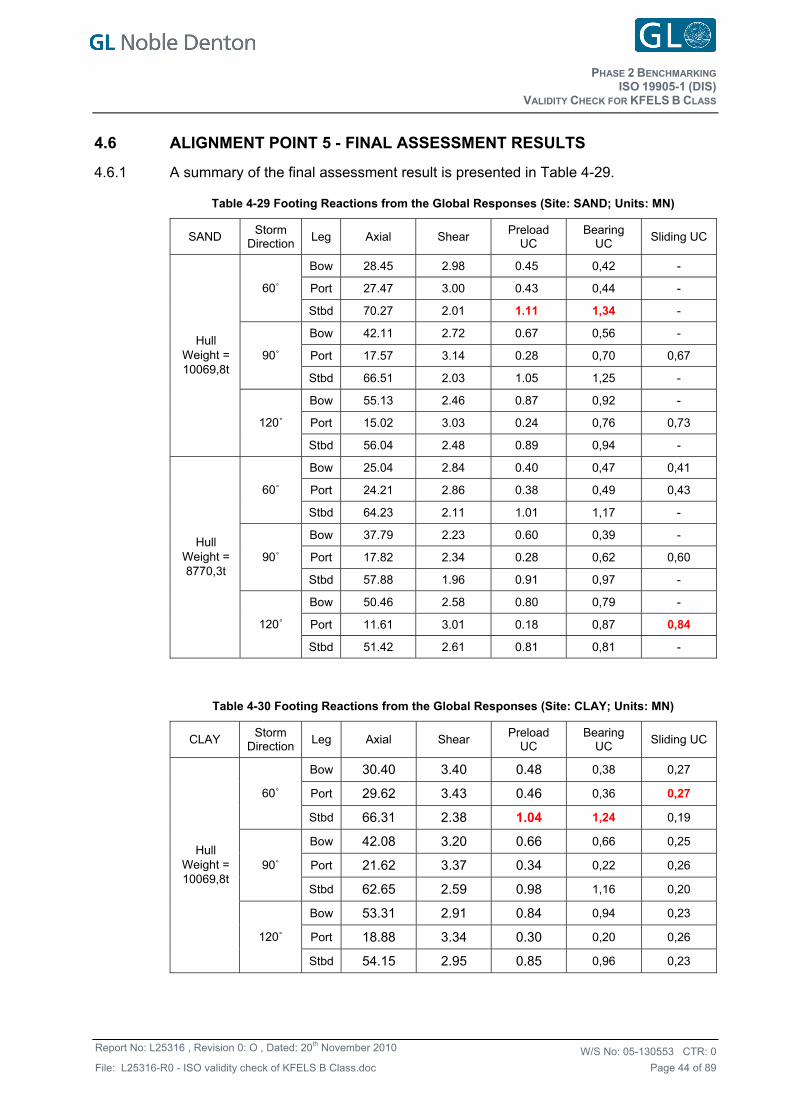
4.6 ALIGNMENT POINT 5 - FINAL ASSESSMENT RESULTS
4.6.1 A summary of the final assessment result is presented in Table 4-29.
Table 4-29 Footing Reactions from the Global Responses (Site: SAND; Units: MN)
SAND Storm
Direction Leg Axial Shear
Preload UC
Bearing UC
Sliding UC
Bow 28.45 2.98 0.45 0,42 -
Port 27.47 3.00 0.43 0,44 - 60˚
Stbd 70.27 2.01 1.11 1,34 -
Bow 42.11 2.72 0.67 0,56 -
Port 17.57 3.14 0.28 0,70 0,67 90˚
Stbd 66.51 2.03 1.05 1,25 -
Bow 55.13 2.46 0.87 0,92 -
Port 15.02 3.03 0.24 0,76 0,73
Hull Weight = 10069,8t
120˚
Stbd 56.04 2.48 0.89 0,94 -
Bow 25.04 2.84 0.40 0,47 0,41
Port 24.21 2.86 0.38 0,49 0,43 60˚
Stbd 64.23 2.11 1.01 1,17 -
Bow 37.79 2.23 0.60 0,39 -
Port 17.82 2.34 0.28 0,62 0,60 90˚
Stbd 57.88 1.96 0.91 0,97 -
Bow 50.46 2.58 0.80 0,79 -
Port 11.61 3.01 0.18 0,87 0,84
Hull Weight = 8770,3t
120˚
Stbd 51.42 2.61 0.81 0,81 -
Table 4-30 Footing Reactions from the Global Responses (Site: CLAY; Units: MN)
CLAY Storm
Direction Leg Axial Shear
Preload UC
Bearing UC
Sliding UC
Bow 30.40 3.40 0.48 0,38 0,27
Port 29.62 3.43 0.46 0,36 0,27 60˚
Stbd 66.31 2.38 1.04 1,24 0,19
Bow 42.08 3.20 0.66 0,66 0,25
Port 21.62 3.37 0.34 0,22 0,26 90˚
Stbd 62.65 2.59 0.98 1,16 0,20
Bow 53.31 2.91 0.84 0,94 0,23
Port 18.88 3.34 0.30 0,20 0,26
Hull Weight = 10069,8t
120˚
Stbd 54.15 2.95 0.85 0,96 0,23
PHASE 2 BENCHMARKING
VALIDITY CHECK FOR KFELS B CLASS ISO 19905-1 (DIS)
W/S No: CTR: 05-130553 0
Page 45 of 89
Report No: L25316 , Revision 0: O , Dated: 20th November 2010
File: L25316-R0 - ISO validity check of KFELS B Class.doc
Bow 27.04 3.24 0.42 0,30 0,25
Port 26.24 3.27 0.41 0,29 0,26 60˚
Stbd 60.27 2.64 0.95 1,10 0,21
Bow 37.87 3.15 0.59 0,55 0,25
Port 18.50 3.23 0.29 0,19 0,25 90˚
Stbd 57.18 2.72 0.90 1,04 0,21
Bow 48.58 2.93 0.76 0,80 0,23
Port 15.66 3.23 0.25 0,18 0,25
Hull Weight = 8770,3t
120˚
Stbd 49.31 2.97 0.77 0,82 0,23
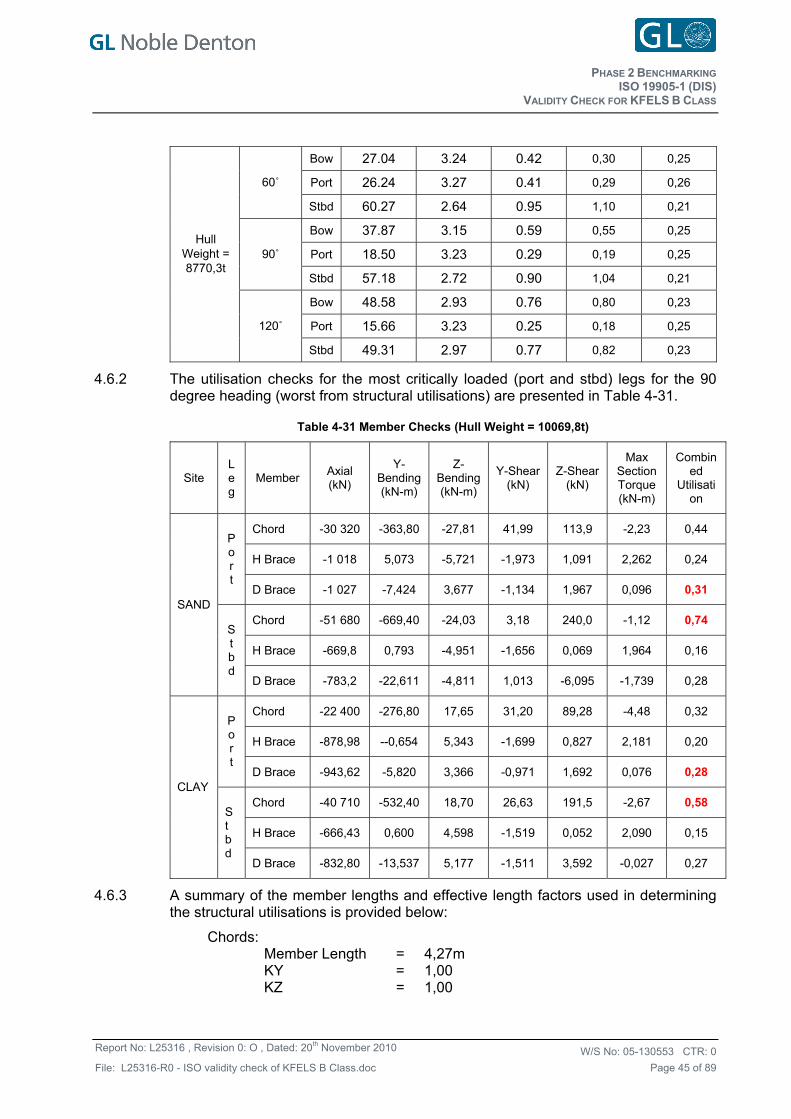
4.6.2 The utilisation checks for the most critically loaded (port and stbd) legs for the 90 degree heading (worst from structural utilisations) are presented in Table 4-31.
Table 4-31 Member Checks (Hull Weight = 10069,8t)
Site Leg
Member Axial (kN)
Y-Bending (kN-m)
Z-Bending (kN-m)
Y-Shear (kN)
Z-Shear (kN)
Max Section Torque (kN-m)
Combined
Utilisation
Chord -30 320 -363,80 -27,81 41,99 113,9 -2,23 0,44
H Brace -1 018 5,073 -5,721 -1,973 1,091 2,262 0,24
Po r t
D Brace -1 027 -7,424 3,677 -1,134 1,967 0,096 0,31
Chord -51 680 -669,40 -24,03 3,18 240,0 -1,12 0,74
H Brace -669,8 0,793 -4,951 -1,656 0,069 1,964 0,16
SAND
S t bd
D Brace -783,2 -22,611 -4,811 1,013 -6,095 -1,739 0,28
Chord -22 400 -276,80 17,65 31,20 89,28 -4,48 0,32
H Brace -878,98 --0,654 5,343 -1,699 0,827 2,181 0,20
Po r t
D Brace -943,62 -5,820 3,366 -0,971 1,692 0,076 0,28
Chord -40 710 -532,40 18,70 26,63 191,5 -2,67 0,58
H Brace -666,43 0,600 4,598 -1,519 0,052 2,090 0,15
CLAY
S t bd
D Brace -832,80 -13,537 5,177 -1,511 3,592 -0,027 0,27
4.6.3 A summary of the member lengths and effective length factors used in determining the structural utilisations is provided below:
Chords: Member Length = 4,27m KY = 1,00 KZ = 1,00
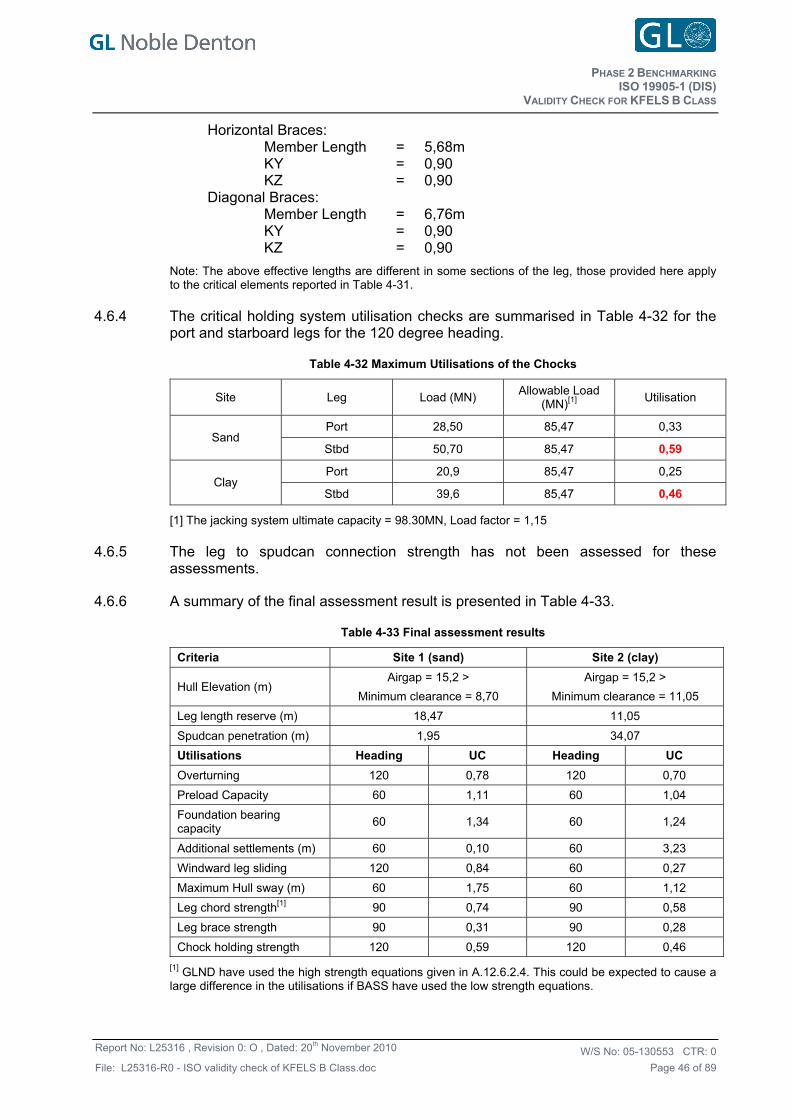
PHASE 2 BENCHMARKING
VALIDITY CHECK FOR KFELS B CLASS ISO 19905-1 (DIS)
W/S No: CTR: 05-130553 0
Page 46 of 89
Report No: L25316 , Revision 0: O , Dated: 20th November 2010
File: L25316-R0 - ISO validity check of KFELS B Class.doc
Horizontal Braces: Member Length = 5,68m KY = 0,90 KZ = 0,90 Diagonal Braces: Member Length = 6,76m KY = 0,90 KZ = 0,90
Note: The above effective lengths are different in some sections of the leg, those provided here apply to the critical elements reported in Table 4-31.
4.6.4 The critical holding system utilisation checks are summarised in Table 4-32 for the port and starboard legs for the 120 degree heading.
Table 4-32 Maximum Utilisations of the Chocks
Site Leg Load (MN) Allowable Load
(MN)[1] Utilisation
Port 28,50 85,47 0,33 Sand
Stbd 50,70 85,47 0,59
Port 20,9 85,47 0,25 Clay
Stbd 39,6 85,47 0,46
[1] The jacking system ultimate capacity = 98.30MN, Load factor = 1,15
4.6.5 The leg to spudcan connection strength has not been assessed for these assessments.
4.6.6 A summary of the final assessment result is presented in Table 4-33.
Table 4-33 Final assessment results
Criteria Site 1 (sand) Site 2 (clay)
Hull Elevation (m) Airgap = 15,2 >
Minimum clearance = 8,70
Airgap = 15,2 >
Minimum clearance = 11,05
Leg length reserve (m) 18,47 11,05
Spudcan penetration (m) 1,95 34,07
Utilisations Heading UC Heading UC
Overturning 120 0,78 120 0,70
Preload Capacity 60 1,11 60 1,04
Foundation bearing capacity
60 1,34 60 1,24
Additional settlements (m) 60 0,10 60 3,23
Windward leg sliding 120 0,84 60 0,27
Maximum Hull sway (m) 60 1,75 60 1,12
Leg chord strength[1] 90 0,74 90 0,58
Leg brace strength 90 0,31 90 0,28
Chock holding strength 120 0,59 120 0,46
[1] GLND have used the high strength equations given in A.12.6.2.4. This could be expected to cause a large difference in the utilisations if BASS have used the low strength equations.
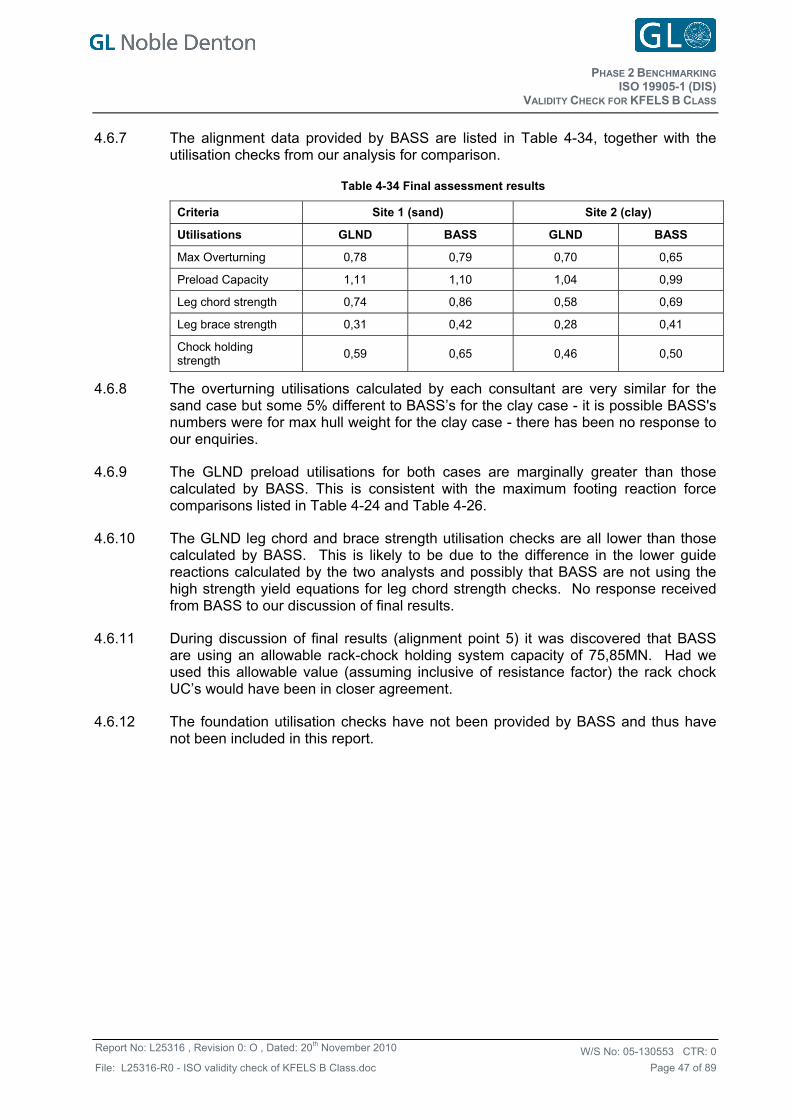
PHASE 2 BENCHMARKING
VALIDITY CHECK FOR KFELS B CLASS ISO 19905-1 (DIS)
W/S No: CTR: 05-130553 0
Page 47 of 89
Report No: L25316 , Revision 0: O , Dated: 20th November 2010
File: L25316-R0 - ISO validity check of KFELS B Class.doc
4.6.7 The alignment data provided by BASS are listed in Table 4-34, together with the utilisation checks from our analysis for comparison.
Table 4-34 Final assessment results
Criteria Site 1 (sand) Site 2 (clay)
Utilisations GLND BASS GLND BASS
Max Overturning 0,78 0,79 0,70 0,65
Preload Capacity 1,11 1,10 1,04 0,99
Leg chord strength 0,74 0,86 0,58 0,69
Leg brace strength 0,31 0,42 0,28 0,41
Chock holding strength
0,59 0,65 0,46 0,50
4.6.8 The overturning utilisations calculated by each consultant are very similar for the sand case but some 5% different to BASS’s for the clay case - it is possible BASS's numbers were for max hull weight for the clay case - there has been no response to our enquiries.
4.6.9 The GLND preload utilisations for both cases are marginally greater than those calculated by BASS. This is consistent with the maximum footing reaction force comparisons listed in Table 4-24 and Table 4-26.
4.6.10 The GLND leg chord and brace strength utilisation checks are all lower than those calculated by BASS. This is likely to be due to the difference in the lower guide reactions calculated by the two analysts and possibly that BASS are not using the high strength yield equations for leg chord strength checks. No response received from BASS to our discussion of final results.
4.6.11 During discussion of final results (alignment point 5) it was discovered that BASS are using an allowable rack-chock holding system capacity of 75,85MN. Had we used this allowable value (assuming inclusive of resistance factor) the rack chock UC’s would have been in closer agreement.
4.6.12 The foundation utilisation checks have not been provided by BASS and thus have not been included in this report.
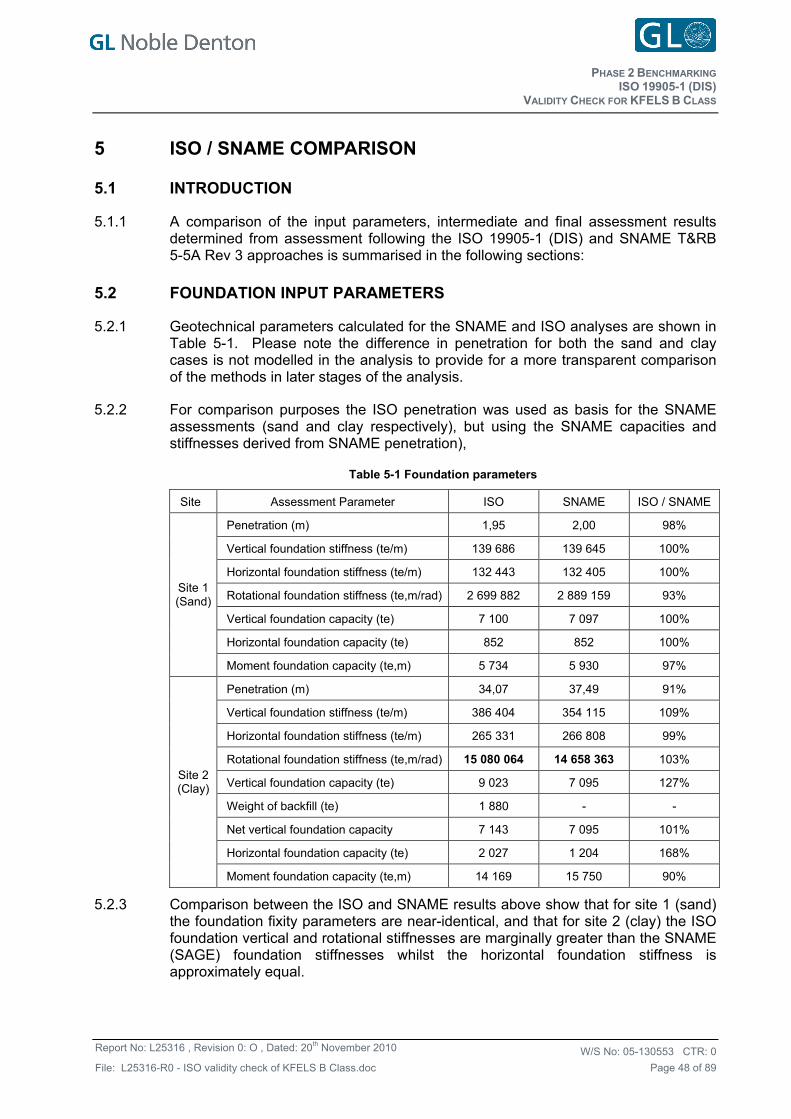
PHASE 2 BENCHMARKING
VALIDITY CHECK FOR KFELS B CLASS ISO 19905-1 (DIS)
W/S No: CTR: 05-130553 0
Page 48 of 89
Report No: L25316 , Revision 0: O , Dated: 20th November 2010
File: L25316-R0 - ISO validity check of KFELS B Class.doc
5.1
5.2
5 ISO / SNAME COMPARISON
INTRODUCTION
5.1.1 A comparison of the input parameters, intermediate and final assessment results determined from assessment following the ISO 19905-1 (DIS) and SNAME T&RB 5-5A Rev 3 approaches is summarised in the following sections:
FOUNDATION INPUT PARAMETERS
5.2.1 Geotechnical parameters calculated for the SNAME and ISO analyses are shown in Table 5-1. Please note the difference in penetration for both the sand and clay cases is not modelled in the analysis to provide for a more transparent comparison of the methods in later stages of the analysis.
5.2.2 For comparison purposes the ISO penetration was used as basis for the SNAME assessments (sand and clay respectively), but using the SNAME capacities and stiffnesses derived from SNAME penetration),
Table 5-1 Foundation parameters
Site Assessment Parameter ISO SNAME ISO / SNAME
Penetration (m) 1,95 2,00 98%
Vertical foundation stiffness (te/m) 139 686 139 645 100%
Horizontal foundation stiffness (te/m) 132 443 132 405 100%
Rotational foundation stiffness (te,m/rad) 2 699 882 2 889 159 93%
Vertical foundation capacity (te) 7 100 7 097 100%
Horizontal foundation capacity (te) 852 852 100%
Site 1 (Sand)
Moment foundation capacity (te,m) 5 734 5 930 97%
Penetration (m) 34,07 37,49 91%
Vertical foundation stiffness (te/m) 386 404 354 115 109%
Horizontal foundation stiffness (te/m) 265 331 266 808 99%
Rotational foundation stiffness (te,m/rad) 15 080 064 14 658 363 103%
Vertical foundation capacity (te) 9 023 7 095 127%
Weight of backfill (te) 1 880 - -
Net vertical foundation capacity 7 143 7 095 101%
Horizontal foundation capacity (te) 2 027 1 204 168%
Site 2 (Clay)
Moment foundation capacity (te,m) 14 169 15 750 90%
5.2.3 Comparison between the ISO and SNAME results above show that for site 1 (sand) the foundation fixity parameters are near-identical, and that for site 2 (clay) the ISO foundation vertical and rotational stiffnesses are marginally greater than the SNAME (SAGE) foundation stiffnesses whilst the horizontal foundation stiffness is approximately equal.
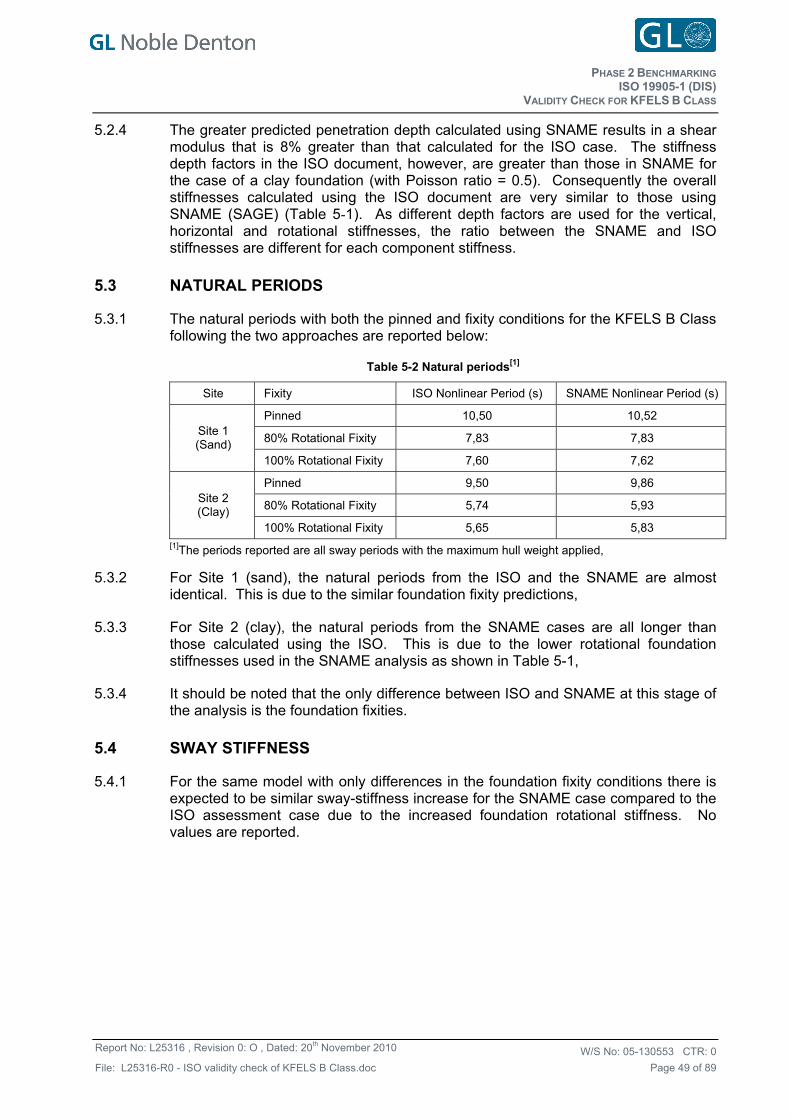
PHASE 2 BENCHMARKING
VALIDITY CHECK FOR KFELS B CLASS ISO 19905-1 (DIS)
W/S No: CTR: 05-130553 0
Page 49 of 89
Report No: L25316 , Revision 0: O , Dated: 20th November 2010
File: L25316-R0 - ISO validity check of KFELS B Class.doc
5.3
5.2.4 The greater predicted penetration depth calculated using SNAME results in a shear modulus that is 8% greater than that calculated for the ISO case. The stiffness depth factors in the ISO document, however, are greater than those in SNAME for the case of a clay foundation (with Poisson ratio = 0.5). Consequently the overall stiffnesses calculated using the ISO document are very similar to those using SNAME (SAGE) (Table 5-1). As different depth factors are used for the vertical, horizontal and rotational stiffnesses, the ratio between the SNAME and ISO stiffnesses are different for each component stiffness.
NATURAL PERIODS
5.3.1 The natural periods with both the pinned and fixity conditions for the KFELS B Class following the two approaches are reported below:
Table 5-2 Natural periods[1]
Site Fixity ISO Nonlinear Period (s) SNAME Nonlinear Period (s)
Pinned 10,50 10,52
80% Rotational Fixity 7,83 7,83 Site 1 (Sand)
100% Rotational Fixity 7,60 7,62
Pinned 9,50 9,86
80% Rotational Fixity 5,74 5,93 Site 2 (Clay)
100% Rotational Fixity 5,65 5,83 [1]The periods reported are all sway periods with the maximum hull weight applied,
5.3.2 For Site 1 (sand), the natural periods from the ISO and the SNAME are almost identical. This is due to the similar foundation fixity predictions,
5.3.3 For Site 2 (clay), the natural periods from the SNAME cases are all longer than those calculated using the ISO. This is due to the lower rotational foundation stiffnesses used in the SNAME analysis as shown in Table 5-1,
5.3.4 It should be noted that the only difference between ISO and SNAME at this stage of the analysis is the foundation fixities.
5.4 SWAY STIFFNESS
5.4.1 For the same model with only differences in the foundation fixity conditions there is expected to be similar sway-stiffness increase for the SNAME case compared to the ISO assessment case due to the increased foundation rotational stiffness. No values are reported.
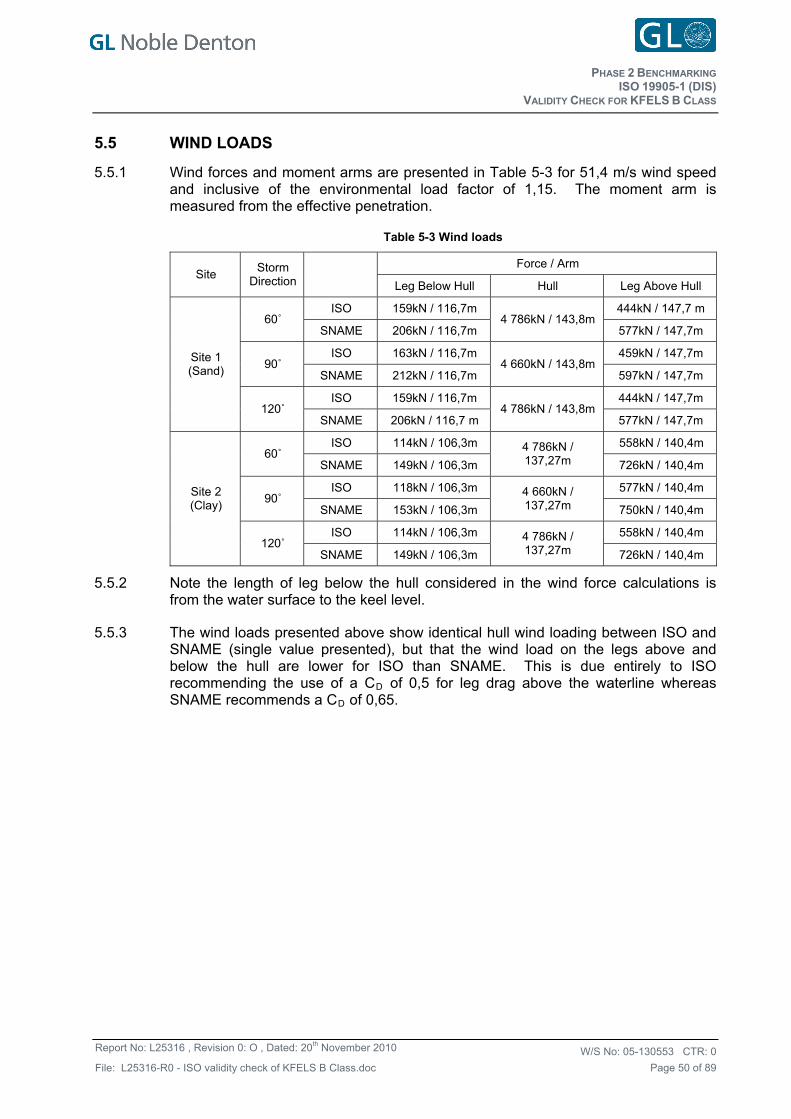
PHASE 2 BENCHMARKING
VALIDITY CHECK FOR KFELS B CLASS ISO 19905-1 (DIS)
W/S No: CTR: 05-130553 0
Page 50 of 89
Report No: L25316 , Revision 0: O , Dated: 20th November 2010
File: L25316-R0 - ISO validity check of KFELS B Class.doc
5.5 WIND LOADS
5.5.1 Wind forces and moment arms are presented in Table 5-3 for 51,4 m/s wind speed and inclusive of the environmental load factor of 1,15. The moment arm is measured from the effective penetration.
Table 5-3 Wind loads
Force / Arm Site
Storm Direction
Leg Below Hull Hull Leg Above Hull
ISO 159kN / 116,7m 444kN / 147,7 m 60˚
SNAME 206kN / 116,7m 4 786kN / 143,8m
577kN / 147,7m
ISO 163kN / 116,7m 459kN / 147,7m 90˚
SNAME 212kN / 116,7m 4 660kN / 143,8m
597kN / 147,7m
ISO 159kN / 116,7m 444kN / 147,7m
Site 1 (Sand)
120˚ SNAME 206kN / 116,7 m
4 786kN / 143,8m 577kN / 147,7m
ISO 114kN / 106,3m 558kN / 140,4m 60˚
SNAME 149kN / 106,3m
4 786kN / 137,27m 726kN / 140,4m
ISO 118kN / 106,3m 577kN / 140,4m 90˚
SNAME 153kN / 106,3m
4 660kN / 137,27m 750kN / 140,4m
ISO 114kN / 106,3m 558kN / 140,4m
Site 2 (Clay)
120˚ SNAME 149kN / 106,3m
4 786kN / 137,27m 726kN / 140,4m
5.5.2 Note the length of leg below the hull considered in the wind force calculations is from the water surface to the keel level.
5.5.3 The wind loads presented above show identical hull wind loading between ISO and SNAME (single value presented), but that the wind load on the legs above and below the hull are lower for ISO than SNAME. This is due entirely to ISO recommending the use of a CD of 0,5 for leg drag above the waterline whereas SNAME recommends a CD of 0,65.
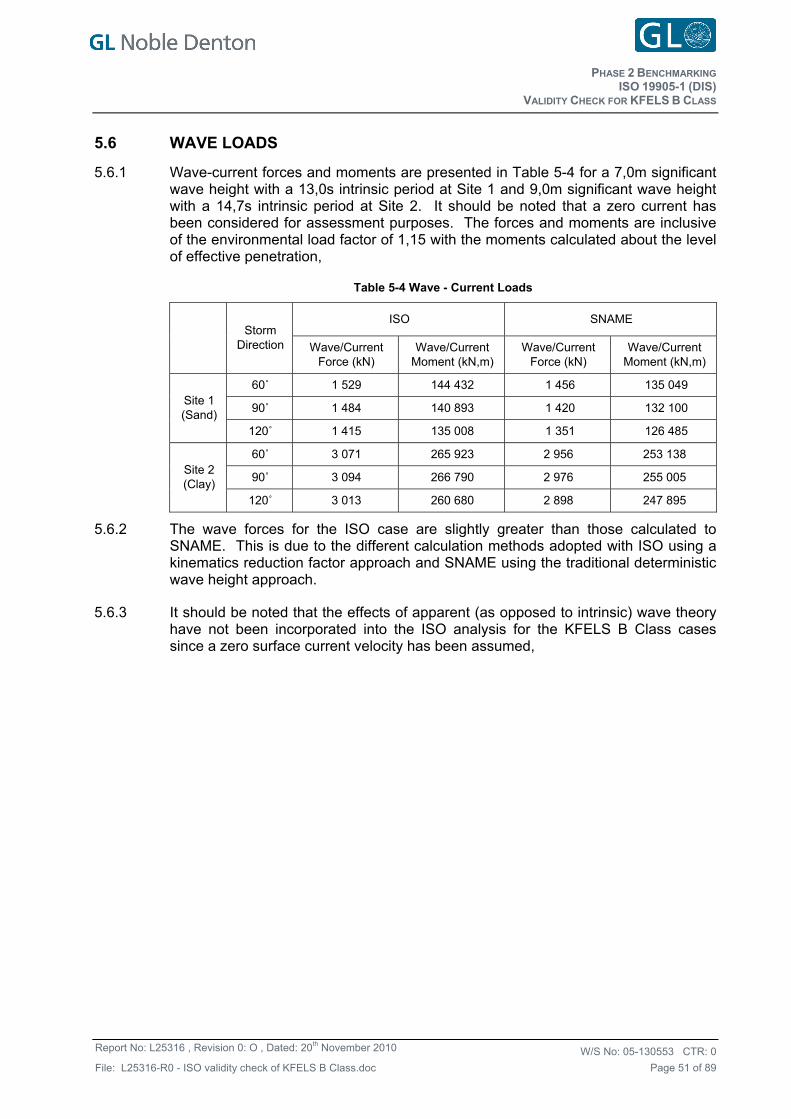
PHASE 2 BENCHMARKING
VALIDITY CHECK FOR KFELS B CLASS ISO 19905-1 (DIS)
W/S No: CTR: 05-130553 0
Page 51 of 89
Report No: L25316 , Revision 0: O , Dated: 20th November 2010
File: L25316-R0 - ISO validity check of KFELS B Class.doc
5.6 WAVE LOADS
5.6.1 Wave-current forces and moments are presented in Table 5-4 for a 7,0m significant wave height with a 13,0s intrinsic period at Site 1 and 9,0m significant wave height with a 14,7s intrinsic period at Site 2. It should be noted that a zero current has been considered for assessment purposes. The forces and moments are inclusive of the environmental load factor of 1,15 with the moments calculated about the level of effective penetration,
Table 5-4 Wave - Current Loads
ISO SNAME
Storm
Direction Wave/Current Force (kN)
Wave/Current Moment (kN,m)
Wave/Current Force (kN)
Wave/Current Moment (kN,m)
60˚ 1 529 144 432 1 456 135 049
90˚ 1 484 140 893 1 420 132 100 Site 1 (Sand)
120˚ 1 415 135 008 1 351 126 485
60˚ 3 071 265 923 2 956 253 138
90˚ 3 094 266 790 2 976 255 005 Site 2 (Clay)
120˚ 3 013 260 680 2 898 247 895
5.6.2 The wave forces for the ISO case are slightly greater than those calculated to SNAME. This is due to the different calculation methods adopted with ISO using a kinematics reduction factor approach and SNAME using the traditional deterministic wave height approach.
5.6.3 It should be noted that the effects of apparent (as opposed to intrinsic) wave theory have not been incorporated into the ISO analysis for the KFELS B Class cases since a zero surface current velocity has been assumed,
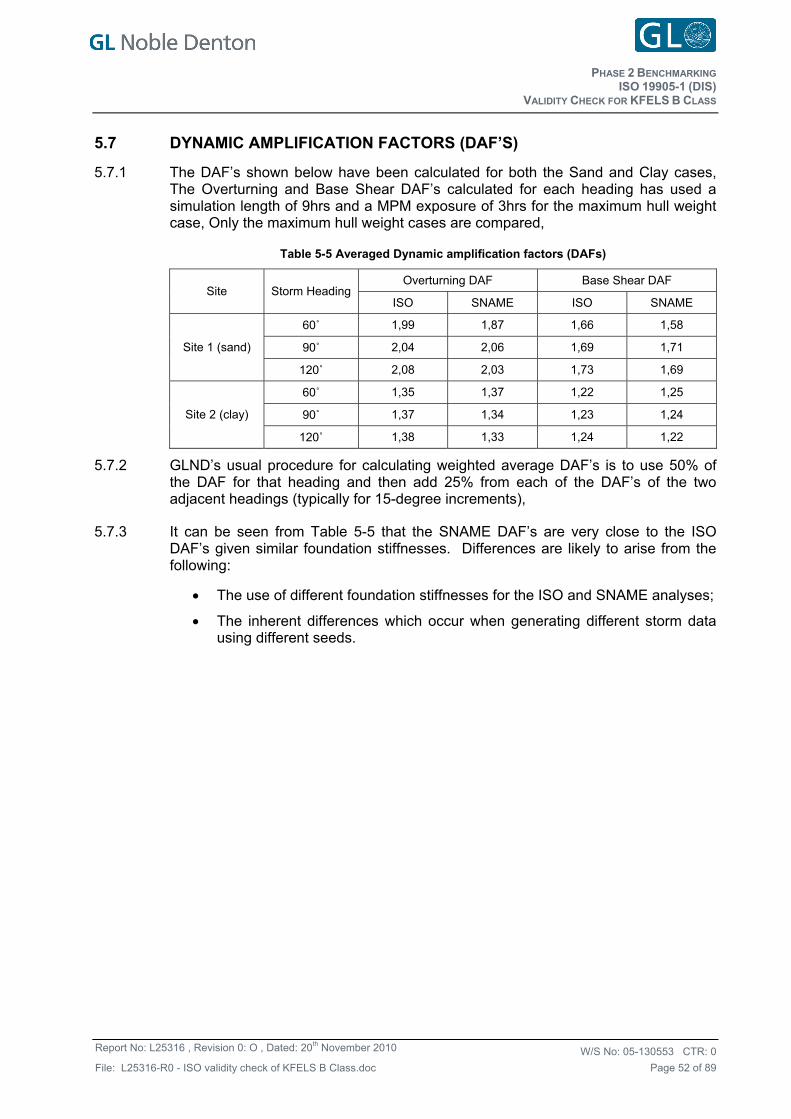
PHASE 2 BENCHMARKING
VALIDITY CHECK FOR KFELS B CLASS ISO 19905-1 (DIS)
W/S No: CTR: 05-130553 0
Page 52 of 89
Report No: L25316 , Revision 0: O , Dated: 20th November 2010
File: L25316-R0 - ISO validity check of KFELS B Class.doc
5.7 DYNAMIC AMPLIFICATION FACTORS (DAF’S)
5.7.1 The DAF’s shown below have been calculated for both the Sand and Clay cases, The Overturning and Base Shear DAF’s calculated for each heading has used a simulation length of 9hrs and a MPM exposure of 3hrs for the maximum hull weight case, Only the maximum hull weight cases are compared,
Table 5-5 Averaged Dynamic amplification factors (DAFs)
Overturning DAF Base Shear DAF Site Storm Heading
ISO SNAME ISO SNAME
60˚ 1,99 1,87 1,66 1,58
90˚ 2,04 2,06 1,69 1,71 Site 1 (sand)
120˚ 2,08 2,03 1,73 1,69
60˚ 1,35 1,37 1,22 1,25
90˚ 1,37 1,34 1,23 1,24 Site 2 (clay)
120˚ 1,38 1,33 1,24 1,22
5.7.2 GLND’s usual procedure for calculating weighted average DAF’s is to use 50% of the DAF for that heading and then add 25% from each of the DAF’s of the two adjacent headings (typically for 15-degree increments),
5.7.3 It can be seen from Table 5-5 that the SNAME DAF’s are very close to the ISO DAF’s given similar foundation stiffnesses. Differences are likely to arise from the following:
The use of different foundation stiffnesses for the ISO and SNAME analyses;
The inherent differences which occur when generating different storm data using different seeds.
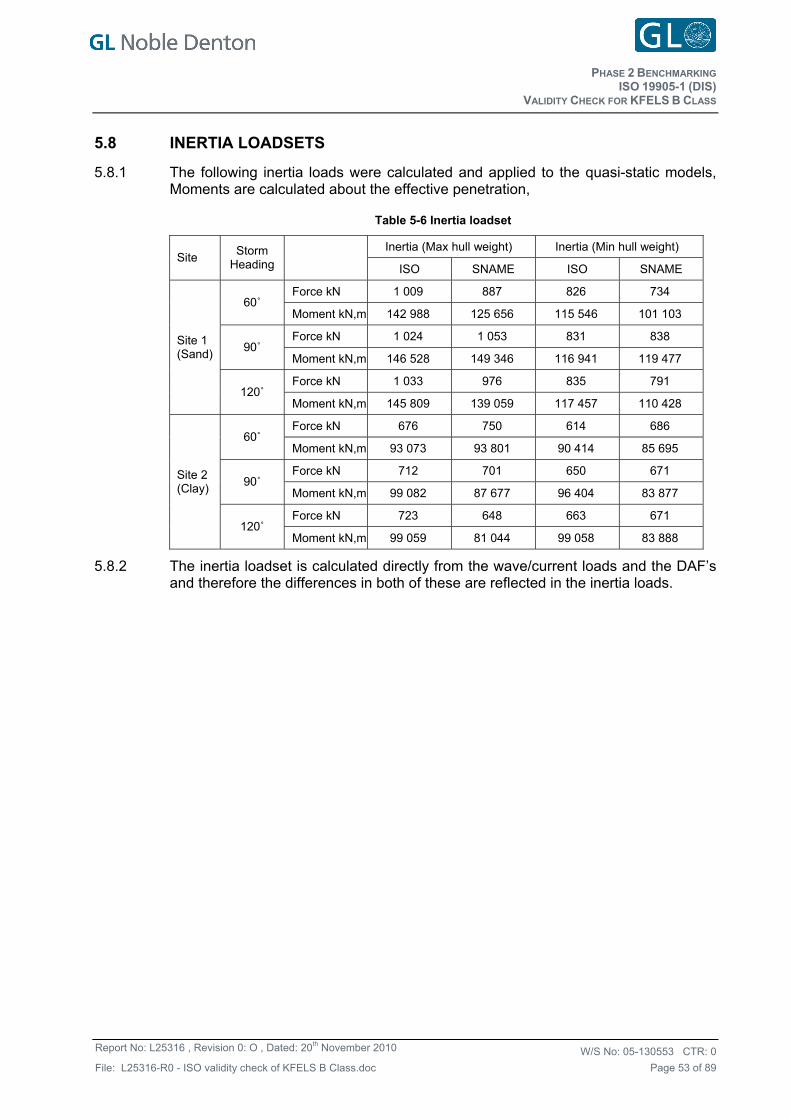
PHASE 2 BENCHMARKING
VALIDITY CHECK FOR KFELS B CLASS ISO 19905-1 (DIS)
W/S No: CTR: 05-130553 0
Page 53 of 89
Report No: L25316 , Revision 0: O , Dated: 20th November 2010
File: L25316-R0 - ISO validity check of KFELS B Class.doc
5.8 INERTIA LOADSETS
5.8.1 The following inertia loads were calculated and applied to the quasi-static models, Moments are calculated about the effective penetration,
Table 5-6 Inertia loadset
Inertia (Max hull weight) Inertia (Min hull weight) Site
Storm Heading ISO SNAME ISO SNAME
Force kN 1 009 887 826 734 60˚
Moment kN,m 142 988 125 656 115 546 101 103
Force kN 1 024 1 053 831 838 90˚
Moment kN,m 146 528 149 346 116 941 119 477
Force kN 1 033 976 835 791
Site 1 (Sand)
120˚ Moment kN,m 145 809 139 059 117 457 110 428
Force kN 676 750 614 686 60˚
Moment kN,m 93 073 93 801 90 414 85 695
Force kN 712 701 650 671 90˚
Moment kN,m 99 082 87 677 96 404 83 877
Force kN 723 648 663 671
Site 2 (Clay)
120˚ Moment kN,m 99 059 81 044 99 058 83 888
5.8.2 The inertia loadset is calculated directly from the wave/current loads and the DAF’s and therefore the differences in both of these are reflected in the inertia loads.
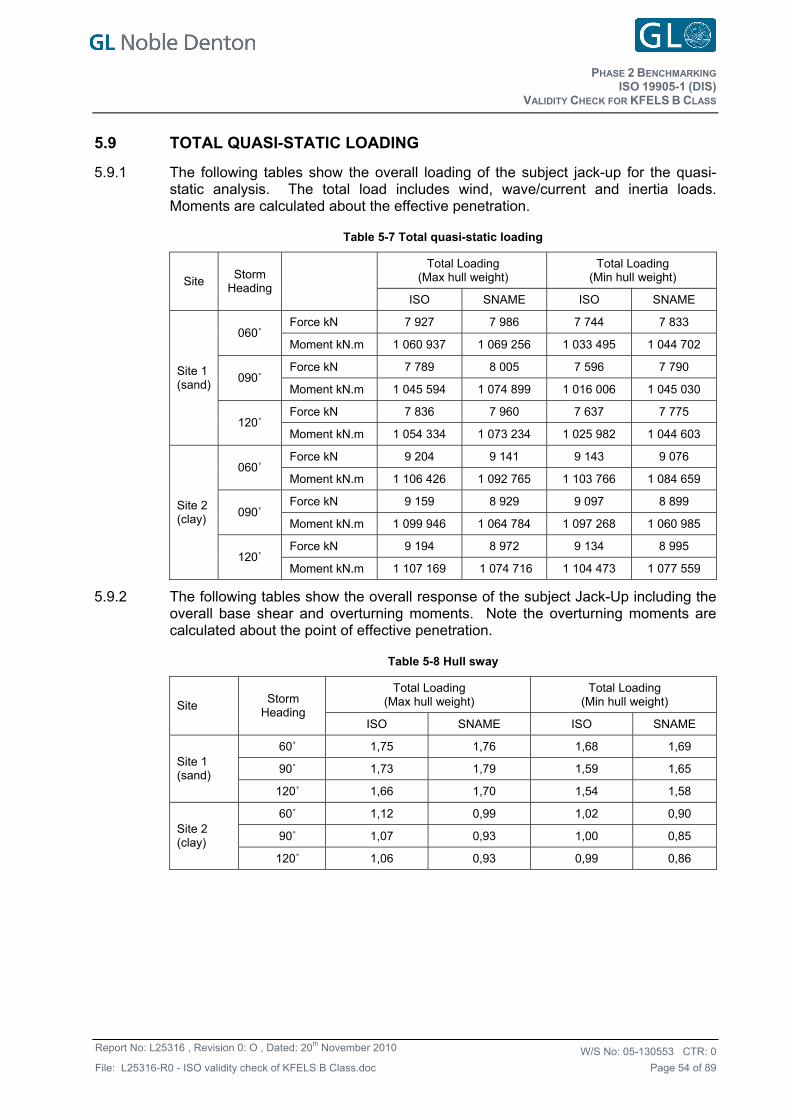
PHASE 2 BENCHMARKING
VALIDITY CHECK FOR KFELS B CLASS ISO 19905-1 (DIS)
W/S No: CTR: 05-130553 0
Page 54 of 89
Report No: L25316 , Revision 0: O , Dated: 20th November 2010
File: L25316-R0 - ISO validity check of KFELS B Class.doc
5.9 TOTAL QUASI-STATIC LOADING
5.9.1 The following tables show the overall loading of the subject jack-up for the quasi-static analysis. The total load includes wind, wave/current and inertia loads. Moments are calculated about the effective penetration.
Table 5-7 Total quasi-static loading
Total Loading (Max hull weight)
Total Loading (Min hull weight) Site
Storm Heading
ISO SNAME ISO SNAME
Force kN 7 927 7 986 7 744 7 833 060˚
Moment kN.m 1 060 937 1 069 256 1 033 495 1 044 702
Force kN 7 789 8 005 7 596 7 790 090˚
Moment kN.m 1 045 594 1 074 899 1 016 006 1 045 030
Force kN 7 836 7 960 7 637 7 775
Site 1 (sand)
120˚ Moment kN.m 1 054 334 1 073 234 1 025 982 1 044 603
Force kN 9 204 9 141 9 143 9 076 060˚
Moment kN.m 1 106 426 1 092 765 1 103 766 1 084 659
Force kN 9 159 8 929 9 097 8 899 090˚
Moment kN.m 1 099 946 1 064 784 1 097 268 1 060 985
Force kN 9 194 8 972 9 134 8 995
Site 2 (clay)
120˚ Moment kN.m 1 107 169 1 074 716 1 104 473 1 077 559
5.9.2 The following tables show the overall response of the subject Jack-Up including the overall base shear and overturning moments. Note the overturning moments are calculated about the point of effective penetration.
Table 5-8 Hull sway
Total Loading (Max hull weight)
Total Loading (Min hull weight) Site
Storm Heading
ISO SNAME ISO SNAME
60˚ 1,75 1,76 1,68 1,69
90˚ 1,73 1,79 1,59 1,65 Site 1 (sand)
120˚ 1,66 1,70 1,54 1,58
60˚ 1,12 0,99 1,02 0,90
90˚ 1,07 0,93 1,00 0,85 Site 2 (clay)
120˚ 1,06 0,93 0,99 0,86

PHASE 2 BENCHMARKING
VALIDITY CHECK FOR KFELS B CLASS ISO 19905-1 (DIS)
W/S No: CTR: 05-130553 0
Page 55 of 89
Report No: L25316 , Revision 0: O , Dated: 20th November 2010
File: L25316-R0 - ISO validity check of KFELS B Class.doc
Table 5-9 Reactions in leg at base of rack chock - Maximum Hull Weight
ISO SNAME Site
Storm Heading Moment
kNm Shear
kN Axial kN
Moment kN,m
Shear kN
Axial kN
342 683 2 246 20 326 346 430 2 305 20 366
339 603 2 276 19 277 349 982 2 335 19 316 60
396 726 1 717 65 187 400 297 1 756 65 109
348 137 2 109 34 963 360 831 2 237 34 963
338 200 2 423 8 819 349 893 2 551 8 260 90
383 159 1 609 61 028 397 305 1 697 61 577
354 730 1 913 49 011 364 029 1 991 49 178
326 487 2 472 5 817 335 306 2 551 5 454
Site 1 (sand)
120
361 597 1 874 49 982 370 985 1 942 50 159
258 415 2 188 23 652 321 670 2 433 22 485
261 230 2 217 22 887 321 376 2 423 21 621 60
300 137 1 619 59 056 343 350 1 158 60 224
261 397 1 913 35 159 308 426 2 080 34 767
250 596 2 403 14 852 298 126 2 394 13 852 90
285 805 1 628 55 603 320 395 1 295 55 711
267 391 1 746 46 342 316 176 1 736 46 362
252 352 2 659 12 076 299 892 2 560 10 781
Site 2 (clay)
120
273 473 1 668 47 186 314 509 1 619 47 186
Table 5-10 Reactions in leg at base of rack chock - Minimum Hull Weight
ISO SNAME Site
Storm Heading Moment
kNm Shear
kN Axial kN
Moment kN,m
Shear kN
Axial kN
325 457 2 158 16 706 328 939 2 207 16 697
328 782 2 188 15 794 332 353 2 227 15 784 60
376 988 1 717 59 596 380 500 1 736 59 615
322 474 1 972 30 656 335 080 2 090 30 656
308 279 2 207 6 494 321 640 2 325 5 798 90
355 701 1 776 54 936 369 808 1 815 55 642
329 126 1 913 43 762 337 258 1 982 43 939
300 824 2 266 3 590 308 309 2 325 3 227
Site 1 (sand)
120
335 492 1 884 44 753 343 801 1 942 44 940
235 842 2 040 20 189 289 689 2 207 19 326
238 334 2 060 19 394 289 395 2 197 18 531 60
278 888 1 854 53 219 313 233 1 550 53 720
199 074 1 854 30 960 282 234 2 001 30 519
209 375 2 276 11 684 272 326 2 197 11 193 90
199 781 1 766 50 168 295 379 1 560 49 864
210 199 1 766 41 634 292 240 1 844 41 300
222 098 2 551 8 829 275 955 2 374 8 211
Site 2 (clay)
120
213 495 1 697 42 340 290 670 1 727 42 065
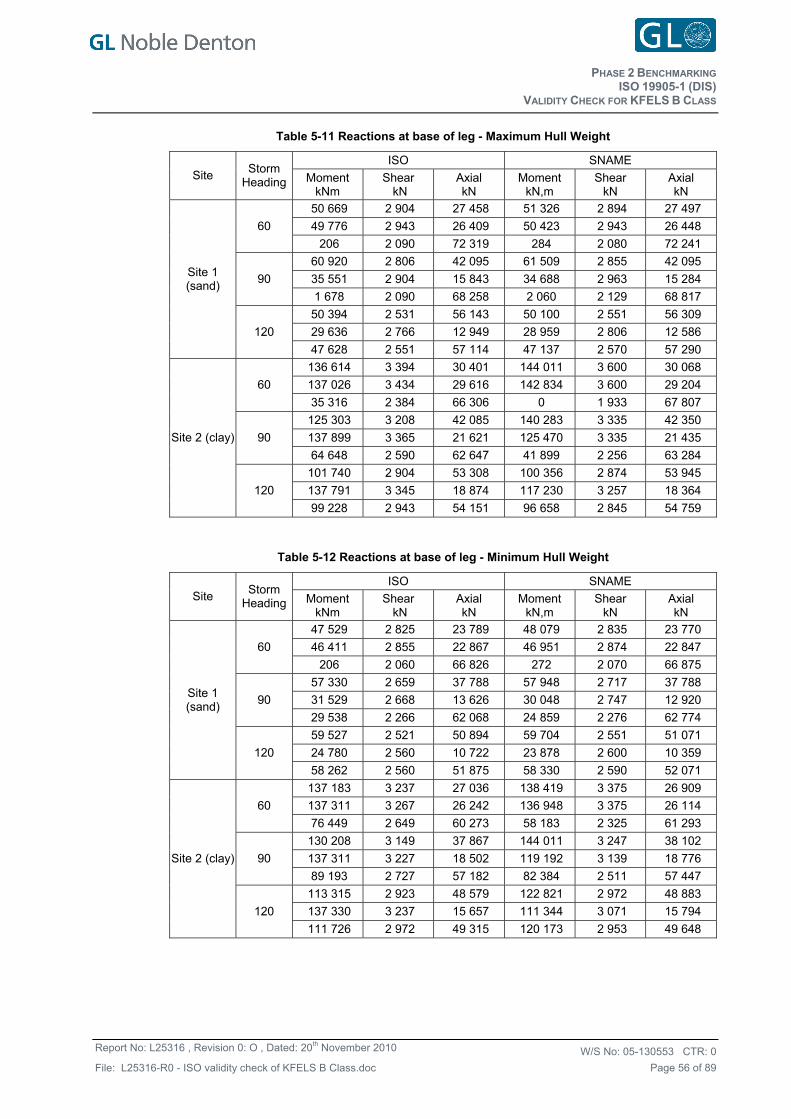
PHASE 2 BENCHMARKING
VALIDITY CHECK FOR KFELS B CLASS ISO 19905-1 (DIS)
W/S No: CTR: 05-130553 0
Page 56 of 89
Report No: L25316 , Revision 0: O , Dated: 20th November 2010
File: L25316-R0 - ISO validity check of KFELS B Class.doc
Table 5-11 Reactions at base of leg - Maximum Hull Weight
ISO SNAME Site
Storm Heading Moment
kNm Shear
kN Axial kN
Moment kN,m
Shear kN
Axial kN
50 669 2 904 27 458 51 326 2 894 27 497
49 776 2 943 26 409 50 423 2 943 26 448 60
206 2 090 72 319 284 2 080 72 241
60 920 2 806 42 095 61 509 2 855 42 095
35 551 2 904 15 843 34 688 2 963 15 284 90
1 678 2 090 68 258 2 060 2 129 68 817
50 394 2 531 56 143 50 100 2 551 56 309
29 636 2 766 12 949 28 959 2 806 12 586
Site 1 (sand)
120
47 628 2 551 57 114 47 137 2 570 57 290
136 614 3 394 30 401 144 011 3 600 30 068
137 026 3 434 29 616 142 834 3 600 29 204 60
35 316 2 384 66 306 0 1 933 67 807
125 303 3 208 42 085 140 283 3 335 42 350
137 899 3 365 21 621 125 470 3 335 21 435 90
64 648 2 590 62 647 41 899 2 256 63 284
101 740 2 904 53 308 100 356 2 874 53 945
137 791 3 345 18 874 117 230 3 257 18 364
Site 2 (clay)
120
99 228 2 943 54 151 96 658 2 845 54 759
Table 5-12 Reactions at base of leg - Minimum Hull Weight
ISO SNAME Site
Storm Heading Moment
kNm Shear
kN Axial kN
Moment kN,m
Shear kN
Axial kN
47 529 2 825 23 789 48 079 2 835 23 770
46 411 2 855 22 867 46 951 2 874 22 847 60
206 2 060 66 826 272 2 070 66 875
57 330 2 659 37 788 57 948 2 717 37 788
31 529 2 668 13 626 30 048 2 747 12 920 90
29 538 2 266 62 068 24 859 2 276 62 774
59 527 2 521 50 894 59 704 2 551 51 071
24 780 2 560 10 722 23 878 2 600 10 359
Site 1 (sand)
120
58 262 2 560 51 875 58 330 2 590 52 071
137 183 3 237 27 036 138 419 3 375 26 909
137 311 3 267 26 242 136 948 3 375 26 114 60
76 449 2 649 60 273 58 183 2 325 61 293
130 208 3 149 37 867 144 011 3 247 38 102
137 311 3 227 18 502 119 192 3 139 18 776 90
89 193 2 727 57 182 82 384 2 511 57 447
113 315 2 923 48 579 122 821 2 972 48 883
137 330 3 237 15 657 111 344 3 071 15 794
Site 2 (clay)
120
111 726 2 972 49 315 120 173 2 953 49 648
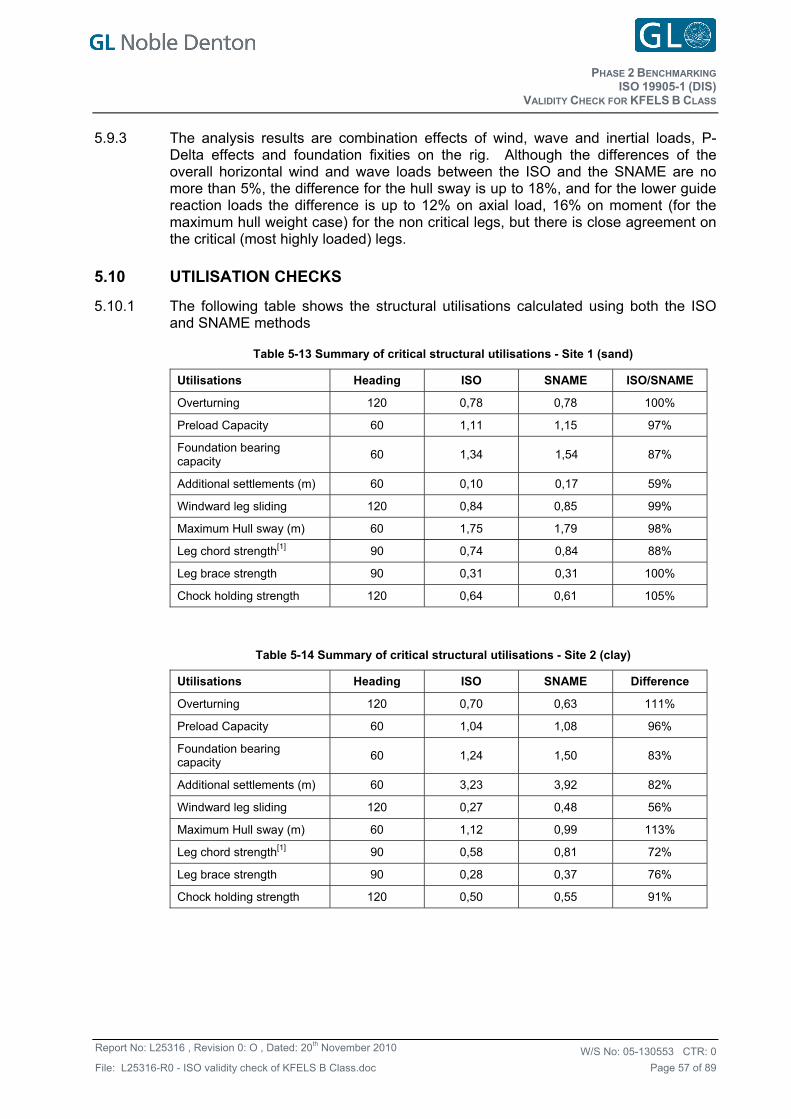
PHASE 2 BENCHMARKING
VALIDITY CHECK FOR KFELS B CLASS ISO 19905-1 (DIS)
W/S No: CTR: 05-130553 0
Page 57 of 89
Report No: L25316 , Revision 0: O , Dated: 20th November 2010
File: L25316-R0 - ISO validity check of KFELS B Class.doc
5.10
5.9.3 The analysis results are combination effects of wind, wave and inertial loads, P-Delta effects and foundation fixities on the rig. Although the differences of the overall horizontal wind and wave loads between the ISO and the SNAME are no more than 5%, the difference for the hull sway is up to 18%, and for the lower guide reaction loads the difference is up to 12% on axial load, 16% on moment (for the maximum hull weight case) for the non critical legs, but there is close agreement on the critical (most highly loaded) legs.
UTILISATION CHECKS
5.10.1 The following table shows the structural utilisations calculated using both the ISO and SNAME methods
Table 5-13 Summary of critical structural utilisations - Site 1 (sand)
Utilisations Heading ISO SNAME ISO/SNAME
Overturning 120 0,78 0,78 100%
Preload Capacity 60 1,11 1,15 97%
Foundation bearing capacity
60 1,34 1,54 87%
Additional settlements (m) 60 0,10 0,17 59%
Windward leg sliding 120 0,84 0,85 99%
Maximum Hull sway (m) 60 1,75 1,79 98%
Leg chord strength[1] 90 0,74 0,84 88%
Leg brace strength 90 0,31 0,31 100%
Chock holding strength 120 0,64 0,61 105%
Table 5-14 Summary of critical structural utilisations - Site 2 (clay)
Utilisations Heading ISO SNAME Difference
Overturning 120 0,70 0,63 111%
Preload Capacity 60 1,04 1,08 96%
Foundation bearing capacity
60 1,24 1,50 83%
Additional settlements (m) 60 3,23 3,92 82%
Windward leg sliding 120 0,27 0,48 56%
Maximum Hull sway (m) 60 1,12 0,99 113%
Leg chord strength[1] 90 0,58 0,81 72%
Leg brace strength 90 0,28 0,37 76%
Chock holding strength 120 0,50 0,55 91%
PHASE 2 BENCHMARKING
VALIDITY CHECK FOR KFELS B CLASS ISO 19905-1 (DIS)
W/S No: CTR: 05-130553 0
Page 58 of 89
Report No: L25316 , Revision 0: O , Dated: 20th November 2010
File: L25316-R0 - ISO validity check of KFELS B Class.doc
5.11 CONCLUSION
5.11.1 Comparison between the ISO and SNAME results above show that for site 1 (sand) the foundation fixity parameters are near-identical, and that for site 2 (clay) the ISO foundation vertical and rotational stiffnesses are marginally greater than the SNAME (SAGE) foundation stiffnesses whilst the horizontal foundation stiffness is approximately equal.
5.11.2 The greater predicted penetration depth calculated using SNAME results in a shear modulus that is 8% greater than that calculated for the ISO case. The stiffness depth factors in the ISO document, however, are greater than those in SNAME for the case of a clay foundation (with Poisson ratio = 0.5). Consequently the overall stiffnesses calculated using the ISO document are very similar to those using SNAME (SAGE) (Table 5-1). As different depth factors are used for the vertical, horizontal and rotational stiffnesses, the ratio between the SNAME and ISO stiffnesses are different for each component stiffness. The loading condition is similar; ISO results are slightly less onerous for site 1 (sand), and near-identical, or slightly more onerous for site 2 (clay) when compared to SNAME (Table 5-7); lower guide reaction loads the difference is up to 12% on axial load, 16% on moment (for the maximum hull weight case) for the non critical legs, but shows close agreement on the critical (most highly loaded) legs.
5.11.3 Overturning checks are similar for site 1 (sand), but more onerous when calculated to ISO compared to SNAME for site 2 (clay) - due to increased hull sway resulting from different foundation stiffnesses.
5.11.4 Whilst preload capacity checks are similar (ISO 3-4% better than SNAME), the foundation bearing capacity utilisations and additional settlement required are more pronounced (ISO 13-17% better than SNAME) due to the change in nature of the checks - particularly for deep foundation cases with backfill.
5.11.5 Leg sliding checks are near-identical for the shallow penetration case in sand (site 1), but significantly different (ISO almost half that of SNAME) for the deep penetration case into clay; mostly from the significantly increased horizontal capacity afforded by ISO (ISO horizontal capacity is 68% greater than SNAME)
5.11.6 Leg strength utilisations are less onerous when calculated to ISO based on use of the high strength yield equations and reduced buckling ‘B’-factor compared to SNAME. (More favourable strength checks would be expected with ISO for the same member loading conditions).
5.11.7 Chock strength checks are similar in magnitude between ISO and SNAME for both assessment cases, but reflect the change in overall loading and resistance factor (ISO’s 1/1,15 (0.87) to SNAME’s 0.85).
5.11.8 The ISO and SNAME assessment approaches differ in only a few key areas, the aim of this assessment has been to compare the overall analysis methodology from beginning to end to asses the effect of the combination of these differences,
5.11.9 Table 5-15 shows the main aspects of the analysis with the associated cause of the differences between ISO and SNAME,
PHASE 2 BENCHMARKING
VALIDITY CHECK FOR KFELS B CLASS ISO 19905-1 (DIS)
W/S No: CTR: 05-130553 0
Page 59 of 89
Report No: L25316 , Revision 0: O , Dated: 20th November 2010
File: L25316-R0 - ISO validity check of KFELS B Class.doc
5.11.10 It has been mentioned that one particular difference between the ISO and the SNAME is the drag coefficient CD used in the wind load on the legs above and below the hull, The ISO recommends the use of a CD of 0,5 whereas SNAME recommends a CD of 0,65, Thus, another final quasi-static analysis of the ISO has been undertaken using the same wind loads on the legs above and below the hull to the SNAME, i,e,, CD = 0,65 and the results are compared with the above analyses as Appendix B
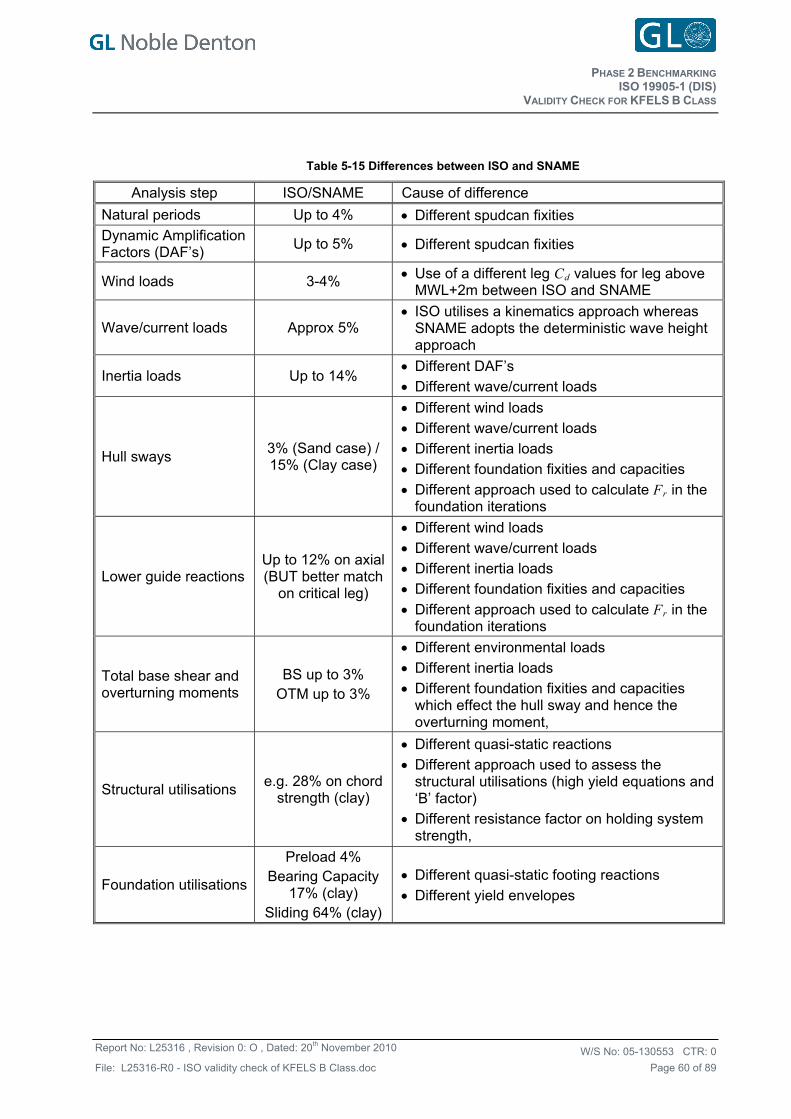
PHASE 2 BENCHMARKING
VALIDITY CHECK FOR KFELS B CLASS ISO 19905-1 (DIS)
W/S No: CTR: 05-130553 0
Page 60 of 89
Report No: L25316 , Revision 0: O , Dated: 20th November 2010
File: L25316-R0 - ISO validity check of KFELS B Class.doc
Table 5-15 Differences between ISO and SNAME
Analysis step ISO/SNAME Cause of difference
Natural periods Up to 4% Different spudcan fixities Dynamic Amplification Factors (DAF’s)
Up to 5% Different spudcan fixities
Wind loads 3-4% Use of a different leg Cd values for leg above MWL+2m between ISO and SNAME
Wave/current loads Approx 5% ISO utilises a kinematics approach whereas
SNAME adopts the deterministic wave height approach
Inertia loads Up to 14% Different DAF’s
Different wave/current loads
Hull sways 3% (Sand case) / 15% (Clay case)
Different wind loads
Different wave/current loads
Different inertia loads
Different foundation fixities and capacities
Different approach used to calculate Fr in the foundation iterations
Lower guide reactions Up to 12% on axial(BUT better match
on critical leg)
Different wind loads
Different wave/current loads
Different inertia loads
Different foundation fixities and capacities
Different approach used to calculate Fr in the foundation iterations
Total base shear and overturning moments
BS up to 3% OTM up to 3%
Different environmental loads
Different inertia loads
Different foundation fixities and capacities which effect the hull sway and hence the overturning moment,
Structural utilisations e.g. 28% on chord
strength (clay)
Different quasi-static reactions
Different approach used to assess the structural utilisations (high yield equations and ‘B’ factor)
Different resistance factor on holding system strength,
Foundation utilisations
Preload 4% Bearing Capacity
17% (clay) Sliding 64% (clay)
Different quasi-static footing reactions
Different yield envelopes
PHASE 2 BENCHMARKING
VALIDITY CHECK FOR KFELS B CLASS ISO 19905-1 (DIS)
W/S No: CTR: 05-130553 0
Page 61 of 89
Report No: L25316 , Revision 0: O , Dated: 20th November 2010
File: L25316-R0 - ISO validity check of KFELS B Class.doc
This report is intended for the sole use of the person or
company to whom it is addressed and no liability of any
nature whatsoever shall be assumed to any other party
in respect of its contents.
GL NOBLE DENTON
Signed: _________________________________________
Yongxia Hua, BEng., MSC., PhD.
Senior Structural Engineer, Jack-up and Geotechnical Engineering
Signed: ____________________________________
Mark Hayward, MEng..
Senior Principal Engineer, Jack-up and Geotechnical Engineering
Countersigned: ______________________________________
pp. Richard Stonor, B.Sc., Ph.D., C.Eng., MRINA
Manager, Jack-up and Geotechnical Engineering
Dated : London, 20th November 2010
PHASE 2 BENCHMARKING
VALIDITY CHECK FOR KFELS B CLASS ISO 19905-1 (DIS)
W/S No: CTR: 05-130553 0
Page 62 of 89
Report No: L25316 , Revision 0: O , Dated: 20th November 2010
File: L25316-R0 - ISO validity check of KFELS B Class.doc
REFERENCES
[1] SNAME Technical and Research Bulletin 5-5A. ‘Recommended Practice for Site Specific Assessment of Mobile Jack-Up Units”, 1st Ed., Rev 2., Jan 2002.
[2] ISO 19905-1, “Petroleum and natural gas industries - Site-specific assessment of mobile offshore units - Part 1: Jack-Ups”, Draft DIS, 12, 2009.
[3] Noble Denton Report No. L22909, “PHASE 1 BENCHMARKING OF ISO 19905-1.9 -COMPLETENESS CHECK”, Rev 1, Apr, 2009.
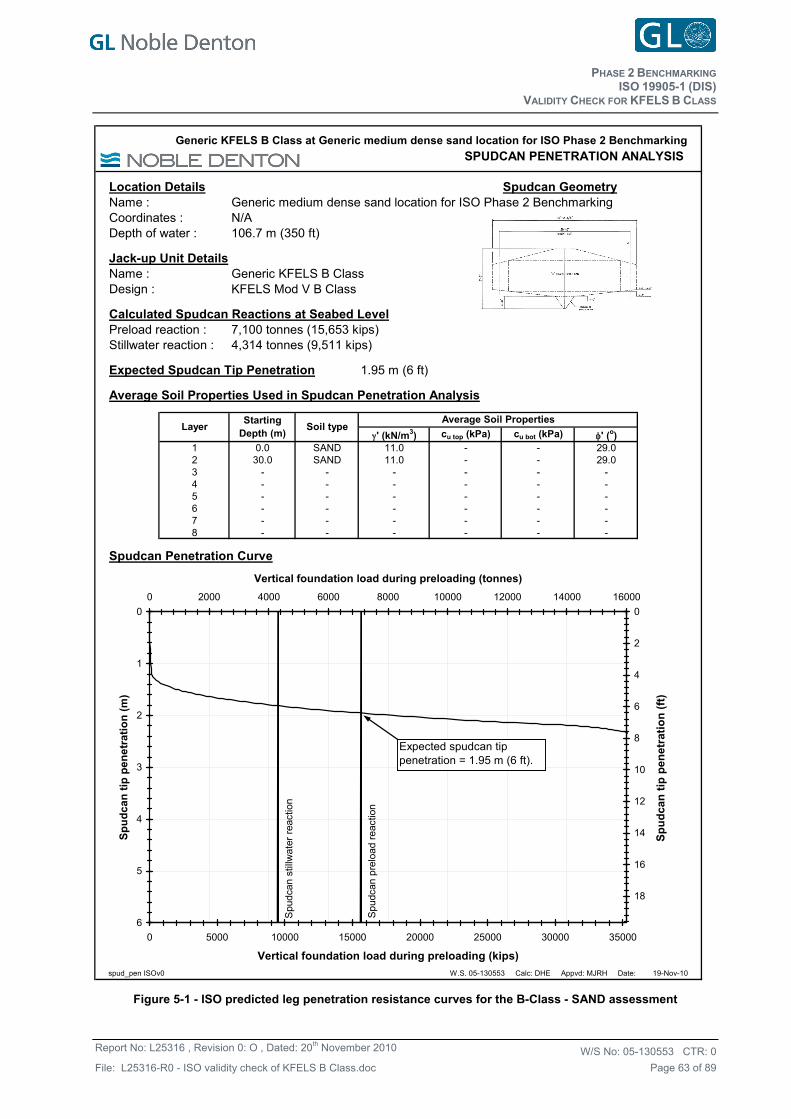
PHASE 2 BENCHMARKING
VALIDITY CHECK FOR KFELS B CLASS ISO 19905-1 (DIS)
W/S No: CTR: 05-130553 0
Page 63 of 89
Report No: L25316 , Revision 0: O , Dated: 20th November 2010
File: L25316-R0 - ISO validity check of KFELS B Class.doc
Location DetailsName : Generic medium dense sand location for ISO Phase 2 BenchmarkingCoordinates : N/ADepth of water : 106.7 m (350 ft) 106.7 350
Jack-up Unit DetailsName : Generic KFELS B ClassDesign : KFELS Mod V B Class
Calculated Spudcan Reactions at Seabed LevelPreload reaction : 7,100 tonnes (15,653 kips) 7,100 15,653Stillwater reaction : 4,314 tonnes (9,511 kips) 4,314 9,511
Expected Spudcan Tip Penetration 1.95 m (6 ft) 1.95 6
Average Soil Properties Used in Spudcan Penetration Analysis
' (kN/m3) cu top (kPa) cu bot (kPa) ' (o)1 0.0 SAND 11.0 - - 29.02 30.0 SAND 11.0 - - 29.03 - - - - - -4 - - - - - -5 - - - - - -6 - - - - - -7 - - - - - -8 - - - - - -
Spudcan Penetration Curve
spud_pen ISOv0 W.S. 05-130553 Calc: DHE Appvd: MJRH Date: 19-Nov-10
SPUDCAN PENETRATION ANALYSIS Generic KFELS B Class at Generic medium dense sand location for ISO Phase 2 Benchmarking
Layer Soil type
Spudcan Geometry
Average Soil PropertiesStarting Depth (m)
0
1
2
3
4
5
6
0 2000 4000 6000 8000 10000 12000 14000 16000
Vertical foundation load during preloading (tonnes)
Sp
ud
ca
n t
ip p
en
etr
ati
on
(m
)
0
2
4
6
8
10
12
14
16
18
0 5000 10000 15000 20000 25000 30000 35000
Vertical foundation load during preloading (kips)
Sp
ud
can
tip
pen
etra
tio
n (
ft)
Spu
dcan
pre
load
rea
ctio
n
Expected spudcan tip penetration = 1.95 m (6 ft).
Spu
dcan
stil
lwat
er r
eact
ion
Figure 5-1 - ISO predicted leg penetration resistance curves for the B-Class - SAND assessment
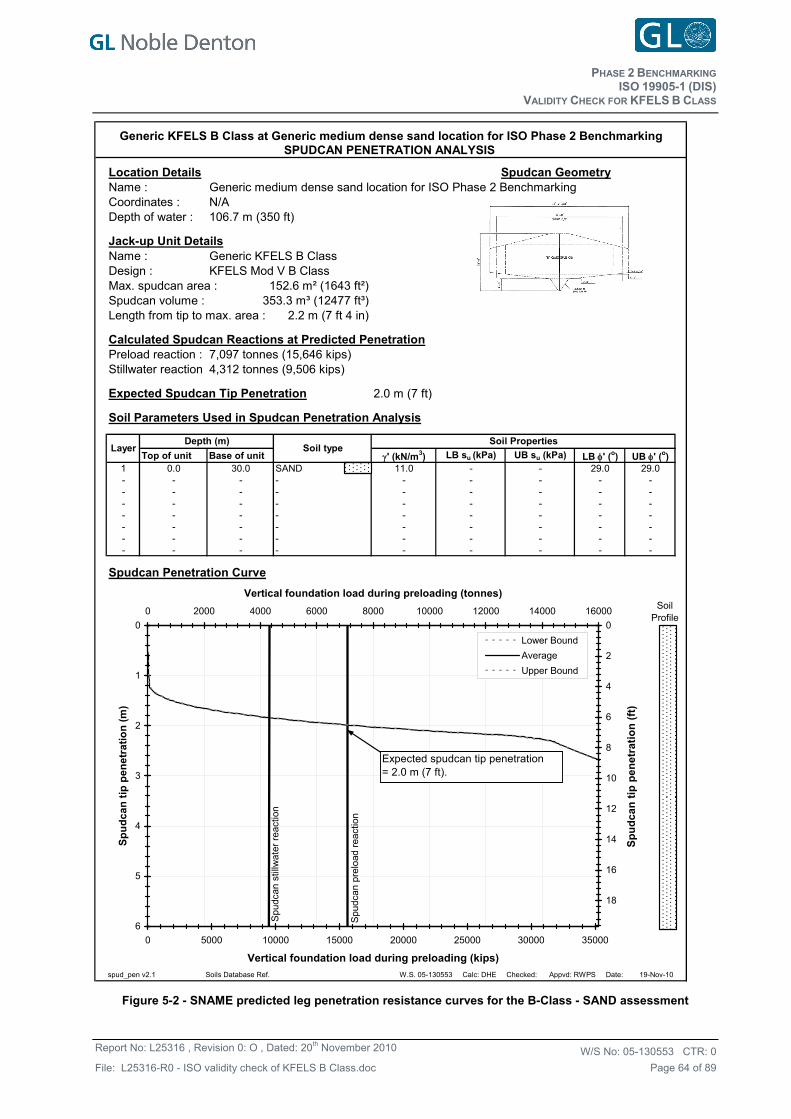
PHASE 2 BENCHMARKING
VALIDITY CHECK FOR KFELS B CLASS ISO 19905-1 (DIS)
W/S No: CTR: 05-130553 0
Page 64 of 89
Report No: L25316 , Revision 0: O , Dated: 20th November 2010
File: L25316-R0 - ISO validity check of KFELS B Class.doc
Location DetailsName : Generic medium dense sand location for ISO Phase 2 BenchmarkingCoordinates : N/ADepth of water : 106.7 m (350 ft) 106.7 350
Jack-up Unit DetailsName : Generic KFELS B ClassDesign : KFELS Mod V B ClassMax. spudcan area : 152.6 m² (1643 ft²)Spudcan volume : 353.3 m³ (12477 ft³)Length from tip to max. area : 2.2 m (7 ft 4 in)
Calculated Spudcan Reactions at Predicted PenetrationPreload reaction : 7,097 tonnes (15,646 kips) 7,097 15,646Stillwater reaction 4,312 tonnes (9,506 kips) 4,312 9,506
Expected Spudcan Tip Penetration 2.0 m (7 ft) 2.0 7
Soil Parameters Used in Spudcan Penetration Analysis
Top of unit Base of unit ' (kN/m3) LB su (kPa) UB su (kPa) LB' (o) UB' (o)1 0.0 30.0 SAND 11.0 - - 29.0 29.0- - - - - - - - -- - - - - - - - -- - - - - - - - -- - - - - - - - -- - - - - - - - -- - - - - - - - -- - - - - - - - -
Spudcan Penetration Curve
spud_pen v2.1 Soils Database Ref. W.S. 05-130553 Calc: DHE Checked: Appvd: RWPS Date: 19-Nov-10
SPUDCAN PENETRATION ANALYSIS Generic KFELS B Class at Generic medium dense sand location for ISO Phase 2 Benchmarking
Soil type
Spudcan Geometry
LayerDepth (m) Soil Properties
0
1
2
3
4
5
6
0 2000 4000 6000 8000 10000 12000 14000 16000
Vertical foundation load during preloading (tonnes)
Sp
ud
ca
n t
ip p
en
etr
ati
on
(m
)
0
2
4
6
8
10
12
14
16
18
0 5000 10000 15000 20000 25000 30000 35000
Vertical foundation load during preloading (kips)
Sp
ud
can
tip
pen
etra
tio
n (
ft)
Lower Bound
Average
Upper Bound
Spu
dcan
pre
load
rea
ctio
n
Expected spudcan tip penetration= 2.0 m (7 ft).
Spu
dcan
stil
lwat
er r
eact
ion
Soil Profile
Figure 5-2 - SNAME predicted leg penetration resistance curves for the B-Class - SAND assessment
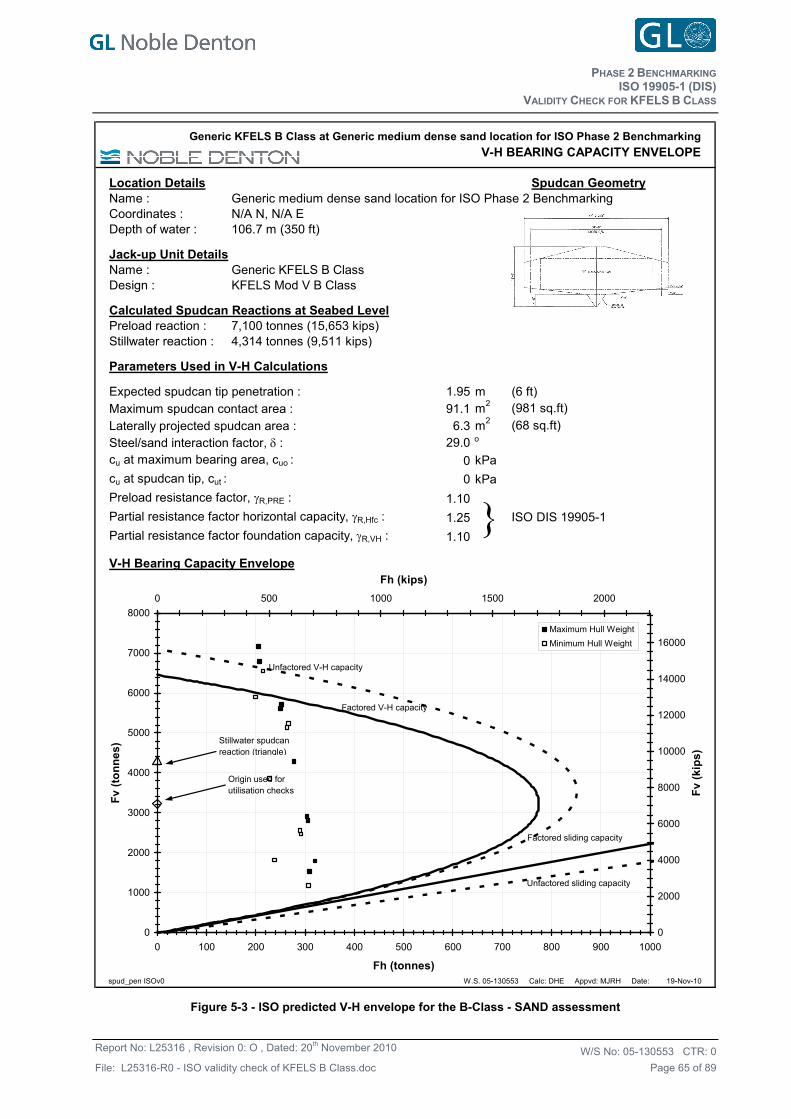
PHASE 2 BENCHMARKING
VALIDITY CHECK FOR KFELS B CLASS ISO 19905-1 (DIS)
W/S No: CTR: 05-130553 0
Page 65 of 89
Report No: L25316 , Revision 0: O , Dated: 20th November 2010
File: L25316-R0 - ISO validity check of KFELS B Class.doc
Location DetailsName : Generic medium dense sand location for ISO Phase 2 BenchmarkingCoordinates : N/A N, N/A EDepth of water : 106.7 m (350 ft) 106.7 350
Jack-up Unit DetailsName : Generic KFELS B ClassDesign : KFELS Mod V B Class
Calculated Spudcan Reactions at Seabed LevelPreload reaction : 7,100 tonnes (15,653 kips) 7,100 15,653Stillwater reaction : 4,314 tonnes (9,511 kips) 4,314 9,511
Parameters Used in V-H Calculations
Expected spudcan tip penetration : 1.95 m (6 ft) 6Maximum spudcan contact area : 91.1 m2 (981 sq.ft) 981Laterally projected spudcan area : 6.3 m2 (68 sq.ft) 68Steel/sand interaction factor, : 29.0 o 29.0cu at maximum bearing area, cuo : 0 kPa 0
cu at spudcan tip, cut : 0 kPa 0
Preload resistance factor, R,PRE : 1.10
Partial resistance factor horizontal capacity, R,Hfc : 1.25
Partial resistance factor foundation capacity, R,VH : 1.10
V-H Bearing Capacity Envelope
spud_pen ISOv0 W.S. 05-130553 Calc: DHE Appvd: MJRH Date: 19-Nov-10
Spudcan Geometry
Generic KFELS B Class at Generic medium dense sand location for ISO Phase 2 Benchmarking
V-H BEARING CAPACITY ENVELOPE
ISO DIS 19905-1
0
1000
2000
3000
4000
5000
6000
7000
8000
0 100 200 300 400 500 600 700 800 900 1000
Fh (tonnes)
Fv
(to
nn
es
)
0
2000
4000
6000
8000
10000
12000
14000
16000
0 500 1000 1500 2000
Fh (kips)
Fv
(kip
s)
Maximum Hull Weight
Minimum Hull Weight
Factored sliding capacity
Unfactored V-H capacity
Factored V-H capacity
Unfactored sliding capacity
Stillwater spudcan reaction (triangle)
Origin used for utilisation checks
}
Figure 5-3 - ISO predicted V-H envelope for the B-Class - SAND assessment
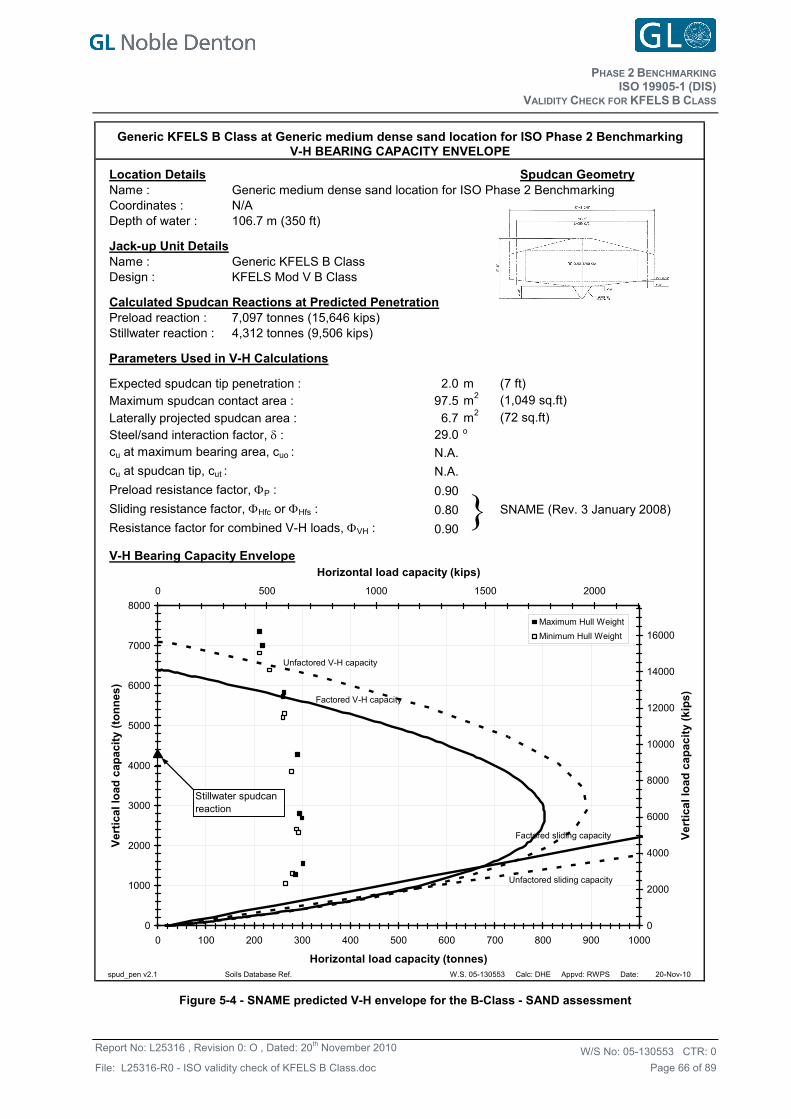
PHASE 2 BENCHMARKING
VALIDITY CHECK FOR KFELS B CLASS ISO 19905-1 (DIS)
W/S No: CTR: 05-130553 0
Page 66 of 89
Report No: L25316 , Revision 0: O , Dated: 20th November 2010
File: L25316-R0 - ISO validity check of KFELS B Class.doc
Location DetailsName : Generic medium dense sand location for ISO Phase 2 BenchmarkingCoordinates : N/ADepth of water : 106.7 m (350 ft) 106. 350
Jack-up Unit DetailsName : Generic KFELS B ClassDesign : KFELS Mod V B Class
Calculated Spudcan Reactions at Predicted PenetrationPreload reaction : 7,097 tonnes (15,646 kips) 7,097 15,646Stillwater reaction : 4,312 tonnes (9,506 kips) 4,312 9,506
Parameters Used in V-H Calculations
Expected spudcan tip penetration : 2.0 m (7 ft) 7Maximum spudcan contact area : 97.5 m2 (1,049 sq.ft) 1,049Laterally projected spudcan area : 6.7 m2 (72 sq.ft) 72Steel/sand interaction factor, : 29.0 o 29.0cu at maximum bearing area, cuo : N.A. #######
cu at spudcan tip, cut : N.A. #######
Preload resistance factor, P : 0.90
Sliding resistance factor, Hfc or Hfs : 0.80
Resistance factor for combined V-H loads, VH : 0.90
V-H Bearing Capacity Envelope
spud_pen v2.1 Soils Database Ref. W.S. 05-130553 Calc: DHE Appvd: RWPS Date: 20-Nov-10
Spudcan Geometry
Generic KFELS B Class at Generic medium dense sand location for ISO Phase 2 BenchmarkingV-H BEARING CAPACITY ENVELOPE
SNAME (Rev. 3 January 2008)
0
1000
2000
3000
4000
5000
6000
7000
8000
0 100 200 300 400 500 600 700 800 900 1000
Horizontal load capacity (tonnes)
Ve
rtic
al
loa
d c
ap
ac
ity
(to
nn
es
)
0
2000
4000
6000
8000
10000
12000
14000
16000
0 500 1000 1500 2000
Horizontal load capacity (kips)
Ve
rtic
al
loa
d c
ap
ac
ity
(k
ips
)
Maximum Hull Weight
Minimum Hull Weight
Factored sliding capacity
Unfactored V-H capacity
Factored V-H capacity
Unfactored sliding capacity
Stillwater spudcan reaction
}
Figure 5-4 - SNAME predicted V-H envelope for the B-Class - SAND assessment

PHASE 2 BENCHMARKING
VALIDITY CHECK FOR KFELS B CLASS ISO 19905-1 (DIS)
W/S No: CTR: 05-130553 0
Page 67 of 89
Report No: L25316 , Revision 0: O , Dated: 20th November 2010
File: L25316-R0 - ISO validity check of KFELS B Class.doc
Location Details Spudcan GeometryName : Generic medium dense sand location for ISO Phase 2 BenchmarkingCoordinates : N/A N, N/A EDepth of water : 106.7 m (350 ft) 106.7 350
Jack-up Unit DetailsName : Generic KFELS B ClassDesign : KFELS Mod V B Class
Calculated Spudcan Reactions at Seabed LevelPreload reaction : 7,100 tonnes (15,653 kips) 7,100 15,653Stillwater reaction : 4,314 tonnes (9,511 kips) 4,314 9,511
Parameters Used in Fixity Calculations
Expected spudcan tip penetration : 1.95 m (6 ft) 6Maximum spudcan contact area : 91.1 m2 (981 sq.ft) 981Soil type : SandSoil backflow : YesBackflow unit weight: 11
Undrained shear strength, cu : N.A. kPa ######Overconsolidation ratio, OCR : N.A.Relative density, DR : 60 %Poisson's ratio, : 0.2
Calculated Vertical, Horizontal and Rotational Foundation Capacities
The following foundation capacities have been calculated in accordance with the 'ISO DIS 19905-1
These foundation capacities are for use with the ultimate vertical/horizontal/rotational capacityinteraction function for spudcan footings (Section A.9.3.3.2).
Vertical foundation capacity, VLO : 7100 tonnes (15,652 kips) 15,652
Horizontal foundation capacity, HLO : 852 tonnes (1,878 kips) 1,878
Moment foundation capacity, MLO : 5734 tonne.m (41,474 kips.ft) 41,474
Calculated Initial Vertical, Horizontal and Rotational Foundation Stiffnesses
In accordance with ISO DIS 19905-1
Vertical foundation stiffness, K1 : 139,686 tonnes/m (93,865 kips/ft)
Horizontal foundation stiffness, K2 : 132,443 tonnes/m (88,998 kips/ft)
Rotational foundation stiffness, K3 : 2,699,882 tonne.m/rad (19,528,287 kips.ft/rad)
80% of Rotational foundation stiffness, K3 : 2,159,906 tonne.m/rad (15,622,630 kips.ft/rad)
Stiffness degradation factor, n 0.0
NOTE: In accordance with Clause A.10.4.4.1.2 the initial linearised rotational stiffness used in
detailed dynamic calculations may typically be taken as 80-100% of the values determined above.79,344 7,523 6,602,882 5,282,30593,865 88,998 19,528,287 622,630
Generic KFELS B Class at Generic medium dense sand location for ISO Phase 2 Benchmarking
SPUDCAN FIXITY PARAMETERS
Figure 5-5 - ISO predicted ultimate capacities and stiffnesses for the B-Class - SAND assessment
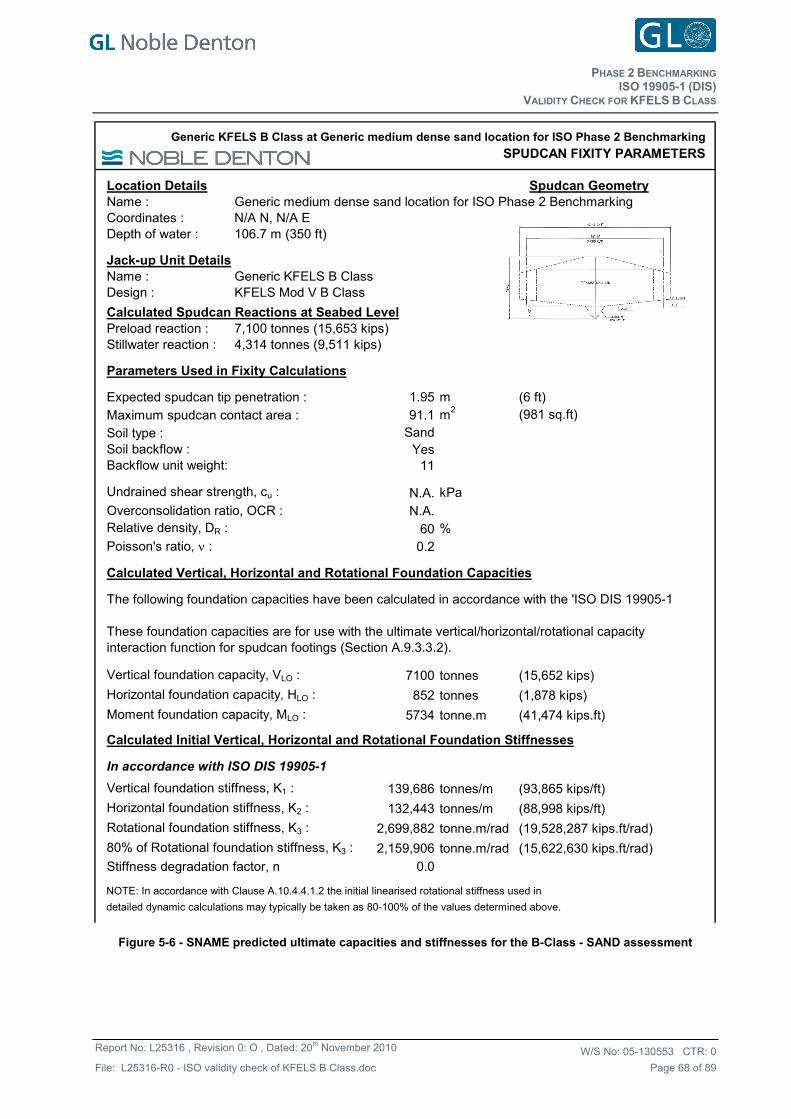
PHASE 2 BENCHMARKING
VALIDITY CHECK FOR KFELS B CLASS ISO 19905-1 (DIS)
W/S No: CTR: 05-130553 0
Page 68 of 89
Report No: L25316 , Revision 0: O , Dated: 20th November 2010
File: L25316-R0 - ISO validity check of KFELS B Class.doc
Location Details Spudcan GeometryName : Generic medium dense sand location for ISO Phase 2 BenchmarkingCoordinates : N/A N, N/A EDepth of water : 106.7 m (350 ft) 106.7 350
Jack-up Unit DetailsName : Generic KFELS B ClassDesign : KFELS Mod V B Class
Calculated Spudcan Reactions at Seabed LevelPreload reaction : 7,100 tonnes (15,653 kips) 7,100 15,653Stillwater reaction : 4,314 tonnes (9,511 kips) 4,314 9,511
Parameters Used in Fixity Calculations
Expected spudcan tip penetration : 1.95 m (6 ft) 6Maximum spudcan contact area : 91.1 m2 (981 sq.ft) 981Soil type : SandSoil backflow : YesBackflow unit weight: 11
Undrained shear strength, cu : N.A. kPa ######Overconsolidation ratio, OCR : N.A.Relative density, DR : 60 %Poisson's ratio, : 0.2
Calculated Vertical, Horizontal and Rotational Foundation Capacities
The following foundation capacities have been calculated in accordance with the 'ISO DIS 19905-1
These foundation capacities are for use with the ultimate vertical/horizontal/rotational capacityinteraction function for spudcan footings (Section A.9.3.3.2).
Vertical foundation capacity, VLO : 7100 tonnes (15,652 kips) 15,652
Horizontal foundation capacity, HLO : 852 tonnes (1,878 kips) 1,878
Moment foundation capacity, MLO : 5734 tonne.m (41,474 kips.ft) 41,474
Calculated Initial Vertical, Horizontal and Rotational Foundation Stiffnesses
In accordance with ISO DIS 19905-1
Vertical foundation stiffness, K1 : 139,686 tonnes/m (93,865 kips/ft)
Horizontal foundation stiffness, K2 : 132,443 tonnes/m (88,998 kips/ft)
Rotational foundation stiffness, K3 : 2,699,882 tonne.m/rad (19,528,287 kips.ft/rad)
80% of Rotational foundation stiffness, K3 : 2,159,906 tonne.m/rad (15,622,630 kips.ft/rad)
Stiffness degradation factor, n 0.0
NOTE: In accordance with Clause A.10.4.4.1.2 the initial linearised rotational stiffness used in
detailed dynamic calculations may typically be taken as 80-100% of the values determined above.79,344 7,523 6,602,882 5,282,30593,865 88,998 19,528,287 622,630
Generic KFELS B Class at Generic medium dense sand location for ISO Phase 2 Benchmarking
SPUDCAN FIXITY PARAMETERS
Figure 5-6 - SNAME predicted ultimate capacities and stiffnesses for the B-Class - SAND assessment
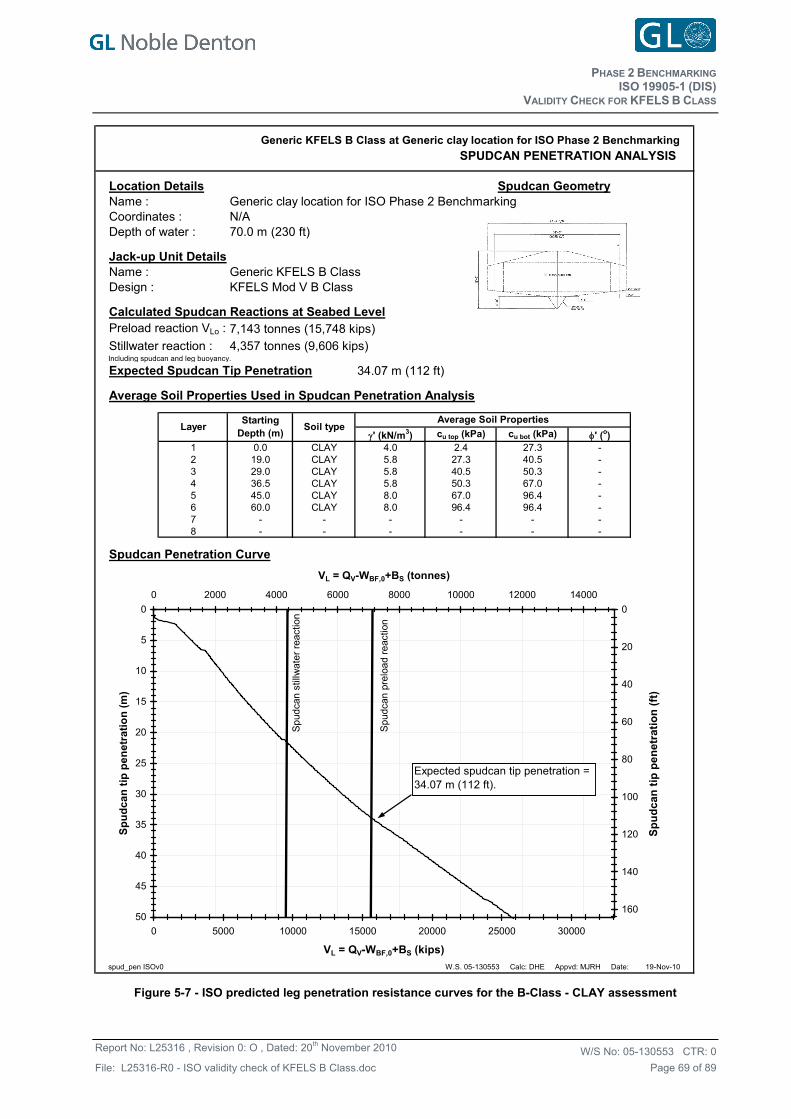
PHASE 2 BENCHMARKING
VALIDITY CHECK FOR KFELS B CLASS ISO 19905-1 (DIS)
W/S No: CTR: 05-130553 0
Page 69 of 89
Report No: L25316 , Revision 0: O , Dated: 20th November 2010
File: L25316-R0 - ISO validity check of KFELS B Class.doc
Location DetailsName : Generic clay location for ISO Phase 2 BenchmarkingCoordinates : N/ADepth of water : 70.0 m (230 ft) 70.0 230
Jack-up Unit DetailsName : Generic KFELS B ClassDesign : KFELS Mod V B Class
Calculated Spudcan Reactions at Seabed LevelPreload reaction VLo : 7,143 tonnes (15,748 kips) 7,143 15,748
Stillwater reaction : 4,357 tonnes (9,606 kips) 4,357 9,606Including spudcan and leg buoyancy.
Expected Spudcan Tip Penetration 34.07 m (112 ft) 34.07 112
Average Soil Properties Used in Spudcan Penetration Analysis
' (kN/m3) cu top (kPa) cu bot (kPa) ' (o)1 0.0 CLAY 4.0 2.4 27.3 -2 19.0 CLAY 5.8 27.3 40.5 -3 29.0 CLAY 5.8 40.5 50.3 -4 36.5 CLAY 5.8 50.3 67.0 -5 45.0 CLAY 8.0 67.0 96.4 -6 60.0 CLAY 8.0 96.4 96.4 -7 - - - - - -8 - - - - - -
Spudcan Penetration Curve
spud_pen ISOv0 W.S. 05-130553 Calc: DHE Appvd: MJRH Date: 19-Nov-10
SPUDCAN PENETRATION ANALYSIS Generic KFELS B Class at Generic clay location for ISO Phase 2 Benchmarking
Layer Soil type
Spudcan Geometry
Average Soil PropertiesStarting Depth (m)
0
5
10
15
20
25
30
35
40
45
50
0 2000 4000 6000 8000 10000 12000 14000
VL = QV-WBF,0+BS (tonnes)
Sp
ud
ca
n t
ip p
en
etr
ati
on
(m
)
0
20
40
60
80
100
120
140
160
0 5000 10000 15000 20000 25000 30000
VL = QV-WBF,0+BS (kips)
Sp
ud
can
tip
pe
ne
trat
ion
(ft
)
Spu
dcan
pre
load
rea
ctio
n
Expected spudcan tip penetration = 34.07 m (112 ft).
Sp
udca
n s
tillw
ate
r re
actio
n
Figure 5-7 - ISO predicted leg penetration resistance curves for the B-Class - CLAY assessment
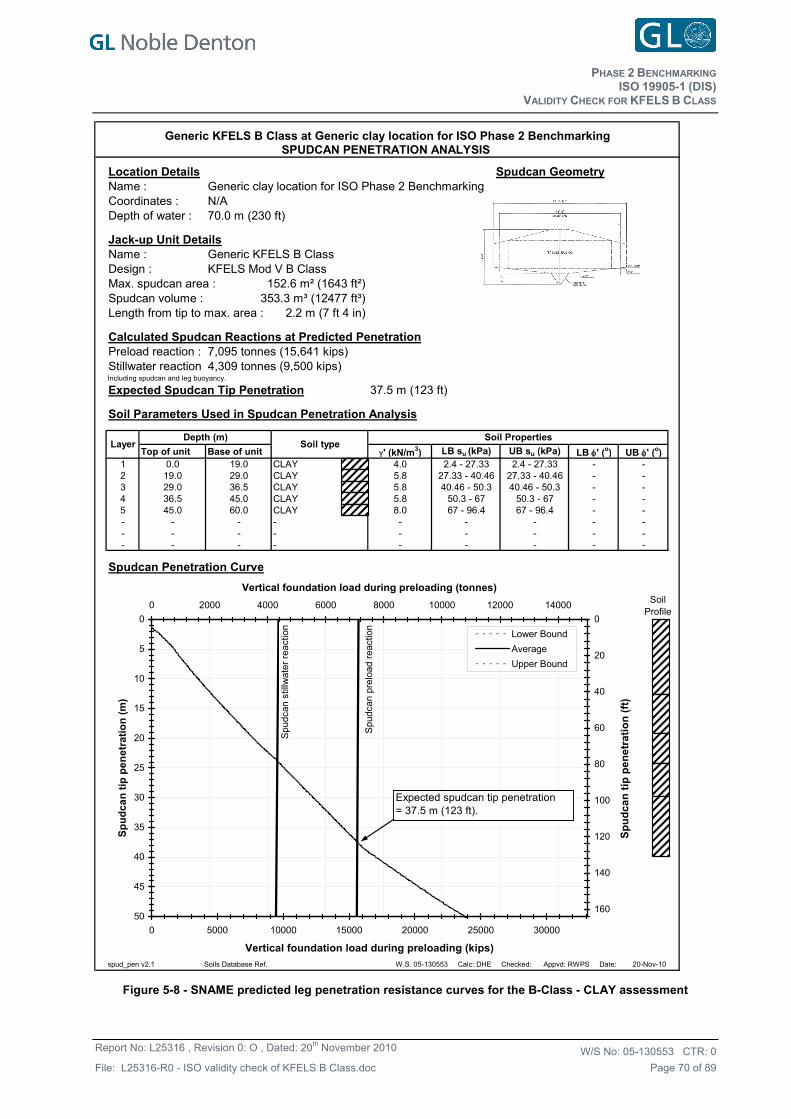
PHASE 2 BENCHMARKING
VALIDITY CHECK FOR KFELS B CLASS ISO 19905-1 (DIS)
W/S No: CTR: 05-130553 0
Page 70 of 89
Report No: L25316 , Revision 0: O , Dated: 20th November 2010
File: L25316-R0 - ISO validity check of KFELS B Class.doc
Location DetailsName : Generic clay location for ISO Phase 2 BenchmarkingCoordinates : N/ADepth of water : 70.0 m (230 ft) 70.0 230
Jack-up Unit DetailsName : Generic KFELS B ClassDesign : KFELS Mod V B ClassMax. spudcan area : 152.6 m² (1643 ft²)Spudcan volume : 353.3 m³ (12477 ft³)Length from tip to max. area : 2.2 m (7 ft 4 in)
Calculated Spudcan Reactions at Predicted PenetrationPreload reaction : 7,095 tonnes (15,641 kips) 7,095 15,641Stillwater reaction 4,309 tonnes (9,500 kips) 4,309 9,500Including spudcan and leg buoyancy.
Expected Spudcan Tip Penetration 37.5 m (123 ft) 37.5 123
Soil Parameters Used in Spudcan Penetration Analysis
Top of unit Base of unit ' (kN/m3) LB su (kPa) UB su (kPa) LB' (o) UB' (o)1 0.0 19.0 CLAY 4.0 2.4 - 27.33 2.4 - 27.33 - -2 19.0 29.0 CLAY 5.8 27.33 - 40.46 27.33 - 40.46 - -3 29.0 36.5 CLAY 5.8 40.46 - 50.3 40.46 - 50.3 - -4 36.5 45.0 CLAY 5.8 50.3 - 67 50.3 - 67 - -5 45.0 60.0 CLAY 8.0 67 - 96.4 67 - 96.4 - -- - - - - - - - -- - - - - - - - -- - - - - - - - -
Spudcan Penetration Curve
spud_pen v2.1 Soils Database Ref. W.S. 05-130553 Calc: DHE Checked: Appvd: RWPS Date: 20-Nov-10
SPUDCAN PENETRATION ANALYSIS Generic KFELS B Class at Generic clay location for ISO Phase 2 Benchmarking
Soil type
Spudcan Geometry
LayerDepth (m) Soil Properties
0
5
10
15
20
25
30
35
40
45
50
0 2000 4000 6000 8000 10000 12000 14000
Vertical foundation load during preloading (tonnes)
Sp
ud
ca
n t
ip p
en
etr
ati
on
(m
)
0
20
40
60
80
100
120
140
160
0 5000 10000 15000 20000 25000 30000
Vertical foundation load during preloading (kips)
Sp
ud
can
tip
pe
ne
tra
tio
n (
ft)
Lower Bound
Average
Upper Bound
Spu
dcan
pre
load
rea
ctio
n
Expected spudcan tip penetration= 37.5 m (123 ft).
Spu
dcan
stil
lwat
er r
eact
ion
Soil Profile
Figure 5-8 - SNAME predicted leg penetration resistance curves for the B-Class - CLAY assessment
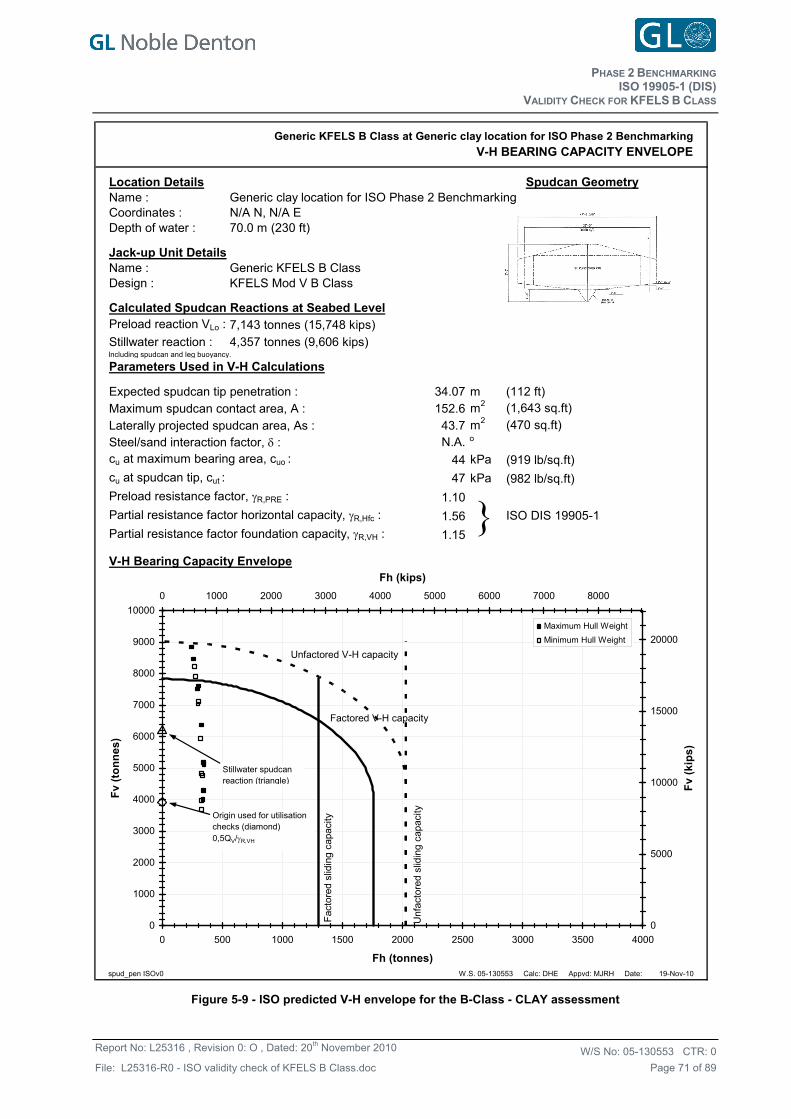
PHASE 2 BENCHMARKING
VALIDITY CHECK FOR KFELS B CLASS ISO 19905-1 (DIS)
W/S No: CTR: 05-130553 0
Page 71 of 89
Report No: L25316 , Revision 0: O , Dated: 20th November 2010
File: L25316-R0 - ISO validity check of KFELS B Class.doc
Location DetailsName : Generic clay location for ISO Phase 2 BenchmarkingCoordinates : N/A N, N/A EDepth of water : 70.0 m (230 ft) 70.0 230
Jack-up Unit DetailsName : Generic KFELS B ClassDesign : KFELS Mod V B Class
Calculated Spudcan Reactions at Seabed LevelPreload reaction VLo : 7,143 tonnes (15,748 kips) 7,143 15,748
Stillwater reaction : 4,357 tonnes (9,606 kips) 4,357 9,606Including spudcan and leg buoyancy.
Parameters Used in V-H Calculations
Expected spudcan tip penetration : 34.07 m (112 ft) 112Maximum spudcan contact area, A : 152.6 m2 (1,643 sq.ft) 1,643Laterally projected spudcan area, As : 43.7 m2 (470 sq.ft) 470Steel/sand interaction factor, : N.A. o 0.0cu at maximum bearing area, cuo : 44 kPa (919 lb/sq.ft) 919
cu at spudcan tip, cut : 47 kPa (982 lb/sq.ft) 982
Preload resistance factor, R,PRE : 1.10
Partial resistance factor horizontal capacity, R,Hfc : 1.56
Partial resistance factor foundation capacity, R,VH : 1.15
V-H Bearing Capacity Envelope
spud_pen ISOv0 W.S. 05-130553 Calc: DHE Appvd: MJRH Date: 19-Nov-10
Spudcan Geometry
Generic KFELS B Class at Generic clay location for ISO Phase 2 Benchmarking
V-H BEARING CAPACITY ENVELOPE
ISO DIS 19905-1
0
1000
2000
3000
4000
5000
6000
7000
8000
9000
10000
0 500 1000 1500 2000 2500 3000 3500 4000
Fh (tonnes)
Fv
(to
nn
es
)
0
5000
10000
15000
20000
0 1000 2000 3000 4000 5000 6000 7000 8000
Fh (kips)
Fv
(k
ips
)
Maximum Hull Weight
Minimum Hull Weight
Fac
tore
d sl
idin
g ca
paci
ty
Unfactored V-H capacity
Factored V-H capacity
Unf
acto
red
slid
ing
capa
city
Stillwater spudcan reaction (triangle)
Origin used for utilisation checks (diamond)0,5QV/R,VH
}
Figure 5-9 - ISO predicted V-H envelope for the B-Class - CLAY assessment
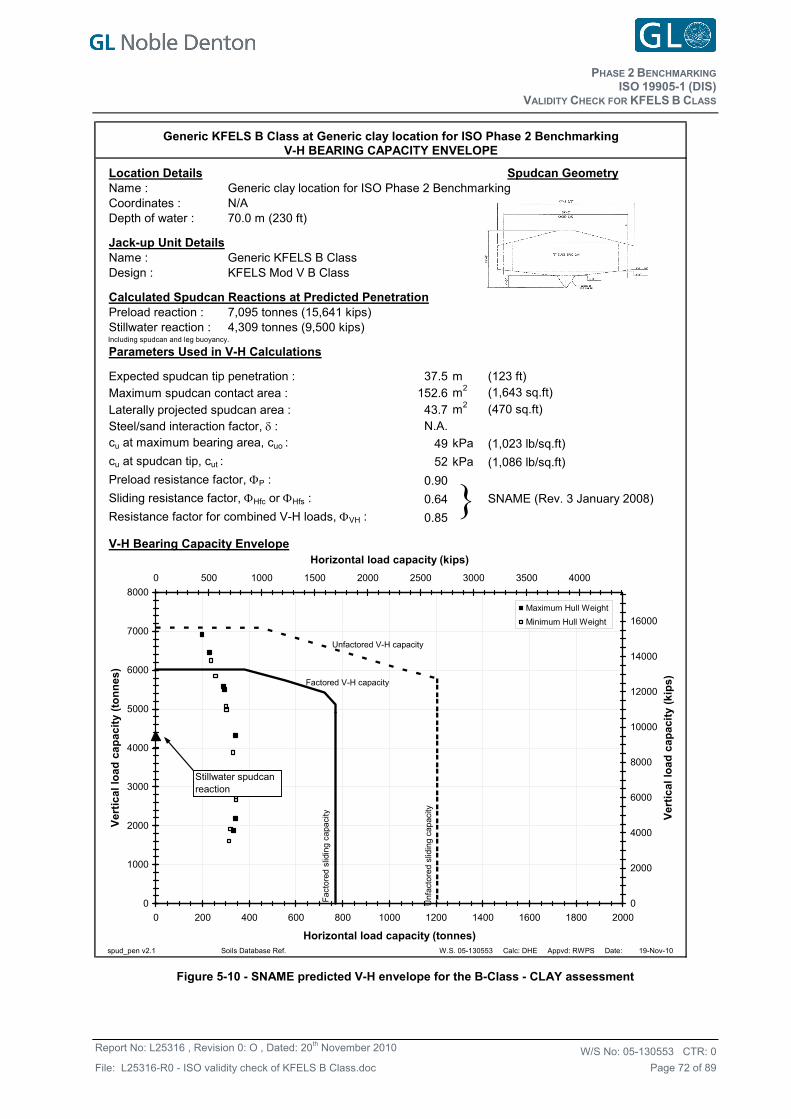
PHASE 2 BENCHMARKING
VALIDITY CHECK FOR KFELS B CLASS ISO 19905-1 (DIS)
W/S No: CTR: 05-130553 0
Page 72 of 89
Report No: L25316 , Revision 0: O , Dated: 20th November 2010
File: L25316-R0 - ISO validity check of KFELS B Class.doc
Location DetailsName : Generic clay location for ISO Phase 2 BenchmarkingCoordinates : N/ADepth of water : 70.0 m (230 ft) 70.0 230
Jack-up Unit DetailsName : Generic KFELS B ClassDesign : KFELS Mod V B Class
Calculated Spudcan Reactions at Predicted PenetrationPreload reaction : 7,095 tonnes (15,641 kips) 7,095 15,641Stillwater reaction : 4,309 tonnes (9,500 kips) 4,309 9,500Including spudcan and leg buoyancy.
Parameters Used in V-H Calculations
Expected spudcan tip penetration : 37.5 m (123 ft) 123Maximum spudcan contact area : 152.6 m2 (1,643 sq.ft) 1,643Laterally projected spudcan area : 43.7 m2 (470 sq.ft) 470Steel/sand interaction factor, : N.A. 0.0cu at maximum bearing area, cuo : 49 kPa (1,023 lb/sq.ft) 1,023
cu at spudcan tip, cut : 52 kPa (1,086 lb/sq.ft) 1,086
Preload resistance factor, P : 0.90
Sliding resistance factor, Hfc or Hfs : 0.64
Resistance factor for combined V-H loads, VH : 0.85
V-H Bearing Capacity Envelope
spud_pen v2.1 Soils Database Ref. W.S. 05-130553 Calc: DHE Appvd: RWPS Date: 19-Nov-10
Spudcan Geometry
Generic KFELS B Class at Generic clay location for ISO Phase 2 BenchmarkingV-H BEARING CAPACITY ENVELOPE
SNAME (Rev. 3 January 2008)
0
1000
2000
3000
4000
5000
6000
7000
8000
0 200 400 600 800 1000 1200 1400 1600 1800 2000
Horizontal load capacity (tonnes)
Ver
tic
al
loa
d c
ap
ac
ity
(to
nn
es)
0
2000
4000
6000
8000
10000
12000
14000
16000
0 500 1000 1500 2000 2500 3000 3500 4000
Horizontal load capacity (kips)
Ve
rtic
al
loa
d c
ap
aci
ty (
kip
s)
Maximum Hull Weight
Minimum Hull Weight
Fac
tore
d sl
idin
g ca
paci
ty
Unfactored V-H capacity
Factored V-H capacity
Unf
acto
red
slid
ing
capa
city
Stillwater spudcan reaction
}
Figure 5-10 - SNAME predicted V-H envelope for the B-Class - CLAY assessment
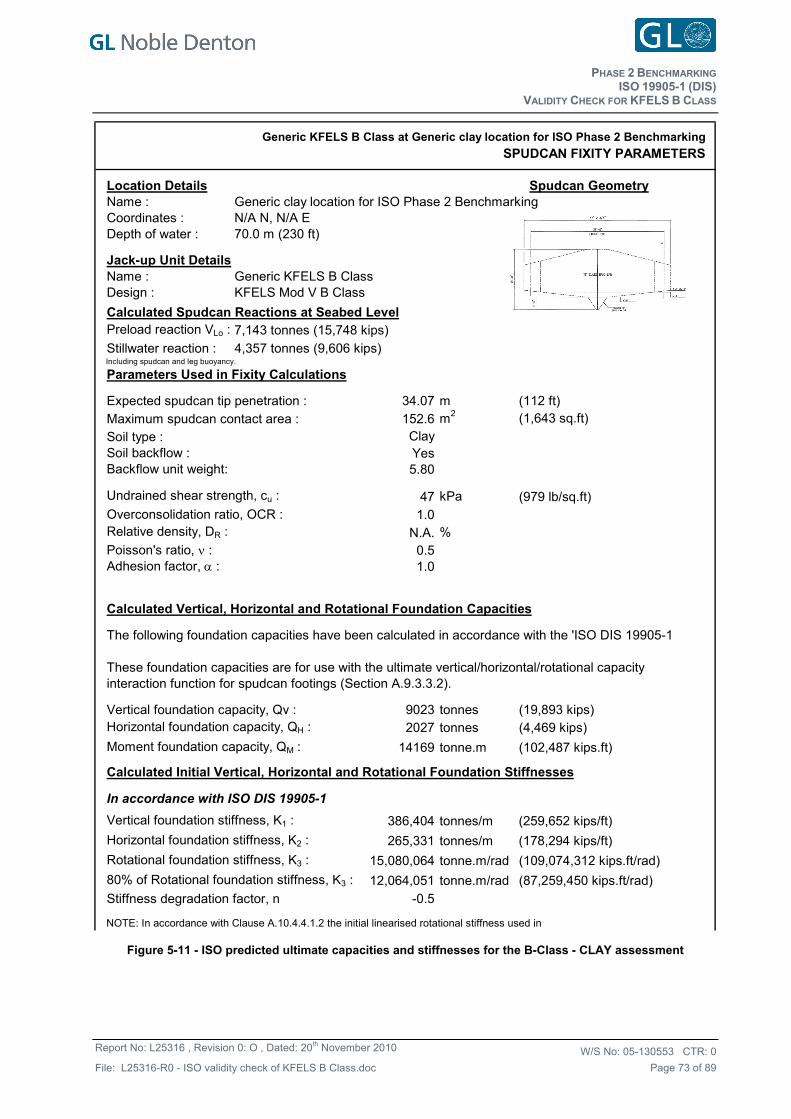
PHASE 2 BENCHMARKING
VALIDITY CHECK FOR KFELS B CLASS ISO 19905-1 (DIS)
W/S No: CTR: 05-130553 0
Page 73 of 89
Report No: L25316 , Revision 0: O , Dated: 20th November 2010
File: L25316-R0 - ISO validity check of KFELS B Class.doc
Location Details Spudcan GeometryName : Generic clay location for ISO Phase 2 BenchmarkingCoordinates : N/A N, N/A EDepth of water : 70.0 m (230 ft) 70.0 230
Jack-up Unit DetailsName : Generic KFELS B ClassDesign : KFELS Mod V B Class
Calculated Spudcan Reactions at Seabed LevelPreload reaction VLo : 7,143 tonnes (15,748 kips) 7,143 15,748
Stillwater reaction : 4,357 tonnes (9,606 kips) 4,357 9,606Including spudcan and leg buoyancy.
Parameters Used in Fixity Calculations
Expected spudcan tip penetration : 34.07 m (112 ft) 112Maximum spudcan contact area : 152.6 m2 (1,643 sq.ft) 1,643Soil type : ClaySoil backflow : YesBackflow unit weight: 5.80
Undrained shear strength, cu : 47 kPa (979 lb/sq.ft) 979Overconsolidation ratio, OCR : 1.0Relative density, DR : N.A. %Poisson's ratio, : 0.5Adhesion factor, : 1.0
Calculated Vertical, Horizontal and Rotational Foundation Capacities
The following foundation capacities have been calculated in accordance with the 'ISO DIS 19905-1
These foundation capacities are for use with the ultimate vertical/horizontal/rotational capacityinteraction function for spudcan footings (Section A.9.3.3.2).
Vertical foundation capacity, Qv : 9023 tonnes (19,893 kips) 19,893Horizontal foundation capacity, QH : 2027 tonnes (4,469 kips) 4,469
Moment foundation capacity, QM : 14169 tonne.m (102,487 kips.ft) 102,487
Calculated Initial Vertical, Horizontal and Rotational Foundation Stiffnesses
In accordance with ISO DIS 19905-1
Vertical foundation stiffness, K1 : 386,404 tonnes/m (259,652 kips/ft)
Horizontal foundation stiffness, K2 : 265,331 tonnes/m (178,294 kips/ft)
Rotational foundation stiffness, K3 : 15,080,064 tonne.m/rad (109,074,312 kips.ft/rad)
80% of Rotational foundation stiffness, K3 : 12,064,051 tonne.m/rad (87,259,450 kips.ft/rad)
Stiffness degradation factor, n -0.5
NOTE: In accordance with Clause A.10.4.4.1.2 the initial linearised rotational stiffness used in
Generic KFELS B Class at Generic clay location for ISO Phase 2 Benchmarking
SPUDCAN FIXITY PARAMETERS
Figure 5-11 - ISO predicted ultimate capacities and stiffnesses for the B-Class - CLAY assessment
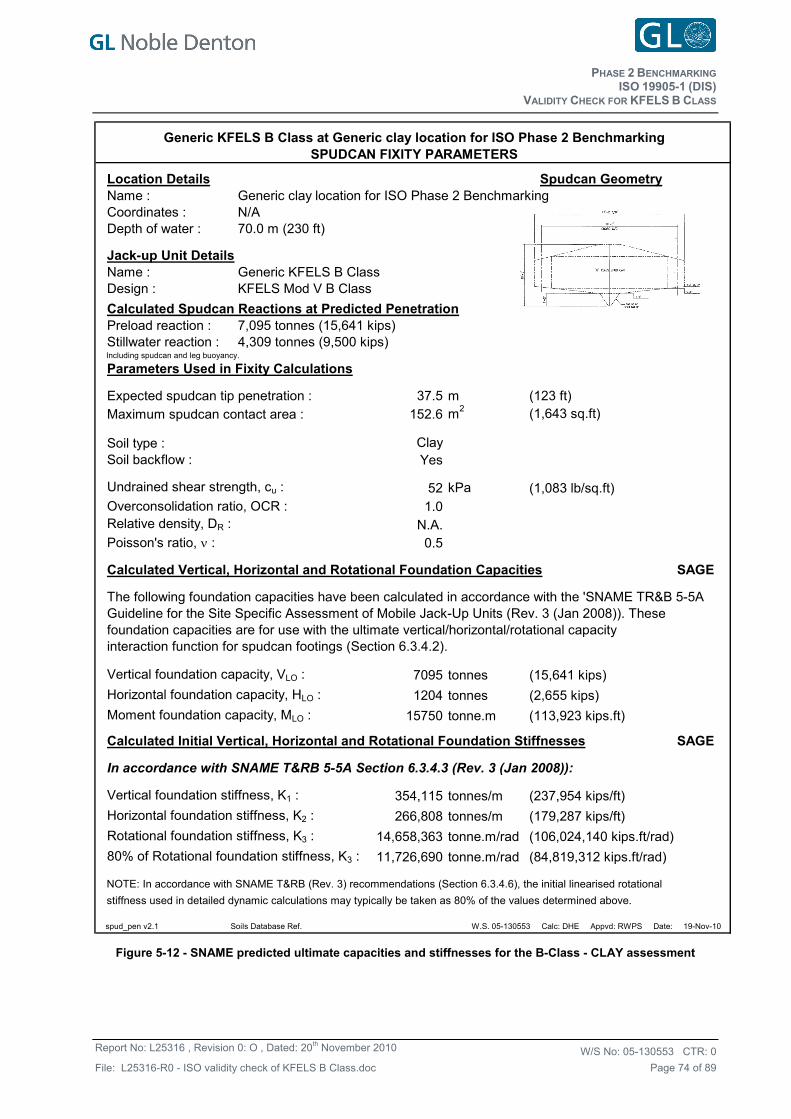
PHASE 2 BENCHMARKING
VALIDITY CHECK FOR KFELS B CLASS ISO 19905-1 (DIS)
W/S No: CTR: 05-130553 0
Page 74 of 89
Report No: L25316 , Revision 0: O , Dated: 20th November 2010
File: L25316-R0 - ISO validity check of KFELS B Class.doc
Location Details Spudcan GeometryName : Generic clay location for ISO Phase 2 BenchmarkingCoordinates : N/ADepth of water : 70.0 m (230 ft) 70.0 230
Jack-up Unit DetailsName : Generic KFELS B ClassDesign : KFELS Mod V B Class
Calculated Spudcan Reactions at Predicted PenetrationPreload reaction : 7,095 tonnes (15,641 kips) 7,095 15,641Stillwater reaction : 4,309 tonnes (9,500 kips) 4,309 9,500Including spudcan and leg buoyancy.
Parameters Used in Fixity Calculations
Expected spudcan tip penetration : 37.5 m (123 ft) 123Maximum spudcan contact area : 152.6 m2 (1,643 sq.ft) 1,643
Soil type : ClaySoil backflow : Yes
Undrained shear strength, cu : 52 kPa (1,083 lb/sq.ft) 1,083Overconsolidation ratio, OCR : 1.0Relative density, DR : N.A.Poisson's ratio, : 0.5
Calculated Vertical, Horizontal and Rotational Foundation Capacities SAGE
The following foundation capacities have been calculated in accordance with the 'SNAME TR&B 5-5AGuideline for the Site Specific Assessment of Mobile Jack-Up Units (Rev. 3 (Jan 2008)). Thesefoundation capacities are for use with the ultimate vertical/horizontal/rotational capacityinteraction function for spudcan footings (Section 6.3.4.2).
Vertical foundation capacity, VLO : 7095 tonnes (15,641 kips) 15,641
Horizontal foundation capacity, HLO : 1204 tonnes (2,655 kips) 2,655
Moment foundation capacity, MLO : 15750 tonne.m (113,923 kips.ft) 113,923
Calculated Initial Vertical, Horizontal and Rotational Foundation Stiffnesses SAGE
In accordance with SNAME T&RB 5-5A Section 6.3.4.3 (Rev. 3 (Jan 2008)):
Vertical foundation stiffness, K1 : 354,115 tonnes/m (237,954 kips/ft)
Horizontal foundation stiffness, K2 : 266,808 tonnes/m (179,287 kips/ft)
Rotational foundation stiffness, K3 : 14,658,363 tonne.m/rad (106,024,140 kips.ft/rad)
80% of Rotational foundation stiffness, K3 : 11,726,690 tonne.m/rad (84,819,312 kips.ft/rad)
NOTE: In accordance with SNAME T&RB (Rev. 3) recommendations (Section 6.3.4.6), the initial linearised rotational
stiffness used in detailed dynamic calculations may typically be taken as 80% of the values determined above.63,003 42,530 21,687,426 17,349,94237,954 179,287 106,024,140 819,312spud_pen v2.1 Soils Database Ref. W.S. 05-130553 Calc: DHE Appvd: RWPS Date: 19-Nov-10
Generic KFELS B Class at Generic clay location for ISO Phase 2 BenchmarkingSPUDCAN FIXITY PARAMETERS
Figure 5-12 - SNAME predicted ultimate capacities and stiffnesses for the B-Class - CLAY assessment
PHASE 2 BENCHMARKING
VALIDITY CHECK FOR KFELS B CLASS ISO 19905-1 (DIS)
W/S No: CTR: 05-130553 0
Page 75 of 89
Report No: L25316 , Revision 0: O , Dated: 20th November 2010
File: L25316-R0 - ISO validity check of KFELS B Class.doc
APPENDIX A COMMENTS SUBMITTED TO ISO
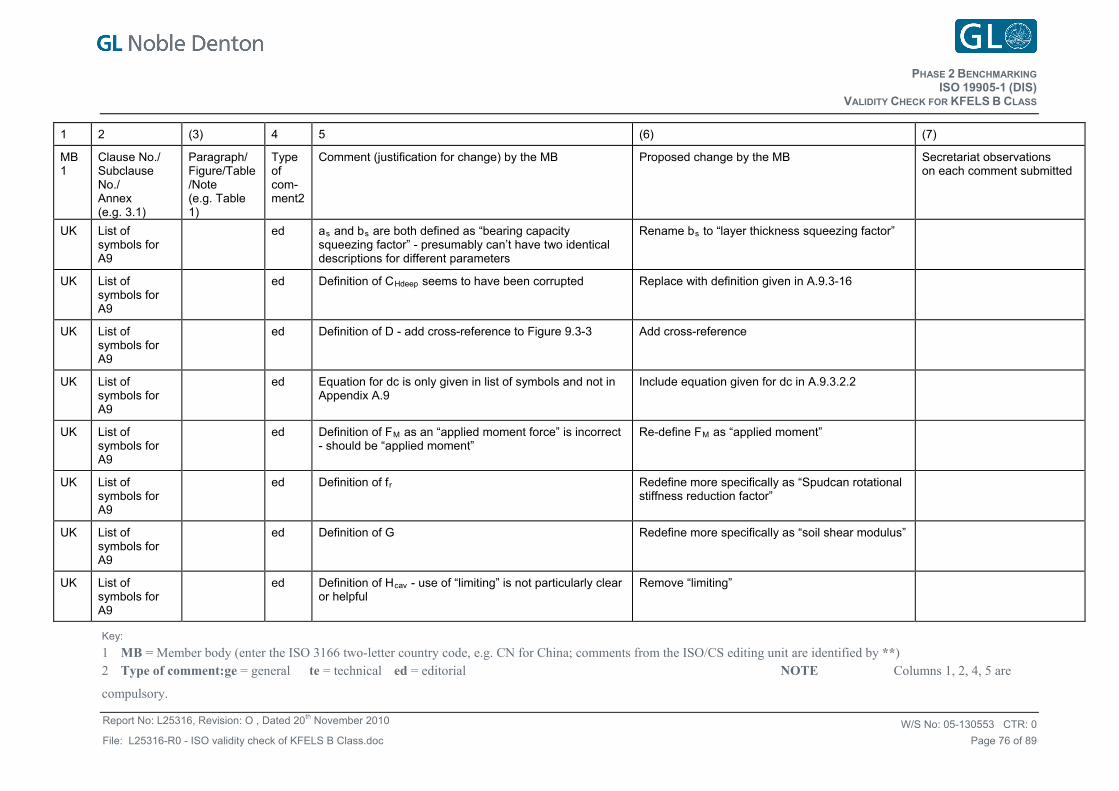
HASE ENCHMARKINGP 2 B
VALIDITY CHECK FOR KFELS B CLASS ISO 19905-1 (DIS)
W/S No: CTR:05-130553 0
Page 76 of 89
Report No: L25316, Revision: O , Dated 20th November 2010
File: L25316-R0 - ISO validity check of KFELS B Class.doc
1 2 (3) 4 5 (6) (7)
MB1
Clause No./ Subclause No./ Annex (e.g. 3.1)
Paragraph/ Figure/Table/Note (e.g. Table 1)
Type of com-ment2
Comment (justification for change) by the MB Proposed change by the MB Secretariat observations on each comment submitted
UK List of symbols for A9
ed as and bs are both defined as “bearing capacity squeezing factor” - presumably can’t have two identical descriptions for different parameters
Rename bs to “layer thickness squeezing factor”
UK List of symbols for A9
ed Definition of CHdeep seems to have been corrupted Replace with definition given in A.9.3-16
UK List of symbols for A9
ed Definition of D - add cross-reference to Figure 9.3-3 Add cross-reference
UK List of symbols for A9
ed Equation for dc is only given in list of symbols and not in Appendix A.9
Include equation given for dc in A.9.3.2.2
UK List of symbols for A9
ed Definition of FM as an “applied moment force” is incorrect - should be “applied moment”
Re-define FM as “applied moment”
UK List of symbols for A9
ed Definition of fr Redefine more specifically as “Spudcan rotational stiffness reduction factor”
UK List of symbols for A9
ed Definition of G Redefine more specifically as “soil shear modulus”
UK List of symbols for A9
ed Definition of Hcav - use of “limiting” is not particularly clear or helpful
Remove “limiting”
Key:
1 MB = Member body (enter the ISO 3166 two-letter country code, e.g. CN for China; comments from the ISO/CS editing unit are identified by **) 2 Type of comment: ge = general te = technical ed = editorial NOTE Columns 1, 2, 4, 5 are
compulsory.
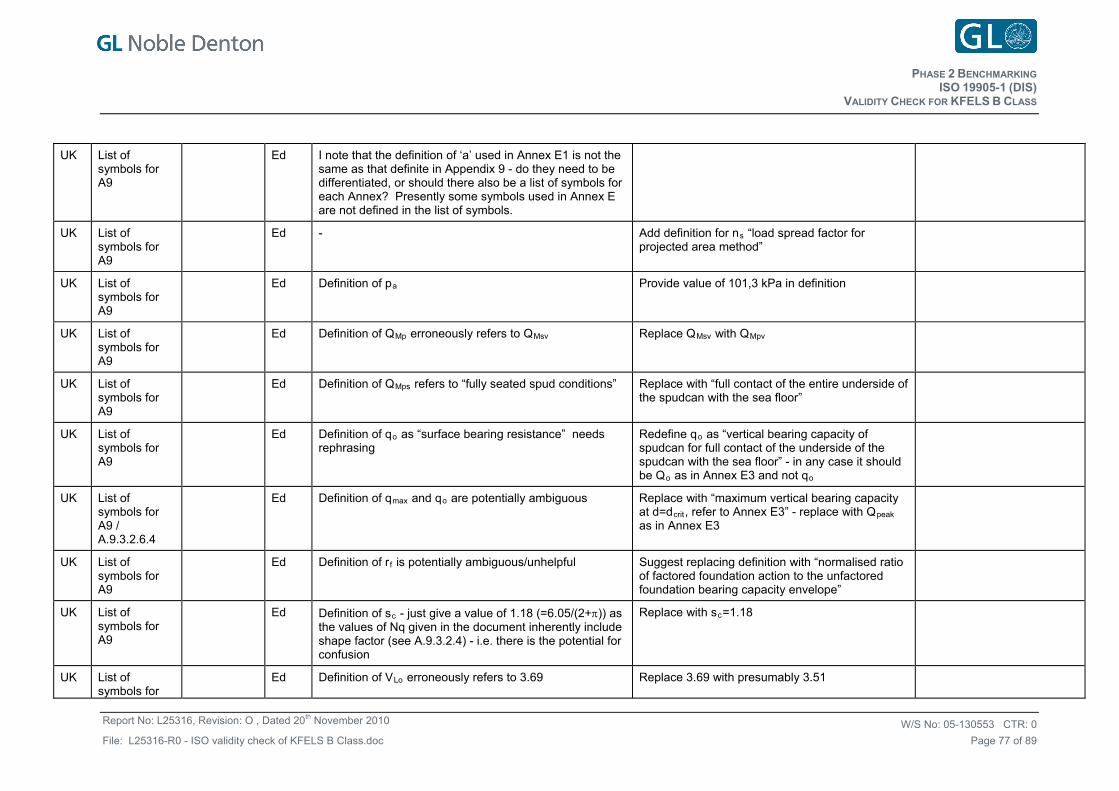
HASE ENCHMARKINGP 2 B
VALIDITY CHECK FOR KFELS B CLASS ISO 19905-1 (DIS)
W/S No: CTR:05-130553 0
Page 77 of 89
Report No: L25316, Revision: O , Dated 20th November 2010
File: L25316-R0 - ISO validity check of KFELS B Class.doc
UK List of symbols for A9
Ed I note that the definition of ‘a’ used in Annex E1 is not the same as that definite in Appendix 9 - do they need to be differentiated, or should there also be a list of symbols for each Annex? Presently some symbols used in Annex E are not defined in the list of symbols.
UK List of symbols for A9
Ed - Add definition for ns “load spread factor for projected area method”
UK List of symbols for A9
Ed Definition of pa Provide value of 101,3 kPa in definition
UK List of symbols for A9
Ed Definition of QMp erroneously refers to QMsv Replace QMsv with QMpv
UK List of symbols for A9
Ed Definition of QMps refers to “fully seated spud conditions” Replace with “full contact of the entire underside of the spudcan with the sea floor”
UK List of symbols for A9
Ed Definition of qo as “surface bearing resistance” needs rephrasing
Redefine qo as “vertical bearing capacity of spudcan for full contact of the underside of the spudcan with the sea floor” - in any case it should be Qo as in Annex E3 and not qo
UK List of symbols for A9 / A.9.3.2.6.4
Ed Definition of qmax and qo are potentially ambiguous Replace with “maximum vertical bearing capacity at d=dcrit, refer to Annex E3” - replace with Qpeak as in Annex E3
UK List of symbols for A9
Ed Definition of rf is potentially ambiguous/unhelpful Suggest replacing definition with “normalised ratio of factored foundation action to the unfactored foundation bearing capacity envelope”
UK List of symbols for A9
Ed Definition of sc - just give a value of 1.18 (=6.05/(2+)) as the values of Nq given in the document inherently include shape factor (see A.9.3.2.4) - i.e. there is the potential for confusion
Replace with sc=1.18
UK List of symbols for
Ed Definition of VLo erroneously refers to 3.69 Replace 3.69 with presumably 3.51
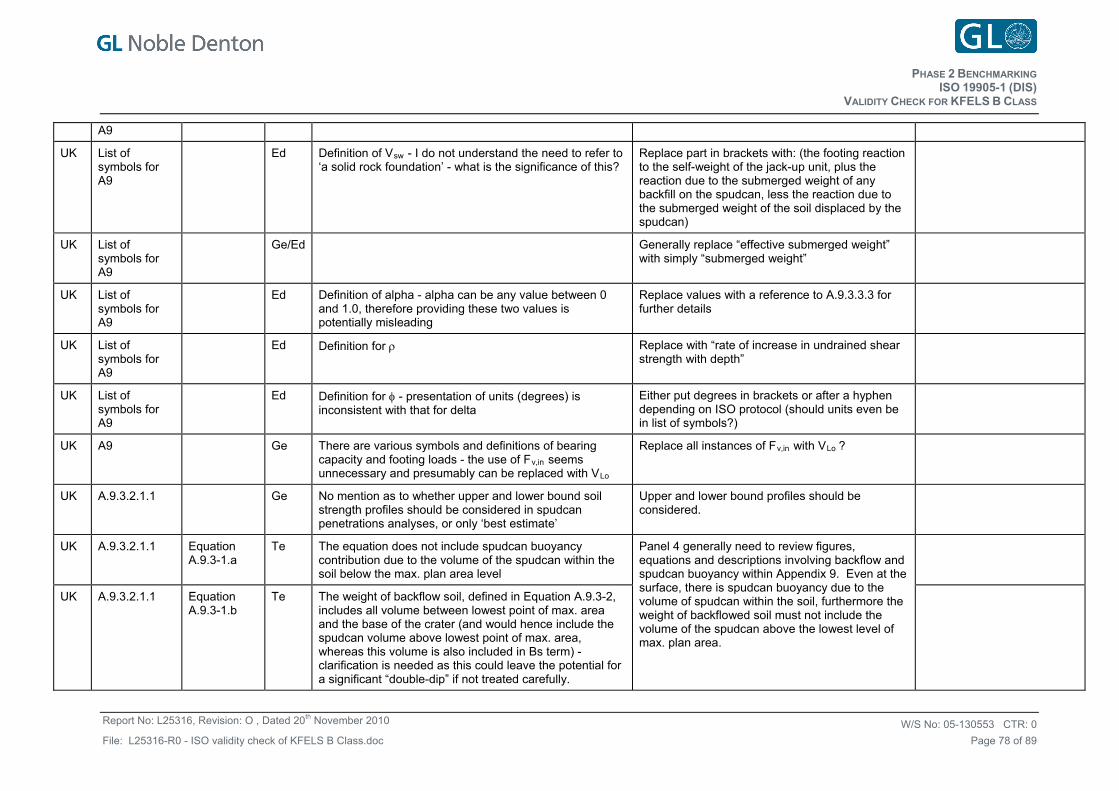
HASE ENCHMARKINGP 2 B
VALIDITY CHECK FOR KFELS B CLASS ISO 19905-1 (DIS)
W/S No: CTR:05-130553 0
Page 78 of 89
Report No: L25316, Revision: O , Dated 20th November 2010
File: L25316-R0 - ISO validity check of KFELS B Class.doc
A9
UK List of symbols for A9
Ed Definition of Vsw - I do not understand the need to refer to ‘a solid rock foundation’ - what is the significance of this?
Replace part in brackets with: (the footing reaction to the self-weight of the jack-up unit, plus the reaction due to the submerged weight of any backfill on the spudcan, less the reaction due to the submerged weight of the soil displaced by the spudcan)
UK List of symbols for A9
Ge/Ed Generally replace “effective submerged weight” with simply “submerged weight”
UK List of symbols for A9
Ed Definition of alpha - alpha can be any value between 0 and 1.0, therefore providing these two values is potentially misleading
Replace values with a reference to A.9.3.3.3 for further details
UK List of symbols for A9
Ed Definition for Replace with “rate of increase in undrained shear strength with depth”
UK List of symbols for A9
Ed Definition for - presentation of units (degrees) is inconsistent with that for delta
Either put degrees in brackets or after a hyphen depending on ISO protocol (should units even be in list of symbols?)
UK A9 Ge There are various symbols and definitions of bearing capacity and footing loads - the use of Fv,in seems unnecessary and presumably can be replaced with VLo
Replace all instances of Fv,in with VLo ?
UK A.9.3.2.1.1 Ge No mention as to whether upper and lower bound soil strength profiles should be considered in spudcan penetrations analyses, or only ‘best estimate’
Upper and lower bound profiles should be considered.
UK A.9.3.2.1.1 Equation A.9.3-1.a
Te The equation does not include spudcan buoyancy contribution due to the volume of the spudcan within the soil below the max. plan area level
UK A.9.3.2.1.1 Equation A.9.3-1.b
Te The weight of backflow soil, defined in Equation A.9.3-2, includes all volume between lowest point of max. area and the base of the crater (and would hence include the spudcan volume above lowest point of max. area, whereas this volume is also included in Bs term) - clarification is needed as this could leave the potential for a significant “double-dip” if not treated carefully.
Panel 4 generally need to review figures, equations and descriptions involving backflow and spudcan buoyancy within Appendix 9. Even at the surface, there is spudcan buoyancy due to the volume of spudcan within the soil, furthermore the weight of backflowed soil must not include the volume of the spudcan above the lowest level of max. plan area.
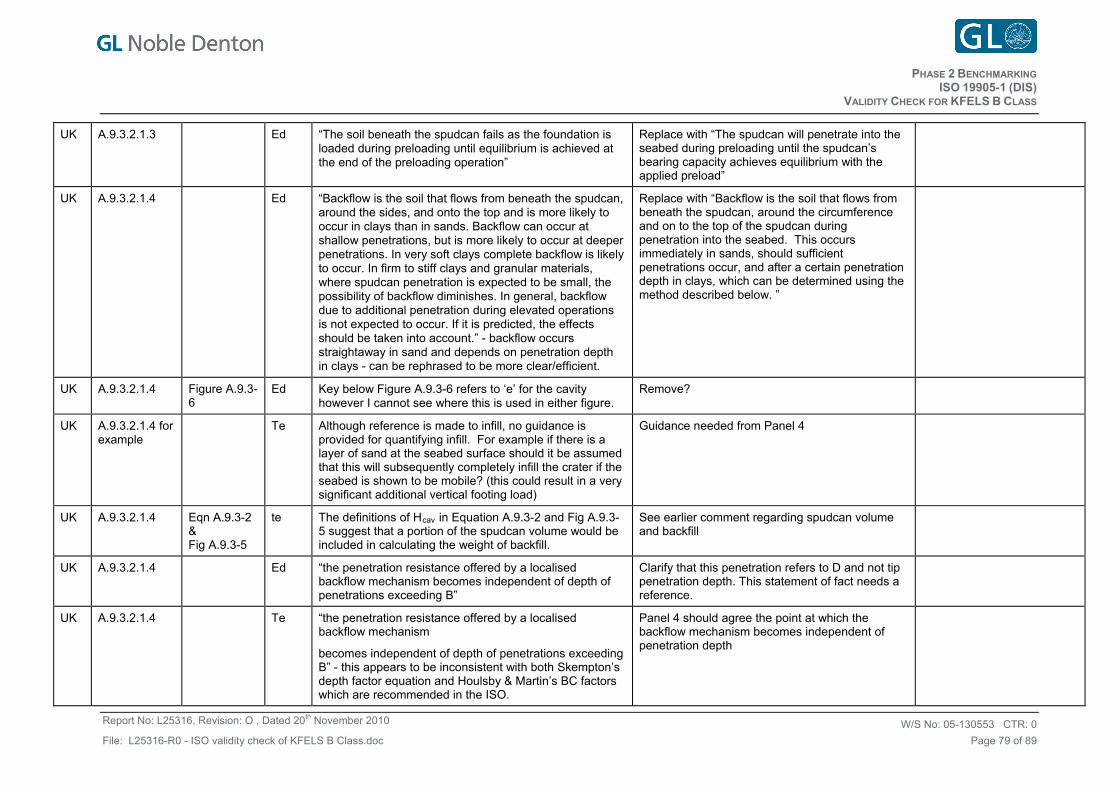
HASE ENCHMARKINGP 2 B
VALIDITY CHECK FOR KFELS B CLASS ISO 19905-1 (DIS)
W/S No: CTR:05-130553 0
Page 79 of 89
Report No: L25316, Revision: O , Dated 20th November 2010
File: L25316-R0 - ISO validity check of KFELS B Class.doc
UK A.9.3.2.1.3 Ed “The soil beneath the spudcan fails as the foundation is loaded during preloading until equilibrium is achieved at the end of the preloading operation”
Replace with “The spudcan will penetrate into the seabed during preloading until the spudcan’s bearing capacity achieves equilibrium with the applied preload”
UK A.9.3.2.1.4 Ed “Backflow is the soil that flows from beneath the spudcan, around the sides, and onto the top and is more likely to occur in clays than in sands. Backflow can occur at shallow penetrations, but is more likely to occur at deeper penetrations. In very soft clays complete backflow is likely to occur. In firm to stiff clays and granular materials, where spudcan penetration is expected to be small, the possibility of backflow diminishes. In general, backflow due to additional penetration during elevated operations is not expected to occur. If it is predicted, the effects should be taken into account.” - backflow occurs straightaway in sand and depends on penetration depth in clays - can be rephrased to be more clear/efficient.
Replace with “Backflow is the soil that flows from beneath the spudcan, around the circumference and on to the top of the spudcan during penetration into the seabed. This occurs immediately in sands, should sufficient penetrations occur, and after a certain penetration depth in clays, which can be determined using the method described below. ”
UK A.9.3.2.1.4 Figure A.9.3-6
Ed Key below Figure A.9.3-6 refers to ‘e’ for the cavity however I cannot see where this is used in either figure.
Remove?
UK A.9.3.2.1.4 for example
Te Although reference is made to infill, no guidance is provided for quantifying infill. For example if there is a layer of sand at the seabed surface should it be assumed that this will subsequently completely infill the crater if the seabed is shown to be mobile? (this could result in a very significant additional vertical footing load)
Guidance needed from Panel 4
UK A.9.3.2.1.4 Eqn A.9.3-2 & Fig A.9.3-5
te The definitions of Hcav in Equation A.9.3-2 and Fig A.9.3-5 suggest that a portion of the spudcan volume would be included in calculating the weight of backfill.
See earlier comment regarding spudcan volume and backfill
UK A.9.3.2.1.4 Ed “the penetration resistance offered by a localised backflow mechanism becomes independent of depth of penetrations exceeding B”
Clarify that this penetration refers to D and not tip penetration depth. This statement of fact needs a reference.
UK A.9.3.2.1.4
Te “the penetration resistance offered by a localised backflow mechanism
becomes independent of depth of penetrations exceeding B” - this appears to be inconsistent with both Skempton’s depth factor equation and Houlsby & Martin’s BC factors which are recommended in the ISO.
Panel 4 should agree the point at which the backflow mechanism becomes independent of penetration depth
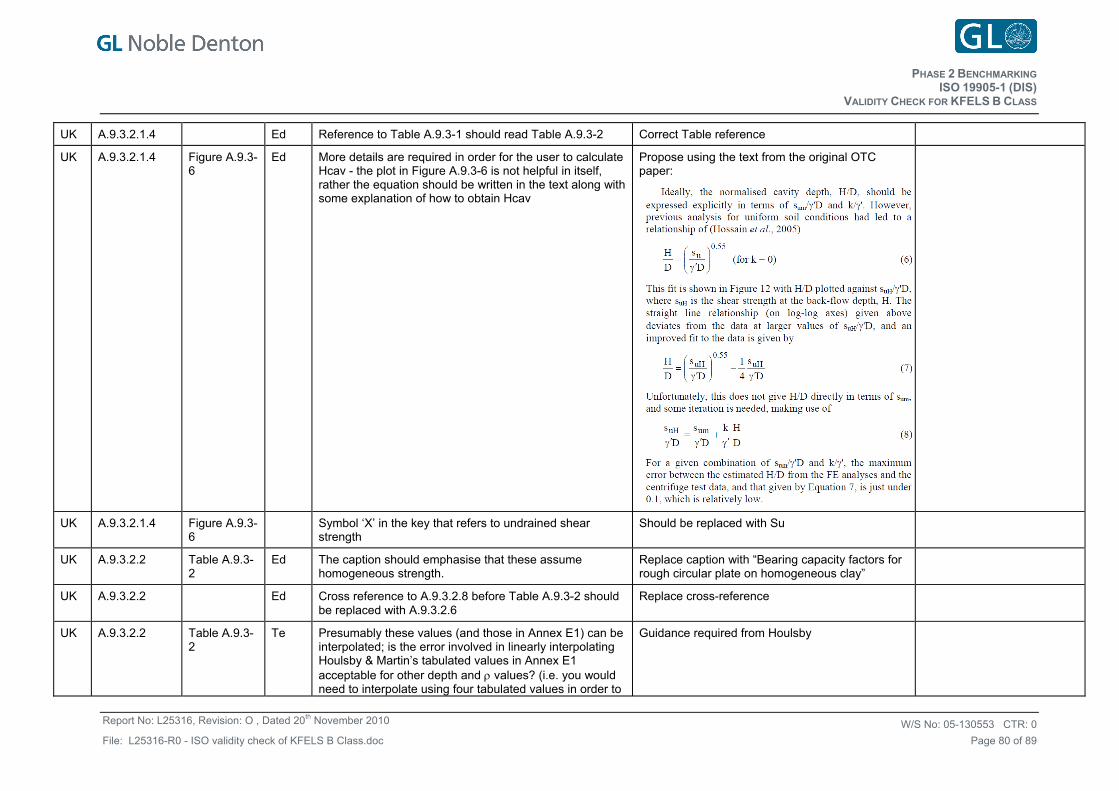
HASE ENCHMARKINGP 2 B
VALIDITY CHECK FOR KFELS B CLASS ISO 19905-1 (DIS)
W/S No: CTR:05-130553 0
Page 80 of 89
Report No: L25316, Revision: O , Dated 20th November 2010
File: L25316-R0 - ISO validity check of KFELS B Class.doc
UK A.9.3.2.1.4 Ed Reference to Table A.9.3-1 should read Table A.9.3-2 Correct Table reference
UK A.9.3.2.1.4 Figure A.9.3-6
Ed More details are required in order for the user to calculate Hcav - the plot in Figure A.9.3-6 is not helpful in itself, rather the equation should be written in the text along with some explanation of how to obtain Hcav
Propose using the text from the original OTC paper:
UK A.9.3.2.1.4 Figure A.9.3-6
Symbol ‘X’ in the key that refers to undrained shear strength
Should be replaced with Su
UK A.9.3.2.2 Table A.9.3-2
Ed The caption should emphasise that these assume homogeneous strength.
Replace caption with “Bearing capacity factors for rough circular plate on homogeneous clay”
UK A.9.3.2.2 Ed Cross reference to A.9.3.2.8 before Table A.9.3-2 should be replaced with A.9.3.2.6
Replace cross-reference
UK A.9.3.2.2 Table A.9.3-2
Te Presumably these values (and those in Annex E1) can be interpolated; is the error involved in linearly interpolating Houlsby & Martin’s tabulated values in Annex E1 acceptable for other depth and values? (i.e. you would need to interpolate using four tabulated values in order to
Guidance required from Houlsby
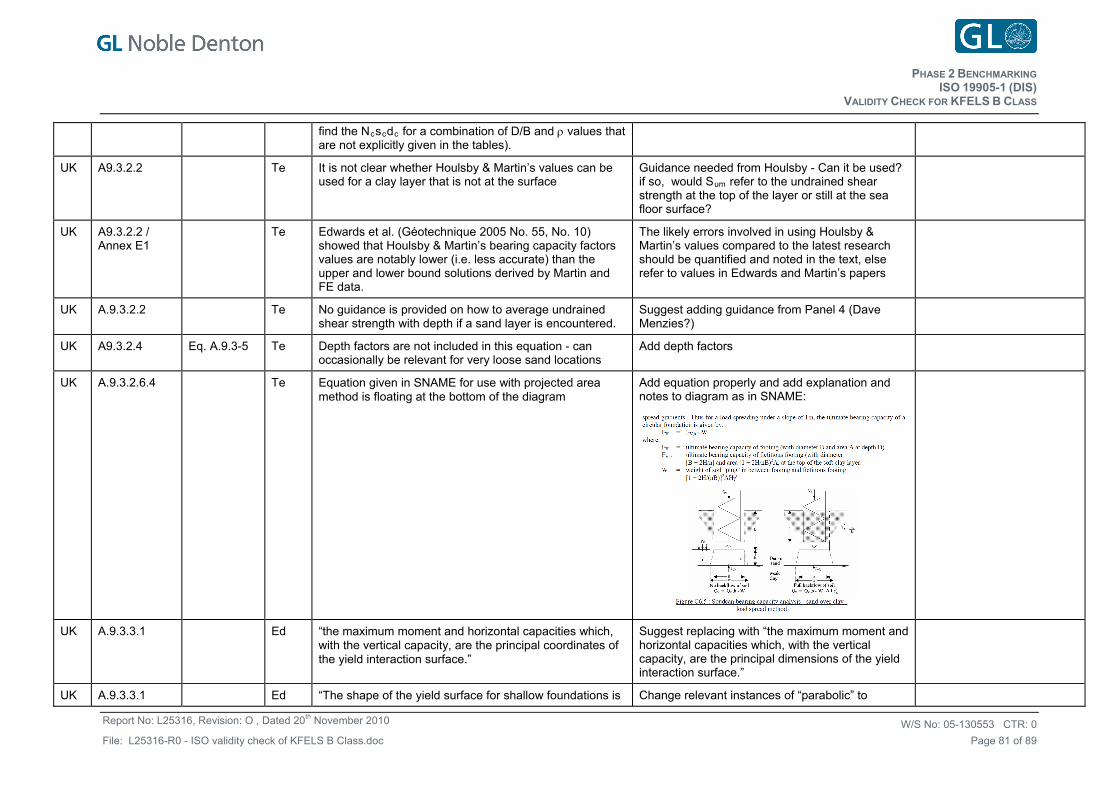
HASE ENCHMARKINGP 2 B
VALIDITY CHECK FOR KFELS B CLASS ISO 19905-1 (DIS)
W/S No: CTR:05-130553 0
Page 81 of 89
Report No: L25316, Revision: O , Dated 20th November 2010
File: L25316-R0 - ISO validity check of KFELS B Class.doc
find the Ncscdc for a combination of D/B and values that are not explicitly given in the tables).
UK A9.3.2.2 Te It is not clear whether Houlsby & Martin’s values can be used for a clay layer that is not at the surface
Guidance needed from Houlsby - Can it be used? if so, would Sum refer to the undrained shear strength at the top of the layer or still at the sea floor surface?
UK A9.3.2.2 / Annex E1
Te Edwards et al. (Géotechnique 2005 No. 55, No. 10) showed that Houlsby & Martin’s bearing capacity factors values are notably lower (i.e. less accurate) than the upper and lower bound solutions derived by Martin and FE data.
The likely errors involved in using Houlsby & Martin’s values compared to the latest research should be quantified and noted in the text, else refer to values in Edwards and Martin’s papers
UK A.9.3.2.2 Te No guidance is provided on how to average undrained shear strength with depth if a sand layer is encountered.
Suggest adding guidance from Panel 4 (Dave Menzies?)
UK A9.3.2.4 Eq. A.9.3-5 Te Depth factors are not included in this equation - can occasionally be relevant for very loose sand locations
Add depth factors
UK A.9.3.2.6.4 Te Equation given in SNAME for use with projected area method is floating at the bottom of the diagram
Add equation properly and add explanation and notes to diagram as in SNAME:
UK A.9.3.3.1 Ed “the maximum moment and horizontal capacities which, with the vertical capacity, are the principal coordinates of the yield interaction surface.”
Suggest replacing with “the maximum moment and horizontal capacities which, with the vertical capacity, are the principal dimensions of the yield interaction surface.”
UK A.9.3.3.1 Ed “The shape of the yield surface for shallow foundations is Change relevant instances of “parabolic” to
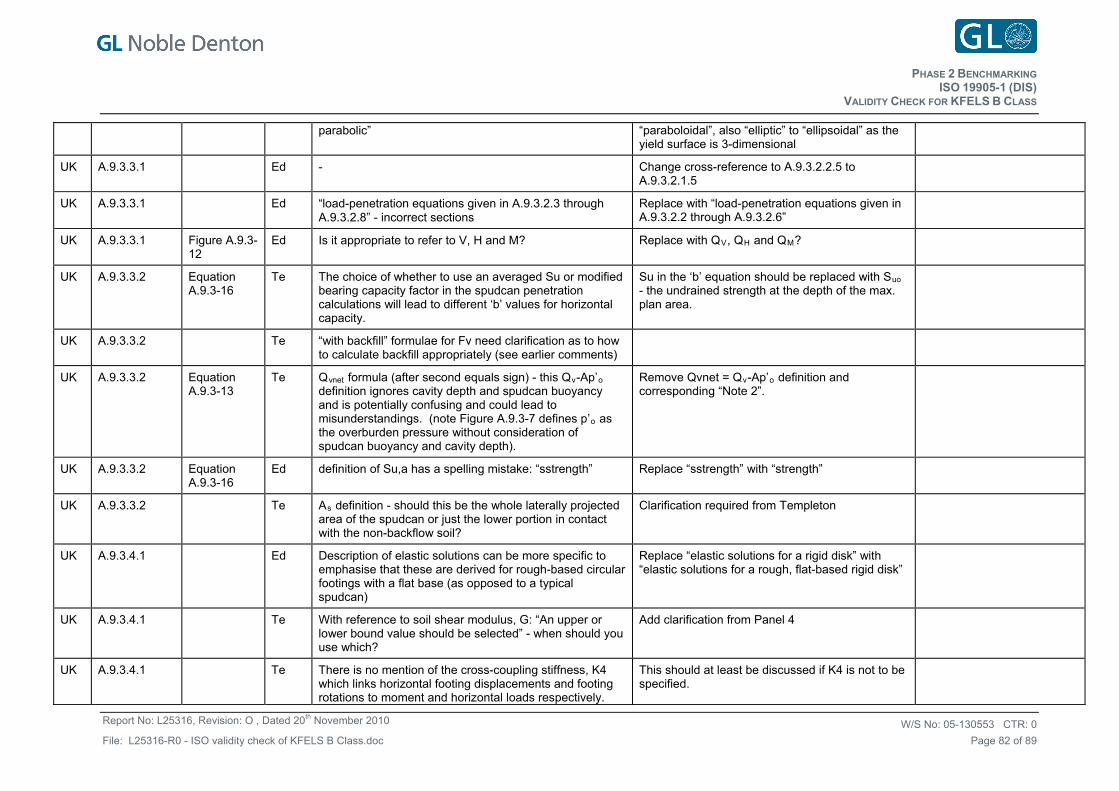
HASE ENCHMARKINGP 2 B
VALIDITY CHECK FOR KFELS B CLASS ISO 19905-1 (DIS)
W/S No: CTR:05-130553 0
Page 82 of 89
Report No: L25316, Revision: O , Dated 20th November 2010
File: L25316-R0 - ISO validity check of KFELS B Class.doc
parabolic” “paraboloidal”, also “elliptic” to “ellipsoidal” as the yield surface is 3-dimensional
UK A.9.3.3.1 Ed - Change cross-reference to A.9.3.2.2.5 to A.9.3.2.1.5
UK A.9.3.3.1 Ed “load-penetration equations given in A.9.3.2.3 through A.9.3.2.8” - incorrect sections
Replace with “load-penetration equations given in A.9.3.2.2 through A.9.3.2.6”
UK A.9.3.3.1 Figure A.9.3-12
Ed Is it appropriate to refer to V, H and M? Replace with QV, QH and QM?
UK A.9.3.3.2 Equation A.9.3-16
Te The choice of whether to use an averaged Su or modified bearing capacity factor in the spudcan penetration calculations will lead to different ‘b’ values for horizontal capacity.
Su in the ‘b’ equation should be replaced with Suo - the undrained strength at the depth of the max. plan area.
UK A.9.3.3.2 Te “with backfill” formulae for Fv need clarification as to how to calculate backfill appropriately (see earlier comments)
UK A.9.3.3.2 Equation A.9.3-13
Te Qvnet formula (after second equals sign) - this Qv-Ap’o definition ignores cavity depth and spudcan buoyancy and is potentially confusing and could lead to misunderstandings. (note Figure A.9.3-7 defines p’o as the overburden pressure without consideration of spudcan buoyancy and cavity depth).
Remove Qvnet = Qv-Ap’o definition and corresponding “Note 2”.
UK A.9.3.3.2 Equation A.9.3-16
Ed definition of Su,a has a spelling mistake: “sstrength” Replace “sstrength” with “strength”
UK A.9.3.3.2 Te As definition - should this be the whole laterally projected area of the spudcan or just the lower portion in contact with the non-backflow soil?
Clarification required from Templeton
UK A.9.3.4.1 Ed Description of elastic solutions can be more specific to emphasise that these are derived for rough-based circular footings with a flat base (as opposed to a typical spudcan)
Replace “elastic solutions for a rigid disk” with “elastic solutions for a rough, flat-based rigid disk”
UK A.9.3.4.1 Te With reference to soil shear modulus, G: “An upper or lower bound value should be selected” - when should you use which?
Add clarification from Panel 4
UK A.9.3.4.1 Te There is no mention of the cross-coupling stiffness, K4 which links horizontal footing displacements and footing rotations to moment and horizontal loads respectively.
This should at least be discussed if K4 is not to be specified.
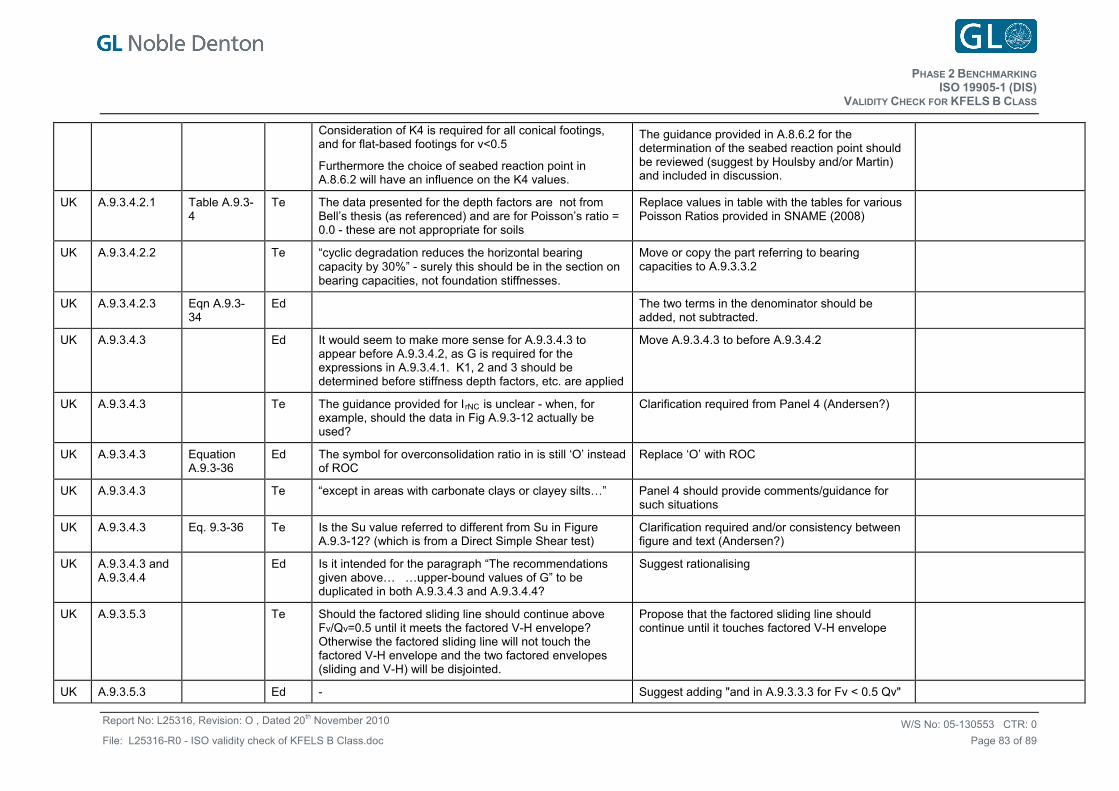
HASE ENCHMARKINGP 2 B
VALIDITY CHECK FOR KFELS B CLASS ISO 19905-1 (DIS)
W/S No: CTR:05-130553 0
Page 83 of 89
Report No: L25316, Revision: O , Dated 20th November 2010
File: L25316-R0 - ISO validity check of KFELS B Class.doc
Consideration of K4 is required for all conical footings, and for flat-based footings for v<0.5
Furthermore the choice of seabed reaction point in A.8.6.2 will have an influence on the K4 values.
The guidance provided in A.8.6.2 for the determination of the seabed reaction point should be reviewed (suggest by Houlsby and/or Martin) and included in discussion.
UK A.9.3.4.2.1 Table A.9.3-4
Te The data presented for the depth factors are not from Bell’s thesis (as referenced) and are for Poisson’s ratio = 0.0 - these are not appropriate for soils
Replace values in table with the tables for various Poisson Ratios provided in SNAME (2008)
UK A.9.3.4.2.2 Te “cyclic degradation reduces the horizontal bearing capacity by 30%” - surely this should be in the section on bearing capacities, not foundation stiffnesses.
Move or copy the part referring to bearing capacities to A.9.3.3.2
UK A.9.3.4.2.3 Eqn A.9.3-34
Ed The two terms in the denominator should be added, not subtracted.
UK A.9.3.4.3 Ed It would seem to make more sense for A.9.3.4.3 to appear before A.9.3.4.2, as G is required for the expressions in A.9.3.4.1. K1, 2 and 3 should be determined before stiffness depth factors, etc. are applied
Move A.9.3.4.3 to before A.9.3.4.2
UK A.9.3.4.3 Te The guidance provided for IrNC is unclear - when, for example, should the data in Fig A.9.3-12 actually be used?
Clarification required from Panel 4 (Andersen?)
UK A.9.3.4.3 Equation A.9.3-36
Ed The symbol for overconsolidation ratio in is still ‘O’ instead of ROC
Replace ‘O’ with ROC
UK A.9.3.4.3 Te “except in areas with carbonate clays or clayey silts…” Panel 4 should provide comments/guidance for such situations
UK A.9.3.4.3 Eq. 9.3-36 Te Is the Su value referred to different from Su in Figure A.9.3-12? (which is from a Direct Simple Shear test)
Clarification required and/or consistency between figure and text (Andersen?)
UK A.9.3.4.3 and A.9.3.4.4
Ed Is it intended for the paragraph “The recommendations given above… …upper-bound values of G” to be duplicated in both A.9.3.4.3 and A.9.3.4.4?
Suggest rationalising
UK A.9.3.5.3 Te Should the factored sliding line should continue above Fv/Qv=0.5 until it meets the factored V-H envelope? Otherwise the factored sliding line will not touch the factored V-H envelope and the two factored envelopes (sliding and V-H) will be disjointed.
Propose that the factored sliding line should continue until it touches factored V-H envelope
UK A.9.3.5.3 Ed - Suggest adding "and in A.9.3.3.3 for Fv < 0.5 Qv"
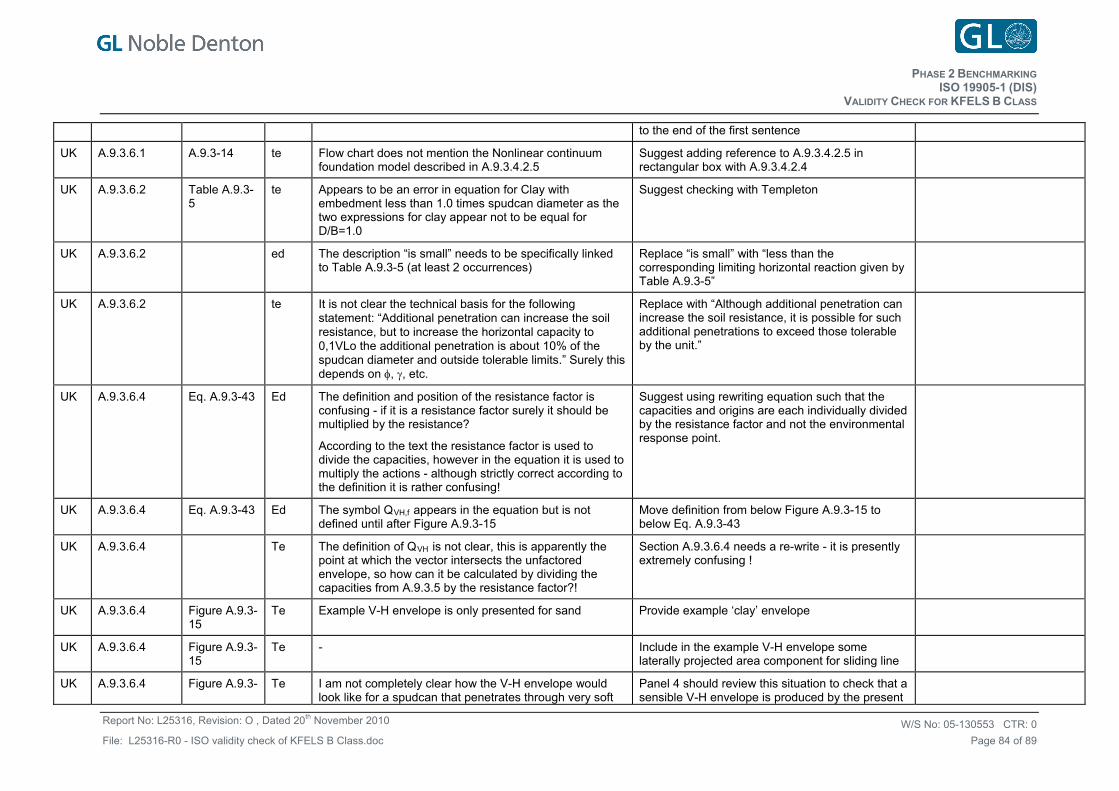
HASE ENCHMARKINGP 2 B
VALIDITY CHECK FOR KFELS B CLASS ISO 19905-1 (DIS)
W/S No: CTR:05-130553 0
Page 84 of 89
Report No: L25316, Revision: O , Dated 20th November 2010
File: L25316-R0 - ISO validity check of KFELS B Class.doc
to the end of the first sentence
UK A.9.3.6.1 A.9.3-14 te Flow chart does not mention the Nonlinear continuum foundation model described in A.9.3.4.2.5
Suggest adding reference to A.9.3.4.2.5 in rectangular box with A.9.3.4.2.4
UK A.9.3.6.2 Table A.9.3-5
te Appears to be an error in equation for Clay with embedment less than 1.0 times spudcan diameter as the two expressions for clay appear not to be equal for D/B=1.0
Suggest checking with Templeton
UK A.9.3.6.2 ed The description “is small” needs to be specifically linked to Table A.9.3-5 (at least 2 occurrences)
Replace “is small” with “less than the corresponding limiting horizontal reaction given by Table A.9.3-5”
UK A.9.3.6.2 te It is not clear the technical basis for the following statement: “Additional penetration can increase the soil resistance, but to increase the horizontal capacity to 0,1VLo the additional penetration is about 10% of the spudcan diameter and outside tolerable limits.” Surely this depends on , , etc.
Replace with “Although additional penetration can increase the soil resistance, it is possible for such additional penetrations to exceed those tolerable by the unit.”
UK A.9.3.6.4 Eq. A.9.3-43 Ed The definition and position of the resistance factor is confusing - if it is a resistance factor surely it should be multiplied by the resistance?
According to the text the resistance factor is used to divide the capacities, however in the equation it is used to multiply the actions - although strictly correct according to the definition it is rather confusing!
Suggest using rewriting equation such that the capacities and origins are each individually divided by the resistance factor and not the environmental response point.
UK A.9.3.6.4 Eq. A.9.3-43 Ed The symbol QVH,f appears in the equation but is not defined until after Figure A.9.3-15
Move definition from below Figure A.9.3-15 to below Eq. A.9.3-43
UK A.9.3.6.4 Te The definition of QVH is not clear, this is apparently the point at which the vector intersects the unfactored envelope, so how can it be calculated by dividing the capacities from A.9.3.5 by the resistance factor?!
Section A.9.3.6.4 needs a re-write - it is presently extremely confusing !
UK A.9.3.6.4 Figure A.9.3-15
Te Example V-H envelope is only presented for sand Provide example ‘clay’ envelope
UK A.9.3.6.4 Figure A.9.3-15
Te - Include in the example V-H envelope some laterally projected area component for sliding line
UK A.9.3.6.4 Figure A.9.3- Te I am not completely clear how the V-H envelope would look like for a spudcan that penetrates through very soft
Panel 4 should review this situation to check that a sensible V-H envelope is produced by the present
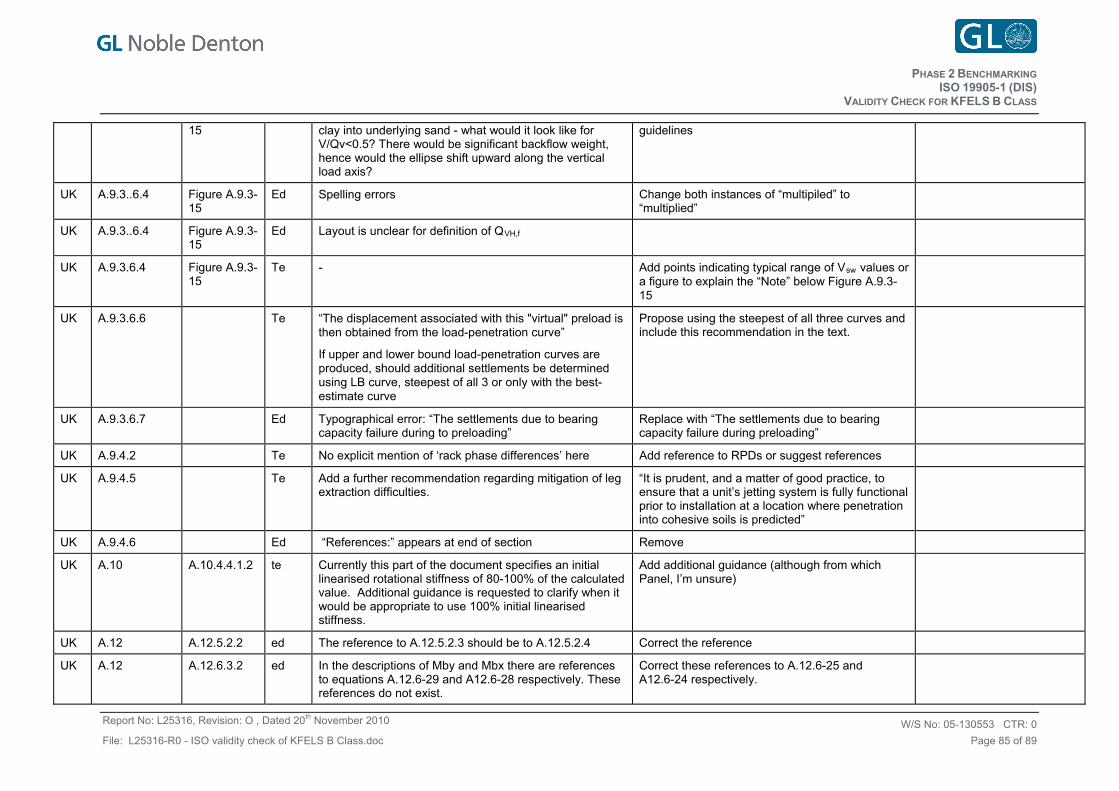
HASE ENCHMARKINGP 2 B
VALIDITY CHECK FOR KFELS B CLASS ISO 19905-1 (DIS)
W/S No: CTR:05-130553 0
Page 85 of 89
Report No: L25316, Revision: O , Dated 20th November 2010
File: L25316-R0 - ISO validity check of KFELS B Class.doc
15 clay into underlying sand - what would it look like for V/Qv<0.5? There would be significant backflow weight, hence would the ellipse shift upward along the vertical load axis?
guidelines
UK A.9.3..6.4 Figure A.9.3-15
Ed Spelling errors Change both instances of “multipiled” to “multiplied”
UK A.9.3..6.4 Figure A.9.3-15
Ed Layout is unclear for definition of QVH,f
UK A.9.3.6.4 Figure A.9.3-15
Te - Add points indicating typical range of Vsw values or a figure to explain the “Note” below Figure A.9.3-15
UK A.9.3.6.6 Te “The displacement associated with this "virtual" preload is then obtained from the load-penetration curve”
If upper and lower bound load-penetration curves are produced, should additional settlements be determined using LB curve, steepest of all 3 or only with the best-estimate curve
Propose using the steepest of all three curves and include this recommendation in the text.
UK A.9.3.6.7 Ed Typographical error: “The settlements due to bearing capacity failure during to preloading”
Replace with “The settlements due to bearing capacity failure during preloading”
UK A.9.4.2 Te No explicit mention of ‘rack phase differences’ here Add reference to RPDs or suggest references
UK A.9.4.5 Te Add a further recommendation regarding mitigation of leg extraction difficulties.
“It is prudent, and a matter of good practice, to ensure that a unit’s jetting system is fully functional prior to installation at a location where penetration into cohesive soils is predicted”
UK A.9.4.6 Ed “References:” appears at end of section Remove
UK A.10 A.10.4.4.1.2 te Currently this part of the document specifies an initial linearised rotational stiffness of 80-100% of the calculated value. Additional guidance is requested to clarify when it would be appropriate to use 100% initial linearised stiffness.
Add additional guidance (although from which Panel, I’m unsure)
UK A.12 A.12.5.2.2 ed The reference to A.12.5.2.3 should be to A.12.5.2.4 Correct the reference
UK A.12 A.12.6.3.2 ed In the descriptions of Mby and Mbx there are references to equations A.12.6-29 and A12.6-28 respectively. These references do not exist.
Correct these references to A.12.6-25 and A12.6-24 respectively.
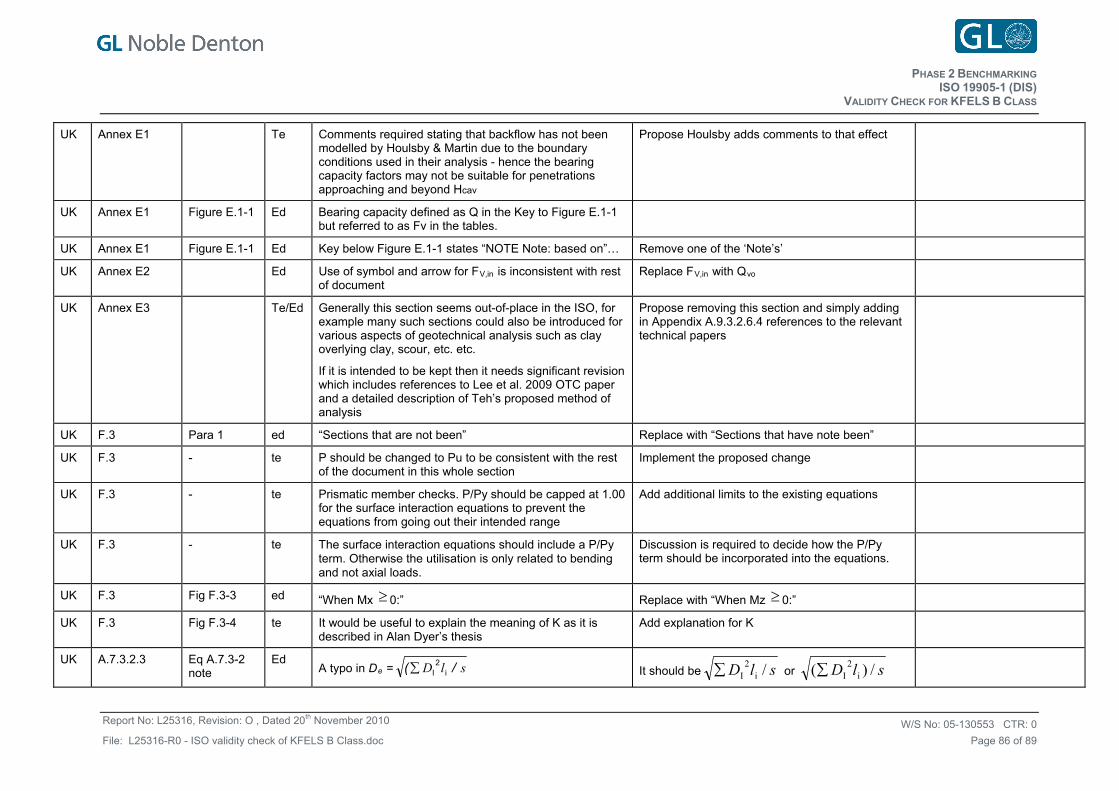
HASE ENCHMARKINGP 2 B
VALIDITY CHECK FOR KFELS B CLASS ISO 19905-1 (DIS)
W/S No: CTR:05-130553 0
Page 86 of 89
Report No: L25316, Revision: O , Dated 20th November 2010
File: L25316-R0 - ISO validity check of KFELS B Class.doc
UK Annex E1 Te Comments required stating that backflow has not been modelled by Houlsby & Martin due to the boundary conditions used in their analysis - hence the bearing capacity factors may not be suitable for penetrations approaching and beyond Hcav
Propose Houlsby adds comments to that effect
UK Annex E1 Figure E.1-1 Ed Bearing capacity defined as Q in the Key to Figure E.1-1 but referred to as Fv in the tables.
UK Annex E1 Figure E.1-1 Ed Key below Figure E.1-1 states “NOTE Note: based on”… Remove one of the ‘Note’s’
UK Annex E2 Ed Use of symbol and arrow for FV,in is inconsistent with rest of document
Replace FV,in with Qvo
UK Annex E3 Te/Ed Generally this section seems out-of-place in the ISO, for example many such sections could also be introduced for various aspects of geotechnical analysis such as clay overlying clay, scour, etc. etc.
If it is intended to be kept then it needs significant revision which includes references to Lee et al. 2009 OTC paper and a detailed description of Teh’s proposed method of analysis
Propose removing this section and simply adding in Appendix A.9.3.2.6.4 references to the relevant technical papers
UK F.3 Para 1 ed “Sections that are not been” Replace with “Sections that have note been”
UK F.3 - te P should be changed to Pu to be consistent with the rest of the document in this whole section
Implement the proposed change
UK F.3 - te Prismatic member checks. P/Py should be capped at 1.00 for the surface interaction equations to prevent the equations from going out their intended range
Add additional limits to the existing equations
UK F.3 - te The surface interaction equations should include a P/Py term. Otherwise the utilisation is only related to bending and not axial loads.
Discussion is required to decide how the P/Py term should be incorporated into the equations.
UK F.3 Fig F.3-3 ed “When Mx 0:” Replace with “When Mz 0:”
UK F.3 Fig F.3-4 te It would be useful to explain the meaning of K as it is described in Alan Dyer’s thesis
Add explanation for K
UK A.7.3.2.3 Eq A.7.3-2 note
Ed A typo in De = slD /( i
2I It should be slD /i
2I or slD /)( i
2I
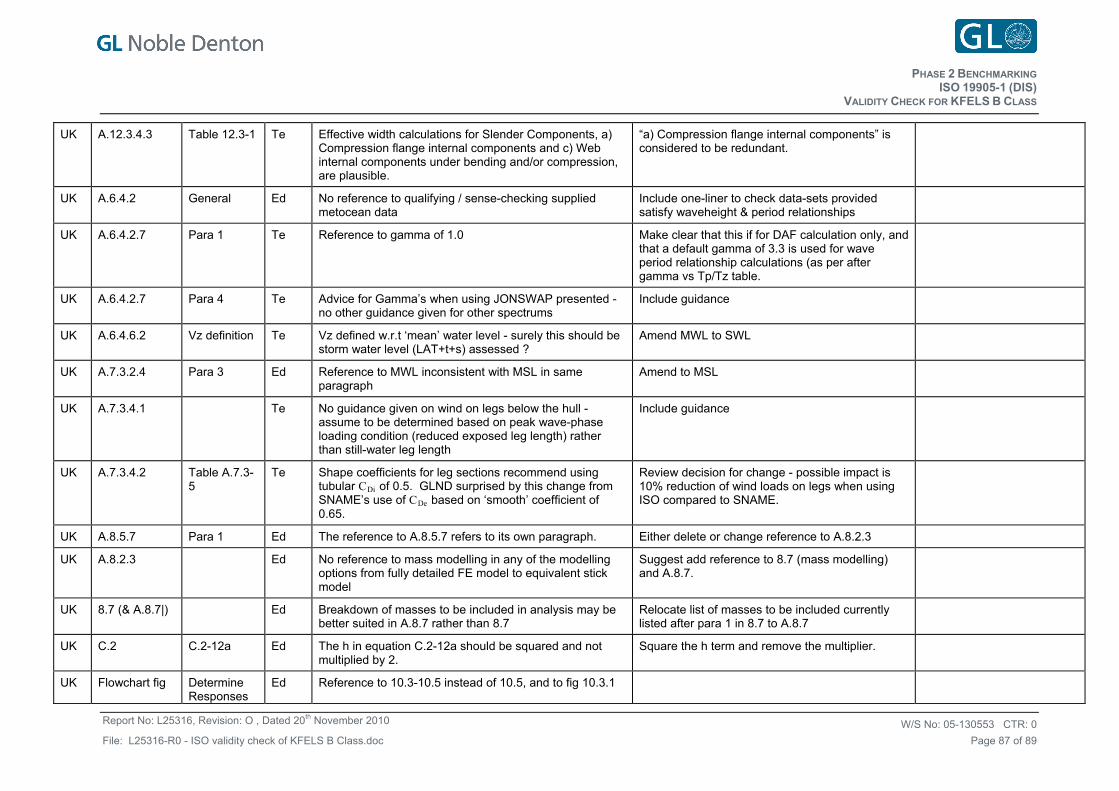
HASE ENCHMARKINGP 2 B
VALIDITY CHECK FOR KFELS B CLASS ISO 19905-1 (DIS)
W/S No: CTR:05-130553 0
Page 87 of 89
Report No: L25316, Revision: O , Dated 20th November 2010
File: L25316-R0 - ISO validity check of KFELS B Class.doc
UK A.12.3.4.3 Table 12.3-1 Te Effective width calculations for Slender Components, a) Compression flange internal components and c) Web internal components under bending and/or compression, are plausible.
“a) Compression flange internal components” is considered to be redundant.
UK A.6.4.2 General Ed No reference to qualifying / sense-checking supplied metocean data
Include one-liner to check data-sets provided satisfy waveheight & period relationships
UK A.6.4.2.7 Para 1 Te Reference to gamma of 1.0 Make clear that this if for DAF calculation only, and that a default gamma of 3.3 is used for wave period relationship calculations (as per after gamma vs Tp/Tz table.
UK A.6.4.2.7 Para 4 Te Advice for Gamma’s when using JONSWAP presented - no other guidance given for other spectrums
Include guidance
UK A.6.4.6.2 Vz definition Te Vz defined w.r.t ‘mean’ water level - surely this should be storm water level (LAT+t+s) assessed ?
Amend MWL to SWL
UK A.7.3.2.4 Para 3 Ed Reference to MWL inconsistent with MSL in same paragraph
Amend to MSL
UK A.7.3.4.1 Te No guidance given on wind on legs below the hull - assume to be determined based on peak wave-phase loading condition (reduced exposed leg length) rather than still-water leg length
Include guidance
UK A.7.3.4.2 Table A.7.3-5
Te Shape coefficients for leg sections recommend using tubular CDi of 0.5. GLND surprised by this change from SNAME’s use of CDe based on ‘smooth’ coefficient of 0.65.
Review decision for change - possible impact is 10% reduction of wind loads on legs when using ISO compared to SNAME.
UK A.8.5.7 Para 1 Ed The reference to A.8.5.7 refers to its own paragraph. Either delete or change reference to A.8.2.3
UK A.8.2.3 Ed No reference to mass modelling in any of the modelling options from fully detailed FE model to equivalent stick model
Suggest add reference to 8.7 (mass modelling) and A.8.7.
UK 8.7 (& A.8.7|) Ed Breakdown of masses to be included in analysis may be better suited in A.8.7 rather than 8.7
Relocate list of masses to be included currently listed after para 1 in 8.7 to A.8.7
UK C.2 C.2-12a Ed The h in equation C.2-12a should be squared and not multiplied by 2.
Square the h term and remove the multiplier.
UK Flowchart fig Determine Responses
Ed Reference to 10.3-10.5 instead of 10.5, and to fig 10.3.1
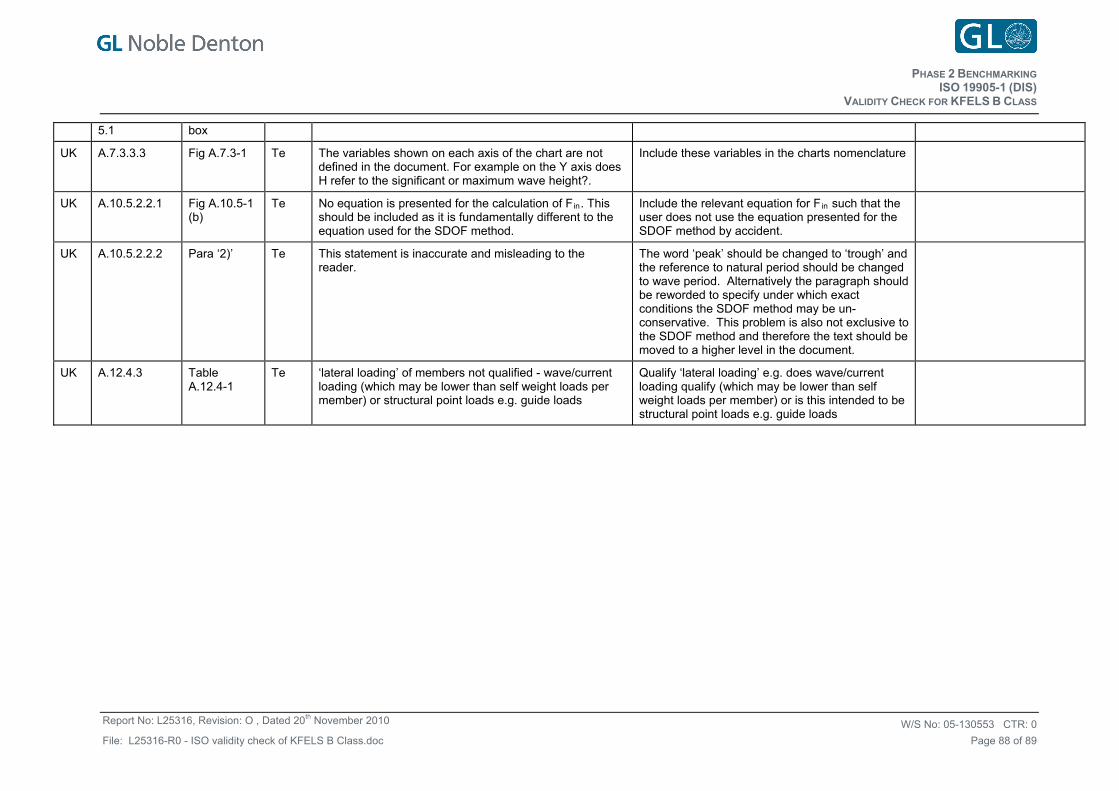
PHASE 2 BENCHMARKING
VALIDITY CHECK FOR KFELS B CLASS ISO 19905-1 (DIS)
W/S No: CTR:05-130553 0
Page 88 of 89
Report No: L25316, Revision: O , Dated 20th November 2010
File: L25316-R0 - ISO validity check of KFELS B Class.doc
5.1 box
UK A.7.3.3.3 Fig A.7.3-1 Te The variables shown on each axis of the chart are not defined in the document. For example on the Y axis does H refer to the significant or maximum wave height?.
Include these variables in the charts nomenclature
UK A.10.5.2.2.1 Fig A.10.5-1 (b)
Te No equation is presented for the calculation of Fin. This should be included as it is fundamentally different to the equation used for the SDOF method.
Include the relevant equation for Fin such that the user does not use the equation presented for the SDOF method by accident.
UK A.10.5.2.2.2 Para ‘2)’ Te This statement is inaccurate and misleading to the reader.
The word ‘peak’ should be changed to ‘trough’ and the reference to natural period should be changed to wave period. Alternatively the paragraph should be reworded to specify under which exact conditions the SDOF method may be un-conservative. This problem is also not exclusive to the SDOF method and therefore the text should be moved to a higher level in the document.
UK A.12.4.3 Table A.12.4-1
Te ‘lateral loading’ of members not qualified - wave/current loading (which may be lower than self weight loads per member) or structural point loads e.g. guide loads
Qualify ‘lateral loading’ e.g. does wave/current loading qualify (which may be lower than self weight loads per member) or is this intended to be structural point loads e.g. guide loads
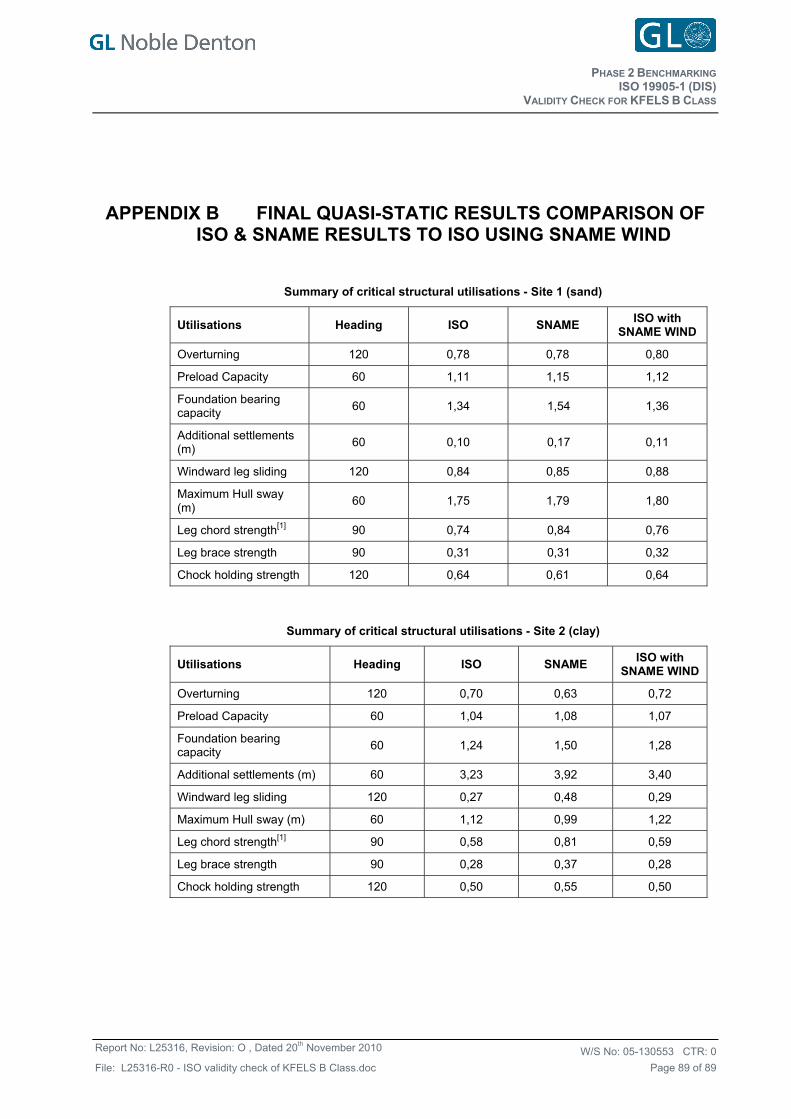
PHASE 2 BENCHMARKING
VALIDITY CHECK FOR KFELS B CLASS ISO 19905-1 (DIS)
W/S No: CTR: 05-130553 0
Page 89 of 89
Report No: L25316, Revision: O , Dated 20th November 2010
File: L25316-R0 - ISO validity check of KFELS B Class.doc
APPENDIX B FINAL QUASI-STATIC RESULTS COMPARISON OF ISO & SNAME RESULTS TO ISO USING SNAME WIND
Summary of critical structural utilisations - Site 1 (sand)
Utilisations Heading ISO SNAME ISO with
SNAME WIND
Overturning 120 0,78 0,78 0,80
Preload Capacity 60 1,11 1,15 1,12
Foundation bearing capacity
60 1,34 1,54 1,36
Additional settlements (m)
60 0,10 0,17 0,11
Windward leg sliding 120 0,84 0,85 0,88
Maximum Hull sway (m)
60 1,75 1,79 1,80
Leg chord strength[1] 90 0,74 0,84 0,76
Leg brace strength 90 0,31 0,31 0,32
Chock holding strength 120 0,64 0,61 0,64
Summary of critical structural utilisations - Site 2 (clay)
Utilisations Heading ISO SNAME ISO with
SNAME WIND
Overturning 120 0,70 0,63 0,72
Preload Capacity 60 1,04 1,08 1,07
Foundation bearing capacity
60 1,24 1,50 1,28
Additional settlements (m) 60 3,23 3,92 3,40
Windward leg sliding 120 0,27 0,48 0,29
Maximum Hull sway (m) 60 1,12 0,99 1,22
Leg chord strength[1] 90 0,58 0,81 0,59
Leg brace strength 90 0,28 0,37 0,28
Chock holding strength 120 0,50 0,55 0,50