dnv-rp-f116 integrity management of submarine pipeline
TRANSCRIPT
The electronic
RECOMMENDED PRACTICE
DNV-RP-F116
Integrity management of submarine pipeline systems
FEBRUARY 2015
DET NORSKE VERITAS AS
pdf version of this document found through http://www.dnvgl.com is the officially binding version
FOREWORD
DNV is a global provider of knowledge for managing risk. Today, safe and responsible business conduct is both a licenseto operate and a competitive advantage. Our core competence is to identify, assess, and advise on risk management. Fromour leading position in certification, classification, verification, and training, we develop and apply standards and bestpractices. This helps our customers safely and responsibly improve their business performance. DNV is an independentorganisation with dedicated risk professionals in more than 100 countries, with the purpose of safeguarding life, propertyand the environment.
DNV service documents consist of among others the following types of documents:— Service Specifications. Procedural requirements.— Standards. Technical requirements.— Recommended Practices. Guidance.
The Standards and Recommended Practices are offered within the following areas:A) Qualification, Quality and Safety MethodologyB) Materials TechnologyC) StructuresD) SystemsE) Special FacilitiesF) Pipelines and RisersG) Asset OperationH) Marine OperationsJ) Cleaner Energy
O) Subsea SystemsU) Unconventional Oil & Gas
© Det Norske Veritas AS February 2015
Any comments may be sent by e-mail to [email protected]
This service document has been prepared based on available knowledge, technology and/or information at the time of issuance of this document, and is believed to reflect the best ofcontemporary technology. The use of this document by others than DNV is at the user's sole risk. DNV does not accept any liability or responsibility for loss or damages resulting fromany use of this document.
Recommended Practice DNV-RP-F116, February 2015 CHANGES – CURRENT – Page 3
CHANGES – CURRENT
General
This document supersedes DNV-RP-F116, October 2009.
Text affected by the main changes in this edition is highlighted in red colour. However, if the changes involve
Det Norske Veritas AS, company registration number 945 748 931, has on 27th November 2013 changed itsname to DNV GL AS. For further information, see www.dnvgl.com. Any reference in this document to“Det Norske Veritas AS” or “DNV” shall therefore also be a reference to “DNV GL AS”.
a whole chapter, section or sub-section, normally only the title will be in red colour.
Main changes
• General— More detailed guidelines on carrying out risk assessments are included.— Guidelines regarding integrity management review as well as help for identifying key performance
indicators are included. Topics recommended to include in a review of an integrity management system arebased on the recommendations otherwise included in the RP. In order to avoid duplication of text,recommendations in the main sections of the RP (sec. 1 to Sec. 7) have been re-organized.
— General improvements to the existing material have been suggested.— The term “should” is generally applied given that this is a recommended practice and not a standard.
• Sec.1 GeneralThe introduction part of the document has been structured as shown:
— [1.1]: Objective — [1.2]: Scope and application (submarine pipeline system, onshore part of the submarine pipeline system
and pipeline system integrity)— [1.3]: Structure of the document— [1.4]: References (relation to other codes, onshore sections, riser systems, codes and bibliographies)— [1.5]: Definitions— [1.6]: Verbal forms— [1.7]: Abbreviations.
• Sec.2 Integrity management system
— Previous sub section 2.3 Pipeline system integrity has been moved to sub section [1.2.3].— Previous sub sections 2.4 Pipeline system threats, 2.5 Risk based approach and 2.6 Safety philosophy have
been moved to sub sections [3.1.4] (and 4.2) and [3.1.2]. Section 3 introduces the core integritymanagement process where risk based planning is also introduced.
— Previous sub sections 2.7 Authority and company requirements and 2.8 Operator's responsibility have beenmoved to sub sections [2.1.1] and [2.1.2].
— Content from previous sub section 3.8 Documentation has been merged with the previous sub section 2.2.8Information management. The merged content is now in sub section [2.3.9].
— Previous sub section 2.2.9 Integrity management process has been moved to sub section [2.2] and mademuch shorter with reference to more details in other sections of the RP.
— Other than previous sub section 2.2.8 and 2.2.9 mainly small changes to the text have been made in relationto the other integrity management elements.
• Sec.3 Integrity management process in a life cycle perspective— Content from previous sub sections 3.3 From threats to failures in the integrity management process, 3.4
Risk assessment and integrity management planning are moved to Sec.4 and App.F.— Content from previous sub section 3.8 has been moved to Sec.2. — Other than these content moves, the section is now divided into four main sub sections.
A first general sub section introduces the core process and includes some content previously located insection 2. The next three main sub sections focus on the life cycle perspective. The text has also been revised /simplified with less repetition and more focus on clear recommendations.
• Sec.4 Risk assessment and integrity management planning
In the new revision, much new input have been added to the subject of this section (risk assessment andintegrity management planning).
DET NORSKE VERITAS AS
Recommended Practice DNV-RP-F116, February 2015 CHANGES – CURRENT – Page 4
— Sub section [4.1] is a general introduction and includes recommendations on the objectives, approaches andoutcome.
— Content from previous sub sections 3.3 From threats to failures in the integrity management process hasbeen moved to sub-section [4.2] Pipeline system threats. Previous figure 3.2 is now Figure 4-1 and has beenmodified.
— Previous sub-section 4.3 Basis for risk assessment has been reduced to only focus on prevailingdocumentation. Content from previous sub-section 4.3.2 Risk assessment approaches has been moved tosub-section [4.1].
— Much of the remaining of the previous sub-section 4.3 (Basis for risk assessment) and sub-section 4.4 hasbeen re-organized between Sec.4 and App.F. Basically, section 4 now outlines an overall process and thedetails are moved to the appendices (appendix F to I).
• Sections 5 to 7— Minor changes related to editorial corrections in the text and some re-structuring of the sections have been
done.
• Appendix E Inspection and monitoring techniques— Reference to NACE standard TM0212 Detection, Testing, and Evaluation of Microbiologically Influenced
Corrosion on Internal Surfaces of Pipelines has been added.
• Appendix F Further guidance - risk assessment and integrity management planning— See last bullet for section 4 above.
• Appendix H Probability of failure Level-1 flow charts— See last bullet for section 4 above. The overview of the process is now moved to section 4 and this appendix
contains guidance for level-1 PoF evaluations.
• Appendix I Barrier framework— New appendix covering a barrier framework that supports identification of KPIs and evaluation of PoF has
been added.
• Appendix J Integrity management review— New appendix covering review of the integrity management system has been added.
In addition to the above stated main changes, editorial corrections may have been made.
Editorial corrections
DET NORSKE VERITAS AS
Recommended Practice DNV-RP-F116, February 2015Contents – Page 5
CONTENTS
CHANGES – CURRENT ................................................................................................................... 3
1 General ....................................................................................................................................... 81.1 Objective ......................................................................................................................................................... 8
1.2 Scope and application.................................................................................................................................... 81.2.1 Submarine pipeline system ................................................................................................................ 91.2.2 Onshore part of the submarine pipeline system ................................................................................. 91.2.3 Pipeline system integrity .................................................................................................................. 10
1.3 Structure of the document .......................................................................................................................... 10
1.4 References..................................................................................................................................................... 101.4.1 Relation to other rules and standards ............................................................................................... 101.4.2 Onshore sections .............................................................................................................................. 101.4.3 Riser systems.................................................................................................................................... 101.4.4 Reference standards ......................................................................................................................... 111.4.5 Bibliographies .................................................................................................................................. 12
1.5 Definitions..................................................................................................................................................... 12
1.6 Verbal forms................................................................................................................................................. 13
1.7 Abbreviations ............................................................................................................................................... 13
2 Integrity management system ................................................................................................ 152.1 General.......................................................................................................................................................... 15
2.1.1 Authority and company requirements .............................................................................................. 152.1.2 Operator's responsibility................................................................................................................... 152.1.3 Elements of the integrity management system................................................................................. 15
2.2 Integrity management process.................................................................................................................... 15
2.3 Support elements.......................................................................................................................................... 152.3.1 Company policy ............................................................................................................................... 152.3.2 Organisation and personnel – roles and responsibilities .................................................................. 152.3.3 Organisation and personnel – training needs ................................................................................... 152.3.4 Management of change .................................................................................................................... 162.3.5 Operational controls and procedures................................................................................................ 162.3.6 Contingency plans............................................................................................................................ 162.3.7 Reporting and communication ......................................................................................................... 162.3.8 Audit and review .............................................................................................................................. 162.3.9 Information management ................................................................................................................. 17
3 Integrity management process in a life cycle perspective.................................................... 183.1 General.......................................................................................................................................................... 18
3.1.1 Integrity management process.......................................................................................................... 193.1.2 Safety philosophy............................................................................................................................. 193.1.3 Establishment of battery limits and scope of work .......................................................................... 193.1.4 Managing risk related to pipeline system threats / risk based approach .......................................... 20
3.2 Establish integrity ........................................................................................................................................ 203.2.1 Operator involvement in the establish integrity stage...................................................................... 203.2.2 Systematic review of risk ................................................................................................................. 213.2.3 Involvement in the development of the design fabrication and installation resumes ...................... 21
3.3 Transfer integrity - from design to operations.......................................................................................... 213.3.1 Planning transfer of integrity ........................................................................................................... 213.3.2 Establishment of long term organization ......................................................................................... 213.3.3 Identification of threat related information from design and construction ...................................... 213.3.4 Documents for operation.................................................................................................................. 223.3.5 Take-over plan, verification and check lists .................................................................................... 22
3.4 Maintain integrity ........................................................................................................................................ 223.4.1 Commissioning ................................................................................................................................ 223.4.2 De-commissioning ........................................................................................................................... 233.4.3 Re-commissioning............................................................................................................................ 233.4.4 Re-qualification / lifetime extension................................................................................................ 233.4.5 Abandonment ................................................................................................................................... 23
4 Risk assessment and integrity management planning ......................................................... 254.1 General.......................................................................................................................................................... 25
4.1.1 Risk assessment objectives .............................................................................................................. 25
DET NORSKE VERITAS AS
Recommended Practice DNV-RP-F116, February 2015Contents – Page 6
4.1.2 Risk assessment approaches............................................................................................................. 264.1.3 Risk assessment results .................................................................................................................... 264.1.4 Risk based integrity management programs .................................................................................... 26
4.2 Pipeline system threats ................................................................................................................................ 26
4.3 Prevailing documentation ........................................................................................................................... 274.3.1 Operator guideline............................................................................................................................ 274.3.2 Pipeline system guideline................................................................................................................. 284.3.3 Best practice ..................................................................................................................................... 28
4.4 Overall process ............................................................................................................................................ 284.4.1 Establish equipment scope ............................................................................................................... 284.4.2 Gather data and information, and identify threats............................................................................ 294.4.3 Perform risk assessments according to procedure ........................................................................... 304.4.4 Documentation of risk assessment ................................................................................................... 314.4.5 Develop integrity management programs ........................................................................................ 31
5 Inspection, monitoring and testing ........................................................................................ 325.1 General.......................................................................................................................................................... 32
5.1.1 Detailed planning based on integrity management program............................................................ 325.1.2 Deviations in plans........................................................................................................................... 325.1.3 Handling of unexpected events ........................................................................................................ 325.1.4 Update of detailed plans................................................................................................................... 325.1.5 Handling of significant findings identified during control activities ............................................... 32
5.2 Inspection...................................................................................................................................................... 325.2.1 Purpose of inspection ....................................................................................................................... 335.2.2 Operation/inspection manual ........................................................................................................... 335.2.3 Risk management w.r.t. the inspection operation ............................................................................ 335.2.4 Preparation for inspection ................................................................................................................ 335.2.5 Identification and monitoring of available technology .................................................................... 345.2.6 Reporting format .............................................................................................................................. 355.2.7 External inspection reports............................................................................................................... 365.2.8 Internal inspection reports................................................................................................................ 375.2.9 Review of inspection results ............................................................................................................ 37
5.3 Monitoring.................................................................................................................................................... 375.3.1 Main monitoring activities ............................................................................................................... 375.3.2 Identification and follow-up of available technology ...................................................................... 375.3.3 Review of monitoring data............................................................................................................... 38
5.4 Testing .......................................................................................................................................................... 395.4.1 Pressure testing................................................................................................................................. 395.4.2 Testing of safety equipment ............................................................................................................. 395.4.3 Safety equipment – test interval according to authority requirements............................................. 395.4.4 Review of test results ....................................................................................................................... 39
6 Integrity assessment ................................................................................................................ 406.1 General.......................................................................................................................................................... 40
6.1.1 Integrity assessment due to un-planned events ................................................................................ 406.1.2 Temporary operation of damaged pipeline systems......................................................................... 406.1.3 Planned integrity assessments .......................................................................................................... 406.1.4 Overview of available assessment codes ......................................................................................... 406.1.5 Basis for integrity assessment .......................................................................................................... 40
6.2 Un-piggable pipelines .................................................................................................................................. 40
7 Mitigation, intervention and repair ....................................................................................... 427.1 General.......................................................................................................................................................... 42
7.1.1 Temporary repair.............................................................................................................................. 437.1.2 Pre-loading of bolts .......................................................................................................................... 437.1.3 Qualification of repair clamps, sleeves, pipe spools and mechanical connectors............................ 437.1.4 Effect of mitigation, intervention and repair activities on safety level ............................................ 437.1.5 Execution according to procedures .................................................................................................. 437.1.6 Testing according to procedure ........................................................................................................ 43
7.2 Detailed planning ......................................................................................................................................... 437.2.1 Authority regulations ....................................................................................................................... 437.2.2 Clear purpose of a specific action .................................................................................................... 447.2.3 Risk management w.r.t. mitigation, intervention and repair............................................................ 447.2.4 Detailed procedures.......................................................................................................................... 44
App. A Pipeline statistics ........................................................................................................... 45
App. B Recommendations with regard to global buckling ..................................................... 48
DET NORSKE VERITAS AS
Recommended Practice DNV-RP-F116, February 2015Contents – Page 7
App. C Recommendations with regard to corrosion ............................................................... 56
App. D Leak detection systems .................................................................................................. 66
App. E Inspection and monitoring techniques ......................................................................... 69
App. F Further guidance - risk assessment and integrity management planning................ 73
App. G Example - risk assessment and integrity management planning............................... 89
App. H Probability of failure Level-1 flow charts.................................................................... 93
App. I Barrier framework ...................................................................................................... 115
App. J Integrity management review ..................................................................................... 137
DET NORSKE VERITAS AS
Recommended Practice DNV-RP-F116, February 2015Sec.1 General – Page 8
1 General
1.1 Objective
This recommended practice provides recommendations for managing the integrity of submarine pipelinesystems during the entire service life. The recommendations are based on requirements as given in DNV-OS-F101.
The objectives are to:
— provide guidelines to ensure that the operation of pipeline systems are safe and conducted with due regardto public safety, environment and properties
— provide guidance on how to comply with the requirements given in DNV offshore standard DNV-OS-F101— serve as a guideline for operators and suppliers.
1.2 Scope and application
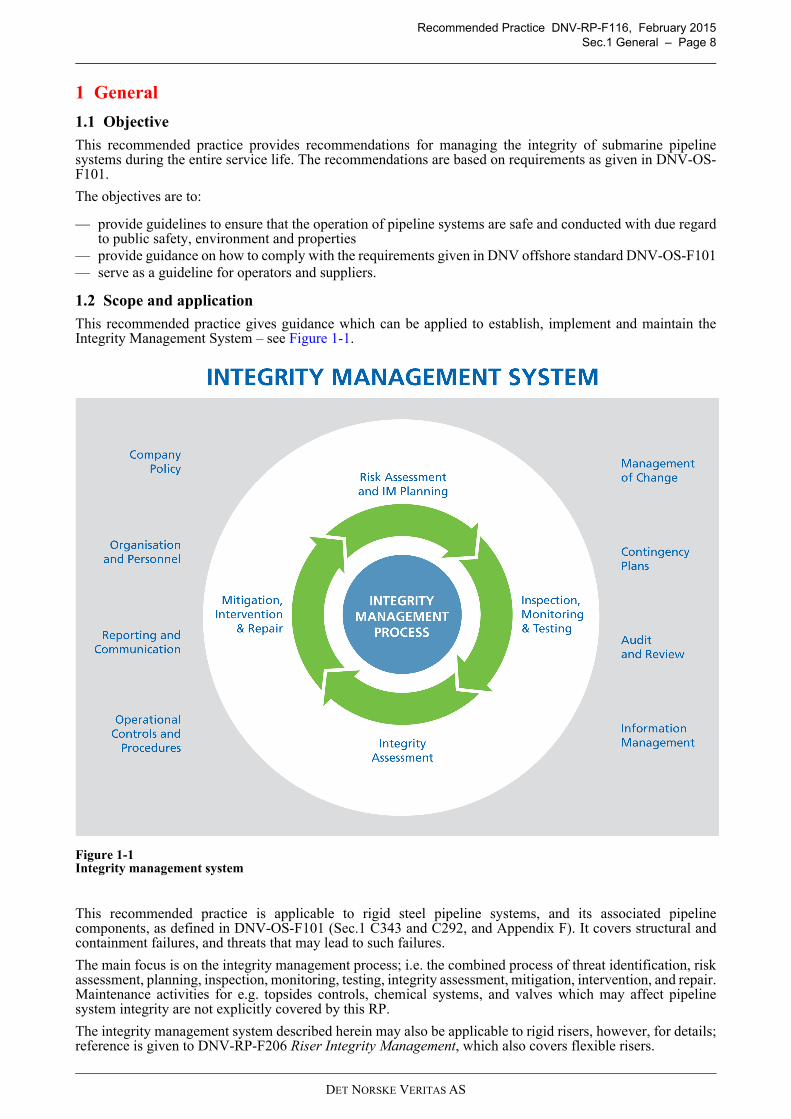
This recommended practice gives guidance which can be applied to establish, implement and maintain theIntegrity Management System – see Figure 1-1.
Figure 1-1Integrity management system
This recommended practice is applicable to rigid steel pipeline systems, and its associated pipelinecomponents, as defined in DNV-OS-F101 (Sec.1 C343 and C292, and Appendix F). It covers structural andcontainment failures, and threats that may lead to such failures.
The main focus is on the integrity management process; i.e. the combined process of threat identification, riskassessment, planning, inspection, monitoring, testing, integrity assessment, mitigation, intervention, and repair.Maintenance activities for e.g. topsides controls, chemical systems, and valves which may affect pipelinesystem integrity are not explicitly covered by this RP.
The integrity management system described herein may also be applicable to rigid risers, however, for details;reference is given to DNV-RP-F206 Riser Integrity Management, which also covers flexible risers.
DET NORSKE VERITAS AS
Recommended Practice DNV-RP-F116, February 2015Sec.1 General – Page 9
This document covers (main/trunk) transport lines and in-field lines, which consist of:
— export lines (oil & gas, multi-phase),— production lines (oil & gas, multi-phase) or— utility / service lines (gas injection, gas lift, water injection, produced water, chemicals).
1.2.1 Submarine pipeline system
It is the responsibility of the pipeline operator to clearly define the pipeline system limits/interfaces (batterylimits – also see [3.1.3]), however a submarine pipeline system typically extends to the first weld beyond:
— the first valve, flange or connection above water on platform or floater— the connection point to the subsea installation (i.e. piping manifolds are not included)— the first valve, flange, connection or isolation joint onshore unless otherwise specified by legislation.
The components mentioned above (valve, flange, connection, isolation joint) may also include any pup pieces,i.e. the submarine pipeline system may extend to the weld beyond the pup piece. In case of branch-offconnections to other pipeline systems, which may introduce a change in the Operator responsibility, thepipeline system may extend to the first valve beyond the branch connection.
Pipeline components within the above limits are typically included as integrated parts of the pipeline system,e.g. pig traps, mechanical connectors, flanges, tees, bends, reducers, spools and valves (also see DNV-OS-F101Sec.1 C343 and C292, and Appendix F). It should be noted that equipment or components that affect orinfluence pipeline integrity may be located outside the afore-mentioned limits, e.g. HIPPS. Intervention andrepair components such as e.g. repair clamps are normally also included.
Protective means implemented as part of the design in order to mitigate threats are typically included as a partof the system. Typical protective means are:
— internal protection means – cladding, internal lining, internal coating, internal HDPE liner, chemicaltreatment, direct electrical heating (DEH)
— external protection means – coating/concrete, galvanic anodes, bend restrictors, support structures (naturaland/or man-made), protective structures, trenches (covered/not covered), GRP covers, rock dumpings,mattresses
— rock dumping, support structures or mattresses in connection with crossings— isolation joints.
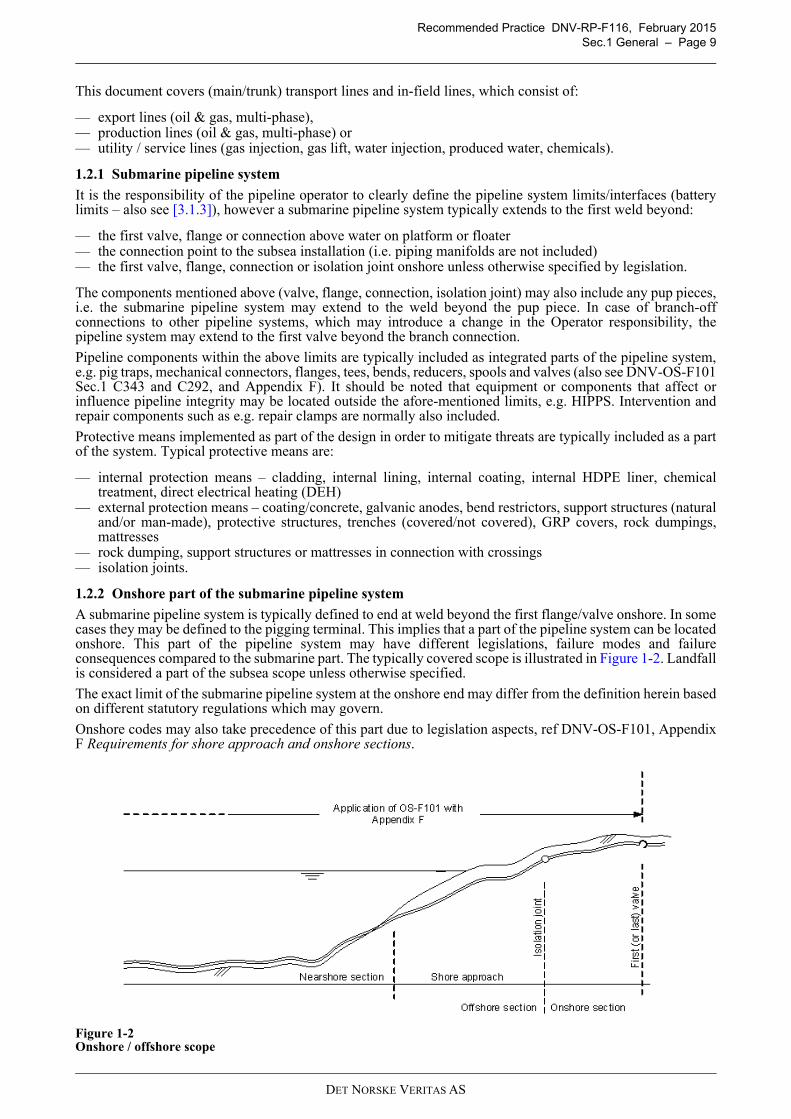
1.2.2 Onshore part of the submarine pipeline system
A submarine pipeline system is typically defined to end at weld beyond the first flange/valve onshore. In somecases they may be defined to the pigging terminal. This implies that a part of the pipeline system can be locatedonshore. This part of the pipeline system may have different legislations, failure modes and failureconsequences compared to the submarine part. The typically covered scope is illustrated in Figure 1-2. Landfallis considered a part of the subsea scope unless otherwise specified.
The exact limit of the submarine pipeline system at the onshore end may differ from the definition herein basedon different statutory regulations which may govern.
Onshore codes may also take precedence of this part due to legislation aspects, ref DNV-OS-F101, AppendixF Requirements for shore approach and onshore sections.
Figure 1-2Onshore / offshore scope
DET NORSKE VERITAS AS
Recommended Practice DNV-RP-F116, February 2015Sec.1 General – Page 10
1.2.3 Pipeline system integrity
The function of submarine pipeline systems is to transport fluids efficiently and safely. This is related to theflow assurance function and the structural/containment function.
A failure is the termination of the ability of an item to perform according to its required function. It is an eventaffecting a component or system and causing one or both of the following effects, Ref. DNV-OS-F101:
— loss of component or system function; or— deterioration of functional capability to such an extent that the safety of the installation, personnel or
environment is significantly reduced.
In this recommended practice, pipeline system integrity is mainly associated with the pipeline system'sstructural/containment function (other functions, such as the flow assurance function may also be part of theintegrity management scope – see [3.1.3]). This is the submarine pipeline system's ability to operate safely andwithstand the loads imposed during the pipeline lifecycle. If a system loses this ability, a failure has occurred.
There are two main failure modes related to the pipeline's containment/structural function:
1) Loss of containment - leakage or full bore rupture.
2) Gross deformation of the pipe cross section resulting in either reduced static strength or fatigue strength.
1.3 Structure of the documentThis recommended practice is structured in the following manner:
— Sec.1 covers objective, scope and application, description of a pipeline system, description of pipelinesystem integrity, relation to other rules and standards, references, and definitions.
— Sec.2 outlines the main elements of an integrity management system including the core integritymanagement process and support elements.
— Sec.3 covers the integrity management process in a life cycle perspective.— Sec.4 to Sec.7 cover the integrity management process in more detail.
The appendices include:
— App.A Pipeline statistics— App.B Recommendations with regard to global buckling— App.C Recommendations with regard to corrosion— App.D Leak detection systems— App.E Inspection and monitoring techniques— App.F Further guidance - risk assessment and integrity management planning— App.G Example - risk assessment and integrity management planning.— App.H Flow charts for probability of failure Level-1 assessments— App.I Barrier framework— App.J Integrity management review.
1.4 References
1.4.1 Relation to other rules and standards
This recommended practice aims to formally support and comply with the DNV-OS-F101. Therecommendations also reflect the overall industry practices and hence the recommendations are also consideredrelevant for pipelines in general.
The recommended practice aims to be a supplement to relevant national rules and regulations, and relevantcompany requirements.
1.4.2 Onshore sections
For the onshore sections, references are given to the following documents:
— ASME B31.8S Managing System Integrity of Gas Pipelines— API RP 1160 Managing System Integrity for Hazardous Liquid Pipelines.
in addition to:
— DNV-OS-F101, Appendix F Requirements for shore approach and onshore sections.
1.4.3 Riser systems
For riser systems, the integrity management process is covered by:
— DNV-RP-F206 Riser Integrity Management.
DET NORSKE VERITAS AS
Recommended Practice DNV-RP-F116, February 2015Sec.1 General – Page 11
1.4.4 Reference standardsDNV GL standards and recommended practices
International standards and recommended practices
Other references
DNV-OS-F101 Submarine Pipeline SystemsDNV-RP-A203 Technology QualificationDNV-RP-F101 Corroded PipelinesDNV-RP-F102 Pipeline Field Joint Coating and Field Repair of Linepipe CoatingDNV-RP-F103 Cathodic Protection of Submarine Pipelines by Galvanic AnodesDNV-RP-F105 Free spanning PipelinesDNV-RP-F107 Risk assessment of Pipeline ProtectionDNV-RP-F109 On-Bottom Stability Design of Submarine PipelinesDNV-RP-F110 Global Buckling of Submarine Pipelines Structural Design due to High
Temperature /High PressureDNV-RP-F113 Pipeline Subsea RepairDNV-RP-F206 Riser Integrity ManagementDNV-RP-F302 Selection and Use of Subsea Leak Detection SystemsDNV-RP-H101 Risk Management in Marine and Subsea OperationsDNV-RP-J202 Design and Operation of CO2 PipelinesDNV-RP-O501 Erosive Wear in Piping SystemsDNVGL-RP-0002 Integrity management of subsea production systemsDNVGL-RP-0005 DNV-RP-C203: Fatigue design of offshore steel structures
ISO/TS 12747:2011 Petroleum and natural gas industries -- Pipeline transportation systems -- Recommended practice for pipeline life extension
ISO 13623 Petroleum and Natural Gas Industries – Pipeline Transportation SystemsISO 14224 Petroleum, petrochemical and natural gas industries – Collection and exchange of
reliability and maintenance data for equipmentISO 16708 Petroleum and natural gas industries – Pipeline transportation systems –
Reliability-based limit state methodsISO 17776 Petroleum and natural gas industries - Offshore production installations -
Guidelines on tools and techniques for hazard identification and risk assessmentISO 55000 Asset management - Overview, principles and terminology
API RP 1110 Pressure Testing of Steel Pipelines for the Transportation of Gas, Petroleum Gas, Hazardous Liquids, Highly Volatile Liquids, or Carbon Dioxide
API RP 1160 Managing System Integrity for Hazardous Liquid PipelinesAPI RP 1111 Design, Construction, Operation and Maintenance of Offshore Hydrocarbon
Pipelines (Limit State Design)API Std 1163 In-Line Inspection System Qualification StandardASME B31.4 Pipeline Transportation Systems for Liquids and SlurriesASME B31.8 Gas Transmission and Distribution Piping SystemsASME B31.8S Managing System Integrity of Gas PipelinesASME B31G Manual for Determining the Remaining Strength of Corroded Pipelines:
Supplement to B31 Code for Pressure PipingANSI/ASNT ILI-PQ In-Line Inspection Personnel Qualification and Certification’BS 7910 Guide to methods for assessing the acceptability of flaws in metallic structuresEN 13509 Cathodic protection measurement techniquesEI Technical Publications Guideline for Management of Integrity of Subsea FacilitiesEPRG publication EPRG Methods for assessing the tolerance and resistance of pipe to external damageGermanischer Lloyd: Rules for Classification and Construction-IV Industrial Services – Part 6 – Offshore
Technology.
DET NORSKE VERITAS AS
Recommended Practice DNV-RP-F116, February 2015Sec.1 General – Page 12
1.4.5 Bibliographies
1.5 Definitions
NACE SP0102 In-Line Inspection of Pipelines NACE 35100 In-Line Nondestructive Inspection of Pipelines NACE TM0212-2012 Detection, Testing, and Evaluation of Microbiologically Influenced Corrosion on
Internal Surfaces of PipelinesNORSOK Y-002 Life Extension for Transportation SystemsNORSOK Z-001 Documentation for Operation (DFO)PDAM 9909A-RPT-001 The Pipeline Defect Assessment manual (PDAM) / PDAM Joint
Industry Project
/1/ Pipeline Operator Forum (POF) Specifications and requirements for intelligent pig inspection of pipelines, version 2009
Term Definitionabandonment activities associated with taking the system permanently out of serviceacceptance criteria (i.e. design limits)
specified indicators or measures providing an acceptable safety level and that are used in assessing the ability of a component, structure, or system to perform its intended function The acceptance criteria should be quantifiable.
commissioning activities associated with the initial filling of the pipeline system with the fluid to be transported, and is part of the operational phase
commissioning, de- activities associated with taking the pipeline temporarily out of servicecommissioning, re- activities associated with returning a de-commissioned pipeline to servicecrack: a planar, two-dimensional feature with displacement of the fracture surfacesdesign life The design life is the period for which the integrity of the system is documented in the
original design. It is the period for which a structure is to be used for its intended purpose with anticipated maintenance, but without requiring substantial repair.
failure an event affecting a component or system and causing one or both of the following effects:
— loss of component or system function; or— deterioration of functional capacity to such an extent that the safety of the installation,
personnel or environment is significantly reduced.in-service the period when the pipeline system is under operationin-service file a system for collection of historical data for the whole service lifeintegrity control activities to verify the integrity of a pipeline with respect to pressure containment
Covers both internal and external activities.oil & gas content in pipe may be either oil or gasoperation the day to day operation as defined in [3.4]operator the party ultimately responsible for operation, and the integrity, of the pipeline systempig device that is driven through a pipeline for performing various internal activities (depending
on pig type) such as to separate fluids, clean or inspect the pipelinepig, intelligent pig that can perform non-destructive examinationspipeline integrity the ability of the system to operate safely and to withstand the loads imposed during the
system life cyclere-qualification re-assessment of design due to modified design premises and/or sustained damage
E.g. life extension is a design premise modification.risk the qualitative or quantitative likelihood of an accidental or unplanned event occurring
considered in conjunction with the potential consequence of such a failureIn quantitative terms, risk is the quantified probability of a defined failure mode times its quantified consequence.
risk management the entire process covering identification of risks, analysing and assessing risks, developing plans to control risks, and implementation and monitoring to evaluate effectiveness of the controls in place
service life the time length the system is intended to operate The service life is a part of the application toward authorities.
supplier an organization that delivers materials, components, goods, or services to another organization
take-over is defined as the process of transferring operating responsibility from the project phase (up to an including pre-commissioning) to operations
DET NORSKE VERITAS AS
Recommended Practice DNV-RP-F116, February 2015Sec.1 General – Page 13
1.6 Verbal forms
1.7 Abbreviations
threat an indication of an impending danger or harm to the system, which may have an adverse influence on the integrity of the system.
Term Definition
shall verbal form used to indicate requirements strictly to be followed in order to conform to the document.
should verbal form used to indicate that among several possibilities one is recommended as particularly suitable, without mentioning or excluding others, or that a certain course of action is preferred but not necessarily required.
may verbal form used to indicate a course of action permissible within the limits of the document.
Abbreviation DescriptionCoF consequence of failureCP cathodic protectionCVI close visual inspectionDEH direct electrical heatingDFI design fabrication installationDFO documents for operationDTM digital terrain modelsEPRG European pipeline research groupER electrical resistanceFIV flow induced vibrationsFMEA failure modes and effects analysisFSM field signature methodGVI general visual inspectionGRP glass reinforced plasticHAZOP hazard and operability analysisHDPE high density polyethylene HIPPS high integrity pressure protection systemHSE health safety and the environmentIA integrity assessmentILI in-line inspectionIM integrity managementIMP integrity management processIMR inspection, maintenance and repairIMMR inspection, maintenance, monitoring and repairIMS integrity management systemKP kilometre pointLPR linear polarisation resistanceMIC microbiologically influenced corrosionMIR mitigation, intervention and repair*MFL magnetic flux leakageNCR non conformances reportNDT non destructive testingOLF The Norwegian Oil Industry Association (No:’ Oljeindustriens Landsforening.’)PDAM pipeline defect assessment manualPIMS pipeline integrity management systemPoF probability of failureRBI risk based inspectionROV remote operated vehicle
Term Definition
DET NORSKE VERITAS AS
Recommended Practice DNV-RP-F116, February 2015Sec.1 General – Page 14
*Other similar abbreviations used in the industry are IMR and IMMR. These are not the same. See Sec.7 for more on MIR.
ROTV remote operated towed vehicleRP recommended practiceTPD third party damageTQ technology qualification UT ultrasonic testingUTM universal transverse mercatorVIV vortex induced vibrationsQRA quantitative risk analysisvs versus
Abbreviation Description
DET NORSKE VERITAS AS
Recommended Practice DNV-RP-F116, February 2015Sec.2 Integrity management system – Page 15
2 Integrity management system
2.1 General
2.1.1 Authority and company requirementsThe relevant national requirements shall be identified and complied with.The relevant company requirements should be complied with when developing, implementing and maintainingthe integrity management system.
2.1.2 Operator's responsibilityEnsuring the integrity of the pipeline system is the ultimate responsibility of the operator. Within the Operator'sorganisation, the responsibilities should be clearly defined and allocated during the entire service life of thepipeline system.
2.1.3 Elements of the integrity management systemThe operator should establish, implement and maintain an integrity management system (IMS) which includes,as a minimum (Ref. DNV-OS-F101), the following elements, as illustrated in Figure 1-1:
— company policy— organisation and personnel— reporting and communication— operation controls and procedures— management of change— contingency plans— audits and review— information management— and the integrity management process.
The IMS should in addition satisfy the requirements from:
— the specific pipeline systems’ design documentation and safety philosophy— the relevant authorities and the operating company itself— other relevant external stakeholders.
Other integrity management elements not specified in the minimum requirements from DNV-OS-F101 maye.g. include: requirement management, spare parts and tools management, interface management, insurancemanagement, contract management, outsourcing management, financial management. ISO 55000 and itsassociated documents may be a good basis for more detailed guidance.Many of these elements may be common at a corporate or company level (across assets). However, the specificpipeline needs may have to be addressed separately (customized elements).
2.2 Integrity management processThe integrity management process is the core of the integrity management system. The steps constituting theintegrity management process are illustrated in Figure 1-1 and should comprise integrity control and integrityimprovement activities as further discussed in Sec.3.
2.3 Support elements
2.3.1 Company policyThe company policy for pipeline integrity management should set the values and beliefs that the companyholds, and guide people in how these are to be realized.
2.3.2 Organisation and personnel – roles and responsibilitiesThe roles and responsibilities of personnel involved with integrity management of the pipeline system shouldbe clearly defined.Typical examples of roles and responsibilities related to safeguarding the integrity of the pipeline system,which should be addressed, are:
— hand-over of pipeline system for operations— establishment of pipeline integrity management system— execution of technical integrity safeguarding activities— execution and documentation of integrity assessments and associated conclusions— ensuring integrity management system improvement.
2.3.3 Organisation and personnel – training needsPipeline integrity management should be developed, implemented and maintained by competent andexperienced personnel. Competency standards should be established for the various roles involved in pipeline
DET NORSKE VERITAS AS
Recommended Practice DNV-RP-F116, February 2015Sec.2 Integrity management system – Page 16
integrity management and individuals assessed against those standards. Training needs should be identified andtraining should be provided for relevant personnel in relation to management of pipeline integrity.
2.3.4 Management of changeModifications of the pipeline system should be subject to a management of change procedure that must addressthe continuing safe operation of the pipeline system. Documentation of changes and communication to thosewho need to be informed is essential.
2.3.5 Operational controls and proceduresRelevant operational controls and procedures should be established, implemented and maintained.The following are typically covered:
— start-up, operations and shutdown procedures— procedures for treatment of non-conformances— instructions for cleaning and/or other maintenance activities— corrosion control activities— inspection and monitoring activities— procedures for operation of safety equipment and pressure control systems.— operation control measures to ensure that critical fluid parameters are kept within the specified design
limits. As a minimum, the following parameters should be controlled or monitored: pressure andtemperature at inlet and outlet of the pipeline, dew point for gas lines, fluid composition, water content,flow rate, density and viscosity.
— periodical testing and inspection of all safety equipment in the pipeline system, including pressure controland over-pressure protection devices, emergency shutdown systems and automatic shutdown valves. Thepurpose is to verify the integrity of the safety equipment and that the equipment can perform the safetyfunction as specified.
2.3.6 Contingency plansPlans and procedures for emergency situations should be established and maintained based on a systematicevaluation of possible scenarios. Dependent upon the commercial criticality of the pipeline system, plans andprocedures for contingency repair of the pipeline should also be established.A pipeline emergency is defined as being any situation or occurrence that endangers the safety of persons,facilities, the environment or safe operation of the pipeline. Possible consequences of pipeline failures (e.g.rupture) is therefore important to establish. To reduce the consequences of a potential emergency scenario,preparedness plans and procedures are typically developed and implemented. The emergency proceduresnormally include the following:
— organisation, roles and responsibilities of parties involved in the event of an emergency situation— communication lines, who to be informed through different stages of the emergency situation— identification of potential pipeline specific emergency scenarios— sources and systems for identifying and reporting an emergency situation— procedures for initial response to an emergency alarm and/ or situation, e.g.: isolation of damaged part of
the pipeline system; controlled shut-down procedures, and emergency shut-down procedures; proceduresfor depressurisation of the system
— plans, organisation, support- and resource teams responsible for evaluating and initiating the appropriateactions to an emergency situation
— mitigating plans / procedures to limit potential environmental damage from an emergency scenario.
When evaluating the extent of required contingency plans and procedures, and the corresponding need for pre-investments in contingency repair equipment and/or spares, the following is normally considered:
— economic consequences when the pipeline is out of service— availability of recognised repair methods— availability/delivery time for required equipment and spares— estimated time for repair.
2.3.7 Reporting and communicationA plan for reporting and communication to employees, management, authorities, customers, public and othersshould be established, implemented and maintained. This covers both regular reporting and communication,and reporting in connection with changes, special findings, emergencies etc.
2.3.8 Audit and reviewAudits and reviews of the pipeline integrity management system should be conducted regularly. The frequencyshould be defined and documented by the responsible for the operation of the pipeline system and should be inline with company requirements.Reviews typically focus on the effectiveness and suitability of the system, and improvements to be
DET NORSKE VERITAS AS
Recommended Practice DNV-RP-F116, February 2015Sec.2 Integrity management system – Page 17
implemented – see App.J for guidance on review with respect to DNV-RP-F116 recommendations. Also, a setof potential key performance indicators are presented in Appendix I [I.2].Audits typically focus on compliance with regulatory and company requirements, and rectifications to beimplemented.
2.3.9 Information managementA system for collection of historical data should be established and maintained for the whole service life. Thissystem (In-service file) will typically consist of documents, data files and databases. The in-service file shouldas a minimum contain documentation regarding:
— results and conclusions from the in-service inspections— accidental events and damages to the pipeline system— intervention, repair, and modifications and— operational data (fluid composition, flow rate, pressure, temperature etc.) including evaluation of incidents
promoting corrosion and other deterioration mechanisms.
The in-service file, together with the design, fabrication and installation (DFI) résumé (see [2.3.9.1]), shouldbe the basis for future integrity management planning.
2.3.9.1 DFI résuméA design fabrication installation (DFI) resume, or similar, should be established with the main objective toprovide the operations organisation with a concise summary of the most relevant data (i.e. acceptance criteria,events etc) from the design, fabrication and installation (incl. pre-commissioning) phase. It should:
— clearly show the limits of the pipeline system— reflect the as-built status of the pipeline system and provide information for the preparation of plans for
inspection and maintenance— specify design and operating premises and requirements— contain or provide reference to all documentation required for normal operation, inspections and maintenance— provide references to the documentation needed for any repair, modification or re-qualification of the
pipeline system— aim at being prepared in parallel, and as an integrated part, of the DFI phase of the project.
Minimum requirements to the content of a DFI resume are given in DNV-OS-F101, Sec.12 H200.
2.3.9.2 Documentation during the operational phaseIn order to maintain the integrity of the pipeline system, the documentation made available during theoperational phase should include, but not be limited to:
— organisation chart showing the functions responsible for the operation of the pipeline system— personnel training and qualifications records— history of pipeline system operation with reference to events which may have significance to design and safety— history of environmental data (e.g. waves, current, sea, temperature, extreme events)— installation condition data as necessary for understanding pipeline system design and configuration, e.g.
previous survey reports, as-laid / as-built installation drawings and test reports— physical and chemical characteristics of transported media including sand data— inspection and maintenance schedules and their records— inspection procedure and results, including supporting records.
2.3.9.3 Documentation related to damage or other abnormalitiesIn case of damage or other abnormalities that might impair the safety, reliability, strength and/or stability of thepipeline system, the following minimum documentation should be prepared prior to start-up / reinstatement ofthe pipeline:
— description of the damage to the pipeline, its systems or components with reference to location, type, extentof damage and temporary measures, if any;
— plans and full particulars of repairs, modifications and replacements, including contingency measures;— further documentation with respect to particular repair, modification and replacement, as agreed upon in
line with those for the construction or installation phase.
2.3.9.4 Documentation related to re-qualification / lifetime extension In case of re-qualification or life extension of the pipeline system (see [3.4.4]), all information related to the re-assessment process of the original design should be documented. This includes e.g. internal and externalinspection data, monitoring data, and integrity assessments.
2.3.9.5 Ease of access in case of emergencyThe in-service file and the DFI-resume should be easily retrievable especially in case of an emergency situation.
DET NORSKE VERITAS AS
Recommended Practice DNV-RP-F116, February 2015Sec.3 Integrity management process in a life cycle perspective – Page 18
3 Integrity management process in a life cycle perspective
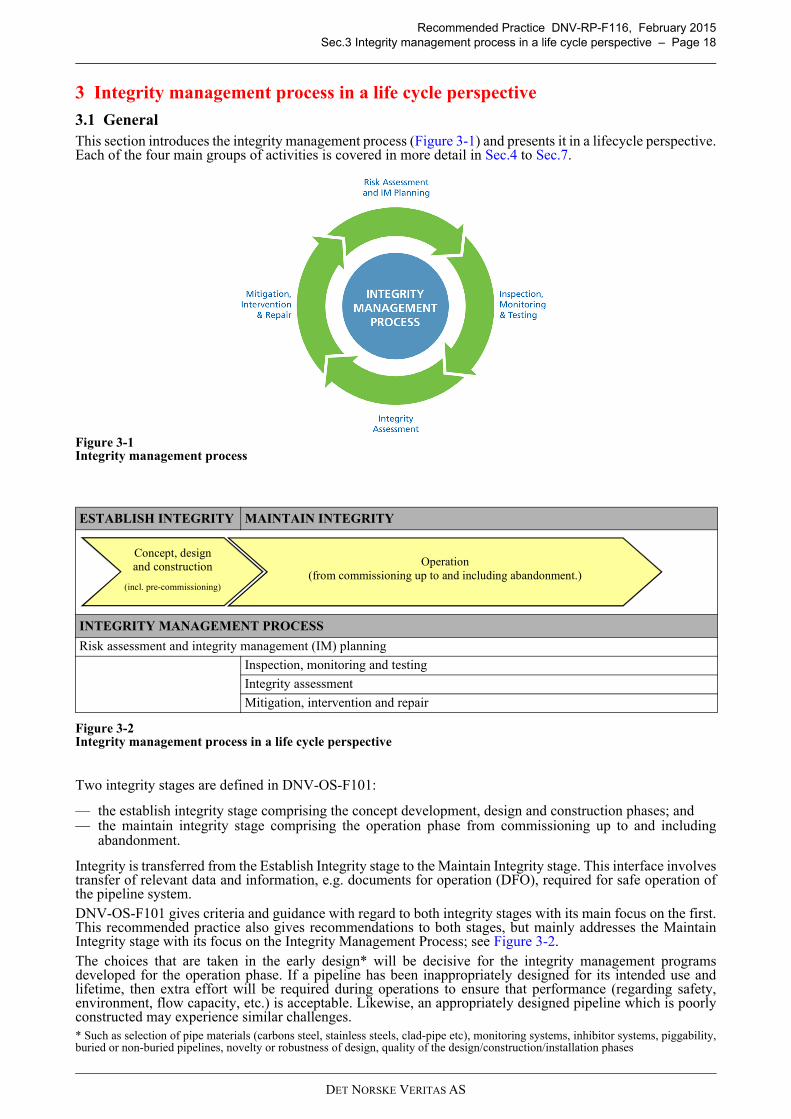
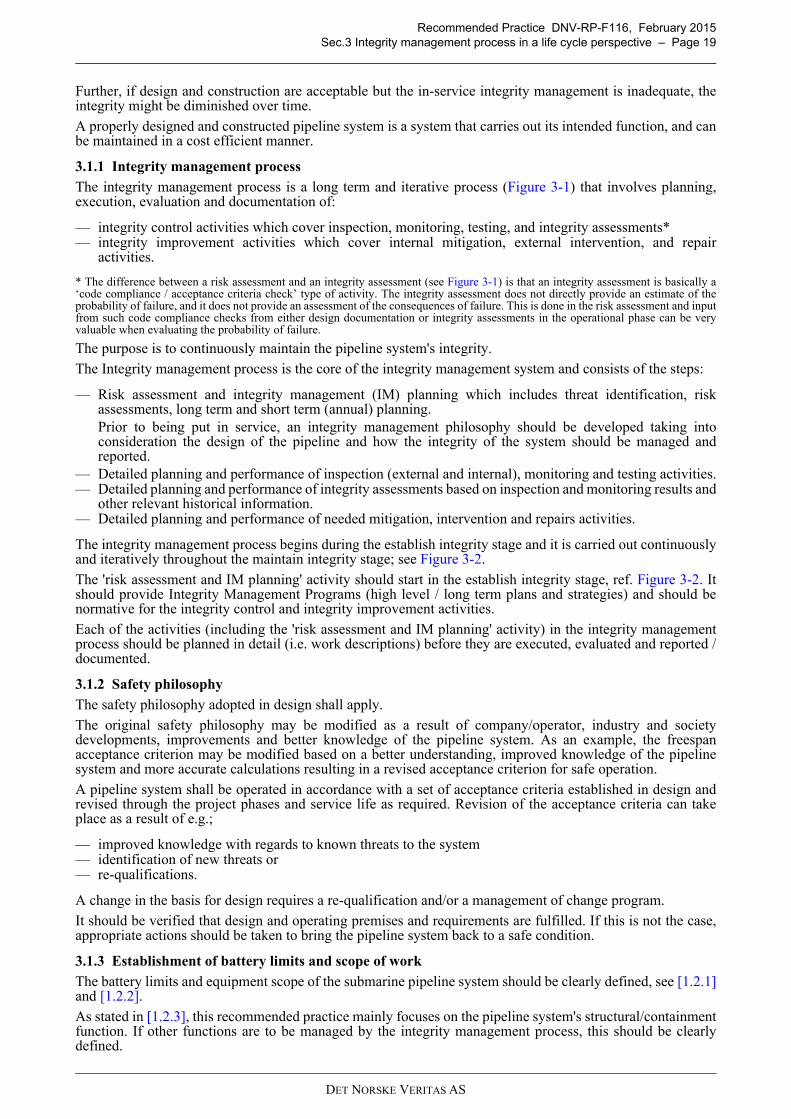
3.1 GeneralThis section introduces the integrity management process (Figure 3-1) and presents it in a lifecycle perspective.Each of the four main groups of activities is covered in more detail in Sec.4 to Sec.7.
Figure 3-1Integrity management process
Figure 3-2Integrity management process in a life cycle perspective
Two integrity stages are defined in DNV-OS-F101:
— the establish integrity stage comprising the concept development, design and construction phases; and— the maintain integrity stage comprising the operation phase from commissioning up to and including
abandonment.
Integrity is transferred from the Establish Integrity stage to the Maintain Integrity stage. This interface involvestransfer of relevant data and information, e.g. documents for operation (DFO), required for safe operation ofthe pipeline system.DNV-OS-F101 gives criteria and guidance with regard to both integrity stages with its main focus on the first.This recommended practice also gives recommendations to both stages, but mainly addresses the MaintainIntegrity stage with its focus on the Integrity Management Process; see Figure 3-2.The choices that are taken in the early design* will be decisive for the integrity management programsdeveloped for the operation phase. If a pipeline has been inappropriately designed for its intended use andlifetime, then extra effort will be required during operations to ensure that performance (regarding safety,environment, flow capacity, etc.) is acceptable. Likewise, an appropriately designed pipeline which is poorlyconstructed may experience similar challenges.* Such as selection of pipe materials (carbons steel, stainless steels, clad-pipe etc), monitoring systems, inhibitor systems, piggability,buried or non-buried pipelines, novelty or robustness of design, quality of the design/construction/installation phases
ESTABLISH INTEGRITY MAINTAIN INTEGRITY
INTEGRITY MANAGEMENT PROCESS
Risk assessment and integrity management (IM) planning
Inspection, monitoring and testing
Integrity assessment
Mitigation, intervention and repair
Concept, design and construction
(incl. pre-commissioning)
Operation (from commissioning up to and including abandonment.)
DET NORSKE VERITAS AS
Recommended Practice DNV-RP-F116, February 2015Sec.3 Integrity management process in a life cycle perspective – Page 19
Further, if design and construction are acceptable but the in-service integrity management is inadequate, theintegrity might be diminished over time.
A properly designed and constructed pipeline system is a system that carries out its intended function, and canbe maintained in a cost efficient manner.
3.1.1 Integrity management process
The integrity management process is a long term and iterative process (Figure 3-1) that involves planning,execution, evaluation and documentation of:
— integrity control activities which cover inspection, monitoring, testing, and integrity assessments*— integrity improvement activities which cover internal mitigation, external intervention, and repair
activities.
* The difference between a risk assessment and an integrity assessment (see Figure 3-1) is that an integrity assessment is basically a‘code compliance / acceptance criteria check’ type of activity. The integrity assessment does not directly provide an estimate of theprobability of failure, and it does not provide an assessment of the consequences of failure. This is done in the risk assessment and inputfrom such code compliance checks from either design documentation or integrity assessments in the operational phase can be veryvaluable when evaluating the probability of failure.
The purpose is to continuously maintain the pipeline system's integrity.
The Integrity management process is the core of the integrity management system and consists of the steps:
— Risk assessment and integrity management (IM) planning which includes threat identification, riskassessments, long term and short term (annual) planning.Prior to being put in service, an integrity management philosophy should be developed taking intoconsideration the design of the pipeline and how the integrity of the system should be managed andreported.
— Detailed planning and performance of inspection (external and internal), monitoring and testing activities.— Detailed planning and performance of integrity assessments based on inspection and monitoring results and
other relevant historical information.— Detailed planning and performance of needed mitigation, intervention and repairs activities.
The integrity management process begins during the establish integrity stage and it is carried out continuouslyand iteratively throughout the maintain integrity stage; see Figure 3-2.
The 'risk assessment and IM planning' activity should start in the establish integrity stage, ref. Figure 3-2. Itshould provide Integrity Management Programs (high level / long term plans and strategies) and should benormative for the integrity control and integrity improvement activities.
Each of the activities (including the 'risk assessment and IM planning' activity) in the integrity managementprocess should be planned in detail (i.e. work descriptions) before they are executed, evaluated and reported /documented.
3.1.2 Safety philosophy
The safety philosophy adopted in design shall apply.
The original safety philosophy may be modified as a result of company/operator, industry and societydevelopments, improvements and better knowledge of the pipeline system. As an example, the freespanacceptance criterion may be modified based on a better understanding, improved knowledge of the pipelinesystem and more accurate calculations resulting in a revised acceptance criterion for safe operation.
A pipeline system shall be operated in accordance with a set of acceptance criteria established in design andrevised through the project phases and service life as required. Revision of the acceptance criteria can takeplace as a result of e.g.;
— improved knowledge with regards to known threats to the system — identification of new threats or— re-qualifications.
A change in the basis for design requires a re-qualification and/or a management of change program.
It should be verified that design and operating premises and requirements are fulfilled. If this is not the case,appropriate actions should be taken to bring the pipeline system back to a safe condition.
3.1.3 Establishment of battery limits and scope of work
The battery limits and equipment scope of the submarine pipeline system should be clearly defined, see [1.2.1]and [1.2.2].
As stated in [1.2.3], this recommended practice mainly focuses on the pipeline system's structural/containmentfunction. If other functions are to be managed by the integrity management process, this should be clearlydefined.
DET NORSKE VERITAS AS
Recommended Practice DNV-RP-F116, February 2015Sec.3 Integrity management process in a life cycle perspective – Page 20
3.1.4 Managing risk related to pipeline system threats / risk based approach
A risk based integrity management approach should be applied (also see Sec.4).
Managing the risk related to the pipeline system threats is essential for maintaining the integrity of the pipelinesystem. The most common submarine pipeline threats are in this document organized into six (6) threatgroups*:
— DFI threats— corrosion/erosion threats— third party threats— structural threats— natural hazards threats— incorrect operation threats.
* The lists in this RP reflect relatively common industry practice. Threats can be defined, organized and broken down in other ways.For example the DFI and Incorrect operation threats may not be considered to be threats by some. These “threats” may be seen asweaknesses that contribute to corrosion, third party and structural threats.
Depending on the established integrity management scope (see [3.1.3]), other groups may be defined (e.g.blockage due to hydrates, debris, solids, etc). Also see [4.2] for division into sub-threats – note that the same 6groups can be used to organize component threats, but the groups are not broken down into sub-threats fordifferent types of components. ISO 14224 may be used as a input to expand the list of threats.
The intention of using a risk based approach is that integrity management activities (such as inspection,monitoring, intervention and repair) are selected and scheduled on the basis of their ability to explicitly measureand manage threats to the pipeline system and ensure that associated risks are managed to be within acceptablelimits. Risk based pipeline integrity management takes into account:
— identification of threats and failure modes— estimation of probabilities of failure (PoF) — estimation of consequences of failure (CoF)— estimation of risk level (CoF × PoF).
Submarine pipeline system failures can have severe safety, environmental and economic consequences atcorporate and national level. Submarine pipeline systems may comprise many sub-systems each with severalthreats that may lead to failure. Risk assessments are used to focus on the right issues at the right time. It is usedto prioritize and schedule integrity management activities.
3.2 Establish integrity
3.2.1 Operator involvement in the establish integrity stage
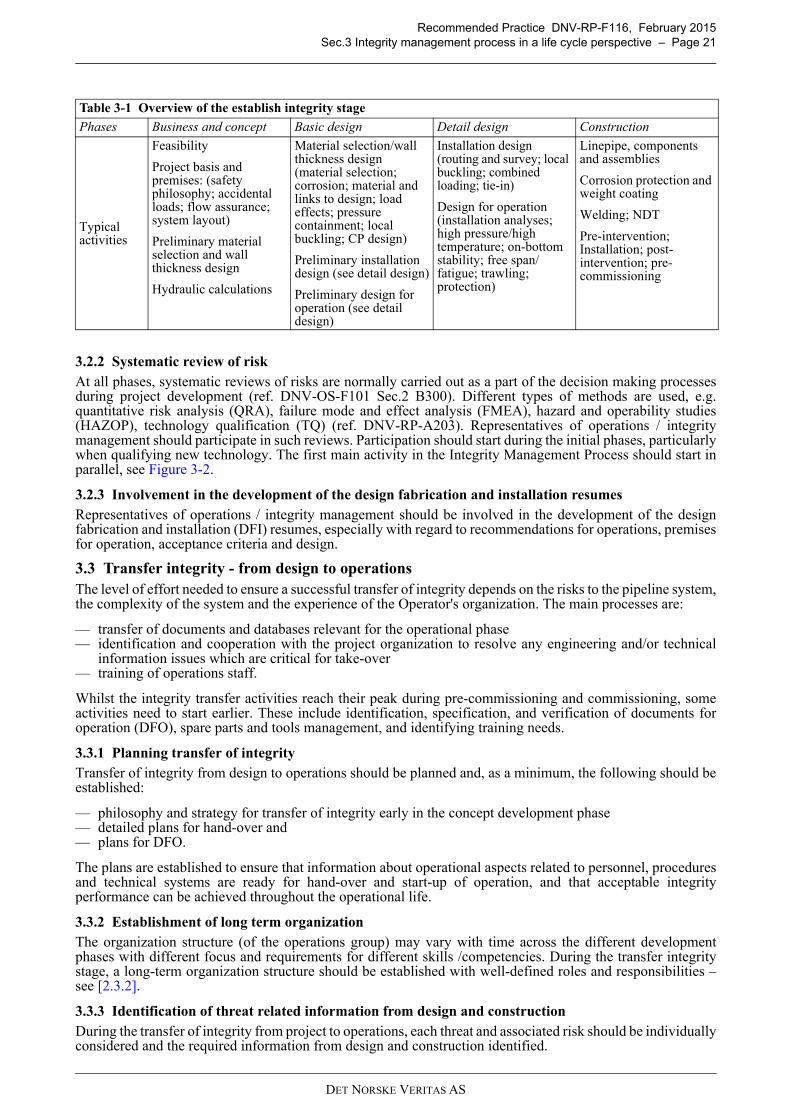
The Operator should allocate resources during the concept, design and construction phase. The purpose is toensure that operational aspects are taken into consideration, and planned for, at an early stage. Directinvolvement into the development project offers an opportunity to maximize value over the asset life byensuring relevant operations input to design and construction of the pipeline system. Such involvement alsogives an intimate knowledge of the asset which will facilitate safe operations and sound integrity management.Table 3-1 gives an overview of the 'establish integrity stage'.
Inappropriate strategic decisions at the front end (business phase) can lead to poor performance in the operationand maintenance phase. Integrity issues are already relevant to be considered at such an early phase. This isparticularly important if the considered development represents potential new technology risks because it ispushing the boundaries beyond what has been developed before.
The concept development includes further qualification of any new technology, selection of engineeringstandards, addressing the HSE risks during operations, and establishing pre-qualification requirements, withintegrity criteria, to ensure competence of contractors and vendors. Preliminary development of strategies forinspection, monitoring, testing and repair should start during the concept development phase (ref. DNV-OS-F101 Sec.3 B).
In the phases from basic design, the major decisions have been made. Key risks are identified and qualityassurance activities are defined for the development project. Strategies for inspection, monitoring, testing andrepair should be further developed by representatives of operations / integrity management in close co-operation with the design team. Detailed performance standards for critical components and systems should bespecified as the basis for assuring compliance with the design intent and the integrity goals. The deviationcontrol procedure should provide for operations review of deviations.
During and after construction, strategies for inspection, monitoring, testing and repair should be finalised byrepresentatives of operations / integrity management.
DET NORSKE VERITAS AS
Recommended Practice DNV-RP-F116, February 2015Sec.3 Integrity management process in a life cycle perspective – Page 21
3.2.2 Systematic review of riskAt all phases, systematic reviews of risks are normally carried out as a part of the decision making processesduring project development (ref. DNV-OS-F101 Sec.2 B300). Different types of methods are used, e.g.quantitative risk analysis (QRA), failure mode and effect analysis (FMEA), hazard and operability studies(HAZOP), technology qualification (TQ) (ref. DNV-RP-A203). Representatives of operations / integritymanagement should participate in such reviews. Participation should start during the initial phases, particularlywhen qualifying new technology. The first main activity in the Integrity Management Process should start inparallel, see Figure 3-2.
3.2.3 Involvement in the development of the design fabrication and installation resumesRepresentatives of operations / integrity management should be involved in the development of the designfabrication and installation (DFI) resumes, especially with regard to recommendations for operations, premisesfor operation, acceptance criteria and design.
3.3 Transfer integrity - from design to operationsThe level of effort needed to ensure a successful transfer of integrity depends on the risks to the pipeline system,the complexity of the system and the experience of the Operator's organization. The main processes are:
— transfer of documents and databases relevant for the operational phase — identification and cooperation with the project organization to resolve any engineering and/or technical
information issues which are critical for take-over — training of operations staff.
Whilst the integrity transfer activities reach their peak during pre-commissioning and commissioning, someactivities need to start earlier. These include identification, specification, and verification of documents foroperation (DFO), spare parts and tools management, and identifying training needs.
3.3.1 Planning transfer of integrityTransfer of integrity from design to operations should be planned and, as a minimum, the following should beestablished:
— philosophy and strategy for transfer of integrity early in the concept development phase— detailed plans for hand-over and— plans for DFO.
The plans are established to ensure that information about operational aspects related to personnel, proceduresand technical systems are ready for hand-over and start-up of operation, and that acceptable integrityperformance can be achieved throughout the operational life.
3.3.2 Establishment of long term organizationThe organization structure (of the operations group) may vary with time across the different developmentphases with different focus and requirements for different skills /competencies. During the transfer integritystage, a long-term organization structure should be established with well-defined roles and responsibilities –see [2.3.2].
3.3.3 Identification of threat related information from design and constructionDuring the transfer of integrity from project to operations, each threat and associated risk should be individuallyconsidered and the required information from design and construction identified.
Table 3-1 Overview of the establish integrity stage
Phases Business and concept Basic design Detail design Construction
Typical activities
Feasibility
Project basis and premises: (safety philosophy; accidental loads; flow assurance; system layout)
Preliminary material selection and wall thickness design
Hydraulic calculations
Material selection/wall thickness design (material selection; corrosion; material and links to design; load effects; pressure containment; local buckling; CP design)
Preliminary installation design (see detail design)
Preliminary design for operation (see detail design)
Installation design (routing and survey; local buckling; combined loading; tie-in)
Design for operation (installation analyses; high pressure/high temperature; on-bottom stability; free span/fatigue; trawling; protection)
Linepipe, components and assemblies
Corrosion protection and weight coating
Welding; NDT
Pre-intervention; Installation; post-intervention; pre-commissioning
DET NORSKE VERITAS AS
Recommended Practice DNV-RP-F116, February 2015Sec.3 Integrity management process in a life cycle perspective – Page 22
See App.B for an example of information that may be useful to transfer from the project to operations withregard to global buckling. Similar generic lists can be established for all the pipeline threats.
3.3.4 Documents for operation
Documents for operation (DFO) requirements should be established defining formal requirements (language,formats, file name conventions, etc.) and requirements for document content.
DNV-OS-F101, Sec.12 presents minimum documentation requirements for the whole life cycle of a submarinepipeline system including requirements for documentation to be established for the operation of the system.
The NORSOK standard Z-001 Documentation for Operation also provides requirements both on a generalbasis and specifically for pipeline systems.
The DFO plan should be established and should include how DFO requirements should be met
— document list identifying DFO— responsibilities— progress reporting— quality plan— procedures and checklists to ensure quality and completeness of the DFO delivery.
The operations organization should approve the DFO.
3.3.5 Take-over plan, verification and check lists
A plan for take-over of the pipeline system and a checklist for project deliverables that are considered essentialfor take-over should be prepared. 'Take-over' is defined as the process of transferring operating responsibilityfrom the project phase (up to an including pre-commissioning) to operations.
There are three main categories of information that should be verified before take-over:
— engineering, i.e. verifying that project activities are completed and that the operations organization hasincluded all necessary engineering information in operating procedures and plans. E.g. corrosionmanagement strategy completed and included in the initial inspection program.
— documents for operation (DFO) i.e. verify that all user documents required for operation are complete,according to specification and available to the operations organization e.g. user manuals, temporary piglauncher installation procedure, field layout and pipeline route etc.
— take-over Dossier i.e. installation and pre-commissioning is complete and documented by the project e.g.relevant certificates, list of NCRs, DFI resume, initial inspection plans, pipeline crossing agreements etc.
Check lists should be prepared, including responsible persons, to verify and document that the above requestedinformation is received prior to take-over.
3.4 Maintain integrityThe maintain integrity stage covers the operational phase of the pipeline system from commissioning and upto and including abandonment. This includes the day to day activities basically corresponding to the integritymanagement scope presented Figure 1-1 and in Sec.2.
A brief description (with associated recommendations) of other key non-“day to day” operation issues/activities considered as important for the integrity management process, and which influence the integrity ofthe system, are covered below.
3.4.1 Commissioning
Commissioning should be part of the operational phase. Commissioning comprises activities associated withthe initial filling of the pipeline system with the fluid to be transported. Requirements pertaining todocumentation and procedures for commissioning are specified in DNV-OS-F101.
Following commissioning of the system, it should be verified that the operational limits are within designconditions. Important issues that may need verification can be:
— flow parameters (pressure, temperature, dew point conditions, hydrate formation sensitivity, sandproduction, chemical injection, etc.)
— CP-system— expansion, movement, lateral snaking/buckling, upheaval buckling, free span and exposure.
Events that occur during commissioning should be considered and this may lead to a revised integritymanagement program.
An integrity management program (in-service strategy / long term program for inspection, monitoring andtesting) is normally established prior to commissioning as a part of the risk assessment and IM planning activity– see [3.1] and [3.1.1]. Any detailed plans are also normally ready prior to commissioning.
DET NORSKE VERITAS AS
Recommended Practice DNV-RP-F116, February 2015Sec.3 Integrity management process in a life cycle perspective – Page 23
3.4.2 De-commissioning
Pipeline de-commissioning should be planned, prepared, conducted and documented in such a way that thepipeline can be re-commissioned and put into service again. De-commissioning is the set of activitiesassociated with taking the pipeline temporarily out of service. It includes aspects such as relevant nationalregulations, environment, obstruction for ship traffic and fishing activities, and corrosion impact on otherstructures, ref. DNV-OS-F101.
De-commissioned pipelines should be preserved to reduce effect from degradation mechanisms, ref. DNV-OS-F101. Inspection and integrity assessment of the pipeline prior to de-commissioning and/or prior to future start-up should be considered. This will help when specifying the preservation actions and/or ensure properverification of integrity status before any future operation.
De-commissioned pipelines should continue being appropriately managed by the Integrity ManagementSystem, i.e. they should e.g. still be covered by the integrity management program as necessary.
3.4.3 Re-commissioning
As for commissioning from the construction phase into the operational phase, preservation measures should beappropriately terminated, correct fluid filling should be ensured and integrity should be verified (through e.g.external surveys and/or inline inspection).
The purpose of re-commissioning is to restore the original intended operating performance. The maindifference from ordinary commissioning is that a de-commissioned system may be out of service for a verylong period and the verification of integrity may be more challenging. Further, after a system has been de-commissioned, non-operational control strategies, faulty equipment, and deferred maintenance may result insystem inefficiencies that are not readily noticeable.
3.4.4 Re-qualification / lifetime extension
Re-qualification is a re-assessment of the design under changed design conditions. It is basically a morecomprehensive integrity assessment (see [3.1] and Figure 3-1) comparable to a re-design and may result inchanges to the pipeline system.
A re-qualification may be triggered by a change in the original design basis, by not fulfilling the design basisor by mistakes or shortcomings discovered during normal or abnormal operation. Possible causes may be:
— preference to use a more recent standard e.g. due to requirements for higher utilisation for existing pipelines — changes of premises such as environmental loads, deformations, scour etc.— changes of operational parameters such as pressure, temperature, the composition of the medium, water
content, H2S-content, operating cycles, etc.— change of flow direction or change of fluid— deterioration mechanisms having exceeded the original assumption such as corrosion rate (internal or
external), dynamic responses causing fatigue (e.g. VIV or start/stop periods)— discovered damages such as dents, damaged pipe protection, corrosion defects, cracks, damaged or
consumed anodes— extended design life.
Re-assessment of the design under changed design conditions and any subsequent construction and installationshould be based on latest issue of original design code or other relevant / recognized design codes. For lifetimeextensions, also see ref. NORSOK Y-002 and ISO 12747.
3.4.5 Abandonment
Abandonment of a pipeline system comprises the activities associated with taking the system / or part of thesystem permanently out of operation. An abandoned pipeline is not intended to be returned to operation.Abandonment should be carried out in line with local legislation and dependent on this legislation variousscenarios may be required, i.e. removal, left in situ, etc. The main concerns are:
— handling of environmental issues related to abandoned pipelines.— ensuring no restrictions to third parties due to the abandonment. For submarine pipelines this is mostly
fisheries with trawlers.
Pipeline abandonment should be planned and prepared. Pipeline abandonment evaluation should include thefollowing aspects:
— relevant national regulations— health and safety of personnel (if the pipeline is to be removed)— environment (especially pollution)— obstruction for ship traffic— obstruction for fishing activities, and— corrosion impact on other structures.
DET NORSKE VERITAS AS
Recommended Practice DNV-RP-F116, February 2015Sec.3 Integrity management process in a life cycle perspective – Page 24
During the abandonment process, the pipeline system may continue being managed by the IntegrityManagement System, i.e. they may e.g. still be covered by inspection plans as necessary. Abandoned parts ofa pipeline system which have not been removed may also need to be followed-up if they e.g. represent a threatto other systems or to third parties.
DET NORSKE VERITAS AS
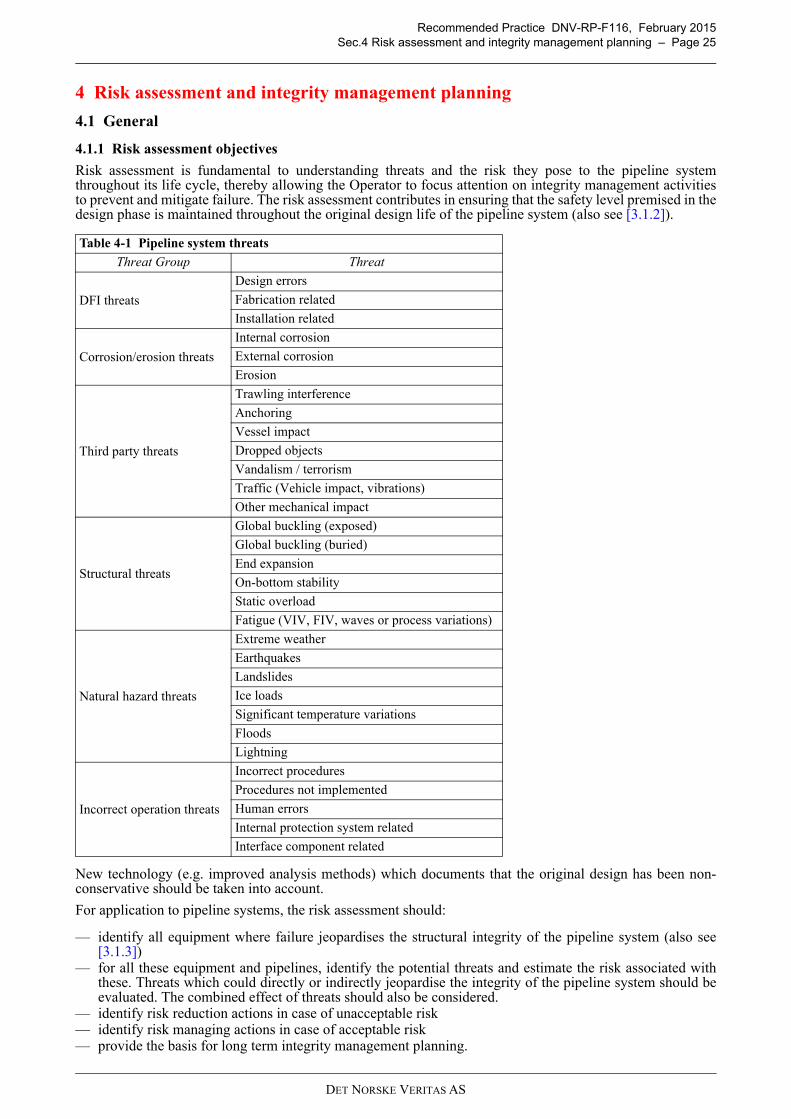
Recommended Practice DNV-RP-F116, February 2015Sec.4 Risk assessment and integrity management planning – Page 25
4 Risk assessment and integrity management planning
4.1 General
4.1.1 Risk assessment objectives
Risk assessment is fundamental to understanding threats and the risk they pose to the pipeline systemthroughout its life cycle, thereby allowing the Operator to focus attention on integrity management activitiesto prevent and mitigate failure. The risk assessment contributes in ensuring that the safety level premised in thedesign phase is maintained throughout the original design life of the pipeline system (also see [3.1.2]).
New technology (e.g. improved analysis methods) which documents that the original design has been non-conservative should be taken into account.
For application to pipeline systems, the risk assessment should:
— identify all equipment where failure jeopardises the structural integrity of the pipeline system (also see[3.1.3])
— for all these equipment and pipelines, identify the potential threats and estimate the risk associated withthese. Threats which could directly or indirectly jeopardise the integrity of the pipeline system should beevaluated. The combined effect of threats should also be considered.
— identify risk reduction actions in case of unacceptable risk— identify risk managing actions in case of acceptable risk — provide the basis for long term integrity management planning.
Table 4-1 Pipeline system threats
Threat Group Threat
DFI threats
Design errors
Fabrication related
Installation related
Corrosion/erosion threats
Internal corrosion
External corrosion
Erosion
Third party threats
Trawling interference
Anchoring
Vessel impact
Dropped objects
Vandalism / terrorism
Traffic (Vehicle impact, vibrations)
Other mechanical impact
Structural threats
Global buckling (exposed)
Global buckling (buried)
End expansion
On-bottom stability
Static overload
Fatigue (VIV, FIV, waves or process variations)
Natural hazard threats
Extreme weather
Earthquakes
Landslides
Ice loads
Significant temperature variations
Floods
Lightning
Incorrect operation threats
Incorrect procedures
Procedures not implemented
Human errors
Internal protection system related
Interface component related
DET NORSKE VERITAS AS
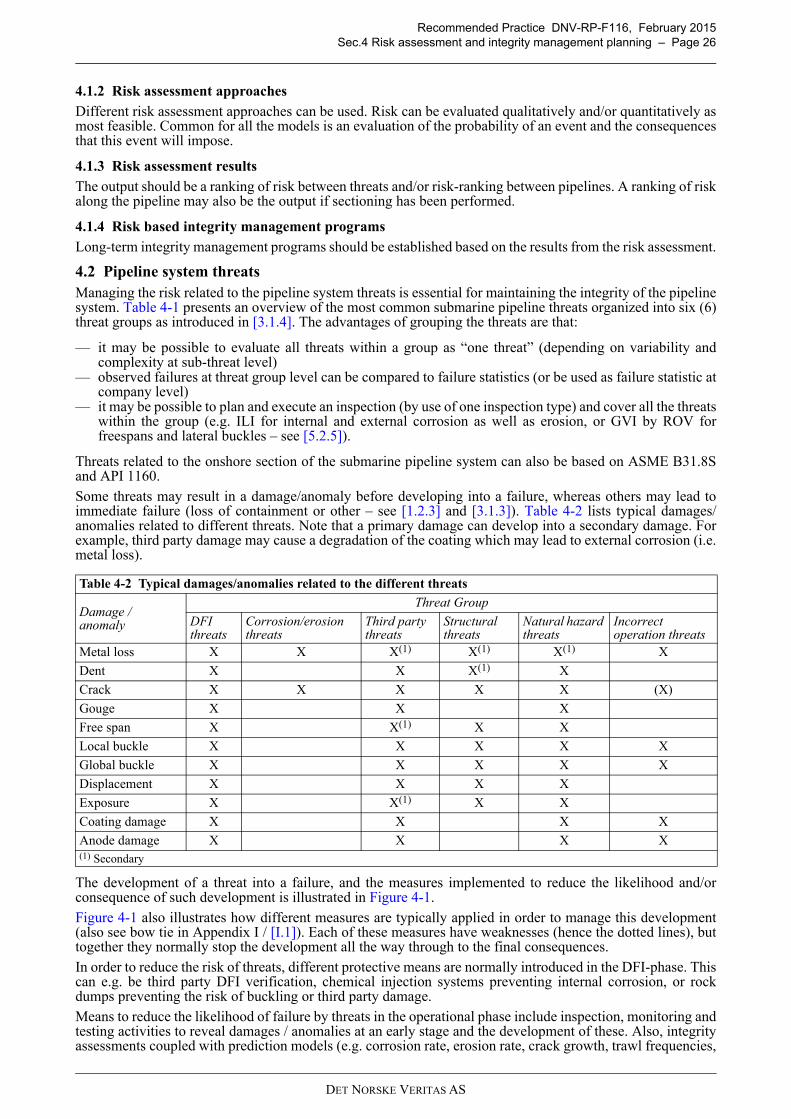
Recommended Practice DNV-RP-F116, February 2015Sec.4 Risk assessment and integrity management planning – Page 26
4.1.2 Risk assessment approaches
Different risk assessment approaches can be used. Risk can be evaluated qualitatively and/or quantitatively asmost feasible. Common for all the models is an evaluation of the probability of an event and the consequencesthat this event will impose.
4.1.3 Risk assessment results
The output should be a ranking of risk between threats and/or risk-ranking between pipelines. A ranking of riskalong the pipeline may also be the output if sectioning has been performed.
4.1.4 Risk based integrity management programs
Long-term integrity management programs should be established based on the results from the risk assessment.
4.2 Pipeline system threatsManaging the risk related to the pipeline system threats is essential for maintaining the integrity of the pipelinesystem. Table 4-1 presents an overview of the most common submarine pipeline threats organized into six (6)threat groups as introduced in [3.1.4]. The advantages of grouping the threats are that:
— it may be possible to evaluate all threats within a group as “one threat” (depending on variability andcomplexity at sub-threat level)
— observed failures at threat group level can be compared to failure statistics (or be used as failure statistic atcompany level)
— it may be possible to plan and execute an inspection (by use of one inspection type) and cover all the threatswithin the group (e.g. ILI for internal and external corrosion as well as erosion, or GVI by ROV forfreespans and lateral buckles – see [5.2.5]).
Threats related to the onshore section of the submarine pipeline system can also be based on ASME B31.8Sand API 1160.
Some threats may result in a damage/anomaly before developing into a failure, whereas others may lead toimmediate failure (loss of containment or other – see [1.2.3] and [3.1.3]). Table 4-2 lists typical damages/anomalies related to different threats. Note that a primary damage can develop into a secondary damage. Forexample, third party damage may cause a degradation of the coating which may lead to external corrosion (i.e.metal loss).
The development of a threat into a failure, and the measures implemented to reduce the likelihood and/orconsequence of such development is illustrated in Figure 4-1.
Figure 4-1 also illustrates how different measures are typically applied in order to manage this development(also see bow tie in Appendix I / [I.1]). Each of these measures have weaknesses (hence the dotted lines), buttogether they normally stop the development all the way through to the final consequences.
In order to reduce the risk of threats, different protective means are normally introduced in the DFI-phase. Thiscan e.g. be third party DFI verification, chemical injection systems preventing internal corrosion, or rockdumps preventing the risk of buckling or third party damage.Means to reduce the likelihood of failure by threats in the operational phase include inspection, monitoring andtesting activities to reveal damages / anomalies at an early stage and the development of these. Also, integrityassessments coupled with prediction models (e.g. corrosion rate, erosion rate, crack growth, trawl frequencies,
Table 4-2 Typical damages/anomalies related to the different threats
Damage / anomaly
Threat Group
DFI threats
Corrosion/erosion threats
Third party threats
Structural threats
Natural hazard threats
Incorrect operation threats
Metal loss X X X(1) X(1) X(1) X
Dent X X X(1) X
Crack X X X X X (X)
Gouge X X X
Free span X X(1) X X
Local buckle X X X X X
Global buckle X X X X X
Displacement X X X X
Exposure X X(1) X X
Coating damage X X X X
Anode damage X X X X(1) Secondary
DET NORSKE VERITAS AS
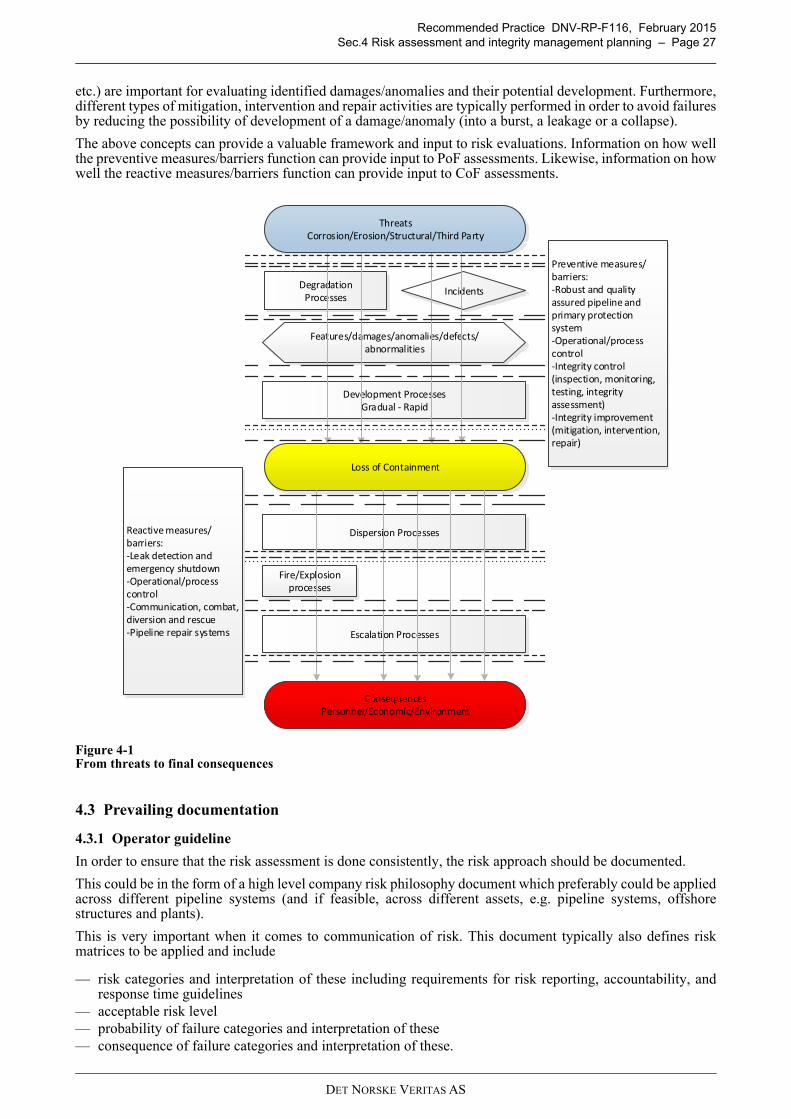
Recommended Practice DNV-RP-F116, February 2015Sec.4 Risk assessment and integrity management planning – Page 27
etc.) are important for evaluating identified damages/anomalies and their potential development. Furthermore,different types of mitigation, intervention and repair activities are typically performed in order to avoid failuresby reducing the possibility of development of a damage/anomaly (into a burst, a leakage or a collapse).
The above concepts can provide a valuable framework and input to risk evaluations. Information on how wellthe preventive measures/barriers function can provide input to PoF assessments. Likewise, information on howwell the reactive measures/barriers function can provide input to CoF assessments.
Figure 4-1From threats to final consequences
4.3 Prevailing documentation
4.3.1 Operator guideline
In order to ensure that the risk assessment is done consistently, the risk approach should be documented.
This could be in the form of a high level company risk philosophy document which preferably could be appliedacross different pipeline systems (and if feasible, across different assets, e.g. pipeline systems, offshorestructures and plants).
This is very important when it comes to communication of risk. This document typically also defines riskmatrices to be applied and include
— risk categories and interpretation of these including requirements for risk reporting, accountability, andresponse time guidelines
— acceptable risk level— probability of failure categories and interpretation of these— consequence of failure categories and interpretation of these.
ConsequencesPersonnel/Economic/Environment
ThreatsCorrosion/Erosion/Structural/Third Party
DegradationProcesses
Development ProcessesGradual - Rapid
Loss of Containment
Dispersion Processes
Fire/Explosionprocesses
Incidents
Features/damages/anomalies/defects/abnormalities
Escalation Processes
Preventive measures/barriers:-Robust and quality assured pipeline and primary protection system-Operational/process control-Integrity control (inspection, monitoring, testing, integrity assessment)-Integrity improvement (mitigation, intervention, repair)
Reactive measures/barriers:-Leak detection and emergency shutdown-Operational/process control-Communication, combat, diversion and rescue-Pipeline repair systems
DET NORSKE VERITAS AS
Recommended Practice DNV-RP-F116, February 2015Sec.4 Risk assessment and integrity management planning – Page 28
4.3.2 Pipeline system guidelinePipeline system specific documents aligned with the company philosophy and regulatory requirements shouldbe established. This document may include but is not limited to:
— reference to regulatory requirements— reference to operator specific requirements and prevailing procedures— list of threats to be considered for the most common equipment types with reference to best practices— list of consequence types to be considered with reference to best practices— list of types of activities and their pertinent frequencies (inspection, monitoring, testing, etc) to be included
in the integrity management program. Guidance on selection between comparable activity types should begiven
— philosophy related to re-qualification / life extension— relevant failure statistics (operator and industry wise).
4.3.3 Best practiceBest practice documents for evaluation of the individual threats or components should be established.Such document could be established on threat group or component type level. The document should at leastcontain the following:
— description of the threat and the operator's experience associated with this— needed input data to address the threats with reference to available data sources— detailed description of the assessment model. It is recommended to establish a levelled approach; where the
conservatism decreases with increasing level. The first level can e.g. be a screening level which requireslimited amount of input to reach a conclusion
— any limitation to the assessment model with guidance on exceptions— calculation example for each defined level.
4.4 Overall process The overall process for developing a long term risk based integrity management program is illustrated in Figure4-2 and outlined in the following sub-sections. It comprises the following main elements:
a) establish equipment scopeb) gather data and information, and identify threatsc) perform risk assessmentsd) develop integrity management programs.
More guidance is provided in App.F to App.I.
4.4.1 Establish equipment scopeThe risk assessment should be conducted for the entire pipeline system. The limits of each studied systemshould be clearly identified and documented. The pipeline as well as all components and protective meanswhere a failure jeopardises the structural integrity of the pipeline system should be included - also see [1.2.1]to [1.2.3], and [3.1.3].
DET NORSKE VERITAS AS
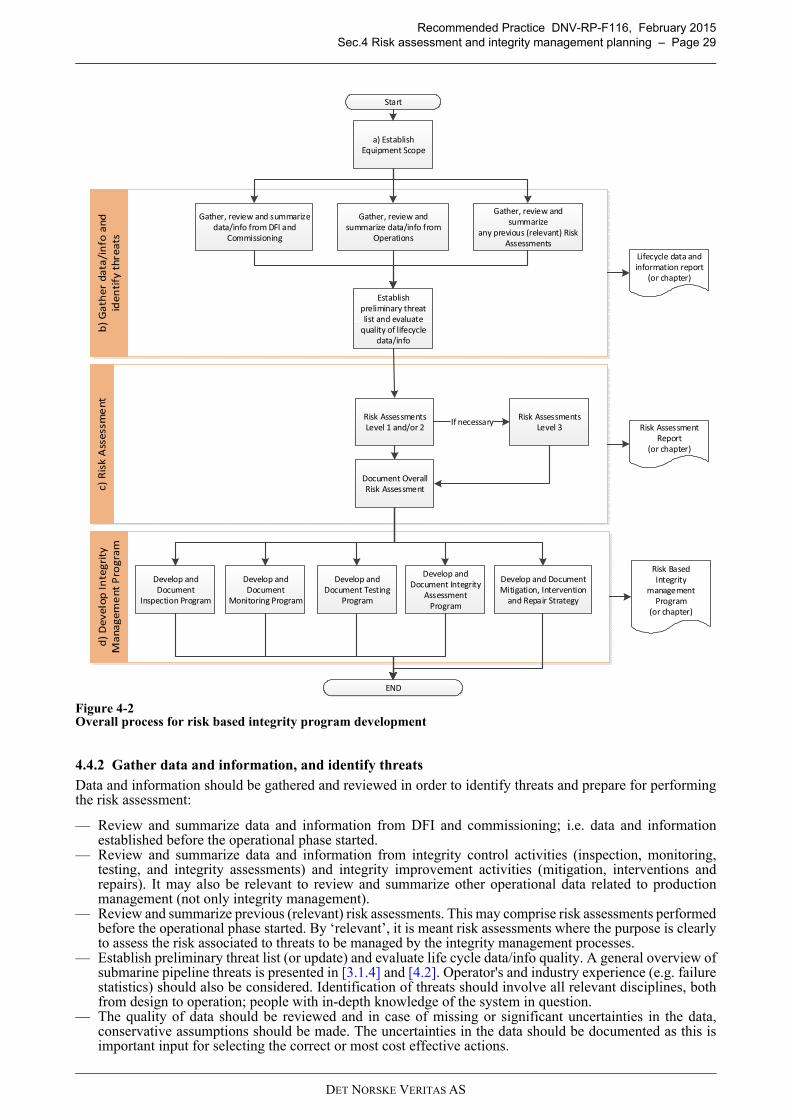
Recommended Practice DNV-RP-F116, February 2015Sec.4 Risk assessment and integrity management planning – Page 29
Figure 4-2Overall process for risk based integrity program development
4.4.2 Gather data and information, and identify threatsData and information should be gathered and reviewed in order to identify threats and prepare for performingthe risk assessment:
— Review and summarize data and information from DFI and commissioning; i.e. data and informationestablished before the operational phase started.
— Review and summarize data and information from integrity control activities (inspection, monitoring,testing, and integrity assessments) and integrity improvement activities (mitigation, interventions andrepairs). It may also be relevant to review and summarize other operational data related to productionmanagement (not only integrity management).
— Review and summarize previous (relevant) risk assessments. This may comprise risk assessments performedbefore the operational phase started. By ‘relevant’, it is meant risk assessments where the purpose is clearlyto assess the risk associated to threats to be managed by the integrity management processes.
— Establish preliminary threat list (or update) and evaluate life cycle data/info quality. A general overview ofsubmarine pipeline threats is presented in [3.1.4] and [4.2]. Operator's and industry experience (e.g. failurestatistics) should also be considered. Identification of threats should involve all relevant disciplines, bothfrom design to operation; people with in-depth knowledge of the system in question.
— The quality of data should be reviewed and in case of missing or significant uncertainties in the data,conservative assumptions should be made. The uncertainties in the data should be documented as this isimportant input for selecting the correct or most cost effective actions.
Start
Gather, review and summarize
any previous (relevant) Risk Assessments
END
Gather, review and summarize data/info from
Operations
Gather, review and summarize data/info from DFI and
Commissioning
Develop and Document
Monitoring Program
Develop and Document
Inspection Program
Risk AssessmentsLevel 1 and/or 2
Risk AssessmentsLevel 3
Establish preliminary threat list and evaluate
quality of lifecycle data/info
If necessary
Lifecycle data and information report
(or chapter)
Risk BasedIntegrity
management Program
(or chapter)
a) Establish Equipment Scope
Risk Assessment Report
(or chapter)
Document Overall Risk Assessment
Develop and Document Testing
Program
Develop and Document Integrity
Assessment Program
Develop and Document Mitigation, Intervention
and Repair Strategy
DET NORSKE VERITAS AS
Recommended Practice DNV-RP-F116, February 2015Sec.4 Risk assessment and integrity management planning – Page 30
— The data and information sources should be documented.— The output of the threat identification activities is a list of relevant threats and notes with regard to e.g.
failure modes, loads and causes, location, as well as related issues of uncertainty. — It is recommended to develop appropriate and re-usable forms for carrying out and recording results and
notes from the reviews and any research processes.
4.4.3 Perform risk assessments according to procedureThe assessment of risk should follow a documented procedure - see [4.3]. Deviation from the procedure shouldbe documented and justified. General guidance to a risk assessment procedure is presented in the following (more guidance is provided inApp.F to App.I):
— The risk is the product of PoF and CoF. In case the risk is not acceptable, risk reducing measures need tobe evaluated.
— Risk matrices should be used to present/communicate risk.
— Consequence of failure - The consequence of failure can be modelled at:
— threat group level, in this case the worst consequence related to the grouped threats apply— individual threat level, in this case the worst consequence related possible failure modes apply— failure mode, in this case the consequence profile can be used for all threats which may yield such
failure mode.
— Probability of failure:
— All threats should be considered either as individual threats or on a group level.— Components of equal type can be evaluated together.— Depending on the adopted methodology, the pipeline can be divided into sections. The selection of
input data should reflect a conservative approach for the entire section. An alternative to pipelinesectioning is to describe the input parameters as profiles along the route and estimate a PoF-profile.
— If the consequence modelling is done on a failure mode level, e.g. leak, burst; the PoF modelling needsto consider all relevant failure modes.
— Identification of risk reducing measures - To be able to select cost effective measures, it is important toidentify the risk driving factors. Further, selection of the most cost effective measure may only be done afterall threats have been considered. Risk reduction can either be achieved by reducing the probability or theconsequence (or both) of an event.
— Typical measures to reduce the probability side are: analytical (i.e. more refined calculations),additional inspection, monitoring and testing, intervention or repair, de-rating e.g. load reduction, loadcontrol measures, replacement of sections or parts of the system.
— Among the measures to reduce the consequence side are: analytical (i.e. more refined calculations),enhance emergency response procedures and associated equipment (especially related to safety andenvironmental consequences), enhance pipeline repair strategies and equipment to reduce down time(economic consequences), establish optional solutions to take over the functionality of the failedequipment.
— Aggregated risk - A total risk profile can be generated along the pipeline system summing up thecontribution from all threats. The risk profile should be benchmarked towards risk profiles for similar/comparable pipeline systems. This is done to ensure consistency in the risk assessment and to detect grosserrors.
— An overall evaluation of the pipeline system should be made. All identified risk reducing measures shouldbe highlighted and registered in an appropriate administrative system.
— A levelled approach can be used for assessing risk*:
— Level-1 assessments are based on applying simple qualitative evaluations. The main objective is todetermine risk levels with minimum efforts through one or several workshops. Certain parts of theLevel-1 assessment will be considered sufficient for the purpose of long term integrity managementplanning. The remaining will need to be assessed at a more detailed level (Level-2). For example,threats where the risk is low enough may be concluded to not require any further (more) detailedassessment. Another example is when the Level-1 CoF assessment is considered sufficient, whereas aLevel-2 PoF assessment is concluded necessary. Prioritizations and planning with respect to furtherassessment at Level-2 can be based on the overall results/ranking from the Level-1 assessment.
— Level-2 assessments require more effort than a Level-1 assessment and may be more appropriate to bedone as a combination of workshops and individual efforts. Level-2 Assessments are based on applyingqualitative and/or semi-quantitative evaluations. Relevant documents and data are typically reviewedmore thoroughly. Documentation of a Level-2 assessment may therefore be more comprehensive thana Level 1 assessment.
DET NORSKE VERITAS AS
Recommended Practice DNV-RP-F116, February 2015Sec.4 Risk assessment and integrity management planning – Page 31
— Level-3 assessments involve quantitative probabilistic calculations (w.r.t. to PoF and possibly alsow.r.t. CoF as well). Such an assessment should be considered if e.g. serious damage has been positivelyidentified, and a strategy for how to handle this damage can benefit from input given by such aquantitative exercise.
*For a given pipeline system, the whole range of approaches may be in use at any given time (i.e. a balanced application of the differentlevels). Whenever practically possible, quantitative calculations should be carried out and used to support qualitative assessments. Butsimilarly, even if a fully quantitative approach is applied it is still recommended to do a qualitative review to sense-check thequantitative results.
4.4.4 Documentation of risk assessmentA report of the risk assessments should be prepared. Risks that require any actions should be highlightedtogether with identified integrity control and improvement activities.
4.4.5 Develop integrity management programsThe (long-term) integrity management programs are developed based on the results from the risk assessment -see [4.1.4].Based on a risk assessment, the program justifies what activities, why, how and when the activities are to beperformed. The integrity management program gives minimum required integrity control activities (incl. max.intervals*) for different pipeline sections. It may also provide strategies for integrity improvement activities fordifferent pipeline sections. It is based on the given design and construction, and modifications and mitigationactions taken during operation. The objectives of the integrity management program is to provide
— a long term plan to verify (through inspection, monitoring, testing and integrity assessment activities) thatthe behaviour of the pipeline is in accordance with expected development as predicted during the designphase and/or previous assessments during the operational phase, and
— a strategy in order to be prepared for handling any integrity issues which may require improvement(through mitigation, intervention and repair activities).
* More frequent intervals of a planned activity may be performed if it is found to be more practical and/or economical.
The following threat groups (and underlying threats) should normally be considered in the long-term programs:
— corrosion/erosion threats— third party threats— and structural threats.
With reference to [3.1.4] and [4.2], failure related to DFI threats normally occurs during installation and earlyoperation. Inspections related to natural hazard are generally done after an event, e.g. after extreme weather.For parts of the world where e.g. hurricanes occur regularly, such threats would be more natural to include inthe long term program. Incorrect operation can be detected by scheduled inspections, but is normally coveredby review/audits and training of personnel.Notice that DFI threats and incorrect operation threats can be handled through the management of corrosion/erosion threats, third party threats, structural threats (with reference to the barrier concept introduced in [4.2],and to the guidelines provided in App.I).The pipeline system may be divided into sections dependent on types of activity* (depending on types ofthreats). This sectioning may e.g. reflect:
— the inspection type capabilities— manageable length within a year— historical practice— risk level (to focus the inspection on high risk sections). Note that locations with unacceptable high risk
may need ad-hoc inspections which are not part of the long term plan.
More guidance is provided in App. F.* Sectioning may also have been carried from a PoF an/or a CoF point of view – See [F.3.5] and [F.4.3].
DET NORSKE VERITAS AS
Recommended Practice DNV-RP-F116, February 2015Sec.5 Inspection, monitoring and testing – Page 32
5 Inspection, monitoring and testing
5.1 GeneralInspection and monitoring are condition monitoring activities carried out to collect operational data and othertype of information indicating the condition of a component. Operational data can be physical data such astemperature, pressure, flow, injection volume of chemicals, number of operating cycles.
For submarine pipelines, maintenance activities are normally covered by the inspection and monitoringprogram. Maintenance activities are typically cleaning pigging (scraper or chemical treatment) or removal ofdebris from anodes prior to CP measurements if necessary (this can reduce the lifetime of anodes).
Generally, an inspection physically monitors the state of a component directly (e.g. wall thickness, damage tothe pipeline, coating defect, pipeline displacement), whilst monitoring is the collection of relevant processparameters which indirectly can give information regarding the condition of a component.
In the context of integrity management of submarine pipeline systems, testing may include the following:system pressure testing, testing of safety equipment, pressure control equipment, over-pressure protectionequipment, emergency shutdown systems, automatic showdown valves, and safety equipment in connectingpiping systems.
System pressure testing is not normally applied as a regular integrity control activity. However, there are caseswhere this might be considered, e.g. if a system has not been designed for pigging operations and theoperational conditions have changed in such a way that there are significant uncertainties with regard to thesystem's structural integrity. In-service system pressure testing may also be carried out in connection withrepairs or modifications of the system.
5.1.1 Detailed planning based on integrity management program
Integrity management programs developed by the risk assessment and IM planning activity should form thebasis for the detailed planning for the integrity control activities (i.e. inspection, monitoring and testingactivities). Also see [3.1.1] and [4.1].
5.1.2 Deviations in plans
Any deviations from the original integrity management programs should be reported and the reason for thedeviation established.
5.1.3 Handling of unexpected events
Unexpected events may initiate the need for unplanned control activities. To what extent, how and when tocarry out this control activity, should be handled through the risk assessment and IM planning activity. This isto ensure coordination with other prospective control activities and to evaluate the need for modification of theoriginal strategies.
5.1.4 Update of detailed plans
The detailed plans should be updated on a regular basis and be based on preceding plans and the resultsachieved from the integrity control activities.
5.1.5 Handling of significant findings identified during control activities
Any (clearly) unacceptable situation, mechanical damage or other abnormalities detected (discovered) duringthe planned control activities, should immediately be reported and subjected for review and the appropriateactions defined and initiated.
5.2 InspectionThe main activities associated with the inspection are:
— detailed planning:
— detailed description of the scope of work— specification of reporting criteria— development of work packages— preparation of work instructions and procedures — establishment of responsibilities and communication lines between inspection Contractor and Operator — procurement of equipment— establishment of plans for the mobilisation of equipment and personnel— carry out risk management activities for the inspection activity.
— Execution:
— mobilisation of personnel and equipment and transportation to the site — carrying out safety activities
DET NORSKE VERITAS AS
Recommended Practice DNV-RP-F116, February 2015Sec.5 Inspection, monitoring and testing – Page 33
— complete the inspection— de-mobilisation— preliminary reporting towards the specified reporting criteria.
— Evaluation of the quality of the data collected during inspection, reporting and documentation:
— quality control of the inspection results— issue of final inspection report.
5.2.1 Purpose of inspection
The purpose for an inspection should be re-visited and clearly defined during detailed planning.
5.2.2 Operation/inspection manual
All work instructions, procedures, communication lines and responsibilities, which are mandatory for a safeand cost-effective inspection process, and which constitutes the operation manual, should be established andimplemented. Also see Sec.2.
5.2.3 Risk management w.r.t. the inspection operation
Risk associated with the inspection operation itself should be explicitly managed. Recommendations withregard to risk management in marine- and subsea operations can be found in DNV-RP-H101. Guidelinesconcerning hazard identification and risk assessment for marine and subsea operations can be found in ISO-17776.
API standard 1163 provides guidance to in-line inspection (ILI) service providers and pipeline operatorsemploying ILI technology or 'smart pigs'. The standard also provides requirements for qualification of in-lineinspection systems used in gas and hazardous liquid lines as well as interpretation of results. API standard 1163is an umbrella document that, by reference, incorporates NACE RP 0102 and ANSI/ASNT ILI-PQ.
5.2.4 Preparation for inspection
The detailed work description should be prepared prior to inspection. This should include preparing thefollowing as a minimum:
— description of the pipeline system, including any special information important for the inspection/survey(e.g. location of pipeline reducers, branches, changes in wall thickness)
— purpose of the inspection including description of relevant threats and types of damage as well as criteria— specification of required equipment— detailed description of the equipment and inspection tools — requirements for calibration of the equipment— qualification of personnel— detailed instructions for the inspection including operation procedures— requirements for documentation of inspection results and/or findings— preparation of an outline of the inspection report.
5.2.4.1 Specification of equipment
The long term inspection program specifies the purpose of the inspection, the type of inspection to be carriedout and where to be carried out. It may e.g. specify intelligent pigging using MFL, or external ROV. Furtherspecification of the required equipment needs to be addressed when planning a specific inspection in detail.This should be done as part of the detail planning. The accuracy of the selected methodology should beconsidered.
In-line Inspections - The following information will typically be required when preparing for a piggingoperation:
— what to inspect for (wall thickness loss, cracks, dents)— internal or external corrosion attacks— launcher and receiver dimensions— inner diameter for the entire system— pipeline length, pipeline wall thickness— linepipe material, internal cladding or lining, if applicable— elevation profile— data (as location, dimensions) on bends, tees, wyes, valves, etc. — pipeline content, pressure, temperature, fluid velocity.
External surveys - The following information will typically be required when preparing for an external survey:
— What to inspect for:
— the CP system - looking for abnormal consumption of the anode mass.
DET NORSKE VERITAS AS
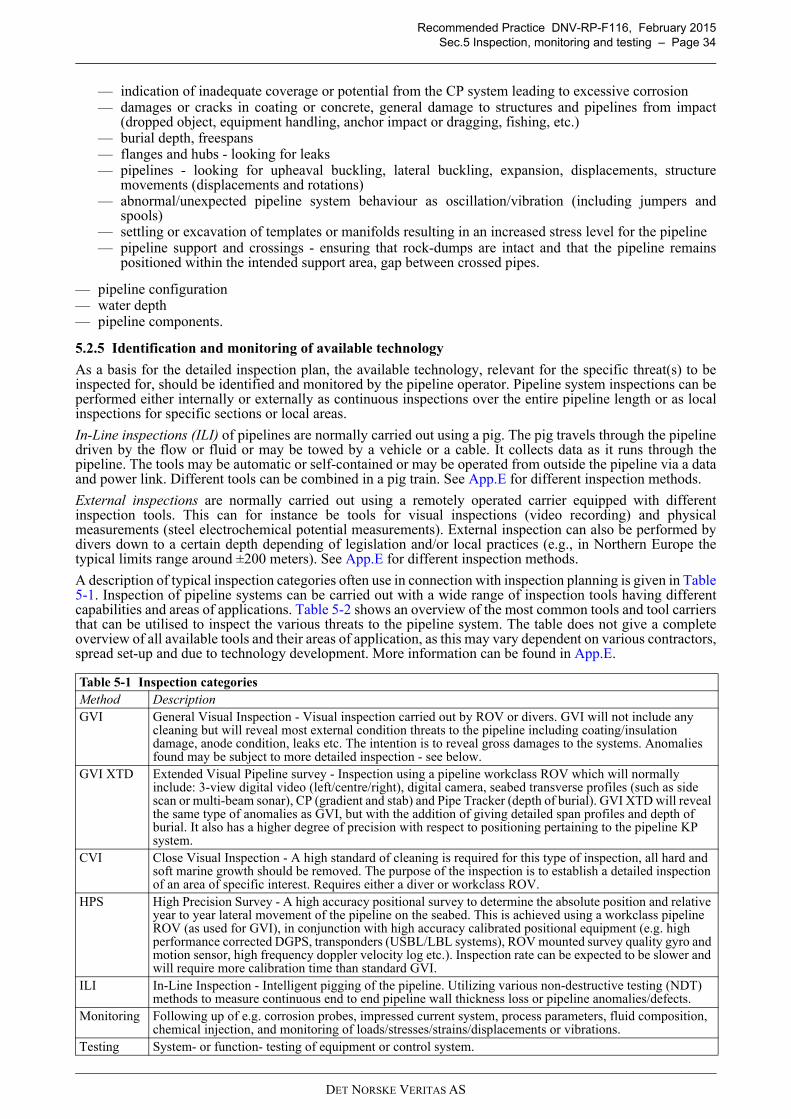
Recommended Practice DNV-RP-F116, February 2015Sec.5 Inspection, monitoring and testing – Page 34
— indication of inadequate coverage or potential from the CP system leading to excessive corrosion— damages or cracks in coating or concrete, general damage to structures and pipelines from impact
(dropped object, equipment handling, anchor impact or dragging, fishing, etc.)— burial depth, freespans— flanges and hubs - looking for leaks— pipelines - looking for upheaval buckling, lateral buckling, expansion, displacements, structure
movements (displacements and rotations)— abnormal/unexpected pipeline system behaviour as oscillation/vibration (including jumpers and
spools)— settling or excavation of templates or manifolds resulting in an increased stress level for the pipeline— pipeline support and crossings - ensuring that rock-dumps are intact and that the pipeline remains
positioned within the intended support area, gap between crossed pipes.
— pipeline configuration— water depth— pipeline components.
5.2.5 Identification and monitoring of available technology
As a basis for the detailed inspection plan, the available technology, relevant for the specific threat(s) to beinspected for, should be identified and monitored by the pipeline operator. Pipeline system inspections can beperformed either internally or externally as continuous inspections over the entire pipeline length or as localinspections for specific sections or local areas.
In-Line inspections (ILI) of pipelines are normally carried out using a pig. The pig travels through the pipelinedriven by the flow or fluid or may be towed by a vehicle or a cable. It collects data as it runs through thepipeline. The tools may be automatic or self-contained or may be operated from outside the pipeline via a dataand power link. Different tools can be combined in a pig train. See App.E for different inspection methods.
External inspections are normally carried out using a remotely operated carrier equipped with differentinspection tools. This can for instance be tools for visual inspections (video recording) and physicalmeasurements (steel electrochemical potential measurements). External inspection can also be performed bydivers down to a certain depth depending of legislation and/or local practices (e.g., in Northern Europe thetypical limits range around ±200 meters). See App.E for different inspection methods.
A description of typical inspection categories often use in connection with inspection planning is given in Table5-1. Inspection of pipeline systems can be carried out with a wide range of inspection tools having differentcapabilities and areas of applications. Table 5-2 shows an overview of the most common tools and tool carriersthat can be utilised to inspect the various threats to the pipeline system. The table does not give a completeoverview of all available tools and their areas of application, as this may vary dependent on various contractors,spread set-up and due to technology development. More information can be found in App.E.
Table 5-1 Inspection categoriesMethod DescriptionGVI General Visual Inspection - Visual inspection carried out by ROV or divers. GVI will not include any
cleaning but will reveal most external condition threats to the pipeline including coating/insulation damage, anode condition, leaks etc. The intention is to reveal gross damages to the systems. Anomalies found may be subject to more detailed inspection - see below.
GVI XTD Extended Visual Pipeline survey - Inspection using a pipeline workclass ROV which will normally include: 3-view digital video (left/centre/right), digital camera, seabed transverse profiles (such as side scan or multi-beam sonar), CP (gradient and stab) and Pipe Tracker (depth of burial). GVI XTD will reveal the same type of anomalies as GVI, but with the addition of giving detailed span profiles and depth of burial. It also has a higher degree of precision with respect to positioning pertaining to the pipeline KP system.
CVI Close Visual Inspection - A high standard of cleaning is required for this type of inspection, all hard and soft marine growth should be removed. The purpose of the inspection is to establish a detailed inspection of an area of specific interest. Requires either a diver or workclass ROV.
HPS High Precision Survey - A high accuracy positional survey to determine the absolute position and relative year to year lateral movement of the pipeline on the seabed. This is achieved using a workclass pipeline ROV (as used for GVI), in conjunction with high accuracy calibrated positional equipment (e.g. high performance corrected DGPS, transponders (USBL/LBL systems), ROV mounted survey quality gyro and motion sensor, high frequency doppler velocity log etc.). Inspection rate can be expected to be slower and will require more calibration time than standard GVI.
ILI In-Line Inspection - Intelligent pigging of the pipeline. Utilizing various non-destructive testing (NDT) methods to measure continuous end to end pipeline wall thickness loss or pipeline anomalies/defects.
Monitoring Following up of e.g. corrosion probes, impressed current system, process parameters, fluid composition, chemical injection, and monitoring of loads/stresses/strains/displacements or vibrations.
Testing System- or function- testing of equipment or control system.
DET NORSKE VERITAS AS
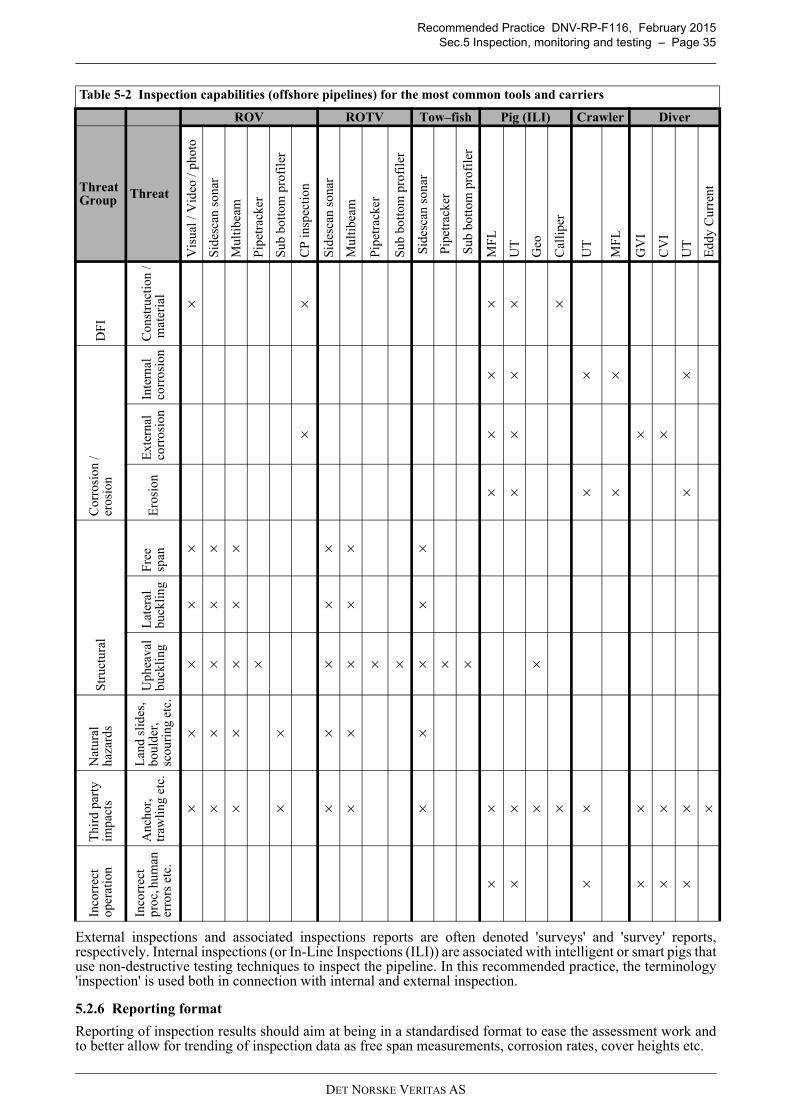
Recommended Practice DNV-RP-F116, February 2015Sec.5 Inspection, monitoring and testing – Page 35
External inspections and associated inspections reports are often denoted 'surveys' and 'survey' reports,respectively. Internal inspections (or In-Line Inspections (ILI)) are associated with intelligent or smart pigs thatuse non-destructive testing techniques to inspect the pipeline. In this recommended practice, the terminology'inspection' is used both in connection with internal and external inspection.
5.2.6 Reporting format
Reporting of inspection results should aim at being in a standardised format to ease the assessment work andto better allow for trending of inspection data as free span measurements, corrosion rates, cover heights etc.
Table 5-2 Inspection capabilities (offshore pipelines) for the most common tools and carriers
ROV ROTV Tow–fish Pig (ILI) Crawler Diver
Threat Group Threat
Vis
ual /
Vid
eo /
phot
o
Sid
esca
n so
nar
Mul
tibe
am
Pip
etra
cker
Sub
bot
tom
pro
file
r
CP
insp
ecti
on
Sid
esca
n so
nar
Mul
tibe
am
Pip
etra
cker
Sub
bot
tom
pro
file
r
Sid
esca
n so
nar
Pip
etra
cker
Sub
bot
tom
pro
file
r
MF
L
UT
Geo
Cal
lipe
r
UT
MF
L
GV
I
CV
I
UT
Edd
y C
urre
nt
DF
I
Con
stru
ctio
n /
mat
eria
l
× × × × ×
Cor
rosi
on /
eros
ion
Inte
rnal
co
rros
ion
× × × × ×
Ext
erna
l co
rros
ion
× × × × ×
Ero
sion × × × × ×
Str
uctu
ral
Fre
e sp
an
× × × × × ×
Lat
eral
bu
ckli
ng
× × × × × ×
Uph
eava
l bu
ckli
ng
× × × × × × × × × × × ×
Nat
ural
ha
zard
s
Lan
d sl
ides
, bo
ulde
r,
scou
ring
etc
.
× × × × × × ×
Thi
rd p
arty
im
pact
s
Anc
hor,
tr
awli
ng e
tc.
× × × × × × × × × × × × × × × ×
Inco
rrec
t op
erat
ion
Inco
rrec
t pr
oc, h
uman
er
rors
etc
.
× × × × × ×
DET NORSKE VERITAS AS
Recommended Practice DNV-RP-F116, February 2015Sec.5 Inspection, monitoring and testing – Page 36
5.2.7 External inspection reports
After an inspection, a report including a printout of the listings (first hand report, final report) should alwaysbe issued.
5.2.7.1 Typical report content
The external survey report should typically contain information on the following:
— scope of the inspection— survey vessel— description of inspection tools and equipment and calibration certificates— acceptance criteria— accuracy and confidence level for the selected inspection method— reference to relevant procedures for the inspection— pipeline information, geometrical data like diameter, wall thickness, coating etc.— KP definitions, date and time, KP— coverage of survey— UTM coordinates and conversion algorithm applied— operational conditions in the pipeline, like measured temperature, pressure and flow-rates and flow
direction including location of measurement equipment— seabed configuration— explanation of expression and terms, symbols used in reports and listings— sea state (current, waves etc) during survey— Digital Terrain Models (DTM), KP database or alignment sheets used to plan the survey and used during
the survey— data recorded on-line and off-line, post processing, manipulation and smoothening of data— threshold or cut-off levels for reporting (like limiting free span length, gap)— listings of findings— findings that exceed acceptance criteria— listing of deviations from plans.
Instead of printing all listings in the survey report, the report should summarize the information similar to whatis listed in the bullet points above.
The report should also include:
— definitions and an explanation on how the data should be read and interpreted— cross reference to digital reports (file name), charts, drawings, pictures and videos delivered should be
given.
5.2.7.2 Listings
The amounts of collected data from one single survey either externally of internally can be significant. Mostdata are reported in so called “listings”.
Listings may contain information as (measured as a function of KP or easting/northing):
— time and date— KP (distance)— Easting and Northing positions — wall thickness (only for ILI)— seabed configuration, average seabed profile, trenches, rock dumpings— scouring — location and condition of mattresses, sleepers, protection structures — location of components like valves and flanges — free span length, gap, shoulders— debris, mines, ship wrecks, fishing equipment, etc.— coating damage— events like dents, leakage, unintended exposure, upheaval buckling— CP recordings — offset or sliding marks in the seabed caused by the pipeline.
“Listings” should be in a digital format. To obtain good quality in survey reporting, it is important that listingsare in a consistent format. The format should be selected based upon the amount of data-recorded, specificationfor data formatting and available software.
Inspection reports are normally issued as first-hand reports shortly after the inspection and as final inspectionreports later on. In most cases, these reports contain the same type of information (and conclusions) but areissued at different times. However, some adjustments of the inspection results may appear after a more detailedassessment of the results has been performed.
DET NORSKE VERITAS AS
Recommended Practice DNV-RP-F116, February 2015Sec.5 Inspection, monitoring and testing – Page 37
5.2.8 Internal inspection reportsFindings from internal inspections are strongly recommended to be reported in such a manner that it allows forcomparison between different campaigns and thereof the possibility of revealing any development of i.e. metalloss over time (i.e. trending).The document “Specifications and requirements for intelligent pig inspection of pipelines” /1/ developed byThe Pipeline Operator Forum (POF) gives operational and reporting specifications and requirements for toolsto be used for geometric measurements, pipeline routing, metal loss, crack or other defect detections reportedduring the inspection campaign.
5.2.9 Review of inspection resultsIn addition to the report from the inspection contractors, which might include an assessment of the results, theoperator should carry out and document a high level evaluation of the inspection and the results. Thisevaluation should address:
— if the inspection has been done according to the plan which describes what, how and when to inspect.— the quality of the inspection (i.e. confidence in results)— a high level evaluation of the inspection results with respect to the integrity (e.g. classified as insignificant,
moderate, significant, severe findings)— recommendations for further assessment of the findings (e.g. remaining life calculations according to
DNV-RP-F101, see Sec.6).
5.3 MonitoringMonitoring is the measurement and collection of data that indirectly can give information on the condition ofa component or a system. The monitoring data is typically either on-line measurements or offline measurements (scheduled). Monitoringplans and schedules should be founded on risk assessments based on current flow and expected fluctuationsunder different production scenarios.
5.3.1 Main monitoring activitiesMonitoring should include the following main activities:
— description of the purpose of the monitoring— data acquisition and storage— retrieval and analysis of data— documentation and reporting, including comparison against acceptance criteria.
The monitoring activities should be governed by the integrity management program – see [3.1.1].
5.3.2 Identification and follow-up of available technologyThe available and relevant monitoring technology should be identified and followed-up by the pipelineoperator.The techniques for condition monitoring can either be on-line or off-line. On-line monitoring representscontinuous and/or real-time measurements of parameters of interest. Off-line monitoring would typically bescheduled sampling with subsequent analysis at e.g. a laboratory.Monitoring can be performed by (locally) direct and indirect techniques. With regard to corrosion, directtechniques typically measure the corrosion attack or metal loss at a certain location in the pipeline systemutilising corrosion probes, whilst indirect techniques measure parameters that affect the corrosion (e.g. O2content).Monitoring is further classified as intrusive or non-intrusive. An intrusive method will require access throughthe pipe wall for measurements to be made, whilst a non-intrusive technique is performed externally (will notrequire access through the wall thickness) or analysis of sample data taken from the process stream.Monitoring techniques are related to monitoring of e.g.:
— chemical composition (e.g. CO2, H2S, water)— process parameters (e.g. P, T, flow)— external or internal corrosion— internal erosion (i.e. sand)— currents— waves— vibrations— oscillations (due to e.g. slugging)— strains— pipe displacements— ship traffic and fishing activity
DET NORSKE VERITAS AS
Recommended Practice DNV-RP-F116, February 2015Sec.5 Inspection, monitoring and testing – Page 38
— land movement— leak detection.
Corrosion monitoring - The rate of corrosion dictates for how long any process equipment can be safelyoperated. The corrosion monitoring techniques can help in several ways such as:
— by providing an early warning of possible changes in corrosion rate— trending of changes in process parameters and the corresponding effect on the corrositivity— monitoring the effectiveness of the implemented corrosion preventive means as e.g. chemical inhibition.
Monitoring of external corrosion - Pipelines are protected from external corrosion by coatings (primaryprotective means) and cathodic protection (secondary protective means). Cathodic protection is typically doneby using sacrificial anodes for submarine pipelines and impressed current for onshore pipelines. Visualinspection is regularly carried out for detecting coating damages. Monitoring of galvanic anodes is done by e.g.measurement of anode potential and current output or measurement of electrical field, ref. [C.4.1].Monitoring of internal corrosion and erosion - Monitoring techniques for corrosion monitoring and sandmanagement are typically:
— monitoring probes:
— electrical resistance (ER) probes— weight loss coupons— linear polarisation resistance (LPR) probes— hydrogen probes.
Note:Since ER-probes, LPR-probes and weight loss coupons normally are located topside, the value of the recordings arediscussed. However, recordings from such probes will enable the Operator to trend any major changes in thecorrosivity of the medium and thus the likelihood for an increased uniform corrosion rate to occur. It will not be ableto disclose local corrosion attacks.
— field Signature Method (FSM) spools located at low spots to measure local corrosion— sampling
— samples of debris gathered by running cleaning or scraper pigs— samples of the fluid.
— sand monitoring devices (e.g. sand detection and monitoring probes, non-intrusive acoustic detectors).
---e-n-d---of---n-o-t-e---
Monitoring of internal corrosion is further described in [C.4.4]Current and vibration monitoring - Currents near the seafloor can be monitored to control the likelihood ofscouring or pipeline movement, while vibration monitoring systems might be installed in connection withfreespans to monitor vortex induced vibrations (VIV) or vibrations caused by currents.Vibration monitoring systems are typically clamp sensor packages that are attached to the pipeline at regularintervals to record vibrations in e.g. all three axial directions.Monitoring of ship traffic and fishing activities - Tracking data of the locations and movements of ships andfishing vessels should be requested for vulnerable parts of the pipeline (e.g. not designed for overtrawlability,high risk areas).Leak detection - Leak detection in way of flow monitoring or external leak detection systems is essential inorder to detect any leaks at an early stage.Industry practice shows that mass/flow monitoring and pressure drop-monitoring is the most commonly usedmethod for detecting leaks (or rupture) from a pipeline while external devices as point sensors are morecommonly used for subsea equipment as templates and manifolds to measure leaks from e.g. valves.Appendix D provides a short overview of different technologies suitable as leak detection systems forsubmarine pipelines. Short comments on whether the leak detection systems are suitable for onshore pipelinesare also given.
5.3.3 Review of monitoring dataThe results from monitoring activities should be evaluated at least on annual basis. More frequent review maybe appropriate in the early operational phase. The review should at least consider:
— that all planned monitoring activities have been done and in accordance with specifications— that the monitoring data are within the design envelope, and if not, ensure that deviations have been handled
according to relevant procedures— a high level evaluation of the monitoring results with possible impact on the integrity assessment— recommendations for further assessment as required.
DET NORSKE VERITAS AS
Recommended Practice DNV-RP-F116, February 2015Sec.5 Inspection, monitoring and testing – Page 39
5.4 Testing
5.4.1 Pressure testingSystem pressure testing - Pressure testing can be used to demonstrate the strength of a pipeline. This integrityassessment method can be both a strength test and a leak test.System pressure testing may be required when:
— the original mill pressure test or system pressure test does not satisfy requirements according to the designstandard in case of e.g. a new design pressure (i.e. re-qualification)
— a significant part of the pipeline has not been system pressure tested e.g. new pipeline sections as part of amodification or repair campaign
— as an alternative to document the current condition of the pipeline system if general inspections techniquescan not be utilised to inspect the internal or external condition of the pipeline.
There are limitations associated with pressure testing when applied after the pipeline has been in service for anumber of years. These are typically:
— the method does not provide any information regarding the depth or location of sub-critical flaws— the method does not verify that the acceptance criteria are fulfilled (e.g. wall thickness)— it normally requires the pipeline to be taken out-of service for the testing— it may be a challenge to remove water from the pipeline following a hydrostatic pressure test. Such residual
water would have the potential for initiating internal corrosion.
ASME B31.8 and DNV-OS-F101 give requirements to the execution of a pressure test.Hydrostatic testing - Hydrostatic testing requires water within the pipeline to be pressurized beyond themaximum operating pressure, and then maintained to determine if there are any leaks. How far beyond themaximum operating pressure and for how long depends on the governing pipeline code (see ASME B31.8 andDNV-OS-F101). The operational integrity of welds and the pipe is demonstrated if the hydrostatic test issuccessfully passed (at the time of testing).Hydrostatic pressure testing requires that detailed procedures for treatment of the water to be used in thepressure test and drying of the pipeline system subsequent to the testing are developed and approved prior tothe pressure testing commences.Gas or media testingGas: Pressure testing with an inert gas or with the produced or processed flowing media is also possible.Testing with gas may increase the likelihood of a rupture rather than a leak should a failure occur during thetest. For this reason, gas testing is often limited to short lengths of pipe.Media: Pressure testing to demonstrate the integrity of a line with the produced or processed flowing mediacould be attractive if the likelihood of a test failure is small. When testing with the flowing media, some gasmay be used to boost the pressure. There is an increased risk of a rupture when significant volumes of gas arerequired.Shut-in testing - In addition to elevated pressure testing, shut-in leak tests are sometimes used. During such atest, the pressure is shut in for the time needed to detect a leak of a given size (leak rate). Shut-in tests are morecommon in liquid lines, where leaks are usually easier to record, provided the media is (nearly) incompressible.Long hold times are required for shut-in tests for small leaks.Pressure testing limitations - There are concerns that any elevated pressure test could enable sub-critical pipeimperfections and cracks to increase in size; and consequently subsequently fail under a pressure below the testpressure. In these cases, the line is exposed for a short time to a spike pressure above that used during the restof the test. The spike pressure is intended to remove any near-critical flaws that might grow during thesubsequent hold period at a lower pressure.A limitation of pressure testing is that it provides no information on the location or even the existence of sub-critical flaws. The time required for a sub-critical flaw to grow to critical dimensions increases as the ratio oftest pressure to operating pressure increases. At low test pressures (i.e., near the operating pressure), little orno safety margin is provided.
5.4.2 Testing of safety equipmentFor testing of safety equipment, appropriate standards and codes (used as basis for design) should be utilized.Many designs are based on the e.g. IEC 61508 / IEC 61511 (safety instrumented systems).
5.4.3 Safety equipment – test interval according to authority requirementsRequirements to test intervals as given by the respective authorities should also be adhered to.
5.4.4 Review of test resultsA review of the test plan should be done on an annual basis to ensure that planned testing has been conductedand that the results from such are take into consideration.
DET NORSKE VERITAS AS
Recommended Practice DNV-RP-F116, February 2015Sec.6 Integrity assessment – Page 40
6 Integrity assessment
6.1 General
Integrity assessments may be split into:
— corrosion assessments covering internal and external corrosion— mechanical assessments covering e.g. fatigue in free-spans, fatigue in buckles, displacement causing
damage, displacement causing overstress, third party damage causing extreme strains.
6.1.1 Integrity assessment due to un-planned events
When a potentially unacceptable damage or abnormality is observed or detected, an integrity assessmentshould be performed and should include a thorough evaluation of the damage/abnormality and the possibleimpact on the safety for further operation of the pipeline.
The details of the damage/anomaly should be quantified taking accuracy and uncertainties of measurementsinto consideration, and the cause(s) should be identified. Additional inspection, monitoring and testing may benecessary.
Necessary information needs to be reported as input to the updated risk assessment where overall plans withregard to any mitigation, intervention and repairs are developed.
6.1.2 Temporary operation of damaged pipeline systems
Pipeline systems with unacceptable damage / anomalies may be operated temporarily under the designconditions or reduced operational conditions until the defect has been removed or repair has be carried out. Itmust, however, be documented that the pipeline integrity and the specific safety level is maintained, which mayinclude reduced operational conditions and/or temporary precautions. If the pipeline cannot be repaired, itshould be formally de-rated prior to continuous operation.
6.1.3 Planned integrity assessments
Integrity management programs developed by the risk assessment and IM planning should determine the needfor planned integrity assessments (not necessarily initiated by the unanticipated discovery of a potentiallyunacceptable defect).
6.1.4 Overview of available assessment codes
An overview of relevant available codes should be provided by the integrity management program.
An overview of available assessment codes for the most common damages/anomalies is given in Table 6-1.For assessment of global buckling, reference is also given to App.B. For internal and external corrosion,reference is also given to App.C.
6.1.5 Basis for integrity assessment
The integrity assessment process should be based on historical data.
Figure 6-1 gives an example of the different activities that produce data needed for the integrity assessment.
The data achieved from such activities should be properly documented to ensure traceability and enabletrending.
6.2 Un-piggable pipelines
Un-piggable pipelines are those that do not allow a standard inspection tool to pass through. The reason for notbeing piggable could be: variations in pipe diameter, over- or under-sized valves, short radius or mitred bends,repair sections in a different size, no permanent pig launcher/receiver or possibilities for connection oftemporary launcher/receiver. Un-piggable pipelines are subject to separate evaluations and alternative methodsand are not covered herein.
Table 6-1 Overview of damages/anomalies vs. assessment codes
Damage/anomaly Code / Guideline Comment
Metal loss
DNV-RP-F101 Corroded pipelines
ASME B31.G Including the “modified edition”
PDAM Summarises most common methods
Dent
DNV-OS-F101 Acceptance criteria and allowable dent depth
DNV-RP-F113 Pipeline repair
DNV-RP-C203 Fatigue
EPRG / PDAM*)
DET NORSKE VERITAS AS
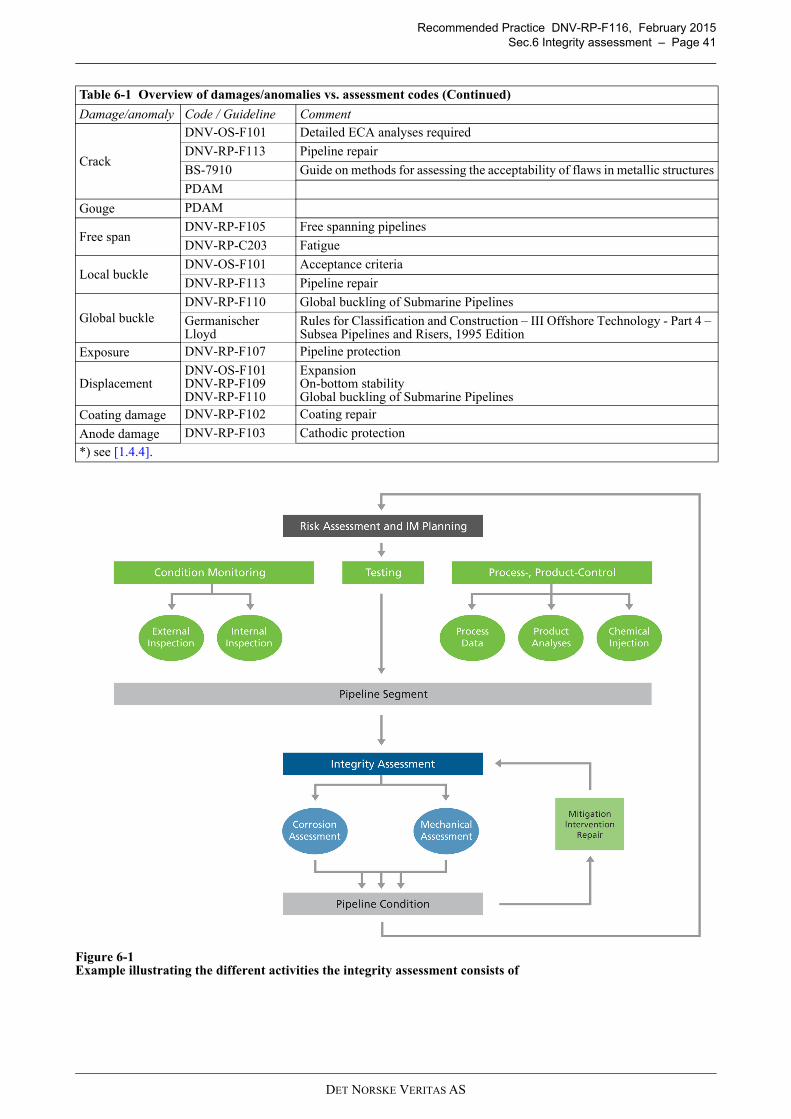
Recommended Practice DNV-RP-F116, February 2015Sec.6 Integrity assessment – Page 41
Figure 6-1Example illustrating the different activities the integrity assessment consists of
Crack
DNV-OS-F101 Detailed ECA analyses required
DNV-RP-F113 Pipeline repair
BS-7910 Guide on methods for assessing the acceptability of flaws in metallic structures
PDAM
Gouge PDAM
Free spanDNV-RP-F105 Free spanning pipelines
DNV-RP-C203 Fatigue
Local buckleDNV-OS-F101 Acceptance criteria
DNV-RP-F113 Pipeline repair
Global buckleDNV-RP-F110 Global buckling of Submarine Pipelines
Germanischer Lloyd
Rules for Classification and Construction – III Offshore Technology - Part 4 – Subsea Pipelines and Risers, 1995 Edition
Exposure DNV-RP-F107 Pipeline protection
DisplacementDNV-OS-F101DNV-RP-F109DNV-RP-F110
ExpansionOn-bottom stabilityGlobal buckling of Submarine Pipelines
Coating damage DNV-RP-F102 Coating repair
Anode damage DNV-RP-F103 Cathodic protection
*) see [1.4.4].
Table 6-1 Overview of damages/anomalies vs. assessment codes (Continued)
Damage/anomaly Code / Guideline Comment
DET NORSKE VERITAS AS
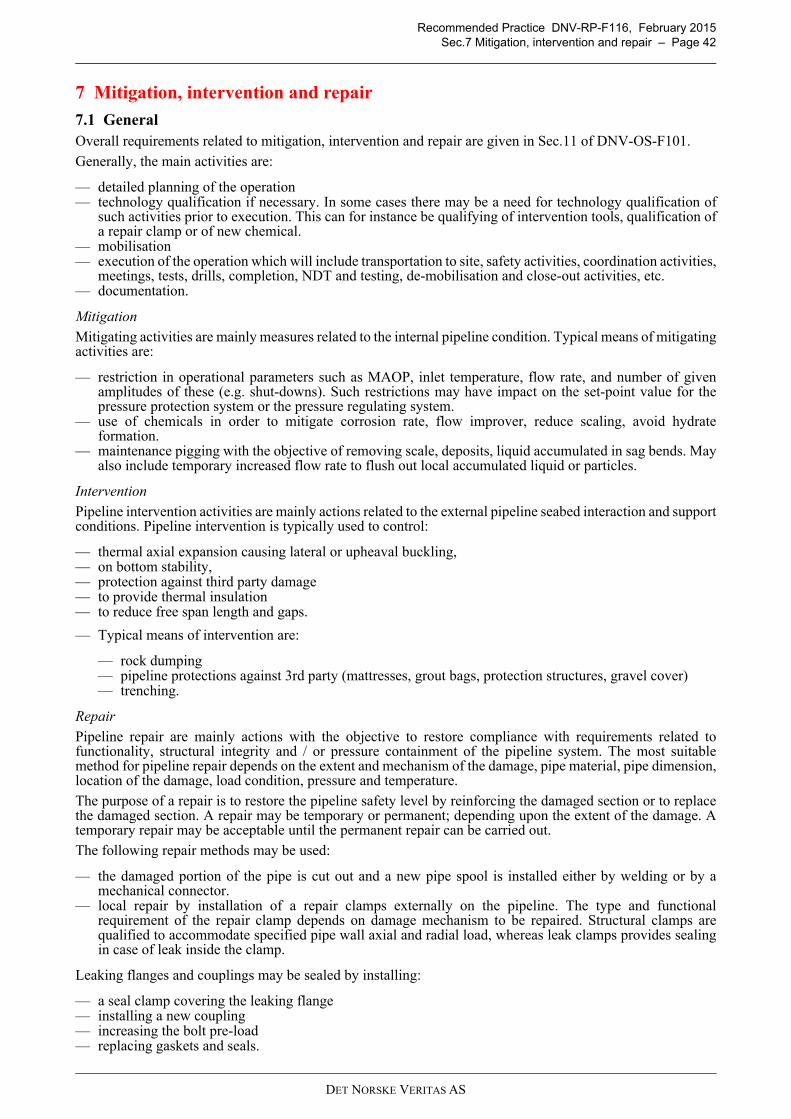
Recommended Practice DNV-RP-F116, February 2015Sec.7 Mitigation, intervention and repair – Page 42
7 Mitigation, intervention and repair
7.1 GeneralOverall requirements related to mitigation, intervention and repair are given in Sec.11 of DNV-OS-F101.
Generally, the main activities are:
— detailed planning of the operation— technology qualification if necessary. In some cases there may be a need for technology qualification of
such activities prior to execution. This can for instance be qualifying of intervention tools, qualification ofa repair clamp or of new chemical.
— mobilisation— execution of the operation which will include transportation to site, safety activities, coordination activities,
meetings, tests, drills, completion, NDT and testing, de-mobilisation and close-out activities, etc.— documentation.
Mitigation
Mitigating activities are mainly measures related to the internal pipeline condition. Typical means of mitigatingactivities are:
— restriction in operational parameters such as MAOP, inlet temperature, flow rate, and number of givenamplitudes of these (e.g. shut-downs). Such restrictions may have impact on the set-point value for thepressure protection system or the pressure regulating system.
— use of chemicals in order to mitigate corrosion rate, flow improver, reduce scaling, avoid hydrateformation.
— maintenance pigging with the objective of removing scale, deposits, liquid accumulated in sag bends. Mayalso include temporary increased flow rate to flush out local accumulated liquid or particles.
Intervention
Pipeline intervention activities are mainly actions related to the external pipeline seabed interaction and supportconditions. Pipeline intervention is typically used to control:
— thermal axial expansion causing lateral or upheaval buckling, — on bottom stability, — protection against third party damage— to provide thermal insulation— to reduce free span length and gaps.
— Typical means of intervention are:
— rock dumping— pipeline protections against 3rd party (mattresses, grout bags, protection structures, gravel cover)— trenching.
Repair
Pipeline repair are mainly actions with the objective to restore compliance with requirements related tofunctionality, structural integrity and / or pressure containment of the pipeline system. The most suitablemethod for pipeline repair depends on the extent and mechanism of the damage, pipe material, pipe dimension,location of the damage, load condition, pressure and temperature.
The purpose of a repair is to restore the pipeline safety level by reinforcing the damaged section or to replacethe damaged section. A repair may be temporary or permanent; depending upon the extent of the damage. Atemporary repair may be acceptable until the permanent repair can be carried out.
The following repair methods may be used:
— the damaged portion of the pipe is cut out and a new pipe spool is installed either by welding or by amechanical connector.
— local repair by installation of a repair clamps externally on the pipeline. The type and functionalrequirement of the repair clamp depends on damage mechanism to be repaired. Structural clamps arequalified to accommodate specified pipe wall axial and radial load, whereas leak clamps provides sealingin case of leak inside the clamp.
Leaking flanges and couplings may be sealed by installing:
— a seal clamp covering the leaking flange — installing a new coupling— increasing the bolt pre-load— replacing gaskets and seals.
DET NORSKE VERITAS AS
Recommended Practice DNV-RP-F116, February 2015Sec.7 Mitigation, intervention and repair – Page 43
7.1.1 Temporary repair
In case of a temporary repair, it should be documented that the pipeline integrity and safety level is maintainedeither by the temporary repair itself and/or in combination with other precautions (e.g. reduced pressure or flowrate).
7.1.2 Pre-loading of bolts
Prior to increasing the pre-load in bolts, it should be documented by calculation that no over-stressing occursin bolts, flange or gasket and seals. In case the pre-load in the bolts is removed, e.g. due to changing of gasket,new bolts should be used for the flange connection.
7.1.3 Qualification of repair clamps, sleeves, pipe spools and mechanical connectors
All repair clamps, sleeves, pipe spools and mechanical connectors should be qualified to governing designpremises and codes prior to installation and leak tested after installation.
For guidance on pipeline subsea repair, reference is made to DNV-RP-F113 (Pipeline Subsea Repair), whichgives description of different pipeline repair equipment and tools, their application, qualification principles tobe used, pipeline interaction forces to be designed for, design principles and guidelines, requirements relatedto mechanical sealing, hyperbaric welding, test philosophy relevant for the different phases of repair equipmentqualification and documentation requirements. Design and qualification guidelines for hot tap fittings and plugapplications are also given in DNV-RP-F113.
7.1.4 Effect of mitigation, intervention and repair activities on safety level
Mitigation, intervention and repair activities should not impair the safety level of the pipeline system below thespecified safety level, as defined in design. Also see [3.1.2].
7.1.5 Execution according to procedures
All mitigations, interventions and repairs should be carried out by experienced and qualified personnel inaccordance with agreed procedures.
Intervention may introduce new constraint to the system which should be assessed and approved by relevantdisciplines before initiation. Typical aspects to be assessed are 3rd party protection, pipeline integrity with thenew constraints and load scenarios, and corrosion protection.
7.1.6 Testing according to procedure
All interventions and repairs should be verified / tested and inspected by experienced and qualified personnelin accordance with agreed procedures. NDT personnel, equipment, methods, and acceptance criteria should beagreed upon in accordance with appropriate standards and codes.
DNV-RP-F113 outlines such a procedure to qualify the integrity and functionality of a repaired section -including e.g. NDT procedures, local leak tests through test ports, recording of governing parameters (boltpretension level, welding parameters).
The need for system pressure test after completion of a repair operation depends on governing design code,company requirements and the qualification of the repair method.
7.2 Detailed planning
Detailed planning typically includes:
— a detailed definition of the scope of work— if necessary, detailed specification of selected actions / method needs to be completed. This will depend on
the mitigation, intervention and repair strategy provided by the risk assessment and the IM planning activity— preparation of detailed procedures for the operation— establishment of responsibilities and communication lines between involved parties— carry out risk management activities— establishment of plans for mobilisation of the intervention and repair activity— logistics and coordination— carrying out the repair or intervention— NDT and Leak testing if applicable— documentation of the operation— communicating the status of the operation to the risk review and strategy development activity.
7.2.1 Authority regulations
Detailed planning shall take into consideration relevant authority regulations and pipeline license conditionsspecifically related to notifications of mitigation, intervention and repair activities
DET NORSKE VERITAS AS
Recommended Practice DNV-RP-F116, February 2015Sec.7 Mitigation, intervention and repair – Page 44
7.2.2 Clear purpose of a specific actionThe purpose of a specific action or operation should be clearly established prior to any detailed planning. Thisis normally carried out as a part of the development of mitigation, intervention and repair strategies.
7.2.3 Risk management w.r.t. mitigation, intervention and repairRecommendations with regards to risk management can be found in:
— DNV-RP-F107 Risk assessment of pipeline protection— DNV-RP-H101 Risk management in marine and subsea operations— Guidelines on tools and techniques for hazard identification and risk assessment can be found in ISO-
17776.
Typical aspects to be considered with regards to risk management:
— operating envelopes during the operation (e.g. to be perform during hot or cold condition)— risk of 3rd party damage from the operation itself— HAZOP for the different parts of the action / operation— potential consequences of the action / operation to the overall pipeline system.
DNV-RP-F107 Risk assessment of pipeline protection gives a risk based approach for assessing pipelineprotection against accidental external loads. Recommendations are given for damage capacity of pipelines andalternative protection measures and assessment of damage frequency and consequence.
7.2.4 Detailed proceduresExecution of mitigation activities, intervention and repair operations can be complex. Detailed proceduresshould therefore be prepared.This is illustrated by the typical sequence of activities involved in a pipeline section replacement repairoperation:
— emptying, or isolating the location with isolation plugs— sea bed intervention (e.g. excavation, gravel filling), for access and to provide stable support condition for
pipeline support and alignment tools— cutting and removal of weight and corrosion coating— cleaning, close visual inspection and NDT of damage, as required— restraining and supporting the pipeline prior to cutting (e.g. by H-frames)— cutting and removing the damaged section— onshore detailed inspection of the damaged section— preparation and inspection of pipe ends at seabed, to comply with the repair tool specification— installation of new pipeline section and connecting the ends after required alignment by use of the repair
tool. (Marine operation procedure required, e.g. buoyancy elements, jacking from the seabed or liftingassistance from support vessel, tie-in and alignment tools, mounting frame and if welding habitats)
— retrieval of installation tools and equipment— commissioning of repair operation (e.g. NDT, leak test)— protection over repaired section (e.g. cover, gravel bags or mattresses) against 3rd party interference— pressure testing.
For repair operations, the detailed procedures should typically include:
— project procedures defining repair project organisation, the roles, responsibilities and communication linesbetween all parties involved
— procedures for emptying and cleaning the pipeline prior to cutting of pipe section— emergency preparedness plans for the operation— procedures for seabed interventions— procedure for required marine operation, including restrictions related to weather window— pipeline repair procedures— NDT and leak test procedures— procedures for protection of the repair location against 3rd party loads.
DET NORSKE VERITAS AS
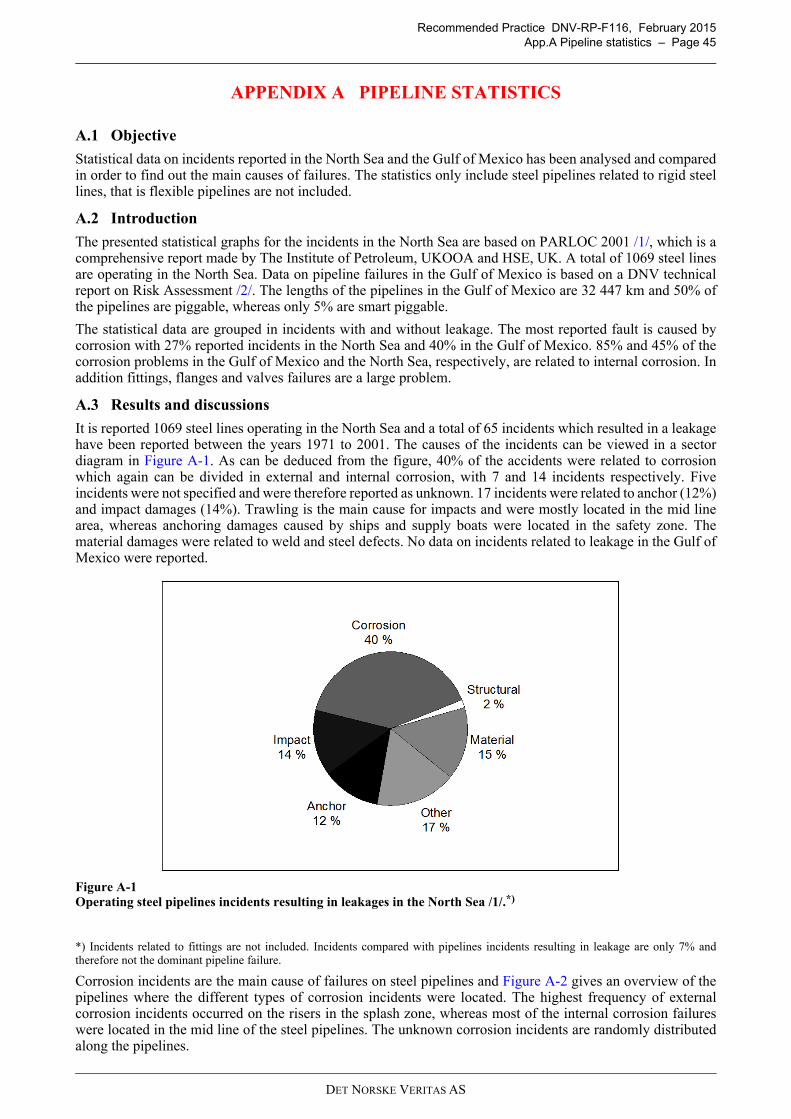
Recommended Practice DNV-RP-F116, February 2015App.A Pipeline statistics – Page 45
APPENDIX A PIPELINE STATISTICS
A.1 Objective
Statistical data on incidents reported in the North Sea and the Gulf of Mexico has been analysed and comparedin order to find out the main causes of failures. The statistics only include steel pipelines related to rigid steellines, that is flexible pipelines are not included.
A.2 Introduction
The presented statistical graphs for the incidents in the North Sea are based on PARLOC 2001 /1/, which is acomprehensive report made by The Institute of Petroleum, UKOOA and HSE, UK. A total of 1069 steel linesare operating in the North Sea. Data on pipeline failures in the Gulf of Mexico is based on a DNV technicalreport on Risk Assessment /2/. The lengths of the pipelines in the Gulf of Mexico are 32 447 km and 50% ofthe pipelines are piggable, whereas only 5% are smart piggable.
The statistical data are grouped in incidents with and without leakage. The most reported fault is caused bycorrosion with 27% reported incidents in the North Sea and 40% in the Gulf of Mexico. 85% and 45% of thecorrosion problems in the Gulf of Mexico and the North Sea, respectively, are related to internal corrosion. Inaddition fittings, flanges and valves failures are a large problem.
A.3 Results and discussions
It is reported 1069 steel lines operating in the North Sea and a total of 65 incidents which resulted in a leakagehave been reported between the years 1971 to 2001. The causes of the incidents can be viewed in a sectordiagram in Figure A-1. As can be deduced from the figure, 40% of the accidents were related to corrosionwhich again can be divided in external and internal corrosion, with 7 and 14 incidents respectively. Fiveincidents were not specified and were therefore reported as unknown. 17 incidents were related to anchor (12%)and impact damages (14%). Trawling is the main cause for impacts and were mostly located in the mid linearea, whereas anchoring damages caused by ships and supply boats were located in the safety zone. Thematerial damages were related to weld and steel defects. No data on incidents related to leakage in the Gulf ofMexico were reported.
Figure A-1 Operating steel pipelines incidents resulting in leakages in the North Sea /1/.*)
*) Incidents related to fittings are not included. Incidents compared with pipelines incidents resulting in leakage are only 7% andtherefore not the dominant pipeline failure.
Corrosion incidents are the main cause of failures on steel pipelines and Figure A-2 gives an overview of thepipelines where the different types of corrosion incidents were located. The highest frequency of externalcorrosion incidents occurred on the risers in the splash zone, whereas most of the internal corrosion failureswere located in the mid line of the steel pipelines. The unknown corrosion incidents are randomly distributedalong the pipelines.
DET NORSKE VERITAS AS
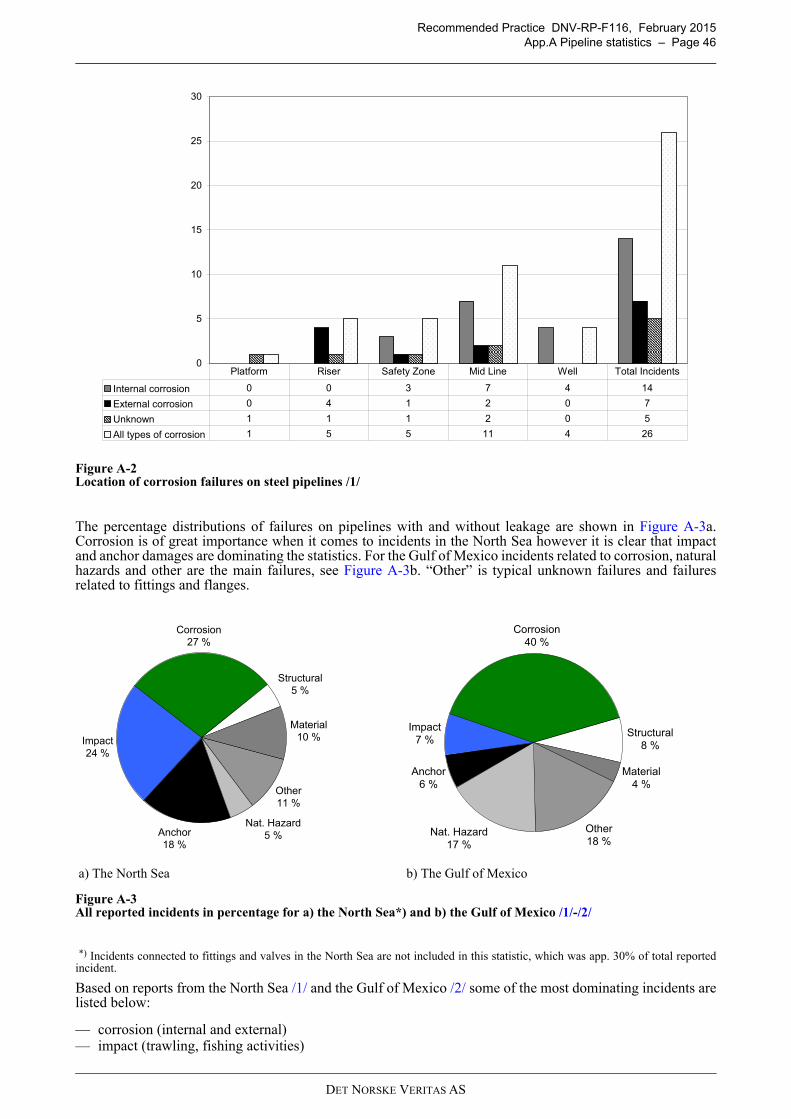
Recommended Practice DNV-RP-F116, February 2015App.A Pipeline statistics – Page 46
Figure A-2 Location of corrosion failures on steel pipelines /1/
The percentage distributions of failures on pipelines with and without leakage are shown in Figure A-3a.Corrosion is of great importance when it comes to incidents in the North Sea however it is clear that impactand anchor damages are dominating the statistics. For the Gulf of Mexico incidents related to corrosion, naturalhazards and other are the main failures, see Figure A-3b. “Other” is typical unknown failures and failuresrelated to fittings and flanges.
Figure A-3 All reported incidents in percentage for a) the North Sea*) and b) the Gulf of Mexico /1/-/2/
*) Incidents connected to fittings and valves in the North Sea are not included in this statistic, which was app. 30% of total reportedincident.
Based on reports from the North Sea /1/ and the Gulf of Mexico /2/ some of the most dominating incidents arelisted below:
— corrosion (internal and external)— impact (trawling, fishing activities)
a) The North Sea b) The Gulf of Mexico
0
5
10
15
20
25
30
Internal corrosion 0 0 3 7 4 14
External corrosion 0 4 1 2 0 7
Unknown 1 1 1 2 0 5
All types of corrosion 1 5 5 11 4 26
Platform Riser Safety Zone Mid Line Well Total Incidents
Anchor18 %
Impact24 %
Corrosion27 %
Structural5 %
Material10 %
Other11 %
Nat. Hazard5 %
Anchor6 %
Impact7 %
Corrosion40 %
Structural8 %
Material4 %
Other18 %
Nat. Hazard17 %
DET NORSKE VERITAS AS
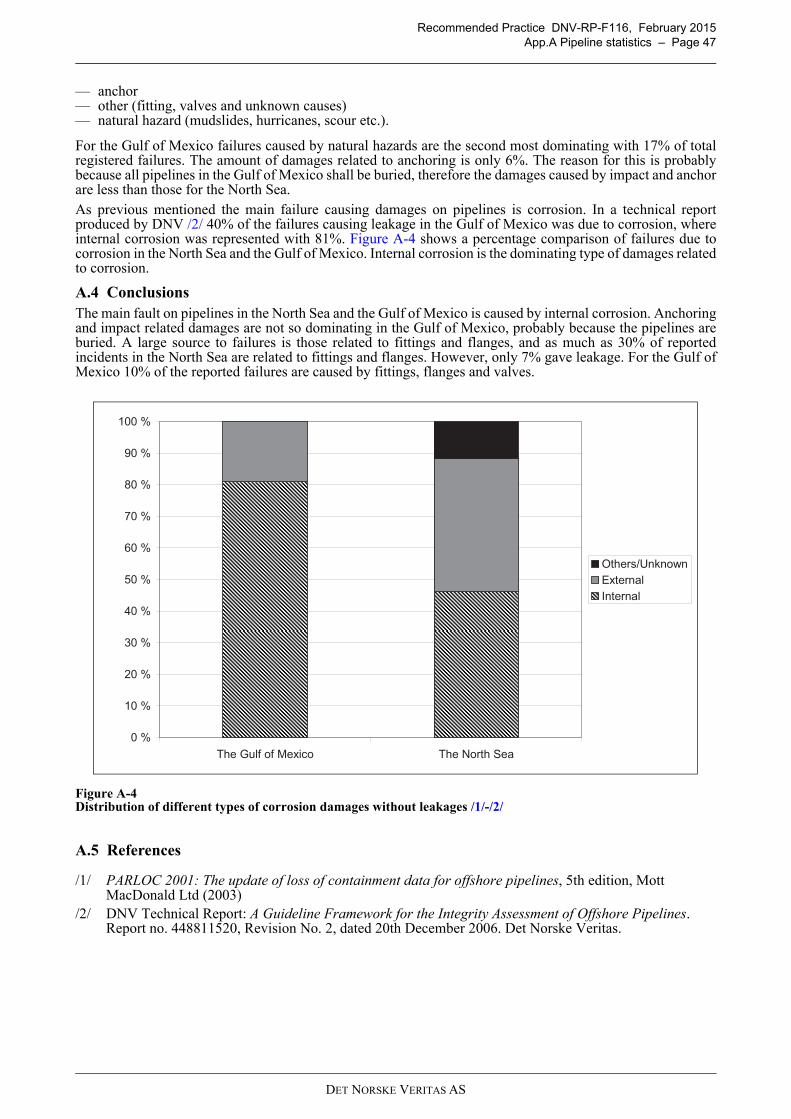
Recommended Practice DNV-RP-F116, February 2015App.A Pipeline statistics – Page 47
— anchor— other (fitting, valves and unknown causes)— natural hazard (mudslides, hurricanes, scour etc.).
For the Gulf of Mexico failures caused by natural hazards are the second most dominating with 17% of totalregistered failures. The amount of damages related to anchoring is only 6%. The reason for this is probablybecause all pipelines in the Gulf of Mexico shall be buried, therefore the damages caused by impact and anchorare less than those for the North Sea.As previous mentioned the main failure causing damages on pipelines is corrosion. In a technical reportproduced by DNV /2/ 40% of the failures causing leakage in the Gulf of Mexico was due to corrosion, whereinternal corrosion was represented with 81%. Figure A-4 shows a percentage comparison of failures due tocorrosion in the North Sea and the Gulf of Mexico. Internal corrosion is the dominating type of damages relatedto corrosion.
A.4 ConclusionsThe main fault on pipelines in the North Sea and the Gulf of Mexico is caused by internal corrosion. Anchoringand impact related damages are not so dominating in the Gulf of Mexico, probably because the pipelines areburied. A large source to failures is those related to fittings and flanges, and as much as 30% of reportedincidents in the North Sea are related to fittings and flanges. However, only 7% gave leakage. For the Gulf ofMexico 10% of the reported failures are caused by fittings, flanges and valves.
Figure A-4 Distribution of different types of corrosion damages without leakages /1/-/2/
A.5 References
/1/ PARLOC 2001: The update of loss of containment data for offshore pipelines, 5th edition, Mott MacDonald Ltd (2003)
/2/ DNV Technical Report: A Guideline Framework for the Integrity Assessment of Offshore Pipelines. Report no. 448811520, Revision No. 2, dated 20th December 2006. Det Norske Veritas.
0 %
10 %
20 %
30 %
40 %
50 %
60 %
70 %
80 %
90 %
100 %
The Gulf of Mexico The North Sea
Others/UnknownExternalInternal
DET NORSKE VERITAS AS
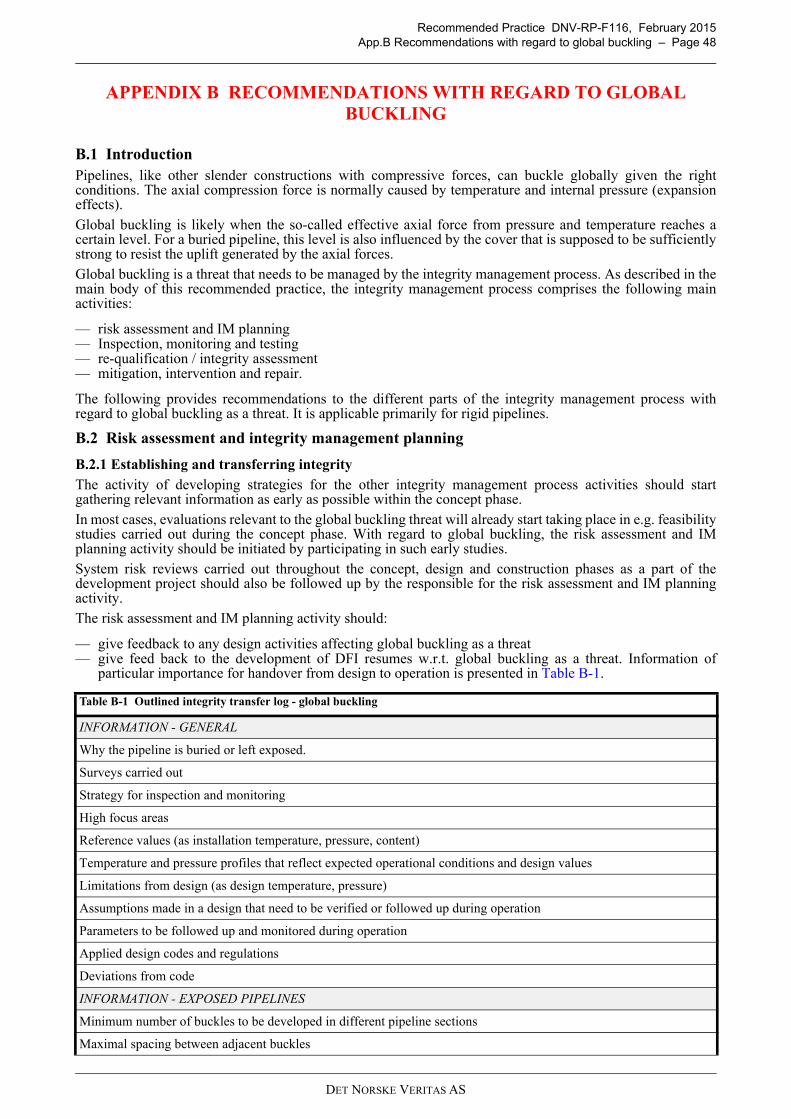
Recommended Practice DNV-RP-F116, February 2015App.B Recommendations with regard to global buckling – Page 48
APPENDIX B RECOMMENDATIONS WITH REGARD TO GLOBAL BUCKLING
B.1 IntroductionPipelines, like other slender constructions with compressive forces, can buckle globally given the rightconditions. The axial compression force is normally caused by temperature and internal pressure (expansioneffects).Global buckling is likely when the so-called effective axial force from pressure and temperature reaches acertain level. For a buried pipeline, this level is also influenced by the cover that is supposed to be sufficientlystrong to resist the uplift generated by the axial forces.Global buckling is a threat that needs to be managed by the integrity management process. As described in themain body of this recommended practice, the integrity management process comprises the following mainactivities:
— risk assessment and IM planning— Inspection, monitoring and testing— re-qualification / integrity assessment— mitigation, intervention and repair.
The following provides recommendations to the different parts of the integrity management process withregard to global buckling as a threat. It is applicable primarily for rigid pipelines.
B.2 Risk assessment and integrity management planning
B.2.1 Establishing and transferring integrityThe activity of developing strategies for the other integrity management process activities should startgathering relevant information as early as possible within the concept phase.In most cases, evaluations relevant to the global buckling threat will already start taking place in e.g. feasibilitystudies carried out during the concept phase. With regard to global buckling, the risk assessment and IMplanning activity should be initiated by participating in such early studies.System risk reviews carried out throughout the concept, design and construction phases as a part of thedevelopment project should also be followed up by the responsible for the risk assessment and IM planningactivity.The risk assessment and IM planning activity should:
— give feedback to any design activities affecting global buckling as a threat— give feed back to the development of DFI resumes w.r.t. global buckling as a threat. Information of
particular importance for handover from design to operation is presented in Table B-1.
Table B-1 Outlined integrity transfer log - global buckling
INFORMATION - GENERAL
Why the pipeline is buried or left exposed.
Surveys carried out
Strategy for inspection and monitoring
High focus areas
Reference values (as installation temperature, pressure, content)
Temperature and pressure profiles that reflect expected operational conditions and design values
Limitations from design (as design temperature, pressure)
Assumptions made in a design that need to be verified or followed up during operation
Parameters to be followed up and monitored during operation
Applied design codes and regulations
Deviations from code
INFORMATION - EXPOSED PIPELINES
Minimum number of buckles to be developed in different pipeline sections
Maximal spacing between adjacent buckles
DET NORSKE VERITAS AS
Recommended Practice DNV-RP-F116, February 2015App.B Recommendations with regard to global buckling – Page 49
B.2.2 The global buckling threat
B.2.2.1 Exposed pipelines
Global (lateral) buckling for an exposed pipeline is not necessarily a failure. Whether or not it is a failure needsto be established through a condition assessment focusing primarily on pipeline utilization, but also on pipelinedisplacement (e.g. pipeline walking).
The loading/utilisation of the pipeline is closely linked to the curvature in the pipeline. A sharp curvaturenormally implies high utilisation. The loading can be expressed as a bending moment [kNm], strains on thecompressive or tensile side [%] or stresses [MPa]. The most relevant failure modes that directly related toutilization / curvature are (for more details see DNV-OS-F101 Sec.5D):
— Local buckling; which is normally the governing failure mode resulting from excessive utilization. Localbuckling appears as wrinkling or as a local buckle on the compressive side of the cross section. Localbuckling can lead to excessive ovalisation and reduced cross-section area. This means reduced production,or even full production stop if e.g. a pig should get stuck. A locally buckled pipeline cannot stand anincreased bending moment in the pipeline. This could lead to pipeline collapse and full production stop.
— Loss of containment; as a result of:
— Fracture is failure on the tensile side of the cross section also resulting from excessive utilization.Fracture leads to leakage or full bore rupture, meaning reduced production, or even full production stop.
— Low cycle fatigue can occur for limited load cycles in case each cycle gives strains in the plastic region;i.e. the utilization is excessive in periods. Low cycle fatigue may lead to leakage or rupture, meaningreduced production, or full production stop.
— Hydrogen induced stress cracking (HISC) can occur in martensitic steels (“13%Cr) and ferritic-austenitic steels (duplex and super-duplex). Blisters of free hydrogen can create cracks in steel or weldat a CP/anode location when the steel is exposed to seawater and stresses from the buckle. The pipelineutilization does not have to necessarily be excessive. HISC leads to leakage or full bore rupture,meaning reduced production, or full production stop. For more on HISC, see DNV-RP-F112 /3/.
Examples of unacceptable displacement are:
— displacement of in-line tees— displacement of valves— interference with other pipelines— interference with other structures— skidding off free span supports— unwanted uplift at crests— unacceptable pipeline walking.
Predicted buckling locations, shapes and sizes
When buckling may occur at the different sections along the pipeline
Areas where global buckles are acceptable
Areas where global buckles may be unacceptable
Governing failure mode(s)
Other potential failure modes
Walking rate considered in design, walking alert level, number of full shutdowns and short shutdowns in design basis
Acceptance criteria related to different failure modes (different formats for different failure modes - either as strain, curvature or bending, stresses or a bending moment, displacement, rotations)
Means used to control buckling initiation and post buckling behaviour (must describe purpose and schedule)
INFORMATION - BURIED PIPELINES
Required cover as a function of KP
Types of backfill material used and where
Achieved backfill height
Evaluation of the potential for floatation of the pipeline. Floatation may be initiated by earth quakes, vibrations in the pipeline or for a light content condition
Evaluation of potential seabed erosion. Actual areas are shallow wave affected areas, river crossings, land falls, etc.
Table B-1 Outlined integrity transfer log - global buckling (Continued)
DET NORSKE VERITAS AS
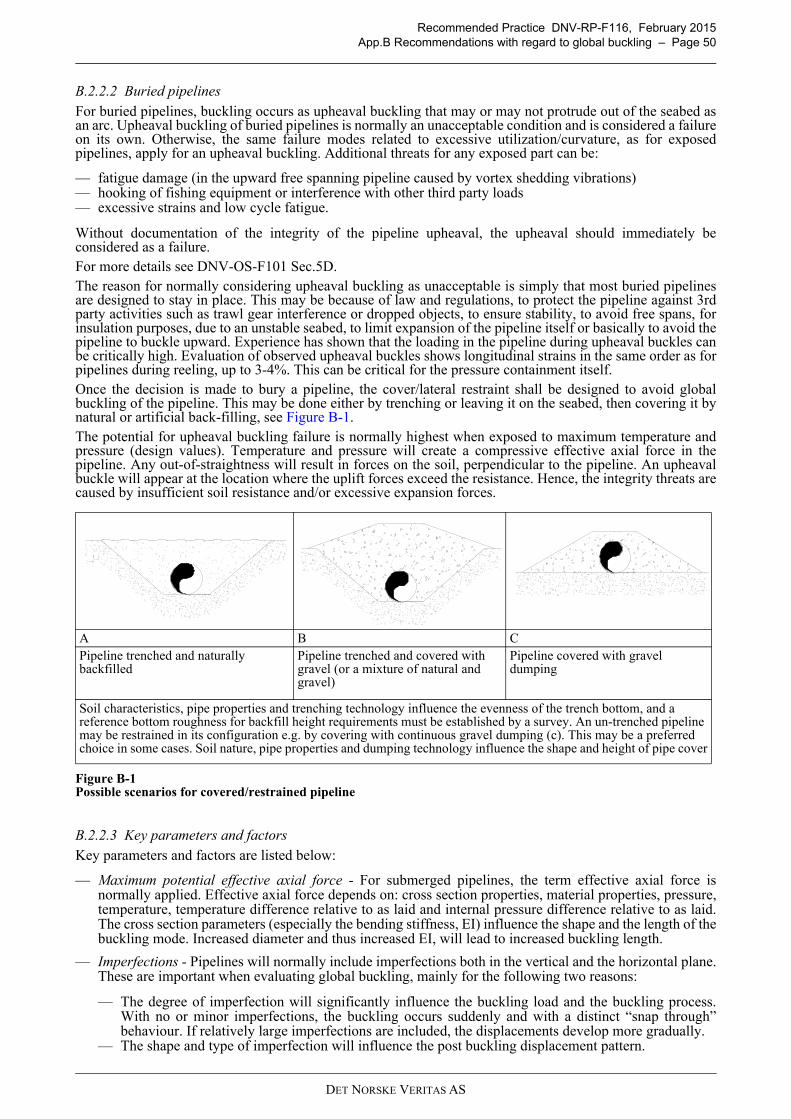
Recommended Practice DNV-RP-F116, February 2015App.B Recommendations with regard to global buckling – Page 50
B.2.2.2 Buried pipelinesFor buried pipelines, buckling occurs as upheaval buckling that may or may not protrude out of the seabed asan arc. Upheaval buckling of buried pipelines is normally an unacceptable condition and is considered a failureon its own. Otherwise, the same failure modes related to excessive utilization/curvature, as for exposedpipelines, apply for an upheaval buckling. Additional threats for any exposed part can be:
— fatigue damage (in the upward free spanning pipeline caused by vortex shedding vibrations)— hooking of fishing equipment or interference with other third party loads— excessive strains and low cycle fatigue.
Without documentation of the integrity of the pipeline upheaval, the upheaval should immediately beconsidered as a failure.For more details see DNV-OS-F101 Sec.5D.The reason for normally considering upheaval buckling as unacceptable is simply that most buried pipelinesare designed to stay in place. This may be because of law and regulations, to protect the pipeline against 3rdparty activities such as trawl gear interference or dropped objects, to ensure stability, to avoid free spans, forinsulation purposes, due to an unstable seabed, to limit expansion of the pipeline itself or basically to avoid thepipeline to buckle upward. Experience has shown that the loading in the pipeline during upheaval buckles canbe critically high. Evaluation of observed upheaval buckles shows longitudinal strains in the same order as forpipelines during reeling, up to 3-4%. This can be critical for the pressure containment itself.Once the decision is made to bury a pipeline, the cover/lateral restraint shall be designed to avoid globalbuckling of the pipeline. This may be done either by trenching or leaving it on the seabed, then covering it bynatural or artificial back-filling, see Figure B-1.The potential for upheaval buckling failure is normally highest when exposed to maximum temperature andpressure (design values). Temperature and pressure will create a compressive effective axial force in thepipeline. Any out-of-straightness will result in forces on the soil, perpendicular to the pipeline. An upheavalbuckle will appear at the location where the uplift forces exceed the resistance. Hence, the integrity threats arecaused by insufficient soil resistance and/or excessive expansion forces.
Figure B-1 Possible scenarios for covered/restrained pipeline
B.2.2.3 Key parameters and factorsKey parameters and factors are listed below:
— Maximum potential effective axial force - For submerged pipelines, the term effective axial force isnormally applied. Effective axial force depends on: cross section properties, material properties, pressure,temperature, temperature difference relative to as laid and internal pressure difference relative to as laid.The cross section parameters (especially the bending stiffness, EI) influence the shape and the length of thebuckling mode. Increased diameter and thus increased EI, will lead to increased buckling length.
— Imperfections - Pipelines will normally include imperfections both in the vertical and the horizontal plane.These are important when evaluating global buckling, mainly for the following two reasons:
— The degree of imperfection will significantly influence the buckling load and the buckling process.With no or minor imperfections, the buckling occurs suddenly and with a distinct “snap through”behaviour. If relatively large imperfections are included, the displacements develop more gradually.
— The shape and type of imperfection will influence the post buckling displacement pattern.
A B CPipeline trenched and naturally backfilled
Pipeline trenched and covered with gravel (or a mixture of natural and gravel)
Pipeline covered with gravel dumping
Soil characteristics, pipe properties and trenching technology influence the evenness of the trench bottom, and a reference bottom roughness for backfill height requirements must be established by a survey. An un-trenched pipeline may be restrained in its configuration e.g. by covering with continuous gravel dumping (c). This may be a preferred choice in some cases. Soil nature, pipe properties and dumping technology influence the shape and height of pipe cover
DET NORSKE VERITAS AS
Recommended Practice DNV-RP-F116, February 2015App.B Recommendations with regard to global buckling – Page 51
— Axial feed-in into buckled areas - In the post buckling condition, any additional pipeline expansion will befed axially towards the buckling location and the buckle will adjust accordingly. The axial feed-in istherefore a crucial parameter for the post buckling behaviour as bending moment/strain and lateraldisplacement will increase by increasing axial feed-in. The governing parameters regarding axial feed-inare the temperature and the inner pressure, and the buckling pattern (distance between buckles).
— Lateral resistance - Lateral resistance is the product of submerged weight and lateral friction. For a givenaxial feed-in, high lateral resistance tends to give “narrow” shaped buckling mode with corresponding highbending moment in apex. Low lateral resistance gives a wider buckling mode shape and lower bendingmoment.
— Axial resistance - The product of submerged weight and axial friction. Axial resistance does not influencethe response in the buckle directly. But since the axial response affect the axial feed-in and the globalbuckling pattern (distance between each buckle), the parameter may be important. Large axial resistancewill trigger relatively many buckling locations. Many buckling locations are normally beneficial (the totalaxial expansion can be shared by many buckles).
— Vertical resistance (upheaval buckling) - the resistance provided by the cover.— Pipe-soil interaction - Pipe-soil interaction parameters are in general very important when evaluating
global buckling of pipelines. Here, pipe-soil interaction is indirectly included via axial and lateralresistance.
— Hoop utilisation - high utilization in hoop direction (due to high inner pressure or high D/t ratio) tends todecrease the allowable bending moment.
— Corrosion - Any significant corrosion will decrease the allowable bending moment.
— Effect of varying operating conditions - Cyclic loading, e.g. due to repeated start-ups and shut-downs.Normally, varying operating conditions have a limited effect on lines not susceptible to buckling. For linesthat are susceptible to buckling, the cyclic loading may influence the pipeline behaviour significantly:
— Cyclic loading may lead to fatigue / low cycle fatigue or ratcheting.— Long free spans in shut-down condition - Smaller diameter lines are more sensitive to this effect than
lines with larger diameters. Long free spans may be exposed to VIV/fatigue. In addition, the likelihoodfor 3rd party loads may increase (e.g. from trawl gear interference).
— Unwanted large displacement or buckling at unwanted locations - Repeated load cycles will normallycause a change of buckling configuration. Compared to the 1st time of buckling, the lateral bucklingmode shape tends to be wider after some cycles. Though this leads to reduced bending moment/axialstress in apex, a wider mode shape will also lead to increased and possibly unwanted lateraldisplacements. There may also be cases where more significant changes occur after some cycles, e.g.new, possibly unwanted, buckling locations occur.
— End expansion. A pipeline tends to expand toward its ends due to pressure and temperature increase.Excessive end expansion may cause unwanted high deformation of end terminations, in rigid spools,flexible tails, riser bases etc.
— Pipeline walking is a denotation for a situation where the pipeline globally shifts position in the axialdirection. Pipeline walking is related to transient temperature during start-up of the pipeline and:
— has limited anchoring in the axial direction, or— lays on a slope, or— is pulled in one end, as the tension from a steel catenary riser.
Pipeline walking may also be an issue for a pipeline with global buckles with limited axial anchoring inbetween two adjacent buckles.
B.3 Inspection, monitoring and testing
B.3.1 Inspection
The configuration of a global buckling pipeline will normally change with operational conditions and overtime. The global buckling condition should be assessed focusing primarily on pipeline utilization, but also onpipeline displacement - see [B.2.2]. Inspection is the primary tool for establishing the necessary informationneeded.
B.3.1.1 General recommendations
— The main purpose of the survey should be to identify global buckles and define their curvature.— Carry out a survey before pipeline is pressure tested, and another survey before pipeline is put into
operation (see DNV-OS-F101 regarding as-laid and as-built survey).— Regularly carry out inspection with regard to global buckling. Note that the inspections are often more
frequent in the first few years of operation.— Monitor and report the operational conditions prior to and during any such surveys. The monitoring period
should start 48 hours before the survey. For more information about monitoring parameters, see [B.3.2].
DET NORSKE VERITAS AS
Recommended Practice DNV-RP-F116, February 2015App.B Recommendations with regard to global buckling – Page 52
— Document whether the reported configuration is related to the position of the survey vessel or the pipeline.— Inherent and achieved survey accuracy should be recorded.— Calibration of the survey equipment is in all cases important and should be documented.
B.3.1.2 Recommendations specific for exposed pipelines
— Surveys of an exposed pipeline with a global buckling potential should focus on addressing theconfiguration of the pipeline both in the horizontal plane and in the vertical plane.
— The configuration of the pipeline should preferably be given together with the seabed.— The position of any berms should also be identified along the pipeline route with regard to pipeline position.
B.3.1.3 Recommendations specific for buried pipelines
— The survey(s) carried out on the as-installed and/or as trenched pipeline and used as the basis for designingthe required cover should be considered as the reference survey(s).
— To be able to fully document the integrity of a buried pipeline, both the pipeline configuration and theheight of the cover should be measured.
B.3.1.4 Recommendations wrt development of strategies and plans for inspection
— Inspection planning should reflect the long term development of temperature and pressure in the pipeline.— A pipeline with increasing operational conditions may require frequent inspection, whereas a pipeline with
decreasing operational conditions, the first year of operation is the most critical requiring most of theattention.
— Though buried pipelines are designed to stay in place different processes can affect the stability:
— creep in the soils due to variations in operational conditions— erosion process reducing the cover.
— Events/factors that can affect both planned and unplanned inspection can be:
— large variations in operational conditions— exceeding the design conditions— hooking by trawl gear or anchor interference / emergency anchoring— storm, hurricanes, storm surges or flooding from river mouth that can cause erosion— earth quakes— subsidence.
B.3.1.5 Inspection toolsAn inspection is normally carried out through external ROV surveys (with e.g. cross profiler, multi beam andpipe tracker). Other external survey solutions can be applied as well (see [E.1.1]). Some external survey toolshave range limitations. Pipelines buried deep into the soil may e.g. not be able to be inspected by using seabedsurface survey techniques. High accuracy surveys are generally recommended when global buckling may beunacceptable.High quality tools like geo-pigs can provide accurate measurements of the configuration, but the survey mayhave limited value unless it can be linked to the seabed topology and/or the soil cover.The survey of a buried pipeline can be carried out applying different techniques depending on the inspectionphilosophy. For pipelines with high temperature and pressure, an upheaval buckling failure will most likelyresult in an arc rising out of the seabed. For this case, visual inspections, side-scan sonar and similar methodscan reveal an upheaval buckling failure. In some soils, creep effects can occur, i.e. the pipeline can shift itsposition due to cyclic loadings. This may be a case for low temperature and pressure pipelines. Such caseswould require more comprehensive survey techniques.Displacement of the pipeline can be measured through (reference) marks on the seabed such as piles or rocks.Such methods may be crucial for measuring axial displacement such as end displacements, feed-in to globalbuckles or pipeline walking. For some exposed pipelines, skidding marks can be visible on the seabed. Thesemarks can provide a measure of changes in operational conditions. Erosion processes or soil settlements mayerase marks in the soil over time.
B.3.2 MonitoringDuring operation, the following key parameters should be monitored:
— inlet temperature and pressure— outlet temperature and pressure (optional)— flowrate.
Recording of historic maximum/minimum values, variations in temperature and pressure (eg. shutdowns) andactual values during survey should be made.
DET NORSKE VERITAS AS
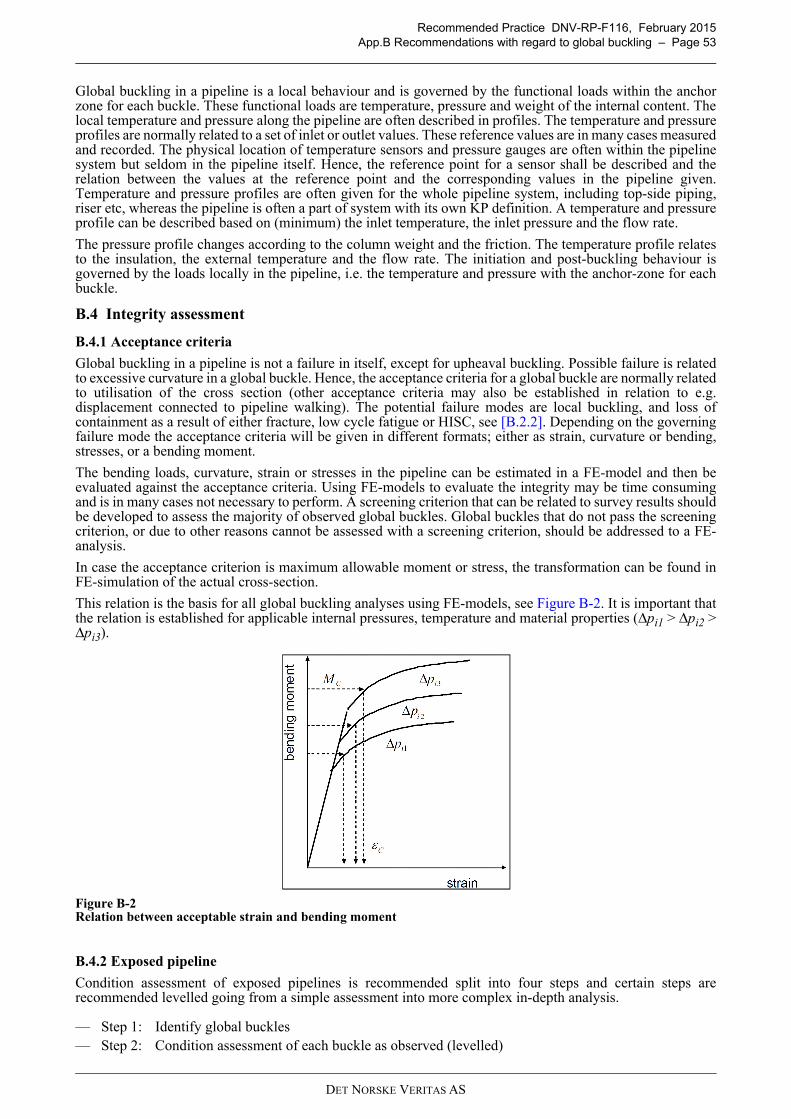
Recommended Practice DNV-RP-F116, February 2015App.B Recommendations with regard to global buckling – Page 53
Global buckling in a pipeline is a local behaviour and is governed by the functional loads within the anchorzone for each buckle. These functional loads are temperature, pressure and weight of the internal content. Thelocal temperature and pressure along the pipeline are often described in profiles. The temperature and pressureprofiles are normally related to a set of inlet or outlet values. These reference values are in many cases measuredand recorded. The physical location of temperature sensors and pressure gauges are often within the pipelinesystem but seldom in the pipeline itself. Hence, the reference point for a sensor shall be described and therelation between the values at the reference point and the corresponding values in the pipeline given.Temperature and pressure profiles are often given for the whole pipeline system, including top-side piping,riser etc, whereas the pipeline is often a part of system with its own KP definition. A temperature and pressureprofile can be described based on (minimum) the inlet temperature, the inlet pressure and the flow rate.
The pressure profile changes according to the column weight and the friction. The temperature profile relatesto the insulation, the external temperature and the flow rate. The initiation and post-buckling behaviour isgoverned by the loads locally in the pipeline, i.e. the temperature and pressure with the anchor-zone for eachbuckle.
B.4 Integrity assessment
B.4.1 Acceptance criteria
Global buckling in a pipeline is not a failure in itself, except for upheaval buckling. Possible failure is relatedto excessive curvature in a global buckle. Hence, the acceptance criteria for a global buckle are normally relatedto utilisation of the cross section (other acceptance criteria may also be established in relation to e.g.displacement connected to pipeline walking). The potential failure modes are local buckling, and loss ofcontainment as a result of either fracture, low cycle fatigue or HISC, see [B.2.2]. Depending on the governingfailure mode the acceptance criteria will be given in different formats; either as strain, curvature or bending,stresses, or a bending moment.
The bending loads, curvature, strain or stresses in the pipeline can be estimated in a FE-model and then beevaluated against the acceptance criteria. Using FE-models to evaluate the integrity may be time consumingand is in many cases not necessary to perform. A screening criterion that can be related to survey results shouldbe developed to assess the majority of observed global buckles. Global buckles that do not pass the screeningcriterion, or due to other reasons cannot be assessed with a screening criterion, should be addressed to a FE-analysis.
In case the acceptance criterion is maximum allowable moment or stress, the transformation can be found inFE-simulation of the actual cross-section.
This relation is the basis for all global buckling analyses using FE-models, see Figure B-2. It is important thatthe relation is established for applicable internal pressures, temperature and material properties (Δpi1 > Δpi2 >Δpi3).
Figure B-2 Relation between acceptable strain and bending moment
B.4.2 Exposed pipeline
Condition assessment of exposed pipelines is recommended split into four steps and certain steps arerecommended levelled going from a simple assessment into more complex in-depth analysis.
— Step 1: Identify global buckles— Step 2: Condition assessment of each buckle as observed (levelled)
DET NORSKE VERITAS AS
Recommended Practice DNV-RP-F116, February 2015App.B Recommendations with regard to global buckling – Page 54
The three first steps (1), (2) and (3) are based upon survey measurements of the pipeline and the installed seabedmeasures. Together with knowledge of the operational condition during a survey these steps can be followedto document the integrity of the pipeline as observed by the survey.
Step (4) is an integrity prediction based on other operational conditions, including e.g. future design condition.
The procedure starting point is based upon observations made from survey data, through numerical processingof survey data and finally supported by finite element simulations.
The condition assessment can stop at the first level if there is access to detailed data, and extensive knowledgeand experience. This is the case if e.g. a qualified and experienced team has access to:
— analyses and acceptance criteria from the design phase that are properly documented in a comprehensiblemanner
— well defined and documented operational temperature and pressure loads— well defined and documented historical survey data.
The condition assessment can also stop at the first level if e.g. the pipeline is a stationary pipeline that does notchange configuration over time.
An in-depth assessment may be required in the cases where e.g. there is lack of acceptance criteria, significantuncertainties in design data, frequent changes in operational conditions or if global buckling is not addressedby design.
B.4.3 Buried pipelines
B.4.3.1 Evaluation of buried pipelineUpheaval buckling in a buried pipeline is related to failure in the soil. Hence, the condition assessment of aburied pipeline is mainly related to measurement of the cover. The required cover height shall be given fromdesign as a function of KP - see Table B-1.
The actual cover height is best evaluated as the measured distance from the pipeline to the seabed. Preferably,this measure is made in the same survey. It can be difficult to perform surveys of good quality for buriedpipeline. Hence, any comparison between the as-laid or as-trenched pipeline will give valuable information.
The potential for experiencing upheaval buckling is at its peak for the design loads. Failure will occur at the“weakest point” (the combination of pipeline imperfection, soil resistance and functional loads). A pipeline canbe considered “field proven” for the highest historical operational loads.
B.4.3.2 Evaluation of pipeline with upheaval buckle
A pipeline that fails due to upheaval buckling will in many cases be standing like an arc out of the seabed. Theheight and length of this arc can be significant; lengths of up to 50 meters and heights of up to 5 metres havebeen recorded. Failures can also occur within the soil and not be visible on the surface. An upheaval buckle islikely to have high strain values.An upheaval must be checked for potential for new failure modes, as fatigue in the free span, hooking of fishingequipment, excessive ovalisation, fracture and local buckling. In many cases, the integrity of an upheavalcannot be documented and intervention is often required.
B.5 Mitigation, intervention and repair
B.5.1 Mitigation
Mitigating actions are actions that reduce the likelihood or consequence of failure.
Examples of possible mitigation actions are:
— lowering the temperature or pressure — carrying out maintenance pigging in order to improve flow conditions— limitations regarding future start-ups and shut-downs in case of high strain values, and/or in case of
unacceptable displacement.
Any such actions should be designed to fit the purpose, and any resulting new threats should be evaluated.
B.5.2 Intervention
Pipeline intervention actions are mainly rectifying actions related to the external pipeline constraints.
An unacceptable global buckling condition (excessive utilization or unacceptable displacement) is normallyrepaired buy using different intervention techniques.
Different seabed intervention means can be used during the operational phase to correct and limit certain
— Step 3: Condition of measures/sharing criteria— Step 4: Condition of pipeline for changing operational conditions (levelled)
DET NORSKE VERITAS AS
Recommended Practice DNV-RP-F116, February 2015App.B Recommendations with regard to global buckling – Page 55
behaviour/expansion in connection to global buckling. Trenching, rock dumping, mattresses and buoyancyelements are some options with regard to exposed pipelines - see Table B-2. For buried pipeline, additionaltrenching or backfilling can be possible solutions. A soil cover on top of an upheaval buckle can be designedto restrain / lock the pipeline in its new position. In many cases, the pipeline will have released its compressiveaxial force in the area close to the upheaval. This should be taken into account when designing the new cover.Any such mean should be designed to fit the purpose, and any resulting new threats should be evaluated.
B.5.3 RepairPipeline repair are mainly rectifying actions to maintain compliance with requirements related to structuralintegrity and / or pressure containment of the pipeline.If a global buckle leads to a loss of containment, more comprehensive repair methods should be used.Any repair should be designed to fit the purpose, and any resulting new threats should be evaluated.
B.6 References
Table B-2 Seabed measures to control global buckling behaviour
Measure Purpose
Horizontal curve Initiate global buckle in a horizontal curve
Snake lay Systematic laying of pipeline in curves with a specified interval, each curve is meant to initiate a global buckle
Trigger berms Pre-installed rock berms that shall initiate global buckling at given location
Skidding carpets of rock Pre-installed rock carpets. Installed in areas where buckling is predicted to occur. The purpose is to limit uncertainties with regard to pipe-soil interaction or to reduce the absolute soil resistance.
Sleepers Pre-installed bars installed to initiate global buckling at the actual location. Sleepers may be made of spare pipe-joints and installed perpendicular to the pipeline (specifically engineered sleepers are also an option). To avoid sinking into the soil some are equipped with a foundation. The pipeline may skid on the sleeper, or balance on the sleeper as a turn point for the lateral deflection.
Trenching Limiting or avoiding lateral buckling.
Axial restraints / rock dump Rock berms installed on top of pipeline to restrain a global axial displacement at the actual location. They can be used to limit end expansion, prevent excessive feed-in into a buckle. Ensure that two adjacent buckles both are initiated.
Uplift resistance Rock dump or mattresses installed to prevent pipeline to lift up and buckle at specific locations.
Additional buoyancy Buoyancy element or coating installed on the pipeline to reduce the weight and friction against the soil. The purpose can be to easy initiation of buckles and to make to smoother curvature in post buckling condition.
/1/ Det Norske Veritas DNV-RP-F110 Global buckling of submarine pipelines
/2/ Det Norske Veritas Offshore Standard DNV-OS-F101 Submarine Pipeline Systems
/3/ Det Norske Veritas DNV-RP-F112 Design of Duplex Stainless Steel Subsea Equipment Exposed to Cathodic Protection
DET NORSKE VERITAS AS
Recommended Practice DNV-RP-F116, February 2015App.C Recommendations with regard to corrosion – Page 56
APPENDIX C RECOMMENDATIONS WITH REGARD TO CORROSION
C.1 ObjectivesThe objectives of Appendix C is to give an overview of different corrosion threats commonly associated withsubmarine pipelines for oil and gas production, and applicable techniques for inspection of corrosion controlsystems and recommendations regarding corrosion monitoring.
C.2 IntroductionCorrosion threats to a pipeline system should be managed by the integrity management process.
The integrity management process (Ref. Sec.3) comprises of the following main activities:
— Risk assessment and IM planning (Sec.4)— Inspection, monitoring and testing (Sec.5)— Integrity assessment (Sec.6)— Mitigation, intervention and repair (Sec.7).
Relevant corrosion threats will depend on the linepipe and pipeline components materials, fluid corrosivity andefficiency of options for corrosion mitigation. Materials in corrosion resistant alloys and carbon steel internallylined or clad with a corrosion resistant alloy (CRA) are considered fully resistant to CO2-corrosion in an oiland gas production system.
Duplex and martensitic stainless steel linepipe and pipeline components require special considerations of thesusceptibility of environmentally assisted cracking, primarily related to (HISC).
Alloys resistant to CO2-corrosion: Type 13Cr martensitic materials, 22Cr and 25Cr duplex stainless steel andaustenitic Ni-based alloy
Table C-1 gives an overview of the most common corrosion threats.
C.3 Risk assessment and integrity management planning
C.3.1 Establishing and transferring integrity
System risk reviews (DNV-OS-F101 Sec.2 B300) shall be carried out throughout the concept, design andconstruction phases. Personnel responsible for the system risk review and strategy development activity shouldattend these reviews.
Identification of relevant corrosion threats will already take place during the conceptual design phase as partof the preliminary materials selection and determination of the pipe wall thickness. The need for internalcorrosion control and provisions for inspection and monitoring will in that respect also be assessed. The riskassessment and IM planning activity should therefore be initiated during the conceptual design and followedup in the subsequent design phases.
The risk assessment and IM planning activity should provide input to the DFI resumes with regards to corrosionthreats and provisions for corrosion mitigation and corrosion monitoring.
C.3.1.1 Design of corrosion monitoring systems
Techniques and equipment for corrosion monitoring shall be selected based upon (ref. DNV-OS-F101, Sec.11D327):
— monitoring objectives, including requirements for accuracy and sensitivity— fluid corrosivity and the corrosion preventive measure to be applied— potential corrosion mechanism.
A risk assessment analysis can be used for: identifying the relevant corrosion mechanisms, their associatedcorrosion forms (e.g. pitting, uniform attack), high risk areas and be the basis for the design of the corrosionmonitoring program.
If it is planned for chemical injection to mitigate corrosion, the criticality in terms of regularity of the injections,any need for backup injection systems or spare equipment, should also be evaluated.
The corrosion monitoring methods and fluid analyses that are most suitable for monitoring the corrosion orfluid corrosivity should be established, considering their accuracy and sensitivity.
The most suitable location of any monitoring device should be established during design, such that themonitoring devices are able to detect any changes in the fluid corrosivity (e.g. located in the areas with hold-up and drop-out of water). However, for submarine pipelines, this is normally considered a challenge.
Since a pipeline is inaccessible over its total length, monitoring of the internal condition of the pipeline may berestricted to monitoring of the process parameters, chemical injection rate for corrosion mitigation and by
DET NORSKE VERITAS AS
Recommended Practice DNV-RP-F116, February 2015App.C Recommendations with regard to corrosion – Page 57
intrusive and non-intrusive methods located in accessible areas, typically at pipeline outlet (top side) or at themanifold. However, it is also possible to monitor a submerged section of the pipeline by the installation ofinstrumented spools installed inline the pipelines (the Field Signature Method / FSM is a non-intrusivemonitoring method which makes it possible to monitor changes in the pipe wall in real-time at pre-definedlocations along a subsea pipeline). Since this system can only monitor specific locations along the pipeline, thelocation of the instrumented spool must be carefully selected, such that the area most susceptible to corrosionis selected (e.g. low point areas, areas were water drop out is expected).
C.3.1.2 InspectionCorrosion monitoring does not give information of actual loss of wall thickness in the pipeline and cantherefore not replace the in-line inspection of the pipeline system. It is therefore important that inspectionoptions are considered early during the design phase and preferably during the concept phase. For minimumrequirements with regard to pigging, see DNV-OS-F101.
C.3.2 Risk assessment and integrity management planningExternal and internal corrosion may lead to loss of containment by pinhole leak to full bore rupture. The processleading to the loss of containment will vary depending on the corrosion mechanism. The various tablesprovided in this appendix contain information that can be used in connection with risk assessments as describedin Sec.4.
DET NORSKE VERITAS AS
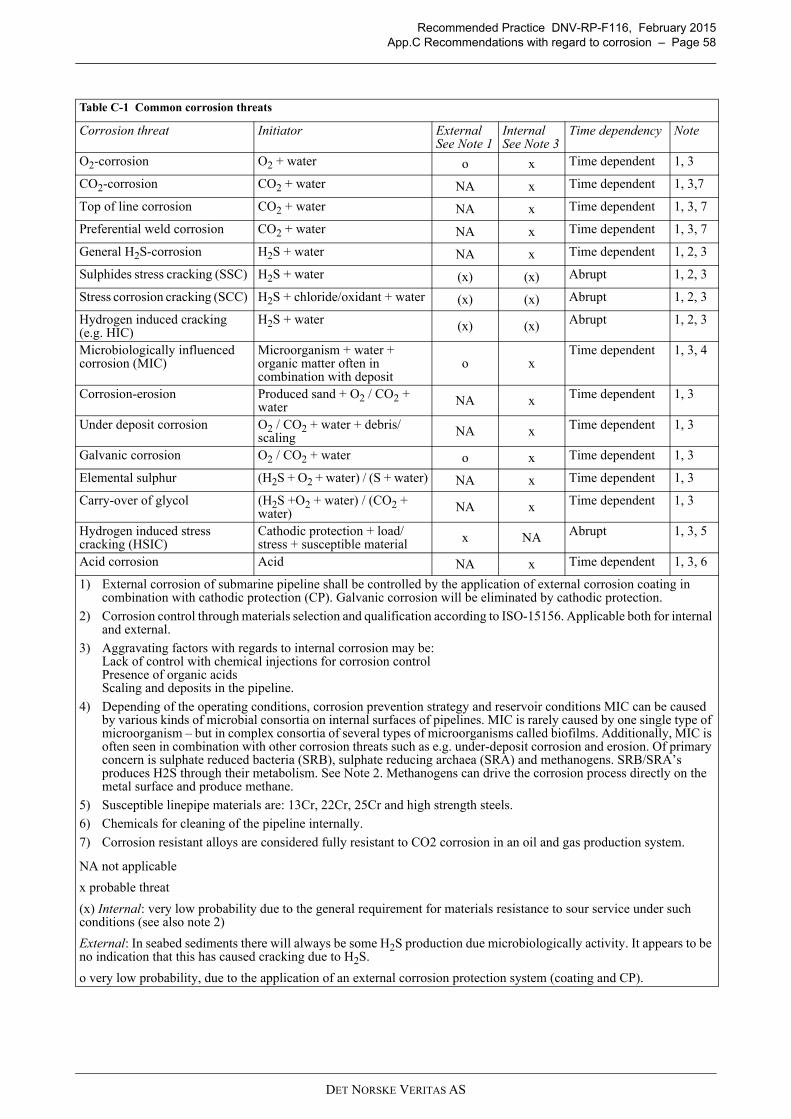
Recommended Practice DNV-RP-F116, February 2015App.C Recommendations with regard to corrosion – Page 58
Table C-1 Common corrosion threats
Corrosion threat Initiator ExternalSee Note 1
Internal See Note 3
Time dependency Note
O2-corrosion O2 + water o x Time dependent 1, 3
CO2-corrosion CO2 + water NA x Time dependent 1, 3,7
Top of line corrosion CO2 + water NA x Time dependent 1, 3, 7
Preferential weld corrosion CO2 + water NA x Time dependent 1, 3, 7
General H2S-corrosion H2S + water NA x Time dependent 1, 2, 3
Sulphides stress cracking (SSC) H2S + water (x) (x) Abrupt 1, 2, 3
Stress corrosion cracking (SCC) H2S + chloride/oxidant + water (x) (x) Abrupt 1, 2, 3
Hydrogen induced cracking (e.g. HIC)
H2S + water (x) (x) Abrupt 1, 2, 3
Microbiologically influenced corrosion (MIC)
Microorganism + water + organic matter often in combination with deposit
o xTime dependent 1, 3, 4
Corrosion-erosion Produced sand + O2 / CO2 + water NA x Time dependent 1, 3
Under deposit corrosion O2 / CO2 + water + debris/scaling NA x Time dependent 1, 3
Galvanic corrosion O2 / CO2 + water o x Time dependent 1, 3
Elemental sulphur (H2S + O2 + water) / (S + water) NA x Time dependent 1, 3
Carry-over of glycol (H2S +O2 + water) / (CO2 + water) NA x Time dependent 1, 3
Hydrogen induced stress cracking (HSIC)
Cathodic protection + load/stress + susceptible material x NA Abrupt 1, 3, 5
Acid corrosion Acid NA x Time dependent 1, 3, 6
1) External corrosion of submarine pipeline shall be controlled by the application of external corrosion coating in combination with cathodic protection (CP). Galvanic corrosion will be eliminated by cathodic protection.
2) Corrosion control through materials selection and qualification according to ISO-15156. Applicable both for internal and external.
3) Aggravating factors with regards to internal corrosion may be:Lack of control with chemical injections for corrosion control Presence of organic acidsScaling and deposits in the pipeline.
4) Depending of the operating conditions, corrosion prevention strategy and reservoir conditions MIC can be caused by various kinds of microbial consortia on internal surfaces of pipelines. MIC is rarely caused by one single type of microorganism – but in complex consortia of several types of microorganisms called biofilms. Additionally, MIC is often seen in combination with other corrosion threats such as e.g. under-deposit corrosion and erosion. Of primary concern is sulphate reduced bacteria (SRB), sulphate reducing archaea (SRA) and methanogens. SRB/SRA’s produces H2S through their metabolism. See Note 2. Methanogens can drive the corrosion process directly on the metal surface and produce methane.
5) Susceptible linepipe materials are: 13Cr, 22Cr, 25Cr and high strength steels.
6) Chemicals for cleaning of the pipeline internally.
7) Corrosion resistant alloys are considered fully resistant to CO2 corrosion in an oil and gas production system.
NA not applicable
x probable threat
(x) Internal: very low probability due to the general requirement for materials resistance to sour service under such conditions (see also note 2)
External: In seabed sediments there will always be some H2S production due microbiologically activity. It appears to be no indication that this has caused cracking due to H2S.
o very low probability, due to the application of an external corrosion protection system (coating and CP).
DET NORSKE VERITAS AS
Recommended Practice DNV-RP-F116, February 2015App.C Recommendations with regard to corrosion – Page 59
C.4 Inspection, monitoring and testing
C.4.1 Inspection of external corrosion
External inspection includes to a large extent inspection of the external corrosion protection system. Most oftenis the inspection limited to look for coating deficiency and the condition of the galvanic anodes.
Inspection for any suspected external corrosion should be carried out by wall thickness measurements.Inspection for external corrosion may be triggered if there is significant uncertainties concerning the externalcorrosion protection system or if the external corrosion protection system has failed. Wall thicknessmeasurement can be performed by:
— intelligent pigging— wall thickness measurements by portable NDT equipment or permanently installed NDT equipment.
Measurements are taken from the external surface at a specific location.
External corrosion protection system of submarine pipelines includes the application of a linepipe and fieldjoint corrosion coating and cathodic protection (CP). Cathodic protection can be obtained by the use of galvanicanodes or by an impressed current system (i.e. submerged zone and buried zone). For submerged pipelines,cathodic protection by galvanic anodes is almost always the preferred system, whilst impressed current isnormally used on onshore pipeline. In areas where cathodic protection is not feasible (i.e. splash zone andatmospheric zone), a corrosion allowance is normally applied to compensate for external corrosion.
The objective of monitoring and inspecting the external corrosion protection system is to confirm that thesystem functions properly and to look for any shortcomings caused by installation or during operation (Ref.DNV-OS F101).
Inspection of the external corrosion protection system of pipelines with a galvanic cathodic protection systemcan include:
— visual inspection of the external coating condition— visual inspection of the condition and consumption of the galvanic anodes — potential measurements of galvanic anodes— steel-to-electrolyte potential measurements along the pipeline— potential measurements at any coating damage exposing bare pipe metal— electric field gradient measurements and current densities in the vicinity of the pipe— anode current output.
Buried/rockdumped pipelines are in principle inaccessible for visual inspection and direct potentialmeasurements. Inspection of these pipelines may be limited to inspection of exposed sections of the pipelineat pipeline ends and any possible galvanic anodes installed on these sections.
Several survey techniques are available for condition assessment of the cathodic protection system. The mostapplicable system will depend on the availability of the pipeline in terms of water depth and on availableequipment (e.g. ROV, survey vessel).
Monitoring of the CP-system can be performed by portable equipment or by permanently installed sensors.Portable equipment can be managed by a diver or by a remote operating vehicle (ROV).
Most of the instrumentation used for portable surveys is reference electrodes for potential, field gradientmeasurements, a metal tip probe for direct metallic contact and camera.
A permanently installed monitoring system may include the installation of reference electrodes for potentialmeasurements, current density coupons and anode current monitoring shunts to determine the anode currentoutput. Such systems may be installed on sections of the pipeline inaccessible for inspection or at locationsconsidered as critical.
C.4.1.1 Corrosion zones
External surfaces of pipeline systems may be divided into “corrosion zones”, based on the environmentalparameters that determine the actual corrosivity. The physical characteristics of the corrosion zones furtherdetermine the applicable techniques for corrosion protection, and for inspection and monitoring of corrosioncontrol.
The following major zones may apply:
— Atmospheric Zone (Marine, Rural/Industrial, Dry)— Marine Splash Zone— Offshore Submerged Zone— Offshore Buried Zone— Onshore Buried Zone.
Marine atmospheric zone; pipeline components may become directly exposed to sea spray, rain andcondensation. For onshore sections, the atmospheric corrosivity will vary much depending on the exposure
DET NORSKE VERITAS AS
Recommended Practice DNV-RP-F116, February 2015App.C Recommendations with regard to corrosion – Page 60
conditions; e.g. direct exposure to atmospheric precipitation or exposure to humid atmosphere in shelteredconditions, (e.g. exposure in tunnels and any other subsurface compartments without humidity control).Rural/Industrial atmospheric zone; at locations further away from the coast, onshore atmospheric zones areclassified as “rural” or “industrial”, depending on the amount of atmospheric pollutants affecting corrosion.Dry atmospheric zone; closed compartments with humidity control are often referred to as a “dry atmosphericzone” independent of location.Marine Splash Zone; can be defined as the area of e.g. a riser that is periodically in and out of the water by theinfluence of waves and tides.With the exception of the two buried zones, the corrosion zones can further be defined as “external” or“internal”. Internal atmospheric, splash and submerged zones may apply e.g. in platform shafts and in land falltunnels. Pipelines in tunnels and entrances are sometimes grouted but the corrosion zones defined above arestill applicable.
C.4.1.2 Visual inspectionVisual inspection of unburied section of a pipeline can be performed by a diver or with an ROV equipped witha camera. Visual examination may include inspection of:
— damage to anode fastening cables— anode consumptions (assessment of anode dimensions)— measurements of anode dimensions— identification of missing or damaged anodes— coating damage— corrosion damage (rust).
Excessive anode consumption is indicative of coating deficiencies, except close to platforms, templates andother structures where current drain may lead to premature consumption of adjacent pipeline anodes. Lowanode consumption can indicate passivation of the galvanic anode.Apparent rust or discoloration of the steel is indicative of under-protection of the pipe.
C.4.1.3 Potential surveyThe effectiveness of the CP-system can only be assessed by measuring the actual pipe-to-seawater potential.Commonly used survey methods to obtain the pipe-to-seawater potential along the pipeline are by:
— Direct contact measurements - Measurement of the pipe-to-seawater potential difference with a voltmeterby direct contact with the steel via a metal tip probe and a reference electrode located adjacent to the steelsurface.
— Drop-cell survey - An electrical connection to the riser above the water line is established and a referenceelectrode is to be lowered into the water and positioned along the side of a structure by a cable at differentelevation, by a diver or by a ROV (applicable for risers).
— Trailing wire survey / weighted-electrode survey - An electrical connection with a wire to the pipeline atthe riser above the water line is established. A 'towed fish' with a reference electrode connected to a surveyvessel via a wire is positioned over the pipeline and moved along the pipeline route (by a vessel, ROV ordiver) where the potential versus distance is measured.
— Remote electrode survey - A remote reference electrode (remote earth) is used to measure the potentialbetween the pipe and a remote electrode (an electrode is remote when the distance between the electrodeand the pipeline is such that change of electrode position do not change the measured potential between theelectrode and the pipeline). The remote electrode can be located on the ROV umbilical or below the surveyvessel hull. The fixed voltage offset between the pipeline and the remote electrode must be established priorto the survey by a calibration contact measurement to the pipeline.
— Electrical field gradient survey - The same electrodes used for measuring electrical field gradients (EFG inµV/cm) along the pipeline can also be used to obtain pipe-to-seawater potential.
C.4.1.4 Electrical field gradient surveyThe electrical field gradient (EFG in µV/cm) method measures the voltage difference between two referenceelectrodes separated at a constant distance. The electrical field close to the pipeline and anode will vary due tothe CP-currents in the seawater.The measurements can be used to assess the current density levels on anodes (for semi-quantitative assessmentsof anode current outputs), locate coating defects and to convert the measurements into pipe-to seawaterpotentials.
C.4.1.5 Monitoring and inspection of galvanic anodesGalvanic anodes can be monitored by direct and in-direct techniques. Direct techniques include directmeasurement of anode potential and current output. Indirect measurement includes measurement of theelectrical field in order to assess the anode current output and potential level in the vicinity (close to) of theanode.
DET NORSKE VERITAS AS
Recommended Practice DNV-RP-F116, February 2015App.C Recommendations with regard to corrosion – Page 61
Monitoring techniques for the condition and performance of galvanic anodes may include:
— anode ‘stab’ measurement for anode potential measurement— electrical field gradient measurements – can be used for semi-quantitative measurement of the anode
current output— installation of anode current monitoring shunt for quantification of anode current output— induction coil meters for determination of anode current output.
C.4.1.6 Initial survey
A visual post lay survey should preferably be performed to look for any damage to the coating and the CP-system caused by installation. The survey can also include the determination of the potential along the pipelineand current output of galvanic anodes from field gradient measurement which can be used as a baseline for latersurveys. If a post lay survey is not feasible, a survey of the external corrosion protection system should at leastbe carried out within one year of installation (DNV-OS- F101 Sec. 11 D302).
C.4.1.7 Impressed current CP systems
For pipelines or pipeline sections (e.g. landfalls) with an impressed current cathodic protection system,reference is made to applicable sections in ISO-15589-1 and NACE SP0207 for monitoring and inspection ofsuch systems.
C.4.1.8 Requirements for calibration of equipment
All equipment used for potential measurements shall be calibrated. For the calibration of reference electrodesreference is made to NACE Standard TM 0497 or an equivalent standard.
C.4.2 Inspection of internal corrosion
Internal inspection of pipeline systems to monitor a time dependant internal corrosion mechanism will requirewall thickness measurement. Wall thickness measurement can be performed by:
— intelligent pigging equipped with UT and MFL— wall thickness measurements by portable NDT equipment or permanently installed NDT equipment.
Measurements are taken from the external surface at a specific location.
C.4.3 Inspection of abrupt corrosion threats
Abrupt corrosion threats are typically stress corrosion cracking mechanisms and hydrogen induced cracking.ROV inspection and intelligent pigging can be used to identify such cracking. However, due to the abruptnature of such damages, regular inspection of such failures is normally not carried out. See Sec.5 for moredetails regarding inspection methods.
C.4.4 Monitoring
The objective of internal corrosion monitoring is to confirm that a fluid remain non-corrosive or to evaluate theefficiency of the corrosion preventative measures.
Corrosion monitoring can also be used to diagnose any prospective corrosion problem in the system (e.g. MIC),for determination of inspection schedules and extended service life assessments.
Pipelines in corrosion resistant alloys are considered resistant to CO2-corrosion. For such systems, monitoringcould be restricted to condition monitoring of process parameters and scheduled monitoring of fluidcomposition. CMn- and low alloy steel linepipe material, which are not resistant to CO2-corrosion, will inaddition, require monitoring of the internal corrosion and the corrosivity of the fluid.
Corrosion monitoring of pipelines carrying non corrosive fluid (e.g. dry gas) could be restricted to monitoringof the water dew point (ref. DNV-OS F101).
Corrosion monitoring does not give information of actual loss of wall thickness in the pipeline and cantherefore not replace the in-line inspection of the pipeline system.
C.4.4.1 Corrosion surveillance
Corrosion surveillance includes activities related to condition monitoring and corrosion monitoring andcomprises of:
— monitoring process parameters (e.g. pressure)— fluid analysis (e.g. of corrosive species)— monitoring aiming to control the corrosion (e.g. corrosion inhibitor, dew point)— use of corrosion probes or other more sophisticated monitoring techniques— chemical analysis of corrosion product (e.g. on corrosion probes, debris collected after cleaning)— integrity monitoring (wall thickness measurements by permanently installed equipment or used at a
specific location).
DET NORSKE VERITAS AS
Recommended Practice DNV-RP-F116, February 2015App.C Recommendations with regard to corrosion – Page 62
The objective of the corrosion surveillance is to detect any operational changes, changes in the fluid corrosivityand incipient corrosion that may lead to a potential threat to the pipeline.
C.4.4.2 Corrosion monitoring techniques
The techniques for corrosion monitoring can either be on-line or off-line. On-line monitoring representscontinuous and/or real-time measurements of the parameter of interest, whilst off-line monitoring wouldtypically be scheduled sampling with subsequent analysis at e.g. a laboratory.
Corrosion monitoring can be performed by direct and indirect techniques. Direct techniques measure the metalloss or corrosion at a certain location in the pipeline system (e.g. corrosion probes), whilst indirect techniquesmeasure parameters that affect the corrosion (e.g. O2 content) or the outcome of the corrosion (remaining wallthickness by NDT methods).
Corrosion monitoring is further classified as an intrusive or non-intrusive. An intrusive method will requireaccess through the pipe wall for measurements to be made (e.g. corrosion probes), whilst a non-intrusivetechnique is performed externally (will not require access through the wall thickness) or analysis of samplestaken from of the process stream.
Intrusive techniques used to monitor the corrosion in the system are related to a specific location and are mostsuitable to monitor overall changes in fluid the corrosivity.
Non-intrusive methods in terms of scheduled sampling are suitable for monitoring any possible changes in thefluid corrosivity over time.
Non-intrusive indirect techniques for wall thickness measurements should be performed at the same locationwhen using portable equipment in order to monitor any prospective development in the corrosion.
Table C-2 shows examples of different corrosion monitoring techniques.
C.4.4.3 Typical monitoring parameters
The extent of fluid analysis will depend on the fluid composition and the use of chemical treatment for limitingthe corrosion in the pipeline. Table C-3 gives an overview of typical monitoring parameters to be consideredin connection with planning and implementation of a corrosion monitoring program for a pipeline.
Use of chemicals for corrosion control shall always include monitoring of the efficiency of the chemicalinjection. It is worth nothing that the lists above can be extended to include other parameters. This will dependon the particular need for a specific pipeline system.
C.5 Integrity assessment
C.5.1 Corroded pipelines
For integrity assessments of corroded pipelines, ref. DNV-RP-F101.
C.5.2 Assessment of integrity of cathodic protection system
The cathodic protection potential criteria as given by the design code (or the CP-design code applied) shall bemaintained throughout the design life.
C.6 Mitigation, intervention and repair
C.6.1 Mitigation
The main mitigation action is corrosion control improvements. Corrosion control includes measures taken tolimit the corrosion in the pipeline. This may include the use of chemical injections (e.g. inhibition) or the needfor scheduled cleaning of the pipeline (see Table C-4).
C.6.2 Intervention
Intervention is not usually applied as a measure against corrosion. Potential cases where it may be consideredas an option are:
— removal of debris that may damage the external corrosion protection system— carrying out intervention in order to limit or reduce stresses on the pipeline.
C.6.3 Repair
Corrosion can lead to a loss of containment requiring repairs. An integrity assessment of a corroded pipelinemay conclude that repairs are required in order to prevent a loss of containment - See Sec.7 for more on pipelinerepairs.
If the cathodic protection (CP) system should turn out not to meet the protection criterion or the installedcapacity of the CP system are inadequate and unable to meet the pipeline design life (anodes have for somereason shown excessive depletion), it is possible to retrofit anodes by the installation of anode banks. It isnecessary to do a reassessment of the cathodic protection system and to qualify the method for installation.
DET NORSKE VERITAS AS
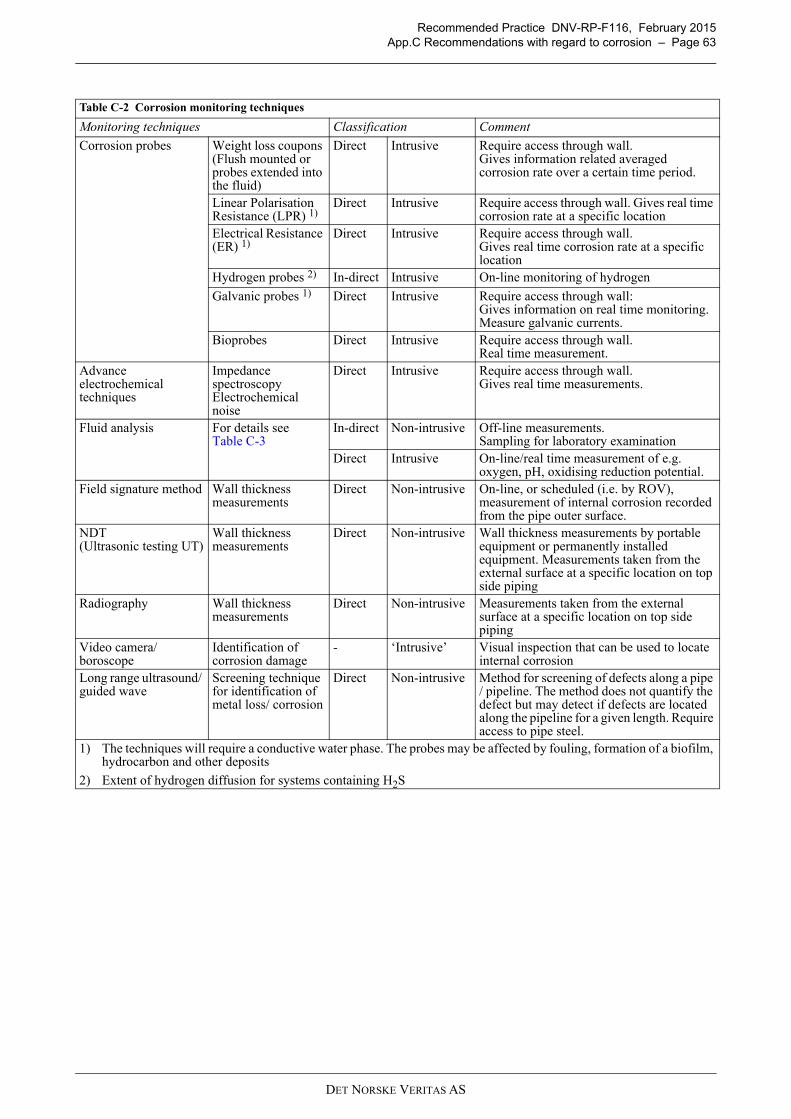
Recommended Practice DNV-RP-F116, February 2015App.C Recommendations with regard to corrosion – Page 63
Table C-2 Corrosion monitoring techniques
Monitoring techniques Classification Comment
Corrosion probes Weight loss coupons (Flush mounted or probes extended into the fluid)
Direct Intrusive Require access through wall.Gives information related averaged corrosion rate over a certain time period.
Linear Polarisation Resistance (LPR) 1)
Direct Intrusive Require access through wall. Gives real time corrosion rate at a specific location
Electrical Resistance (ER) 1)
Direct Intrusive Require access through wall.Gives real time corrosion rate at a specific location
Hydrogen probes 2) In-direct Intrusive On-line monitoring of hydrogen
Galvanic probes 1) Direct Intrusive Require access through wall:Gives information on real time monitoring. Measure galvanic currents.
Bioprobes Direct Intrusive Require access through wall. Real time measurement.
Advance electrochemical techniques
Impedance spectroscopyElectrochemical noise
Direct Intrusive Require access through wall. Gives real time measurements.
Fluid analysis For details see Table C-3
In-direct Non-intrusive Off-line measurements.Sampling for laboratory examination
Direct Intrusive On-line/real time measurement of e.g. oxygen, pH, oxidising reduction potential.
Field signature method Wall thickness measurements
Direct Non-intrusive On-line, or scheduled (i.e. by ROV), measurement of internal corrosion recorded from the pipe outer surface.
NDT (Ultrasonic testing UT)
Wall thickness measurements
Direct Non-intrusive Wall thickness measurements by portable equipment or permanently installed equipment. Measurements taken from the external surface at a specific location on top side piping
Radiography Wall thickness measurements
Direct Non-intrusive Measurements taken from the external surface at a specific location on top side piping
Video camera/ boroscope
Identification of corrosion damage
- ‘Intrusive’ Visual inspection that can be used to locate internal corrosion
Long range ultrasound/ guided wave
Screening technique for identification of metal loss/ corrosion
Direct Non-intrusive Method for screening of defects along a pipe / pipeline. The method does not quantify the defect but may detect if defects are located along the pipeline for a given length. Require access to pipe steel.
1) The techniques will require a conductive water phase. The probes may be affected by fouling, formation of a biofilm, hydrocarbon and other deposits
2) Extent of hydrogen diffusion for systems containing H2S
DET NORSKE VERITAS AS
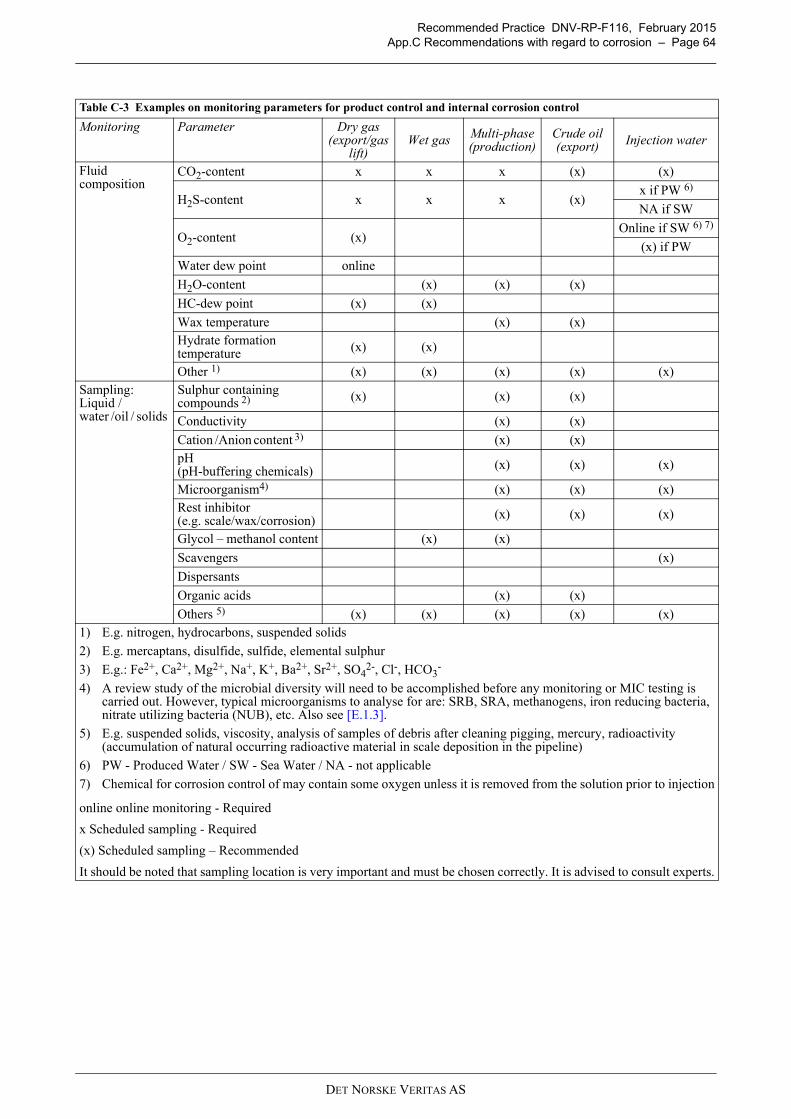
Recommended Practice DNV-RP-F116, February 2015App.C Recommendations with regard to corrosion – Page 64
Table C-3 Examples on monitoring parameters for product control and internal corrosion control
Monitoring Parameter Dry gas(export/gas
lift)Wet gas Multi-phase
(production)Crude oil(export) Injection water
Fluid composition
CO2-content x x x (x) (x)
H2S-content x x x (x)x if PW 6)
NA if SW
O2-content (x)Online if SW 6) 7)
(x) if PW
Water dew point online
H2O-content (x) (x) (x)
HC-dew point (x) (x)
Wax temperature (x) (x)Hydrate formation temperature (x) (x)
Other 1) (x) (x) (x) (x) (x)Sampling: Liquid / water /oil / solids
Sulphur containing compounds 2) (x) (x) (x)
Conductivity (x) (x)
Cation /Anion content 3) (x) (x)pH (pH-buffering chemicals) (x) (x) (x)
Microorganism4) (x) (x) (x)Rest inhibitor (e.g. scale/wax/corrosion) (x) (x) (x)
Glycol – methanol content (x) (x)
Scavengers (x)
Dispersants
Organic acids (x) (x)
Others 5) (x) (x) (x) (x) (x)1) E.g. nitrogen, hydrocarbons, suspended solids
2) E.g. mercaptans, disulfide, sulfide, elemental sulphur
3) E.g.: Fe2+, Ca2+, Mg2+, Na+, K+, Ba2+, Sr2+, SO42-, Cl-, HCO3
-
4) A review study of the microbial diversity will need to be accomplished before any monitoring or MIC testing is carried out. However, typical microorganisms to analyse for are: SRB, SRA, methanogens, iron reducing bacteria, nitrate utilizing bacteria (NUB), etc. Also see [E.1.3].
5) E.g. suspended solids, viscosity, analysis of samples of debris after cleaning pigging, mercury, radioactivity (accumulation of natural occurring radioactive material in scale deposition in the pipeline)
6) PW - Produced Water / SW - Sea Water / NA - not applicable
7) Chemical for corrosion control of may contain some oxygen unless it is removed from the solution prior to injection
online online monitoring - Required
x Scheduled sampling - Required
(x) Scheduled sampling – Recommended
It should be noted that sampling location is very important and must be chosen correctly. It is advised to consult experts.
DET NORSKE VERITAS AS
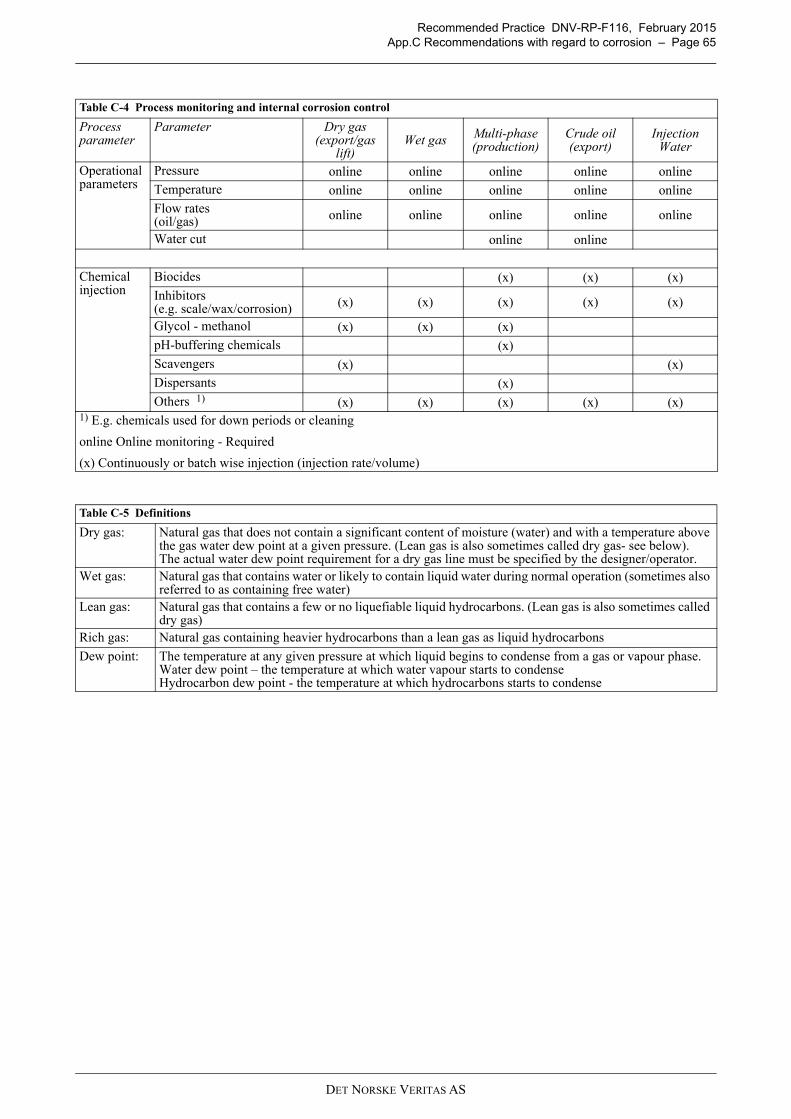
Recommended Practice DNV-RP-F116, February 2015App.C Recommendations with regard to corrosion – Page 65
Table C-4 Process monitoring and internal corrosion control
Process parameter
Parameter Dry gas(export/gas
lift)Wet gas Multi-phase
(production)Crude oil(export)
Injection Water
Operational parameters
Pressure online online online online onlineTemperature online online online online onlineFlow rates (oil/gas) online online online online online
Water cut online online
Chemical injection
Biocides (x) (x) (x)Inhibitors (e.g. scale/wax/corrosion) (x) (x) (x) (x) (x)
Glycol - methanol (x) (x) (x)pH-buffering chemicals (x)Scavengers (x) (x)Dispersants (x)Others 1) (x) (x) (x) (x) (x)
1) E.g. chemicals used for down periods or cleaning
online Online monitoring - Required
(x) Continuously or batch wise injection (injection rate/volume)
Table C-5 Definitions
Dry gas: Natural gas that does not contain a significant content of moisture (water) and with a temperature above the gas water dew point at a given pressure. (Lean gas is also sometimes called dry gas- see below).The actual water dew point requirement for a dry gas line must be specified by the designer/operator.
Wet gas: Natural gas that contains water or likely to contain liquid water during normal operation (sometimes also referred to as containing free water)
Lean gas: Natural gas that contains a few or no liquefiable liquid hydrocarbons. (Lean gas is also sometimes called dry gas)
Rich gas: Natural gas containing heavier hydrocarbons than a lean gas as liquid hydrocarbons
Dew point: The temperature at any given pressure at which liquid begins to condense from a gas or vapour phase.Water dew point – the temperature at which water vapour starts to condenseHydrocarbon dew point - the temperature at which hydrocarbons starts to condense
DET NORSKE VERITAS AS
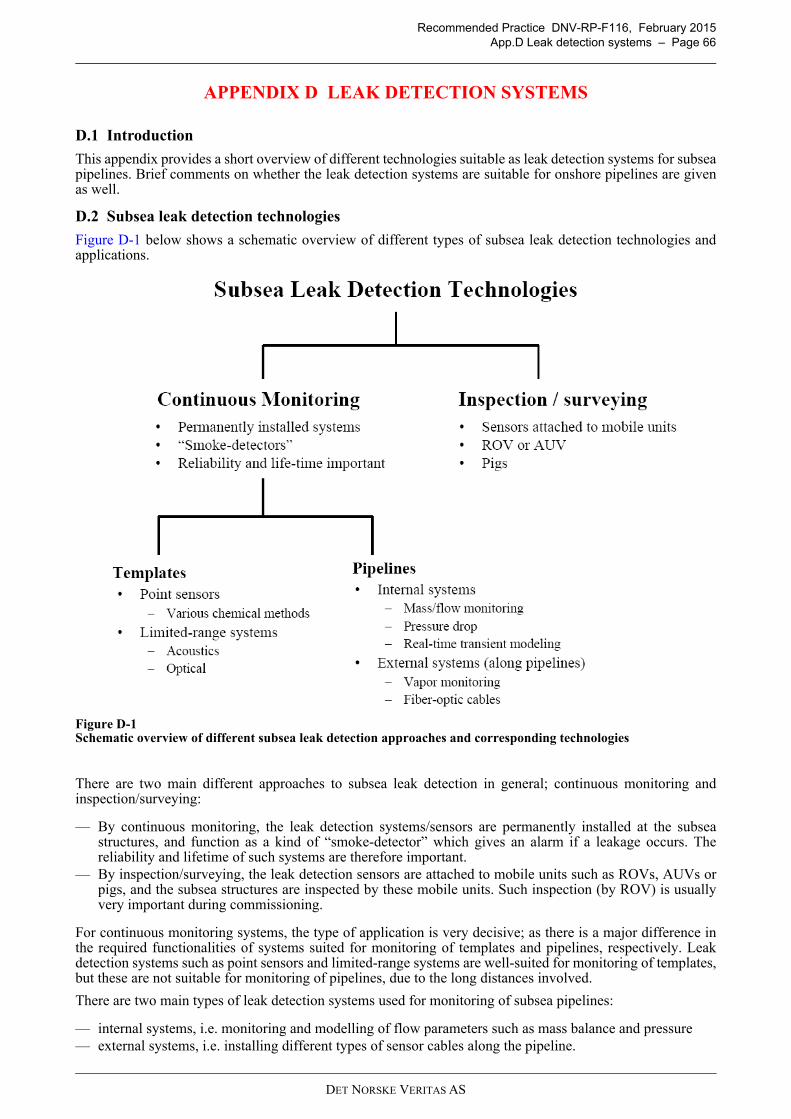
Recommended Practice DNV-RP-F116, February 2015App.D Leak detection systems – Page 66
APPENDIX D LEAK DETECTION SYSTEMS
D.1 Introduction
This appendix provides a short overview of different technologies suitable as leak detection systems for subseapipelines. Brief comments on whether the leak detection systems are suitable for onshore pipelines are givenas well.
D.2 Subsea leak detection technologies
Figure D-1 below shows a schematic overview of different types of subsea leak detection technologies andapplications.
Figure D-1 Schematic overview of different subsea leak detection approaches and corresponding technologies
There are two main different approaches to subsea leak detection in general; continuous monitoring andinspection/surveying:
— By continuous monitoring, the leak detection systems/sensors are permanently installed at the subseastructures, and function as a kind of “smoke-detector” which gives an alarm if a leakage occurs. Thereliability and lifetime of such systems are therefore important.
— By inspection/surveying, the leak detection sensors are attached to mobile units such as ROVs, AUVs orpigs, and the subsea structures are inspected by these mobile units. Such inspection (by ROV) is usuallyvery important during commissioning.
For continuous monitoring systems, the type of application is very decisive; as there is a major difference inthe required functionalities of systems suited for monitoring of templates and pipelines, respectively. Leakdetection systems such as point sensors and limited-range systems are well-suited for monitoring of templates,but these are not suitable for monitoring of pipelines, due to the long distances involved.
There are two main types of leak detection systems used for monitoring of subsea pipelines:
— internal systems, i.e. monitoring and modelling of flow parameters such as mass balance and pressure— external systems, i.e. installing different types of sensor cables along the pipeline.
DET NORSKE VERITAS AS
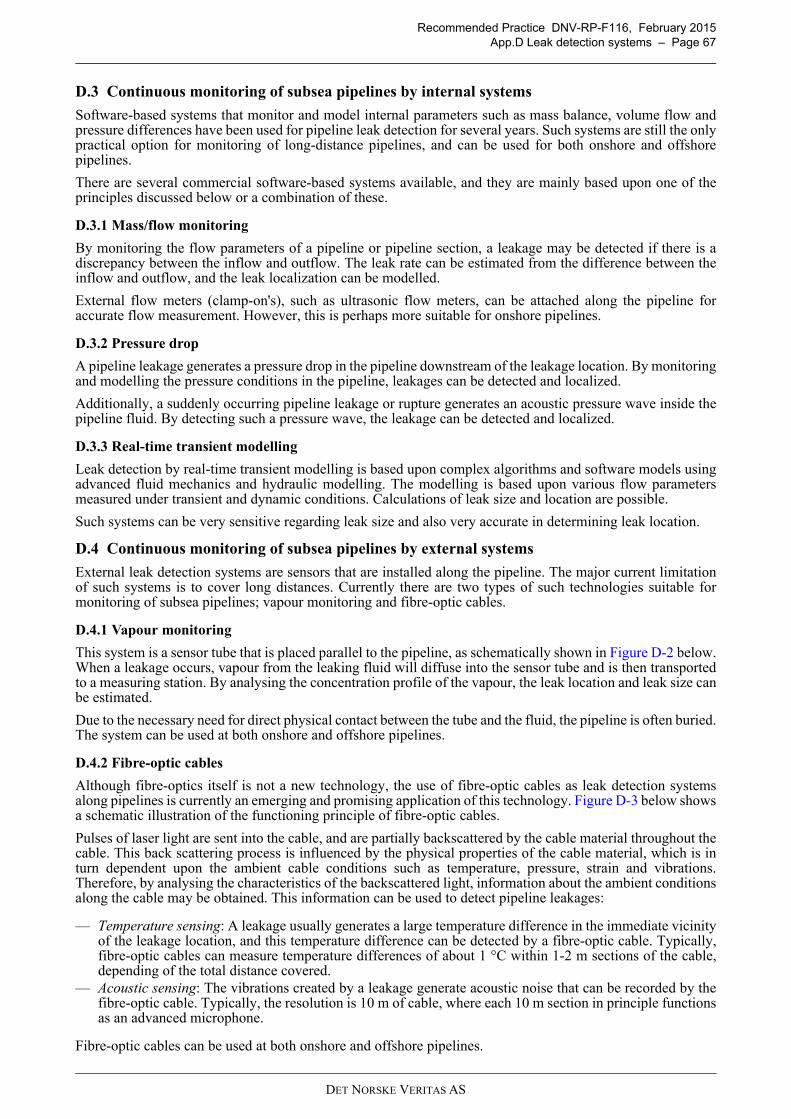
Recommended Practice DNV-RP-F116, February 2015App.D Leak detection systems – Page 67
D.3 Continuous monitoring of subsea pipelines by internal systems
Software-based systems that monitor and model internal parameters such as mass balance, volume flow andpressure differences have been used for pipeline leak detection for several years. Such systems are still the onlypractical option for monitoring of long-distance pipelines, and can be used for both onshore and offshorepipelines.
There are several commercial software-based systems available, and they are mainly based upon one of theprinciples discussed below or a combination of these.
D.3.1 Mass/flow monitoring
By monitoring the flow parameters of a pipeline or pipeline section, a leakage may be detected if there is adiscrepancy between the inflow and outflow. The leak rate can be estimated from the difference between theinflow and outflow, and the leak localization can be modelled.
External flow meters (clamp-on's), such as ultrasonic flow meters, can be attached along the pipeline foraccurate flow measurement. However, this is perhaps more suitable for onshore pipelines.
D.3.2 Pressure drop
A pipeline leakage generates a pressure drop in the pipeline downstream of the leakage location. By monitoringand modelling the pressure conditions in the pipeline, leakages can be detected and localized.
Additionally, a suddenly occurring pipeline leakage or rupture generates an acoustic pressure wave inside thepipeline fluid. By detecting such a pressure wave, the leakage can be detected and localized.
D.3.3 Real-time transient modelling
Leak detection by real-time transient modelling is based upon complex algorithms and software models usingadvanced fluid mechanics and hydraulic modelling. The modelling is based upon various flow parametersmeasured under transient and dynamic conditions. Calculations of leak size and location are possible.
Such systems can be very sensitive regarding leak size and also very accurate in determining leak location.
D.4 Continuous monitoring of subsea pipelines by external systems
External leak detection systems are sensors that are installed along the pipeline. The major current limitationof such systems is to cover long distances. Currently there are two types of such technologies suitable formonitoring of subsea pipelines; vapour monitoring and fibre-optic cables.
D.4.1 Vapour monitoring
This system is a sensor tube that is placed parallel to the pipeline, as schematically shown in Figure D-2 below.When a leakage occurs, vapour from the leaking fluid will diffuse into the sensor tube and is then transportedto a measuring station. By analysing the concentration profile of the vapour, the leak location and leak size canbe estimated.
Due to the necessary need for direct physical contact between the tube and the fluid, the pipeline is often buried.The system can be used at both onshore and offshore pipelines.
D.4.2 Fibre-optic cables
Although fibre-optics itself is not a new technology, the use of fibre-optic cables as leak detection systemsalong pipelines is currently an emerging and promising application of this technology. Figure D-3 below showsa schematic illustration of the functioning principle of fibre-optic cables.
Pulses of laser light are sent into the cable, and are partially backscattered by the cable material throughout thecable. This back scattering process is influenced by the physical properties of the cable material, which is inturn dependent upon the ambient cable conditions such as temperature, pressure, strain and vibrations.Therefore, by analysing the characteristics of the backscattered light, information about the ambient conditionsalong the cable may be obtained. This information can be used to detect pipeline leakages:
— Temperature sensing: A leakage usually generates a large temperature difference in the immediate vicinityof the leakage location, and this temperature difference can be detected by a fibre-optic cable. Typically,fibre-optic cables can measure temperature differences of about 1 °C within 1-2 m sections of the cable,depending of the total distance covered.
— Acoustic sensing: The vibrations created by a leakage generate acoustic noise that can be recorded by thefibre-optic cable. Typically, the resolution is 10 m of cable, where each 10 m section in principle functionsas an advanced microphone.
Fibre-optic cables can be used at both onshore and offshore pipelines.
DET NORSKE VERITAS AS
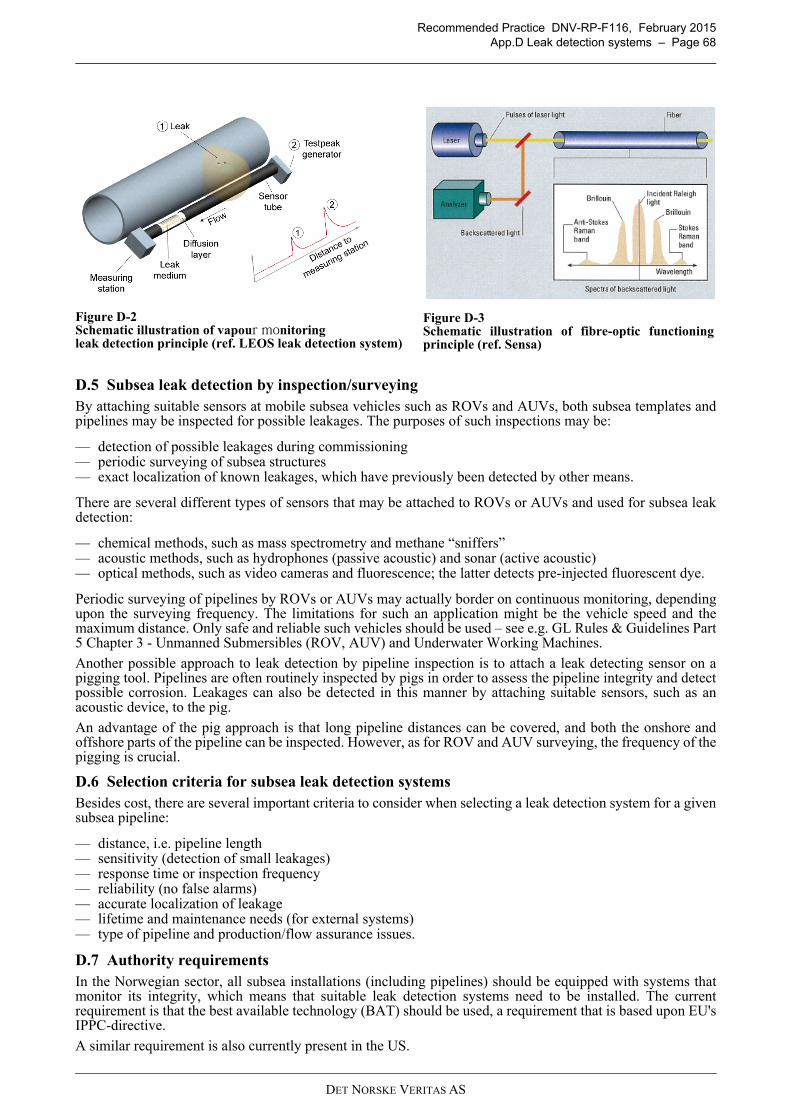
Recommended Practice DNV-RP-F116, February 2015App.D Leak detection systems – Page 68
D.5 Subsea leak detection by inspection/surveyingBy attaching suitable sensors at mobile subsea vehicles such as ROVs and AUVs, both subsea templates andpipelines may be inspected for possible leakages. The purposes of such inspections may be:
— detection of possible leakages during commissioning— periodic surveying of subsea structures— exact localization of known leakages, which have previously been detected by other means.
There are several different types of sensors that may be attached to ROVs or AUVs and used for subsea leakdetection:
— chemical methods, such as mass spectrometry and methane “sniffers”— acoustic methods, such as hydrophones (passive acoustic) and sonar (active acoustic)— optical methods, such as video cameras and fluorescence; the latter detects pre-injected fluorescent dye.
Periodic surveying of pipelines by ROVs or AUVs may actually border on continuous monitoring, dependingupon the surveying frequency. The limitations for such an application might be the vehicle speed and themaximum distance. Only safe and reliable such vehicles should be used – see e.g. GL Rules & Guidelines Part5 Chapter 3 - Unmanned Submersibles (ROV, AUV) and Underwater Working Machines.
Another possible approach to leak detection by pipeline inspection is to attach a leak detecting sensor on apigging tool. Pipelines are often routinely inspected by pigs in order to assess the pipeline integrity and detectpossible corrosion. Leakages can also be detected in this manner by attaching suitable sensors, such as anacoustic device, to the pig.
An advantage of the pig approach is that long pipeline distances can be covered, and both the onshore andoffshore parts of the pipeline can be inspected. However, as for ROV and AUV surveying, the frequency of thepigging is crucial.
D.6 Selection criteria for subsea leak detection systemsBesides cost, there are several important criteria to consider when selecting a leak detection system for a givensubsea pipeline:
— distance, i.e. pipeline length— sensitivity (detection of small leakages)— response time or inspection frequency— reliability (no false alarms)— accurate localization of leakage— lifetime and maintenance needs (for external systems)— type of pipeline and production/flow assurance issues.
D.7 Authority requirementsIn the Norwegian sector, all subsea installations (including pipelines) should be equipped with systems thatmonitor its integrity, which means that suitable leak detection systems need to be installed. The currentrequirement is that the best available technology (BAT) should be used, a requirement that is based upon EU'sIPPC-directive.
A similar requirement is also currently present in the US.
Figure D-2 Schematic illustration of vapour monitoring leak detection principle (ref. LEOS leak detection system)
Figure D-3 Schematic illustration of fibre-optic functioningprinciple (ref. Sensa)
DET NORSKE VERITAS AS
Recommended Practice DNV-RP-F116, February 2015App.E Inspection and monitoring techniques – Page 69
APPENDIX E INSPECTION AND MONITORING TECHNIQUES
E.1 Pipeline inspection methodsThe various inspection (survey) methods for either external inspection or in-line inspection are brieflydescribed below. The methods described are current industry normal practice however new techniques arecontinually being developed and can be used as deemed appropriate. Only safe and reliable vehicles should beused – see e.g. GL Rules & Guidelines Part 5 Chapter 3 - Unmanned Submersibles (ROV, AUV) andUnderwater Working Machines.
E.1.1 External (SUBSEA) inspections
E.1.1.1 External carriers There are different options for external carriers of survey equipment. The choice of inspection vehicle may besubject to the threats related to the individual pipeline. The different vehicles will have different capacity withrespect to speed, ability to stop and perform detailed surveys, ability to carry sensors and data accuracy andtherefore have got different advantages for consideration.ROV - Remotely Operated Vehicles (ROV) are used for inspection of submarine pipeline system and lowerparts of the splash zone. The ROV either runs on support wheels on top of a pipeline or moves above thepipeline system. The ROV can be equipped with various equipment depending on the inspection andmonitoring requirements, as typically:
— visual control (video or still camera)— sonar systems (Multi Beam (MB) sonar or Side Scan Sonar)— positioning systems and mapping of pipeline position relative to sea bottom (transponders, digiquarts
measurements, photogrammetry etc)— seabed mapping— pipeline location and burial depth measuring (pipe tracker including cross profiler, video and inclinometer)— measurement of corrosion protection system (stab- and/or field gradient-measurements)— environmental sensors (measuring parameters that influence the sound velocity in water)— manipulator arms.
The ROV is normally regarded as a relatively slow, but reliable, survey platform. The speed of the survey is acompromise between ROV capacity, data density, water depth and environmental conditions. In goodconditions, a survey speed between 1.0 and 1.5 m/s can be achieved. In other areas a survey speed of less than0.5 m/s can be expected.The use of ROV can in any case provide good positioning data, combination of all available survey tools andthe possibility to stop and provide extra details when required. The sub-surface positioning may typically beprovided with an absolute accuracy of 0.5 metres dependant on water depths. The favourable manoeuvrabilityof an ROV will provide possibility for simultaneous utilisation of boom cameras, pipe trackers and multibeamecho sounders.As of today the ROV is the only alternative to carry the wide range of survey tools simultaneously and for closevisual inspection of pipelines. The ROV will therefore be the best method for detecting most of the individualthreats.The achieved quality by the ROV system is to a high degree degraded by poor visibility caused by muddywater, schools of fish etc. and the quality of the ROV survey may also be affected by strong current.ROTV - The Remotely Operated Towed Vehicle (ROTV) is used for external inspection of the pipeline system.The system has no internal powered progress in any direction, but can be steered sideways and up/down byrudders to provide a best possible position and altitude relative to the pipeline. The ROTV is towed behind asurvey vessel at relatively high speeds, typically 4 knots (equals to 2 m/s). The normal operation will be toposition the ROTV besides the pipeline (typically 20 metres), at an altitude of 10-20 metres.Traditionally the ROTV has only been capable of carrying a Side Scan Sonar, but new technology has alsoallowed the inclusion of a multi-beam echo sounder. Future technology development may include pipe trackersfor use on ROTV under certain conditions.Compared to an ROV, the ROTV is faster and has a longer range, but can only carry limited sensors and willfor certain has lower potential for observing certain threats. The ROTV will however provide sufficient resultswith respect to detecting most third party threats and may also provide a fair representation of the pipelinelaying conditions including freespan detection. The layback between the vessel and the ROTV is relative to thewater depth and therefore the quality of the positioning of the ROTV subject to the water depth. The ROTVcan not stop and perform detailed survey of a particular area.The ROTV can be evaluated as a primary tool for pipeline inspection in certain areas, but can also be evaluatedas a tool for providing the “big picture” prior to a more detailed survey performed by a ROV at limited areasof interest.The method is however restricted by the water depth and is not recommended for depths larger thanapproximately 300 m.
DET NORSKE VERITAS AS
Recommended Practice DNV-RP-F116, February 2015App.E Inspection and monitoring techniques – Page 70
Tow-Fish - The tow-fish is as the ROTV towed after the survey vessel, but with no means of active steering ofthe vehicle. The tow-fish position is controlled by tow-cable and vessel speed. In practical terms, the tow-fishdoes only have the capability to carry Side Scan Sonars.
Un-tethered underwater vehicle - Un-tethered underwater vehicle is a free-swimming vehicle that can beprogrammed to run by a pre-defined program, but can also be given commands by acoustic links. A typicalvehicle operates at a speed of about 4 knots. The vehicle is launched and retrieved from a vessel, and needs thevessel to follow under a mission. Sample data can be transmitted to the vessel by acoustic link during themission for quality checks. Survey tools can be multibeam bathymetry, sidescan sonar and sub bottom profiler.Autonomous underwater vehicle (AUV) is a robot without a fixed cable to a survey vessel and does not haveany remote control capabilities. It is launched and retrieved from a vessel and follows a pre-defined route.Survey tools can be multibeam bathymetry, sidescan sonar and sub bottom profiler.
Divers - Divers can be required if the operation can not be performed by ROV and if the depth is not more thanapproximately 150 m.
E.1.1.2 External inspection tools
Visual / Video / photo - An ROV is usually equipped with several cameras, which are used for visual inspectionsof the pipeline system.
Normally, three cameras will be utilised for visual pipeline inspection, namely one top camera and boomcameras either side. It is important to maintain the cameras at the same relative position and to maintain theboom cameras in a position relative to the pipeline to provide best possible coverage of the pipeline and thesurrounding seabed. Furthermore it is important to optimise the lighting of the ROV to provide the best possiblepicture quality during the inspection.Both general visual inspection (GVI) and closed visual inspection (CVI) can be performed.
Visual inspections are recorded digitally for documentation. Visual inspections offer easy identification ofvisible observations of the system and the seabed for manual interpretation by the operators.
Close Visual Inspection is the best available method for detecting all threats and for providing the bestunderstanding of the pipeline laying conditions including freespan configuration. However, it is important tobe aware of the reduction in quality of recorded data in areas with poor visibility.
Sidescan SONAR - The sidescan sonar (SOund NAvigation Ranging) is able to look sideways.
The sidescan sonar creates an image of the seabed and pipeline by transmitting sound waves towards the seabedand analysing the echo. It creates images of the seabed even in water with reduced visibility. It can provide highresolution images and it can detect objects from significant distances. Survey images are manually interpreted.
For visual surveys the Side Scan Sonar is very often providing complementary information as it has thepotential for a wide detection of large observations such as large 3rd party damages, intervention, shiftingseabed conditions etc.
Used as a primary inspection tool, Side Scan Sonar will be able to identify large 3rd party damages as well asthe pipeline burial status and also freespanning activity although to a lower accuracy than during visual surveys.
Multibeam echosounder (MBE) - This sonar based technology is used to map the seabed topography in thevicinity of the pipeline including the pipeline position relative to the seabed. The tool transmits sound wavestowards the seabed and makes a profile of the seabed and pipeline. It enables high resolution screening anddetects objects and installations in the vicinity of the pipeline, and is very useful for imaging the pipeline andsurrounding seabed for freespan detecting. A very high data density may be achieved from MBE systems, onlylimited by the detected range of the system. Therefore the data density has no practical impact on the speed ofthe surveys. The system operates at high frequency with no means of detecting buried objects.Cross profiler - In principle, this is the same concept as the Multibeam sonar, but the technology is older, it isa more time consuming method and it holds only one sonar. It consists of moving scanning heads providing across profile over a few seconds of time introducing errors as the vehicle is moving forwards.
A cross profiler records the seabed in a cross-section (2D) at the actual position. A cross profiler deliverstypically listings of seabed topography and the top-of-pipe for unburied pipelines. For buried pipelines, theburial depth can be found if combined with a pipetracker.
Pipetracker - The pipetracker is used to detect and survey buried pipelines down to approximately two metersbelow the seabed. There are different technologies on the market, both acoustic low frequency sensors andelectromagnetic systems. The latter technology is mostly used in the industry at present. The tool uses amagnetic field to measure a relative distance between the tool and pipeline. The tool should be calibrated to thespecific pipeline and its target burial depth. Survey errors are dependant on the tool itself and the operation ofthe carrier (ROV), however, small diameter pipelines with large burial depth are difficult to detect. Thepipetracker can only detect the lateral and vertical distance from the sensor to the top of the pipeline and thedata needs to be merged with complementary data measuring the distance between the sensor and the seabedto provide burial depth.
The pipetracker can not measure the seabed profile.
DET NORSKE VERITAS AS
Recommended Practice DNV-RP-F116, February 2015App.E Inspection and monitoring techniques – Page 71
Sub bottom profiler - This is an acoustic based tool operating at low frequency penetrating the seabed to provideburial depth. It is also a profiling tool for shallow geophysics. The tool has limitations with regard to measuringthe configuration of the pipeline and can only be used to track the pipeline if used at high altitude from a vehiclecrossing the pipeline to spot check burial depth at certain points (as opposed to running along the pipeline).There are technology development projects ongoing that may provide large improvements and possibilities forthe future.Stabbing - 1) Stabbing consists of physically penetrating a pole through the soil to measure the pipeline cover-height. It is often used for calibrating other tools. Stabbing is normally used for short sections.Stabbing - 2) Recordings of anode potentials and pipe protections potentials is sometimes carried out bycontacting the anode or pipe surface by some spike arrangement connected to a reference electrode via avoltmeter. Such potential recordings are often referred to as “stabbings”. The recordings are applicable todemonstrate that anodes are “active”; i.e. that the anode potential is not less negative than the design value, andthat the protection potential is more negative than the design protective potential.Eddy current - This is an electrical NDT method which can be utilised to detect and quantify surface breakingor near surface defects in the pipe material. It is a non-contact method and can test through paint coatings.It can not size cracks larger than approximately 2 mm.External UT - External UT (Ultrasonic Testing) tools are available for both onshore (in atmospheric) conditionsand for offshore (ROV or divers) applications. The UT tools spans from the single handhold probe to fullyautomated UT tools (AUT) that scans a section of the pipe and store the measurements in a data logger.
E.1.1.3 Onshore inspection toolsCP-measurements - On onshore pipelines, periodic recordings of the pipe-to-soil potential is carried out at testposts located along the line, mostly with a permanently installed reference electrode close to the pipe surface.Potential recordings may be carried out manually at the test posts, or recordings may be carried outautomatically for electronic transfer to a remote location. As an alternative to a close fixed reference electrode,a portable reference electrode may be positioned at the surface close to the test post. The potential recordingwill then include an IR-drop which in some cases represents a significant measuring error. The IR-drop can,however, be eliminated by so-called on/off measurements for which the DC-source for CP is interrupted for ashort period of time and the instantaneous potential drop (i.e. the actual IR-drop) is recorded. Periodic CPsurveys should also include testing of the efficiency of electrically insulating joints.Special onshore CP surveys are carried out for the purpose of e.g. detecting and locating coating defects (CIPSor “close interval potential surveys”) or to detect interaction between the pipeline CP-system and other buriedstructures, with and without an own CP system. The objective can further be to detect stray currents in theground originating from other remote DC sources. As such sources are not normally permanent, recordings ofDC-interference have to be carried out by continuous monitoring of pipe-to-soil over an extended period oftime. Special CP onshore surveys will have to be carried out by personnel with documented training and practicalexperience of such surveys. EN 13509 describes various techniques to monitor buried and immersed CPsystems, including the testing of pipeline insulating joints.Furthermore description of onshore inspection tools and methods, reference is given to ASME B31.8S andAPI1160.
E.1.2 In-line inspection (ILI) with intelligent pigMagnetic flux leakage - A MFL-pig measures changes in wall thickness from the inside of a pipeline made ofa ferro-magnetic material. It can operate in both gas and liquid fluids. The method detects metal losses causedby e.g. pitting or generalised corrosion. An MFL pig detects the change in magnetic response from the pipe inconnection with metal loss The MFL technology is an indirect method to size defects since the signals is afunction of the volume of the corrosion defect. The signals have to be subsequently analysed in order todetermine the dimensions of the defect.The MFL inspection pig can detect both external and internal metal loss defects. MFL pigs are available in HR(high resolution) and XHR (extra high resolution) versions. The sizing accuracy of the defect depth for theXHR version is of the order of 5%-8% of the wall thickness for a wall thickness of about 1" (25.4 mm) andinternal defects. This corresponds to an accuracy of 1.3 mm to 2.0 mm. For external defects or thicker wallthickness the accuracy reduces.Ultrasound technology - Ultrasound technology (UT) is used as a pigging tool to measure the absolutethickness of the wall. The technique can differentiate between external and internal metal loss. It can onlyoperate with a liquid film between the sensors and the wall and is therefore mostly used in pipelinestransporting fluids. In case of gas pipelines, the pig has to be carried in a liquid plug. The UT-pig requires thatthe steel surface has been properly cleaned in order to obtain reliable measurements. The method is alsorestricted by the wall thickness and the speed. An UT-pig can be run for all types of pipeline materials (i.e. bothferrous and non-ferrous). The method also detects cracks.
DET NORSKE VERITAS AS
Recommended Practice DNV-RP-F116, February 2015App.E Inspection and monitoring techniques – Page 72
Laser-optical inspection tool - The laser-optic instrument records a visual image of the inner wall of pipelinescarrying transparent fluids. Features are visualised giving valuable information for evaluating andinterpretations of the features. The image can be processed and animated adding a 3D grid and the feature canbe positioned and sized, for defects the clock and KP-position, width, length and depth can be provided. Theoptical inspection tool is hence considered to represent a new and valuable inspection tool for inspection ofinternal features in pipelines carrying transparent fluids, e.g. gas pipelines. The sizing accuracy would be of theorder of 0.5 mm for the depth and provides the profile of the defects. Dropouts of oil and debris may fillpotential pits reducing the value of the visual image and the accuracy of the seizing of the defects.Geopig - Geopig is a pig that measures the global curvature based upon gyro-technology. A geopig can measurethe global curvature with a high accuracy. The distance is measured by a tracking odometer. The tool can notmeasure a radius above its threshold value. A high accuracy measurement from a geopig has a limited value ifthe data can not be linked to the seabed topography, burial depth, etc. Calliper - A calliper pig measures the pipe out-of roundness. Simple calliper tools indicate pipeline damage(e.g. a dent, a buckle) without giving information regarding its location. More advanced callipers can scan thecross section along the route and report the shape of the pipe.
E.1.3 Monitoring systemsCorrosion coupons (Weight loss) - The method involves exposing a specimen of material (the coupon) to theprocess environment for a given duration, then removing the specimen for analysis. The basic measurementwhich is determined from corrosion coupons is weight loss; the weight loss taking place over the period ofexposure being expressed as corrosion rate. Electrical resistance (ER) monitoring - ER-probes provide a basic measurement of metal loss. The metal lossin measured on-line while the probe is in-situ and permanently exposed to the process stream.Linear polarization resistance (LPR) probes - The LRP technique is based on electro-chemical theory. Itmeasures the DC current through the metal/fluid interface when the electrodes are polarised by a smallelectrical potential. The advantage is that as this current is related to the corrosion current that in turn is directlyproportional to the corrosion rate, the method provides an instantaneous measurement of the corrosion rate. The disadvantage is that it requires relatively clean aqueous environments (i.e. the fluid has to be conductive)It will not work in gases or water/oil emulsions where the electrodes can become coated in oil or covered withscale.Field signature measurements (FSM) - The FSM-method is a non-intrusive monitoring method which makesit possible to monitor changes in the pipe wall in real-time at specific locations along a subsea pipeline. Sincethis system can only monitor specific locations along the pipeline, the location of the FSM should be carefullyselected and be located at critical points.Sand / erosion monitoring - These are devices which are designed to measure erosion caused by sand in aflowing system (sand detection and monitoring probes, non-intrusive acoustic detectors).Assessment and monitoring of microbiologically influenced corrosion (MIC) - A common way to assess MICis to analyze the microbial and chemical composition of pigging debris and/or surfaces of corrosion coupons.NACE standard TM0212-2012 contains the most recent update on how to perform MIC detection, testing, andevaluation on internal surfaces of pipelines.Current and vibration monitoring - Currents near the seafloor can be monitored to control the likelihood ofscouring or pipeline movement, while vibration monitoring systems might be installed in connection withfreespans to monitor vortex induced vibrations (VIV), vibrations caused by currents, or to monitor other issuessuch as slugging.Vibration monitoring systems are typically clamp sensor packages that are attached to the pipeline at regularintervals to record vibrations in e.g. all three axial directions.
DET NORSKE VERITAS AS
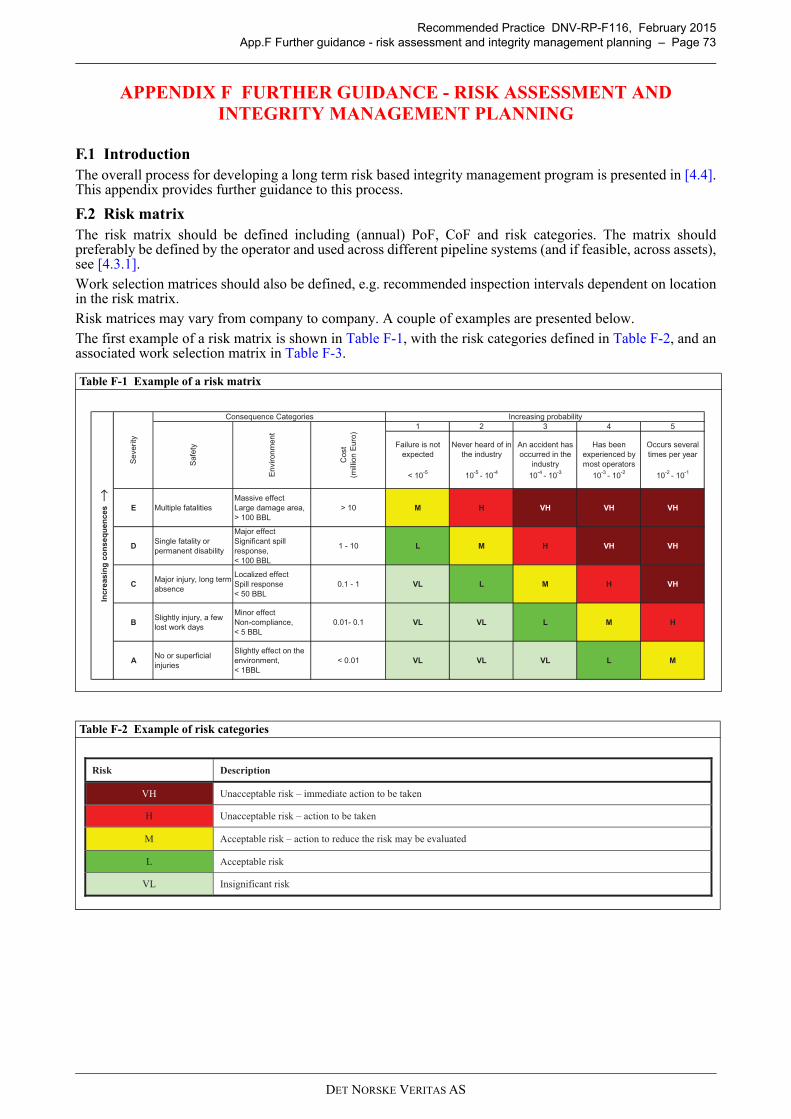
Recommended Practice DNV-RP-F116, February 2015App.F Further guidance - risk assessment and integrity management planning – Page 73
APPENDIX F FURTHER GUIDANCE - RISK ASSESSMENT AND INTEGRITY MANAGEMENT PLANNING
F.1 IntroductionThe overall process for developing a long term risk based integrity management program is presented in [4.4].This appendix provides further guidance to this process.
F.2 Risk matrixThe risk matrix should be defined including (annual) PoF, CoF and risk categories. The matrix shouldpreferably be defined by the operator and used across different pipeline systems (and if feasible, across assets),see [4.3.1].Work selection matrices should also be defined, e.g. recommended inspection intervals dependent on locationin the risk matrix.Risk matrices may vary from company to company. A couple of examples are presented below.The first example of a risk matrix is shown in Table F-1, with the risk categories defined in Table F-2, and anassociated work selection matrix in Table F-3.
Table F-1 Example of a risk matrix
Table F-2 Example of risk categories
1 2 3 4 5
Failure is not expected
< 10-5
Never heard of in the industry
10-5 - 10-4
An accident has occurred in the
industry10-4 - 10-3
Has been experienced by most operators
10-3 - 10-2
Occurs several times per year
10-2 - 10-1
E Multiple fatalitiesMassive effectLarge damage area,> 100 BBL
> 10 M H VH VH VH
D Single fatality or permanent disability
Major effectSignificant spill response,< 100 BBL
1 - 10 L M H VH VH
C Major injury, long term absence
Localized effectSpill response< 50 BBL
0.1 - 1 VL L M H VH
B Slightly injury, a few lost work days
Minor effectNon-compliance,< 5 BBL
0.01- 0.1 VL VL L M H
A No or superficial injuries
Slightly effect on the environment,< 1BBL
< 0.01 VL VL VL L M
Increasing probability
Incr
easi
ng c
onse
quen
ces
→
Consequence Categories
Safe
ty
Env
ironm
ent
Cos
t(m
illion
Eur
o)
Seve
rity
Risk Description
VH Unacceptable risk – immediate action to be taken
H Unacceptable risk – action to be taken
M Acceptable risk – action to reduce the risk may be evaluated
L Acceptable risk
VL Insignificant risk
→
DET NORSKE VERITAS AS
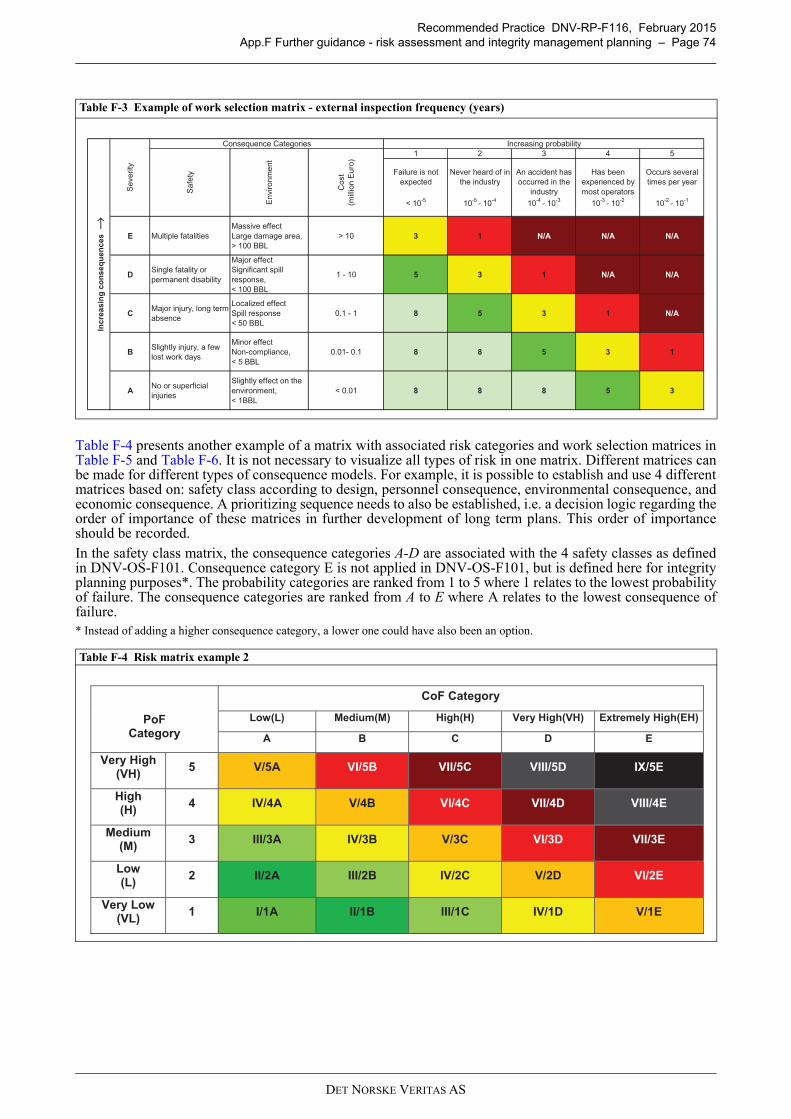
Recommended Practice DNV-RP-F116, February 2015App.F Further guidance - risk assessment and integrity management planning – Page 74
Table F-4 presents another example of a matrix with associated risk categories and work selection matrices inTable F-5 and Table F-6. It is not necessary to visualize all types of risk in one matrix. Different matrices canbe made for different types of consequence models. For example, it is possible to establish and use 4 differentmatrices based on: safety class according to design, personnel consequence, environmental consequence, andeconomic consequence. A prioritizing sequence needs to also be established, i.e. a decision logic regarding theorder of importance of these matrices in further development of long term plans. This order of importanceshould be recorded.In the safety class matrix, the consequence categories A-D are associated with the 4 safety classes as definedin DNV-OS-F101. Consequence category E is not applied in DNV-OS-F101, but is defined here for integrityplanning purposes*. The probability categories are ranked from 1 to 5 where 1 relates to the lowest probabilityof failure. The consequence categories are ranked from A to E where A relates to the lowest consequence offailure.* Instead of adding a higher consequence category, a lower one could have also been an option.
Table F-3 Example of work selection matrix - external inspection frequency (years)
Table F-4 Risk matrix example 2
1 2 3 4 5
Failure is not expected
< 10-5
Never heard of in the industry
10-5 - 10-4
An accident has occurred in the
industry10-4 - 10-3
Has been experienced by most operators
10-3 - 10-2
Occurs several times per year
10-2 - 10-1
E Multiple fatalitiesMassive effectLarge damage area,> 100 BBL
> 10 3 1 N/A N/A N/A
D Single fatality or permanent disability
Major effectSignificant spill response,< 100 BBL
1 - 10 5 3 1 N/A N/A
C Major injury, long term absence
Localized effectSpill response< 50 BBL
0.1 - 1 8 5 3 1 N/A
B Slightly injury, a few lost work days
Minor effectNon-compliance,< 5 BBL
0.01- 0.1 8 8 5 3 1
A No or superficial injuries
Slightly effect on the environment,< 1BBL
< 0.01 8 8 8 5 3
Increasing probability
Incr
easi
ng c
onse
quen
ces
→
Consequence Categories
Safe
ty
Envi
ronm
ent
Cos
t(m
illion
Eur
o)
Seve
rity
PoF Category
CoF Category
Low(L) Medium(M) High(H) Very High(VH) Extremely High(EH)
A B C D E
Very High (VH) 5 V/5A VI/5B VII/5C VIII/5D IX/5E
High (H) 4 IV/4A V/4B VI/4C VII/4D VIII/4E
Medium (M) 3 III/3A IV/3B V/3C VI/3D VII/3E
Low (L) 2 II/2A III/2B IV/2C V/2D VI/2E
Very Low (VL) 1 I/1A II/1B III/1C IV/1D V/1E
→
DET NORSKE VERITAS AS
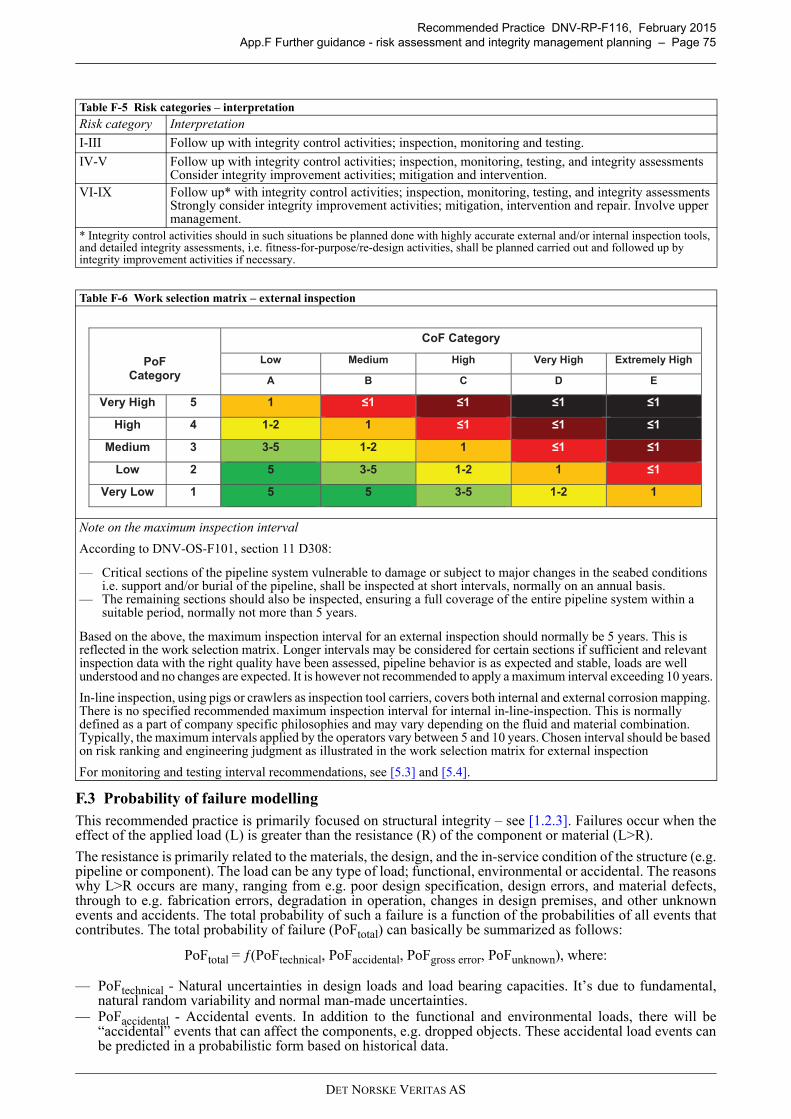
Recommended Practice DNV-RP-F116, February 2015App.F Further guidance - risk assessment and integrity management planning – Page 75
F.3 Probability of failure modellingThis recommended practice is primarily focused on structural integrity – see [1.2.3]. Failures occur when theeffect of the applied load (L) is greater than the resistance (R) of the component or material (L>R).
The resistance is primarily related to the materials, the design, and the in-service condition of the structure (e.g.pipeline or component). The load can be any type of load; functional, environmental or accidental. The reasonswhy L>R occurs are many, ranging from e.g. poor design specification, design errors, and material defects,through to e.g. fabrication errors, degradation in operation, changes in design premises, and other unknownevents and accidents. The total probability of such a failure is a function of the probabilities of all events thatcontributes. The total probability of failure (PoFtotal) can basically be summarized as follows:
PoFtotal = ƒ(PoFtechnical, PoFaccidental, PoFgross error, PoFunknown), where:
— PoFtechnical - Natural uncertainties in design loads and load bearing capacities. It’s due to fundamental,natural random variability and normal man-made uncertainties.
— PoFaccidental - Accidental events. In addition to the functional and environmental loads, there will be“accidental” events that can affect the components, e.g. dropped objects. These accidental load events canbe predicted in a probabilistic form based on historical data.
Table F-5 Risk categories – interpretation
Risk category Interpretation
I-III Follow up with integrity control activities; inspection, monitoring and testing.
IV-V Follow up with integrity control activities; inspection, monitoring, testing, and integrity assessmentsConsider integrity improvement activities; mitigation and intervention.
VI-IX Follow up* with integrity control activities; inspection, monitoring, testing, and integrity assessmentsStrongly consider integrity improvement activities; mitigation, intervention and repair. Involve upper management.
* Integrity control activities should in such situations be planned done with highly accurate external and/or internal inspection tools, and detailed integrity assessments, i.e. fitness-for-purpose/re-design activities, shall be planned carried out and followed up by integrity improvement activities if necessary.
Table F-6 Work selection matrix – external inspection
Note on the maximum inspection interval
According to DNV-OS-F101, section 11 D308:
— Critical sections of the pipeline system vulnerable to damage or subject to major changes in the seabed conditions i.e. support and/or burial of the pipeline, shall be inspected at short intervals, normally on an annual basis.
— The remaining sections should also be inspected, ensuring a full coverage of the entire pipeline system within a suitable period, normally not more than 5 years.
Based on the above, the maximum inspection interval for an external inspection should normally be 5 years. This is reflected in the work selection matrix. Longer intervals may be considered for certain sections if sufficient and relevant inspection data with the right quality have been assessed, pipeline behavior is as expected and stable, loads are well understood and no changes are expected. It is however not recommended to apply a maximum interval exceeding 10 years.
In-line inspection, using pigs or crawlers as inspection tool carriers, covers both internal and external corrosion mapping. There is no specified recommended maximum inspection interval for internal in-line-inspection. This is normally defined as a part of company specific philosophies and may vary depending on the fluid and material combination. Typically, the maximum intervals applied by the operators vary between 5 and 10 years. Chosen interval should be based on risk ranking and engineering judgment as illustrated in the work selection matrix for external inspection
For monitoring and testing interval recommendations, see [5.3] and [5.4].
PoF Category
CoF Category
Low Medium High Very High Extremely High
A B C D E
Very High 5 1 1 1 1 1
High 4 1-2 1 1 1 1
Medium 3 3-5 1-2 1 1 1
Low 2 5 3-5 1-2 1 1
Very Low 1 5 5 3-5 1-2 1
DET NORSKE VERITAS AS
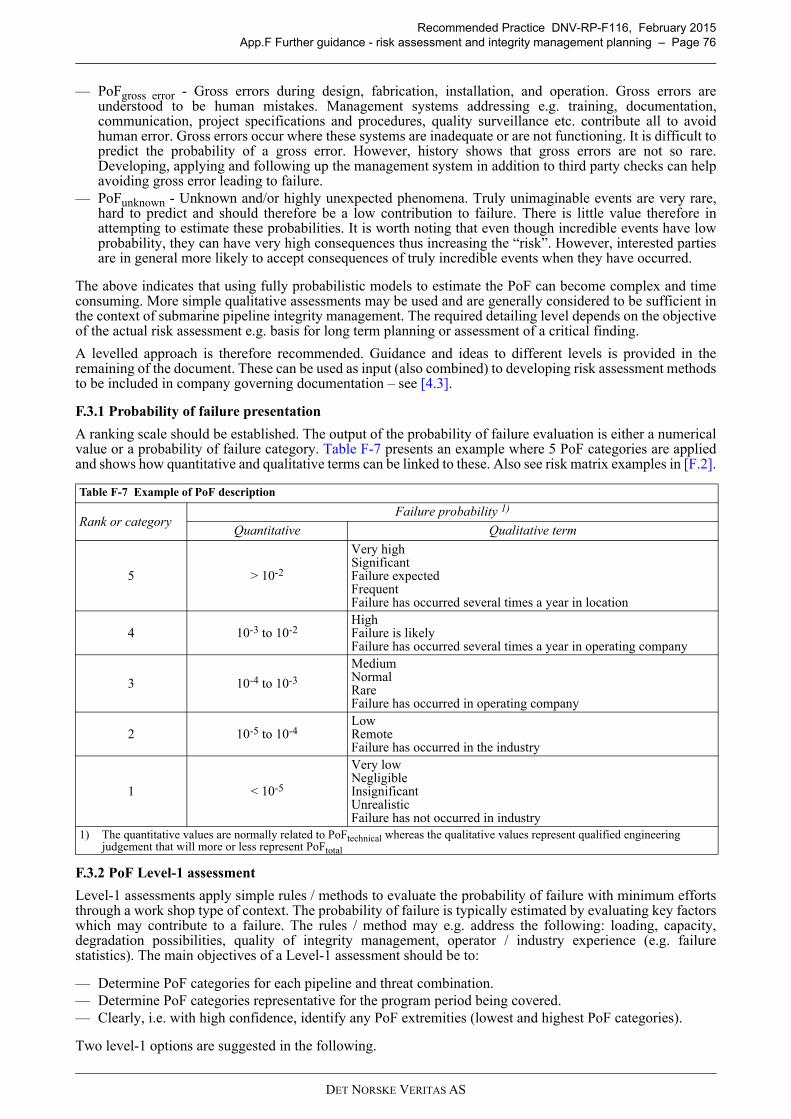
Recommended Practice DNV-RP-F116, February 2015App.F Further guidance - risk assessment and integrity management planning – Page 76
— PoFgross error - Gross errors during design, fabrication, installation, and operation. Gross errors areunderstood to be human mistakes. Management systems addressing e.g. training, documentation,communication, project specifications and procedures, quality surveillance etc. contribute all to avoidhuman error. Gross errors occur where these systems are inadequate or are not functioning. It is difficult topredict the probability of a gross error. However, history shows that gross errors are not so rare.Developing, applying and following up the management system in addition to third party checks can helpavoiding gross error leading to failure.
— PoFunknown - Unknown and/or highly unexpected phenomena. Truly unimaginable events are very rare,hard to predict and should therefore be a low contribution to failure. There is little value therefore inattempting to estimate these probabilities. It is worth noting that even though incredible events have lowprobability, they can have very high consequences thus increasing the “risk”. However, interested partiesare in general more likely to accept consequences of truly incredible events when they have occurred.
The above indicates that using fully probabilistic models to estimate the PoF can become complex and timeconsuming. More simple qualitative assessments may be used and are generally considered to be sufficient inthe context of submarine pipeline integrity management. The required detailing level depends on the objectiveof the actual risk assessment e.g. basis for long term planning or assessment of a critical finding.
A levelled approach is therefore recommended. Guidance and ideas to different levels is provided in theremaining of the document. These can be used as input (also combined) to developing risk assessment methodsto be included in company governing documentation – see [4.3].
F.3.1 Probability of failure presentation
A ranking scale should be established. The output of the probability of failure evaluation is either a numericalvalue or a probability of failure category. Table F-7 presents an example where 5 PoF categories are appliedand shows how quantitative and qualitative terms can be linked to these. Also see risk matrix examples in [F.2].
F.3.2 PoF Level-1 assessment
Level-1 assessments apply simple rules / methods to evaluate the probability of failure with minimum effortsthrough a work shop type of context. The probability of failure is typically estimated by evaluating key factorswhich may contribute to a failure. The rules / method may e.g. address the following: loading, capacity,degradation possibilities, quality of integrity management, operator / industry experience (e.g. failurestatistics). The main objectives of a Level-1 assessment should be to:
— Determine PoF categories for each pipeline and threat combination.— Determine PoF categories representative for the program period being covered.— Clearly, i.e. with high confidence, identify any PoF extremities (lowest and highest PoF categories).
Two level-1 options are suggested in the following.
Table F-7 Example of PoF description
Rank or categoryFailure probability 1)
Quantitative Qualitative term
5 > 10-2
Very highSignificantFailure expectedFrequentFailure has occurred several times a year in location
4 10-3 to 10-2HighFailure is likelyFailure has occurred several times a year in operating company
3 10-4 to 10-3
MediumNormalRareFailure has occurred in operating company
2 10-5 to 10-4LowRemoteFailure has occurred in the industry
1 < 10-5
Very lowNegligibleInsignificantUnrealisticFailure has not occurred in industry
1) The quantitative values are normally related to PoFtechnical whereas the qualitative values represent qualified engineering judgement that will more or less represent PoFtotal
DET NORSKE VERITAS AS
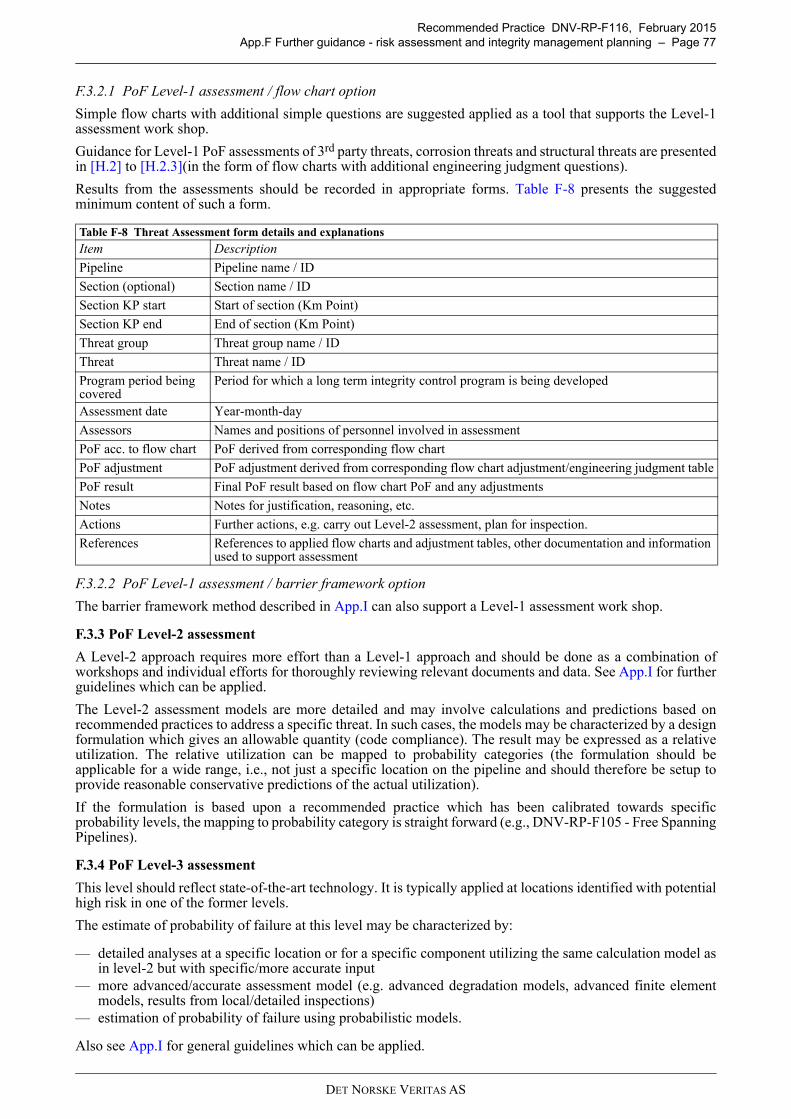
Recommended Practice DNV-RP-F116, February 2015App.F Further guidance - risk assessment and integrity management planning – Page 77
F.3.2.1 PoF Level-1 assessment / flow chart option
Simple flow charts with additional simple questions are suggested applied as a tool that supports the Level-1assessment work shop.
Guidance for Level-1 PoF assessments of 3rd party threats, corrosion threats and structural threats are presentedin [H.2] to [H.2.3](in the form of flow charts with additional engineering judgment questions).
Results from the assessments should be recorded in appropriate forms. Table F-8 presents the suggestedminimum content of such a form.
F.3.2.2 PoF Level-1 assessment / barrier framework option
The barrier framework method described in App.I can also support a Level-1 assessment work shop.
F.3.3 PoF Level-2 assessment
A Level-2 approach requires more effort than a Level-1 approach and should be done as a combination ofworkshops and individual efforts for thoroughly reviewing relevant documents and data. See App.I for furtherguidelines which can be applied.
The Level-2 assessment models are more detailed and may involve calculations and predictions based onrecommended practices to address a specific threat. In such cases, the models may be characterized by a designformulation which gives an allowable quantity (code compliance). The result may be expressed as a relativeutilization. The relative utilization can be mapped to probability categories (the formulation should beapplicable for a wide range, i.e., not just a specific location on the pipeline and should therefore be setup toprovide reasonable conservative predictions of the actual utilization).
If the formulation is based upon a recommended practice which has been calibrated towards specificprobability levels, the mapping to probability category is straight forward (e.g., DNV-RP-F105 - Free SpanningPipelines).
F.3.4 PoF Level-3 assessment
This level should reflect state-of-the-art technology. It is typically applied at locations identified with potentialhigh risk in one of the former levels.
The estimate of probability of failure at this level may be characterized by:
— detailed analyses at a specific location or for a specific component utilizing the same calculation model asin level-2 but with specific/more accurate input
— more advanced/accurate assessment model (e.g. advanced degradation models, advanced finite elementmodels, results from local/detailed inspections)
— estimation of probability of failure using probabilistic models.
Also see App.I for general guidelines which can be applied.
Table F-8 Threat Assessment form details and explanations
Item Description
Pipeline Pipeline name / ID
Section (optional) Section name / ID
Section KP start Start of section (Km Point)
Section KP end End of section (Km Point)
Threat group Threat group name / ID
Threat Threat name / ID
Program period being covered
Period for which a long term integrity control program is being developed
Assessment date Year-month-day
Assessors Names and positions of personnel involved in assessment
PoF acc. to flow chart PoF derived from corresponding flow chart
PoF adjustment PoF adjustment derived from corresponding flow chart adjustment/engineering judgment table
PoF result Final PoF result based on flow chart PoF and any adjustments
Notes Notes for justification, reasoning, etc.
Actions Further actions, e.g. carry out Level-2 assessment, plan for inspection.
References References to applied flow charts and adjustment tables, other documentation and information used to support assessment
DET NORSKE VERITAS AS
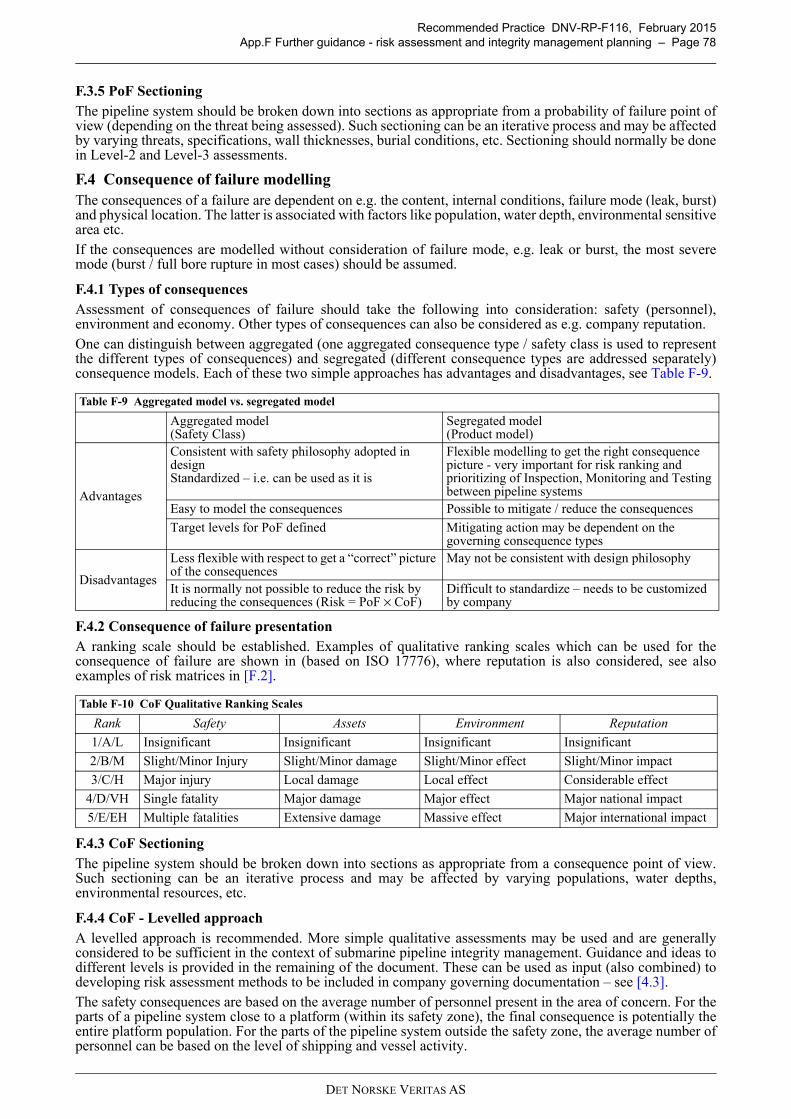
Recommended Practice DNV-RP-F116, February 2015App.F Further guidance - risk assessment and integrity management planning – Page 78
F.3.5 PoF SectioningThe pipeline system should be broken down into sections as appropriate from a probability of failure point ofview (depending on the threat being assessed). Such sectioning can be an iterative process and may be affectedby varying threats, specifications, wall thicknesses, burial conditions, etc. Sectioning should normally be donein Level-2 and Level-3 assessments.
F.4 Consequence of failure modellingThe consequences of a failure are dependent on e.g. the content, internal conditions, failure mode (leak, burst)and physical location. The latter is associated with factors like population, water depth, environmental sensitivearea etc.If the consequences are modelled without consideration of failure mode, e.g. leak or burst, the most severemode (burst / full bore rupture in most cases) should be assumed.
F.4.1 Types of consequencesAssessment of consequences of failure should take the following into consideration: safety (personnel),environment and economy. Other types of consequences can also be considered as e.g. company reputation.One can distinguish between aggregated (one aggregated consequence type / safety class is used to representthe different types of consequences) and segregated (different consequence types are addressed separately)consequence models. Each of these two simple approaches has advantages and disadvantages, see Table F-9.
F.4.2 Consequence of failure presentationA ranking scale should be established. Examples of qualitative ranking scales which can be used for theconsequence of failure are shown in (based on ISO 17776), where reputation is also considered, see alsoexamples of risk matrices in [F.2].
F.4.3 CoF SectioningThe pipeline system should be broken down into sections as appropriate from a consequence point of view.Such sectioning can be an iterative process and may be affected by varying populations, water depths,environmental resources, etc.
F.4.4 CoF - Levelled approachA levelled approach is recommended. More simple qualitative assessments may be used and are generallyconsidered to be sufficient in the context of submarine pipeline integrity management. Guidance and ideas todifferent levels is provided in the remaining of the document. These can be used as input (also combined) todeveloping risk assessment methods to be included in company governing documentation – see [4.3].The safety consequences are based on the average number of personnel present in the area of concern. For theparts of a pipeline system close to a platform (within its safety zone), the final consequence is potentially theentire platform population. For the parts of the pipeline system outside the safety zone, the average number ofpersonnel can be based on the level of shipping and vessel activity.
Table F-9 Aggregated model vs. segregated model
Aggregated model (Safety Class)
Segregated model(Product model)
Advantages
Consistent with safety philosophy adopted in designStandardized – i.e. can be used as it is
Flexible modelling to get the right consequence picture - very important for risk ranking and prioritizing of Inspection, Monitoring and Testing between pipeline systems
Easy to model the consequences Possible to mitigate / reduce the consequences
Target levels for PoF defined Mitigating action may be dependent on the governing consequence types
Disadvantages
Less flexible with respect to get a “correct” picture of the consequences
May not be consistent with design philosophy
It is normally not possible to reduce the risk by reducing the consequences (Risk = PoF × CoF)
Difficult to standardize – needs to be customized by company
Table F-10 CoF Qualitative Ranking Scales
Rank Safety Assets Environment Reputation
1/A/L Insignificant Insignificant Insignificant Insignificant
2/B/M Slight/Minor Injury Slight/Minor damage Slight/Minor effect Slight/Minor impact
3/C/H Major injury Local damage Local effect Considerable effect
4/D/VH Single fatality Major damage Major effect Major national impact
5/E/EH Multiple fatalities Extensive damage Massive effect Major international impact
DET NORSKE VERITAS AS
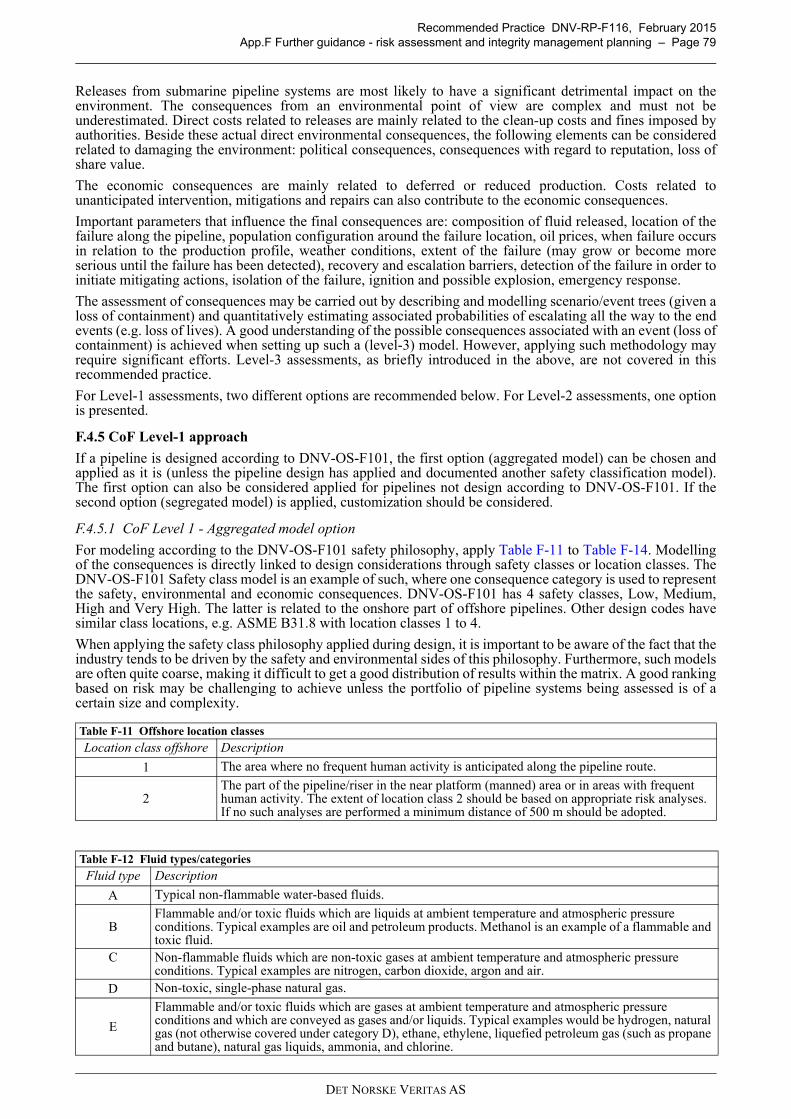
Recommended Practice DNV-RP-F116, February 2015App.F Further guidance - risk assessment and integrity management planning – Page 79
Releases from submarine pipeline systems are most likely to have a significant detrimental impact on theenvironment. The consequences from an environmental point of view are complex and must not beunderestimated. Direct costs related to releases are mainly related to the clean-up costs and fines imposed byauthorities. Beside these actual direct environmental consequences, the following elements can be consideredrelated to damaging the environment: political consequences, consequences with regard to reputation, loss ofshare value.
The economic consequences are mainly related to deferred or reduced production. Costs related tounanticipated intervention, mitigations and repairs can also contribute to the economic consequences.
Important parameters that influence the final consequences are: composition of fluid released, location of thefailure along the pipeline, population configuration around the failure location, oil prices, when failure occursin relation to the production profile, weather conditions, extent of the failure (may grow or become moreserious until the failure has been detected), recovery and escalation barriers, detection of the failure in order toinitiate mitigating actions, isolation of the failure, ignition and possible explosion, emergency response.
The assessment of consequences may be carried out by describing and modelling scenario/event trees (given aloss of containment) and quantitatively estimating associated probabilities of escalating all the way to the endevents (e.g. loss of lives). A good understanding of the possible consequences associated with an event (loss ofcontainment) is achieved when setting up such a (level-3) model. However, applying such methodology mayrequire significant efforts. Level-3 assessments, as briefly introduced in the above, are not covered in thisrecommended practice.
For Level-1 assessments, two different options are recommended below. For Level-2 assessments, one optionis presented.
F.4.5 CoF Level-1 approach
If a pipeline is designed according to DNV-OS-F101, the first option (aggregated model) can be chosen andapplied as it is (unless the pipeline design has applied and documented another safety classification model).The first option can also be considered applied for pipelines not design according to DNV-OS-F101. If thesecond option (segregated model) is applied, customization should be considered.
F.4.5.1 CoF Level 1 - Aggregated model option
For modeling according to the DNV-OS-F101 safety philosophy, apply Table F-11 to Table F-14. Modellingof the consequences is directly linked to design considerations through safety classes or location classes. TheDNV-OS-F101 Safety class model is an example of such, where one consequence category is used to representthe safety, environmental and economic consequences. DNV-OS-F101 has 4 safety classes, Low, Medium,High and Very High. The latter is related to the onshore part of offshore pipelines. Other design codes havesimilar class locations, e.g. ASME B31.8 with location classes 1 to 4.
When applying the safety class philosophy applied during design, it is important to be aware of the fact that theindustry tends to be driven by the safety and environmental sides of this philosophy. Furthermore, such modelsare often quite coarse, making it difficult to get a good distribution of results within the matrix. A good rankingbased on risk may be challenging to achieve unless the portfolio of pipeline systems being assessed is of acertain size and complexity.
Table F-11 Offshore location classes
Location class offshore Description
1 The area where no frequent human activity is anticipated along the pipeline route.
2The part of the pipeline/riser in the near platform (manned) area or in areas with frequent human activity. The extent of location class 2 should be based on appropriate risk analyses. If no such analyses are performed a minimum distance of 500 m should be adopted.
Table F-12 Fluid types/categories
Fluid type Description
A Typical non-flammable water-based fluids.
BFlammable and/or toxic fluids which are liquids at ambient temperature and atmospheric pressure conditions. Typical examples are oil and petroleum products. Methanol is an example of a flammable and toxic fluid.
C Non-flammable fluids which are non-toxic gases at ambient temperature and atmospheric pressure conditions. Typical examples are nitrogen, carbon dioxide, argon and air.
D Non-toxic, single-phase natural gas.
E
Flammable and/or toxic fluids which are gases at ambient temperature and atmospheric pressure conditions and which are conveyed as gases and/or liquids. Typical examples would be hydrogen, natural gas (not otherwise covered under category D), ethane, ethylene, liquefied petroleum gas (such as propane and butane), natural gas liquids, ammonia, and chlorine.
DET NORSKE VERITAS AS
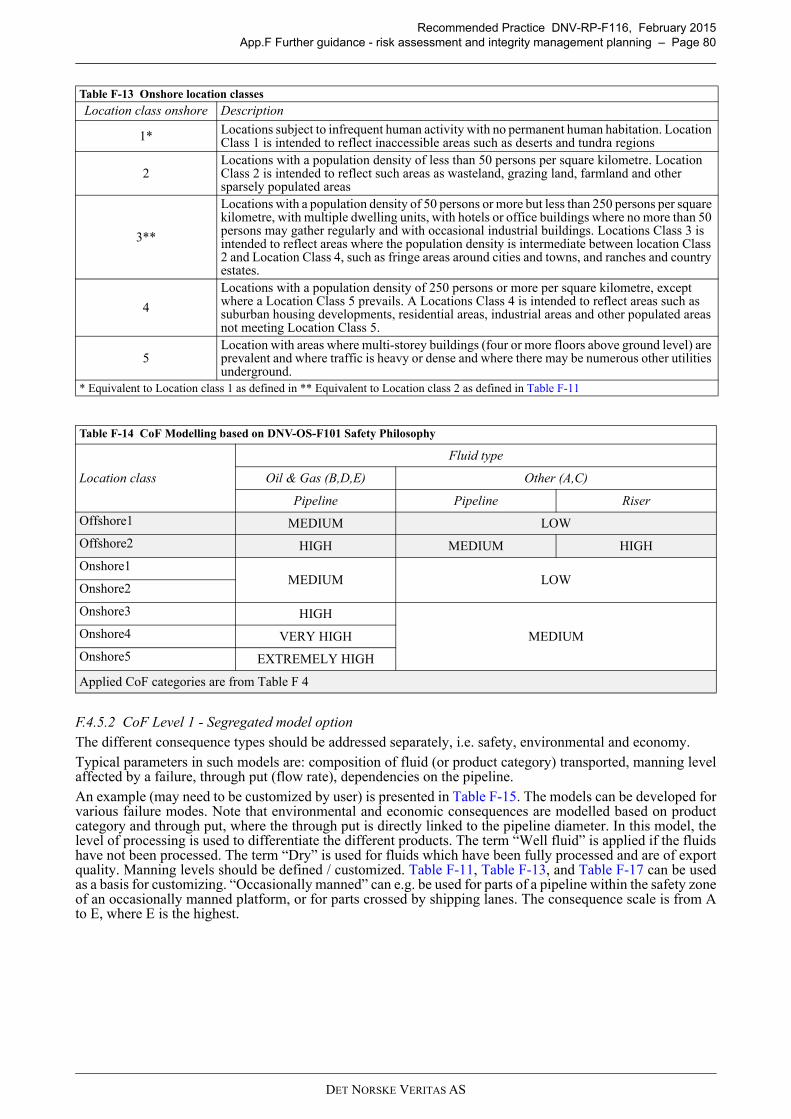
Recommended Practice DNV-RP-F116, February 2015App.F Further guidance - risk assessment and integrity management planning – Page 80
F.4.5.2 CoF Level 1 - Segregated model optionThe different consequence types should be addressed separately, i.e. safety, environmental and economy. Typical parameters in such models are: composition of fluid (or product category) transported, manning levelaffected by a failure, through put (flow rate), dependencies on the pipeline.An example (may need to be customized by user) is presented in Table F-15. The models can be developed forvarious failure modes. Note that environmental and economic consequences are modelled based on productcategory and through put, where the through put is directly linked to the pipeline diameter. In this model, thelevel of processing is used to differentiate the different products. The term “Well fluid” is applied if the fluidshave not been processed. The term “Dry” is used for fluids which have been fully processed and are of exportquality. Manning levels should be defined / customized. Table F-11, Table F-13, and Table F-17 can be usedas a basis for customizing. “Occasionally manned” can e.g. be used for parts of a pipeline within the safety zoneof an occasionally manned platform, or for parts crossed by shipping lanes. The consequence scale is from Ato E, where E is the highest.
Table F-13 Onshore location classes
Location class onshore Description
1* Locations subject to infrequent human activity with no permanent human habitation. Location Class 1 is intended to reflect inaccessible areas such as deserts and tundra regions
2Locations with a population density of less than 50 persons per square kilometre. Location Class 2 is intended to reflect such areas as wasteland, grazing land, farmland and other sparsely populated areas
3**
Locations with a population density of 50 persons or more but less than 250 persons per square kilometre, with multiple dwelling units, with hotels or office buildings where no more than 50 persons may gather regularly and with occasional industrial buildings. Locations Class 3 is intended to reflect areas where the population density is intermediate between location Class 2 and Location Class 4, such as fringe areas around cities and towns, and ranches and country estates.
4
Locations with a population density of 250 persons or more per square kilometre, except where a Location Class 5 prevails. A Locations Class 4 is intended to reflect areas such as suburban housing developments, residential areas, industrial areas and other populated areas not meeting Location Class 5.
5Location with areas where multi-storey buildings (four or more floors above ground level) are prevalent and where traffic is heavy or dense and where there may be numerous other utilities underground.
* Equivalent to Location class 1 as defined in ** Equivalent to Location class 2 as defined in Table F-11
Table F-14 CoF Modelling based on DNV-OS-F101 Safety Philosophy
Location class
Fluid type
Oil & Gas (B,D,E) Other (A,C)
Pipeline Pipeline Riser
Offshore1 MEDIUM LOW
Offshore2 HIGH MEDIUM HIGH
Onshore1MEDIUM LOW
Onshore2
Onshore3 HIGH
MEDIUMOnshore4 VERY HIGH
Onshore5 EXTREMELY HIGH
Applied CoF categories are from Table F 4
DET NORSKE VERITAS AS
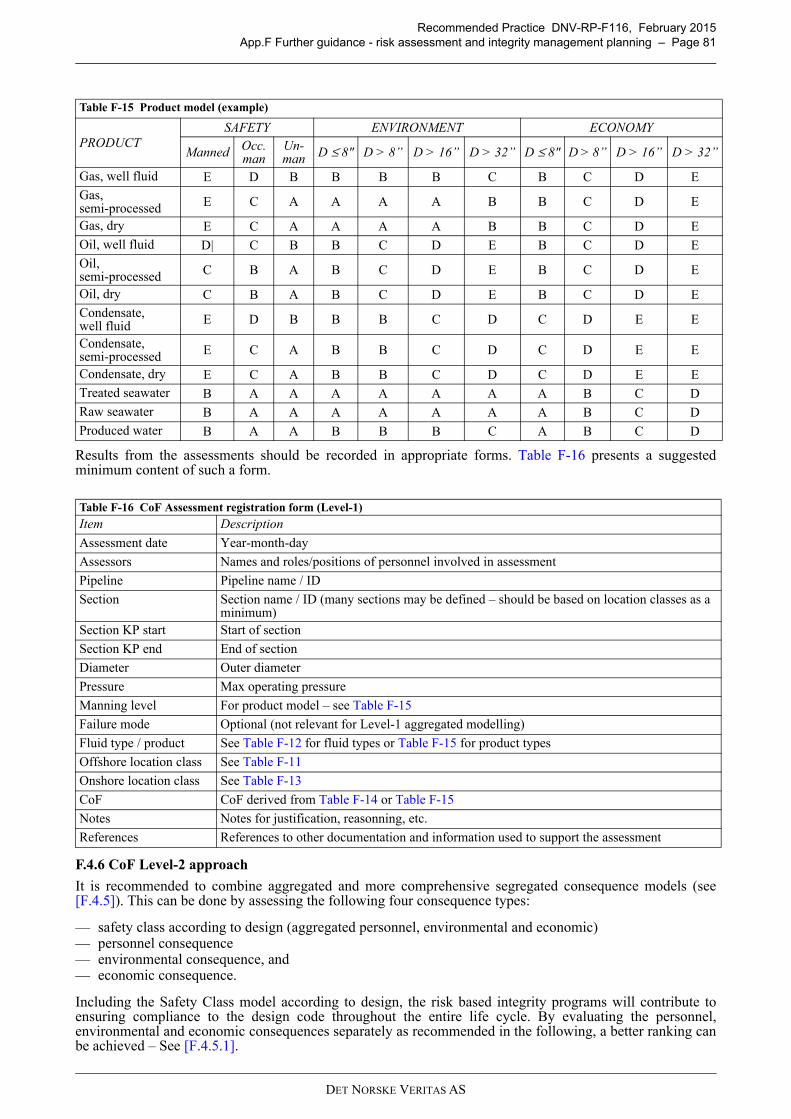
Recommended Practice DNV-RP-F116, February 2015App.F Further guidance - risk assessment and integrity management planning – Page 81
Results from the assessments should be recorded in appropriate forms. Table F-16 presents a suggestedminimum content of such a form.
F.4.6 CoF Level-2 approach
It is recommended to combine aggregated and more comprehensive segregated consequence models (see[F.4.5]). This can be done by assessing the following four consequence types:
— safety class according to design (aggregated personnel, environmental and economic)— personnel consequence— environmental consequence, and— economic consequence.
Including the Safety Class model according to design, the risk based integrity programs will contribute toensuring compliance to the design code throughout the entire life cycle. By evaluating the personnel,environmental and economic consequences separately as recommended in the following, a better ranking canbe achieved – See [F.4.5.1].
Table F-15 Product model (example)
PRODUCTSAFETY ENVIRONMENT ECONOMY
Manned Occ. man
Un-man D ≤ 8" D > 8” D > 16” D > 32” D ≤ 8" D > 8” D > 16” D > 32”
Gas, well fluid E D B B B B C B C D EGas, semi-processed E C A A A A B B C D E
Gas, dry E C A A A A B B C D EOil, well fluid D| C B B C D E B C D EOil, semi-processed C B A B C D E B C D E
Oil, dry C B A B C D E B C D ECondensate, well fluid E D B B B C D C D E E
Condensate, semi-processed E C A B B C D C D E E
Condensate, dry E C A B B C D C D E ETreated seawater B A A A A A A A B C DRaw seawater B A A A A A A A B C DProduced water B A A B B B C A B C D
Table F-16 CoF Assessment registration form (Level-1)
Item Description
Assessment date Year-month-day
Assessors Names and roles/positions of personnel involved in assessment
Pipeline Pipeline name / ID
Section Section name / ID (many sections may be defined – should be based on location classes as a minimum)
Section KP start Start of section
Section KP end End of section
Diameter Outer diameter
Pressure Max operating pressure
Manning level For product model – see Table F-15
Failure mode Optional (not relevant for Level-1 aggregated modelling)
Fluid type / product See Table F-12 for fluid types or Table F-15 for product types
Offshore location class See Table F-11
Onshore location class See Table F-13
CoF CoF derived from Table F-14 or Table F-15
Notes Notes for justification, reasonning, etc.
References References to other documentation and information used to support the assessment
DET NORSKE VERITAS AS
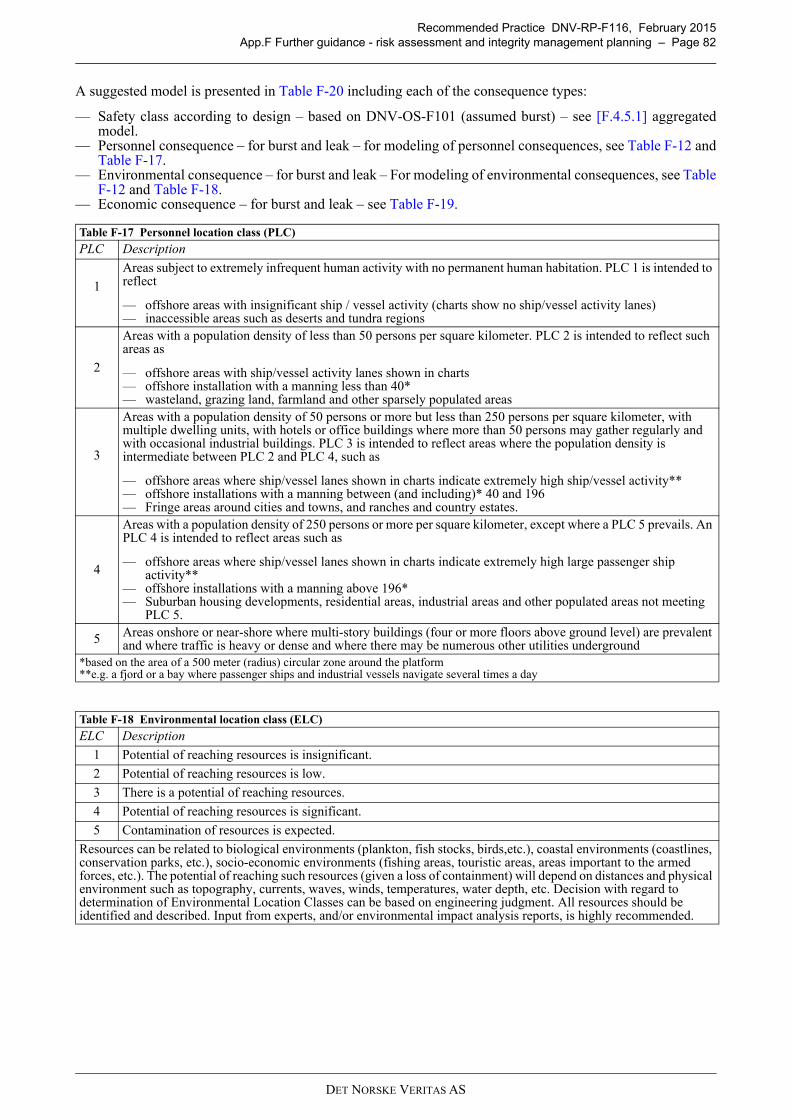
Recommended Practice DNV-RP-F116, February 2015App.F Further guidance - risk assessment and integrity management planning – Page 82
A suggested model is presented in Table F-20 including each of the consequence types:
— Safety class according to design – based on DNV-OS-F101 (assumed burst) – see [F.4.5.1] aggregatedmodel.
— Personnel consequence – for burst and leak – for modeling of personnel consequences, see Table F-12 andTable F-17.
— Environmental consequence – for burst and leak – For modeling of environmental consequences, see TableF-12 and Table F-18.
— Economic consequence – for burst and leak – see Table F-19.
Table F-17 Personnel location class (PLC)
PLC Description
1
Areas subject to extremely infrequent human activity with no permanent human habitation. PLC 1 is intended to reflect
— offshore areas with insignificant ship / vessel activity (charts show no ship/vessel activity lanes)— inaccessible areas such as deserts and tundra regions
2
Areas with a population density of less than 50 persons per square kilometer. PLC 2 is intended to reflect such areas as
— offshore areas with ship/vessel activity lanes shown in charts— offshore installation with a manning less than 40*— wasteland, grazing land, farmland and other sparsely populated areas
3
Areas with a population density of 50 persons or more but less than 250 persons per square kilometer, with multiple dwelling units, with hotels or office buildings where more than 50 persons may gather regularly and with occasional industrial buildings. PLC 3 is intended to reflect areas where the population density is intermediate between PLC 2 and PLC 4, such as
— offshore areas where ship/vessel lanes shown in charts indicate extremely high ship/vessel activity** — offshore installations with a manning between (and including)* 40 and 196— Fringe areas around cities and towns, and ranches and country estates.
4
Areas with a population density of 250 persons or more per square kilometer, except where a PLC 5 prevails. An PLC 4 is intended to reflect areas such as
— offshore areas where ship/vessel lanes shown in charts indicate extremely high large passenger ship activity**
— offshore installations with a manning above 196*— Suburban housing developments, residential areas, industrial areas and other populated areas not meeting
PLC 5.
5 Areas onshore or near-shore where multi-story buildings (four or more floors above ground level) are prevalent and where traffic is heavy or dense and where there may be numerous other utilities underground
*based on the area of a 500 meter (radius) circular zone around the platform**e.g. a fjord or a bay where passenger ships and industrial vessels navigate several times a day
Table F-18 Environmental location class (ELC)
ELC Description
1 Potential of reaching resources is insignificant.
2 Potential of reaching resources is low.
3 There is a potential of reaching resources.
4 Potential of reaching resources is significant.
5 Contamination of resources is expected.
Resources can be related to biological environments (plankton, fish stocks, birds,etc.), coastal environments (coastlines, conservation parks, etc.), socio-economic environments (fishing areas, touristic areas, areas important to the armed forces, etc.). The potential of reaching such resources (given a loss of containment) will depend on distances and physical environment such as topography, currents, waves, winds, temperatures, water depth, etc. Decision with regard to determination of Environmental Location Classes can be based on engineering judgment. All resources should be identified and described. Input from experts, and/or environmental impact analysis reports, is highly recommended.
DET NORSKE VERITAS AS
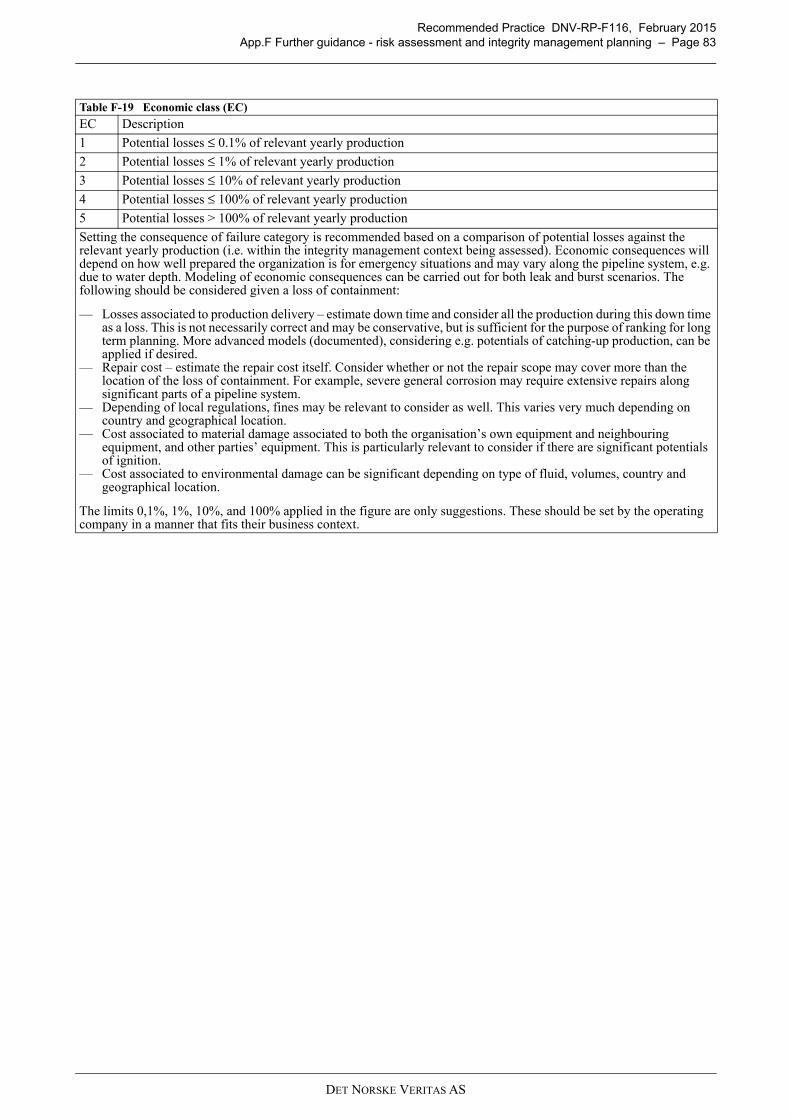
Recommended Practice DNV-RP-F116, February 2015App.F Further guidance - risk assessment and integrity management planning – Page 83
Table F-19 Economic class (EC)
EC Description
1 Potential losses ≤ 0.1% of relevant yearly production
2 Potential losses ≤ 1% of relevant yearly production
3 Potential losses ≤ 10% of relevant yearly production
4 Potential losses ≤ 100% of relevant yearly production
5 Potential losses > 100% of relevant yearly production
Setting the consequence of failure category is recommended based on a comparison of potential losses against the relevant yearly production (i.e. within the integrity management context being assessed). Economic consequences will depend on how well prepared the organization is for emergency situations and may vary along the pipeline system, e.g. due to water depth. Modeling of economic consequences can be carried out for both leak and burst scenarios. The following should be considered given a loss of containment:
— Losses associated to production delivery – estimate down time and consider all the production during this down time as a loss. This is not necessarily correct and may be conservative, but is sufficient for the purpose of ranking for long term planning. More advanced models (documented), considering e.g. potentials of catching-up production, can be applied if desired.
— Repair cost – estimate the repair cost itself. Consider whether or not the repair scope may cover more than the location of the loss of containment. For example, severe general corrosion may require extensive repairs along significant parts of a pipeline system.
— Depending of local regulations, fines may be relevant to consider as well. This varies very much depending on country and geographical location.
— Cost associated to material damage associated to both the organisation’s own equipment and neighbouring equipment, and other parties’ equipment. This is particularly relevant to consider if there are significant potentials of ignition.
— Cost associated to environmental damage can be significant depending on type of fluid, volumes, country and geographical location.
The limits 0,1%, 1%, 10%, and 100% applied in the figure are only suggestions. These should be set by the operating company in a manner that fits their business context.
DET NORSKE VERITAS AS
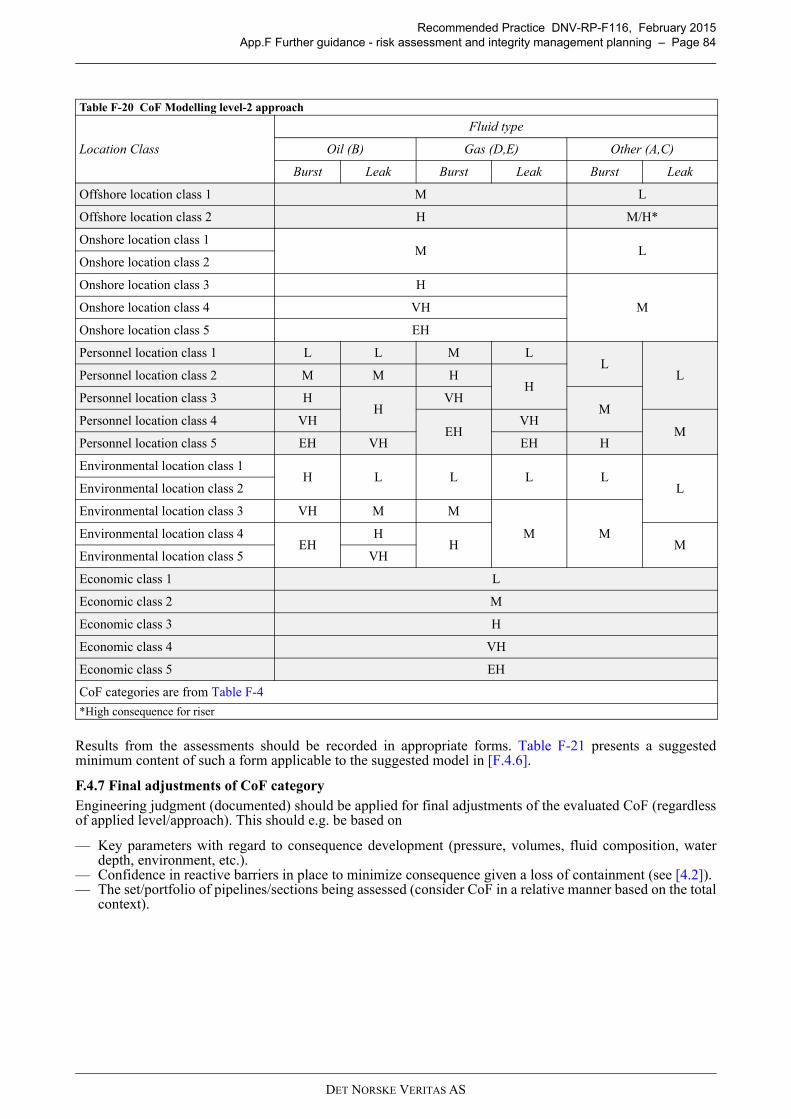
Recommended Practice DNV-RP-F116, February 2015App.F Further guidance - risk assessment and integrity management planning – Page 84
Results from the assessments should be recorded in appropriate forms. Table F-21 presents a suggestedminimum content of such a form applicable to the suggested model in [F.4.6].
F.4.7 Final adjustments of CoF categoryEngineering judgment (documented) should be applied for final adjustments of the evaluated CoF (regardlessof applied level/approach). This should e.g. be based on
— Key parameters with regard to consequence development (pressure, volumes, fluid composition, waterdepth, environment, etc.).
— Confidence in reactive barriers in place to minimize consequence given a loss of containment (see [4.2]).— The set/portfolio of pipelines/sections being assessed (consider CoF in a relative manner based on the total
context).
Table F-20 CoF Modelling level-2 approach
Location Class
Fluid type
Oil (B) Gas (D,E) Other (A,C)
Burst Leak Burst Leak Burst Leak
Offshore location class 1 M L
Offshore location class 2 H M/H*
Onshore location class 1M L
Onshore location class 2
Onshore location class 3 H
MOnshore location class 4 VH
Onshore location class 5 EH
Personnel location class 1 L L M LL
LPersonnel location class 2 M M HH
Personnel location class 3 HH
VHM
Personnel location class 4 VHEH
VHM
Personnel location class 5 EH VH EH H
Environmental location class 1H L L L L
LEnvironmental location class 2
Environmental location class 3 VH M M
M MEnvironmental location class 4EH
HH M
Environmental location class 5 VH
Economic class 1 L
Economic class 2 M
Economic class 3 H
Economic class 4 VH
Economic class 5 EH
CoF categories are from Table F-4
*High consequence for riser
DET NORSKE VERITAS AS
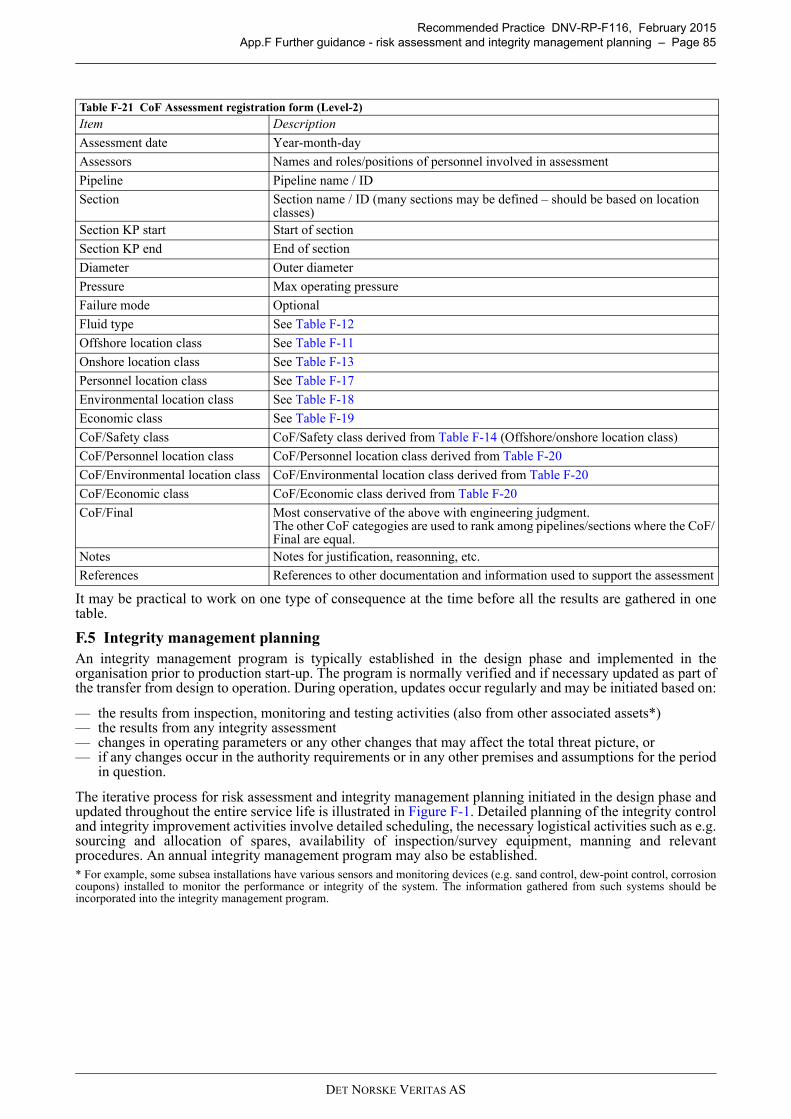
Recommended Practice DNV-RP-F116, February 2015App.F Further guidance - risk assessment and integrity management planning – Page 85
It may be practical to work on one type of consequence at the time before all the results are gathered in onetable.
F.5 Integrity management planningAn integrity management program is typically established in the design phase and implemented in theorganisation prior to production start-up. The program is normally verified and if necessary updated as part ofthe transfer from design to operation. During operation, updates occur regularly and may be initiated based on:
— the results from inspection, monitoring and testing activities (also from other associated assets*)— the results from any integrity assessment— changes in operating parameters or any other changes that may affect the total threat picture, or— if any changes occur in the authority requirements or in any other premises and assumptions for the period
in question.
The iterative process for risk assessment and integrity management planning initiated in the design phase andupdated throughout the entire service life is illustrated in Figure F-1. Detailed planning of the integrity controland integrity improvement activities involve detailed scheduling, the necessary logistical activities such as e.g.sourcing and allocation of spares, availability of inspection/survey equipment, manning and relevantprocedures. An annual integrity management program may also be established.* For example, some subsea installations have various sensors and monitoring devices (e.g. sand control, dew-point control, corrosioncoupons) installed to monitor the performance or integrity of the system. The information gathered from such systems should beincorporated into the integrity management program.
Table F-21 CoF Assessment registration form (Level-2)
Item Description
Assessment date Year-month-day
Assessors Names and roles/positions of personnel involved in assessment
Pipeline Pipeline name / ID
Section Section name / ID (many sections may be defined – should be based on location classes)
Section KP start Start of section
Section KP end End of section
Diameter Outer diameter
Pressure Max operating pressure
Failure mode Optional
Fluid type See Table F-12
Offshore location class See Table F-11
Onshore location class See Table F-13
Personnel location class See Table F-17
Environmental location class See Table F-18
Economic class See Table F-19
CoF/Safety class CoF/Safety class derived from Table F-14 (Offshore/onshore location class)
CoF/Personnel location class CoF/Personnel location class derived from Table F-20
CoF/Environmental location class CoF/Environmental location class derived from Table F-20
CoF/Economic class CoF/Economic class derived from Table F-20
CoF/Final Most conservative of the above with engineering judgment.The other CoF categogies are used to rank among pipelines/sections where the CoF/Final are equal.
Notes Notes for justification, reasonning, etc.
References References to other documentation and information used to support the assessment
DET NORSKE VERITAS AS
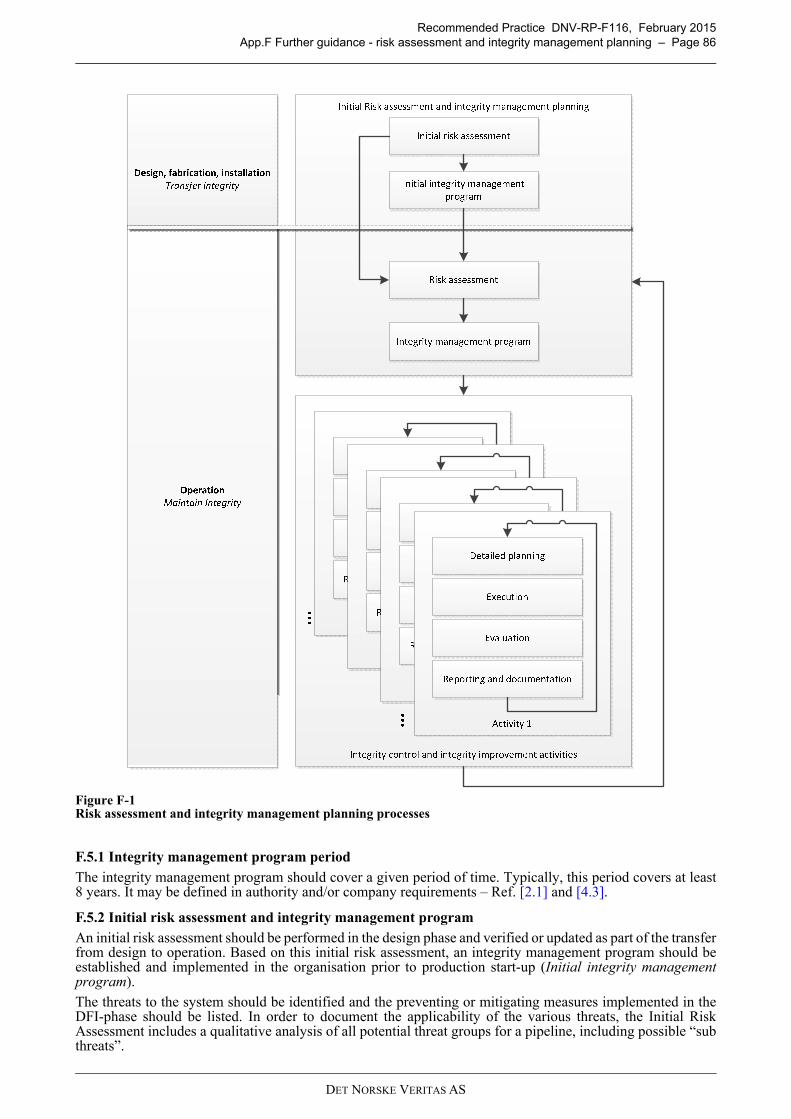
Recommended Practice DNV-RP-F116, February 2015App.F Further guidance - risk assessment and integrity management planning – Page 86
Figure F-1 Risk assessment and integrity management planning processes
F.5.1 Integrity management program period
The integrity management program should cover a given period of time. Typically, this period covers at least8 years. It may be defined in authority and/or company requirements – Ref. [2.1] and [4.3].
F.5.2 Initial risk assessment and integrity management program
An initial risk assessment should be performed in the design phase and verified or updated as part of the transferfrom design to operation. Based on this initial risk assessment, an integrity management program should beestablished and implemented in the organisation prior to production start-up (Initial integrity managementprogram).
The threats to the system should be identified and the preventing or mitigating measures implemented in theDFI-phase should be listed. In order to document the applicability of the various threats, the Initial RiskAssessment includes a qualitative analysis of all potential threat groups for a pipeline, including possible “subthreats”.
DET NORSKE VERITAS AS
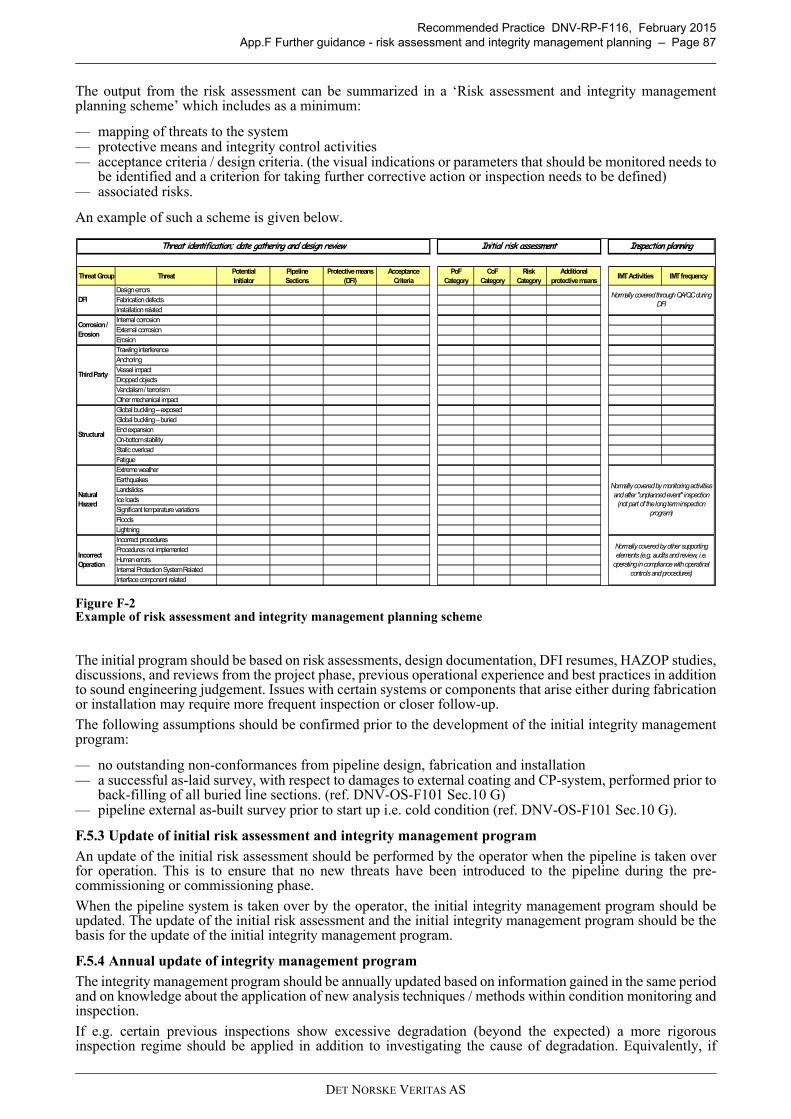
Recommended Practice DNV-RP-F116, February 2015App.F Further guidance - risk assessment and integrity management planning – Page 87
The output from the risk assessment can be summarized in a ‘Risk assessment and integrity managementplanning scheme’ which includes as a minimum:
— mapping of threats to the system— protective means and integrity control activities — acceptance criteria / design criteria. (the visual indications or parameters that should be monitored needs to
be identified and a criterion for taking further corrective action or inspection needs to be defined)— associated risks.
An example of such a scheme is given below.
Figure F-2 Example of risk assessment and integrity management planning scheme
The initial program should be based on risk assessments, design documentation, DFI resumes, HAZOP studies,discussions, and reviews from the project phase, previous operational experience and best practices in additionto sound engineering judgement. Issues with certain systems or components that arise either during fabricationor installation may require more frequent inspection or closer follow-up.
The following assumptions should be confirmed prior to the development of the initial integrity managementprogram:
— no outstanding non-conformances from pipeline design, fabrication and installation— a successful as-laid survey, with respect to damages to external coating and CP-system, performed prior to
back-filling of all buried line sections. (ref. DNV-OS-F101 Sec.10 G)— pipeline external as-built survey prior to start up i.e. cold condition (ref. DNV-OS-F101 Sec.10 G).
F.5.3 Update of initial risk assessment and integrity management program
An update of the initial risk assessment should be performed by the operator when the pipeline is taken overfor operation. This is to ensure that no new threats have been introduced to the pipeline during the pre-commissioning or commissioning phase.
When the pipeline system is taken over by the operator, the initial integrity management program should beupdated. The update of the initial risk assessment and the initial integrity management program should be thebasis for the update of the initial integrity management program.
F.5.4 Annual update of integrity management program
The integrity management program should be annually updated based on information gained in the same periodand on knowledge about the application of new analysis techniques / methods within condition monitoring andinspection.
If e.g. certain previous inspections show excessive degradation (beyond the expected) a more rigorousinspection regime should be applied in addition to investigating the cause of degradation. Equivalently, if
Threat Group ThreatPotentialInitiator
PipelineSections
Protective means(DFI)
AcceptanceCriteria
PoF Category
CoF Category
Risk Category
Additionalprotective means
IMT Activities IMT frequency
Design errorsFabrication defectsInstallation related Internal corrosionExternal corrosionErosionTrawling interference AnchoringVessel impactDropped objectsVandalism / terrorismOther mechanical impact Global buckling – exposedGlobal buckling – buriedEnd expansionOn-bottom stabilityStatic overloadFatigueExtreme weatherEarthquakesLandslidesIce loadsSignificant temperature variationsFloodsLightningIncorrect proceduresProcedures not implementedHuman errorsInternal Protection System RelatedInterface component related
Initial risk assessment Inspection planningThreat identification; date gathering and design review
Corrosion / Erosion
DFI
Normally covered by other supporting elements (e.g. audits and review, i.e.
operating in compliance with operatinal controls and procedures)
Normally covered through QA/QC during DFI
Normally covered by monitoring activities and after "unplanned event" inspection (not part of the long term inspection
program)
Third Party
Structural
NaturalHazard
Incorrect Operation
DET NORSKE VERITAS AS
Recommended Practice DNV-RP-F116, February 2015App.F Further guidance - risk assessment and integrity management planning – Page 88
degradation over time is less than expected, the possibility of extending the inspection intervals should beconsidered.The confidence in the inspection results and monitoring data should be taken into consideration.
F.5.5 Periodic update of risk assessment and integrity management programA periodic update of the entire risk assessment and integrity management program should be performed whenrequired or at least each 5 to 7 years.The need for such updates may be related to changes in: trawling activities (offshore), the design of trawlingand fishing equipment, population (onshore), shipping lanes, methods for inspection and monitoring etc.Modifications, re-qualifications, life extensions, changes in operatorship can also be reasons for such updates.
F.5.6 Event based inspectionsIf a certain event occurs such as a dropped object or a monitored parameter that has exceeded its acceptancecriteria, this should trigger a separate investigation or more frequent inspections. The integrity managementprogram should be updated accordingly.Other types of events may also provide opportunities (e.g. planned shutdowns) to carry out inspectionactivities. The planned inspections already included in the integrity management program should be re-evaluated based on the results from such opportunistic inspection (other types of inspection may be chosen;next planned inspection may be postponed or may need to be performed earlier, etc.).
F.5.7 FrequencyThe frequency of IM-activities should depend on risk level, confidence in input data to the risk assessment,confidence in integrity status, evaluation of possible development of the risk.
F.5.7.1 Use of work selection matricesWork selection matrices can be used to ensure that consistent actions are taken dependent on the results fromthe risk assessment. Also see [F.2].
F.5.7.2 Time to reach a defined risk limitWhere relevant and feasible (i.e. where the probability of failure is expected to change with time), the timewhen a certain risk limit is reached can be estimated and can be used to decide on the next inspection year.It is recommended to base the time to inspection on the time to reach the risk limit minus the time considerednecessary to:
— carry out the inspection— evaluate the results— carry out any integrity assessments and— plan and implement any necessary improvement activities.
This time to inspection should be compared to the next inspection year due to legislation and/or companyrequirements. The most conservative solution should be implemented.Normally, the consequences of a failure are considered time independent and fixed (constant). The major tasksin the risk assessment are therefore the evaluation of the probability of failure in the evaluation year (this willtypically, but not necessarily be the year of last inspection) and its possible development (This is done byconsidering factors that could result in a different probability of failure as time goes).
DET NORSKE VERITAS AS
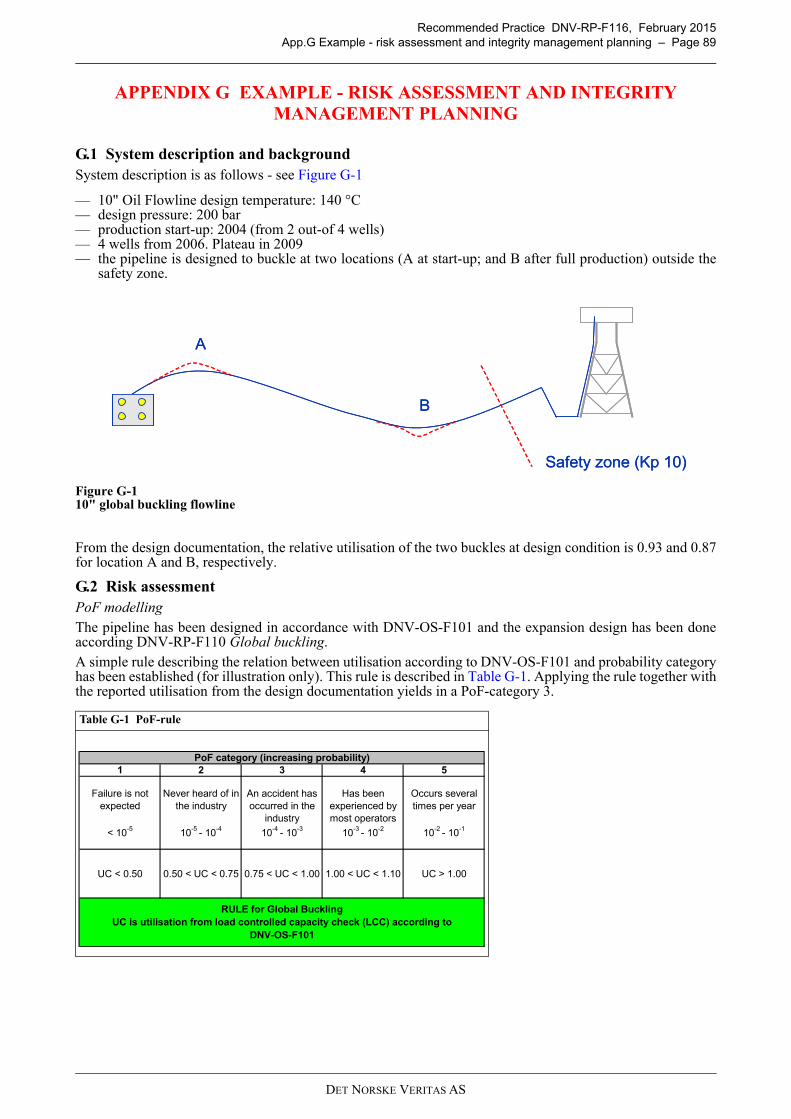
Recommended Practice DNV-RP-F116, February 2015App.G Example - risk assessment and integrity management planning – Page 89
APPENDIX G EXAMPLE - RISK ASSESSMENT AND INTEGRITY MANAGEMENT PLANNING
G.1 System description and backgroundSystem description is as follows - see Figure G-1
— 10" Oil Flowline design temperature: 140 °C— design pressure: 200 bar— production start-up: 2004 (from 2 out-of 4 wells)— 4 wells from 2006. Plateau in 2009— the pipeline is designed to buckle at two locations (A at start-up; and B after full production) outside the
safety zone.
Figure G-1 10" global buckling flowline
From the design documentation, the relative utilisation of the two buckles at design condition is 0.93 and 0.87for location A and B, respectively.
G.2 Risk assessmentPoF modellingThe pipeline has been designed in accordance with DNV-OS-F101 and the expansion design has been doneaccording DNV-RP-F110 Global buckling.A simple rule describing the relation between utilisation according to DNV-OS-F101 and probability categoryhas been established (for illustration only). This rule is described in Table G-1. Applying the rule together withthe reported utilisation from the design documentation yields in a PoF-category 3.
Table G-1 PoF-rule
A
B
Safety zone (Kp 10)
A
B
Safety zone (Kp 10)
1 2 3 4 5
Failure is not expected
< 10-5
Never heard of in the industry
10-5 - 10-4
An accident has occurred in the
industry
10-4 - 10-3
Has been experienced by most operators
10-3 - 10-2
Occurs several times per year
10-2 - 10-1
UC < 0.50 0.50 < UC < 0.75 0.75 < UC < 1.00 1.00 < UC < 1.10 UC > 1.00
RULE for Global BucklingUC is utilisation from load controlled capacity check (LCC) according to
DNV-OS-F101
PoF category (increasing probability)
DET NORSKE VERITAS AS
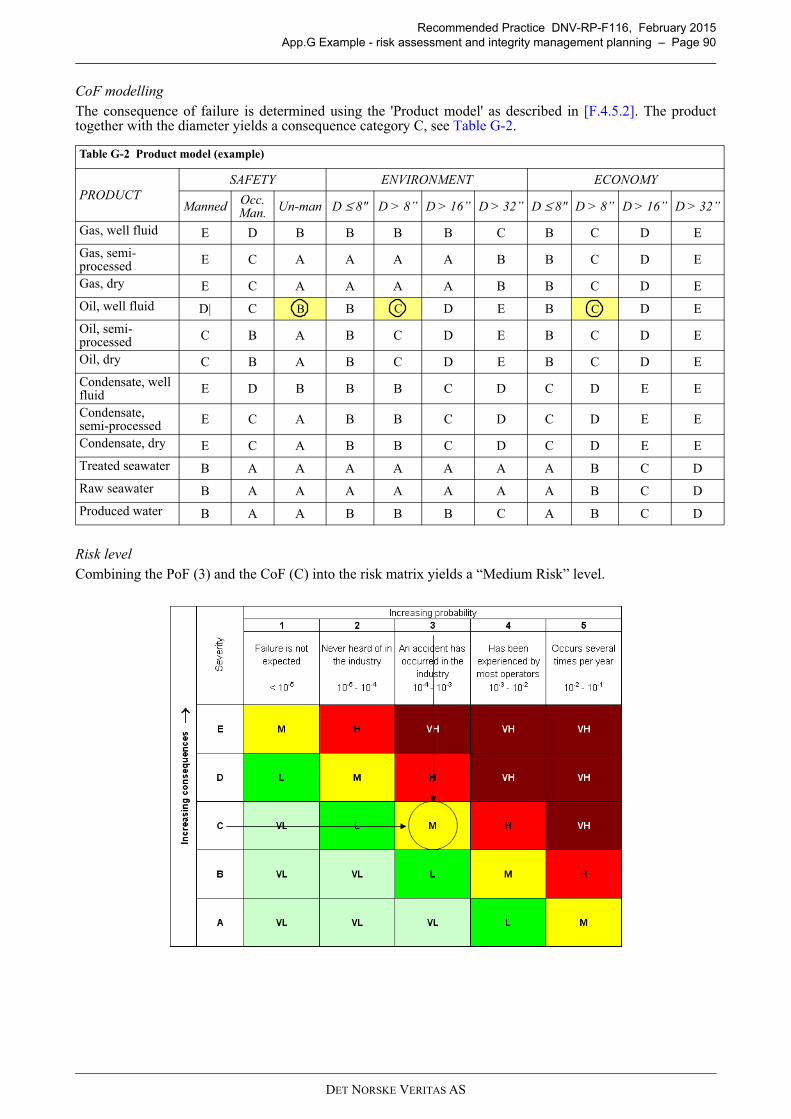
Recommended Practice DNV-RP-F116, February 2015App.G Example - risk assessment and integrity management planning – Page 90
CoF modellingThe consequence of failure is determined using the 'Product model' as described in [F.4.5.2]. The producttogether with the diameter yields a consequence category C, see Table G-2.
Risk levelCombining the PoF (3) and the CoF (C) into the risk matrix yields a “Medium Risk” level.
Table G-2 Product model (example)
PRODUCTSAFETY ENVIRONMENT ECONOMY
Manned Occ. Man. Un-man D ≤ 8" D > 8” D > 16” D > 32” D ≤ 8" D > 8” D > 16” D > 32”
Gas, well fluid E D B B B B C B C D E
Gas, semi-processed E C A A A A B B C D E
Gas, dry E C A A A A B B C D E
Oil, well fluid D| C B D E B D E
Oil, semi-processed C B A B C D E B C D E
Oil, dry C B A B C D E B C D E
Condensate, well fluid E D B B B C D C D E E
Condensate, semi-processed E C A B B C D C D E E
Condensate, dry E C A B B C D C D E E
Treated seawater B A A A A A A A B C D
Raw seawater B A A A A A A A B C D
Produced water B A A B B B C A B C D
B C C
DET NORSKE VERITAS AS
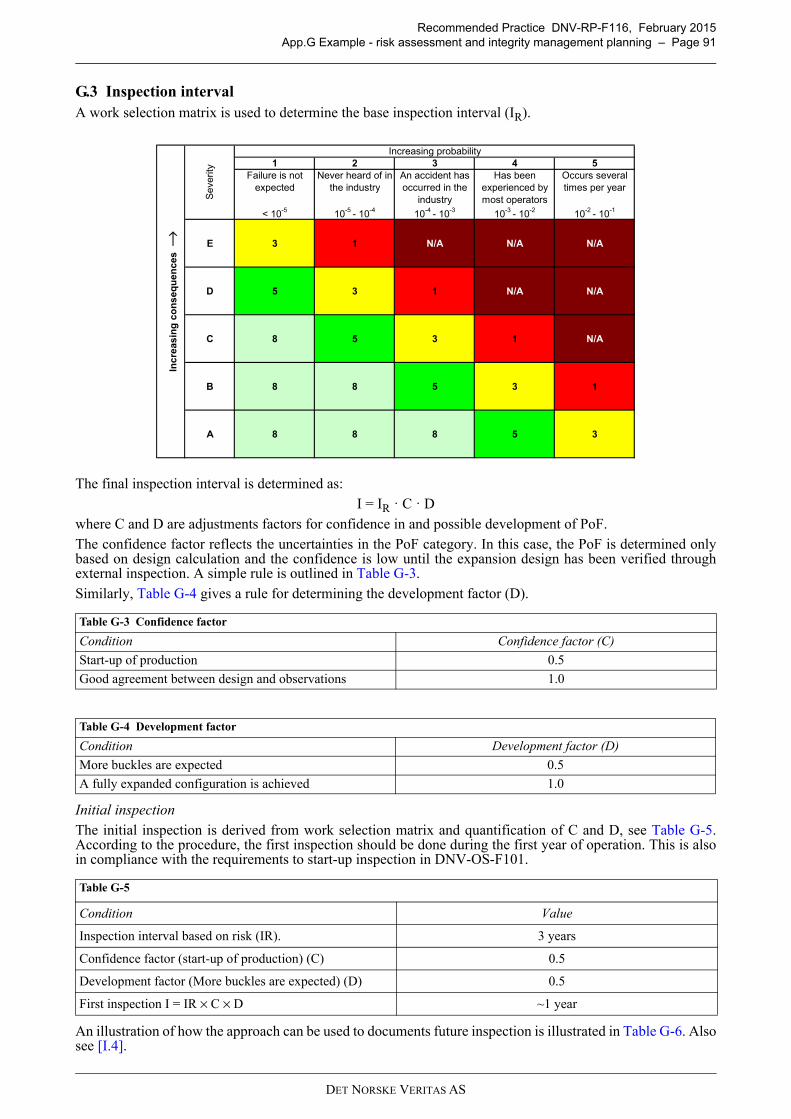
Recommended Practice DNV-RP-F116, February 2015App.G Example - risk assessment and integrity management planning – Page 91
G.3 Inspection intervalA work selection matrix is used to determine the base inspection interval (IR).
The final inspection interval is determined as:I = IR · C · D
where C and D are adjustments factors for confidence in and possible development of PoF.The confidence factor reflects the uncertainties in the PoF category. In this case, the PoF is determined onlybased on design calculation and the confidence is low until the expansion design has been verified throughexternal inspection. A simple rule is outlined in Table G-3.Similarly, Table G-4 gives a rule for determining the development factor (D).
Initial inspectionThe initial inspection is derived from work selection matrix and quantification of C and D, see Table G-5.According to the procedure, the first inspection should be done during the first year of operation. This is alsoin compliance with the requirements to start-up inspection in DNV-OS-F101.
An illustration of how the approach can be used to documents future inspection is illustrated in Table G-6. Alsosee [I.4].
Table G-3 Confidence factor
Condition Confidence factor (C)
Start-up of production 0.5
Good agreement between design and observations 1.0
Table G-4 Development factor
Condition Development factor (D)
More buckles are expected 0.5
A fully expanded configuration is achieved 1.0
Table G-5
Condition Value
Inspection interval based on risk (IR). 3 years
Confidence factor (start-up of production) (C) 0.5
Development factor (More buckles are expected) (D) 0.5
First inspection I = IR × C × D ~1 year
1 2 3 4 5Failure is not
expected
< 10-5
Never heard of in the industry
10-5 - 10-4
An accident has occurred in the
industry
10-4 - 10-3
Has been experienced by most operators
10-3 - 10-2
Occurs several times per year
10-2 - 10-1
E 3 1 N/A N/A N/A
D 5 3 1 N/A N/A
C 8 5 3 1 N/A
B 8 8 5 3 1
A 8 8 8 5 3
Incr
easi
ng
co
ns
equ
ence
s →
Sev
erity
Increasing probability
DET NORSKE VERITAS AS
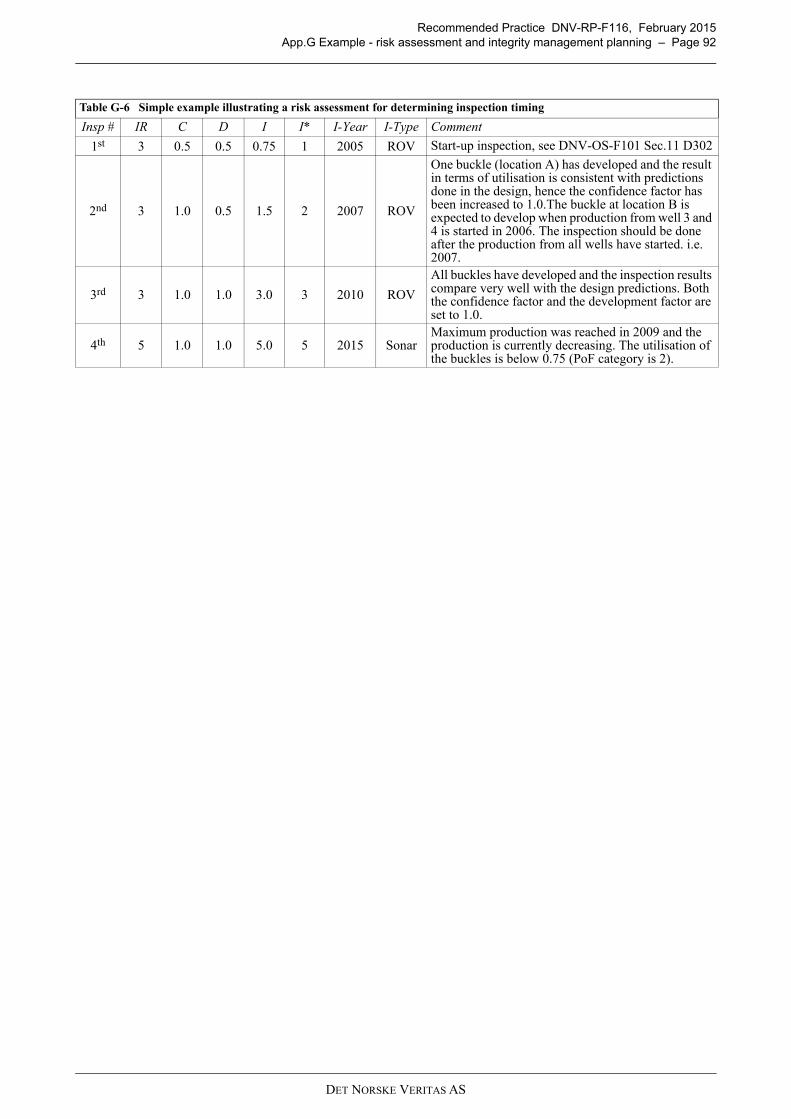
Recommended Practice DNV-RP-F116, February 2015App.G Example - risk assessment and integrity management planning – Page 92
Table G-6 Simple example illustrating a risk assessment for determining inspection timing
Insp # IR C D I I* I-Year I-Type Comment
1st 3 0.5 0.5 0.75 1 2005 ROV Start-up inspection, see DNV-OS-F101 Sec.11 D302
2nd 3 1.0 0.5 1.5 2 2007 ROV
One buckle (location A) has developed and the result in terms of utilisation is consistent with predictions done in the design, hence the confidence factor has been increased to 1.0.The buckle at location B is expected to develop when production from well 3 and 4 is started in 2006. The inspection should be done after the production from all wells have started. i.e. 2007.
3rd 3 1.0 1.0 3.0 3 2010 ROV
All buckles have developed and the inspection results compare very well with the design predictions. Both the confidence factor and the development factor are set to 1.0.
4th 5 1.0 1.0 5.0 5 2015 SonarMaximum production was reached in 2009 and the production is currently decreasing. The utilisation of the buckles is below 0.75 (PoF category is 2).
DET NORSKE VERITAS AS
Recommended Practice DNV-RP-F116, February 2015App.H Probability of failure Level-1 flow charts – Page 93
APPENDIX H PROBABILITY OF FAILURE LEVEL-1 FLOW CHARTS
H.1 IntroductionThis appendix presents flow charts which can be applied as a tool that supports assessment workshops asdescribed in [4.4.3] and Sec. [F.3.2.1].
H.2 Level-1 assessments - Third party threats
H.2.1 GeneralPrior to a risk assessment with regard to third party threats, an appropriate system description should beprepared. The description should cover the entire pipeline and should consider the following life cycleinformation:
— Overview of activities potentially affecting pipeline integrity
— crane handling on platform or rig— fishing (bottom trawling)— supply vessels and general ship traffic in the area around the pipeline— subsea operations (e.g. simultaneous operations as drilling, completion and intervention)— others (planned construction work, etc.).
— Physical characteristic of the pipeline
— diameter, wall thickness, coating thickness— material (steel and coating)— construction details (connectors, swan necks, etc.)— protection (burial, rock dump, protection structures etc.)— routing and water depth.
— Summary of any relevant inspection and monitoring data from external ROV inspections, internalinspections, ship monitoring systems.
With respect to providing input to the evaluations of the consequences of a failure, an assessment as to the mostlikely failure mode (leak through to rupture) should be done from case to case. In the following, guidance forhow to assess the probability of failure is given.
H.2.2 Description of third party threatsThird party threats are associated to human activities and/or hardware that can cause external loading topipelines. The following type of loads may typically be relevant:
— impact loads— pull-over loads— hooking loads— or a combination of the above.
Table H-1 shows examples of third party threats and the typical loads that the system may be subject to.For small diameter pipelines and/or pipelines which have not been designed to withstand such loads caused bythird party threats, failure by loss of containment (leakage through to rupture) may occur as a direct effect. Theprobability of such a failure is equal to the probability of experiencing such an event and is normally timeindependent within the time frames relevant in an integrity management context (long term integritymanagement programs typically cover up to 8 years).Normally, the relevant third party threats are taken into account during design. Third party threat related eventswill most likely lead to pipeline damage such as dents, abrasion, cracks, gouges, local buckles, coating damage,anode damage, and displacements. These types of damage may with time develop into a loss of containmentfailure. The associated probability of failure is more complex and can be time dependent in these cases.
DET NORSKE VERITAS AS
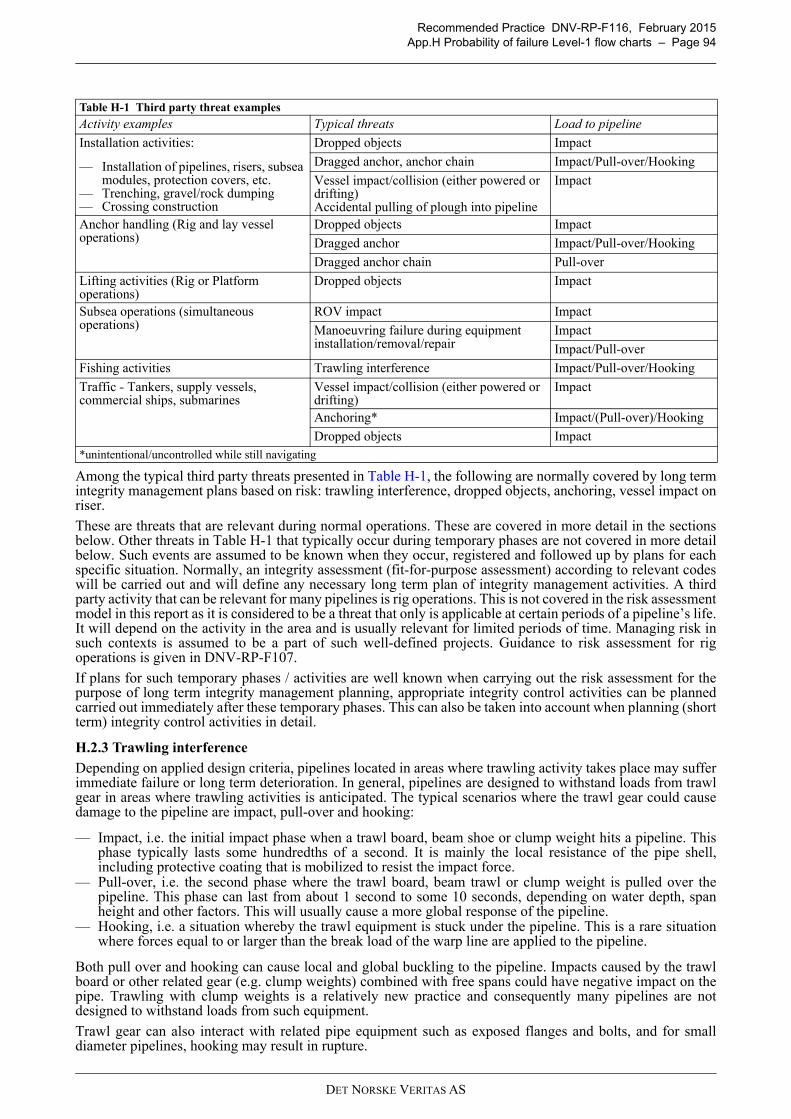
Recommended Practice DNV-RP-F116, February 2015App.H Probability of failure Level-1 flow charts – Page 94
Among the typical third party threats presented in Table H-1, the following are normally covered by long termintegrity management plans based on risk: trawling interference, dropped objects, anchoring, vessel impact onriser.
These are threats that are relevant during normal operations. These are covered in more detail in the sectionsbelow. Other threats in Table H-1 that typically occur during temporary phases are not covered in more detailbelow. Such events are assumed to be known when they occur, registered and followed up by plans for eachspecific situation. Normally, an integrity assessment (fit-for-purpose assessment) according to relevant codeswill be carried out and will define any necessary long term plan of integrity management activities. A thirdparty activity that can be relevant for many pipelines is rig operations. This is not covered in the risk assessmentmodel in this report as it is considered to be a threat that only is applicable at certain periods of a pipeline’s life.It will depend on the activity in the area and is usually relevant for limited periods of time. Managing risk insuch contexts is assumed to be a part of such well-defined projects. Guidance to risk assessment for rigoperations is given in DNV-RP-F107.
If plans for such temporary phases / activities are well known when carrying out the risk assessment for thepurpose of long term integrity management planning, appropriate integrity control activities can be plannedcarried out immediately after these temporary phases. This can also be taken into account when planning (shortterm) integrity control activities in detail.
H.2.3 Trawling interference
Depending on applied design criteria, pipelines located in areas where trawling activity takes place may sufferimmediate failure or long term deterioration. In general, pipelines are designed to withstand loads from trawlgear in areas where trawling activities is anticipated. The typical scenarios where the trawl gear could causedamage to the pipeline are impact, pull-over and hooking:
— Impact, i.e. the initial impact phase when a trawl board, beam shoe or clump weight hits a pipeline. Thisphase typically lasts some hundredths of a second. It is mainly the local resistance of the pipe shell,including protective coating that is mobilized to resist the impact force.
— Pull-over, i.e. the second phase where the trawl board, beam trawl or clump weight is pulled over thepipeline. This phase can last from about 1 second to some 10 seconds, depending on water depth, spanheight and other factors. This will usually cause a more global response of the pipeline.
— Hooking, i.e. a situation whereby the trawl equipment is stuck under the pipeline. This is a rare situationwhere forces equal to or larger than the break load of the warp line are applied to the pipeline.
Both pull over and hooking can cause local and global buckling to the pipeline. Impacts caused by the trawlboard or other related gear (e.g. clump weights) combined with free spans could have negative impact on thepipe. Trawling with clump weights is a relatively new practice and consequently many pipelines are notdesigned to withstand loads from such equipment.
Trawl gear can also interact with related pipe equipment such as exposed flanges and bolts, and for smalldiameter pipelines, hooking may result in rupture.
Table H-1 Third party threat examples
Activity examples Typical threats Load to pipeline
Installation activities:
— Installation of pipelines, risers, subsea modules, protection covers, etc.
— Trenching, gravel/rock dumping— Crossing construction
Dropped objects Impact
Dragged anchor, anchor chain Impact/Pull-over/Hooking
Vessel impact/collision (either powered or drifting)Accidental pulling of plough into pipeline
Impact
Anchor handling (Rig and lay vessel operations)
Dropped objects Impact
Dragged anchor Impact/Pull-over/Hooking
Dragged anchor chain Pull-over
Lifting activities (Rig or Platform operations)
Dropped objects Impact
Subsea operations (simultaneous operations)
ROV impact Impact
Manoeuvring failure during equipment installation/removal/repair
Impact
Impact/Pull-over
Fishing activities Trawling interference Impact/Pull-over/Hooking
Traffic - Tankers, supply vessels, commercial ships, submarines
Vessel impact/collision (either powered or drifting)
Impact
Anchoring* Impact/(Pull-over)/Hooking
Dropped objects Impact*unintentional/uncontrolled while still navigating
DET NORSKE VERITAS AS
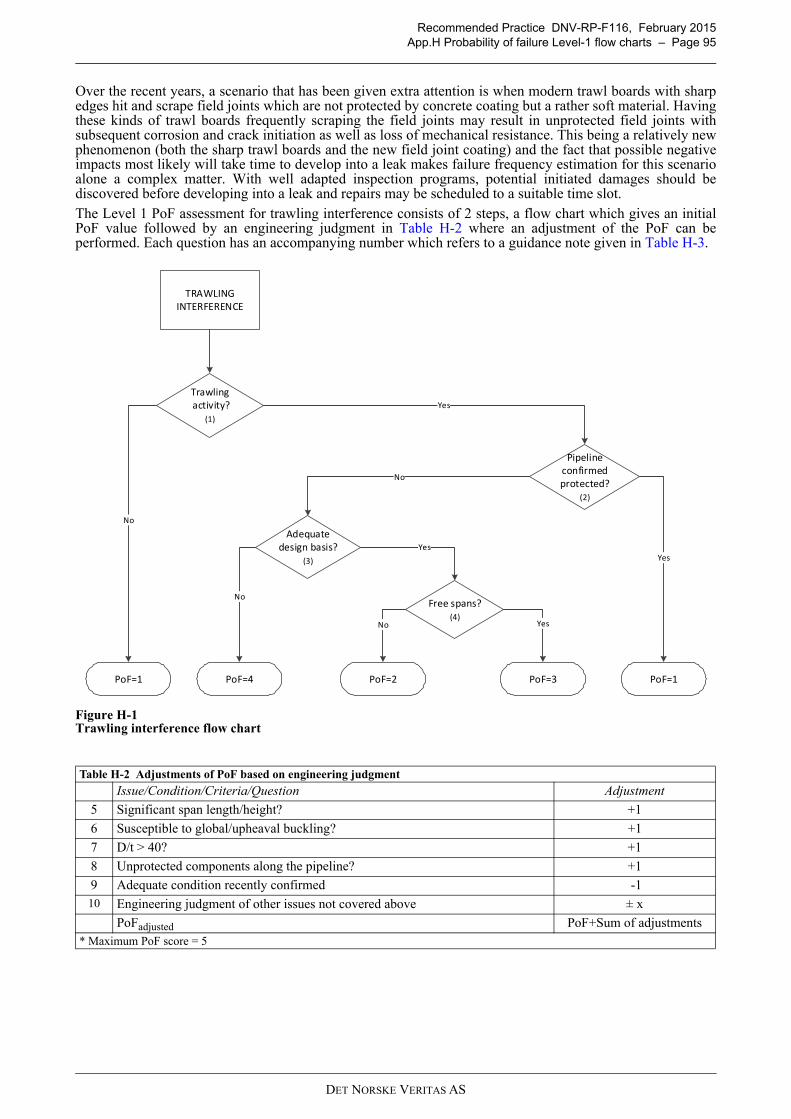
Recommended Practice DNV-RP-F116, February 2015App.H Probability of failure Level-1 flow charts – Page 95
Over the recent years, a scenario that has been given extra attention is when modern trawl boards with sharpedges hit and scrape field joints which are not protected by concrete coating but a rather soft material. Havingthese kinds of trawl boards frequently scraping the field joints may result in unprotected field joints withsubsequent corrosion and crack initiation as well as loss of mechanical resistance. This being a relatively newphenomenon (both the sharp trawl boards and the new field joint coating) and the fact that possible negativeimpacts most likely will take time to develop into a leak makes failure frequency estimation for this scenarioalone a complex matter. With well adapted inspection programs, potential initiated damages should bediscovered before developing into a leak and repairs may be scheduled to a suitable time slot.The Level 1 PoF assessment for trawling interference consists of 2 steps, a flow chart which gives an initialPoF value followed by an engineering judgment in Table H-2 where an adjustment of the PoF can beperformed. Each question has an accompanying number which refers to a guidance note given in Table H-3.
Figure H-1 Trawling interference flow chart
Table H-2 Adjustments of PoF based on engineering judgment
Issue/Condition/Criteria/Question Adjustment
5 Significant span length/height? +1
6 Susceptible to global/upheaval buckling? +1
7 D/t > 40? +1
8 Unprotected components along the pipeline? +1
9 Adequate condition recently confirmed -110 Engineering judgment of other issues not covered above ± x
PoFadjusted PoF+Sum of adjustments* Maximum PoF score = 5
Trawling activity?
(1)
PoF=1
Pipeline confirmed protected?
(2)
Adequate design basis?
(3)
Free spans?(4)
PoF=1 PoF=4 PoF=2 PoF=3
No
Yes
No
No
Yes
No Yes
Yes
TRAWLING INTERFERENCE
DET NORSKE VERITAS AS
Recommended Practice DNV-RP-F116, February 2015App.H Probability of failure Level-1 flow charts – Page 96
H.2.4 Anchoring
Anchoring is here applied in connection with uncontrolled / unintentional anchoring while still navigating.Controlled anchor drops are normally done when the vessel has very low speed/stand still and should thereforebe considered as a dropped object. Hooking is not a threat under these situations due to low vessel speed.
Anchoring as a threat depends on a large number of factors such as pipeline location, size, protectionphilosophy, number of ship crossings per time unit and ship size distribution.
Anchor hooking is most relevant for exposed pipelines, but buried pipelines may also suffer from anchoring ifthe burial depth is insufficient. Depending on the water depth, a dragged anchor may reach the seabed andthereby posing a threat to the submarine pipeline.
There are areas where the probability of unintentional anchor drop is higher than others:
— When the ship approaches a port or navigates through narrow passages, the anchor is prepared for quickdrop, meaning that both the anchor stopper and chain lock is removed. This is done in order to minimizethe time from a possible machinery or steering failure to initiated emergency anchoring. Since the anchorthen only rests on the band break, there is an increased likelihood for uncontrolled anchor drop.
— In case of significant free sailing distances in deeper waters before reaching shallow waters (if pipelines arepresent in the interface area between deeper waters and shallower waters), the probability of an anchorhooking incident may be higher than when only sailing in areas within these shallow waters (where theunintentional dropped anchor most likely will be discovered quickly due to vibrations, noise, speed,maneuvering).
— In addition to dragged anchors from manned ships there are also ships and barges being towed. There is aconcern that the likelihood for unintentional anchor drops from such ships/barges is higher than for mannedships under way. One reason for the concern is that the towed ship or barge may be unmanned, increasingthe likelihood for the drop to remain undiscovered. Another reason is that some of the ships are being towedto distant yards for scrapping. The condition and technical integrity of such ships including equipment foranchoring can be expected to be significantly lower than for ships registered for traffic.
The Level 1 PoF assessment for anchoring consists of 2 steps, a flow chart which gives an initial PoF valuefollowed by an engineering judgment in Table H-4 where an adjustment of the PoF can be performed. Eachquestion has an accompanying number which refers to a guidance note given in Table H-5.
Table H-3 Guidance for trawling interference
Flow chart
1 Trawling activity? Is there any trawling activity in the area that can interfere with the pipeline or is there expected any trawling activity in the near future?
2Pipeline confirmed protected?
Pipeline confirmed protected (i.e. buried or rock dumped) against trawling interference by inspection and it is not expected that there have been any significant changes in the burial depth since the last inspection.
3Adequate design basis?
Pipeline designed against trawling and the loads of the actual equipment used in the area. Note that especially for older pipelines the trawl gear may have increased in size/weight since the design and if clump weight is used is the pipeline able to withstand these loads?
4 Free spans? Are there any free spans along the pipeline?
Engineering judgement
5 Significant span length/height
Free spans with significant length and height that can act as potential hooking points. Only relevant for pipelines in areas with trawling activities.
6 Susceptible to global/upheaval buckling
Buried pipelines that may have experienced global/upheaval buckling since last inspection leading to exposure of the pipeline and risk of trawling interference.
7 D/t > 40 Diameter/thickness ratio above 40 and therefore considered as a less robust pipeline system which is more susceptible to trawling interference than more robust pipelines.
8Unprotected components along the pipeline
Are there any unprotected components, i.e. flanges, valves, fittings, that can be hooked by trawl wire and/or net?
9
Adequate condition recently confirmed
Inspection and monitoring performed showing no damages due to trawling and/or no trawling activity in the area around the pipeline. For buried/rock dumped pipelines relevant inspection types can be internal inspections that can detect dents or advanced external inspections that can reveal global buckling due to trawling. For unprotected pipelines it can be ROV inspections.
10
Engineering judgment of other issues
“x” is selected based on the knowledge of
— the system itself— how it has been operated and— maintained (i.e quality of integrity control and integrity improvement functions in the
integrity management system)
DET NORSKE VERITAS AS
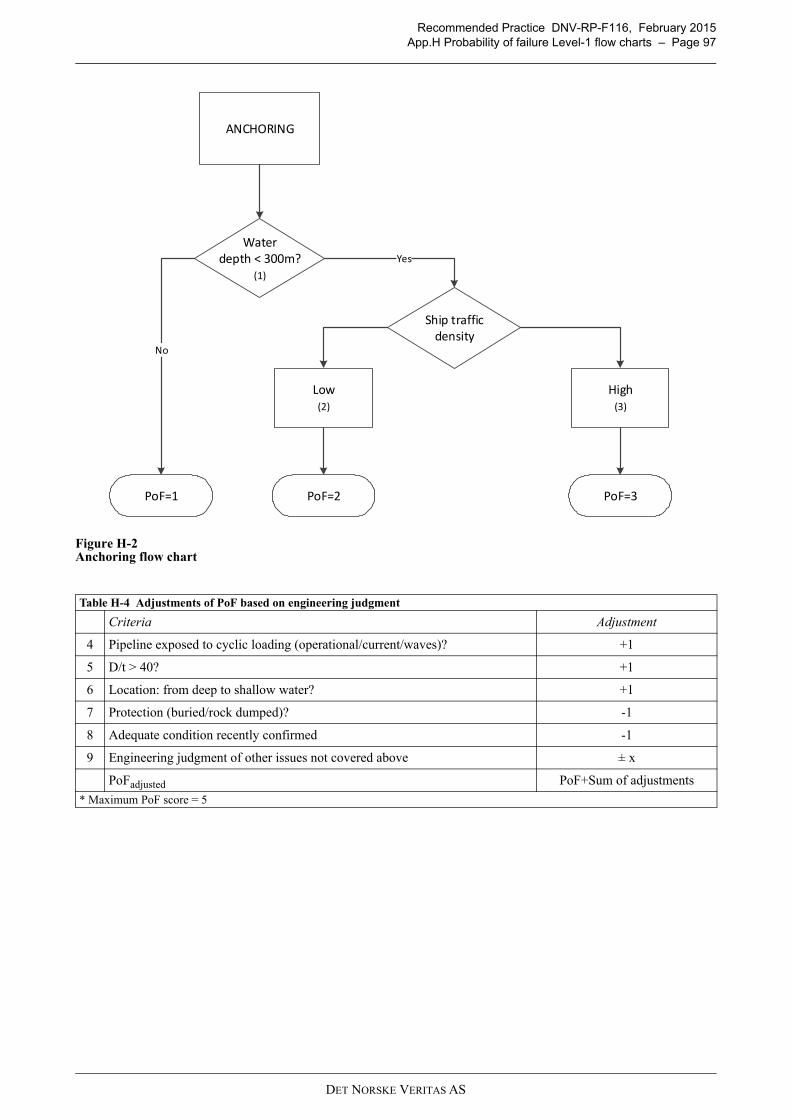
Recommended Practice DNV-RP-F116, February 2015App.H Probability of failure Level-1 flow charts – Page 97
Figure H-2 Anchoring flow chart
Table H-4 Adjustments of PoF based on engineering judgment
Criteria Adjustment
4 Pipeline exposed to cyclic loading (operational/current/waves)? +1
5 D/t > 40? +1
6 Location: from deep to shallow water? +1
7 Protection (buried/rock dumped)? -1
8 Adequate condition recently confirmed -1
9 Engineering judgment of other issues not covered above ± x
PoFadjusted PoF+Sum of adjustments
* Maximum PoF score = 5
Water depth < 300m?
(1)
Ship traffic density
PoF=1 PoF=2 PoF=3
No
Yes
ANCHORING
Low(2)
High(3)
DET NORSKE VERITAS AS
Recommended Practice DNV-RP-F116, February 2015App.H Probability of failure Level-1 flow charts – Page 98
H.2.5 Dropped objectsDamages from dropped objects may occur from passing ships and near platforms/fields. The risk is typicallygreater during drilling and construction work. Dropped objects can be a result of failing lifting operations:
— between supply vessel and platform/rig.— between platform/rig and subsea installation— internally on the platform where objects drop into the sea.
The Level 1 PoF assessment for dropped objects consists of 2 steps, a flow chart which gives an initial PoFvalue followed by an engineering judgment in Table H-6 where an adjustment of the PoF can be performed.Each question has an accompanying number which refers to a guidance note given in Table H-7.
Table H-5 Guidance for anchoring
Flow chart
1 Water depth < 300 m* Dragged anchors are generally not considered to be able to reach the pipeline if it is located at water depths larger than 300 meters.
2 Low ship traffic density Areas with low ship traffic.
3 High ship traffic density High density of ships with anchors that constitute a threat to the pipeline. Typical areas with high ship traffic density are shipping lanes, near harbours, area with drilling operations etc.
Engineering judgement
4 Pipeline exposed to cyclic loading A potential damage to pipelines exposed to cyclic loading from operation (pressure, temperature, shut downs), current, waves etc. can develop faster into failure than a pipeline with low exposure to cyclic loading. Only relevant for areas with water depth < 300 m.
5 D/t > 40? Diameter/thickness ratio above 40 and is therefore considered as a less robust pipeline system. Only relevant for areas with water depth < 300 m.
6 Location: from deep to shallow water Pipeline crossing (transversely) a depth transition zone from shallow to deep water. Free sailing distance in deep waters will increase the probability for not discovering an unintentionally released anchor. When the ship approaches shallow water, the anchor will be able to hook the pipeline since it here will reach the seabed and the pipeline. Only relevant for areas with water depth < 300 m.
7 Protection (buried/rock dumped) Anchor damages can occur even for buried or rock dumped pipelines as anchors can penetrate several meters into the soil, however the damage will be less severe for a buried/rock dumped than for an exposed pipeline.
8 Adequate condition recently confirmed Inspection/monitoring performed showing no damages due to anchoring and/or very low ship activity in the area around the pipeline. For buried/rock dumped pipelines relevant inspection types can be internal inspections that can detect dents or advanced external inspections that can reveal global buckling due to anchoring. For unprotected pipelines it can be ROV inspections.
9 Engineering judgment of other issues “x” is selected based on the knowledge of
— the system itself— how it has been operated and— maintained (i.e quality of integrity control and integrity
improvement functions in the integrity management system)*It has been suggested to use a limit of up to 400 meters as well.
DET NORSKE VERITAS AS
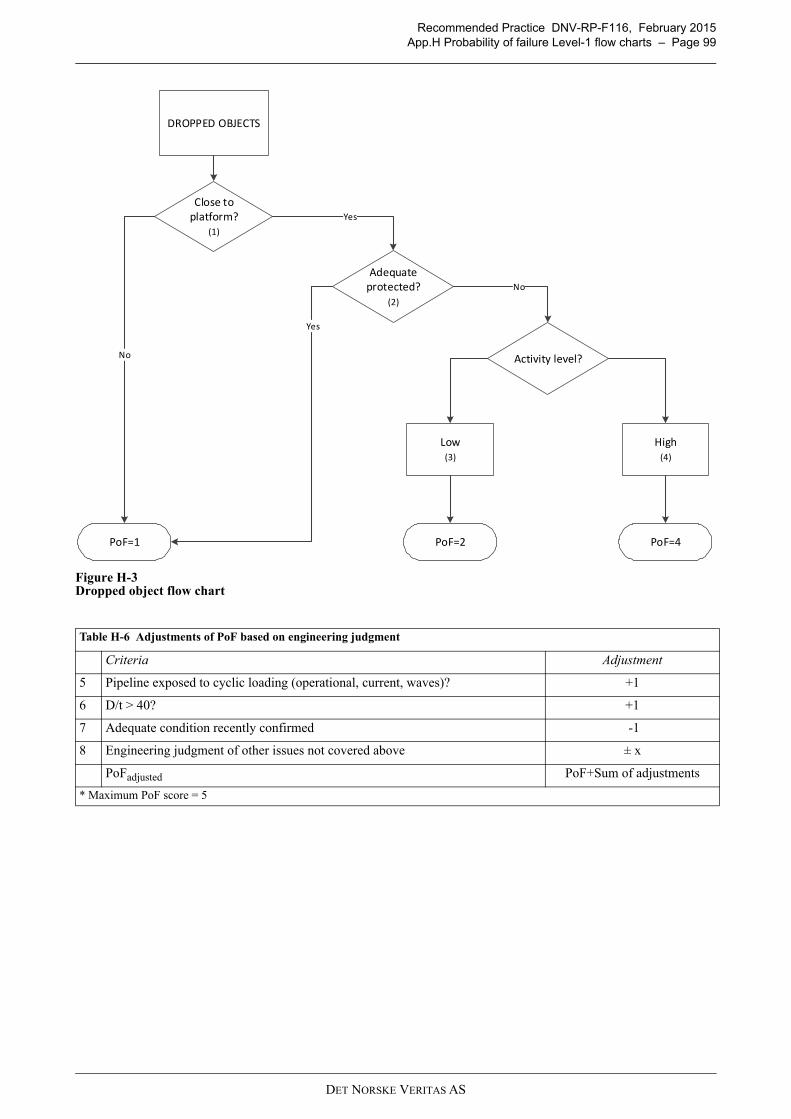
Recommended Practice DNV-RP-F116, February 2015App.H Probability of failure Level-1 flow charts – Page 99
Figure H-3 Dropped object flow chart
Table H-6 Adjustments of PoF based on engineering judgment
Criteria Adjustment
5 Pipeline exposed to cyclic loading (operational, current, waves)? +1
6 D/t > 40? +1
7 Adequate condition recently confirmed -1
8 Engineering judgment of other issues not covered above ± x
PoFadjusted PoF+Sum of adjustments
* Maximum PoF score = 5
Close to platform?
(1)
Activity level?
PoF=1 PoF=2
No
DROPPED OBJECTS
Adequate protected?
(2)
Yes
Yes
No
PoF=4
Low(3)
High(4)
DET NORSKE VERITAS AS
Recommended Practice DNV-RP-F116, February 2015App.H Probability of failure Level-1 flow charts – Page 100
H.2.6 Vessel impact on riserRisers may be subject to interference with ships. Vessel impact on risers should be evaluated to ensure that theriser is fit-for-purpose and still adequately protected. Ship collision damage to risers can be due to collisionbetween risers and:
— passing vessels; merchant vessels or a supply vessels to other fields— shuttle tankers approaching the platform field— fishing vessels— standby vessels— supply vessels to the current field (either while waiting to load/unload, or during loading/unloading
operations).
The Level 1 PoF assessment for vessel impact in riser consists of 2 steps, a flow chart which gives an initialPoF value followed by an engineering judgment where an adjustment of the PoF can be performed. Eachquestion has an accompanying number which refers to a guidance note given in Table H-9.
Table H-7 Guidance for dropped objects
Flow chart
1 Close to platform? Damages due to dropped objects occur more frequent in the platform zone.
2 Adequate protected? Pipeline confirmed protected (buried or rock dumped) against dropped objects by inspection and it is not expected that there have been any significant changes in the burial depth since the last inspection.
3 Low activity level Low activity level above the pipeline
4 High activity level High level of activity above the pipeline, i.e. under drilling and construction work
Engineering judgement
5 Pipeline exposed to cyclic loading
A potential damage to pipelines exposed to cyclic loading from operation (pressure, temperature, shut downs), current, waves etc. can develop faster into failure than a pipeline with low exposure to cyclic loading.
6 D/t > 40 Diameter/thickness ratio above 40 and is therefore considered as a less robust pipeline system.
7 Adequate condition recently confirmed
Inspection and monitoring performed showing no damages due to dropped objects and/or very low activity in the area around the pipeline. Relevant inspections can be ROV inspections and/or internal inspections that can detect dents.
8 Engineering judgment of other issues
“x” is selected based on the knowledge of
— the system itself— how it has been operated and— maintained (i.e quality of integrity control and integrity improvement functions in the
integrity management system)
DET NORSKE VERITAS AS
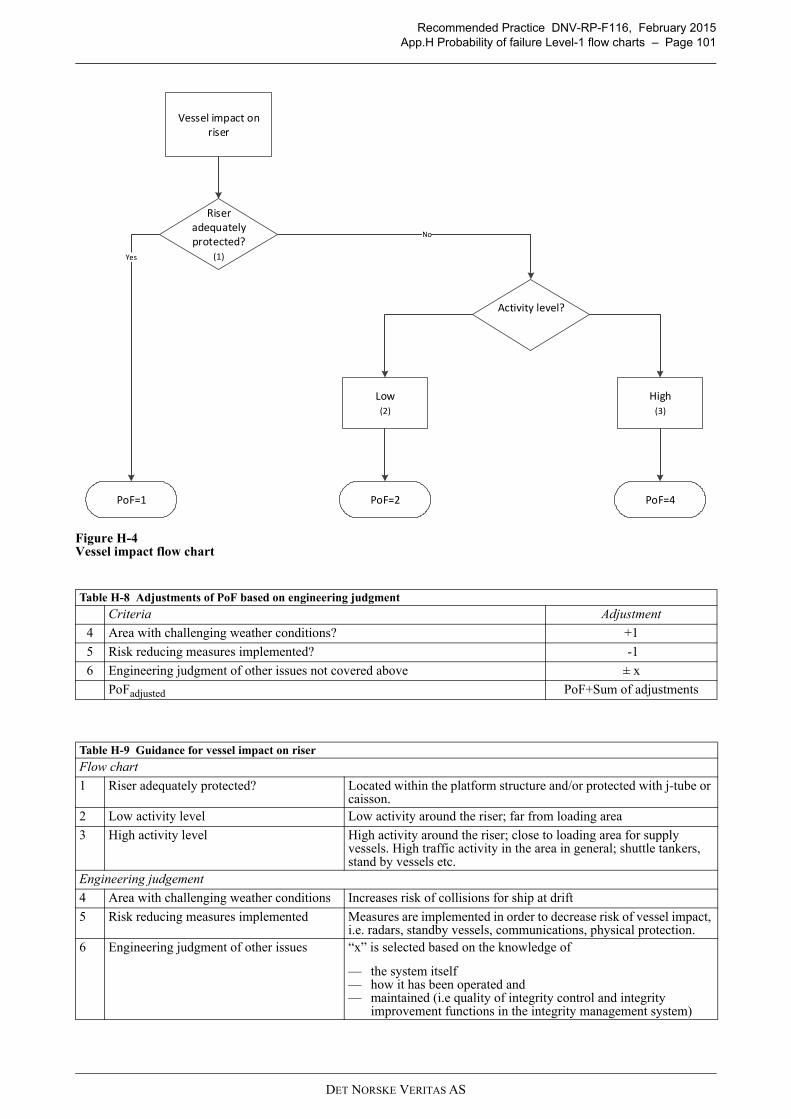
Recommended Practice DNV-RP-F116, February 2015App.H Probability of failure Level-1 flow charts – Page 101
Figure H-4 Vessel impact flow chart
Table H-8 Adjustments of PoF based on engineering judgment
Criteria Adjustment
4 Area with challenging weather conditions? +1
5 Risk reducing measures implemented? -1
6 Engineering judgment of other issues not covered above ± x
PoFadjusted PoF+Sum of adjustments
Table H-9 Guidance for vessel impact on riser
Flow chart
1 Riser adequately protected? Located within the platform structure and/or protected with j-tube or caisson.
2 Low activity level Low activity around the riser; far from loading area
3 High activity level High activity around the riser; close to loading area for supply vessels. High traffic activity in the area in general; shuttle tankers, stand by vessels etc.
Engineering judgement
4 Area with challenging weather conditions Increases risk of collisions for ship at drift
5 Risk reducing measures implemented Measures are implemented in order to decrease risk of vessel impact, i.e. radars, standby vessels, communications, physical protection.
6 Engineering judgment of other issues “x” is selected based on the knowledge of
— the system itself— how it has been operated and— maintained (i.e quality of integrity control and integrity
improvement functions in the integrity management system)
PoF=1
Vessel impact on riser
Riser adequately protected?
(1)
PoF=2
Yes
No
Activity level?
Low(2)
High(3)
PoF=4
DET NORSKE VERITAS AS
Recommended Practice DNV-RP-F116, February 2015App.H Probability of failure Level-1 flow charts – Page 102
H.3 Level-1 assessments - Corrosion threats
H.3.1 GeneralThe internal and external corrosion threats can be split down to threats caused by different corrosionmechanisms, as indicated in Appendix C Table C-1. Relevant corrosion mechanism in a pipeline system willdepend on the type of fluid. The inspection and monitoring plans will therefore also be specific for each fluidtype and anticipated corrosion mechanism, and how the corrosion threat is controlled and mitigated. With regard to evaluations of the corrosion threats, the following need to be considered in particular:
1) Relevant documentation regarding design, fabrication and installation of the pipeline system that may haveimpact on the service life of the system. The following design information should be considered:
— material (CMn, CRA, Clad and lined pipeline) and corrosion allowance — fluid composition (CO2, H2S, O2, etc.), — design and operational parameters (pressure, temperature, flow rates, water content) specified, — chemical injection or other measures for corrosion control (e.g. biocides, inhibitor, cleaning etc.).
Incidents from fabrication and installation which may have an impact on the service life of the pipeline.system such as:
— coating damages and anode damages— dents.
2) The Integrity management (IM) system and implementation of the IM-system covering the following:
— corrosion control program in place and implemented— implemented product monitoring relevant for the fluid in question— inspection program in place and implemented.
3) Consider the verification of the operation according to design covering:
— monitored data within operational envelope and explicitly documented and evaluated on a regular basis— adequate reporting/assessment routines covering out-of-spec incidents implemented— change in fluid corrosivity— verification of the internal condition of the pipeline (metal loss) — corrosion assessment carried out on a regular basis based on the monitored data through the IM system.
The information used as basis when determining the PoF may be of different quality and at different detailinglevel. The level of confidence in the information used when determining the PoF should therefore also beconsidered as part of the assessment. If monitoring data is inconsistent, insufficient or lacking, the confidencein the available data will be low and on this basis, the PoF category may be increased. However, if themonitoring data is inconsistent or lacking, but an ILI has been carried out showing that the condition of thepipeline is better than anticipated in design, the PoF for the next period may be reduced. Four fluid categories have been defined and will in the following be treated separately:
— Dry gas export – Dry hydrocarbon gas (also dry lift gas).— Oil export – Separated crude oil (typically water content less than 0.5 vol% H2O).— Producers – well fluid (wet gas, unprocessed gas, condensate, multiphase flow containing a free water
phase).— Injection water – Produced water or seawater for water injection.
The same methodology described in the following sections can, however, be applied for other fluid categorieseven though not covered specifically in this document.
H.3.2 Internal corrosionThe internal corrosion threat should be assessed considering all potential corrosion mechanisms. Theprobability of failure due to internal corrosion depends on the combination of linepipe material and type of fluidtransported. Each fluid category has therefore been treated separately and is described in the following sections:
— Dry hydrocarbon gas – [H.3.2.1]— Oil export – Sec. [H.3.2.2]— Producers – Sec. [H.3.2.3]— Injection water – [H.3.2.4]
These sections illustrate schematically in the form of flow charts how the PoF is determined. Associated tablesare also given with an overview of relevant information to be assessed during the PoF assessment.Type 13Cr martensitic stainless steels (i.e. proprietary alloys developed for oil/gas pipelines) are generally
DET NORSKE VERITAS AS
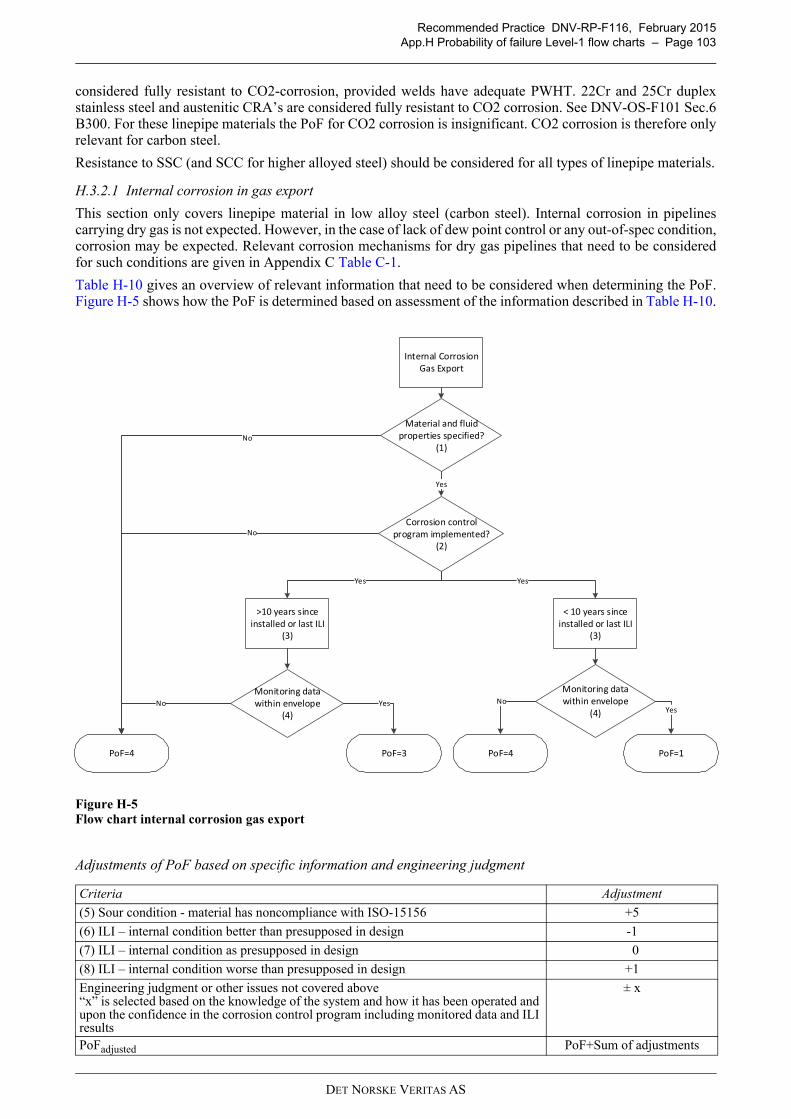
Recommended Practice DNV-RP-F116, February 2015App.H Probability of failure Level-1 flow charts – Page 103
considered fully resistant to CO2-corrosion, provided welds have adequate PWHT. 22Cr and 25Cr duplexstainless steel and austenitic CRA’s are considered fully resistant to CO2 corrosion. See DNV-OS-F101 Sec.6B300. For these linepipe materials the PoF for CO2 corrosion is insignificant. CO2 corrosion is therefore onlyrelevant for carbon steel.
Resistance to SSC (and SCC for higher alloyed steel) should be considered for all types of linepipe materials.
H.3.2.1 Internal corrosion in gas export
This section only covers linepipe material in low alloy steel (carbon steel). Internal corrosion in pipelinescarrying dry gas is not expected. However, in the case of lack of dew point control or any out-of-spec condition,corrosion may be expected. Relevant corrosion mechanisms for dry gas pipelines that need to be consideredfor such conditions are given in Appendix C Table C-1.
Table H-10 gives an overview of relevant information that need to be considered when determining the PoF.Figure H-5 shows how the PoF is determined based on assessment of the information described in Table H-10.
Figure H-5 Flow chart internal corrosion gas export
Adjustments of PoF based on specific information and engineering judgment
Criteria Adjustment
(5) Sour condition - material has noncompliance with ISO-15156 +5
(6) ILI – internal condition better than presupposed in design -1
(7) ILI – internal condition as presupposed in design 0
(8) ILI – internal condition worse than presupposed in design +1
Engineering judgment or other issues not covered above“x” is selected based on the knowledge of the system and how it has been operated and upon the confidence in the corrosion control program including monitored data and ILI results
± x
PoFadjusted PoF+Sum of adjustments
Internal CorrosionGas Export
PoF=4
No
>10 years since installed or last ILI
(3)
< 10 years since installed or last ILI
(3)
YesYes
PoF=3
Corrosion control program implemented?
(2)
Material and fluid properties specified?
(1)No
Yes
Monitoring data within envelope
(4)No Yes
Monitoring datawithin envelope
(4)
PoF=4
No
PoF=1
Yes
DET NORSKE VERITAS AS
Recommended Practice DNV-RP-F116, February 2015App.H Probability of failure Level-1 flow charts – Page 104
H.3.2.2 Internal corrosion in oil exportThis section covers only low alloy steel (carbon steel). Relevant corrosion threats to be considered for oil exportpipelines are given in Ref. Appendix C Table C-1. Table H-11 gives an overview of relevant information thatneed to be considered when determining the PoF. Figure H-6 shows how the PoF is determined based onassessment of the information described in Table H-11.
Table H-10 Internal corrosion of low alloy steel (carbon steel) gas export pipeline
ID Question Relevant information for PoF assessment
1 Material and fluid properties specified? Carbon steelCorrosion allowanceMaximum water content (alt. water dew point), CO2 and H2S content, P, T
2 Corrosion control program in place? Product monitoring (e.g. water content, H2S) Corrosion monitoring (corrosion probes)Operational parameter monitoring (P, T)
3 Time since installation or last ILI 1) Confirmation of adequate corrosion control:If time since installation or last ILI is more than 10 years condition assessment should be carried out
4 Monitored data within envelope and explicitly evaluated and documented on a regular basis?
Monitored data shows that the pipeline is operated according to design. Corrosion assessment carried out on a regular basis based on the monitored data.
1) Only given as guidance since it will dependent on company philosophy for internal inspection
Table H-11 Internal corrosion in carbon steel oil export pipeline
ID Question Relevant information for PoF assessment
1 Material and fluid properties specified? Carbon steelWater cut, water corrosivity, T, P
2 Internal corrosion allowance included?
3 Corrosion control program in place? Corrosion control: Chemical additions, internal cleaning, ILI Product monitoring (water content, CO2, H2S, sampling)Corrosion monitoring (e.g. corrosion probes)Operational parameters monitoring (P, T, flow)
4 Time since installation or last ILI 1) Confirmation of adequate corrosion control:If time since installation or last ILI is more than 10 years condition assessment should be carried out
5 Adequate corrosion control Monitored data showing that the pipeline is operated according to design (including internal corrosion control program) and that the corrosivity of the fluid has not changed. Implementation of measures to control corrosion e.g. cleaning pigging with or whiteout biocide treatment. Corrosion assessment carried out on a regular basis based on the monitored data.
1) Only given as guidance since it will dependent on company philosophy for internal inspection If ILI identifies internal metal loss findings, a more regular ILI pigging may be carried out
DET NORSKE VERITAS AS
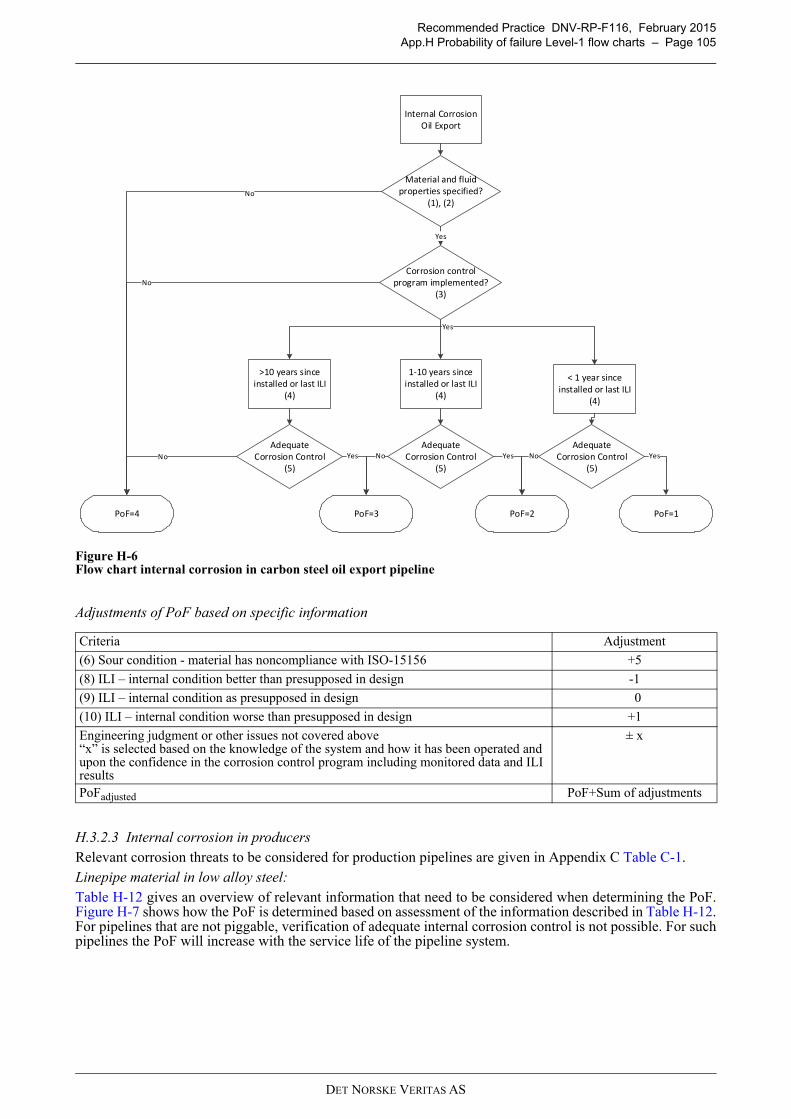
Recommended Practice DNV-RP-F116, February 2015App.H Probability of failure Level-1 flow charts – Page 105
Figure H-6 Flow chart internal corrosion in carbon steel oil export pipeline
Adjustments of PoF based on specific information
H.3.2.3 Internal corrosion in producersRelevant corrosion threats to be considered for production pipelines are given in Appendix C Table C-1. Linepipe material in low alloy steel:Table H-12 gives an overview of relevant information that need to be considered when determining the PoF.Figure H-7 shows how the PoF is determined based on assessment of the information described in Table H-12.For pipelines that are not piggable, verification of adequate internal corrosion control is not possible. For suchpipelines the PoF will increase with the service life of the pipeline system.
Criteria Adjustment
(6) Sour condition - material has noncompliance with ISO-15156 +5
(8) ILI – internal condition better than presupposed in design -1
(9) ILI – internal condition as presupposed in design 0
(10) ILI – internal condition worse than presupposed in design +1
Engineering judgment or other issues not covered above“x” is selected based on the knowledge of the system and how it has been operated and upon the confidence in the corrosion control program including monitored data and ILI results
± x
PoFadjusted PoF+Sum of adjustments
Internal Corrosion
Oil Export
PoF=4
No
>10 years since installed or last ILI
(4)
1-10 years since installed or last ILI
(4)
< 1 year since installed or last ILI
(4)
Yes
PoF=3 PoF=2 PoF=1
Corrosion control program implemented?
(3)
Material and fluid properties specified?
(1), (2)No
Yes
AdequateCorrosion Control
(5)No Yes
AdequateCorrosion Control
(5)
AdequateCorrosion Control
(5)No Yes No Yes
DET NORSKE VERITAS AS
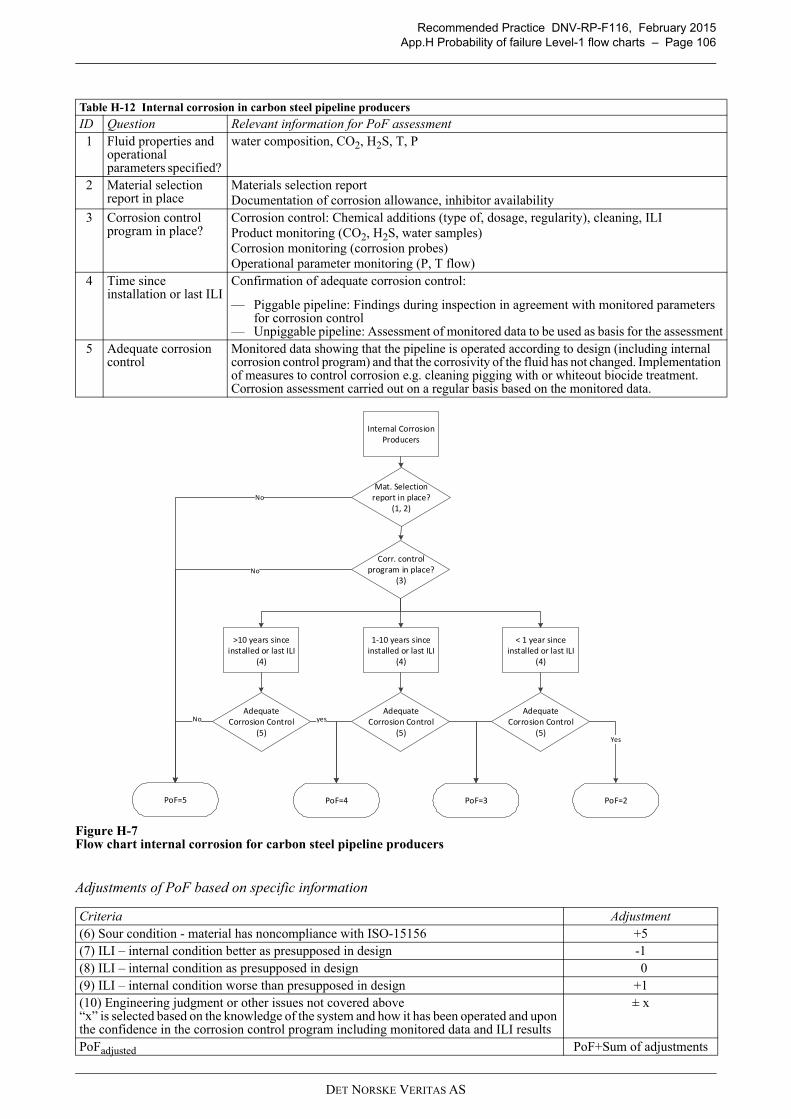
Recommended Practice DNV-RP-F116, February 2015App.H Probability of failure Level-1 flow charts – Page 106
Figure H-7 Flow chart internal corrosion for carbon steel pipeline producers
Adjustments of PoF based on specific information
Table H-12 Internal corrosion in carbon steel pipeline producers
ID Question Relevant information for PoF assessment1 Fluid properties and
operational parameters specified?
water composition, CO2, H2S, T, P
2 Material selection report in place
Materials selection report Documentation of corrosion allowance, inhibitor availability
3 Corrosion control program in place?
Corrosion control: Chemical additions (type of, dosage, regularity), cleaning, ILIProduct monitoring (CO2, H2S, water samples)Corrosion monitoring (corrosion probes)Operational parameter monitoring (P, T flow)
4 Time since installation or last ILI
Confirmation of adequate corrosion control:
— Piggable pipeline: Findings during inspection in agreement with monitored parameters for corrosion control
— Unpiggable pipeline: Assessment of monitored data to be used as basis for the assessment5 Adequate corrosion
controlMonitored data showing that the pipeline is operated according to design (including internal corrosion control program) and that the corrosivity of the fluid has not changed. Implementation of measures to control corrosion e.g. cleaning pigging with or whiteout biocide treatment. Corrosion assessment carried out on a regular basis based on the monitored data.
Criteria Adjustment(6) Sour condition - material has noncompliance with ISO-15156 +5(7) ILI – internal condition better as presupposed in design -1(8) ILI – internal condition as presupposed in design 0(9) ILI – internal condition worse than presupposed in design +1(10) Engineering judgment or other issues not covered above“x” is selected based on the knowledge of the system and how it has been operated and upon the confidence in the corrosion control program including monitored data and ILI results
± x
PoFadjusted PoF+Sum of adjustments
Internal CorrosionProducers
PoF=5
No
>10 years since installed or last ILI
(4)
1-10 years since installed or last ILI
(4)
< 1 year since installed or last ILI
(4)
PoF=4 PoF=3 PoF=2
Corr. control program in place?
(3)
Mat. Selectionreport in place?
(1, 2)No
AdequateCorrosion Control
(5)No yes
AdequateCorrosion Control
(5)
AdequateCorrosion Control
(5) Yes
DET NORSKE VERITAS AS
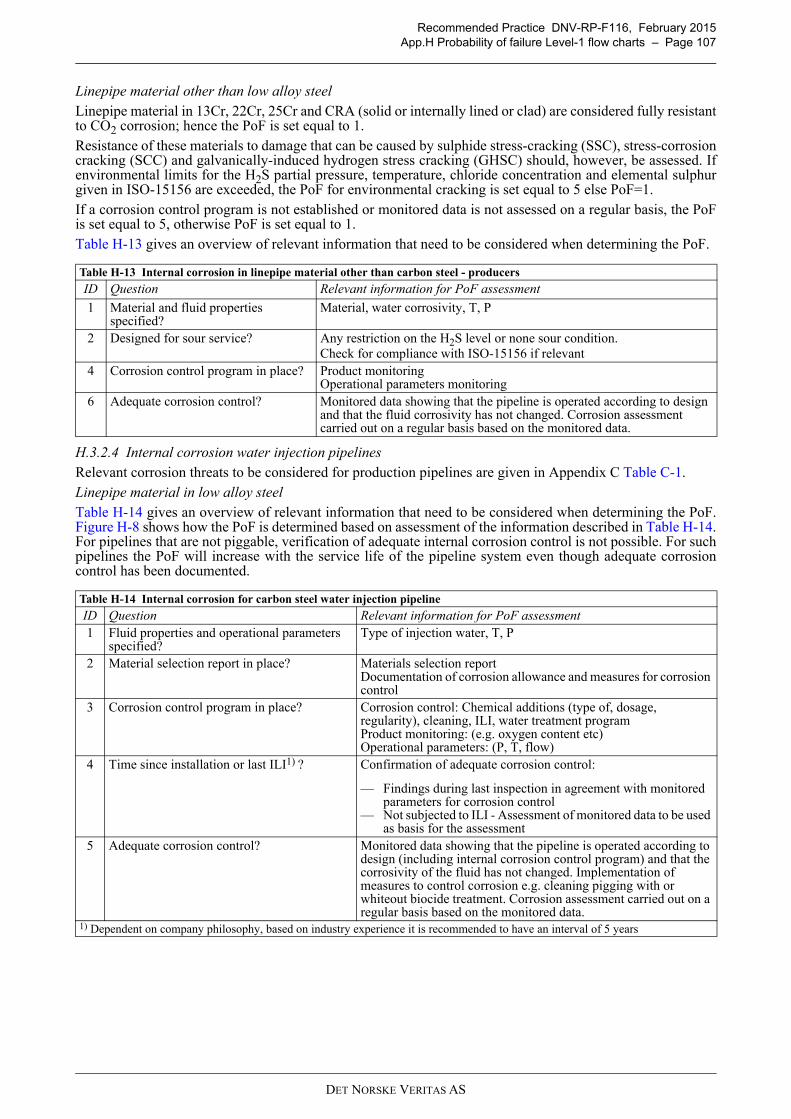
Recommended Practice DNV-RP-F116, February 2015App.H Probability of failure Level-1 flow charts – Page 107
Linepipe material other than low alloy steel Linepipe material in 13Cr, 22Cr, 25Cr and CRA (solid or internally lined or clad) are considered fully resistantto CO2 corrosion; hence the PoF is set equal to 1. Resistance of these materials to damage that can be caused by sulphide stress-cracking (SSC), stress-corrosioncracking (SCC) and galvanically-induced hydrogen stress cracking (GHSC) should, however, be assessed. Ifenvironmental limits for the H2S partial pressure, temperature, chloride concentration and elemental sulphurgiven in ISO-15156 are exceeded, the PoF for environmental cracking is set equal to 5 else PoF=1. If a corrosion control program is not established or monitored data is not assessed on a regular basis, the PoFis set equal to 5, otherwise PoF is set equal to 1.Table H-13 gives an overview of relevant information that need to be considered when determining the PoF.
H.3.2.4 Internal corrosion water injection pipelinesRelevant corrosion threats to be considered for production pipelines are given in Appendix C Table C-1.Linepipe material in low alloy steelTable H-14 gives an overview of relevant information that need to be considered when determining the PoF.Figure H-8 shows how the PoF is determined based on assessment of the information described in Table H-14.For pipelines that are not piggable, verification of adequate internal corrosion control is not possible. For suchpipelines the PoF will increase with the service life of the pipeline system even though adequate corrosioncontrol has been documented.
Table H-13 Internal corrosion in linepipe material other than carbon steel - producers
ID Question Relevant information for PoF assessment
1 Material and fluid properties specified?
Material, water corrosivity, T, P
2 Designed for sour service? Any restriction on the H2S level or none sour condition.Check for compliance with ISO-15156 if relevant
4 Corrosion control program in place? Product monitoringOperational parameters monitoring
6 Adequate corrosion control? Monitored data showing that the pipeline is operated according to design and that the fluid corrosivity has not changed. Corrosion assessment carried out on a regular basis based on the monitored data.
Table H-14 Internal corrosion for carbon steel water injection pipeline
ID Question Relevant information for PoF assessment1 Fluid properties and operational parameters
specified?Type of injection water, T, P
2 Material selection report in place? Materials selection report Documentation of corrosion allowance and measures for corrosion control
3 Corrosion control program in place? Corrosion control: Chemical additions (type of, dosage, regularity), cleaning, ILI, water treatment programProduct monitoring: (e.g. oxygen content etc)Operational parameters: (P, T, flow)
4 Time since installation or last ILI1) ? Confirmation of adequate corrosion control:
— Findings during last inspection in agreement with monitored parameters for corrosion control
— Not subjected to ILI - Assessment of monitored data to be used as basis for the assessment
5 Adequate corrosion control? Monitored data showing that the pipeline is operated according to design (including internal corrosion control program) and that the corrosivity of the fluid has not changed. Implementation of measures to control corrosion e.g. cleaning pigging with or whiteout biocide treatment. Corrosion assessment carried out on a regular basis based on the monitored data.
1) Dependent on company philosophy, based on industry experience it is recommended to have an interval of 5 years
DET NORSKE VERITAS AS
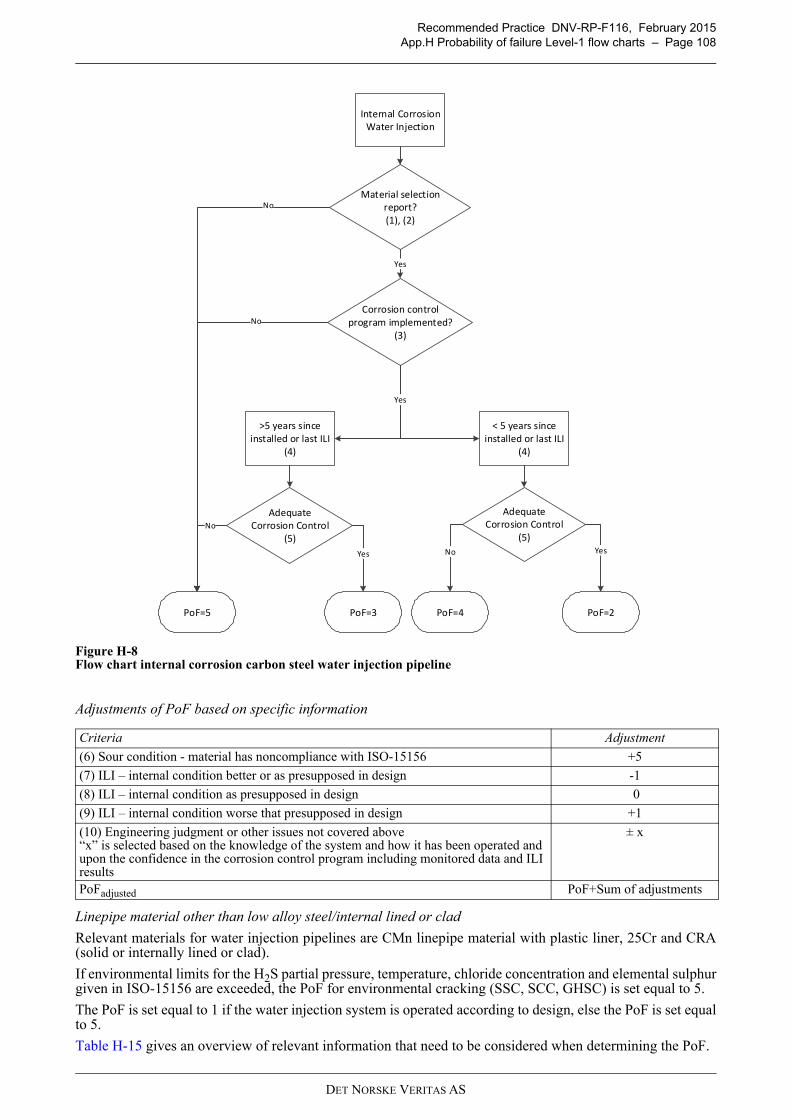
Recommended Practice DNV-RP-F116, February 2015App.H Probability of failure Level-1 flow charts – Page 108
Figure H-8 Flow chart internal corrosion carbon steel water injection pipeline
Adjustments of PoF based on specific information
Linepipe material other than low alloy steel/internal lined or clad
Relevant materials for water injection pipelines are CMn linepipe material with plastic liner, 25Cr and CRA(solid or internally lined or clad).
If environmental limits for the H2S partial pressure, temperature, chloride concentration and elemental sulphurgiven in ISO-15156 are exceeded, the PoF for environmental cracking (SSC, SCC, GHSC) is set equal to 5.
The PoF is set equal to 1 if the water injection system is operated according to design, else the PoF is set equalto 5.
Table H-15 gives an overview of relevant information that need to be considered when determining the PoF.
Criteria Adjustment
(6) Sour condition - material has noncompliance with ISO-15156 +5
(7) ILI – internal condition better or as presupposed in design -1
(8) ILI – internal condition as presupposed in design 0
(9) ILI – internal condition worse that presupposed in design +1
(10) Engineering judgment or other issues not covered above“x” is selected based on the knowledge of the system and how it has been operated and upon the confidence in the corrosion control program including monitored data and ILI results
± x
PoFadjusted PoF+Sum of adjustments
Internal Corrosion
Water Injection
PoF=5
>5 years since installed or last ILI
(4)
< 5 years since installed or last ILI
(4)
PoF=3
Material selection report?(1), (2)
No
AdequateCorrosion Control
(5)No
Yes
AdequateCorrosion Control
(5)
PoF=4
No
PoF=2
Yes
Corrosion controlprogram implemented?
(3)
Yes
Yes
No
DET NORSKE VERITAS AS
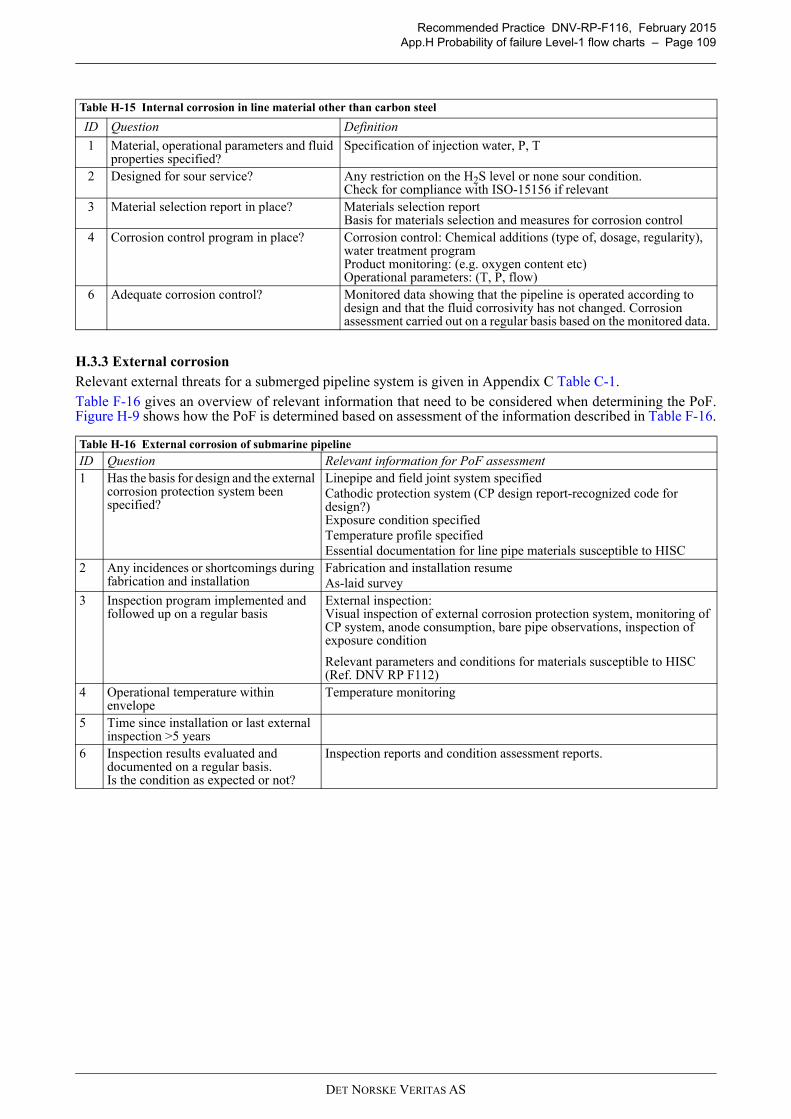
Recommended Practice DNV-RP-F116, February 2015App.H Probability of failure Level-1 flow charts – Page 109
H.3.3 External corrosionRelevant external threats for a submerged pipeline system is given in Appendix C Table C-1. Table F-16 gives an overview of relevant information that need to be considered when determining the PoF.Figure H-9 shows how the PoF is determined based on assessment of the information described in Table F-16.
Table H-15 Internal corrosion in line material other than carbon steel
ID Question Definition
1 Material, operational parameters and fluid properties specified?
Specification of injection water, P, T
2 Designed for sour service? Any restriction on the H2S level or none sour condition.Check for compliance with ISO-15156 if relevant
3 Material selection report in place? Materials selection report Basis for materials selection and measures for corrosion control
4 Corrosion control program in place? Corrosion control: Chemical additions (type of, dosage, regularity), water treatment programProduct monitoring: (e.g. oxygen content etc)Operational parameters: (T, P, flow)
6 Adequate corrosion control? Monitored data showing that the pipeline is operated according to design and that the fluid corrosivity has not changed. Corrosion assessment carried out on a regular basis based on the monitored data.
Table H-16 External corrosion of submarine pipeline
ID Question Relevant information for PoF assessment1 Has the basis for design and the external
corrosion protection system been specified?
Linepipe and field joint system specifiedCathodic protection system (CP design report-recognized code for design?)Exposure condition specifiedTemperature profile specifiedEssential documentation for line pipe materials susceptible to HISC
2 Any incidences or shortcomings during fabrication and installation
Fabrication and installation resumeAs-laid survey
3 Inspection program implemented and followed up on a regular basis
External inspection: Visual inspection of external corrosion protection system, monitoring of CP system, anode consumption, bare pipe observations, inspection of exposure condition
Relevant parameters and conditions for materials susceptible to HISC (Ref. DNV RP F112)
4 Operational temperature within envelope
Temperature monitoring
5 Time since installation or last external inspection >5 years
6 Inspection results evaluated and documented on a regular basis.Is the condition as expected or not?
Inspection reports and condition assessment reports.
DET NORSKE VERITAS AS
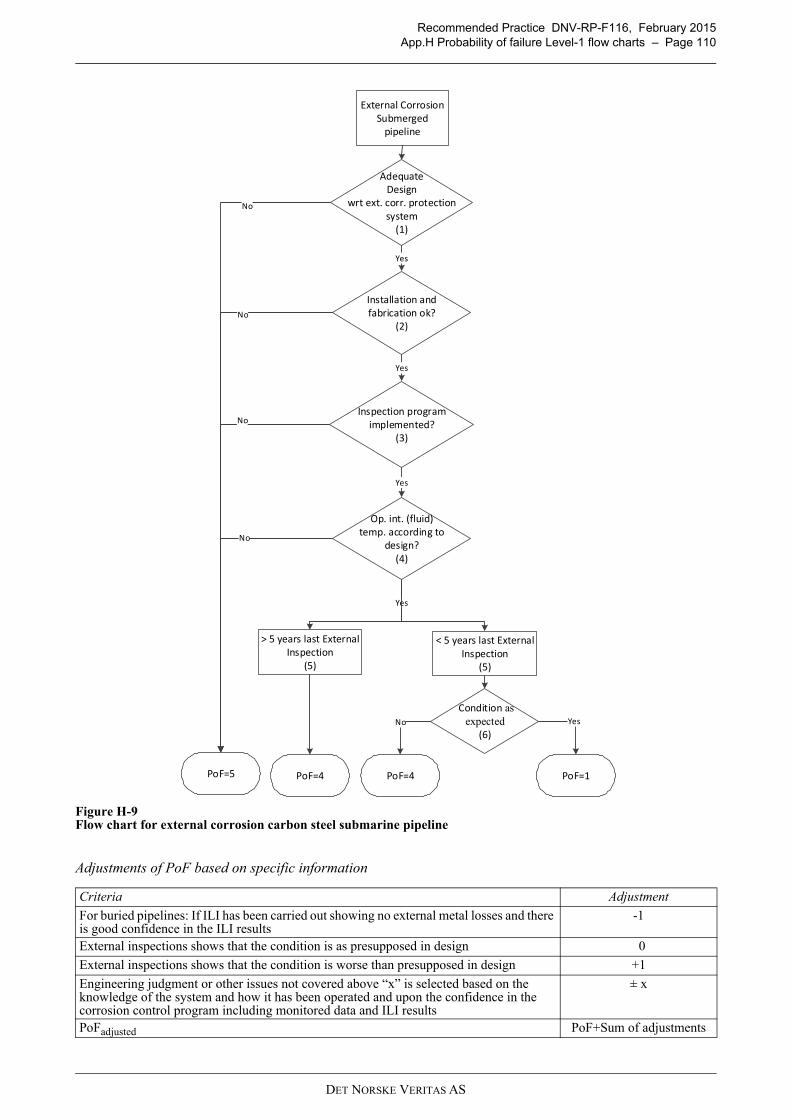
Recommended Practice DNV-RP-F116, February 2015App.H Probability of failure Level-1 flow charts – Page 110
Figure H-9 Flow chart for external corrosion carbon steel submarine pipeline
Adjustments of PoF based on specific information
Criteria Adjustment
For buried pipelines: If ILI has been carried out showing no external metal losses and there is good confidence in the ILI results
-1
External inspections shows that the condition is as presupposed in design 0
External inspections shows that the condition is worse than presupposed in design +1
Engineering judgment or other issues not covered above “x” is selected based on the knowledge of the system and how it has been operated and upon the confidence in the corrosion control program including monitored data and ILI results
± x
PoFadjusted PoF+Sum of adjustments
External CorrosionSubmerged
pipeline
PoF=5
NoInstallation and fabrication ok?
(2)
AdequateDesign
wrt ext. corr. protection system
(1)
No
Op. int. (fluid)temp. according to
design?(4)
Yes
Yes
No
Yes
Inspection program implemented?
(3)
Yes
No
> 5 years last External Inspection
(5)
< 5 years last External Inspection
(5)
PoF=1
Condition as expected
(6)No Yes
PoF=4PoF=4
DET NORSKE VERITAS AS
Recommended Practice DNV-RP-F116, February 2015App.H Probability of failure Level-1 flow charts – Page 111
H.4 Level-1 assessments - structural threats
H.4.1 GeneralThe following structural threats are covered in the sections below:
— global buckling (exposed)— global buckling (buried) / Upheaval buckling (UHB)— end expansion— on-bottom stability— pipeline free spans.
Other structural threats which have been discussed but not addressed any further are listed below:
— Pipeline Walking - To be considered for both exposed and buried pipeline. Pipeline walking is a non-reversible axial displacement of the whole pipeline towards one end. It relates to start-up heat transientsand following shut-downs cycles. Short pipelines with frequent and large variations in temperature are mostsusceptible to pipeline walking. Slopes may enhance pipeline walking. Steel catenary risers, directlycoupled to the pipeline, may also enhance pipeline walking.
— Collapse – blockage caused by external overpressure is normally an issue during installation. However, apipeline can collapse due to external overpressure in case the cross section has an excessive ovality, dentor being highly corroded. To deform a cross section from an initial oval state to a collapse, the pipeline islikely depressurized and filled with gas.
— Propagating buckling – blockage caused by external overpressure is normally an issue during installation.Propagating buckling needs to be initiated through an event such as a dent or collapse. The failure runsalong the pipeline until the external pressure is lower than the propagating pressure. Buckle arrestors canbe designed to stop a propagating buckle and limit the damaged section length.
The flow chart shown in Figure H-10 can be used as guidance for carrying out a level 1 PoF evaluation for thedifferent structural threats. Important issues to consider are whether or not:
— (1) Threats are applicable / relevant.— (2) Design activities have been performed and are carried out to meet recognized design codes. Novel
design and state-of the art design goes to a Level 2 assessment. — (3) An operational envelope has been established (maximum temperature, pressure, flow-rate, trawl loads,
frequencies, environmental load, impact loads, frequencies, maximum allowable span lengths, minimumcover height, etc.) and a program to check compliance is in place.
— (4) Design is according to DNV codes (such a design can give a PoF category between 2 and 4 as a startingpoint depending on safety class and the revision of the code - for design according to other codes, a PoFcategory of 3 is assumed as a starting point).
— (5) Issues with PoF = 5 go to a Level 2 assessment.
Threats that are not addressed require a re-design / re-qualification and give a PoF category of 5.The result from the flow chart are further adjusted based on a few and simple questions. These adjustments maychange the PoF category by 1 or more steps.The set of questions to be used for adjustments, as well as the ‘not applicable’ conditions, are presented in thefollowing sections for the following different structural threats:
— Global buckling (exposed) – [H.4.2]— Global buckling (buried) / Upheaval buckling (UHB) – [H.4.3]— End expansion (interface between pipeline and connected component) – [H.4.4]— On-bottom stability – [F.4.5]— Pipeline free spans – [H.4.6].
DET NORSKE VERITAS AS
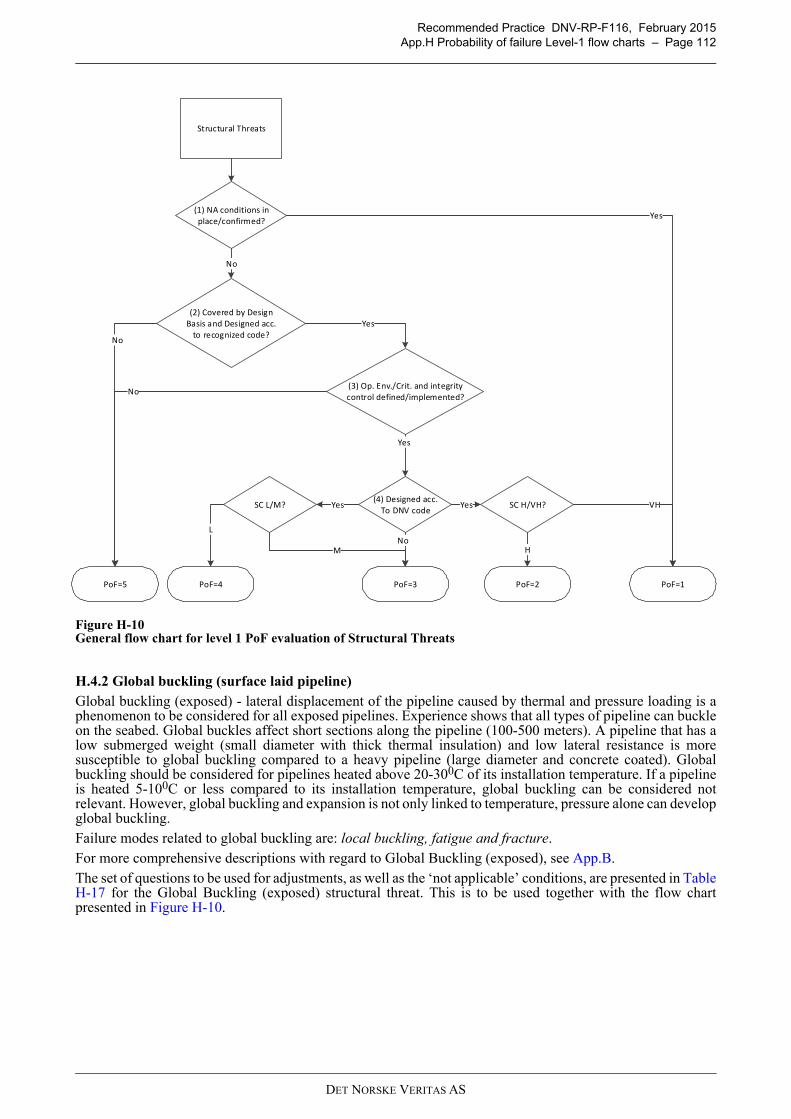
Recommended Practice DNV-RP-F116, February 2015App.H Probability of failure Level-1 flow charts – Page 112
Figure H-10 General flow chart for level 1 PoF evaluation of Structural Threats
H.4.2 Global buckling (surface laid pipeline)Global buckling (exposed) - lateral displacement of the pipeline caused by thermal and pressure loading is aphenomenon to be considered for all exposed pipelines. Experience shows that all types of pipeline can buckleon the seabed. Global buckles affect short sections along the pipeline (100-500 meters). A pipeline that has alow submerged weight (small diameter with thick thermal insulation) and low lateral resistance is moresusceptible to global buckling compared to a heavy pipeline (large diameter and concrete coated). Globalbuckling should be considered for pipelines heated above 20-300C of its installation temperature. If a pipelineis heated 5-100C or less compared to its installation temperature, global buckling can be considered notrelevant. However, global buckling and expansion is not only linked to temperature, pressure alone can developglobal buckling.Failure modes related to global buckling are: local buckling, fatigue and fracture.For more comprehensive descriptions with regard to Global Buckling (exposed), see App.B.The set of questions to be used for adjustments, as well as the ‘not applicable’ conditions, are presented in TableH-17 for the Global Buckling (exposed) structural threat. This is to be used together with the flow chartpresented in Figure H-10.
(2) Covered by DesignBasis and Designed acc.
to recognized code?
(3) Op. Env./Crit. and integrity control defined/implemented?
PoF=5 PoF=3 PoF=1
No
Yes
No
No
Yes
Structural Threats
(1) NA conditions in place/confirmed?
No
(4) Designed acc. To DNV code
Yes
Yes SC H/VH?SC L/M? Yes VH
PoF=2
H
PoF=4
L
M
DET NORSKE VERITAS AS
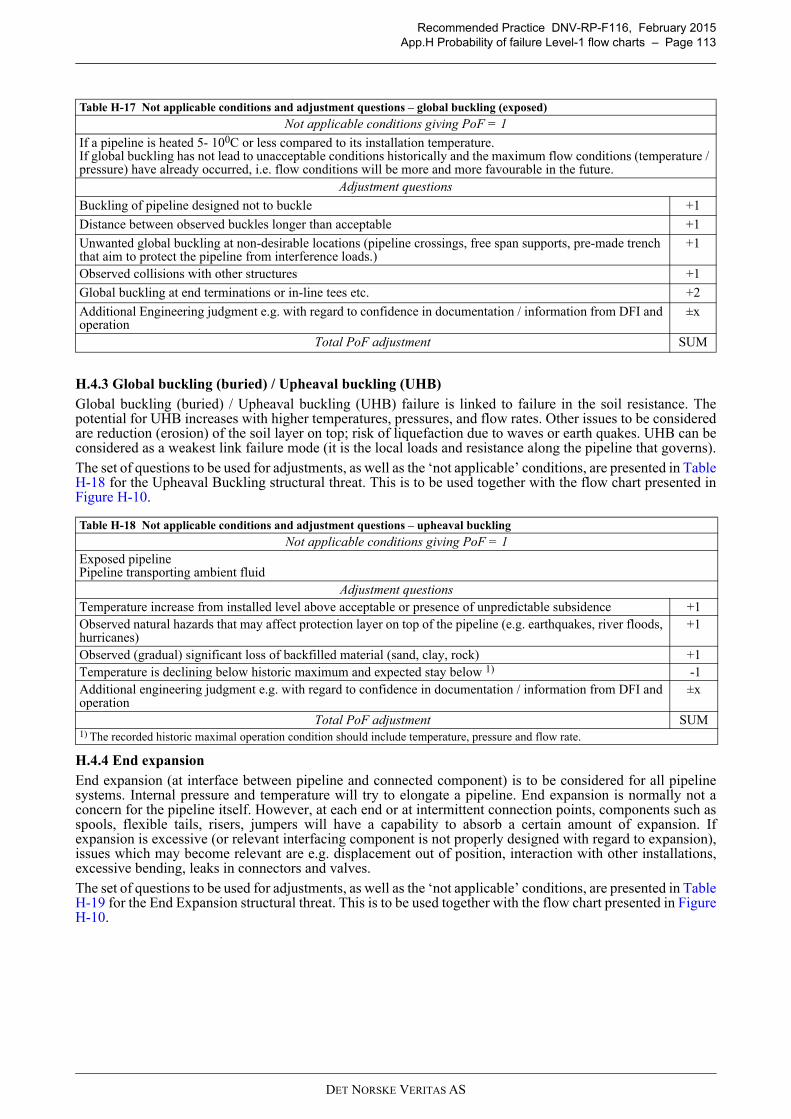
Recommended Practice DNV-RP-F116, February 2015App.H Probability of failure Level-1 flow charts – Page 113
H.4.3 Global buckling (buried) / Upheaval buckling (UHB)Global buckling (buried) / Upheaval buckling (UHB) failure is linked to failure in the soil resistance. Thepotential for UHB increases with higher temperatures, pressures, and flow rates. Other issues to be consideredare reduction (erosion) of the soil layer on top; risk of liquefaction due to waves or earth quakes. UHB can beconsidered as a weakest link failure mode (it is the local loads and resistance along the pipeline that governs).The set of questions to be used for adjustments, as well as the ‘not applicable’ conditions, are presented in TableH-18 for the Upheaval Buckling structural threat. This is to be used together with the flow chart presented inFigure H-10.
H.4.4 End expansionEnd expansion (at interface between pipeline and connected component) is to be considered for all pipelinesystems. Internal pressure and temperature will try to elongate a pipeline. End expansion is normally not aconcern for the pipeline itself. However, at each end or at intermittent connection points, components such asspools, flexible tails, risers, jumpers will have a capability to absorb a certain amount of expansion. Ifexpansion is excessive (or relevant interfacing component is not properly designed with regard to expansion),issues which may become relevant are e.g. displacement out of position, interaction with other installations,excessive bending, leaks in connectors and valves.The set of questions to be used for adjustments, as well as the ‘not applicable’ conditions, are presented in TableH-19 for the End Expansion structural threat. This is to be used together with the flow chart presented in FigureH-10.
Table H-17 Not applicable conditions and adjustment questions – global buckling (exposed)
Not applicable conditions giving PoF = 1
If a pipeline is heated 5- 100C or less compared to its installation temperature.If global buckling has not lead to unacceptable conditions historically and the maximum flow conditions (temperature / pressure) have already occurred, i.e. flow conditions will be more and more favourable in the future.
Adjustment questions
Buckling of pipeline designed not to buckle +1
Distance between observed buckles longer than acceptable +1
Unwanted global buckling at non-desirable locations (pipeline crossings, free span supports, pre-made trench that aim to protect the pipeline from interference loads.)
+1
Observed collisions with other structures +1
Global buckling at end terminations or in-line tees etc. +2
Additional Engineering judgment e.g. with regard to confidence in documentation / information from DFI and operation
±x
Total PoF adjustment SUM
Table H-18 Not applicable conditions and adjustment questions – upheaval buckling
Not applicable conditions giving PoF = 1Exposed pipelinePipeline transporting ambient fluid
Adjustment questionsTemperature increase from installed level above acceptable or presence of unpredictable subsidence +1Observed natural hazards that may affect protection layer on top of the pipeline (e.g. earthquakes, river floods, hurricanes)
+1
Observed (gradual) significant loss of backfilled material (sand, clay, rock) +1Temperature is declining below historic maximum and expected stay below 1) -1Additional engineering judgment e.g. with regard to confidence in documentation / information from DFI and operation
±x
Total PoF adjustment SUM1) The recorded historic maximal operation condition should include temperature, pressure and flow rate.
DET NORSKE VERITAS AS
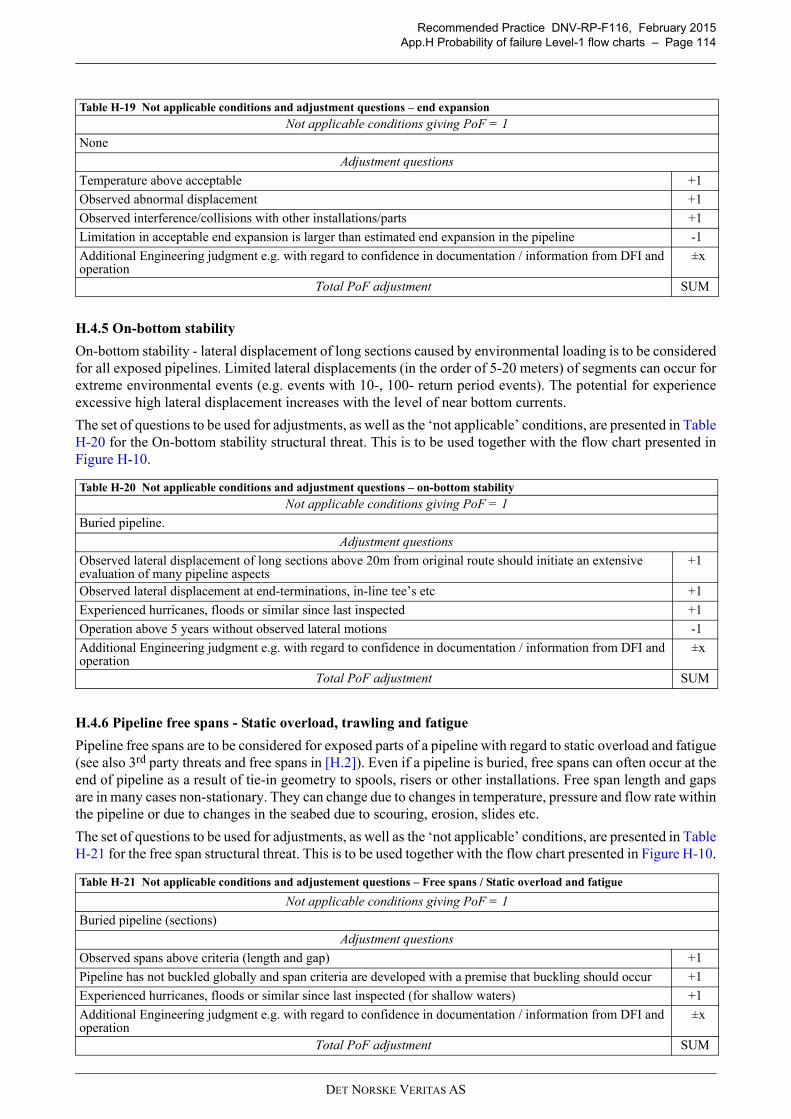
Recommended Practice DNV-RP-F116, February 2015App.H Probability of failure Level-1 flow charts – Page 114
H.4.5 On-bottom stability
On-bottom stability - lateral displacement of long sections caused by environmental loading is to be consideredfor all exposed pipelines. Limited lateral displacements (in the order of 5-20 meters) of segments can occur forextreme environmental events (e.g. events with 10-, 100- return period events). The potential for experienceexcessive high lateral displacement increases with the level of near bottom currents.
The set of questions to be used for adjustments, as well as the ‘not applicable’ conditions, are presented in TableH-20 for the On-bottom stability structural threat. This is to be used together with the flow chart presented inFigure H-10.
H.4.6 Pipeline free spans - Static overload, trawling and fatigue
Pipeline free spans are to be considered for exposed parts of a pipeline with regard to static overload and fatigue(see also 3rd party threats and free spans in [H.2]). Even if a pipeline is buried, free spans can often occur at theend of pipeline as a result of tie-in geometry to spools, risers or other installations. Free span length and gapsare in many cases non-stationary. They can change due to changes in temperature, pressure and flow rate withinthe pipeline or due to changes in the seabed due to scouring, erosion, slides etc.
The set of questions to be used for adjustments, as well as the ‘not applicable’ conditions, are presented in TableH-21 for the free span structural threat. This is to be used together with the flow chart presented in Figure H-10.
Table H-19 Not applicable conditions and adjustment questions – end expansion
Not applicable conditions giving PoF = 1
None
Adjustment questions
Temperature above acceptable +1
Observed abnormal displacement +1
Observed interference/collisions with other installations/parts +1
Limitation in acceptable end expansion is larger than estimated end expansion in the pipeline -1
Additional Engineering judgment e.g. with regard to confidence in documentation / information from DFI and operation
±x
Total PoF adjustment SUM
Table H-20 Not applicable conditions and adjustment questions – on-bottom stability
Not applicable conditions giving PoF = 1
Buried pipeline.
Adjustment questions
Observed lateral displacement of long sections above 20m from original route should initiate an extensive evaluation of many pipeline aspects
+1
Observed lateral displacement at end-terminations, in-line tee’s etc +1
Experienced hurricanes, floods or similar since last inspected +1
Operation above 5 years without observed lateral motions -1
Additional Engineering judgment e.g. with regard to confidence in documentation / information from DFI and operation
±x
Total PoF adjustment SUM
Table H-21 Not applicable conditions and adjustement questions – Free spans / Static overload and fatigue
Not applicable conditions giving PoF = 1
Buried pipeline (sections)
Adjustment questions
Observed spans above criteria (length and gap) +1
Pipeline has not buckled globally and span criteria are developed with a premise that buckling should occur +1
Experienced hurricanes, floods or similar since last inspected (for shallow waters) +1
Additional Engineering judgment e.g. with regard to confidence in documentation / information from DFI and operation
±x
Total PoF adjustment SUM
DET NORSKE VERITAS AS
Recommended Practice DNV-RP-F116, February 2015App.I Barrier framework – Page 115
APPENDIX I BARRIER FRAMEWORK
I.1 IntroductionBarriers are any kind of measure put in place to prevent a hazardous event (preventive barriers) and anymeasure that breaks the chain of events to prevent or minimize consequence escalation should the hazardousevent take place (reactive barriers). Such measures can be physical and/or non-physical (human/operational/organisational). Barriers can be illustrated in a so-called bow-tie diagram as shown in Figure I-1. Preventive barriers are illustrated on the left side of the bow-tie, whereas the reactive barriers are illustrated onthe right side of the bow-tie. Barriers can be logically organised in barrier groups. Each barrier group comprisesone or more barrier systems and elements that together help fulfil the function. A barrier element can help fulfilseveral functions on both sides of the bow-tie diagram. In the pipeline integrity management context, the topevent is typically defined as loss of containment. Other top events can also be defined.As shown in Figure I-1, four groups of preventive barriers have been defined:
— Pressure Containment and Primary Protection – This is considered to be the main barrier group comprisingthe containment system itself and its primary protective system. Conceptually, a well-developed, robustand well protected pipeline system is considered the first line of defence positioned at the far left of the bowtie diagram.
— Operational/Process Control – Conceptually, this is the second line of defence. It should ensure that thepipeline system is being operated as intended and that the (relevant) predefined operational envelopes aremaintained and not violated.
— Pipeline Integrity Control – The third line of defence consists of processes and systems to detect and assessanomalies.
— Pipeline Integrity Improvement – The last line of defence (conceptually positioned right to the left of thetop event) consists of processes and systems that will improve the integrity where anomalies have reducedthe pipeline system to an unacceptable condition.
The four preventive barrier groups comprise a number of elements (see Figure I-1).Reactive barriers contribute in minimizing the consequences of a loss of containment and may typically includeleak detection and emergency shutdown, operational/process control, emergency response (communication,combat, diversion and rescue) and pipeline repair systems (part of pipeline integrity improvement). The focusin the following is on the preventive barriers. The reactive barriers are therefore not detailed any further.A set of potential KPIs is presented in this section based on the above concept. Also see [2.3.8]. Further guidance on how to assess the PoF based on the above framework is also presented in this section. Alsosee [4.2], [4.4.3] and [F.3].
DET NORSKE VERITAS AS
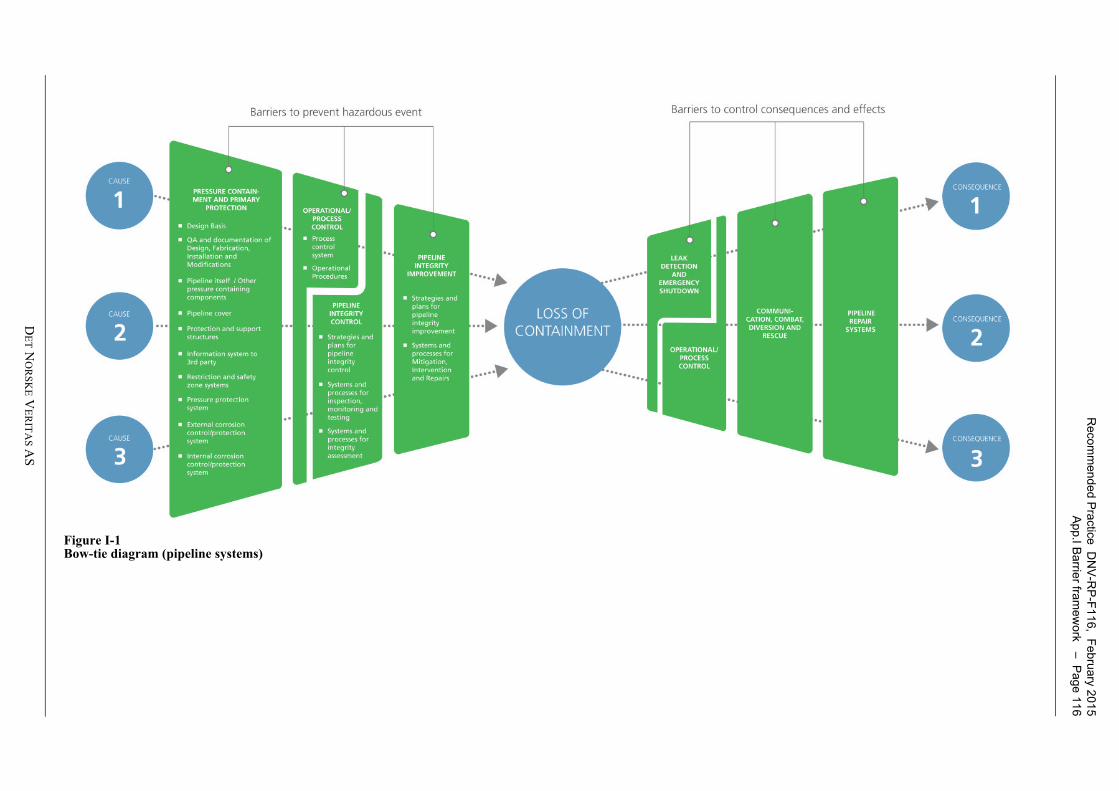
R
ecomm
ended P
ractice DN
V-R
P-F
116, F
ebruary 201
5A
pp.I B
arrier fram
ework – P
age 116
DE
T NO
RS
KE V
ER
ITA
S A
S
FB
igure I-1 ow-tie diagram (pipeline systems)
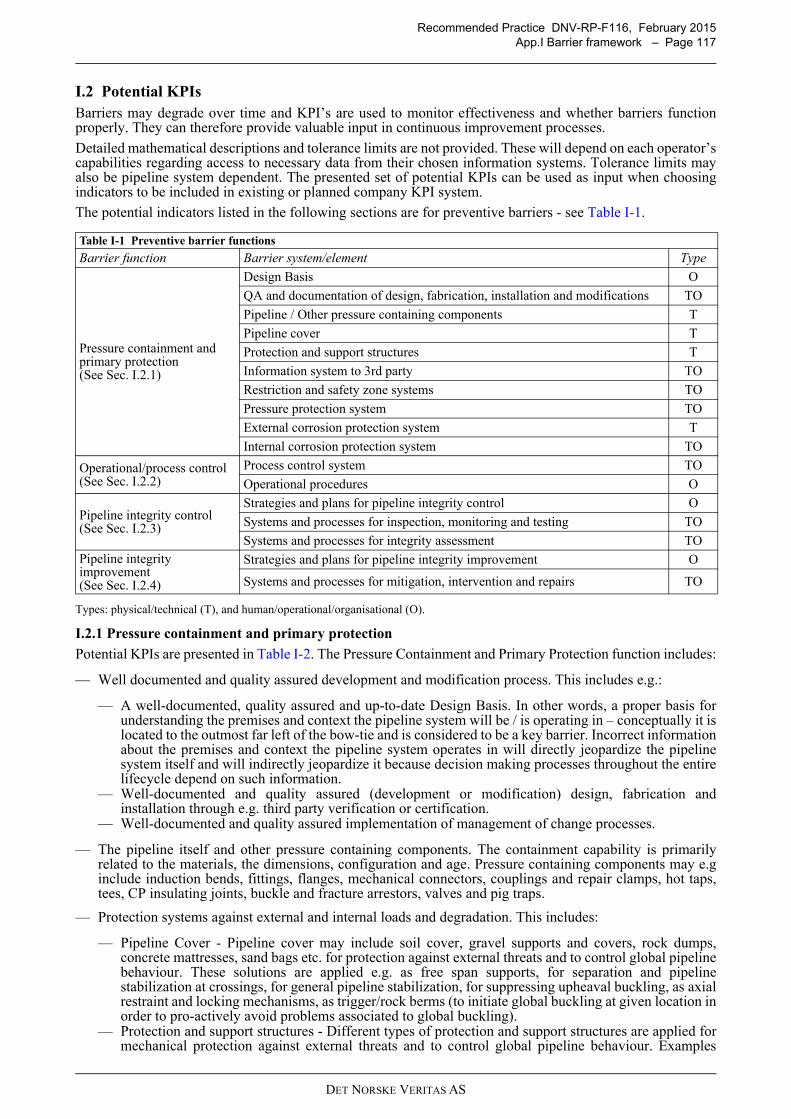
Recommended Practice DNV-RP-F116, February 2015App.I Barrier framework – Page 117
I.2 Potential KPIsBarriers may degrade over time and KPI’s are used to monitor effectiveness and whether barriers functionproperly. They can therefore provide valuable input in continuous improvement processes.
Detailed mathematical descriptions and tolerance limits are not provided. These will depend on each operator’scapabilities regarding access to necessary data from their chosen information systems. Tolerance limits mayalso be pipeline system dependent. The presented set of potential KPIs can be used as input when choosingindicators to be included in existing or planned company KPI system.
The potential indicators listed in the following sections are for preventive barriers - see Table I-1.
Types: physical/technical (T), and human/operational/organisational (O).
I.2.1 Pressure containment and primary protection
Potential KPIs are presented in Table I-2. The Pressure Containment and Primary Protection function includes:
— Well documented and quality assured development and modification process. This includes e.g.:
— A well-documented, quality assured and up-to-date Design Basis. In other words, a proper basis forunderstanding the premises and context the pipeline system will be / is operating in – conceptually it islocated to the outmost far left of the bow-tie and is considered to be a key barrier. Incorrect informationabout the premises and context the pipeline system operates in will directly jeopardize the pipelinesystem itself and will indirectly jeopardize it because decision making processes throughout the entirelifecycle depend on such information.
— Well-documented and quality assured (development or modification) design, fabrication andinstallation through e.g. third party verification or certification.
— Well-documented and quality assured implementation of management of change processes.
— The pipeline itself and other pressure containing components. The containment capability is primarilyrelated to the materials, the dimensions, configuration and age. Pressure containing components may e.ginclude induction bends, fittings, flanges, mechanical connectors, couplings and repair clamps, hot taps,tees, CP insulating joints, buckle and fracture arrestors, valves and pig traps.
— Protection systems against external and internal loads and degradation. This includes:
— Pipeline Cover - Pipeline cover may include soil cover, gravel supports and covers, rock dumps,concrete mattresses, sand bags etc. for protection against external threats and to control global pipelinebehaviour. These solutions are applied e.g. as free span supports, for separation and pipelinestabilization at crossings, for general pipeline stabilization, for suppressing upheaval buckling, as axialrestraint and locking mechanisms, as trigger/rock berms (to initiate global buckling at given location inorder to pro-actively avoid problems associated to global buckling).
— Protection and support structures - Different types of protection and support structures are applied formechanical protection against external threats and to control global pipeline behaviour. Examples
Table I-1 Preventive barrier functions
Barrier function Barrier system/element Type
Pressure containment and primary protection(See Sec. I.2.1)
Design Basis O
QA and documentation of design, fabrication, installation and modifications TO
Pipeline / Other pressure containing components T
Pipeline cover T
Protection and support structures T
Information system to 3rd party TO
Restriction and safety zone systems TO
Pressure protection system TO
External corrosion protection system T
Internal corrosion protection system TO
Operational/process control(See Sec. I.2.2)
Process control system TO
Operational procedures O
Pipeline integrity control(See Sec. I.2.3)
Strategies and plans for pipeline integrity control O
Systems and processes for inspection, monitoring and testing TO
Systems and processes for integrity assessment TOPipeline integrity improvement(See Sec. I.2.4)
Strategies and plans for pipeline integrity improvement O
Systems and processes for mitigation, intervention and repairs TO
DET NORSKE VERITAS AS
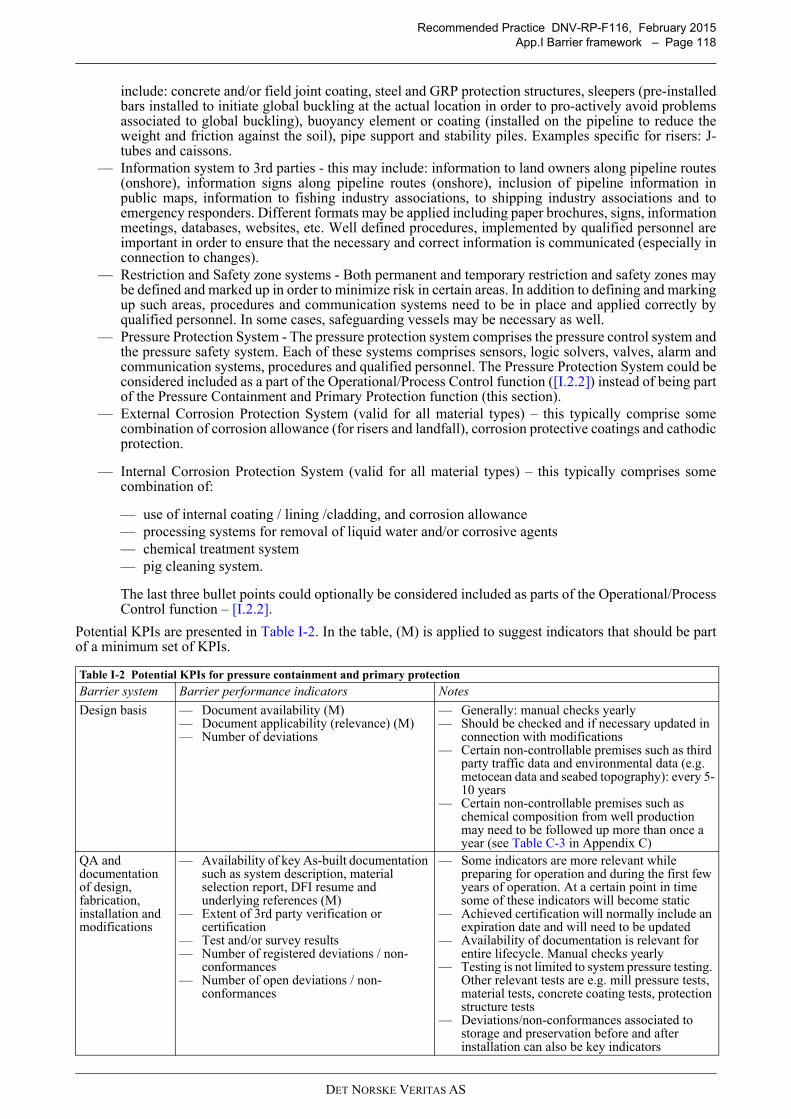
Recommended Practice DNV-RP-F116, February 2015App.I Barrier framework – Page 118
include: concrete and/or field joint coating, steel and GRP protection structures, sleepers (pre-installedbars installed to initiate global buckling at the actual location in order to pro-actively avoid problemsassociated to global buckling), buoyancy element or coating (installed on the pipeline to reduce theweight and friction against the soil), pipe support and stability piles. Examples specific for risers: J-tubes and caissons.
— Information system to 3rd parties - this may include: information to land owners along pipeline routes(onshore), information signs along pipeline routes (onshore), inclusion of pipeline information inpublic maps, information to fishing industry associations, to shipping industry associations and toemergency responders. Different formats may be applied including paper brochures, signs, informationmeetings, databases, websites, etc. Well defined procedures, implemented by qualified personnel areimportant in order to ensure that the necessary and correct information is communicated (especially inconnection to changes).
— Restriction and Safety zone systems - Both permanent and temporary restriction and safety zones maybe defined and marked up in order to minimize risk in certain areas. In addition to defining and markingup such areas, procedures and communication systems need to be in place and applied correctly byqualified personnel. In some cases, safeguarding vessels may be necessary as well.
— Pressure Protection System - The pressure protection system comprises the pressure control system andthe pressure safety system. Each of these systems comprises sensors, logic solvers, valves, alarm andcommunication systems, procedures and qualified personnel. The Pressure Protection System could beconsidered included as a part of the Operational/Process Control function ([I.2.2]) instead of being partof the Pressure Containment and Primary Protection function (this section).
— External Corrosion Protection System (valid for all material types) – this typically comprise somecombination of corrosion allowance (for risers and landfall), corrosion protective coatings and cathodicprotection.
— Internal Corrosion Protection System (valid for all material types) – this typically comprises somecombination of:
— use of internal coating / lining /cladding, and corrosion allowance— processing systems for removal of liquid water and/or corrosive agents— chemical treatment system— pig cleaning system.
The last three bullet points could optionally be considered included as parts of the Operational/ProcessControl function – [I.2.2].
Potential KPIs are presented in Table I-2. In the table, (M) is applied to suggest indicators that should be partof a minimum set of KPIs.
Table I-2 Potential KPIs for pressure containment and primary protection
Barrier system Barrier performance indicators Notes
Design basis — Document availability (M)— Document applicability (relevance) (M)— Number of deviations
— Generally: manual checks yearly— Should be checked and if necessary updated in
connection with modifications— Certain non-controllable premises such as third
party traffic data and environmental data (e.g. metocean data and seabed topography): every 5-10 years
— Certain non-controllable premises such as chemical composition from well production may need to be followed up more than once a year (see Table C-3 in Appendix C)
QA and documentation of design, fabrication, installation and modifications
— Availability of key As-built documentation such as system description, material selection report, DFI resume and underlying references (M)
— Extent of 3rd party verification or certification
— Test and/or survey results— Number of registered deviations / non-
conformances— Number of open deviations / non-
conformances
— Some indicators are more relevant while preparing for operation and during the first few years of operation. At a certain point in time some of these indicators will become static
— Achieved certification will normally include an expiration date and will need to be updated
— Availability of documentation is relevant for entire lifecycle. Manual checks yearly
— Testing is not limited to system pressure testing. Other relevant tests are e.g. mill pressure tests, material tests, concrete coating tests, protection structure tests
— Deviations/non-conformances associated to storage and preservation before and after installation can also be key indicators
DET NORSKE VERITAS AS
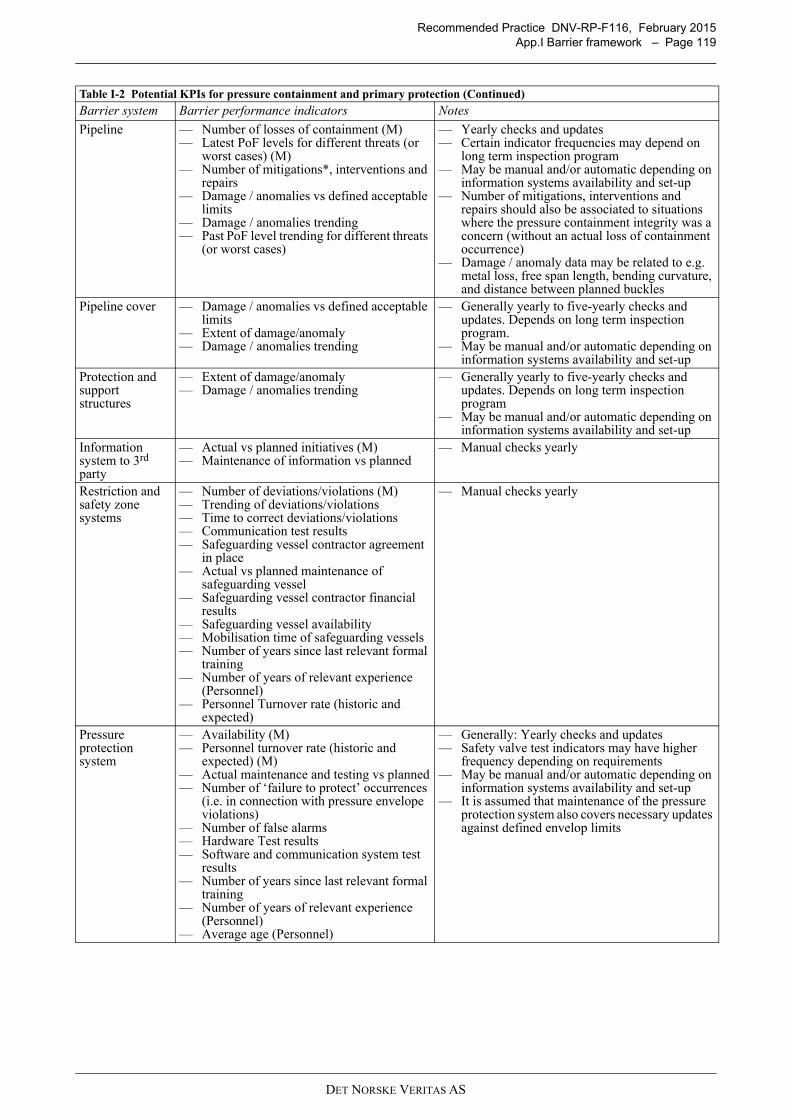
Recommended Practice DNV-RP-F116, February 2015App.I Barrier framework – Page 119
Pipeline — Number of losses of containment (M)— Latest PoF levels for different threats (or
worst cases) (M)— Number of mitigations*, interventions and
repairs— Damage / anomalies vs defined acceptable
limits— Damage / anomalies trending— Past PoF level trending for different threats
(or worst cases)
— Yearly checks and updates— Certain indicator frequencies may depend on
long term inspection program— May be manual and/or automatic depending on
information systems availability and set-up— Number of mitigations, interventions and
repairs should also be associated to situations where the pressure containment integrity was a concern (without an actual loss of containment occurrence)
— Damage / anomaly data may be related to e.g. metal loss, free span length, bending curvature, and distance between planned buckles
Pipeline cover — Damage / anomalies vs defined acceptable limits
— Extent of damage/anomaly— Damage / anomalies trending
— Generally yearly to five-yearly checks and updates. Depends on long term inspection program.
— May be manual and/or automatic depending on information systems availability and set-up
Protection and support structures
— Extent of damage/anomaly— Damage / anomalies trending
— Generally yearly to five-yearly checks and updates. Depends on long term inspection program
— May be manual and/or automatic depending on information systems availability and set-up
Information system to 3rd party
— Actual vs planned initiatives (M)— Maintenance of information vs planned
— Manual checks yearly
Restriction and safety zone systems
— Number of deviations/violations (M)— Trending of deviations/violations— Time to correct deviations/violations— Communication test results— Safeguarding vessel contractor agreement
in place— Actual vs planned maintenance of
safeguarding vessel— Safeguarding vessel contractor financial
results— Safeguarding vessel availability— Mobilisation time of safeguarding vessels— Number of years since last relevant formal
training— Number of years of relevant experience
(Personnel)— Personnel Turnover rate (historic and
expected)
— Manual checks yearly
Pressure protection system
— Availability (M)— Personnel turnover rate (historic and
expected) (M)— Actual maintenance and testing vs planned— Number of ‘failure to protect’ occurrences
(i.e. in connection with pressure envelope violations)
— Number of false alarms— Hardware Test results— Software and communication system test
results— Number of years since last relevant formal
training— Number of years of relevant experience
(Personnel)— Average age (Personnel)
— Generally: Yearly checks and updates— Safety valve test indicators may have higher
frequency depending on requirements— May be manual and/or automatic depending on
information systems availability and set-up— It is assumed that maintenance of the pressure
protection system also covers necessary updates against defined envelop limits
Table I-2 Potential KPIs for pressure containment and primary protection (Continued)
Barrier system Barrier performance indicators Notes
DET NORSKE VERITAS AS
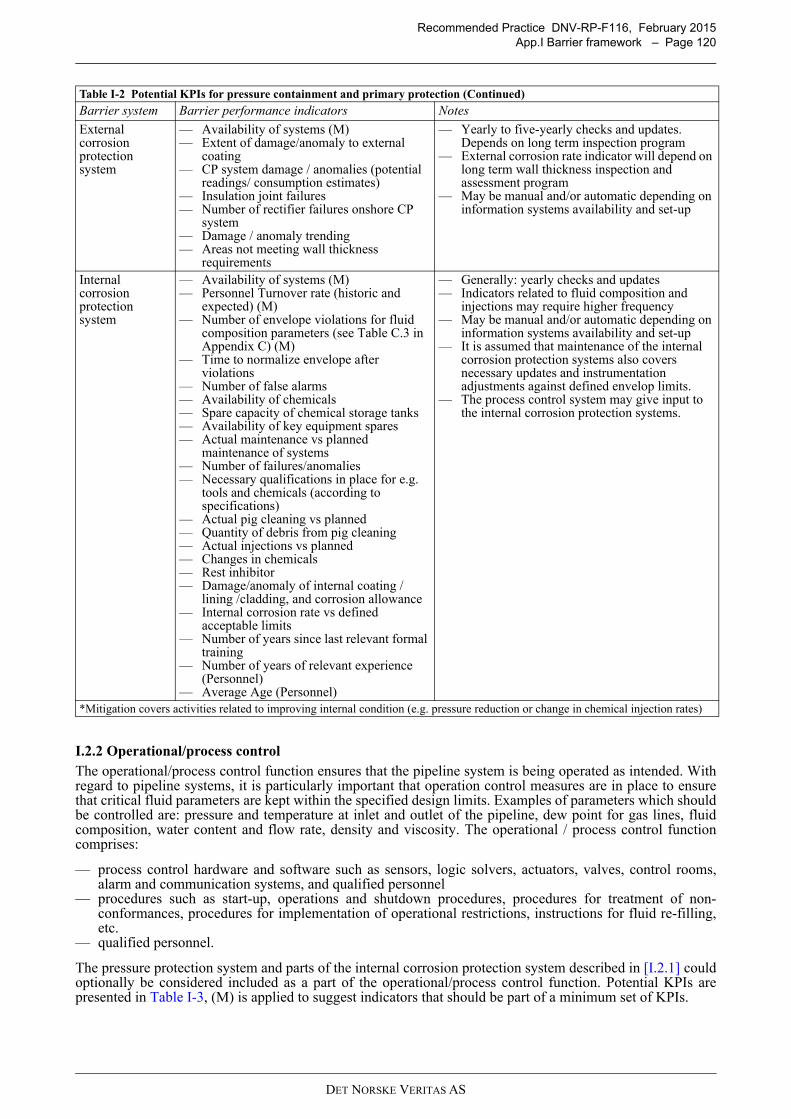
Recommended Practice DNV-RP-F116, February 2015App.I Barrier framework – Page 120
I.2.2 Operational/process controlThe operational/process control function ensures that the pipeline system is being operated as intended. Withregard to pipeline systems, it is particularly important that operation control measures are in place to ensurethat critical fluid parameters are kept within the specified design limits. Examples of parameters which shouldbe controlled are: pressure and temperature at inlet and outlet of the pipeline, dew point for gas lines, fluidcomposition, water content and flow rate, density and viscosity. The operational / process control functioncomprises:
— process control hardware and software such as sensors, logic solvers, actuators, valves, control rooms,alarm and communication systems, and qualified personnel
— procedures such as start-up, operations and shutdown procedures, procedures for treatment of non-conformances, procedures for implementation of operational restrictions, instructions for fluid re-filling,etc.
— qualified personnel.
The pressure protection system and parts of the internal corrosion protection system described in [I.2.1] couldoptionally be considered included as a part of the operational/process control function. Potential KPIs arepresented in Table I-3, (M) is applied to suggest indicators that should be part of a minimum set of KPIs.
External corrosion protection system
— Availability of systems (M)— Extent of damage/anomaly to external
coating— CP system damage / anomalies (potential
readings/ consumption estimates)— Insulation joint failures— Number of rectifier failures onshore CP
system— Damage / anomaly trending— Areas not meeting wall thickness
requirements
— Yearly to five-yearly checks and updates. Depends on long term inspection program
— External corrosion rate indicator will depend on long term wall thickness inspection and assessment program
— May be manual and/or automatic depending on information systems availability and set-up
Internal corrosion protection system
— Availability of systems (M)— Personnel Turnover rate (historic and
expected) (M)— Number of envelope violations for fluid
composition parameters (see Table C.3 in Appendix C) (M)
— Time to normalize envelope after violations
— Number of false alarms— Availability of chemicals— Spare capacity of chemical storage tanks— Availability of key equipment spares— Actual maintenance vs planned
maintenance of systems— Number of failures/anomalies— Necessary qualifications in place for e.g.
tools and chemicals (according to specifications)
— Actual pig cleaning vs planned— Quantity of debris from pig cleaning— Actual injections vs planned— Changes in chemicals— Rest inhibitor— Damage/anomaly of internal coating /
lining /cladding, and corrosion allowance— Internal corrosion rate vs defined
acceptable limits— Number of years since last relevant formal
training— Number of years of relevant experience
(Personnel)— Average Age (Personnel)
— Generally: yearly checks and updates— Indicators related to fluid composition and
injections may require higher frequency— May be manual and/or automatic depending on
information systems availability and set-up— It is assumed that maintenance of the internal
corrosion protection systems also covers necessary updates and instrumentation adjustments against defined envelop limits.
— The process control system may give input to the internal corrosion protection systems.
*Mitigation covers activities related to improving internal condition (e.g. pressure reduction or change in chemical injection rates)
Table I-2 Potential KPIs for pressure containment and primary protection (Continued)
Barrier system Barrier performance indicators Notes
DET NORSKE VERITAS AS
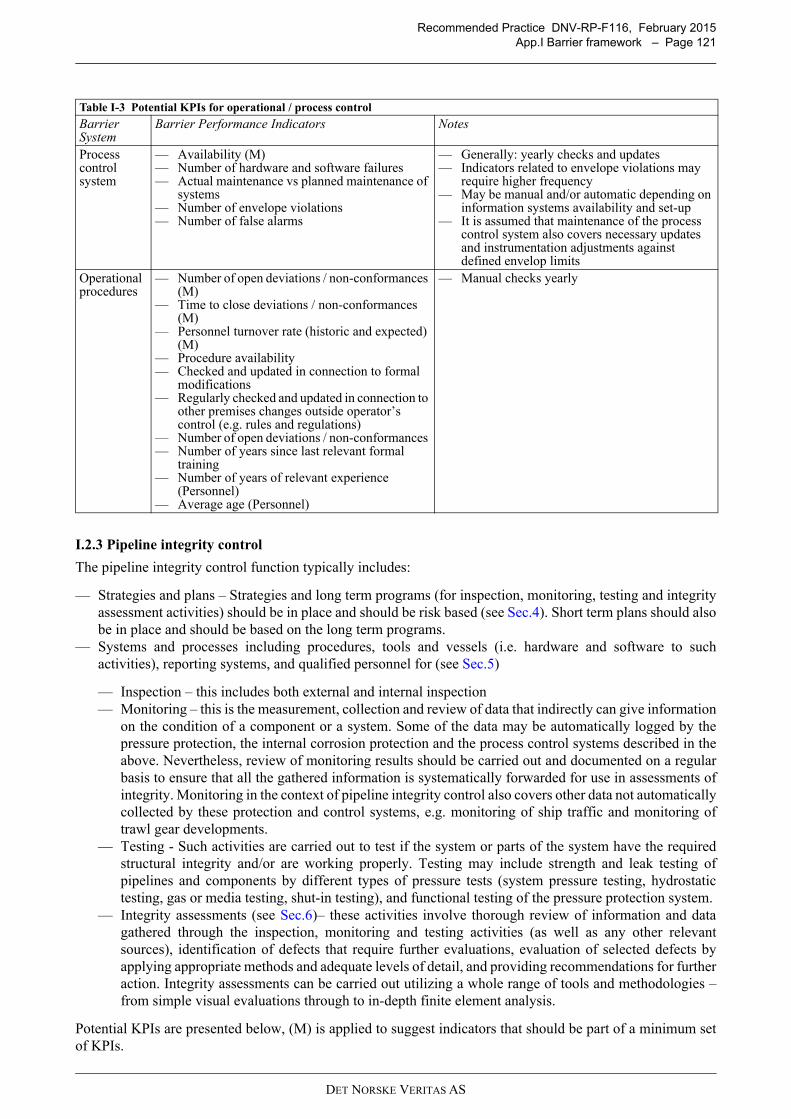
Recommended Practice DNV-RP-F116, February 2015App.I Barrier framework – Page 121
I.2.3 Pipeline integrity control
The pipeline integrity control function typically includes:
— Strategies and plans – Strategies and long term programs (for inspection, monitoring, testing and integrityassessment activities) should be in place and should be risk based (see Sec.4). Short term plans should alsobe in place and should be based on the long term programs.
— Systems and processes including procedures, tools and vessels (i.e. hardware and software to suchactivities), reporting systems, and qualified personnel for (see Sec.5)
— Inspection – this includes both external and internal inspection— Monitoring – this is the measurement, collection and review of data that indirectly can give information
on the condition of a component or a system. Some of the data may be automatically logged by thepressure protection, the internal corrosion protection and the process control systems described in theabove. Nevertheless, review of monitoring results should be carried out and documented on a regularbasis to ensure that all the gathered information is systematically forwarded for use in assessments ofintegrity. Monitoring in the context of pipeline integrity control also covers other data not automaticallycollected by these protection and control systems, e.g. monitoring of ship traffic and monitoring oftrawl gear developments.
— Testing - Such activities are carried out to test if the system or parts of the system have the requiredstructural integrity and/or are working properly. Testing may include strength and leak testing ofpipelines and components by different types of pressure tests (system pressure testing, hydrostatictesting, gas or media testing, shut-in testing), and functional testing of the pressure protection system.
— Integrity assessments (see Sec.6)– these activities involve thorough review of information and datagathered through the inspection, monitoring and testing activities (as well as any other relevantsources), identification of defects that require further evaluations, evaluation of selected defects byapplying appropriate methods and adequate levels of detail, and providing recommendations for furtheraction. Integrity assessments can be carried out utilizing a whole range of tools and methodologies –from simple visual evaluations through to in-depth finite element analysis.
Potential KPIs are presented below, (M) is applied to suggest indicators that should be part of a minimum setof KPIs.
Table I-3 Potential KPIs for operational / process control
Barrier System
Barrier Performance Indicators Notes
Process control system
— Availability (M)— Number of hardware and software failures— Actual maintenance vs planned maintenance of
systems— Number of envelope violations— Number of false alarms
— Generally: yearly checks and updates— Indicators related to envelope violations may
require higher frequency— May be manual and/or automatic depending on
information systems availability and set-up— It is assumed that maintenance of the process
control system also covers necessary updates and instrumentation adjustments against defined envelop limits
Operational procedures
— Number of open deviations / non-conformances (M)
— Time to close deviations / non-conformances (M)
— Personnel turnover rate (historic and expected) (M)
— Procedure availability— Checked and updated in connection to formal
modifications— Regularly checked and updated in connection to
other premises changes outside operator’s control (e.g. rules and regulations)
— Number of open deviations / non-conformances — Number of years since last relevant formal
training— Number of years of relevant experience
(Personnel)— Average age (Personnel)
— Manual checks yearly
DET NORSKE VERITAS AS
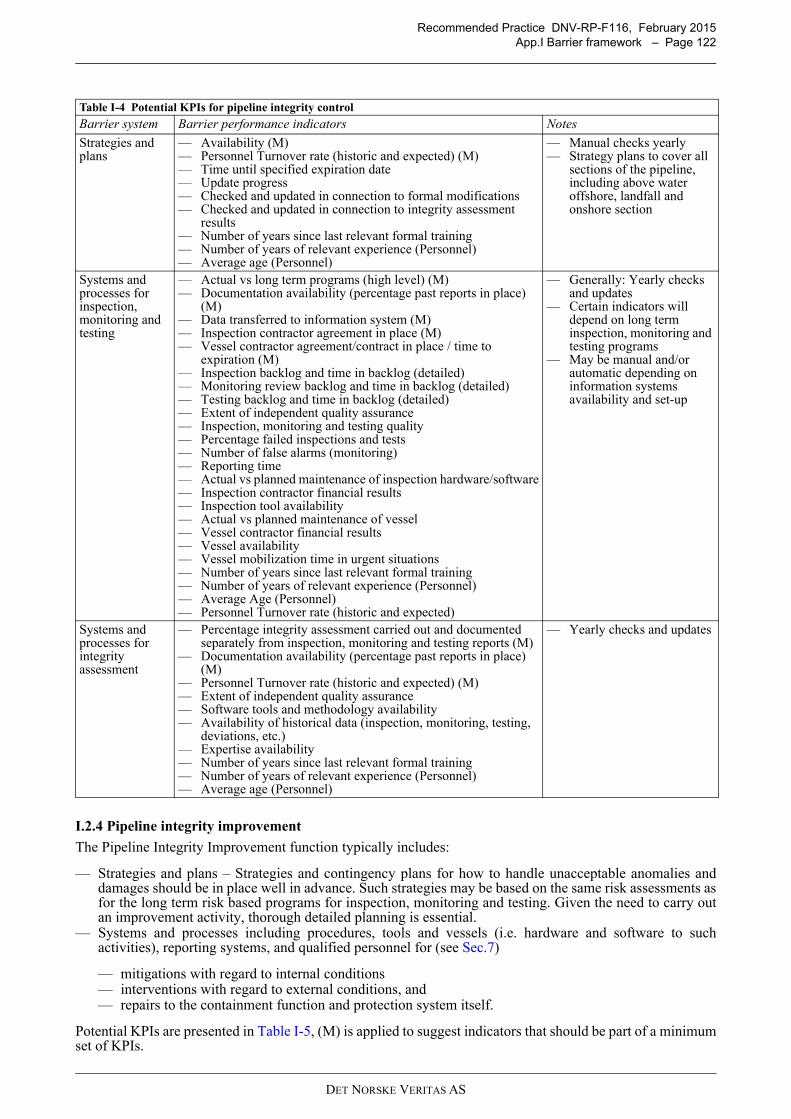
Recommended Practice DNV-RP-F116, February 2015App.I Barrier framework – Page 122
I.2.4 Pipeline integrity improvement
The Pipeline Integrity Improvement function typically includes:
— Strategies and plans – Strategies and contingency plans for how to handle unacceptable anomalies anddamages should be in place well in advance. Such strategies may be based on the same risk assessments asfor the long term risk based programs for inspection, monitoring and testing. Given the need to carry outan improvement activity, thorough detailed planning is essential.
— Systems and processes including procedures, tools and vessels (i.e. hardware and software to suchactivities), reporting systems, and qualified personnel for (see Sec.7)
— mitigations with regard to internal conditions— interventions with regard to external conditions, and— repairs to the containment function and protection system itself.
Potential KPIs are presented in Table I-5, (M) is applied to suggest indicators that should be part of a minimumset of KPIs.
Table I-4 Potential KPIs for pipeline integrity control
Barrier system Barrier performance indicators Notes
Strategies and plans
— Availability (M)— Personnel Turnover rate (historic and expected) (M)— Time until specified expiration date— Update progress— Checked and updated in connection to formal modifications— Checked and updated in connection to integrity assessment
results— Number of years since last relevant formal training— Number of years of relevant experience (Personnel)— Average age (Personnel)
— Manual checks yearly— Strategy plans to cover all
sections of the pipeline, including above water offshore, landfall and onshore section
Systems and processes for inspection, monitoring and testing
— Actual vs long term programs (high level) (M)— Documentation availability (percentage past reports in place)
(M)— Data transferred to information system (M)— Inspection contractor agreement in place (M)— Vessel contractor agreement/contract in place / time to
expiration (M)— Inspection backlog and time in backlog (detailed)— Monitoring review backlog and time in backlog (detailed)— Testing backlog and time in backlog (detailed) — Extent of independent quality assurance— Inspection, monitoring and testing quality— Percentage failed inspections and tests— Number of false alarms (monitoring)— Reporting time— Actual vs planned maintenance of inspection hardware/software— Inspection contractor financial results— Inspection tool availability— Actual vs planned maintenance of vessel— Vessel contractor financial results— Vessel availability— Vessel mobilization time in urgent situations— Number of years since last relevant formal training— Number of years of relevant experience (Personnel)— Average Age (Personnel)— Personnel Turnover rate (historic and expected)
— Generally: Yearly checks and updates
— Certain indicators will depend on long term inspection, monitoring and testing programs
— May be manual and/or automatic depending on information systems availability and set-up
Systems and processes for integrity assessment
— Percentage integrity assessment carried out and documented separately from inspection, monitoring and testing reports (M)
— Documentation availability (percentage past reports in place) (M)
— Personnel Turnover rate (historic and expected) (M)— Extent of independent quality assurance— Software tools and methodology availability— Availability of historical data (inspection, monitoring, testing,
deviations, etc.)— Expertise availability— Number of years since last relevant formal training— Number of years of relevant experience (Personnel)— Average age (Personnel)
— Yearly checks and updates
DET NORSKE VERITAS AS
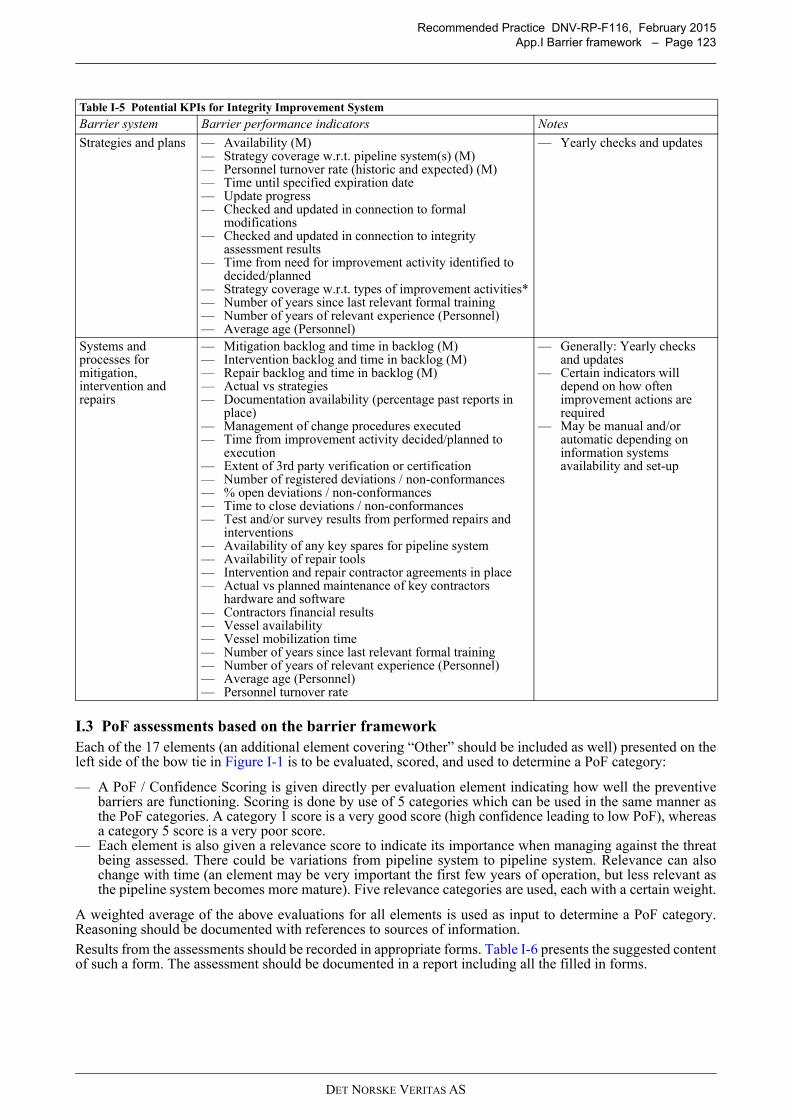
Recommended Practice DNV-RP-F116, February 2015App.I Barrier framework – Page 123
I.3 PoF assessments based on the barrier frameworkEach of the 17 elements (an additional element covering “Other” should be included as well) presented on theleft side of the bow tie in Figure I-1 is to be evaluated, scored, and used to determine a PoF category:
— A PoF / Confidence Scoring is given directly per evaluation element indicating how well the preventivebarriers are functioning. Scoring is done by use of 5 categories which can be used in the same manner asthe PoF categories. A category 1 score is a very good score (high confidence leading to low PoF), whereasa category 5 score is a very poor score.
— Each element is also given a relevance score to indicate its importance when managing against the threatbeing assessed. There could be variations from pipeline system to pipeline system. Relevance can alsochange with time (an element may be very important the first few years of operation, but less relevant asthe pipeline system becomes more mature). Five relevance categories are used, each with a certain weight.
A weighted average of the above evaluations for all elements is used as input to determine a PoF category.Reasoning should be documented with references to sources of information.Results from the assessments should be recorded in appropriate forms. Table I-6 presents the suggested contentof such a form. The assessment should be documented in a report including all the filled in forms.
Table I-5 Potential KPIs for Integrity Improvement System
Barrier system Barrier performance indicators Notes
Strategies and plans — Availability (M)— Strategy coverage w.r.t. pipeline system(s) (M)— Personnel turnover rate (historic and expected) (M)— Time until specified expiration date— Update progress— Checked and updated in connection to formal
modifications— Checked and updated in connection to integrity
assessment results— Time from need for improvement activity identified to
decided/planned— Strategy coverage w.r.t. types of improvement activities*— Number of years since last relevant formal training— Number of years of relevant experience (Personnel)— Average age (Personnel)
— Yearly checks and updates
Systems and processes for mitigation, intervention and repairs
— Mitigation backlog and time in backlog (M)— Intervention backlog and time in backlog (M)— Repair backlog and time in backlog (M)— Actual vs strategies— Documentation availability (percentage past reports in
place)— Management of change procedures executed— Time from improvement activity decided/planned to
execution— Extent of 3rd party verification or certification— Number of registered deviations / non-conformances— % open deviations / non-conformances— Time to close deviations / non-conformances— Test and/or survey results from performed repairs and
interventions— Availability of any key spares for pipeline system— Availability of repair tools— Intervention and repair contractor agreements in place— Actual vs planned maintenance of key contractors
hardware and software— Contractors financial results— Vessel availability— Vessel mobilization time — Number of years since last relevant formal training— Number of years of relevant experience (Personnel)— Average age (Personnel)— Personnel turnover rate
— Generally: Yearly checks and updates
— Certain indicators will depend on how often improvement actions are required
— May be manual and/or automatic depending on information systems availability and set-up
DET NORSKE VERITAS AS
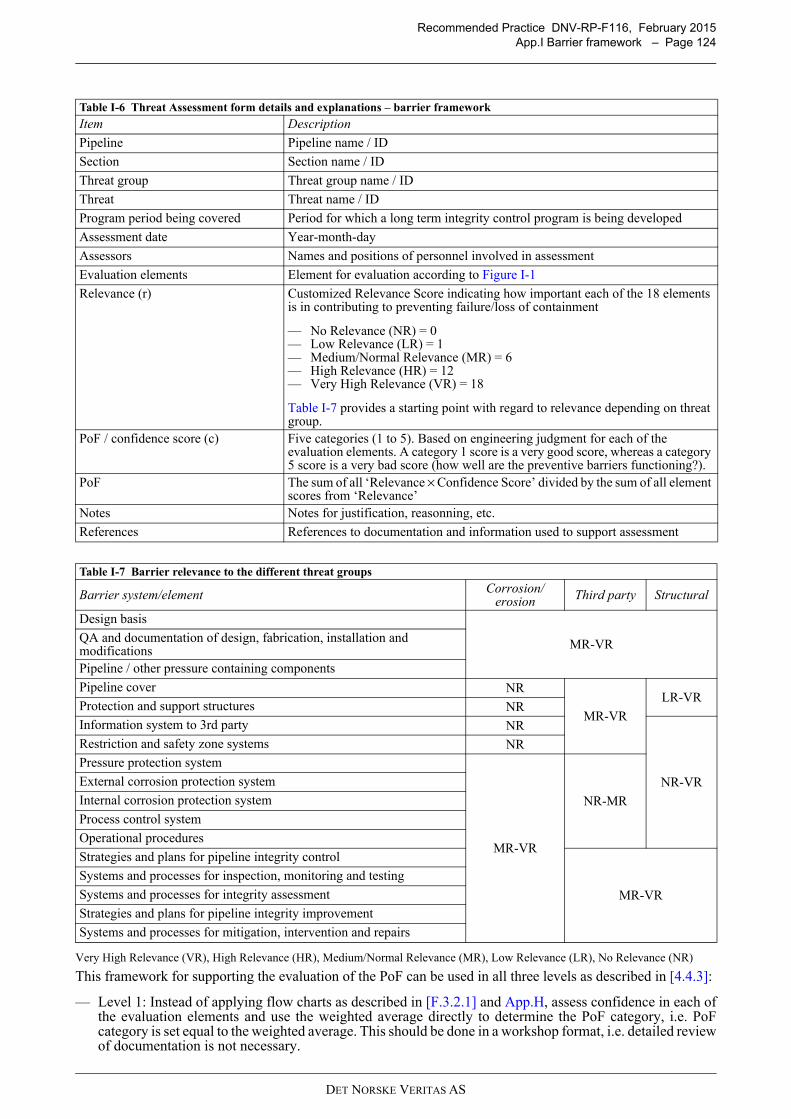
Recommended Practice DNV-RP-F116, February 2015App.I Barrier framework – Page 124
Very High Relevance (VR), High Relevance (HR), Medium/Normal Relevance (MR), Low Relevance (LR), No Relevance (NR)
This framework for supporting the evaluation of the PoF can be used in all three levels as described in [4.4.3]:
— Level 1: Instead of applying flow charts as described in [F.3.2.1] and App.H, assess confidence in each ofthe evaluation elements and use the weighted average directly to determine the PoF category, i.e. PoFcategory is set equal to the weighted average. This should be done in a workshop format, i.e. detailed reviewof documentation is not necessary.
Table I-6 Threat Assessment form details and explanations – barrier framework
Item Description
Pipeline Pipeline name / ID
Section Section name / ID
Threat group Threat group name / ID
Threat Threat name / ID
Program period being covered Period for which a long term integrity control program is being developed
Assessment date Year-month-day
Assessors Names and positions of personnel involved in assessment
Evaluation elements Element for evaluation according to Figure I-1
Relevance (r) Customized Relevance Score indicating how important each of the 18 elements is in contributing to preventing failure/loss of containment
— No Relevance (NR) = 0— Low Relevance (LR) = 1— Medium/Normal Relevance (MR) = 6— High Relevance (HR) = 12— Very High Relevance (VR) = 18
Table I-7 provides a starting point with regard to relevance depending on threat group.
PoF / confidence score (c) Five categories (1 to 5). Based on engineering judgment for each of the evaluation elements. A category 1 score is a very good score, whereas a category 5 score is a very bad score (how well are the preventive barriers functioning?).
PoF The sum of all ‘Relevance × Confidence Score’ divided by the sum of all element scores from ‘Relevance’
Notes Notes for justification, reasonning, etc.
References References to documentation and information used to support assessment
Table I-7 Barrier relevance to the different threat groups
Barrier system/element Corrosion/ erosion Third party Structural
Design basis
MR-VRQA and documentation of design, fabrication, installation and modificationsPipeline / other pressure containing components
Pipeline cover NR
MR-VR
LR-VRProtection and support structures NRInformation system to 3rd party NR
NR-VR
Restriction and safety zone systems NRPressure protection system
MR-VR
NR-MR
External corrosion protection system
Internal corrosion protection system
Process control system
Operational procedures
Strategies and plans for pipeline integrity control
MR-VR
Systems and processes for inspection, monitoring and testing
Systems and processes for integrity assessment
Strategies and plans for pipeline integrity improvement
Systems and processes for mitigation, intervention and repairs
DET NORSKE VERITAS AS
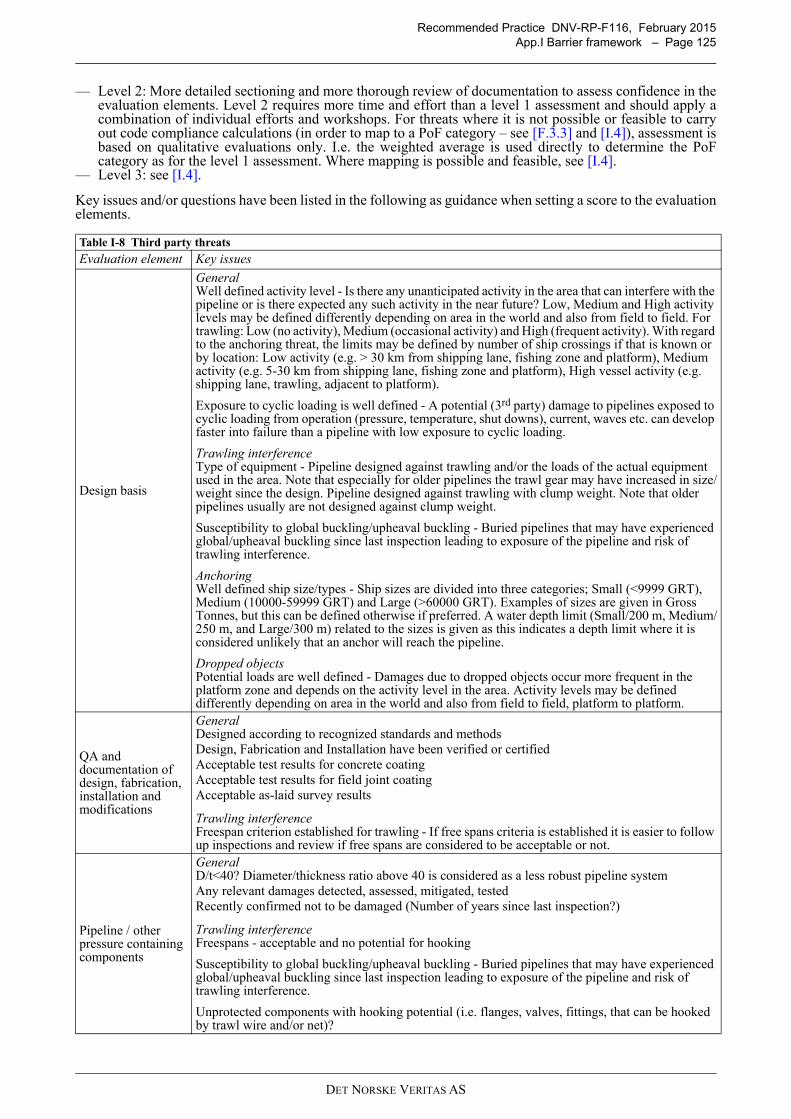
Recommended Practice DNV-RP-F116, February 2015App.I Barrier framework – Page 125
— Level 2: More detailed sectioning and more thorough review of documentation to assess confidence in theevaluation elements. Level 2 requires more time and effort than a level 1 assessment and should apply acombination of individual efforts and workshops. For threats where it is not possible or feasible to carryout code compliance calculations (in order to map to a PoF category – see [F.3.3] and [I.4]), assessment isbased on qualitative evaluations only. I.e. the weighted average is used directly to determine the PoFcategory as for the level 1 assessment. Where mapping is possible and feasible, see [I.4].
— Level 3: see [I.4].
Key issues and/or questions have been listed in the following as guidance when setting a score to the evaluationelements.
Table I-8 Third party threats
Evaluation element Key issues
Design basis
General Well defined activity level - Is there any unanticipated activity in the area that can interfere with the pipeline or is there expected any such activity in the near future? Low, Medium and High activity levels may be defined differently depending on area in the world and also from field to field. For trawling: Low (no activity), Medium (occasional activity) and High (frequent activity). With regard to the anchoring threat, the limits may be defined by number of ship crossings if that is known or by location: Low activity (e.g. > 30 km from shipping lane, fishing zone and platform), Medium activity (e.g. 5-30 km from shipping lane, fishing zone and platform), High vessel activity (e.g. shipping lane, trawling, adjacent to platform).
Exposure to cyclic loading is well defined - A potential (3rd party) damage to pipelines exposed to cyclic loading from operation (pressure, temperature, shut downs), current, waves etc. can develop faster into failure than a pipeline with low exposure to cyclic loading.
Trawling interferenceType of equipment - Pipeline designed against trawling and/or the loads of the actual equipment used in the area. Note that especially for older pipelines the trawl gear may have increased in size/weight since the design. Pipeline designed against trawling with clump weight. Note that older pipelines usually are not designed against clump weight.
Susceptibility to global buckling/upheaval buckling - Buried pipelines that may have experienced global/upheaval buckling since last inspection leading to exposure of the pipeline and risk of trawling interference.
AnchoringWell defined ship size/types - Ship sizes are divided into three categories; Small (<9999 GRT), Medium (10000-59999 GRT) and Large (>60000 GRT). Examples of sizes are given in Gross Tonnes, but this can be defined otherwise if preferred. A water depth limit (Small/200 m, Medium/250 m, and Large/300 m) related to the sizes is given as this indicates a depth limit where it is considered unlikely that an anchor will reach the pipeline.
Dropped objectsPotential loads are well defined - Damages due to dropped objects occur more frequent in the platform zone and depends on the activity level in the area. Activity levels may be defined differently depending on area in the world and also from field to field, platform to platform.
QA and documentation of design, fabrication, installation and modifications
General Designed according to recognized standards and methodsDesign, Fabrication and Installation have been verified or certifiedAcceptable test results for concrete coatingAcceptable test results for field joint coatingAcceptable as-laid survey results
Trawling interferenceFreespan criterion established for trawling - If free spans criteria is established it is easier to follow up inspections and review if free spans are considered to be acceptable or not.
Pipeline / other pressure containing components
General D/t<40? Diameter/thickness ratio above 40 is considered as a less robust pipeline systemAny relevant damages detected, assessed, mitigated, testedRecently confirmed not to be damaged (Number of years since last inspection?)
Trawling interferenceFreespans - acceptable and no potential for hooking
Susceptibility to global buckling/upheaval buckling - Buried pipelines that may have experienced global/upheaval buckling since last inspection leading to exposure of the pipeline and risk of trawling interference.
Unprotected components with hooking potential (i.e. flanges, valves, fittings, that can be hooked by trawl wire and/or net)?
DET NORSKE VERITAS AS
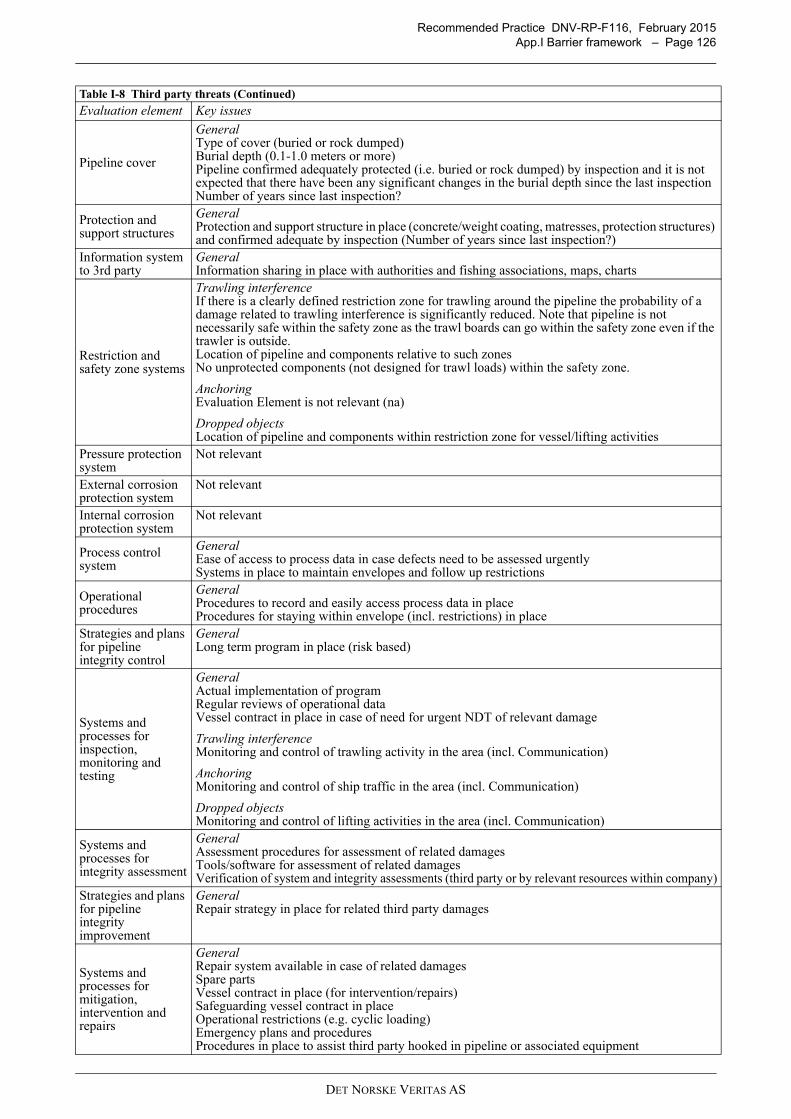
Recommended Practice DNV-RP-F116, February 2015App.I Barrier framework – Page 126
Pipeline cover
General Type of cover (buried or rock dumped)Burial depth (0.1-1.0 meters or more)Pipeline confirmed adequately protected (i.e. buried or rock dumped) by inspection and it is not expected that there have been any significant changes in the burial depth since the last inspectionNumber of years since last inspection?
Protection and support structures
General Protection and support structure in place (concrete/weight coating, matresses, protection structures) and confirmed adequate by inspection (Number of years since last inspection?)
Information system to 3rd party
General Information sharing in place with authorities and fishing associations, maps, charts
Restriction and safety zone systems
Trawling interferenceIf there is a clearly defined restriction zone for trawling around the pipeline the probability of a damage related to trawling interference is significantly reduced. Note that pipeline is not necessarily safe within the safety zone as the trawl boards can go within the safety zone even if the trawler is outside.Location of pipeline and components relative to such zonesNo unprotected components (not designed for trawl loads) within the safety zone.
AnchoringEvaluation Element is not relevant (na)
Dropped objectsLocation of pipeline and components within restriction zone for vessel/lifting activities
Pressure protection system
Not relevant
External corrosion protection system
Not relevant
Internal corrosion protection system
Not relevant
Process control system
General Ease of access to process data in case defects need to be assessed urgentlySystems in place to maintain envelopes and follow up restrictions
Operational procedures
General Procedures to record and easily access process data in placeProcedures for staying within envelope (incl. restrictions) in place
Strategies and plans for pipeline integrity control
General Long term program in place (risk based)
Systems and processes for inspection, monitoring and testing
General Actual implementation of programRegular reviews of operational dataVessel contract in place in case of need for urgent NDT of relevant damage
Trawling interferenceMonitoring and control of trawling activity in the area (incl. Communication)
AnchoringMonitoring and control of ship traffic in the area (incl. Communication)
Dropped objectsMonitoring and control of lifting activities in the area (incl. Communication)
Systems and processes for integrity assessment
General Assessment procedures for assessment of related damagesTools/software for assessment of related damagesVerification of system and integrity assessments (third party or by relevant resources within company)
Strategies and plans for pipeline integrity improvement
General Repair strategy in place for related third party damages
Systems and processes for mitigation, intervention and repairs
General Repair system available in case of related damagesSpare partsVessel contract in place (for intervention/repairs)Safeguarding vessel contract in placeOperational restrictions (e.g. cyclic loading)Emergency plans and proceduresProcedures in place to assist third party hooked in pipeline or associated equipment
Table I-8 Third party threats (Continued)
Evaluation element Key issues
DET NORSKE VERITAS AS
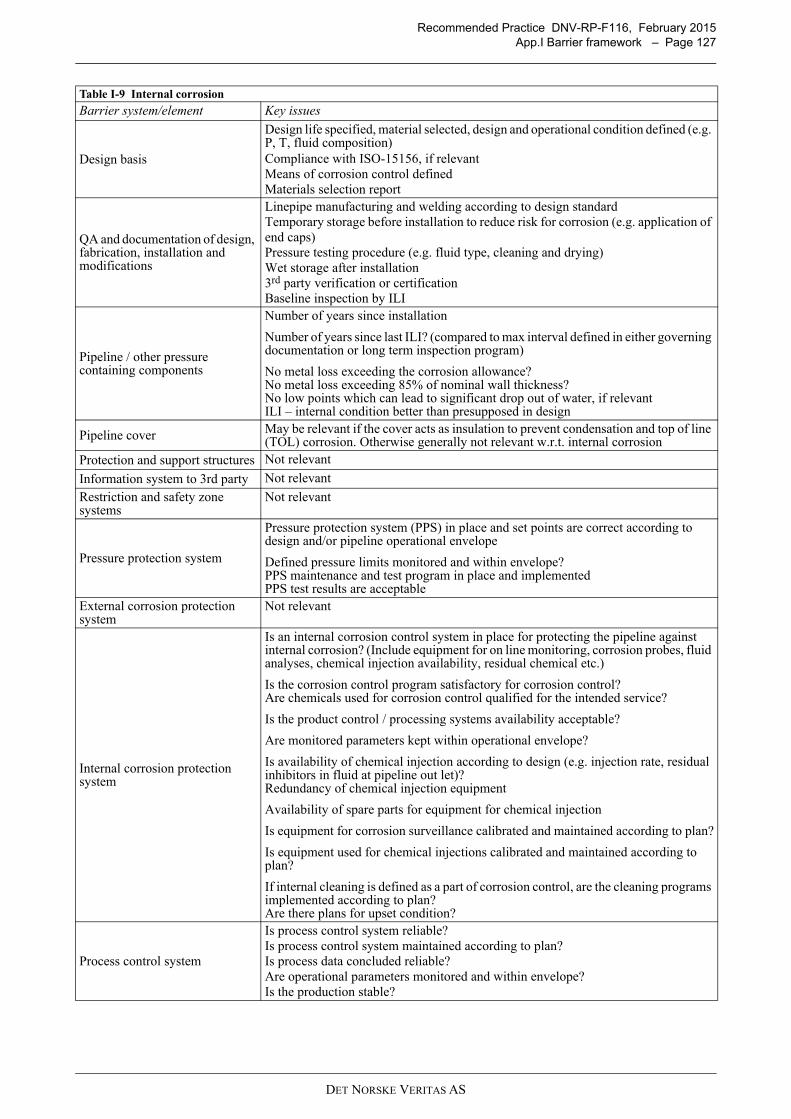
Recommended Practice DNV-RP-F116, February 2015App.I Barrier framework – Page 127
Table I-9 Internal corrosion
Barrier system/element Key issues
Design basis
Design life specified, material selected, design and operational condition defined (e.g. P, T, fluid composition)Compliance with ISO-15156, if relevantMeans of corrosion control definedMaterials selection report
QA and documentation of design, fabrication, installation and modifications
Linepipe manufacturing and welding according to design standardTemporary storage before installation to reduce risk for corrosion (e.g. application of end caps)Pressure testing procedure (e.g. fluid type, cleaning and drying)Wet storage after installation 3rd party verification or certification Baseline inspection by ILI
Pipeline / other pressure containing components
Number of years since installation
Number of years since last ILI? (compared to max interval defined in either governing documentation or long term inspection program)
No metal loss exceeding the corrosion allowance?No metal loss exceeding 85% of nominal wall thickness?No low points which can lead to significant drop out of water, if relevant ILI – internal condition better than presupposed in design
Pipeline cover May be relevant if the cover acts as insulation to prevent condensation and top of line (TOL) corrosion. Otherwise generally not relevant w.r.t. internal corrosion
Protection and support structures Not relevant
Information system to 3rd party Not relevant
Restriction and safety zone systems
Not relevant
Pressure protection system
Pressure protection system (PPS) in place and set points are correct according to design and/or pipeline operational envelope
Defined pressure limits monitored and within envelope?PPS maintenance and test program in place and implementedPPS test results are acceptable
External corrosion protection system
Not relevant
Internal corrosion protection system
Is an internal corrosion control system in place for protecting the pipeline against internal corrosion? (Include equipment for on line monitoring, corrosion probes, fluid analyses, chemical injection availability, residual chemical etc.)
Is the corrosion control program satisfactory for corrosion control?Are chemicals used for corrosion control qualified for the intended service?
Is the product control / processing systems availability acceptable?
Are monitored parameters kept within operational envelope?
Is availability of chemical injection according to design (e.g. injection rate, residual inhibitors in fluid at pipeline out let)? Redundancy of chemical injection equipment
Availability of spare parts for equipment for chemical injection
Is equipment for corrosion surveillance calibrated and maintained according to plan?
Is equipment used for chemical injections calibrated and maintained according to plan?
If internal cleaning is defined as a part of corrosion control, are the cleaning programs implemented according to plan? Are there plans for upset condition?
Process control system
Is process control system reliable?Is process control system maintained according to plan?Is process data concluded reliable?Are operational parameters monitored and within envelope?Is the production stable?
DET NORSKE VERITAS AS
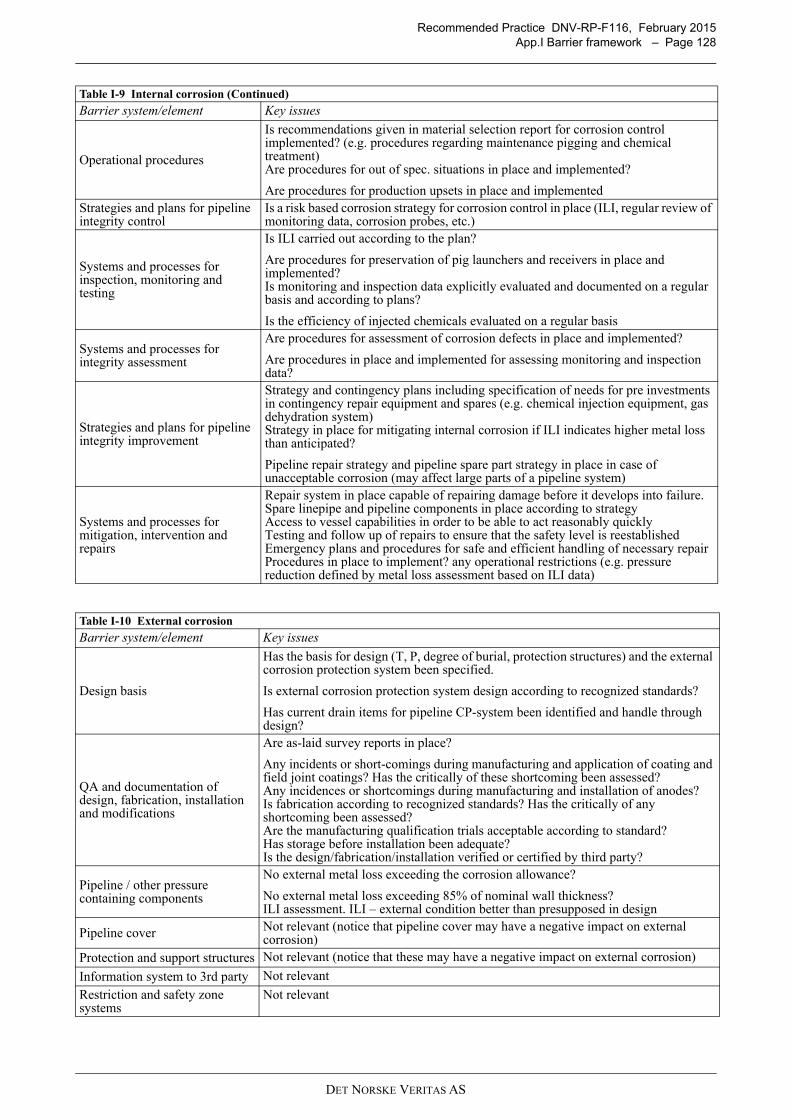
Recommended Practice DNV-RP-F116, February 2015App.I Barrier framework – Page 128
Operational procedures
Is recommendations given in material selection report for corrosion control implemented? (e.g. procedures regarding maintenance pigging and chemical treatment)Are procedures for out of spec. situations in place and implemented?
Are procedures for production upsets in place and implementedStrategies and plans for pipeline integrity control
Is a risk based corrosion strategy for corrosion control in place (ILI, regular review of monitoring data, corrosion probes, etc.)
Systems and processes for inspection, monitoring and testing
Is ILI carried out according to the plan?
Are procedures for preservation of pig launchers and receivers in place and implemented?Is monitoring and inspection data explicitly evaluated and documented on a regular basis and according to plans?
Is the efficiency of injected chemicals evaluated on a regular basis
Systems and processes for integrity assessment
Are procedures for assessment of corrosion defects in place and implemented?
Are procedures in place and implemented for assessing monitoring and inspection data?
Strategies and plans for pipeline integrity improvement
Strategy and contingency plans including specification of needs for pre investments in contingency repair equipment and spares (e.g. chemical injection equipment, gas dehydration system)Strategy in place for mitigating internal corrosion if ILI indicates higher metal loss than anticipated?
Pipeline repair strategy and pipeline spare part strategy in place in case of unacceptable corrosion (may affect large parts of a pipeline system)
Systems and processes for mitigation, intervention and repairs
Repair system in place capable of repairing damage before it develops into failure.Spare linepipe and pipeline components in place according to strategyAccess to vessel capabilities in order to be able to act reasonably quicklyTesting and follow up of repairs to ensure that the safety level is reestablishedEmergency plans and procedures for safe and efficient handling of necessary repair Procedures in place to implement? any operational restrictions (e.g. pressure reduction defined by metal loss assessment based on ILI data)
Table I-10 External corrosion
Barrier system/element Key issues
Design basis
Has the basis for design (T, P, degree of burial, protection structures) and the external corrosion protection system been specified.
Is external corrosion protection system design according to recognized standards?
Has current drain items for pipeline CP-system been identified and handle through design?
QA and documentation of design, fabrication, installation and modifications
Are as-laid survey reports in place?
Any incidents or short-comings during manufacturing and application of coating and field joint coatings? Has the critically of these shortcoming been assessed?Any incidences or shortcomings during manufacturing and installation of anodes?Is fabrication according to recognized standards? Has the critically of any shortcoming been assessed?Are the manufacturing qualification trials acceptable according to standard?Has storage before installation been adequate?Is the design/fabrication/installation verified or certified by third party?
Pipeline / other pressure containing components
No external metal loss exceeding the corrosion allowance?
No external metal loss exceeding 85% of nominal wall thickness?ILI assessment. ILI – external condition better than presupposed in design
Pipeline cover Not relevant (notice that pipeline cover may have a negative impact on external corrosion)
Protection and support structures Not relevant (notice that these may have a negative impact on external corrosion)
Information system to 3rd party Not relevant
Restriction and safety zone systems
Not relevant
Table I-9 Internal corrosion (Continued)
Barrier system/element Key issues
DET NORSKE VERITAS AS
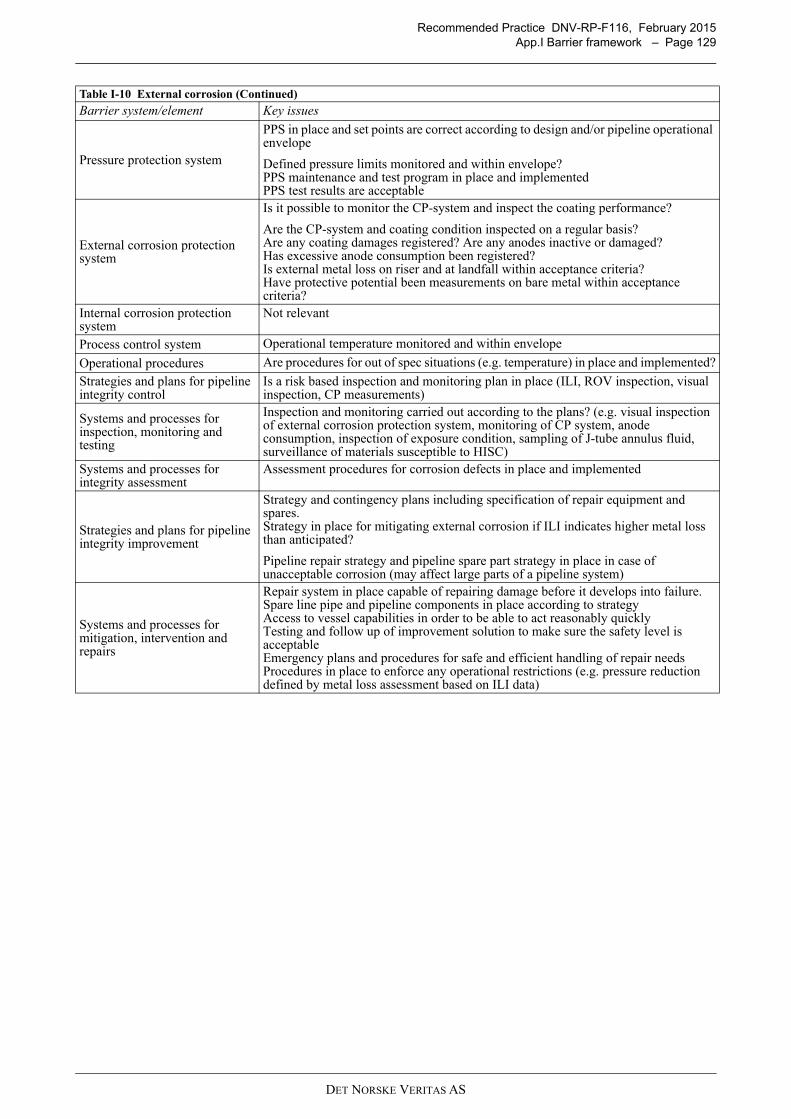
Recommended Practice DNV-RP-F116, February 2015App.I Barrier framework – Page 129
Pressure protection system
PPS in place and set points are correct according to design and/or pipeline operational envelope
Defined pressure limits monitored and within envelope?PPS maintenance and test program in place and implementedPPS test results are acceptable
External corrosion protection system
Is it possible to monitor the CP-system and inspect the coating performance?
Are the CP-system and coating condition inspected on a regular basis? Are any coating damages registered? Are any anodes inactive or damaged?Has excessive anode consumption been registered?Is external metal loss on riser and at landfall within acceptance criteria?Have protective potential been measurements on bare metal within acceptance criteria?
Internal corrosion protection system
Not relevant
Process control system Operational temperature monitored and within envelope
Operational procedures Are procedures for out of spec situations (e.g. temperature) in place and implemented?
Strategies and plans for pipeline integrity control
Is a risk based inspection and monitoring plan in place (ILI, ROV inspection, visual inspection, CP measurements)
Systems and processes for inspection, monitoring and testing
Inspection and monitoring carried out according to the plans? (e.g. visual inspection of external corrosion protection system, monitoring of CP system, anode consumption, inspection of exposure condition, sampling of J-tube annulus fluid, surveillance of materials susceptible to HISC)
Systems and processes for integrity assessment
Assessment procedures for corrosion defects in place and implemented
Strategies and plans for pipeline integrity improvement
Strategy and contingency plans including specification of repair equipment and spares.Strategy in place for mitigating external corrosion if ILI indicates higher metal loss than anticipated?
Pipeline repair strategy and pipeline spare part strategy in place in case of unacceptable corrosion (may affect large parts of a pipeline system)
Systems and processes for mitigation, intervention and repairs
Repair system in place capable of repairing damage before it develops into failure.Spare line pipe and pipeline components in place according to strategyAccess to vessel capabilities in order to be able to act reasonably quicklyTesting and follow up of improvement solution to make sure the safety level is acceptableEmergency plans and procedures for safe and efficient handling of repair needsProcedures in place to enforce any operational restrictions (e.g. pressure reduction defined by metal loss assessment based on ILI data)
Table I-10 External corrosion (Continued)
Barrier system/element Key issues
DET NORSKE VERITAS AS
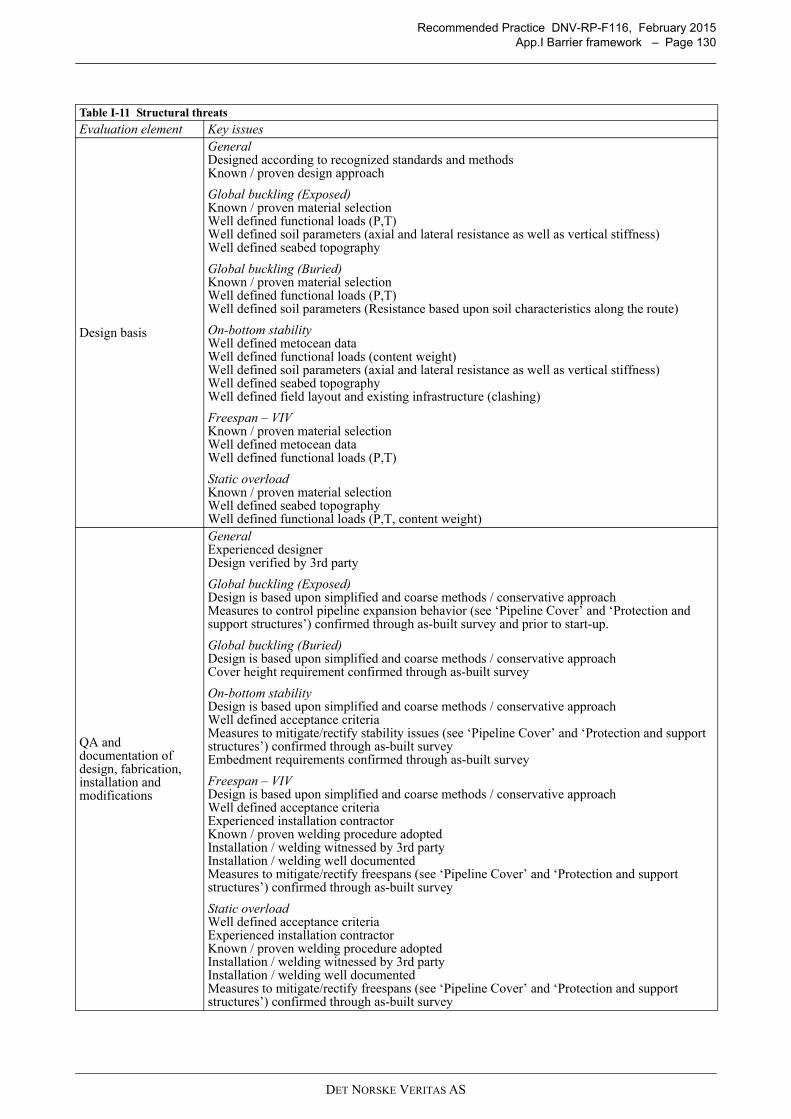
Recommended Practice DNV-RP-F116, February 2015App.I Barrier framework – Page 130
Table I-11 Structural threats
Evaluation element Key issues
Design basis
GeneralDesigned according to recognized standards and methodsKnown / proven design approach
Global buckling (Exposed)Known / proven material selectionWell defined functional loads (P,T)Well defined soil parameters (axial and lateral resistance as well as vertical stiffness)Well defined seabed topography
Global buckling (Buried)Known / proven material selectionWell defined functional loads (P,T)Well defined soil parameters (Resistance based upon soil characteristics along the route)
On-bottom stabilityWell defined metocean dataWell defined functional loads (content weight)Well defined soil parameters (axial and lateral resistance as well as vertical stiffness)Well defined seabed topographyWell defined field layout and existing infrastructure (clashing)
Freespan – VIVKnown / proven material selectionWell defined metocean dataWell defined functional loads (P,T)
Static overloadKnown / proven material selectionWell defined seabed topographyWell defined functional loads (P,T, content weight)
QA and documentation of design, fabrication, installation and modifications
GeneralExperienced designerDesign verified by 3rd party
Global buckling (Exposed)Design is based upon simplified and coarse methods / conservative approachMeasures to control pipeline expansion behavior (see ‘Pipeline Cover’ and ‘Protection and support structures’) confirmed through as-built survey and prior to start-up.
Global buckling (Buried)Design is based upon simplified and coarse methods / conservative approachCover height requirement confirmed through as-built survey
On-bottom stabilityDesign is based upon simplified and coarse methods / conservative approachWell defined acceptance criteriaMeasures to mitigate/rectify stability issues (see ‘Pipeline Cover’ and ‘Protection and support structures’) confirmed through as-built surveyEmbedment requirements confirmed through as-built survey
Freespan – VIVDesign is based upon simplified and coarse methods / conservative approachWell defined acceptance criteriaExperienced installation contractorKnown / proven welding procedure adoptedInstallation / welding witnessed by 3rd partyInstallation / welding well documentedMeasures to mitigate/rectify freespans (see ‘Pipeline Cover’ and ‘Protection and support structures’) confirmed through as-built survey
Static overloadWell defined acceptance criteriaExperienced installation contractorKnown / proven welding procedure adoptedInstallation / welding witnessed by 3rd partyInstallation / welding well documentedMeasures to mitigate/rectify freespans (see ‘Pipeline Cover’ and ‘Protection and support structures’) confirmed through as-built survey
DET NORSKE VERITAS AS
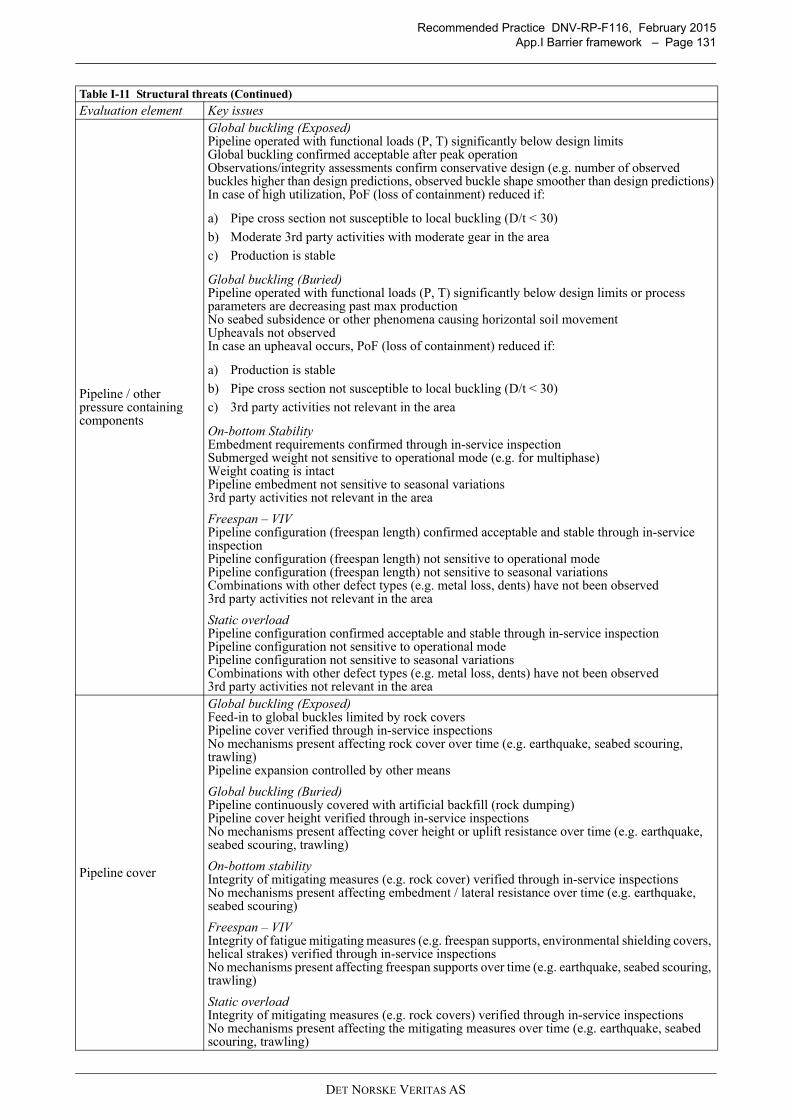
Recommended Practice DNV-RP-F116, February 2015App.I Barrier framework – Page 131
Pipeline / other pressure containing components
Global buckling (Exposed)Pipeline operated with functional loads (P, T) significantly below design limitsGlobal buckling confirmed acceptable after peak operationObservations/integrity assessments confirm conservative design (e.g. number of observed buckles higher than design predictions, observed buckle shape smoother than design predictions)In case of high utilization, PoF (loss of containment) reduced if:
a) Pipe cross section not susceptible to local buckling (D/t < 30)
b) Moderate 3rd party activities with moderate gear in the area
c) Production is stable
Global buckling (Buried)Pipeline operated with functional loads (P, T) significantly below design limits or process parameters are decreasing past max productionNo seabed subsidence or other phenomena causing horizontal soil movementUpheavals not observedIn case an upheaval occurs, PoF (loss of containment) reduced if:
a) Production is stable
b) Pipe cross section not susceptible to local buckling (D/t < 30)
c) 3rd party activities not relevant in the area
On-bottom StabilityEmbedment requirements confirmed through in-service inspectionSubmerged weight not sensitive to operational mode (e.g. for multiphase)Weight coating is intactPipeline embedment not sensitive to seasonal variations3rd party activities not relevant in the area
Freespan – VIVPipeline configuration (freespan length) confirmed acceptable and stable through in-service inspectionPipeline configuration (freespan length) not sensitive to operational modePipeline configuration (freespan length) not sensitive to seasonal variationsCombinations with other defect types (e.g. metal loss, dents) have not been observed3rd party activities not relevant in the area
Static overloadPipeline configuration confirmed acceptable and stable through in-service inspectionPipeline configuration not sensitive to operational modePipeline configuration not sensitive to seasonal variationsCombinations with other defect types (e.g. metal loss, dents) have not been observed3rd party activities not relevant in the area
Pipeline cover
Global buckling (Exposed)Feed-in to global buckles limited by rock coversPipeline cover verified through in-service inspectionsNo mechanisms present affecting rock cover over time (e.g. earthquake, seabed scouring, trawling)Pipeline expansion controlled by other means
Global buckling (Buried)Pipeline continuously covered with artificial backfill (rock dumping)Pipeline cover height verified through in-service inspectionsNo mechanisms present affecting cover height or uplift resistance over time (e.g. earthquake, seabed scouring, trawling)
On-bottom stabilityIntegrity of mitigating measures (e.g. rock cover) verified through in-service inspectionsNo mechanisms present affecting embedment / lateral resistance over time (e.g. earthquake, seabed scouring)
Freespan – VIVIntegrity of fatigue mitigating measures (e.g. freespan supports, environmental shielding covers, helical strakes) verified through in-service inspectionsNo mechanisms present affecting freespan supports over time (e.g. earthquake, seabed scouring, trawling)
Static overloadIntegrity of mitigating measures (e.g. rock covers) verified through in-service inspectionsNo mechanisms present affecting the mitigating measures over time (e.g. earthquake, seabed scouring, trawling)
Table I-11 Structural threats (Continued)
Evaluation element Key issues
DET NORSKE VERITAS AS
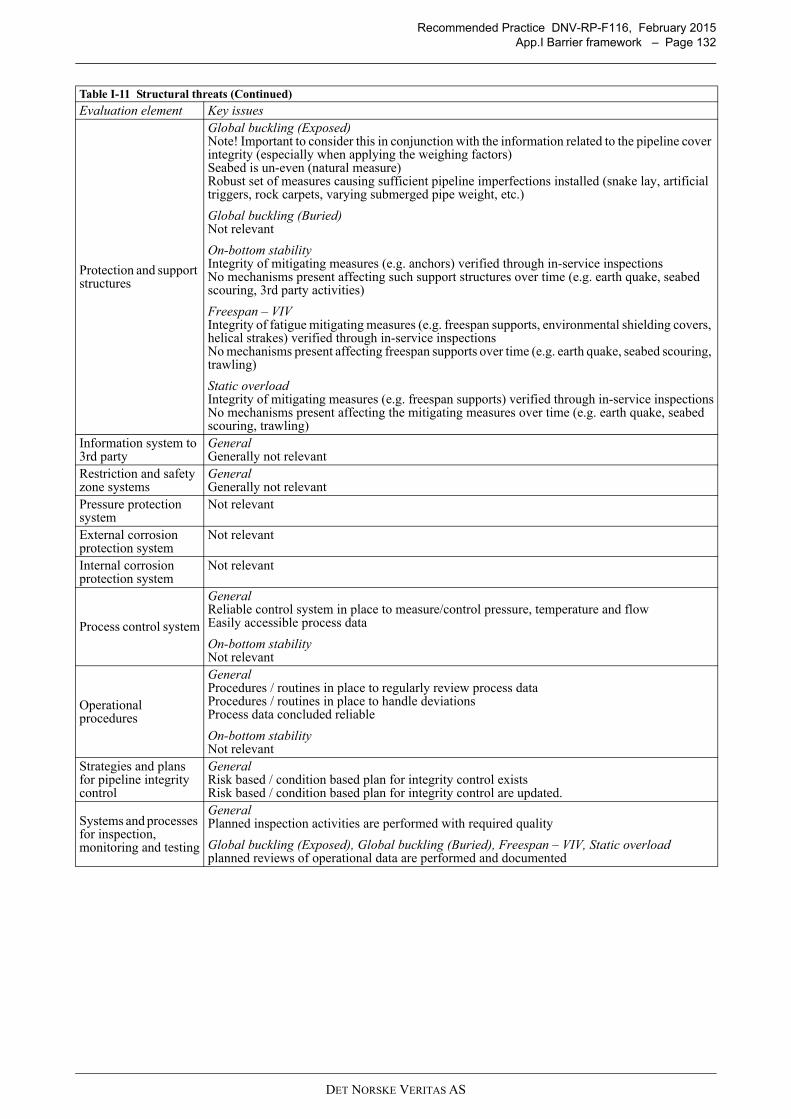
Recommended Practice DNV-RP-F116, February 2015App.I Barrier framework – Page 132
Protection and support structures
Global buckling (Exposed)Note! Important to consider this in conjunction with the information related to the pipeline cover integrity (especially when applying the weighing factors)Seabed is un-even (natural measure)Robust set of measures causing sufficient pipeline imperfections installed (snake lay, artificial triggers, rock carpets, varying submerged pipe weight, etc.)
Global buckling (Buried)Not relevant
On-bottom stabilityIntegrity of mitigating measures (e.g. anchors) verified through in-service inspectionsNo mechanisms present affecting such support structures over time (e.g. earth quake, seabed scouring, 3rd party activities)
Freespan – VIVIntegrity of fatigue mitigating measures (e.g. freespan supports, environmental shielding covers, helical strakes) verified through in-service inspectionsNo mechanisms present affecting freespan supports over time (e.g. earth quake, seabed scouring, trawling)
Static overloadIntegrity of mitigating measures (e.g. freespan supports) verified through in-service inspectionsNo mechanisms present affecting the mitigating measures over time (e.g. earth quake, seabed scouring, trawling)
Information system to 3rd party
General Generally not relevant
Restriction and safety zone systems
General Generally not relevant
Pressure protection system
Not relevant
External corrosion protection system
Not relevant
Internal corrosion protection system
Not relevant
Process control system
GeneralReliable control system in place to measure/control pressure, temperature and flowEasily accessible process data
On-bottom stabilityNot relevant
Operational procedures
GeneralProcedures / routines in place to regularly review process dataProcedures / routines in place to handle deviationsProcess data concluded reliable
On-bottom stabilityNot relevant
Strategies and plans for pipeline integrity control
GeneralRisk based / condition based plan for integrity control existsRisk based / condition based plan for integrity control are updated.
Systems and processes for inspection, monitoring and testing
GeneralPlanned inspection activities are performed with required quality
Global buckling (Exposed), Global buckling (Buried), Freespan – VIV, Static overloadplanned reviews of operational data are performed and documented
Table I-11 Structural threats (Continued)
Evaluation element Key issues
DET NORSKE VERITAS AS
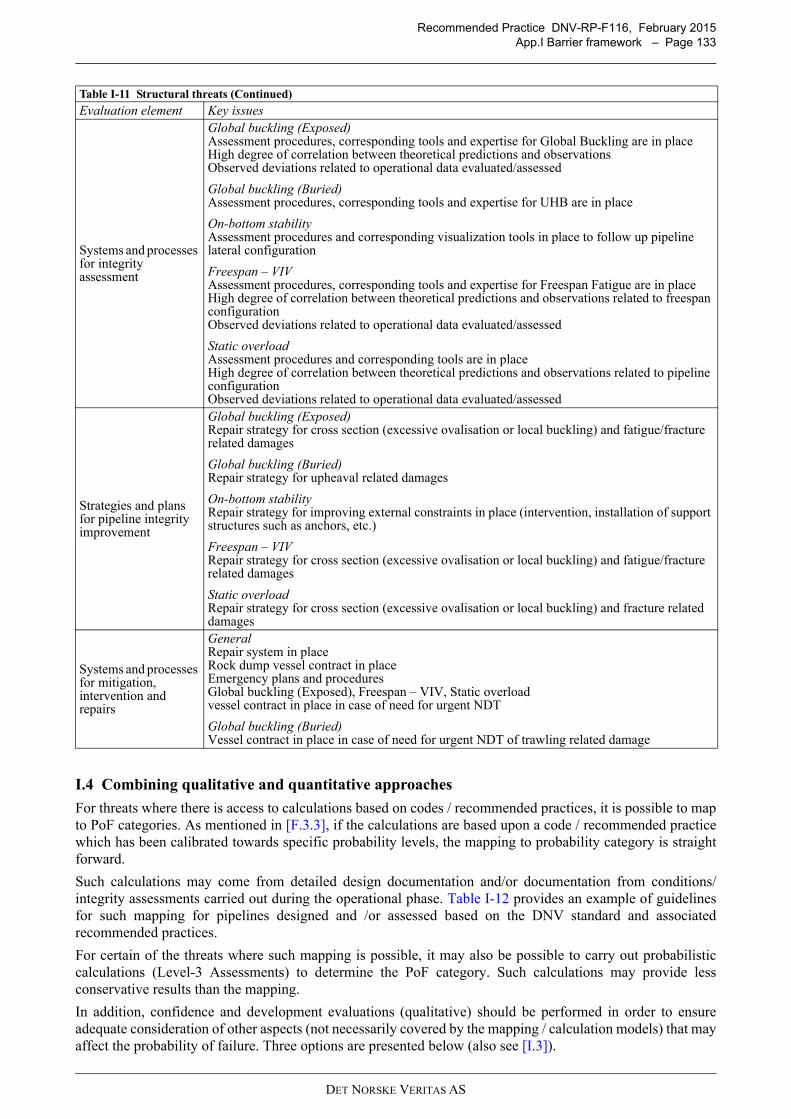
Recommended Practice DNV-RP-F116, February 2015App.I Barrier framework – Page 133
I.4 Combining qualitative and quantitative approaches
For threats where there is access to calculations based on codes / recommended practices, it is possible to mapto PoF categories. As mentioned in [F.3.3], if the calculations are based upon a code / recommended practicewhich has been calibrated towards specific probability levels, the mapping to probability category is straightforward.
Such calculations may come from detailed design documentation and/or documentation from conditions/integrity assessments carried out during the operational phase. Table I-12 provides an example of guidelinesfor such mapping for pipelines designed and /or assessed based on the DNV standard and associatedrecommended practices.
For certain of the threats where such mapping is possible, it may also be possible to carry out probabilisticcalculations (Level-3 Assessments) to determine the PoF category. Such calculations may provide lessconservative results than the mapping.
In addition, confidence and development evaluations (qualitative) should be performed in order to ensureadequate consideration of other aspects (not necessarily covered by the mapping / calculation models) that mayaffect the probability of failure. Three options are presented below (also see [I.3]).
Systems and processes for integrity assessment
Global buckling (Exposed)Assessment procedures, corresponding tools and expertise for Global Buckling are in placeHigh degree of correlation between theoretical predictions and observationsObserved deviations related to operational data evaluated/assessed
Global buckling (Buried)Assessment procedures, corresponding tools and expertise for UHB are in place
On-bottom stabilityAssessment procedures and corresponding visualization tools in place to follow up pipeline lateral configuration
Freespan – VIVAssessment procedures, corresponding tools and expertise for Freespan Fatigue are in placeHigh degree of correlation between theoretical predictions and observations related to freespan configurationObserved deviations related to operational data evaluated/assessed
Static overloadAssessment procedures and corresponding tools are in placeHigh degree of correlation between theoretical predictions and observations related to pipeline configurationObserved deviations related to operational data evaluated/assessed
Strategies and plans for pipeline integrity improvement
Global buckling (Exposed)Repair strategy for cross section (excessive ovalisation or local buckling) and fatigue/fracture related damages
Global buckling (Buried)Repair strategy for upheaval related damages
On-bottom stabilityRepair strategy for improving external constraints in place (intervention, installation of support structures such as anchors, etc.)
Freespan – VIVRepair strategy for cross section (excessive ovalisation or local buckling) and fatigue/fracture related damages
Static overloadRepair strategy for cross section (excessive ovalisation or local buckling) and fracture related damages
Systems and processes for mitigation, intervention and repairs
GeneralRepair system in placeRock dump vessel contract in placeEmergency plans and proceduresGlobal buckling (Exposed), Freespan – VIV, Static overloadvessel contract in place in case of need for urgent NDT
Global buckling (Buried)Vessel contract in place in case of need for urgent NDT of trawling related damage
Table I-11 Structural threats (Continued)
Evaluation element Key issues
DET NORSKE VERITAS AS
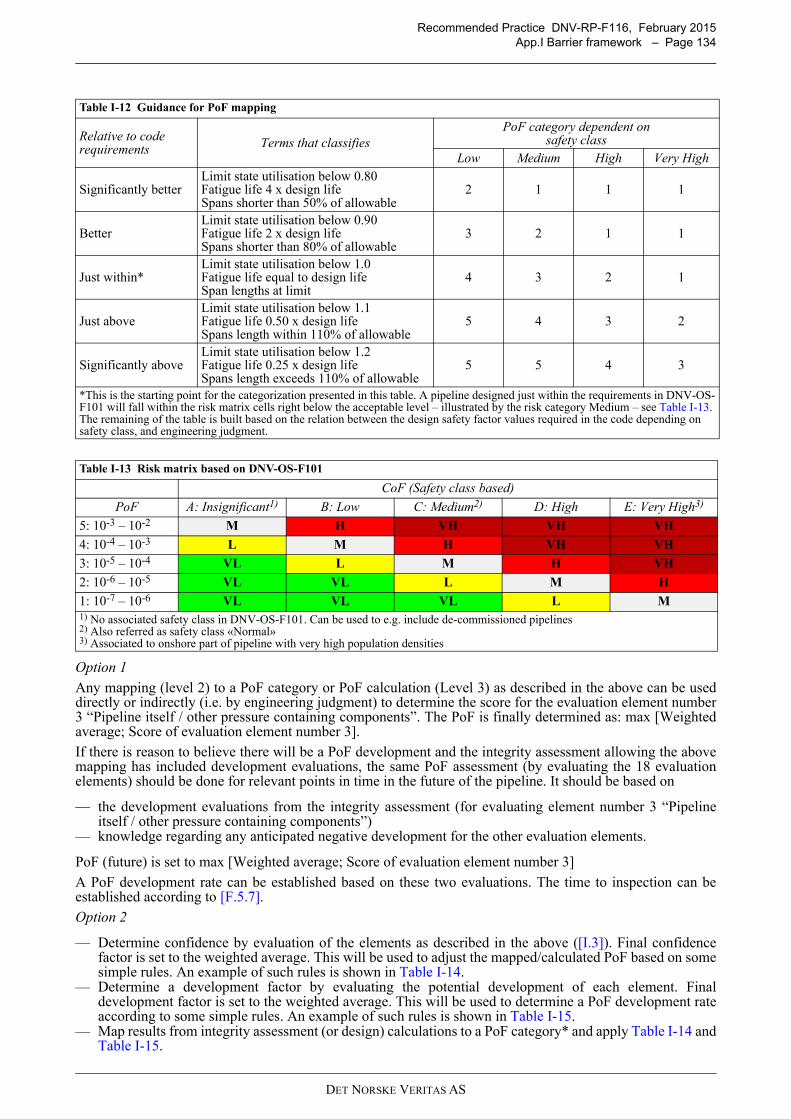
Recommended Practice DNV-RP-F116, February 2015App.I Barrier framework – Page 134
Option 1
Any mapping (level 2) to a PoF category or PoF calculation (Level 3) as described in the above can be useddirectly or indirectly (i.e. by engineering judgment) to determine the score for the evaluation element number3 “Pipeline itself / other pressure containing components”. The PoF is finally determined as: max [Weightedaverage; Score of evaluation element number 3].
If there is reason to believe there will be a PoF development and the integrity assessment allowing the abovemapping has included development evaluations, the same PoF assessment (by evaluating the 18 evaluationelements) should be done for relevant points in time in the future of the pipeline. It should be based on
— the development evaluations from the integrity assessment (for evaluating element number 3 “Pipelineitself / other pressure containing components”)
— knowledge regarding any anticipated negative development for the other evaluation elements.
PoF (future) is set to max [Weighted average; Score of evaluation element number 3]
A PoF development rate can be established based on these two evaluations. The time to inspection can beestablished according to [F.5.7].
Option 2
— Determine confidence by evaluation of the elements as described in the above ([I.3]). Final confidencefactor is set to the weighted average. This will be used to adjust the mapped/calculated PoF based on somesimple rules. An example of such rules is shown in Table I-14.
— Determine a development factor by evaluating the potential development of each element. Finaldevelopment factor is set to the weighted average. This will be used to determine a PoF development rateaccording to some simple rules. An example of such rules is shown in Table I-15.
— Map results from integrity assessment (or design) calculations to a PoF category* and apply Table I-14 andTable I-15.
Table I-12 Guidance for PoF mapping
Relative to code requirements Terms that classifies
PoF category dependent onsafety class
Low Medium High Very High
Significantly betterLimit state utilisation below 0.80Fatigue life 4 x design lifeSpans shorter than 50% of allowable
2 1 1 1
BetterLimit state utilisation below 0.90Fatigue life 2 x design lifeSpans shorter than 80% of allowable
3 2 1 1
Just within*Limit state utilisation below 1.0Fatigue life equal to design lifeSpan lengths at limit
4 3 2 1
Just aboveLimit state utilisation below 1.1Fatigue life 0.50 x design lifeSpans length within 110% of allowable
5 4 3 2
Significantly aboveLimit state utilisation below 1.2Fatigue life 0.25 x design lifeSpans length exceeds 110% of allowable
5 5 4 3
*This is the starting point for the categorization presented in this table. A pipeline designed just within the requirements in DNV-OS-F101 will fall within the risk matrix cells right below the acceptable level – illustrated by the risk category Medium – see Table I-13. The remaining of the table is built based on the relation between the design safety factor values required in the code depending on safety class, and engineering judgment.
Table I-13 Risk matrix based on DNV-OS-F101
CoF (Safety class based)
PoF A: Insignificant1) B: Low C: Medium2) D: High E: Very High3)
5: 10-3 – 10-2 M H VH VH VH
4: 10-4 – 10-3 L M H VH VH
3: 10-5 – 10-4 VL L M H VH
2: 10-6 – 10-5 VL VL L M H
1: 10-7 – 10-6 VL VL VL L M1) No associated safety class in DNV-OS-F101. Can be used to e.g. include de-commissioned pipelines2) Also referred as safety class «Normal»3) Associated to onshore part of pipeline with very high population densities
DET NORSKE VERITAS AS
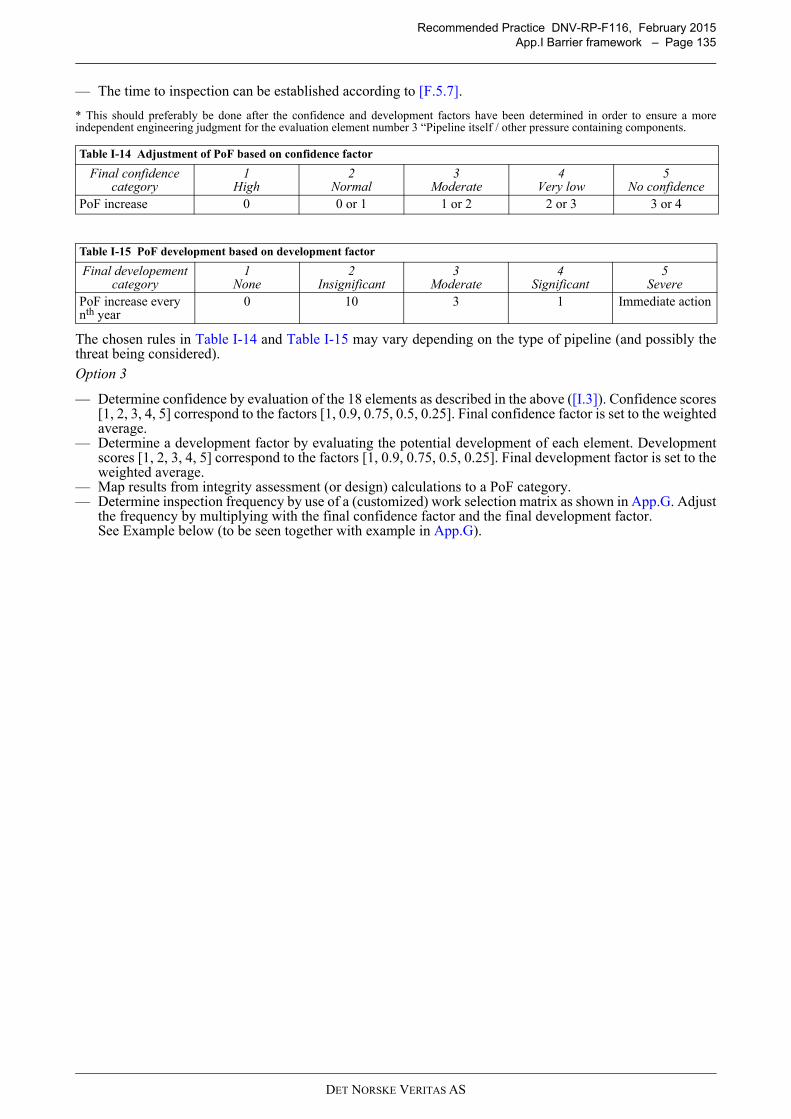
Recommended Practice DNV-RP-F116, February 2015App.I Barrier framework – Page 135
— The time to inspection can be established according to [F.5.7].
* This should preferably be done after the confidence and development factors have been determined in order to ensure a moreindependent engineering judgment for the evaluation element number 3 “Pipeline itself / other pressure containing components.
The chosen rules in Table I-14 and Table I-15 may vary depending on the type of pipeline (and possibly thethreat being considered).Option 3
— Determine confidence by evaluation of the 18 elements as described in the above ([I.3]). Confidence scores[1, 2, 3, 4, 5] correspond to the factors [1, 0.9, 0.75, 0.5, 0.25]. Final confidence factor is set to the weightedaverage.
— Determine a development factor by evaluating the potential development of each element. Developmentscores [1, 2, 3, 4, 5] correspond to the factors [1, 0.9, 0.75, 0.5, 0.25]. Final development factor is set to theweighted average.
— Map results from integrity assessment (or design) calculations to a PoF category.— Determine inspection frequency by use of a (customized) work selection matrix as shown in App.G. Adjust
the frequency by multiplying with the final confidence factor and the final development factor.See Example below (to be seen together with example in App.G).
Table I-14 Adjustment of PoF based on confidence factor
Final confidence category
1High
2Normal
3Moderate
4Very low
5No confidence
PoF increase 0 0 or 1 1 or 2 2 or 3 3 or 4
Table I-15 PoF development based on development factor
Final developement category
1None
2Insignificant
3Moderate
4Significant
5Severe
PoF increase every nth year
0 10 3 1 Immediate action
DET NORSKE VERITAS AS
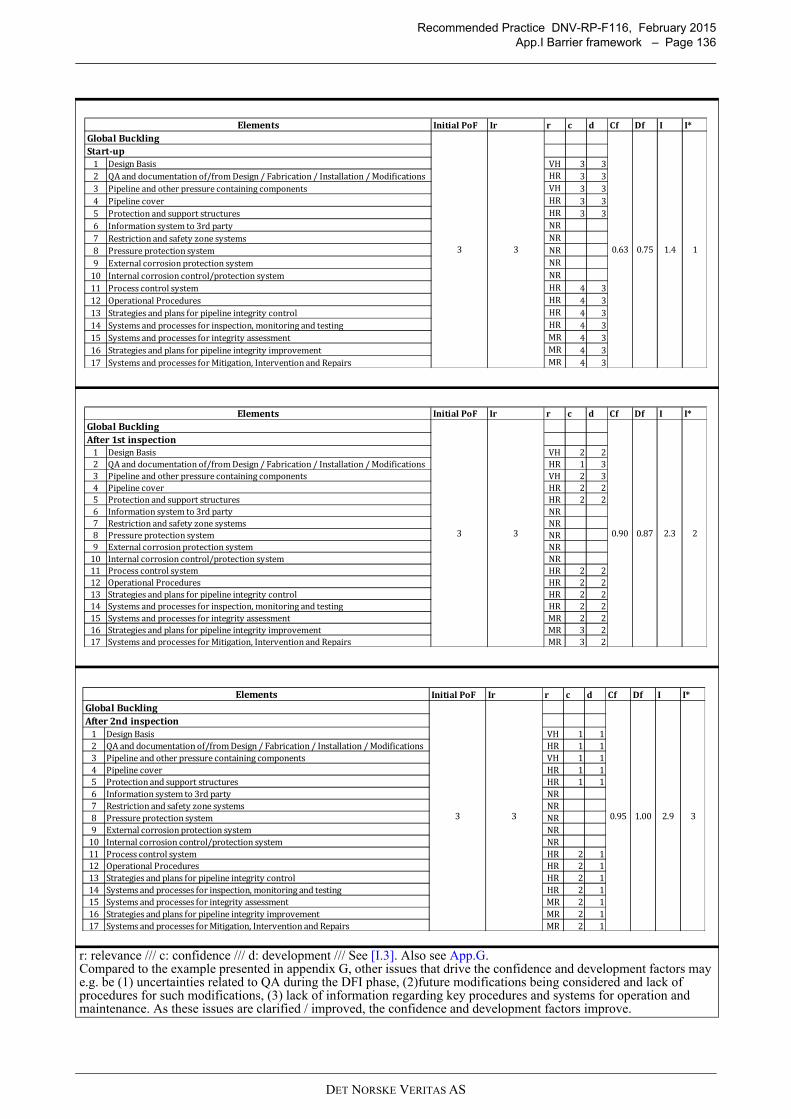
Recommended Practice DNV-RP-F116, February 2015App.I Barrier framework – Page 136
r: relevance /// c: confidence /// d: development /// See [I.3]. Also see App.G.Compared to the example presented in appendix G, other issues that drive the confidence and development factors may e.g. be (1) uncertainties related to QA during the DFI phase, (2)future modifications being considered and lack of procedures for such modifications, (3) lack of information regarding key procedures and systems for operation and maintenance. As these issues are clarified / improved, the confidence and development factors improve.
Initial PoF Ir r c d Cf Df I I*Global BucklingStart-up1 Design Basis VH 3 32 QA and documentation of/from Design / Fabrication / Installation / Modifications HR 3 33 Pipeline and other pressure containing components VH 3 34 Pipeline cover HR 3 35 Protection and support structures HR 3 36 Information system to 3rd party NR7 Restriction and safety zone systems NR8 Pressure protection system NR9 External corrosion protection system NR10 Internal corrosion control/protection system NR11 Process control system HR 4 312 Operational Procedures HR 4 313 Strategies and plans for pipeline integrity control HR 4 314 Systems and processes for inspection, monitoring and testing HR 4 315 Systems and processes for integrity assessment MR 4 316 Strategies and plans for pipeline integrity improvement MR 4 317 Systems and processes for Mitigation, Intervention and Repairs MR 4 3
3 0.63 0.75 1.4 1
Elements
3
Initial PoF Ir r c d Cf Df I I*Global BucklingAfter 1st inspection1 Design Basis VH 2 22 QA and documentation of/from Design / Fabrication / Installation / Modifications HR 1 33 Pipeline and other pressure containing components VH 2 34 Pipeline cover HR 2 25 Protection and support structures HR 2 26 Information system to 3rd party NR7 Restriction and safety zone systems NR8 Pressure protection system NR9 External corrosion protection system NR10 Internal corrosion control/protection system NR11 Process control system HR 2 212 Operational Procedures HR 2 213 Strategies and plans for pipeline integrity control HR 2 214 Systems and processes for inspection, monitoring and testing HR 2 215 Systems and processes for integrity assessment MR 2 216 Strategies and plans for pipeline integrity improvement MR 3 217 Systems and processes for Mitigation, Intervention and Repairs MR 3 2
2.3 23 0.90 0.87
Elements
3
Initial PoF Ir r c d Cf Df I I*Global BucklingAfter 2nd inspection1 Design Basis VH 1 12 QA and documentation of/from Design / Fabrication / Installation / Modifications HR 1 13 Pipeline and other pressure containing components VH 1 14 Pipeline cover HR 1 15 Protection and support structures HR 1 16 Information system to 3rd party NR7 Restriction and safety zone systems NR8 Pressure protection system NR9 External corrosion protection system NR10 Internal corrosion control/protection system NR11 Process control system HR 2 112 Operational Procedures HR 2 113 Strategies and plans for pipeline integrity control HR 2 114 Systems and processes for inspection, monitoring and testing HR 2 115 Systems and processes for integrity assessment MR 2 116 Strategies and plans for pipeline integrity improvement MR 2 117 Systems and processes for Mitigation, Intervention and Repairs MR 2 1
2.9 33 0.95 1.00
Elements
3
DET NORSKE VERITAS AS
Recommended Practice DNV-RP-F116, February 2015App.J Integrity management review – Page 137
APPENDIX J INTEGRITY MANAGEMENT REVIEW
J.1 GeneralReviews of the integrity management system should be carried out regularly (see [2.3.8])
— as a part of any existing continuous improvement systems— as self-checks and/or with support from independent reviewers/facilitators (not necessarily from outside the
operator’s organisation)— for all, or parts of the integrity management system.
Such reviews should typically be performed such that the entire system is covered within 5 years at the most.
A default set of topics based on recommendations included in DNV-RP-F116 is presented in [J.3] and can beused as a starting point.
Many operators may find it beneficial to customize the set of review topics/issues in order to includerecommendations and requirements based on e.g.
— other recommended practices— operator prevailing documentation— local regulations, etc.
J.2 Review levelsDifferent types/levels of reviews may be defined and carried out depending on the needs. The chosen reviewlevel is based on the risk associated with the set of pipelines managed by the integrity management system. Ifthe risk associated with the set of pipelines is on the higher side, the review level is more detailed. Conversely,if the risk associated with the set of pipelines is on the lower side, the review level is less detailed. It is alsopossible to have a mix of levels for the different issues being reviewed. This should be specified in the reviewplans (e.g. 5-year plans).
The following review levels are suggested:
— General review – focus is on review of general principles with spot check regarding implementation. Workis carried out by review of (1) general prevailing/governing documentation, (2) a representative set ofdocuments for a representative pipeline (or smaller set of pipelines) and (3) meetings/interviews. Suchreviews are carried out for pipelines:
— with proven design and/or successful operation and maintenance over many years (min. 5 years),— located in benign environmental conditions— with low consequences of failure— relaxed to normal production regimes (not due to integrity issues).
— Comprehensive review – focus is more on implementation as well as review of general principles. Work iscarried out by more detailed review of (1) general prevailing/governing documentation, (2) a representativeset of documents for a set of pipelines, and (3) meetings/interviews. Also, attendance during certain keyactivities as observers/witnesses may be relevant. Such reviews are carried out for pipelines:
— with moderately novel design and/or less proven/successful operation and maintenance— located in moderate environmental conditions— with medium consequences of failure— normal to tighter production regimes.
— Detailed review – focus is very much on implementation as well as review of general principles. Work iscarried out by in-depth detailed review of (1) general prevailing/governing documentation, (2) a major partof the documents for a major part of the pipelines, and (3) meetings/interviews. Also, attendance duringmany key activities as observers/witnesses is included. Such reviews are carried out for pipelines
— with novel design and/or poor operation and maintenance records— located in harsh environmental conditions— with high consequences of failure— excessively tight production regimes.
J.3 Review topicsA default set of topics based on recommendations included in DNV-RP-F116 is presented in Table J-1 and canbe used as a starting point.
The suggested content of review forms to be used is presented in Table J-2.
DET NORSKE VERITAS AS
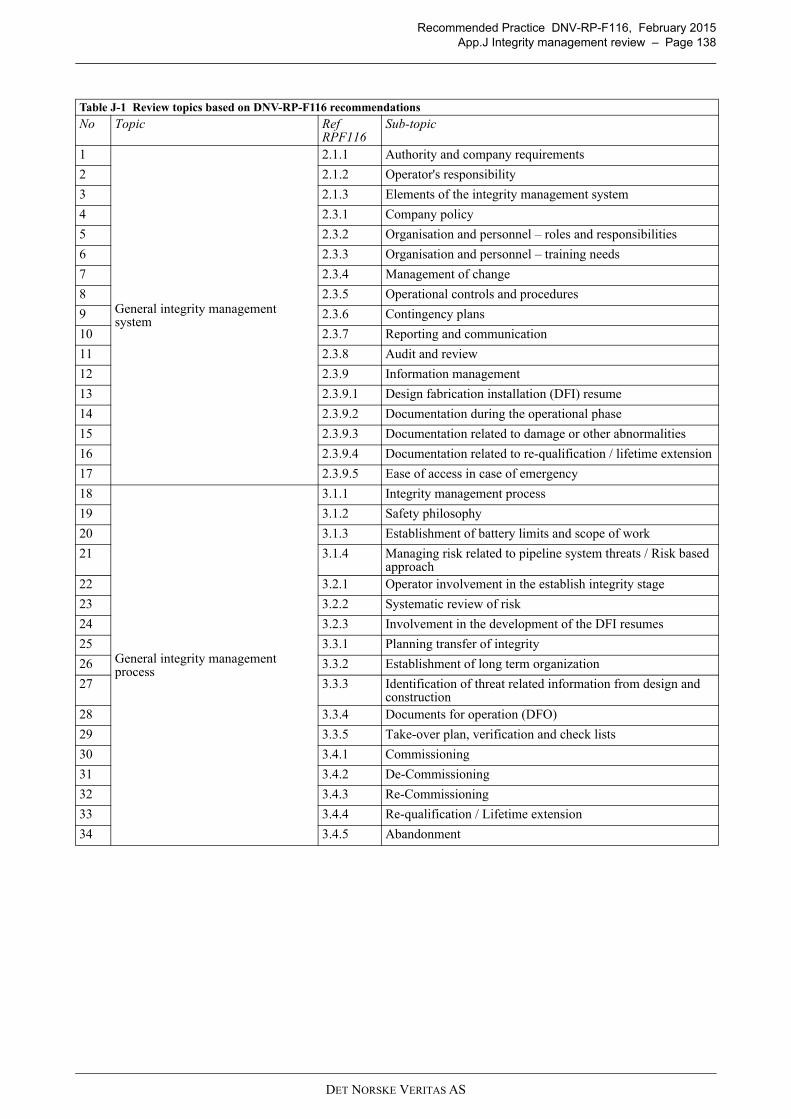
Recommended Practice DNV-RP-F116, February 2015App.J Integrity management review – Page 138
Table J-1 Review topics based on DNV-RP-F116 recommendations
No Topic Ref RPF116
Sub-topic
1
General integrity management system
2.1.1 Authority and company requirements
2 2.1.2 Operator's responsibility
3 2.1.3 Elements of the integrity management system
4 2.3.1 Company policy
5 2.3.2 Organisation and personnel – roles and responsibilities
6 2.3.3 Organisation and personnel – training needs
7 2.3.4 Management of change
8 2.3.5 Operational controls and procedures
9 2.3.6 Contingency plans
10 2.3.7 Reporting and communication
11 2.3.8 Audit and review
12 2.3.9 Information management
13 2.3.9.1 Design fabrication installation (DFI) resume
14 2.3.9.2 Documentation during the operational phase
15 2.3.9.3 Documentation related to damage or other abnormalities
16 2.3.9.4 Documentation related to re-qualification / lifetime extension
17 2.3.9.5 Ease of access in case of emergency
18
General integrity management process
3.1.1 Integrity management process
19 3.1.2 Safety philosophy
20 3.1.3 Establishment of battery limits and scope of work
21 3.1.4 Managing risk related to pipeline system threats / Risk based approach
22 3.2.1 Operator involvement in the establish integrity stage
23 3.2.2 Systematic review of risk
24 3.2.3 Involvement in the development of the DFI resumes
25 3.3.1 Planning transfer of integrity
26 3.3.2 Establishment of long term organization
27 3.3.3 Identification of threat related information from design and construction
28 3.3.4 Documents for operation (DFO)
29 3.3.5 Take-over plan, verification and check lists
30 3.4.1 Commissioning
31 3.4.2 De-Commissioning
32 3.4.3 Re-Commissioning
33 3.4.4 Re-qualification / Lifetime extension
34 3.4.5 Abandonment
DET NORSKE VERITAS AS
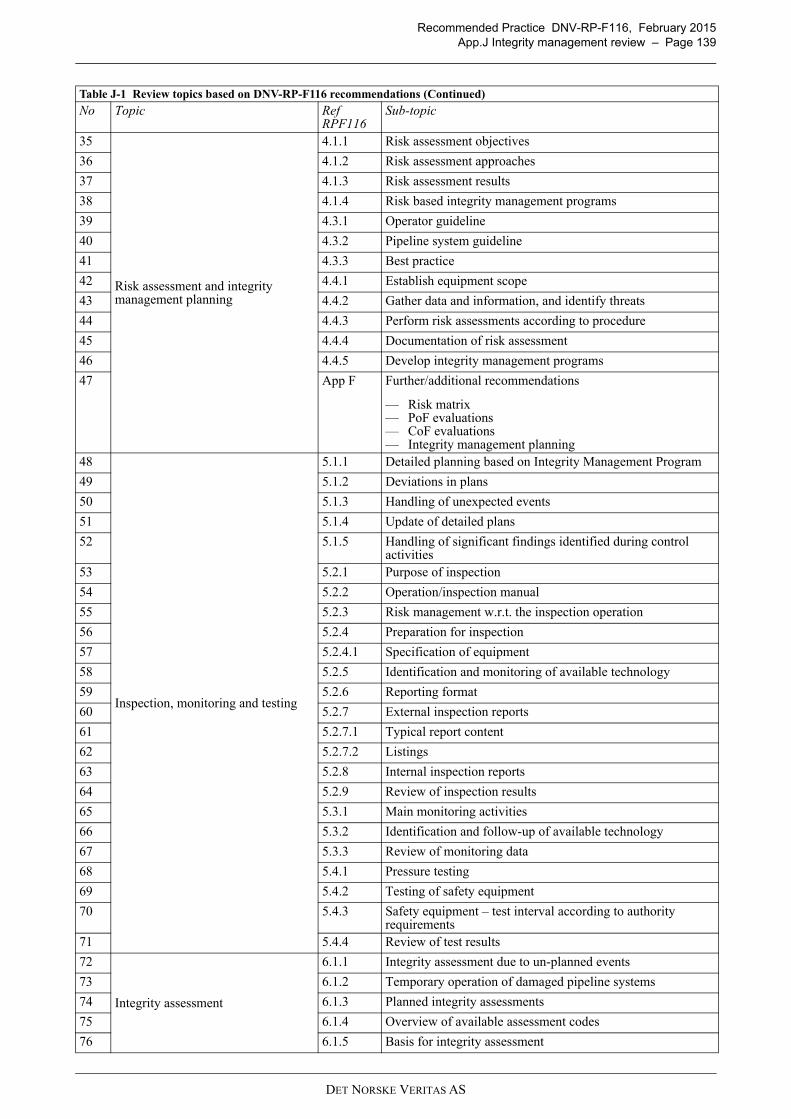
Recommended Practice DNV-RP-F116, February 2015App.J Integrity management review – Page 139
35
Risk assessment and integrity management planning
4.1.1 Risk assessment objectives
36 4.1.2 Risk assessment approaches
37 4.1.3 Risk assessment results
38 4.1.4 Risk based integrity management programs
39 4.3.1 Operator guideline
40 4.3.2 Pipeline system guideline
41 4.3.3 Best practice
42 4.4.1 Establish equipment scope
43 4.4.2 Gather data and information, and identify threats
44 4.4.3 Perform risk assessments according to procedure
45 4.4.4 Documentation of risk assessment
46 4.4.5 Develop integrity management programs
47 App F Further/additional recommendations
— Risk matrix— PoF evaluations— CoF evaluations— Integrity management planning
48
Inspection, monitoring and testing
5.1.1 Detailed planning based on Integrity Management Program
49 5.1.2 Deviations in plans
50 5.1.3 Handling of unexpected events
51 5.1.4 Update of detailed plans
52 5.1.5 Handling of significant findings identified during control activities
53 5.2.1 Purpose of inspection
54 5.2.2 Operation/inspection manual
55 5.2.3 Risk management w.r.t. the inspection operation
56 5.2.4 Preparation for inspection
57 5.2.4.1 Specification of equipment
58 5.2.5 Identification and monitoring of available technology
59 5.2.6 Reporting format
60 5.2.7 External inspection reports
61 5.2.7.1 Typical report content
62 5.2.7.2 Listings
63 5.2.8 Internal inspection reports
64 5.2.9 Review of inspection results
65 5.3.1 Main monitoring activities
66 5.3.2 Identification and follow-up of available technology
67 5.3.3 Review of monitoring data
68 5.4.1 Pressure testing
69 5.4.2 Testing of safety equipment
70 5.4.3 Safety equipment – test interval according to authority requirements
71 5.4.4 Review of test results
72
Integrity assessment
6.1.1 Integrity assessment due to un-planned events
73 6.1.2 Temporary operation of damaged pipeline systems
74 6.1.3 Planned integrity assessments
75 6.1.4 Overview of available assessment codes
76 6.1.5 Basis for integrity assessment
Table J-1 Review topics based on DNV-RP-F116 recommendations (Continued)
No Topic Ref RPF116
Sub-topic
DET NORSKE VERITAS AS
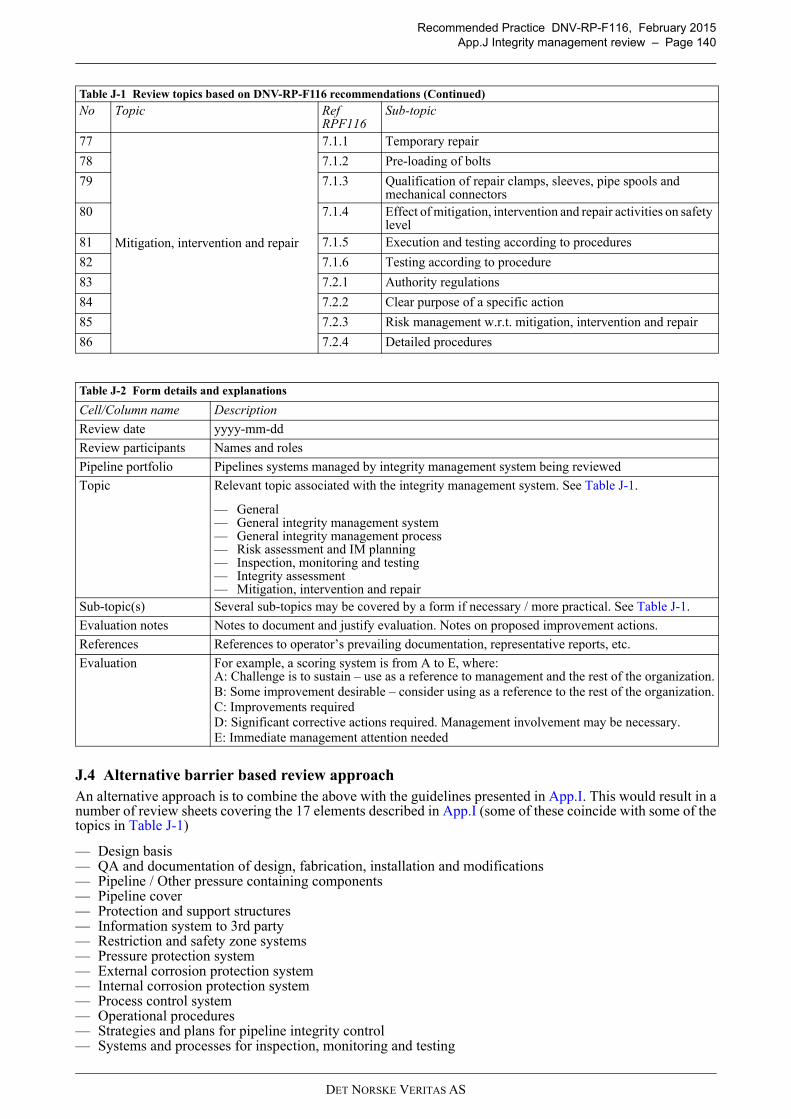
Recommended Practice DNV-RP-F116, February 2015App.J Integrity management review – Page 140
J.4 Alternative barrier based review approachAn alternative approach is to combine the above with the guidelines presented in App.I. This would result in anumber of review sheets covering the 17 elements described in App.I (some of these coincide with some of thetopics in Table J-1)
— Design basis— QA and documentation of design, fabrication, installation and modifications— Pipeline / Other pressure containing components— Pipeline cover— Protection and support structures— Information system to 3rd party— Restriction and safety zone systems— Pressure protection system— External corrosion protection system— Internal corrosion protection system— Process control system— Operational procedures— Strategies and plans for pipeline integrity control— Systems and processes for inspection, monitoring and testing
77
Mitigation, intervention and repair
7.1.1 Temporary repair
78 7.1.2 Pre-loading of bolts
79 7.1.3 Qualification of repair clamps, sleeves, pipe spools and mechanical connectors
80 7.1.4 Effect of mitigation, intervention and repair activities on safety level
81 7.1.5 Execution and testing according to procedures
82 7.1.6 Testing according to procedure
83 7.2.1 Authority regulations
84 7.2.2 Clear purpose of a specific action
85 7.2.3 Risk management w.r.t. mitigation, intervention and repair
86 7.2.4 Detailed procedures
Table J-2 Form details and explanations
Cell/Column name Description
Review date yyyy-mm-dd
Review participants Names and roles
Pipeline portfolio Pipelines systems managed by integrity management system being reviewed
Topic Relevant topic associated with the integrity management system. See Table J-1.
— General— General integrity management system — General integrity management process— Risk assessment and IM planning— Inspection, monitoring and testing— Integrity assessment— Mitigation, intervention and repair
Sub-topic(s) Several sub-topics may be covered by a form if necessary / more practical. See Table J-1.
Evaluation notes Notes to document and justify evaluation. Notes on proposed improvement actions.
References References to operator’s prevailing documentation, representative reports, etc.
Evaluation For example, a scoring system is from A to E, where:A: Challenge is to sustain – use as a reference to management and the rest of the organization.B: Some improvement desirable – consider using as a reference to the rest of the organization.C: Improvements requiredD: Significant corrective actions required. Management involvement may be necessary.E: Immediate management attention needed
Table J-1 Review topics based on DNV-RP-F116 recommendations (Continued)
No Topic Ref RPF116
Sub-topic
DET NORSKE VERITAS AS
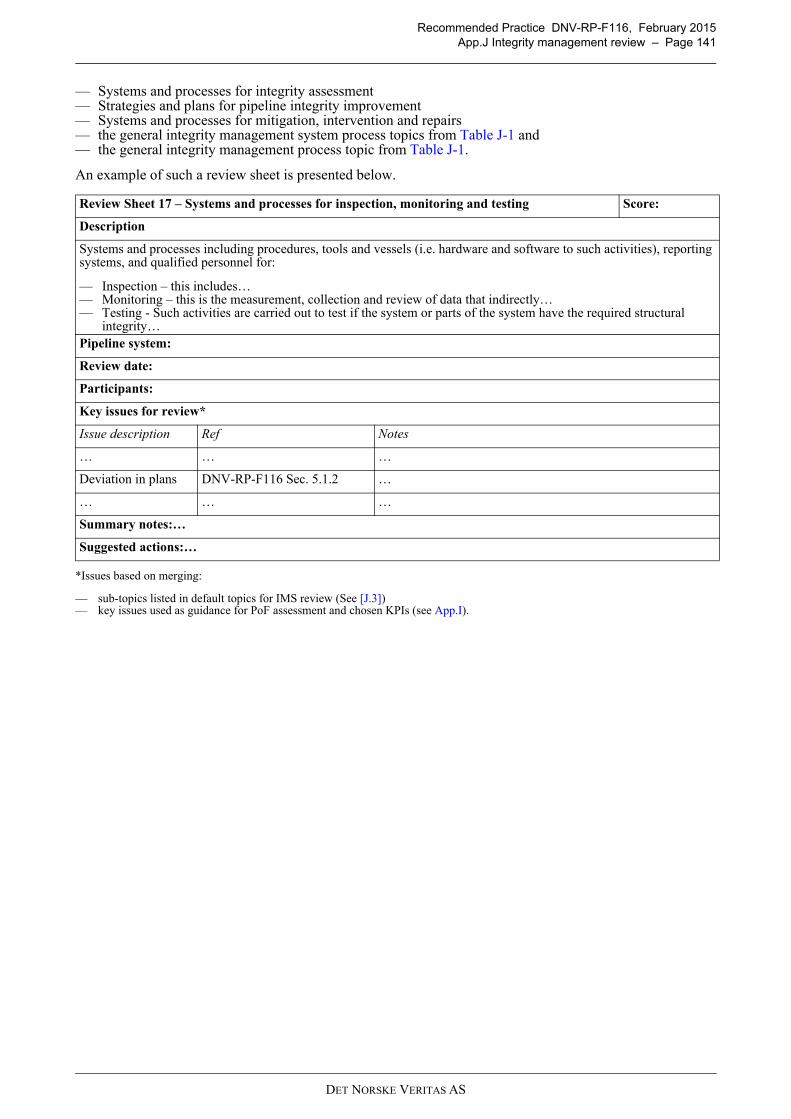
Recommended Practice DNV-RP-F116, February 2015App.J Integrity management review – Page 141
— Systems and processes for integrity assessment— Strategies and plans for pipeline integrity improvement— Systems and processes for mitigation, intervention and repairs— the general integrity management system process topics from Table J-1 and— the general integrity management process topic from Table J-1.
An example of such a review sheet is presented below.
*Issues based on merging:
— sub-topics listed in default topics for IMS review (See [J.3])— key issues used as guidance for PoF assessment and chosen KPIs (see App.I).
Review Sheet 17 – Systems and processes for inspection, monitoring and testing Score:
Description
Systems and processes including procedures, tools and vessels (i.e. hardware and software to such activities), reporting systems, and qualified personnel for:
— Inspection – this includes…— Monitoring – this is the measurement, collection and review of data that indirectly…— Testing - Such activities are carried out to test if the system or parts of the system have the required structural
integrity…Pipeline system:
Review date:
Participants:
Key issues for review*
Issue description Ref Notes
… … …
Deviation in plans DNV-RP-F116 Sec. 5.1.2 …
… … …
Summary notes:…
Suggested actions:…
DET NORSKE VERITAS AS