ionic and carbonaceous compositions of pm10, pm2.5 and
TRANSCRIPT
Atmos. Chem. Phys., 12, 2007–2024, 2012www.atmos-chem-phys.net/12/2007/2012/doi:10.5194/acp-12-2007-2012© Author(s) 2012. CC Attribution 3.0 License.
AtmosphericChemistry
and Physics
Ionic and carbonaceous compositions of PM10, PM2.5 and PM1.0 atGosan ABC Superstation and their ratios as source signature
S. Lim1,*, M. Lee1, G. Lee2, S. Kim3, S. Yoon3, and K. Kang4
1Dept. of Earth and Environmental Sciences, Korea University, Seoul, South Korea2Dept. of Environmental Science, Hankuk University of Foreign Studies, Yongin, South Korea3School of Earth and Environmental Sciences, Seoul National University, Seoul, South Korea4College of Ocean Science, Jeju National University, Jeju, South Korea* now at: Laboratoire de Glaciologie et Geophysique de l’Environnement (LGGE), CNRS/University of Grenoble,Grenoble, France
Correspondence to:M. Lee ([email protected])
Received: 26 April 2011 – Published in Atmos. Chem. Phys. Discuss.: 19 July 2011Revised: 30 January 2012 – Accepted: 2 February 2012 – Published: 21 February 2012
Abstract. PM1.0, PM2.5, and PM10 were sampled at GosanABC Superstation on Jeju Island from August 2007 toSeptember 2008. The carbonaceous aerosols were quan-tified with the thermal/optical reflectance (TOR) method,which produced five organic carbon (OC) fractions, OC1,OC2, OC3, OC4, and pyrolyzed organic carbon (OP), andthree elemental carbon (EC) fractions, EC1, EC2, and EC3.The mean mass concentrations of PM1.0, PM2.5, and PM10were 13.7 µg m−3, 17.2 µg m−3, and 28.4 µg m−3, respec-tively. The averaged mass fractions of OC and EC were23.0 % and 10.4 % for PM1.0, 22.9 % and 9.8 % for PM2.5,and 16.4 % and 6.0 % for PM10. Among the OC and ECsub-components, OC2 and EC2+3 were enriched in the finemode, but OC3 and OC4 in the coarse mode. The filter-based PM1.0 EC agreed well with black carbon (BC) mea-sured by an Aethalometer, and PM10 EC was higher than BC,implying less light absorption by larger particles. EC waswell correlated with sulfate, resulting in good relationshipsof sulfate with both aerosol scattering coefficient measuredby Nephelometer and BC concentration. Our measurementsof EC confirmed the definition of EC1 as char-EC emittedfrom smoldering combustion and EC2+3 as soot-EC gener-ated from higher-temperature combustion such as motor ve-hicle exhaust and coal combustion (Han et al., 2010). In par-ticular, EC1 was strongly correlated with potassium, a tra-ditional biomass burning indicator, except during the sum-mer, when the ratio of EC1 to EC2+3 was the lowest. Wealso found the ratios of major chemical species to be a use-ful tool to constrain the main sources of aerosols, by whichthe five air masses were well distinguished: Siberia, Beijing,
Shanghai, Yellow Sea, and East Sea types. Except Siberianair, the continental background of the study region, Beijingplumes showed the highest EC1 (and OP) to sulfate ratio,which implies that this air mass had the highest net warmingby aerosols of the four air masses. Shanghai-type air, whichwas heavily influenced by southern China, showed the high-est sulfate enhancement. The highest EC2+3/EC1 ratio wasfound in aged East Sea air, demonstrating a significant influ-ence of motor vehicle emissions from South Korea and Japanand less influence from industrial regions of China. The highratio results from the longer residence time and less sensitiv-ity to wet scavenging of EC2+3 compared to EC1, indicat-ing that soot-EC could have greater consequence in regional-scale warming.
1 Introduction
Atmospheric aerosols play an important role in climatechange by influencing the global radiation balance both di-rectly and indirectly. The direct effect is the mechanismby which aerosols scatter and absorb shortwave and long-wave radiation, thereby altering the radiative balance of theEarth-atmosphere system (IPCC, 2007). The relative impor-tance of these processes depends on the chemical composi-tion and size distribution of aerosols (Ramachandran et al.,2009). Aerosols also cause a negative radiative forcing indi-rectly through changes in cloud properties. This indirect ef-fect includes the role of aerosols in modifying cloud droplet
Published by Copernicus Publications on behalf of the European Geosciences Union.
2008 S. Lim et al.: Ionic and carbonaceous compositions of PM10, PM2.5 and PM1.0 at Gosan
number concentration and cloud lifetime (IPCC, 2007; Hay-wood and Boucher, 2000).
Because the chemical composition and size distribution ofaerosols are important in quantifying their radiative effects(Brasseur et al., 1999; Ramanathan et al., 2001; Buzoriuset al., 2004), knowledge of the chemical composition of at-mospheric aerosols of a given size is required to assess theirimpact on the environment. Aerosols are often classified intosubmicron and supermicron particles; the former are of par-ticular concern to public health and climate change becausethey mainly originate from anthropogenic sources and inter-act more efficiently with sunlight. Anthropogenic sourcescontribute almost as much as natural sources to the globalaerosol optical depth (AOD) (Hansen et al., 1997; Robertsonet al., 2001).
Anthropogenic aerosols are typically composed of variousinorganic and organic species (IPCC, 2007), among whichsulfate, nitrate, and carbonaceous aerosols including blackcarbon (BC) and organic carbon (OC) are of major interestdue to their atmospheric abundances. In particular, carbona-ceous aerosols are major contributors to fine aerosols smallerthan 1 µm and typically constitute a significant, sometimesdominant, fraction of the total fine particle mass of submi-cron particles (Gray et al., 1986; Shah et al., 1986; An-drews et al., 2000; Yang et al., 2005). They are composedof light-absorbing carbon as well as light-scattering carbon.The radiative forcing at the top of the atmosphere is foundto change sign from negative to positive when carbonaceousaerosols are abundant over highly reflecting surfaces such asland and snow, which results in higher atmospheric heating(Ramanathan and Carmichael, 2008; Ramachandran et al.,2009).
These carbonaceous aerosols are mainly divided into twocategories: elemental carbon (EC), often called BC or soot,and OC. Especially for EC, there are various definitionsand analytical methods to quantify its atmospheric concen-tration (Andreae and Gelencser, 2006; Han et al., 2010).EC is usually referred to a near-elemental soot-carbon-likecomposition and to the fraction of carbon that is oxidizedin combustion analysis above a certain temperature thresh-old. Soot carbon may be defined as aggregates of spherulesmade of grapheme layers, consisting almost purely of car-bon, with minor amounts of bound heteroelements, espe-cially hydrogen and oxygen, whereas BC is referred to ablack, blackish or brown substance formed by combustion,present in the atmosphere as fine particles. BC generallyimplies to have optical properties and composition similarto soot carbon. While EC is usually determined by ther-mal methods based on its chemical properties, BC is mea-sured using its optical properties. Therefore, BC and EC mayshow slightly different concentrations due to their differentquantification techniques. EC enters the atmosphere exclu-sively as a primary (i.e. direct particulate) emission origi-nating nearly completely from pyrolysis during incompletecombustion, mainly of biomass and fossil fuel (Nunes and
Pio, 1993; Bond et al., 2007). Because EC is optically ab-sorptive and highly polyaromatic, it has recently been a sub-ject of interest in many studies encompassing local to globalscales. In particular, EC (or BC) could be the next most im-portant contributor to global warming, in terms of direct forc-ing, after CO2 (Jacobson, 2001; Ramanathan and Xu, 2010).The surface forcing is about 2–3 times larger than the forc-ing at the top of the atmosphere for absorbing aerosols suchas EC, producing a large atmospheric warming (Ramanathanand Carmichael, 2008).
On the other hand, OC is commonly considered as thenon-absorptive fraction of the carbonaceous aerosol. It hasmore molecular forms and a lower molecular weight thanEC. OC is produced from both direct emission and gaseousprecursors by atmospheric oxidation or oligomerization (Ja-cobson et al., 2000; Kanakidou et al., 2005; Tsigaridis etal., 2006). The main primary source of OC is combustionalong with EC emissions and biogenic emissions. In addi-tion, OC is produced from oxidation of precursor gases inthe atmosphere, constituting what is called secondary organicaerosol (SOA). A considerable proportion of organic aerosolsis hygroscopic, thereby serving as cloud condensation nu-clei (CCN) along with sulfate aerosols. On the other hand,EC particles are hydrophobic when they are emitted, but thesulfates or water soluble organic compounds (WSOC) thatbecome attached to EC particles can change them from hy-drophobic to hydrophilic, eventually making them efficientCCN (Decesari et al., 2002; Persiantseva et al., 2004; Pet-zold et al., 2005). When EC was coated with reflecting com-pounds like OC, the absorption by EC was found to increaseat least by a factor of 1.5 (Bond et al., 2006). In addition,carbonaceous aerosols, when mixed with atmospheric dust,have the potential to influence the atmospheric chemistry ofseveral trace gases such as NO2, O3, and SO2 (Dentener etal., 1996).
Although the definition and measurement techniques foratmospheric EC or BC have long been subjects of scientificcontroversy, the recent discovery of light-absorbing carbonthat is not black but brown (or yellowish) makes it imperativeto reassess and redefine the components that make up light-absorbing carbonaceous matter in the atmosphere (Andreaeand Gelencser, 2006). There has been growing evidence forthe contribution of brown carbon to light absorption in atmo-spheric aerosols from chemical aerosol measurements andlaboratory studies (Mukai and Ambe, 1986; Havers et al.,1998; Hoffer et al., 2006; Alexander et al., 2008; Park et al.,2010).
Aerosols are more concentrated in the source regions andexhibit strong spatial and temporal variations. Furthermore,they have an impact on global climate because their ra-diative influence can be transported due to changes in themean atmospheric circulation patterns (Ramachandran et al.,2009). Therefore, finding a source and a source region of ma-jor components of aerosols, such as carbonaceous species,sulfate, and nitrate, is crucial for the assessment of their
Atmos. Chem. Phys., 12, 2007–2024, 2012 www.atmos-chem-phys.net/12/2007/2012/

S. Lim et al.: Ionic and carbonaceous compositions of PM10, PM2.5 and PM1.0 at Gosan 2009
radiative effect. In particular, Asia is the main source ofglobal anthropogenic aerosol emission. At present, anthro-pogenic emissions of gaseous pollutants in Asia are largerthan those in Europe and North America and will continue toincrease in the future (Akimoto, 2003). An emission inven-tory study in Asia suggests that 30–60 % of the total emissionof aerosol gaseous precursors and primary BC and OC areemitted in China (Streets et al., 2003), in particular,∼41 %of submicron BC. The recently documented linear increaseof primary BC and OC between 1850 and 2000 highlightsthe importance of continuous measurements of carbonaceousparticles (Bond et al., 2007). Additionally, the frequent pres-ence of desert dust makes the East Asian atmosphere morecomplex because of both scattering of sunlight and absorp-tion of radiation (Huebert et al., 2003).
In recent decades, carbonaceous aerosols, both EC andOC, have been measured in many regions of Northeast Asia,including South Korea, China, and Japan (Ohta et al., 1998;Kim et al., 2000; He et al., 2001; Park et al., 2001; Ye etal., 2003; Cao et al., 2005; Hagler et al., 2006; Lee et al.,2007, 2008; Shen et al., 2007; Zhang et al., 2007; Moon etal., 2008; Aggarwal and Kawamura, 2009; Lee et al., 2009).The areas covered have included urban areas (He et al., 2001;Park et al., 2001; Ye et al., 2003; Zhang et al., 2007; Leeet al., 2009), developing regions (Hagler et al., 2006), andsandlands (Cao et al., 2005; Shen et al., 2007). Most ofthese studies focused on PM2.5 through a year (He et al.,2001; Ye et al., 2003) and PM2.5 or PM10 during a specificseason, such as spring (Lee et al., 2007; Shen et al., 2007),spring and early summer (Aggarwal and Kawamura, 2009),fall and winter (Cao et al., 2005) , or winter (Zhang et al.,2007). There have been few year-round studies of both fineand coarse aerosols, particularly at a site where it is feasi-ble to monitor long-range transport and the atmospheric pro-cesses involving air pollutants emitted from the Asian conti-nent. This limitation hinders the full characterization of car-bonaceous aerosols in Northeast Asia.
In the present study, we measured soluble ionic species,OC, and EC in PM1.0, PM2.5, and PM10 at Gosan ABCSuperstation on Jeju Island throughout the year from Au-gust 2007 to September 2008. The main objective was three-fold: (1) to better understand the variability of major PMcomponents, particularly OC and EC, of both fine and coarseaerosols; (2) to identify the sources of these components;and finally (3) to examine the relationships between chem-ical compositions and optical properties.
2 Measurement
PM1.0, PM2.5, and PM10 were measured at GosanABC Superstation on Jeju Island during August 2007–September 2008. Gosan station (33.17◦ N, 126.10◦ E,70 m a.s.l., Fig. 1) served as a base for the ACE-Asia ex-periment in 2001 and was designated as one of the ABC Su-
42
Figure 1
Fig. 1. Map showing Gosan ABC superstation (33.17◦ N,126.10◦ E, 70 m a.s.l.) from Google mapmaker (http://www.google.com/mapmaker). The station is located on the west coast of Jeju Is-land, South Korea.
perstations (Lee et al., 2007). It has been considered to bean ideal location to monitor Asian outflows and assess theirimpact on air quality over the northern Pacific (Carmichaelet al., 1996, 1997; Chen et al., 1997).
In the present study, the concentrations of water-solubleinorganic ions, EC, OC, and mass in PM1.0, PM2.5, and PM10were measured for about one year. Ambient air was collectedthrough PM1.0, PM2.5, and PM10 sharp-cut cyclone coatedwith Teflon (URG, USA) at 16.7 LPM, and cumulative flowwas measured with a dry gas-meter. These low-volume sam-plers were installed at the top of a 10-m tower. Particles werecollected on pre-weighed 37-mm Teflon filters for mass andion analysis, and on pre-heated 37-mm quartz-fiber filters(Pall corp., USA) for carbon analysis.
Sampling was conducted usually once every six days. Itstarted at 09:00 LST and lasted for 24 h. There was less num-ber of samples collected during summer and winter monsoonperiods because of rain, snow, or strong wind. With addi-tional samples during particular events such as Asian dustand pollution plumes, a total of 41 sets of samples were takenfor this study (Table 1).
Eight species of water-soluble ions, which included SO2−
4 ,NO−
3 , Cl−, NH+
4 , K+, Na+, Ca2+, and Mg2+, were deter-mined by ion chromatography (Dionex 4500, Dionex, USA).More details on this method of analysis can be found in Lim(2009). EC, OC, and TC were analyzed at the Desert Re-search Institute (Reno, NV, USA) following the InteragencyMonitoring of Protected Visual Environments (IMPROVE)thermal/optical reflectance protocol. Thermal/optical meth-ods assume EC is a low-volatility carbon fraction that is not
www.atmos-chem-phys.net/12/2007/2012/ Atmos. Chem. Phys., 12, 2007–2024, 2012
2010 S. Lim et al.: Ionic and carbonaceous compositions of PM10, PM2.5 and PM1.0 at Gosan
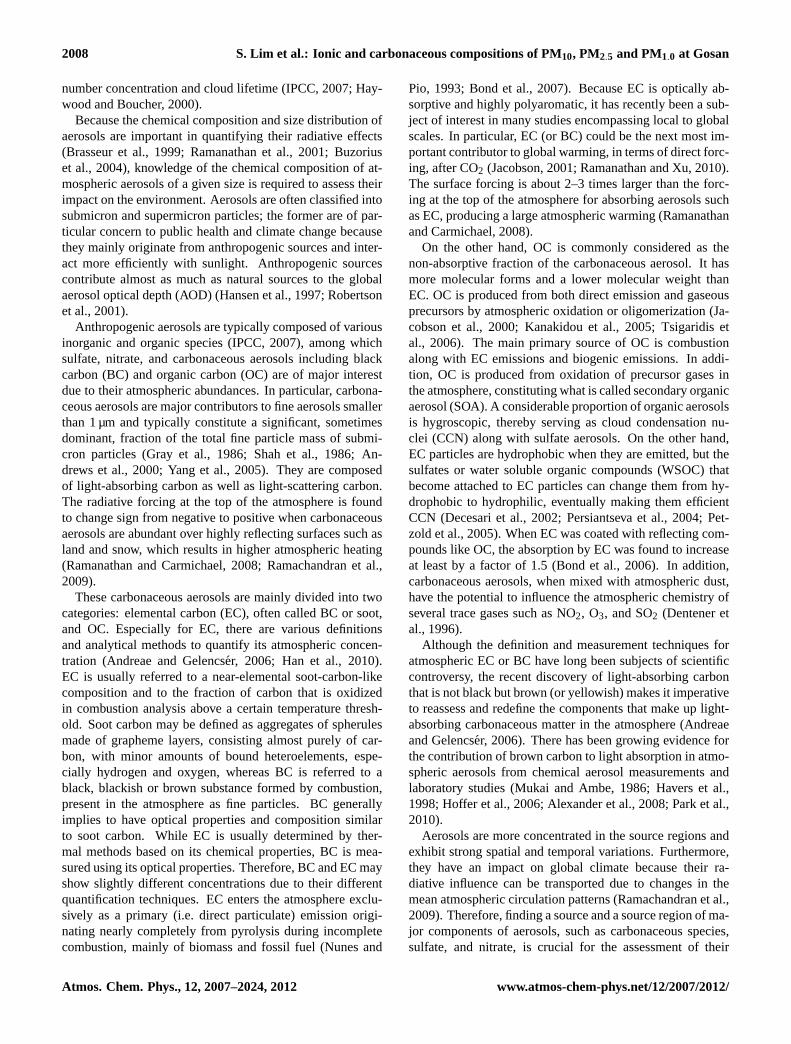
Table 1. The number of sample sets of PM10, PM2.5, and PM1.0 taken from August 2007 to September 2008.
Year 2007 2008
Month Aug Oct Nov Dec Jan Feb Mar Apr May Jun Aug Sep total
No. 1 5 4 2 5 3 4 8 4 1 2 2 41
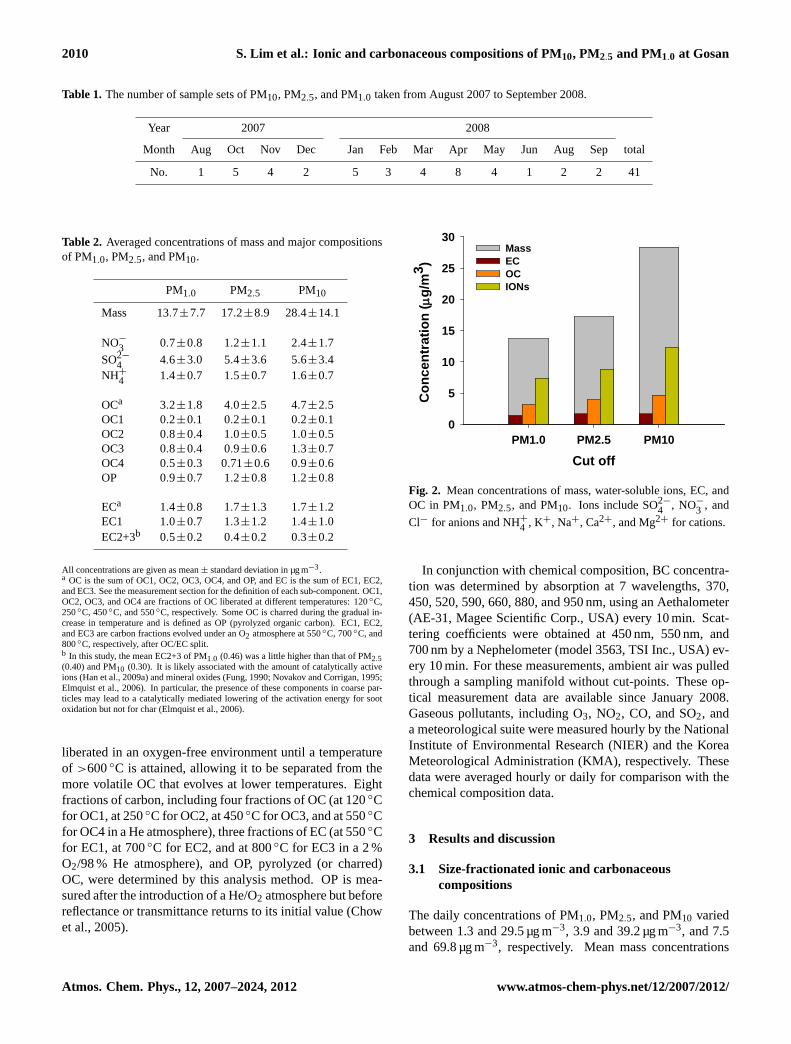
Table 2. Averaged concentrations of mass and major compositionsof PM1.0, PM2.5, and PM10.
PM1.0 PM2.5 PM10
Mass 13.7±7.7 17.2±8.9 28.4±14.1
NO−
3 0.7±0.8 1.2±1.1 2.4±1.7
SO2−
4 4.6±3.0 5.4±3.6 5.6±3.4NH+
4 1.4±0.7 1.5±0.7 1.6±0.7
OCa 3.2±1.8 4.0±2.5 4.7±2.5OC1 0.2±0.1 0.2±0.1 0.2±0.1OC2 0.8±0.4 1.0±0.5 1.0±0.5OC3 0.8±0.4 0.9±0.6 1.3±0.7OC4 0.5±0.3 0.71±0.6 0.9±0.6OP 0.9±0.7 1.2±0.8 1.2±0.8
ECa 1.4±0.8 1.7±1.3 1.7±1.2EC1 1.0±0.7 1.3±1.2 1.4±1.0EC2+3b 0.5±0.2 0.4±0.2 0.3±0.2
All concentrations are given as mean± standard deviation in µg m−3.a OC is the sum of OC1, OC2, OC3, OC4, and OP, and EC is the sum of EC1, EC2,and EC3. See the measurement section for the definition of each sub-component. OC1,OC2, OC3, and OC4 are fractions of OC liberated at different temperatures: 120◦C,250◦C, 450◦C, and 550◦C, respectively. Some OC is charred during the gradual in-crease in temperature and is defined as OP (pyrolyzed organic carbon). EC1, EC2,and EC3 are carbon fractions evolved under an O2 atmosphere at 550◦C, 700◦C, and800◦C, respectively, after OC/EC split.b In this study, the mean EC2+3 of PM1.0 (0.46) was a little higher than that of PM2.5(0.40) and PM10 (0.30). It is likely associated with the amount of catalytically activeions (Han et al., 2009a) and mineral oxides (Fung, 1990; Novakov and Corrigan, 1995;Elmquist et al., 2006). In particular, the presence of these components in coarse par-ticles may lead to a catalytically mediated lowering of the activation energy for sootoxidation but not for char (Elmquist et al., 2006).
liberated in an oxygen-free environment until a temperatureof >600◦C is attained, allowing it to be separated from themore volatile OC that evolves at lower temperatures. Eightfractions of carbon, including four fractions of OC (at 120◦Cfor OC1, at 250◦C for OC2, at 450◦C for OC3, and at 550◦Cfor OC4 in a He atmosphere), three fractions of EC (at 550◦Cfor EC1, at 700◦C for EC2, and at 800◦C for EC3 in a 2 %O2/98 % He atmosphere), and OP, pyrolyzed (or charred)OC, were determined by this analysis method. OP is mea-sured after the introduction of a He/O2 atmosphere but beforereflectance or transmittance returns to its initial value (Chowet al., 2005).
43
Cut offPM1.0 PM2.5 PM10
Con
cent
ratio
n ( µ
g/m
3 )0
5
10
15
20
25
30MassECOCIONs
Figure 2
Fig. 2. Mean concentrations of mass, water-soluble ions, EC, andOC in PM1.0, PM2.5, and PM10. Ions include SO2−
4 , NO−
3 , and
Cl− for anions and NH+4 , K+, Na+, Ca2+, and Mg2+ for cations.
In conjunction with chemical composition, BC concentra-tion was determined by absorption at 7 wavelengths, 370,450, 520, 590, 660, 880, and 950 nm, using an Aethalometer(AE-31, Magee Scientific Corp., USA) every 10 min. Scat-tering coefficients were obtained at 450 nm, 550 nm, and700 nm by a Nephelometer (model 3563, TSI Inc., USA) ev-ery 10 min. For these measurements, ambient air was pulledthrough a sampling manifold without cut-points. These op-tical measurement data are available since January 2008.Gaseous pollutants, including O3, NO2, CO, and SO2, anda meteorological suite were measured hourly by the NationalInstitute of Environmental Research (NIER) and the KoreaMeteorological Administration (KMA), respectively. Thesedata were averaged hourly or daily for comparison with thechemical composition data.
3 Results and discussion
3.1 Size-fractionated ionic and carbonaceouscompositions
The daily concentrations of PM1.0, PM2.5, and PM10 variedbetween 1.3 and 29.5 µg m−3, 3.9 and 39.2 µg m−3, and 7.5and 69.8 µg m−3, respectively. Mean mass concentrations
Atmos. Chem. Phys., 12, 2007–2024, 2012 www.atmos-chem-phys.net/12/2007/2012/

S. Lim et al.: Ionic and carbonaceous compositions of PM10, PM2.5 and PM1.0 at Gosan 2011
1
PM1.0 PM2.5 PM10
TC /
Mas
s
0.0
0.2
0.4
0.6
0.8
1.0
PM1.0 PM2.5 PM10
OC
/ M
ass
0.0
0.2
0.4
0.6
0.8
1.0
PM1.0 PM2.5 PM10
EC /
Mas
s
0.0
0.2
0.4
0.6
0.8
1.0
PM1.0 PM2.5 PM10
Nitr
ate
/ Mas
s
0.0
0.2
0.4
0.6
0.8
1.0
PM1.0 PM2.5 PM10
Sulfa
te /
Mas
s
0.0
0.2
0.4
0.6
0.8
1.0
PM1.0 PM2.5 PM10
Cal
cium
/ M
ass
0.00
0.01
0.02
0.03
0.04
0.05
PM1.0 PM2.5 PM10
OC
/ TC
0.0
0.2
0.4
0.6
0.8
1.0
PM1.0 PM2.5 PM10
EC /
TC
0.0
0.2
0.4
0.6
0.8
1.0
(a) (b)
(d)(c)
(e) (f)
(g) (h)
2
PM1.0 PM2.5 PM10
OC
1/TC
0.0
0.1
0.2
0.3
0.4
0.5
PM1.0 PM2.5 PM10
OC
2/TC
0.0
0.1
0.2
0.3
0.4
0.5
PM1.0 PM2.5 PM10
OC
3/TC
0.0
0.1
0.2
0.3
0.4
0.5
PM1.0 PM2.5 PM10
OC
4/TC
0.0
0.1
0.2
0.3
0.4
0.5
PM1.0 PM2.5 PM10O
P/TC
0.0
0.1
0.2
0.3
0.4
0.5
PM1.0 PM2.5 PM10
EC1/
TC
0.0
0.1
0.2
0.3
0.4
0.5
PM1.0 PM2.5 PM10
EC2+
3 / T
C
0.0
0.1
0.2
0.3
0.4
0.5
(i) (j)
(k) (l)
(m) (n)
(o)
Figure 3 Fig. 3. Ratios of each chemical component to mass or total carbon (TC = OC + EC) in PM1.0, PM2.5, and PM10: (a) total carbon-to-mass,(b) OC-to-mass,(c) EC-to-mass,(d) nitrate-to-mass,(e) sulfate-to-mass,(f) calcium-to-mass,(g) OC-to-TC,(h) EC-to-TC,(i) OC1-to-TC,(j) OC2-to-TC,(k) OC3-to-TC,(l) OC4-to-TC,(m) OP-to-TC,(n) EC1-to-TC,(o) EC2+3-to-TC. Total Carbon (TC) is the sum of OC andEC, which are the sum of 5 sub-components (OC1, OC2, OC3, OC4, and OP) for OC and 3 components (EC1, EC2, and EC3) for EC (Han etal., 2007, 2010). OP stands for pyrolyzed organic carbon. Solid and blue dotted lines within the box denote the median and the mean value,respectively, and the box represents the 25th and 75th percentiles. Whiskers above and below the box indicate the 90th and 10th percentiles,and solid circles are outliers corresponding to 5th and 95th percentiles of the data.
were 13.7 µg m−3 for PM1.0, 17.2 µg m−3 for PM2.5, and28.4 µg m−3 for PM10 (Fig. 2 and Table 2), suggesting thatthe daily mass well represented episodic events associatedwith pollution and dust plumes. Caution needs to be ex-erted when comparing these values with annual mean be-cause there is relatively less number of samples during sum-mer and winter monsoon periods. The noticeable feature wasa large fraction of PM1.0 against PM10 (48.4 %) and againstPM2.5 (60.8 %) on average. PM2.5 accounted for 79.6 % ofPM10.
In particulate matter of all sizes, the most abundant con-stituents were water-soluble ions, which were followed byOC and EC (Fig. 2). We did not convert OC to OM, andthe following discussion is pertinent only to OC. The con-centrations of ions were almost twice as high as those of OC,and OC was nearly two times higher than EC. The averagemass fractions of ions, OC, and EC were 53.9 %, 23.0 %,
and 10.4 % for PM1.0, 52.4 %, 22.9 %, and 9.8 % for PM2.5,and 43.4 %, 16.4 %, and 6.0 % for PM10, revealing that car-bonaceous compounds were the most abundant in PM1.0 andPM2.5. A considerable fraction of mass other than water-soluble ions, OC, and EC was possibly due to major, minor,and trace metals, including silica, which were not measured(Moon et al., 2008).
The ratios of OC/EC were 2.2, 2.3, and 2.8 for PM1.0,PM2.5, and PM10, respectively. These mean OC/EC ratioswere much lower than those measured at the regional back-ground (RB) site in Western Mediterranean (∼11 for PM2.5)
(Pey et al., 2009) and at two RB sites in western China (∼12for PM10) (Qu et al., 2009), and still lower than those ofmany RB sites in Europe (OC/EC>2–3) (Pey et al., 2009).Our OC/EC ratios were, however, comparable to those ob-served in Beijing and Shanghai regions (He et al., 2001;Ye et al., 2003). Although there are not significant local
www.atmos-chem-phys.net/12/2007/2012/ Atmos. Chem. Phys., 12, 2007–2024, 2012
2012 S. Lim et al.: Ionic and carbonaceous compositions of PM10, PM2.5 and PM1.0 at Gosan
3
Month1 2 3 4 5 6 7 8 9 10 11 12
Win
d sp
eed
(m/s
)
2
4
6
8
10
12
14
Rel
ativ
e hu
mid
ity (%
), Te
mpe
ratu
re (o c
)
0
20
40
60
80
100
Win
d di
rect
ion
mod
e
NW
SE
NE
Wind speedTemperatureRelative humidityWind direction mode
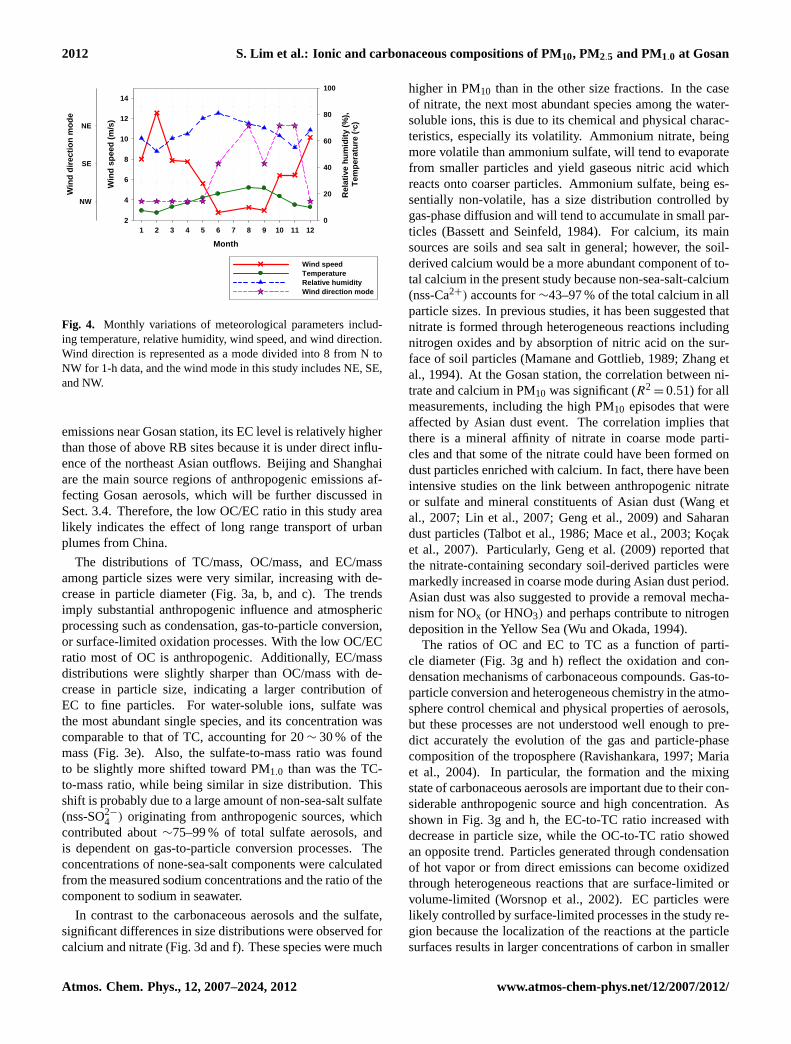
Figure 4Fig. 4. Monthly variations of meteorological parameters includ-ing temperature, relative humidity, wind speed, and wind direction.Wind direction is represented as a mode divided into 8 from N toNW for 1-h data, and the wind mode in this study includes NE, SE,and NW.
emissions near Gosan station, its EC level is relatively higherthan those of above RB sites because it is under direct influ-ence of the northeast Asian outflows. Beijing and Shanghaiare the main source regions of anthropogenic emissions af-fecting Gosan aerosols, which will be further discussed inSect. 3.4. Therefore, the low OC/EC ratio in this study arealikely indicates the effect of long range transport of urbanplumes from China.
The distributions of TC/mass, OC/mass, and EC/massamong particle sizes were very similar, increasing with de-crease in particle diameter (Fig. 3a, b, and c). The trendsimply substantial anthropogenic influence and atmosphericprocessing such as condensation, gas-to-particle conversion,or surface-limited oxidation processes. With the low OC/ECratio most of OC is anthropogenic. Additionally, EC/massdistributions were slightly sharper than OC/mass with de-crease in particle size, indicating a larger contribution ofEC to fine particles. For water-soluble ions, sulfate wasthe most abundant single species, and its concentration wascomparable to that of TC, accounting for 20∼ 30 % of themass (Fig. 3e). Also, the sulfate-to-mass ratio was foundto be slightly more shifted toward PM1.0 than was the TC-to-mass ratio, while being similar in size distribution. Thisshift is probably due to a large amount of non-sea-salt sulfate(nss-SO2−
4 ) originating from anthropogenic sources, whichcontributed about∼75–99 % of total sulfate aerosols, andis dependent on gas-to-particle conversion processes. Theconcentrations of none-sea-salt components were calculatedfrom the measured sodium concentrations and the ratio of thecomponent to sodium in seawater.
In contrast to the carbonaceous aerosols and the sulfate,significant differences in size distributions were observed forcalcium and nitrate (Fig. 3d and f). These species were much
higher in PM10 than in the other size fractions. In the caseof nitrate, the next most abundant species among the water-soluble ions, this is due to its chemical and physical charac-teristics, especially its volatility. Ammonium nitrate, beingmore volatile than ammonium sulfate, will tend to evaporatefrom smaller particles and yield gaseous nitric acid whichreacts onto coarser particles. Ammonium sulfate, being es-sentially non-volatile, has a size distribution controlled bygas-phase diffusion and will tend to accumulate in small par-ticles (Bassett and Seinfeld, 1984). For calcium, its mainsources are soils and sea salt in general; however, the soil-derived calcium would be a more abundant component of to-tal calcium in the present study because non-sea-salt-calcium(nss-Ca2+) accounts for∼43–97 % of the total calcium in allparticle sizes. In previous studies, it has been suggested thatnitrate is formed through heterogeneous reactions includingnitrogen oxides and by absorption of nitric acid on the sur-face of soil particles (Mamane and Gottlieb, 1989; Zhang etal., 1994). At the Gosan station, the correlation between ni-trate and calcium in PM10 was significant (R2
= 0.51) for allmeasurements, including the high PM10 episodes that wereaffected by Asian dust event. The correlation implies thatthere is a mineral affinity of nitrate in coarse mode parti-cles and that some of the nitrate could have been formed ondust particles enriched with calcium. In fact, there have beenintensive studies on the link between anthropogenic nitrateor sulfate and mineral constituents of Asian dust (Wang etal., 2007; Lin et al., 2007; Geng et al., 2009) and Saharandust particles (Talbot et al., 1986; Mace et al., 2003; Kocaket al., 2007). Particularly, Geng et al. (2009) reported thatthe nitrate-containing secondary soil-derived particles weremarkedly increased in coarse mode during Asian dust period.Asian dust was also suggested to provide a removal mecha-nism for NOx (or HNO3) and perhaps contribute to nitrogendeposition in the Yellow Sea (Wu and Okada, 1994).
The ratios of OC and EC to TC as a function of parti-cle diameter (Fig. 3g and h) reflect the oxidation and con-densation mechanisms of carbonaceous compounds. Gas-to-particle conversion and heterogeneous chemistry in the atmo-sphere control chemical and physical properties of aerosols,but these processes are not understood well enough to pre-dict accurately the evolution of the gas and particle-phasecomposition of the troposphere (Ravishankara, 1997; Mariaet al., 2004). In particular, the formation and the mixingstate of carbonaceous aerosols are important due to their con-siderable anthropogenic source and high concentration. Asshown in Fig. 3g and h, the EC-to-TC ratio increased withdecrease in particle size, while the OC-to-TC ratio showedan opposite trend. Particles generated through condensationof hot vapor or from direct emissions can become oxidizedthrough heterogeneous reactions that are surface-limited orvolume-limited (Worsnop et al., 2002). EC particles werelikely controlled by surface-limited processes in the study re-gion because the localization of the reactions at the particlesurfaces results in larger concentrations of carbon in smaller
Atmos. Chem. Phys., 12, 2007–2024, 2012 www.atmos-chem-phys.net/12/2007/2012/

S. Lim et al.: Ionic and carbonaceous compositions of PM10, PM2.5 and PM1.0 at Gosan 2013
4
PM1.0
Spring Summer Fall Winter
Mas
s fr
actio
n (%
)
0
20
40
60
80
100 PM2.5
Season
Spring Summer Fall Winter
PM10
Spring Summer Fall Winter Mas
s co
ncen
trat
ion
(μg
m-3
)
0
10
20
30
40
OCECnitratesulfateMass
Figure 5
Fig. 5. Seasonal variations of mass concentrations (blue circle) and fractions of OC, EC, nitrate, and sulfate against mass in PM1.0, PM2.5,and PM10. Spring, summer, fall, and winter include March to May, June to early September, October to November, and December toFebruary, respectively.
aerosol particles with larger surface-to-volume ratios thanlarger particles (Maria et al., 2004). Although EC is mixedwith organic compounds in the atmosphere, surface-limitedoxidation may easily occur because organic compounds of-ten have efficient surface reactivity (Maria et al., 2004; Rus-sell et al., 2002). In the case of OC, interestingly, the OC/TCratio was highest in the coarse mode and lowest in PM1.0.The OC enrichment in coarse mode could be attributed tothe formation of secondary organic aerosols (SOA) and sub-sequent increase in size during aging processes (Liu et al.,2009). The relatively higher OC/EC ratio (2.5 for PM2.5 and3.3 for PM10) in spring and summer implies SOA formationat higher temperature, even though OC concentrations werelower than those in winter. Mochida et al. (2007) performedsize-segregated aerosol measurements off the coast of EastAsia and found a high OC proportion in the supermicronmode of up to 61 %, suggesting primary emission of organ-ics associated with sea salt and dust particles or other primarysources (e.g. plant waxes, soil-derived microbes, and anthro-pogenic particles). In this measurement, a similar behaviorof OC and EC was observed during an Asian dust event inMay 2008 (Lim et al., 2010a, b), in which the ratio of OCto EC was raised in dust-laden air possibly due to the impactof dust-related primary OC. Therefore, it is suggested thatthere was a considerable contribution of primary OC as wellas SOA to total OC concentration particularly in the presentstudy.
The ratios of OC and EC subcomponents to TC (Fig. 3i–o)were divided into three types. The first group includes OC1,OP, and EC1, whose ratios against TC did not show a cleartendency to vary with particle size (Fig. 3i, m, and n). OC1may represent semi-volatile organic carbon because OC1 notonly is the first carbon evolved at the lowest temperature butalso is observed to be the most abundant and variable in con-centration among the 5 OC fractions in our blank filters. OPis a measure of pyrolyzed organic carbon, and its character-
istics are well described by Andreae and Gelencser (2006),who explained that OP can be released as a gas or in solidform and become associated with submicron or supermicronparticles. Similarly, EC1 was defined as char EC (Han et al.,2010), and a detailed discussion of EC1 is given in Sect. 3.3.The second group includes OC2 and EC2+3, whose ratios toTC were enhanced in the smaller size particles (Fig. 3j ando). This enhancement strongly supports the view that a con-densation process or surface-limited oxidation was involvedin the formation of OC2 and EC2+3. Particularly, OC2 isthought to be a secondary organic carbon, which will be fur-ther discussed in Sect. 3.4. In contrast to OC2, the fractionsOC3 and OC4 clearly increased with increasing particle size(Fig. 3k and l), and their concentrations were also higher inPM10 than in PM1.0, suggesting the characteristic of primaryaerosols.
3.2 Seasonal patterns
The monthly variations of meteorological parameters in-clude those of temperature, which varied between 4.4◦C and25.8◦C, and relative humidity, which ranged from 37.2 % to87.6 % over the whole period, showing distinct seasonal pat-terns. The mode of wind direction in degrees from 0◦ to 360◦
was chosen for each month and categorized into eight groupsfrom N to NW. Throughout the winter and the spring, theprevailing wind was northwesterly under the influence of thewinter monsoon over East Asia, with high wind speeds upto 13 m s−1, suggesting a greater influence during that periodfrom Asian continental outflows. With the arrival of sum-mer, the wind direction was shifted to easterly with lowerwind speeds below 3 m s−1, indicating reduced continentaloutflows (Kim et al., 2007).
Seasonal mass fractions of major components (OC, EC,nitrate, and, sulfate) and mass concentrations are comparedin Fig. 5. The average PM1.0 and PM2.5 levels were highest
www.atmos-chem-phys.net/12/2007/2012/ Atmos. Chem. Phys., 12, 2007–2024, 2012
2014 S. Lim et al.: Ionic and carbonaceous compositions of PM10, PM2.5 and PM1.0 at Gosan
(a)
5
(a)
Aethalometer 880 nm BC (μg/m3)
0 1 2 3 4
EC (μg
/m3 )
0
1
2
3
4
5
6PM10 EC, slope=1.5 , R2=0.95
PM1.0 EC, slope=1.0, R2=0.92
(b)
PM1.0 sulfate (μg/m3)
0 2 4 6 8 10 12 14
PM1.
0 EC
( μg/
m3 )
0
1
2
3
4
R2=0.59
Figure 6
(b)
5
(a)
Aethalometer 880 nm BC (μg/m3)
0 1 2 3 4
EC (μg
/m3 )
0
1
2
3
4
5
6PM10 EC, slope=1.5 , R2=0.95
PM1.0 EC, slope=1.0, R2=0.92
(b)
PM1.0 sulfate (μg/m3)
0 2 4 6 8 10 12 14
PM1.
0 EC
( μg/
m3 )
0
1
2
3
4
R2=0.59
Figure 6
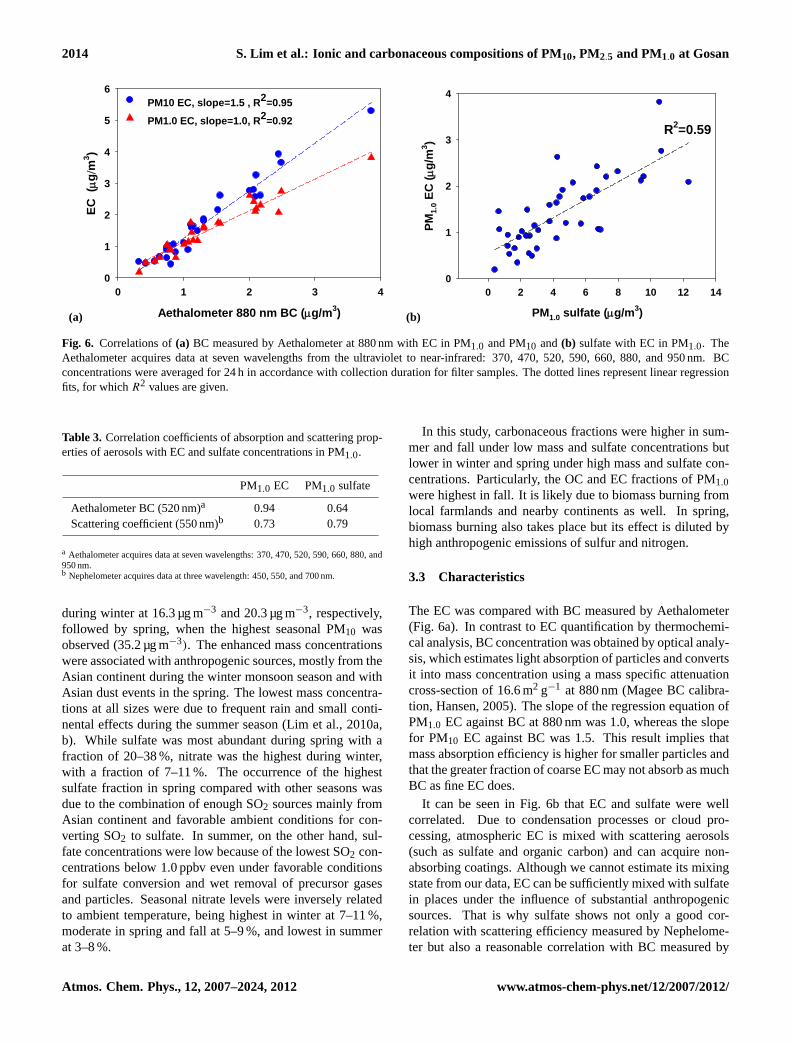
Fig. 6. Correlations of(a) BC measured by Aethalometer at 880 nm with EC in PM1.0 and PM10 and(b) sulfate with EC in PM1.0. TheAethalometer acquires data at seven wavelengths from the ultraviolet to near-infrared: 370, 470, 520, 590, 660, 880, and 950 nm. BCconcentrations were averaged for 24 h in accordance with collection duration for filter samples. The dotted lines represent linear regressionfits, for whichR2 values are given.
Table 3. Correlation coefficients of absorption and scattering prop-erties of aerosols with EC and sulfate concentrations in PM1.0.
PM1.0 EC PM1.0 sulfate
Aethalometer BC (520 nm)a 0.94 0.64Scattering coefficient (550 nm)b 0.73 0.79
a Aethalometer acquires data at seven wavelengths: 370, 470, 520, 590, 660, 880, and950 nm.b Nephelometer acquires data at three wavelength: 450, 550, and 700 nm.
during winter at 16.3 µg m−3 and 20.3 µg m−3, respectively,followed by spring, when the highest seasonal PM10 wasobserved (35.2 µg m−3). The enhanced mass concentrationswere associated with anthropogenic sources, mostly from theAsian continent during the winter monsoon season and withAsian dust events in the spring. The lowest mass concentra-tions at all sizes were due to frequent rain and small conti-nental effects during the summer season (Lim et al., 2010a,b). While sulfate was most abundant during spring with afraction of 20–38 %, nitrate was the highest during winter,with a fraction of 7–11 %. The occurrence of the highestsulfate fraction in spring compared with other seasons wasdue to the combination of enough SO2 sources mainly fromAsian continent and favorable ambient conditions for con-verting SO2 to sulfate. In summer, on the other hand, sul-fate concentrations were low because of the lowest SO2 con-centrations below 1.0 ppbv even under favorable conditionsfor sulfate conversion and wet removal of precursor gasesand particles. Seasonal nitrate levels were inversely relatedto ambient temperature, being highest in winter at 7–11 %,moderate in spring and fall at 5–9 %, and lowest in summerat 3–8 %.
In this study, carbonaceous fractions were higher in sum-mer and fall under low mass and sulfate concentrations butlower in winter and spring under high mass and sulfate con-centrations. Particularly, the OC and EC fractions of PM1.0were highest in fall. It is likely due to biomass burning fromlocal farmlands and nearby continents as well. In spring,biomass burning also takes place but its effect is diluted byhigh anthropogenic emissions of sulfur and nitrogen.
3.3 Characteristics
The EC was compared with BC measured by Aethalometer(Fig. 6a). In contrast to EC quantification by thermochemi-cal analysis, BC concentration was obtained by optical analy-sis, which estimates light absorption of particles and convertsit into mass concentration using a mass specific attenuationcross-section of 16.6 m2 g−1 at 880 nm (Magee BC calibra-tion, Hansen, 2005). The slope of the regression equation ofPM1.0 EC against BC at 880 nm was 1.0, whereas the slopefor PM10 EC against BC was 1.5. This result implies thatmass absorption efficiency is higher for smaller particles andthat the greater fraction of coarse EC may not absorb as muchBC as fine EC does.
It can be seen in Fig. 6b that EC and sulfate were wellcorrelated. Due to condensation processes or cloud pro-cessing, atmospheric EC is mixed with scattering aerosols(such as sulfate and organic carbon) and can acquire non-absorbing coatings. Although we cannot estimate its mixingstate from our data, EC can be sufficiently mixed with sulfatein places under the influence of substantial anthropogenicsources. That is why sulfate shows not only a good cor-relation with scattering efficiency measured by Nephelome-ter but also a reasonable correlation with BC measured by
Atmos. Chem. Phys., 12, 2007–2024, 2012 www.atmos-chem-phys.net/12/2007/2012/

S. Lim et al.: Ionic and carbonaceous compositions of PM10, PM2.5 and PM1.0 at Gosan 2015
Aethalometer (Table 3). EC was also well correlated withscattering efficiency and BC. It has been shown that more hy-groscopic particles, such as sulfate of a given size, will growmore under humid conditions, scattering more incident light(Jimenez et al., 2009). Other studies have reported Mie cal-culations of soot particles with sulfate coatings showing en-hanced absorption (Martins et al., 1998; Fuller et al., 1999).These results suggest a positive contribution of sulfate coat-ings to net warming.
EC is not a single chemical compound. It can be subdi-vided into two classes based on our analytical method: char-EC and soot-EC (Han et al., 2007, 2010). Char was de-fined as carbonaceous material obtained by heating organicsand formed directly from pyrolysis or as an impure form ofgraphitic carbon obtained as a residue when carbonaceousmaterial is partially burned or heated with a limited supplyof air. Soot was defined as only those carbon particles thatform at high temperature via gas-phase processes. Previousstudies showed that char and soot had different chemical andphysical properties (Kuhlbusch, 1997; Masiello, 2004), aswell as optical properties (Bond, 2001; Bond et al., 2002;Kirchstetter et al., 2004). We adopted the operational def-initions of EC fractions that Han et al. (2010) suggested todemonstrate the different characteristics of char and soot,based on their previous lab experiment (Han et al., 2007).Their experiment result supported the use of the TOR methodto discriminate between char- and soot-EC. The activationenergy was lower for char- than soot-EC; char materials al-ways oxidized at low-temperature (550◦C, at EC1 stage),while Diesel and n-hexane soot samples exhibited similarEC2 peaks (at 700◦C) and carbon black samples peaked atboth EC2 and EC3 (800◦C). In our study, therefore, char-ECand soot-EC are operationally defined as EC1 and as EC2+3,respectively. In the present work, the mean EC1 concentra-tions were almost two times higher than the mean EC2+3concentrations for all size cuts, ranging from 0.96 µg m−3 to1.39 µg m−3 for EC1 and from 0.30 µg m−3 to 0.46 µg m−3
for EC2+3.We compared the relationships between EC1 and EC2+3
in the different seasons. They showed the strongest correla-tion in winter and spring (R2
= 0.4–0.6 for PM1.0, PM2.5,and PM10), which suggests common combustion sourcessuch as biomass burning, residential heating, and coal com-bustion. In contrast, they were poorly correlated in sum-mer (R2
= 0.03–0.2 for PM1.0, PM2.5, and PM10), whichwas likely due to reduced sources, particularly from biomassburning and residential heating. Furthermore, the overall cor-relation between EC1 and EC2+3 was better in PM10 ratherthan PM1.0. This seems to be associated with particle size:EC1 has larger size (∼1–100 µm) than EC2+3, which is emit-ted as gas or smaller particles (∼hundreds of nm).
Although, generally, the concentration of aerosols in thestudy area is mainly determined by emissions from the Asiancontinent, transport processes and wet scavenging have aneffect on the level of each aerosol component. Here, we ex-
Table 4. The ratios of EC1 and EC23 concentrations for non-rainydays to those for rainy days in PM1.0, PM2.5, and PM10.
Non-rainy days (N = 31)/ PM1.0 PM2.5 PM10Rainy days (N = 10)
EC1 1.5 1.8 1.5EC2+3 1.0 1.1 1.3
amined the impact of precipitation on the mass differencebetween EC1 and EC2+3 using the ratio of the concentra-tion during non-rainy days (31 days) to the concentrationduring rainy days (10 days) (Table 4). EC2+3 showed lit-tle wet scavenging effect with a ratio of 1.0∼ 1.3. On theother hand, EC1 had a difference in concentration betweennon-rainy and rainy days. These results imply a longer res-idence time of EC2+3 in the atmosphere, meaning that sootaerosols are suspended and transported longer. In general,since char-EC is composed of large particles (>∼1 µm) aswell as small particles, it could be easily removed by wetdeposition. Soot, consisting of submicron particles of grape-like clusters, may have an atmospheric lifetime of a month(Ogren and Charlson, 1983) and has strong light absorptioncharacteristics with little spectral dependence (Schnaiter etal., 2003; Kirchstetter et al., 2004). Thus soot could havegreater consequence for warming.
The soot-EC/char-EC ratio depends upon the mixing func-tion of the different sources: motor vehicle emissions andpossibly grass burning result in higher soot-EC/char-EC ra-tios, while wood combustion, particularly biomass burningby smoldering at low temperature, produces lower soot-EC/char-EC ratios (Chow et al., 2004; Chen et al., 2007). Incoal combustion, this ratio can be very low or relatively high,depending on the type of coal (Han et al., 2010). To applythe definitions of Han et al. (2010) to our study, we com-pared seasonal EC2+3/EC1 ratios (Fig. 7). Seasonally aver-aged EC1 concentration was highest in winter and lowest insummer. This order is very well matched with the intensity ofcontinental outflows. In contrast, EC2+3 did not show clearseasonal variation, but the highest concentrations were foundin spring and the lowest concentrations in fall and winter.As a result, the ratios of EC2+3/EC1 were highest in sum-mer, when air masses reached at Gosan from the east passingthrough South Korea or/and Japan with the least influence bythe continent and greater influence by South Korea and Japan(see Fig. 9e). In fact, the EC2+3/EC1 ratio of 1.25 in summeris comparable to the ratio of 1.67 for motor vehicle exhaust(Chow et al., 2004). EC2+3 emitted during winter and springmay have remained suspended in the atmosphere due to itssmaller size and kept its proportion through increased motorvehicle sources from South Korea and Japan, in spite of thewet scavenging caused by frequent precipitation during sum-mer. Han et al. (2010) collected PM2.5 EC particles in Xi’an,
www.atmos-chem-phys.net/12/2007/2012/ Atmos. Chem. Phys., 12, 2007–2024, 2012

2016 S. Lim et al.: Ionic and carbonaceous compositions of PM10, PM2.5 and PM1.0 at Gosan
6
SeasonWinter Spring Summer Fall
PM1.
0 EC
2+3/
EC1
0.0
0.5
1.0
1.5
SeasonWinter Spring Summer Fall
PM10
EC
2+3/
EC1
0.0
0.5
1.0
1.5
Figure 7
Fig. 7. Seasonal variations of soot-EC to char-EC in PM1.0 and PM10. See Fig. 3 for the detailed explanation of box and whisker plot.
7
PM10
EC10 1 2 3 4 5 6
Winter: slope=0.19, R2=0.84Spring: slope=0.16, R2=0.79Summer: slope=0.11, R2=0.60Fall: slope=0.13, R2=0.59
PM1.0
EC10.0 0.5 1.0 1.5 2.0 2.5 3.0 3.5
Pota
ssiu
m
0.0
0.2
0.4
0.6
0.8
1.0Winter: slope =0.21, R2=0.80Spring: slope=0.25, R2=0.79Summer: slope=0.07, R2=0.27Fall: slope=0.19, R2=0.76
Figure 8
Fig. 8. Correlations of EC1 with potassium for PM1.0 and PM10 in each season. Lines stand for linear regression fittings, for which slopesandR2 values are given.
a sandland in China, of which result were consistent with ourobservation that EC1 had a minimum level in summer, butin contrast to our observations, the level of EC2+3 was alsominimum in summer. Higher EC2+3 concentrations duringsummer in our data imply increased influence of South Koreaand Japan on EC concentrations. Hence, EC2+3 is consider-ably enhanced, but EC1 is markedly less because of limitedcontact with industrial regions in China. In other study byHan et al. (2009b) that measured PM2.5 EC in 14 Chinesecities during summer and winter period, the lower ratios ofEC2+3/EC1 were found at the sites associated with indus-tries in the Eastern coastal region of China, while the oppo-site trend was observed at the sites in Northern and SouthernChina with the least industrial effect. Therefore, our studysupports the classification of char-EC and soot-EC proposedby Han et al. (2010), and the ratio of EC2+3 to EC1 can serveas an indication of a continental effect. This result agreeswell with air mass trajectories, which will be discussed inthe following section. For example, the EC2+3/EC1 ratiosfor the days shown in Fig. 9 are (a) 0.96, (b) 0.17, (c) 0.32,(d) 0.47, and (e) 1.79.
Except for summer, EC1 was closely correlated withpotassium, which, among the water-soluble ions, is tradition-ally well known as an indication of biomass burning (Silvaet al., 1999; Guazzotti et al., 2003). Because char-EC has awide variety of sources and its concentration itself does notprovide accurate information about the source, this approachcan suggest the contribution of biomass burning to EC1concentration in different seasons. For the whole measure-ments, non-sea-salt potassium (nss-K+) accounted for∼50–99 %, which could be associated with mineral dust as wellas combustion aerosols. In PM10, nss-K+ was well corre-lated with nss-SO2−
4 (R2= 0.70), but moderately correlated
with nss-Ca2+ (R2= 0.53). In addition, nss-K+ and nss-
SO2−
4 showed similarity in size distribution of being enrichedin fine mode. Among OC sub-components, OC2, thoughtto be secondary, was significantly correlated with sulfateand potassium. In the airborne measurements of trace ele-ments produced from savanna biomass burning, Gaudichetet al. (1995) indicated that near the emission, K was mainlypresent as KCl, evolving to K2SO4 in the ambient samples.Thus, our potassium would be likely to represent the effect
Atmos. Chem. Phys., 12, 2007–2024, 2012 www.atmos-chem-phys.net/12/2007/2012/

S. Lim et al.: Ionic and carbonaceous compositions of PM10, PM2.5 and PM1.0 at Gosan 2017
(a)
51
(a)
(b)
52
(b)
(c)
53
(c)
(d)
54
(d)
(e)
55
(e)
Figure 9 Fig. 9. Five air mass trajectories representing the influence from(a) Siberia region (e.g. 4 December 2007),(b) Beijing region (e.g. 3 Jan-uary 2008),(c) Shanghai region (e.g. 11 March 2008),(d) Yellow Sea region (e.g. 14 April 2008), and(e) East Sea region (e.g. 25 Au-gust 2008). Backward trajectories were calculated every 3 h using the Lagrangian particle dispersion model FLEXPART (Stohl et al., 2005;http://zardoz.nilu.no/∼andreas/STATIONS/GOSAN/index.html). The model output (s kg−1) is a potential emission sensitivity distributionof 40 000 particles released in a particular grid cell at the measurement location and during the measurement interval and followed backwardin time, which is proportional to the particle residence time in that cell.
www.atmos-chem-phys.net/12/2007/2012/ Atmos. Chem. Phys., 12, 2007–2024, 2012

2018 S. Lim et al.: Ionic and carbonaceous compositions of PM10, PM2.5 and PM1.0 at Gosan
of biomass burning, even if it may include some of fossil fuelcombustion, dust, and sea salt as well.
Li et al. (2006) quantified EC and OC concentrations inHorquin sandland in northeastern China by a thermal methodand reported the strongest correlation of EC with potassiumamong five elements, suggesting a significant contributionof rural biomass burning to regional carbonaceous aerosolconcentrations. A previous study estimated the emissions ofBC in China and pointed out that biomass burning is oneof the main sources of BC in China (Streets et al., 2003).Gustafsson et al. (2009) used14C to distinguish fossil fueland biomass-burning contributions to BC during pollutionevents in South Asia. They found a far larger contributionof biomass combustion to BC emissions. Biomass burningis dominated on a global scale by fires due to slash-and-burnland clearance, waste burning in agriculture and forestry, andresidential wood combustion for heating and cooking (Szi-dat et al., 2009). In particular, East Asia contains biomassburning sources in undeveloped regions of China, Siberia,and North Korea. Biomass combustion-derived materials arelikely generated throughout, with the strongest correlationsin winter and spring, and transported to the study area. Insummer, it is possible that reduced burning and relatively in-creased sea-salt potassium (ss-K+) lead to a poor correlationbetween EC1 and potassium, and that EC1 may deposit onthe surface of larger and hygroscopic ss-K+, leading to bettercorrelation in PM10 than PM1.0. It is less likely that Siberianwildfires or biomass burning in eastern China had influenceon EC1 level of summer samples (Kim et al., 2007).
3.4 Source areas
To examine the source signature of aerosols and the effectof transport paths on aerosol composition, we categorized airmasses into 5 regimes based on meteorological and chemicalcharacteristics and air mass trajectories every 3 h using theFLEX-PART Lagrangian particle dispersion model (Stohl etal., 2005) (Fig. 9). In this analysis, samples which were af-fected by precipitation or did not show constant trajectoriesin time were excluded. The five types are labeled “Siberia”,“Beijing”, “Shanghai”, “Yellow Sea”, and “East Sea” ac-cording to the major geographical regions over which an airmass passed during transport. The Siberia, Beijing, Shang-hai, Yellow Sea, and East Sea types included 6 days from Oc-tober to March, 10 days from October to May, 4 days fromOctober to May, 2 days in April, and 6 days from June toSeptember, respectively. The characteristic regimes of eachair type are summarized in Table 5. It should be noted thatthe study region is heavily affected by the monsoon system,and stagnant conditions often developed during transition pe-riods, when trajectories tended to spread over wider areas.
From late fall to early spring, the study region is underthe influence of frontal system in association with a Siberianhigh that is periodically extends towards the southeasternChina. As a high pressure approaches, air is usually trans-
ported directly from Siberia to Jeju along with a trough. Thenhigh pressure center shifts its way to the southeast and windturns to northwesterly. While the former represents the con-tinental background air descending from the free tropospherein Siberian region, the latter is classified as Beijing type airthat passed fast over Mongolia and Beijing region. As thehigh pressure is weakened, the air slowly moves down to thesouthern part of China or over the Yellow Sea before reach-ing Gosan. The former is classified as Shanghai type thatcaptured the emissions from the southern (Shanghai) as wellas northern (Beijing) part of China. The latter is Yellow Seathat is mainly influenced by the Bohai Bay area and in partthe west coast of the Korean peninsula. The air mass labeledEast Sea was influenced by the East Sea, including Japan andSouth Korea, and was the most frequently observed air massin summer. Siberia type can be regarded as clean backgroundair of the northeast Asia (Fig. 9a). The Beijing and Shanghaitypes represent fresh continental and aged continental plume,respectively (Fig. 9b and c). As being aged over the ocean,the Yellow Sea type exhibits characteristics of continentalplumes (Fig. 9d) and is distinguished from East Sea type air(Fig. 9e).
For each air mass category, the ratios of major constituentsin submicron and supermicron aerosols are compared in Ta-ble 6. Siberia air showed the lowest levels of CO, sulfate,and PM1.0 mass concentrations, resulting in high ratios ofchemical constituents. In Beijing type air, the ratios of OP,EC1, and nitrate to mass were the highest. In contrast, an en-hanced sulfate/mass ratio was recognizable in Shanghai andYellow Sea air masses. For these two air masses, the high sul-fate content was the result of favorable meteorological con-ditions such as weak winds and high relative humidity overa warm sea surface (Fig. 9c and d) (Lim et al., 2010a, b) inconjunction with sources from nearby land. The higher ni-trate/sulfate ratios in Beijing type air mass are largely due tothe temperature dependency of nitrate because the Beijing airwas more frequently encountered at Gosan in the colder sea-sons. Therefore, Beijing and Shanghai plumes were unam-biguously differentiated by the ratios of EC1, OP, and nitrateagainst sulfate.
It is noteworthy that the OC2 fraction against total car-bon was also much higher in the Yellow Sea and East Seatypes, which could be characterized as relatively aged ma-rine air masses (Fig. 9d and e). It is supporting evidencefor the secondary nature of OC2, such that its ratio to TCtended to be higher in the smaller particle sizes (Fig. 3j). Inaddition, the ratio of EC2+3 to EC1 was distinctly higher inthe East Sea air mass. This result agrees with the findingsof Han et al. (2010) and this study that the ratio of EC2+3to EC1 can serve as an indicator of continental effects andsuggests a greater influence of motor vehicle emissions fromSouth Korea and Japan, with a reduced influence from China.This ratio is also likely to be increased in aged air due to thelonger lifetime of EC2+3 than EC1, as discussed in the pre-vious section.
Atmos. Chem. Phys., 12, 2007–2024, 2012 www.atmos-chem-phys.net/12/2007/2012/

S. Lim et al.: Ionic and carbonaceous compositions of PM10, PM2.5 and PM1.0 at Gosan 2019
Table 5. Meteorological and chemical characteristics of the 5 air mass categories.
Siberia Beijing Shanghai Yellow Sea East Sea
Meteorology
Wind speed (m s−1) 8.7 7.3 4.6 3.9 3.1Temperature (◦C) 11.6 11.8 14.1 14.3 23.8Relative humidity (%) 56.6 57.5 57.5 76.2 73.4
Gases (ppbv)
CO 501 648 533 527 613SO2 1.7 5.3 5 2 0.5NO2 NAa 4.9b NAa 4.2 4.1O3 44.3 46.8 65.1 64.2 41.0
Particles (µg m−3)
PM1.0Mass 7.5 15.2 24.1 22.8 12.3Nitrate 0.4 0.9 1.8 1.0 0.3Sulfate 2.0 4.9 10.0 8.7 3.1TC 3.5 6.0 6.9 5.9 3.0OC2 0.7 1.0 1.3 1.2 0.7OP 0.7 1.5 1.4 1.0 0.3EC1 0.6 1.4 1.8 1.5 0.4EC2+3 0.4 0.4 0.5 0.8 0.5
PM10Mass 23.2 35.9 42.8 40.8 20.9Nitrate 1.7 3.4 4.3 2.9 1.6Sulfate 2.8 5.9 11.2 10.7 3.7TC 4.9 8.4 10.7 7.6 3.8OC2 0.8 1.2 1.6 1.4 0.8OP 0.9 1.8 2.1 1.4 0.7EC1 0.8 1.9 2.9 2.2 0.6EC2+3 0.2 0.3 0.5 0.4 0.3
a NA: not available.b NA on 14 February and 3 April.
In the present study, OP was recognized as a major com-ponent of OC and found to be a source signature of the Bei-jing type air mass. Through the entire period of observa-tion, OP was noticeably elevated when wind speed was highunder the influence of a strong continental high or a migra-tory cyclone. As a result, high ratios of OP to EC1 wereobserved in fast-moving air parcels carried by northwesterlywinds in winter or northerly winds in spring, which couldbring relatively fresh emissions from Beijing and its vicinityand plumes due to biomass burning in Mongolia (Kim et al.,2007) and Siberia if they existed (Fig. 9a). In contrast, OP re-mained low in the warmer seasons, which were characterizedby stagnant air masses, leading to low OP/EC ratios. Thesevariations are evident in Table 6, in which it can be seen thatthe ratio of OP/EC1 was quite low in Yellow Sea and EastSea air masses. Therefore, the main sources of OP are likelyto be coal combustion and biomass burning.
OP is defined as charred OC having characteristics similarto those of EC1that absorbs light. The BC absorption spec-trum measured by Aethalometer revealed different tenden-cies among 7 wavelengths, for some of which the absorptionof short wavelength (370 nm) was greater than that of longerwavelengths. It is generally known that soot, which is com-posed of submicron particles of grape-like clusters, exhibitsstrong light absorption characteristics with little spectral de-pendence (Schnaiter et al., 2003; Kirchstetter et al., 2004). Inthe present study, the enhanced absorption of shortwave radi-ation was clear for samples containing large amounts of OP,implying the link between OP and light-absorbing organiccarbon.
www.atmos-chem-phys.net/12/2007/2012/ Atmos. Chem. Phys., 12, 2007–2024, 2012

2020 S. Lim et al.: Ionic and carbonaceous compositions of PM10, PM2.5 and PM1.0 at Gosan
Table 6. Ratios of major chemical constituents indicating source regions categorized into 5 regimes: Siberia, Beijing, Shanghai, Yellow Sea,and East Sea.
RatioPM1.0 PM10
Siberia Beijing Shanghai Yellow Sea East Sea Siberia Beijing Shanghai Yellow Sea East Sea
OP/Mass ↑ ↑ – – – ↑ ↑ – – –EC1/Mass ↑ ↑ – – – ↑ ↑ ↑ – –Nitrate/Mass ↑ ↑ ↑ – – – ↑ ↑ – –Sulfate/Mass – – ↑ ↑ – – – ↑ ↑ –Nitrate/Sulfate ↑ – – – – ↑ ↑ – – –
OC2/TC – – – ↑ ↑ – – – ↑ ↑
EC2+3/EC1 ↑ – ↑ – ↑↑ – – ↑ – ↑↑
OP/Sulfate ↑↑ ↑ – ↓ ↓ ↑ ↑ – – –EC1/Sulfate ↑ ↑ – – – ↑ ↑ – – –
The ratios are expressed as symbols:↑↑ for values larger than mean×1.5,↑ for those between mean and mean×1.5, – for those between mean×0.5 and mean, and↓ for thosesmaller than mean×0.5.
Although EC and BC have long been major topics of re-search due to their light-absorbing characteristics, the recentdiscovery of light-absorbing organic carbon makes it imper-ative to reassess and redefine the components that make uplight-absorbing carbonaceous matter in the atmosphere (An-dreae and Gelencser, 2006; Alexander et al., 2008). Thereis a continuum of carbonaceous substances in atmosphericaerosols, where refractory organics included in a thermo-chemical classification are consistent with colored organicsin an optical classification. These so-called brown carbonshave a sharply increased absorption efficiency toward shorterwavelengths, although the absorption is much less than thatof soot carbon at the wavelength of 550 nm, and this spectraldependence causes the material to appear brown and makestheir absorption in the UV potentially significant due to thelarge amounts occurring in continental aerosols (Kirchstet-ter et al., 2004; Hoffer et al., 2006). However, their opticalproperties, origin, and chemical composition are poorly un-derstood and thus need further investigation.
The results discussed above highlight the fact that the Bei-jing air mass is distinguished not only by higher ratios of EC1and OP to mass but also by higher ratios of EC1 (and OP) tosulfate. This implies that air masses from the Beijing areamay have a more significant influence on net warming thando air masses from the other regions. This result confirms themain conclusion of Ramana et al. (2010), who estimated theimpact of BC/sulfate ratios of air masses transported from theBeijing and Shanghai areas on net warming based on surfaceand aircraft measurements conducted over the Yellow Sea inspring and summer.
4 Conclusions
Daily PM1.0, PM2.5, and PM10 samples were taken at GosanABC Superstation on Jeju Island from August 2007 toSeptember 2008. The mass concentrations of PM1.0, PM2.5,and PM10 varied between 1.3 and 29.5 µg m−3, 3.9 and39.2 µg m−3, and 7.5 and 69.8 µg m−3, respectively. PM1.0and PM2.5 account for 48.4 % and 79.6 % of PM10, respec-tively, indicating a large portion of fine-mode aerosols in thisstudy area. EC tended to be enriched in smaller particlesand made up 10.4 %, 9.8 %, and 6.0 % of PM1.0, PM2.5, andPM10, respectively. Unlike EC, OC accounted for 23.0 %,22.9 %, and 16.4 % in PM1.0, PM2.5, and PM10, respec-tively. The size distributions of OC subcomponents such asOC3 and OC4 reflected substantial contributions of primarysources such as dust, sea salt, or biogenic matter.
The definition and measurement techniques for atmo-spheric EC (or BC) have long been subjects of scientific con-troversy. We compared our observed EC with BC measure-ments obtained by Aethalometer and found a perfect relation-ship with a slope of 1.0 for PM1.0 EC1 (but not for PM10).This result indicates that coarse particles have lower light-absorbing efficiency than fine particles. In our data, EC andsulfate were well correlated, meaning that there is difficultyin distinguishing absorbing aerosols from scattering aerosols.For EC, the definition of EC1 as char-EC and EC2+3 as soot-EC applied well to our measurements; the former is emit-ted from smoldering combustion (such as biomass burningand residential and coal combustion), and the latter is gen-erated from flaming combustion (such as motor vehicle ex-haust and coal combustion). The mean EC1 concentrationswere almost two times higher than the mean EC2+3 concen-trations for all three particle sizes, ranging from 1.0 µg m−3
to 1.4 µg m−3 for EC1 and from 0.3 µg m−3 to 0.5 µg m−3
Atmos. Chem. Phys., 12, 2007–2024, 2012 www.atmos-chem-phys.net/12/2007/2012/

S. Lim et al.: Ionic and carbonaceous compositions of PM10, PM2.5 and PM1.0 at Gosan 2021
for EC2+3. EC1 was strongly correlated with potassiumthroughout the year except for summer. While EC2+3 wasmore enriched in PM1.0, EC1 favored PM2.5 or PM10. Asa result, EC1 was more sensitive to wet scavenging, and theratio of EC1 to EC2+3 was higher in summer. This differ-ence was likely linked with a longer residence time of EC2+3than that of EC1 in the atmosphere. This result implies arole of EC2+3 as a contribution to warming, particularly ata regional scale, due to its longer lifetime, even though itsconcentrations in the atmosphere are lower.
This study highlights the ratios of major chemical speciesas useful tools to distinguish the main sources of aerosols andthe degree of atmospheric processing. Five air mass typeswere clearly identified: Siberia, Beijing, Shanghai, YellowSea, and East Sea types. Siberian types would be regarded ascontinental background air of the northeast Asia. While theBeijing, Shanghai, and Yellow Sea air masses were mostlyinfluenced by China, the Korean emissions affected the Yel-low Sea and East Sea type air masses. For the East Sea air,Japanese and Korean influences were dominant. The Bei-jing type air was the freshest and was distinguished by higherconcentrations of EC and OP relative to sulfate, signifying ahigher net warming effect of aerosols in this air type thanin the other three types. OP was also suggested as a light-absorbing form of carbon. On the other hand, sulfate wasremarkably enhanced in air that had been slowly transportedover China or the Yellow Sea, which was the case of theShanghai and Yellow Sea air masses. The aged air massesof Yellow Sea and East Sea types in particular showed lowerOP to sulfate ratios and higher OC2 to TC ratios. The latterimplies a secondary role among OC fractions in conjunctionwith a tendency of enrichment at smaller aerosol sizes. Fur-thermore, the highest ratio of EC2+3 to EC1 was found inthe East Sea air, in sharp contrast with the other air mass cat-egories, which showed less impact of Chinese emissions.
Acknowledgements.Authors thank to A. Stohl for allowing us touse Flexpart results at Gosan. This study was supported by theKorea Research Foundation grant KRF-2008-314-C00402 andResearch Agency for Climate Science grant RACS 2010-1007.
Edited by: X. Querol
References
Aggarwal, S. G. and Kawamura, K.: Carbonaceous and inorganiccomposition in long-range transported aerosols over northernJapan: Implication for aging of water-soluble organic fraction,Atmos. Environ., 43, 2532–2540, 2009.
Akimoto, H.: Global Air Quality and Pollution, Science, 302,1716–1719,doi:10.1126/science.1092666, 2003.
Alexander, D. T. L., Crozier, P. A., and Anderson, J. R.: Brown Car-bon Spheres in East Asian Outflow and Their Optical Properties,Science, 321, 833–836,doi:10.1126/science.1155296, 2008.
Andreae, M. O. and Gelencser, A.: Black carbon or brown car-bon? The nature of light-absorbing carbonaceous aerosols, At-
mos. Chem. Phys., 6, 3131–3148,doi:10.5194/acp-6-3131-2006,2006.
Andrews, E., Saxena, P., Musarra, S., Hildemann, L. M., Koutrakis,P., McMurry, P. H., Olmez, I., and White, W. H.: Concentrationand composition of atmospheric aerosols from the 1995 SEAVSexperiment and a review of the closure between chemical andgravimetric measurements, J. Air Waste Manage. Assoc., 50,648–664, 2000.
Bassett, M. E. and Seinfeld, J. H.: Atmospheric equilibrium modelof sulfate and nitrate aerosols-II. Particle size analysis, Atmos.Environ., 18, 1163–1170, 1984.
Bond, T. C.: Spectral dependence of visible light absorption bycarbonaceous particles emitted from coal combustion, Geophys.Res. Lett., 28, 4075–4078,doi:10.1029/2001GL013652, 2001.
Bond, T. C., Covert, D. S., Kramlich, J. C., Larson, T. V., and Charl-son, R. J.: Primary particle emissions from residential coal burn-ing: Optical properties and size distributions, J. Geophys. Res.,107, 8347,doi:10.1029/2001JD000571, 2002.
Bond, T. C., Habib, G., and Bergstrom, R. W.: Limitations in theenhancement of visible light absorption due to mixing state, J.Geophys. Res., 111, D20211,doi:10.1029/2006JD007315, 2006.
Bond, T. C., Bhardwaj, E., Dong, R., Jogani, R., Jung, S., Ro-den, C., Streets, D. G., and Trautmann, N. M.: Historical emis-sions of black and organic carbon aerosols from energy-relatedcombustion, 1850–2000, Global Biogeochem. Cy., 21, GB2018,doi:10.1029/2006GB002840, 2007.
Brasseur, G. P., Orlando, J. J., and Tyndall, G. S.: AtmosphericChemistry and Global Change. Oxford University Press., Ox-ford, UK, 654, 1999.
Buzorius, G., McNaughton, C. S., Clarke, A. D., Covert,D. S., Blomquist, B., Nielsen, K., and Brechtel, F. J.:Secondary aerosol formation in continental outflow condi-tions during ACE-Asia, J. Geophys. Res., 109, D24203,doi:10.1029/2004JD004749, 2004.
Cao, J. J., Wu, F., Chow, J. C., Lee, S. C., Li, Y., Chen, S. W., An, Z.S., Fung, K. K., Watson, J. G., Zhu, C. S., and Liu, S. X.: Char-acterization and source apportionment of atmospheric organicand elemental carbon during fall and winter of 2003 in Xi’an,China, Atmos. Chem. Phys., 5, 3127–3137,doi:10.5194/acp-5-3127-2005, 2005.
Carmichael, G. R., Zhang, Y., Chen, L. L., Hong, M. S., and Ueda,H. : Seasonal variation of aerosol composition at Cheju Island,Korea, Atmos. Environ., 30, 2407–2416, 1996.
Carmichael, G. R., Hong, M. S., Ueda, H., Chen, L. L., Murano,K., Park, J. K., Lee, H. G., Kim, Y., Kang, C., and Shim, S.:Aerosol composition at Cheju Island, Korea, J. Geophys. Res.,102, 6047–6061,doi:10.1016/1352-2310(95)00230-8, 1997.
Chen, L.-L., Carmichael, G. R., Hong, M., Ueda, H., Shim, S.,Song, C. H., Kim, Y. P., Arimoto, R., Prospero, J., Savoie,D., Murano, K., Park, J. K., Lee, H., and Kang, C.: Influ-ence of continental outflow events on the aerosol composition atCheju Island, South Korea, J. Geophys. Res., 102, 28551–28574,doi:10.1029/97JD01431, 1997.
Chen, L.-W. A., Moosmuller, H., Arnott, W. P., Chow, J. C., Wat-son, J. G., Susott, R. A., Babbitt, R. E., Wold, C. E., Lincoln,E. N., and Hao, W. M.: Emissions from laboratory combustionof wildland fuels: Emission factors and source profiles. Environ.Sci. Technol., 41, 4317–4325, 2007.
Chow, J. C., Watson, J. G., Kuhns, H. D., Etyemezian, V.,
www.atmos-chem-phys.net/12/2007/2012/ Atmos. Chem. Phys., 12, 2007–2024, 2012

2022 S. Lim et al.: Ionic and carbonaceous compositions of PM10, PM2.5 and PM1.0 at Gosan
Lowenthal, D. H., Crow, D. J., Kohl, S. D., Engelbrecht, J.P., and Green, M. C.: Source profiles for industrial, mobile,and area sources in the Big Bend Regional Aerosol Visibil-ity and Observational (BRAVO) Study, Chemos., 54, 185–208,doi:10.1016/j.chemosphere.2003.07.004, 2004.
Chow, J. C., Watson, J. G., Louie, P. K., Chen, L. W., and Sin,D.: Comparison of PM2.5 carbon measurement methods in HongKong, China, Environ. Pollut., 137, 334–344, 2005.
Decesari, S., Facchini, M. C., Matta, E., Mircea, M., Fuzzi, S.,Chughtai, A. R., and Smith, D. M.: Water soluble organic com-pounds formed by oxidation of soot, Atmos. Environ., 36, 1827–1832, 2002.
Dentener, F. J., Carmichael, G. R., Zhang, Y., Lelieveld, J., andCrutzen, P. J.: Role of mineral aerosol as a reactive surface inthe global troposphere. J. Geophys. Res., 101, 22869–22889,doi:10.1029/96JD01818, 1996.
Elmquist, M., Cornelissen, G., Kukulska, Z., and Gustafs-son, O.: Distinct oxidative stabilities of char versus sootblack carbon: Implications for quantification and environmen-tal recalcitrance, Global Biogeochem. Cycles, 20, GB2009,doi:10.1029/2005GB002629, 2006.
Fuller, K. A., Malm,W. C., and Kreidenweis, S. M.: Effects of mix-ing on extinction by carbonaceous particles, J. Geophys. Res.,104, 15941–15954, 1999.
Fung, K. K.: Particulate carbon speciation by MnO2 oxidation.Aerosol Sci. Technol., 12, 122–127, 1990.
Gaudichet, A., Echalar, F., Chatenet, B., Quisefit, J. P., Malingre,G., Cachier, H., Artaxo, P., Maenhaut, W., and Buat-M’enard,P.: Trace elements in tropical African savannah biomass burningaerosol, J. Atmos. Chem., 22, 19–39, 1995.
Geng, H., Park, Y., Hwang, H., Kang, S., and Ro, C.-U.: Elevatednitrogen-containing particles observed in Asian dust aerosolsamples collected at the marine boundary layer of the BohaiSea and the Yellow Sea, Atmos. Chem. Phys., 9, 6933–6947,doi:10.5194/acp-9-6933-2009, 2009.
Gray, H. A., Cass, G. R., Huntzicker, J. J., Heyerdahl, E. K., andRau, J. A.: Characteristics of atmospheric organic and elemen-tal carbon particle concentrations in Los Angeles, Environ. Sci.Technol., 20, 580–582,doi:10.1021/es00148a006, 1986.
Guazzotti, S. A., Suess, D. T., Coffee, K. R., Quinn, P. K., Bates,T. S., Wisthaler, A., Hansel. A., Ball, W. P., Dickerson, R.R., Neusuß, C., Crutzen, P. J., Prather, K. A.: Characteriza-tion of carbonaceous aerosols outflow from India and Arabia:Biomass/biofuel burning and fossil fuel combustion, J. Geophys.Res., 108, D15,doi:10.1029/2002JD003277, 2003.
Gustafsson,O., Krusa, M., Zencak, Z., Sheesley, R. J., Granat, L.,Engstrom, E., Praveen, P. S., Rao, P. S. P., Leck, C., and Rodhe,H.: Brown clouds over South Asia: Biomass or fossil fuel com-bustion?, Science, 323, 495–498,doi:10.1126/science.1164857,2009.
Hagler, G. S. W., Bergin, M. H., Salmon, L. G., Yu, J. Z., Wan, E. C.H., Zheng, M., Zeng, L. M., Kiang, C. S., Zhang, Y. H., Lau, A.K. H., and Schauer, J. J.: Source areas and chemical compositionof fine particulate matter in the Pearl River Delta region of China,Atmos. Environ., 40, 3802–3815, 2006.
Han, Y. M., Cao, J., Chow, J. C., Watson, J. G., An, Z., Jin, Z., Fung,K., and Liu, S.: Evaluation of the thermal/optical reflectancemethod for discrimination between char- and soot-EC, Chemo-sphere, 69, 569–574,doi:10.1016/j.chemosphere.2007.03.024,
2007.Han, Y. M., Cao, J. J., Posmentier, E. S., Chow, J. C., Watson, J.
G., Fung, K. K., Jin, Z. D., Liu, S. X., and An, Z. S.: The effectof acidification on the determination of elemental carbon, char-,and soot-elemental carbon in soils and sediments, Chemosphere,75, 92–95,doi:10.1016/j.chemosphere.2008.11.044, 2009a.
Han, Y. M., Lee, S. C., Cao, J. J., Ho, K. F., and An, Z. S.: Spa-tial distribution and seasonal variation of char-EC and soot-ECin the atmosphere over China, Atmos. Environ., 43, 6066–6073,doi:10.1016/j.atmosenv.2009.08.018, 2009b.
Han, Y. M., Cao, J.J., Lee, S. C., Ho, K. F., and An, Z. S.: Differentcharacteristics of char and soot in the atmosphere and their ratioas an indicator for source identification in Xi’an, China, Atmos.Chem. Phys., 10, 595–607,doi:10.5194/acp-10-595-2010, 2010.
Hansen, A. D. H.: The Aethalometer™, Magee Scientific Com-pany, Berkeley, California, USA, 2005.
Hansen, J., Sato, M., and Ruedy, R.: Radiative forcingand climate response. J. Geophys. Res., 102, 6831–6864,doi:10.1029/96JD03436, 1997.
Havers, N., Burba, P., Lambert, J., and Klockow, D.: Spec-troscopic characterization of humic-like substances in air-borne particulate matter, J. Atmos. Chem., 29, 45–54,doi:10.1023/A:1005875225800, 1998.
Haywood, J. and Boucher, O.: Estimates of the direct and indirectradiative fording due to tropospheric aerosols: A review, Rev.Geophys., 38, 513–543,doi:10.1029/1999RG000078, 2000.
He, K., Yang, F., Ma, Y., Zhang, Q., Yao, X., Chan, C. K., Cadle,S., Chan, T., and Mulawa, P.: The characteristics of PM2.5 inBeijing, China, Atmos. Environ., 35, 4959–4970, 2001.
Hoffer, A., Gelencser, A., Guyon, P., Kiss, G., Schmid, O., Frank,G. P., Artaxo, P., and Andreae, M. O.: Optical properties ofhumic-like substances (HULIS) in biomass-burning aerosols, At-mos. Chem. Phys., 6, 3563–3570,doi:10.5194/acp-6-3563-2006,2006.
Huebert, B. J., Bates, T., Russell, P. B., Shi, G., Kim, Y. J., Kawa-mura, K., Carmichael, G., and Nakajima, T.: An overview ofACE-Asia: Strategies for quantifying the relationships betweenAsian aerosols and their climatic impacts, J. Geophys. Res., 108,8633,doi:10.1029/2003JD003550, 2003.
IPCC: Climate Change 2007: The Physical Science Basis (Con-tribution of Working Group I to the Fourth Assessment Reportof the Intergovernmental Panel on Climate Change), edited by:Solomon, S., Qin, D., Manning, M., Chen, Z., Marquis, M., Av-eryt, K. B., Tignor, M., and Miller, H. L., Cambridge Univ. Press,New York, 131–217, 2007.
Jacobson, M. Z.: Strong radiative heating due to the mixing stateof black carbon in atmospheric aerosols, Nature, 409, 695–697,doi:10.1038/35055518, 2001.
Jacobson, M. C., Hansson, H.-C., Noone, K. J., and Charlson, R.J.: Organic atmospheric aerosols: review and state of the sci-ence, Rev. Geophys., 38, 267–294,doi:10.1029/1998RG000045,2000.
Jimenez, J. L., Canagaratna, M. R., Donahue, N. M., Prevot, A. S.H., Zhang, Q., Kroll, J. H., DeCarlo, P. F., Allan, J. D., Coe,H., Ng, N. L., Aiken, A. C., Docherty, K. S., Ulbrich, I. M.,Grieshop, A. P., Robinson, A. L., Duplissy, J., Smith, J. D.,Wilson, K. R., Lanz, V. A., Hueglin, C., Sun, Y. L., Tian, J.,Laaksonen, A., Raatikainen, T., Rautiainen, J., Vaattovaara, P.,Ehn, M., Kulmala, M., Tomlinson, J. M., Collins, D. R., Cu-
Atmos. Chem. Phys., 12, 2007–2024, 2012 www.atmos-chem-phys.net/12/2007/2012/

S. Lim et al.: Ionic and carbonaceous compositions of PM10, PM2.5 and PM1.0 at Gosan 2023
bison, M. J., E., Dunlea, J., Huffman, J. A., Onasch, T. B.,Alfarra, M. R., Williams, P. I., Bower, K., Kondo, Y., Schnei-der, J., Drewnick, F., Borrmann, S., Weimer, S., Demerjian, K.,Salcedo, D., Cottrell, L., Griffin, R., Takami, A., Miyoshi, T.,Hatakeyama, S., Shimono, A., Sun, J. Y., Zhang, Y. M., Dzepina,K., Kimmel, J. R., Sueper, D., Jayne, J. T., Herndon, S. C., Trim-born, A. M., Williams, L. R., Wood, E. C., Middlebrook, A.M., Kolb, C. E., Baltensperger, U., and Worsnop, D. R.: Evolu-tion of Organic Aerosols in the Atmosphere, Science, 326, 1525,doi:10.1126/science.1180353, 2009.
Kanakidou, M., Seinfeld, J. H., Pandis, S. N., Barnes, I., Dentener,F. J., Facchini, M. C., Van Dingenen, R., Ervens, B., Nenes, A.,Nielsen, C. J., Swietlicki, E., Putaud, J. P., Balkanski, Y., Fuzzi,S., Horth, J., Moortgat, G. K., Winterhalter, R., Myhre, C. E.L., Tsigaridis, K., Vignati, E., Stephanou, E. G., and Wilson,J.: Organic aerosol and global climate modelling: a review, At-mos. Chem. Phys., 5, 1053–1123,doi:10.5194/acp-5-1053-2005,2005.
Kim, Y. P., Moon, K.-C., and Lee, J. H.: Organic and elementalcarbon in fine particles at Kosan, Korea, Atmos. Environ., 34,3309–3317, 2000.
Kim, S.-W., Yoon, S.-C., Kim, J., and Kim, S.-Y.: Seasonal andmonthly variations of columnar aerosol optical properties overeast Asia determined from multi-year MODIS, LIDAR, andAERONET Sun/sky radiometer measurements, Atmos. Environ.,41, 1634–1651,doi:10.1016/j.atmosenv.2006.10.044, 2007.
Kirchstetter, T. W., Novakow, T., and Hobbs, P. V.: Evidencethat the spectral dependence of light absorption by aerosols isaffected by organic carbon, J. Geophys. Res., 109, D21208,doi:10.1029/2004JD004999, 2004.
Kocak, M., Mihalopoulos, N., and Kubilay, N.: Chemical composi-tion of the fine and coarse fraction of aerosols in the NortheasternMediterranean, Atmos. Environ., 41, 7351–7368, 2007.
Kuhlbusch, T. A. J.: Black carbon in soils, sediments, and ice cores,in: Environmental analysis and remediation, edited by: Meyers,R. A., John Wiley & Sons, Toronto, Canada, 813–823, 1997.
Lee, M., Song, M., Moon, K. J., Han, J. S., Lee, G., and Kim, K.-R.: Origins and chemical characteristics of fine aerosols duringthe northeastern Asia regional experiment (Atmospheric BrownCloud – East Asia Regional Experiment 2005), J. Geophys. Res.,112, D22S29,doi:10.1029/2006JD008210, 2007.
Lee, J. Y., Kim, Y. P., Bae, G. N., Park, S. M., and Jin, H. C.: Thecharacteristics of particulate PAHs concentrations at a roadsidein Seoul, Korean J. Atmos. Environ., 24, 133–142, 2008.
Lee, H. W., Lee, T. J., and Kim, D. S.: Identifying Ambient PM2.5Sources and estimating their contributions by using PMF: Sep-aration of gasoline and diesel automobile sources by analyzingECs and OCs, J. Korean Soc. Atmos. Environ., 25, 75–89, 2009.
Li, X., Shen, Z., Cao, J., Liu, S., Zuh, C., and Zhang, T.: Dis-tribution of carbonaceous aerosol during spring 2005 over theHorquin sandland in northeastern China, China Particuology, 4,316–322,doi:10.1016/S1672-2515(07)60282-6, 2006.
Lim, S.: Source Signature of Ions and Carbonaceous Compounds inSubmicron and Supermicron Aerosols at Gosan-super site, Jeju,South Korea, Master’s thesis, Korea University, 2009.
Lim, S., Lee, M., and Kang, K.: Seasonal Variations of OC and ECin PM10, PM2.5 and PM1.0 at Gosan Superstation on Jeju Island,Korean J. Atmos. Environ., 26, 567–580, 2010a.
Lim, S., Lee, M., Lee, G., and Kang, K.: Source signature of
mass, nitrate and sulfate in supermicron and submicron aerosolsat Gosan Superstation on Jeju Island, J. Atmos., 20, 221–228,2010b.
Lin, C.-Y., Wang, Z., Chen, W.-N., Chang, S.-Y., Chou, C. C. K.,Sugimoto, N., and Zhao, X.: Long-range transport of Asian dustand air pollutants to Taiwan: observed evidence and model simu-lation, Atmos. Chem. Phys., 7, 423–434,doi:10.5194/acp-7-423-2007, 2007.
Liu, X., Zhang, W., Wang, Z., Zhao, W., Tao, L., and Yang, X.:Chemical composition and size distribution of secondary organicaerosol formed from the photooxidation of isoprene, J. Environ.Sci., 21, 1525–1531, 2009.
Mace, K. A., Kubilay, N., and Duce, R. A.: Organic nitrogenin rain and aerosol in the eastern Mediterranean: an associa-tion with atmospheric dust, J. Geophys. Res., 108, 4320–4330,doi:10.1029/2002JD002997, 2003.
Mamane, Y. and Gottlieb, J.: Heterogeneous reactions of mineralswith sulfur and nitrogen oxides, J. Aerosol Sci., 20, 303–311,doi:10.1016/0021-8502(89)90006-2, 1989.
Maria, S. F., Russell, L. M., Gilles, M. K., and My-neni, S. C. B.: Organic aerosol growth mechanisms andtheir climate-forcing implications, Science, 306, 1921–1924,doi:10.1126/science.1103491, 2004.
Martins, J. V., Artaxo, P., Liousse, C., Reid, J. S., Hobbs, P. V., andKaufman, Y. J.: Effects of black carbon content, particle size, andmixing on light absorption by aerosols from biomass burning inBrazil, J. Geophys. Res., 103, 32041–32050, 1998.
Masiello, C. A.: New directions in black carbon organic geochem-istry, Mar. Chem., 92, 201–213, 2004.
Mochida, M., Umemoto, N., Kawamura, K., Lim, H.-J., and Turpin,B. J.: Bimodal size distributions of various organic acids andfatty acids in the marine atmosphere: Influence of anthropogenicaerosols, Asian dusts, and sea spray off the coast of East Asia, J.Geophys. Res., 112, D15209,doi:10.1029/2006JD007773, 2007.
Moon, K. J., Han, J. S., Ghim, Y. S., and Kim, Y. J.: Source appor-tionment of fine carbonaceous particles by positive matrix fac-torization at Gosan background site in East Asia, Environ. Int.,34, 654–664, 2008.
Mukai, H. and Ambe, Y.: Characterization of a humic acid-likebrown substance in airborne particulatematter and tentative iden-tification of its origin, Atmos. Environ., 20, 813–819, 1986.
Novakov, T. and Corrigan, C. E.: Thermal characterization ofbiomass smoke particles, Mikrochim. Acta, 119, 157–166, 1995.
Nunes, T. V. and Pio, C. A.: Carbonaceous aerosols in industrialand coastal atmosphere, Atmos. Environ., 27, 1339–1346, 1993.
Ogren, J. A. and Charlson, R. J.: Elemental carbon in theatmosphere: cycle and lifetime, Tellus Series B-Chemicaland Physical Meteorology, 35B, 241–254,doi:10.1111/j.1600-0889.1983.tb00027.x,1983.
Ohta, S., Hori, M., Yamagata, S., and Murao, N.: Chemical charac-terization of atmospheric fine particles in Sapporo with determi-nation of water content, Atmos. Environ, 32, 1021–1025, 1998.
Park, S. S., Kim, Y. J., and Fung, K.: Characteristics of PM2.5 car-bonaceous aerosol in the Sihwa industrial area, Korea, Atmos.Environ., 35, 657–665, 2001.
Park, R., Kim, M., Jeong, J., Youn, D., and Kim, S.: A contributionof brown carbon aerosol to the aerosol light absorption and itsradiative forcing in East Asia, Atmos. Environ., 44, 1414–1421,doi:10.1016/j.atmosenv.2010.01.042, 2010.
www.atmos-chem-phys.net/12/2007/2012/ Atmos. Chem. Phys., 12, 2007–2024, 2012

2024 S. Lim et al.: Ionic and carbonaceous compositions of PM10, PM2.5 and PM1.0 at Gosan
Persiantseva, N. M., Popovicheva, O. B., and Shonija, N. K.: Wet-ting and hydration of insoluble soot particles in the upper tropo-sphere, J. Environ. Monit., 6, 939–945, 2004.
Petzold, A., Gysel, M., Vancassel, X., Hitzenberger, R., Puxbaum,H., Vrochticky, S., Weingartner, E., Baltensperger, U., andMirabel, P.: On the effects of organic matter and sulphur-containing compounds on the CCN activation of combustion par-ticles, Atmos. Chem. Phys., 5, 3187–3203,doi:10.5194/acp-5-3187-2005, 2005.
Pey, J., Perez, N., Castillo, S., Viana, M., Moreno, T., Pandolfi, M.,Lopez-Sebastian, J.M., Alastuey, A., and Qeurol., X.: Geochem-istry of regional background aerosols in the Western Mediter-ranean, Atmos. Res., 94, 422–435, 2009.
Qu, W. J., Zhang, X. Y., Arimoto, R., Wang, Y. Q., Wang, D.,Sheng, L. F., and Fu, G.: Aerosol background at two remoteCAWNET sites in western China, Sci. Total Environ., 407, 3518–3529, 2009.
Ramachandran, S., Rengarajan, R., and Sarin, M. M.: Atmosphericcarbonaceous aerosols: issues, radiative forcing and climate im-pacts, Cur. Sci. Com., 97, 18–20, 2009.
Ramana, M. V., Ramanathan, V., Feng, Y., Yoon, S.-C., Kim, S.-W.,and Carmichael, G. R.: Warming influenced by the ratio of blackcarbon to sulphate and the black-carbon source, Nature Geosci.,3, 542–545,doi:10.1038/NGEO918, 2010.
Ramanathan, V. and Carmichael, G.: Global and regionalclimate changes due to black carbon, Nature Geosci., 1,doi:10.1038/ngeo156, 2008.
Ramanathan, V. and Xu, Y.: The Copenhagen Accord for limit-ing global warming: Criteria, constraints, and available avenues,PNAS, 107, 8055–8062,doi:10.1073/pnas.1002293107, 2010.
Ramanathan, V., Crutzen, P. J., Kiehl, J. T., and Rosenfeld, D.: At-mosphere – Aerosols, climate, and the hydrological cycle, Sci-ence, 294, 2119–2124,doi:10.1126/science.1064034, 2001.
Ravishankara, A. R.: Heterogeneous and multiphase chem-istry in the Troposphere, Science, 276, 1058–1065,doi:1126/science.276.5315.1058, 1997.
Robertson, A., Overpeck, J., Rind, D., Mosley-Thompson, E.,Zielinski, G., Lean, J., Koch, D., Penner, J., Tegen, I.,and Healy, R.: Hypothesized climate forcing time series forthe last 500 years, J. Geophys. Res., 106, 14783–14803,doi:10.1029/2000JD900469, 2001.
Russell, L. M., Maria, S. F., and Myneni, S. C. B.: Mapping organiccoatings on atmospheric particles, Geophys. Res. Lett., 29, 1779,doi:10.1029/2002GL014874, 2002.
Schnaiter, M., Horvath, H., Mohler, O., Naumann, K.-H., Saatoff,H., and Schock, O. W.: UV-VIS-NIR spectral optical propertiesof soot and soot-containing aerosols, J. Aerosol Sci., 34, 1421–1444,doi:10.1016/S0021-8502(03)00361-6, 2003.
Shah, J. J., Johnson, R. L., Heyerdahl, E. K., and Huntzicker, J.J.: Carbonaceous aerosol at urban and rural sites in the UnitedStates, J. Air Pollut. Control Assoc., 36, 254–257, 1986.
Shen, Z. X., Cao, J. J., Arimoto, R., Zhang, R. J., Jie, D.M., Liu, S. X., and Zhu, C. S.: Chemical composition andsource characterization of spring aerosol over Horqin sandland in northeastern China, J. Geophys. Res., 112, D14315,doi:10.1029/2006JD007991, 2007.
Silva, P. J., Liu, D. Y., Noble, C. A., and Prather, K. A.: Size andchemical characterization of individual particles resulting frombiomass burning of local southern California species, Environ.
Sci. Technol., 33, 3068,doi:10.1021/es980544p, 1999.Stohl, A., Forster, C., Frank, A., Seibert, P., and Wotawa,
G.: Technical note: The Lagrangian particle dispersion modelFLEXPART version 6.2, Atmos. Chem. Phys., 5, 2461–2474,doi:10.5194/acp-5-2461-2005, 2005.
Streets, D. G., Bond, T. C., Carmichael, G. R., Fernandes, S. D., Fu,Q., He, D., Klimont, Z., Nelson, S. M., Tsai, N. Y., Wang, M. Q.,Woo, J.-H., and Yarber, K. F.: An inventory of gaseous and pri-mary aerosol emissions in Asia in the year 2000, J. Geophys.Res., 108, GTE30-1-GTE30-23,doi:10.1029/2002JD003093,2003.
Szidat, S., Ruff, M., Perron, N., Wacker, L., Synal, H.-A., Hallquist,M., Shannigrahi, A. S., Yttri, K. E., Dye, C., and Simpson, D.:Fossil and non-fossil sources of organic carbon (OC) and ele-mental carbon (EC) in Goteborg, Sweden, Atmos. Chem. Phys.,9, 1521–1535,doi:10.5194/acp-9-1521-2009, 2009.
Talbot, R. W., Harriss, P. C., Browell, E. V., Gregory, G. L.,Sebacher, D. I., Beck, S. M.: Distribution andgeochemistryof aerosols in the tropical north Atlantic troposphere: rela-tionship to Saharan dust, J. Geophys. Res., 91, 5173–5182,doi:10.1029/JD091iD04p05173, 1986.
Tsigaridis, K., Krol, M., Dentener, F. J., Balkanski, Y., Lathiere, J.,Metzger, S., Hauglustaine, D. A., and Kanakidou, M.: Changein global aerosol composition since preindustrial times, At-mos. Chem. Phys., 6, 5143–5162,doi:10.5194/acp-6-5143-2006,2006.
Wang, Y., Zhuang, G., Tang, A., Zhang, W., Sun, Y., Wang, Z., andAn, Z.: The evolution of chemical components of aerosols at fivemonitoring sites of China during dust storms, Atmos. Environ.,41, 1091–1106, 2007.
Worsnop, D. R., Morris, J. W., Shi, Q., Davidovits, P., andKolb, C. E.: A chemical kinetic model for reactive transforma-tions of aerosol particles, Geophys. Res. Lett., 29, 57-1–57-4,doi:10.1029/2002GL015542, 2002.
Wu, P. M. and Okada, K.: Nature of coarse nitrate particles in theatmosphere: a single particle approach, Atmos. Environ., 28,2053–2060, 1994.
Yang, F., He, K., Ye, B., Chen, X., Cha, L., Cadle, S. H., Chan,T., and Mulawa, P. A.: One-year record of organic and elementalcarbon in fine particles in downtown Beijing and Shanghai, At-mos. Chem. Phys., 5, 1449–1457,doi:10.5194/acp-5-1449-2005,2005.
Ye, B., Ji, X., Yang, H., Yao, X., Chan, C. K., Cadle, S. H., ChanT., Mulawa, P. A.: Concentration and chemical composition ofPM2.5 in Shanghai for a 1-year period, Atmos. Environ., 37,499–510, 2003.
Zhang, Y., Sunwoo, Y., Kotamarthi, V., and Carmichael, G. R.: Pho-tochemical oxidant processes in the presence of dust: an evalua-tion of the impact of dust on particulate nitrate and ozone forma-tion, J. Applied Meteorology, 33, 7, 813–824,doi:10.1175/1520-0450(1994)033<0813:POPITP>2.0.CO;2, 1994.
Zhang, R., Cao, J., Lee, S., Shen, Z., and Ho, K.: Carbonaceousaerosols in PM10 and pollution gases in winter in Beijing, J. En-viron. Sci., 19, 564–571, 2007.
Atmos. Chem. Phys., 12, 2007–2024, 2012 www.atmos-chem-phys.net/12/2007/2012/