diurnal, seasonal, and spatial variation of pm2.5 in beijing
TRANSCRIPT

Artic le Earth Sciences
Diurnal, seasonal, and spatial variation of PM2.5 in Beijing
Runkui Li • Zhipeng Li • Wenju Gao •
Wenjun Ding • Qun Xu • Xianfeng Song
Received: 12 April 2014 / Accepted: 25 July 2014 / Published online: 30 December 2014
� Science China Press and Springer-Verlag Berlin Heidelberg 2014
Abstract PM2.5 pollution in Beijing has attracted exten-
sive attention in recent years, but research on the detailed
spatiotemporal characteristics of PM2.5 is critically lacking
for effective pollution control. In our study, hourly PM2.5
concentration data of 35 fixed monitoring sites in Beijing
were collected continuously from October 2012 to Sep-
tember 2013, for exploring the diurnal and seasonal char-
acteristics of PM2.5 at traffic, urban, and background
environments. Spatial trend and regional contribution of
PM2.5 under different pollution levels were also investi-
gated. Results show that the average PM2.5 concentration
of all the 35 sites (including 5 traffic sites) was 88.6 lg/m3.
Although PM2.5 varied largely with the site location and
seasons, a clear spatial trend could be observed with the
PM2.5 concentration decreasing linearly from south to
north, with a gradient of -0.46 lg/m3/km for average
days, -0.83 lg/m3/km for heavily–severely polluted days,
-0.52 lg/m3/km at lightly–moderately polluted days, and
-0.26 lg/m3/km for excellent–good days. PM2.5 at traffic
sites was varied, but was generally over 10 % higher than
at the nearby urban assessment sites.
Keywords Fine particulate matter � Spatiotemporal
variation � Trend � Traffic site � Regional transmission �Beijing
1 Introduction
PM2.5 is fine particles suspended in the atmosphere with a
diameter less than 2.5 lm and may have damaging effects on
human health, especially the cardiovascular and respiratory
systems [1–6]. Due to this, various governments and inter-
national groups have launched regulations and standards to
control ambient particulate concentrations [7]. Extremely
polluted weather related to high PM2.5 concentrations, such as
haze and fog, has frequently affected Beijing severely over
the past few years [8–13], causing wide public concern. In
October 2011, severe air pollution in Beijing resulted in rapid
administrative measures. This included PM2.5 being added to
the real-time air quality monitoring system of the Ministry of
Environmental Protection of China, and integration into the
Chinese National Ambient Air Quality (CNAAQ) standard.
Despite initial improvements in air quality, long-lasting haze
and fog occurred in January 2013. Therefore, it is necessary to
comprehensively investigate the source, distribution, fluctu-
ation pattern, and other characteristics of the PM2.5 pollution
in Beijing and to provide a more reliable research basis for
valid control measures.
There is a complex contribution of different emission
sources to PM2.5 in Beijing. Given the rapid growth in traffic
during the past two decades, vehicles in Beijing reached 5.2
million by the end of 2012, while coal consumption and
industrial emissions decreased at the same time [14]. On-road
R. Li � Z. Li � X. Song (&)
College of Resources and Environment, University of Chinese
Academy of Sciences, Beijing 100049, China
e-mail: [email protected]
W. Gao
Institute of Resources and Environment, Henan Polytechnic
University, Jiaozuo 454000, China
W. Ding
College of Life Sciences, University of Chinese Academy of
Sciences, Beijing 100049, China
Q. Xu
Department of Epidemiology and Biostatistics, Institute of Basic
Medical Sciences, Chinese Academy of Medical Sciences and
School of Basic Medicine of Peking Union Medical College,
Beijing 100005, China
123
Sci. Bull. (2015) 60(3):387–395 www.scibull.com
DOI 10.1007/s11434-014-0607-9 www.springer.com/scp

traffic emission has become a main concern for public health
and new pollution control targets in Beijing. Meanwhile,
pollutants from neighboring regions, such as the Hebei
Province and Tianjin Municipality, have contributed to the air
pollution in Beijing. Although scientific research has provided
some useful data, temporal variations in the proportion of
PM2.5 sources have made it difficult to determine the exact
composition of PM2.5 in Beijing [14–17]. In addition, the
source of air pollution varies across multiple spatial scales,
e.g., on local scales associated with immediate sources to
larger spatial areas with secondary reactions and transport
mechanisms [18]. High traffic emissions and regional changes
also increase the difficulty of exploring detailed spatiotem-
poral patterns of PM2.5 concentration. Only with long-term
monitoring across both space and time can the variations of
PM2.5 in Beijing be quantitatively characterized.
In this paper, to comprehensively describe the spatio-
temporal characteristics of PM2.5, a large amount of PM2.5
data were collected over a 1-year time span and analyzed
with the new technique of geographic information system
(GIS), which greatly facilitates the understanding of PM2.5
pollution at spatial perspectives [19]. To evaluate the
contribution of traffic toward pollution control in Beijing,
data from traffic sites were specifically collected and
compared with data from other sites.
The aim of this study was to explore the spatiotemporal
variation of PM2.5 concentration in Beijing through ana-
lyzing the diurnal, seasonal, and spatial patterns based on
1-year hourly collected data from 35 monitoring stations.
PM2.5 pollution status and spatial trends in Beijing were
investigated to provide information for exposure assess-
ment and theoretical support for taking appropriate control
strategies on PM2.5 pollution in this region.
2 Materials and methods
2.1 Study area
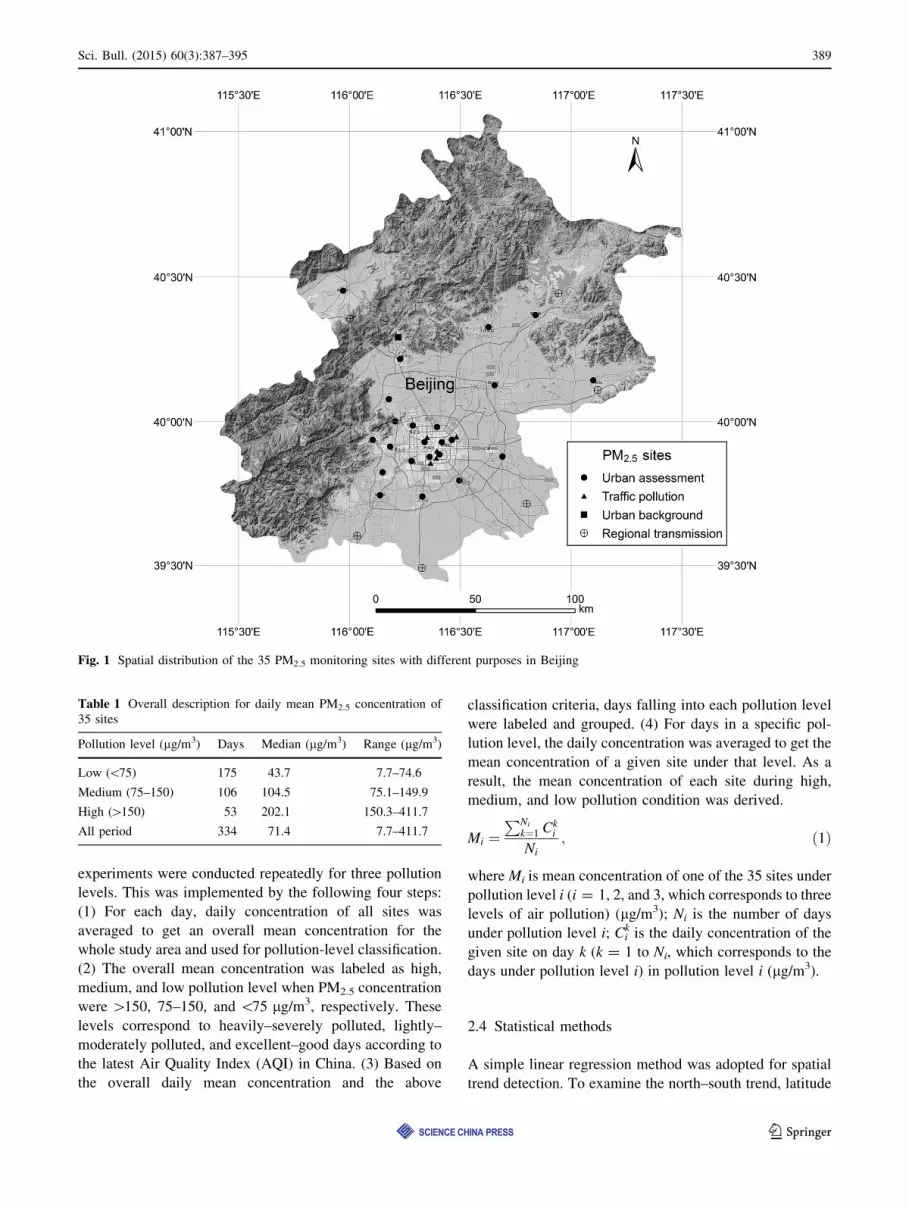
Beijing covers about 16,410 km2 and consists of six urban
districts, eight suburban districts, and two rural counties
and possessed 21.148 million people at the end of 2013,
making it one of the most populous cities in the world.
Mountainous at northern, northwestern, and western
regions, the terrain of Beijing gets flatter toward the
southeast. Plains cover most of the central urban area and
the vast suburban districts in south and east directions
(Fig. 1). The main urban area, on the plains in the south-
center of the municipality, spreads out in concentric ring
roads with Tian’anmen roughly as its center. Beijing is
surrounded almost entirely by Hebei Province except for
the Tianjin Municipality, which is neighboring to the
southeast. This study covered all the 16 municipal districts,
and at least one air quality monitoring site was contained in
each district.
2.2 Data collection
Hourly PM2.5 data from October 2012 to September 2013 for
35 fixed monitoring sites were obtained from the real-time
air quality system (AQS) of Beijing Municipal Environ-
mental Protection Bureau (BJEPB). These data were col-
lected since the stations started to publish PM2.5 data and
covered a total of more than 280,000 site-hour records.
Among the 35 monitoring sites, 23 are urban environmental
assessment sites, which are mainly used to assess regional
environmental air quality and its overall variation; 1 is an
urban background site to reflect the air quality unaffected by
urban pollution; 6 are cross-region transmission sites close to
Beijing municipal boundary in six directions to characterize
regional background levels and monitor the transmission of
pollutants between regions; and 5 are traffic sites at the edges
of busy roads to monitor on-road traffic pollution on ambient
air quality (Fig. 1). These sites scatter from the very south to
the north end of Beijing, covering most of the spatial regions
and typical land types in Beijing, e.g., from the center of most
developed urban areas to faraway countryside.
Six regional transmission sites are set in separate
directions: Two sites in the north are called the Trans-
mission-North in the study, two in the east and southeast
near Tianjin refer to the Transmission-Southeast, and
another two sites in the south and southwest near Hebei the
Transmission-Southwest.
Meteorological data, including daily maximum 10-min
averaged wind speed and observed sunshine hours, were
acquired from China Meteorological Data Sharing Service
System (http://cdc.cma.gov.cn/). For the missing data in
September 2013 for Beijing, we took that of Tianjin station
in view of the high similarity between the two sites.
2.3 Data preparation
Because the hourly real-time data were probably published
before official auditing, the data were checked manually.
Due to equipment failure or internet error, some data were
missing. Some data were also rejected due to anomalous
measurements. Daily average concentration was obtained
by averaging everyday hourly data from 00:00 to 23:00.
According to the national standard GB 3095-2012, obser-
vation for at least 20 h is required to obtain daily average
concentrations for each site to ensure the representative-
ness of the daily average value when missing data appear.
Otherwise, data of the day was invalid and had to be
excluded from this study (Table 1).
The spatial pattern of pollution may vary with climate
conditions and pollution levels. To investigate such effects,
388 Sci. Bull. (2015) 60(3):387–395
123
experiments were conducted repeatedly for three pollution
levels. This was implemented by the following four steps:
(1) For each day, daily concentration of all sites was
averaged to get an overall mean concentration for the
whole study area and used for pollution-level classification.
(2) The overall mean concentration was labeled as high,
medium, and low pollution level when PM2.5 concentration
were [150, 75–150, and \75 lg/m3, respectively. These
levels correspond to heavily–severely polluted, lightly–
moderately polluted, and excellent–good days according to
the latest Air Quality Index (AQI) in China. (3) Based on
the overall daily mean concentration and the above
classification criteria, days falling into each pollution level
were labeled and grouped. (4) For days in a specific pol-
lution level, the daily concentration was averaged to get the
mean concentration of a given site under that level. As a
result, the mean concentration of each site during high,
medium, and low pollution condition was derived.
Mi ¼PNi
k¼1 Cki
Ni
; ð1Þ
where Mi is mean concentration of one of the 35 sites under
pollution level i (i = 1, 2, and 3, which corresponds to three
levels of air pollution) (lg/m3); Ni is the number of days
under pollution level i; Cik is the daily concentration of the
given site on day k (k = 1 to Ni, which corresponds to the
days under pollution level i) in pollution level i (lg/m3).
2.4 Statistical methods
A simple linear regression method was adopted for spatial
trend detection. To examine the north–south trend, latitude
Fig. 1 Spatial distribution of the 35 PM2.5 monitoring sites with different purposes in Beijing
Table 1 Overall description for daily mean PM2.5 concentration of
35 sites
Pollution level (lg/m3) Days Median (lg/m3) Range (lg/m3)
Low (\75) 175 43.7 7.7–74.6
Medium (75–150) 106 104.5 75.1–149.9
High ([150) 53 202.1 150.3–411.7
All period 334 71.4 7.7–411.7
Sci. Bull. (2015) 60(3):387–395 389
123
of the monitoring sites (with degree unit) under the lati-
tude–longitude coordinate system indicating relative north
and south positions was derived and used as a predictor
variable. For convenience, geographic coordinates of all
the 35 sites were projected onto a rectangular coordinate
system, and latitude was then transferred to a projected
geographic Y coordinate with meter units, and mean PM2.5
concentration of each pollution level, as derived from
Eq. (1), was used as response variable to explore the spatial
trend from north to south.
Mi ¼ aY þ b; ð2Þ
where Mi is mean concentration of pollution level i (lg/m3);
Y is coordinate at south–north direction of the monitoring
sites (m); a and b are the coefficients.
For computational convenience and physical clarity,
distance to the extreme south boundary line of Beijing
[hereinafter, called ‘‘Distance from South’’ (DFS)] was
used as a surrogate of the original Y coordinate as shown in
Eq. (3). As a result, mean PM2.5 concentration from 35
monitoring sites was regressed with their DFS for each
pollution level.
DFS ¼ Y � Ymin; ð3Þ
where Ymin is Y coordinate of the extremely south boundary
of Beijing (m).
3 Results
3.1 Temporal variation of PM2.5
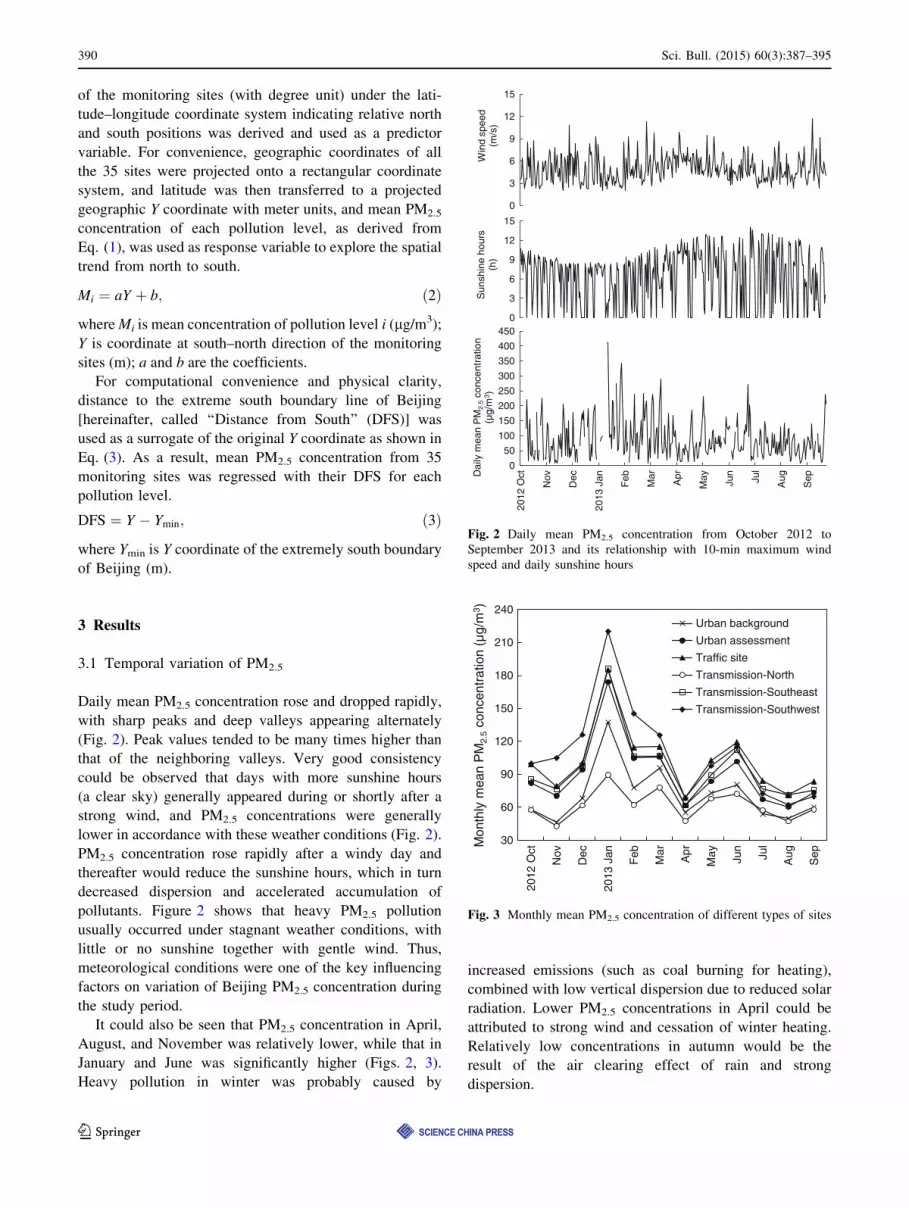
Daily mean PM2.5 concentration rose and dropped rapidly,
with sharp peaks and deep valleys appearing alternately
(Fig. 2). Peak values tended to be many times higher than
that of the neighboring valleys. Very good consistency
could be observed that days with more sunshine hours
(a clear sky) generally appeared during or shortly after a
strong wind, and PM2.5 concentrations were generally
lower in accordance with these weather conditions (Fig. 2).
PM2.5 concentration rose rapidly after a windy day and
thereafter would reduce the sunshine hours, which in turn
decreased dispersion and accelerated accumulation of
pollutants. Figure 2 shows that heavy PM2.5 pollution
usually occurred under stagnant weather conditions, with
little or no sunshine together with gentle wind. Thus,
meteorological conditions were one of the key influencing
factors on variation of Beijing PM2.5 concentration during
the study period.
It could also be seen that PM2.5 concentration in April,
August, and November was relatively lower, while that in
January and June was significantly higher (Figs. 2, 3).
Heavy pollution in winter was probably caused by
increased emissions (such as coal burning for heating),
combined with low vertical dispersion due to reduced solar
radiation. Lower PM2.5 concentrations in April could be
attributed to strong wind and cessation of winter heating.
Relatively low concentrations in autumn would be the
result of the air clearing effect of rain and strong
dispersion.
0
3
6
9
12
15
sruohenihsnu
S(h
)
0
50
100
150
200
250
300
350
400
450
2012
Oct
Nov
Dec
2013
Jan
Feb
Mar
Apr
May Jun
Jul
Aug
Sep
MP
naem
yliaD
2.5
noitartnecnoc(µ
g/m
3 )
0
3
6
9
12
15
deepsdni
W(m
/s)
Fig. 2 Daily mean PM2.5 concentration from October 2012 to
September 2013 and its relationship with 10-min maximum wind
speed and daily sunshine hours
30
60
90
120
150
180
210
240
2012
Oct
Nov
Dec
2013
Jan
Feb
Mar
Apr
May Jun
Jul
Aug
Sep
MP
naem
ylhtnoM
2.5
m/gµ (no itartne cnoc
3 )
Urban background
Urban assessment
Traffic site
Transmission-North
Transmission-Southeast
Transmission-Southwest
Fig. 3 Monthly mean PM2.5 concentration of different types of sites
390 Sci. Bull. (2015) 60(3):387–395
123

PM2.5 concentration differences among sites were sig-
nificant and also varied with seasons (Fig. 3). Traffic sites
were always higher than urban assessment sites, while the
urban background was much lower. This fact verified our
understanding that sites closer to intensive emission sour-
ces would have higher values, and vice versa. Transmission
sites at different directions varied more distinctly. For
example, transmission sites in the southwest (close to He-
bei) and southeast (close to Tianjin) were much higher than
those in the north (close to the mountains). This could be
explained by the regional characteristics that sites at central
and south urbanized plain areas would probably be more
polluted than sites in the northern mountainous area that
were less affected by human activities [20]. Concentrations
in the southwest was generally higher than in the southeast
from October 2012 to June 2013, yet was lower from July
to September 2013. This would be caused by the change of
pollution sources and wind directions during the summer
and requires further investigation.
The classified pollution level based on daily mean
concentration of all sites is shown in Table 1. Median
PM2.5 concentration of the 35 sites during the study period
is 71.4 lg/m3 (with 88.6 lg/m3 for the mean), and median
concentration during low, medium, and high pollution level
is 43.7, 104.5, and 202.1 lg/m3, respectively. Although
most days of the study were under low and medium pol-
lution level, highly polluted days also occupied a consid-
erable part of the period, to which special attention should
be given. Because all sites (including traffic sites) were
included in this study, the classification of low, medium,
and high pollution level of a day here would probably be
different from the AQI published by BJEPB, which is
based on only part of sites in this study.
3.2 Diurnal variation among seasons and sites
Diurnal characteristics of PM2.5 concentration varied with
seasons and sites (Fig. 4). The overall PM2.5 concentration
had significantly higher values in winter than the other
three seasons (Fig. 4a). Spring was slightly but consistently
higher than summer, while autumn showed stronger diurnal
fluctuations with lower values during daytime and higher
values at night. The seasonal variations were probably
caused by changes in meteorological conditions and sour-
ces of particulate matter. For example, dry climate and
heavy wind in spring generated more soil dust, while wet
and hot summer enhanced photochemistry and generated
more secondary pollution, and cold winter induced more
primary pollution from coal burning for heating [21–25].
Diurnal variation was weak in spring and summer, but
was much stronger in autumn and winter (Fig. 4a). The
daily variation in autumn and winter seemed like a flat
‘‘W’’ shape, with lowest values generally appearing at
06:00–07:00 or 14:00–16:00.
Diurnal concentrations varied largely among sites
(Fig. 4b). Transmission sites in the north had the lowest
values, while sites in the southwest had the highest values.
The concentrations at southwest sites were nearly double
that of the north sites, which revealed the remarkable
spatial variation from south to north. Traffic sites were
generally higher than urban assessment sites. Concentra-
tion at most sites rose from 06:00 until 11:00 to reach the
peak and then decreased reaching the lowest point of a day
at around 16:00, except for urban background sites and
transmission sites in the north. Concentration at urban
background sites rose steadily during daytime and showed
a distinct pattern.
0
20
40
60
80
100
120
140
160
00:0
0
02:0
0
04:0
0
06:0
0
08:0
0
10:0
0
12:0
0
14:0
0
16:0
0
18:0
0
20:0
0
22:0
0
MP
naeM
2.5
m/gµ (no ita rt n ecnoc
3 )
Spring Summer Autumn Winter
(a)
(b)
0
20
40
60
80
100
120
140
00:0
0
02:0
0
04:0
0
06:0
0
08:0
0
10:0
0
12:0
0
14:0
0
16:0
0
18:0
0
20:0
0
22:0
0
MP
naeM
2.5
m/gµ(noitartn ecnoc
3 )
Transmission-Southwest Urban assessmentTransmission-Southeast Traffic sitesTransmission-North Urban background
Fig. 4 Diurnal variation of PM2.5 concentration in different seasons
and among different types of site. a Seasonal variation of PM2.5
concentration of 35 sites for Spring (March–May), Summer (June–
August), Autumn (September–November), and Winter (December–
February), b spatial variation across 24 h among urban assessment
sites, traffic sites, urban background site, and transmission sites in
southwest, southeast, and north directions
Sci. Bull. (2015) 60(3):387–395 391
123

3.3 The spatial trend
To investigate the general spatial trend across the study
area, regression analysis of PM2.5 concentration with dis-
tance from the site to the south was conducted for each
pollution level (Table 2, Fig. 5). Analysis was conducted
with and without traffic sites separately. Traffic sites were
included to demonstrate the effect of local automobile
emission sources on the overall pollution pattern.
PM2.5 concentration showed a very good relationship with
distance from south, with R2 larger than 0.70 when all 35 sites
were used, and larger than 0.80 without traffic sites (Table 2).
Relative ranking of R2 for different pollution levels was All
days (R2 = 0.84) [ Medium (R2 = 0.83) [ Low (R2 =
0.77) [ High (R2 = 0.73) for all 35 sites. The relative rank of
R2 kept the same when traffic sites were excluded, and an
improved relationship was obtained with R2 = 0.89 for All
days and R2 = 0.80 for High pollution level.
A clear spatial trend could be found with the PM2.5 con-
centration decreasing steadily from the south to north of
Beijing (Fig. 5). Without traffic sites, the gradient was about
0.46 lg/m3/km for all of the study period, 0.83 lg/m3/km for
highly polluted days, 0.52 lg/m3/km at medium pollution
level, and 0.26 lg/m3/km at low pollution levels (Table 2).
Therefore, gradual change of the PM2.5 concentration from
south to north of Beijing, with the distance exceeding
100 km, caused significant regional differences.
4 Discussion
This study presented the overall spatiotemporal character-
istics of PM2.5 in Beijing based on the latest hourly data
from 35 sites including 5 traffic sites. Diurnal, seasonal,
PM2.5 = – 0.4741DSF + 116.65R 2 = 0.84
0
30
60
90
120
150
0 20 40 60 80 100 120
PM
2.5
m/gµ(
no itartne cn oc3 )
Distance from south (km)
(a)
Urban background Regional transmission
Urban assessment Traffic pollution
PM2.5 = –0.8736DSF + 258.26R 2 = 0.74
0
60
120
180
240
300
0 20 40 60 80 100 120
PM
2.5
conc
entr
atio
n (µ
g/m
3 )
Distance from south (km)
(b)
Urban background Regional transmission
Urban assessment Traffic pollution
PM2.5 = –0.5468DSF + 138.66R 2 = 0.83
0
30
60
90
120
150
0 20 40 60 80 100 120
PM
2.5
m/gµ(
noit art nec noc3 )
Distance from south (km)
(c)
Urban background Regional transmission
Urban assessment Traffic pollution
PM2.5 = – 0.2685DSF + 58.13R 2 = 0.77
0
10
20
30
40
50
60
70
0 20 40 60 80 100 120
PM
2.5
conc
entr
atio
n (µ
g/m
3 )
Distance from south (km)
(d)
Urban background Regional transmission
Urban assessment Traffic pollution
Fig. 5 Regression plot of PM2.5 concentration to distance from south (DFS) of Beijing of 35 sites, with labeled site types and ±10 % enveloping
area of the trend line. a Data of entire research period, b high polluted days, c medium polluted days, d low polluted days
Table 2 Regression of PM2.5 concentration to distance from south
(DFS) of Beijing under different pollution levels
Pollution
levels
Regression function Number of
sites
R2
Low PM2.5 = -0.2685DFS ? 58.13 35 0.77
PM2.5 = -0.2588DFS ? 56.94 30 0.81
Medium PM2.5 = -0.5468DFS ? 138.66 35 0.83
PM2.5 = -0.5237DFS ? 135.87 30 0.88
High PM2.5 = -0.8736DFS ? 258.26 35 0.73
PM2.5 = -0.8336DFS ? 252.99 30 0.80
All days PM2.5 = -0.4741DFS ? 116.65 35 0.84
PM2.5 = -0.4553DFS ? 114.31 30 0.89
392 Sci. Bull. (2015) 60(3):387–395
123

and spatial variations of the PM2.5 concentrations were
demonstrated.
Daily fluctuations varied among sites and seasons,
mainly due to diversification in local emissions, secondary
reactions, regional transmissions, and meteorological con-
ditions (such as wind speed, wind direction, and solar
radiation). Variation between heavily polluted days and
good days followed the cycles of quick accumulation and
rapid removal processes, which was similar to previous
study [20]. Daily mean PM2.5 concentrations fluctuated
markedly, and heavily polluted days were several times
higher than the neighboring days. Fog and haze days not
only appeared in winter, but also occurred during the
summer and autumn. Highly polluted days mostly occurred
during stagnant weather conditions, and the good days
were usually accompanied with heavy wind (Fig. 2). Thus,
the rapidly raised PM2.5 concentrations were probably the
result of large emission, reaction, or transmission rate
comparing with small dispersion rate, which induced fast
regional accumulation of PM2.5.
As for annual variations, higher PM2.5 concentration in
winter was probably attributable to increased emissions
due to coal burning for heating, superimposed with lower
vertical dispersion, which adjusted with solar radiation.
Decreasing PM2.5 concentrations from south to north
represented the overall spatial pattern across the study area.
The pattern was simple yet steady and clear regardless of
the pollution level, which confirmed the public perceptual
recognition of air quality in Beijing. The spatial gradient
from south to north varied with pollution levels and was
much larger during highly polluted days, indicating larger
difference of pollution accumulation rate among regions
under such conditions (Table 2, Fig. 5). Pollutants at or
surrounding the south part of Beijing were even higher than
at traffic sites (Figs. 3–5). However, transmission sites in
the north part retained a consistently lower level around the
year, representing the closeness to regional background
with much less anthropogenic emissions nearby.
Behind the general spatial trend, local variation could
also be observed (Fig. 5). Some sites faraway from emis-
sion sources were 10 % lower than the trend line, and some
traffic sites were more than 10 % higher (Fig. 5a). This
indicated that local variation of annual mean PM2.5 could
be more than roughly 20 % in the urban area and that
traffic emission was an important influencing factor at the
intra-urban scale. However, the overall spatial trend over-
whelmed the traffic effect, and we may arbitrarily deduce
that restricting traffic on roads would improve air quality,
but might have limited effects due to high regional pollu-
tion. This could also be partly verified by results from other
studies that traffic contributed relatively small portion to
total air pollution in Beijing [22, 23].
PM2.5 concentrations at Transmission sites in the north
were even lower than urban background sites (Fig. 3–5).
This could be explained by the spatial trend shown in
Fig. 5. The urban background site was closer to the central
urban area and also closer to the south of Beijing, therefore
was closer to emission sources or more influenced by
pollution transported from the south.
The concentrations of regional transmission sites in the
south were also higher than the central urban area, espe-
cially during periods with low pollution levels (Fig. 5d).
Therefore, except for traffic emissions, there should be
extra emissions generated from the south suburban area or
transported from the neighboring Hebei Province in the
south or Tianjin Municipality in the southeast. This could
also be verified by the inconsistent behavior of sites
neighboring Hebei and Tianjin with the inner sites that far
from the southeastern or southwestern boundary (Fig. 6).
PM2.5 concentrations generally decreased when distance to
the core urban area (taking Tian’anmen as the center)
increased, except for the abnormal sites located close to
Hebei and Tianjin, which were obvious outliers. The out-
liers had much higher concentrations and partly indicated a
large amount of cross-boundary transmission from outside.
Previous studies have also shown that contribution from the
outside would be significant [15–17]. However, the quan-
titative contribution of each part, e.g., locally generated and
transmission across large spatial scales, had not been
clearly separated here in this study.
Another issue requiring explanation is the daily AQI of
Beijing. AQI is usually published based on 11 sites in the
0
20
40
60
80
100
120
0 20 40 60 80
MP
naeM
2.5
m/g µ(noitartnecnoc
3 )
Distance to Tian'anmen (km)
Close to Hebei
Close to Tianjin
Fig. 6 Plot of PM2.5 concentration to the distance of site to center of
Beijing core area, Tian’anmen. Outliers in the circles were close to
Hebei Province and Tianjin Municipality
Sci. Bull. (2015) 60(3):387–395 393
123

National network within the 23 urban assessment sites that
are close to or located in areas with people intensively
living or working. These sites are adopted to assess the
overall health risk to air pollution inside Beijing. Figure 5
clearly shows that PM2.5 concentrations of urban assess-
ment sites varied largely from south to north. Therefore,
the daily AQI of Beijing is used to represent the overall air
condition of a certain day and could not reflect the indi-
vidual conditions at a specific location. This is probably the
reason for disagreement about the published AQI [9].
As is shown in Fig. 5, the transmission site in the north
has the lowest PM2.5 concentration of entire Beijing, while
the transmission site in the south region tended to have the
highest. We could then arbitrarily infer that the difference
of PM2.5 concentration between regional transmission sites
at north and urban assessment sites, to some extent, indi-
cated the maximum potential magnitude of improvements
that would be achieved by environmental management
practices in a predictable future. Yet, PM2.5 concentration
in Beijing was generally high, with the lowest concentra-
tion of monitoring sites in the north (about 60 lg/m3) still
much higher than developed countries [18, 26–33]. Further
pollution reduction may occur after the launch of Beijing
2013–2017 Clean Air Action Plan.
5 Conclusions
Spatiotemporal variation of PM2.5 concentration in Beijing
was investigated in this study. The median of PM2.5 con-
centration of all the 35 sites (including 5 traffic sites) was
71.4 lg/m3, with the range of 7.7–411.7 lg/m3, and mean
of 88.6 lg/m3 during the study period. The time series of
PM2.5 showed a typical accumulation–removal circle, with
heavy wind as an important influencing factor. PM2.5
concentration varied largely between seasons, with winter
significantly higher than the other three seasons, and more
distinct diurnal variation could be observed in winter and
autumn. PM2.5 concentration decreased linearly from south
to north, with a gradient of -0.46 lg/m3/km in average.
The spatial gradient of PM2.5 concentration was small at
low polluted days (excellent-good days) with the value of
-0.26 lg/m3/km, but would be larger at lightly-moderately
polluted and heavily-severely polluted days, with -0.52
and -0.83 lg/m3/km, respectively. PM2.5 concentrations at
traffic sites which floated with different site locations, were
generally 10 % higher than nearby urban assessment sites.
In future study, a detailed land use regression (LUR)
model including various geographic covariates can be
adopted to explore the spatial distribution of PM2.5 con-
centration and the potential contributors in Beijing. Also,
examination of the spatiotemporal evolutionary process of
haze and fog days using hourly data from spatially
scattered sites may partly reveal the origin and transmis-
sion of pollutants.
Acknowledgments We thank Mingsi Xie from Research Labora-
tory for Conservation and Archaeology of Shanghai Museum who
contributed instructive discussions. This study was supported by the
Key Research Program of Chinese Academy of Sciences (KZZD-
EW-13), the Gong-Yi Program of Chinese Ministry of Environmental
Protection (200909016, 201209008), the National Natural Science
Foundation of China (21377127, 41201038), and the President Fund
of University of Chinese Academy of Sciences (UCAS).
Conflict of interest The authors declare that they have no conflict
of interest.
References
1. Cao JJ, Xu HM, Xu Q et al (2012) Fine particulate matter con-
stituents and cardiopulmonary mortality in a heavily polluted
Chinese city. Environ Health Perspect 120:373–378
2. Du X, Kong Q, Ge W et al (2010) Characterization of personal
exposure concentration of fine particles for adults and children
exposed to high ambient concentrations in Beijing, China.
J Environ Sci 22:1757–1764
3. Pope CA III, Ezzati M, Dockery DW (2009) Fine-particulate air
pollution and life expectancy in the United States. N Engl J Med
360:376–386
4. Dockery DW, Stone PH (2007) Cardiovascular risks from fine
particulate air pollution. N Engl J Med 356:511–513
5. Miller KA, Siscovick DS, Sheppard L et al (2007) Long-term
exposure to air pollution and incidence of cardiovascular events
in women. N Engl J Med 356:447–458
6. Jerrett M, Burnett RT, Beckerman BS et al (2013) Spatial ana-
lysis of air pollution and mortality in California. Am J Respir Crit
Care Med 188:593–599
7. Cao JJ, Chow JC, Lee FSC et al (2013) Evolution of PM2.5
measurements and standards in the U.S. and future perspectives
for China. Aerosol Air Qual Res 13:1197–1211
8. Han X, Zhang M, Tao J et al (2013) Modeling aerosol impacts on
atmospheric visibility in Beijing with RAMS-CMAQ. Atmos
Environ 72:177–191
9. Wang JF, Hu MG, Xu CD et al (2013) Estimation of citywide air
pollution in Beijing. PLoS One 8:e53400
10. Yang Y, Li RK, Li WJ et al (2013) The association between
ambient air pollution and daily mortality in Beijing after the 2008
Olympics: a time series study. PLoS One 8:e76759
11. Zhang A, Qi QW, Jiang LL et al (2013) Population exposure to
PM2.5 in the urban area of Beijing. PLoS One 8:e63486
12. Zhang FY, Krafft T, Ye BX et al (2013) The lag effects and
seasonal differences of air pollutants on allergic rhinitis in Bei-
jing. Sci Total Environ 442:172–176
13. Zhang FY, Li LP, Krafft T et al (2011) Study on the association
between ambient air pollution and daily mortality of cardiovas-
cular disease and respiratory disease in a district of Beijing. Int J
Environ Res Publ Health 8:2109–2123
14. Wang SX, Zhao M, Xing J et al (2010) Quantifying the air pol-
lutants emission reduction during the 2008 Olympic Games in
Beijing. Environ Sci Technol 44:2490–2496
15. Chen DS, Cheng SY, Liu L et al (2007) An integrated MM5-
CMAQ modeling approach for assessing trans-boundary PM10
contribution to the host city of 2008 Olympic summer games—
Beijing, China. Atmos Environ 41:1237–1250
394 Sci. Bull. (2015) 60(3):387–395
123

16. Streets DG, Fu JS, Jang CJ et al (2007) Air quality during the
2008 Beijing Olympic Games. Atmos Environ 41:480–492
17. Wang LT, Hao JM, He KB et al (2008) A modeling study of
coarse particulate matter pollution in beijing: regional source
contributions and control implications for the 2008 Summer
Olympics. J Air Waste Manage Assoc 58:1057–1069
18. Beckerman BS, Jerrett M, Serre M et al (2013) A hybrid approach
to estimating national scale spatiotemporal variability of PM2.5 in
the contiguous United States. Environ Sci Technol 47:7233–7241
19. Richardson DB, Volkow ND, Kwan MP et al (2013) Spatial turn
in health research. Science 339:1390–1392
20. Xin JY, Wang YS, Tang GQ et al (2010) Variability and
reduction of atmospheric pollutants in Beijing and its surrounding
area during the Beijing 2008 Olympic Games. Chin Sci Bull
55:1937–1944
21. Yao Q, Li SQ, Xu HW et al (2009) Studies on formation and
control of combustion particulate matter in China: a review.
Energy 34:1296–1309
22. Zhang R, Jing J, Tao J et al (2013) Chemical characterization and
source apportionment of PM2.5 in Beijing: seasonal perspective.
Atmos Chem Phys 13:7053–7074
23. Yu L, Wang G, Zhang R et al (2013) Characterization and source
apportionment of PM2.5 in an urban environment in Beijing. Aero
Air Qual Res 13:574–583
24. Zhang K, Wang YS, Wen TX et al (2007) Properties of nitrate,
sulfate and ammonium in typical polluted atmospheric aerosols
(PM10) in Beijing. Atmos Res 84:67–77
25. Meng Z, Dabdub D, Seinfeld JH (1997) Chemical coupling
between atmospheric ozone and particulate matter. Science
277:116–119
26. Henderson SB, Beckerman B, Jerrett M et al (2007) Application
of land use regression to estimate long-term concentrations of
traffic-related nitrogen oxides and fine particulate matter. Environ
Sci Technol 41:2422–2428
27. Moore DK, Jerrett M, Mack WJ et al (2007) A land use regres-
sion model for predicting ambient fine particulate matter across
Los Angeles, CA. J Environ Monit 9:246–252
28. Ross Z, Jerrett M, Ito K et al (2007) A land use regression for
predicting fine particulate matter concentrations in the New York
City region. Atmos Environ 41:2255–2269
29. Kashima S, Yorifuji T, Tsuda T et al (2009) Application of land
use regression to regulatory air quality data in Japan. Sci Total
Environ 407:3055–3062
30. Su JG, Jerrett M, Beckerman B et al (2009) Predicting traffic-
related air pollution in Los Angeles using a distance decay
regression selection strategy. Environ Res 109:657–670
31. Hoek G, Beelen R, Kos G et al (2011) Land use regression model
for ultrafine particles in Amsterdam. Environ Sci Technol
45:622–628
32. Beckerman BS, Jerrett M, Martin RV et al (2013) Application of
the deletion/substitution/addition algorithm to selecting land use
regression models for interpolating air pollution measurements in
California. Atmos Environ 77:172–177
33. Sampson PD, Richards M, Szpiro AA et al (2013) A regionalized
national universal kriging model using partial least squares
regression for estimating annual PM2.5 concentrations in epide-
miology. Atmos Environ 75:383–392
Sci. Bull. (2015) 60(3):387–395 395
123