investigation on reconstruction methods applied to 3d terahertz computed tomography
TRANSCRIPT
Investigation on reconstruction methodsapplied to 3D terahertz computed
tomography
B. Recur,3 A. Younus,1 S. Salort,2 P. Mounaix,1 B. Chassagne,2P. Desbarats,3 J-P. Caumes,2 and E. Abraham1,∗
1LOMA, Universite de Bordeaux / CNRS351 Cours de la Liberation, 33405 Talence Cedex, France
2ALPhANOV, Centre Technologique Optique et Lasers, Universite de Bordeaux351 Cours de la Liberation, 33405 Talence Cedex, France
3LaBRI, Universite de Bordeaux / CNRS351 Cours de la Liberation, 33405 Talence Cedex, France
Abstract: 3D terahertz computed tomography has been performed usinga monochromatic millimeter wave imaging system coupled with an infraredtemperature sensor. Three different reconstruction methods (standardback-projection algorithm and two iterative analysis) have been comparedin order to reconstruct large size 3D objects. The quality (intensity, contrastand geometric preservation) of reconstructed cross-sectional images hasbeen discussed together with the optimization of the number of projections.Final demonstration to real-life 3D objects has been processed to illustratethe potential of the reconstruction methods for applied terahertz tomogra-phy.
© 2011 Optical Society of AmericaOCIS codes: (110.6795) Terahertz imaging, (110.6955) Tomographic imaging, (100.6890)Three-dimensional image processing, (170.3010) Image reconstruction techniques, (120.5800)Scanners.
References and links1. W. L. Chan, J. Deibel, and D. M. Mittleman, “Imaging with terahertz radiation,” Rep. Prog. Phys. 70, 1325–1379
(2007).2. K. Kawase, Y. Ogawa, Y. Watanabe, and H. Inoue, “Non-destructive terahertz imaging of illicit drugs using
spectral fingerprints,” Opt. Express 11, 2549–2554 (2003).3. Y. C. Shen, T. Lo, P. F. Taday, B. E. Cole, W. R. Tribe, and M. C. Kemp, “Detection and identification of
explosives using terahertz pulsed spectroscopic imaging,” Appl. Phys. Lett. 86, 241116 (2005).4. K. Fukunaga and M. Picollo, “Terahertz spectroscopy applied to the analysis of artists materials,” Appl. Phys. A
100, 591–597 (2010).5. E. Abraham, A. Younus, J.-C. Delagnes, and P. Mounaix, “Non-invasive investigation of art paintings by terahertz
imaging,” Appl. Phys. A 100, 585–590 (2010).6. S. Y. Huang, Y. X. J. Wang, D. K. W. Yeung, A. T. Ahuja, Y. T. Zhang, and E. Pickwell-MacPherson, “Tissue
characterization using terahertz pulsed imaging in reflection geometry,” Phys. Med. Biol. 54, 149–160 (2009).7. B. Ferguson, S. Wang, D. Gray, D. Abbot, and X. C. Zhang, “T-ray computed tomography,” Opt. Lett. 27, 1312–
1314 (2002).8. E. Abraham, A. Younus, C. Aguerre, P. Desbarats, and P. Mounaix, “Refraction losses in terahertz computed
tomography,” Opt. Commun. 283, 2050–2055 (2010).9. S. Wang, B. Ferguson, D. Abbott, and X. C. Zhang, “T-ray imaging and tomography,” J. Biol. Phys. 29, 247–256
(2003).
10. S. Wang and X. C. Zhang, “Pulsed terahertz tomography,” J. Phys. D: Appl. Phys. 37, R1–R36 (2004).11. M. M. Awad and R. A. Cheville, “Transmission terahertz waveguide-based imaging below the diffraction limit,”
Appl. Phys. Lett. 86, 221107 (2005).12. X. Yin, B. W. H. Ng, B. Ferguson, and D. Abbott, “Wavelet based local tomographic image using terahertz
techniques,” Digital Signal Process. 19, 750–763 (2009).13. A. Brahm, M. Kunz, S. Riehemann, G. Notni, and A. Tunnermann, “Volumetric spectral analysis of materials
using terahertz-tomography techniques,” Appl. Phys. B 100, 151–158 (2010).14. K. L. Nguyen, M. L. Johns, L. F. Gladden, C. H. Worral, P. Alexander, H. E. Beere, M. Pepper, D. A. Ritchie,
J. Alton, S. Barbieri, and E. H. Linfield, “Three-dimensional imaging with a terahertz quantum cascade laser,”Opt. Express 14, 2123–2129 (2006).
15. A. Younus, S. Salort, B . Recur, P . Desbarats, P . Mounaix, J-P. Caumes, and E. Abraham, “3D millimeterwave tomographic scanner for large size opaque object inspection with different refractive index contrasts,” inMillimetre Wave and Terahertz Sensors and Technology III, K.A. Krapels and N.A. Salmon, eds., Proc. SPIE7837, 783709 (2010).
16. N. Sunaguchi, Y. Sasaki, N. Maikusa, M. Kawai, T. Yuasa, and C. Otani, “Depth-resolving terahertz imagingwith tomosynthesis,” Opt. Express 17, 9558–9570 (2009).
17. T. Yasuda, T. Yasui, T. Araki, and E. Abraham, “Real-time two-dimensional terahertz tomography of movingobjects,” Opt. Commun. 267, 128–136 (2006).
18. T. Yasui, K. Sawanaka, A. Ihara, E. Abraham, M. Hashimoto, and T. Araki, “Real-time terahertz color scannerfor moving objects,” Opt. Express 16, 1208–1221 (2008).
19. G. T. Herman, Image Reconstruction From Projections : The Fundamentals of Computerized Tomography (Aca-demic Press Inc., New York, 1980).
20. A. H. Andersen and A. C. Kak, “Simultaneous algebraic reconstruction technique (SART) : A superior imple-mentation of the ART algorithm,” Ultrasonic Imaging 6, 81–94 (1984).
21. L. A. Shepp and Y. Vardi, “Maximum likelihood reconstruction for emission tomography,” IEEE Trans. Med.Imaging 1, 113–122 (1982).
22. H. M. Hudson and R. S. Larkin, “Accelerated image reconstruction using ordered subsets of projection data,”IEEE Trans. Med. Imaging 13, 601–609 (1994).
23. C. Pradere, J.-P. Caumes, D. Balageas, S. Salort, E. Abraham, B. Chassagne, and J.-C. Batsale, “Photothermalconverters for quantitative 2D and 3D real-time terahertz imaging,” Quantitative InfraRed Thermography 7, 217–235 (2010).
24. P. Toft, “The Radon Transform : Theory and Implementation,” Ph.D. thesis, Department of Mathematical Mod-elling, Section for Digital Signal Processing, Technical University of Denmark (1996).
25. J. Radon, “Uber die Bestimmung von Funktionen durch ihre Integralwerte langs gewisser Mannigfaltigkeiten.”Ber. Ver. Sachs. Akad. Wiss. Leipzig, Math-Phys. Kl 69, 262–277 (1917). In German. An english translation canbe found in S. R. Deans : The Radon Transform and Some of Its Applications.
26. R. Gordon, R. Bender, and G. T. Herman, “Algebraic Reconstruction Techniques (ART) for Three-dimensionalElectron Microscopy and X-ray Photography,” J. Theor. Biol. 29, 471–481 (1970).
27. B. Recur, “Qualite et Precision en Reconstruction Tomographique : Algorithmes et Applications,” Ph.D. thesis,LaBRI, Bordeaux 1 University (2010).
28. Z. Wang, A. C. Bovik, H. R. Sheikh, and E. P. Simoncelli, “Image quality assessment : From error visibility tostructural similarity,” IEEE Trans. Image Process. 13 600–612 (2004).
1. Introduction
In the field of 3D imaging, X-Ray Computed Tomography (CT) is an ubiquitous techniquewhich provides cross-sectional images of an object by analyzing the radiation transmitted bythe sample through different incidence angles. This technique can visualize 3D dense mate-rials such as wood, bones and biological tissues but cannot be easily applied to soft materi-als such as plastics, papers or paintings owing to the low absorption of the X-Ray radiation.Alternatively, terahertz (THz) radiation proposes attractive features such as non-invasive andnon-destructive analysis, transparency and good penetration depth through various materials[?]. All these properties make THz radiation very promising for direct applications in non-destructive inspection, detection of illicit drugs [?] and explosives [?], art conservation [?, ?]and biomedical applications [?]. Especially in 2002, THz CT has been proposed for 3D imag-ing of opaque materials [?]. Ferguson et al. demonstrated that cross-sectional images can beobtained by measuring the transmitted amplitude and phase of broadband THz pulses at mul-tiple projection angles. However, it has been emphasized that several peaks in the THz wave-
form obtained with a time-domain spectrometer strongly complicate the signal analysis [?].Although THz CT seems powerful, few papers have been published since the technique suffersfrom strong limitations [?, ?, ?, ?, ?, ?].
The first limitation concerns the diffraction effects and Fresnel losses experienced by thepropagation of the THz wave through the sample [?]. Until now, most samples that have beenimaged using THz CT were made of polystyrene or similar low refractive index materials.However, as soon as the refractive index of the sample is in the order or greater than 1.5, whichrepresents the majority of realistic samples, the THz beam is strongly refracted by the sampleand the transmitted signal is very difficult to detect.
The second limitation is the long acquisition time required by pulsed THz system based ontime-domain spectrometer, since it used a point-to-point measurement associated with a tempo-ral sampling and the rotation of the sample. This limitation can be reduced by the utilization ofa continuous wave THz source even if in this case the phase information of the object can not beextracted [?, ?]. The limitation is also directly connected to the number of projection data. Toreduce this parameter, a recent study proposed the development of depth-resolving THz imag-ing with tomosynthesis, which is similar to CT except that the number of projections is muchsmaller [?]. The authors used only five projections instead of generally 15 to 20 in THz CT.However, the efficiency of their system was mainly limited to thin and wide samples (50 sheetsof post-it notes). Another method to perform fast THz imaging consists in illuminating thesample by a focused THz line and detecting the THz radiation by non-collinear electro-opticaltime-to-space conversion in a non-linear crystal [?, ?].
Finally, it is obvious that an important consideration in CT concerns the choice of the recon-struction method to be able to visualize the different cross-sectional images and the final 3Dvolume of the sample. Usually, a back-projection of the filtered projections (BFP) is employedas the standard reconstruction method [?]. The analysis is based on Radon inverse transfor-mations from the projection data. In the case of THz CT, to our knowledge, only this BFPmethod has been employed since it is proposed in most conventional mathematical softwares.However, in X-Ray CT, it is well-known that BFP suffers from several disadvantages such asbeam hardening, noise sensitivity and geometric degradation in case of insufficient number ofprojections. Consequently, alternative iterative reconstruction methods have been proposed forX-Ray CT such as the Simultaneous Algebraic Reconstruction Technique (SART) [?] and theOrdered Subsets Expectation Maximization (OSEM) method [?, ?]. These alternative iterativereconstruction methods have never been applied to THz CT. In this paper, to the first time to ourknowledge, we propose to test and compare these three reconstruction methods (BFP, SART,OSEM) applied to THz CT. Especially, a particular interest will concern the optimization ofthe number of projections associated with the preservation of the image quality. For this study,we employed a flexible and easy-to-align system based on a continuous millimeter wave sourceand a commercial pyroelectric sensor.
The paper is organized as follows. In the first part, the experimental setup and the spatialresolution of the system will be presented. Then, the reconstruction methods will be exposedand evaluated taking into account the number of projections and the quality (intensity, contrast,noise, geometric preservation) of the final reconstructed cross-sections. Finally, challenges forprecise and efficient tomographic reconstruction of complex refraction index materials will beunderlined in order to demonstrate the potential of the proposed 3D millimeter wave tomo-graphic scanner.
2. Experimental setup
The experimental setup of the 3D millimeter wave tomographic scanner is shown in Fig. ??(a).The output beam of a compact millimeter wave Gunn diode coupled with a horn antenna is
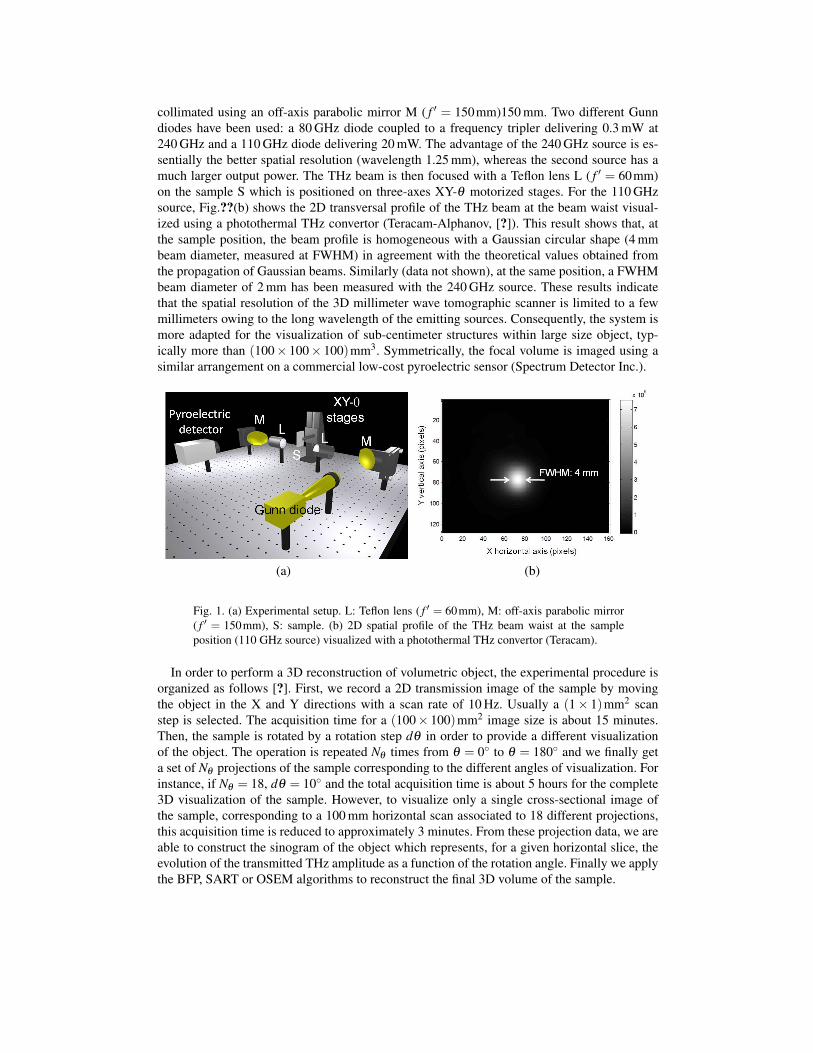
collimated using an off-axis parabolic mirror M ( f ′ = 150mm)150 mm. Two different Gunndiodes have been used: a 80 GHz diode coupled to a frequency tripler delivering 0.3 mW at240 GHz and a 110 GHz diode delivering 20 mW. The advantage of the 240 GHz source is es-sentially the better spatial resolution (wavelength 1.25 mm), whereas the second source has amuch larger output power. The THz beam is then focused with a Teflon lens L ( f ′ = 60mm)on the sample S which is positioned on three-axes XY-θ motorized stages. For the 110 GHzsource, Fig.??(b) shows the 2D transversal profile of the THz beam at the beam waist visual-ized using a photothermal THz convertor (Teracam-Alphanov, [?]). This result shows that, atthe sample position, the beam profile is homogeneous with a Gaussian circular shape (4 mmbeam diameter, measured at FWHM) in agreement with the theoretical values obtained fromthe propagation of Gaussian beams. Similarly (data not shown), at the same position, a FWHMbeam diameter of 2 mm has been measured with the 240 GHz source. These results indicatethat the spatial resolution of the 3D millimeter wave tomographic scanner is limited to a fewmillimeters owing to the long wavelength of the emitting sources. Consequently, the system ismore adapted for the visualization of sub-centimeter structures within large size object, typ-ically more than (100× 100× 100)mm3. Symmetrically, the focal volume is imaged using asimilar arrangement on a commercial low-cost pyroelectric sensor (Spectrum Detector Inc.).
(a) (b)
Fig. 1. (a) Experimental setup. L: Teflon lens ( f ′ = 60mm), M: off-axis parabolic mirror( f ′ = 150mm), S: sample. (b) 2D spatial profile of the THz beam waist at the sampleposition (110 GHz source) visualized with a photothermal THz convertor (Teracam).
In order to perform a 3D reconstruction of volumetric object, the experimental procedure isorganized as follows [?]. First, we record a 2D transmission image of the sample by movingthe object in the X and Y directions with a scan rate of 10 Hz. Usually a (1× 1)mm2 scanstep is selected. The acquisition time for a (100× 100)mm2 image size is about 15 minutes.Then, the sample is rotated by a rotation step dθ in order to provide a different visualizationof the object. The operation is repeated Nθ times from θ = 0◦ to θ = 180◦ and we finally geta set of Nθ projections of the sample corresponding to the different angles of visualization. Forinstance, if Nθ = 18, dθ = 10◦ and the total acquisition time is about 5 hours for the complete3D visualization of the sample. However, to visualize only a single cross-sectional image ofthe sample, corresponding to a 100 mm horizontal scan associated to 18 different projections,this acquisition time is reduced to approximately 3 minutes. From these projection data, we areable to construct the sinogram of the object which represents, for a given horizontal slice, theevolution of the transmitted THz amplitude as a function of the rotation angle. Finally we applythe BFP, SART or OSEM algorithms to reconstruct the final 3D volume of the sample.
3. Tomographic reconstruction methods
Tomography is used to reconstruct the volume of an object from the set of projections done fromthe exterior of the object [?, ?]. This technique, widely developed in X-Ray CT scan imaging,is modeled by the Radon theorem [?]. The direct transform R describes the projection lineacquisition. It maps a 2D function defined by f (x,y) into a 1D projection along an angle θ anda module ρ . It is defined by the following formula:
Rθ (ρ) =∫
∞
−∞
∫∞
−∞
f (x,y)δ (ρ− xcosθ − ysinθ)dxdy (1)
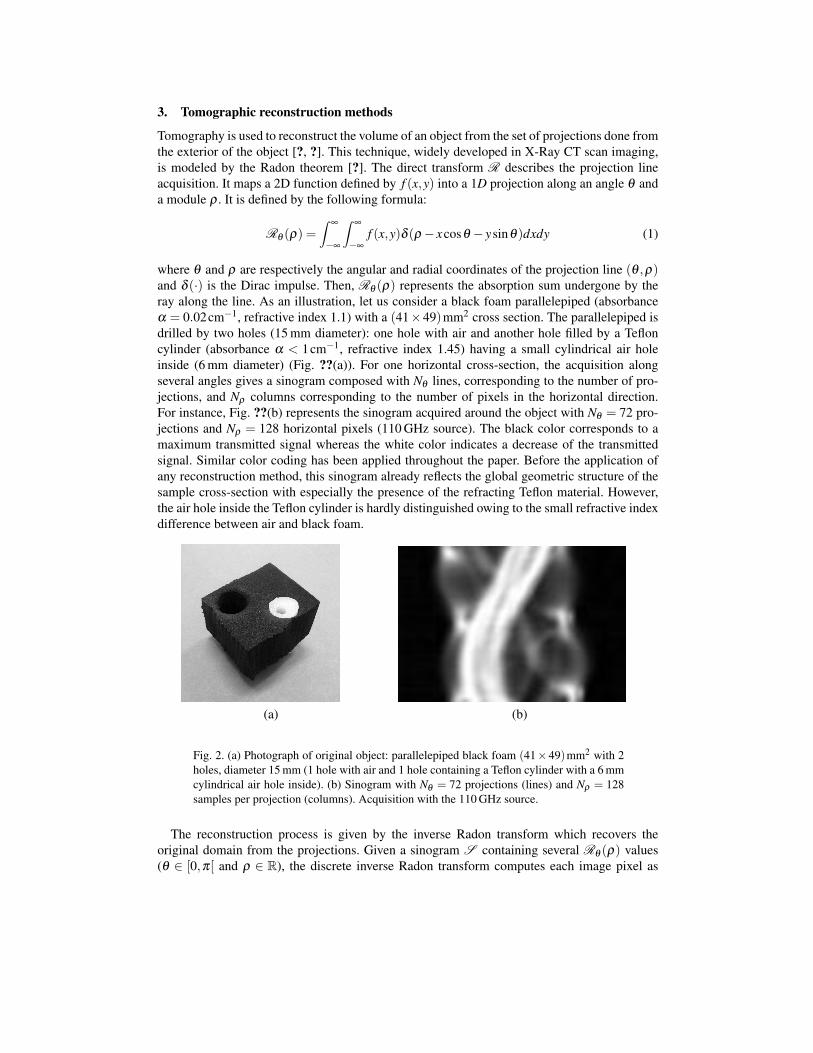
where θ and ρ are respectively the angular and radial coordinates of the projection line (θ ,ρ)and δ (·) is the Dirac impulse. Then, Rθ (ρ) represents the absorption sum undergone by theray along the line. As an illustration, let us consider a black foam parallelepiped (absorbanceα = 0.02cm−1, refractive index 1.1) with a (41×49)mm2 cross section. The parallelepiped isdrilled by two holes (15 mm diameter): one hole with air and another hole filled by a Tefloncylinder (absorbance α < 1cm−1, refractive index 1.45) having a small cylindrical air holeinside (6 mm diameter) (Fig. ??(a)). For one horizontal cross-section, the acquisition alongseveral angles gives a sinogram composed with Nθ lines, corresponding to the number of pro-jections, and Nρ columns corresponding to the number of pixels in the horizontal direction.For instance, Fig. ??(b) represents the sinogram acquired around the object with Nθ = 72 pro-jections and Nρ = 128 horizontal pixels (110 GHz source). The black color corresponds to amaximum transmitted signal whereas the white color indicates a decrease of the transmittedsignal. Similar color coding has been applied throughout the paper. Before the application ofany reconstruction method, this sinogram already reflects the global geometric structure of thesample cross-section with especially the presence of the refracting Teflon material. However,the air hole inside the Teflon cylinder is hardly distinguished owing to the small refractive indexdifference between air and black foam.
(a) (b)
Fig. 2. (a) Photograph of original object: parallelepiped black foam (41×49)mm2 with 2holes, diameter 15 mm (1 hole with air and 1 hole containing a Teflon cylinder with a 6 mmcylindrical air hole inside). (b) Sinogram with Nθ = 72 projections (lines) and Nρ = 128samples per projection (columns). Acquisition with the 110 GHz source.
The reconstruction process is given by the inverse Radon transform which recovers theoriginal domain from the projections. Given a sinogram S containing several Rθ (ρ) values(θ ∈ [0,π[ and ρ ∈ R), the discrete inverse Radon transform computes each image pixel as
follows:
I(i, j) =Nθ−1
∑iθ=0
Nρ
2
∑ρ=−Nρ
2
Wθ(iθ )(ρ)A(θ ,ρ),(i, j) (2)
where:
• θ(iθ ) = iθ π
Nθ,
• A(θ ,ρ),(i, j) is the weight-matrix defining the weight value between each pixel and eachprojection line,
• Wθ (ρ) =
Nρ
2
∑ν=−Nρ
2
|ν |
Nρ
2
∑ρs=−Nρ
2
Rθ (ρs)e−i2πρsν
ei2πρν .
First, this inversion filters each projection Rθ in the Fourier domain with the ramp filter |ν | toincrease geometric details. Second, it computes the pixel values from the filtered projectionsWθ(iθ ). This method is thus denoted back-projection of filtered projections (BFP). As alreadypointed out in the introduction, this technique is widely used in THz CT imaging since it isproposed in most of CT software tools.
However, it is known that BFP suffers from several drawbacks such as the beam hardeningand noise sensitivity. Moreover, it is very sensitive to the projection number Nθ . This numberNθ is very critical because it acts on the global acquisition time, which is particularly importantin THz CT imaging. Consequently, in this paper, we also investigated other reconstructionmethods allowing to reduce the projection number (i.e. the acquisition time) while preservingreconstruction quality.
Particularly, several CT imaging systems are based on iterative reconstructions such asSART [?] or OSEM [?] algorithms. The SART algebraic method is based on the Karczmarzalgorithm used to approach the solution of the linear equation system I = AT R, where I is theimage, R is the sinogram and A is the weight-matrix [?]. SART is an iterative process followingk ∈ [0 · · ·Niter[. Each sub-iteration s, 0 ≤ s < Nθ , updates each pixel of the image Ik,s by com-paring the original projection Rθs with Rk
θs(computed from Ik,s−1). A super-iteration k is over
when all the projections have been used. Consequently, pixel update using SART is computedas follows:
Ik,s(i, j) = Ik,s−1(i, j)+λ
Nρ−1
∑iρ=0
A(θ ,ρ),(i, j)
[Rθs(ρ)−Rk
θs(ρ)
Dθs(ρ)
]Nρ−1
∑iρ=0
A(θ ,ρ),(i, j)
(3)
where Dθ (ρ) =W−1
∑i=0
H−1
∑j=0
A(θ ,ρ),(i, j) is the norm of the segment (θ ,ρ) crossing the image and
(W ×H) is the image size. Iterations are performed until the convergence of the solution. Theinitial I0,0 image is usually an uniform image.
OSEM algorithm [?] is another iterative process which slightly differs from the SART. Theupdate is done from a subset of several projections at once and the error correction is multi-
plicative:
Ik+1(i, j) = I(i, j)k
Nθ−1
∑iθ=0
Nρ−1
∑iρ=0
A(θ ,ρ),(i, j)Rθ (ρ)
Rkθ(ρ)
Nθ−1
∑iθ=0
Nρ−1
∑iρ=0
A(θ ,ρ),(i, j)
(4)
With the OSEM method, the convergence of the solution is longer than with the SARTmethod because OSEM directly uses all the projections at once. Moreover, after convergence tothe solution, OSEM is very sensitive to any solution divergence so that it needs non-trivial reg-ularizations to reduce induced artifacts. However, OSEM reconstruction quality is commonlyhigher than SART and BFP ones. Finally, OSEM computation time is significantly longer thanother methods but still negligible compared to the acquisition time required for THz CT.
4. Quality and accuracy according to the projection number and the reconstructionmethod
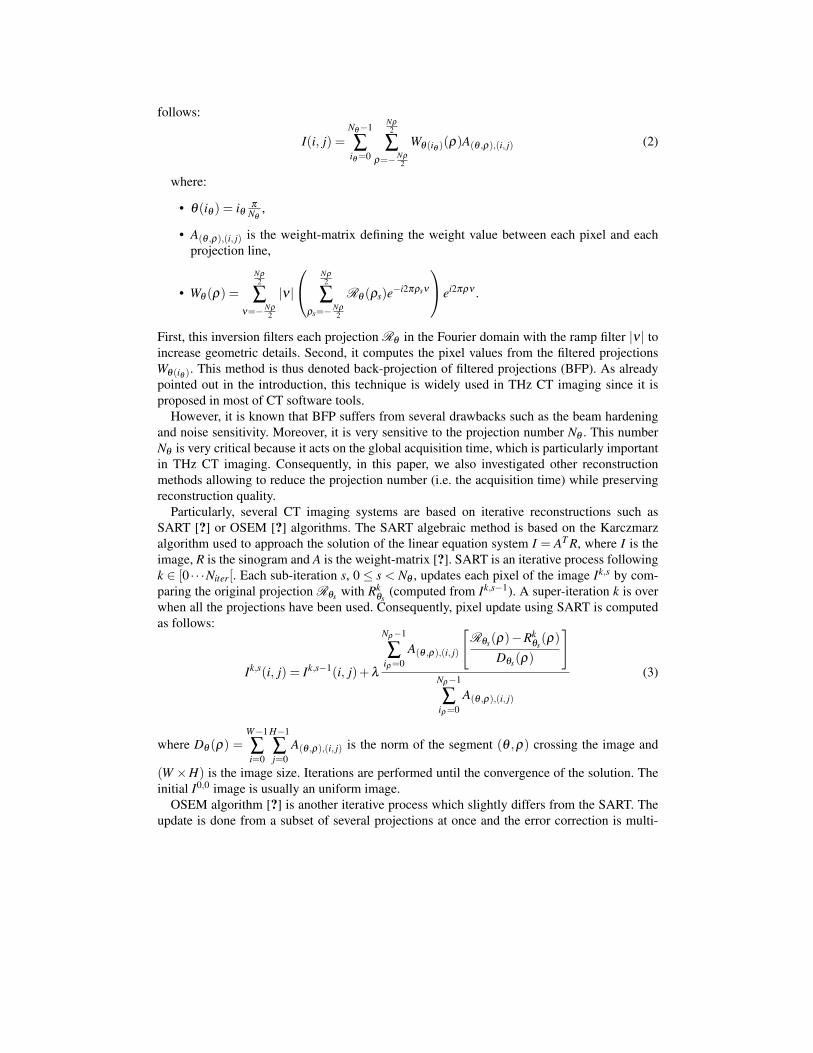
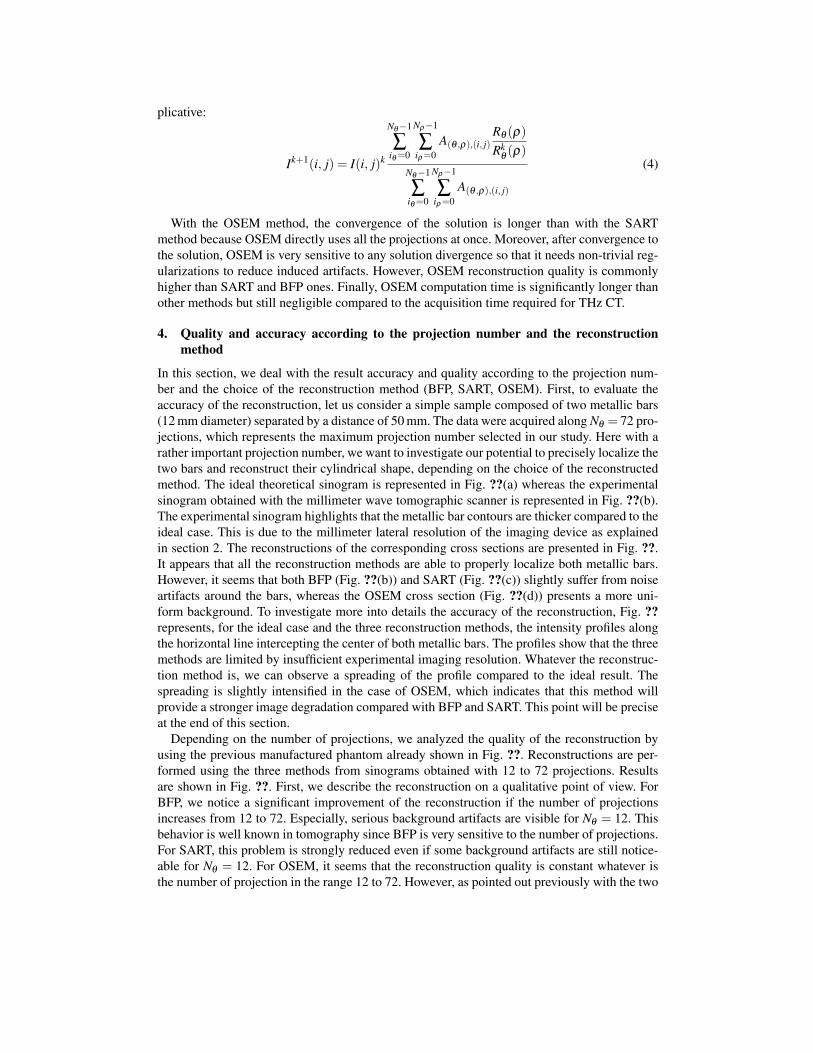
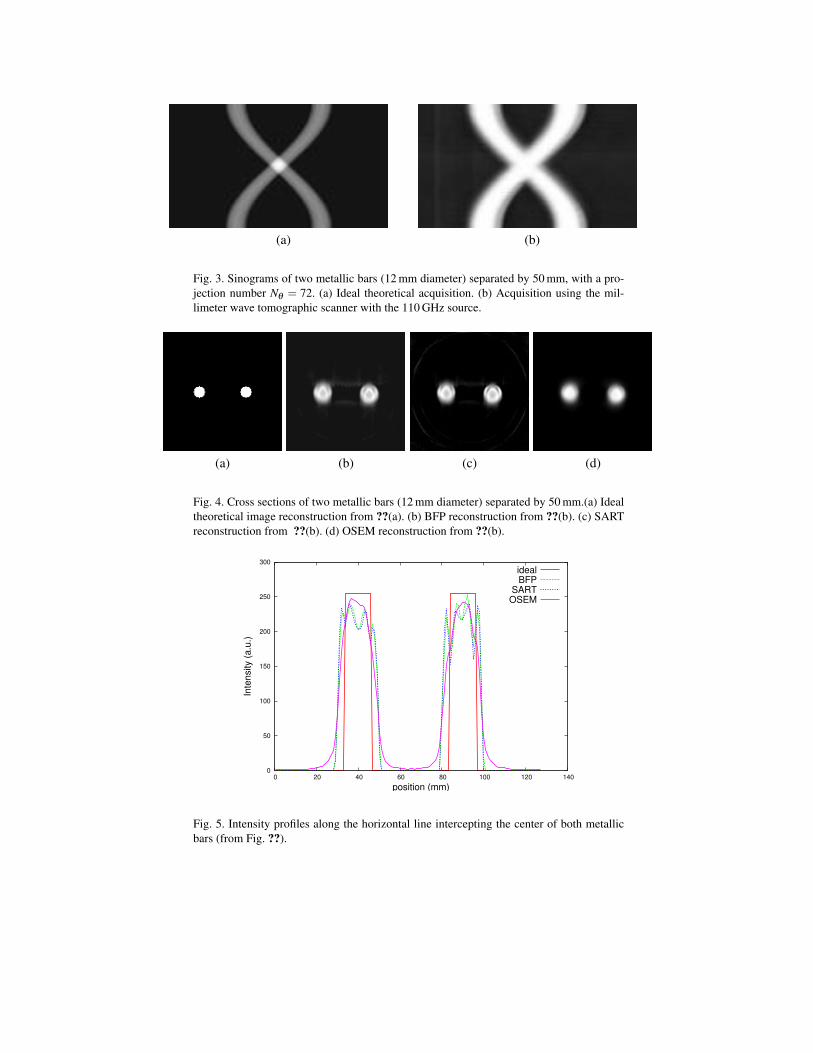
In this section, we deal with the result accuracy and quality according to the projection num-ber and the choice of the reconstruction method (BFP, SART, OSEM). First, to evaluate theaccuracy of the reconstruction, let us consider a simple sample composed of two metallic bars(12 mm diameter) separated by a distance of 50 mm. The data were acquired along Nθ = 72 pro-jections, which represents the maximum projection number selected in our study. Here with arather important projection number, we want to investigate our potential to precisely localize thetwo bars and reconstruct their cylindrical shape, depending on the choice of the reconstructedmethod. The ideal theoretical sinogram is represented in Fig. ??(a) whereas the experimentalsinogram obtained with the millimeter wave tomographic scanner is represented in Fig. ??(b).The experimental sinogram highlights that the metallic bar contours are thicker compared to theideal case. This is due to the millimeter lateral resolution of the imaging device as explainedin section 2. The reconstructions of the corresponding cross sections are presented in Fig. ??.It appears that all the reconstruction methods are able to properly localize both metallic bars.However, it seems that both BFP (Fig. ??(b)) and SART (Fig. ??(c)) slightly suffer from noiseartifacts around the bars, whereas the OSEM cross section (Fig. ??(d)) presents a more uni-form background. To investigate more into details the accuracy of the reconstruction, Fig. ??represents, for the ideal case and the three reconstruction methods, the intensity profiles alongthe horizontal line intercepting the center of both metallic bars. The profiles show that the threemethods are limited by insufficient experimental imaging resolution. Whatever the reconstruc-tion method is, we can observe a spreading of the profile compared to the ideal result. Thespreading is slightly intensified in the case of OSEM, which indicates that this method willprovide a stronger image degradation compared with BFP and SART. This point will be preciseat the end of this section.
Depending on the number of projections, we analyzed the quality of the reconstruction byusing the previous manufactured phantom already shown in Fig. ??. Reconstructions are per-formed using the three methods from sinograms obtained with 12 to 72 projections. Resultsare shown in Fig. ??. First, we describe the reconstruction on a qualitative point of view. ForBFP, we notice a significant improvement of the reconstruction if the number of projectionsincreases from 12 to 72. Especially, serious background artifacts are visible for Nθ = 12. Thisbehavior is well known in tomography since BFP is very sensitive to the number of projections.For SART, this problem is strongly reduced even if some background artifacts are still notice-able for Nθ = 12. For OSEM, it seems that the reconstruction quality is constant whatever isthe number of projection in the range 12 to 72. However, as pointed out previously with the two
(a) (b)
Fig. 3. Sinograms of two metallic bars (12 mm diameter) separated by 50 mm, with a pro-jection number Nθ = 72. (a) Ideal theoretical acquisition. (b) Acquisition using the mil-limeter wave tomographic scanner with the 110 GHz source.
(a) (b) (c) (d)
Fig. 4. Cross sections of two metallic bars (12 mm diameter) separated by 50 mm.(a) Idealtheoretical image reconstruction from ??(a). (b) BFP reconstruction from ??(b). (c) SARTreconstruction from ??(b). (d) OSEM reconstruction from ??(b).
0
50
100
150
200
250
300
0 20 40 60 80 100 120 140
Inte
nsity (
a.u
.)
position (mm)
idealBFP
SARTOSEM
Fig. 5. Intensity profiles along the horizontal line intercepting the center of both metallicbars (from Fig. ??).
metallic bars, we can observe a small degradation of the reconstruction accuracy for OSEMcompared with BFP and SART with blurred contours of the foam parallelepiped. This degra-dation is directly connected to the OSEM algorithm which uses a subset of several projectionsat once with a multiplicative error correction.
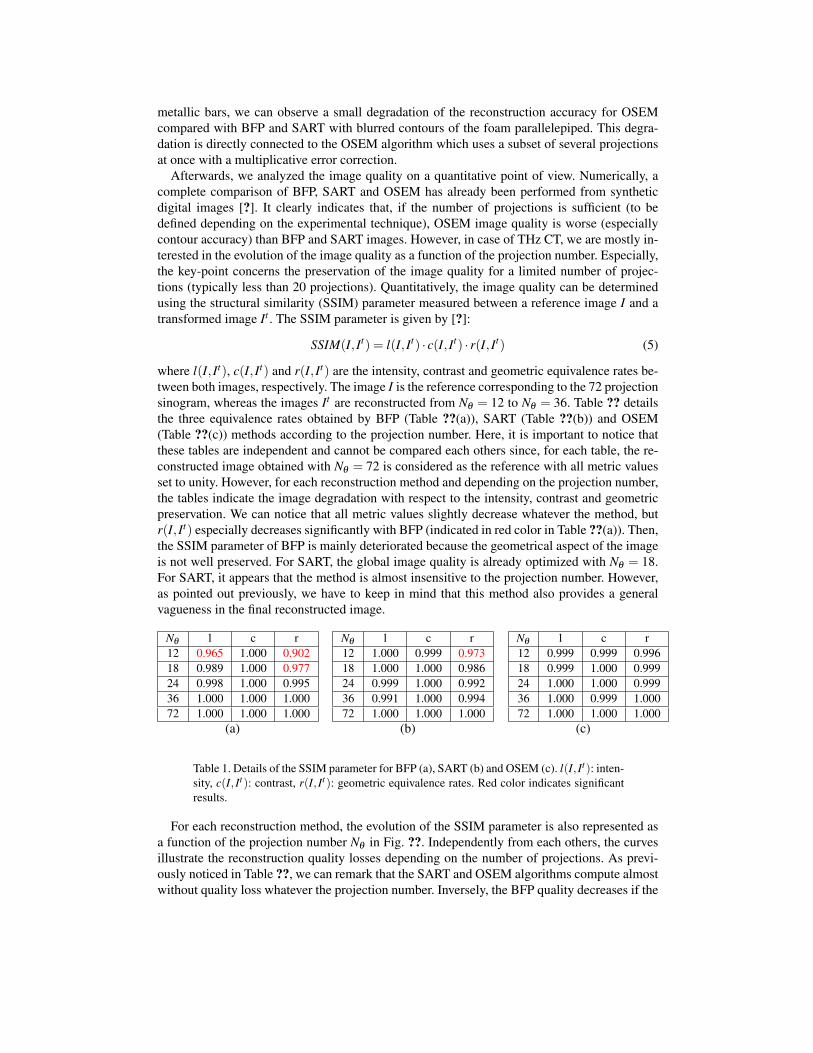
Afterwards, we analyzed the image quality on a quantitative point of view. Numerically, acomplete comparison of BFP, SART and OSEM has already been performed from syntheticdigital images [?]. It clearly indicates that, if the number of projections is sufficient (to bedefined depending on the experimental technique), OSEM image quality is worse (especiallycontour accuracy) than BFP and SART images. However, in case of THz CT, we are mostly in-terested in the evolution of the image quality as a function of the projection number. Especially,the key-point concerns the preservation of the image quality for a limited number of projec-tions (typically less than 20 projections). Quantitatively, the image quality can be determinedusing the structural similarity (SSIM) parameter measured between a reference image I and atransformed image It . The SSIM parameter is given by [?]:
SSIM(I, It) = l(I, It) · c(I, It) · r(I, It) (5)
where l(I, It), c(I, It) and r(I, It) are the intensity, contrast and geometric equivalence rates be-tween both images, respectively. The image I is the reference corresponding to the 72 projectionsinogram, whereas the images It are reconstructed from Nθ = 12 to Nθ = 36. Table ?? detailsthe three equivalence rates obtained by BFP (Table ??(a)), SART (Table ??(b)) and OSEM(Table ??(c)) methods according to the projection number. Here, it is important to notice thatthese tables are independent and cannot be compared each others since, for each table, the re-constructed image obtained with Nθ = 72 is considered as the reference with all metric valuesset to unity. However, for each reconstruction method and depending on the projection number,the tables indicate the image degradation with respect to the intensity, contrast and geometricpreservation. We can notice that all metric values slightly decrease whatever the method, butr(I, It) especially decreases significantly with BFP (indicated in red color in Table ??(a)). Then,the SSIM parameter of BFP is mainly deteriorated because the geometrical aspect of the imageis not well preserved. For SART, the global image quality is already optimized with Nθ = 18.For SART, it appears that the method is almost insensitive to the projection number. However,as pointed out previously, we have to keep in mind that this method also provides a generalvagueness in the final reconstructed image.
Nθ l c r12 0.965 1.000 0.90218 0.989 1.000 0.97724 0.998 1.000 0.99536 1.000 1.000 1.00072 1.000 1.000 1.000
(a)
Nθ l c r12 1.000 0.999 0.97318 1.000 1.000 0.98624 0.999 1.000 0.99236 0.991 1.000 0.99472 1.000 1.000 1.000
(b)
Nθ l c r12 0.999 0.999 0.99618 0.999 1.000 0.99924 1.000 1.000 0.99936 1.000 0.999 1.00072 1.000 1.000 1.000
(c)
Table 1. Details of the SSIM parameter for BFP (a), SART (b) and OSEM (c). l(I, It): inten-sity, c(I, It): contrast, r(I, It): geometric equivalence rates. Red color indicates significantresults.
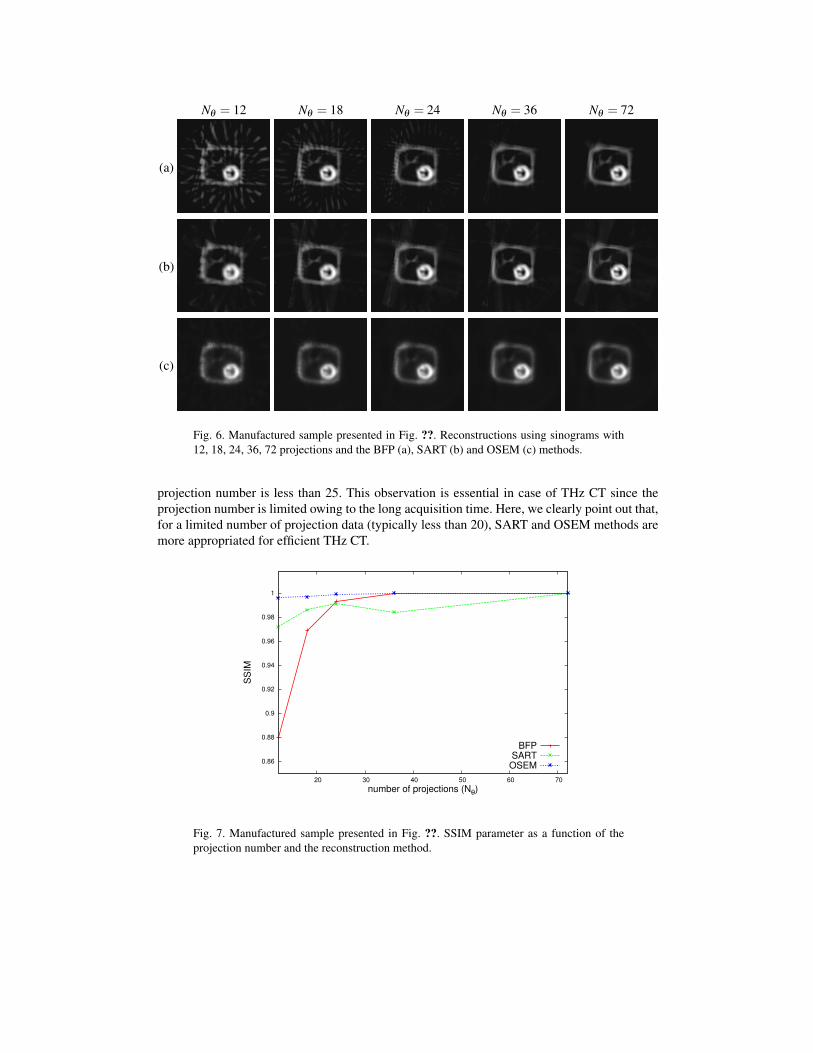
For each reconstruction method, the evolution of the SSIM parameter is also represented asa function of the projection number Nθ in Fig. ??. Independently from each others, the curvesillustrate the reconstruction quality losses depending on the number of projections. As previ-ously noticed in Table ??, we can remark that the SART and OSEM algorithms compute almostwithout quality loss whatever the projection number. Inversely, the BFP quality decreases if the
Nθ = 12 Nθ = 18 Nθ = 24 Nθ = 36 Nθ = 72
(a)
(b)
(c)
Fig. 6. Manufactured sample presented in Fig. ??. Reconstructions using sinograms with12, 18, 24, 36, 72 projections and the BFP (a), SART (b) and OSEM (c) methods.
projection number is less than 25. This observation is essential in case of THz CT since theprojection number is limited owing to the long acquisition time. Here, we clearly point out that,for a limited number of projection data (typically less than 20), SART and OSEM methods aremore appropriated for efficient THz CT.
0.86
0.88
0.9
0.92
0.94
0.96
0.98
1
20 30 40 50 60 70
SS
IM
number of projections (Nθ)
BFPSARTOSEM
Fig. 7. Manufactured sample presented in Fig. ??. SSIM parameter as a function of theprojection number and the reconstruction method.
5. 3D reconstructions
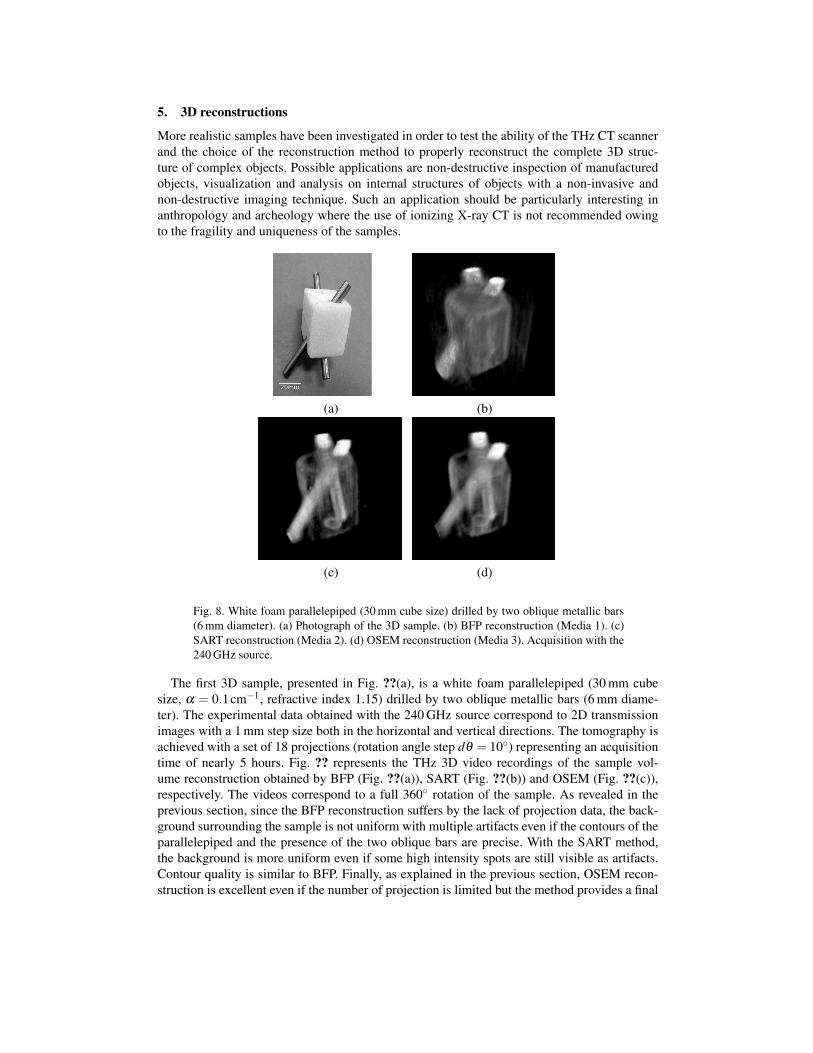
More realistic samples have been investigated in order to test the ability of the THz CT scannerand the choice of the reconstruction method to properly reconstruct the complete 3D struc-ture of complex objects. Possible applications are non-destructive inspection of manufacturedobjects, visualization and analysis on internal structures of objects with a non-invasive andnon-destructive imaging technique. Such an application should be particularly interesting inanthropology and archeology where the use of ionizing X-ray CT is not recommended owingto the fragility and uniqueness of the samples.
(a) (b)
(c) (d)
Fig. 8. White foam parallelepiped (30 mm cube size) drilled by two oblique metallic bars(6 mm diameter). (a) Photograph of the 3D sample. (b) BFP reconstruction (Media 1). (c)SART reconstruction (Media 2). (d) OSEM reconstruction (Media 3). Acquisition with the240 GHz source.
The first 3D sample, presented in Fig. ??(a), is a white foam parallelepiped (30 mm cubesize, α = 0.1cm−1, refractive index 1.15) drilled by two oblique metallic bars (6 mm diame-ter). The experimental data obtained with the 240 GHz source correspond to 2D transmissionimages with a 1 mm step size both in the horizontal and vertical directions. The tomography isachieved with a set of 18 projections (rotation angle step dθ = 10◦) representing an acquisitiontime of nearly 5 hours. Fig. ?? represents the THz 3D video recordings of the sample vol-ume reconstruction obtained by BFP (Fig. ??(a)), SART (Fig. ??(b)) and OSEM (Fig. ??(c)),respectively. The videos correspond to a full 360◦ rotation of the sample. As revealed in theprevious section, since the BFP reconstruction suffers by the lack of projection data, the back-ground surrounding the sample is not uniform with multiple artifacts even if the contours of theparallelepiped and the presence of the two oblique bars are precise. With the SART method,the background is more uniform even if some high intensity spots are still visible as artifacts.Contour quality is similar to BFP. Finally, as explained in the previous section, OSEM recon-struction is excellent even if the number of projection is limited but the method provides a final
(a) (b)
(c) (d)
Fig. 9. Wooden Russian doll Matriochka (total height 160 mm). (a) Photograph of the 3Dsample. (b) BFP reconstruction (Media 4). (c) SART reconstruction (Media 5). (d) OSEMreconstruction (Media 6). Acquisition with the 110 GHz source.
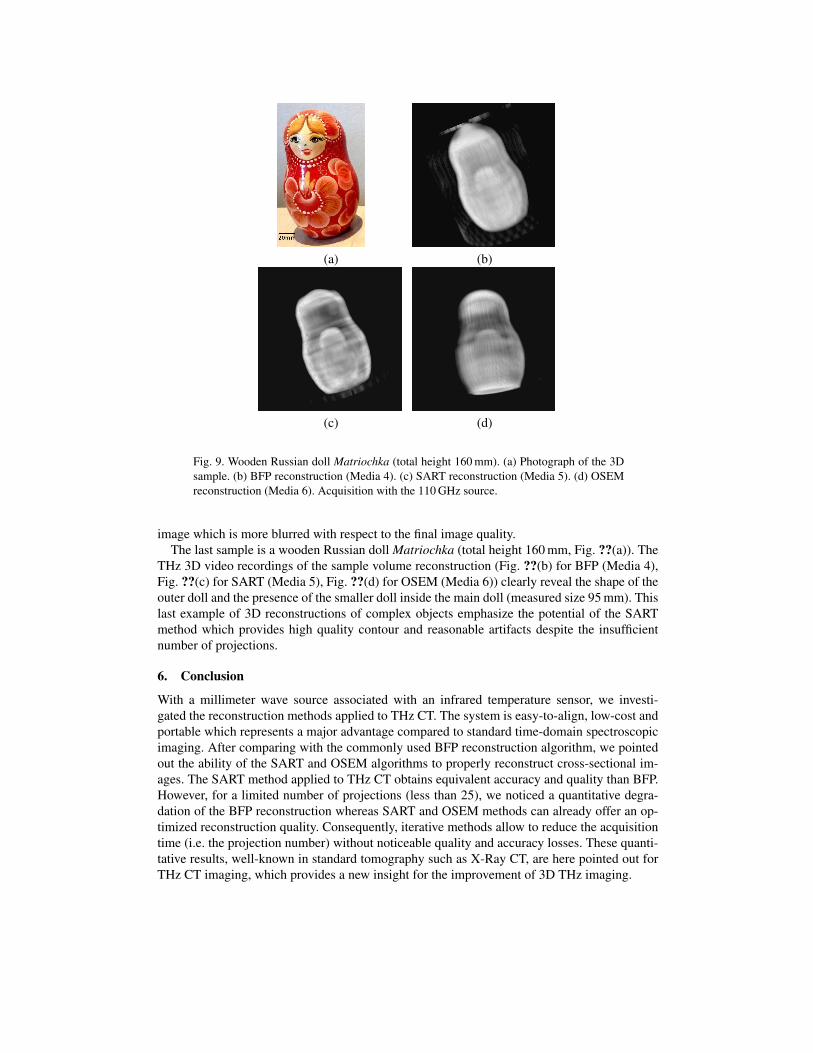
image which is more blurred with respect to the final image quality.The last sample is a wooden Russian doll Matriochka (total height 160 mm, Fig. ??(a)). The
THz 3D video recordings of the sample volume reconstruction (Fig. ??(b) for BFP (Media 4),Fig. ??(c) for SART (Media 5), Fig. ??(d) for OSEM (Media 6)) clearly reveal the shape of theouter doll and the presence of the smaller doll inside the main doll (measured size 95 mm). Thislast example of 3D reconstructions of complex objects emphasize the potential of the SARTmethod which provides high quality contour and reasonable artifacts despite the insufficientnumber of projections.
6. Conclusion
With a millimeter wave source associated with an infrared temperature sensor, we investi-gated the reconstruction methods applied to THz CT. The system is easy-to-align, low-cost andportable which represents a major advantage compared to standard time-domain spectroscopicimaging. After comparing with the commonly used BFP reconstruction algorithm, we pointedout the ability of the SART and OSEM algorithms to properly reconstruct cross-sectional im-ages. The SART method applied to THz CT obtains equivalent accuracy and quality than BFP.However, for a limited number of projections (less than 25), we noticed a quantitative degra-dation of the BFP reconstruction whereas SART and OSEM methods can already offer an op-timized reconstruction quality. Consequently, iterative methods allow to reduce the acquisitiontime (i.e. the projection number) without noticeable quality and accuracy losses. These quanti-tative results, well-known in standard tomography such as X-Ray CT, are here pointed out forTHz CT imaging, which provides a new insight for the improvement of 3D THz imaging.