computed tomography measurement of rib cage morphometry in emphysema
TRANSCRIPT

Computed Tomography Measurement of Rib CageMorphometry in EmphysemaNicola Sverzellati1*, Davide Colombi1, Giorgia Randi2, Antonio Pavarani1, Mario Silva1, Simon L. Walsh3,
Massimo Pistolesi4, Veronica Alfieri5, Alfredo Chetta5, Mauro Vaccarezza6, Marco Vitale7, Ugo Pastorino8
1 Section of Diagnostic Imaging, Department of Surgery, University of Parma, Parma, Italy, 2 Department of Epidemiology, Mario Negri Institute, Milan, Italy, 3 Department
of Radiology, St George’s Hospital, London, United Kingdom, 4 Section of Respiratory Medicine, Department of Internal Medicine, University of Florence, Florence, Italy,
5 Department of Clinical and Experimental Medicine, Respiratory Disease and Lung Function Unit, University of Parma, Parma, Italy, 6 Department of Human, Social and
Health Sciences, University of Cassino, Cassino, Italy, 7 Department of Biomedical, Biotechnological and Translational Sciences, Human Anatomy Section (S.Bi.Bi.T.),
University of Parma, Parma, Italy, 8 Department Surgery, Section of Thoracic Surgery, Fondazione IRCCS Istituto Nazionale dei Tumori, Milan, Italy
Abstract
Background: Factors determining the shape of the human rib cage are not completely understood. We aimed to quantifythe contribution of anthropometric and COPD-related changes to rib cage variability in adult cigarette smokers.
Methods: Rib cage diameters and areas (calculated from the inner surface of the rib cage) in 816 smokers with or withoutCOPD, were evaluated at three anatomical levels using computed tomography (CT). CTs were analyzed with software, whichallows quantification of total emphysema (emphysema%). The relationship between rib cage measurements andanthropometric factors, lung function indices, and %emphysema were tested using linear regression models.
Results: A model that included gender, age, BMI, emphysema%, forced expiratory volume in one second (FEV1)%, andforced vital capacity (FVC)% fit best with the rib cage measurements (R2 = 64% for the rib cage area variation at the loweranatomical level). Gender had the biggest impact on rib cage diameter and area (105.3 cm2; 95% CI: 111.7 to 98.8 for malelower area). Emphysema% was responsible for an increase in size of upper and middle CT areas (up to 5.4 cm2; 95% CI: 3.0to 7.8 for an emphysema increase of 5%). Lower rib cage areas decreased as FVC% decreased (5.1 cm2; 95% CI: 2.5 to 7.6 for10 percentage points of FVC variation).
Conclusions: This study demonstrates that simple CT measurements can predict rib cage morphometric variability and alsohighlight relationships between rib cage morphometry and emphysema.
Citation: Sverzellati N, Colombi D, Randi G, Pavarani A, Silva M, et al. (2013) Computed Tomography Measurement of Rib Cage Morphometry in Emphysema. PLoSONE 8(7): e68546. doi:10.1371/journal.pone.0068546
Editor: Erik L. Ritman, Mayo Clinic College of Medicine, United States of America
Received March 26, 2013; Accepted May 29, 2013; Published July 31, 2013
Copyright: � 2013 Sverzellati et al. This is an open-access article distributed under the terms of the Creative Commons Attribution License, which permitsunrestricted use, distribution, and reproduction in any medium, provided the original author and source are credited.
Funding: This study was supported by grants from the Italian Association for Research on Cancer (AIRC), Lombardia-Cariplo Foundation and Italian Ministry ofHealth. The funders had no role in study design, data collection and analysis, decision to publish, or preparation of the manuscript.
Competing Interests: The authors have declared that no competing interests exist.
* E-mail: [email protected]
Introduction
Anthropometric variables such as height, weight, sex, and age
affect rib cage dimensions and morphology [1,2,3,4]. However
there is limited data on the range of rib cage morphometric
variability as previous investigations have been performed in small
study populations [1,2,3,4,5,6]. Obtaining geometric data on the
rib cage may be useful for biomechanical and surgical applications
and may also increase the understanding of the relationships
between rib cage morphometry, anthropometric parameters and
thoracic abnormalities [6,7,8,9].
Besides anthropometric factors, several lung diseases are
independent determinants of the rib cage variability
[5,10,11,12,13,14]. Notably, chronic obstructive pulmonary dis-
ease (COPD) is a multi-compartmental disease which may cause
hyperinflation of the lungs and musculoskeletal abnormalities
[10,11,15,16,17]. As a consequence, COPD is likely to produce
complex changes in the rib cage dimensions and shape
[5,15,18,19]. This has been suggested by previous investigations
based on clinical assessment and chest radiographic techniques
[20,21].
However, the clinical assessment cannot quantify rib cage
functional abnormities and measurements using conventional
radiographic techniques are relatively inaccurate and hampered
by the superimposition of bone and soft tissues. Recent technical
developments allow a 3D reconstruction of the ribs from lateral
and frontal chest radiographs, but these tools are not widely
available [6,22]. In contrast, CT may provide simple and precise
measurements, which are capable of capturing rib cage changes
due to several factors such as COPD.
The objective of this study was to assess the impact of
anthropometric factors and COPD on the rib-cage variability
using CT measurements in a large cohort of smokers.
Methods
The study population consisted of 816 Caucasian patients (age
range 39–86 years, mean 58.466.9 years, 559 men, 257 women).
PLOS ONE | www.plosone.org 1 July 2013 | Volume 8 | Issue 7 | e68546
This cohort comprised two separate groups: 1) 725/816 (88.8%)
subjects (485 men, 240 women, age range 49–75 years, mean 57.3
years65.7) consecutively recruited by a lung cancer screening trial
(MILD trial), between September 2005 and May 2006; 2) and 91/
816 (9.9%) COPD patients (74 men, 17 women, age range 39–86
years, mean 67.4 years68.2), who had undergone clinico-
functional evaluation, but were not part of the lung cancer
screening trial.
Eligibility criteria for the MILD trial included: men and women
aged 49 to 75 years who had at least 20 pack-years of cigarette
smoking and who currently smoked or smoked within the previous
10 years, with no history of cancer within the previous 5 years.
Further details of MILD eligibility criteria have been previously
described [23]. The original IRB approval and informed consent
allowed use of MILD data for future research. Informed consent
was obtained from all MILD participants for their information to
be stored in the MILD database and used for research.
COPD patients were prospectively recruited in a tertiary care
centre to participate in a study assessing the COPD-related
emphysema phenotypes. This study was approved by the
University Hospital of Parma’s IRB which allows retrospective
use of data for research purposes; informed consent was obtained
from all patients for their information to be stored in the hospital
database and used for research. All patients met GOLD criteria
[compatible history and symptoms along with post-bronchodilator
forced expiratory volume in one second (FEV1)/forced vital
capacity (FVC) #0.7] [24].
Pulmonary function testingFEV1 and FVC were measured according to the American
Thoracic Society (ATS) and European Respiratory Society (ERS)
guidelines in MILD participants [25]. MILD participants with a
pre-bronchodilator FEV1/FVC less than 0.7 (171/725, 23.5%)
were defined as having modified COPD (mCOPD). MILD
subjects with mCOPD were classified according to the GOLD
stages (which ranks disease severity on a scale from 1–4, stage 4
being the most severe stage) as follows: 97 (56.7%) subjects with
GOLD stage 1, 61 (35.7%) with GOLD stage 2, 12 (7%) with
GOLD 3, 1 (0.6%) with GOLD stage 4 mCOPD. The 91 patients
with COPD after post-bronchodilator spirometry were classified
according to the GOLD stages as follows: 4 (4.4%) with GOLD
stage 1, 47 (51.6%) with GOLD stage 2, 32 (35.2%) with GOLD
stage 3, 8 (8.8%) with GOLD stage 4
CT protocolMILD participants were evaluated by using a 16-detector row
CT scanner (Somatom Sensation 16, Siemens Medical Solutions,
Forchheim, Germany), whereas COPD patients were studied with
a 64-detector row CT scanner (64, Siemens Medical Solutions,
Forchheim, Germany). All CT scans of the whole lung were
acquired during one deep inspiratory breath-hold without the use
of the intravenous contrast medium. Both scanners were calibrated
daily using air to ensure measurements were accurate and
consistent for all examinations. Standard CT parameters were
used for both scanners: kV 120, effective mAs 30, individual
detector collimation 0.75 mm, gantry rotation time 0.5 s, pitch
1.5.
Rib cage analysisThe assessment of the rib cage morphometry was performed on
CT reconstructions as follows: 1-mm-thick sections with a
reconstruction increment of 1 mm and a soft kernel (B30f).
The first consecutive 100 CTs of the MILD cohort were
transferred into two identical personal computers and reviewed,
independently, by two operators (AP and DC, two residents with 2
years of experience in chest imaging) in order to evaluate the inter-
operator variation related to rib cage morphometry assessment.
The rib cage morphometry was assessed by using a Dicom viewer
software validated for clinical purpose (OsiriX, 3.5.1 Imaging
Processing Software 64 bit format). For each CT, internal rib cage
measurements were taken at three anatomical levels as follows: 1)
1st sternocostal joint (upper level), 2) manubrio-sternal joint
(middle level), and 3) xiphisternal joint (lower level) (Fig. 1A).
These three anatomical levels were selected as they were shown to
display the greatest inter-individual variability [26,27].
Rib cage diameters, which best describe rib cage morphometry,
were selected by an anatomist (MV, with 10 years of experience in
research on rib cage morphometry) and a chest radiologist (NS)
with expertise in anatomic and radiologic rib cage morphometry.
Electronic calliper measurements were taken for each of these
diameters within each hemithorax as follows (Fig. 1): dorsal
transverse diameter (D1 - from the most dorsal point of the rib and
the apex of the vertebral spinous process); ventral transverse
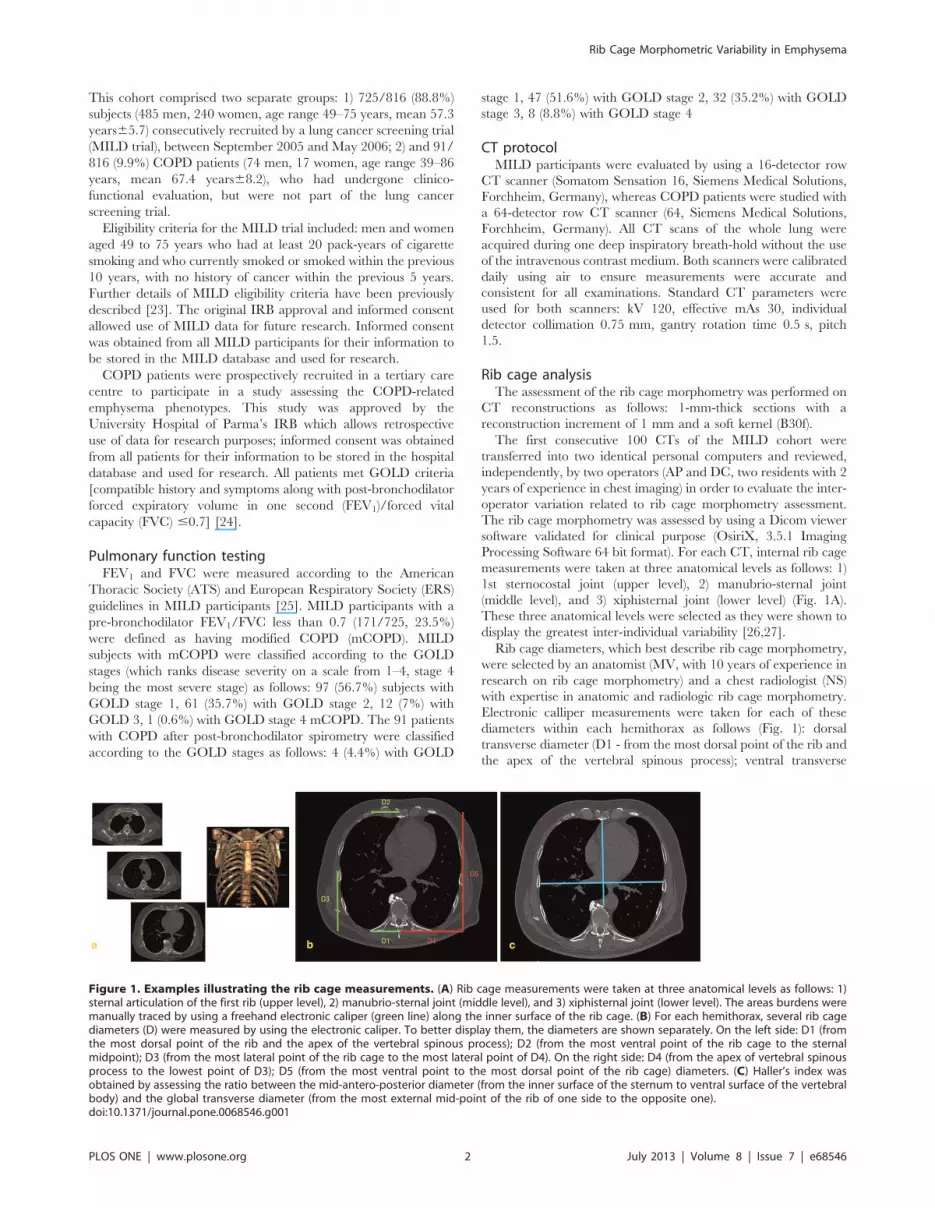
Figure 1. Examples illustrating the rib cage measurements. (A) Rib cage measurements were taken at three anatomical levels as follows: 1)sternal articulation of the first rib (upper level), 2) manubrio-sternal joint (middle level), and 3) xiphisternal joint (lower level). The areas burdens weremanually traced by using a freehand electronic caliper (green line) along the inner surface of the rib cage. (B) For each hemithorax, several rib cagediameters (D) were measured by using the electronic caliper. To better display them, the diameters are shown separately. On the left side: D1 (fromthe most dorsal point of the rib and the apex of the vertebral spinous process); D2 (from the most ventral point of the rib cage to the sternalmidpoint); D3 (from the most lateral point of the rib cage to the most lateral point of D4). On the right side: D4 (from the apex of vertebral spinousprocess to the lowest point of D3); D5 (from the most ventral point to the most dorsal point of the rib cage) diameters. (C) Haller’s index wasobtained by assessing the ratio between the mid-antero-posterior diameter (from the inner surface of the sternum to ventral surface of the vertebralbody) and the global transverse diameter (from the most external mid-point of the rib of one side to the opposite one).doi:10.1371/journal.pone.0068546.g001
Rib Cage Morphometric Variability in Emphysema
PLOS ONE | www.plosone.org 2 July 2013 | Volume 8 | Issue 7 | e68546

Ta
ble
1.
Bas
elin
est
ud
yp
op
ula
tio
nch
arac
teri
stic
s.
PA
TIE
NT
SW
ITH
CO
PD
(n=
91
)M
ILD
SU
BJE
CT
SW
ITH
MC
OP
D(n
=1
71
)N
OR
MA
LM
ILD
SU
BJE
CT
S(n
=5
54
)p
-va
lue
*p
-va
lue
(CO
PD
vs.
mC
OP
D)
p-v
alu
e(C
OP
Dv
s.n
orm
al)
p-v
alu
e(m
CO
PD
vs.
no
rma
l)
Ge
nd
er
Mal
e7
4(8
1.3
%)
12
6(7
3.7
%)
35
9(6
4.8
%)
Fem
ale
17
(18
.7%
)4
5(2
6.3
%)
19
5(3
5.2
%)
0.0
01
90
.00
19
0.1
66
0.0
31
Ag
e6
7.3
7(8
.20
)5
9.8
0(6
.55
)5
6.4
8(5
.27
),
.00
01
,.0
00
1,
.00
01
,.0
00
1
BM
I2
6.0
0(4
.14
)2
5.3
9(3
.93
)2
6.0
9(6
.23
)0
.36
90
.85
40
.25
60
.08
2
Pac
k-ye
ars
45
.34
(25
.10
)4
8.5
3(2
5.1
2)
41
.90
(19
.15
)0
.00
10
.37
30
.44
90
.00
2
Smo
kin
gst
atu
s
Cu
rre
nt
33
(53
.2%
)1
25
(76
.2%
)3
73
(69
.9%
)
Form
er
29
(46
.8%
)3
9(2
3.8
%)
16
1(3
0.1
%)
0.0
03
50
.00
80
.00
10
.11
5
FEV
1%
52
.91
(16
.75
)8
1.2
3(2
0.2
9)
10
2.2
8(1
4.7
1)
,.0
00
1,
.00
01
,.0
00
1,
.00
01
FVC
%7
5.0
3(1
8.4
2)
10
3.8
2(2
2.7
8)
10
5.9
6(1
6.8
4)
,.0
00
1,
.00
01
,.0
00
10
.26
6
FEV
1/F
VC
%5
4.7
5(1
0.1
3)
61
.57
(8.0
5)
79
.57
(11
.01
),
.00
01
,.0
00
1,
.00
01
,.0
00
1
Emp
hys
em
a%
14
.2(1
0.6
)7
.6(5
.3)
4.2
(3.7
),
.00
01
,.0
00
1,
.00
01
,.0
00
1
AR
EAS
U1
99
.09
(29
.06
)1
84
.56
(31
.89
)1
76
.76
(32
.61
),
.00
01
,.0
00
1,
.00
01
0.0
06
M3
06
.63
(35
.65
)3
11
.32
(40
.60
)2
96
.93
(40
.12
),
.00
01
0.0
31
0.3
54
,.0
00
1
L4
58
.25
(58
.33
)4
46
.53
(66
.35
)4
34
.78
(66
.33
)0
.00
20
.00
20
.15
70
.04
3
DIA
MET
ERS
D1
_U
51
.65
(5.1
9)
53
.19
(5.2
0)
52
.64
(5.3
0)
0.0
80
0.0
99
0.0
23
0.2
33
D1
_M
55
.26
(5.1
4)
57
.41
(5.4
3)
56
.52
(5.2
0)
0.0
06
0.0
32
0.0
02
0.0
53
D1
_L
62
.71
(5.9
9)
64
.22
(6.4
1)
63
.36
(6.1
6)
0.1
34
0.3
48
0.0
65
0.1
16
D2
_U
53
.70
(6.7
1)
57
.33
(8.4
5)
56
.49
(8.8
8)
0.0
04
0.0
01
0.0
00
0.2
76
D2
_M
41
.65
(8.1
1)
45
.39
(8.5
9)
46
.33
(8.4
4)
,.0
00
1,
.00
01
0.0
01
0.2
03
D2
_L
53
.60
(11
.50
)6
1.3
6(1
0.9
2)
61
.09
(10
.73
),
.00
01
,.0
00
1,
.00
01
0.7
76
D3
_U
54
.85
(8.4
6)
53
.95
(8.7
2)
52
.52
(8.8
1)
0.0
22
0.0
19
0.4
25
0.0
63
D3
_M
75
.85
(9.7
0)
78
.82
(9.9
9)
76
.17
(10
.08
)0
.00
80
.77
70
.02
10
.00
3
D3
_L
10
3.7
4(1
3.9
0)
10
3.0
8(1
1.7
9)
10
1.9
8(1
2.6
7)
0.3
46
0.2
28
0.6
90
0.3
12
D4
_U
98
.86
(8.7
0)
10
0.6
8(9
.52
)9
9.1
3(9
.37
)0
.13
60
.80
00
.13
00
.05
9
D4
_M
11
4.1
2(7
.75
)1
18
.64
(8.2
6)
11
6.6
8(8
.04
),
.00
01
0.0
05
,.0
00
10
.00
6
D4
_L
13
1.0
4(9
.30
)1
34
.75
(10
.50
)1
33
.62
(10
.07
)0
.01
80
.02
30
.00
50
.20
1
D5
_U
12
0.8
7(1
2.3
4)
11
1.2
7(1
2.9
2)
10
8.2
7(1
2.5
7)
,.0
00
1,
.00
01
,.0
00
10
.00
7
D5
_M
16
3.7
0(1
3.3
9)
16
2.4
1(1
3.2
8)
15
7.2
7(1
3.5
0)
,.0
00
1,
.00
01
0.4
56
,.0
00
1
D5
_L
20
7.8
1(1
9.1
0)
20
0.1
7(1
8.0
1)
19
5.7
3(1
9.0
0)
,.0
00
1,
.00
01
0.0
02
0.0
07
Hal
ler’
sIn
de
x1
.73
(0.2
7)
1.9
2(0
.28
)1
.96
(0.2
7)
,.0
00
1,
.00
01
,.0
00
10
.09
2
No
tes:
D=
dia
me
ter;
U=
up
pe
r;M
=m
idd
le;
L=
low
er;
*p-v
alu
ein
dic
ate
sth
ep
rob
abili
tyo
fth
en
ull
hyp
oth
esi
sw
he
nco
mp
arin
gp
atie
nts
wit
hC
OP
D,
MIL
Dsu
bje
cts
wit
hm
od
ifie
dC
OP
D(m
CO
PD
),an
dn
orm
alM
ILD
sub
ject
sb
yu
sin
go
ne
-way
AN
OV
Aan
alys
is.
do
i:10
.13
71
/jo
urn
al.p
on
e.0
06
85
46
.t0
01
Rib Cage Morphometric Variability in Emphysema
PLOS ONE | www.plosone.org 3 July 2013 | Volume 8 | Issue 7 | e68546

diameter (D2 - from the most ventral point of the rib cage to the
sternal midpoint); lower antero-posterior diameter (D3 - from the
most lateral point of the rib cage to the most lateral point of D4);
maximal transverse (D4 - from the apex of vertebral spinous
process to the lowest point of D3) maximal antero-posterior (D5 -
from the most ventral point to the most dorsal point of the rib
cage) diameters (Fig. 1B). The Haller’s index [28] - the ratio
between the maximum transverse diameter of the chest (between
the inner rib margins) and the minimum antero-posterior diameter
(from the anterior aspect of the spine to the inner surface of the
sternum) – was taken at the lower anatomical level to evaluate for
the presence of pectus excavatum (Fig. 1C). A Haller’s index
greater than 3 was considered consistent with pectus excavatum.
In addition, the total area included within the rib cage was also
measured for each CT section. The areas burdens were manually
traced by using the freehand electronic caliper along the inner
surface of the rib cage (Fig. 1A).
After evaluating inter-operator variability for the measurements
of the rib cage diameters and areas (see Results section and Table
S1), the remaining study cases (n = 716) were independently
reviewed by A.P. (350 CTs) and D.C. (366 CTs).
The operators also reviewed the CTs for the presence of
interstitial lung disease or skeletal abnormality (e.g. extremely
severe scoliosis) that could potentially influence the rib cage
morphometry. No specific criteria were provided to the operators
for these interpretations.
Emphysema assessmentCT imaging data was reconstructed for the detection of
pulmonary nodules (1-mm-thick sections with a reconstruction
increment of 1 mm and a sharp kernel [medium-sharp kernel -
B50f]) and transferred to a personal computer running Mevis-
PULMO software (version 1.4, Fraunhofer MEVIS, Bremen,
Germany). A quantitative analysis of emphysema was performed
by one operator (NS). A 363 kernel-based axial Gauss smoothing
algorithm was applied to minimise the noise in sharp kernel
images. For the whole lung, emphysema extent was defined as the
percentage of lung voxels less than or equal to -950 Hounsfield
units (HU) [29].
Statistical analysisInter-operator variability for the rib cage measurements were
evaluated by the Bland and Altman method [30].
Differences between left and right hemithoraces measurements
were assessed by the Student’s paired t-test. The baseline
characteristics of the study population were compared according
to the presence or absence of COPD (i.e. patients with COPD vs.
MILD subjects with mCOPD vs. MILD subjects without COPD)
by using Chi-square test and analysis of variance (ANOVA) as
appropriate.
Univariate linear regression analysis was used to examine the
relationship between anthropometric factors, smoking history,
functional data and emphysema %, and both rib cage areas and
averaged (left and right) diameters. Multivariate linear regression
was performed, entering univariate variables in a stepwise manner
at the 0.05 significance level and removing them at the 0.10 level,
in order to select factors most strongly associated with rib cage
measurements. The selected factors were age, gender, body mass
index (BMI), emphysema %, FEV1% and FVC%. We considered
the goodness of fit of linear models by estimating the coefficient of
determination (R2). Derived prediction equations were used to
generate normal predicted values based on individual character-
istics.
A p value less than 0.05 was considered statistically significant.
All statistical analyses were performed using SAS Release 9.1 (SAS
Institute Inc., Cary, North Carolina).
Results
The inter-operator mean differences ranged from 0.03 mm to
24.9 mm and from 20.7 cm2 to 21.1 cm2 for the diameters and
the areas respectively over the first 100 consecutive MILD CTs.
Detailed inter-operator mean differences and levels of inter-
observer variation for each rib cage measurement are summarized
in the Table S1.
The baseline characteristics of the study population, stratified
for the presence or absence of COPD are given in Table 1. There
were three cases (0.4%) with interstitial lung disease consistent with
usual interstitial pneumonia (UIP), although this was limited in
extent. There were no major spinal abnormalities. For each
anatomical level, both area and most diameters were different
among the three subgroups (Table 1). The rib cage areas of
subjects with COPD or mCOPD were significantly higher than
those of normal subjects (p,.0001 to 0.03). No Haller’s index
greater than 3 was recorded.
Differences between right and left diameters ranged from
0.7 mm to 4 mm (p,0. 0001 to 0.017; Table 2). The greatest
asymmetry was recorded for D2 and D5, which were larger on the
right side at the lower and the upper anatomical level, respectively.
A regression model which included gender, age, and, emphy-
sema%, FEV1%, and FVC% fit best with the rib cage
measurements. Table 3 shows the partial regression coefficients
(b) for all the included model variables. Overall, the coefficients
were greater for the rib cage measurements at the lower
anatomical level, explaining up to 64% of rib cage variation.
Gender was the strongest predictor of both diameter and area at
all CT levels - rib cage measurements were greater for men with
the most striking gender difference (105.3 cm2, 95% CI: 111.7 to
98.8) reported for the lower rib cage area. Gender was the only
independent predictor of the Haller’s index, although this
Table 2. Differences between left and right side of eachmeasures in all subjects, with the p-value of the difference.
DIAMETERS Section Mean SD p-value*
D1 U 1.10 5.0 ,.0001
M 1.13 4.3 ,.0001
L 2.12 4.6 ,.0001
D2 U 20.02 12.7 0.967
M 0.00 13.4 0.998
L 24.01 16.0 ,.0001
D3 U 20.83 7.6 ,.0001
M 20.16 8.6 0.587
L 21.72 13.7 ,.0001
D4 U 21.55 7.2 ,.0001
M 20.38 7.3 0.139
L 20.75 8.9 0.017
D5 U 22.65 9.7 ,.0001
M 21.29 5.4 ,.0001
L 0.67 6.3 0.003
Notes: SD = standard deviation;*p-value was estimated by paired t-test.doi:10.1371/journal.pone.0068546.t002
Rib Cage Morphometric Variability in Emphysema
PLOS ONE | www.plosone.org 4 July 2013 | Volume 8 | Issue 7 | e68546

Table 3. Partial regression coefficient (b) and 95% confidence intervals (95%CI) of area variation at different lung sections byselected variables.
U M L
b 95%CI b 95%CI b 95%CI
Areas Gender1 26.0 (30.8,21.2) 45.0 (50.5,39.6) 105.3 (111.7,98.8)
Age 0.4 (0.0,0.7) 0.3 (20.1,0.7) 0.5 (0.0,0.9)
BMI 20.4 (20.7,0.0) 0.2 (20.2,0.7) 2.8 (2.3,3.3)
Emphysema%* 3.9 (1.8,6.0) 5.4 (3.0,7.8) 2.4 (20.4,5.3)
FEV1%** 21.5 (23.2,0.3) 20.2 (22.2,1.8) 20.4 (22.7,2.0)
FVC%** 1.3 (20.6,3.2) 2.8 (0.7,4.9) 5.1 (2.5,7.6)
R2 20.6% 31.7% 64.0%
D1 Gender1 3.90 (4.71,3.09) 4.90 (5.68,4.12) 7.21 (8.06,6.35)
Age 20.08 (20.14,20.02) 20.07 (20.13,20.01) 20.01 (20.08,0.05)
BMI 20.06 (20.12,0.01) 0.00 (20.06,0.06) 0.00 (20.07,0.07)
Emphysema%* 0.24 (20.12,0.59) 0.13 (20.21,0.47) 0.13 (20.25,0.50)
FEV1%** 20.01 (20.31,0.29) 0.04 (20.25,0.32) 0.13 (20.18,0.45)
FVC%** 0.13 (20.18,0.45) 0.15 (20.15,0.45) 0.27 (20.06,0.61)
R2 12.0% 18.5% 28.3%
D2 Gender1 8.12 (9.34,6.89) 3.98 (5.32,2.63) 8.87 (10.53,7.22)
Age 20.07 (20.16,0.03) 20.11 (20.21,20.01) 20.04 (20.17,0.08)
BMI 0.17 (0.07,0.27) 0.17 (0.06,0.28) 0.12 (20.02,0.25)
Emphysema%* 20.37 (20.91,0.17) 20.58 (21.17,0.01) 20.69 (21.42,0.04)
FEV1%** 0.09 (20.35,0.54) 0.13 (20.37,0.62) 0.61 (0.00,1.21)
FVC%** 0.15 (20.33,0.63) 0.09 (20.44,0.61) 0.41 (20.24,1.06)
R2 22.0% 8.3% 16.7%
D3 Gender1 3.68 (5.08,2.28) 5.05 (6.64,3.46) 11.83 (13.63,10.04)
Age 0.04 (20.07,0.14) 20.01 (20.13,0.11) 0.05 (20.08,0.19)
BMI 20.10 (20.21,0.02) 20.02 (20.15,0.11) 0.36 (0.22,0.51)
Emphysema%* 0.75 (0.14,1.37) 1.08 (0.38,1.78) 0.61 (20.18,1.40)
FEV1%** 20.12 (20.63,0.39) 0.16 (20.43,0.74) 0.30 (20.36,0.96)
FVC%** 0.05 (20.49,0.60) 0.12 (20.50,0.74) 0.35 (20.35,1.05)
R2 6.6% 7.4% 23.9%
D4 Gender1 6.30 (7.74,4.86) 7.77 (8.94,6.60) 14.50 (15.70,13.30)
Age 20.10 (20.20,0.01) 20.12 (20.21,20.03) 20.05 (20.14,0.03)
BMI 20.15 (20.26,20.03) 20.03 (20.13,0.06) 0.29 (0.20,0.39)
Emphysema%* 1.02 (0.39,1.65) 1.01 (0.49,1.52) 0.19 (20.34,0.71)
FEV1%** 20.07 (20.59,0.46) 0.23 (20.20,0.66) 0.34 (20.11,0.78)
FVC%** 0.33 (20.23,0.89) 0.39 (20.07,0.85) 0.77 (0.30,1.24)
R2 12.0% 22.3% 47.7%
D5 Gender1 7.55 (9.51,5.58) 12.27 (14.23,210.31) 26.08 (28.26,23.89)
Age 0.28 (0.13,0.43) 0.30 (0.16,0.45) 0.29 (0.13,0.45)
BMI 20.11 (20.27,0.05) 0.10 (20.06,0.25) 0.75 (0.57,0.93)
Emphysema%* 1.44 (0.58,2.29) 1.55 (0.69,2.40) 0.87 (20.08,1.83)
FEV1%** 20.76 (21.48,20.04) 20.23 (20.94,0.49) 20.55 (21.35,0.25)
FVC%** 0.52 (20.25,1.28) 0.93 (0.17,1.70) 1.29 (0.44,2.14)
R2 17.5% 24.5% 51.2%
Notes: numbers in bold characters are statistically significant;1male as compared with female;*5 percentage points variation;**10 percentage points variation.doi:10.1371/journal.pone.0068546.t003
Rib Cage Morphometric Variability in Emphysema
PLOS ONE | www.plosone.org 5 July 2013 | Volume 8 | Issue 7 | e68546

association was weak (0.11, 95% CI: 0.07 to 0.15 for women as
compared to men). Although age and BMI had a similar impact
on rib cage measurements at the upper and middle levels, the
impact of BMI was greater for the lower area measurement which
increased as BMI increased (Table 3).
Emphysema% influenced diameters and areas more than
FEV1% and FVC% at the upper anatomical level (Table 3).
Specifically, for an emphysema increase of 5%, upper and middle
areas respectively increased by 3.9 cm2 (95% CI: 1.8 to 6.0) and
5.4 cm2 (95% CI: 3 to 7.8) respectively. The effect of emphyse-
ma% did not substantially change when adjusted only for age,
gender and BMI. Rib cage changes according to the proportional
increase of emphysema% are displayed in Fig. 2.
The selected model showed a proportional relationship between
FVC% and both middle and lower areas (Table 3). Specifically, for
a 10% decrease in FVC%, the middle area decreased by 2.8 cm2
(95% CI: 0.7 to 4.9) and lower area by 5.1 cm2 (95% CI: 2.5 to
7.6).
FEV1% was not significantly related with most measurements
(p.0.05), and this was true even for values lower than 50%
predicted (as found by a post-hoc subanalysis). However, by
eliminating the potential confounding interaction with emphysema
extent and FVC% (i.e. by adjusting only for gender, age and BMI),
the effect of decreasing FEV1% on the rib cage lower area was
similar to that observed for FVC%: for a 10% decrease of FEV1%,
the lower area decreased of 2.8 cm2 (95% CI: 1.5 to 4.2). The
relationship between rib cage variation and functional decline is
exemplified in Fig. 3.
Predicted rib cage measurements based on individual charac-
teristics as derived by the model’s prediction equations can be
calculated using the online interactive File S1.
Discussion
To the best of our knowledge, this is the first normative study
which provides ranges of rib cage morphometry in a large series of
adult smokers as well as novel data about rib cage variation due to
anthropometric and lung disease-related factors.
In line with prior investigations assessing rib cage diameters on
the chest radiograph, we found that gender had the strongest
impact on rib cage dimension [3,4]. Bellemare et al. reported that
cross-section areas as well as anterior–posterior and transverse
diameters were significantly smaller in females than in males with
the same anthropometric characteristics as assessed at anatomical
levels similar to those of the current study. Such a difference is
explained by a greater inclination of the ribs in females [4].
At upper and middle levels, the impact of emphysema% on rib
cage morphometry was greater than that of age and BMI. To our
knowledge this is the first study evaluating the relationship
between emphysema and rib cage morphometric variability. This
was made possible by CT, which is considered the gold standard
for quantifying extent of emphysema. The effect of increasing
emphysema % on rib cage morphometry was striking - rib cage
area as well as both antero-posterior and maximal transverse
diameters at the upper-middle levels increased as emphysema %
Figure 2. Example showing the independent effect of emphy-sema. Two overlapping upper (second level) CT slices of two differentmale subjects with similar demographic characteristics: the subject withthe smaller area (green line) had an emphysema extent of 2.1%,whereas the one with the larger area (red line) had an emphysemaextent of 35%.doi:10.1371/journal.pone.0068546.g002
Figure 3. Rib cage morphometric differences between a normal 58-year-old male smoker (A) and a 61-year-old male COPD patientwith severe emphysema (B). Both detailed measurements and the 3D reformation display the main morphologic differences: larger upper ribcage dimensions and smaller lower rib cage dimensions in COPD. Overall, the morphometric changes in COPD contribute to the ‘‘barrel chest’’configuration.doi:10.1371/journal.pone.0068546.g003
Rib Cage Morphometric Variability in Emphysema
PLOS ONE | www.plosone.org 6 July 2013 | Volume 8 | Issue 7 | e68546

increased. We speculate that the bony rib cage undergoes chronic
adaptation to more severe emphysema in the upper lobes.
The relationship between rib cage variation and COPD is
controversial [5,10,11,19,31,32,33]. It was traditionally believed
that patients with hyperinflation and COPD accommodate part of
the increased lung volume by expanding the rib cage [5,34]. By
matching seven normal with seven COPD subjects, Cassart et al.
showed an increase in antero-posterior but not in trasverse
diameters on CT such that the rib cage adopted a more circular
shape among subjects with COPD [5]. By contrast, other studies
measuring several diameters on chest radiography found that
when compared to sex-, age-, and height-matched normal
subjects, the rib cage of COPD patients remained normal in size
and shape, with the exception of an increase of cranio-caudal
diameter due to a caudal displacement of the diaphragm
[3,35,36]. We found that when adjusting for anthropometric
variables and emphysema%, decreasing FEV1% did not produce
any relevant change for rib cage areas. This suggests that in
COPD, the parenchymal destruction associated with emphysema
may have a greater impact on rib cage morphometric variability
than conductive airway abnormalities. This is in keeping with the
early observation that, for a given level of airflow obstruction,
patients with a emphysema dominant subtype are more likely
demonstrate a ‘barrel chest’ rib cage configuration, than those
with chronic bronchitis and/or small airways disease [37].
Nevertheless, we found significant relationships between FVC%
and FEV1% decrease (the latter when adjusted only for
anthropometric variables) and middle-lower rib cage areas and
lateral diameters reduction. It is well known that patients with
reduced lung function can display a reduced range of motion of
the diaphragm, thus impeding the ability of the rib cage to enlarge
during full inspiration. This observation is consistent with the so
called Hoover’s sign, so-called because of the inward motion of the
lateral diameter of the lower rib cage during the inspiratory phase
[38,39]. This has been attributed to direct diaphragmatic traction
on the lower rib cage margin, when the diaphragm is flattened in
conditions associated with hyperinflation [40,41]. COPD may
disadvantage the respiratory muscles by impairing their capacity to
generate force [17,42].
Our study has several limitations. Although large, our study
population size is still insufficient to fully explore ranges of rib cage
morphometry which are highly variable. Rib cage measurements
were obtained from CT examinations in a supine decubitus
position during deep inspiratory. Such conditions influence the rib
cage morphometry limiting transpositions or matching with
measurements directly taken from the body or the upright chest
radiography. CT data acquisitions were not spirometrically
controlled, which would have enabled a standardization of the
inspiratory level. The assessment of the functional associations
may be biased as for the majority of subjects functional
reversibility data were not available; however, the possibility that
these subjects were misclassified is minimal mainly based on their
heavy smoking history. Diameters and areas were measured only
at three pre-selected anatomical levels, but more sections are
needed to get more complete information of the entire rib cage.
Rib cage diameters might also be influenced by skeletal disease
(e.g. scoliosis, osteoporosis etc.) which was not fully assessed in the
present study. Nevertheless averaging left and right hemithoracic
measurements, should have reduced bias associated with skeletal
abnormalities. Furthermore, the mild degree of asymmetry
reported between left and right side suggests that severe scoliosis
was not frequent in our study population. The relatively low
prevalence of more severe GOLD stages limits the interpretation
of the relationship between airflow limitation and the rib cage
morphometry.
In conclusion, this study provides ranges of several rib cage
measurements in smokers with or without COPD. We have also
revealed an important independent relationship with emphysema.
Lastly, our statistical model can only partly explain the rib cage
variation, suggesting that there are other factors, which are
important and should be the focus of further studies.
Supporting Information
Table S1 Mean Differences, P-Values, Standard Deviations and
Associated Limits of Agreement (LOA) for the rib cage diameters
and areas.
(DOCX)
File S1 Instructions: users can change values in the green
column (above) and obtain a prediction of the rib cage
measurements in the three blue columns (below); the other file
sheets (i.e. areas, diameters and other measurements have not to
be removed because they include corresponding prediction
equations derived from the multivariate analysis).
(XLS)
Acknowledgments
The Authors thank Jan-Martin Kunhigk for development and mainte-
nance of the analysis software and database and Prof. Alexander A.
Bankier for revising the manuscript critically.
Author Contributions
Conceived and designed the experiments: NS UP M. Vaccarezza M. Vitale
DC MP SLW. Performed the experiments: DC AP MS VA AC. Analyzed
the data: GR DC. Wrote the paper: NS SLW GR MP.
References
1. Takahashi E, Atsumi H (1955) Age differences in thoracic form as indicated by
thoracic index. Hum Biol 27: 65–74.
2. Lennon EA, Simon G (1965) The height of the diaphragm in the chest
radiograph of normal adults. Br J Radiol 38: 937–943.
3. Bellemare JF, Cordeau MP, Leblanc P, Bellemare F (2001) Thoracic dimensionsat maximum lung inflation in normal subjects and in patients with obstructive
and restrictive lung diseases. Chest 119: 376–386.
4. Bellemare F, Jeanneret A, Couture J (2003) Sex differences in thoracicdimensions and configuration. Am J Respir Crit Care Med 168: 305–312.
5. Cassart M, Gevenois PA, Estenne M (1996) Rib cage dimensions in
hyperinflated patients with severe chronic obstructive pulmonary disease.Am J Respir Crit Care Med 154: 800–805.
6. Gayzik FS, Yu MM, Danelson KA, Slice DE, Stitzel JD (2008) Quantification of
age-related shape change of the human rib cage through geometricmorphometrics. J Biomech 41: 1545–1554.
7. Girotti P, Leo F, Bravi F, Tavecchio L, Spano A, et al. (2011) The ‘‘rib-like’’
technique for surgical treatment of sternal tumors: lessons learned from 101
consecutive cases. Ann Thorac Surg 92: 1208–1215; discussion 1215–1206.
8. Leo F, Girotti P, Tavecchio L, Conti B, Delledonne V, et al. (2010) Anterior
diaphragmatic plication in mediastinal surgery: the ‘‘reefing the mainsail’’
technique. Ann Thorac Surg 90: 2065–2067.
9. Lee M, Kelly DW, Steven GP (1995) A model of spine, ribcage and pelvic
responses to a specific lumbar manipulative force in relaxed subjects. J Biomech
28: 1403–1408.
10. Aliverti A (2008) Lung and chest wall mechanics during exercise: effects of
expiratory flow limitation. Respir Physiol Neurobiol 163: 90–99.
11. Aliverti A, Stevenson N, Dellaca RL, Lo Mauro A, Pedotti A, et al. (2004)
Regional chest wall volumes during exercise in chronic obstructive pulmonary
disease. Thorax 59: 210–216.
12. Simon BA, Christensen GE, Low DA, Reinhardt JM (2005) Computed
tomography studies of lung mechanics. Proc Am Thorac Soc 2: 517–521,
506–517.
13. Ben-Haim SA, Saidel GM (1989) Chest wall mechanics: effects of acute and
chronic lung disease. J Biomech 22: 559–564.
Rib Cage Morphometric Variability in Emphysema
PLOS ONE | www.plosone.org 7 July 2013 | Volume 8 | Issue 7 | e68546

14. Fauroux B, Aubertin G, Cohen E, Clement A, Lofaso F (2009) Sniff nasal
inspiratory pressure in children with muscular, chest wall or lung disease. EurRespir J 33: 113–117.
15. Ley-Zaporozhan J, Ley S, Kauczor HU (2008) Morphological and functional
imaging in COPD with CT and MRI: present and future. Eur Radiol 18: 510–521.
16. Malaguti C, Rondelli RR, de Souza LM, Domingues M, Dal Corso S (2009)Reliability of chest wall mobility and its correlation with pulmonary function in
patients with chronic obstructive pulmonary disease. Respir Care 54: 1703–
1711.17. De Troyer A, Wilson TA (2009) Effect of acute inflation on the mechanics of the
inspiratory muscles. J Appl Physiol 107: 315–323.18. De Troyer A (2012) Respiratory effect of the lower rib displacement produced by
the diaphragm. J Appl Physiol 112: 529–534.19. Jubran A, Tobin MJ (1992) The effect of hyperinflation on rib cage-abdominal
motion. Am Rev Respir Dis 146: 1378–1382.
20. Marazzini L, Rizzato GF (1970) Relative contribution of rib cage and abdomen-diaphragm to the variation of lung volume in emphysema. Respiration 27: 105–
119.21. Sharp JT, Beard GA, Sunga M, Kim TW, Modh A, et al. (1986) The rib cage in
normal and emphysematous subjects: a roentgenographic approach. J Appl
Physiol 61: 2050–2059.22. Mitton D, Zhao K, Bertrand S, Zhao C, Laporte S, et al. (2008) 3D
reconstruction of the ribs from lateral and frontal X-rays in comparison to 3DCT-scan reconstruction. J Biomech 41: 706–710.
23. Pastorino U, Rossi M, Rosato V, Marchiano A, Sverzellati N, et al. (2012)Annual or biennial CT screening versus observation in heavy smokers: 5-year
results of the MILD trial. Eur J Cancer Prev 21: 308–315.
24. (2002) ATS statement: guidelines for the six-minute walk test. Am J Respir CritCare Med 166: 111–117.
25. (1995) Standards for the diagnosis and care of patients with chronic obstructivepulmonary disease. American Thoracic Society. Am J Respir Crit Care Med
152: S77–121.
26. Testut L (1899) Traite D’Anatomy Humaine. Paris: Octave Doin.27. Standring S (2008) GRAY’S ANATOMY: THE ANATOMICAL BASIS OF
CLINICAL PRACTICE: Churchill-Livingstone Elsevier.28. Haller JA, Jr., Kramer SS, Lietman SA (1987) Use of CT scans in selection of
patients for pectus excavatum surgery: a preliminary report. J Pediatr Surg 22:904–906.
29. Gevenois PA, De Vuyst P, de Maertelaer V, Zanen J, Jacobovitz D, et al. (1996)
Comparison of computed density and microscopic morphometry in pulmonary
emphysema. Am J Respir Crit Care Med 154: 187–192.
30. Bland JM, Altman DG (1986) Statistical methods for assessing agreement
between two methods of clinical measurement. Lancet 1: 307–310.
31. Decramer M (1997) Hyperinflation and respiratory muscle interaction. Eur
Respir J 10: 934–941.
32. Briscoe WA, Dubois AB (1958) The relationship between airway resistance,
airway conductance and lung volume in subjects of different age and body size.
J Clin Invest 37: 1279–1285.
33. Binazzi B, Bianchi R, Romagnoli I, Lanini B, Stendardi L, et al. (2008) Chest
wall kinematics and Hoover’s sign. Respir Physiol Neurobiol 160: 325–333.
34. Rothpearl A, Varma AO, Goodman K (1988) Radiographic measures of
hyperinflation in clinical emphysema. Discrimination of patients from controls
and relationship to physiologic and mechanical lung function. Chest 94: 907–
913.
35. Kilburn KH, Asmundsson T (1969) Anteroposterior chest diameter in
emphysema. From maxim to measurement. Arch Intern Med 123: 379–382.
36. Walsh JM, Webber CL, Jr., Fahey PJ, Sharp JT (1992) Structural change of the
thorax in chronic obstructive pulmonary disease. J Appl Physiol 72: 1270–1278.
37. Pierce JA, Ebert RV (1958) The barrel deformity of the chest, the senile lung and
obstructive pulmonary emphysema. Am J Med 25: 13–22.
38. Johnston CR, 3rd, Krishnaswamy N, Krishnaswamy G (2008) The Hoover’s
Sign of Pulmonary Disease: Molecular Basis and Clinical Relevance. Clin Mol
Allergy 6: 8.
39. Bruyneel M, Jacob V, Sanida C, Ameye L, Sergysels R, et al. (2011) Hoover’s
sign is a predictor of airflow obstruction severity and is not related to
hyperinflation in chronic obstructive pulmonary disease. Eur J Intern Med 22:
e115–118.
40. Gilmartin JJ, Gibson GJ (1986) Mechanisms of paradoxical rib cage motion in
patients with chronic obstructive pulmonary disease. Am Rev Respir Dis 134:
683–687.
41. Leduc D, Cappello M, Gevenois PA, De Troyer A (2012) Mechanism of the
lung-deflating action of the canine diaphragm at extreme lung inflation. J Appl
Physiol 112: 1311–1316.
42. Priori R, Aliverti A, Albuquerque AL, Quaranta M, Albert P, et al. (2013) The
effect of posture on asynchronous chest wall movement in COPD. J Appl Physiol
114: 1066–1075.
Rib Cage Morphometric Variability in Emphysema
PLOS ONE | www.plosone.org 8 July 2013 | Volume 8 | Issue 7 | e68546