pulmonary involvement in rheumatoid arthritis: multidetector computed tomography findings
TRANSCRIPT

http://acr.sagepub.com/Acta Radiologica
http://acr.sagepub.com/content/54/10/1138The online version of this article can be found at:
DOI: 10.1177/0284185113491566
2013 54: 1138 originally published online 19 July 2013Acta RadiolRuken Yuksekkaya, Fatih Celikyay, Ayse Yilmaz, Sule Arslan, Ahmet Inanir, Handan Inonu and Caglar DenizPulmonary involvement in rheumatoid arthritis: multidetector computed tomography findings
Published by:
http://www.sagepublications.com
On behalf of:
Nordic Society of Medical Radiology
can be found at:Acta RadiologicaAdditional services and information for
http://acr.sagepub.com/cgi/alertsEmail Alerts:
http://acr.sagepub.com/subscriptionsSubscriptions:
http://www.sagepub.com/journalsReprints.navReprints:
http://www.sagepub.com/journalsPermissions.navPermissions:
What is This?
- Jul 19, 2013OnlineFirst Version of Record
- Nov 19, 2013Version of Record >>
at Gaziosmanpasa Universitesi on June 3, 2014acr.sagepub.comDownloaded from at Gaziosmanpasa Universitesi on June 3, 2014acr.sagepub.comDownloaded from

Original Article
Pulmonary involvement in rheumatoidarthritis: multidetector computedtomography findings
Ruken Yuksekkaya1, Fatih Celikyay1, Ayse Yilmaz2,Sule Arslan3, Ahmet Inanir3, Handan Inonu2 and Caglar Deniz1
AbstractBackground: Pulmonary involvement in rheumatoid arthritis (RA) is common and encompasses a large spectrum of
disease with different treatment options and prognoses. Therefore, assessment of these patients with multidetector
computed tomography (MDCT) is vital.
Purpose: To evaluate the MDCT pulmonary findings of patients with RA and to compare these findings with the clinical
status.
Material and Methods: Chest MDCT scans of 85 patients with RA between 2006–2012 were assessed. One patient
with a pulmonary infection was excluded from the study. MDCT findings and distribution of the CT findings were
examined, and patients were classified according to the predominant CT pattern. The pulmonary function test (PFT)
results and categories, demographic characteristics, and clinical status of some of the patients for whom the results were
obtained were evaluated, and the CT findings, PFT results, demographic characteristics, and clinical status were
compared.
Results: The study group consisted of 20 men (mean age, 58.1 years� 13.1; range, 15–77 years) and 64 women (mean
age, 55.3 years� 11.5; range, 30–84 years). The most frequent findings were nodules (78.6%) and pleural thickening
(48.8%). The most common CT patterns were follicular bronchiolitis (FB) in 28 (33.3%) patients and nodular disease
(ND) in 12 (14.3%) others. There was no statistically significant difference between the CT findings and PFT results, and
no statistically significant difference was noted in the CT findings between symptomatic and asymptomatic patients. In
addition, there were some patients who exhibited no symptoms and/or had abnormal PFT results but had abnormal CT
findings.
Conclusion: Rheumatoid arthritis is associated with a high frequency of CT findings and CT patterns, with nodules and
pleural thickening being the most common CT findings and FB and ND being the most common CT patterns. MDCT
identification of patients with RA may be helpful in the evaluation of pulmonary disease, even in patients without
symptoms and PFT abnormalities.
Keywords
MDCT, high resolution CT, lung, connective tissue disorders
Date received: 22 May 2012; accepted: 29 April 2013
Introduction
Rheumatiod arthritis (RA) is a chronic inflammatoryautoimmune disease that primarly affects diarthrodialjoints (1). Approximately 40% of patients with RAhave extra-articular manifestations (2), and pulmonaryinvolvement is the second most common cause of death(18%) after infection (27%) (3,4). Thoracic manifest-ations of RA include pleural thickening and effusion,airway disease (bronchiectasis [BE]), nodular disease(ND), interstitial lung disease (ILD) (non-specific
1Radiology Department, Gaziosmanpasa University School of Medicine,
Tokat, Turkey2Chest Disease Department, Gaziosmanpasa University School of
Medicine, Tokat, Turkey3Department of Physical Medicine and Rehabilitation, Gaziosmanpasa
University School of Medicine, Tokat, Turkey
Corresponding author:
Ruken Yuksekkaya, Radiology Department, Gaziosmanpasa University
School of Medicine, Tokat 60100, Turkey.
Email: [email protected]
Acta Radiologica
54(10) 1138–1149
! The Foundation Acta Radiologica
2013
Reprints and permissions:
sagepub.co.uk/journalsPermissions.nav
DOI: 10.1177/0284185113491566
acr.sagepub.com
at Gaziosmanpasa Universitesi on June 3, 2014acr.sagepub.comDownloaded from

interstitial pneumonia [NSIP], usual interstitial pneu-monia [UIP], organizing pneumonia [OP], acute intersti-tial pneumonia [AIP], lymphoid interstitial pneumonia[LIP], bronchiolitis obliterans [BO], follicular bronchio-litis [FB]), drug-induced diseases, pulmonary hyperten-sion, and other pulmonary infections (5–10).
Our aim was to evaluate the multidetector computedtomography (MDCT) findings of patients with RA andcompare these with their clinical status.
Material and Methods
Patients
We retrospectively reviewed chest MDCT scans of RApatients between 2006 and 2012. The patients fulfilledthe American Rheumatism Association 1987 revisedcriteria for the classification of RA (11). These patientsunderwent chest MDCT scans before administration ofany biological agents, or they had pulmonary symp-toms and abnormal chest radiograms. One patientwith a pulmonary infection was excluded from thestudy. Since we did not disclose the identity of ourpatients, institutional review board approval andinformed consent of the patients were not requiredfor this retrospective review of patient records andMDCT scans.
The data obtained from the hospital informationsystem included the following items: age at RA onset,duration of the disease, exposure to asbestos and smok-ing, respiratory symptoms (dyspnea, cough, wheezing,sputum, fever, and hemoptysis) and medical treatment(if any) at the time of the examination, presence andlevels of rheumatoid factors (RFs) at the time of thefirst diagnosis or the first medical examination at theRheumatism Department of our University Hospital,erythrocyte sedimentation rate (ESR) (mm/h), and C-reactive protein (CRP) levels at the time of the CTexaminations or within 2 months. The reference rangefor RF was 0–15 IU/mL in our laboratory.
MDCT scanning
MDCT protocols were applied with the patients in thedorsal decubitis position, during maximum inspiration,by using an 8-channel MDCT system (GE Healthcare,Milwaukee, WI, USA). The patients had either a chestCT (n¼ 35; 41.7%), a chest high resolution CT(HRCT) (n¼ 24; 28.6%), or both (n¼ 25; 29.8%).Contiguous axial slices at contrast-enhanced chest CTscans were obtained at 5-mm intervals, with 5-mm col-limation, 120Kvp, and automatic tube modulation at120–225mA. The high resolution computed tomog-raphy (HRCT) was at 10-mm intervals, with 1-mm col-limation, 120Kvp, and automatic tube modulation of
400mA. All images were obtained at window levelsappropriate for lung parenchyma (window width,1500–1700HU; window level, �600 or �700HU) andthe mediastinum (window width, 250–400HU; windowlevel, 40–50HU). The images were reconstructed with ahigh-resolution algorithm.
Interpretation of CT examinations
Data retrieval and analysis were performed using apatient archive and communication system (PACS)workstation (Centricity RA 1000, GE HealthcareMilwaukee, WI, USA). All examinations were assessedby simultaneous consensus of two radiologists with 10years of experience who were blinded to the patients’clinical information and pulmonary function test (PFT)results but were informed about the presence of RA.The data were recorded on an imaging evaluation form.
The characteristics, distribution, and extent of thechest CT and HRCT findings were evaluated basedon the criteria defined by the study of Tanaka et al.(5). Each examination result was scored based on thepresence or absence of air-space consolidation, ground-glass opacity (GGO), reticulation (interlobular andintralobular septal thickening), peribronchial thicken-ing (PBT), honeycombing, nodules, emphysema,bullae, BE, bronchiolectasis, crazy-paving appearance(GGO with interlobular and intralobular septalthickening), tree-in-bud appearance, mosaic perfusion(patchwork of heterogenous lung attenuation becauseof air trapping or lung perfusion abnormalities), andarchitectural distorsion (displacement of vessels, fis-sures, and bronchi). Various types of BE, such ascylindric, cystic, and traction, were noted. The noduleswere separated into three groups according to micro-nodules (<3mm in diameter), small nodules (3–10mmin diameter), and large nodules (>10mm in diameter).Distribution of these nodules was also recorded as cen-trilobular or others. A CT examination was accepted asabnormal with the presence of at least one of the above-mentioned criteria.
The vertical and axial distributions of all of the CTfindings were evaluated. The vertical distribution of thepulmonary disease was assessed according tothe involvement of the upper and/or lower zones, andthe inferior pulmonary vein was found on the borderbetween the upper and lower zones. Axial distributionof the disease was also rated as having central, periph-eral, or diffuse involvement. The extent of the diseasewas evaluated based on the presence of radiologicalsigns (grade 0, absent) and degree of the involvementas grades 1 (1–25%), 2 (26–50%), 3 (51–75%), and 4(76–100%). The location of BE was coded as grade1 (at one bronchopulmonary segment) and grade 2(extensive).
Yuksekkaya et al. 1139
at Gaziosmanpasa Universitesi on June 3, 2014acr.sagepub.comDownloaded from

In addition, each examination was evaluated accord-ing to the presence or absence of pleural thickening,pleural effusion, pericardial effusion or thickening,esophageal dilatation, and lymph node enlargement.A lymph node was considered enlarged when its shortaxis was �10mm (12). Enlarged lymph nodes were dis-tributed within one (Group 1) or multiple (Group 2)locations. The diameter of the largest lymph node wasnoted. The widest diameter of the pulmonary trunkperpendicular to the long axis was measured, and theupper limit of the pulmonary trunk diameter wasaccepted as 30mm.
The patients with early onset RA (<2 years) andother types of this disease were compared in terms ofcharacteristics, distribution and grade of CT findings,and location of BE.
The most likely radiological diagnoses, such as NSIP,UIP, OP, AIP, LIP, BO, FB, hypersensitivity pneumo-nia (HP), ND, and airway disease, were defined based onprevious descriptions of the disease (5–10,13–18).
Pulmonary function tests
Lung function was measured by a standard protocoland included spirometry. The spirometry results ofpatients within 2 months of their CT examinationswere recorded, and the values and percentages offorced vital capacity (FVC), forced expiratory volumein 1 s (FEV1), FEV1/FVC ratio, and forced expiratoryflow between 25% and 75% of vital capacity (FEF25–75) were determined.
Pulmonary function test results were categorized asabnormal if the values were <80% of the predictedvalues adjusted for age, sex, and height. Obstructionwas defined by a FEV1/FVC ratio of �80% of the pre-dicted ratio or an FEF25–75 ratio of <80% in theabsence of a reduced FEV1/FVC ratio. Restrictionwas defined as an FVC of <80% of the predictednormal FEV1/FVC ratio. A combined (mixed) patternwas defined as the coexistence of an airway obstructionand restrictive disorder (19).
Statistical analysis
Continuous data was expressed as the mean� standarddeviation (SD) and categorical data as numbers withrelated percentages (n, %). Differences in continuousdata were analyzed by using Student’s t test, and cat-egorical data was compared using a chi-square test.A two-tailed P value< 0.05 was considered to be stat-istically significant. The correlation between the CTfindings and the extent score of the CT findings andage along with the results of the pulmonary functiontests, ESR, CRP, and RF were analyzed with a non-parametric test (Spearman’s rank correlation
coefficient). A correlation was considered presentwhen the P value for the difference was <0.05. All stat-istical analyses were performed using the StatisticalPackage for the Social Sciences software package ver-sion 15.0 (SPSS Inc., Chicago, IL, USA).
Results
Demographic characteristics of patients
The study group consisted of 20 men (23.8%) (meanage, 58.1� 13.1; range, 15–77 years) and 64 women(76.2%) (mean age, 55.3� 11.5; range, 30–84 years).
Table 2. Clinical characteristics and medical history of the
study group.
RA (n¼ 80)
Asymptomatic, n (%) 29 (34.5)
Cough, n (%) 26/80 (32.5)
Dyspnea, n (%) 40/80 (50)
Sputum, n (%) 18/80 (22.5)
Wheezing, n (%) 7/80 (8.75)
Fever, n (%) 4/80 (5)
Hemoptysis, n (%) 3/80 (3.75)
Multiple symptoms, n (%) 27 (32.1)
RF positivity, n (%) 59/77 (76.6)
Mean RF value (n¼ 77) 155.1� 193
Drug use:
Anti-inflammatory drugs, n (%) 45/83 (53.6)
Immunosuppressive drugs, n (%) 62/83 (73.8)
Corticosteroids, n (%) 67/83 (79.8)
Antimalarials, n (%) 22/83 (26.2)
Colchicine, n (%) 4/83 (4.8)
Biological agents, n (%) 3/83 (3.6)
Multiple drugs, n (%) 4/83 (4.8)
RA, rheumatoid arthritis; RF, rheumatoid factor.
Table 1. Demographic and baseline characteristics of the study
group.
RA (n¼ 84)
Gender (men/women) 20/64
Age (years) (mean� SD) 56� 12.1
Tobacco use, n (%) 18/73 (24.4)
Asbestos exposure, n (%) 10/69 (14.5)
Mean age at diagnosis (years), (n¼ 80) 47.7� 14
Mean disease duration (years), (n¼ 80) 8.12� 7.7
Early RA patients, n (%) 19 (22.6)
RA, rheumatoid arthritis.
1140 Acta Radiologica 54(10)
at Gaziosmanpasa Universitesi on June 3, 2014acr.sagepub.comDownloaded from

A history of tobacco and asbestos exposure was notavailable for 11 (13.1%) and 15 (17.9%) patients,respectively. The data about disease onset and durationwas obtained from 80 (95.2%) of the 84 patients. Thedemographic characteristics for all of the patients aresummarized in Table 1.
The data related to the frequency of respiratorysymptoms were also retrieved from the records of80 (95.2%) patients. Twenty-seven (32.1%) of thesehad more than one respiratory symptom, whereas29 (34.5%) had no respiratory issues at all. In addition,the RF test values of 77 (91.7%) patients were obtained,and information about any previous medical therapywas received from 83 (98.9%) patients. The clinical char-acteristics of the patients are summarized in Table 2.
CT findings
The frequency of the CT findings is summarized inTable 3, and the most common occurrences were nod-ules (78.6%) (Figs. 1–3) and pleural thickening(48.8%). Peribronchial thickening (Fig. 1a), GGO(Figs. 4 and 5), bronchiolectasis, BE (Figs 5 and 6),
lymph node enlargement, and reticulation (Fig. 6), airtrapping, tree-in-bud appearance (Fig. 1), and honey-combing (Fig. 6) were also detected. No abnormalitieswere detected in seven (8.3%) patients.
Nodule sizes and their location (Figs. 1–3) alongwith the types of BE are shown in Table 4. The meandiameter of enlarged lymph nodes was 11.15mm� 1.62(10–15mm). Of 26 (31%) patients with enlarged lymphnodes, 16 (19%) had multiple lymphadenopathies.
The distribution and the extent of the CT findings,except for pleural thickening, pleural effusion, pericar-dial effusion, lymph node enlargement, and esophagealdilatation, are given in Table 5. One (1.2%) patient hadonly pleural thickening; thus, the extent and distribu-tion of the disease were not evaluated in this patient.
There was no statistically significant relationshipbetween exposure to asbestos and pleural thickeningand/or effusion (P> 0.05 for all).
In 66 (78.6%) patients, specific CT patterns weredetected. The distribution of these patterns was as fol-lows: FB (33.3%), ND (14.3%), BO (9.5%), NSIP(7.1%), UIP (6%), AD (6%), OP (1.2%), and HP(1.2%).
Table 3. Chest MDCT, HRCT findings, and CT patterns in 84 patients with rheumatoid arthritis.
Total
(n¼ 84)
Follicular
bronchiolitis
pattern
(n¼ 28)
Nodular
disease
pattern
(n¼ 12)
Bronchiolitis
obliterans
pattern
(n¼ 8)
Non-specific
interstitial
pneumonia
pattern
(n¼ 6)
Usual
interstitial
pneumonia
pattern
(n¼ 5)
Airway
disease
pattern
(n¼ 5)
Other CT
patterns
(n¼ 2)
Nodules, n (%) 66 (78.6) 28 (100) 12 (100) 8 (100) 4 (66.7) 2 (40) 2 (40) 2 (100)
Pleural thickening, n (%) 41 (48.8) 16 (57.1) 4 (33.3) 4 (50) 5 (83.3) 4 (80) 3 (60) 0 (0)
PBT, n (%) 40 (47.6) 19 (67.9) 1 (8.3) 6 (75) 4 (66.7) 3 (60) 4 (80) 1 (50)
GGO, n (%) 35 (41.7) 14 (50) 3 (25) 0 (0) 6 (100) 5 (100) 1 (20) 2 (100)
Bronchiolectasis, n (%) 34 (40.5) 14 (50) 0 (0) 6 (75) 5 (83.3) 5 (100) 3 (60) 1 (50)
BE, n (%) 33 (39.3) 18 (64.3) 3 (25) 4 (50) 3 (50) 2 (40) 3 (60) 0 (0)
Bronchiolectasis or BE, n (%) 45 (53.6) 22 (78.5) 3 (25) 6 (75) 5 (83.3) 5 (100) 3 (60) 1 (50)
Lymph node enlargement, n (%) 26 (31) 11 (39.3) 3 (25) 1 (12.5) 5 (83.3) 3 (60) 1 (20) 2 (100)
Reticulation, n (%) 24 (28.6) 6 (21.4) 1 (8.3) 0 (0) 6 (100) 5 (100) 2 (40) 2 (100)
Interlobular septal thickening, n (%) 23 (27.4) 6 (21.4) 1 (8.3) 0 (0) 5 (83.3) 5 (100) 2 (40) 2 (100)
Intralobular septal thickening, n (%) 15 (17.9) 2 (7.1) 0 (0) 0 (0) 5 (83.3) 5 (100) 0 (0) 2 (100)
Air trapping, n (%) 22 (26.7) 7 (25) 1 (8.3) 8 (100) 1 (16.7) 0 (0) 3 (60) 0 (0)
Honeycombing, n (%) 8 (9.5) 0 (0) 0 (0) 0 (0) 2 (33.3) 5 (100) 0 (0) 1 (50)
Tree-in-bud appearance, n (%) 15 (17.9) 11 (39.3) 0 (0) 4 (50) 0 (0) 0 (0) 0 (0) 0 (0)
Architectural distorsion, n (%) 13 (15.5) 5 (17.9) 1 (8.3) 0 (0) 2 (33.3) 3 (60) 1 (20) 0 (0)
Emphysema, n (%) 10 (11.9) 5 (17.9) 0 (0) 0 (0) 1 (16.7) 1 (20) 1 (20) 1 (20)
Bullae, n (%) 8 (9.5) 4 (14.3) 0 (0) 0 (0) 1 (16.7) 2 (40) 0 (0) 0 (0)
Pleural effusion, n (%) 6 (7.1) 1 (16.7) 1 (8.3) 0 (0) 2 (33.3) 2 (40) 0 (0) 0 (0)
Consolidation, n (%) 5 (6) 2 (7.1) 0 (0) 0 (0) 1 (16.7) 1 (20) 0 (0) 1 (50)
Enlargement of the pulmonary artery, n (%) 4 (4.8) 2 (7.1) 0 (0) 0 (0) 1 (16.7) 0 (0) 0 (0) 0 (0)
Crazy-paving appearance, n (%) 3 (3.6) 0 (0) 0 (0) 0 (0) 0 (0) 1 (20) 0 (0) 2 (100)
Pericardial effusion or thickening, n (%) 3 (3.6) 1 (16.7) 0 (0) 0 (0) 1 (16.7) 1 (20) 0 (0) 0 (0)
BE, bronchiectasis; CT, computed tomography; GGO, ground-glass opacity; PBT, peribronchial thickening.
Yuksekkaya et al. 1141
at Gaziosmanpasa Universitesi on June 3, 2014acr.sagepub.comDownloaded from

Four patients with enlarged pulmonary trunk hadCT patterns (NSIP [n¼ 1; 25%] and FB [n¼ 2; 50%])(Table 3).
Follicular bronchiolitis
In the 28 patients with FBpattern, nodules were themostfrequently detected finding (Figs. 1 and 2). The noduleswere centrilobular in 57.1%andwere identified asmicro-nodules in 60.7% of the patients. Other CT findings aresummarized in Table 3. Bronchiectasis was mostly cylin-drical (50%) and located extensively (55.6%). The verti-cal and axial distributions of the disease were mostlydiffuse in 82.1% and 60.7% of the patients, respectively.
The extent of the disease was mostly of grade 1 (67.9%),and there was no crazy-paving appearance or honey-combing in these patients (Table 3).
Nodular disease
Nodules were present in all 12 patients with an NDpattern (Fig. 3), and most were micronodules with acentrilobular location (58.4%). Other common CTfindings were GGO and BE (Table 3). All of thecases with cylindrical BE were mostly extensivelylocated (55.6%). These abnormal CT findings weremostly detected on the periphery (58.3%) in theaxial direction and all over the pulmonary
Fig. 1. Transverse MDCT scans obtained at the level of the lower lobes in a 39-year-old woman (a) and a 75-year-old man with FB CT
patterns (b). Centrilobular nodules (thick arrows), tree-in bud appearances (arrowheads), peribronchial thickening, and BEs (thin
arrows) can be seen.
Fig. 3. Transverse MDCT scan obtained at the level of the lower
zones in a 54-year-old woman. Centrilobular, microsized nodules
(arrowheads) and a small nodule (arrow) at subpleural right
middle lobe can be seen.
Fig. 2. A transverse MDCT scan obtained at the lower lobes in
a 44-year-old woman with an FB CT pattern. Microsized, cen-
trilobular nodules (arrows) at the subpleural regions can be seen.
1142 Acta Radiologica 54(10)
at Gaziosmanpasa Universitesi on June 3, 2014acr.sagepub.comDownloaded from
parenchyma (66.7%) in the vertical direction. Theextent of the disease was mostly grade 1 (91.7%).However, some CT findings were not observed inpatients with ND (Table 3).
Bronchiolitis obliterans
All eight patients with a BO pattern manifested nodulesand air trapping. The nodules were mostly
micronodules with a centrilobular location.Peribronchial thickening, bronchiolectasis, BE, andtree-in-bud appearance were observed most often.Most of the BE were located extensively (66.7%). Thevertical and axial distributions of the disease werefound to be diffuse in 87.5% and 100% of the patients,respectively. The extent of the disease was mostly grade1 (62.5%). However, some CT findings were notobserved in patients with ND (Table 3).
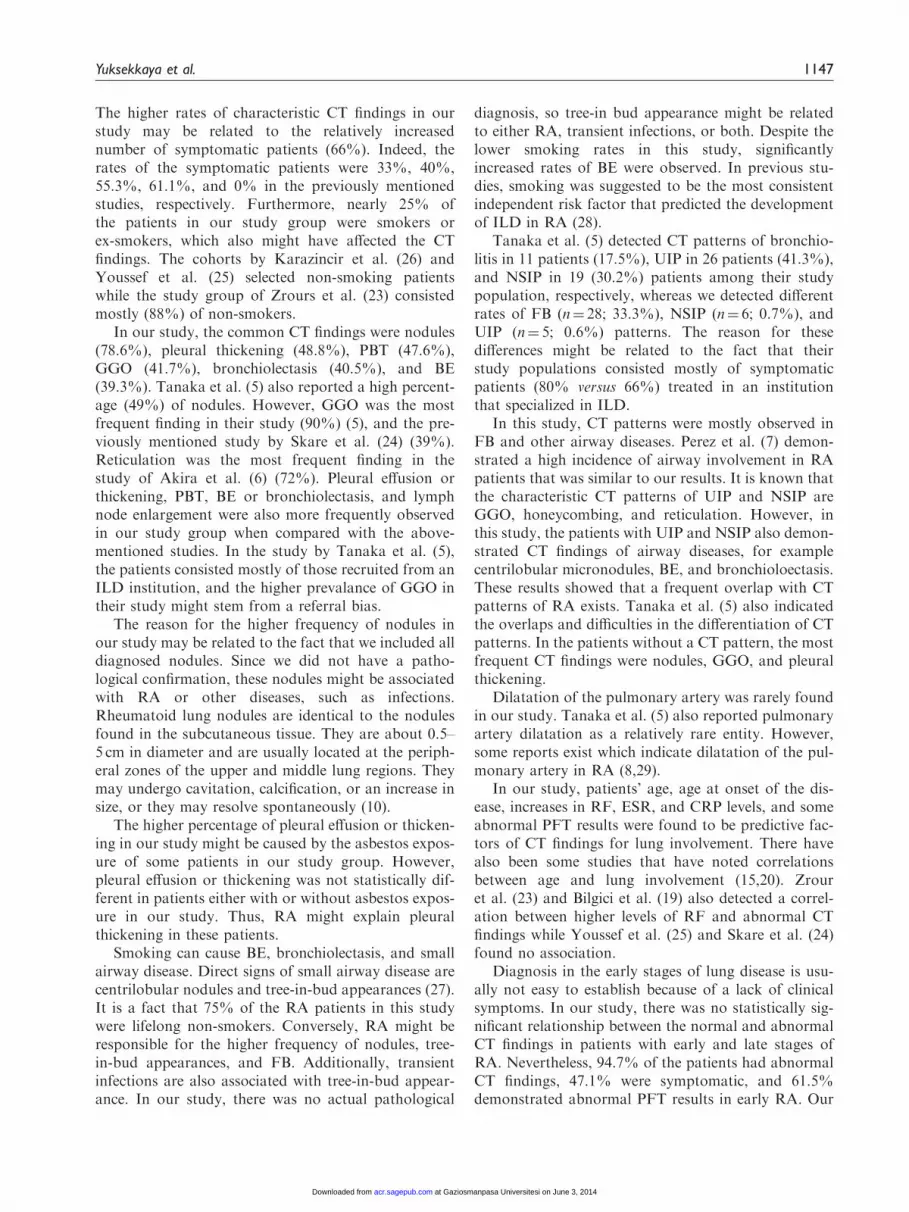
Fig. 5. A transverse HRCT scan obtained at the level of the lower lobes in a 71-year-old woman with NSIP. Mixed areas of GGO (thin
arrows) and consolidation (thick arrow) can be seen extensively. Honeycombing (arrowhead), reticular abnormalities at the subpleural
lower lobes, bronchiectasis with PBT (thick white arrow), and bronchiolectasis (white arrowhead) are well demonstrated.
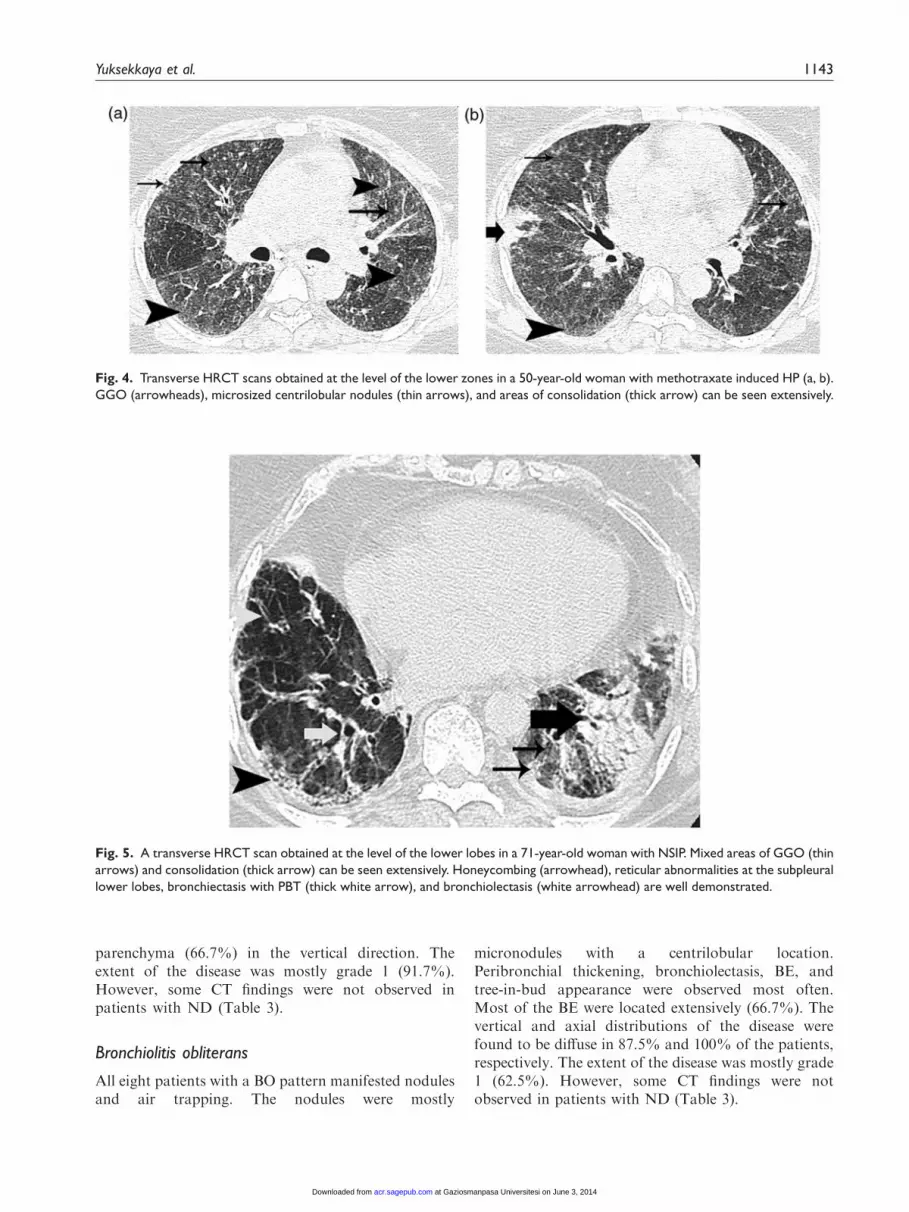
Fig. 4. Transverse HRCT scans obtained at the level of the lower zones in a 50-year-old woman with methotraxate induced HP (a, b).
GGO (arrowheads), microsized centrilobular nodules (thin arrows), and areas of consolidation (thick arrow) can be seen extensively.
Yuksekkaya et al. 1143
at Gaziosmanpasa Universitesi on June 3, 2014acr.sagepub.comDownloaded from

Non-specific interstitial pneumonia
All six patients with an NSIP pattern had GGO andreticulation (Fig. 5) (Table 3). Peribronchial thickening,nodules, bronchiolectasis, BE, architectural distorsion,and honeycombing were also common. Micronodules(50%) and small nodules (50%), mostly centrilobular in
Fig. 6. A transverse thin-section CT scan obtained at the level of the lower lobes in a 58-year-old man with UIP. Reticulation and
honeycombing (arrows) can be seen in the posterior subpleural lower lobes. Bronchiectasis is well demonstrated (arrowheads).
Table 5. Distribution of CT findings not including pleural
thickening, pleural effusion, pericardial effusion, lymph node
enlargement, and esophageal dilatation.
CT findings except for pleural thickening pleural
thickening, pleural effusion, pericardial effusion,
lymph node enlargement, and esophageal dilatation
Vertical distribution, n (%)
Upper zone 4 (4.8)
Lower zone 15 (17.9)
Diffuse involvement 57 (67.9)
Axial distribution, n (%)
Central 3 (3.6)
Peripheral 29 (34.5)
Diffuse involvement 44 (52.4)
Extension of CT findings, n (%)
Grade 1 49 (58.3)
Grade 2 16 (19)
Grade 3 7 (8.3)
Grade 4 3 (3.6)
Extension of bronchiectasis, n (%)
At one bronchopulmonary segment 17 (20.2)
At more than one bronchopulmonary segment 16 (19)
Table 4. Size and location of nodules and types of bronchiec-
tasis (BE).
CT findings n (%)
Nodule
Size (mm)
Micronodules (<3) 44 (52.4)
Small nodules (3–10) 22 (26.2)
Large nodules (>10) 0 (0)
Location
Centrilobular 34 (40.5)
Others 32 (48.5)
BE 24 (28.6)
Types
Cylindrical
Tractional 4 (4.8)
Cylindrical-tractional 5 (6)
1144 Acta Radiologica 54(10)
at Gaziosmanpasa Universitesi on June 3, 2014acr.sagepub.comDownloaded from

nature (75%), were seen. Reticulations were visualized.Most of the BE were of the cylindrical and traction(66.7%) types with an extensive distribution (75%).The vertical and axial distributions of the diseasewere mostly diffuse in both types (83.3%). The exten-sion of the disease was generally grade 3 (66.7%), andno tree-in bud or crazy-paving appearances wereobserved (Table 3).
Usual interstitial pneumonia
All five patients with the UIP pattern had GGO, reticu-lations, bronchiolectasis, and honeycombing (Fig. 6)(Table 3). In these patients, PBT, architectural distor-sion, BE, bullae, and nodules were also commonlyfound. Centrilobular nodules were observed in 50%of the patients with nodules. Bronchiectasis was diffuse(50%) or involved one bronchopulmonary segment(50%). Vertical and axial distributions of the diseasewere diffuse in 100% and 80% of the patients, respect-ively. The extent of the disease was mostly grade 2(60%), and no tree-in-bud appearance or air trappingwere observed (Table 3).
Airway disease
In the five patients with an AD pattern, PBT, BE,bronchiolectasis, and air trapping were the most
common findings. All of the BE detected were cylin-drical, and most involved a single bronchopulmonarysegment. Nodules were identified as micronodules(50%) or small nodules (50%) and were mostly in thecentrilobular location (75%). The axial distribution ofthe disease was mostly (80%) diffuse in these patients,whereas the vertical distribution of the disease was dif-fuse in 40% and inferior in 40% of the patients withAD. The extent of the disease was at grade 1 in all ofthe patients, and no consolidation, bullae, crazy-paving, or tree-in-bud appearances were noted.
Other CT patterns
In one patient who was diagnosed with an OP pattern,GGO, PBT, small nodules exhibiting other types ratherthan centrilobular, reticulation with interlobular andintralobular septal thickening, bronchiolectasis, andcrazy-paving appearances were observed (Table 3).The distribution of the disease was diffuse in both thevertical and axial directions, and the extent of the dis-ease was grade 2.
In the other patient with an HP pattern (Fig. 4) con-solidation, GGO, honeycombing, microsized and cen-trilobular nodules, reticulation with interlobular andintralobular septal thickening, and crazy-pavingappearance were observed (Table 3). The disease wasdistributed peripherally and diffusely, and the extent of
Table 6. Statistically significant correlations between patient characteristics, clinical status, and pulmonary function test results with
respect to CT findings.
Age
Age at onset
of disease ESR CRP RF levels RF positivity FVC FEV1 FEF25–75
PBT 0.359
GGO 0.238 –0.354
Bronchiolectasis 0.409 0.266 –0.345
BE 0.272
Reticulation 0.232
Interlobular septal thickening 0.275
Intralobular septal thickening 0.260 –0.331
Honeycombing 0.258
Architectural distorsion 0.233 0.280
Emphysema 0.240
Bullae 0.234 0.216
Pleural effusion –0.286
Pleural thickening 0.218
Consolidation –0.332 –0.358
Crazy-paving appearance 0.254
Extension of abnormal CT findings 0.243 0.231 –0.482 –0.349
Nodule sizes 0.280
BE, bronchiectasis; CRP, C-reactive protein; ESR, erythrocyte sedimentation rate; FEV1, forced expiratory volume in 1 second; FEF25–75, forced
expiratory flow between 25% and 75% of vital capacity; FVC, forced vital capacity; GGO, ground-glass opacity; PBT, peribronchial thickening; RF,
rheumatoid factor.
Yuksekkaya et al. 1145
at Gaziosmanpasa Universitesi on June 3, 2014acr.sagepub.comDownloaded from

the disease was grade 3. This patient was using metho-trexate at the time of the CT examination. When thiswas stopped, the clinical and radiological findingsregressed, suggesting the diagnosis of methotraxate-induced HP.
Pulmonary function tests
Forty-nine (58.3%) of our 84 patients with RA hadPFT results. Obstructive disorder was reported in28.5%, restrictive disorder in 2.2%, and a combinedpattern in 28.5% of the patients, respectively. Themean values of the PFT results calculated as percent-ages of predictive value were as follows: FVC, 90.5%(13.8–129.8%); FEV1, 90.9% (16.8–136.7%); FEV1/FVC, 84% (66.8–100%); FEF25–75, 75.9% (17.2–206.4%). These results did not differ between non-smo-kers and current and/or former smokers (P> 0.05).
Assessment of patient characteristics, clinical status,and pulmonary function test results with respect toCT findings and patterns
The statistically significant (P< 0.05) positive andnegative correlations between the CT findings andpatient characteristics, clinical status, and pulmonaryfunction test results are summarized in Table 6.
Eighteen patients with early RA (18/19, 94.7%) and55 (55/61, 90.2%) with �2 years of disease durationdemonstrated abnormal CT examination results.There was no statistically significant difference regard-ing the normal or abnormal CT examinations betweenthe patients with early RA and the other patients(P¼ 1.00). Three (15.8%) patients in the early RAand 28 (45.9%) patients in the other group had GGOwith a statistically significant intergroup difference(P¼ 0.037). The PFT results of 13 (68.4%) patients inthe early RA, and 34 (61.8%) patients in the othergroup were retrieved. Among them, eight early RA(61.5%) patients and 20 (58.8%) patients in the othergroup demonstrated abnormal PFT results. No statis-tically significant difference was noted concerning thenormal and abnormal PFT results between the earlyRA patients and the comparator group (P¼ 1.00).
Abnormal CT examination results were recorded in26 of 29 (89.7%) asymptomatic and 47 of 51 (92.2%)symptomatic patients, and there was no statistically sig-nificant difference regarding the normal and abnormalCT examination results between these patients(P¼ 0.70). When we compared the CT findings inpatients with and without respiratory symptoms, thefollowing CT abnormalities were found with a signifi-cantly higher frequency among symptomatic patients:PBT (60.8%, P¼ 0.009), interlobular septal thickening(37.3%, P¼ 0.026), and air trapping (33.3%,
P¼ 0.022). Eight symptomatic patients (15.7%) hadnot manifested any CT pattern. The most frequentCT patterns were FB (29.4% versus 44.8%) and ND(11.8% versus 17.2%) in both patients with and withoutrespiratory symptoms, respectively.
When we compared the CT findings and smokingstatus among patients with RA, micronodules were fre-quently observed in patients who were lifelong non-smokers (76.2%) and small nodules in smokers(58.8%) with a statistically significant differencebetween the groups (P¼ 0.23). Smokers also hadhigher rates of emphysema (33.3% versus 7.3%,P¼ 0.012) and BE (72.2% versus 32.7%, P¼ 0.005).
There was no statistically significant relationshipbetween the CT findings and the disorders based onthe PFT results, and no difference was noted in thenormal and abnormal PFT results between the patientswith normal and abnormal CT examinations. Also,there was no statistically significant difference betweenthe normal and abnormal PFT results regarding theextent and grade of CT findings, and the mean PFTvalues were not statistically different in the patientswith normal and abnormal CT findings (P> 0.05 forall). Among the 20 patients with normal PFT results,18 (90%) had abnormal CT examination results. Themost common CT finding in these patients was nodulesin 16 (80%) cases, and micronodules<3mm in size weremostly detected. In addition, 16 (80%) patients withnormal PFT results manifested some CT patterns, withthe most common pattern being FB (n¼ 8; 50%).
Discussion
Collagen vascular diseases are often observed in thelungs, mediastinum, and pleura. Inappropriate or inad-equate medical treatment may also lead to infectiousdiseases and some immune reactions. Interstitial lungdisease and pulmonary hypertension are mainly respon-sible for any related mortality and morbidity (20).Clinically significant ILD occurs in nearly 10% of theRA population (21). Many studies have evaluated theprevalence of lung involvement, but the resultsdepended on the definition of the disease, studydesign, and diagnostic methods. In these studies, ahigh prevalence of abnormality was found (19,22–26)in the CT findings, and CT patterns were also identifiedin some studies (5,19,23,24).
In our study, 91.7% of the patients had some CTfindings, and 78.6% had some CT patterns. Severalauthors have reported various percentages of charac-teristic CT findings in their study groups, includingZrour et al. (23) with 49%, Bilgici et al. (19)with 67.3%, Skare et al. (24) with 55%, Youssef et al.(25) with 47.2%, and Karazincir et al. (26) with 48%.
1146 Acta Radiologica 54(10)
at Gaziosmanpasa Universitesi on June 3, 2014acr.sagepub.comDownloaded from
The higher rates of characteristic CT findings in ourstudy may be related to the relatively increasednumber of symptomatic patients (66%). Indeed, therates of the symptomatic patients were 33%, 40%,55.3%, 61.1%, and 0% in the previously mentionedstudies, respectively. Furthermore, nearly 25% ofthe patients in our study group were smokers orex-smokers, which also might have affected the CTfindings. The cohorts by Karazincir et al. (26) andYoussef et al. (25) selected non-smoking patientswhile the study group of Zrours et al. (23) consistedmostly (88%) of non-smokers.
In our study, the common CT findings were nodules(78.6%), pleural thickening (48.8%), PBT (47.6%),GGO (41.7%), bronchiolectasis (40.5%), and BE(39.3%). Tanaka et al. (5) also reported a high percent-age (49%) of nodules. However, GGO was the mostfrequent finding in their study (90%) (5), and the pre-viously mentioned study by Skare et al. (24) (39%).Reticulation was the most frequent finding in thestudy of Akira et al. (6) (72%). Pleural effusion orthickening, PBT, BE or bronchiolectasis, and lymphnode enlargement were also more frequently observedin our study group when compared with the above-mentioned studies. In the study by Tanaka et al. (5),the patients consisted mostly of those recruited from anILD institution, and the higher prevalance of GGO intheir study might stem from a referral bias.
The reason for the higher frequency of nodules inour study may be related to the fact that we included alldiagnosed nodules. Since we did not have a patho-logical confirmation, these nodules might be associatedwith RA or other diseases, such as infections.Rheumatoid lung nodules are identical to the nodulesfound in the subcutaneous tissue. They are about 0.5–5 cm in diameter and are usually located at the periph-eral zones of the upper and middle lung regions. Theymay undergo cavitation, calcification, or an increase insize, or they may resolve spontaneously (10).
The higher percentage of pleural effusion or thicken-ing in our study might be caused by the asbestos expos-ure of some patients in our study group. However,pleural effusion or thickening was not statistically dif-ferent in patients either with or without asbestos expos-ure in our study. Thus, RA might explain pleuralthickening in these patients.
Smoking can cause BE, bronchiolectasis, and smallairway disease. Direct signs of small airway disease arecentrilobular nodules and tree-in-bud appearances (27).It is a fact that 75% of the RA patients in this studywere lifelong non-smokers. Conversely, RA might beresponsible for the higher frequency of nodules, tree-in-bud appearances, and FB. Additionally, transientinfections are also associated with tree-in-bud appear-ance. In our study, there was no actual pathological
diagnosis, so tree-in bud appearance might be relatedto either RA, transient infections, or both. Despite thelower smoking rates in this study, significantlyincreased rates of BE were observed. In previous stu-dies, smoking was suggested to be the most consistentindependent risk factor that predicted the developmentof ILD in RA (28).
Tanaka et al. (5) detected CT patterns of bronchio-litis in 11 patients (17.5%), UIP in 26 patients (41.3%),and NSIP in 19 (30.2%) patients among their studypopulation, respectively, whereas we detected differentrates of FB (n¼ 28; 33.3%), NSIP (n¼ 6; 0.7%), andUIP (n¼ 5; 0.6%) patterns. The reason for thesedifferences might be related to the fact that theirstudy populations consisted mostly of symptomaticpatients (80% versus 66%) treated in an institutionthat specialized in ILD.
In this study, CT patterns were mostly observed inFB and other airway diseases. Perez et al. (7) demon-strated a high incidence of airway involvement in RApatients that was similar to our results. It is known thatthe characteristic CT patterns of UIP and NSIP areGGO, honeycombing, and reticulation. However, inthis study, the patients with UIP and NSIP also demon-strated CT findings of airway diseases, for examplecentrilobular micronodules, BE, and bronchioloectasis.These results showed that a frequent overlap with CTpatterns of RA exists. Tanaka et al. (5) also indicatedthe overlaps and difficulties in the differentiation of CTpatterns. In the patients without a CT pattern, the mostfrequent CT findings were nodules, GGO, and pleuralthickening.
Dilatation of the pulmonary artery was rarely foundin our study. Tanaka et al. (5) also reported pulmonaryartery dilatation as a relatively rare entity. However,some reports exist which indicate dilatation of the pul-monary artery in RA (8,29).
In our study, patients’ age, age at onset of the dis-ease, increases in RF, ESR, and CRP levels, and someabnormal PFT results were found to be predictive fac-tors of CT findings for lung involvement. There havealso been some studies that have noted correlationsbetween age and lung involvement (15,20). Zrouret al. (23) and Bilgici et al. (19) also detected a correl-ation between higher levels of RF and abnormal CTfindings while Youssef et al. (25) and Skare et al. (24)found no association.
Diagnosis in the early stages of lung disease is usu-ally not easy to establish because of a lack of clinicalsymptoms. In our study, there was no statistically sig-nificant relationship between the normal and abnormalCT findings in patients with early and late stages ofRA. Nevertheless, 94.7% of the patients had abnormalCT findings, 47.1% were symptomatic, and 61.5%demonstrated abnormal PFT results in early RA. Our
Yuksekkaya et al. 1147
at Gaziosmanpasa Universitesi on June 3, 2014acr.sagepub.comDownloaded from

study suggests that CT is an important method for theevaluation of lung involvement, especially in early andasymptomatic RA patients. Habib et al. (30) evaluated40 patients with early RA and found that 27% of themhad abnormal CT findings, 10% were symptomatic,and 37.5% demonstrated abnormal PFT results.However, their study group consisted only of earlyRA patients; therefore, they did not compare the CTfindings in patients with early and late stages of RA. Inaddition, in our study, the only statistically significantCT finding concerned GGO between the early RA andthe other RA groups. It is known that GGO reflectsactive alveolitis. This result might be important for themonitoring and treatment of these patients before thedevelopment of ILD.
Most of our patients with available PFT results(59.8%) had some abnormalities. The most commonpulmonary disorders were both obstructive and com-bined disorders. The results of other studies were alsosimilar. Bilgici et al. (19) reported abnormal PFTresults in 55.8% of their study group while the com-bined form was the most commonly seen pattern. Zrouret al. (23) reported abnormal PFT results in 60% oftheir study group while obstructive disorders were themost common abnormalities. Youssef et al. (25)reported that 64% of their patients had abnormalPFT results, with the combined form as the mostcommon type. Karazincir et al. (26) found abnormalPFT results in 16% of their study group that consistedof asymptomatic and non-smoking patients.
We found intercorrelations between some parameters(Table 6). Bilgici et al. (19) did not find a statisticallysignificant association between the PFT results and CTfindings. Similar to our results, McDonagh et al. (9)observed an association between GGO and decreasesin FEV1. Cortet et al. (22) also detected an associationbetween BE and decreases in FVC, FEV1, and FEF25-75 along with GGO and decreases in FVC. These cor-relations between CT findings and PFT results, and thepresence of patients with normal PFT results and abnor-mal CT findings in our study indicate that CT scanningreveals pulmonary involvement at an earlier stage beforea significant loss of lung volumes occurs.
The higher prevalence of abnormal CT findings inour study and the other abnormalities mentioned aboveled to concerns about the monitoring of patients withRA. Questions regarding how symptomatic or asymp-tomatic patients should be evaluated, whether thisshould happen in the early or late stages of the disease,and whether CT or PFT diagnostic methods should beused are appropriate, and the data in the literature pro-vides no answers. Dawson et al. (31) reported no dif-ference in the prevalence of respiratory symptoms inpatients with HRCT-documented lung disease versusthose without this documentation. Karazincir et al.
(26) also selected asymptomatic patients and demon-strated the presence of some CT abnormalities. In ourstudy, there was no statistical difference between theCT findings and CT patterns of symptomatic andasymptomatic patients.
There were several limitations to this study. Thesample size of the CT patterns was too small to infer areliable correlation among the variables. Consequently,correlations between CT patterns and patient character-istics, clinical status, and PFT results could not be estab-lished. Indeed, histopathological confirmation was notavailable for all patients, and it was not clear whetherCT patterns really reflect pathological classification.However, it is not possible in clinical medicine to establisha diagnosis in all patients by means of a histopathologicalexamination of surgical biopsy specimens. In fact, somestudies have reflected good correlations between histo-pathological results and CT findings in RA patients (6).MDCT scanning offers a non-invasive approach for thedetection of both the presence and type of lung abnorm-alities in RA patients. The retrospective nature of ourstudy meant that some data about the patients (especiallythe PFT results) could not be obtained. Because of thesetechnical insufficiencies, diffusion capacities and lungcapacities could not be evaluated. Additionally, it isknown that expiratory scans are helpful in the detectionof subtle areas of air trapping. However, expiratory CTscans were not available for all of our patients.
In conclusion, we frequently observed abnormal CTfindings and patterns in the patients in our study.Nodules, pleural thickening and/or effusion, PBT, andGGO were the most commonly seen abnormalities inthe 84 patients with RA. The most predominant CTpattern was FB. The patients with no respiratory symp-toms and normal PFTs also had some abnormal CTmanifestations and patterns. CT is beneficial for show-ing RA-related lung disease, even in cases with challen-ging histopathological diagnoses. Therefore, thedetection of patients with RA may be helpful for theevaluation of pulmonary disease, even in asymptomaticpatients without any PFT abnormalities.
Funding
This research received no specific grant from any funding
agency in the public, commercial, or not-for-profit sectors.
References
1. Arnett FC, Edworthy SM, Bloch DA, et al. The American
Rheumatism Association 1987 revised criteria for the clas-
sification of rheumatoid arthritis. Arthritis Rheum
1988;31:315–324.
2. Turesson C, O’Fallon WM, Crowson CS, et al. Extra-
articular disease manifestations in rheumatoid arthritis:
incidence trends and risk factors over 46 years. Ann
Rheum Dis 2003;62:722–727.
1148 Acta Radiologica 54(10)
at Gaziosmanpasa Universitesi on June 3, 2014acr.sagepub.comDownloaded from

3. Toyoshima H, Kusaba T, Yamaguchi M. Cause of deathin autopsied RA patients. Ryumachi 1993;33:209–214.
4. Suzuki A, Ohosone Y, Obana M, et al. Cause of death in
81 autopsied patients with rheumatoid arthritis.J Rheumatol 1994;21:33–36.
5. Tanaka N, Kim JS, Newell JD, et al. Rheumatoid arthri-tis-related lung diseases: CT findings. Radiology
2004;232:81–91.6. Akira M, Sakatani M, Hara H. Thin-section CT findings
in rheumatoid arthritis-associated lung disease: CT pat-
terns and their courses. J Comput Assist Tomogr1999;23:941–948.
7. Perez T, Remy-Jardin M, Cortet B. Airways involvement
in rheumatoid arthritis- Clinical, functional, and HRCTfindings. Am J Respir Crit Care Med1998;157:1658–1665.
8. Balagopal VP, Dacosta P, Greenstone MA. Fatal pul-monary hypertension and rheumatoid vasculitis. EurRespir J 1995;8:331–333.
9. Mcdonagh J, Greaves M, Wright AR, et al. High reso-
lution computed tomography of the lungs in patients withrheumatoid arthritis and interstitial lung disease. Br JRheumatol 1994;33:118–122.
10. Ozkaya SBS, Hamsici S, Findik S. The pulmonary radio-logic findings of rheumatoid arthritis. Respir Med CME2011;4:187–192.
11. Silman AJ. The 1987 revised American RheumatismAssociation criteria for rheumatoid arthritis. Br JRheumatol 1988;27:341–343.
12. Glazer GM, Gross BH, Quint LE, et al. Normal medias-
tinal lymph nodes: number and size according toAmerican Thoracic Society mapping. Am J Roentgenol1985;144:261–265.
13. Lynch DA. High-resolution CT of idiopathic intersti-tial pneumonias. Radiol Clin North Am2001;39:1153–1170.
14. Reynolds JH, Hansell DM. The interstitial pneumonias:understanding the acronyms. Clin Radiol2000;55:249–260.
15. Johkoh T, Muller NL, Pickford HA, et al. Lymphocyticinterstitial pneumonia: thin-section CT findings in 22patients. Radiology 1999;212:567–572.
16. Johkoh T, Muller NL, Taniguchi H, et al. Acute intersti-
tial pneumonia: thin-section CT findings in 36 patients.Radiology 1999;211:859–863.
17. Sidhu HS, Bhatnagar G, Bhogal P, et al. Imaging fea-
tures of the pleuropulmonary manifestations of rheuma-toid arthritis: pearls and pitfalls. J Clin Imaging Sci2011;1:32.
18. Howling SJ, Hansell DM, Wells AU, et al. Follicularbronchiolitis: thin-section CT and histologic findings.Radiology 1999;212:637–642.
19. Bilgici A, Ulusoy H, Kuru O, et al. Pulmonary involve-ment in rheumatoid arthritis. Rheumatol Int2005;25:429–435.
20. Woodhead F, Wells AU, Desai SR. Pulmonary compli-cations of connective tissue diseases. Clin Chest Med2008;29:149–164.
21. Olson AL, Swigris JJ, Sprunger DB, et al. Rheumatoid
arthritis-interstitial lung disease-associated mortality. AmJ Respir Crit Care Med 2011;183:372–378.
22. Cortet B, Perez T, Roux N, et al. Pulmonary function
tests and high resolution computed tomography of thelungs in patients with rheumatoid arthritis. Ann RheumDis 1997;56:596–600.
23. Zrour SH, Touzi M, Bejia I, et al. Correlations betweenhigh-resolution computed tomography of the chest andclinical function in patients with rheumatoid arthritis.
Prospective study in 75 patients. Joint Bone Spine2005;72:41–47.
24. Skare TL, Nakano I, Escuissiato DL, et al. Pulmonarychanges on high-resolution computed tomography
of patients with rheumatoid arthritis and theirassociation with clinical, demographic, serological andtherapeutic variables. Rev Bras Reumatol
2011;51:325–330.25. Youssef AA, Machaly SA, El-Dosoky ME, et al.
Respiratory symptoms in rheumatoid arthritis: relation
to pulmonary abnormalities detected by high-resolutionCT and pulmonary functional testing. Rheumatol Int2012;32:1985–1995.
26. Karazincir S, Akoglu S, Guler H, et al. The evaluation of
early pulmonary involvement with high resolution com-puterized tomography in asymptomatic and non-smokerpatients with rheumatoid arthritis. Tuberk Toraks
2009;57:14–21.27. Pipavath SJ, Lynch DA, Cool C, et al. Radiologic and
pathologic features of bronchiolitis. Am J Roentgenol
2005;185:354–363.28. Saag KG, Kolluri S, Koehnke RK, et al. Rheumatoid
arthritis lung disease. Determinants of radiographic and
physiologic abnormalities. Arthritis Rheum1996;39:1711–1719.
29. Lehrman SG, Hollander RC. Severe pulmonary hyper-tension in a patient with rheumatoid arthritis–response
to nifedipine. West J Med 1986;145:242–244.30. Habib HM, Eisa AA, Arafat WR, et al. Pulmonary
involvement in early rheumatoid arthritis patients. Clin
Rheumatol 2011;30:217–221.31. Dawson JK, Fewins HE, Desmond J, et al. Fibrosing
alveolitis in patients with rheumatoid arthritis as assessed
by high resolution computed tomography, chest radiog-raphy, and pulmonary function tests. Thorax2001;56:622–627.
Yuksekkaya et al. 1149
at Gaziosmanpasa Universitesi on June 3, 2014acr.sagepub.comDownloaded from