investigating the effects of psychological factors on commuting mode choice behaviour
TRANSCRIPT
1
Investigating the Effects of Psychological Factors on Commuting Mode Choice 1 Behaviour 2
3 4
Ahmed O. Osman Idris 5
Ph.D. Candidate 6 Department of Civil Engineering, University of Toronto 7 35 St. George Street, Toronto, Ontario, M5S 1A4, Canada 8 Tel: (416) 978-5049 9 Fax: (416) 978-5054 10
Email: [email protected] 11 12
13 Khandker M. Nurul Habib
* 14
Assistant Professor 15 Department of Civil Engineering, University of Toronto 16 35 St. George Street, Toronto, Ontario, M5S 1A4, Canada 17
Tel: (416) 946-8027 18 Fax: (416) 978-5054 19
Email: [email protected] 20 21
22 Alejandro Tudela 23 Associate Professor 24
Department of Civil Engineering, Universidad de Concepción 25
P.O. Box 160-C, Concepción, Chile 26 Tel: (56 41) 220-3601 27 Fax: (56 41) 220-7089 28
Email: [email protected] 29 30
31 Amer Shalaby 32 Associate Professor 33
Department of Civil Engineering, University of Toronto 34 35 St. George Street, Toronto, Ontario, M5S 1A4, Canada 35
Tel: (416) 978-5907 36
Fax: (416) 978-5054 37
Email: [email protected] 38 39 40 41 42
43 44 45
46 47
* Corresponding author
2
Abstract 48
49
This paper utilizes socio-psychometric survey data to investigate the influence of 50
attitudes, affective appraisal and habit formation on commuting mode choice. The 51
dataset was collected in 2009-2010 in Edmonton, Alberta. In addition to common 52
socioeconomic, demographic and modal attributes, the survey gathered psychological 53
information regarding habitual behaviour, affective appraisal and personal attitudes. 54
Different psychometric tools were used to capture psychological factors affecting 55
mode choice. Habitual behaviour was measured by using Verplanken’s response-56
frequency questionnaire. Affective appraisal was indirectly estimated using the 57
Osgood's semantic differential. Five-point Likert scales were used to measure attitude. 58
The Structural Equation Modelling (SEM) approach was used to investigate the 59
effects of psychological factors on mode choice behaviour. SEM captures the latent 60
nature of psychological factors and uses path diagram to identify the directionality as 61
well as intensity of the relationships. The investigation reveals that passengers have 62
positive emotions towards their chosen mode. Further, evidence of the superiority of 63
the car as a travel alternative was established in terms of strong habit towards it, such 64
that passengers would use the car for almost every single trip. 65
66
Keywords 67
68
Affective Appraisal, Attitudes, Habit, Mode choice, Structural Equation Models. 69
70
71
1. Introduction 72

3
73
Random Utility Maximization (RUM)-based mode choice models are extensively 74
used to analyze the choice of an alternative mode from a set of mutually exclusive 75
options. The underlying assumption of such models is that a traveller chooses the 76
mode that maximizes his/her utility. Utility in RUM-based models is specified by 77
assigning weights to the different attributes characterizing each of the available 78
options as well as those of the individual traveller (McFadden 1974; Banister 1978; 79
Barff et al. 1982; Ben-Akiva and Boccara 1995; Eriksson et al. 2008). Among such 80
characteristics, auto ownership, auto availability, travel time and travel cost are 81
considered the major determinants of mode choice (Quarmby 1967; Williams 1978; 82
Barff et al. 1982). The simplest choice model is a multinomial logit (MNL) model, 83
which assumes that the random errors of the utility functions are independently and 84
identically distributed (iid). More advanced models include the nested logit (NL) 85
model, tree logit model, GEV model and mixed logit models (Barff et al. 1982; Chih-86
Wen 2005). 87
88
All conventional mode choice models have been criticized for their inability to pay 89
appropriate attention to some psychological constructs such as habit, attitude and 90
affective factors. In most cases, such psychological factors are not directly observable, 91
but they greatly influence individuals’ choices (Heinen et al. 2010). There have been 92
compelling arguments to consider behavioural psychological factors directly in the 93
mode choice models (Banister 1978; Aarts et al. 1997; Gärling et al. 1998; Fujii and 94
Kitamura 2003; Gärling and Axhausen 2003; Mackett 2003). Numerous research 95
attempts have been made to capture the intricacies of the choice process by including 96
socio-psychological aspects as explanatory variables within the traditional mode 97
4
choice models in addition to the conventional socioeconomic and service variables 98
(Morikawa 1994; Bradley and Daly 1997; Cantillo et al. 2007). 99
100
It is clear that mode choice is a complex process, which is strongly influenced by 101
different socio-psychological factors. It is also established that incorporating 102
psychological factors in the utility functions of the mode choice model improves its 103
goodness of fit (Domarchi et al. 2008). Although a number of attempts have been 104
made to incorporate psychological factors directly within the mode choice analyses, in 105
most cases the direct effects of psychological variables are incorporated through the 106
inclusion of alternative-specific constants or dummy variables without any causal 107
relationships between latent variables (Johansson et al. 2006; Temme et al. 2008; 108
Habib et al. 2010; Galdames et al. 2011). In order to address this critical issue, this 109
paper adopts a multivariate statistical modelling approach to investigate the causal 110
relationships between the underlying psychological aspects affecting mode choice 111
such as habit, attitude and affective factors. Further, the Theory of Interpersonal 112
Behaviour (TIB), by Triandis (1977), is utilized as the theoretical foundation of the 113
adopted approach. 114
115
The remainder of the paper is arranged as follows: the next section provides a review 116
of the psychological aspects affecting mode choice and a description of the 117
methodology used in the analysis. Section three includes a description of the data used 118
in this research. This is followed by the modelling process in Section four. Finally, 119
conclusions are reported in Section five. 120
121
2. Utilizing the Theory of Interpersonal Behaviour as the theoretical Foundation 122

5
of SEM Analysis 123
124
Structural equation models (SEMs), also known as simultaneous equation models, 125
refer to a statistical technique for linear-in-parameters multivariate (i.e., multi-126
equation) regression models representing causal relationships between variables in the 127
model. In addition, the response variable in one regression equation may appear as a 128
predictor in another equation. Hence, variables in SEM can affect one another either 129
directly or indirectly. Further, in addition to the inclusion of observed exogenous and 130
endogenous variables, a SEM can incorporate unobservable latent variables, also 131
called constructs or factors, that are not measured directly but rather indirectly 132
through their effects (indicators) or observable causes. Such latent variables are 133
modelled by specifying a measurement model and a structural model. The 134
measurement model specifies the relationships between the observed indicators and 135
the latent variables while the structural model specifies the relationships amongst the 136
latent variables themselves. Furthermore, what differentiates SEM from other 137
conventional multivariate linear models is that it requires specification of a model in 138
terms of a system of unidirectional effects between variables based on theory and 139
research. Therefore, SEM is considered a confirmatory rather than exploratory 140
method (Hoyle 1995; MacCallum and Austin 2000). 141
142
In general, a full SEM consists of three sub models; namely, a measurement model for 143
the endogenous variables, a measurement model for the exogenous variables and a 144
structural model for latent variables. Nevertheless, one or both of the measurement 145
models can be eliminated in practice. Hence, SEM analyses can be classified in one of 146
the following three categories. An SEM with both measurement and structural models 147

6
is called an SEM with latent variables. On the other hand, an SEM with no 148
measurement models is called an SEM with observed variables, whereas a 149
measurement model alone is typically a confirmatory factor analysis (Golob 2003). 150
151
Within the structural equation modelling framework, cause and effect relationships 152
are commonly expressed in the form of a causal graph or a path diagram. Path 153
diagrams provide a graphical representation of the SEM such that circles or oval 154
shapes enclose the unobservable (latent) variables. Rectangular boxes, on the other 155
hand, enclose directly observed variables, whereas the disturbances and error terms 156
are not enclosed. Further, unidirectional straight arrows are used to represent the 157
structural parameters indicating a linear impact of the exogenous variable at the base 158
of the arrow on the endogenous variable at the head of the arrow. Bidirectional curved 159
arrows represent non-causal linear covariance (correlation) between exogenous 160
variables and also between disturbances/errors. Compared to other modelling 161
techniques, the SEM has major advantages in behaviour modelling given its 162
capabilities in dealing with latent variables with multiple indicators, modelling 163
mediating factors and dynamic phenomena such as habit and inertia in mode choice 164
(Golob 2003). 165
166
In light of the above, the objective of this research is to identify the causal effects of 167
several psychological aspects on mode choice behaviour using the SEM approach. As 168
a first step for achieving this objective, the path diagram that represents the 169
hypothesized relationships between all latent and observed variables is specified using 170
a psychological theory as the theoretical framework describing the underlying 171
interaction between latent variables and final behaviour (mode choice). 172

7
173
In general, research in social psychology has suggested that the decision making 174
process underlying mode choice can be better understood by modelling the 175
relationship between attitude and behaviour. Numerous psychological theories have 176
studied such interaction between attitude and behaviour such as the Theory of Planned 177
Behaviour (TPB) by Ajzen (1985), and the Theory of Interpersonal Behaviour (TIB) 178
by Triandis (1977). 179
180
In essence, this paper utilizes the elements of the Theory of Interpersonal Behaviour 181
as the socio-psychological theoretical framework for SEM analysis. This theory has 182
the advantage over other approaches of taking into account the role of the past 183
behaviour frequency (habit) on final behaviour. 184
185
According to Triandis (1977), observed behaviour is generally assumed to succeed 186
both intention and habit that respectively represent the motivation to perform a 187
specific action and the past frequency of a specific behaviour, while being mediated 188
by contextual facilitating conditions. 189
190
The theory of interpersonal behaviour assumes that intention is guided by three major 191
determinants; namely attitudinal, social and affective factors. First, attitudinal factors 192
refer to the degree to which an individual has a favourable or unfavourable appraisal 193
of the behaviour under consideration (Ajzen 1991). In other words, attitude is 194
considered as the accumulated evaluation of the choice which has a magnitude and a 195
direction. Based on the expectancy-value theory (Reeve 2005), the magnitude of an 196
attitude depends on two components which are the expectations that an individual has 197

8
regarding the results of the behaviour, and the values that he/she assigns to these 198
possible results. Furthermore, the direction of an attitude represents whether the 199
decision maker is for or against a specific behaviour (Triandis 1977; Gärling et al. 200
1998; Domarchi et al. 2008). 201
202
The second determinant of intention is the social factors which include social norm, 203
social role and self-concept. Social norms are the social rules about what should and 204
should not be done, whereas social roles are sets of behaviours that are considered 205
appropriate for persons holding particular status in a group. On the other hand, self-206
concept refers to the idea that an individual has of his/herself, the goals that it is 207
appropriate for the person to pursue or to eschew, and the behaviours that the person 208
does or does not engage in. 209
210
The third determinant of intention is the affective factors which refer to the emotional 211
response that an individual has towards or against a specific mode of travel. Affect is 212
more or less unconsciously evoked such that it is governed by instinctive behavioural 213
responses to particular situations (Anable and Gatersleben 2004). 214
215
Finally, facilitating conditions (contextual factors) refer to the ease or difficulty of 216
performing the behaviour in terms of several attributes representing the 217
socioeconomic and demographic characteristics of the decision maker, and relative 218
attractiveness of the competing alternatives such as mode availability, level of service, 219
travel time and cost. 220
221
As discussed, the TIB provides a detailed description of the decision making process 222

9
starting from the initial determinants of the behavioural response and moving forward 223
till reaching the final observed outcome. The theory indicates that attitude and 224
behaviour are positively correlated and can be described such that the more 225
favourable the attitude, social and affective factors, the stronger should be an 226
individual’s intention to perform the behaviour in question. Such intention interacts 227
with habit and contextual aspects producing the final behaviour. 228
229
In light of the TIB, this research models the way decisions are made using the SEM 230
approach. However, the proposed approach starts from the final observed mode 231
choice behaviour and moves backward till reaching the determinants of such choice. 232
In other words, the suggested path diagram of SEM analysis models the relationship 233
and the correlation between the unobservable behavioural factors and their observable 234
indicators, as shown in Fig. 1. 235
Expectations
Values
Social Norm
Social Role
Emotions
Self Concept
Attitude
Social
Factors
Affective
Factors
Intention
HabitFrequency of
past Behaviour
Facilitating
Conditions
Mode Choice
Behaviour
236
Fig. 1. Path Diagram Inspired by the Theory of Interpersonal Behaviour. 237
238
As shown in Fig. 1, intention is represented by a latent variable which in turn is 239

10
affected by a set of three constructs; namely, attitude, social and affective factors. 240
Each of the three factors is indirectly measured through its indicators as suggested by 241
the theory of interpersonal behaviour. In addition, habit is represented by a latent 242
variable which is indirectly measured through the frequency of past behaviour as its 243
effect. Finally, intention, habit and facilitating conditions interact together to produce 244
the observed mode choice behaviour. 245
246
3. Data Description 247
248
A dataset gathered in 2009-2010 in Edmonton, Canada (Dogar 2010) was used in this 249
work, dataset oriented to investigate the behavioural factors affecting travel mode 250
choice. The survey follows an innovative procedure where habit, affective and 251
attitudinal factors were explicitly measured using different scales (Domarchi et al. 252
2008). The study was conducted using face-to-face random intercept interviews at 253
transit stops/stations, shopping malls and restaurants in the central business district 254
during the afternoon lunch period. 255
256
The survey had three sections. One of these gathered socioeconomic and demographic 257
data related to the respondent, whereas a second section referred to the home-to-work 258
commuting trip and gathered level of service and cost information for the used 259
transport mode. In a third section, respondents were asked to give information 260
regarding attitudinal, affective and habit factors that would affect their choices, using 261
specific psychometric tools which are explained hereafter. 262
263

11
Attitude is associated with the expectancy (being good) and value (importance) 264
related to an attitudinal object, following the Expectancy-value theory (Reeve 2005). 265
Hence, the force of an attitude will depend on these two elements. Attitude towards 266
car and transit were measured using five-point Likert scales for all the respondents 267
(i.e., regardless of being a user or not), measuring both expectancy and value. 268
Questions to measure expectancy regarding transit had the following structure: public 269
transport is a good mode for work trips, whilst to measure value with respect to transit 270
the wording was used: public transit service is important for work trips. Appropriated 271
questions were prepared for auto users. People were asked to state whether they 272
strongly agree or disagree with these sentences. 273
274
The affective factor is related to the emotional value assigned to an object, 275
considering the induced emotions associated with an action, such as using a transport 276
mode. This factor can be assessed indirectly using the Osgood's semantic differential 277
(Osgood et al. 1975), which corresponds to a rating scale aimed to capture the 278
connotative meaning of a concept. A set of two-end semantic scales is prepared to 279
capture the secret meaning of the concept, each scale containing perfect antonym 280
words in each end; for instance: good-bad, strong-weak. People must point out 281
quickly the location in each two-end semantic scale of the concept under analysis 282
(chosen mode). Edmonton survey contained 14 two-end scales, considering adjectives 283
related to the dimensions of evaluation, potency, control and activity. 284
285
Finally, habitual behaviour was measured in the Edmonton survey using Verplanken’s 286
response-frequency questionnaire (Verplanken et al. 1994). A list of nine hypothetical 287
activities was given to respondents, who were asked to choose the transport mode 288

12
they would use (auto, transit or another) to carry out these activities. An index can be 289
computed using respondents’ answers, counting how many times each transport mode 290
is stated as the preferred option. 291
292
A total sample of 176 records was initially collected. This number was reduced to 293
only 141 records with 88 records of car users and 53 records of transit riders that were 294
available for the model estimation after a process of cleaning the dataset. In addition, 295
people walking or using other means of transportation were excluded from the 296
analysis. With respect to gender, 79.4% were males and 20.6% were females. The 297
average age was 37.8 years old, with a standard deviation of 9.8 years. 298
299
4. Model Estimation and Analysis 300
301
This paper focuses on the interaction between the psychological precursors of the 302
observed mode choice behaviour, utilizing the theory of interpersonal behaviour as 303
the theoretical foundation of the analysis. In particular, the analysis models the 304
interaction between habitual inertia and those aspects affecting intention; namely 305
attitudinal and affective factors. Although social factors are not studied in this 306
research, it is suggested that they should be considered in future work. Alternative 307
SEM specifications were estimated and tested against one another till reaching the 308
final models. The covariance analysis method (method of moments) is used to 309
estimate the proposed models using the LInear Structural RELation (LISREL) 310
software version 8.80. 311
312
Furthermore, in order to determine the goodness of fit of the estimated models to the 313

13
observed data, several statistical tests were performed such as Chi-square statistics, 314
Normed Fit Index (NFI), Comparative Fit Index (CFI), and Root Mean Square Error 315
of Approximation (RMSEA) were examined. In practice, the recommended 316
acceptance of a good fit to a model requires that the obtained NFI and CFI value 317
should be in range from 0 to 1, with higher values indicating better model fit and a 318
recommended value of 0.90 or greater for model acceptance. On the other hand, 319
RMSEA values below 0.05 indicate good fit, while those ranging from 0.08 to 0.10 320
indicate mediocre fit whereas those greater than 0.10 indicate poor fit (Long et al. 321
2011). However, it is important to note that although model fit is necessary, it is not a 322
sufficient condition for the validity of the hypothesis or theory. Goodness of fit within 323
reasonable values implies only that the data under consideration support the 324
hypothesis. Nevertheless, a conceptual model that guides the specification process, 325
especially the paths between latent and observed variables, is required. 326
327
4.1. SEM Measurement Models 328
329
In this research, two separate SEM measurement models were built separately for car 330
and transit users since their choice behaviours were different. The developed models 331
specified a set of four latent variables (i.e., habit, affective factor, attitude towards car 332
and attitude towards transit), as linear functions of other observed exogenous 333
indicators measured using semantic scales through an ad hoc questionnaire. Such 334
models are considered simultaneous confirmatory factor analysis such that the 335
measurement models contained the relationships between four factors and their 336
indicators. Path diagrams for car and public transit users, including habit, affective 337
and attitudinal factors, are shown in Fig. 2 and Fig. 3, respectively. 338
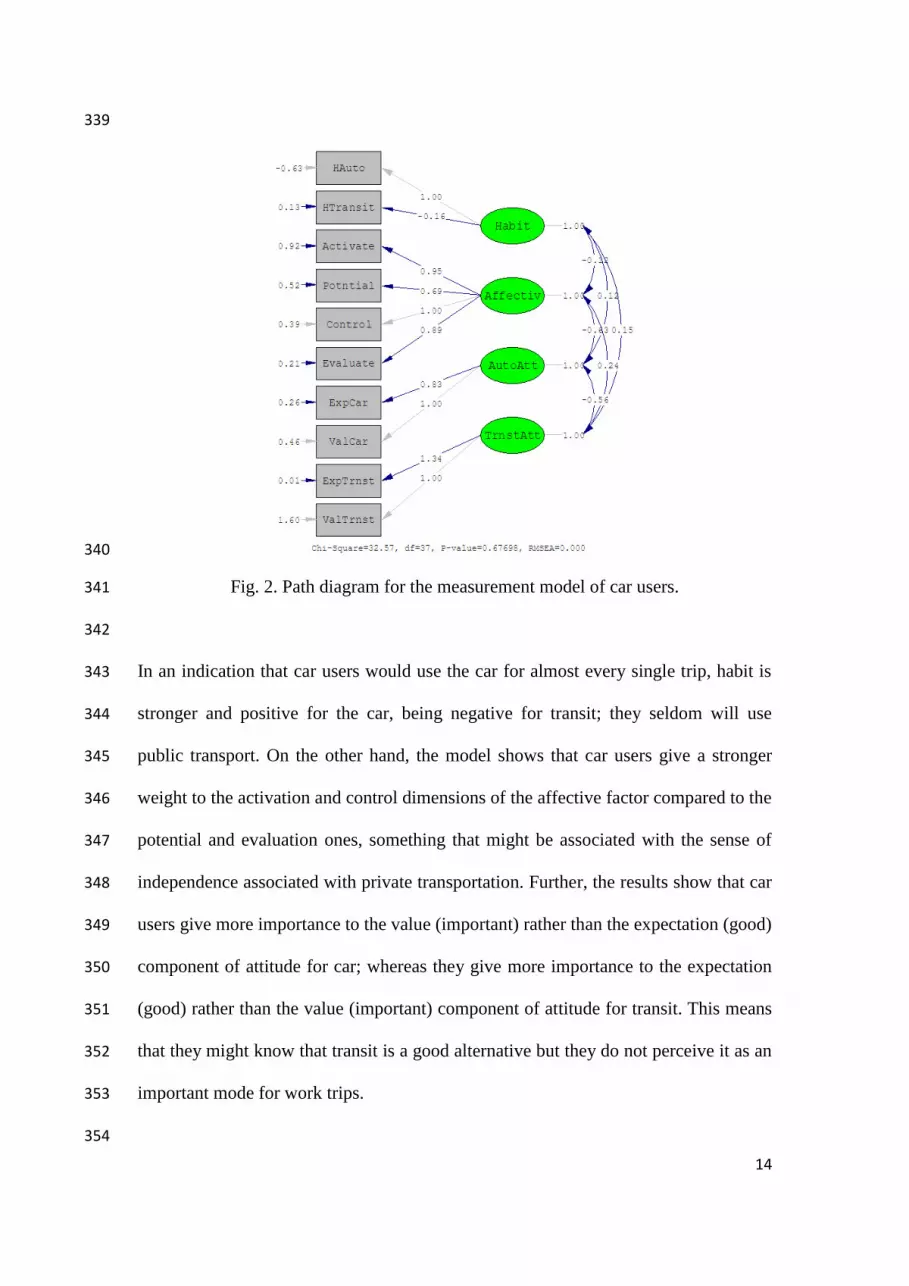
14
339
340
Fig. 2. Path diagram for the measurement model of car users. 341
342
In an indication that car users would use the car for almost every single trip, habit is 343
stronger and positive for the car, being negative for transit; they seldom will use 344
public transport. On the other hand, the model shows that car users give a stronger 345
weight to the activation and control dimensions of the affective factor compared to the 346
potential and evaluation ones, something that might be associated with the sense of 347
independence associated with private transportation. Further, the results show that car 348
users give more importance to the value (important) rather than the expectation (good) 349
component of attitude for car; whereas they give more importance to the expectation 350
(good) rather than the value (important) component of attitude for transit. This means 351
that they might know that transit is a good alternative but they do not perceive it as an 352
important mode for work trips. 353
354
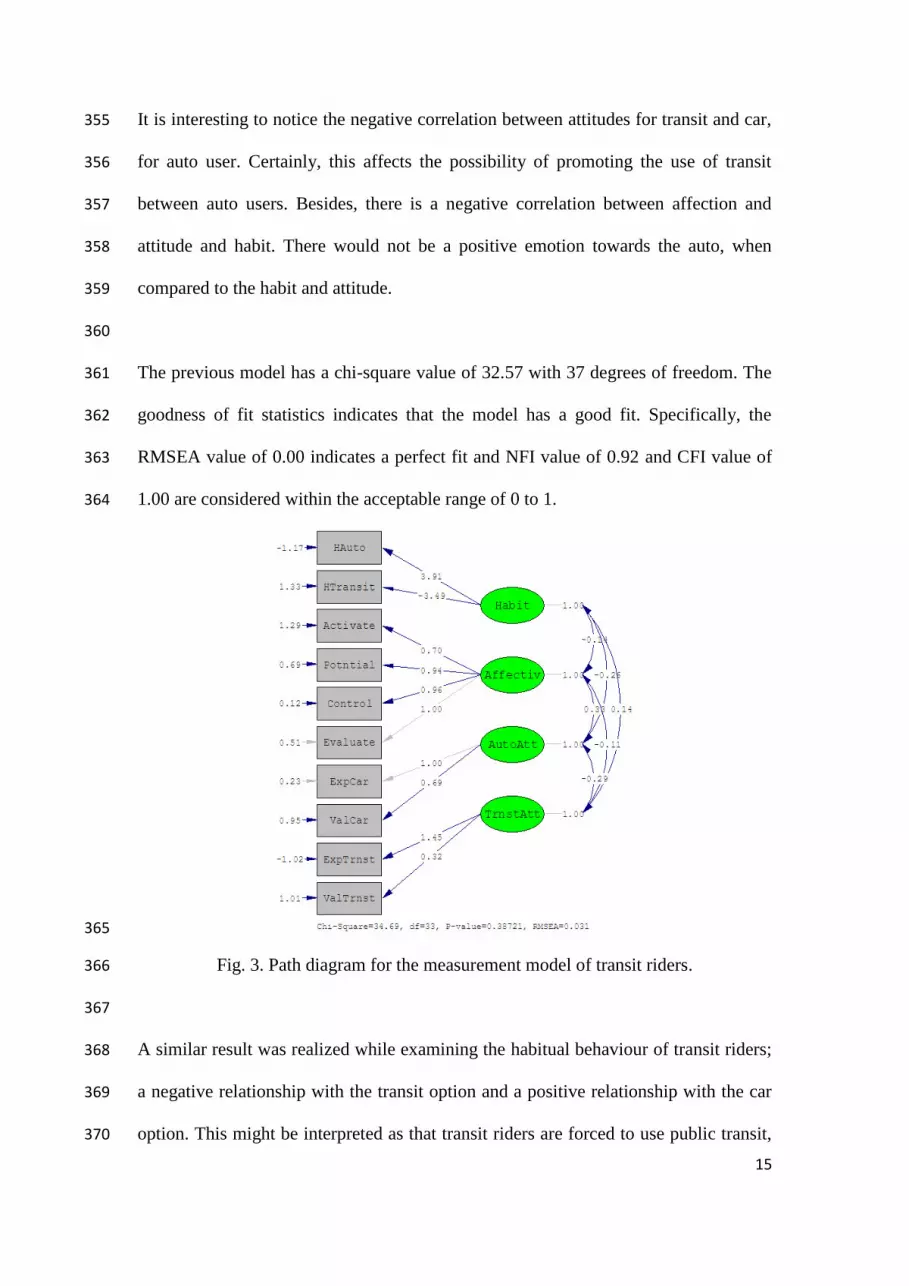
15
It is interesting to notice the negative correlation between attitudes for transit and car, 355
for auto user. Certainly, this affects the possibility of promoting the use of transit 356
between auto users. Besides, there is a negative correlation between affection and 357
attitude and habit. There would not be a positive emotion towards the auto, when 358
compared to the habit and attitude. 359
360
The previous model has a chi-square value of 32.57 with 37 degrees of freedom. The 361
goodness of fit statistics indicates that the model has a good fit. Specifically, the 362
RMSEA value of 0.00 indicates a perfect fit and NFI value of 0.92 and CFI value of 363
1.00 are considered within the acceptable range of 0 to 1. 364
365
Fig. 3. Path diagram for the measurement model of transit riders. 366
367
A similar result was realized while examining the habitual behaviour of transit riders; 368
a negative relationship with the transit option and a positive relationship with the car 369
option. This might be interpreted as that transit riders are forced to use public transit, 370

16
however they might shift to the car option if it is available which is considered as 371
evidence to the superiority of the car as a mode of travel. On the other hand, transit 372
riders give a stronger weight to the potential, control and evaluation dimensions of the 373
affective factor compared to the activation one; that is, there is a low motivation for 374
using public transport. Furthermore, in contrast to car users, transit riders give more 375
weight to the expectation (good) rather than the value (important) component of 376
attitude for car, whereas they still give more weight to the expectation (good) rather 377
than the value (important) component of attitude for transit. In other words, they 378
might know that transit is good and that is the reason why they use it, although it is 379
not important for them. There is a sort of detachment toward the transit. 380
381
It is worth noticing the negative correlation between affection and habit and attitude 382
towards transit. This reinforces what has been expressed before. People use transit, 383
because they have to, but there is no attachment or positive attitude. 384
385
The previous model has a chi-square value of 34.69 with 33 degrees of freedom. The 386
goodness of fit statistics indicates that the model has a good fit. Specifically, the 387
RMSEA value of 0.031 is lower than the upper limit of 0.05 and NFI value of 0.840 388
and CFI value of 0.970 are considered within the acceptable range of 0 to 1. 389
390
4.2. SEM with Latent Variables 391
392
A joint SEM with latent variables is estimated such that a structural model for the 393
relationship between the latent variables, and two measurement models for both the 394
endogenous (i.e., mode choice) and exogenous indicators of the psychological factors 395

17
are integrated. The theory of interpersonal behaviour is utilized as the path diagram of 396
the corresponding SEM as shown in Fig. 4. 397
398
Fig. 4. Path diagram for the SEM with latent variables. 399
400
In general, the proposed model specifies the causal influences among the latent 401
variables by incorporating both a measurement model to deal with how indicators 402
load on the factors, and the structural model to deal with the causal relationships 403
among factors. 404
405
As shown in Fig. 4, intention is modelled as a latent variable which is indirectly 406
measured through three constructs; namely affective factor, attitude towards car and 407
attitude towards transit. Further, each of the three factors is indirectly measured 408
through its effects as indicated by the measurement models. In addition, habit is 409
modelled as a latent variable which is indirectly reflected by the frequency of past 410

18
use. Finally, both intention and habit affects the observed mode choice behaviour as 411
suggested by Triandis. 412
413
The SEM with latent variables shows similar relationships as that indicated by the 414
measurement model for car users. In an indication that car users would use the car for 415
almost every single trip, habit is stronger and positive for the car, being negative for 416
transit. On the other hand, the results show that Edmonton users give a stronger 417
weight to the activation and evaluation dimensions of the affective factor compared to 418
the potential and control ones. Further, users give more weight to the value 419
(important) rather than the expectation (good) component of attitude for car; whereas 420
they give more weight to the expectation (good) rather than the value (importance) 421
component of attitude for transit. 422
423
In addition, the SEM with latent variables shows the causal relationship among 424
factors such that intention is reflected by affective and attitudinal factors towards car 425
and transit. Interestingly, it can be shown that Edmonton users give a strong positive 426
weight to the attitude towards transit whereas a negative sign is associated with the 427
attitude towards car. It seems that intention is guided by the attitude towards transit 428
rather than the attitude to the car. 429
430
Further, both habit and intention integrate to influence the final observed mode choice 431
behaviour. In an indication of the superiority of the car as a mode of travel, the final 432
mode choice is associated with a negative habitual behaviour towards transit and a 433
positive one towards car usage. On the other hand, intention is associated with a 434
negative sign for car and positive sign for transit. This would be interpreted as that 435

19
Edmonton users know the importance of the transit service and might be motivated to 436
use it, although the strong frequency of car use does not allow that. 437
438
The previous model has a chi-square value of 104.36 with 51 degrees of freedom. The 439
goodness of fit statistics indicates that this model fits the data well. Specifically, the 440
RMSEA value of 0.086 is lower than the upper limit of 0.10 and NFI value of 0.920 441
and CFI value of 0.950 are considered within the acceptable range of 0 to 1. 442
443
5. Conclusions 444
445
This paper adopted the structural equation modelling (SEM) approach to investigate 446
the cause and effect relationships between the underlying psychological aspects 447
affecting mode choice. The proposed approach focused on the psychological 448
antecedents of mode choice behaviour following the theory of interpersonal behaviour 449
(TIB), by Triandis (1977), as the theoretical framework. 450
451
Different psychometric tools were used to measure the effects of psychological 452
factors such as habitual behaviour, attitudes and affective factors. Although such 453
psychological factors were measured using different semantic scales, the SEM 454
analysis allowed for the detection of correlation between latent variables and the 455
determination of the importance of each latent attribute. 456
457
Several structures were proposed and estimated using LISREL software for SEM 458
analysis. The results showed that the consideration of psychological attributes as 459
latent variables helped explain mode choice behaviour. In addition, it was shown that 460

20
users have positive emotions towards their chosen mode. Further, evidence to the 461
superiority of the car as a travel alternative was realized such that car users would use 462
the car for almost every single trip. 463
464
Although social factors were not studied in this research, it is suggested that their 465
effect on intention should be considered in future work. 466
467
The impact of these findings on policy issues is a matter that should be kept in mind. 468
The strong habit towards the auto use, associated with a positive attitude and affection 469
to it, and the lower attitude and affection towards transit, certainly constitute a 470
deterrent when trying to promote the use of transit facilities. Actually, demand 471
management schema, such as road pricing, might not have the expected result given 472
the found level of attachment to the car. 473
474
Acknowledgements 475
This study was funded by an NSERC DISCOVERY grant awarded to the second 476
author. Dataset used in this study was collected by the second author when he was an 477
Assistant Professor at the University of Albert. Authors acknowledge the help of 478
Nasrullah Dogar, Shariq Khan, Muhammad Munir and Raquibul Hasan, who helped 479
designing the survey, pilot testing the survey, collecting datasets and data recording 480
under direct supervision of Dr. Nurul Habib. However, views expressed in this paper 481
belong only to the authors of the paper. 482
483 References 484
485 Aarts, H., B. Verplanken, et al. (1997). "Habit and information use in travel mode 486
choices." Acta Psychologica 96(1-2): 1-14. 487
488
21
Ajzen, I. (1985). "From intentions to actions: A theory of planned behavior." Action-489 control: From cognition to behavior 11: 39. 490 491 Ajzen, I. (1991). "The theory of planned behavior." Organizational behavior and 492 human decision processes 50(2): 179-211. 493
494 Anable, J. and Gatersleben, B. (2004). “All work and no play? The role of 495 instrumental and affective factors in work and leisure journeys by different travel 496 modes” Transportation Research A 39: 163–181. 497 498
Banister, D. (1978). "The influence of habit formation on modal choice—a Heuristic 499 model." Transportation 7(1): 5-33. 500
501 Barff, R., D. MacKay, et al. (1982). "A selective review of travel-mode choice 502 models." Journal of Consumer Research 8(4): 370-380. 503 504 Ben-Akiva, M. and B. Boccara (1995). "Discrete choice models with latent choice 505
sets* 1." International Journal of Research in Marketing 12(1): 9-24. 506 507
Bradley, M. and A. Daly (1997). "Estimation of logit choice models using mixed 508 stated preference and revealed preference information." Understanding travel 509
behaviour in an era of change, Pergamon, Oxford: 209-232. 510 511 Cantillo, V., J. de Dios Ortuzar, et al. (2007). "Modeling Discrete Choices in the 512
Presence of Inertia and Serial Correlation." Transportation Science 41(2): 195-205. 513
514 Chih-Wen, Y. (2005). "Modeling Multiple Sources of Heterogeneity in Mode Choice 515 Model." Journal of the Eastern Asia Society for Transportation Studies 6: 2031-2045. 516
517 Dogar, N. (2010). Socio-psychometric Survey to Measure Habit and Inertia in 518
Commuting Mode Choice. Department of Civil & Environmental Engineering, 519 University of Alberta. Master of Engineering. 520 521
Domarchi, C., A. Tudela, et al. (2008). "Effect of attitudes, habit and affective 522 appraisal on mode choice: an application to university workers." Transportation 35(5): 523
585-599. 524
525
Eriksson, L., J. Garvill, et al. (2008). "Interrupting habitual car use: The importance of 526 car habit strength and moral motivation for personal car use reduction." 527 Transportation Research Part F: Psychology and Behaviour 11(1): 10-23. 528 529 Fujii, S. and R. Kitamura (2003). "What does a one-month free bus ticket do to 530
habitual drivers? An experimental analysis of habit and attitude change." 531 Transportation 30(1): 81-95. 532 533 Galdames, C., A. Tudela, et al. (2011). Exploring the Role of Psychological Factors 534 on Mode Choice Models Using Latent Variable Approach. Transportation Research 535
Board. 536
537

22
Gärling, T. and K. Axhausen (2003). "Introduction: Habitual travel choice." 538 Transportation 30(1): 1-11. 539 540 Gärling, T., R. Gillholm, et al. (1998). "Reintroducing attitude theory in travel 541 behavior research: The validity of an interactive interview procedure to predict car 542
use." Transportation 25(2): 129-146. 543 544 Golob, T. (2003). "Structural equation modeling for travel behavior research." 545 Transportation Research Part B: Methodological 37(1): 1-25. 546 547
Habib, K., L. Kattan, et al. (2010). "Model of personal attitudes towards transit 548 service quality." Journal of Advanced Transportation. 549
550 Heinen, E., K. Maat, et al. (2010). "The role of attitudes toward characteristics of 551 bicycle commuting on the choice to cycle to work over various distances." 552 Transportation Research Part D: Transport and Environment. 553 554
Hoyle, R. (1995). Structural equation modeling: Concepts, issues, and applications, 555 Sage Publications, Inc. 556
557 Johansson, V. M., T. Heldt, et al. (2006). "The effects of attitudes and personality 558
traits on mode choice." Transportation Research Part A 40(6): 507-525. 559 560 Long, B., K. Choocharukul, et al. (2011). Psychological Factors Influencing 561
Behavioral Intention Toward Future Sky Train Usage in Phnom Penh, Cambodia. 562
Transportation Research Board. 563 564 MacCallum, R. and J. Austin (2000). "Applications of structural equation modeling in 565
psychological research." Annual review of psychology 51(1): 201-226. 566 567
Mackett, R. (2003). "Why do people use their cars for short trips?" Transportation 568 30(3): 329-349. 569 570
McFadden, D. (1974). "Conditional logit analysis of qualitative choice behavior." 571 Frontiers in econometrics 8: 105–142. 572
573
Morikawa, T. (1994). "Correcting state dependence and serial correlation in the 574
RP/SP combined estimation method." Transportation 21(2): 153-165. 575 576 Osgood, C., Suci, G. and Tannenbaum, P. (1975) The Measurement of Meaning. 577 University of Illinois Press. Urbana. 578 579
Quarmby, D. (1967). "Choice of travel mode for the journey to work: some findings." 580 Journal of Transport Economics and Policy: 273-314. 581 582 Reeve, J. (2005) Understanding Motivation and Emotion. Wiley and Sons. Hoboken. 583 584
23
Temme, D., M. Paulssen, et al. (2008). "Incorporating Latent Variables into Discrete 585 Choice Models-A Simultaneous Estimation Approach Using SEM Software." BuR – 586 Bussiness Research, Official Open Access Journal of VHB 1(2): 220-237. 587 588 Triandis, H. (1977). Interpersonal behavior, Brooks/Cole Pub. Co. 589
590 Verplanken, B., Arts, H., van Knippenberg, A. and van Knippenberg, C. (1994) 591 “Attitude versus general habit: Antecedents of travel mode choice.” Journal of 592 Applied Social Psychology 24: 285–300. 593 594
Williams, M. (1978). "Factors affecting modal choice decisions in urban travel:: 595 Some further evidence." Transportation Research 12(2): 91-96. 596