international longitudinal pediatric reference standards for bone mineral content
TRANSCRIPT
Bone 46 (2010) 208–216
Contents lists available at ScienceDirect
Bone
j ourna l homepage: www.e lsev ie r.com/ locate /bone
International longitudinal pediatric reference standards for bone mineral content
Adam D.G. Baxter-Jones a, Melonie Burrows c, Laura K. Bachrach d, Tom Lloyd e, Moira Petit f,Heather Macdonald g, Robert L. Mirwald a, Don Bailey a,h, Heather McKay b,⁎a College of Kinesiology, University of Saskatchewan, SK, Canadab Department of Family Practice and Centre for Hip Health and Mobility, University of British Columbia, Vancouver Coastal Health Research Institute, BC, Canadac Department of Orthopaedics and Centre for Hip Health and Mobility, University of British Columbia, Vancouver Coastal Health Research Institute, BC, Canadad Stanford University, School of Medicine, Stanford, CA, USAe Department of Public Health Sciences, Hershey Medical Center, Hershey, PA, USAf School of Kinesiology, University of Minnesota, Minneapolis, MN, USAg Department of Mechanical & Manufacturing Engineering, University of Calgary, Calgary, ABh School of Human Movement Studies, University of Queensland, Australia
⁎ Corresponding author. Departments of OrthopaedicsMedicine and Centre for Hip Health and Mobility, VancInstitute, University of British Columbia, 315-2647 WilloVancouver, BC, Canada V5Z 3P1.
E-mail address: [email protected] (H. McKay).
8756-3282/$ – see front matter © 2009 Elsevier Inc. Adoi:10.1016/j.bone.2009.10.017
a b s t r a c t
a r t i c l e i n f oArticle history:Received 10 July 2009Revised 29 September 2009Accepted 15 October 2009Available online 22 October 2009
Edited by: S. Ralston
Keywords:ChildrenDXAGrowthMaturationZ-score
To render a diagnosis pediatricians rely upon reference standards for bone mineral density or bone mineralcontent, which are based on cross-sectional data from a relatively small sample of children. These standardsare unable to adequately represent growth in a diverse pediatric population. Thus, the goal of this study wasto develop sex and site-specific standards for BMC using longitudinal data collected from four internationalsites in Canada and the United States. Data from four studies were combined; Saskatchewan Paediatric BoneMineral Accrual Study (n=251), UBC Healthy Bones Study (n=382); Penn State Young Women's HealthStudy (n=112) and Stanford's Bone Mineral Accretion study (n=423). Males and females (8 to 25 years)were measured for whole body (WB), total proximal femur (PF), femoral neck (FN) and lumbar spine (LS)BMC (g). Data were analyzed using random effects models. Bland–Altman was used to investigate agreementbetween predicted and actual data. Age, height, weight and ethnicity independently predicted BMC accrualacross sites (Pb0.05). Compared to White males, Asian males had 31.8 (6.8) g less WB BMC accrual; Hispanic75.4 (28.2) g less BMC accrual; Blacks 82.8 (26.3) g more BMC accrual with confounders of age, height andweight controlled. We report similar findings for the PF and FN. Models for females for all sites were similarwith age, height and weight as independent significant predictors of BMC accrual (Pb0.05). We provide atool to calculate a child's BMC Z-score, accounting for age, size, sex and ethnicity. In conclusion, wheninterpreting BMC in pediatrics we recommend standards that are sex, age, size and ethnic specific.
© 2009 Elsevier Inc. All rights reserved.
Introduction
There are many diseases that deleteriously affect bone mass andbone mass accrual during the growing years [1]. Dual energy x-rayabsorptiometry (DXA) is widely available, precise and safe and hasbecome the preferred clinical instrument to assess bone mass inchildren [2]. However, DXA is a planar instrument and provides anareal bone mineral density (aBMD, g/cm2) that may be influenced bybone size, shape or body habitus [3]. Results may thereforemisrepresent or be especially disadvantageous to healthy childrenwho are late maturing or have less than average height compared tosame age peers [4]. To overcome the inherent size artifact in DXAimages, researchers have since developed normative data for BMC and
and Family Practice, Faculty ofouver Coastal Health Researchw Street, Willow Chest Centre,
ll rights reserved.
aBMD adjusted for body size and for estimated volumetric aBMD[3,5–8].
To render a diagnosis, pediatricians may rely upon referencestandards for young adult or pediatric aBMD or bone mineral content(BMC, g) [1,3,5–17]. Although these reference data address animportant need in the clinical community they are based upon; i)cross-sectional data, ii) longitudinal data treated cross-sectionally[12] or, iii) a relatively small sample of children in a specificgeographic region [9].
The limitations of using cross-sectional data to represent alongitudinal event, the growth of any tissue including bone, havebeen discussed at length over many years [18]. Indeed, longitudinalstudies of children clearly demonstrated the wide variability in thepattern, magnitude and timing of bone mineral accrual in the humanskeleton [19]. Comparing individuals to reference data may also belimited by the sex and/or ethnicity of the sample and the type of DXAinstrument used to acquire the reference data [20]. Thus, to betterrepresent sex differences [21] and the highly individualized process ofmaturation it may be more appropriate to develop normative growth
209A.D.G. Baxter-Jones et al. / Bone 46 (2010) 208–216
curves from a diverse sample of children using repeated measure-ments of BMC across growth [10].
Therefore, our aim was to develop sex and site-specific standardsfor BMC using longitudinal data collected from four international sitesin Canada and the United States. These standards are unique in thatthey, i) derive from longitudinal data, ii) were acquired from a diversesample of children aged 8–25 years, iii) were developed usingmultilevel modeling and, iv) account for ethnicity, age and size.
Materials and methods
Research design
We undertook a collaborative multi-center project and integratedlongitudinal bone mineral accrual data from four centers in Canadaand the United States to create international standards for bonemineral content (BMC) in males and females aged 8–25 years.Although all studies were conducted with healthy participants andused Hologic (Hologic, Inc., Waltham, MA, USA) bone densitometers,there were differences in recruitment methods, data collection timeframe and sample sizes. We introduce and outline specific methodsfor each site below.
1. University of British Columbia (UBC)The UBC Healthy Bones Study (1999–2006) 7-year longitudinal
study is described in detail elsewhere [22]. In brief, it used a mixedlongitudinal design [23], and recruited 382 girls and boys across fourage cohorts (9, 10, 11 and 12 years). Children were all prepubertal atbaseline and recruited from two multi-ethnic communities inVancouver. Forty-four percent of children were Caucasian, 38% wereAsian and 18% were from other or mixed ethnic groups. A healthhistory questionnaire was used to determine each child's ethnicitybased on parents' or grandparents' place of birth. Children wereclassified as ‘Asian’ if both parents or all 4 grandparents were born inHong Kong or China, India, Philippines, Vietnam, Korea or Taiwan or‘Caucasian’ if both parents or all 4 grandparents were born in NorthAmerica or Europe. The relative composition of the ethnic clusters wasconsistent across the 7 years of data collection. Children visited thelaboratory at UBC every 6 months for the first 3 years of the study andannually for the next 4 years. The study experienced 39% attrition ratefrom 1999 to 2006. The greatest attrition occurred between years2000 and 2001 where teachers (rather than children) chose todiscontinue their participation. There were no differences in anybaseline measure between children who continued to participate andthosewho dropped out of the study. All eligible childrenwere healthy,had no history of chronic disease or chronic medication use and hadno medical conditions, allergies or medications known to influencebone metabolism or calcium balance. Children with recent fracturesand whowere casted at the time of measurement were excluded fromthe study. Previous history of fracture was not an exclusion criterion.The UBC Clinical and Behavioural Sciences Research Ethics Boardapproved the study. All parents/guardians and children completedand signed informed consents prior to study participation.
2. University of Saskatchewan (U of S)The U of S Paediatric Bone Mineral Accrual Study (1991–1998) has
been described in detail elsewhere [19]. In brief, this 7-year studyutilized a mixed longitudinal design [24], and recruited 251males andfemales from local elementary schools across eight age cohorts.Children were prepubertal, pubertal, and post-pubertal, and agedbetween 8 and 15 years at baseline. The cohorts were all healthyCaucasian children from middle-income neighborhoods. Ethnicitywas determined based on parents' place of birth. During the 7 years ofdata collection the relative composition of the clusters remained thesame. As there were overlaps in ages between the clusters it waspossible to estimate a consecutive 13-year developmental pattern
over the shorter period of 7 years. The study experienced 39% attritionrate from 1991 to 1997. There were no differences in any baselinemeasure between children who continued to participate and thosewho dropped out of the study. Eligible children had no history ofchronic disease or chronic medication use; and nomedical conditions,allergies or medications known to influence bone metabolism orcalcium balance. Children with recent fractures and who were castedat the time of measurement were excluded from the study. Previoushistory of fracture was not an exclusion criterion. The study receivedapproval from the University of Saskatchewan Biomedical ResearchEthics Board (Bio # 88-102). Between 1991 and 1993 writteninformed consent was obtained from parents of participating childrenfor the whole study.
3. Stanford University Medical Center (Stanford)The Stanford study has been described in detail elsewhere [1]. In
brief, this 4-year study utilized a mixed longitudinal design andrecruited 423 males and females (aged 9–25 years) from thecommunity. Recruitment occurred between May 1992 and February1996 and data collection was completed in February 1997. Subjectswere encouraged to return annually and were included if they had atleast four visits or until they had reached age 25 years. Children werefrom low to upper-middle-income families. The cohort at entry were24% non-Hispanic Whites, 24% Hispanics, 24% East Asians (Chinese,Japanese), and 27% non-Hispanic blacks; aged 8.8–25.9 years [1].Ethnicity was determined by self-identity of the parents (both had tohave the same self-identity as the child), with mixed race familiesexcluded. Participants were excluded if they completed fewer thanfour visits, refused to participate, relocated, or reached age 25 duringthe study period. Participants whowere recruited late in the study didnot undertake 4 visits prior to the end of the funding period and theywere excluded from analysis. Therefore, 73% of the samples were notincluded in this analysis. Eligible children had no history of chronicdisease or chronic medication use: and no medical conditions ormedications known to influence bone metabolism. Children withrecent fractures and who were casted at the time of measurementwere excluded from the study. Previous history of fracture was not anexclusion criterion. The study protocol was approved by the StanfordUniversity Administrative Panel on Human Subjects in MedicalResearch. Written consent was obtained from all participants andfrom the parents of participants who were younger than age 18 years.
4. Pennsylvania State University Young Women's Health StudyThe Penn State University (PSU) Young Women's Health Study
(YWHS) has been described in detail elsewhere [25]. Briefly, theYWHS was a 10-year prospective study that enrolled 112 healthy,premenarcheal femaleswhowere aged 11.9 (0.5) years, on average, atbaseline (1990). Participants were Caucasian adolescent females whoattended public school in central Pennsylvania. Participants wereexcluded if they were not within 80–120% of the ideal weight forheight (based on the most recent US National Health and NutritionExamination Survey), and not of Northern European descent(determined if all grandparents were descendants of NorthernEuropeans). Participants were assessed every 6 months across years1–4 and annually across years 6–10. The study experienced 31%attrition rate across the 10-year study. There were no differences inany baseline measure between girls who continued to participate andthose who dropped out of the study [26]. Eligible children had nomedical history known to effect bone development and did not haveany known disorders of dietary behavior. Children with recentfractures and who were casted at the time of measurement wereexcluded from the study. Previous history of fracture was not anexclusion criterion. The study was approved by the PSU College ofMedicine Institutional Review Board. Participants and their parentsprovided informed consent.
Table 1Conversion factors for Hologic 1000 and 2000 to 4500 machines.
Variables 4500=slope⁎2000 4500=slope⁎1000
Whole body BMC (g) = 1.019⁎2000 = 1.053⁎1000Proximal femur BMC (g) = 1.063⁎2000 = 0.989⁎1000Femoral neck BMC (g) = 1.037⁎2000 = 0.978⁎1000Lumbar spine BMC (g) = 1.035⁎2000 = 0.979⁎1000
Key: BMC = bone mineral content; Slope = slope of the regression of either 1000 or2000 on 4500.
210 A.D.G. Baxter-Jones et al. / Bone 46 (2010) 208–216
5. All datasetsIn the present analysis we included all participants who were
assessed on at least two measurement occasions with complete dataon those occasions. Thus, for our analysis we included 814 males whowere measured on 1944 occasions and 1061 females who weremeasured on 3229 occasions.
Descriptive data
Chronological ageAge in years was determined as a decimal age by subtracting date
of birth from the measurement date. In the models age (Agec) wascentered around the mid age of the subjects, 13 years.
AnthropometryAt all sites, standard anthropometric techniques were used to
measure height (to the nearest 0.1 cm), and bodymass (to the nearest0.1 kg). Participants were assessed at study entry and reassessedusing identical techniques at subsequent follow-up visits. We createdthe height by weight index (weight/height⁎100) to represent theinteraction between height (Agec ⁎ height) and weight(Agec⁎weight).
Bone mineral content measurement
The UBC study assessed BMC (g) at the whole body (WB), lumbarspine (L1–L4; LS), proximal femur (PF) and femoral neck (FN) usingDXA in array mode (Hologic QDR 4500W, Hologic, Inc., Waltham, MA,USA). Trained and qualified technologists conducted and analyzed allscans using standard procedures (Software version 12.1). Short-termprecision for WB, LS, PF and FN BMC was assessed in vivo, bymeasuring healthy young adults. Coefficients of variation (CV) forBMC at the WB and LS were b0.7% and at the PF and FN precisionranged from 1.4 to 3.5%. A spine anthropomorphic phantom wasscanned daily to maintain quality assurance of the QDR 4500W.
The U of S study assessed BMC (g) of the WB, LS (L1-L4) andFN using DXA in array mode (Hologic QDR 2000, Hologic, Inc.,Waltham, MA, USA). Trained and qualified technologists conductedand analyzed all scans using standard procedures. Whole body scanswere analyzed using software version 5.67A, with LS and FNanalyzed using software version 4.66A. Short-term precision forWB, LS, PF and FN BMC was assessed in vivo, by measuring healthyyoung adults. The CV for BMC at the WB and LS were b0.61%, andat the FN precision was 0.91%. [27]. Lumbar spine BMC was notmeasured in the first year hence there were less data for thisvariable at each chronological age band. A spine anthropomorphicphantom was scanned daily to maintain quality assurance of the QDR2000W.
The Stanford study assessed BMC (g) for theWB, LS (L2–L4) and PFusing DXA using the pencil beammode (Hologic QDR 1000W, HologicInc., Waltham, MA, USA). One DXA technologist acquired 95% of theDXA scans and analyzed all scans using software version 6.10. Astandardized protocol was used to analyze PF so as to reducemeasurement inconsistencies that may arise from changes in FNgeometry during growth [1]. Short-term precision for WB, LS and FNBMC was assessed in vivo by measuring healthy adolescents andyoung adults. The CV for BMC was 0.6% at all skeletal sites. A spineanthropomorphic phantom was scanned daily to maintain qualityassurance of the QDR 1000W.
The Penn State study assessed BMC (g) at the WB, LS (L1-L4) andPF using DXA (Hologic QDR 2000W, Hologic Inc., Waltham, MA, USA).Whole body scans were acquired in pencil beammode in the presenceof the manufacturer's three-step acrylic and aluminum tissuephantom. Bi-lateral PF and LS scans were acquired in array mode.The same two clinical research coordinators acquired and analyzed allthe scans. Whole body and LS scans were acquired every 6 months
from baseline through age 16 years. A proximal femur protocol wasadded in the last 6 years of the study. The observed CV assessed invitro, was less than 0.7% for the day to day quality control scans. Aspine anthropomorphic phantom was scanned daily to maintainquality assurance of the QDR 2000W.
Precision and cross-calibration of DXA instruments
We used the European Spine Phantom (ESP) to compare DXAinstruments and to establish precision across sites. A trained DXAtechnologist acquired ten repeat measurements, without reposition-ing the ESP at each geographical site. All DXA instruments demon-strated excellent precision within-site with coefficients of variationbetween 0.32% (PSU) and 0.59% (Stanford). Based on QC data fromeach site, there was excellent stability over the study periods.Although all data were collected on Hologic instruments there was asmall (6%) systematic difference in bone outcomes between theStanford and Hologic instruments at other sites. To correct fordifferences between instruments in vivo, the U of S and Stanforddetermined precision across different Hologic instruments at theirsites. The U of S compared results obtained from 9 males and 15females assessed on Hologic 2000 and 4500 instruments. Stanfordcompared results obtained from 20 males and 20 females assessed onHologic 1000 and 4500 instruments. From these data we developedconversion factors so that all outcomes used for analysis representedHologic 4500 equivalent values (Table 1). Each site undertookstandard data cleaning and screened for outliers. In addition, oneresearcher at UBC (re)examined all scans to identify any discrepanciesin scan analyses between sites. Questionable scans were reanalyzedusing standard procedures.
Statistical analysis
We used SPSS software version 15.0 (SPSS Inc.) to generatedescriptive data for the whole sample. We report values as means(SD) unless otherwise noted. For the longitudinal analyses, weconstructed hierarchical (multilevel) random effects models using amultilevel modeling approach (MlwiN version 1.0, Multi-level ModelsProject; Institute of Education, University of London, UK) [28,29]. Wepreviously used multilevel (hierarchical) regression to develop boneaccrual models [30,31] and described this approach in detail [32]. Inbrief, we obtained repeated measures of BMC and other independentvariables from within individuals (level 1 of the hierarchy) andbetween individuals (level 2 of the hierarchy). Specifically, wedeveloped 8 random effects models to describe these longitudinalevents at the total proximal femur, femoral neck, lumbar spine andwhole body for males and females. The general additive, sex and site-specific random effects regression model we used to describedevelopmental changes in BMC across chronological ages is describedbelow:
Yij = αj + βjXij + K1Zij N KnZij + μ j + eij
where: y is the BMC parameter on measurement occasion i in the j-thindividual; αj is the constant for the j-th individual; βjxij is the slope ofthe BMC parameter with centered chronological age (years) for j-th
211A.D.G. Baxter-Jones et al. / Bone 46 (2010) 208–216
individual; and k1 to kn are the coefficients of various explanatoryvariables (e.g. height, weight and ethnicity) at assessment occasion iin the j-th individual. These are the fixed parameters in the model.Both μj and ɛij are random quantities, whose means are equal to zero;they form the random parameters in the model. They are assumed tobe uncorrelated and follow a normal distribution and thus theirvariances can be estimated; μj is the level-2 (between subjectsvariance) and ɛij the level-1 residual (within individual variance) forthe i-th assessment of BMC in the j-th individual. We centered agearound the mean age of the sample (Agec), where Agec=decimalage - 13.00 years. We built models in a stepwise procedure, i.e.predictor variables (κ-fixed effects) were added one at a time and thelog-likelihood ratio statistic was used to judge improvement of themodel [32]. Predictor variables (κ) were accepted as significant if theestimated mean coefficient was greater than twice the standard errorof the estimate (SEE) i.e. Pb0.05. If the retention criteria were not metwe discarded the predictor variable (shown as non-significant (NS) inTables 3 and 4). To allow for the non-linearity of growth, weintroduced age centered power functions into the linear models(Agec2, Agec3). To allow for maturity-associated changes in propor-tionality we added interaction terms: Agec⁎height interaction, Agec⁎-weight interaction and weight divided by height ⁎100. Ethnicity wasadded as a dummy variable where Caucasians were the base categoryand compared with Asians, Blacks and Hispanics, respectively.
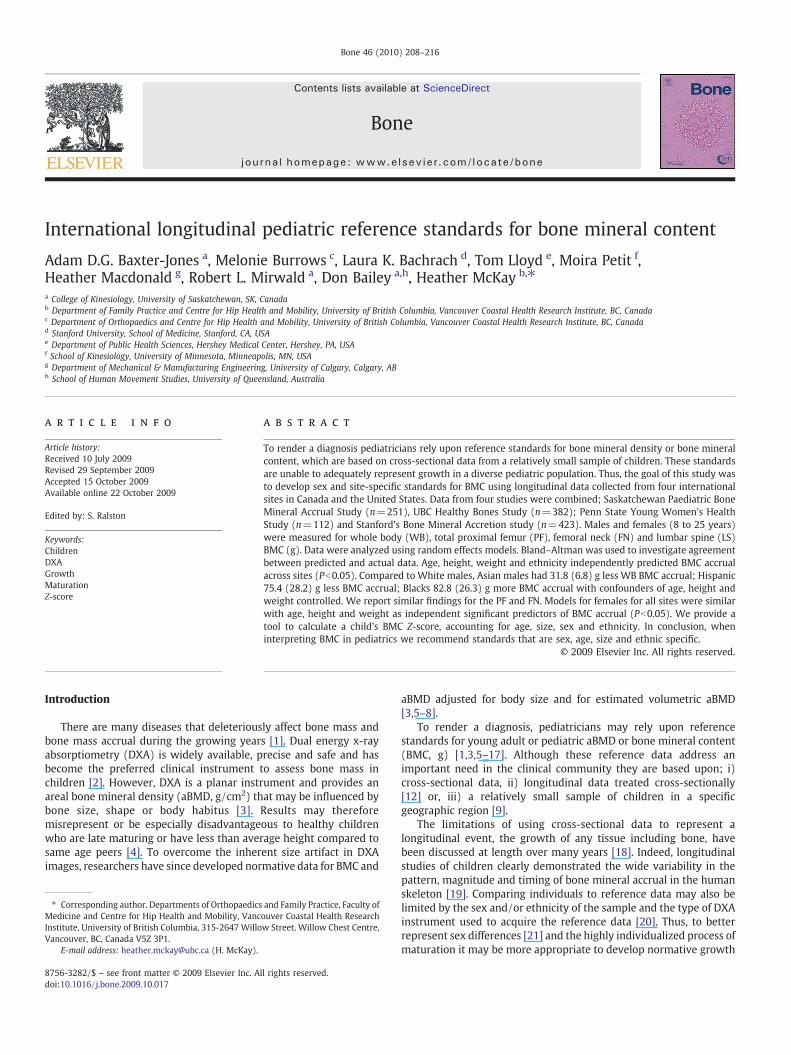
Fig. 1. Bland and Altman procedure showing the agreement between predicted BMC and obs(b) total proximal femur; (c) femoral neck; (d) lumbar spine.
To determine the accuracy of our BMC prediction equations weapplied our prediction models for BMC to two separate populations;a) a random selection of half of the original sample and, b) anindependent sample of same age children recruited into the UBCHealthy Bones Study in 2009 (40 males, 10.4 (±0.5) years; and 78females, 10.4 (±0.6) years; 50% Caucasian and 50% Asian). Theindependent sample of children were all prepubertal and wereassessed using the same testing protocol as the original UBC sample.We compared predicted to actual BMC in the original (Figs. 1 and 2)and the independent (Fig. 3), samples using the procedure describedby Bland and Altman [33]. Finally, we developed models using theoriginal data (Tables 3 and 4). We calculated Z-scores for the sampleas [Z=observed BMC – predicted BMC) / BMC standard deviation].
Results
We provide participant demographics in Table 2.Figs. 1 and 2 illustrate the outcomes of the Bland–Altman
procedure where we compared predicted with actual values inmales and females, from the original cohort, at the four measuredbone sites. We plotted the mean difference between predicted andactual BMC against the average of the two BMC values. For males' WBBMC the mean difference between actual and predicted values was21.2 g with a standard deviation of 178.6 g. The mean and standard
erved BMC for all four skeletal sites in males from the original sample; (a) whole body;
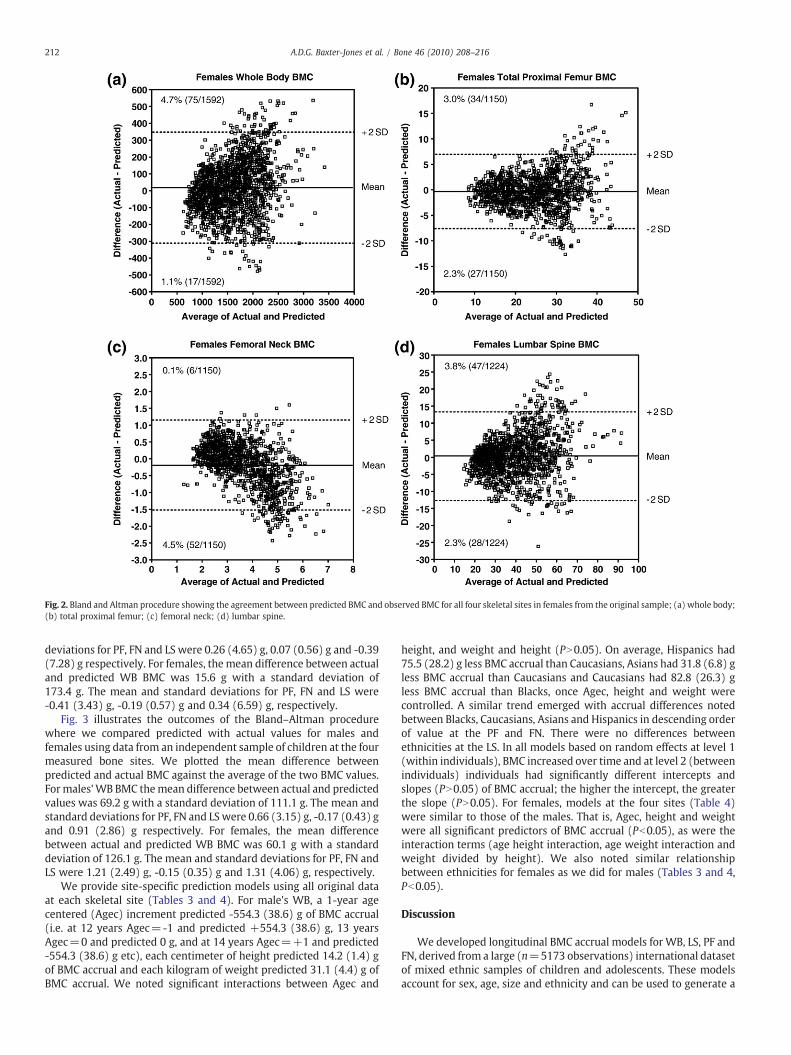
Fig. 2. Bland and Altman procedure showing the agreement between predicted BMC and observed BMC for all four skeletal sites in females from the original sample; (a) whole body;(b) total proximal femur; (c) femoral neck; (d) lumbar spine.
212 A.D.G. Baxter-Jones et al. / Bone 46 (2010) 208–216
deviations for PF, FN and LS were 0.26 (4.65) g, 0.07 (0.56) g and -0.39(7.28) g respectively. For females, themean difference between actualand predicted WB BMC was 15.6 g with a standard deviation of173.4 g. The mean and standard deviations for PF, FN and LS were-0.41 (3.43) g, -0.19 (0.57) g and 0.34 (6.59) g, respectively.
Fig. 3 illustrates the outcomes of the Bland–Altman procedurewhere we compared predicted with actual values for males andfemales using data from an independent sample of children at the fourmeasured bone sites. We plotted the mean difference betweenpredicted and actual BMC against the average of the two BMC values.Formales'WB BMC themean difference between actual and predictedvalues was 69.2 g with a standard deviation of 111.1 g. The mean andstandard deviations for PF, FN and LSwere 0.66 (3.15) g, -0.17 (0.43) gand 0.91 (2.86) g respectively. For females, the mean differencebetween actual and predicted WB BMC was 60.1 g with a standarddeviation of 126.1 g. The mean and standard deviations for PF, FN andLS were 1.21 (2.49) g, -0.15 (0.35) g and 1.31 (4.06) g, respectively.
We provide site-specific prediction models using all original dataat each skeletal site (Tables 3 and 4). For male's WB, a 1-year agecentered (Agec) increment predicted -554.3 (38.6) g of BMC accrual(i.e. at 12 years Agec=-1 and predicted +554.3 (38.6) g, 13 yearsAgec=0 and predicted 0 g, and at 14 years Agec=+1 and predicted-554.3 (38.6) g etc), each centimeter of height predicted 14.2 (1.4) gof BMC accrual and each kilogram of weight predicted 31.1 (4.4) g ofBMC accrual. We noted significant interactions between Agec and
height, and weight and height (PN0.05). On average, Hispanics had75.5 (28.2) g less BMC accrual than Caucasians, Asians had 31.8 (6.8) gless BMC accrual than Caucasians and Caucasians had 82.8 (26.3) gless BMC accrual than Blacks, once Agec, height and weight werecontrolled. A similar trend emerged with accrual differences notedbetween Blacks, Caucasians, Asians and Hispanics in descending orderof value at the PF and FN. There were no differences betweenethnicities at the LS. In all models based on random effects at level 1(within individuals), BMC increased over time and at level 2 (betweenindividuals) individuals had significantly different intercepts andslopes (PN0.05) of BMC accrual; the higher the intercept, the greaterthe slope (PN0.05). For females, models at the four sites (Table 4)were similar to those of the males. That is, Agec, height and weightwere all significant predictors of BMC accrual (Pb0.05), as were theinteraction terms (age height interaction, age weight interaction andweight divided by height). We also noted similar relationshipbetween ethnicities for females as we did for males (Tables 3 and 4,Pb0.05).
Discussion
We developed longitudinal BMC accrual models for WB, LS, PF andFN, derived from a large (n=5173 observations) international datasetof mixed ethnic samples of children and adolescents. These modelsaccount for sex, age, size and ethnicity and can be used to generate a
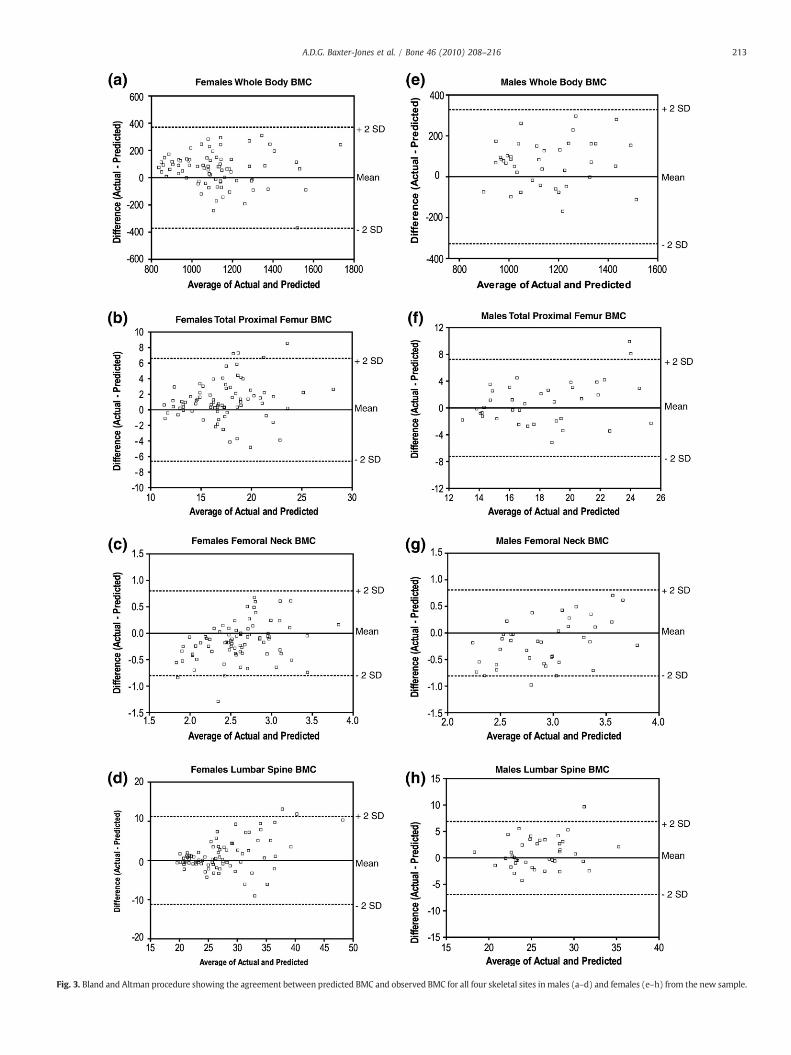
Fig. 3. Bland and Altman procedure showing the agreement between predicted BMC and observed BMC for all four skeletal sites inmales (a–d) and females (e–h) from the new sample.
213A.D.G. Baxter-Jones et al. / Bone 46 (2010) 208–216
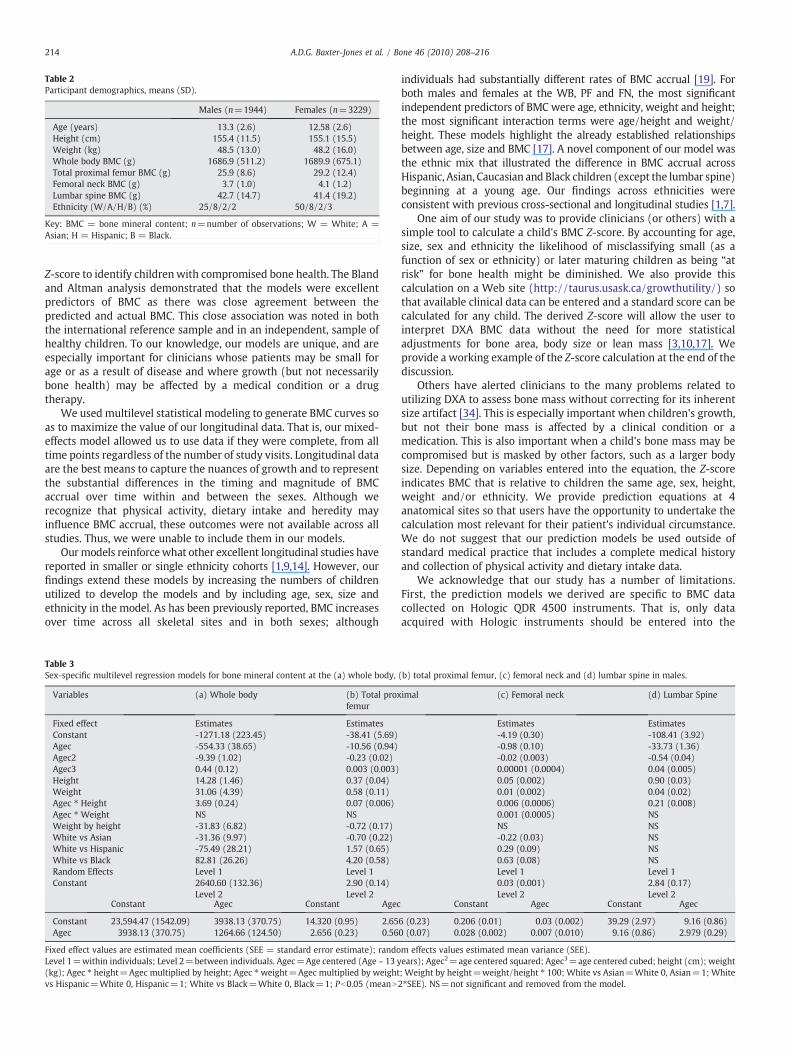
Table 2Participant demographics, means (SD).
Males (n=1944) Females (n=3229)
Age (years) 13.3 (2.6) 12.58 (2.6)Height (cm) 155.4 (11.5) 155.1 (15.5)Weight (kg) 48.5 (13.0) 48.2 (16.0)Whole body BMC (g) 1686.9 (511.2) 1689.9 (675.1)Total proximal femur BMC (g) 25.9 (8.6) 29.2 (12.4)Femoral neck BMC (g) 3.7 (1.0) 4.1 (1.2)Lumbar spine BMC (g) 42.7 (14.7) 41.4 (19.2)Ethnicity (W/A/H/B) (%) 25/8/2/2 50/8/2/3
Key: BMC = bone mineral content; n=number of observations; W = White; A =Asian; H = Hispanic; B = Black.
214 A.D.G. Baxter-Jones et al. / Bone 46 (2010) 208–216
Z-score to identify childrenwith compromised bone health. The Blandand Altman analysis demonstrated that the models were excellentpredictors of BMC as there was close agreement between thepredicted and actual BMC. This close association was noted in boththe international reference sample and in an independent, sample ofhealthy children. To our knowledge, our models are unique, and areespecially important for clinicians whose patients may be small forage or as a result of disease and where growth (but not necessarilybone health) may be affected by a medical condition or a drugtherapy.
We used multilevel statistical modeling to generate BMC curves soas to maximize the value of our longitudinal data. That is, our mixed-effects model allowed us to use data if they were complete, from alltime points regardless of the number of study visits. Longitudinal dataare the best means to capture the nuances of growth and to representthe substantial differences in the timing and magnitude of BMCaccrual over time within and between the sexes. Although werecognize that physical activity, dietary intake and heredity mayinfluence BMC accrual, these outcomes were not available across allstudies. Thus, we were unable to include them in our models.
Ourmodels reinforcewhat other excellent longitudinal studies havereported in smaller or single ethnicity cohorts [1,9,14]. However, ourfindings extend these models by increasing the numbers of childrenutilized to develop the models and by including age, sex, size andethnicity in the model. As has been previously reported, BMC increasesover time across all skeletal sites and in both sexes; although
Table 3Sex-specific multilevel regression models for bone mineral content at the (a) whole body,
Variables (a) Whole body (b) Total proxfemur
Fixed effect Estimates EstimatesConstant -1271.18 (223.45) -38.41 (5.69)Agec -554.33 (38.65) -10.56 (0.94)Agec2 -9.39 (1.02) -0.23 (0.02)Agec3 0.44 (0.12) 0.003 (0.003)Height 14.28 (1.46) 0.37 (0.04)Weight 31.06 (4.39) 0.58 (0.11)Agec ⁎ Height 3.69 (0.24) 0.07 (0.006)Agec ⁎ Weight NS NSWeight by height -31.83 (6.82) -0.72 (0.17)White vs Asian -31.36 (9.97) -0.70 (0.22)White vs Hispanic -75.49 (28.21) 1.57 (0.65)White vs Black 82.81 (26.26) 4.20 (0.58)Random Effects Level 1 Level 1Constant 2640.60 (132.36) 2.90 (0.14)
Level 2 Level 2Constant Agec Constant Agec
Constant 23,594.47 (1542.09) 3938.13 (370.75) 14.320 (0.95) 2.65Agec 3938.13 (370.75) 1264.66 (124.50) 2.656 (0.23) 0.56
Fixed effect values are estimated mean coefficients (SEE = standard error estimate); randoLevel 1=within individuals; Level 2=between individuals. Agec=Age centered (Age – 13 y(kg); Agec ⁎ height=Agec multiplied by height; Agec ⁎weight=Agec multiplied by weightvs Hispanic=White 0, Hispanic=1; White vs Black=White 0, Black=1; Pb0.05 (meanN
individuals had substantially different rates of BMC accrual [19]. Forboth males and females at the WB, PF and FN, the most significantindependent predictors of BMC were age, ethnicity, weight and height;the most significant interaction terms were age/height and weight/height. These models highlight the already established relationshipsbetween age, size and BMC [17]. A novel component of our model wasthe ethnic mix that illustrated the difference in BMC accrual acrossHispanic, Asian, Caucasian and Black children (except the lumbar spine)beginning at a young age. Our findings across ethnicities wereconsistent with previous cross-sectional and longitudinal studies [1,7].
One aim of our study was to provide clinicians (or others) with asimple tool to calculate a child's BMC Z-score. By accounting for age,size, sex and ethnicity the likelihood of misclassifying small (as afunction of sex or ethnicity) or later maturing children as being “atrisk” for bone health might be diminished. We also provide thiscalculation on a Web site (http://taurus.usask.ca/growthutility/) sothat available clinical data can be entered and a standard score can becalculated for any child. The derived Z-score will allow the user tointerpret DXA BMC data without the need for more statisticaladjustments for bone area, body size or lean mass [3,10,17]. Weprovide a working example of the Z-score calculation at the end of thediscussion.
Others have alerted clinicians to the many problems related toutilizing DXA to assess bone mass without correcting for its inherentsize artifact [34]. This is especially important when children's growth,but not their bone mass is affected by a clinical condition or amedication. This is also important when a child's bone mass may becompromised but is masked by other factors, such as a larger bodysize. Depending on variables entered into the equation, the Z-scoreindicates BMC that is relative to children the same age, sex, height,weight and/or ethnicity. We provide prediction equations at 4anatomical sites so that users have the opportunity to undertake thecalculation most relevant for their patient's individual circumstance.We do not suggest that our prediction models be used outside ofstandard medical practice that includes a complete medical historyand collection of physical activity and dietary intake data.
We acknowledge that our study has a number of limitations.First, the prediction models we derived are specific to BMC datacollected on Hologic QDR 4500 instruments. That is, only dataacquired with Hologic instruments should be entered into the
(b) total proximal femur, (c) femoral neck and (d) lumbar spine in males.
imal (c) Femoral neck (d) Lumbar Spine
Estimates Estimates-4.19 (0.30) -108.41 (3.92)-0.98 (0.10) -33.73 (1.36)-0.02 (0.003) -0.54 (0.04)0.00001 (0.0004) 0.04 (0.005)0.05 (0.002) 0.90 (0.03)0.01 (0.002) 0.04 (0.02)0.006 (0.0006) 0.21 (0.008)0.001 (0.0005) NSNS NS-0.22 (0.03) NS0.29 (0.09) NS0.63 (0.08) NSLevel 1 Level 10.03 (0.001) 2.84 (0.17)Level 2 Level 2
Constant Agec Constant Agec
6 (0.23) 0.206 (0.01) 0.03 (0.002) 39.29 (2.97) 9.16 (0.86)0 (0.07) 0.028 (0.002) 0.007 (0.010) 9.16 (0.86) 2.979 (0.29)
m effects values estimated mean variance (SEE).ears); Agec2=age centered squared; Agec3=age centered cubed; height (cm); weight; Weight by height=weight/height ⁎ 100; White vs Asian=White 0, Asian=1; White2⁎SEE). NS=not significant and removed from the model.
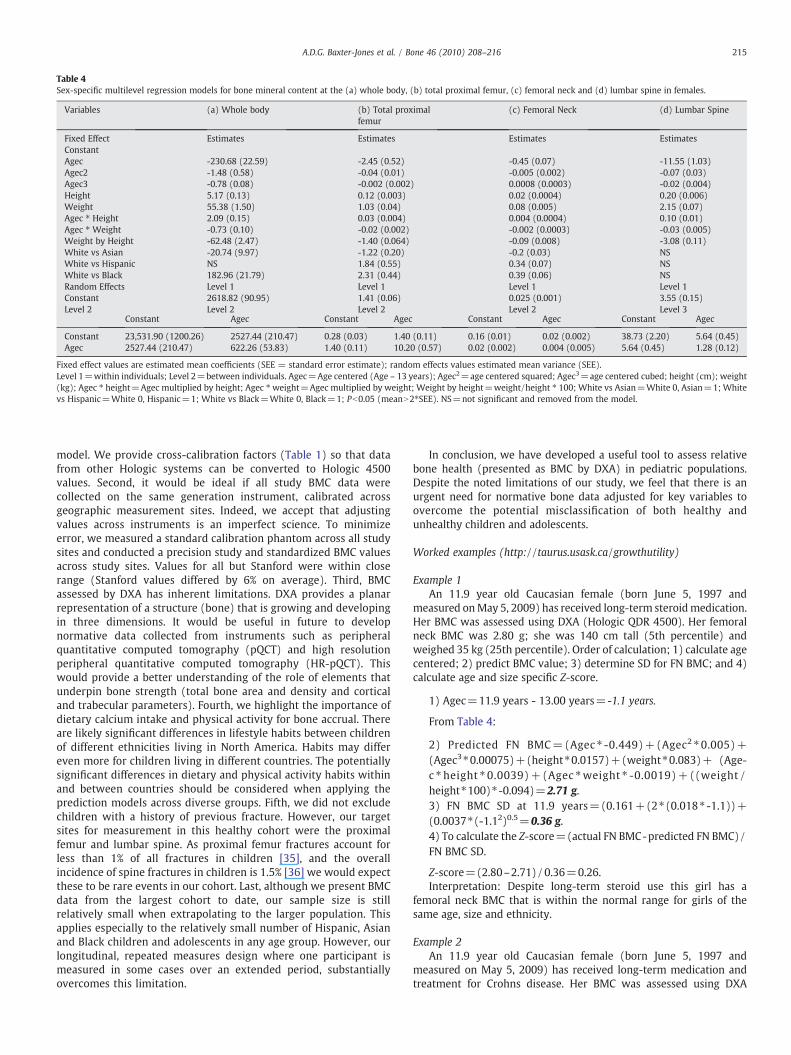
Table 4Sex-specific multilevel regression models for bone mineral content at the (a) whole body, (b) total proximal femur, (c) femoral neck and (d) lumbar spine in females.
Variables (a) Whole body (b) Total proximalfemur
(c) Femoral Neck (d) Lumbar Spine
Fixed Effect Estimates Estimates Estimates EstimatesConstantAgec -230.68 (22.59) -2.45 (0.52) -0.45 (0.07) -11.55 (1.03)Agec2 -1.48 (0.58) -0.04 (0.01) -0.005 (0.002) -0.07 (0.03)Agec3 -0.78 (0.08) -0.002 (0.002) 0.0008 (0.0003) -0.02 (0.004)Height 5.17 (0.13) 0.12 (0.003) 0.02 (0.0004) 0.20 (0.006)Weight 55.38 (1.50) 1.03 (0.04) 0.08 (0.005) 2.15 (0.07)Agec ⁎ Height 2.09 (0.15) 0.03 (0.004) 0.004 (0.0004) 0.10 (0.01)Agec ⁎ Weight -0.73 (0.10) -0.02 (0.002) -0.002 (0.0003) -0.03 (0.005)Weight by Height -62.48 (2.47) -1.40 (0.064) -0.09 (0.008) -3.08 (0.11)White vs Asian -20.74 (9.97) -1.22 (0.20) -0.2 (0.03) NSWhite vs Hispanic NS 1.84 (0.55) 0.34 (0.07) NSWhite vs Black 182.96 (21.79) 2.31 (0.44) 0.39 (0.06) NSRandom Effects Level 1 Level 1 Level 1 Level 1Constant 2618.82 (90.95) 1.41 (0.06) 0.025 (0.001) 3.55 (0.15)Level 2 Level 2 Level 2 Level 2 Level 3
Constant Agec Constant Agec Constant Agec Constant Agec
Constant 23,531.90 (1200.26) 2527.44 (210.47) 0.28 (0.03) 1.40 (0.11) 0.16 (0.01) 0.02 (0.002) 38.73 (2.20) 5.64 (0.45)Agec 2527.44 (210.47) 622.26 (53.83) 1.40 (0.11) 10.20 (0.57) 0.02 (0.002) 0.004 (0.005) 5.64 (0.45) 1.28 (0.12)
Fixed effect values are estimated mean coefficients (SEE = standard error estimate); random effects values estimated mean variance (SEE).Level 1=within individuals; Level 2=between individuals. Agec=Age centered (Age – 13 years); Agec2=age centered squared; Agec3=age centered cubed; height (cm); weight(kg); Agec ⁎ height=Agec multiplied by height; Agec ⁎weight=Agec multiplied by weight; Weight by height=weight/height ⁎ 100; White vs Asian=White 0, Asian=1; Whitevs Hispanic=White 0, Hispanic=1; White vs Black=White 0, Black=1; Pb0.05 (meanN2⁎SEE). NS=not significant and removed from the model.
215A.D.G. Baxter-Jones et al. / Bone 46 (2010) 208–216
model. We provide cross-calibration factors (Table 1) so that datafrom other Hologic systems can be converted to Hologic 4500values. Second, it would be ideal if all study BMC data werecollected on the same generation instrument, calibrated acrossgeographic measurement sites. Indeed, we accept that adjustingvalues across instruments is an imperfect science. To minimizeerror, we measured a standard calibration phantom across all studysites and conducted a precision study and standardized BMC valuesacross study sites. Values for all but Stanford were within closerange (Stanford values differed by 6% on average). Third, BMCassessed by DXA has inherent limitations. DXA provides a planarrepresentation of a structure (bone) that is growing and developingin three dimensions. It would be useful in future to developnormative data collected from instruments such as peripheralquantitative computed tomography (pQCT) and high resolutionperipheral quantitative computed tomography (HR-pQCT). Thiswould provide a better understanding of the role of elements thatunderpin bone strength (total bone area and density and corticaland trabecular parameters). Fourth, we highlight the importance ofdietary calcium intake and physical activity for bone accrual. Thereare likely significant differences in lifestyle habits between childrenof different ethnicities living in North America. Habits may differeven more for children living in different countries. The potentiallysignificant differences in dietary and physical activity habits withinand between countries should be considered when applying theprediction models across diverse groups. Fifth, we did not excludechildren with a history of previous fracture. However, our targetsites for measurement in this healthy cohort were the proximalfemur and lumbar spine. As proximal femur fractures account forless than 1% of all fractures in children [35], and the overallincidence of spine fractures in children is 1.5% [36] we would expectthese to be rare events in our cohort. Last, although we present BMCdata from the largest cohort to date, our sample size is stillrelatively small when extrapolating to the larger population. Thisapplies especially to the relatively small number of Hispanic, Asianand Black children and adolescents in any age group. However, ourlongitudinal, repeated measures design where one participant ismeasured in some cases over an extended period, substantiallyovercomes this limitation.
In conclusion, we have developed a useful tool to assess relativebone health (presented as BMC by DXA) in pediatric populations.Despite the noted limitations of our study, we feel that there is anurgent need for normative bone data adjusted for key variables toovercome the potential misclassification of both healthy andunhealthy children and adolescents.
Worked examples (http://taurus.usask.ca/growthutility)
Example 1An 11.9 year old Caucasian female (born June 5, 1997 and
measured onMay 5, 2009) has received long-term steroidmedication.Her BMC was assessed using DXA (Hologic QDR 4500). Her femoralneck BMC was 2.80 g; she was 140 cm tall (5th percentile) andweighed 35 kg (25th percentile). Order of calculation; 1) calculate agecentered; 2) predict BMC value; 3) determine SD for FN BMC; and 4)calculate age and size specific Z-score.
1) Agec=11.9 years - 13.00 years=-1.1 years.
From Table 4:
2) Predicted FN BMC=(Agec ⁎ -0.449)+(Agec2 ⁎ 0.005)+(Agec3⁎0.00075)+(height⁎0.0157)+(weight⁎0.083)+ (Age-c ⁎ height ⁎ 0.0039)+ (Agec ⁎weight ⁎ -0.0019)+ ((weight /height⁎100)⁎ -0.094)=2.71 g.3) FN BMC SD at 11.9 years=(0.161+(2⁎ (0.018⁎ -1.1))+(0.0037⁎(-1.12)0.5=0.36 g.4) To calculate the Z-score=(actual FN BMC-predicted FN BMC)/FN BMC SD.
Z-score=(2.80–2.71)/0.36=0.26.Interpretation: Despite long-term steroid use this girl has a
femoral neck BMC that is within the normal range for girls of thesame age, size and ethnicity.
Example 2An 11.9 year old Caucasian female (born June 5, 1997 and
measured on May 5, 2009) has received long-term medication andtreatment for Crohns disease. Her BMC was assessed using DXA
216 A.D.G. Baxter-Jones et al. / Bone 46 (2010) 208–216
(Hologic QDR 4500). Her femoral neck BMC was 1.89 g; she was145 cm tall (25th percentile) and weighed 35 kg (25th percentile).Order of calculation; 1) calculate age centered; 2) predict BMC value;3) determine SD for FN BMC; 4) calculate age and size specific Z-score.
1) Agec=11.9 years-13.00 years=-1.1 years.
From Table 4:
2) Predicted FN BMC=(Agec⁎-0.449)+(Agec2⁎0.005)+(Agec3⁎0.00075)+(height⁎0.0157)+ (weight⁎0.083)+ (Age-c⁎height⁎0.0039)+(Agec⁎weight⁎-0.0019)+((weight/height⁎100)⁎-0.094)=2.85 g.3) FN BMC SD at 11.9 years=(0.161 + (2⁎(0.018⁎-1.1)) +(0.0037⁎(-1.12)0.5=0.36 g.4) To calculate the Z-score=(actual FN BMC - predicted FN BMC)/FN BMC SD.
Z-score=(1.89 – 2.85)/0.36=-2.71Interpretation: The long-termmedication and treatment for Crohns
disease in this girl has a resulted in a femoral neck BMC that is over 2 SDbelow thenormal range for girls of the sameage, size and ethnicity. Sucha Z-score would warrant further investigation for low BMC.
Funding disclosures
The UBC Healthy Bones Study (1999–2006) was supported by theCanadian Institute for Health Research project grant (20RNO793).Additional support was provided by the Michael Smith Foundation forHealth Research grant no (20R41770). PBMAS (1991–1998) wassupported by the Canadian National Health and Research Develop-ment Program (NHRDP), grant no. 6608-1261. PBMAS (2002–2005)was supported by the Canadian Institute of Health Research, grant no.MOP 57671. Additional support was provided by the SaskatchewanHealth Research Foundation. Stanford bone study was funded by theNIH, grant DK 45226. The Penn State YWHS was supported by NIHgrants from the NICHD-R01 HD25973 (T. Lloyd), M01-RR-10732(Penn State University GCRC), and NIAMS-K23 AR49040-01A1 (M.Petit). The BUGSY study was supported by an NIH RO1, grant no.AR45655-08.
All authors do not perceive or have any real potential conflicts ofinterests. The study sponsors had no input into the study design,collection, analysis and interpretation of the data, the writing of thereport, or the decision to submit the paper for publication.
References
[1] Bachrach LK, Hastie T, Wang MC, Narasimhan B, Marcus R. Bone mineralacquisition in healthy Asian, Hispanic, black, and Caucasian youth: a longitudinalstudy. J Clin Endocrinol Metab 1999;84:4702–12.
[2] Specker B, Schoenau E. Quantitative bone analysis in children: current methodsand recommendations. J Pediatr 2005:726–31.
[3] Carter DR, Bouxsein ML, Marcus R. New approaches for interpreting projectedbone densitometry data. J Bone Miner Res 1992;7:137–45.
[4] LeonardMBPK, Zemel BS, Stallings VA, FeldmanHI. Discrepancies in pediatric bonemineral density reference data: potential for misdiagnosis of osteopenia. J Pediatr1999:135.
[5] Kroger H, Kotaniemi A, Vainio P, Alhava E. Bone densitometry of the spine andfemur in children by dual-energy x-ray absorptiometry. Bone Miner 1992;17:75–85.
[6] Molgaard C, Thomsen BL, Prentice A, Cole TJ, Michaelsen KF. Whole body bonemineral content in healthy children and adolescents. Arch Dis Child 1997;76:9–15.
[7] Ellis K, Shypailo RJ, Hardin DS, Perez MD, Motil KJ, Wong WW, et al. Z scoreprediction model for assessment of bone mineral content in pediatric diseases. JBone Miner Res 2001;16:1658–64.
[8] Schoenau E, Neu CM, Rauch F, Manz F. Gender-specific pubertal changes in volume-tric cortical bone mineral density at the proximal radius. Bone 2002;31:110–3.
[9] Faulkner R, Bailey DA, Drinkwater DT, McKay HA, Arnold C, Wilkinson AA. Bonedensitometry in Canadian children 8–17 years of age. Calcif Tissue Int 1996;59:344–51.
[10] Molgaard C, Thomsen BL, Michaelsen KF. Influence of weight, age and puberty onbone size and bone mineral content in healthy children and adolescents. ActaPaediatr 1998;87:494–9.
[11] Binkley TL, Specker BL, Wittig TA. Centile curves for bone densitometrymeasurements in healthy males and females ages 5–22 yr. J Clin Densitom2002;5:343–53.
[12] Kalkwarf HJ, Zemel BS, Gilsanz V, Lappe JM, Horlick M, Oberfield S, et al. The BoneMineral Density in Childhood Study: bone mineral content and density accordingto age, sex, and race. J Clin Endocrinol Metab 2007;92:2087–99.
[13] Lu P, Cowell CT, Lloyd-Jones SA, Briody JN, Howan-Giles R. Volumetric bonemineral density in normal subjects aged 5-27 years. J Clin Endocrinol Metab1996;81:1586–90.
[14] Maynard LM, Guo SS, Chumlea WC, Roche AF, Wisemandle WA, Zeller CM, et al.Total-body and regional bone mineral content and areal bone mineral densityin children aged 8–18 y: the Fels Longitudinal Study. Am J Clin Nutr 1998;68:1111–7.
[15] Zanchetta JR, Plotkin H, Alvarez Filgueira ML. Bone mass in children: normativevalues for the 2–20 year old population. Bone 1995;16:S393–9.
[16] Boot AM, Engels MA, Boerma GJ, Krenning EP, De Muinck Keizer-Schrama SM.Changes in bone mineral density, body composition, and lipid metabolism duringgrowth hormone (GH) treatment in children with GH deficiency. J Clin EndocrinolMetab 1997;82:2423–8.
[17] Crabtree NJ, Kibirige MS, Fordham JN, Banks LM, Muntoni F, Chinn D, et al. Therelationship between lean body mass and bone mineral content in paediatrichealth and disease. Bone 2004;35:965–72.
[18] Bailey DA, Baxter-Jones AD, Mirwald RL, Faulkner RA. Bone growth and exercisestudies: the complications of maturation. J Musculoskelet Interact 2003;3:335–7discussion 356.
[19] Bailey DA, McKay HA, Mirwald RL, Crocker PR, Faulkner RAA. Six-year longitudinalstudy of the relationship of physical activity to bone mineral accrual in growingchildren: The University of Saskatchewan Bone Mineral Accrual Study. J BoneMiner Res 1999;14:1672–9.
[20] Bachrach L. Osteoporosis and measurement of bone mass in children andadolescents. Endocrinol Metab Clin N Am 2005;34:521–35.
[21] Bailey D, Faulkner RA, McKay HA. Growth, physical activity and bone mineralacquisition. Exerc Sport Sci Rev 1996;24:233–66.
[22] MacKelvie KJ, McKay HA, Khan KM, Crocker PR. A school-based exerciseintervention augments bone mineral accrual in early pubertal girls. J Pediatr2001;139:501–8.
[23] Bailey DA, McKay HA, Mirwald RL, Crocker PRE, Faulkner RA. The University ofSaskatchewan Bone Mineral Accrual Study: a six-year longitudinal study of therelationship of physical activity to bone mineral accrual in growing children.Journal of Bone and Mineral Research 1999;14(10):1672–1679.
[24] Kemper H, Twisk JWR, Van Mechelen W, Post GB, Roos JC, Lips P. A fifteen-yearlongitudinal study in young adults on the relation of physical activity and fitnesswith the development of the bone mass: the Amsterdam Growth and HealthLongitudinal Study. Bone 2000;27:847–53.
[25] Lloyd T, Rollings N, Andon MB, Demers LM, Eggle DF, Kieselhorst K, et al.Determinants of bone density in young women. I. Relationships among pubertaldevelopment, total body bone mass, and total body bone density in premenarchalfemales. J Clin Endocrinol Metab 1992;75:383–7.
[26] Lloyd T, Petit MA, Lin HM, Beck TJ. Lifestyle factors and the development of bonemass and bone strength in young women. J Pediatr 2004;144:776–82.
[27] Wallace B. Precision of bone mineral and soft tissue measurements using anHologic QDR 2000 in array mode. College of Physical Education. University ofSaskatchewan: Saskatoon; 1995.
[28] Baxter-Jones A, Mirwald RM. Multilevel modeling. In: Hauspie RC, Cameron N,Molinari L, editors. Methods in Human Growth Research: Cambridge UniversityPress; 2004. p. 306–29.
[29] Goldstein H. Multilevel Statistics Models. London: Arnold; 1995.[30] Baxter-Jones AD, Mirwald RL, McKay HA, Bailey DA. A longitudinal analysis of sex
differences in bone mineral accrual in healthy 8–19-year-old boys and girls. AnnHum Biol 2003;30:160–75.
[31] Forwood MR, Baxter-Jones AD, Beck TJ, Mirwald RL, Howard A, Bailey DA. Physicalactivity and strength of the femoral neck during the adolescent growth spurt: alongitudinal analysis. Bone 2006;38:576–83.
[32] Forwood MR, Bailey DA, Beck TJ, Mirwald RL, Baxter-Jones AD, Uusi-Rasi K. Sexualdimorphism of the femoral neck during the adolescent growth spurt: a structuralanalysis. Bone 2004;35:973–81.
[33] Bland JM, Altman DG. Statistical methods for assessing agreement between twomethods of clinical measurement. Lancet 1986;i:307–10.
[34] Rauch F. Bone growth in length and width: the yin and yang of bone stability.J Musculoskelet Neuronal Interact 2005;5:194–201.
[35] Canale S. Fractures of the hip in children and adolescents. Orthop Clin North Am1990;21:341–52.
[36] Patel JC, Tepas JJ, Mollitt DL, Pieper P. Pediatric cervical spine injuries: defining thedisease. J Pediatr Surg 2001;36:373–6.