intercellular calcium waves in hela cells expressing gfp-labeled connexin 43, 32, or 26
TRANSCRIPT
Molecular Biology of the CellVol. 11, 1815–1827, May 2000
Intercellular Calcium Waves in HeLa Cells ExpressingGFP-labeled Connexin 43, 32, or 26Koen Paemeleire,* Patricia E. M. Martin,† Sharon L. Coleman,†Kevin E. Fogarty,‡ Walter A. Carrington,‡ Luc Leybaert,* Richard A. Tuft,‡W. Howard Evans,† and Michael J. Sanderson‡§
‡Department of Physiology, University of Massachusetts Medical School, Worcester, Massachusetts01655; *Department of Physiology and Pathophysiology, University of Ghent, B-9000 Ghent, Belgium;and †Department of Medical Biochemistry, University of Wales College of Medicine, Cardiff CF44XN, Wales, United Kingdom
Submitted August 27, 1999; Revised January 10, 2000; Accepted January 28, 2000Monitoring Editor: Paul T. Matsudaira
This study was undertaken to obtain direct evidence for the involvement of gap junctions in thepropagation of intercellular Ca21 waves. Gap junction-deficient HeLa cells were transfected withplasmids encoding for green fluorescent protein (GFP) fused to the cytoplasmic carboxyl terminiof connexin 43 (Cx43), 32 (Cx32), or 26 (Cx26). The subsequently expressed GFP-labeled gapjunctions rendered the cells dye- and electrically coupled and were detected at the plasmamembranes at points of contact between adjacent cells. To correlate the distribution of gapjunctions with the changes in [Ca21]i associated with Ca21 waves and the distribution of theendoplasmic reticulum (ER), cells were loaded with fluorescent Ca21-sensitive (fluo-3 and fura-2)and ER membrane (ER-Tracker) dyes. Digital high-speed microscopy was used to collect a seriesof image slices from which the three-dimensional distribution of the gap junctions and ER werereconstructed. Subsequently, intercellular Ca21 waves were induced in these cells by mechanicalstimulation with or without extracellular apyrase, an ATP-degrading enzyme. In untransfectedHeLa cells and in the absence of apyrase, cell-to-cell propagating [Ca21]i changes were charac-terized by initiating Ca21 puffs associated with the perinuclear ER. By contrast, in Cx–GFP-transfected cells and in the presence of apyrase, [Ca21]i changes were propagated withoutinitiating perinuclear Ca21 puffs and were communicated between cells at the sites of the Cx–GFPgap junctions. The efficiency of Cx expression determined the extent of Ca21 wave propagation.These results demonstrate that intercellular Ca21 waves may be propagated simultaneously via anextracellular pathway and an intracellular pathway through gap junctions and that one form ofcommunication may mask the other.
INTRODUCTION
Intercellular Ca21 waves have been found to occur in a widevariety of cell types (Cornell-Bell and Finkbeiner, 1991;Sanderson et al., 1994; Kasai, 1995; Robb-Gaspers andThomas, 1995; Charles, 1998). Intercellular Ca21 waves canbe induced by electrical, chemical, and mechanical stimuliand consist of an increase in the intracellular free Ca21
concentration ([Ca21]i) in the stimulated cell that is commu-nicated through consecutive rows of neighboring cells(Sanderson et al., 1990; Charles et al., 1991; Hassinger et al.,1996). Studies aimed at elucidating the mechanisms under-lying the propagation of waves have led to the hypothesis
that IP3 acts as a Ca21-mobilizing messenger and diffusesthrough gap junctions between neighboring cells (Sander-son, 1995; Leybaert et al., 1998a). Alternatively, Ca21 itselfmay diffuse through gap junctions and trigger the release ofCa21 from IP3-sensitized IP3 receptors (Robb-Gaspers andThomas, 1995; Zimmermann and Walz, 1999). Either sce-nario requires the presence of gap junctions.
Gap junction channels are formed from two hexamerichemichannels, called connexons, that are embedded in op-posing plasma membranes and assembled from six proteinmonomers or connexins (Cxs) arranged around a centralpore. Connexins are a family of 15 proteins (in rodents) thatare classified on the basis of their molecular weight andstructure (Kumar and Gilula, 1992; Yeager et al., 1998). Per-haps the most commonly studied gap junctional proteins areCx26, Cx32, and Cx43 (Simon and Goodenough, 1998; Si-
§ Corresponding author. E-mail address: [email protected].
© 2000 by The American Society for Cell Biology 1815

mon, 1999). The relationship between gap junctions andCa21 waves has been examined previously, and it wasfound that C6 glioma cells, which have nonfunctional gapjunctions, transmitted Ca21 waves only after transfectionwith Cx43 (Charles et al., 1992). Similarly, Toyofuku et al.(1998) have shown that expression of Cx43 in the humanembryonic kidney cell line, HEK293, is required to propa-gate intercellular Ca21 waves. In addition, blockers of gapjunctional communication, such as halothane, octanol, a-gly-cyrrhetinic acid, and antibodies, significantly reduce thepropagation distance of intercellular Ca21 waves (Sander-son et al., 1990; Finkbeiner, 1992; Venance et al., 1997; Boitanoet al., 1998), whereas fast superfusion did not bias the prop-agation of calcium waves in the direction of the flow (Han-sen et al., 1993; Churchill et al., 1996).
Although a role for gap junctions in the propagation ofCa21 waves is well supported, Ca21 waves may also bepropagated by the release of an extracellular messenger suchas ATP. These waves are able to cross discontinuities in thecell culture, are biased by extracellular fluid flows, and areinhibited by the ATP-degrading enzyme apyrase (Osipchukand Cahalan, 1992; Furuya et al., 1993; Hassinger et al., 1996;Guthrie et al., 1999). This ability to release and respond toATP also appears to be linked to the expression of gapjunctions, because forced overexpression of gap junctionswas suggested to increase the amount of ATP released byHeLa and C6 glioma cells transfected with Cx43 (Cotrina etal., 1998). As a result, the mechanism of Ca21 wave propa-gation in transfected cells is more complicated and mayoccur via both ATP and gap junctions.
Because the subcellular characteristics should indicate themechanism of the propagating Ca21 waves, i.e., whetherthey move intracellularly or extracellularly, we directlystudied the involvement of gap junctions in intercellularCa21 wave propagation by using green fluorescent protein(GFP) to visualize the location of specific gap junctions inlive HeLa cells. Cells were transfected with plasmids thatresulted in the expression of GFP-labeled connexin 43(Cx43), connexin 32 (Cx32), or connexin 26 (Cx26), and theintercellular Ca21 waves in these cells were analyzed withdigital microscopy. Although there are numerous types ofconnexins that exist in various tissues, we limited this studyto connexins 43, 32, and 26 because these connexins are thepredominate forms in the epithelial and glial cells in whichintercellular Ca21 waves have been extensively observed. Inaddition, we correlated the distribution of the endoplasmicreticulum with elemental and global intracellular Ca21
events that were observed during wave propagation. Usingthese techniques, we demonstrate that both modes of Ca21
wave propagation, that is, intercellular propagation throughgap junctions and extracellular propagation by ATP diffu-sion, can occur simultaneously in GFP–connexin-transfectedHeLa cells.
MATERIALS AND METHODS
MaterialsCell culture reagents and plasticware were obtained from Life Tech-nologies (Grand Island, NY), molecular biology reagents were ob-tained from Promega (Madison, WI) and other reagents were ob-tained from Sigma (St. Louis, MO) unless stated otherwise.
Construction of Chimeric Connexin–GFP cDNACx26, Cx32, and Cx43 cDNA were fused inframe to the aminoterminus of enhanced GFP (EGFP) in the vector pEGFP-N1 asfollows. The ORF of Cx26, Cx32, and Cx43 was initially amplified byPCR from plasmids containing the relevant full-length cDNA usingthe appropriate oligonucleotide primers that introduced BglII (forCx43 and Cx26 constructs) and HindIII restriction enzyme sites (forCx32 constructs) at the 59 and 39 end of the cDNA. The primers usedwere as follows (restriction enzyme sites are underlined; Cx se-quences are in bold): Cx43 forward primer Cx43GF: 59 CTA CCGGAC TCA GAT CTC ATG GGT GAC TGG AGT; Cx43 reverseprimer Cx43GR: 59 CTT GAG CTC GAG ATC TGA AAT CTC CAGGTC ATC; Cx32 forward primer Cx32GF: 59 CTC GAG CTC AAGCTT ATG AAC TGG ACA GGT; Cx32 reverse primer Cx32GR: 59CAG AAT TCG AAG CTT GCA GGC TGA GCA TCG; Cx26forward primer Cx26GF: 59 CTA CCG GAC TCA GAT CTC ATGGAT TGG GGC ACC; Cx26 reverse primer Cx26GR: 59 CTT GAGCTC GAG ATC TGA GAC TGG TCT TTT GGA.
To generate the Cx–GFP chimeric constructs, the resulting PCRproducts were digested with BglII or HindIII and ligated into theBglII or HindIII site of pEGFP-N1 (Clontech, Basingstoke, Hamp-shire, United Kingdom) (Sambrook et al., 1989) followed by trans-formation into Escherichia coli (DH5a). Identification of positiveclones was achieved by miniplasmid preparation and restrictionenzyme analysis. Selected constructs were sequenced using thePRISM Dye Termination Cycle Sequencing kit (Perkin Elmer-Cetus,Beaconsfield, Buckinghamshire, United Kingdom).
Establishment of Stable HeLa Cell PopulationsExpressing Cx–GFP ProteinsHeLa Ohio cells (ECACC, Salisbury, Wiltshire, United Kingdom)were cultured in DMEM supplemented with 10% fetal calf serum,penicillin/streptomycin (100 mg/ml), amphotericin (100 mg/ml),and l-glutamine (2 mM). Subconfluent monolayers (4 3 106 cells in100-mm dishes) were transfected with 10 mg of the relevant Cx–GFPcDNA by calcium phosphate (Martin et al., 1998). Forty-eight hoursafter transfection, cells were transferred to medium supplementedwith 4 mg/ml Geneticin (antibiotic G418-sulfate) and cultured for;3 wk. After significant cell death had occurred and the survivingcells were growing well in Geneticin, cells positive for GFP fluores-cence were separated and collected with a fluorescence-activatedcell sorter (Becton Dickinson, San Jose, CA). The GFP-positive cellpopulations were maintained in complete DMEM supplementedwith 4 mg/ml Geneticin. Separate media were prepared for non-transfected HeLa (further called HeLa control cells), HeLa Cx26,HeLa Cx32, and HeLa Cx43 cells, respectively, to avoid contamina-tion of different strains of cells. Stocks of cells were split at a ratio of1:10 once a week and used for up to seven passages. For Ca21
imaging experiments, cells were grown on glass-bottom Petri dishes(Mattek, Ashland, MA). Eighteen hours before experiments, Cx–GFP expression was enhanced by addition of 5 mM sodium bu-tyrate to the medium (Wilkinson and Akrigg, 1992; George et al.,1998b).
Western Blot AnalysisHeLa cells (ECACC) were transfected with cDNA encoding forCx43–GFP chimerae and harvested for Western blot analysis asdescribed by Martin et al., (1998). Proteins were detected witheither a primary rabbit antibody generated against amino acidsequences in the carboxyl tail of the Cx43 (Gap33, amino acids314 –325) or a polyclonal antibody against GFP (Clontech) and asecondary goat anti-rabbit antibody conjugated to horseradishperoxidase (Bio-Rad, Hemel Hempstead, Hertfordshire, UnitedKingdom). Blots were developed using the enhanced chemilumi-nescence system (Pierce, Chester, Cheshire, United Kingdom).
K. Paemeleire et al.
Molecular Biology of the Cell1816

Immunolocalization of Connexin–GFP ProteinsCells (1 3 105) were seeded on 16-mm2 coverslips overnight andfixed the next day in 4% formaldehyde and processed for immuno-cytochemical analysis as described (Martin et al., 1998). Colocaliza-tion of Cx and GFP fluorescence was confirmed by staining the cellswith the relevant primary antibodies. For Cx26 and Cx32, commer-cially available monoclonal antibodies (Chemicon, Harrow, UnitedKingdom) against the intracellular loop were used; for Cx 43, apolyclonal antibody, raised in rabbits, against the carboxyl tail wasused (Gap 33; Diez et al., [1999]). The secondary antibody was eithergoat anti-rabbit or goat anti-mouse IgG conjugated to Cy3. Cellswere mounted in Fluorsave (Calbiochem, Beeston, Nottingham,United Kingdom) to preserve fluorescence and viewed on a LeitzDMBRE confocal microscope.
Assessment of Efficiency of ExpressionThe expression of Cx43–GFP, Cx32–GFP and Cx26–GFP was quan-tified by averaging imaging data from 15 different areas (320 3 240mm) obtained from the respective confluent monolayers of passage4 HeLa cells. To obtain the area of Cxs, images were recorded andthresholded to separate the GFP fluorescence from background, andall pixels with values above the threshold were counted. This num-ber was divided by the total number of pixels in the field of viewand expressed as a percentage.
Assessment of Dye and Electrical CouplingConfluent monolayers of HeLa cells expressing the chimeric Cx–GFP constructs were microinjected with Lucifer yellow (5% wt/volin 0.3 M LiCl). Fifteen minutes after injection, cells were fixed in 4%formaldehyde and viewed on a Zeiss Axiostat microscope. Thedye-coupling efficiency was calculated as the percentage of cells,injected with Lucifer yellow, that transferred dye to five or moreneighboring cells. Electrical coupling was measured in isolated cellpairs with two microelectrodes pulled from glass capillaries(1.2-mm outer diameter; A-M Systems, Carlsbourg, WA), with re-sistances ;50–100 MV. Electrodes were connected to a balancedbridge circuit (Cyto 721, World Precision Instruments, Sarasota, FL)and served to inject current and measure potential. Current wasinjected as 1-nA square pulses of 200 ms duration at a frequency of2 Hz (I1). The resulting changes in membrane potential in theinjected cell (V1) and the adjacent cell (V2) were measured, and theelectrical coupling ratio (V2/V1) was calculated.
Experimental SolutionsExperiments were performed in HBSS supplemented with 25 mMHEPES and brought to pH 7.4 (HBSS–HEPES) with or withoutapyrase (Grade III) as required. A stock solution of apyrase wasprepared in distilled H2O at 2000 IU/ml and further diluted inHBSS–HEPES to yield a final concentration of 40 IU/ml. Wheneverapyrase was used in the experiments, cultures were preincubated inapyrase solution for 30 min.
Mechanical StimulationA glass pipette with a tip diameter of ;1 mm was pulled from aglass capillary (1.5-mm outer diameter; A-M Systems) and mountedon a piezo-electric device that was driven by a single square pulseof 3 V and 150 ms duration. The height of the pipette tip wasadjusted such that it gently touched the cell membrane of a singlecell upon activation of the piezo-electric device. A stronger mechan-ical stimulus was applied to the cells by lowering the glass pipette;1 mm so that it distorted the cell to a great extent.
Measurements of Intracellular Free Ca21
ConcentrationInitial experiments were performed with digital video microscopyand an epifluorescence microscope as described elsewhere (Lansleyand Sanderson, 1999). HeLa cells were loaded with the Ca21-sensi-tive dye fura-2 AM (Molecular Probes, Eugene, OR) (5 mM inHBSS–HEPES for 30 min at 37°C followed by deesterification atroom temperature for 30 min). The fura-2 loaded cultures wereobserved on an inverted microscope (Nikon Diaphot 300) with a403 oil immersion objective. The video field of view measured320 3 240 mm. Cells were excited by light emitted from a Hg arclamp and filtered with excitation filters (center wavelengths of 340and 380 nm). Excitation light was separated from the light emittedfrom the specimen using a 400-nm dichroic mirror. Emitted lightwas collected through an emission filter (center wavelength of 515nm) by a silicon intensified target camera. Images were recorded atvideo rate (30 fps) by an optical memory disk recorder (OMDR) andanalyzed using custom-written software (Leybaert et al., 1998b).
Studies requiring higher temporal and spatial resolution wereperformed on a digital high-speed microscope (Figure 1) that isdescribed in detail elsewhere (Rizzuto et al., 1998; Kidd et al., 1999;ZhuGe et al., 1999). For high-resolution experiments, HeLa cellswere loaded with the Ca21-sensitive fluoroprobe fluo-3 AM (Mo-lecular Probes) (5 mM in HBSS–HEPES for 30 min at 37°C followedby deesterification at room temperature for 30 min). Fluo-3–loadedcells were viewed with a 603 NA 1.4 oil immersion lens (Nikon).The cells were excited by the 488 nm line of an Argon laser ex-panded to provide wide-field illumination of the specimen. Emittedfluorescence was collected using a 510-nm long-pass emission filterand a cooled CCD camera, at a maximal frequency of 100 images persecond. Because of a storage limit of 200 images, the duration ofrecordings was 2 s at 100 images per second. Slower image collec-tion rates were used to increase the duration of recordings. Eachpixel represents an area of 333 3 333 nm. The dimensions of eachimage were 42.6 3 42.6 mm (128 3 128 pixels). An in situ calibrationwas investigated for fura-2–loaded cells by exposing them to knownCa21 concentrations in the presence of 100 mM ionomycin and 10mM thapsigargin. These calibrations confirmed previous observa-tions that there is a difference in the apparent KD of fura-2 in thenucleus and cytoplasm (Perez-Terzic et al., 1997), a situation that isincompatible with the calibration formula described by Grynk-iewicz et al. (1985). Therefore the fura-2 data were not transformedto [Ca21]i values but were represented in arbitrary Ca21 units usingestimated values from calibration experiments for the parametersRmin (0.1), Rmax (5.0), and FoFs (6.0). The fluo-3 data are representedas relative changes in fluorescence (DF/F or (Ft 2 F0)/F0, where Ftis the fluorescence at time 5 t and F0 is the fluorescence at time 50). Data are represented either as two-dimensional maps with apseudocolor scale or with respect to time from 2.3 3 2.3 mm analysispoints (7 3 7 pixels).
ER-Tracker, Mito-Tracker, and Connexin–GFPImage Acquisition and DeconvolutionCells loaded with fluo-3 were subsequently loaded with eitherER-Tracker Blue-White DPX (ER-Tracker) or Mito-Tracker Red CM-H2Ros (Mito-Tracker; both from Molecular Probes). Stock solutionsof ER-Tracker and Mito-Tracker were prepared at 1 mM in DMSO.Cells were loaded for 30 min at 37°C with 100 nM of either ER-Tracker or Mito-Tracker in prewarmed culture medium. The ER-Tracker, Mito-Tracker, and Cx–GFP fluorescence were imaged on adigital high-speed microscope by exciting the specimen with 386 nm(UV laser), 514 nm, or 488 nm (tuned visible laser) light, respec-tively. Fluorescence images were taken for each dye at 51 sequentialfocal planes separated by 0.25 mm. The focus changes were achievedby moving the microscope stage with a piezo-electric translator(Figure 1). Point-spread functions were obtained from 189 nm flu-orescein-coated beads. A dark-current image was obtained from a
Intercellular Calcium Waves and Gap Junctions
Vol. 11, May 2000 1817
HBSS–HEPES-filled glass-bottom Petri dish. The images of ER-Tracker, Mito-Tracker, and Cx-GFP were digitally restored by sub-tracting dark currents and removing the out-of-focus light using thepoint spread function and a deconvolution algorithm described byCarrington et al. (1995).
RESULTS
Distribution and Function of Cx–GFP Gap JunctionsThe cellular location of the Cx–GFP proteins was deter-mined by the fluorescent properties of the GFP. Analysis byconfocal microscopy showed that GFP chimerae of wild-type Cx26, Cx32, and Cx43 were targeted to the plasmamembrane to produce a punctate staining typical for gapjunctions. Cx–GFP expression varied considerably from cellto cell. For immunolocalization studies, cells expressing nu-merous gap junctions were analyzed; however, to simplifythe correlation of Ca21 waves with specific gap junctions,cells expressing only one to five Cx–GFP plaques betweenneighboring cells were used. Immunolocalization studiesusing site-specific antibodies to Cx43 demonstrated that theGFP fluorescence coincided with the Cx–antibody fluores-cence, confirming that GFP identified the location of the gapjunctions (Figure 2). Similar results were obtained with Cx26and Cx32 (our unpublished data).
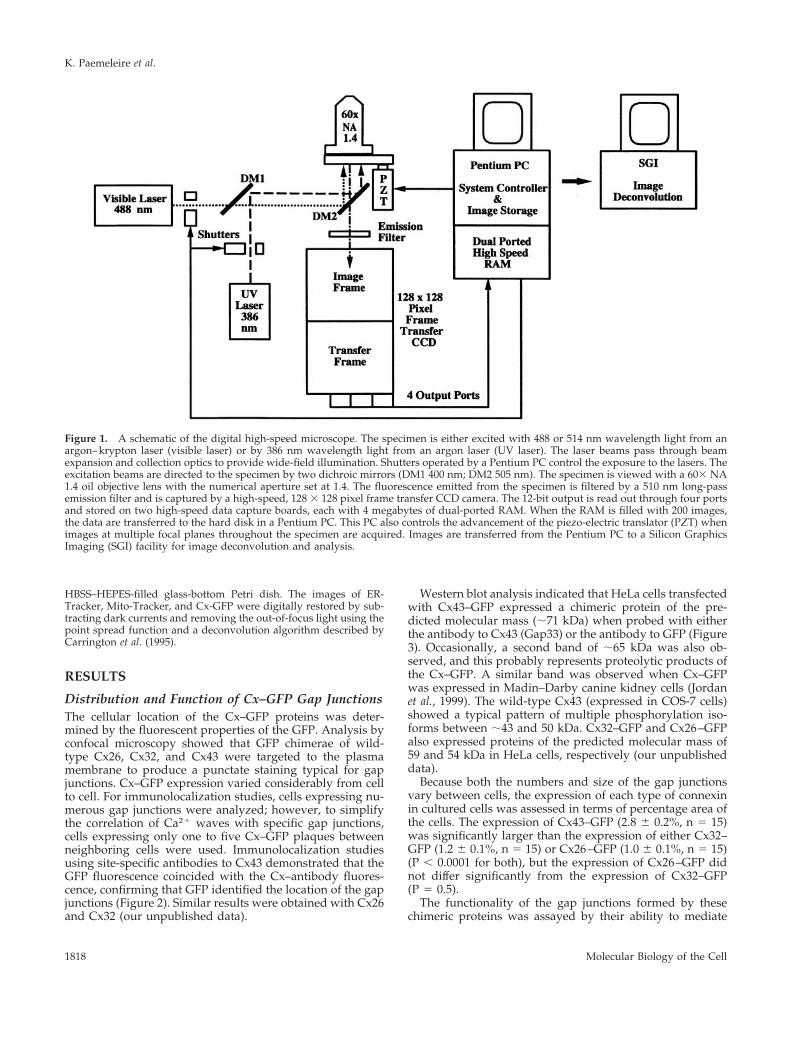
Western blot analysis indicated that HeLa cells transfectedwith Cx43–GFP expressed a chimeric protein of the pre-dicted molecular mass (;71 kDa) when probed with eitherthe antibody to Cx43 (Gap33) or the antibody to GFP (Figure3). Occasionally, a second band of ;65 kDa was also ob-served, and this probably represents proteolytic products ofthe Cx–GFP. A similar band was observed when Cx–GFPwas expressed in Madin–Darby canine kidney cells (Jordanet al., 1999). The wild-type Cx43 (expressed in COS-7 cells)showed a typical pattern of multiple phosphorylation iso-forms between ;43 and 50 kDa. Cx32–GFP and Cx26–GFPalso expressed proteins of the predicted molecular mass of59 and 54 kDa in HeLa cells, respectively (our unpublisheddata).
Because both the numbers and size of the gap junctionsvary between cells, the expression of each type of connexinin cultured cells was assessed in terms of percentage area ofthe cells. The expression of Cx43–GFP (2.8 6 0.2%, n 5 15)was significantly larger than the expression of either Cx32–GFP (1.2 6 0.1%, n 5 15) or Cx26–GFP (1.0 6 0.1%, n 5 15)(P , 0.0001 for both), but the expression of Cx26–GFP didnot differ significantly from the expression of Cx32–GFP(P 5 0.5).
The functionality of the gap junctions formed by thesechimeric proteins was assayed by their ability to mediate
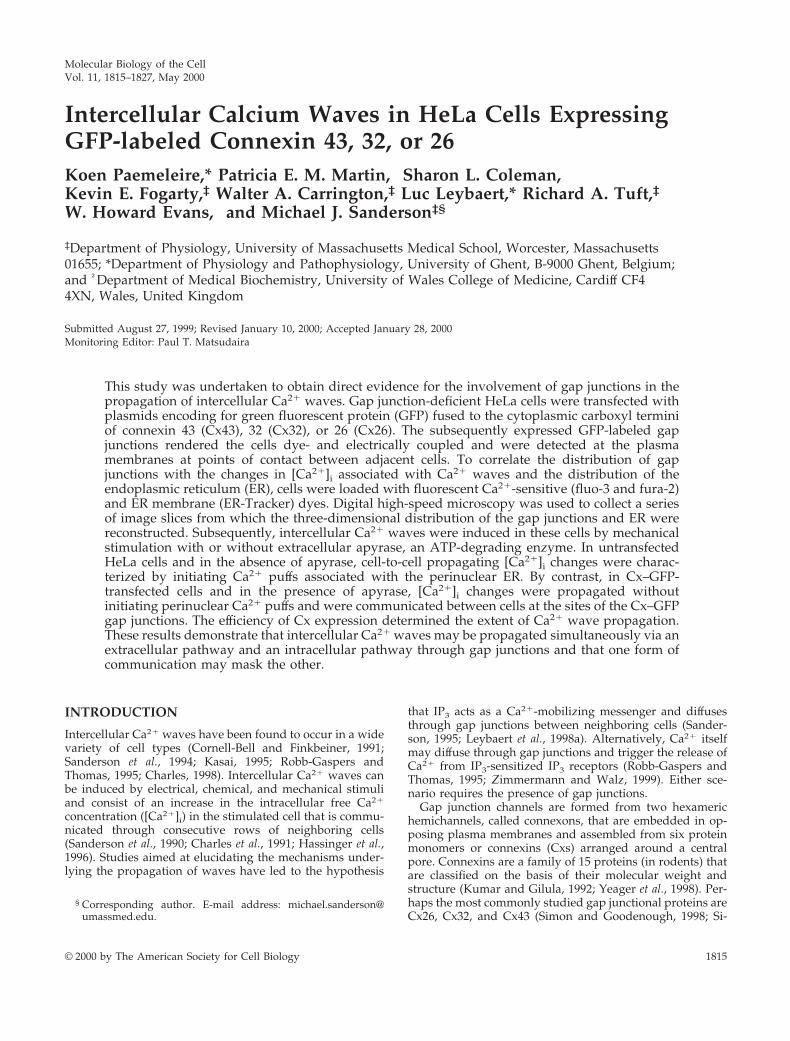
Figure 1. A schematic of the digital high-speed microscope. The specimen is either excited with 488 or 514 nm wavelength light from anargon–krypton laser (visible laser) or by 386 nm wavelength light from an argon laser (UV laser). The laser beams pass through beamexpansion and collection optics to provide wide-field illumination. Shutters operated by a Pentium PC control the exposure to the lasers. Theexcitation beams are directed to the specimen by two dichroic mirrors (DM1 400 nm; DM2 505 nm). The specimen is viewed with a 603 NA1.4 oil objective lens with the numerical aperture set at 1.4. The fluorescence emitted from the specimen is filtered by a 510 nm long-passemission filter and is captured by a high-speed, 128 3 128 pixel frame transfer CCD camera. The 12-bit output is read out through four portsand stored on two high-speed data capture boards, each with 4 megabytes of dual-ported RAM. When the RAM is filled with 200 images,the data are transferred to the hard disk in a Pentium PC. This PC also controls the advancement of the piezo-electric translator (PZT) whenimages at multiple focal planes throughout the specimen are acquired. Images are transferred from the Pentium PC to a Silicon GraphicsImaging (SGI) facility for image deconvolution and analysis.
K. Paemeleire et al.
Molecular Biology of the Cell1818
dye and electrical coupling. Lucifer yellow, microinjectedinto an individual cell, was subsequently observed in neigh-boring cells, indicating that all three Cx–GFP chimeraeformed dye-permeable gap junction channels (Table 1). Cellsexpressing Cx43–GFP had generally better dye couplingthan the cells expressing Cx32–GFP or Cx26–GFP. Similarly,the injection of 1 nA current into a single cell resulted insynchronous changes in the membrane potential of isolatedcell pairs, confirming that the Cx43–GFP cells were electri-cally coupled (Figure 4). Although multiple GFP-labeledplaques were observed in individual cells, the presence ofonly one GFP-labeled plaque at the plasma membrane be-tween neighboring cells was sufficient to render the cells
Figure 2. Cellular localization of Cx43–GFP observed by confocalmicroscopy. (A) A culture of Cx43–GFP-transfected HeLa cells wasexcited with 450–490 nm light and viewed at 510–520 nm to reveal thelocation of GFP. Discrete fluorescence plaques, characteristic of gapjunctional staining, were observed along the boundary between twocells (arrows). Fluorescence was also detected in the perinuclear regionand most likely represents Cx–GFP being processed through the ER.(B) The same area of cells as shown in A stained with Cy3-conjugatedantibodies to Cx43 and illuminated at 540–550 nm and viewed at580–590 nm. A similar staining pattern was observed. (C) The imagesin A and B were digitally superimposed. The combination of green andred fluorescence results in yellow fluorescence and demonstrates thatthe membrane plaques and cytoplasmic areas represent sites of colo-calization of GFP and Cy3 fluorescence and confirms that GFP fluo-rescence indicates the location of expressed Cxs. The plaques in C havea green–yellow appearance caused by the larger contribution of greenas compared with red. The cells shown were selected for the largenumber of plaques expressed. For Ca21 experiments, cells with fewerplaques were used. Image width 5 60 mm.
Figure 3. Western blot analysis of Cx43–GFP expressed by mam-malian cells. HeLa and COS-7 cells were transiently transfected with10 mg Cx43–GFP or wild-type Cx43 cDNA, respectively, and wereharvested. Cells were dissolved in SDS and analyzed by SDS-PAGEand Western blotting using an antibody to either Cx43 (Gap33) orGFP. Lane 1: control (mock-transfected HeLa cells). Lane 2: HeLacells expressing Cx43–GFP stained with GFP antibodies. Lane 3:HeLa cells expressing Cx43–GFP stained with Cx43 antibodies. Twomajor bands are visible. The band at ;71 kDa represents the Cx43–GFP (lanes 2 and 3), whereas the band at ;65 kDa (lane 3) probablyrepresents proteolytic products of Cx43. Lane 4: COS-7 cells ex-pressing wild-type Cx43 stained with Cx43 antibodies. A broadband representing phosphorylated isoforms of Cx43 is evident at;48–50 kDa. The numbers on the right represent the location andmolecular weight (kilodalton) markers.
Table 1. Lucifer yellow dye transfer in stable transfected HeLa cells
Cell population
% Cellstransferring dye
6 SEM (n)
Cx43–GFP 60.25 6 2.25 (50)Cx32–GFP 24.6 6 4.4 (78)Cx26–GFP 33.2 6 4 (62)HeLa control cells 0 (70)
Cells expressing the three Cx–GFP constructs were assessed fortheir ability to transfer Lucifer yellow. The results are expressed asthe percentage of cells transferring dye to five or more cells 6 SEM;(n) 5 total number of cells injected.
Intercellular Calcium Waves and Gap Junctions
Vol. 11, May 2000 1819

electrically coupled. The coupling ratio of Cx43-transfectedcells was ;5%. HeLa control cells were neither electricallynor dye-coupled (Table 1).
The Propagation of Ca21 Waves by ATPTo study Ca21 wave propagation in HeLa cells, cells wereloaded with either the fluorescent Ca21-sensitive indicatorfura-2 or fluo-3 and studied by either digital video or high-speed microscopy. Initially Ca21 wave propagation in HeLacontrol cells was examined. The gentle mechanical stimula-tion with a glass pipette of a single cell in a confluent layerof cells induced a rise in [Ca21]i only in the mechanicallystimulated cell (Figure 5A). Increasing the strength or am-plitude of the mechanical stimulus induced an increase in[Ca21]i in the stimulated cell followed by [Ca21]i increasesin neighboring cells that propagated in a wave-like manner(Figure 5B). This Ca21 wave propagated at a speed of 10.5 61.1 mm/s and over a distance of .160 mm (n 5 5), corre-sponding to more than six rows of cells.
Because HeLa control cells are not coupled by gap junc-tions, these experiments suggest that an extracellular factoris involved in Ca21 wave propagation. Other studies havesuggested that this factor is ATP (Hassinger et al., 1996;Cotrina et al., 1998; Guthrie et al., 1999). Consequently, thesensitivity of HeLa control cells was tested to a range of ATPconcentrations (Figure 6A). HeLa cells were found to havean EC50 of 431 nM (95% confidence interval 289–644 nM; R2
99.7%). An ATP concentration of 10 mM or more increased[Ca21]i in all the cells, and this Ca21 response consisted of arapid increase followed by oscillatory changes of intracellu-lar Ca21 (Figure 7A); however, the presence of the ATP-degrading enzyme apyrase (40 IU/ml) prevented a Ca21
response to 50 mM ATP in 100% of the cells (n 5 3) (Figure7B). By contrast, Ca21 responses to 100 mM histamine wereunaffected by extracellular apyrase (n 5 3) (Figure 7, C andD). Apyrase was present in the extracellular medium for 30min before agonist addition but did not cause any Ca21
changes itself (tested up to 1 h).
Because apyrase abolished the effect of ATP on [Ca21]i, itfollows that if Ca21 waves in HeLa control cells are medi-ated by ATP, apyrase should also abolish or attenuate theCa21 waves. In the presence of apyrase (40 IU/ml), mechan-ical stimulation of HeLa control cells induced Ca21 changesthat were limited to only the stimulated cell (n 5 5) (Figure5C). Propagated Ca21 changes were observed once, but inthis case two neighboring cells showed intracellular Ca21
changes only after a delay of at least 6 s. Normally, Ca21
waves would have propagated .50 mm in this time period.Analysis with digital high-speed microscopy revealed
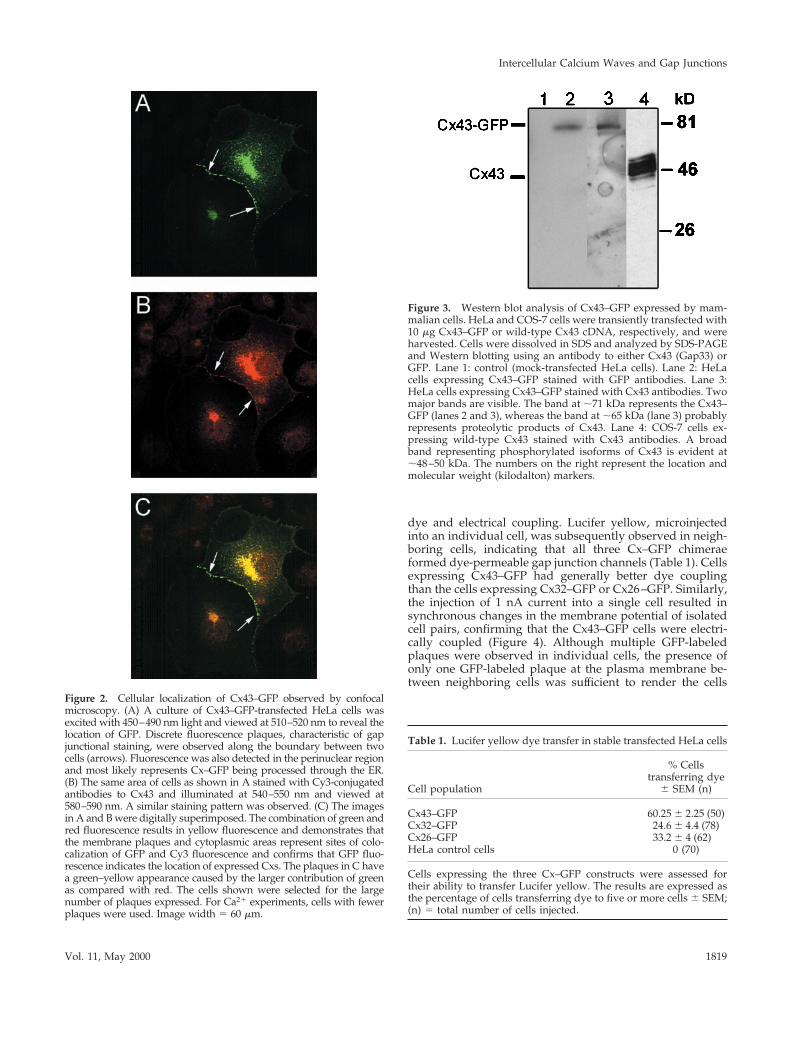
that, in the absence of apyrase, wave propagation after me-chanical stimulation in HeLa control cells initially beganwith perinuclear Ca21 changes, presumably Ca21 puffs(Thorn et al., 1993; Yao et al., 1995; Bootman and Berridge,1996), that were followed by a global [Ca21]i change, whichoften appeared as an intracellular Ca21 wave (Figure 8).Although the locations of the perinuclear Ca21 puffs did notcorrelate with a specific site associated with the nucleus,three-dimensional reconstructions of the ER-Tracker signalshowed that ER was invariably present in the perinucleararea (Figure 8). The number of Ca21 puffs preceding globalCa21 changes varied between one and four per experiment(n 5 16). The direction of the subsequent intracellular Ca21
wave appeared to be random and not correlated to theinterface with the neighboring stimulated cell. A similarhigh temporal analysis with digital high-speed microscopyof the [Ca21]i elevation after exposure to ATP also revealedCa21 puff-like events preceding a global [Ca21]i increase(Figure 6B). These puffs had a t1/2rise of 87.5 6 21 ms and at1/2decay of 204 6 50 ms (n 5 6), and their amplitude was;10% relative change in fluo-3 fluorescence.
Ca21 Waves in Cx–GFP-Transfected CellsIn contrast to the HeLa control cells, mechanical stimulationof a single transfected HeLa cell in a confluent culture in thepresence of 40 IU/ml apyrase did evoke propagated Ca21
changes (Figure 9). The numbers of cells participating in
Figure 4. Electrical coupling between isolated pairs of Cx43–GFP-transfected HeLa cells. The left image illustrates a pair of HeLa Cx43–GFPcells impaled with microelectrodes (M) with two gap junctional plaques (white structures or dots) that formed between these cells (whitearrows). The image was generated by digitally combining the phase-contrast image of the cells with the fluorescence image of the Cx43–GFP.Cell 1 (C1) was injected with 1 nA square current pulses of 200 ms duration at a frequency of 2Hz (I1). The resulting changes in membranepotential in cell 1 (V1) are synchronous with the changes in membrane potential (V2) of cell 2 (C2), indicating electrical coupling between bothcells. The coupling ratio (V2/V1) is ;5%.
K. Paemeleire et al.
Molecular Biology of the Cell1820

these waves were significantly smaller than in their coun-terparts in the absence of apyrase, and propagated Ca21
changes were only observed up to the third row of cells inHeLa Cx43 and up to the second row of cells in HeLa Cx32and Cx26 (n 5 5 for each). The average number of cellspropagating the Ca21 wave was 4.2 6 1.0 for HeLa Cx43,2.4 6 0.2 for HeLa Cx32, and 2.4 6 0.4 for HeLa Cx26.
To study the involvement of gap junctions in this type ofCa21 wave propagation in more detail, Ca21 waves inducedby mechanical stimulation were examined with digital high-speed microscopy. The localization of the Cx–GFP gap junc-tions, together with the ER (labeled with ER-Tracker), wasthree-dimensionally reconstructed from 51 consecutive Zplanes that were 0.25-mm apart and encompassed the entirecell thickness (Figure 10). The ER was abundant throughoutthese cells and invariably present close to the gap junctions(Figure 10). As a control for the ER-Tracker specificity, HeLacells were loaded with Mito-Tracker. Mitochondria were lessabundant in these cells, and their distribution differed sig-nificantly. Transfected HeLa cells were mechanically stimu-lated in the presence of 40 IU/ml apyrase, and the subse-quent Ca21 changes were recorded in neighboring cells, at amaximal rate of 100 images per second. Mechanical stimu-lation induced an intracellular Ca21 wave in the stimulatedcell, which spread throughout this cell until it reached theplasma membrane. Subsequent propagation of the Ca21
wave in the neighboring cell was clearly correlated with thelocation of the Cx–GFP (Figure 10). Delays observed at the
site of the gap junction were compared for the three differenttransfected cell lines and calculated from the difference intime to onset of Ca21 changes in 2.3 3 2.3 mm analysis pointslocated on either side of the gap junctions (Figure 11). Fre-quently the delay times could not be measured because theywere smaller than the time resolution of 10 ms, and thereforeaveraging the data was not possible. The range of delays atthe site of the gap junction was ,10 ms to 90 ms for HeLaCx26, ,10 ms to 156 ms for HeLa Cx32, and ,10 ms to 162ms for HeLa Cx43. The number of gap junctional plaquespresent at the interface between the two cells was on average2 6 0.2 (n 5 22) for Cx43 plaques, 2 6 0.2 (n 5 15) for Cx32plaques, and 2 6 0.4 (n 5 10) for Cx26 plaques.
DISCUSSION
The mechanism underlying the propagation of intercellularCa21 waves, which occur in various cell types and tissues(Cornell-Bell and Finkbeiner, 1991; Kasai, 1995; Robb-Gaspers and Thomas, 1995; Charles, 1998), has been pro-posed to occur either by the diffusion of a second messenger(e.g., IP3) through intercellular gap junctions (Sanderson etal., 1990; Boitano et al., 1992; Hansen et al., 1993; Venance etal., 1997; Leybaert et al., 1998a) or by a factor (e.g., ATP)released into the extracellular space (Hassinger et al., 1996;Cotrina et al., 1998; Guthrie et al., 1999); however, the resultsof this article demonstrate that in Cx–GFP-transfected HeLa
Figure 5. The effects of mechanical stimulation in HeLa control cells using digital video microscopy. The morphology of the cell culture isindicated by the fluorescence of cells loaded with fura-2 (left), and the changes in [Ca21]i are indicated by the pseudocolored images (right)(A) A single cell (p, white arrow) was gently stimulated with a glass micropipette. Although this stimulus produced Ca21 changes in thestimulated cell, it did not induce propagated Ca21 changes. (B) Stronger mechanical stimulation of another cell in a different area, inducedby distorting the cell to a great extent, initiated propagated Ca21 changes that took the form of a radiating Ca21 wave. (C) The propagatingCa21 changes induced by strong mechanical stimulation were abolished by the presence of 40 IU/ml apyrase in the extracellular solution.The time that each image was recorded after mechanical stimulation is shown in the lower right of each image. Changes of fura-2 fluorescencecorresponding to changes in [Ca21]i are represented according to a pseudocolor scale bar in arbitrary values.
Intercellular Calcium Waves and Gap Junctions
Vol. 11, May 2000 1821

cells, both mechanisms of Ca21 wave propagation, intercel-lular through gap junctions and extracellular, can coexist.
The use of HeLa cells, an epithelial cell line derived froman epidermoid carcinoma of the cervix, for the study of therelationship between Ca21 signaling and gap junctions hasseveral advantages. HeLa cells have been widely used in thestudy of Ca21 signaling mechanisms and have been found topossess competent Ca21 signaling machinery (Bootman etal., 1992). HeLa cells have several receptors that are linked tothe Ca21 signaling cascade, including the P2 receptor forphosphorylated nucleotides (e.g., ATP, UTP) and H2 forhistamine (Bootman et al., 1992). The purinoceptor is be-lieved to be P2U on the basis of the nucleotide sensitivity ofATP 5 UTP . ADP . 2MesATP (Smit et al., 1993). Activa-tion of both P2U and H2 results in the production of IP3,which in turn releases Ca21 from intracellular stores formedin the ER (Koch, 1990). The Golgi apparatus and mitochon-dria also serve as Ca21 stores and contribute to the localiza-
tion of Ca21 signals in discrete areas of the cytosol (Pinton etal., 1998; Rizzuto et al., 1998). The other advantages of usingHeLa cells is that these cells normally express very few, ifany, gap junctions and do not display cell coupling (Cao etal., 1998). In addition, this cell line readily tolerates transfec-tion with a wide variety of chimeric proteins (Schroder et al.,1990; Touitou et al., 1990; Graeber and Hulser, 1998). Con-sequently, these cells were ideal for transfection with plas-mids that encode for GFP linked to Cx43, Cx32, or Cx26 sothat specific gap junction proteins could be located in livingcells and correlated with Ca21 signals.
Mechanical stimulation has been shown to initiate Ca21
waves in a wide variety of cells (Goligorsky, 1988; Sander-son et al., 1990; Frame and de Feijter, 1997; Grandolfo et al.,1998; Himpens et al., 1999). The mechanism propagatingthese Ca21 waves appears to be the diffusion of IP3 throughgap junctions (Sanderson et al., 1990; Boitano et al., 1992;Hansen et al., 1993; Venance et al., 1997; Leybaert et al.,1998a). The involvement of gap junctions is supported byresults showing that C6 glioma cells gained the ability topropagate Ca21 waves after transfection with Cx43 (Charleset al., 1992). In addition, Ca21 wave propagation is notbiased by an extracellular fluid flow (Hansen et al., 1993) andcan be blocked by gap junction inhibitors in various cells(Enkvist and McCarthy, 1992; Venance et al., 1997); however,in other cell types, mechanical stimulation also appears toinitiate the release of ATP from cells, either physiologicallyor as a result of trauma. The diffusion and perhaps regen-erative release of ATP into the extracellular space then leads
Figure 6. Intracellular Ca21 changes of HeLa control cells in re-sponse to ATP. (A) The dose–response curve of the number of HeLacontrol cells showing an increase in [Ca21]i in response to a range ofATP concentrations. Each data point represents the mean (6SE) ofthree separate experiments and .200 cells. (B) The relative changesin [Ca21]i of a HeLa control cell represented by fluo-3 fluorescencein a 2.3 3 2.3 mm (7 3 7 pixels) perinuclear area with respect to timeduring exposure to 10 mM ATP, which was applied by solutionexchange. Before global [Ca21]i increases, a much smaller and tran-sient [Ca21]i change or Ca21 puff (black arrow) could be observedwith digital high-speed microscopy. The Ca21 puff represents a;10% change in fluo-3 fluorescence.
Figure 7. The effect of extracellular apyrase on changes of [Ca21]iof HeLa control cells in response to agonists. (A) In the absence ofapyrase, fura-2–loaded HeLa control cells respond to 50 mM ATP,added at t 5 0 and present throughout the experiment, with aninitial Ca21 increase followed by Ca21 oscillations. Time scale bar isindicated at the bottom of the figure. (B) In the presence of 40 IU/mlapyrase, the [Ca21]i increase in response to 50 mM ATP is com-pletely abolished. (C) In the absence of apyrase, HeLa control cellsalso respond to the continuous presence of 100 mM histamine withan initial [Ca21]i peak followed by oscillatory changes of [Ca21]i. (D)In the presence of 40 IU/ml apyrase, the [Ca21]i responses to 100mM histamine are unchanged. The changes in [Ca21]i are repre-sented in arbitrary values.
K. Paemeleire et al.
Molecular Biology of the Cell1822
to sequential changes in [Ca21]i in adjacent cells (Hassingeret al., 1996; Cotrina et al., 1998; Guthrie et al., 1999). Becausemost mammalian cells express gap junctions and may alsorelease ATP, it has been difficult to determine the predom-inant mechanism of Ca21 wave propagation.
Because control HeLa cells lack gap junctions, their abilityto communicate mechanically stimulated Ca21 waves wasmore easily assessed. After gentle stimulation, a Ca21 in-crease occurred only in the stimulated cell; however, heavierstimulation, which was likely to release intracellular ATP,resulted in [Ca21]i increases in adjacent cells. High timeresolution analysis of these Ca21 waves in HeLa control cellsrevealed that the changes in [Ca21]i frequently were initi-ated in the form of local Ca21 transients located in a perinu-clear position. These Ca21 events are most likely equivalentto Ca21 puffs, as described previously in response to hista-mine (Bootman and Berridge, 1996), because the stimulatingagonist is believed to be IP3. The Ca21 puffs rapidly grewand coalesced into an intracellular Ca21 wave that spreadout toward the cell periphery to bring about a global in-crease in [Ca21]i. The direction of travel of the intracellularwave was often back toward the stimulated cell. The ideathat the Ca21 waves, resulting from strong stimulation, aremediated by ATP diffusion is also supported by the findingthat HeLa control cells displayed Ca21 oscillations in re-sponse to ATP. The addition to the medium of apyrase, amixture of enzymes that degrades ATP to AMP, could abol-ish both the Ca21 oscillations and the Ca21 wave.
The ability to abolish Ca21 waves in nontransfected cellsprovided the experimental means to examine the propaga-
tion of Ca21 waves via gap junctions in HeLa cells trans-fected with Cx–GFP. The transfected cells appeared to havefunctional gap junctions as judged by their ability to dem-onstrate dye and electrical coupling. Digital high-speed mi-croscopy was used to analyze the three-dimensional distri-bution of the gap junctions and ER and the propagation ofCa21 changes between cells. High temporal (100 images persecond) and spatial resolution (333 3 333 3 250 nm pixelsize) reconstructions were obtained by using a short expo-sure time (possible only with a high-energy laser), a highnumerical aperture lens for maximal light collection, a high-speed, low-noise CCD (Rizzuto et al., 1998; Kidd et al., 1999;ZhuGe et al., 1999), and advanced deconvolution software(Carrington et al., 1995).
In the presence of apyrase, mechanically induced Ca21
waves propagated between cells only at points where aCx–GFP gap junction existed. The route of propagation wasoften circuitous, as described previously (Sanderson et al.,1990; Charles et al., 1992; Finkbeiner, 1992), and correlatedwith the presence of gap junctions. Although most cellsexpressed GFP-labeled gap junctions, cells only participatedin a Ca21 wave if the gap junctions faced the adjacent cellshowing the Ca21 increase. In the presence of apyrase, Ca21
puffs were not observed, a fact that fits well with the distallocation of the perinuclear ER from the gap junction and thatan extracellular factor is absent or inactive. The distance ofwave propagation in transfected cells also seemed to corre-late with the amount of Cx–GFP expression but did not seemto correlate with the type of Cx expressed. This suggests that
Figure 8. Digital high-speed microscopy of Ca21 waves mediated by an extracellular messenger in HeLa control cells. A and B show thereconstructed ER-Tracker signal (green) in 1-mm-thick slices through the (A) top of the cells and the (B) middle of the cell. The ER surroundsthe dark nucleus. No GFP-like fluorescence was detected in these untransfected cells. (C1–C6) A Ca21 wave was evoked, in the absence ofapyrase, by mechanically stimulating the cell (p) on the left (B). The propagation of [Ca21]i changes in the neighboring cell was initiated byan increase in [Ca21]i (white arrow) that was correlated to the supranuclear ER (A, arrow). These initial Ca21 changes were followed by anintracellular Ca21 wave that propagated toward the stimulated cell. Recording times after mechanical stimulation are indicated in the bottomright of each image. The white dotted line represents the cell boundary. Changes of fluo-3 fluorescence at 488 nm excitation, correspondingto changes in [Ca21]i, are represented in pseudocolor, according to a scale bar. The color scale was chosen to enhance the differentiation ofsmall Ca21 changes. The color scale numbers represent the minimal, saturating, and maximal percentage changes.
Intercellular Calcium Waves and Gap Junctions
Vol. 11, May 2000 1823

Cx43, Cx32, and Cx26 each has similar permeabilities for thediffusing messenger.
These studies in Cx-transfected HeLa cells do not provideadditional information on the identity of the internal mes-senger. Although IP3 has been shown to be a messenger inprevious studies (Sanderson et al., 1990; Leybaert et al.,1998a), the fact that no lag in the propagation of a wavebetween two cells at the mouth of the gap junction wasobserved raises the possibility of a rapid local communica-tion by Ca21 itself; however, the gap junctions were alwaysin close proximity to ER, and it is possible that the Ca21 wasreleased from this source through the action of IP3. It isunclear why substantially longer lag times are observed inother cell types (Sanderson et al., 1990; Robb-Gaspers andThomas, 1995). One explanation is that the spatial and tem-poral resolutions, as well as the sensitivity of earlier studies,were insufficient to detect the very early changes at themouth of the gap junction. An interesting approach forfuture experiments to determine whether Ca21 itself passesthrough gap junctions could be to use cells transfected withCx–aequorin chimeras, which have been shown to report[Ca21]i levels at the mouth of the gap junctions (George etal., 1998a).
Other studies investigating Ca21 wave propagation intransfected cells concluded that the forced expression of Cxresulted in the increased ability to release ATP and therebygenerate larger Ca21 waves (Cotrina et al., 1998). This hy-pothesis was based on the ability of cells to release ATP inresponse to a 30 min stimulation with UTP. How this stim-ulus correlates to a mechanical stimulus of 150 ms of a singlecell is very difficult to interpret. In this study, the presence ofextracellular apyrase counters the release of additional ATPby the cells. It is possible that the amount of ATP releasedwould overcome the effects of apyrase; however, the hall-mark of ATP-induced waves, i.e., Ca21 puffs and gap junc-tion-independent intercellular Ca21 waves, were not ob-served. The concentration of apyrase used was able toneutralize the effects of at least 50 mM ATP. Although theconcentration of released ATP at the stimulated cell may behigh, it would be rapidly diluted by the extracellular spaceand therefore would be unlikely to stimulate adjacent cells.
In summary, Cx–GFP-transfected HeLa cells have proved tobe ideal for the study of the mechanism underlying Ca21 wavepropagation. The ability to separate Ca21 changes induced byATP from Ca21 changes associated with gap junctions leads to
Figure 9 (cont). sition, the fluorescent GFP image was processed toset the pixel values to black if less than a selected threshold value.(B) An outline of the cell boundaries (gray lines) as well as thepositions of the Cx43–GFP plaques (red dots, arrows) were mappedfrom the phase-contrast and fluorescence images. (C and D) Digitalvideo microscopy of the sequential changes in [Ca21]i induced bymechanically stimulating a single Cx43–GFP HeLa cell (white ar-row). The time each image was recorded is indicated at the bottomright. The changes in [Ca21]i are mapped onto the cell outlines (theexpanding gray shaded zone) to correlate the propagation route ofthe intercellular Ca21 wave with the location of the Cx43–GFP.Close inspection reveals that a Ca21 wave only propagates at siteswhere two cells are coupled by a gap junction (red dots). Pseudo-color bar represents changes in [Ca21]i, as measured from thechanges in fura-2 fluorescence, in arbitrary values.
Figure 9. Digital video microscopy of a mechanically inducedintercellular Ca21 wave in HeLa cells expressing Cx43–GFP in thepresence of 40 IU/ml apyrase. (A) A phase-contrast image of Cx43–GFP HeLa cells superimposed with the corresponding fluorescentimage of Cx43–GFP showing plaques of GFP-labeled gap junctions(arrows, white patches) that formed between individual cells. Todiscard irrelevant background information and before superimpo-
K. Paemeleire et al.
Molecular Biology of the Cell1824
the conclusion that mechanically induced Ca21 waves can bepropagated simultaneously via an extracellular route or by anintracellular route via gap junctions.
ACKNOWLEDGMENTSWe acknowledge Lawrence Lifshitz (Biomedical Imaging Group,University of Massachusetts Medical School) for assistance in 4D
visualization and image analysis using his DAVE software. Thiswork was supported by National Institutes of Health grantHL49288 to M.J.S., a Medical Research Council program grant toW.H.E., and National Science Foundation grants DBI-9724611and DIR92000027 to R.T., W.C., and K.F. We thank the “DeVooght Foundation” (Belgium) for sponsoring K.P.’s stay at theUniversity of Massachusetts during which this work was com-pleted.
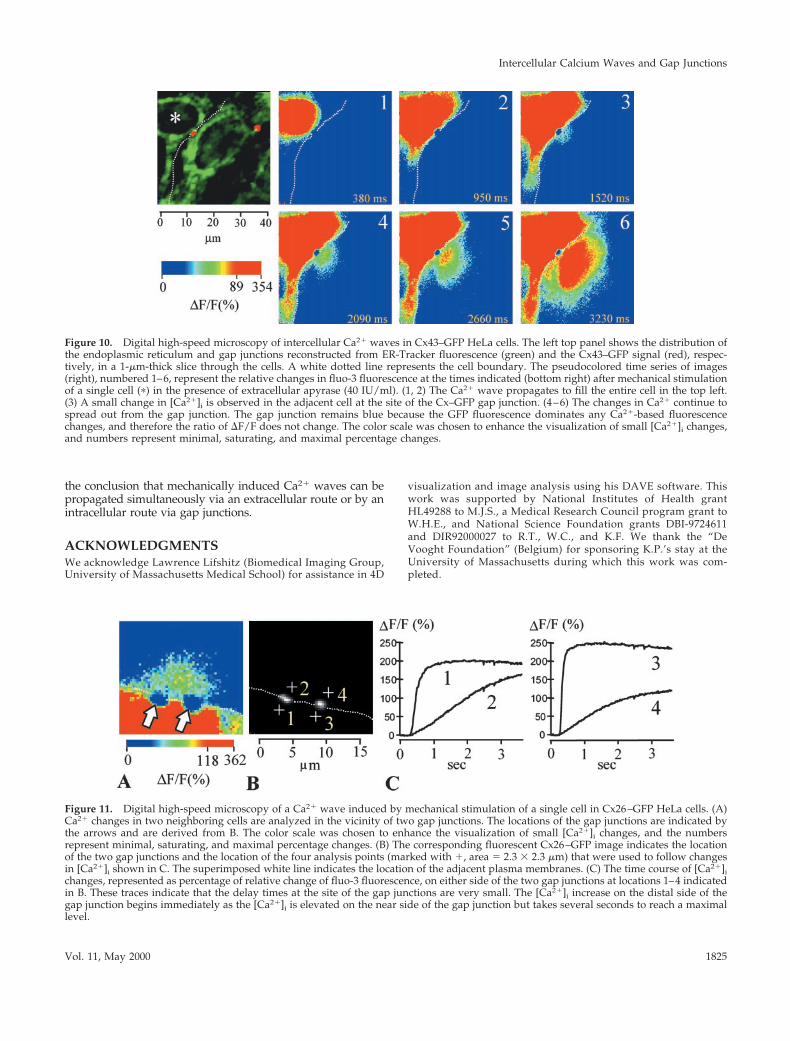
Figure 10. Digital high-speed microscopy of intercellular Ca21 waves in Cx43–GFP HeLa cells. The left top panel shows the distribution ofthe endoplasmic reticulum and gap junctions reconstructed from ER-Tracker fluorescence (green) and the Cx43–GFP signal (red), respec-tively, in a 1-mm-thick slice through the cells. A white dotted line represents the cell boundary. The pseudocolored time series of images(right), numbered 1–6, represent the relative changes in fluo-3 fluorescence at the times indicated (bottom right) after mechanical stimulationof a single cell (p) in the presence of extracellular apyrase (40 IU/ml). (1, 2) The Ca21 wave propagates to fill the entire cell in the top left.(3) A small change in [Ca21]i is observed in the adjacent cell at the site of the Cx–GFP gap junction. (4–6) The changes in Ca21 continue tospread out from the gap junction. The gap junction remains blue because the GFP fluorescence dominates any Ca21-based fluorescencechanges, and therefore the ratio of DF/F does not change. The color scale was chosen to enhance the visualization of small [Ca21]i changes,and numbers represent minimal, saturating, and maximal percentage changes.
Figure 11. Digital high-speed microscopy of a Ca21 wave induced by mechanical stimulation of a single cell in Cx26–GFP HeLa cells. (A)Ca21 changes in two neighboring cells are analyzed in the vicinity of two gap junctions. The locations of the gap junctions are indicated bythe arrows and are derived from B. The color scale was chosen to enhance the visualization of small [Ca21]i changes, and the numbersrepresent minimal, saturating, and maximal percentage changes. (B) The corresponding fluorescent Cx26–GFP image indicates the locationof the two gap junctions and the location of the four analysis points (marked with 1, area 5 2.3 3 2.3 mm) that were used to follow changesin [Ca21]i shown in C. The superimposed white line indicates the location of the adjacent plasma membranes. (C) The time course of [Ca21]ichanges, represented as percentage of relative change of fluo-3 fluorescence, on either side of the two gap junctions at locations 1–4 indicatedin B. These traces indicate that the delay times at the site of the gap junctions are very small. The [Ca21]i increase on the distal side of thegap junction begins immediately as the [Ca21]i is elevated on the near side of the gap junction but takes several seconds to reach a maximallevel.
Intercellular Calcium Waves and Gap Junctions
Vol. 11, May 2000 1825

REFERENCES
Boitano, S., Dirksen, E.R., and Evans W.H. (1998). Sequence-specificantibodies to connexins block intercellular calcium signalingthrough gap junctions. Cell Calcium 23, 1–9.
Boitano, S., Dirksen, E.R., and Sanderson, M.J. (1992). Intercellularpropagation of calcium waves mediated by inositol trisphosphate.Science 258, 292–295.
Bootman, M.D., and Berridge, M.J. (1996). Subcellular Ca21 signalsunderlying waves and graded responses in HeLa cells. Curr. Biol. 6,855–865.
Bootman, M.D., Berridge, M.J., and Taylor, C.W. (1992). All-or-nothing Ca21 mobilization from the intracellular stores of singlehistamine-stimulated HeLa cells. J. Physiol. (Lond.) 450, 163–178.
Cao, F., Eckert, R., Elfgang, C., Nitsche, J.M., Snyder, S.A., H-ulser,D.F., Willecke, K., and Nicholson, B.J. (1998). A quantitative analysisof connexin-specific permeability differences of gap junctions ex-pressed in HeLa transfectants and Xenopus oocytes. J. Cell Sci. 111,31–43.
Carrington, W.A., Lynch, R.M., Moore, E.D., Isenberg, G., Fogarty,K.E., and Fay, F.S. (1995). Superresolution three-dimensional imagesof fluorescence in cells with minimal light exposure. Science 268,1483–1487.
Charles, A. (1998). Intercellular calcium waves in glia. Glia 24,39–49.
Charles, A.C., Merrill, J.E., Dirksen, E.R., and Sanderson, M.J. (1991).Intercellular signaling in glial cells: calcium waves and oscillationsin response to mechanical stimulation and glutamate. Neuron 6,983–992.
Charles, A.C., Naus, C.C., Zhu, D., Kidder, G.M., Dirksen, E.R., andSanderson, M.J. (1992). Intercellular calcium signaling via gap junc-tions in glioma cells. J. Cell Biol. 118, 195–201.
Churchill, G.C., Atkinson, M.M., and Louis, C.F. (1996). Mechanicalstimulation initiates cell-to-cell calcium signaling in ovine lens epi-thelial cells. J. Cell Sci. 109, 355–365.
Cornell-Bell, A.H., and Finkbeiner, S.M. (1991). Ca21 waves in as-trocytes. Cell Calcium 12, 185–204.
Cotrina, M.L., Lin, J.H., Alves-Rodrigues, A., Liu, S., Li, J., Azmi-Ghadimi, H., Kang, J., Naus, C.C., and Nedergaard, M. (1998).Connexins regulate calcium signaling by controlling ATP release.Proc. Natl. Acad. Sci. USA 95, 15735–15740.
Diez, J.A., Ahmad, S., and Evans, W.H. (1999). Assembly of hetero-meric connexons in guinea-pig liver en route to the golgi apparatus,plasma membrane and gap junctions. Eur. J. Biochem. 262, 142–148.
Enkvist, M.O., and McCarthy, K.D. (1992). Activation of proteinkinase C blocks astroglial gap junction communication and inhibitsthe spread of calcium waves. J. Neurochem. 59, 519–526.
Finkbeiner, S. (1992). Calcium waves in astrocytes: filling in thegaps. Neuron 8, 1101–1108.
Frame, M.K., and de Feijter, A.W. (1997). Propagation of mechani-cally induced intercellular calcium waves via gap junctions andATP receptors in rat liver epithelial cells. Exp. Cell Res. 230, 197–207.
Furuya, K., Enomoto, K., Maeno, T., and Yamagishi, S. (1993).Mechanically induced calcium signal in mammary epithelial cells.Jpn. J. Physiol. 43(Suppl 1), S105–108.
George, C.H., Kendall, J.M., Campbell, A.K., and Evans, W.H.(1998a). Connexin-aequorin chimerae report cytoplasmic calciumenvironments along trafficking pathways leading to gap junctionbiogenesis in living COS-7 cells. J. Biol. Chem. 273, 29822–29829.
George, C.H., Martin, P.E., and Evans, W.H. (1998b). Rapid deter-mination of gap junction formation using HeLa cells microinjected
with cDNAs encoding wild-type and chimeric connexins. Biochem.Biophys. Res. Commun. 247, 785–789.
Goligorsky, M.S. (1988). Mechanical stimulation induces Ca21i tran-
sients and membrane depolarization in cultured endothelial cells.Effects on Ca21
i in co-perfused smooth muscle cells. FEBS Lett. 240,59–64.
Graeber, S.H., and Hulser, D.F. (1998). Connexin transfection in-duces invasive properties in HeLa cells. Exp. Cell Res. 243, 142–149.
Grandolfo, M., Calabrese, A., and D’Andrea, P. (1998). Mechanismof mechanically induced intercellular calcium waves in rabbit artic-ular chondrocytes and in HIG-82 synovial cells. J. Bone Miner. Res.13, 443–453.
Grynkiewicz, G., Poenie, M., and Tsien, R.Y. (1985). A new gener-ation of Ca21 indicators with greatly improved fluorescence prop-erties. J. Biol. Chem. 260, 3440–3450.
Guthrie, P.B., Knappenberger, J., Segal, M., Bennett, M.V.L.,Charles, A.C., and Kater, S.B. (1999). ATP released from astrocytesmediates glial calcium waves. J. Neurosci. 19, 520–528.
Hansen, M., Boitano, S., Dirksen, E.R., and Sanderson, M.J. (1993).Intercellular calcium signaling induced by extracellular adenosine59-triphosphate and mechanical stimulation in airway epithelialcells. J. Cell Sci. 106, 995–1004.
Hassinger, T.D., Guthrie, P.B., Atkinson, P.B., Bennett, M.V., andKater, S.B. (1996). An extracellular signaling component in propa-gation of astrocytic calcium waves. Proc. Natl. Acad. Sci. USA 93,13268–13273.
Himpens, B., Stalmans, P., Gomez, P., Malfait, M., and Vereecke, J.(1999). Intra- and intercellular Ca21 signaling in retinal pigmentepithelial cells during mechanical stimulation. FASEB J. 13, S63–68.
Jordan, K., Solan, J.L., Dominguez, M., Sia, M., Hand, A., Lampe,P.D., and Laird, D.W. (1999). Trafficking, assembly, and function ofa connexin43-green fluorescent protein chimera in live mammaliancells. Mol. Biol. Cell 10, 2033–2050.
Kasai, H. (1995). Pancreatic calcium waves and secretion. CibaFound. Symp. 188, 104–116.
Kidd, J.F., Fogarty, K.E., Tuft, R.A., and Thorn, P. (1999). The role ofCa21 feedback in shaping InsP3-evoked Ca21 signals in mousepancreatic acinar cells. J. Physiol. (Lond.) 520, 187–201.
Koch, G.L. (1990). The endoplasmic reticulum and calcium storage.BioEssays 12, 527–531.
Kumar, N.M., and Gilula, N.B. (1992). Molecular biology and ge-netics of gap junction channels. Semin. Cell Biol. 3, 3–16.
Lansley, A.B., and Sanderson, M.J. (1999). Regulation of airwayciliary activity by Ca21: simultaneous measurement of beat fre-quency and intracellular Ca21. Biophys. J. 77, 629–638.
Leybaert, L., Paemeleire, K., Strahonja, A., and Sanderson, M.J.(1998a). Inositol-trisphosphate-dependent intercellular calcium sig-naling in and between astrocytes and endothelial cells. Glia 24,398–407.
Leybaert, L., Sneyd, J., and Sanderson, M.J. (1998b). A simplemethod for high temporal resolution calcium imaging with dualexcitation dyes. Biophys. J. 75, 2025–2029.
Martin, P.E., George, C.H., Castro, C., Kendall, J.M., Capel, J.,Campbell,, A.K., Revilla, A., Barrio, L.C., and Evans, W.H. (1998).Assembly of chimeric connexin-aequorin proteins into functionalgap junction channels. Reporting intracellular and plasma mem-brane calcium environments. J. Biol. Chem. 273, 1719–1726.
Osipchuk, Y., and Cahalan, M. (1992). Cell-to-cell spread of calciumsignals mediated by ATP receptors in mast cells. Nature 359, 241–244.
K. Paemeleire et al.
Molecular Biology of the Cell1826

Perez-Terzic, C., Stehno-Bittel, L., and Clapham, D.E. (1997). Nucle-oplasmic and cytoplasmic differences in the fluorescence propertiesof the calcium indicator Fluo-3. Cell Calcium 21, 275–282.
Pinton, P., Pozzan, T., and Rizzuto, R. (1998). The Golgi apparatus isan inositol 1,4,5-trisphosphate-sensitive Ca21 store, with functionalproperties distinct from those of the endoplasmic reticulum. EMBOJ. 17, 5298–5308.
Rizzuto, R., Pinton, P., Carrington, W., Fay, F.S., Fogarty, K.E.,Lifshitz, L.M., Tuft, R.A., and Pozzan, T. (1998). Close contacts withthe endoplasmic reticulum as determinants of mitochondrial Ca21
responses. Science 280, 1763–1766.
Robb-Gaspers, L.D., and Thomas, A.P. (1995). Coordination of Ca21
signaling by intercellular propagation of Ca21 waves in the intactliver. J. Biol. Chem. 270, 8102–8107.
Sambrook, J., Fritsch, E.F., and Maniatis, T. (1989). Molecular clon-ing: a laboratory manual. Cold Spring Harbor, NY: Cold SpringHarbor Laboratory.
Sanderson, M.J. (1995). Intercellular calcium waves mediated byinositol trisphosphate. Ciba Found. Symp. 188, 175–189.
Sanderson, M.J., Charles, A.C., Boitano, S., and Dirksen, E.R. (1994).Mechanisms and function of intercellular calcium signaling. Mol.Cell. Endocrinol. 98, 173–187.
Sanderson, M.J., Charles, A.C., and Dirksen, E.R. (1990). Mechanicalstimulation and intercellular communication increases intracellularCa21 in epithelial cells. Cell Regul. 1, 585–596.
Schroder, H.C., Ugarkovic, D., Merz, H., Kuchino, Y., Okamoto, T.,and Muller, W.E. (1990). Protection of HeLa-T41 cells against hu-man immunodeficiency virus (HIV) infection after stable transfec-tion with HIV LTR-29,59-oligoadenylate synthetase hybrid gene.FASEB J. 4, 3124–3130.
Simon, A.M. (1999). Gap junctions: more roles and new structuraldata. Trends Cell Biol. 9, 169–170.
Simon, A.M., and Goodenough, D.A. (1998). Diverse functions ofvertebrate gap junctions. Trends Cell Biol. 8, 477–483.
Smit, M.J., Leurs, R., Bloemers, S.M., Tertoolen, L.G., Bast, A., DeLaat, S.W., and Timmerman, H. (1993). Extracellular ATP elevates
cytoplasmatic free Ca21 in HeLa cells by the interaction with a59-nucleotide receptor. Eur. J. Pharmacol. 247, 223–226.
Thorn, P., Lawrie, A.M., Smith, P.M., Gallacher, D.V., and Petersen,O.H. (1993). Local and global cytosolic Ca21 oscillations in exocrinecells evoked by agonists and inositol trisphosphate. Cell 74, 661–668.
Touitou, I., Mathieu, M., and Rochefort, H. (1990). Stable transfec-tion of the estrogen receptor cDNA into HeLa cells induces estrogenresponsiveness of endogenous cathepsin D gene but not of cellgrowth. Biochem. Biophys. Res. Commun. 169, 109–115.
Toyofuku, T., Yabuki, M., Otsu, K., Kuzuya, T., Hori, M., and Tada,M. (1998). Intercellular calcium signaling via gap junction in con-nexin-43- transfected cells. J. Biol Chem. 273, 1519–1528 (erratum273, 22856).
Venance, L., Stella, N., Glowinski, J., and Giaume, C. (1997). Mech-anism involved in initiation and propagation of receptor-inducedintercellular calcium signaling in cultured rat astrocytes. J. Neuro-sci. 17, 1981–1992.
Wilkinson, G.W., and Akrigg, A. (1992). Constitutive and enhancedexpression from the CMV major IE promoter in a defective adeno-virus vector. Nucleic Acids Res. 20, 2233–2239.
Yao, Y., Choi, J., and Parker, I. (1995). Quantal puffs of intracellularCa21 evoked by inositol trisphosphate in Xenopus oocytes.J. Physiol. (Lond.) 482:533–553.
Yeager, M., Unger, V.M., and Falk, M.M. (1998). Synthesis, assemblyand structure of gap junction intercellular channels. Curr. Opin.Struct. Biol. 8:517–524.
ZhuGe, R., Tuft, R.A., Fogarty, K.E., Bellve, K., Fay, F.S., and Walsh,J.V., Jr. (1999). The influence of sarcoplasmic reticulum Ca21 con-centration on Ca21 sparks and spontaneous transient outward cur-rents in single smooth muscle cells. J. Gen. Physiol. 113, 215–228.
Zimmermann, B., and Walz, B. (1999). The mechanism mediatingregenerative intercellular Ca21 waves in the blowfly salivary gland.EMBO J. 18, 3222–3231.
Intercellular Calcium Waves and Gap Junctions
Vol. 11, May 2000 1827