intelligent thermographic diagnostic applied to surge arresters: a new approach
TRANSCRIPT
IEEE TRANSACTIONS ON POWER DELIVERY, VOL. 24, NO. 2, APRIL 2009 751
Intelligent Thermographic Diagnostic Applied toSurge Arresters: A New Approach
Carlos A. Laurentys Almeida, Antônio P. Braga, Sinval Nascimento, Vinicius Paiva, Hélvio J. A. Martins,Rodolfo Torres, and Walmir M. Caminhas
Abstract—This paper describes a methodology that aims to ex-tract information to enable the detection and diagnosis of faults insurge arresters, using the thermovision technique. Thermovisionis a non-destructive technique used in diverse services of mainte-nance, having the advantage not to demand the disconnection ofthe equipment. The methodology uses a digital image processingalgorithm based on the Watershed Transform to get the segmenta-tion of the surge arresters. By applying the methodology is possibleto classify surge arresters operative condition in: faulty, normal,light, and suspicious. The computational system generated trainits neuro-fuzzy network by using a historical thermovision data.During the train phase, a heuristic is proposed in order to set thenumber of networks in the diagnosis system. This system was val-idated by a database with a hundreds of different faulty sceneries.The validation error of the set of neuro-fuzzy and the automaticdigital thermovision image processing was about 10%t. The diag-nosis system described has been successfully used by Electric En-ergy Research Center as a decision making tool for surge arrestersfault diagnosis.
Index Terms—Digital image processing, fault detection, neuro-fuzzy networks.
I. INTRODUCTION
B RAZIL is at present the country with the largest inci-dence of atmospheric lightning strokes per square kilo-
meter (sq/km) in the world. INPE and NASA studies between1996 and 2000 show that annual Brazilian average lays around70 million strokes [1].
Electric discharges cause big disturbances to energy trans-mission and distribution lines, industries and telecommunica-tion, and private properties. These effects are due to the highcurrent and voltage of strokes, which generate heat as well asother damaging effects. The extension of damages caused bythis phenomenon is well known both in relation with lost humanlives as well as with material damages caused to energy utili-ties, consumers and industries. According to INPE AtmosphericElectricity Group, lightning strokes cause an annual loss thatamounts to US$ 67 million including losses due to fires, inter-ruption of energy supply, and electric network oscillation.
Manuscript received January 29, 2008; revised May 04, 2008. Current versionpublished March 25, 2009. Paper no. TPWRD-00058-2008.
C. A. Laurentys Almeida, A. P. Braga, S. Nascimento, V. Paiva and W. M.Caminhas are with the Federal University of Minas Gerais (UFMG), MG, Brazil(e-mail: [email protected]).
H. J. A. Martins and R. Torres are with the Electric Energy Research Center,Ilha do Fundao, RJ, Brazil.
Color versions of one or more of the figures in this paper are available onlineat http://ieeexplore.ieee.org.
Digital Object Identifier 10.1109/TPWRD.2009.2013375
Such effects can be avoided when an efficient system is ap-plied, such as surge arresters, whose operational condition canguarantee equipment protective characteristics. Surge arrestersprotect equipment against impacts due to strokes and guaranteereliability, economy, and continuity of power systems operation.
Protection system control is needed to check if the system op-eration shows any kind of anomaly. This control is performedby measurement and assessment of variables such as leakagecurrent, radio interference and other variables that may give in-dication about surge arresters operational condition.
This article uses thermographic information to achieve surgearresters faults diagnosis. A computational system, based onneuro-fuzzy networks has been developed. This system aims atgeneration of operational condition diagnosis of the surge ar-rester, by applying the methodology described as follows.
Therefore the main contribution is a decision making tool thatis based on computational intelligence techniques and digitalimage processing. This tool is able to generate a four conditiondiagnosis based on thermographic information.
II. METHODOLOGY
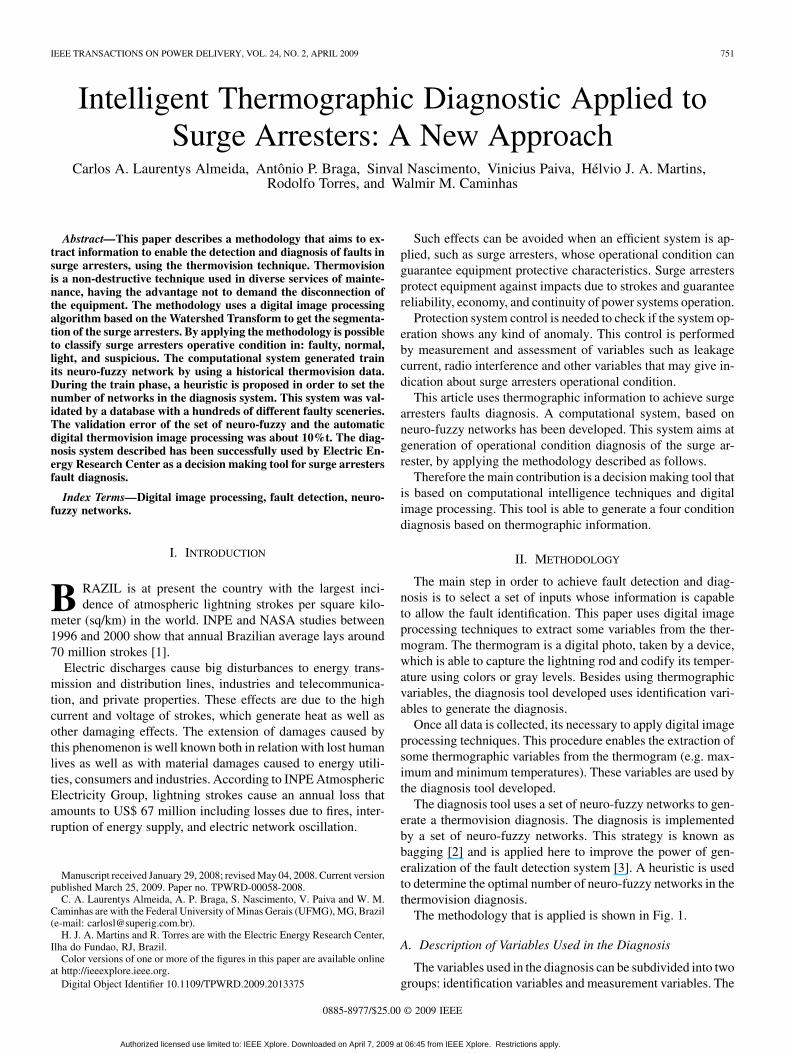
The main step in order to achieve fault detection and diag-nosis is to select a set of inputs whose information is capableto allow the fault identification. This paper uses digital imageprocessing techniques to extract some variables from the ther-mogram. The thermogram is a digital photo, taken by a device,which is able to capture the lightning rod and codify its temper-ature using colors or gray levels. Besides using thermographicvariables, the diagnosis tool developed uses identification vari-ables to generate the diagnosis.
Once all data is collected, its necessary to apply digital imageprocessing techniques. This procedure enables the extraction ofsome thermographic variables from the thermogram (e.g. max-imum and minimum temperatures). These variables are used bythe diagnosis tool developed.
The diagnosis tool uses a set of neuro-fuzzy networks to gen-erate a thermovision diagnosis. The diagnosis is implementedby a set of neuro-fuzzy networks. This strategy is known asbagging [2] and is applied here to improve the power of gen-eralization of the fault detection system [3]. A heuristic is usedto determine the optimal number of neuro-fuzzy networks in thethermovision diagnosis.
The methodology that is applied is shown in Fig. 1.
A. Description of Variables Used in the Diagnosis
The variables used in the diagnosis can be subdivided into twogroups: identification variables and measurement variables. The
0885-8977/$25.00 © 2009 IEEE
Authorized licensed use limited to: IEEE Xplore. Downloaded on April 7, 2009 at 06:45 from IEEE Xplore. Restrictions apply.
752 IEEE TRANSACTIONS ON POWER DELIVERY, VOL. 24, NO. 2, APRIL 2009
Fig. 1. Applied methodology.
TABLE IFOUR LEVELS DEFINED FOR POLLUTION INDEX AS A VARIABLE
(SOURCE: INTERNATIONAL ELECTROTECHNICAL COMMISSION IECREPORT—PUBLICATION 815—FIRST EDITION—1986)
identification variables (surge arresters rated voltage, manufac-turer, pollution level, etc.) refer to specific characteristics of thesurge arresters or of the substation they are installed; the mea-surement variables (emissivity, ambient temperature, humidity,etc.) are related to the diagnosis techniques.
This work applies the thermovision diagnosis in order toachieve surge arresters fault diagnosis. This technique uses bothtype of variables presented. Such technique and their respectivevariables are detailed as follows.
1) Surge Arresters Identification Variables: Surge arrestersidentification variables act as separators and represent specificcharacteristics of the surge arresters or the substation they are.In this system a group of four identification variables was usedas input to the neuro-fuzzy network. This group comprehendsthe following variables.
• Material: can be SiC (porcelain) or ZnO without sparkgaps (porcelain or polymeric).
• Surge arresters Rated Voltage.• Manufacturer: refers to the company that designed and
manufactured the surge arresters.• Pollution Index: This variable characterizes the substation
and is obtained by measurement of pollution particles inthe air. Table I presents four pollution levels defined. Thisvariable is important to enable an efficient analysis andtreatment of a thermogram. In some cases, the thermogramcan change its main characteristics (maximum tempera-ture) under high pollution levels.
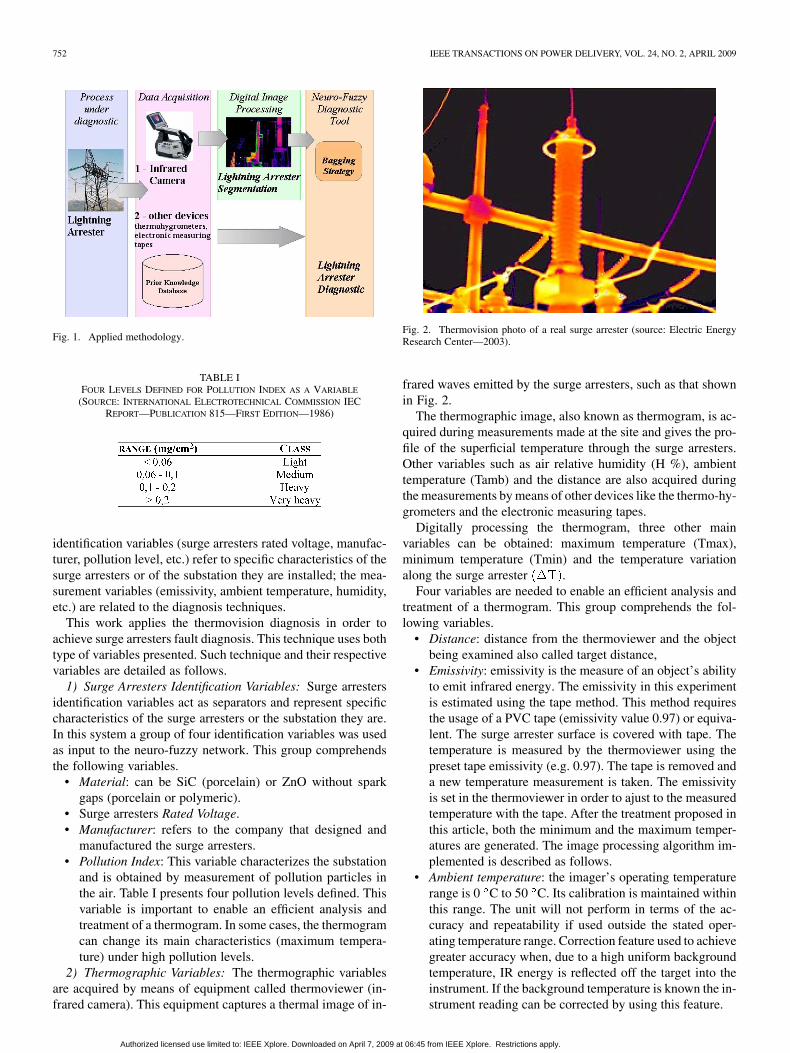
2) Thermographic Variables: The thermographic variablesare acquired by means of equipment called thermoviewer (in-frared camera). This equipment captures a thermal image of in-
Fig. 2. Thermovision photo of a real surge arrester (source: Electric EnergyResearch Center—2003).
frared waves emitted by the surge arresters, such as that shownin Fig. 2.
The thermographic image, also known as thermogram, is ac-quired during measurements made at the site and gives the pro-file of the superficial temperature through the surge arresters.Other variables such as air relative humidity (H %), ambienttemperature (Tamb) and the distance are also acquired duringthe measurements by means of other devices like the thermo-hy-grometers and the electronic measuring tapes.
Digitally processing the thermogram, three other mainvariables can be obtained: maximum temperature (Tmax),minimum temperature (Tmin) and the temperature variationalong the surge arrester .
Four variables are needed to enable an efficient analysis andtreatment of a thermogram. This group comprehends the fol-lowing variables.
• Distance: distance from the thermoviewer and the objectbeing examined also called target distance,
• Emissivity: emissivity is the measure of an object’s abilityto emit infrared energy. The emissivity in this experimentis estimated using the tape method. This method requiresthe usage of a PVC tape (emissivity value 0.97) or equiva-lent. The surge arrester surface is covered with tape. Thetemperature is measured by the thermoviewer using thepreset tape emissivity (e.g. 0.97). The tape is removed anda new temperature measurement is taken. The emissivityis set in the thermoviewer in order to ajust to the measuredtemperature with the tape. After the treatment proposed inthis article, both the minimum and the maximum temper-atures are generated. The image processing algorithm im-plemented is described as follows.
• Ambient temperature: the imager’s operating temperaturerange is 0 C to 50 C. Its calibration is maintained withinthis range. The unit will not perform in terms of the ac-curacy and repeatability if used outside the stated oper-ating temperature range. Correction feature used to achievegreater accuracy when, due to a high uniform backgroundtemperature, IR energy is reflected off the target into theinstrument. If the background temperature is known the in-strument reading can be corrected by using this feature.
Authorized licensed use limited to: IEEE Xplore. Downloaded on April 7, 2009 at 06:45 from IEEE Xplore. Restrictions apply.

LAURENTYS ALMEIDA et al.: INTELLIGENT THERMOGRAPHIC DIAGNOSTIC APPLIED TO SURGE ARRESTERS: A NEW APPROACH 753
Fig. 3. Infrared camera specification (source: FLIR Systems—2004).
Fig. 4. Original (left) and gray-level images (right).
• Relative humidity: is defined as the ratio, expressed as apercent, of the amount of water vapor actually present in asample of air to the greatest amount of water vapor possibleat the same temperature.
B. Digital Thermogram Processing
The image processing techniques have been widely used tosolve problems in process of all areas [4], [5]. In this article, thethermogram image processing is applied to segment the surgearrester’s body from the image. In other words, the purpose isto extract the lightning arrest from the scene. With the separationand the coordinates of the lightning arrest its possible to obtainthe maximum and minimum temperature and its localization,which are needed to achieve the diagnosis.
Digital image processing consists of a set of techniques usedto make transformations in one or more images with the objec-tive to enhance the visual information or scenes analysis to getan automatic perception or recognition from machines [6].
The Digital Image Processing may be divided in the followingsteps:
• image acquisition;• pre-processing;• segmentation.1) Image Acquisition: This article uses special infrared cam-
eras, known as thermoviewers, to allow image acquisition. Anexample of a thermoviewer is shown in Fig. 3.
2) Pre-Processing: The pre-processing consists of the imagetransformation obtained by the thermoviewer at a gray levelimage, which allows the utilization of the traditional segmen-tation techniques as depicted by Fig. 4.
3) Segmentation: Segmentation is the most complex step ofimage processing system based and it can be made by manyways, depending on the problem characteristic and the purposesto be reached. The segmentation objective is the image divisionits set of parts and objects [4], [5].
Fig. 5. (a) Gray level image with two different sources of water, catchmentsbasins, meet each other and generate a watershed line and (b) its representationas a surface.
Its necessary to use the whole information available relatedto the problem in order to have a successful segmentation. If theobjective is the segmentation of a specific object, its most meantcharacteristics, which distinguishes it among others in the scene,are the key to have a good result.
Important information at the surge arrester image is its posi-tion, which is always at the center of the picture. Its evident thatthe person, who acquires the image, fits the image center withthe surge arrester center to identify it after the acquisition.
The most common tools used at the segmentation are: Pointor Line detection, Edge detection, Gradient operators, Lapla-cian, Hough Transformation, Simple or Adaptive Threshold,Region Growing and Watershed Transformation [7]–[10]. Thispaper uses Watershed Transformation to achieve the segmenta-tion. This technique is described below.
1) Watershed transformation: The Watershed Transforma-tion algorithm, that will be explained as follows, is an extremelynoise and non uniform illumination robust procedure. It is usedto segment the surge arrester from the thermogram.
The Watershed Transformation is a relatively new techniqueand so powerful to segment touching objects, like ore grains andblood blobs. It proposes an abstraction of the image as a kind oftopographic surface, where the gray level represents its height.It simulates the flooding of this surface, initializing from theminima points. The water level (gray level) goes being increaseduntil the whole image is completely flooded.
Independent water sources, coming from different minimaare distinct labeled and as the water rises the trend is that twoor more labeled regions being grown touch each other, so anwatershed is build to keep them not touching. At the end, thesewatersheds are the boundaries between the objects, as shown inFig. 5.
The disadvantages of this algorithm are that the initial markshave to be well estimated besides the relative long time took
Authorized licensed use limited to: IEEE Xplore. Downloaded on April 7, 2009 at 06:45 from IEEE Xplore. Restrictions apply.
754 IEEE TRANSACTIONS ON POWER DELIVERY, VOL. 24, NO. 2, APRIL 2009
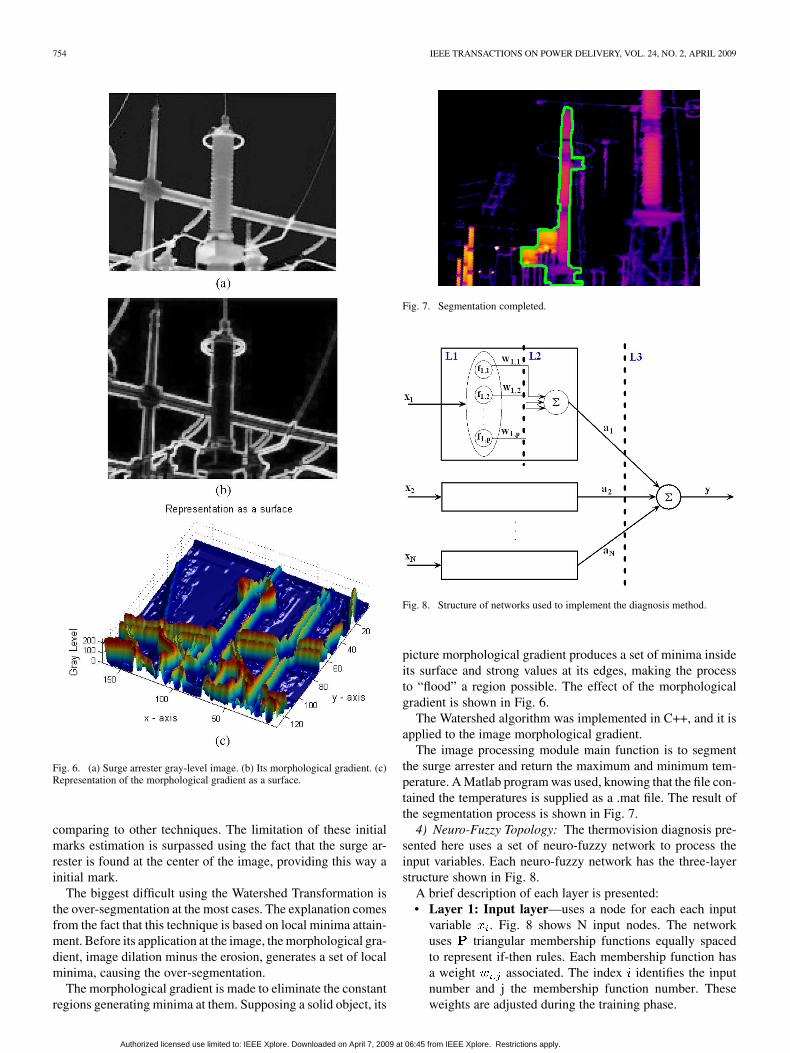
Fig. 6. (a) Surge arrester gray-level image. (b) Its morphological gradient. (c)Representation of the morphological gradient as a surface.
comparing to other techniques. The limitation of these initialmarks estimation is surpassed using the fact that the surge ar-rester is found at the center of the image, providing this way ainitial mark.
The biggest difficult using the Watershed Transformation isthe over-segmentation at the most cases. The explanation comesfrom the fact that this technique is based on local minima attain-ment. Before its application at the image, the morphological gra-dient, image dilation minus the erosion, generates a set of localminima, causing the over-segmentation.
The morphological gradient is made to eliminate the constantregions generating minima at them. Supposing a solid object, its
Fig. 7. Segmentation completed.
Fig. 8. Structure of networks used to implement the diagnosis method.
picture morphological gradient produces a set of minima insideits surface and strong values at its edges, making the processto “flood” a region possible. The effect of the morphologicalgradient is shown in Fig. 6.
The Watershed algorithm was implemented in C++, and it isapplied to the image morphological gradient.
The image processing module main function is to segmentthe surge arrester and return the maximum and minimum tem-perature. A Matlab program was used, knowing that the file con-tained the temperatures is supplied as a .mat file. The result ofthe segmentation process is shown in Fig. 7.
4) Neuro-Fuzzy Topology: The thermovision diagnosis pre-sented here uses a set of neuro-fuzzy network to process theinput variables. Each neuro-fuzzy network has the three-layerstructure shown in Fig. 8.
A brief description of each layer is presented:• Layer 1: Input layer—uses a node for each each input
variable . Fig. 8 shows N input nodes. The networkuses triangular membership functions equally spacedto represent if-then rules. Each membership function hasa weight associated. The index identifies the inputnumber and j the membership function number. Theseweights are adjusted during the training phase.
Authorized licensed use limited to: IEEE Xplore. Downloaded on April 7, 2009 at 06:45 from IEEE Xplore. Restrictions apply.

LAURENTYS ALMEIDA et al.: INTELLIGENT THERMOGRAPHIC DIAGNOSTIC APPLIED TO SURGE ARRESTERS: A NEW APPROACH 755
Fig. 9. Bagging topology.
• Layer 2: Aggregation layer aggregation—this layer ag-gregates all the actived rules by adding using the Max-Mininference system:
• Layer 3: Output layer—only one node whose value indi-cate the operational condition. The diagnosis qualifies thesurge arrester in accordance with its operational condition,and can be assigned the following value.:— Surge arrester in normal condition (NORMAL).— Surge arrester in leaving normal condition condition
(LIGHT).— Surge arrester in suspicious condition (SUSPICIOUS).— Surge arrester in faulty condition (FAULTY).
The four types condition diagnosis was defined based in thediagnosis provided by CEPEL. This diagnosis was executed bya specialist from CEPEL. The normal and faulty conditions aredefined by parameters that show that the surge arrester is ok orfaulty. A condition defined between these two main boundariesmay define the surge arrester in a light or suspicious condition.The light condition means that the surge arrester deserves spe-cialist attention because it might be leaving normal condition.The suspicious condition means that the surge arrester needscaution because it might be turning into a faulty condition.
5) Bagging Topology: The diagnosis tool uses a set of neuro-fuzzy networks to generate a thermovision diagnosis. The diag-nosis is implemented by a set of neuro-fuzzy networks havingthe structure detailed in 2.3.1. The diagnosis is obtained by themajority voting of all neuro-fuzzy networks that implement thediagnosis, as clearly shown by the topology in Fig. 9.
If parity occurs, the worst diagnosis is selected. This strategyis known as bagging [2] and is applied here to improve the powerof generalization of the fault detection system [3].
A heuristic is used to determine the optimal number of neuro-fuzzy networks in the thermovision diagnosis. The heuristic de-veloped is shown in Fig. 10.
6) Neuro-Fuzzy Input/Output: Fig. 11 shows the neuro-fuzzyinputs and outputs used by the proposed methodology.
Fig. 10. Heuristic applied.
Fig. 11. Neuro-fuzzy input/output diagram.
III. RESULTS
The fault detection system topology was implemented inC++, accessing a MySql database.
The database used to implement the topology of the fault de-tector was formed by 764 measurements obtained in substationswhich belonged to eight different clients of Electric Energy Re-search Center: ABB, Alstom, Asea, Hitachi, McGraw, Sorester,Sprecher, and Westinghouse.
Authorized licensed use limited to: IEEE Xplore. Downloaded on April 7, 2009 at 06:45 from IEEE Xplore. Restrictions apply.
756 IEEE TRANSACTIONS ON POWER DELIVERY, VOL. 24, NO. 2, APRIL 2009
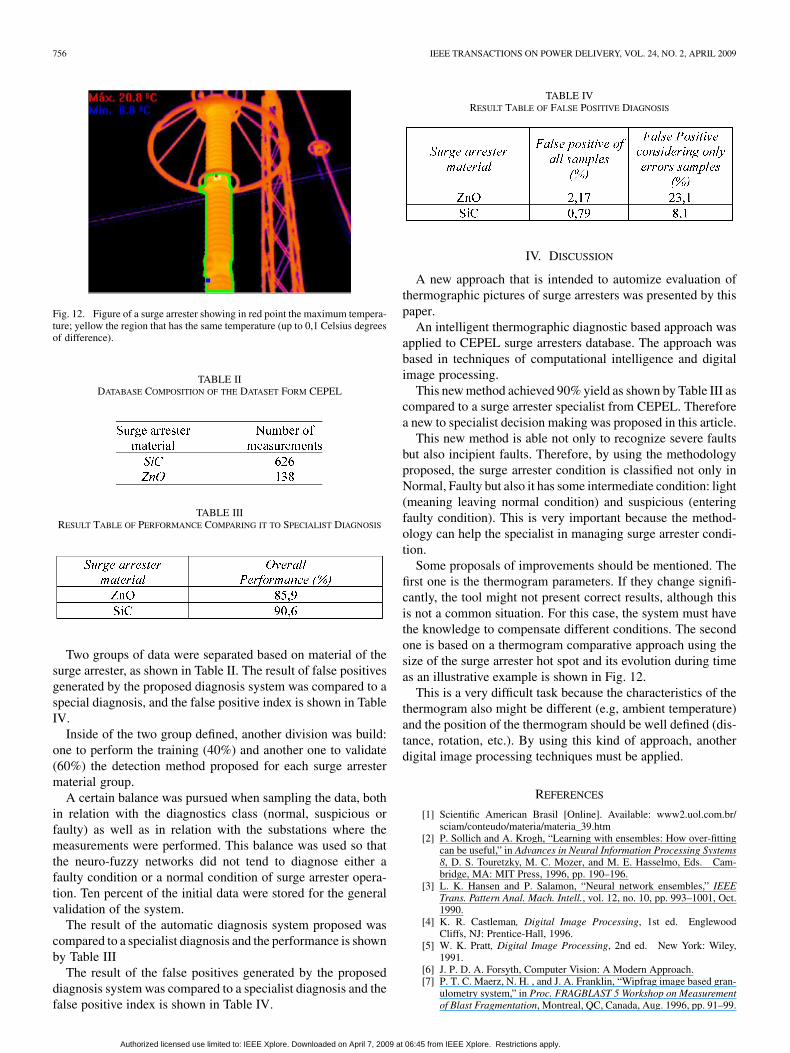
Fig. 12. Figure of a surge arrester showing in red point the maximum tempera-ture; yellow the region that has the same temperature (up to 0,1 Celsius degreesof difference).
TABLE IIDATABASE COMPOSITION OF THE DATASET FORM CEPEL
TABLE IIIRESULT TABLE OF PERFORMANCE COMPARING IT TO SPECIALIST DIAGNOSIS
Two groups of data were separated based on material of thesurge arrester, as shown in Table II. The result of false positivesgenerated by the proposed diagnosis system was compared to aspecial diagnosis, and the false positive index is shown in TableIV.
Inside of the two group defined, another division was build:one to perform the training (40%) and another one to validate(60%) the detection method proposed for each surge arrestermaterial group.
A certain balance was pursued when sampling the data, bothin relation with the diagnostics class (normal, suspicious orfaulty) as well as in relation with the substations where themeasurements were performed. This balance was used so thatthe neuro-fuzzy networks did not tend to diagnose either afaulty condition or a normal condition of surge arrester opera-tion. Ten percent of the initial data were stored for the generalvalidation of the system.
The result of the automatic diagnosis system proposed wascompared to a specialist diagnosis and the performance is shownby Table III
The result of the false positives generated by the proposeddiagnosis system was compared to a specialist diagnosis and thefalse positive index is shown in Table IV.
TABLE IVRESULT TABLE OF FALSE POSITIVE DIAGNOSIS
IV. DISCUSSION
A new approach that is intended to automize evaluation ofthermographic pictures of surge arresters was presented by thispaper.
An intelligent thermographic diagnostic based approach wasapplied to CEPEL surge arresters database. The approach wasbased in techniques of computational intelligence and digitalimage processing.
This new method achieved 90% yield as shown by Table III ascompared to a surge arrester specialist from CEPEL. Thereforea new to specialist decision making was proposed in this article.
This new method is able not only to recognize severe faultsbut also incipient faults. Therefore, by using the methodologyproposed, the surge arrester condition is classified not only inNormal, Faulty but also it has some intermediate condition: light(meaning leaving normal condition) and suspicious (enteringfaulty condition). This is very important because the method-ology can help the specialist in managing surge arrester condi-tion.
Some proposals of improvements should be mentioned. Thefirst one is the thermogram parameters. If they change signifi-cantly, the tool might not present correct results, although thisis not a common situation. For this case, the system must havethe knowledge to compensate different conditions. The secondone is based on a thermogram comparative approach using thesize of the surge arrester hot spot and its evolution during timeas an illustrative example is shown in Fig. 12.
This is a very difficult task because the characteristics of thethermogram also might be different (e.g, ambient temperature)and the position of the thermogram should be well defined (dis-tance, rotation, etc.). By using this kind of approach, anotherdigital image processing techniques must be applied.
REFERENCES
[1] Scientific American Brasil [Online]. Available: www2.uol.com.br/sciam/conteudo/materia/materia_39.htm
[2] P. Sollich and A. Krogh, “Learning with ensembles: How over-fittingcan be useful,” in Advances in Neural Information Processing Systems8, D. S. Touretzky, M. C. Mozer, and M. E. Hasselmo, Eds. Cam-bridge, MA: MIT Press, 1996, pp. 190–196.
[3] L. K. Hansen and P. Salamon, “Neural network ensembles,” IEEETrans. Pattern Anal. Mach. Intell., vol. 12, no. 10, pp. 993–1001, Oct.1990.
[4] K. R. Castleman, Digital Image Processing, 1st ed. EnglewoodCliffs, NJ: Prentice-Hall, 1996.
[5] W. K. Pratt, Digital Image Processing, 2nd ed. New York: Wiley,1991.
[6] J. P. D. A. Forsyth, Computer Vision: A Modern Approach.[7] P. T. C. Maerz, N. H. , and J. A. Franklin, “Wipfrag image based gran-
ulometry system,” in Proc. FRAGBLAST 5 Workshop on Measurementof Blast Fragmentation, Montreal, QC, Canada, Aug. 1996, pp. 91–99.
Authorized licensed use limited to: IEEE Xplore. Downloaded on April 7, 2009 at 06:45 from IEEE Xplore. Restrictions apply.
LAURENTYS ALMEIDA et al.: INTELLIGENT THERMOGRAPHIC DIAGNOSTIC APPLIED TO SURGE ARRESTERS: A NEW APPROACH 757
[8] N. H. Maerz, “Reconstructing 3-d block size distributions from 2-dmeasurements on sections,” in Proc. FRAGBLAST 5 Workshop on Mea-surement of Blast Fragmentation, Montreal, QC, Canada, Aug. 1996,pp. 39–43.
[9] J. B. T. M. Roerdink and A. Meijster, The Watershed Transform:Definitions, Algorithms and Parallelization Strategies Inst. Mathemat.Comput. Sci., Univ. Groningen, Groningen, Germany, 2001, Tech.Rep..
[10] L. Vincent and P. Soille, “Watersheds in digital spaces: An efficient al-gorithm based on dimmersion simulations,” IEEE Trans. Pattern Anal.Mach. Intell., vol. 13, no. 6, pp. 583–598, Jun. 1991.
[11] C. Farfán, R. A. Salinas, and G. Cifuentes, “Rock segmentation andmeasures on gray level images using watershed for sizing distributionin particle systems,” in Dept. Metallurgical Eng., Univ. Santiago Chile(USACH).
[12] [Online]. Available: http://www.mathworks.com/company/newslet-ters/news_notes/win02/watershed.html
Carlos A. Laurentys Almeida received the Master’s degree in optimization in2004 and is currently pursuing the Ph.D. degree at the Federal University ofMinas Gerais (UFMG).
Antônio P. Braga received the Master’s degree in computer science from theFederal University of Minas Gerais (UFMG) and the Ph.D. degree in electricalengineering in the area of artificial neural networks (ANNs) from London Uni-versity (Imperial College), London, U.K.
Currently, he is an Assistant Professor at DELT-UFMG, counselling manydoctorate as well as master degree and graduation students in the area of ANNs.He has published many articles in journals as well as in international and na-tional conferences in the area of ANNs. He was the General Coordinator of theV Brazilian Symposium of Neural Networks and is the present Coordinator ofthe Special Commission of Neural Networks of the Brazilian Computation So-ciety. He is the Chief Co-Editor of the International Journal of ComputationalIntelligence and Applications
Sinval Nascimento , photograph and biography not available at the time of pub-lication.
Vinicius Paiva , photograph and biography not available at the time of publica-tion.
Hélvio J. A. Martins received the Master’s degree in electrical engineering(high voltage) at the Universidade Federal do Rio de Janeiro, Rio de Janeiro,Brazil, in 1987.
His professional experience includes companies, such as ex-PTEL-Projetos eEstudos de Engenharia, where he took part in planning studies for interconnec-tion of the Brazilian Power System and substation projects. He has been withCEPEL since 1985, where he came to work with projects dedicated to the de-velopment of techniques and tests applied to assess high-voltage electric equip-ment. Currently, he develops research targeting the development of methods andtechniques for monitoring, evaluation, and diagnostics of electric equipment. Heis also attending a doctorate course in electrical engineering at UFRJ/COPPEand is in the phase of thesis development on monitoring the geometrical dis-placement of power transformer windings by application of the frequency-re-sponse technique associated with artificial-intelligence algorithms.
Rodolfo Torres , photograph and biography not available at the time of publi-cation.
Walmir M. Caminhas received the Master’s degree in electrical engineeringfrom the Federal University of Minas Gerais (UFMG), Brazil, in 1989 and thePh.D. degree in electrical engineering from UNICAMP in 1997.
Currently, he is Professor of the Electrical Engineering Department at UFMG,where he has been since 1988. His main areas of interest are fuzzy systems, ar-tificial neural networks, and the detection and diagnostics of faults in dynamicsystems. He has already taken part in several research projects supported byCNPq, FAPEMIG, and FINEP. He is also working in a development and re-search project together with companies, such as CEMIG, CEPEL, Petrobras,Açominas, and others.
Authorized licensed use limited to: IEEE Xplore. Downloaded on April 7, 2009 at 06:45 from IEEE Xplore. Restrictions apply.